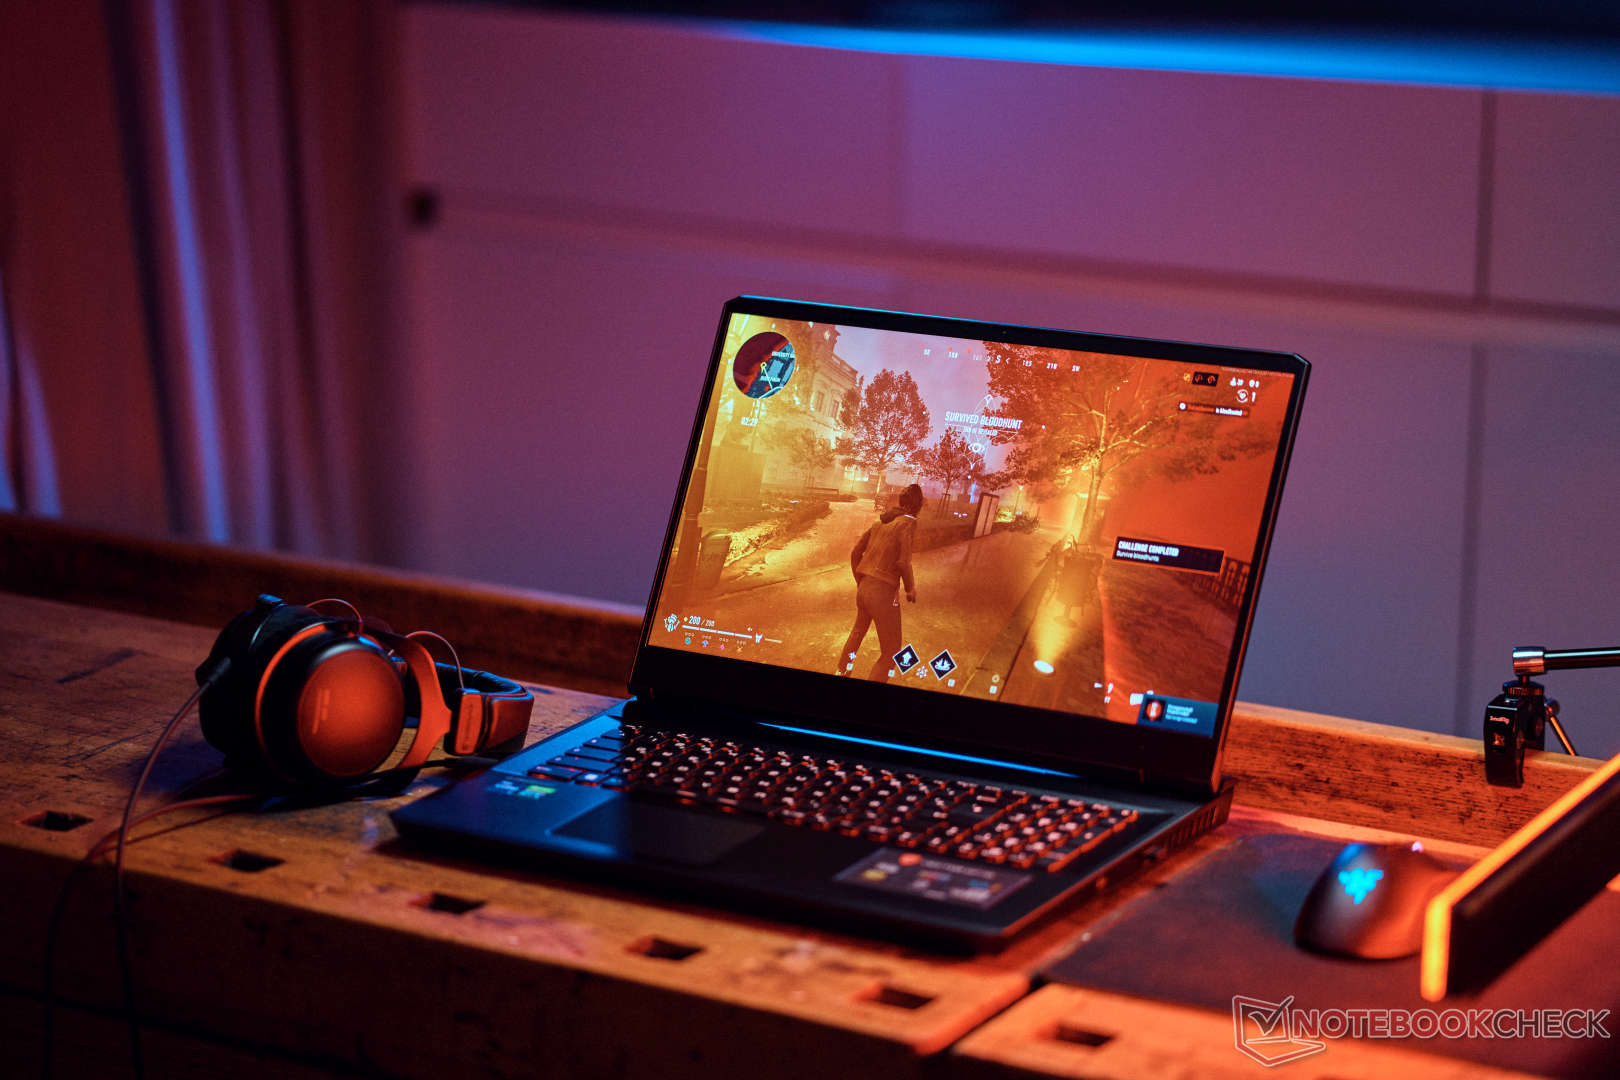
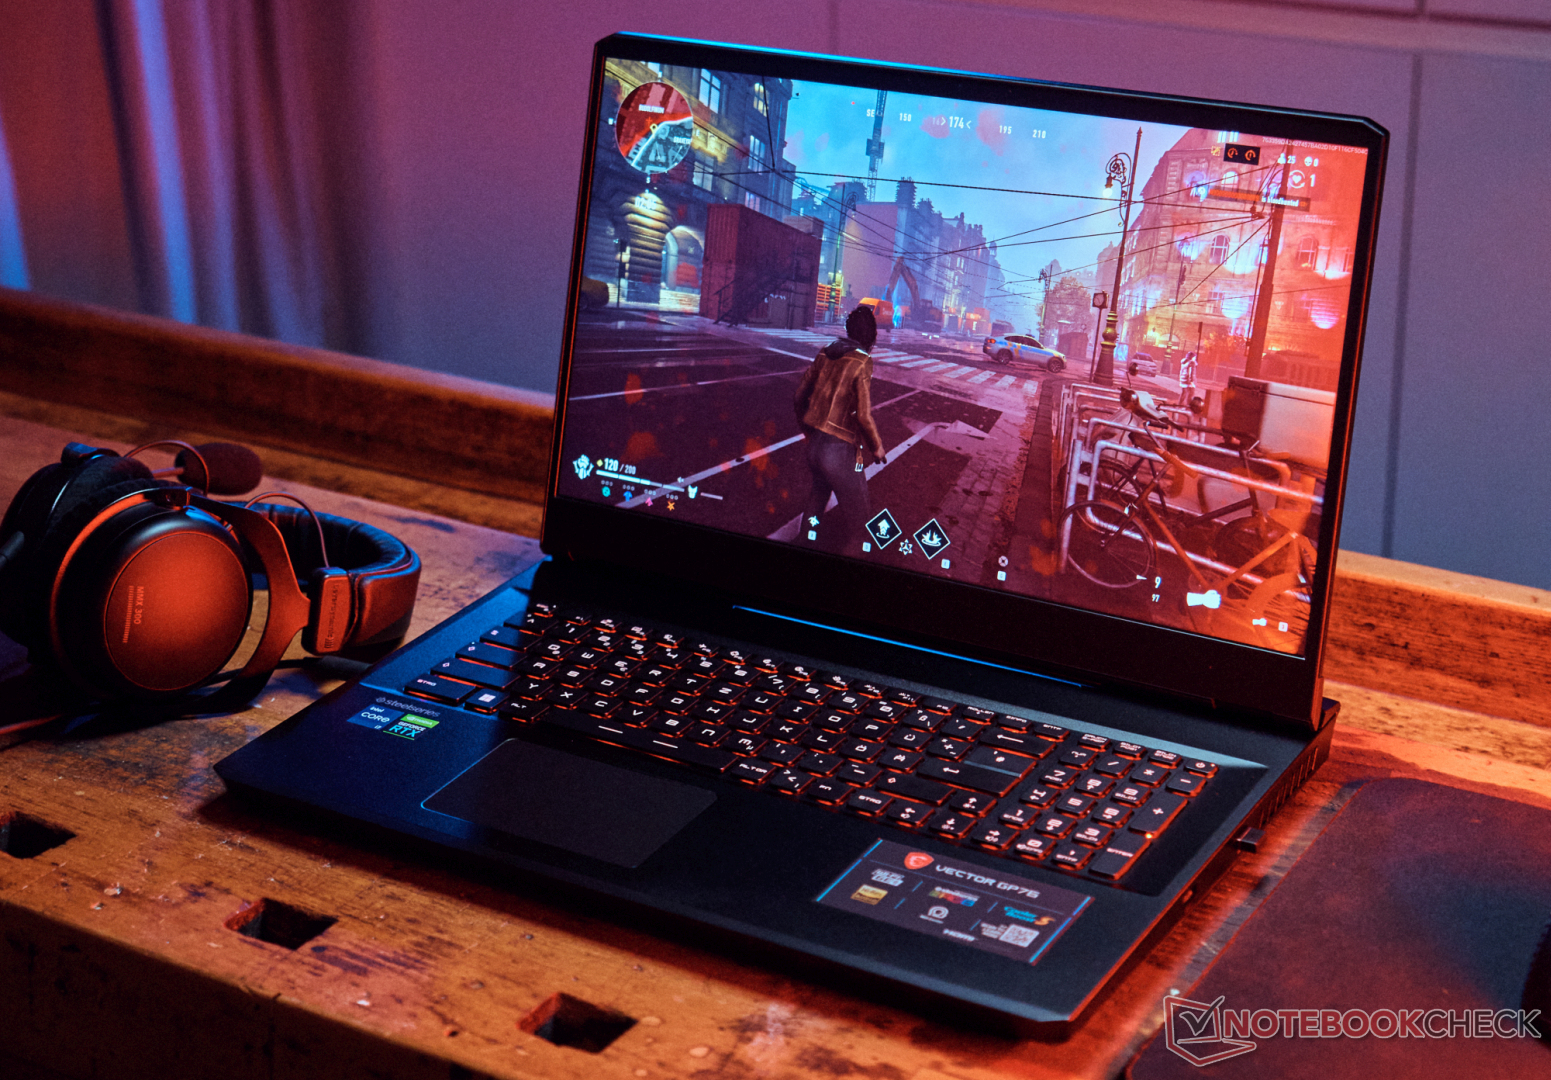
Revisão MSI Vector GP76 12UGS: Laptop de jogos em velocidade

Com sua nova série Vector, a MSI está introduzindo dois novos cadernos nos campos de batalha de jogos este ano. O menor de 15 polegadas já oferece um desempenho excepcional, mas que atualizações o Vector GP76 oferece como sucessor direto doGP76 Leopardo? ao contrário dos MSI Alfa, Katana ou Pulsoa linha Vector não foi projetada para usuários de nível básico ou médio, mas oferece máquinas de jogo de alto nível com elementos de gama média, o que também se reflete no preço de cerca de US$ 2.600.
No entanto, faltam algumas características em comparação com aSérie GE para os entusiastas e o compacto Série GS. Por exemplo, o Thunderbolt 4, um leitor de cartões e carregamento USB-C são omitidos, juntamente com a falta de opções para displays QHD ou UHD, ou um Nvidia GeForce RTX 3080 Tialém disso, vem com uma RAM DDR4 um pouco mais lenta e uma bateria menor. No entanto, há muitas características fortes e atualizações que destacamos neste relatório, como o painel rápido de 360 Hz com tempo de resposta de 4ms.
Os competiradores incluem o Asus ROG Strix G17o Gigabyte Aorus 17, Schenker's XMG Neo 17 e Lenovo's Legion 5 Pro. Também é de interesse a comparação com os preços similares Asus ROG Zephyrus M16.
Possíveis concorrentes em comparação
Avaliação | Data | Modelo | Peso | Altura | Size | Resolução | Preço |
|---|---|---|---|---|---|---|---|
| 86.7 % v7 (old) | 05/2022 | MSI Vector GP76 12UGS-434 i7-12700H, GeForce RTX 3070 Ti Laptop GPU | 2.9 kg | 25.9 mm | 17.30" | 1920x1080 | |
| 85.1 % v7 (old) | 03/2021 | MSI GP76 Leopard 10UG i7-10750H, GeForce RTX 3070 Laptop GPU | 2.9 kg | 26 mm | 17.30" | 1920x1080 | |
| 83.4 % v7 (old) | 08/2021 | Asus ROG Strix G17 G713QE-RB74 R7 5800H, GeForce RTX 3050 Ti Laptop GPU | 2.5 kg | 24.6 mm | 17.30" | 1920x1080 | |
| 85.2 % v7 (old) | 04/2022 | Aorus 17 XE4 i7-12700H, GeForce RTX 3070 Ti Laptop GPU | 2.6 kg | 27 mm | 17.30" | 1920x1080 | |
| 87.4 % v7 (old) | 09/2021 | Schenker XMG NEO 17 GM7TG8S i7-11800H, GeForce RTX 3080 Laptop GPU | 2.6 kg | 27.45 mm | 17.30" | 2560x1440 | |
| 88 % v7 (old) | 03/2022 | Lenovo Legion 5 Pro 16 G7 i7 RTX 3070Ti i7-12700H, GeForce RTX 3070 Ti Laptop GPU | 2.6 kg | 26.6 mm | 16.00" | 2560x1600 | |
| 85.6 % v7 (old) | 07/2021 | Asus ROG Zephyrus M16 GU603H i9-11900H, GeForce RTX 3070 Laptop GPU | 2 kg | 20 mm | 16.00" | 2560x1600 | |
| 86.9 % v7 (old) | 03/2022 | MSI Vector GP66 12UGS i9-12900H, GeForce RTX 3070 Ti Laptop GPU | 2.3 kg | 23.4 mm | 15.60" | 1920x1080 |
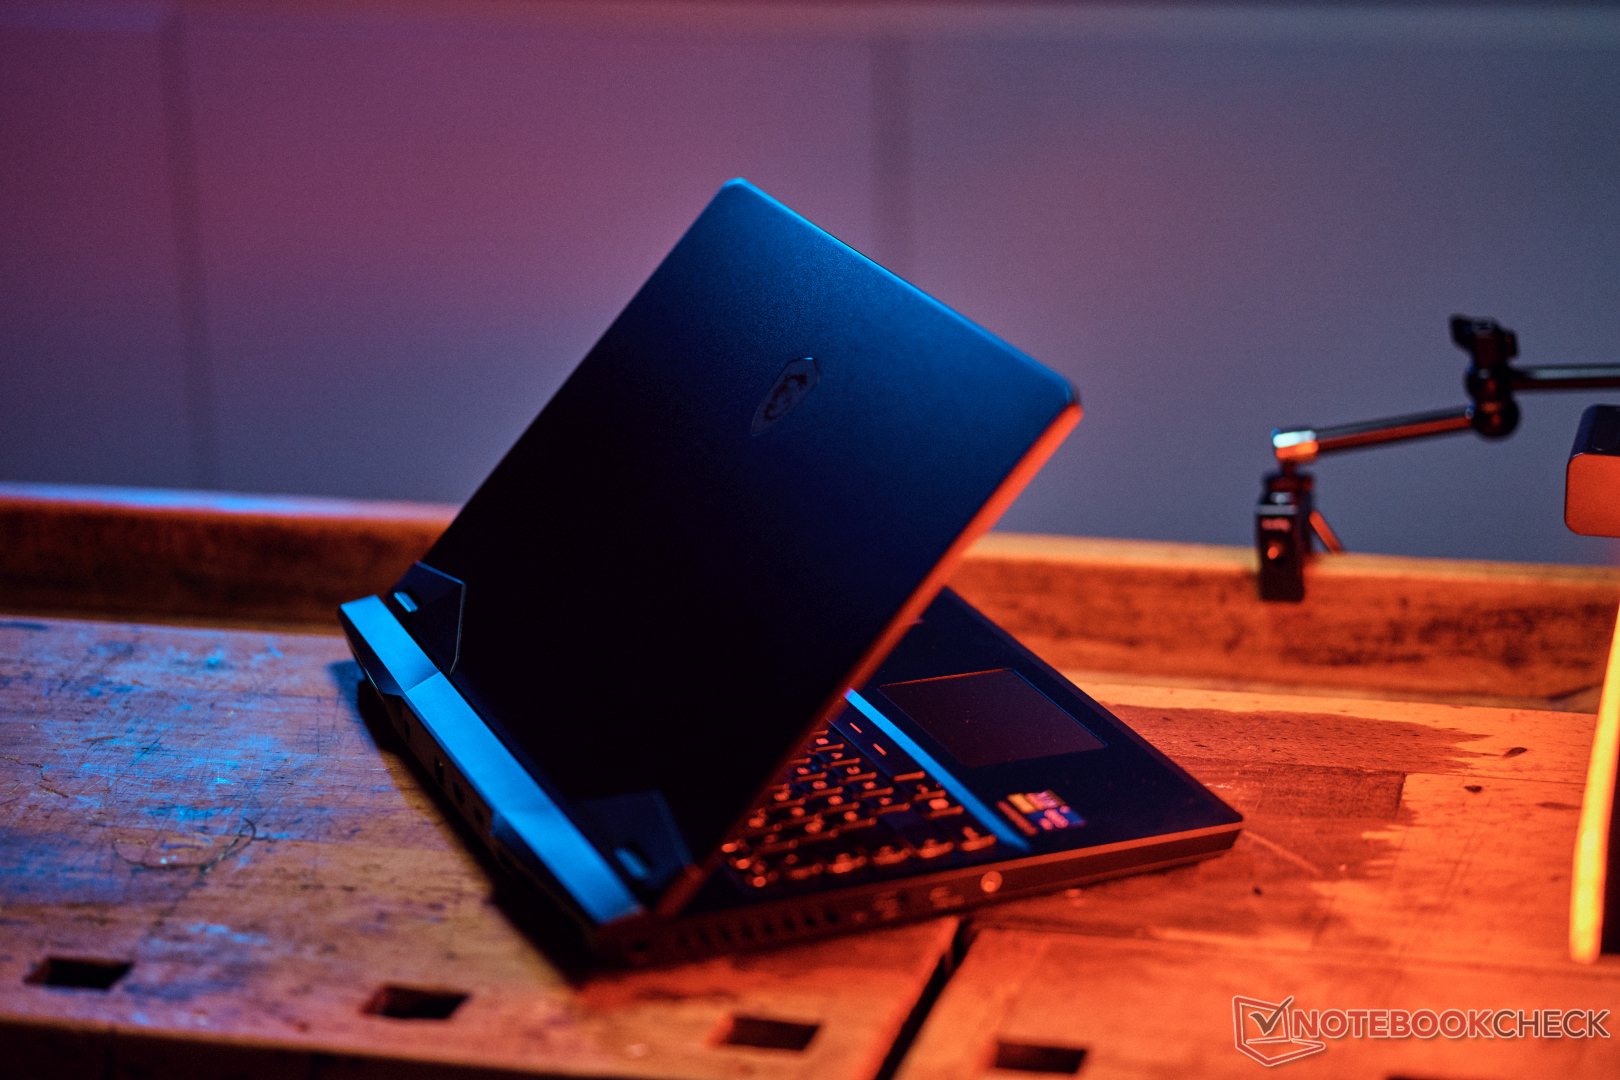
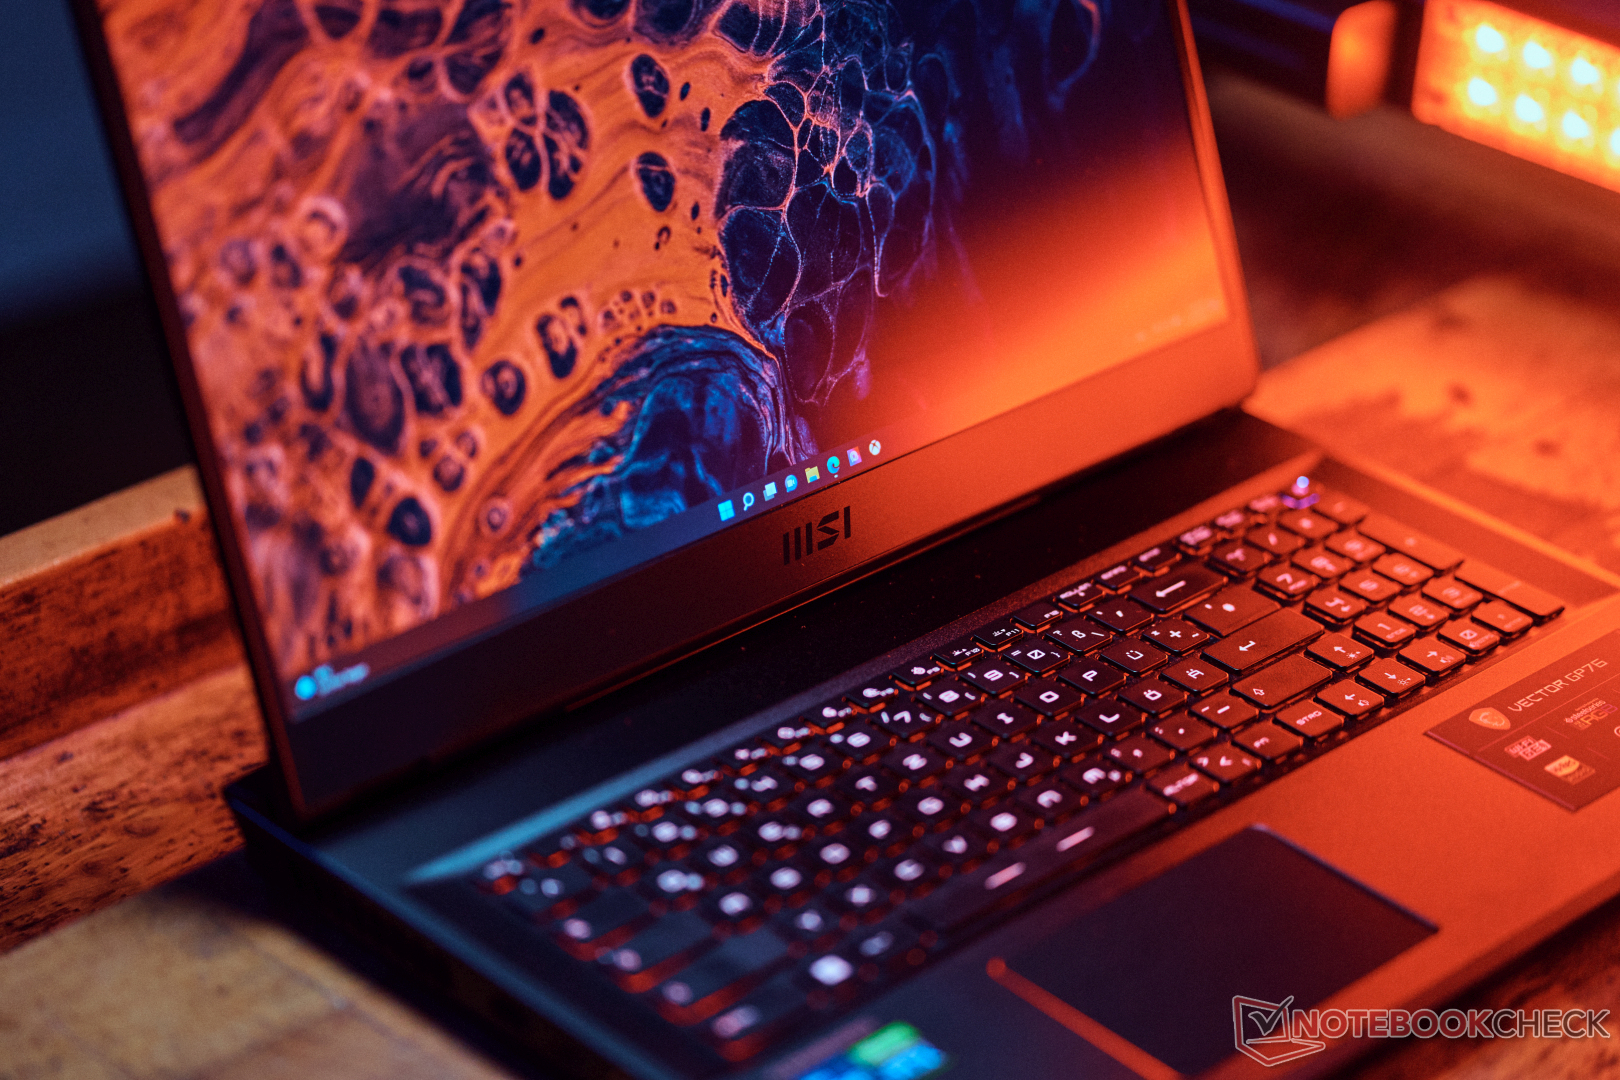
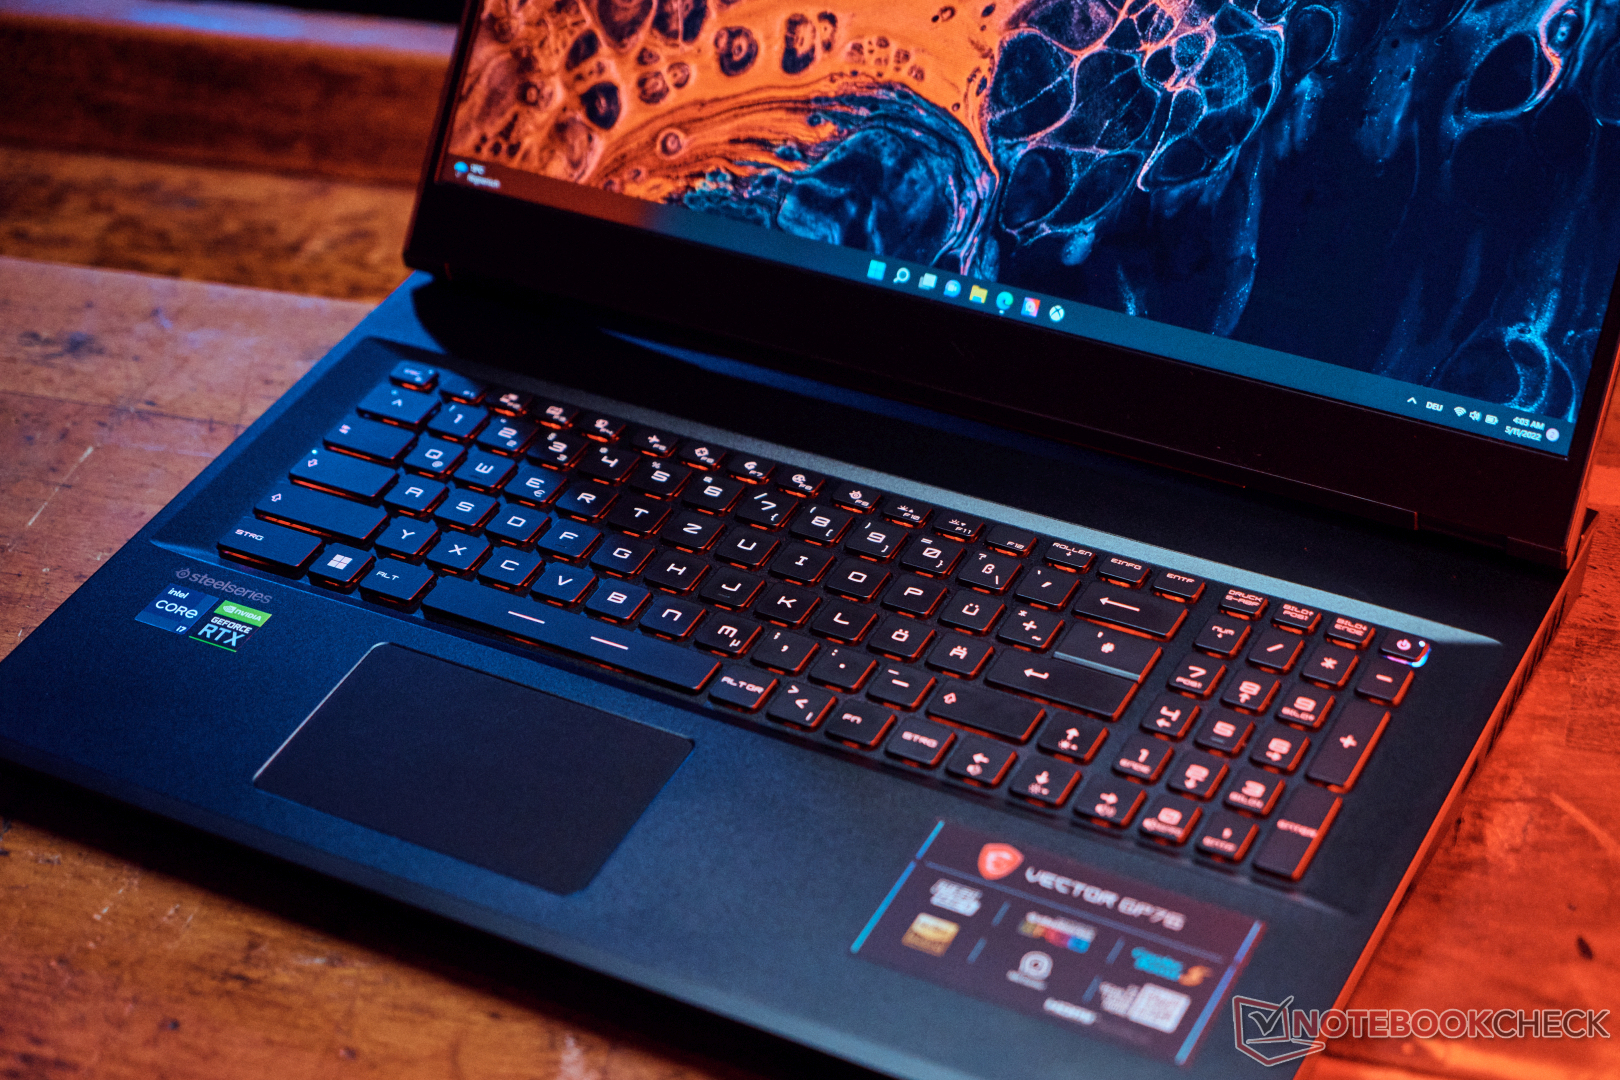
Estojo: MSI com Vetor estável e muito metal
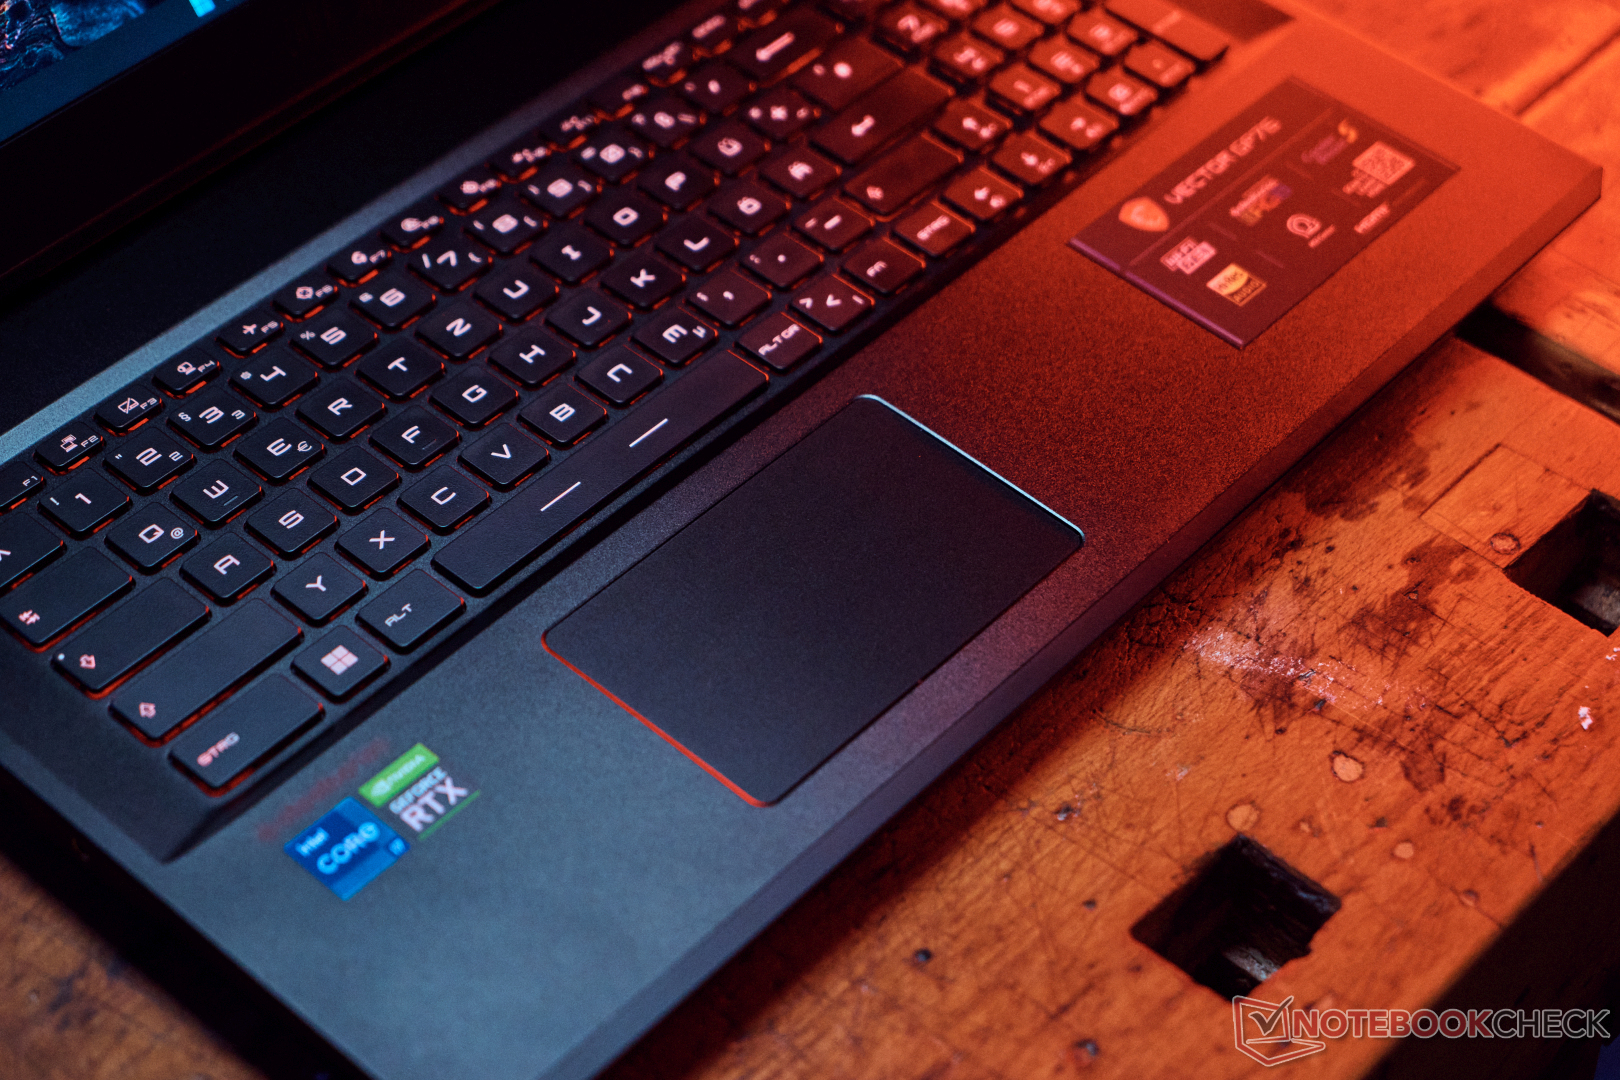
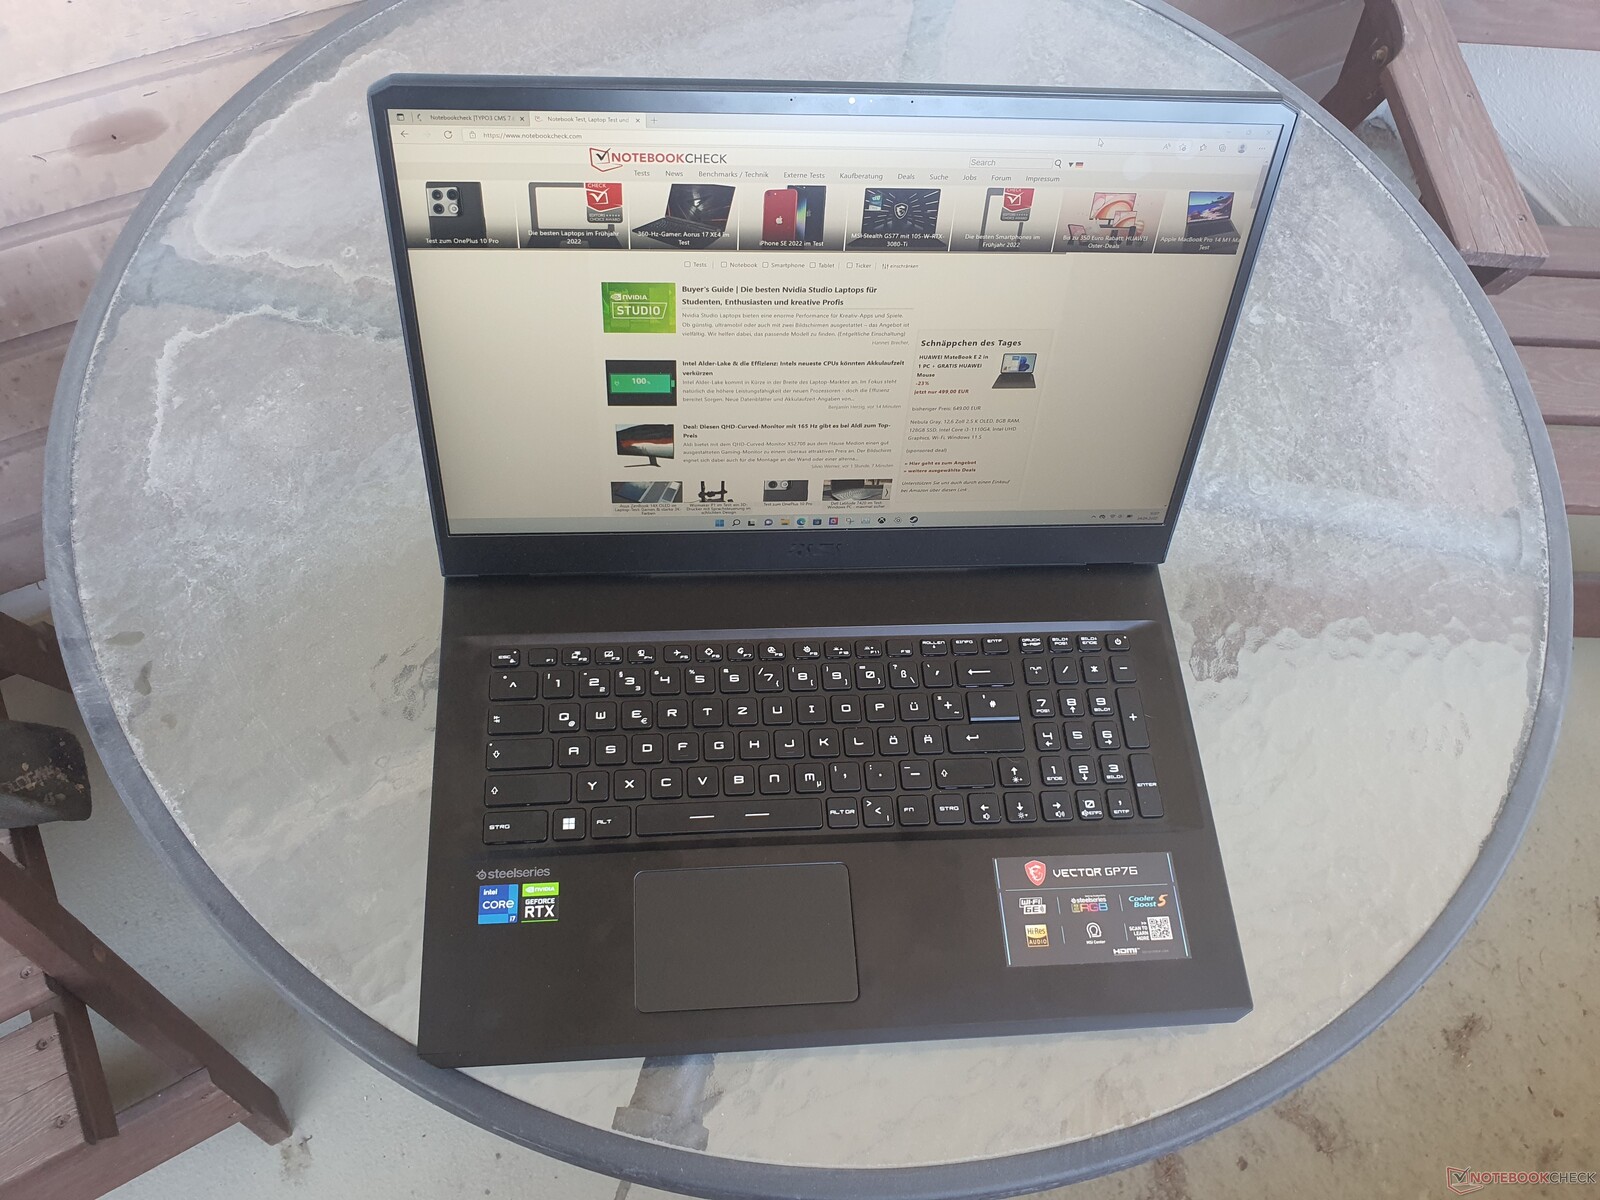
O MSI Vector GP76, que só está disponível em "Coral Black", tem uma caixa extremamente robusta com uma tampa de exibição e uma área de teclado feita de alumínio. Em comparação com o modelo anterior, o estojo permaneceu praticamente o mesmo e tem uma parte inferior de plástico. O Vector é resistente à torção, incluindo o display, e a pressão direcionada na parte de trás do display não causa distorções na imagem. Apenas a parte inferior da moldura do display cede um pouco à pressão, mas isto não é um problema importante. A tela teeters apenas ligeiramente.
A tampa pode ser aberta com uma mão, enquanto o ângulo máximo de abertura de 140 graus é um pouco pequeno. O teclado está bem embutido na caixa e não dobra de forma alguma. As superfícies são levemente ásperas e têm uma sensação de alta qualidade. Algumas bordas são um pouco afiadas devido ao desenho do jogo, mas ainda assim são aceitáveis. Entretanto, como a borda frontal da caixa está conectada ao painel inferior, isto pode afrouxar ou descolar um pouco com o tempo, o que estraga a impressão geral de qualidade.

O peso de 2,85 kg é aceitável, tendo em vista que se trata de uma máquina de jogo de 17 polegadas com componentes poderosos. A concorrência oferece dispositivos imperceptivelmente mais leves, em que a classe de 16 polegadas, como a Asus ROG Zephyrus M16o dispositivo de comparação é significativamente mais leve com um peso de apenas 2 kg e é também o dispositivo mais compacto de longe no campo de comparação. A diferença aqui é bastante significativa e definitivamente vale a pena levar em consideração para os jogos móveis. A espessura de 26mm não é ruim. Em geral, o GP76 é ligeiramente mais grosso do que outros dispositivos comparáveis de 17 polegadas.
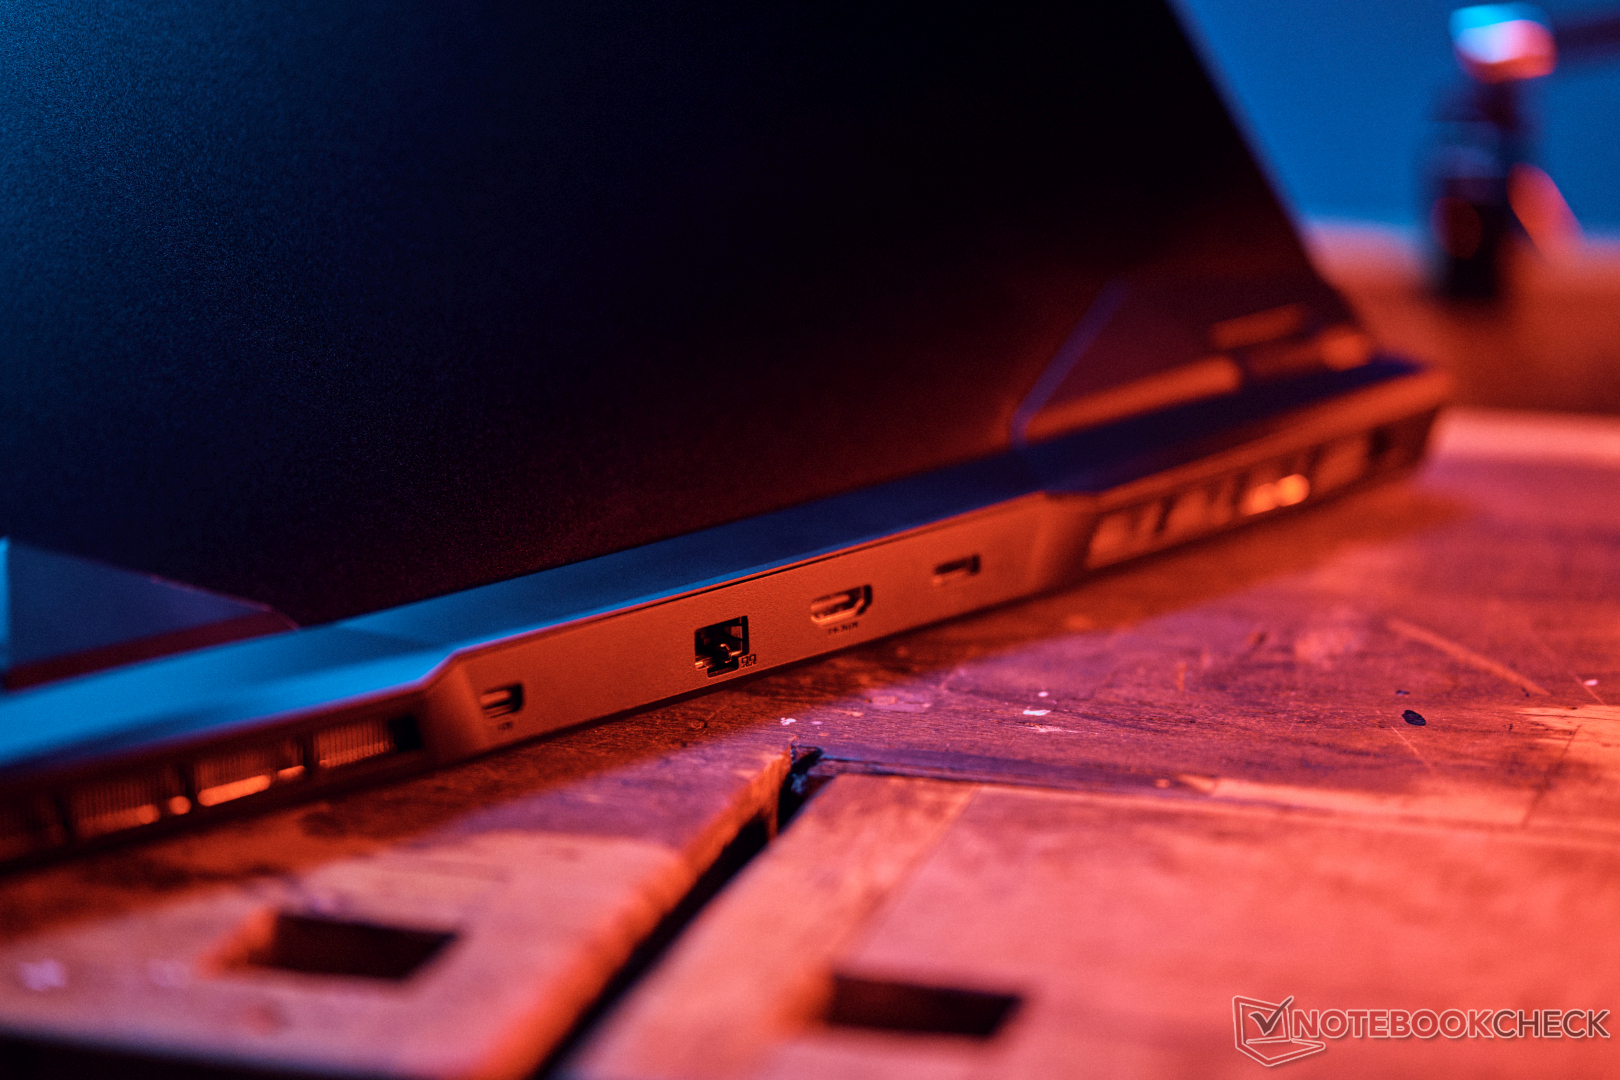
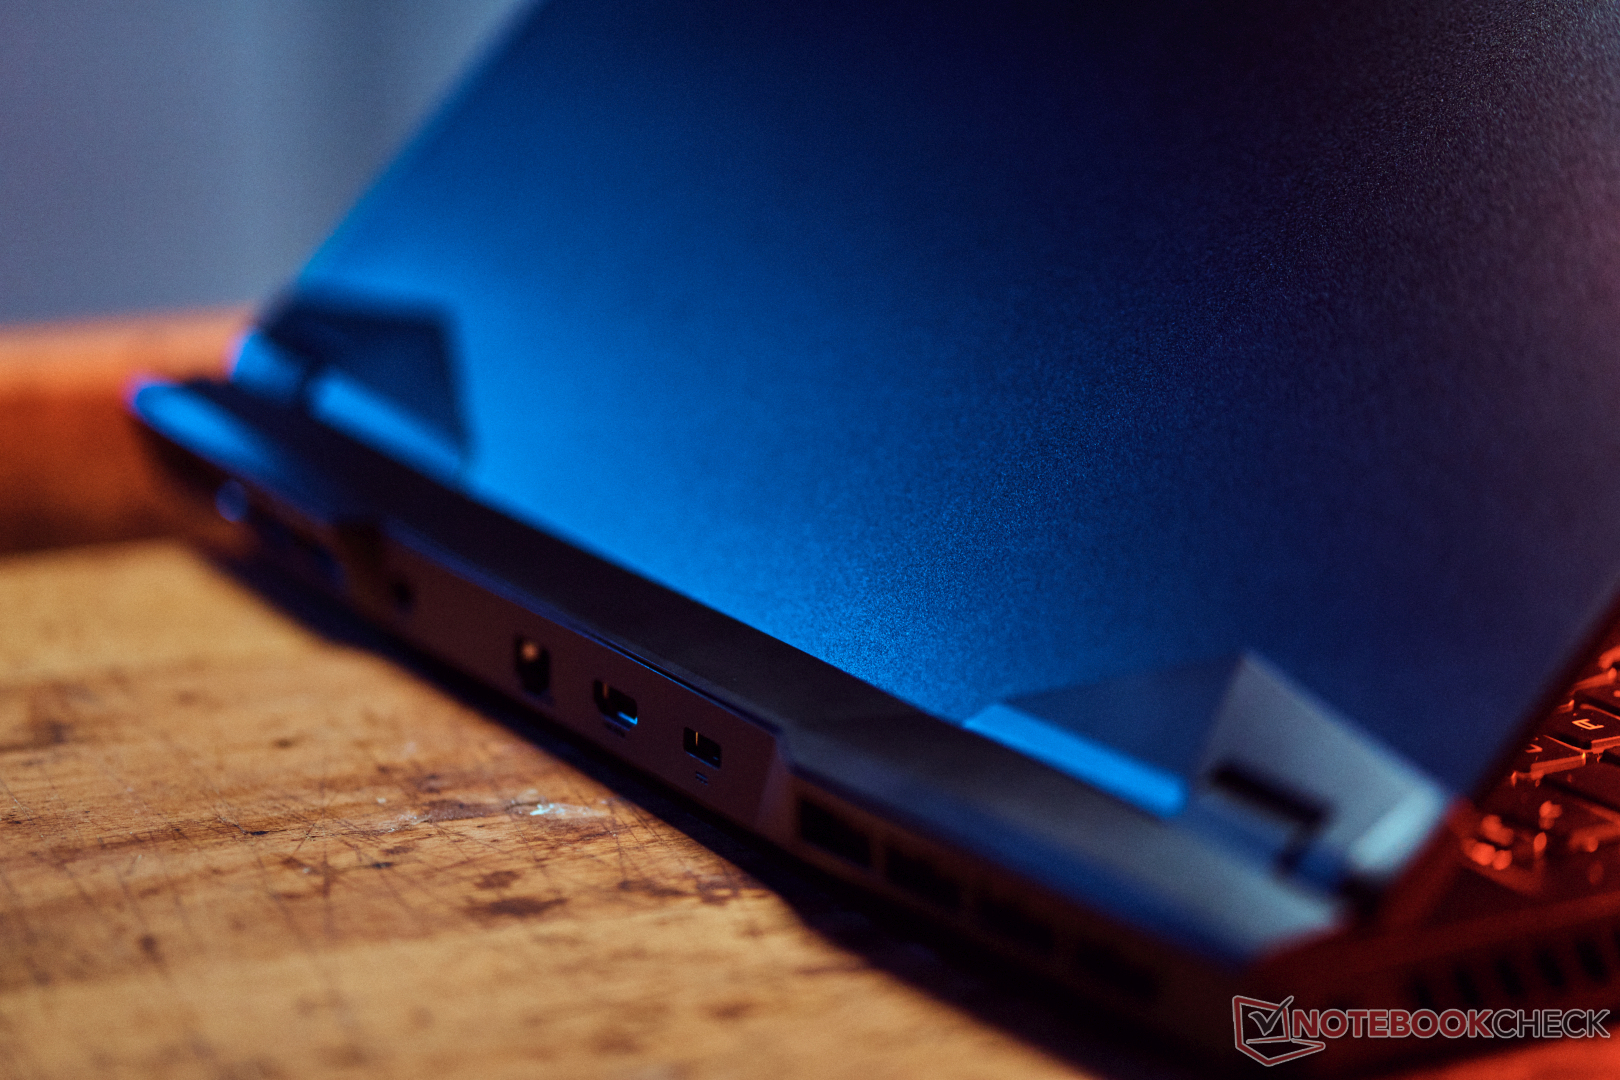
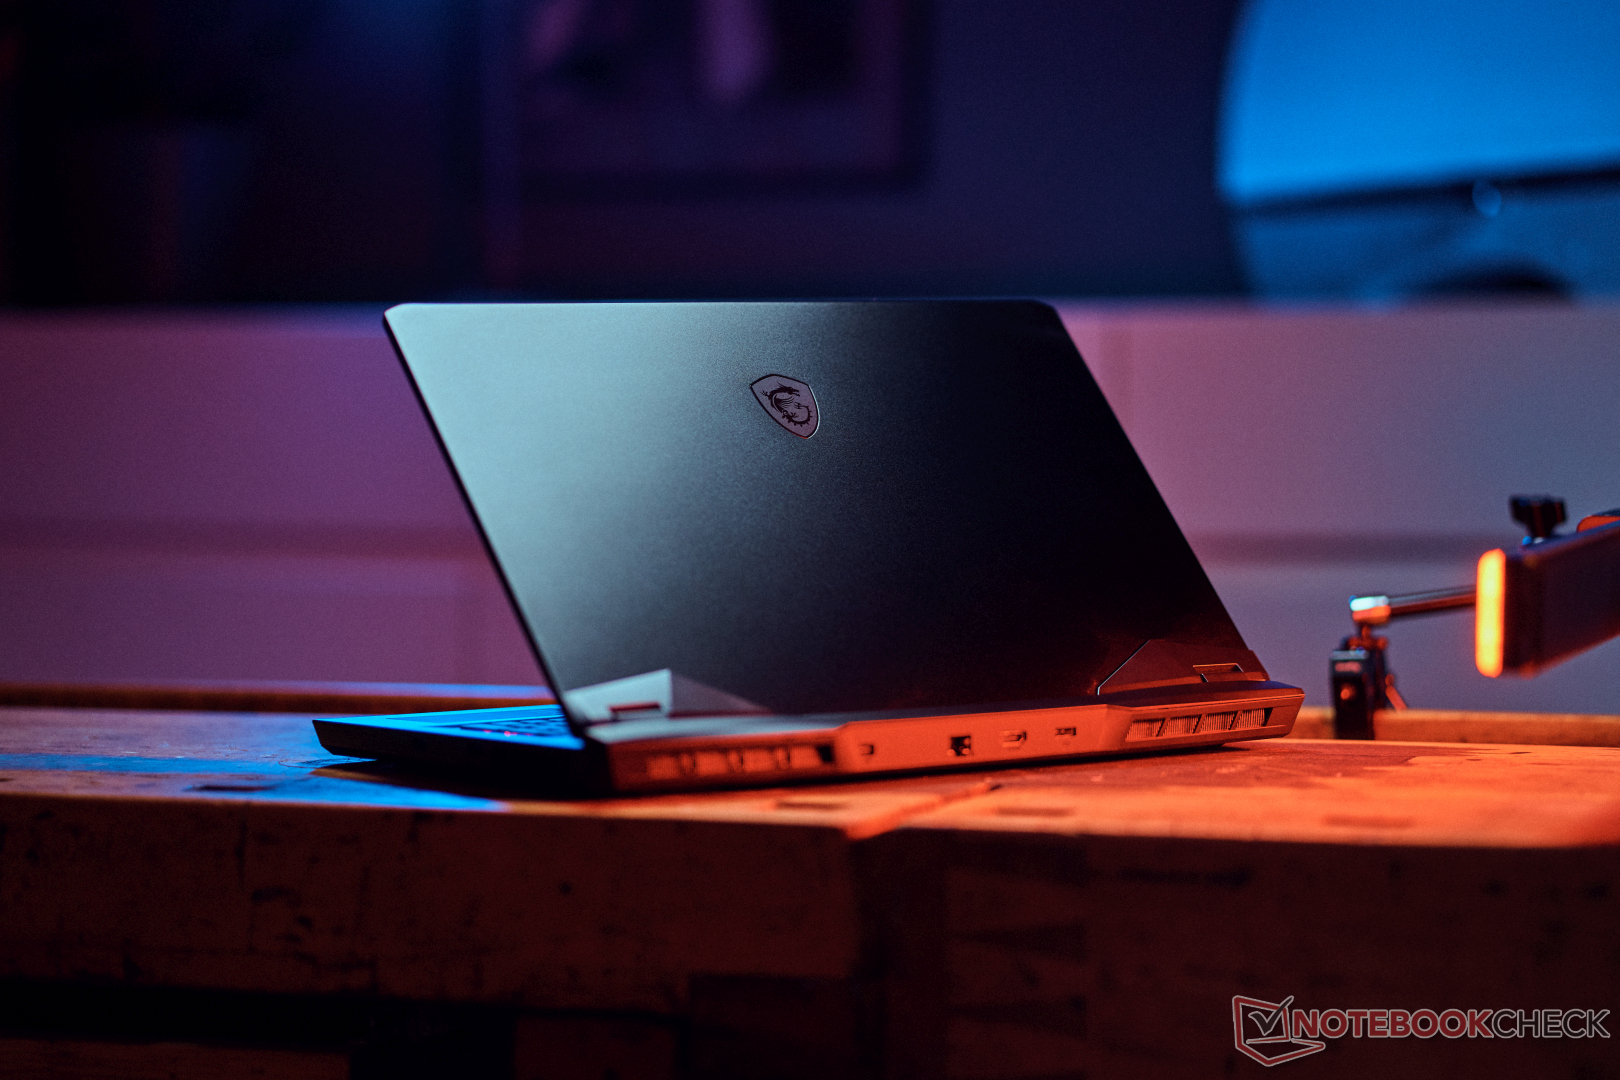
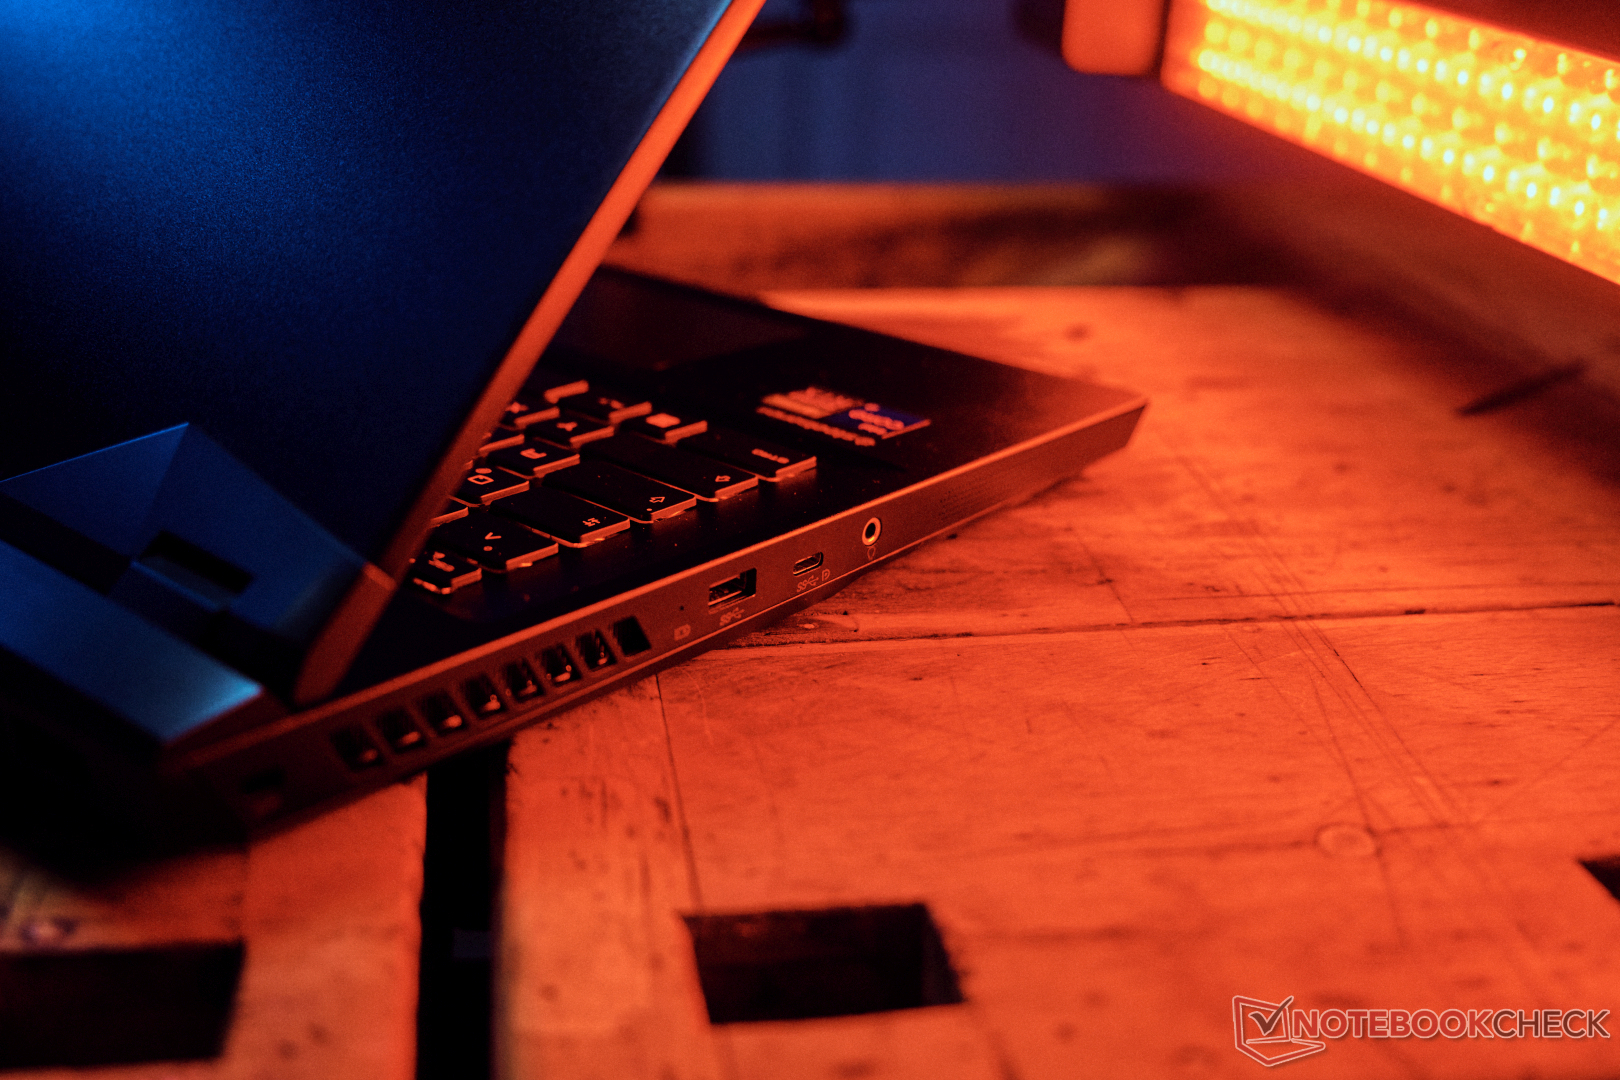
Hardware: Sem cobrança via USB-C
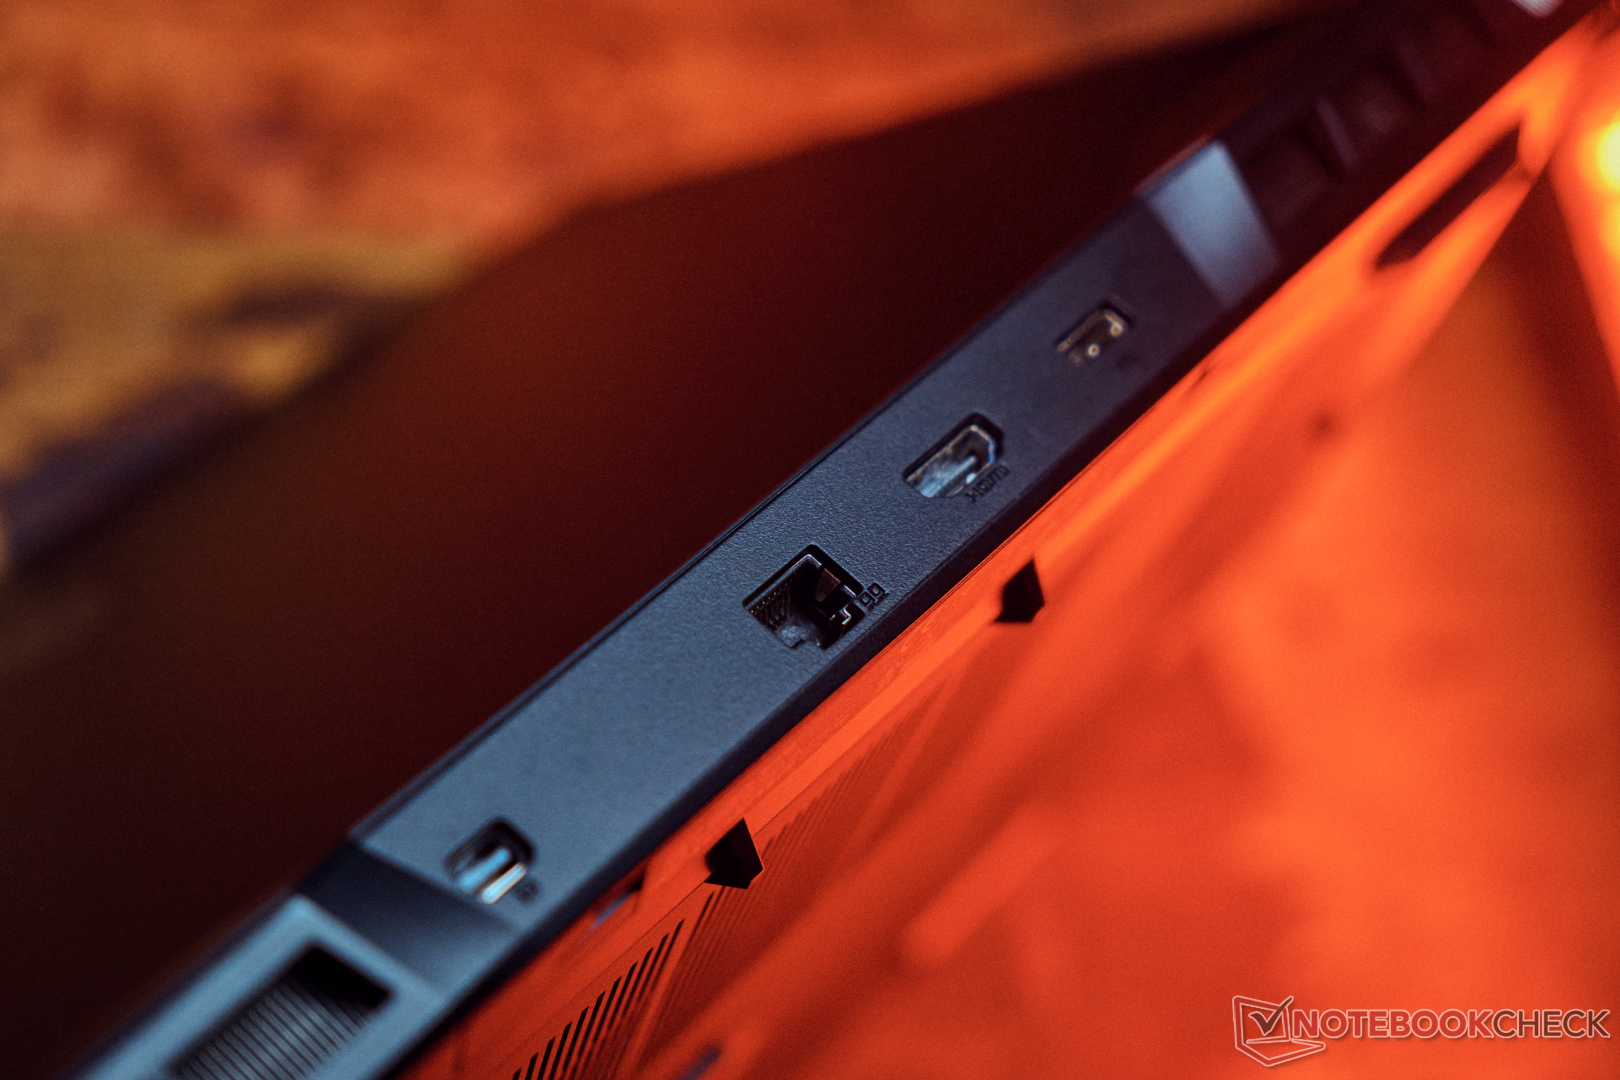
Felizmente, algumas das portas estão localizadas na parte de trás do dispositivo, de modo que os cabos correspondentes não são visíveis. Um mini DisplayPort com Adaptive Sync está presente, juntamente com uma saída HDMI (4K @120Hz), 2.5-GBit LAN e o conector de energia proprietário.
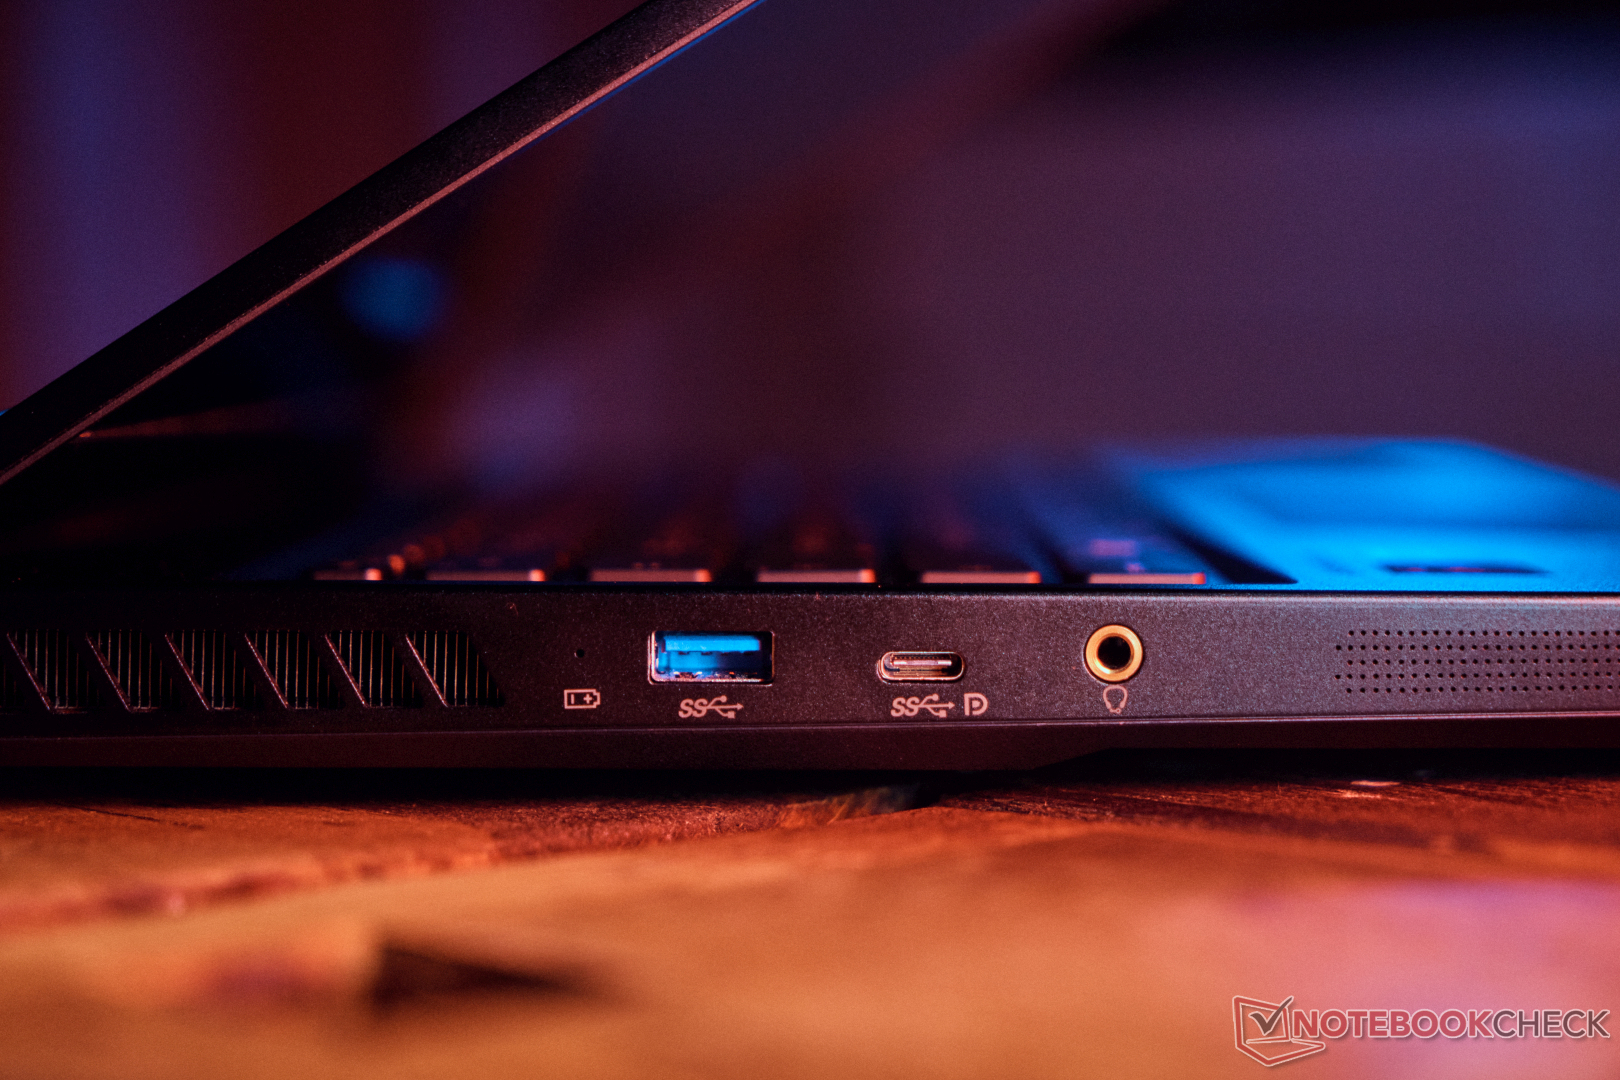
No lado esquerdo está uma fechadura Kensington, 1x USB-A 3.2 Gen1 (5 GBit/s), 1x USB-C 3.2 Gen2 (10 GBit/s) com funcionalidade DisplayPort. No entanto, faltam o fornecimento de energia e o Thunderbolt. Jogos móveis na ausência de uma fonte de alimentação de 800 gramas não podem, portanto, ser garantidos. Uma placa gráfica mais forte e externa também não pode ser usada.
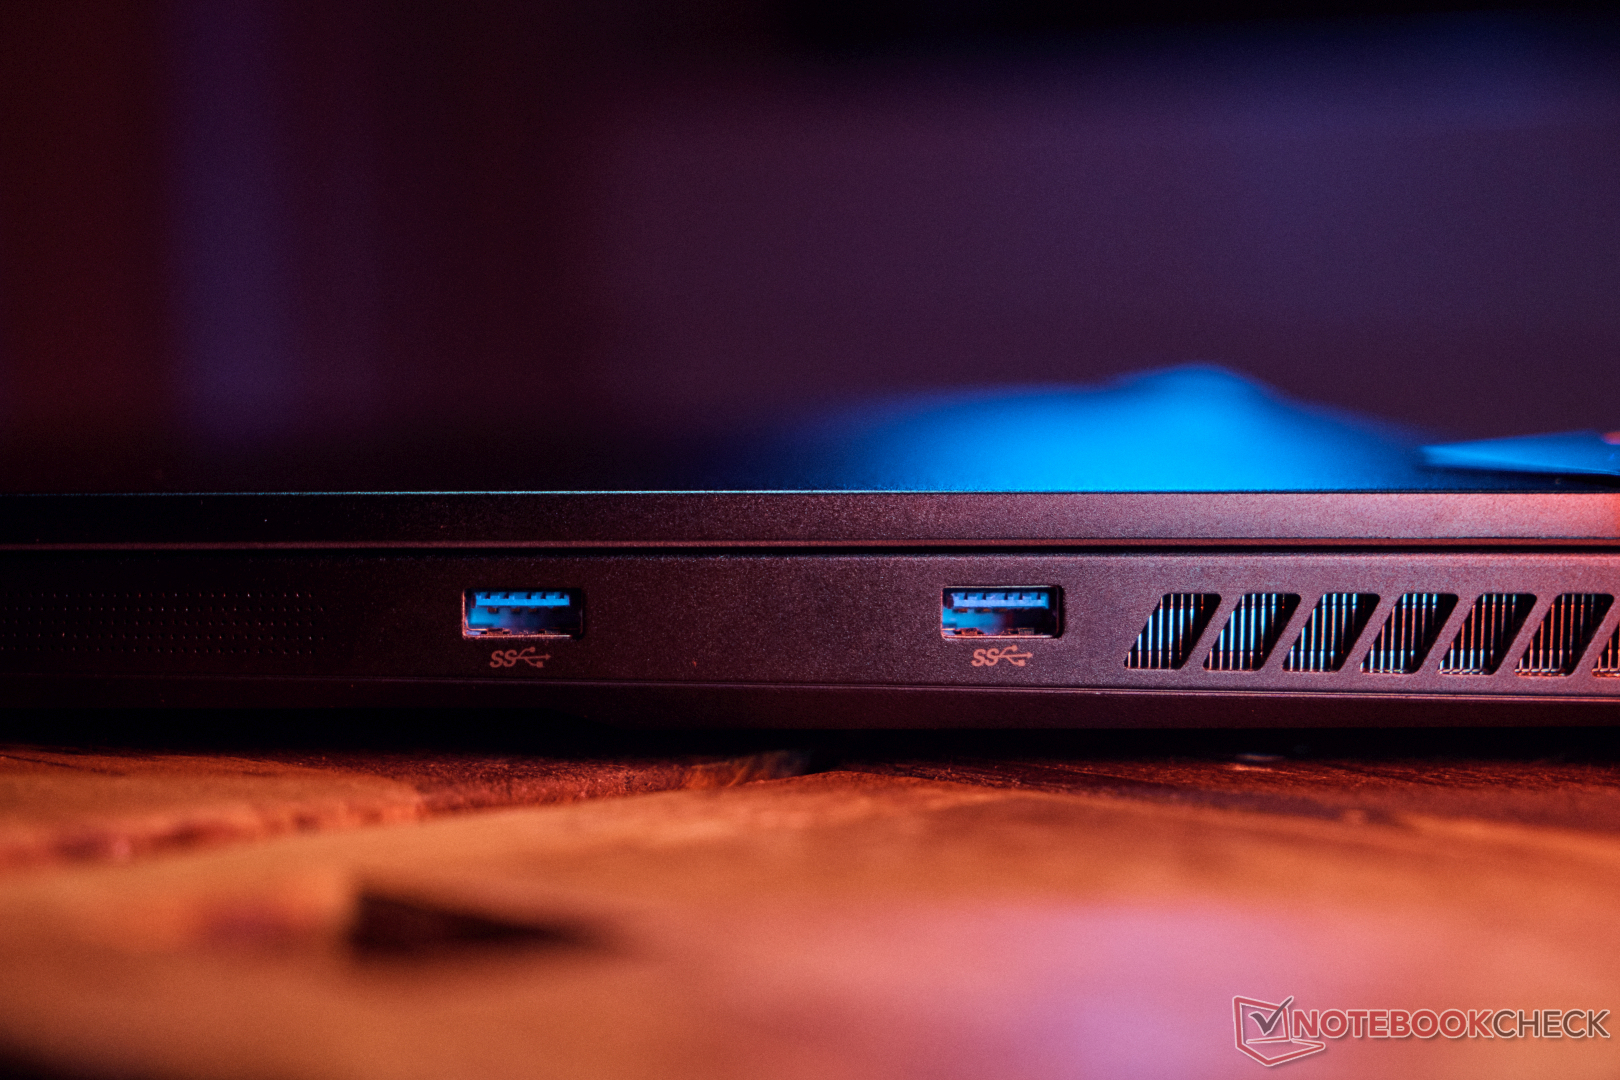
Caso contrário, há uma conexão jack e mais duas portas USB A 3.2 Gen1 no lado direito do notebook. Não há leitor de cartões SD ou leitor de impressões digitais. Com um disco rígido externo, conseguimos taxas de transferência de cerca de 1 GB/s na porta mais rápida (USB-C a 10 GBIt/s), o que maximiza aproximadamente a saída da porta. O SSD externo (USB 3.2 Gen 2x2) alcança o dobro da taxa de transferência em uma porta Thunderbolt.
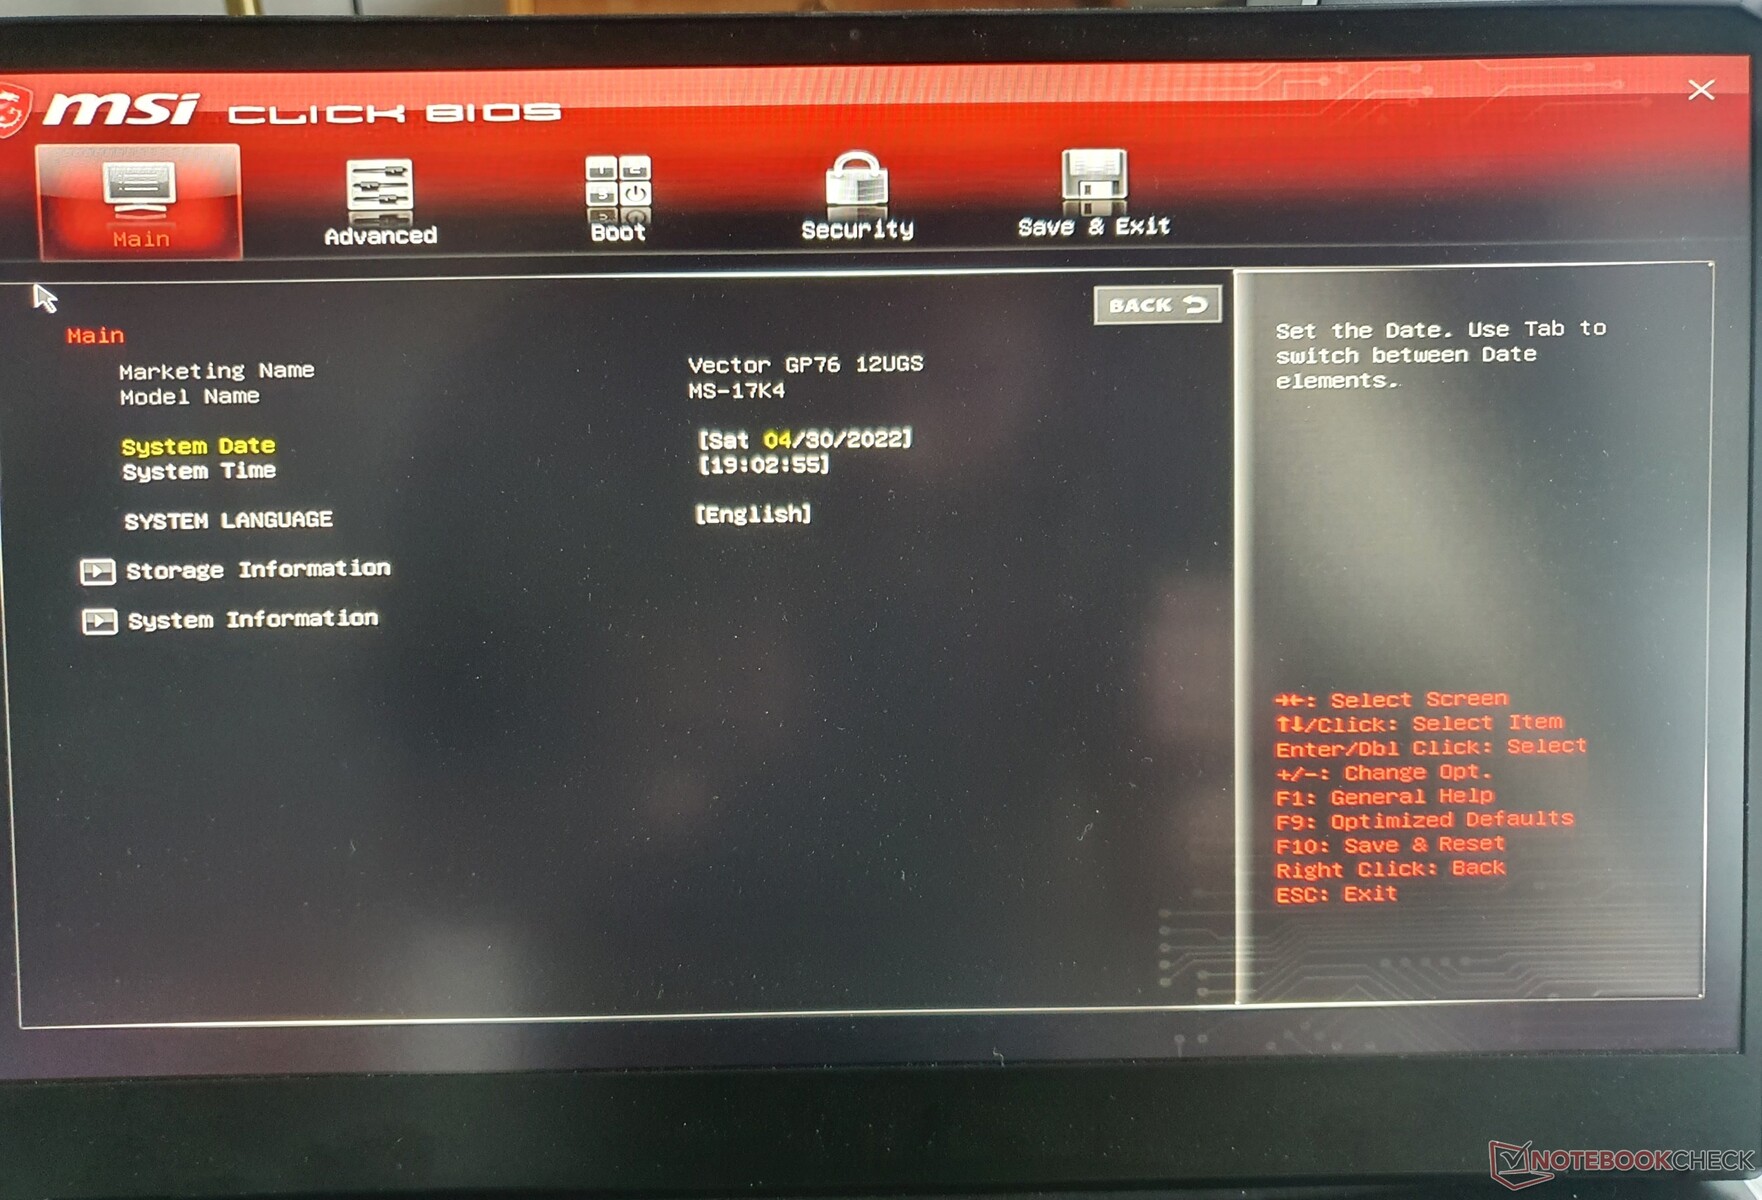
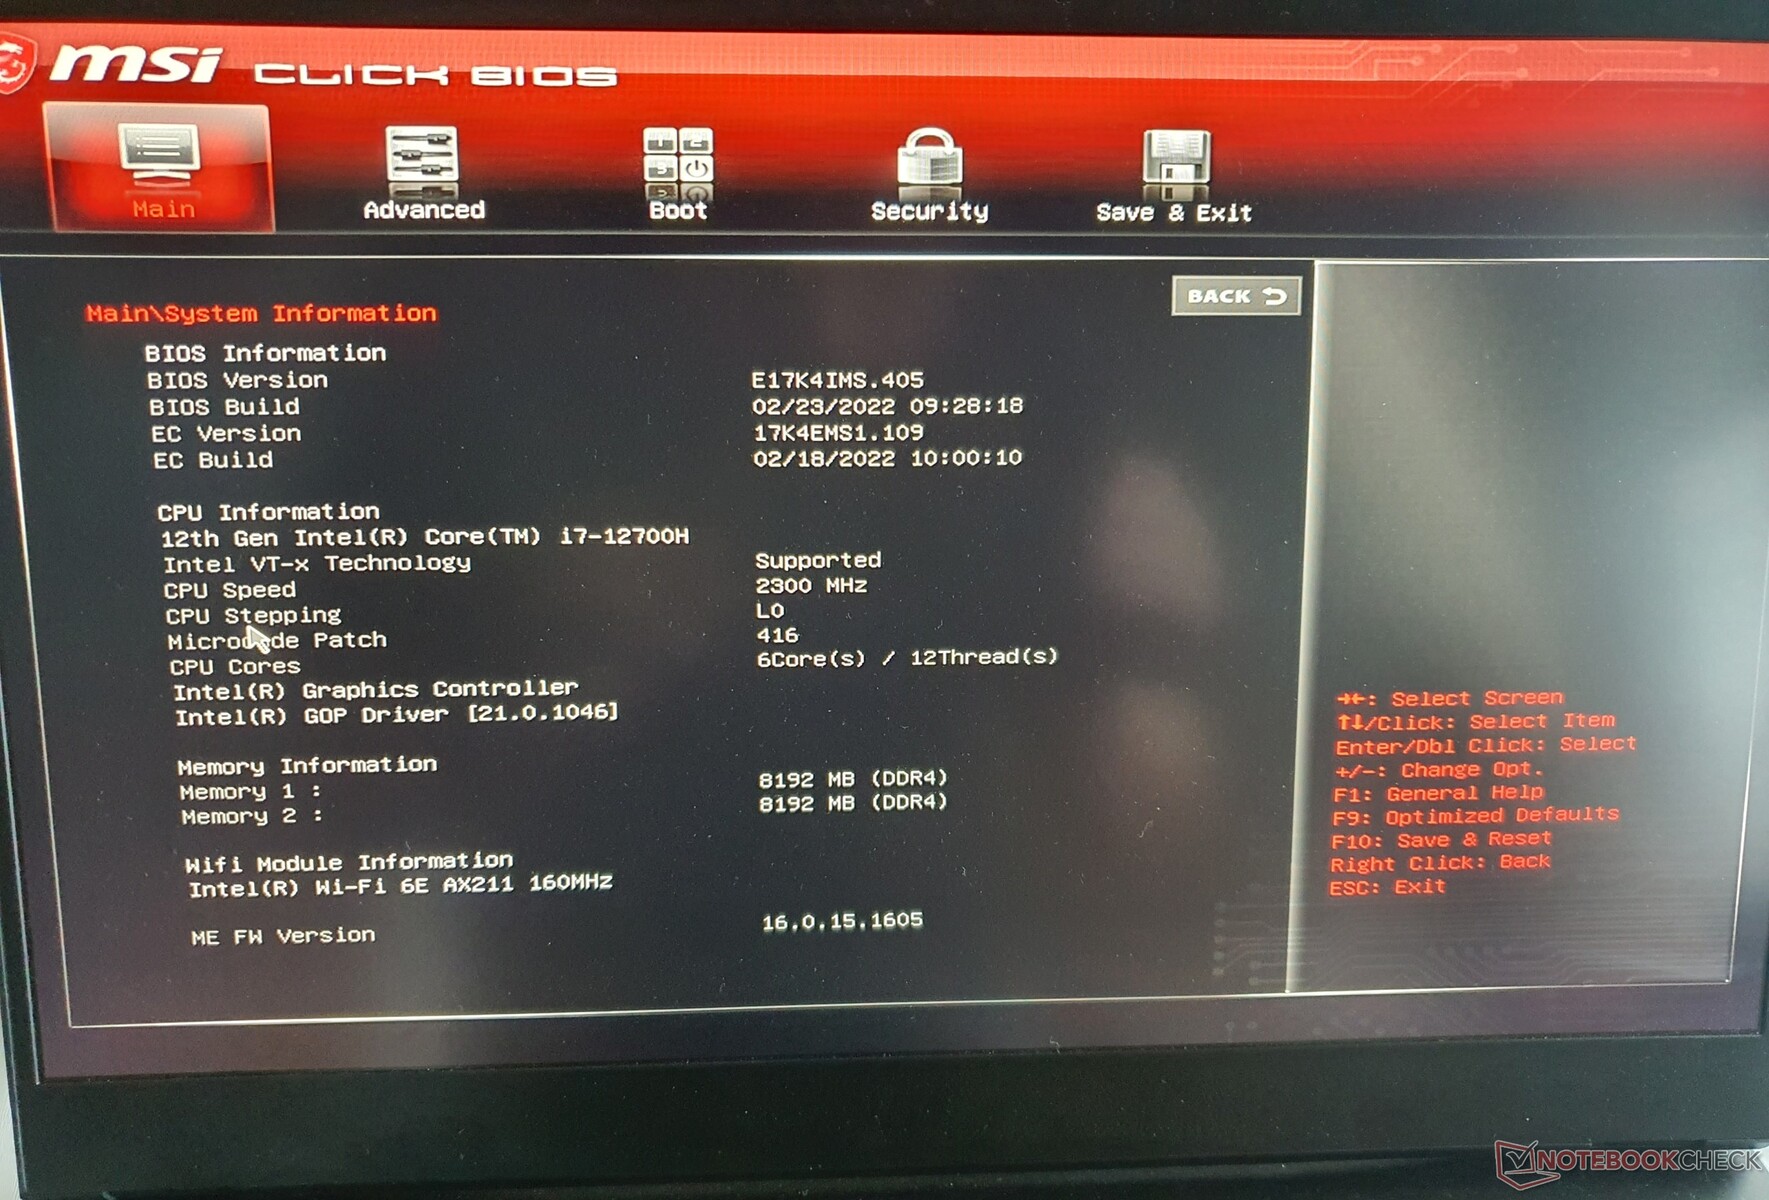
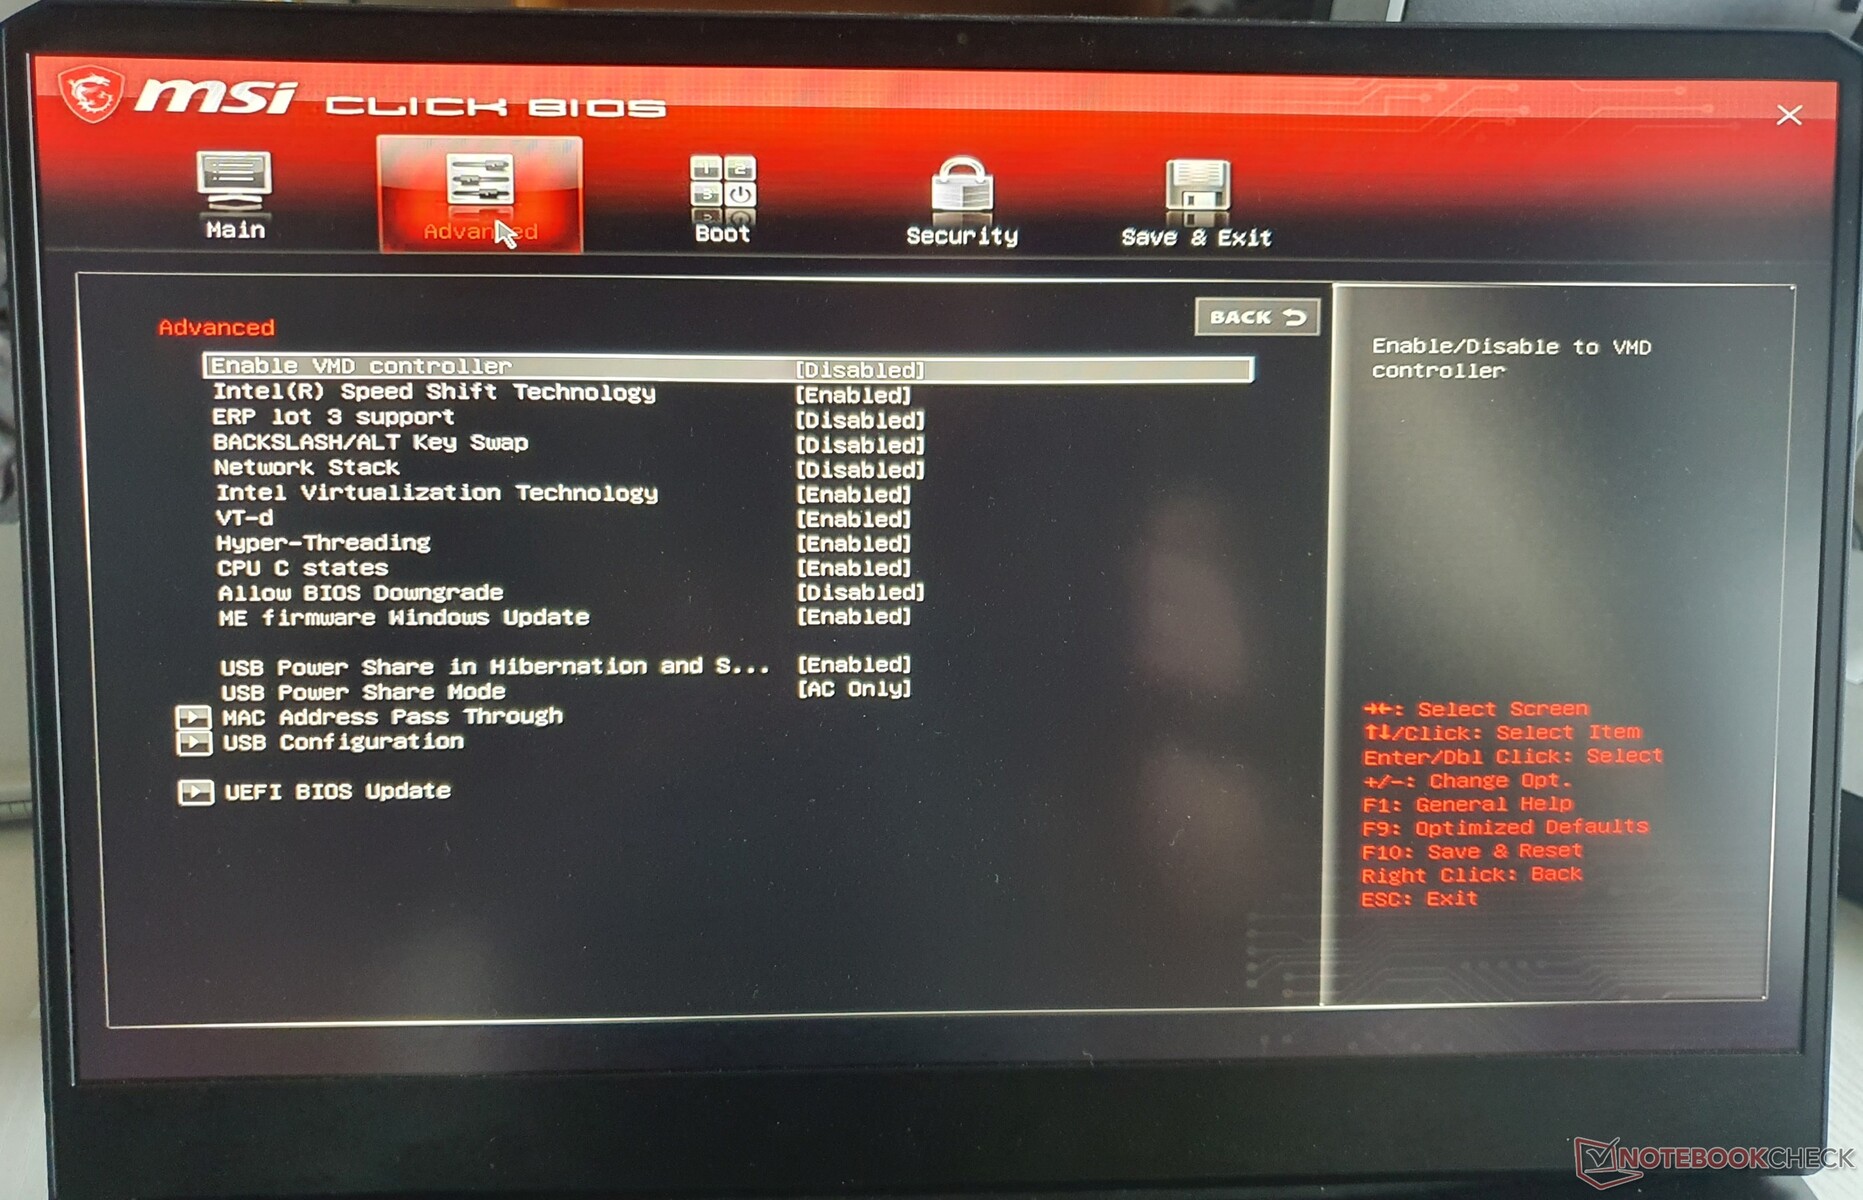
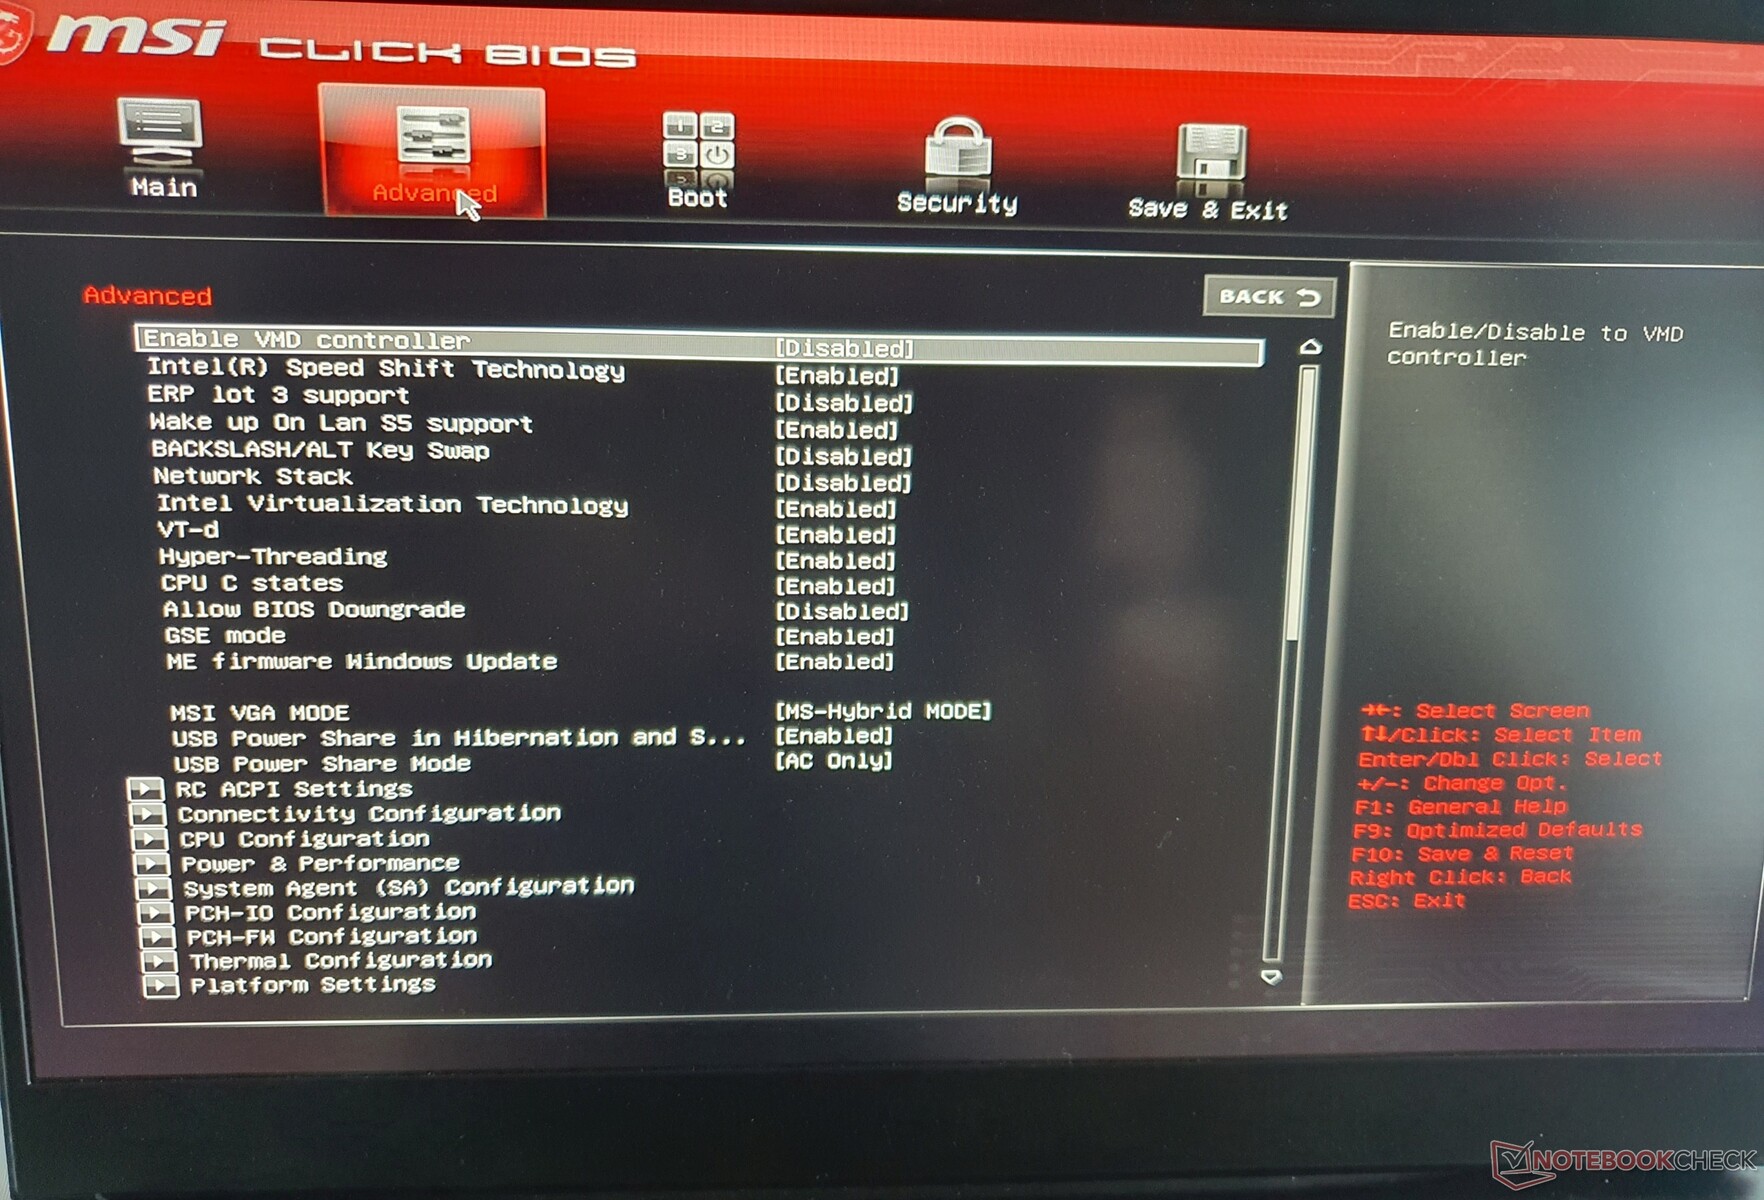
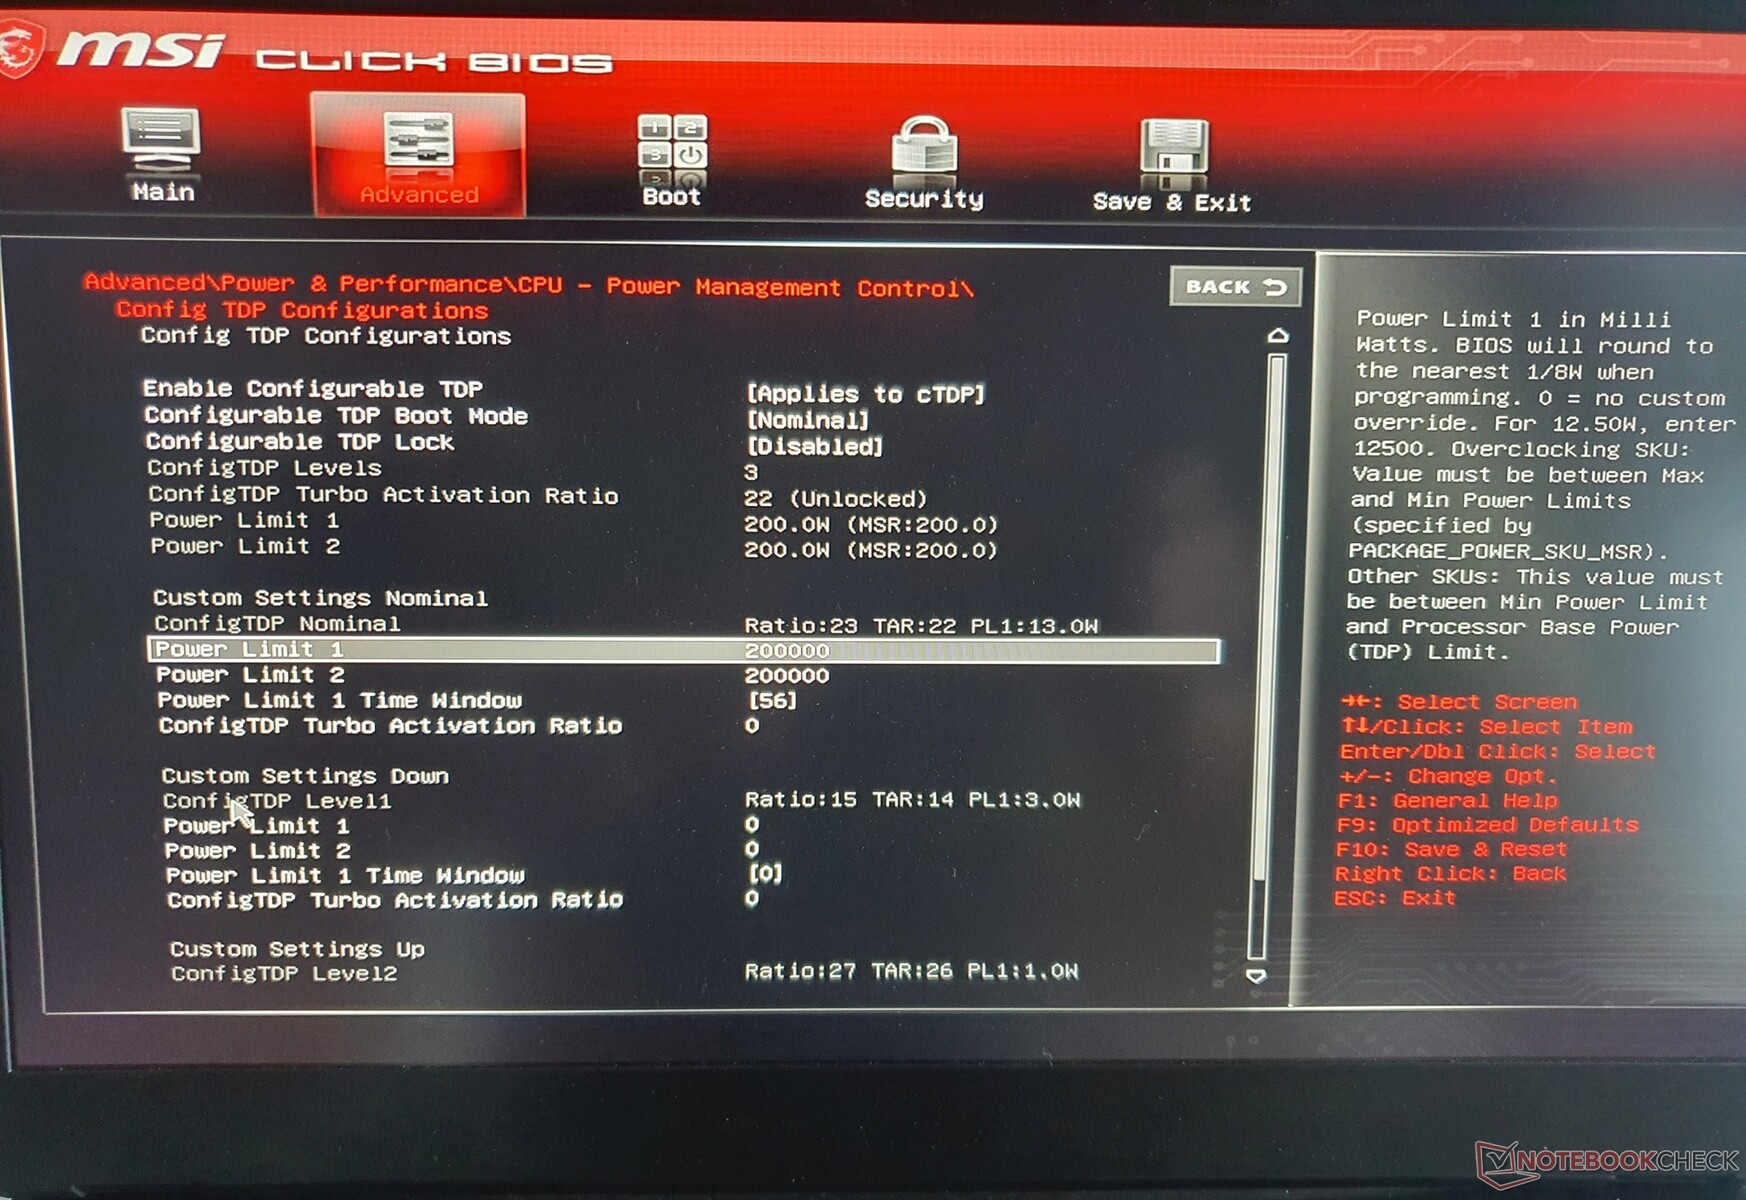
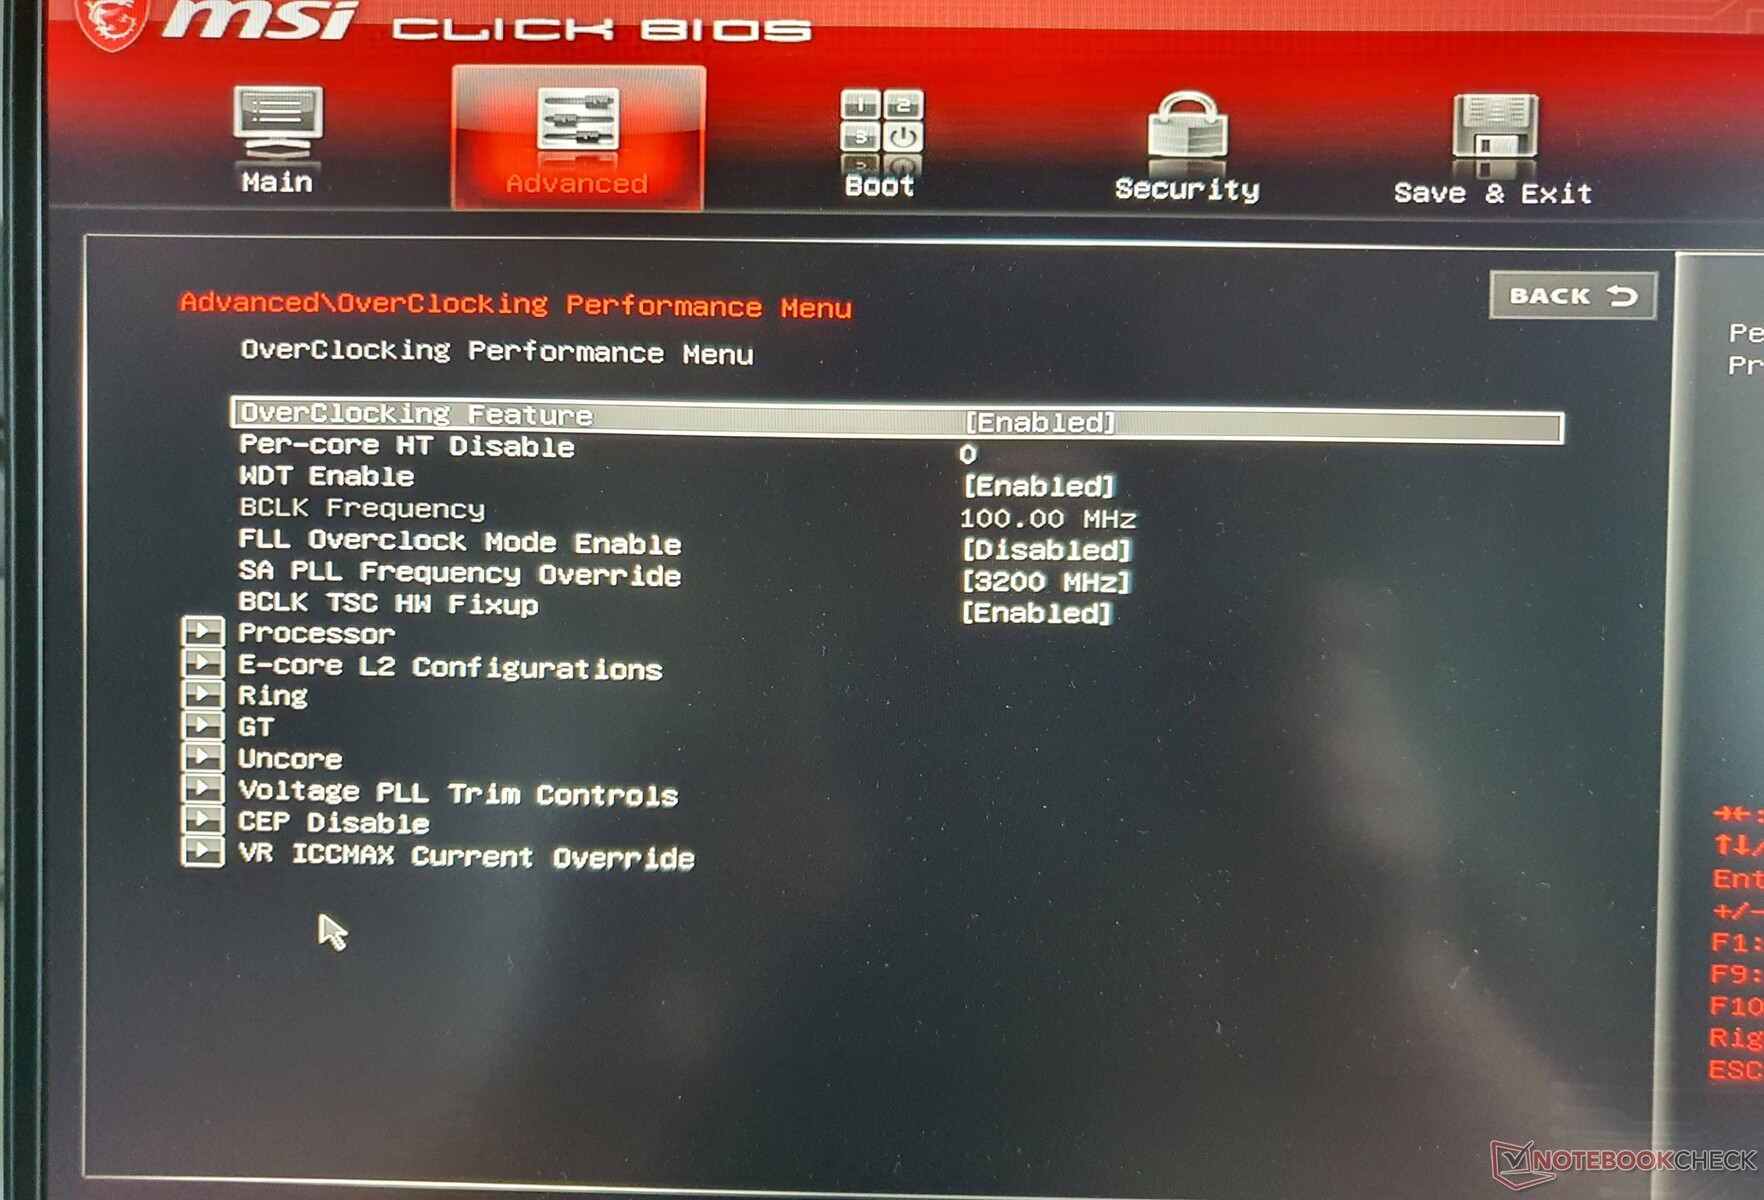
BIOS
A BIOS normalmente pode ser acessada nos laptops de jogos MSI através da combinação "F1 + DEL". À primeira vista, não há muito para ver, mas a combinação chave "Shift (direita) + CTRL (direita) + ALT + F2" desbloqueia todas as funções possíveis da BIOS, desde limites de desempenho, configurações térmicas até possibilidades de overclock (por sua própria conta e risco, é claro).
Comunicação
O módulo parafusado Wi-Fi 6 da Intel (AX211) liberta todo o seu potencial com uma potência de sinal de cerca de 1,6 GBit/s. Os laptops concorrentes com a mesma placa WLAN ou similar têm níveis semelhantes em média. Os dois laptops Asus estão muito atrasados no campo de comparação.
Além disso, o Vector GP76 tem Bluetooth 5.2, mas não o WWAN, que também não pode ser instalado posteriormente.
Webcam

A webcam, que tem uma resolução de 1280x720, oferece uma qualidade abaixo do padrão. 1080p ainda deve chegar à série Vector, mesmo em 2022. IR, Windows Olá e um obturador mecânico também estão faltando.


Acessórios
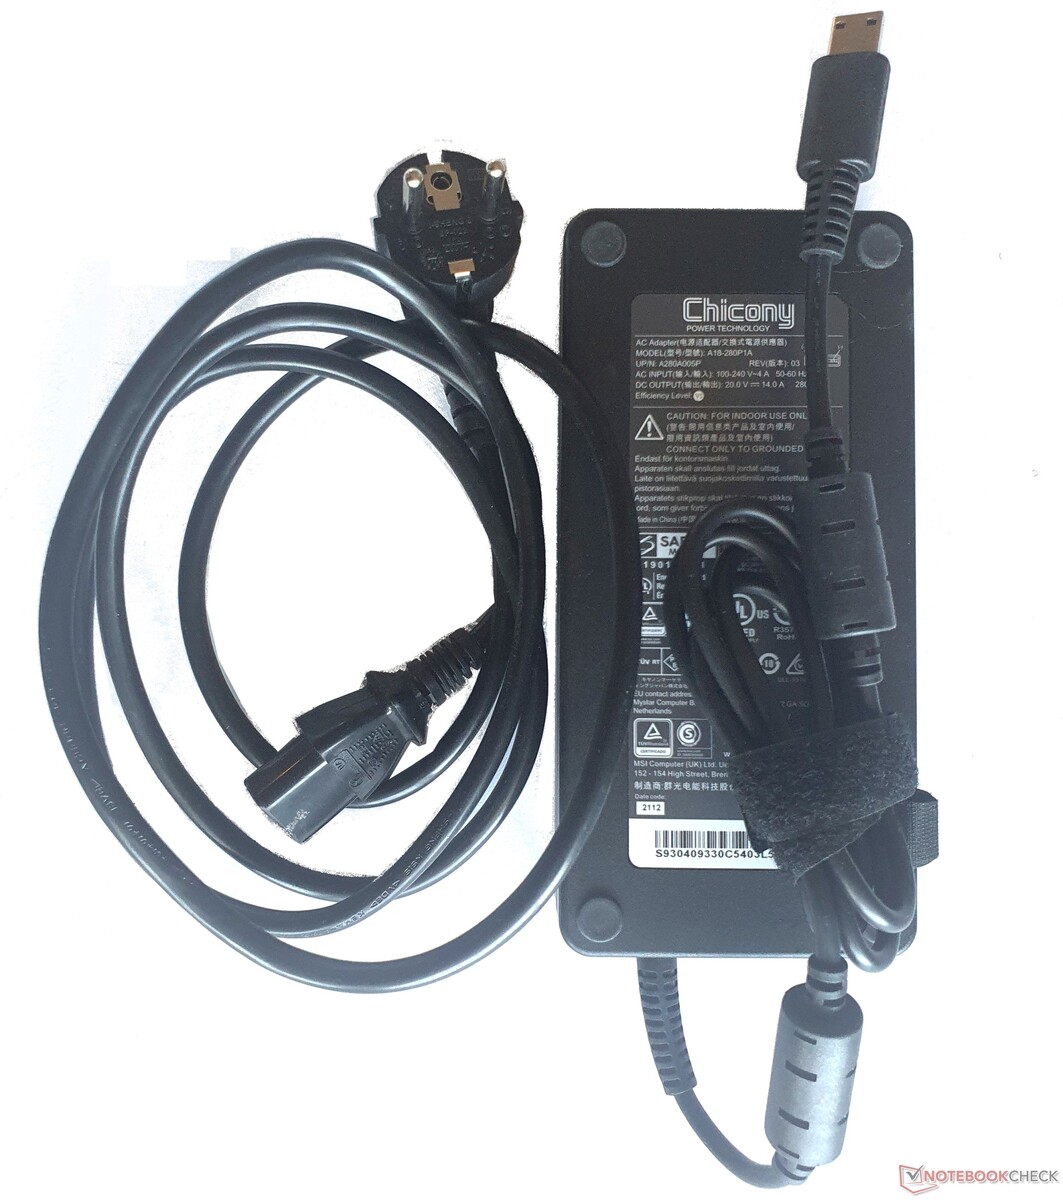
Está incluída na entrega uma unidade de alimentação de 280 watts, que fornece 50 watts a mais do que sua antecessora. Não há outros acessórios e materiais reciclados não são (ainda) utilizados na embalagem.
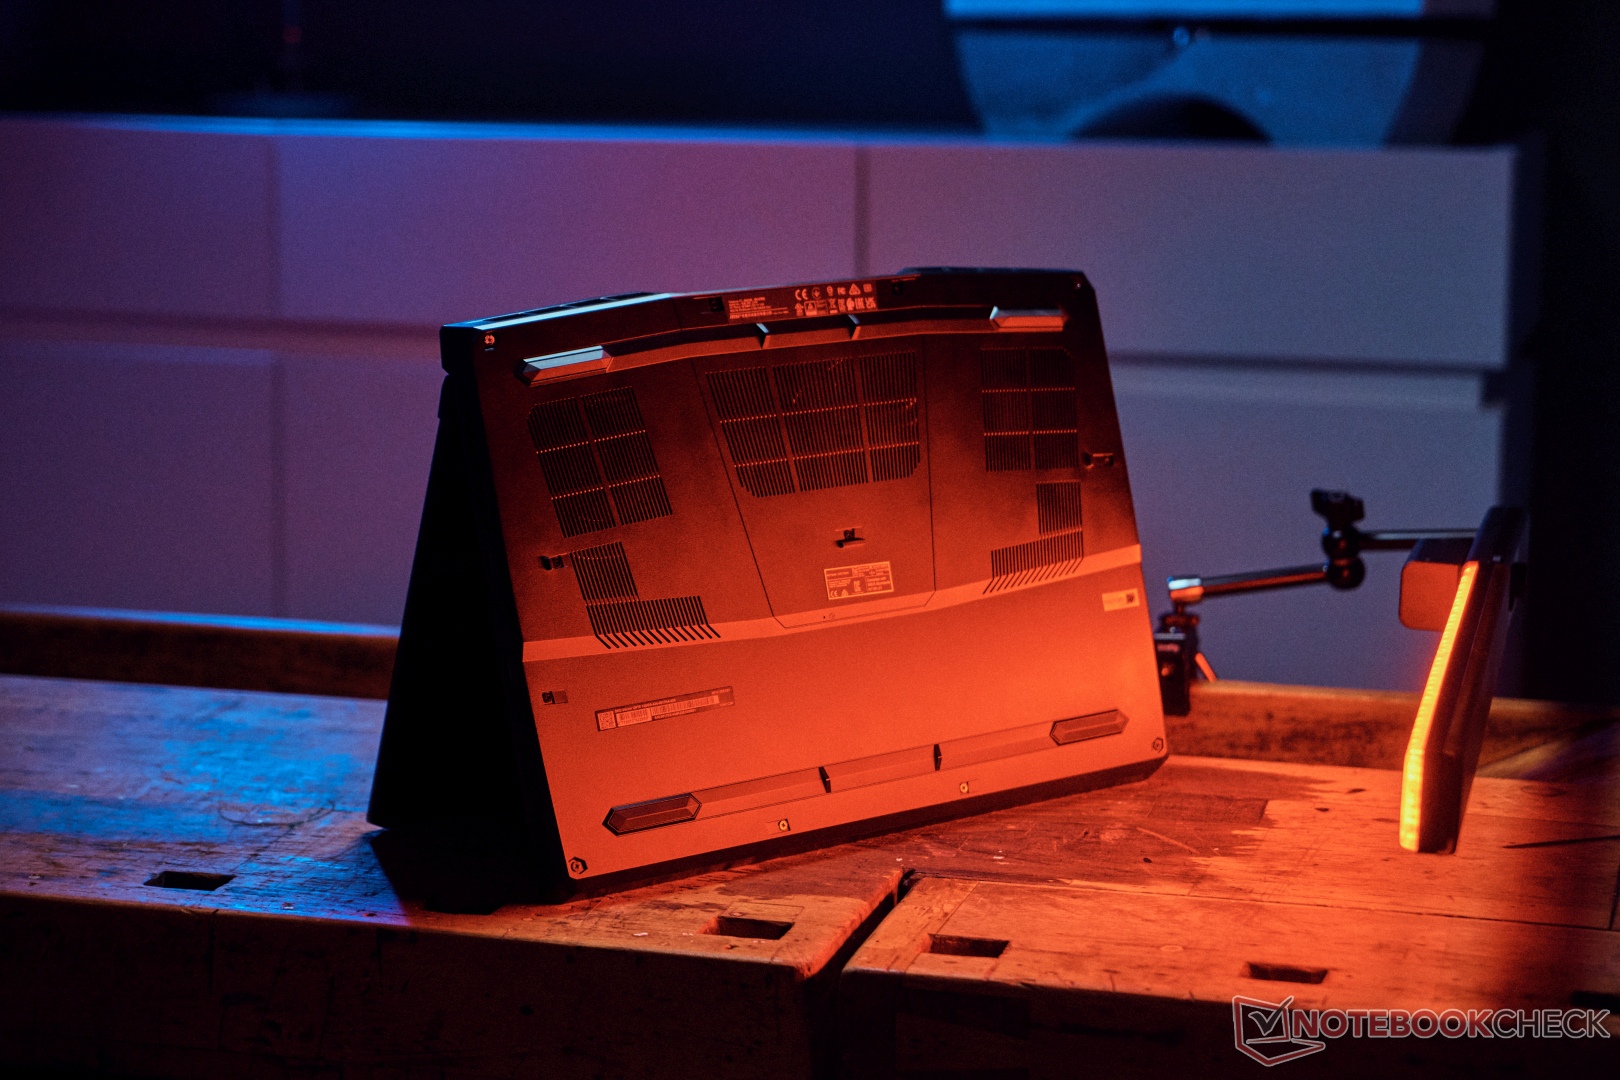
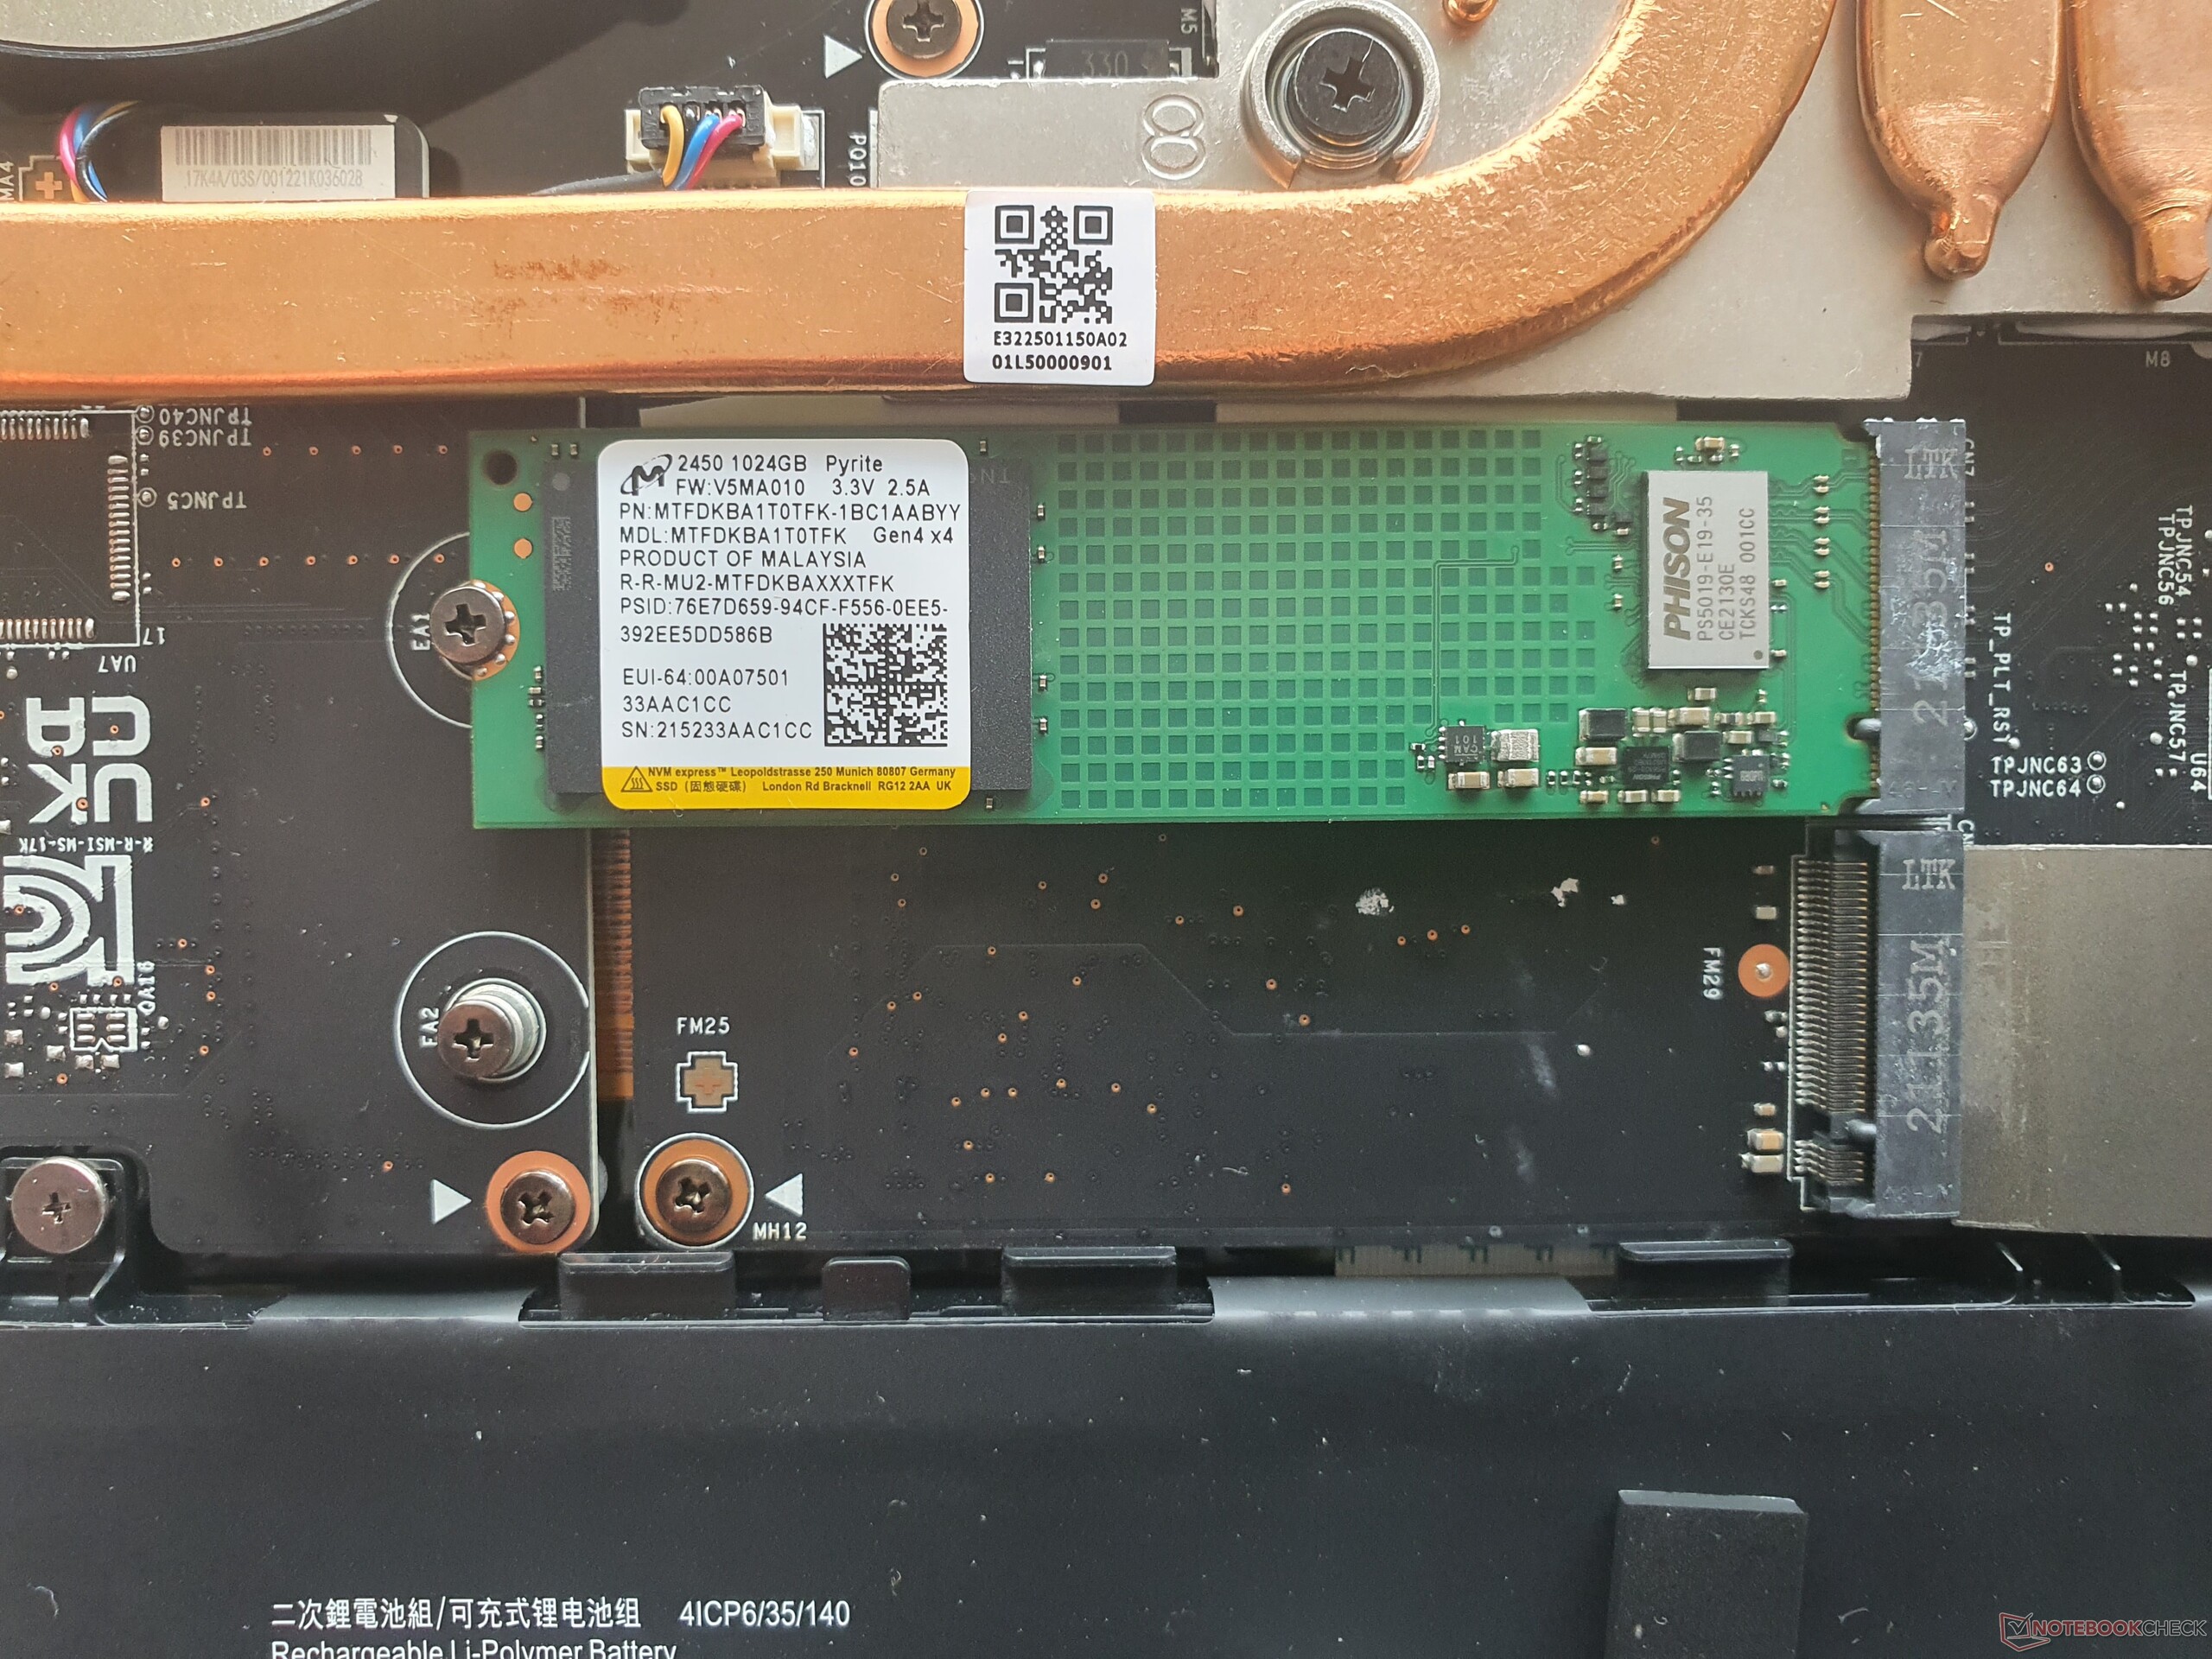
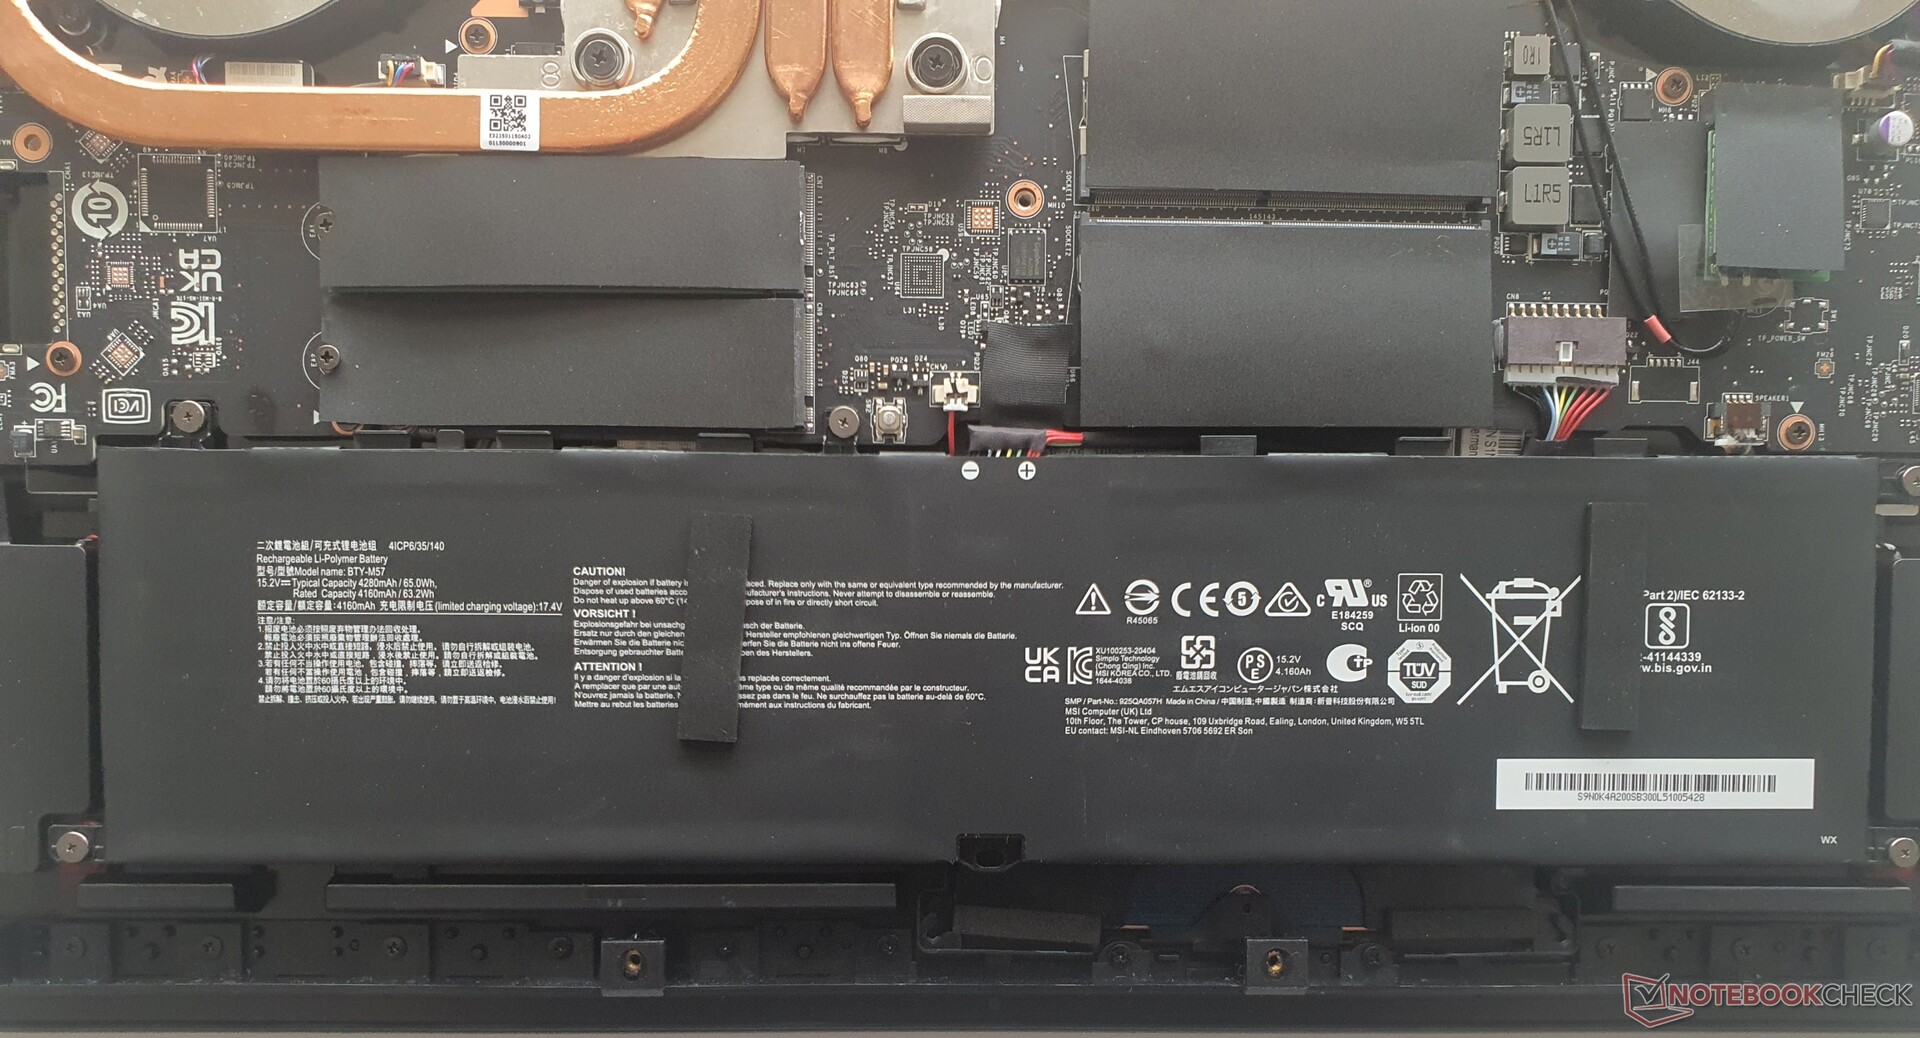
Manutenção
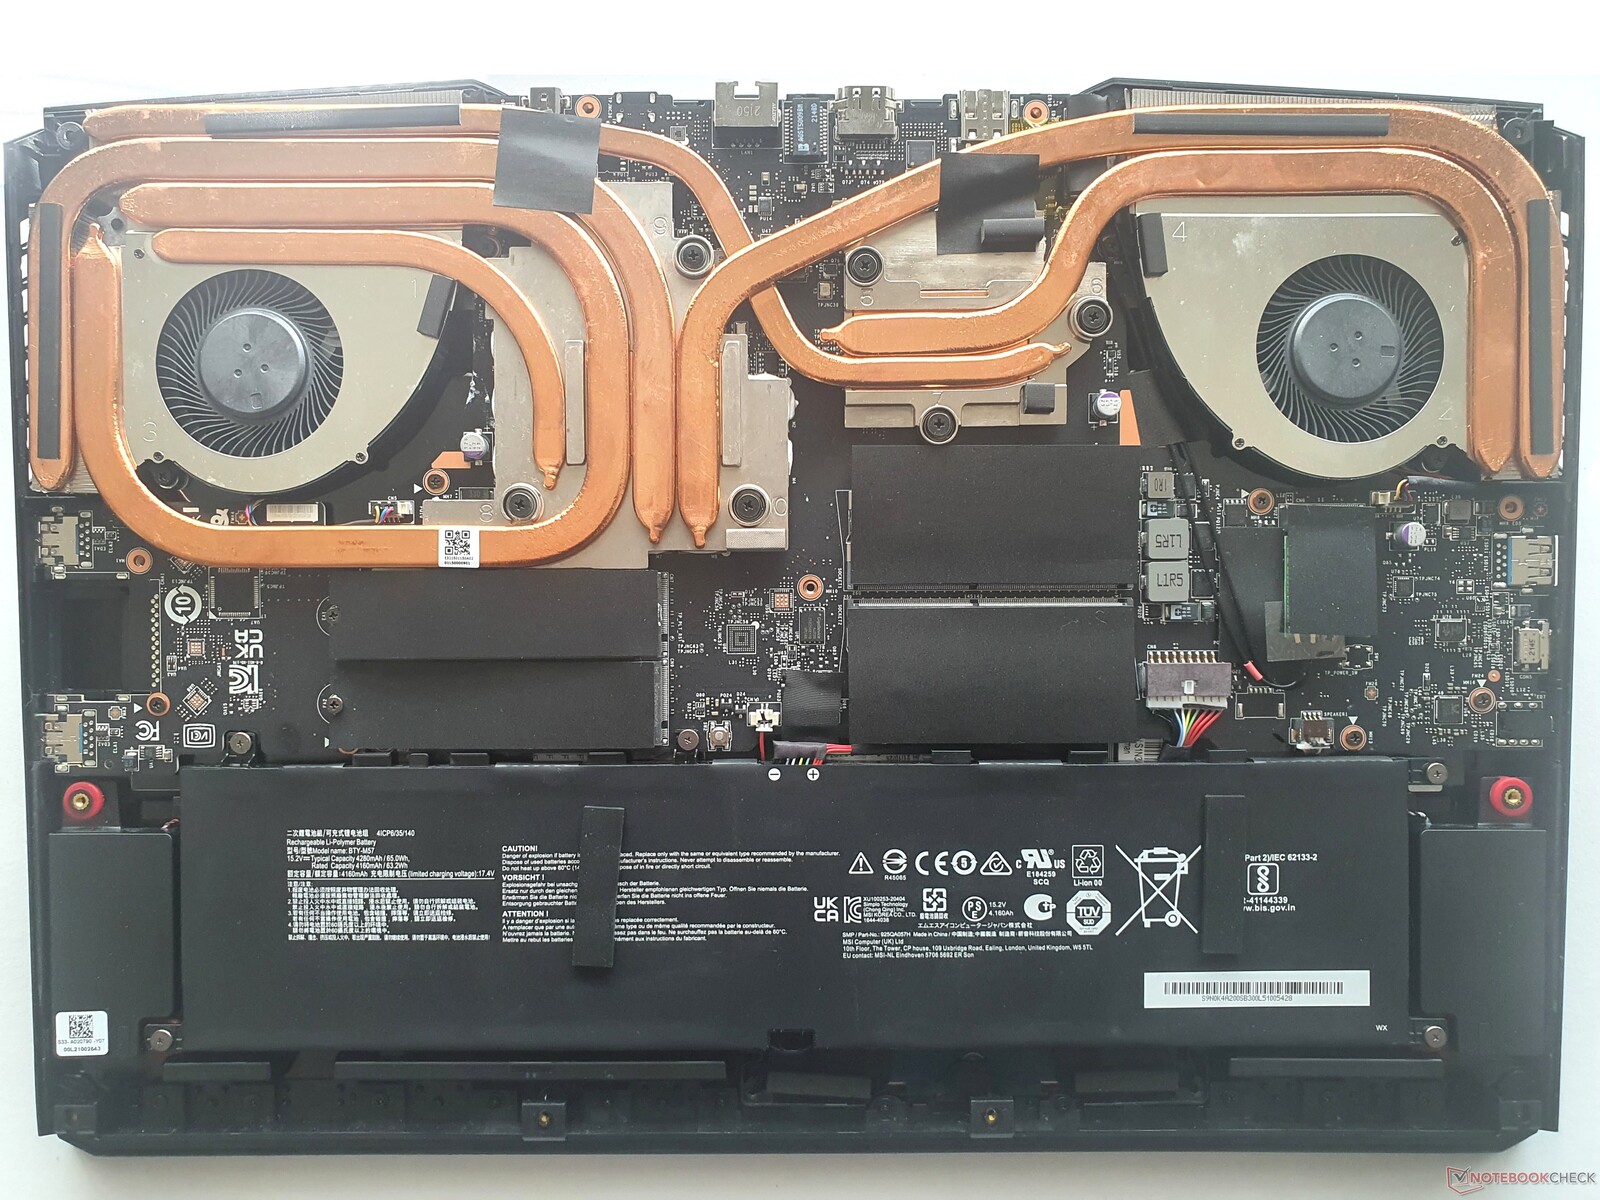
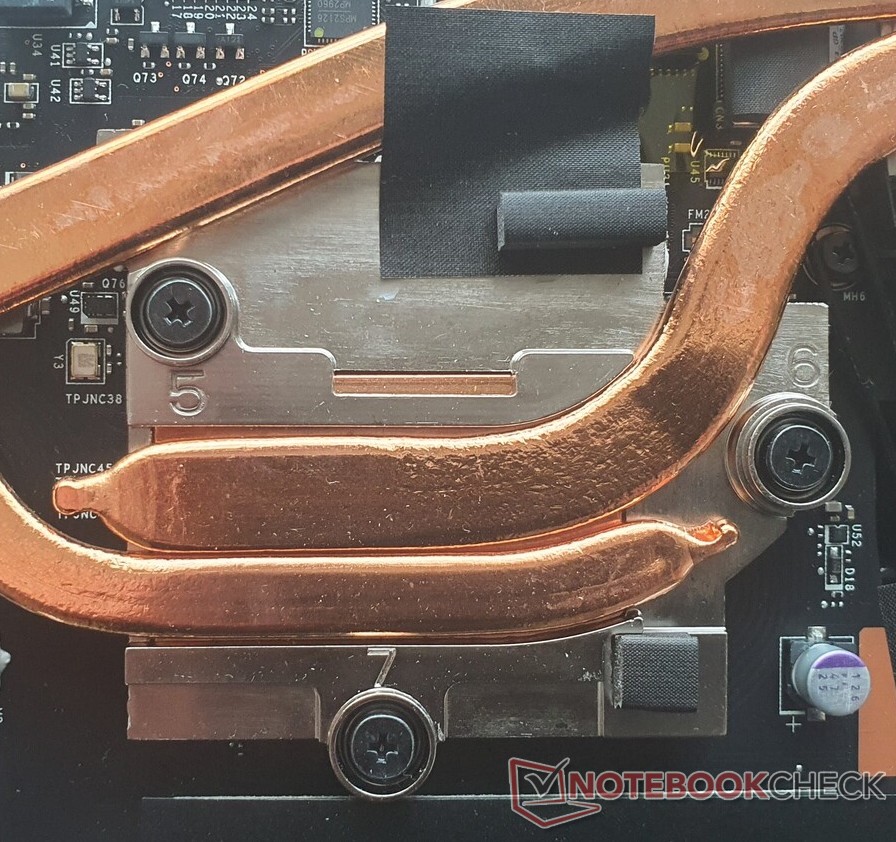
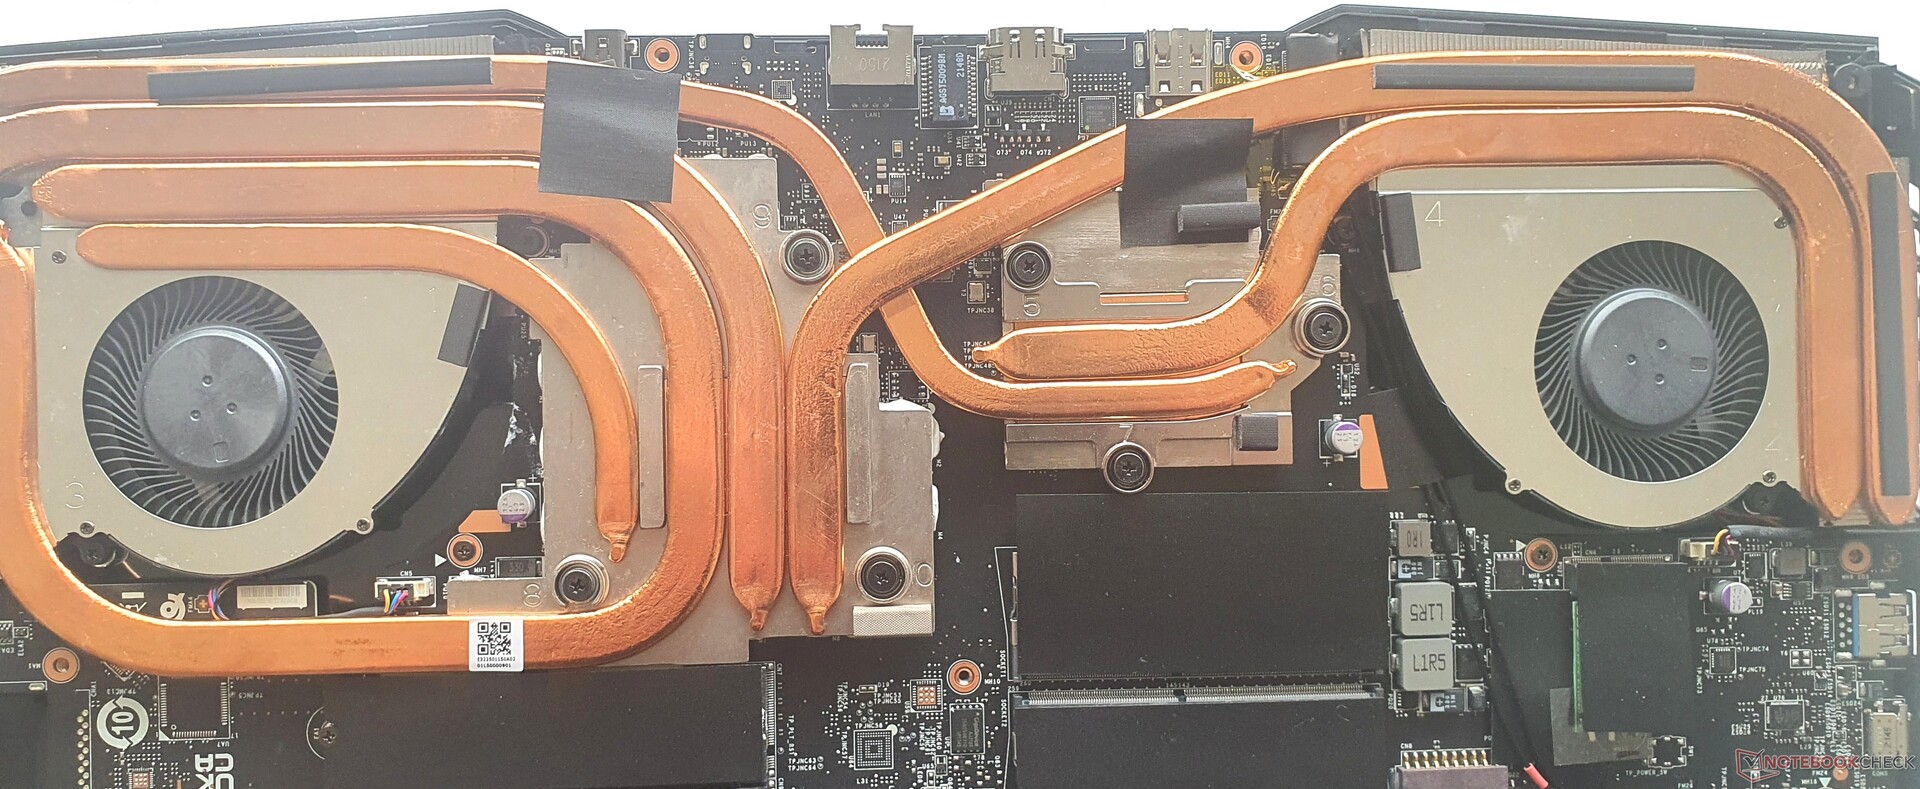
A parte de trás da caixa pode ser retirada após a remoção de 13 parafusos Phillips e usando uma ferramenta spudger. A borda frontal, que chega até a parte superior do laptop e tem muitos ganchos, requer algumas doses de força e habilidade bem aplicadas.
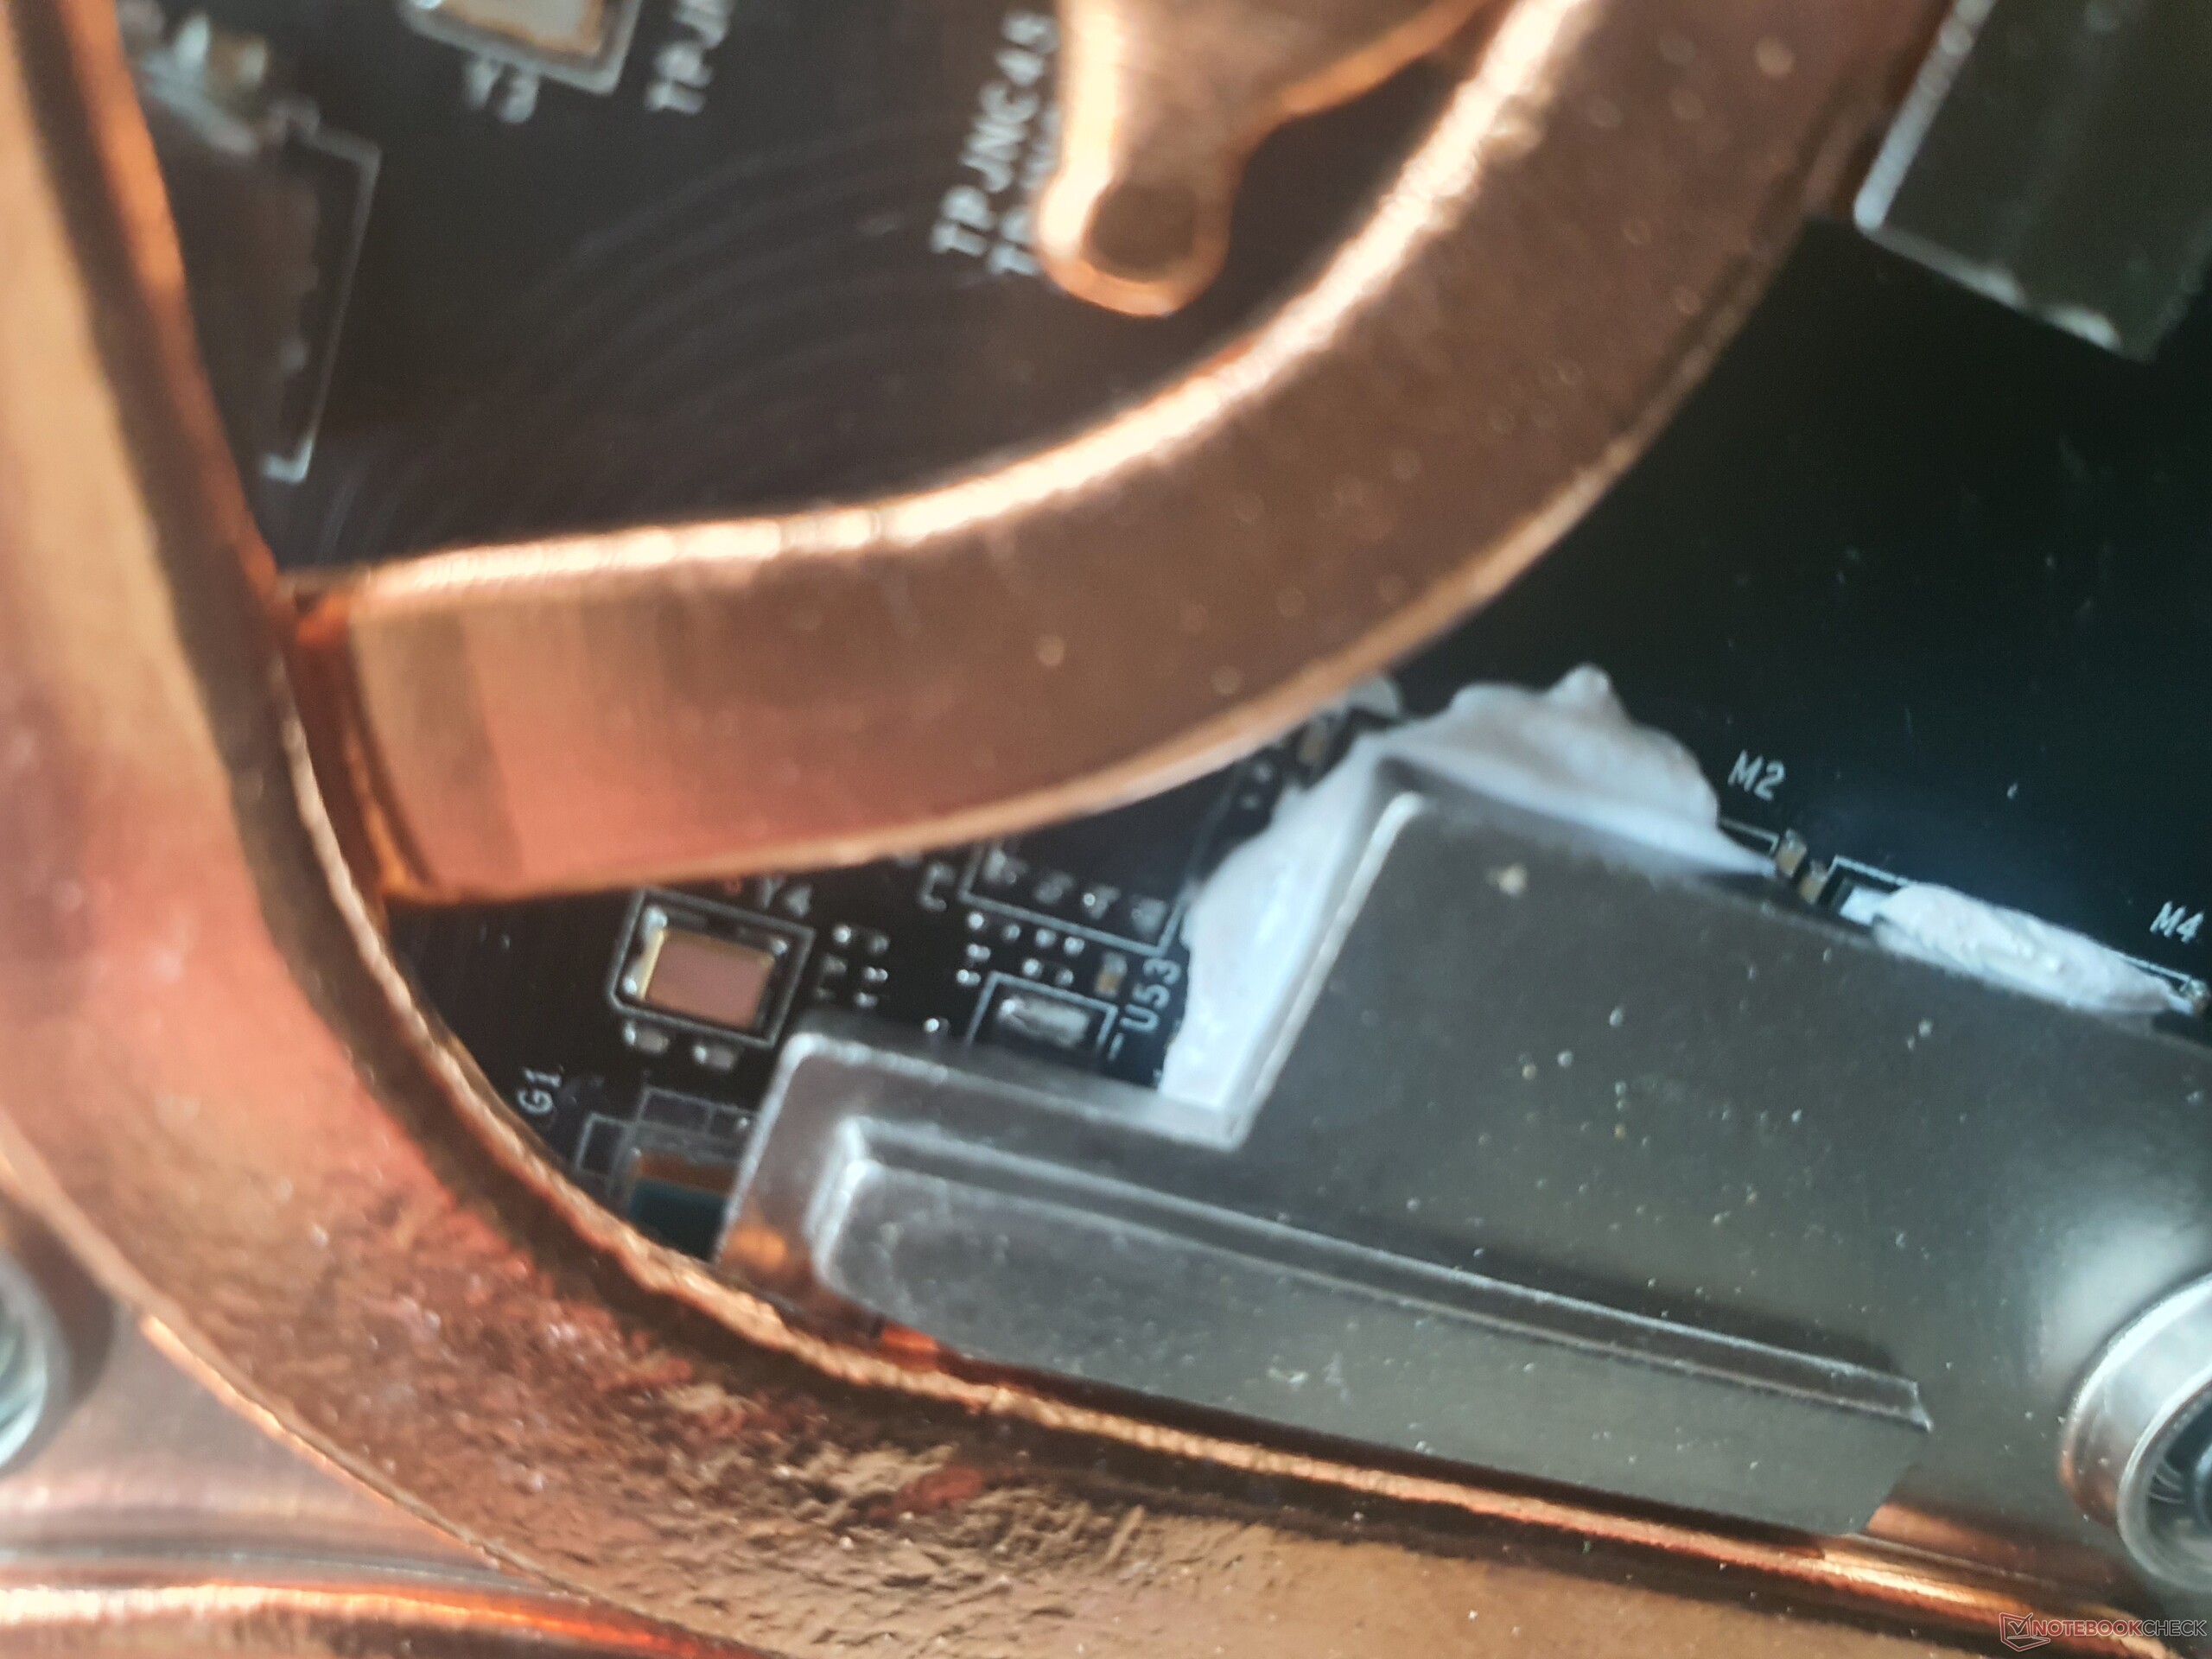
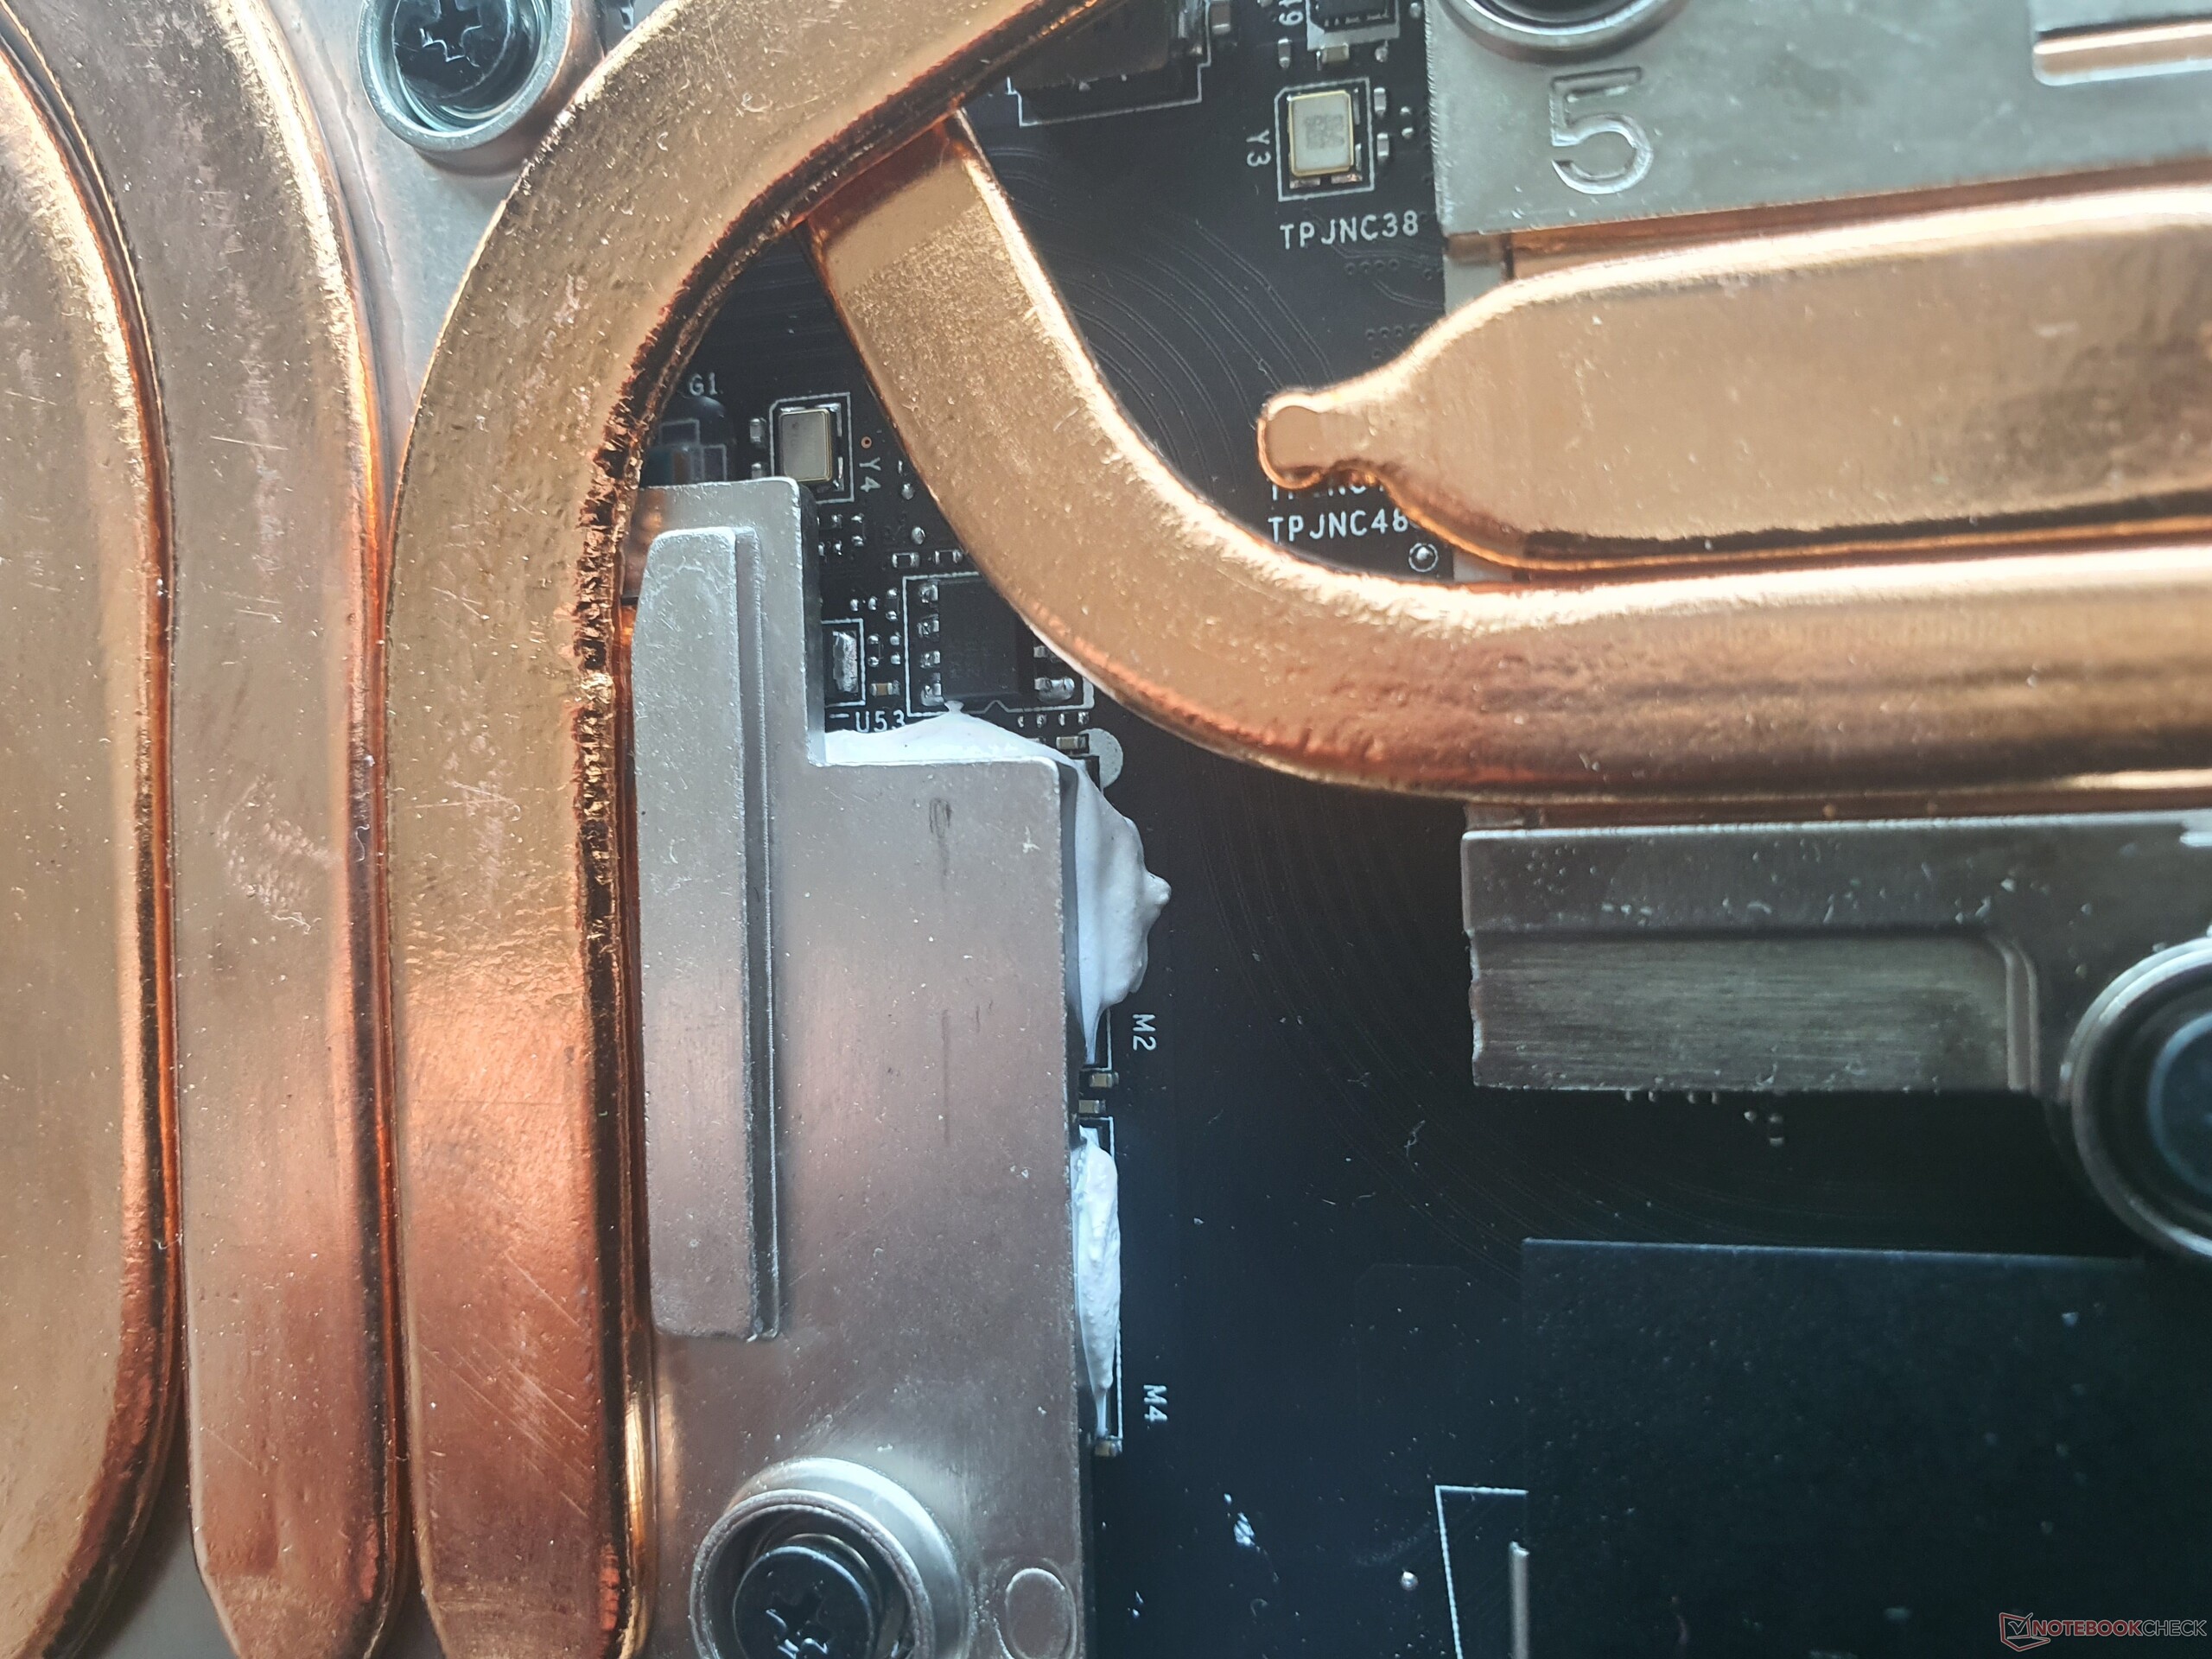
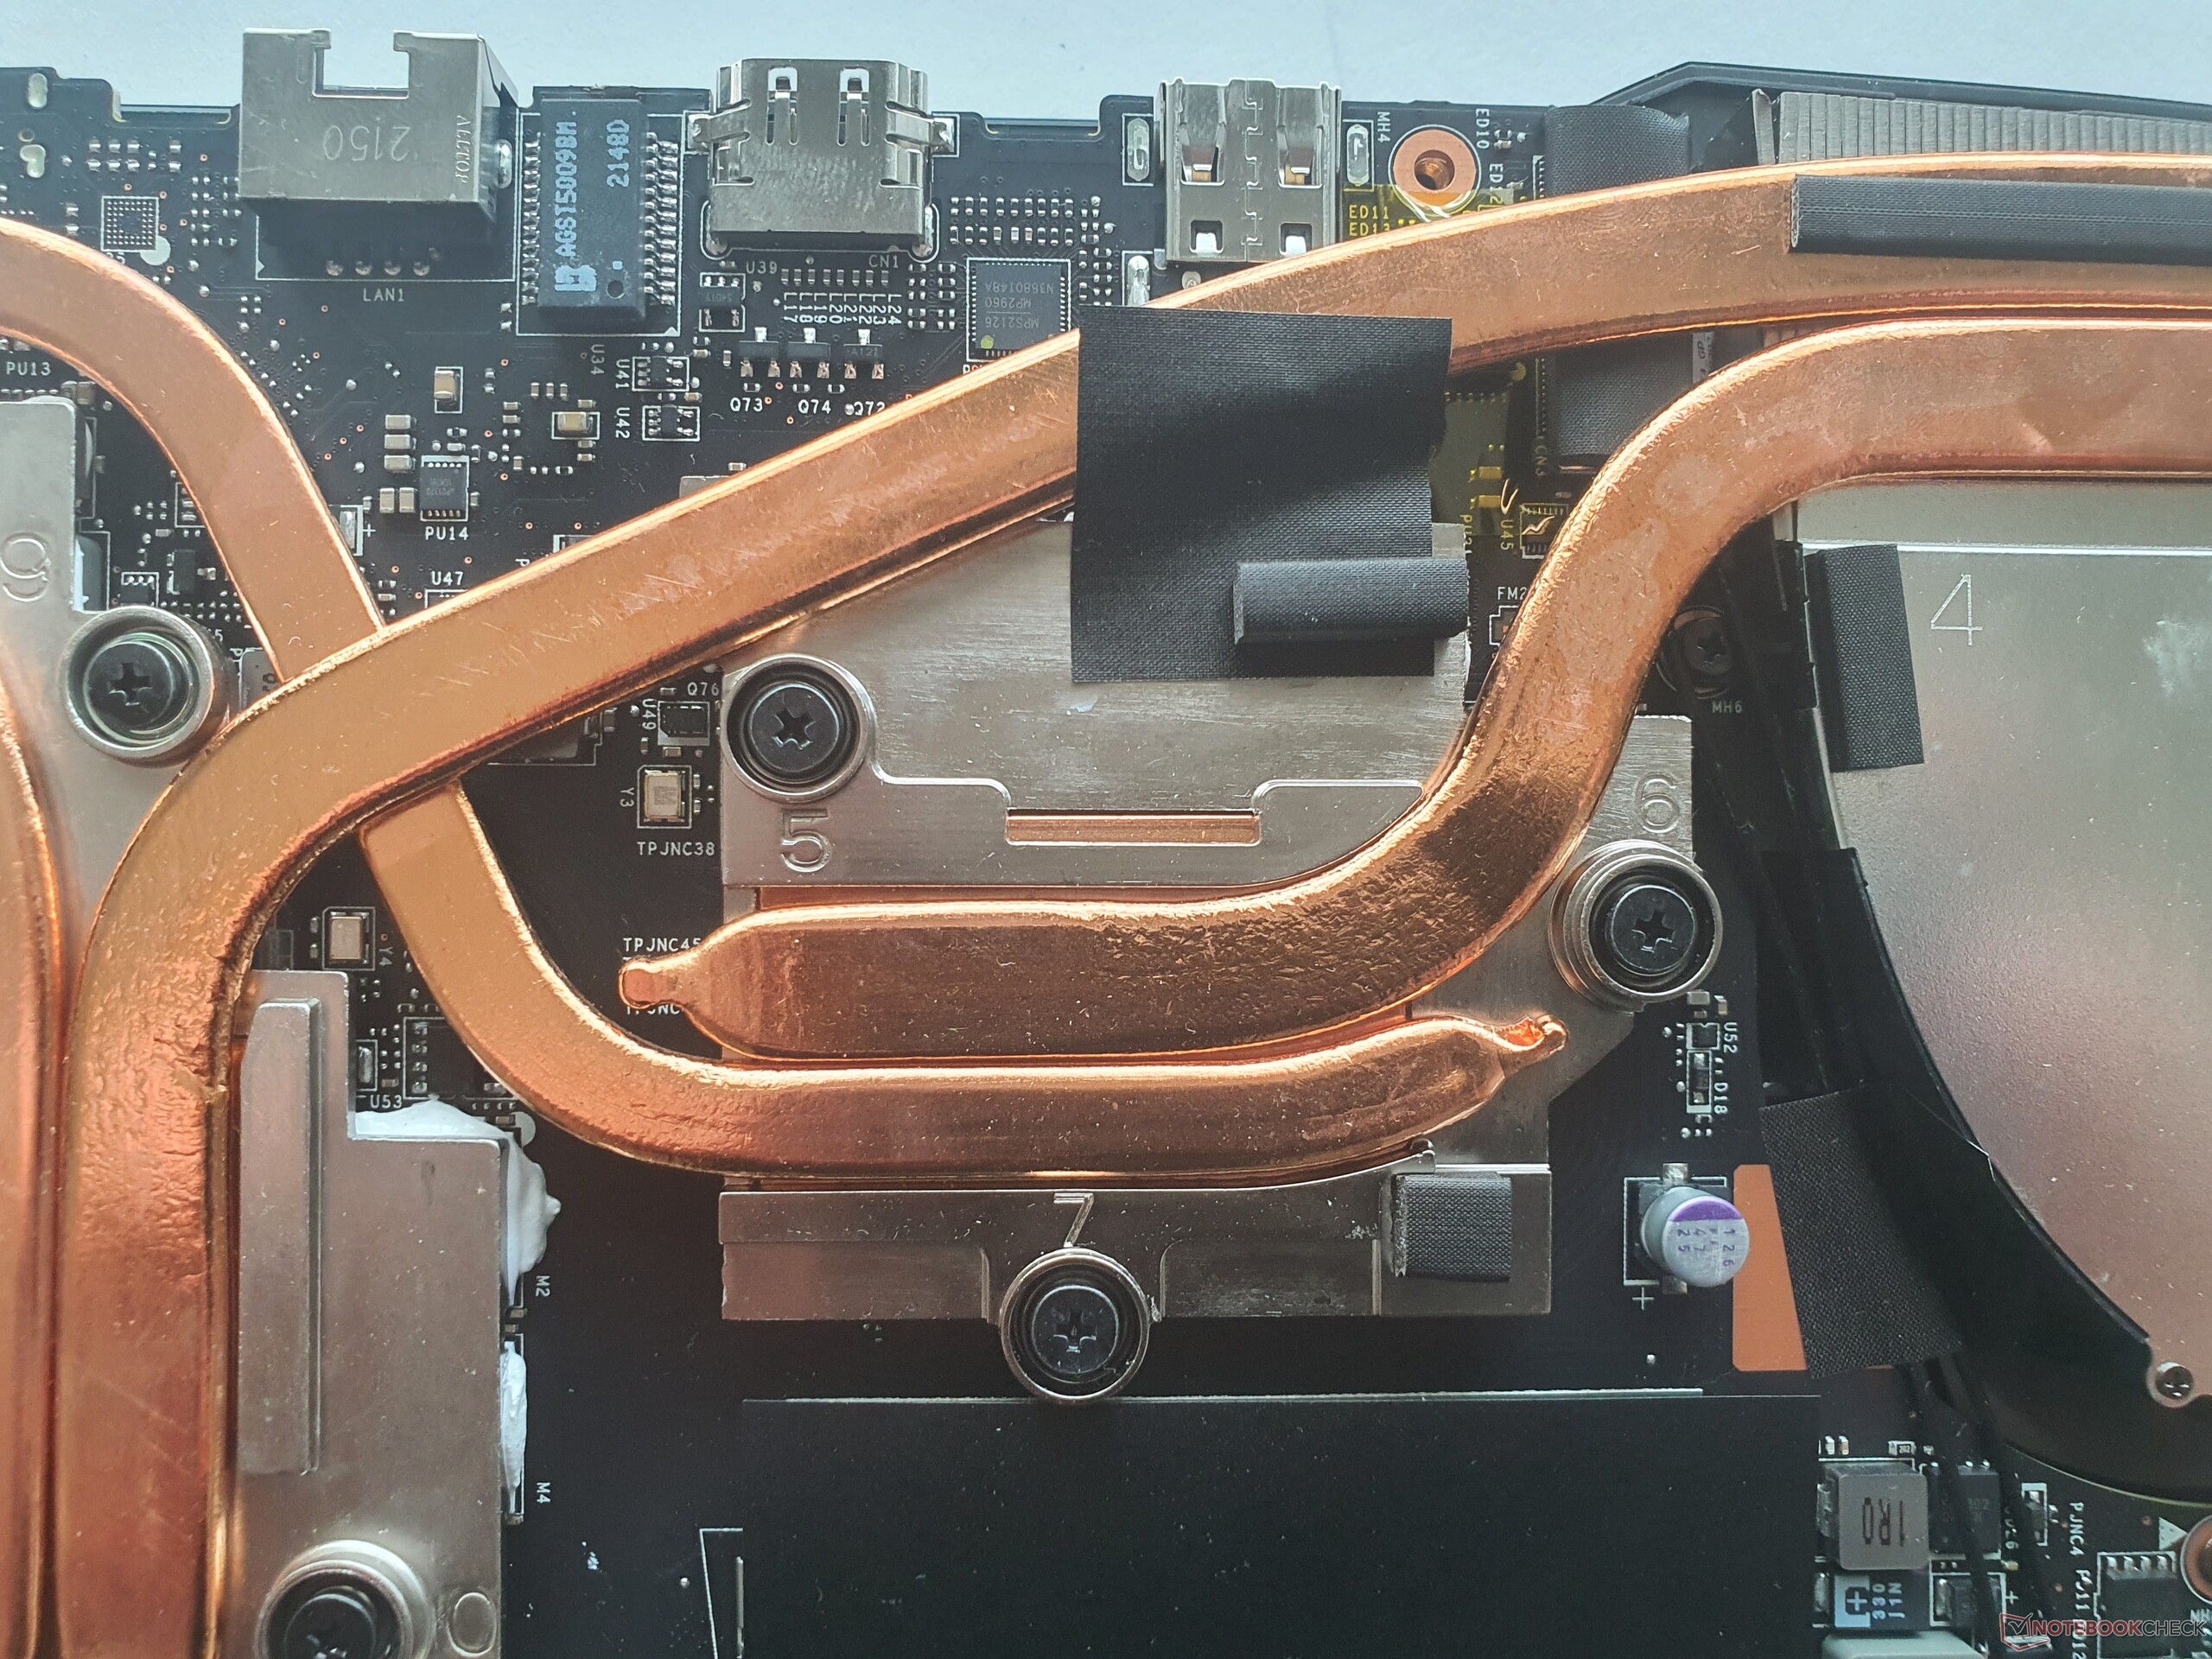
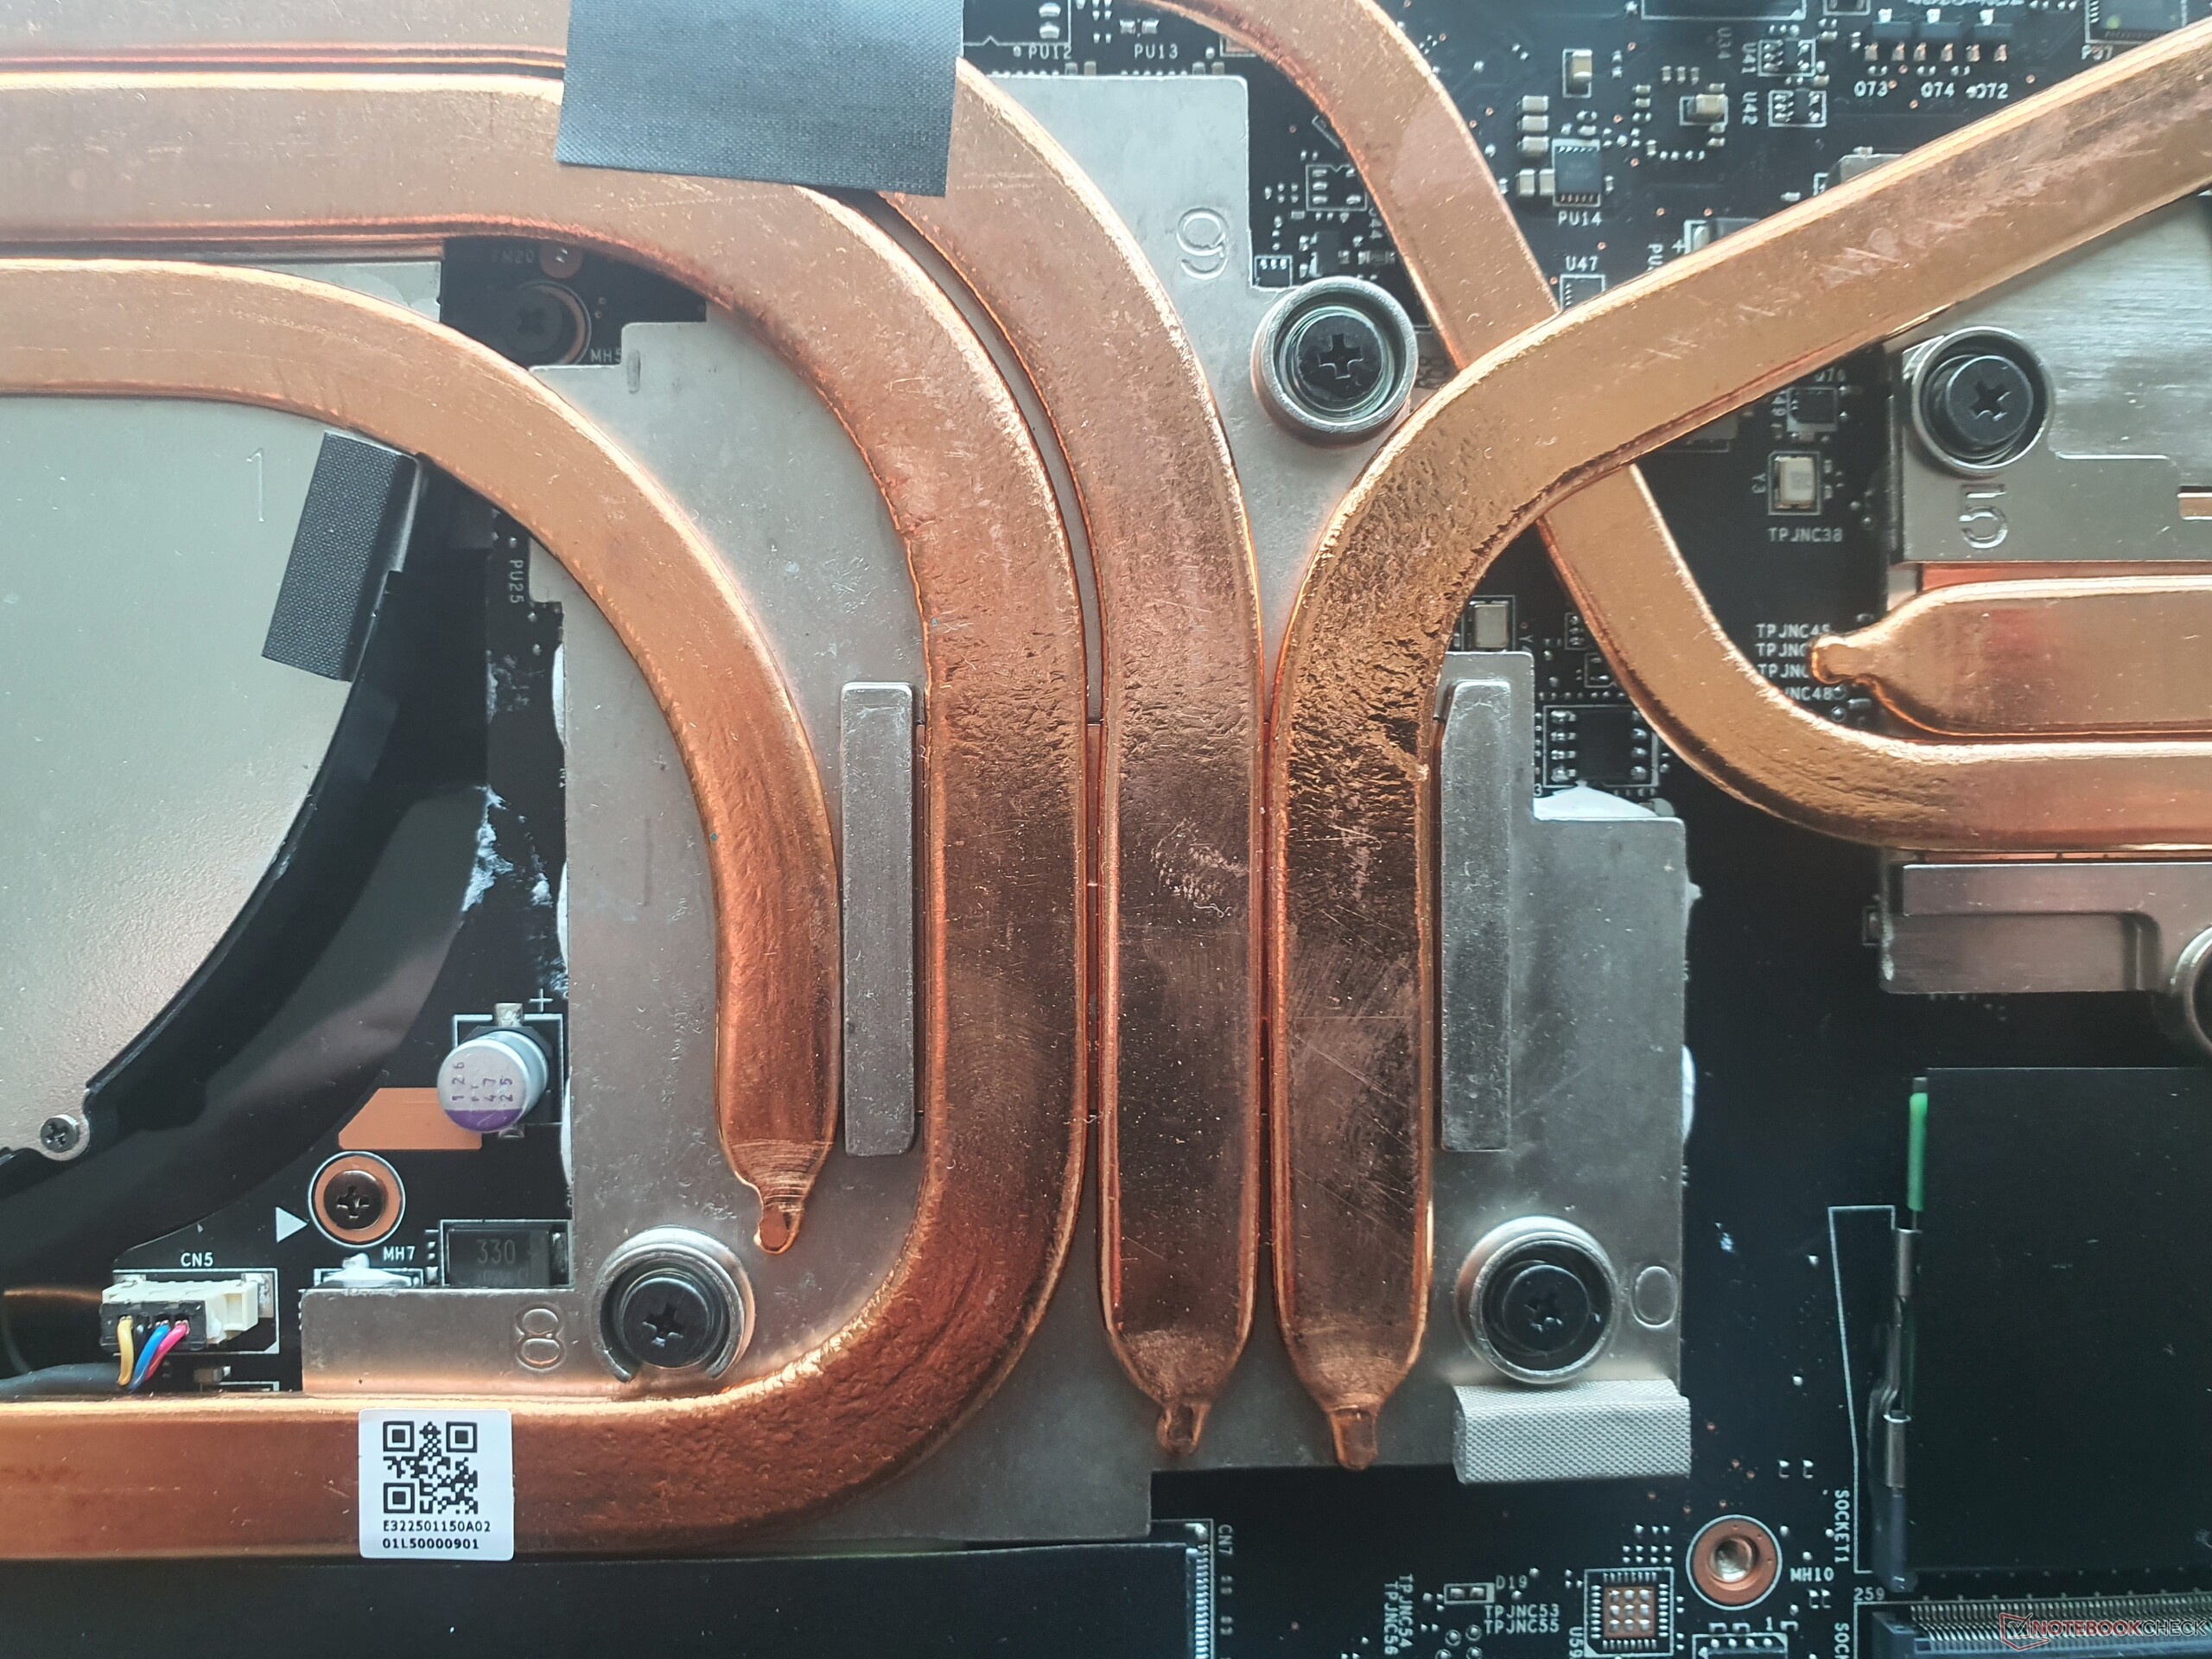
Em seguida, encontra-se uma grande quantidade de cobre na forma de 6 tubos de calor, incluindo dois grandes ventiladores que podem ser limpos. Os elementos que podem ser resfriados, como a CPU e a GPU, são cobertos com pasta condutora de calor que "transborda" e em parte derrama sobre a placa de circuito.
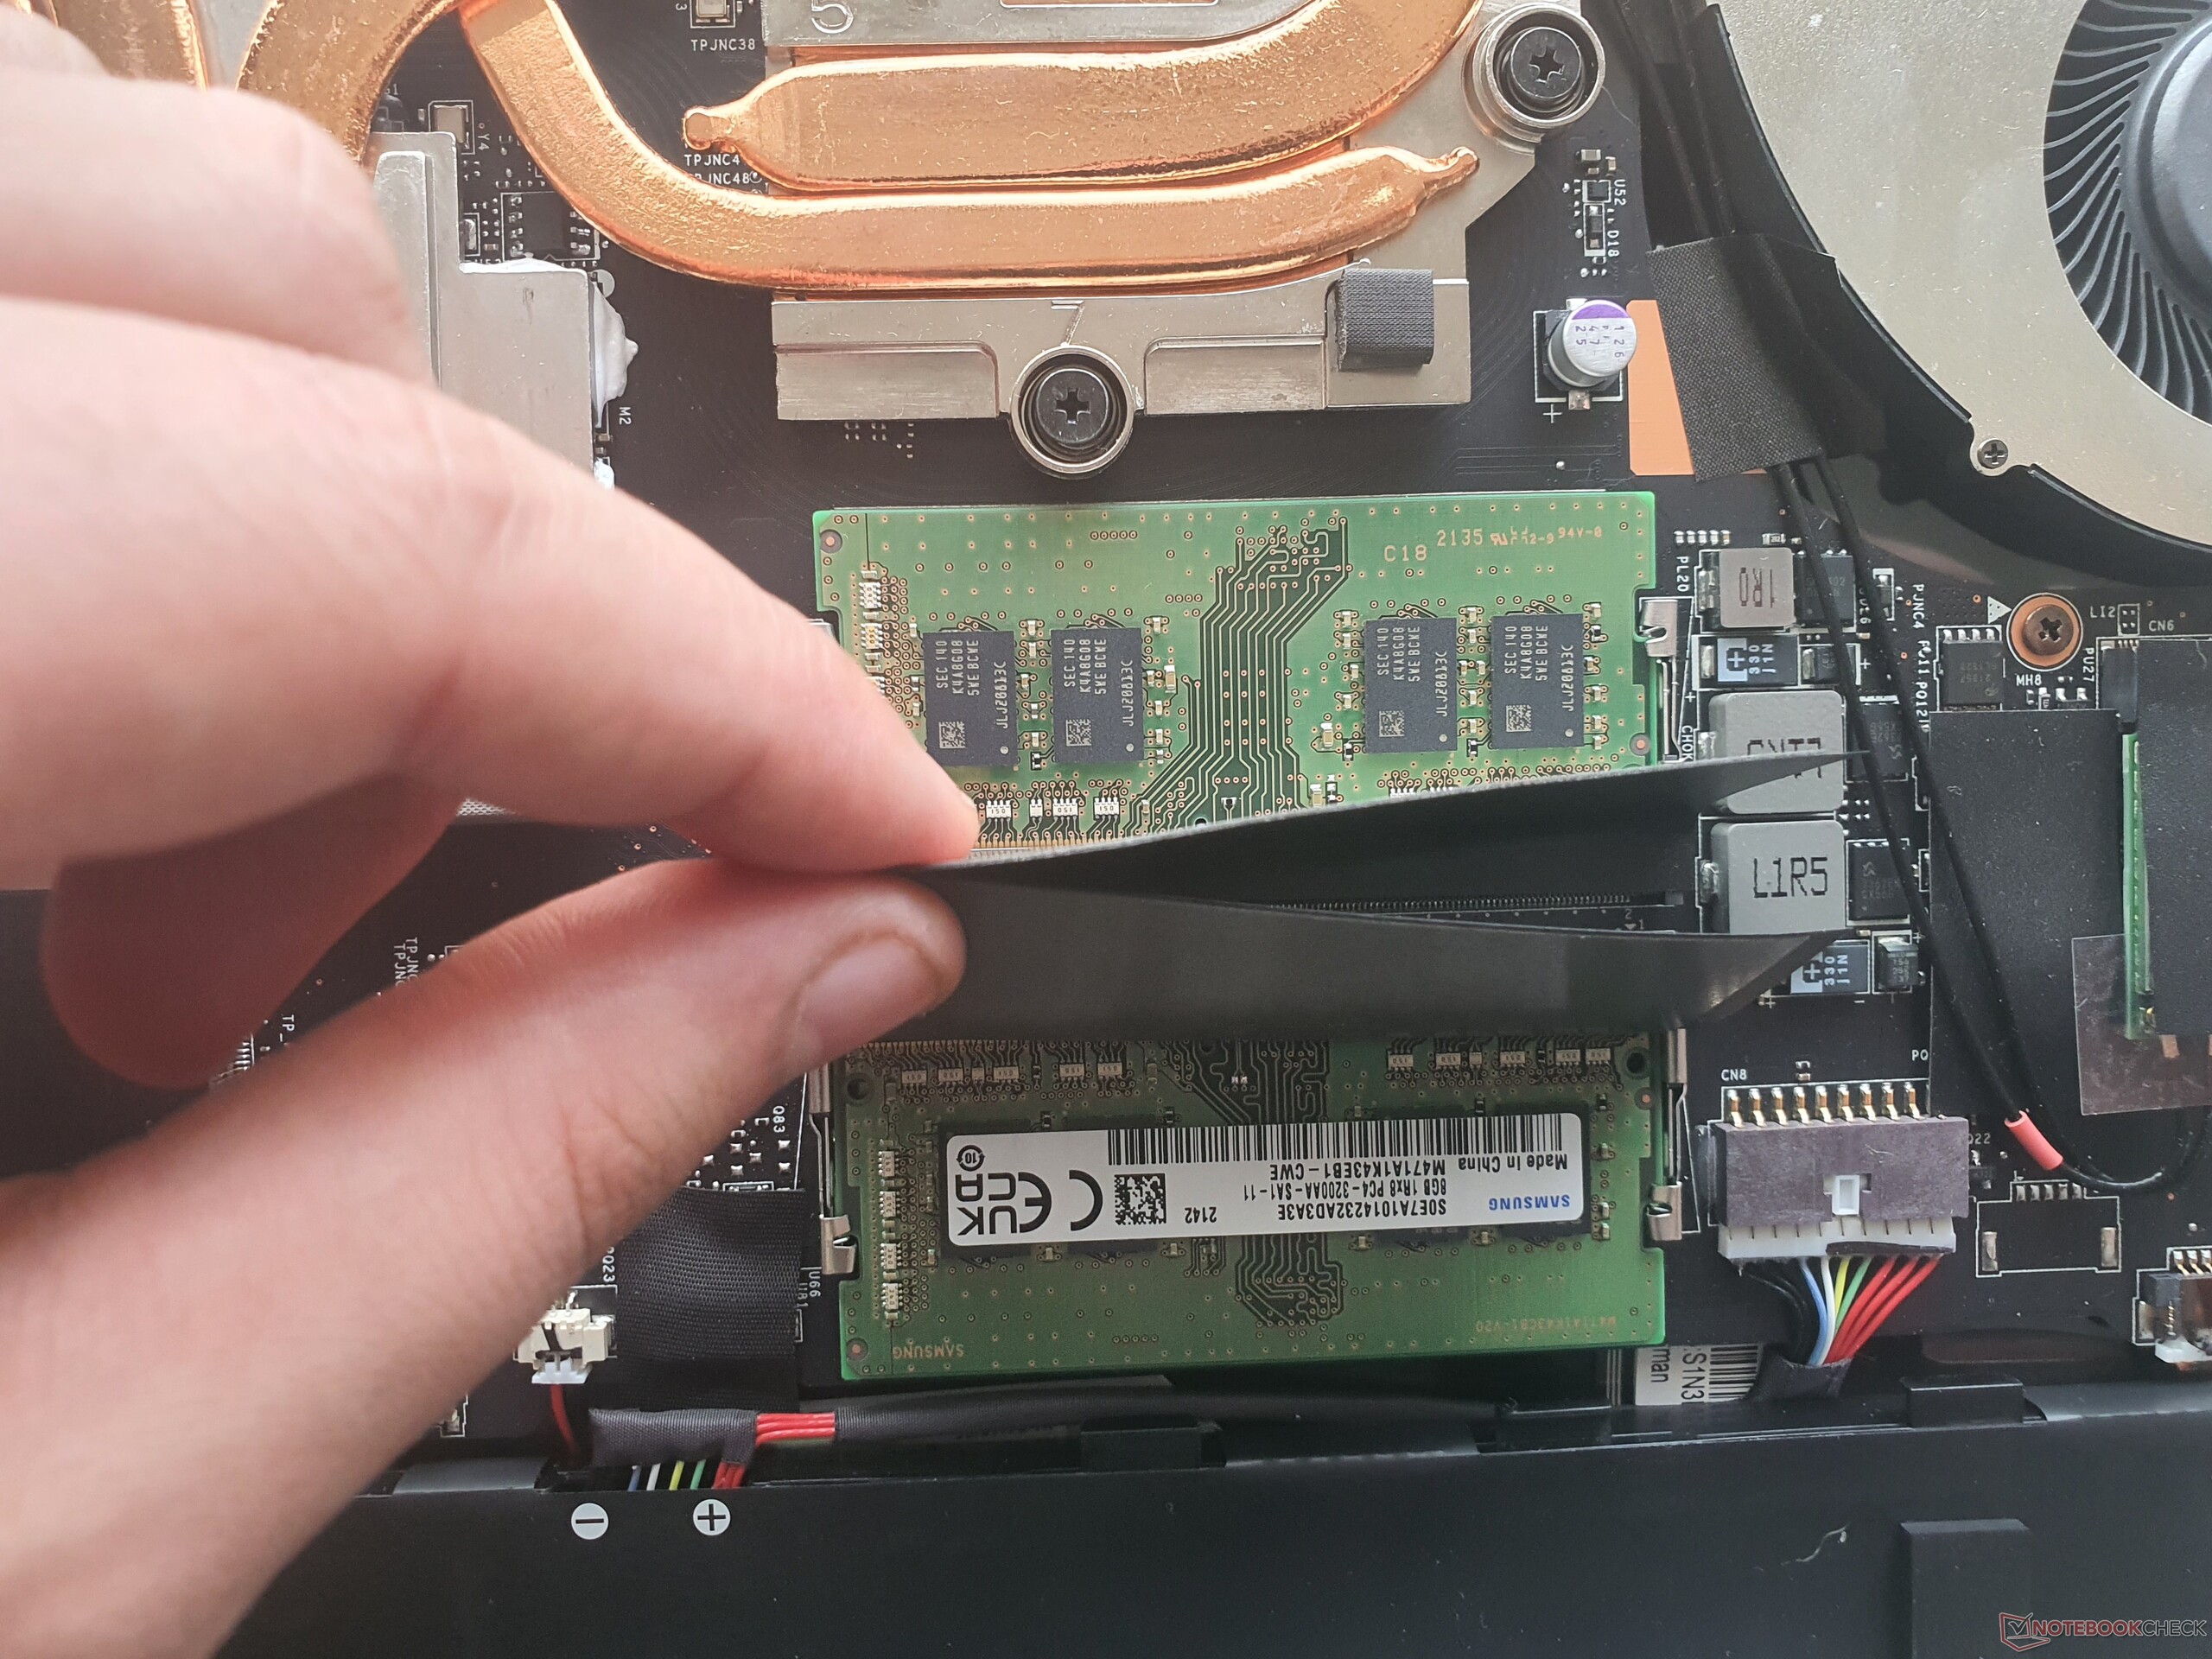
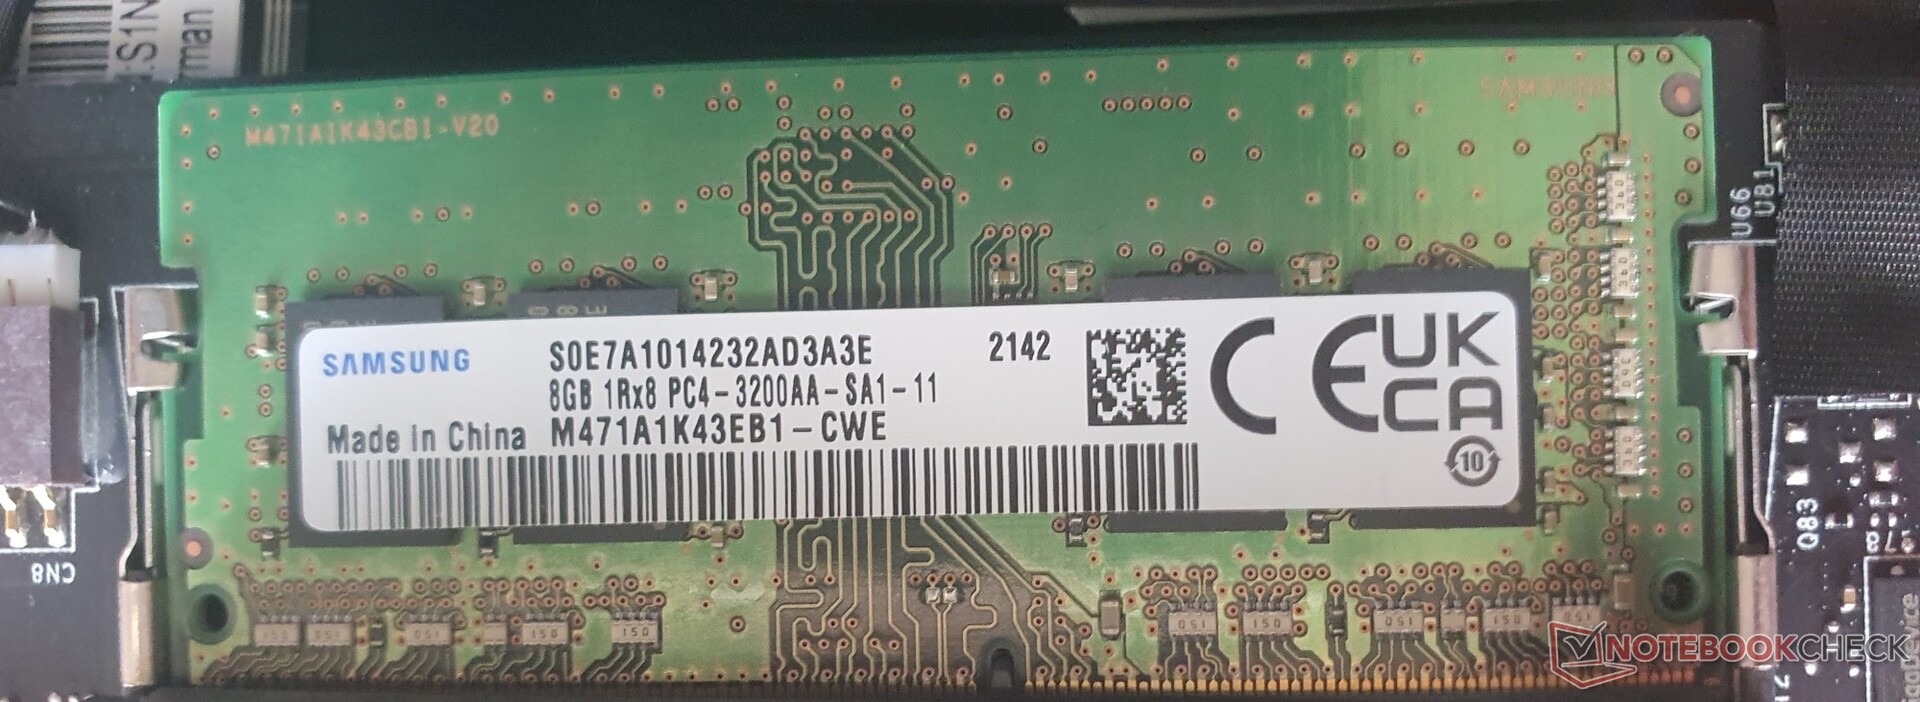
O próximo componente maior e de manutenção é a bateria de 65 Wh (parafusada). Além disso, dois slots M.2 com especificação PCIe4x4 (RAID 0.1 capaz) são fornecidos, que são arredondados por dois SODIMMs para até 64GB de RAM DDR4-3200. Como já mencionado, o módulo Wi-Fi também é substituível. Portanto, de modo geral, o Vector GP76 é de fácil manutenção.
Garantia
A garantia dentro da UE é de 24 meses com serviço de pick-up. Na maioria das outras regiões, isto é 12 meses. Também é possível uma extensão para uma sobretaxa.
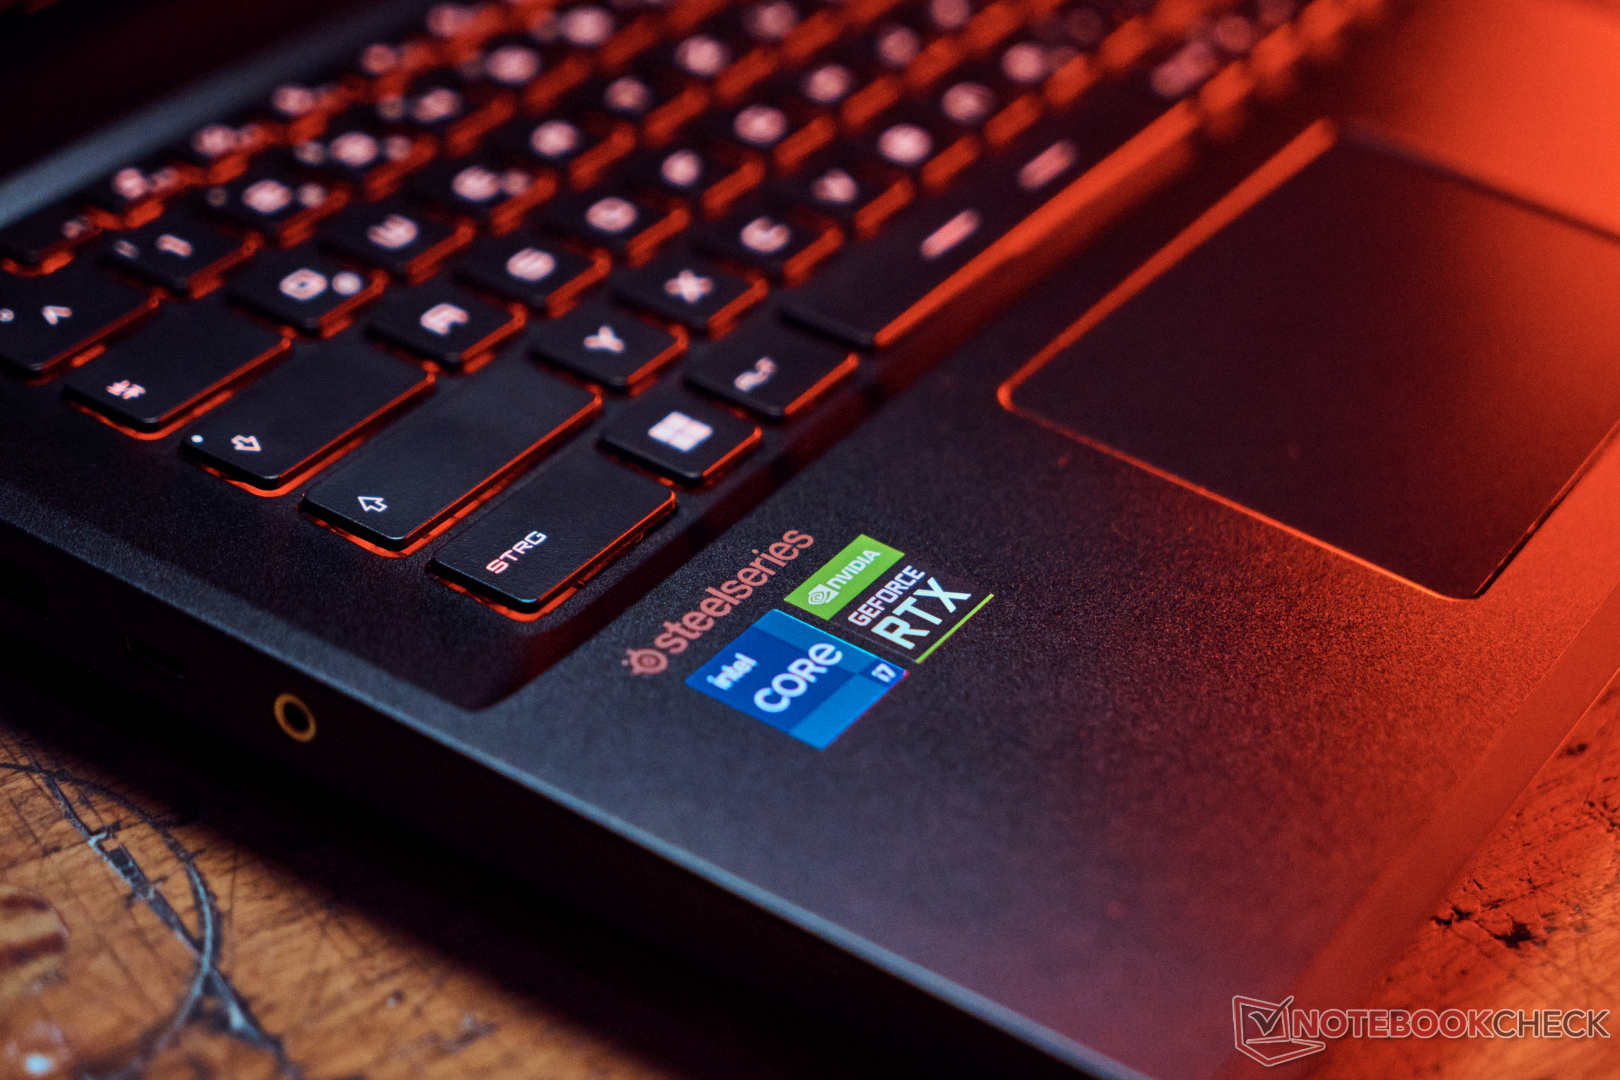
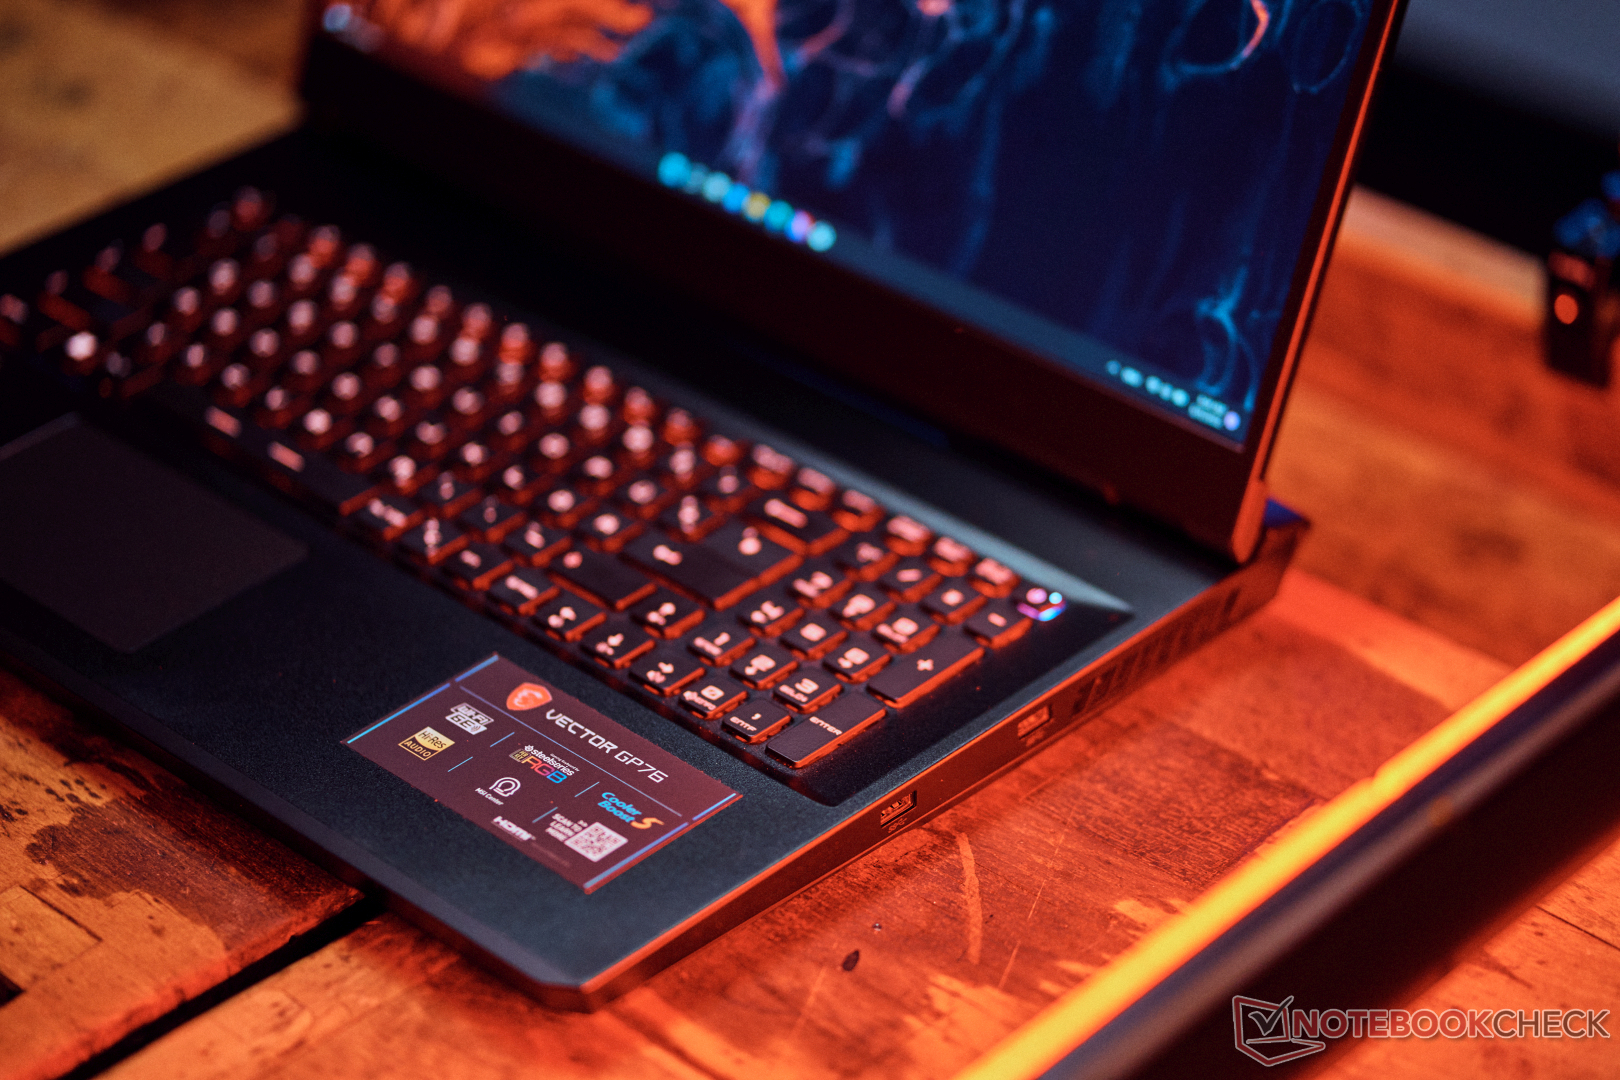
Dispositivos de entrada: MSI com RGB per-key para um respingo de cor
Teclado
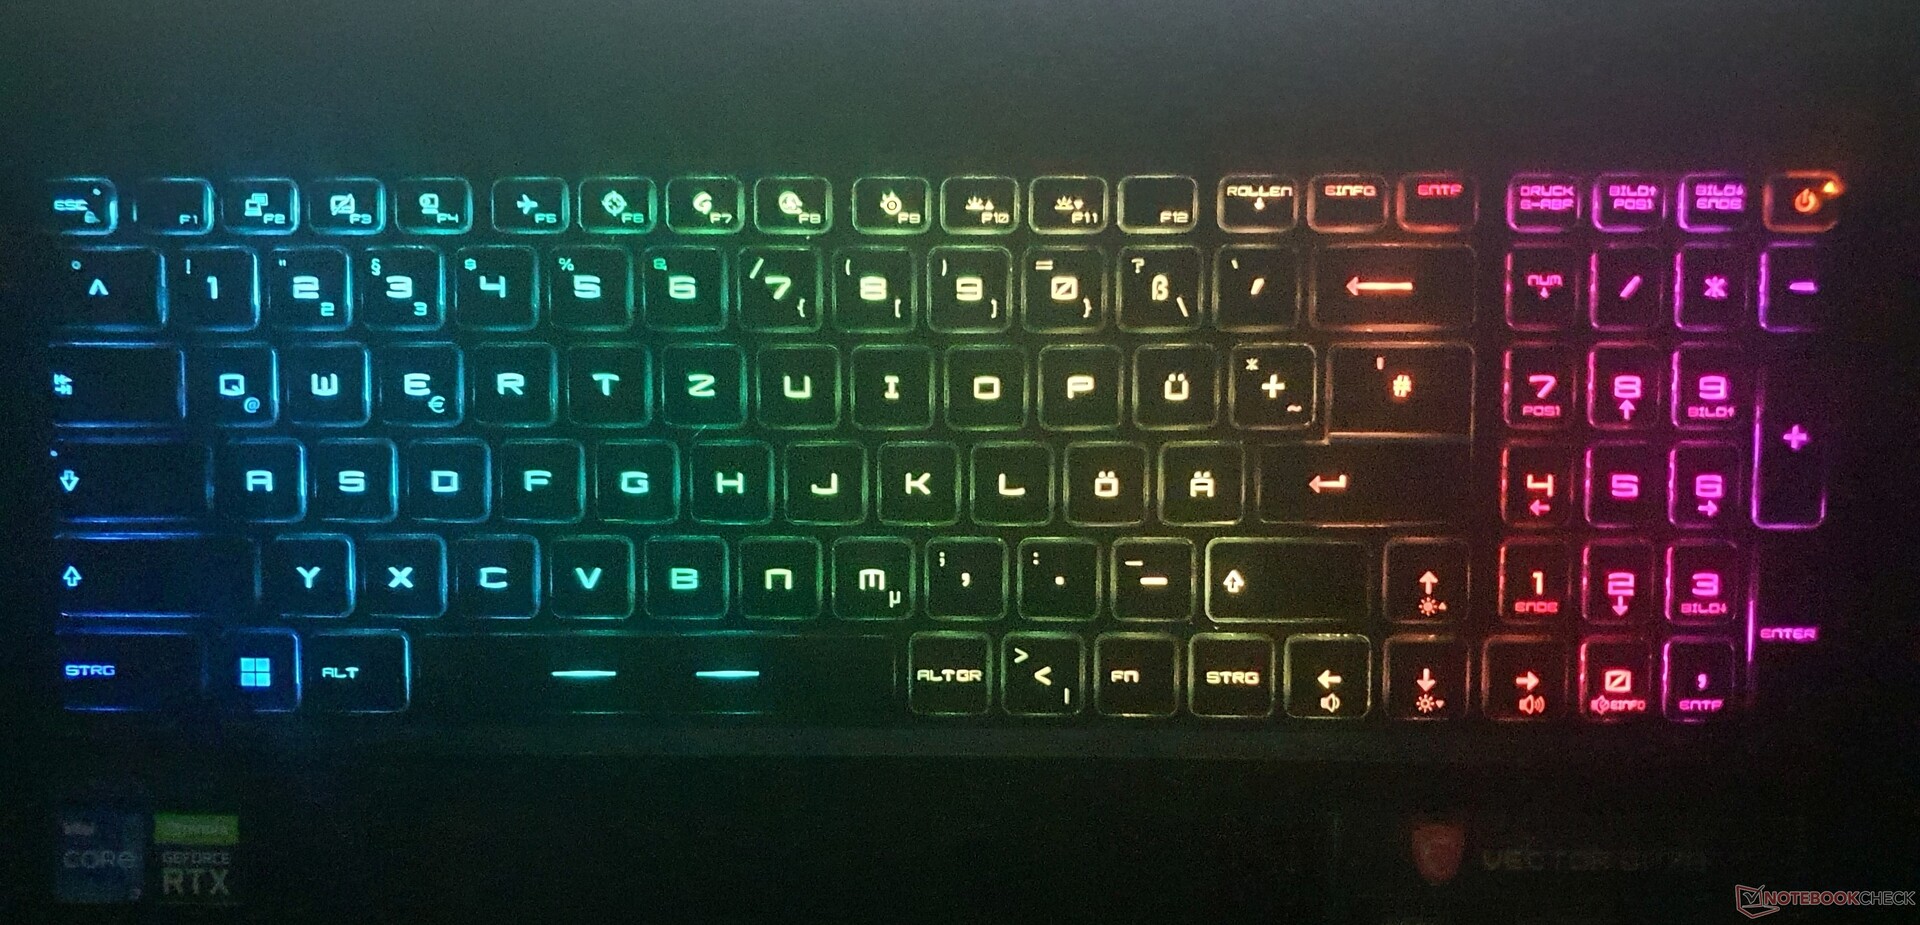
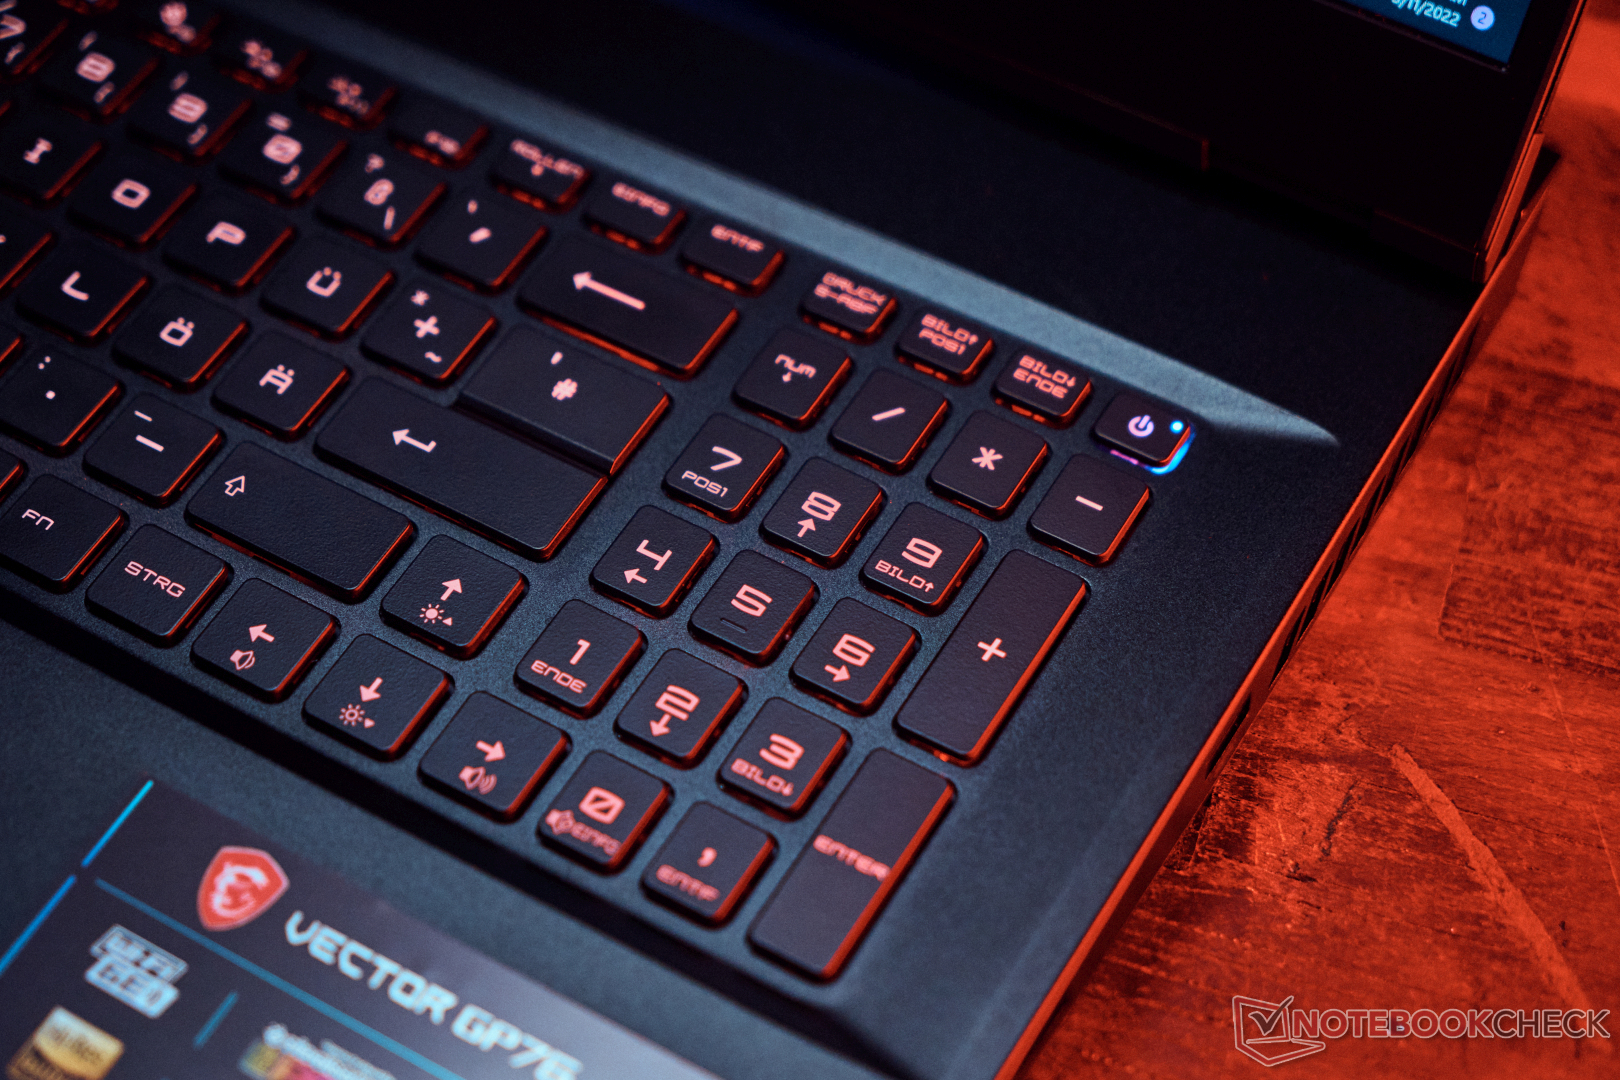
O teclado SteelSeries, que não mudou por gerações, oferece teclas um pouco menores, mas grippy, com um ponto de pressão moderado e um curso médio.
Textos mais longos podem ser escritos sem qualquer problema, mesmo que o curso seja um pouco suave. Há algumas coisas a notar sobre o layout: Como a maioria das outras teclas, as teclas de seta são 15x15mm, mas a tecla Enter está dividida e as teclas Shift, bloco de números e F da direita são menores. O teclado corresponde assim ao do mercado americano com a etiqueta DE adaptada. Algumas teclas de função também têm funções duplas.
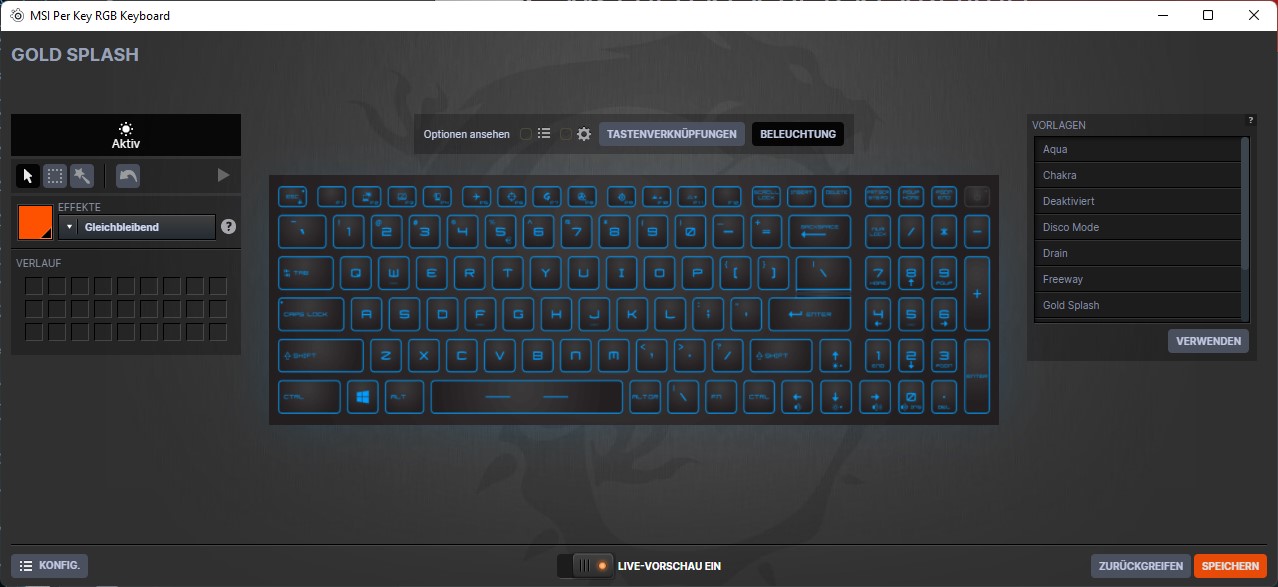
Uma vantagem é o baixo nível de ruído. Graças ao anti-ghosting, até 10 toques de tecla são possíveis ao mesmo tempo e a retroiluminação individual das teclas pode ser configurada usando o software "SteelSeries Engine 3".
Touchpad

O touchpad mede 10,5 x 6,5cm e, portanto, não é o maior, mas a qualidade de deslizamento é muito boa e funciona com muita precisão. No entanto, os botões de clique integrados só funcionam com muita pressão e não oferecem um feedback ideal. Dito isto, existem clickpads muito piores no mercado.
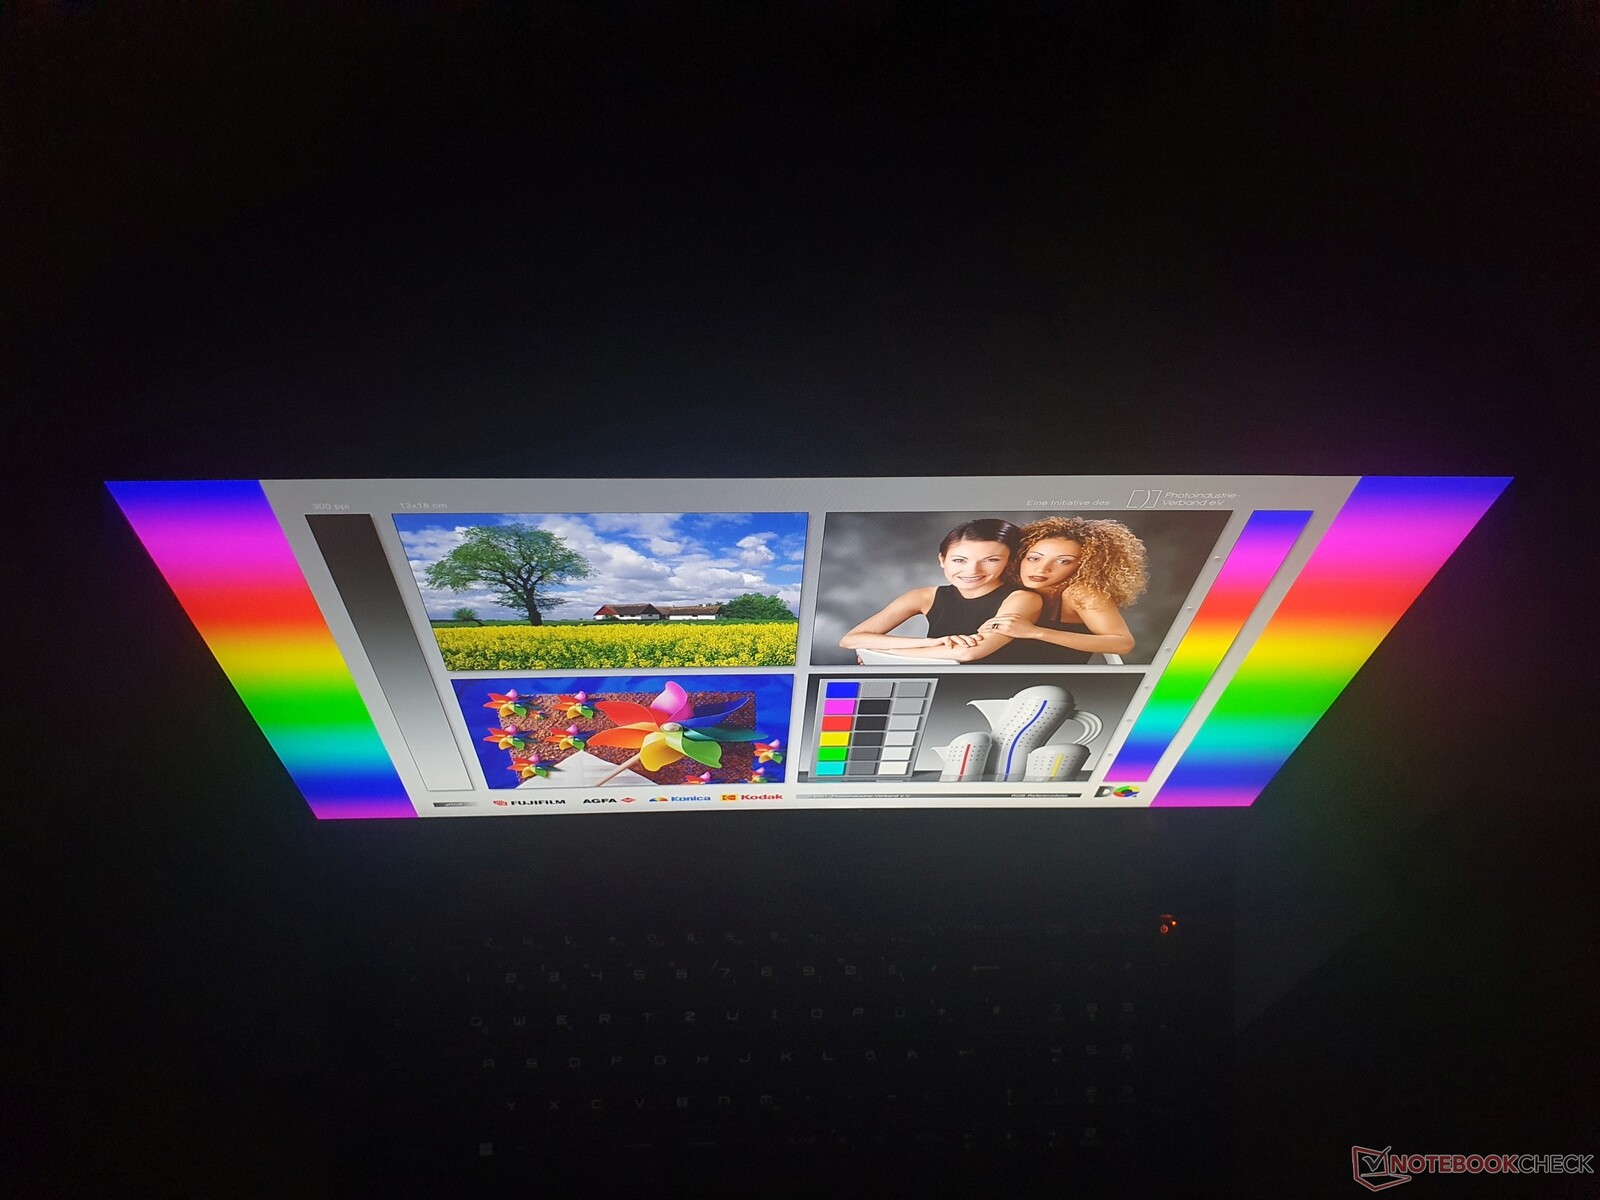
Mostrar: Rápido 360 Hz e 4ms cinza a cinza sobre o Vector GP76

A tela IPS mate de 17,3 polegadas no formato 16:9 oferece um brilho medíocre de 264 cd/m², o que prova ser suficiente para uso interno. A resolução 1920x1080 (Full HD) é a única que a MSI oferece na série Vector e é suficientemente nítida desde que você não cole seu nariz à tela. As imagens também são muito nítidas e claras, reforçadas por uma boa qualidade subpixel.
O contraste de 1.096:1 é aceitável, e o bom valor de preto de 0,25 resulta em um preto rico. Enquanto o campo de comparação está geralmente em um nível semelhante, o menor Vetor GP66 (juntamente com seu próprio predecessor) é ainda mais brilhante a 324 cd/m². Entretanto, o Legion 5 Pro e Zephyrus M16superam a concorrência em pouco menos de 500 cd/m² e, portanto, também são adequados para uso externo.
Em termos de tempos de resposta, nada pode competir com a GP76: Além da taxa de atualização super-rápida de 360 Hz, um sinal de cinza a cinza leva apenas 4ms e de preto a branco ainda é um muito bom 8ms. A competição situa-se entre 15 e 27 ms para cinza a cinza. No geral, o painel corresponde às especificações high-end apropriadas para jogos. O predecessor usa um painel de 144 Hz.
Entretanto, não há G-Sync interno. O Adaptive Sync é suportado em um monitor externo via DisplayPort. A cintilação PWM não foi detectada
| |||||||||||||||||||||||||
iluminação: 87 %
iluminação com acumulador: 270 cd/m²
Contraste: 1096:1 (Preto: 0.25 cd/m²)
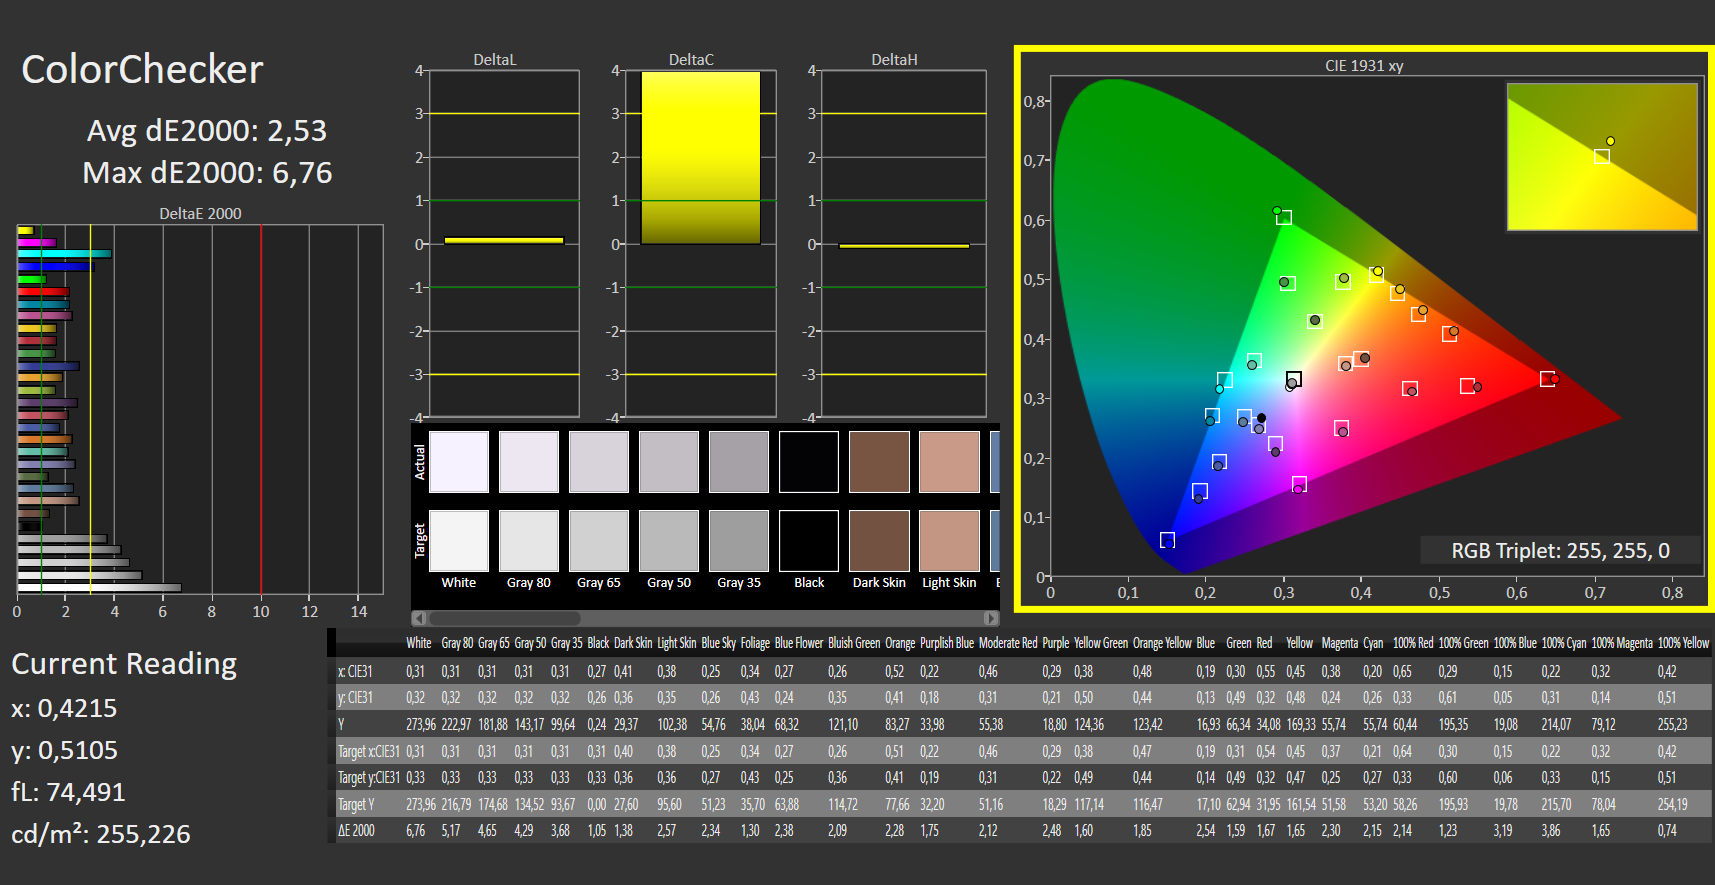
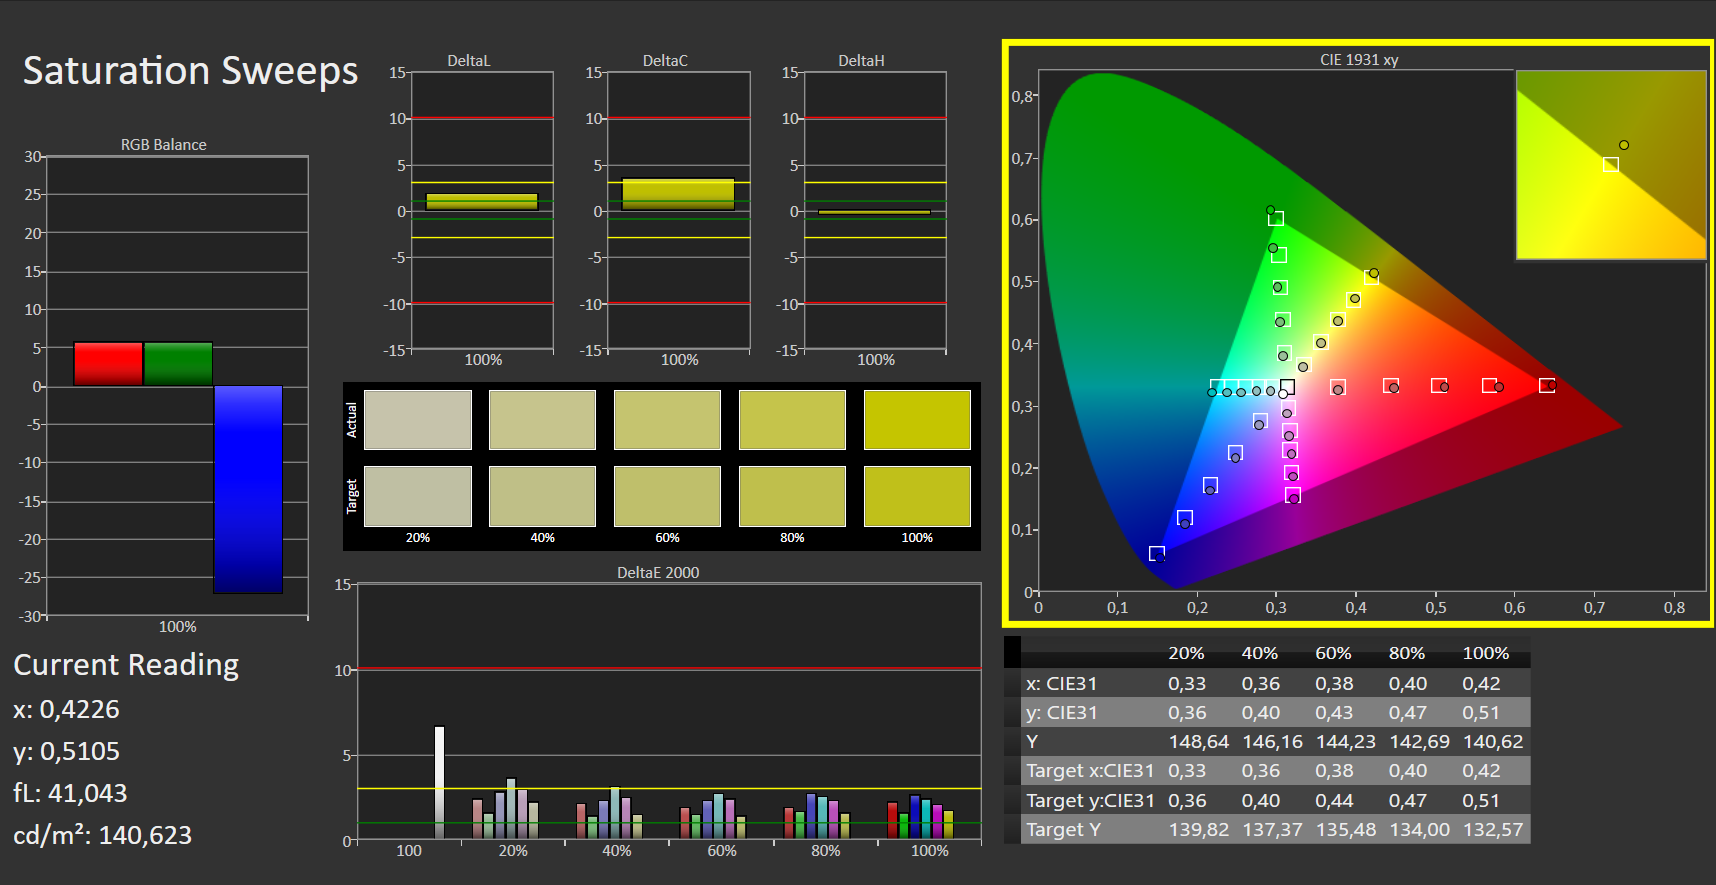
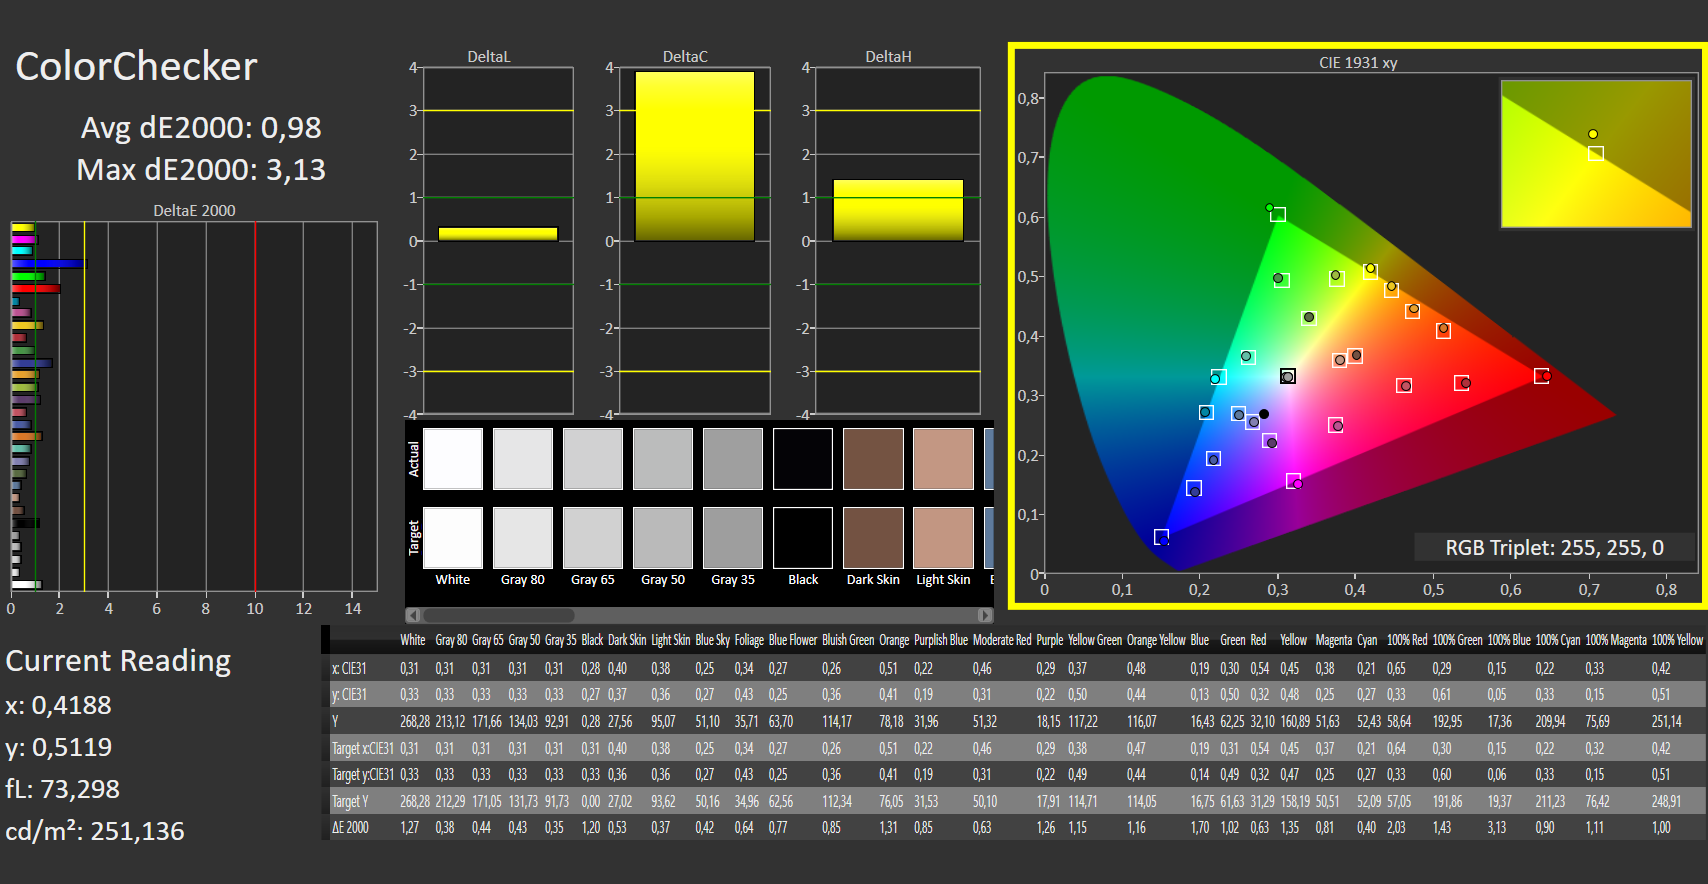
ΔE ColorChecker Calman: 2.53 | ∀{0.5-29.43 Ø4.71}
calibrated: 0.98
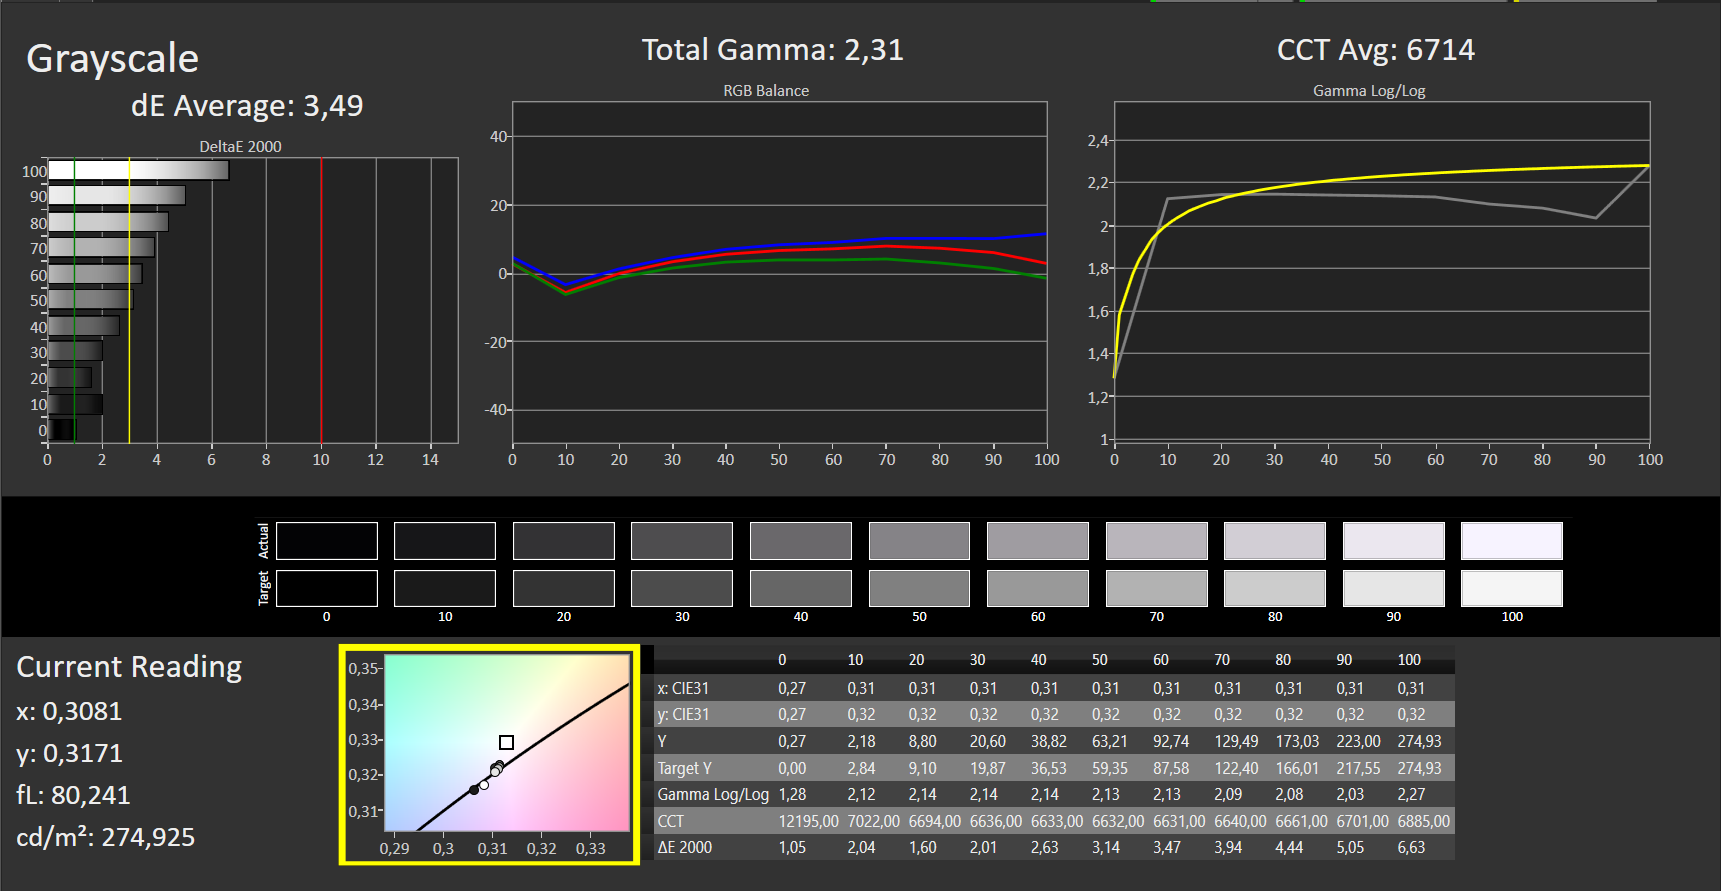
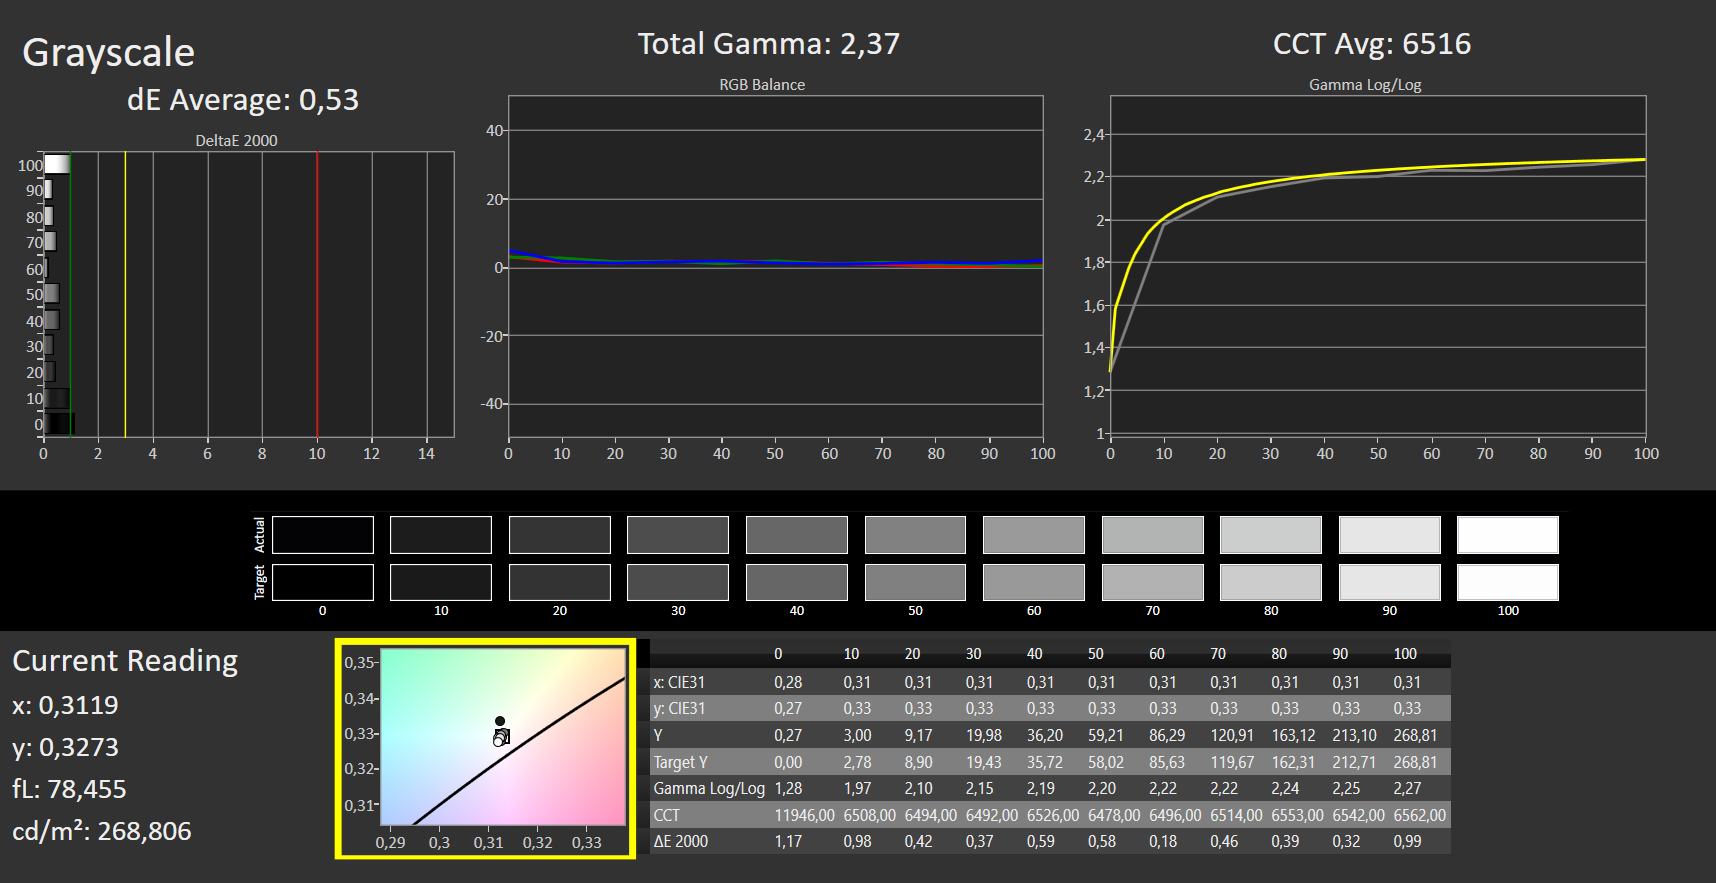
ΔE Greyscale Calman: 3.49 | ∀{0.09-98 Ø4.96}
70.91% AdobeRGB 1998 (Argyll 3D)
98.98% sRGB (Argyll 3D)
70.09% Display P3 (Argyll 3D)
Gamma: 2.31
CCT: 6714 K
| MSI Vector GP76 12UGS-434 AUO B173HAN05.4, IPS, 1920x1080, 17.3" | MSI GP76 Leopard 10UG Chi Mei CMN176E, IPS, 1920x1080, 17.3" | Asus ROG Strix G17 G713QE-RB74 AU Optronics B173HAN04.9, IPS, 1920x1080, 17.3" | Aorus 17 XE4 Sharp LQ173M1JW12, IPS, 1920x1080, 17.3" | Schenker XMG NEO 17 GM7TG8S BOE0977 (NE173QHM-NY2), IPS, 2560x1440, 17.3" | Lenovo Legion 5 Pro 16 G7 i7 RTX 3070Ti NE160QDM-NY1, IPS, 2560x1600, 16" | Asus ROG Zephyrus M16 GU603H AU Optronics AUOC199, IPS, 2560x1600, 16" | MSI Vector GP66 12UGS BOE NE156FHM-NZ3, IPS, 1920x1080, 15.6" | |
|---|---|---|---|---|---|---|---|---|
| Display | -6% | -41% | -1% | -3% | -1% | 1% | ||
| Display P3 Coverage (%) | 70.09 | 64.7 -8% | 40.2 -43% | 69 -2% | 67.1 -4% | 68.7 -2% | 70.1 0% | |
| sRGB Coverage (%) | 98.98 | 96.4 -3% | 60.3 -39% | 99.4 0% | 96.3 -3% | 97.6 -1% | 99.5 1% | |
| AdobeRGB 1998 Coverage (%) | 70.91 | 66.9 -6% | 41.6 -41% | 71.2 0% | 68.6 -3% | 70.9 0% | 72.1 2% | |
| Response Times | -60% | -355% | -160% | -145% | -168% | 3% | -33% | |
| Response Time Grey 50% / Grey 80% * (ms) | 4 ? | 7.4 ? -85% | 26.8 ? -570% | 15.2 ? -280% | 15.2 -280% | 17.6 ? -340% | 4.8 ? -20% | 5.8 ? -45% |
| Response Time Black / White * (ms) | 8 ? | 10.8 ? -35% | 19.2 ? -140% | 11.2 ? -40% | 8.8 -10% | 7.6 ? 5% | 6 ? 25% | 9.6 ? -20% |
| PWM Frequency (Hz) | 24510 ? | |||||||
| Screen | 14% | -30% | 8% | 11% | 17% | -19% | 0% | |
| Brightness middle (cd/m²) | 274 | 328 20% | 270.5 -1% | 274 0% | 396 45% | 502 83% | 448 64% | 353.1 29% |
| Brightness (cd/m²) | 264 | 314 19% | 269 2% | 267 1% | 366 39% | 491 86% | 446 69% | 325 23% |
| Brightness Distribution (%) | 87 | 87 0% | 92 6% | 82 -6% | 82 -6% | 91 5% | 86 -1% | 85 -2% |
| Black Level * (cd/m²) | 0.25 | 0.29 -16% | 0.19 24% | 0.25 -0% | 0.45 -80% | 0.37 -48% | 0.48 -92% | 0.38 -52% |
| Contrast (:1) | 1096 | 1131 3% | 1424 30% | 1096 0% | 880 -20% | 1357 24% | 933 -15% | 929 -15% |
| Colorchecker dE 2000 * | 2.53 | 1.93 24% | 4.39 -74% | 2.07 18% | 1.43 43% | 2.7 -7% | 2.76 -9% | 2.24 11% |
| Colorchecker dE 2000 max. * | 6.76 | 4.94 27% | 20.8 -208% | 4.89 28% | 2.2 67% | 4.5 33% | 7.09 -5% | 5 26% |
| Colorchecker dE 2000 calibrated * | 0.98 | 0.68 31% | 1.56 -59% | 0.83 15% | 1.34 -37% | 1.4 -43% | 2.86 -192% | 1.02 -4% |
| Greyscale dE 2000 * | 3.49 | 2.8 20% | 3.1 11% | 3 14% | 1.8 48% | 2.7 23% | 3.1 11% | 4 -15% |
| Gamma | 2.31 95% | 2.18 101% | 2.14 103% | 2.207 100% | 2.4 92% | 2.44 90% | 2.153 102% | 2.24 98% |
| CCT | 6714 97% | 7023 93% | 6927 94% | 6999 93% | 6489 100% | 6326 103% | 6826 95% | 6864 95% |
| Color Space (Percent of AdobeRGB 1998) (%) | 67 | 87 | ||||||
| Color Space (Percent of sRGB) (%) | 89 | 100 | ||||||
| Média Total (Programa/Configurações) | -17% /
-1% | -142% /
-79% | -51% /
-18% | -46% /
-14% | -51% /
-13% | -8% /
-15% | -11% /
-4% |
* ... menor é melhor
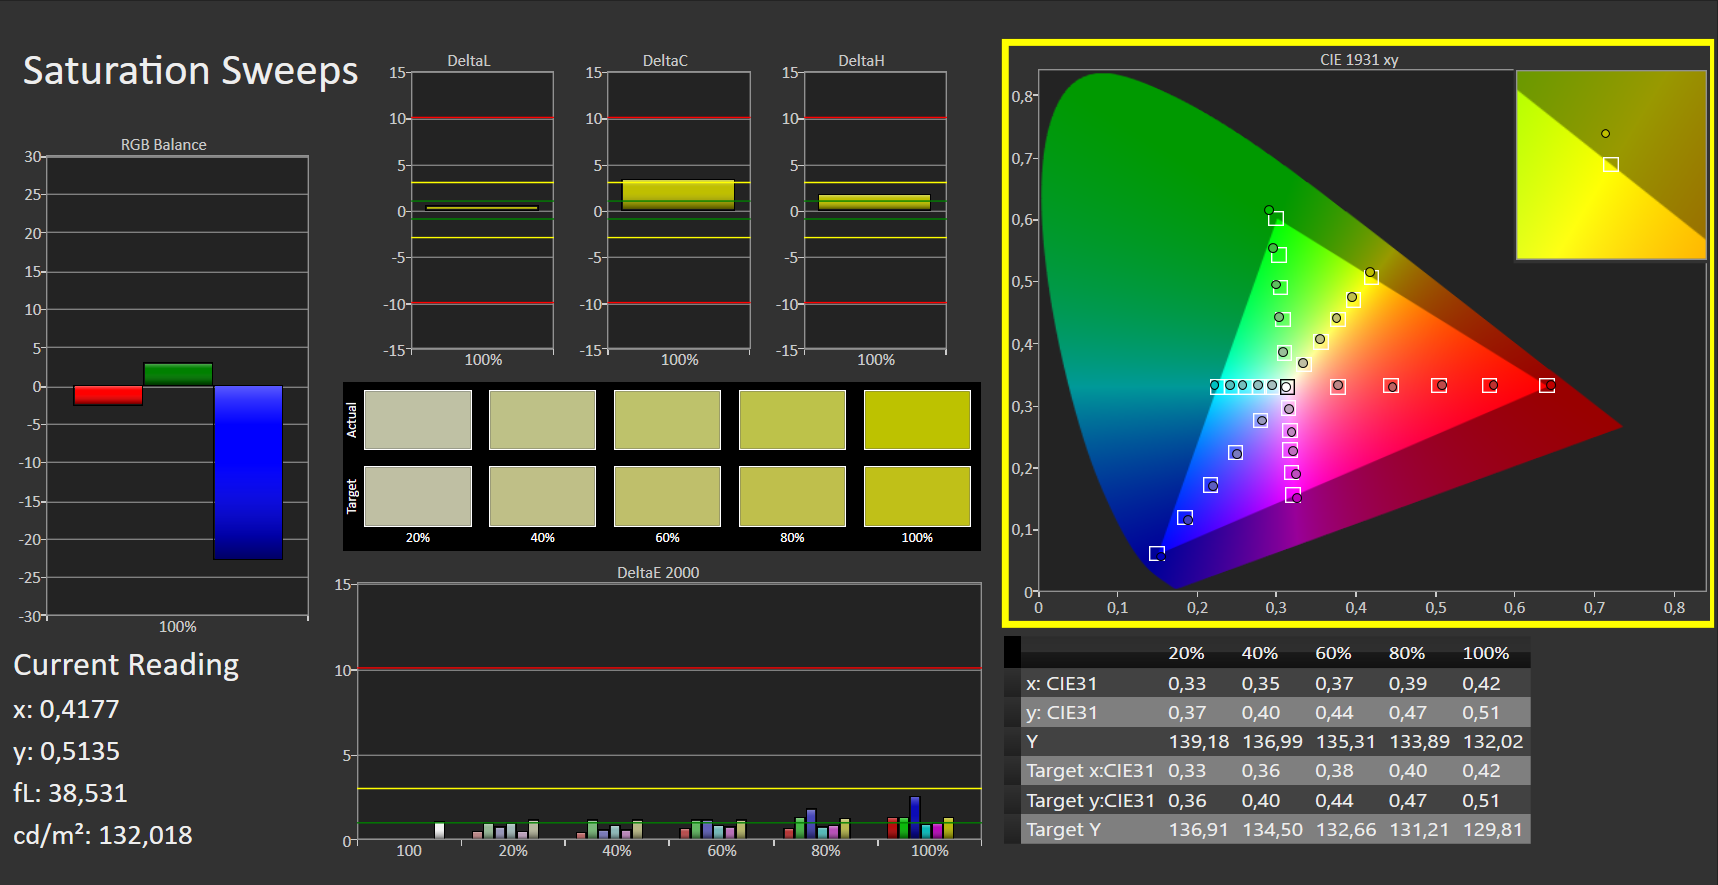
A gama de cores sRGB é muito bem coberta em pouco menos de 99%. Para DCI-P3 e AdobeRGB, isto é 70 a 71%, o que é suficiente para esta classe de laptop. O valor DeltaE de 2,54 está ligeiramente acima do limiar de 2 e, portanto, aproximadamente de acordo com a concorrência.
A calibração melhora os valores, mas o azul ligeiramente subrepresentado só pode ser ligeiramente otimizado. A percepção subjetiva das cores também testemunha tons de cor relativamente não adulterados, que parecem muito ricos, mas não particularmente super saturados. O arquivo ICC da calibração está disponível para download na janela ao lado do gráfico de cobertura.
Exibir tempos de resposta
| ↔ Tempo de resposta preto para branco | ||
|---|---|---|
| 8 ms ... ascensão ↗ e queda ↘ combinadas | ↗ 4 ms ascensão |  |
| ↘ 4 ms queda | ||
| A tela mostra taxas de resposta rápidas em nossos testes e deve ser adequada para jogos. Em comparação, todos os dispositivos testados variam de 0.1 (mínimo) a 240 (máximo) ms. » 22 % de todos os dispositivos são melhores. Isso significa que o tempo de resposta medido é melhor que a média de todos os dispositivos testados (19.8 ms). | ||
| ↔ Tempo de resposta 50% cinza a 80% cinza | ||
| 4 ms ... ascensão ↗ e queda ↘ combinadas | ↗ 1 ms ascensão |  |
| ↘ 3 ms queda | ||
| A tela mostra taxas de resposta muito rápidas em nossos testes e deve ser muito adequada para jogos em ritmo acelerado. Em comparação, todos os dispositivos testados variam de 0.165 (mínimo) a 636 (máximo) ms. » 15 % de todos os dispositivos são melhores. Isso significa que o tempo de resposta medido é melhor que a média de todos os dispositivos testados (30.9 ms). | ||
Cintilação da tela / PWM (modulação por largura de pulso)
| Tela tremeluzindo / PWM não detectado |  | ||
[pwm_comparison] Em comparação: 52 % de todos os dispositivos testados não usam PWM para escurecer a tela. Se PWM foi detectado, uma média de 7744 (mínimo: 5 - máximo: 343500) Hz foi medida. | |||
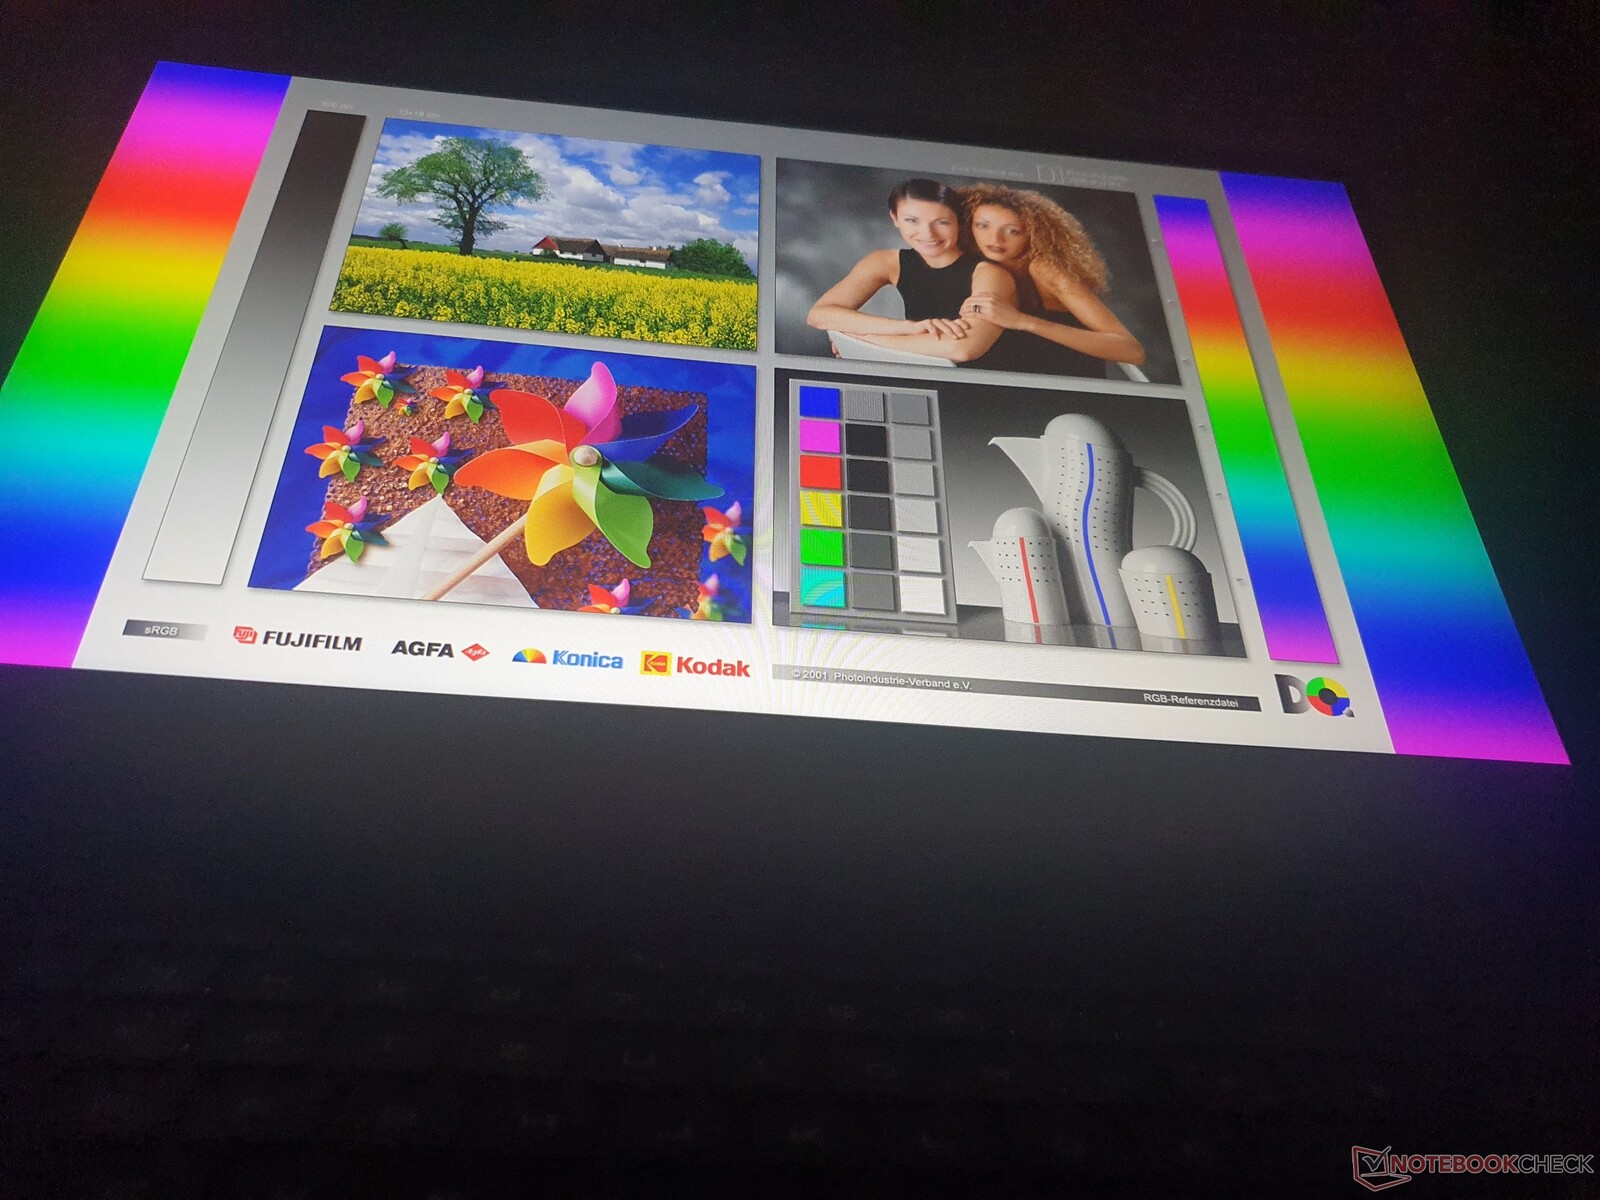
Se você quer desfrutar dos jogos ao ar livre, você tem que fazê-lo à sombra. Mais do que uma festa LAN sob o pavilhão não é possível com um brilho de 264 cd/m², mesmo com uma tela fosca.
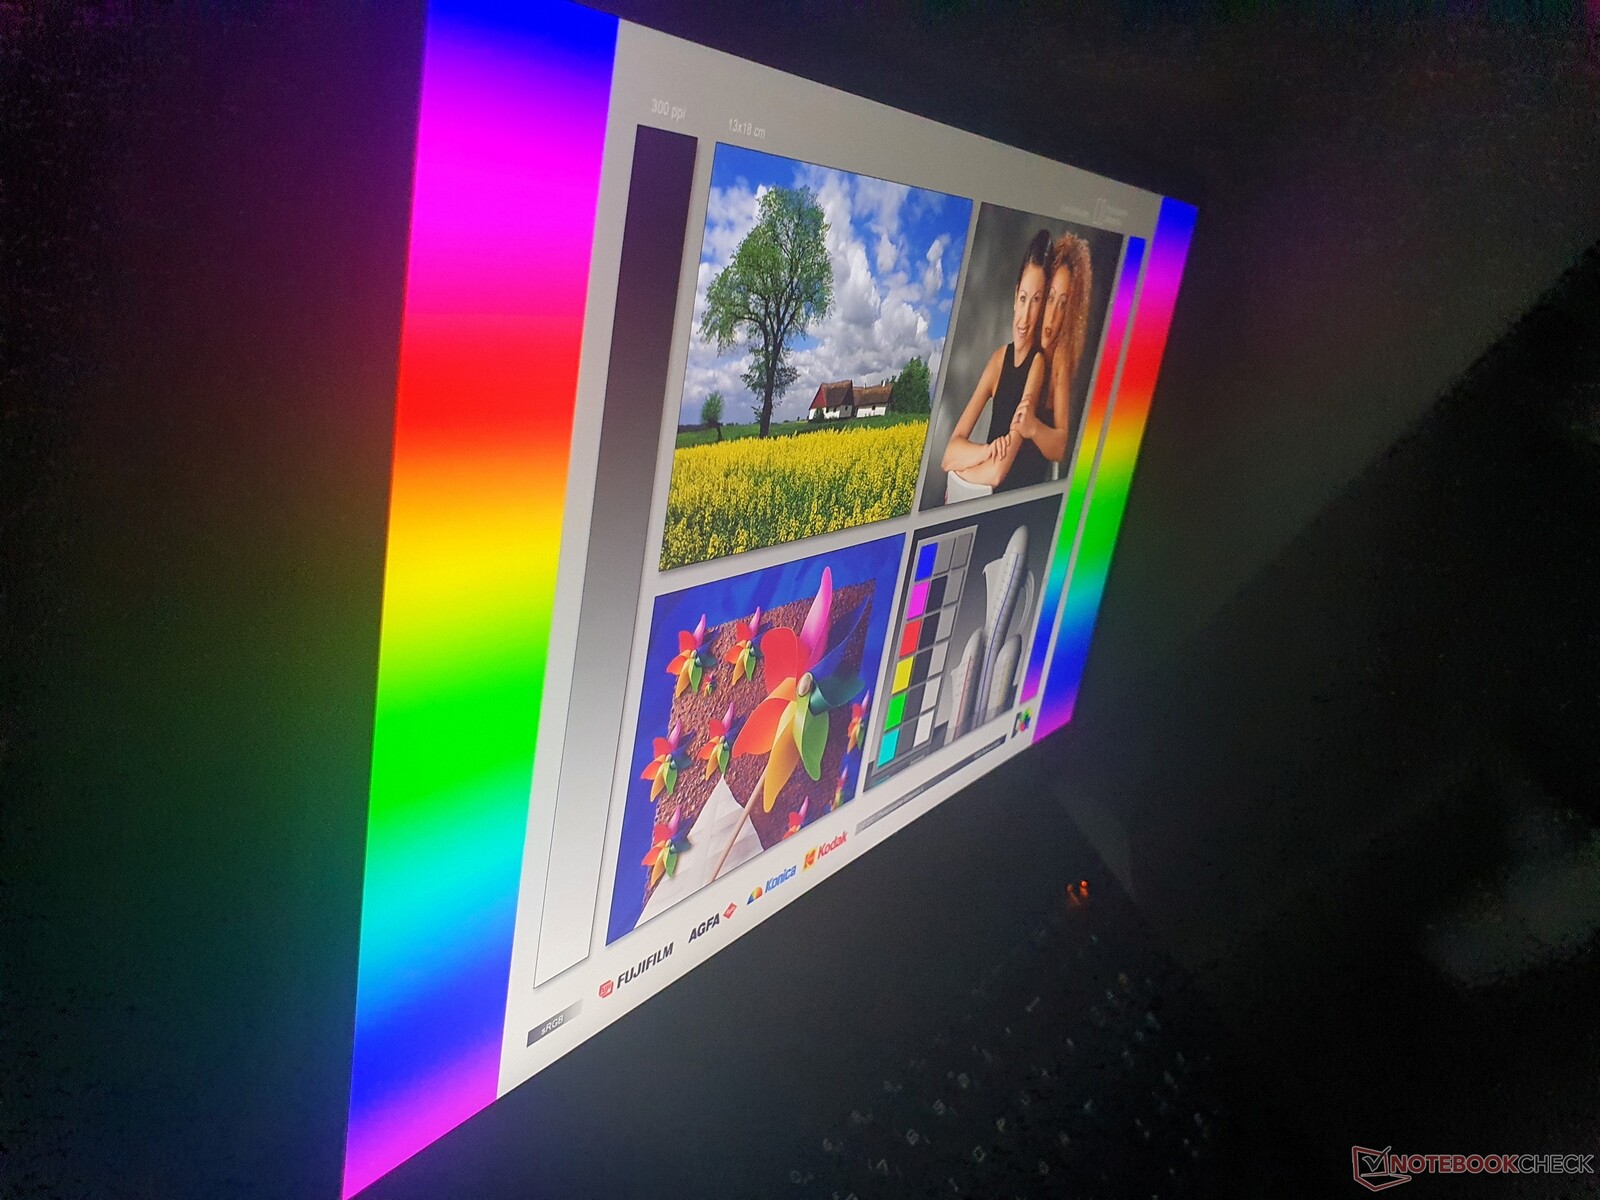
Os ângulos de visão são bons em todas as telas IPS, incluindo nosso modelo de teste. Nenhum desejo fica por realizar aqui. OLED, por exemplo, oferece uma estabilidade ainda melhor dos ângulos de visão
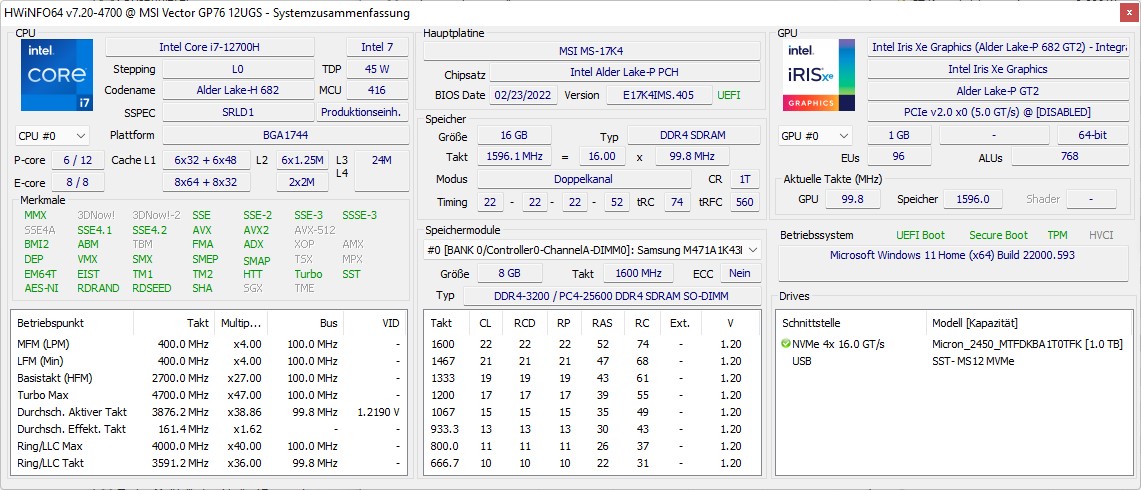
Desempenho: MSI manivela o GeForce RTX 3070 Ti ao máximo
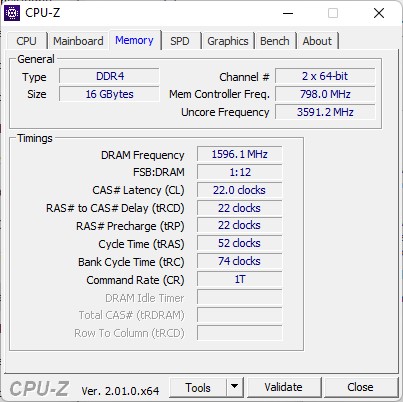
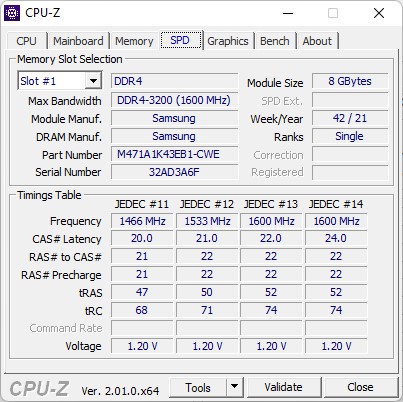
Em termos de CPU, os compradores interessados podem decidir entre aNúcleo i7-12700H ou a Intel i9-12900HK. Para gráficos, há apenas o Nvidia RTX 3070 Ti(150 W) e o RTX 3080 (não-Ti, 165 W). A RAM sempre vem como 2x 8GB DDR4-3200 ex fábrica (2x 16 GB em outras regiões do mundo).
A RAM DDR5 aproximadamente 25% mais rápida (ver abaixo: tabela comparativa da AIDA) é reservada para as classes high-end da MSI. Entretanto, isto não tem nenhum impacto negativo sobre os jogos e aplicações gráficas profissionais, para os quais o Vector GP76 é destinado. Também é padrão um SSD PCIe4x4 de 1 TB, cujo desempenho é testado abaixo.
Condições de teste
Testamos primeiro o MSI Vector GP76 em modo Automático. Naturalmente, também testamos o desempenho no modo Extreme Performance, mas no meio dele encontramos o seguinte problema com o controle do ventilador:
Os ventiladores só funcionavam a uma velocidade muito baixa mesmo sob carga total, o que levou ao superaquecimento do sistema com estrangulamento severo subseqüente e até mesmo ao ponto em que o sistema ficou inutilizável. Já estamos familiarizados com este erro dos laptops de jogos MSI, que foi previamente resolvido através de atualizações BIOS e CE.
Como já estávamos usando a última BIOS neste ponto, pudemos corrigir temporariamente o problema pressionando o botão "Turbo Fan" duas vezes, mas isso ocorreu novamente um pouco mais tarde, então não conseguimos completar os testes no modo de Desempenho Extremo.
Entretanto, o modo não tem influência no desempenho puro da CPU, enquanto que cerca de 7% a mais de desempenho é possível nos jogos. O Witcher 3 e o PCMark 10 ainda conseguiram funcionar no modo de desempenho extremo. Você também pode dar uma olhada no MSI Vector GP66 que analisamos recentemente, que foi totalmente testado no modo de Desempenho Extremo e gerou valores muito semelhantes. Os benchmarks da GPU também foram executados em modo GPU discreto.
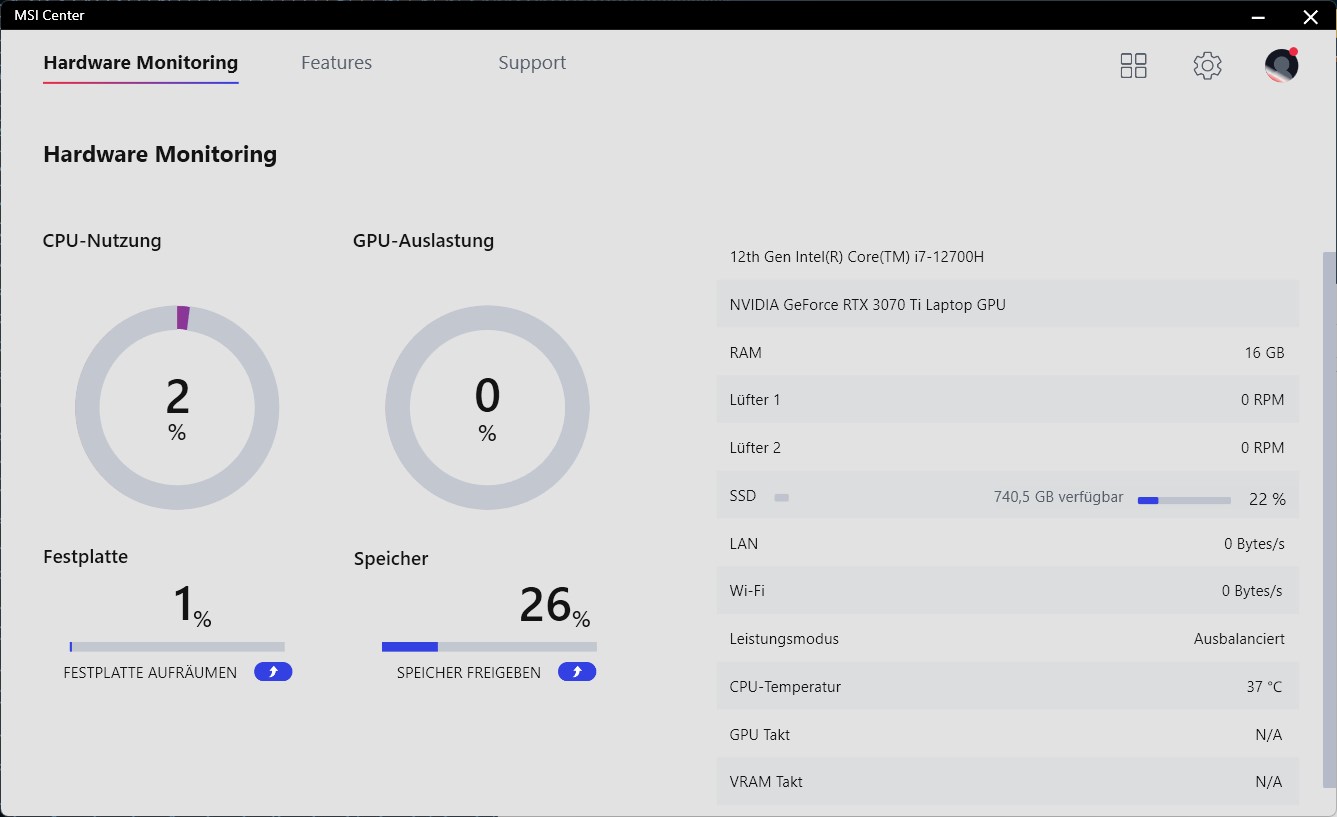
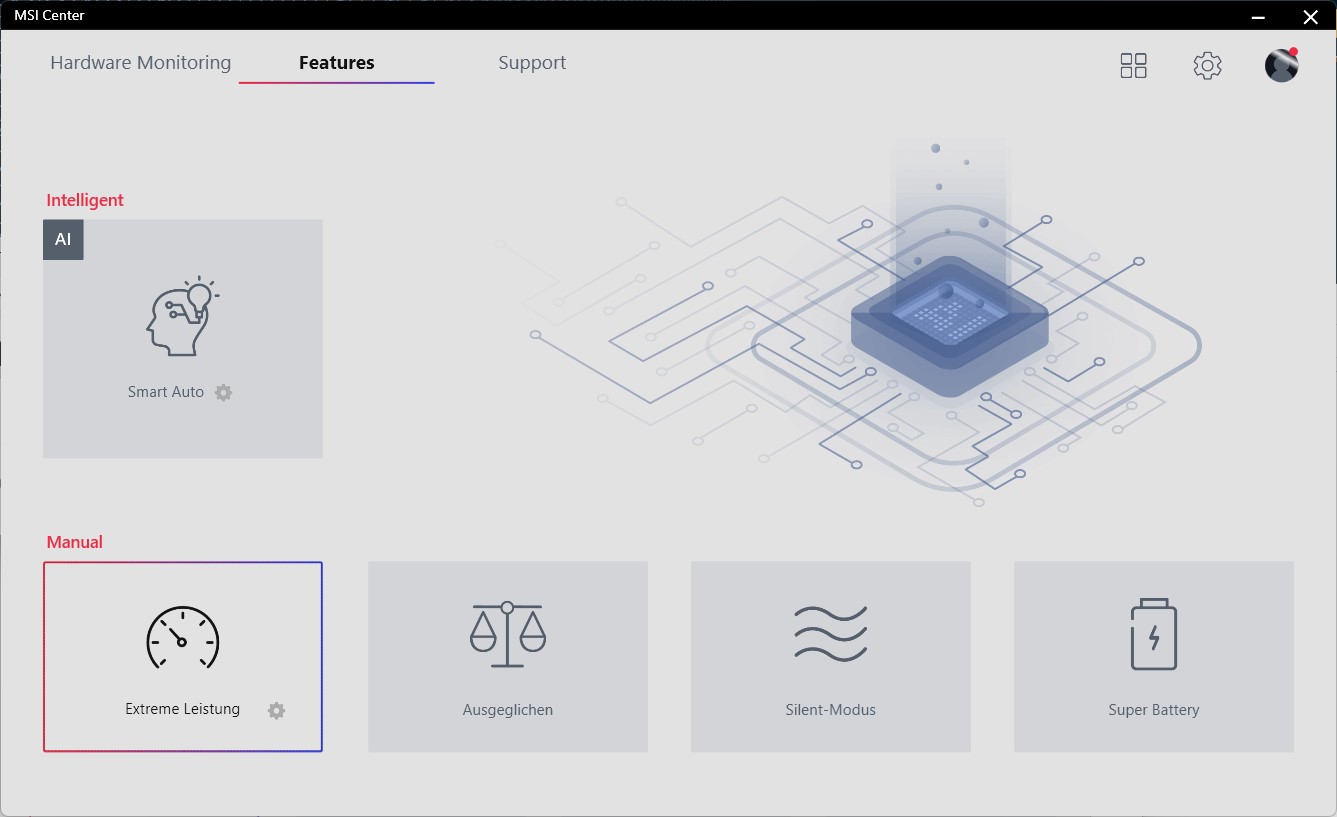
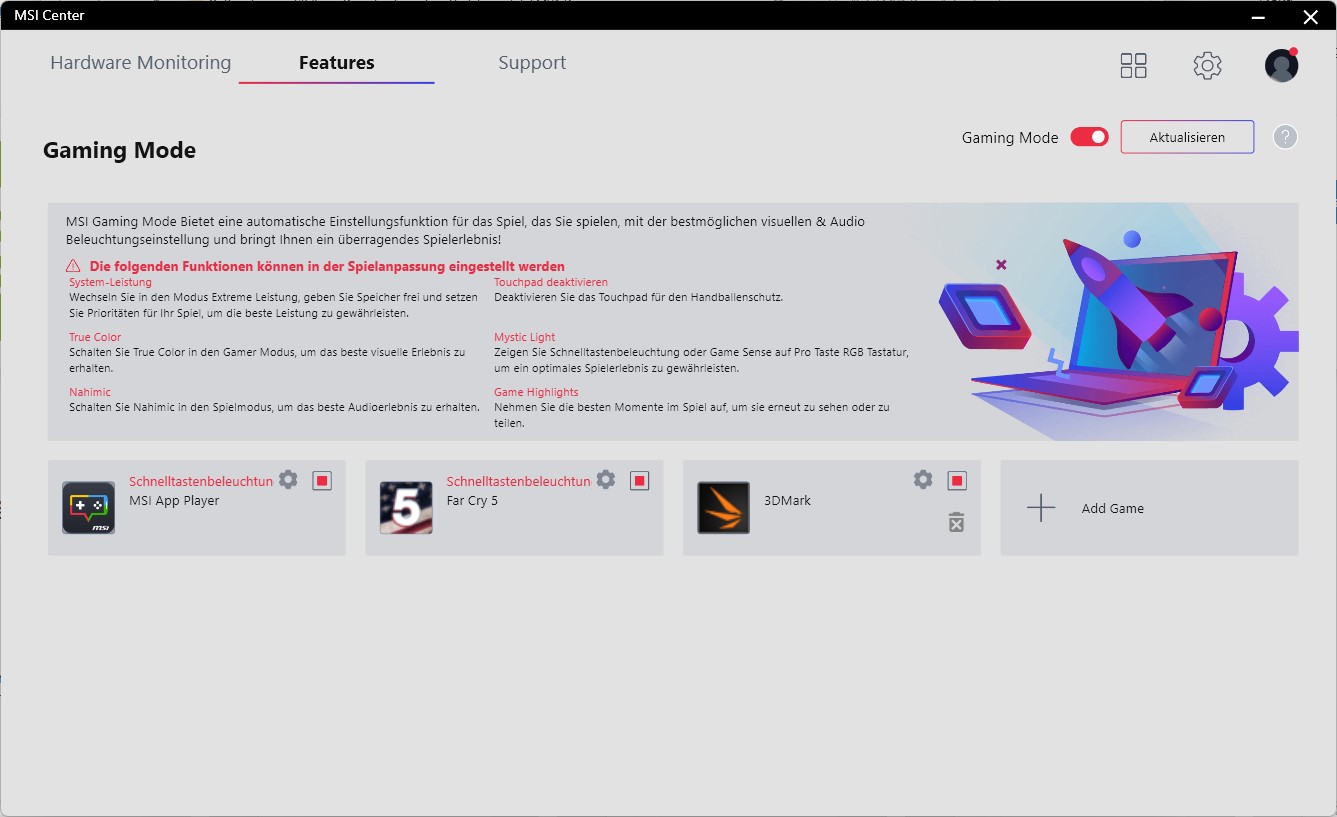
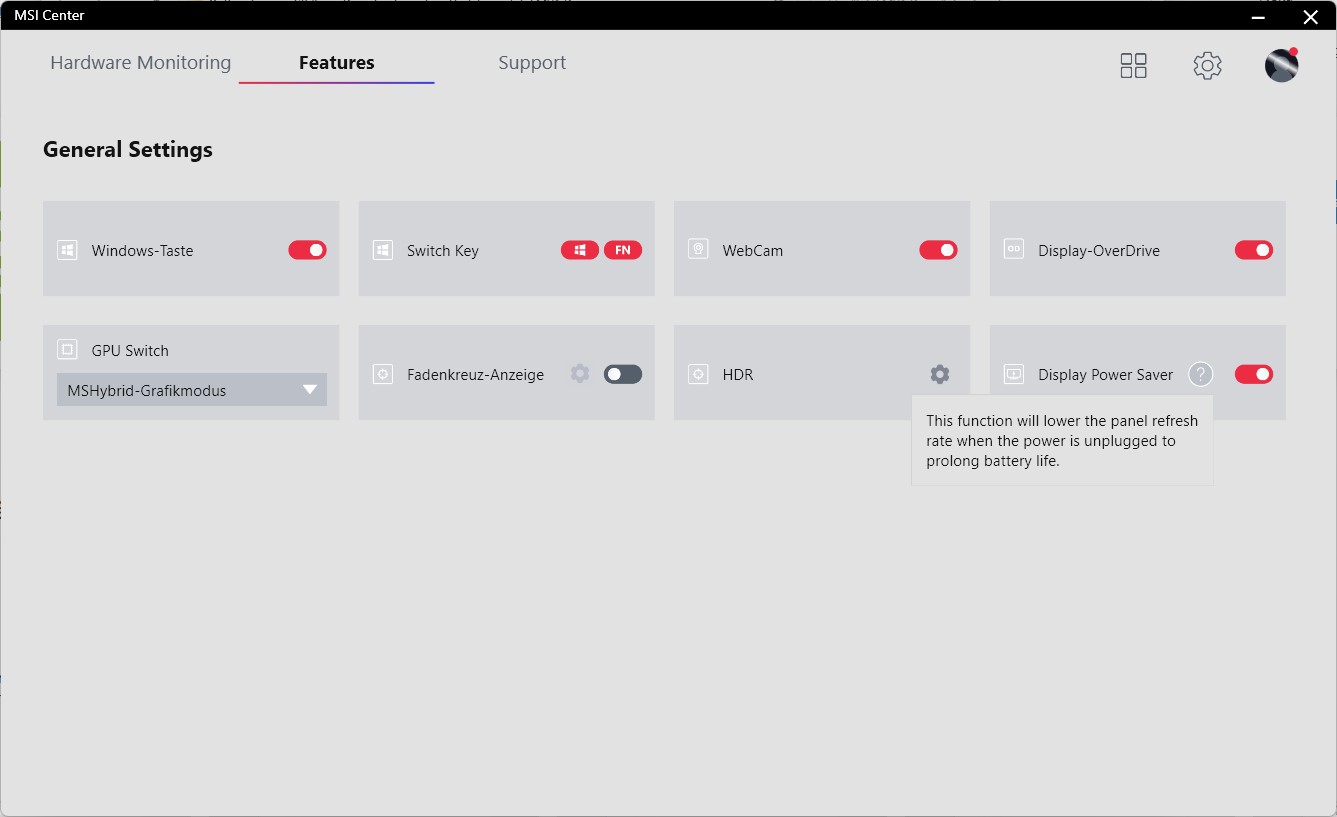
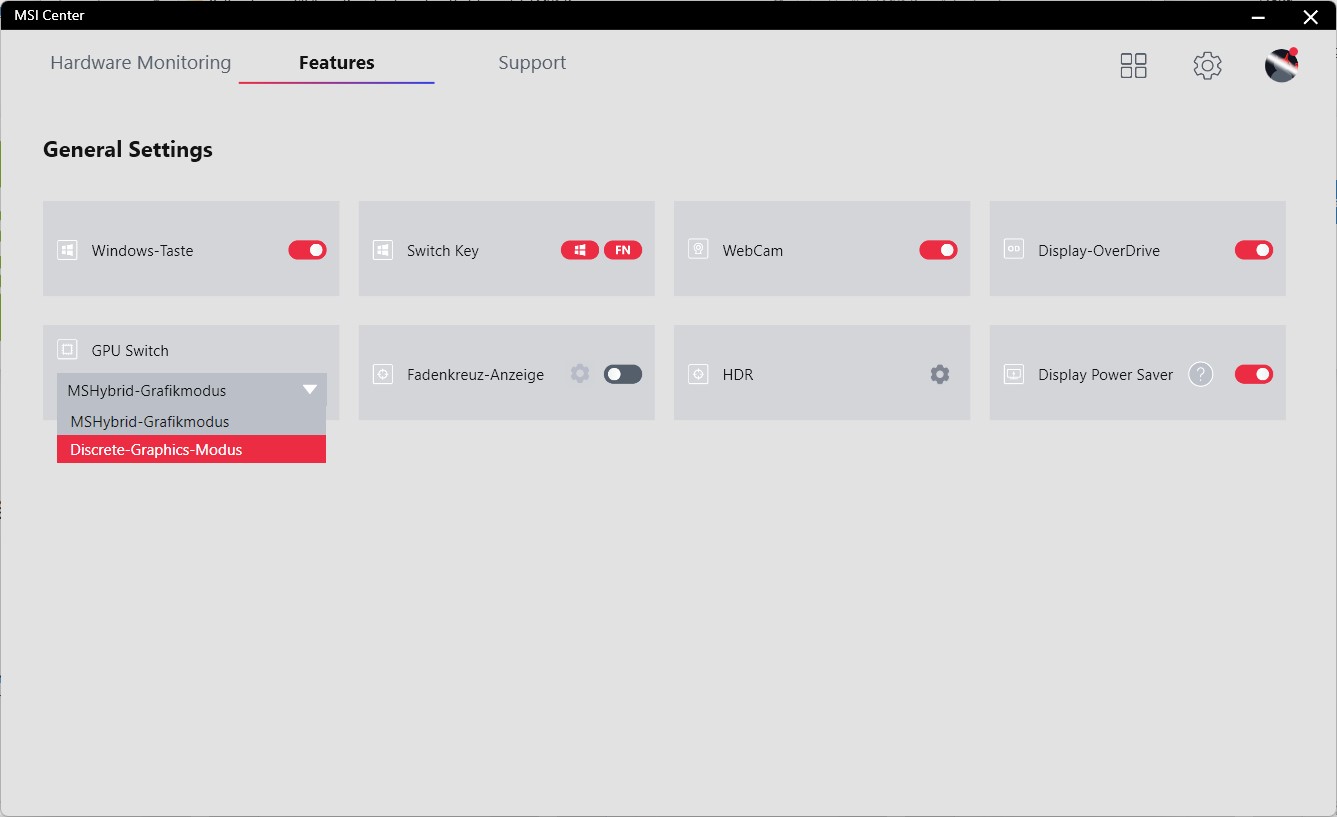
MSI Center:
O MSI Center oferece várias configurações além dos quatro modos "Performance Extrema", "Balanceado", "Silencioso" e "Super Bateria", tais como a chave MUX e uma função que permite mudar para uma taxa de atualização de 60 Hz no modo de bateria para economizar energia.
| Szenario | Silent Mode | Auto Mode | Extreme-Perf. | Bateria |
|---|---|---|---|---|
| CPU-Last | 30 Watt | 45 Watt | 70 Watt | 15 Watt |
| GPU-Last | 125 Watt | 125 Watt | 150 Watt | 35 Watt |
| Stresstestest | CPU: 30 Watt | CPU: 50 Watt | CPU: 70 Watt | |
| GPU: 35 Watt | GPU: 120 Watt | GPU: 150 Watt |
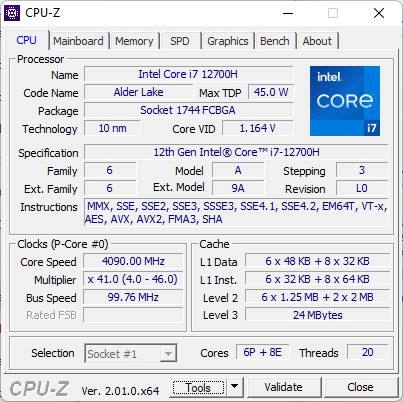
Processador
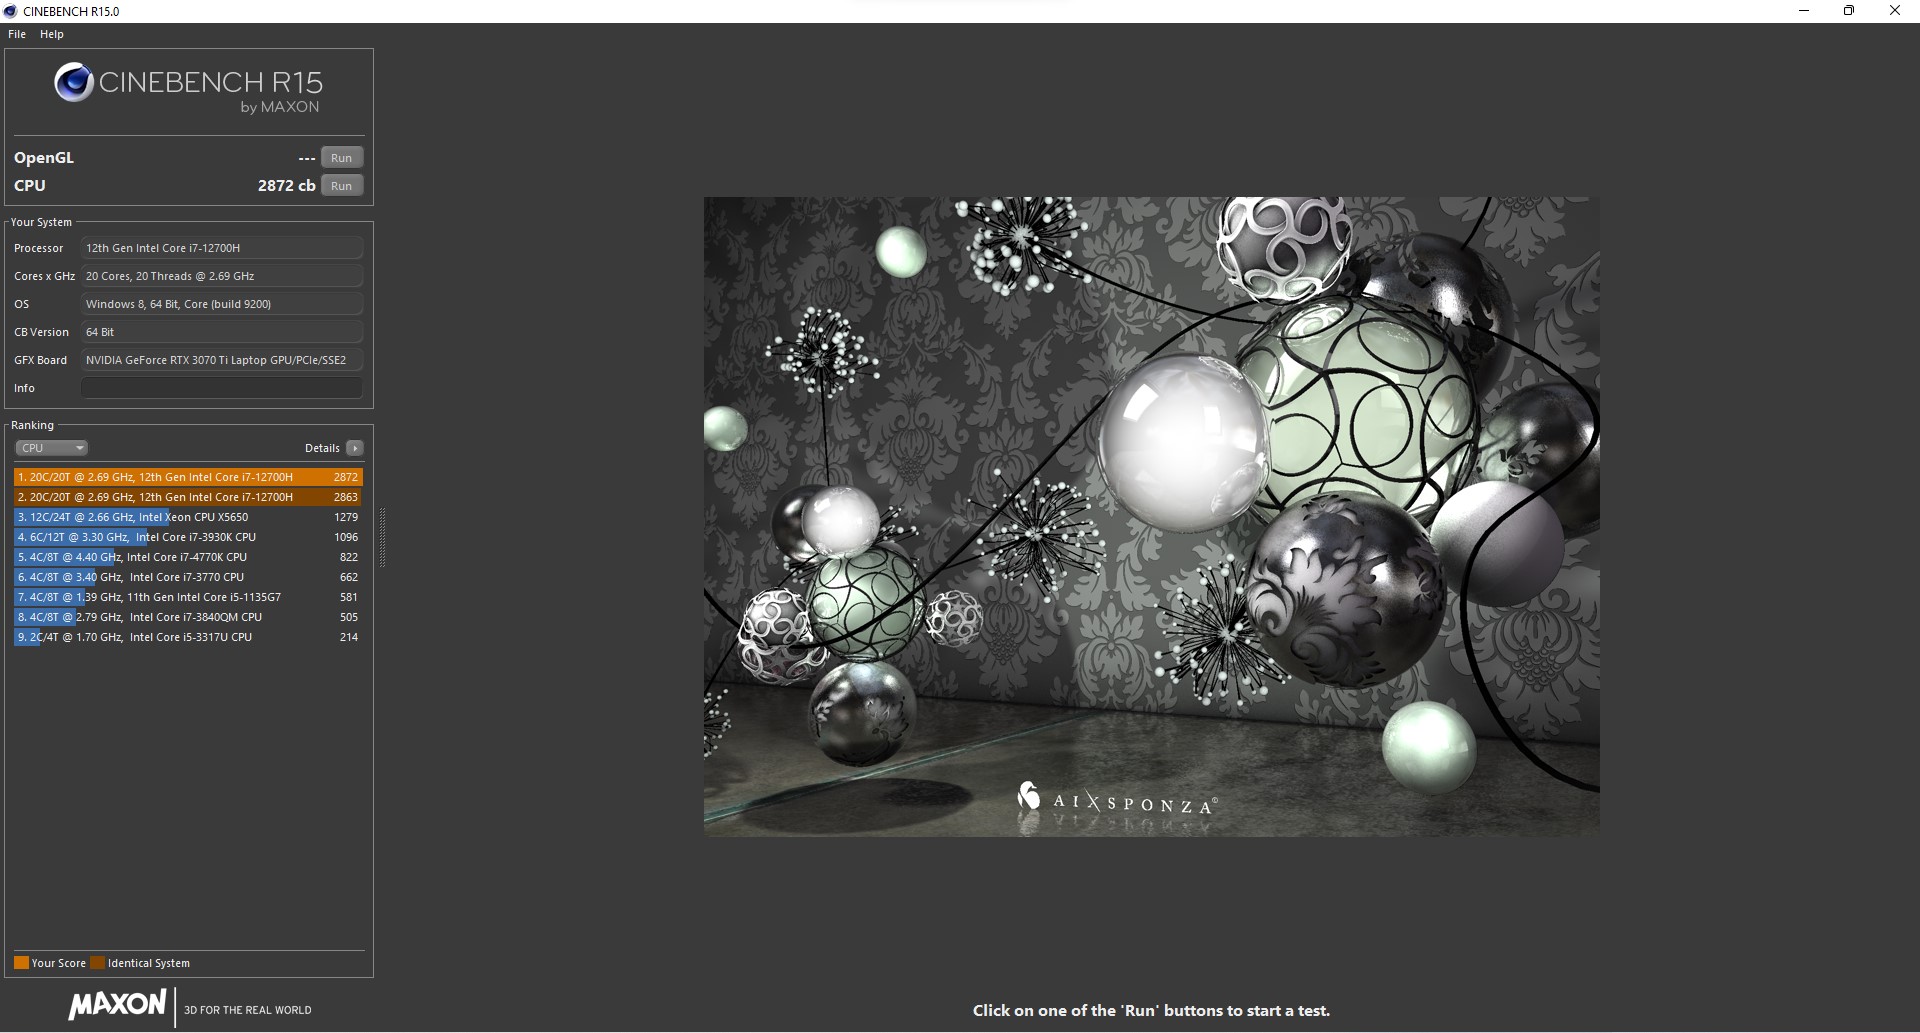
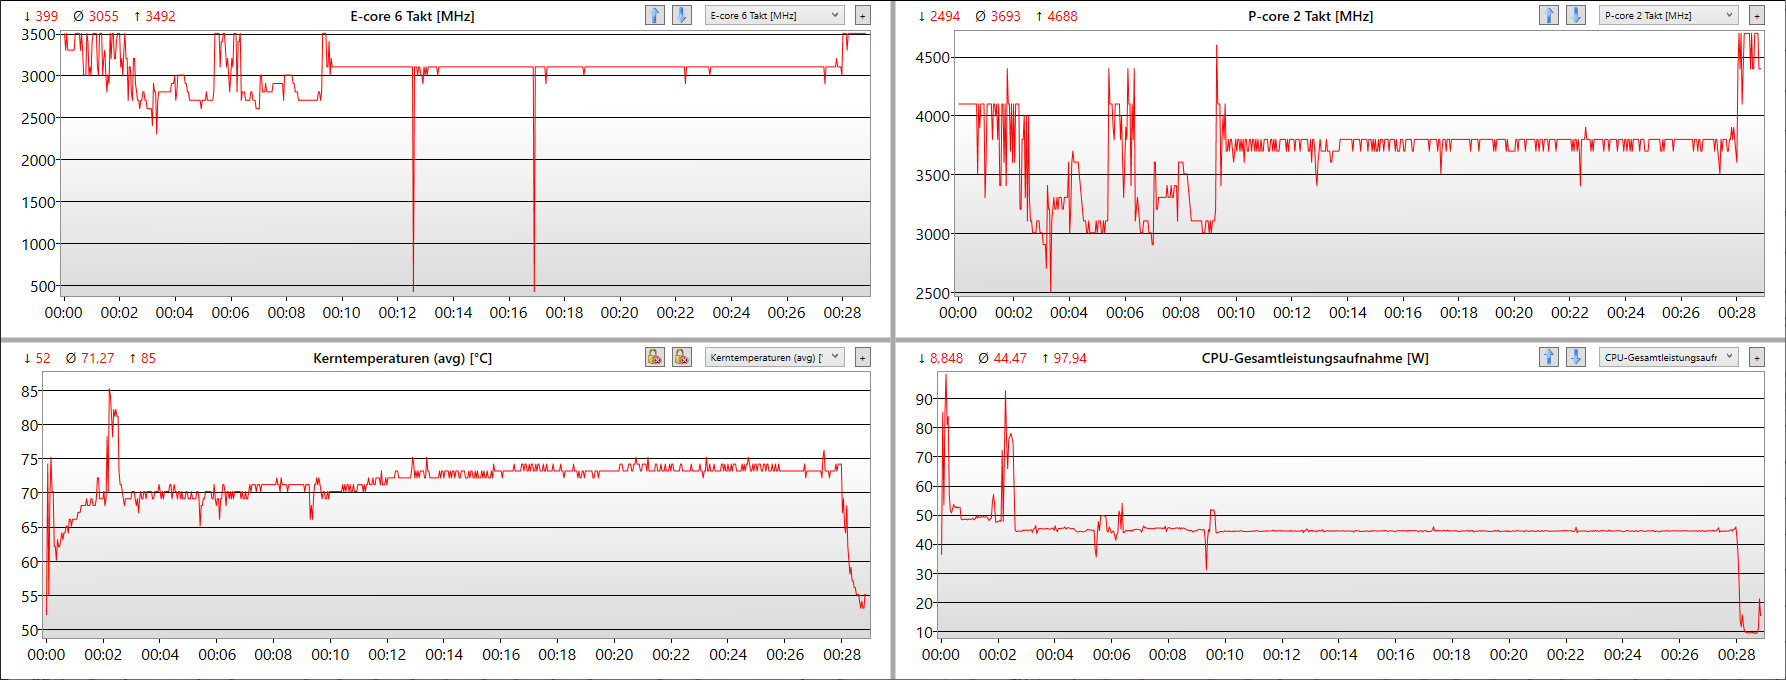
O Núcleo i7-12700Hé aproximadamente duas vezes mais rápido que seu predecessor sob carga sustentada e não é inferior ao Núcleo i9-12900H. Somente Lenovo's Legion 5 Pro é mais rápido, uma vez que não tem trava TDP e pode consumir 127 watts continuamente. O Core i7 no Vector GP76, por outro lado, está desregulado de 100 watts para 45 watts após um curto período de tempo, o que o loop Cinebench R15 mostra. O desempenho é assim reduzido em 20%.
A freqüência dos núcleos de desempenho é de 3,7 GHz estável e as temperaturas estão em território mais frio, em torno de 74°C. Em termos de carga pura do processador, o sistema de resfriamento tem muito espaço para melhorias. No modo de desempenho extremo, a CPU se trata a 70 watts, o que não melhora realmente os resultados, pelo menos não no Cinebench R15.
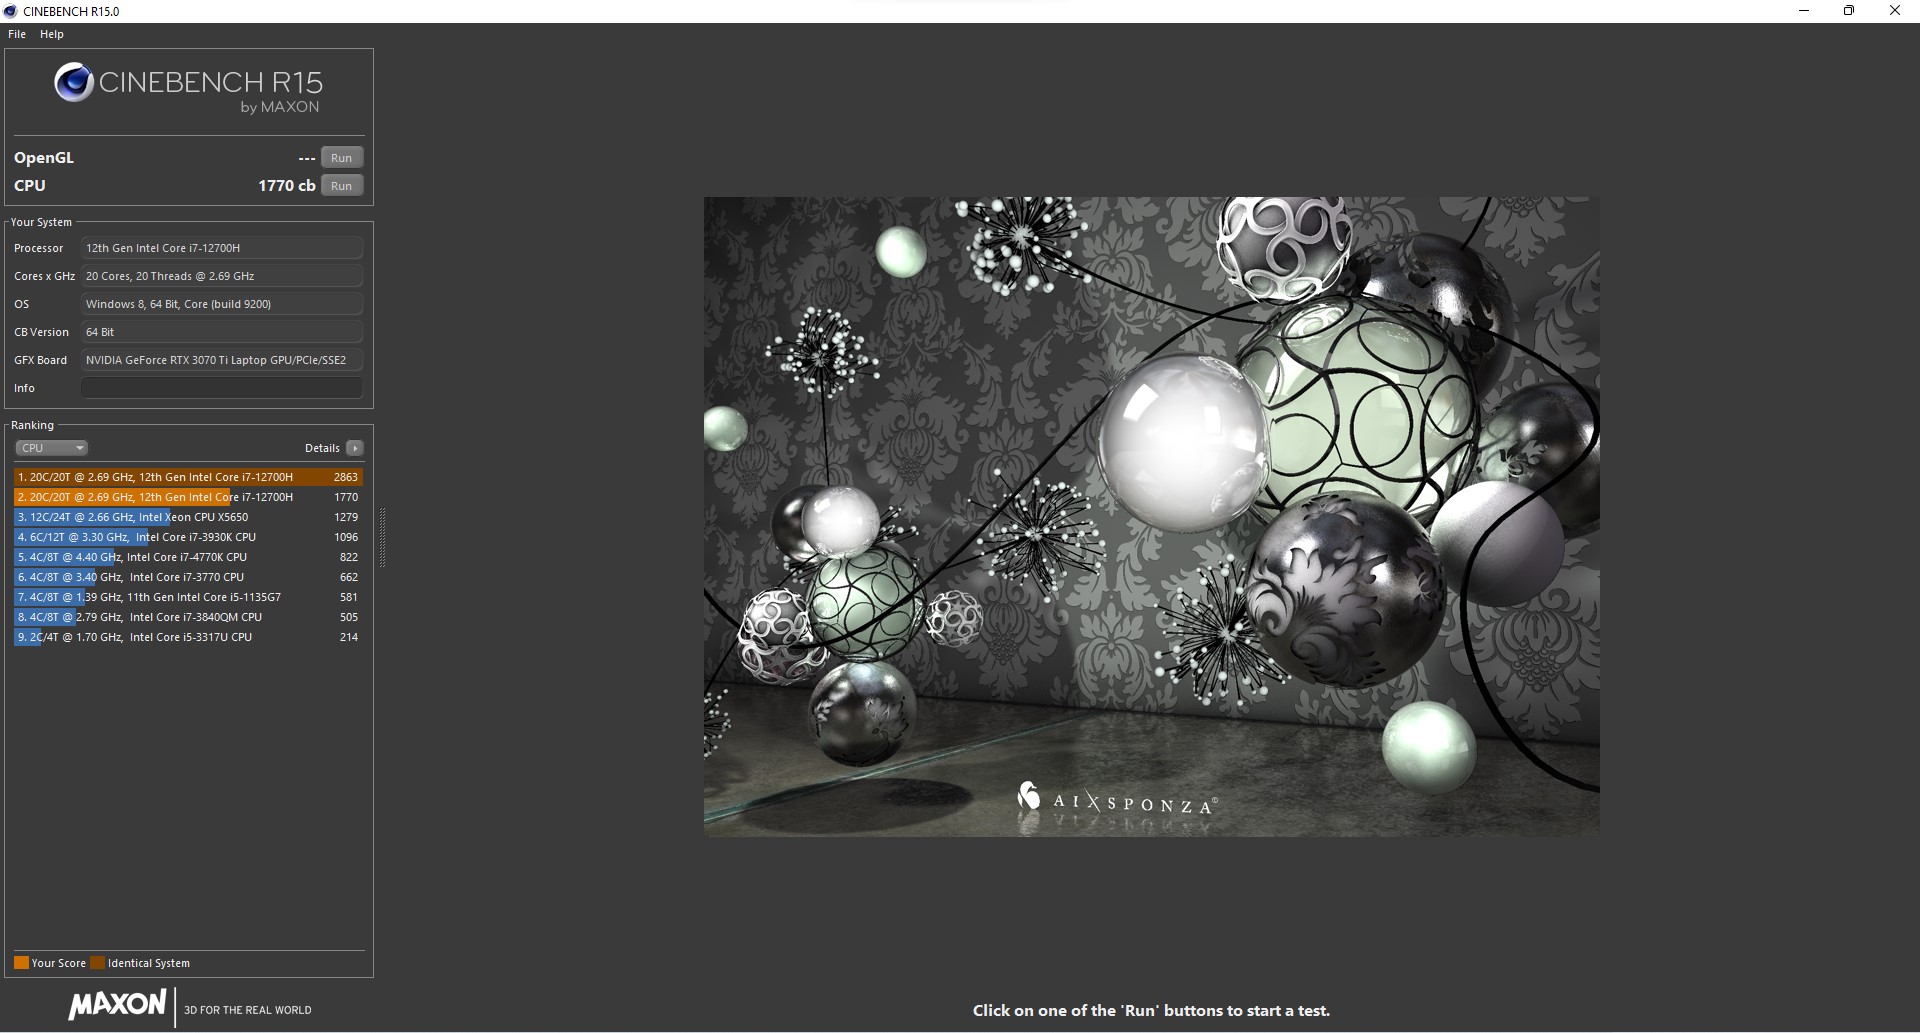
No modo de bateria, o TDP da CPU, típico para laptops com um alto TDP combinado, é severamente limitado a 15 watts. Assim, o desempenho do processador Intel cai 40% (ver capturas de tela CB15). Entretanto, isto ainda é 45% mais rápido do que o desempenho total do predecessor, e se você olhar para o valor sob carga sustentada, a perda é de apenas cerca de 25%.
As CPUs de 45 watts da AMD, tais como a Ryzen 7 5800H no Asus ROG Strix G17os sistemas de energia de bateria são geralmente um pouco mais lentos, mas dificilmente apresentam qualquer perda de desempenho quando funcionam com a bateria.
Cinebench R15 Multi Sustained Load
Cinebench R23: Multi Core | Single Core
Cinebench R20: CPU (Multi Core) | CPU (Single Core)
Cinebench R15: CPU Multi 64Bit | CPU Single 64Bit
Blender: v2.79 BMW27 CPU
7-Zip 18.03: 7z b 4 | 7z b 4 -mmt1
Geekbench 5.5: Multi-Core | Single-Core
HWBOT x265 Benchmark v2.2: 4k Preset
LibreOffice : 20 Documents To PDF
R Benchmark 2.5: Overall mean
Geekbench 5.5: OpenCL Score
| CPU Performance rating | |
| Média da turma Gaming | |
| Lenovo Legion 5 Pro 16 G7 i7 RTX 3070Ti | |
| MSI Vector GP66 12UGS | |
| MSI Vector GP76 12UGS-434 | |
| Aorus 17 XE4 | |
| Média Intel Core i7-12700H | |
| Asus ROG Zephyrus M16 GU603H -2! | |
| Schenker XMG NEO 17 GM7TG8S | |
| Asus ROG Strix G17 G713QE-RB74 -3! | |
| MSI GP76 Leopard 10UG -2! | |
| Cinebench R23 / Multi Core | |
| Média da turma Gaming (10488 - 42661, n=104, últimos 2 anos) | |
| Lenovo Legion 5 Pro 16 G7 i7 RTX 3070Ti | |
| MSI Vector GP76 12UGS-434 | |
| MSI Vector GP66 12UGS | |
| Aorus 17 XE4 | |
| Média Intel Core i7-12700H (4032 - 19330, n=64) | |
| Asus ROG Strix G17 G713QE-RB74 | |
| Schenker XMG NEO 17 GM7TG8S | |
| Cinebench R23 / Single Core | |
| Média da turma Gaming (1601 - 2415, n=104, últimos 2 anos) | |
| MSI Vector GP66 12UGS | |
| Lenovo Legion 5 Pro 16 G7 i7 RTX 3070Ti | |
| Aorus 17 XE4 | |
| MSI Vector GP76 12UGS-434 | |
| Média Intel Core i7-12700H (778 - 1826, n=63) | |
| Schenker XMG NEO 17 GM7TG8S | |
| Asus ROG Strix G17 G713QE-RB74 | |
| Cinebench R20 / CPU (Multi Core) | |
| Média da turma Gaming (4029 - 16433, n=103, últimos 2 anos) | |
| Lenovo Legion 5 Pro 16 G7 i7 RTX 3070Ti | |
| MSI Vector GP76 12UGS-434 | |
| MSI Vector GP66 12UGS | |
| Aorus 17 XE4 | |
| Média Intel Core i7-12700H (1576 - 7407, n=64) | |
| Asus ROG Zephyrus M16 GU603H | |
| Asus ROG Strix G17 G713QE-RB74 | |
| Schenker XMG NEO 17 GM7TG8S | |
| MSI GP76 Leopard 10UG | |
| Cinebench R20 / CPU (Single Core) | |
| Média da turma Gaming (622 - 913, n=103, últimos 2 anos) | |
| MSI Vector GP66 12UGS | |
| Lenovo Legion 5 Pro 16 G7 i7 RTX 3070Ti | |
| Aorus 17 XE4 | |
| MSI Vector GP76 12UGS-434 | |
| Média Intel Core i7-12700H (300 - 704, n=64) | |
| Asus ROG Zephyrus M16 GU603H | |
| Schenker XMG NEO 17 GM7TG8S | |
| Asus ROG Strix G17 G713QE-RB74 | |
| MSI GP76 Leopard 10UG | |
| Cinebench R15 / CPU Multi 64Bit | |
| Média da turma Gaming (1578 - 6330, n=102, últimos 2 anos) | |
| Lenovo Legion 5 Pro 16 G7 i7 RTX 3070Ti | |
| MSI Vector GP76 12UGS-434 | |
| Aorus 17 XE4 | |
| Média Intel Core i7-12700H (1379 - 2916, n=70) | |
| MSI Vector GP66 12UGS | |
| Asus ROG Zephyrus M16 GU603H | |
| Asus ROG Strix G17 G713QE-RB74 | |
| Schenker XMG NEO 17 GM7TG8S | |
| MSI GP76 Leopard 10UG | |
| Cinebench R15 / CPU Single 64Bit | |
| Média da turma Gaming (188.8 - 350, n=103, últimos 2 anos) | |
| MSI Vector GP66 12UGS | |
| Lenovo Legion 5 Pro 16 G7 i7 RTX 3070Ti | |
| Aorus 17 XE4 | |
| MSI Vector GP76 12UGS-434 | |
| Média Intel Core i7-12700H (113 - 263, n=65) | |
| Asus ROG Zephyrus M16 GU603H | |
| Asus ROG Strix G17 G713QE-RB74 | |
| Schenker XMG NEO 17 GM7TG8S | |
| MSI GP76 Leopard 10UG | |
| Blender / v2.79 BMW27 CPU | |
| MSI GP76 Leopard 10UG | |
| Schenker XMG NEO 17 GM7TG8S | |
| Asus ROG Zephyrus M16 GU603H | |
| Asus ROG Strix G17 G713QE-RB74 | |
| Aorus 17 XE4 | |
| Média Intel Core i7-12700H (168 - 732, n=63) | |
| MSI Vector GP76 12UGS-434 | |
| MSI Vector GP66 12UGS | |
| Lenovo Legion 5 Pro 16 G7 i7 RTX 3070Ti | |
| Média da turma Gaming (79 - 330, n=101, últimos 2 anos) | |
| 7-Zip 18.03 / 7z b 4 | |
| Média da turma Gaming (33491 - 148086, n=102, últimos 2 anos) | |
| Lenovo Legion 5 Pro 16 G7 i7 RTX 3070Ti | |
| MSI Vector GP66 12UGS | |
| MSI Vector GP76 12UGS-434 | |
| Média Intel Core i7-12700H (22844 - 73067, n=63) | |
| Aorus 17 XE4 | |
| Asus ROG Strix G17 G713QE-RB74 | |
| Asus ROG Zephyrus M16 GU603H | |
| Schenker XMG NEO 17 GM7TG8S | |
| MSI GP76 Leopard 10UG | |
| 7-Zip 18.03 / 7z b 4 -mmt1 | |
| Média da turma Gaming (4824 - 7436, n=102, últimos 2 anos) | |
| MSI Vector GP66 12UGS | |
| Aorus 17 XE4 | |
| Lenovo Legion 5 Pro 16 G7 i7 RTX 3070Ti | |
| Média Intel Core i7-12700H (2743 - 5972, n=63) | |
| Asus ROG Zephyrus M16 GU603H | |
| Asus ROG Strix G17 G713QE-RB74 | |
| Schenker XMG NEO 17 GM7TG8S | |
| MSI Vector GP76 12UGS-434 | |
| MSI GP76 Leopard 10UG | |
| Geekbench 5.5 / Multi-Core | |
| Média da turma Gaming (6460 - 28263, n=102, últimos 2 anos) | |
| Lenovo Legion 5 Pro 16 G7 i7 RTX 3070Ti | |
| MSI Vector GP66 12UGS | |
| Aorus 17 XE4 | |
| MSI Vector GP76 12UGS-434 | |
| Média Intel Core i7-12700H (5144 - 13745, n=64) | |
| Asus ROG Zephyrus M16 GU603H | |
| Schenker XMG NEO 17 GM7TG8S | |
| MSI GP76 Leopard 10UG | |
| Geekbench 5.5 / Single-Core | |
| Média da turma Gaming (1403 - 2474, n=102, últimos 2 anos) | |
| MSI Vector GP66 12UGS | |
| Aorus 17 XE4 | |
| MSI Vector GP76 12UGS-434 | |
| Lenovo Legion 5 Pro 16 G7 i7 RTX 3070Ti | |
| Média Intel Core i7-12700H (803 - 1851, n=64) | |
| Asus ROG Zephyrus M16 GU603H | |
| Schenker XMG NEO 17 GM7TG8S | |
| MSI GP76 Leopard 10UG | |
| HWBOT x265 Benchmark v2.2 / 4k Preset | |
| Média da turma Gaming (11.5 - 44.4, n=102, últimos 2 anos) | |
| Lenovo Legion 5 Pro 16 G7 i7 RTX 3070Ti | |
| MSI Vector GP66 12UGS | |
| MSI Vector GP76 12UGS-434 | |
| Média Intel Core i7-12700H (4.67 - 21.8, n=64) | |
| Aorus 17 XE4 | |
| Asus ROG Zephyrus M16 GU603H | |
| Asus ROG Strix G17 G713QE-RB74 | |
| Schenker XMG NEO 17 GM7TG8S | |
| MSI GP76 Leopard 10UG | |
| LibreOffice / 20 Documents To PDF | |
| Asus ROG Strix G17 G713QE-RB74 | |
| MSI GP76 Leopard 10UG | |
| Média da turma Gaming (33.2 - 88.8, n=102, últimos 2 anos) | |
| Média Intel Core i7-12700H (34.2 - 95.3, n=63) | |
| MSI Vector GP76 12UGS-434 | |
| Lenovo Legion 5 Pro 16 G7 i7 RTX 3070Ti | |
| Asus ROG Zephyrus M16 GU603H | |
| MSI Vector GP66 12UGS | |
| Schenker XMG NEO 17 GM7TG8S | |
| Aorus 17 XE4 | |
| R Benchmark 2.5 / Overall mean | |
| MSI GP76 Leopard 10UG | |
| Schenker XMG NEO 17 GM7TG8S | |
| Asus ROG Zephyrus M16 GU603H | |
| Asus ROG Strix G17 G713QE-RB74 | |
| Média Intel Core i7-12700H (0.4441 - 1.052, n=63) | |
| MSI Vector GP76 12UGS-434 | |
| Aorus 17 XE4 | |
| Lenovo Legion 5 Pro 16 G7 i7 RTX 3070Ti | |
| Média da turma Gaming (0.3439 - 0.59, n=102, últimos 2 anos) | |
| MSI Vector GP66 12UGS | |
| Geekbench 5.5 / OpenCL Score | |
| Média da turma Gaming (80702 - 277970, n=98, últimos 2 anos) | |
| Aorus 17 XE4 | |
| Schenker XMG NEO 17 GM7TG8S | |
| Lenovo Legion 5 Pro 16 G7 i7 RTX 3070Ti | |
| MSI Vector GP76 12UGS-434 | |
| MSI Vector GP66 12UGS | |
| Asus ROG Zephyrus M16 GU603H | |
| MSI GP76 Leopard 10UG | |
| Média Intel Core i7-12700H (13944 - 148757, n=62) | |
* ... menor é melhor
AIDA64: FP32 Ray-Trace | FPU Julia | CPU SHA3 | CPU Queen | FPU SinJulia | FPU Mandel | CPU AES | CPU ZLib | FP64 Ray-Trace | CPU PhotoWorxx
| Performance rating | |
| Média da turma Gaming | |
| Asus ROG Strix G17 G713QE-RB74 | |
| Lenovo Legion 5 Pro 16 G7 i7 RTX 3070Ti | |
| Média Intel Core i7-12700H | |
| MSI Vector GP76 12UGS-434 | |
| MSI Vector GP66 12UGS | |
| Aorus 17 XE4 | |
| MSI GP76 Leopard 10UG | |
| AIDA64 / FP32 Ray-Trace | |
| Média da turma Gaming (10227 - 85542, n=102, últimos 2 anos) | |
| Asus ROG Strix G17 G713QE-RB74 | |
| Média Intel Core i7-12700H (2585 - 17957, n=64) | |
| Lenovo Legion 5 Pro 16 G7 i7 RTX 3070Ti | |
| MSI GP76 Leopard 10UG | |
| MSI Vector GP66 12UGS | |
| MSI Vector GP76 12UGS-434 | |
| Aorus 17 XE4 | |
| AIDA64 / FPU Julia | |
| Média da turma Gaming (51376 - 372155, n=102, últimos 2 anos) | |
| Asus ROG Strix G17 G713QE-RB74 | |
| Média Intel Core i7-12700H (12439 - 90760, n=64) | |
| MSI GP76 Leopard 10UG | |
| Lenovo Legion 5 Pro 16 G7 i7 RTX 3070Ti | |
| MSI Vector GP76 12UGS-434 | |
| MSI Vector GP66 12UGS | |
| Aorus 17 XE4 | |
| AIDA64 / CPU SHA3 | |
| Média da turma Gaming (2180 - 10115, n=102, últimos 2 anos) | |
| Lenovo Legion 5 Pro 16 G7 i7 RTX 3070Ti | |
| MSI Vector GP76 12UGS-434 | |
| Asus ROG Strix G17 G713QE-RB74 | |
| Média Intel Core i7-12700H (833 - 4242, n=64) | |
| MSI Vector GP66 12UGS | |
| Aorus 17 XE4 | |
| MSI GP76 Leopard 10UG | |
| AIDA64 / CPU Queen | |
| Média da turma Gaming (49785 - 173351, n=86, últimos 2 anos) | |
| MSI Vector GP66 12UGS | |
| Aorus 17 XE4 | |
| Lenovo Legion 5 Pro 16 G7 i7 RTX 3070Ti | |
| Média Intel Core i7-12700H (57923 - 103202, n=63) | |
| MSI Vector GP76 12UGS-434 | |
| Asus ROG Strix G17 G713QE-RB74 | |
| MSI GP76 Leopard 10UG | |
| AIDA64 / FPU SinJulia | |
| Média da turma Gaming (4424 - 33636, n=102, últimos 2 anos) | |
| Asus ROG Strix G17 G713QE-RB74 | |
| Lenovo Legion 5 Pro 16 G7 i7 RTX 3070Ti | |
| MSI Vector GP76 12UGS-434 | |
| MSI Vector GP66 12UGS | |
| Média Intel Core i7-12700H (3249 - 9939, n=64) | |
| Aorus 17 XE4 | |
| MSI GP76 Leopard 10UG | |
| AIDA64 / FPU Mandel | |
| Média da turma Gaming (25115 - 196829, n=102, últimos 2 anos) | |
| Asus ROG Strix G17 G713QE-RB74 | |
| Média Intel Core i7-12700H (7135 - 44760, n=64) | |
| Lenovo Legion 5 Pro 16 G7 i7 RTX 3070Ti | |
| MSI Vector GP66 12UGS | |
| MSI GP76 Leopard 10UG | |
| MSI Vector GP76 12UGS-434 | |
| Aorus 17 XE4 | |
| AIDA64 / CPU AES | |
| Asus ROG Strix G17 G713QE-RB74 | |
| Média da turma Gaming (39258 - 247074, n=102, últimos 2 anos) | |
| Lenovo Legion 5 Pro 16 G7 i7 RTX 3070Ti | |
| MSI Vector GP76 12UGS-434 | |
| MSI Vector GP66 12UGS | |
| Média Intel Core i7-12700H (31839 - 144360, n=64) | |
| Aorus 17 XE4 | |
| MSI GP76 Leopard 10UG | |
| AIDA64 / CPU ZLib | |
| Média da turma Gaming (574 - 2531, n=102, últimos 2 anos) | |
| Lenovo Legion 5 Pro 16 G7 i7 RTX 3070Ti | |
| MSI Vector GP76 12UGS-434 | |
| MSI Vector GP66 12UGS | |
| Média Intel Core i7-12700H (305 - 1171, n=64) | |
| Aorus 17 XE4 | |
| Asus ROG Strix G17 G713QE-RB74 | |
| MSI GP76 Leopard 10UG | |
| AIDA64 / FP64 Ray-Trace | |
| Média da turma Gaming (5509 - 45446, n=102, últimos 2 anos) | |
| Asus ROG Strix G17 G713QE-RB74 | |
| Média Intel Core i7-12700H (1437 - 9692, n=64) | |
| Lenovo Legion 5 Pro 16 G7 i7 RTX 3070Ti | |
| MSI GP76 Leopard 10UG | |
| MSI Vector GP66 12UGS | |
| MSI Vector GP76 12UGS-434 | |
| Aorus 17 XE4 | |
| AIDA64 / CPU PhotoWorxx | |
| Média da turma Gaming (12271 - 89891, n=102, últimos 2 anos) | |
| Lenovo Legion 5 Pro 16 G7 i7 RTX 3070Ti | |
| Média Intel Core i7-12700H (12863 - 52207, n=64) | |
| MSI Vector GP66 12UGS | |
| MSI Vector GP76 12UGS-434 | |
| Aorus 17 XE4 | |
| MSI GP76 Leopard 10UG | |
| Asus ROG Strix G17 G713QE-RB74 | |
Desempenho do sistema
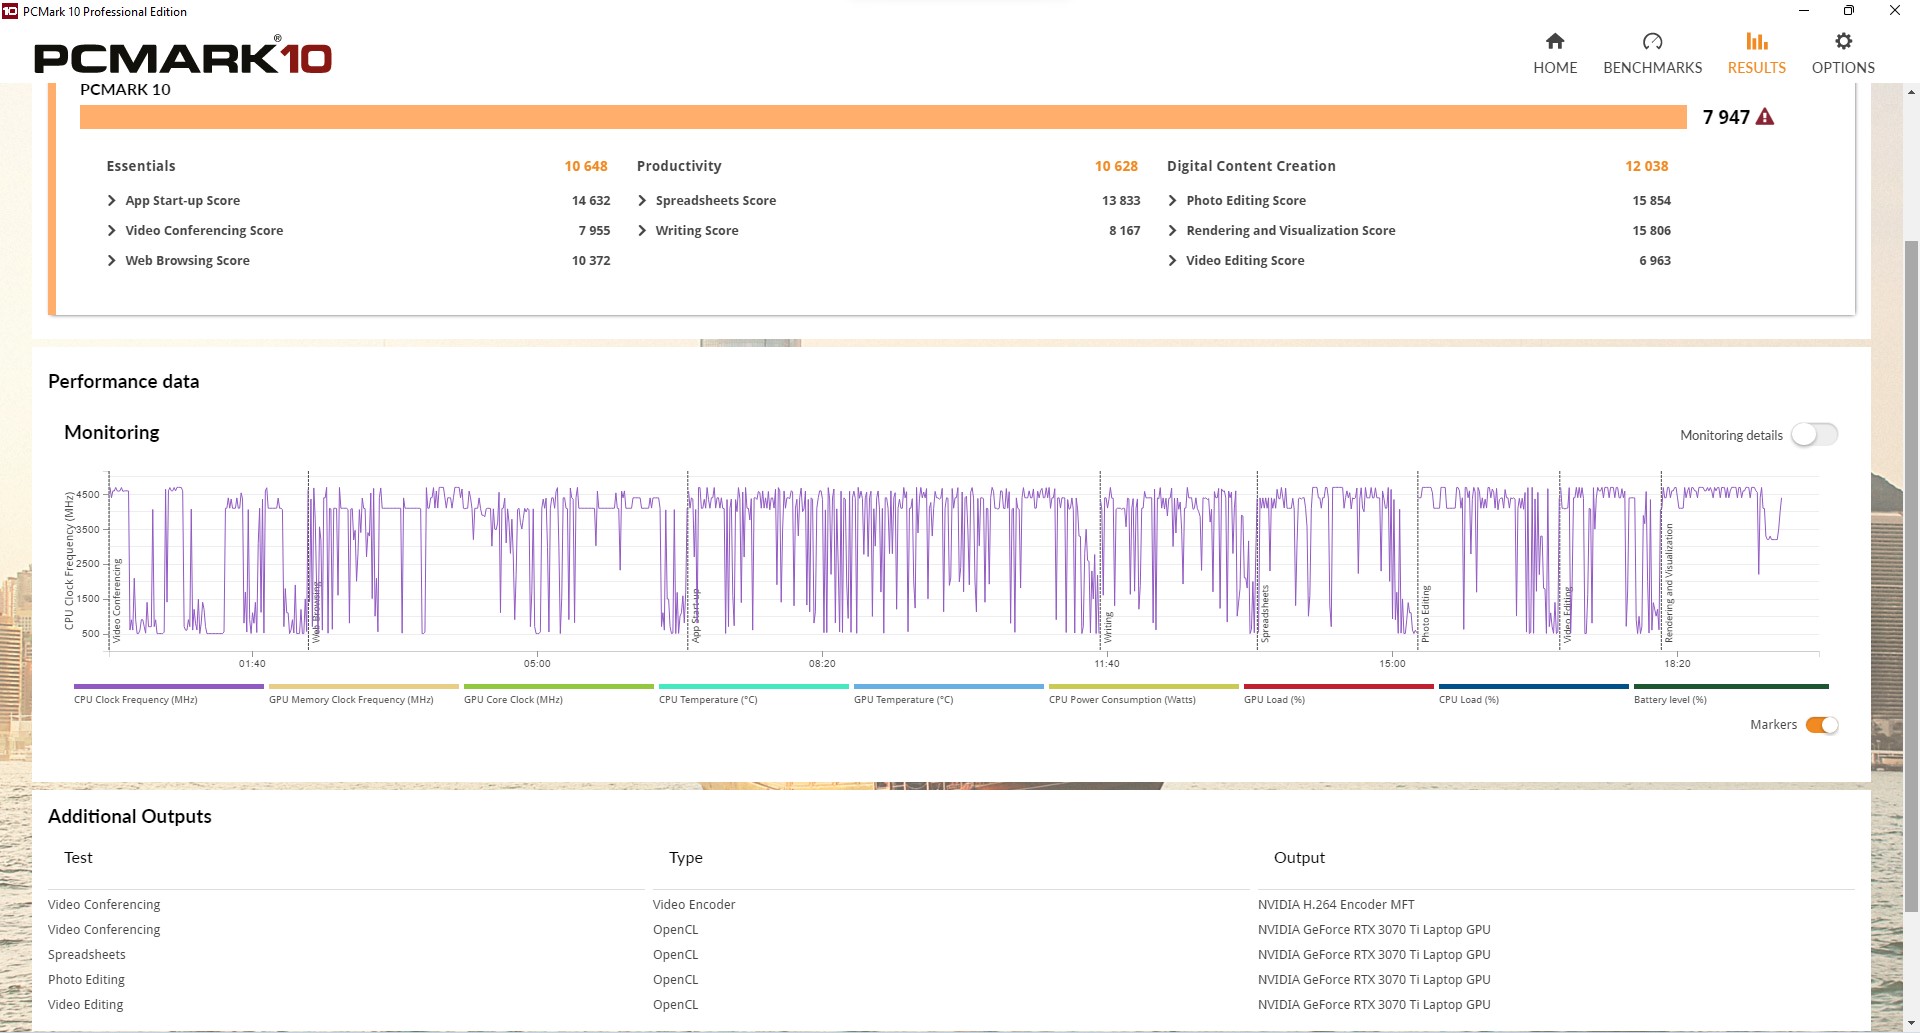
Aqui, nosso dispositivo de revisão está bem no topo; na verdade, quase não há melhor resultado em todo o nosso banco de dados. O predecessor tem um desempenho superior em 33%. Os programas abrem imediatamente, assim como as múltiplas abas do navegador.
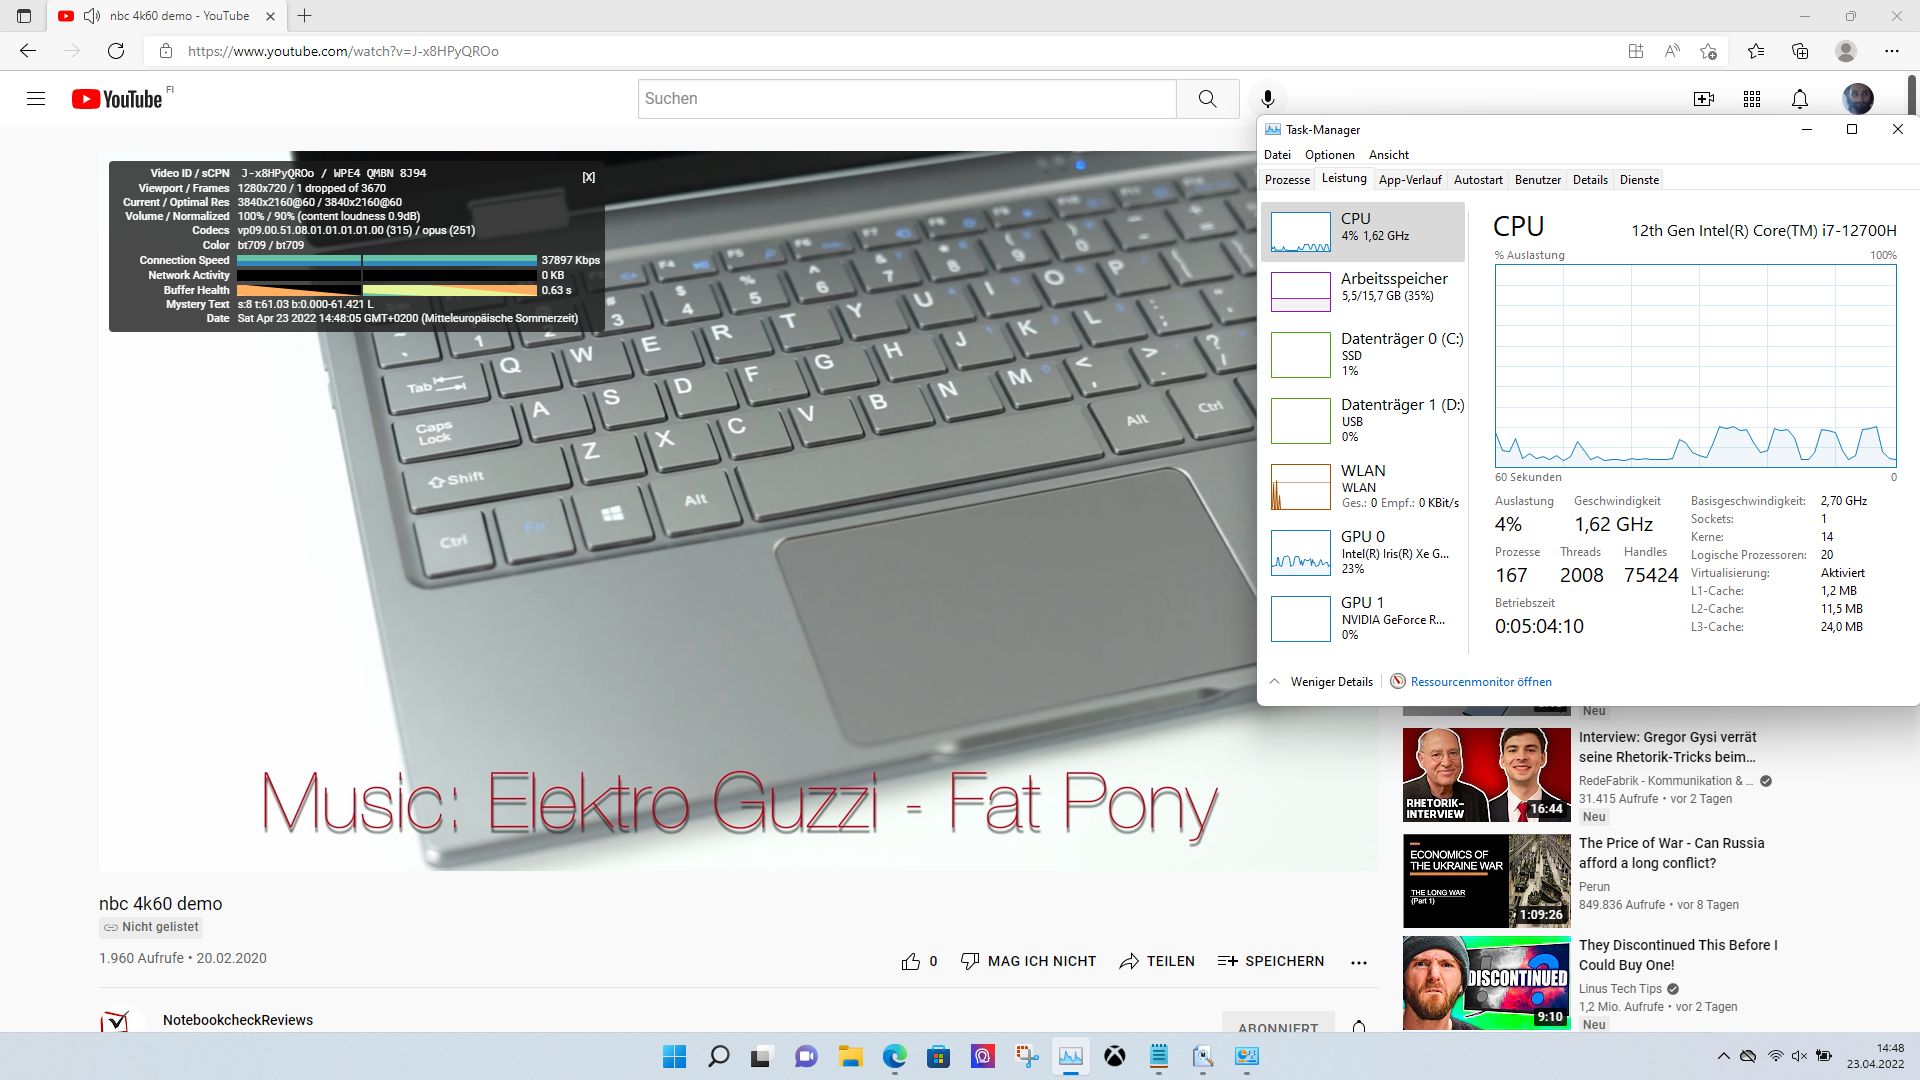
O painel de 360 Hz contribui definitivamente para um sistema de alta capacidade de resposta. a reprodução do 4K YouTube também requer muito poucos recursos da CPU
CrossMark: Overall | Productivity | Creativity | Responsiveness
| PCMark 10 / Score | |
| Média da turma Gaming (5828 - 12414, n=93, últimos 2 anos) | |
| MSI Vector GP66 12UGS | |
| MSI Vector GP76 12UGS-434 | |
| Aorus 17 XE4 | |
| Lenovo Legion 5 Pro 16 G7 i7 RTX 3070Ti | |
| Média Intel Core i7-12700H, NVIDIA GeForce RTX 3070 Ti Laptop GPU (6941 - 7947, n=11) | |
| Schenker XMG NEO 17 GM7TG8S | |
| Asus ROG Zephyrus M16 GU603H | |
| Asus ROG Strix G17 G713QE-RB74 | |
| MSI GP76 Leopard 10UG | |
| PCMark 10 / Essentials | |
| MSI Vector GP66 12UGS | |
| Aorus 17 XE4 | |
| Média da turma Gaming (8810 - 11935, n=97, últimos 2 anos) | |
| MSI Vector GP76 12UGS-434 | |
| Asus ROG Zephyrus M16 GU603H | |
| Média Intel Core i7-12700H, NVIDIA GeForce RTX 3070 Ti Laptop GPU (9892 - 10935, n=11) | |
| Schenker XMG NEO 17 GM7TG8S | |
| Asus ROG Strix G17 G713QE-RB74 | |
| Lenovo Legion 5 Pro 16 G7 i7 RTX 3070Ti | |
| MSI GP76 Leopard 10UG | |
| PCMark 10 / Productivity | |
| Média da turma Gaming (6845 - 25323, n=95, últimos 2 anos) | |
| MSI Vector GP76 12UGS-434 | |
| MSI Vector GP66 12UGS | |
| Lenovo Legion 5 Pro 16 G7 i7 RTX 3070Ti | |
| Aorus 17 XE4 | |
| Média Intel Core i7-12700H, NVIDIA GeForce RTX 3070 Ti Laptop GPU (9024 - 10638, n=11) | |
| Schenker XMG NEO 17 GM7TG8S | |
| Asus ROG Strix G17 G713QE-RB74 | |
| Asus ROG Zephyrus M16 GU603H | |
| MSI GP76 Leopard 10UG | |
| PCMark 10 / Digital Content Creation | |
| Média da turma Gaming (7602 - 19954, n=95, últimos 2 anos) | |
| MSI Vector GP66 12UGS | |
| MSI Vector GP76 12UGS-434 | |
| Lenovo Legion 5 Pro 16 G7 i7 RTX 3070Ti | |
| Aorus 17 XE4 | |
| Média Intel Core i7-12700H, NVIDIA GeForce RTX 3070 Ti Laptop GPU (10165 - 12546, n=11) | |
| Schenker XMG NEO 17 GM7TG8S | |
| Asus ROG Zephyrus M16 GU603H | |
| Asus ROG Strix G17 G713QE-RB74 | |
| MSI GP76 Leopard 10UG | |
| CrossMark / Overall | |
| Aorus 17 XE4 | |
| Média da turma Gaming (1366 - 2409, n=94, últimos 2 anos) | |
| MSI Vector GP76 12UGS-434 | |
| Lenovo Legion 5 Pro 16 G7 i7 RTX 3070Ti | |
| Média Intel Core i7-12700H, NVIDIA GeForce RTX 3070 Ti Laptop GPU (974 - 2000, n=12) | |
| CrossMark / Productivity | |
| Aorus 17 XE4 | |
| MSI Vector GP76 12UGS-434 | |
| Lenovo Legion 5 Pro 16 G7 i7 RTX 3070Ti | |
| Média da turma Gaming (1386 - 2254, n=94, últimos 2 anos) | |
| Média Intel Core i7-12700H, NVIDIA GeForce RTX 3070 Ti Laptop GPU (907 - 1962, n=12) | |
| CrossMark / Creativity | |
| Média da turma Gaming (1343 - 2786, n=94, últimos 2 anos) | |
| Lenovo Legion 5 Pro 16 G7 i7 RTX 3070Ti | |
| Aorus 17 XE4 | |
| MSI Vector GP76 12UGS-434 | |
| Média Intel Core i7-12700H, NVIDIA GeForce RTX 3070 Ti Laptop GPU (1027 - 2057, n=12) | |
| CrossMark / Responsiveness | |
| Aorus 17 XE4 | |
| MSI Vector GP76 12UGS-434 | |
| Lenovo Legion 5 Pro 16 G7 i7 RTX 3070Ti | |
| Média Intel Core i7-12700H, NVIDIA GeForce RTX 3070 Ti Laptop GPU (1029 - 2142, n=12) | |
| Média da turma Gaming (1226 - 2334, n=94, últimos 2 anos) | |
| PCMark 10 Score | 7947 pontos | |
Ajuda | ||
| AIDA64 / Memory Copy | |
| Média da turma Gaming (21750 - 129946, n=102, últimos 2 anos) | |
| Média Intel Core i7-12700H (25615 - 80511, n=64) | |
| Lenovo Legion 5 Pro 16 G7 i7 RTX 3070Ti | |
| MSI Vector GP66 12UGS | |
| Aorus 17 XE4 | |
| MSI Vector GP76 12UGS-434 | |
| Asus ROG Strix G17 G713QE-RB74 | |
| MSI GP76 Leopard 10UG | |
| AIDA64 / Memory Read | |
| Média da turma Gaming (22956 - 118858, n=102, últimos 2 anos) | |
| Lenovo Legion 5 Pro 16 G7 i7 RTX 3070Ti | |
| Média Intel Core i7-12700H (25586 - 79442, n=64) | |
| MSI Vector GP66 12UGS | |
| Aorus 17 XE4 | |
| MSI Vector GP76 12UGS-434 | |
| Asus ROG Strix G17 G713QE-RB74 | |
| MSI GP76 Leopard 10UG | |
| AIDA64 / Memory Write | |
| Média da turma Gaming (22297 - 135096, n=102, últimos 2 anos) | |
| Lenovo Legion 5 Pro 16 G7 i7 RTX 3070Ti | |
| Média Intel Core i7-12700H (23679 - 88660, n=64) | |
| MSI Vector GP76 12UGS-434 | |
| MSI Vector GP66 12UGS | |
| Aorus 17 XE4 | |
| MSI GP76 Leopard 10UG | |
| Asus ROG Strix G17 G713QE-RB74 | |
| AIDA64 / Memory Latency | |
| Média da turma Gaming (75.3 - 165.4, n=102, últimos 2 anos) | |
| Lenovo Legion 5 Pro 16 G7 i7 RTX 3070Ti | |
| MSI Vector GP76 12UGS-434 | |
| Aorus 17 XE4 | |
| MSI Vector GP66 12UGS | |
| Asus ROG Strix G17 G713QE-RB74 | |
| Média Intel Core i7-12700H (76.2 - 133.9, n=62) | |
| MSI GP76 Leopard 10UG | |
| Asus ROG Zephyrus M16 GU603H | |
| Schenker XMG NEO 17 GM7TG8S | |
* ... menor é melhor
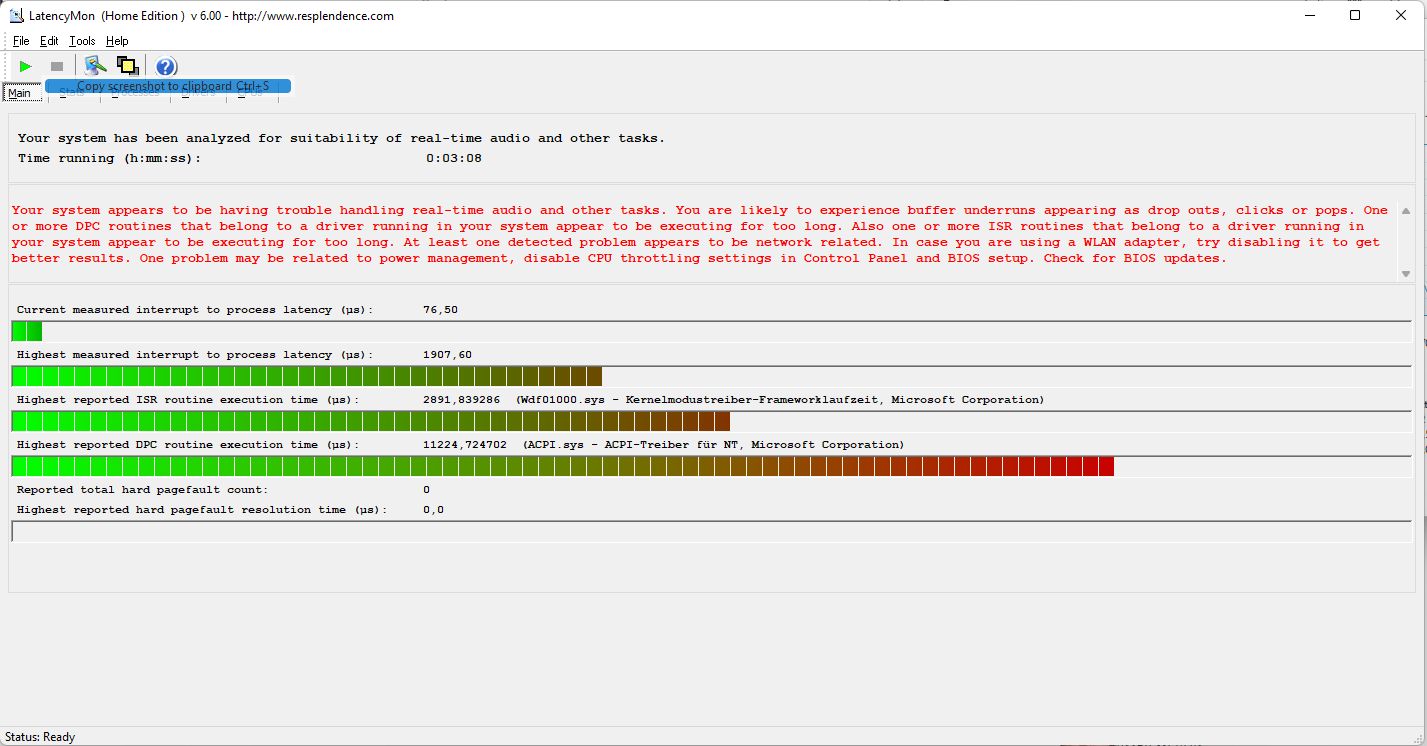
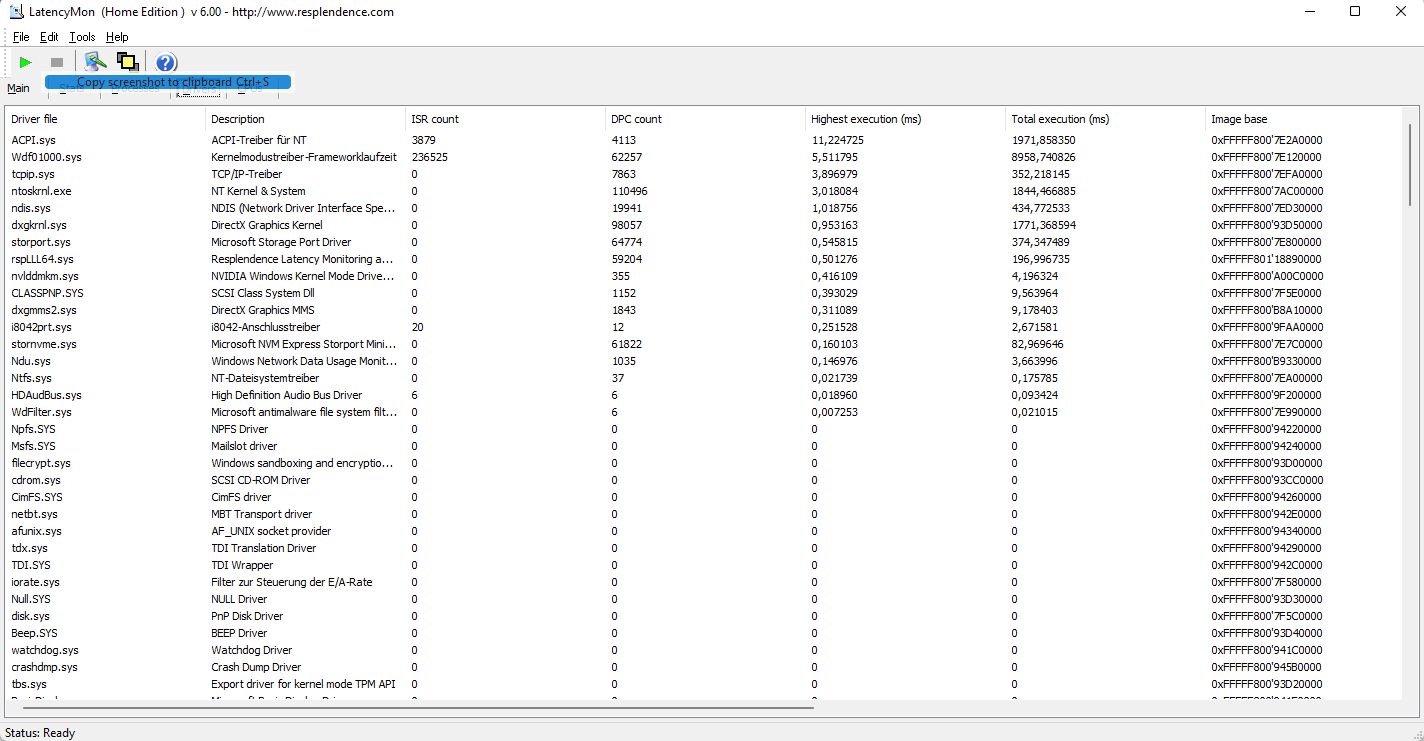
Latências DPC
As latências DPC mostram o atraso da entrada à exibição: o sistema aqui se mostra inadequado para edição de vídeo e áudio em tempo real porque as latências são muito altas com um atraso de 1.907ms. O motorista da ACPI é o culpado aqui. No entanto, isto pode ser melhorado após uma atualização da BIOS.
Felizmente, não houve queda de quadros durante a reprodução do YouTube 4K e a carga da CPU permaneceu baixa. Entretanto, a GPU Intel integrada permanece um pouco ocupada com uma carga de 23%.
| DPC Latencies / LatencyMon - interrupt to process latency (max), Web, Youtube, Prime95 | |
| Schenker XMG NEO 17 GM7TG8S | |
| MSI Vector GP66 12UGS | |
| MSI Vector GP76 12UGS-434 | |
| Aorus 17 XE4 | |
| MSI GP76 Leopard 10UG | |
| Asus ROG Strix G17 G713QE-RB74 | |
| Asus ROG Zephyrus M16 GU603H | |
| Lenovo Legion 5 Pro 16 G7 i7 RTX 3070Ti | |
* ... menor é melhor
Dispositivos de armazenamento
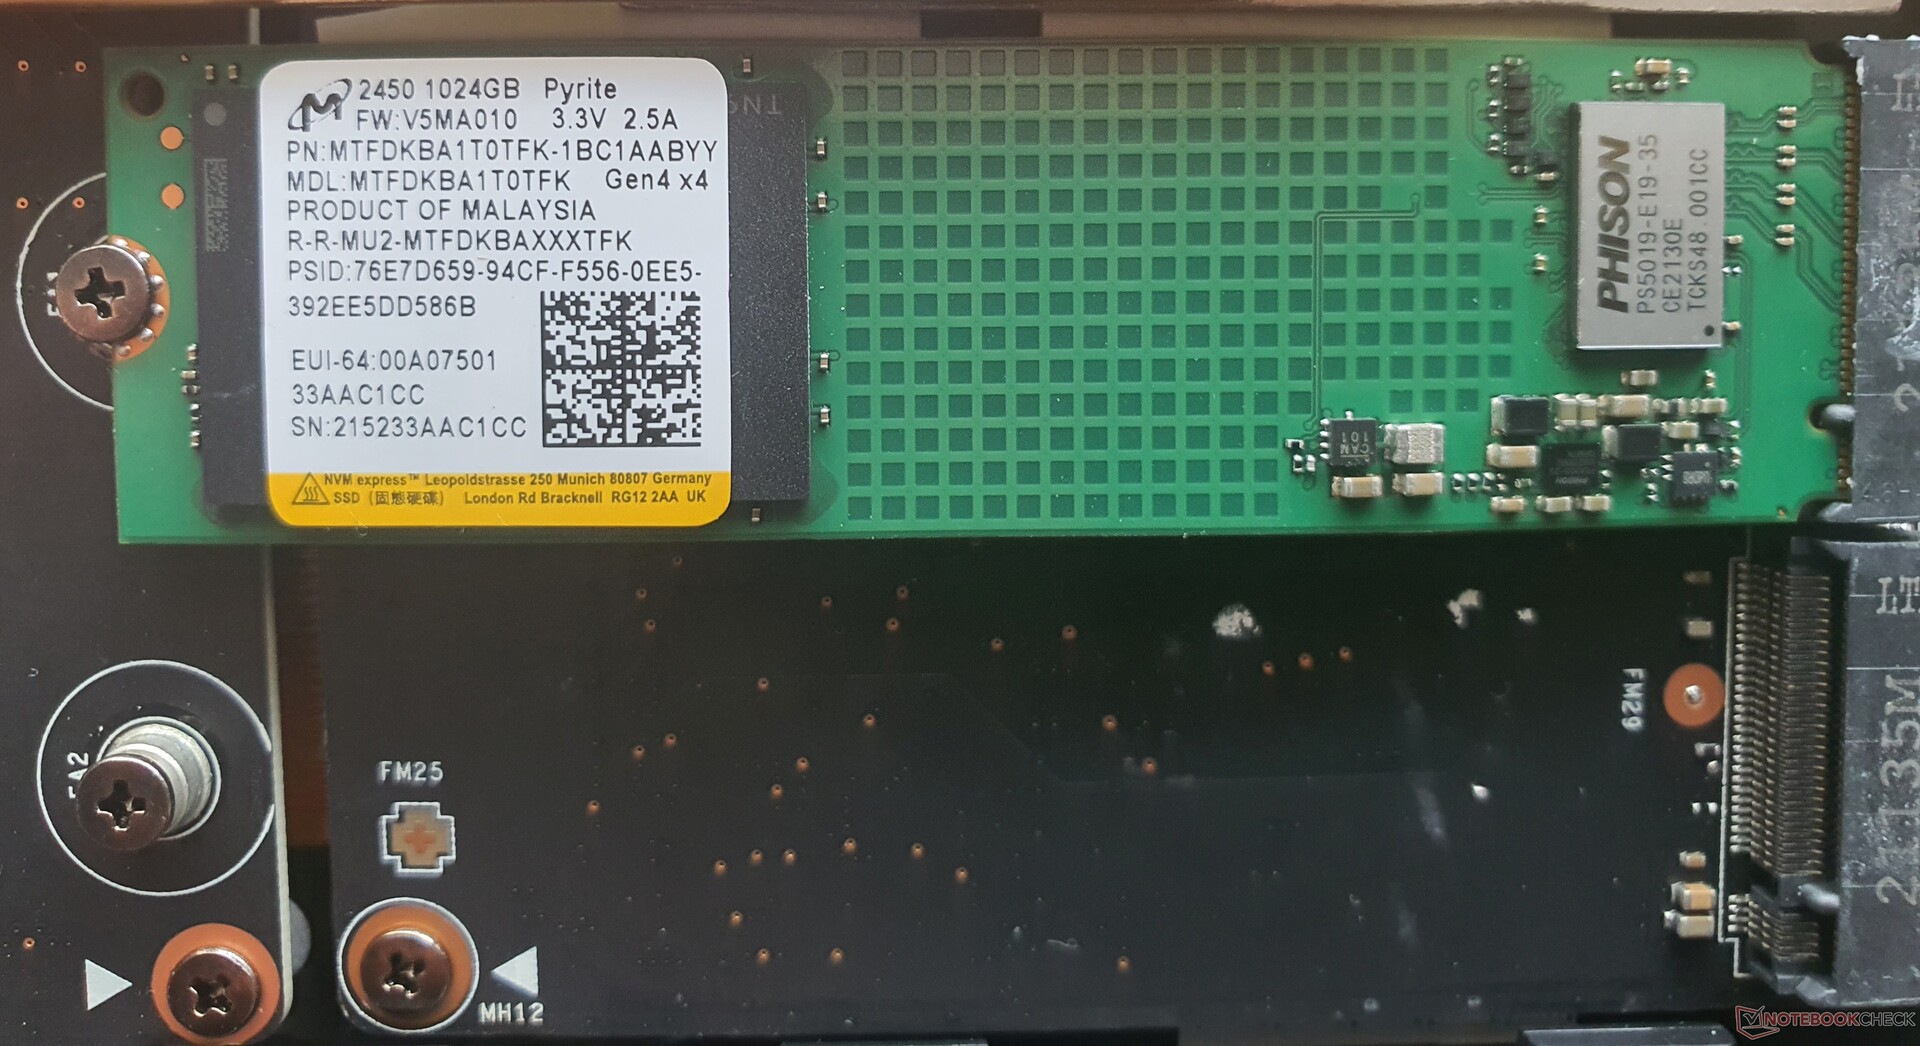
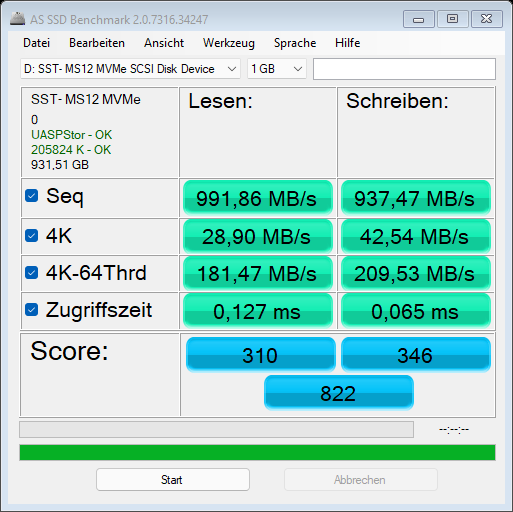
O SSD 1 TB M.2 2280 NVMe da Micron utiliza a mais recente norma PCIe4x4, mas isto deve ser visto como um SSD de orçamento que só atinge velocidades PCIe 3.0.
No entanto, dois discos rígidos mais rápidos podem ser montados posteriormente e também em configuração RAID (0,1). O campo de comparação oferece SSDs mais rápidos, mas pelo menos o predecessor é claramente superado.
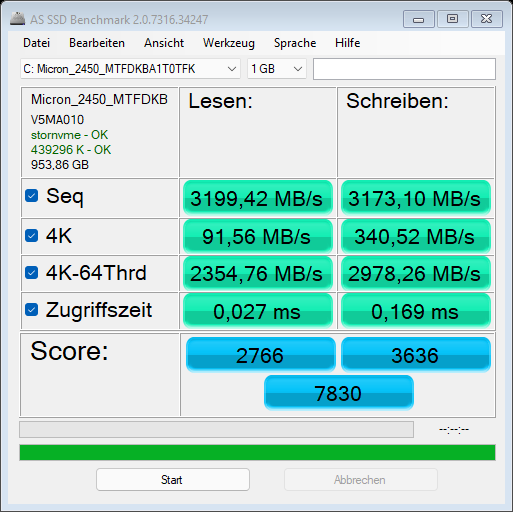
| MSI Vector GP76 12UGS-434 GeForce RTX 3070 Ti Laptop GPU, i7-12700H, Micron 2450 1TB MTFDKBA1T0TFK | MSI GP76 Leopard 10UG GeForce RTX 3070 Laptop GPU, i7-10750H, Kingston OM8PCP3512F-AB | Asus ROG Strix G17 G713QE-RB74 GeForce RTX 3050 Ti Laptop GPU, R7 5800H, Samsung PM991 MZVLQ512HBLU | Aorus 17 XE4 GeForce RTX 3070 Ti Laptop GPU, i7-12700H, Gigabyte AG470S1TB-SI B10 | Schenker XMG NEO 17 GM7TG8S GeForce RTX 3080 Laptop GPU, i7-11800H, Samsung SSD 980 Pro 1TB MZ-V8P1T0BW | Lenovo Legion 5 Pro 16 G7 i7 RTX 3070Ti GeForce RTX 3070 Ti Laptop GPU, i7-12700H, Samsung PM9A1 MZVL21T0HCLR | Asus ROG Zephyrus M16 GU603H GeForce RTX 3070 Laptop GPU, i9-11900H, Samsung PM9A1 MZVL22T0HBLB | MSI Vector GP66 12UGS GeForce RTX 3070 Ti Laptop GPU, i9-12900H | |
|---|---|---|---|---|---|---|---|---|
| AS SSD | -98% | -45% | 13% | 27% | 36% | 9% | -5% | |
| Seq Read (MB/s) | 3199 | 1659 -48% | 2602 -19% | 5031 57% | 5223 63% | 5036 57% | 5615 76% | 3080 -4% |
| Seq Write (MB/s) | 3173 | 921 -71% | 1218 -62% | 3162 0% | 3922 24% | 3784 19% | 4297 35% | 2997 -6% |
| 4K Read (MB/s) | 91.56 | 51 -44% | 42.31 -54% | 108 18% | 82.2 -10% | 88.1 -4% | 55.3 -40% | 70 -24% |
| 4K Write (MB/s) | 340.52 | 120.1 -65% | 122 -64% | 308.6 -9% | 207.6 -39% | 240.4 -29% | 170.5 -50% | 352 3% |
| 4K-64 Read (MB/s) | 2355 | 463.5 -80% | 1182 -50% | 2938 25% | 2439 4% | 2788 18% | 2591 10% | 1630 -31% |
| 4K-64 Write (MB/s) | 2978 | 909 -69% | 972 -67% | 3371 13% | 2652 -11% | 3424 15% | 3190 7% | 2435 -18% |
| Access Time Read * (ms) | 0.027 | 0.179 -563% | 0.101 -274% | 0.048 -78% | 0.022 19% | 0.02 26% | 0.04 -48% | 0.033 -22% |
| Access Time Write * (ms) | 0.169 | 0.032 81% | 0.096 43% | 0.013 92% | 0.021 88% | 0.018 89% | 0.025 85% | 0.425 -151% |
| Score Read (Points) | 2766 | 680 -75% | 1484 -46% | 3549 28% | 3044 10% | 3380 22% | 3208 16% | 2008 -27% |
| Score Write (Points) | 3636 | 1121 -69% | 1216 -67% | 3996 10% | 3252 -11% | 4043 11% | 3790 4% | 3087 -15% |
| Score Total (Points) | 7830 | 2130 -73% | 3394 -57% | 9279 19% | 7794 0% | 9094 16% | 8563 9% | 6130 -22% |
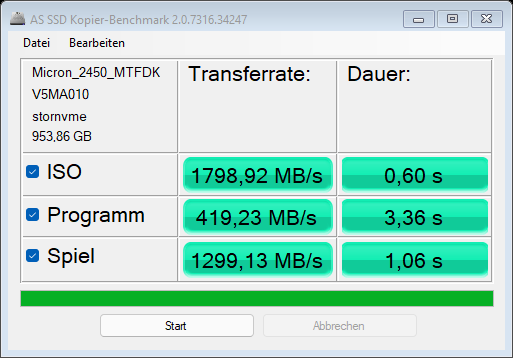
| Copy ISO MB/s (MB/s) | 1799 | 1538 -15% | 1967 9% | 3221 79% | 3221 79% | 3576 99% | ||
| Copy Program MB/s (MB/s) | 419 | 805 92% | 458.2 9% | 1151 175% | 939 124% | 791 89% | ||
| Copy Game MB/s (MB/s) | 1299 | 1418 9% | 1194 -8% | 1194 -8% | 1995 54% | 2134 64% |
* ... menor é melhor

* ... menor é melhor
Sustained Read Performance: DiskSpd Read Loop, Queue Depth 8
GPU
A MSI promete um relógio de impulso 100 MHz mais alto de 1.585 MHz para aRTX 3070 Ti (8 GB VRAM). No geral, a GPU tem um desempenho apenas 5% mais lento do que uma RTX 3080 e cerca de 10% abaixo de uma área de trabalho RTX-3070. A fina Asus ROG Zephyrus M16 é até mesmo espancado em 80%.
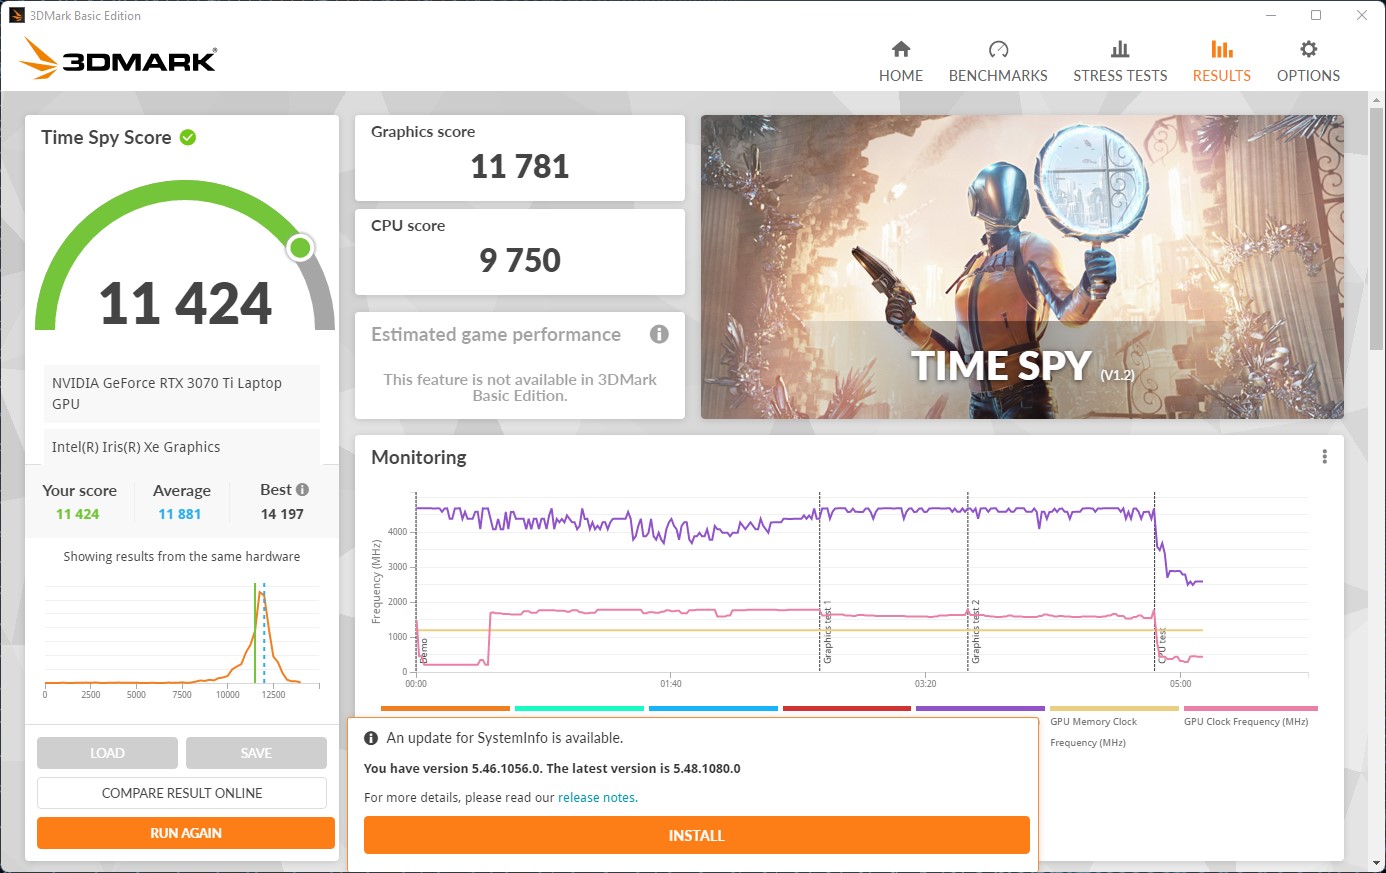
No setor móvel, praticamente não existem GPUs que sejam mais potentes. Deve-se notar que os resultados no modo Extremo são cerca de 7% mais altos. O modo silencioso reduz os resultados em apenas 10%, enquanto os ventiladores são muito mais silenciosos e você pode até usar os alto-falantes internos quando estiver jogando. Entretanto, isto aumenta a temperatura da superfície.
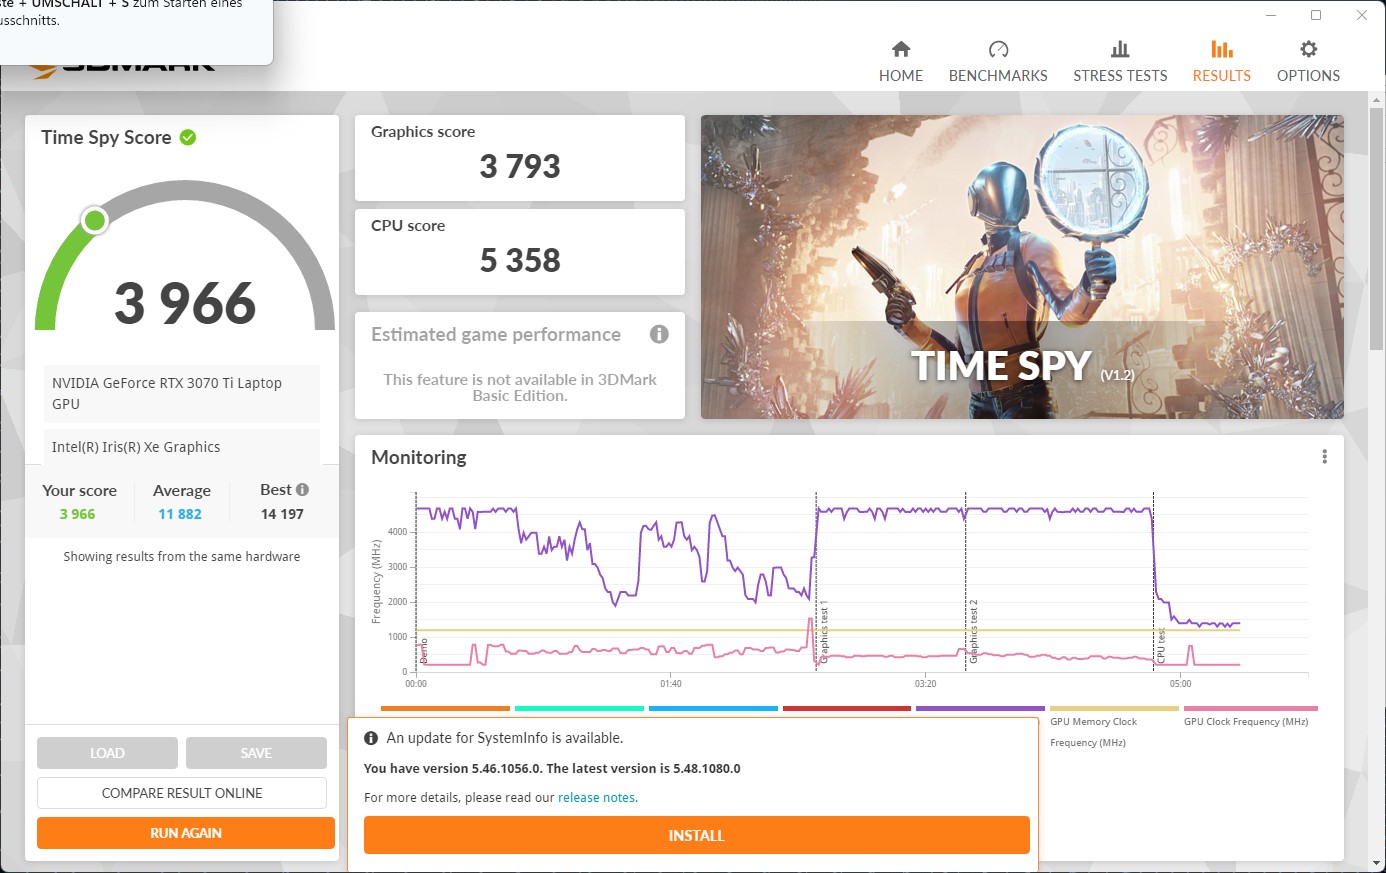
No modo Bateria, o TGP e, portanto, o desempenho é grandemente reduzido: Com um consumo total permitido de 50 watts (CPU: 15 W + GPU: 35 W), o resultado do 3DMark Time Spy é quase triplicado e está, portanto, aproximadamente no nível de umGTX 1650 Ti.
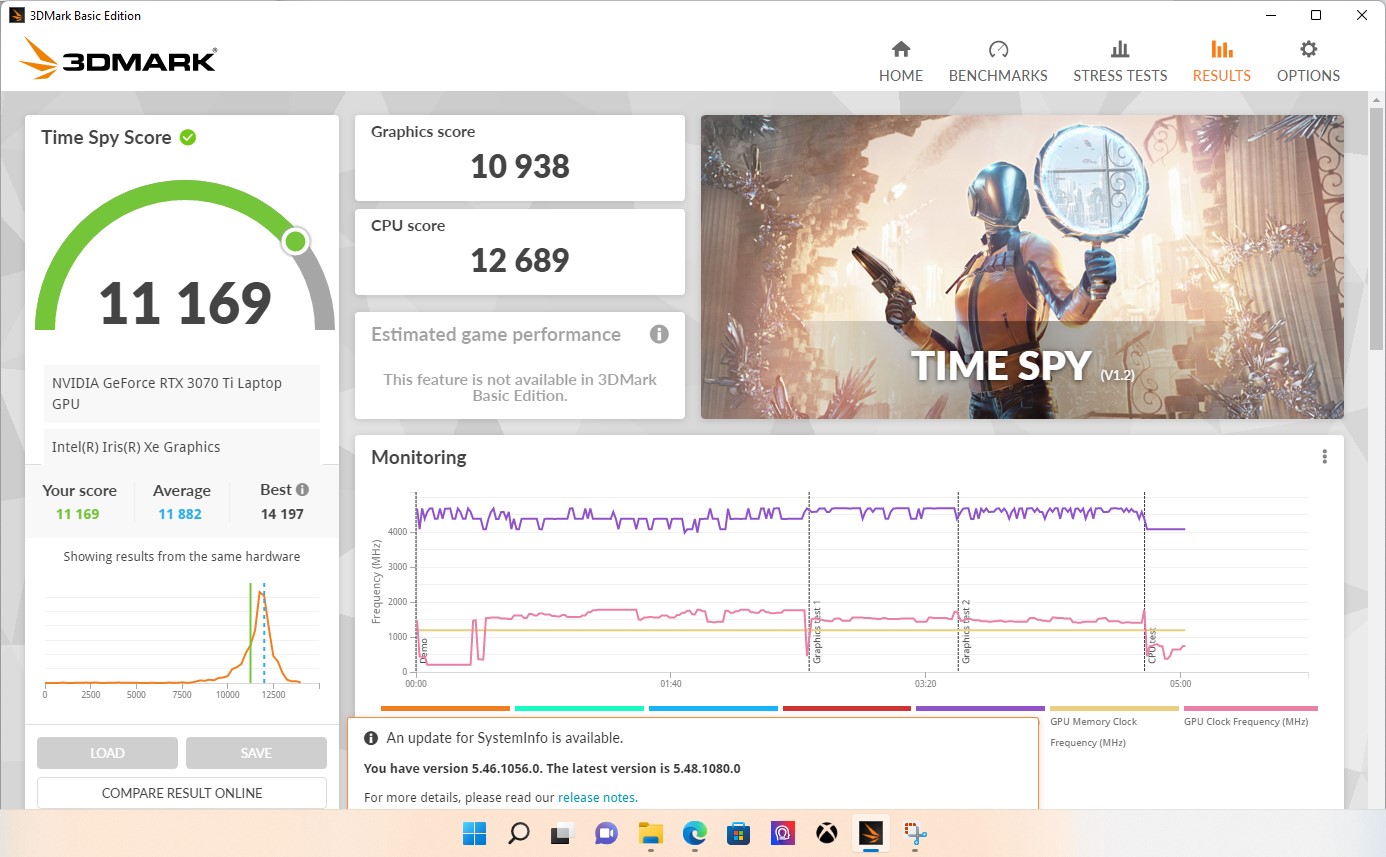
| 3DMark 11 Performance | 32326 pontos | |
| 3DMark Fire Strike Score | 25633 pontos | |
| 3DMark Time Spy Score | 11169 pontos | |
Ajuda | ||
Desempenho nos jogos
O sólido desempenho do RTX 3070 Ti com seu TGP de 150 watts também se reflete nos jogos. Todos os jogos funcionam com FPS alto. Mesmo em configurações máximas e com um monitor externo correspondente, as resoluções de 4K são impecáveis.
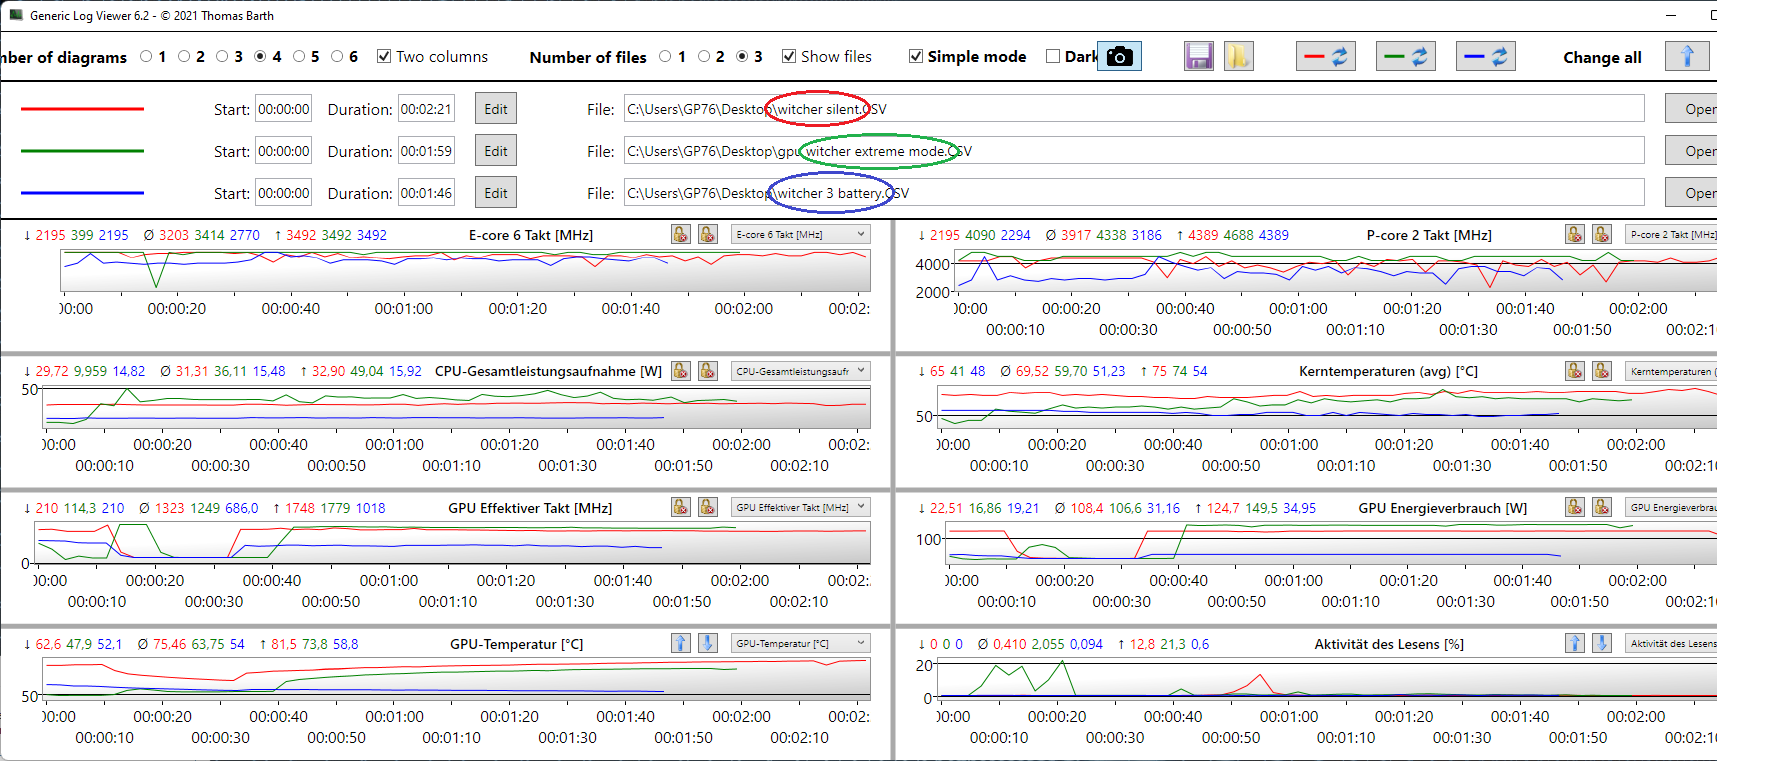
Enquanto o Witcher 3 atinge 113 FPS em configurações máximas @FHD, isto cai ligeiramente para 105 FPS no modo Silencioso e para pouco menos de 24 FPS no modo Bateria, então você tem que reduzir os detalhes significativamente sem uma fonte de alimentação externa
.
O gráfico abaixo mostra os modos "Extremo", "Silencioso" e "Bateria". O TGP cai para cerca de 125 watts no modo Silencioso. O relógio GPU é quase totalmente utilizado no modo Extremo a 1.780 MHz.
| Elden Ring | |
| 1920x1080 High Preset | |
| MSI Vector GP76 12UGS-434 | |
| Média NVIDIA GeForce RTX 3070 Ti Laptop GPU (59.8 - 59.9, n=2) | |
| 1920x1080 Maximum Preset | |
| Média NVIDIA GeForce RTX 3070 Ti Laptop GPU (46.3 - 59.7, n=2) | |
| MSI Vector GP76 12UGS-434 | |
| Elex 2 | |
| 1920x1080 High / On AA:FX AF:16x | |
| MSI Vector GP76 12UGS-434 | |
| Média NVIDIA GeForce RTX 3070 Ti Laptop GPU (83 - 99.4, n=3) | |
| Aorus 17 XE4 | |
| 1920x1080 Ultra / On AA:SM AF:16x | |
| MSI Vector GP76 12UGS-434 | |
| Média NVIDIA GeForce RTX 3070 Ti Laptop GPU (75 - 89, n=3) | |
| Aorus 17 XE4 | |
O gráfico Witcher 3 não revela quedas de estrutura e gagueira nos modos testados.
Witcher 3 FPS Diagram
| baixo | média | alto | ultra | |
|---|---|---|---|---|
| GTA V (2015) | 179.1 | 167.9 | 109.7 | |
| The Witcher 3 (2015) | 219 | 112.8 | ||
| Dota 2 Reborn (2015) | 164.8 | 150.7 | 140.9 | 134.5 |
| Final Fantasy XV Benchmark (2018) | 107.7 | |||
| X-Plane 11.11 (2018) | 139.1 | 114.7 | 91.1 | |
| Far Cry 5 (2018) | 147 | 138 | ||
| Strange Brigade (2018) | 263 | 222 | 195.1 | |
| Shadow of the Tomb Raider (2018) | 131 | 129 | ||
| Elden Ring (2022) | 59.9 | 46.3 | ||
| Elex 2 (2022) | 99.4 | 89 |
Emissões do Vector GP76: Modo silencioso para a vitória
Ruído
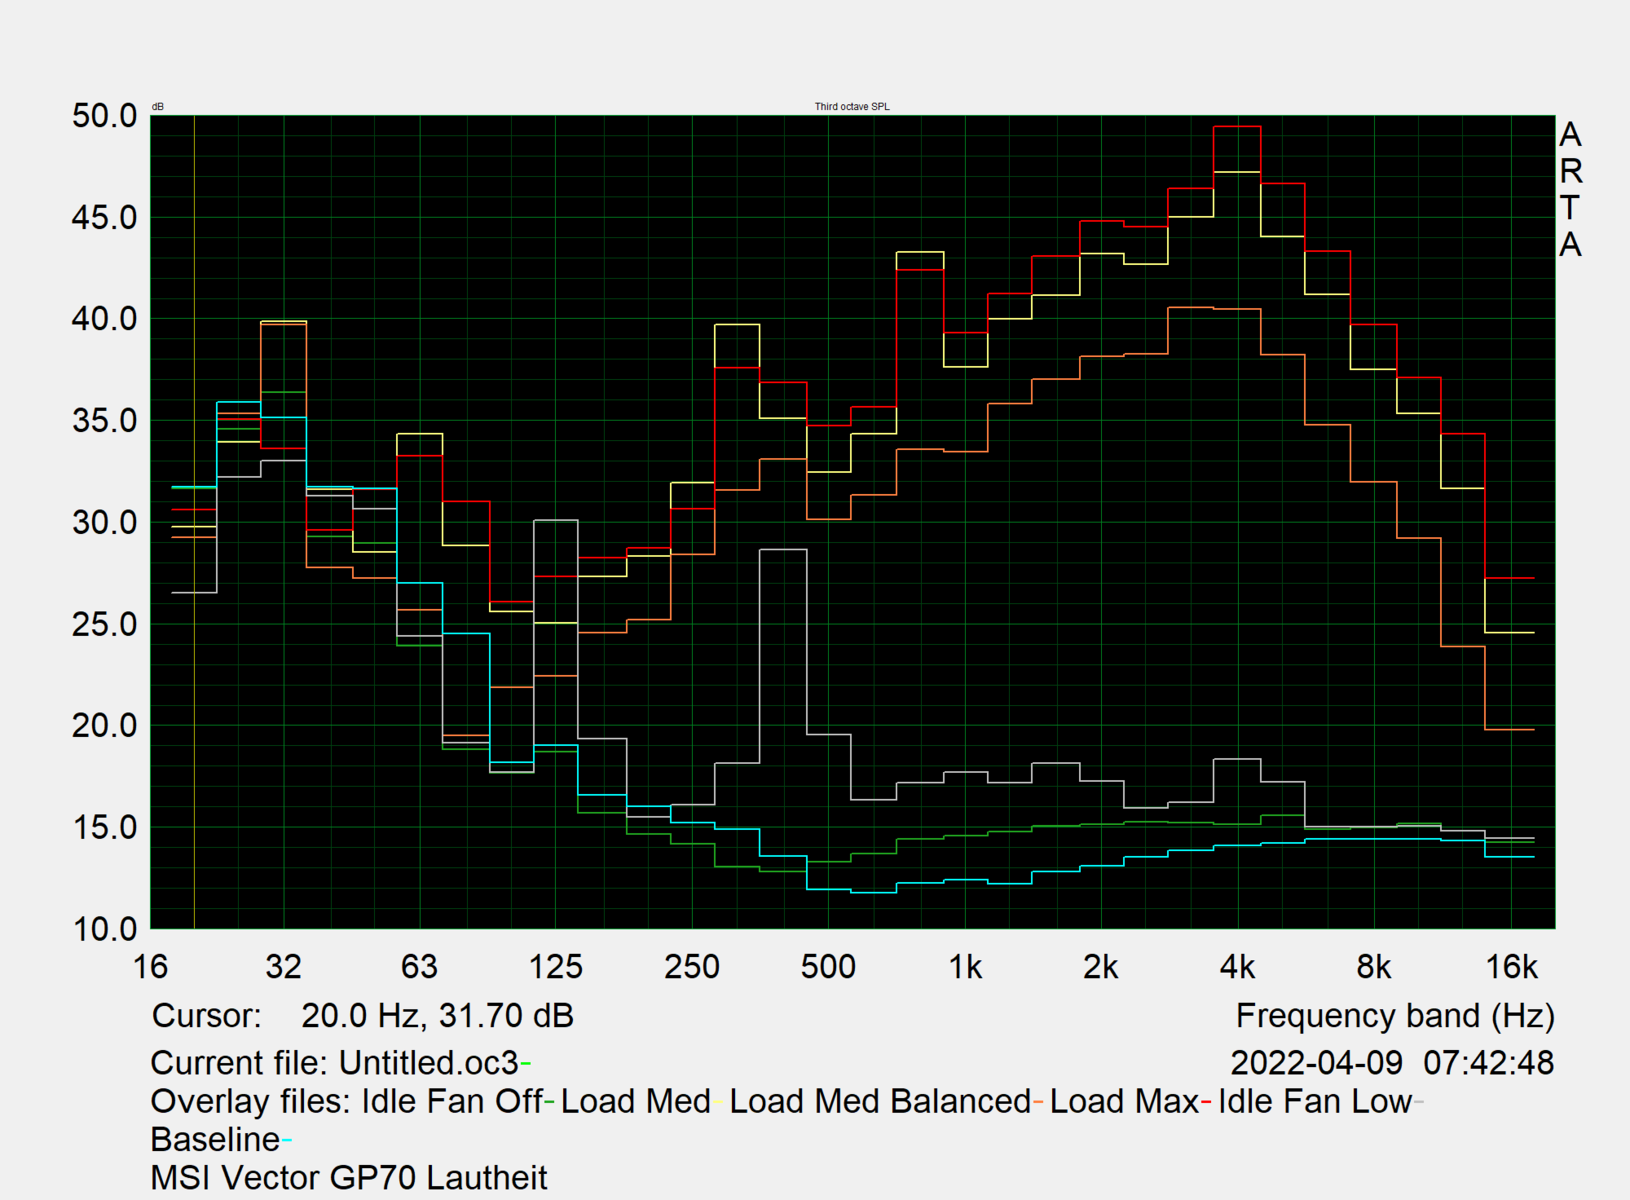
Quando ocioso, o MSI Vector GP76 é quase silencioso e, como o modo silencioso não restringe o desempenho da CPU, não há ruídos de ventilador excessivamente incômodos sob carga apropriada e não se pode ouvir frequências altas.
Quando se joga no modo Extremo, no entanto, ele se torna bastante barulhento ao ponto de poder ser incômodo. Um sistema de som externo ou fones de ouvido seria apropriado aqui, ou você pode usar o modo Silencioso. Mas mesmo no modo Equilibrado, o ruído é muito melhor com apenas perdas muito leves de desempenho
Barulho
| Ocioso |
| 27 / 27 / 30.1 dB |
| Carga |
| 54.4 / 56.2 dB |
 | ||
30 dB silencioso 40 dB(A) audível 50 dB(A) ruidosamente alto |
||
min: | ||
| MSI Vector GP76 12UGS-434 GeForce RTX 3070 Ti Laptop GPU, i7-12700H, Micron 2450 1TB MTFDKBA1T0TFK | MSI GP76 Leopard 10UG GeForce RTX 3070 Laptop GPU, i7-10750H, Kingston OM8PCP3512F-AB | Asus ROG Strix G17 G713QE-RB74 GeForce RTX 3050 Ti Laptop GPU, R7 5800H, Samsung PM991 MZVLQ512HBLU | Aorus 17 XE4 GeForce RTX 3070 Ti Laptop GPU, i7-12700H, Gigabyte AG470S1TB-SI B10 | Schenker XMG NEO 17 GM7TG8S GeForce RTX 3080 Laptop GPU, i7-11800H, Samsung SSD 980 Pro 1TB MZ-V8P1T0BW | Lenovo Legion 5 Pro 16 G7 i7 RTX 3070Ti GeForce RTX 3070 Ti Laptop GPU, i7-12700H, Samsung PM9A1 MZVL21T0HCLR | Asus ROG Zephyrus M16 GU603H GeForce RTX 3070 Laptop GPU, i9-11900H, Samsung PM9A1 MZVL22T0HBLB | MSI Vector GP66 12UGS GeForce RTX 3070 Ti Laptop GPU, i9-12900H | |
|---|---|---|---|---|---|---|---|---|
| Noise | -2% | 13% | -0% | 16% | 2% | -6% | 13% | |
| desligado / ambiente * (dB) | 25.6 | 24 6% | 24.9 3% | 24 6% | 23 10% | 24.6 4% | 25 2% | 22.9 11% |
| Idle Minimum * (dB) | 27 | 25 7% | 25.1 7% | 30 -11% | 23 15% | 28.4 -5% | 25 7% | 23.4 13% |
| Idle Average * (dB) | 27 | 32 -19% | 25.1 7% | 31 -15% | 23 15% | 28.4 -5% | 31 -15% | 23.4 13% |
| Idle Maximum * (dB) | 30.1 | 34 -13% | 25.1 17% | 34 -13% | 23 24% | 28.4 6% | 42 -40% | 27.4 9% |
| Load Average * (dB) | 54.4 | 54 1% | 36.3 33% | 44 19% | 39.5 27% | 49.4 9% | 48 12% | 36 34% |
| Load Maximum * (dB) | 56.2 | 54 4% | 49.9 11% | 49 13% | 55.09 2% | 54.7 3% | 56 -0% | 58 -3% |
| Witcher 3 ultra * (dB) | 51 | 49.9 | 51 | 54.5 | 49.4 | 52 | 58.2 |
* ... menor é melhor
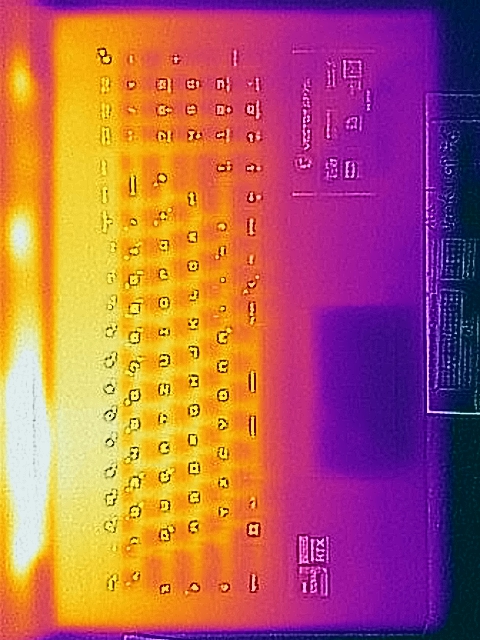
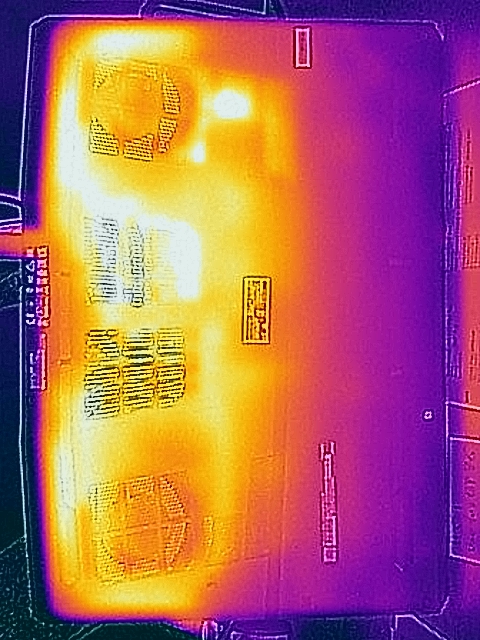
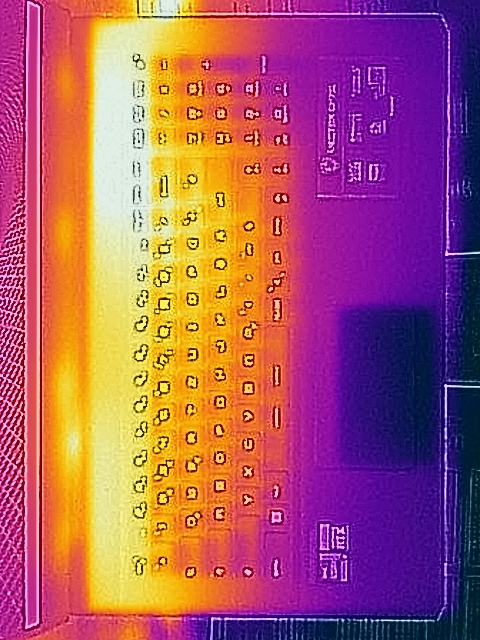
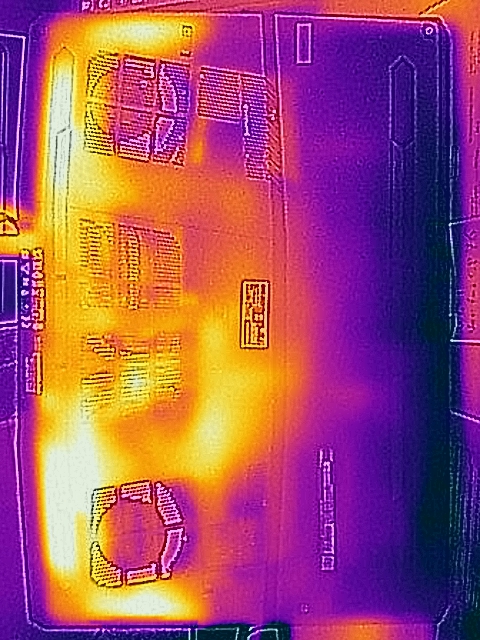
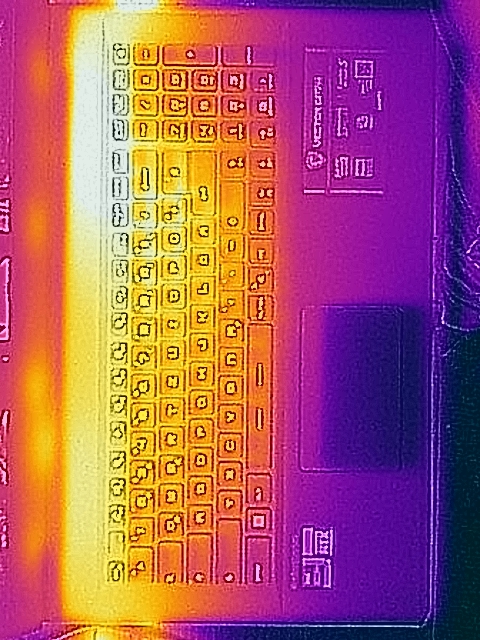
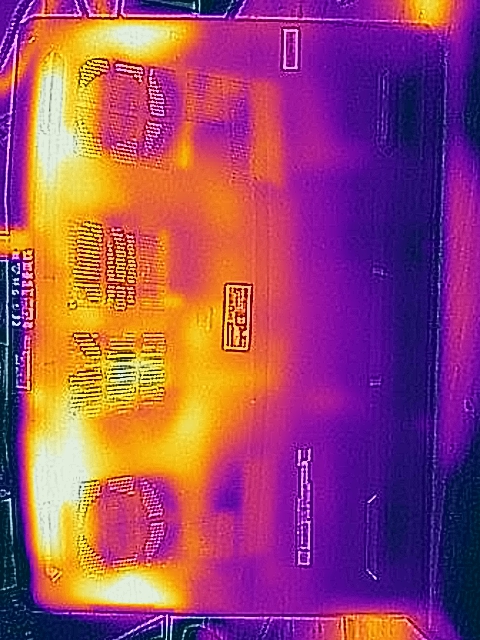
Temperatura
O laptop para jogos da MSI é bastante legal em todos os cenários, exceto no modo Silencioso durante os jogos, quando os fãs giram muito mais lentamente. No entanto, as superfícies nunca se tornam muito quentes. Dispositivos mais finos como oMSI Stealth GS66 ou o Lâmina Razer 15lutar com temperaturas significativamente mais altas.
(-) A temperatura máxima no lado superior é 46.3 °C / 115 F, em comparação com a média de 40.4 °C / 105 F , variando de 21.2 a 68.8 °C para a classe Gaming.
(±) A parte inferior aquece até um máximo de 45 °C / 113 F, em comparação com a média de 43.2 °C / 110 F
(+) Em uso inativo, a temperatura média para o lado superior é 30.8 °C / 87 F, em comparação com a média do dispositivo de 33.9 °C / ### class_avg_f### F.
(±) Jogando The Witcher 3, a temperatura média para o lado superior é 34.8 °C / 95 F, em comparação com a média do dispositivo de 33.9 °C / ## #class_avg_f### F.
(+) Os apoios para as mãos e o touchpad são mais frios que a temperatura da pele, com um máximo de 27.4 °C / 81.3 F e, portanto, são frios ao toque.
(±) A temperatura média da área do apoio para as mãos de dispositivos semelhantes foi 28.8 °C / 83.8 F (+1.4 °C / 2.5 F).
| MSI Vector GP76 12UGS-434 Intel Core i7-12700H, NVIDIA GeForce RTX 3070 Ti Laptop GPU | MSI GP76 Leopard 10UG Intel Core i7-10750H, NVIDIA GeForce RTX 3070 Laptop GPU | Asus ROG Strix G17 G713QE-RB74 AMD Ryzen 7 5800H, NVIDIA GeForce RTX 3050 Ti Laptop GPU | Aorus 17 XE4 Intel Core i7-12700H, NVIDIA GeForce RTX 3070 Ti Laptop GPU | Schenker XMG NEO 17 GM7TG8S Intel Core i7-11800H, NVIDIA GeForce RTX 3080 Laptop GPU | Lenovo Legion 5 Pro 16 G7 i7 RTX 3070Ti Intel Core i7-12700H, NVIDIA GeForce RTX 3070 Ti Laptop GPU | Asus ROG Zephyrus M16 GU603H Intel Core i9-11900H, NVIDIA GeForce RTX 3070 Laptop GPU | MSI Vector GP66 12UGS Intel Core i9-12900H, NVIDIA GeForce RTX 3070 Ti Laptop GPU | |
|---|---|---|---|---|---|---|---|---|
| Heat | 7% | -0% | -2% | -12% | 0% | -12% | 4% | |
| Maximum Upper Side * (°C) | 46.3 | 43 7% | 43.8 5% | 50 -8% | 51 -10% | 45.3 2% | 52 -12% | 40.2 13% |
| Maximum Bottom * (°C) | 45 | 47 -4% | 47.2 -5% | 58 -29% | 62 -38% | 61.2 -36% | 53 -18% | 43.8 3% |
| Idle Upper Side * (°C) | 34.2 | 30 12% | 33.4 2% | 30 12% | 35 -2% | 28.6 16% | 38 -11% | 34.8 -2% |
| Idle Bottom * (°C) | 38.3 | 33 14% | 39.4 -3% | 32 16% | 38 1% | 31.4 18% | 41 -7% | 37 3% |
* ... menor é melhor
Teste de estresse
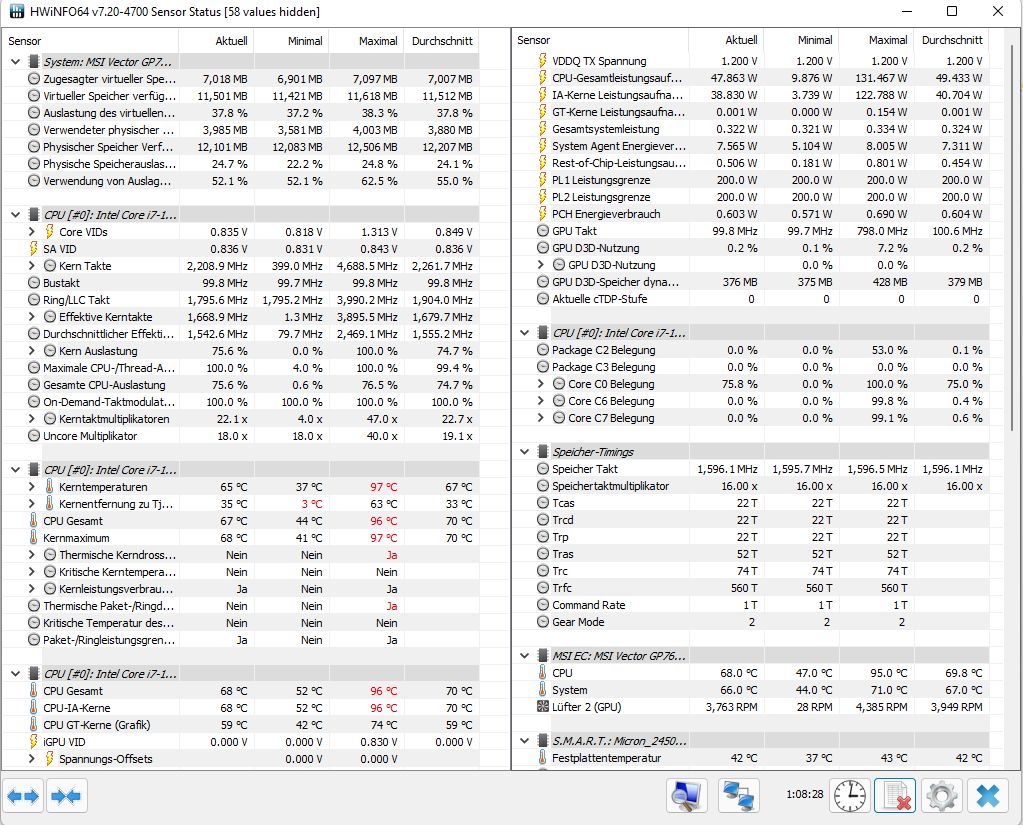
Em 2,3 GHz, a CPU só trabalha 100 MHz abaixo da velocidade do relógio base no teste de esforço combinado (Prime95 + FurMark), enquanto o Vector GP66 menor só gerencia 1 GHz. A GPU também pode funcionar à velocidade total do relógio neste cenário extremo. Portanto, a aceleração não entra em jogo, e nenhuma redução de desempenho pode ser vista no benchmark 3D diretamente após o teste de estresse.
O processador começou inicialmente com 131 watts, mas isto foi rapidamente acelerada para 50 watts, o que manteve as temperaturas do núcleo muito baixas. As temperaturas da GPU Nvidia também podem ser descritas como muito discretas, embora ela ainda consuma mais de 140 watts. Sob puro estresse da CPU, ela se permite uma constante de 70 watts (modo extremo) e permanece bastante fria a 76°C.
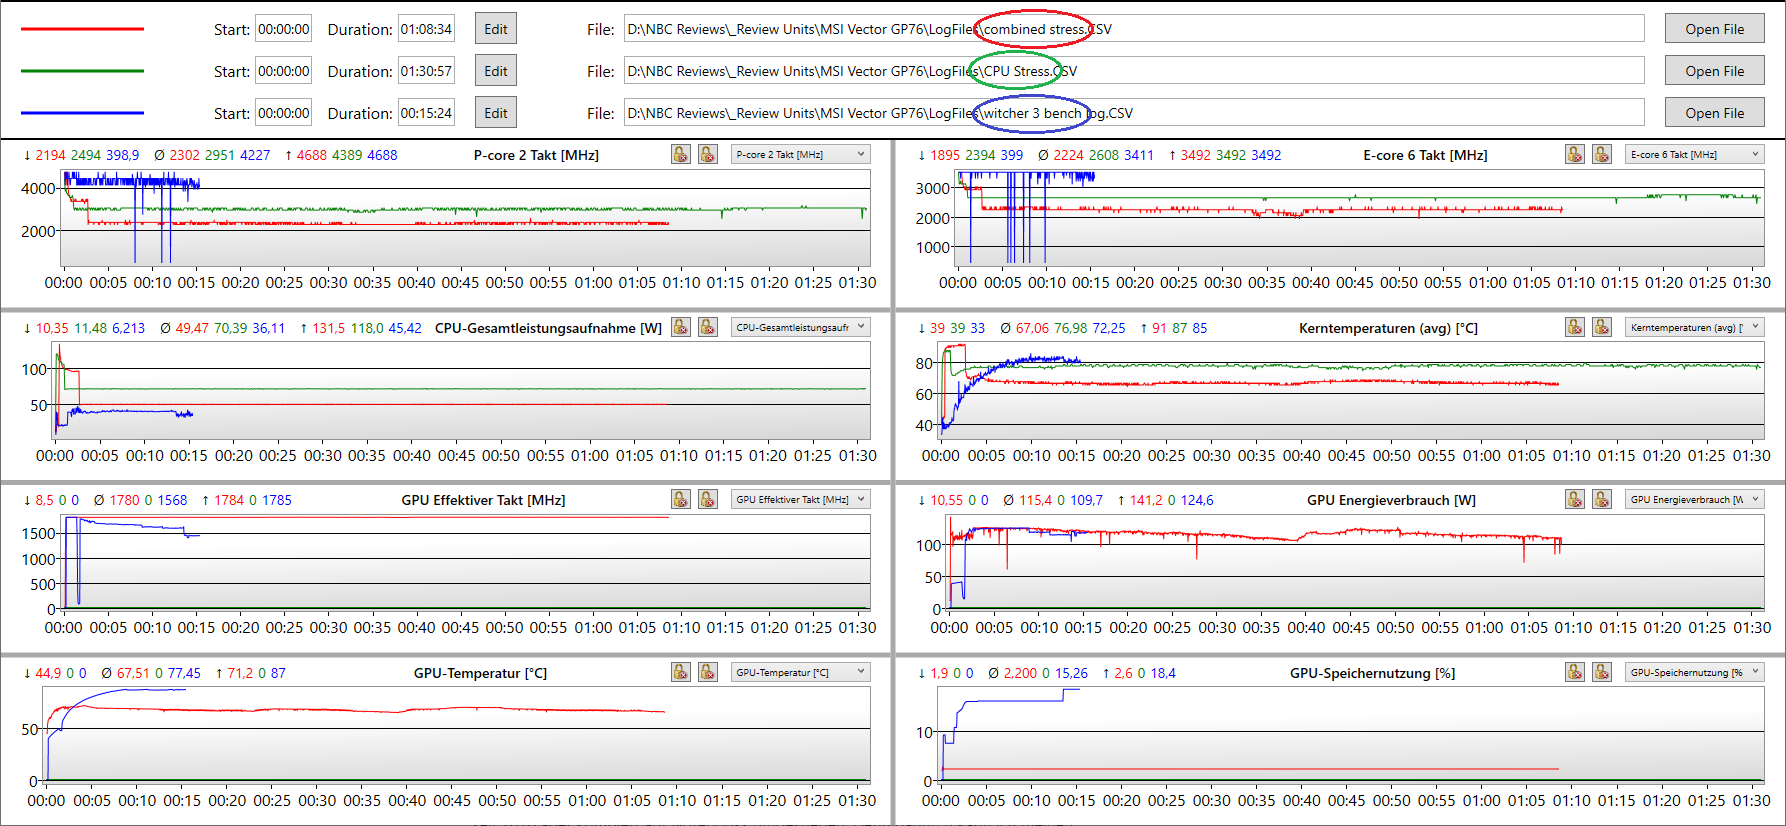
| Relógio CPU (GHz) | Relógio GPU (MHz) | Temperatura média da CPU (°C) | Temperatura média da GPU (°C) | |
| System Idle | -- | 200 | 36 | 40 |
| Prime95 Stress | 2.6 | 200 | 77 | -- |
| Prime95 + FurMark Stress | 2.2 | 1.780 | 67 | 68 |
| Witcher 3 Stress | 3.4 | 1.780 | 82 | 78 |
| Witcher 3 @Bateria | 3.2 | 1.000 | 51 | 59 |
Oradores
Os alto-falantes são decentes, mesmo se Asus for melhor com seuSérie SCARes. Mas eles certamente são melhores que a série Aorus da Gigabyte.
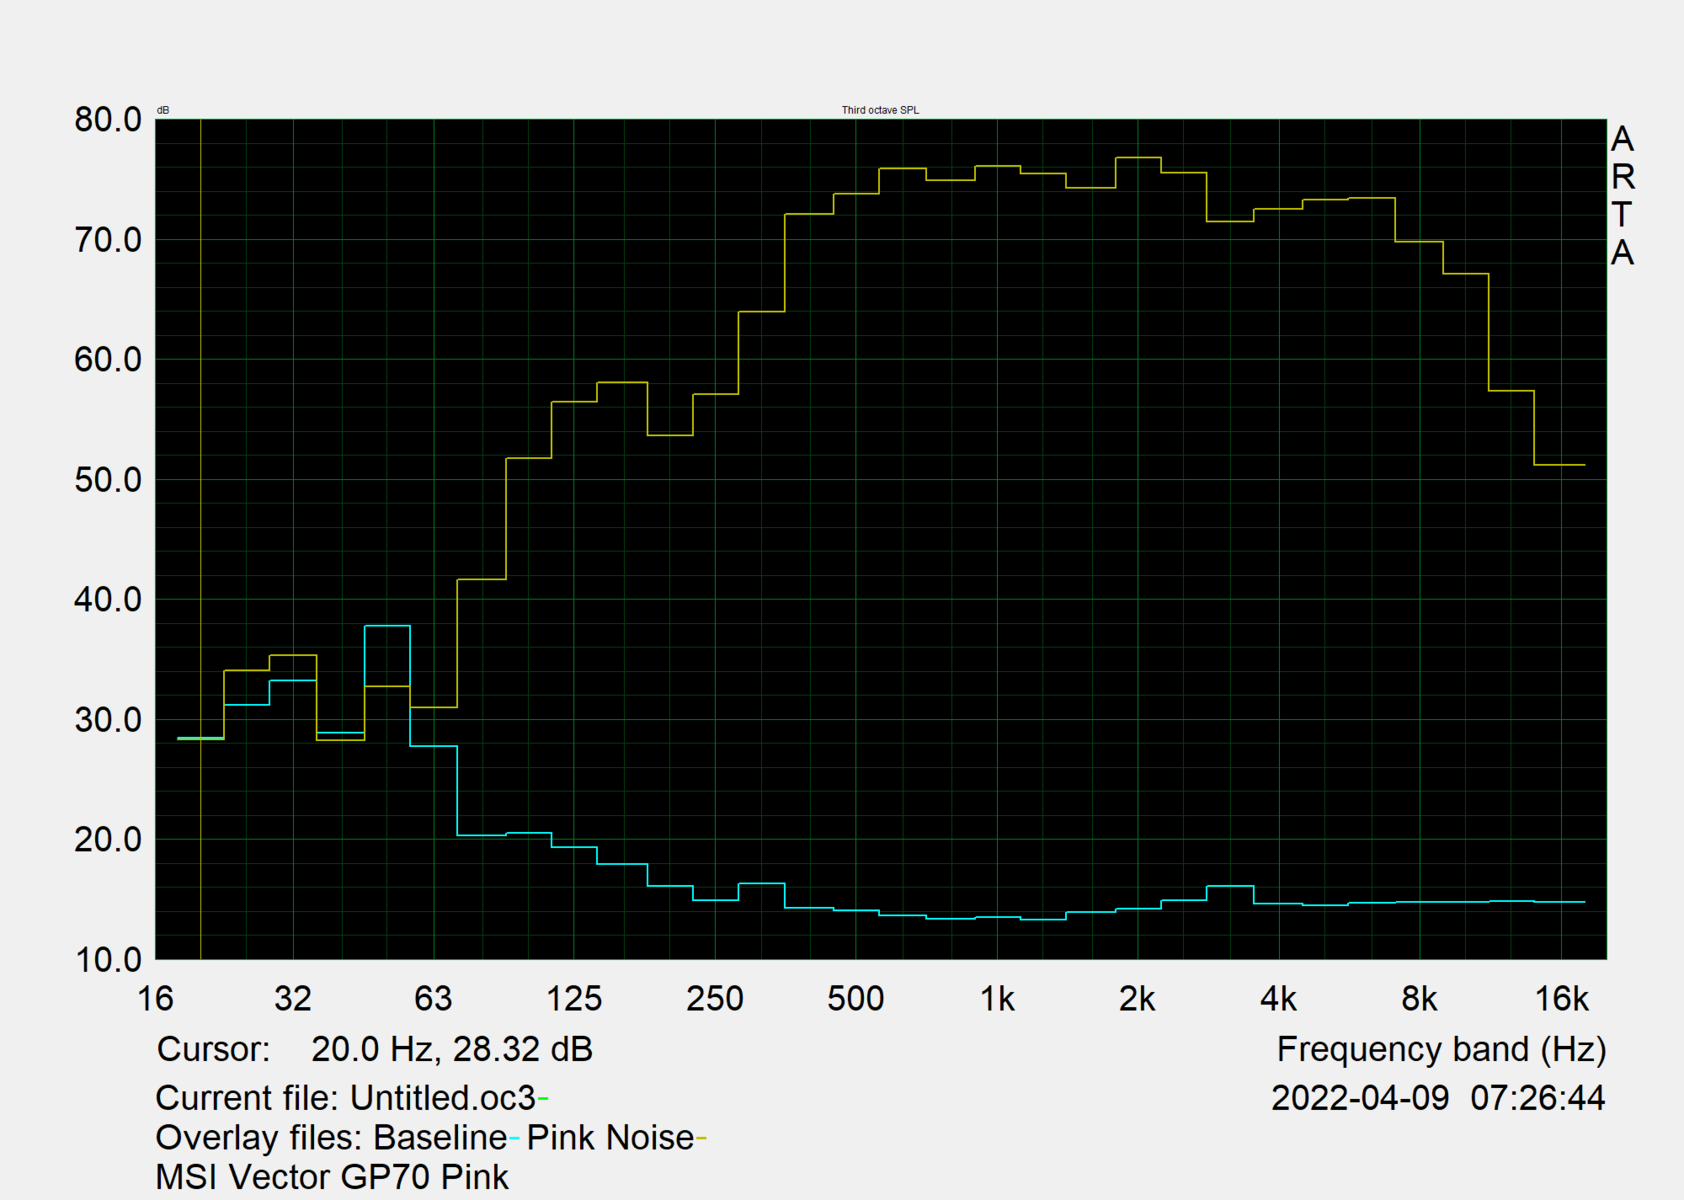
Os agudos e médios são muito bem reproduzidos, enquanto que os graves são rudimentares. O volume máximo é bom. Não se pode tirar muito mais de um sistema de alto-falantes estéreo com 2x 2,5 watts.
MSI Vector GP76 12UGS-434 análise de áudio
(±) | o volume do alto-falante é médio, mas bom (###valor### dB)
Graves 100 - 315Hz
(-) | quase nenhum baixo - em média 15.3% menor que a mediana
(±) | a linearidade dos graves é média (9% delta para a frequência anterior)
Médios 400 - 2.000 Hz
(+) | médios equilibrados - apenas 2.8% longe da mediana
(+) | médios são lineares (4% delta para frequência anterior)
Altos 2 - 16 kHz
(+) | agudos equilibrados - apenas 2% longe da mediana
(+) | os máximos são lineares (3.4% delta da frequência anterior)
Geral 100 - 16.000 Hz
(+) | o som geral é linear (12.6% diferença em relação à mediana)
Comparado com a mesma classe
» 16% de todos os dispositivos testados nesta classe foram melhores, 4% semelhantes, 81% piores
» O melhor teve um delta de 6%, a média foi 18%, o pior foi 132%
Comparado com todos os dispositivos testados
» 11% de todos os dispositivos testados foram melhores, 3% semelhantes, 86% piores
» O melhor teve um delta de 4%, a média foi 23%, o pior foi 134%
Asus ROG Strix G17 G713QE-RB74 análise de áudio
(±) | o volume do alto-falante é médio, mas bom (###valor### dB)
Graves 100 - 315Hz
(±) | graves reduzidos - em média 13% menor que a mediana
(±) | a linearidade dos graves é média (9.8% delta para a frequência anterior)
Médios 400 - 2.000 Hz
(±) | médios mais altos - em média 5.6% maior que a mediana
(+) | médios são lineares (6.5% delta para frequência anterior)
Altos 2 - 16 kHz
(+) | agudos equilibrados - apenas 3.4% longe da mediana
(±) | a linearidade dos máximos é média (12% delta para frequência anterior)
Geral 100 - 16.000 Hz
(±) | a linearidade do som geral é média (16.9% diferença em relação à mediana)
Comparado com a mesma classe
» 44% de todos os dispositivos testados nesta classe foram melhores, 11% semelhantes, 44% piores
» O melhor teve um delta de 6%, a média foi 18%, o pior foi 132%
Comparado com todos os dispositivos testados
» 30% de todos os dispositivos testados foram melhores, 8% semelhantes, 62% piores
» O melhor teve um delta de 4%, a média foi 23%, o pior foi 134%
Gerenciamento de energia: MSI melhora a vida útil da bateria do Vector GP76
Consumo de energia
Para uma máquina de jogos, o consumo ocioso de 15,6 watts é em média bom, enquanto o consumo em modo de espera de 0,5 watts é agradável e promete um tempo de espera de mais de 5 dias (geralmente muito mais longo na prática).
O consumo máximo permanente sob carga combinada e jogos é de pouco menos de 200 watts. Em princípio, um alto valor é bom aqui, o que significa que a GPU pode consumir muita energia e assim trabalhar mais rápido. Sob carga pura da CPU, o valor (de acordo com HWInfo) deve estar entre 50 e 80 watts, dependendo do modo.
No modo Balanceado e Silencioso, os valores de consumo são menores, de acordo com a tabela acima ("Condições de Teste"). Um pico de carga de pouco menos de 320 watts só ocorre muito brevemente no início do teste de estresse combinado e não ocorre no uso diário. No geral, a unidade de alimentação de 280 watts é suficientemente dimensionada.
| desligado | |
| Ocioso | |
| Carga |
|
Key:
min: | |
| MSI Vector GP76 12UGS-434 i7-12700H, GeForce RTX 3070 Ti Laptop GPU, Micron 2450 1TB MTFDKBA1T0TFK, IPS, 1920x1080, 17.3" | MSI GP76 Leopard 10UG i7-10750H, GeForce RTX 3070 Laptop GPU, Kingston OM8PCP3512F-AB, IPS, 1920x1080, 17.3" | Asus ROG Strix G17 G713QE-RB74 R7 5800H, GeForce RTX 3050 Ti Laptop GPU, Samsung PM991 MZVLQ512HBLU, IPS, 1920x1080, 17.3" | Aorus 17 XE4 i7-12700H, GeForce RTX 3070 Ti Laptop GPU, Gigabyte AG470S1TB-SI B10, IPS, 1920x1080, 17.3" | Schenker XMG NEO 17 GM7TG8S i7-11800H, GeForce RTX 3080 Laptop GPU, Samsung SSD 980 Pro 1TB MZ-V8P1T0BW, IPS, 2560x1440, 17.3" | Lenovo Legion 5 Pro 16 G7 i7 RTX 3070Ti i7-12700H, GeForce RTX 3070 Ti Laptop GPU, Samsung PM9A1 MZVL21T0HCLR, IPS, 2560x1600, 16" | Asus ROG Zephyrus M16 GU603H i9-11900H, GeForce RTX 3070 Laptop GPU, Samsung PM9A1 MZVL22T0HBLB, IPS, 2560x1600, 16" | MSI Vector GP66 12UGS i9-12900H, GeForce RTX 3070 Ti Laptop GPU, , IPS, 1920x1080, 15.6" | Média NVIDIA GeForce RTX 3070 Ti Laptop GPU | Média da turma Gaming | |
|---|---|---|---|---|---|---|---|---|---|---|
| Power Consumption | 10% | 29% | -12% | -12% | 12% | 8% | -24% | -0% | 5% | |
| Idle Minimum * (Watt) | 13.5 | 12 11% | 9.2 32% | 20 -48% | 19 -41% | 8.6 36% | 11 19% | 17.5 -30% | 14.2 ? -5% | 13.1 ? 3% |
| Idle Average * (Watt) | 15.6 | 16 -3% | 12.6 19% | 23 -47% | 25 -60% | 17.6 -13% | 20 -28% | 20.1 -29% | 19.9 ? -28% | 19 ? -22% |
| Idle Maximum * (Watt) | 20.6 | 28 -36% | 23.3 -13% | 28 -36% | 28 -36% | 18.5 10% | 30 -46% | 47.3 -130% | 26.2 ? -27% | 24.6 ? -19% |
| Load Average * (Watt) | 198 | 92 54% | 89.3 55% | 120 39% | 105 47% | 110 44% | 111 44% | 107.3 46% | 125.8 ? 36% | 111.3 ? 44% |
| Witcher 3 ultra * (Watt) | 199 | 198 1% | 136 32% | 196 2% | 223 -12% | 227 -14% | 156 22% | 225 -13% | ||
| Load Maximum * (Watt) | 319 | 210 34% | 162.7 49% | 257 19% | 226 29% | 294.6 8% | 197 38% | 277.7 13% | 248 ? 22% | 260 ? 18% |
* ... menor é melhor
Power Consumption Witcher 3 / Stress test
Power Consumption with external monitor
Vida útil da bateria
A vida útil da bateria melhorou em média 20% em comparação com a do predecessor. O resto do campo de teste não oferece muito mais, mesmo com baterias mais fortes, além das mais finas.Zephyrus M16.
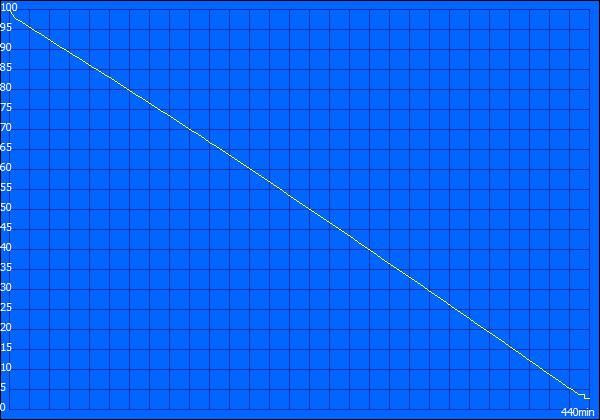
Pouco mais de 5 horas foram possíveis em nosso teste WLAN a 150 cd/m² de brilho no modo de desempenho equilibrado do Windows. A bateria de 65 Wh demorou quase 2,5 horas para ser totalmente recarregada. Isto é significativamente mais longo do que muitos outros notebooks de qualquer classe.
| MSI Vector GP76 12UGS-434 i7-12700H, GeForce RTX 3070 Ti Laptop GPU, 65 Wh | MSI GP76 Leopard 10UG i7-10750H, GeForce RTX 3070 Laptop GPU, 65 Wh | Asus ROG Strix G17 G713QE-RB74 R7 5800H, GeForce RTX 3050 Ti Laptop GPU, 56 Wh | Aorus 17 XE4 i7-12700H, GeForce RTX 3070 Ti Laptop GPU, 99 Wh | Schenker XMG NEO 17 GM7TG8S i7-11800H, GeForce RTX 3080 Laptop GPU, 62 Wh | Lenovo Legion 5 Pro 16 G7 i7 RTX 3070Ti i7-12700H, GeForce RTX 3070 Ti Laptop GPU, 80 Wh | Asus ROG Zephyrus M16 GU603H i9-11900H, GeForce RTX 3070 Laptop GPU, 90 Wh | MSI Vector GP66 12UGS i9-12900H, GeForce RTX 3070 Ti Laptop GPU, 65 Wh | Média da turma Gaming | |
|---|---|---|---|---|---|---|---|---|---|
| Duração da bateria | -31% | 12% | 4% | -17% | -30% | 42% | -7% | 11% | |
| Reader / Idle (h) | 7.3 | 5.6 -23% | 11.1 52% | 8.6 18% | 13.3 82% | 7.9 8% | 7.84 ? 7% | ||
| WiFi v1.3 (h) | 5.1 | 4.2 -18% | 6 18% | 5.1 0% | 3.7 -27% | 5.4 6% | 7.7 51% | 5.7 12% | 7.08 ? 39% |
| Load (h) | 1.7 | 0.8 -53% | 1.1 -35% | 1.6 -6% | 1.6 -6% | 0.6 -65% | 1.6 -6% | 1 -41% | 1.496 ? -12% |
| H.264 (h) | 6.1 | 3.7 | 6.3 | 8.27 ? |
Pro
Contra
Veredicto: Desempenho superior em todos os níveis graças aos gráficos MSI Vector
As vantagens são claras: o Vector GP76 é um verdadeiro gamer com seu display de 360 Hz e tempos de resposta super-rápidos. Além disso, o Núcleo i7-12700H tem o dobro da potência da CPU em seu predecessor e outro destaque é a Nvidia RTX 3070 Ti com um consumo real de energia de 150 watts. Isto coloca o dispositivo na linha superior de nosso banco de dados.
O Vector também pode operar de forma bastante silenciosa, oferece uma gama completa de som, melhores tempos de funcionamento da bateria, um teclado RGB configurável por teclas, um chassi muito estável e boas opções de atualização. Além disso, a tela produz uma imagem agradável, rica e clara, mas poderia brilhar um pouco mais e oferecer resoluções mais altas como opções.
O MSI Vector GP76 opera com velocidade em todos os níveis: Visor, CPU e uma GPU com TGP de 150 watts. A crítica só se aplica a áreas menores, como a tela um pouco escura.
Além disso, não há Thunderbolt e não há fornecimento de energia via USB-C. A fonte de alimentação é pesada e volumosa, e não há leitor de cartões SD. O SSD não é o mais rápido do mercado e o desempenho é significativamente reduzido no modo de bateria. Além disso, o preço atual de US$ 2.649 é um pouco exorbitante.
Se você consegue viver com estas limitações, você obtém uma máquina de jogo muito sólida. Alternativamente, você pode ir para o Zephyrus M16 se a compactação for mais importante para você do que o desempenho total, ou para o Legion 5 Pro para um melhor valor, uma tela mais brilhante, um teclado melhor e o Core i9 solto. O Asus ROG Strix G17 também é uma boa escolha com a configuração correta (display QHD + RTX 3070) porque não só é acessível e extremamente robusto, como também é muito silencioso e fresco graças à AMD. Ele também tem o melhor teclado de sua classe.
Preço e Disponibilidade
Nosso modelo revisado (12UGS-434) não parece estar disponível fora da Alemanha no momento da publicação. Em vez disso, a Amazon US oferece duas variações na forma do modelo 12UGS-298 e o 12UGS-61. O primeiro vem com uma Intel i7-12700H e o segundo com uma Intel i9-12900HK . Os preços começam em US$ 2.449,00 e US$ 2.649,00, respectivamente, e estão sujeitos a alterações dependendo da configuração SSD escolhida.
MSI Vector GP76 12UGS-434
- 05/06/2022 v7 (old)
Marvin Gollor
Price comparison

