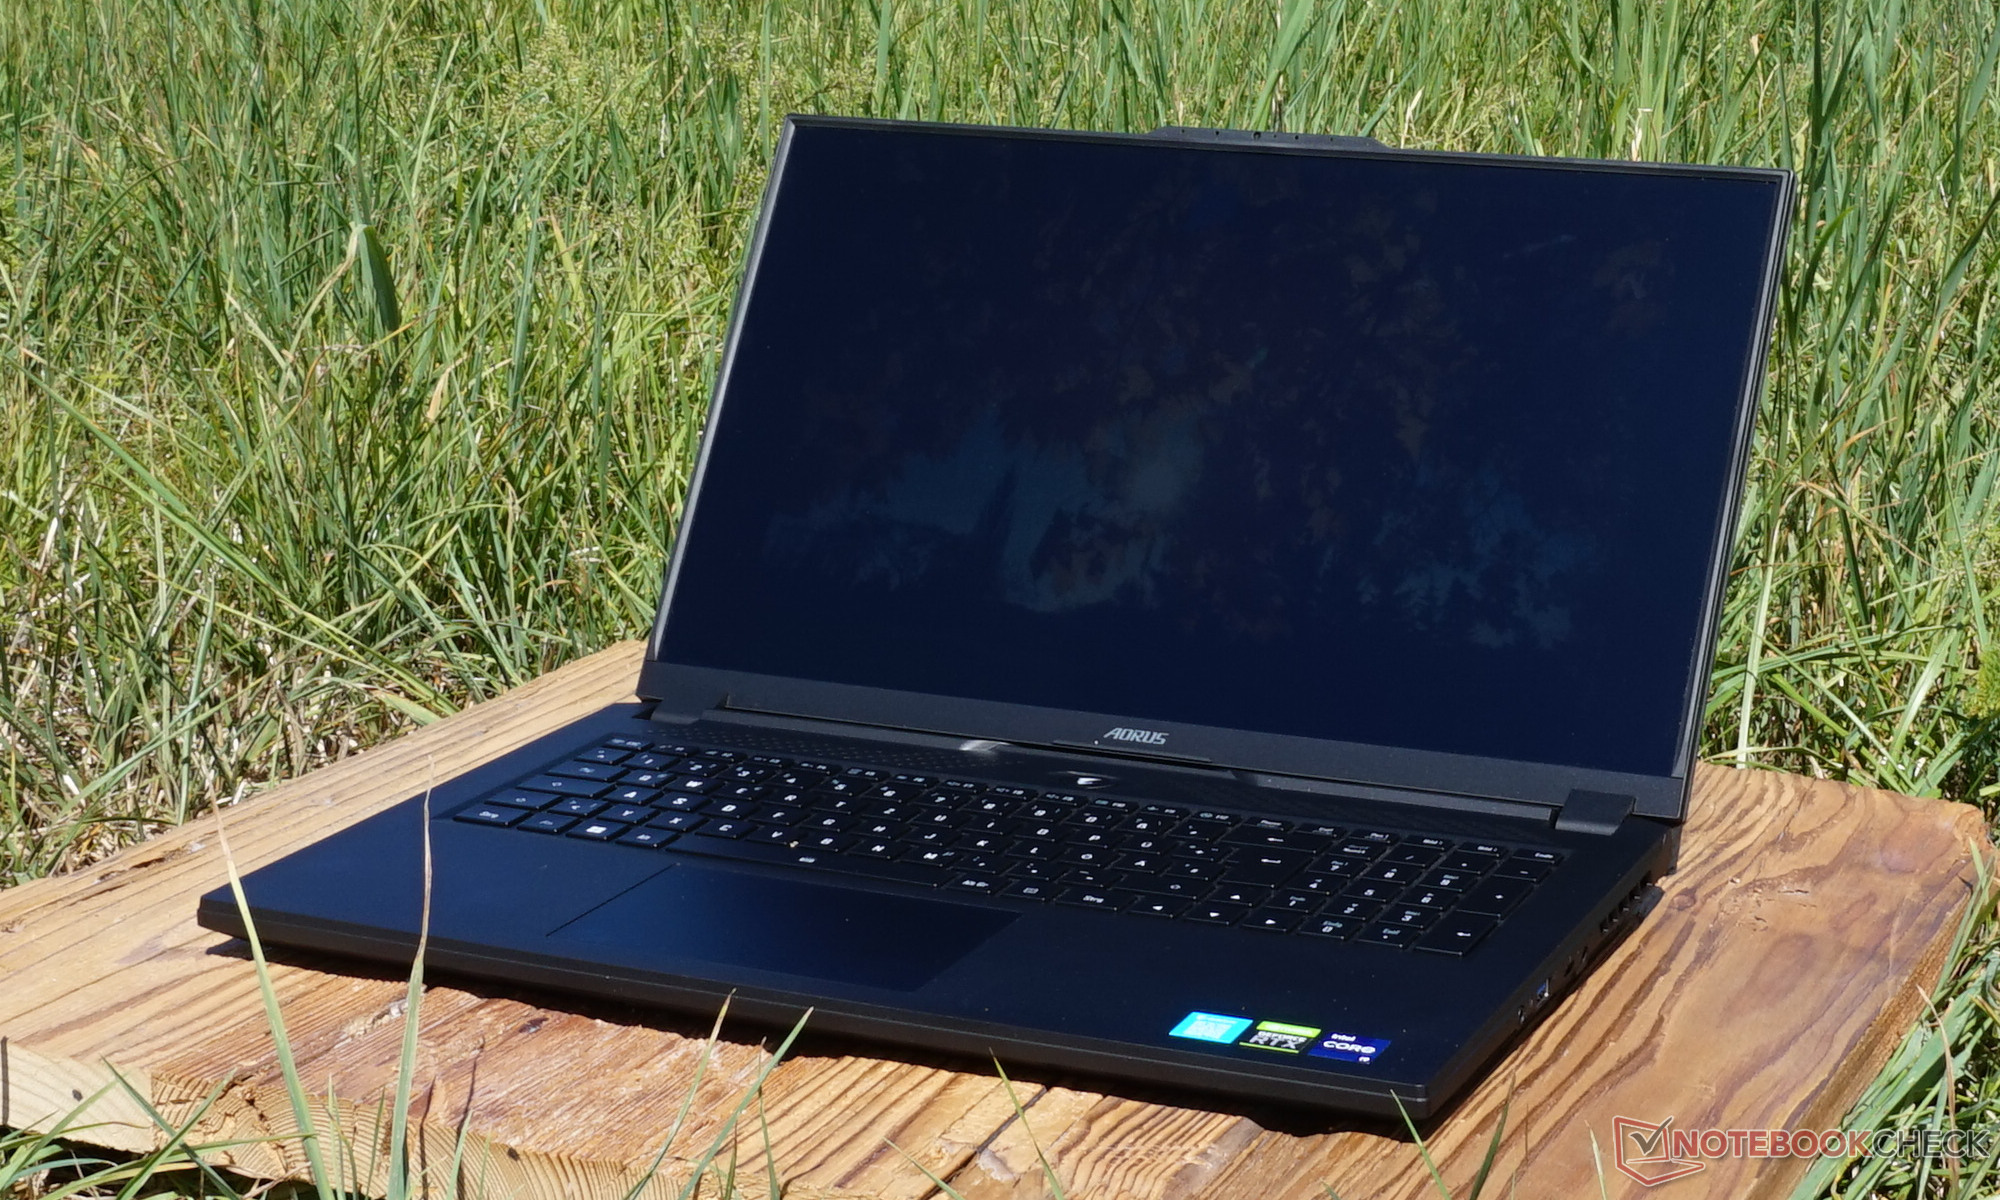
Revisão Aorus 17X XES: O laptop para jogos com um i9-12900HX oferece um desempenho superior


Com suas especificações-chave mais importantes, o laptop é predestinado para jogos. Devido a seu painel 360-Hertz, o Aorus 17X deve lidar particularmente bem com altas taxas de quadros. Considerando o Intel i9-12900HX, que é atualmente o processador móvel mais potente da classe Alder Lake com seus abundantes 16 núcleos e um Nvidia GeForce RTX 3070 Ti, este não parece ser um objetivo ilusório. Além disso, há também um modelo com o Nvidia RTX 3080 Ti, que promete FPS adicional e deve ser ainda um pouco mais rápido.
Com tanto desempenho, os concorrentes incluem laptops para jogos correspondentemente bem equipados, tais como o MSI GE67 HX 12 UGS ou oSchenker XMG Pro 17 E22. Outra comparação interessante deve ser com o exterior idêntico Aorus 17 XE4que combina a mesma placa gráfica com uma CPU um pouco menor. Você também pode encontrar detalhes adicionais sobre o estojo, manutenção ou dispositivos de entrada na revisão do Aorus 17 XE4, já que estas seções são idênticas para o Aorus 17X.
Possíveis concorrentes em comparação
Avaliação | Data | Modelo | Peso | Altura | Size | Resolução | Preço |
|---|---|---|---|---|---|---|---|
| 83.7 % v7 (old) | 08/2022 | Aorus 17X XES i9-12900HX, GeForce RTX 3070 Ti Laptop GPU | 2.7 kg | 30 mm | 17.30" | 1920x1080 | |
| 86.3 % v7 (old) | 09/2022 | HP Omen 17-ck1075ng i7-12700H, GeForce RTX 3070 Ti Laptop GPU | 2.8 kg | 31 mm | 17.30" | 1920x1080 | |
| 87.7 % v7 (old) | 07/2022 | MSI GE67 HX 12UGS i7-12800HX, GeForce RTX 3070 Ti Laptop GPU | 2.5 kg | 23.4 mm | 15.60" | 1920x1080 | |
| 85.4 % v7 (old) | 07/2022 | Schenker XMG Pro 17 E22 i9-12900H, GeForce RTX 3080 Ti Laptop GPU | 2.8 kg | 27 mm | 17.30" | 2560x1440 | |
| 87.4 % v7 (old) | 06/2022 | MSI Raider GE66 12UHS i9-12900HK, GeForce RTX 3080 Ti Laptop GPU | 2.4 kg | 23.4 mm | 15.60" | 3840x2160 | |
| 88.2 % v7 (old) | 05/2022 | Asus ROG Zephyrus Duo 16 GX650RX R9 6900HX, GeForce RTX 3080 Ti Laptop GPU | 2.6 kg | 20.5 mm | 16.00" | 3840x2400 | |
| 85.2 % v7 (old) | 04/2022 | Aorus 17 XE4 i7-12700H, GeForce RTX 3070 Ti Laptop GPU | 2.6 kg | 27 mm | 17.30" | 1920x1080 |
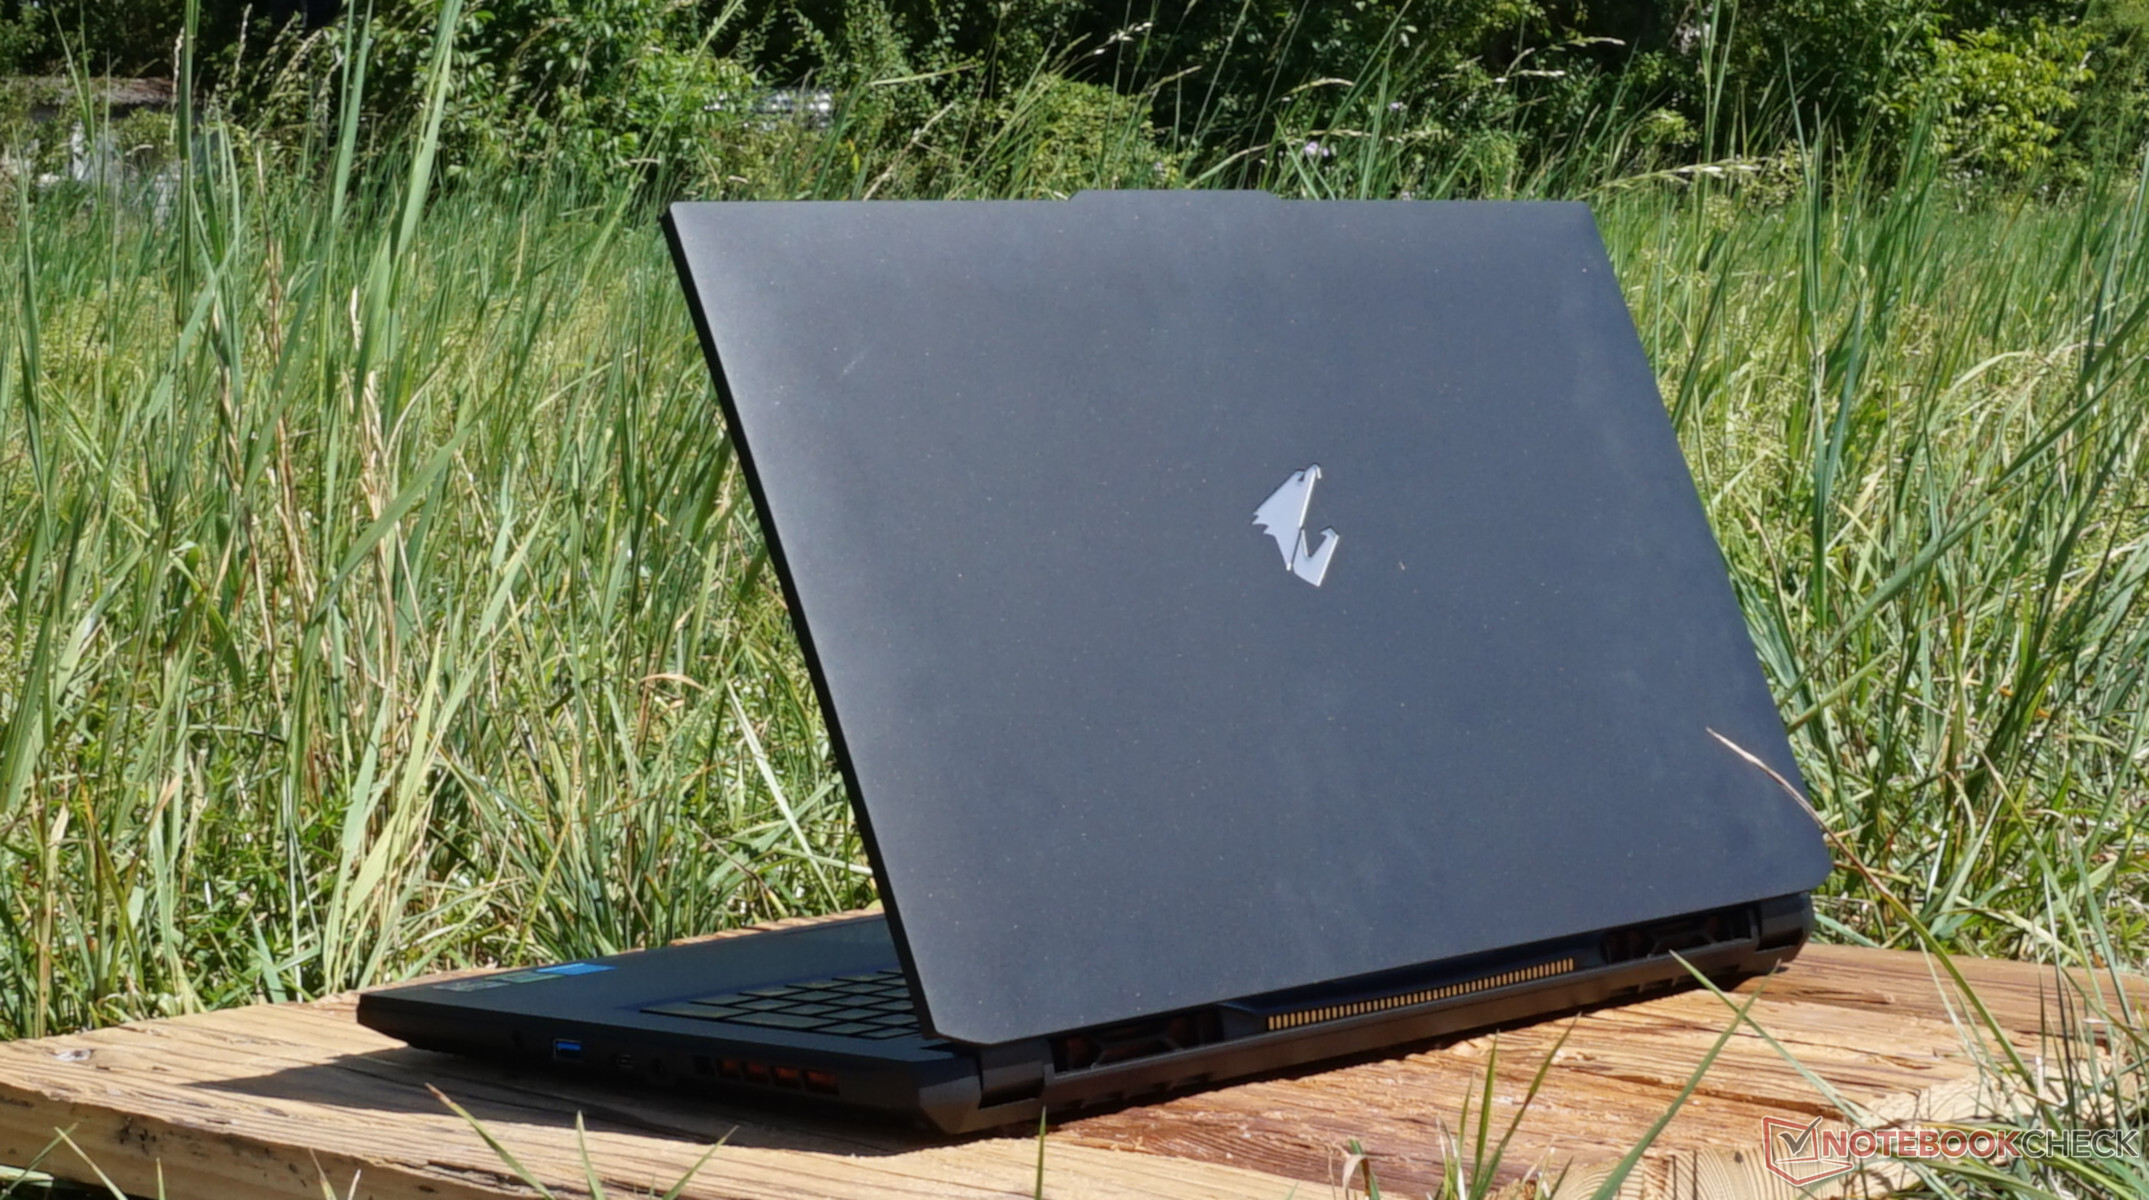
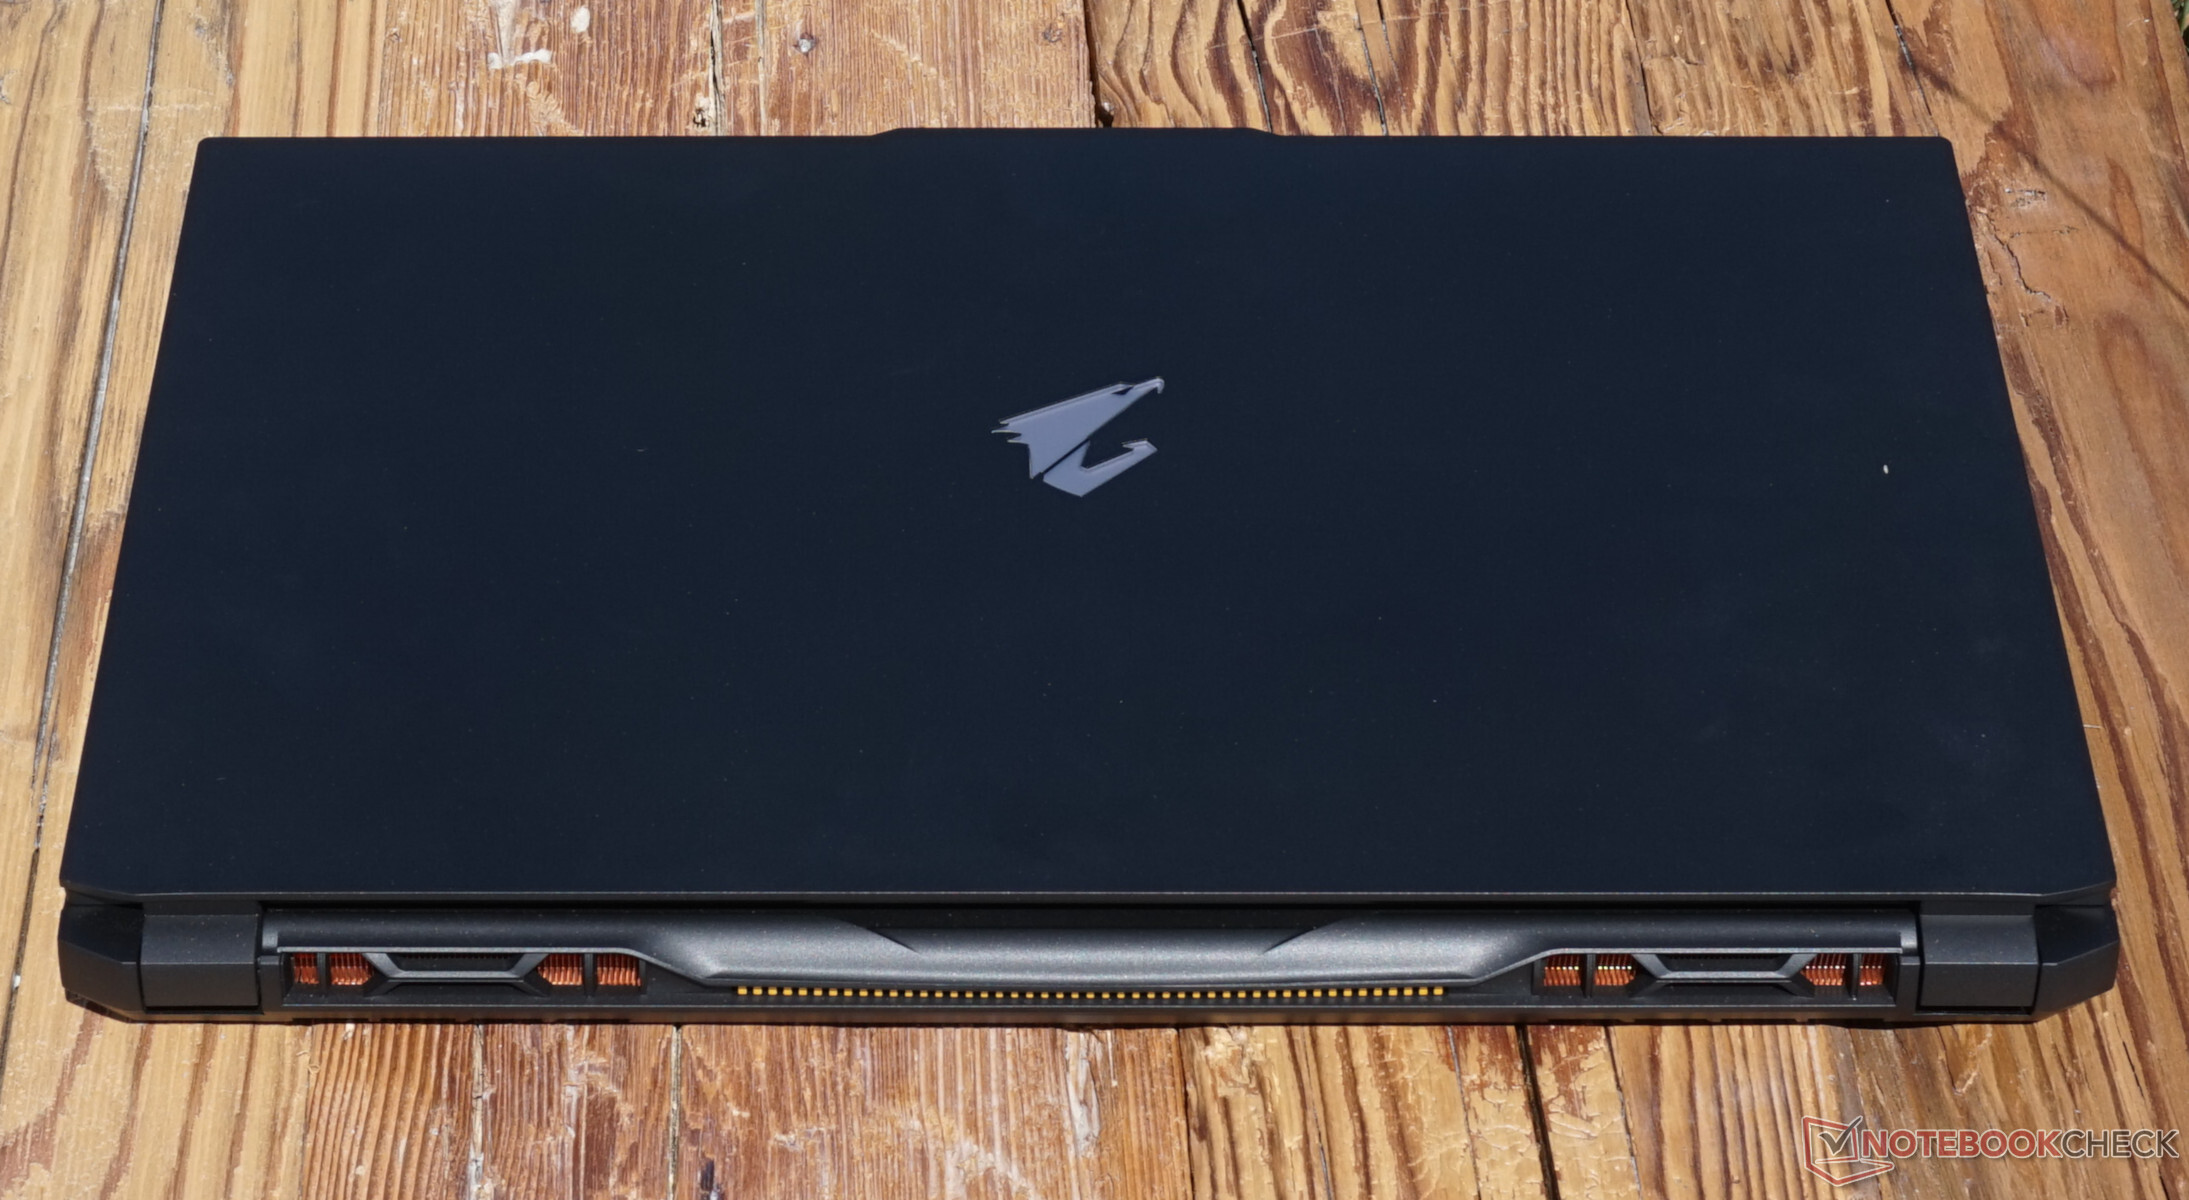
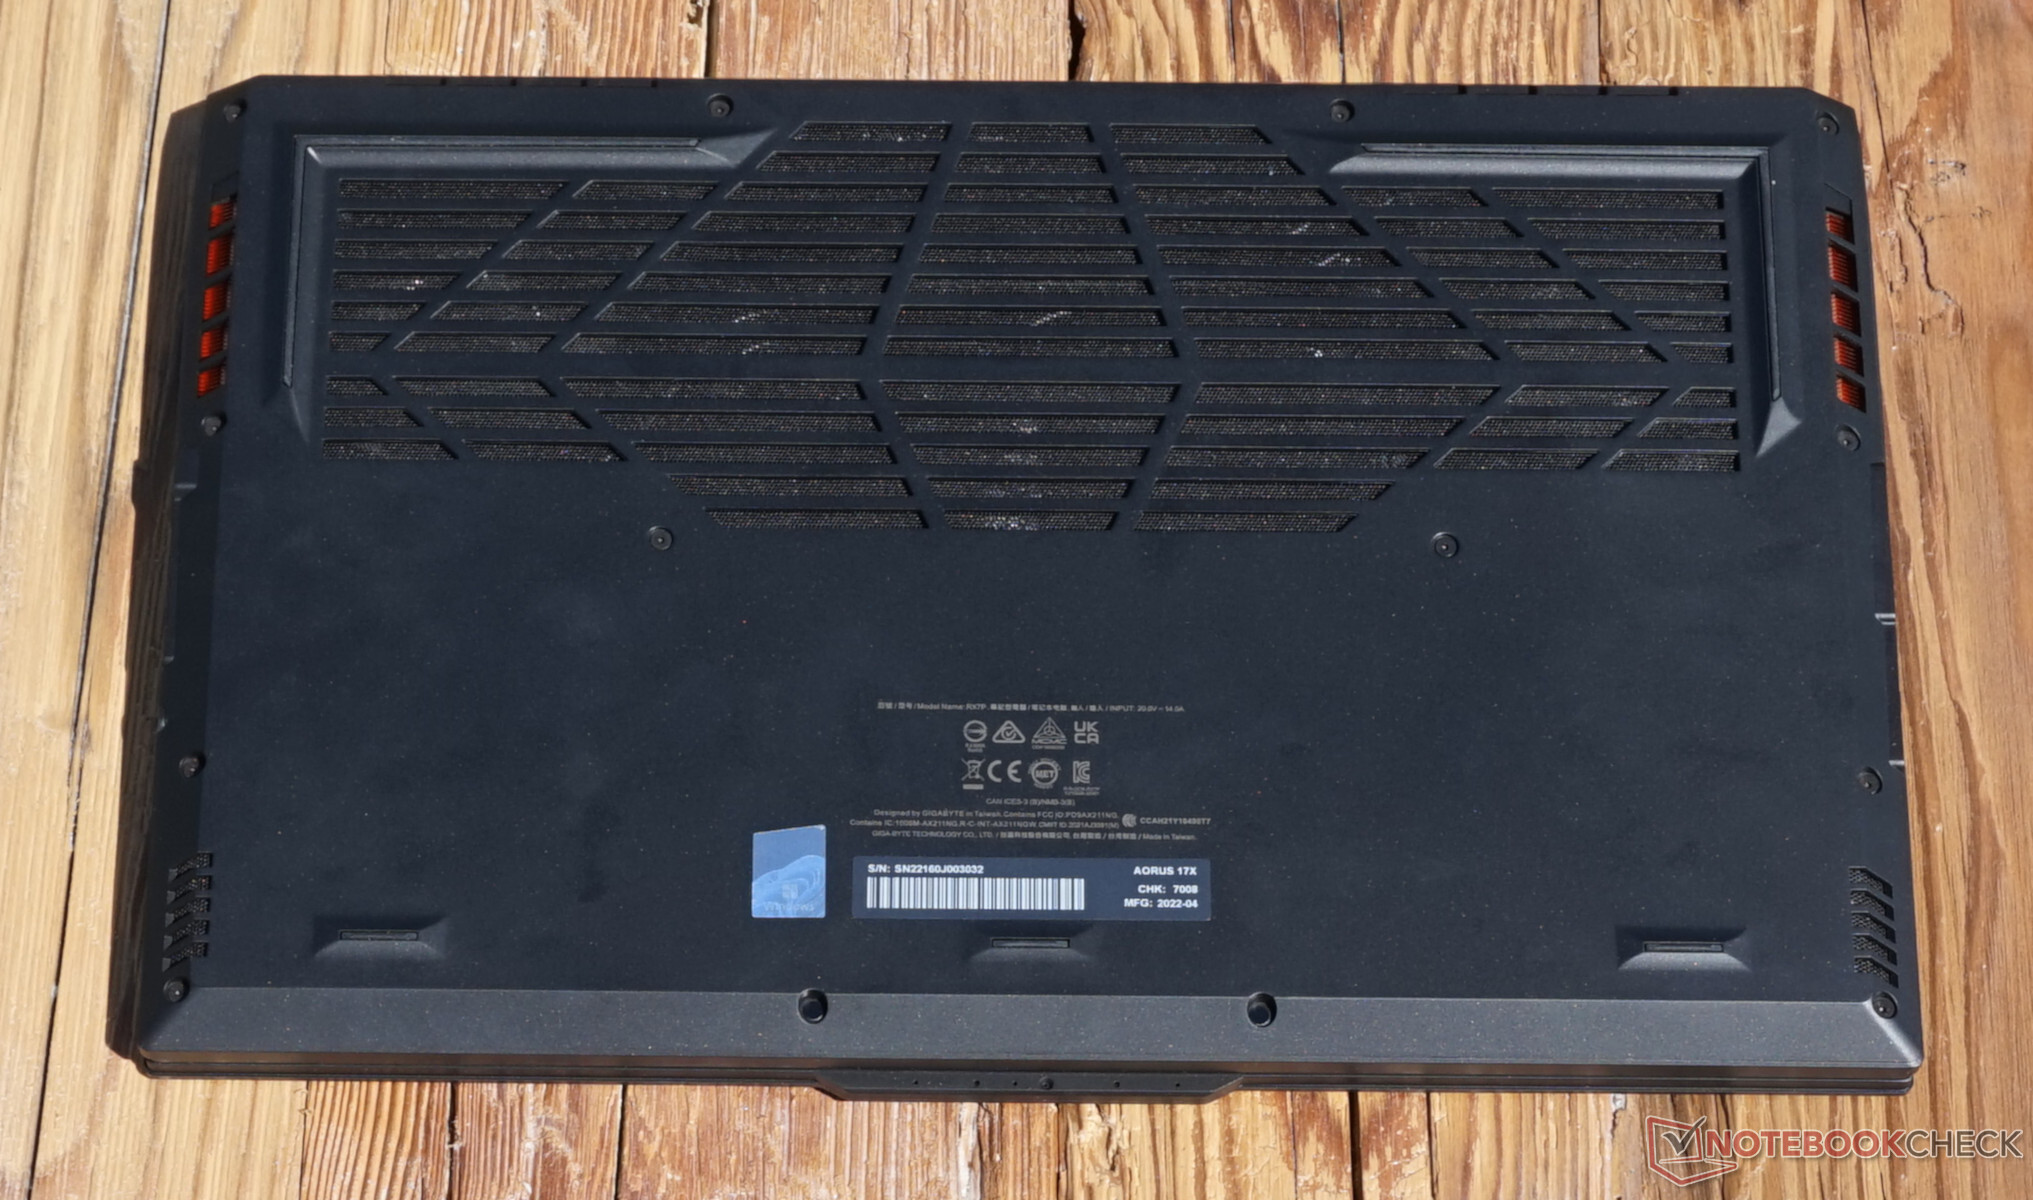
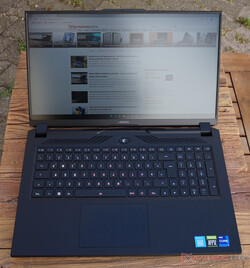
Case - Grande sistema de resfriamento e muito plástico no Aorus 17X
Sendo grande, pesado e dominado pelo plástico, o estojo pode ser considerado pragmático na melhor das hipóteses. A tampa do display poderia ter sido um pouco mais robusta, mas no geral, não há ruídos irritantes de rangidos, e você também pode abrir a tampa até 130 graus usando uma única mão sem nenhum problema. Considerando a base pesada, isto, naturalmente, não é surpreendente. O logotipo branco e iluminado da Aorus é atraente de se ver.
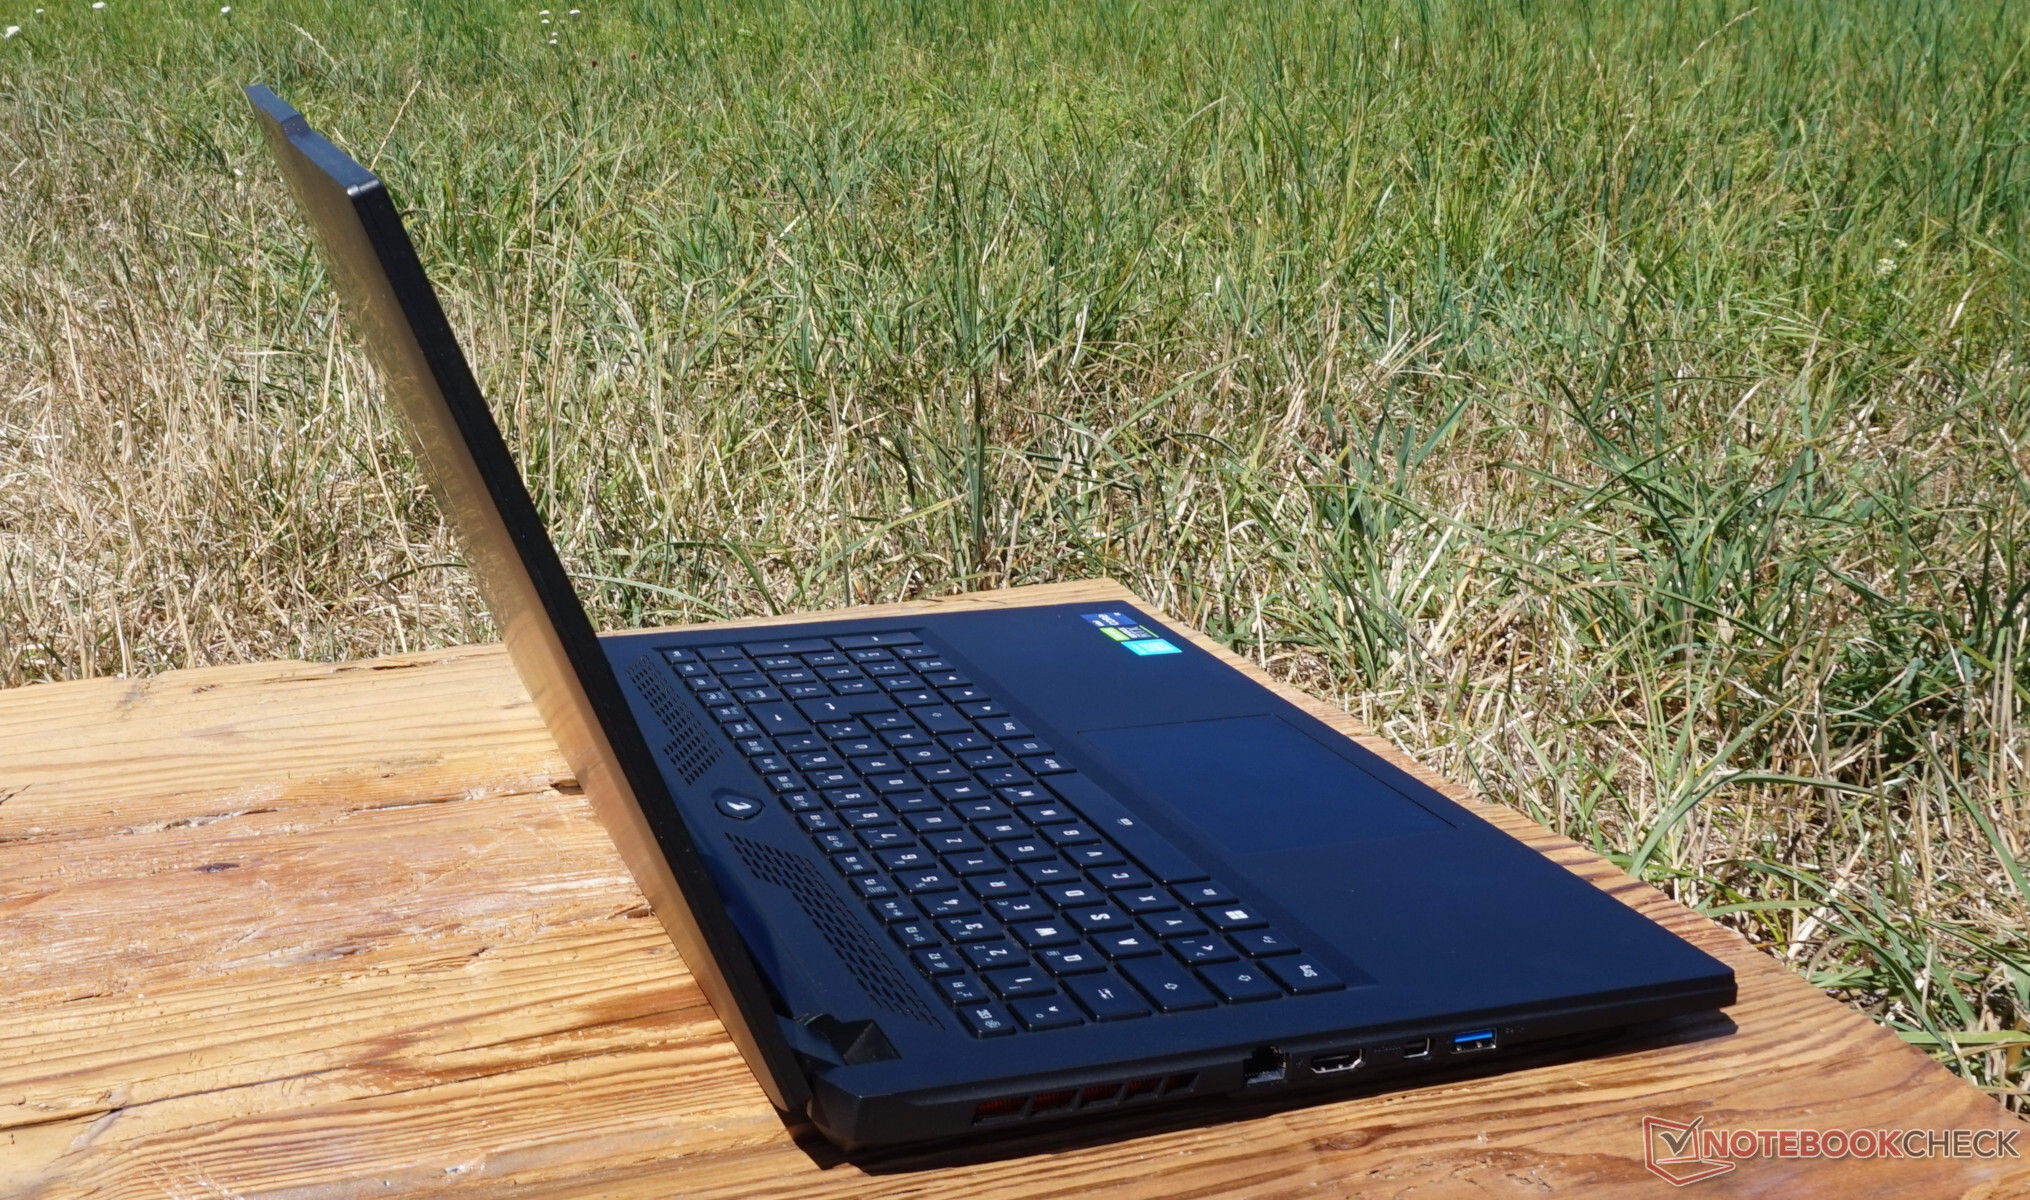
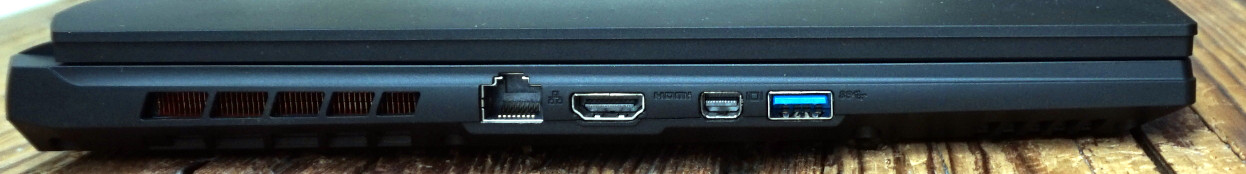
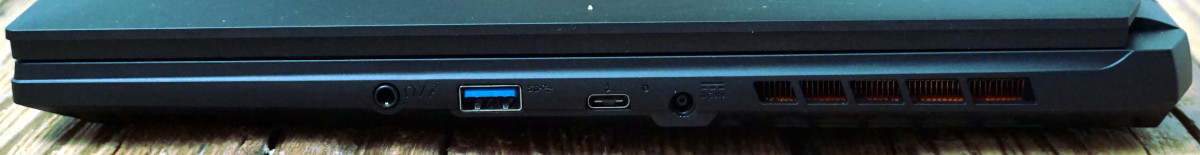
Equipamento - Mínimo, mas adequado para um laptop para jogos
A quantidade de conexões não é realmente abundante. Mas, pelo menos, o Thunderbolt 4 garante uma rápida transferência de dados. A porta LAN de 2,5 Gigabit oferece uma vantagem semelhante, e não apenas os profissionais criativos devem estar satisfeitos com as três diferentes portas de saída de vídeo.
Comunicações
O módulo WLAN, que supera ligeiramente as taxas médias de transmissão dos laptops para jogos, também oferece uma alta largura de banda. Mas com Wi-Fi 6E, o padrão utilizado aqui também é correspondentemente poderoso.
| Networking | |
| iperf3 receive AXE11000 6GHz | |
| Aorus 17X XES | |
| Média da turma Gaming (975 - 1775, n=35, últimos 2 anos) | |
| Média Intel Wi-Fi 6E AX211 (700 - 1857, n=226) | |
| MSI GE67 HX 12UGS | |
| iperf3 transmit AXE11000 6GHz | |
| Aorus 17X XES | |
| Média da turma Gaming (723 - 1868, n=36, últimos 2 anos) | |
| Média Intel Wi-Fi 6E AX211 (385 - 1851, n=226) | |
| MSI GE67 HX 12UGS | |
Webcam
Como no Aorus 17 XE4, o 17X XES também usa uma câmera HD simples. Com sua resolução fraca, ela é apenas pouco adequada para chamadas de vídeo. Pelo menos, a imagem resultante é facilmente reconhecível, mesmo em más condições de luz, e os desvios de cor permanecem dentro dos limites.
Por outro lado, o microfone de dois raios se torna bom. As gravações de várias direções e distâncias são reproduzidas quase no mesmo volume. Infelizmente, as vozes soam muito tintinhas, mas pelo menos são facilmente compreensíveis.


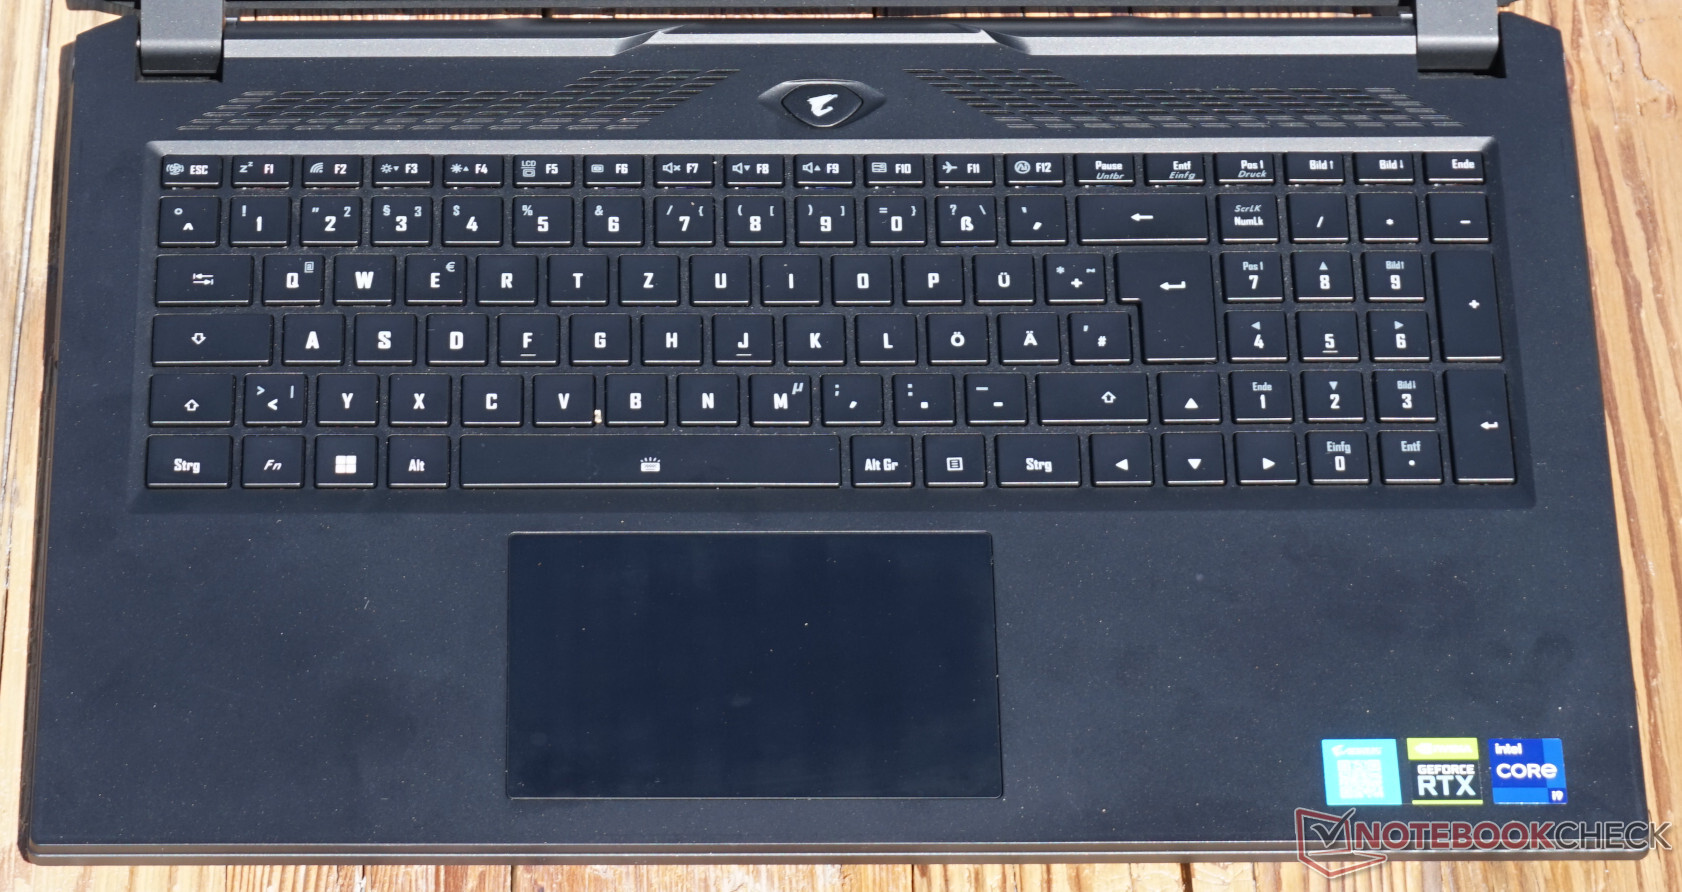
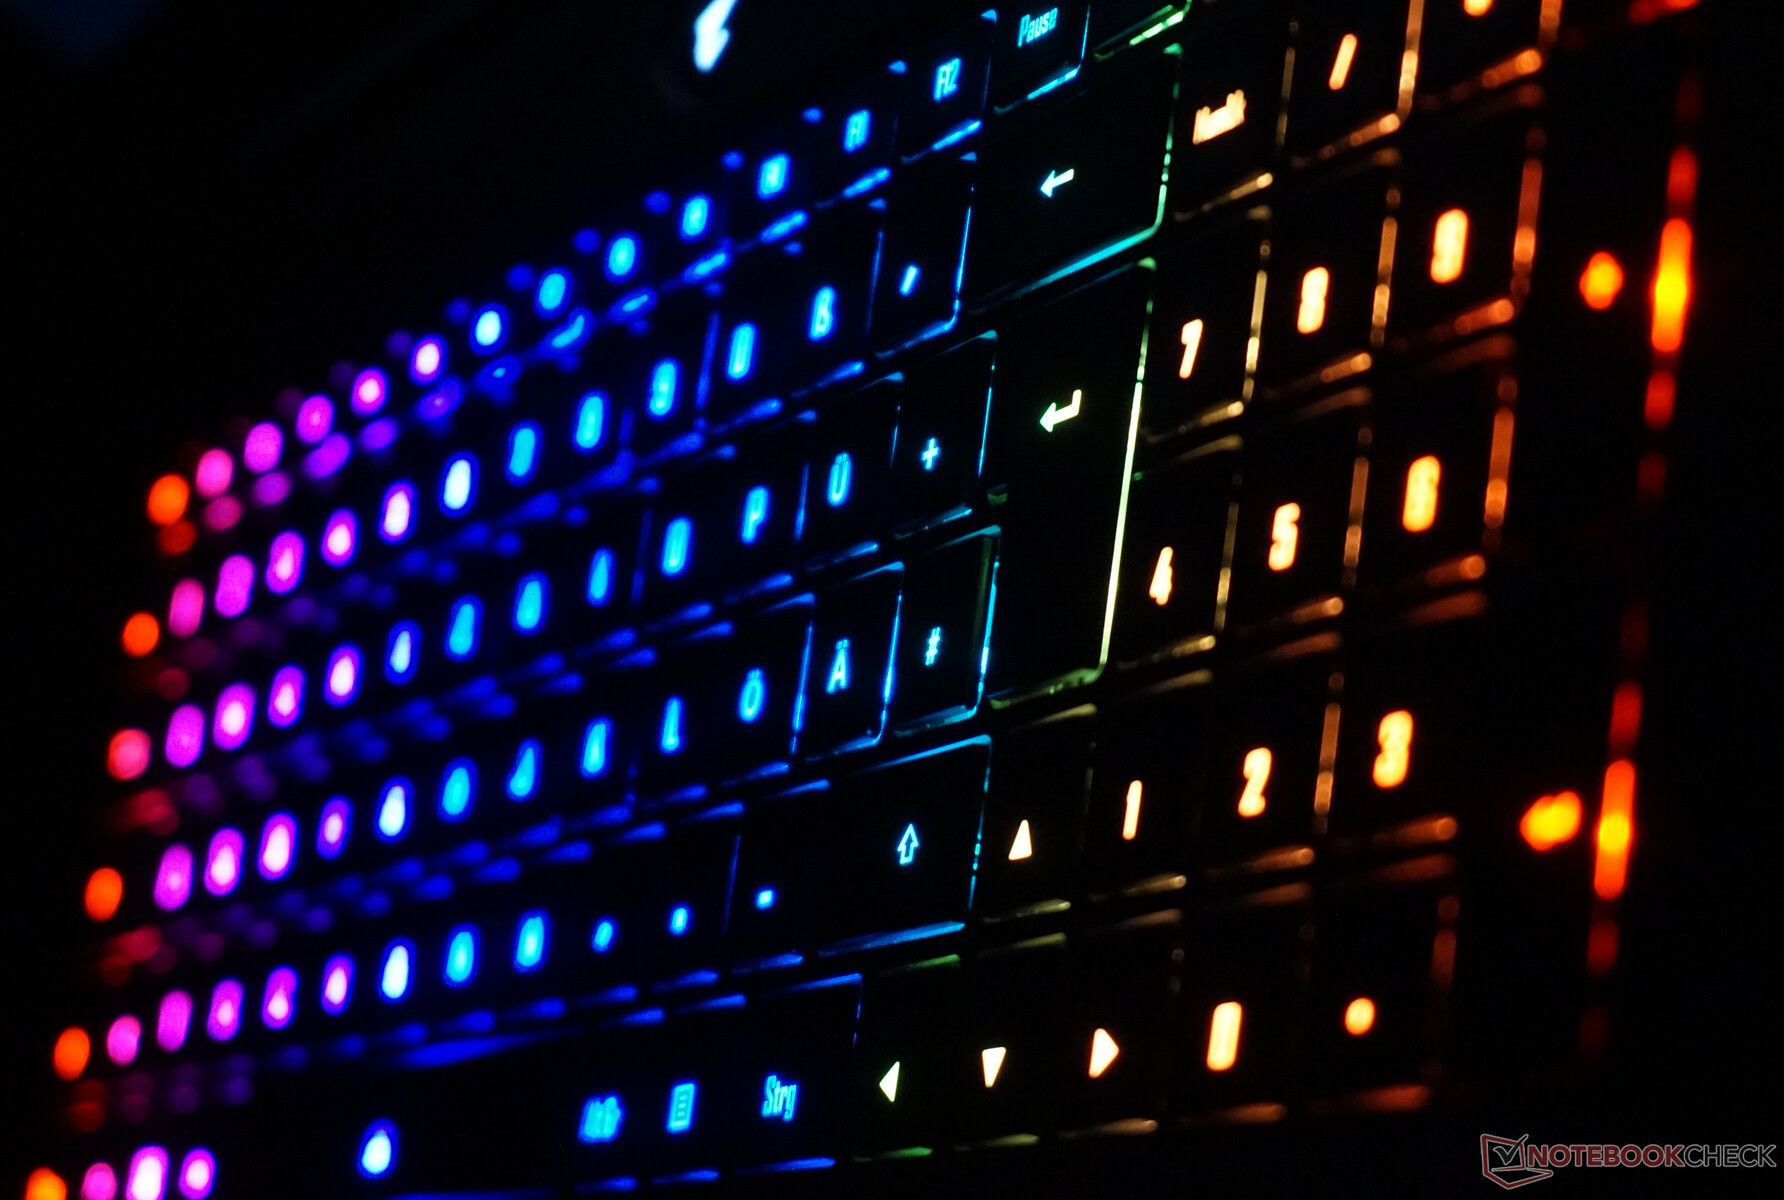
Dispositivos de entrada - O teclado do jogo tem uma iluminação colorida
O teclado decente não oferece um grande curso, mas uma resistência confortável. A estrutura dificilmente se dobra. Pelo menos, com a iluminação RGB livremente configurável, uma grande seleção de teclas de função e o bloco de número completo, não há motivos de reclamação. Entretanto, temos que ser cuidadosos, já que o teclado é minimamente menor que o padrão, o que pode causar alguma irritação ao digitar.
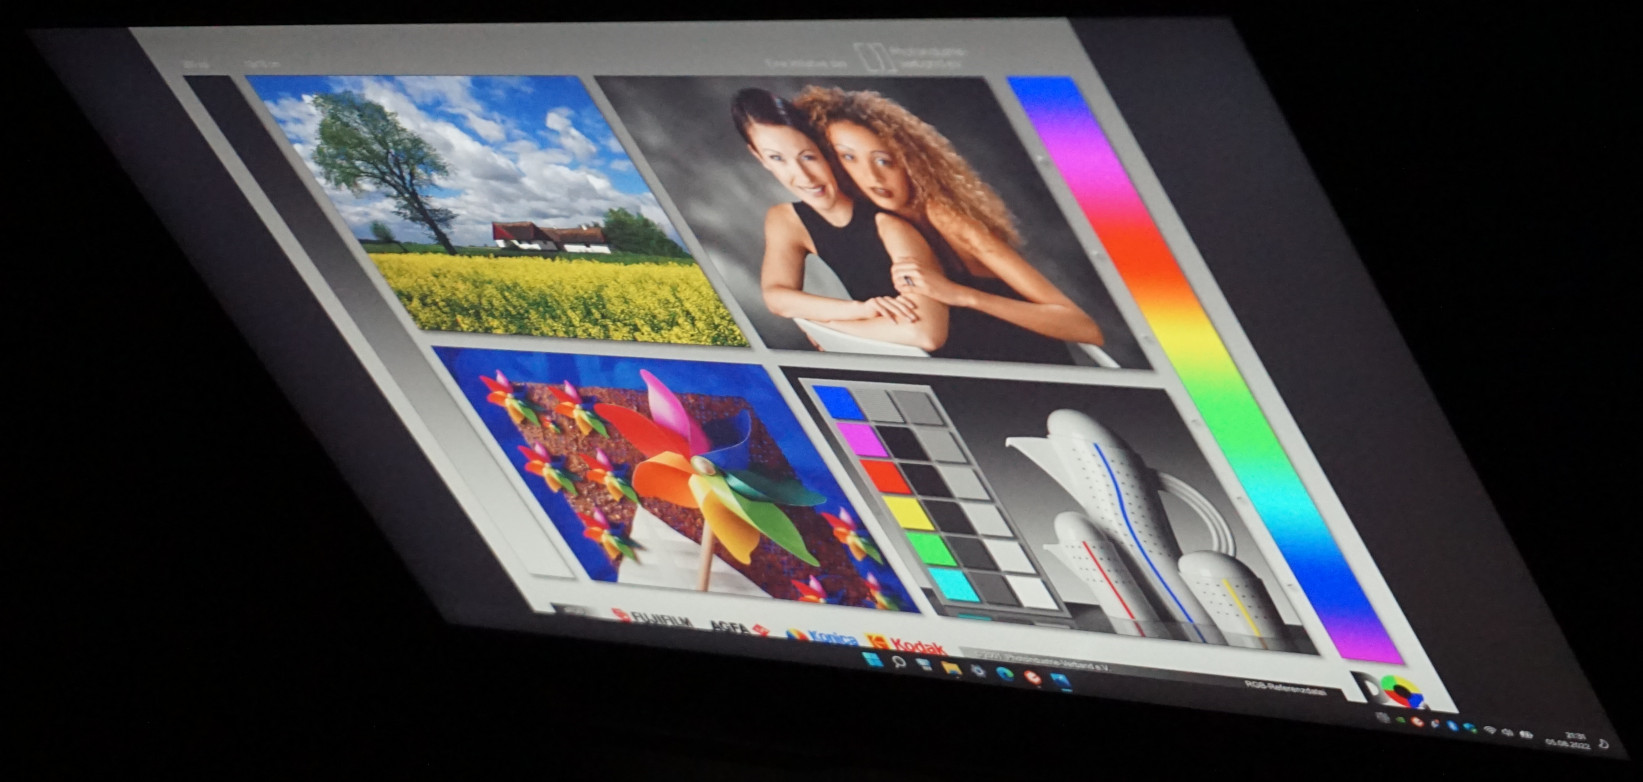
Visor - Rápido mas não brilhante

A grande tela com uma diagonal de 17,3 polegadas impressiona particularmente com sua taxa de atualização de 360 Hz. O tempo de resposta é correspondentemente curto. Além disso, há uma taxa de contraste decente de mais de 1000:1. A alta taxa de refrescamento é combinada com uma resolução Full HD.
O que é menos convincente é a luminosidade. Mesmo sobre a mesa, o valor médio de 270 cd/m² parece às vezes muito baixo, e a iluminação carece de energia. Considerando a fraca iluminação de fundo, o sangramento da tela permanece dentro dos limites, e só notamos uma auréola clara no canto superior direito com conteúdo de imagem extremamente escuro.
Para permitir que a tela se ajuste automaticamente ao ambiente, a Gigabyte equipou o Aorus 17X com um sensor de luminosidade. Embora funcione de forma confiável, ele se ativa um pouco demais para nossos gostos. A simples criação de alguma sombra movendo a mão à sua frente, pode levar a um ajuste do brilho, o que também é relatado a cada vez.
Nvidia Advanced Optimus, que funciona em segundo plano e limita as latências a um mínimo, garante uma comutação quase imperceptível entre o iGPU e a placa gráfica de jogo. Isto é especialmente prático para jogos rápidos e competitivos, mas também útil em geral.
| |||||||||||||||||||||||||
iluminação: 79 %
iluminação com acumulador: 278 cd/m²
Contraste: 1069:1 (Preto: 0.26 cd/m²)
ΔE ColorChecker Calman: 3.96 | ∀{0.5-29.43 Ø4.71}
calibrated: 1.07
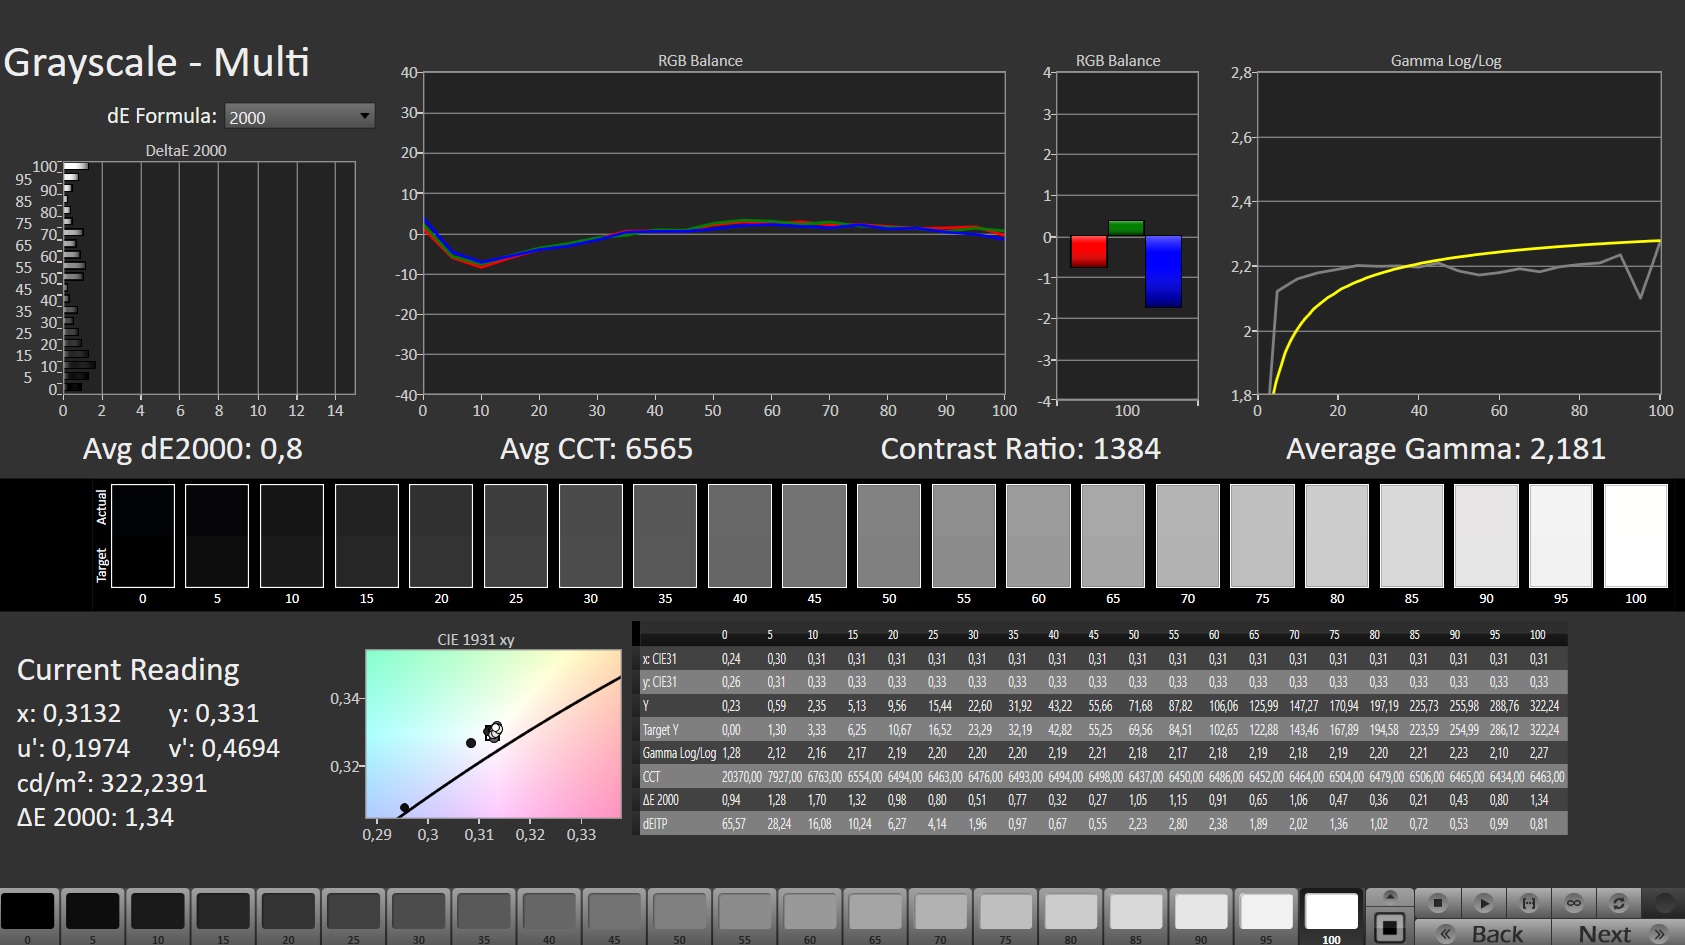
ΔE Greyscale Calman: 6.8 | ∀{0.09-98 Ø4.96}
71.9% AdobeRGB 1998 (Argyll 3D)
99.9% sRGB (Argyll 3D)
70.1% Display P3 (Argyll 3D)
Gamma: 2.224
CCT: 7651 K
| Aorus 17X XES Sharp SHP1563, IPS, 1920x1080, 17.3" | HP Omen 17-ck1075ng BOE09EE, IPS, 1920x1080, 17.3" | MSI GE67 HX 12UGS Samsung ATNA562P02-0, OLED, 1920x1080, 15.6" | Schenker XMG Pro 17 E22 BOE099D, IPS, 2560x1440, 17.3" | MSI Raider GE66 12UHS AUO51EB, IPS, 3840x2160, 15.6" | Asus ROG Zephyrus Duo 16 GX650RX BOE NE160QAM-NX1, IPS-Level, 3840x2400, 16" | Aorus 17 XE4 Sharp LQ173M1JW12, IPS, 1920x1080, 17.3" | |
|---|---|---|---|---|---|---|---|
| Display | -14% | -1% | 19% | 15% | 20% | -1% | |
| Display P3 Coverage (%) | 70.1 | 59.03 -16% | 71.7 2% | 97.5 39% | 80.4 15% | 98 40% | 69 -2% |
| sRGB Coverage (%) | 99.9 | 87.46 -12% | 89.7 -10% | 99.9 0% | 98.4 -2% | 99.9 0% | 99.4 -1% |
| AdobeRGB 1998 Coverage (%) | 71.9 | 61.04 -15% | 75.2 5% | 85.2 18% | 94.7 32% | 86.3 20% | 71.2 -1% |
| Response Times | -192% | 93% | -38% | -287% | -163% | -220% | |
| Response Time Grey 50% / Grey 80% * (ms) | 3.4 ? | 14 ? -312% | 0.25 ? 93% | 5.4 ? -59% | 18.8 ? -453% | 14.6 ? -329% | 15.2 ? -347% |
| Response Time Black / White * (ms) | 5.8 ? | 10 ? -72% | 0.4 ? 93% | 6.8 ? -17% | 12.8 ? -121% | 5.6 ? 3% | 11.2 ? -93% |
| PWM Frequency (Hz) | 100 ? | 480.4 ? | |||||
| Screen | 8% | 24% | 20% | 18% | 16% | 21% | |
| Brightness middle (cd/m²) | 278 | 321 15% | 356.1 28% | 349 26% | 351 26% | 459 65% | 274 -1% |
| Brightness (cd/m²) | 273 | 302 11% | 358 31% | 319 17% | 347 27% | 434 59% | 267 -2% |
| Brightness Distribution (%) | 79 | 84 6% | 99 25% | 83 5% | 90 14% | 88 11% | 82 4% |
| Black Level * (cd/m²) | 0.26 | 0.41 -58% | 0.32 -23% | 0.35 -35% | 0.44 -69% | 0.25 4% | |
| Contrast (:1) | 1069 | 783 -27% | 1091 2% | 1003 -6% | 1043 -2% | 1096 3% | |
| Colorchecker dE 2000 * | 3.96 | 1.62 59% | 4.83 -22% | 2.5 37% | 2.54 36% | 2.97 25% | 2.07 48% |
| Colorchecker dE 2000 max. * | 10.78 | 4.08 62% | 7.94 26% | 6.87 36% | 8.36 22% | 8.13 25% | 4.89 55% |
| Colorchecker dE 2000 calibrated * | 1.07 | 1.93 -80% | 0.64 40% | 0.67 37% | 1.03 4% | 0.83 22% | |
| Greyscale dE 2000 * | 6.8 | 1.24 82% | 3.1 54% | 3.9 43% | 4.1 40% | 4.9 28% | 3 56% |
| Gamma | 2.224 99% | 2.41 91% | 2.2 100% | 2.09 105% | 2.089 105% | 2.235 98% | 2.207 100% |
| CCT | 7651 85% | 6261 104% | 5938 109% | 7192 90% | 7036 92% | 6775 96% | 6999 93% |
| Média Total (Programa/Configurações) | -66% /
-26% | 39% /
30% | 0% /
12% | -85% /
-26% | -42% /
-9% | -67% /
-18% |
* ... menor é melhor
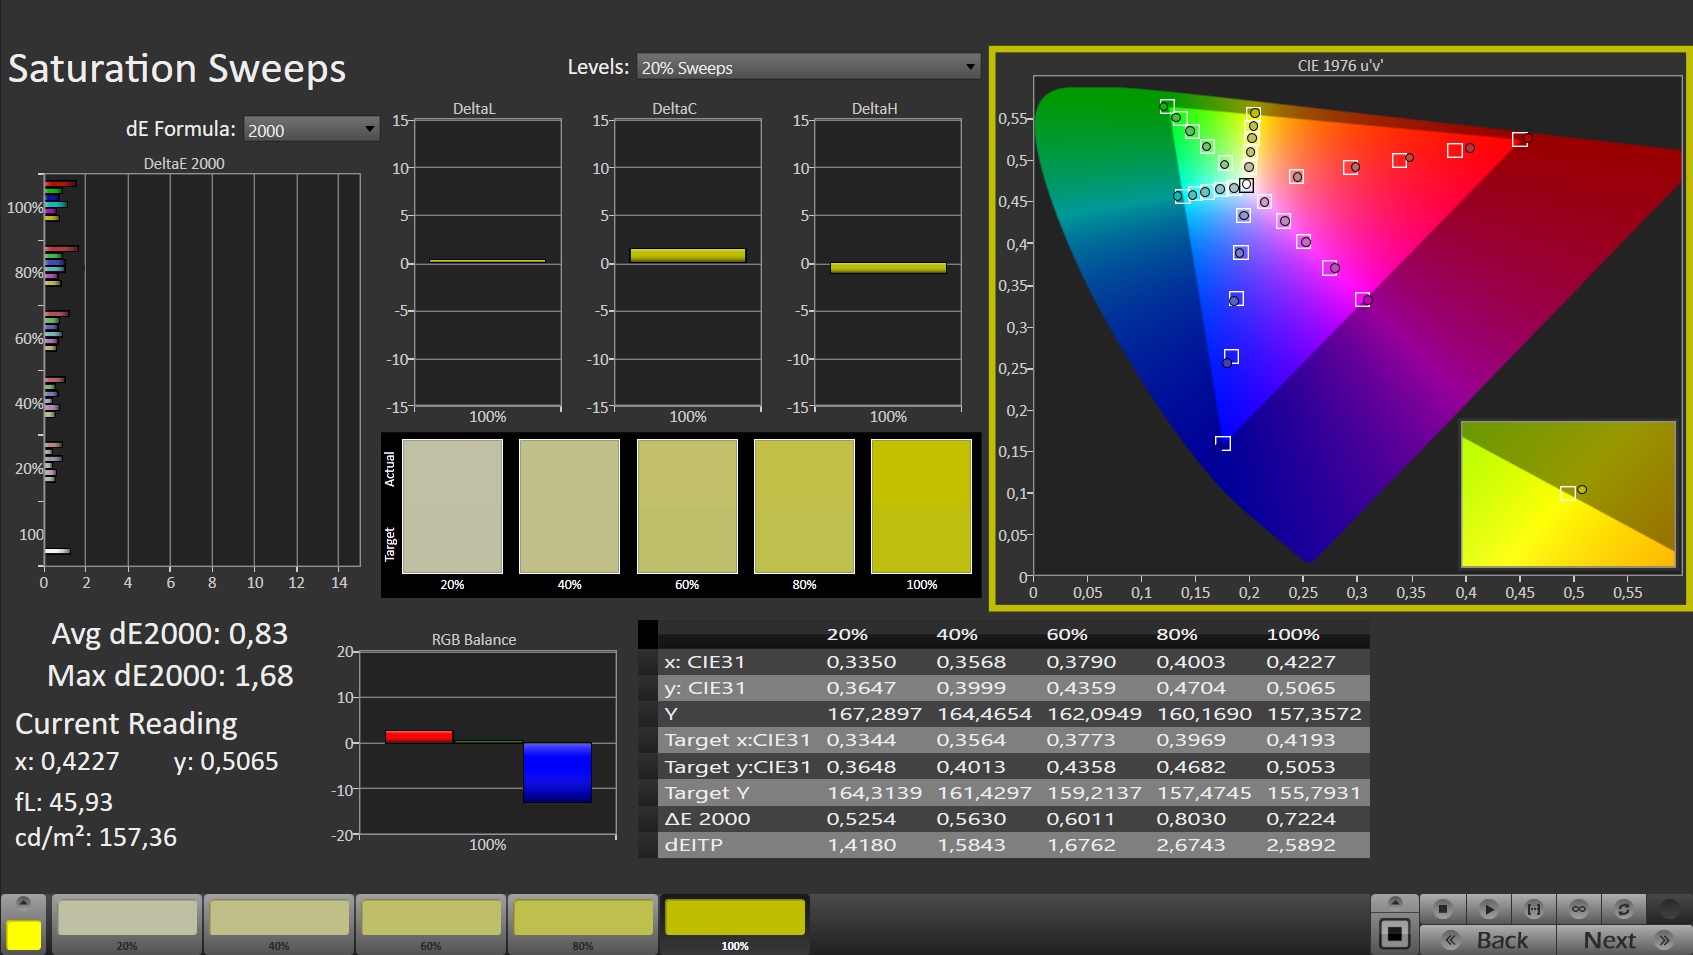
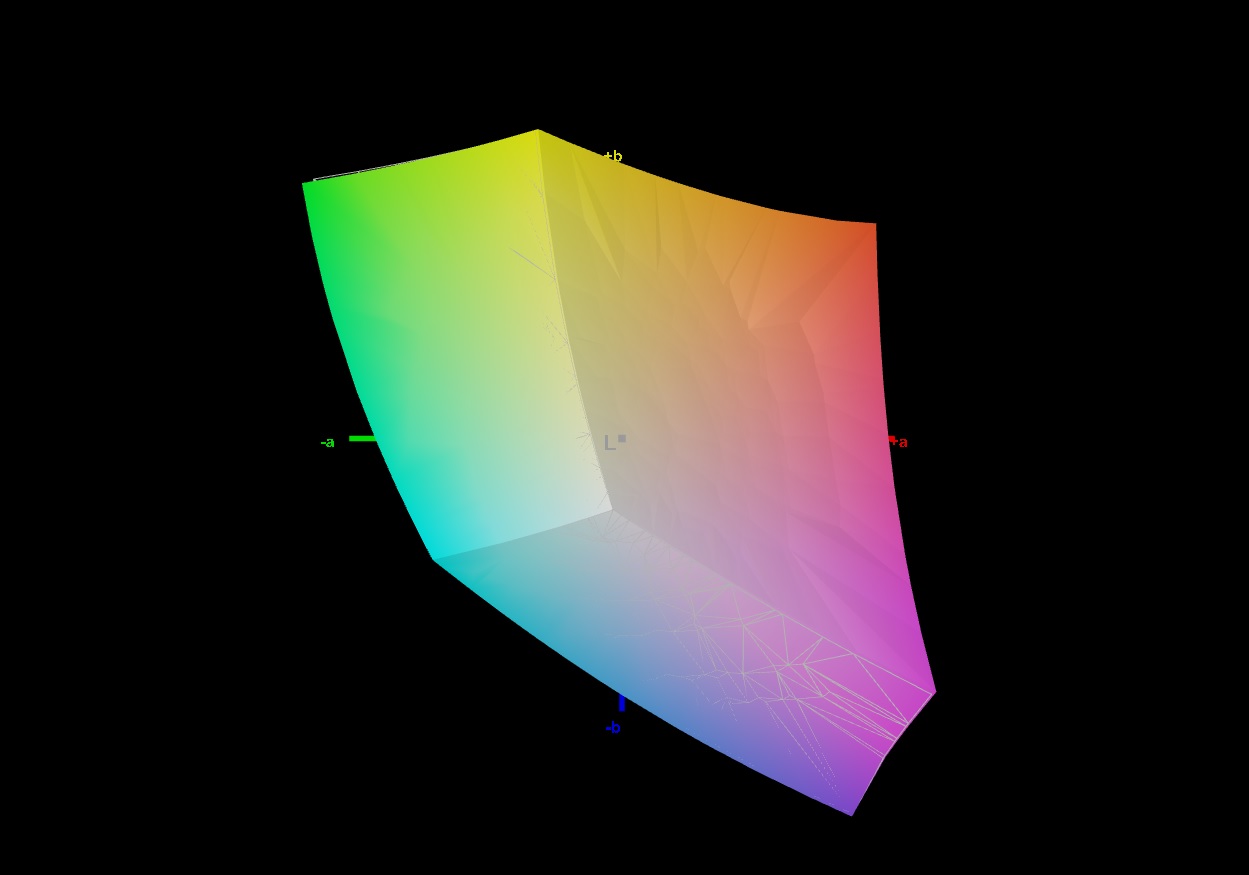
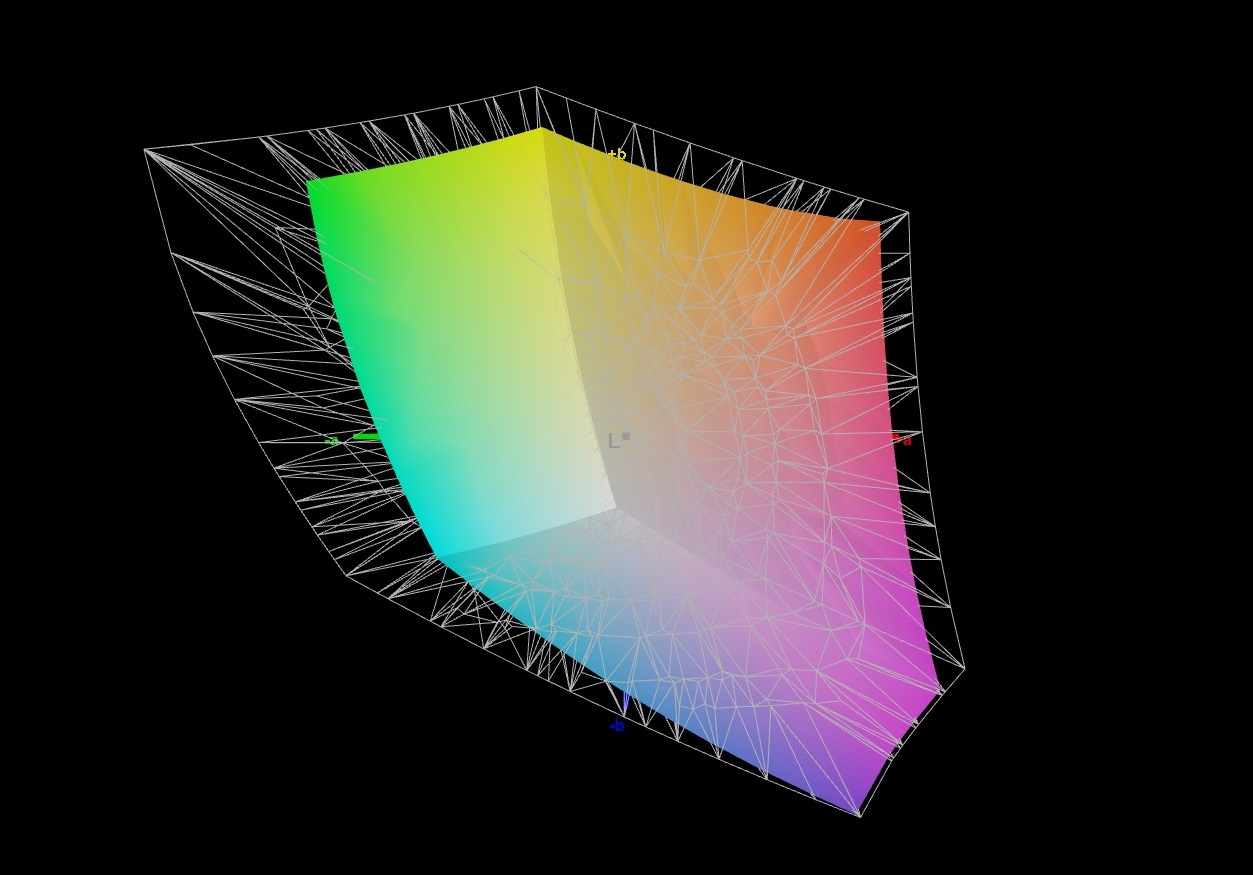
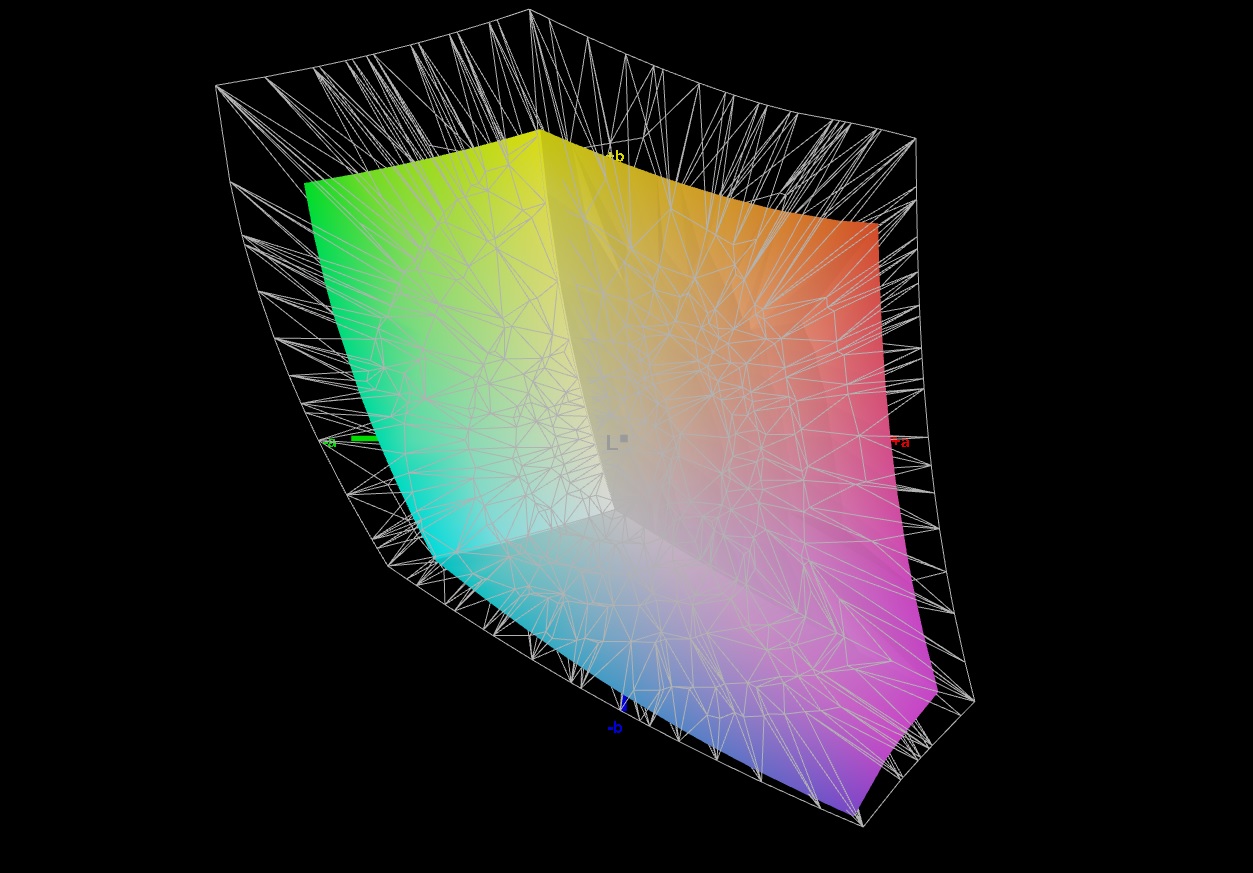
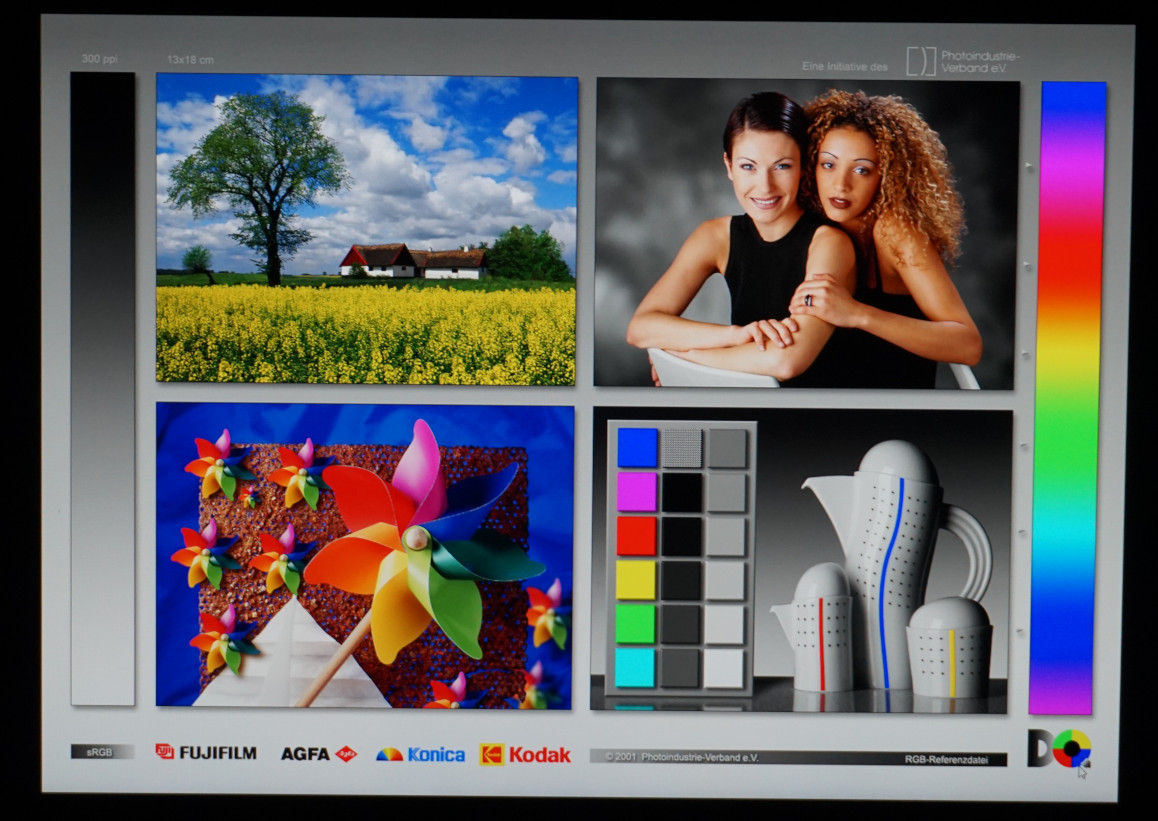
A cobertura do espaço de cores é otimamente direcionada para jogos. O espaço de cores sRGB pode basicamente ser reproduzido completamente. Como esperado, a tela só pode cobrir partes dos espaços de cor AdobeRGB ou DCI-P3, que são mais usados para processar mídia.
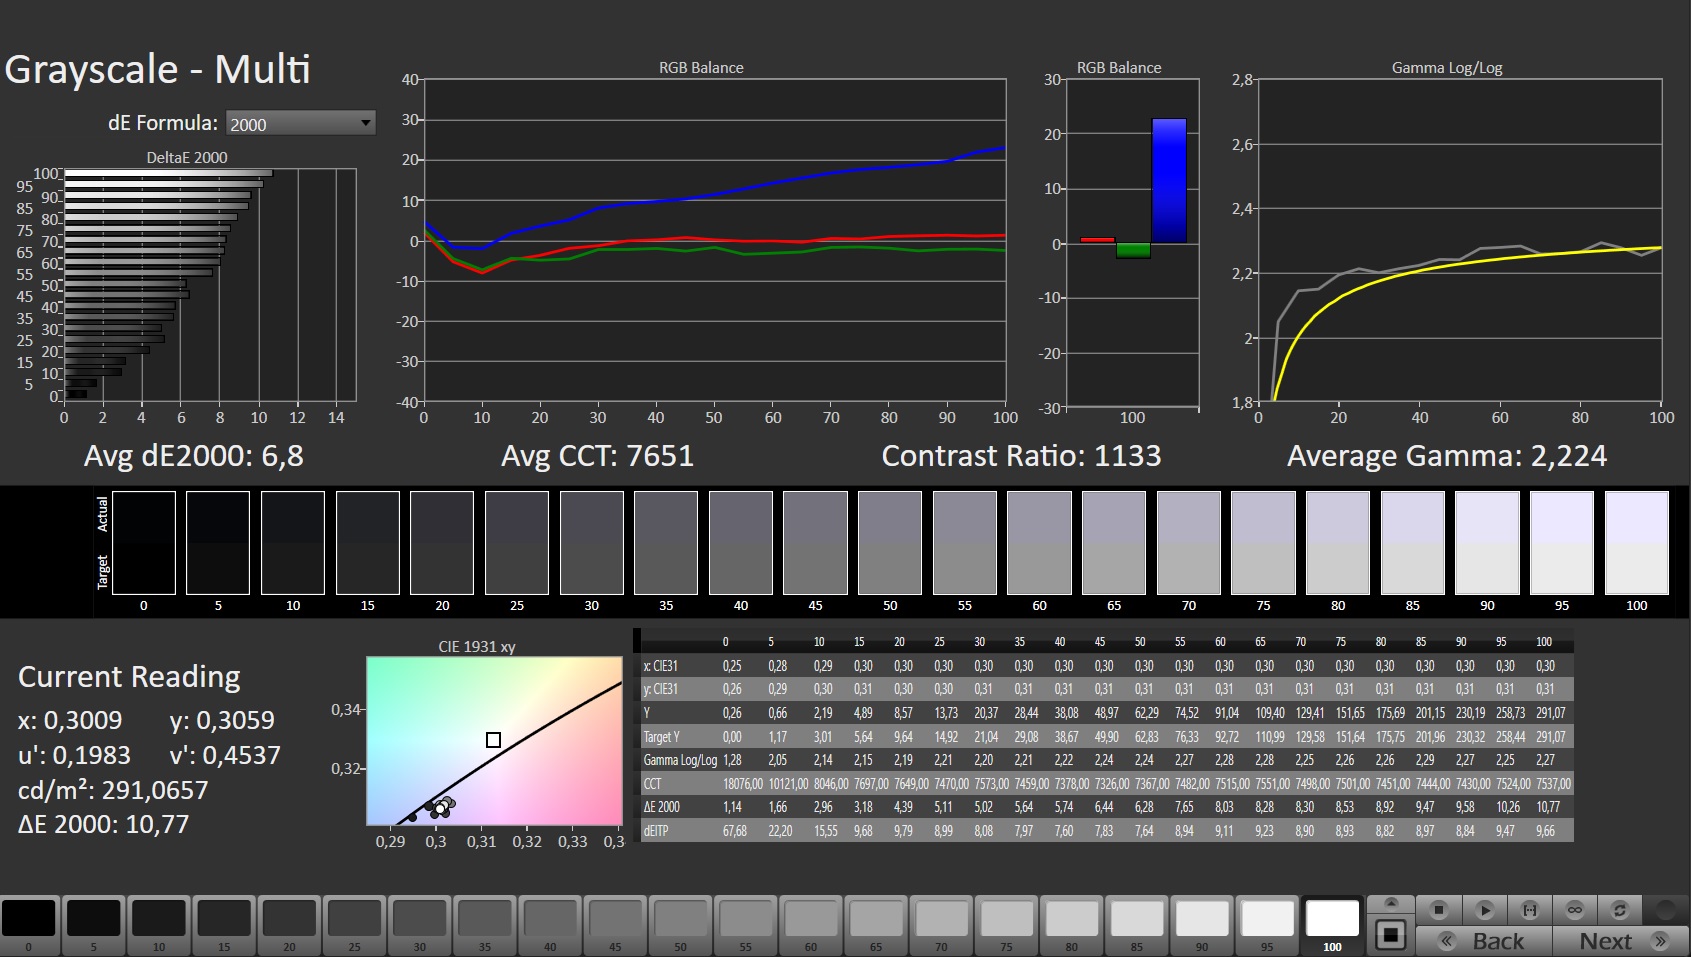
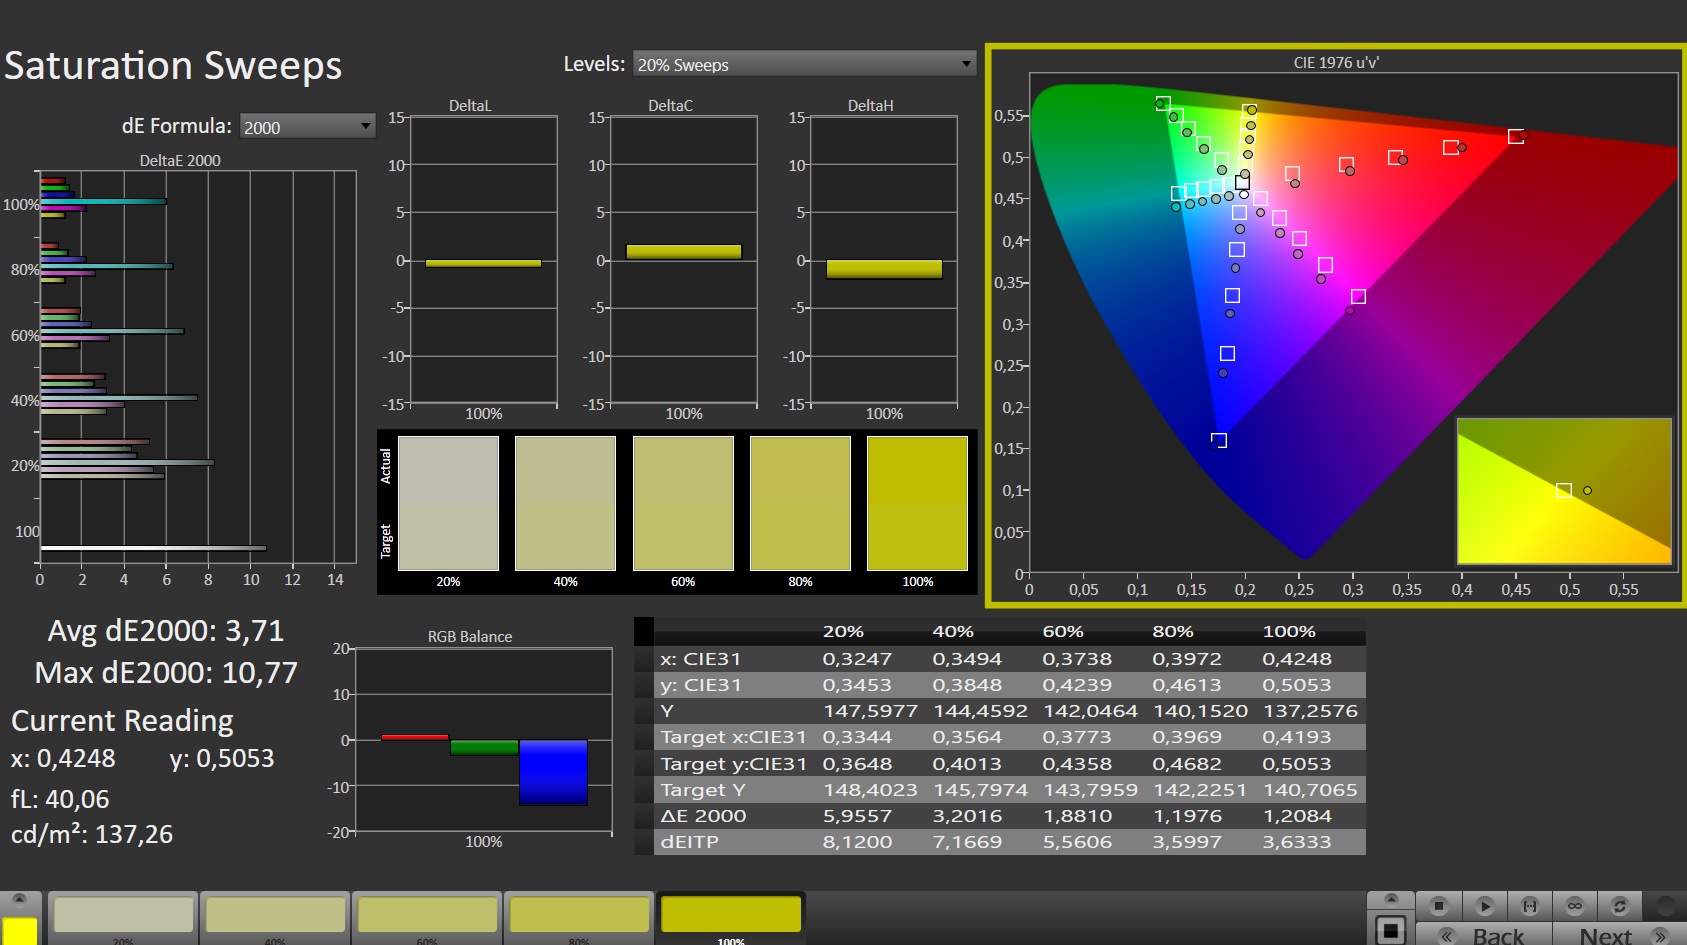
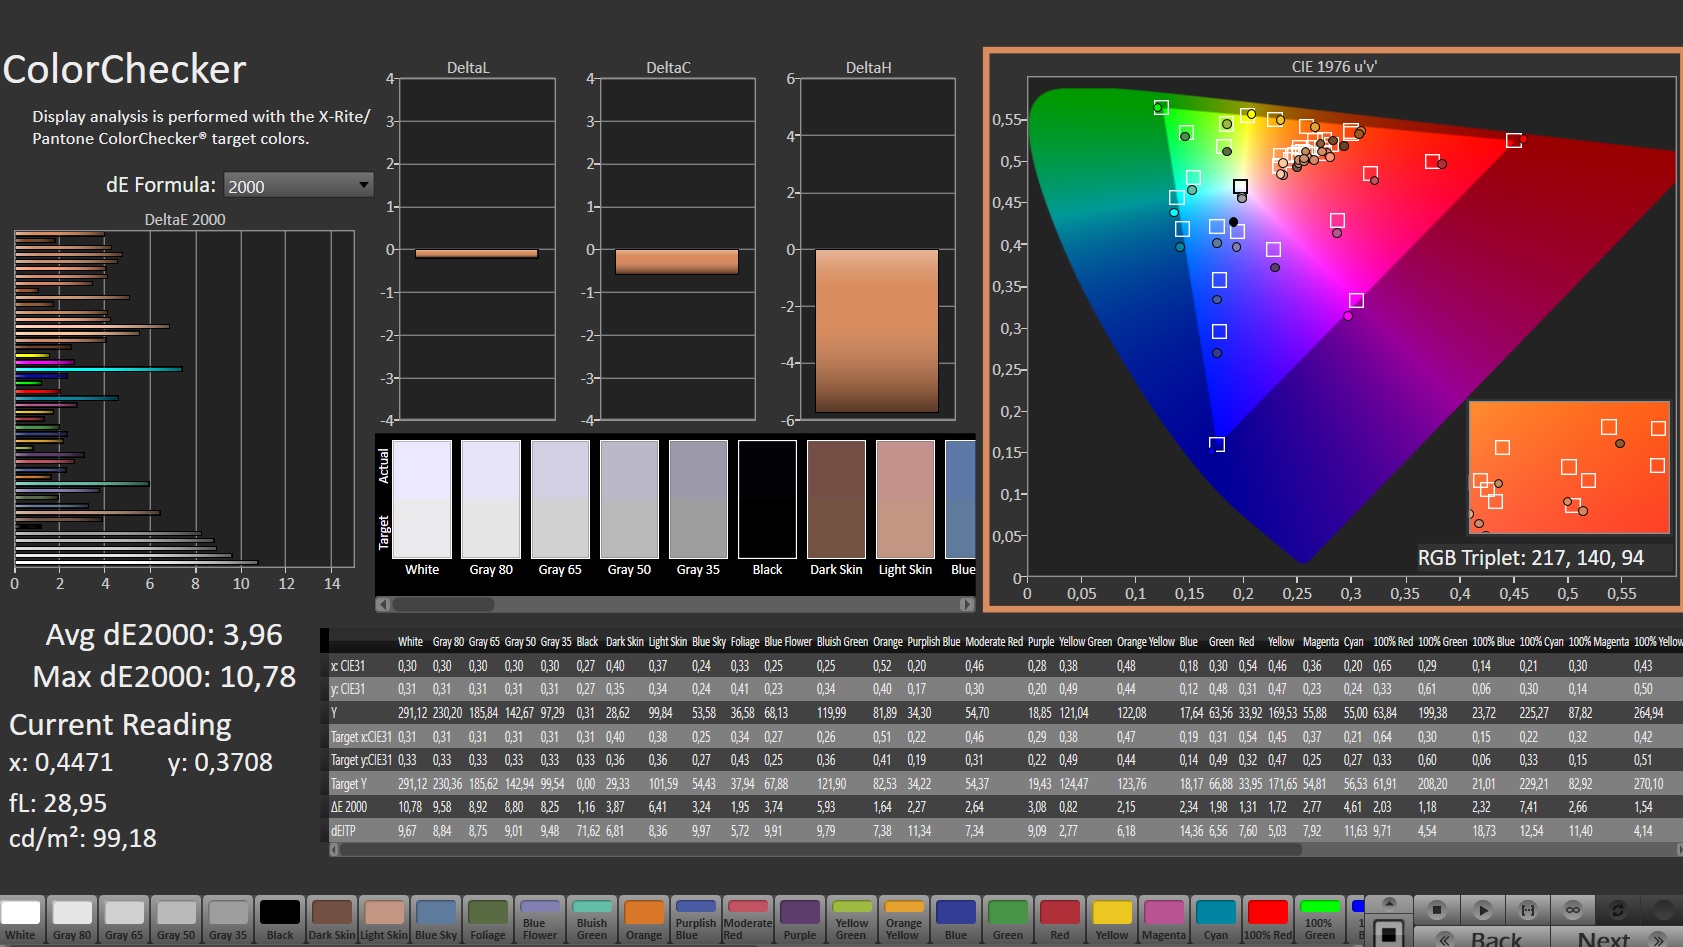
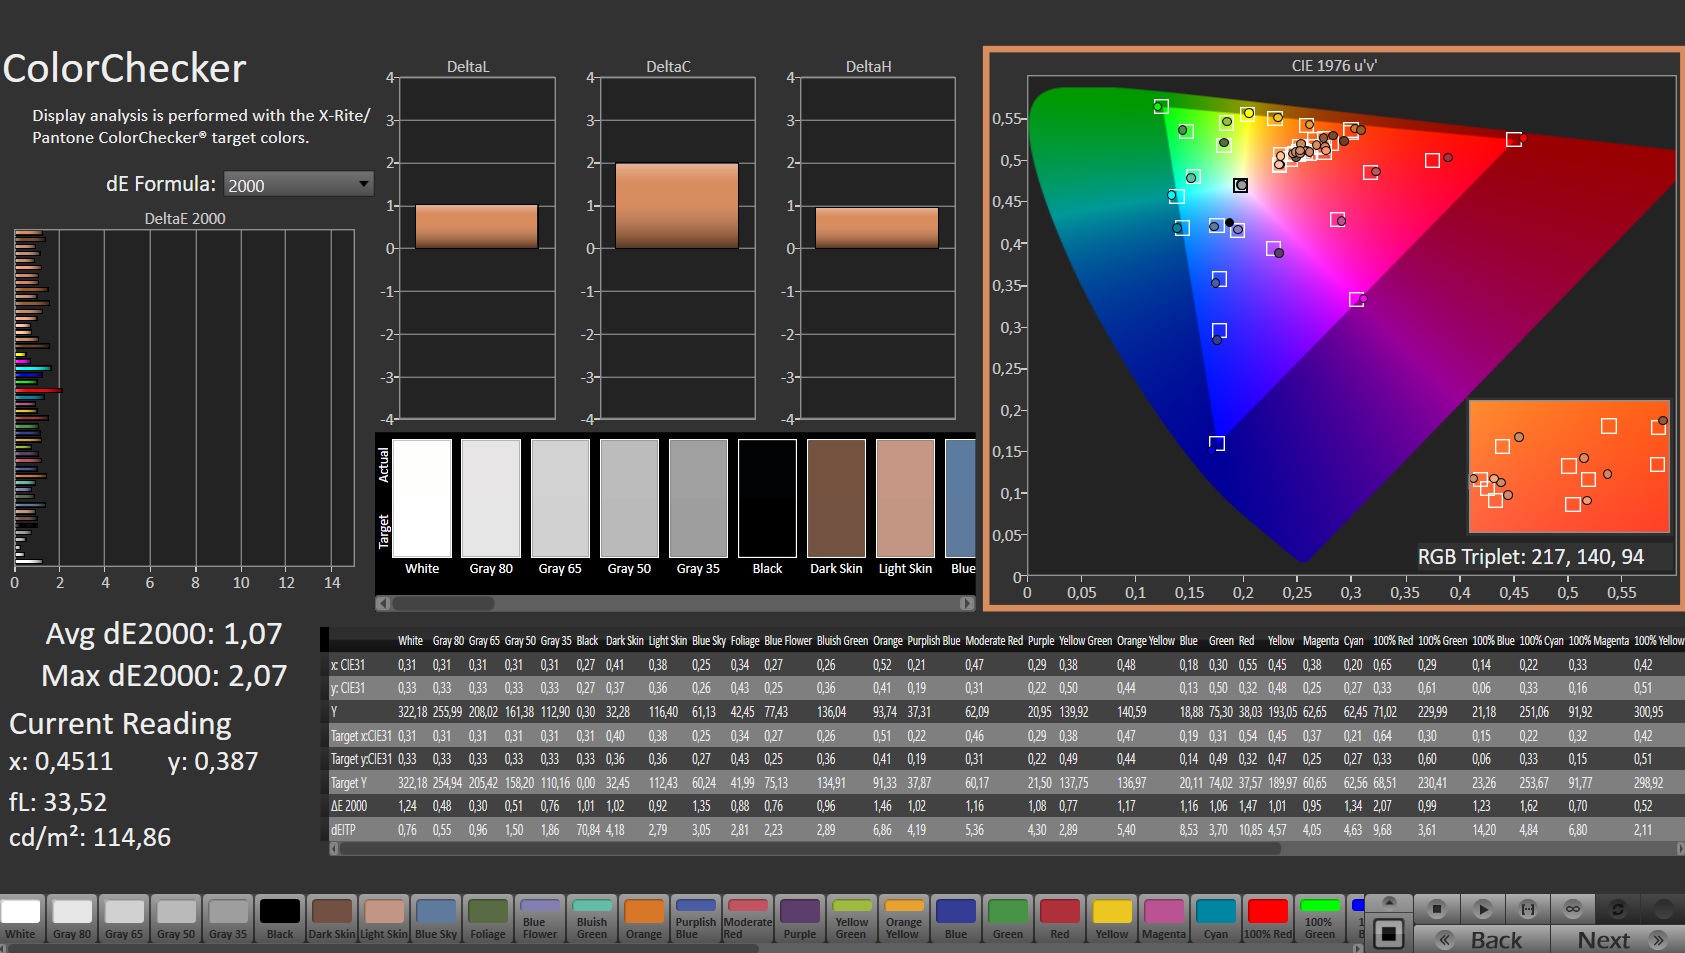
A precisão da cor no estado de entrega ainda pode ser melhorada. Entretanto, é necessário ter olhos treinados para poder realmente notar o DeltaE de apenas 4. Após a calibração, medimos um DeltaE de apenas 1, o que corresponde a uma reprodução de cor quase ideal. Você pode baixar o perfil de cor associado no link acima, na parte inferior da caixa com os valores do painel.
Exibir tempos de resposta
| ↔ Tempo de resposta preto para branco | ||
|---|---|---|
| 5.8 ms ... ascensão ↗ e queda ↘ combinadas | ↗ 2.5 ms ascensão | 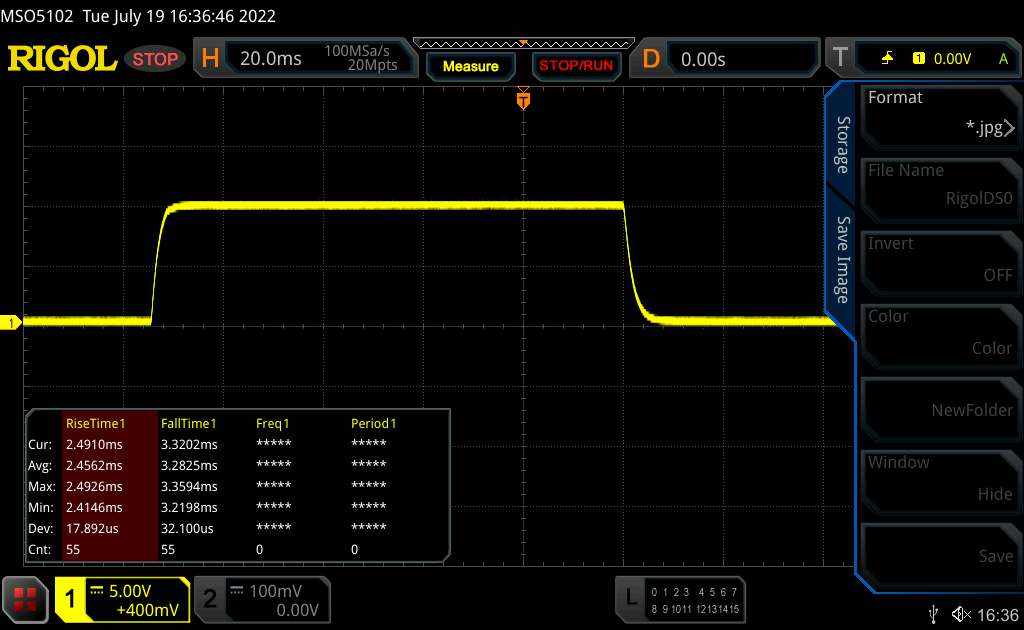 |
| ↘ 3.3 ms queda | ||
| A tela mostra taxas de resposta muito rápidas em nossos testes e deve ser muito adequada para jogos em ritmo acelerado. Em comparação, todos os dispositivos testados variam de 0.1 (mínimo) a 240 (máximo) ms. » 18 % de todos os dispositivos são melhores. Isso significa que o tempo de resposta medido é melhor que a média de todos os dispositivos testados (19.8 ms). | ||
| ↔ Tempo de resposta 50% cinza a 80% cinza | ||
| 3.4 ms ... ascensão ↗ e queda ↘ combinadas | ↗ 1.4 ms ascensão | 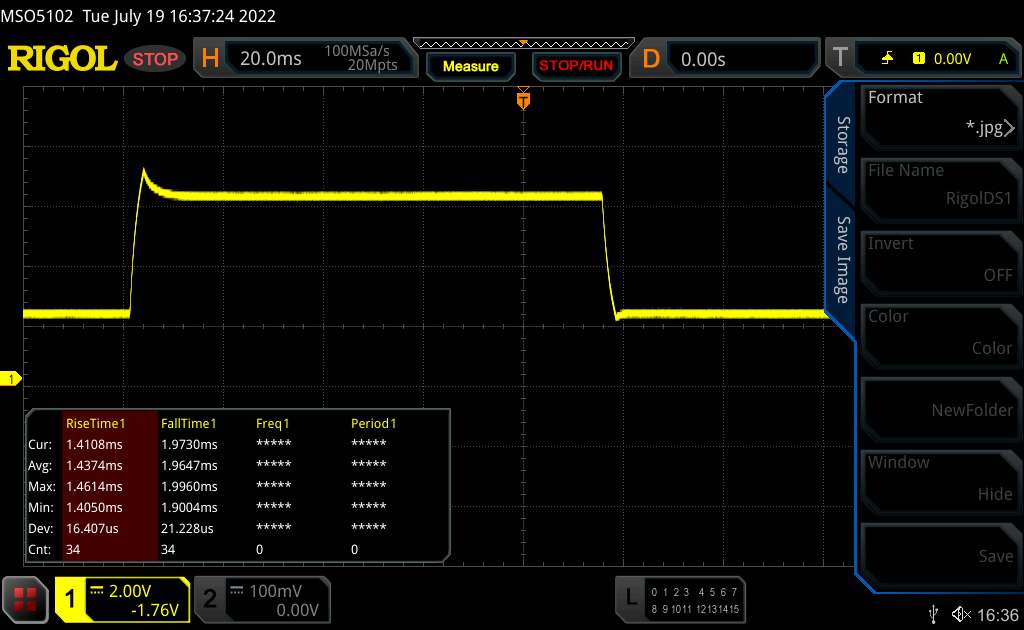 |
| ↘ 2 ms queda | ||
| A tela mostra taxas de resposta muito rápidas em nossos testes e deve ser muito adequada para jogos em ritmo acelerado. Em comparação, todos os dispositivos testados variam de 0.165 (mínimo) a 636 (máximo) ms. » 14 % de todos os dispositivos são melhores. Isso significa que o tempo de resposta medido é melhor que a média de todos os dispositivos testados (31 ms). | ||
Cintilação da tela / PWM (modulação por largura de pulso)
| Tela tremeluzindo / PWM não detectado | 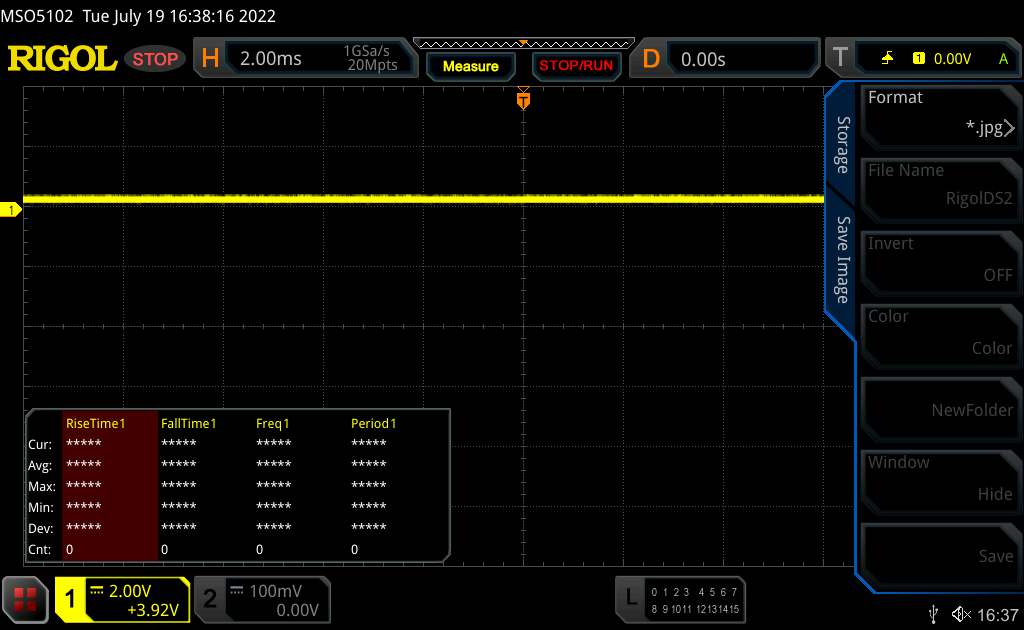 | ||
[pwm_comparison] Em comparação: 52 % de todos os dispositivos testados não usam PWM para escurecer a tela. Se PWM foi detectado, uma média de 7754 (mínimo: 5 - máximo: 343500) Hz foi medida. | |||
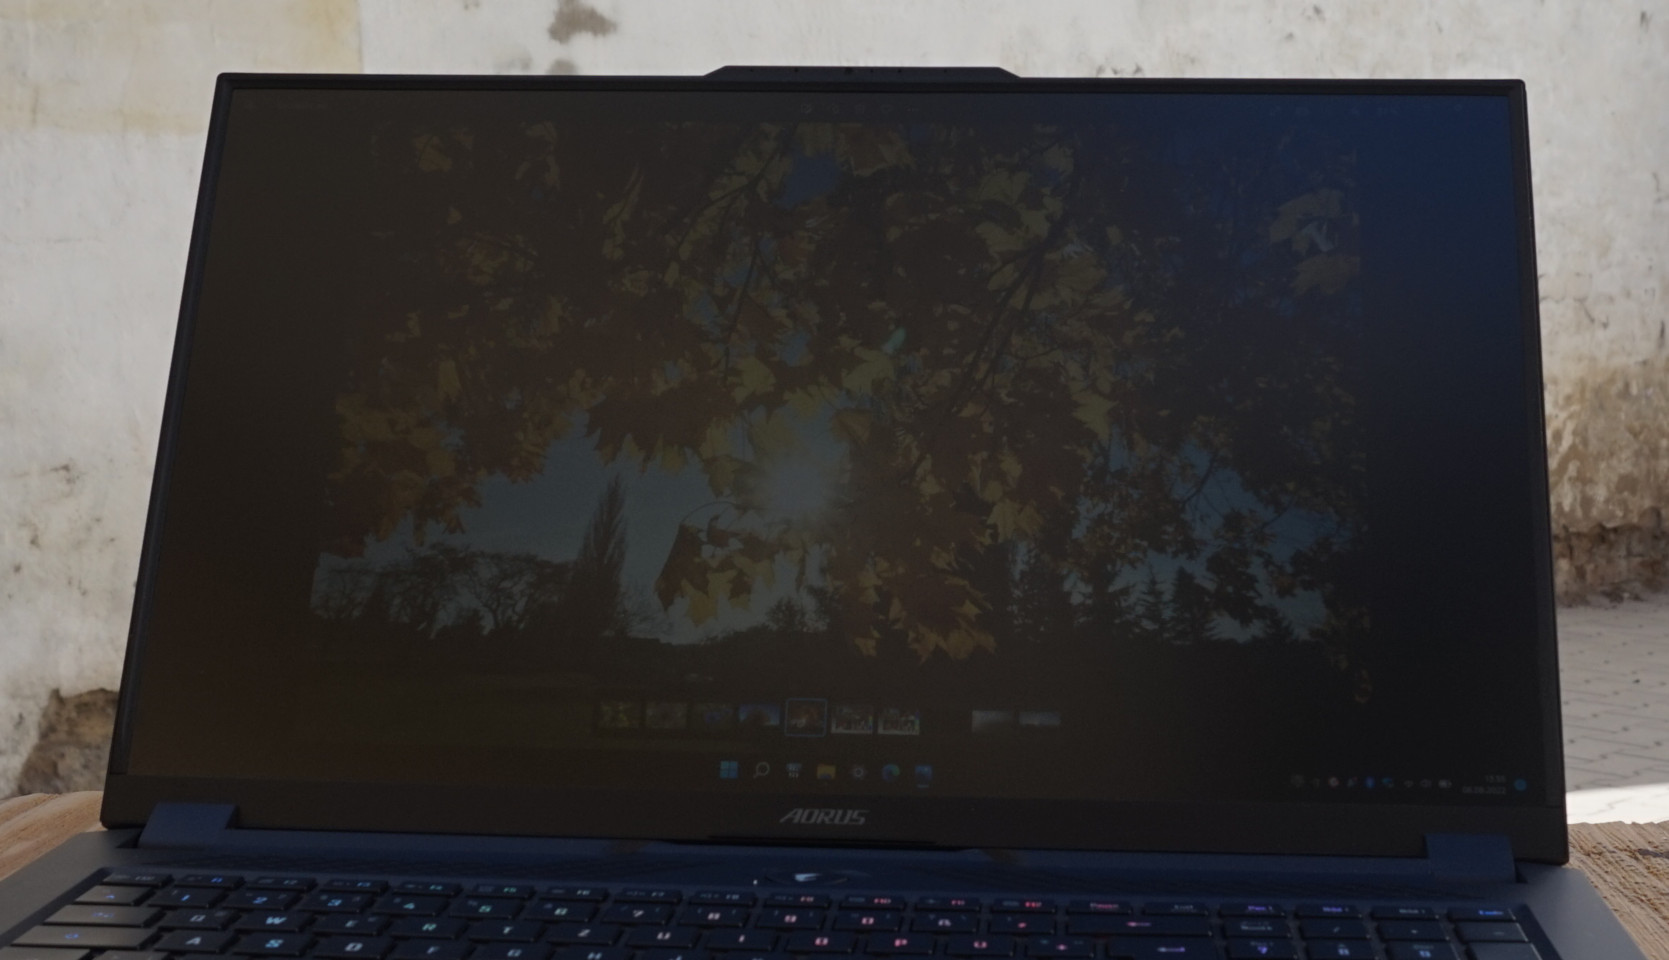
O uso do Aorus 17X XES ao ar livre dificilmente pode ser recomendado. Sob a luz direta do sol, dificilmente se reconhece mais nada. Mesmo à sombra ou com a luz da parte de trás, a maioria das cores faltará em brilho.
O laptop ainda é suficiente para ser usado para navegar na web ou ler em um lugar sombrio. Entretanto, o processamento de imagens ou jogos só podem ser recomendados dentro de casa.
A estabilidade do ângulo de visão é sem falhas, mas não esperamos mais nada de um painel IPS. Mesmo de um ângulo de visão íngreme de quase 90°, não observamos nenhuma mudança de cor. Embora a luminosidade seja reduzida, isto não impede o reconhecimento.

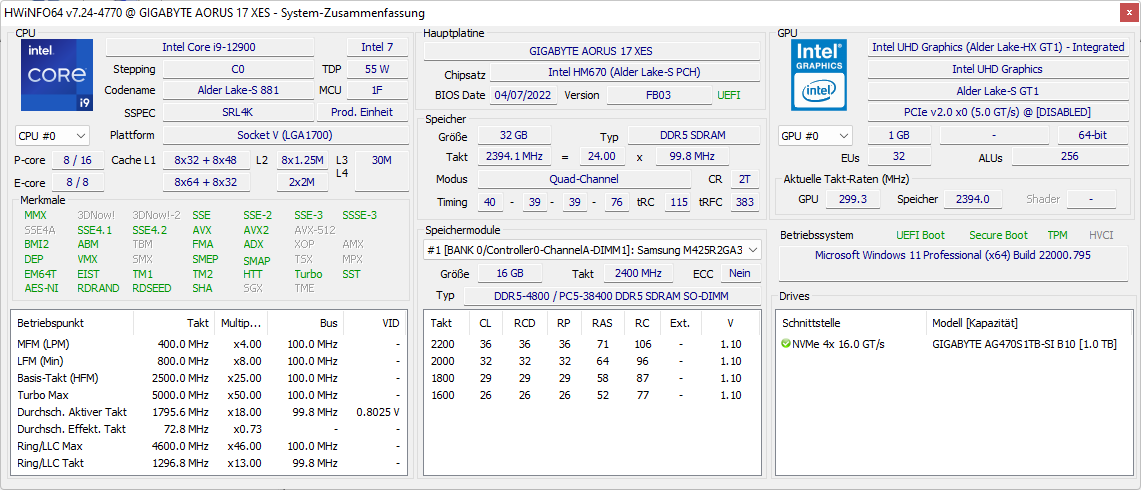
Desempenho - A CPU i9 domina no laptop para jogos
O equipamento de hardware provou ser suficiente para a resolução Full-HD. Todos os jogos atuais e muito provavelmente também muitos jogos futuros podem ser jogados suavemente no laptop do jogo sem nenhum tipo de compromisso. Se você puder aceitar com menos detalhes, taxas de quadros muito altas também se tornam realistas e podem ser exibidas de forma ideal graças a 360 Hz, incluindo taxas de atualização variáveis.
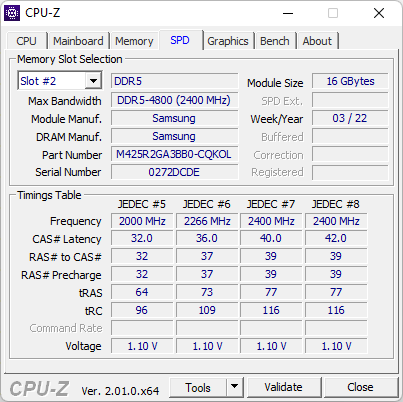
Além disso, o processador extremamente rápido com um total de 24 threads em combinação com 32 GB de RAM DDR5 também permite utilizá-lo para cálculos exigentes, além de aplicações gráficas. O desempenho computacional não precisa de forma alguma se esconder de uma estação de trabalho.
Condições de teste
Para todos os testes, jogos e benchmarks, assim como tarefas adicionais desde o processamento de texto e imagem até a navegação na Internet, usamos a comutação automática dos perfis de desempenho no Centro de Controle Gigabyte, que é chamado de "Ai Boost" Isto não apenas ajusta os limites de potência da CPU, mas os perfis de cor e comportamento dos ventiladores ou teclado também mudam dependendo da situação. A tabela abaixo mostra quanta energia é alocada para o processador.
No geral, o sistema funciona de forma confiável, reconhece todos os programas e os associa com os modos correspondentes. Entretanto, achamos a mudança muito perceptível entre os perfis de cor que sempre ocorreu com algum atraso um pouco irritante. Isto foi perceptível, por exemplo, ao fechar o navegador e iniciar um programa de escrita que ativa o modo criador
Embora desligar completamente a iluminação do teclado quando a tomada é puxada da tomada pareça conseqüente, isto ainda não é realmente prático nas horas da noite
Independente do controle inteligente, os perfis de desempenho também podem ser ajustados individualmente até os menores detalhes, a fim de orientá-los de acordo com suas próprias preferências. No entanto, é necessário trocá-los manualmente. Você pode fazer isso através do aperto de botões, que também é a mesma maneira que você pode ajustar o perfil do ventilador
| Modo de jogo | Modo Creator | Modo Turbo | Reunião | Economia de energia | |
|---|---|---|---|---|---|
| PL1 | 65 W | 86 W | 86 W | 15 W | 15 W |
| PL2 | 157 W | 157 W | 157 W | 157 W | 30 W 30 W |
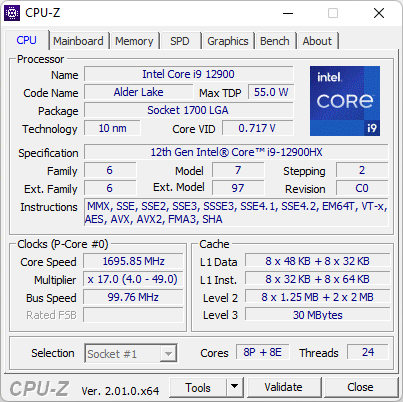
Processador
OIntel Core i9-12900HXoferece 2 núcleos de desempenho adicionais em comparação com o i9-12900H. Juntamente com 8 núcleos adicionais de Eficiência, isto resulta na capacidade de lidar com um total de 24 fios, que se tornam perceptíveis durante tarefas intensas, incluindo multi-tarefas.
Como somente os núcleos P atingem a velocidade máxima do relógio de 5,0 GHz, o chip HX oferece o mesmo em papel que um AMD Ryzen 9 6900HX a este respeito. No teste de carga constante com o Cinebench R15 e também no desempenho geral da CPU, ele se posiciona significativamente à frente do chip AMD. No geral, a i9 deixa a maioria dos concorrentes significativamente para trás em termos de capacidade de desempenho bruto, o que não é surpreendente quando se considera seu impressionante equipamento. Os processadores i9 com 6 núcleos P, como o i9-12900H, também são deixados para trás.
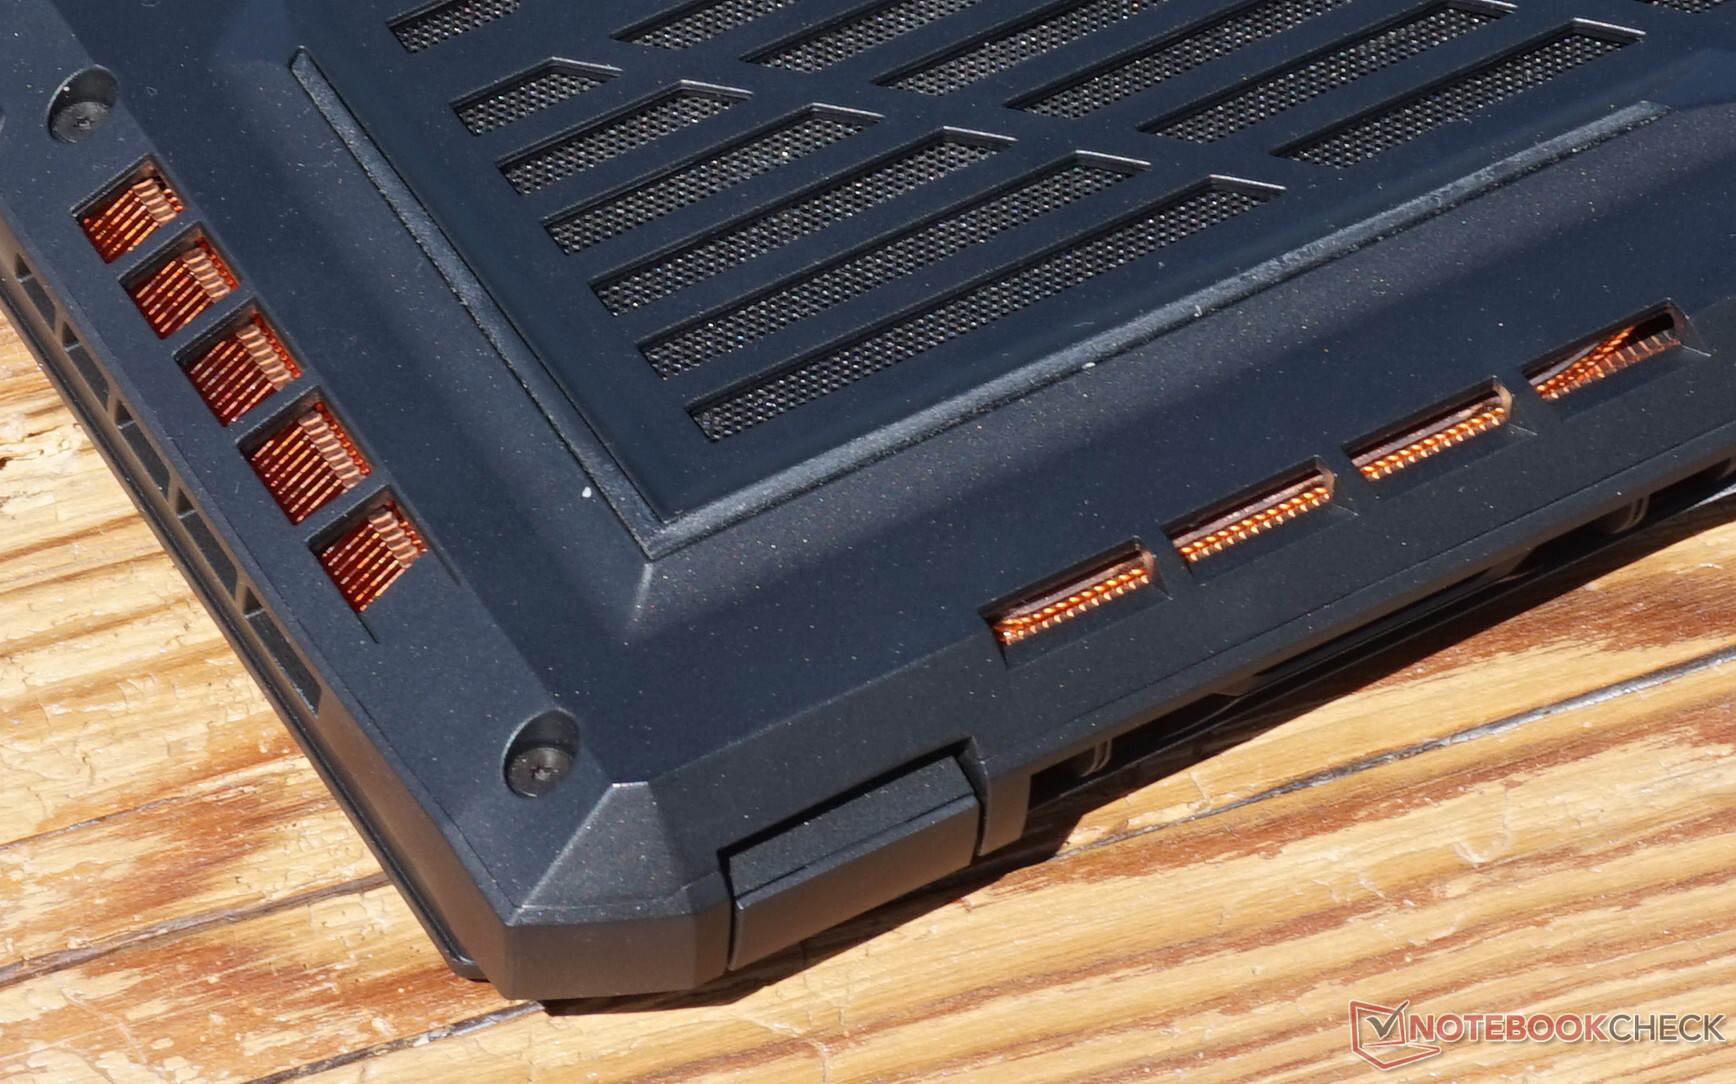
Além disso, há um desempenho muito estável a longo prazo, o que, considerando o alto consumo de energia, também aponta para um sistema de resfriamento muito bem projetado. Após a primeira corrida do Cinebench R15, o valor não cai nem 4% no longo prazo. O resfriamento também representa a única diferença externa visível para o Aorus 17 XE4. Ao invés das aletas de refrigeração pintadas de preto feitas de alumínio, pode-se ver o cobre dos tubos de calor através das aberturas de ventilação dos ventiladores.
Nosso lista de referênciafornece uma visão geral do desempenho de vários processadores.
Cinebench R15 Multi Constant Load Test
Cinebench R23: Multi Core | Single Core
Cinebench R20: CPU (Multi Core) | CPU (Single Core)
Cinebench R15: CPU Multi 64Bit | CPU Single 64Bit
Blender: v2.79 BMW27 CPU
7-Zip 18.03: 7z b 4 | 7z b 4 -mmt1
Geekbench 5.5: Multi-Core | Single-Core
HWBOT x265 Benchmark v2.2: 4k Preset
LibreOffice : 20 Documents To PDF
R Benchmark 2.5: Overall mean
| CPU Performance rating | |
| Média da turma Gaming | |
| Média Intel Core i9-12900HX | |
| MSI GE67 HX 12UGS | |
| Aorus 17X XES | |
| Schenker XMG Pro 17 E22 | |
| MSI Raider GE66 12UHS | |
| Aorus 17 XE4 | |
| HP Omen 17-ck1075ng | |
| Asus ROG Zephyrus Duo 16 GX650RX | |
| Cinebench R23 / Multi Core | |
| Média da turma Gaming (10488 - 42661, n=107, últimos 2 anos) | |
| Média Intel Core i9-12900HX (18337 - 23482, n=8) | |
| MSI GE67 HX 12UGS | |
| Aorus 17X XES | |
| Schenker XMG Pro 17 E22 | |
| MSI Raider GE66 12UHS | |
| Aorus 17 XE4 | |
| Asus ROG Zephyrus Duo 16 GX650RX | |
| HP Omen 17-ck1075ng | |
| Cinebench R23 / Single Core | |
| Média da turma Gaming (1166 - 2415, n=107, últimos 2 anos) | |
| Aorus 17X XES | |
| Média Intel Core i9-12900HX (1897 - 1936, n=8) | |
| Schenker XMG Pro 17 E22 | |
| MSI Raider GE66 12UHS | |
| MSI GE67 HX 12UGS | |
| Aorus 17 XE4 | |
| HP Omen 17-ck1075ng | |
| Asus ROG Zephyrus Duo 16 GX650RX | |
| Cinebench R20 / CPU (Multi Core) | |
| Média da turma Gaming (4029 - 16433, n=106, últimos 2 anos) | |
| Média Intel Core i9-12900HX (7037 - 9042, n=8) | |
| MSI GE67 HX 12UGS | |
| Aorus 17X XES | |
| Schenker XMG Pro 17 E22 | |
| MSI Raider GE66 12UHS | |
| Aorus 17 XE4 | |
| Asus ROG Zephyrus Duo 16 GX650RX | |
| HP Omen 17-ck1075ng | |
| Cinebench R20 / CPU (Single Core) | |
| Média da turma Gaming (442 - 913, n=106, últimos 2 anos) | |
| Aorus 17X XES | |
| Média Intel Core i9-12900HX (728 - 745, n=8) | |
| Schenker XMG Pro 17 E22 | |
| MSI Raider GE66 12UHS | |
| Aorus 17 XE4 | |
| HP Omen 17-ck1075ng | |
| MSI GE67 HX 12UGS | |
| Asus ROG Zephyrus Duo 16 GX650RX | |
| Cinebench R15 / CPU Multi 64Bit | |
| Média da turma Gaming (1578 - 6330, n=105, últimos 2 anos) | |
| Média Intel Core i9-12900HX (2830 - 3652, n=8) | |
| MSI GE67 HX 12UGS | |
| Aorus 17X XES | |
| Schenker XMG Pro 17 E22 | |
| Aorus 17 XE4 | |
| MSI Raider GE66 12UHS | |
| HP Omen 17-ck1075ng | |
| HP Omen 17-ck1075ng | |
| Asus ROG Zephyrus Duo 16 GX650RX | |
| Cinebench R15 / CPU Single 64Bit | |
| Média da turma Gaming (188.8 - 350, n=106, últimos 2 anos) | |
| Média Intel Core i9-12900HX (274 - 282, n=8) | |
| Aorus 17X XES | |
| Schenker XMG Pro 17 E22 | |
| MSI Raider GE66 12UHS | |
| Aorus 17 XE4 | |
| MSI GE67 HX 12UGS | |
| HP Omen 17-ck1075ng | |
| HP Omen 17-ck1075ng | |
| Asus ROG Zephyrus Duo 16 GX650RX | |
| Blender / v2.79 BMW27 CPU | |
| HP Omen 17-ck1075ng | |
| Aorus 17 XE4 | |
| Asus ROG Zephyrus Duo 16 GX650RX | |
| Aorus 17X XES | |
| MSI Raider GE66 12UHS | |
| Schenker XMG Pro 17 E22 | |
| Média Intel Core i9-12900HX (144 - 201, n=8) | |
| MSI GE67 HX 12UGS | |
| Média da turma Gaming (79 - 330, n=104, últimos 2 anos) | |
| 7-Zip 18.03 / 7z b 4 | |
| Média da turma Gaming (33491 - 148086, n=105, últimos 2 anos) | |
| Média Intel Core i9-12900HX (69778 - 88128, n=7) | |
| MSI GE67 HX 12UGS | |
| Aorus 17X XES | |
| MSI Raider GE66 12UHS | |
| Schenker XMG Pro 17 E22 | |
| Asus ROG Zephyrus Duo 16 GX650RX | |
| Aorus 17 XE4 | |
| HP Omen 17-ck1075ng | |
| 7-Zip 18.03 / 7z b 4 -mmt1 | |
| Média da turma Gaming (4199 - 7436, n=105, últimos 2 anos) | |
| Aorus 17X XES | |
| Média Intel Core i9-12900HX (6165 - 6358, n=7) | |
| Schenker XMG Pro 17 E22 | |
| MSI Raider GE66 12UHS | |
| Aorus 17 XE4 | |
| HP Omen 17-ck1075ng | |
| Asus ROG Zephyrus Duo 16 GX650RX | |
| MSI GE67 HX 12UGS | |
| Geekbench 5.5 / Multi-Core | |
| Média da turma Gaming (6460 - 28263, n=105, últimos 2 anos) | |
| Média Intel Core i9-12900HX (15116 - 16925, n=8) | |
| Aorus 17X XES | |
| MSI GE67 HX 12UGS | |
| MSI Raider GE66 12UHS | |
| Schenker XMG Pro 17 E22 | |
| Aorus 17 XE4 | |
| HP Omen 17-ck1075ng | |
| Asus ROG Zephyrus Duo 16 GX650RX | |
| Geekbench 5.5 / Single-Core | |
| Média da turma Gaming (986 - 2474, n=105, últimos 2 anos) | |
| Média Intel Core i9-12900HX (1874 - 1949, n=8) | |
| Aorus 17X XES | |
| MSI Raider GE66 12UHS | |
| Schenker XMG Pro 17 E22 | |
| Aorus 17 XE4 | |
| MSI GE67 HX 12UGS | |
| HP Omen 17-ck1075ng | |
| Asus ROG Zephyrus Duo 16 GX650RX | |
| HWBOT x265 Benchmark v2.2 / 4k Preset | |
| Média da turma Gaming (11.5 - 44.4, n=105, últimos 2 anos) | |
| Média Intel Core i9-12900HX (19.6 - 26.6, n=7) | |
| MSI GE67 HX 12UGS | |
| Aorus 17X XES | |
| Schenker XMG Pro 17 E22 | |
| MSI Raider GE66 12UHS | |
| Asus ROG Zephyrus Duo 16 GX650RX | |
| Aorus 17 XE4 | |
| HP Omen 17-ck1075ng | |
| LibreOffice / 20 Documents To PDF | |
| Média da turma Gaming (33.2 - 88.8, n=105, últimos 2 anos) | |
| Asus ROG Zephyrus Duo 16 GX650RX | |
| HP Omen 17-ck1075ng | |
| MSI GE67 HX 12UGS | |
| Schenker XMG Pro 17 E22 | |
| Aorus 17X XES | |
| Média Intel Core i9-12900HX (33.6 - 42.4, n=7) | |
| Aorus 17 XE4 | |
| MSI Raider GE66 12UHS | |
| R Benchmark 2.5 / Overall mean | |
| Asus ROG Zephyrus Duo 16 GX650RX | |
| HP Omen 17-ck1075ng | |
| MSI GE67 HX 12UGS | |
| Aorus 17 XE4 | |
| MSI Raider GE66 12UHS | |
| Schenker XMG Pro 17 E22 | |
| Média da turma Gaming (0.3439 - 0.759, n=106, últimos 2 anos) | |
| Média Intel Core i9-12900HX (0.4159 - 0.4242, n=7) | |
| Aorus 17X XES | |
* ... menor é melhor
AIDA64: FP32 Ray-Trace | FPU Julia | CPU SHA3 | CPU Queen | FPU SinJulia | FPU Mandel | CPU AES | CPU ZLib | FP64 Ray-Trace | CPU PhotoWorxx
| Performance rating | |
| Média da turma Gaming | |
| Média Intel Core i9-12900HX | |
| Asus ROG Zephyrus Duo 16 GX650RX | |
| Aorus 17X XES | |
| HP Omen 17-ck1075ng | |
| MSI GE67 HX 12UGS | |
| MSI Raider GE66 12UHS | |
| Schenker XMG Pro 17 E22 | |
| Aorus 17 XE4 | |
| AIDA64 / FP32 Ray-Trace | |
| Média da turma Gaming (10227 - 85542, n=105, últimos 2 anos) | |
| Média Intel Core i9-12900HX (11535 - 22183, n=7) | |
| Asus ROG Zephyrus Duo 16 GX650RX | |
| Aorus 17X XES | |
| HP Omen 17-ck1075ng | |
| MSI GE67 HX 12UGS | |
| Schenker XMG Pro 17 E22 | |
| MSI Raider GE66 12UHS | |
| Aorus 17 XE4 | |
| AIDA64 / FPU Julia | |
| Média da turma Gaming (51376 - 238426, n=105, últimos 2 anos) | |
| Asus ROG Zephyrus Duo 16 GX650RX | |
| Média Intel Core i9-12900HX (52916 - 110093, n=7) | |
| Aorus 17X XES | |
| HP Omen 17-ck1075ng | |
| MSI GE67 HX 12UGS | |
| MSI Raider GE66 12UHS | |
| Schenker XMG Pro 17 E22 | |
| Aorus 17 XE4 | |
| AIDA64 / CPU SHA3 | |
| Média da turma Gaming (2180 - 10115, n=105, últimos 2 anos) | |
| Média Intel Core i9-12900HX (3559 - 5123, n=7) | |
| MSI GE67 HX 12UGS | |
| HP Omen 17-ck1075ng | |
| Aorus 17X XES | |
| Asus ROG Zephyrus Duo 16 GX650RX | |
| Schenker XMG Pro 17 E22 | |
| MSI Raider GE66 12UHS | |
| Aorus 17 XE4 | |
| AIDA64 / CPU Queen | |
| Média da turma Gaming (49785 - 173351, n=90, últimos 2 anos) | |
| Schenker XMG Pro 17 E22 | |
| MSI Raider GE66 12UHS | |
| Asus ROG Zephyrus Duo 16 GX650RX | |
| Aorus 17X XES | |
| Média Intel Core i9-12900HX (101029 - 104457, n=7) | |
| HP Omen 17-ck1075ng | |
| Aorus 17 XE4 | |
| MSI GE67 HX 12UGS | |
| AIDA64 / FPU SinJulia | |
| Média da turma Gaming (4424 - 33636, n=105, últimos 2 anos) | |
| Asus ROG Zephyrus Duo 16 GX650RX | |
| Média Intel Core i9-12900HX (10475 - 13062, n=7) | |
| MSI GE67 HX 12UGS | |
| Aorus 17X XES | |
| Schenker XMG Pro 17 E22 | |
| MSI Raider GE66 12UHS | |
| HP Omen 17-ck1075ng | |
| Aorus 17 XE4 | |
| AIDA64 / FPU Mandel | |
| Média da turma Gaming (25115 - 128721, n=105, últimos 2 anos) | |
| Asus ROG Zephyrus Duo 16 GX650RX | |
| Média Intel Core i9-12900HX (31779 - 53628, n=7) | |
| Aorus 17X XES | |
| HP Omen 17-ck1075ng | |
| MSI GE67 HX 12UGS | |
| Schenker XMG Pro 17 E22 | |
| MSI Raider GE66 12UHS | |
| Aorus 17 XE4 | |
| AIDA64 / CPU AES | |
| Média Intel Core i9-12900HX (125268 - 183146, n=7) | |
| Asus ROG Zephyrus Duo 16 GX650RX | |
| HP Omen 17-ck1075ng | |
| Aorus 17X XES | |
| MSI GE67 HX 12UGS | |
| Média da turma Gaming (39258 - 247074, n=105, últimos 2 anos) | |
| Schenker XMG Pro 17 E22 | |
| MSI Raider GE66 12UHS | |
| Aorus 17 XE4 | |
| AIDA64 / CPU ZLib | |
| Média da turma Gaming (574 - 2531, n=105, últimos 2 anos) | |
| MSI GE67 HX 12UGS | |
| Média Intel Core i9-12900HX (990 - 1408, n=7) | |
| MSI Raider GE66 12UHS | |
| Schenker XMG Pro 17 E22 | |
| HP Omen 17-ck1075ng | |
| Aorus 17X XES | |
| Asus ROG Zephyrus Duo 16 GX650RX | |
| Aorus 17 XE4 | |
| AIDA64 / FP64 Ray-Trace | |
| Média da turma Gaming (5509 - 45446, n=105, últimos 2 anos) | |
| Média Intel Core i9-12900HX (6663 - 11913, n=7) | |
| Asus ROG Zephyrus Duo 16 GX650RX | |
| Aorus 17X XES | |
| HP Omen 17-ck1075ng | |
| MSI GE67 HX 12UGS | |
| Schenker XMG Pro 17 E22 | |
| MSI Raider GE66 12UHS | |
| Aorus 17 XE4 | |
| AIDA64 / CPU PhotoWorxx | |
| Média da turma Gaming (12271 - 89891, n=105, últimos 2 anos) | |
| Média Intel Core i9-12900HX (40239 - 47710, n=7) | |
| MSI Raider GE66 12UHS | |
| Aorus 17X XES | |
| HP Omen 17-ck1075ng | |
| MSI GE67 HX 12UGS | |
| Asus ROG Zephyrus Duo 16 GX650RX | |
| Schenker XMG Pro 17 E22 | |
| Aorus 17 XE4 | |
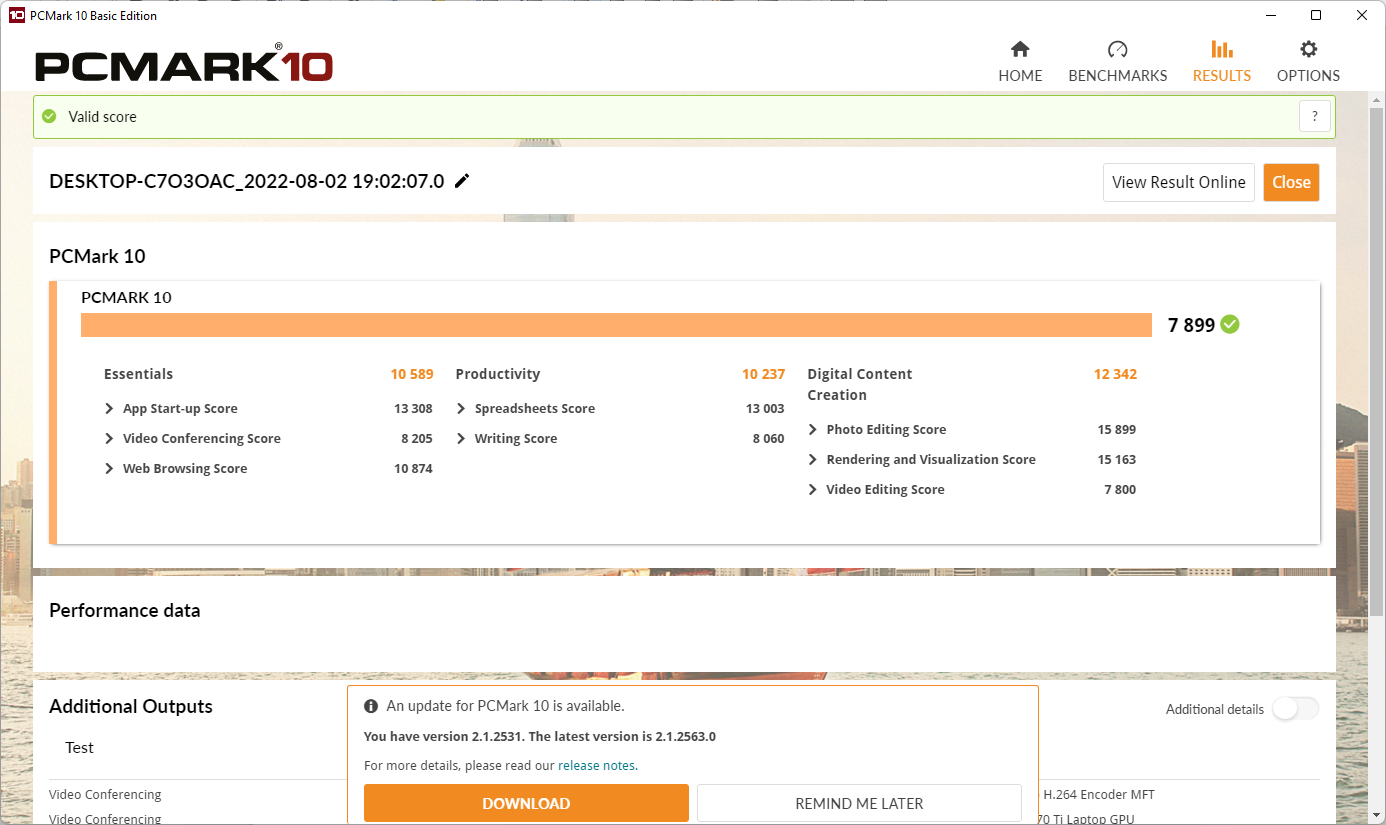
Desempenho do sistema
Considerando o processador utilizado, quase esperávamos o excelente desempenho do Aorus 17X em termos de desempenho do sistema. O laptop é claramente capaz de se antecipar à média dos laptops para jogos que testamos, em algumas partes até mesmo em mais de 20%. Ele quase sempre se coloca à frente do Aorus 17 XE4o que não é muito surpreendente, considerando o desempenho inferior do processador desse sistema. Somente o MSI Raider GE66 12UHScom o overclock Intel Core i9-12900HKé capaz de alcançar valores ainda melhores em quase toda a sua extensão.
As capacidades de desempenho podem ser claramente sentidas durante quase todas as partidas de aplicações, e dificilmente podemos, se é que podemos, observar algum atraso. Mesmo a execução de várias aplicações em paralelo não leva a nenhum impedimento, o que também se deve à grande e rápida memória de trabalho. O uso de cenários virtuais, portanto, também parece completamente realista.
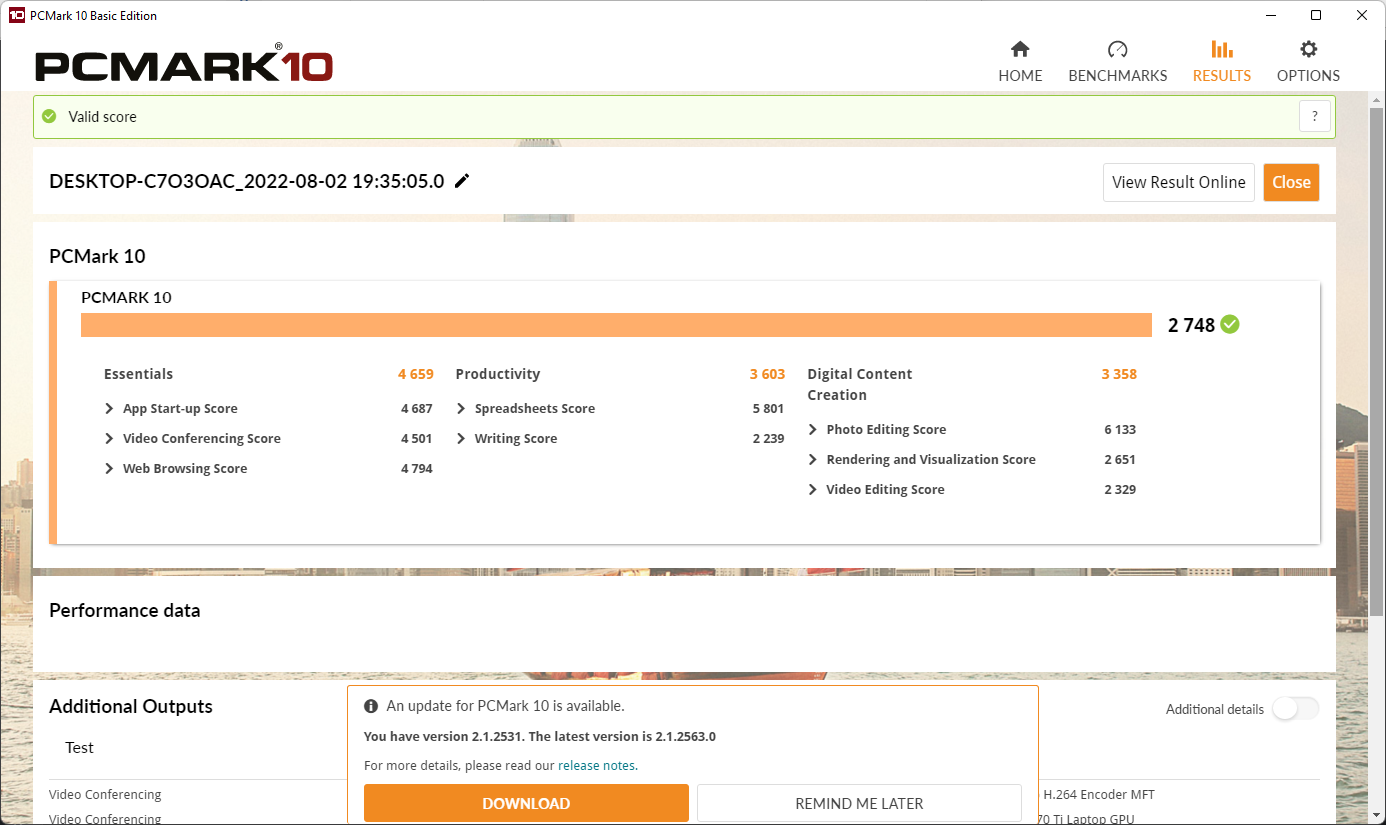
Na operação com bateria, que força o uso do modo Power Saving, não sobra muito do alto desempenho, e o resultado no PCMark10 então atinge apenas um terço do melhor valor.
CrossMark: Overall | Productivity | Creativity | Responsiveness
| PCMark 10 / Score | |
| Média da turma Gaming (5828 - 12414, n=93, últimos 2 anos) | |
| MSI Raider GE66 12UHS | |
| MSI GE67 HX 12UGS | |
| Aorus 17X XES | |
| Média Intel Core i9-12900HX, NVIDIA GeForce RTX 3070 Ti Laptop GPU (n=1) | |
| Schenker XMG Pro 17 E22 | |
| Aorus 17 XE4 | |
| HP Omen 17-ck1075ng | |
| Asus ROG Zephyrus Duo 16 GX650RX | |
| PCMark 10 / Essentials | |
| MSI Raider GE66 12UHS | |
| MSI GE67 HX 12UGS | |
| Schenker XMG Pro 17 E22 | |
| Aorus 17 XE4 | |
| Média da turma Gaming (8810 - 11935, n=97, últimos 2 anos) | |
| HP Omen 17-ck1075ng | |
| Aorus 17X XES | |
| Média Intel Core i9-12900HX, NVIDIA GeForce RTX 3070 Ti Laptop GPU (n=1) | |
| Asus ROG Zephyrus Duo 16 GX650RX | |
| PCMark 10 / Productivity | |
| Média da turma Gaming (6845 - 25323, n=95, últimos 2 anos) | |
| MSI Raider GE66 12UHS | |
| Aorus 17X XES | |
| Média Intel Core i9-12900HX, NVIDIA GeForce RTX 3070 Ti Laptop GPU (n=1) | |
| Schenker XMG Pro 17 E22 | |
| MSI GE67 HX 12UGS | |
| Aorus 17 XE4 | |
| HP Omen 17-ck1075ng | |
| Asus ROG Zephyrus Duo 16 GX650RX | |
| PCMark 10 / Digital Content Creation | |
| Média da turma Gaming (7602 - 19954, n=95, últimos 2 anos) | |
| MSI GE67 HX 12UGS | |
| MSI Raider GE66 12UHS | |
| Aorus 17X XES | |
| Média Intel Core i9-12900HX, NVIDIA GeForce RTX 3070 Ti Laptop GPU (n=1) | |
| Schenker XMG Pro 17 E22 | |
| Aorus 17 XE4 | |
| HP Omen 17-ck1075ng | |
| Asus ROG Zephyrus Duo 16 GX650RX | |
| CrossMark / Overall | |
| Aorus 17X XES | |
| Média Intel Core i9-12900HX, NVIDIA GeForce RTX 3070 Ti Laptop GPU (n=1) | |
| Aorus 17 XE4 | |
| Média da turma Gaming (1366 - 2409, n=94, últimos 2 anos) | |
| MSI GE67 HX 12UGS | |
| HP Omen 17-ck1075ng | |
| Asus ROG Zephyrus Duo 16 GX650RX | |
| CrossMark / Productivity | |
| Aorus 17X XES | |
| Média Intel Core i9-12900HX, NVIDIA GeForce RTX 3070 Ti Laptop GPU (n=1) | |
| Aorus 17 XE4 | |
| MSI GE67 HX 12UGS | |
| Média da turma Gaming (1386 - 2254, n=94, últimos 2 anos) | |
| HP Omen 17-ck1075ng | |
| Asus ROG Zephyrus Duo 16 GX650RX | |
| CrossMark / Creativity | |
| Aorus 17X XES | |
| Média Intel Core i9-12900HX, NVIDIA GeForce RTX 3070 Ti Laptop GPU (n=1) | |
| Média da turma Gaming (1343 - 2786, n=94, últimos 2 anos) | |
| MSI GE67 HX 12UGS | |
| HP Omen 17-ck1075ng | |
| Aorus 17 XE4 | |
| Asus ROG Zephyrus Duo 16 GX650RX | |
| CrossMark / Responsiveness | |
| Aorus 17 XE4 | |
| Aorus 17X XES | |
| Média Intel Core i9-12900HX, NVIDIA GeForce RTX 3070 Ti Laptop GPU (n=1) | |
| MSI GE67 HX 12UGS | |
| Asus ROG Zephyrus Duo 16 GX650RX | |
| Média da turma Gaming (1226 - 2334, n=94, últimos 2 anos) | |
| HP Omen 17-ck1075ng | |
| PCMark 10 Score | 7899 pontos | |
Ajuda | ||
| AIDA64 / Memory Copy | |
| Média da turma Gaming (21750 - 129946, n=105, últimos 2 anos) | |
| Média Intel Core i9-12900HX (62852 - 70863, n=7) | |
| MSI Raider GE66 12UHS | |
| Aorus 17X XES | |
| Asus ROG Zephyrus Duo 16 GX650RX | |
| HP Omen 17-ck1075ng | |
| MSI GE67 HX 12UGS | |
| Schenker XMG Pro 17 E22 | |
| Aorus 17 XE4 | |
| AIDA64 / Memory Read | |
| Média da turma Gaming (22956 - 118858, n=105, últimos 2 anos) | |
| Aorus 17X XES | |
| Média Intel Core i9-12900HX (62140 - 72930, n=7) | |
| MSI Raider GE66 12UHS | |
| HP Omen 17-ck1075ng | |
| MSI GE67 HX 12UGS | |
| Asus ROG Zephyrus Duo 16 GX650RX | |
| Aorus 17 XE4 | |
| Schenker XMG Pro 17 E22 | |
| AIDA64 / Memory Write | |
| Média da turma Gaming (22297 - 135096, n=105, últimos 2 anos) | |
| MSI Raider GE66 12UHS | |
| Média Intel Core i9-12900HX (60001 - 68782, n=7) | |
| Aorus 17X XES | |
| HP Omen 17-ck1075ng | |
| MSI GE67 HX 12UGS | |
| Asus ROG Zephyrus Duo 16 GX650RX | |
| Schenker XMG Pro 17 E22 | |
| Aorus 17 XE4 | |
| AIDA64 / Memory Latency | |
| Média da turma Gaming (75.3 - 259, n=105, últimos 2 anos) | |
| HP Omen 17-ck1075ng | |
| MSI GE67 HX 12UGS | |
| MSI Raider GE66 12UHS | |
| Asus ROG Zephyrus Duo 16 GX650RX | |
| Aorus 17 XE4 | |
| Schenker XMG Pro 17 E22 | |
| Média Intel Core i9-12900HX (83.9 - 93.4, n=7) | |
| Aorus 17X XES | |
* ... menor é melhor
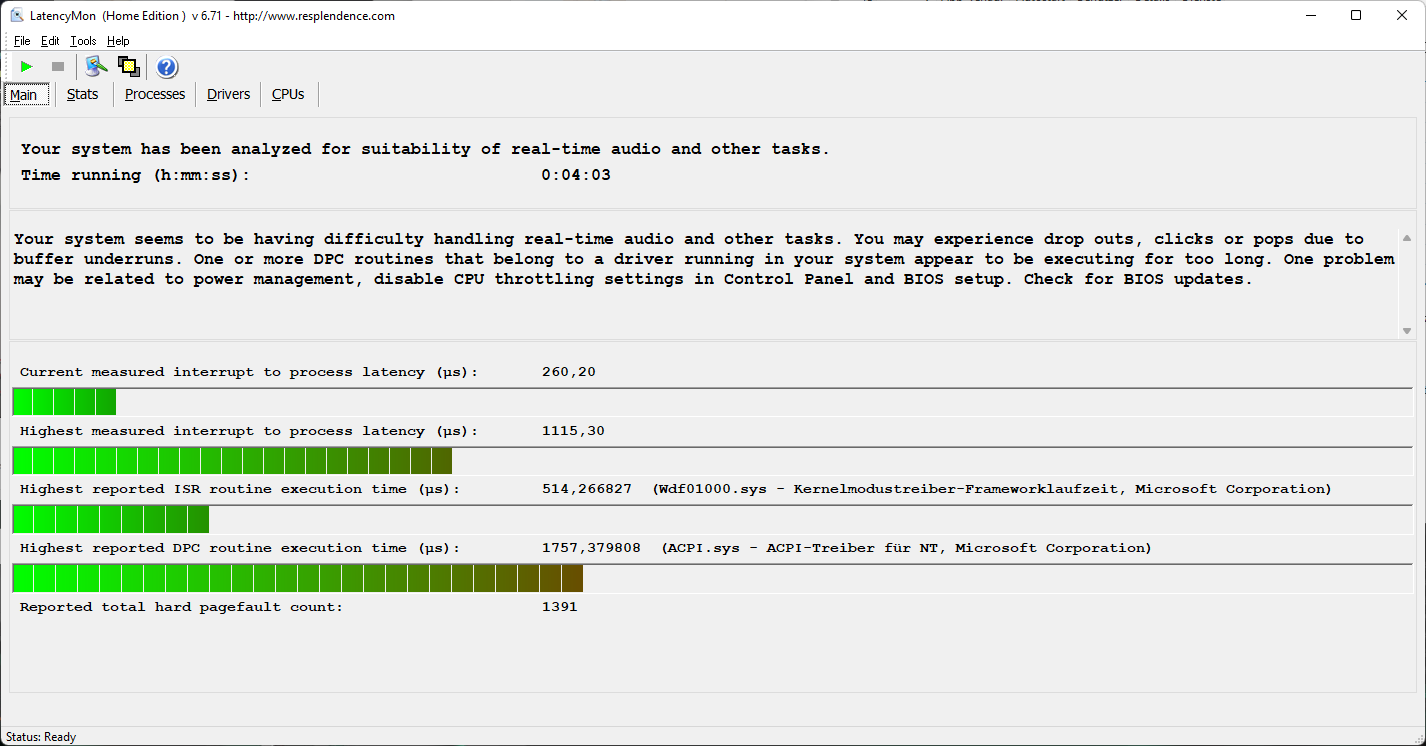
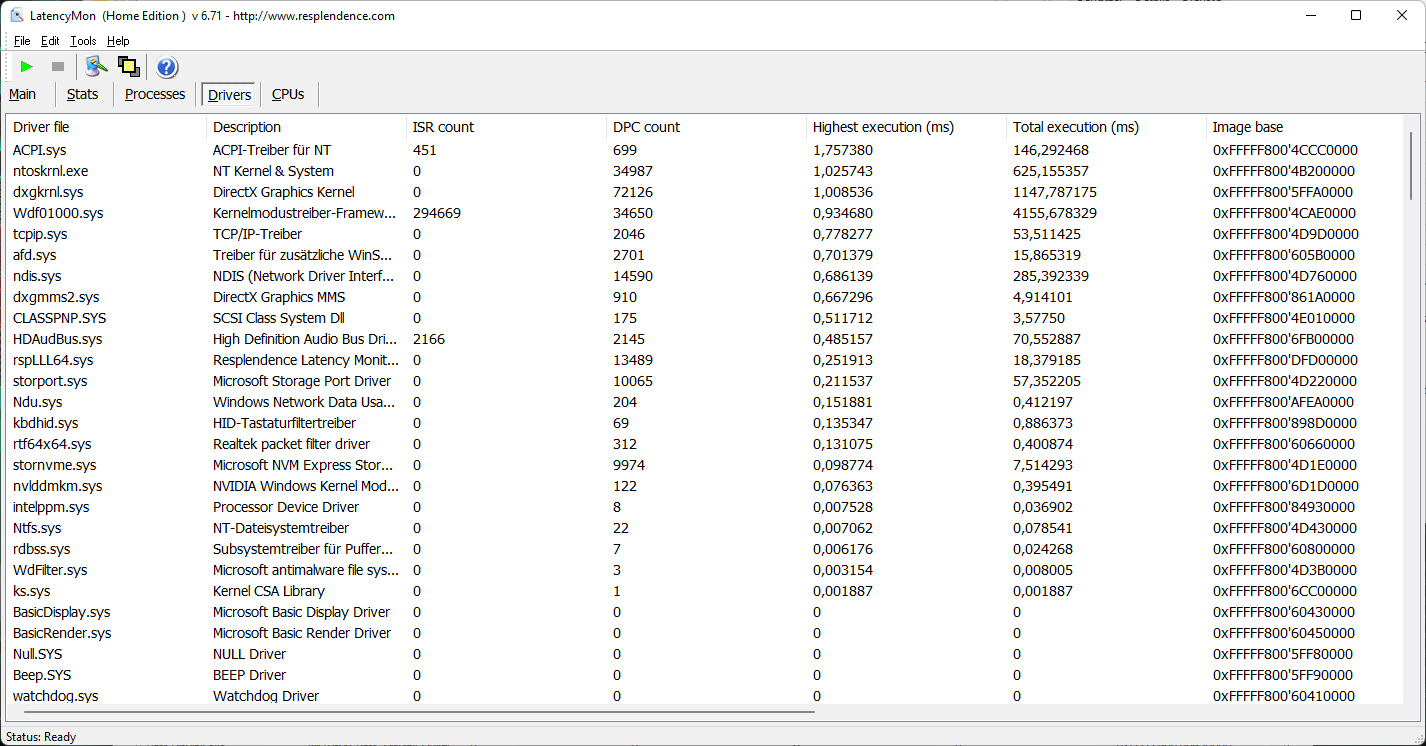
Latências DPC
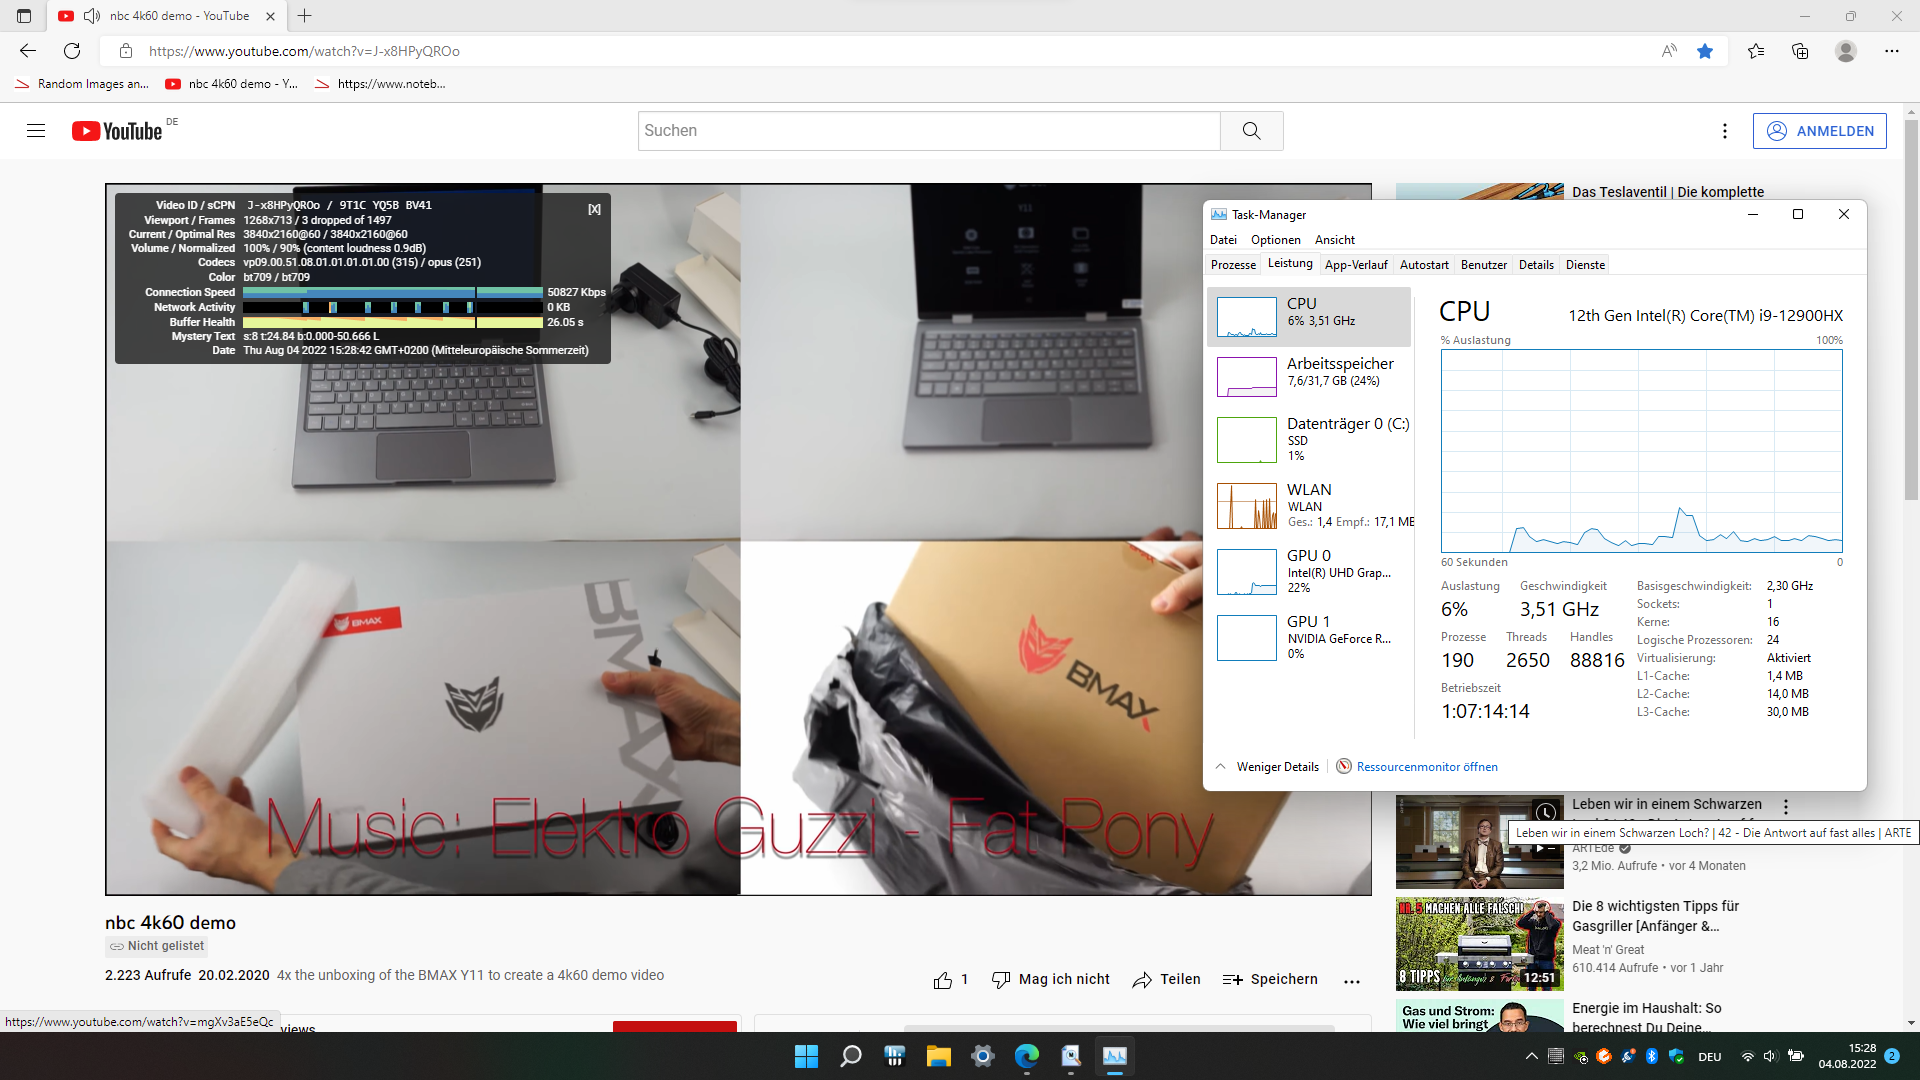
Na avaliação das latências ao executar programas, o laptop não é capaz de nos impressionar plenamente. Para avaliar isto, abrimos várias páginas no navegador padrão e depois reproduzimos um vídeo do Youtube em resolução 4K e executamos Prime95. Isto resulta em um atraso máximo de pouco mais de 1 ms. Este valor é limitado e, em alguns casos, significativamente menor do que o dos concorrentes. No entanto, o Aorus 17X XES ainda não é adequado para o processamento de áudio e vídeo em tempo real com isto.
A reprodução do vídeo 4K dá resultados sólidos, mas não perfeitos. A demanda sobre o processador não é muito alta e, após completar o vídeo, apenas 3 quadros foram descartados de um total de 3.500 quadros individuais.
| DPC Latencies / LatencyMon - interrupt to process latency (max), Web, Youtube, Prime95 | |
| HP Omen 17-ck1075ng | |
| MSI Raider GE66 12UHS | |
| MSI GE67 HX 12UGS | |
| Aorus 17 XE4 | |
| Aorus 17X XES | |
| Schenker XMG Pro 17 E22 | |
| Asus ROG Zephyrus Duo 16 GX650RX | |
* ... menor é melhor
Solução de armazenamento
O Gigabyte M.2 SSD utilizado não apresenta nenhum ponto fraco. Mesmo durante o teste de carga, que é particularmente destinado a mostrar se o desenvolvimento do calor é muito alto, o desempenho máximo permanece constante. As capacidades da conexão PCIe 4.0 são utilizadas em toda a sua extensão.
Entre os outros concorrentes, a Schenker XMG Pro 17 E22mostra como as coisas não devem ser feitas, uma vez que já há estrangulamento após um curto período de tempo.

| Aorus 17X XES Gigabyte AG470S1TB-SI B10 | HP Omen 17-ck1075ng WDC PC SN810 1TB | MSI GE67 HX 12UGS Samsung PM9A1 MZVL21T0HCLR | Schenker XMG Pro 17 E22 Samsung SSD 980 Pro 1TB MZ-V8P1T0BW | MSI Raider GE66 12UHS Samsung PM9A1 MZVL22T0HBLB | Asus ROG Zephyrus Duo 16 GX650RX 2x Samsung SSD 980 Pro 2TB MZ-V8P2T0 (RAID 0) | Aorus 17 XE4 Gigabyte AG470S1TB-SI B10 | Média Gigabyte AG470S1TB-SI B10 | Média da turma Gaming | |
|---|---|---|---|---|---|---|---|---|---|
| Drive Performance rating | |||||||||
| Percent (pt) | 76.7 | 55.3 -28% | 75.9 -1% | 73.4 -4% | 77.5 1% | 76.8 0% | 79.3 3% | 75 -2% | 62.1 -19% |
| DiskSpd | -25% | 3% | -4% | -2% | 24% | -6% | -6% | -14% | |
| seq read (MB/s) | 3871 | 3605 -7% | 3929 1% | 3141 -19% | 3813 -1% | 4903 27% | 3631 -6% | 3374 ? -13% | 3556 ? -8% |
| seq write (MB/s) | 4224 | 3593 -15% | 4063 -4% | 3391 -20% | 3838 -9% | 7889 87% | 2200 -48% | 3243 ? -23% | 3957 ? -6% |
| seq q8 t1 read (MB/s) | 6921 | 6799 -2% | 6683 -3% | 6766 -2% | 5358 -23% | 10557 53% | 7034 2% | 6976 ? 1% | 7552 ? 9% |
| seq q8 t1 write (MB/s) | 4852 | 5199 7% | 4985 3% | 4993 3% | 4951 2% | 9830 103% | 3611 -26% | 4350 ? -10% | 5961 ? 23% |
| 4k q1 t1 read (MB/s) | 74.1 | 77 4% | 93 26% | 67.2 -9% | 88.3 19% | 73.1 -1% | 88.8 20% | 75.4 ? 2% | 70.3 ? -5% |
| 4k q1 t1 write (MB/s) | 319 | 205 -36% | 275 -14% | 279 -13% | 273 -14% | 359 13% | 356 12% | 322 ? 1% | 195.9 ? -39% |
| 4k q32 t16 read (MB/s) | 3564 | 1274 -64% | 4176 17% | 4260 20% | 4068 14% | 2390 -33% | 3582 1% | 3564 ? 0% | 2264 ? -36% |
| 4k q32 t16 write (MB/s) | 3570 | 553 -85% | 3491 -2% | 3961 11% | 3478 -3% | 1542 -57% | 3604 1% | 3512 ? -2% | 1832 ? -49% |
| AS SSD | -25% | -21% | -6% | 1% | 0% | 7% | 0% | -27% | |
| Score Total (Points) | 9242 | 5693 -38% | 8980 -3% | 9047 -2% | 8959 -3% | 6635 -28% | 9279 0% | 8696 ? -6% | 6872 ? -26% |
| Score Read (Points) | 3629 | 1898 -48% | 3469 -4% | 3276 -10% | 3341 -8% | 2619 -28% | 3549 -2% | 3255 ? -10% | 2248 ? -38% |
| Score Write (Points) | 3877 | 2955 -24% | 3799 -2% | 4151 7% | 3977 3% | 2556 -34% | 3996 3% | 3859 ? 0% | 3547 ? -9% |
| Seq Read (MB/s) | 5715 | 5233.79 -8% | 5282.63 -8% | 4559 -20% | 5098.97 -11% | 5344.88 -6% | 5031 -12% | 5105 ? -11% | 5591 ? -2% |
| Seq Write (MB/s) | 3218 | 2355.42 -27% | 3975.65 24% | 3548 10% | 3667.77 14% | 7663.27 138% | 3162 -2% | 3302 ? 3% | 3972 ? 23% |
| 4K Read (MB/s) | 94.04 | 68.25 -27% | 86.37 -8% | 63.1 -33% | 84.06 -11% | 68.93 -27% | 108 15% | 91 ? -3% | 71.1 ? -24% |
| 4K Write (MB/s) | 256.3 | 224.32 -12% | 240.81 -6% | 254.1 -1% | 244.47 -5% | 328.69 28% | 308.6 20% | 286 ? 12% | 215 ? -16% |
| 4K-64 Read (MB/s) | 2963 | 1306.59 -56% | 2854.25 -4% | 2757 -7% | 2747.2 -7% | 2015.68 -32% | 2938 -1% | 2653 ? -10% | 1618 ? -45% |
| 4K-64 Write (MB/s) | 3299 | 2495.32 -24% | 3160.56 -4% | 3543 7% | 3365.94 2% | 1460.96 -56% | 3371 2% | 3242 ? -2% | 2935 ? -11% |
| Access Time Read * (ms) | 0.085 | 0.078 8% | 0.029 66% | 0.073 14% | 0.032 62% | 0.053 38% | 0.048 44% | 0.06282 ? 26% | 0.06364 ? 25% |
| Access Time Write * (ms) | 0.014 | 0.017 -21% | 0.054 -286% | 0.018 -29% | 0.018 -29% | 0.013 7% | 0.013 7% | 0.01364 ? 3% | 0.03794 ? -171% |
| Média Total (Programa/Configurações) | -26% /
-25% | -6% /
-11% | -5% /
-5% | 0% /
-0% | 8% /
10% | 1% /
2% | -3% /
-2% | -20% /
-21% |
* ... menor é melhor
Constant Performance Reading: DiskSpd Read Loop, Queue Depth 8
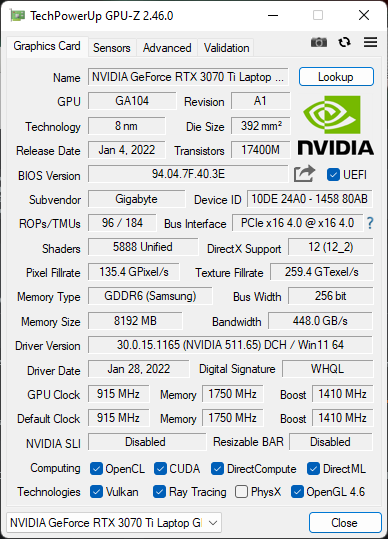
Placa Gráfica
O Aorus 17X fornece oNvidia GeForce RTX 3070 Tiplaca gráfica com um máximo de 130 watts, com a possibilidade de tomar 15 watts disso como "Dynamic Boost" para a CPU. Em nossos vários benchmarks, o laptop para jogos tem um desempenho próximo ao valor médio da GPU utilizada
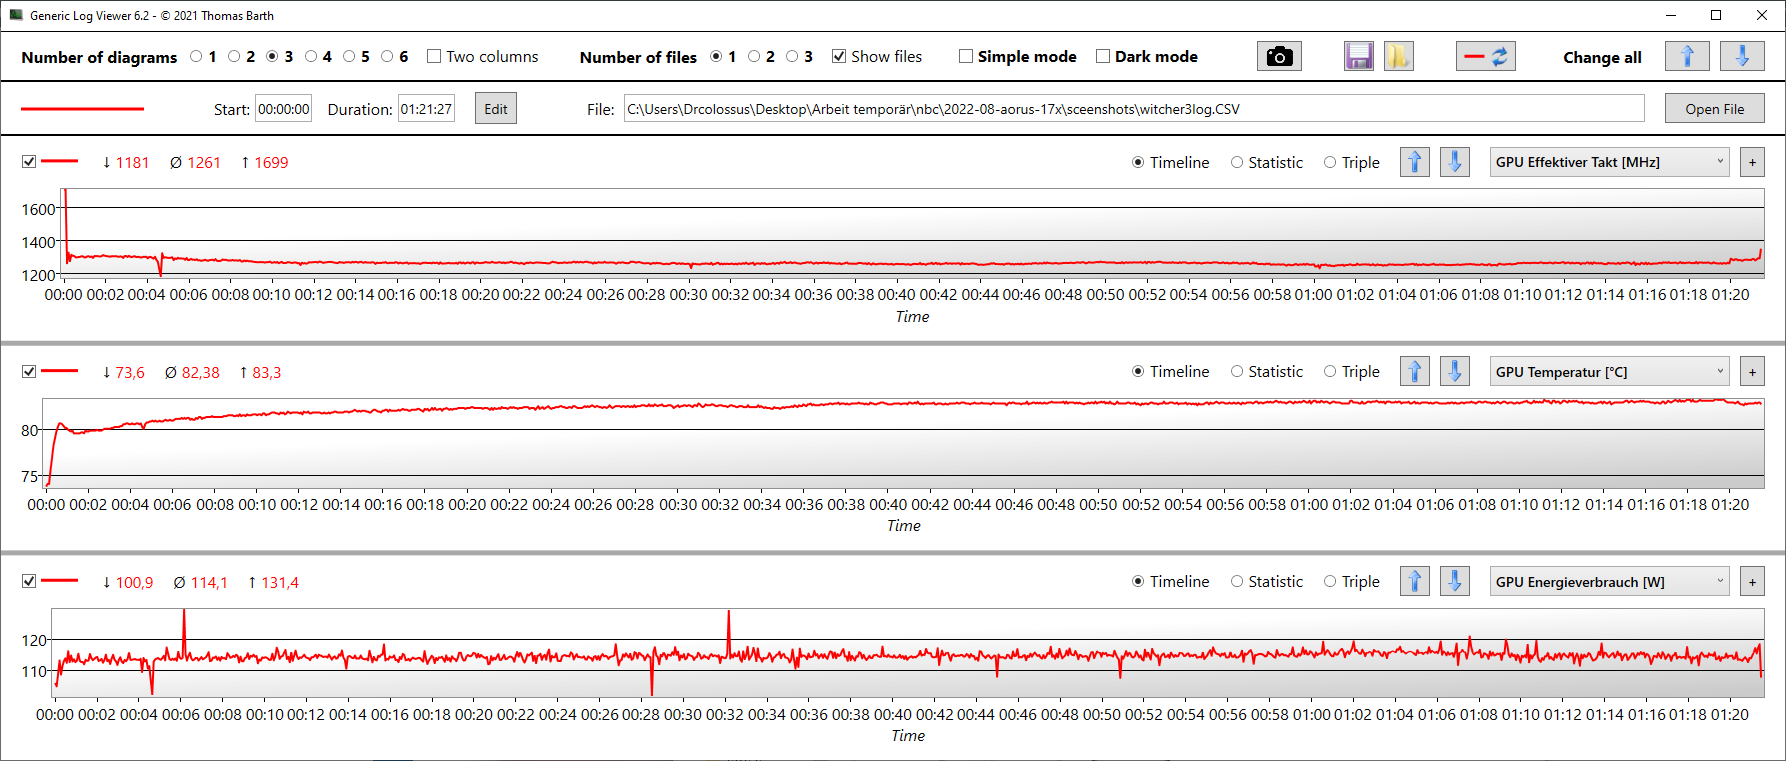
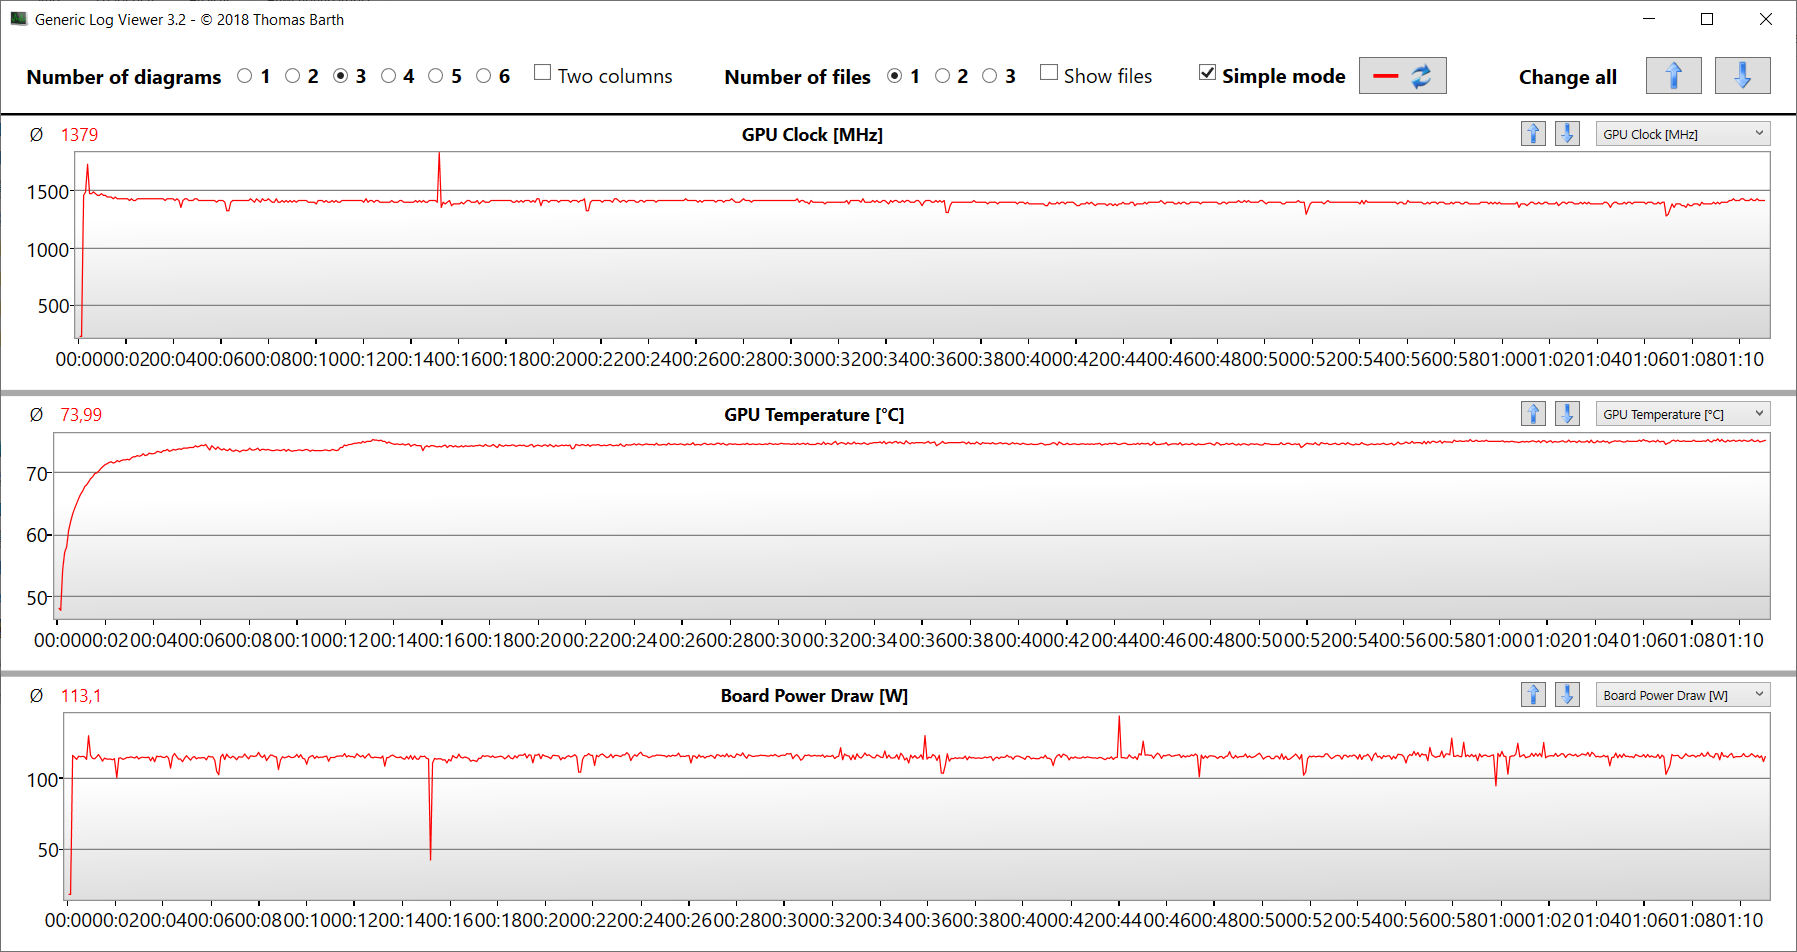
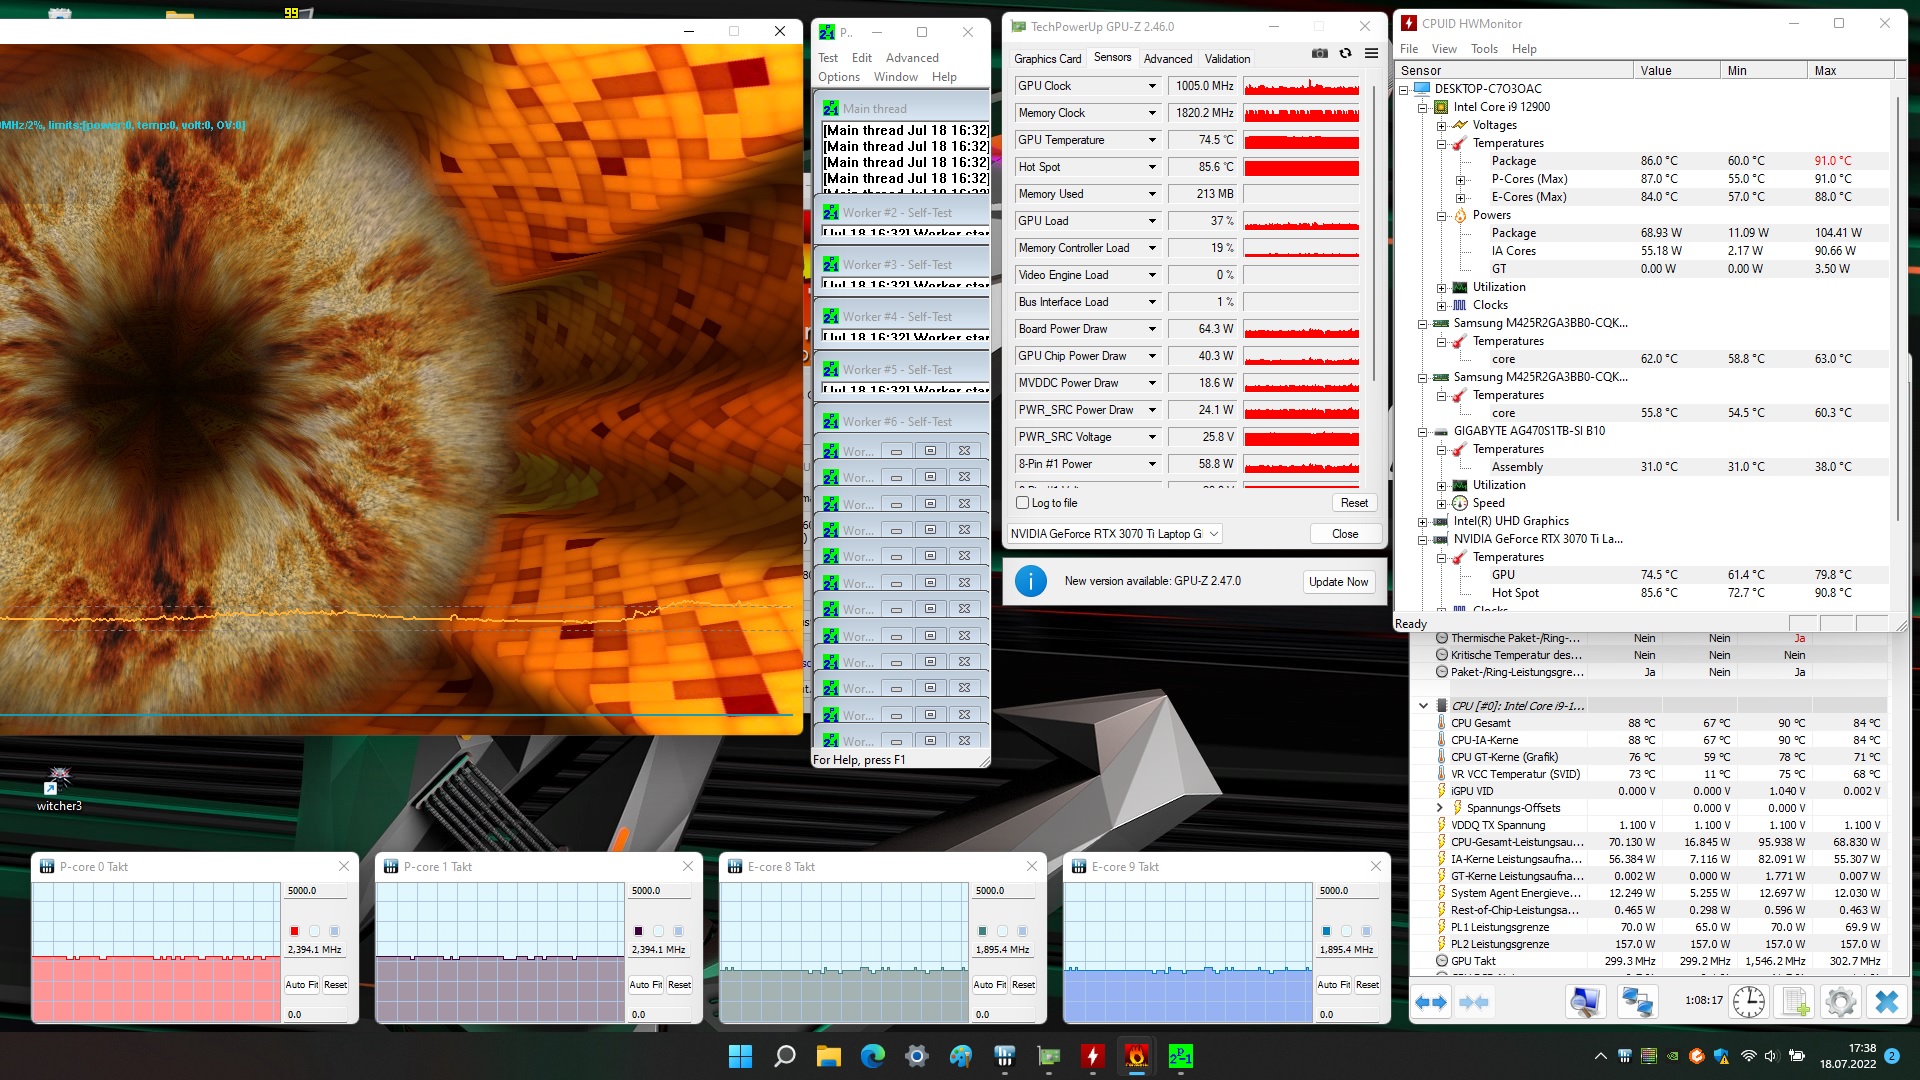
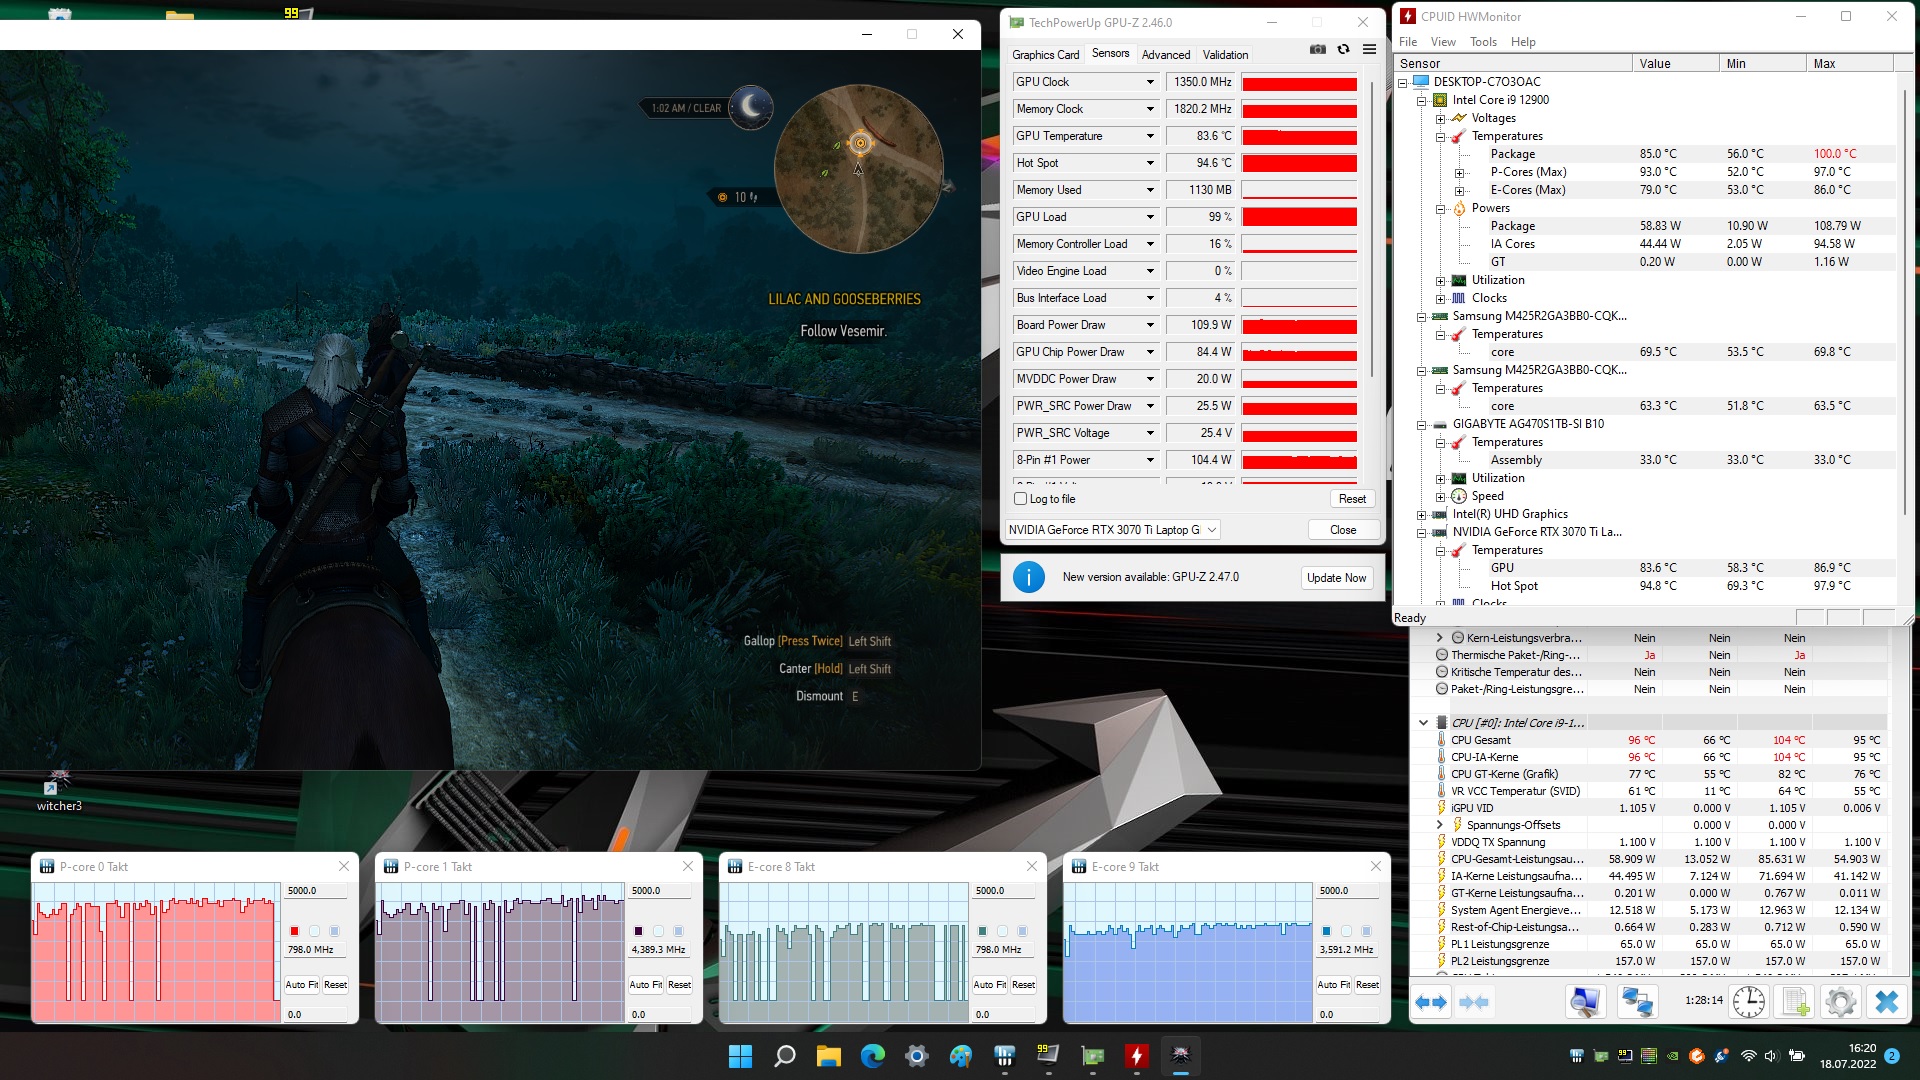
No teste de estresse com o The Witcher 3, o desempenho também permanece constante por períodos de tempo mais longos, o que é uma indicação de que o sistema de resfriamento é suficientemente dimensionado. Entretanto, é evidente que o Aorus 17 XE4 com o processador menor i7-12700H se sai melhor por aqui. Uma olhada nos valores dos sensores do HWiNFO mostra que a GPU não atinge os mesmos valores de desempenho, que provavelmente podem ser rastreados até as necessidades significativamente maiores de potência e resfriamento do processador maior. Isto significa que a temperatura máxima da GPU é atingida consideravelmente mais rápido, levando a uma redução da velocidade do relógio. Os valores médios dos dois gráficos abaixo mostram isso bastante bem.
Você pode encontrar benchmarks adicionais e comparações com várias placas gráficas em nossa lista de referência.
| 3DMark 11 Performance | 29161 pontos | |
| 3DMark Cloud Gate Standard Score | 59273 pontos | |
| 3DMark Fire Strike Score | 23528 pontos | |
| 3DMark Time Spy Score | 10254 pontos | |
Ajuda | ||
Desempenho nos jogos
Todos os jogos que testamos são capazes de manter uma taxa de quadros acima de 60 FPS, mesmo nos mais altos detalhes. Isto significa que o Aorus 17X deve ser capaz de lidar bem com jogos mais novos e exigentes, mesmo para o futuro previsível. Aqui, a resolução Full-HD também fornece uma limitação pragmática do desempenho exigido.
Como já mencionado, o RTX 3070 Ti é incapaz de atingir todo o seu potencial. OMSI GE67 12UGScom a mesma GPU está claramente à frente em algumas áreas aqui. O foco do laptop Gigabyte é mais a produtividade.
O painel 360-Hz pode atingir seu potencial máximo apenas em alguns jogos mais simples. Entretanto, ele ainda atinge um bom número a 100 ou mais quadros por segundo, uma vez que taxas de atualização variáveis são suportadas e os tempos de resposta são extremamente baixos.
| The Witcher 3 | |
| 1920x1080 High Graphics & Postprocessing (Nvidia HairWorks Off) | |
| Média da turma Gaming (341 - 404, n=2, últimos 2 anos) | |
| MSI GE67 HX 12UGS | |
| MSI Raider GE66 12UHS | |
| Schenker XMG Pro 17 E22 | |
| HP Omen 17-ck1075ng | |
| Asus ROG Zephyrus Duo 16 GX650RX | |
| Média NVIDIA GeForce RTX 3070 Ti Laptop GPU (139.7 - 226, n=27) | |
| Aorus 17 XE4 | |
| Aorus 17X XES | |
| 1920x1080 Ultra Graphics & Postprocessing (HBAO+) | |
| Média da turma Gaming (104.7 - 240, n=7, últimos 2 anos) | |
| MSI GE67 HX 12UGS | |
| Schenker XMG Pro 17 E22 | |
| Asus ROG Zephyrus Duo 16 GX650RX | |
| MSI Raider GE66 12UHS | |
| HP Omen 17-ck1075ng | |
| Média NVIDIA GeForce RTX 3070 Ti Laptop GPU (76.8 - 124.1, n=39) | |
| Aorus 17 XE4 | |
| Aorus 17X XES | |
| Forza Horizon 5 | |
| 1920x1080 High Preset | |
| Schenker XMG Pro 17 E22 | |
| Aorus 17X XES | |
| Média NVIDIA GeForce RTX 3070 Ti Laptop GPU (122 - 130, n=3) | |
| Aorus 17 XE4 | |
| 1920x1080 Extreme Preset | |
| Schenker XMG Pro 17 E22 | |
| Aorus 17X XES | |
| Aorus 17 XE4 | |
| Média NVIDIA GeForce RTX 3070 Ti Laptop GPU (76 - 80, n=3) | |
| God of War | |
| 1920x1080 High Preset | |
| Aorus 17X XES | |
| Média NVIDIA GeForce RTX 3070 Ti Laptop GPU (76.6 - 92, n=5) | |
| Aorus 17 XE4 | |
| 1920x1080 Ultra Preset | |
| Aorus 17X XES | |
| Média NVIDIA GeForce RTX 3070 Ti Laptop GPU (55.1 - 64.3, n=5) | |
| Aorus 17 XE4 | |
| Elex 2 | |
| 1920x1080 High / On AA:FX AF:16x | |
| Schenker XMG Pro 17 E22 | |
| Média NVIDIA GeForce RTX 3070 Ti Laptop GPU (83 - 99.4, n=3) | |
| Aorus 17 XE4 | |
| Aorus 17X XES | |
| 1920x1080 Ultra / On AA:SM AF:16x | |
| Schenker XMG Pro 17 E22 | |
| Média NVIDIA GeForce RTX 3070 Ti Laptop GPU (75 - 89, n=3) | |
| Aorus 17 XE4 | |
| Aorus 17X XES | |
Além de uma pequena queda de 4%, a taxa de estrutura em nosso The Witcher 3 teste de estresse permanece quase constante nos detalhes máximos. Isto indica um desempenho de resfriamento suficiente, mesmo sob carga constante
Você pode ver no gráfico, assim como nos valores fps dos vários jogos, que o Aorus 17 XE4com a mesma placa gráfica e a i7-12700H sempre tem um desempenho alguns pontos percentuais melhor. A placa gráfica tem que compartilhar demasiados recursos com o processador. Entretanto, isto não muda a boa impressão geral em termos de adequação aos jogos atuais.
The Witcher 3 FPS Chart
| baixo | média | alto | ultra | |
|---|---|---|---|---|
| GTA V (2015) | 178.5 | 110.9 | ||
| The Witcher 3 (2015) | 158 | 93.7 | ||
| Dota 2 Reborn (2015) | 158.3 | 148 | ||
| Final Fantasy XV Benchmark (2018) | 94.7 | |||
| X-Plane 11.11 (2018) | 116.9 | |||
| Far Cry 5 (2018) | 144 | 135 | ||
| Strange Brigade (2018) | 184.7 | 163.2 | ||
| Forza Horizon 5 (2021) | 130 | 80 | ||
| God of War (2022) | 92 | 61 | ||
| Elex 2 (2022) | 83 | 75 |
Emissões - Aorus 17X com altas necessidades de resfriamento
Emissões sonoras
É claro que os ventiladores ficam barulhentos sob carga. Infelizmente, o volume de ruído supera o dos concorrentes em alguns casos significativamente, mas normalmente também se ouve lá alguns ruídos de zumbido.
O que realmente se destaca é o repentino aumento da velocidade dos ventiladores, às vezes até na operação com bateria. Isto se torna irritante sob carga regular, como navegação na web, processamento de imagens e execução de programas de escritório. Os ventiladores continuam a aumentar de repente.
Aparentemente, Gigabyte já tomou nota do quão irritante isto pode se tornar. A tecla "Escape" oferece uma segunda função para ajustar o comportamento dos ventiladores com o apertar de um botão, sem ter que fazer nenhuma outra alteração.
Barulho
| Ocioso |
| 28 / 32 / 38 dB |
| Carga |
| 53 / 55 dB |
 | ||
30 dB silencioso 40 dB(A) audível 50 dB(A) ruidosamente alto |
||
min: | ||
| Aorus 17X XES GeForce RTX 3070 Ti Laptop GPU, i9-12900HX, Gigabyte AG470S1TB-SI B10 | HP Omen 17-ck1075ng GeForce RTX 3070 Ti Laptop GPU, i7-12700H, WDC PC SN810 1TB | MSI GE67 HX 12UGS GeForce RTX 3070 Ti Laptop GPU, i7-12800HX, Samsung PM9A1 MZVL21T0HCLR | Schenker XMG Pro 17 E22 GeForce RTX 3080 Ti Laptop GPU, i9-12900H, Samsung SSD 980 Pro 1TB MZ-V8P1T0BW | MSI Raider GE66 12UHS GeForce RTX 3080 Ti Laptop GPU, i9-12900HK, Samsung PM9A1 MZVL22T0HBLB | Asus ROG Zephyrus Duo 16 GX650RX GeForce RTX 3080 Ti Laptop GPU, R9 6900HX, 2x Samsung SSD 980 Pro 2TB MZ-V8P2T0 (RAID 0) | Aorus 17 XE4 GeForce RTX 3070 Ti Laptop GPU, i7-12700H, Gigabyte AG470S1TB-SI B10 | |
|---|---|---|---|---|---|---|---|
| Noise | 6% | 15% | -4% | 8% | 13% | 7% | |
| desligado / ambiente * (dB) | 26 | 25.4 2% | 22.7 13% | 26 -0% | 26 -0% | 26 -0% | 24 8% |
| Idle Minimum * (dB) | 28 | 28 -0% | 22.9 18% | 26 7% | 27 4% | 26 7% | 30 -7% |
| Idle Average * (dB) | 32 | 28 12% | 22.9 28% | 34 -6% | 30 6% | 27 16% | 31 3% |
| Idle Maximum * (dB) | 38 | 31.2 18% | 22.9 40% | 42 -11% | 39 -3% | 29 24% | 34 11% |
| Load Average * (dB) | 53 | 52.2 2% | 44.4 16% | 58 -9% | 45 15% | 41 23% | 44 17% |
| Witcher 3 ultra * (dB) | 54 | 52.2 3% | 55.7 -3% | 57 -6% | 45 17% | 48 11% | 51 6% |
| Load Maximum * (dB) | 55 | 52.2 5% | 57.4 -4% | 58 -5% | 47 15% | 50 9% | 49 11% |
* ... menor é melhor
Temperaturas
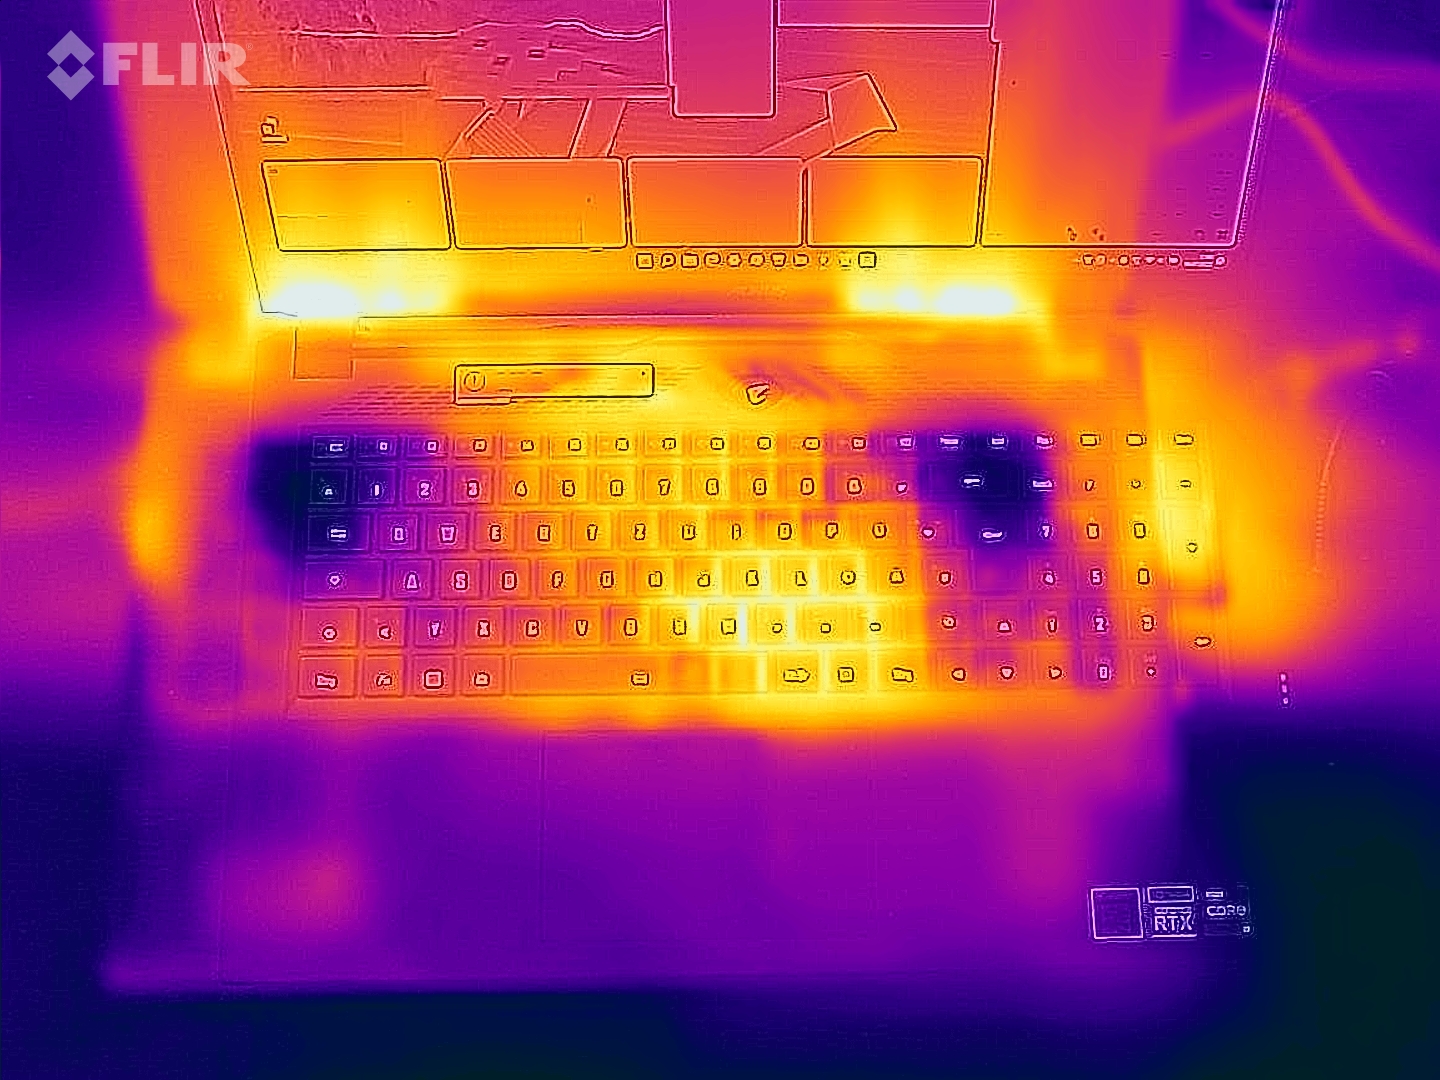
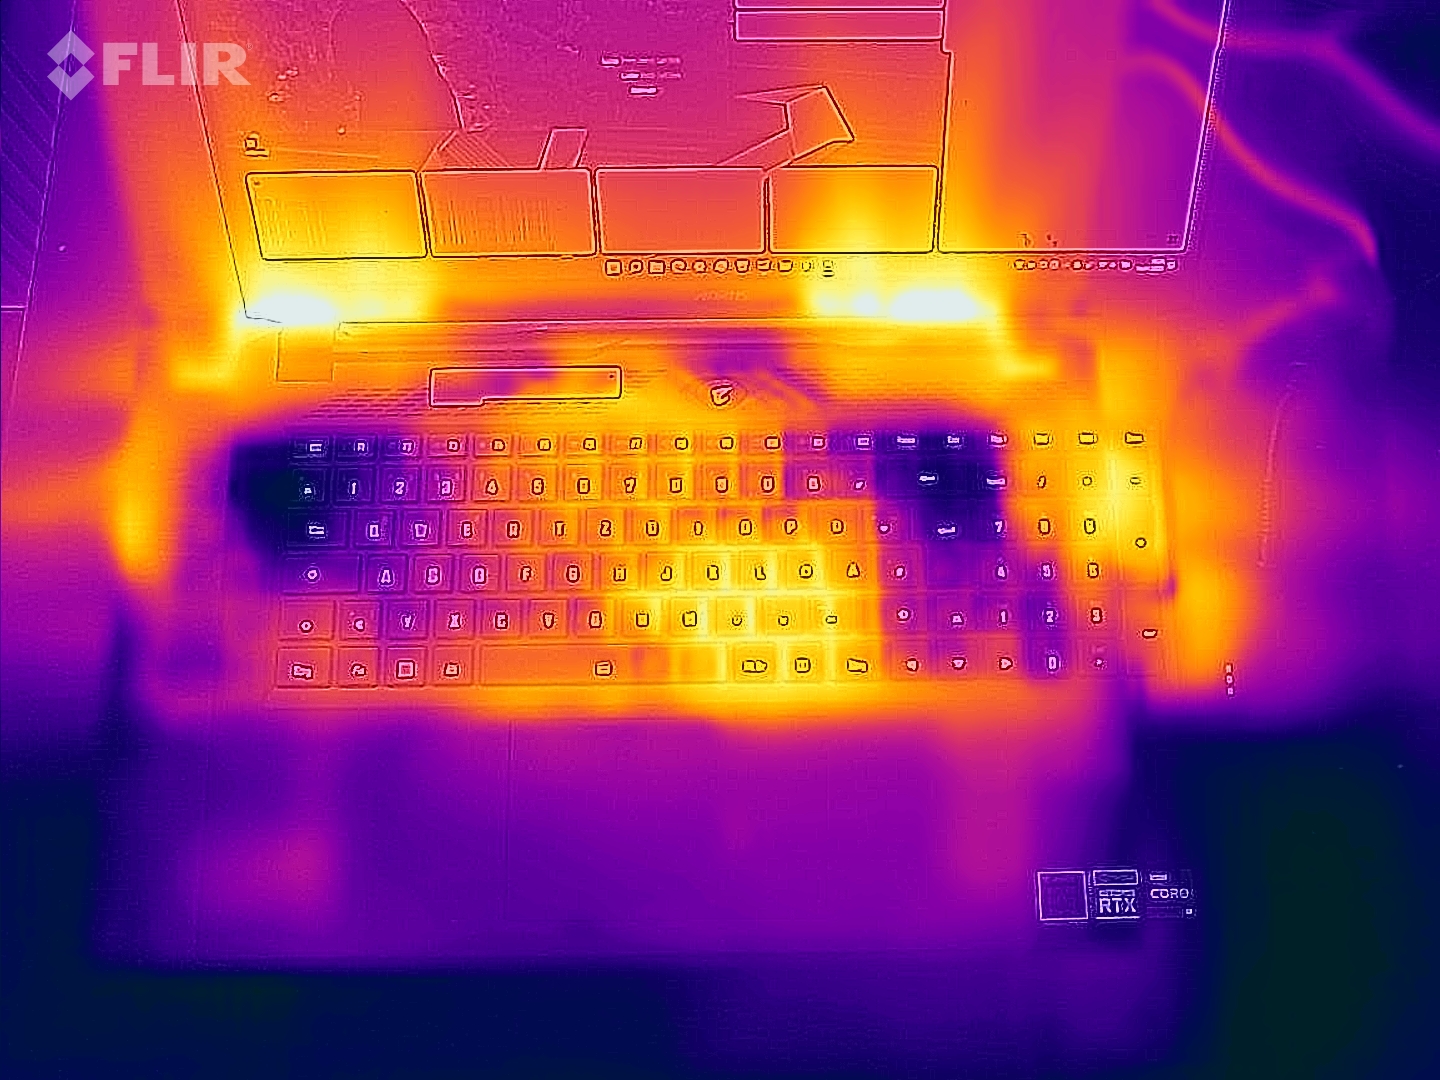
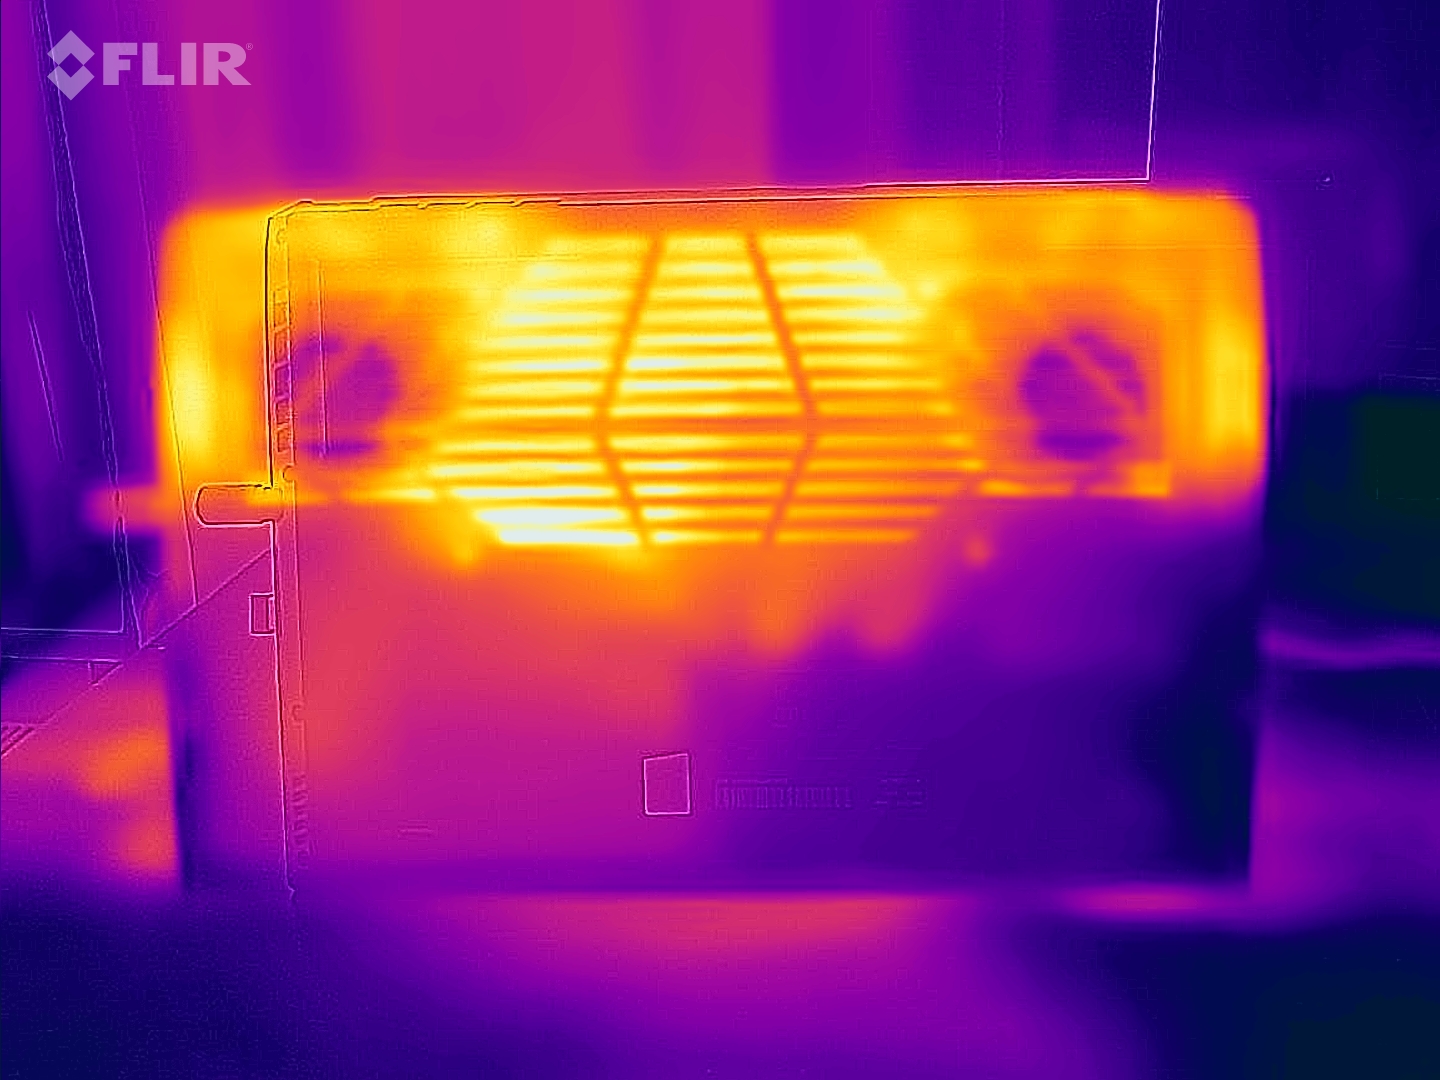
O desenvolvimento do calor do laptop para jogos enquanto joga e mesmo durante o teste de estresse não fica muito extremo. Os descansos da palma da mão permanecem relativamente frios. O desenvolvimento de calor também se mantém dentro de limites aceitáveis na área do teclado, mesmo que as teclas aqueçam visivelmente.
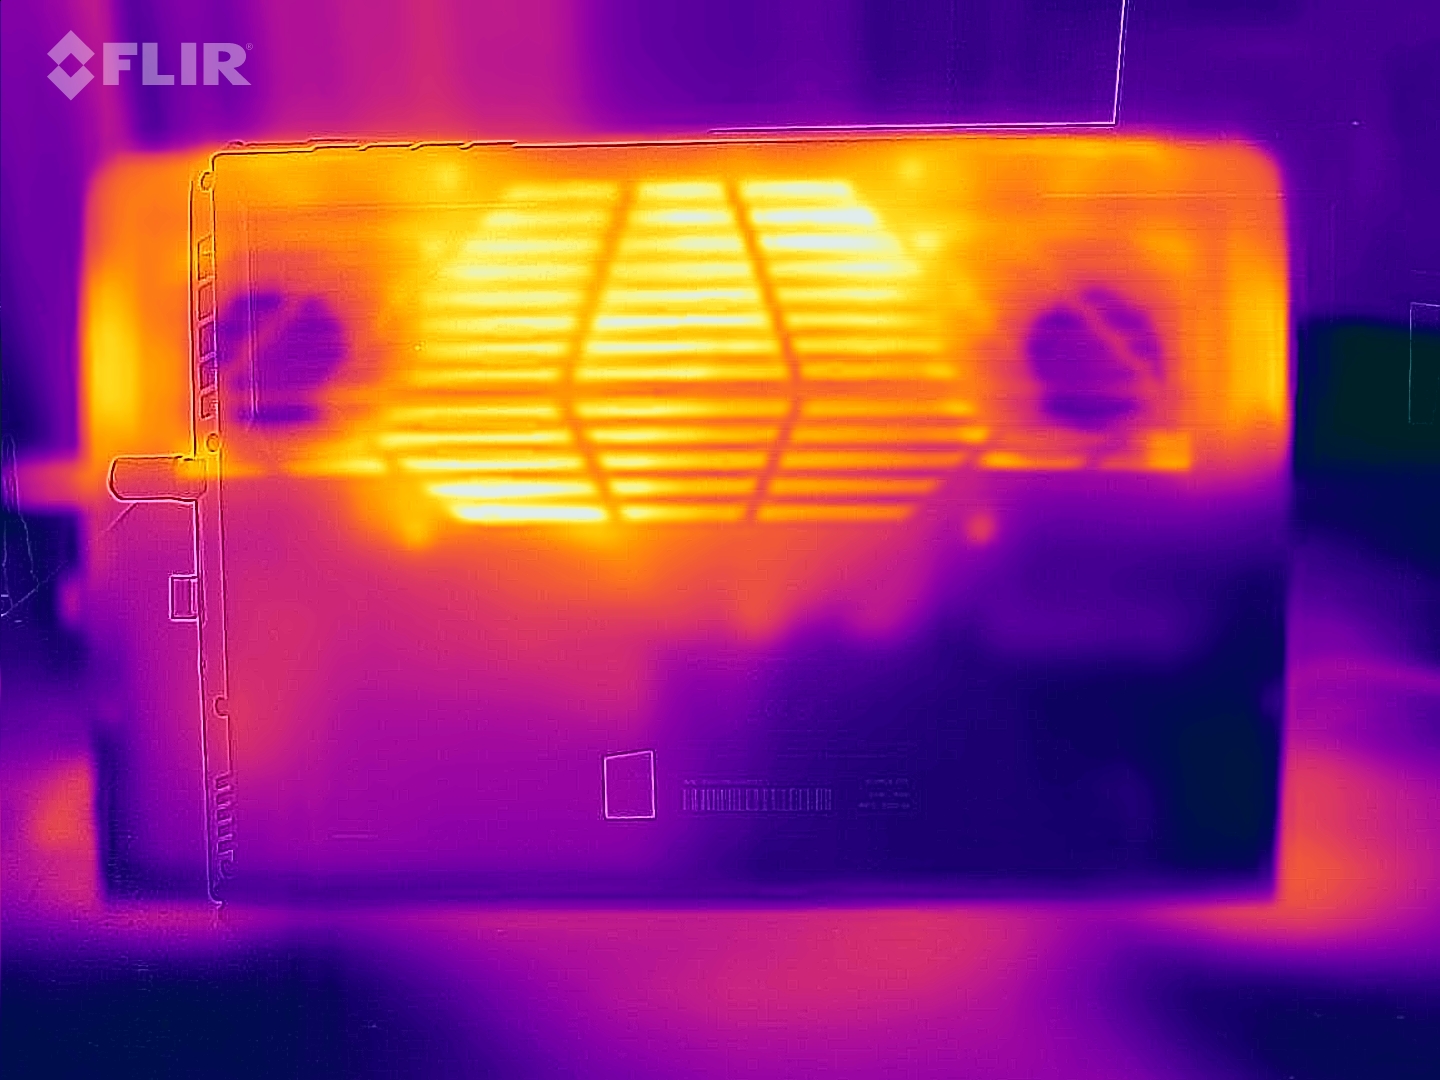
Uma grande parte do calor é removida através da parte inferior, que se torna vários graus mais quente do que a parte superior. Medimos um valor máximo de 65 °C (149 °F). Isto também significa que não se deve usar o Aorus 17X em uma superfície almofadada, mas ele é melhor colocado em uma superfície sólida como uma mesa.
(-) A temperatura máxima no lado superior é 54 °C / 129 F, em comparação com a média de 40.4 °C / 105 F , variando de 21.2 a 68.8 °C para a classe Gaming.
(-) A parte inferior aquece até um máximo de 58 °C / 136 F, em comparação com a média de 43.2 °C / 110 F
(±) Em uso inativo, a temperatura média para o lado superior é 34.1 °C / 93 F, em comparação com a média do dispositivo de 33.9 °C / ### class_avg_f### F.
(-) Jogando The Witcher 3, a temperatura média para o lado superior é 45.2 °C / 113 F, em comparação com a média do dispositivo de 33.9 °C / ## #class_avg_f### F.
(-) Os apoios para as mãos e o touchpad podem ficar muito quentes ao toque, com um máximo de 41 °C / 105.8 F.
(-) A temperatura média da área do apoio para as mãos de dispositivos semelhantes foi 28.8 °C / 83.8 F (-12.2 °C / -22 F).
| Aorus 17X XES Intel Core i9-12900HX, NVIDIA GeForce RTX 3070 Ti Laptop GPU | HP Omen 17-ck1075ng Intel Core i7-12700H, NVIDIA GeForce RTX 3070 Ti Laptop GPU | MSI GE67 HX 12UGS Intel Core i7-12800HX, NVIDIA GeForce RTX 3070 Ti Laptop GPU | Schenker XMG Pro 17 E22 Intel Core i9-12900H, NVIDIA GeForce RTX 3080 Ti Laptop GPU | MSI Raider GE66 12UHS Intel Core i9-12900HK, NVIDIA GeForce RTX 3080 Ti Laptop GPU | Asus ROG Zephyrus Duo 16 GX650RX AMD Ryzen 9 6900HX, NVIDIA GeForce RTX 3080 Ti Laptop GPU | Aorus 17 XE4 Intel Core i7-12700H, NVIDIA GeForce RTX 3070 Ti Laptop GPU | |
|---|---|---|---|---|---|---|---|
| Heat | 18% | 29% | 2% | 4% | 14% | 11% | |
| Maximum Upper Side * (°C) | 54 | 31.3 42% | 34.4 36% | 56 -4% | 54 -0% | 45 17% | 50 7% |
| Maximum Bottom * (°C) | 58 | 43.3 25% | 42 28% | 60 -3% | 65 -12% | 50 14% | 58 -0% |
| Idle Upper Side * (°C) | 37 | 31.3 15% | 24 35% | 34 8% | 30 19% | 33 11% | 30 19% |
| Idle Bottom * (°C) | 39 | 43.3 -11% | 33.2 15% | 36 8% | 35 10% | 33 15% | 32 18% |
* ... menor é melhor
Teste de estresse
Sob carga constante, a i9-12900HX alcança até 100 °C (212 °F). Depois disso, o Aorus 17X tem sempre que acelerar significativamente sua velocidade do relógio. Entretanto, este só é o caso se a placa gráfica também estiver sob carga pesada. Este cenário com o The Witcher 3 em configurações de máximo detalhe, que é bem apresentado, revela o desenvolvimento extremamente alto do calor da CPU ávida de energia.
Oradores
Você pode ver imediatamente, olhando o gráfico de barras abaixo, que o laptop não tem baixo. O MacBook Pro 16 mostra como deve ser este aspecto. Infelizmente, você pode ouvir claramente a diferença com a música correspondente, como a eletrônica ou o rock. As freqüências profundas claramente carecem de energia.
Em contraste, as vozes e as altas freqüências em geral são reproduzidas com clareza e precisão. A música que enfatiza as vozes e todo o conteúdo dominado pela voz e pelo diálogo soa convincente. Para alto-falantes estereofônicos em um laptop, este é um bom resultado.
Graças à porta do fone de ouvido e várias portas de vídeo, há numerosas opções adicionais para alto-falantes externos.
Aorus 17X XES análise de áudio
(+) | os alto-falantes podem tocar relativamente alto (###valor### dB)
Graves 100 - 315Hz
(-) | quase nenhum baixo - em média 27.6% menor que a mediana
(±) | a linearidade dos graves é média (11.8% delta para a frequência anterior)
Médios 400 - 2.000 Hz
(±) | médios mais altos - em média 5.1% maior que a mediana
(+) | médios são lineares (5.5% delta para frequência anterior)
Altos 2 - 16 kHz
(+) | agudos equilibrados - apenas 3% longe da mediana
(+) | os máximos são lineares (6% delta da frequência anterior)
Geral 100 - 16.000 Hz
(±) | a linearidade do som geral é média (19% diferença em relação à mediana)
Comparado com a mesma classe
» 63% de todos os dispositivos testados nesta classe foram melhores, 8% semelhantes, 28% piores
» O melhor teve um delta de 6%, a média foi 18%, o pior foi 132%
Comparado com todos os dispositivos testados
» 45% de todos os dispositivos testados foram melhores, 7% semelhantes, 47% piores
» O melhor teve um delta de 4%, a média foi 23%, o pior foi 134%
Apple MacBook Pro 16 2021 M1 Pro análise de áudio
(+) | os alto-falantes podem tocar relativamente alto (###valor### dB)
Graves 100 - 315Hz
(+) | bons graves - apenas 3.8% longe da mediana
(+) | o baixo é linear (5.2% delta para a frequência anterior)
Médios 400 - 2.000 Hz
(+) | médios equilibrados - apenas 1.3% longe da mediana
(+) | médios são lineares (2.1% delta para frequência anterior)
Altos 2 - 16 kHz
(+) | agudos equilibrados - apenas 1.9% longe da mediana
(+) | os máximos são lineares (2.7% delta da frequência anterior)
Geral 100 - 16.000 Hz
(+) | o som geral é linear (4.6% diferença em relação à mediana)
Comparado com a mesma classe
» 0% de todos os dispositivos testados nesta classe foram melhores, 0% semelhantes, 100% piores
» O melhor teve um delta de 5%, a média foi 17%, o pior foi 45%
Comparado com todos os dispositivos testados
» 0% de todos os dispositivos testados foram melhores, 0% semelhantes, 100% piores
» O melhor teve um delta de 4%, a média foi 23%, o pior foi 134%
Power Management - Um laptop de 17 polegadas faminto de energia
Consumo de energia
Como em outros portáteis de jogos comparavelmente equipados e potentes, o consumo de energia já é muito alto, mesmo sem carga. Embora um mínimo de 18 watts seja aceitável em comparação, ele ainda parece muito alto se considerarmos que não há nenhuma aplicação em execução.
O consumo médio de carga de mais de 150 watts é significativamente maior do que o dos concorrentes. Só a i9-12900HX consome 10 watts a mais do que as CPUs mais fracas. No entanto, a potência não é realmente utilizada de forma eficaz. Em nosso The Witcher 3 stress test, o Aorus 17 XE4 faz melhor e usa 10% menos energia para isso também.
Com um consumo máximo de 290 watts, a fonte de alimentação de 280 watts ainda é capaz de lidar com ela.
| desligado | |
| Ocioso | |
| Carga |
|
Key:
min: | |
| Aorus 17X XES i9-12900HX, GeForce RTX 3070 Ti Laptop GPU | HP Omen 17-ck1075ng i7-12700H, GeForce RTX 3070 Ti Laptop GPU | Schenker XMG Pro 17 E22 i9-12900H, GeForce RTX 3080 Ti Laptop GPU | MSI Raider GE66 12UHS i9-12900HK, GeForce RTX 3080 Ti Laptop GPU | Asus ROG Zephyrus Duo 16 GX650RX R9 6900HX, GeForce RTX 3080 Ti Laptop GPU | Aorus 17 XE4 i7-12700H, GeForce RTX 3070 Ti Laptop GPU | Média NVIDIA GeForce RTX 3070 Ti Laptop GPU | Média da turma Gaming | |
|---|---|---|---|---|---|---|---|---|
| Power Consumption | 24% | 21% | 21% | 14% | 12% | 22% | 26% | |
| Idle Minimum * (Watt) | 18 | 12.2 32% | 13 28% | 16 11% | 19 -6% | 20 -11% | 14.2 ? 21% | 13 ? 28% |
| Idle Average * (Watt) | 28 | 18 36% | 17 39% | 19 32% | 24 14% | 23 18% | 19.9 ? 29% | 19 ? 32% |
| Idle Maximum * (Watt) | 36 | 19.4 46% | 26 28% | 26 28% | 31 14% | 28 22% | 26.2 ? 27% | 24.6 ? 32% |
| Load Average * (Watt) | 153 | 128 16% | 120 22% | 110 28% | 104 32% | 120 22% | 125.8 ? 18% | 110.7 ? 28% |
| Witcher 3 ultra * (Watt) | 221 | 209 5% | 221 -0% | 202 9% | 186.5 16% | 196 11% | ||
| Load Maximum * (Watt) | 290 | 266 8% | 266 8% | 242 17% | 256 12% | 257 11% | 248 ? 14% | 259 ? 11% |
* ... menor é melhor
Power Consumption The Witcher 3 / Stress Test
Power Consumption With External Monitor
Vida útil da bateria
Não é surpreendente que com a mesma capacidade de bateria que no Aorus 17 XE4, o processador mais ávido de energia no Aorus 17X leva a uma vida útil da bateria muito pior. Particularmente enquanto navega na web, o laptop não é convincente apesar de quase não haver nenhuma carga que valha a pena mencionar no sistema. Você mal tem mais de 4 horas para encontrar outra saída novamente. Apesar do modo de economia de energia e brilho limitado, o resultado ainda está abaixo da média, mesmo que a bateria armazene quase 100 Wh.
O laptop simplesmente não foi projetado para funcionar com bateria, portanto você deve sempre manter a fonte de alimentação ao seu alcance, mesmo que não seja de forma alguma pequena.
| Aorus 17X XES i9-12900HX, GeForce RTX 3070 Ti Laptop GPU, 99 Wh | HP Omen 17-ck1075ng i7-12700H, GeForce RTX 3070 Ti Laptop GPU, 78 Wh | MSI GE67 HX 12UGS i7-12800HX, GeForce RTX 3070 Ti Laptop GPU, 99.9 Wh | Schenker XMG Pro 17 E22 i9-12900H, GeForce RTX 3080 Ti Laptop GPU, 80 Wh | Asus ROG Zephyrus Duo 16 GX650RX R9 6900HX, GeForce RTX 3080 Ti Laptop GPU, 90 Wh | Aorus 17 XE4 i7-12700H, GeForce RTX 3070 Ti Laptop GPU, 99 Wh | Média da turma Gaming | |
|---|---|---|---|---|---|---|---|
| Duração da bateria | 49% | 39% | 28% | 64% | 30% | 63% | |
| H.264 (h) | 3.8 | 4.6 21% | 9.3 145% | 6.1 61% | 8.32 ? 119% | ||
| WiFi v1.3 (h) | 4.4 | 6.2 41% | 5.6 27% | 6.8 55% | 7.8 77% | 5.1 16% | 7.11 ? 62% |
| Load (h) | 1.4 | 2.2 57% | 2.1 50% | 1.5 7% | 1 -29% | 1.6 14% | 1.502 ? 7% |
Pro
Contra
Veredicto - Jogos e trabalho com o laptop Gigabyte
O coração e o destaque do Aorus 17X XES é o processador. Com o i9-12900HX, o laptop avança muito para o topo nos benchmarks da CPU, com um desempenho convincente durante tarefas exigentes que ele também pode facilmente rodar em paralelo. Muita RAM DDR5 e o rápido e capaz M.2 SSD sublinham as altas ambições em termos de desempenho do sistema.
Apesar do monitor 360-Hertz com cobertura total de espaço colorido sRGB e Nvidia Advanced Optimus para uma exibição correspondentemente rápida, este não é de forma alguma um puro laptop para jogos. Em seu lugar adequado em uma mesa com entre uma e três telas apropriadas conectadas a suas portas de vídeo, ele também é capaz de provar suas qualidades de estação de trabalho.
Os 32 GB de memória de trabalho são bem adequados para isto, entre outras coisas. Além disso, o processador parece muito potente e com muita necessidade de refrigeração para poder fazer pleno uso do desempenho da placa gráfica, o que pode se tornar um grande obstáculo durante os jogos.
Não sendo um puro laptop para jogos, o Aorus 17X está igualmente bem equipado para tarefas exigentes e para os jogos ocasionais de alto nível.
Não é surpreendente que o laptop se torne bastante fraco em termos da duração da bateria e do desenvolvimento de ruído e calor. Os componentes potentes exigem compromissos claros em termos de mobilidade. Entretanto, ainda teríamos esperado mais, considerando a bateria muito grande.
O equipamento de conexão também poderia ter se revelado um pouco mais abundante. O laptop de 17 polegadas definitivamente ofereceria espaço suficiente para isso. Além disso, as duas conexões USB-A ainda usam o padrão USB 3.0 com apenas 5 Gbit/s. Por outro lado, Thunderbolt 4, 2.5-Gigbit LAN, assim como HDMI e DP compensam um pouco isso.
Mas é claro que isto não muda nada no bom desempenho do sistema. Se um laptop deve funcionar realmente rápido e também exibir jogos com a melhor qualidade, tudo para isso está disponível aqui. Mas se os jogos devem estar em primeiro plano, oAorus 17 XE4poderia ser uma escolha melhor. O processador menor diminui o preço notavelmente, sem limitar o desempenho durante os jogos. Você pode encontrar um desempenho ainda maior do sistema a um preço correspondentemente mais alto no MSI Raider GE66por exemplo.
Preço e Disponibilidade
O Aorus 17X está listado em Gigabytee uma configuração Aorus 17 similar com o processador Intel i9-12900H está disponível em BestBuy por $2999. Você pode encontrar o Aorus 17 XE4 com i7-12700H, que tem melhor desempenho no puro desempenho de jogos, em Amazon por $1999.
Aorus 17X XES
- 08/17/2022 v7 (old)
Mario Petzold
Price comparison

