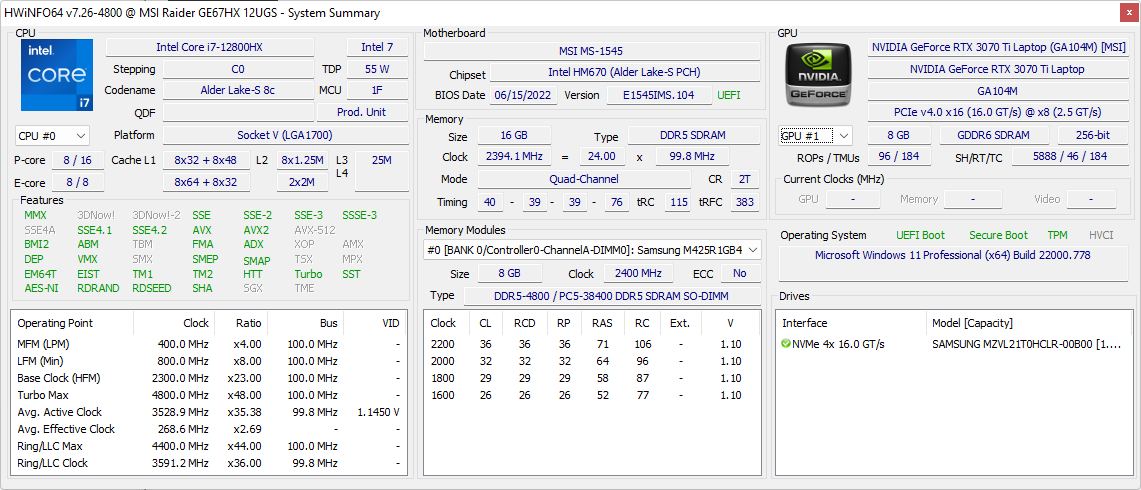
O Intel Core i7-12800HX é uma loucura: MSI Raider GE67 HX 12UGS revisão de laptop
O MSI GE67 é uma série de jogos de alto nível que se situa acima da série menos cara Katana GF ou Vector GP, mas abaixo da entusiasta série Titan GT. Nossa unidade de teste GE67 é um sucessor direto do GE66 2020. Em vez de ser enviado com CPUs Intel Comet Lake-H de 10ª geração e Nvidia GeForce Super GPUs, o GE67 vem com CPUs Alder Lake-H de 12ª geração e móveis GeForce Ti GPUs
Recomendamos verificar nossas existente duas revisões no GE66, já que o GE67 utiliza principalmente o mesmo design e as mesmas características de chassis. No entanto, existem algumas diferenças visuais relativamente menores que detalharemos em nossa revisão abaixo
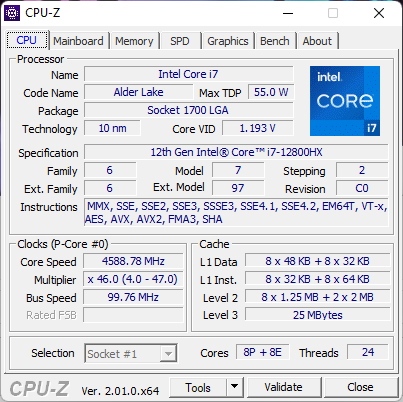
Nossa unidade de teste vem equipada com o CPU Core i7-12800HX de 16 núcleos, GeForce RTX 3070 Ti GPU, e painel QHD OLED de 240 Hz, prometendo cobertura total DCI-P3 por aproximadamente US$2500 de varejo. Os concorrentes diretos neste espaço incluem outros laptops de 15,6 polegadas de alta qualidade para jogos como o Asus ROG Strix Scar 15, Lâmina Razer 15ouAlienware m15 R6.
Mais revisões da MSI:
Possíveis concorrentes em comparação
Avaliação | Data | Modelo | Peso | Altura | Size | Resolução | Preço |
|---|---|---|---|---|---|---|---|
| 87.7 % v7 (old) | 07/2022 | MSI GE67 HX 12UGS i7-12800HX, GeForce RTX 3070 Ti Laptop GPU | 2.5 kg | 23.4 mm | 15.60" | 1920x1080 | |
| 87.4 % v7 (old) | 06/2022 | MSI Raider GE66 12UHS i9-12900HK, GeForce RTX 3080 Ti Laptop GPU | 2.4 kg | 23.4 mm | 15.60" | 3840x2160 | |
| 86.9 % v7 (old) | 03/2022 | MSI Vector GP66 12UGS i9-12900H, GeForce RTX 3070 Ti Laptop GPU | 2.3 kg | 23.4 mm | 15.60" | 1920x1080 | |
| 86.3 % v7 (old) | 06/2022 | Asus ROG Strix Scar 15 G533ZW-LN106WS i9-12900H, GeForce RTX 3070 Ti Laptop GPU | 2.3 kg | 27.2 mm | 15.60" | 2560x1440 | |
| 86.1 % v7 (old) | 11/2021 | Alienware m15 R6, i7-11800H RTX 3080 i7-11800H, GeForce RTX 3080 Laptop GPU | 2.5 kg | 22.85 mm | 15.60" | 1920x1080 | |
| 89.1 % v7 (old) | 03/2022 | Razer Blade 15 2022 i7-12800H, GeForce RTX 3080 Ti Laptop GPU | 2.1 kg | 16.99 mm | 15.60" | 2560x1440 |
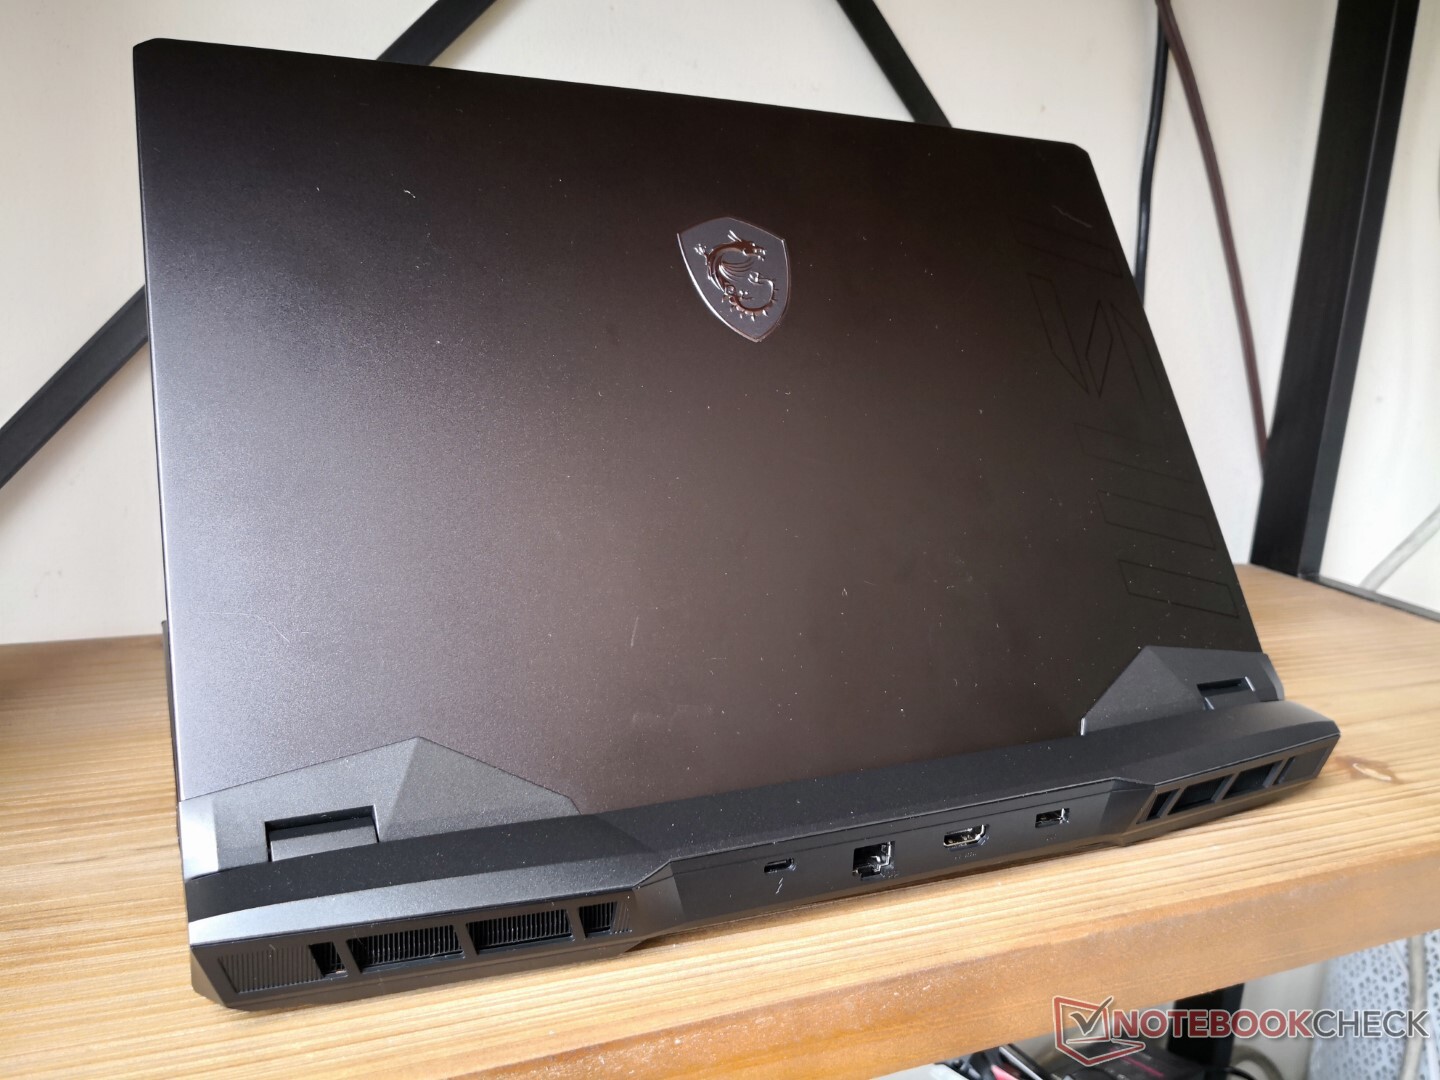
Estojo - O mesmo em cima, diferente em baixo
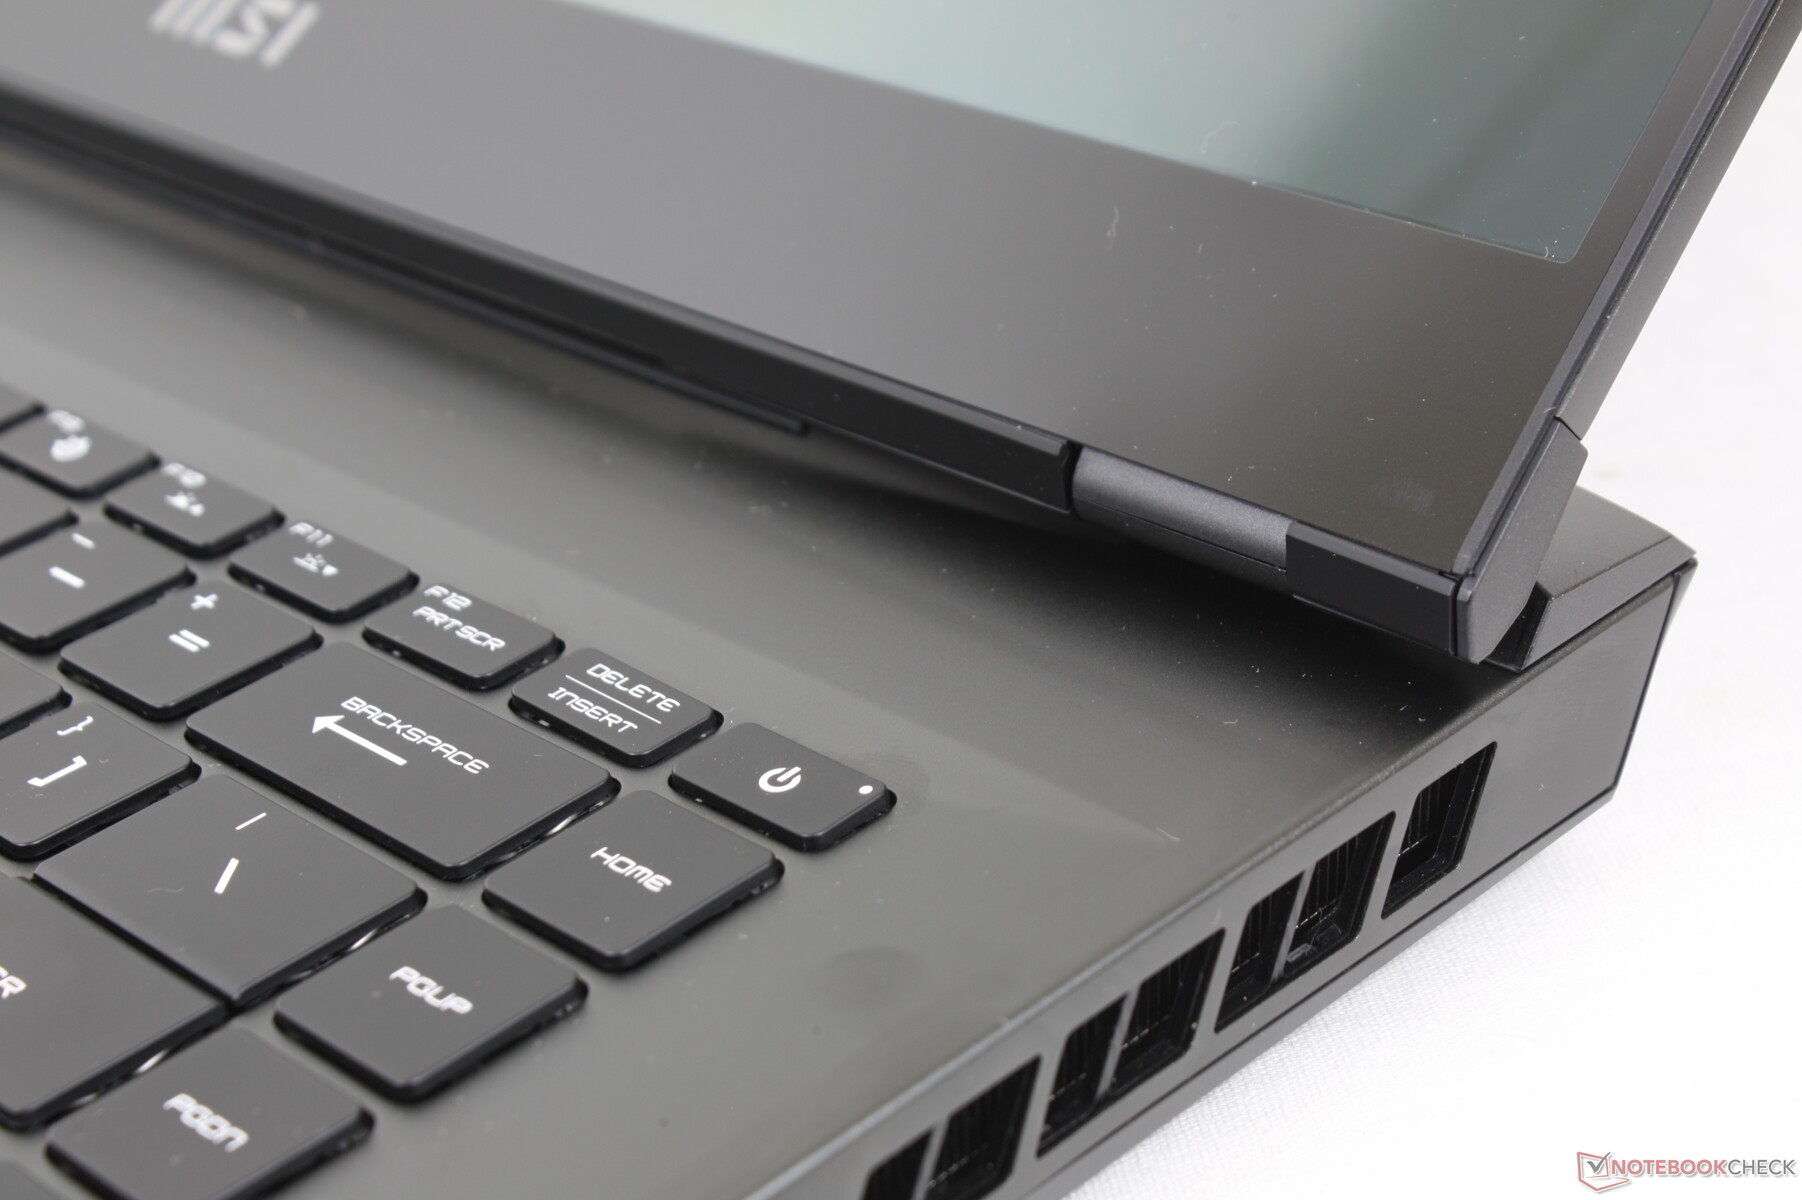
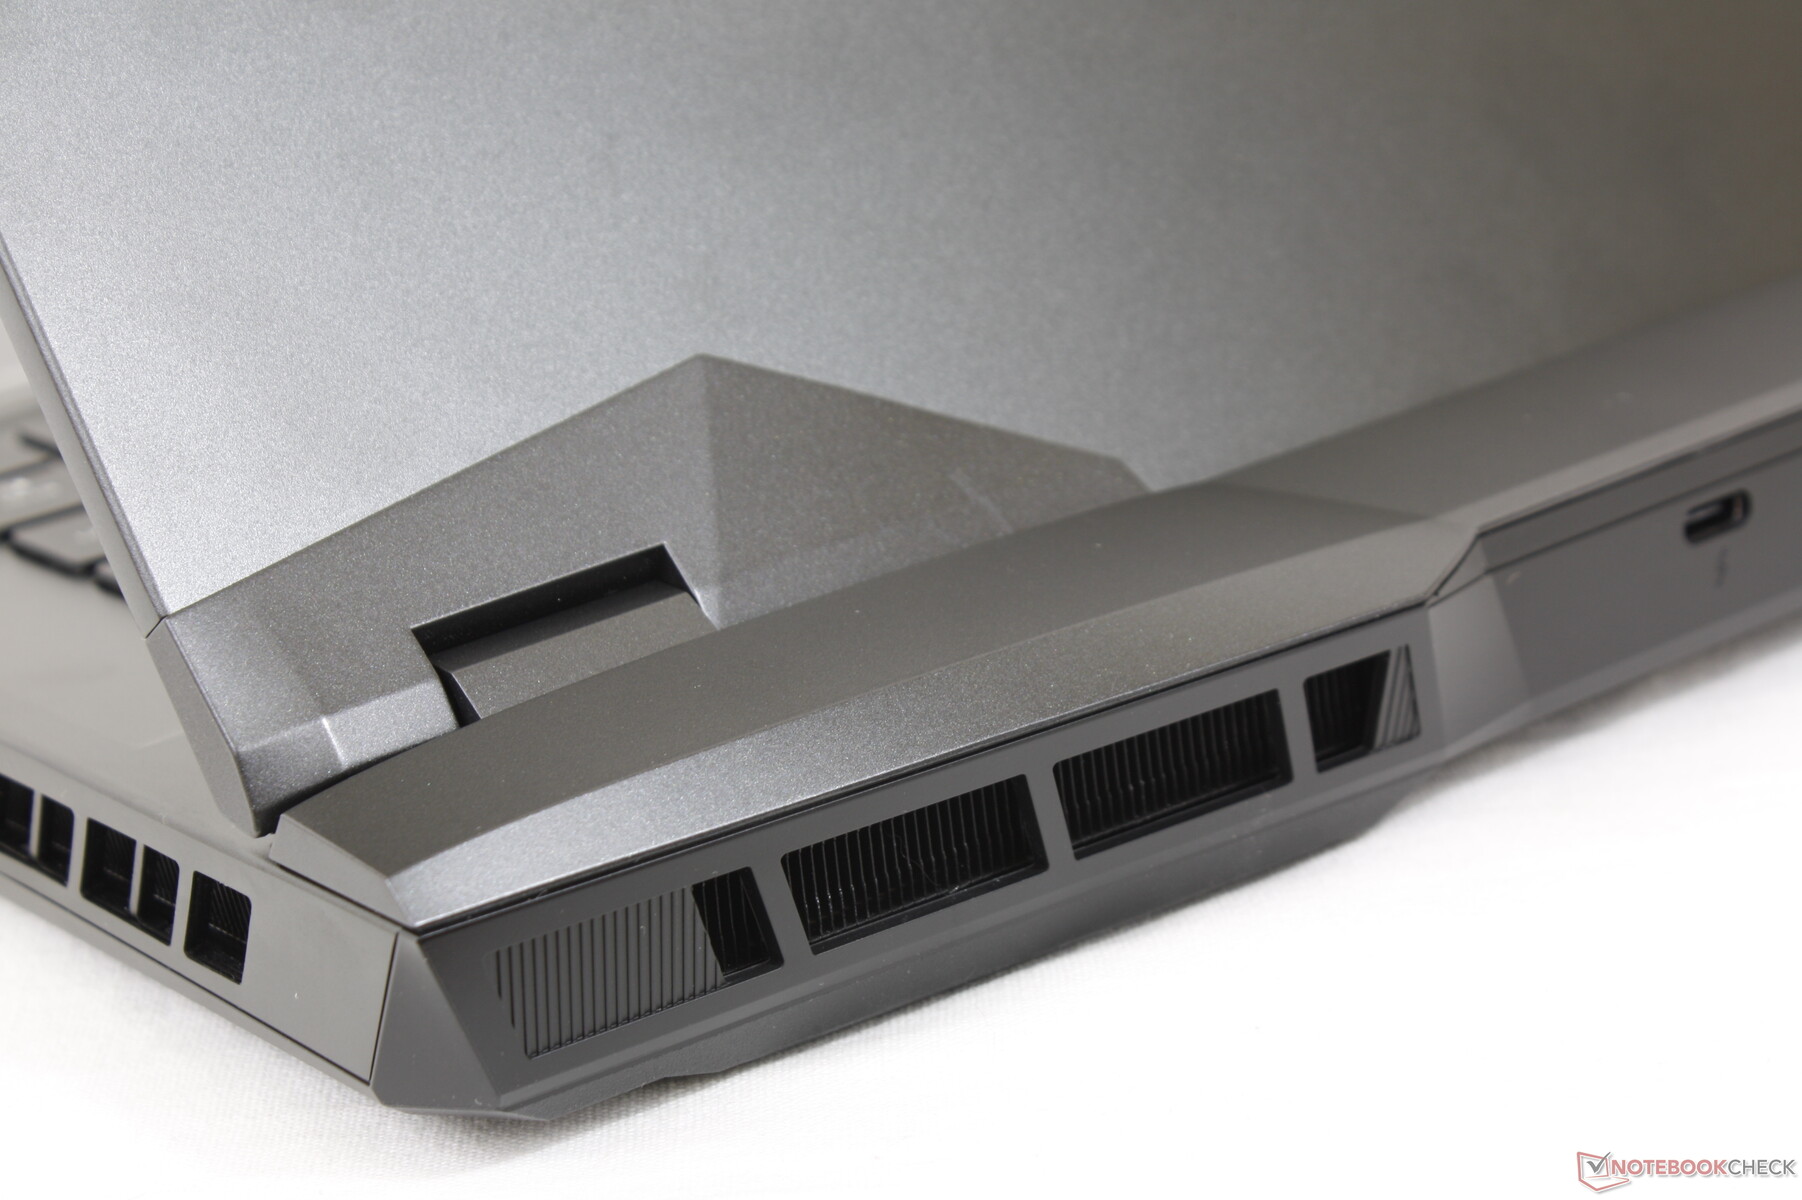
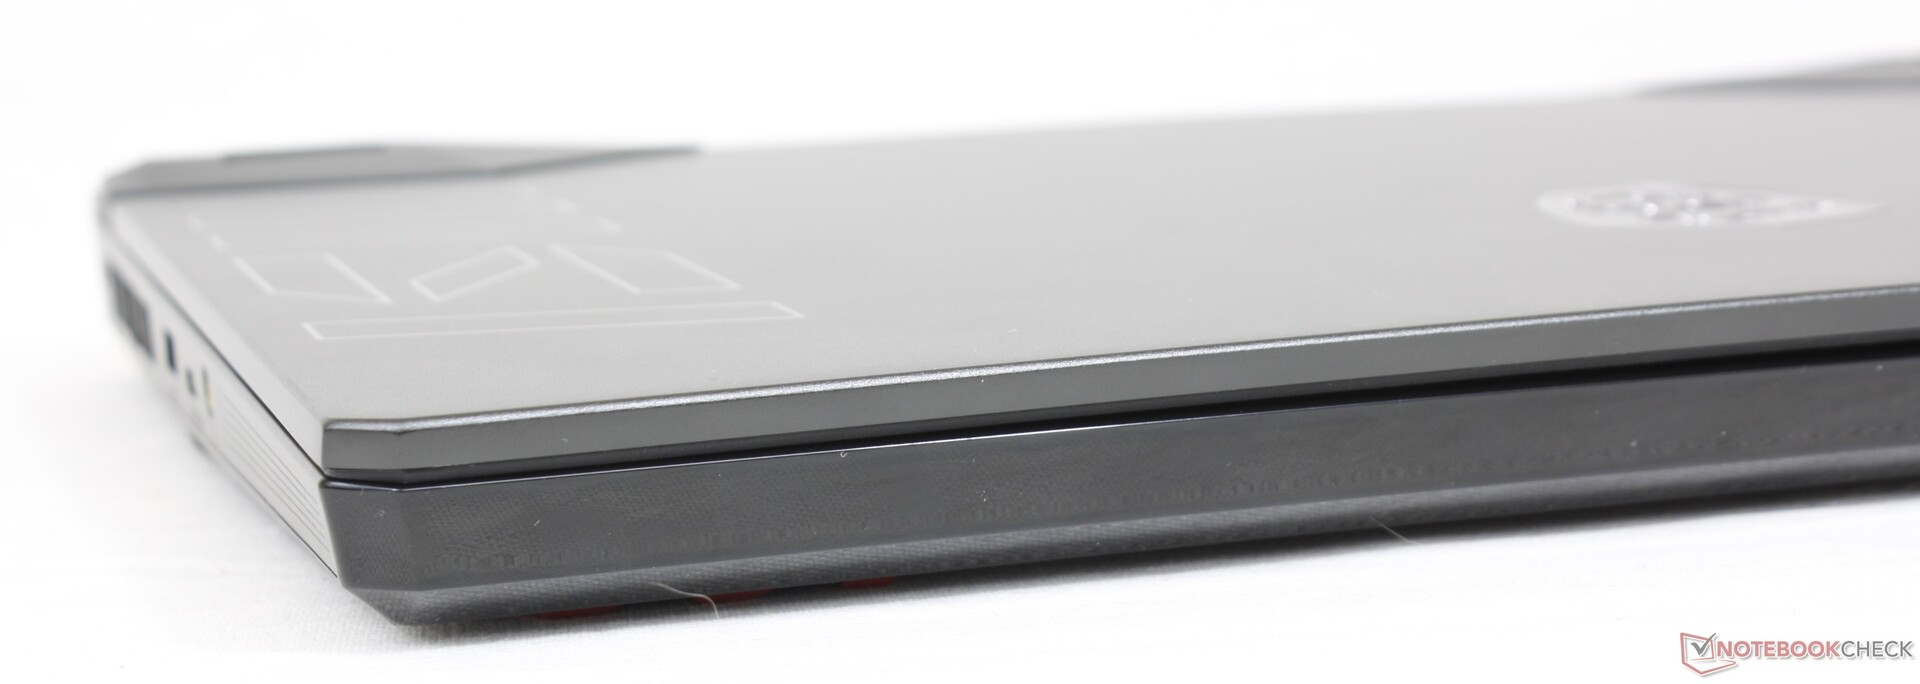
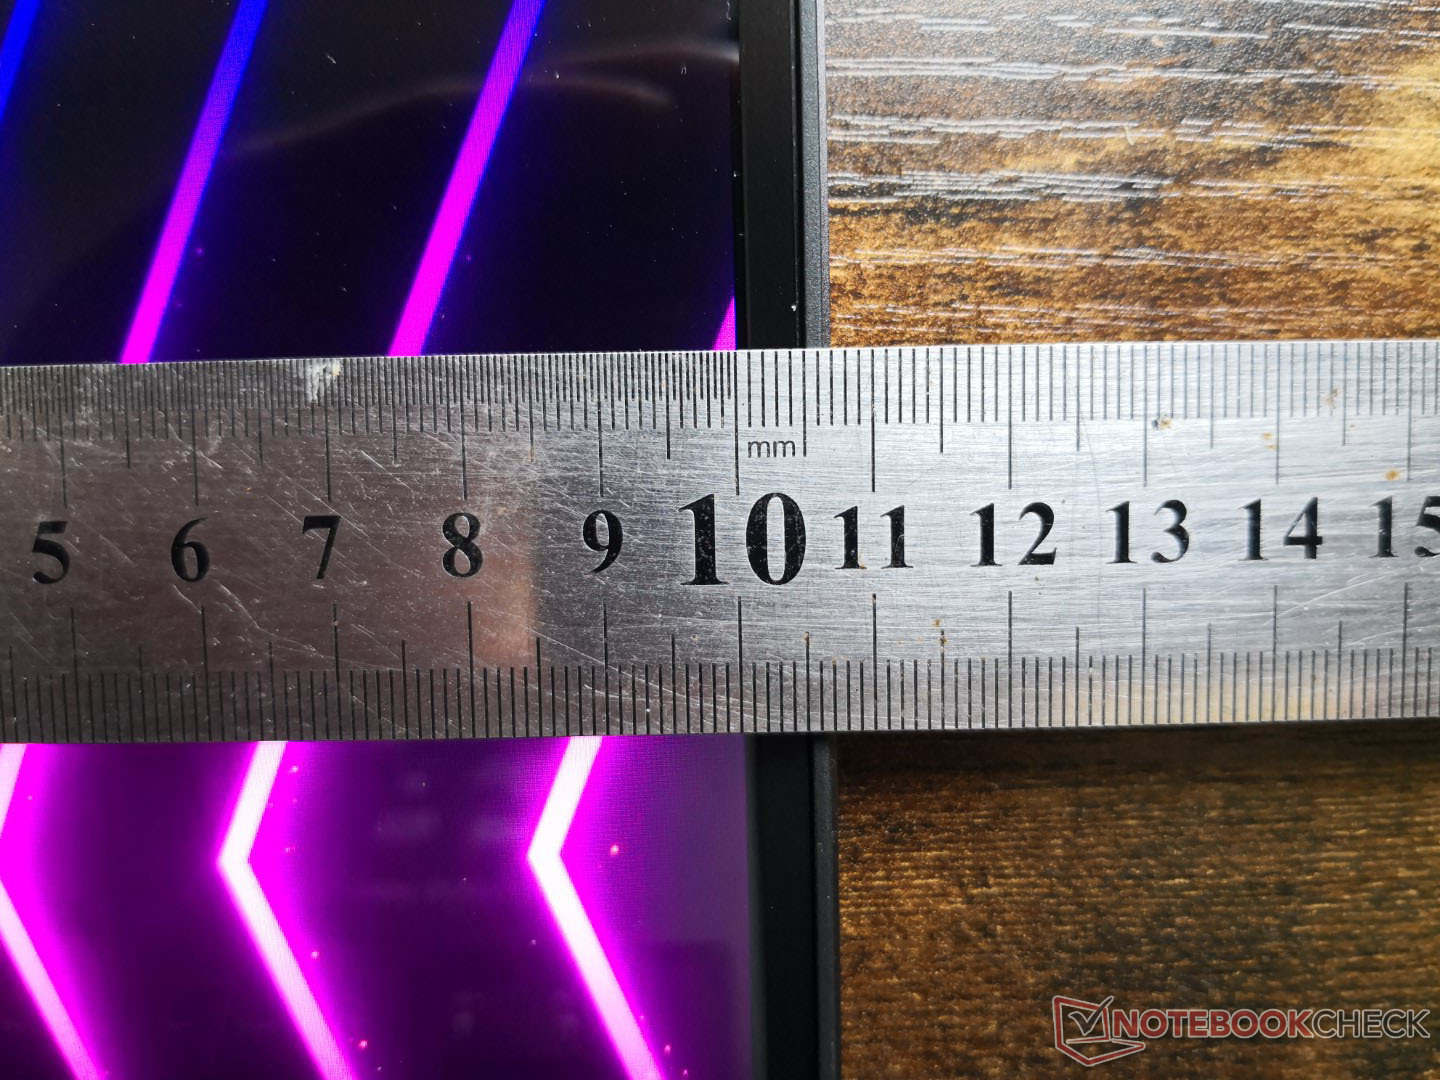
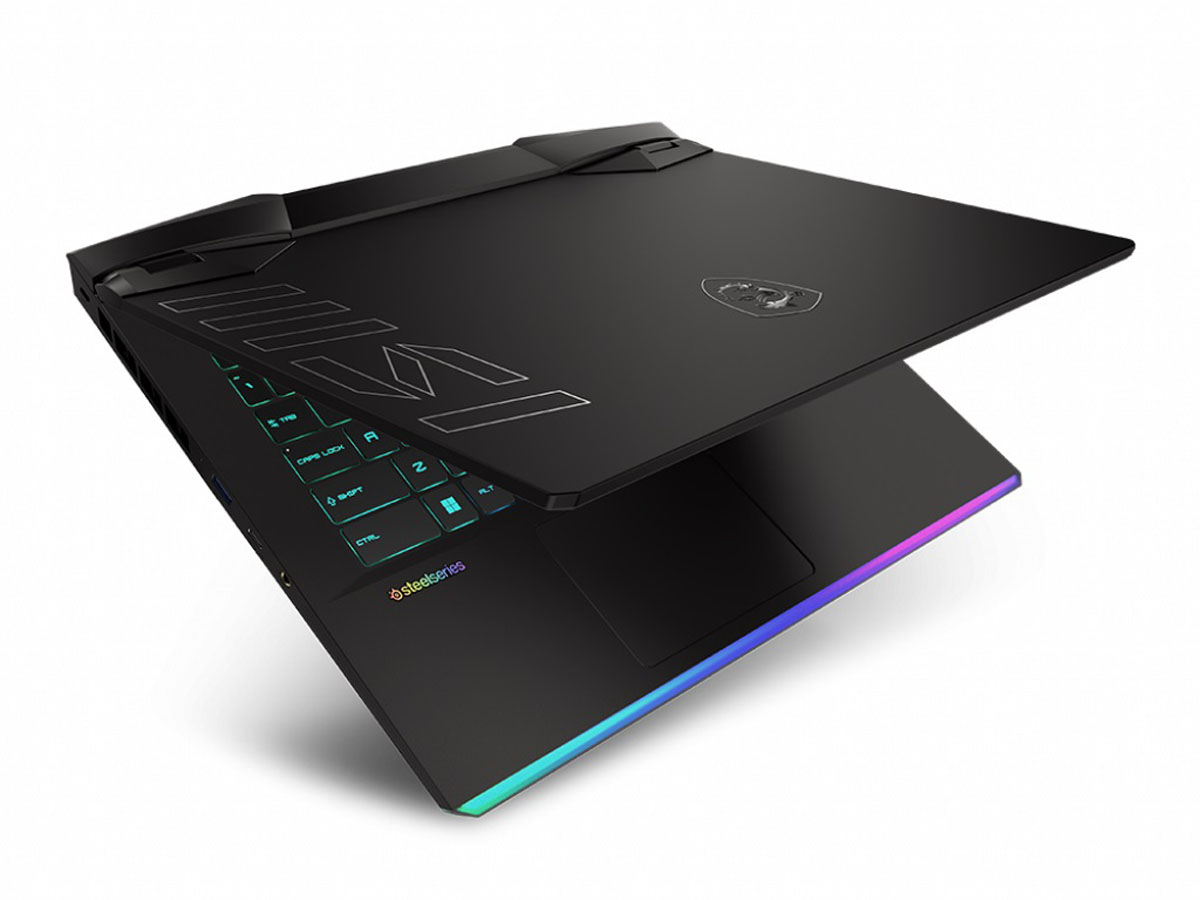
Embora as dimensões do chassi sejam exatamente as mesmas que no GE66, há uma série de diferenças visuais. Primeiramente, o GE67 inclui um grande logotipo MSI ao longo da borda esquerda da tampa externa que ajuda a distinguir mais facilmente entre o GE66 e o GE67. Em segundo lugar, a MSI redesenhou completamente o lado inferior do GE67, o que pode melhorar o potencial de resfriamento geral do modelo. Caso contrário, tanto o GE66 quanto o GE67 utilizam materiais metálicos similares para a tampa e o teclado e plástico para a placa inferior. A barra LED de assinatura ao longo da borda frontal permanece incólume.
O novo modelo é ligeiramente mais pesado que seu predecessor em cerca de 100 g, provavelmente devido às pequenas mudanças.
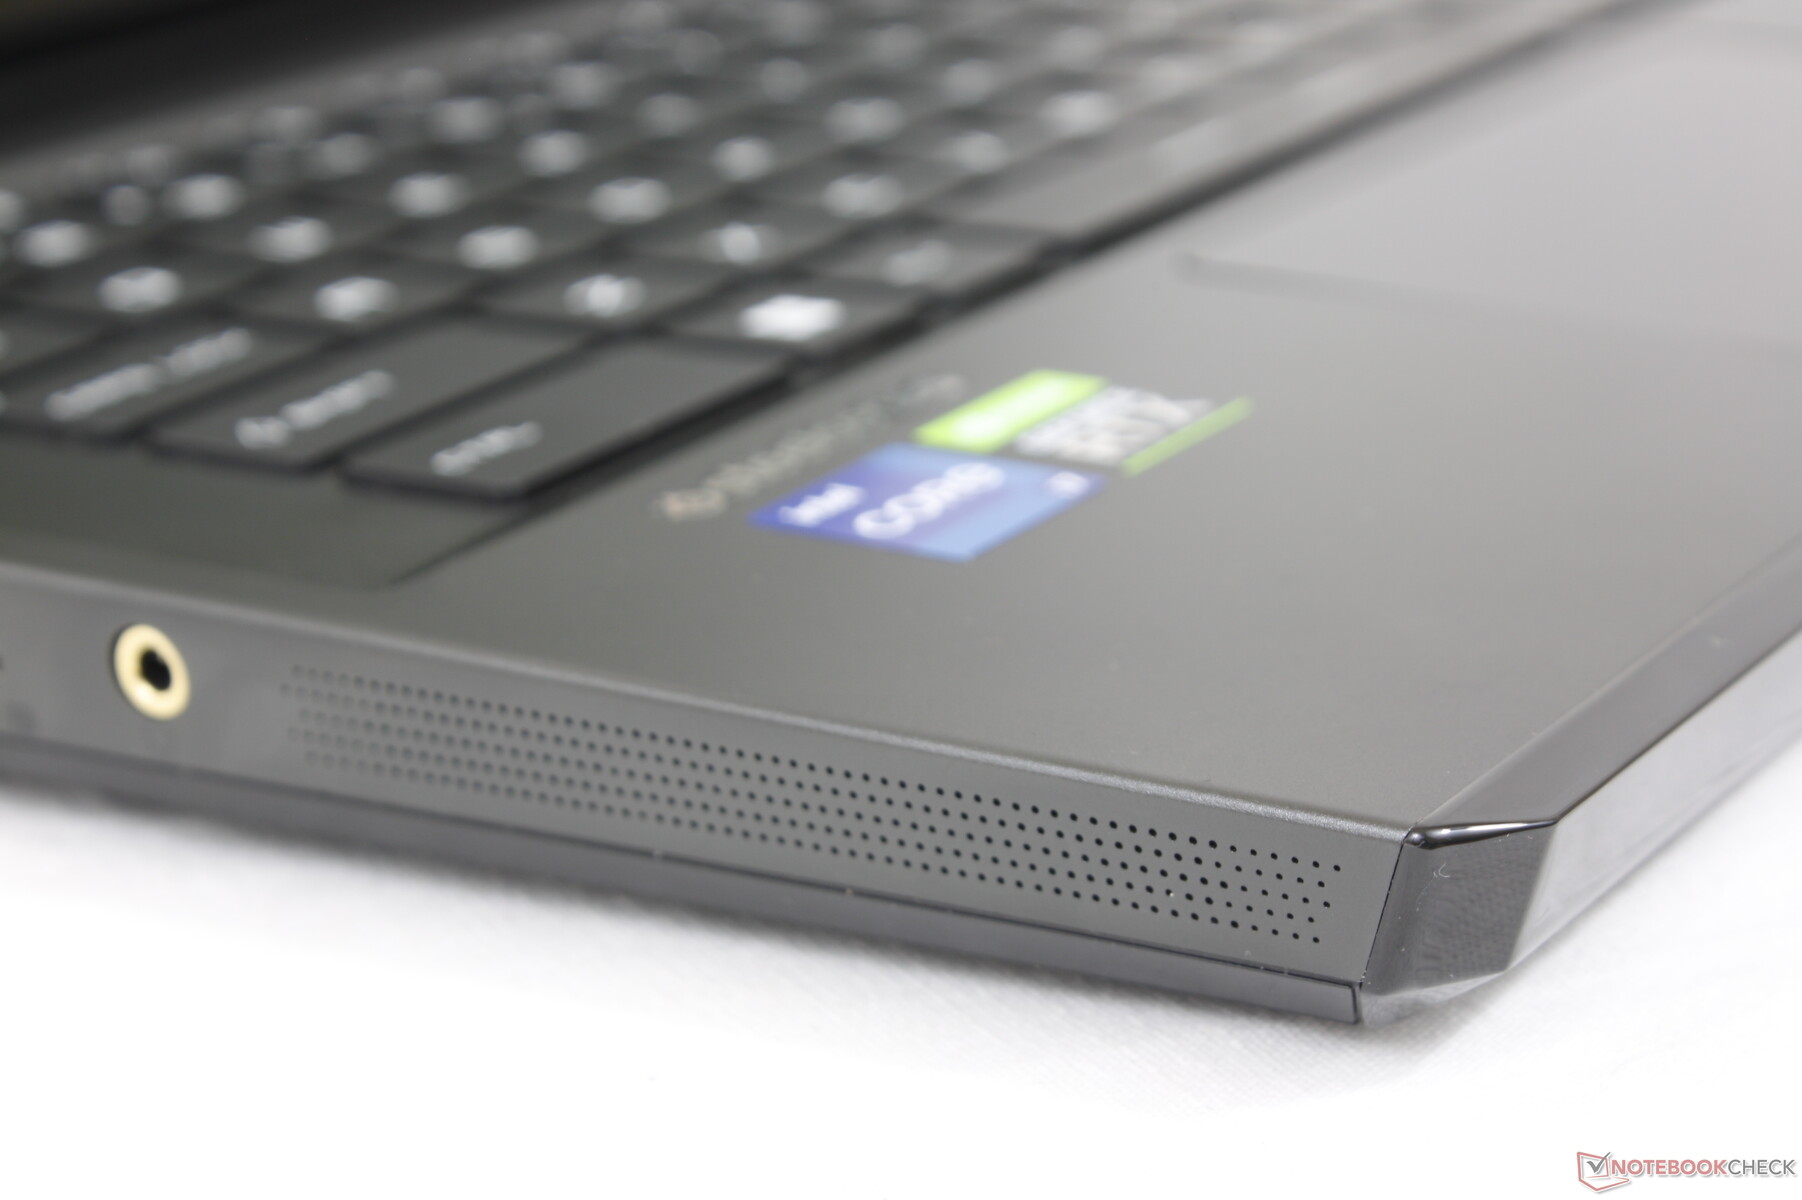
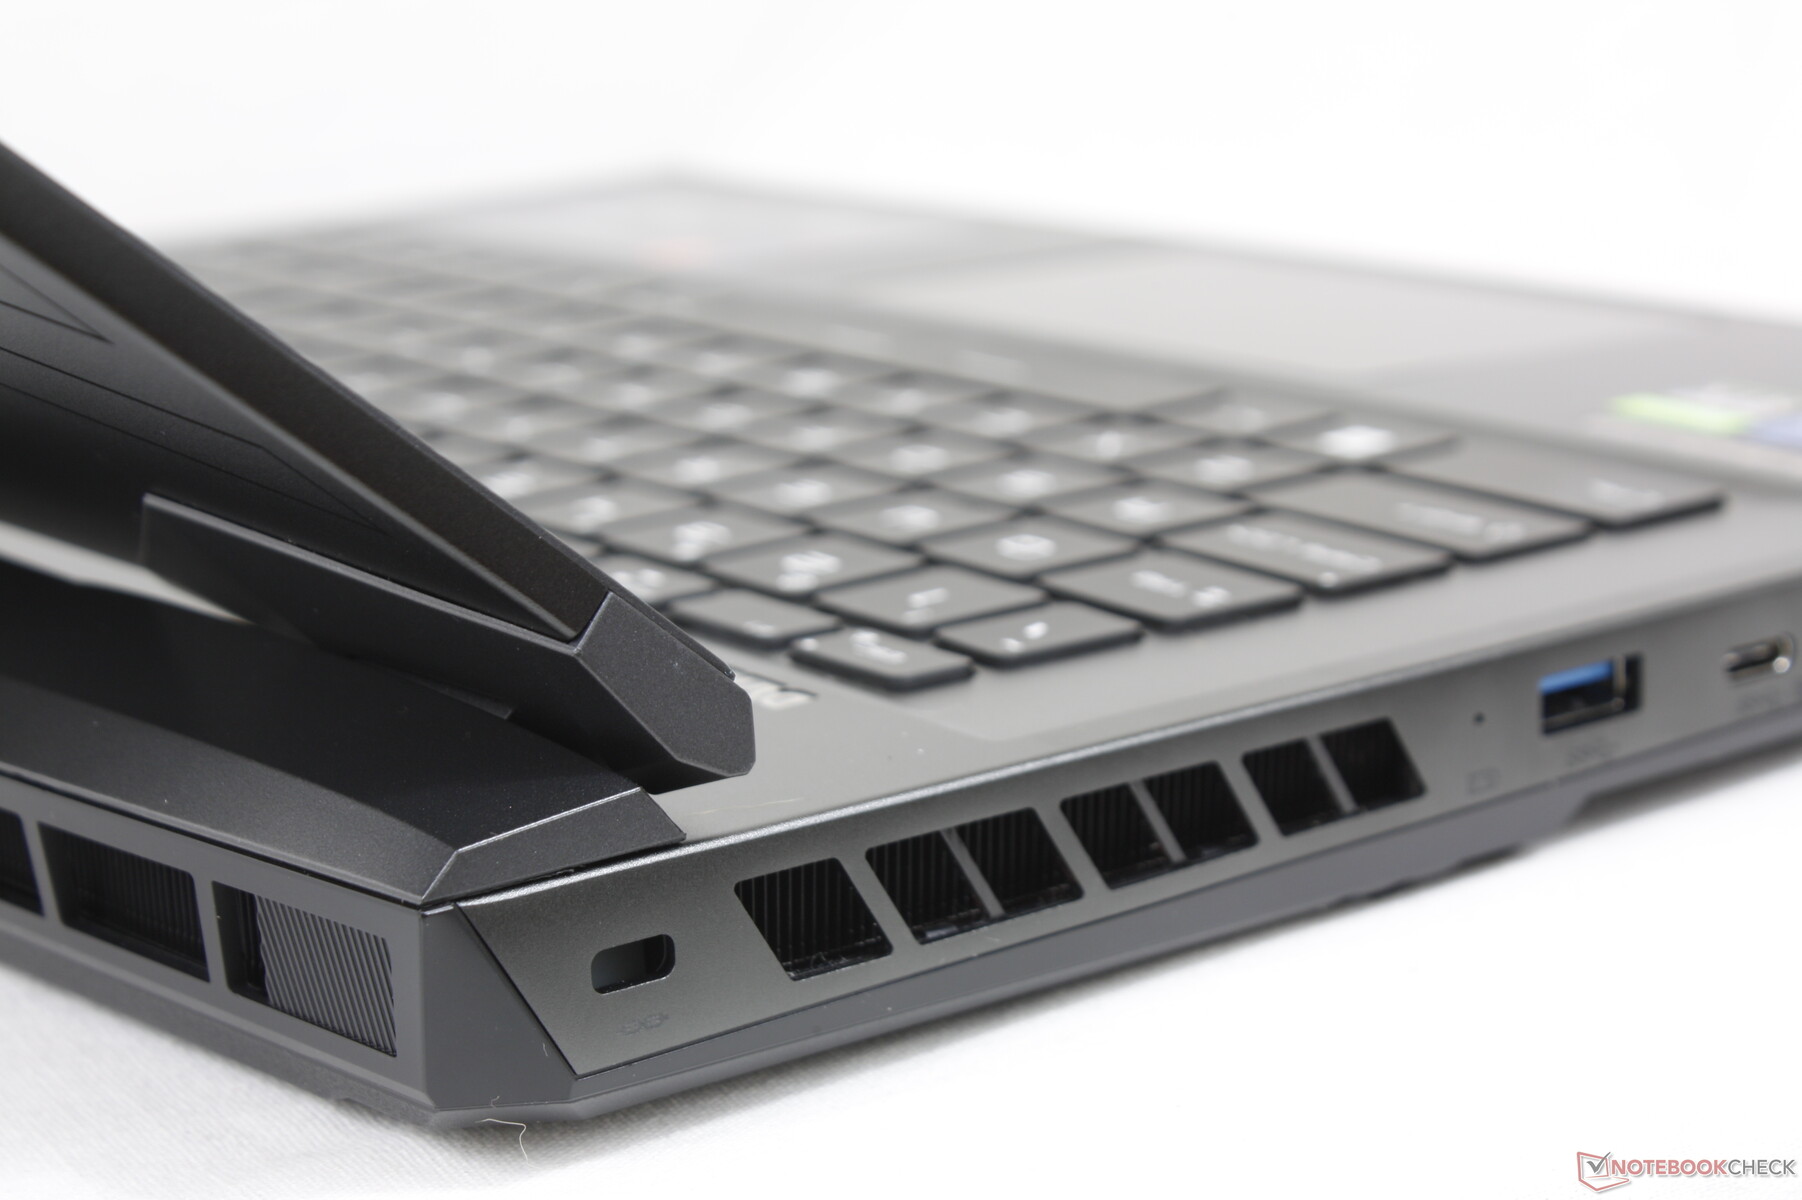
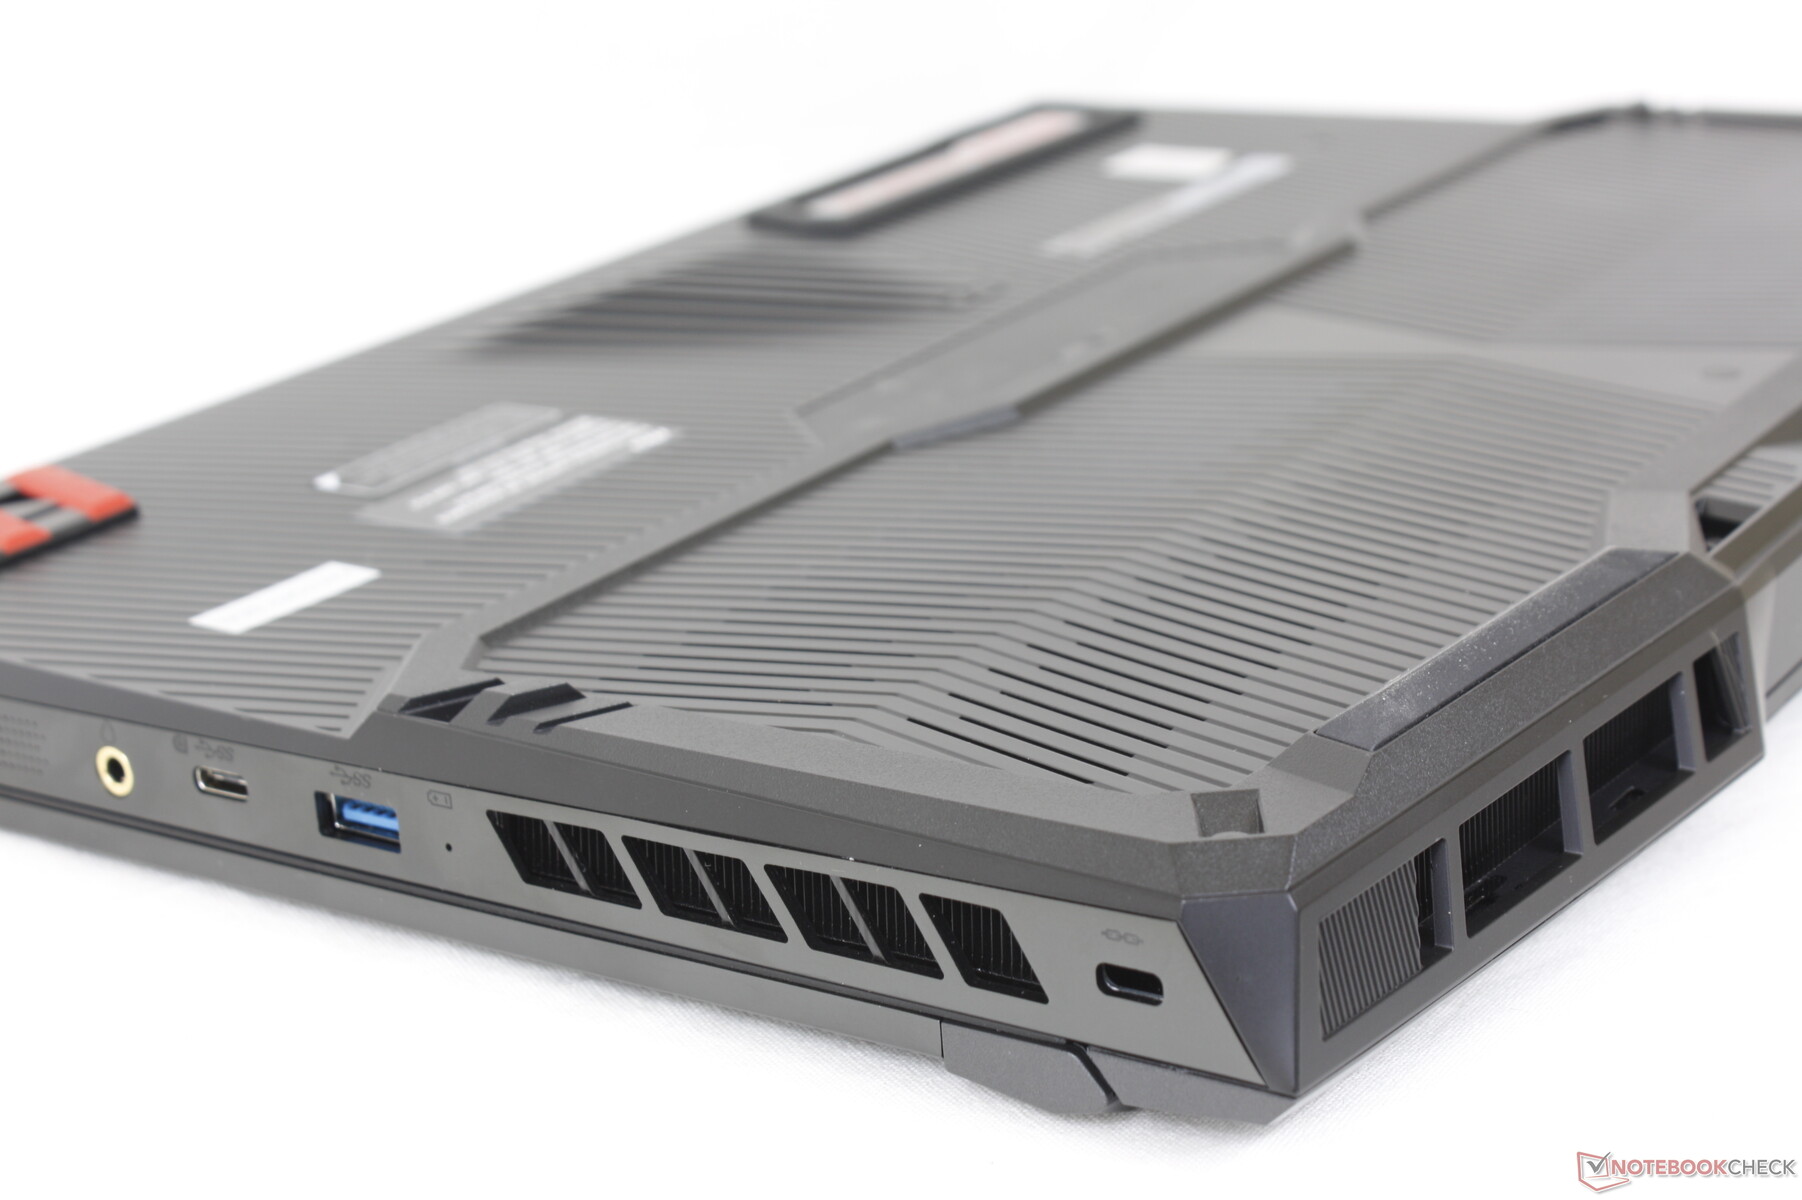
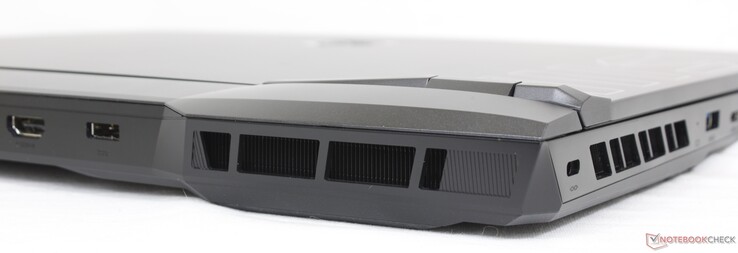
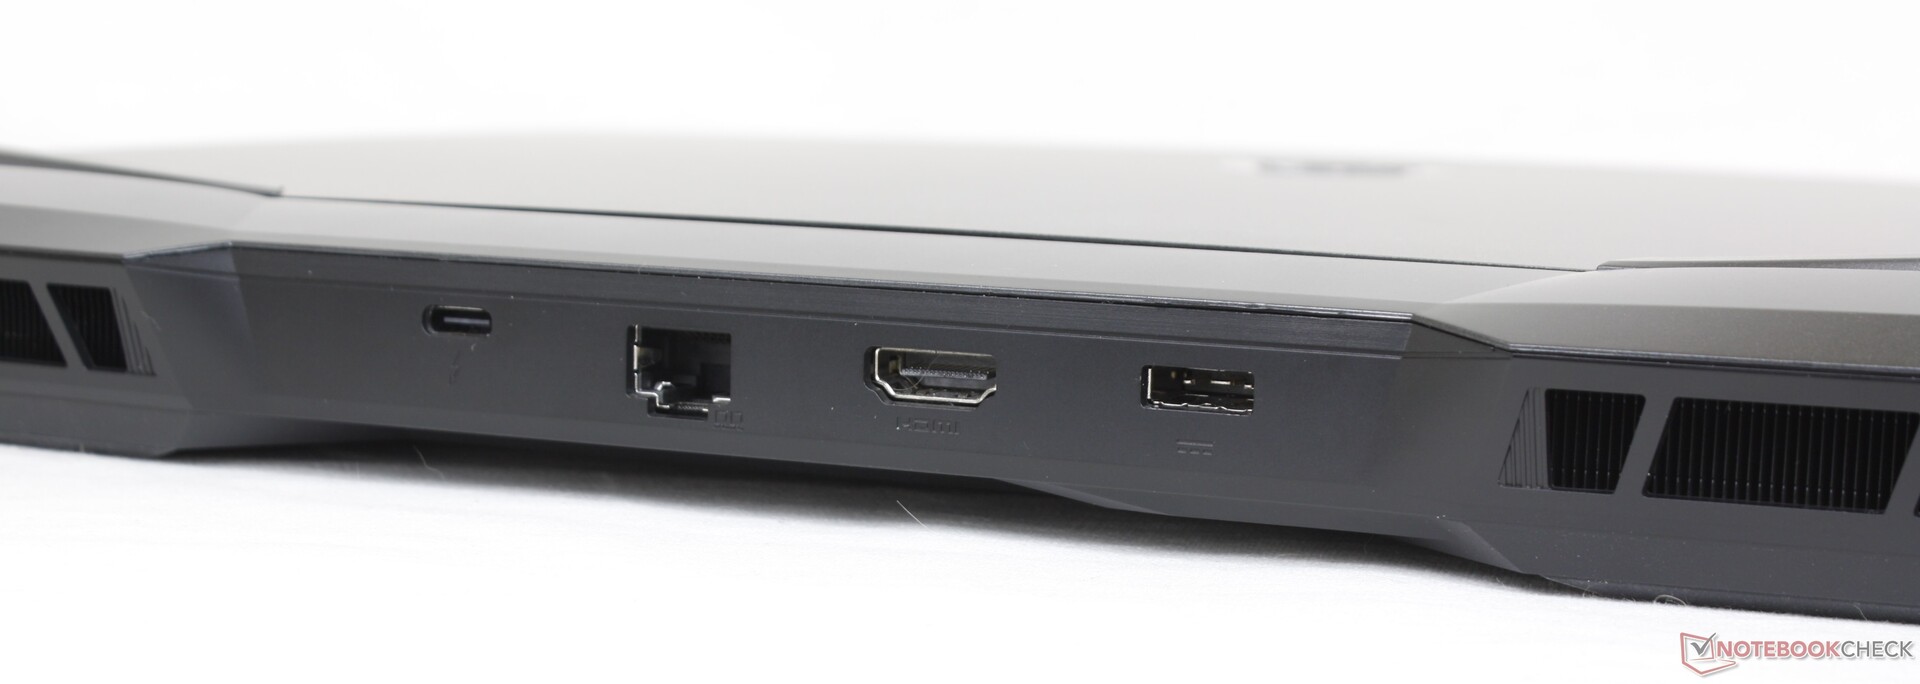
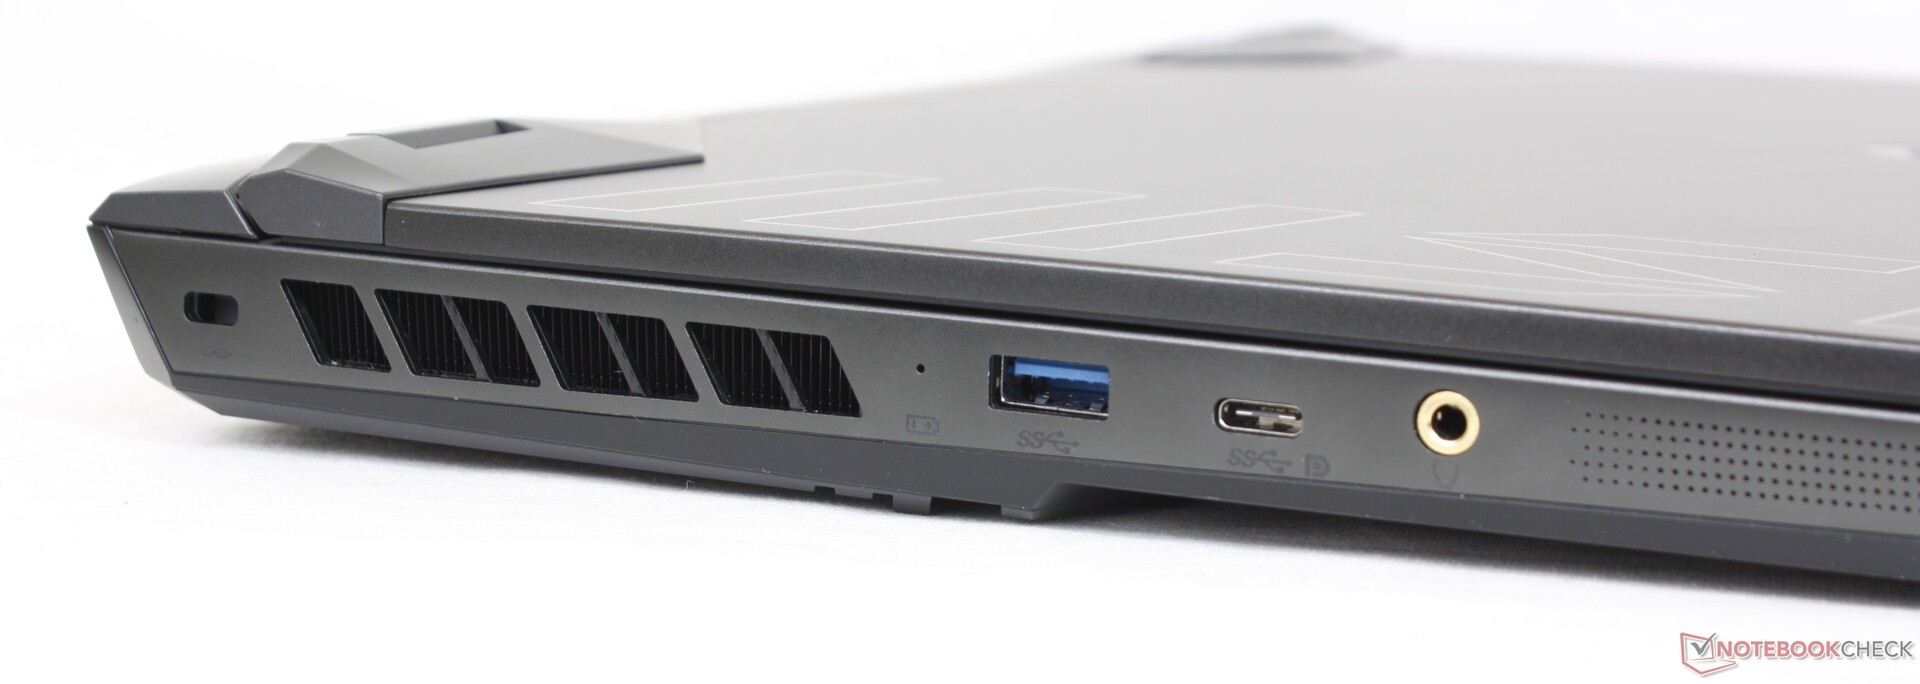
Conectividade - Chega de Mini-DisplayPort
O GE67 abandonou o mini-DisplayPort dedicado que estava presente no GE66. O DisplayPort ainda é suportado através das duas portas USB-C.
Como em outros laptops para jogos baseados na plataforma Alder-Lake-H, como o Asus TUF Gaming F15 FX507ZMa conectividade do Thunderbolt 4 será desativada se for executada em modo gráfico discreto.
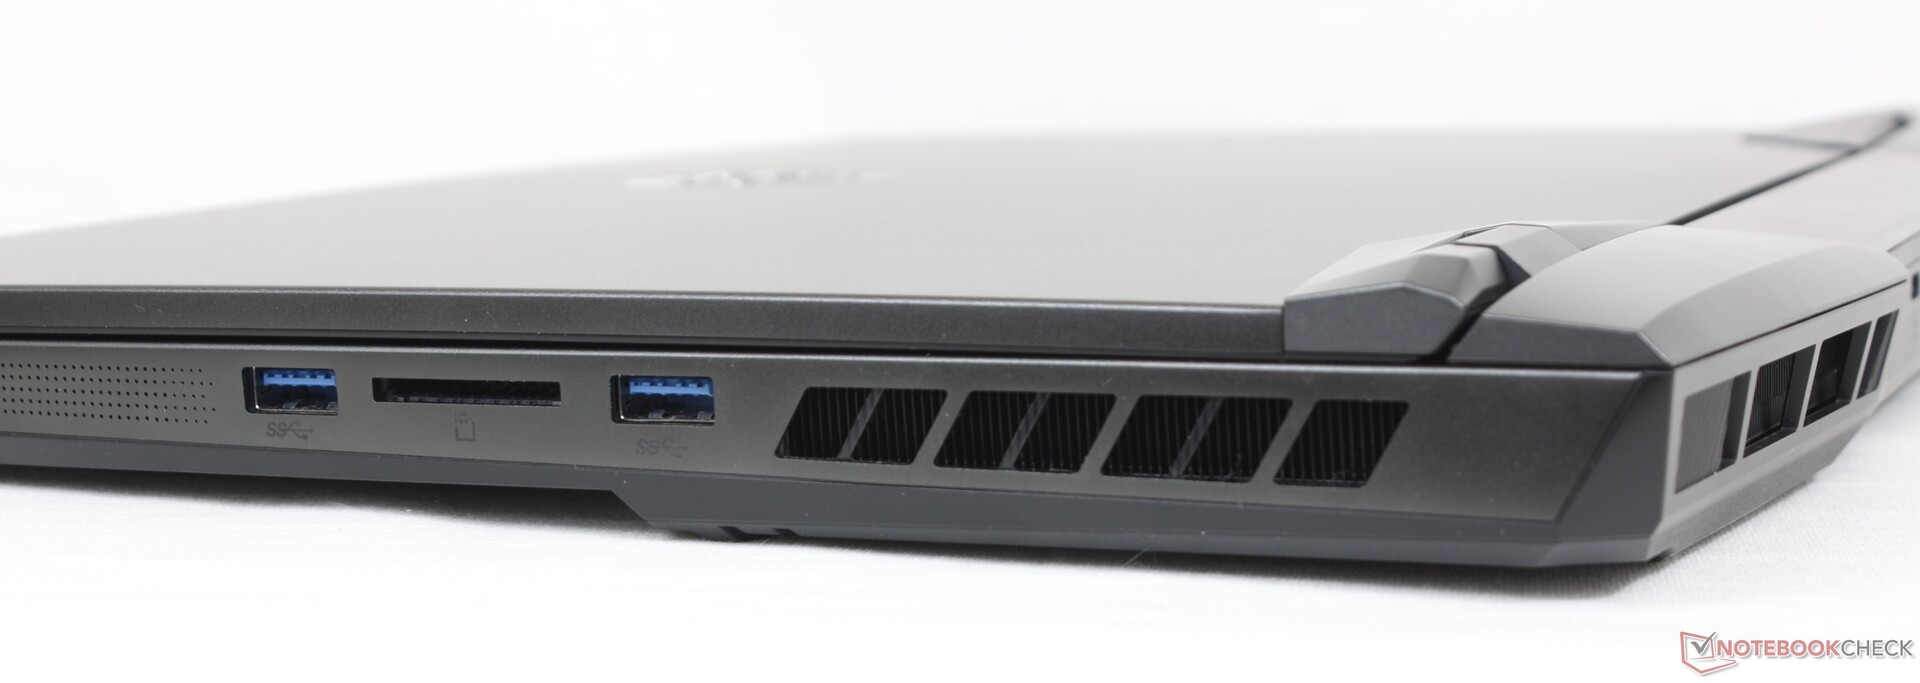
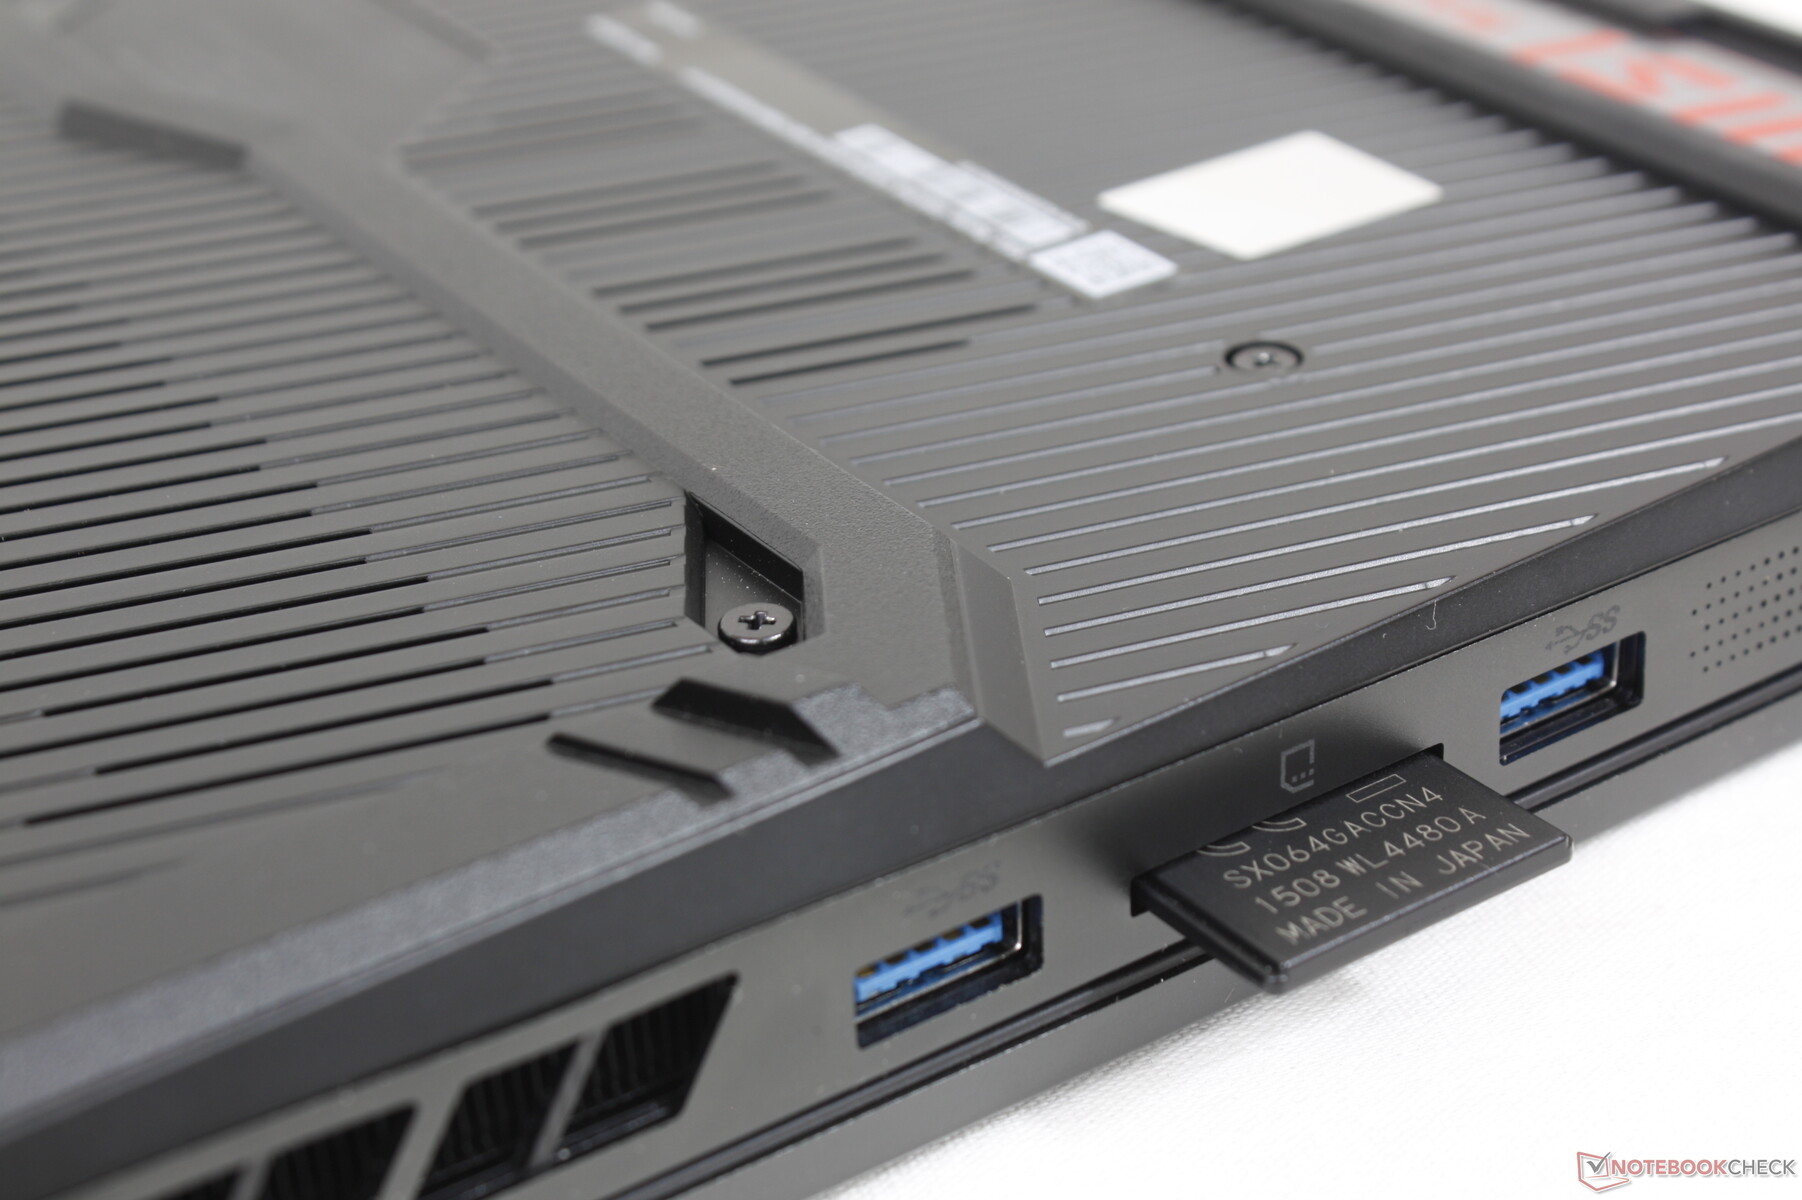
Leitor de cartões SD
As taxas de transferência do leitor de cartões SD integrado são lentas em relação ao preço pedido da configuração. Os usuários verão um desempenho 2x mais rápido do leitor SD de modelos concorrentes como o Razer Blade 15 ou o Asus ROG Zephyrus Duo 16.
| SD Card Reader | |
| average JPG Copy Test (av. of 3 runs) | |
| Razer Blade 15 2022 (Toshiba Exceria Pro SDXC 64 GB UHS-II) | |
| MSI GE67 HX 12UGS (Toshiba Exceria Pro SDXC 64 GB UHS-II) | |
| MSI Raider GE66 12UHS (AV PRO microSD 128 GB V60) | |
| maximum AS SSD Seq Read Test (1GB) | |
| Razer Blade 15 2022 (Toshiba Exceria Pro SDXC 64 GB UHS-II) | |
| MSI GE67 HX 12UGS (Toshiba Exceria Pro SDXC 64 GB UHS-II) | |
Comunicação
| Networking | |
| iperf3 transmit AX12 | |
| Razer Blade 15 2022 | |
| MSI Vector GP66 12UGS | |
| Alienware m15 R6, i7-11800H RTX 3080 | |
| iperf3 receive AX12 | |
| Razer Blade 15 2022 | |
| MSI Vector GP66 12UGS | |
| Alienware m15 R6, i7-11800H RTX 3080 | |
| iperf3 receive AXE11000 6GHz | |
| Asus ROG Strix Scar 15 G533ZW-LN106WS | |
| MSI GE67 HX 12UGS | |
| iperf3 transmit AXE11000 6GHz | |
| Asus ROG Strix Scar 15 G533ZW-LN106WS | |
| MSI GE67 HX 12UGS | |
Webcam
Não há mudanças na webcam de 2 MP, o que também significa que ainda não há obturador de privacidade física ou mesmo suporte ao Windows. Em vez disso, os usuários podem desativar a webcam eletronicamente através da tecla F4.
Note que a luz de atividade da webcam está sempre piscando quando a webcam está ativa. Isto é particularmente irritante durante as chamadas de vídeo e não podemos encontrar nenhuma opção para desligar a luz piscante.


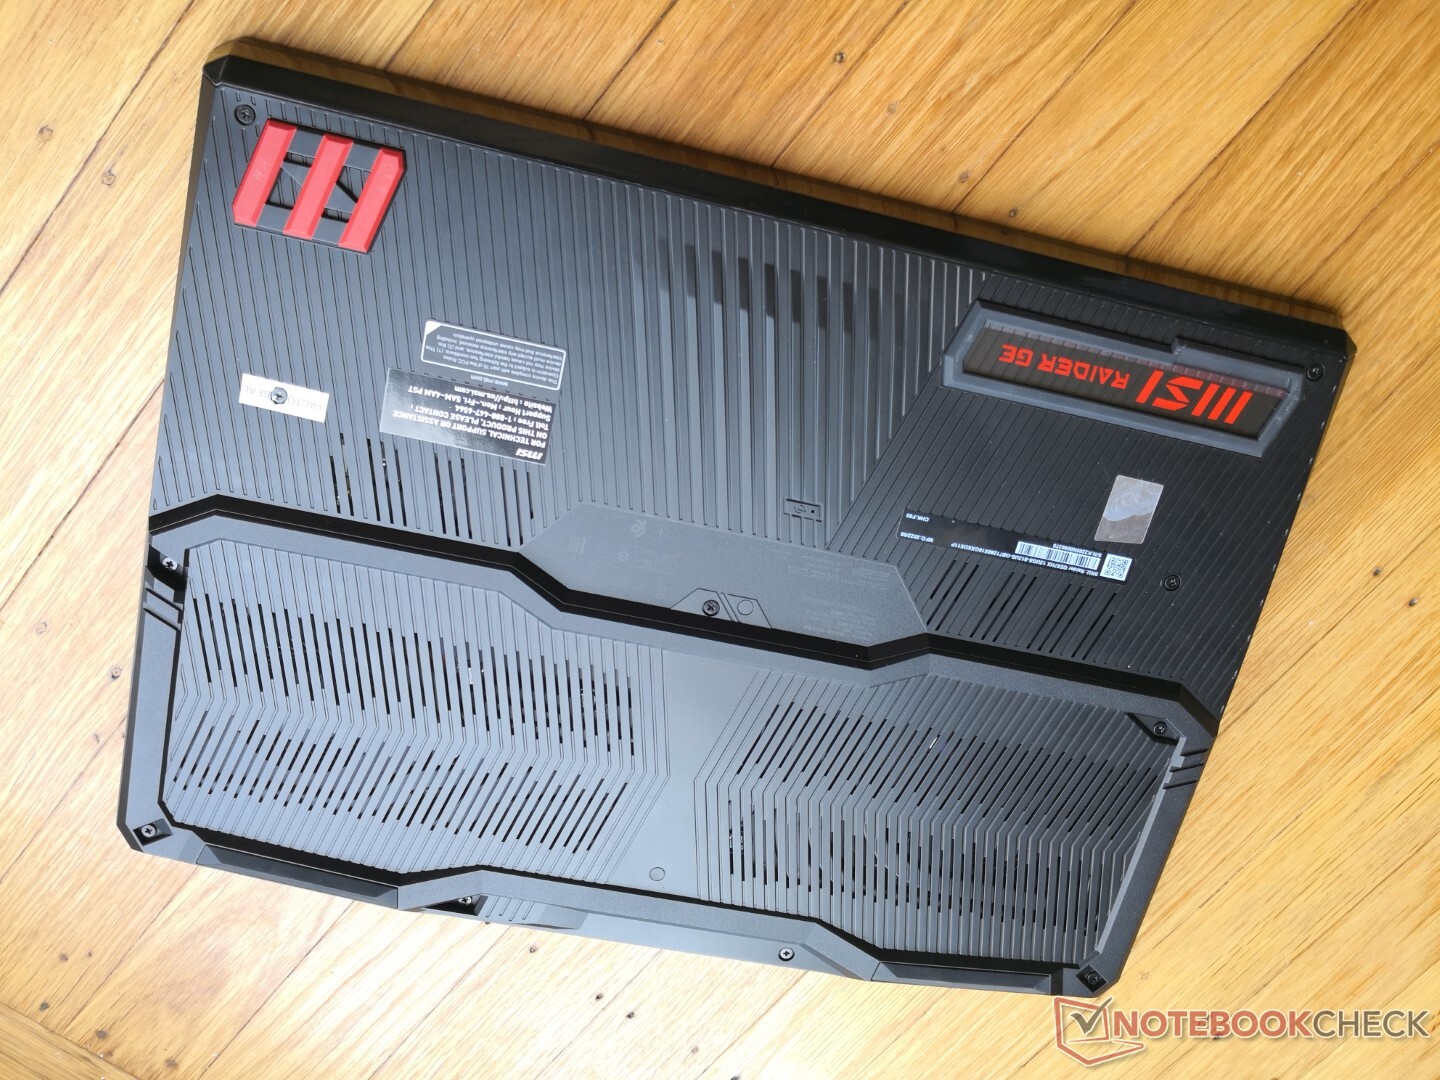
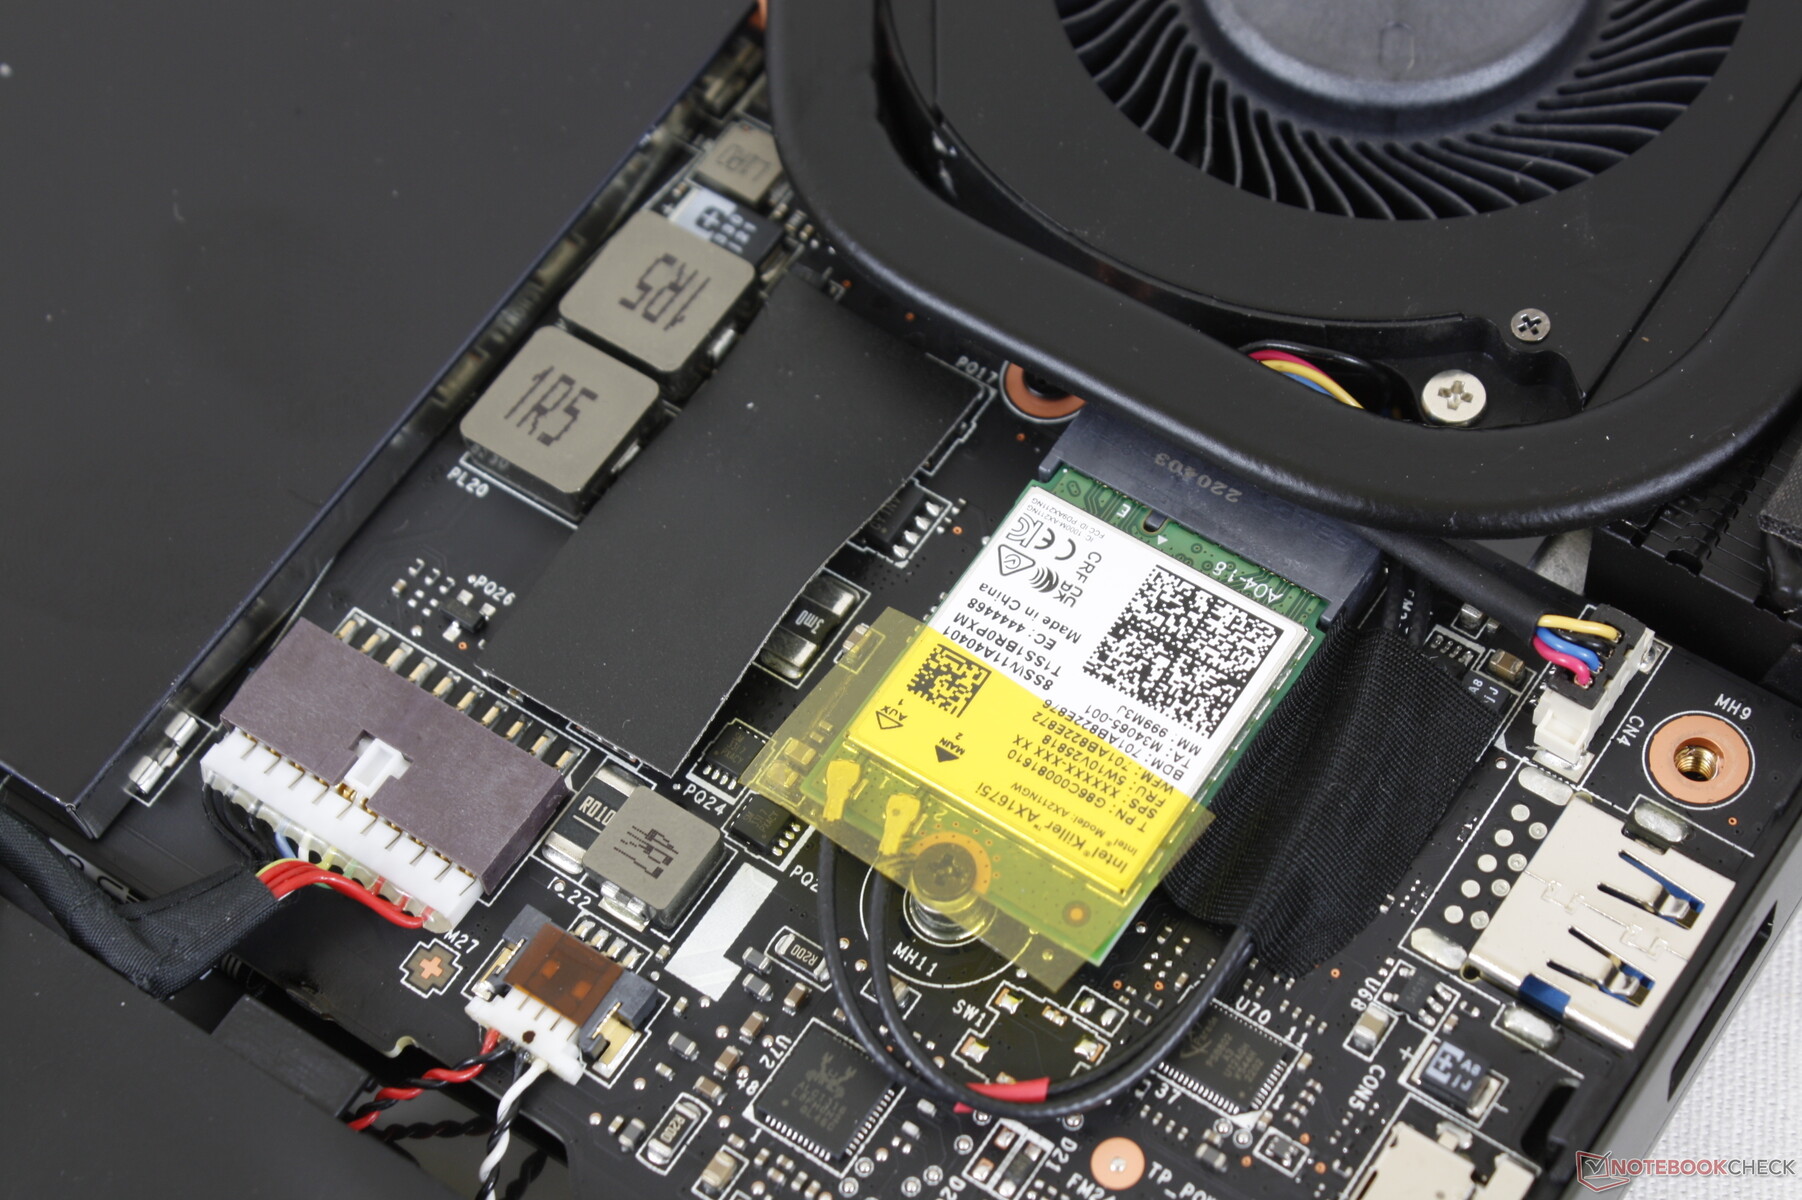
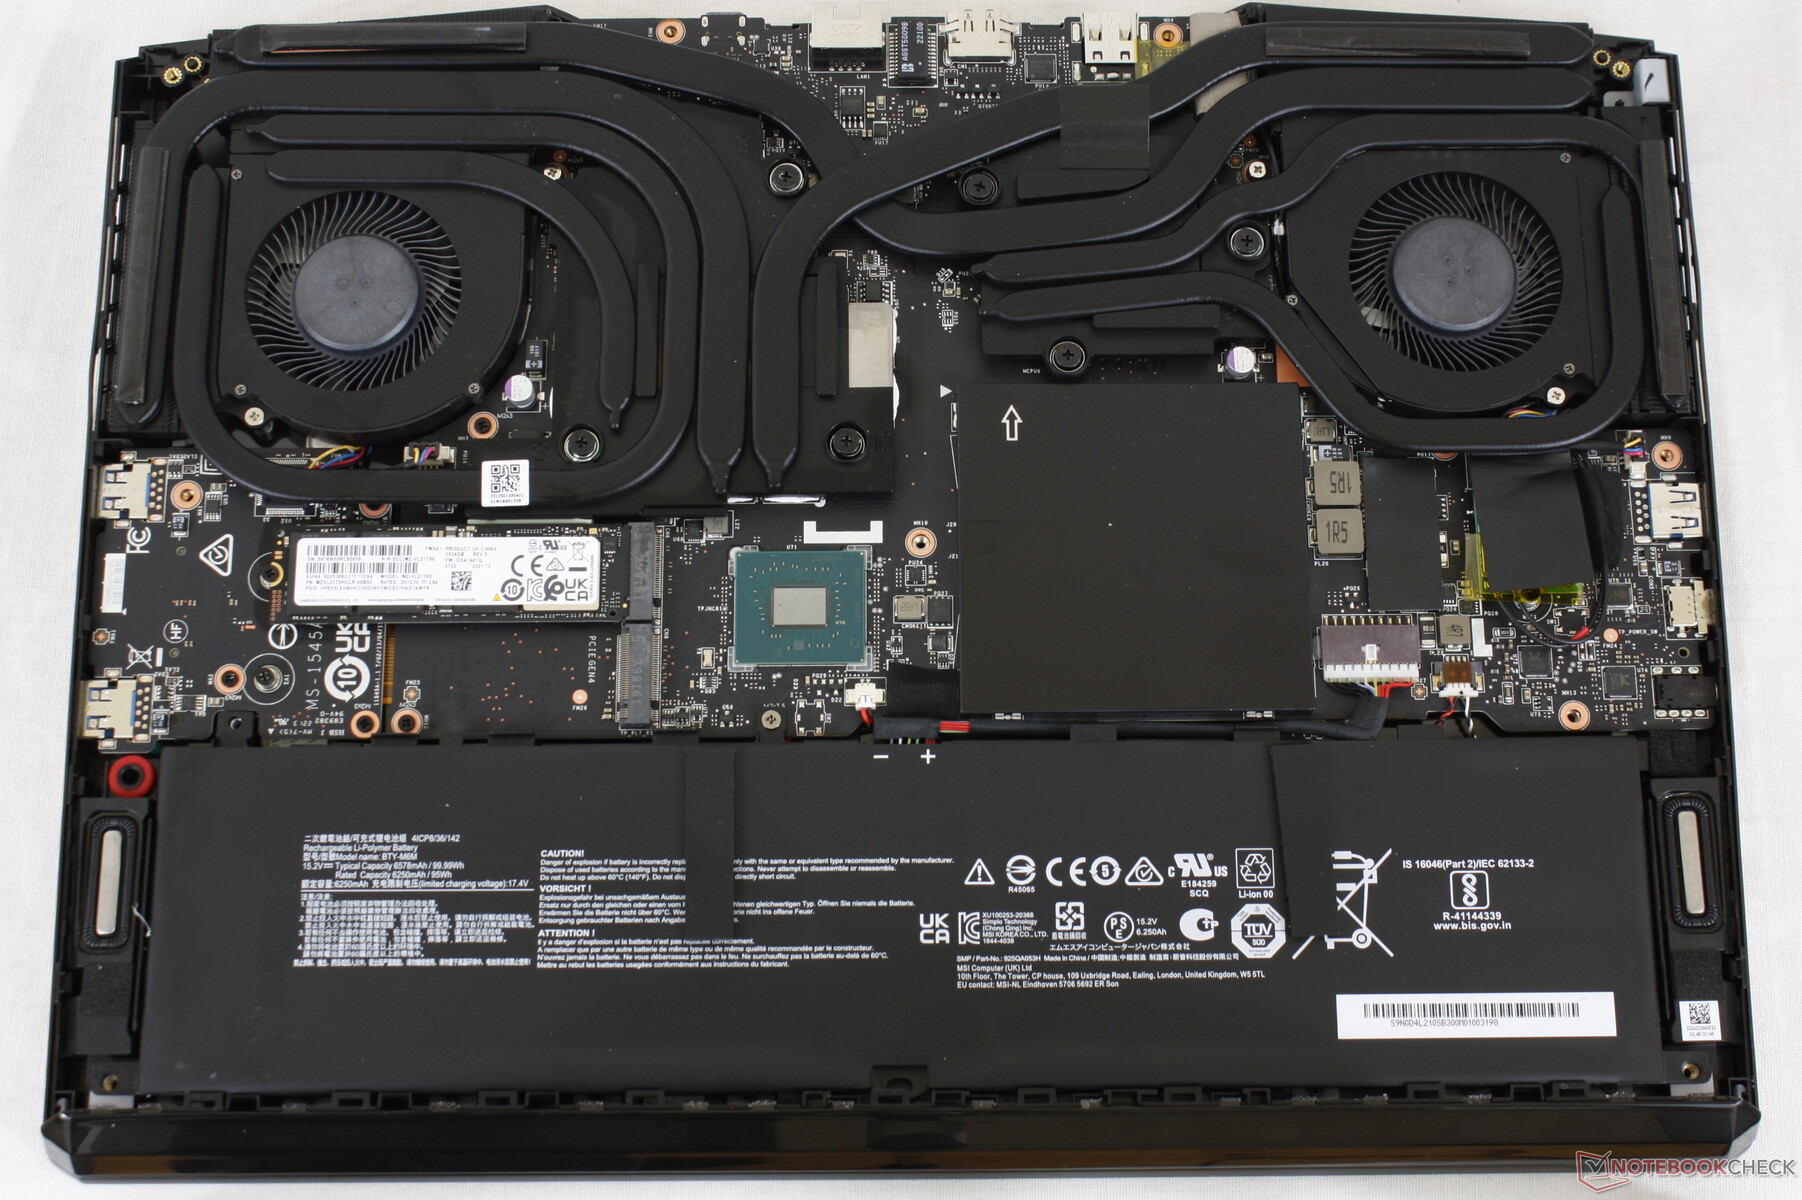
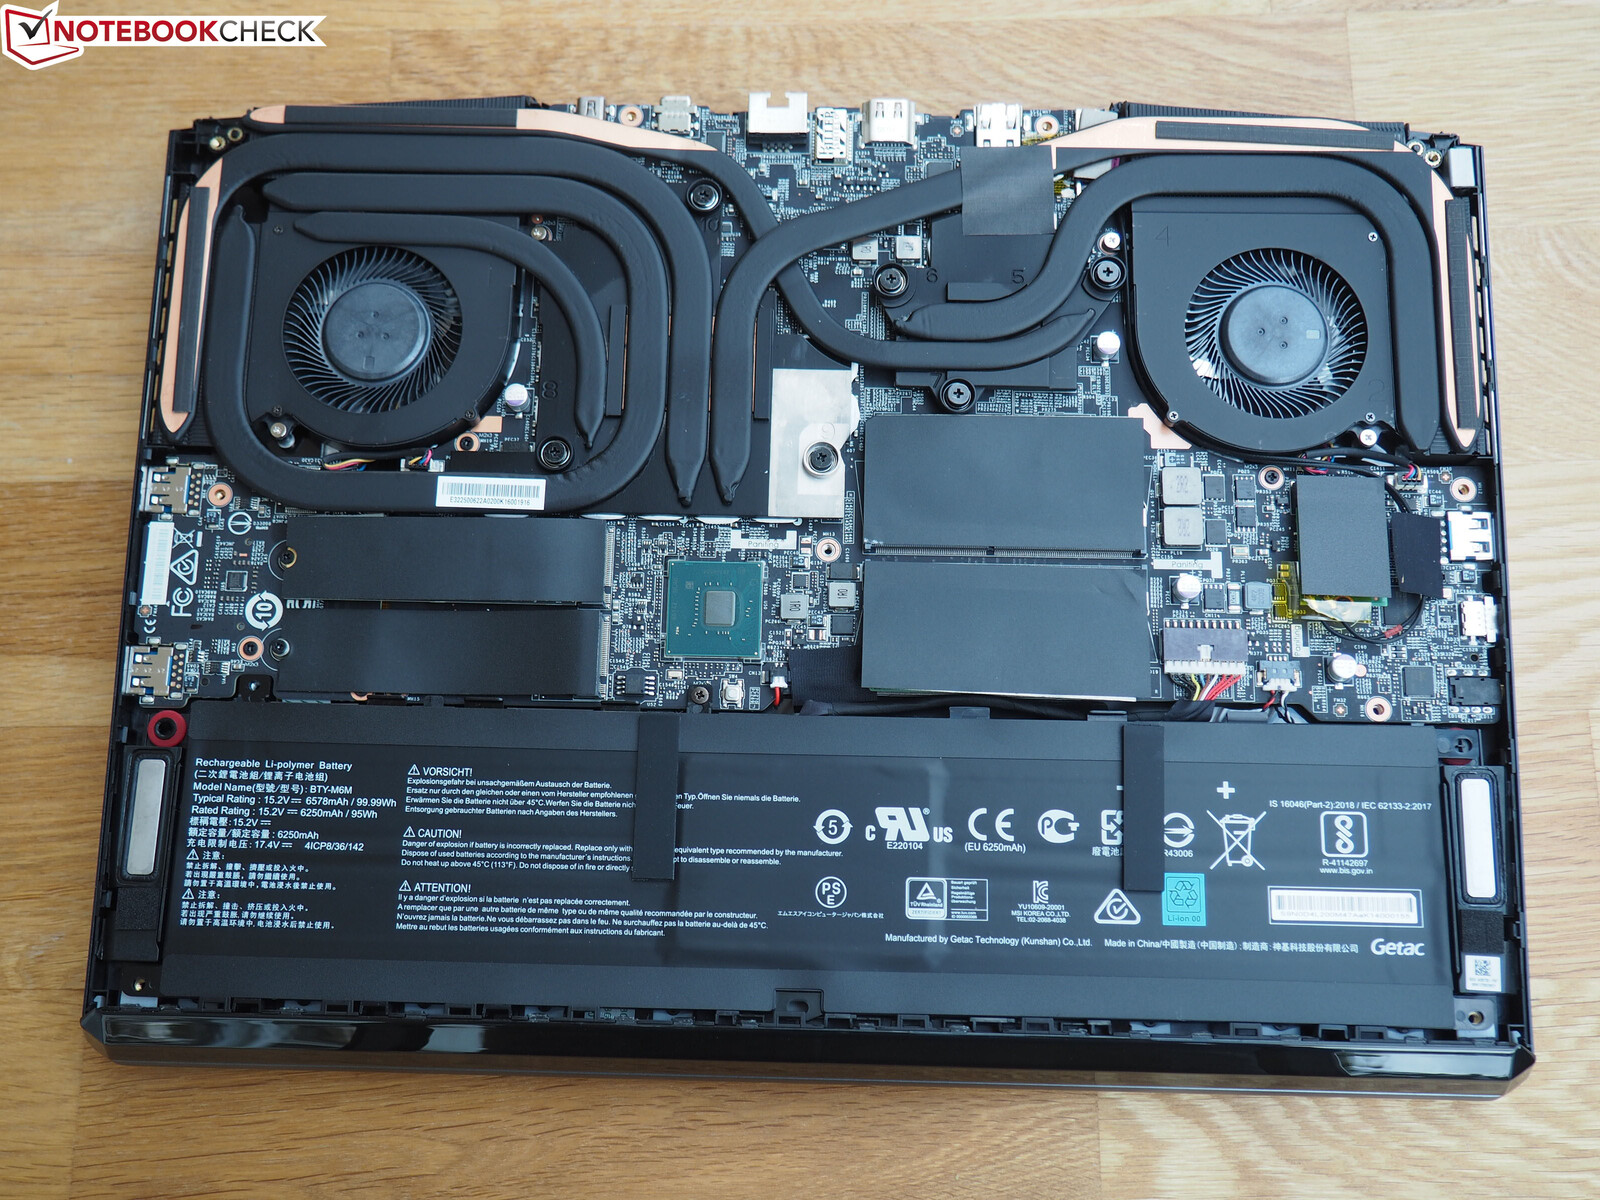
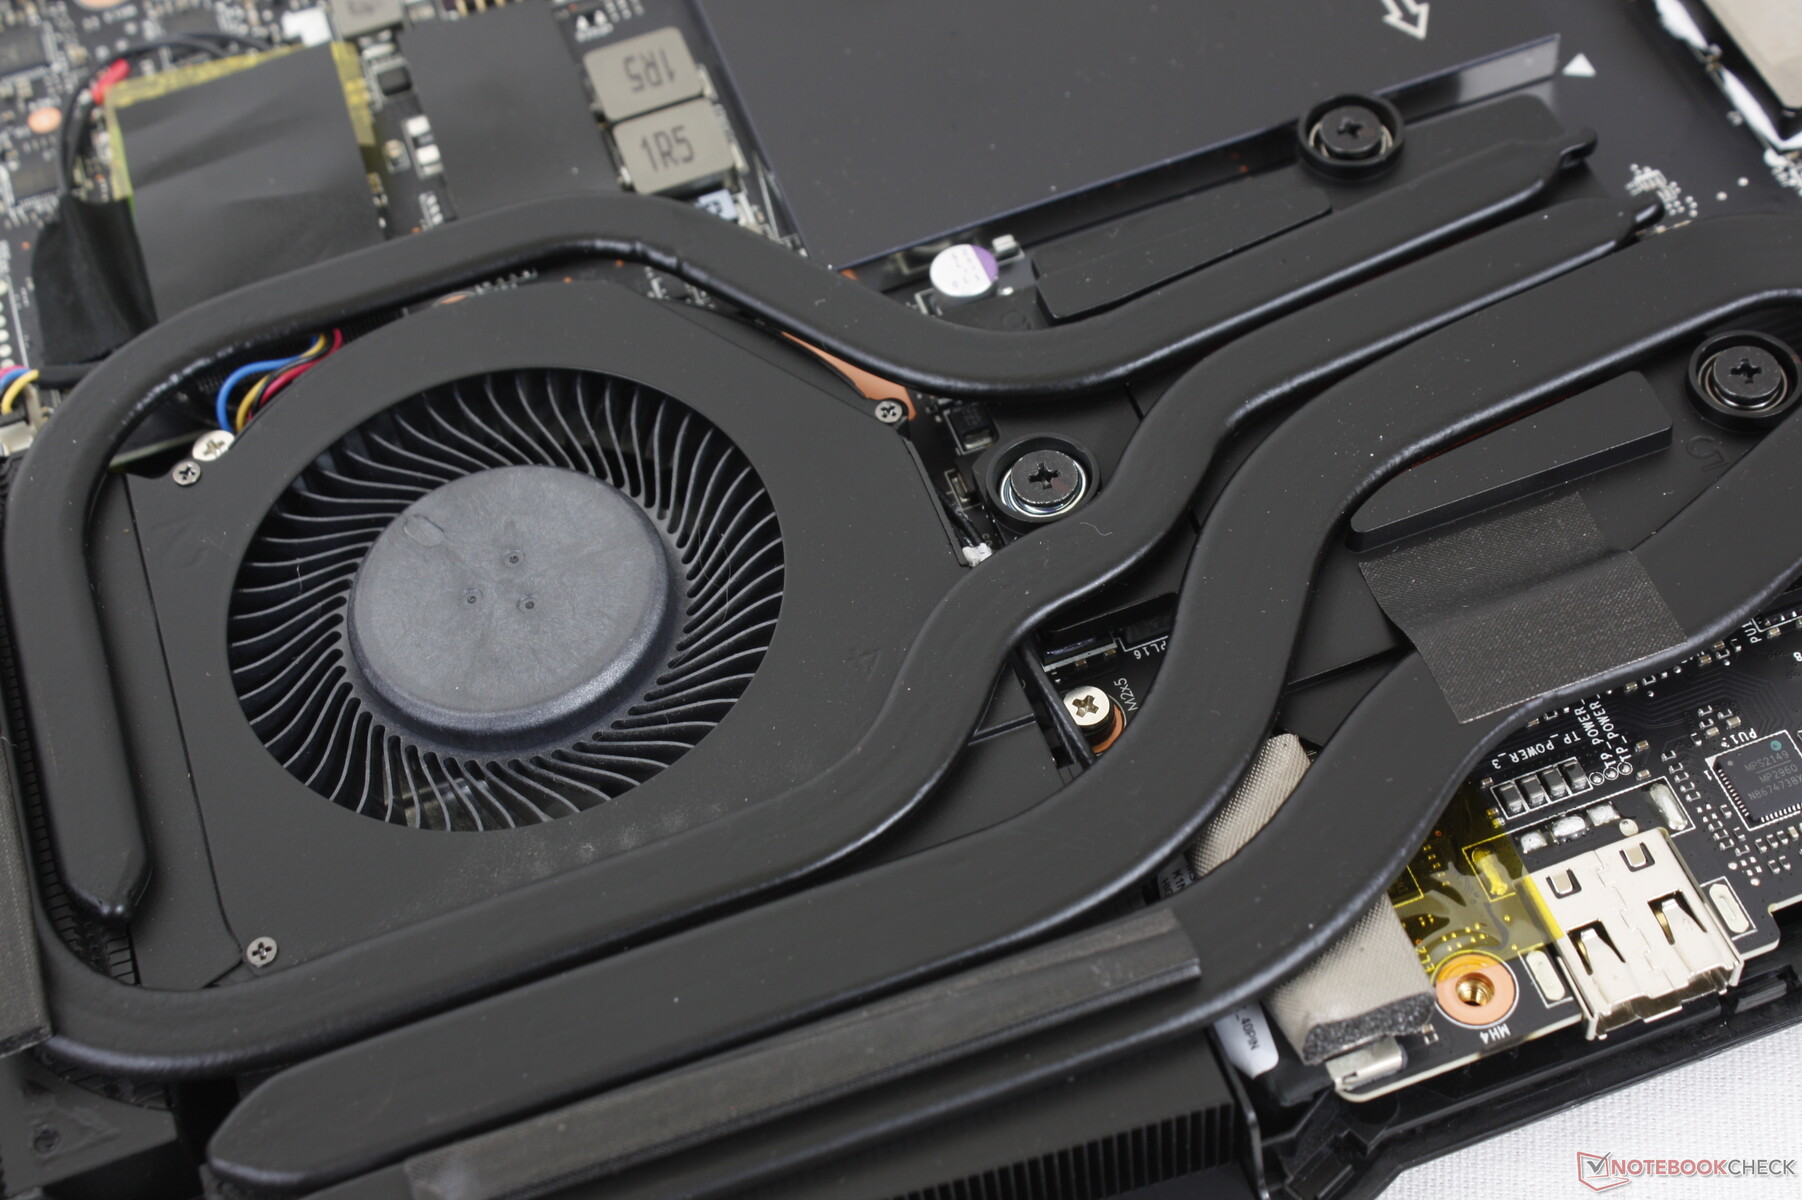
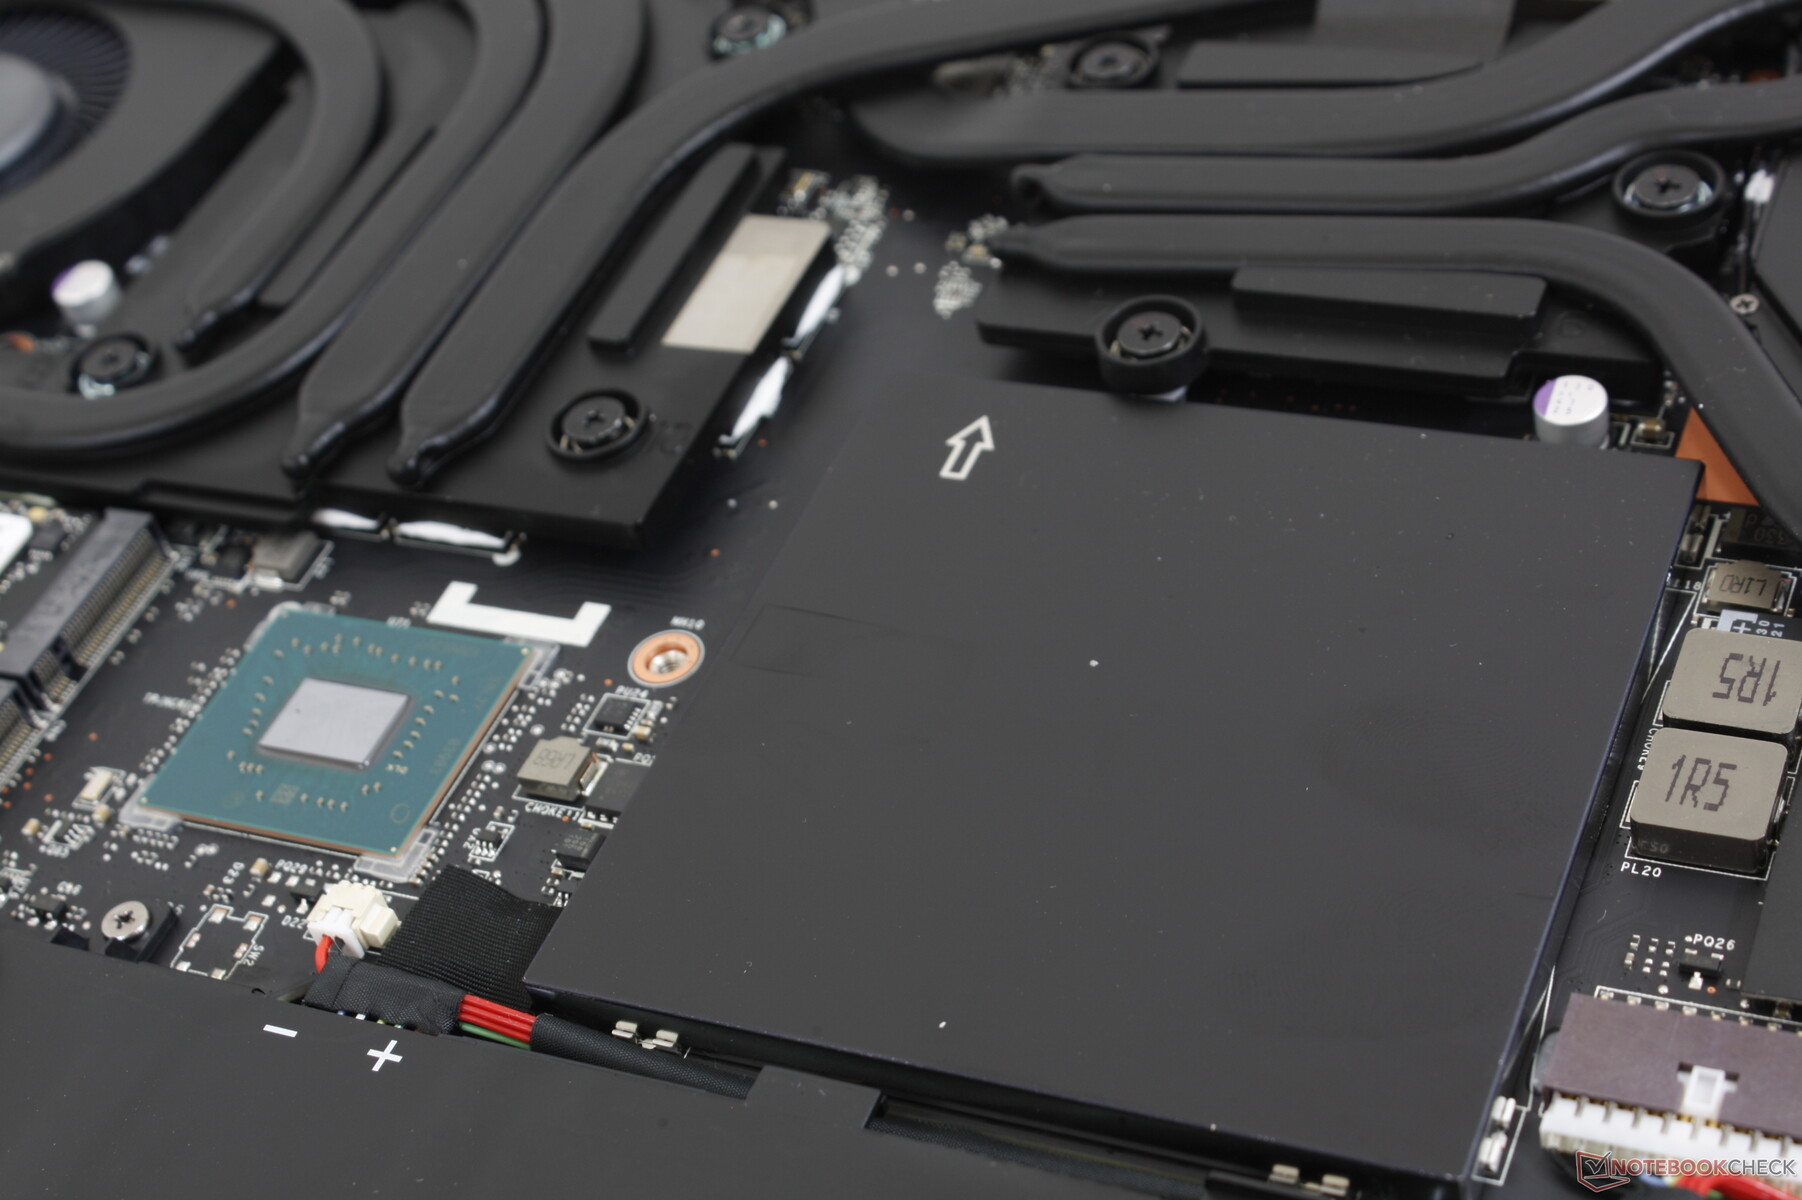
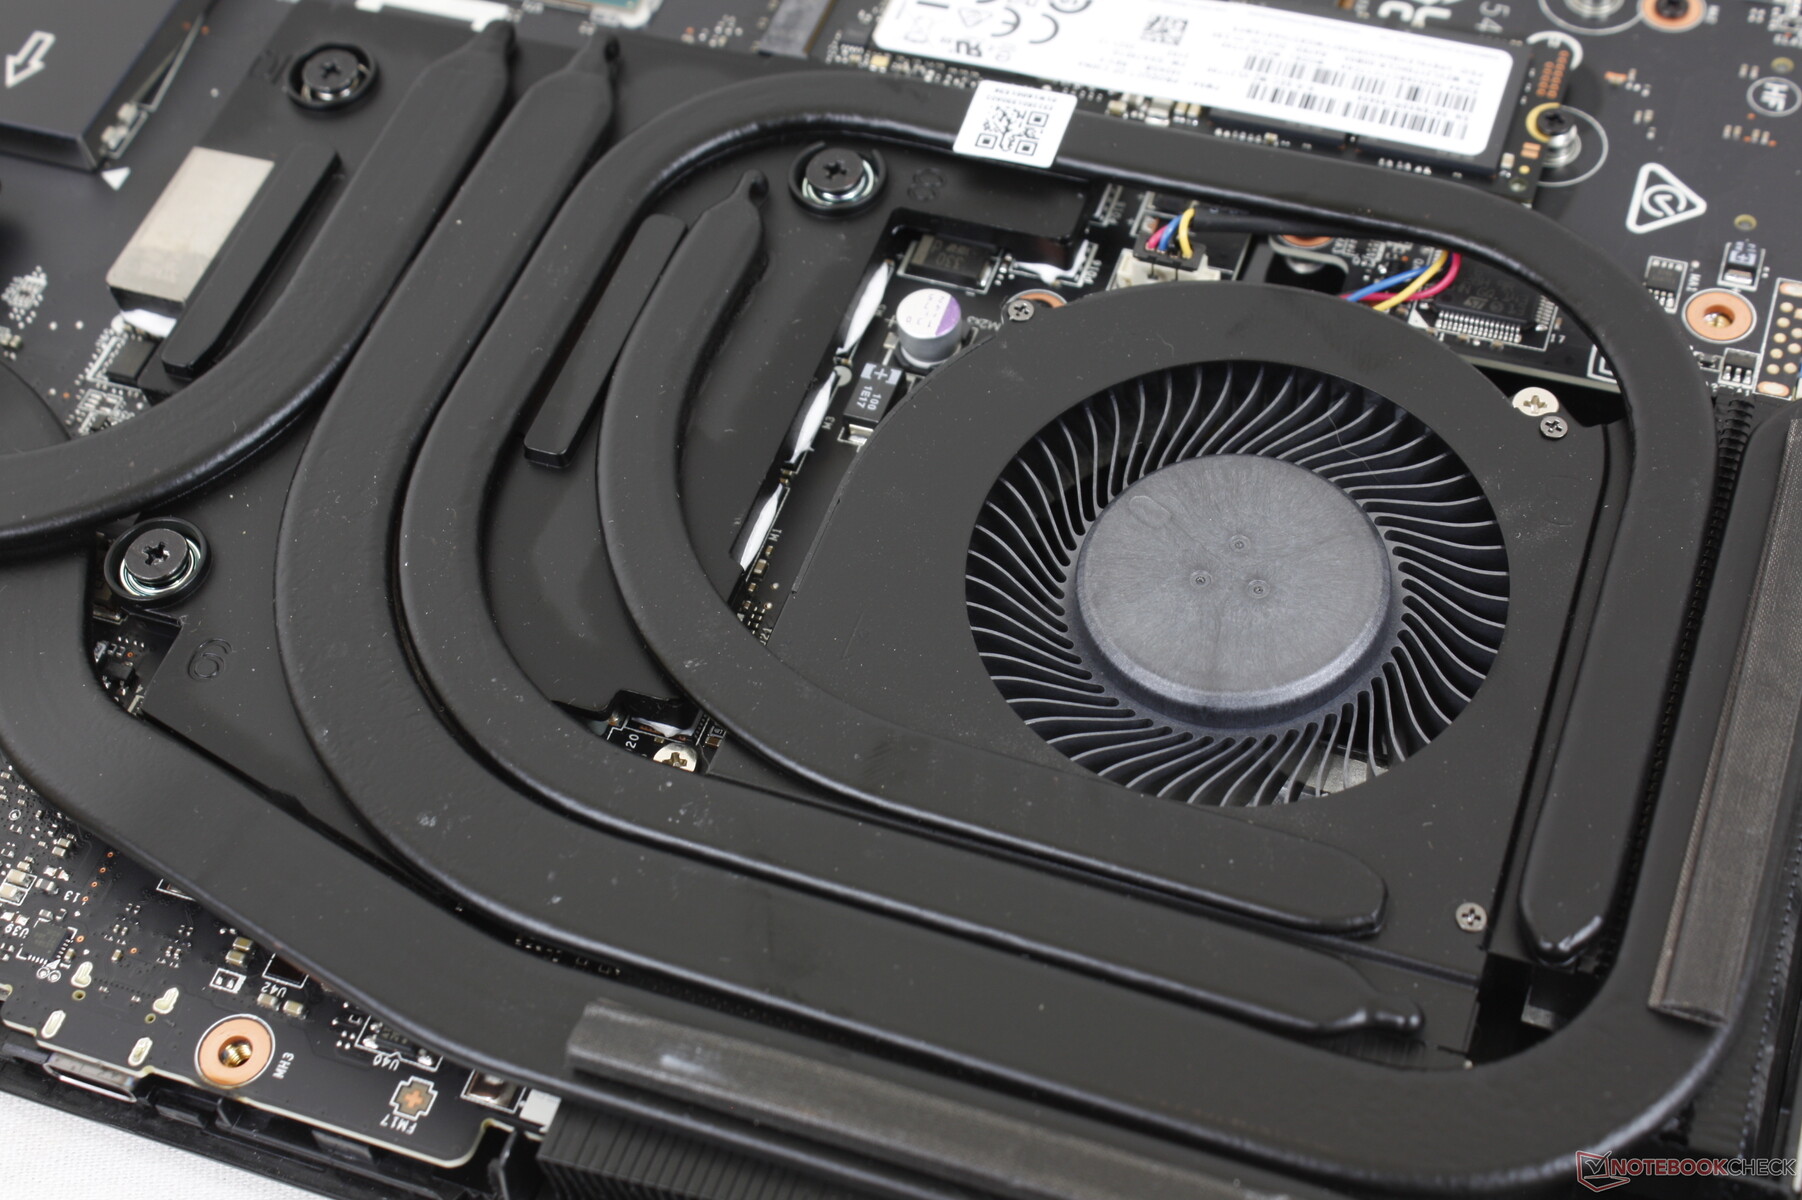
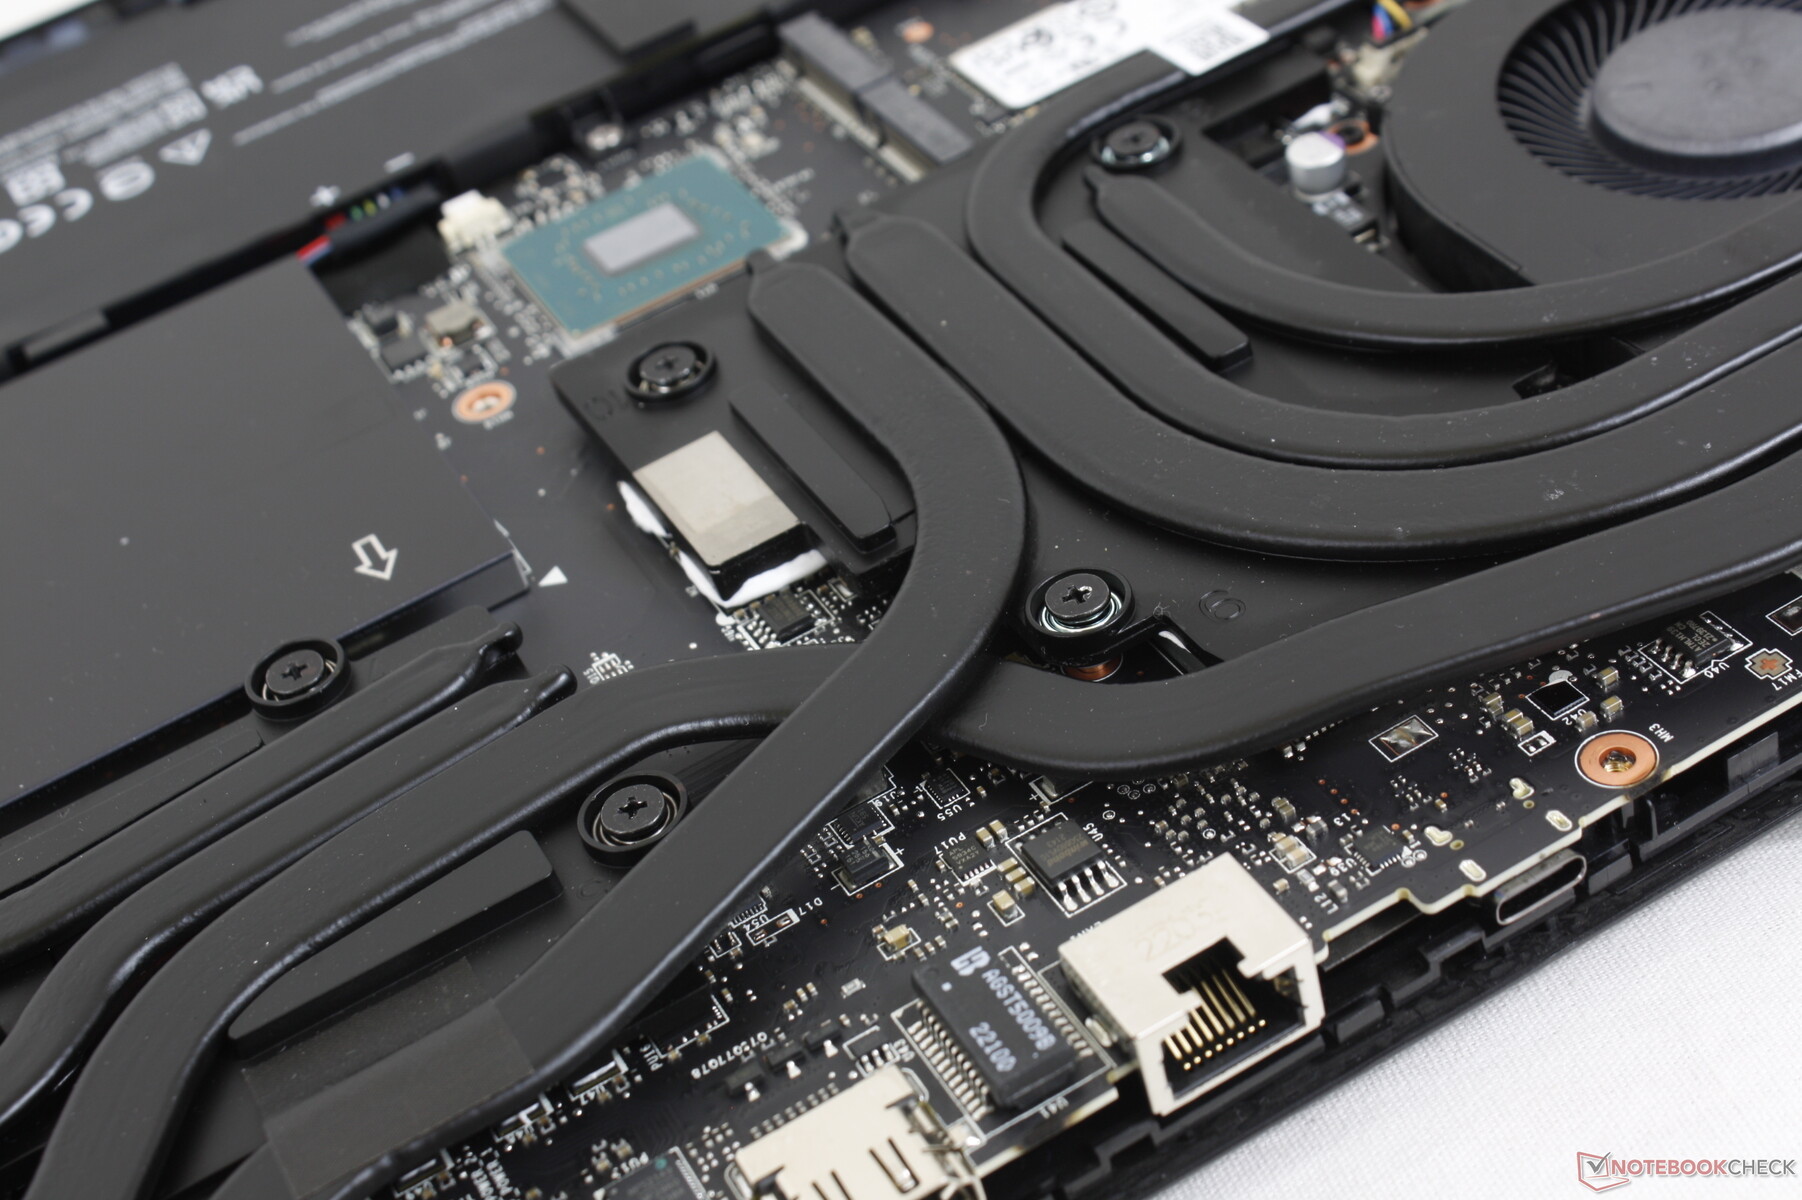
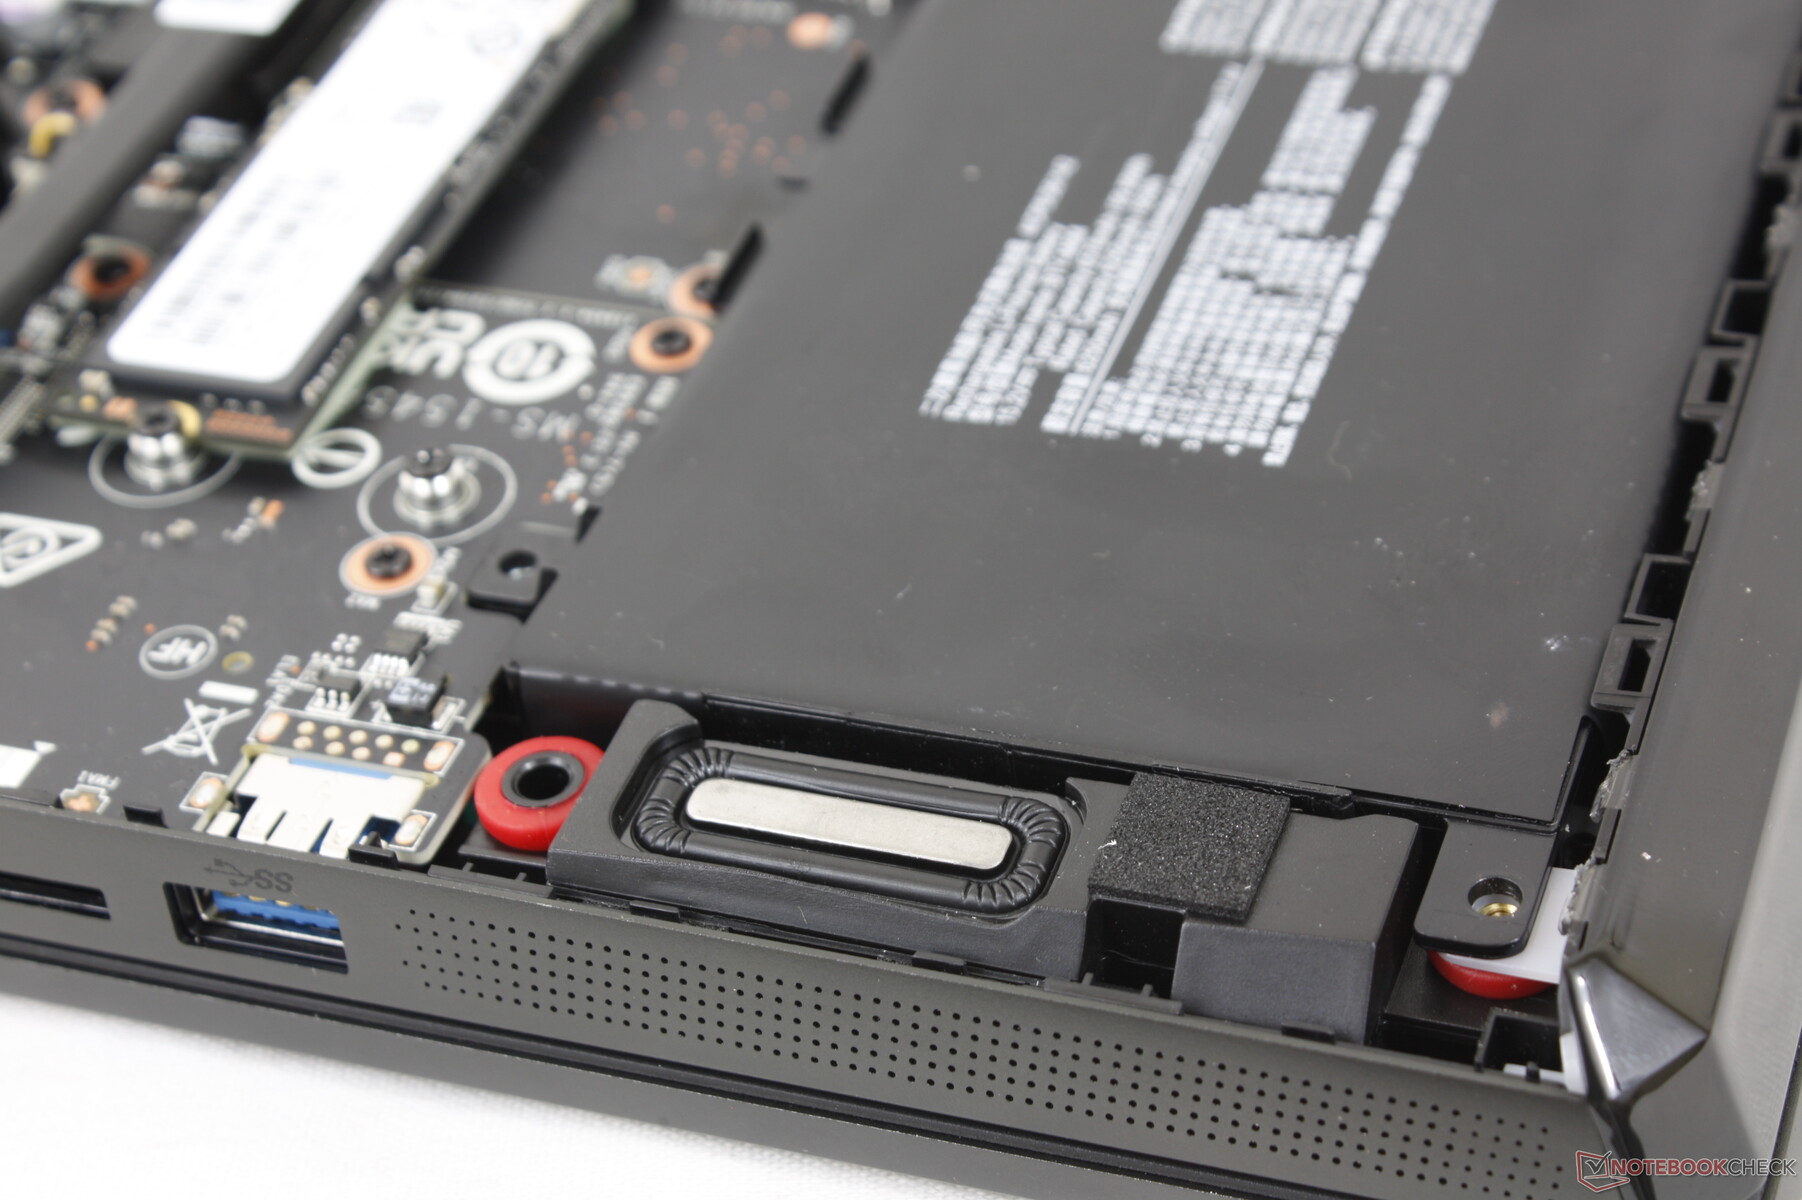
Manutenção
O painel inferior requer uma chave de fenda Philips e uma borda plana para ser removido. Quando comparado com o GE66, o GE67 tem um tubo de calor adicional sobre a CPU, como mostrado abaixo, para melhorar o resfriamento.
Acessórios e Garantia
A caixa de varejo inclui um grande pano de veludo, além do adaptador AC e papelada. A garantia padrão de um ano do fabricante se aplica se adquirido nos EUA.
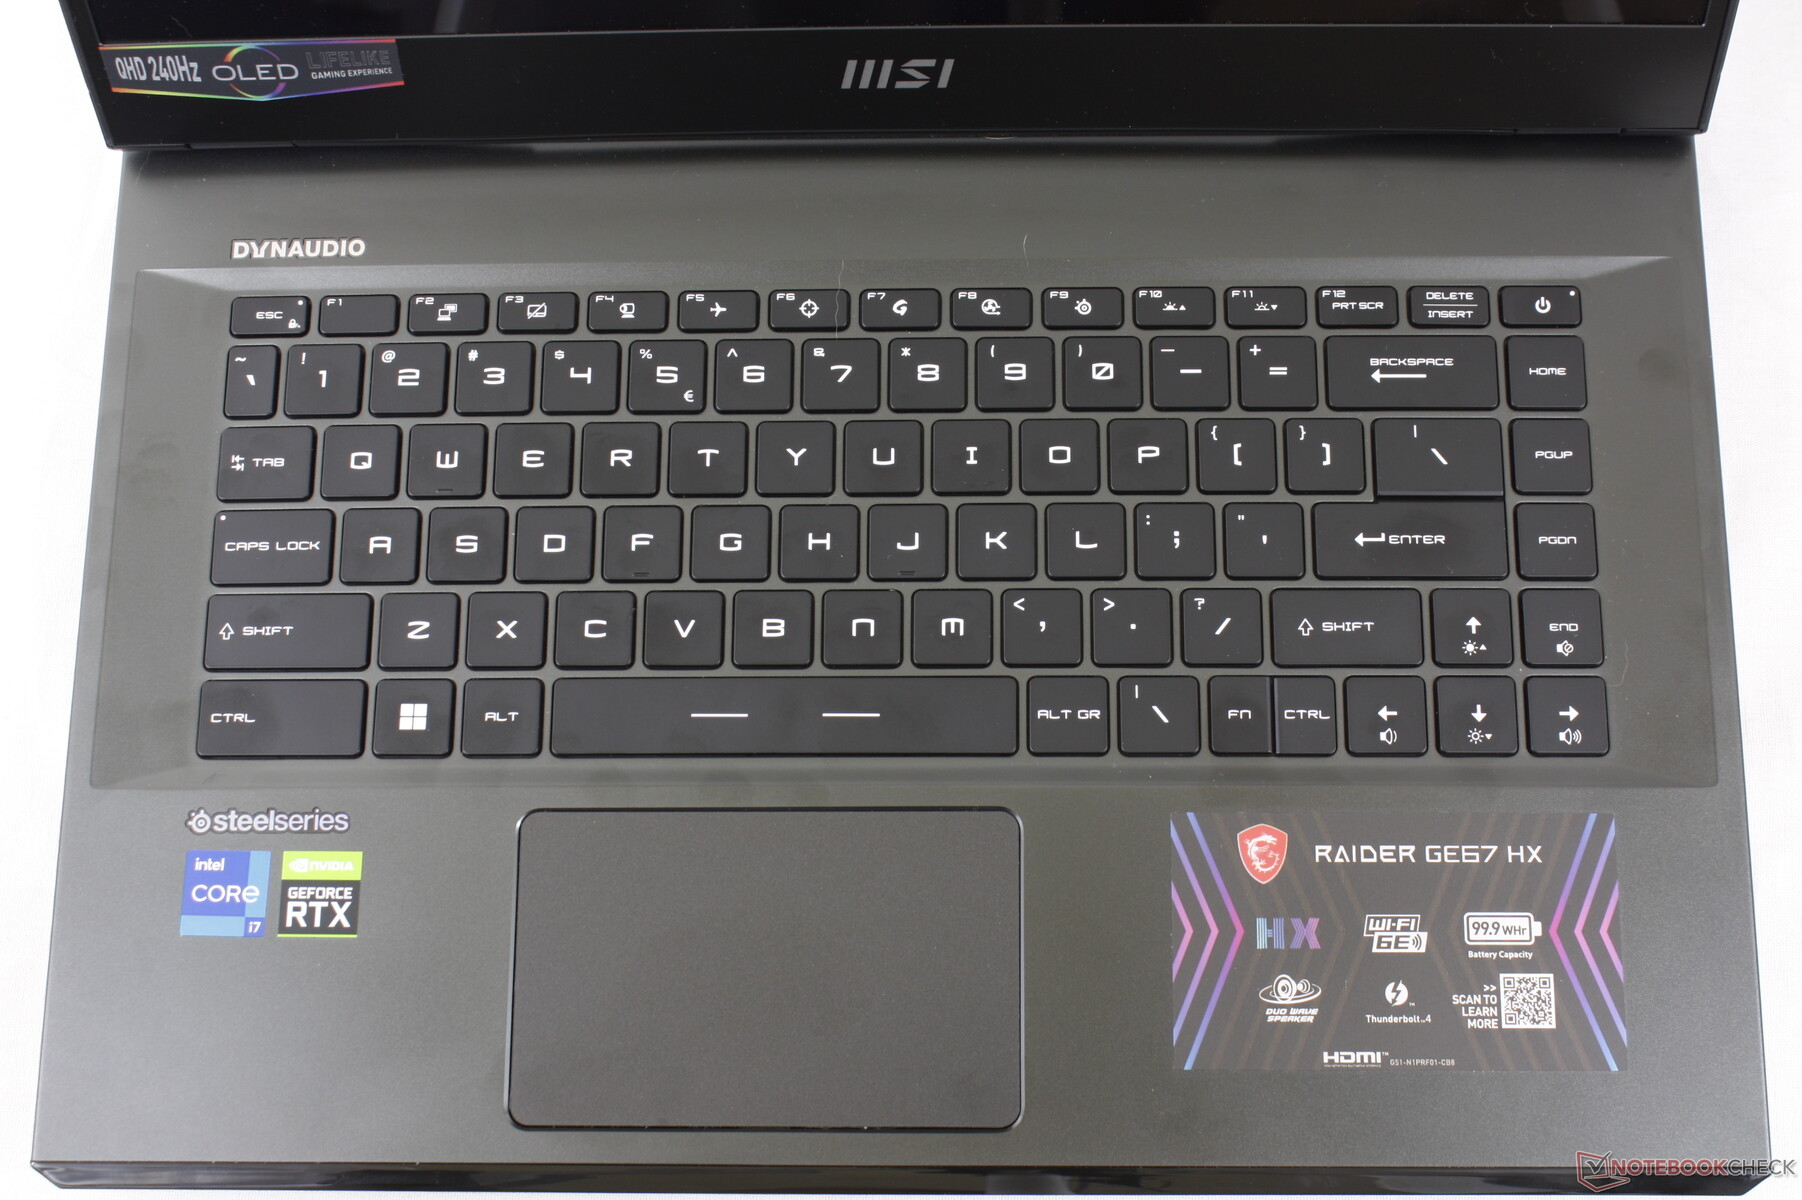
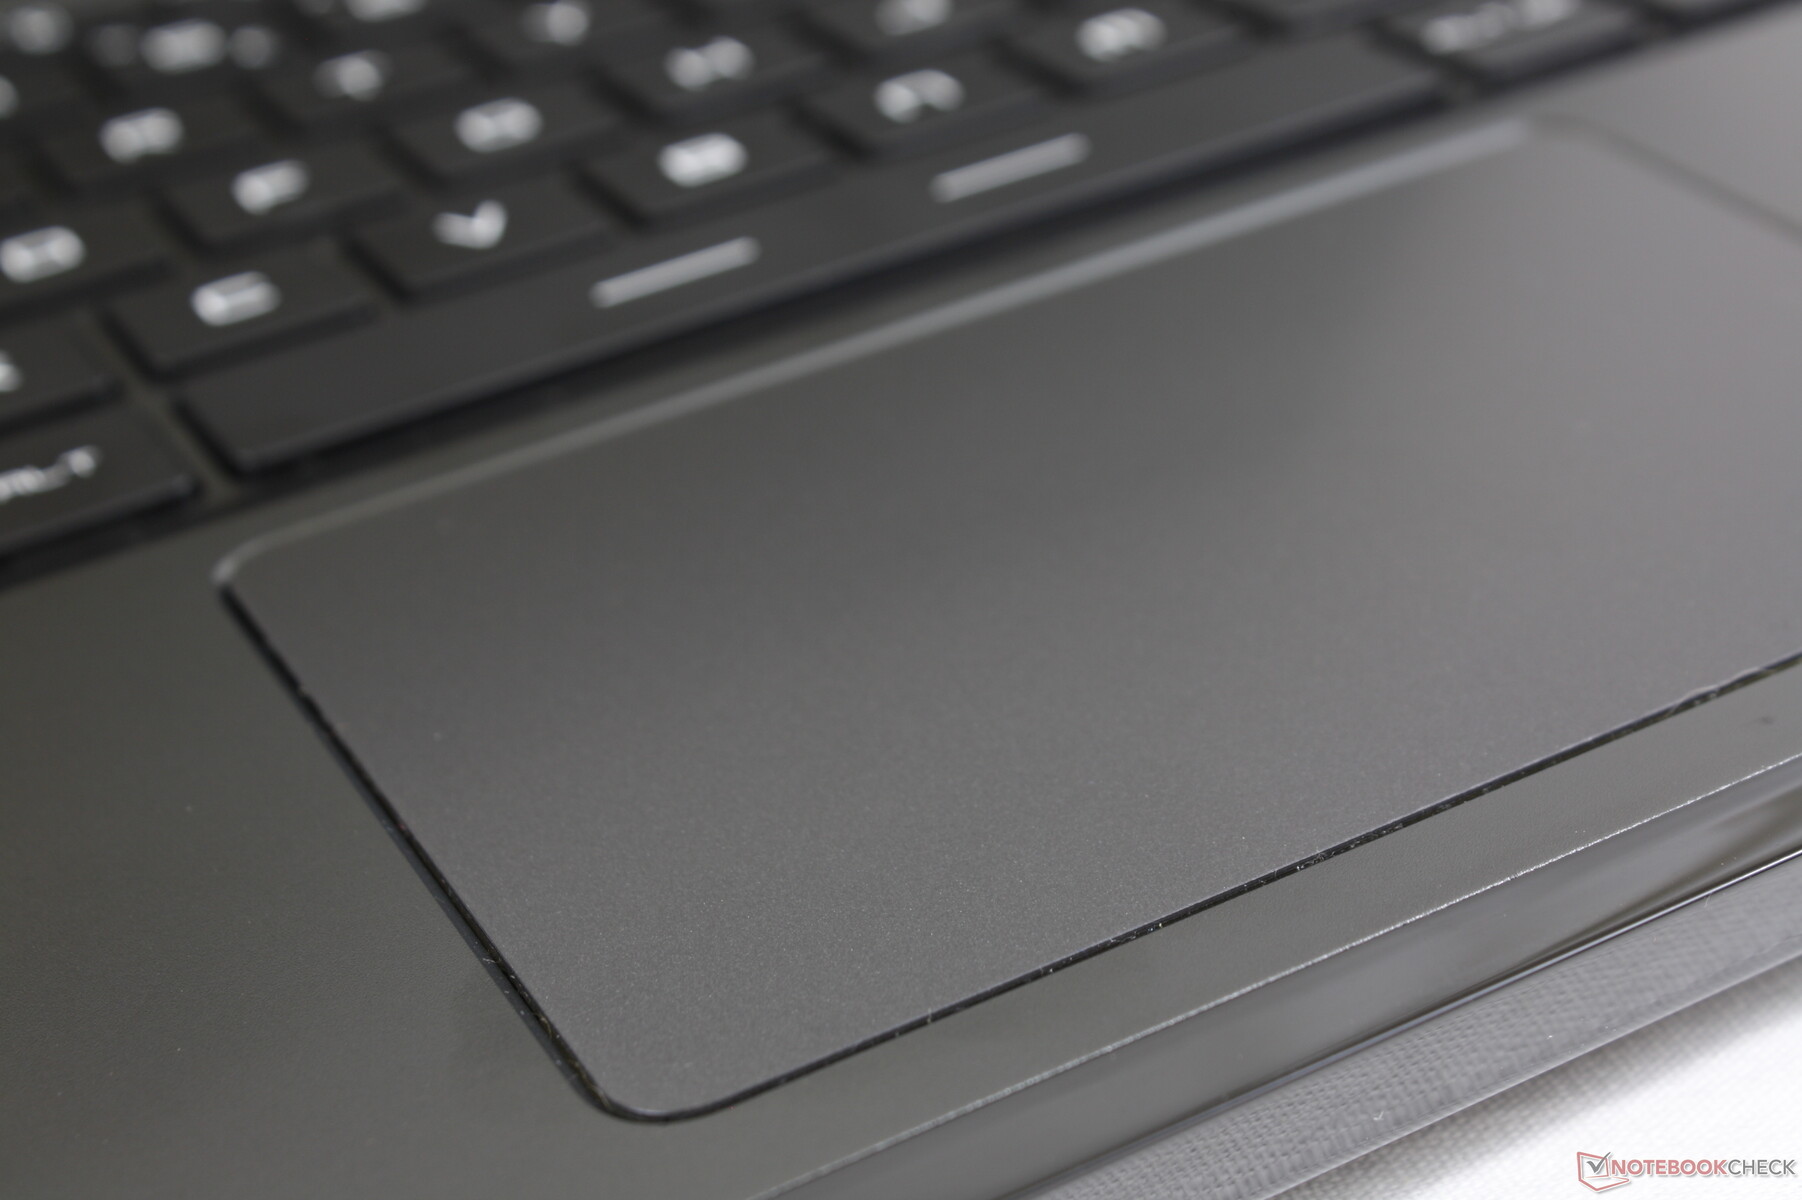
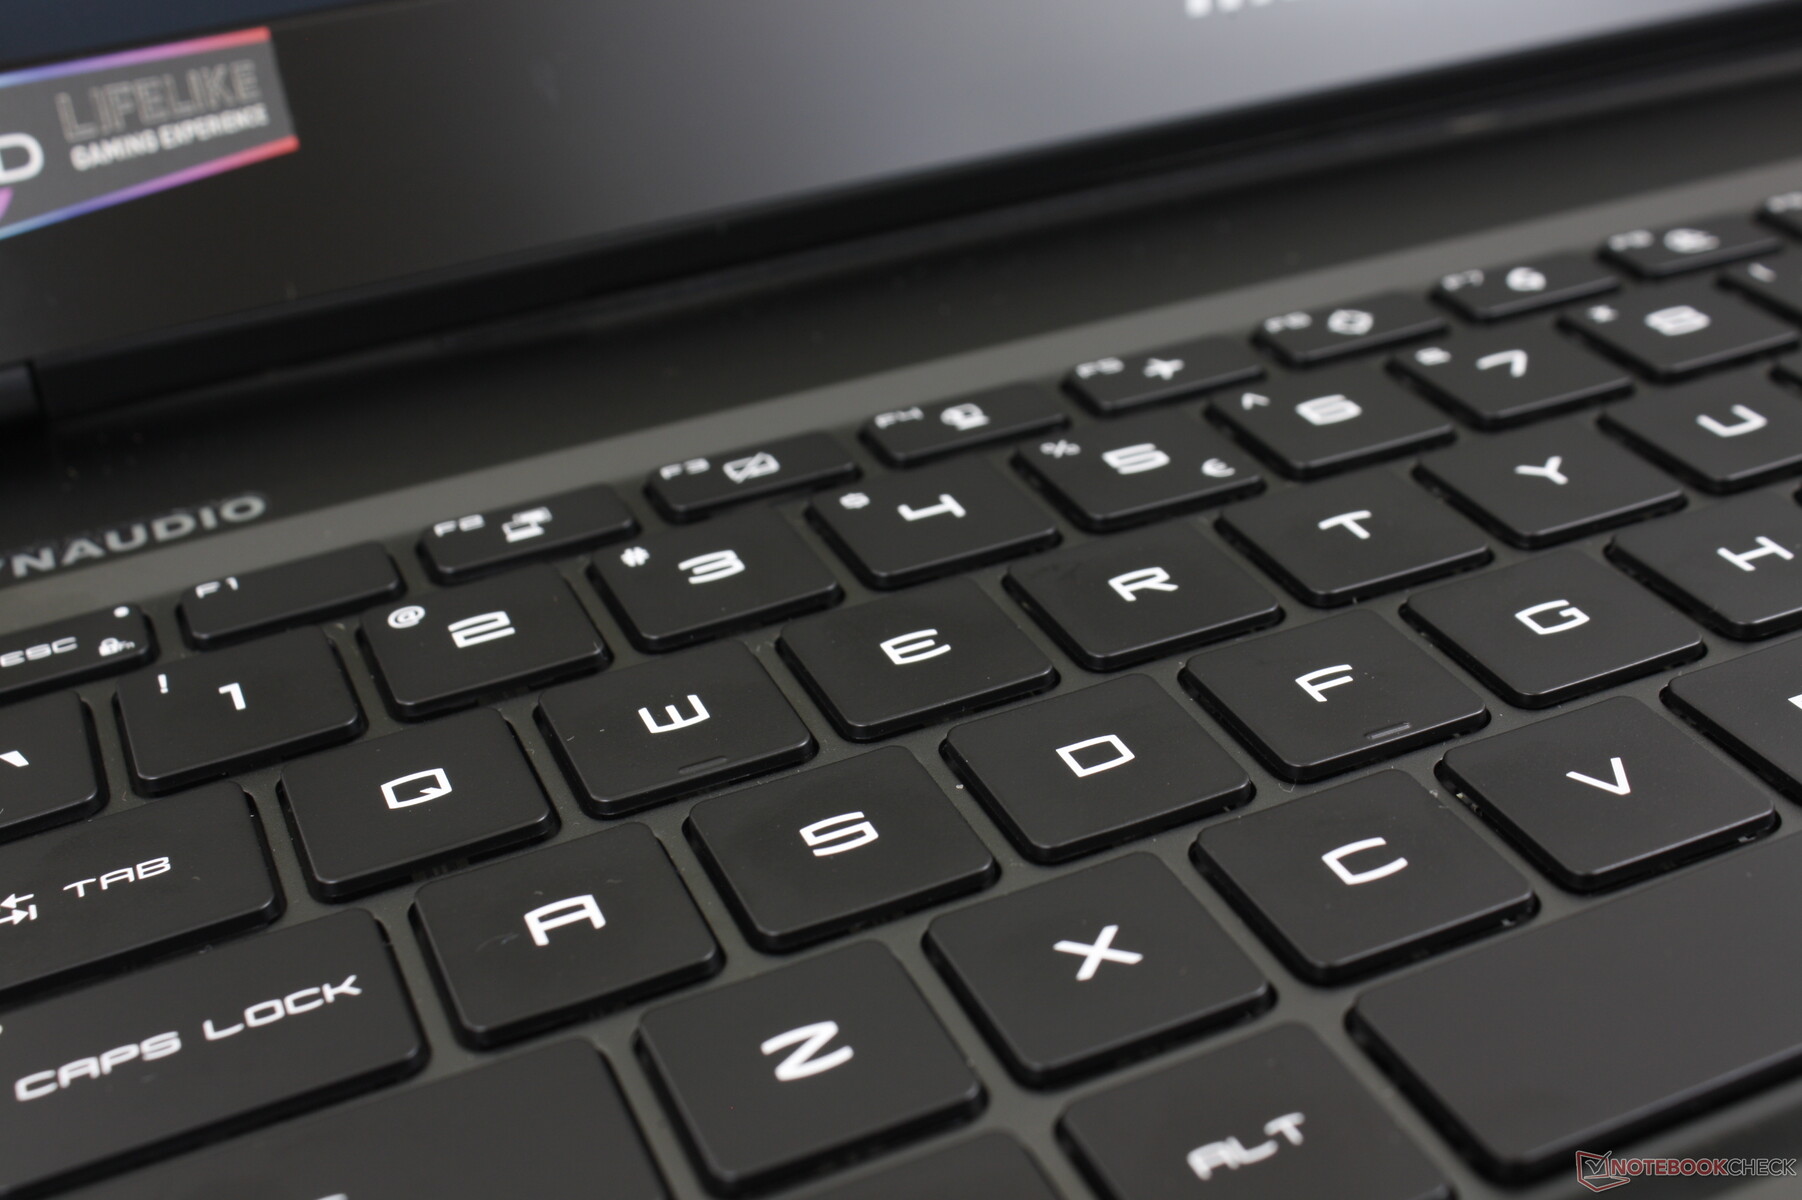
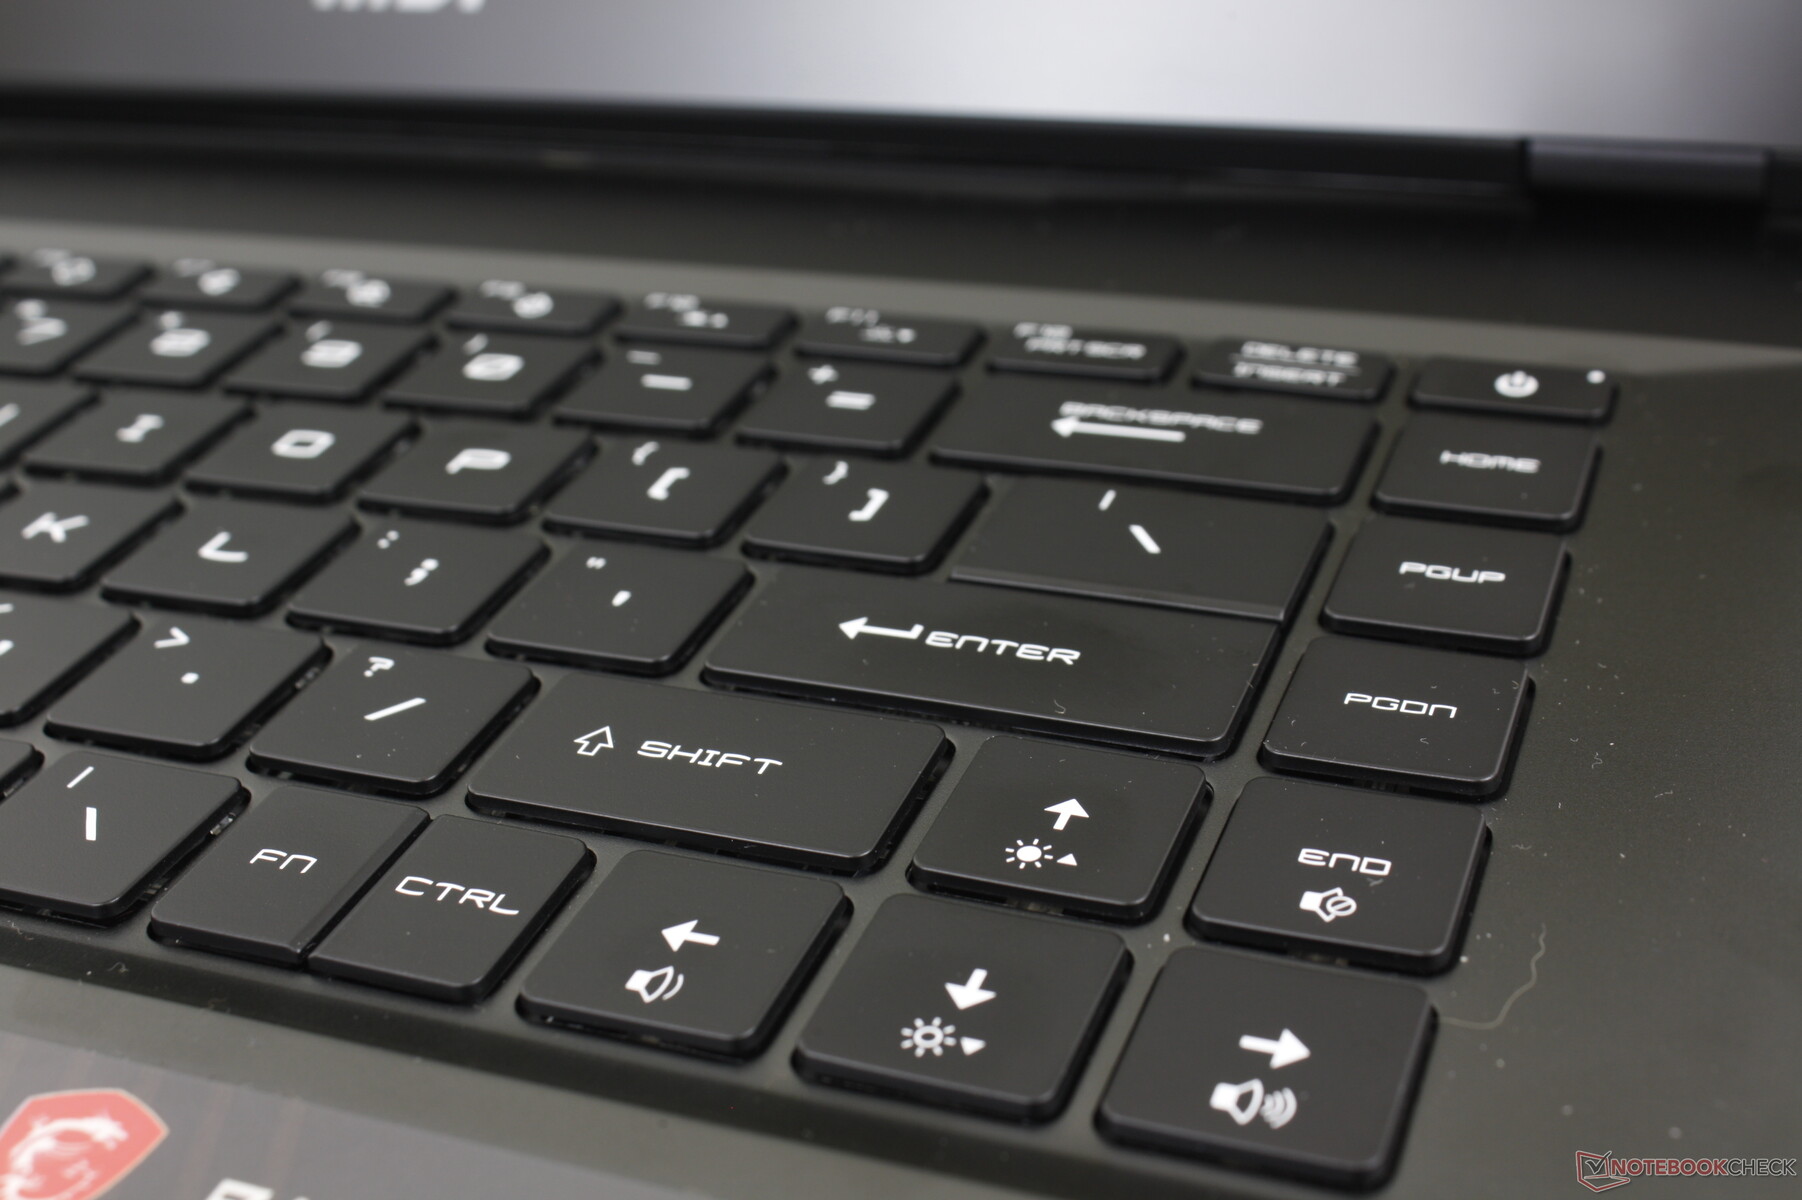
Dispositivos de entrada - Sem grandes mudanças em relação ao GE66
Teclado e Touchpad
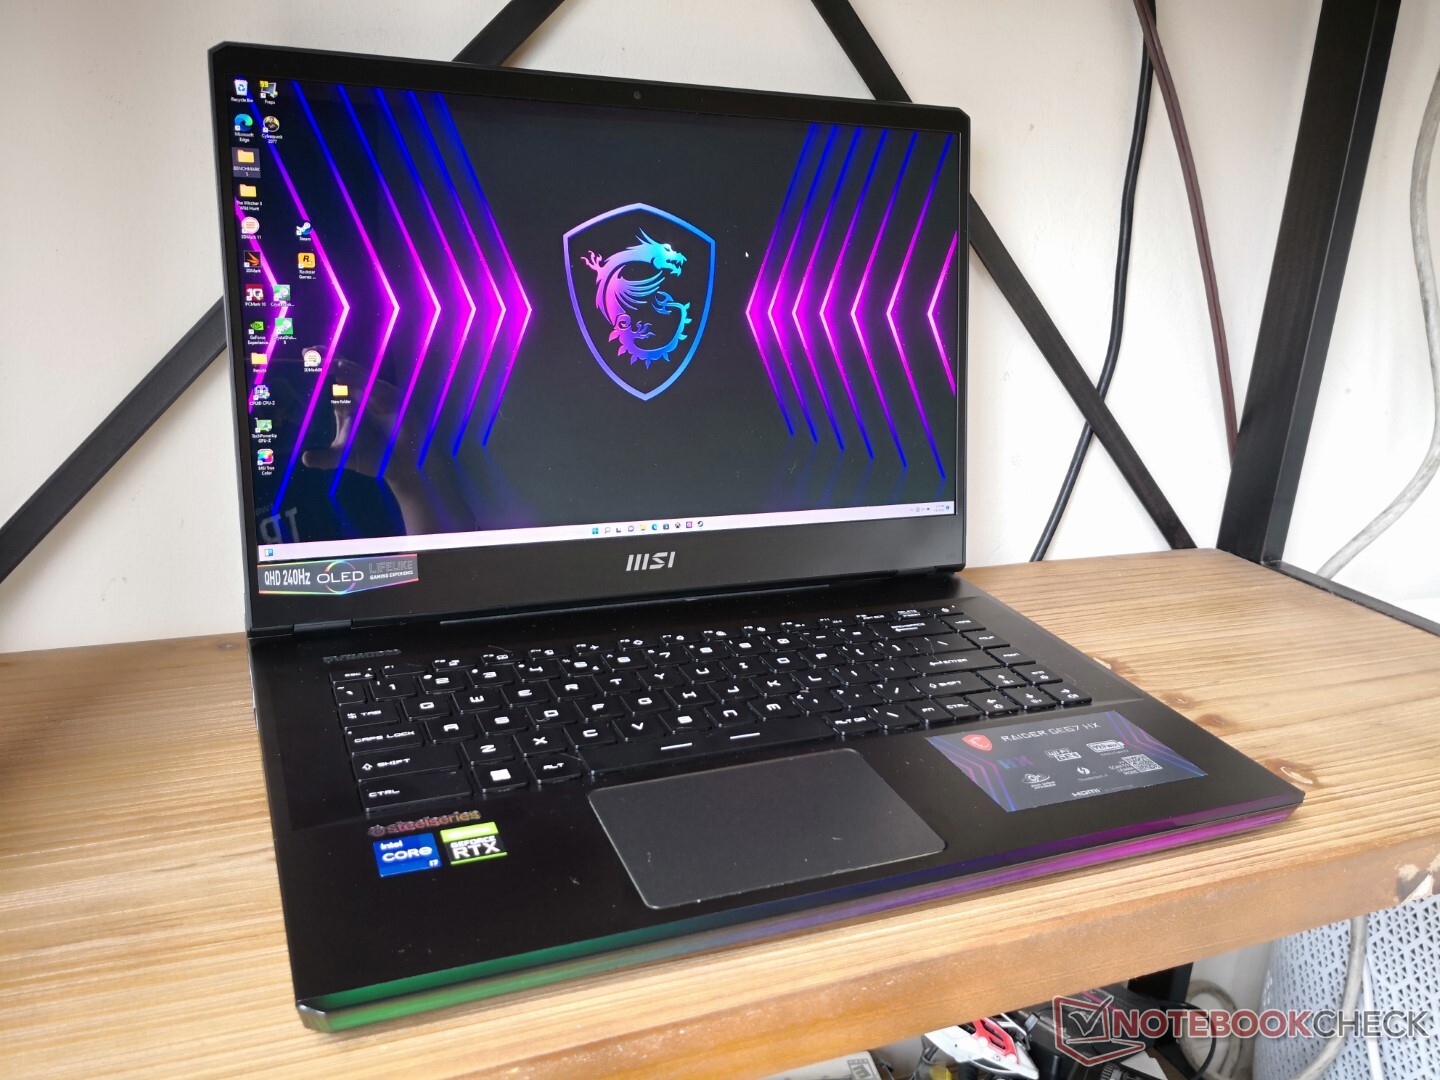
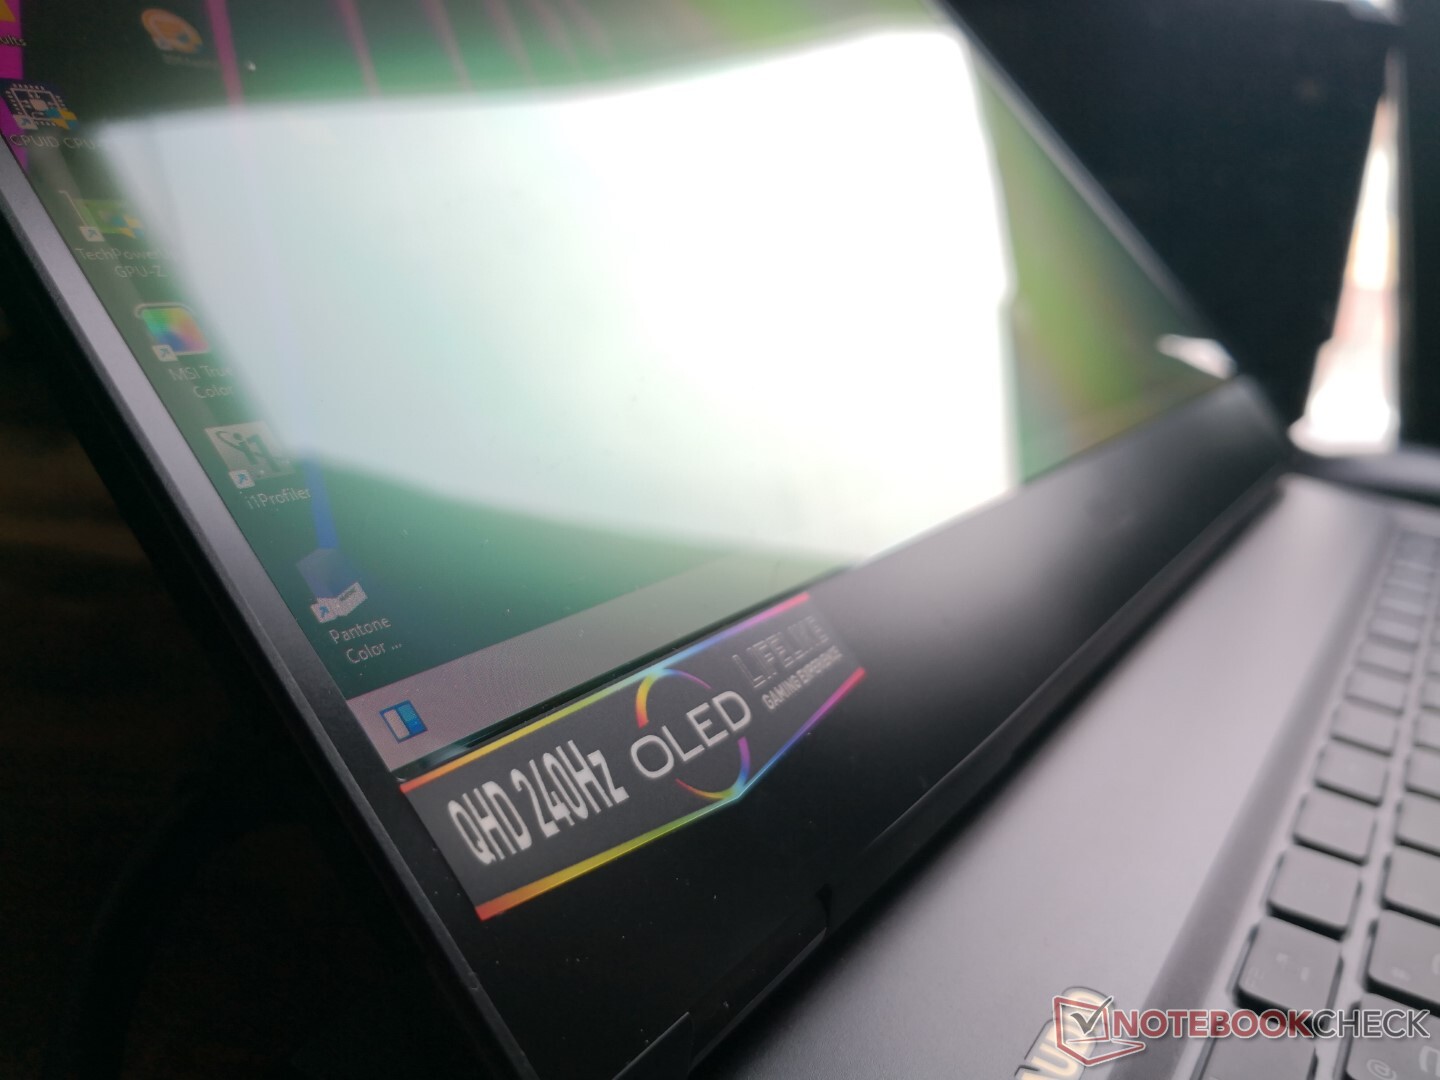
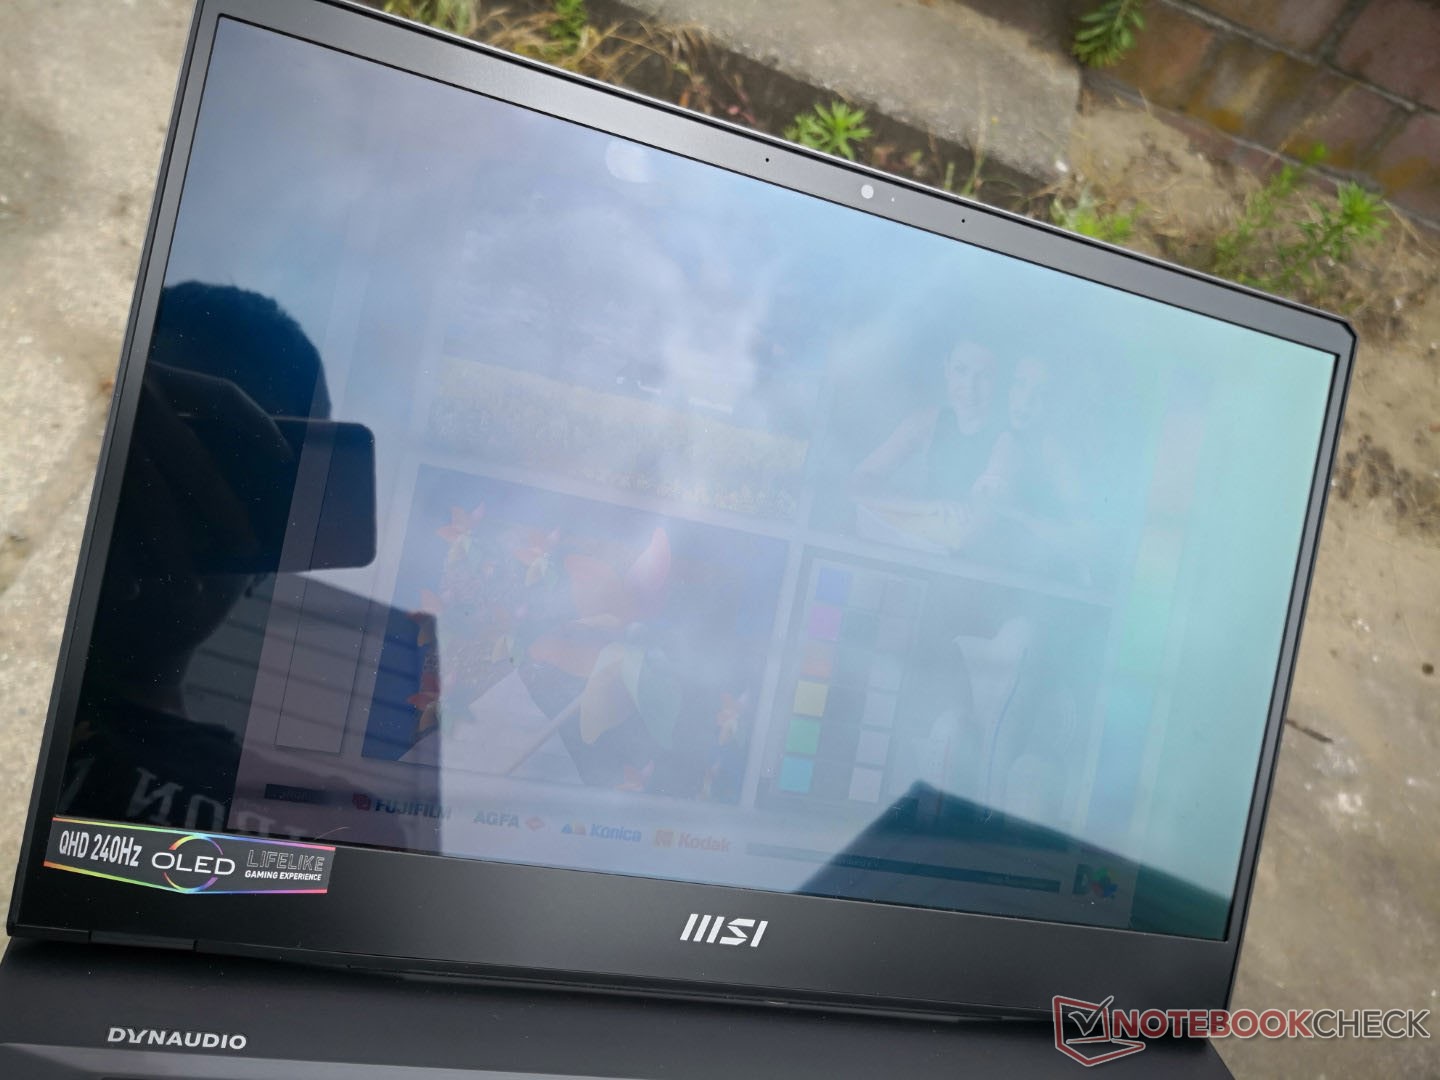
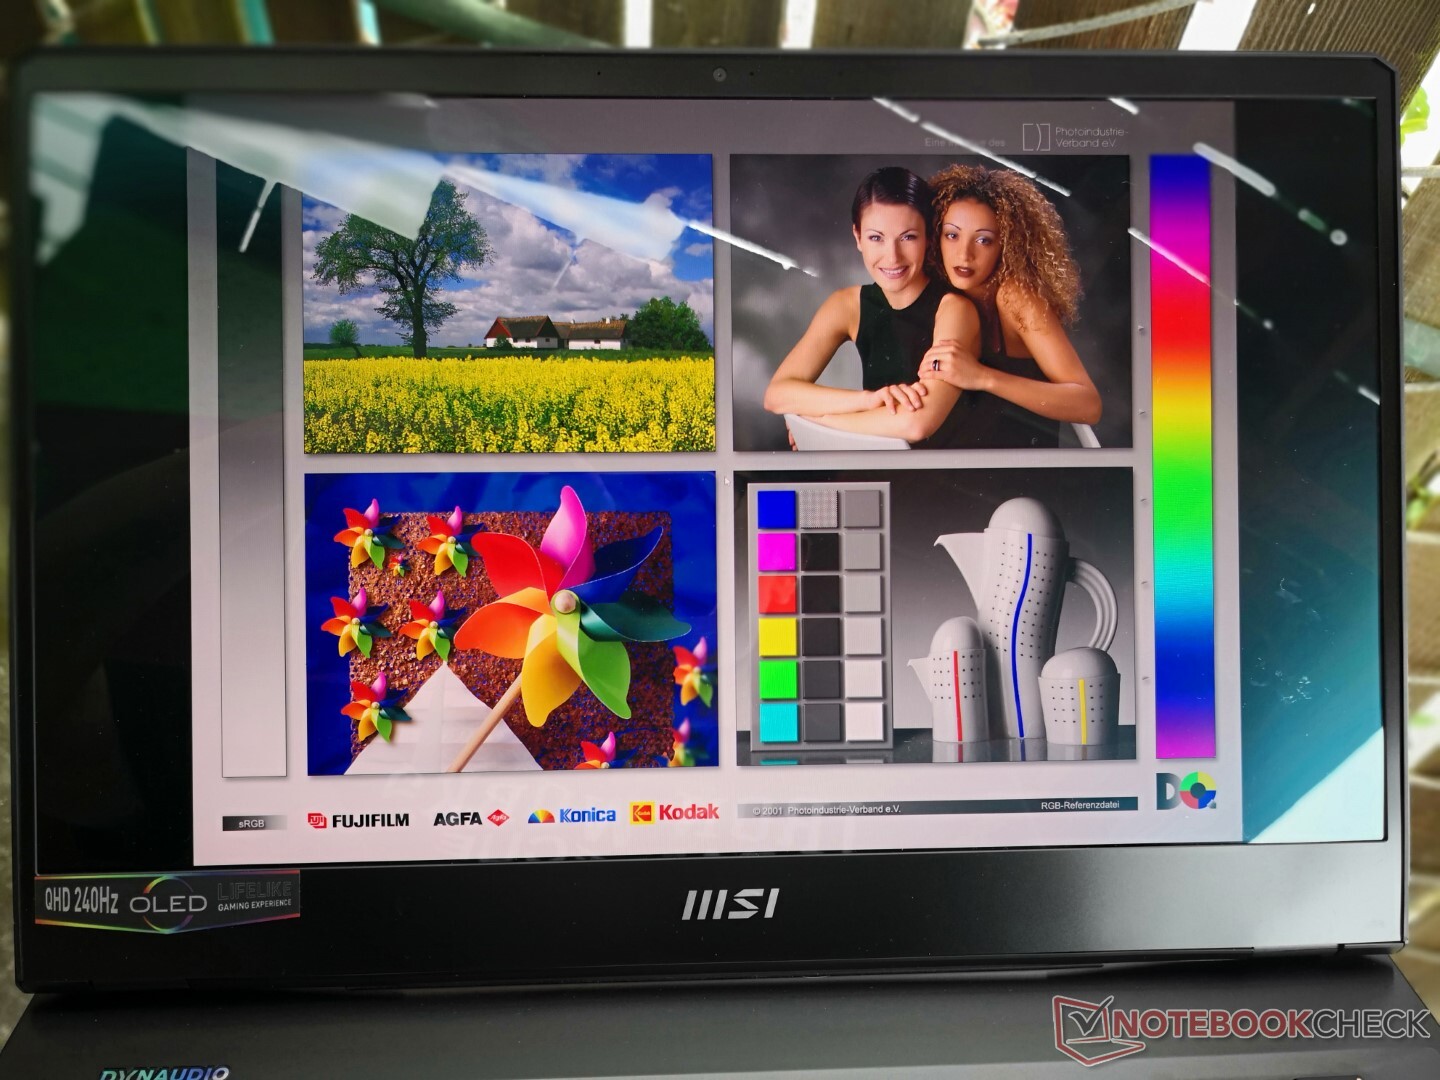
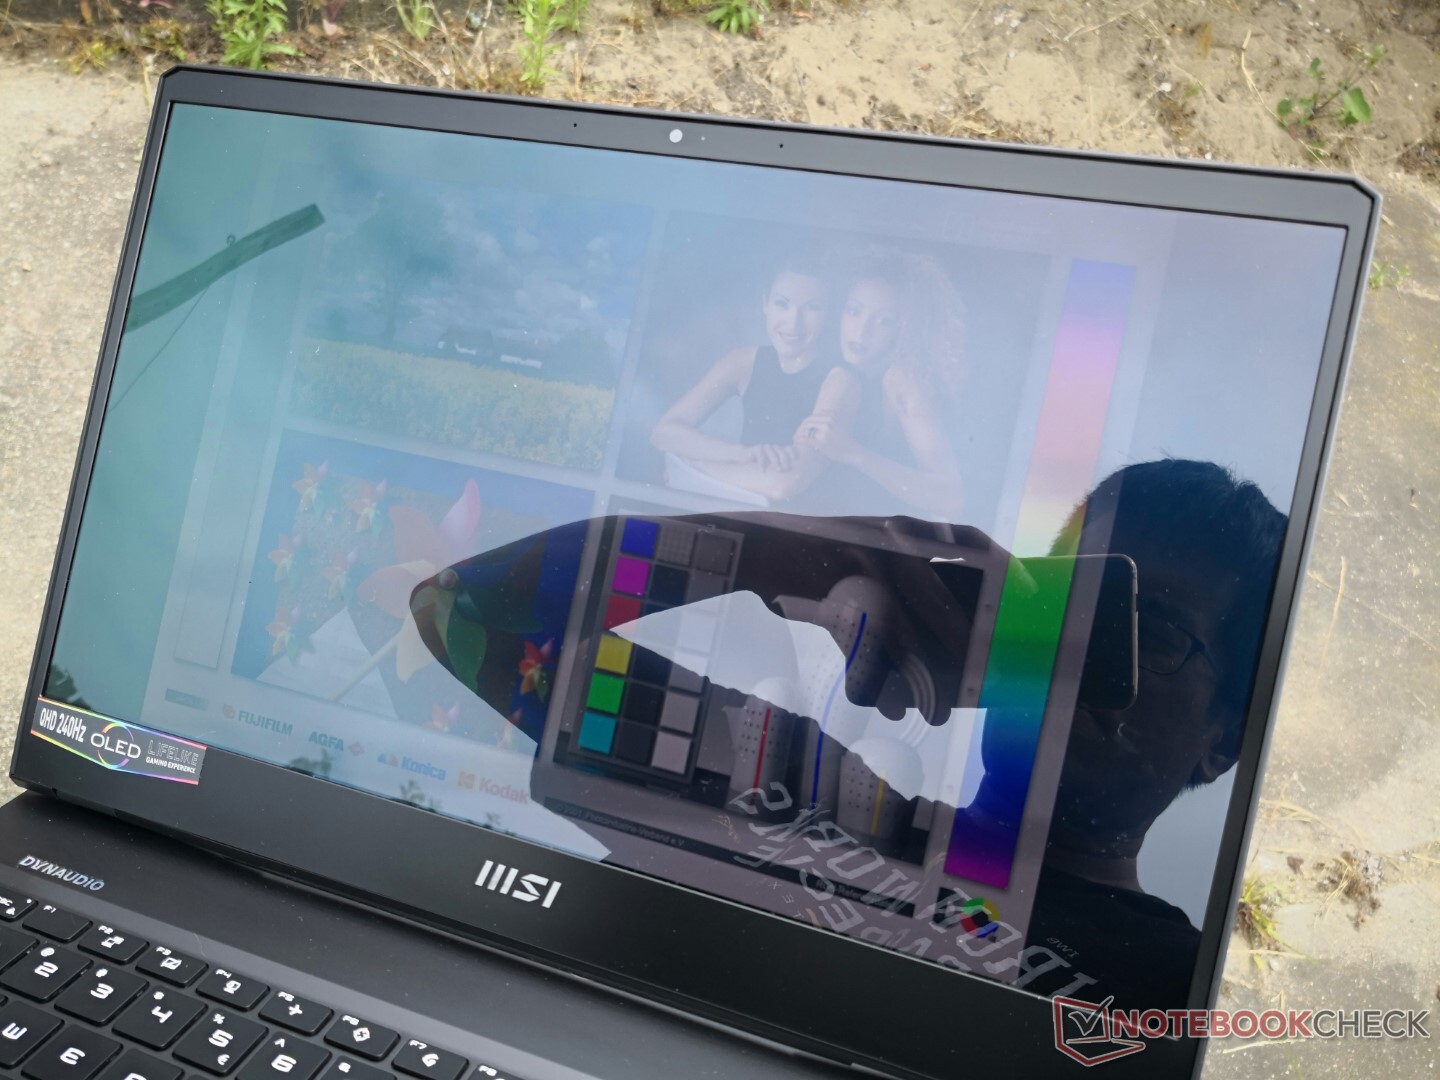
Mostrador - Quase ideal para jogos
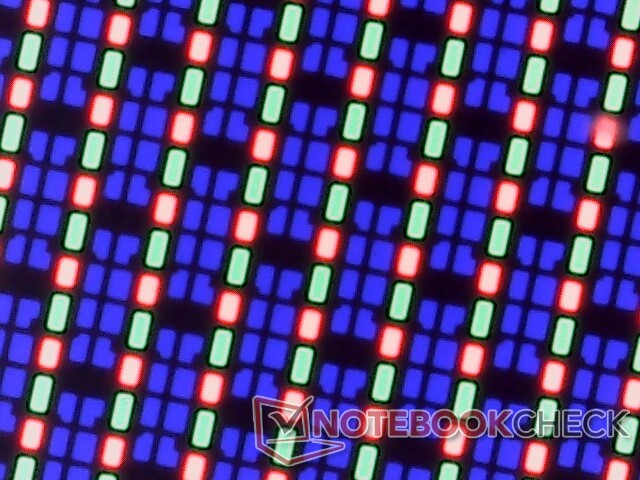
O MSI GE67 e Lâmina Razer 15 são dois dos primeiros laptops a oferecer opções de exibição QHD OLED 240 Hz. Embora isto possa parecer excelente no papel, há alguns asteriscos a ter em mente
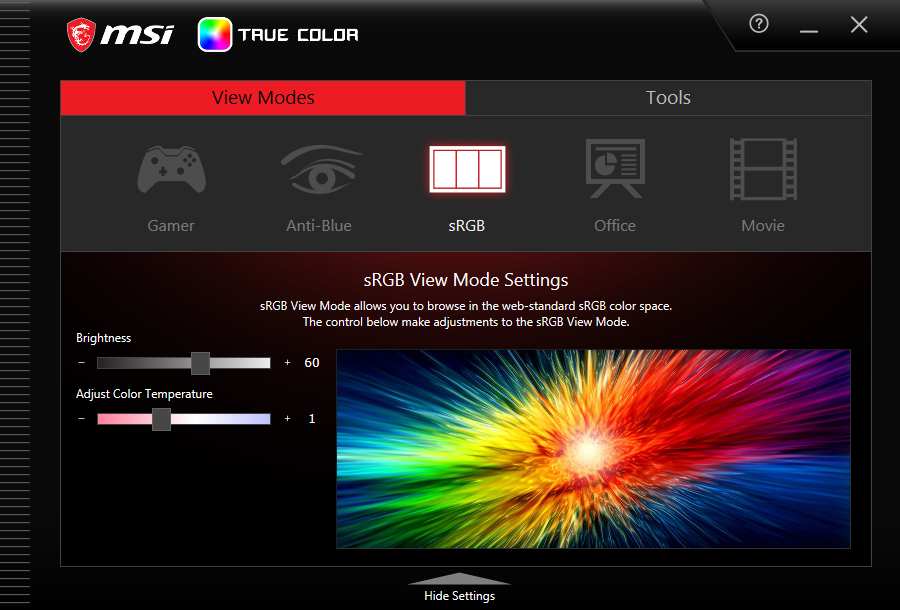
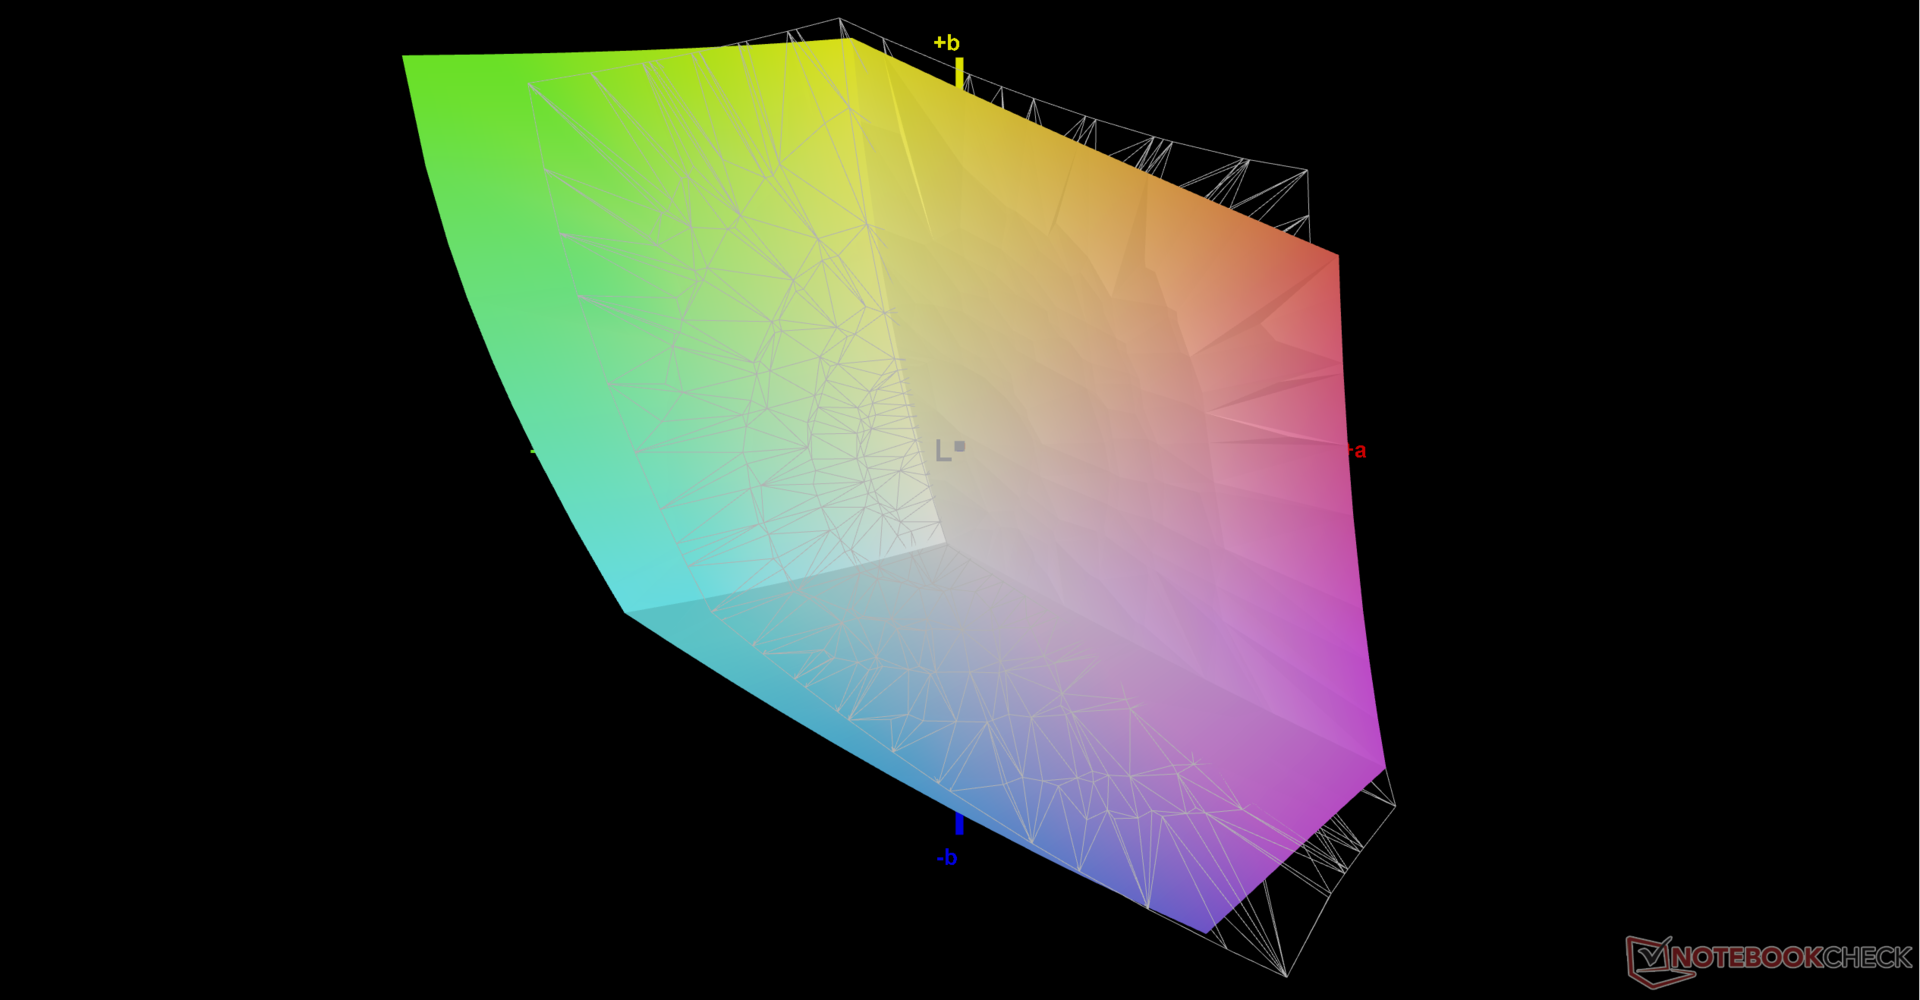
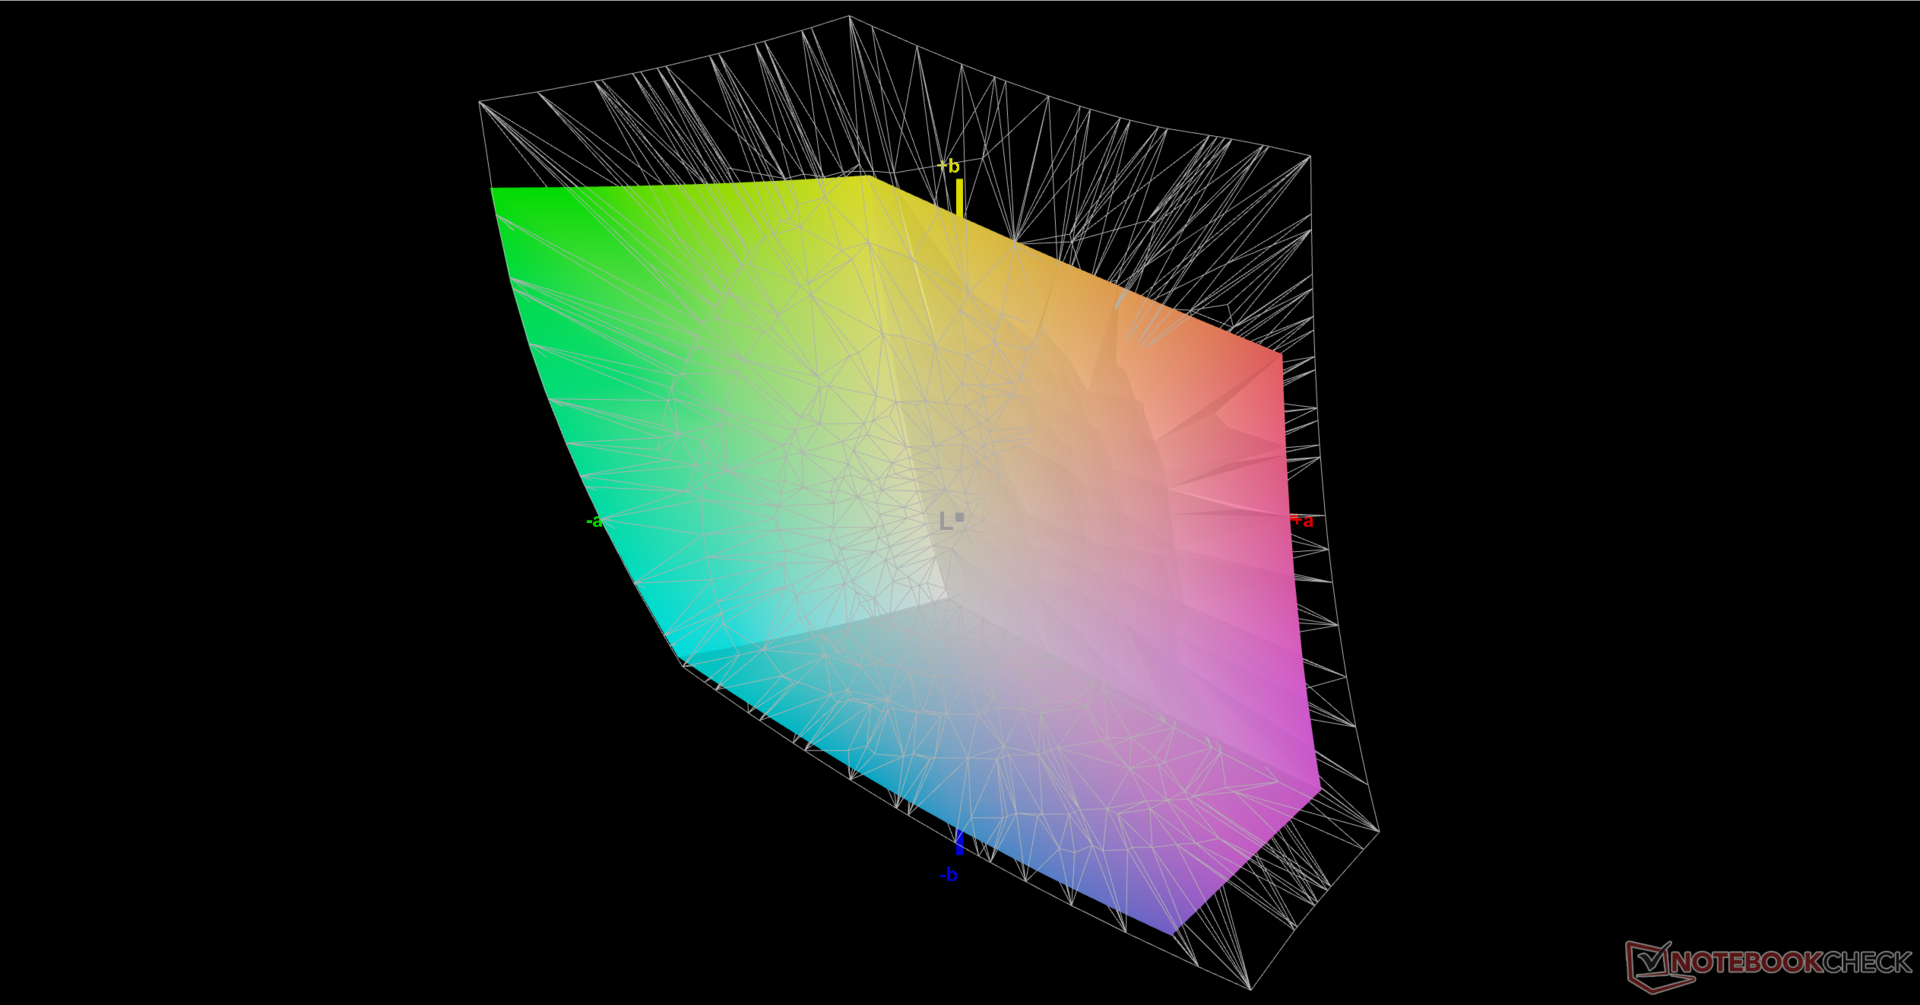
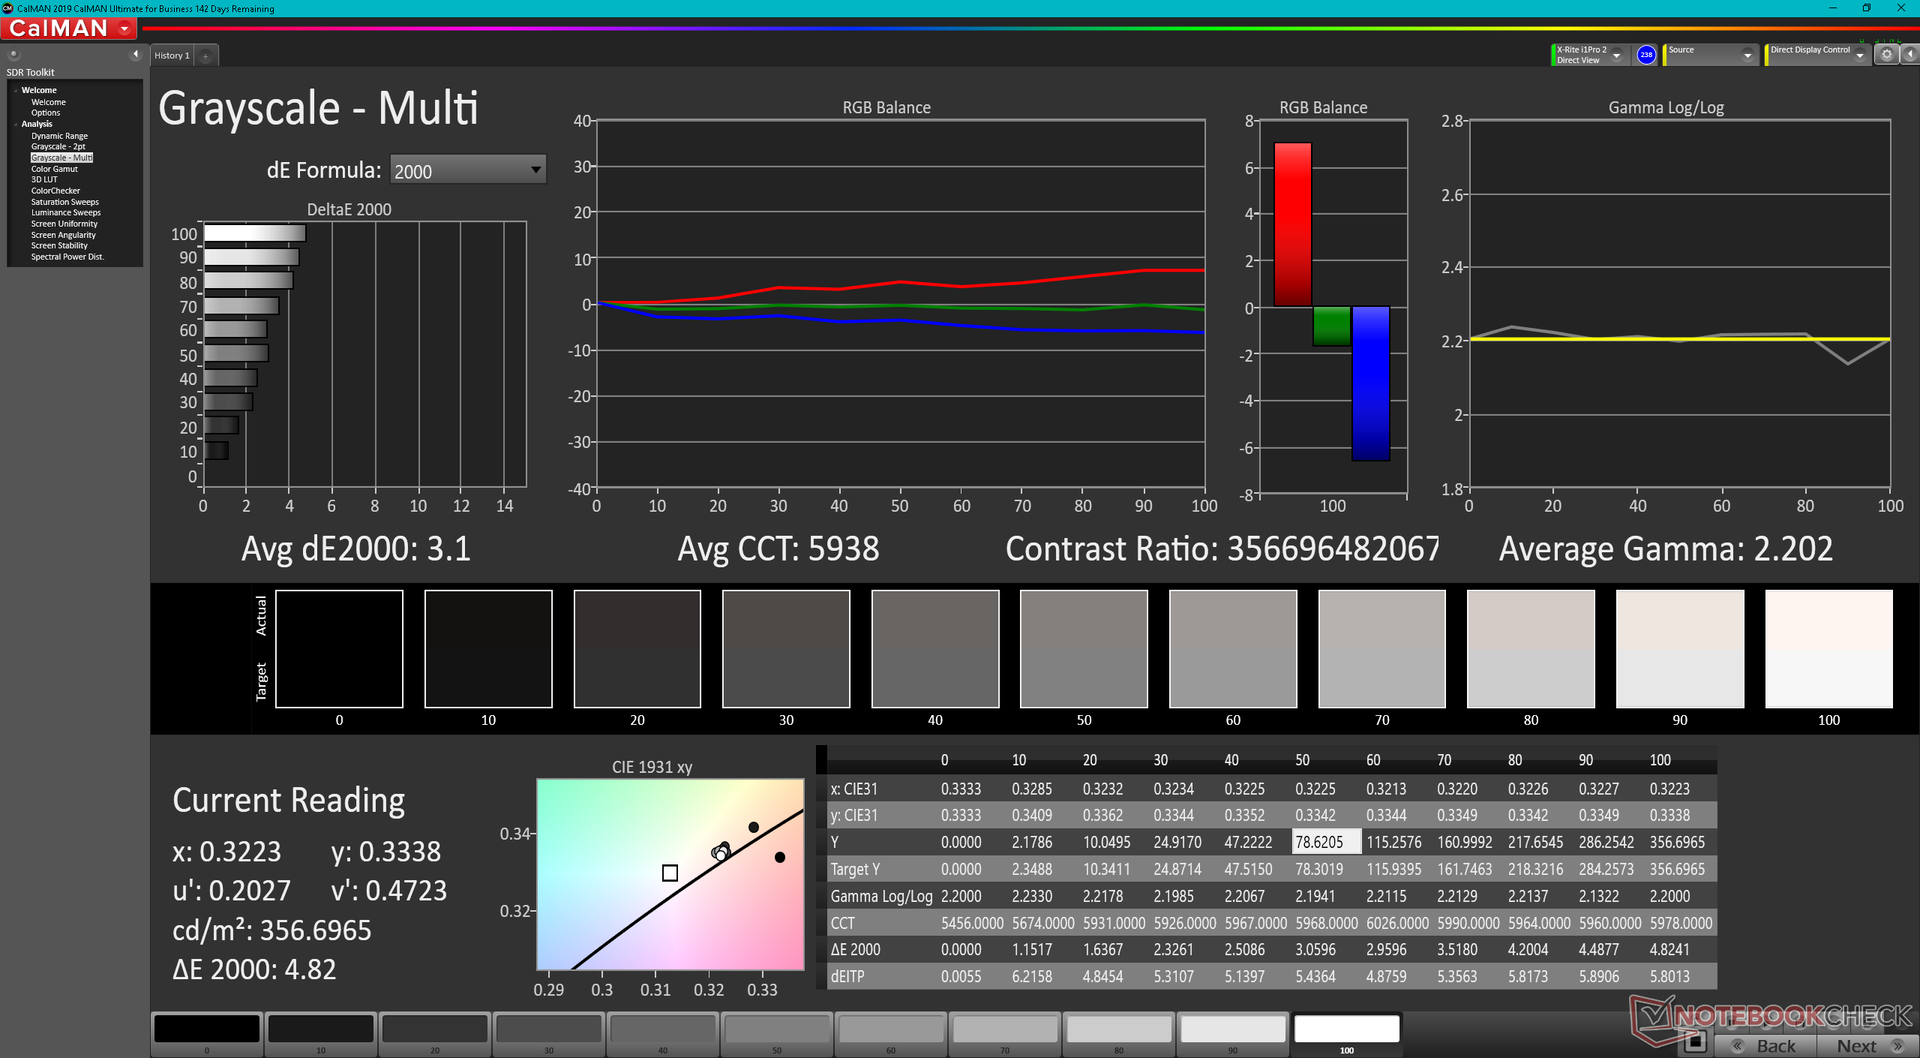
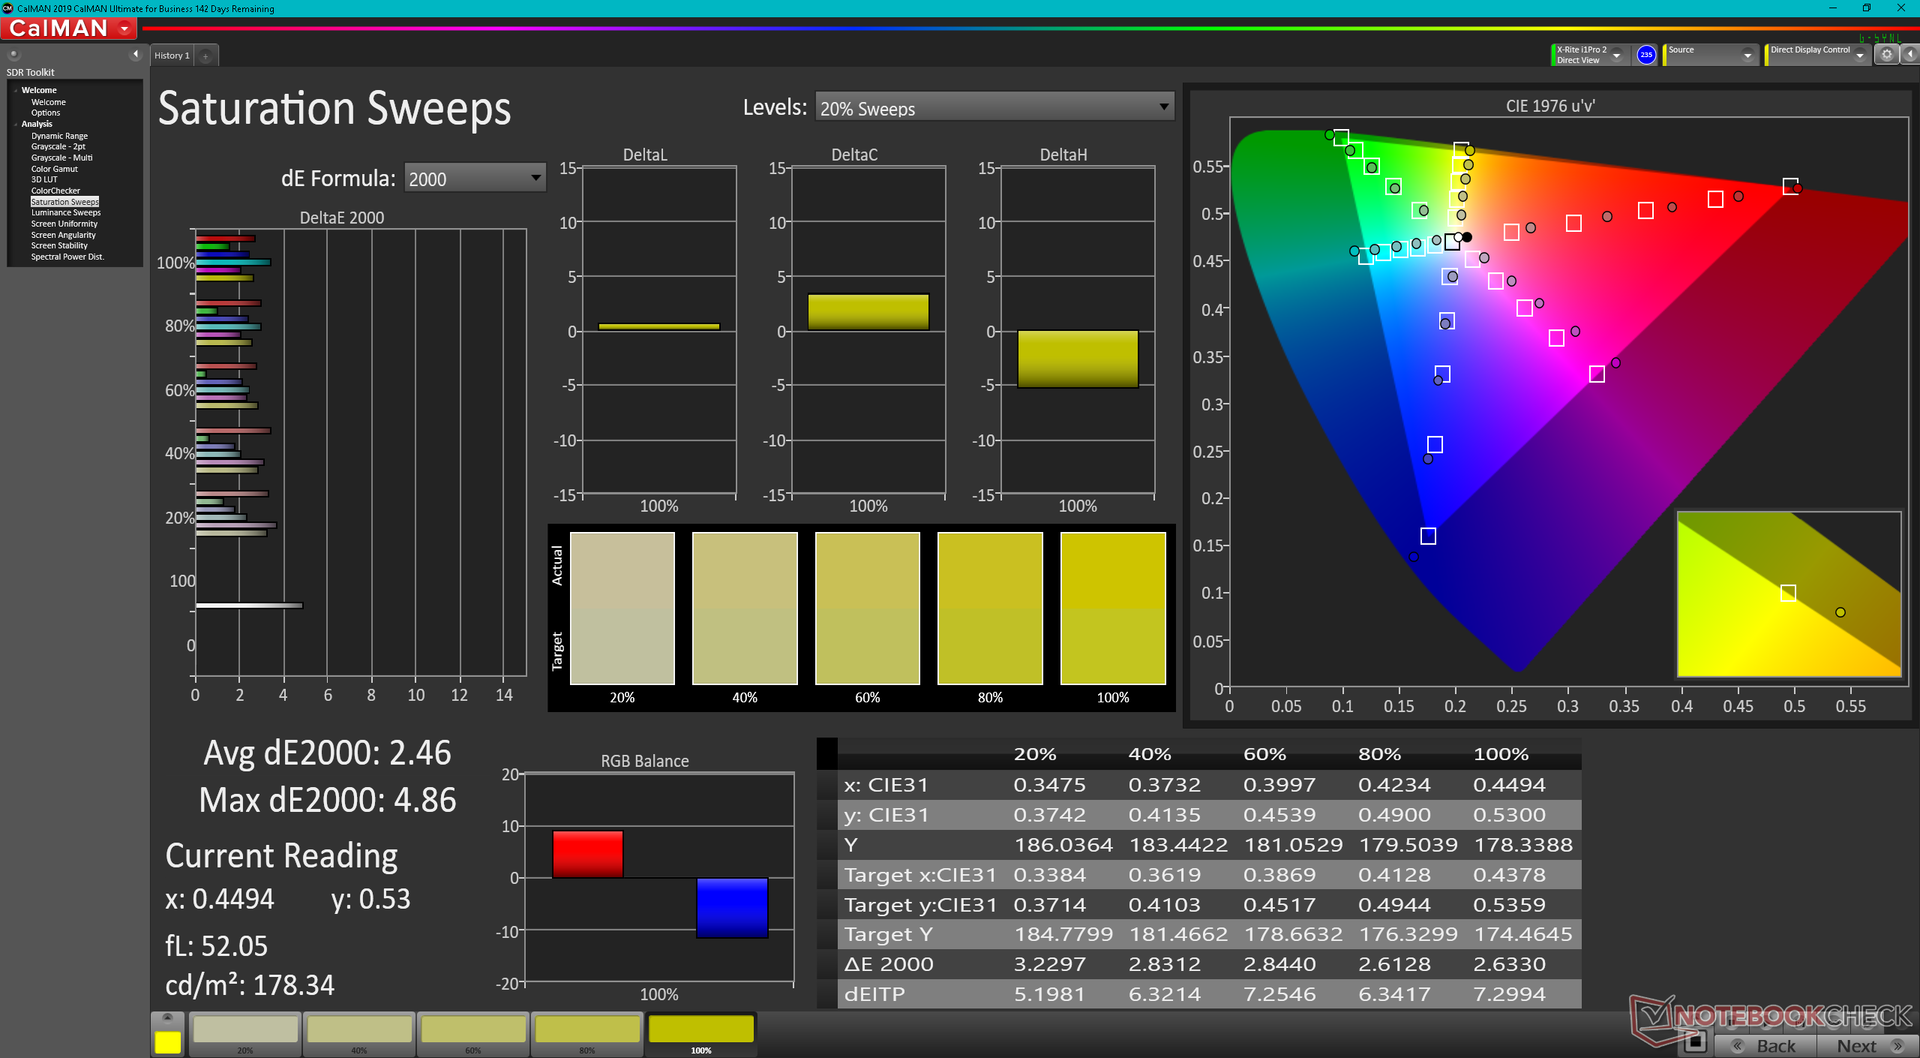
Primeiro, a tela GE67 não é calibrada na fábrica, apesar de o painel OLED anunciar a cobertura completa do DCI-P3. Na verdade, só conseguimos gravar uma cobertura de apenas 72% e o software MSI True Color em si não tem opção DCI-P3 para escolher. Quando pressionado para comentários, a MSI respondeu que o modo DCI-P3 é "mais para editores de vídeo e em nossa série de portáteis Creator" e que o GE67 implementa o modo Display P3 em seu lugar
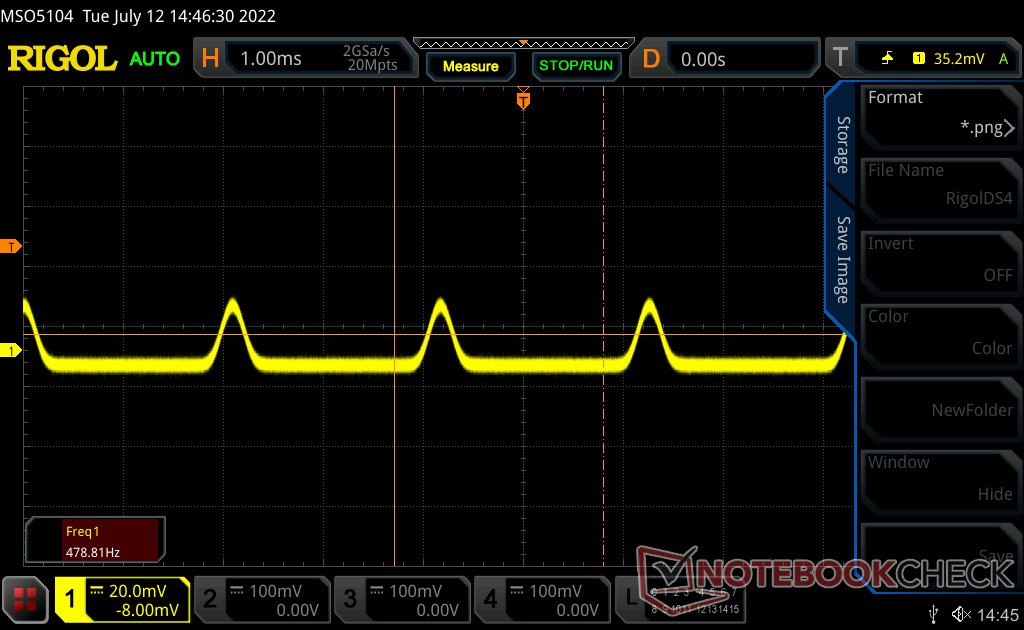
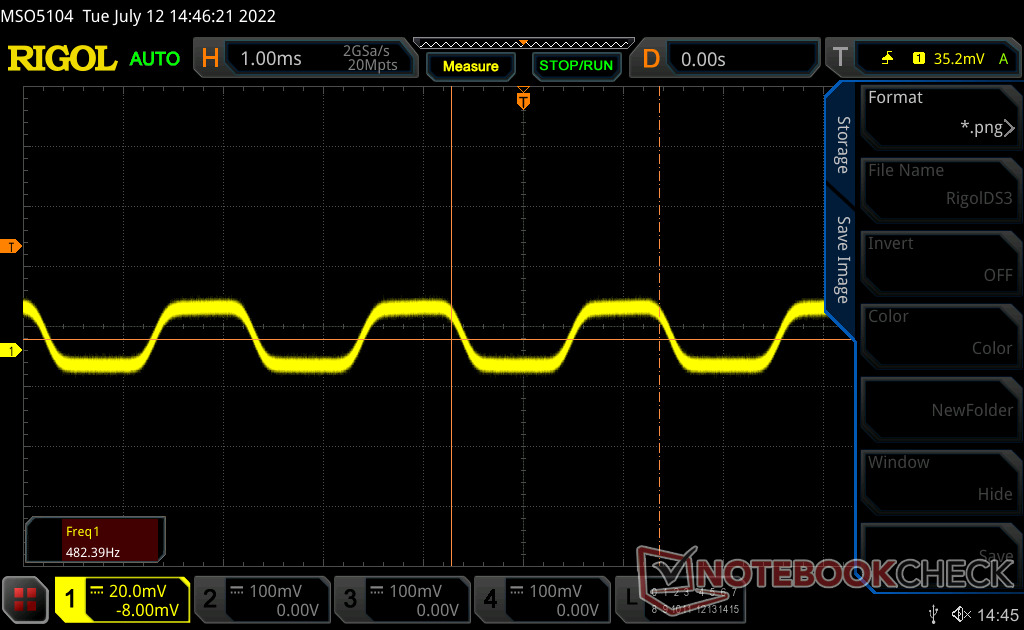
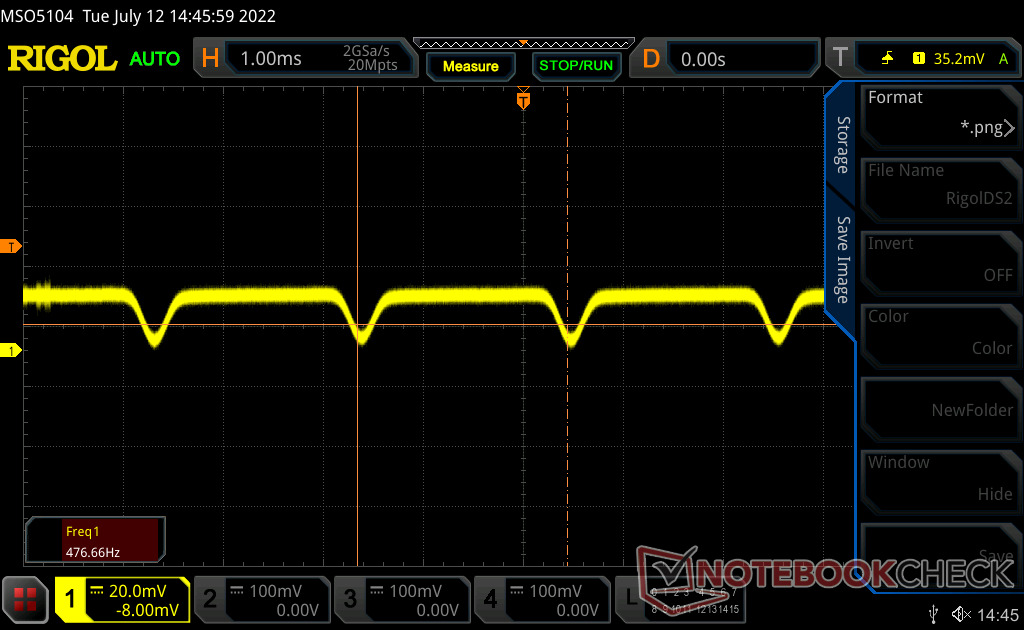
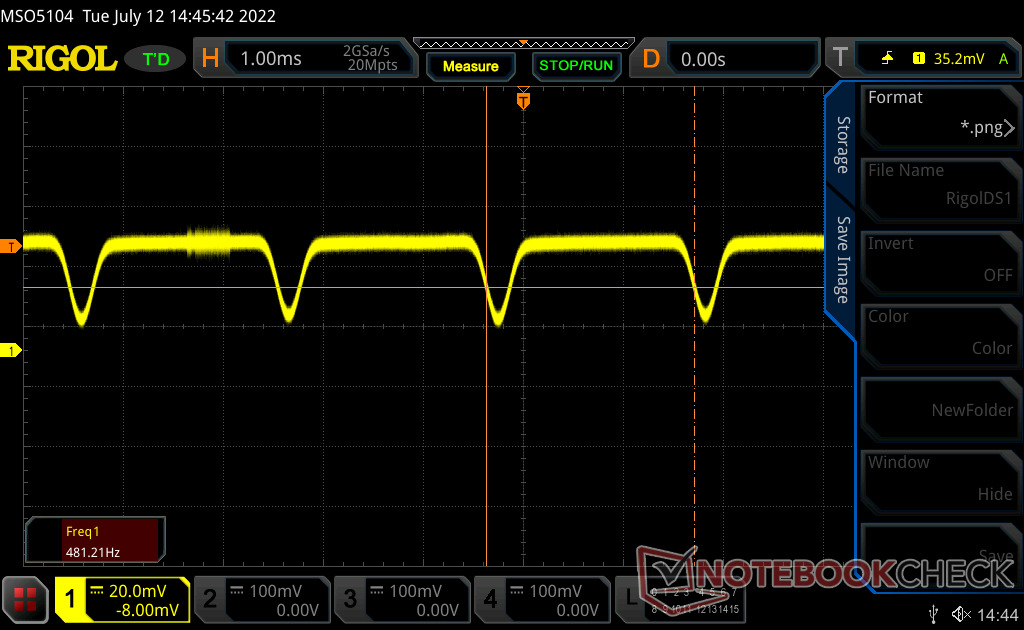
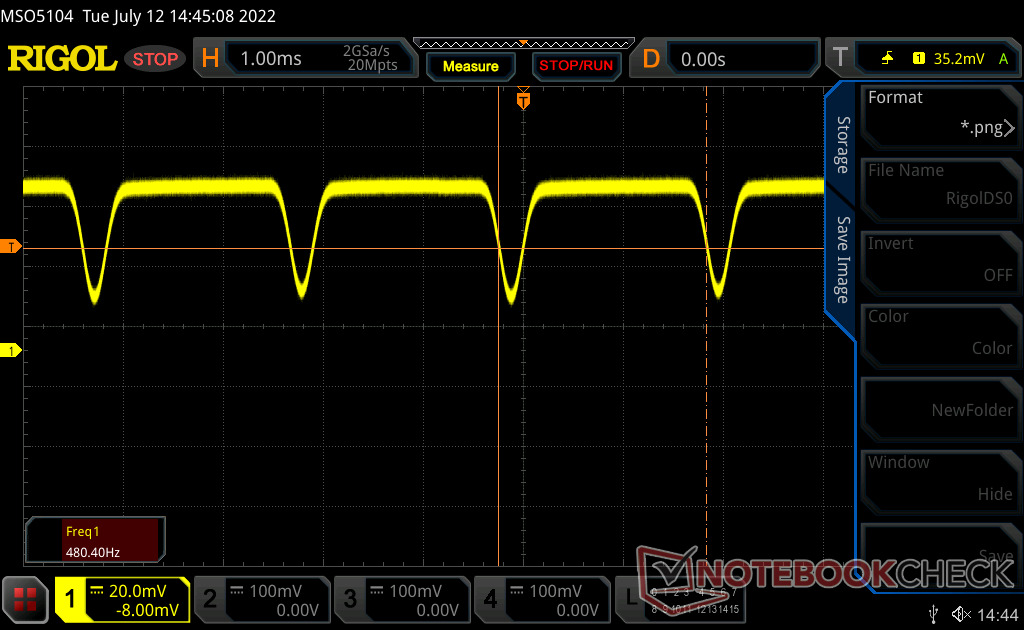
Em segundo lugar, o painel exibe cintilação a 480 Hz em todos os níveis de luminosidade, incluindo a configuração 100%. Registramos resultados similares em muitos recente Asus Vivobook e também os laptops OLED Zenbook. Se seus olhos são sensíveis à cintilação na tela, então talvez seja melhor baixar o brilho ou evitar o uso do GE67 por longos períodos
E por último, a tela interna não suporta G-Sync ou sincronia adaptativa
Além dos inconvenientes acima, o painel QHD OLED 240 Hz oferece definitivamente uma das experiências OLED mais suaves que já vimos quando jogávamos. Os painéis OLED mais antigos eram limitados a 60 Hz, o que, embora perfeitamente adequado para fins de edição, seria inapetente para os jogadores entusiastas. A MSI moldou o visor para fins de jogos e menos para edição ou para profissionais aqui.
| |||||||||||||||||||||||||
iluminação: 99 %
iluminação com acumulador: 356.1 cd/m²
Contraste: ∞:1 (Preto: 0 cd/m²)
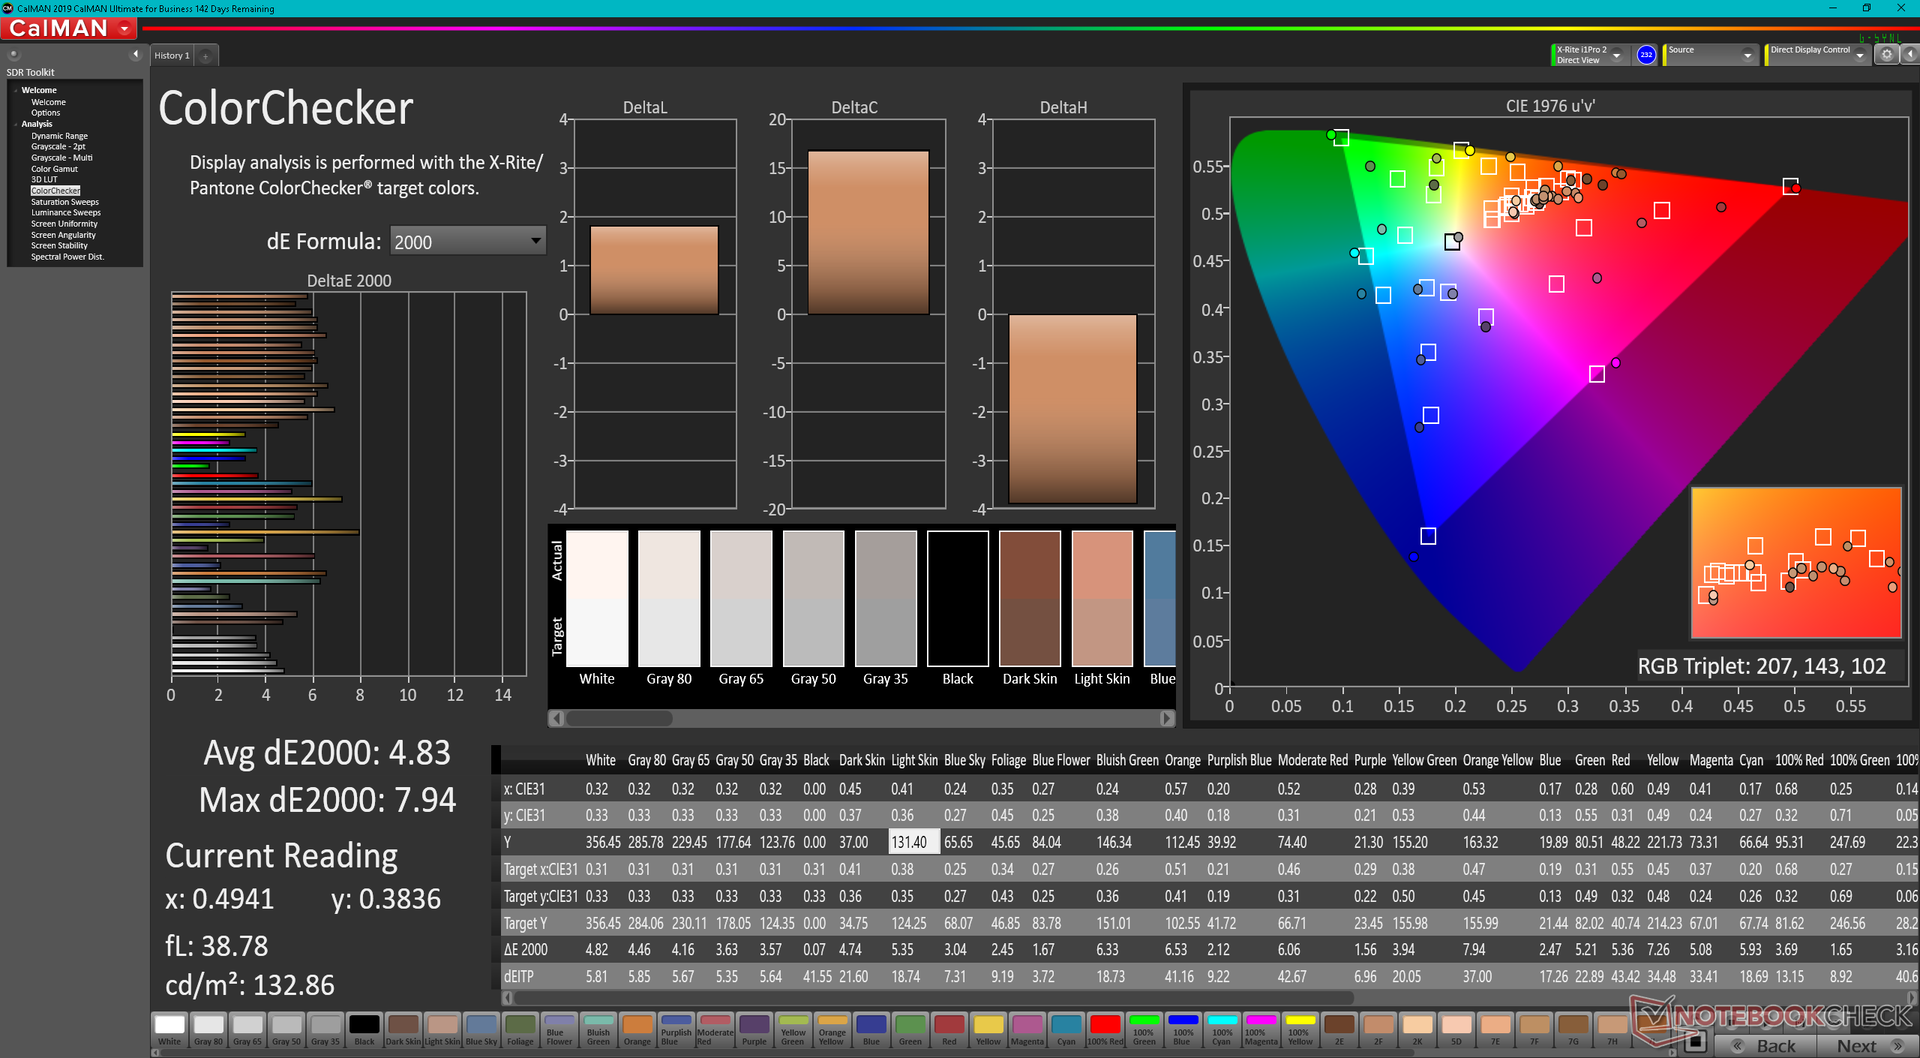
ΔE ColorChecker Calman: 4.83 | ∀{0.5-29.43 Ø4.71}
ΔE Greyscale Calman: 3.1 | ∀{0.09-98 Ø4.96}
75.2% AdobeRGB 1998 (Argyll 3D)
89.7% sRGB (Argyll 3D)
71.7% Display P3 (Argyll 3D)
Gamma: 2.2
CCT: 5938 K
| MSI GE67 HX 12UGS Samsung ATNA562P02-0, OLED, 1920x1080, 15.6" | MSI Raider GE66 12UHS AUO51EB, IPS, 3840x2160, 15.6" | MSI Vector GP66 12UGS BOE NE156FHM-NZ3, IPS, 1920x1080, 15.6" | Asus ROG Strix Scar 15 G533ZW-LN106WS BOE CQ NE156QHM-NZ2, IPS-level, 2560x1440, 15.6" | Alienware m15 R6, i7-11800H RTX 3080 AU Optronics AUO9092 (B156HAN), IPS, 1920x1080, 15.6" | Razer Blade 15 2022 Sharp LQ156T1JW03, IPS, 2560x1440, 15.6" | |
|---|---|---|---|---|---|---|
| Display | 16% | 2% | 19% | 5% | 21% | |
| Display P3 Coverage (%) | 71.7 | 80.4 12% | 70.1 -2% | 96.2 34% | 74.1 3% | 99.1 38% |
| sRGB Coverage (%) | 89.7 | 98.4 10% | 99.5 11% | 99.9 11% | 99.5 11% | 99.9 11% |
| AdobeRGB 1998 Coverage (%) | 75.2 | 94.7 26% | 72.1 -4% | 84.5 12% | 75.7 1% | 86.8 15% |
| Response Times | -5260% | -2260% | -2134% | -1160% | -4230% | |
| Response Time Grey 50% / Grey 80% * (ms) | 0.25 ? | 18.8 ? -7420% | 5.8 ? -2220% | 7.86 ? -3044% 4.21 ? -1584% | 2.8 -1020% | 14.4 ? -5660% |
| Response Time Black / White * (ms) | 0.4 ? | 12.8 ? -3100% | 9.6 ? -2300% | 7.5 ? -1775% | 5.6 -1300% | 11.6 ? -2800% |
| PWM Frequency (Hz) | 480.4 ? | |||||
| Screen | -1% | 6% | 9% | 6% | 15% | |
| Brightness middle (cd/m²) | 356.1 | 351 -1% | 353.1 -1% | 346 -3% | 359 1% | 286 -20% |
| Brightness (cd/m²) | 358 | 347 -3% | 325 -9% | 329 -8% | 344 -4% | 271 -24% |
| Brightness Distribution (%) | 99 | 90 -9% | 85 -14% | 91 -8% | 85 -14% | 89 -10% |
| Black Level * (cd/m²) | 0.35 | 0.38 | 0.59 | 0.35 | 0.25 | |
| Colorchecker dE 2000 * | 4.83 | 2.54 47% | 2.24 54% | 3.06 37% | 3.3 32% | 2.74 43% |
| Colorchecker dE 2000 max. * | 7.94 | 8.36 -5% | 5 37% | 5.81 27% | 4.84 39% | 5.21 34% |
| Greyscale dE 2000 * | 3.1 | 4.1 -32% | 4 -29% | 3.66 -18% | 1.1 65% | |
| Gamma | 2.2 100% | 2.089 105% | 2.24 98% | 2.12 104% | 2.43 91% | 2.2 100% |
| CCT | 5938 109% | 7036 92% | 6864 95% | 7021 93% | 5896 110% | 6408 101% |
| Contrast (:1) | 1003 | 929 | 586 | 1026 | 1144 | |
| Colorchecker dE 2000 calibrated * | 0.67 | 1.02 | 2.57 | 3.28 | 2.52 | |
| Média Total (Programa/Configurações) | -1748% /
-952% | -751% /
-407% | -702% /
-573% | -383% /
-206% | -1398% /
-755% |
* ... menor é melhor
Exibir tempos de resposta
| ↔ Tempo de resposta preto para branco | ||
|---|---|---|
| 0.4 ms ... ascensão ↗ e queda ↘ combinadas | ↗ 0.2 ms ascensão | 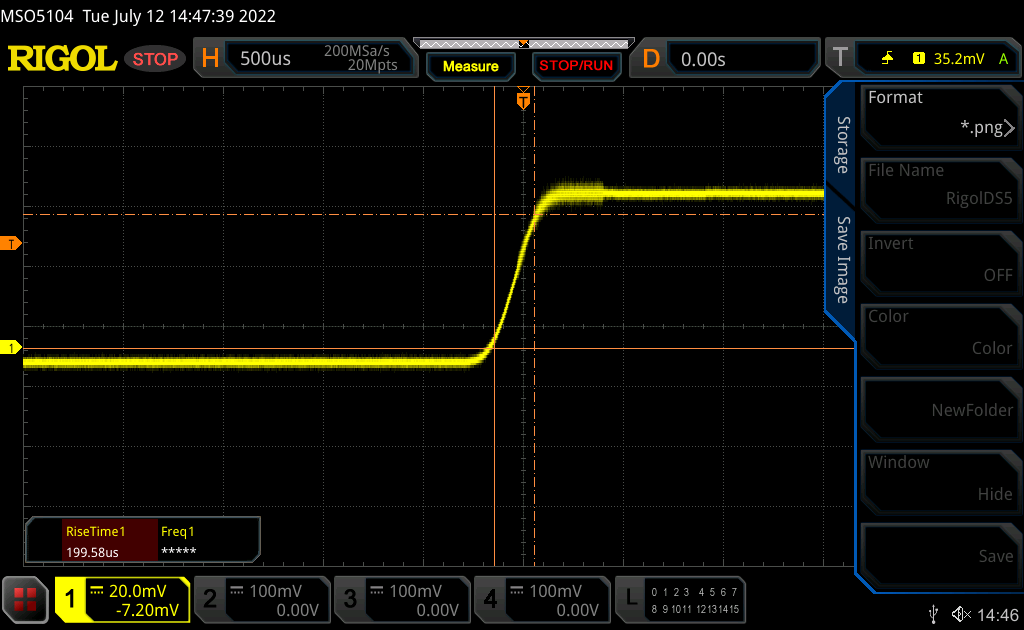 |
| ↘ 0.2 ms queda | ||
| A tela mostra taxas de resposta muito rápidas em nossos testes e deve ser muito adequada para jogos em ritmo acelerado. Em comparação, todos os dispositivos testados variam de 0.1 (mínimo) a 240 (máximo) ms. » 0 % de todos os dispositivos são melhores. Isso significa que o tempo de resposta medido é melhor que a média de todos os dispositivos testados (19.8 ms). | ||
| ↔ Tempo de resposta 50% cinza a 80% cinza | ||
| 0.25 ms ... ascensão ↗ e queda ↘ combinadas | ↗ 0.13 ms ascensão | 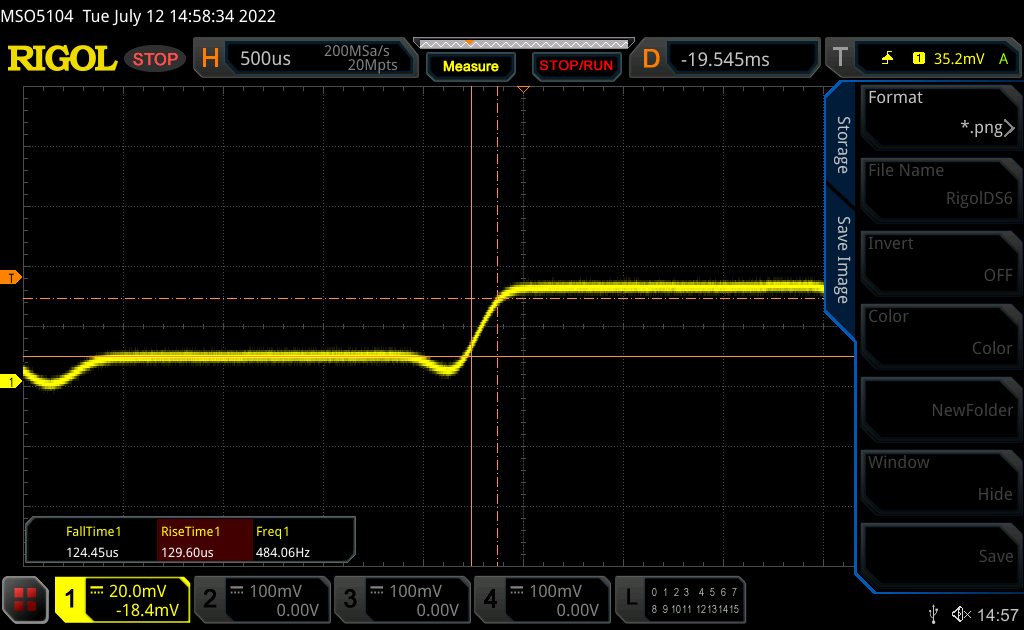 |
| ↘ 0.12 ms queda | ||
| A tela mostra taxas de resposta muito rápidas em nossos testes e deve ser muito adequada para jogos em ritmo acelerado. Em comparação, todos os dispositivos testados variam de 0.165 (mínimo) a 636 (máximo) ms. » 0 % de todos os dispositivos são melhores. Isso significa que o tempo de resposta medido é melhor que a média de todos os dispositivos testados (31 ms). | ||
Cintilação da tela / PWM (modulação por largura de pulso)
| Tela tremeluzindo/PWM detectado | 480.4 Hz | ≤ 100 % configuração de brilho |  |
A luz de fundo da tela pisca em 480.4 Hz (pior caso, por exemplo, utilizando PWM) Cintilação detectada em uma configuração de brilho de 100 % e abaixo. Não deve haver cintilação ou PWM acima desta configuração de brilho. A frequência de 480.4 Hz é relativamente alta, portanto, a maioria dos usuários sensíveis ao PWM não deve notar nenhuma oscilação. No entanto, há relatos de que alguns usuários ainda são sensíveis ao PWM em 500 Hz e acima, portanto, esteja atento. [pwm_comparison] Em comparação: 52 % de todos os dispositivos testados não usam PWM para escurecer a tela. Se PWM foi detectado, uma média de 7757 (mínimo: 5 - máximo: 343500) Hz foi medida. | |||

Desempenho - 16 Núcleos e 24 Roscas
Condições de teste
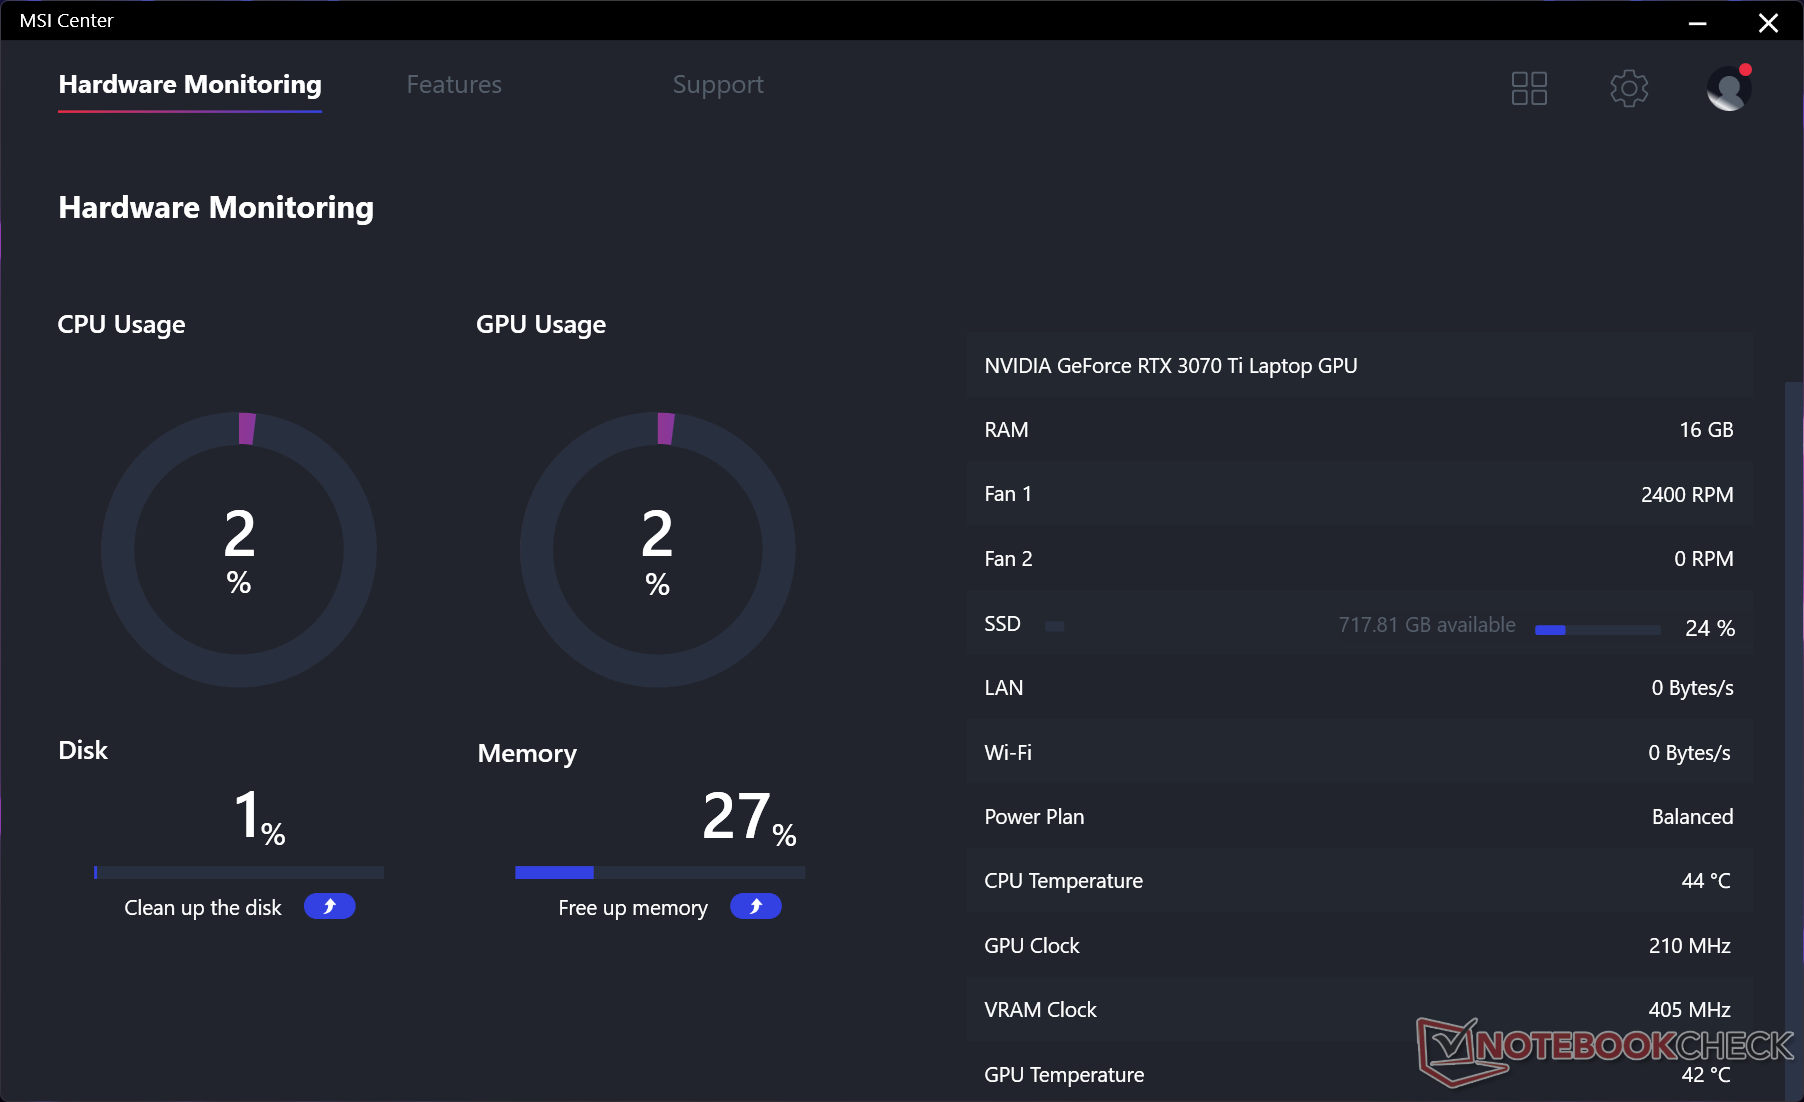
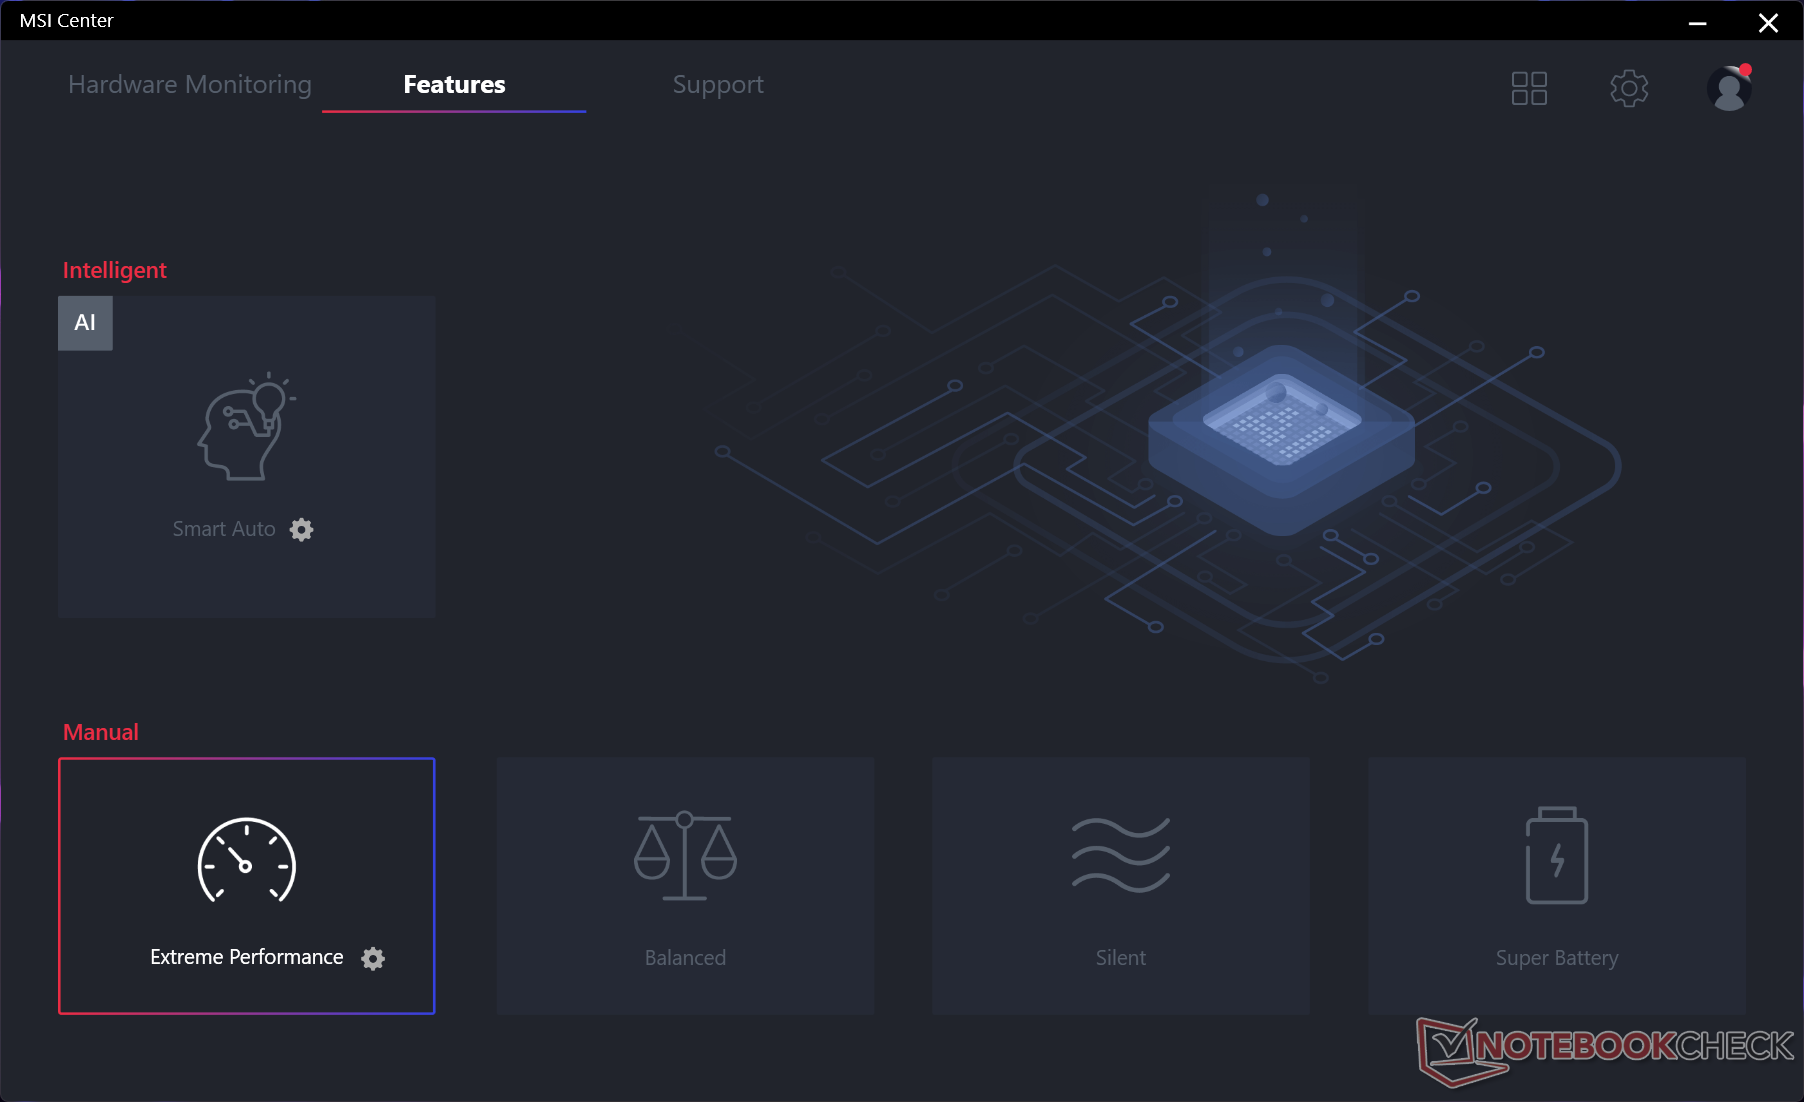
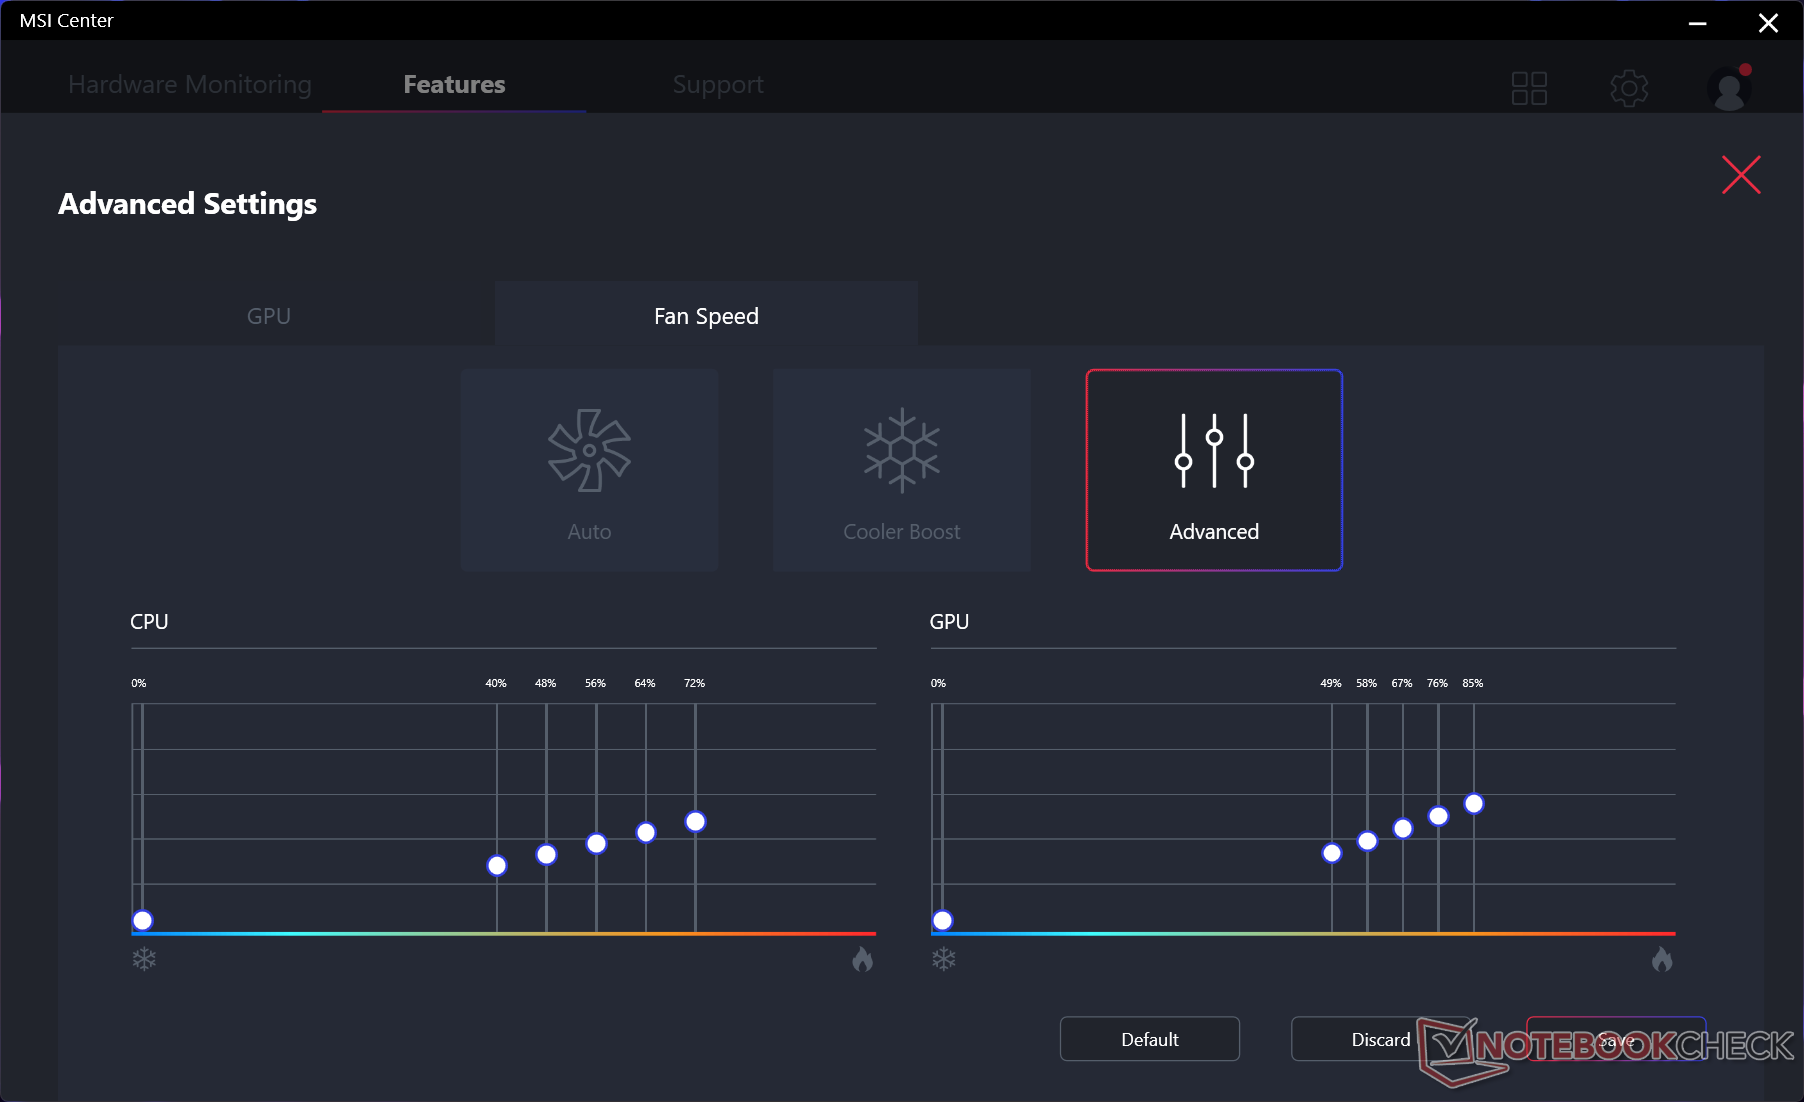
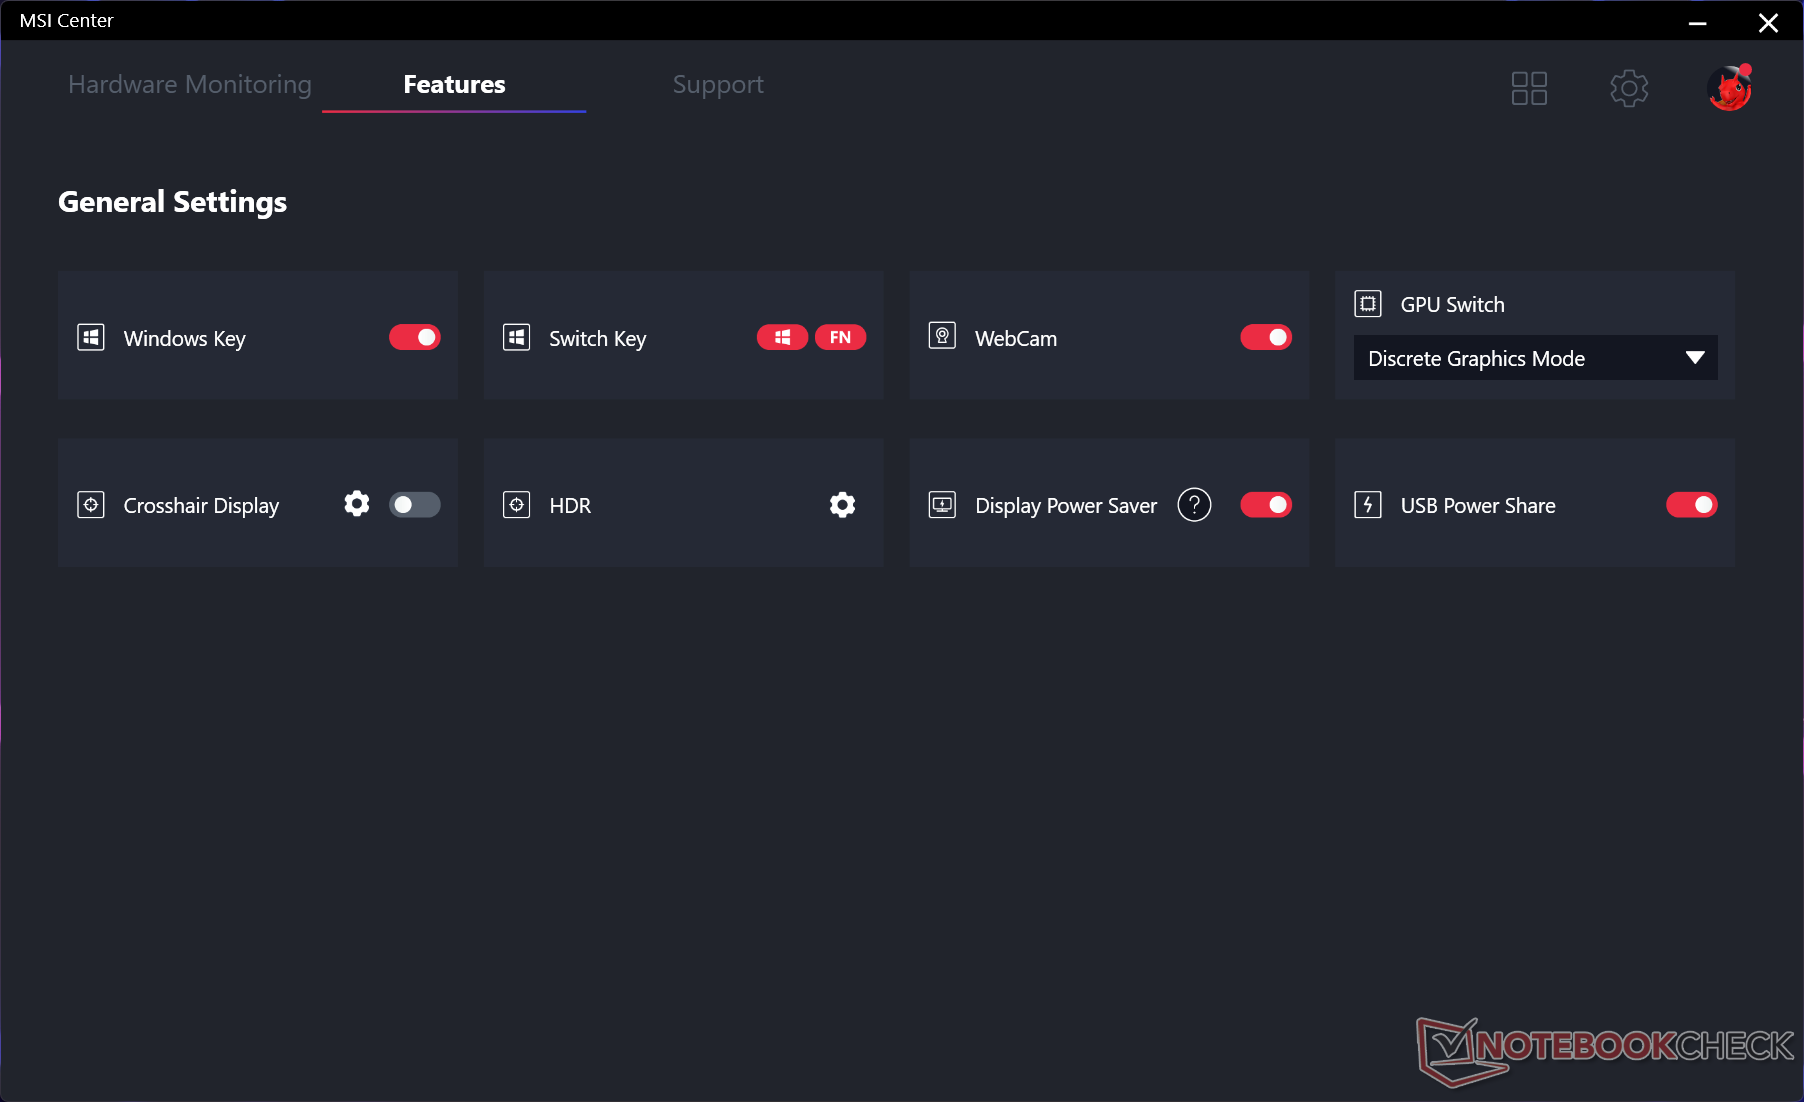
Ajustamos nossa unidade para o modo Performance via Windows, modo Performance Extrema via MSI Center, e a GPU discreta ativa em vez do modo MSHybrid antes de executar quaisquer benchmarks abaixo. Recomendamos que os usuários se familiarizem com o software pré-instalado do MSI Center, uma vez que as principais características de desempenho e auxiliares são alternadas aqui.
Processador
ONúcleo i7-12800HX é facilmente um dos destaques do GE67 HX. O desempenho bruto multi-fio é aproximadamente 25% mais rápido do que oNúcleo i9-12900HK no 1T2022 GE66 e este delta é ainda maior quando comparado com o 10º gênero Núcleo i9-10980HK no GE66 original de 2020. Ele supera facilmente qualquer processador móvel na linha Zen 3 da AMD. O Ryzen 9 5900HXpor exemplo, é mais lento em 40 a 45% em cargas com múltiplas roscas
A sustentabilidade do desempenho também é muito boa, sem grandes quedas nas taxas do relógio ao longo do tempo, mesmo quando estressado por longos períodos
O desempenho de rosca única permanece similar ao Core i9-12900HK apesar de suas diferenças na contagem do núcleo (16 vs. 14) e na contagem de roscas (24 vs. 20).
Cinebench R15 Multi Loop
Cinebench R23: Multi Core | Single Core
Cinebench R15: CPU Multi 64Bit | CPU Single 64Bit
Blender: v2.79 BMW27 CPU
7-Zip 18.03: 7z b 4 | 7z b 4 -mmt1
Geekbench 5.5: Multi-Core | Single-Core
HWBOT x265 Benchmark v2.2: 4k Preset
LibreOffice : 20 Documents To PDF
R Benchmark 2.5: Overall mean
| Cinebench R20 / CPU (Multi Core) | |
| Intel Core i9-12900K | |
| MSI GE67 HX 12UGS | |
| Média Intel Core i7-12800HX (n=1) | |
| Eurocom Raptor X15 | |
| MSI GE76 Raider | |
| Schenker XMG Neo 15 (i7-12700H, RTX 3080 Ti) | |
| MSI Raider GE66 12UHS | |
| Asus ROG Strix Scar 15 G533zm | |
| Schenker XMG Apex 15 NH57E PS | |
| MSI Delta 15 A5EFK | |
| Eurocom Sky X4C i9-9900KS | |
| Dell G5 15 SE 5505 P89F | |
| Asus Zephyrus S15 GX502L | |
| MSI GE66 Raider 10SFS | |
| Cinebench R20 / CPU (Single Core) | |
| Intel Core i9-12900K | |
| Eurocom Raptor X15 | |
| MSI GE76 Raider | |
| Asus ROG Strix Scar 15 G533zm | |
| MSI Raider GE66 12UHS | |
| Schenker XMG Neo 15 (i7-12700H, RTX 3080 Ti) | |
| MSI GE67 HX 12UGS | |
| Média Intel Core i7-12800HX (n=1) | |
| MSI Delta 15 A5EFK | |
| Schenker XMG Apex 15 NH57E PS | |
| Eurocom Sky X4C i9-9900KS | |
| Dell G5 15 SE 5505 P89F | |
| MSI GE66 Raider 10SFS | |
| Asus Zephyrus S15 GX502L | |
| Cinebench R23 / Multi Core | |
| Intel Core i9-12900K | |
| MSI GE67 HX 12UGS | |
| Média Intel Core i7-12800HX (n=1) | |
| MSI GE76 Raider | |
| Schenker XMG Neo 15 (i7-12700H, RTX 3080 Ti) | |
| Eurocom Raptor X15 | |
| Asus ROG Strix Scar 15 G533zm | |
| MSI Raider GE66 12UHS | |
| Schenker XMG Apex 15 NH57E PS | |
| MSI Delta 15 A5EFK | |
| Cinebench R23 / Single Core | |
| Intel Core i9-12900K | |
| MSI GE76 Raider | |
| MSI Raider GE66 12UHS | |
| MSI GE67 HX 12UGS | |
| Média Intel Core i7-12800HX (n=1) | |
| Schenker XMG Neo 15 (i7-12700H, RTX 3080 Ti) | |
| Eurocom Raptor X15 | |
| Asus ROG Strix Scar 15 G533zm | |
| MSI Delta 15 A5EFK | |
| Schenker XMG Apex 15 NH57E PS | |
| Cinebench R15 / CPU Multi 64Bit | |
| Intel Core i9-12900K | |
| MSI GE67 HX 12UGS | |
| Média Intel Core i7-12800HX (n=1) | |
| Asus ROG Strix Scar 15 G533zm | |
| MSI GE76 Raider | |
| Schenker XMG Neo 15 (i7-12700H, RTX 3080 Ti) | |
| MSI Raider GE66 12UHS | |
| MSI Delta 15 A5EFK | |
| Schenker XMG Apex 15 NH57E PS | |
| Dell G5 15 SE 5505 P89F | |
| Eurocom Sky X4C i9-9900KS | |
| MSI GE66 Raider 10SFS | |
| Asus Zephyrus S15 GX502L | |
| Cinebench R15 / CPU Single 64Bit | |
| Intel Core i9-12900K | |
| Asus ROG Strix Scar 15 G533zm | |
| MSI GE76 Raider | |
| MSI Raider GE66 12UHS | |
| Schenker XMG Neo 15 (i7-12700H, RTX 3080 Ti) | |
| MSI GE67 HX 12UGS | |
| Média Intel Core i7-12800HX (n=1) | |
| MSI Delta 15 A5EFK | |
| Schenker XMG Apex 15 NH57E PS | |
| Eurocom Sky X4C i9-9900KS | |
| MSI GE66 Raider 10SFS | |
| Asus Zephyrus S15 GX502L | |
| Dell G5 15 SE 5505 P89F | |
| Blender / v2.79 BMW27 CPU | |
| MSI GE66 Raider 10SFS | |
| Dell G5 15 SE 5505 P89F | |
| Asus Zephyrus S15 GX502L | |
| Eurocom Sky X4C i9-9900KS | |
| Schenker XMG Apex 15 NH57E PS | |
| MSI Delta 15 A5EFK | |
| MSI Raider GE66 12UHS | |
| Eurocom Raptor X15 | |
| MSI GE76 Raider | |
| Schenker XMG Neo 15 (i7-12700H, RTX 3080 Ti) | |
| Asus ROG Strix Scar 15 G533zm | |
| MSI GE67 HX 12UGS | |
| Média Intel Core i7-12800HX (n=1) | |
| Intel Core i9-12900K | |
| 7-Zip 18.03 / 7z b 4 | |
| Intel Core i9-12900K | |
| MSI GE67 HX 12UGS | |
| Média Intel Core i7-12800HX (n=1) | |
| Asus ROG Strix Scar 15 G533zm | |
| MSI GE76 Raider | |
| Schenker XMG Neo 15 (i7-12700H, RTX 3080 Ti) | |
| MSI Raider GE66 12UHS | |
| Eurocom Raptor X15 | |
| MSI Delta 15 A5EFK | |
| Schenker XMG Apex 15 NH57E PS | |
| Eurocom Sky X4C i9-9900KS | |
| Dell G5 15 SE 5505 P89F | |
| Asus Zephyrus S15 GX502L | |
| MSI GE66 Raider 10SFS | |
| 7-Zip 18.03 / 7z b 4 -mmt1 | |
| Intel Core i9-12900K | |
| Eurocom Raptor X15 | |
| MSI GE76 Raider | |
| Asus ROG Strix Scar 15 G533zm | |
| MSI Raider GE66 12UHS | |
| Schenker XMG Neo 15 (i7-12700H, RTX 3080 Ti) | |
| MSI Delta 15 A5EFK | |
| Eurocom Sky X4C i9-9900KS | |
| MSI GE67 HX 12UGS | |
| Média Intel Core i7-12800HX (n=1) | |
| Schenker XMG Apex 15 NH57E PS | |
| MSI GE66 Raider 10SFS | |
| Asus Zephyrus S15 GX502L | |
| Dell G5 15 SE 5505 P89F | |
| Geekbench 5.5 / Multi-Core | |
| Intel Core i9-12900K | |
| MSI GE67 HX 12UGS | |
| Média Intel Core i7-12800HX (n=1) | |
| MSI Raider GE66 12UHS | |
| MSI GE76 Raider | |
| Asus ROG Strix Scar 15 G533zm | |
| Schenker XMG Neo 15 (i7-12700H, RTX 3080 Ti) | |
| Eurocom Raptor X15 | |
| Eurocom Sky X4C i9-9900KS | |
| MSI Delta 15 A5EFK | |
| Schenker XMG Apex 15 NH57E PS | |
| MSI GE66 Raider 10SFS | |
| Dell G5 15 SE 5505 P89F | |
| Asus Zephyrus S15 GX502L | |
| Geekbench 5.5 / Single-Core | |
| Intel Core i9-12900K | |
| Eurocom Raptor X15 | |
| MSI GE76 Raider | |
| MSI Raider GE66 12UHS | |
| Asus ROG Strix Scar 15 G533zm | |
| MSI GE67 HX 12UGS | |
| Média Intel Core i7-12800HX (n=1) | |
| Schenker XMG Neo 15 (i7-12700H, RTX 3080 Ti) | |
| MSI Delta 15 A5EFK | |
| Schenker XMG Apex 15 NH57E PS | |
| Eurocom Sky X4C i9-9900KS | |
| MSI GE66 Raider 10SFS | |
| Asus Zephyrus S15 GX502L | |
| Dell G5 15 SE 5505 P89F | |
| HWBOT x265 Benchmark v2.2 / 4k Preset | |
| Intel Core i9-12900K | |
| MSI GE67 HX 12UGS | |
| Média Intel Core i7-12800HX (n=1) | |
| Asus ROG Strix Scar 15 G533zm | |
| Schenker XMG Neo 15 (i7-12700H, RTX 3080 Ti) | |
| MSI GE76 Raider | |
| MSI Raider GE66 12UHS | |
| MSI Delta 15 A5EFK | |
| Schenker XMG Apex 15 NH57E PS | |
| Eurocom Sky X4C i9-9900KS | |
| Eurocom Raptor X15 | |
| Asus Zephyrus S15 GX502L | |
| MSI GE66 Raider 10SFS | |
| Dell G5 15 SE 5505 P89F | |
Cinebench R23: Multi Core | Single Core
Cinebench R15: CPU Multi 64Bit | CPU Single 64Bit
Blender: v2.79 BMW27 CPU
7-Zip 18.03: 7z b 4 | 7z b 4 -mmt1
Geekbench 5.5: Multi-Core | Single-Core
HWBOT x265 Benchmark v2.2: 4k Preset
LibreOffice : 20 Documents To PDF
R Benchmark 2.5: Overall mean
* ... menor é melhor
AIDA64: FP32 Ray-Trace | FPU Julia | CPU SHA3 | CPU Queen | FPU SinJulia | FPU Mandel | CPU AES | CPU ZLib | FP64 Ray-Trace | CPU PhotoWorxx
| Performance rating | |
| Alienware m15 R6, i7-11800H RTX 3080 | |
| MSI GE67 HX 12UGS | |
| Média Intel Core i7-12800HX | |
| Asus ROG Strix Scar 15 G533ZW-LN106WS | |
| MSI Raider GE66 12UHS | |
| MSI Vector GP66 12UGS | |
| Razer Blade 15 2022 | |
| AIDA64 / FP32 Ray-Trace | |
| Alienware m15 R6, i7-11800H RTX 3080 | |
| MSI GE67 HX 12UGS | |
| Média Intel Core i7-12800HX (n=1) | |
| Asus ROG Strix Scar 15 G533ZW-LN106WS | |
| MSI Raider GE66 12UHS | |
| MSI Vector GP66 12UGS | |
| Razer Blade 15 2022 | |
| AIDA64 / FPU Julia | |
| Alienware m15 R6, i7-11800H RTX 3080 | |
| MSI GE67 HX 12UGS | |
| Média Intel Core i7-12800HX (n=1) | |
| Asus ROG Strix Scar 15 G533ZW-LN106WS | |
| MSI Raider GE66 12UHS | |
| MSI Vector GP66 12UGS | |
| Razer Blade 15 2022 | |
| AIDA64 / CPU SHA3 | |
| Alienware m15 R6, i7-11800H RTX 3080 | |
| MSI GE67 HX 12UGS | |
| Média Intel Core i7-12800HX (n=1) | |
| Asus ROG Strix Scar 15 G533ZW-LN106WS | |
| MSI Vector GP66 12UGS | |
| MSI Raider GE66 12UHS | |
| Razer Blade 15 2022 | |
| AIDA64 / CPU Queen | |
| MSI Vector GP66 12UGS | |
| MSI Raider GE66 12UHS | |
| Asus ROG Strix Scar 15 G533ZW-LN106WS | |
| Razer Blade 15 2022 | |
| Alienware m15 R6, i7-11800H RTX 3080 | |
| MSI GE67 HX 12UGS | |
| Média Intel Core i7-12800HX (n=1) | |
| AIDA64 / FPU SinJulia | |
| MSI GE67 HX 12UGS | |
| Média Intel Core i7-12800HX (n=1) | |
| Asus ROG Strix Scar 15 G533ZW-LN106WS | |
| Alienware m15 R6, i7-11800H RTX 3080 | |
| MSI Vector GP66 12UGS | |
| MSI Raider GE66 12UHS | |
| Razer Blade 15 2022 | |
| AIDA64 / FPU Mandel | |
| Alienware m15 R6, i7-11800H RTX 3080 | |
| MSI GE67 HX 12UGS | |
| Média Intel Core i7-12800HX (n=1) | |
| Asus ROG Strix Scar 15 G533ZW-LN106WS | |
| MSI Raider GE66 12UHS | |
| MSI Vector GP66 12UGS | |
| Razer Blade 15 2022 | |
| AIDA64 / CPU AES | |
| Alienware m15 R6, i7-11800H RTX 3080 | |
| MSI GE67 HX 12UGS | |
| Média Intel Core i7-12800HX (n=1) | |
| Asus ROG Strix Scar 15 G533ZW-LN106WS | |
| MSI Vector GP66 12UGS | |
| MSI Raider GE66 12UHS | |
| Razer Blade 15 2022 | |
| AIDA64 / CPU ZLib | |
| MSI GE67 HX 12UGS | |
| Média Intel Core i7-12800HX (n=1) | |
| Asus ROG Strix Scar 15 G533ZW-LN106WS | |
| MSI Vector GP66 12UGS | |
| MSI Raider GE66 12UHS | |
| Razer Blade 15 2022 | |
| Alienware m15 R6, i7-11800H RTX 3080 | |
| AIDA64 / FP64 Ray-Trace | |
| Alienware m15 R6, i7-11800H RTX 3080 | |
| MSI GE67 HX 12UGS | |
| Média Intel Core i7-12800HX (n=1) | |
| Asus ROG Strix Scar 15 G533ZW-LN106WS | |
| MSI Raider GE66 12UHS | |
| MSI Vector GP66 12UGS | |
| Razer Blade 15 2022 | |
| AIDA64 / CPU PhotoWorxx | |
| Razer Blade 15 2022 | |
| MSI Raider GE66 12UHS | |
| Asus ROG Strix Scar 15 G533ZW-LN106WS | |
| MSI GE67 HX 12UGS | |
| Média Intel Core i7-12800HX (n=1) | |
| MSI Vector GP66 12UGS | |
| Alienware m15 R6, i7-11800H RTX 3080 | |
Desempenho do sistema
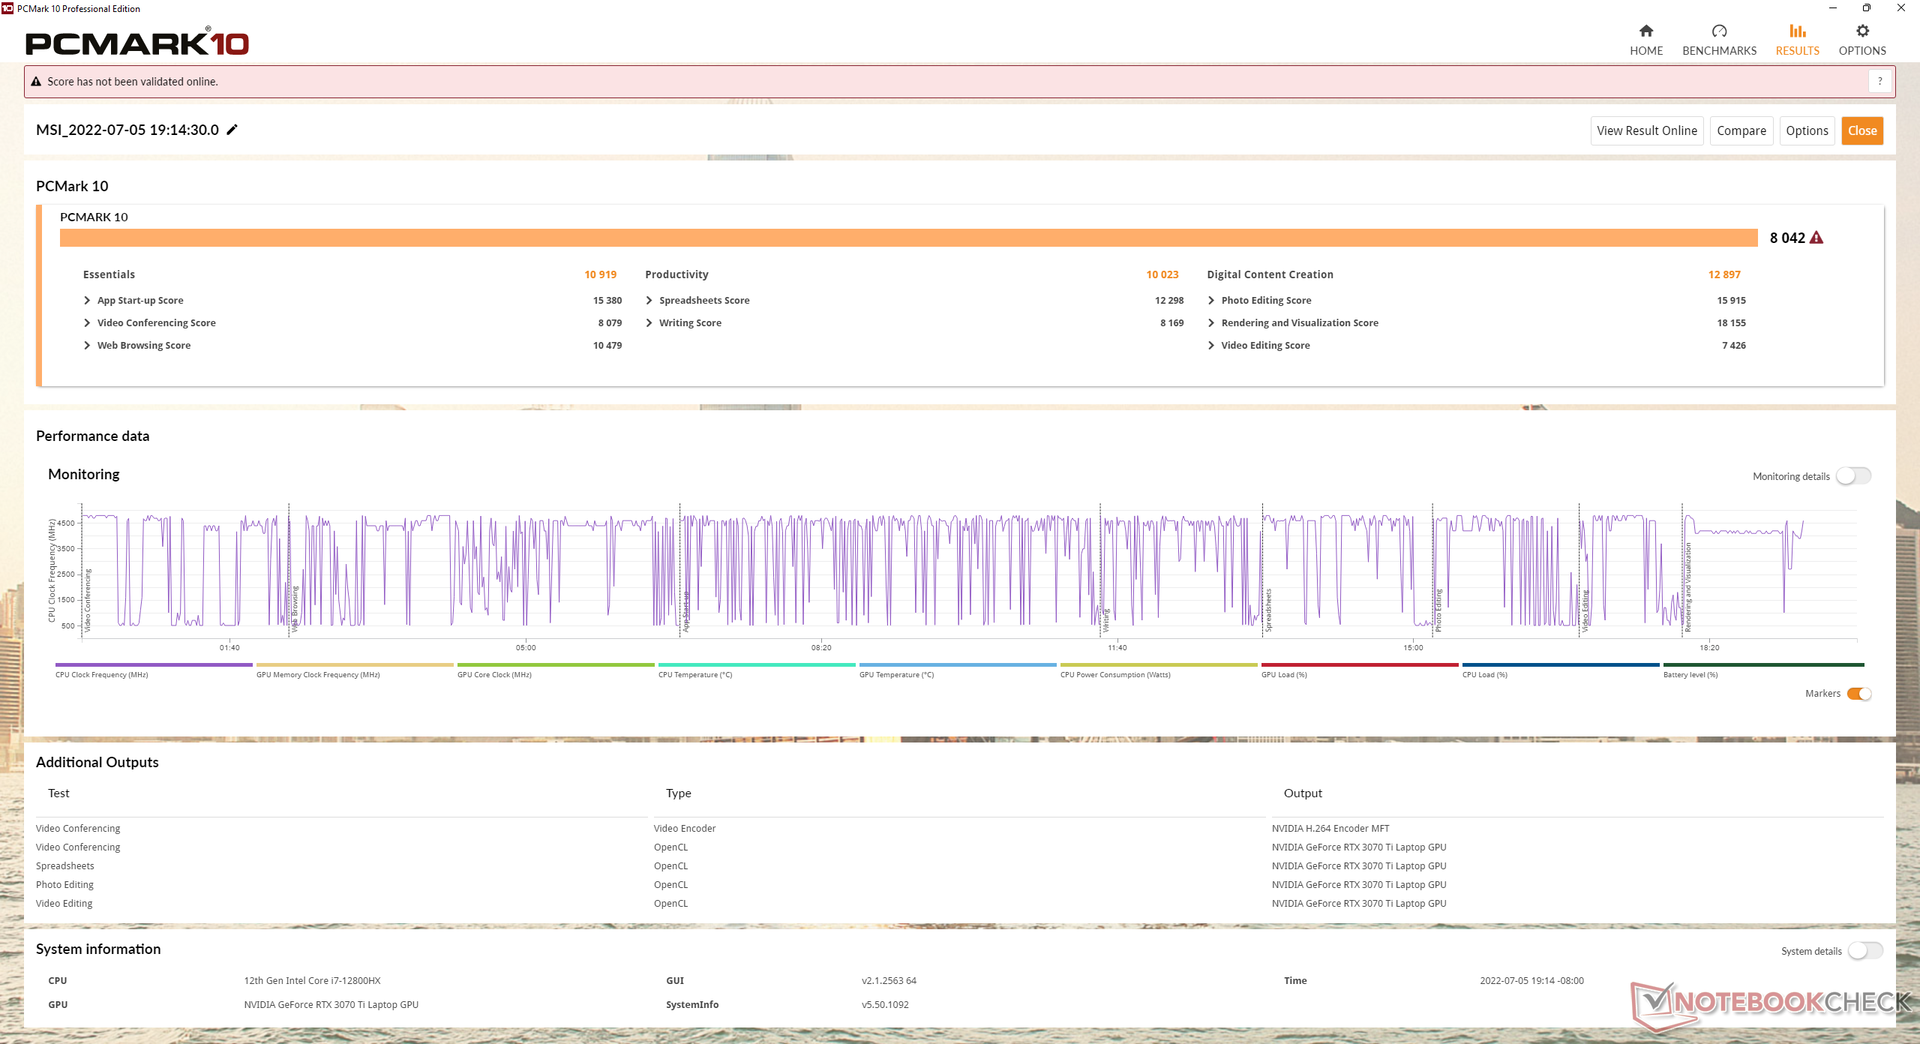
Os resultados do PCMark 10 são alguns dos mais altos em nosso banco de dados com pontuações semelhantes ao que observamos no GE66 mais antigo rodando no Core i9-12900HK mais lento, mas mais rápido GeForce RTX 3080 Ti.
Curiosamente, a assinatura de Criação de Conteúdo Digital cairia de 12897 pontos para apenas 9568 pontos quando no modo MSHybrid.
CrossMark: Overall | Productivity | Creativity | Responsiveness
| PCMark 10 / Score | |
| MSI Raider GE66 12UHS | |
| MSI GE67 HX 12UGS | |
| Média Intel Core i7-12800HX, NVIDIA GeForce RTX 3070 Ti Laptop GPU (n=1) | |
| MSI Vector GP66 12UGS | |
| Asus ROG Strix Scar 15 G533ZW-LN106WS | |
| Razer Blade 15 2022 | |
| Alienware m15 R6, i7-11800H RTX 3080 | |
| PCMark 10 / Essentials | |
| MSI Raider GE66 12UHS | |
| MSI Vector GP66 12UGS | |
| MSI GE67 HX 12UGS | |
| Média Intel Core i7-12800HX, NVIDIA GeForce RTX 3070 Ti Laptop GPU (n=1) | |
| Razer Blade 15 2022 | |
| Asus ROG Strix Scar 15 G533ZW-LN106WS | |
| Alienware m15 R6, i7-11800H RTX 3080 | |
| PCMark 10 / Productivity | |
| Asus ROG Strix Scar 15 G533ZW-LN106WS | |
| MSI Raider GE66 12UHS | |
| MSI Vector GP66 12UGS | |
| MSI GE67 HX 12UGS | |
| Média Intel Core i7-12800HX, NVIDIA GeForce RTX 3070 Ti Laptop GPU (n=1) | |
| Razer Blade 15 2022 | |
| Alienware m15 R6, i7-11800H RTX 3080 | |
| PCMark 10 / Digital Content Creation | |
| MSI GE67 HX 12UGS | |
| Média Intel Core i7-12800HX, NVIDIA GeForce RTX 3070 Ti Laptop GPU (n=1) | |
| MSI Raider GE66 12UHS | |
| MSI Vector GP66 12UGS | |
| Razer Blade 15 2022 | |
| Asus ROG Strix Scar 15 G533ZW-LN106WS | |
| Alienware m15 R6, i7-11800H RTX 3080 | |
| CrossMark / Overall | |
| Asus ROG Strix Scar 15 G533ZW-LN106WS | |
| MSI GE67 HX 12UGS | |
| Média Intel Core i7-12800HX, NVIDIA GeForce RTX 3070 Ti Laptop GPU (n=1) | |
| CrossMark / Productivity | |
| Asus ROG Strix Scar 15 G533ZW-LN106WS | |
| MSI GE67 HX 12UGS | |
| Média Intel Core i7-12800HX, NVIDIA GeForce RTX 3070 Ti Laptop GPU (n=1) | |
| CrossMark / Creativity | |
| Asus ROG Strix Scar 15 G533ZW-LN106WS | |
| MSI GE67 HX 12UGS | |
| Média Intel Core i7-12800HX, NVIDIA GeForce RTX 3070 Ti Laptop GPU (n=1) | |
| CrossMark / Responsiveness | |
| Asus ROG Strix Scar 15 G533ZW-LN106WS | |
| MSI GE67 HX 12UGS | |
| Média Intel Core i7-12800HX, NVIDIA GeForce RTX 3070 Ti Laptop GPU (n=1) | |
| PCMark 10 Score | 8042 pontos | |
Ajuda | ||
| AIDA64 / Memory Copy | |
| MSI Raider GE66 12UHS | |
| Razer Blade 15 2022 | |
| Asus ROG Strix Scar 15 G533ZW-LN106WS | |
| MSI GE67 HX 12UGS | |
| Média Intel Core i7-12800HX (n=1) | |
| MSI Vector GP66 12UGS | |
| Alienware m15 R6, i7-11800H RTX 3080 | |
| AIDA64 / Memory Read | |
| MSI Raider GE66 12UHS | |
| Razer Blade 15 2022 | |
| Asus ROG Strix Scar 15 G533ZW-LN106WS | |
| MSI GE67 HX 12UGS | |
| Média Intel Core i7-12800HX (n=1) | |
| Alienware m15 R6, i7-11800H RTX 3080 | |
| MSI Vector GP66 12UGS | |
| AIDA64 / Memory Write | |
| Razer Blade 15 2022 | |
| MSI Raider GE66 12UHS | |
| Asus ROG Strix Scar 15 G533ZW-LN106WS | |
| MSI GE67 HX 12UGS | |
| Média Intel Core i7-12800HX (n=1) | |
| MSI Vector GP66 12UGS | |
| Alienware m15 R6, i7-11800H RTX 3080 | |
| AIDA64 / Memory Latency | |
| Asus ROG Strix Scar 15 G533ZW-LN106WS | |
| Alienware m15 R6, i7-11800H RTX 3080 | |
| MSI GE67 HX 12UGS | |
| Média Intel Core i7-12800HX (n=1) | |
| MSI Raider GE66 12UHS | |
| MSI Vector GP66 12UGS | |
| Razer Blade 15 2022 | |
* ... menor é melhor
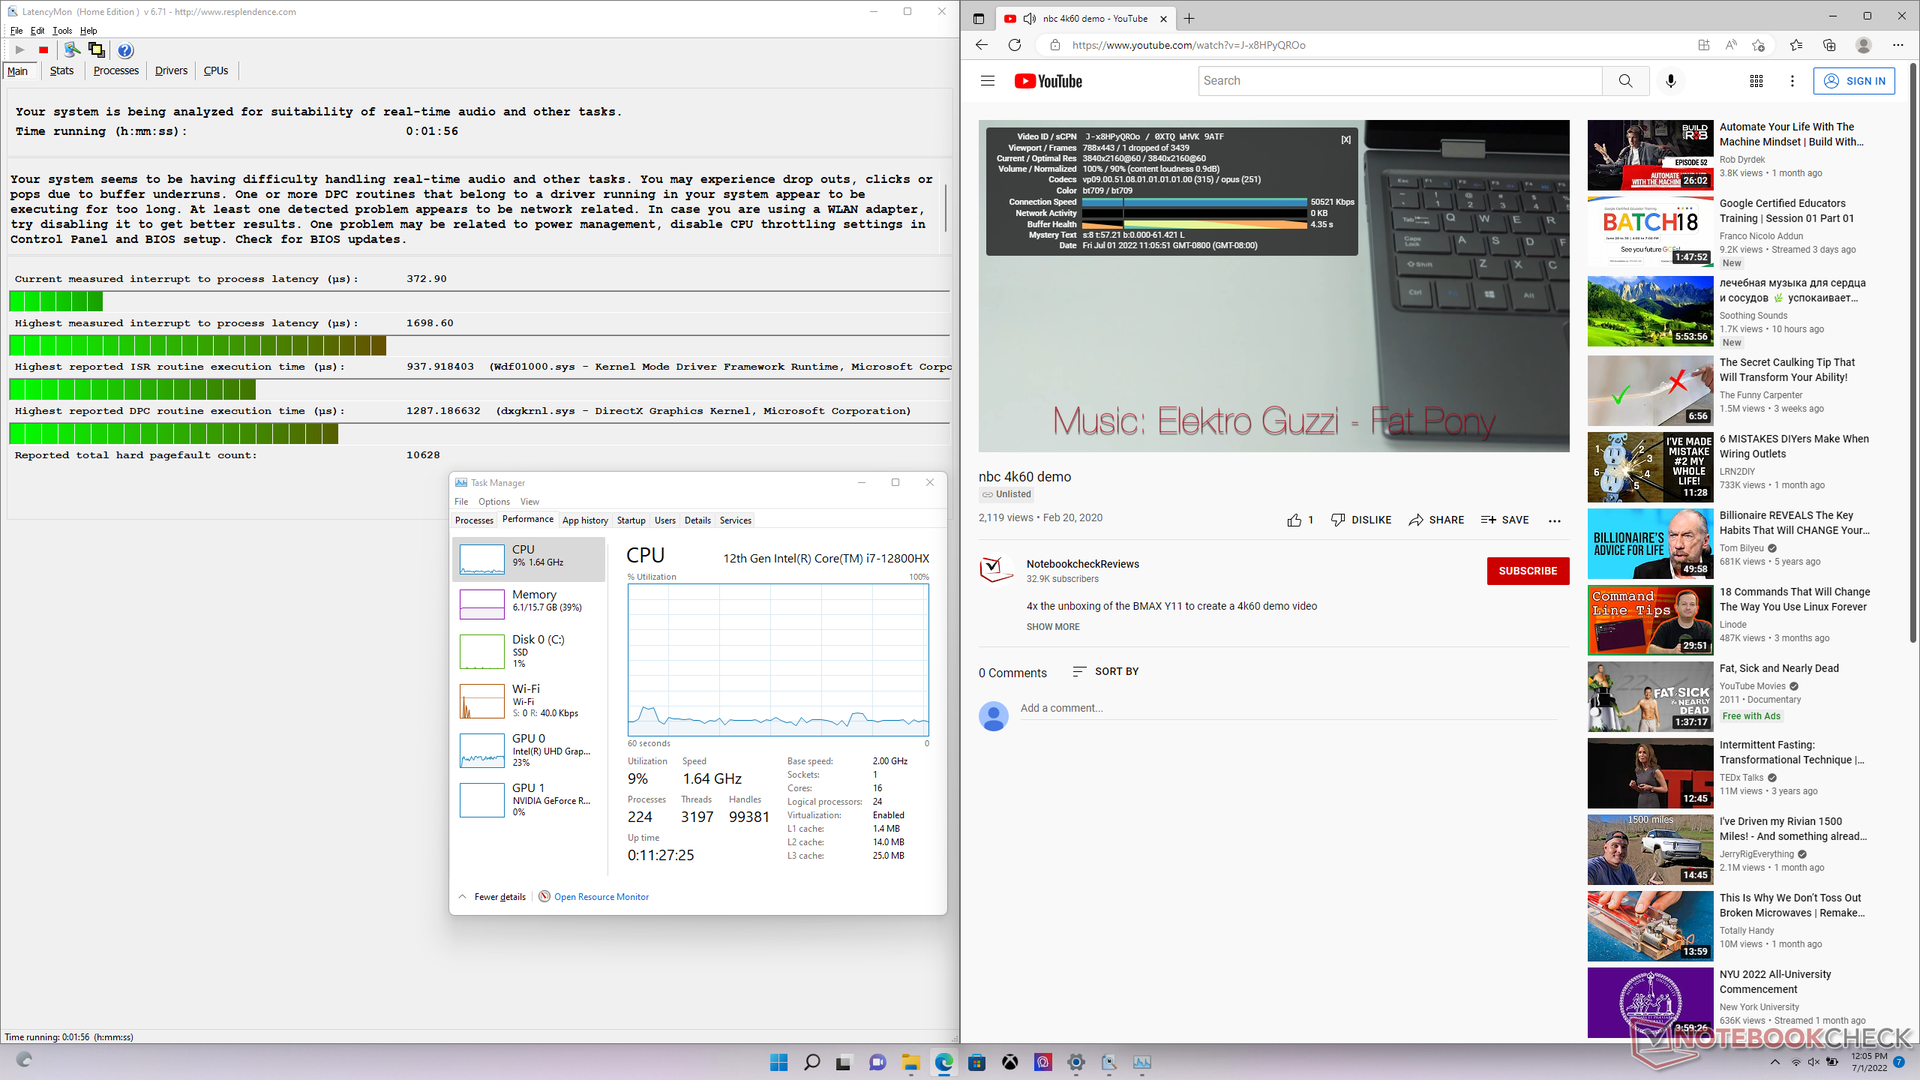
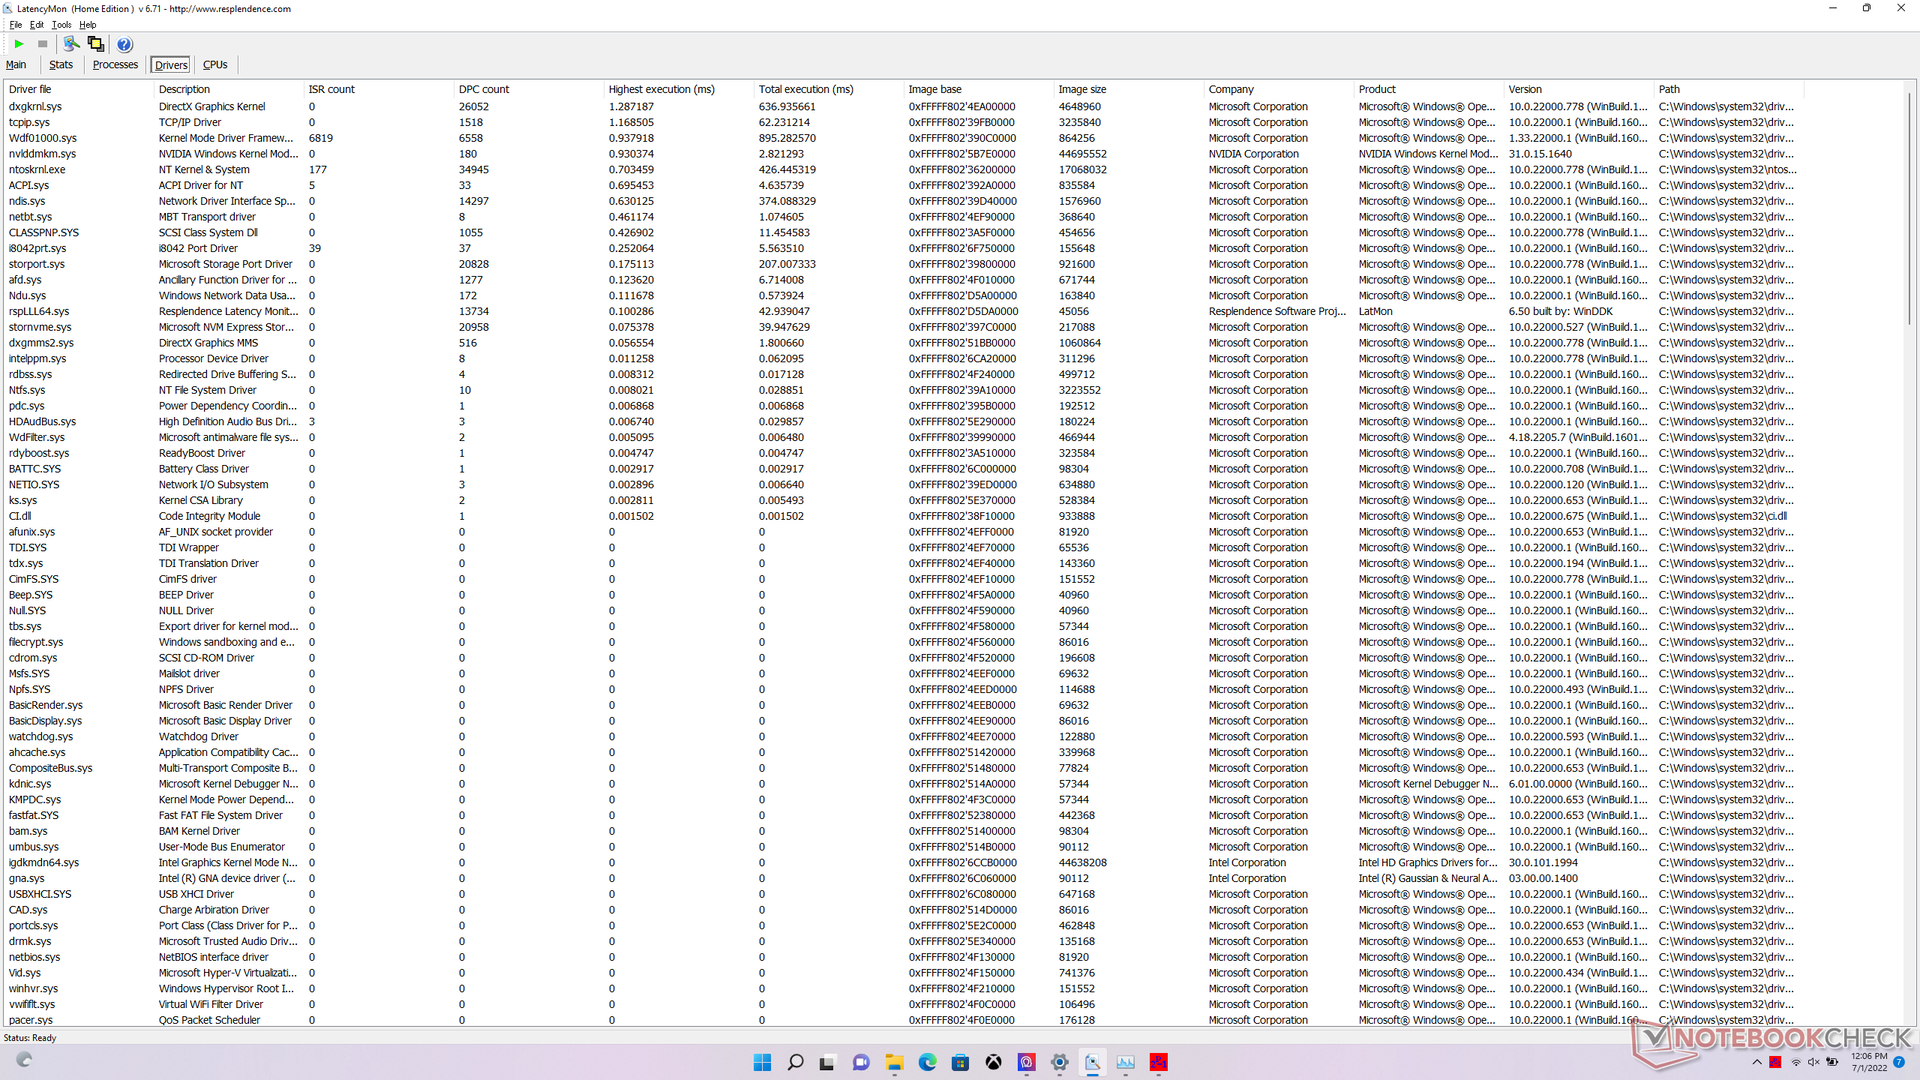
Latência do DPC
LatencyMon revela pequenos problemas de DPC ao abrir várias abas do navegador em nossa página inicial. a reprodução de vídeo de 4K a 60 FPS é de outra forma suave com apenas um frame caído durante nosso teste de vídeo de 60 segundos.
| DPC Latencies / LatencyMon - interrupt to process latency (max), Web, Youtube, Prime95 | |
| MSI Raider GE66 12UHS | |
| MSI Vector GP66 12UGS | |
| MSI GE67 HX 12UGS | |
| Razer Blade 15 2022 | |
| Alienware m15 R6, i7-11800H RTX 3080 | |
| Asus ROG Strix Scar 15 G533ZW-LN106WS | |
* ... menor é melhor
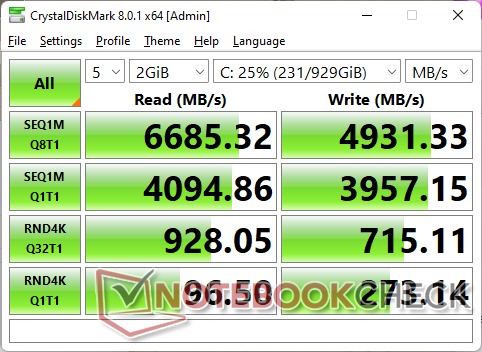
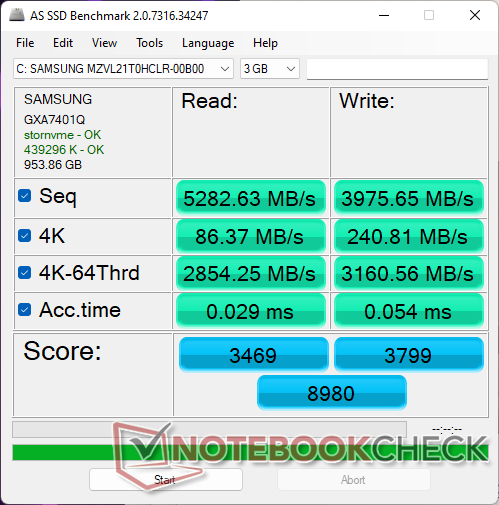
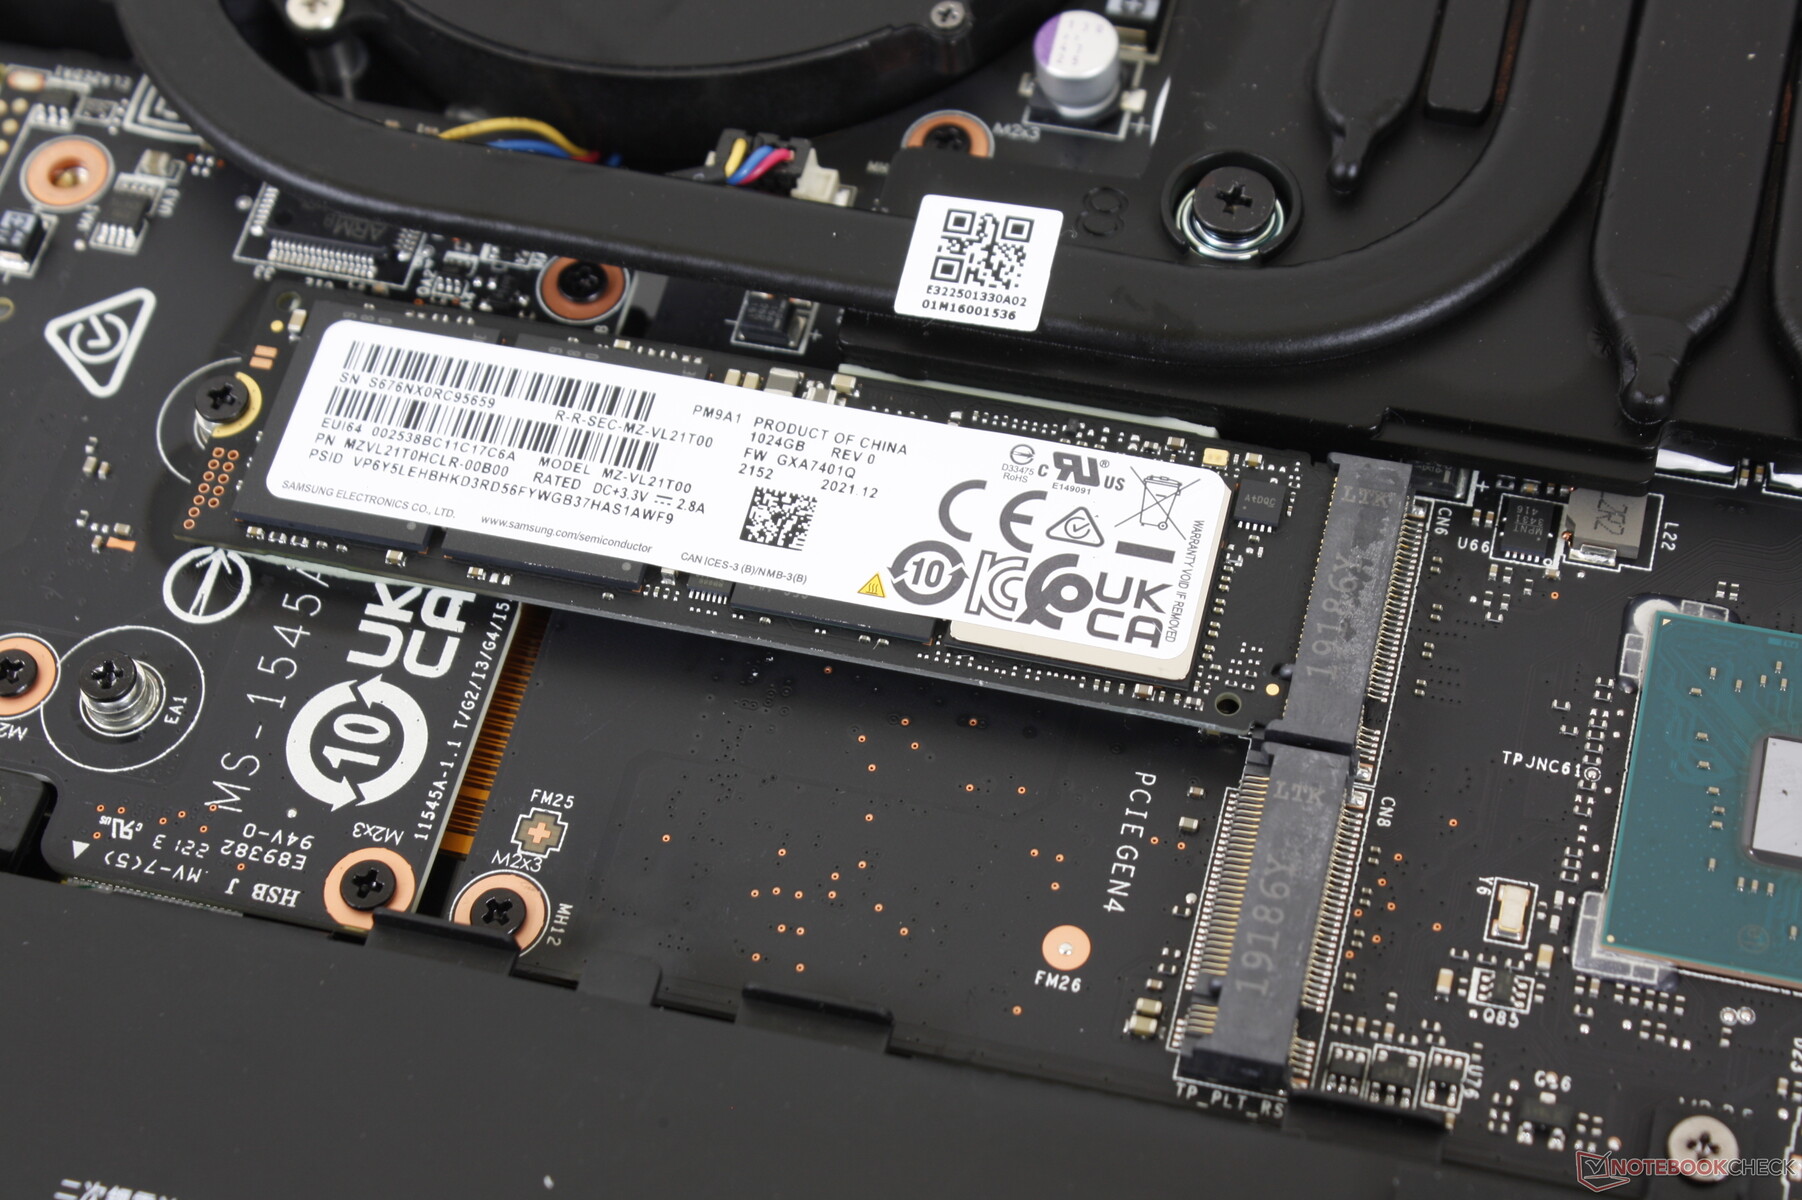
Dispositivos de armazenamento - Padrão PCIe4 x4
Nossa unidade vem com uma unidade de 1 TBSamsung PM9A1 PCIe4 x4 NVMe SSD para taxas de leitura e gravação seqüenciais de até 7000 MB/s e 5100 MB/s, respectivamente. Infelizmente, nossa unidade teria problemas para manter sua taxa máxima de leitura por períodos prolongados, como mostra nosso teste de loop DiskSpd abaixo. As taxas de leitura eventualmente cairiam para tão baixos quanto 1500 MB/s, provavelmente devido aos limites de temperatura e à falta de um espalhador de calor adequado sobre o SSD.

* ... menor é melhor
Disk Throttling: DiskSpd Read Loop, Queue Depth 8
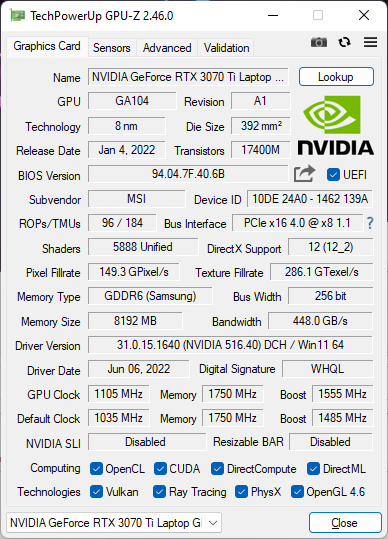
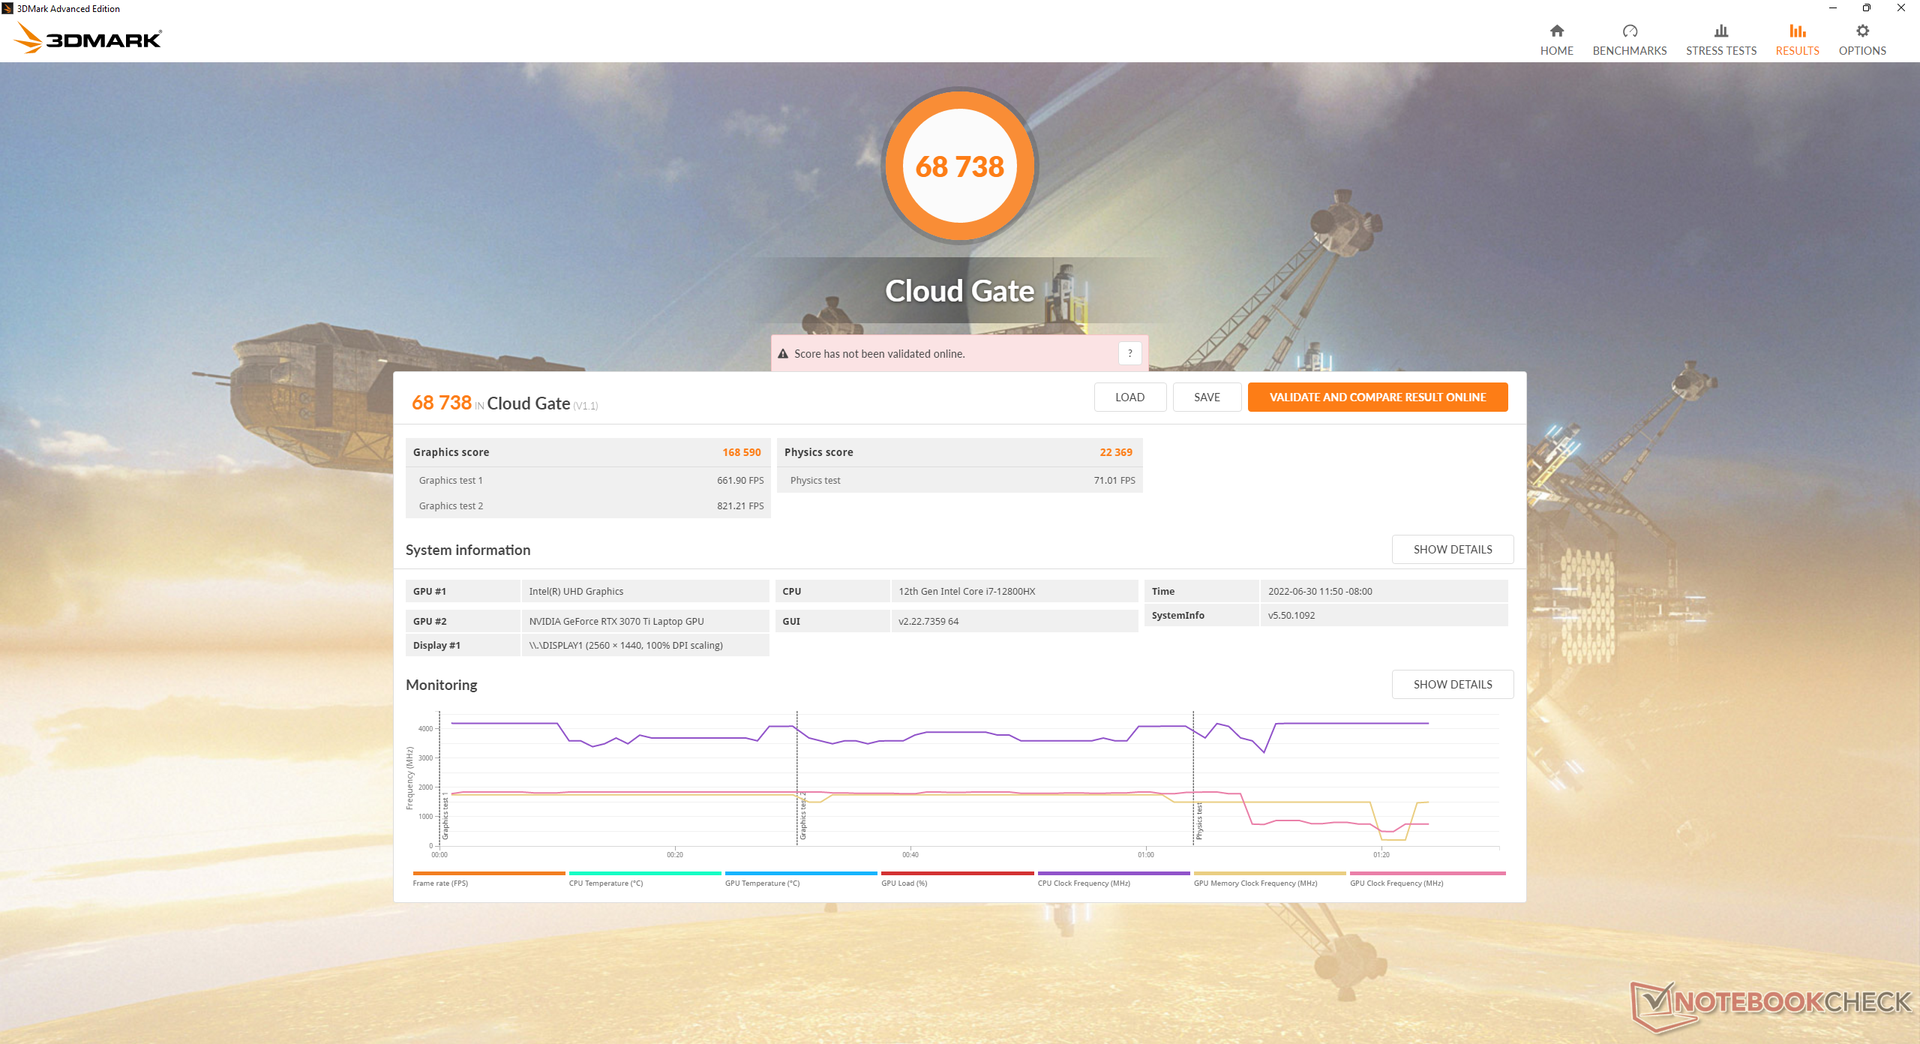
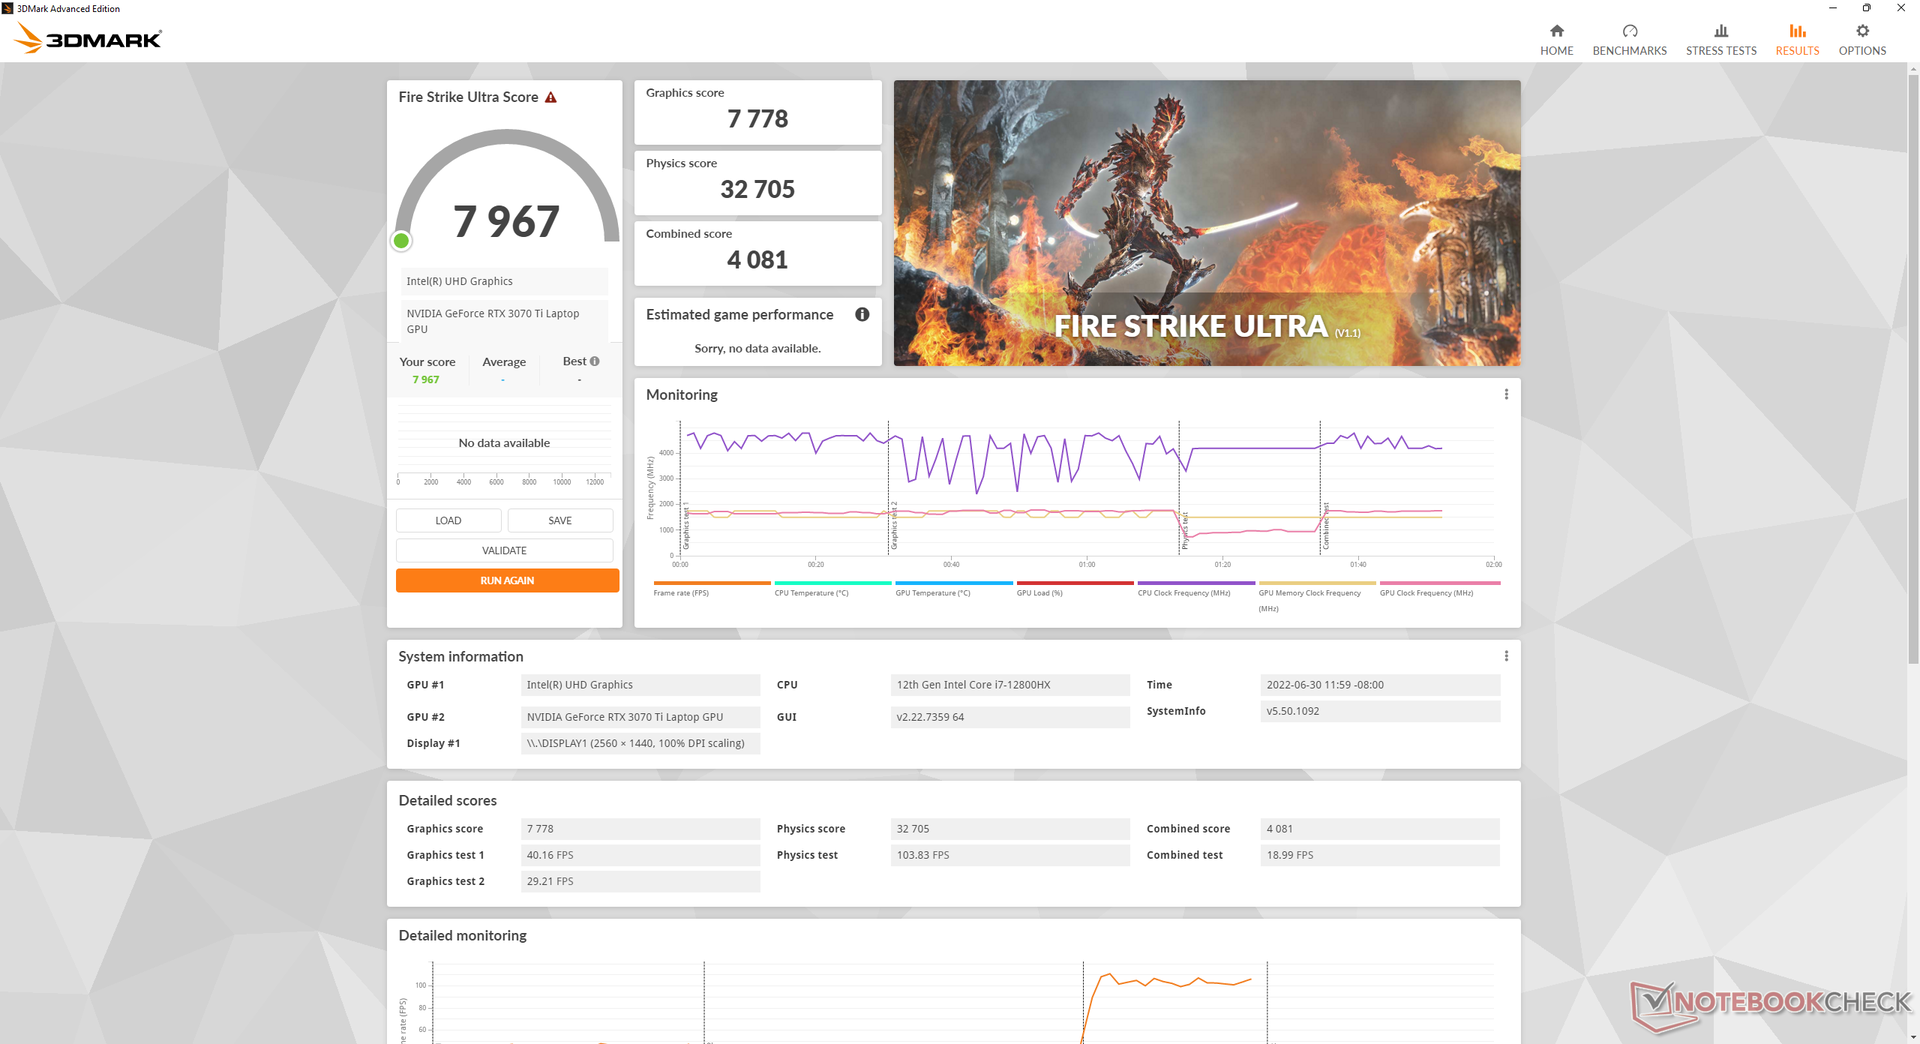
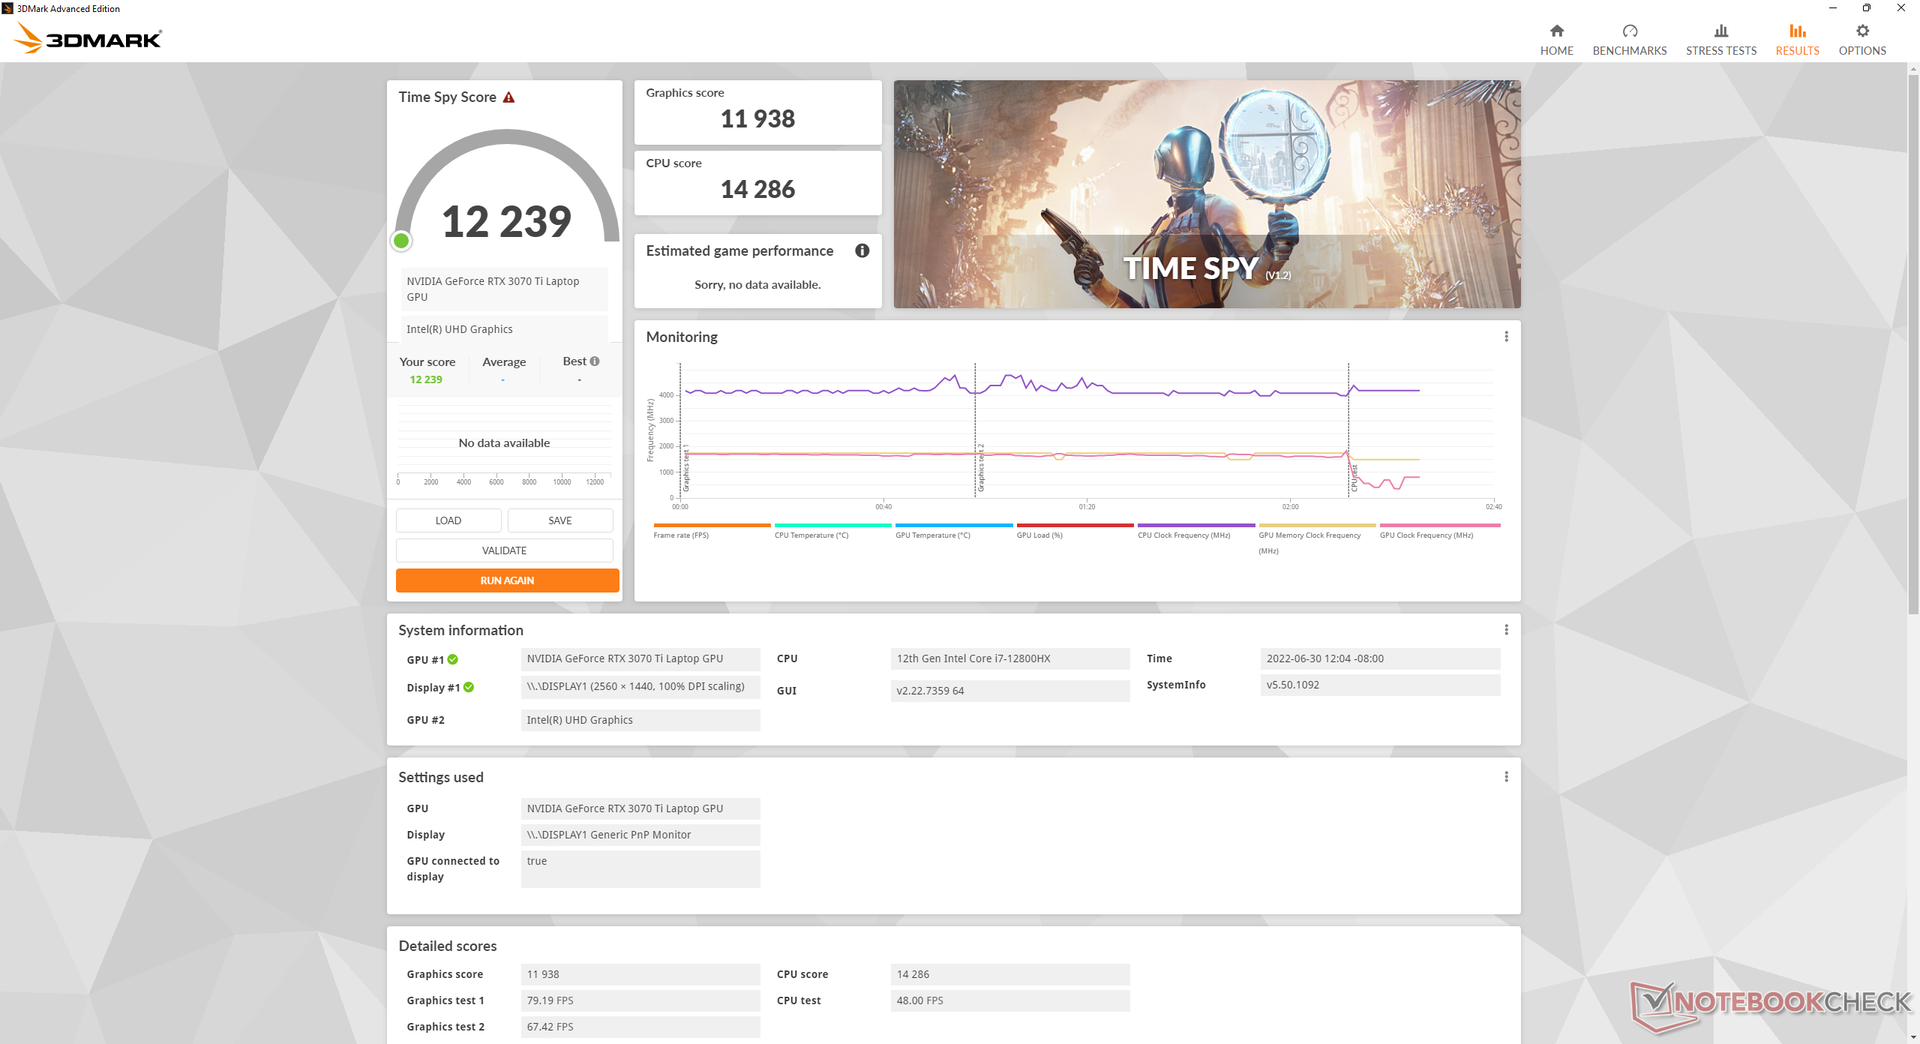
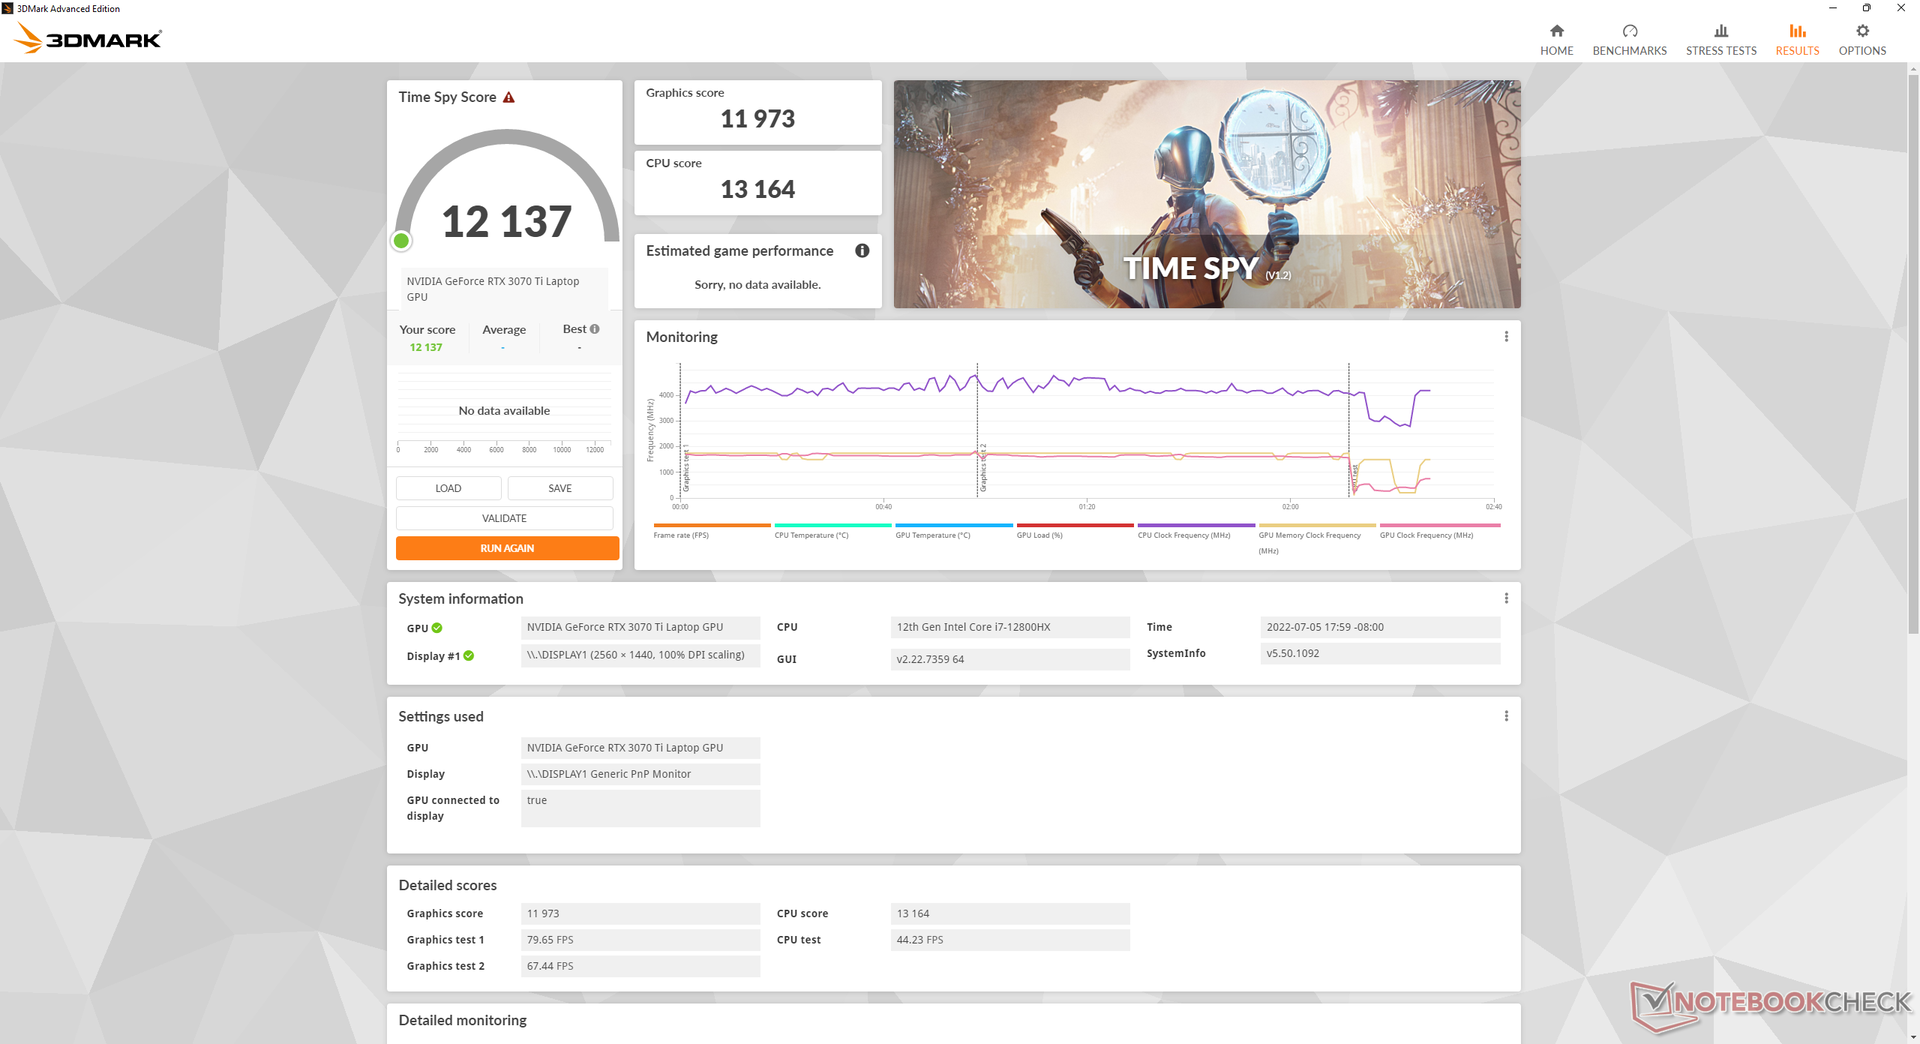
GPU Performance - 150 W com 25 W de Dynamic Boost
os resultados do 3DMark são aproximadamente 12% superiores à média dos portáteis em nosso banco de dados equipados com o mesmo mobile GeForce RTX 3070 Ti GPU. Os números superiores ao esperado podem ser atribuídos ao alvo alto de 150 W TGP e RAM DDR5 rápida, enquanto a maioria dos laptops de jogos ainda estão rodando em GPUs de 130 W ou inferiores e/ou RAM DDR4 mais lenta. As diferenças são suficientes para impulsionar nosso GTX 3070 Ti móvel a ter um desempenho semelhante ao do RTX 3080 Ti móvel rodando no antigo Q1 2022 GE66
.
Para fins de jogos, a GPU Nvidia teria um desempenho quase idêntico entre os modos MSHybrid e discreto.
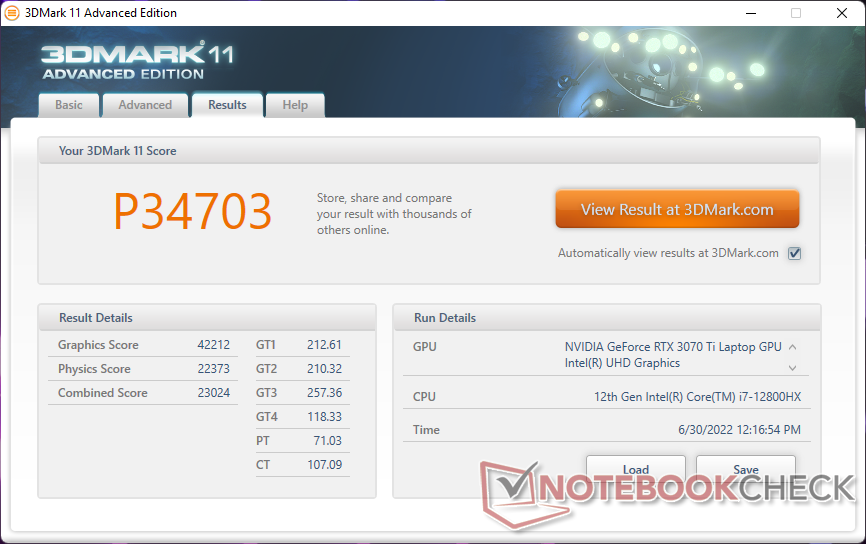
| 3DMark 11 Performance | 34703 pontos | |
| 3DMark Cloud Gate Standard Score | 68738 pontos | |
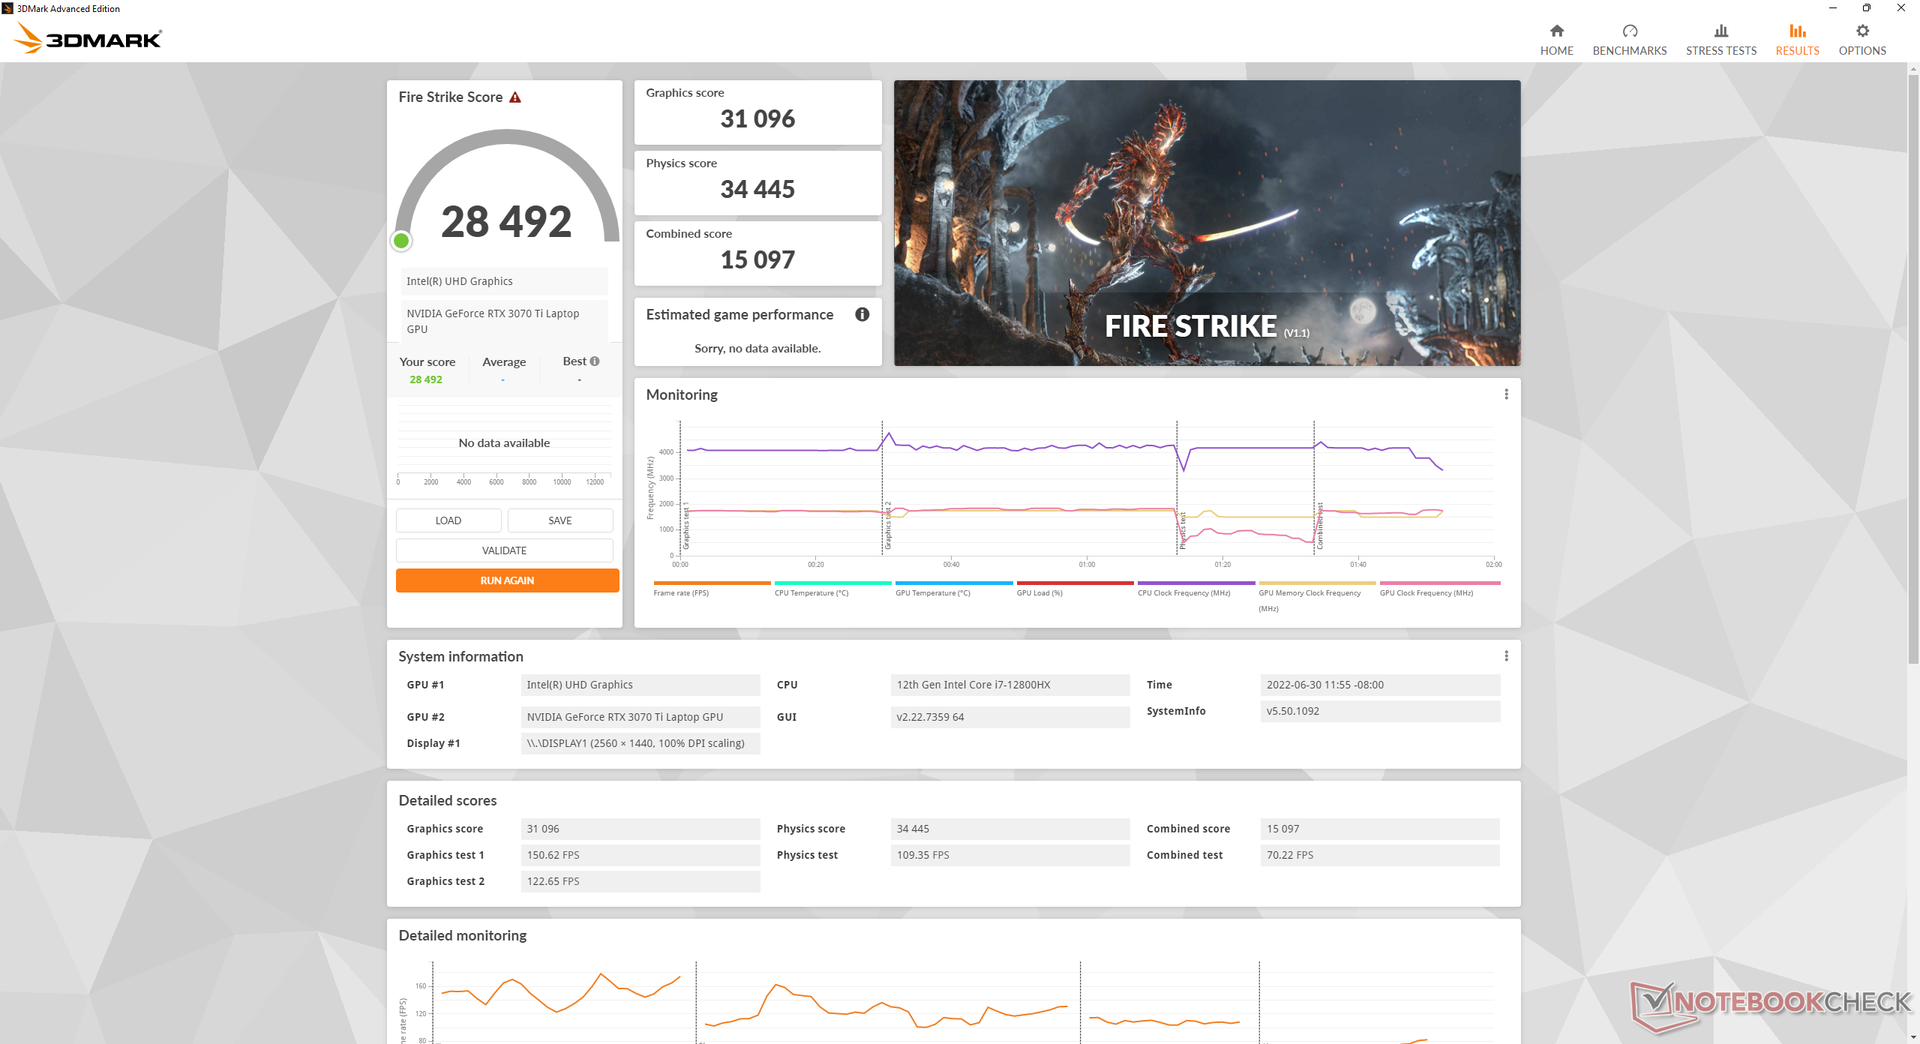
| 3DMark Fire Strike Score | 28492 pontos | |
| 3DMark Time Spy Score | 12239 pontos | |
Ajuda | ||
Witcher 3 FPS Chart
| baixo | média | alto | ultra | QHD | 4K | |
|---|---|---|---|---|---|---|
| GTA V (2015) | 186.8 | 184.7 | 178.1 | 122 | 108.7 | |
| The Witcher 3 (2015) | 426.4 | 329 | 223.3 | 112.7 | ||
| Dota 2 Reborn (2015) | 181.2 | 165.6 | 155.3 | 147.7 | 148.9 | |
| Final Fantasy XV Benchmark (2018) | 201 | 162.6 | 122.4 | 93 | ||
| X-Plane 11.11 (2018) | 145.5 | 133.4 | 105.9 | |||
| Strange Brigade (2018) | 453 | 288 | 235 | 207 | 154.1 | |
| Cyberpunk 2077 1.6 (2022) | 141.2 | 133.2 | 106 | 88.1 | 56.4 |
Emissões
Ruído do sistema
O ruído do ventilador depende dos cinco perfis de potência predefinidos, como mencionado nas Condições de Teste acima. Quando ocioso na área de trabalho sem aplicações em execução, nossa unidade é capaz de permanecer silenciosa a 22,9 dB(A) mesmo quando definida para o perfil de Desempenho Extremo. Entretanto, pequenas demandas como navegação na web ou transmissão de vídeo induzirão um ruído do ventilador na faixa audível de 30 a 34 dB(A), não importando a configuração do perfil. A execução da primeira cena de referência do 3DMark 06 no modo Balanceado induziria um ruído do ventilador de 44 dB(A) a ser semelhante ao que gravamos no GE66 ou Lâmina Razer 15.
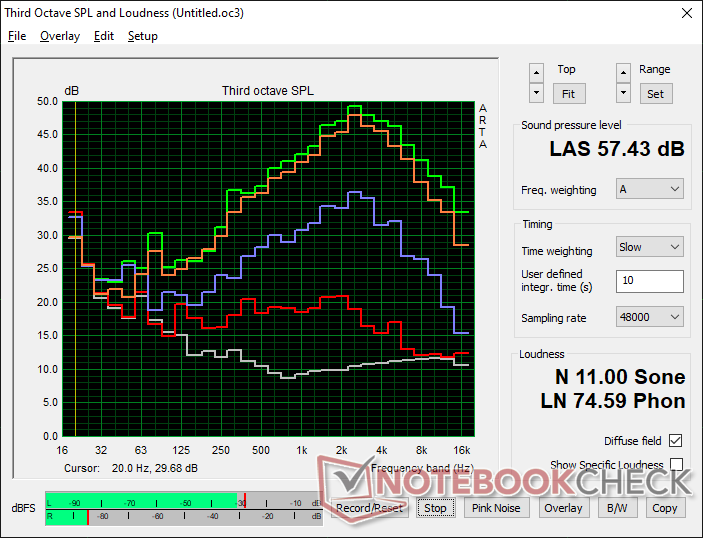
Rodando Witcher 3 no modo Balanceado e no modo Extreme Performance resultaria em um ruído do ventilador de 49,8 dB(A) e 55,7 dB(A), respectivamente. Consideramos que qualquer coisa na faixa de 50 dB(A) é muito barulhenta ao ponto de recomendar fones de ouvido quando se joga. No entanto, esta faixa é infelizmente comum em muitos laptops para jogos, incluindo o Vector GP66, o Asus ROG Strix Scar 15, ou o Alienware m15 R6. Se o Cooler Boost (ou seja, modo de máximo ruído do ventilador) estiver ativo, o ruído do ventilador será ainda maior a 57,4 dB(A). Os usuários terão que jogar no modo Extreme Performance no GE67 para maximizar o TGP como nossa seção de Teste de Estresse abaixo mostrará. O GE66 não era tão alto quando sob condições semelhantes.
Barulho
| Ocioso |
| 22.9 / 22.9 / 22.9 dB |
| Carga |
| 44.4 / 57.4 dB |
 | ||
30 dB silencioso 40 dB(A) audível 50 dB(A) ruidosamente alto |
||
min: | ||
| MSI GE67 HX 12UGS GeForce RTX 3070 Ti Laptop GPU, i7-12800HX, Samsung PM9A1 MZVL21T0HCLR | MSI Raider GE66 12UHS GeForce RTX 3080 Ti Laptop GPU, i9-12900HK, Samsung PM9A1 MZVL22T0HBLB | MSI Vector GP66 12UGS GeForce RTX 3070 Ti Laptop GPU, i9-12900H | Asus ROG Strix Scar 15 G533ZW-LN106WS GeForce RTX 3070 Ti Laptop GPU, i9-12900H, Samsung PM9A1 MZVL22T0HBLB | Alienware m15 R6, i7-11800H RTX 3080 GeForce RTX 3080 Laptop GPU, i7-11800H, Samsung PM9A1 MZVL21T0HCLR | Razer Blade 15 2022 GeForce RTX 3080 Ti Laptop GPU, i7-12800H, SSSTC CA6-8D1024 | |
|---|---|---|---|---|---|---|
| Noise | -14% | -2% | -36% | -2% | -5% | |
| desligado / ambiente * (dB) | 22.7 | 26 -15% | 22.9 -1% | 26.86 -18% | 23 -1% | 25.4 -12% |
| Idle Minimum * (dB) | 22.9 | 27 -18% | 23.4 -2% | 39.07 -71% | 23 -0% | 26.2 -14% |
| Idle Average * (dB) | 22.9 | 30 -31% | 23.4 -2% | 39.07 -71% | 23 -0% | 26.2 -14% |
| Idle Maximum * (dB) | 22.9 | 39 -70% | 27.4 -20% | 39.07 -71% | 30 -31% | 28.4 -24% |
| Load Average * (dB) | 44.4 | 45 -1% | 36 19% | 53.34 -20% | 41.26 7% | 44.7 -1% |
| Witcher 3 ultra * (dB) | 55.7 | 45 19% | 58.2 -4% | 56.6 -2% | 53.4 4% | 44.7 20% |
| Load Maximum * (dB) | 57.4 | 47 18% | 58 -1% | 56.6 1% | 53.37 7% | 51.9 10% |
* ... menor é melhor
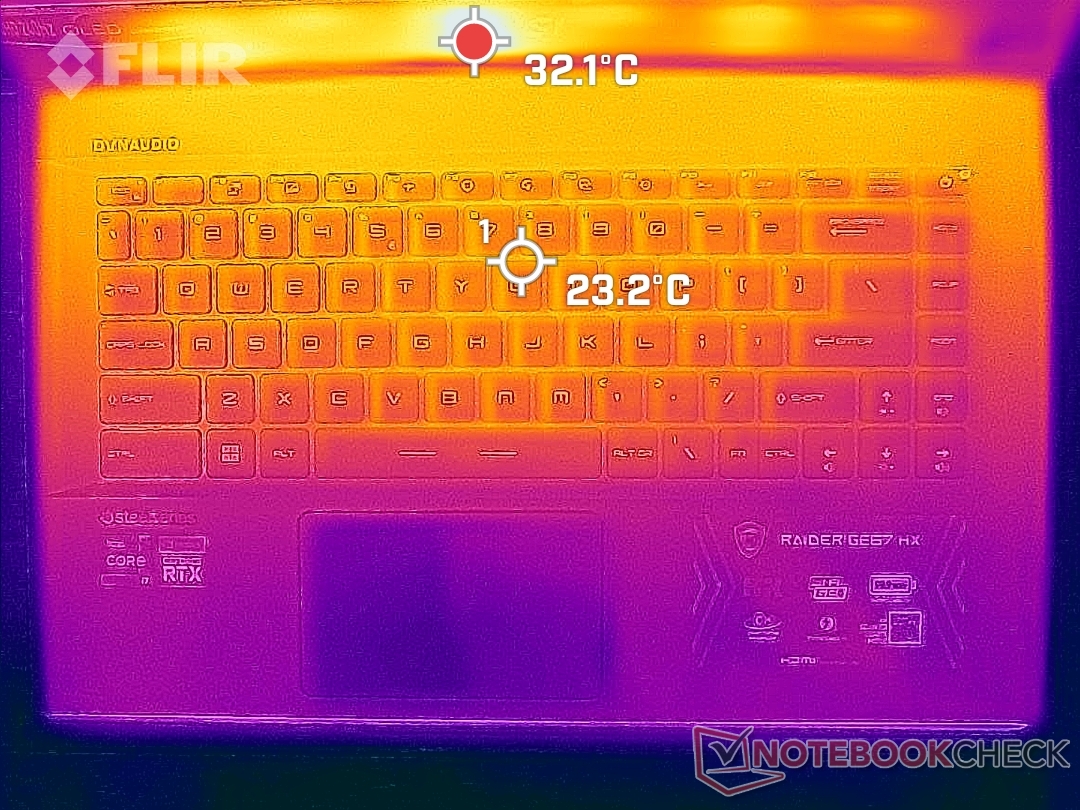
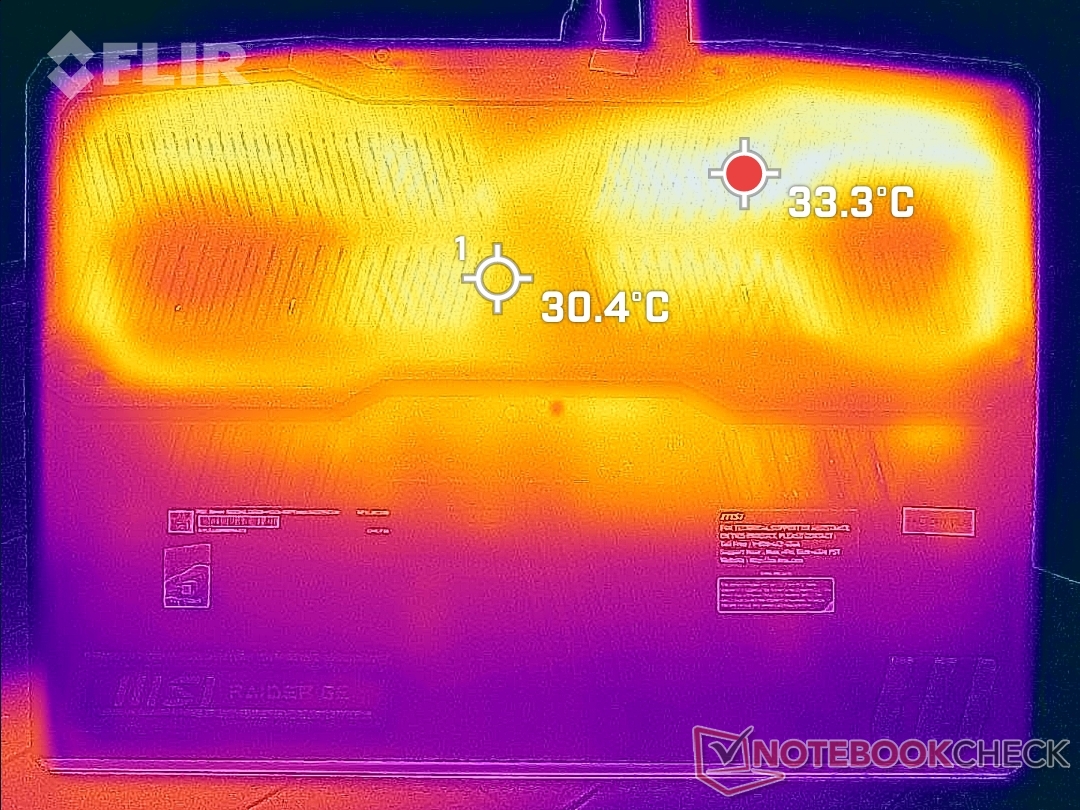
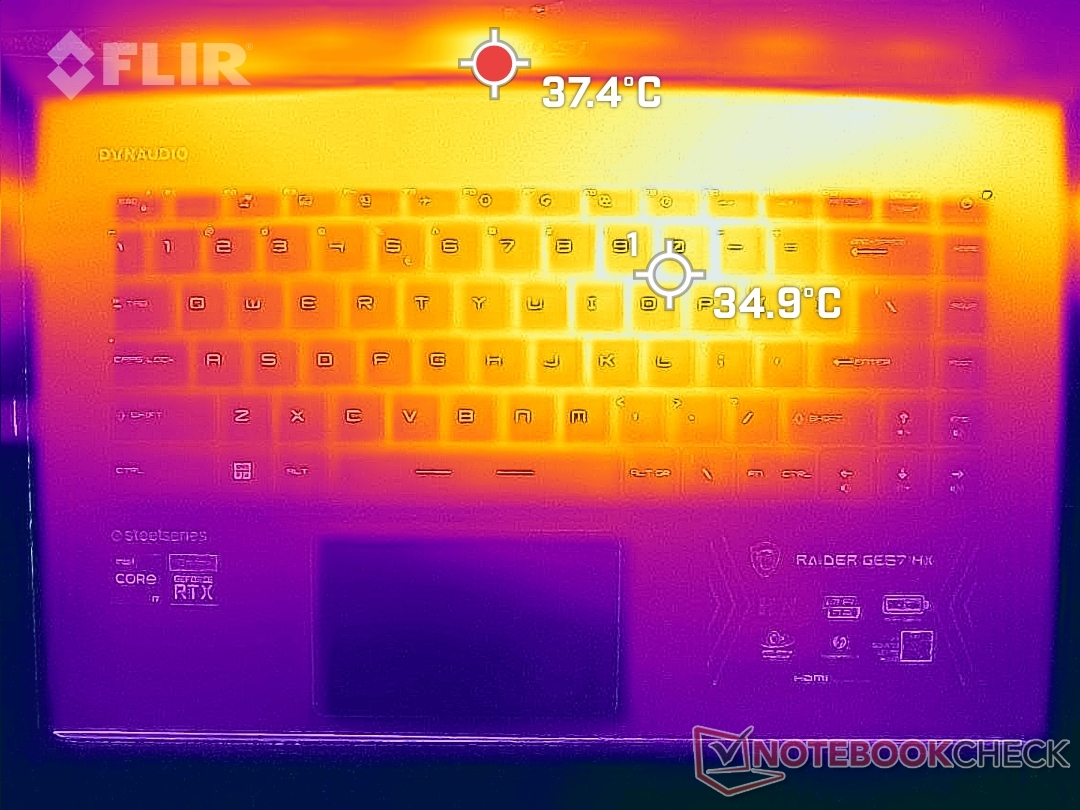
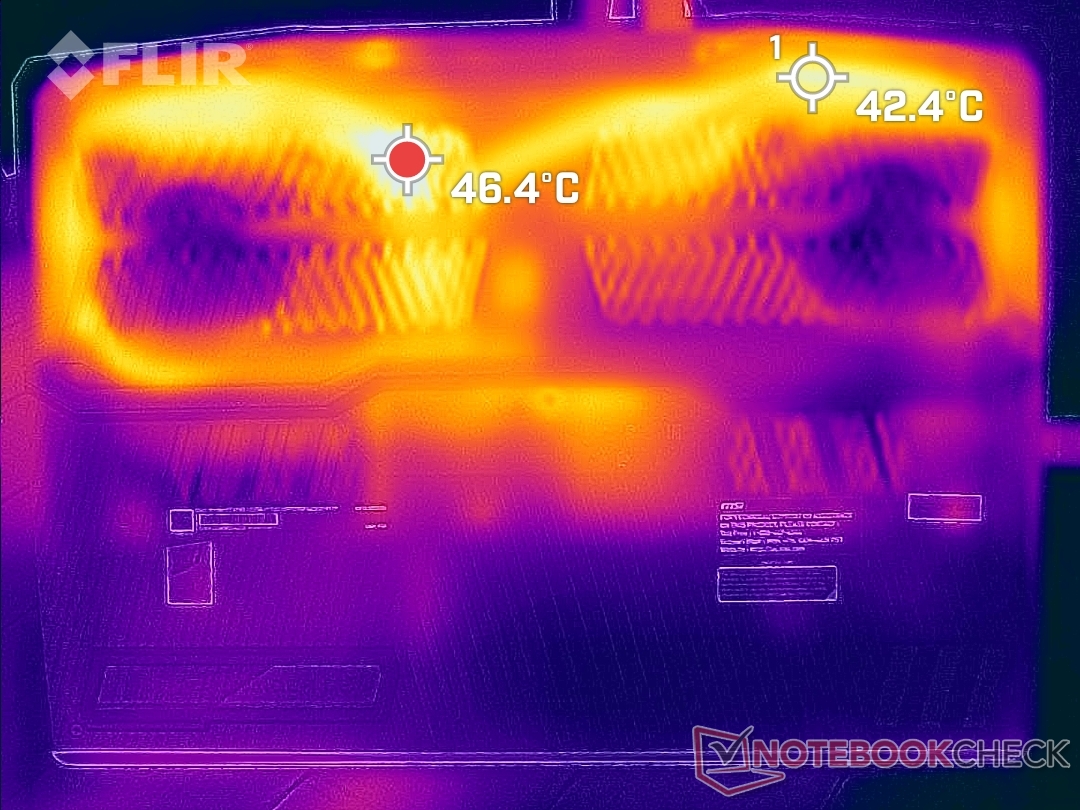
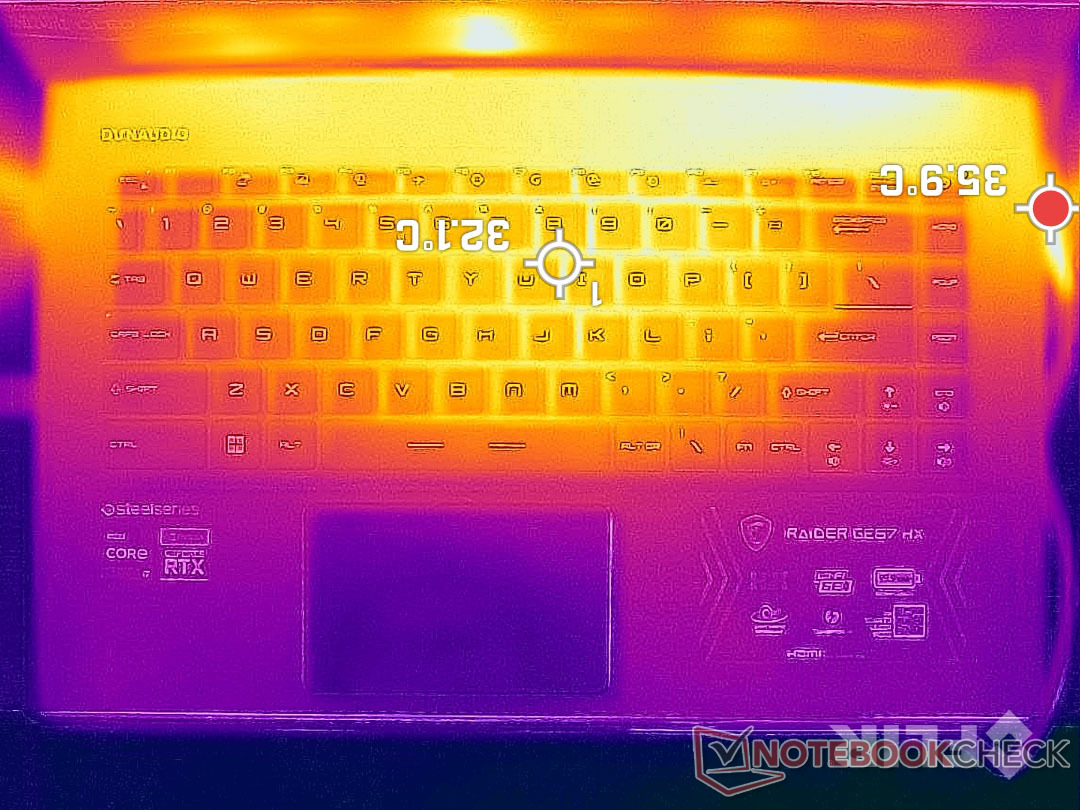
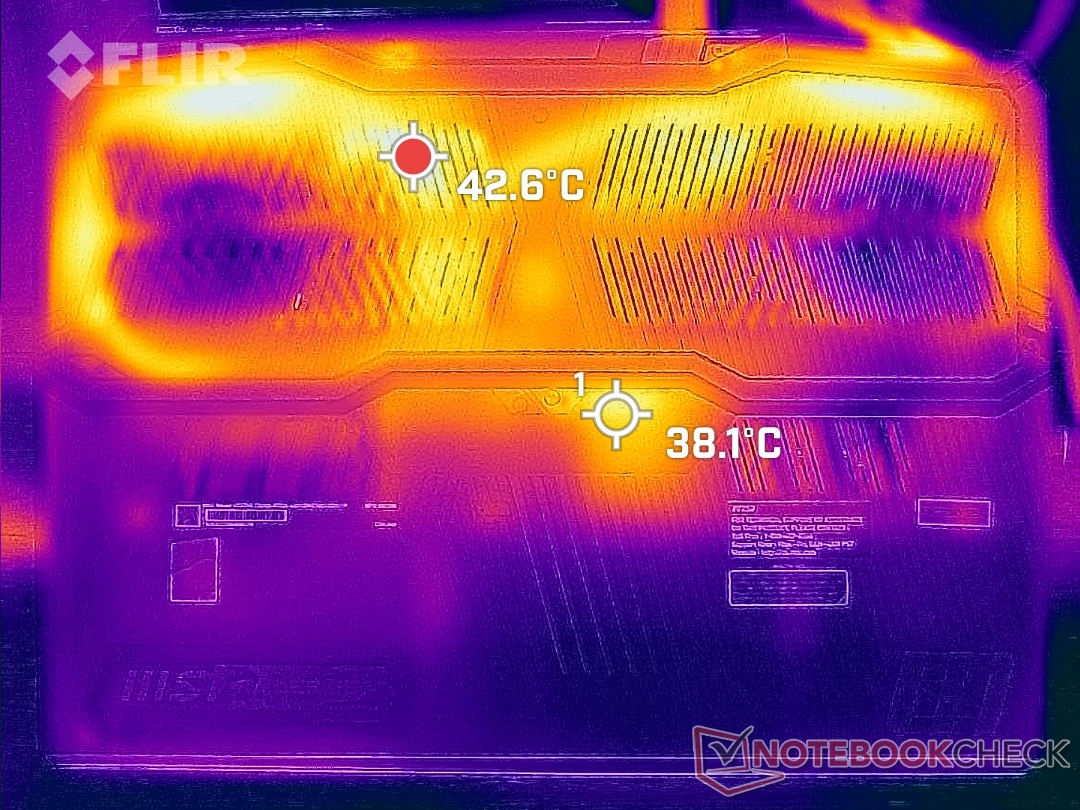
Temperatura
As temperaturas de superfície são mais frias do que o que observamos no GE66 mais antigo. Quando se joga, os pontos quentes no deck do teclado e no painel inferior podem chegar a 35 C e 46 C, respectivamente. Estas zonas estão na parte de trás do chassi, como mostram os mapas de temperatura abaixo.
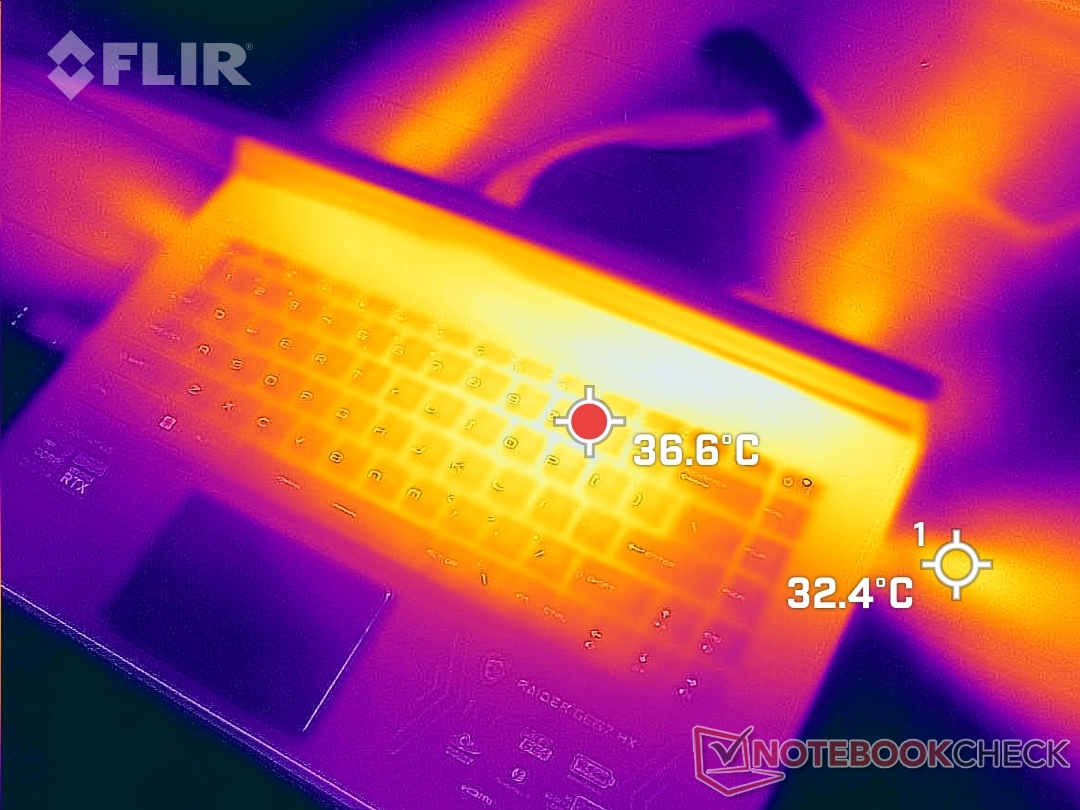
(+) A temperatura máxima no lado superior é 34.4 °C / 94 F, em comparação com a média de 40.4 °C / 105 F , variando de 21.2 a 68.8 °C para a classe Gaming.
(±) A parte inferior aquece até um máximo de 42 °C / 108 F, em comparação com a média de 43.2 °C / 110 F
(+) Em uso inativo, a temperatura média para o lado superior é 21.4 °C / 71 F, em comparação com a média do dispositivo de 33.9 °C / ### class_avg_f### F.
(+) Jogando The Witcher 3, a temperatura média para o lado superior é 27.9 °C / 82 F, em comparação com a média do dispositivo de 33.9 °C / ## #class_avg_f### F.
(+) Os apoios para as mãos e o touchpad são mais frios que a temperatura da pele, com um máximo de 20.4 °C / 68.7 F e, portanto, são frios ao toque.
(+) A temperatura média da área do apoio para as mãos de dispositivos semelhantes foi 28.8 °C / 83.8 F (+8.4 °C / 15.1 F).
| MSI GE67 HX 12UGS Intel Core i7-12800HX, NVIDIA GeForce RTX 3070 Ti Laptop GPU | MSI Raider GE66 12UHS Intel Core i9-12900HK, NVIDIA GeForce RTX 3080 Ti Laptop GPU | MSI Vector GP66 12UGS Intel Core i9-12900H, NVIDIA GeForce RTX 3070 Ti Laptop GPU | Asus ROG Strix Scar 15 G533ZW-LN106WS Intel Core i9-12900H, NVIDIA GeForce RTX 3070 Ti Laptop GPU | Alienware m15 R6, i7-11800H RTX 3080 Intel Core i7-11800H, NVIDIA GeForce RTX 3080 Laptop GPU | Razer Blade 15 2022 Intel Core i7-12800H, NVIDIA GeForce RTX 3080 Ti Laptop GPU | |
|---|---|---|---|---|---|---|
| Heat | -36% | -19% | -29% | -45% | -32% | |
| Maximum Upper Side * (°C) | 34.4 | 54 -57% | 40.2 -17% | 42.6 -24% | 61 -77% | 50 -45% |
| Maximum Bottom * (°C) | 42 | 65 -55% | 43.8 -4% | 50.2 -20% | 58 -38% | 47 -12% |
| Idle Upper Side * (°C) | 24 | 30 -25% | 34.8 -45% | 36.2 -51% | 38 -58% | 37.4 -56% |
| Idle Bottom * (°C) | 33.2 | 35 -5% | 37 -11% | 40.2 -21% | 36 -8% | 38.4 -16% |
* ... menor é melhor
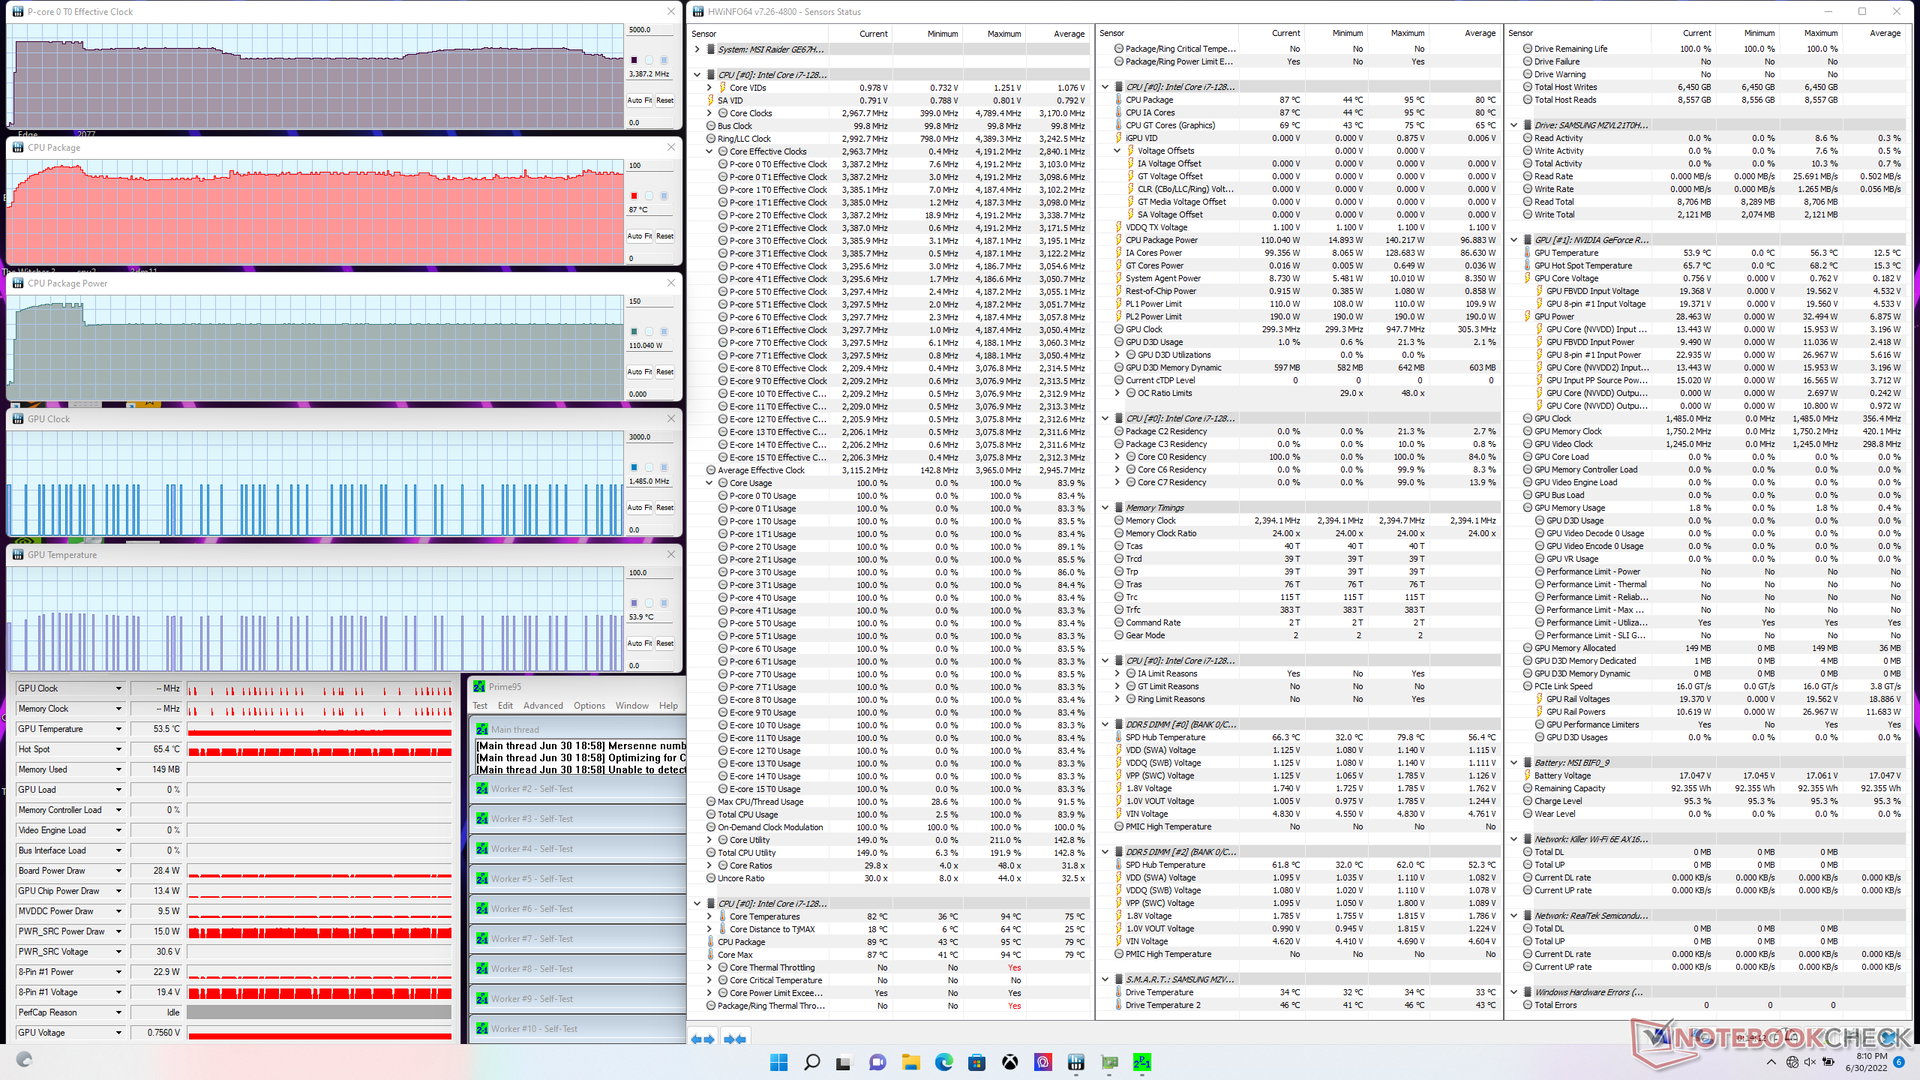
Teste de estresse
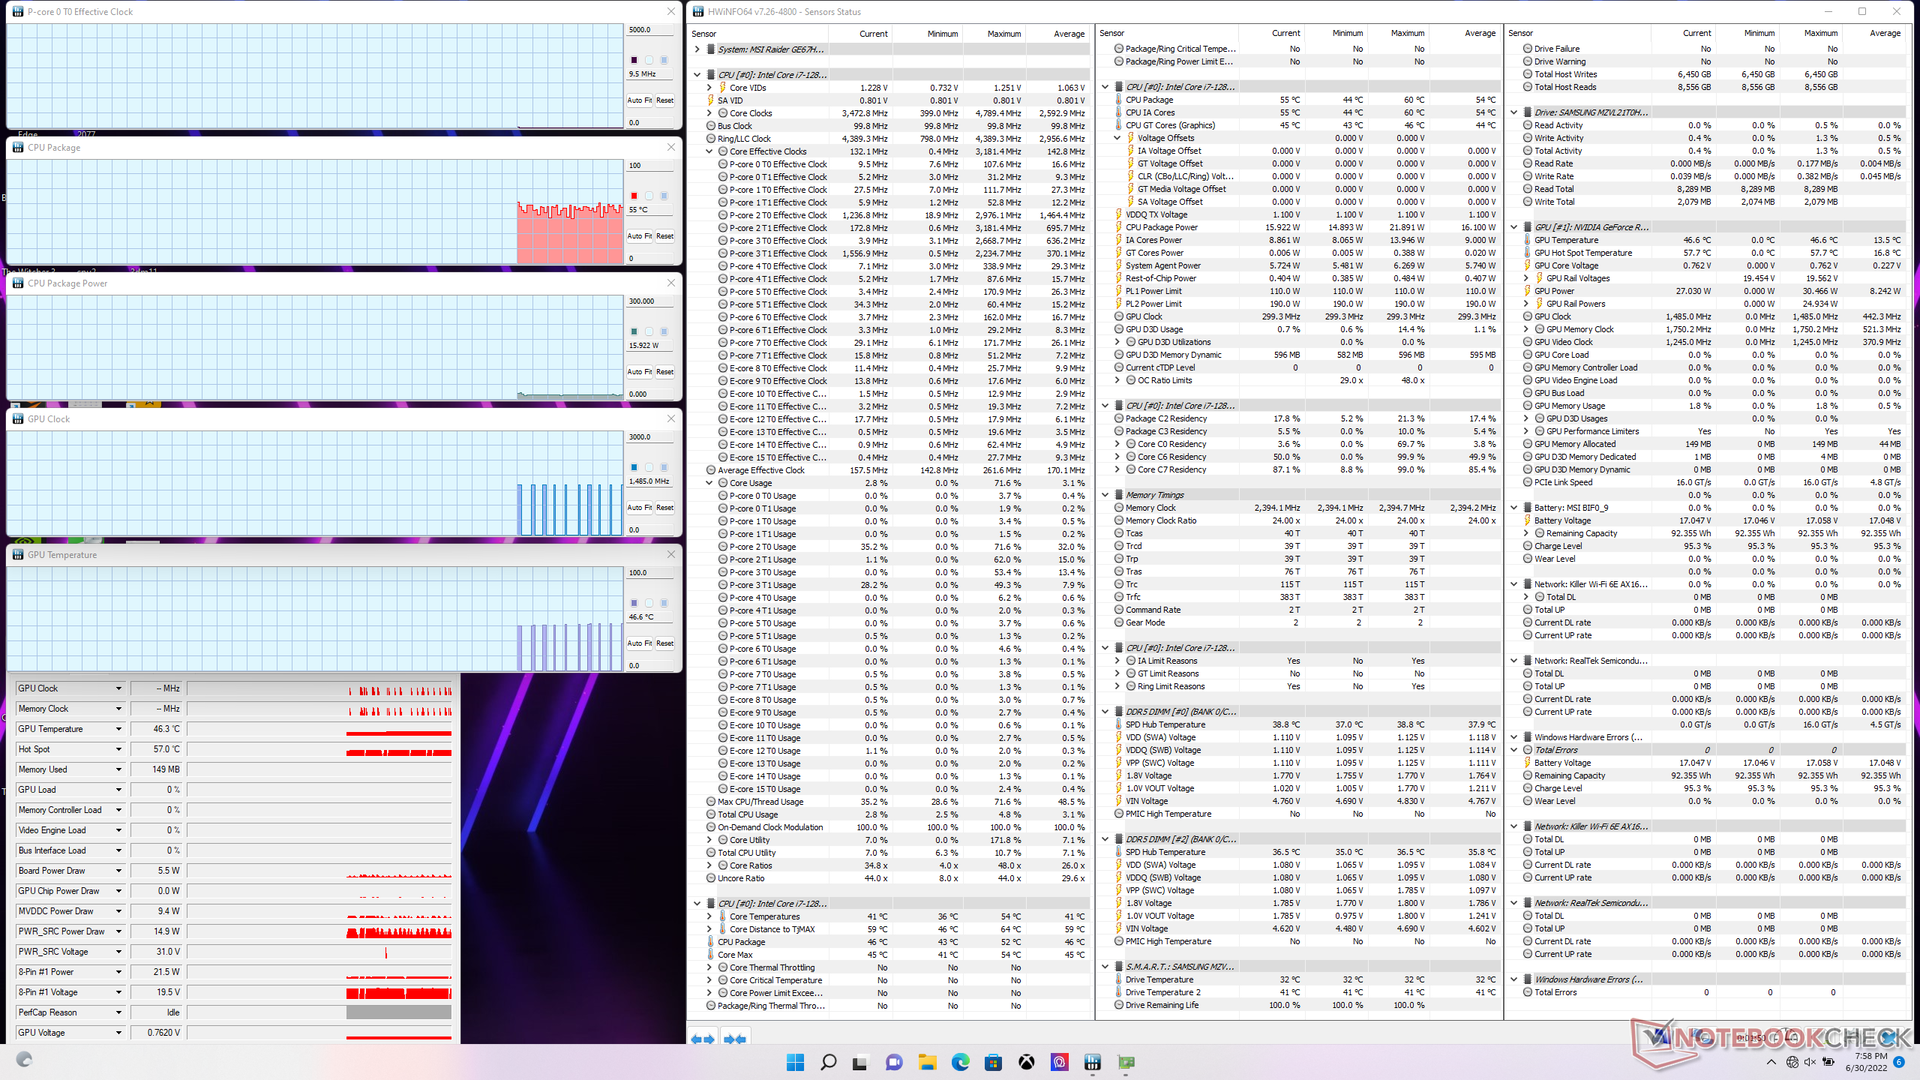
Quando estressada sob Prime95, a CPU aumentaria para 4,2 GHz até cerca de 90 segundos depois, quando a temperatura central atingiria 96 C. Depois disso, as taxas de relógio cairiam na faixa de 3,4 a 3,7 GHz para manter uma temperatura central mais fria de cerca de 87 C. O consumo de energia da CPU chegaria a 140 W durante os primeiros 90 segundos do teste antes de se estabilizar em 110 W. Em comparação, o Core i7-12900HK no GE66 mais antigo se estabilizaria em apenas 45 W quando sob condições semelhantes.
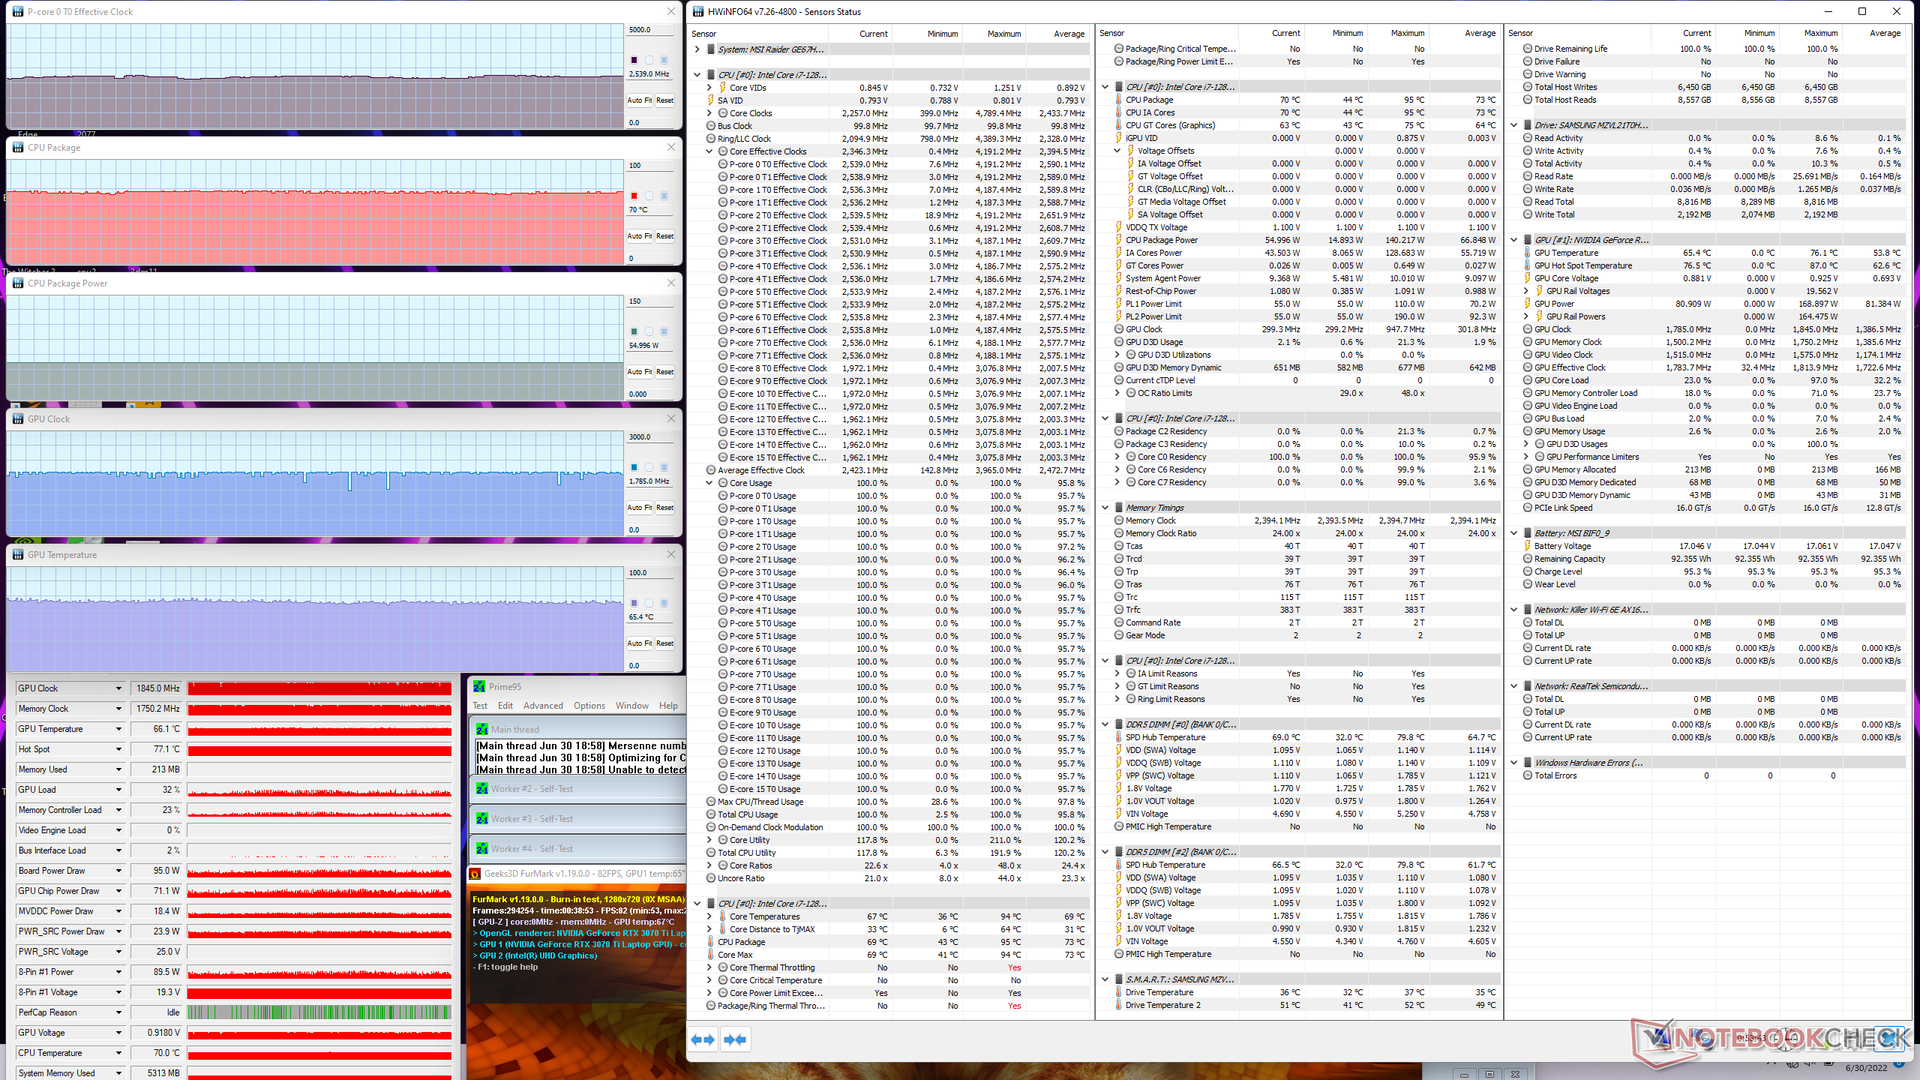
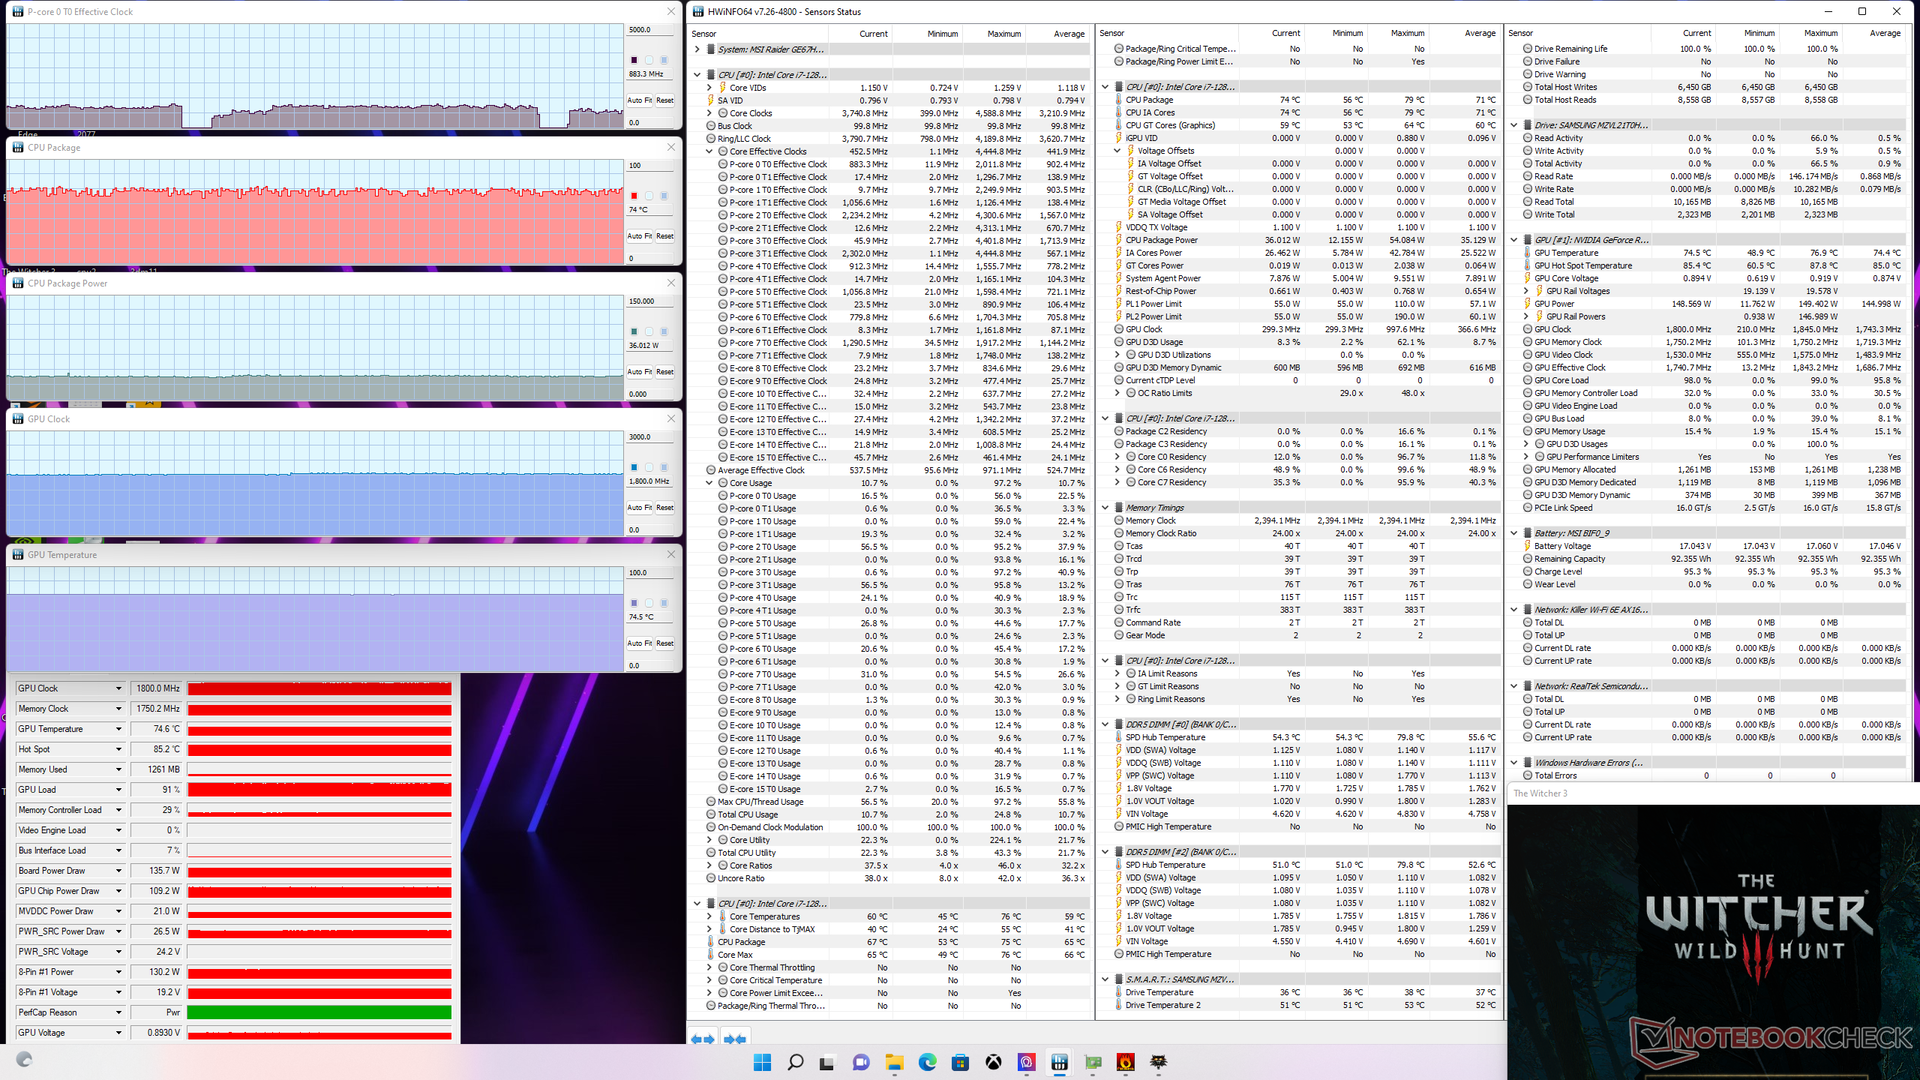
O consumo de energia da placa GPU seria de 148 W quando no modo de Desempenho Extremo, comparado com ~135 W quando no perfil de Energia Equilibrada. Você vai querer ativar o modo de Desempenho Extremo para maximizar o potencial da GPU como resultado. As temperaturas médias de CPU e GPU são razoáveis a 69 C e 77 C, respectivamente, em comparação com 71 C e 70 C no modo de Vetor GP66 que vem com a mesma GeForce RTX 3070 Ti GPU, mas uma CPU mais lenta do 11º gênero.
Vale a pena notar que só conseguimos atingir uma potência de placa GPU de apenas 148 W, apesar do anúncio MSI de 150 W + 25 W de Dynamic Boost, mesmo quando funcionando em modo de desempenho extremo, pelo menos de acordo com GPU-Z.
A execução em baterias afeta a performance. Um teste Fire Strike na potência da bateria retornaria pontuações Física e Gráfica de 22492 e 11614 pontos, respectivamente, em comparação com 34445 e 31096 pontos quando em rede elétrica.
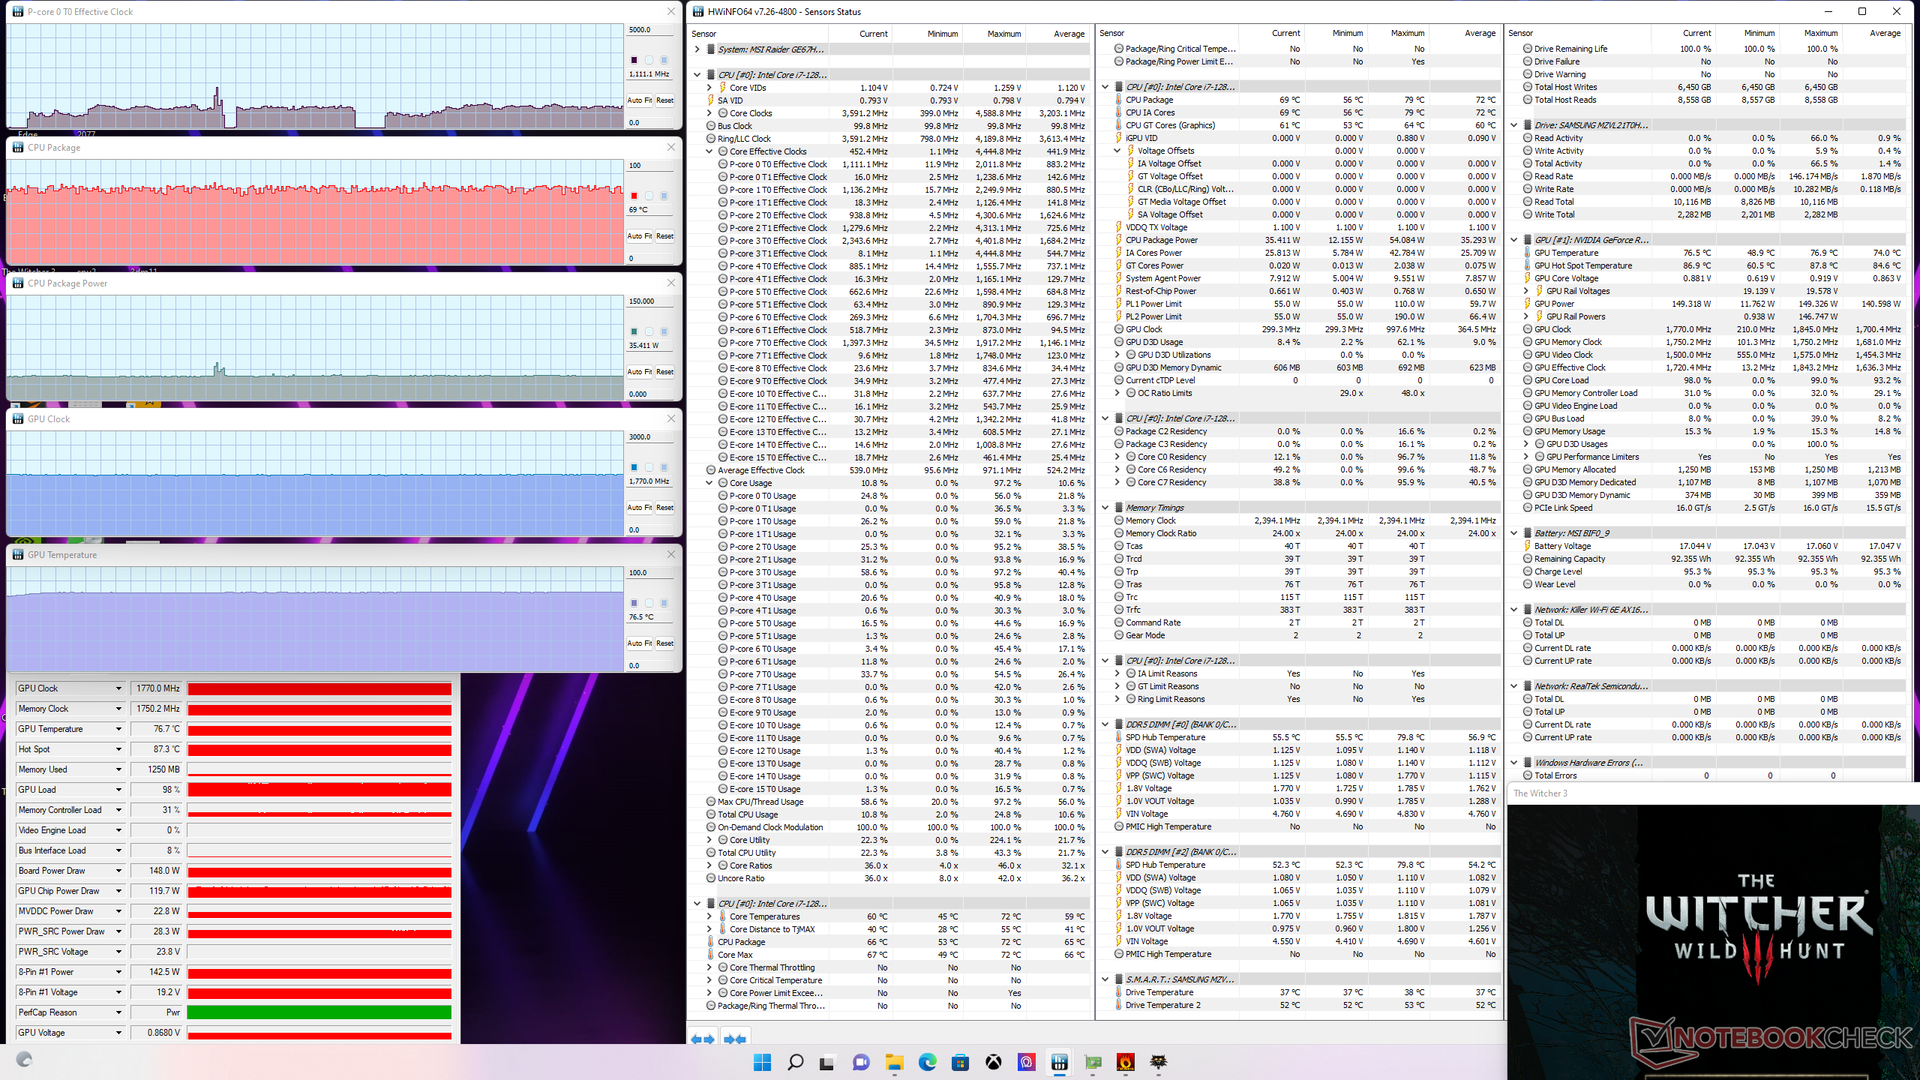
| Relógio CPU (GHz) | Relógio GPU (MHz) | Temperatura média da CPU (°C) | Temperatura média da GPU (°C) | |
| System Idle | -- | -- | 55 | 47 |
| Prime95 Stress | 3.4 - 3.7 | -- | 87 | 54 |
| Prime95 + FurMark Stress | 2.6 | 1845 | 70 | 65 |
| Witcher 3 Stress (modo equilibrado) | 0.9 | 1800 | 74 | 75 |
| Witcher 3 Estresse (modo de desempenho extremo) | 1.1 | 1770 | 69 | 77 |
Oradores
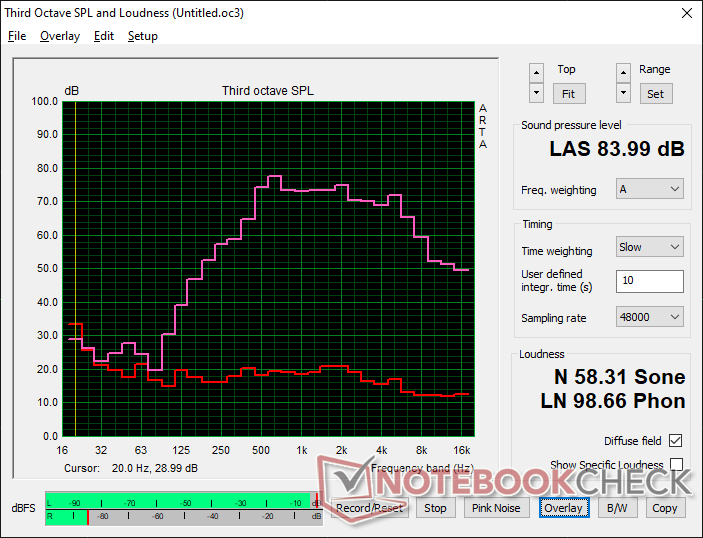
MSI GE67 HX 12UGS análise de áudio
(+) | os alto-falantes podem tocar relativamente alto (###valor### dB)
Graves 100 - 315Hz
(-) | quase nenhum baixo - em média 17.9% menor que a mediana
(±) | a linearidade dos graves é média (13.7% delta para a frequência anterior)
Médios 400 - 2.000 Hz
(±) | médios mais altos - em média 7.9% maior que a mediana
(+) | médios são lineares (6.6% delta para frequência anterior)
Altos 2 - 16 kHz
(±) | máximos mais altos - em média 5.5% maior que a mediana
(±) | a linearidade dos máximos é média (8.6% delta para frequência anterior)
Geral 100 - 16.000 Hz
(±) | a linearidade do som geral é média (22.1% diferença em relação à mediana)
Comparado com a mesma classe
» 79% de todos os dispositivos testados nesta classe foram melhores, 6% semelhantes, 15% piores
» O melhor teve um delta de 6%, a média foi 18%, o pior foi 132%
Comparado com todos os dispositivos testados
» 64% de todos os dispositivos testados foram melhores, 6% semelhantes, 30% piores
» O melhor teve um delta de 4%, a média foi 23%, o pior foi 134%
Apple MacBook Pro 16 2021 M1 Pro análise de áudio
(+) | os alto-falantes podem tocar relativamente alto (###valor### dB)
Graves 100 - 315Hz
(+) | bons graves - apenas 3.8% longe da mediana
(+) | o baixo é linear (5.2% delta para a frequência anterior)
Médios 400 - 2.000 Hz
(+) | médios equilibrados - apenas 1.3% longe da mediana
(+) | médios são lineares (2.1% delta para frequência anterior)
Altos 2 - 16 kHz
(+) | agudos equilibrados - apenas 1.9% longe da mediana
(+) | os máximos são lineares (2.7% delta da frequência anterior)
Geral 100 - 16.000 Hz
(+) | o som geral é linear (4.6% diferença em relação à mediana)
Comparado com a mesma classe
» 0% de todos os dispositivos testados nesta classe foram melhores, 0% semelhantes, 100% piores
» O melhor teve um delta de 5%, a média foi 17%, o pior foi 45%
Comparado com todos os dispositivos testados
» 0% de todos os dispositivos testados foram melhores, 0% semelhantes, 100% piores
» O melhor teve um delta de 4%, a média foi 23%, o pior foi 134%
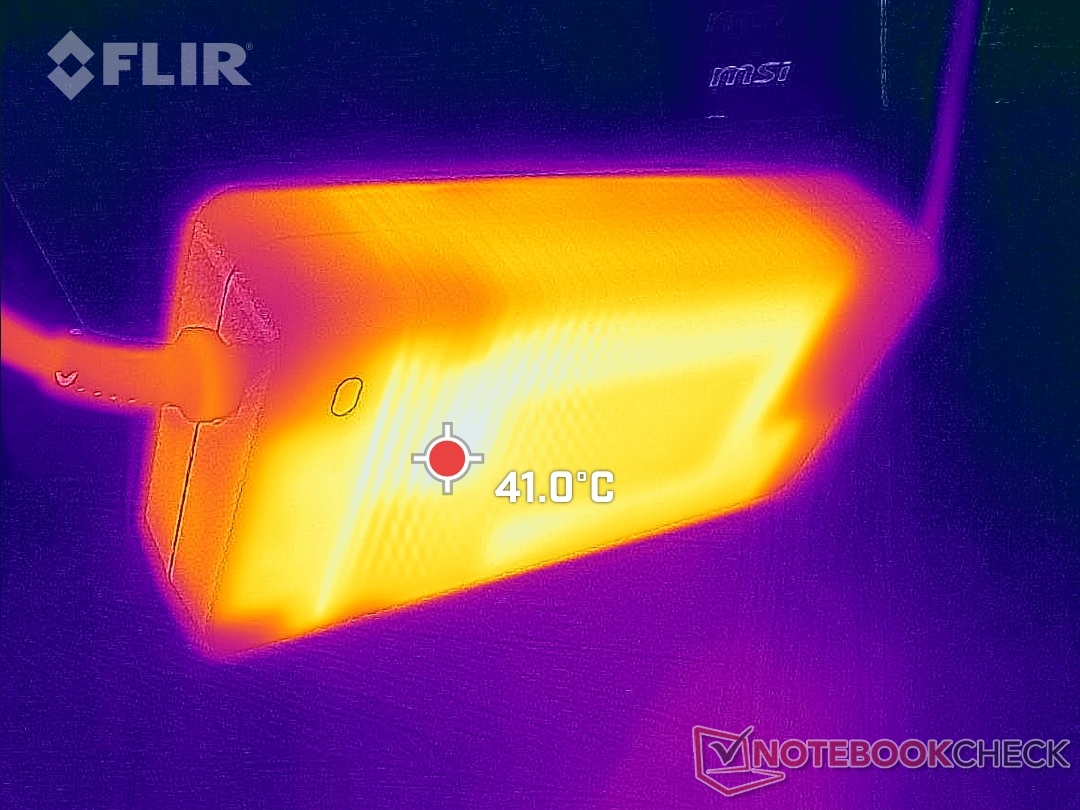
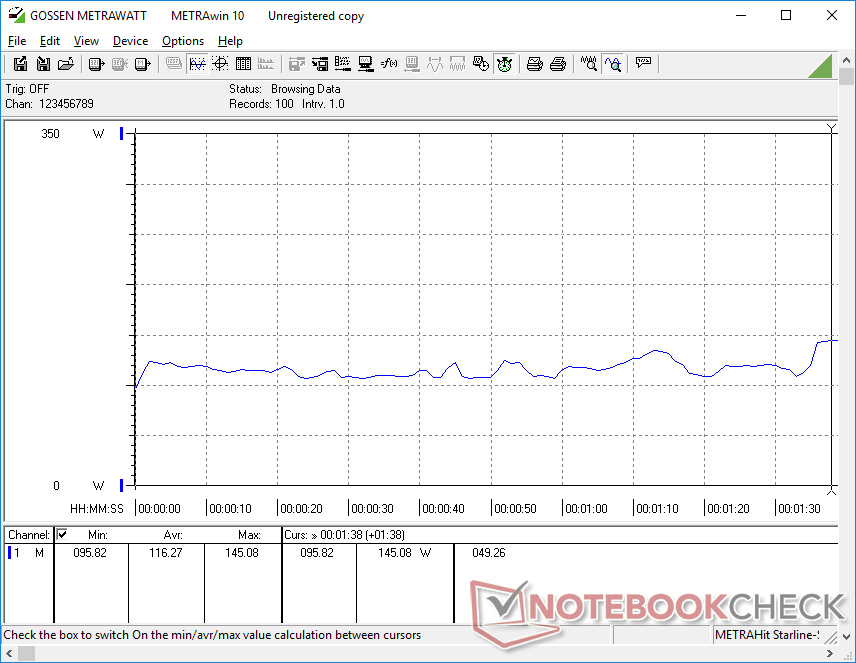
Gerenciamento de energia - Tijolos de alto consumo e de alta potência
Consumo de energia
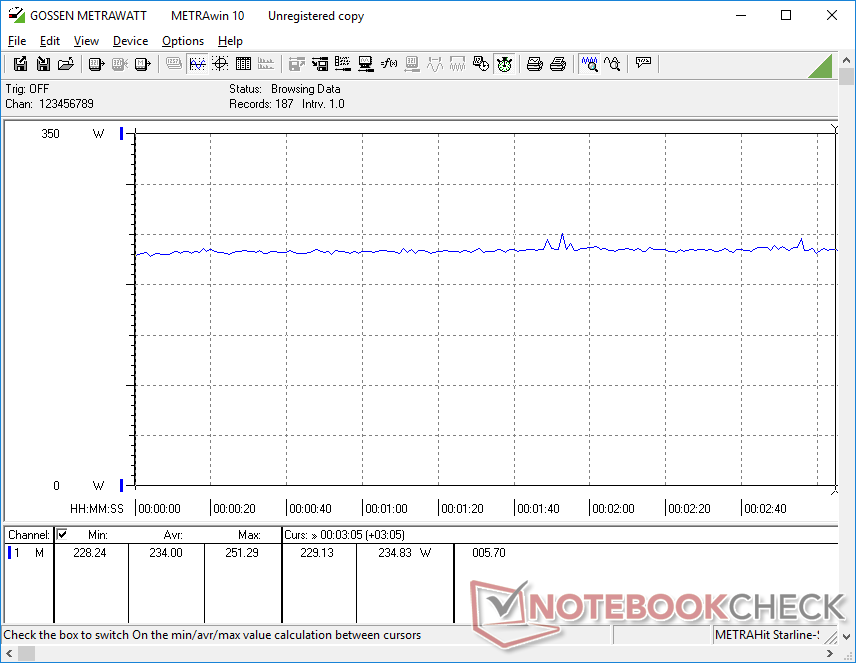
O consumo é notavelmente maior do que o que registramos no Core i9-12900HK GE66 mais antigo, especialmente quando executamos aplicações pesadas de CPU. Prime95, por exemplo, consumiria cerca de 165 W em nosso GE67 em comparação com apenas 90 W no GE66 para representar um aumento de 83 por cento. É um preço alto a pagar pelo aumento de 35 a 40 por cento no desempenho bruto multi-fio entre o Core i9-12900HK e o Core i7-12800HX
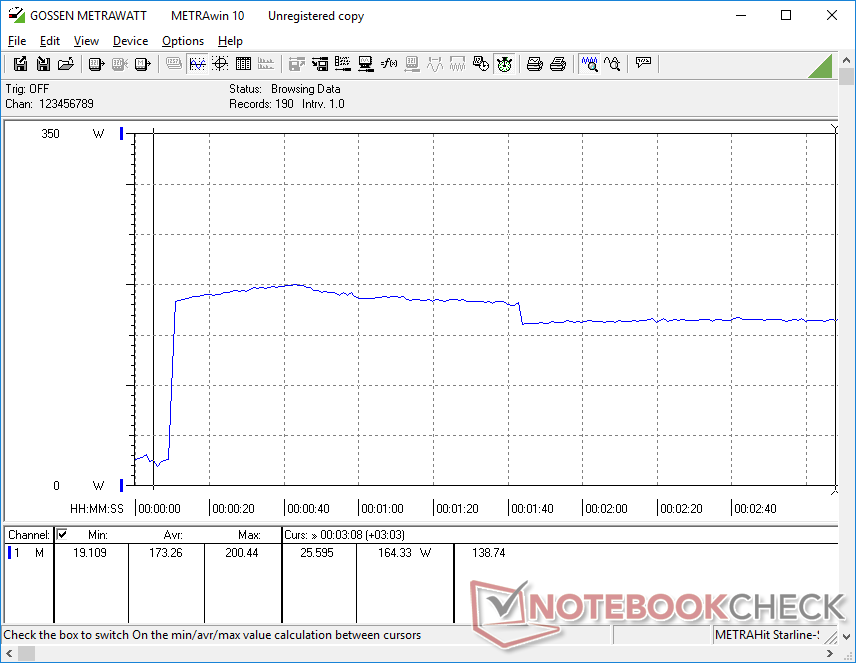
Rodando Witcher 3 consumiria cerca de 237 W que é novamente maior do que os 202 W que registramos no GE66. Mesmo quando comparado a outros laptops de alto desempenho como o Asus ROG Strix Scar 15 ou Alienware m15 R6ou GE67 estaria mais sedento de poder em ambas as ocasiões
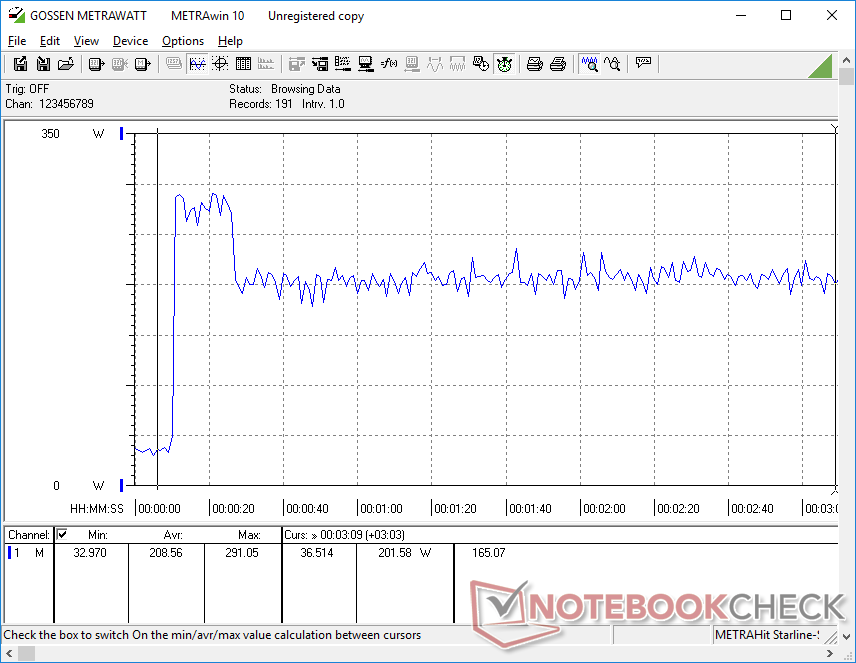
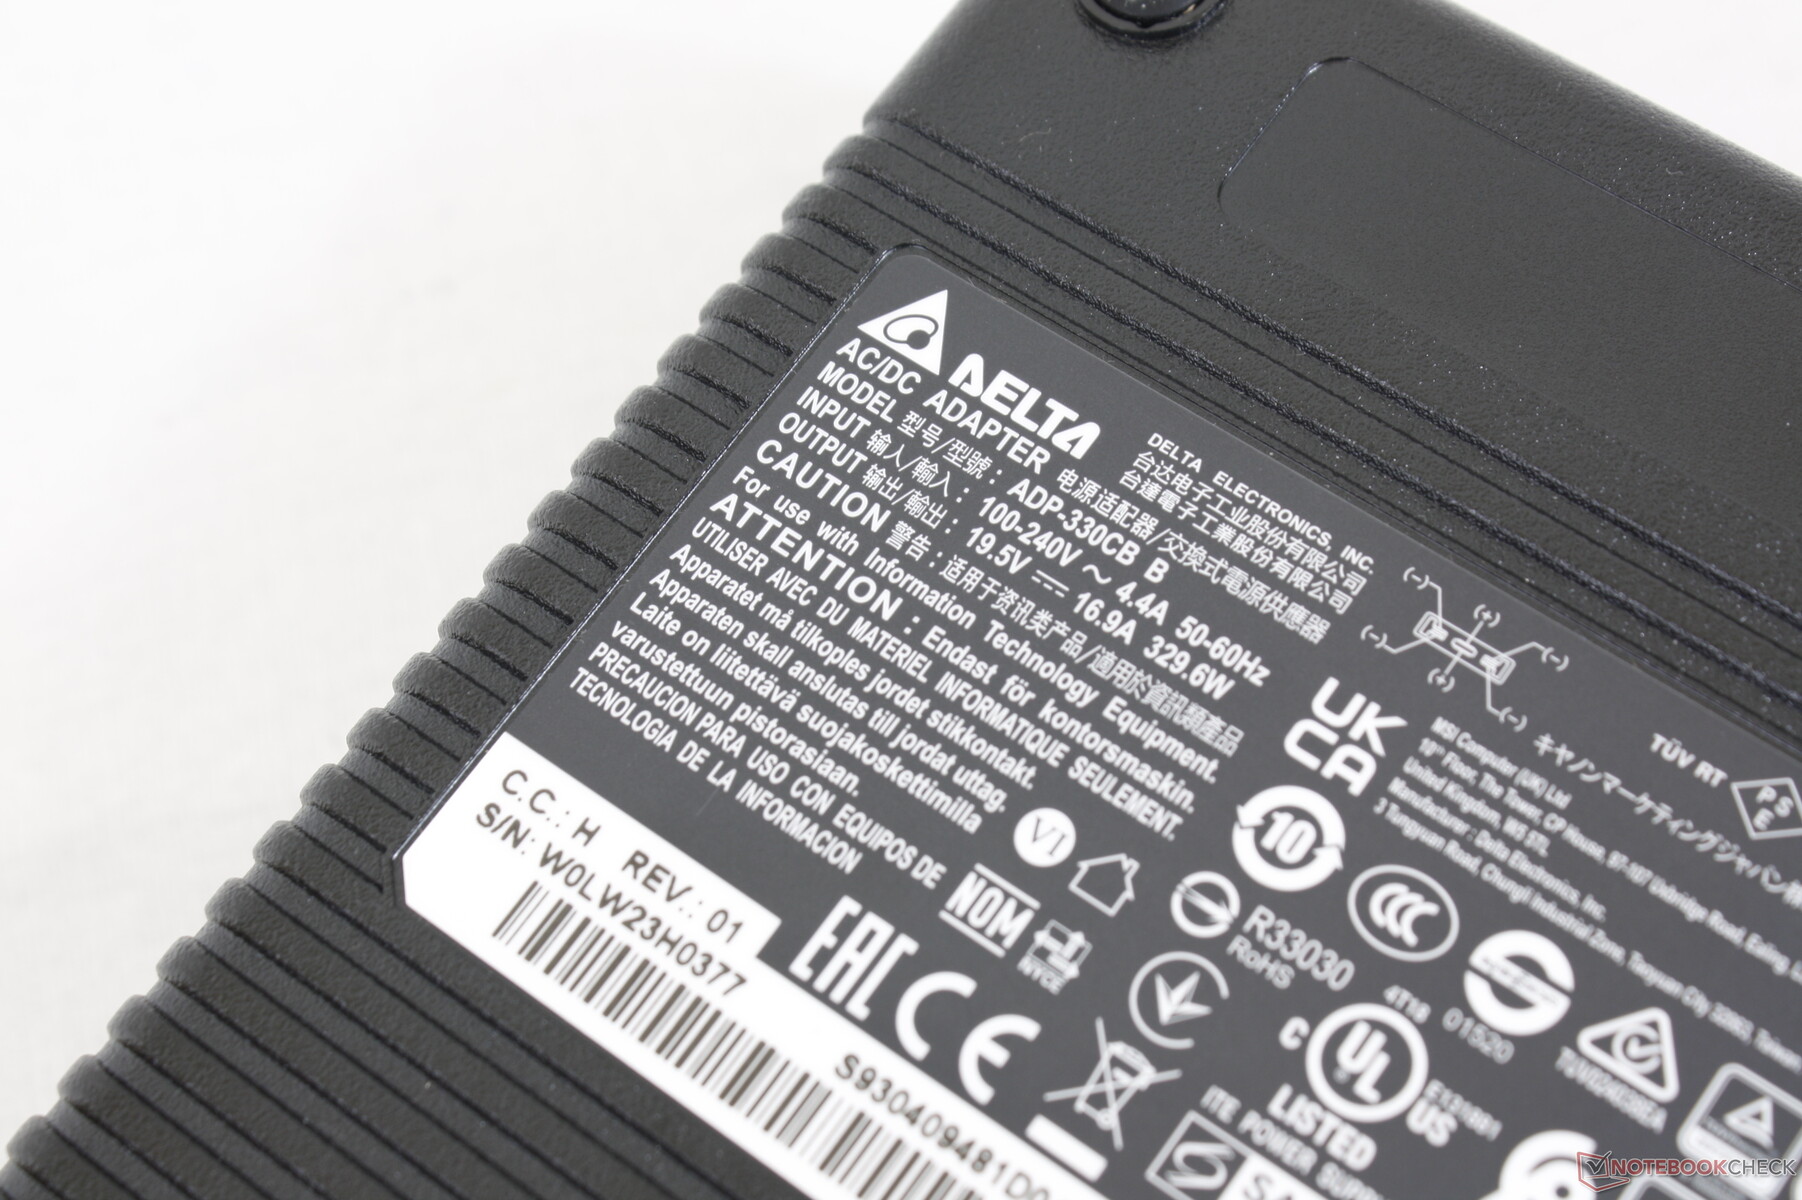
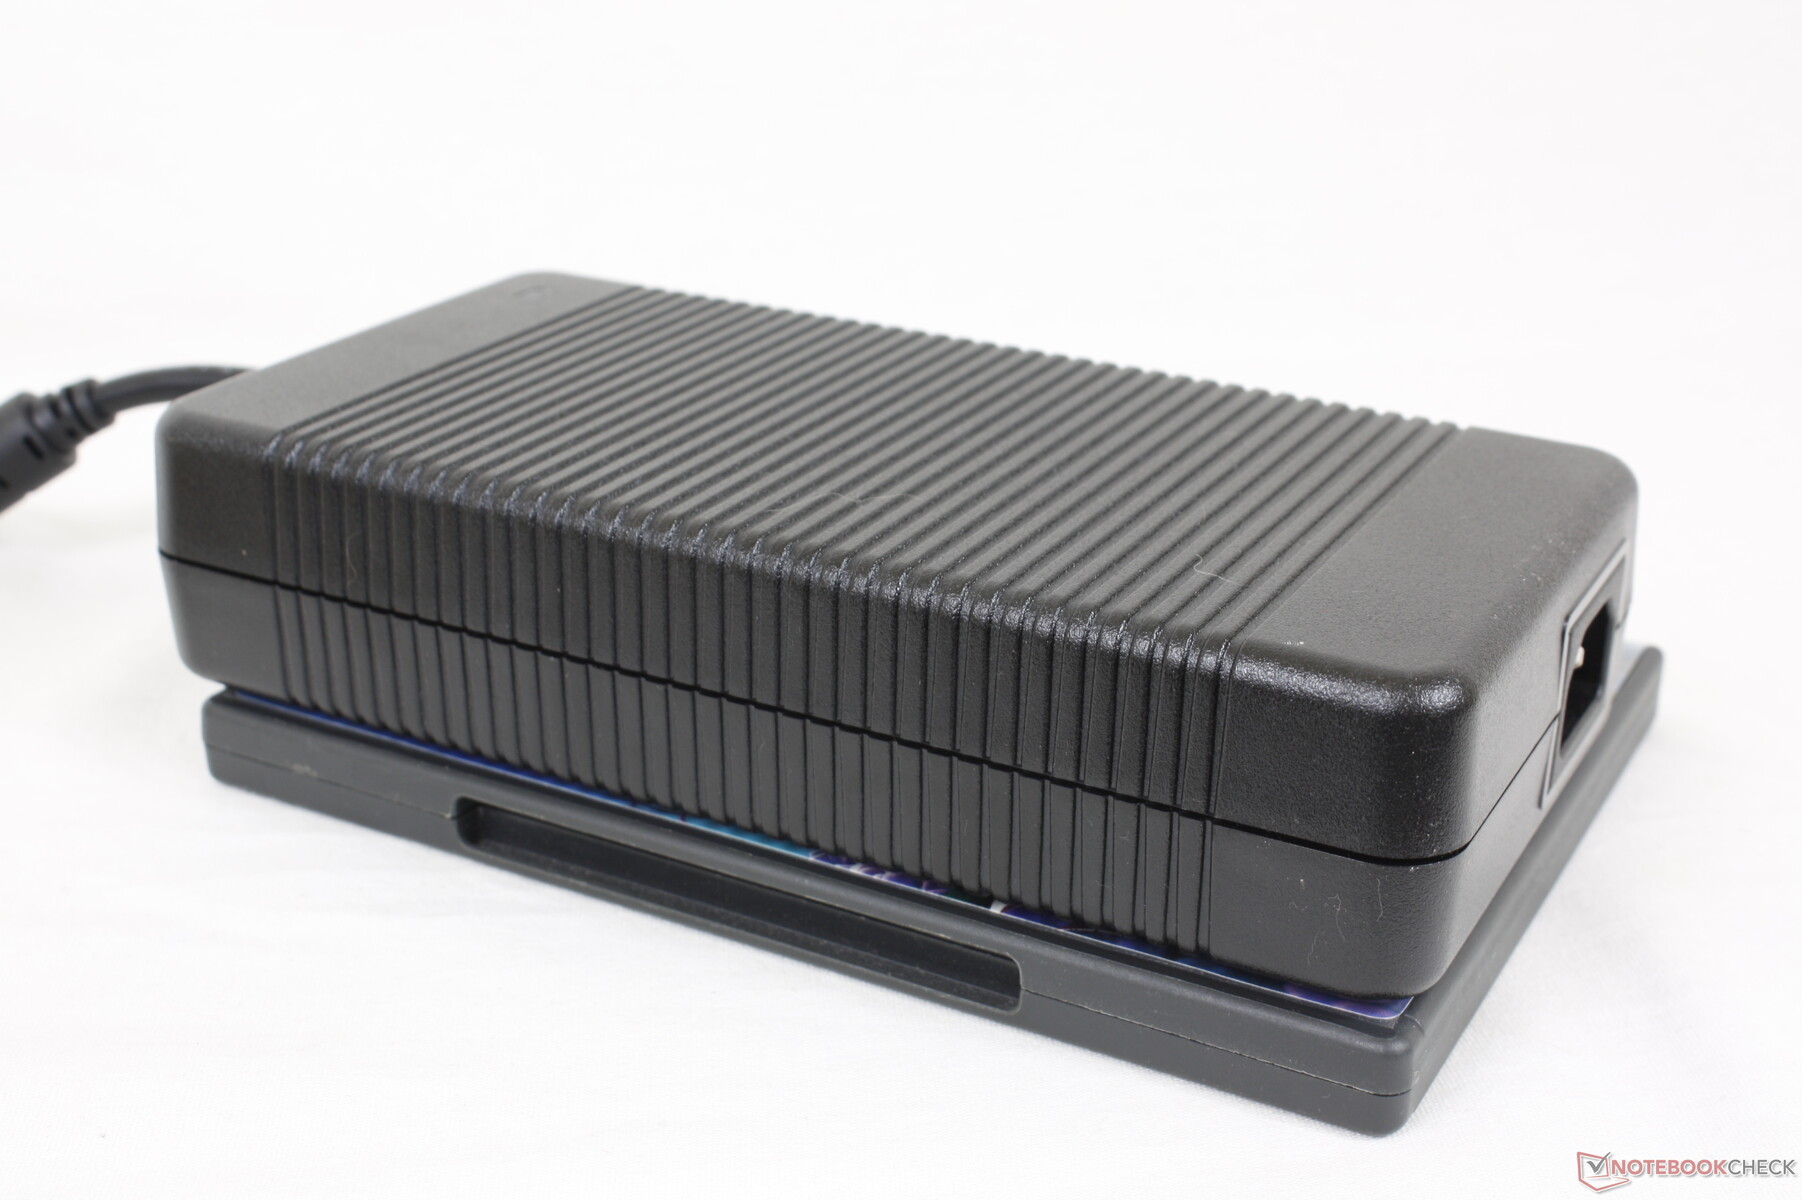
Somos capazes de registrar uma potência máxima de 291 W a partir do maciço (~20 x 9,8 x 4,3 cm) e pesado (1,3 kg) 330 W de tijolos de potência ao rodar simultaneamente o Prime95 e o FurMark. Note que a maioria dos outros laptops para jogos são fornecidos com adaptadores CA de 280 W ou menores.
| desligado | |
| Ocioso | |
| Carga |
|
Key:
min: | |
| MSI GE67 HX 12UGS i7-12800HX, GeForce RTX 3070 Ti Laptop GPU, Samsung PM9A1 MZVL21T0HCLR, OLED, 1920x1080, 15.6" | MSI Raider GE66 12UHS i9-12900HK, GeForce RTX 3080 Ti Laptop GPU, Samsung PM9A1 MZVL22T0HBLB, IPS, 3840x2160, 15.6" | MSI Vector GP66 12UGS i9-12900H, GeForce RTX 3070 Ti Laptop GPU, , IPS, 1920x1080, 15.6" | Asus ROG Strix Scar 15 G533ZW-LN106WS i9-12900H, GeForce RTX 3070 Ti Laptop GPU, Samsung PM9A1 MZVL22T0HBLB, IPS-level, 2560x1440, 15.6" | Alienware m15 R6, i7-11800H RTX 3080 i7-11800H, GeForce RTX 3080 Laptop GPU, Samsung PM9A1 MZVL21T0HCLR, IPS, 1920x1080, 15.6" | Razer Blade 15 2022 i7-12800H, GeForce RTX 3080 Ti Laptop GPU, SSSTC CA6-8D1024, IPS, 2560x1440, 15.6" | |
|---|---|---|---|---|---|---|
| Power Consumption | 5% | -15% | 21% | 12% | -35% | |
| Idle Minimum * (Watt) | 16.1 | 16 1% | 17.5 -9% | 7.56 53% | 14 13% | 33.2 -106% |
| Idle Average * (Watt) | 17.1 | 19 -11% | 20.1 -18% | 13.5 21% | 18 -5% | 36.4 -113% |
| Idle Maximum * (Watt) | 26.6 | 26 2% | 47.3 -78% | 16.87 37% | 29 -9% | 37.6 -41% |
| Load Average * (Watt) | 116.3 | 110 5% | 107.3 8% | 128.9 -11% | 93 20% | 116.7 -0% |
| Witcher 3 ultra * (Watt) | 237 | 202 15% | 225 5% | 196.2 17% | 190 20% | 172 27% |
| Load Maximum * (Watt) | 291.1 | 242 17% | 277.7 5% | 274.86 6% | 203 30% | 228.6 21% |
* ... menor é melhor
Power Consumption Witcher 3 / Stresstest
Power Consumption external Monitor
Vida útil da bateria - Na verdade, nada mal
A capacidade da bateria é a maior permitida a 99,9 Wh como qualquer outra superior violaria as normas de segurança das baterias de lítio da FAA. Os usuários podem esperar tempos de funcionamento da WLAN de cerca de 5,5 horas quando configurada para o perfil de potência balanceada, que é semelhante ao que registramos no GE66 apesar de suas diferenças de desempenho.
A carga de vazio a cheio é lenta de 2 a 2,5 horas. O sistema não pode ser carregado via USB-C, ao contrário da série Razer Blade ou da maioria dos modelos Asus ROG.
| MSI GE67 HX 12UGS i7-12800HX, GeForce RTX 3070 Ti Laptop GPU, 99.9 Wh | MSI Raider GE66 12UHS i9-12900HK, GeForce RTX 3080 Ti Laptop GPU, 99 Wh | MSI Vector GP66 12UGS i9-12900H, GeForce RTX 3070 Ti Laptop GPU, 65 Wh | Asus ROG Strix Scar 15 G533ZW-LN106WS i9-12900H, GeForce RTX 3070 Ti Laptop GPU, 90 Wh | Alienware m15 R6, i7-11800H RTX 3080 i7-11800H, GeForce RTX 3080 Laptop GPU, 84 Wh | Razer Blade 15 2022 i7-12800H, GeForce RTX 3080 Ti Laptop GPU, 80 Wh | |
|---|---|---|---|---|---|---|
| Duração da bateria | -9% | -19% | -4% | -18% | -12% | |
| Reader / Idle (h) | 8.4 | 7.9 -6% | ||||
| WiFi v1.3 (h) | 5.6 | 5.7 2% | 5.7 2% | 8.4 50% | 5 -11% | 4.9 -12% |
| Load (h) | 2.1 | 1.7 -19% | 1 -52% | 0.9 -57% | 1.6 -24% | |
| H.264 (h) | 7.1 | 8.5 | 5.6 | |||
| Witcher 3 ultra (h) | 1.2 |
Pro
Contra
Veredicto - Contas de Maior Desempenho, Maior Potência
As vantagens de desempenho do Core i7-12800HX são inegáveis. Quando comparado com o Ryzen 7 5800H ou mesmo o Núcleo i9-12900Ha CPU Intel HX pode oferecer até 80% mais rápido de desempenho multi-tarefa do que a primeira e 30% a 60% mais rápido do que a segunda. Os ganhos são significativos o suficiente para se antecipar à classe de desktop Núcleo i7-12700K em muitos casos. Entusiastas e jogadores que sabem que podem tirar vantagem do processador, como para taxas de quadros mais altas quando se joga, encontrarão muito a gostar sobre o que o GE67 pode oferecer.
Todo esse desempenho extra não vem de graça. Enquanto que o GE66 seria enviado com um adaptador CA 280 W mais fino, o GE67 é enviado com um adaptador CA 330 W mais volumoso apenas para acomodar a CPU HX de 12ª geração da Intel, que consome muita energia. O consumo de energia é inquestionavelmente maior como resultado. Alguns usuários podem achar que estas desvantagens valem a pena ao considerar os imensos ganhos da CPU, mas ainda é algo a se ter em mente se de uma perspectiva de desempenho por watt.
O GE67 é um dos laptops para jogos mais rápidos de 15,6 polegadas graças à CPU Core i7-12800HX e 150 W GeForce GPU RTX. É também um dos mais ávidos por energia, pois requer um tijolo grande de 330 W de potência para funcionar.
Quanto ao visor QHD OLED 240 Hz, é facilmente o melhor painel OLED atualmente disponível para fins de jogos e emparelha-se muito bem com a CPU HX e 150 W GeForce RTX 3070 Ti GPU. Sua implementação no GE67 não é para fins de edição profissional, no entanto, e a cintilação pode impactar uma minoria de usuários.
Preço e Disponibilidade
O MSI GE67 ainda não está amplamente disponível na Amazon ou Best Buy a partir deste escrito. Entretanto, lojas como XoticPC e EXcaliberPC ter SKUs em estoque a partir de $2500 USD.
MSI GE67 HX 12UGS
- 08/30/2022 v7 (old)
Allen Ngo
Price comparison

