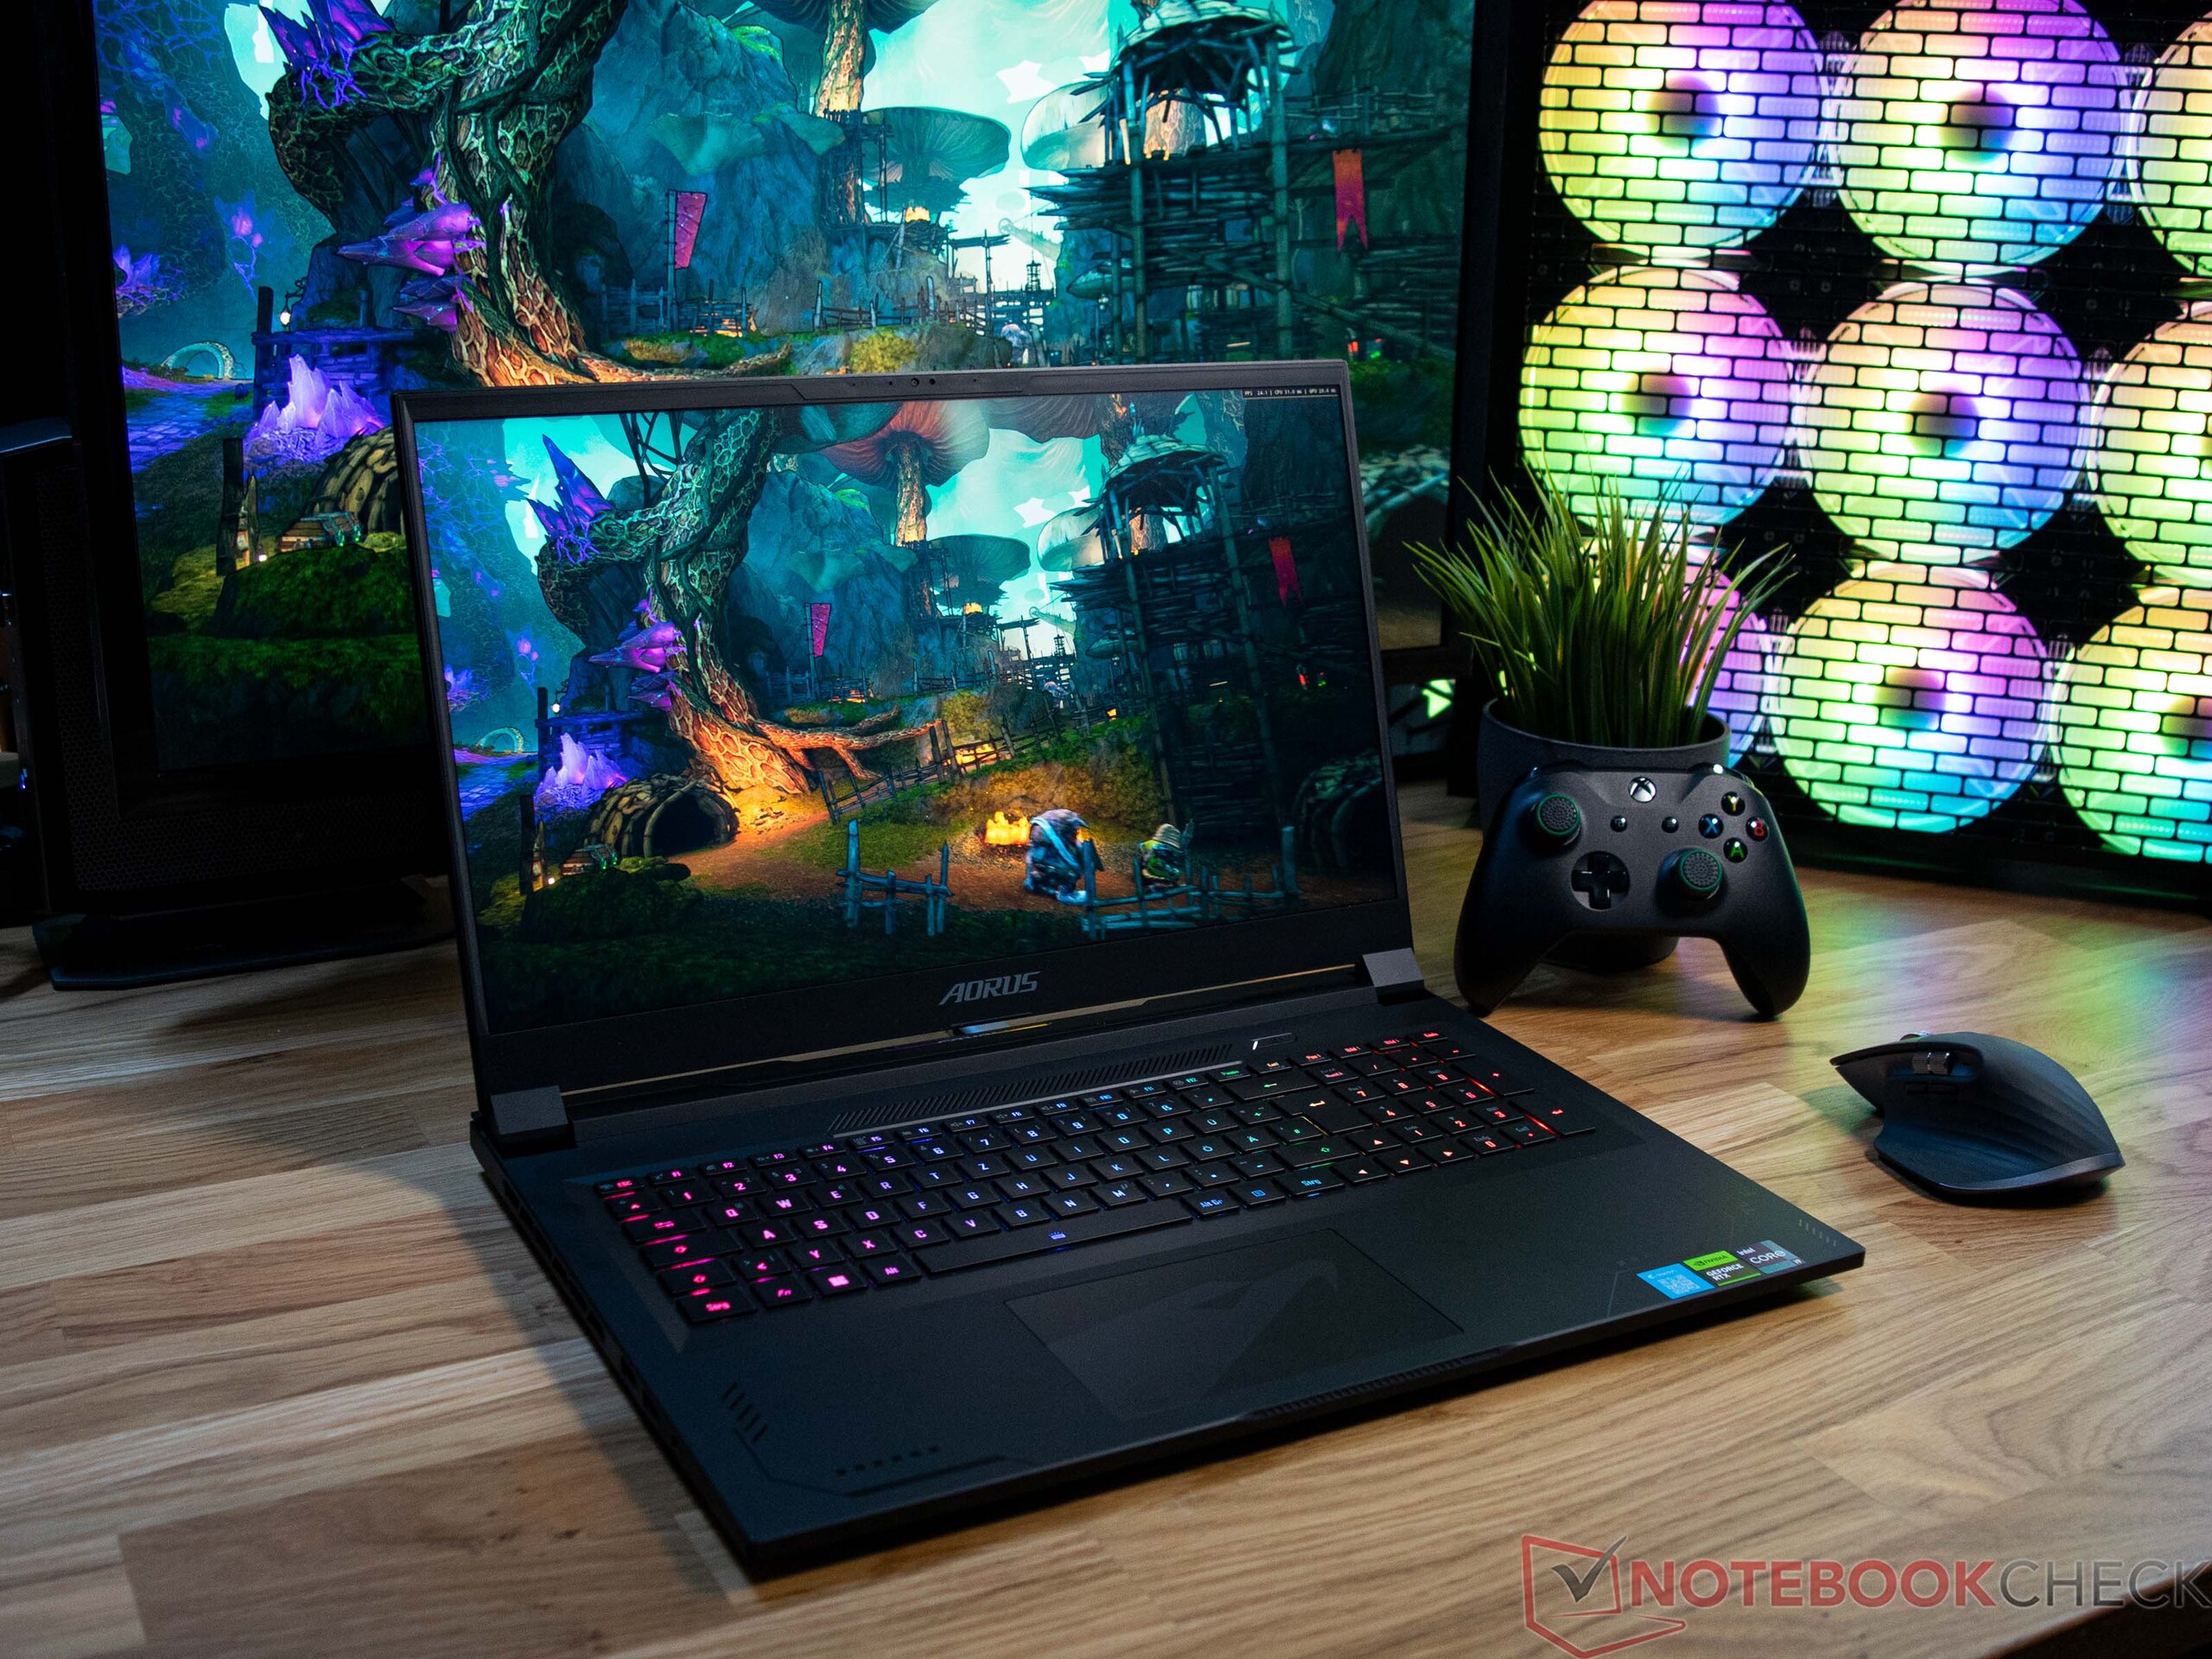
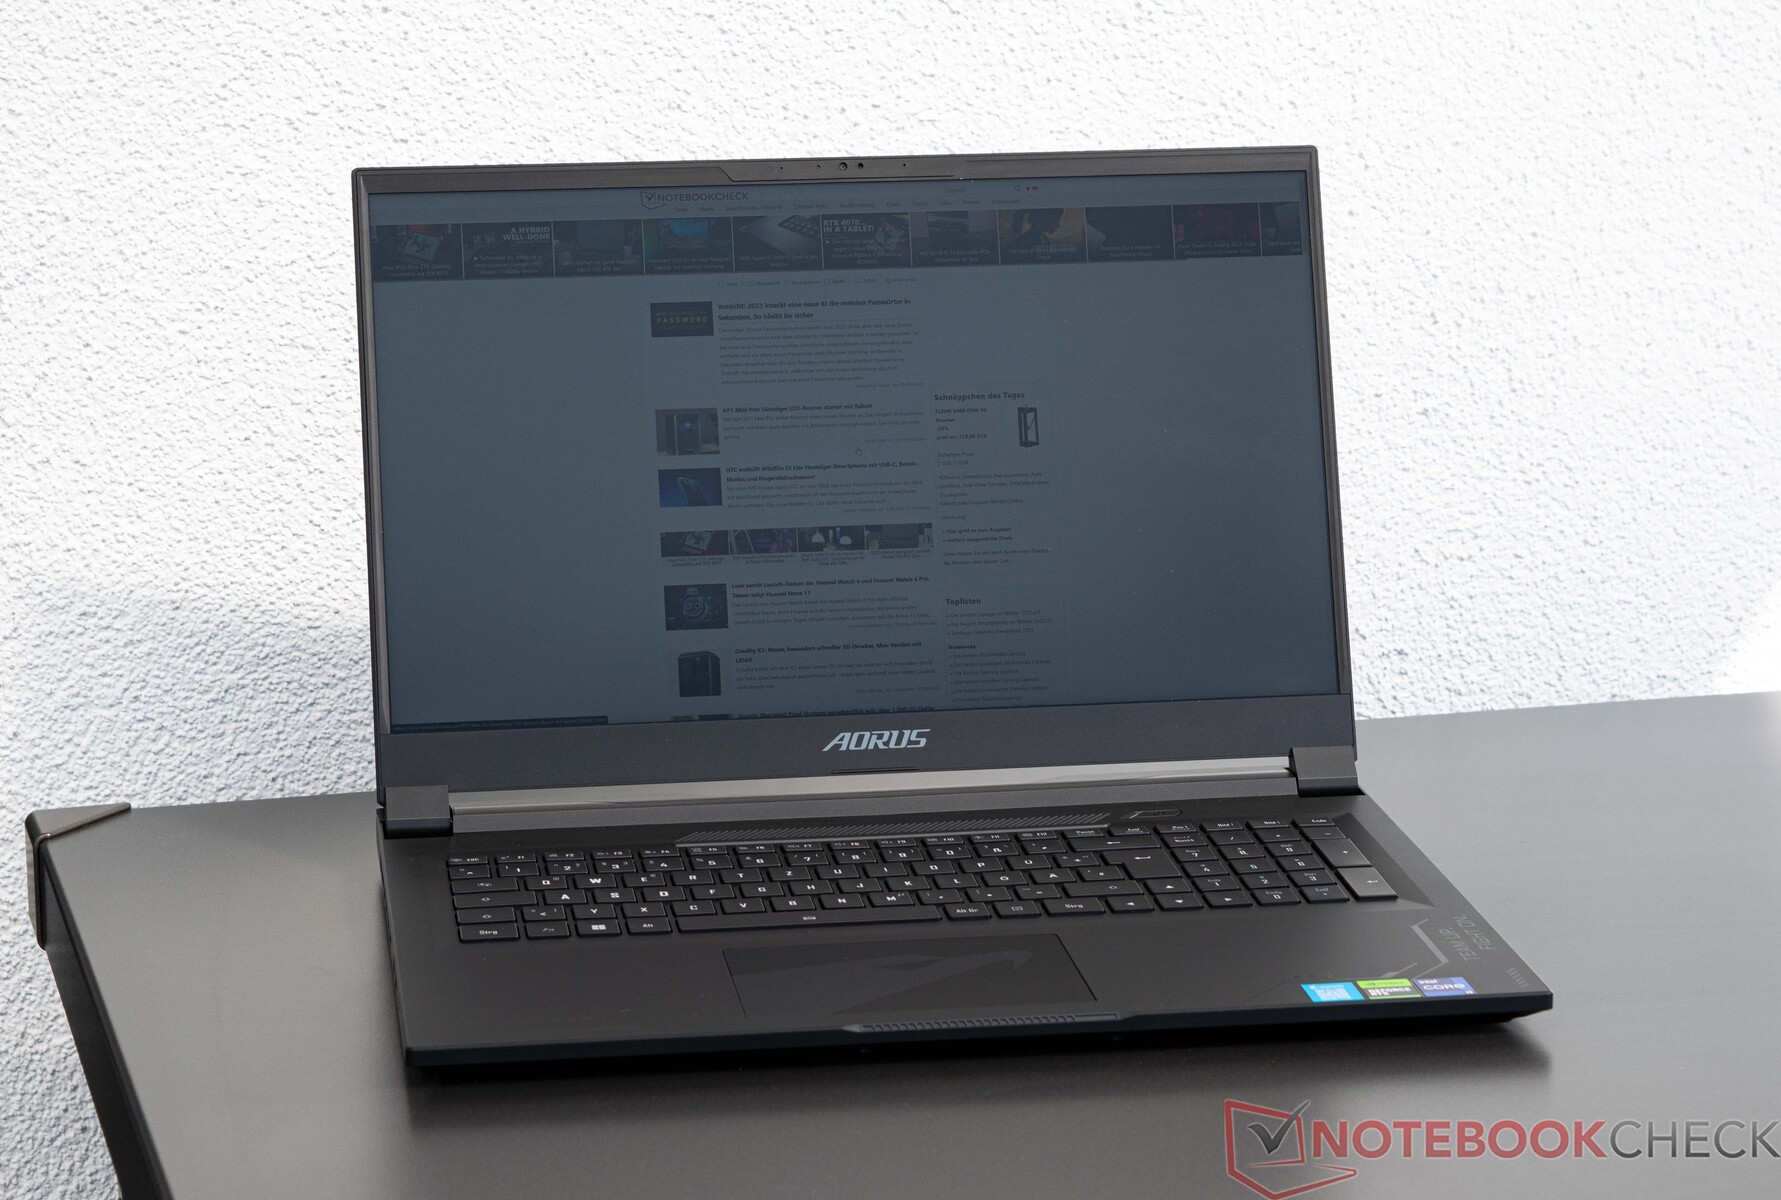
Revisão Aorus 17X AZF: Laptop para jogos de alta qualidade com i9-13900HX e RTX 4090 em um estojo fino
O novo Aorus 17X AZF é construído sobre um processador Intel Raptor Lake H e o mais recente GPU móvel da Nvidia. Um Intel Core i9 13900HX trabalha em conjunto com um Nvidia GeForce RTX 4090 GPU para laptop debaixo do capô. Somente estes dois componentes dão uma idéia da finalidade do laptop. Mas qual é o desempenho do hardware no estojo fino? Examinamos isso e entraremos em mais detalhes mais tarde. Mas só a CPU e a GPU não fazem um bom laptop para jogos - estes são acompanhados por uma tela de 240 Hz de 17 polegadas no Aorus 17X AZF, assim como um total de armazenamento SSD de 2 TB que pode facilmente armazenar um grande número de jogos e outros programas. Tal configuração totaliza US$3.499,00.
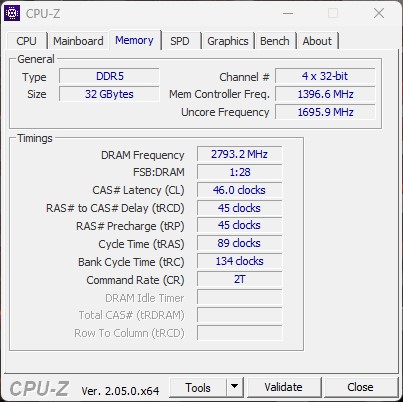
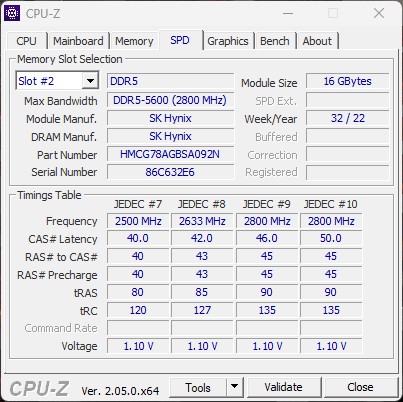
Alternativamente, o Aorus 17X está disponível com um Intel Core Intel Core i7 13700HX. Embora não haja outras opções em termos de placa gráfica, a velocidade da RAM DDR5 pode variar. O Core i7 é tecnicamente limitado a um máximo de 4800 MT/s, enquanto o modelo Core i9 tem um máximo de 5600 MT/s à sua disposição.
Os laptops concorrentes nesta classe também oferecem níveis de desempenho semelhantes quando se observam as especificações técnicas, já que também são equipados com processadores Intel Raptor-Lake H e GPUs Ada-Lovelace móveis. Uma visão detalhada dos dispositivos de comparação pode ser encontrada na tabela a seguir.
Possíveis concorrentes em comparação
Avaliação | Data | Modelo | Peso | Altura | Size | Resolução | Preço |
|---|---|---|---|---|---|---|---|
| 86 % v7 (old) | 04/2023 | Aorus 17X AZF i9-13900HX, GeForce RTX 4090 Laptop GPU | 2.9 kg | 21.8 mm | 17.30" | 2560x1440 | |
| 88.4 % v7 (old) | 03/2023 | Medion Erazer Beast X40 i9-13900HX, GeForce RTX 4090 Laptop GPU | 2.9 kg | 33 mm | 17.00" | 2560x1600 | |
| 88.3 % v7 (old) | 03/2023 | MSI GE78HX 13VH-070US i9-13950HX, GeForce RTX 4080 Laptop GPU | 3 kg | 23 mm | 17.00" | 2560x1600 | |
| 85.4 % v7 (old) | 03/2023 | HP Omen 17-ck2097ng i9-13900HX, GeForce RTX 4080 Laptop GPU | 2.8 kg | 27 mm | 17.30" | 2560x1440 | |
| 90.7 % v7 (old) | 04/2023 | Alienware m18 R1 i9-13980HX, GeForce RTX 4090 Laptop GPU | 3.9 kg | 26.7 mm | 18.00" | 1920x1200 | |
| 89 % v7 (old) | 02/2023 | MSI Titan GT77 HX 13VI i9-13950HX, GeForce RTX 4090 Laptop GPU | 3.5 kg | 23 mm | 17.30" | 3840x2160 |
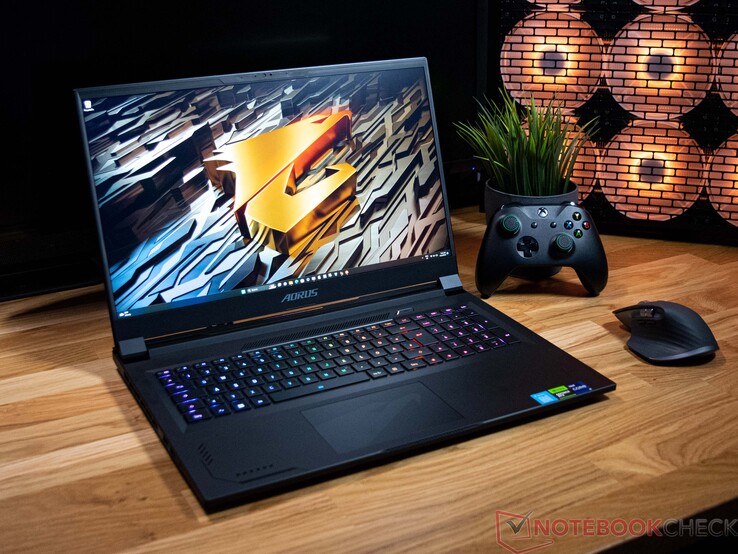
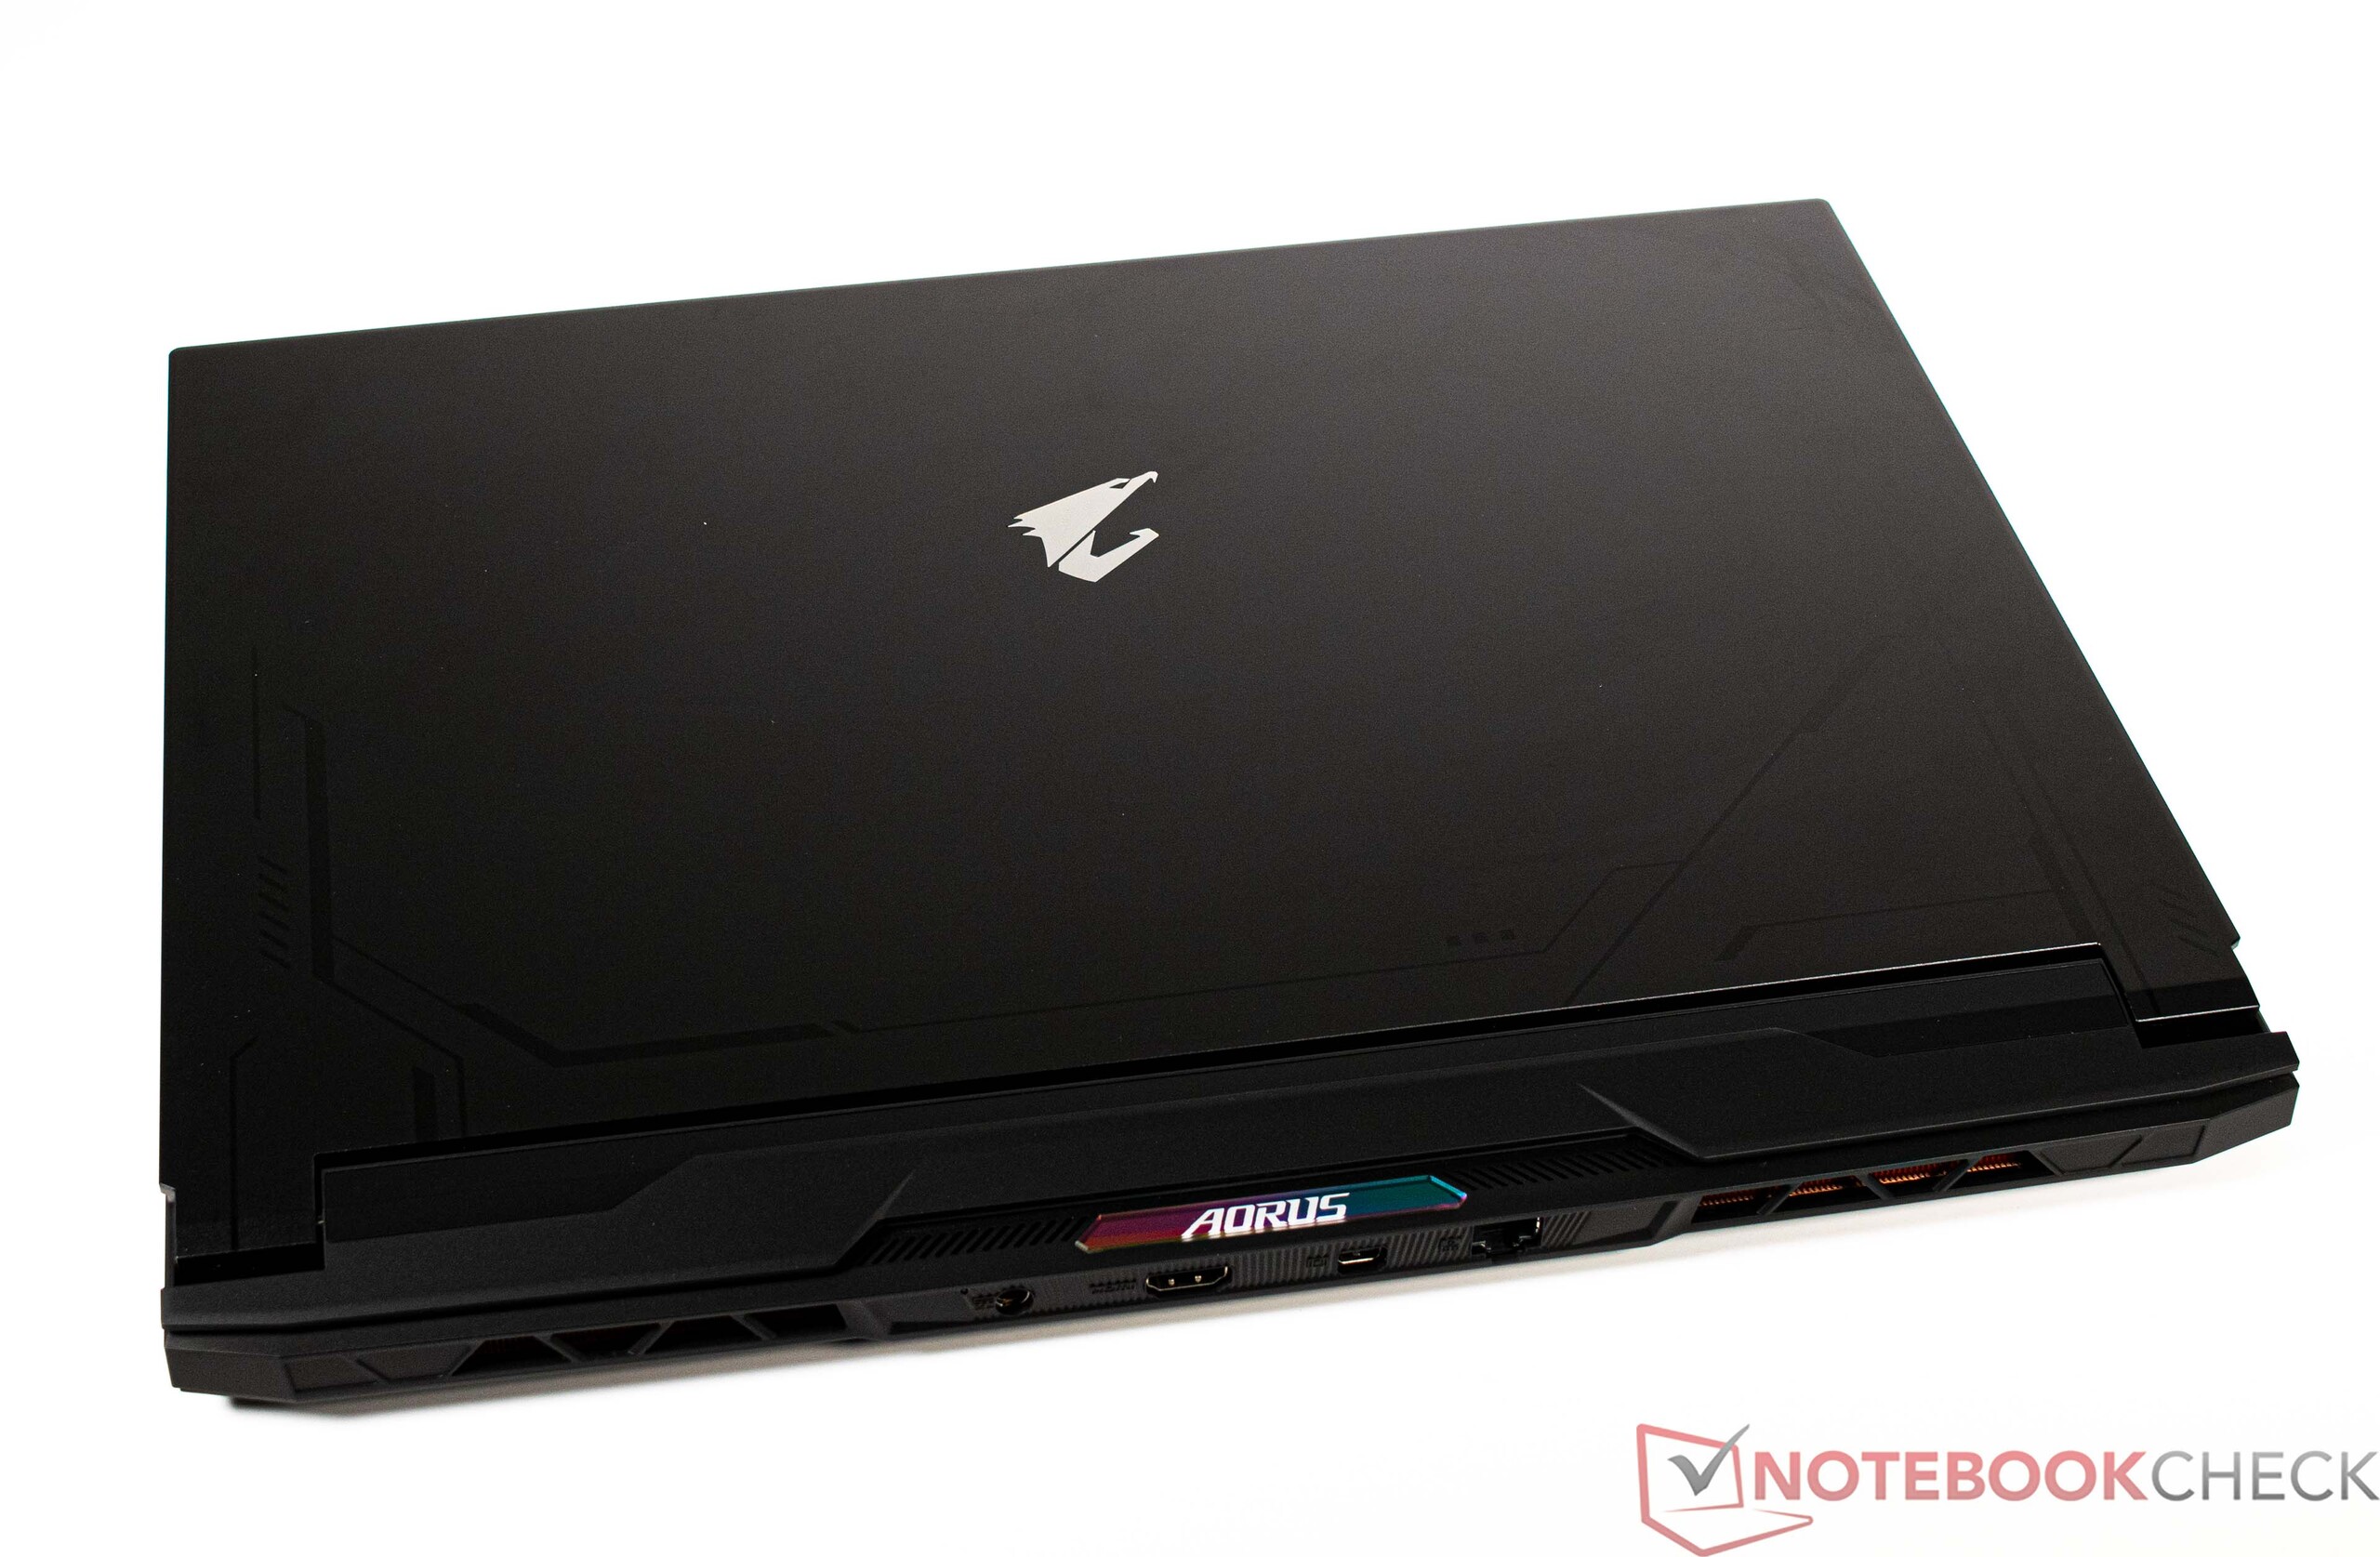
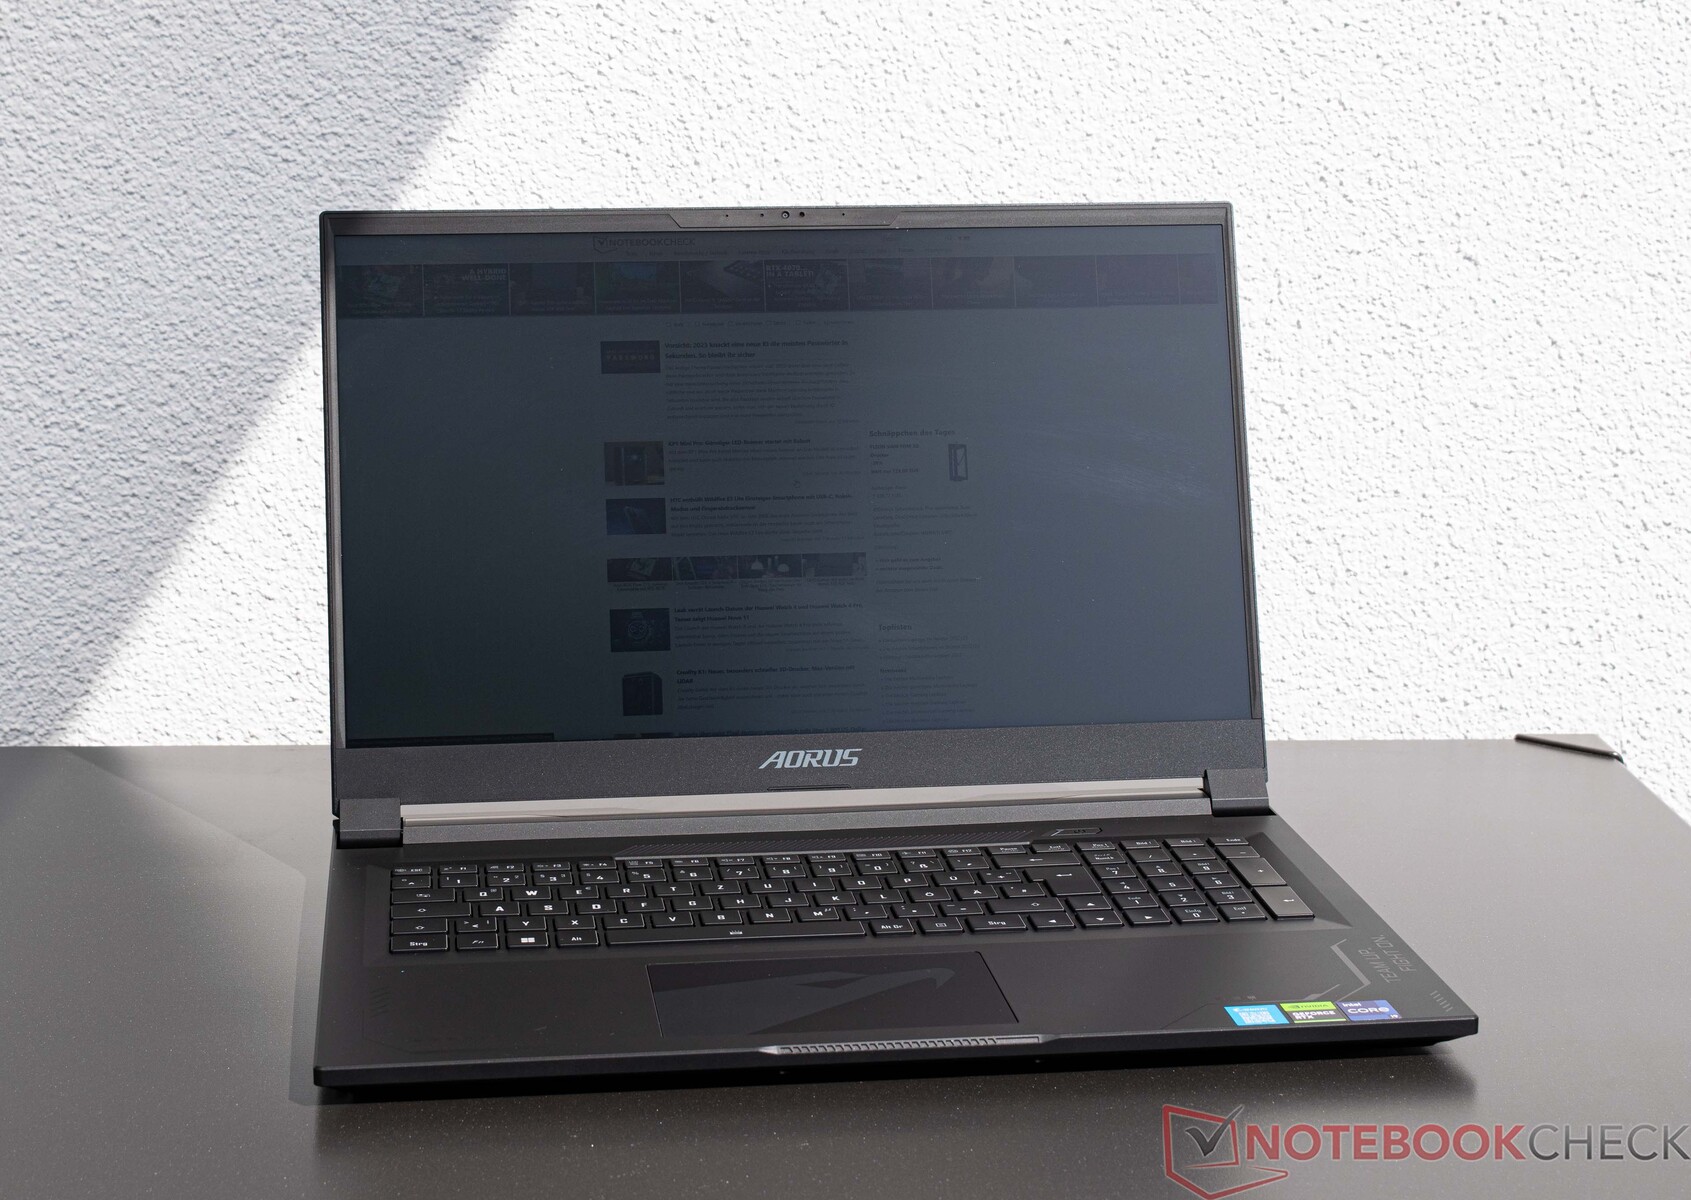
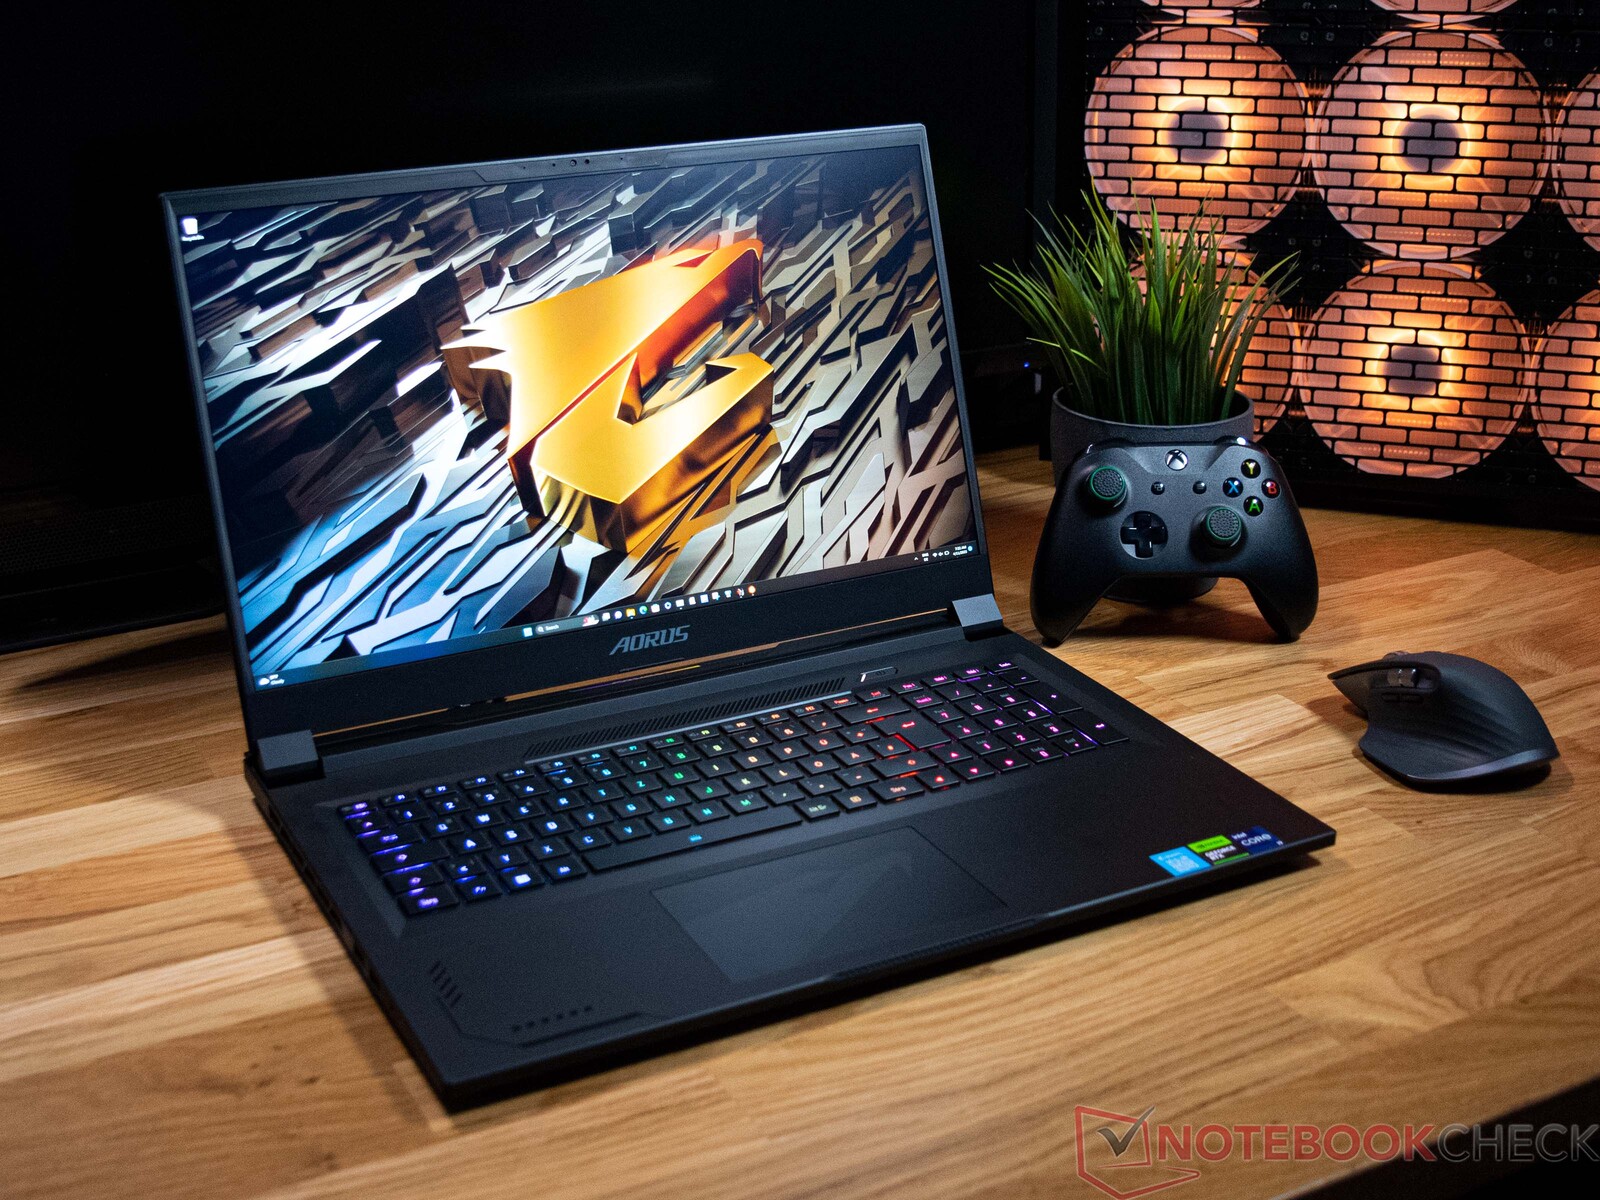
Caixa - Alumínio e plástico no Aorus 17X
O Aorus 17X é feito principalmente de alumínio e plástico. Isto tem a vantagem do baixo peso, pois com menos de 3 quilos, o dispositivo é um dos representantes mais leves aqui em comparação. Apenas o HP Omen 17 é ligeiramente mais leve.
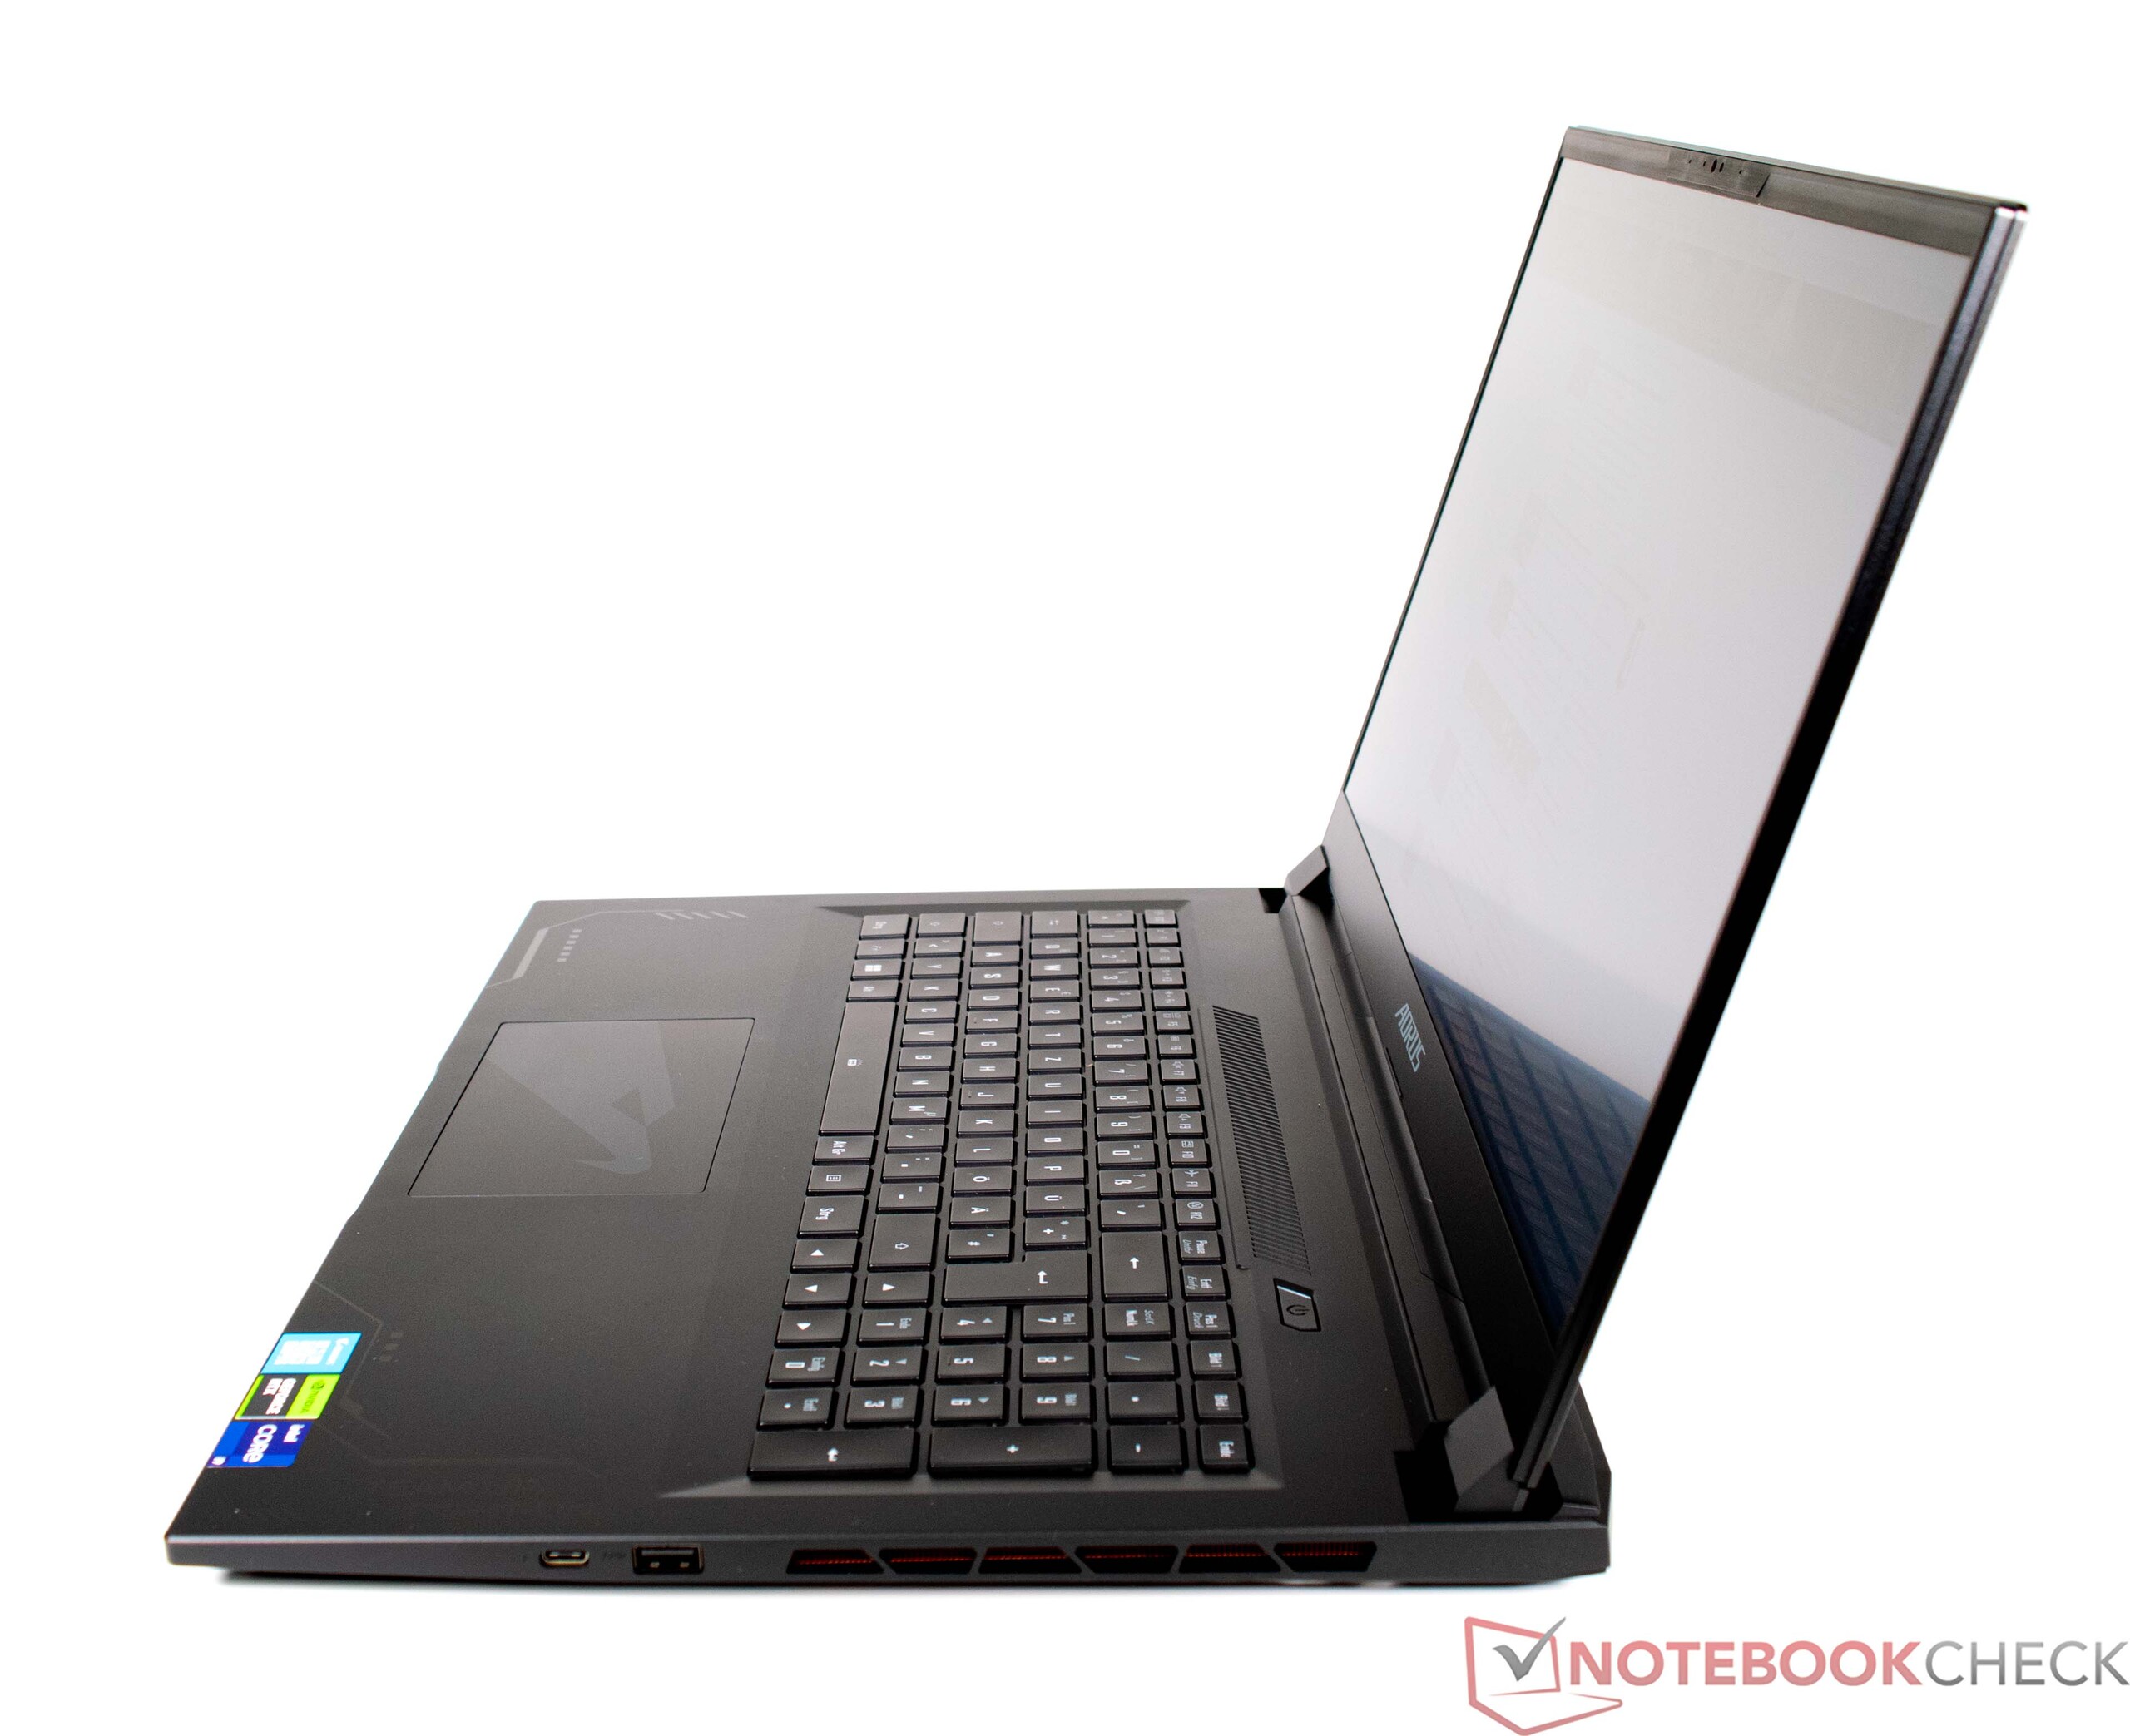
Em termos de estabilidade, a escolha dos materiais se mostra um pouco desvantajosa, mas ainda assim provou ser sólida em nosso teste de pressão. Os fabricantes sempre têm que gerenciar um ato de equilíbrio entre estabilidade e mobilidade em grandes laptops de 17 polegadas, o que acreditamos ter sido um sucesso no Aorus 17X AZF. A tampa da tela, feita de alumínio na parte superior, é relativamente estável, embora ainda possa ser torcida com um pouco de esforço. As dobradiças também são estáveis, o que dá uma sensação de solidez e reduz ao mínimo o tetering. Além disso, a abertura do visor com uma só mão é possível.
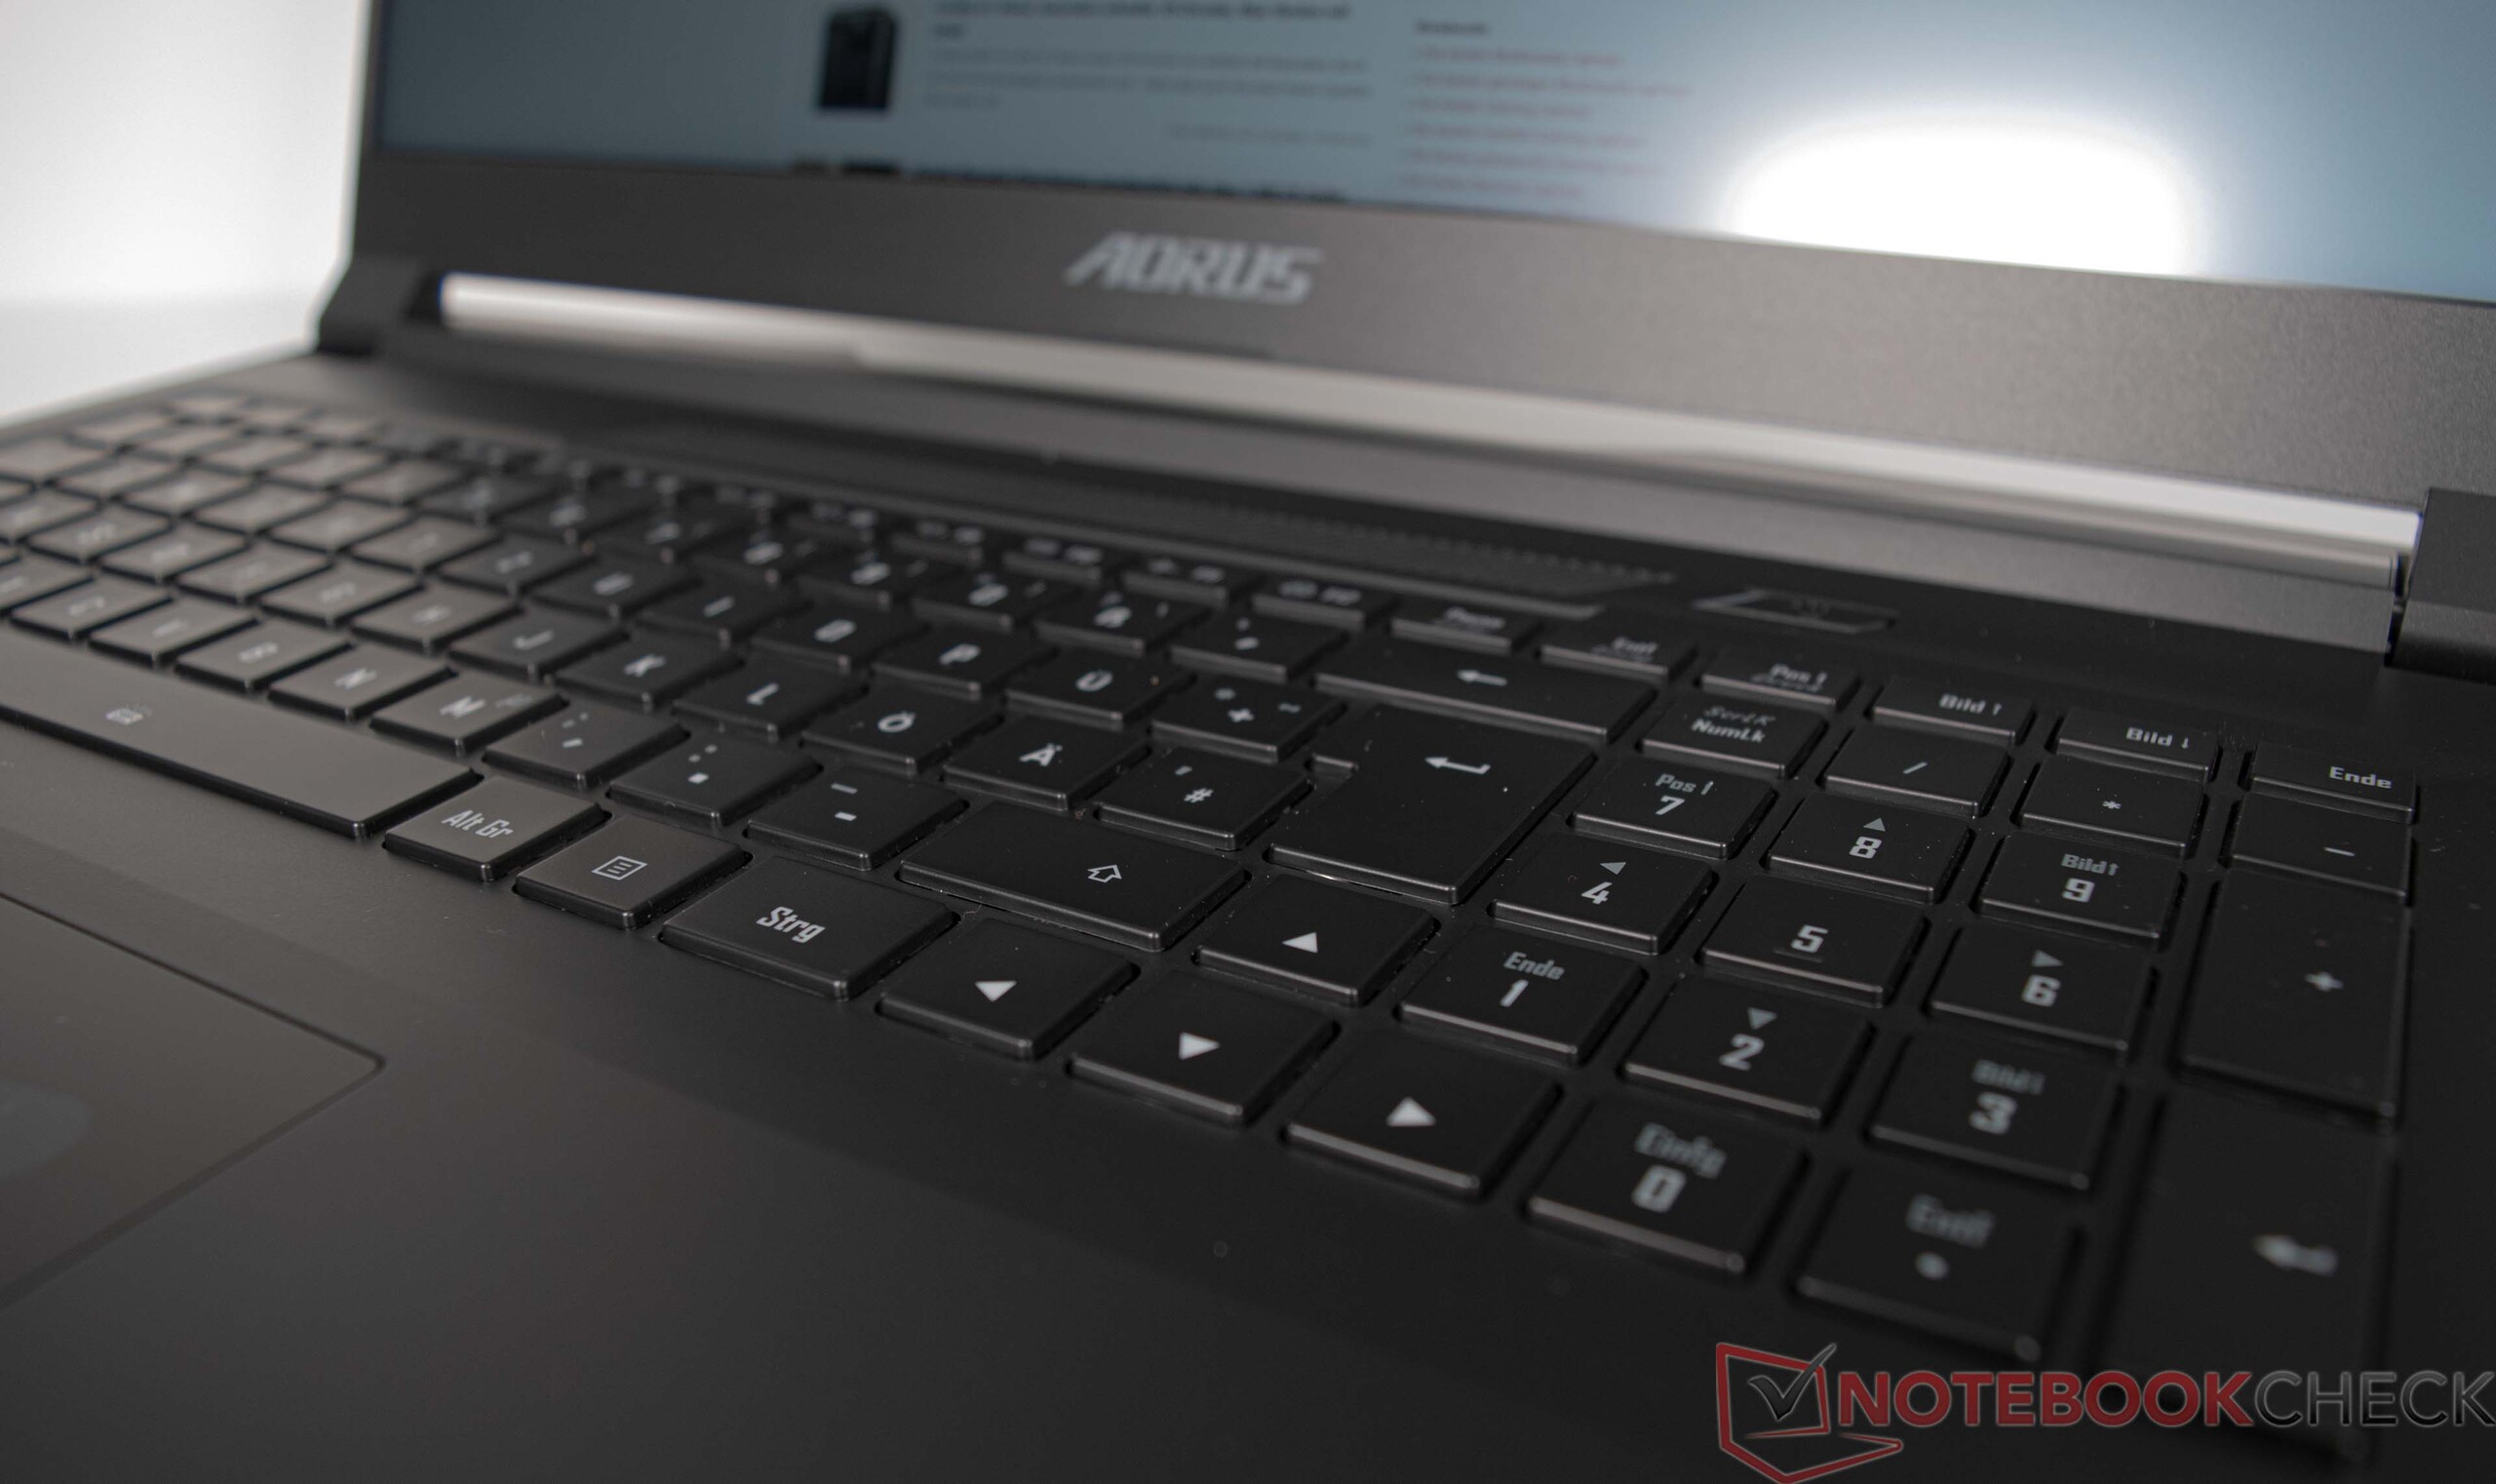
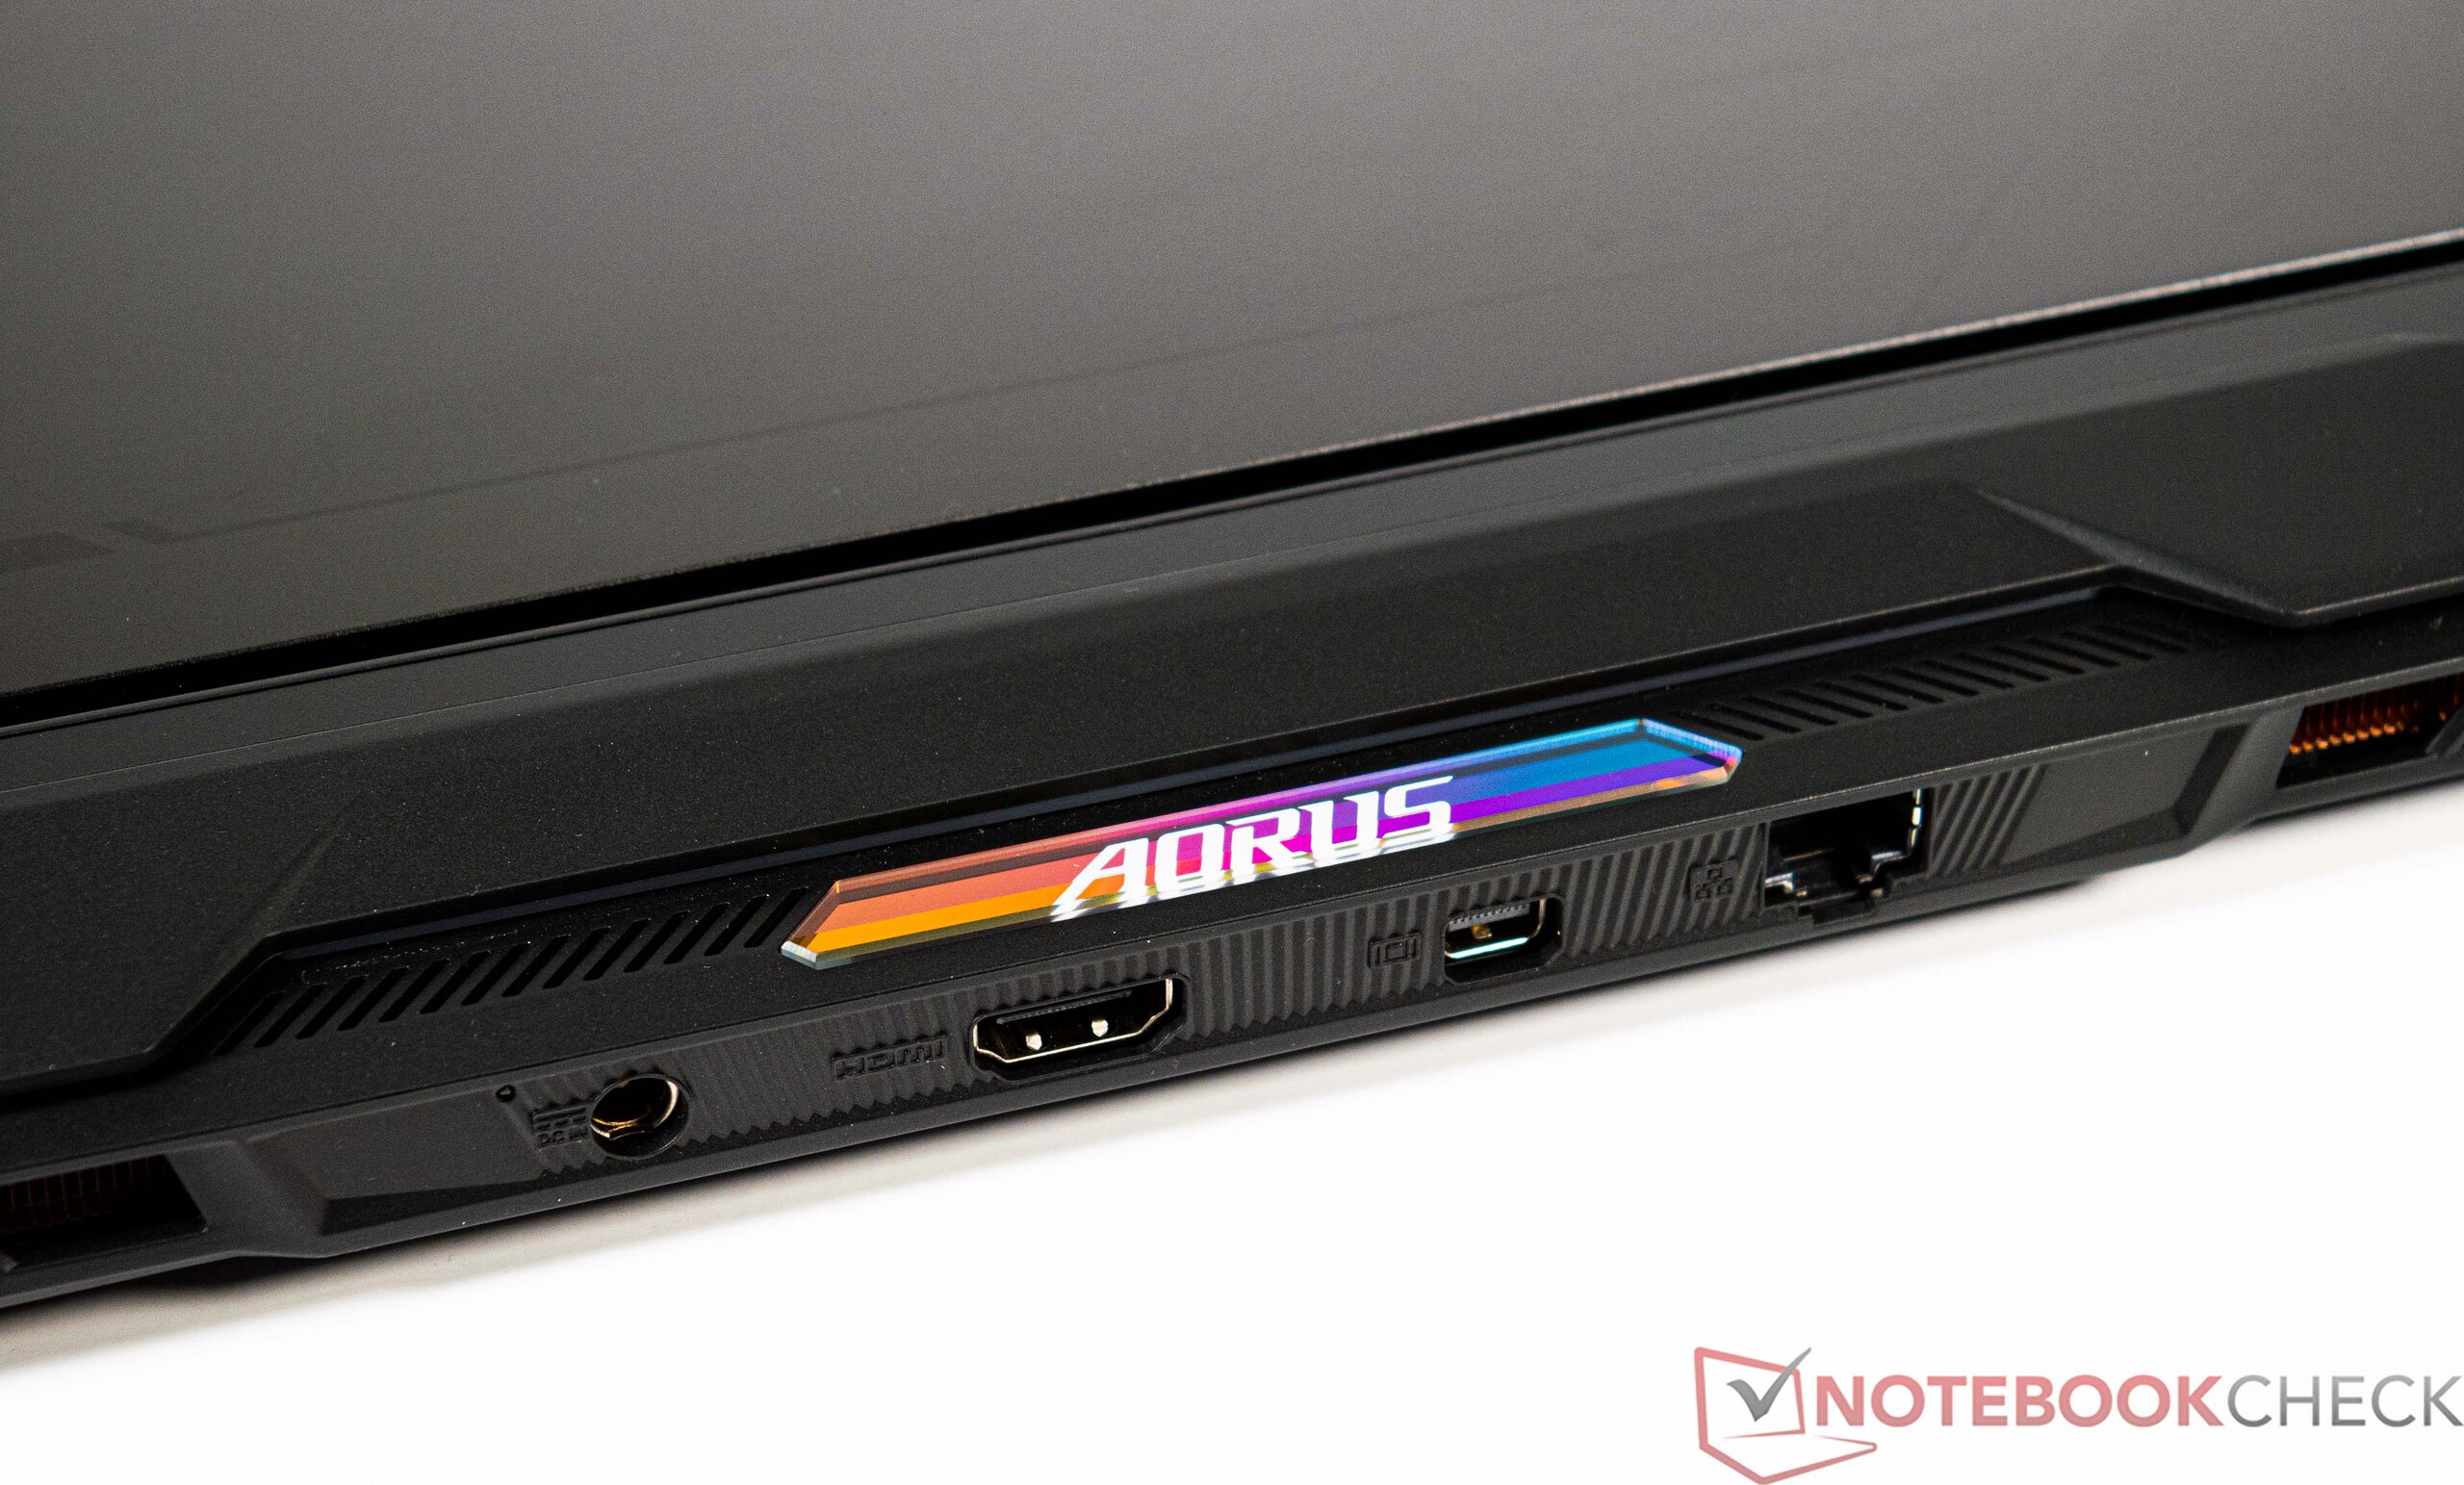
Os únicos elementos coloridos estão na parte de trás sob a forma de letras Aorus iluminadas. Há também um logotipo Aorus prateado na tampa do display, que quebra a monotonia do dispositivo, que de outra forma seria completamente preto.
Equipamento
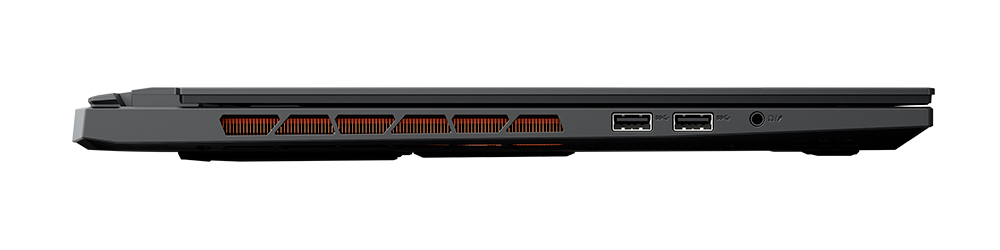
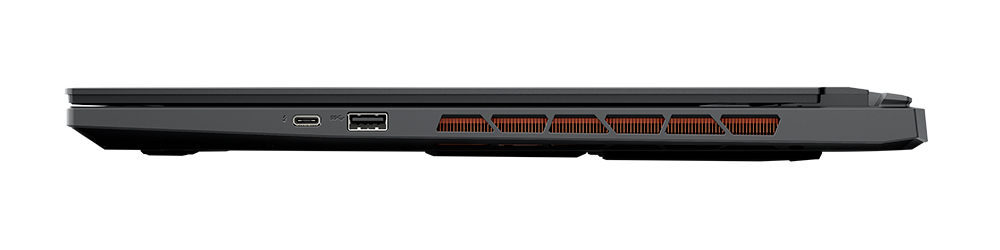
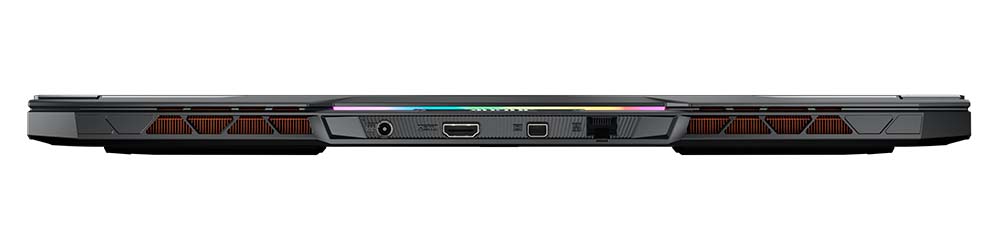
O Aorus 17X AZF infelizmente não oferece uma seleção tão grande de portos, mas as interfaces disponíveis devem, no entanto, satisfazer a maioria dos usuários. Afinal de contas, existe uma porta Thunderbolt 4 moderna com fornecimento de energia (PD) e três portas USB convencionais. Enquanto isso, displays externos podem ser conectados via HDMI ou DisplayPort. A localização das interfaces é decente, embora o fabricante não tenha tido muitas opções devido à construção expansiva de tubos de calor no interior.
Comunicação
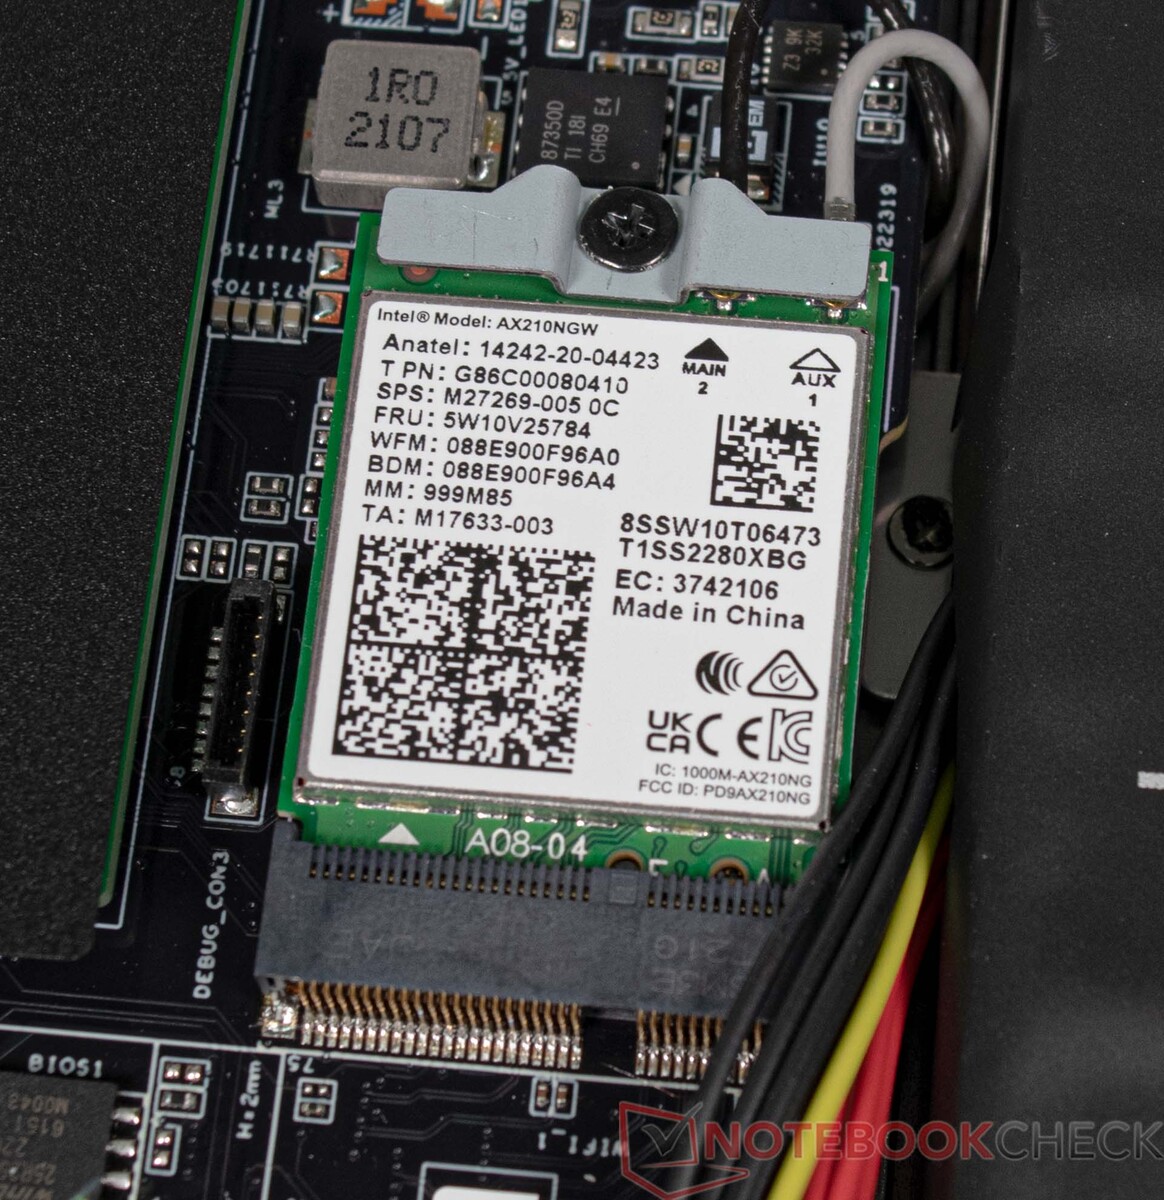
O módulo WLAN instalado proporciona bom desempenho, de modo que o Aorus 17X AZF não precisa se afastar da concorrência aqui. Nosso Asus ROG Rapture GT-AXE11000 foi usado como roteador de teste. Alternativamente, o Aorus 17X AZF também oferece uma porta Ethernet, que fornece taxas de até 2,5 GBit/s.
Webcam
A webcam da Aorus 17X AZF é capaz de FHD, tornando-a adequada para telefonia de vídeo simples. Alguns pontos foram deduzidos devido à falta de fidelidade de cores. O microfone de dois raios, por outro lado, faz um bom trabalho, já que as gravações de diferentes direções são reproduzidas em um volume semelhante.


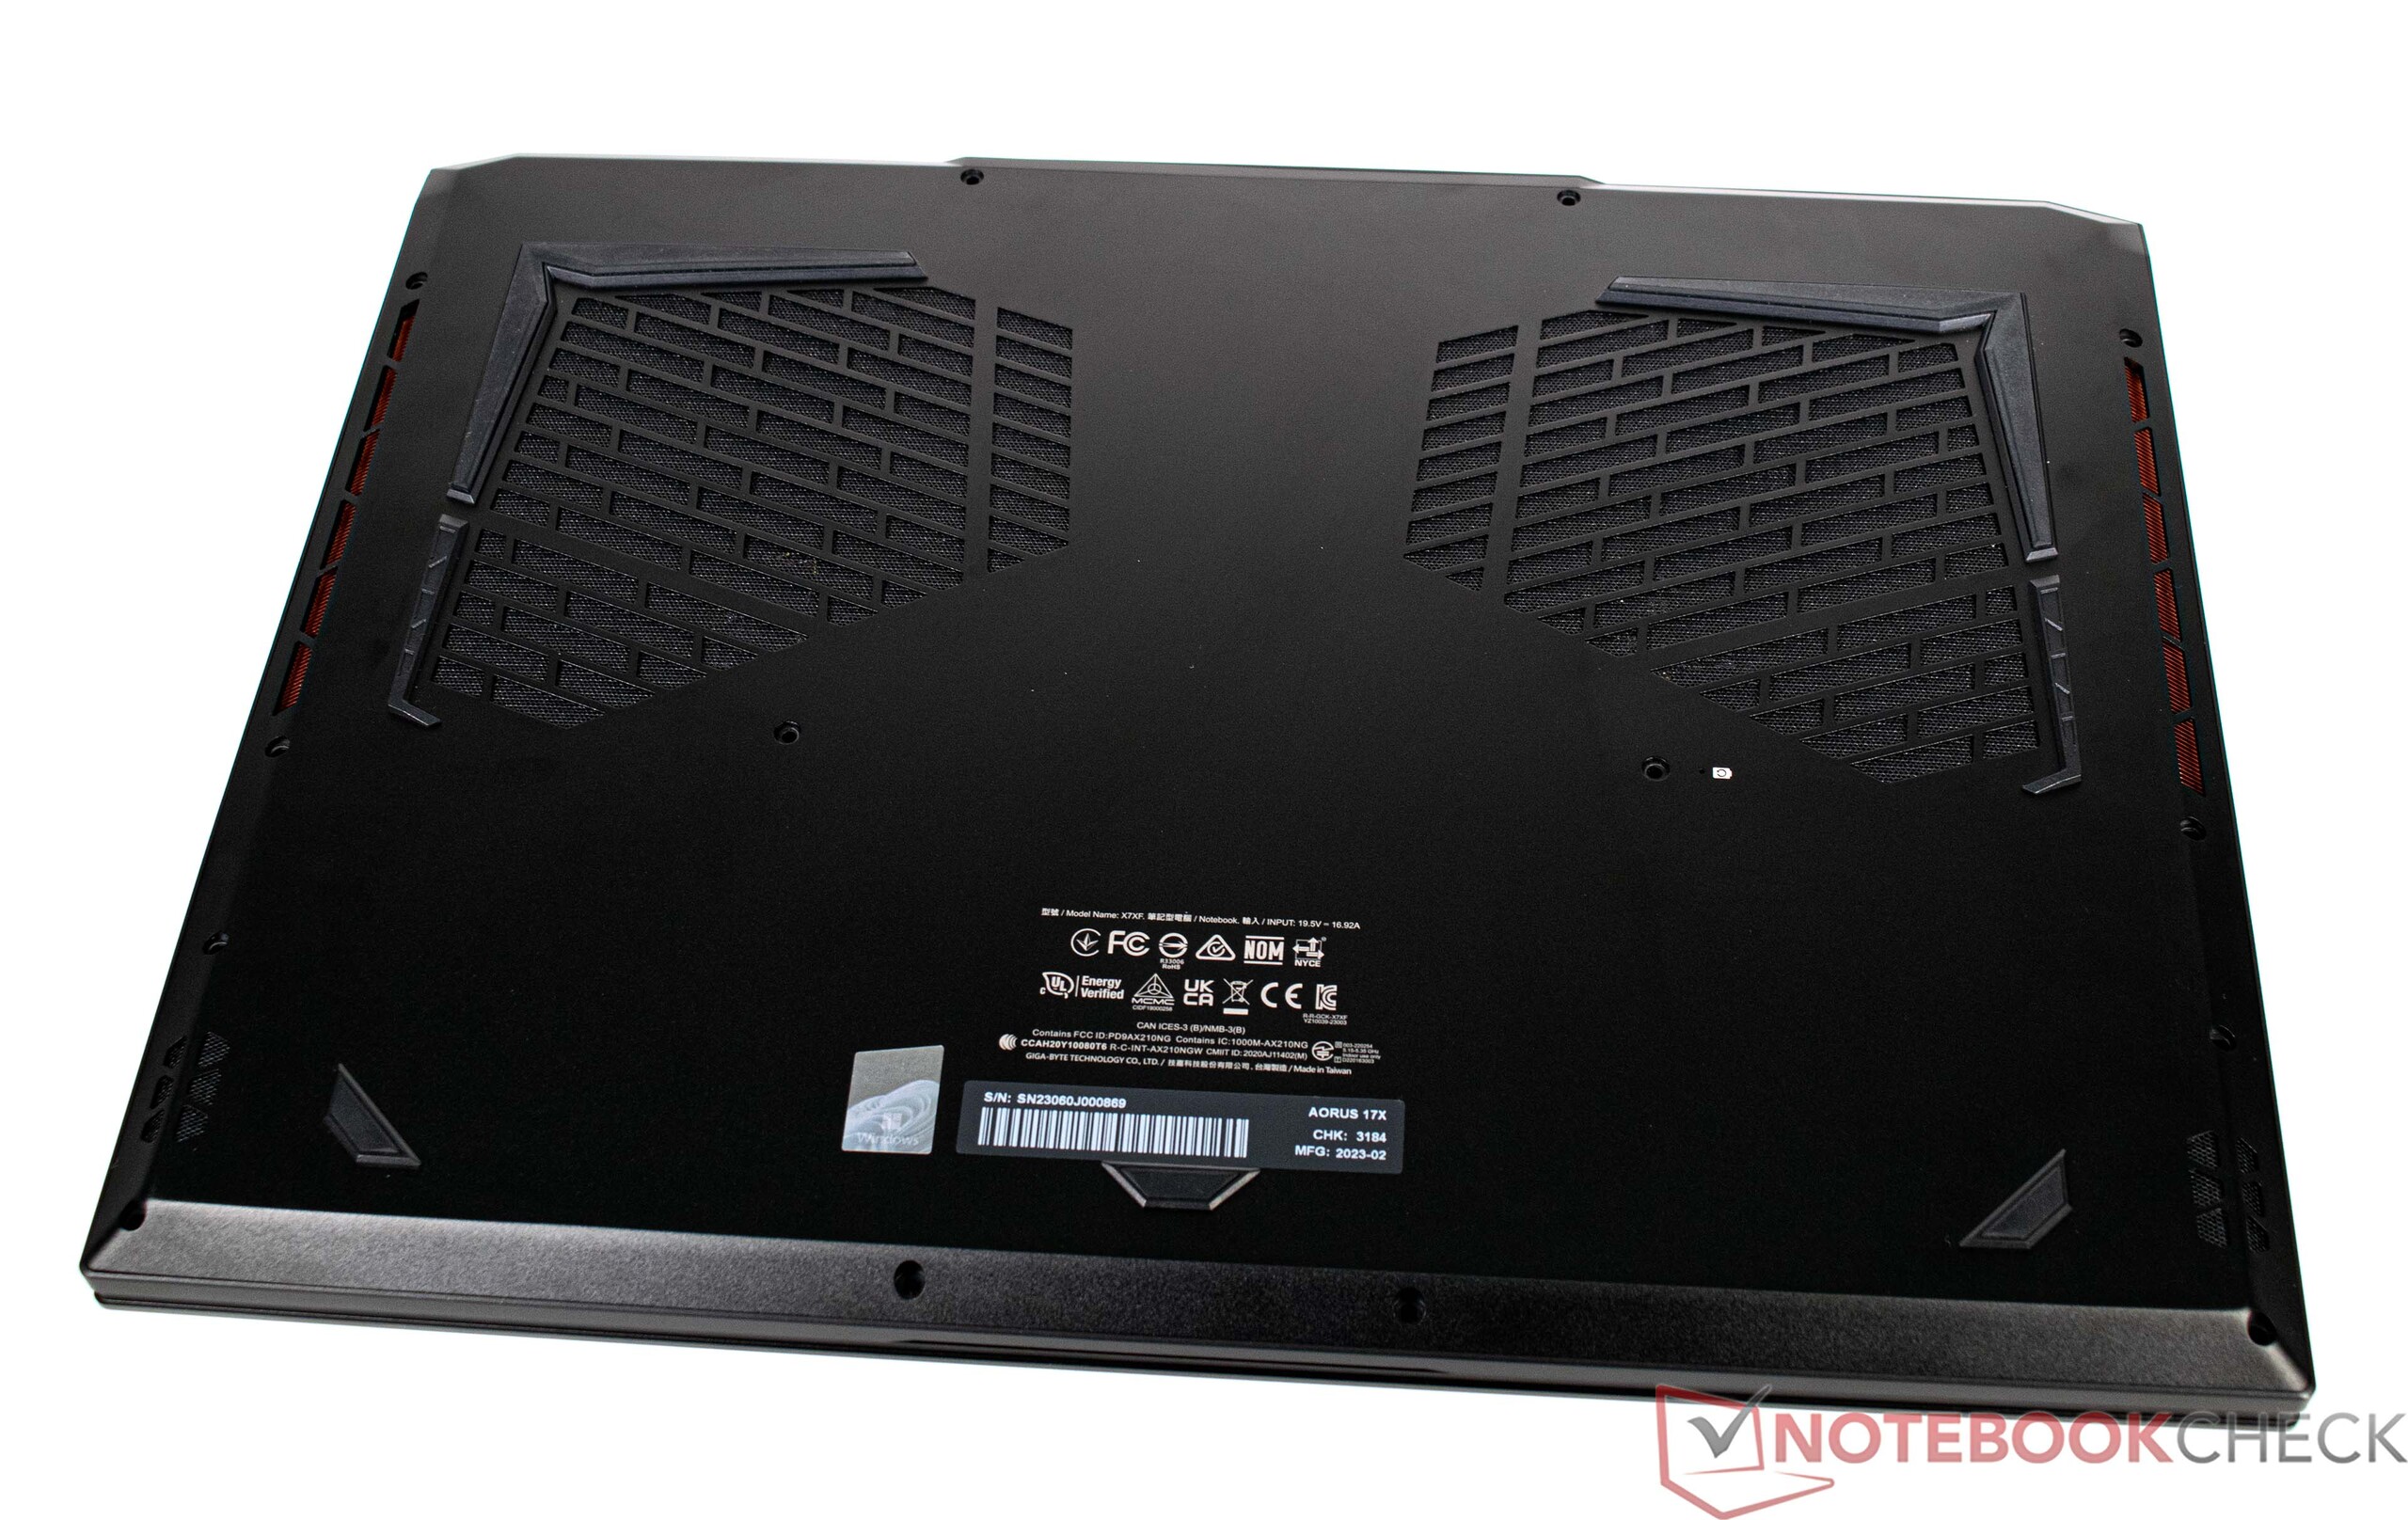
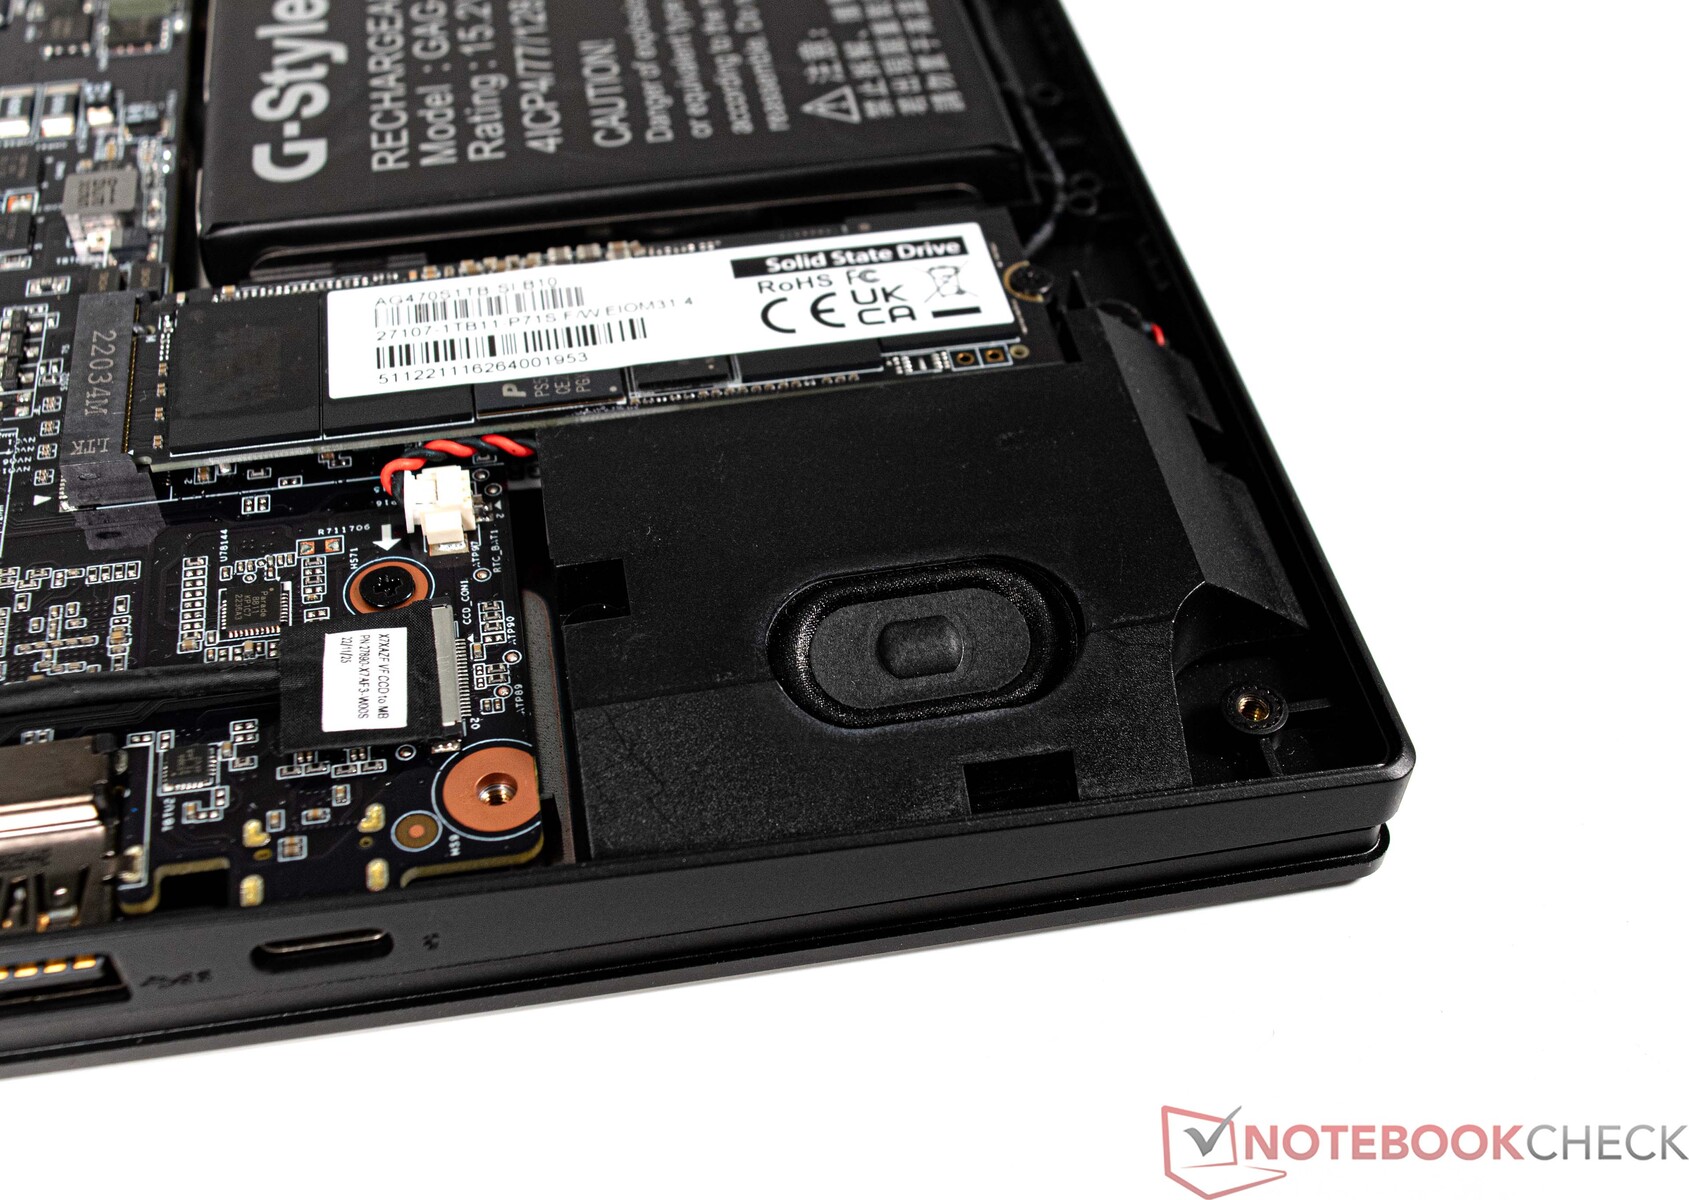
Manutenção
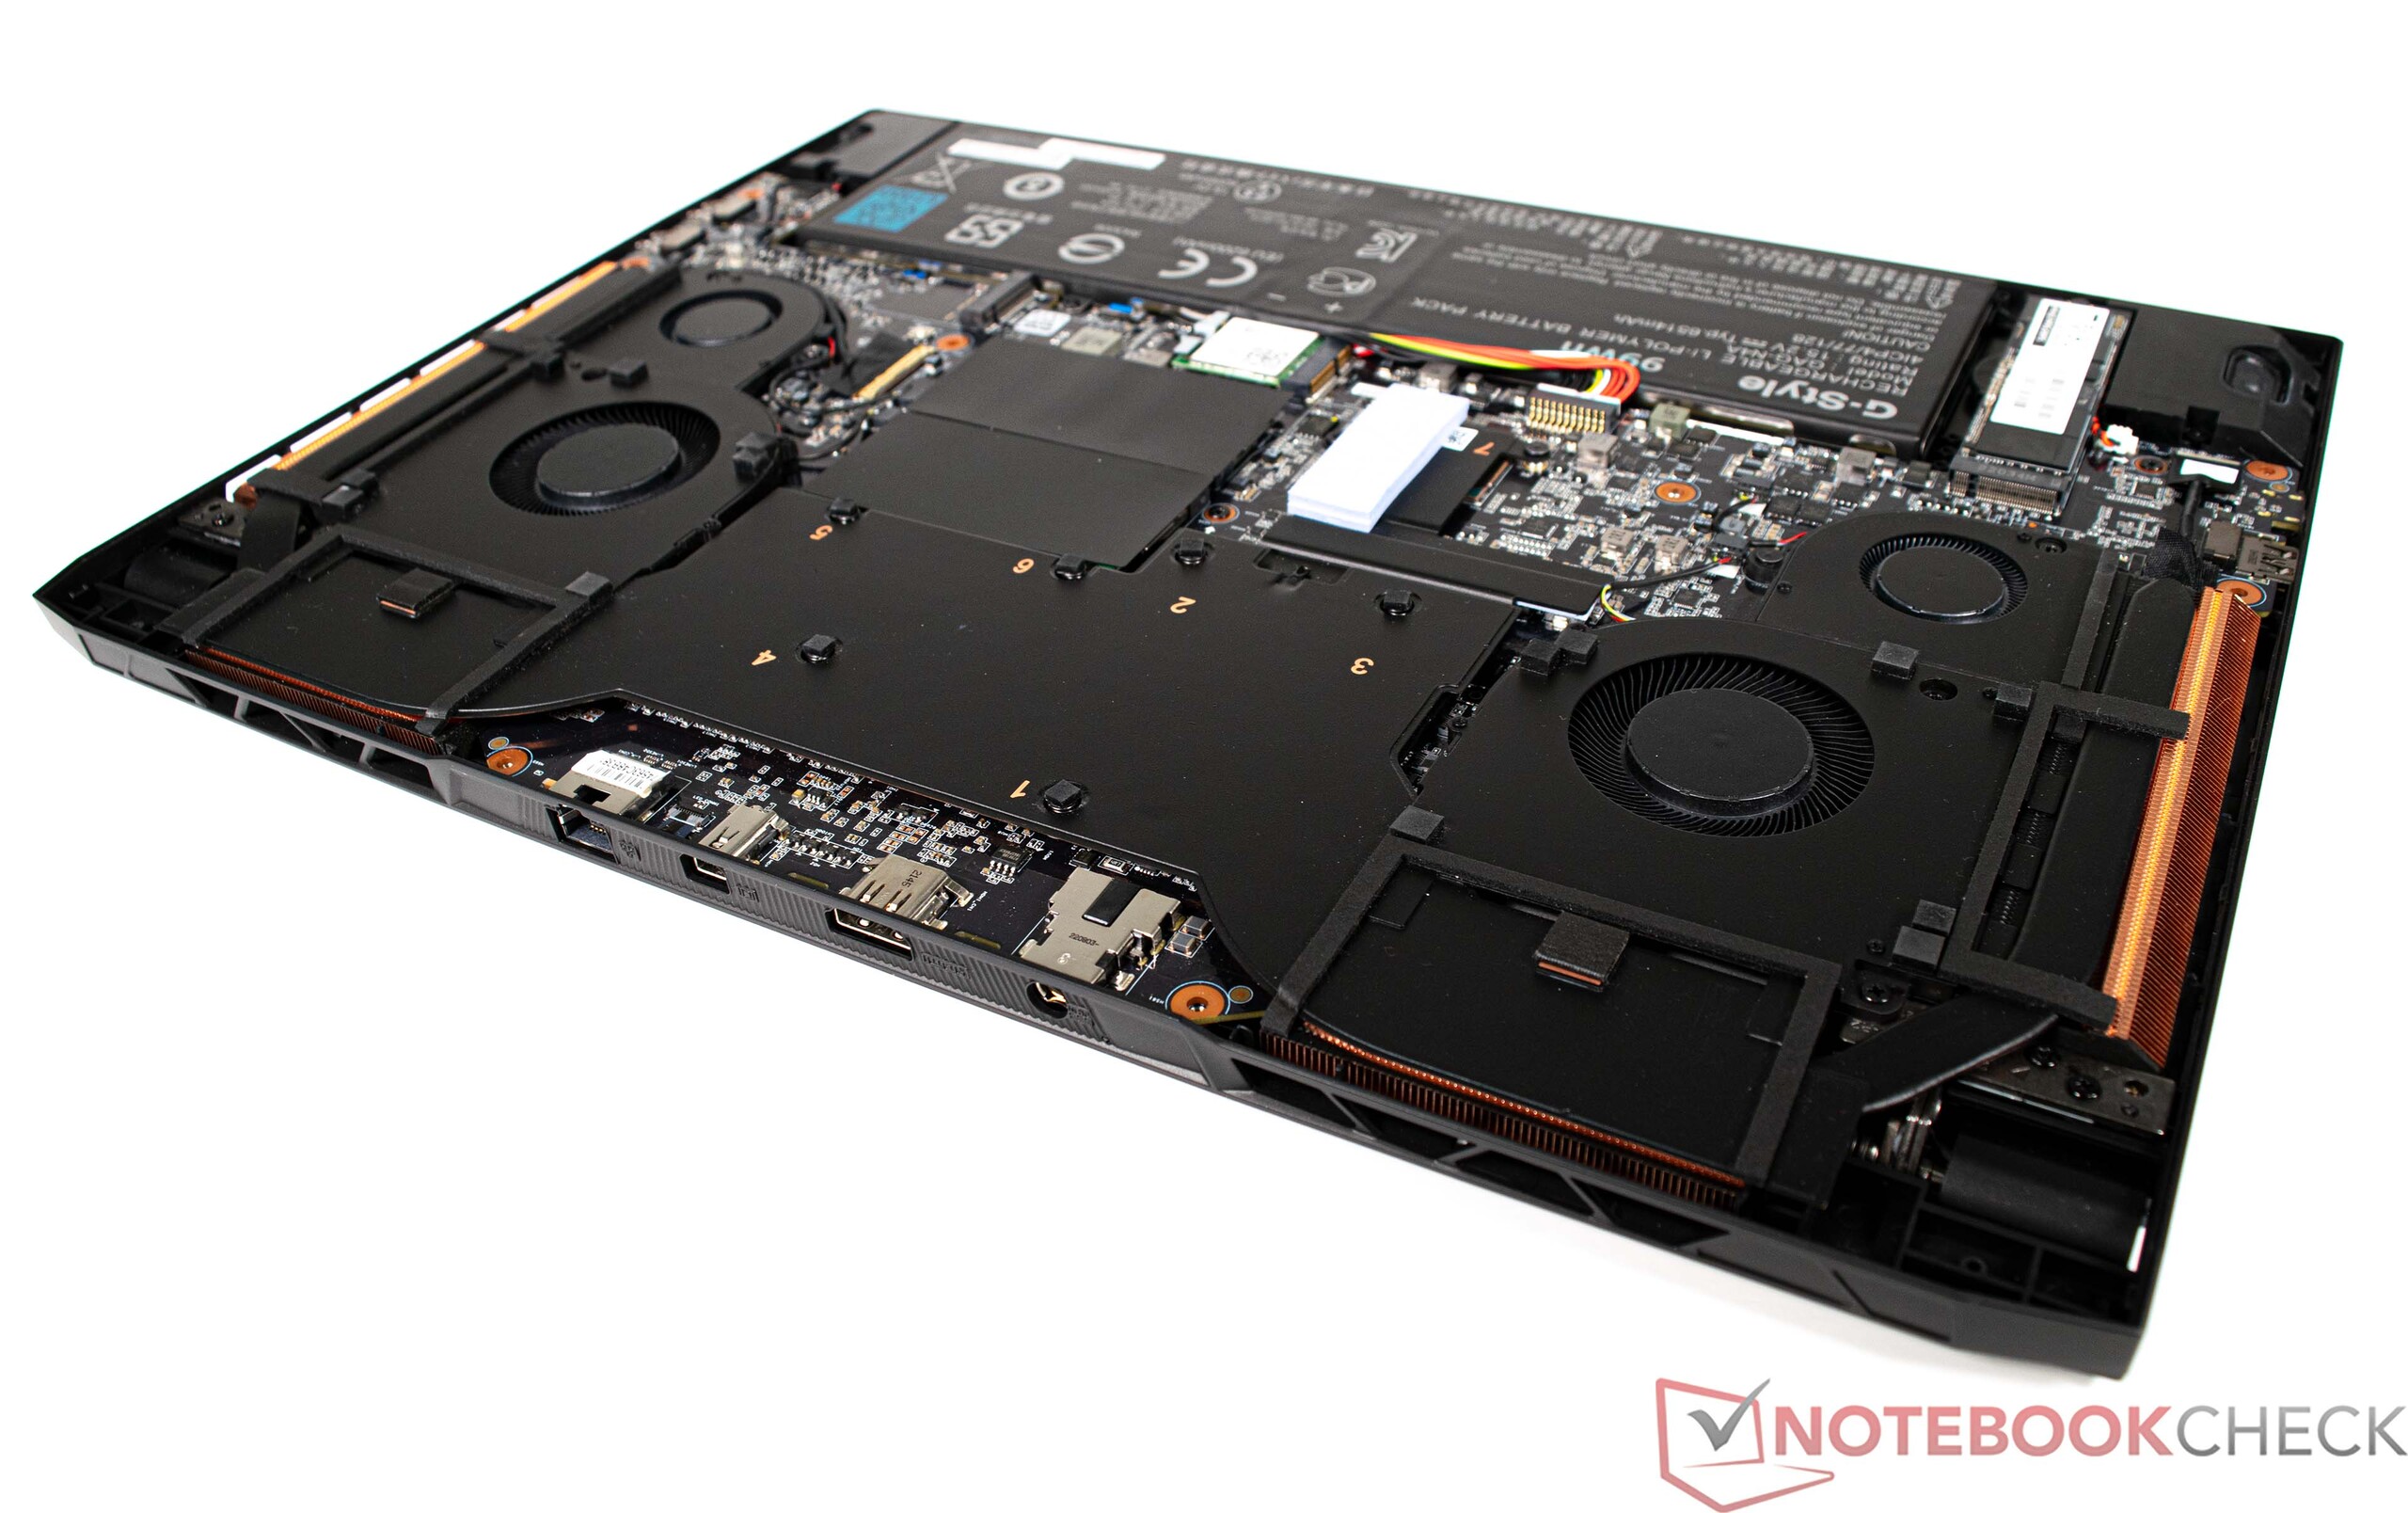
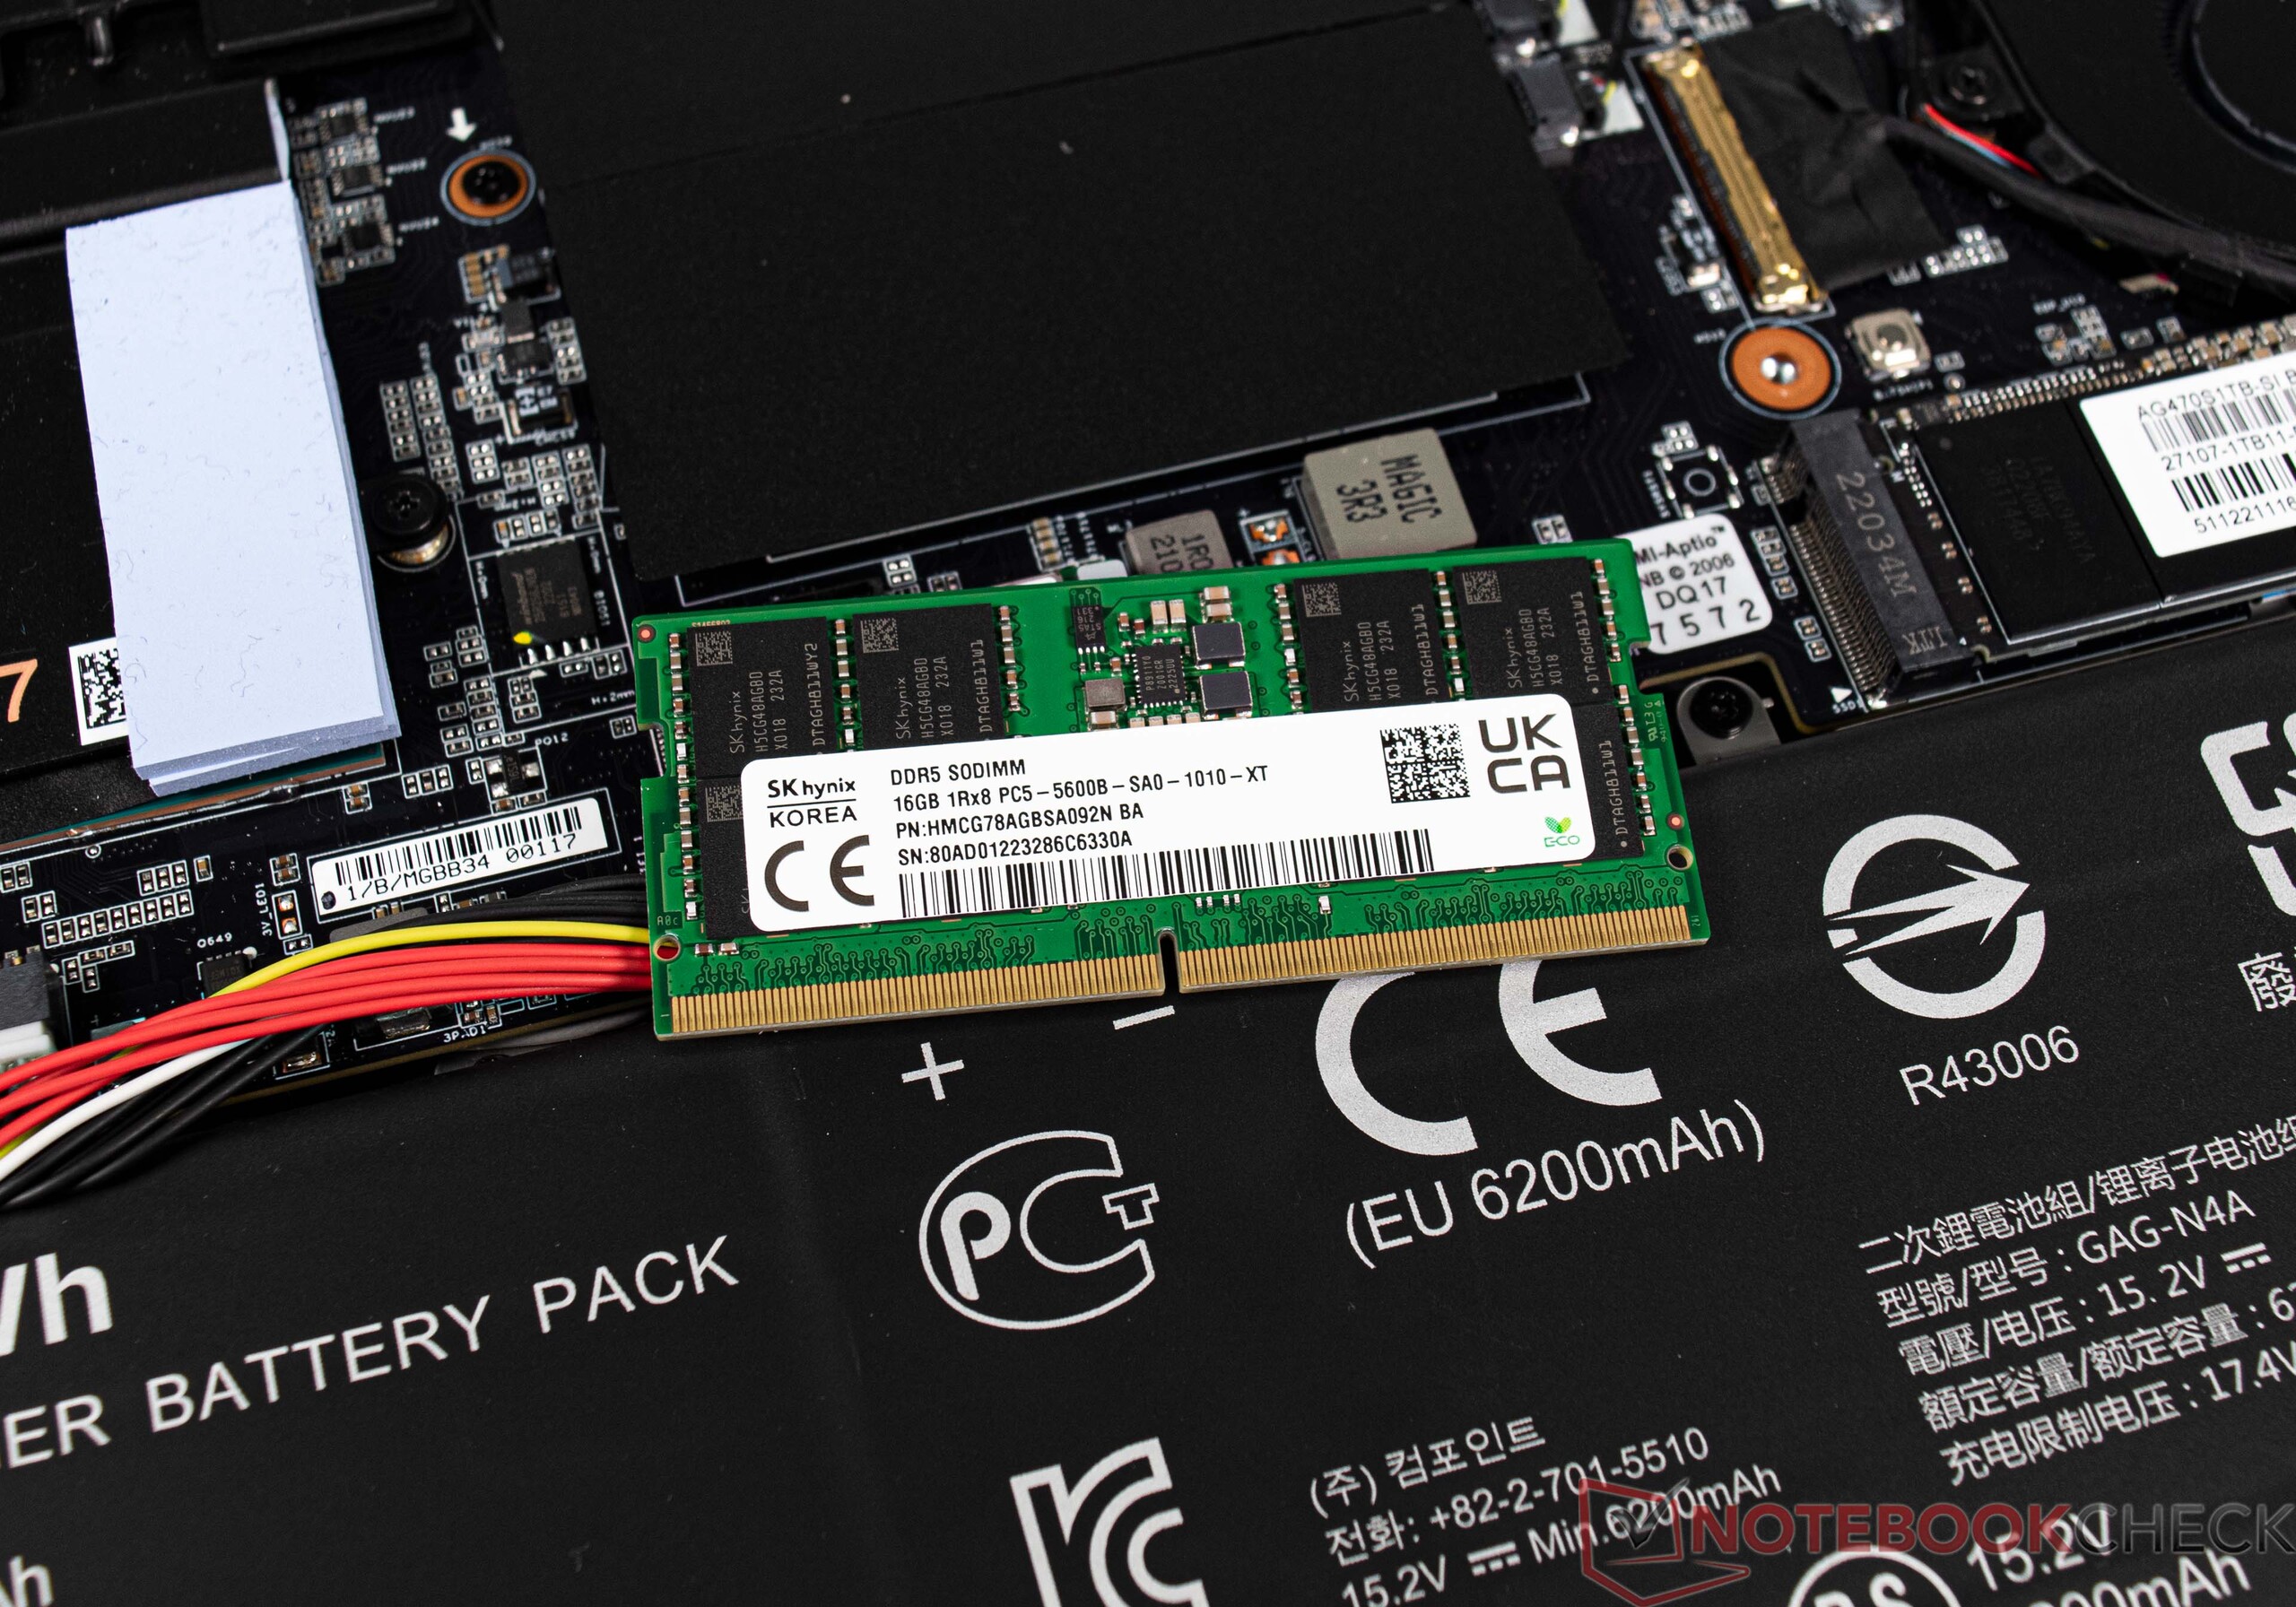
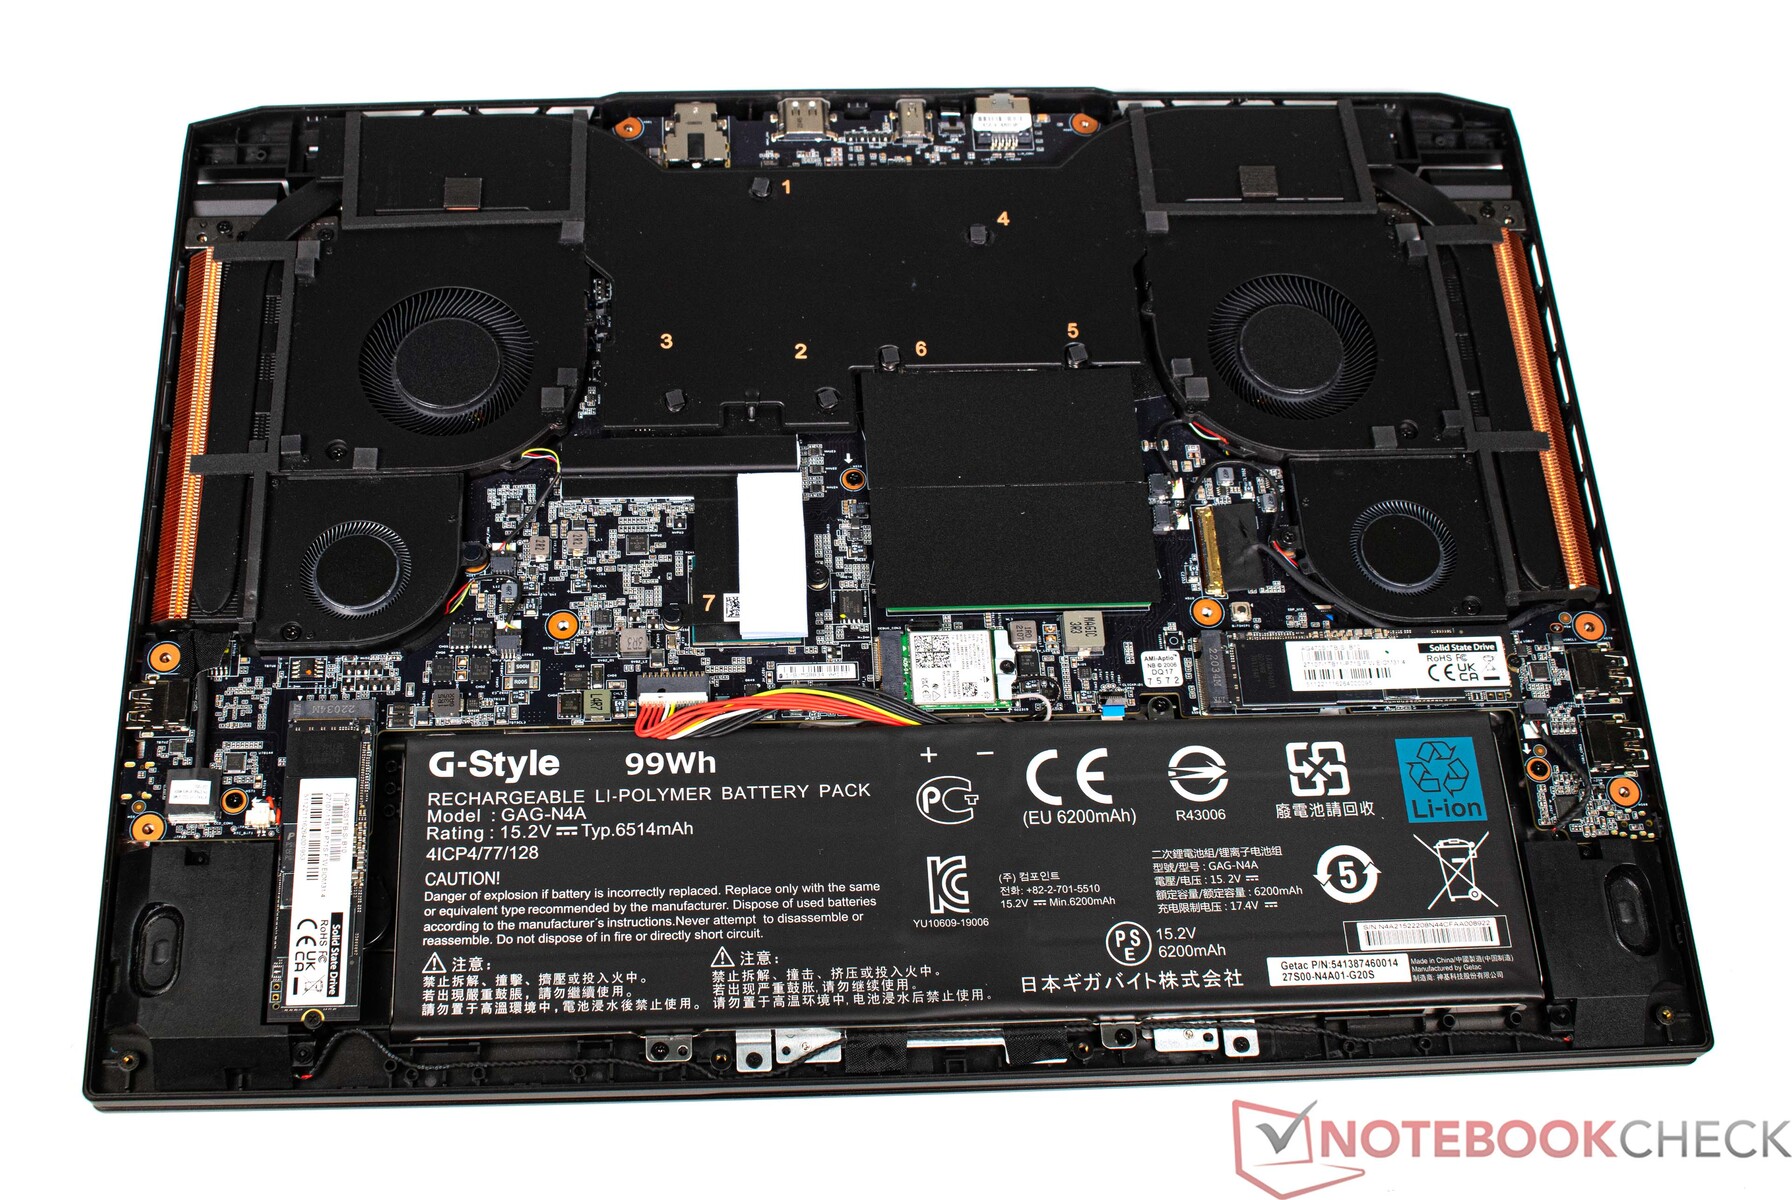
O trabalho de manutenção é fundamentalmente possível no Aorus 17X AZF. Entretanto, a placa de base, que é fixada com numerosos parafusos, tem que ser removida para isto. Tudo o que é importante está embaixo da placa base, como os quatro ventiladores, o armazenamento em massa e a RAM. Em nosso caso, o laptop está totalmente equipado e não há slots livres para RAM ou SSD.
Garantia
Na Alemanha, o Aorus 17X AZF vem com uma garantia de 24 meses com serviço de coleta e devolução incluído. Isto, é claro, é provável que seja diferente de país para país, portanto os compradores devem checar novamente antes da compra.
Software
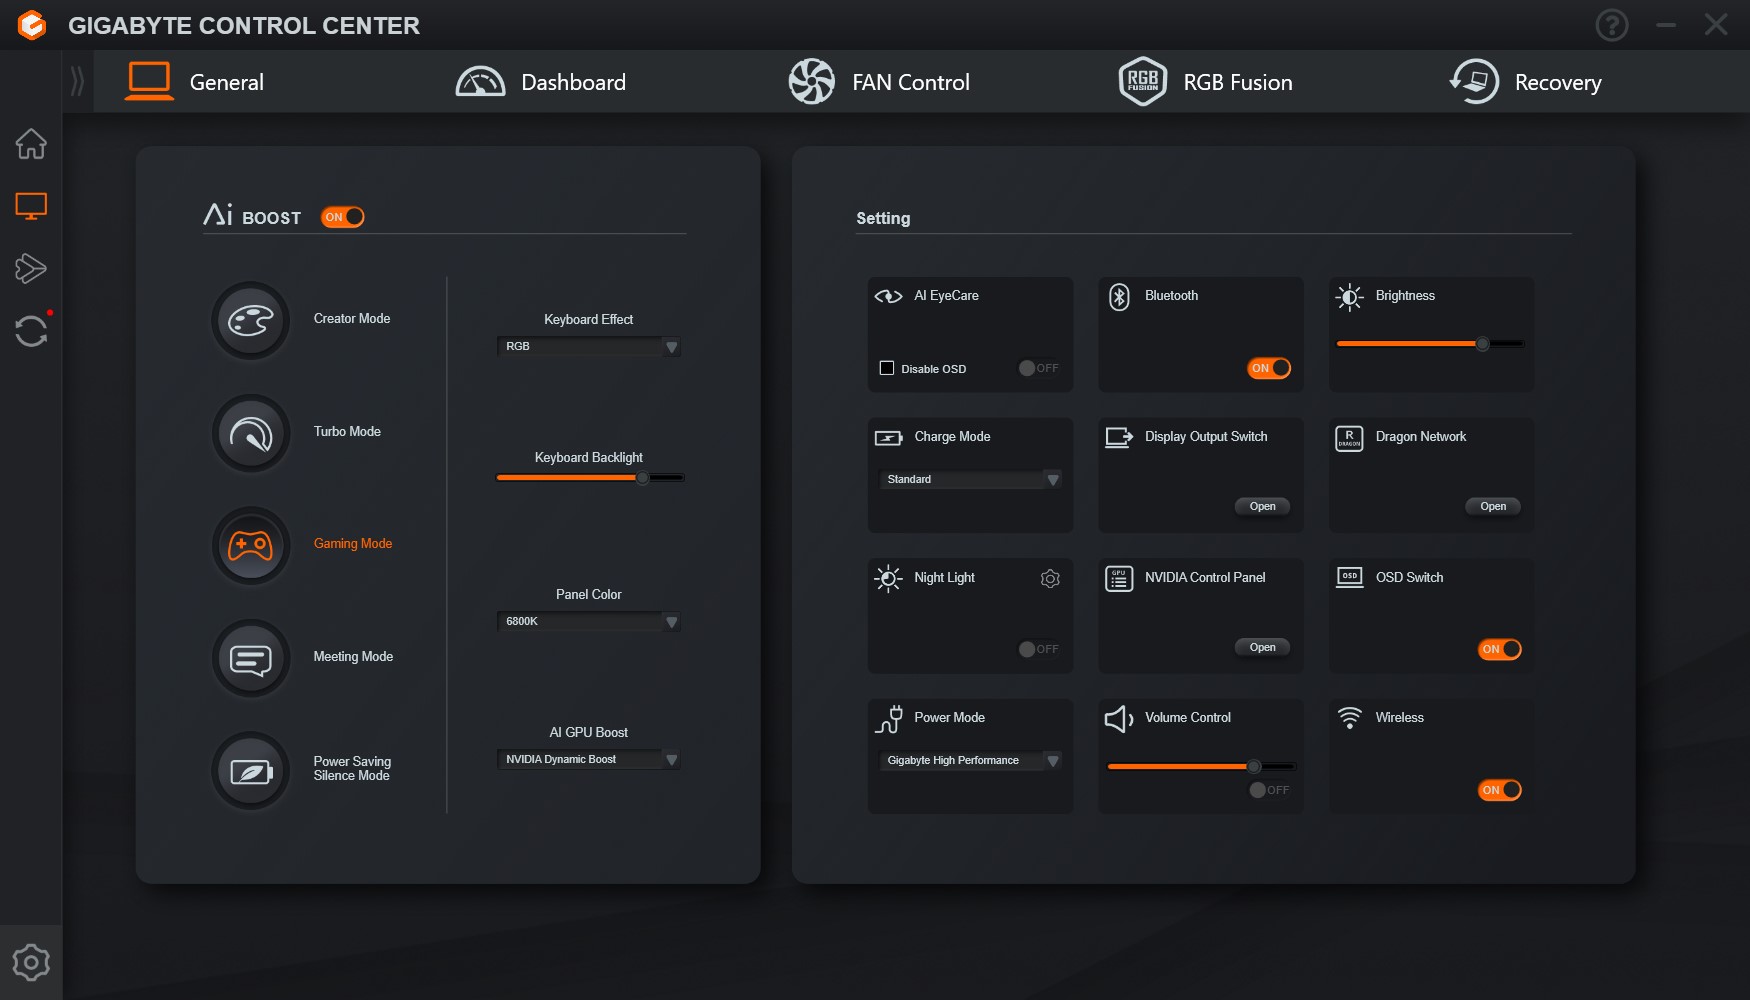
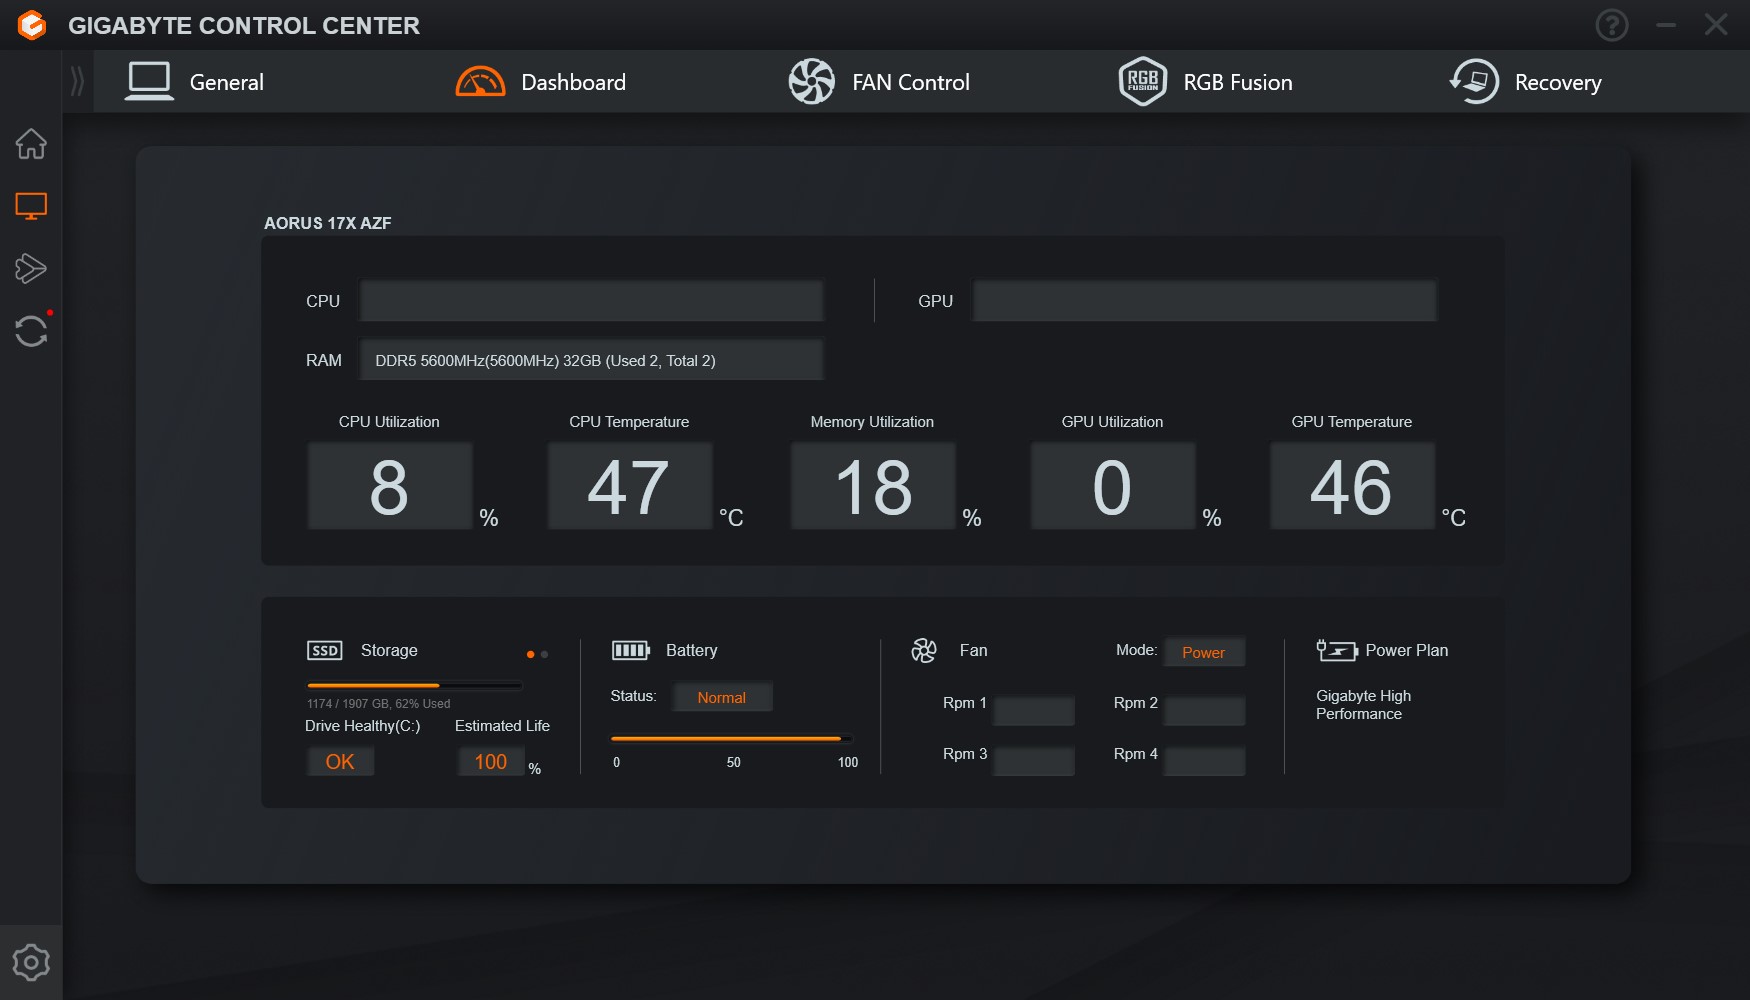
O Gigabyte Control Center (GCC) é utilizado para controlar e monitorar os componentes do Aorus 17X AZF. Em nossos testes, não foram encontrados problemas com o GCC, que pode ser usado para regular o desempenho do laptop e assim influenciar o ruído de fundo. A curva do ventilador pode ser ajustada um pouco através da aba FAN Control. Além disso, é possível selecionar um grande número de efeitos de luz de fundo para o teclado.
Dispositivos de entrada
Teclado
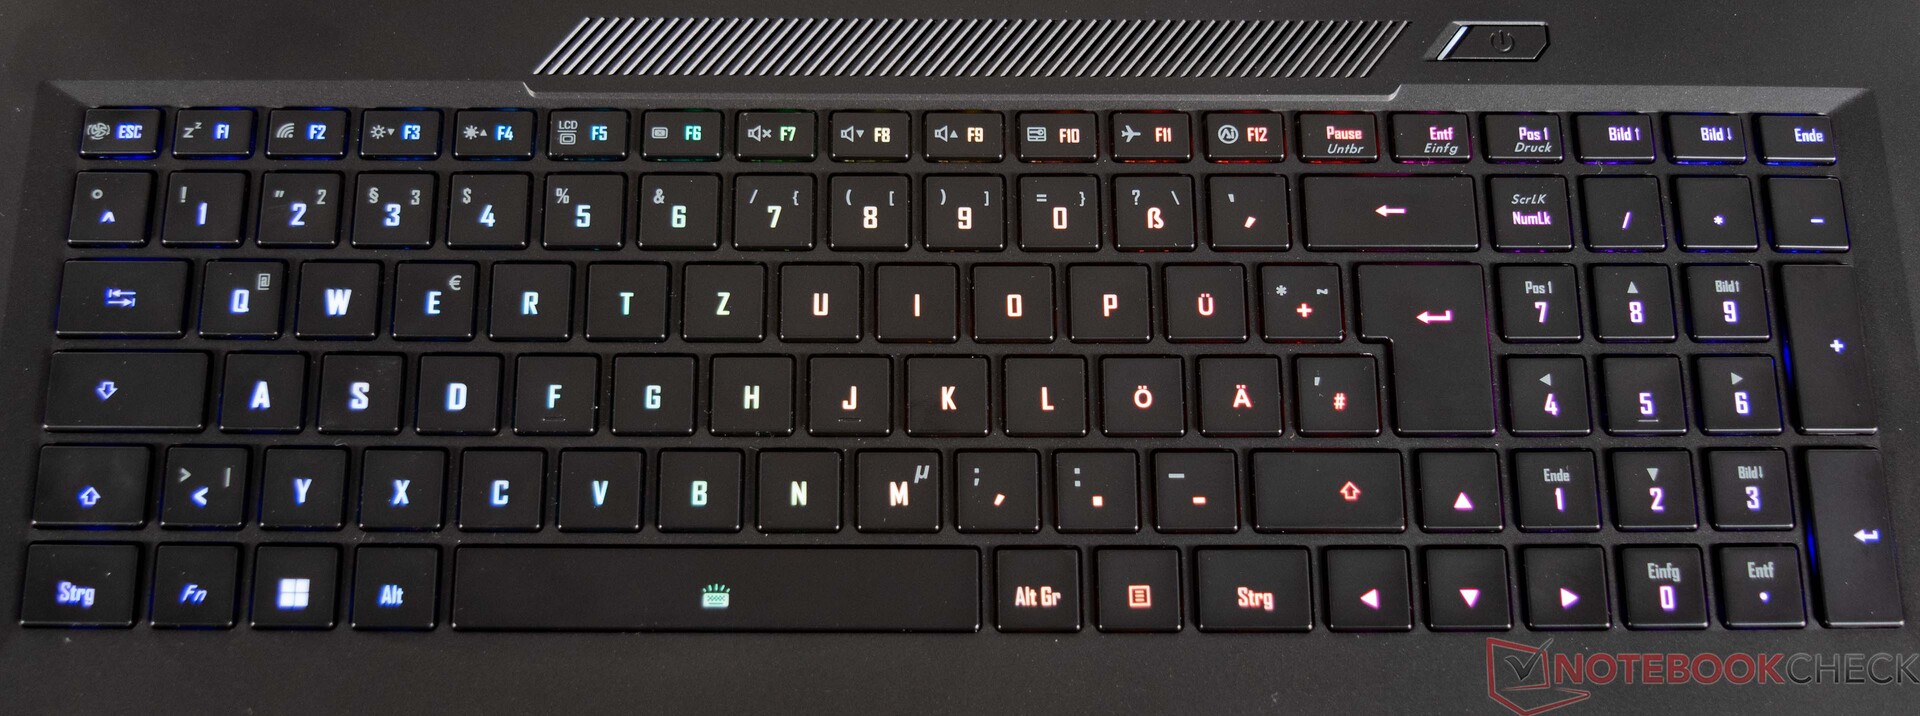
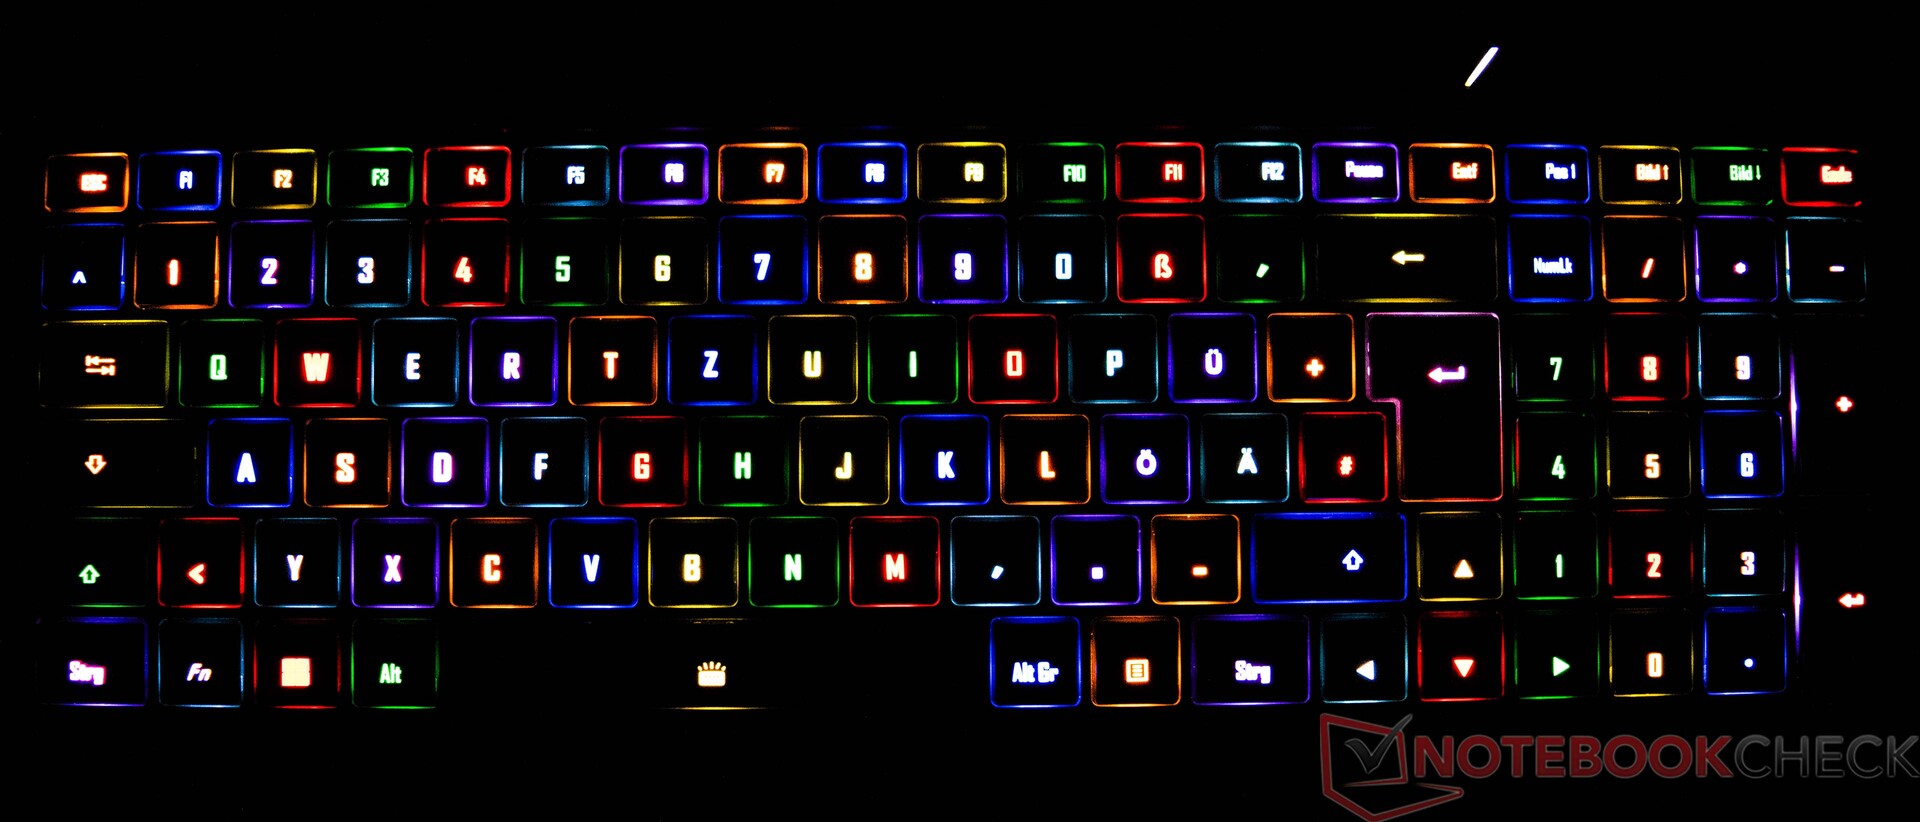
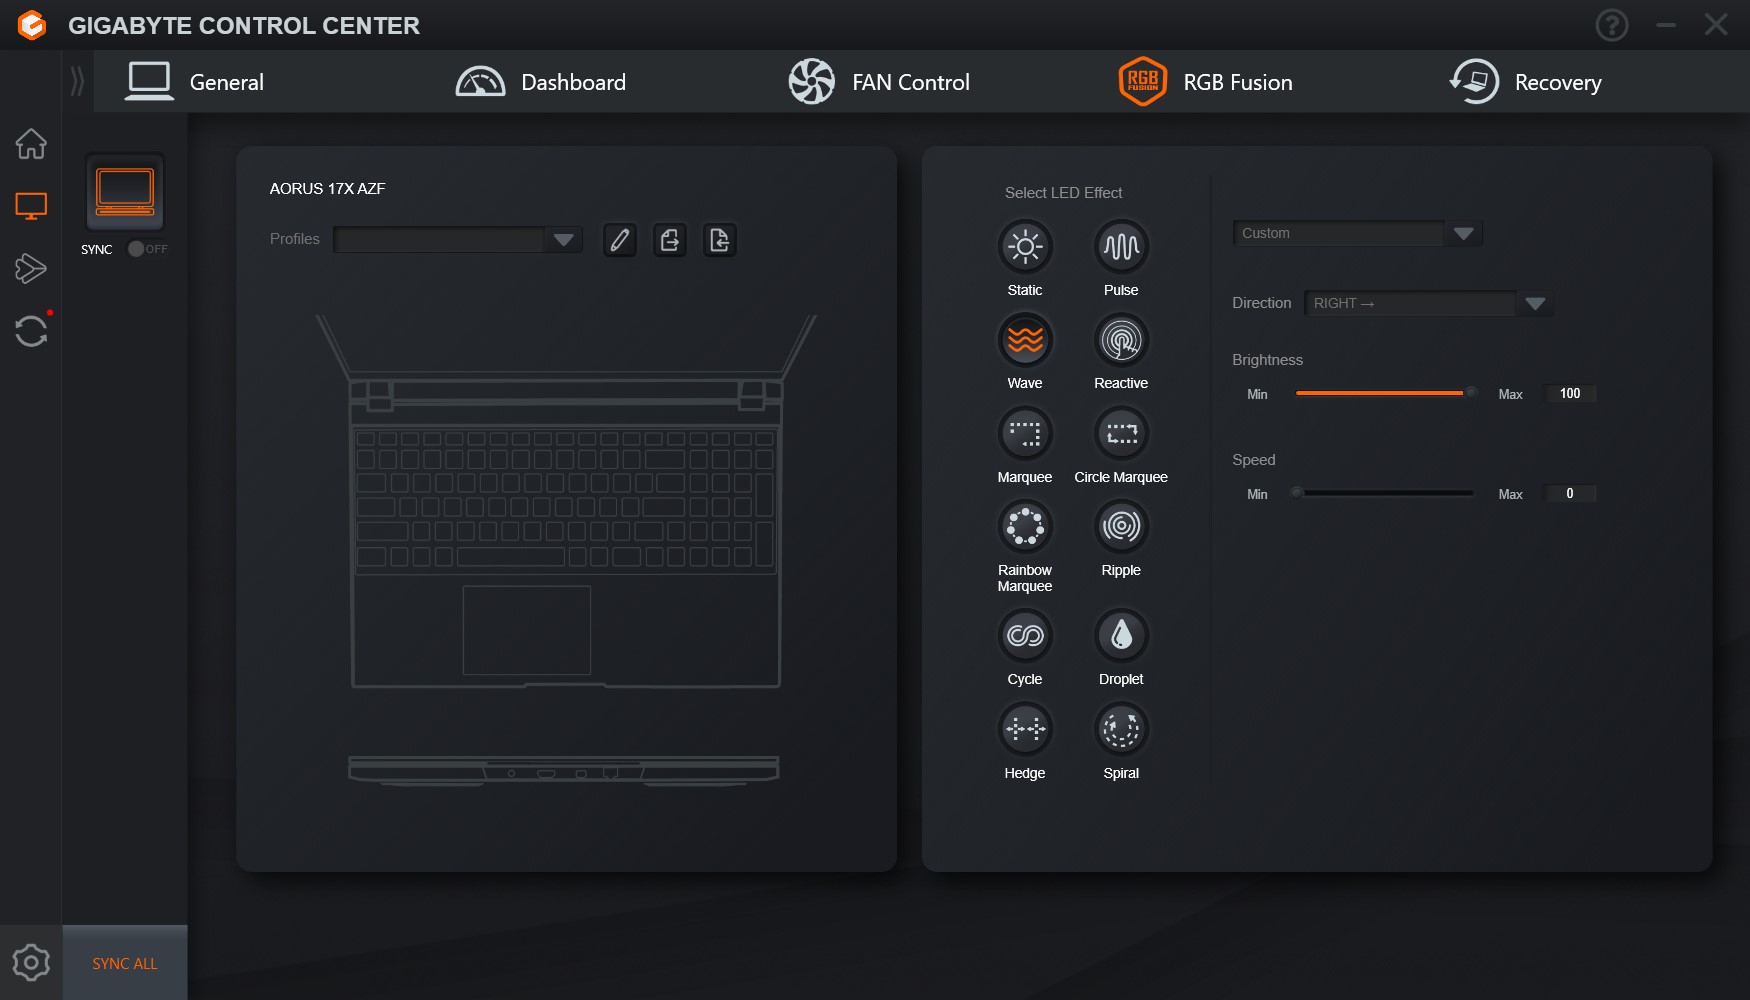
O Aorus 17X AZF vem com um teclado chiclet de 6 linhas iluminado, incluindo um teclado numérico. As teclas suaves têm curso médio e um ponto de pressão claro. O teclado rende um pouco ao digitar, mas isto não é muito pronunciado. A retroiluminação pode ser ajustada em três níveis de brilho usando uma combinação de teclas, e há muito mais opções para efeitos de iluminação via GCC (Gigabyte Control Center).
Touchpad
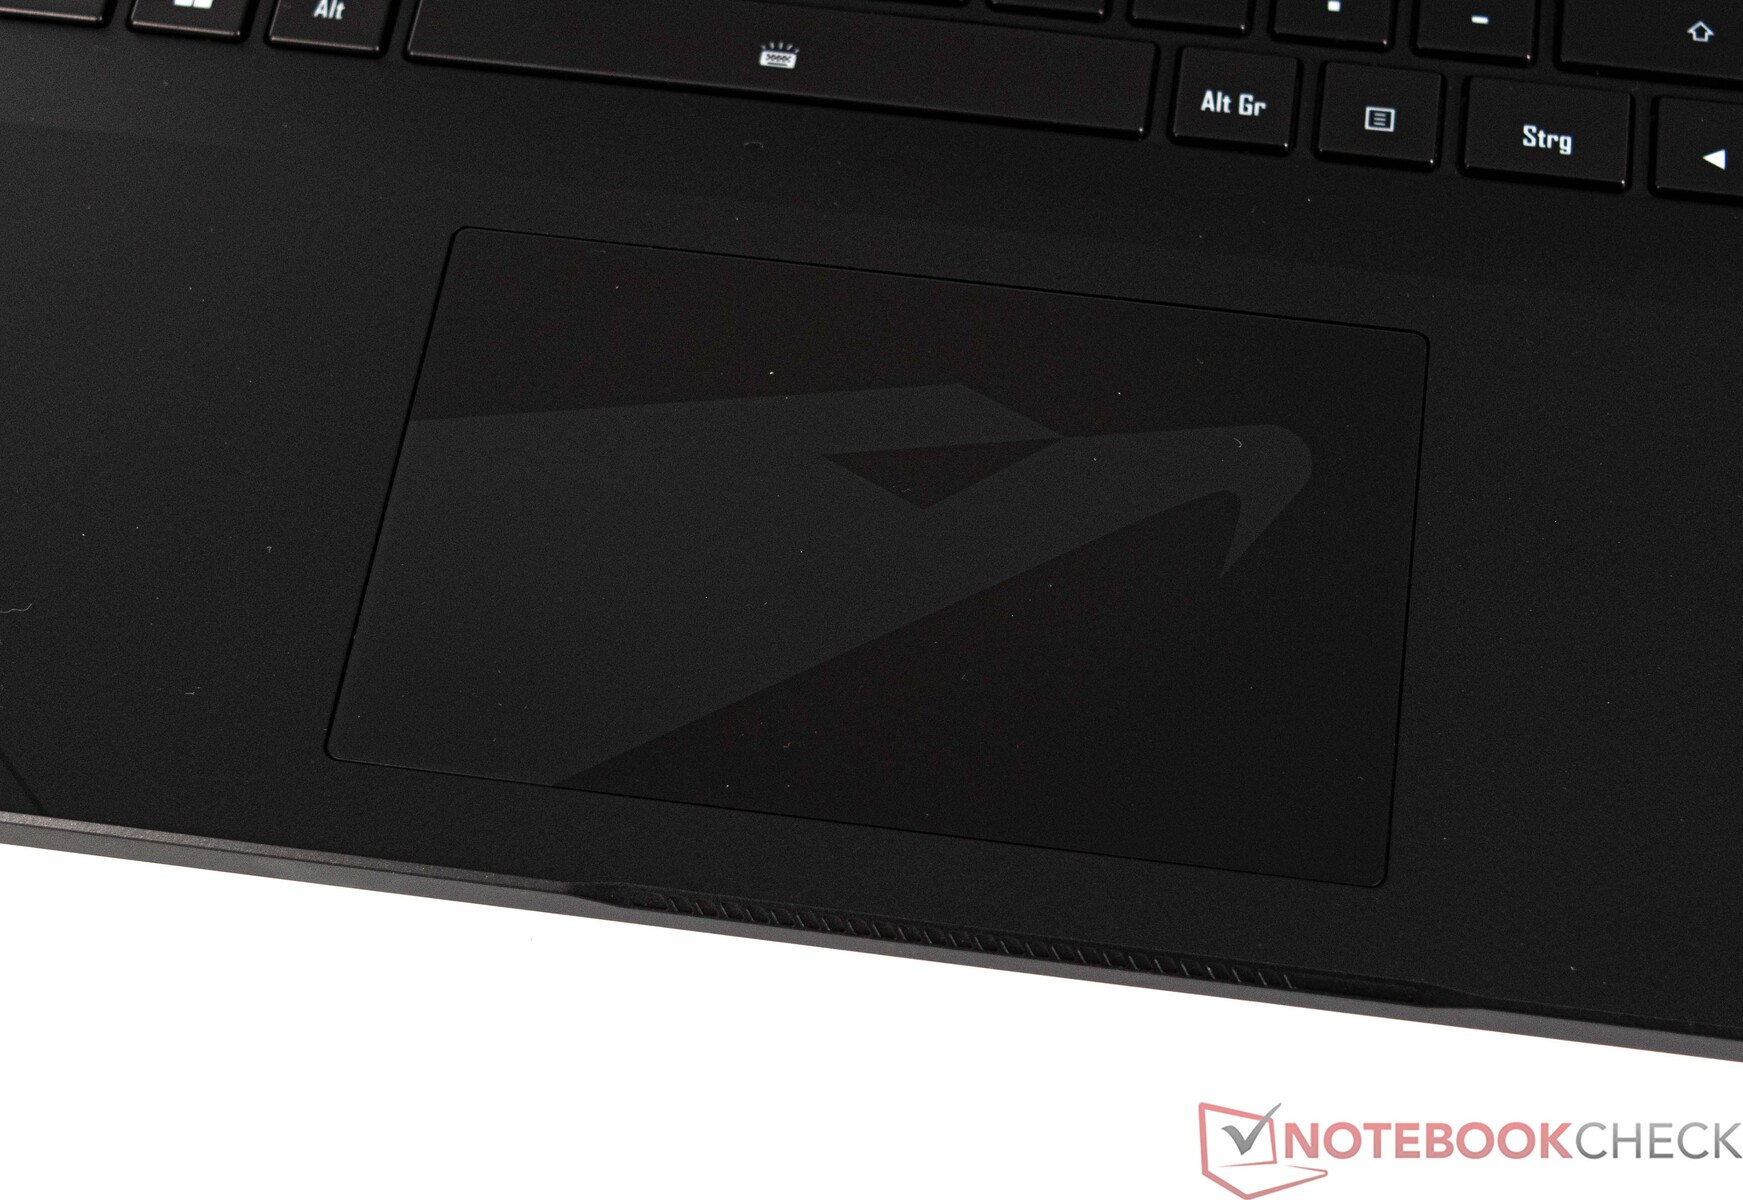
A substituição do mouse na forma de um ClickPad multi-toque (aprox. 12,1 x 7,6 cm) oferece um tamanho agradável. A Aorus também sobrepôs seu próprio logotipo no touchpad, o que é visualmente agradável de se ver. O ClickPad oferece uma superfície lisa, o que permite um deslizamento suave dos dedos. A superfície de entrada pode ser usada em sua totalidade e também reage bem nos cantos. O tapete oferece um curso curto para as entradas e fornece um feedback claro graças a seu ponto de pressão claro.
Mostrar
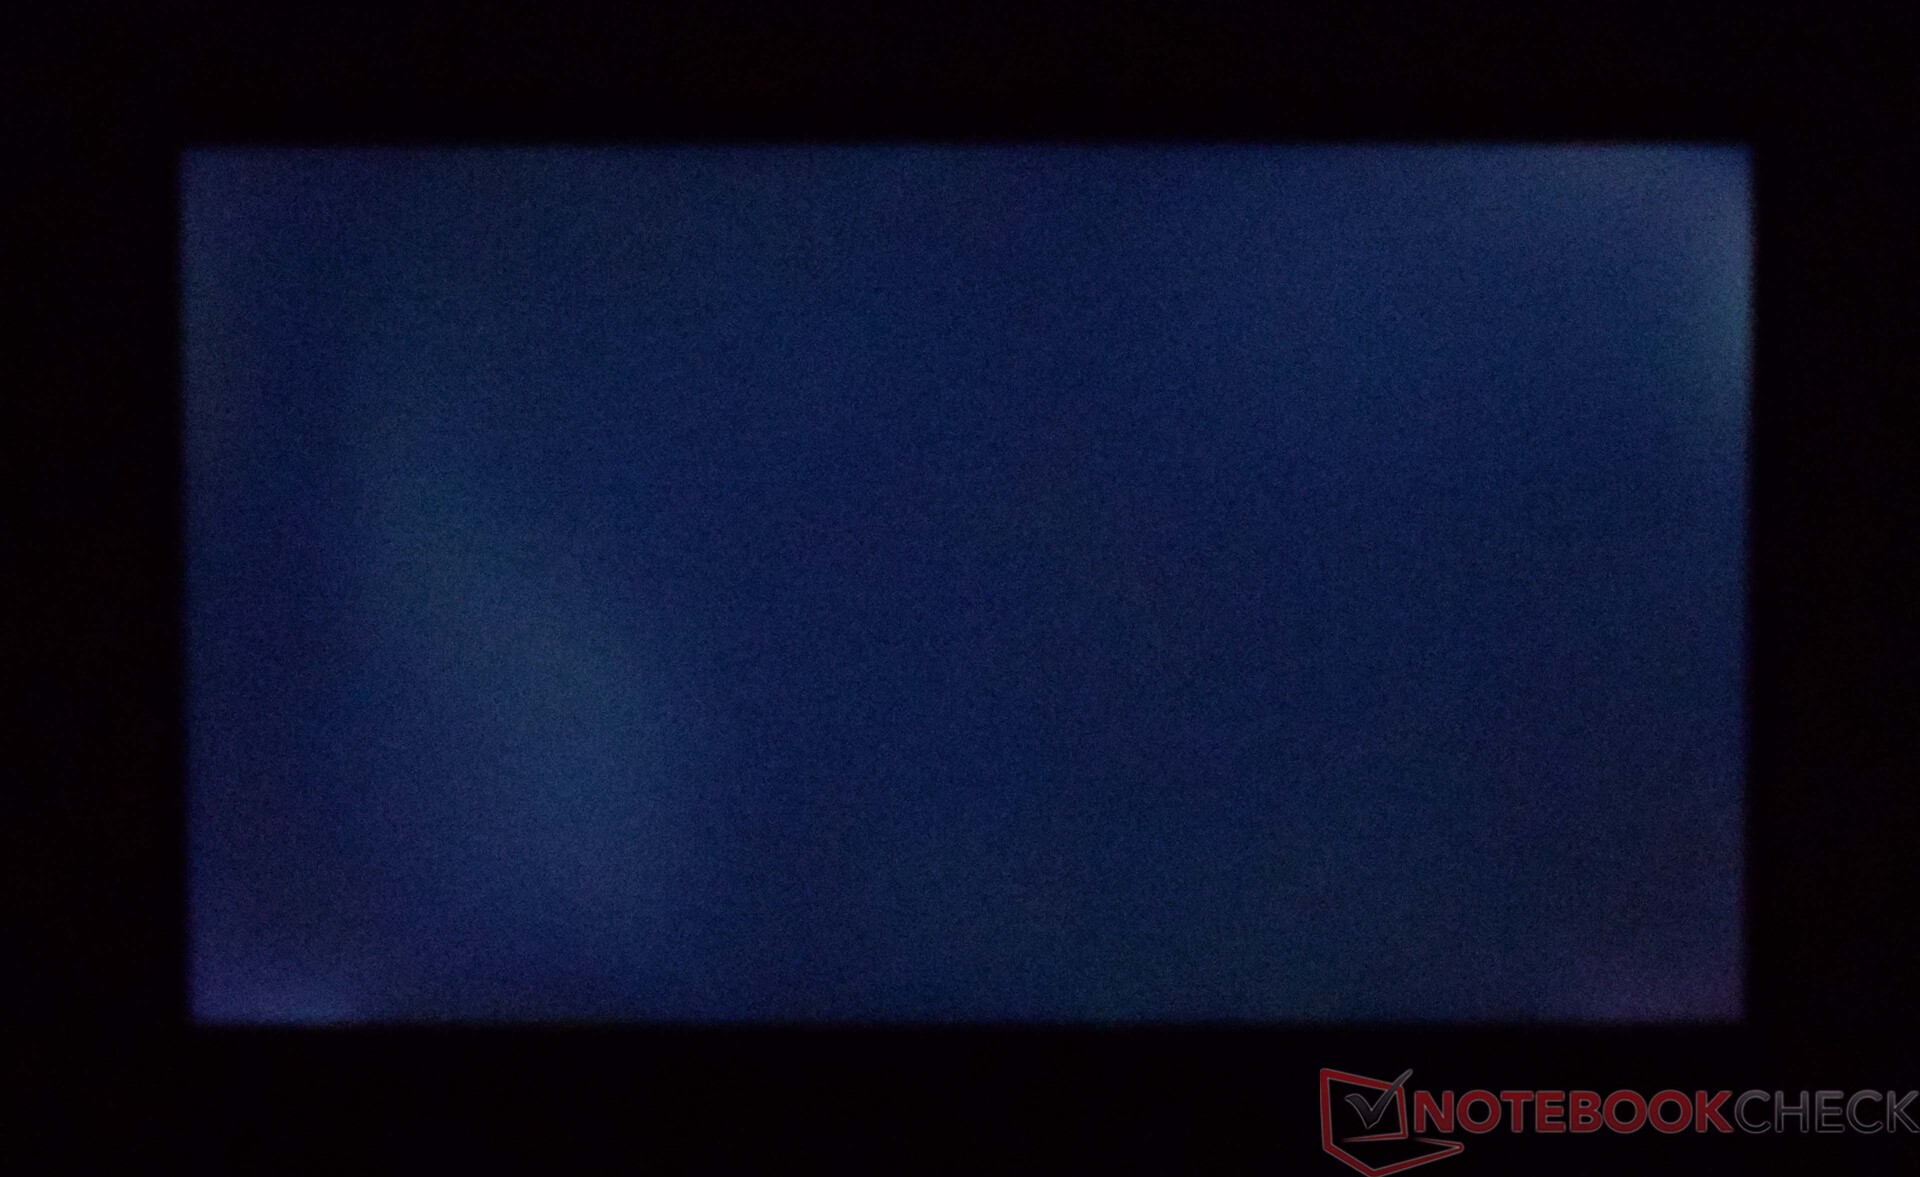
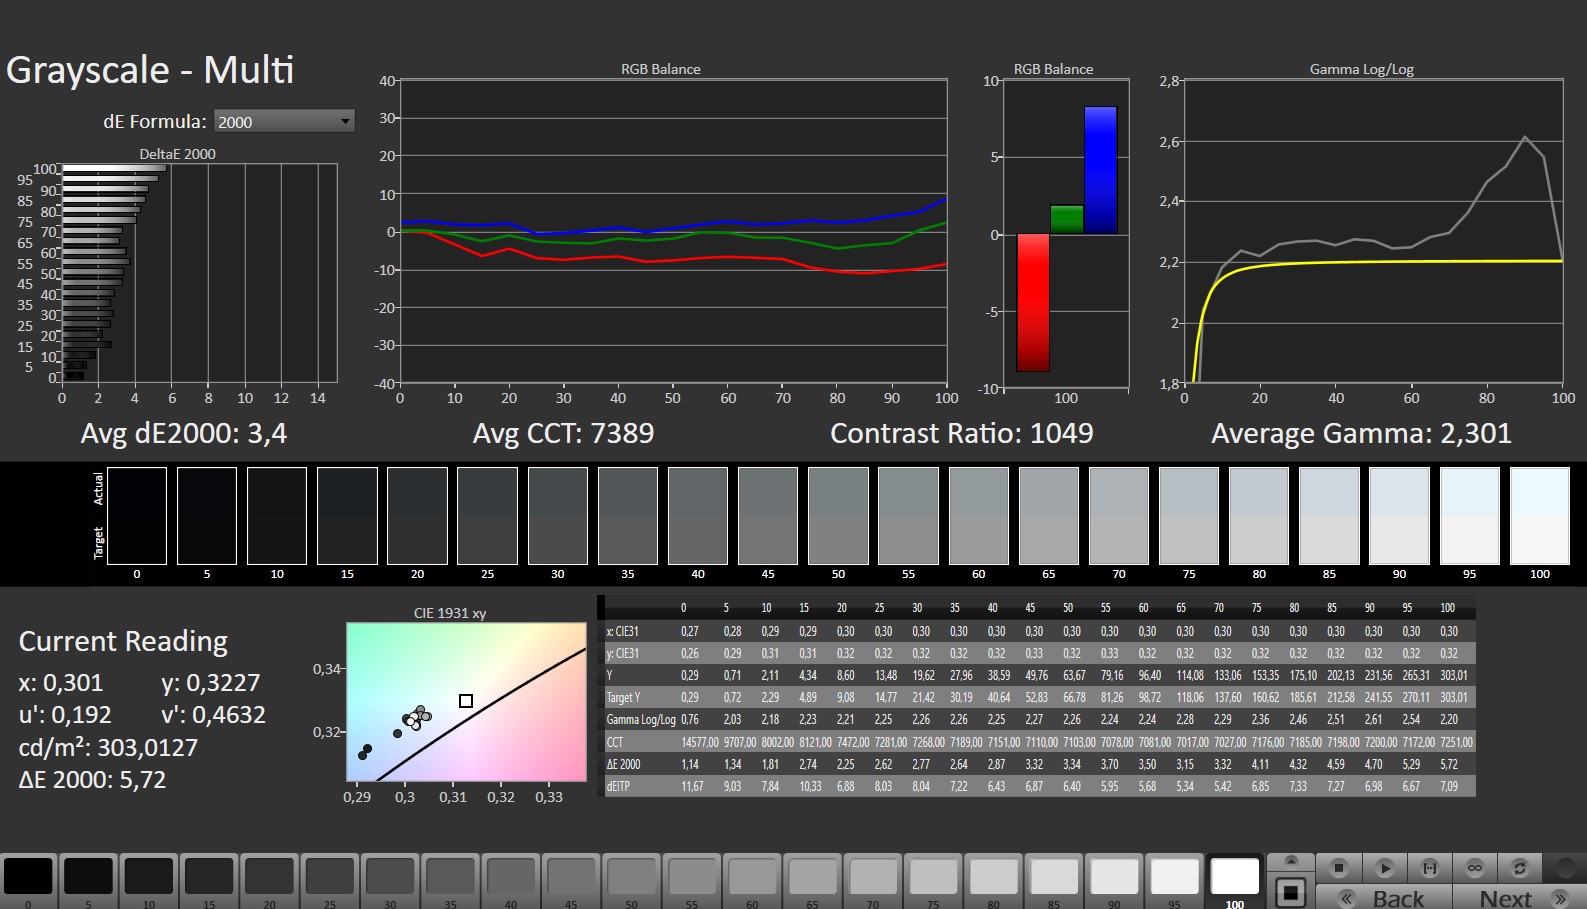
O Aorus 17X AZF vem com um bom painel QHD, que deve atender as necessidades da maioria dos jogadores com uma taxa de atualização de 240 Hz. Entretanto, o brilho médio de nossa unidade de teste é claramente mais fraco em comparação com a concorrência. Uma média de apenas 276 cd/m² é muito baixa e é apenas o suficiente para o último lugar. O Aorus 17X AZF também perde pontos importantes na pontuação da tela com ligeiros halos. Nenhum PWM foi detectado
Opções alternativas de exibição, como um painel 4K, não são destinadas ao Aorus 17X AZF.
| |||||||||||||||||||||||||
iluminação: 90 %
iluminação com acumulador: 294 cd/m²
Contraste: 1050:1 (Preto: 0.28 cd/m²)
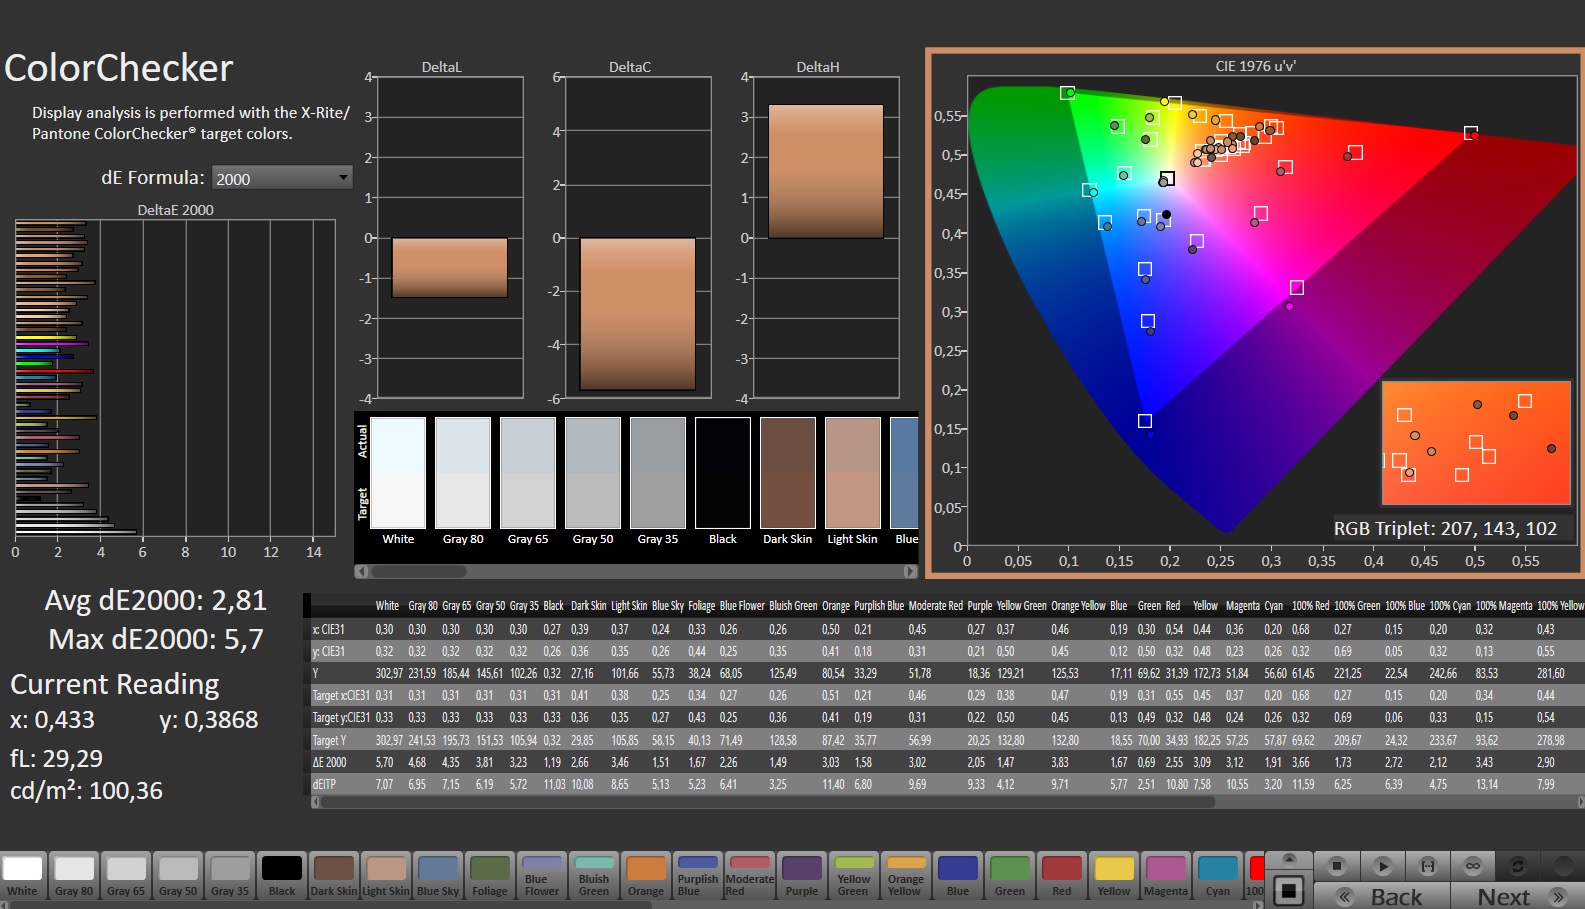
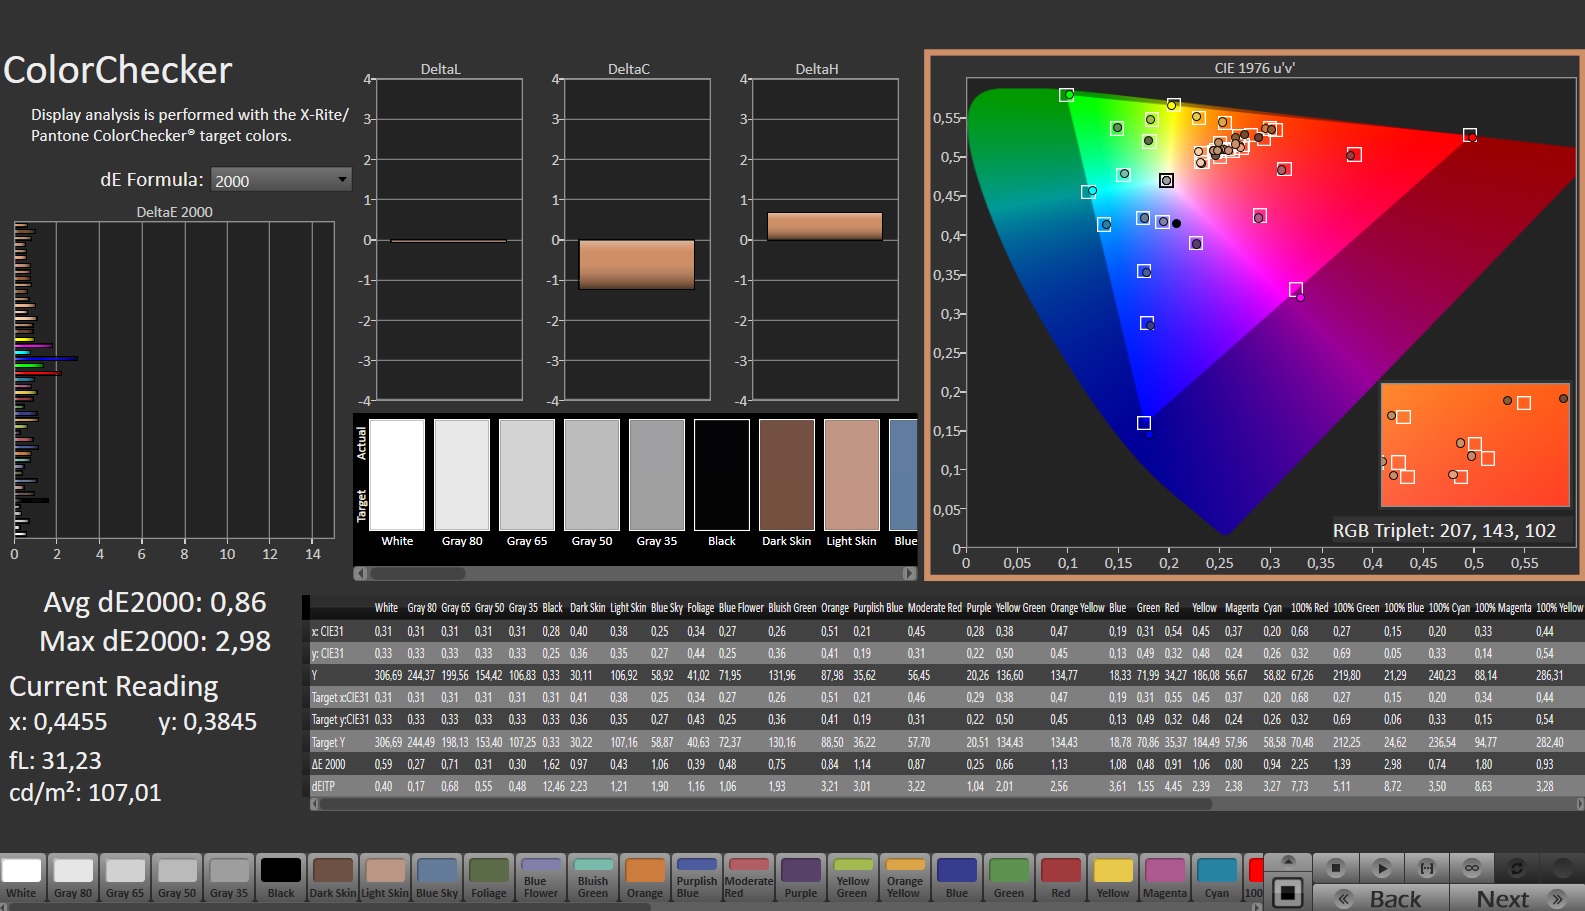
ΔE ColorChecker Calman: 2.81 | ∀{0.5-29.43 Ø4.71}
calibrated: 0.86
ΔE Greyscale Calman: 3.4 | ∀{0.09-98 Ø4.96}
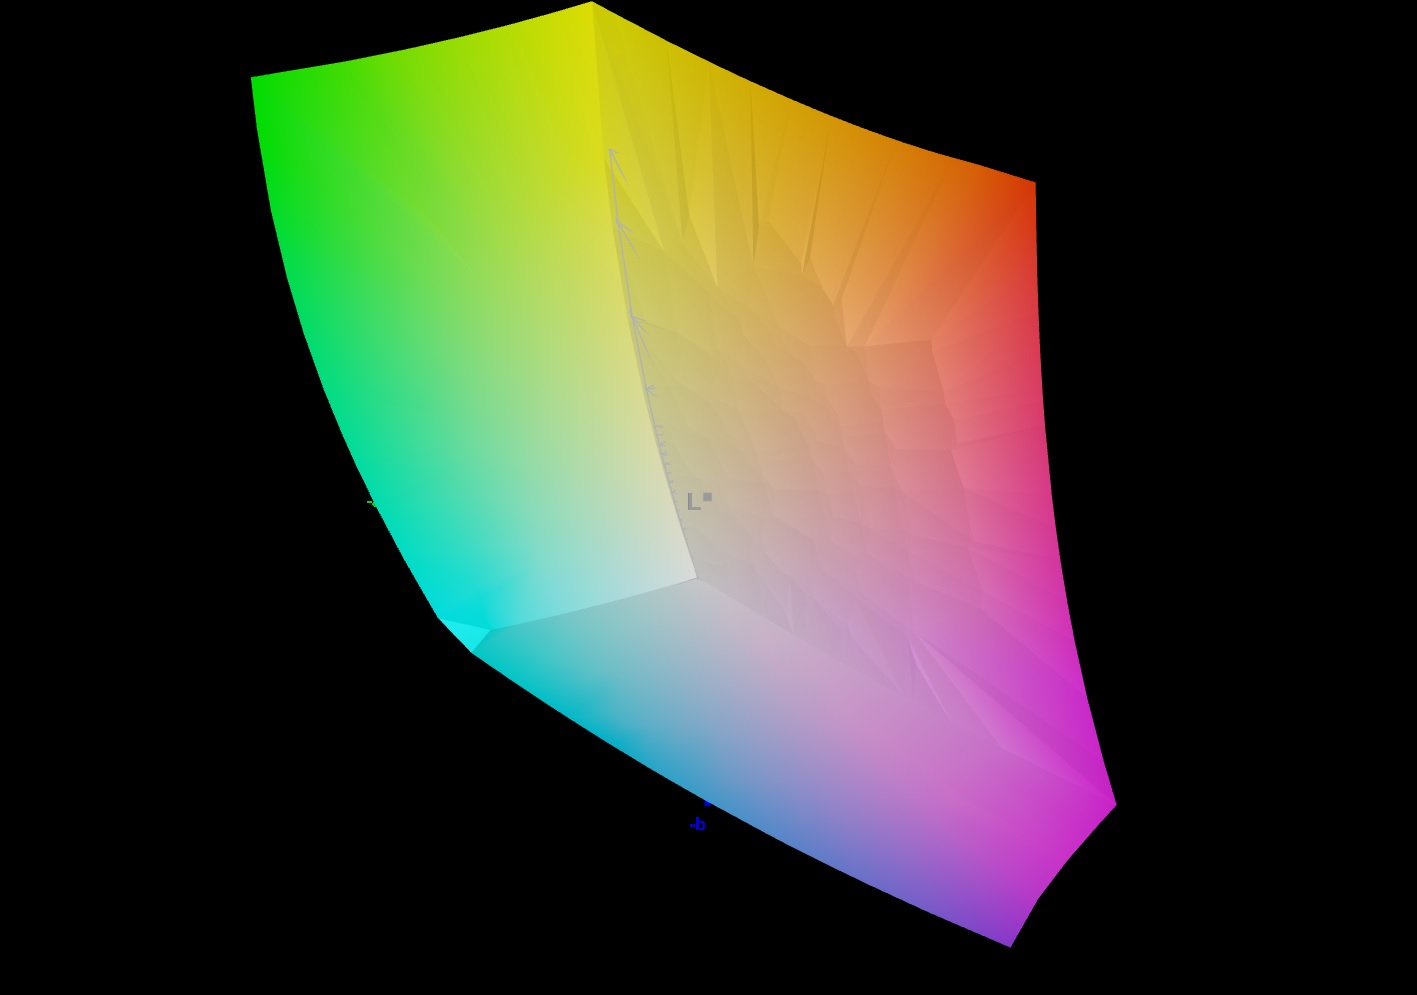
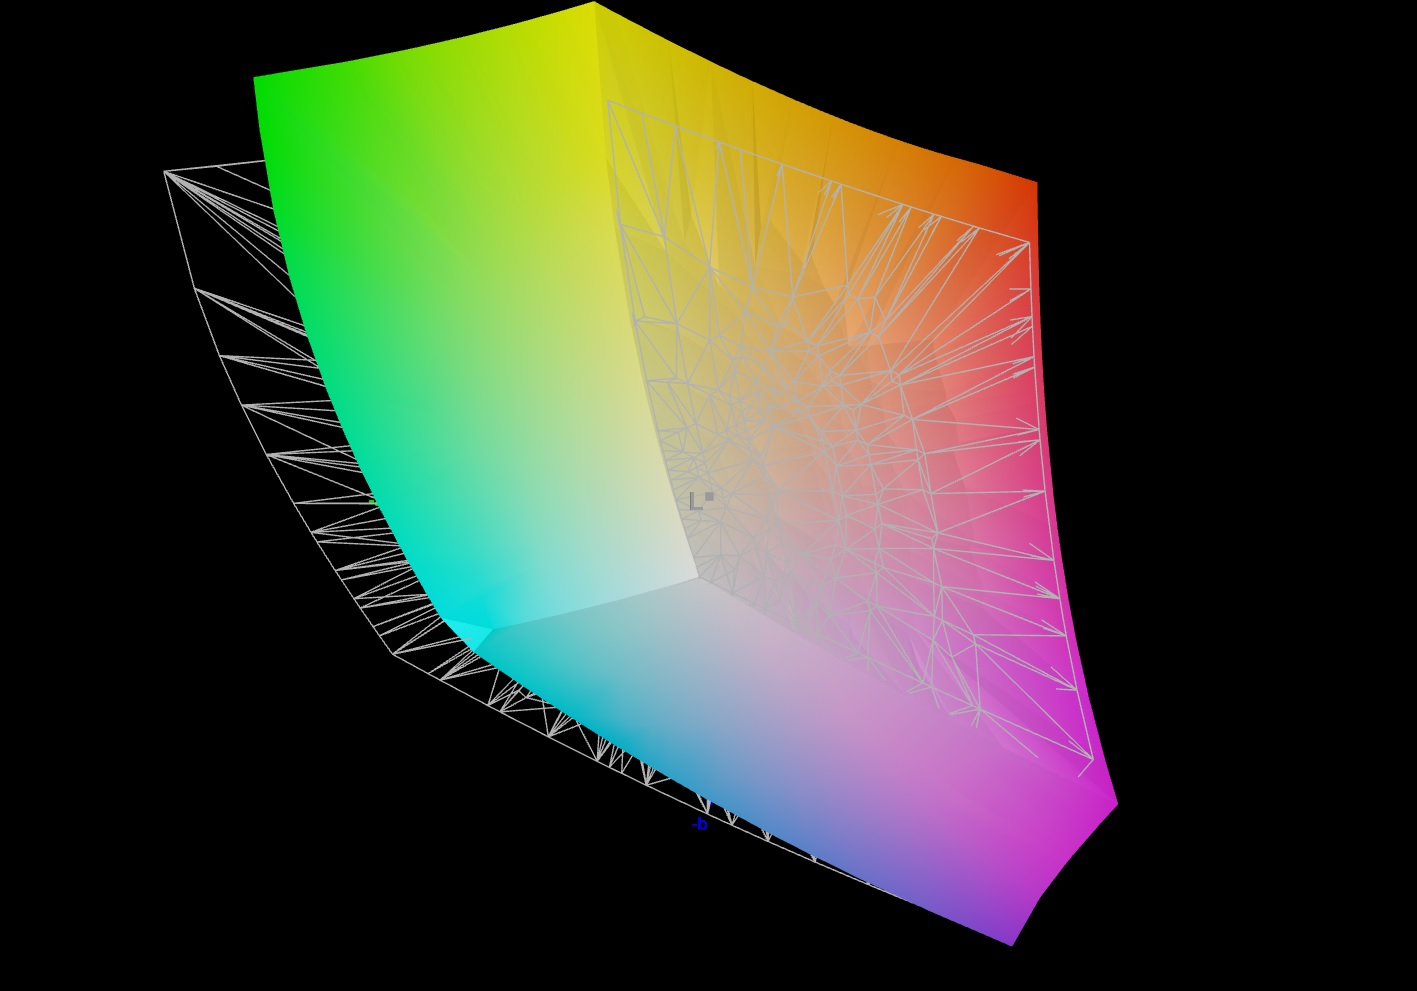
84.5% AdobeRGB 1998 (Argyll 3D)
99.9% sRGB (Argyll 3D)
96.7% Display P3 (Argyll 3D)
Gamma: 2.301
CCT: 7389 K
| Aorus 17X AZF BOE09F9, IPS, 2560x1440, 17.3" | Medion Erazer Beast X40 BOE NE170QDM-NZ1, IPS, 2560x1600, 17" | MSI GE78HX 13VH-070US AU Optronics B170QAN01.2, IPS, 2560x1600, 17" | HP Omen 17-ck2097ng BOE BOE09BF, IPS, 2560x1440, 17.3" | MSI Titan GT77 HX 13VI B173ZAN06.C, Mini-LED, 3840x2160, 17.3" | Alienware m18 R1 Chi Mei 180JME, IPS, 1920x1200, 18" | |
|---|---|---|---|---|---|---|
| Display | -16% | 1% | -17% | 2% | 2% | |
| Display P3 Coverage (%) | 96.7 | 68.6 -29% | 97.6 1% | 67.4 -30% | 94.9 -2% | 97.7 1% |
| sRGB Coverage (%) | 99.9 | 99.8 0% | 99.9 0% | 97.6 -2% | 99.9 0% | 100 0% |
| AdobeRGB 1998 Coverage (%) | 84.5 | 69.4 -18% | 86.5 2% | 69.6 -18% | 92.4 9% | 89.8 6% |
| Response Times | 23% | 54% | 1% | -169% | 41% | |
| Response Time Grey 50% / Grey 80% * (ms) | 14 ? | 11.3 ? 19% | 4.2 ? 70% | 15.6 ? -11% | 38.4 ? -174% | 3 ? 79% |
| Response Time Black / White * (ms) | 10.1 ? | 7.5 ? 26% | 6.4 ? 37% | 8.9 ? 12% | 26.6 ? -163% | 9.9 ? 2% |
| PWM Frequency (Hz) | 2380 ? | |||||
| Screen | 11% | -24% | 14% | 64117% | 26% | |
| Brightness middle (cd/m²) | 294 | 384 31% | 398.6 36% | 371 26% | 606 106% | 372.8 27% |
| Brightness (cd/m²) | 276 | 377 37% | 384 39% | 350 27% | 602 118% | 367 33% |
| Brightness Distribution (%) | 90 | 90 0% | 89 -1% | 90 0% | 93 3% | 97 8% |
| Black Level * (cd/m²) | 0.28 | 0.45 -61% | 0.46 -64% | 0.32 -14% | 0.0001 100% | 0.32 -14% |
| Contrast (:1) | 1050 | 853 -19% | 867 -17% | 1159 10% | 6060000 577043% | 1165 11% |
| Colorchecker dE 2000 * | 2.81 | 2.05 27% | 4.05 -44% | 1.74 38% | 4.8 -71% | 1.92 32% |
| Colorchecker dE 2000 max. * | 5.7 | 3.64 36% | 8.68 -52% | 3.59 37% | 8.2 -44% | 3.65 36% |
| Colorchecker dE 2000 calibrated * | 0.86 | 0.74 14% | 1.02 -19% | 1.01 -17% | 1.8 -109% | 0.51 41% |
| Greyscale dE 2000 * | 3.4 | 2.3 32% | 6.5 -91% | 2.8 18% | 6.5 -91% | 1.5 56% |
| Gamma | 2.301 96% | 2.017 109% | 2.11 104% | 2.19 100% | 2.63 84% | 2.34 94% |
| CCT | 7389 88% | 6546 99% | 7518 86% | 6474 100% | 6596 99% | 6607 98% |
| Média Total (Programa/Configurações) | 6% /
7% | 10% /
-7% | -1% /
5% | 21317% /
41195% | 23% /
23% |
* ... menor é melhor
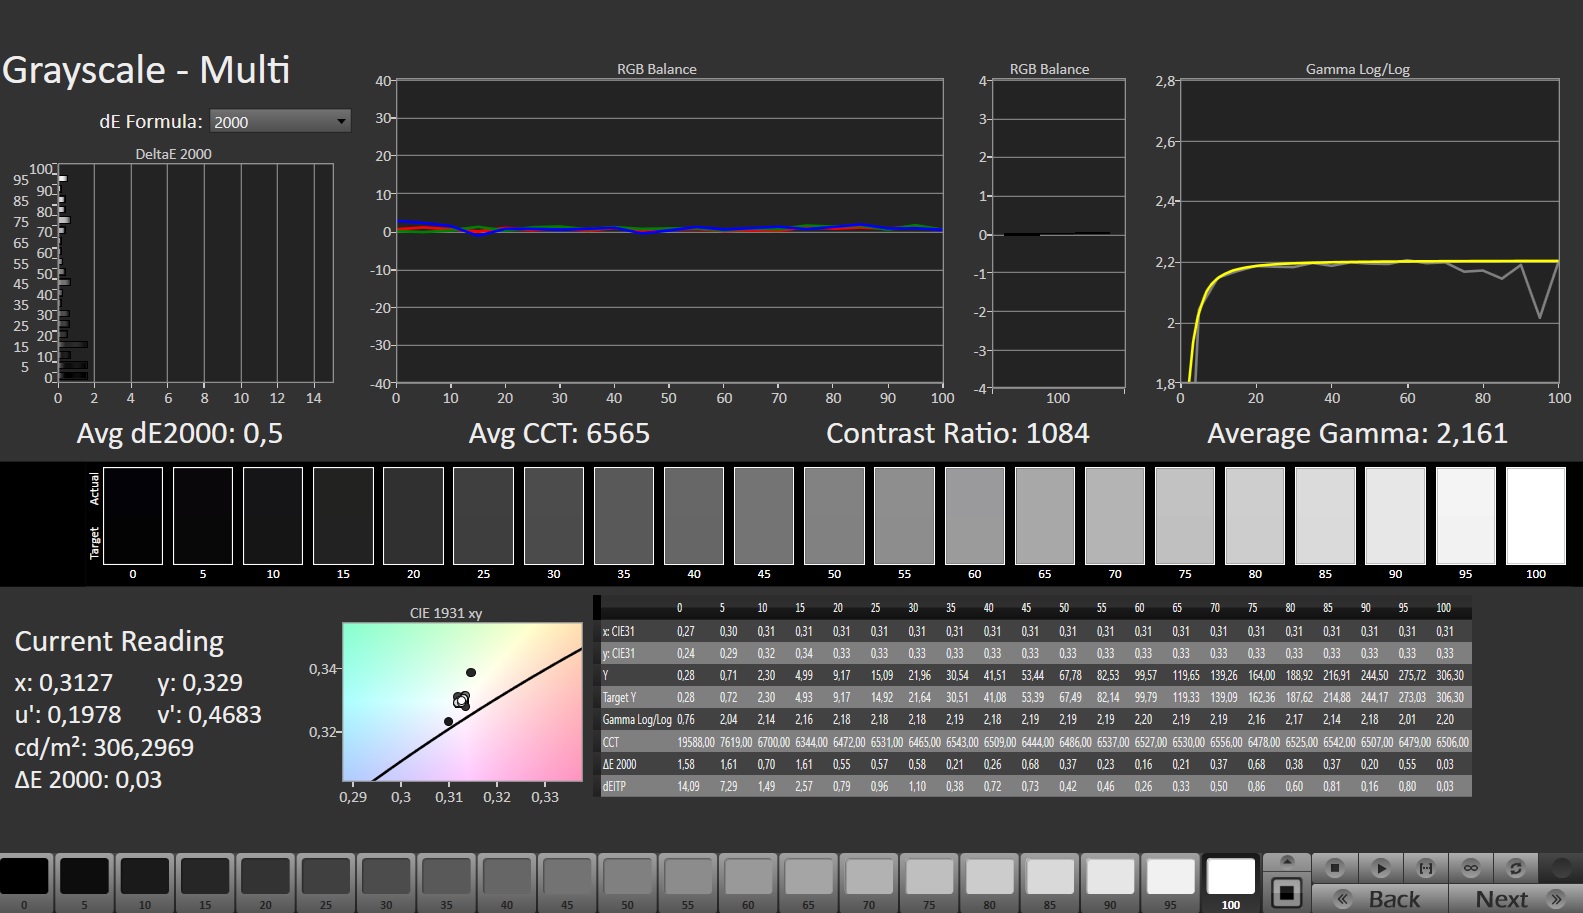
Subjetivamente, a qualidade de exibição da tela é impecável e não há grãos visíveis, apesar da superfície fosca. Em resumo, os valores medidos do DeltaE-2000 estão relativamente próximos do valor-alvo de 3 no estado de entrega. Entretanto, outros laptops da classe mostram que isto pode ser feito melhor. Conseguimos melhorar consideravelmente os valores através da calibração manual. Além disso, conseguimos também reduzir um pouco o elenco azul. Portanto, recomendamos o uso do perfil ICC ligado acima se você quiser usar o dispositivo para edição de imagens.
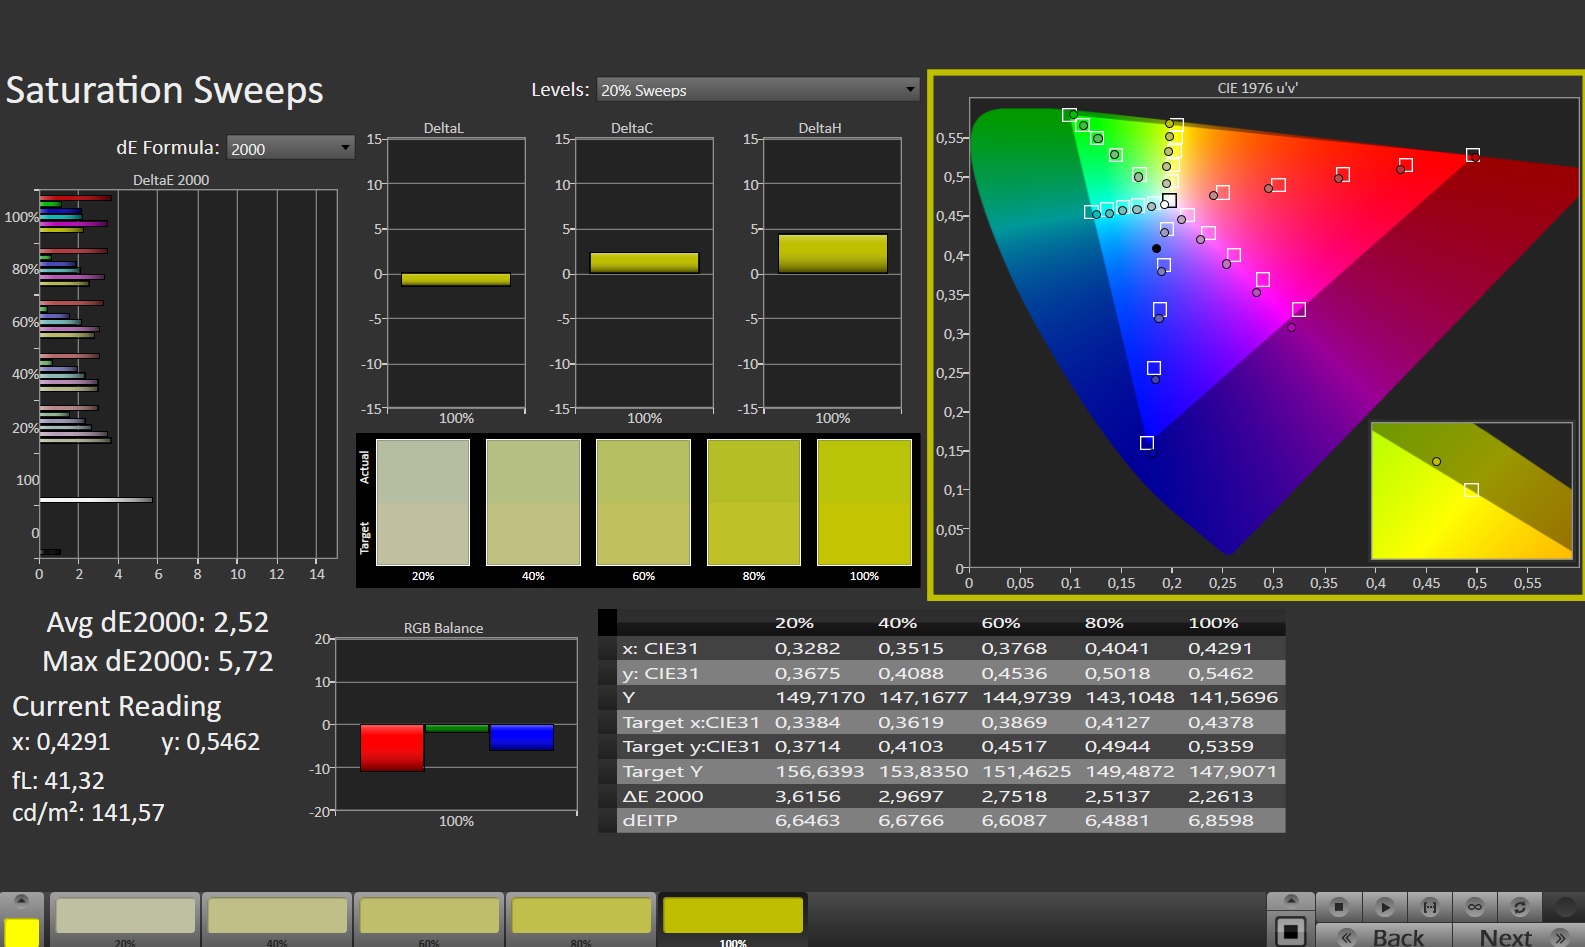
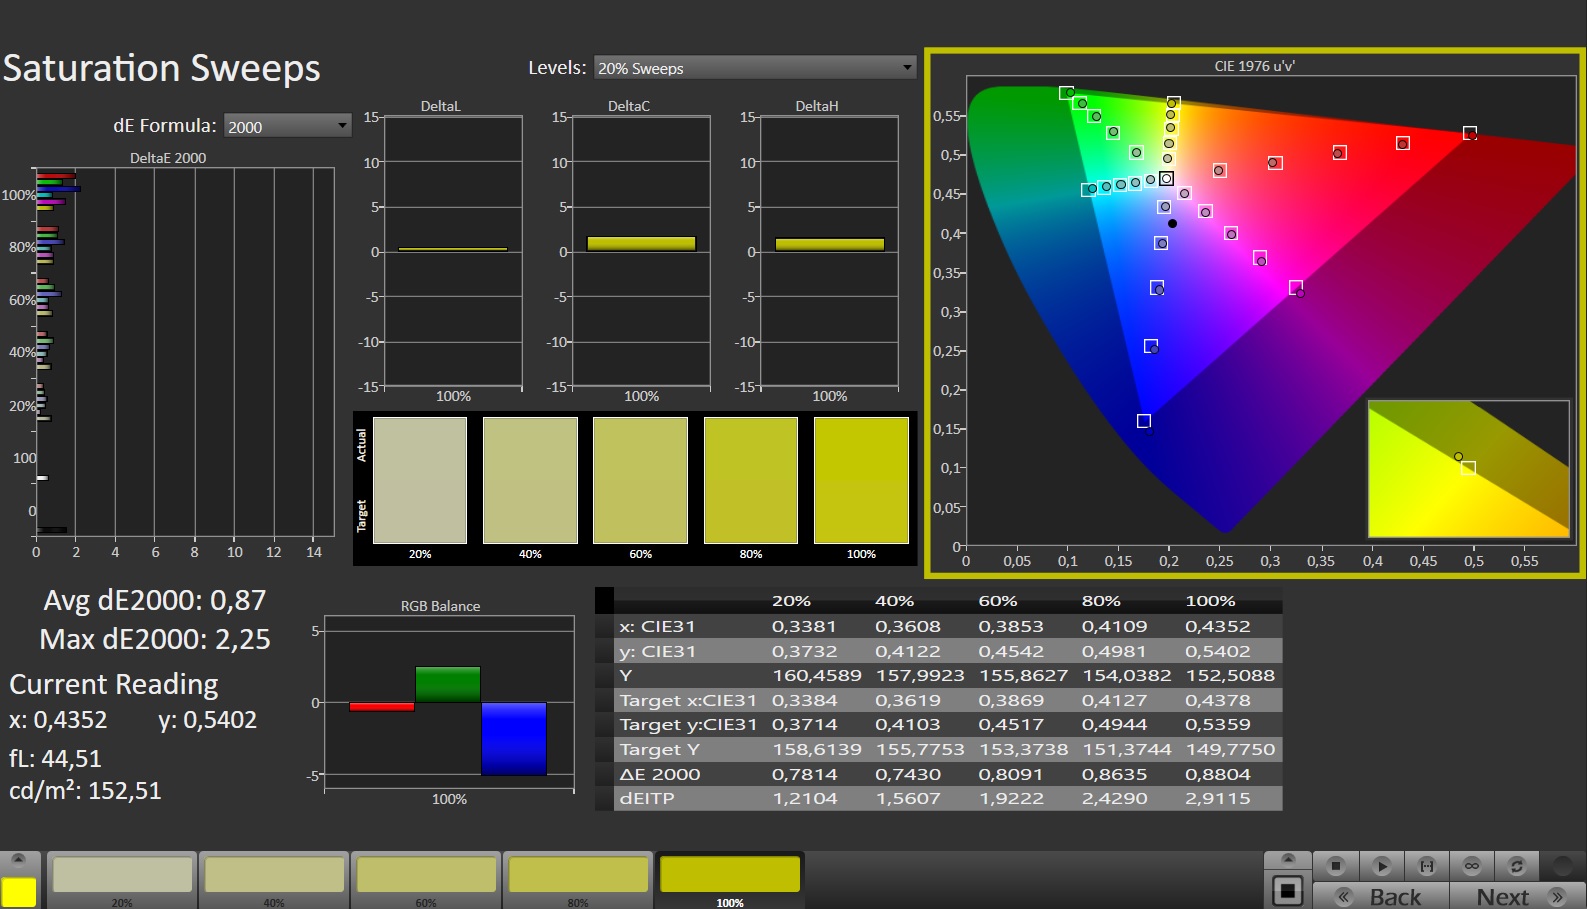
A cobertura do espaço de cor medida é boa e o espaço de cor sRGB é totalmente coberto a 100%. O espaço de cor AdobeRGB ampliado é suficientemente coberto a 84,5% e o espaço de cor P3 a 96,7%.

Exibir tempos de resposta
| ↔ Tempo de resposta preto para branco | ||
|---|---|---|
| 10.1 ms ... ascensão ↗ e queda ↘ combinadas | ↗ 5.3 ms ascensão | 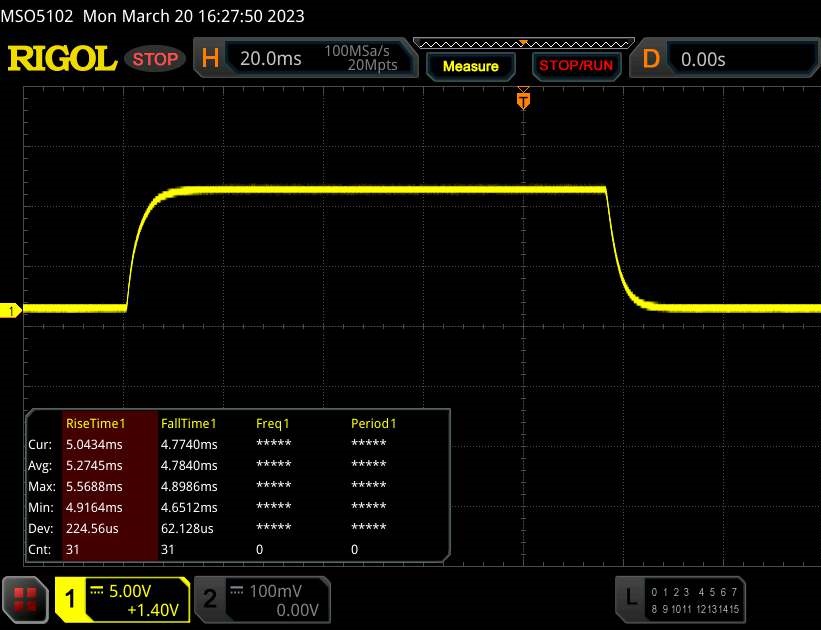 |
| ↘ 4.8 ms queda | ||
| A tela mostra boas taxas de resposta em nossos testes, mas pode ser muito lenta para jogadores competitivos. Em comparação, todos os dispositivos testados variam de 0.1 (mínimo) a 240 (máximo) ms. » 28 % de todos os dispositivos são melhores. Isso significa que o tempo de resposta medido é melhor que a média de todos os dispositivos testados (19.8 ms). | ||
| ↔ Tempo de resposta 50% cinza a 80% cinza | ||
| 14 ms ... ascensão ↗ e queda ↘ combinadas | ↗ 6.9 ms ascensão | 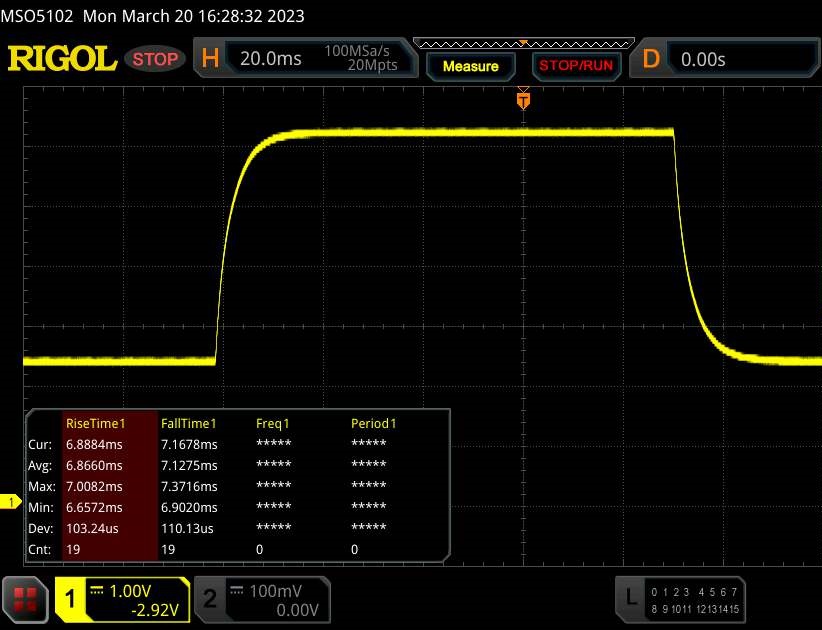 |
| ↘ 7.1 ms queda | ||
| A tela mostra boas taxas de resposta em nossos testes, mas pode ser muito lenta para jogadores competitivos. Em comparação, todos os dispositivos testados variam de 0.165 (mínimo) a 636 (máximo) ms. » 28 % de todos os dispositivos são melhores. Isso significa que o tempo de resposta medido é melhor que a média de todos os dispositivos testados (30.9 ms). | ||
Cintilação da tela / PWM (modulação por largura de pulso)
| Tela tremeluzindo / PWM não detectado | 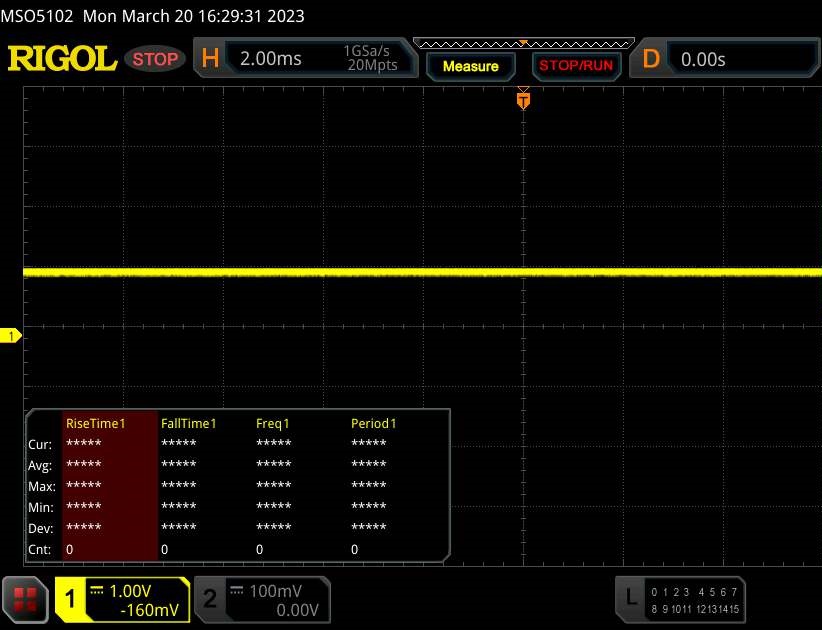 | ||
[pwm_comparison] Em comparação: 52 % de todos os dispositivos testados não usam PWM para escurecer a tela. Se PWM foi detectado, uma média de 7741 (mínimo: 5 - máximo: 343500) Hz foi medida. | |||
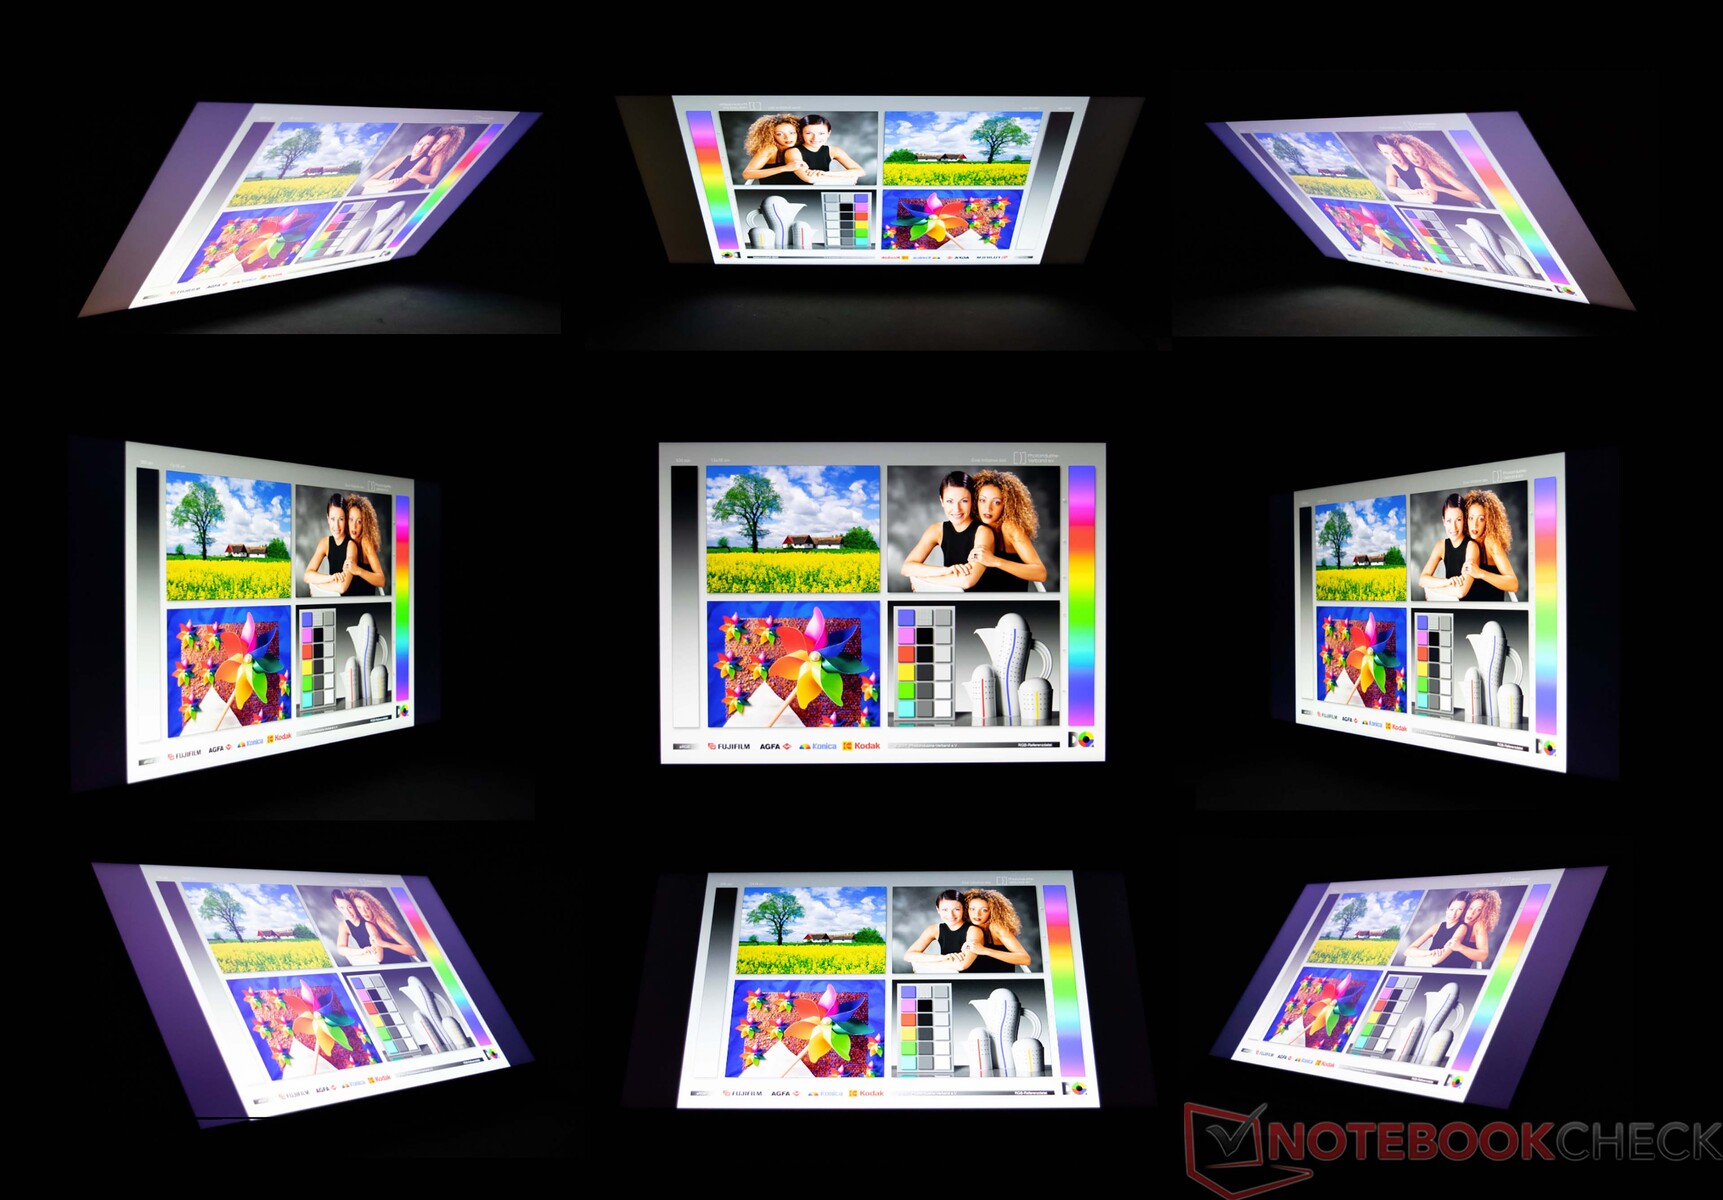
O brilho comparativamente baixo da tela não é propício ao uso ao ar livre. No entanto, o trabalho ao ar livre é possível com total luminosidade, embora com algumas limitações. A luz direta do sol deve ser evitada.
O painel IPS instalado oferece excelente qualidade de imagem em uso normal. Dificuldades na forma de um leve embaçamento só ocorrem nas imagens dos quatro cantos.
Desempenho - Raptor Lake combinado com Ada Lovelace
O Aorus 17X AZF é atualmente um dos mais poderosos notebooks para jogos e oferece excelente desempenho, impulsionado pelo Raptor Lake e Ada Lovelace. A configuração desta unidade de teste está disponível por US$3499,99.
Condições de teste
Além dos modos de desempenho típicos (ver tabela), o centro de controle do Aorus 17X AZF (Gigabyte Control Center) fornece uma função de AI Boost de nível superior que usamos. O Centro de Controle selecionou então o perfil apropriado - modo de jogo e modo Creator para os benchmarks, modo de sono com economia de energia para os testes de bateria
Omodo Turbo dispara em casos individuais para um pequeno aumento no desempenho, mas isto tem um preço: Os ventiladores trabalham constantemente em potência máxima. No modo Meeting, o dispositivo funciona muito silenciosamente, quase até o ponto de silêncio. O desempenho diminui visivelmente como resultado, embora o desempenho de múltiplas roscas seja afetado mais do que o desempenho de uma única rosca.
| Modus Creator | Turbo Modus | Gaming Modus | Meeting Modus | Energiespar Ruhemodus | |
|---|---|---|---|---|---|
| Limite de potência 1 | 86 Watt | 86 Watt | 86 Watt | 15 Watt | 15 Watt |
| Limite de potência 2 | 157 Watt | 157 Watt | 157 Watt | 30 Watt | 30 Watt |
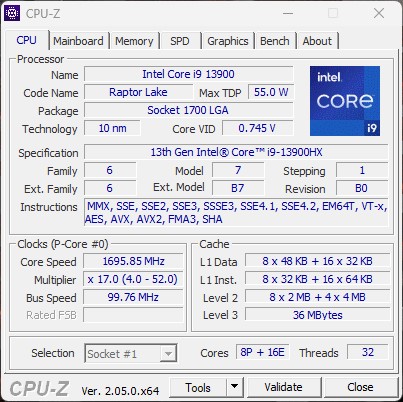
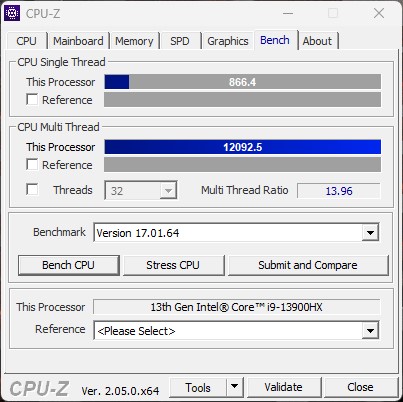
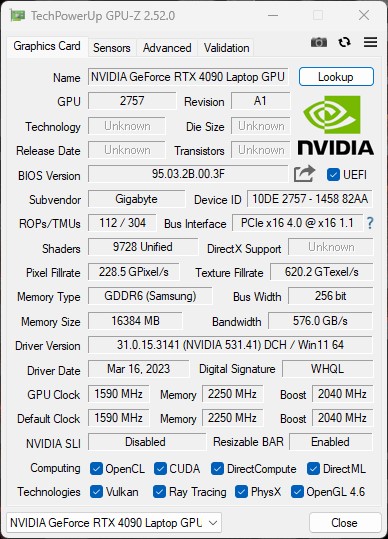
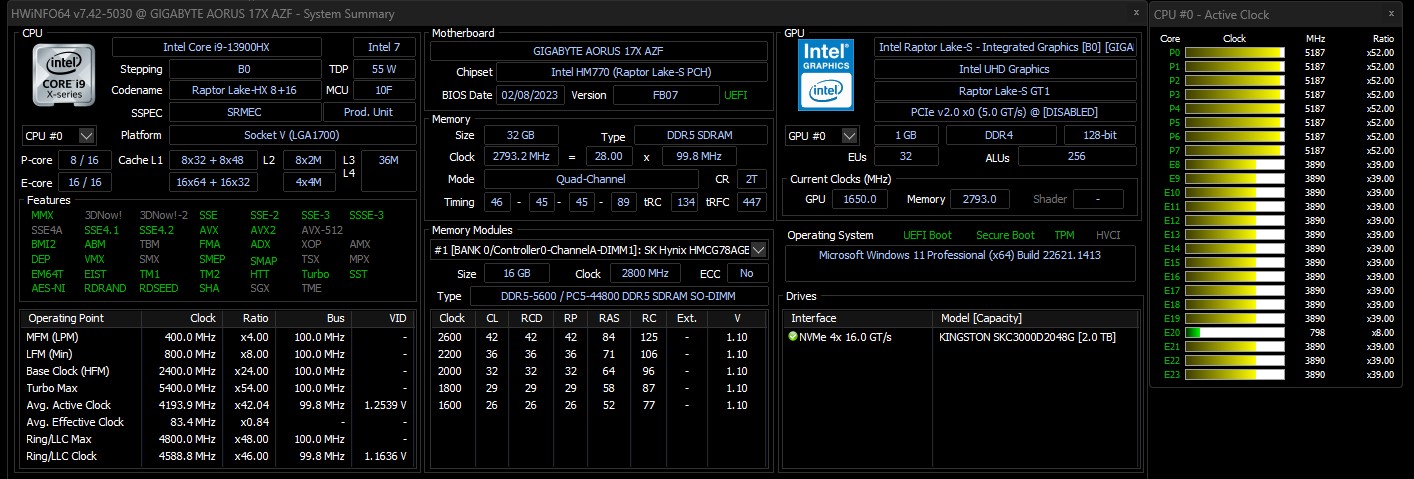
Processador
O Intel Core-i7-13900HX-Prozessor (Raptor Lake) consiste em 16 núcleos eficientes (sem hiperthreading, 1,6 a 3,9 GHz) e 8 núcleos de desempenho (hiperthreading, 2,2 a 5,4 GHz). Há 32 núcleos lógicos de CPU no total, o que foi acompanhado por um enorme desempenho multi-tarefa em nossos testes. Nos benchmarks, todos os competidores estão em uma corrida apertada frente a frente. No entanto, na classificação de desempenho da CPU, que representa o valor médio dos benchmarks apresentados, nossa unidade de teste ficou em segundo lugar. Somente o HP Omen 17, usando o mesmo SoC, pode ser testado aqui, enquanto o Medion Erazer Beastproporciona um desempenho um pouco melhor. Os outros concorrentes se saem melhor devido a seus SoCs ligeiramente mais rápidos. No entanto, a diferença para os MSI GE78HX é administrável em apenas 12%.
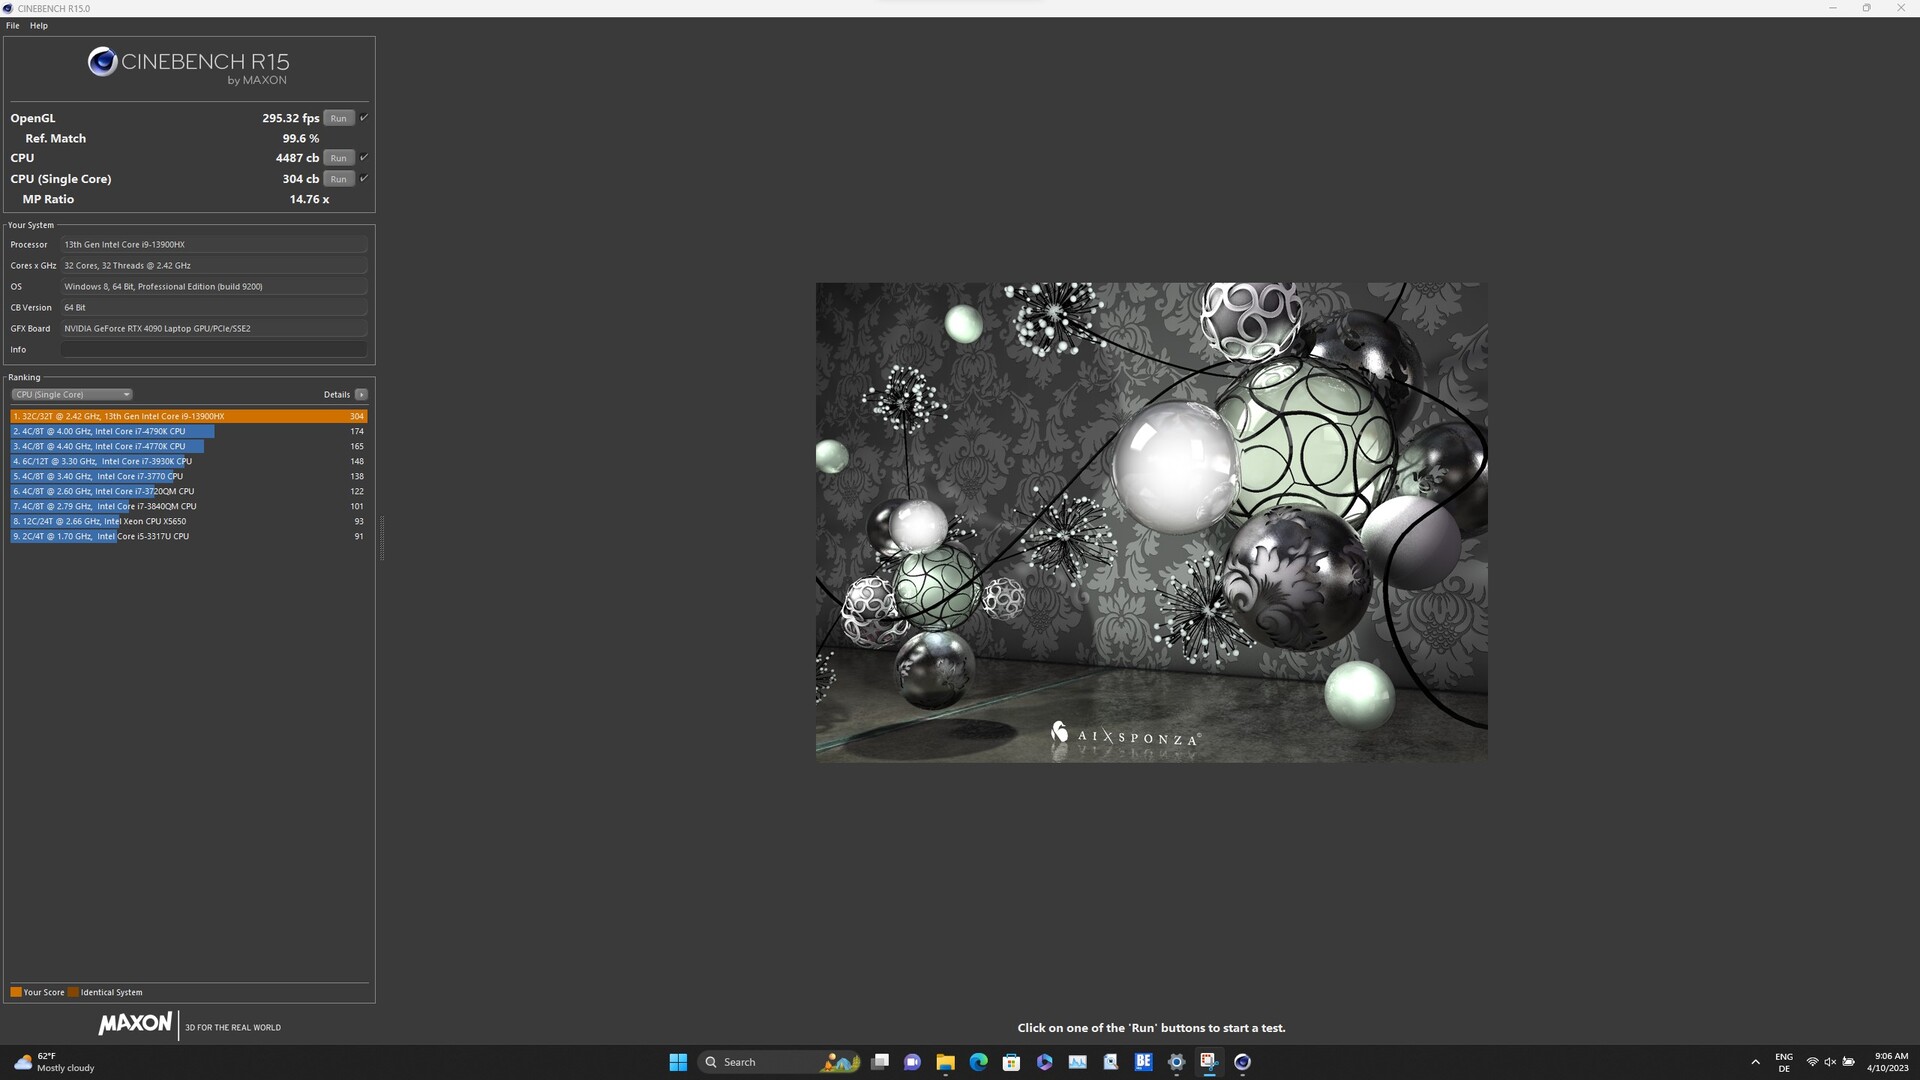
O teste de loop CB15 mostra que o aumento da CPU é utilizado apenas no início. A carga multi-tarefa permanente simulada faz com que o relógio caia ligeiramente após a primeira corrida, embora o desempenho permaneça estável a partir da terceira corrida.
Cinebench R15 Multi Sustained Load
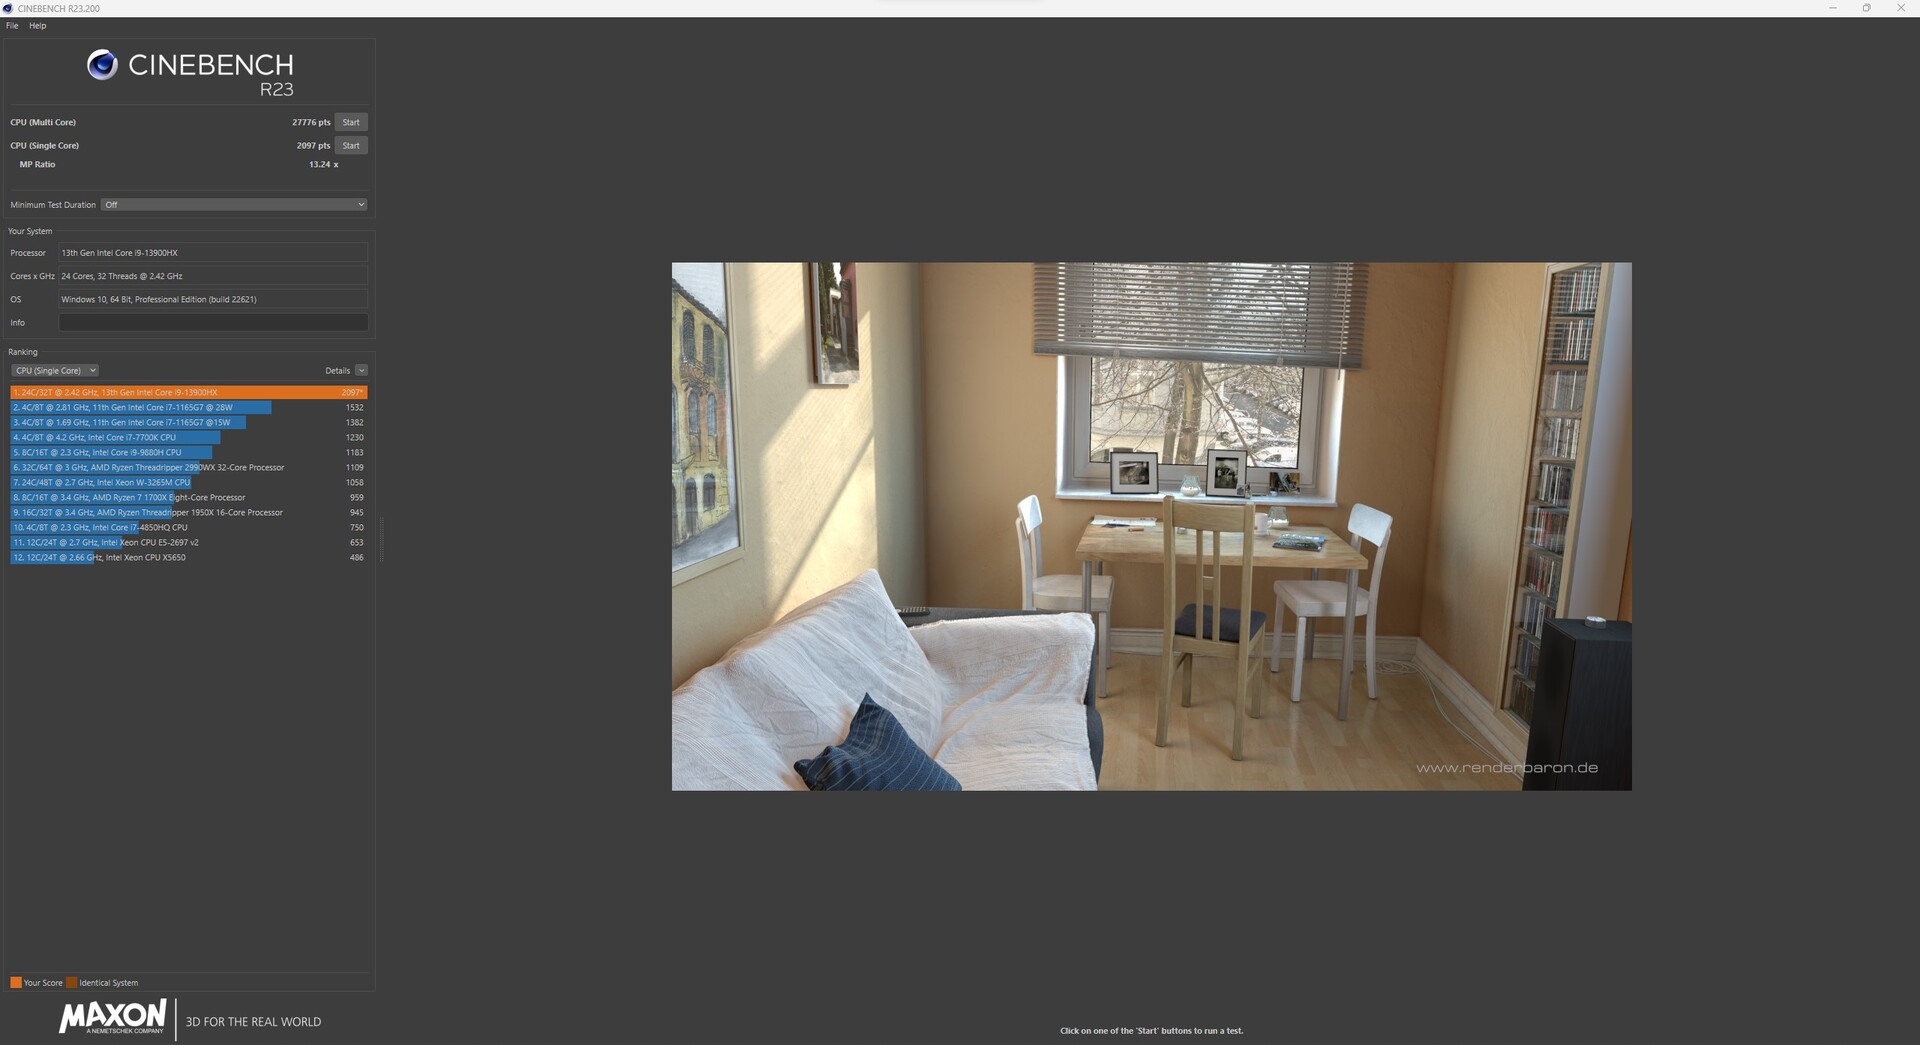
Cinebench R23: Multi Core | Single Core
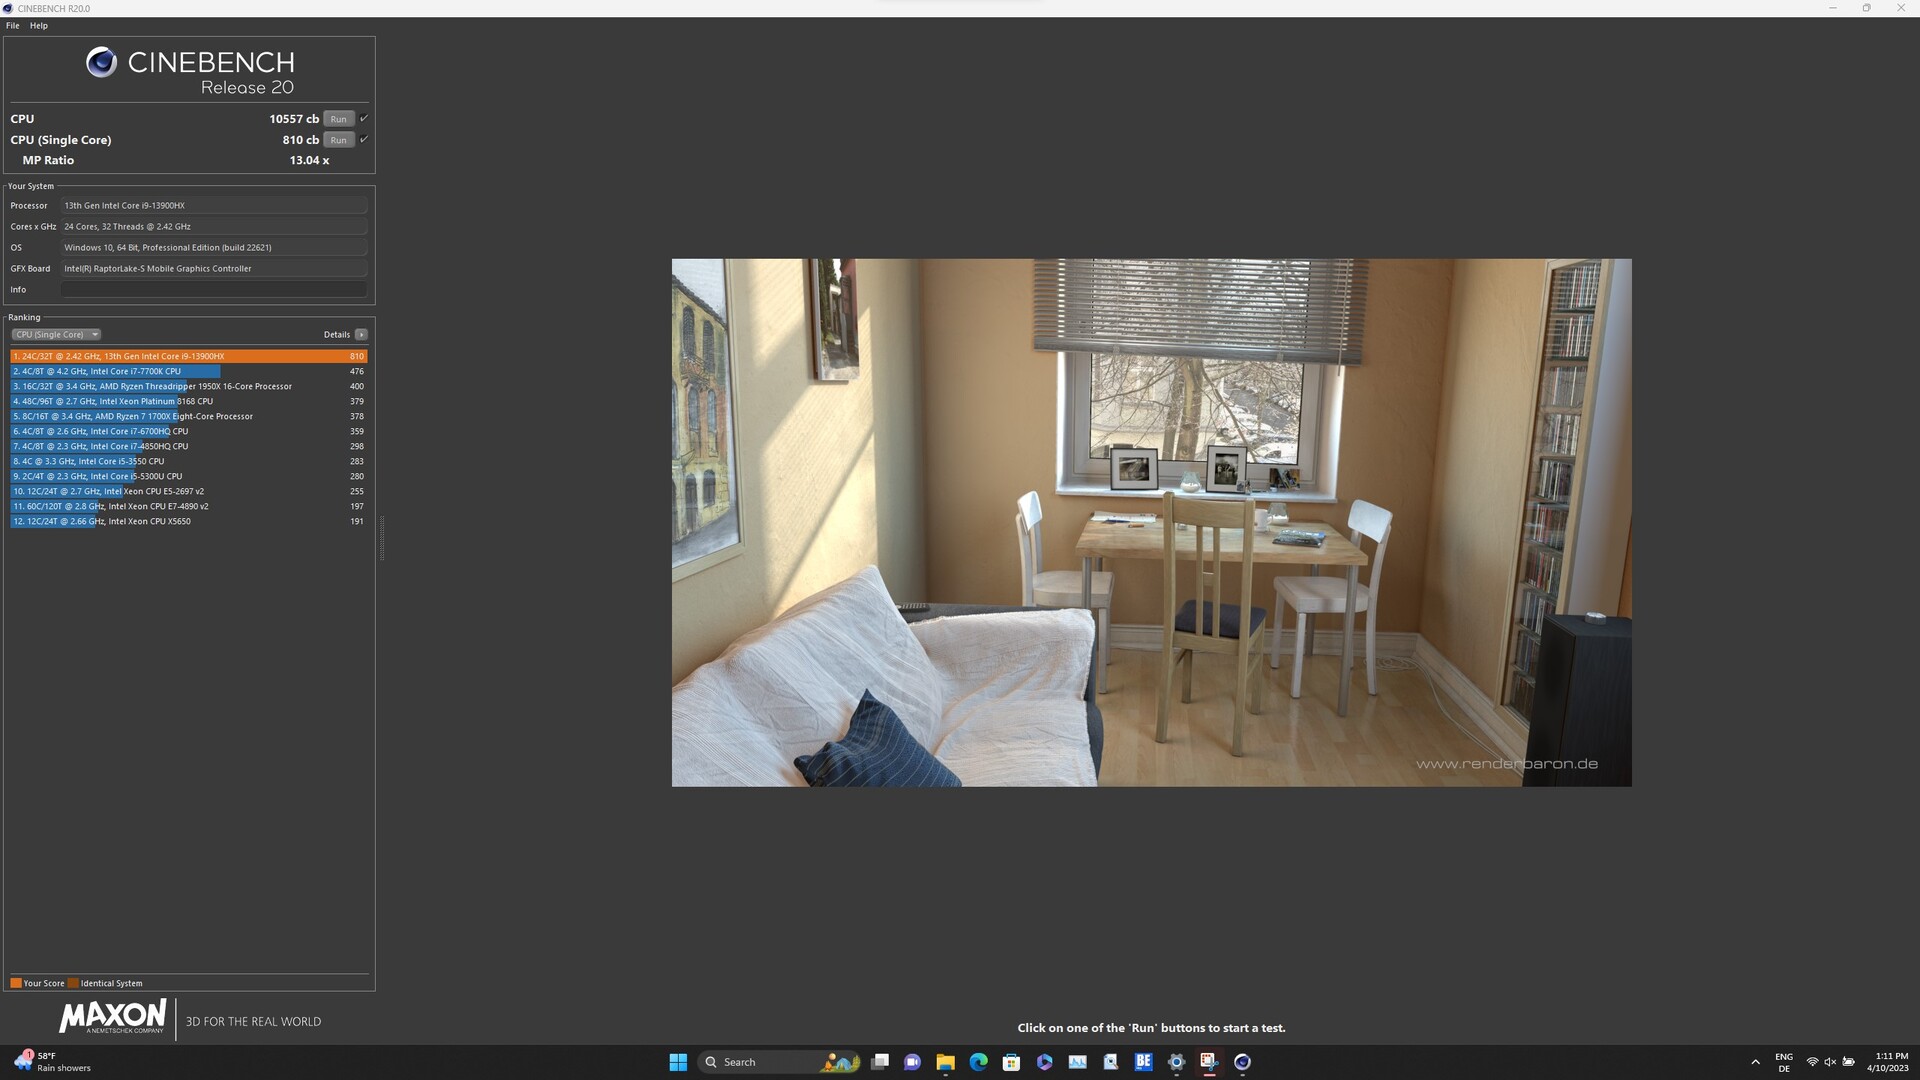
Cinebench R20: CPU (Multi Core) | CPU (Single Core)
Cinebench R15: CPU Multi 64Bit | CPU Single 64Bit
Blender: v2.79 BMW27 CPU
7-Zip 18.03: 7z b 4 | 7z b 4 -mmt1
Geekbench 5.5: Multi-Core | Single-Core
HWBOT x265 Benchmark v2.2: 4k Preset
LibreOffice : 20 Documents To PDF
R Benchmark 2.5: Overall mean
| CPU Performance rating | |
| MSI GE78HX 13VH-070US | |
| Alienware m18 R1 | |
| MSI Titan GT77 HX 13VI | |
| Medion Erazer Beast X40 | |
| Média Intel Core i9-13900HX | |
| Aorus 17X AZF | |
| HP Omen 17-ck2097ng | |
| Média da turma Gaming | |
| Cinebench R23 / Multi Core | |
| MSI Titan GT77 HX 13VI | |
| MSI GE78HX 13VH-070US | |
| Alienware m18 R1 | |
| Medion Erazer Beast X40 | |
| Média Intel Core i9-13900HX (24270 - 32623, n=23) | |
| Aorus 17X AZF | |
| Média da turma Gaming (10488 - 42661, n=104, últimos 2 anos) | |
| HP Omen 17-ck2097ng | |
| Cinebench R23 / Single Core | |
| MSI GE78HX 13VH-070US | |
| Alienware m18 R1 | |
| MSI Titan GT77 HX 13VI | |
| Aorus 17X AZF | |
| HP Omen 17-ck2097ng | |
| Média Intel Core i9-13900HX (1867 - 2105, n=20) | |
| Medion Erazer Beast X40 | |
| Média da turma Gaming (1601 - 2415, n=104, últimos 2 anos) | |
| Cinebench R20 / CPU (Multi Core) | |
| MSI Titan GT77 HX 13VI | |
| MSI GE78HX 13VH-070US | |
| Alienware m18 R1 | |
| Medion Erazer Beast X40 | |
| Média Intel Core i9-13900HX (9152 - 12541, n=21) | |
| Aorus 17X AZF | |
| Média da turma Gaming (4029 - 16433, n=103, últimos 2 anos) | |
| HP Omen 17-ck2097ng | |
| Cinebench R20 / CPU (Single Core) | |
| Aorus 17X AZF | |
| Alienware m18 R1 | |
| HP Omen 17-ck2097ng | |
| MSI Titan GT77 HX 13VI | |
| MSI GE78HX 13VH-070US | |
| Média da turma Gaming (622 - 913, n=103, últimos 2 anos) | |
| Média Intel Core i9-13900HX (722 - 810, n=21) | |
| Medion Erazer Beast X40 | |
| Cinebench R15 / CPU Multi 64Bit | |
| MSI Titan GT77 HX 13VI | |
| MSI GE78HX 13VH-070US | |
| Alienware m18 R1 | |
| Medion Erazer Beast X40 | |
| Média Intel Core i9-13900HX (3913 - 4970, n=22) | |
| Aorus 17X AZF | |
| HP Omen 17-ck2097ng | |
| Média da turma Gaming (1578 - 6330, n=102, últimos 2 anos) | |
| Cinebench R15 / CPU Single 64Bit | |
| Aorus 17X AZF | |
| MSI GE78HX 13VH-070US | |
| Alienware m18 R1 | |
| HP Omen 17-ck2097ng | |
| MSI Titan GT77 HX 13VI | |
| Média da turma Gaming (188.8 - 350, n=103, últimos 2 anos) | |
| Medion Erazer Beast X40 | |
| Média Intel Core i9-13900HX (247 - 304, n=22) | |
| Blender / v2.79 BMW27 CPU | |
| HP Omen 17-ck2097ng | |
| Média da turma Gaming (79 - 330, n=101, últimos 2 anos) | |
| Aorus 17X AZF | |
| Média Intel Core i9-13900HX (101 - 153, n=22) | |
| Medion Erazer Beast X40 | |
| MSI GE78HX 13VH-070US | |
| MSI Titan GT77 HX 13VI | |
| Alienware m18 R1 | |
| 7-Zip 18.03 / 7z b 4 | |
| Alienware m18 R1 | |
| MSI Titan GT77 HX 13VI | |
| MSI GE78HX 13VH-070US | |
| Medion Erazer Beast X40 | |
| Média Intel Core i9-13900HX (90675 - 127283, n=21) | |
| HP Omen 17-ck2097ng | |
| Aorus 17X AZF | |
| Média da turma Gaming (33491 - 148086, n=102, últimos 2 anos) | |
| 7-Zip 18.03 / 7z b 4 -mmt1 | |
| Aorus 17X AZF | |
| MSI GE78HX 13VH-070US | |
| HP Omen 17-ck2097ng | |
| MSI Titan GT77 HX 13VI | |
| Medion Erazer Beast X40 | |
| Alienware m18 R1 | |
| Média Intel Core i9-13900HX (6340 - 7177, n=21) | |
| Média da turma Gaming (4824 - 7436, n=102, últimos 2 anos) | |
| Geekbench 5.5 / Multi-Core | |
| Alienware m18 R1 | |
| MSI GE78HX 13VH-070US | |
| MSI Titan GT77 HX 13VI | |
| HP Omen 17-ck2097ng | |
| Medion Erazer Beast X40 | |
| Média Intel Core i9-13900HX (17614 - 21075, n=22) | |
| Aorus 17X AZF | |
| Média da turma Gaming (6460 - 28263, n=102, últimos 2 anos) | |
| Geekbench 5.5 / Single-Core | |
| MSI GE78HX 13VH-070US | |
| Média da turma Gaming (1403 - 2474, n=102, últimos 2 anos) | |
| HP Omen 17-ck2097ng | |
| Aorus 17X AZF | |
| Alienware m18 R1 | |
| MSI Titan GT77 HX 13VI | |
| Medion Erazer Beast X40 | |
| Média Intel Core i9-13900HX (1345 - 2093, n=22) | |
| HWBOT x265 Benchmark v2.2 / 4k Preset | |
| MSI GE78HX 13VH-070US | |
| Alienware m18 R1 | |
| MSI Titan GT77 HX 13VI | |
| Medion Erazer Beast X40 | |
| Média da turma Gaming (11.5 - 44.4, n=102, últimos 2 anos) | |
| Média Intel Core i9-13900HX (23.5 - 34.4, n=22) | |
| HP Omen 17-ck2097ng | |
| Aorus 17X AZF | |
| LibreOffice / 20 Documents To PDF | |
| Média da turma Gaming (33.2 - 88.8, n=102, últimos 2 anos) | |
| MSI GE78HX 13VH-070US | |
| Alienware m18 R1 | |
| MSI Titan GT77 HX 13VI | |
| Aorus 17X AZF | |
| HP Omen 17-ck2097ng | |
| Medion Erazer Beast X40 | |
| Média Intel Core i9-13900HX (32.8 - 51.1, n=21) | |
| R Benchmark 2.5 / Overall mean | |
| Média da turma Gaming (0.3439 - 0.59, n=102, últimos 2 anos) | |
| MSI Titan GT77 HX 13VI | |
| Média Intel Core i9-13900HX (0.375 - 0.4564, n=22) | |
| Medion Erazer Beast X40 | |
| Aorus 17X AZF | |
| Alienware m18 R1 | |
| HP Omen 17-ck2097ng | |
| MSI GE78HX 13VH-070US | |
* ... menor é melhor
AIDA64: FP32 Ray-Trace | FPU Julia | CPU SHA3 | CPU Queen | FPU SinJulia | FPU Mandel | CPU AES | CPU ZLib | FP64 Ray-Trace | CPU PhotoWorxx
| Performance rating | |
| Alienware m18 R1 | |
| MSI GE78HX 13VH-070US | |
| MSI Titan GT77 HX 13VI | |
| Média da turma Gaming | |
| Medion Erazer Beast X40 | |
| Média Intel Core i9-13900HX | |
| Aorus 17X AZF | |
| HP Omen 17-ck2097ng | |
| AIDA64 / FP32 Ray-Trace | |
| Média da turma Gaming (10227 - 85542, n=102, últimos 2 anos) | |
| Alienware m18 R1 | |
| MSI Titan GT77 HX 13VI | |
| MSI GE78HX 13VH-070US | |
| Medion Erazer Beast X40 | |
| Média Intel Core i9-13900HX (17589 - 27615, n=22) | |
| Aorus 17X AZF | |
| HP Omen 17-ck2097ng | |
| AIDA64 / FPU Julia | |
| Alienware m18 R1 | |
| Média da turma Gaming (51376 - 372155, n=102, últimos 2 anos) | |
| MSI Titan GT77 HX 13VI | |
| MSI GE78HX 13VH-070US | |
| Medion Erazer Beast X40 | |
| Média Intel Core i9-13900HX (88686 - 137015, n=22) | |
| Aorus 17X AZF | |
| HP Omen 17-ck2097ng | |
| AIDA64 / CPU SHA3 | |
| Alienware m18 R1 | |
| MSI Titan GT77 HX 13VI | |
| MSI GE78HX 13VH-070US | |
| Medion Erazer Beast X40 | |
| Média da turma Gaming (2180 - 10115, n=102, últimos 2 anos) | |
| Média Intel Core i9-13900HX (4362 - 7029, n=22) | |
| Aorus 17X AZF | |
| HP Omen 17-ck2097ng | |
| AIDA64 / CPU Queen | |
| Alienware m18 R1 | |
| MSI GE78HX 13VH-070US | |
| MSI Titan GT77 HX 13VI | |
| HP Omen 17-ck2097ng | |
| Média Intel Core i9-13900HX (125644 - 141385, n=22) | |
| Medion Erazer Beast X40 | |
| Aorus 17X AZF | |
| Média da turma Gaming (49785 - 173351, n=86, últimos 2 anos) | |
| AIDA64 / FPU SinJulia | |
| MSI Titan GT77 HX 13VI | |
| MSI GE78HX 13VH-070US | |
| Alienware m18 R1 | |
| Medion Erazer Beast X40 | |
| Média da turma Gaming (4424 - 33636, n=102, últimos 2 anos) | |
| Média Intel Core i9-13900HX (12334 - 17179, n=22) | |
| Aorus 17X AZF | |
| HP Omen 17-ck2097ng | |
| AIDA64 / FPU Mandel | |
| Média da turma Gaming (25115 - 196829, n=102, últimos 2 anos) | |
| Alienware m18 R1 | |
| MSI Titan GT77 HX 13VI | |
| MSI GE78HX 13VH-070US | |
| Medion Erazer Beast X40 | |
| Média Intel Core i9-13900HX (43850 - 69202, n=22) | |
| Aorus 17X AZF | |
| HP Omen 17-ck2097ng | |
| AIDA64 / CPU AES | |
| Aorus 17X AZF | |
| Média Intel Core i9-13900HX (89413 - 237881, n=22) | |
| MSI Titan GT77 HX 13VI | |
| Alienware m18 R1 | |
| MSI GE78HX 13VH-070US | |
| Medion Erazer Beast X40 | |
| Média da turma Gaming (39258 - 247074, n=102, últimos 2 anos) | |
| HP Omen 17-ck2097ng | |
| AIDA64 / CPU ZLib | |
| MSI GE78HX 13VH-070US | |
| MSI Titan GT77 HX 13VI | |
| Alienware m18 R1 | |
| Medion Erazer Beast X40 | |
| Média Intel Core i9-13900HX (1284 - 1958, n=22) | |
| Média da turma Gaming (574 - 2531, n=102, últimos 2 anos) | |
| Aorus 17X AZF | |
| HP Omen 17-ck2097ng | |
| AIDA64 / FP64 Ray-Trace | |
| Média da turma Gaming (5509 - 45446, n=102, últimos 2 anos) | |
| Alienware m18 R1 | |
| MSI Titan GT77 HX 13VI | |
| MSI GE78HX 13VH-070US | |
| Medion Erazer Beast X40 | |
| Média Intel Core i9-13900HX (9481 - 15279, n=22) | |
| Aorus 17X AZF | |
| HP Omen 17-ck2097ng | |
| AIDA64 / CPU PhotoWorxx | |
| Alienware m18 R1 | |
| HP Omen 17-ck2097ng | |
| Aorus 17X AZF | |
| MSI GE78HX 13VH-070US | |
| Média Intel Core i9-13900HX (42994 - 51994, n=22) | |
| Média da turma Gaming (12271 - 89891, n=102, últimos 2 anos) | |
| Medion Erazer Beast X40 | |
| MSI Titan GT77 HX 13VI | |
Desempenho do sistema
Nos benchmarks de desempenho do sistema, o Aorus 17X AZF se classifica da mesma forma que nos testes de CPU. No entanto, o desempenho do sistema é excelente e bem acima da média da classe para laptops de jogos nos últimos dois anos. Nos referenciais AIDA64, o Aorus 17X AZF fornece resultados impecáveis graças à rápida RAM DDR5, o que coloca nossa unidade de revisão em segundo lugar atrás doAlienware m18 R1.
CrossMark: Overall | Productivity | Creativity | Responsiveness
| PCMark 10 / Score | |
| MSI Titan GT77 HX 13VI | |
| MSI GE78HX 13VH-070US | |
| Alienware m18 R1 | |
| Média da turma Gaming (5828 - 12414, n=93, últimos 2 anos) | |
| Média Intel Core i9-13900HX, NVIDIA GeForce RTX 4090 Laptop GPU (7690 - 9331, n=8) | |
| Medion Erazer Beast X40 | |
| Aorus 17X AZF | |
| HP Omen 17-ck2097ng | |
| PCMark 10 / Essentials | |
| HP Omen 17-ck2097ng | |
| MSI Titan GT77 HX 13VI | |
| MSI GE78HX 13VH-070US | |
| Média Intel Core i9-13900HX, NVIDIA GeForce RTX 4090 Laptop GPU (10972 - 11983, n=8) | |
| Medion Erazer Beast X40 | |
| Alienware m18 R1 | |
| Aorus 17X AZF | |
| Média da turma Gaming (8810 - 11935, n=97, últimos 2 anos) | |
| PCMark 10 / Productivity | |
| Média da turma Gaming (6845 - 25323, n=95, últimos 2 anos) | |
| Medion Erazer Beast X40 | |
| MSI GE78HX 13VH-070US | |
| Média Intel Core i9-13900HX, NVIDIA GeForce RTX 4090 Laptop GPU (9038 - 11680, n=8) | |
| Aorus 17X AZF | |
| Alienware m18 R1 | |
| HP Omen 17-ck2097ng | |
| MSI Titan GT77 HX 13VI | |
| PCMark 10 / Digital Content Creation | |
| MSI Titan GT77 HX 13VI | |
| Alienware m18 R1 | |
| MSI GE78HX 13VH-070US | |
| Média da turma Gaming (7602 - 19954, n=95, últimos 2 anos) | |
| Média Intel Core i9-13900HX, NVIDIA GeForce RTX 4090 Laptop GPU (10605 - 16395, n=8) | |
| Medion Erazer Beast X40 | |
| Aorus 17X AZF | |
| HP Omen 17-ck2097ng | |
| CrossMark / Overall | |
| Alienware m18 R1 | |
| Aorus 17X AZF | |
| MSI Titan GT77 HX 13VI | |
| Medion Erazer Beast X40 | |
| Média Intel Core i9-13900HX, NVIDIA GeForce RTX 4090 Laptop GPU (1825 - 2295, n=8) | |
| HP Omen 17-ck2097ng | |
| Média da turma Gaming (1366 - 2409, n=94, últimos 2 anos) | |
| MSI GE78HX 13VH-070US | |
| CrossMark / Productivity | |
| Aorus 17X AZF | |
| Alienware m18 R1 | |
| Medion Erazer Beast X40 | |
| MSI Titan GT77 HX 13VI | |
| Média Intel Core i9-13900HX, NVIDIA GeForce RTX 4090 Laptop GPU (1666 - 2166, n=8) | |
| Média da turma Gaming (1386 - 2254, n=94, últimos 2 anos) | |
| MSI GE78HX 13VH-070US | |
| HP Omen 17-ck2097ng | |
| CrossMark / Creativity | |
| Alienware m18 R1 | |
| MSI Titan GT77 HX 13VI | |
| Medion Erazer Beast X40 | |
| Média Intel Core i9-13900HX, NVIDIA GeForce RTX 4090 Laptop GPU (2162 - 2514, n=8) | |
| Aorus 17X AZF | |
| Média da turma Gaming (1343 - 2786, n=94, últimos 2 anos) | |
| HP Omen 17-ck2097ng | |
| MSI GE78HX 13VH-070US | |
| CrossMark / Responsiveness | |
| Aorus 17X AZF | |
| Alienware m18 R1 | |
| MSI Titan GT77 HX 13VI | |
| Medion Erazer Beast X40 | |
| Média Intel Core i9-13900HX, NVIDIA GeForce RTX 4090 Laptop GPU (1441 - 2275, n=8) | |
| HP Omen 17-ck2097ng | |
| Média da turma Gaming (1226 - 2334, n=94, últimos 2 anos) | |
| MSI GE78HX 13VH-070US | |
| PCMark 10 Score | 7690 pontos | |
Ajuda | ||
| AIDA64 / Memory Copy | |
| Alienware m18 R1 | |
| Aorus 17X AZF | |
| HP Omen 17-ck2097ng | |
| MSI GE78HX 13VH-070US | |
| Média Intel Core i9-13900HX (67716 - 79193, n=22) | |
| Média da turma Gaming (21750 - 129946, n=102, últimos 2 anos) | |
| Medion Erazer Beast X40 | |
| MSI Titan GT77 HX 13VI | |
| AIDA64 / Memory Read | |
| Alienware m18 R1 | |
| Aorus 17X AZF | |
| HP Omen 17-ck2097ng | |
| MSI GE78HX 13VH-070US | |
| Média Intel Core i9-13900HX (73998 - 88462, n=22) | |
| Medion Erazer Beast X40 | |
| Média da turma Gaming (22956 - 118858, n=102, últimos 2 anos) | |
| MSI Titan GT77 HX 13VI | |
| AIDA64 / Memory Write | |
| Alienware m18 R1 | |
| HP Omen 17-ck2097ng | |
| Média da turma Gaming (22297 - 135096, n=102, últimos 2 anos) | |
| Aorus 17X AZF | |
| MSI GE78HX 13VH-070US | |
| Média Intel Core i9-13900HX (65472 - 77045, n=22) | |
| Medion Erazer Beast X40 | |
| MSI Titan GT77 HX 13VI | |
| AIDA64 / Memory Latency | |
| Média da turma Gaming (75.3 - 165.4, n=102, últimos 2 anos) | |
| MSI Titan GT77 HX 13VI | |
| Medion Erazer Beast X40 | |
| Média Intel Core i9-13900HX (75.3 - 91.1, n=22) | |
| HP Omen 17-ck2097ng | |
| MSI GE78HX 13VH-070US | |
| Aorus 17X AZF | |
| Alienware m18 R1 | |
* ... menor é melhor
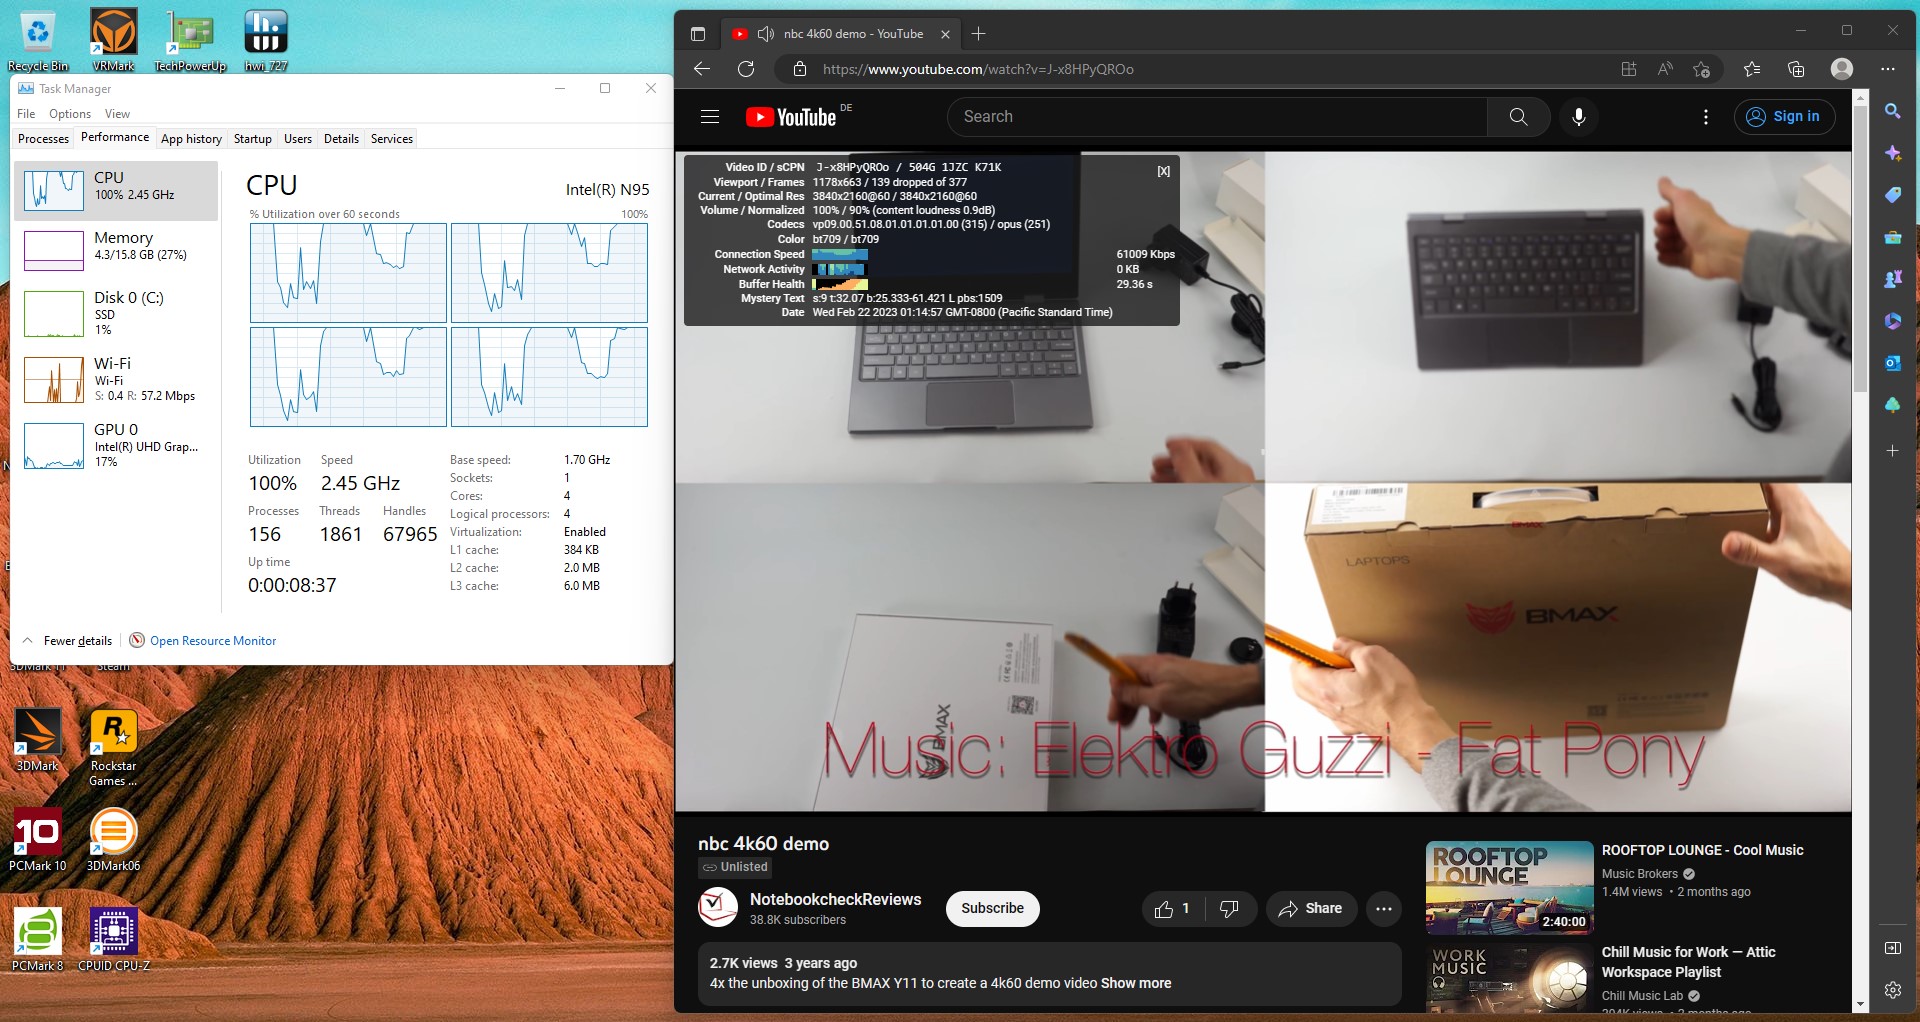
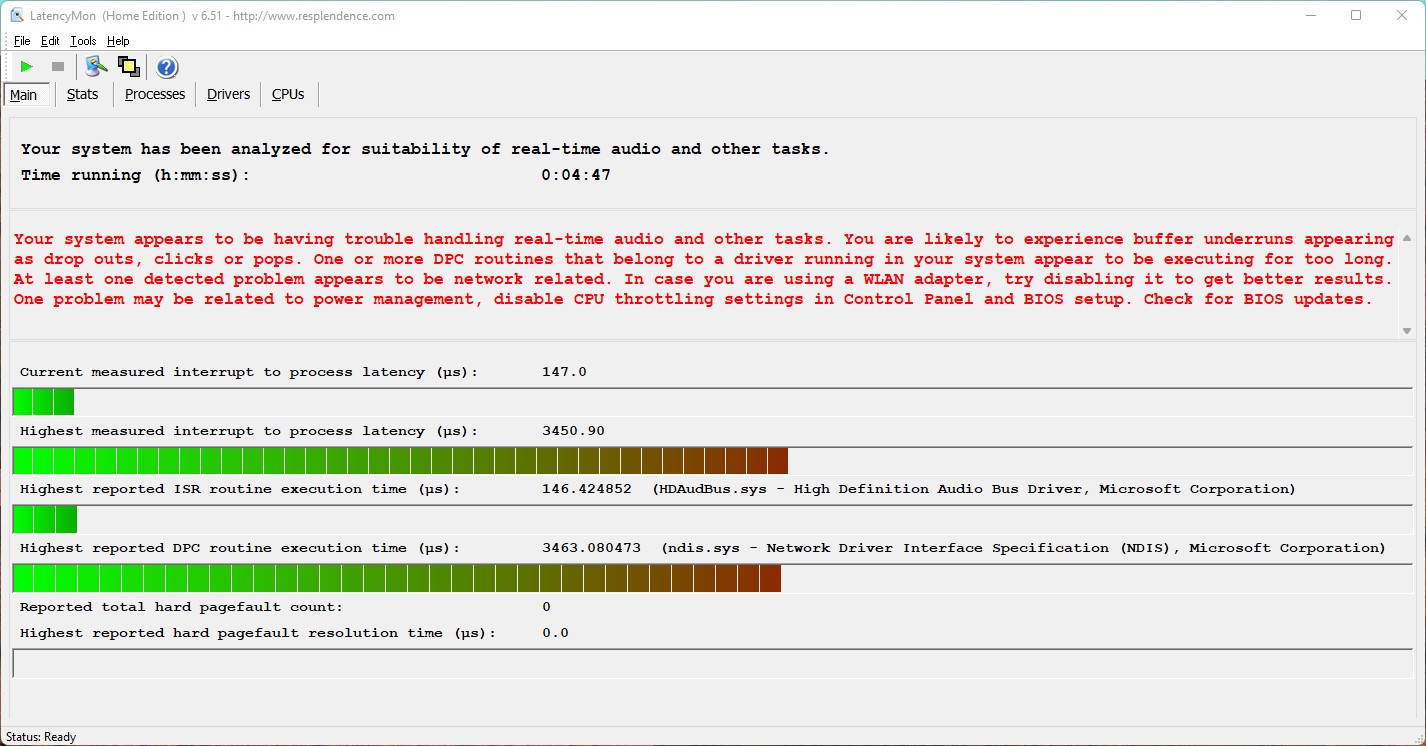
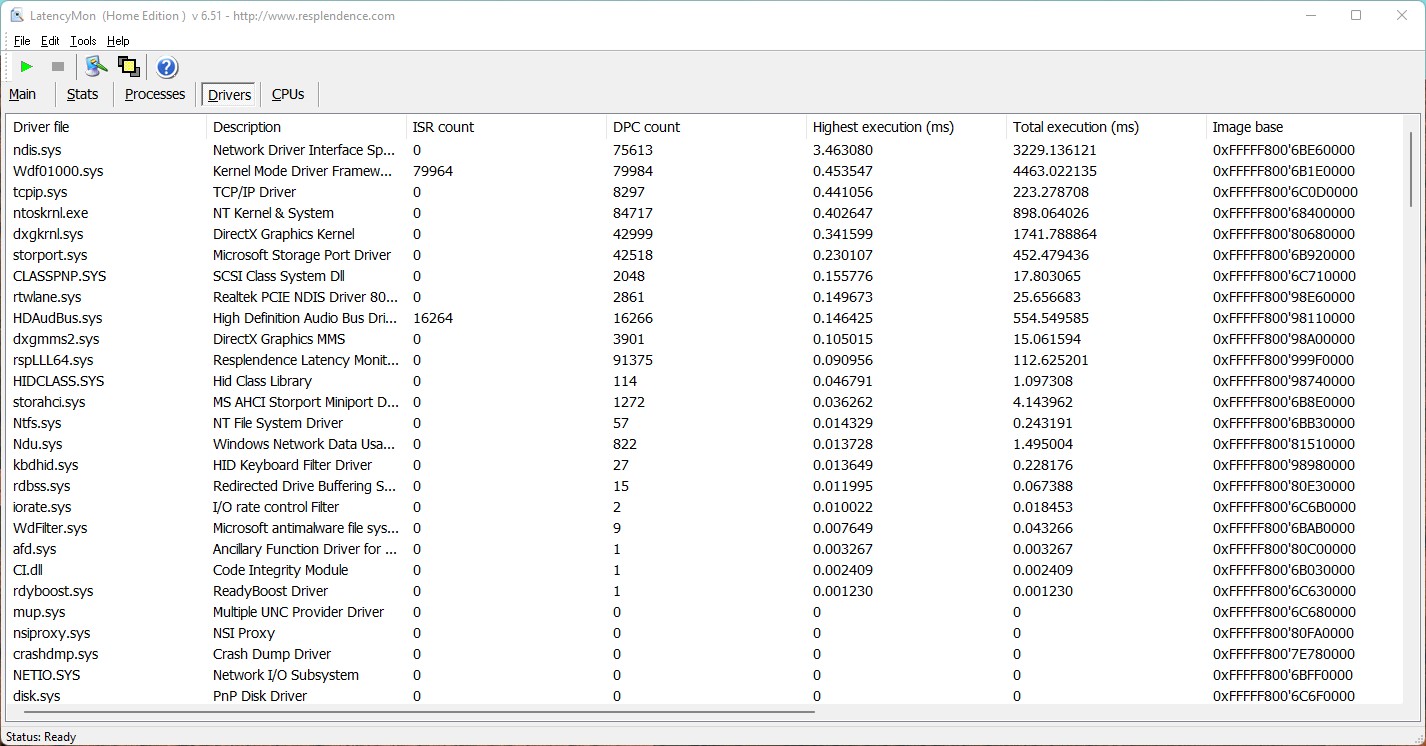
Latências DPC
Nosso teste de monitor de latência padronizado (navegação na web, reprodução de vídeo 4k, Prime95 de alta carga) revela valores extremos no Aorus 17X AZF. As futuras atualizações de software devem melhorar isto para que o sistema seja adequado para edição de vídeo e áudio em tempo real sem limitações.
| DPC Latencies / LatencyMon - interrupt to process latency (max), Web, Youtube, Prime95 | |
| Aorus 17X AZF | |
| MSI Titan GT77 HX 13VI | |
| MSI GE78HX 13VH-070US | |
| Alienware m18 R1 | |
| Medion Erazer Beast X40 | |
| HP Omen 17-ck2097ng | |
* ... menor é melhor
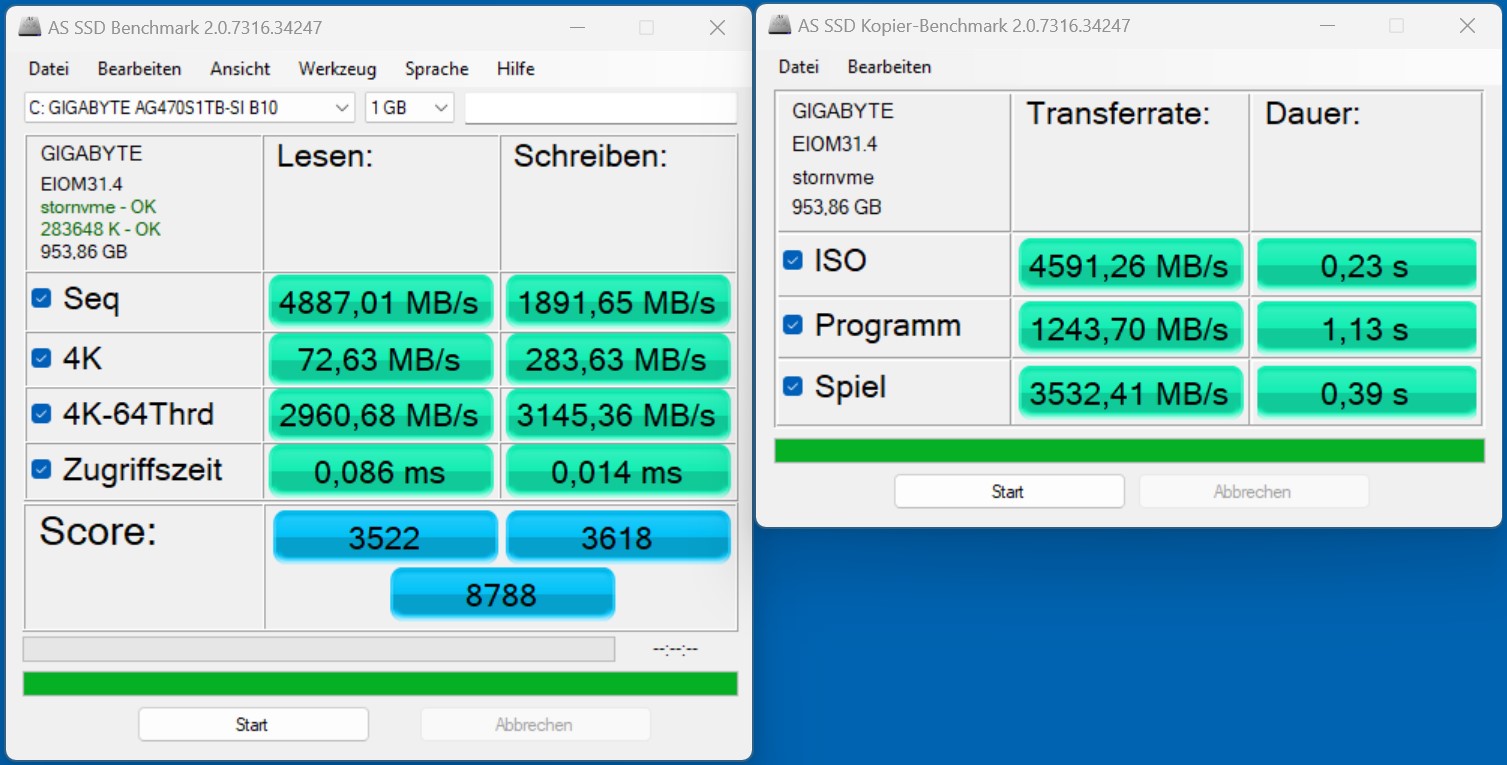
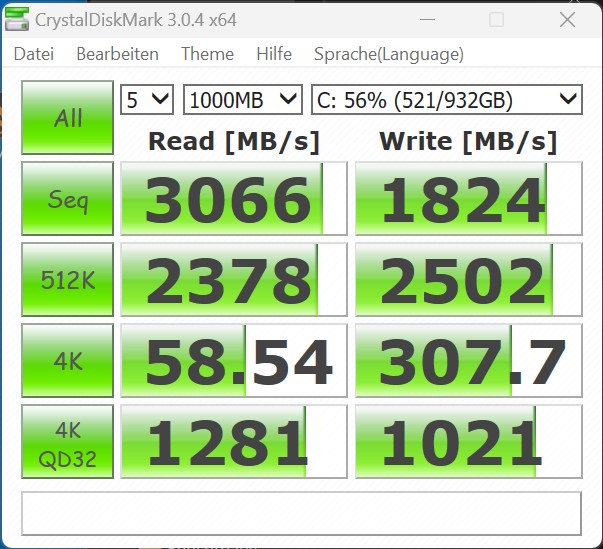
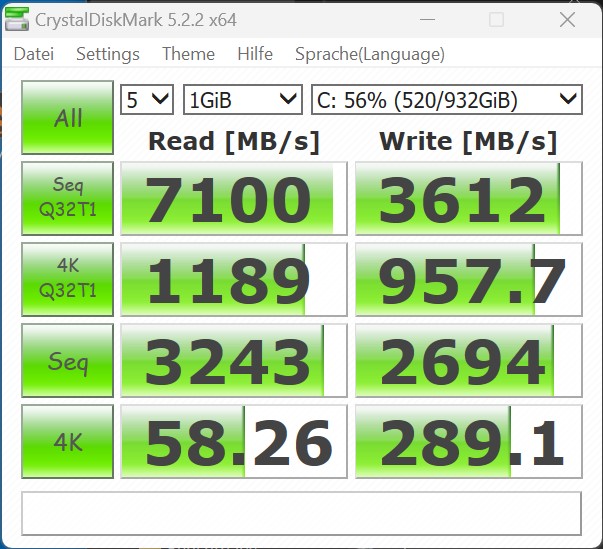
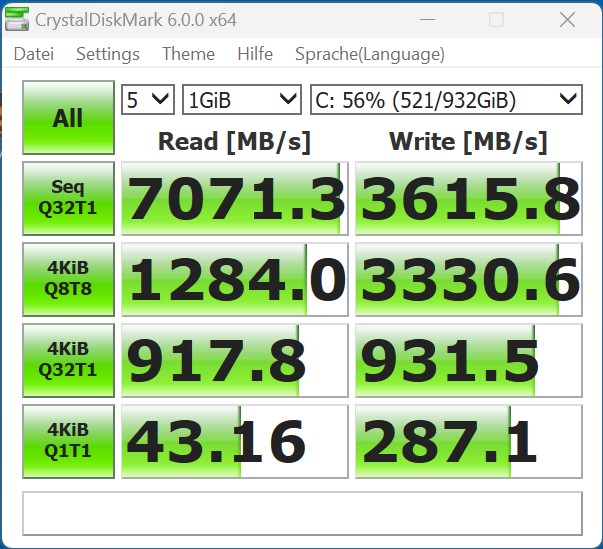
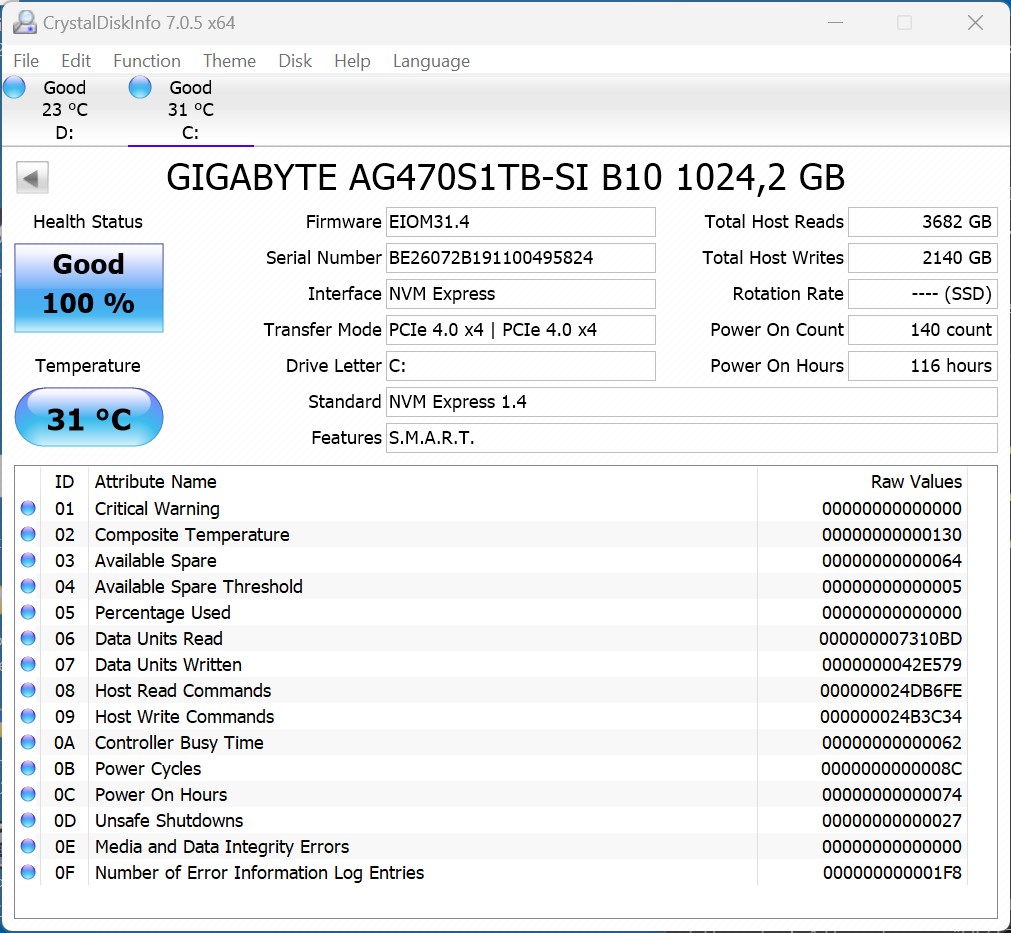
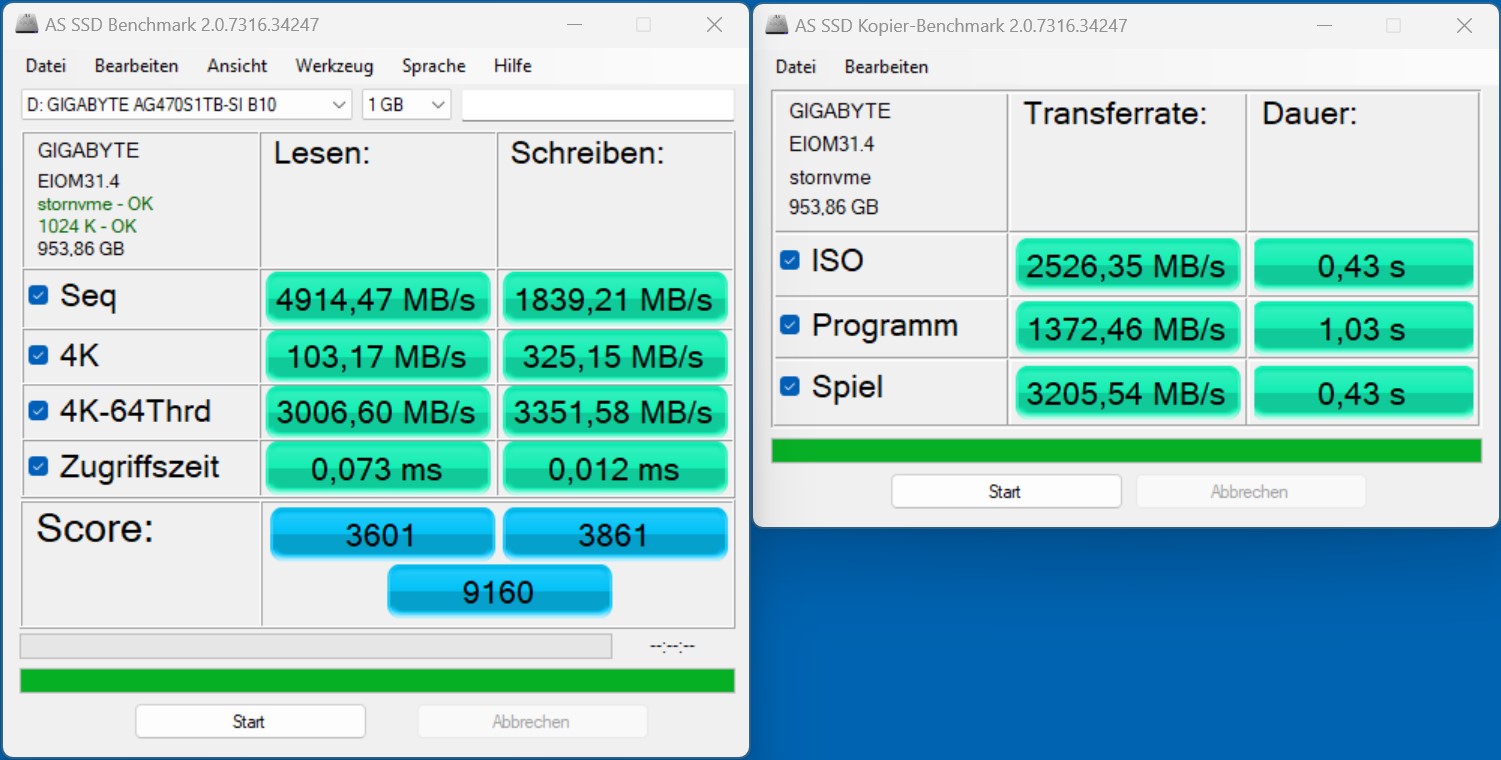
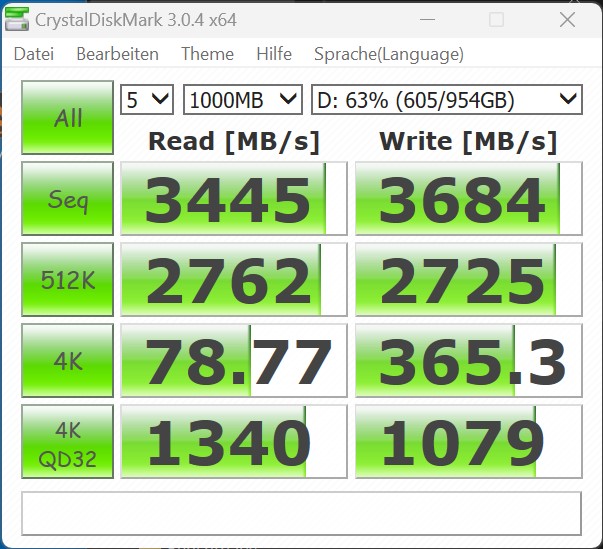
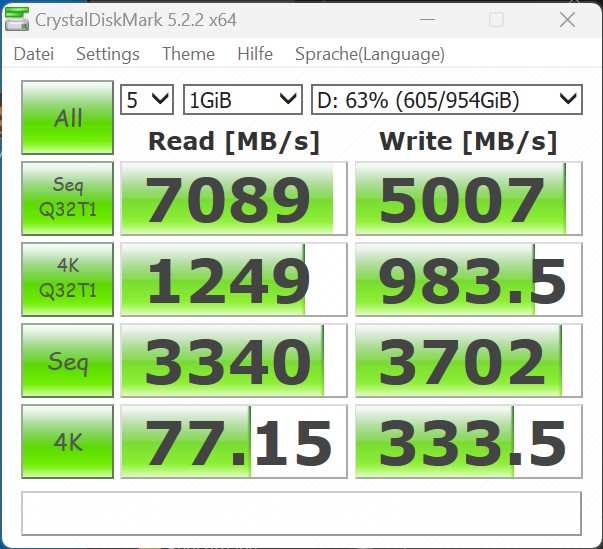
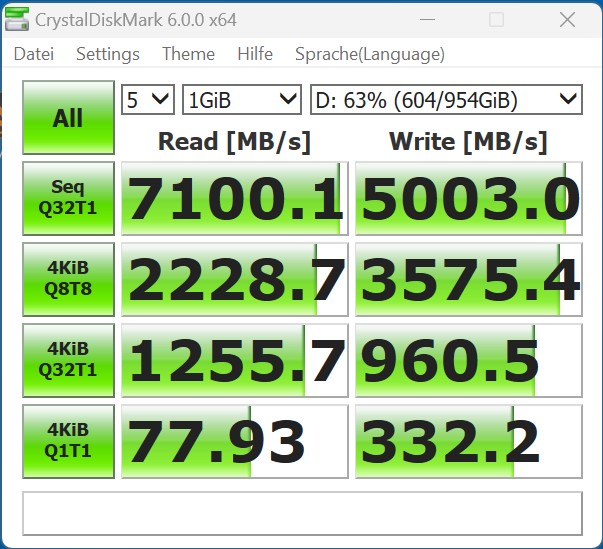
Dispositivos de armazenamento
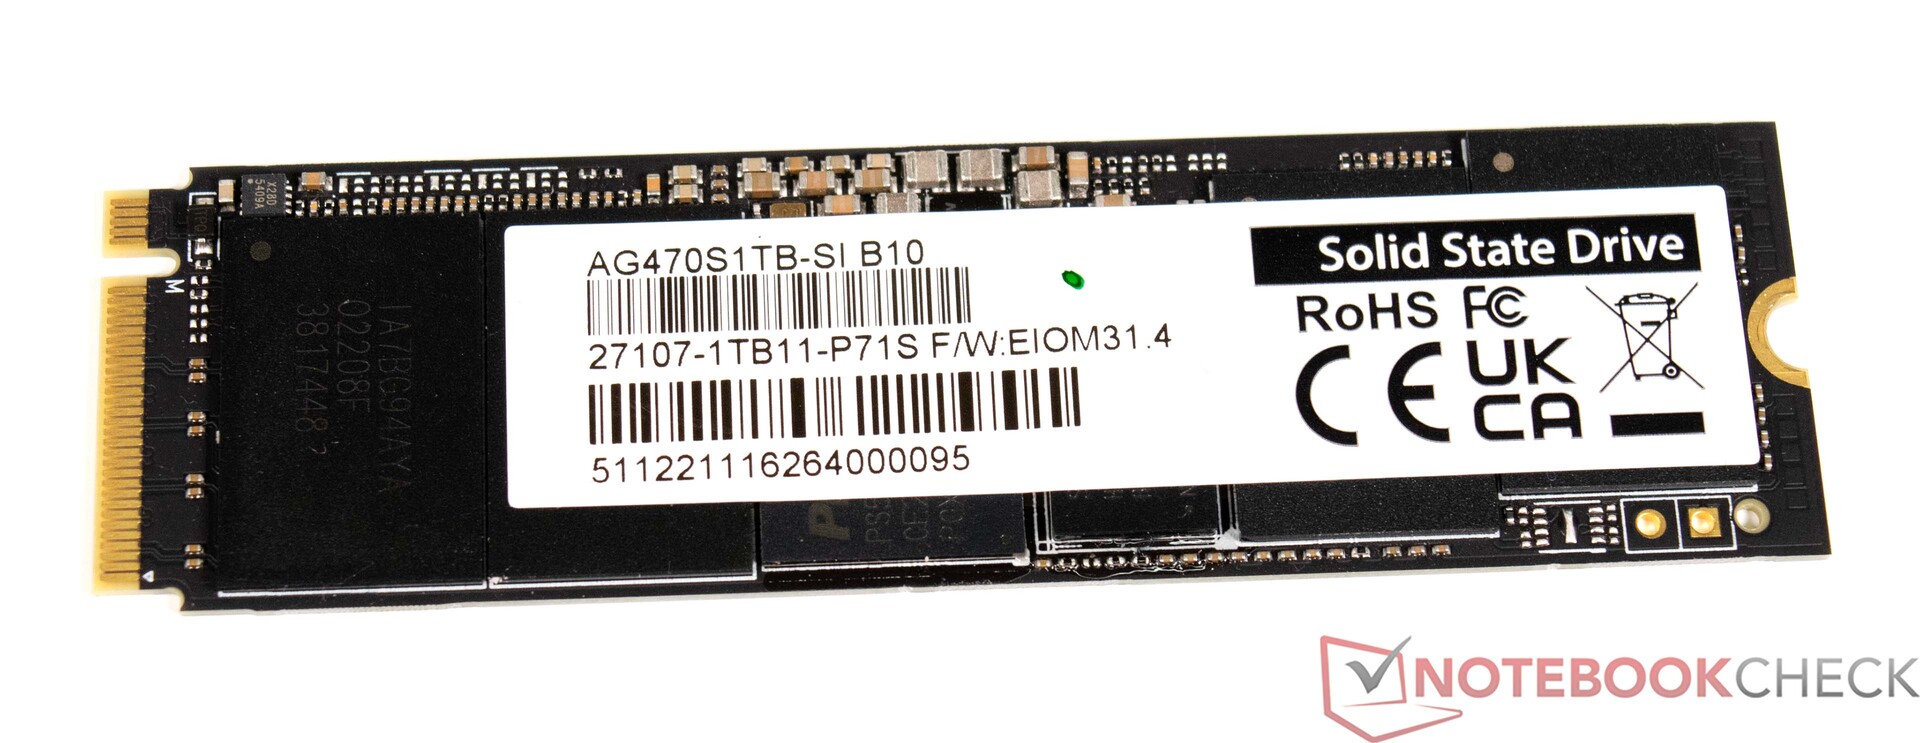
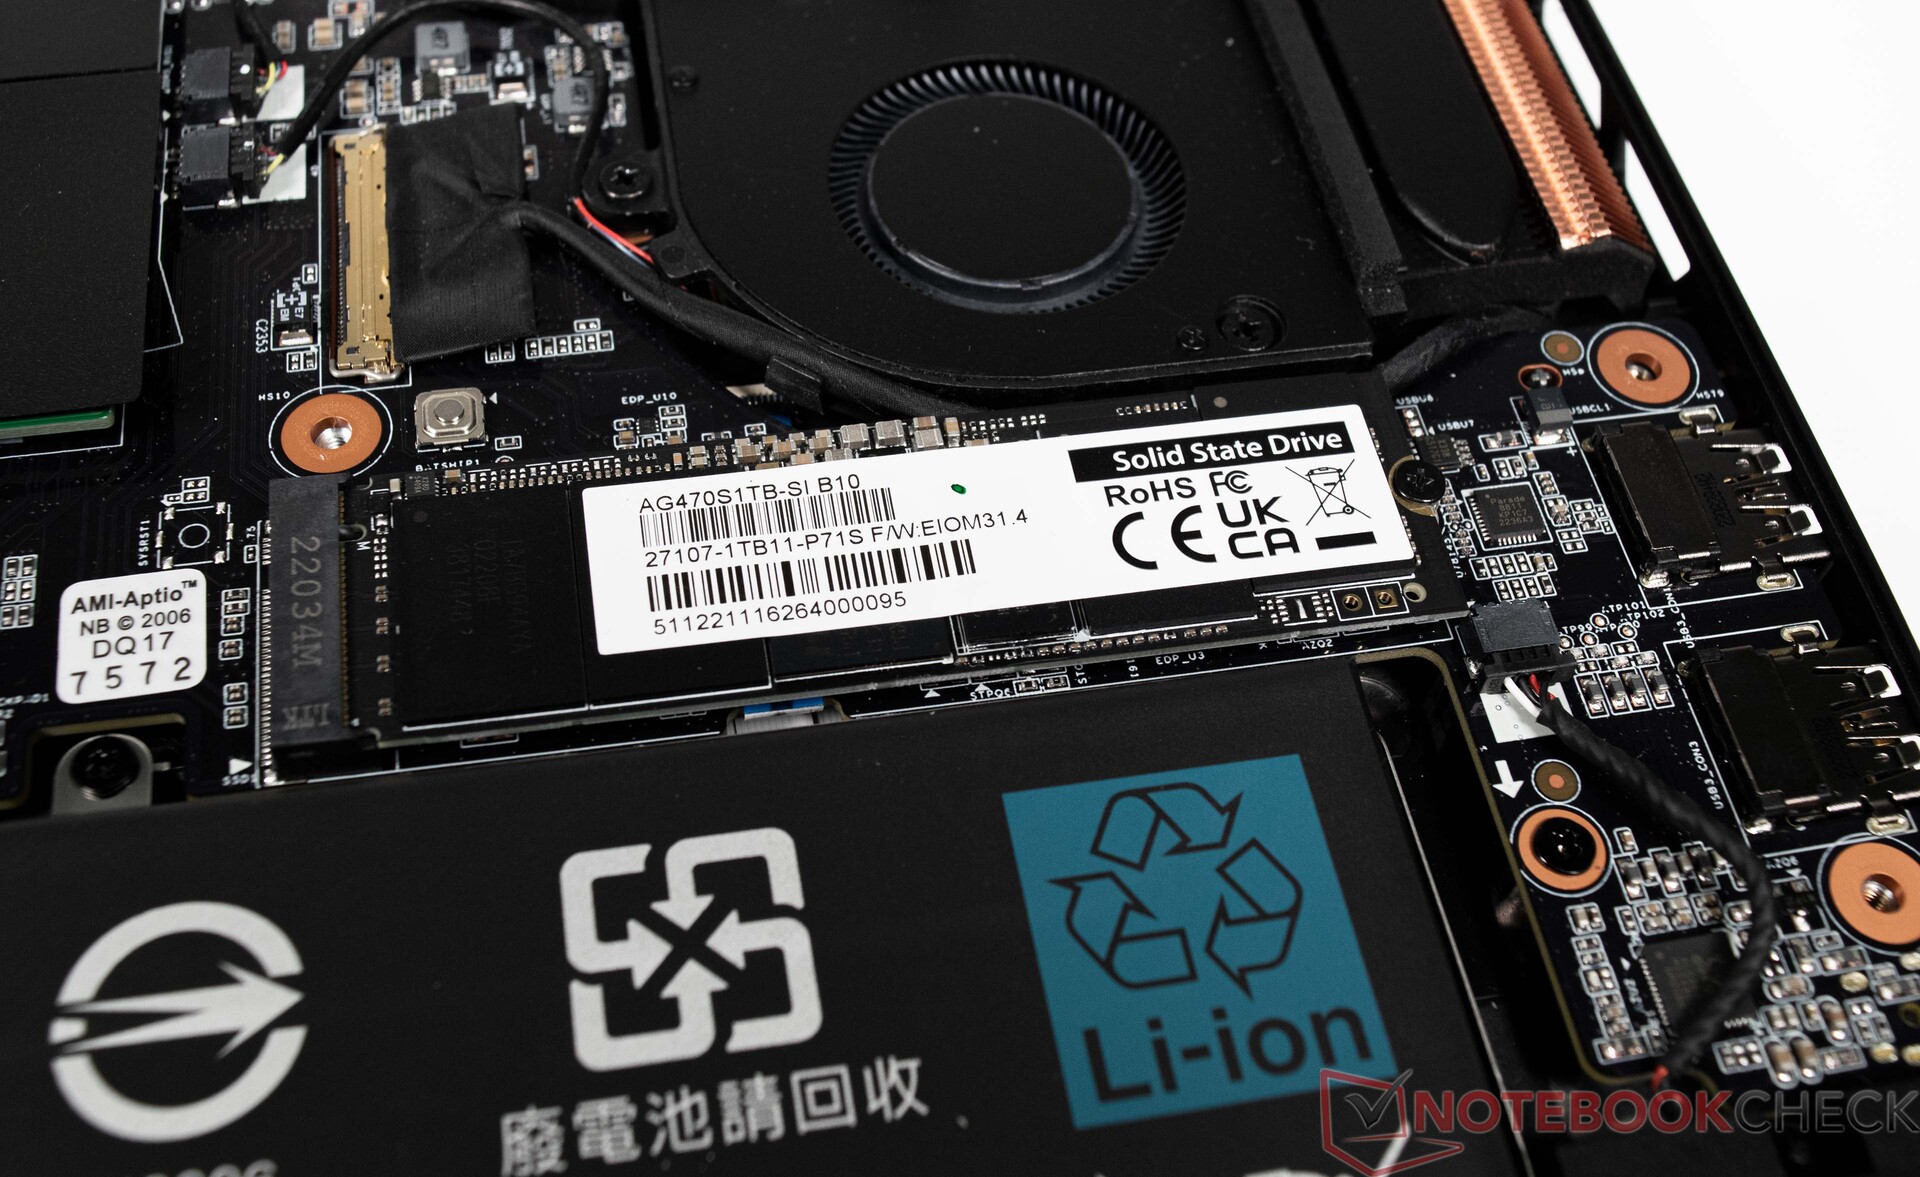
O Aorus 17X AZF utiliza um SSD interno. Para ser mais preciso, nossa unidade de teste oferece dois SSDs NVMe, cada um com 1 TB de espaço de armazenamento, que é adequado para seu propósito. Assim, muitos dados podem ser armazenados nos dois dispositivos de armazenamento em massa. Os dois drives suportam PCIe 4.0 e também são conectados em toda a largura de banda com quatro pistas. O desempenho é sólido, mesmo que vários dispositivos de comparação exibam melhor desempenho em alguns casos. Entretanto, o Aorus 17X AZF já está totalmente equipado com dois SSDs. Alternativamente, modelos de 2 TB também podem, é claro, ser instalados no dispositivo. Enquanto isso, a parte inferior da caixa é utilizada para um resfriamento eficaz, de modo que o dispositivo passou em nosso teste de estresse com distinção.
Para mais comparações e benchmarks, nos referimos ao nossoquadro comparativo aqui.
SSD 1
SSD 2


* ... menor é melhor
Sustained Read Performance: DiskSpd Read Loop, Queue Depth 8
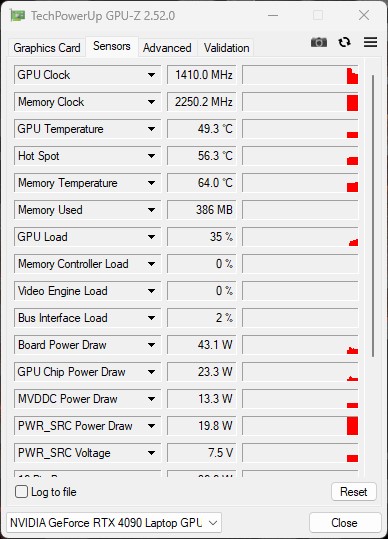
Placa Gráfica
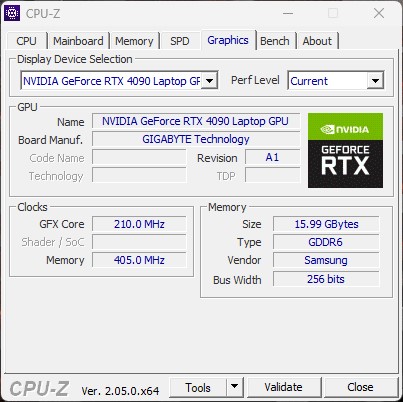
O Aorus 17X AZF utiliza umNvidia GeForce RTX 4090 GPU para notebookque tem um TGP máximo possível de até 175 watts (150 watts + 25 watts Dynamic Boost). O desempenho 3D é correspondentemente bom, embora os laptops concorrentes com a mesma placa gráfica sejam capazes de obter um pouco mais de desempenho. A diferença para o Nvidia GeForce RTX 4080 GPU para laptop é consideravelmente maior a 9 e 18 por cento, respectivamente. Em comparação com o Medion Erazer Beastpraticamente, vemos o mesmo desempenho em nosso Aorus 17X AZF.
Mais referências para a GPU para laptop Nvidia GeForce RTX 4090 podem ser encontradas aqui.
| 3DMark 05 Standard | 61850 pontos | |
| 3DMark 06 Standard Score | 61681 pontos | |
| 3DMark 11 Performance | 43896 pontos | |
| 3DMark Ice Storm Standard Score | 247981 pontos | |
| 3DMark Cloud Gate Standard Score | 58934 pontos | |
| 3DMark Fire Strike Score | 35428 pontos | |
| 3DMark Fire Strike Extreme Score | 24235 pontos | |
| 3DMark Time Spy Score | 20085 pontos | |
Ajuda | ||
* ... menor é melhor
Desempenho nos jogos
O caderno está equipado com um visor de QHD, o que significa que todos os títulos atuais podem ser reproduzidos com o máximo de detalhes sem emissão. Às vezes, o desempenho doNvidia GeForce RTX 4090 GPU para laptoppode facilmente alimentar visores 4K externos com resolução nativa. A VRAM de 16 GB é boa, à prova de futuro e não é um gargalo de estrangulamento, mesmo em QHD. Em nossos testes de jogo, o Aorus 17X AZF aterrissa em um sólido terceiro lugar. Todos os representantes que utilizam o Nvidia GeForce RTX 4090 GPU para laptopoferecem níveis de desempenho semelhantes.
| Performance rating - Percent | |
| Alienware m18 R1 | |
| MSI Titan GT77 HX 13VI | |
| Aorus 17X AZF | |
| Medion Erazer Beast X40 | |
| MSI GE78HX 13VH-070US | |
| Média da turma Gaming | |
| HP Omen 17-ck2097ng | |
| The Witcher 3 - 1920x1080 Ultra Graphics & Postprocessing (HBAO+) | |
| Alienware m18 R1 | |
| Aorus 17X AZF | |
| MSI Titan GT77 HX 13VI | |
| Média da turma Gaming (104.7 - 240, n=7, últimos 2 anos) | |
| Medion Erazer Beast X40 | |
| MSI GE78HX 13VH-070US | |
| HP Omen 17-ck2097ng | |
| GTA V - 1920x1080 Highest AA:4xMSAA + FX AF:16x | |
| Medion Erazer Beast X40 | |
| Alienware m18 R1 | |
| MSI Titan GT77 HX 13VI | |
| Aorus 17X AZF | |
| Média da turma Gaming (67.1 - 186.9, n=90, últimos 2 anos) | |
| HP Omen 17-ck2097ng | |
| MSI GE78HX 13VH-070US | |
| Final Fantasy XV Benchmark - 1920x1080 High Quality | |
| Alienware m18 R1 | |
| MSI Titan GT77 HX 13VI | |
| Aorus 17X AZF | |
| Medion Erazer Beast X40 | |
| Média da turma Gaming (64.2 - 215, n=91, últimos 2 anos) | |
| MSI GE78HX 13VH-070US | |
| HP Omen 17-ck2097ng | |
| Strange Brigade - 1920x1080 ultra AA:ultra AF:16 | |
| Aorus 17X AZF | |
| MSI Titan GT77 HX 13VI | |
| Alienware m18 R1 | |
| Medion Erazer Beast X40 | |
| Média da turma Gaming (113.6 - 458, n=83, últimos 2 anos) | |
| HP Omen 17-ck2097ng | |
| MSI GE78HX 13VH-070US | |
| Dota 2 Reborn - 1920x1080 ultra (3/3) best looking | |
| Alienware m18 R1 | |
| MSI Titan GT77 HX 13VI | |
| Aorus 17X AZF | |
| Medion Erazer Beast X40 | |
| Média da turma Gaming (84.8 - 252, n=104, últimos 2 anos) | |
| HP Omen 17-ck2097ng | |
| MSI GE78HX 13VH-070US | |
| F1 22 - 1920x1080 Ultra High Preset AA:T AF:16x | |
| Alienware m18 R1 | |
| MSI Titan GT77 HX 13VI | |
| Aorus 17X AZF | |
| Medion Erazer Beast X40 | |
| MSI GE78HX 13VH-070US | |
| HP Omen 17-ck2097ng | |
| Média da turma Gaming (40.1 - 121.2, n=4, últimos 2 anos) | |
| The Callisto Protocol - 1920x1080 Ultra Preset (without FSR Upscaling) | |
| MSI Titan GT77 HX 13VI | |
| Aorus 17X AZF | |
| Média NVIDIA GeForce RTX 4090 Laptop GPU (102.6 - 150.7, n=6) | |
| Média NVIDIA GeForce RTX 4080 Laptop GPU (111.5 - 120.4, n=2) | |
| HP Omen 17-ck2097ng | |
| Atomic Heart - 1920x1080 Atomic Preset | |
| Média NVIDIA GeForce RTX 4090 Laptop GPU (128.6 - 166, n=3) | |
| Aorus 17X AZF | |
| Medion Erazer Beast X40 | |
| HP Omen 17-ck2097ng | |
| Média NVIDIA GeForce RTX 4080 Laptop GPU (n=1) | |
| Company of Heroes 3 - 1920x1080 Maximum Settings | |
| Aorus 17X AZF | |
| Média NVIDIA GeForce RTX 4090 Laptop GPU (215 - 235, n=2) | |
| Medion Erazer Beast X40 | |
| HP Omen 17-ck2097ng | |
| Média NVIDIA GeForce RTX 4080 Laptop GPU (n=1) | |
| Dead Space Remake - 1920x1080 Ultra Preset AA:T | |
| Aorus 17X AZF | |
| Média NVIDIA GeForce RTX 4090 Laptop GPU (129 - 140.8, n=2) | |
| MSI Titan GT77 HX 13VI | |
| Média NVIDIA GeForce RTX 4080 Laptop GPU (n=1) | |
| Média da turma Gaming (n=1últimos 2 anos) | |
| Tiny Tina's Wonderlands - 1920x1080 Badass Preset (DX12) | |
| Alienware m18 R1 | |
| MSI Titan GT77 HX 13VI | |
| Média NVIDIA GeForce RTX 4090 Laptop GPU (141.1 - 189.4, n=14) | |
| Aorus 17X AZF | |
| Média NVIDIA GeForce RTX 4080 Laptop GPU (112.9 - 167.1, n=9) | |
| Média da turma Gaming (55 - 159.4, n=4, últimos 2 anos) | |
| High On Life - 1920x1080 Very High Preset | |
| Aorus 17X AZF | |
| Média NVIDIA GeForce RTX 4090 Laptop GPU (180.3 - 185.2, n=2) | |
| Média NVIDIA GeForce RTX 4080 Laptop GPU (n=1) | |
| The Witcher 3 / High Graphics & Postprocessing (Nvidia HairWorks Off) | |
| Alienware m18 R1 | |
| MSI Titan GT77 HX 13VI | |
| Aorus 17X AZF | |
| MSI GE78HX 13VH-070US | |
| Média NVIDIA GeForce RTX 4090 Laptop GPU (290 - 449, n=23) | |
| Média da turma Gaming (341 - 404, n=2, últimos 2 anos) | |
| Medion Erazer Beast X40 | |
| HP Omen 17-ck2097ng | |
| The Witcher 3 / Ultra Graphics & Postprocessing (HBAO+) | |
| Alienware m18 R1 | |
| Aorus 17X AZF | |
| MSI Titan GT77 HX 13VI | |
| Média NVIDIA GeForce RTX 4090 Laptop GPU (139.2 - 216, n=35) | |
| Média da turma Gaming (104.7 - 240, n=7, últimos 2 anos) | |
| Medion Erazer Beast X40 | |
| MSI GE78HX 13VH-070US | |
| HP Omen 17-ck2097ng | |
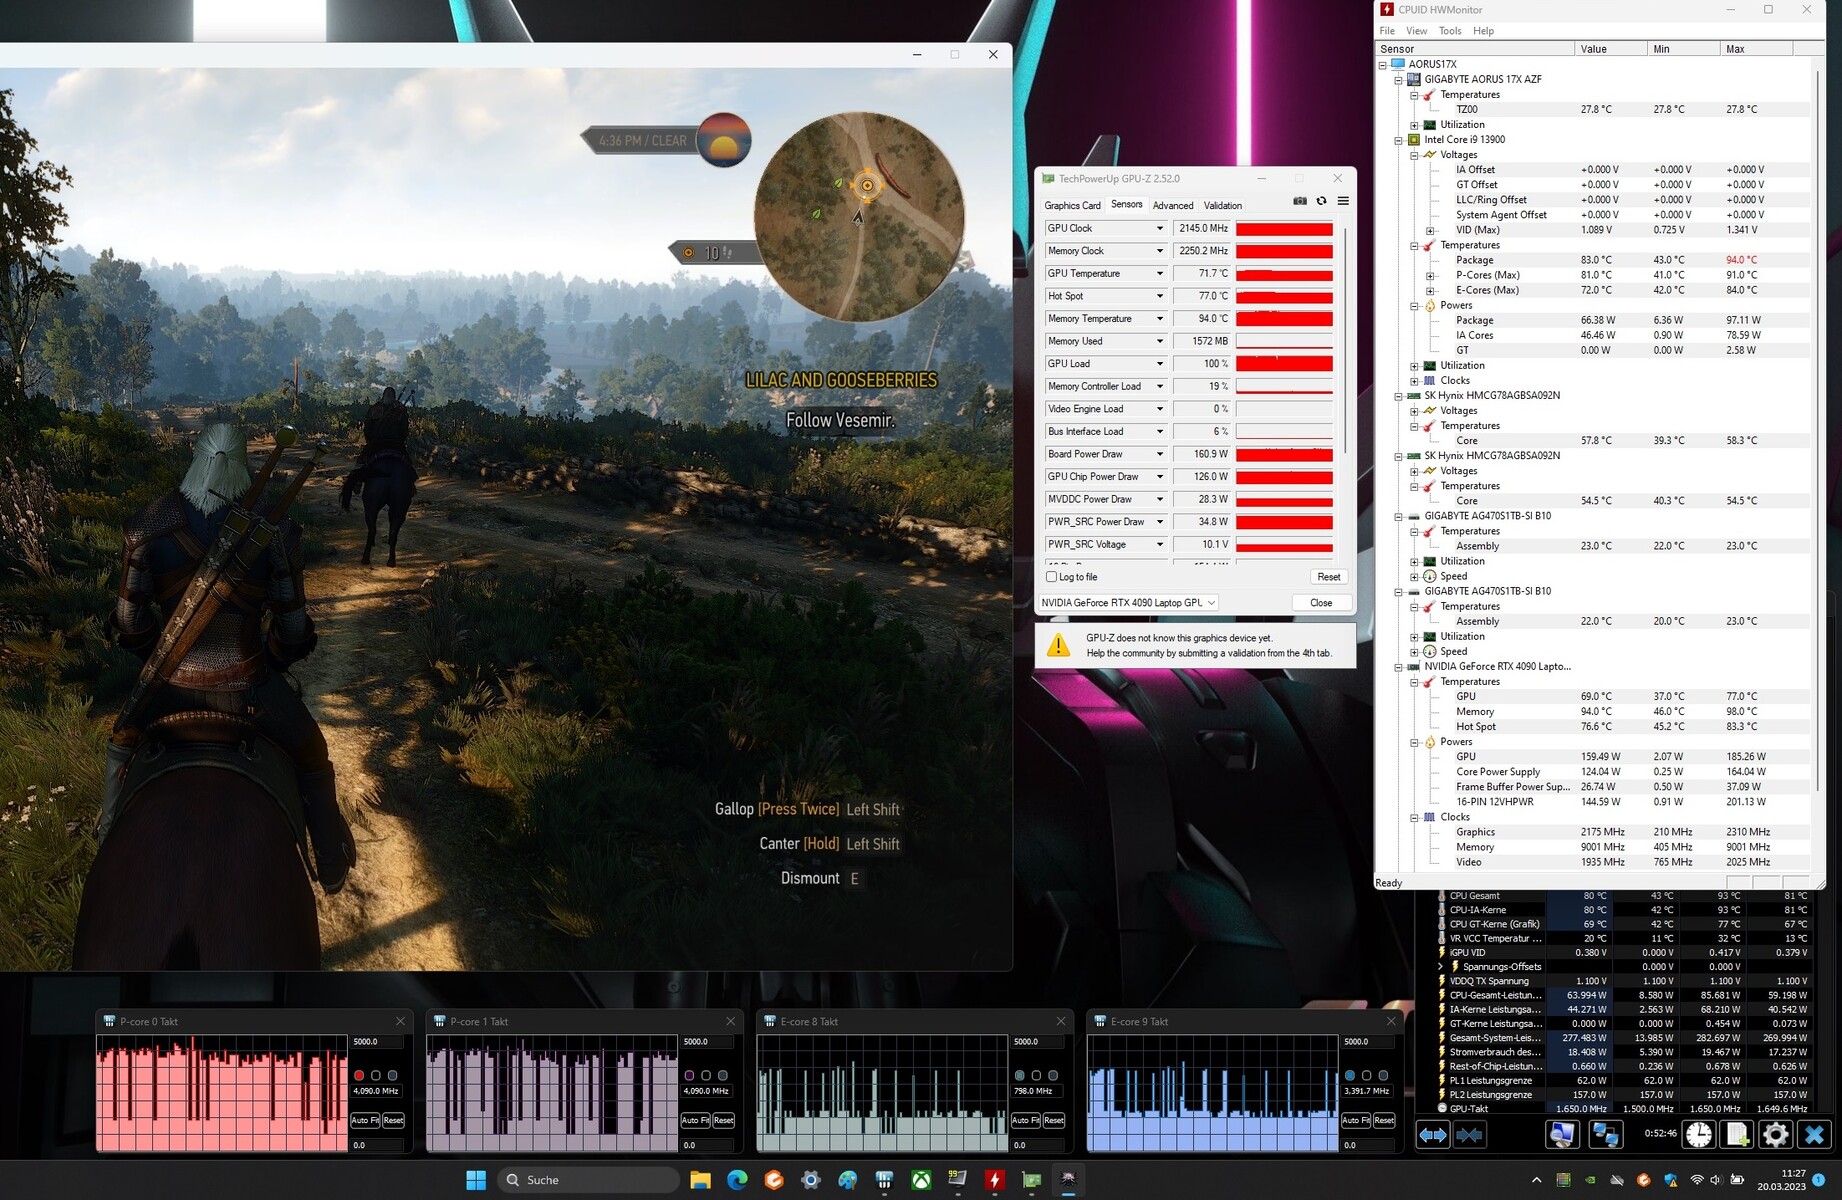
Para verificar se as taxas de quadros permanecem estáveis e constantes durante um longo período de tempo, executamos "The Witcher 3" durante 60 minutos em resolução Full HD e com o máximo de detalhes. O personagem do jogo não foi movido. A taxa de atualização é consistente, como é revelado pelo gráfico.
Witcher 3 FPS chart
| baixo | média | alto | ultra | QHD | 4K | |
|---|---|---|---|---|---|---|
| GTA V (2015) | 187 | 186.1 | 182.2 | 135.3 | 132.9 | 174.3 |
| The Witcher 3 (2015) | 554.3 | 506.7 | 395.8 | 200 | 145.9 | |
| Dota 2 Reborn (2015) | 235.6 | 199.8 | 191.6 | 176.1 | 175.75 | |
| Final Fantasy XV Benchmark (2018) | 222 | 205 | 177.6 | 152.4 | 89.9 | |
| X-Plane 11.11 (2018) | 195.9 | 173.5 | 138.5 | 118.5 | ||
| Far Cry 5 (2018) | 186 | 170 | 161 | 162 | 152 | 98 |
| Strange Brigade (2018) | 527 | 441 | 414 | 386 | 300 | 154.6 |
| Shadow of the Tomb Raider (2018) | 247 | 219 | 210 | 198.6 | 162.5 | 95.2 |
| Far Cry New Dawn (2019) | 170 | 148 | 145 | 131 | 128 | 102 |
| Metro Exodus (2019) | 187.7 | 160.6 | 134.5 | 112.9 | 98 | 68.6 |
| Borderlands 3 (2019) | 208 | 182.1 | 163.6 | 146.5 | 115.8 | 67.9 |
| F1 2020 (2020) | 413 | 354 | 344 | 305 | 253 | 148.7 |
| F1 2021 (2021) | 466 | 421 | 356 | 204 | 182.7 | 107.8 |
| Far Cry 6 (2021) | 175.7 | 154.3 | 136.3 | 128.9 | 115.1 | 73.1 |
| God of War (2022) | 176.8 | 176.7 | 166.8 | 123.6 | 101.5 | 72.7 |
| GRID Legends (2022) | 227 | 209 | 190.1 | 183.2 | 178.9 | 128.6 |
| Tiny Tina's Wonderlands (2022) | 320 | 263 | 194 | 158.3 | 112.5 | 65.7 |
| F1 22 (2022) | 315 | 299 | 283 | 128.9 | 83.5 | 43 |
| The Callisto Protocol (2022) | 193.3 | 168.2 | 166.4 | 131.1 | 101.3 | 61.6 |
| High On Life (2023) | 277 | 246 | 211 | 185.2 | 126.1 | 56.9 |
| Dead Space Remake (2023) | 153.4 | 150.7 | 142.3 | 140.8 | 105.6 | 56.2 |
| Hogwarts Legacy (2023) | 116 | 100.7 | 93.7 | 89.7 | 80.9 | 50.5 |
| Returnal (2023) | 195 | 191 | 176 | 155 | 119 | 70 |
| Atomic Heart (2023) | 217 | 187.1 | 166.6 | 138.5 | 107.8 | 62.7 |
| Company of Heroes 3 (2023) | 308.5 | 280.4 | 239.6 | 235.2 | 194.8 | 117.4 |
| Resident Evil 4 Remake (2023) | 232 | 189.7 | 187.3 | 136.3 | 109.2 | 63.4 |
| The Last of Us (2023) | 113.7 | 110.8 | 109 | 105 | 81.8 | 43.8 |
Emissões - O Aorus 17X AZF também pode ser silencioso
Ruído
Durante o uso ocioso e diário (escritório e internet), os quatro ventiladores muitas vezes giram em baixa velocidade. Com até 34 dB(A), o Aorus 17X AZF é muito tolerável. Sob carga, ele pode ocasionalmente ficar muito alto com valores máximos de 54 dB(A) registrados em nosso teste de estresse. Além disso, os ventiladores produzem um som de alta freqüência, o que subjetivamente torna o volume ainda mais alto.
Em princípio, o Aorus 17X AZF também permite uma operação quase silenciosa. Isto requer o uso do modo Reunião ou dos perfis de modo de sono com economia de energia, que podem ser selecionados através do GCC (Gigabyte Control Center). A redução resultante no consumo de energia da CPU ainda é suficiente para o uso diário.
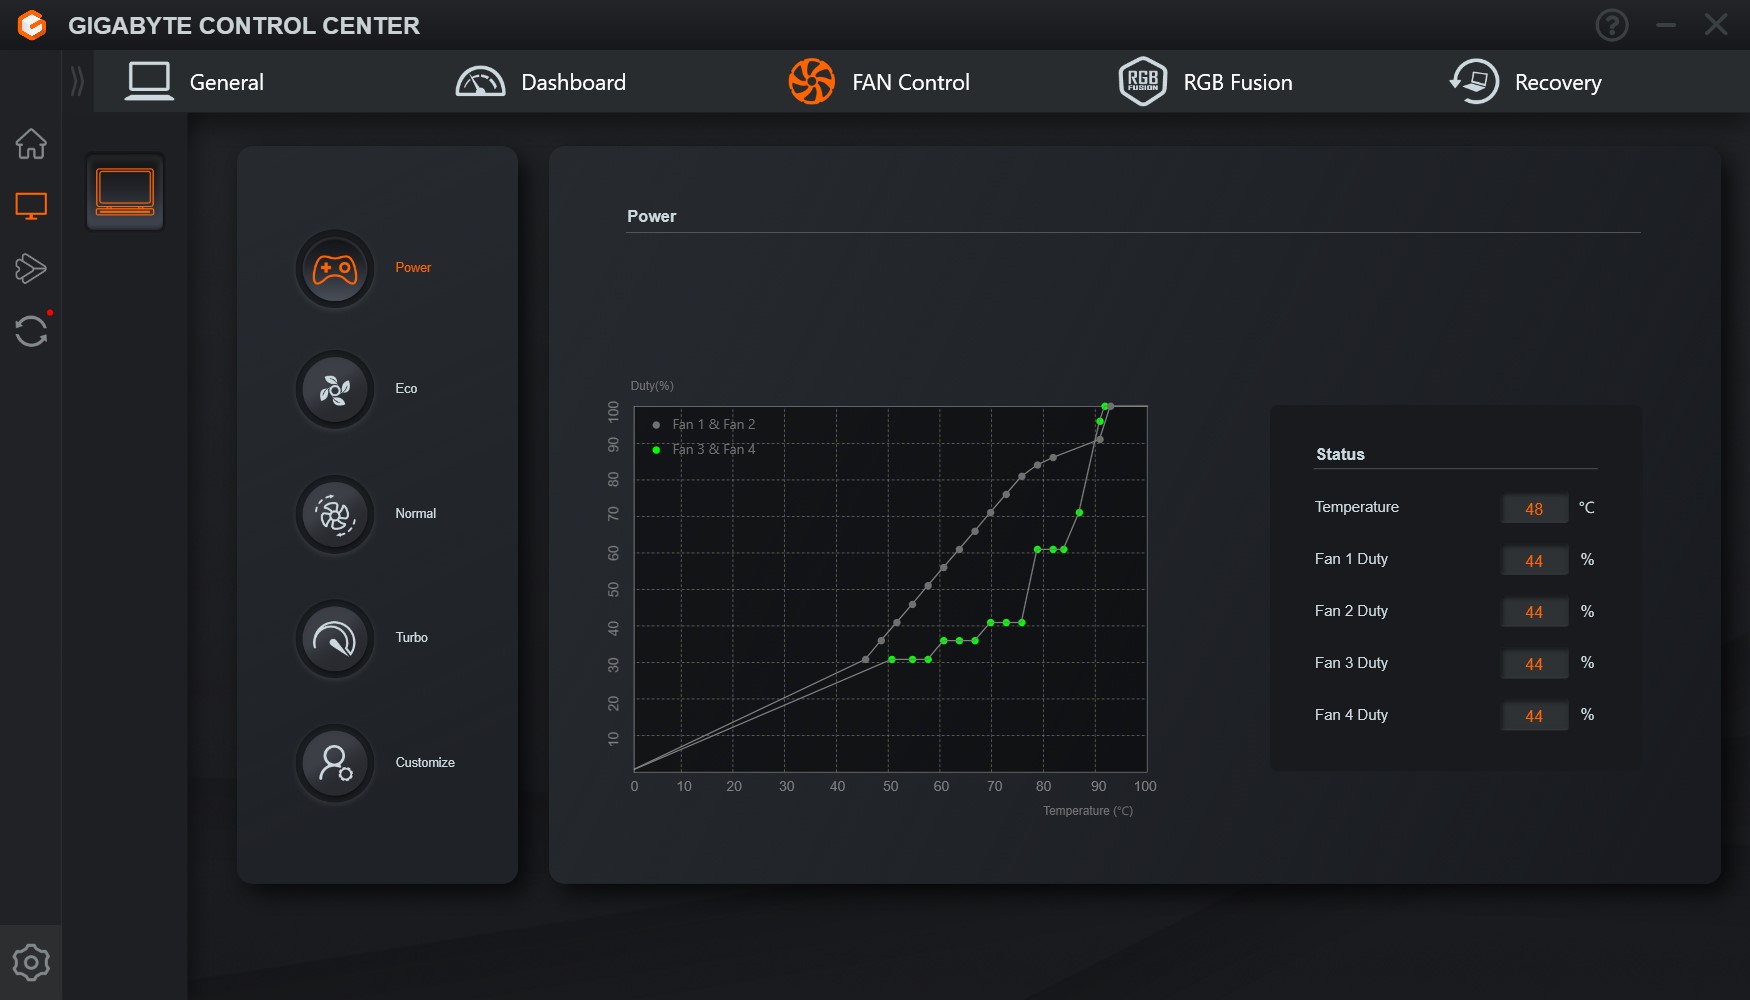
O GCC também pode ser usado para controlar manualmente o ventilador. Além dos perfis pré-definidos, você pode usar suas próprias curvas de ventiladores.
Barulho
| Ocioso |
| 28 / 29 / 34 dB |
| Carga |
| 51 / 54 dB |
 | ||
30 dB silencioso 40 dB(A) audível 50 dB(A) ruidosamente alto |
||
min: | ||
| Aorus 17X AZF i9-13900HX, GeForce RTX 4090 Laptop GPU | Medion Erazer Beast X40 i9-13900HX, GeForce RTX 4090 Laptop GPU | MSI GE78HX 13VH-070US i9-13950HX, GeForce RTX 4080 Laptop GPU | HP Omen 17-ck2097ng i9-13900HX, GeForce RTX 4080 Laptop GPU | MSI Titan GT77 HX 13VI i9-13950HX, GeForce RTX 4090 Laptop GPU | Alienware m18 R1 i9-13980HX, GeForce RTX 4090 Laptop GPU | |
|---|---|---|---|---|---|---|
| Noise | 4% | 7% | 4% | 1% | 16% | |
| desligado / ambiente * (dB) | 25 | 24 4% | 23.4 6% | 24 4% | 24.6 2% | 22.8 9% |
| Idle Minimum * (dB) | 28 | 25 11% | 24.2 14% | 31 -11% | 29.2 -4% | 23 18% |
| Idle Average * (dB) | 29 | 29 -0% | 25.6 12% | 32 -10% | 29.2 -1% | 23 21% |
| Idle Maximum * (dB) | 34 | 35 -3% | 31 9% | 33 3% | 29.2 14% | 23 32% |
| Load Average * (dB) | 51 | 51 -0% | 43.3 15% | 45 12% | 50.7 1% | 35.6 30% |
| Witcher 3 ultra * (dB) | 57 | 51 11% | 56.3 1% | 45 21% | 53.3 6% | 51.3 10% |
| Load Maximum * (dB) | 54 | 53 2% | 59.1 -9% | 50 7% | 61 -13% | 56.7 -5% |
* ... menor é melhor
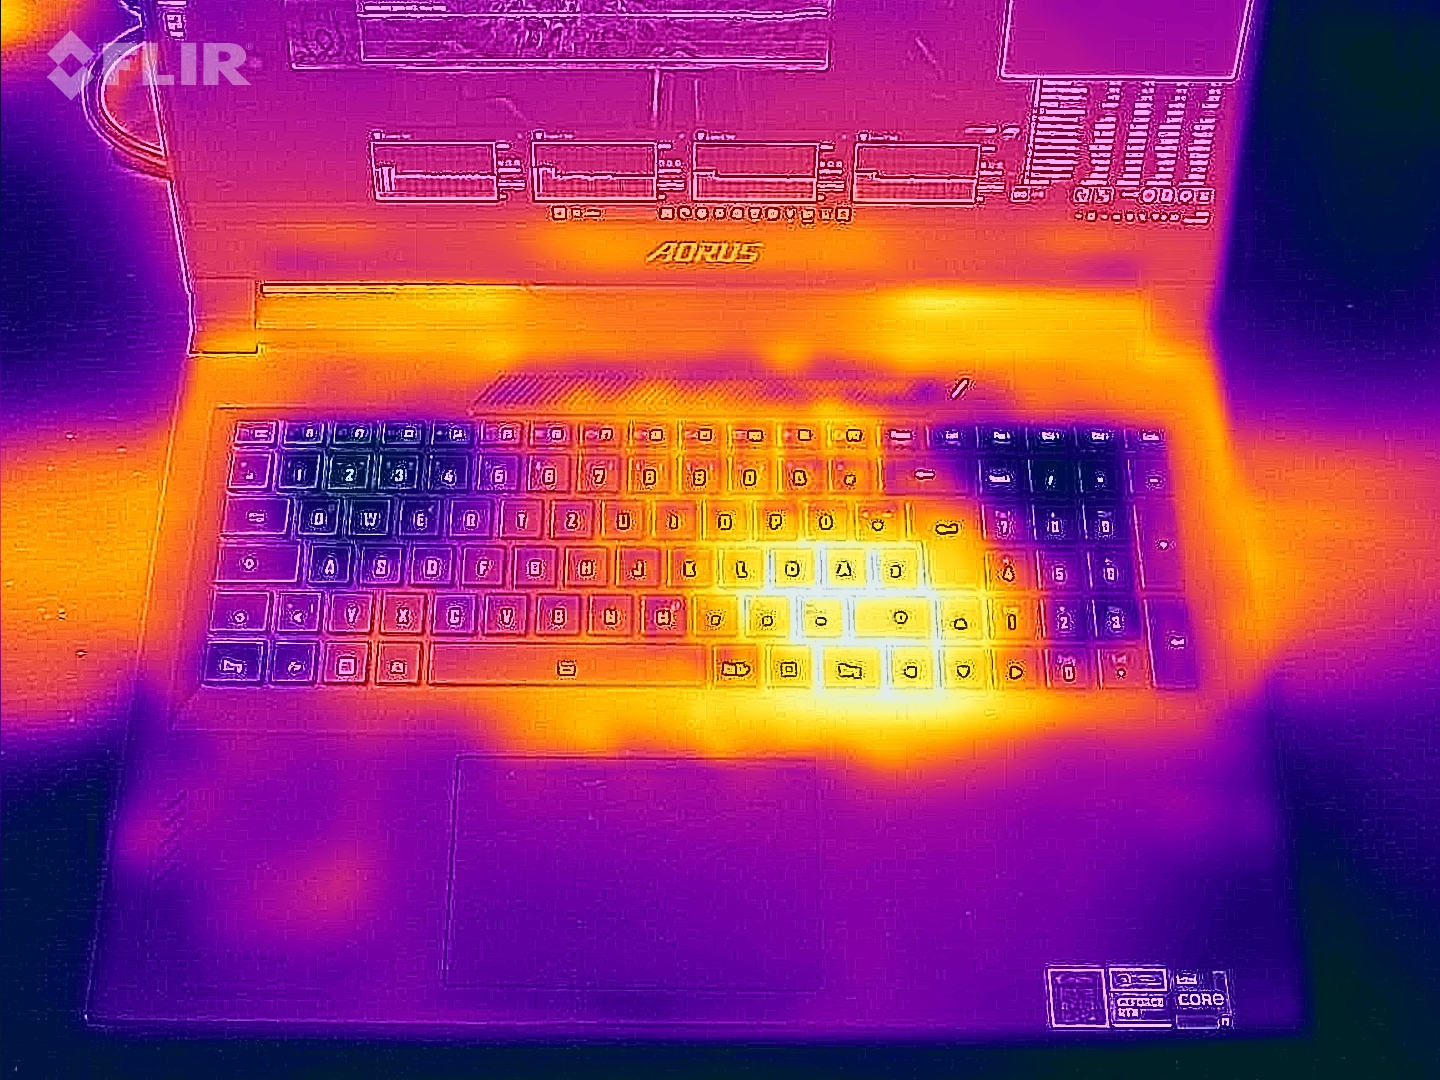
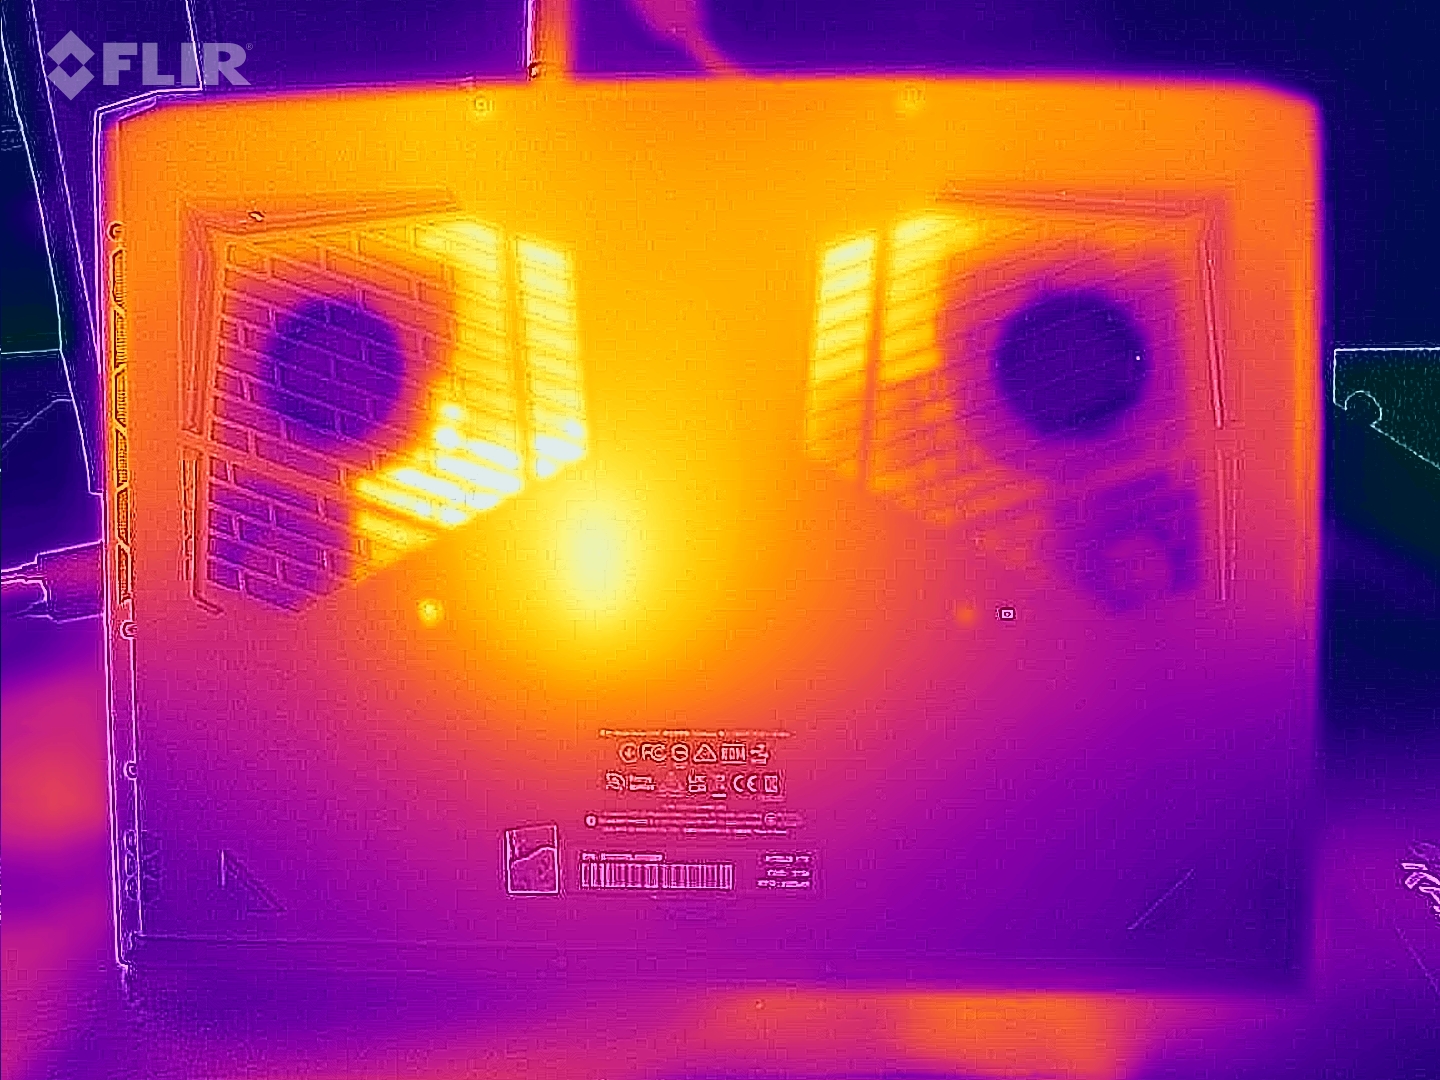
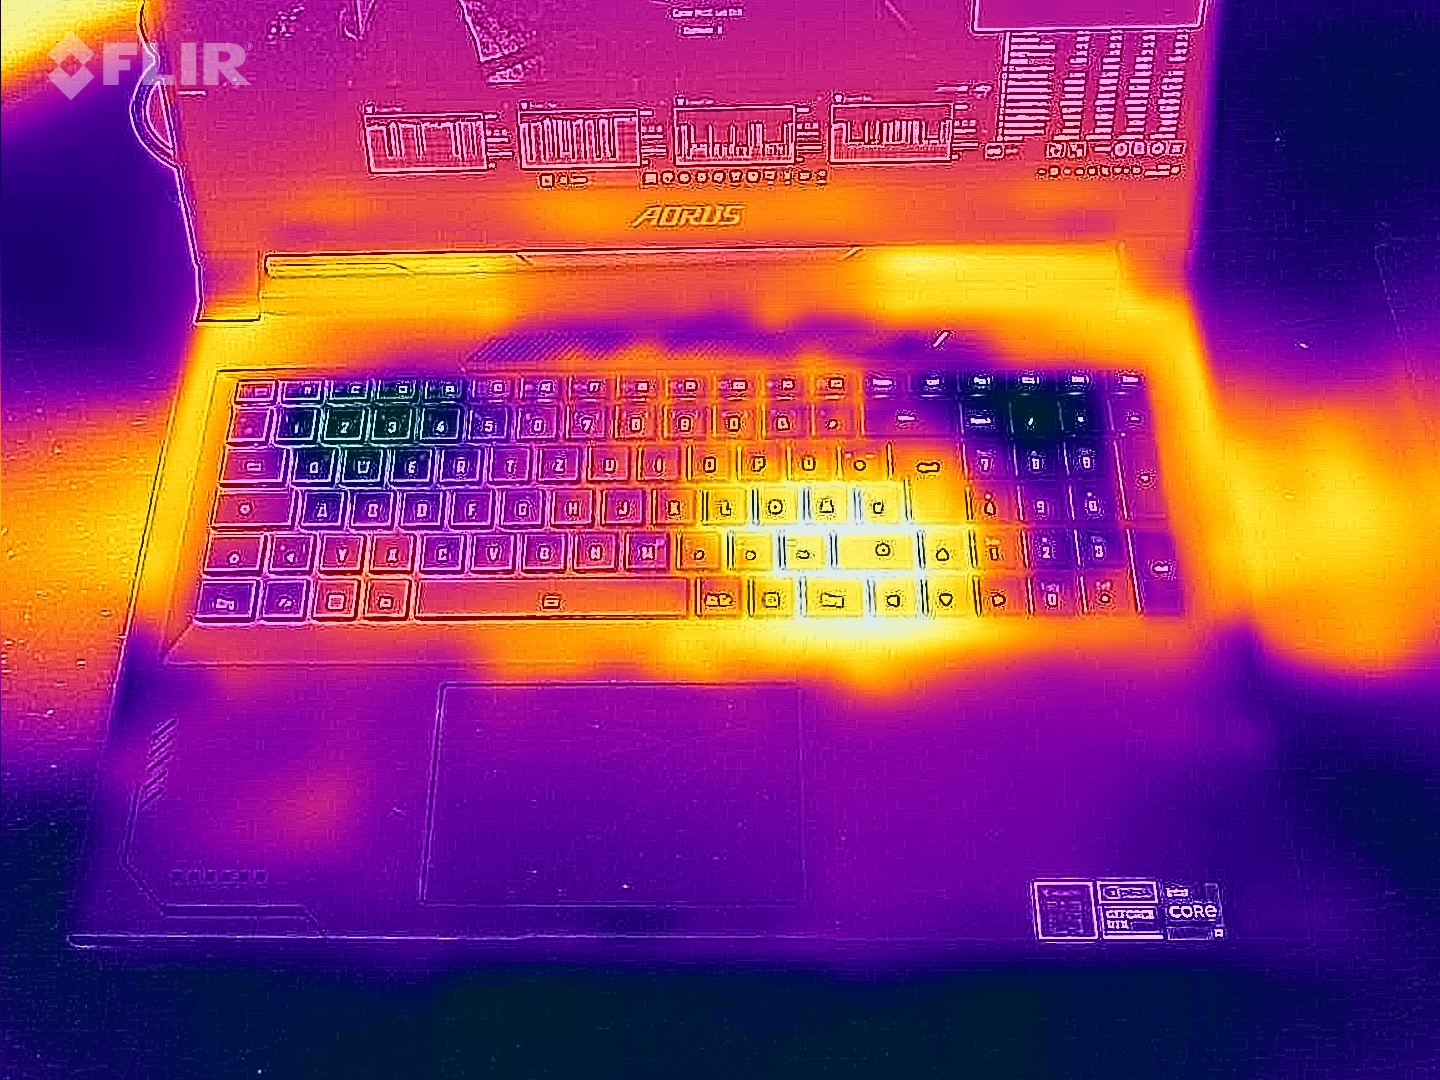
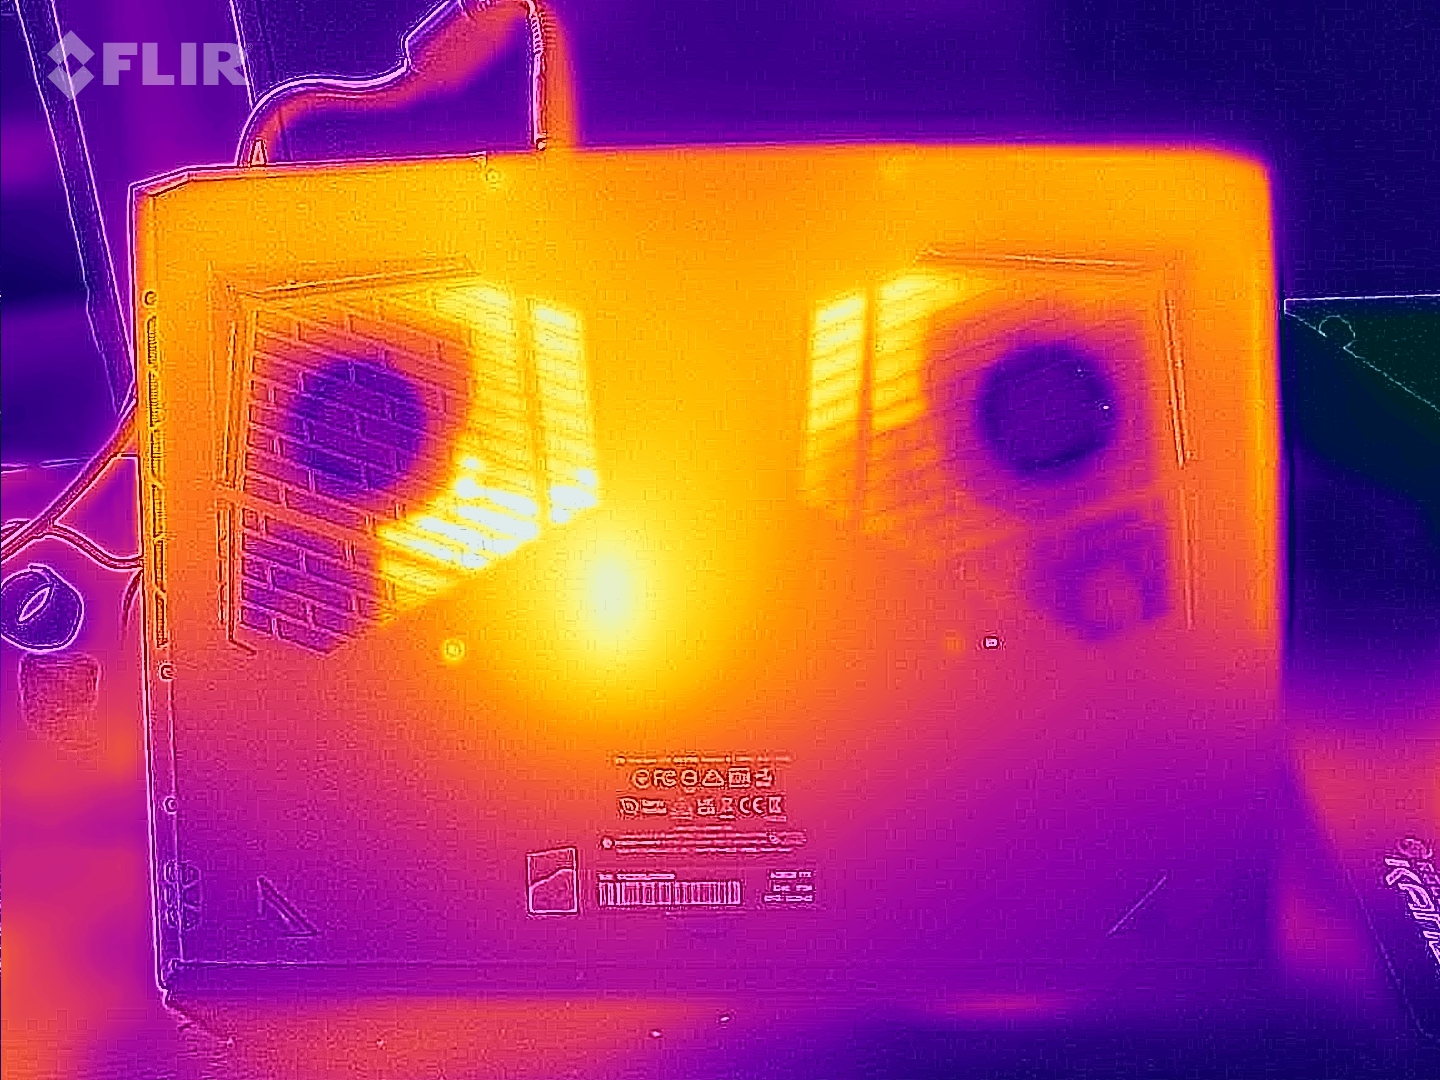
Temperatura
As altas temperaturas dos casos não foram observadas no simples uso diário no escritório e no uso da Internet. Somente sob carga, como durante testes de estresse ou jogos, o notebook aquece significativamente. Registramos as maiores taxas na parte de baixo e na área dos ventiladores.
(-) A temperatura máxima no lado superior é 47 °C / 117 F, em comparação com a média de 40.4 °C / 105 F , variando de 21.2 a 68.8 °C para a classe Gaming.
(-) A parte inferior aquece até um máximo de 51 °C / 124 F, em comparação com a média de 43.2 °C / 110 F
(+) Em uso inativo, a temperatura média para o lado superior é 28.1 °C / 83 F, em comparação com a média do dispositivo de 33.9 °C / ### class_avg_f### F.
(±) Jogando The Witcher 3, a temperatura média para o lado superior é 38 °C / 100 F, em comparação com a média do dispositivo de 33.9 °C / ## #class_avg_f### F.
(+) Os apoios para as mãos e o touchpad estão atingindo a temperatura máxima da pele (34 °C / 93.2 F) e, portanto, não estão quentes.
(-) A temperatura média da área do apoio para as mãos de dispositivos semelhantes foi 28.8 °C / 83.8 F (-5.2 °C / -9.4 F).
| Aorus 17X AZF Intel Core i9-13900HX, NVIDIA GeForce RTX 4090 Laptop GPU | Medion Erazer Beast X40 Intel Core i9-13900HX, NVIDIA GeForce RTX 4090 Laptop GPU | MSI GE78HX 13VH-070US Intel Core i9-13950HX, NVIDIA GeForce RTX 4080 Laptop GPU | HP Omen 17-ck2097ng Intel Core i9-13900HX, NVIDIA GeForce RTX 4080 Laptop GPU | MSI Titan GT77 HX 13VI Intel Core i9-13950HX, NVIDIA GeForce RTX 4090 Laptop GPU | Alienware m18 R1 Intel Core i9-13980HX, NVIDIA GeForce RTX 4090 Laptop GPU | |
|---|---|---|---|---|---|---|
| Heat | -1% | 7% | 13% | 12% | 15% | |
| Maximum Upper Side * (°C) | 47 | 48 -2% | 37.4 20% | 41 13% | 40.6 14% | 39 17% |
| Maximum Bottom * (°C) | 51 | 52 -2% | 45 12% | 51 -0% | 41.1 19% | 36.4 29% |
| Idle Upper Side * (°C) | 30 | 30 -0% | 29.8 1% | 24 20% | 26.2 13% | 29.2 3% |
| Idle Bottom * (°C) | 31 | 31 -0% | 32.4 -5% | 25 19% | 30.3 2% | 27.8 10% |
* ... menor é melhor
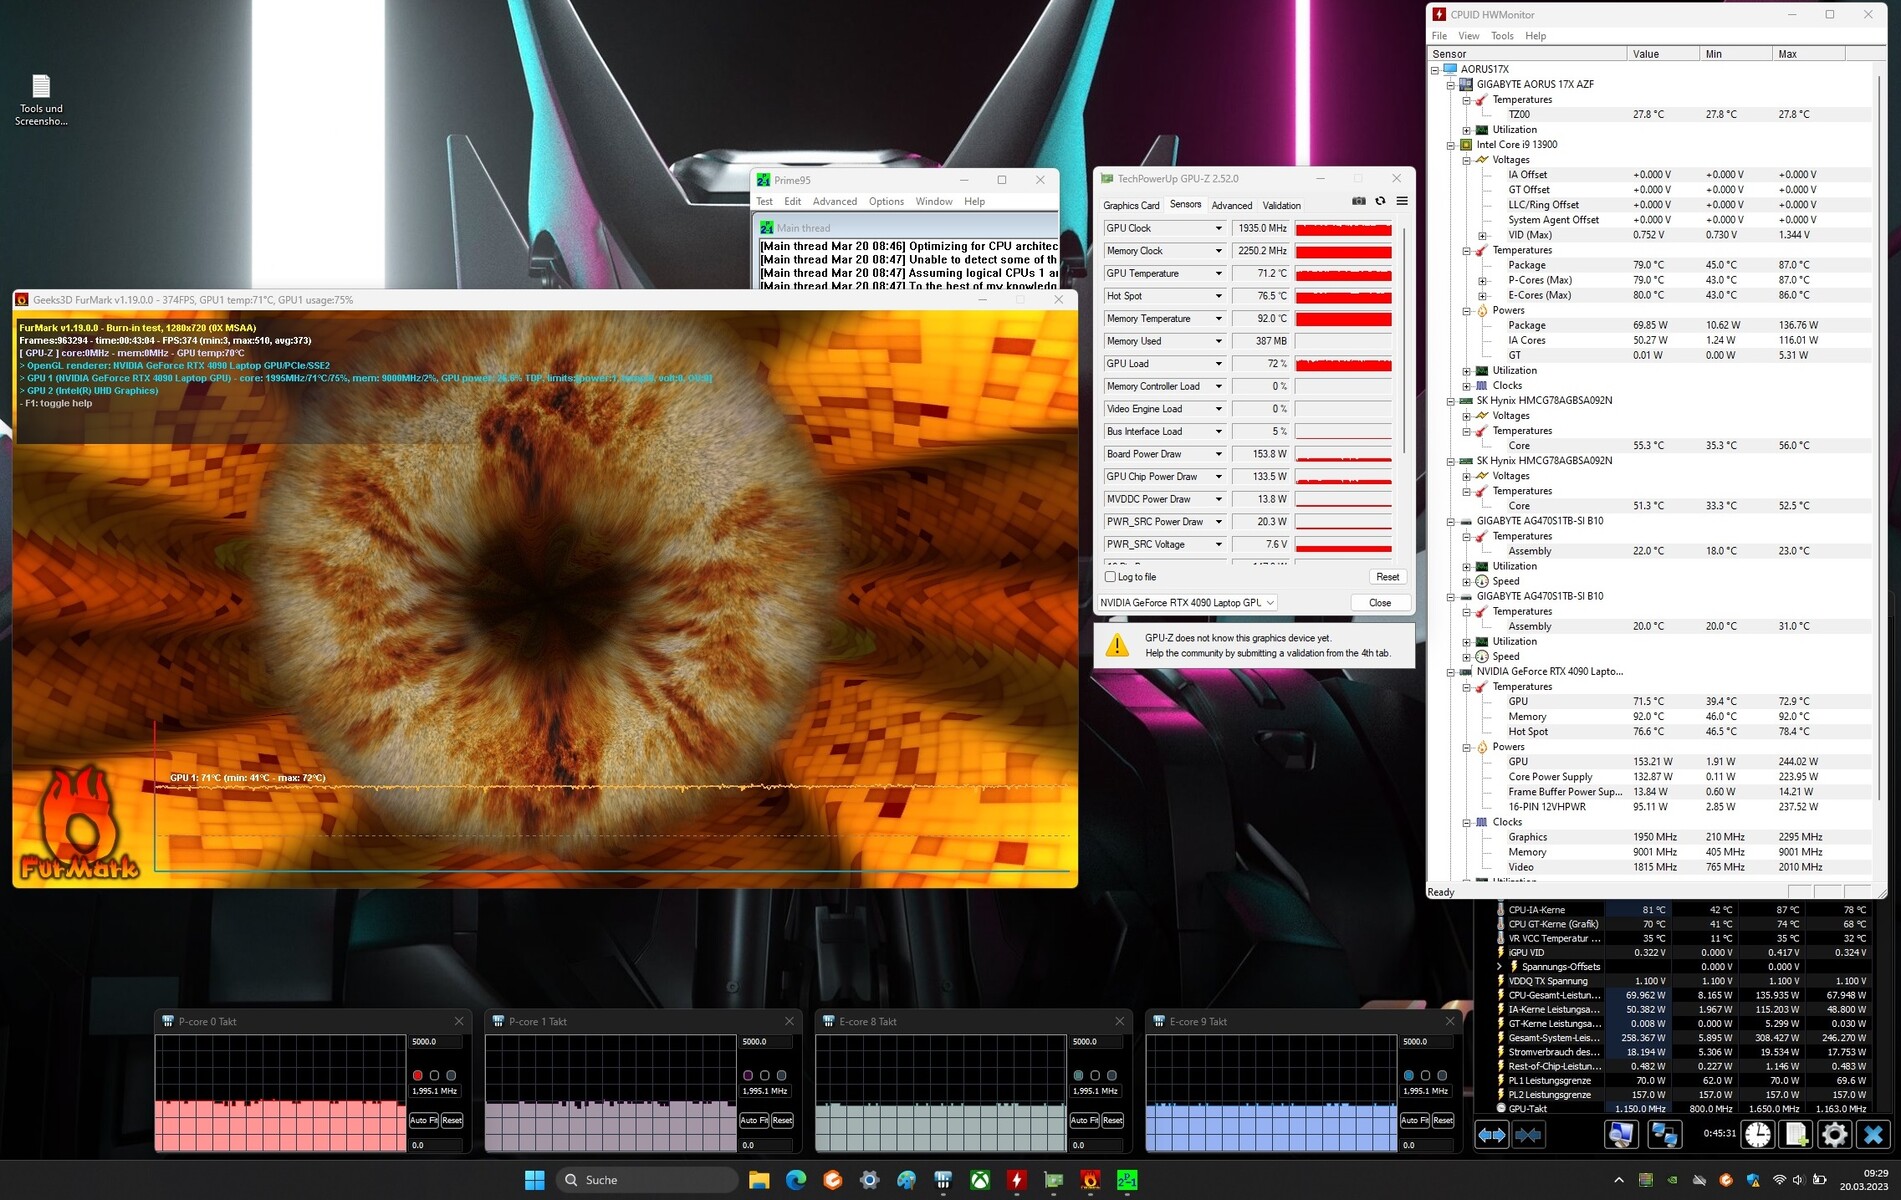
Teste de estresse
O teste de esforço, que simulamos com Prime95 e Furmark em operação contínua, representa um cenário extremo para verificar a estabilidade do sistema sob carga total. A CPU começa com altas taxas de clock, que são aceleradas após um curto período de tempo porque o PL2 não pode ser mantido permanentemente. Os núcleos P e E do Intel Core i7 13900HX funcionam consistentemente em pouco menos de 2 GHz por longos períodos de tempo.
Oradores
Os alto-falantes estéreo produzem som sólido, mas o baixo é menos impressionante devido à falta de volume. Os fones de ouvido ou um sistema de alto-falantes externos são recomendados para uma melhor experiência sonora.
Aorus 17X AZF análise de áudio
(+) | os alto-falantes podem tocar relativamente alto (###valor### dB)
Graves 100 - 315Hz
(-) | quase nenhum baixo - em média 27.1% menor que a mediana
(±) | a linearidade dos graves é média (13% delta para a frequência anterior)
Médios 400 - 2.000 Hz
(+) | médios equilibrados - apenas 4.5% longe da mediana
(+) | médios são lineares (5% delta para frequência anterior)
Altos 2 - 16 kHz
(+) | agudos equilibrados - apenas 1.4% longe da mediana
(+) | os máximos são lineares (4.3% delta da frequência anterior)
Geral 100 - 16.000 Hz
(±) | a linearidade do som geral é média (17.9% diferença em relação à mediana)
Comparado com a mesma classe
» 55% de todos os dispositivos testados nesta classe foram melhores, 9% semelhantes, 36% piores
» O melhor teve um delta de 6%, a média foi 18%, o pior foi 132%
Comparado com todos os dispositivos testados
» 37% de todos os dispositivos testados foram melhores, 8% semelhantes, 55% piores
» O melhor teve um delta de 4%, a média foi 23%, o pior foi 134%
Medion Erazer Beast X40 análise de áudio
(+) | os alto-falantes podem tocar relativamente alto (###valor### dB)
Graves 100 - 315Hz
(-) | quase nenhum baixo - em média 20.2% menor que a mediana
(±) | a linearidade dos graves é média (8.4% delta para a frequência anterior)
Médios 400 - 2.000 Hz
(±) | médios mais altos - em média 5.5% maior que a mediana
(+) | médios são lineares (6.5% delta para frequência anterior)
Altos 2 - 16 kHz
(+) | agudos equilibrados - apenas 3.1% longe da mediana
(+) | os máximos são lineares (5.8% delta da frequência anterior)
Geral 100 - 16.000 Hz
(±) | a linearidade do som geral é média (16.1% diferença em relação à mediana)
Comparado com a mesma classe
» 39% de todos os dispositivos testados nesta classe foram melhores, 7% semelhantes, 54% piores
» O melhor teve um delta de 6%, a média foi 18%, o pior foi 132%
Comparado com todos os dispositivos testados
» 26% de todos os dispositivos testados foram melhores, 5% semelhantes, 69% piores
» O melhor teve um delta de 4%, a média foi 23%, o pior foi 134%
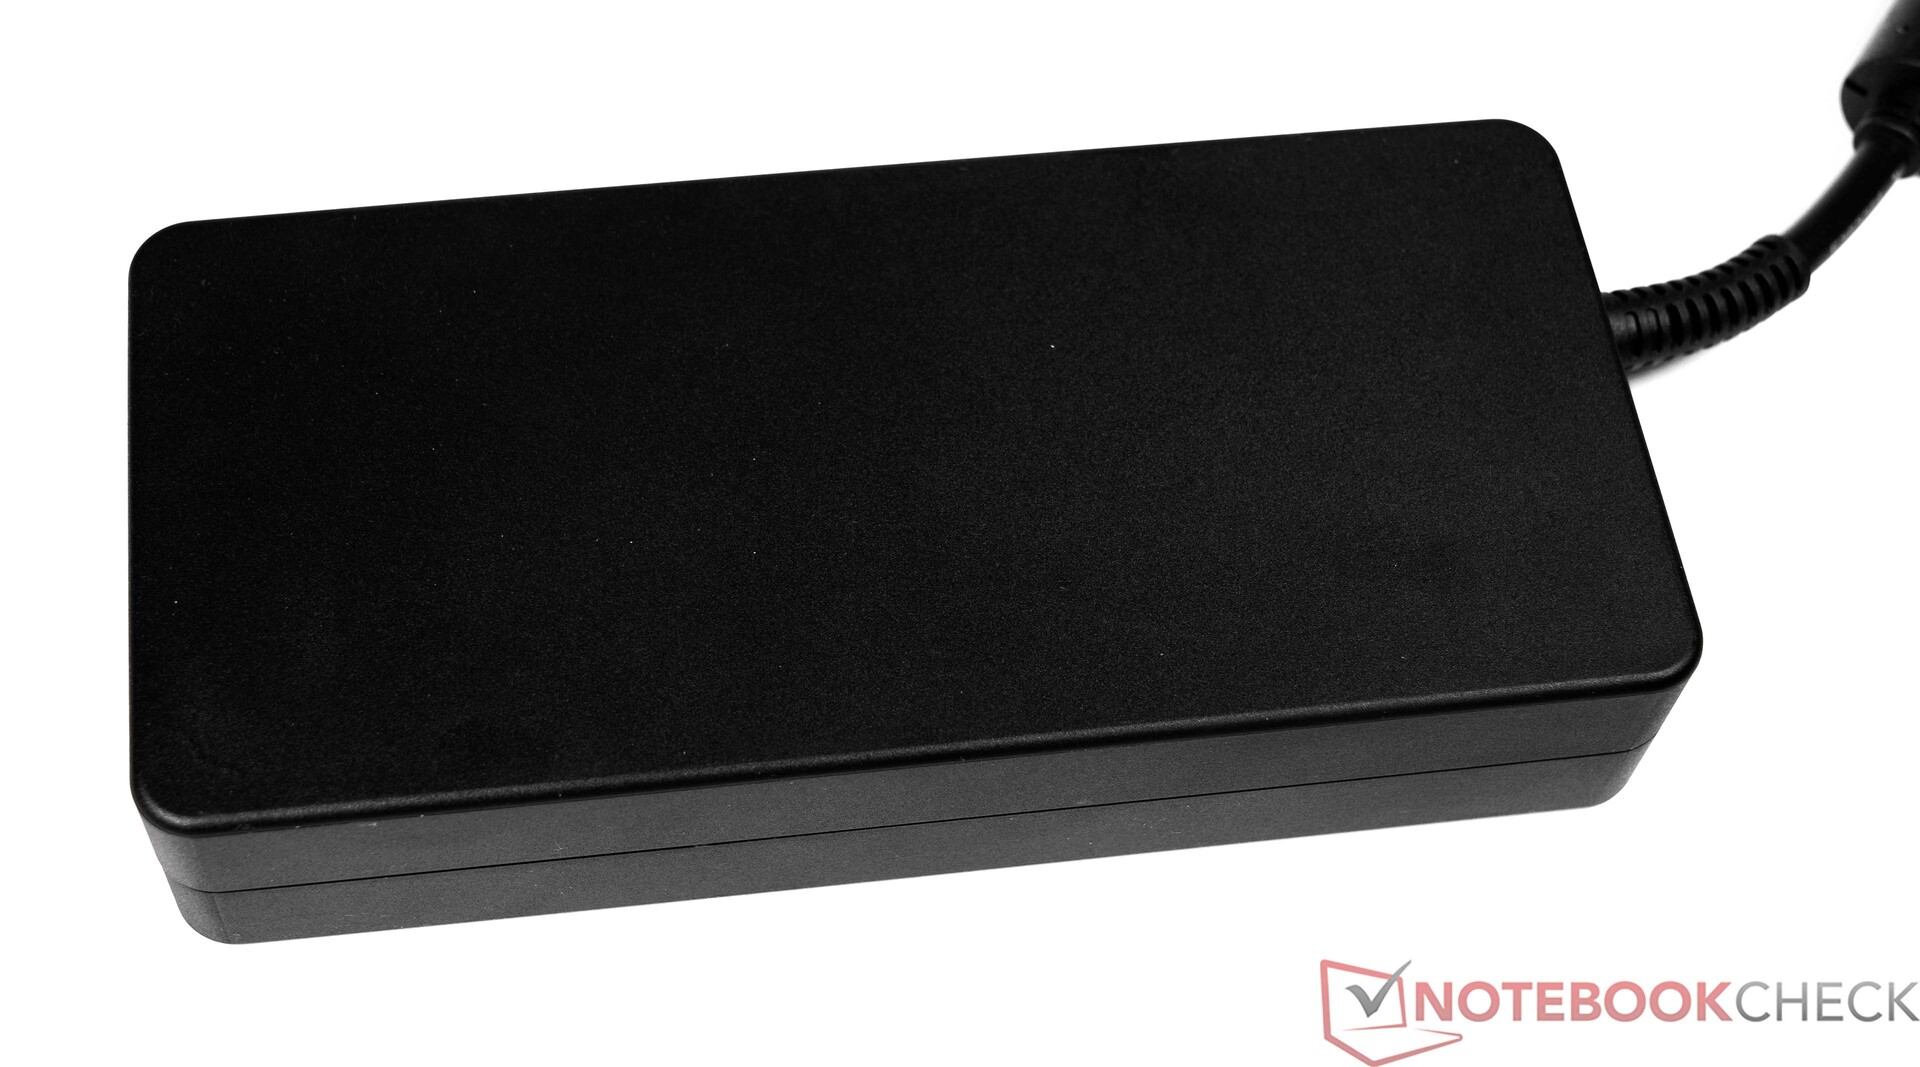
Gestão de energia
Consumo de energia
O Aorus 17X AZF não apresenta nenhuma anormalidade em termos de consumo de energia. Os valores averiguados em ociosidade parecem bastante bons e em alguns casos são significativamente melhores do que a concorrência. Vemos taxas normais sob carga. O adaptador de energia é suficientemente dimensionado para 330 watts, mesmo que 334 watts sejam necessários para rajadas curtas.
| desligado | |
| Ocioso | |
| Carga |
|
Key:
min: | |
| Aorus 17X AZF i9-13900HX, GeForce RTX 4090 Laptop GPU | Medion Erazer Beast X40 i9-13900HX, GeForce RTX 4090 Laptop GPU | MSI GE78HX 13VH-070US i9-13950HX, GeForce RTX 4080 Laptop GPU | HP Omen 17-ck2097ng i9-13900HX, GeForce RTX 4080 Laptop GPU | MSI Titan GT77 HX 13VI i9-13950HX, GeForce RTX 4090 Laptop GPU | Alienware m18 R1 i9-13980HX, GeForce RTX 4090 Laptop GPU | Média NVIDIA GeForce RTX 4090 Laptop GPU | Média da turma Gaming | |
|---|---|---|---|---|---|---|---|---|
| Power Consumption | -3% | -14% | -4% | -9% | -46% | -19% | 5% | |
| Idle Minimum * (Watt) | 11 | 11 -0% | 16.1 -46% | 16 -45% | 14 -27% | 21.6 -96% | 16.2 ? -47% | 13.1 ? -19% |
| Idle Average * (Watt) | 17 | 18 -6% | 24 -41% | 20 -18% | 21.6 -27% | 25.2 -48% | 23.1 ? -36% | 19 ? -12% |
| Idle Maximum * (Watt) | 29 | 30 -3% | 34 -17% | 26 10% | 24.8 14% | 56.7 -96% | 34.2 ? -18% | 24.6 ? 15% |
| Load Average * (Watt) | 134 | 136 -1% | 123.6 8% | 135 -1% | 122.5 9% | 164.1 -22% | 130.5 ? 3% | 111.3 ? 17% |
| Witcher 3 ultra * (Watt) | 278 | 280 -1% | 286 -3% | 215 23% | 265 5% | 311 -12% | ||
| Load Maximum * (Watt) | 334 | 363 -9% | 285.7 14% | 299 10% | 418 -25% | 338.9 -1% | 324 ? 3% | 260 ? 22% |
* ... menor é melhor
Power consumption Witcher 3 / Stress test
Power consumption with an external monitor
Vida útil da bateria
O Aorus 17X AZF atingiu tempos de execução de 6:29 h e 6:43 h em nosso teste WLAN (chamando websites através de um roteiro) e teste de vídeo (curta-metragem Big Buck Bunny, codificação H.264, FHD, em loop), respectivamente. Estas são taxas aceitáveis e refletem a média para a classe de portáteis de jogos. Durante ambos os testes, as funções de economia de energia do laptop foram desativadas e o brilho do visor foi ajustado para cerca de 150 cd/m². Em nosso caso, isto significou uma redução de 50% na luminosidade.
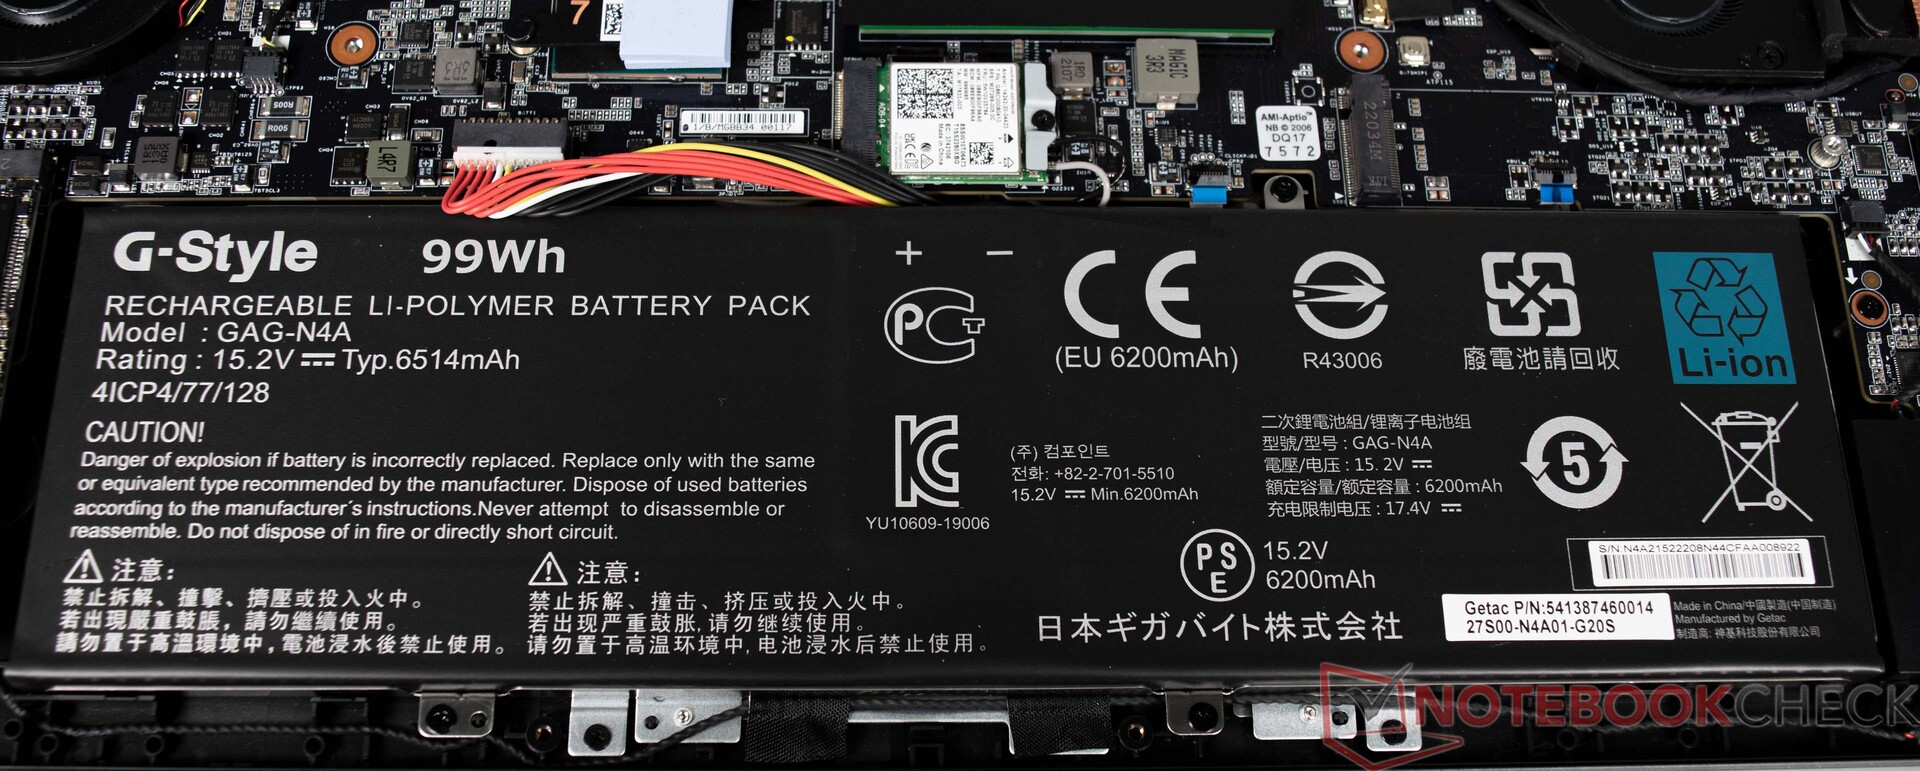
O Aorus 17X AZF está equipado com uma grande bateria de 99 Wh, que também é o máximo em um laptop. Quase todos os dispositivos de comparação oferecem uma bateria com a mesma capacidade. Somente a HP Omen 17 tem que se contentar com uma bateria menor de 83 Wh e, portanto, fica atrás visivelmente.
| Aorus 17X AZF i9-13900HX, GeForce RTX 4090 Laptop GPU, 99 Wh | Medion Erazer Beast X40 i9-13900HX, GeForce RTX 4090 Laptop GPU, 99.8 Wh | MSI GE78HX 13VH-070US i9-13950HX, GeForce RTX 4080 Laptop GPU, 99 Wh | HP Omen 17-ck2097ng i9-13900HX, GeForce RTX 4080 Laptop GPU, 83 Wh | MSI Titan GT77 HX 13VI i9-13950HX, GeForce RTX 4090 Laptop GPU, 99.9 Wh | Alienware m18 R1 i9-13980HX, GeForce RTX 4090 Laptop GPU, 97 Wh | Média da turma Gaming | |
|---|---|---|---|---|---|---|---|
| Duração da bateria | -1% | -18% | -44% | -20% | -46% | -3% | |
| Reader / Idle (h) | 9 | 9.4 4% | 7.3 -19% | 4.2 -53% | 5.6 -38% | 7.84 ? -13% | |
| H.264 (h) | 6.7 | 6.9 3% | 3.7 -45% | 6 -10% | 8.27 ? 23% | ||
| WiFi v1.3 (h) | 6.5 | 6.4 -2% | 6.1 -6% | 3.6 -45% | 5.3 -18% | 4.3 -34% | 7.08 ? 9% |
| Load (h) | 2.1 | 1.9 -10% | 1.5 -29% | 1.4 -33% | 1.4 -33% | 0.7 -67% | 1.496 ? -29% |
Pro
Contra
Verdict- Central de energia móvel para jogos sem compromisso
O Aorus 17X AZF é um caderno de jogos projetado para exigências extremas. O Aorus 17X AZF foi capaz de executar todos os jogos testados sem problemas na resolução do display nativo e sem perdas na qualidade. No entanto, um está limitado aos jogos de 1440p, o que é ótimo. As reservas de desempenho estão disponíveis e podem ser acessadas através de displays externos de 4K. ONvidia GeForce RTX 4090 GPU para laptop oferece uma enorme quantidade de desempenho e é capaz de mantê-la permanentemente. Isto é flanqueado por um poderoso Intel Core-i7-13900HX. Em uma comparação direta com dispositivos comparáveis, entretanto, a CPU no Aorus 17X AZF nem sempre é capaz de se afirmar. No entanto, a lacuna não é tão grande e é pouco provável que se note isso na vida cotidiana.
Gostamos muito do hardware restante: 32 GB de RAM DDR5 e um total de 2 TB de armazenamento SSD fazem um excelente sistema em geral para que você não tenha que atualizar por um tempo. O display com capacidade QHD também se encaixa bem no laptop e também é adequado para edição de fotos e vídeos
Por outro lado, há limitações no volume, que não podem ser ignoradas durante a carga. Por outro lado, o problema também é comum a outros laptops de jogos e não é exclusivo do Aorus 17X AZF. A conectividade também precisa ser melhorada e poderia ser mais extensa para um dispositivo de 17 polegadas. Pelo menos o laptop tem uma conexão Thunderbolt moderna
Em termos de mobilidade, o Aorus 17X AZF está bem posicionado porque os tempos de funcionamento da bateria registrados refletem uma boa média de classe. O dispositivo pode até ser operado quase silenciosamente através do Centro de Controle Gigabyte, que oferece inúmeras opções de ajuste
Aqueles que procuram uma alternativa mais barata devem dar uma olhada no HP Omen 17, que também oferece um excelente desempenho em 1.440p com oNvidia GeForce RTX 4080 GPU para laptop.
Preço e Disponibilidade
Os compradores interessados são aconselhados a verificar diretamente através da página do produto correspondente na loja virtual da Gigabyte, onde uma lista de revendedores/distribuidores oficiais pode ser encontrada. Nos EUA, por exemplo, o Aorus 17X AZF está listado em ambos Amazon e Newegg por $3.499,00 (mas atualmente esgotado em ambas as plataformas).
Os preços são a partir de 17.04.2023 e estão sujeitos a alterações.
Aorus 17X AZF
- 04/14/2023 v7 (old)
Sebastian Bade
Transparência
A seleção dos dispositivos a serem analisados é feita pela nossa equipe editorial. A amostra de teste foi fornecida ao autor como empréstimo pelo fabricante ou varejista para fins desta revisão. O credor não teve influência nesta revisão, nem o fabricante recebeu uma cópia desta revisão antes da publicação. Não houve obrigação de publicar esta revisão. Como empresa de mídia independente, a Notebookcheck não está sujeita à autoridade de fabricantes, varejistas ou editores.
É assim que o Notebookcheck está testando
Todos os anos, o Notebookcheck analisa de forma independente centenas de laptops e smartphones usando procedimentos padronizados para garantir que todos os resultados sejam comparáveis. Desenvolvemos continuamente nossos métodos de teste há cerca de 20 anos e definimos padrões da indústria no processo. Em nossos laboratórios de teste, equipamentos de medição de alta qualidade são utilizados por técnicos e editores experientes. Esses testes envolvem um processo de validação em vários estágios. Nosso complexo sistema de classificação é baseado em centenas de medições e benchmarks bem fundamentados, o que mantém a objetividade.Price comparison

