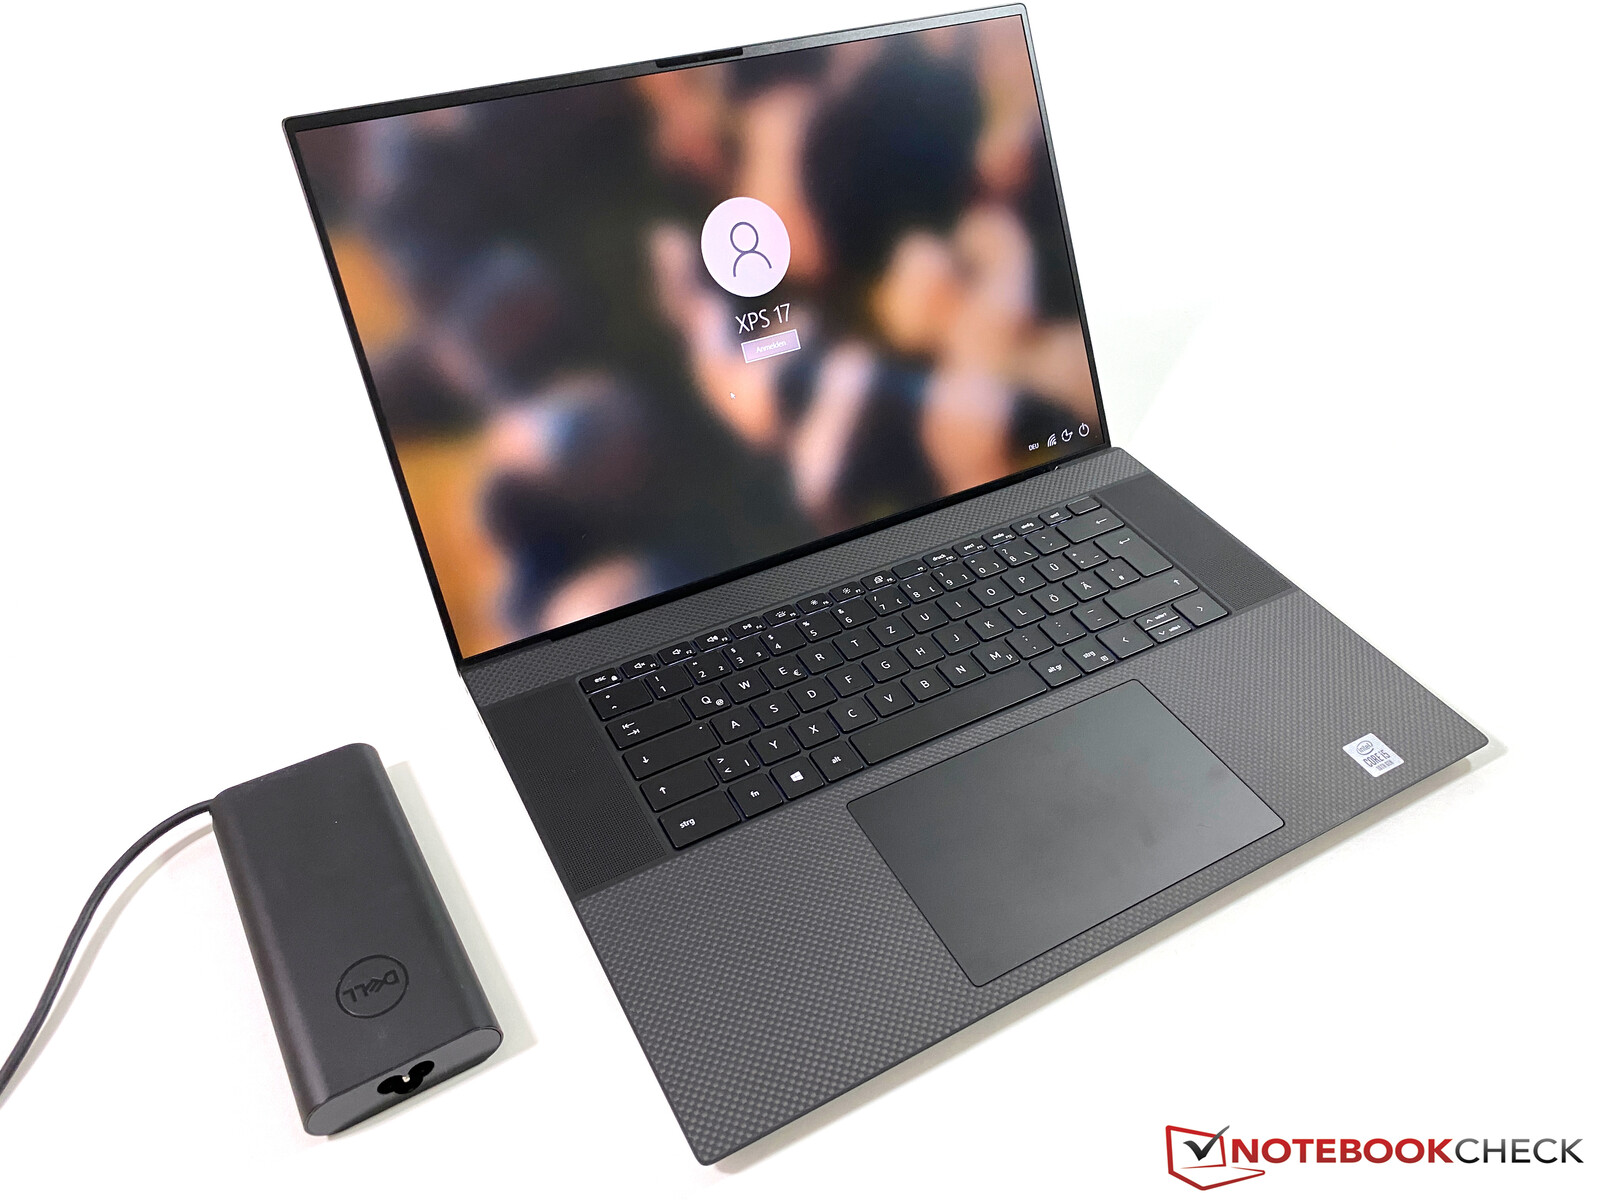
Revisão Dell XPS 17 9700 - Laptop multimídia com painel FHD fosco brilhante e longa duração da bateria
Os laptops multimídia são muitas vezes a entrada de todos os negócios no segmento móvel, e os dispositivos com telas maiores que 15 polegadas são normalmente equipados com GPUs dedicados para proporcionar um desempenho decente nos jogos. Entretanto, se você está procurando um grande laptop multimídia e não planeja jogar, você não precisa realmente de um dGPU caro.
A Dell é uma das exceções, pois tanto o XPS 15 quanto o novo XPS 17 também são oferecidos sem GPUs dedicados. Enquanto a especificação base do XPS 15 começa em torno de 1400 Euros, a Dell ainda cobra quase 2000 Euros (a partir de $1349 nos EUA). Em troca, você recebe um Core i5 incluindo iGPU, 8 GB RAM, 512 GB NVMe- armazenamento, bem como um painel FHD mate. As especificações não são realmente esmagadoras, então queremos descobrir se o alto preço de varejo do XPS 17 ainda é justificado.
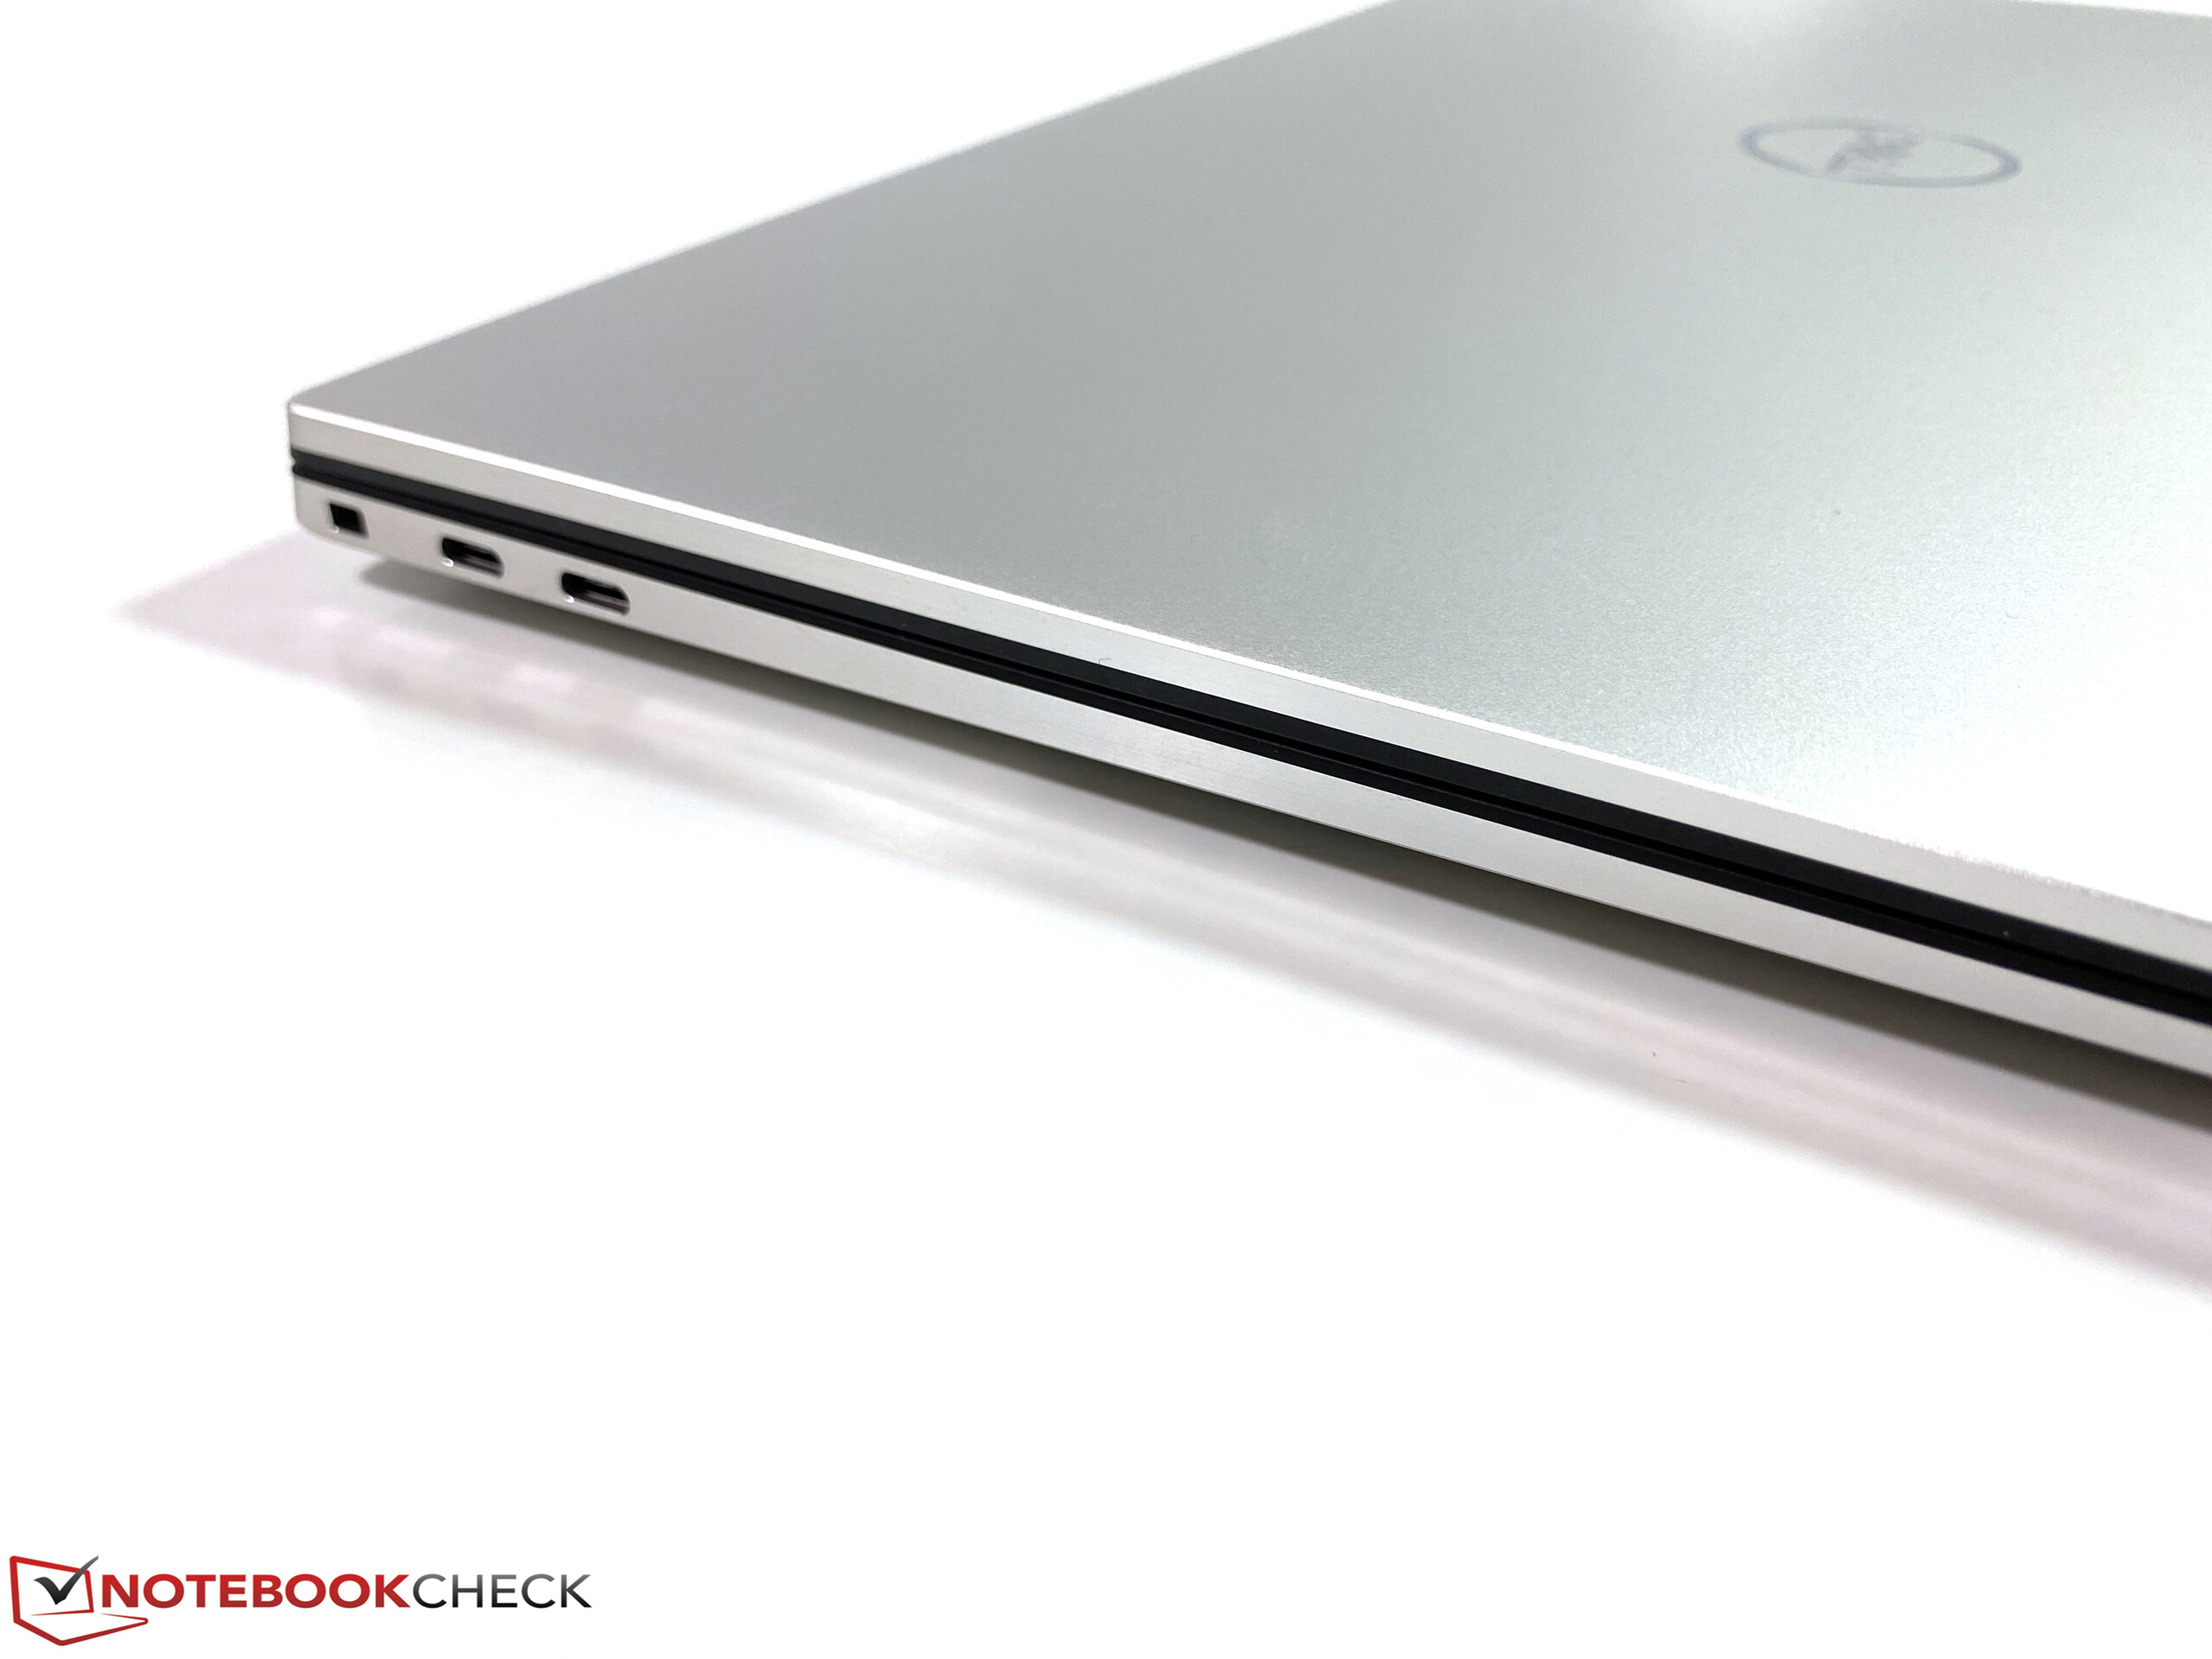
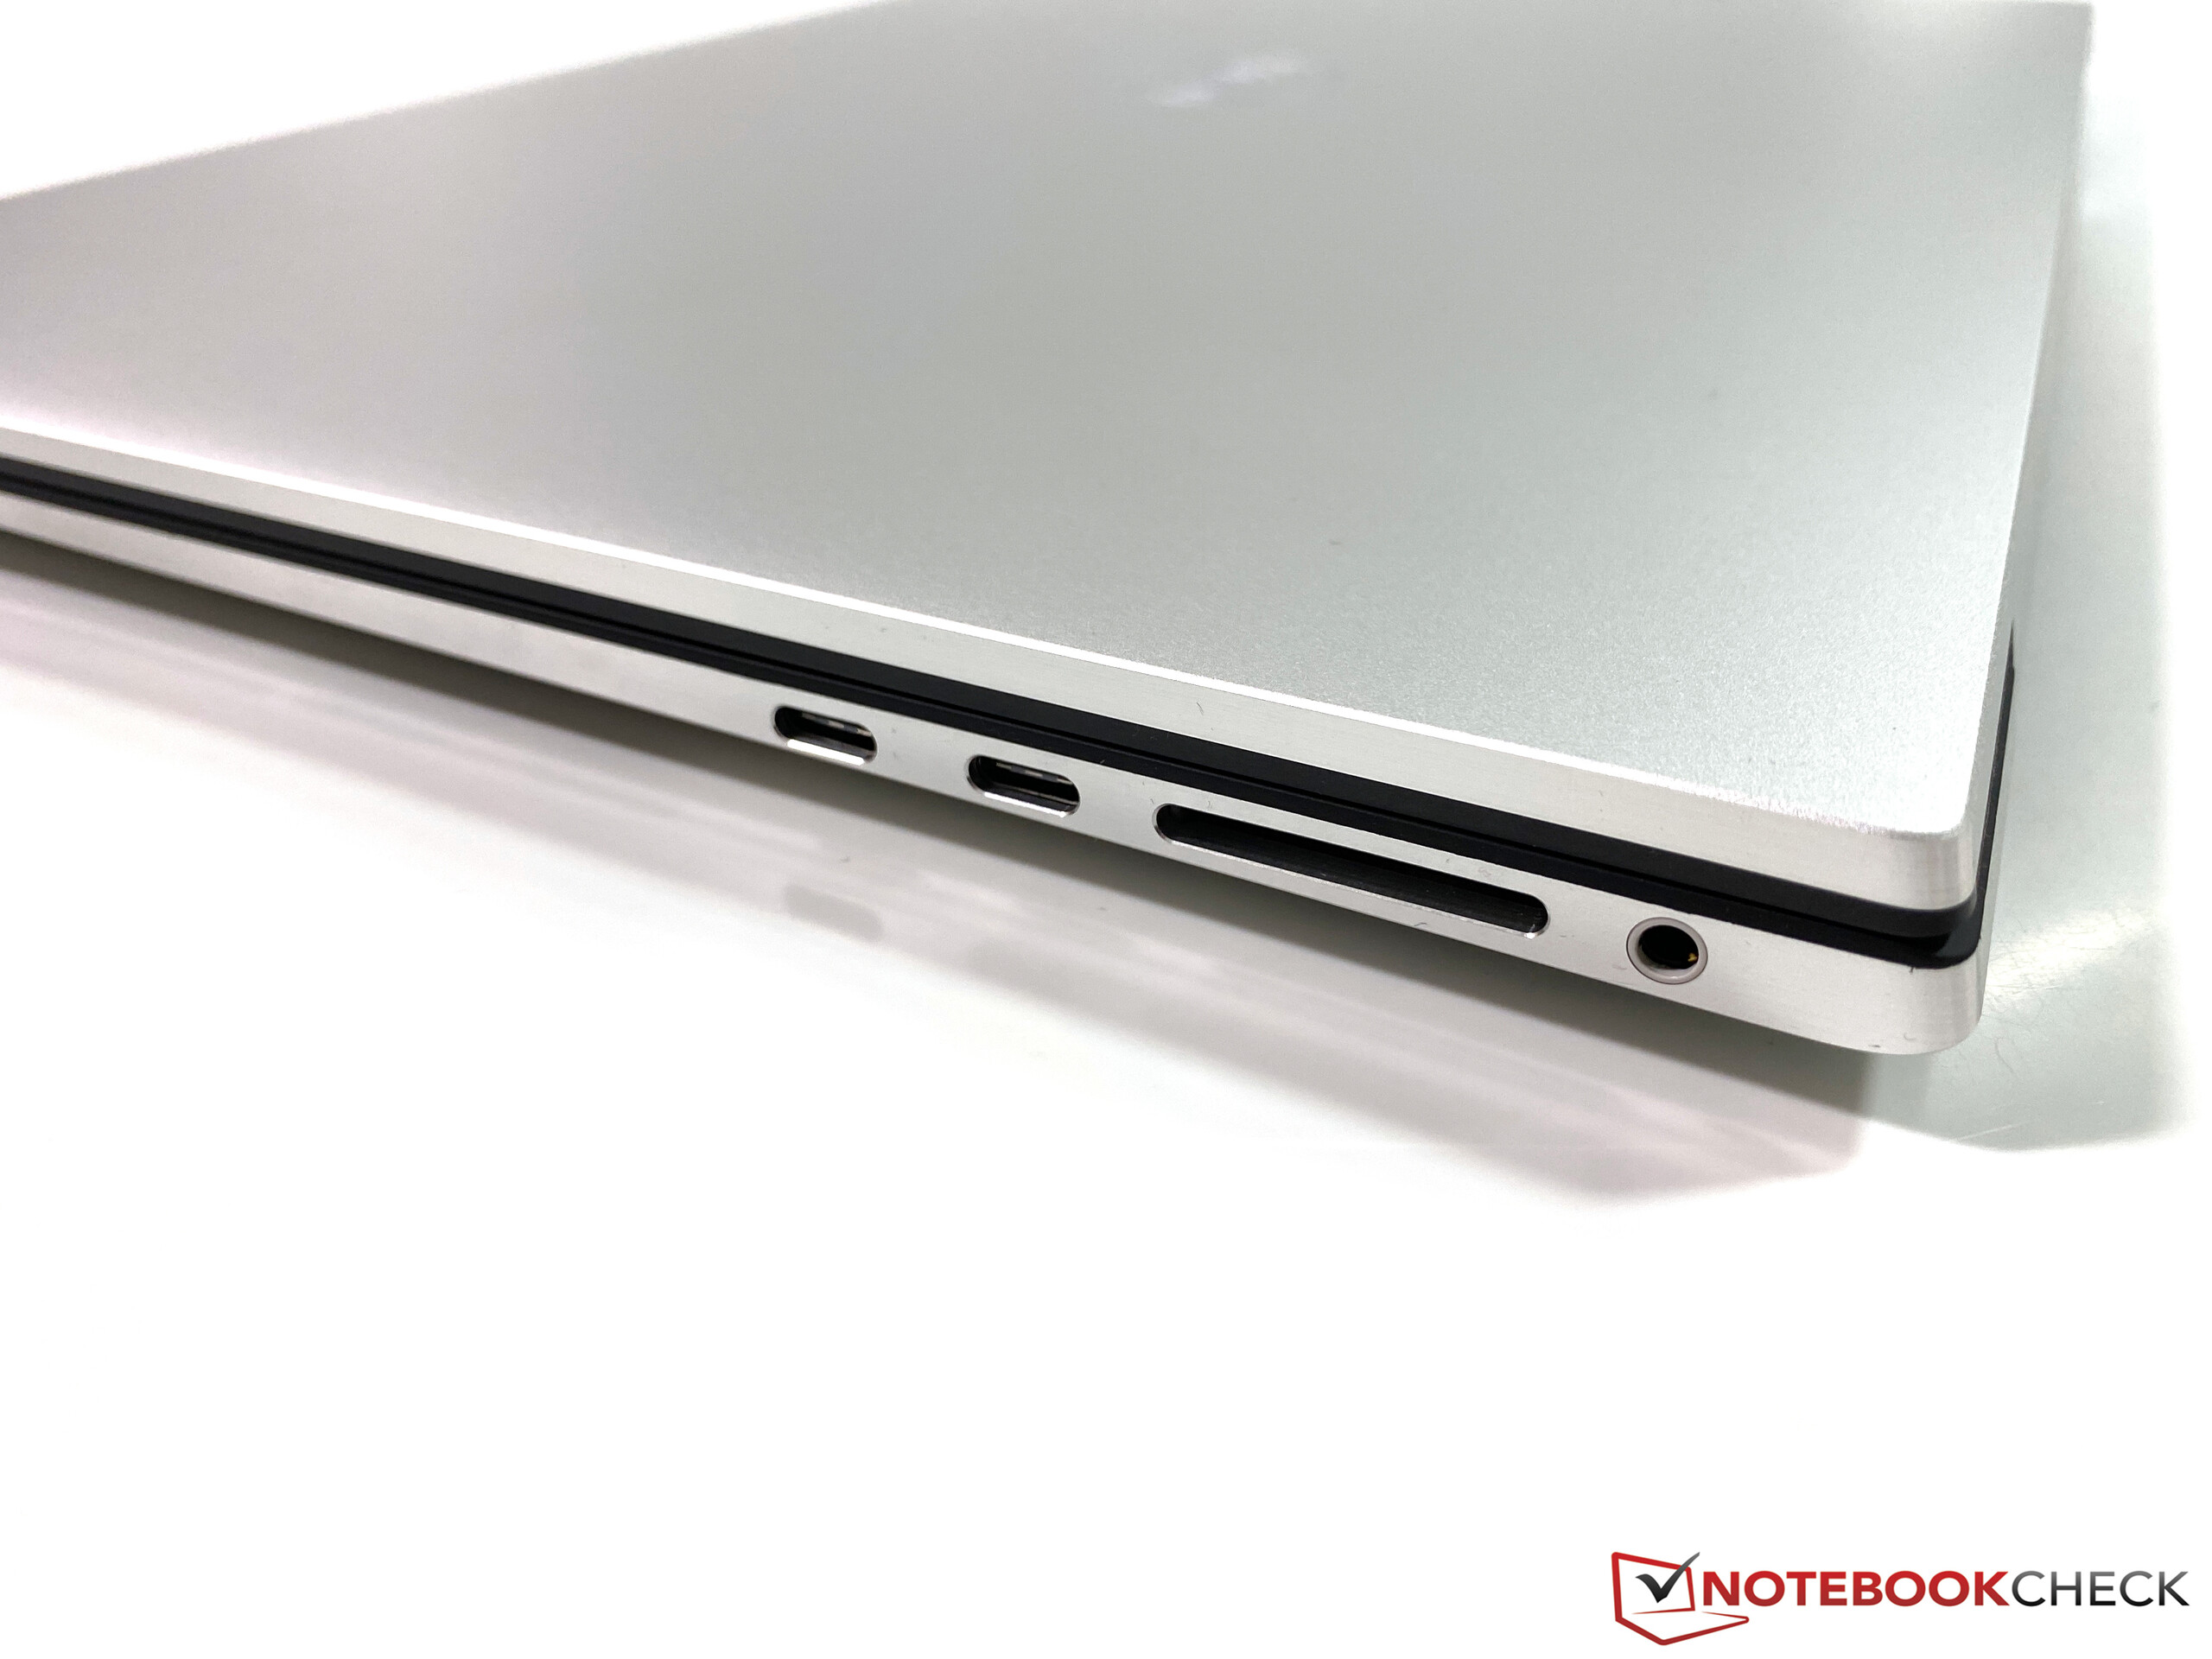
Tópicos como o estojo, as portas, os dispositivos de entrada e os alto-falantes são idênticos à unidade previamente testada, portanto, consulte nossa revisão abrangente do XPS 17 9700 com a CPU i7, RTX 2060 Max-Q GPU, e 4K touchscreen para obter mais informações
Avaliação | Data | Modelo | Peso | Altura | Size | Resolução | Preço |
|---|---|---|---|---|---|---|---|
| 85.8 % v7 (old) | 11/2020 | Dell XPS 17 9700 i5-10300H i5-10300H, UHD Graphics 630 | 2.3 kg | 19.5 mm | 17.30" | 1920x1200 | |
| 85.2 % v7 (old) | 08/2020 | LG Gram 17 17Z90N-V.AA77G i7-1065G7, Iris Plus Graphics G7 (Ice Lake 64 EU) | 1.4 kg | 17.4 mm | 17.00" | 2560x1600 | |
| 87.9 % v7 (old) | 07/2020 | Dell XPS 17 9700 Core i7 RTX 2060 Max-Q i7-10875H, GeForce RTX 2060 Max-Q | 2.5 kg | 19.5 mm | 17.00" | 3840x2400 | |
| 84.5 % v7 (old) | 11/2020 | Honor MagicBook Pro (AMD) R5 4600H, Vega 6 | 1.7 kg | 16.9 mm | 16.10" | 1920x1080 | |
| 86.8 % v7 (old) | 06/2020 | Dell XPS 15 9500 Core i5 i5-10300H, UHD Graphics 630 | 1.8 kg | 18 mm | 15.60" | 1920x1200 |
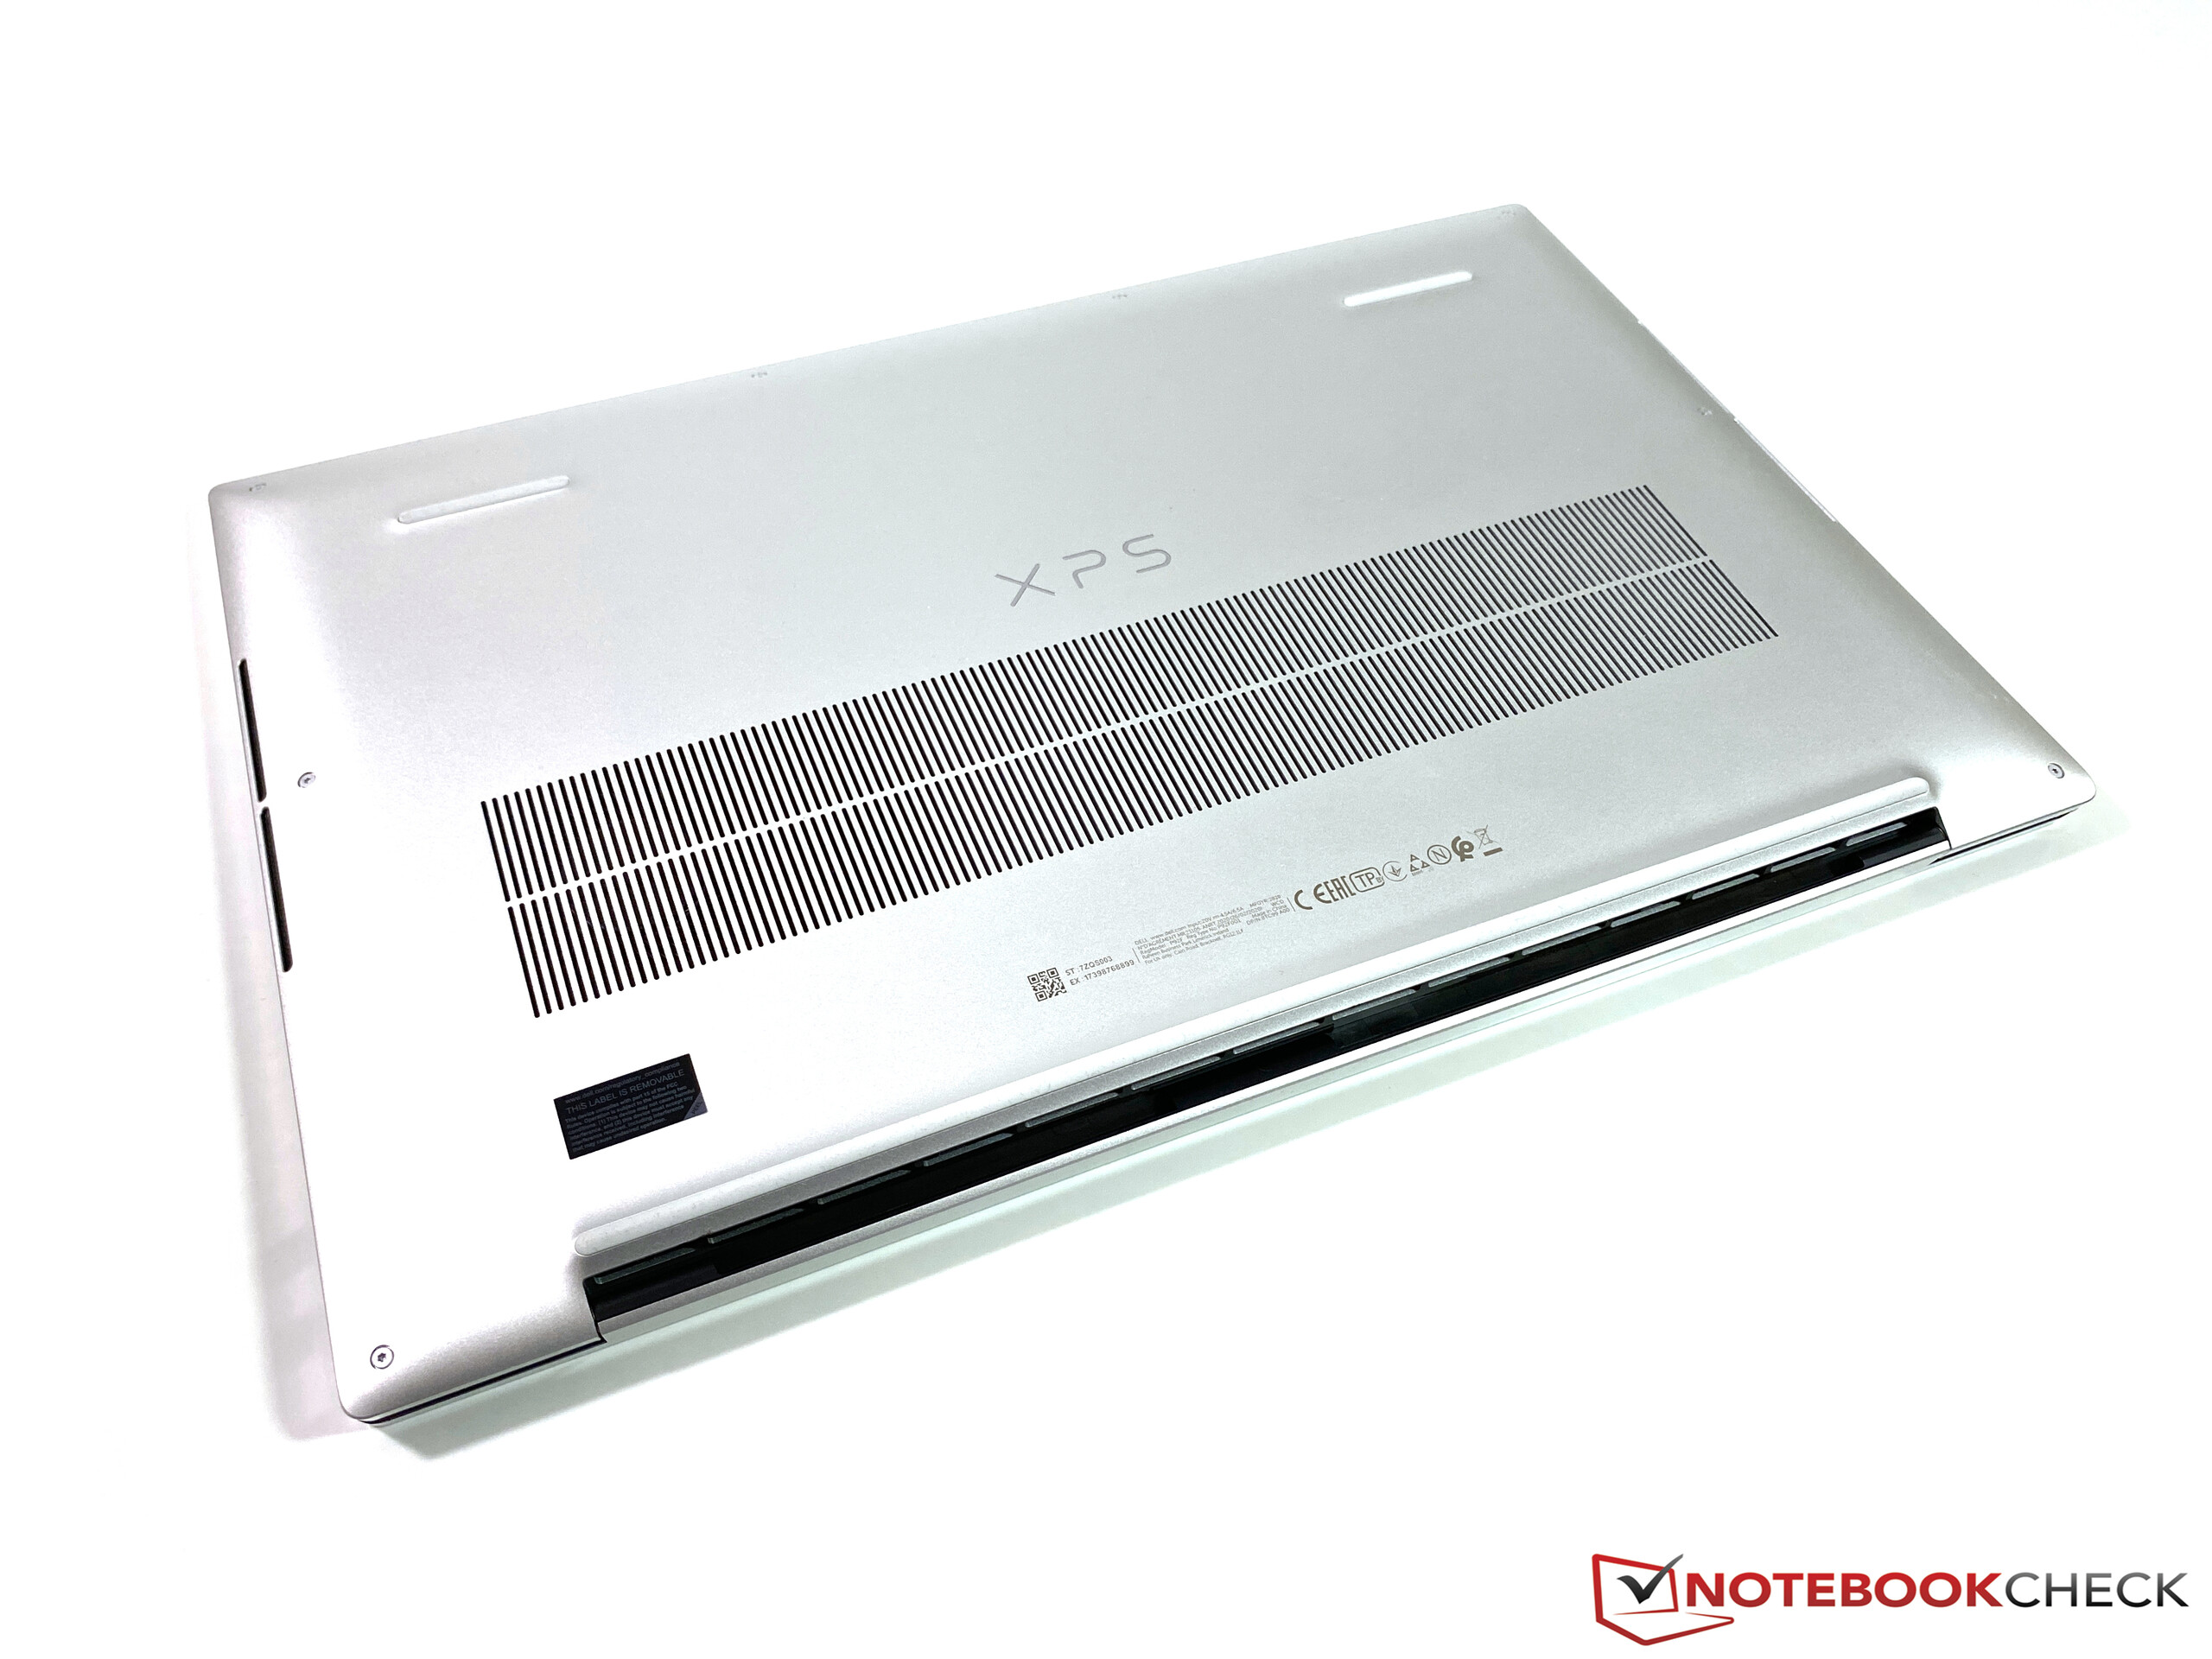
Estojo - XPS com chassis de alta qualidade, mas pesado
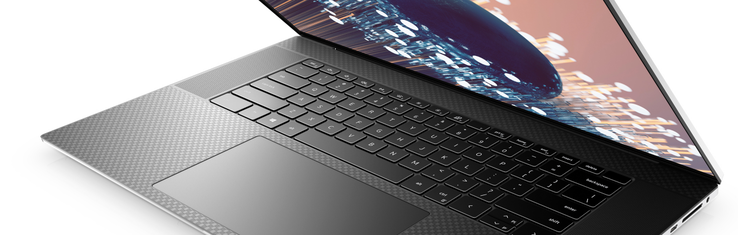
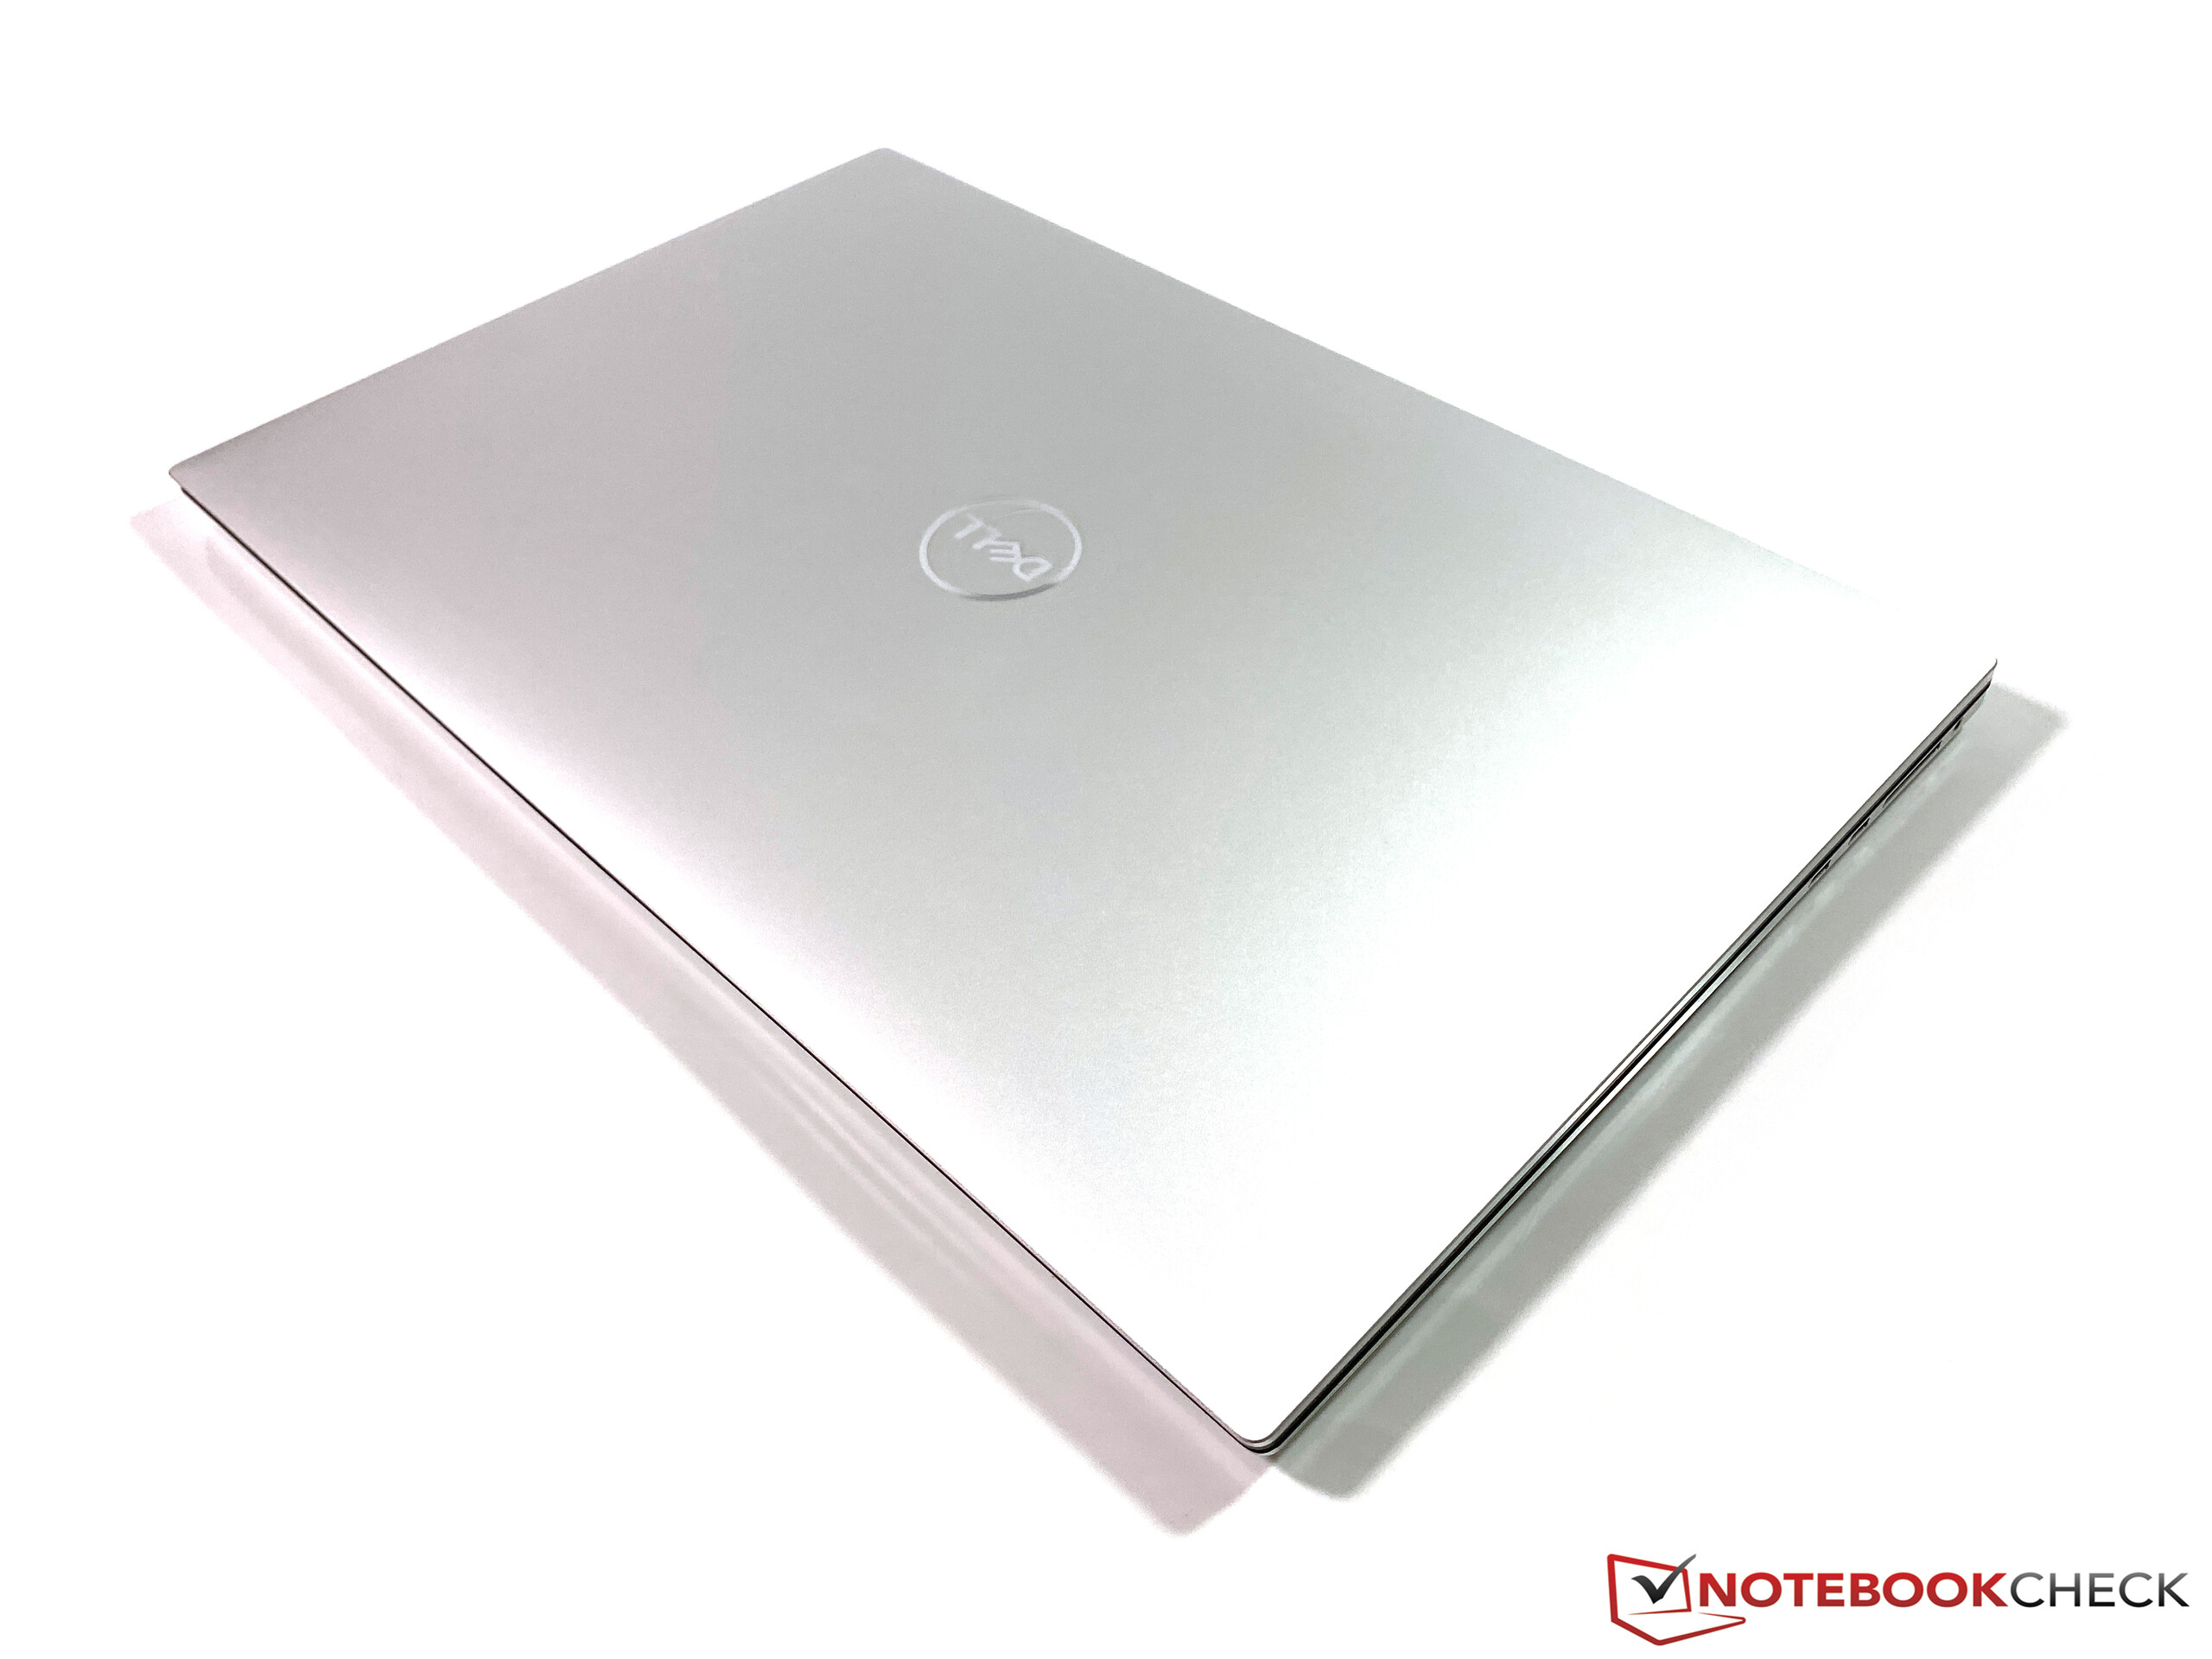
Obviamente não há diferença visual entre os sistemas XPS 17 9700 com ou sem GPUs dedicados. Você obtém um estojo com uma qualidade de construção muito alta e o XPS 17 apenas parece bom, mesmo que as superfícies escuras dos restos da palma da mão sejam muito propensas a impressões digitais
Uma rápida comparação do peso revela que a falta da GPU Nvidia, do painel 4K e do resfriamento da câmara de vapor reduz o peso total em cerca de 170 gramas. Entretanto, o XPS 17 ainda é comparativamente pesado; o LG Gram 17 é quase 1 kg mais leve

| SD Card Reader | |
| average JPG Copy Test (av. of 3 runs) | |
| Dell XPS 15 9500 Core i5 (Toshiba Exceria Pro SDXC 64 GB UHS-II) | |
| Dell XPS 17 9700 i5-10300H (Toshiba Exceria Pro SDXC 64 GB UHS-II) | |
| Dell XPS 17 9700 Core i7 RTX 2060 Max-Q (Toshiba Exceria Pro SDXC 64 GB UHS-II) | |
| Média da turma Multimedia (23 - 531, n=37, últimos 2 anos) | |
| LG Gram 17 17Z90N-V.AA77G (Toshiba Exceria Pro M501 microSDXC 64GB) | |
| maximum AS SSD Seq Read Test (1GB) | |
| Dell XPS 17 9700 i5-10300H (Toshiba Exceria Pro SDXC 64 GB UHS-II) | |
| Dell XPS 15 9500 Core i5 (Toshiba Exceria Pro SDXC 64 GB UHS-II) | |
| Dell XPS 17 9700 Core i7 RTX 2060 Max-Q (Toshiba Exceria Pro SDXC 64 GB UHS-II) | |
| Média da turma Multimedia (37.3 - 1455, n=36, últimos 2 anos) | |
| LG Gram 17 17Z90N-V.AA77G (Toshiba Exceria Pro M501 microSDXC 64GB) | |
Webcam


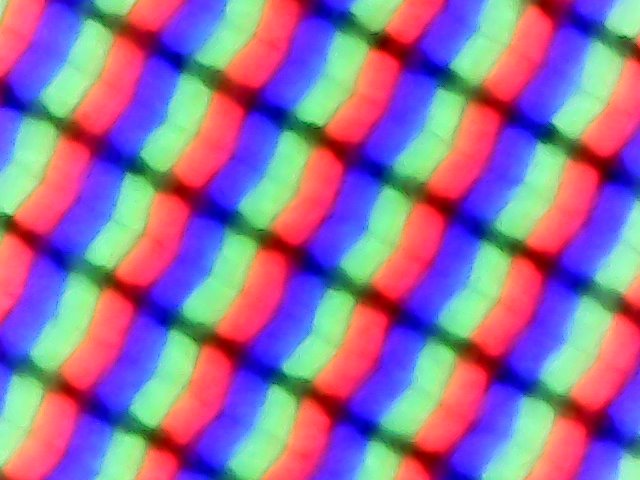
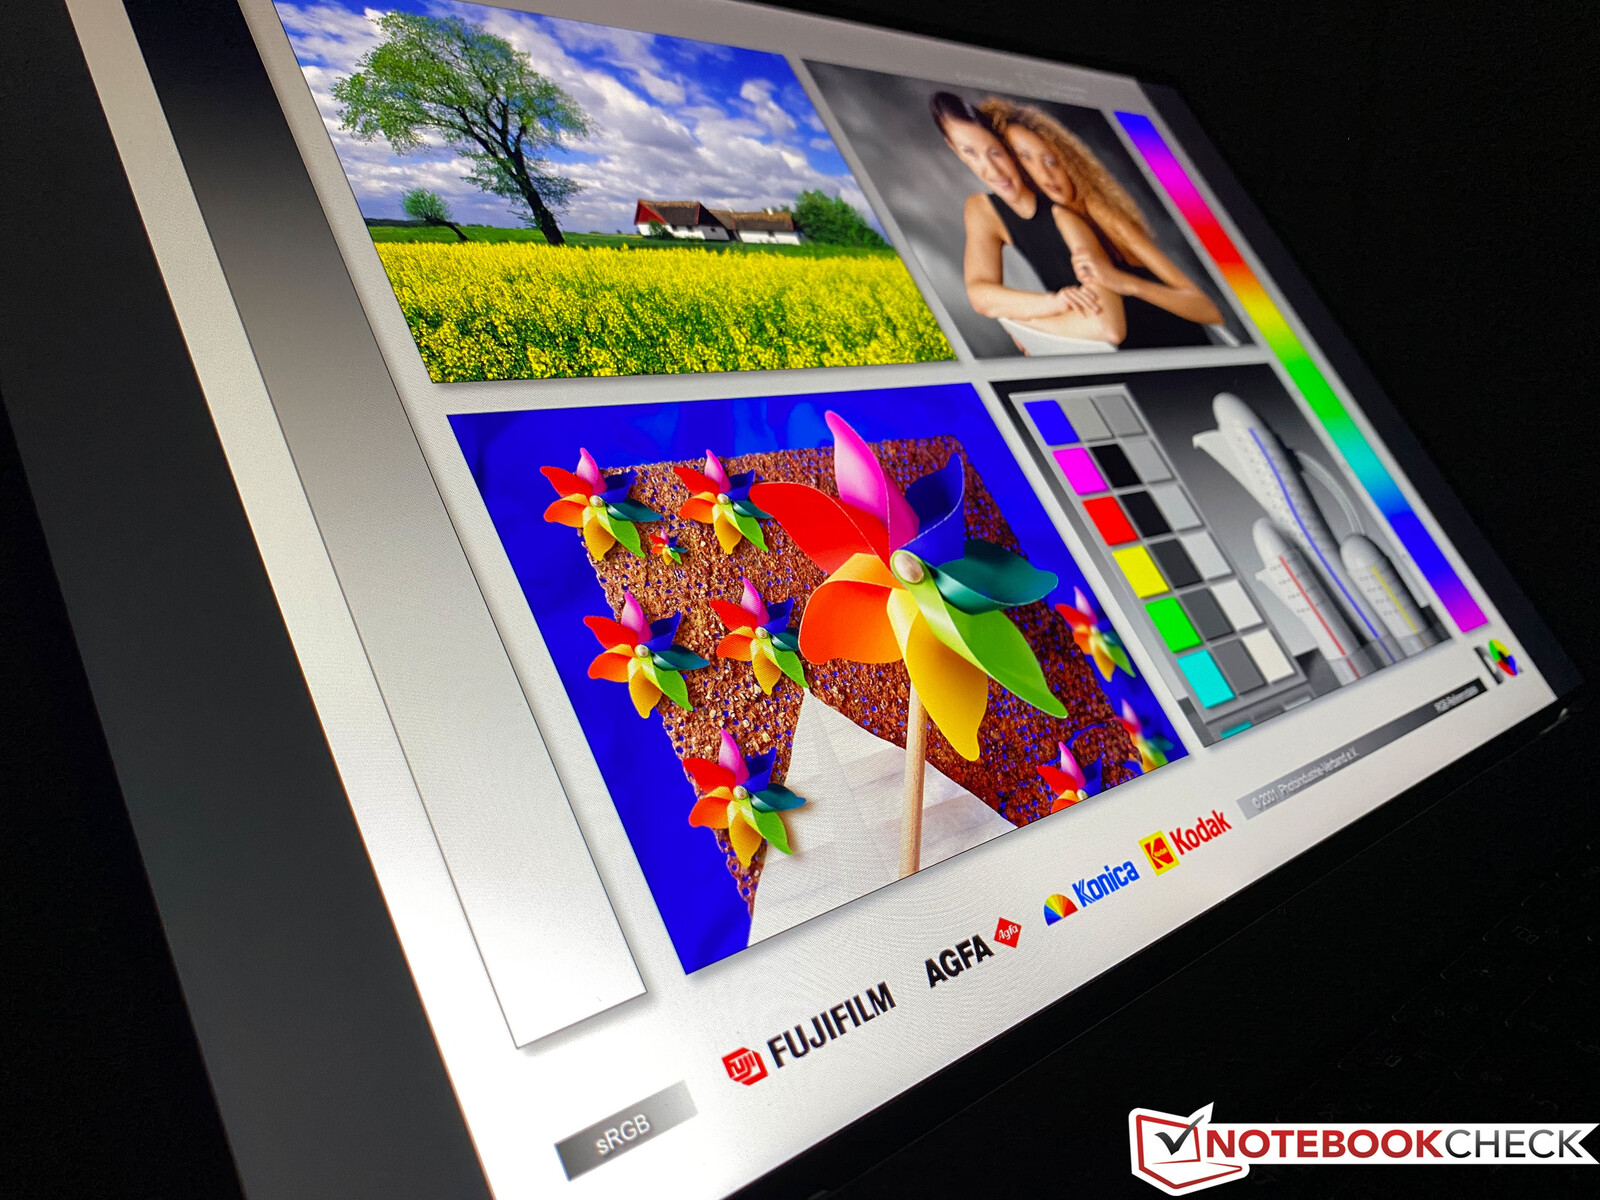
Mostrador - XPS 17 com tela FHD fosca
A Dell oferece duas telas 16:10 diferentes para o XPS 17. Além da tela tátil brilhante 4K, você também pode obter um painel FHD+ fosco que temos em nossa unidade de teste. A resolução de 1920 x 1200 pixels é muito menor em comparação com o SKU opcional 4K, mas o conteúdo ainda é suficientemente nítido. A impressão subjetiva da imagem é muito boa e as superfícies brilhantes não parecem muito granulosas, o que muitas vezes é uma questão de painéis foscos.
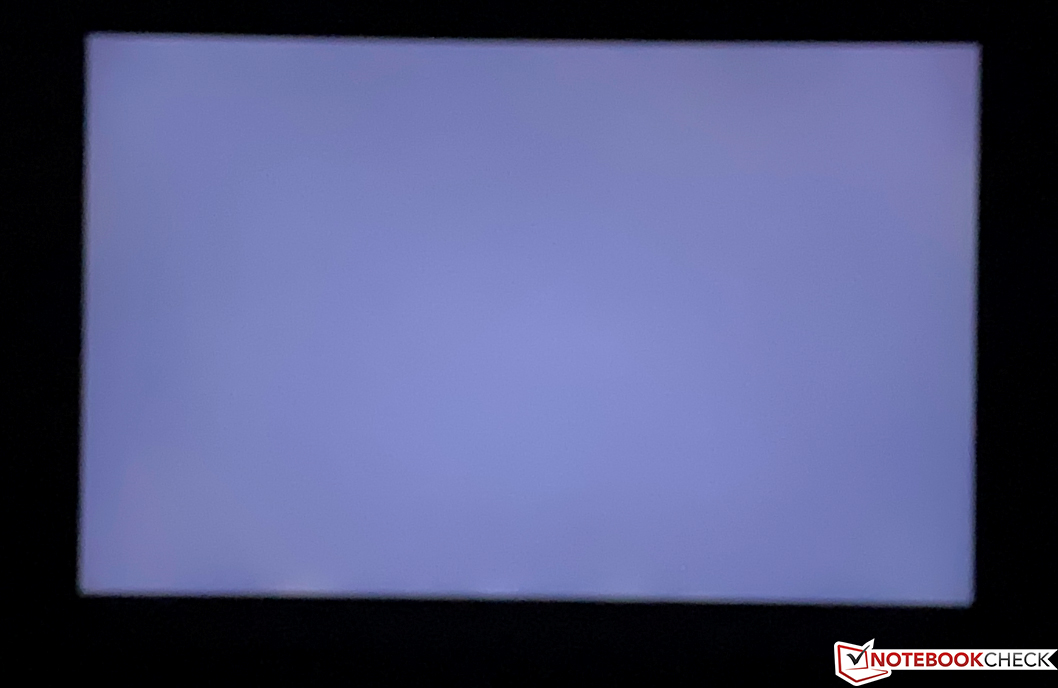
Nossas medidas mostram que o painel pode facilmente atender as 500 lêndeas anunciadas com uma luminância média de 580 lêndeas. Considerando o alto brilho, o valor de preto ainda é decente a 0,34 cd/m² e o resultado é uma excelente relação de contraste de mais de 1800:1.
Ainda podemos detectar dois pequenos problemas, pois podemos medir o PWM cintilando a um brilho de 30% ou inferior. Entretanto, a freqüência de 2500 Hz é muito alta e não deve causar nenhum problema. Um problema muito mais perceptível é o tempo de resposta lento do painel, e você pode ver fantasmas quando você move o cursor, por exemplo. Ainda que este seja um problema conhecido em muitos painéis com biséis muito finos, também há unidades mais rápidas
| |||||||||||||||||||||||||
iluminação: 86 %
iluminação com acumulador: 638 cd/m²
Contraste: 1871:1 (Preto: 0.34 cd/m²)
ΔE ColorChecker Calman: 2.4 | ∀{0.5-29.43 Ø4.71}
calibrated: 1.5
ΔE Greyscale Calman: 2 | ∀{0.09-98 Ø4.96}
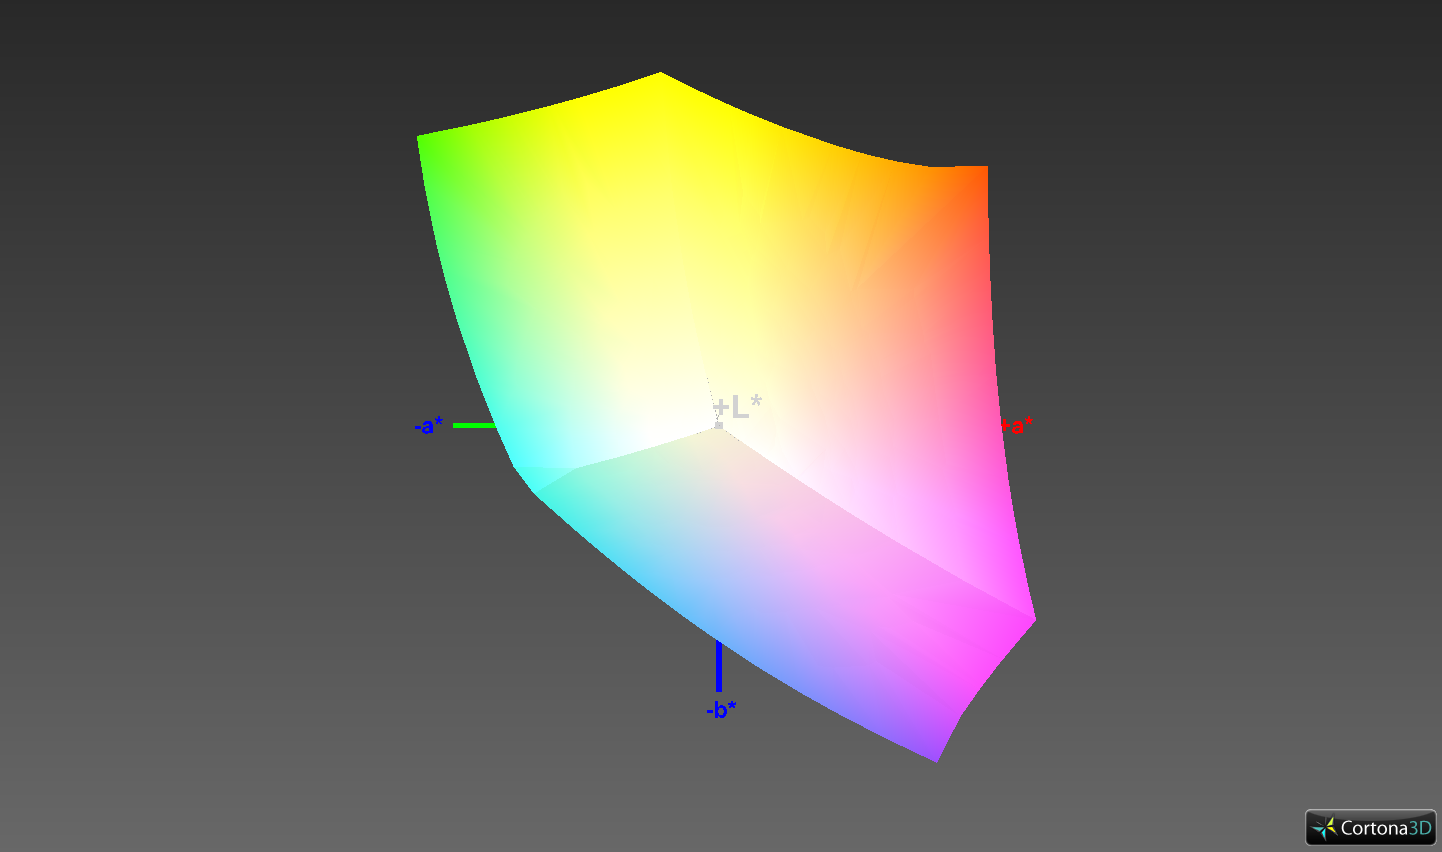
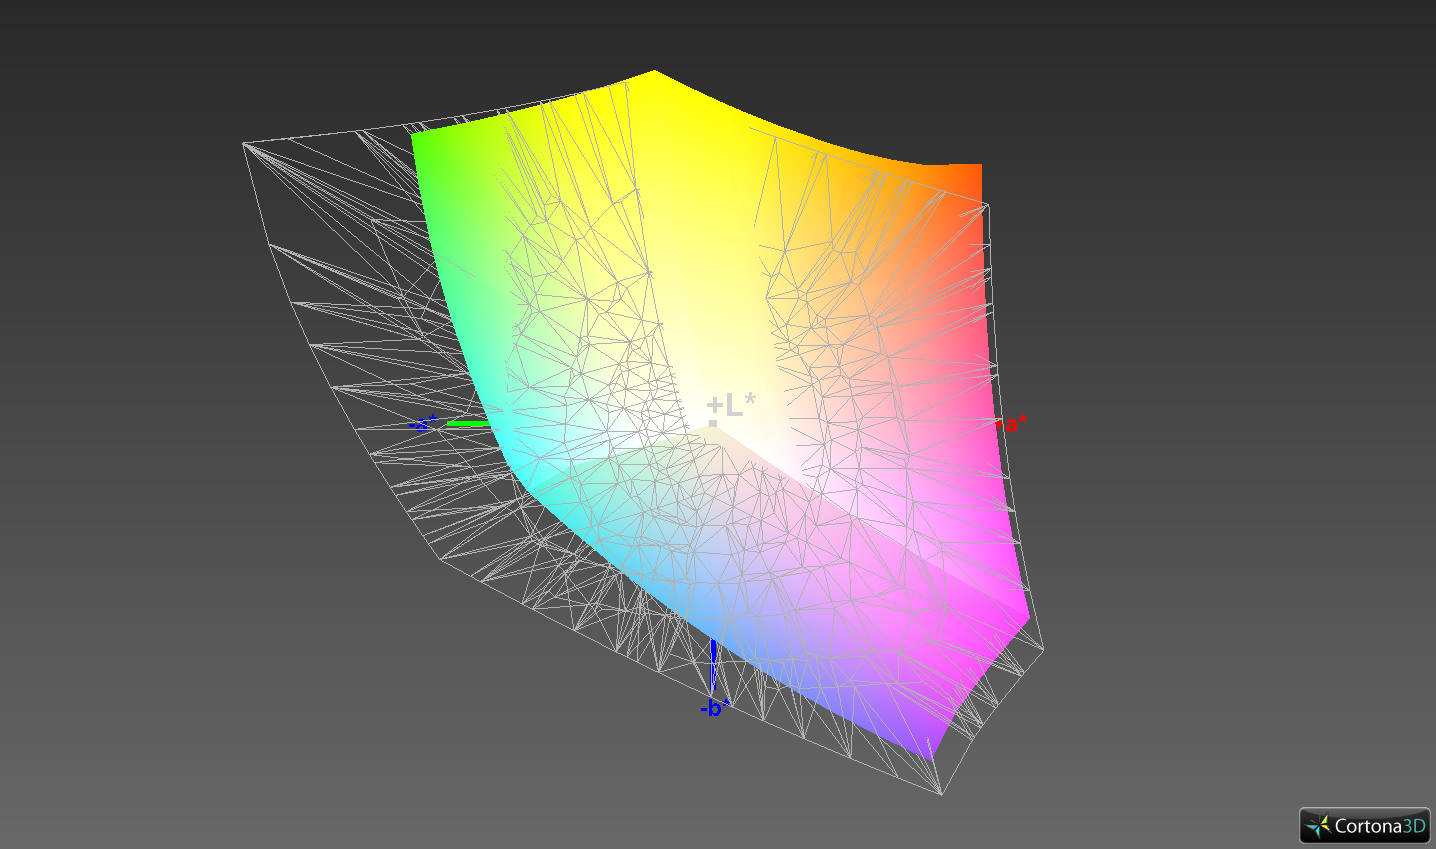
100% sRGB (Argyll 1.6.3 3D)
67.5% AdobeRGB 1998 (Argyll 1.6.3 3D)
76.6% AdobeRGB 1998 (Argyll 3D)
100% sRGB (Argyll 3D)
77.4% Display P3 (Argyll 3D)
Gamma: 2.08
CCT: 6704 K
| Dell XPS 17 9700 i5-10300H SHP14D7, IPS, 1920x1200, 17.3" | LG Gram 17 17Z90N-V.AA77G LG Display LP170WQ1-SPA1, IPS, 2560x1600, 17" | Dell XPS 17 9700 Core i7 RTX 2060 Max-Q Sharp LQ170R1, IPS, 3840x2400, 17" | Honor MagicBook Pro (AMD) N161HCA-EA3, IPS, 1920x1080, 16.1" | Dell XPS 15 9500 Core i5 Sharp LQ156N1, IPS, 1920x1200, 15.6" | |
|---|---|---|---|---|---|
| Display | -14% | 16% | -17% | 3% | |
| Display P3 Coverage (%) | 77.4 | 62.9 -19% | 90.5 17% | 67.5 -13% | 81.5 5% |
| sRGB Coverage (%) | 100 | 92.7 -7% | 100 0% | 69.7 -30% | 100 0% |
| AdobeRGB 1998 Coverage (%) | 76.6 | 63.6 -17% | 99.8 30% | 69.7 -9% | 79.6 4% |
| Response Times | 32% | 15% | 35% | 27% | |
| Response Time Grey 50% / Grey 80% * (ms) | 60.4 ? | 43 ? 29% | 51.2 ? 15% | 37.6 ? 38% | 42 ? 30% |
| Response Time Black / White * (ms) | 37.6 ? | 25 ? 34% | 32 ? 15% | 25.6 ? 32% | 28.8 ? 23% |
| PWM Frequency (Hz) | 2500 ? | 25250 ? | |||
| Screen | -66% | -30% | 16% | -26% | |
| Brightness middle (cd/m²) | 636 | 393 -38% | 539.4 -15% | 337 -47% | 592 -7% |
| Brightness (cd/m²) | 580 | 354 -39% | 494 -15% | 312 -46% | 565 -3% |
| Brightness Distribution (%) | 86 | 84 -2% | 84 -2% | 89 3% | 85 -1% |
| Black Level * (cd/m²) | 0.34 | 0.365 -7% | 0.32 6% | 0.2 41% | 0.46 -35% |
| Contrast (:1) | 1871 | 1077 -42% | 1686 -10% | 1685 -10% | 1287 -31% |
| Colorchecker dE 2000 * | 2.4 | 4.83 -101% | 4.12 -72% | 0.8 67% | 3.19 -33% |
| Colorchecker dE 2000 max. * | 3.5 | 11.6 -231% | 7.65 -119% | 1.1 69% | 5.45 -56% |
| Colorchecker dE 2000 calibrated * | 1.5 | 1.22 19% | 3.91 -161% | 0.7 53% | 2.03 -35% |
| Greyscale dE 2000 * | 2 | 7.37 -269% | 1.5 25% | 1 50% | 3.9 -95% |
| Gamma | 2.08 106% | 2.36 93% | 2.15 102% | 2.2 100% | 2.25 98% |
| CCT | 6704 97% | 6668 97% | 6438 101% | 6538 99% | 6522 100% |
| Color Space (Percent of AdobeRGB 1998) (%) | 67.5 | 59 -13% | 90.4 34% | 63.8 -5% | 71.6 6% |
| Color Space (Percent of sRGB) (%) | 100 | 93 -7% | 100 0% | 99.5 0% | 100 0% |
| Média Total (Programa/Configurações) | -16% /
-44% | 0% /
-16% | 11% /
12% | 1% /
-14% |
* ... menor é melhor
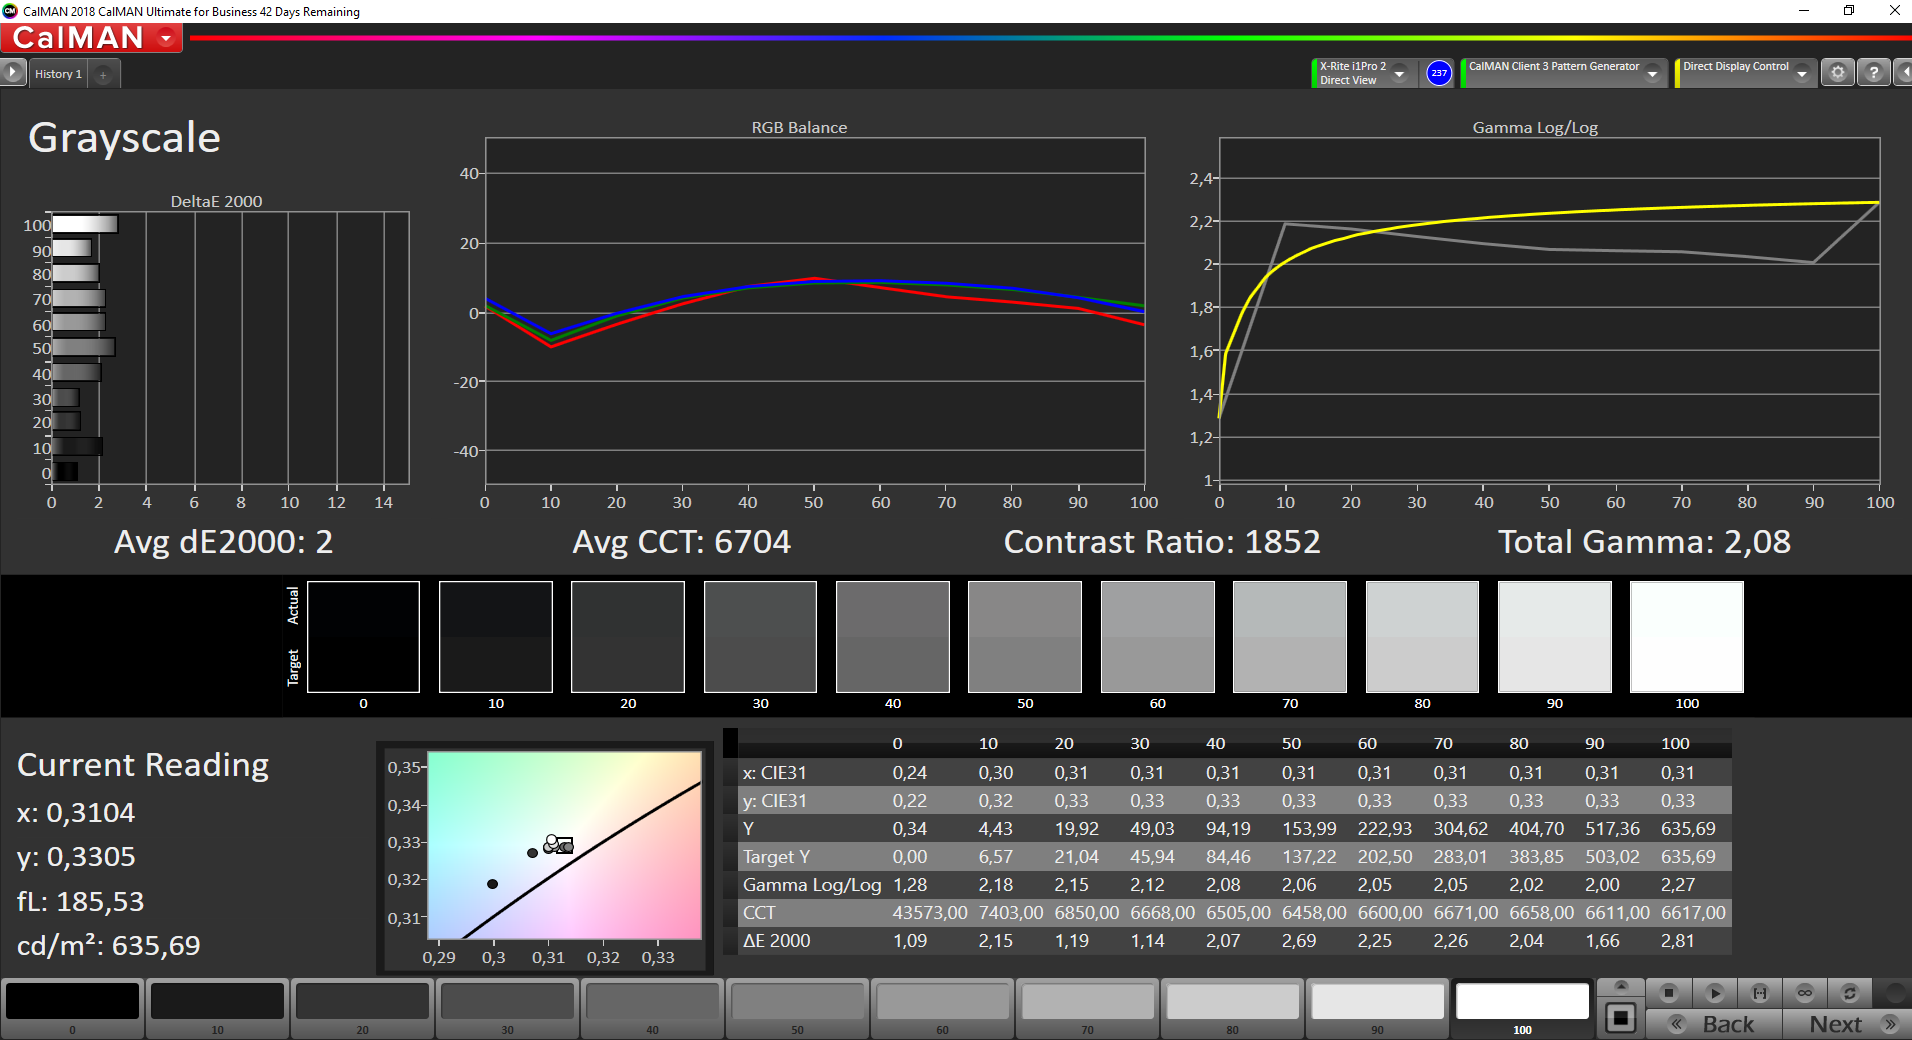
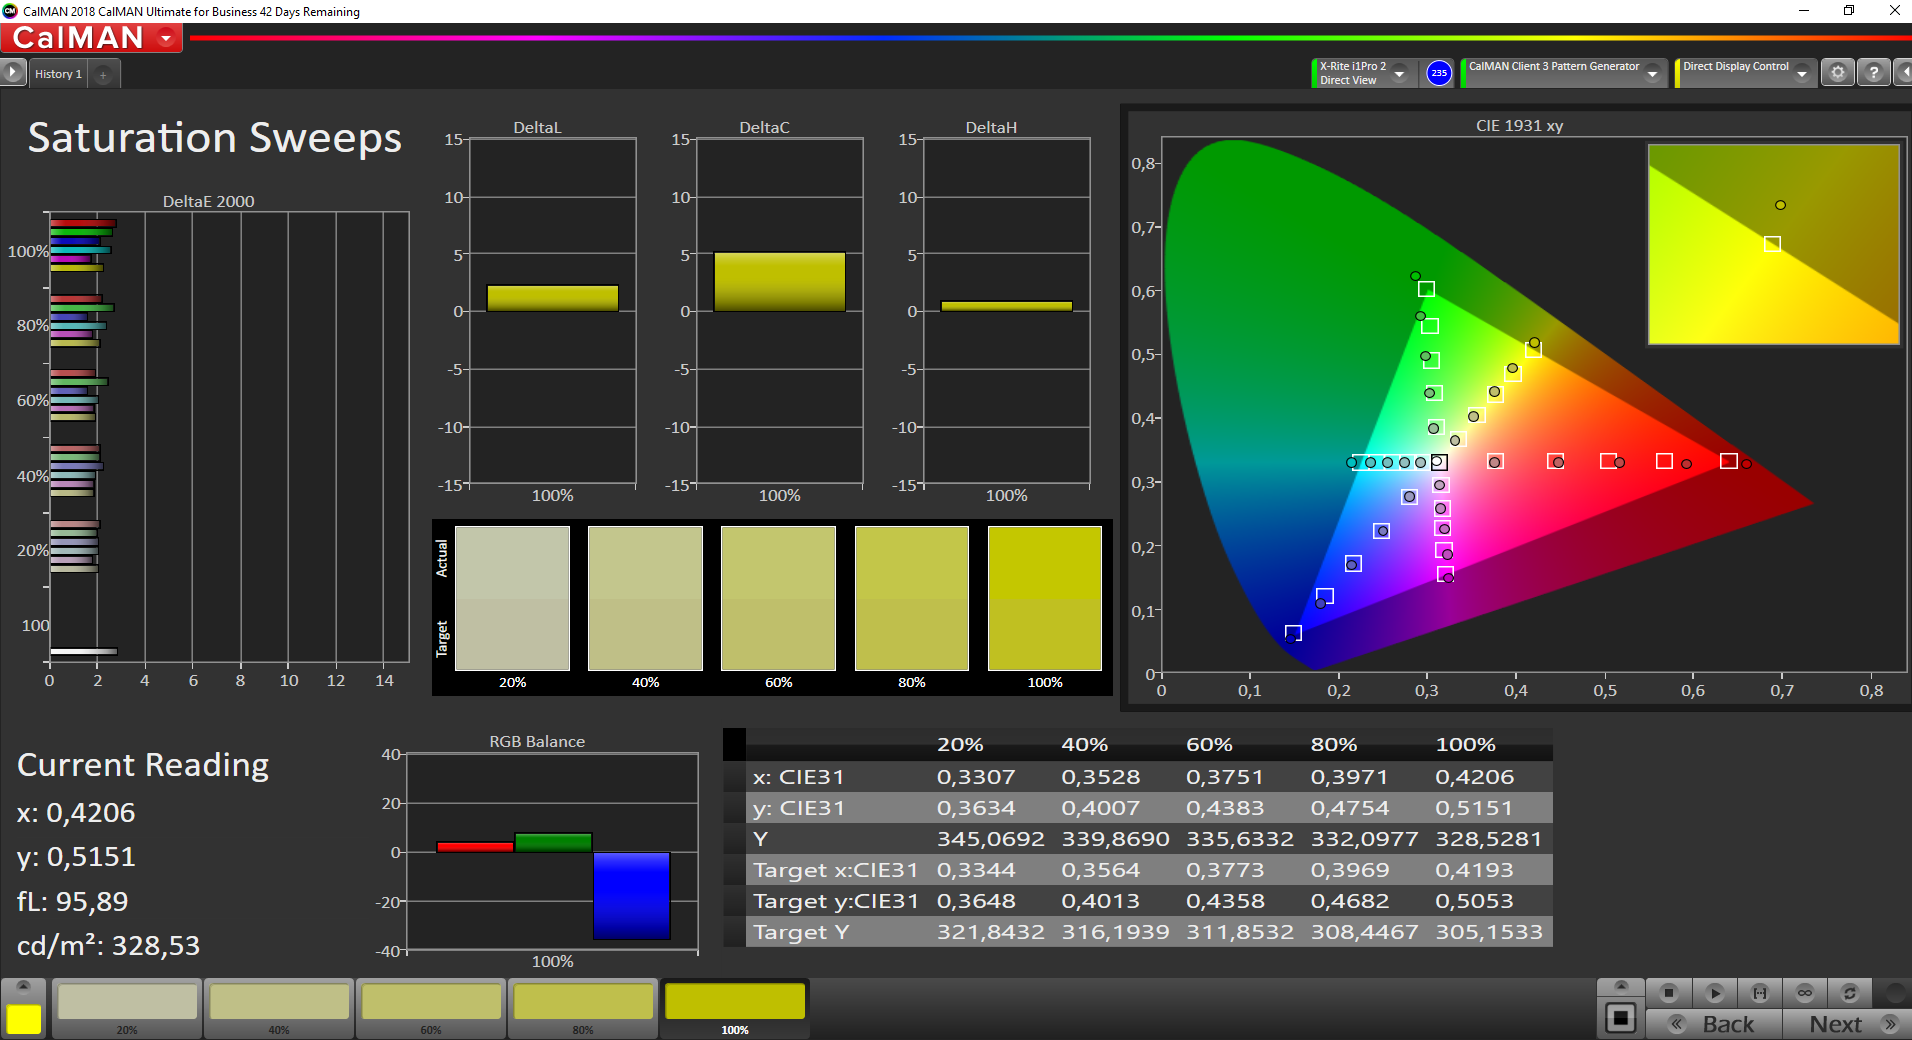
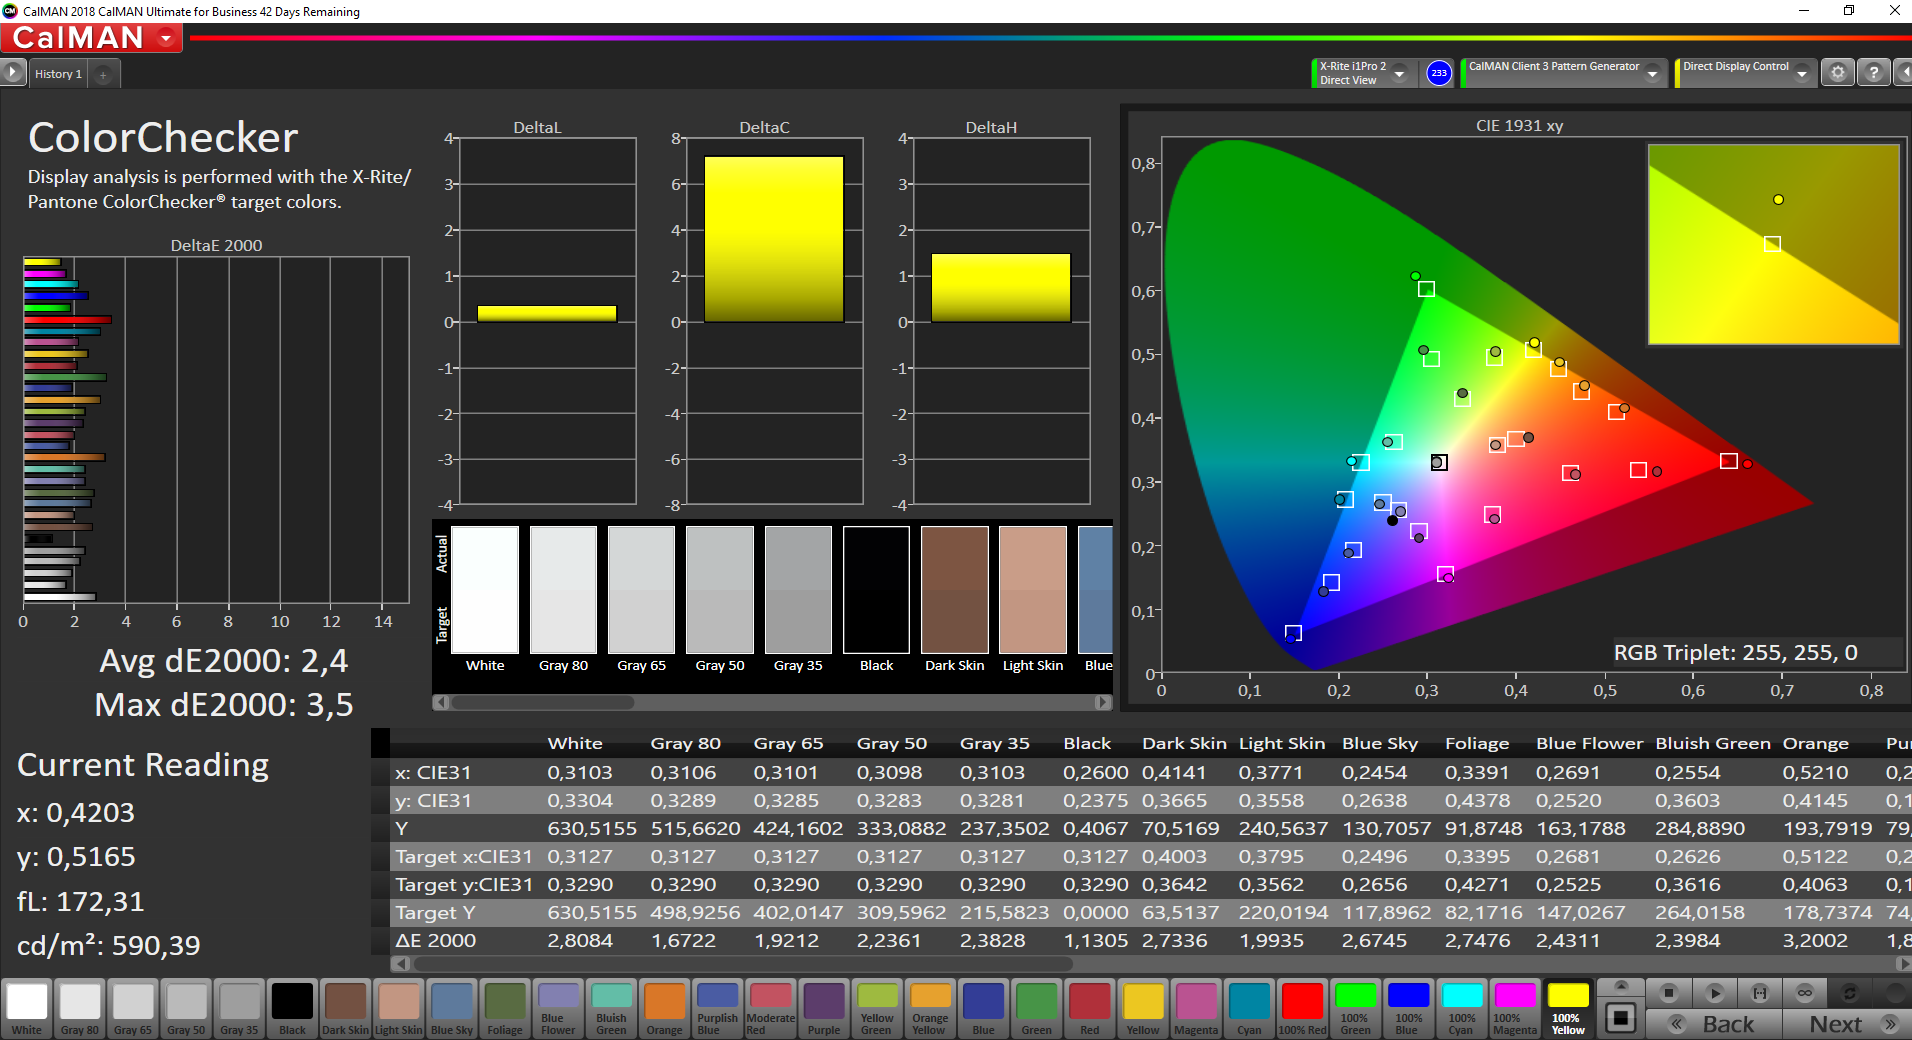
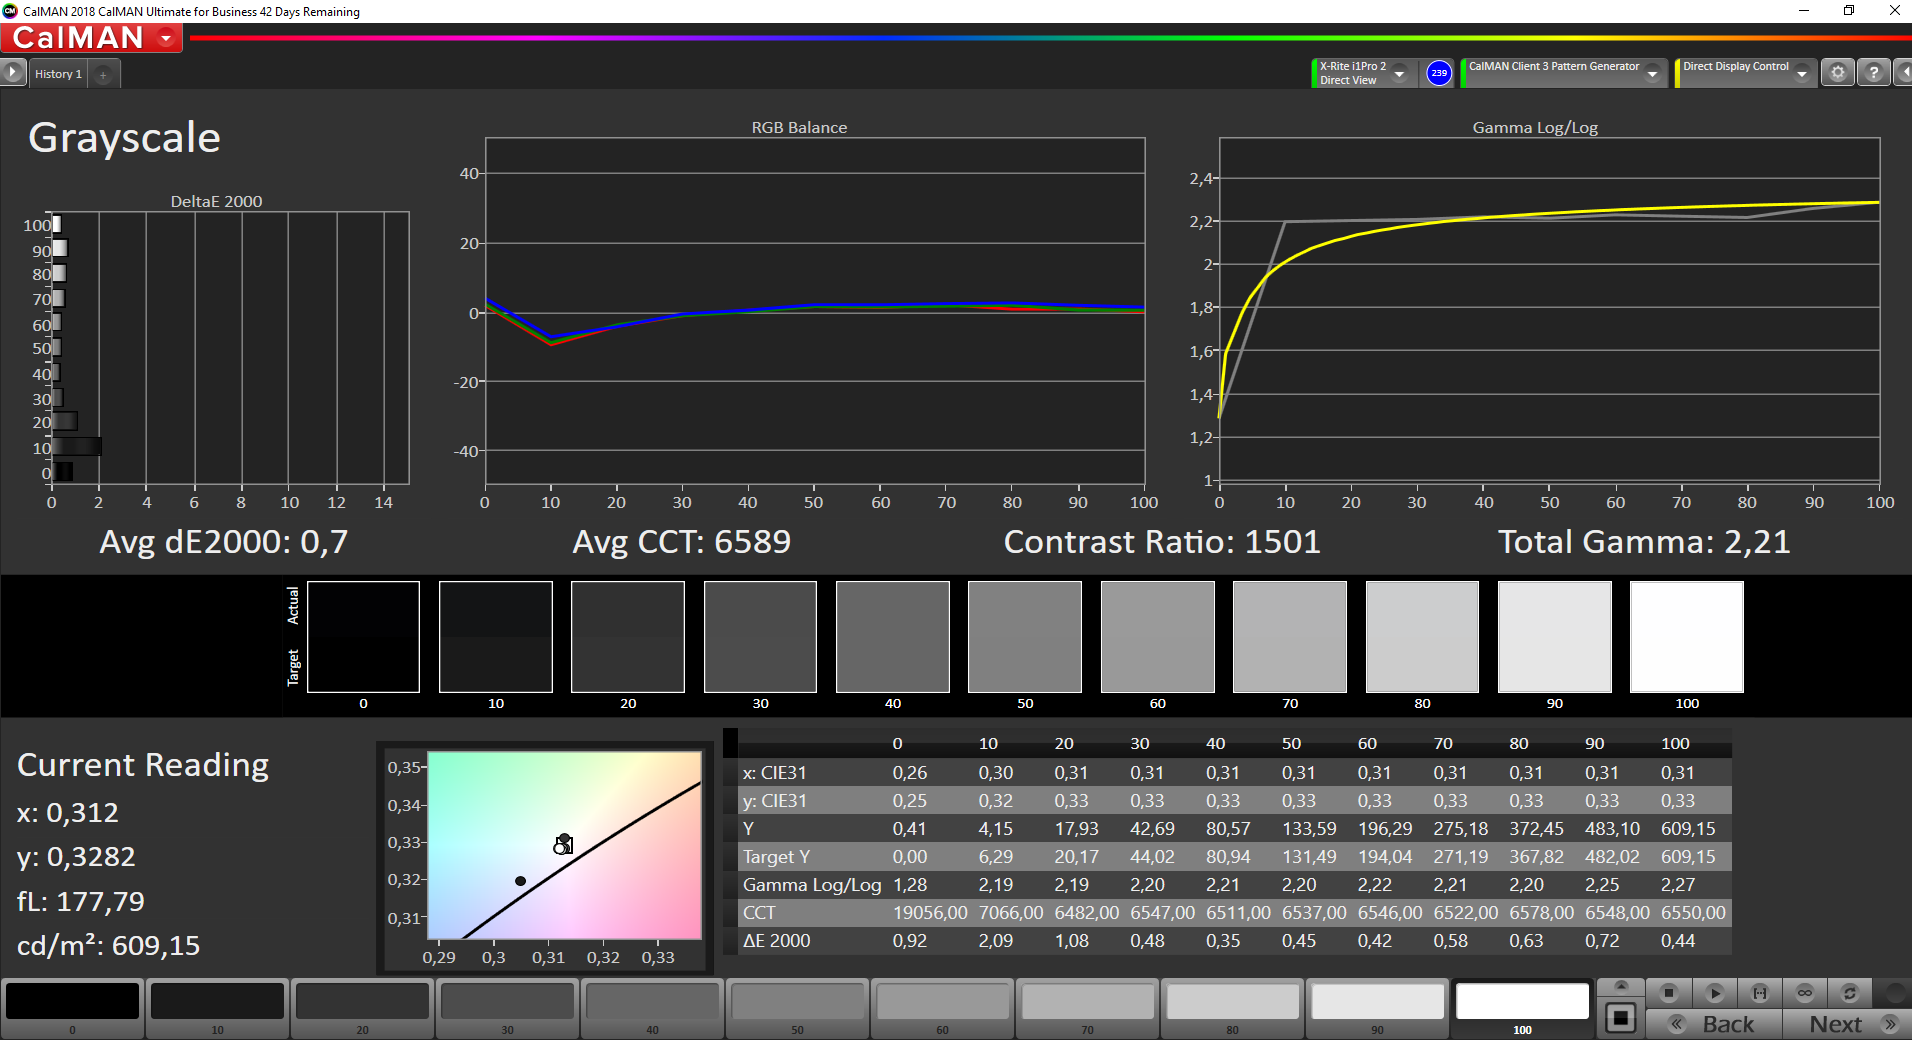

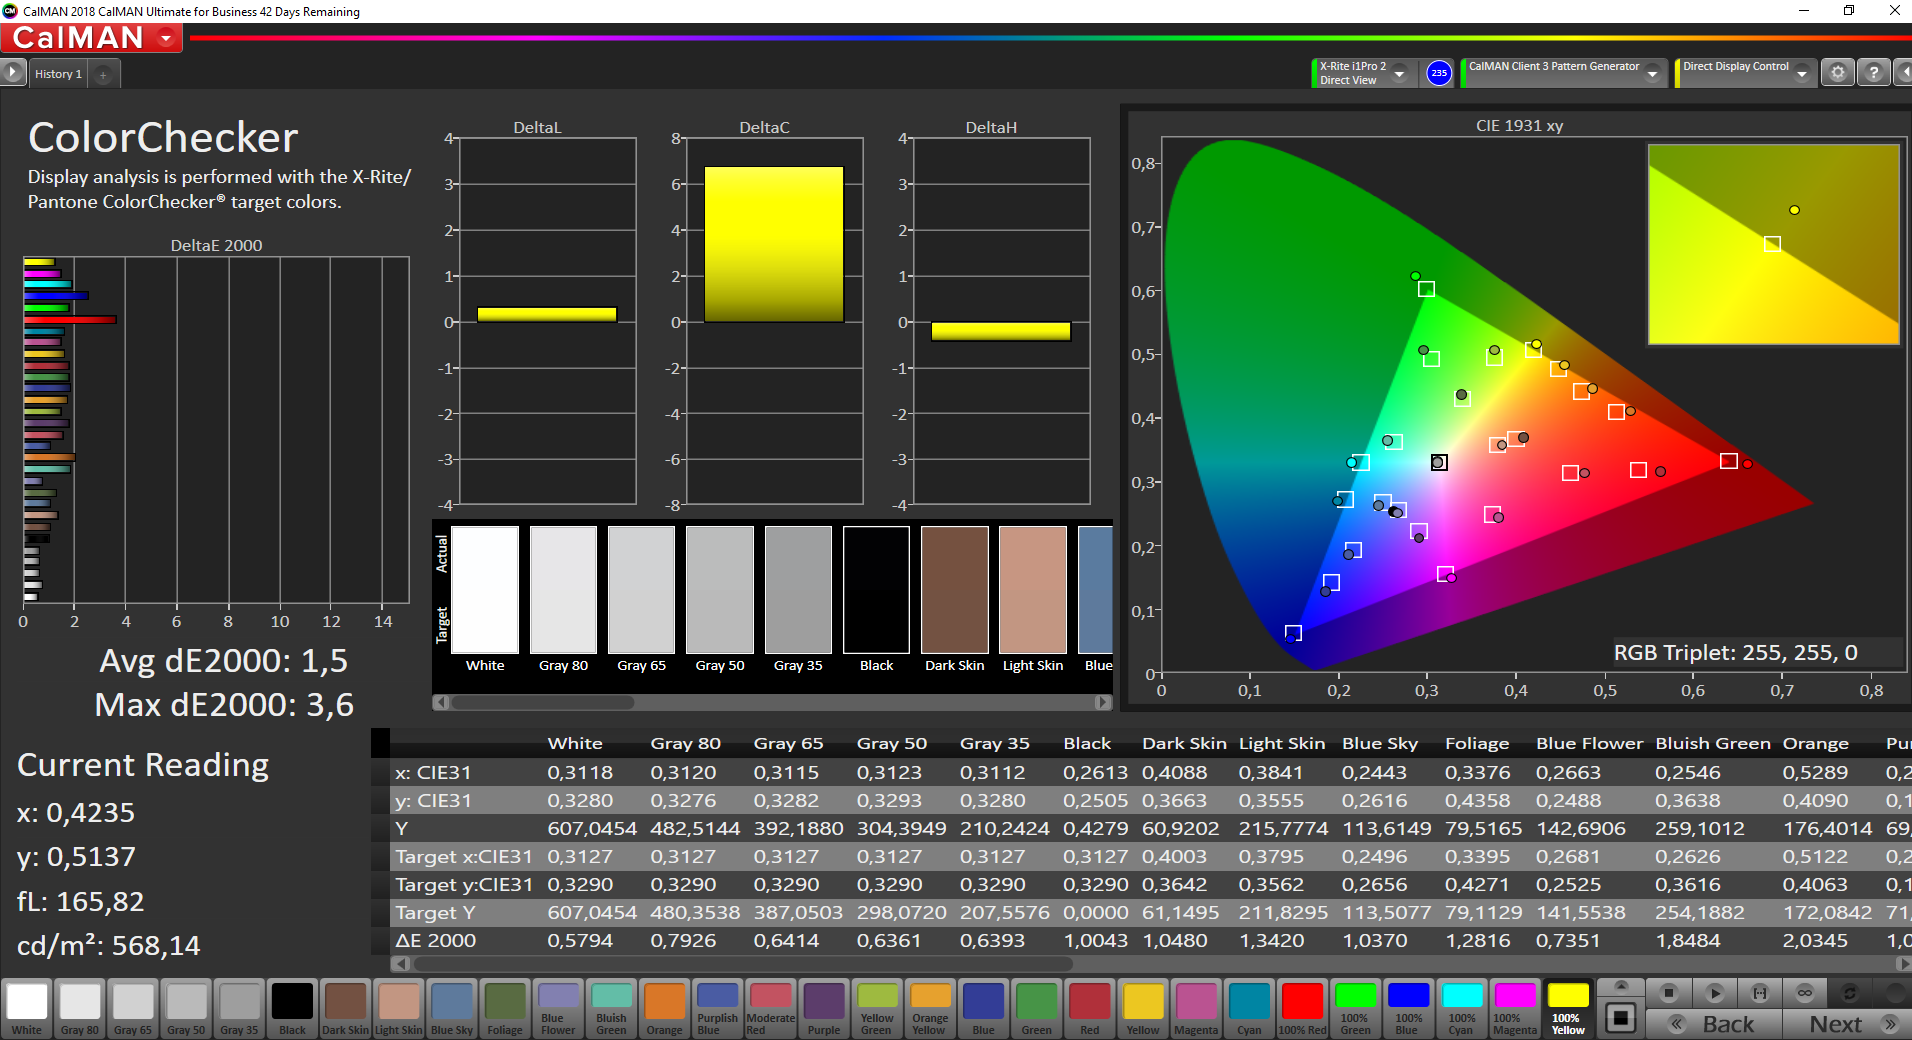
Utilizamos o software profissional CalMAN em combinação com o espectrofotômetro X-Rite i1 Pro 2 para nossos testes. A maioria dos valores já são muito bons fora da caixa e apenas algumas cores excedem um desvio de 3 (comparado com a gama de cores de referência sRGB). Não há um molde de cor visível, portanto a calibração só é realmente necessária quando se deseja editar imagens ou vídeos na gama sRGB, que é coberta completamente pelo painel. Nossa calibração (gratuita para download na caixa acima) melhora ainda mais o desempenho do painel
Exibir tempos de resposta
| ↔ Tempo de resposta preto para branco | ||
|---|---|---|
| 37.6 ms ... ascensão ↗ e queda ↘ combinadas | ↗ 20 ms ascensão | 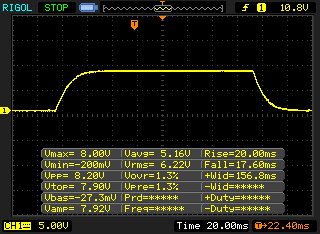 |
| ↘ 17.6 ms queda | ||
| A tela mostra taxas de resposta lentas em nossos testes e será insatisfatória para os jogadores. Em comparação, todos os dispositivos testados variam de 0.1 (mínimo) a 240 (máximo) ms. » 95 % de todos os dispositivos são melhores. Isso significa que o tempo de resposta medido é pior que a média de todos os dispositivos testados (19.8 ms). | ||
| ↔ Tempo de resposta 50% cinza a 80% cinza | ||
| 60.4 ms ... ascensão ↗ e queda ↘ combinadas | ↗ 30.8 ms ascensão | 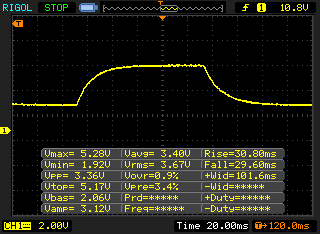 |
| ↘ 29.6 ms queda | ||
| A tela mostra taxas de resposta lentas em nossos testes e será insatisfatória para os jogadores. Em comparação, todos os dispositivos testados variam de 0.165 (mínimo) a 636 (máximo) ms. » 96 % de todos os dispositivos são melhores. Isso significa que o tempo de resposta medido é pior que a média de todos os dispositivos testados (31 ms). | ||
Cintilação da tela / PWM (modulação por largura de pulso)
| Tela tremeluzindo/PWM detectado | 2500 Hz | ≤ 30 % configuração de brilho | 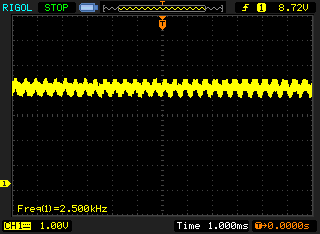 |
A luz de fundo da tela pisca em 2500 Hz (pior caso, por exemplo, utilizando PWM) Cintilação detectada em uma configuração de brilho de 30 % e abaixo. Não deve haver cintilação ou PWM acima desta configuração de brilho. A frequência de 2500 Hz é bastante alta, então a maioria dos usuários sensíveis ao PWM não deve notar nenhuma oscilação. [pwm_comparison] Em comparação: 52 % de todos os dispositivos testados não usam PWM para escurecer a tela. Se PWM foi detectado, uma média de 7754 (mínimo: 5 - máximo: 343500) Hz foi medida. | |||
Graças ao alto brilho e à superfície mate do painel, a tela FHD tem um desempenho muito bom ao ar livre. A luz solar direta ainda é obviamente um desafio, mas você deve ser capaz de encontrar uma posição adequada para uma experiência de visualização confortável na maioria das situações. A estabilidade do ângulo de visão do painel IPS também é muito boa


Desempenho - Quad-core com NVMe-SSD
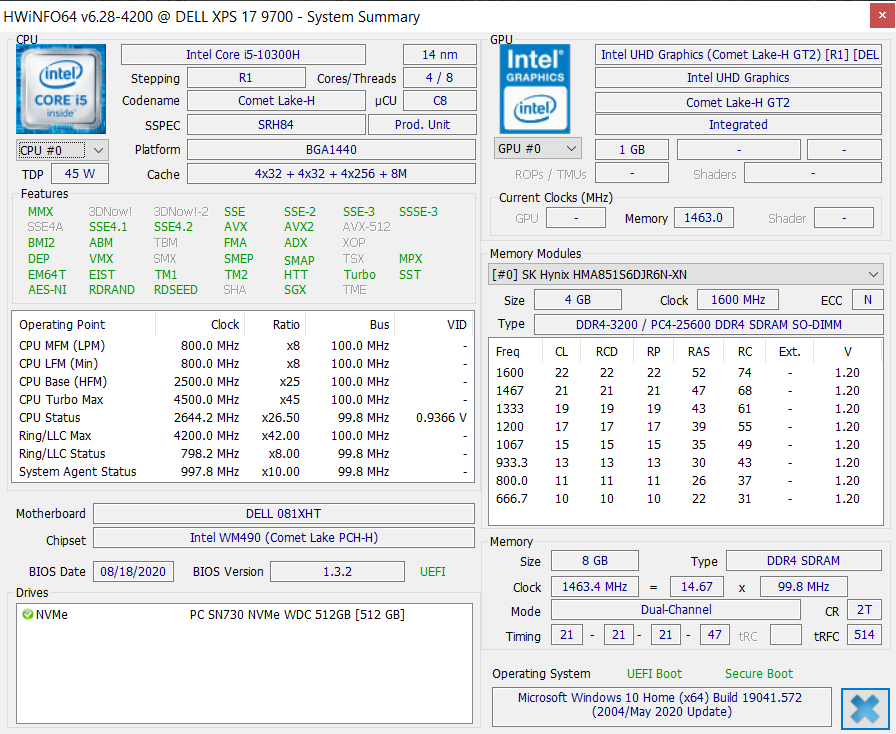
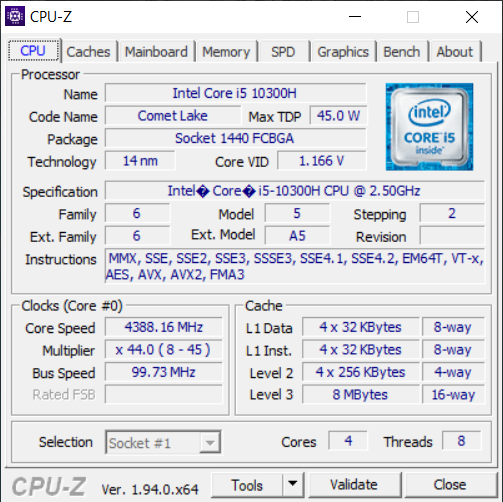
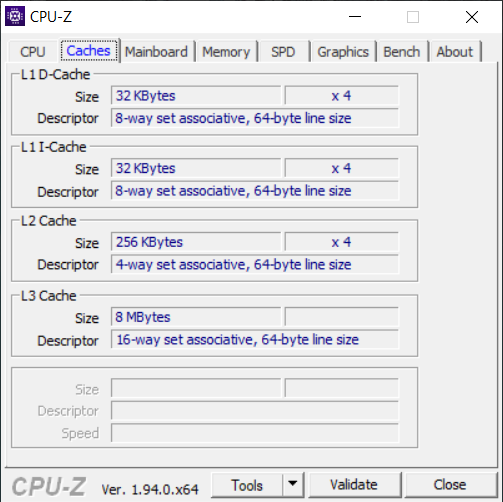
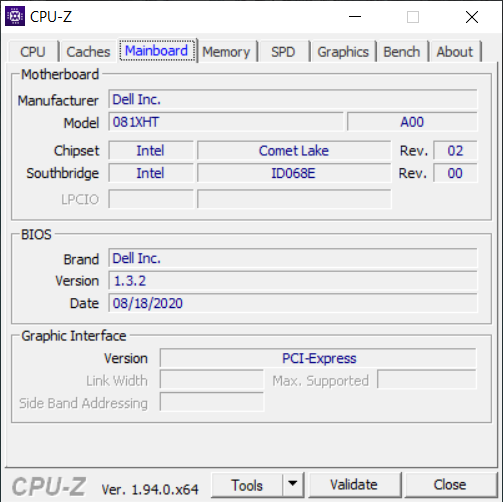
Processador - Intel Comet Lake Quad-core
O modelo básico do XPS 17 é equipado com um processador quad-core da Intel. O Core i5-10300H (Comet Lake, 10ª geração) tem um TDP especificado de 45 W e os 4 núcleos (8 fios) podem funcionar em até 4,5 GHz (4,2 quando todos os núcleos estão estressados ao mesmo tempo). O desempenho é obviamente mais do que suficiente para as tarefas diárias comuns, mas temos que dizer que gostaríamos de ter visto pelo menos uma CPU moderna de 6 núcleos pelo alto preço.
A comparação com as CPUs de 45 W da AMD é outro problema para o XPS 17, o que é evidente quando se comparam os resultados com o Honor MagicBook Pro. Seu Ryzen 5 4600H (6 núcleos) é um pouco mais lento nos testes de um só núcleo, mas é claramente superior em todos os benchmarks de múltiplos núcleos.
A utilização do desempenho do XPS 17 é geralmente boa e se situa a 45 W, mas pensamos que a Dell poderia ter aumentado os limites já que não há GPU dedicado que requeira resfriamento. O consumo da CPU é imediatamente limitado a 45 W na bateria, mas isto não afeta realmente o desempenho
Cinebench R15: CPU Single 64Bit | CPU Multi 64Bit
Blender: v2.79 BMW27 CPU
7-Zip 18.03: 7z b 4 -mmt1 | 7z b 4
Geekbench 5.5: Single-Core | Multi-Core
HWBOT x265 Benchmark v2.2: 4k Preset
LibreOffice : 20 Documents To PDF
R Benchmark 2.5: Overall mean
| Cinebench R20 / CPU (Single Core) | |
| Média da turma Multimedia (425 - 853, n=57, últimos 2 anos) | |
| Dell XPS 17 9700 Core i7 RTX 2060 Max-Q | |
| Asus ROG Zephyrus M15 GU502LU-BI7N4 | |
| Dell XPS 17 9700 i5-10300H | |
| Honor MagicBook Pro (AMD) | |
| Dell XPS 15 9500 Core i5 | |
| Média Intel Core i5-10300H (312 - 470, n=15) | |
| LG Gram 17 17Z90N-V.AA77G | |
| Cinebench R20 / CPU (Multi Core) | |
| Média da turma Multimedia (1887 - 12912, n=57, últimos 2 anos) | |
| Dell XPS 17 9700 Core i7 RTX 2060 Max-Q | |
| Asus ROG Zephyrus M15 GU502LU-BI7N4 | |
| Honor MagicBook Pro (AMD) | |
| Dell XPS 17 9700 i5-10300H | |
| Dell XPS 15 9500 Core i5 | |
| Média Intel Core i5-10300H (1397 - 2240, n=15) | |
| LG Gram 17 17Z90N-V.AA77G | |
| Cinebench R15 / CPU Single 64Bit | |
| Média da turma Multimedia (184.8 - 326, n=59, últimos 2 anos) | |
| Dell XPS 17 9700 Core i7 RTX 2060 Max-Q | |
| Asus ROG Zephyrus M15 GU502LU-BI7N4 | |
| Dell XPS 17 9700 i5-10300H | |
| Dell XPS 15 9500 Core i5 | |
| Honor MagicBook Pro (AMD) | |
| Média Intel Core i5-10300H (108 - 194, n=17) | |
| LG Gram 17 17Z90N-V.AA77G | |
| Cinebench R15 / CPU Multi 64Bit | |
| Média da turma Multimedia (856 - 5224, n=61, últimos 2 anos) | |
| Dell XPS 17 9700 Core i7 RTX 2060 Max-Q | |
| Honor MagicBook Pro (AMD) | |
| Asus ROG Zephyrus M15 GU502LU-BI7N4 | |
| Dell XPS 17 9700 i5-10300H | |
| Dell XPS 15 9500 Core i5 | |
| Média Intel Core i5-10300H (536 - 921, n=17) | |
| LG Gram 17 17Z90N-V.AA77G | |
| Blender / v2.79 BMW27 CPU | |
| LG Gram 17 17Z90N-V.AA77G | |
| Dell XPS 17 9700 i5-10300H | |
| Média Intel Core i5-10300H (479 - 555, n=14) | |
| Dell XPS 15 9500 Core i5 | |
| Honor MagicBook Pro (AMD) | |
| Asus ROG Zephyrus M15 GU502LU-BI7N4 | |
| Dell XPS 17 9700 Core i7 RTX 2060 Max-Q | |
| Média da turma Multimedia (100 - 557, n=58, últimos 2 anos) | |
| 7-Zip 18.03 / 7z b 4 -mmt1 | |
| Média da turma Multimedia (3666 - 7545, n=56, últimos 2 anos) | |
| Dell XPS 17 9700 Core i7 RTX 2060 Max-Q | |
| Asus ROG Zephyrus M15 GU502LU-BI7N4 | |
| Dell XPS 17 9700 i5-10300H | |
| Dell XPS 15 9500 Core i5 | |
| Média Intel Core i5-10300H (2945 - 4956, n=14) | |
| Honor MagicBook Pro (AMD) | |
| LG Gram 17 17Z90N-V.AA77G | |
| 7-Zip 18.03 / 7z b 4 | |
| Média da turma Multimedia (26062 - 130368, n=55, últimos 2 anos) | |
| Dell XPS 17 9700 Core i7 RTX 2060 Max-Q | |
| Honor MagicBook Pro (AMD) | |
| Asus ROG Zephyrus M15 GU502LU-BI7N4 | |
| Dell XPS 15 9500 Core i5 | |
| Dell XPS 17 9700 i5-10300H | |
| Média Intel Core i5-10300H (15146 - 24841, n=14) | |
| LG Gram 17 17Z90N-V.AA77G | |
| Geekbench 5.5 / Single-Core | |
| Média da turma Multimedia (805 - 2974, n=56, últimos 2 anos) | |
| LG Gram 17 17Z90N-V.AA77G | |
| Dell XPS 17 9700 Core i7 RTX 2060 Max-Q | |
| Dell XPS 17 9700 i5-10300H | |
| Asus ROG Zephyrus M15 GU502LU-BI7N4 | |
| Dell XPS 15 9500 Core i5 | |
| Média Intel Core i5-10300H (703 - 1241, n=16) | |
| Honor MagicBook Pro (AMD) | |
| Geekbench 5.5 / Multi-Core | |
| Média da turma Multimedia (4652 - 20422, n=56, últimos 2 anos) | |
| Dell XPS 17 9700 Core i7 RTX 2060 Max-Q | |
| Asus ROG Zephyrus M15 GU502LU-BI7N4 | |
| Honor MagicBook Pro (AMD) | |
| Dell XPS 15 9500 Core i5 | |
| Dell XPS 17 9700 i5-10300H | |
| Média Intel Core i5-10300H (2783 - 4728, n=16) | |
| LG Gram 17 17Z90N-V.AA77G | |
| HWBOT x265 Benchmark v2.2 / 4k Preset | |
| Média da turma Multimedia (5.26 - 36.1, n=56, últimos 2 anos) | |
| Dell XPS 17 9700 Core i7 RTX 2060 Max-Q | |
| Asus ROG Zephyrus M15 GU502LU-BI7N4 | |
| Honor MagicBook Pro (AMD) | |
| Dell XPS 15 9500 Core i5 | |
| Média Intel Core i5-10300H (6.13 - 7.78, n=14) | |
| Dell XPS 17 9700 i5-10300H | |
| LG Gram 17 17Z90N-V.AA77G | |
| LibreOffice / 20 Documents To PDF | |
| Dell XPS 15 9500 Core i5 | |
| Honor MagicBook Pro (AMD) | |
| LG Gram 17 17Z90N-V.AA77G | |
| Média Intel Core i5-10300H (23.9 - 94, n=14) | |
| Dell XPS 17 9700 i5-10300H | |
| Média da turma Multimedia (23.9 - 146.7, n=57, últimos 2 anos) | |
| Asus ROG Zephyrus M15 GU502LU-BI7N4 | |
| Dell XPS 17 9700 Core i7 RTX 2060 Max-Q | |
| R Benchmark 2.5 / Overall mean | |
| LG Gram 17 17Z90N-V.AA77G | |
| Média Intel Core i5-10300H (0.625 - 1.088, n=14) | |
| Dell XPS 17 9700 i5-10300H | |
| Dell XPS 15 9500 Core i5 | |
| Honor MagicBook Pro (AMD) | |
| Asus ROG Zephyrus M15 GU502LU-BI7N4 | |
| Dell XPS 17 9700 Core i7 RTX 2060 Max-Q | |
| Média da turma Multimedia (0.3604 - 0.947, n=56, últimos 2 anos) | |
* ... menor é melhor
Desempenho do sistema
O XPS 17 9700 também é um sistema muito responsivo na configuração da base e não tivemos nenhum problema durante nosso período de revisão
| PCMark 8 Home Score Accelerated v2 | 3976 pontos | |
| PCMark 8 Creative Score Accelerated v2 | 4522 pontos | |
| PCMark 8 Work Score Accelerated v2 | 5037 pontos | |
| PCMark 10 Score | 4162 pontos | |
Ajuda | ||
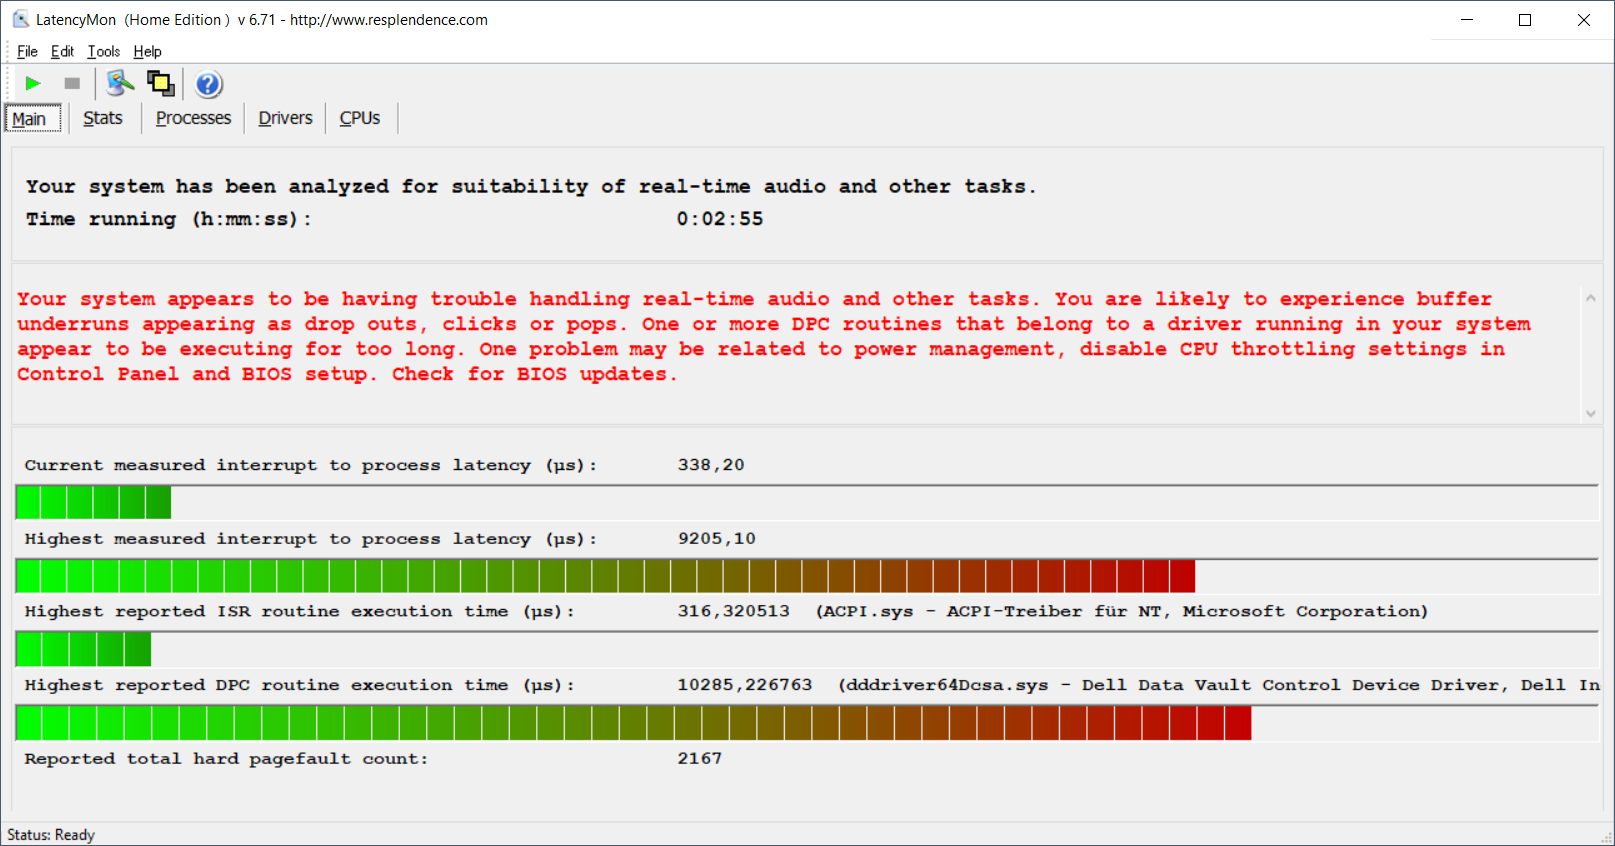
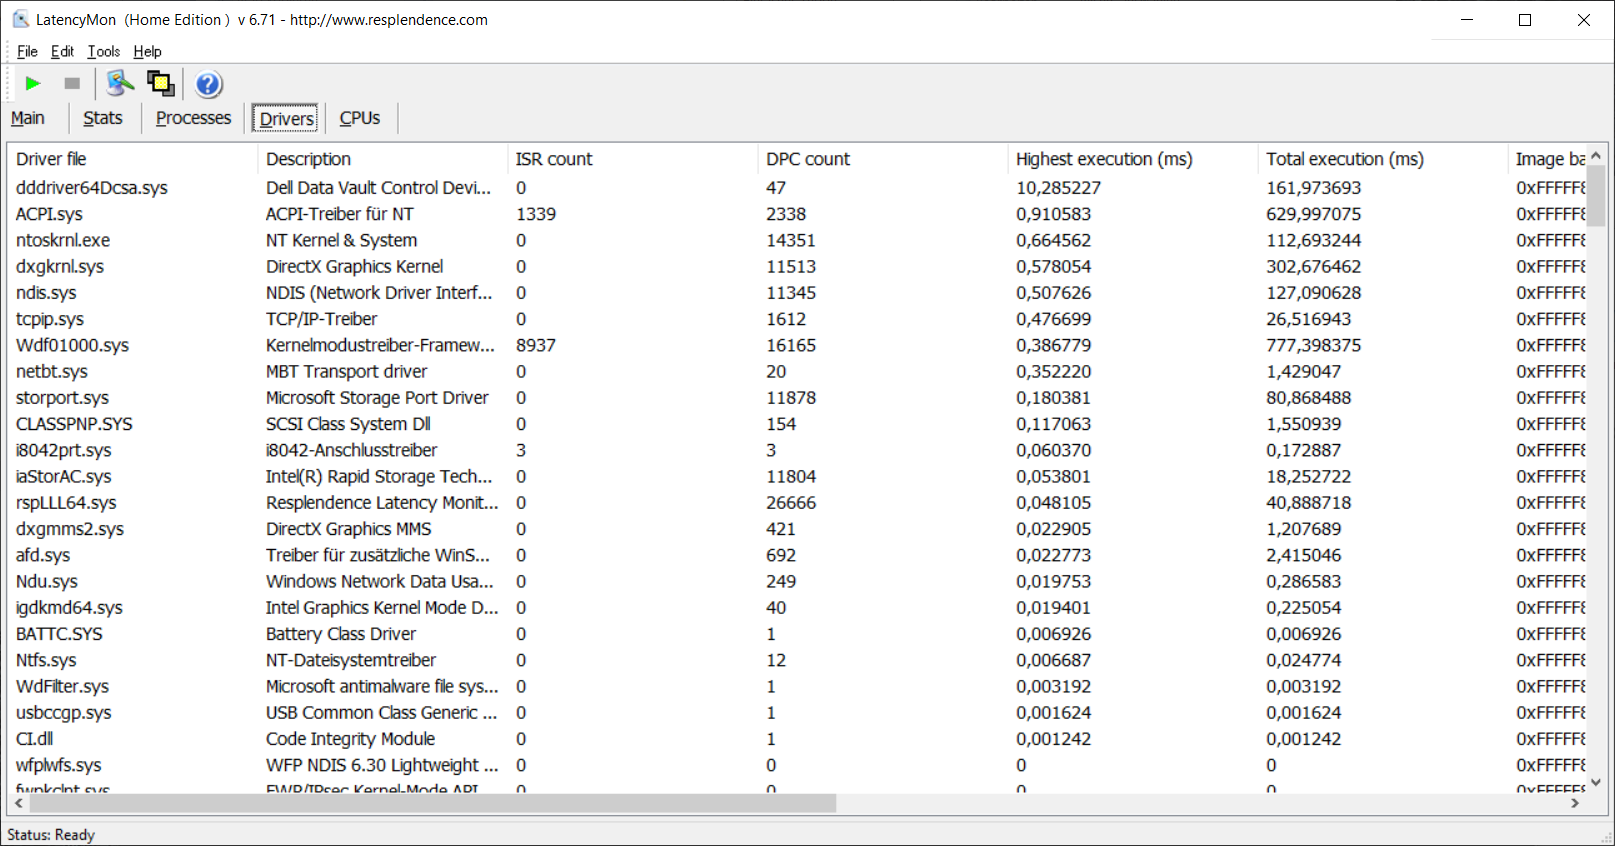
Latências DPC
Notamos problemas durante nosso teste de latência no XPS 17. O principal problema é um motorista da Dell (File Vault)
| DPC Latencies / LatencyMon - interrupt to process latency (max), Web, Youtube, Prime95 | |
| Dell XPS 17 9700 i5-10300H | |
| Dell XPS 15 9500 Core i5 | |
| Honor MagicBook Pro (AMD) | |
| Dell XPS 17 9700 Core i7 RTX 2060 Max-Q | |
| LG Gram 17 17Z90N-V.AA77G | |
* ... menor é melhor
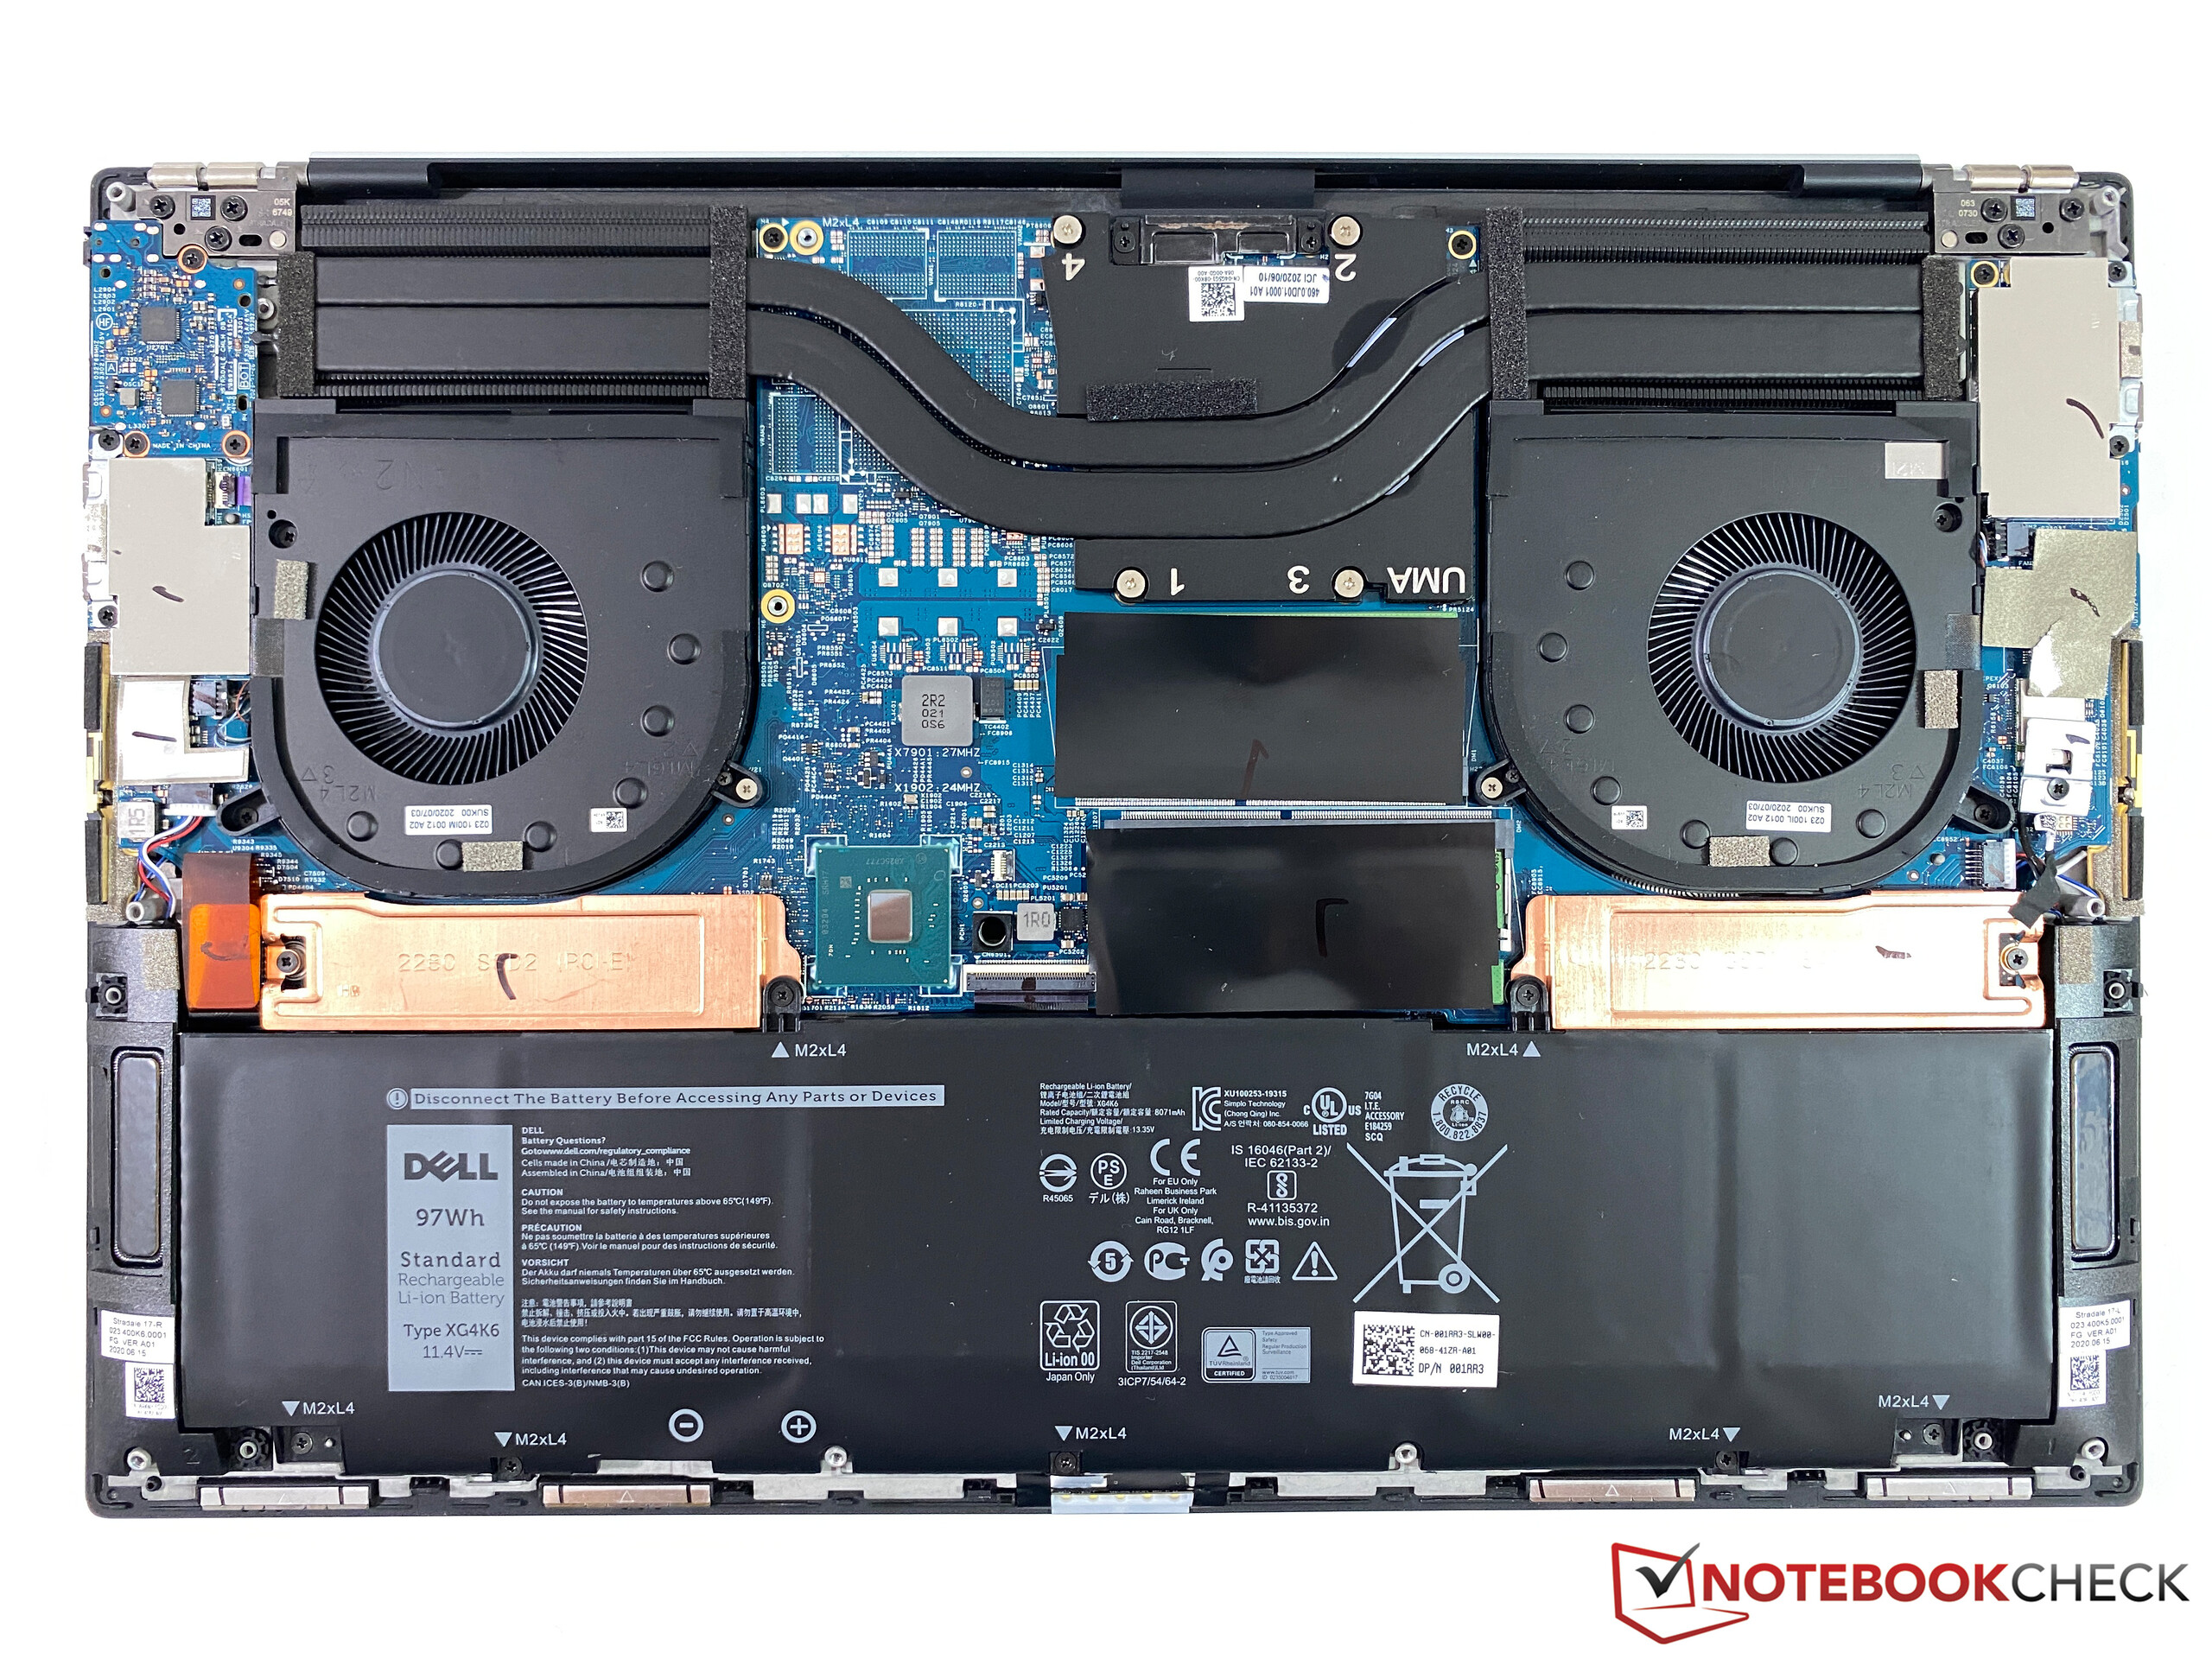
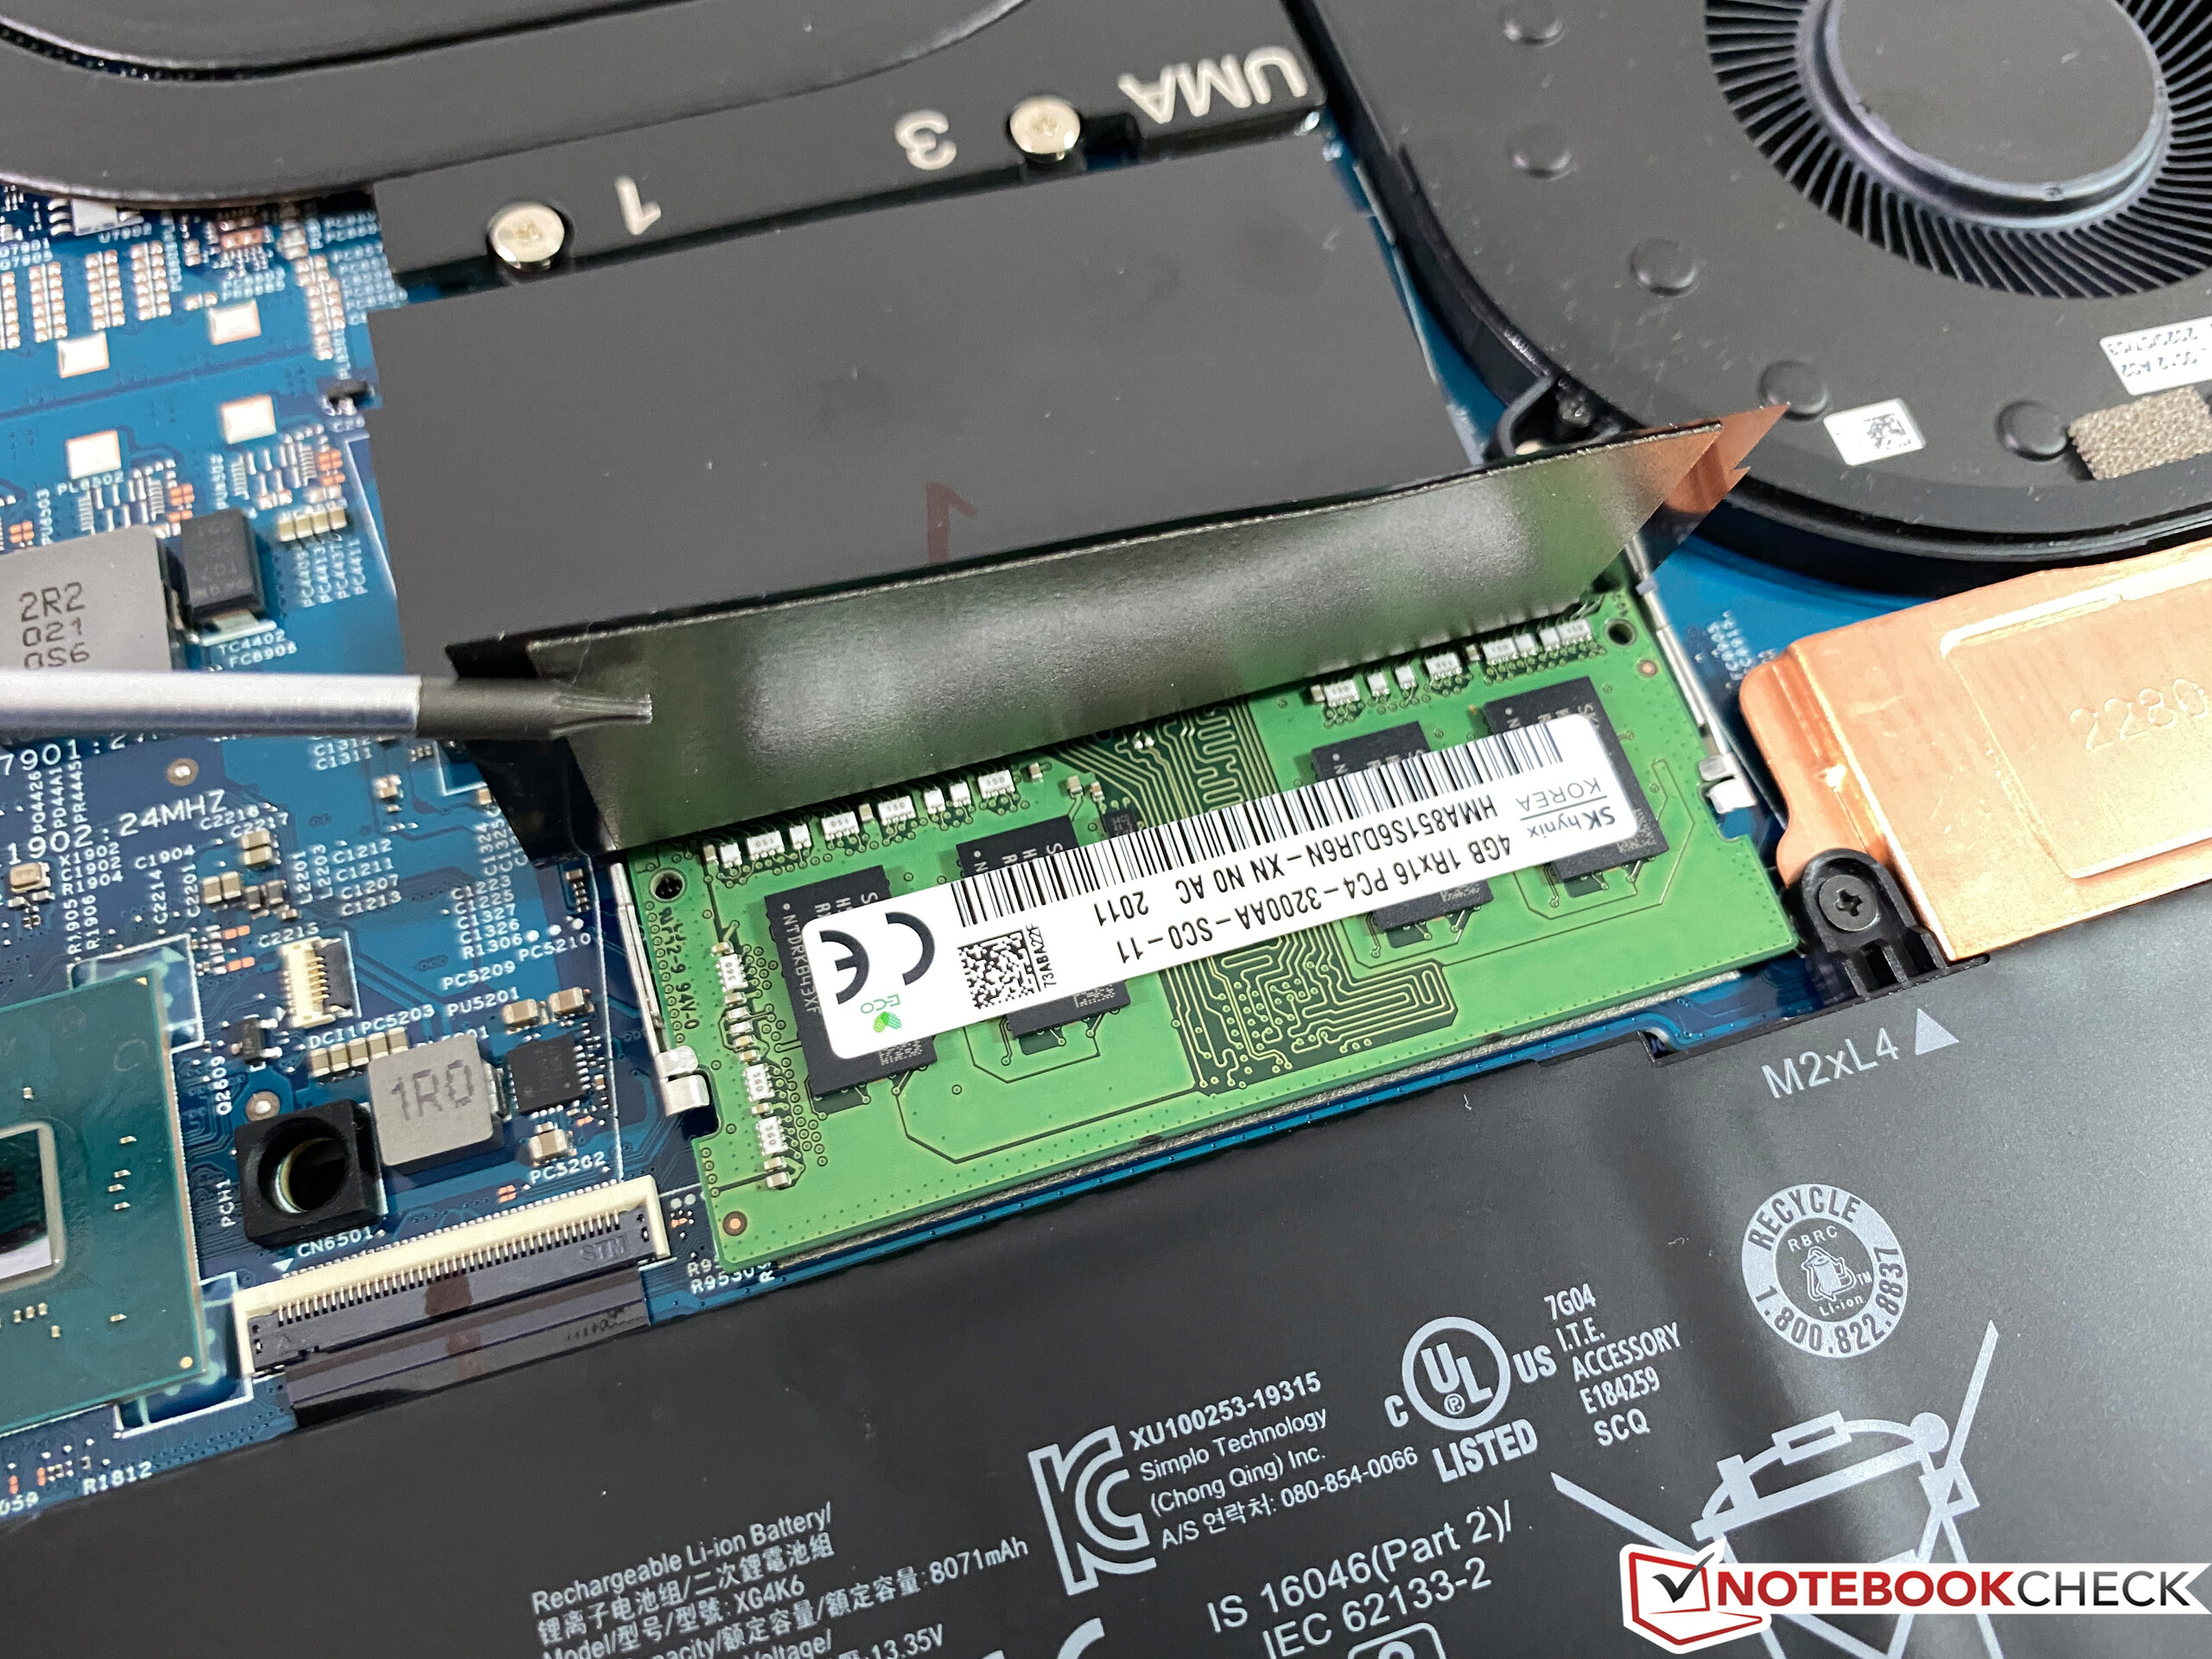
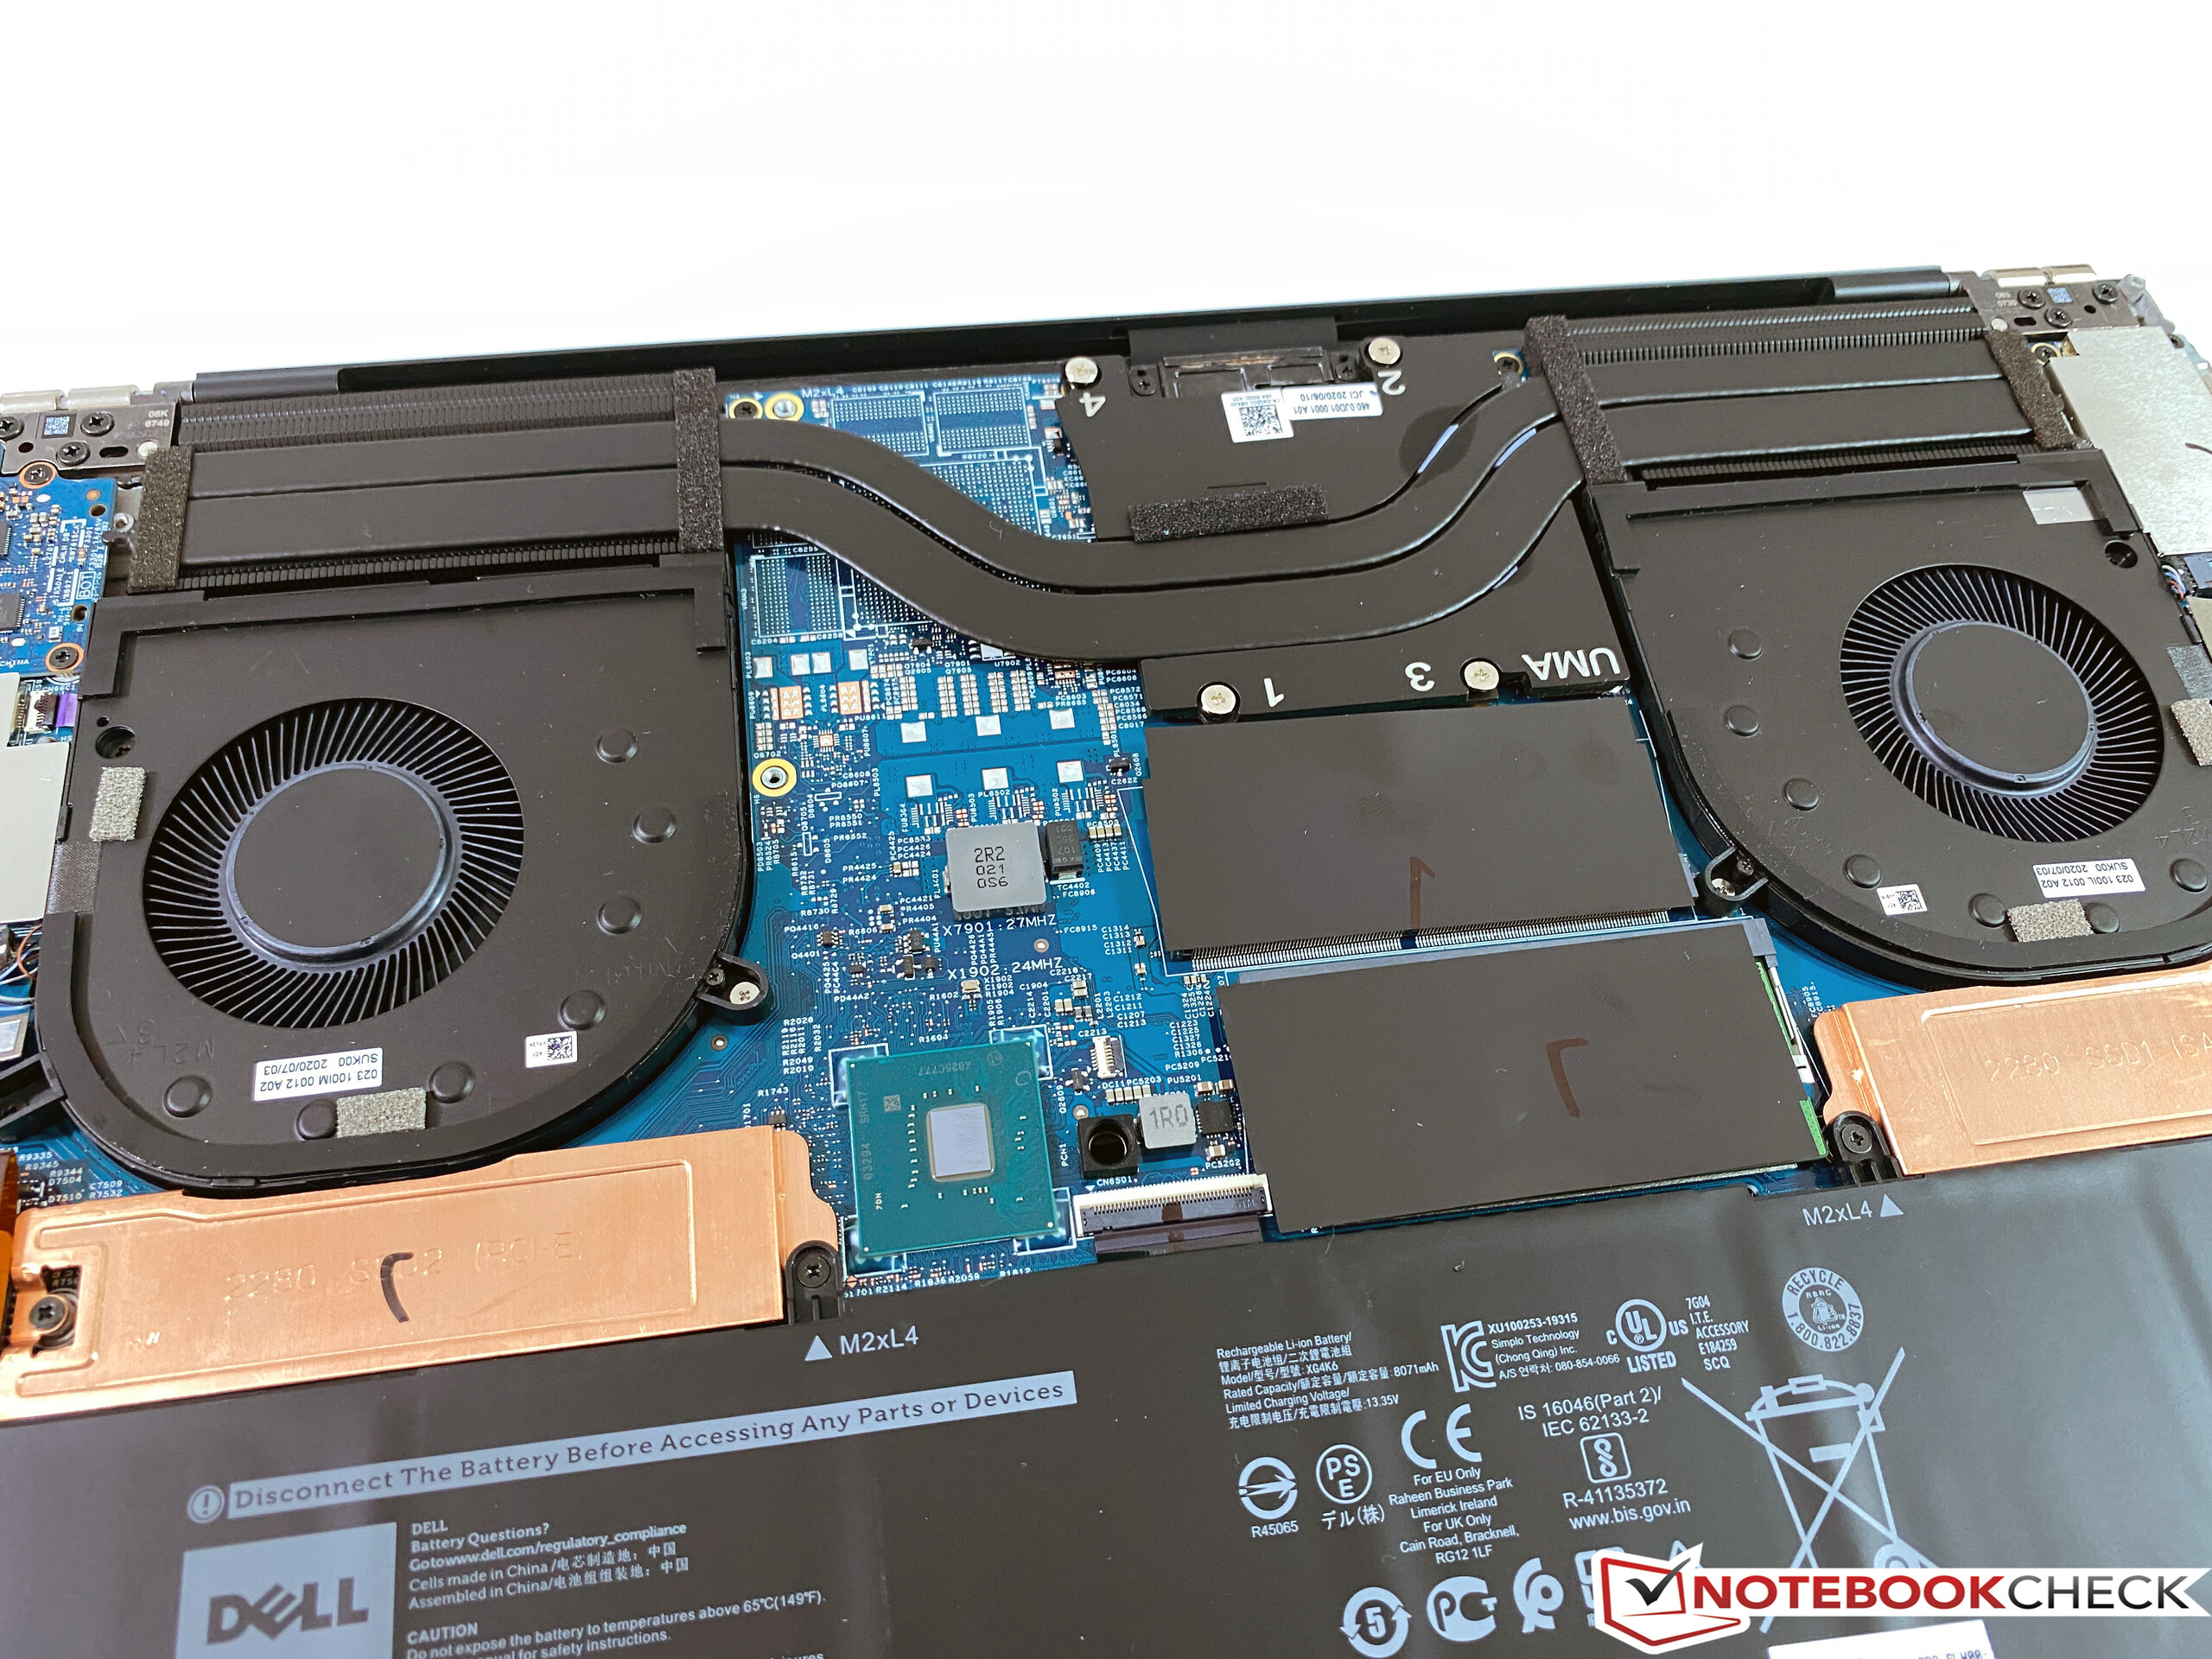
Dispositivos de armazenamento - 2x PCIe-SSD
O XPS 17 9700 oferece dois slots M.2-2280 e nosso modelo de teste está equipado com um único drive de 512 GB (416 GB disponíveis para o usuário). O SN730 da Western Digital é um NVMe-SSD rápido e tem um bom desempenho em nossos benchmarks
| Dell XPS 17 9700 i5-10300H WDC PC SN730 SDBPNTY-512G | LG Gram 17 17Z90N-V.AA77G Samsung PM981a MZVLB1T0HBLR | Dell XPS 17 9700 Core i7 RTX 2060 Max-Q Micron 2200S 1TB MTFDHBA1T0TCK | Honor MagicBook Pro (AMD) WDC PC SN730 SDBPNTY-512G | Dell XPS 15 9500 Core i5 Toshiba KBG40ZNS256G NVMe | Média WDC PC SN730 SDBPNTY-512G | |
|---|---|---|---|---|---|---|
| CrystalDiskMark 5.2 / 6 | 44% | -3% | 21% | -6% | 44% | |
| Write 4K (MB/s) | 106.9 | 162.8 52% | 64.1 -40% | 156.9 47% | 93.3 -13% | 164.3 ? 54% |
| Read 4K (MB/s) | 41.49 | 51 23% | 39.93 -4% | 48.81 18% | 45.9 11% | 48.2 ? 16% |
| Write Seq (MB/s) | 1025 | 2078 103% | 1191 16% | 1050 2% | 1211 18% | 2096 ? 104% |
| Read Seq (MB/s) | 1429 | 1991 39% | 1418 -1% | 2517 76% | 1633 14% | 2123 ? 49% |
| Write 4K Q32T1 (MB/s) | 342.8 | 440.1 28% | 450.3 31% | 408.7 19% | 273.1 -20% | 451 ? 32% |
| Read 4K Q32T1 (MB/s) | 364.2 | 450.1 24% | 365 0% | 504 38% | 356 -2% | 509 ? 40% |
| Write Seq Q32T1 (MB/s) | 1714 | 2998 75% | 1563 -9% | 1087 -37% | 1198 -30% | 2551 ? 49% |
| Read Seq Q32T1 (MB/s) | 3205 | 3562 11% | 2683 -16% | 3407 6% | 2269 -29% | 3330 ? 4% |
| AS SSD | 30% | -130% | 62% | -124% | 29% | |
| Seq Read (MB/s) | 2424 | 2722 12% | 1141 -53% | 2749 13% | 1423 -41% | 2605 ? 7% |
| Seq Write (MB/s) | 1159 | 2649 129% | 994 -14% | 2348 103% | 766 -34% | 1905 ? 64% |
| 4K Read (MB/s) | 34.68 | 52.2 51% | 31.98 -8% | 44.22 28% | 42.21 22% | 45.8 ? 32% |
| 4K Write (MB/s) | 101.7 | 132.4 30% | 61 -40% | 140.5 38% | 74.8 -26% | 155.6 ? 53% |
| 4K-64 Read (MB/s) | 985 | 886 -10% | 790 -20% | 1450 47% | 973 -1% | 1181 ? 20% |
| 4K-64 Write (MB/s) | 956 | 1074 12% | 845 -12% | 2346 145% | 218.8 -77% | 1372 ? 44% |
| Access Time Read * (ms) | 0.116 | 0.041 65% | 0.063 46% | 0.079 32% | 0.125 -8% | 0.0801 ? 31% |
| Access Time Write * (ms) | 0.036 | 0.03 17% | 0.679 -1786% | 0.027 25% | 0.552 -1433% | 0.04195 ? -17% |
| Score Read (Points) | 1262 | 1211 -4% | 966 -23% | 1769 40% | 1157 -8% | 1488 ? 18% |
| Score Write (Points) | 1173 | 1471 25% | 1005 -14% | 2721 132% | 370 -68% | 1718 ? 46% |
| Score Total (Points) | 3020 | 3309 10% | 2448 -19% | 5376 78% | 2094 -31% | 3938 ? 30% |
| Copy ISO MB/s (MB/s) | 1128 | 2096 86% | 1732 54% | 1151 2% | 1718 ? 52% | |
| Copy Program MB/s (MB/s) | 585 | 395.6 -32% | 717 23% | 499.4 -15% | 536 ? -8% | |
| Copy Game MB/s (MB/s) | 902 | 1096 22% | 1343 49% | 733 -19% | 1193 ? 32% | |
| Média Total (Programa/Configurações) | 37% /
35% | -67% /
-84% | 42% /
45% | -65% /
-81% | 37% /
34% |
* ... menor é melhor

Continuous read: DiskSpd Read Loop, Queue Depth 8
GPU Performance - XPS 17 apenas com o antigo UHD Graphics 630
Já mencionamos que não existe uma GPU dedicada, portanto, todos os cálculos gráficos são tratados pela UHD Graphics 630 integrada. O iGPU é obviamente poderoso o suficiente para tarefas simples e o decodificador de vídeo não tem problemas com vídeos de alta resolução, mas este é basicamente um iGPU muito antigo que temos visto há alguns anos. O desempenho do UHD Graphics 630 simplesmente não tem chance contra as novas iGPUs da AMD ou mesmo da Intel.
O LG Gram 17 com a mais nova GPU Iris é mais do dobro da velocidade, e o Vega 6
do Honor MagicBook Pro é ainda mais rápido. Isto significa que o XPS 17 9700 é pouco adequado para jogos; apenas títulos muito antigos ou simples funcionam com taxas de quadros suaves.O desempenho do iGPU é estável mesmo durante períodos de carga mais longos, mas isto não é realmente uma surpresa para um processador de 45 W
| 3DMark 11 Performance | 1952 pontos | |
| 3DMark Ice Storm Standard Score | 68575 pontos | |
| 3DMark Cloud Gate Standard Score | 9393 pontos | |
| 3DMark Fire Strike Score | 1068 pontos | |
| 3DMark Time Spy Score | 431 pontos | |
Ajuda | ||
| baixo | média | alto | ultra | |
|---|---|---|---|---|
| The Witcher 3 (2015) | 16 | |||
| Dota 2 Reborn (2015) | 83.1 | 50.1 | 20 | 17.5 |
| X-Plane 11.11 (2018) | 11.6 | 10.7 | 10.3 | |
| Far Cry 5 (2018) | 13 | |||
| F1 2020 (2020) | 23 | 12 |
Emissões - Demasiado barulhento para o desempenho
Ruído do sistema
A complexa (e cara) solução de refrigeração da câmara de vapor do XPS 17 high-end não é usada aqui, mas a Dell ainda usa dois ventiladores para o SKU iGPU. Eles são normalmente desativados durante cargas leves de trabalho. Medimos 34-37,4 dB(A) durante os jogos e também 37,4 dB(A) sob carga máxima. Isto significa que a unidade de teste é muito mais silenciosa em comparação ao XPS 17 com a GPU RTX 2060 Max-Q, mas ainda é um pouco barulhenta com dois ventiladores considerando o baixo desempenho
Barulho
| Ocioso |
| 29.7 / 29.7 / 29.7 dB |
| Carga |
| 33.1 / 37.4 dB |
 | ||
30 dB silencioso 40 dB(A) audível 50 dB(A) ruidosamente alto |
||
min: | ||
| Dell XPS 17 9700 i5-10300H UHD Graphics 630, i5-10300H, WDC PC SN730 SDBPNTY-512G | LG Gram 17 17Z90N-V.AA77G Iris Plus Graphics G7 (Ice Lake 64 EU), i7-1065G7, Samsung PM981a MZVLB1T0HBLR | Dell XPS 17 9700 Core i7 RTX 2060 Max-Q GeForce RTX 2060 Max-Q, i7-10875H, Micron 2200S 1TB MTFDHBA1T0TCK | Honor MagicBook Pro (AMD) Vega 6, R5 4600H, WDC PC SN730 SDBPNTY-512G | Dell XPS 15 9500 Core i5 UHD Graphics 630, i5-10300H, Toshiba KBG40ZNS256G NVMe | |
|---|---|---|---|---|---|
| Noise | 10% | -7% | 1% | 5% | |
| desligado / ambiente * (dB) | 29.7 | 26 12% | 28 6% | 29.7 -0% | 28 6% |
| Idle Minimum * (dB) | 29.7 | 26 12% | 28 6% | 29.7 -0% | 28 6% |
| Idle Average * (dB) | 29.7 | 26.8 10% | 28 6% | 29.7 -0% | 28 6% |
| Idle Maximum * (dB) | 29.7 | 27.5 7% | 28 6% | 30.5 -3% | 28 6% |
| Load Average * (dB) | 33.1 | 32.2 3% | 43.2 -31% | 31 6% | 28 15% |
| Load Maximum * (dB) | 37.4 | 32.7 13% | 50.5 -35% | 36.7 2% | 41.9 -12% |
| Witcher 3 ultra * (dB) | 49 | 31.3 |
* ... menor é melhor
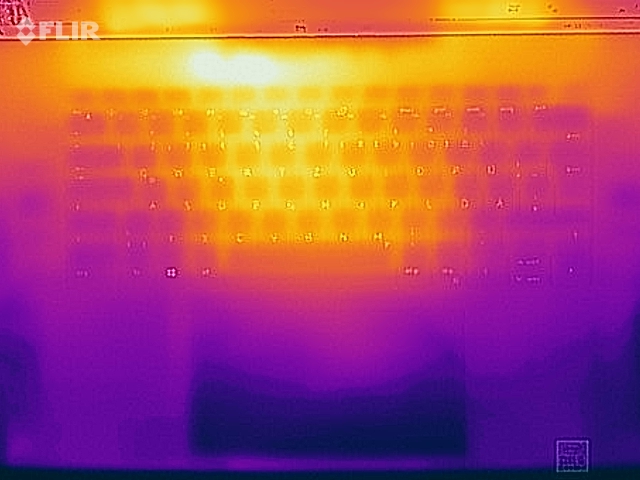
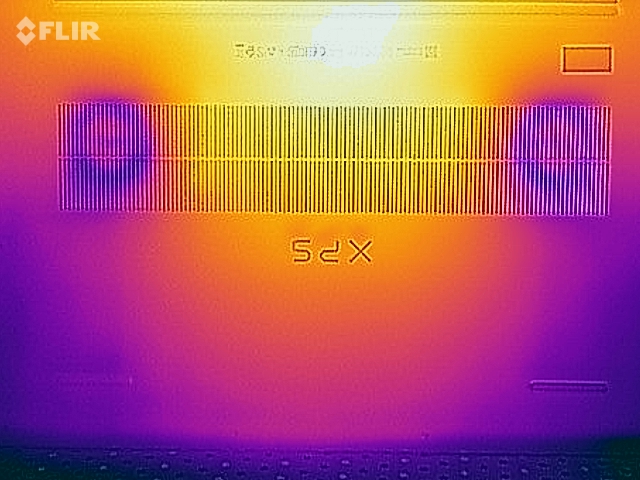
Temperatura
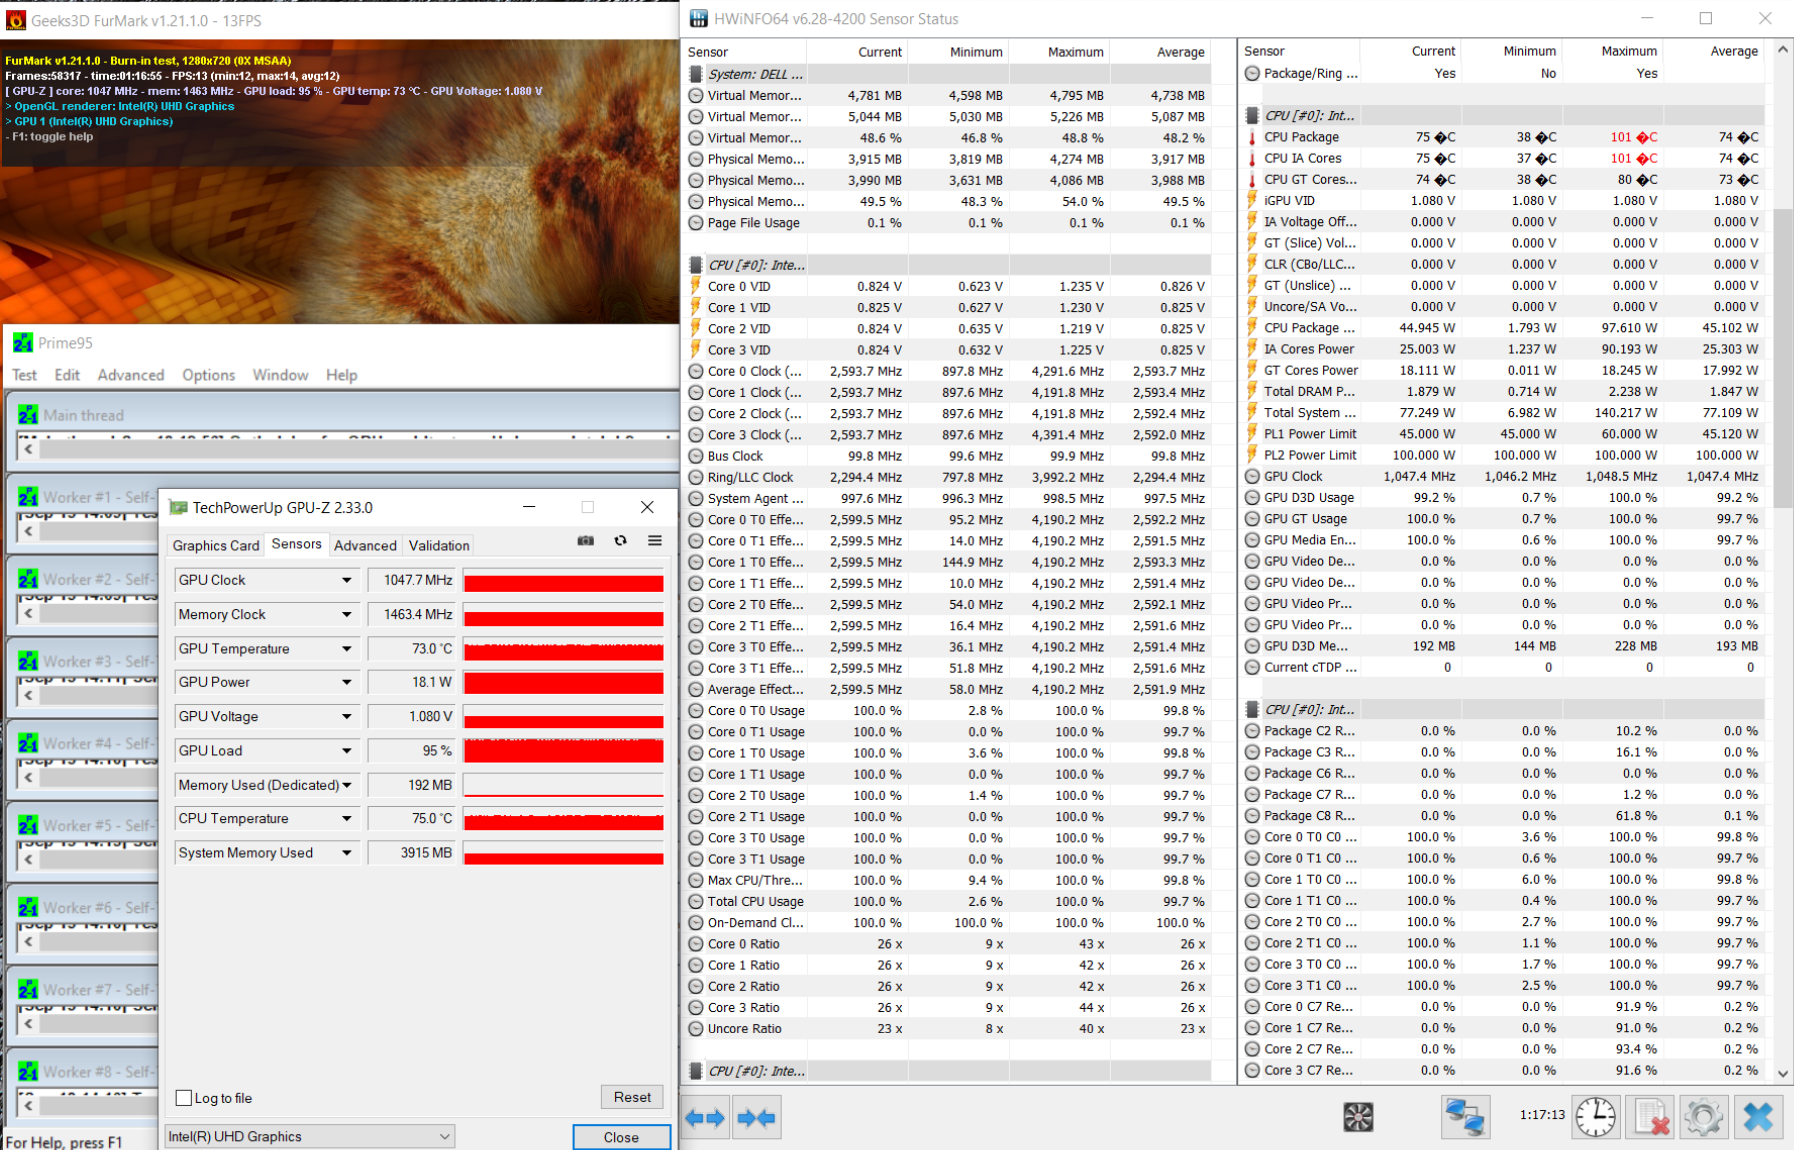
Não há problemas de temperatura na base SKU do XPS 17. Existem apenas alguns pontos onde podemos detectar mais de 40 °C sob carga máxima. O consumo de energia da CPU rapidamente se estabiliza a 45 W durante nosso teste de estresse (até ~90 W nos primeiros segundos), o que ainda é suficiente para um relógio de CPU de 4x 2,6 GHz, para que não caia abaixo da freqüência de base de 2,5 GHz. O relógio da GPU, por outro lado, permanece no máximo 1047 MHz
(±) A temperatura máxima no lado superior é 42.9 °C / 109 F, em comparação com a média de 36.8 °C / 98 F , variando de 21 a 71 °C para a classe Multimedia.
(±) A parte inferior aquece até um máximo de 40.1 °C / 104 F, em comparação com a média de 39.1 °C / 102 F
(+) Em uso inativo, a temperatura média para o lado superior é 22.9 °C / 73 F, em comparação com a média do dispositivo de 31.3 °C / ### class_avg_f### F.
(+) Os apoios para as mãos e o touchpad são mais frios que a temperatura da pele, com um máximo de 27.8 °C / 82 F e, portanto, são frios ao toque.
(±) A temperatura média da área do apoio para as mãos de dispositivos semelhantes foi 28.7 °C / 83.7 F (+0.9 °C / 1.7 F).
Oradores
Dell XPS 17 9700 i5-10300H análise de áudio
(+) | os alto-falantes podem tocar relativamente alto (###valor### dB)
Graves 100 - 315Hz
(±) | graves reduzidos - em média 11.8% menor que a mediana
(±) | a linearidade dos graves é média (9% delta para a frequência anterior)
Médios 400 - 2.000 Hz
(+) | médios equilibrados - apenas 4.7% longe da mediana
(+) | médios são lineares (6.7% delta para frequência anterior)
Altos 2 - 16 kHz
(±) | máximos mais altos - em média 5.5% maior que a mediana
(±) | a linearidade dos máximos é média (8.3% delta para frequência anterior)
Geral 100 - 16.000 Hz
(±) | a linearidade do som geral é média (15.9% diferença em relação à mediana)
Comparado com a mesma classe
» 40% de todos os dispositivos testados nesta classe foram melhores, 6% semelhantes, 54% piores
» O melhor teve um delta de 5%, a média foi 17%, o pior foi 45%
Comparado com todos os dispositivos testados
» 25% de todos os dispositivos testados foram melhores, 5% semelhantes, 70% piores
» O melhor teve um delta de 4%, a média foi 23%, o pior foi 134%
LG Gram 17 17Z90N-V.AA77G análise de áudio
(±) | o volume do alto-falante é médio, mas bom (###valor### dB)
Graves 100 - 315Hz
(-) | quase nenhum baixo - em média 24.6% menor que a mediana
(±) | a linearidade dos graves é média (11.5% delta para a frequência anterior)
Médios 400 - 2.000 Hz
(+) | médios equilibrados - apenas 3.7% longe da mediana
(+) | médios são lineares (6.3% delta para frequência anterior)
Altos 2 - 16 kHz
(+) | agudos equilibrados - apenas 3.2% longe da mediana
(+) | os máximos são lineares (6% delta da frequência anterior)
Geral 100 - 16.000 Hz
(±) | a linearidade do som geral é média (18.1% diferença em relação à mediana)
Comparado com a mesma classe
» 32% de todos os dispositivos testados nesta classe foram melhores, 6% semelhantes, 62% piores
» O melhor teve um delta de 7%, a média foi 21%, o pior foi 53%
Comparado com todos os dispositivos testados
» 39% de todos os dispositivos testados foram melhores, 8% semelhantes, 54% piores
» O melhor teve um delta de 4%, a média foi 23%, o pior foi 134%
Gerenciamento de energia - Dell utiliza eficiente painel FHD
Consumo de energia
Um olhar para os números de consumo de energia mostra rapidamente a grande diferença nas medidas de ociosidade, porque a tela opcional de 4K apenas consome muito mais energia. O painel FHD do XPS 17, por outro lado, é muito eficiente apesar do grande tamanho e dos altos índices de luminosidade. Registramos um valor máximo de 109 W sob carga, mas este valor cai para cerca de 70 W após alguns segundos. O adaptador de energia de 130 W incluído é, portanto, completamente suficiente
| desligado | |
| Ocioso | |
| Carga |
|
Key:
min: | |
| Dell XPS 17 9700 i5-10300H i5-10300H, UHD Graphics 630, WDC PC SN730 SDBPNTY-512G, IPS, 1920x1200, 17.3" | LG Gram 17 17Z90N-V.AA77G i7-1065G7, Iris Plus Graphics G7 (Ice Lake 64 EU), Samsung PM981a MZVLB1T0HBLR, IPS, 2560x1600, 17" | Dell XPS 17 9700 Core i7 RTX 2060 Max-Q i7-10875H, GeForce RTX 2060 Max-Q, Micron 2200S 1TB MTFDHBA1T0TCK, IPS, 3840x2400, 17" | Honor MagicBook Pro (AMD) R5 4600H, Vega 6, WDC PC SN730 SDBPNTY-512G, IPS, 1920x1080, 16.1" | Dell XPS 15 9500 Core i5 i5-10300H, UHD Graphics 630, Toshiba KBG40ZNS256G NVMe, IPS, 1920x1200, 15.6" | Média Intel UHD Graphics 630 | Média da turma Multimedia | |
|---|---|---|---|---|---|---|---|
| Power Consumption | 18% | -86% | 9% | 15% | 8% | -28% | |
| Idle Minimum * (Watt) | 3.7 | 3.2 14% | 5.8 -57% | 4.2 -14% | 2.9 22% | 3.95 ? -7% | 5.66 ? -53% |
| Idle Average * (Watt) | 8.3 | 8.4 -1% | 20.6 -148% | 8.4 -1% | 7.6 8% | 7.23 ? 13% | 10.2 ? -23% |
| Idle Maximum * (Watt) | 11.3 | 11.7 -4% | 21 -86% | 9.7 14% | 8 29% | 8.87 ? 22% | 12.5 ? -11% |
| Load Average * (Watt) | 44 | 39.6 10% | 104.7 -138% | 39.5 10% | 41.7 5% | 45.9 ? -4% | 65.2 ? -48% |
| Load Maximum * (Watt) | 109 | 34 69% | 107.6 1% | 67.1 38% | 94.8 13% | 93.8 ? 14% | 113.5 ? -4% |
| Witcher 3 ultra * (Watt) | 99.2 | 39.1 |
* ... menor é melhor
Autonomia da bateria - XPS continua funcionando
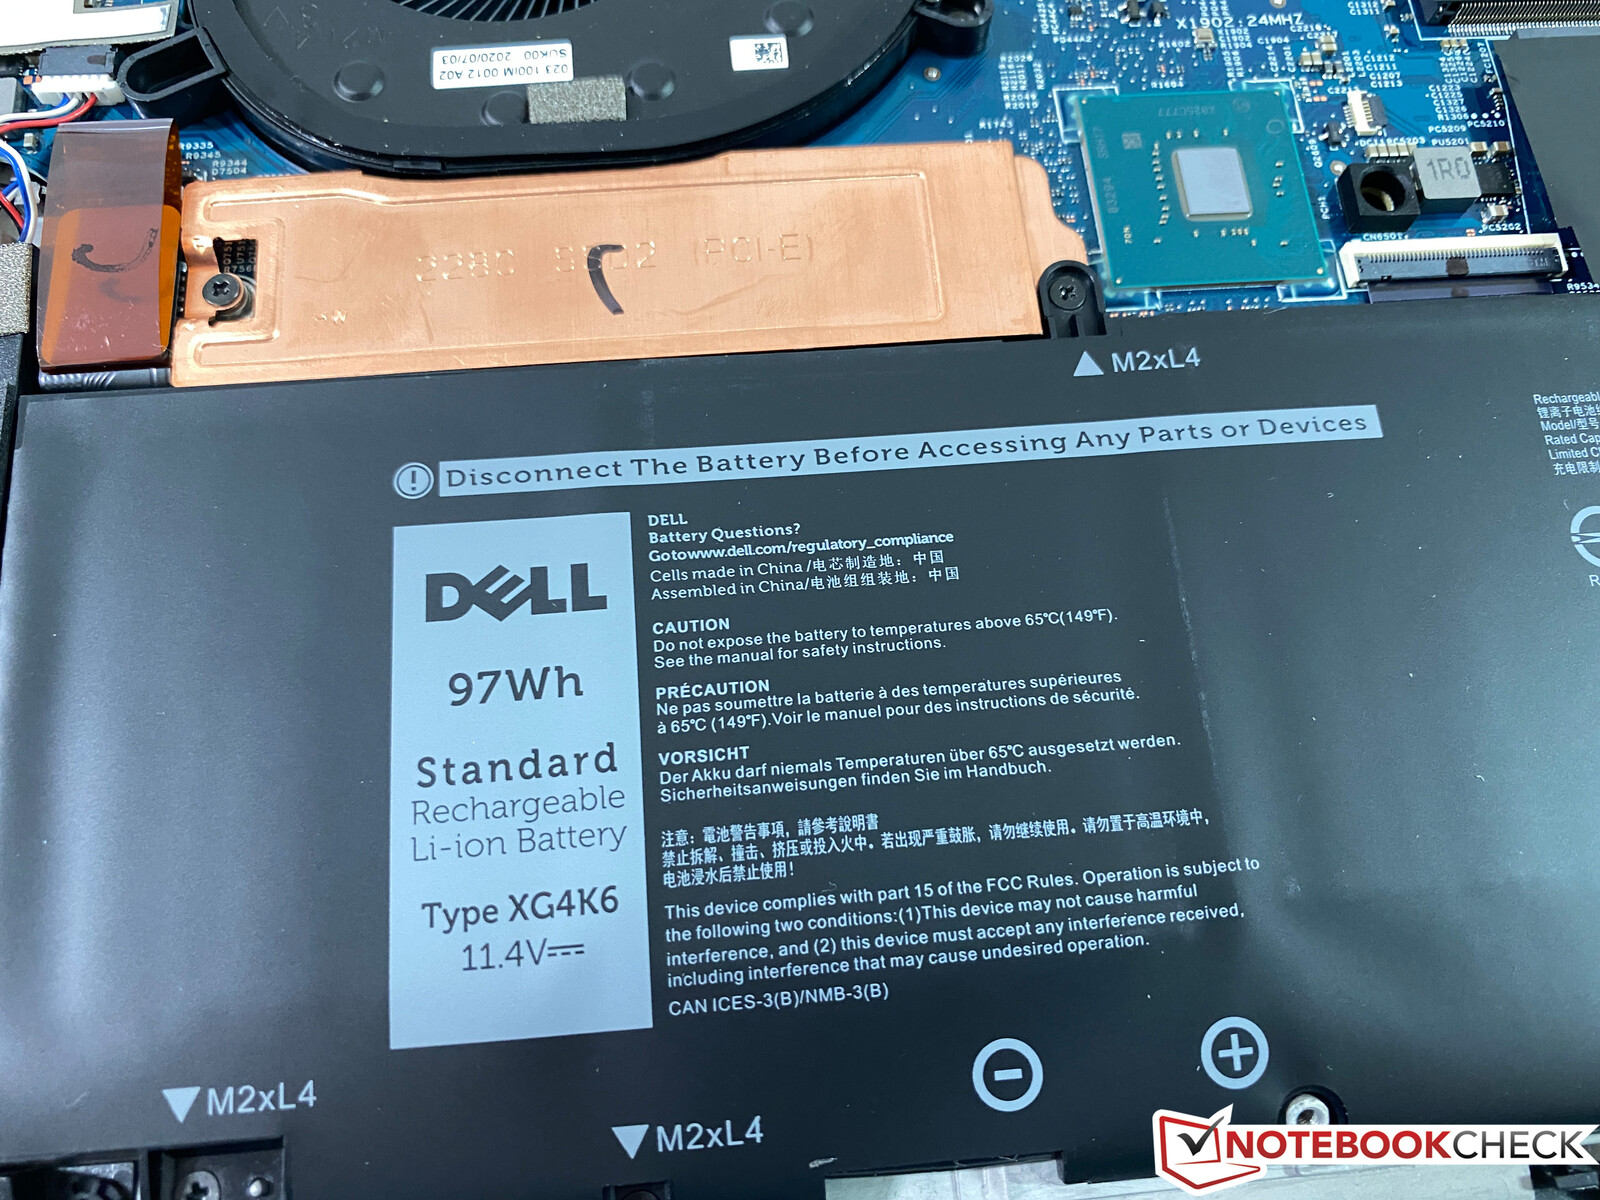
A combinação dos valores de consumo comparativamente baixos e a enorme bateria de 97 Wh resulta em excelentes tempos de funcionamento da bateria. Com um brilho ajustado de 150 cd/m² (34% do brilho máximo em nossa unidade de teste), podemos gravar um tempo de execução de vídeo de mais de 18 horas e ainda mais de 15 horas em nosso teste Wi-Fi. O tempo de execução Wi-Fi ainda é superior a 10 horas quando usamos o brilho máximo da tela. O tempo mínimo de funcionamento da bateria sob carga é de cerca de 2 horas
A concorrência não tem chance aqui, e mesmo o LG Gram 17 com o processador ULV é claramente derrotado
| Dell XPS 17 9700 i5-10300H i5-10300H, UHD Graphics 630, 97 Wh | LG Gram 17 17Z90N-V.AA77G i7-1065G7, Iris Plus Graphics G7 (Ice Lake 64 EU), 80 Wh | Dell XPS 17 9700 Core i7 RTX 2060 Max-Q i7-10875H, GeForce RTX 2060 Max-Q, 97 Wh | Honor MagicBook Pro (AMD) R5 4600H, Vega 6, 56 Wh | Dell XPS 15 9500 Core i5 i5-10300H, UHD Graphics 630, 56 Wh | Média da turma Multimedia | |
|---|---|---|---|---|---|---|
| Duração da bateria | 9% | -18% | -38% | -30% | -15% | |
| H.264 (h) | 18.5 | 12.4 -33% | 10.6 -43% | 17.1 ? -8% | ||
| WiFi v1.3 (h) | 15.2 | 11.4 -25% | 9.7 -36% | 10.3 -32% | 9.3 -39% | 12.2 ? -20% |
| Load (h) | 2 | 3.7 85% | 2 0% | 1.2 -40% | 1.6 -20% | 1.664 ? -17% |
| Reader / Idle (h) | 24 | 23.8 | 26.4 | 24.9 ? |
Pro
Contra
Veredicto - Demasiado lento para o preço
É basicamente uma boa idéia oferecer um grande laptop multimídia sem uma placa gráfica dedicada. Nem todos os clientes querem jogar jogos, para que possam economizar o dinheiro de um GPU caro. No entanto, o atual Dell XPS 17 9700 tem dois grandes problemas. O fabricante não utiliza as CPUs Ryzen da AMD, portanto, a Dell está atualmente limitada às CPUs Comet Lake da Intel com as antigas GPUs integradas. O desempenho, portanto, não é competitivo
O outro grande problema é o preço. Obviamente, você ainda recebe o bom chassi, mas o desempenho é muito baixo por quase 2000 euros (~$2341). A situação pode mudar com os próximos processadores Intel, mas a partir de agora, não podemos recomendar o modelo base do XPS 17 9700.
Devido à limitação das CPUs Intel, o desempenho (especialmente iGPU) simplesmente não é competitivo no momento. Considerando o alto preço, não podemos recomendar o modelo básico do novo XPS 17 9700.
O painel FHD fosco é definitivamente um aspecto positivo. A impressão de imagem subjetiva é boa e o painel pode ser muito brilhante. Graças à gama sRGB completa e à excelente precisão de cor, você também pode usá-lo para edição de imagens/videos. Ele também é muito mais eficiente em comparação com a tela sensível ao toque de 4K, portanto, o tempo de funcionamento da bateria é significativamente melhor. Entretanto, é lamentável que a Dell não ofereça a tela FHD mate em combinação com as opções mais rápidas de CPU/GPU em todas as regiões
Dell XPS 17 9700 i5-10300H
- 10/31/2020 v7 (old)
Andreas Osthoff
Price comparison

