Revisão do laptop Dell XPS 17 9720 RTX 3060: processador 50% mais rápido do que antes
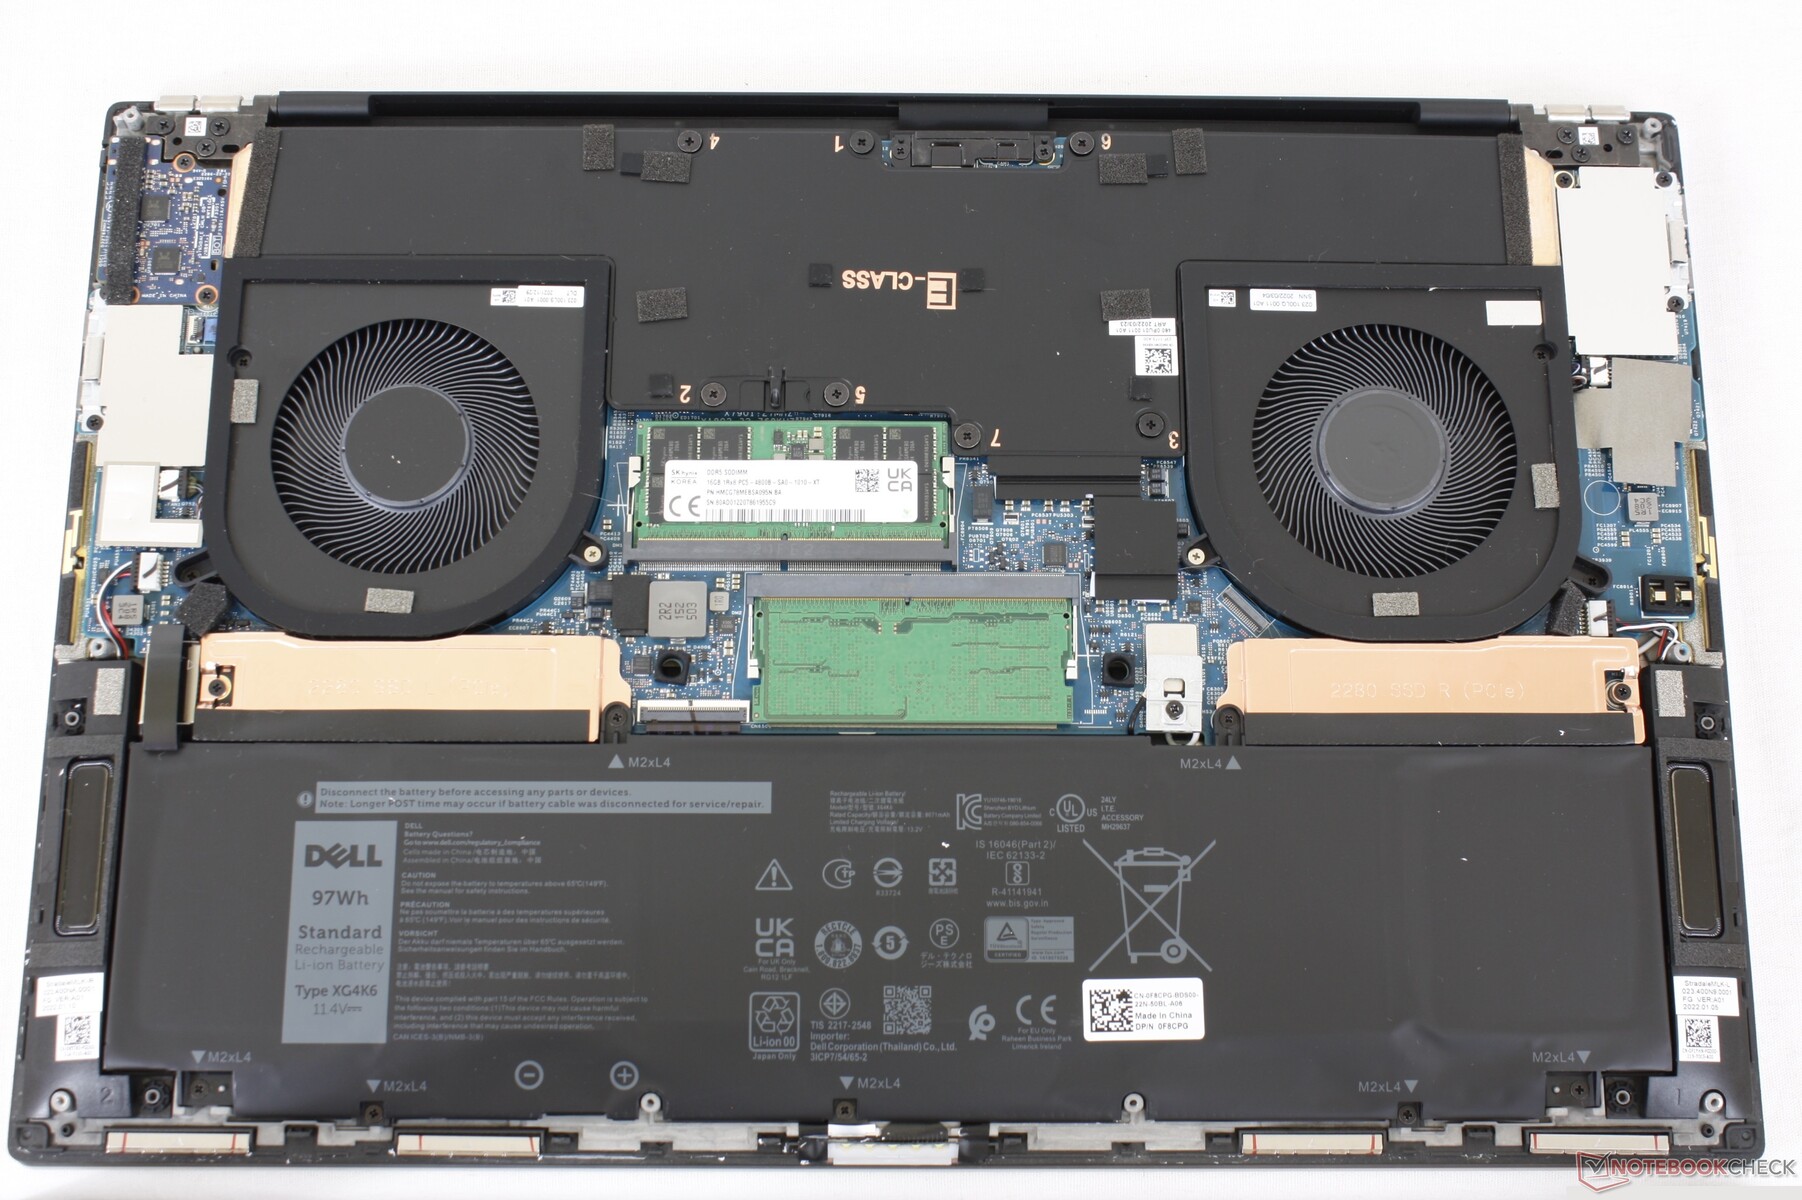
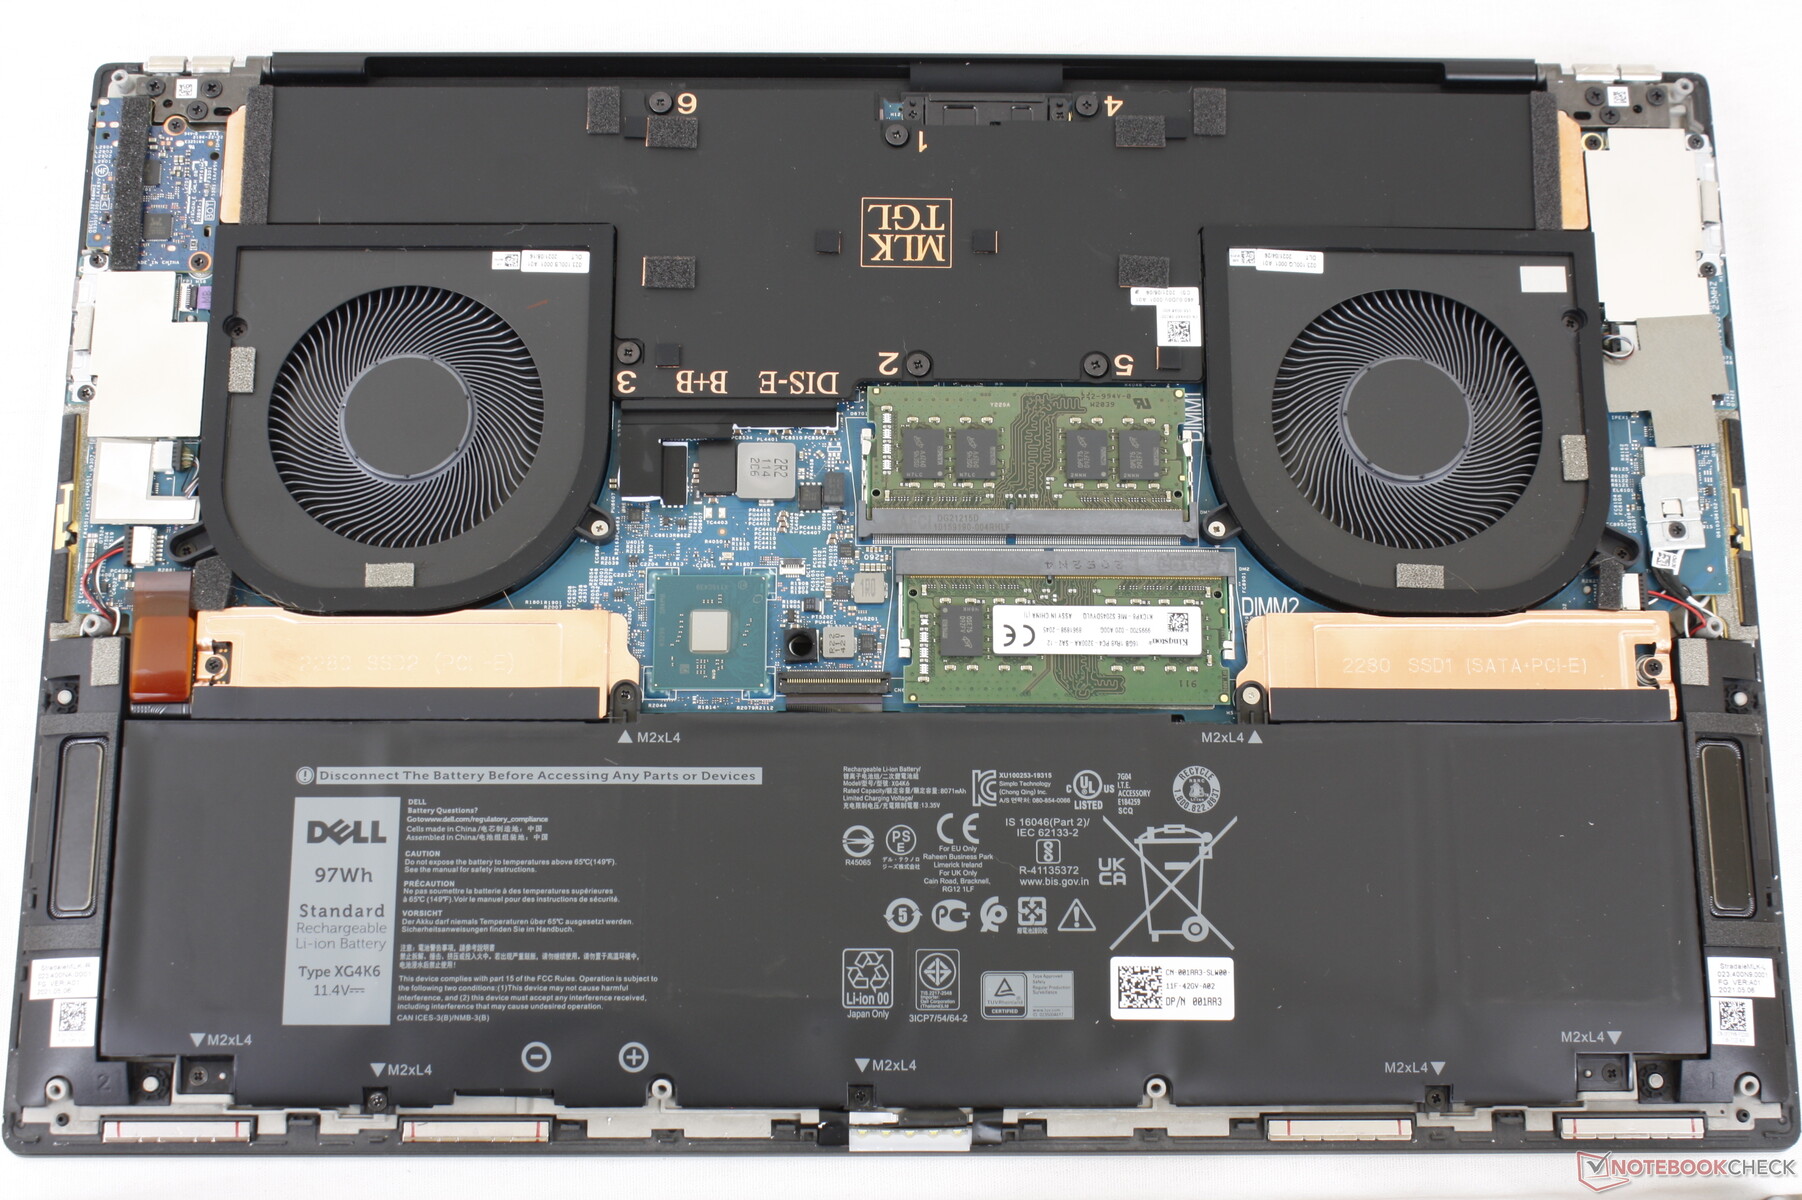
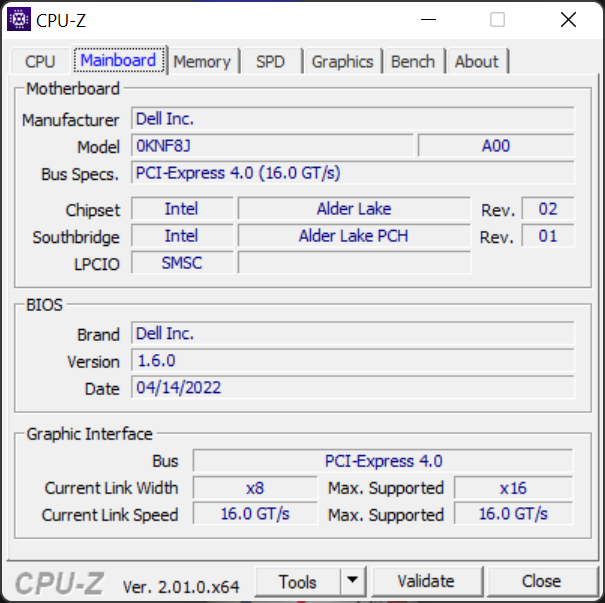
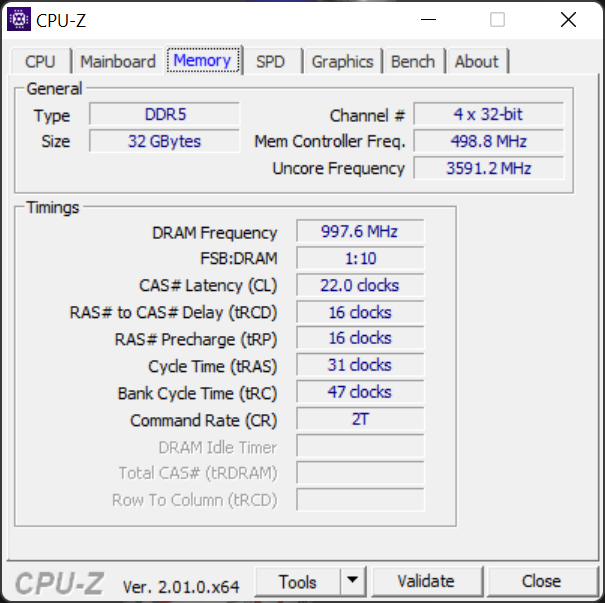
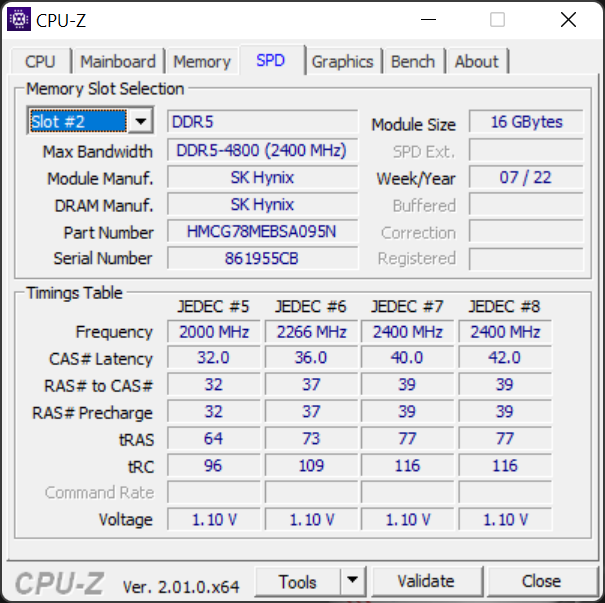
O Dell XPS 17 9720 é a terceira iteração da série XPS 17 de 17,0 polegadas que começou com o 2020 XPS 17 9700. Enquanto as versões XPS 17 9700 e 2021 9710 embarcariam com CPUs Intel de 10ª e 11ª geração, respectivamente, a 2022 9720 adicionou à mistura as CPUs de 12ª geração e as opções de RAM DDR5. Outras características principais como o chassi e opções de GPU são idênticas às do XPS 17 9700 ou 9710 e, portanto, recomendamos verificar nossas revisões existentes sobre a série para saber mais sobre as características físicas do modelo
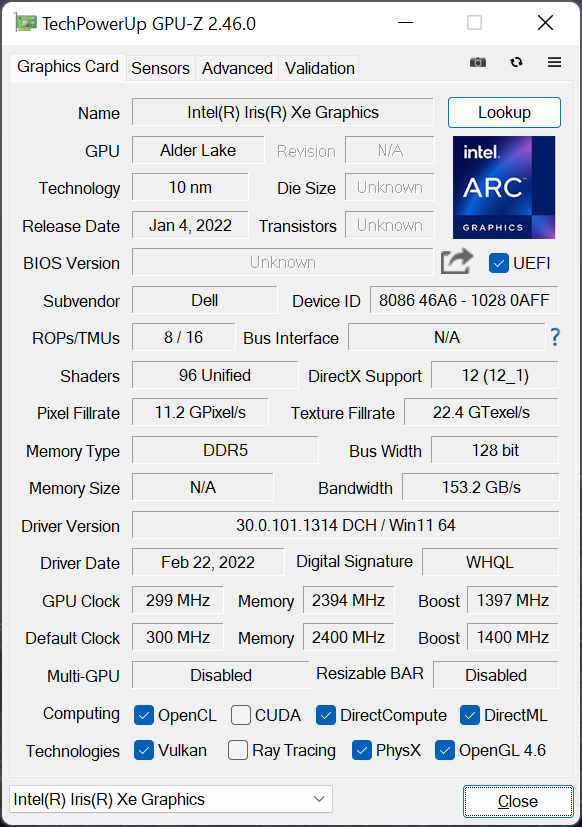
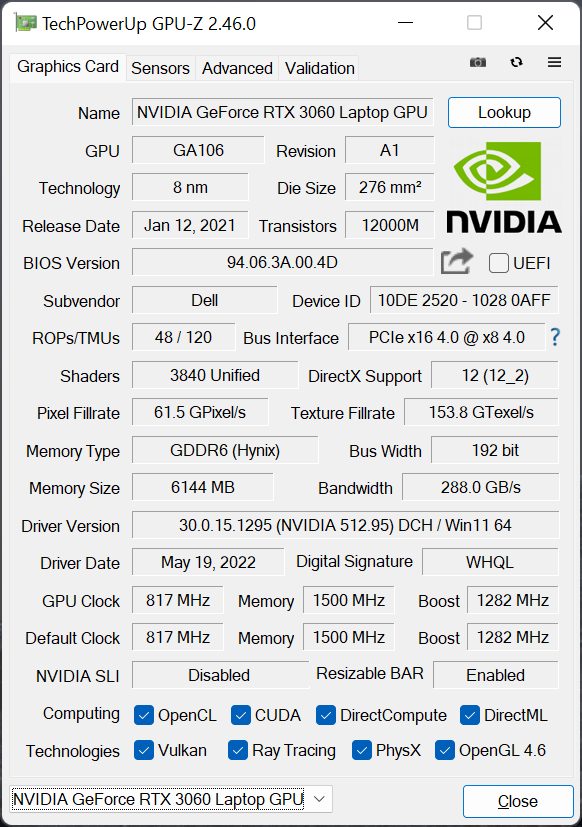
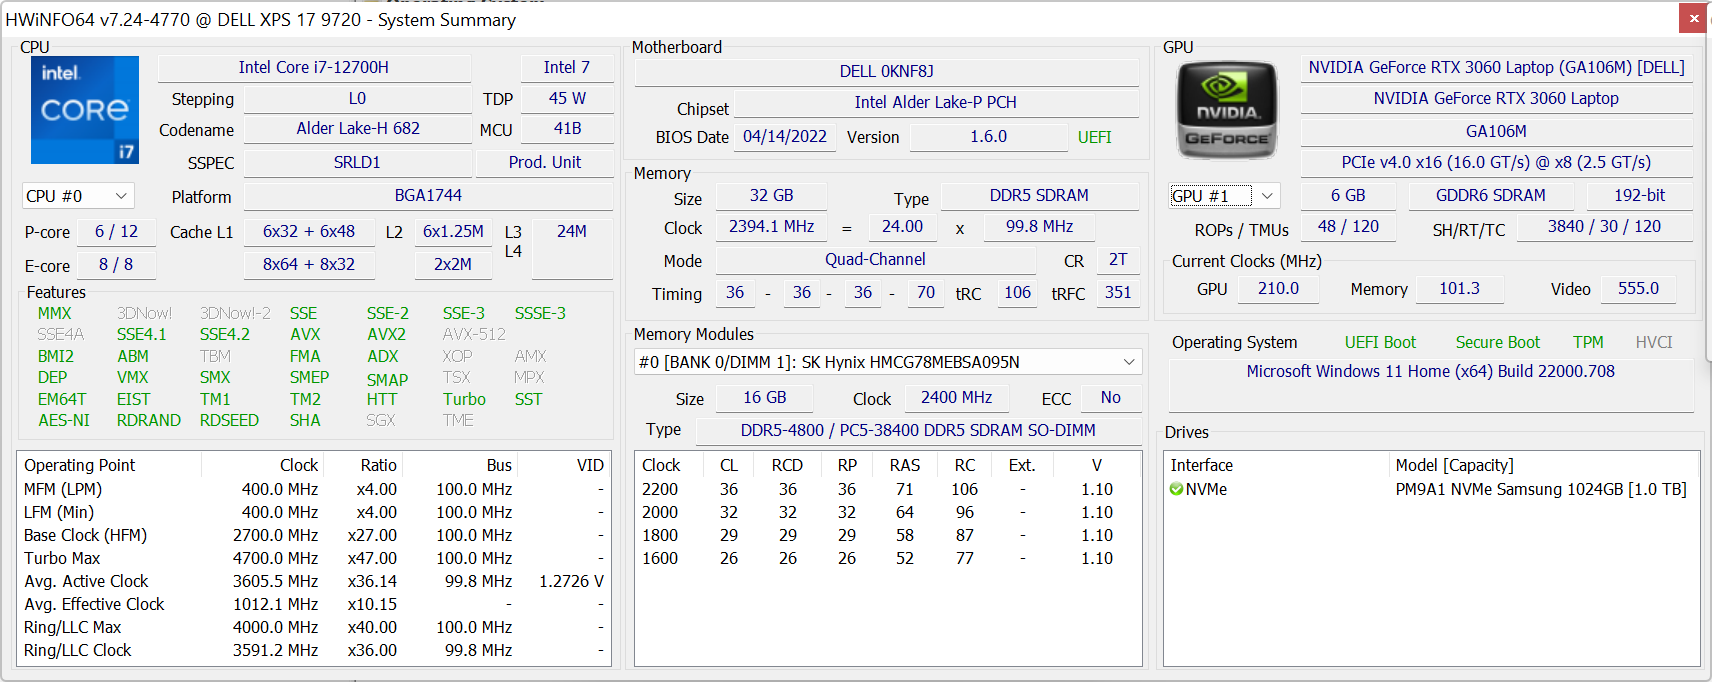
Nossa unidade em revisão é uma configuração de médio alcance superior com a CPU Core i7-12700H, UHD+ (3840 x 2400) IPS touchscreen, e GeForce RTX 3060 GPU por aproximadamente $3000 USD. Outras SKUs também estão disponíveis com a i5-12500H, i9-12900HK, GeForce RTX 3050 Ti, 1200p display, ou somente gráficos integrados
Os concorrentes do XPS 17 9720 incluem laptops multimídia de 17,3 polegadas ou portáteis prosumer como o Gigabyte Aero 17, Lâmina Razer 17, HP Envy 17ou Lenovo Legion 5 17
Mais análises da Dell
Possíveis concorrentes em comparação
Avaliação | Data | Modelo | Peso | Altura | Size | Resolução | Preço |
|---|---|---|---|---|---|---|---|
| 88.8 % v7 (old) | 06/2022 | Dell XPS 17 9720 RTX 3060 i7-12700H, GeForce RTX 3060 Laptop GPU | 2.5 kg | 19.5 mm | 17.00" | 3840x2400 | |
| 82.4 % v7 (old) | 08/2021 | HP Envy 17-cg i5-1135G7, GeForce MX450 | 2.7 kg | 19.3 mm | 17.30" | 1920x1080 | |
| 87.9 % v7 (old) | 07/2021 | Dell XPS 17 9710 Core i7 RTX 3060 i7-11800H, GeForce RTX 3060 Laptop GPU | 2.5 kg | 19.5 mm | 17.00" | 3840x2400 | |
| 87.9 % v7 (old) | 07/2020 | Dell XPS 17 9700 Core i7 RTX 2060 Max-Q i7-10875H, GeForce RTX 2060 Max-Q | 2.5 kg | 19.5 mm | 17.00" | 3840x2400 | |
| 85.2 % v7 (old) | 02/2022 | Lenovo Legion 5 17ACH6H-82JY0003GE R5 5600H, GeForce RTX 3060 Laptop GPU | 3.1 kg | 24.3 mm | 17.30" | 1920x1080 | |
| 76.5 % v7 (old) | 05/2022 | Asus VivoBook 17 F712JA-AU708W i7-1065G7, Iris Plus Graphics G7 (Ice Lake 64 EU) | 2.2 kg | 21.4 mm | 17.30" | 1920x1080 | |
| 90.1 % v7 (old) | 05/2022 | Razer Blade 17 (i7-12800H, RTX 3070 Ti) i7-12800H, GeForce RTX 3070 Ti Laptop GPU | 2.8 kg | 19.9 mm | 17.30" | 2560x1440 |
Caso - O mesmo, mas ainda ótimo
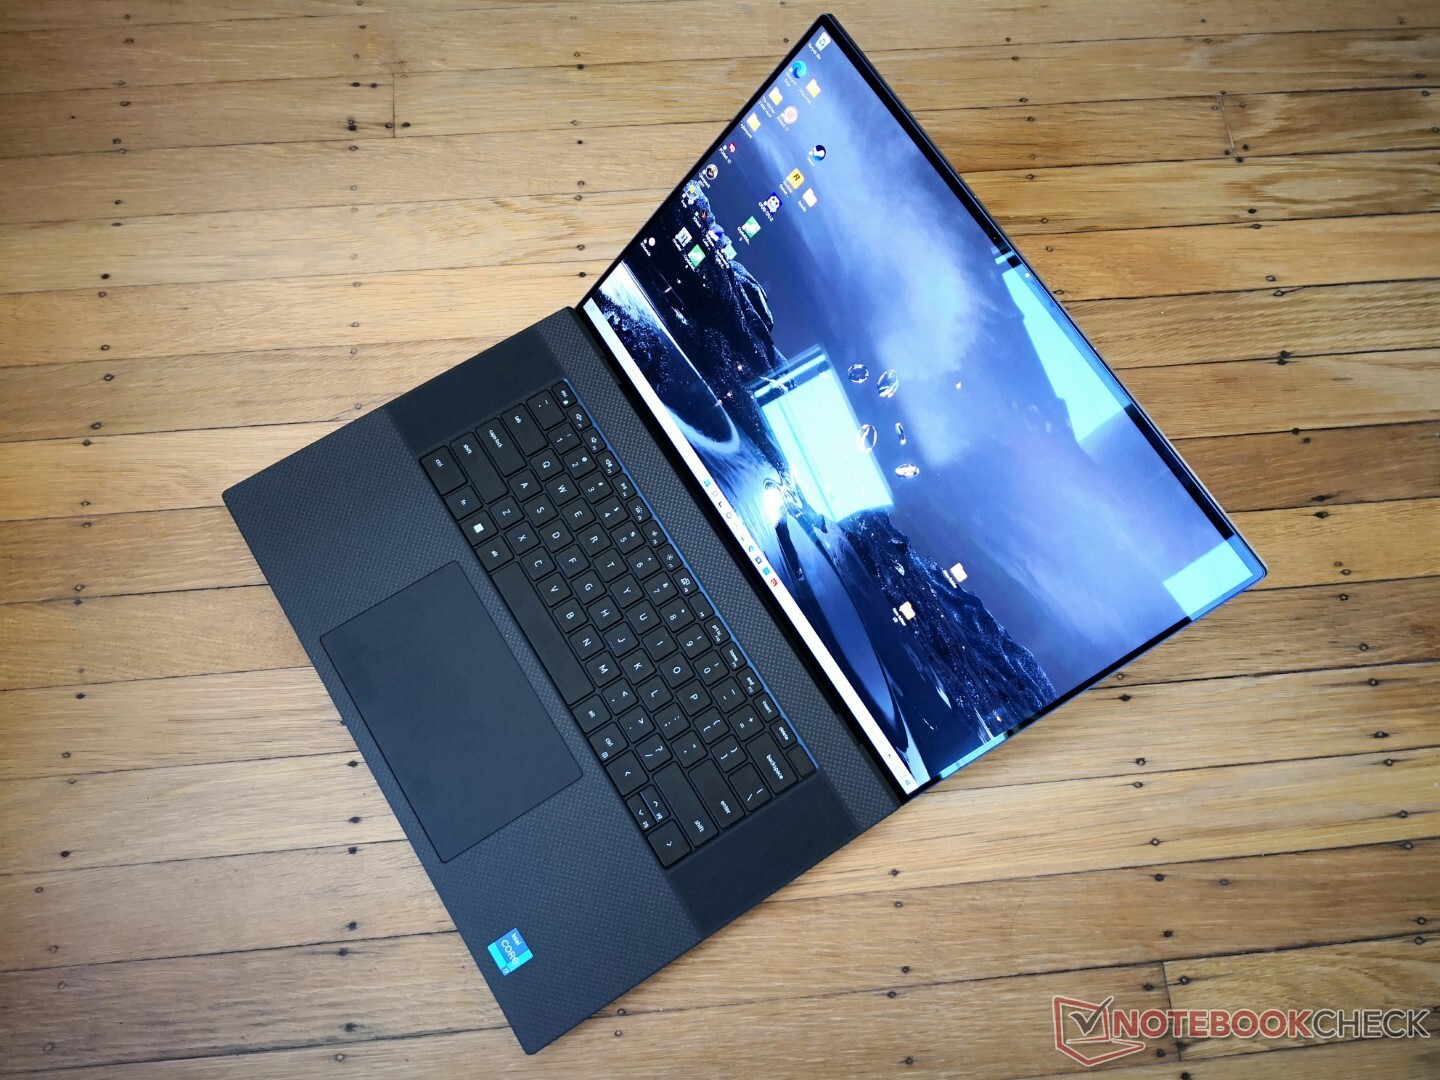
O chassi não foi alterado em relação ao XPS 17 9700 ou 9710. Apesar de ser um modelo de dois anos, seu formato único de 16:10 17,0 polegadas permite que o modelo seja visivelmente menor e mais fino do que outros modelos da mesma categoria de tamanho.
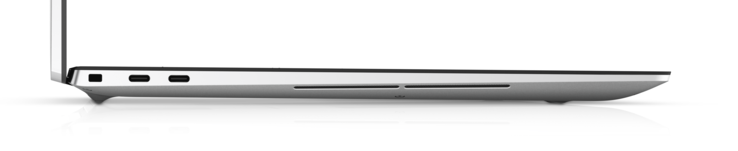
Leitor de cartões SD
| SD Card Reader | |
| average JPG Copy Test (av. of 3 runs) | |
| Dell XPS 17 9720 RTX 3060 (Toshiba Exceria Pro SDXC 64 GB UHS-II) | |
| Dell XPS 17 9700 Core i7 RTX 2060 Max-Q (Toshiba Exceria Pro SDXC 64 GB UHS-II) | |
| Dell XPS 17 9710 Core i7 RTX 3060 (AV PRO microSD 128 GB V60) | |
| Razer Blade 17 (i7-12800H, RTX 3070 Ti) | |
| Lenovo Legion 5 17ACH6H-82JY0003GE (AV Pro SD microSD 128 GB V60) | |
| HP Envy 17-cg (AV Pro microSD 128 GB V60) | |
| Asus VivoBook 17 F712JA-AU708W (AV Pro SD microSD 128 GB V60) | |
| maximum AS SSD Seq Read Test (1GB) | |
| Dell XPS 17 9720 RTX 3060 (Toshiba Exceria Pro SDXC 64 GB UHS-II) | |
| Dell XPS 17 9700 Core i7 RTX 2060 Max-Q (Toshiba Exceria Pro SDXC 64 GB UHS-II) | |
| Razer Blade 17 (i7-12800H, RTX 3070 Ti) | |
| Dell XPS 17 9710 Core i7 RTX 3060 (AV PRO microSD 128 GB V60) | |
| Lenovo Legion 5 17ACH6H-82JY0003GE (AV Pro SD microSD 128 GB V60) | |
| HP Envy 17-cg (AV Pro microSD 128 GB V60) | |
| Asus VivoBook 17 F712JA-AU708W (AV Pro SD microSD 128 GB V60) | |
Comunicação - Sem Wi-Fi 6E
A Dell atualizou a WLAN do Intel AX1650 no XPS 17 9710 para o Intel AX1675 (ou AX211) no XPS 17 9720. O chip mais novo suporta Wi-Fi 6E, mas o recurso está desativado no XPS 17 9720, muito parecido com o que descobrimos no XPS 15 9520. Assim, os usuários só poderão se conectar a redes de 2,4 GHz ou 5 GHz e não a redes de 6 GHz.
| Networking | |
| iperf3 transmit AX12 | |
| HP Envy 17-cg | |
| Dell XPS 17 9710 Core i7 RTX 3060 | |
| Asus VivoBook 17 F712JA-AU708W | |
| Lenovo Legion 5 17ACH6H-82JY0003GE | |
| Dell XPS 17 9700 Core i7 RTX 2060 Max-Q | |
| iperf3 receive AX12 | |
| HP Envy 17-cg | |
| Dell XPS 17 9710 Core i7 RTX 3060 | |
| Dell XPS 17 9700 Core i7 RTX 2060 Max-Q | |
| Asus VivoBook 17 F712JA-AU708W | |
| Lenovo Legion 5 17ACH6H-82JY0003GE | |
| iperf3 receive AXE11000 | |
| Dell XPS 17 9720 RTX 3060 | |
| iperf3 transmit AXE11000 | |
| Dell XPS 17 9720 RTX 3060 | |
Webcam
A câmera continua sendo apenas 720p, sem obturador de privacidade. A baixa resolução nativa emparelha-se mal com o visor de alta resolução para uma imagem inevitavelmente lamacenta. A Dell diz que os sensores IR e RGB estão separados agora para melhor desempenho, mas a densidade de pixels ainda é muito baixa. Em comparação, a Razer Blade 17 navega com uma webcam de maior resolução de 1080p.
Windows Olá ainda é suportado.


Manutenção
Acessórios e Garantia
O XPS 17 9720 é fornecido com o mesmo adaptador AC de 130 W e adaptador USB-C para HDMI e USB-A como no XPS 15 9520, XPS 17 9710, e XPS 17 9700. Uma garantia básica de fabricante limitada a um ano aplica-se se comprada nos EUA.
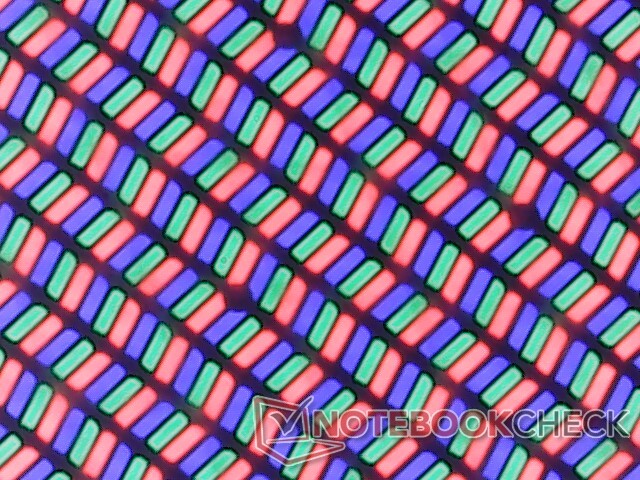
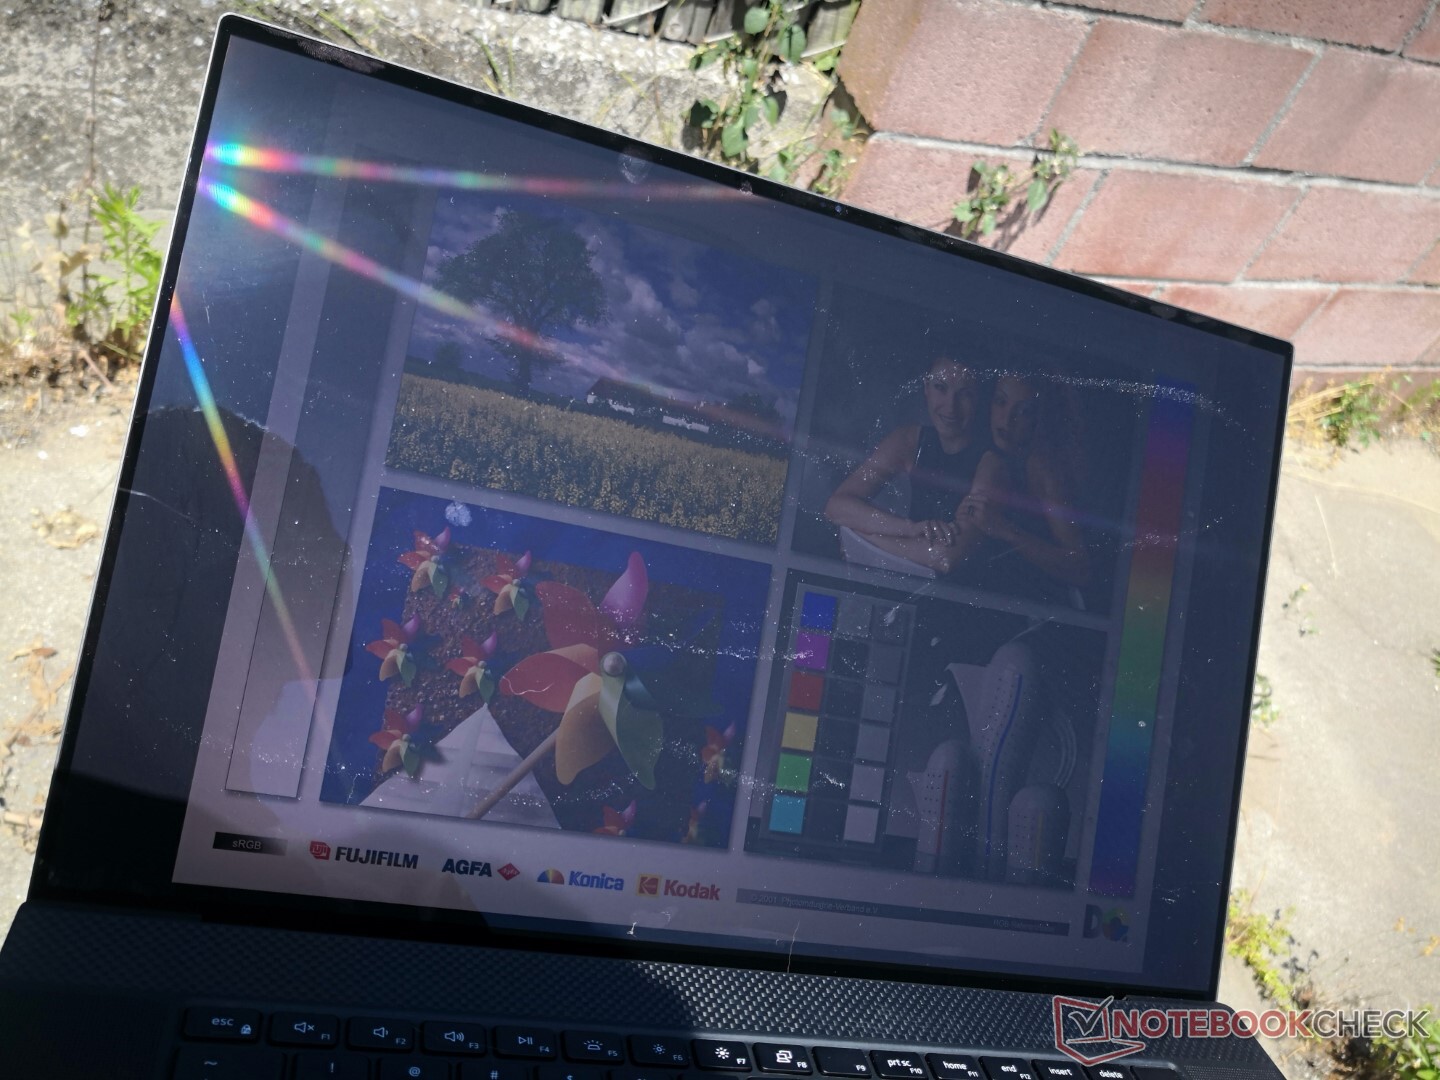
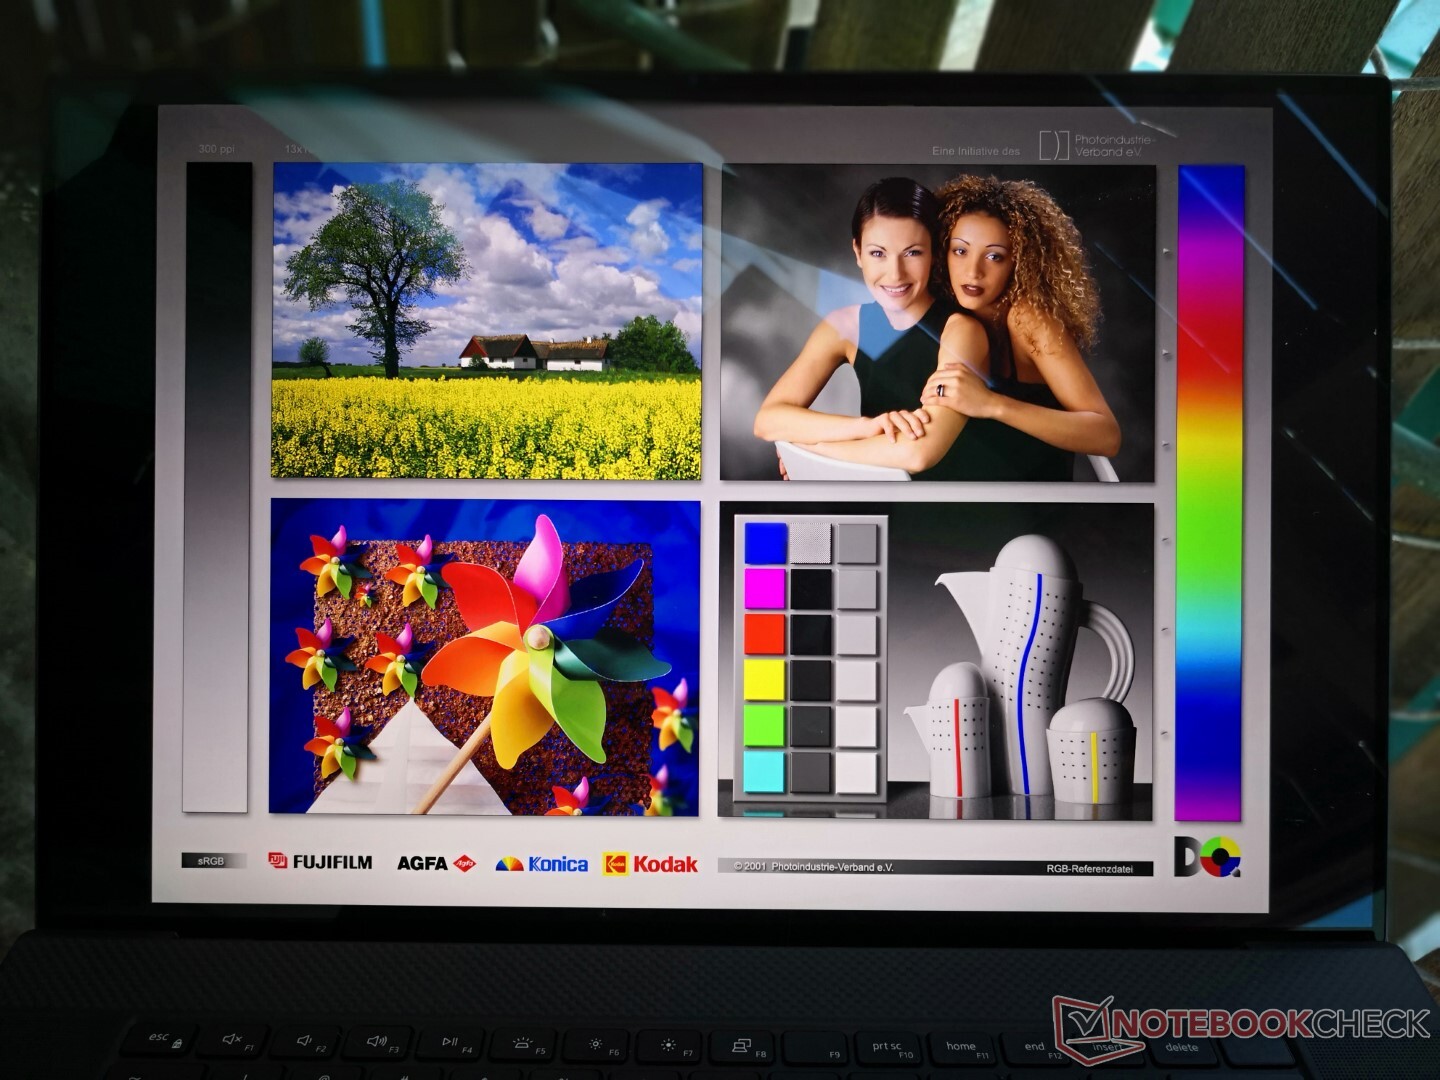
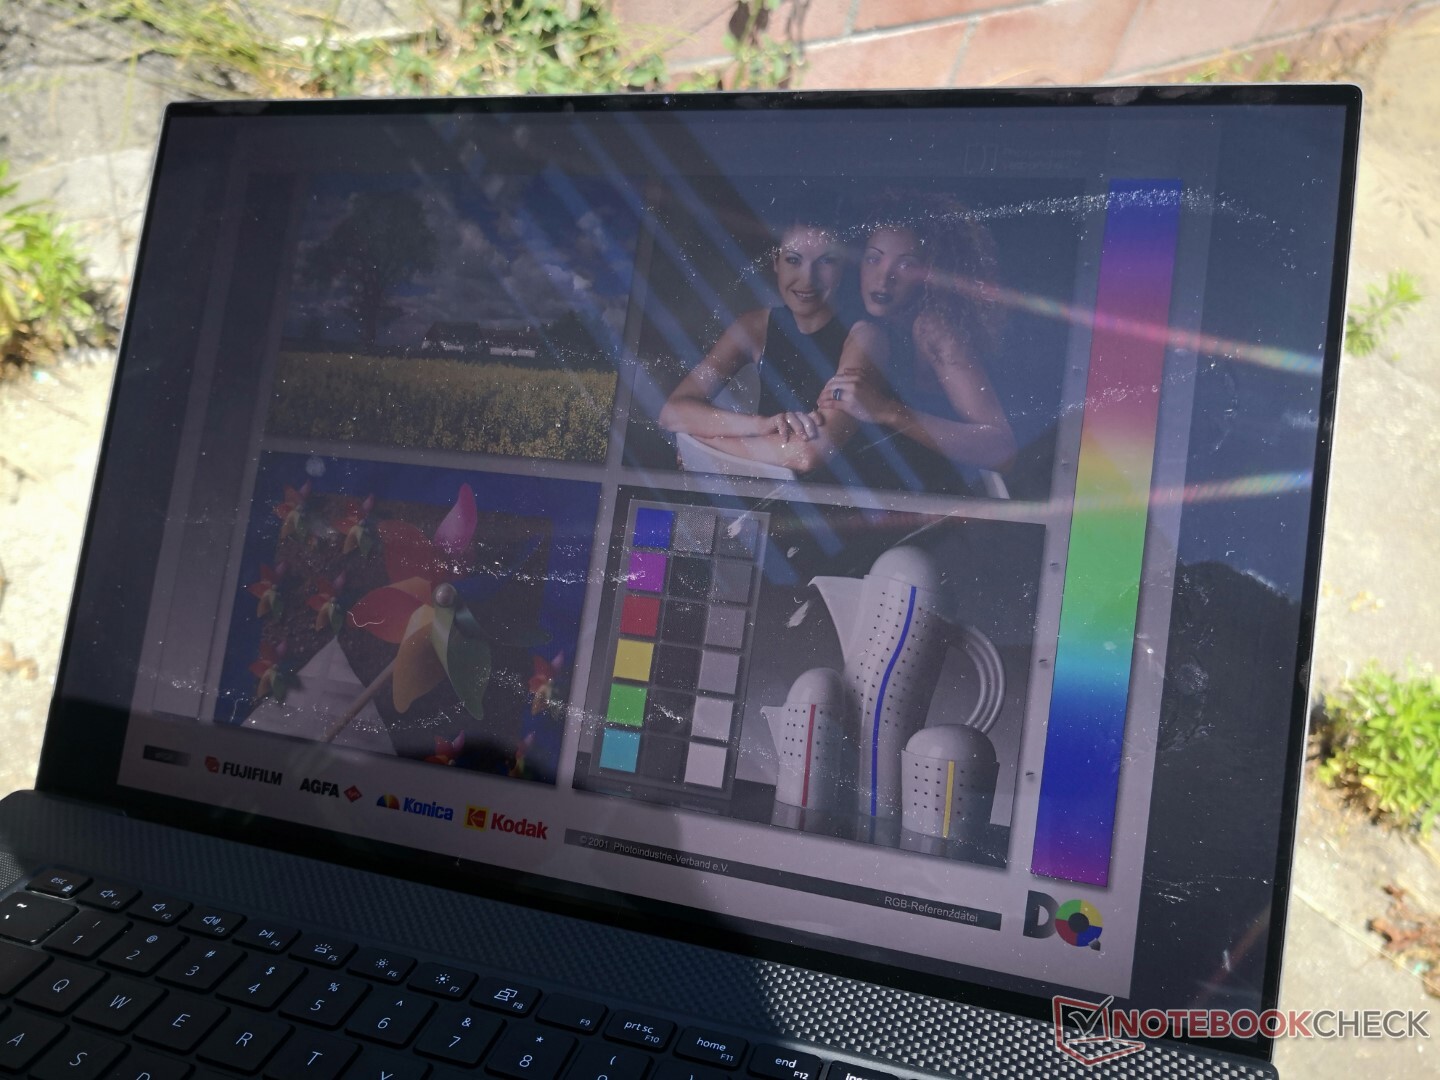
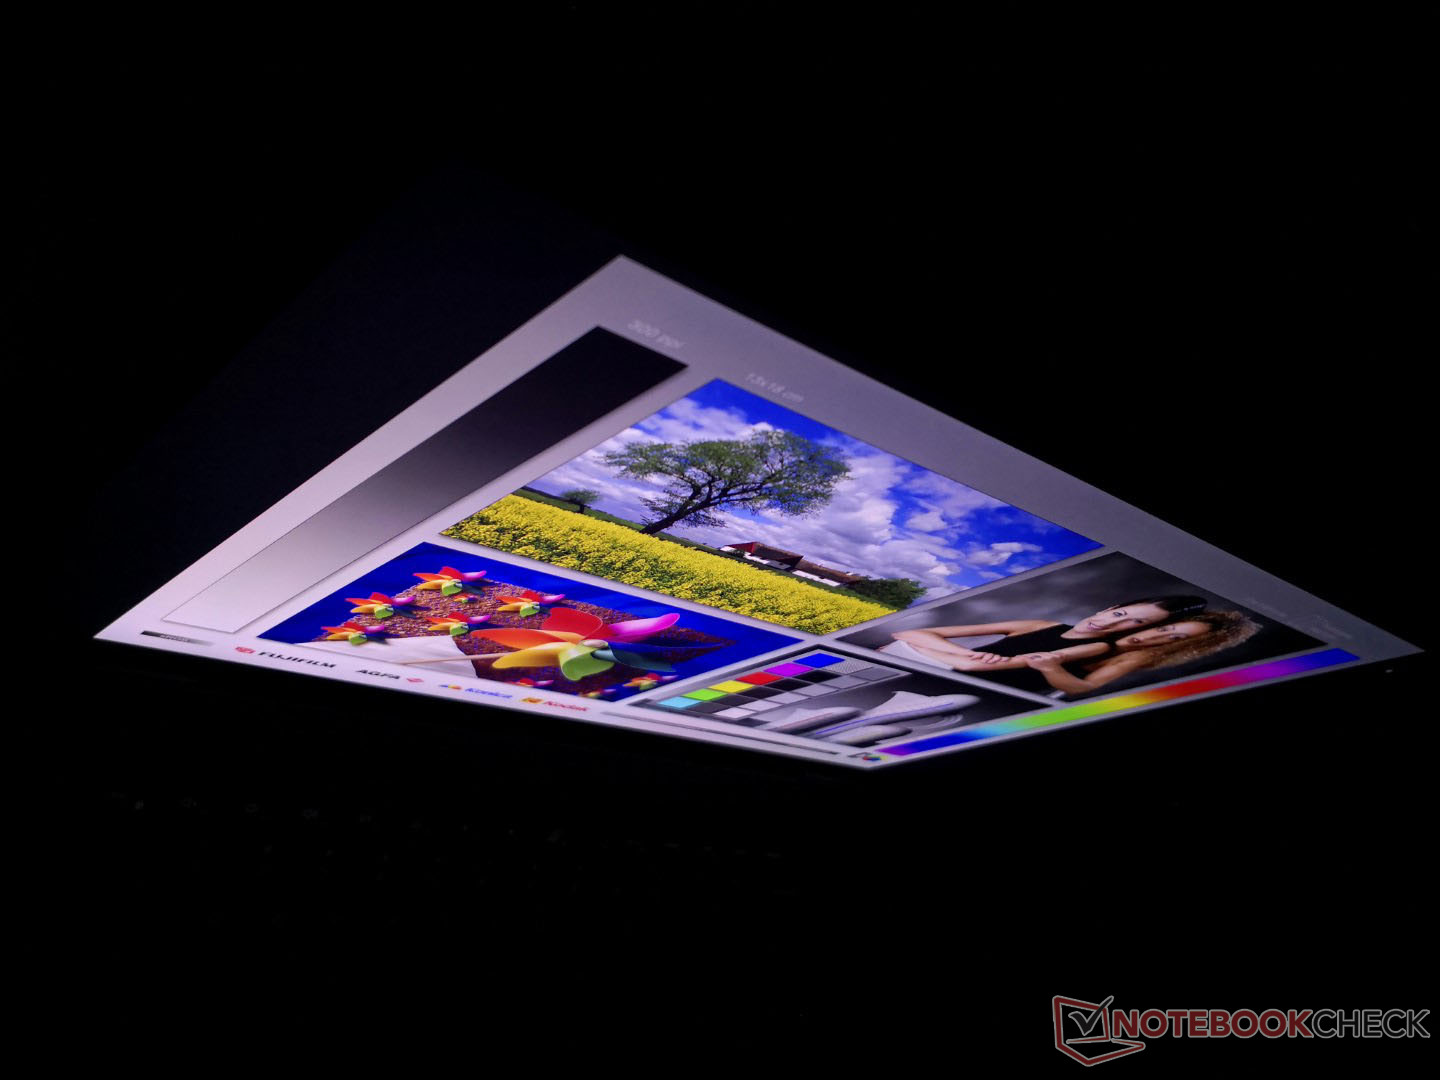
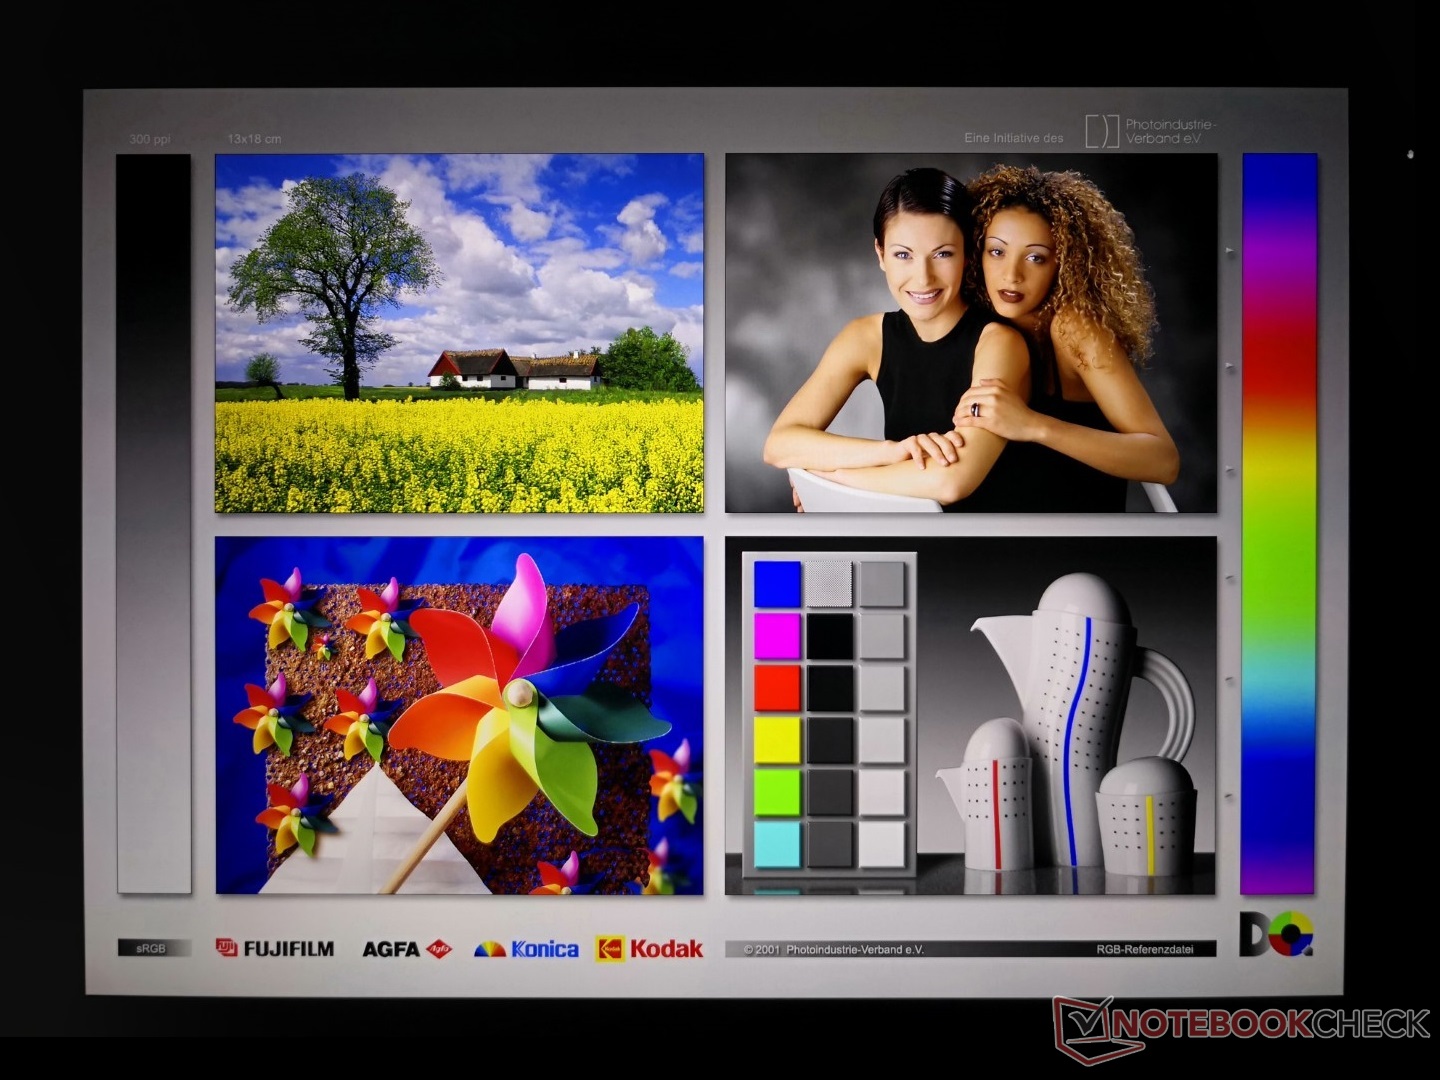
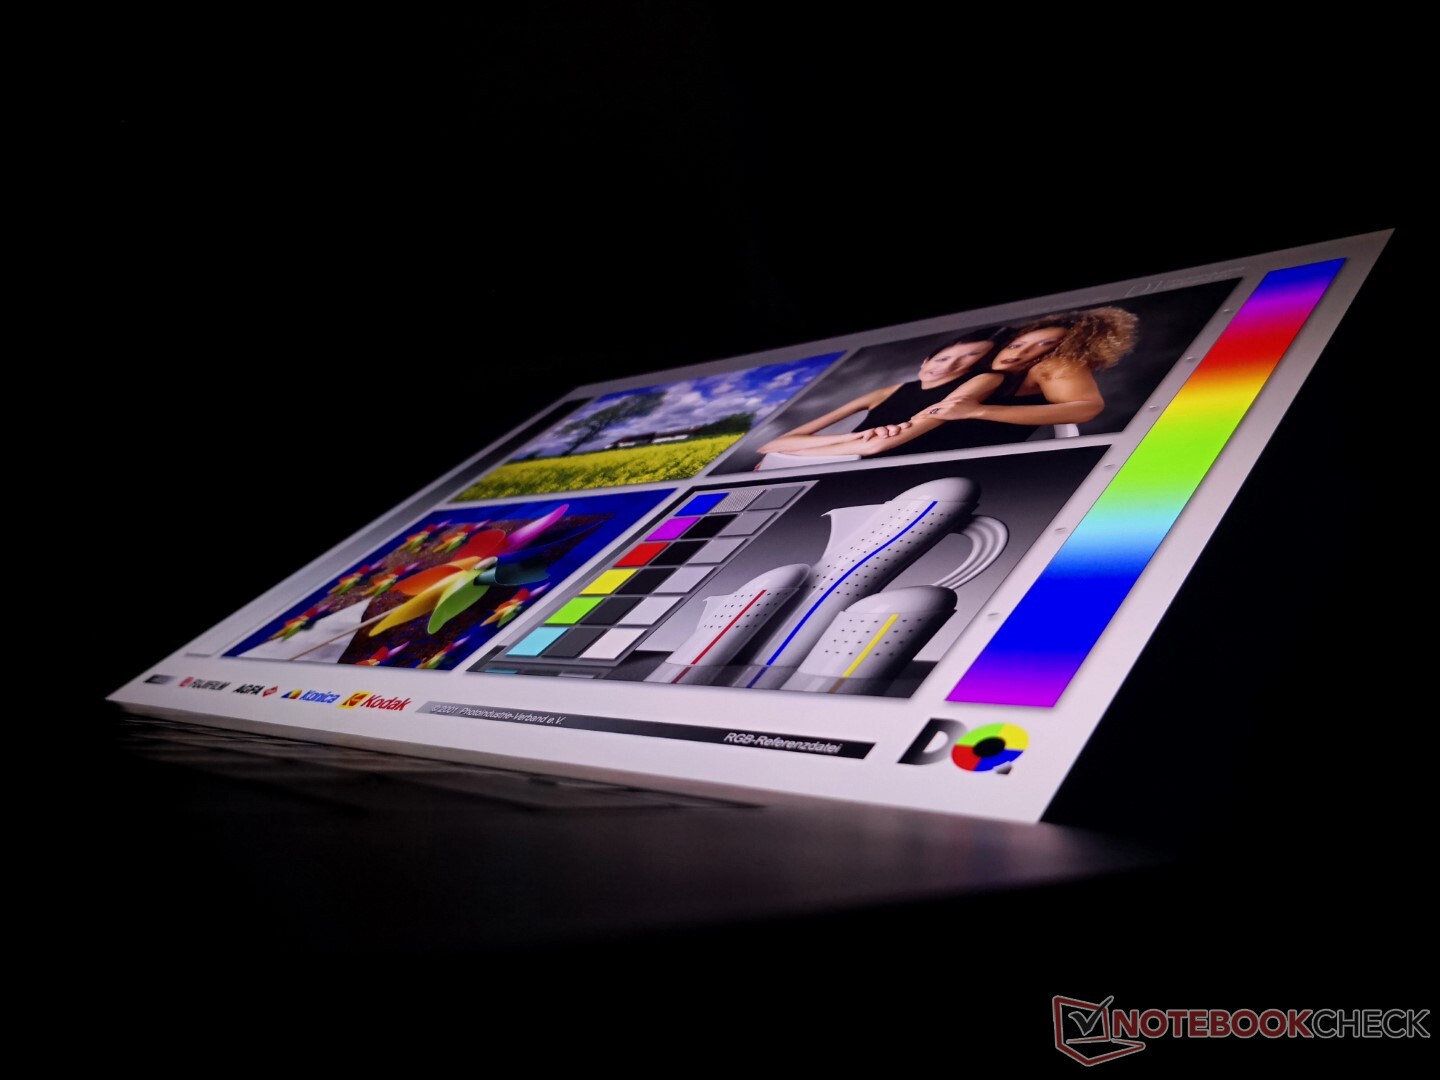
Visor - 16:10 IPS 60 Hz
Há duas opções de exibição a escolher (1200p e 2400p) em comparação com três no XPS 15 9520. O painel em nossa unidade vem com o mesmo painel IPS Sharp LQ170R1 como encontrado no XPS 17 9710 ou 9700, o que significa que a experiência de visualização não mudou desde o modelo original de 2020. Era um excelente visor na época e ainda é agora especialmente em termos de relação de contraste em relação a outros painéis IPS, mas gostaríamos de ver uma taxa de atualização de 90 Hz ou opções mais rápidas no futuro, semelhante ao que já está disponível nos painéis mais recentes IdeaPad Slim 7i Pro ou a ser lançado Zenbook Pro 14 Duo.
| |||||||||||||||||||||||||
iluminação: 85 %
iluminação com acumulador: 512.7 cd/m²
Contraste: 1602:1 (Preto: 0.32 cd/m²)
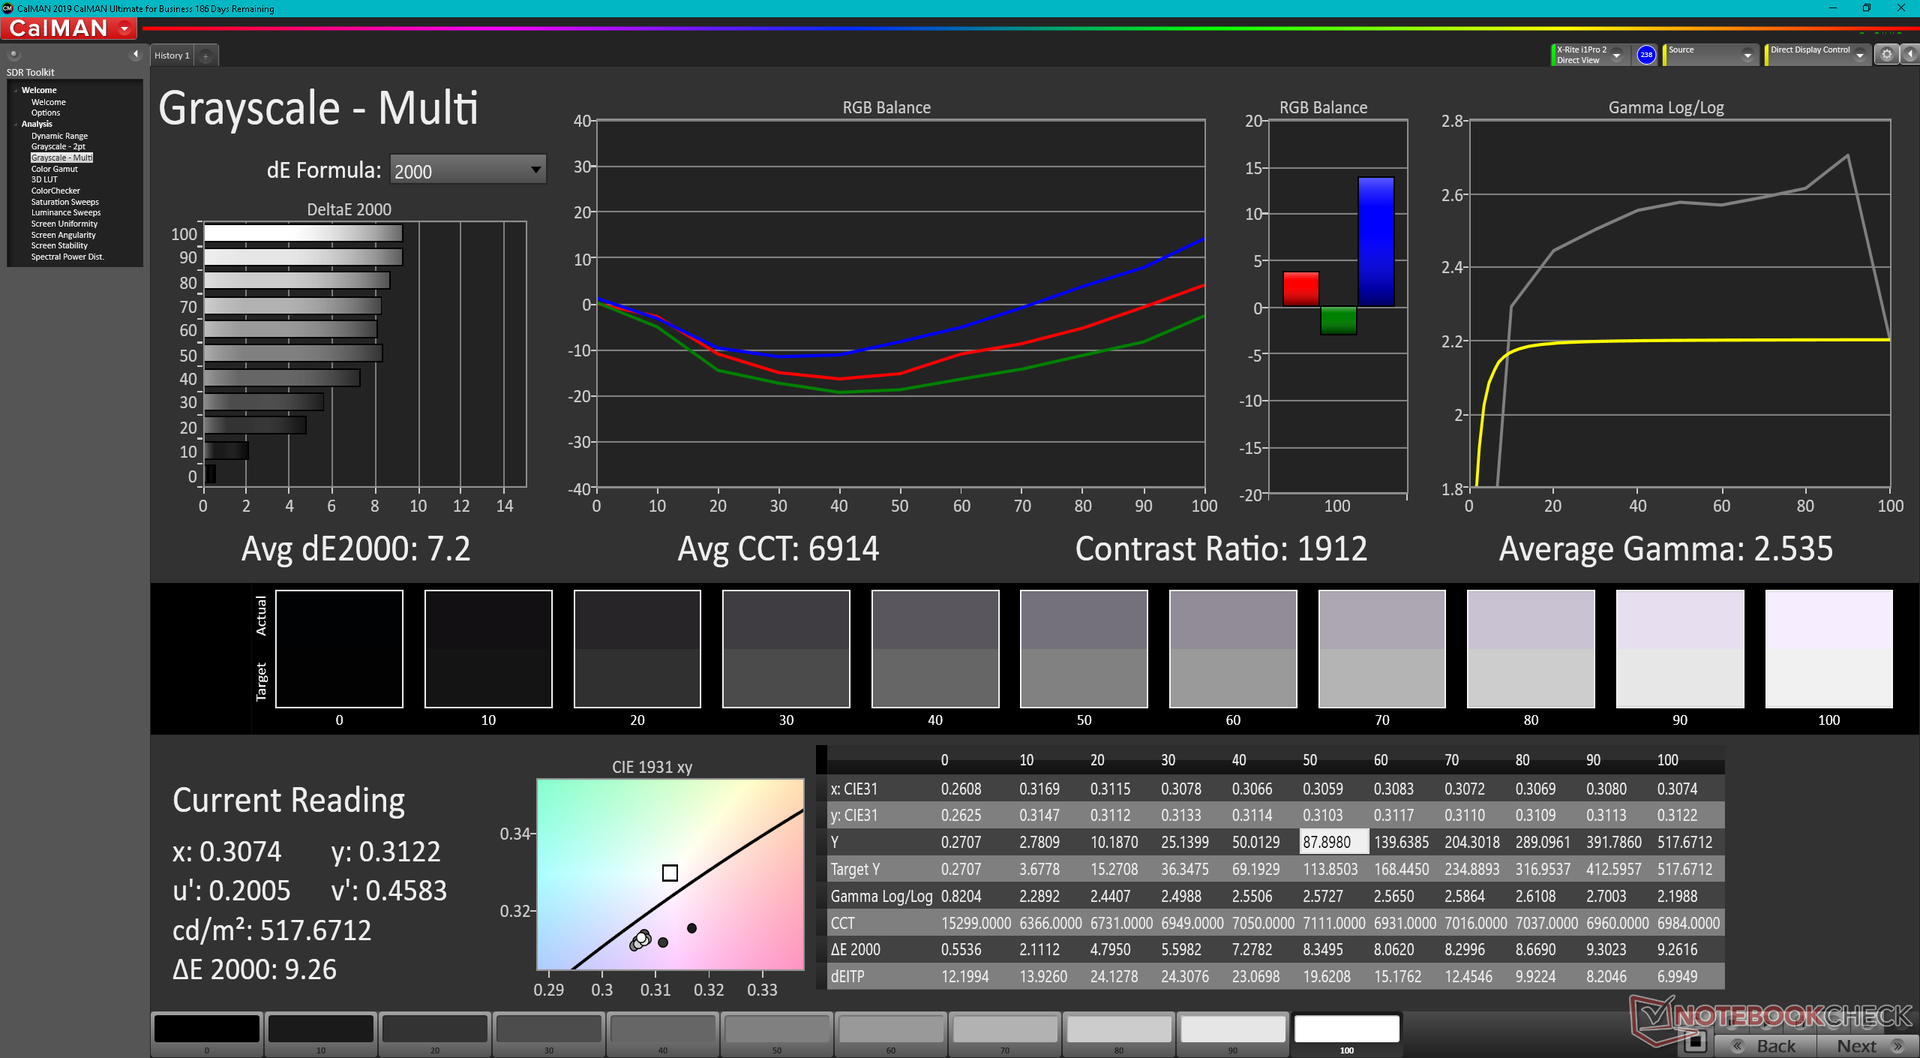
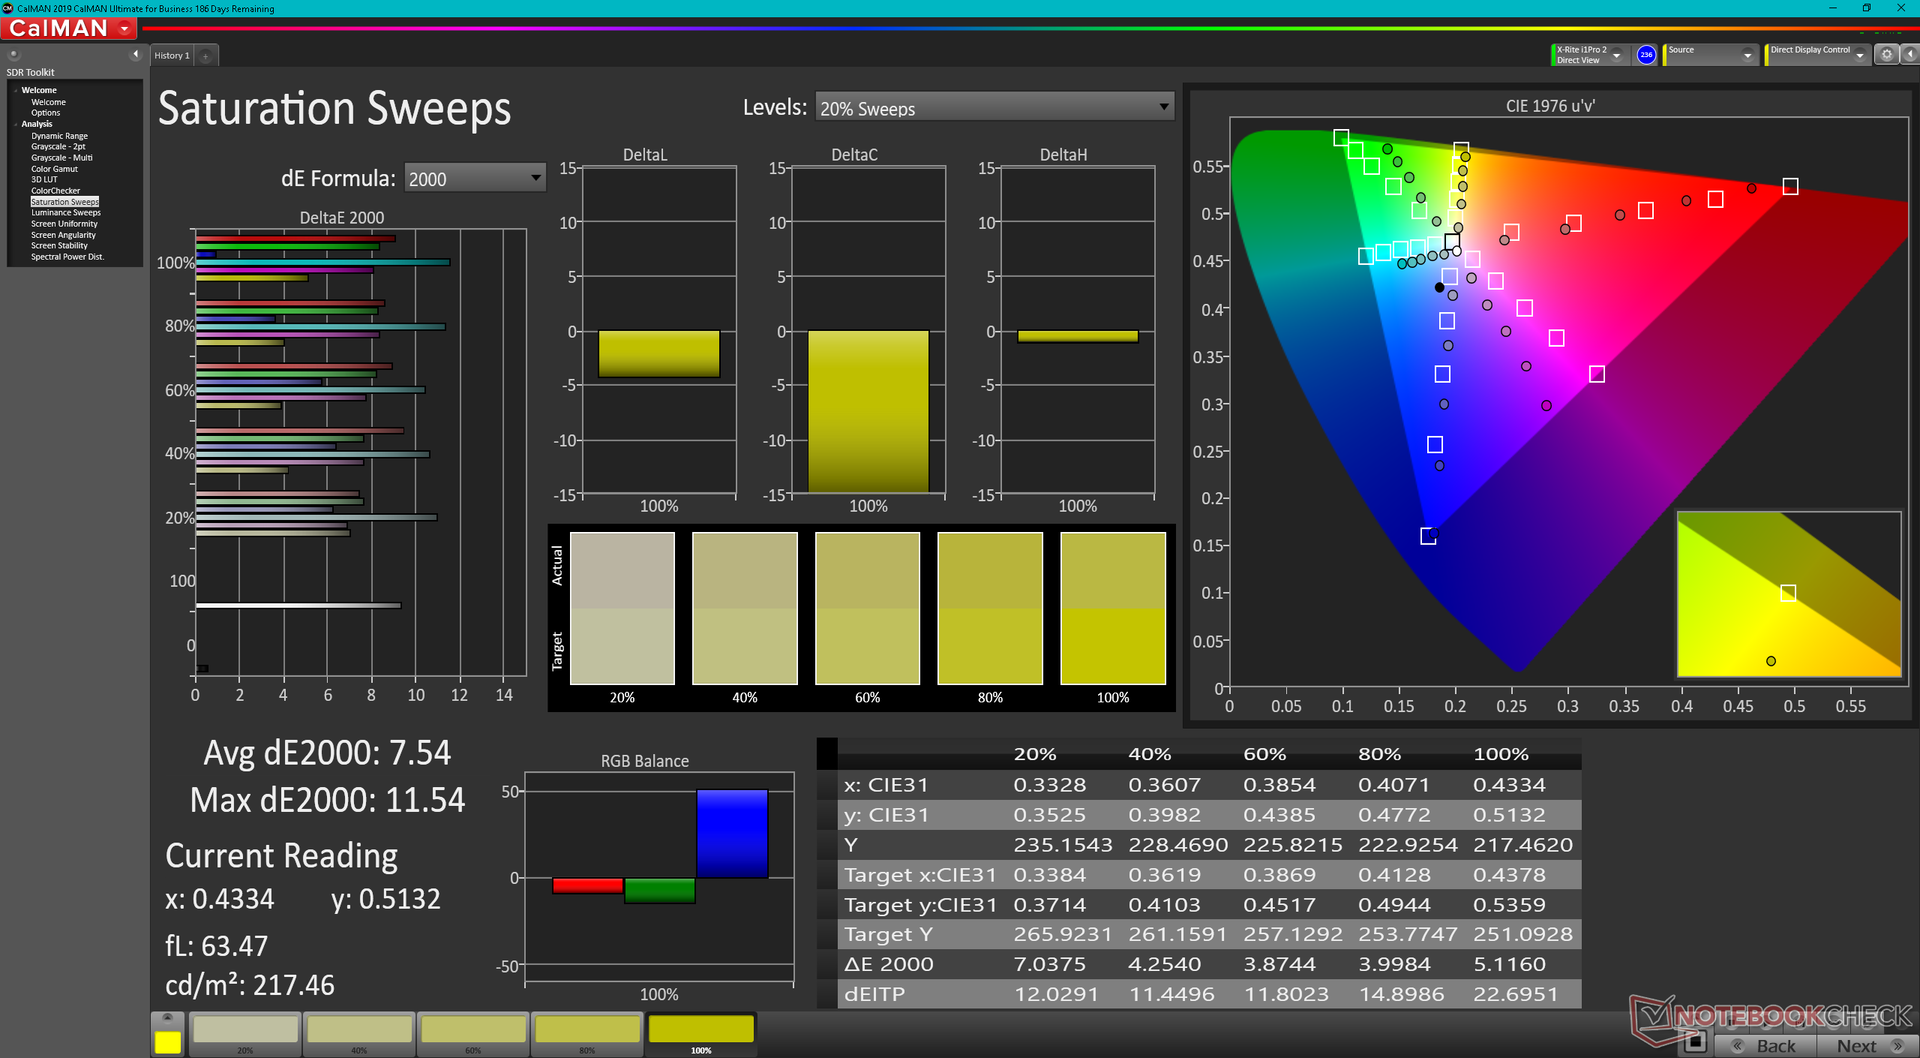
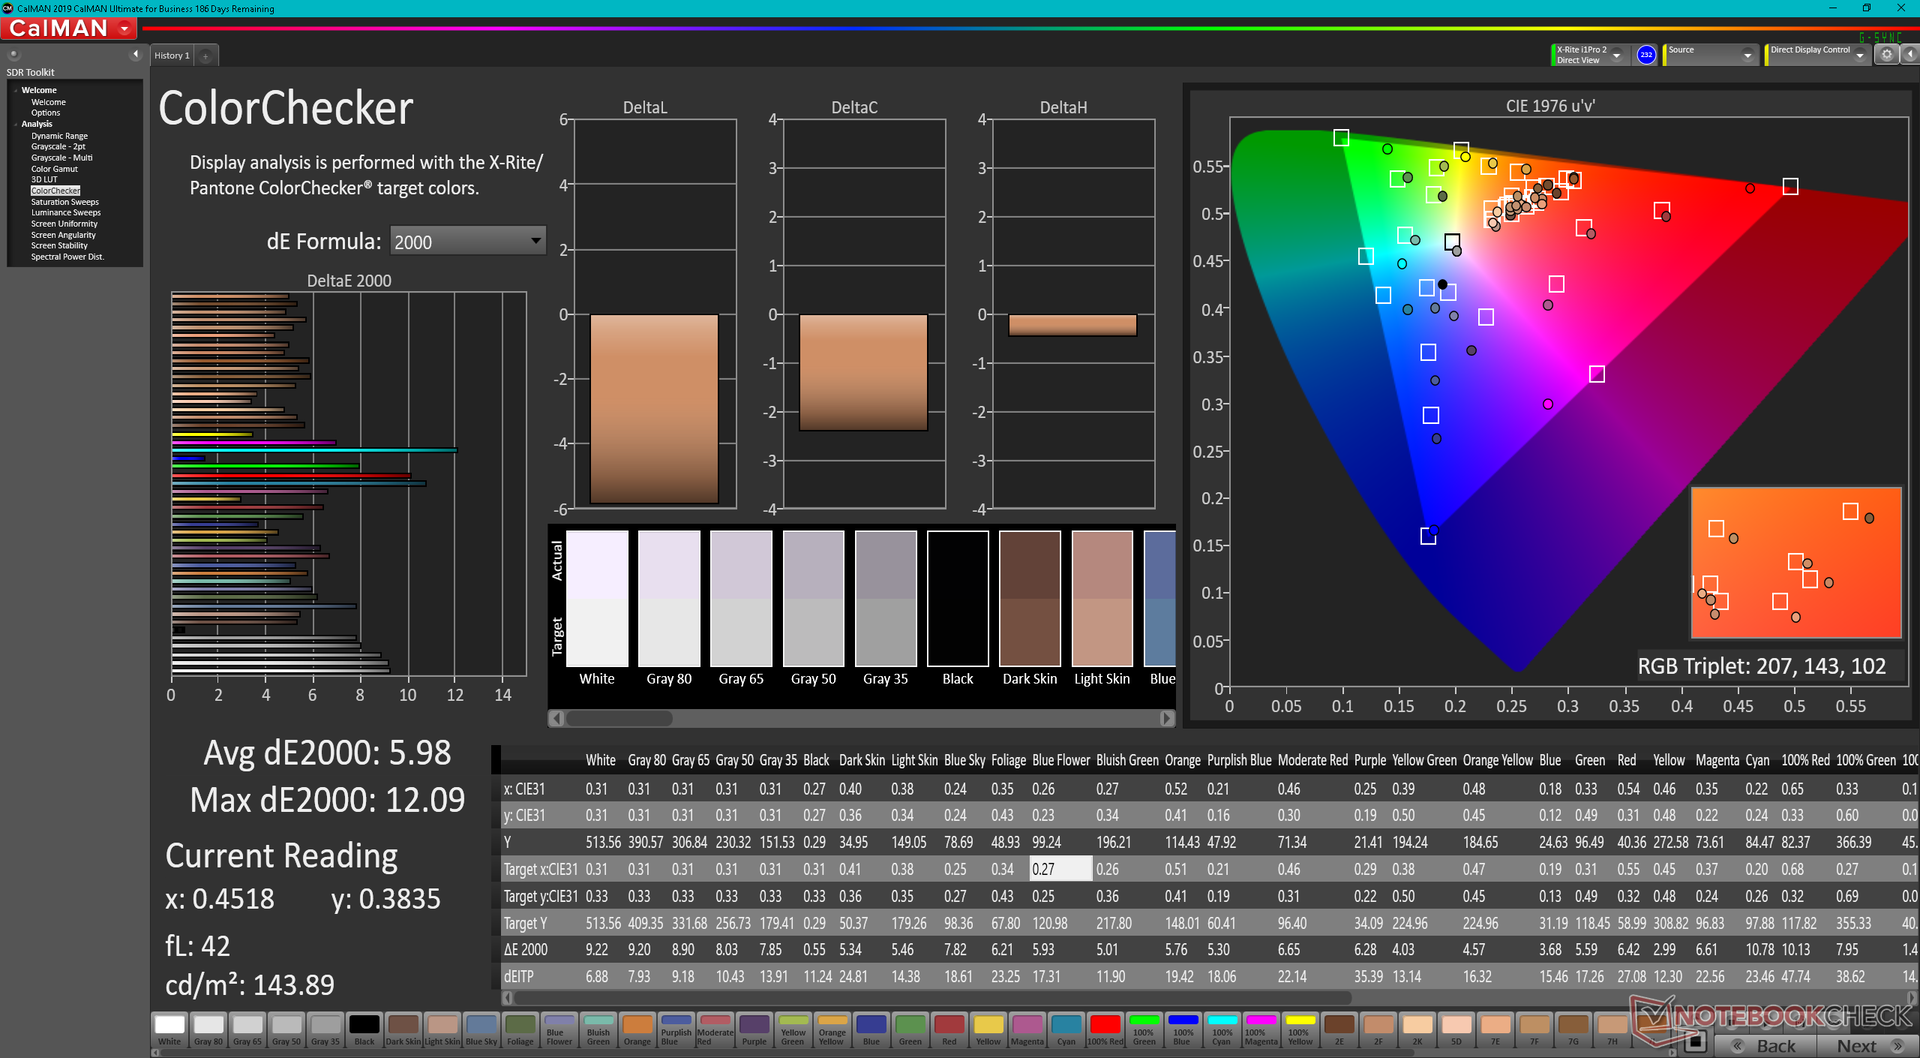
ΔE ColorChecker Calman: 5.98 | ∀{0.5-29.43 Ø4.71}
ΔE Greyscale Calman: 7.2 | ∀{0.09-98 Ø4.96}
85.3% AdobeRGB 1998 (Argyll 3D)
100% sRGB (Argyll 3D)
92.9% Display P3 (Argyll 3D)
Gamma: 2.54
CCT: 6914 K
| Dell XPS 17 9720 RTX 3060 Sharp LQ170R1, IPS, 3840x2400, 17" | Dell XPS 17 9700 Core i7 RTX 2060 Max-Q Sharp LQ170R1, IPS, 3840x2400, 17" | Dell XPS 17 9700 i5-10300H SHP14D7, IPS, 1920x1200, 17.3" | HP Envy 17-cg AU Optronics AUO439D, IPS, 1920x1080, 17.3" | Lenovo Legion 5 17ACH6H-82JY0003GE LEN173FHD, IPS, 1920x1080, 17.3" | Asus VivoBook 17 F712JA-AU708W BOE NV173FHM-N49, IPS, 1920x1080, 17.3" | Razer Blade 17 (i7-12800H, RTX 3070 Ti) BOE CQ NE173QHM-NZ1 (BOE09F9), IPS, 2560x1440, 17.3" | |
|---|---|---|---|---|---|---|---|
| Display | 5% | -9% | -17% | -18% | -50% | 2% | |
| Display P3 Coverage (%) | 92.9 | 90.5 -3% | 77.4 -17% | 68 -27% | 64.8 -30% | 39.53 -57% | 97.9 5% |
| sRGB Coverage (%) | 100 | 100 0% | 100 0% | 95 -5% | 97.2 -3% | 58.85 -41% | 99.9 0% |
| AdobeRGB 1998 Coverage (%) | 85.3 | 99.8 17% | 76.6 -10% | 69 -19% | 66.7 -22% | 40.84 -52% | 85.5 0% |
| Response Times | 5% | -13% | 19% | 73% | 57% | 69% | |
| Response Time Grey 50% / Grey 80% * (ms) | 51.2 ? | 51.2 ? -0% | 60.4 ? -18% | 40 ? 22% | 15 ? 71% | 22 ? 57% | 15.2 ? 70% |
| Response Time Black / White * (ms) | 35.2 ? | 32 ? 9% | 37.6 ? -7% | 30 ? 15% | 9 ? 74% | 15 ? 57% | 11.2 ? 68% |
| PWM Frequency (Hz) | 2500 ? | ||||||
| Screen | 20% | 33% | 6% | 16% | -16% | -9% | |
| Brightness middle (cd/m²) | 512.7 | 539.4 5% | 636 24% | 347 -32% | 323 -37% | 269 -48% | 341 -33% |
| Brightness (cd/m²) | 463 | 494 7% | 580 25% | 329 -29% | 305 -34% | 263 -43% | 308 -33% |
| Brightness Distribution (%) | 85 | 84 -1% | 86 1% | 89 5% | 89 5% | 88 4% | 82 -4% |
| Black Level * (cd/m²) | 0.32 | 0.32 -0% | 0.34 -6% | 0.27 16% | 0.25 22% | 0.3 6% | 0.45 -41% |
| Contrast (:1) | 1602 | 1686 5% | 1871 17% | 1285 -20% | 1292 -19% | 897 -44% | 758 -53% |
| Colorchecker dE 2000 * | 5.98 | 4.12 31% | 2.4 60% | 3.75 37% | 1.87 69% | 5.8 3% | 4.16 30% |
| Colorchecker dE 2000 max. * | 12.09 | 7.65 37% | 3.5 71% | 7.53 38% | 4.84 60% | 18.46 -53% | 8.14 33% |
| Greyscale dE 2000 * | 7.2 | 1.5 79% | 2 72% | 4.88 32% | 2.57 64% | 3.64 49% | 5.09 29% |
| Gamma | 2.54 87% | 2.15 102% | 2.08 106% | 2.53 87% | 2.42 91% | 2.35 94% | 2.48 89% |
| CCT | 6914 94% | 6438 101% | 6704 97% | 6624 98% | 7012 93% | 6995 93% | 6884 94% |
| Colorchecker dE 2000 calibrated * | 3.91 | 1.5 | 0.92 | 3 | |||
| Color Space (Percent of AdobeRGB 1998) (%) | 90.4 | 67.5 | |||||
| Color Space (Percent of sRGB) (%) | 100 | 100 | |||||
| Média Total (Programa/Configurações) | 10% /
14% | 4% /
16% | 3% /
3% | 24% /
17% | -3% /
-12% | 21% /
5% |
* ... menor é melhor
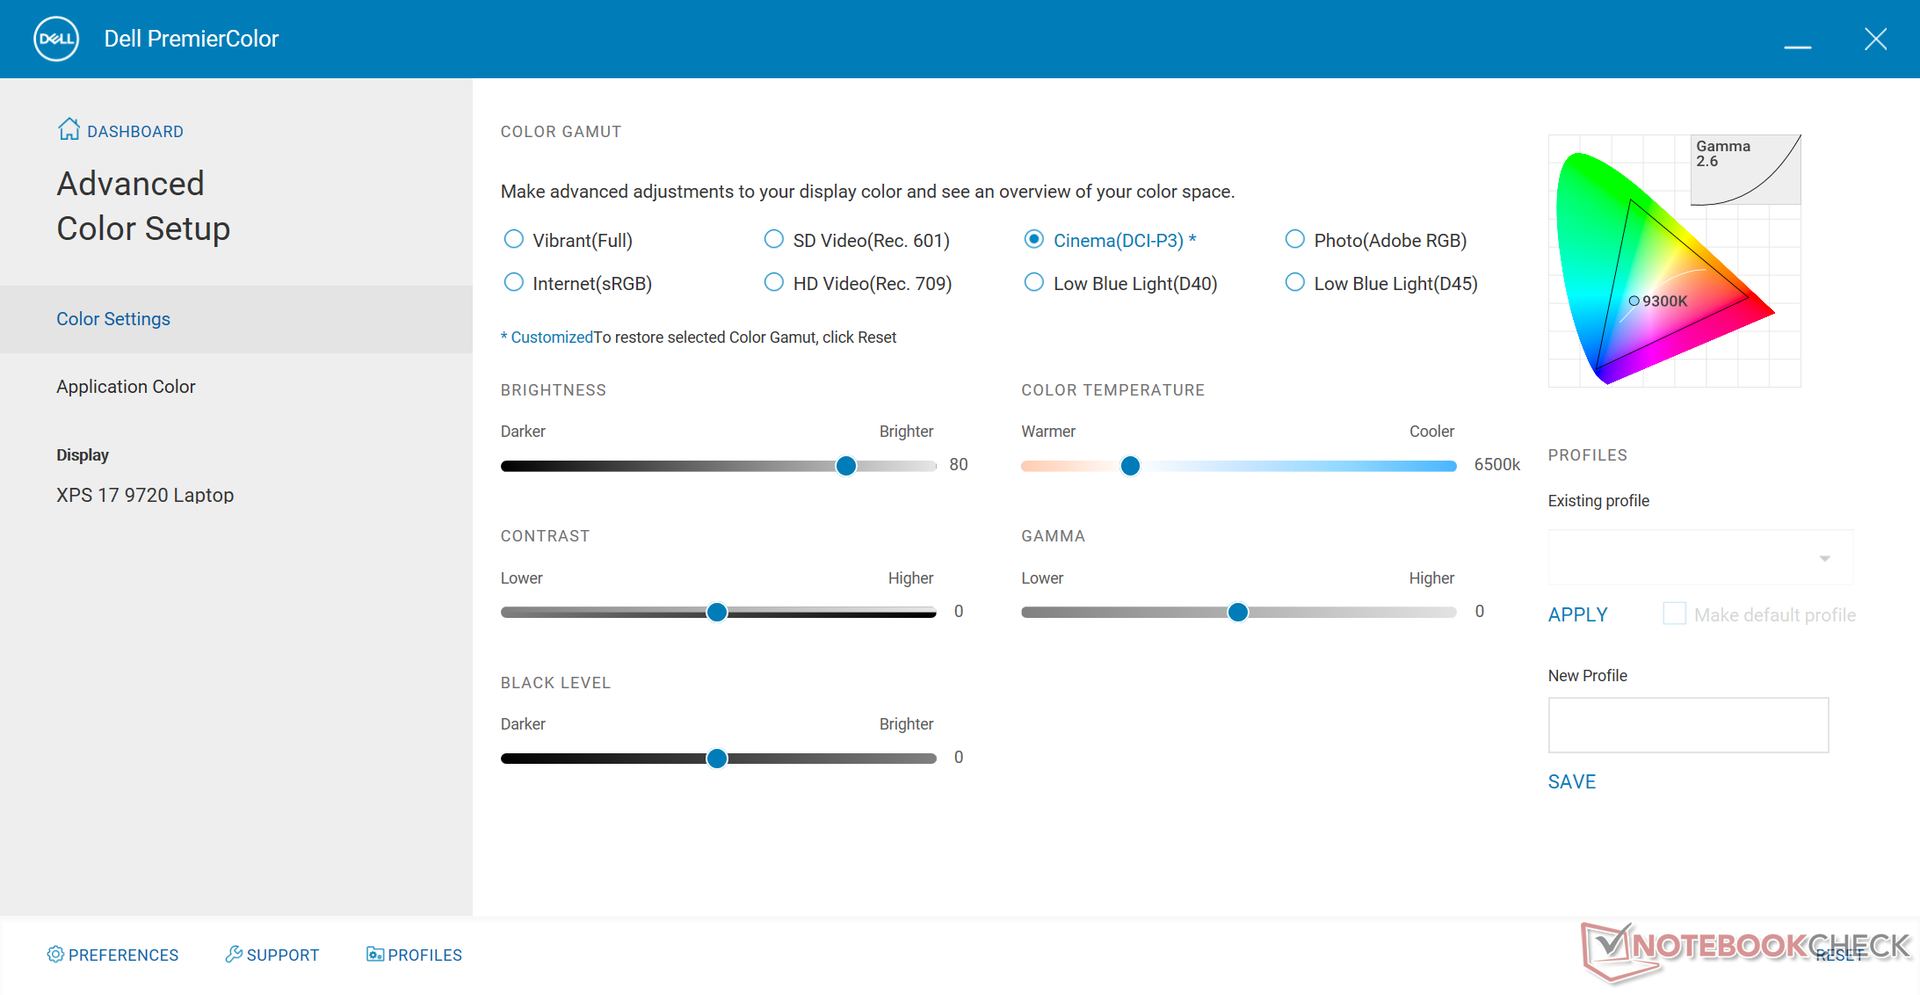
A temperatura de cor é mais quente do que o esperado quando definida para o padrão de cor DCI-P3 através do software Dell PremierColor. Ao contrário de muitos laptops profissionais como o Dell Precision, Gigabyte Aero ou a série HP ZBook, a série XPS não é calibrada em X-Rite na fábrica. Uma calibração do usuário final seria necessária para explorar melhor a ampla gama de cores do painel.
Exibir tempos de resposta
| ↔ Tempo de resposta preto para branco | ||
|---|---|---|
| 35.2 ms ... ascensão ↗ e queda ↘ combinadas | ↗ 18.8 ms ascensão | 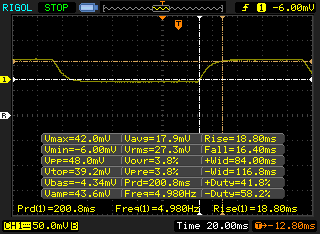 |
| ↘ 16.4 ms queda | ||
| A tela mostra taxas de resposta lentas em nossos testes e será insatisfatória para os jogadores. Em comparação, todos os dispositivos testados variam de 0.1 (mínimo) a 240 (máximo) ms. » 93 % de todos os dispositivos são melhores. Isso significa que o tempo de resposta medido é pior que a média de todos os dispositivos testados (19.8 ms). | ||
| ↔ Tempo de resposta 50% cinza a 80% cinza | ||
| 51.2 ms ... ascensão ↗ e queda ↘ combinadas | ↗ 26 ms ascensão | 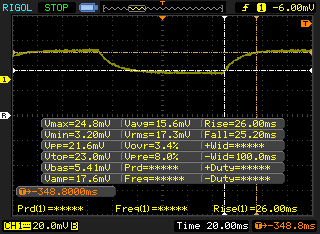 |
| ↘ 25.2 ms queda | ||
| A tela mostra taxas de resposta lentas em nossos testes e será insatisfatória para os jogadores. Em comparação, todos os dispositivos testados variam de 0.165 (mínimo) a 636 (máximo) ms. » 88 % de todos os dispositivos são melhores. Isso significa que o tempo de resposta medido é pior que a média de todos os dispositivos testados (31 ms). | ||
Cintilação da tela / PWM (modulação por largura de pulso)
| Tela tremeluzindo / PWM não detectado |  | ||
[pwm_comparison] Em comparação: 52 % de todos os dispositivos testados não usam PWM para escurecer a tela. Se PWM foi detectado, uma média de 7754 (mínimo: 5 - máximo: 343500) Hz foi medida. | |||
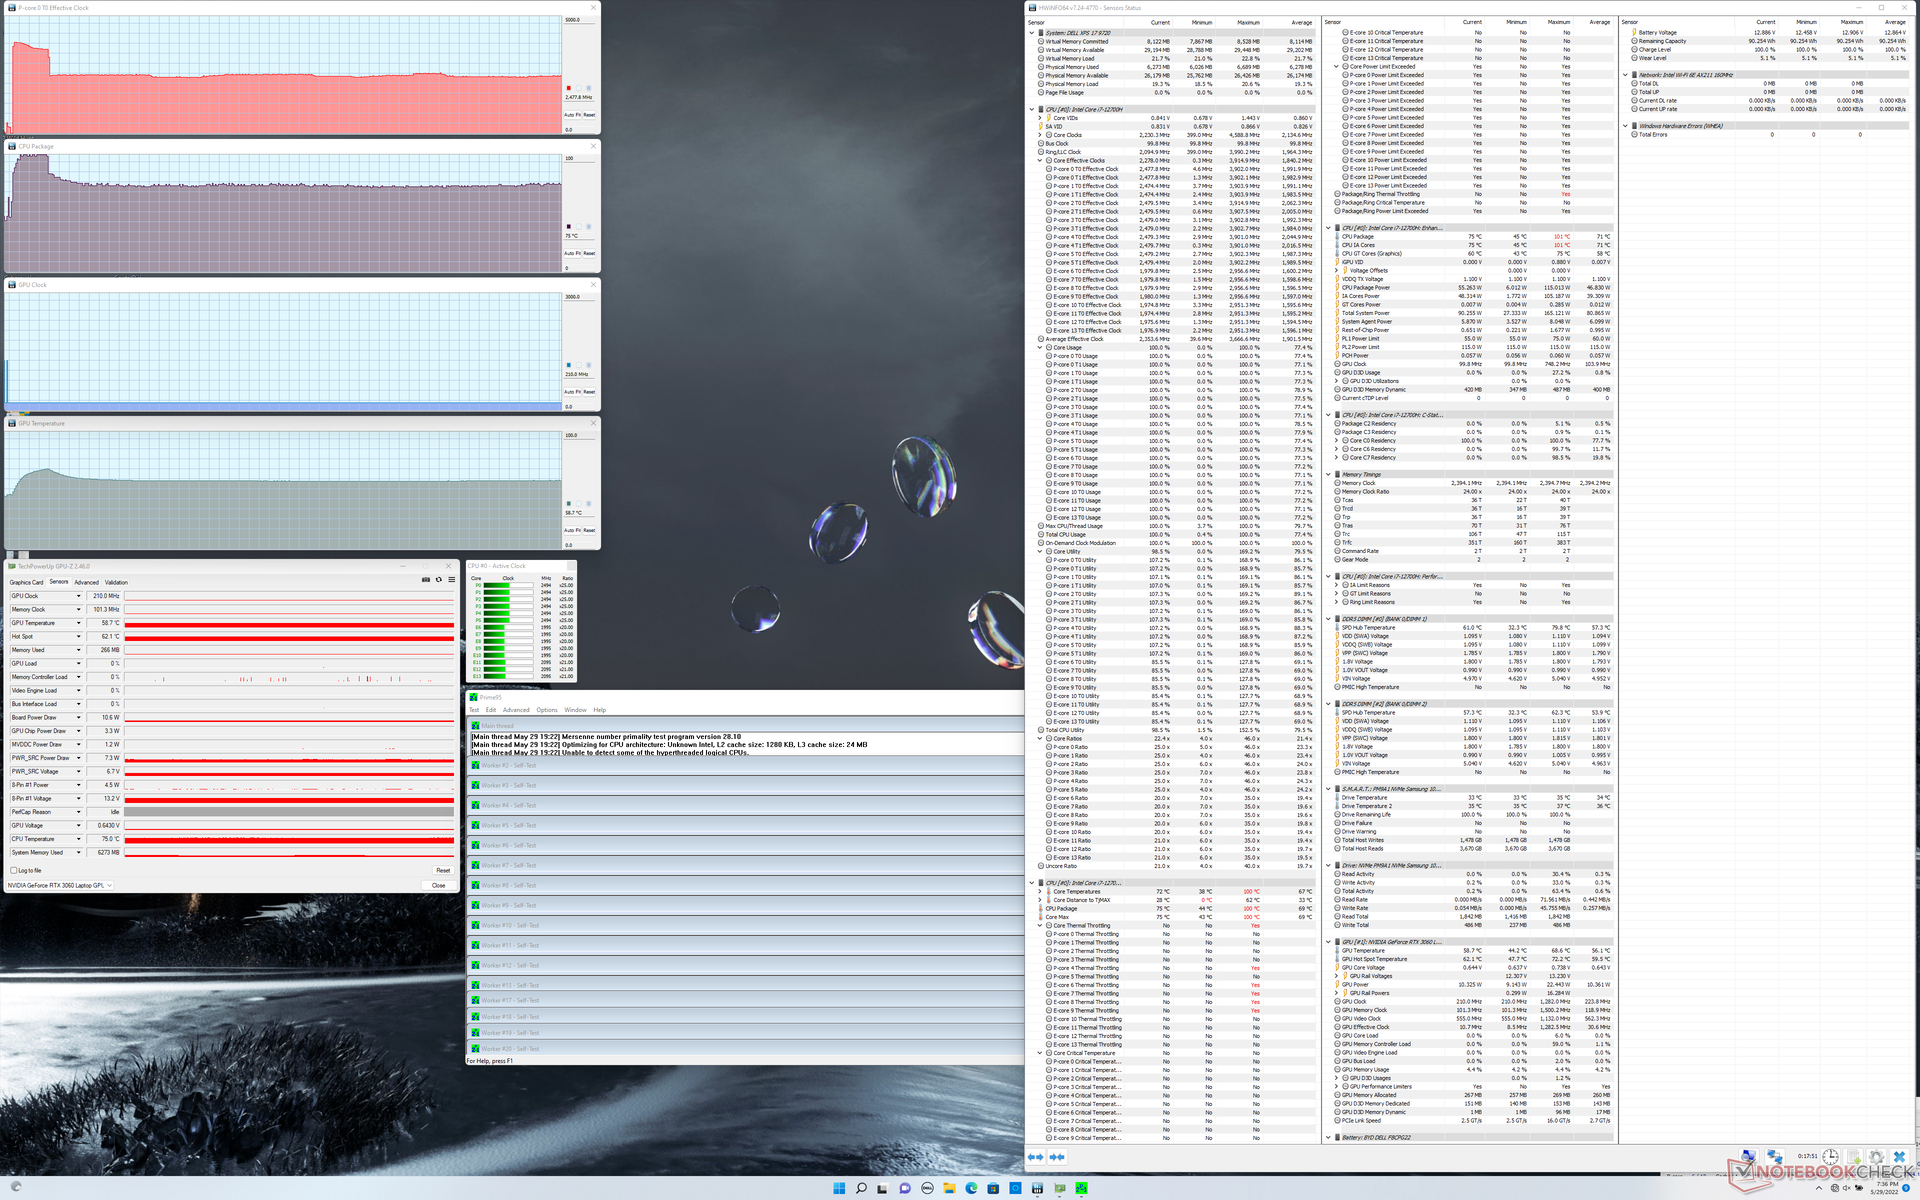
Desempenho - Alder Lake-H Ups The Ante
Condições de teste
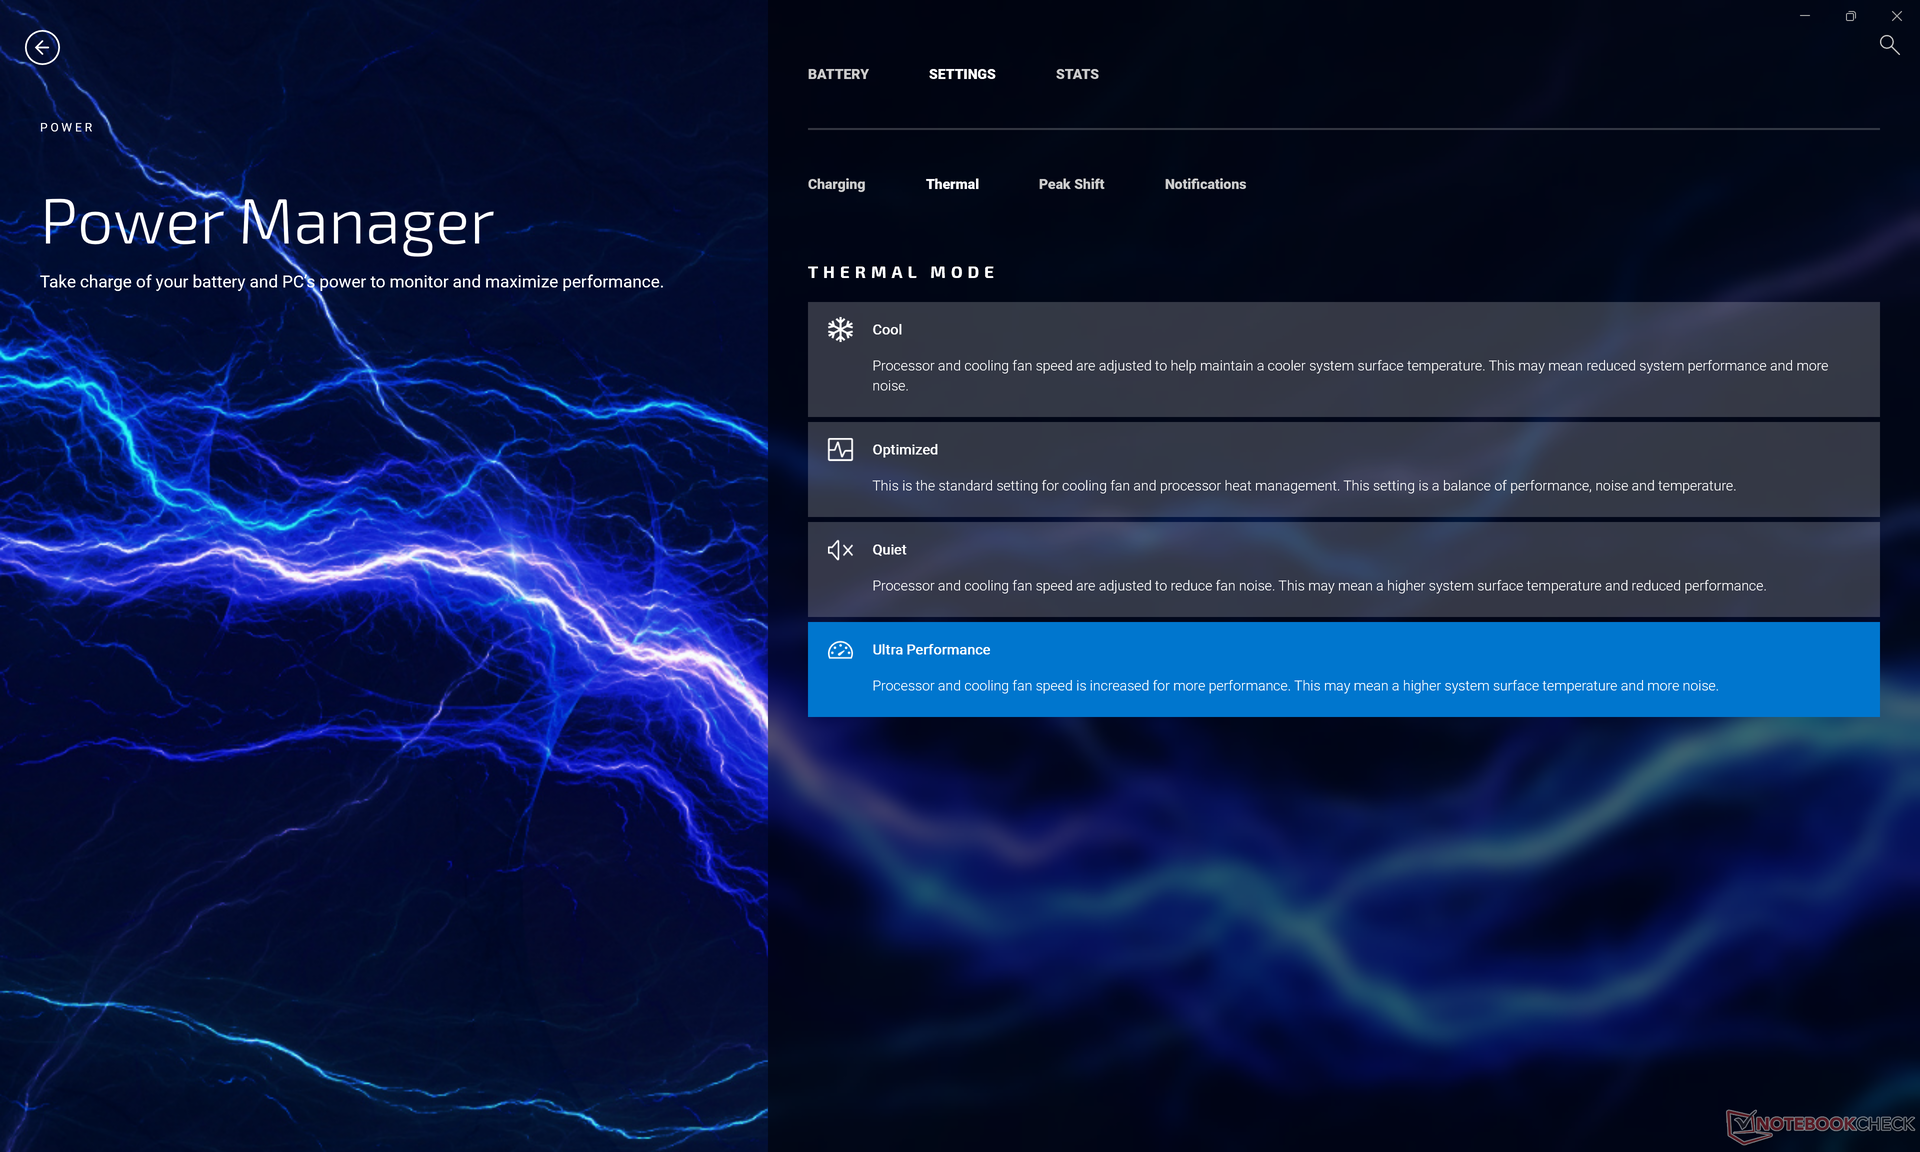
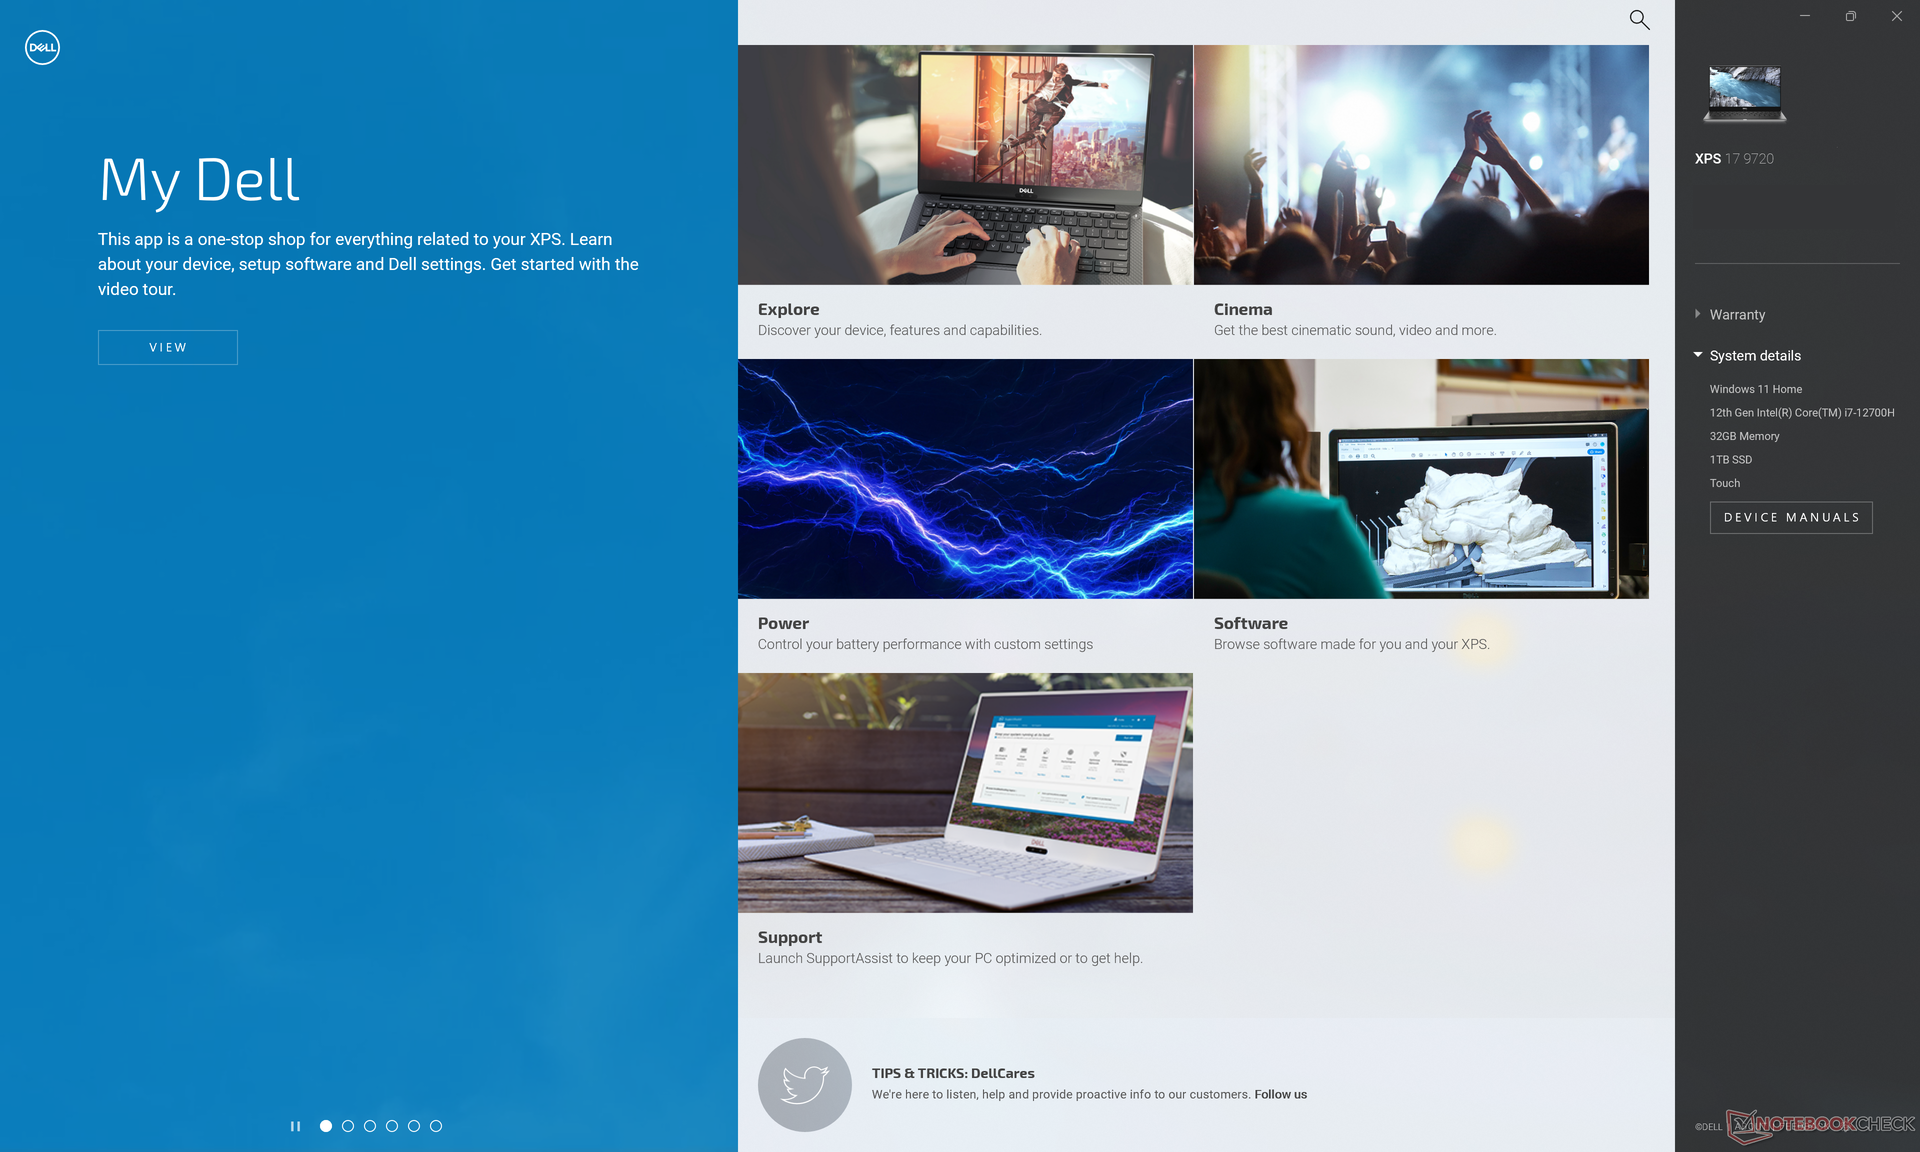
Nossa unidade foi ajustada para o modo Ultra Performance através do software My Dell antes de executar quaisquer benchmarks abaixo para obter as mais altas pontuações possíveis. Recomendamos aos usuários que se familiarizem com My Dell, Dell Update e software PremierColor, pois as principais características do sistema são alternadas através destes aplicativos
Optimus 1.0 vem como padrão para comutação automática de gráficos entre a GPU integrada e a discreta GeForce RTX 3060. Sincronização interna adaptativa e MUX não são suportados, uma vez que o XPS 17 não é uma máquina de jogos.
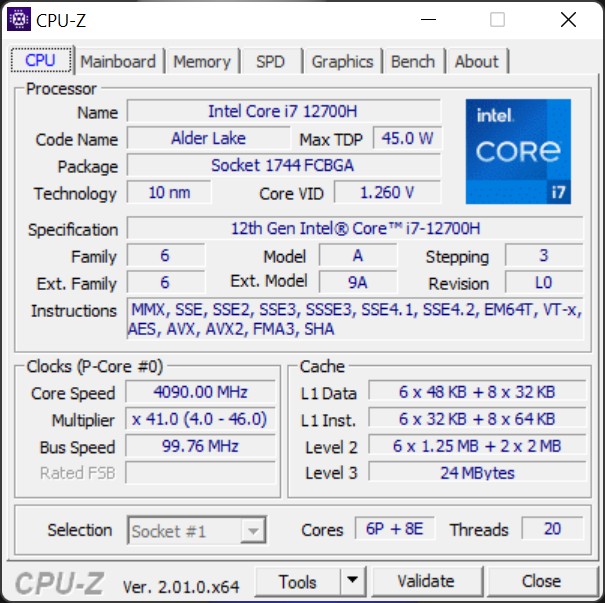
Processador
Os benchmarks CineBench xT e certos sub-testes AIDA64 podem ser até 50% mais rápidos do que no XPS 15 9710 equipados com a última geração Núcleo i7-11800H para representar uma melhoria significativa, ano após ano, no desempenho do processador. Os ganhos são muito menores em outros testes, porém, incluindo Blender e HWBOT x265, mas os ganhos médios ainda são maiores do que os observados entre o XPS 17 9700 e o XPS 17 9710.
Curiosamente, o Núcleo i7-12700H fica atrás do Core i7-10875H da 10ª geração em uma série de benchmarks AIDA64, como mostrado abaixo.
Alguns laptops mais grossos com a mesma CPU Core i7-12800H são capazes de operar o processador a taxas de relógio mais altas e até 20% mais rápido, como no HP Omen 16
O CineBench R15 xT em loop não apresenta problemas de estrangulamento de desempenho quando submetido a cargas extremas de processamento por longos períodos.
Cinebench R15 Multi Loop
Cinebench R23: Multi Core | Single Core
Cinebench R15: CPU Multi 64Bit | CPU Single 64Bit
Blender: v2.79 BMW27 CPU
7-Zip 18.03: 7z b 4 | 7z b 4 -mmt1
Geekbench 5.5: Multi-Core | Single-Core
HWBOT x265 Benchmark v2.2: 4k Preset
LibreOffice : 20 Documents To PDF
R Benchmark 2.5: Overall mean
Cinebench R23: Multi Core | Single Core
Cinebench R15: CPU Multi 64Bit | CPU Single 64Bit
Blender: v2.79 BMW27 CPU
7-Zip 18.03: 7z b 4 | 7z b 4 -mmt1
Geekbench 5.5: Multi-Core | Single-Core
HWBOT x265 Benchmark v2.2: 4k Preset
LibreOffice : 20 Documents To PDF
R Benchmark 2.5: Overall mean
* ... menor é melhor
| AIDA64 / FP32 Ray-Trace | |
| Eurocom RX315 NH57AF1 | |
| Lenovo Legion 5 17ACH6H-82JY0003GE | |
| Média Intel Core i7-12700H (2585 - 17957, n=64) | |
| Dell XPS 17 9700 Core i7 RTX 2060 Max-Q | |
| Razer Blade 17 (i7-12800H, RTX 3070 Ti) | |
| Dell XPS 17 9720 RTX 3060 | |
| Asus VivoBook 17 F712JA-AU708W | |
| AIDA64 / FP64 Ray-Trace | |
| Eurocom RX315 NH57AF1 | |
| Lenovo Legion 5 17ACH6H-82JY0003GE | |
| Média Intel Core i7-12700H (1437 - 9692, n=64) | |
| Dell XPS 17 9700 Core i7 RTX 2060 Max-Q | |
| Dell XPS 17 9720 RTX 3060 | |
| Razer Blade 17 (i7-12800H, RTX 3070 Ti) | |
| Asus VivoBook 17 F712JA-AU708W | |
| AIDA64 / CPU PhotoWorxx | |
| Dell XPS 17 9720 RTX 3060 | |
| Média Intel Core i7-12700H (12863 - 52207, n=64) | |
| Razer Blade 17 (i7-12800H, RTX 3070 Ti) | |
| Dell XPS 17 9700 Core i7 RTX 2060 Max-Q | |
| Eurocom RX315 NH57AF1 | |
| Asus VivoBook 17 F712JA-AU708W | |
| Lenovo Legion 5 17ACH6H-82JY0003GE | |
Desempenho do sistema
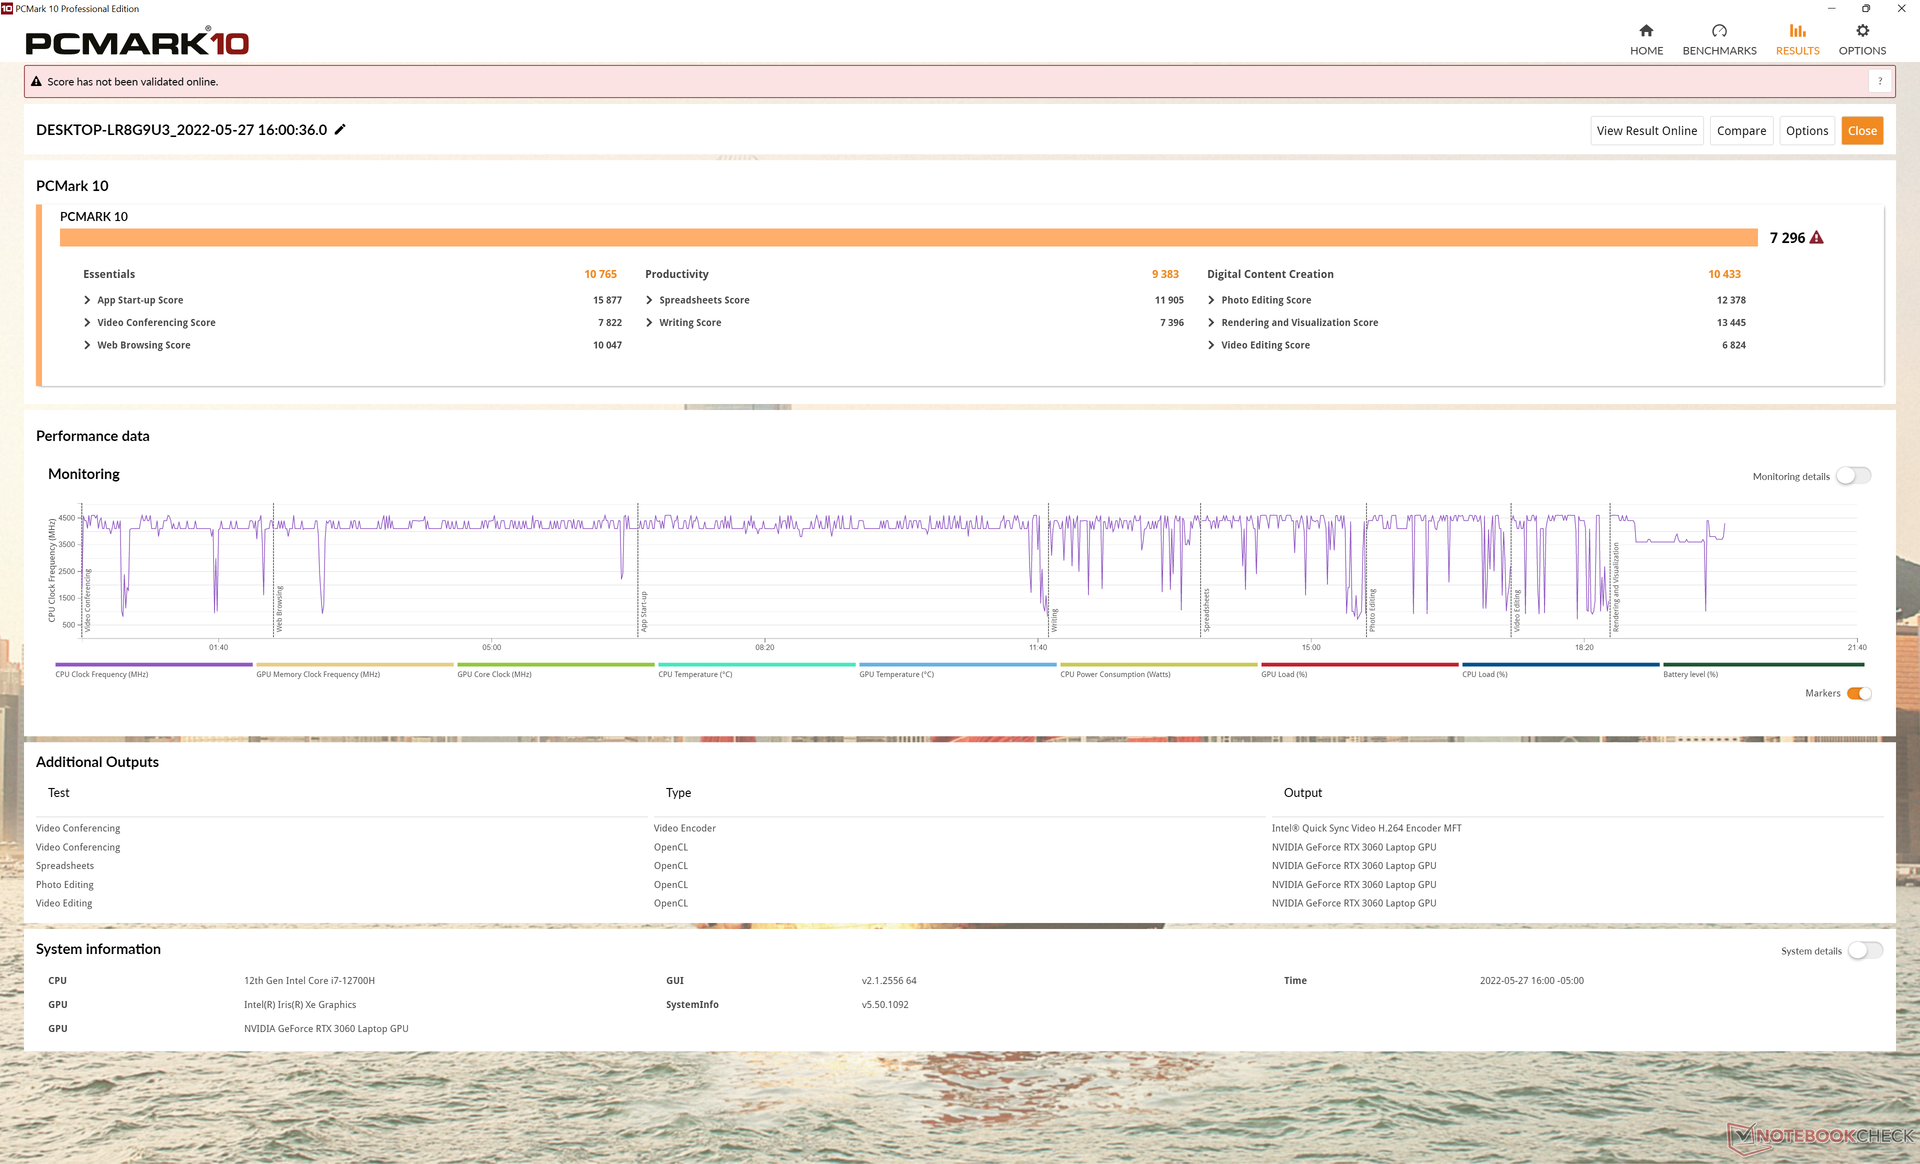
Os resultados do PCMark 10 são consistentemente mais altos do que os que registramos no XPS 17 9710, se apenas por pouco. Nossas pontuações no XPS 17 9720 ainda são algumas das mais rápidas na categoria multimídia.
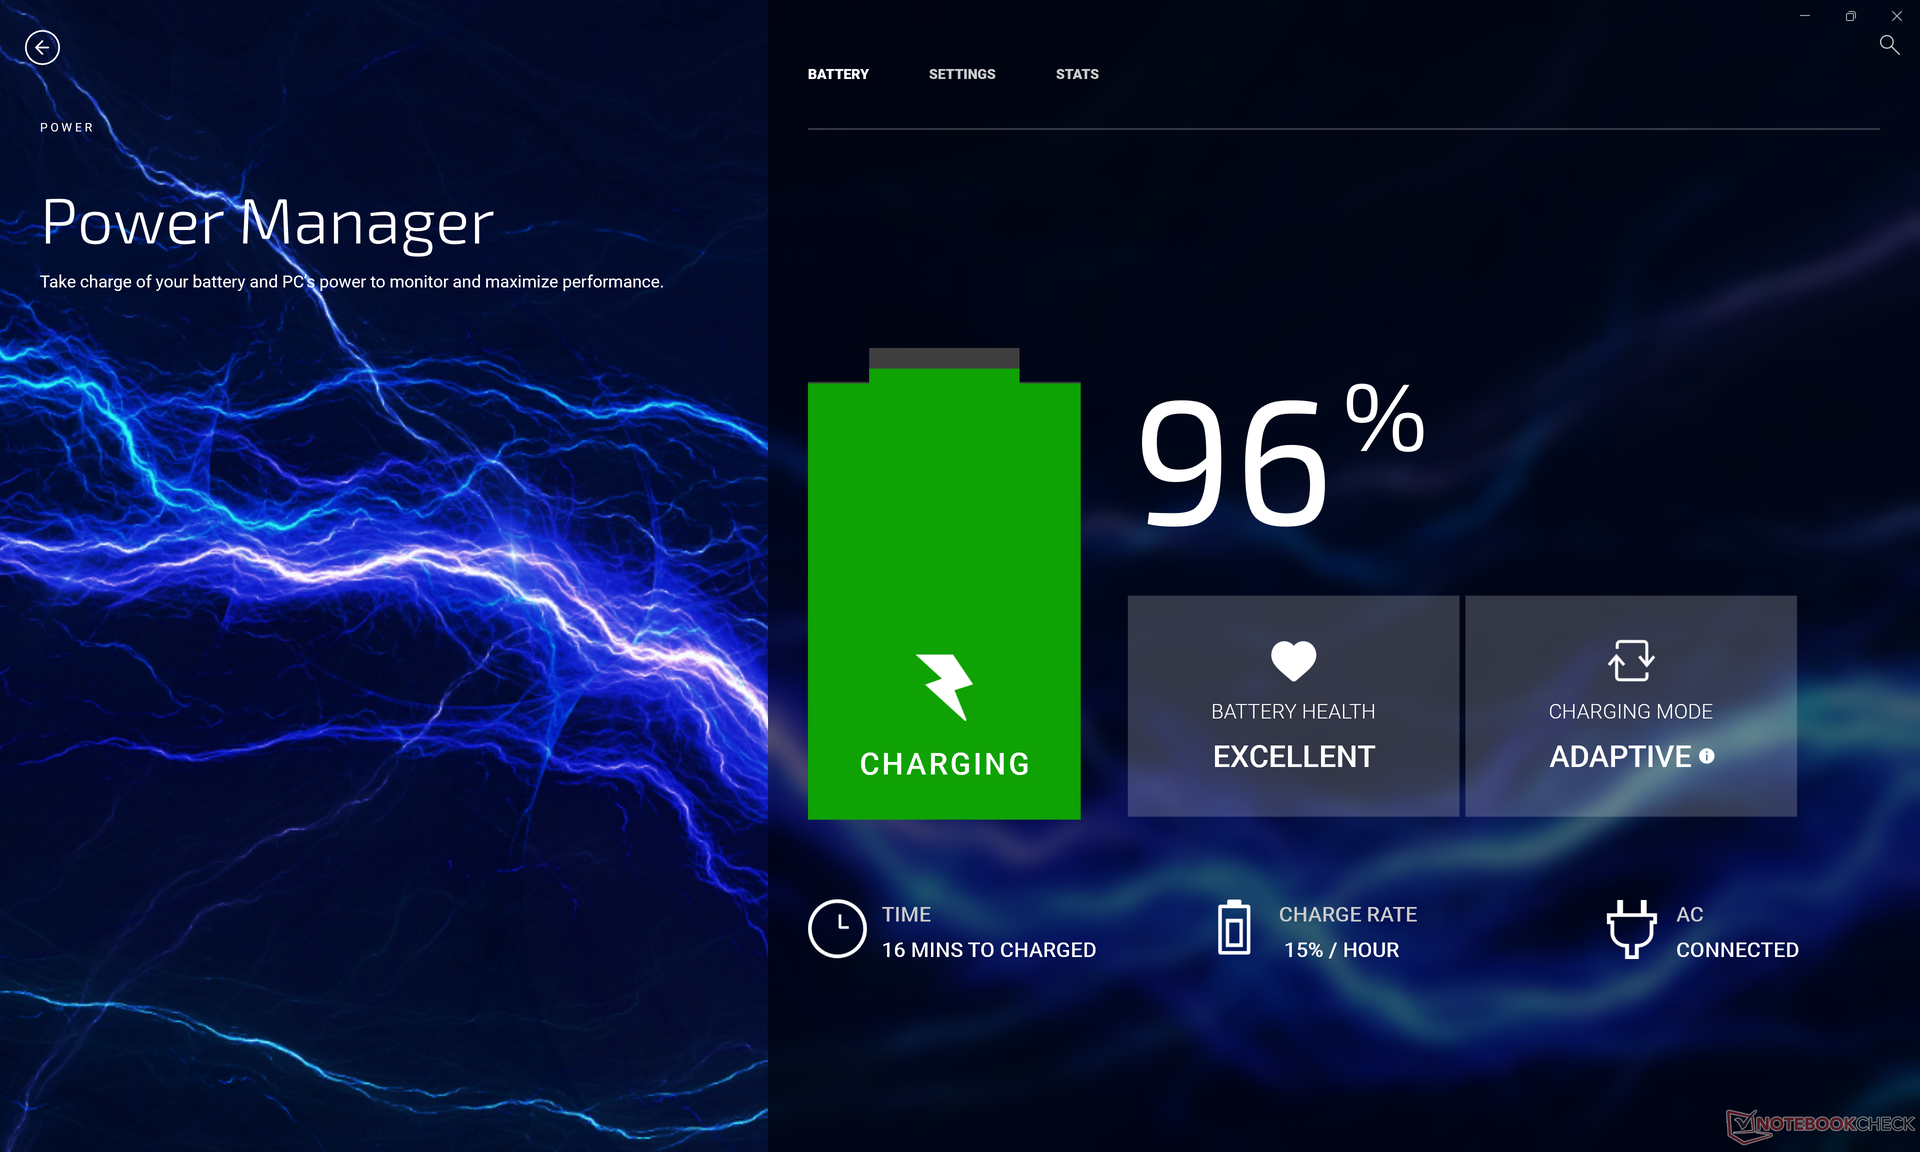
Experimentamos um bug em nossa unidade onde o consumo de energia se estabilizaria estranhamente a 40 W quando em modo Sleep em vez dos habituais <2 W levando a temperaturas de superfície muito quentes e ao desperdício de energia. Alternar os perfis de potência através do My Dell parece ser uma solução temporária para o problema.
CrossMark: Overall | Productivity | Creativity | Responsiveness
| PCMark 10 / Score | |
| Média da turma Multimedia (4325 - 10386, n=52, últimos 2 anos) | |
| Dell XPS 17 9720 RTX 3060 | |
| Razer Blade 17 (i7-12800H, RTX 3070 Ti) | |
| Média Intel Core i7-12700H, NVIDIA GeForce RTX 3060 Laptop GPU (5986 - 8156, n=12) | |
| Dell XPS 17 9710 Core i7 RTX 3060 | |
| Lenovo Legion 5 17ACH6H-82JY0003GE | |
| Dell XPS 17 9700 Core i7 RTX 2060 Max-Q | |
| HP Envy 17-cg | |
| Asus VivoBook 17 F712JA-AU708W | |
| PCMark 10 / Essentials | |
| Dell XPS 17 9720 RTX 3060 | |
| Média Intel Core i7-12700H, NVIDIA GeForce RTX 3060 Laptop GPU (9289 - 12144, n=12) | |
| Média da turma Multimedia (8025 - 11664, n=51, últimos 2 anos) | |
| Razer Blade 17 (i7-12800H, RTX 3070 Ti) | |
| Dell XPS 17 9710 Core i7 RTX 3060 | |
| Lenovo Legion 5 17ACH6H-82JY0003GE | |
| Dell XPS 17 9700 Core i7 RTX 2060 Max-Q | |
| HP Envy 17-cg | |
| Asus VivoBook 17 F712JA-AU708W | |
| PCMark 10 / Productivity | |
| Média da turma Multimedia (7323 - 18233, n=51, últimos 2 anos) | |
| Dell XPS 17 9720 RTX 3060 | |
| Média Intel Core i7-12700H, NVIDIA GeForce RTX 3060 Laptop GPU (6161 - 10362, n=12) | |
| Razer Blade 17 (i7-12800H, RTX 3070 Ti) | |
| Lenovo Legion 5 17ACH6H-82JY0003GE | |
| Dell XPS 17 9710 Core i7 RTX 3060 | |
| HP Envy 17-cg | |
| Dell XPS 17 9700 Core i7 RTX 2060 Max-Q | |
| Asus VivoBook 17 F712JA-AU708W | |
| PCMark 10 / Digital Content Creation | |
| Razer Blade 17 (i7-12800H, RTX 3070 Ti) | |
| Média Intel Core i7-12700H, NVIDIA GeForce RTX 3060 Laptop GPU (8950 - 12554, n=12) | |
| Média da turma Multimedia (3651 - 16240, n=51, últimos 2 anos) | |
| Dell XPS 17 9720 RTX 3060 | |
| Dell XPS 17 9710 Core i7 RTX 3060 | |
| Lenovo Legion 5 17ACH6H-82JY0003GE | |
| Dell XPS 17 9700 Core i7 RTX 2060 Max-Q | |
| HP Envy 17-cg | |
| Asus VivoBook 17 F712JA-AU708W | |
| CrossMark / Overall | |
| Dell XPS 17 9720 RTX 3060 | |
| Média da turma Multimedia (866 - 2728, n=60, últimos 2 anos) | |
| Média Intel Core i7-12700H, NVIDIA GeForce RTX 3060 Laptop GPU (1649 - 2017, n=11) | |
| Razer Blade 17 (i7-12800H, RTX 3070 Ti) | |
| Lenovo Legion 5 17ACH6H-82JY0003GE | |
| Asus VivoBook 17 F712JA-AU708W | |
| CrossMark / Productivity | |
| Média da turma Multimedia (931 - 2489, n=60, últimos 2 anos) | |
| Dell XPS 17 9720 RTX 3060 | |
| Média Intel Core i7-12700H, NVIDIA GeForce RTX 3060 Laptop GPU (1536 - 1958, n=11) | |
| Razer Blade 17 (i7-12800H, RTX 3070 Ti) | |
| Lenovo Legion 5 17ACH6H-82JY0003GE | |
| Asus VivoBook 17 F712JA-AU708W | |
| CrossMark / Creativity | |
| Média da turma Multimedia (907 - 3465, n=60, últimos 2 anos) | |
| Dell XPS 17 9720 RTX 3060 | |
| Média Intel Core i7-12700H, NVIDIA GeForce RTX 3060 Laptop GPU (1816 - 2084, n=11) | |
| Razer Blade 17 (i7-12800H, RTX 3070 Ti) | |
| Lenovo Legion 5 17ACH6H-82JY0003GE | |
| Asus VivoBook 17 F712JA-AU708W | |
| CrossMark / Responsiveness | |
| Dell XPS 17 9720 RTX 3060 | |
| Média Intel Core i7-12700H, NVIDIA GeForce RTX 3060 Laptop GPU (1210 - 2207, n=11) | |
| Razer Blade 17 (i7-12800H, RTX 3070 Ti) | |
| Média da turma Multimedia (605 - 2024, n=60, últimos 2 anos) | |
| Lenovo Legion 5 17ACH6H-82JY0003GE | |
| Asus VivoBook 17 F712JA-AU708W | |
| PCMark 10 Score | 7296 pontos | |
Ajuda | ||
| AIDA64 / Memory Copy | |
| Dell XPS 17 9720 RTX 3060 | |
| Média Intel Core i7-12700H (25615 - 80511, n=64) | |
| Razer Blade 17 (i7-12800H, RTX 3070 Ti) | |
| Dell XPS 17 9700 Core i7 RTX 2060 Max-Q | |
| Lenovo Legion 5 17ACH6H-82JY0003GE | |
| Asus VivoBook 17 F712JA-AU708W | |
| AIDA64 / Memory Read | |
| Dell XPS 17 9720 RTX 3060 | |
| Média Intel Core i7-12700H (25586 - 79442, n=64) | |
| Razer Blade 17 (i7-12800H, RTX 3070 Ti) | |
| Lenovo Legion 5 17ACH6H-82JY0003GE | |
| Dell XPS 17 9700 Core i7 RTX 2060 Max-Q | |
| Asus VivoBook 17 F712JA-AU708W | |
| AIDA64 / Memory Write | |
| Dell XPS 17 9720 RTX 3060 | |
| Média Intel Core i7-12700H (23679 - 88660, n=64) | |
| Razer Blade 17 (i7-12800H, RTX 3070 Ti) | |
| Dell XPS 17 9700 Core i7 RTX 2060 Max-Q | |
| Lenovo Legion 5 17ACH6H-82JY0003GE | |
| Asus VivoBook 17 F712JA-AU708W | |
* ... menor é melhor
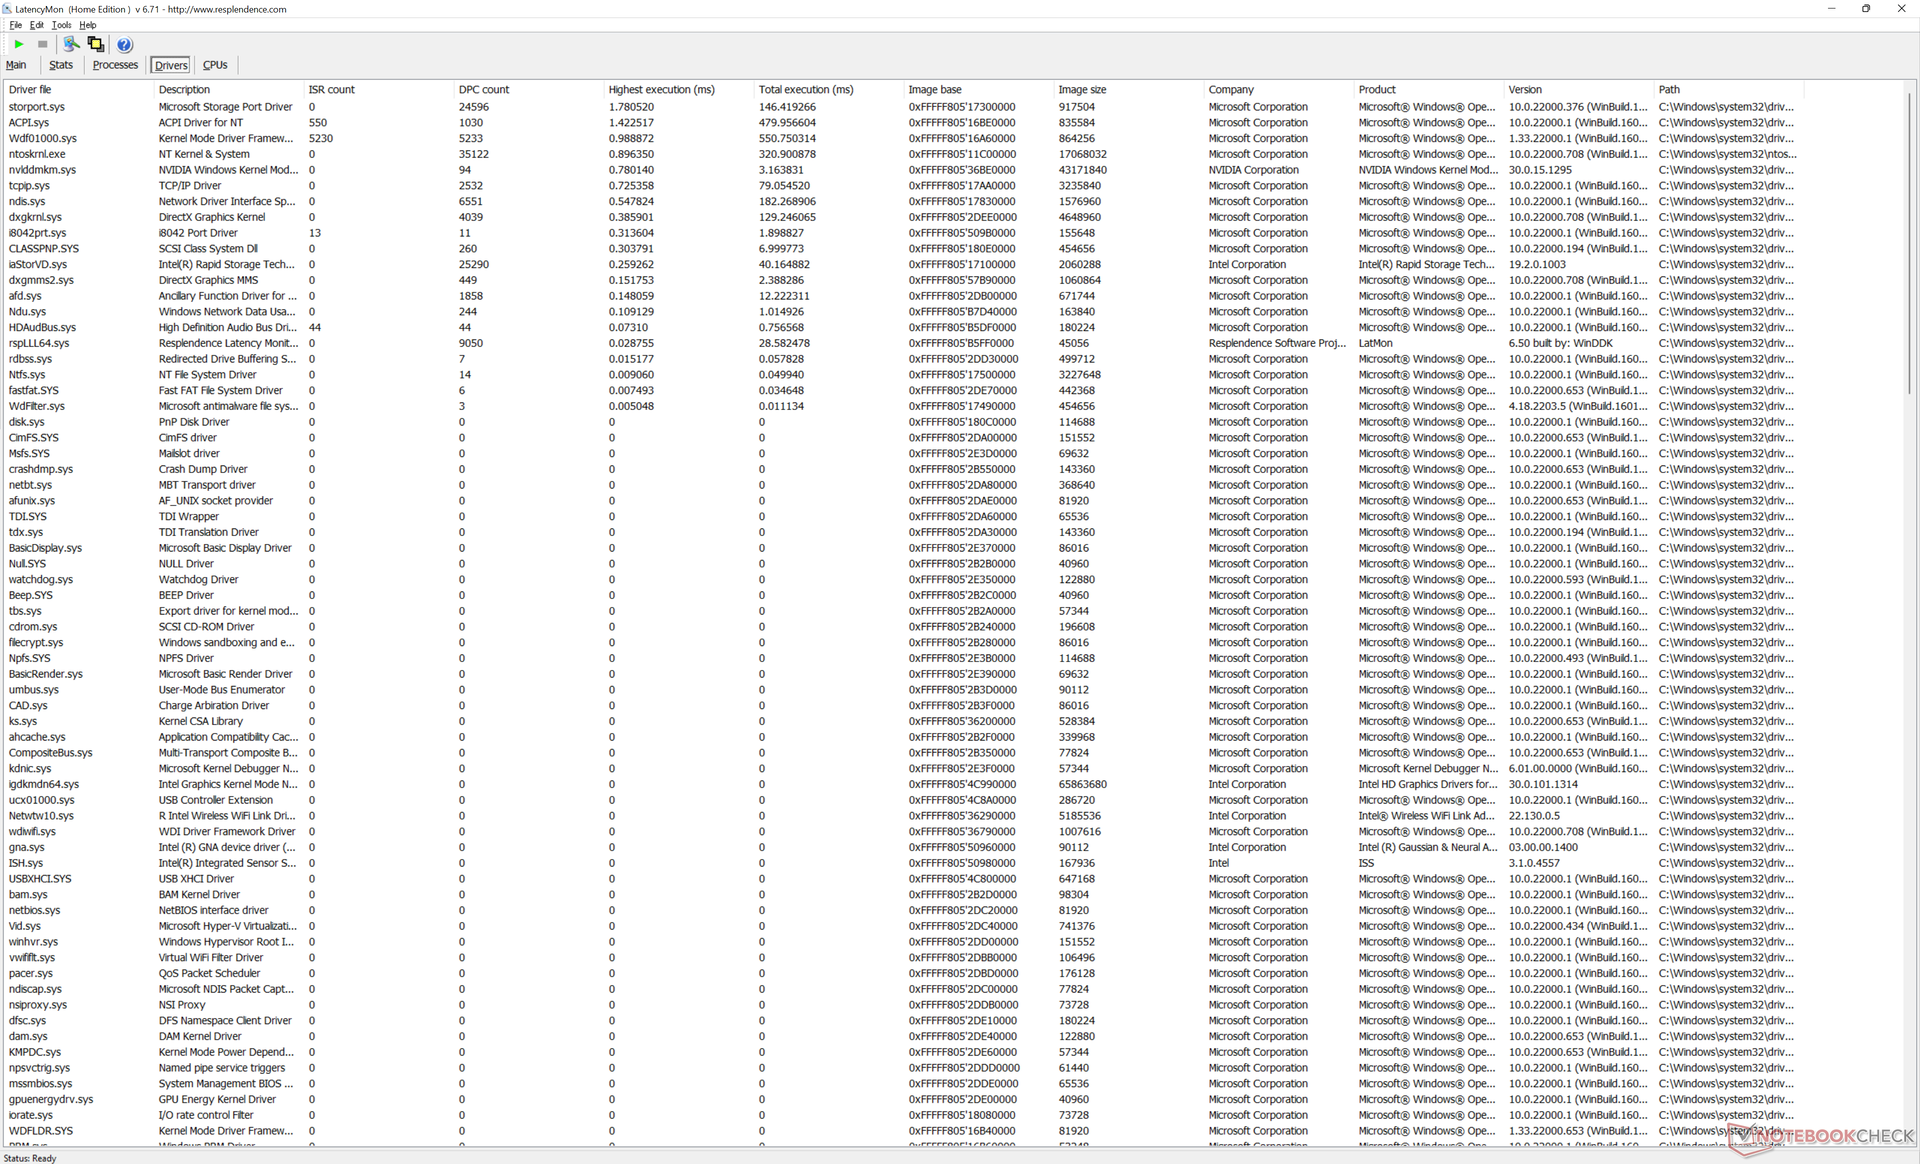
Latência do DPC
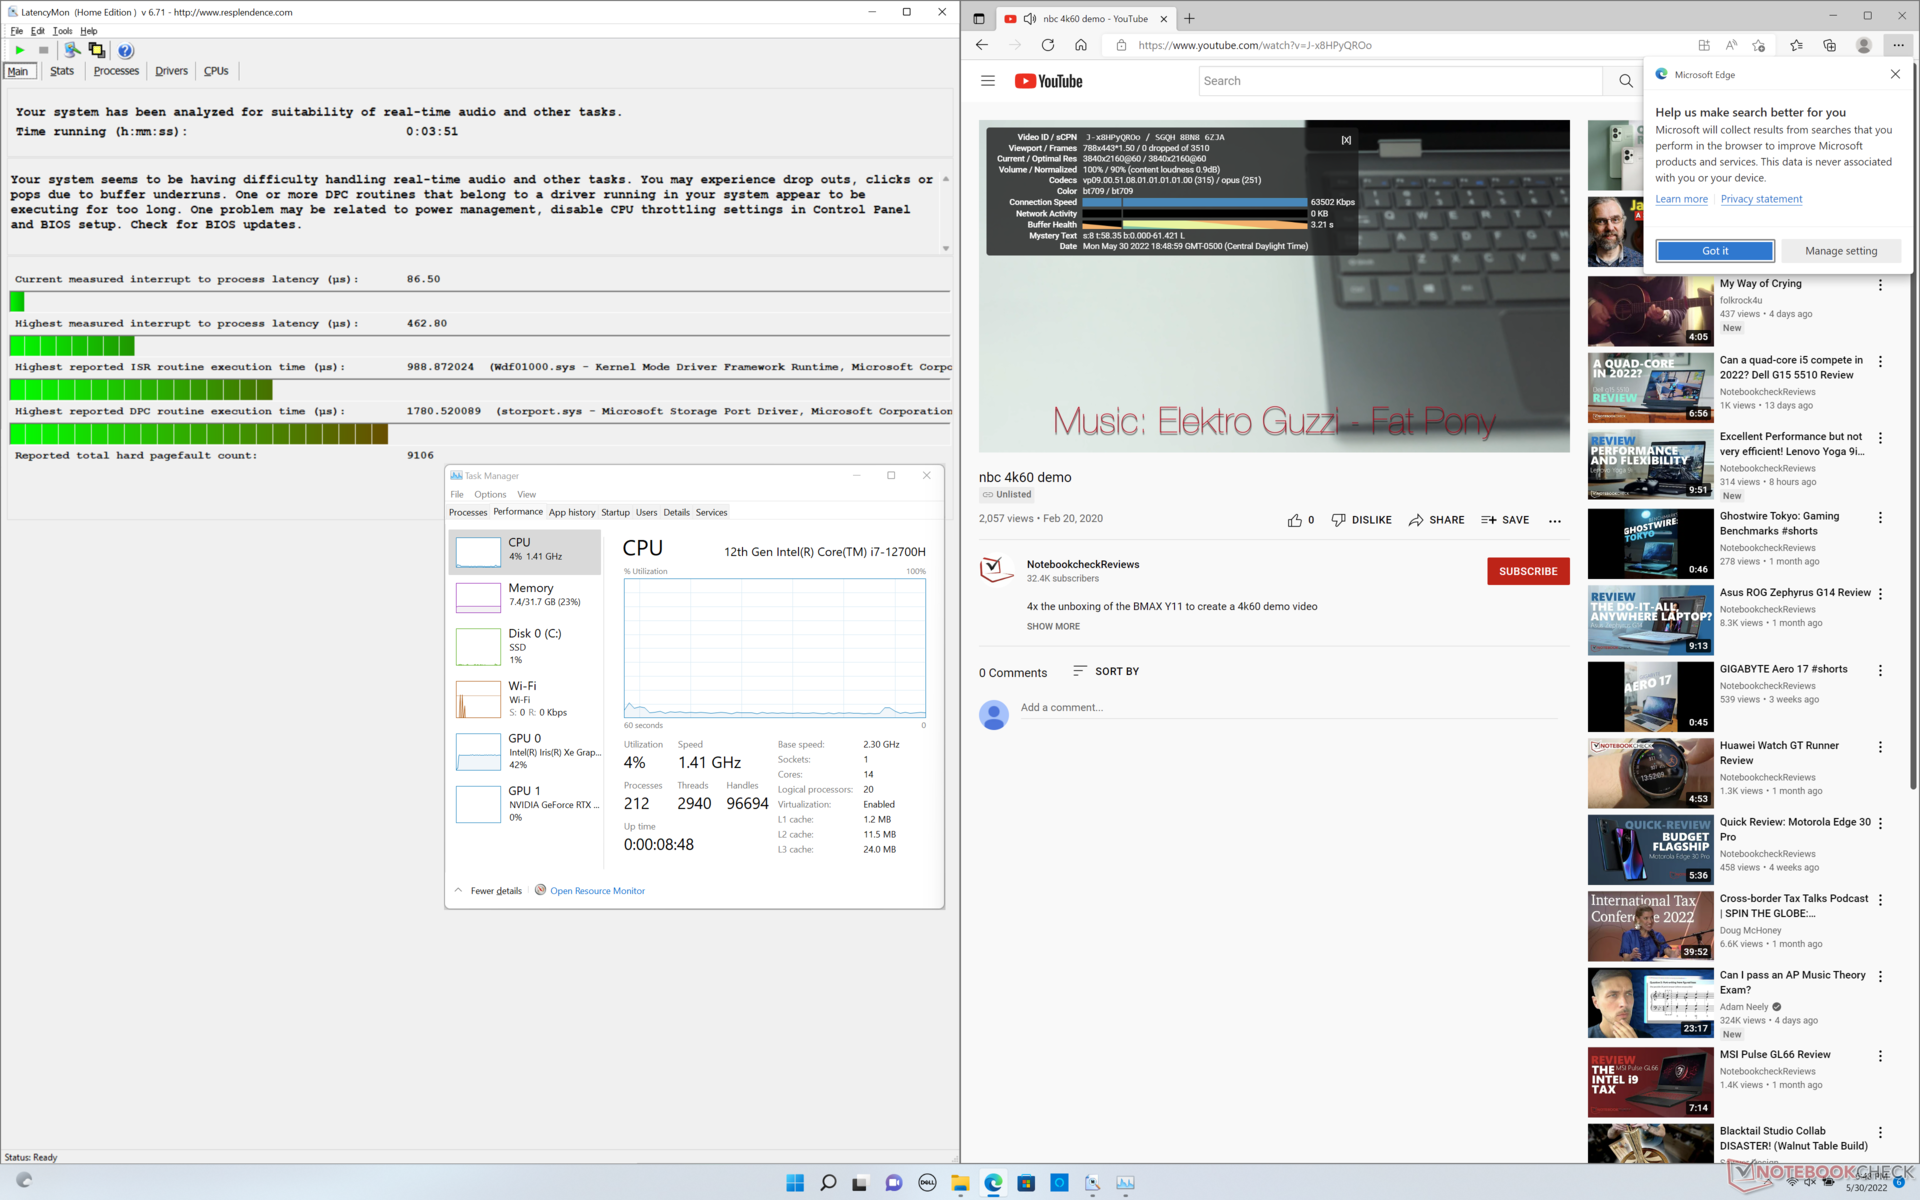
LatencyMon revela pequenos problemas de DPC ao abrir várias abas do navegador em nossa página inicial, muito parecido com o que observamos no XPS 17 9710 e 9700. a reprodução de vídeo de 4K a 60 FPS é, de outra forma, perfeitamente suave, sem queda de quadros, como seria de esperar de qualquer laptop multimídia Core H.
| DPC Latencies / LatencyMon - interrupt to process latency (max), Web, Youtube, Prime95 | |
| HP Envy 17-cg | |
| Lenovo Legion 5 17ACH6H-82JY0003GE | |
| Asus VivoBook 17 F712JA-AU708W | |
| Razer Blade 17 (i7-12800H, RTX 3070 Ti) | |
| Dell XPS 17 9700 Core i7 RTX 2060 Max-Q | |
| Dell XPS 17 9710 Core i7 RTX 3060 | |
| Dell XPS 17 9720 RTX 3060 | |
* ... menor é melhor
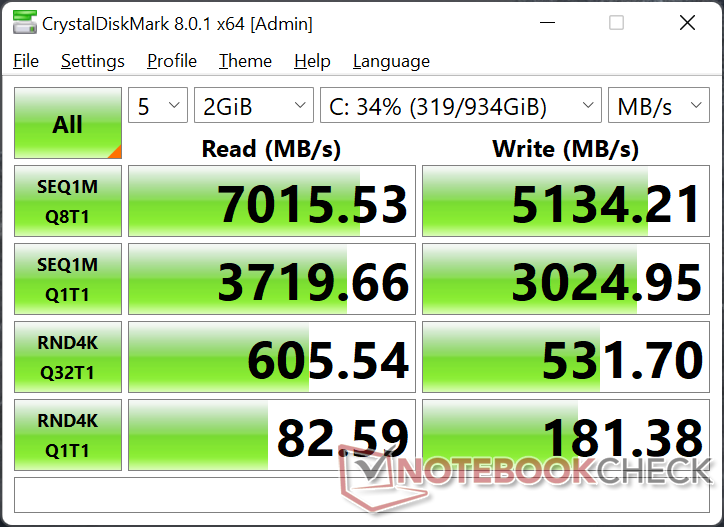
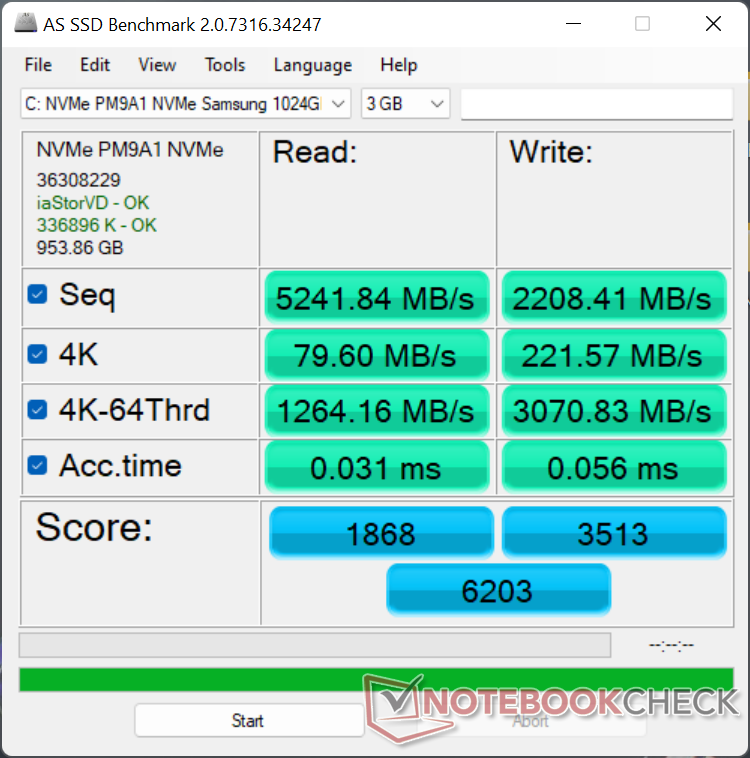
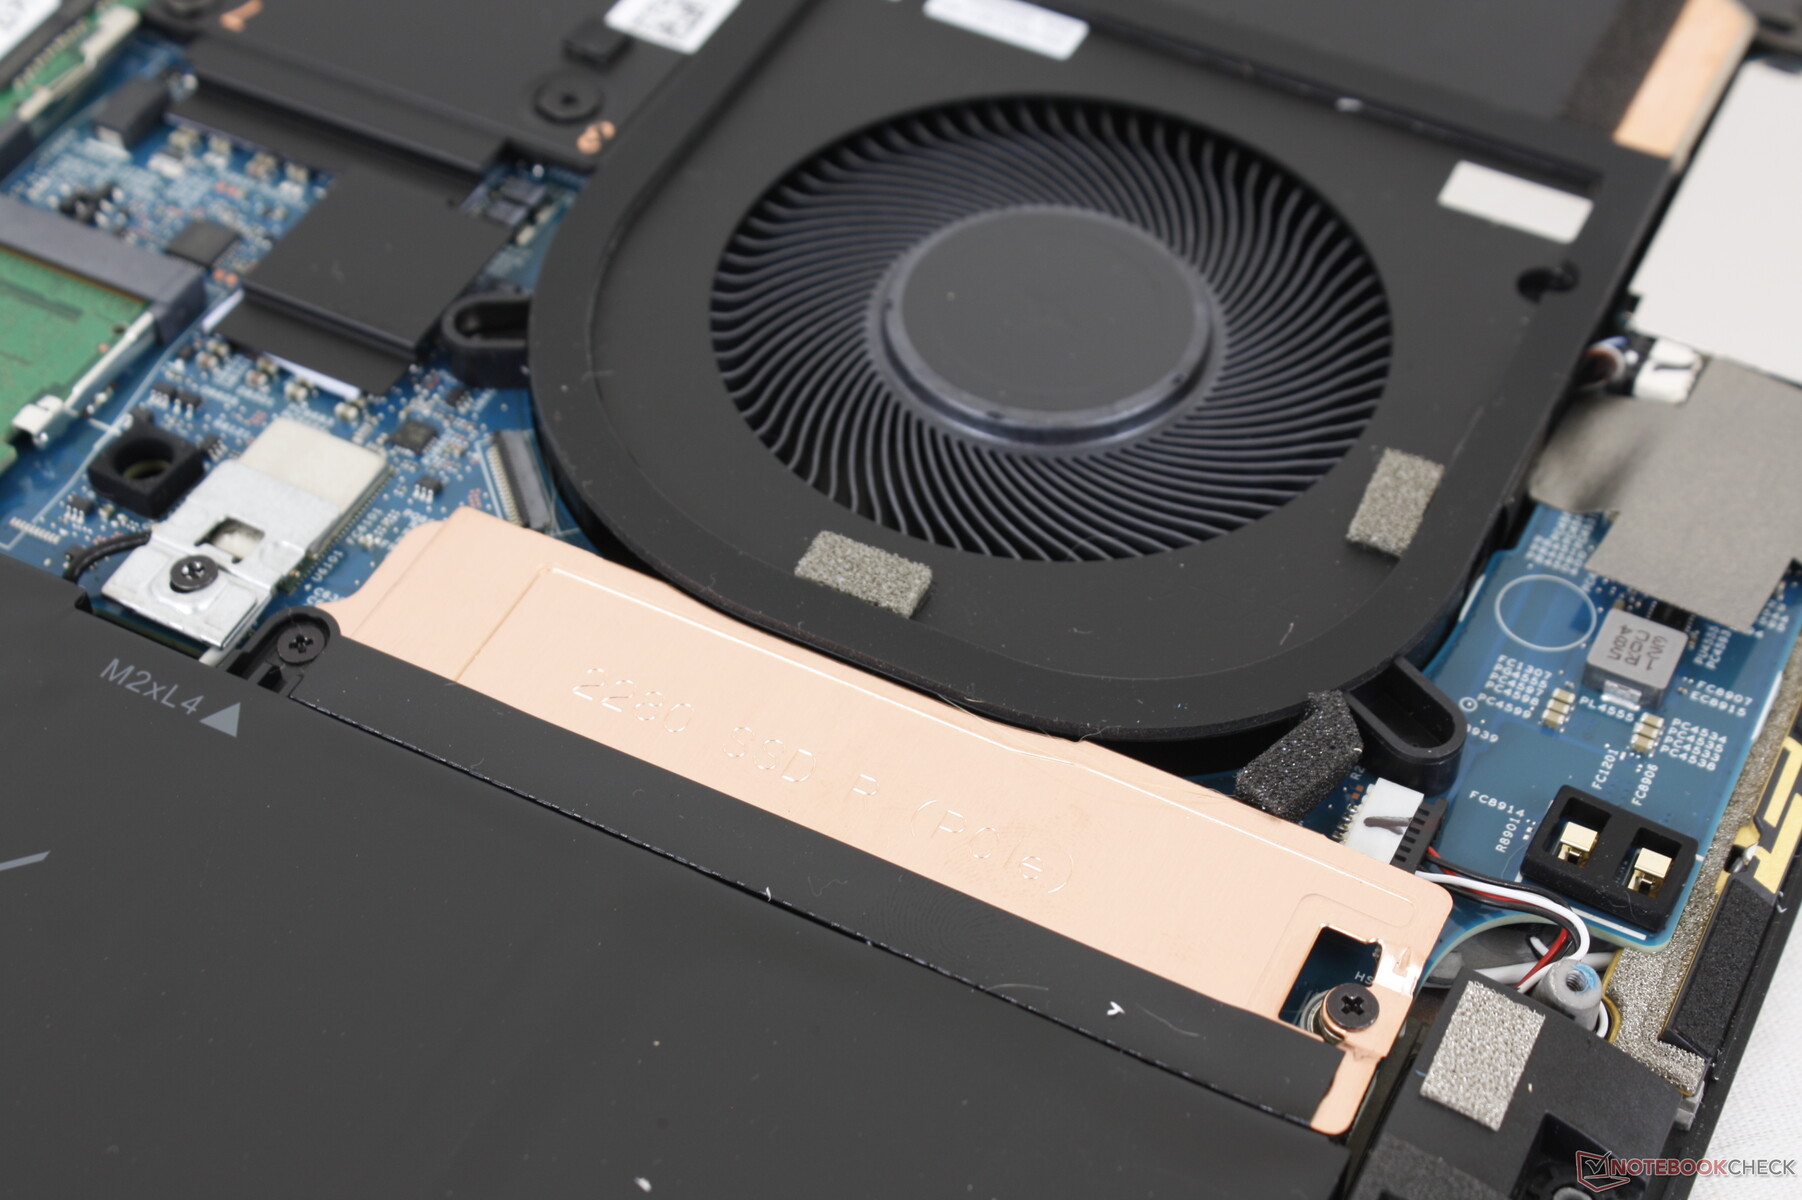
Dispositivos de armazenamento
O XPS 17 9710 foi enviado numa época em que as SSDs PCIe4 x4 NVMe ainda não estavam amplamente disponíveis e por isso as SKUs só viriam com opções PCIe3 x4. As unidades PCIe4 são felizmente mais comuns hoje em dia e é bom ver que o XPS 17 9720 adotou um sistema rápido deSamsung PM9A1 solução. Nossos testes de estresse mostram que o acionamento em nossa unidade não teria problemas em manter sua taxa máxima de leitura sequencial de mais de 7000 MB/s por longos períodos sem necessidade de aceleramento, embora o desempenho geral ainda seja mais lento do que o que registramos noLâmina Razer 17 equipado com o mesmo drive Samsung de 1 TB.

* ... menor é melhor
Disk Throttling: DiskSpd Read Loop, Queue Depth 8
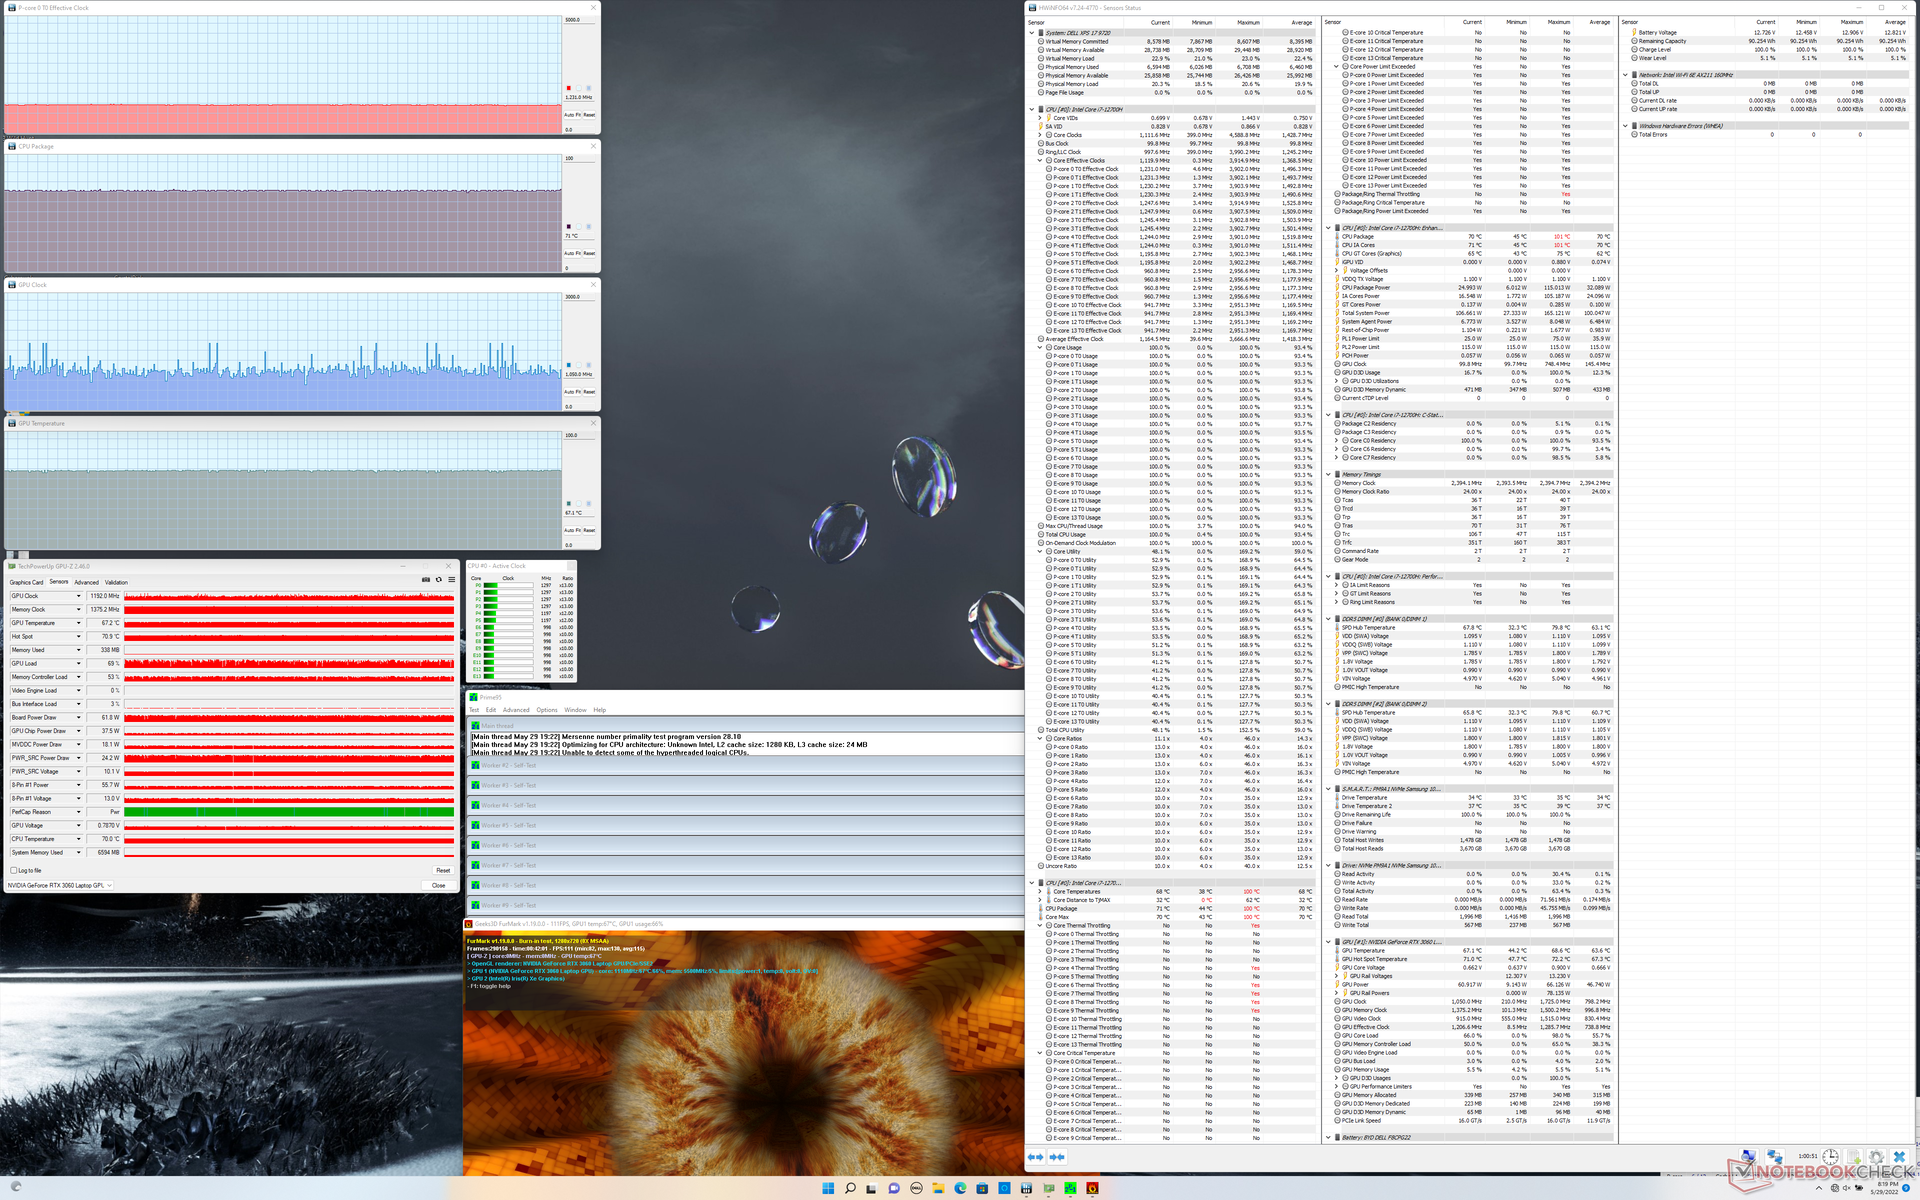
Desempenho da GPU
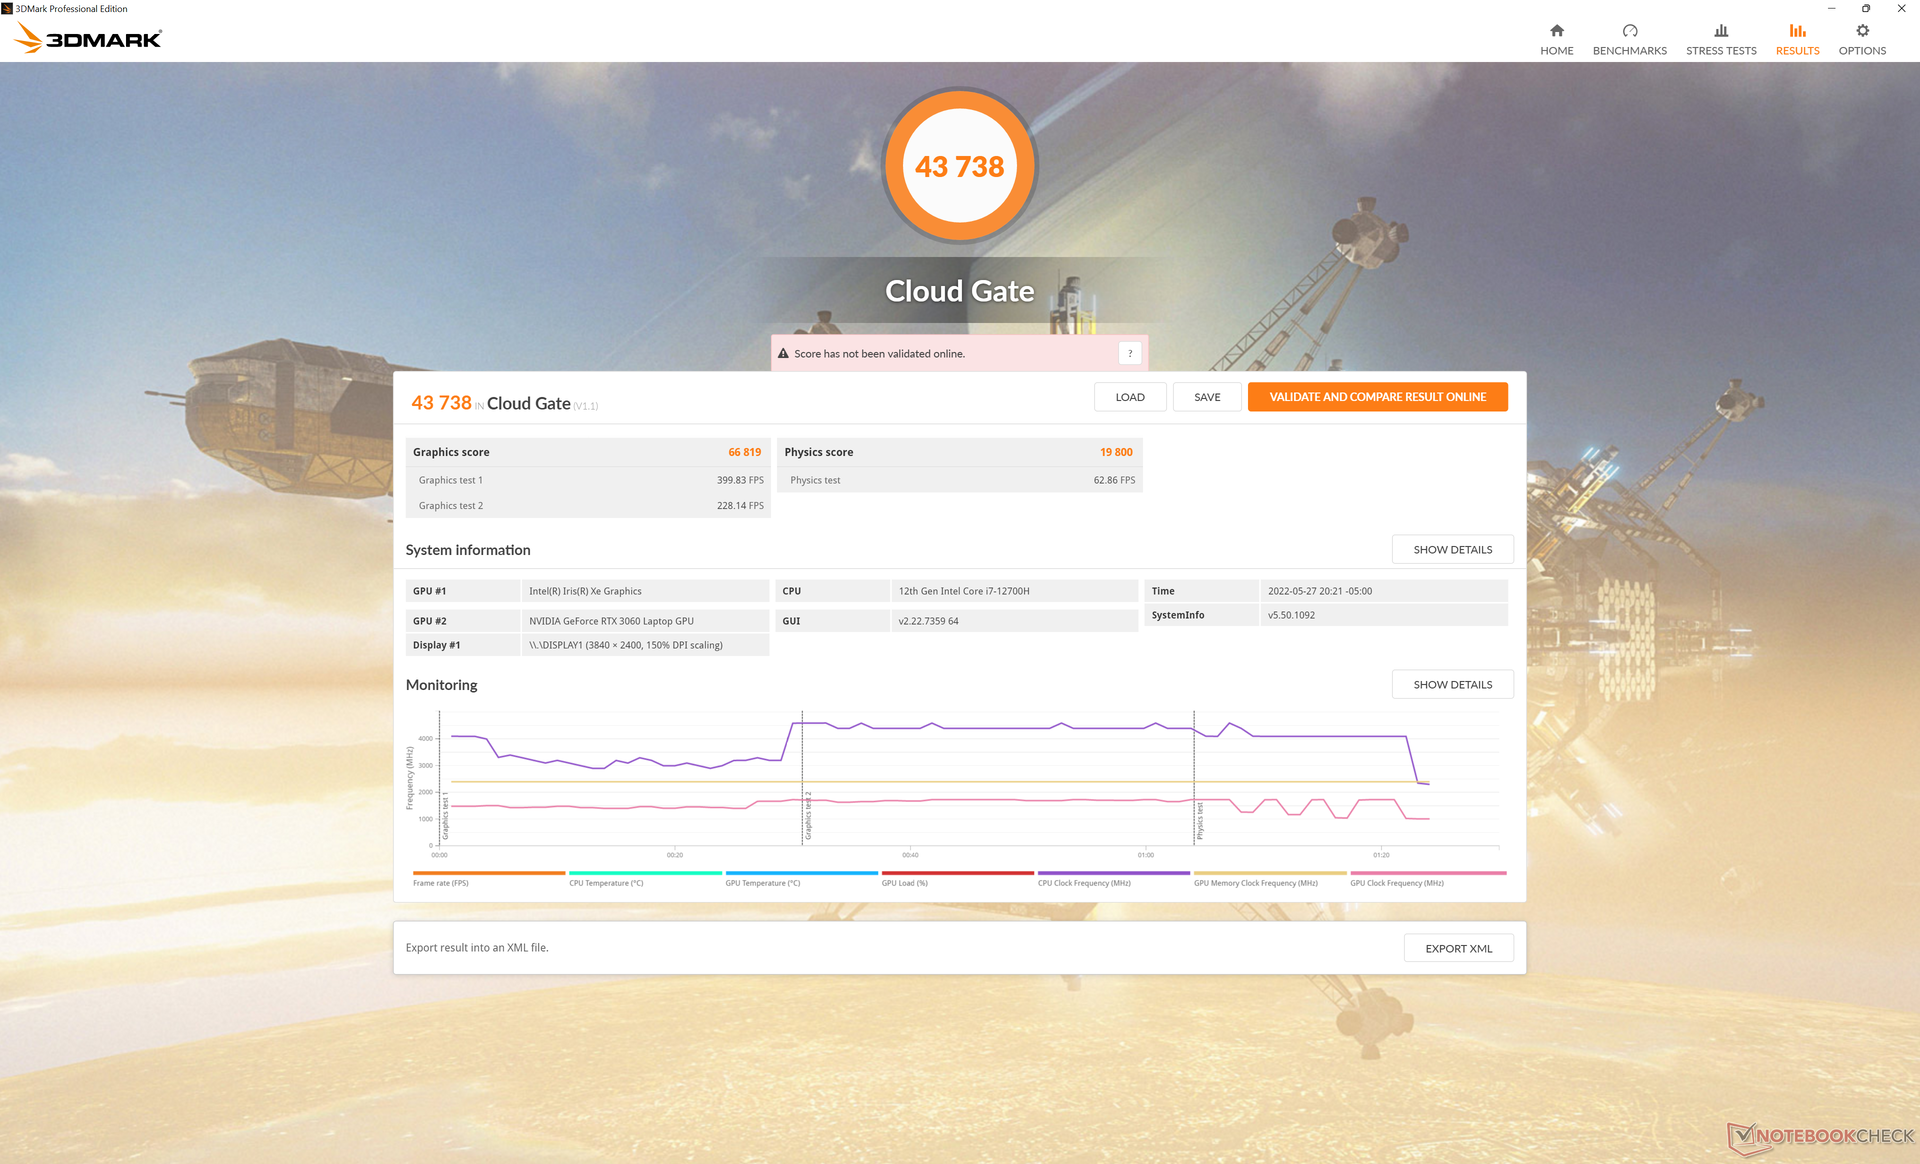
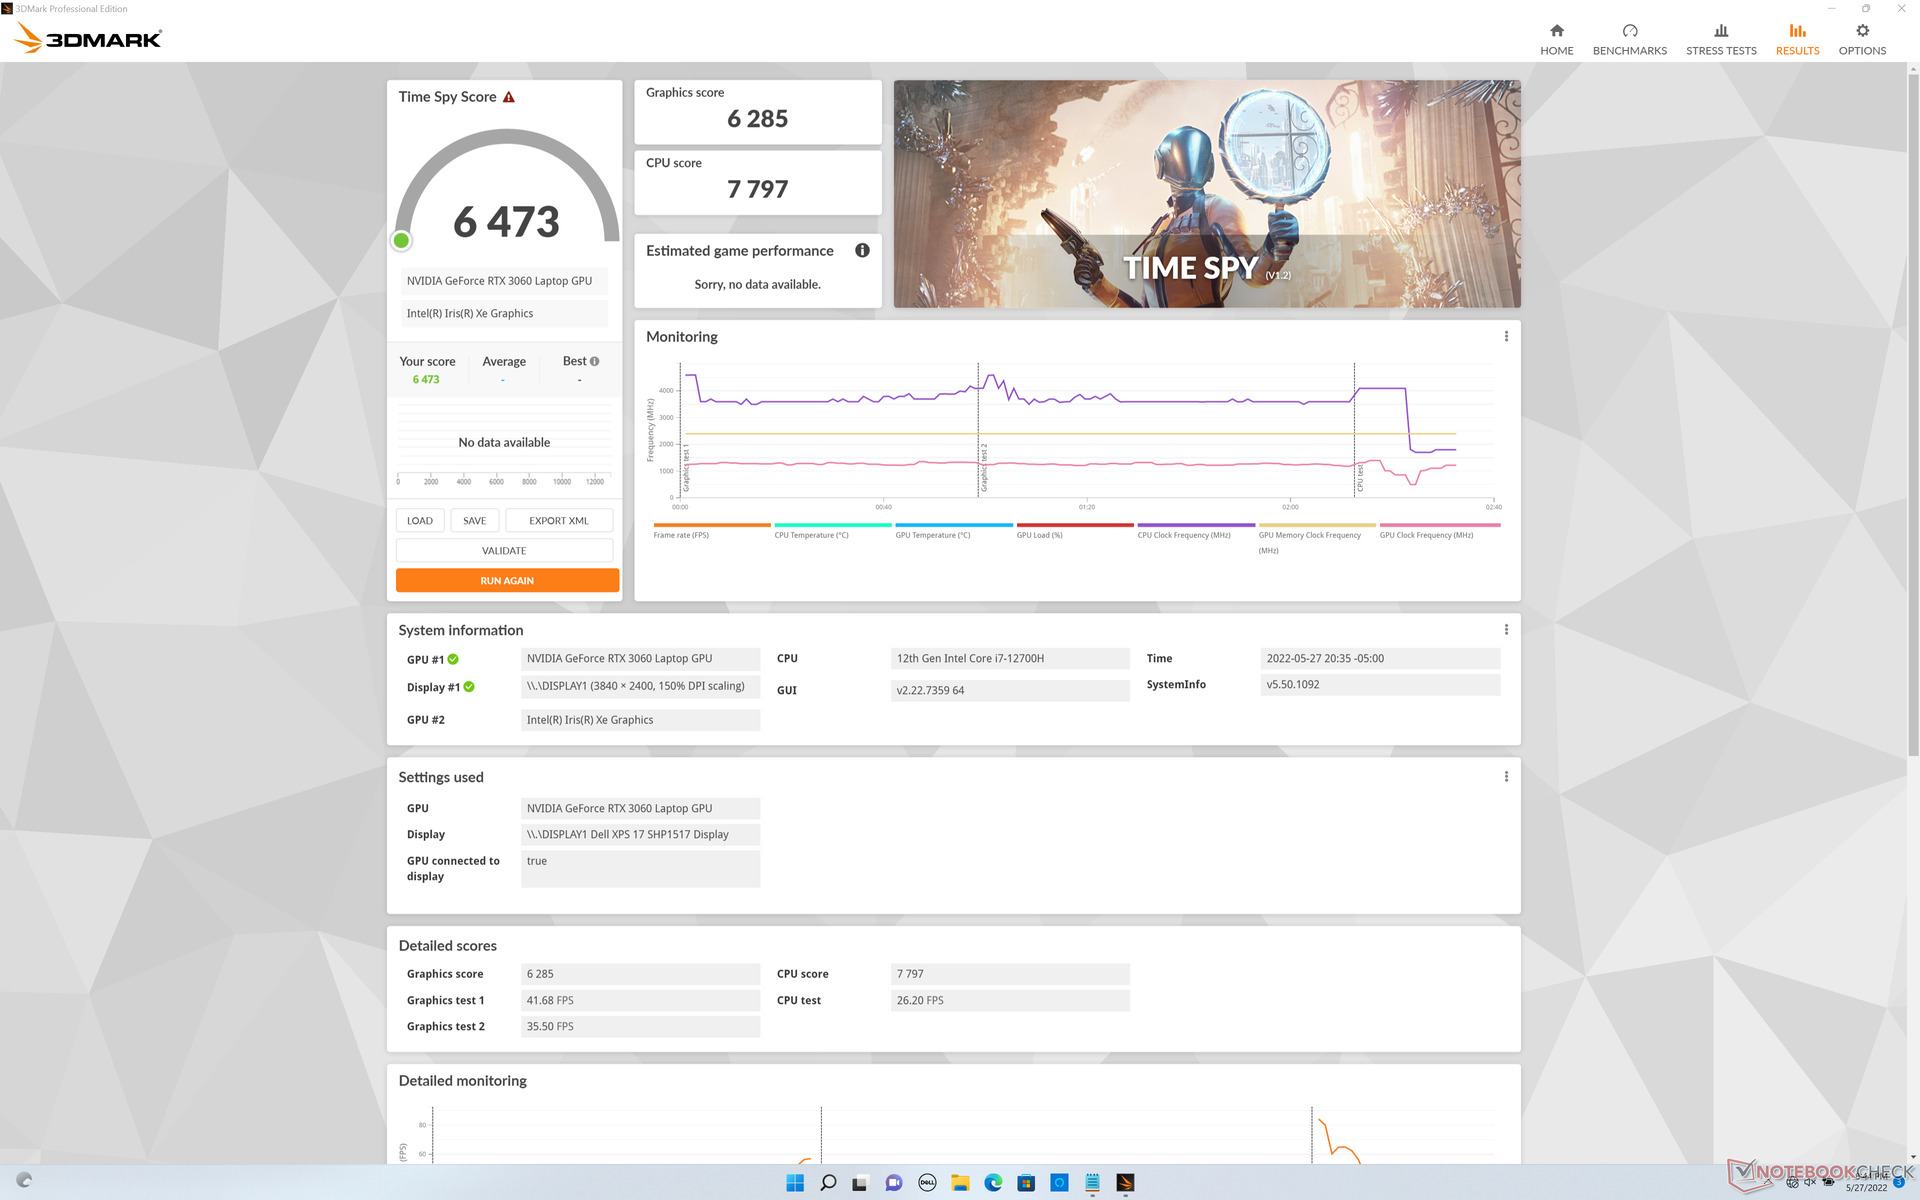
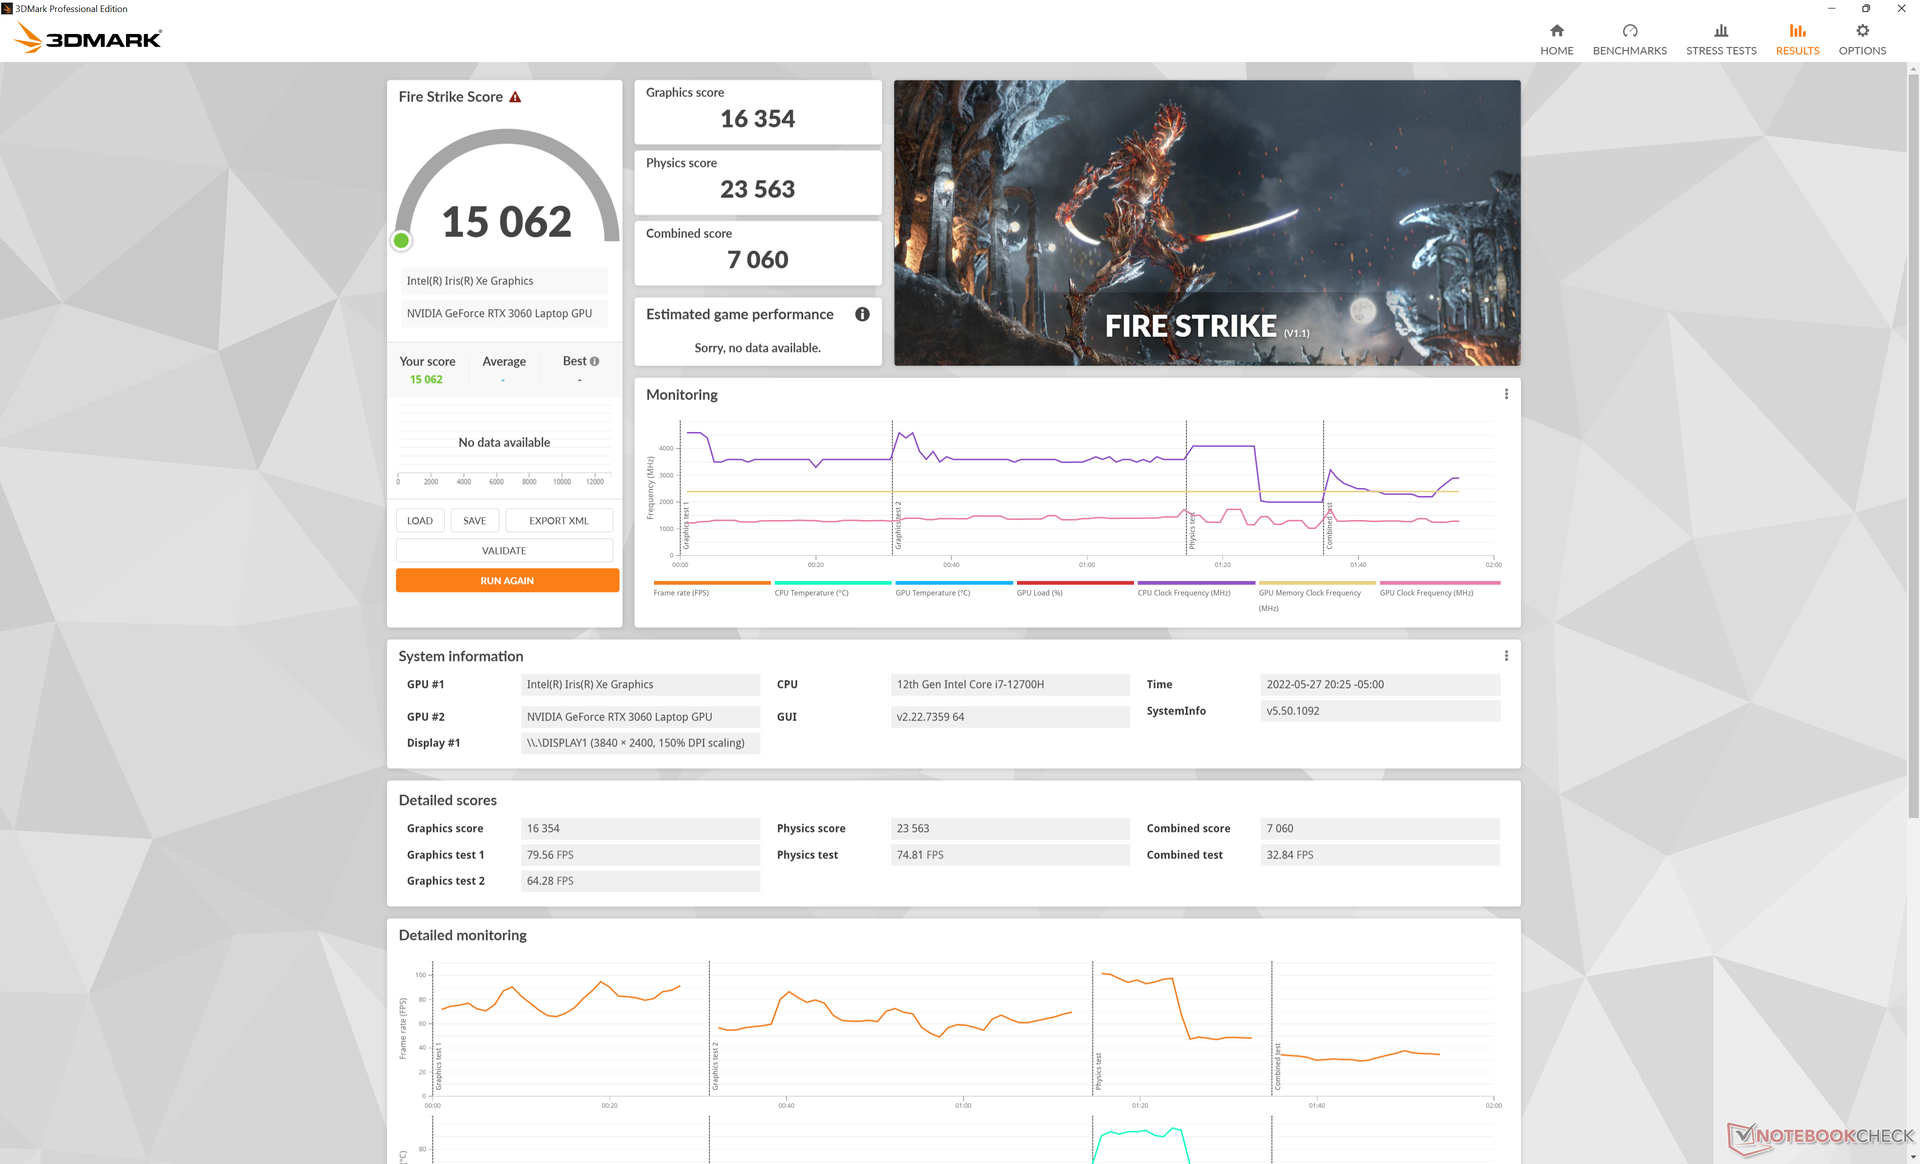
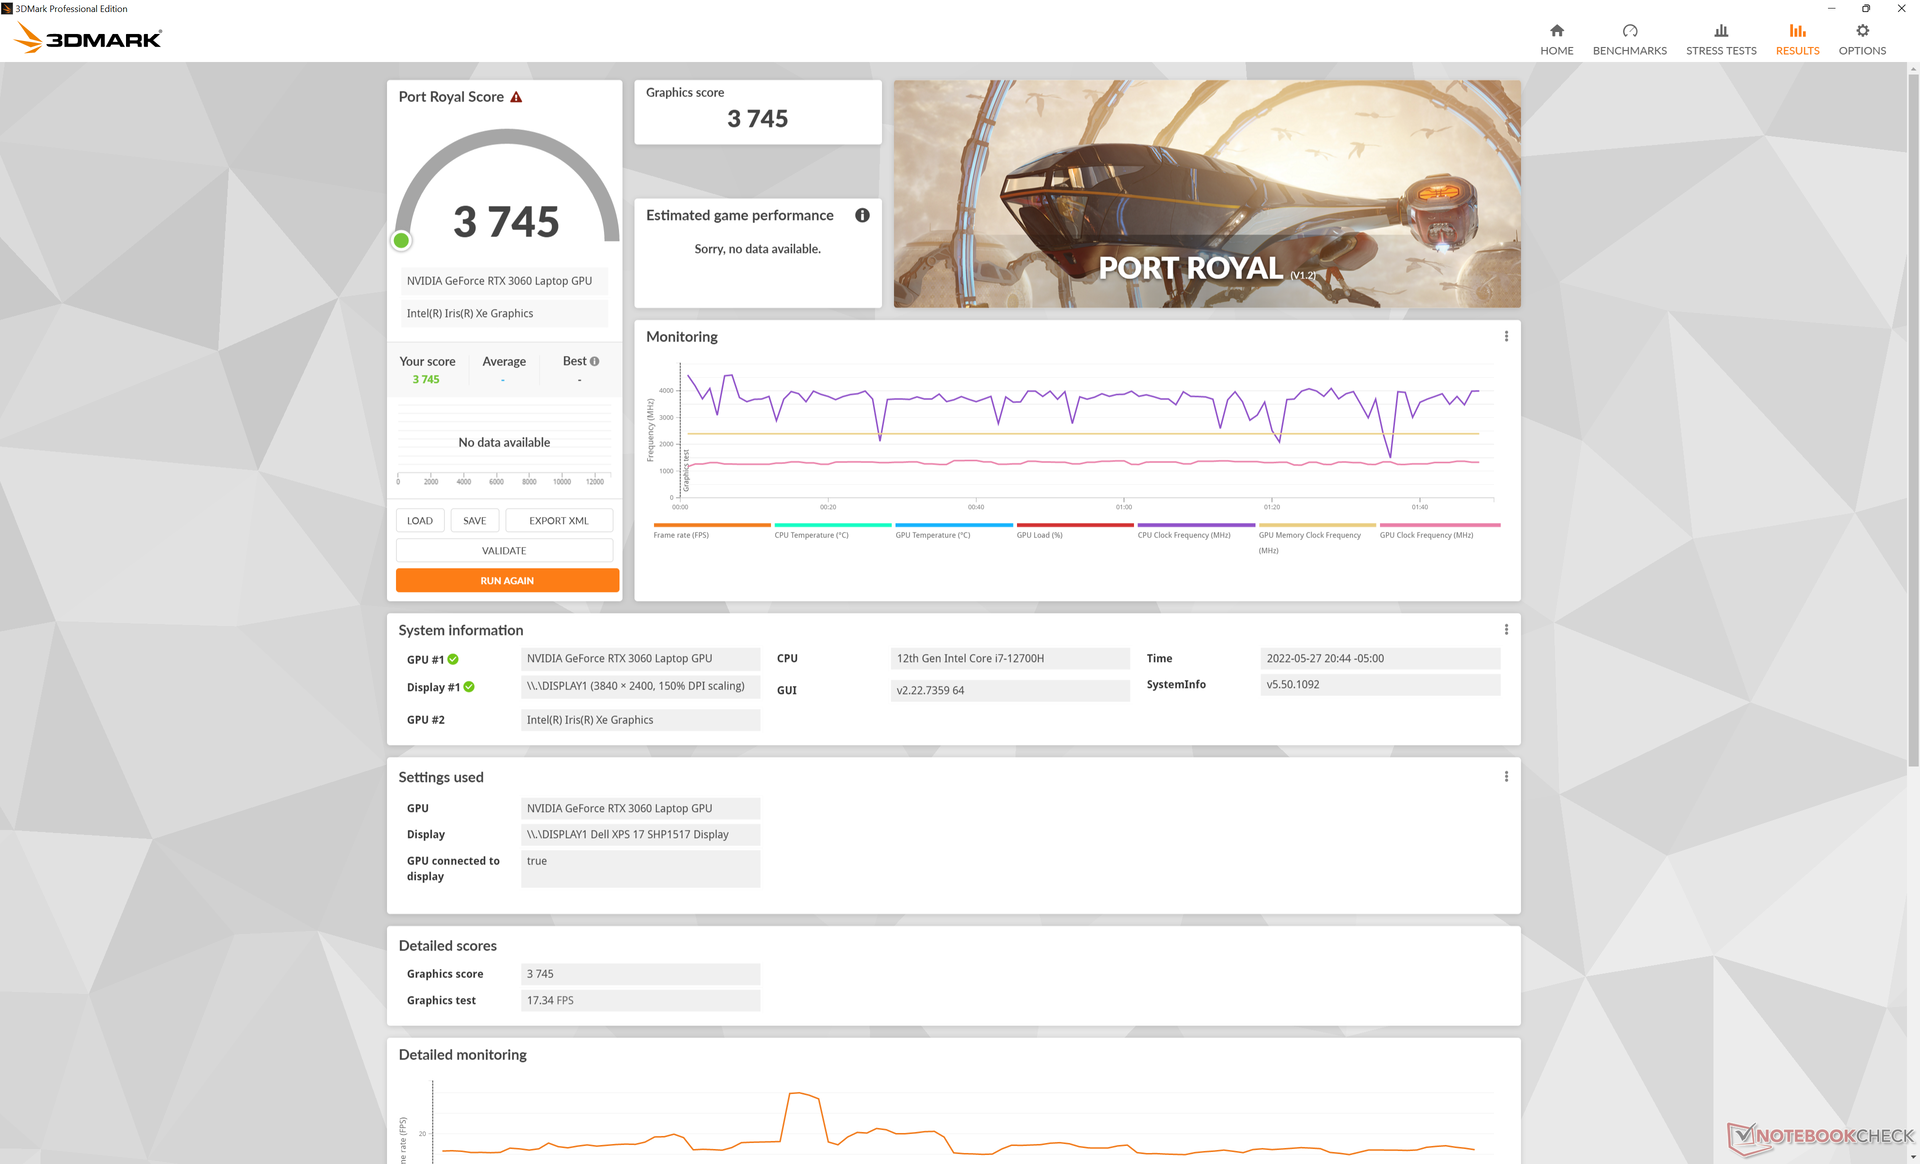
A Dell baixou o GeForce RTX 3060 TGP de 70 W no XPS 17 9710 para 65 W no XPS 17 9720. Apesar de a Dell anunciar uma GPU de 60 W para o 9720, podemos confirmar que o painel de controle Nvidia lê 65 W, o que está mais próximo de nossos próprios resultados independentes durante os testes. O efeito é uma diminuição de 10% no desempenho gráfico bruto de acordo com os 3DMark benchmarks e jogos testados com GPU, tais como Witcher 3, Final Fantasy XV, ou Strange Brigade.
Quando comparado com o laptop médio com o mesmo GeForce RTX 3060 GPU, o do XPS 17 9720 é cerca de 20% mais lento. Vale ressaltar que a maioria dos outros laptops com o RTX 3060 normalmente visam tetos TGP mais altos de 80 W ou mais. No mínimo, a GPU aqui ainda é melhor que a RTX 2060 Max-Q no XPS 17 9700 original por cerca de 15 por cento. Enquanto isso, a redução para RTX 3050 Ti SKU resultaria em um déficit de desempenho de 25 a 30 por cento
.
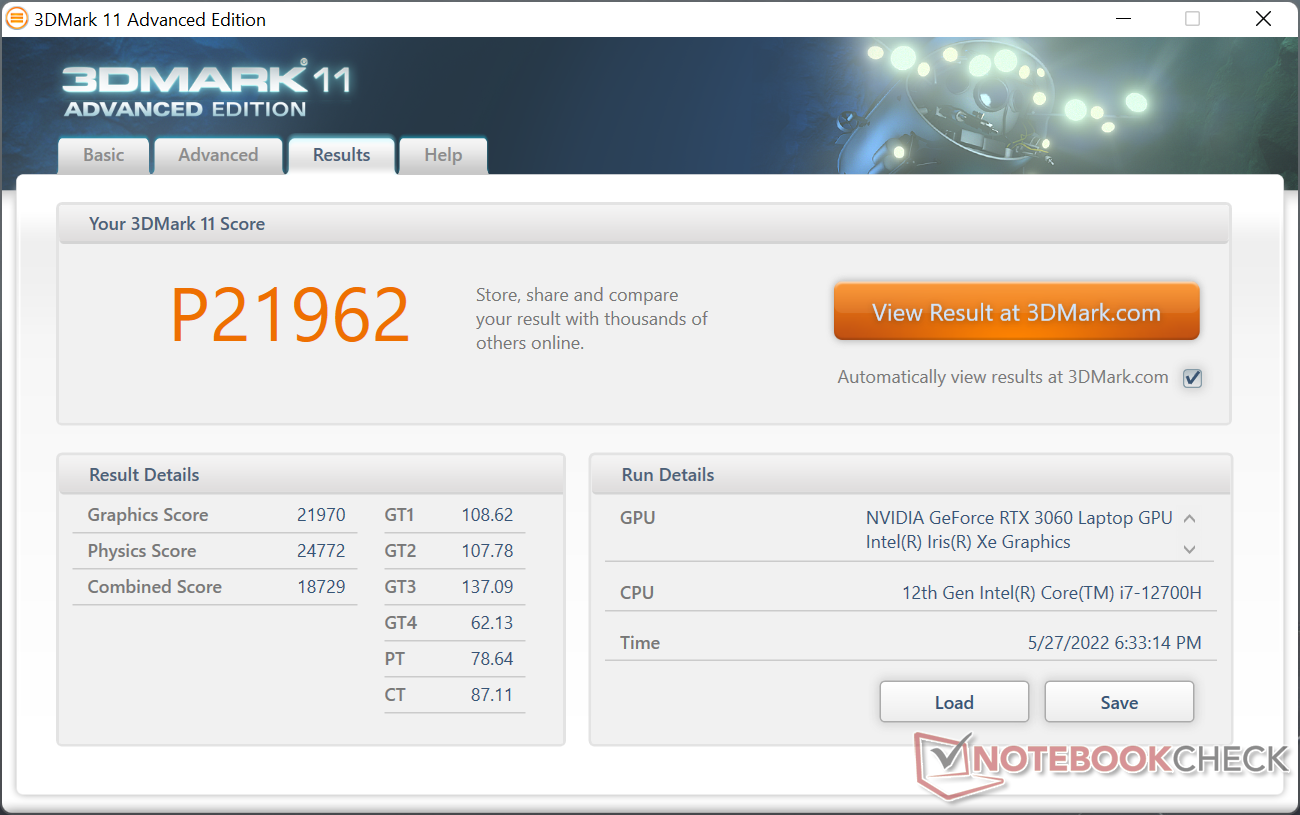
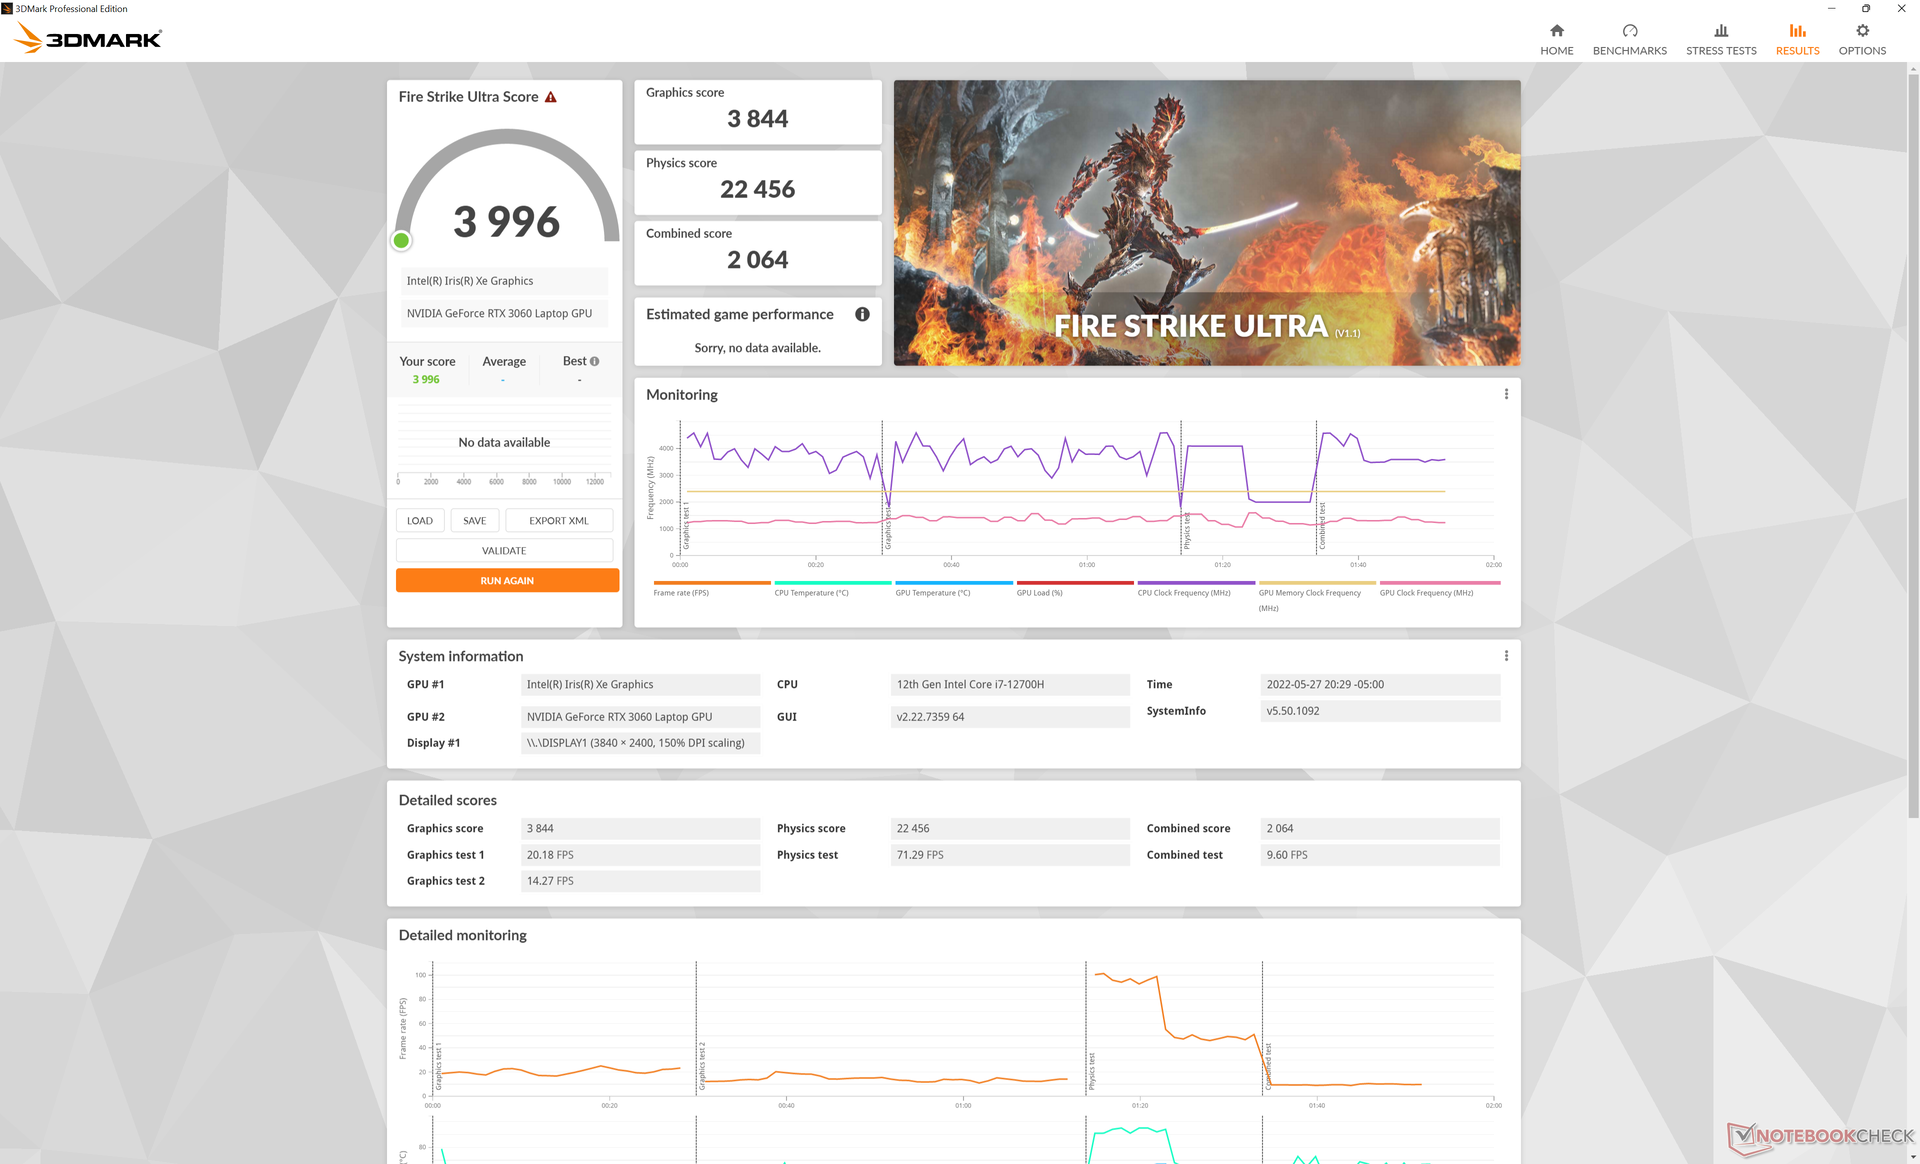
| 3DMark 11 Performance | 21962 pontos | |
| 3DMark Cloud Gate Standard Score | 43738 pontos | |
| 3DMark Fire Strike Score | 15062 pontos | |
| 3DMark Time Spy Score | 6473 pontos | |
Ajuda | ||
Witcher 3 FPS Chart
| baixo | média | alto | ultra | QHD | 4K | |
|---|---|---|---|---|---|---|
| GTA V (2015) | 186.6 | 179 | 152.8 | 83.8 | 63.4 | |
| The Witcher 3 (2015) | 347.7 | 214.6 | 133.9 | 67.8 | ||
| Dota 2 Reborn (2015) | 185.7 | 169.9 | 163 | 133.5 | 84.6 | |
| Final Fantasy XV Benchmark (2018) | 137.9 | 90.5 | 69.3 | 49.1 | 28.3 | |
| X-Plane 11.11 (2018) | 133.3 | 111.6 | 93.8 | 92.3 | ||
| Strange Brigade (2018) | 352 | 162.6 | 130.6 | 113.4 | 82.3 | |
| Cyberpunk 2077 1.6 (2022) | 95.4 | 78.1 | 60 | 48.9 | 29 | 11.6 |
Emissões - Ruído e Temperaturas do Portátil de Jogo
Ruído do sistema
O ruído e o comportamento do ventilador não mudaram desde o XPS 17 9700 original, o que significa que o ruído dos ventiladores ainda será superior a quase 50 db(A) quando se estiver jogando ou executando outras cargas elevadas. O ruído é comparável a muitos laptops de jogos quando em condições tão estressantes.
Os ventiladores irão pulsar de silenciosos para ruidosos bastante rapidamente quando cargas médias a médias-altas forem introduzidas e por isso recomendamos o perfil de potência silencioso para limitar a pulsação dos ventiladores se a potência extra não for necessária.
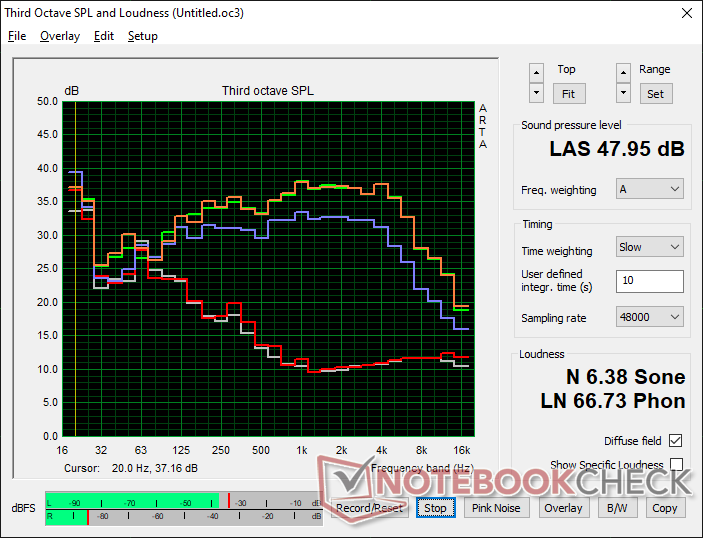
Barulho
| Ocioso |
| 24.1 / 24.1 / 24.1 dB |
| Carga |
| 43.2 / 48 dB |
 | ||
30 dB silencioso 40 dB(A) audível 50 dB(A) ruidosamente alto |
||
min: | ||
| Dell XPS 17 9720 RTX 3060 GeForce RTX 3060 Laptop GPU, i7-12700H, Samsung PM9A1 MZVL21T0HCLR | HP Envy 17-cg GeForce MX450, i5-1135G7, Samsung PM991 MZVLQ1T0HALB | Dell XPS 17 9710 Core i7 RTX 3060 GeForce RTX 3060 Laptop GPU, i7-11800H, Micron 2300 1TB MTFDHBA1T0TDV | Dell XPS 17 9700 Core i7 RTX 2060 Max-Q GeForce RTX 2060 Max-Q, i7-10875H, Micron 2200S 1TB MTFDHBA1T0TCK | Lenovo Legion 5 17ACH6H-82JY0003GE GeForce RTX 3060 Laptop GPU, R5 5600H, Samsung PM991a MZALQ512HBLU | Asus VivoBook 17 F712JA-AU708W Iris Plus Graphics G7 (Ice Lake 64 EU), i7-1065G7, Kingston OM8PCP3512F-AB | Razer Blade 17 (i7-12800H, RTX 3070 Ti) GeForce RTX 3070 Ti Laptop GPU, i7-12800H, Samsung PM9A1 MZVL21T0HCLR | |
|---|---|---|---|---|---|---|---|
| Noise | -9% | -5% | -10% | -6% | -14% | 4% | |
| desligado / ambiente * (dB) | 23.8 | 26 -9% | 25.5 -7% | 28 -18% | 25 -5% | 29.6 -24% | 23 3% |
| Idle Minimum * (dB) | 24.1 | 26 -8% | 25.2 -5% | 28 -16% | 25 -4% | 31.4 -30% | 23 5% |
| Idle Average * (dB) | 24.1 | 31.7 -32% | 25.2 -5% | 28 -16% | 25 -4% | 31.4 -30% | 23 5% |
| Idle Maximum * (dB) | 24.1 | 25.2 -5% | 28 -16% | 30.5 -27% | 31.4 -30% | 23 5% | |
| Load Average * (dB) | 43.2 | 43.2 -0% | 45.9 -6% | 43.2 -0% | 37.5 13% | 36.1 16% | 36.92 15% |
| Witcher 3 ultra * (dB) | 48 | 49 -2% | 49 -2% | 50 -4% | |||
| Load Maximum * (dB) | 48 | 46.6 3% | 50.4 -5% | 50.5 -5% | 51 -6% | 40.1 16% | 50 -4% |
* ... menor é melhor
Temperatura
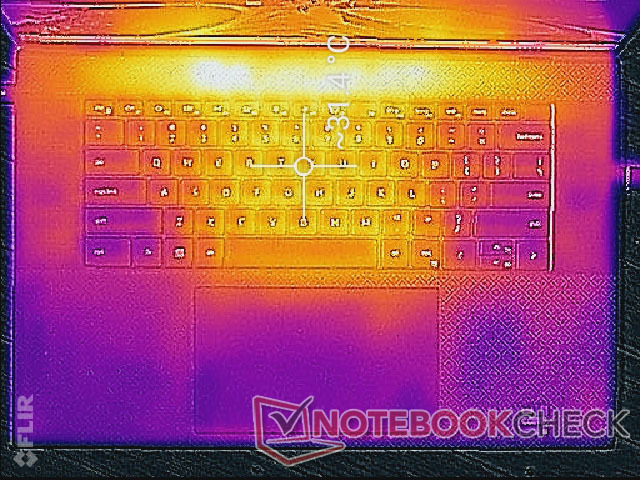
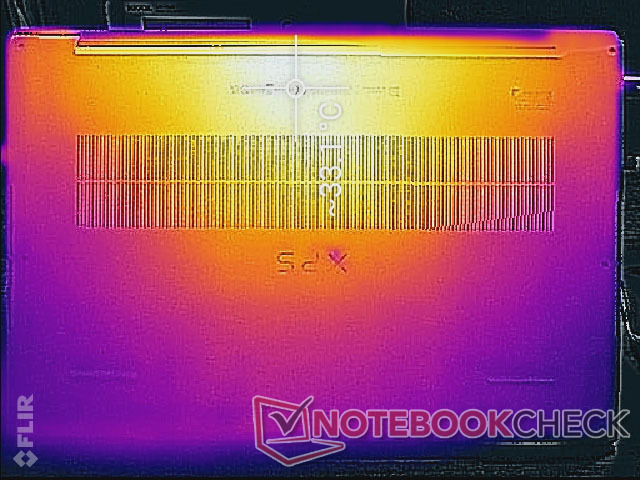
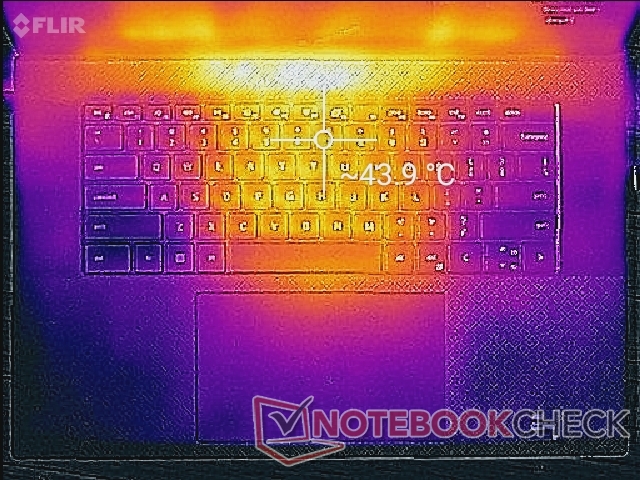
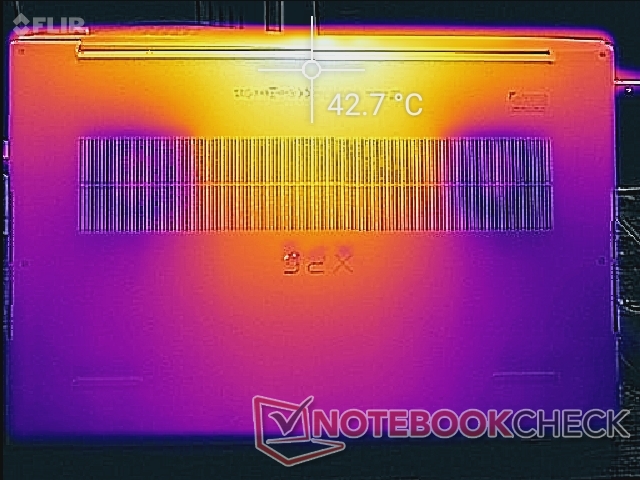
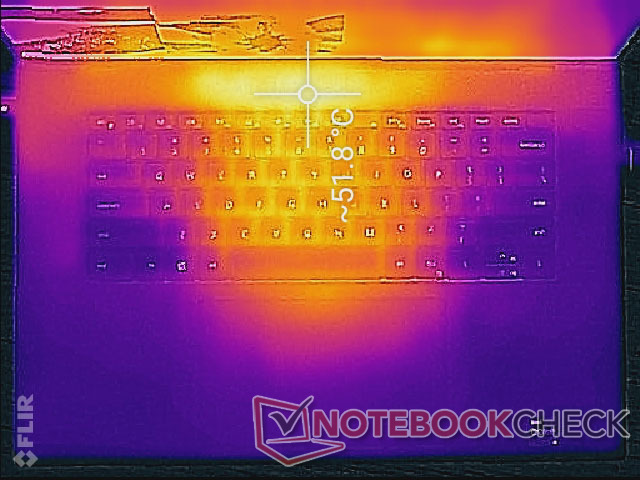
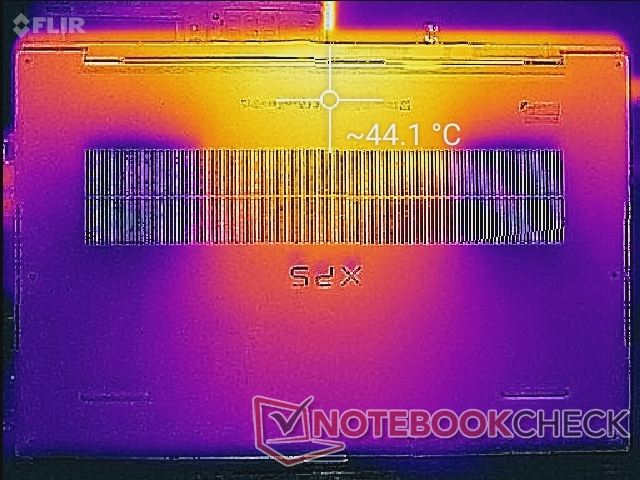
Os pontos quentes podem atingir mais de 52 C e 44 C nos lados superior e inferior, respectivamente, quando se corre com cargas estressantes por longos períodos. Estas áreas estão estrategicamente em direção à parte traseira do chassi e longe dos descansos das palmeiras e da maioria das chaves. No entanto, a superfície inferior ainda será muito quente, já que a placa inferior é um único pedaço de metal.
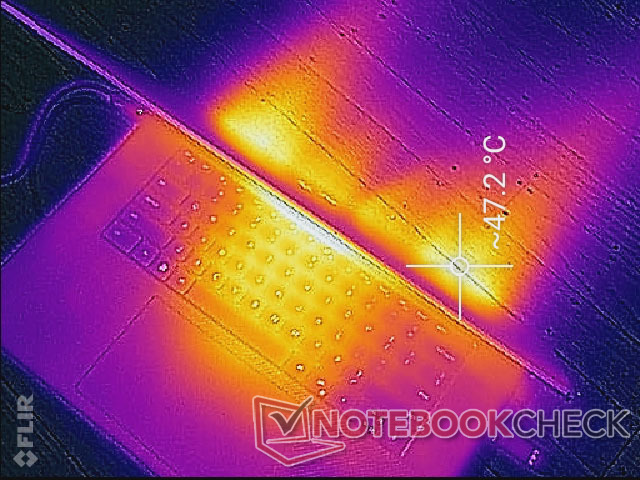
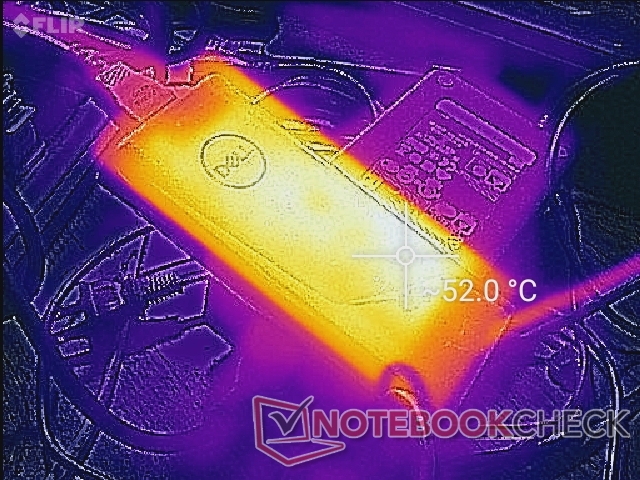
(-) A temperatura máxima no lado superior é 51.8 °C / 125 F, em comparação com a média de 36.8 °C / 98 F , variando de 21 a 71 °C para a classe Multimedia.
(±) A parte inferior aquece até um máximo de 44.2 °C / 112 F, em comparação com a média de 39.1 °C / 102 F
(+) Em uso inativo, a temperatura média para o lado superior é 28.6 °C / 83 F, em comparação com a média do dispositivo de 31.3 °C / ### class_avg_f### F.
(±) Jogando The Witcher 3, a temperatura média para o lado superior é 33.9 °C / 93 F, em comparação com a média do dispositivo de 31.3 °C / ## #class_avg_f### F.
(+) Os apoios para as mãos e o touchpad estão atingindo a temperatura máxima da pele (33.2 °C / 91.8 F) e, portanto, não estão quentes.
(-) A temperatura média da área do apoio para as mãos de dispositivos semelhantes foi 28.7 °C / 83.7 F (-4.5 °C / -8.1 F).
| Dell XPS 17 9720 RTX 3060 Intel Core i7-12700H, NVIDIA GeForce RTX 3060 Laptop GPU | HP Envy 17-cg Intel Core i5-1135G7, NVIDIA GeForce MX450 | Dell XPS 17 9710 Core i7 RTX 3060 Intel Core i7-11800H, NVIDIA GeForce RTX 3060 Laptop GPU | Dell XPS 17 9700 Core i7 RTX 2060 Max-Q Intel Core i7-10875H, NVIDIA GeForce RTX 2060 Max-Q | Lenovo Legion 5 17ACH6H-82JY0003GE AMD Ryzen 5 5600H, NVIDIA GeForce RTX 3060 Laptop GPU | Asus VivoBook 17 F712JA-AU708W Intel Core i7-1065G7, Intel Iris Plus Graphics G7 (Ice Lake 64 EU) | Razer Blade 17 (i7-12800H, RTX 3070 Ti) Intel Core i7-12800H, NVIDIA GeForce RTX 3070 Ti Laptop GPU | |
|---|---|---|---|---|---|---|---|
| Heat | 14% | 1% | -1% | 2% | 12% | 6% | |
| Maximum Upper Side * (°C) | 51.8 | 45.9 11% | 50.2 3% | 53 -2% | 42.2 19% | 40.2 22% | 43 17% |
| Maximum Bottom * (°C) | 44.2 | 49.7 -12% | 38.4 13% | 39.2 11% | 50.9 -15% | 47.9 -8% | 44 -0% |
| Idle Upper Side * (°C) | 34.8 | 24.2 30% | 37.6 -8% | 37 -6% | 34.3 1% | 27.3 22% | 32 8% |
| Idle Bottom * (°C) | 33.2 | 24.8 25% | 34.2 -3% | 35.8 -8% | 32 4% | 28.9 13% | 34 -2% |
* ... menor é melhor
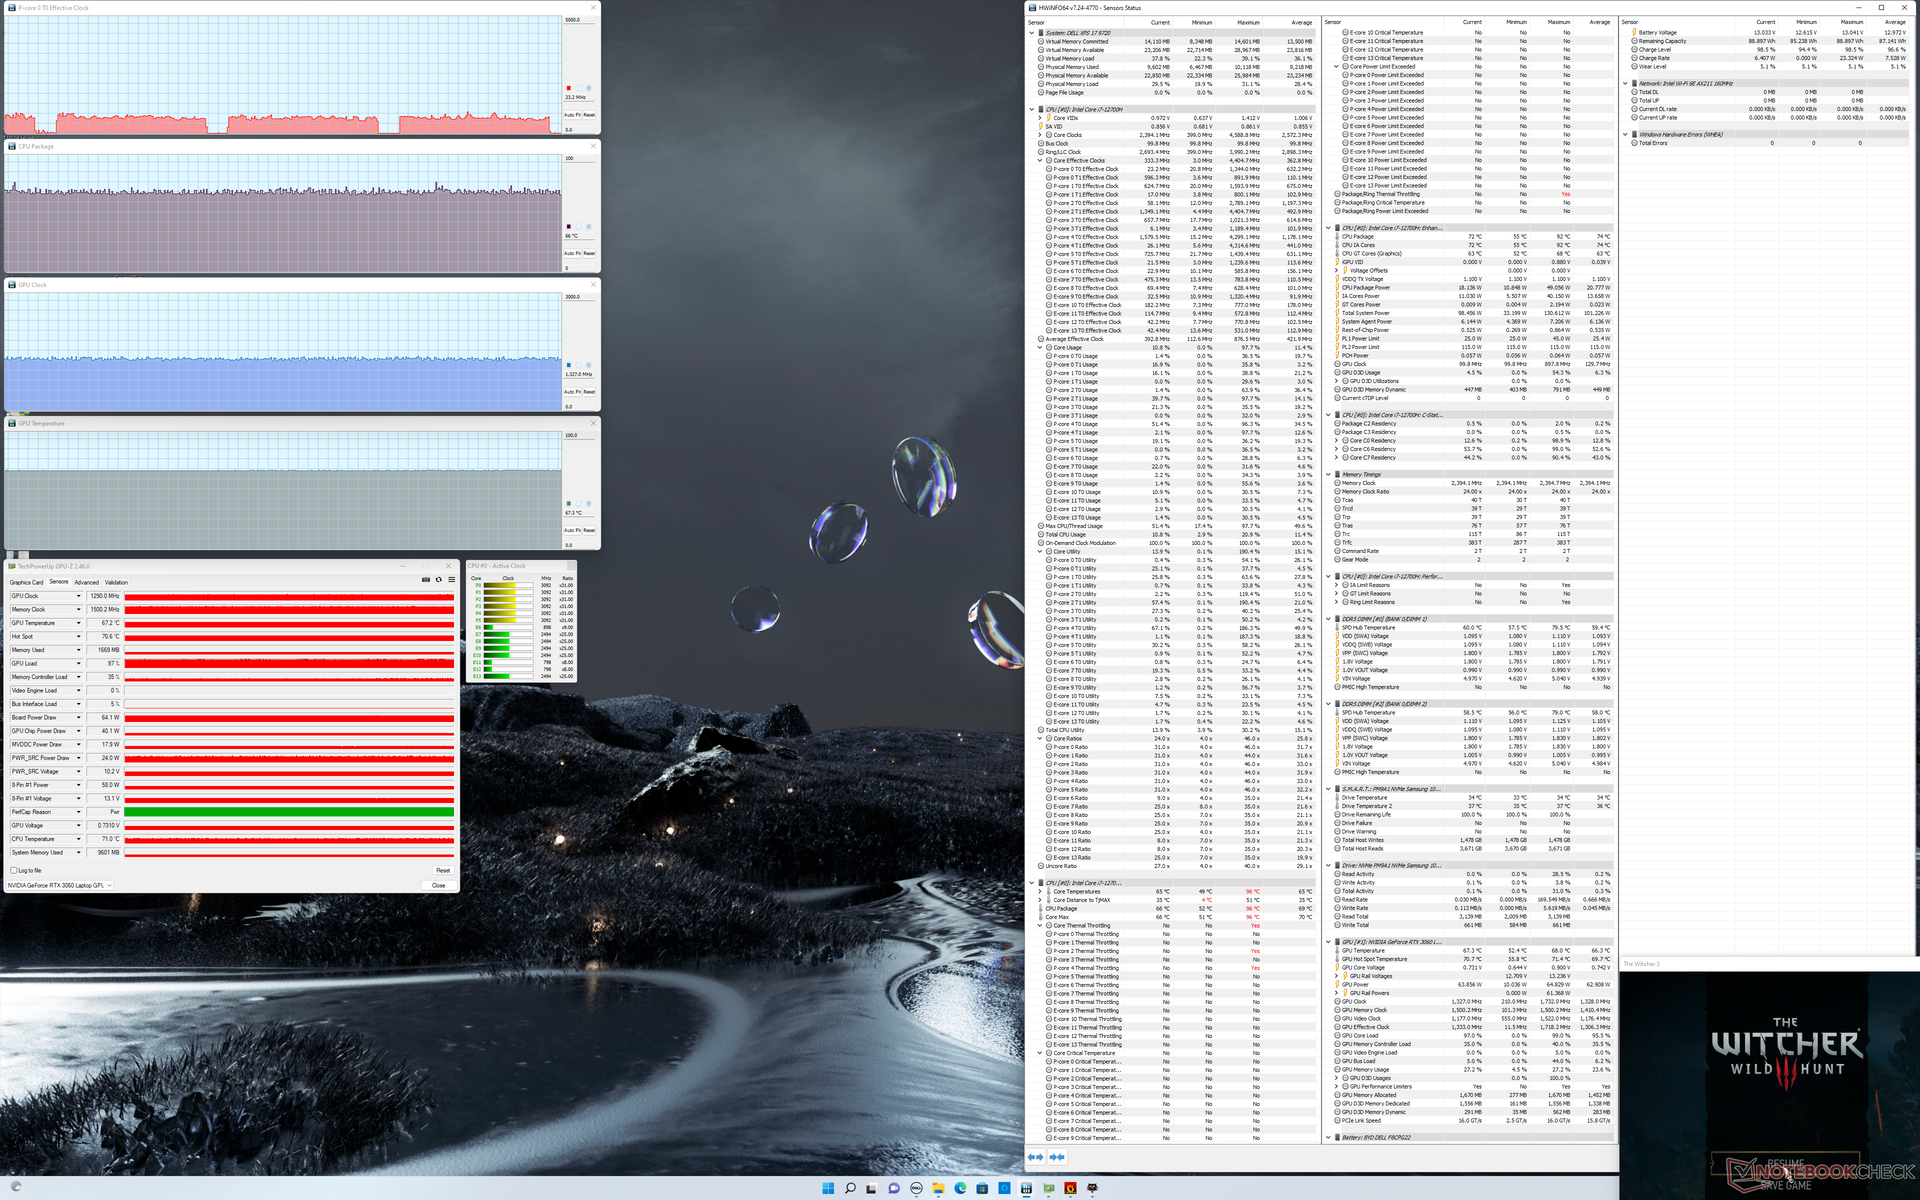
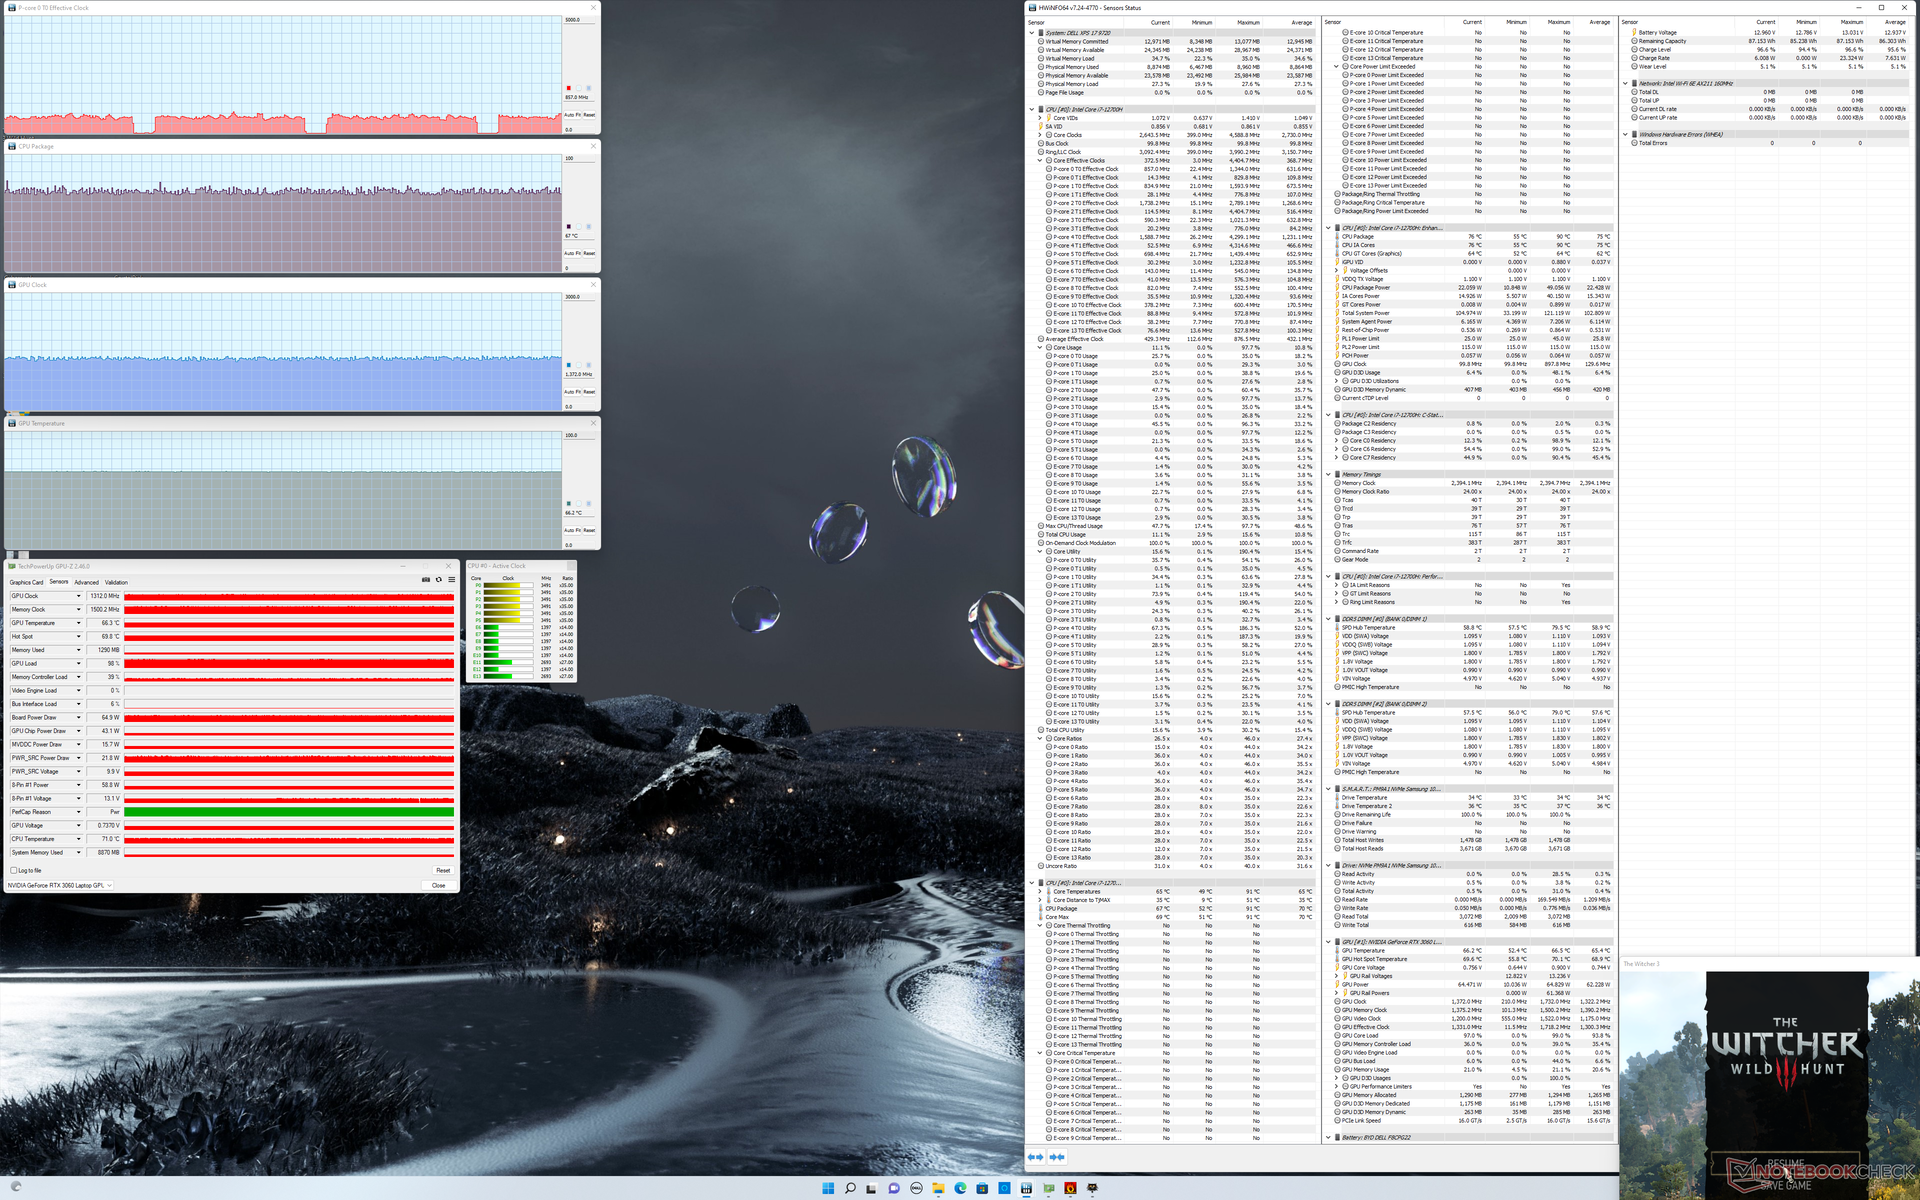
Teste de estresse
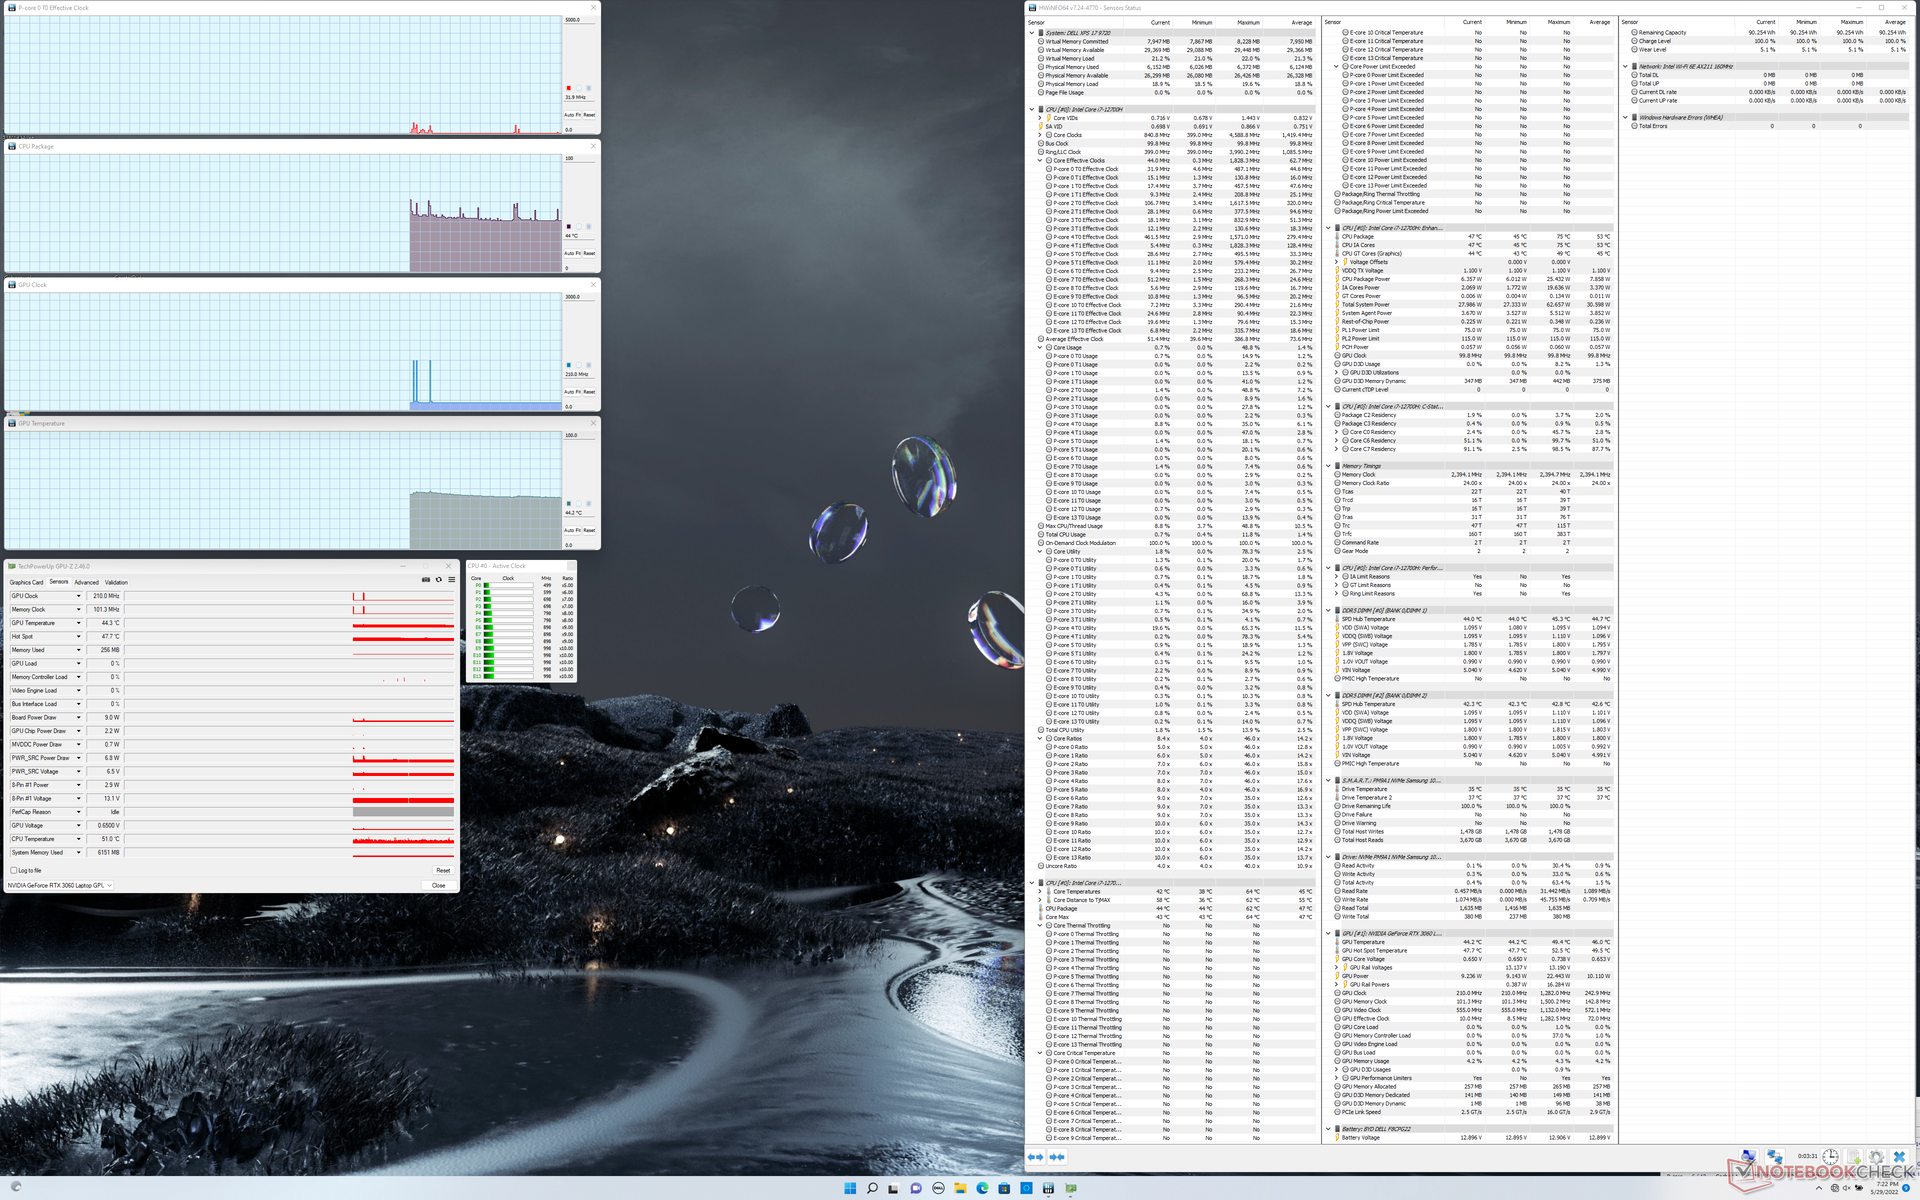
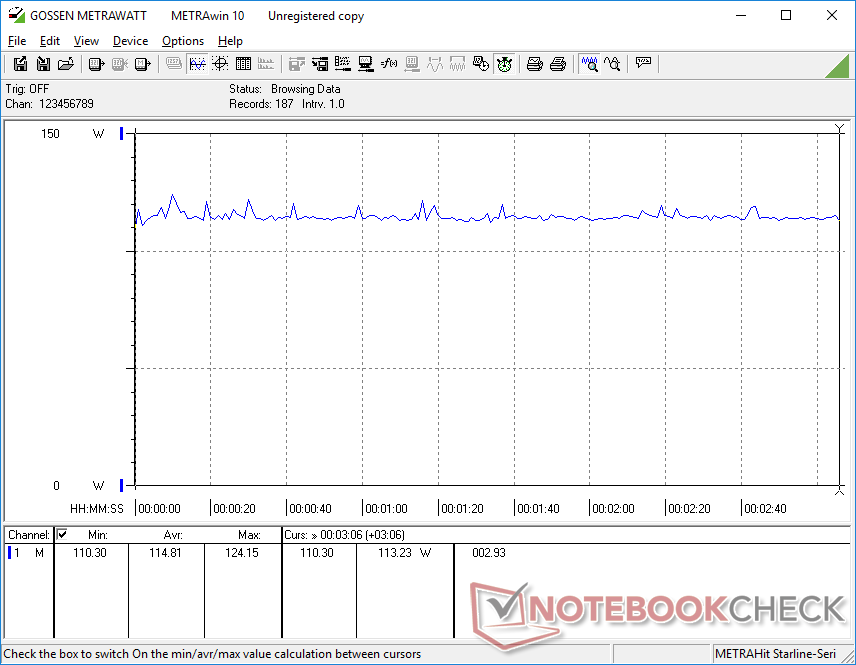
Quando estressada sob Prime95, a CPU aumentaria para 3,8 GHz, 100 C e 115 W por cerca de 10 a 15 segundos antes de cair e estabilizar em 2,5 GHz, 75 C e 55 W. Quando comparada ao Core i7-11800H XPS 17 9710, nossa unidade 9720 pode atingir um consumo de energia inicial maior (115 W vs. 87 W) enquanto estabiliza a uma temperatura mais fria do núcleo (75 C vs. 82 C) e a um consumo de energia idêntico (55 W). Assim, o sistema XPS só é capaz de explorar as maiores faixas de TDP ou taxas de relógio da plataforma do Alder Lake por curtos períodos antes que as limitações térmicas entrem em ação.
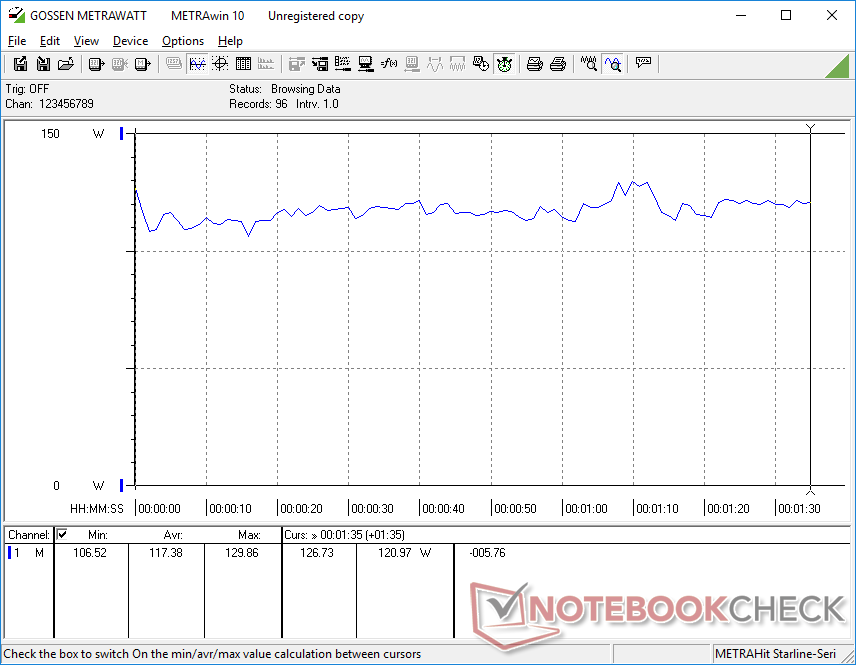
Taxas de relógio da GPU, temperatura e consumo de energia da placa quando em funcionamento Witcher 3 estabilizariam em 1312 MHz, 66 C e 65 W, respectivamente, em comparação com 1530 MHz, 67 C e 69 W no XPS 17 9710. O desempenho gráfico geral mais lento em relação ao ano anterior reflete nossos piores resultados 3DMark registrados acima.
O ganho de desempenho da GPU em execução no modo Ultra Performance versus modo Otimizado parece ser insignificante.
O funcionamento com baterias limita tanto a performance da CPU quanto a da GPU. Um teste Fire Strike sobre a energia da bateria retornaria pontuações de Física e Gráficos de 14770 e 24927 pontos, respectivamente, em comparação com 16354 e 23563 pontos quando em rede elétrica.
| Relógio CPU (GHz) | Relógio GPU (MHz) | Temperatura média da CPU (°C) | Temperatura média da GPU (°C) | |
| System Idle | -- | -- | 44 | 44 |
| Prime95 Stress | 2.5 | -- | 75 | 59 |
| Prime95 + FurMark Stress | ||||
| Witcher 3 Stress (Modo otimizado) | ~0.7 | 1290 | 66 | 67 |
| Witcher 3 Stress (modo Ultra Performance) | ~0.8 | 1312 | 67 | 66 |
Oradores
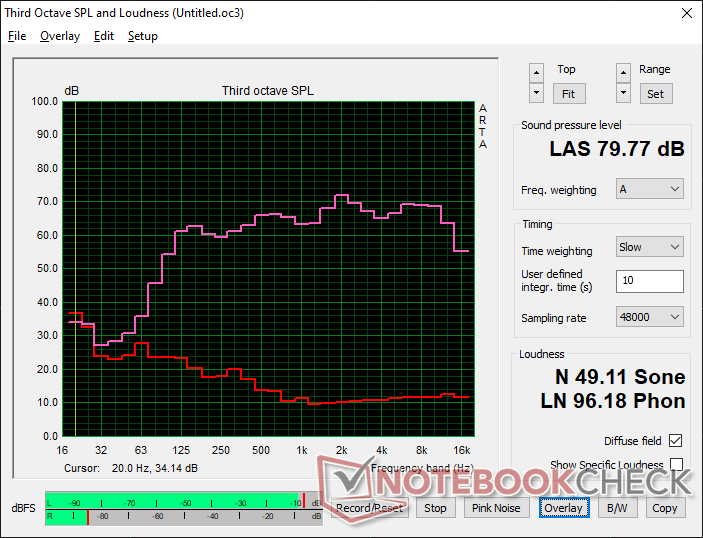
Dell XPS 17 9720 RTX 3060 análise de áudio
(±) | o volume do alto-falante é médio, mas bom (###valor### dB)
Graves 100 - 315Hz
(±) | graves reduzidos - em média 5.2% menor que a mediana
(±) | a linearidade dos graves é média (7% delta para a frequência anterior)
Médios 400 - 2.000 Hz
(+) | médios equilibrados - apenas 2.2% longe da mediana
(+) | médios são lineares (3.8% delta para frequência anterior)
Altos 2 - 16 kHz
(+) | agudos equilibrados - apenas 2.8% longe da mediana
(+) | os máximos são lineares (3.1% delta da frequência anterior)
Geral 100 - 16.000 Hz
(+) | o som geral é linear (8.3% diferença em relação à mediana)
Comparado com a mesma classe
» 9% de todos os dispositivos testados nesta classe foram melhores, 2% semelhantes, 89% piores
» O melhor teve um delta de 5%, a média foi 17%, o pior foi 45%
Comparado com todos os dispositivos testados
» 2% de todos os dispositivos testados foram melhores, 1% semelhantes, 97% piores
» O melhor teve um delta de 4%, a média foi 23%, o pior foi 134%
Apple MacBook Pro 16 2021 M1 Pro análise de áudio
(+) | os alto-falantes podem tocar relativamente alto (###valor### dB)
Graves 100 - 315Hz
(+) | bons graves - apenas 3.8% longe da mediana
(+) | o baixo é linear (5.2% delta para a frequência anterior)
Médios 400 - 2.000 Hz
(+) | médios equilibrados - apenas 1.3% longe da mediana
(+) | médios são lineares (2.1% delta para frequência anterior)
Altos 2 - 16 kHz
(+) | agudos equilibrados - apenas 1.9% longe da mediana
(+) | os máximos são lineares (2.7% delta da frequência anterior)
Geral 100 - 16.000 Hz
(+) | o som geral é linear (4.6% diferença em relação à mediana)
Comparado com a mesma classe
» 0% de todos os dispositivos testados nesta classe foram melhores, 0% semelhantes, 100% piores
» O melhor teve um delta de 5%, a média foi 17%, o pior foi 45%
Comparado com todos os dispositivos testados
» 0% de todos os dispositivos testados foram melhores, 0% semelhantes, 100% piores
» O melhor teve um delta de 4%, a média foi 23%, o pior foi 134%
Gerenciamento de energia - Maior consumo de energia Turbo Boost
Consumo de energia
O XPS 17 9700 problemas de cobrança expostos onde o sistema não foi capaz de extrair mais de 100 W do adaptador de 130 W AC. Felizmente, a Dell abordou a questão sobre o XPS 17 9710 e o 9720 não é diferente. Ao funcionar Witcher 3a unidade 9720 teria 115 W para ser quase idêntica ao que registramos na 9710 mais antiga. A série XPS 15 e XPS 17 continuam sendo os únicos modelos no mercado a serem enviados com um adaptador USB-C de 130 W.
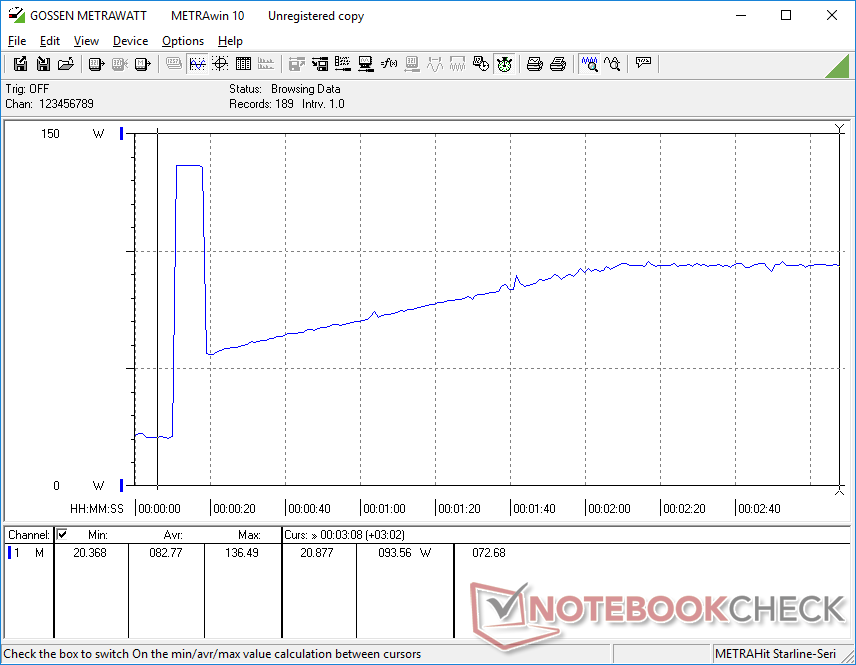
Notavelmente, o consumo de energia ao executar Prime95 é ligeiramente maior do que no 9710 durante o início do teste antes de se estabilizar em cerca de 94 W cada. O maior consumo de energia da CPU do 12º gênero é, portanto, de curta duração antes que ela se torne semelhante ao modelo 9710 com processadores do 11º gênero
A carga é diminuída significativamente quando se joga ou quando há cargas elevadas. Quando em funcionamento Witcher 3 a 13 por cento de capacidade da bateria e com energia CA, por exemplo, a bateria só aumentaria em mais 12 por cento no decorrer de uma hora.
| desligado | |
| Ocioso | |
| Carga |
|
Key:
min: | |
| Dell XPS 17 9720 RTX 3060 i7-12700H, GeForce RTX 3060 Laptop GPU, Samsung PM9A1 MZVL21T0HCLR, IPS, 3840x2400, 17" | HP Envy 17-cg i5-1135G7, GeForce MX450, Samsung PM991 MZVLQ1T0HALB, IPS, 1920x1080, 17.3" | Dell XPS 17 9710 Core i7 RTX 3060 i7-11800H, GeForce RTX 3060 Laptop GPU, Micron 2300 1TB MTFDHBA1T0TDV, IPS, 3840x2400, 17" | Dell XPS 17 9700 Core i7 RTX 2060 Max-Q i7-10875H, GeForce RTX 2060 Max-Q, Micron 2200S 1TB MTFDHBA1T0TCK, IPS, 3840x2400, 17" | Lenovo Legion 5 17ACH6H-82JY0003GE R5 5600H, GeForce RTX 3060 Laptop GPU, Samsung PM991a MZALQ512HBLU, IPS, 1920x1080, 17.3" | Asus VivoBook 17 F712JA-AU708W i7-1065G7, Iris Plus Graphics G7 (Ice Lake 64 EU), Kingston OM8PCP3512F-AB, IPS, 1920x1080, 17.3" | Razer Blade 17 (i7-12800H, RTX 3070 Ti) i7-12800H, GeForce RTX 3070 Ti Laptop GPU, Samsung PM9A1 MZVL21T0HCLR, IPS, 2560x1440, 17.3" | |
|---|---|---|---|---|---|---|---|
| Power Consumption | 46% | 3% | 7% | -40% | 61% | -54% | |
| Idle Minimum * (Watt) | 5.9 | 3.8 36% | 7.5 -27% | 5.8 2% | 15.6 -164% | 4.2 29% | 14.4 -144% |
| Idle Average * (Watt) | 15.8 | 9.4 41% | 15.7 1% | 20.6 -30% | 20.7 -31% | 7.9 50% | 20 -27% |
| Idle Maximum * (Watt) | 26.7 | 10.1 62% | 23.1 13% | 21 21% | 22.9 14% | 8.8 67% | 21.5 19% |
| Load Average * (Watt) | 117.4 | 64.4 45% | 87.2 26% | 104.7 11% | 134 -14% | 29.7 75% | 119 -1% |
| Witcher 3 ultra * (Watt) | 114.8 | 64.4 44% | 116 -1% | 99.2 14% | 135 -18% | 28.8 75% | 218 -90% |
| Load Maximum * (Watt) | 136.6 | 68 50% | 131.6 4% | 107.6 21% | 170 -24% | 44 68% | 248 -82% |
* ... menor é melhor
Power Consumption Witcher 3 / Stresstest
Power Consumption external Monitor
Vida útil da bateria
Os tempos de execução não mudaram significativamente em relação aos modelos 9710 ou 9700 da geração anterior. Esperar pouco menos de 9 horas de uso da WLAN no mundo real quando no perfil de potência Balanceado ou Otimizado com a GPU integrada ativa. O carregamento da capacidade vazia para a plena capacidade leva pouco mais de 2 horas, assumindo que você não esteja executando nenhuma aplicação exigente, como mencionado acima.
| Dell XPS 17 9720 RTX 3060 i7-12700H, GeForce RTX 3060 Laptop GPU, 97 Wh | HP Envy 17-cg i5-1135G7, GeForce MX450, 55.67 Wh | Dell XPS 17 9710 Core i7 RTX 3060 i7-11800H, GeForce RTX 3060 Laptop GPU, 97 Wh | Dell XPS 17 9700 Core i7 RTX 2060 Max-Q i7-10875H, GeForce RTX 2060 Max-Q, 97 Wh | Lenovo Legion 5 17ACH6H-82JY0003GE R5 5600H, GeForce RTX 3060 Laptop GPU, 80 Wh | Asus VivoBook 17 F712JA-AU708W i7-1065G7, Iris Plus Graphics G7 (Ice Lake 64 EU), 32 Wh | Razer Blade 17 (i7-12800H, RTX 3070 Ti) i7-12800H, GeForce RTX 3070 Ti Laptop GPU, 82 Wh | |
|---|---|---|---|---|---|---|---|
| Duração da bateria | 46% | 74% | 56% | 21% | 11% | 24% | |
| WiFi v1.3 (h) | 8.7 | 7.9 -9% | 7.6 -13% | 9.7 11% | 4.4 -49% | 4.4 -49% | 5.9 -32% |
| Load (h) | 1 | 2 100% | 2.6 160% | 2 100% | 1.9 90% | 1.7 70% | 1.8 80% |
| Reader / Idle (h) | 17.7 | 17.7 | 23.8 | 5.5 | |||
| H.264 (h) | 3.5 | 4.9 |
Pro
Contra
Veredicto - Tudo sobre essa CPU
Há pouco a reclamar sobre a CPU atualizada. Embora seja verdade que a plataforma de Alder Lake pode ser muito ávida de energia, os ganhos de desempenho são pelo menos respeitáveis. Os usuários de energia que sabem que podem explorar o desempenho extra certamente apreciarão o trade-off neste aspecto.
O Dell XPS 17 9720 introduz um processador novinho em folha com ganhos significativos de desempenho em relação às opções dos antigos 10º e 11º gêneros. Fora da CPU, entretanto, as mesmas desvantagens do XPS 17 9710 ou 9700 permanecem.
Infelizmente, existem alguns pequenos inconvenientes que ainda não foram resolvidos durante dois anos neste projeto. A qualidade do vídeo da webcam continua pobre, o carregamento é significativamente mais lento quando a carga é muito exigente, a tampa é difícil de abrir com sua aderência deficiente, e ainda não há obturador de privacidade da webcam ou suporte Wi-Fi 6E. O fato de a GPU ter levado um golpe aparentemente do nada pode ser uma pílula difícil de engolir para os entusiastas do XPS. As maiores vantagens do XPS 17 9720 quando comparado a alternativas com mais recursos como o Gigabyte Aero 17 continuam a ser seu tamanho de chassi mais compacto e relação de aspecto 16:10.
Preço e Disponibilidade
Amazônia tem apenas um XPS 17 9720 SKU disponível no momento por $2250 USD com o display Core i7-12700H, GeForce RTX 3050, e 1200p. Para mais opções, os usuários podem encomendar diretamente da Dell ao invés disso.
Dell XPS 17 9720 RTX 3060
- 05/31/2022 v7 (old)
Allen Ngo
Price comparison

