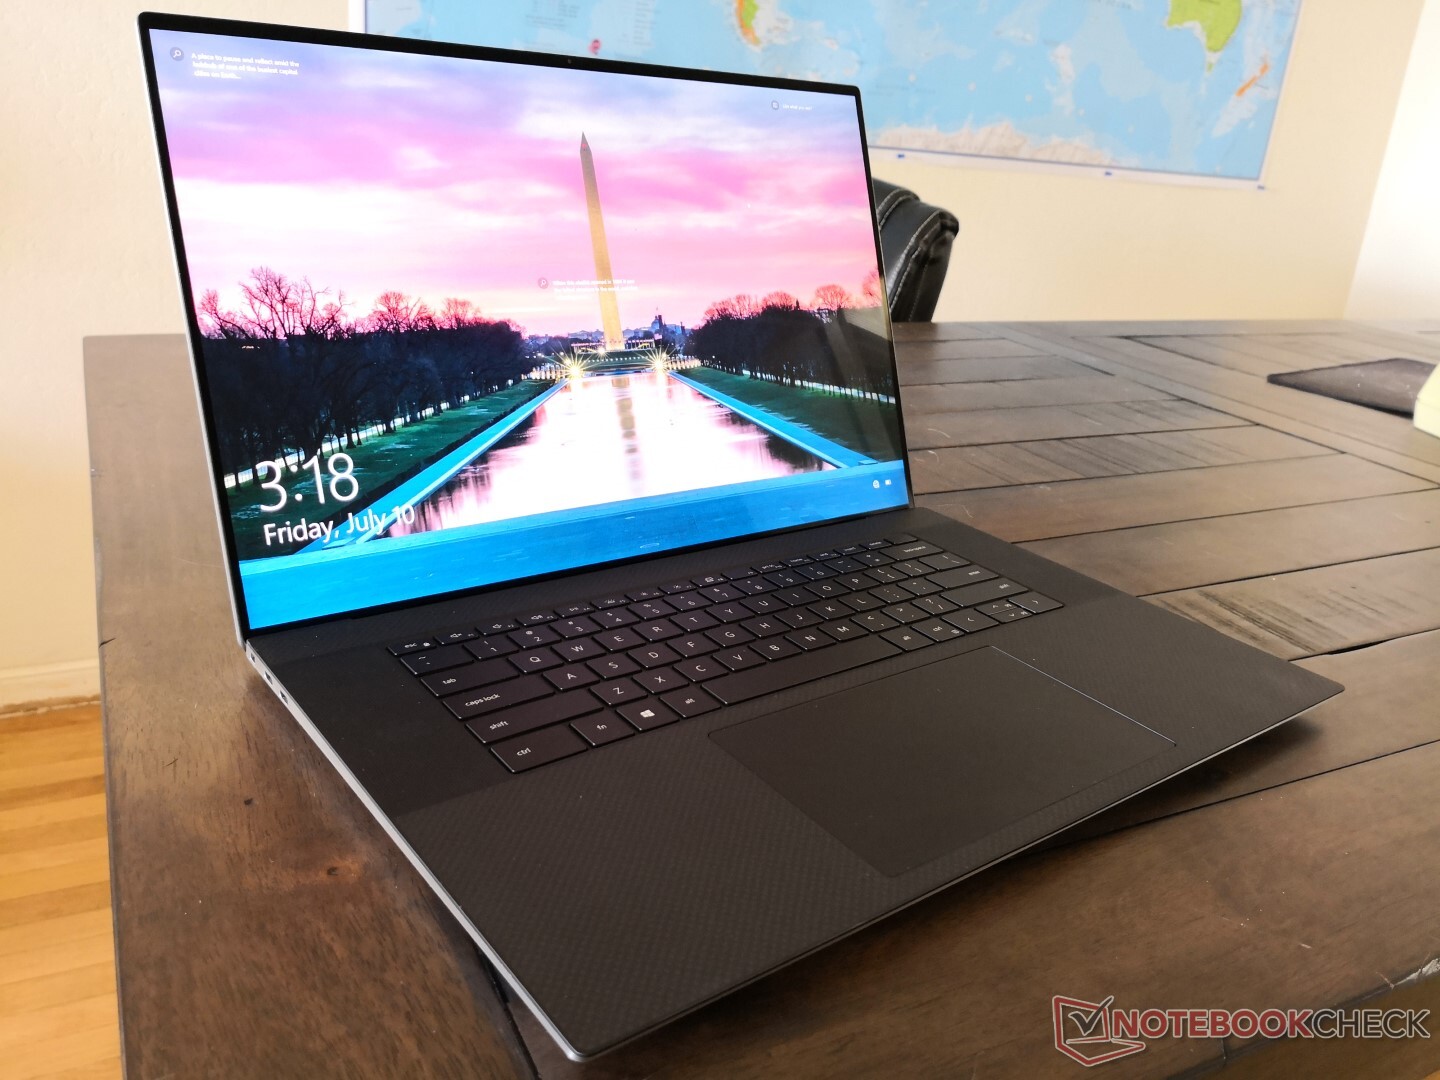
Breve Análise do Portátil Dell XPS 17 9700 Core i7: Praticamente um MacBook Pro 17
Avaliação | Data | Modelo | Peso | Altura | Size | Resolução | Preço |
|---|---|---|---|---|---|---|---|
| 87.9 % v7 (old) | 07/2020 | Dell XPS 17 9700 Core i7 RTX 2060 Max-Q i7-10875H, GeForce RTX 2060 Max-Q | 2.5 kg | 19.5 mm | 17.00" | 3840x2400 | |
| 82.5 % v7 (old) | 07/2020 | MSI Creator 17 A10SGS i7-10875H, GeForce RTX 2080 Super Max-Q | 2.4 kg | 20 mm | 17.30" | 3840x2160 | |
| 80.9 % v7 (old) | 06/2020 | HP Envy 17t-cg000 i7-1065G7, GeForce MX330 | 2.7 kg | 19.3 mm | 17.30" | 3840x2160 | |
| 87 % v7 (old) | 04/2020 | Gigabyte Aero 17 HDR XB i7-10875H, GeForce RTX 2070 Super Max-Q | 2.7 kg | 21 mm | 17.30" | 3840x2160 | |
| 87.4 % v7 (old) | 06/2020 | Razer Blade Pro 17 RTX 2070 Max-Q 300 Hz i7-10875H, GeForce RTX 2070 Max-Q | 2.7 kg | 19.9 mm | 17.30" | 1920x1080 |
| SD Card Reader | |
| average JPG Copy Test (av. of 3 runs) | |
| Razer Blade Pro 17 RTX 2070 Max-Q 300 Hz (Toshiba Exceria Pro SDXC 64 GB UHS-II) | |
| Gigabyte Aero 17 HDR XB (Toshiba Exceria Pro SDXC 64 GB UHS-II) | |
| Dell XPS 17 9700 Core i7 RTX 2060 Max-Q (Toshiba Exceria Pro SDXC 64 GB UHS-II) | |
| HP Envy 17t-cg000 (Toshiba Exceria Pro SDXC 64 GB UHS-II) | |
| maximum AS SSD Seq Read Test (1GB) | |
| Gigabyte Aero 17 HDR XB (Toshiba Exceria Pro SDXC 64 GB UHS-II) | |
| Razer Blade Pro 17 RTX 2070 Max-Q 300 Hz (Toshiba Exceria Pro SDXC 64 GB UHS-II) | |
| Dell XPS 17 9700 Core i7 RTX 2060 Max-Q (Toshiba Exceria Pro SDXC 64 GB UHS-II) | |
| HP Envy 17t-cg000 (Toshiba Exceria Pro SDXC 64 GB UHS-II) | |


| |||||||||||||||||||||||||
iluminação: 84 %
iluminação com acumulador: 539.4 cd/m²
Contraste: 1686:1 (Preto: 0.32 cd/m²)
ΔE ColorChecker Calman: 4.12 | ∀{0.5-29.43 Ø4.71}
calibrated: 3.91
ΔE Greyscale Calman: 1.5 | ∀{0.09-98 Ø4.96}
100% sRGB (Argyll 1.6.3 3D)
90.4% AdobeRGB 1998 (Argyll 1.6.3 3D)
99.8% AdobeRGB 1998 (Argyll 3D)
100% sRGB (Argyll 3D)
90.5% Display P3 (Argyll 3D)
Gamma: 2.15
CCT: 6438 K
| Dell XPS 17 9700 Core i7 RTX 2060 Max-Q Sharp LQ170R1, IPS, 17", 3840x2400 | Razer Blade Pro 17 RTX 2070 Max-Q 300 Hz Sharp LQ173M1JW02, IPS, 17.3", 1920x1080 | MSI Creator 17 A10SGS B173ZAN05.0 (AUO278E), Mini-LED IPS-Level, 17.3", 3840x2160 | HP Envy 17t-cg000 AU Optronics AUO168E, IPS, 17.3", 3840x2160 | Gigabyte Aero 17 HDR XB AUO B173ZAN03.2 (AUO329B), IPS, 17.3", 3840x2160 | Apple MacBook Pro 16 2019 i9 5500M APPA044, IPS, 16", 3072x1920 | |
|---|---|---|---|---|---|---|
| Display | -16% | -9% | -2% | -1% | ||
| Display P3 Coverage (%) | 90.5 | 72.2 -20% | 82 -9% | 86.2 -5% | 86.5 -4% | |
| sRGB Coverage (%) | 100 | 98.5 -1% | 97.5 -2% | 100 0% | 100 0% | |
| AdobeRGB 1998 Coverage (%) | 99.8 | 73 -27% | 84 -16% | 99.8 0% | 100 0% | |
| Response Times | 80% | 72% | 10% | 6% | -6% | |
| Response Time Grey 50% / Grey 80% * (ms) | 51.2 ? | 5.6 ? 89% | 45.2 ? 12% | 55.2 ? -8% | 52.4 ? -2% | |
| Response Time Black / White * (ms) | 32 ? | 9.6 ? 70% | 8.8 ? 72% | 29.6 ? 7% | 26 ? 19% | 34.9 ? -9% |
| PWM Frequency (Hz) | 26600 ? | 131700 | ||||
| Screen | -46% | -6% | -46% | 17% | 12% | |
| Brightness middle (cd/m²) | 539.4 | 328 -39% | 996 85% | 383.4 -29% | 487 -10% | 519 -4% |
| Brightness (cd/m²) | 494 | 329 -33% | 952 93% | 382 -23% | 475 -4% | 477 -3% |
| Brightness Distribution (%) | 84 | 78 -7% | 93 11% | 86 2% | 95 13% | 86 2% |
| Black Level * (cd/m²) | 0.32 | 0.35 -9% | 0.68 -113% | 0.34 -6% | 0.38 -19% | 0.39 -22% |
| Contrast (:1) | 1686 | 937 -44% | 1465 -13% | 1128 -33% | 1282 -24% | 1331 -21% |
| Colorchecker dE 2000 * | 4.12 | 4.74 -15% | 4.21 -2% | 6.24 -51% | 1.19 71% | 2.28 45% |
| Colorchecker dE 2000 max. * | 7.65 | 8.99 -18% | 6.79 11% | 10.18 -33% | 2.43 68% | 6.54 15% |
| Colorchecker dE 2000 calibrated * | 3.91 | 2.12 46% | 2.03 48% | 3.7 5% | 0.5 87% | 0.86 78% |
| Greyscale dE 2000 * | 1.5 | 6.8 -353% | 4.1 -173% | 6.6 -340% | 1.45 3% | 0.9 40% |
| Gamma | 2.15 102% | 2.2 100% | 2.207 100% | 2.272 97% | 2.21 100% | 2145 0% |
| CCT | 6438 101% | 6446 101% | 7491 87% | 5973 109% | 6557 99% | 6572 99% |
| Color Space (Percent of AdobeRGB 1998) (%) | 90.4 | 64.8 -28% | 84 -7% | 88 -3% | 88 -3% | 78 -14% |
| Color Space (Percent of sRGB) (%) | 100 | 98.6 -1% | 97 -3% | 100 0% | 100 0% | |
| Média Total (Programa/Configurações) | 6% /
-24% | 19% /
-1% | -13% /
-31% | 7% /
12% | 3% /
9% |
* ... menor é melhor
Exibir tempos de resposta
| ↔ Tempo de resposta preto para branco | ||
|---|---|---|
| 32 ms ... ascensão ↗ e queda ↘ combinadas | ↗ 18 ms ascensão | 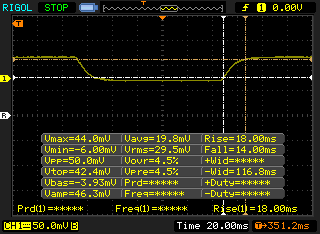 |
| ↘ 14 ms queda | ||
| A tela mostra taxas de resposta lentas em nossos testes e será insatisfatória para os jogadores. Em comparação, todos os dispositivos testados variam de 0.1 (mínimo) a 240 (máximo) ms. » 86 % de todos os dispositivos são melhores. Isso significa que o tempo de resposta medido é pior que a média de todos os dispositivos testados (19.8 ms). | ||
| ↔ Tempo de resposta 50% cinza a 80% cinza | ||
| 51.2 ms ... ascensão ↗ e queda ↘ combinadas | ↗ 27.2 ms ascensão | 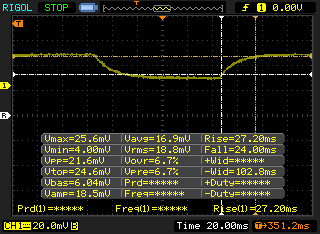 |
| ↘ 24 ms queda | ||
| A tela mostra taxas de resposta lentas em nossos testes e será insatisfatória para os jogadores. Em comparação, todos os dispositivos testados variam de 0.165 (mínimo) a 636 (máximo) ms. » 88 % de todos os dispositivos são melhores. Isso significa que o tempo de resposta medido é pior que a média de todos os dispositivos testados (31 ms). | ||
Cintilação da tela / PWM (modulação por largura de pulso)
| Tela tremeluzindo / PWM não detectado | 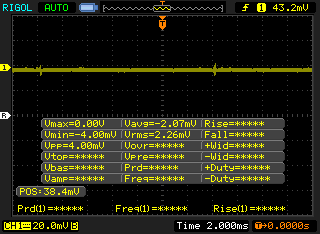 | ||
[pwm_comparison] Em comparação: 52 % de todos os dispositivos testados não usam PWM para escurecer a tela. Se PWM foi detectado, uma média de 7757 (mínimo: 5 - máximo: 343500) Hz foi medida. | |||
Cinebench R15: CPU Multi 64Bit | CPU Single 64Bit
Blender: v2.79 BMW27 CPU
7-Zip 18.03: 7z b 4 -mmt1 | 7z b 4
Geekbench 5.5: Single-Core | Multi-Core
HWBOT x265 Benchmark v2.2: 4k Preset
LibreOffice : 20 Documents To PDF
R Benchmark 2.5: Overall mean
| Blender / v2.79 BMW27 CPU | |
| Dell XPS 15 9500 Core i5 | |
| MSI GE75 Raider 10SE-008US | |
| Acer Nitro 5 AN515-44-R5FT | |
| Dell XPS 17 9700 Core i7 RTX 2060 Max-Q | |
| Média Intel Core i7-10875H (259 - 535, n=30) | |
| Asus Zephyrus G14 GA401IV | |
| MSI GE75 9SG | |
| Asus Strix Scar 17 G732LXS | |
| MSI Bravo 17 A4DDR | |
| 7-Zip 18.03 / 7z b 4 -mmt1 | |
| Média Intel Core i7-10875H (5071 - 5780, n=31) | |
| Asus Strix Scar 17 G732LXS | |
| Dell XPS 17 9700 Core i7 RTX 2060 Max-Q | |
| MSI GE75 Raider 10SE-008US | |
| MSI GE75 9SG | |
| Dell XPS 15 9500 Core i5 | |
| MSI Bravo 17 A4DDR | |
| Asus Zephyrus G14 GA401IV | |
| Acer Nitro 5 AN515-44-R5FT | |
| Geekbench 5.5 / Single-Core | |
| Dell XPS 17 9700 Core i7 RTX 2060 Max-Q | |
| Média Intel Core i7-10875H (1233 - 1371, n=29) | |
| Asus Strix Scar 17 G732LXS | |
| MSI GE75 Raider 10SE-008US | |
| Asus Zephyrus G14 GA401IV | |
| MSI Bravo 17 A4DDR | |
| Dell XPS 15 9500 Core i5 | |
| Acer Nitro 5 AN515-44-R5FT | |
| Geekbench 5.5 / Multi-Core | |
| Asus Strix Scar 17 G732LXS | |
| MSI Bravo 17 A4DDR | |
| Dell XPS 17 9700 Core i7 RTX 2060 Max-Q | |
| Média Intel Core i7-10875H (5715 - 8620, n=29) | |
| Asus Zephyrus G14 GA401IV | |
| MSI GE75 Raider 10SE-008US | |
| Acer Nitro 5 AN515-44-R5FT | |
| Dell XPS 15 9500 Core i5 | |
| HWBOT x265 Benchmark v2.2 / 4k Preset | |
| MSI Bravo 17 A4DDR | |
| Asus Strix Scar 17 G732LXS | |
| Asus Zephyrus G14 GA401IV | |
| MSI GE75 9SG | |
| Média Intel Core i7-10875H (7.27 - 14.1, n=27) | |
| Dell XPS 17 9700 Core i7 RTX 2060 Max-Q | |
| MSI GE75 Raider 10SE-008US | |
| Acer Nitro 5 AN515-44-R5FT | |
| Dell XPS 15 9500 Core i5 | |
| LibreOffice / 20 Documents To PDF | |
| MSI Bravo 17 A4DDR | |
| Acer Nitro 5 AN515-44-R5FT | |
| Dell XPS 15 9500 Core i5 | |
| MSI GE75 Raider 10SE-008US | |
| Asus Strix Scar 17 G732LXS | |
| Média Intel Core i7-10875H (30.2 - 84.3, n=30) | |
| Dell XPS 17 9700 Core i7 RTX 2060 Max-Q | |
| R Benchmark 2.5 / Overall mean | |
| Dell XPS 15 9500 Core i5 | |
| Acer Nitro 5 AN515-44-R5FT | |
| MSI GE75 Raider 10SE-008US | |
| Dell XPS 17 9700 Core i7 RTX 2060 Max-Q | |
| Média Intel Core i7-10875H (0.546 - 0.662, n=29) | |
| Asus Strix Scar 17 G732LXS | |
| MSI Bravo 17 A4DDR | |
* ... menor é melhor
| PCMark 8 | |
| Home Score Accelerated v2 | |
| Razer Blade Pro 17 RTX 2070 Max-Q 300 Hz | |
| HP Envy 17t-cg000 | |
| Dell XPS 17 9700 Core i7 RTX 2060 Max-Q | |
| Work Score Accelerated v2 | |
| Razer Blade Pro 17 RTX 2070 Max-Q 300 Hz | |
| HP Envy 17t-cg000 | |
| Dell XPS 17 9700 Core i7 RTX 2060 Max-Q | |
| PCMark 8 Home Score Accelerated v2 | 3649 pontos | |
| PCMark 8 Work Score Accelerated v2 | 4385 pontos | |
| PCMark 10 Score | 5672 pontos | |
Ajuda | ||
| DPC Latencies / LatencyMon - interrupt to process latency (max), Web, Youtube, Prime95 | |
| HP Envy 17t-cg000 | |
| Gigabyte Aero 17 HDR XB | |
| Razer Blade Pro 17 RTX 2070 Max-Q 300 Hz | |
| MSI Creator 17 A10SGS | |
| Dell XPS 17 9700 Core i7 RTX 2060 Max-Q | |
| Asus Zephyrus S17 GX701LXS | |
* ... menor é melhor
| Dell XPS 17 9700 Core i7 RTX 2060 Max-Q Micron 2200S 1TB MTFDHBA1T0TCK | Razer Blade Pro 17 RTX 2070 Max-Q 300 Hz Lite-On CA5-8D512 | HP Envy 17t-cg000 WDC PC SN520 SDAPNUW-512G | Gigabyte Aero 17 HDR XB Samsung SSD PM981a MZVLB512HBJQ | Apple MacBook Pro 16 2019 i9 5500M Apple SSD AP1024 7171 | Asus ProArt StudioBook Pro 17 W700G3T Samsung SSD PM981 MZVLB1T0HALR | |
|---|---|---|---|---|---|---|
| AS SSD | 19% | 20% | 79% | 39% | 104% | |
| Seq Read (MB/s) | 1141 | 2019 77% | 1161 2% | 1762 54% | 2531 122% | 2958 159% |
| Seq Write (MB/s) | 994 | 1314 32% | 809 -19% | 2309 132% | 2289 130% | 2350 136% |
| 4K Read (MB/s) | 31.98 | 46.61 46% | 40.63 27% | 49.45 55% | 15.85 -50% | 56.6 77% |
| 4K Write (MB/s) | 61 | 90.2 48% | 138.6 127% | 117.1 92% | 39.88 -35% | 106.1 74% |
| 4K-64 Read (MB/s) | 790 | 665 -16% | 857 8% | 1237 57% | 1267 60% | 1836 132% |
| 4K-64 Write (MB/s) | 845 | 813 -4% | 1041 23% | 1986 135% | 1749 107% | 1789 112% |
| Access Time Read * (ms) | 0.063 | 0.058 8% | 0.067 -6% | 0.076 -21% | 0.122 -94% | 0.061 3% |
| Access Time Write * (ms) | 0.679 | 0.167 75% | 0.026 96% | 0.032 95% | 0.095 86% | 0.036 95% |
| Score Read (Points) | 966 | 913 -5% | 1013 5% | 1463 51% | 1536 59% | 2189 127% |
| Score Write (Points) | 1005 | 1034 3% | 1260 25% | 2334 132% | 2018 101% | 2130 112% |
| Score Total (Points) | 2448 | 2392 -2% | 2783 14% | 4581 87% | 4317 76% | 5411 121% |
| Copy ISO MB/s (MB/s) | 1732 | 1715 -1% | 1350 -22% | 1995 15% | ||
| Copy Program MB/s (MB/s) | 717 | 622 -13% | 766 7% | 584 -19% | ||
| Copy Game MB/s (MB/s) | 1343 | 1506 12% | 1190 -11% | 1135 -15% | ||
| CrystalDiskMark 5.2 / 6 | 48% | 11% | 53% | 22% | 53% | |
| Write 4K (MB/s) | 64.1 | 119 86% | 124.2 94% | 123.4 93% | 55.5 -13% | 147.6 130% |
| Read 4K (MB/s) | 39.93 | 51.9 30% | 46.11 15% | 45.59 14% | 16.21 -59% | 47.57 19% |
| Write Seq (MB/s) | 1191 | 2258 90% | 2320 95% | 1959 64% | 2222 87% | |
| Read Seq (MB/s) | 1418 | 2283 61% | 2013 42% | 1763 24% | 2543 79% | |
| Write 4K Q32T1 (MB/s) | 450.3 | 491 9% | 447 -1% | 489.3 9% | 398.5 -12% | 459.2 2% |
| Read 4K Q32T1 (MB/s) | 365 | 540 48% | 350.1 -4% | 559 53% | 648 78% | 515 41% |
| Write Seq Q32T1 (MB/s) | 1563 | 2253 44% | 1463 -6% | 2979 91% | 2727 74% | 2167 39% |
| Read Seq Q32T1 (MB/s) | 2683 | 3172 18% | 1751 -35% | 3432 28% | 3242 21% | 3430 28% |
| Write 4K Q8T8 (MB/s) | 445.5 | |||||
| Read 4K Q8T8 (MB/s) | 926 | |||||
| Média Total (Programa/Configurações) | 34% /
29% | 16% /
17% | 66% /
68% | 31% /
33% | 79% /
83% |
* ... menor é melhor

Disk Throttling: DiskSpd Read Loop, Queue Depth 8
| 3DMark | |
| 1920x1080 Fire Strike Graphics | |
| MSI Creator 17 A10SGS | |
| MSI RTX 2060 Gaming Z 6G | |
| Alienware 17 R5 | |
| Eluktronics RP-15 | |
| Asus TUF A17 FA706IU-AS76 | |
| Média NVIDIA GeForce RTX 2060 Max-Q (14129 - 15650, n=4) | |
| Dell XPS 17 9700 Core i7 RTX 2060 Max-Q | |
| Dell XPS 15 9500 Core i7 4K UHD | |
| Dell XPS 15 7590 9980HK GTX 1650 | |
| 2560x1440 Time Spy Graphics | |
| MSI RTX 2060 Gaming Z 6G | |
| MSI Creator 17 A10SGS | |
| Eluktronics RP-15 | |
| Asus TUF A17 FA706IU-AS76 | |
| Alienware 17 R5 | |
| Média NVIDIA GeForce RTX 2060 Max-Q (5357 - 5914, n=4) | |
| Dell XPS 17 9700 Core i7 RTX 2060 Max-Q | |
| Dell XPS 15 9500 Core i7 4K UHD | |
| Dell XPS 15 7590 9980HK GTX 1650 | |
| 2560x1440 Time Spy Score | |
| MSI RTX 2060 Gaming Z 6G | |
| MSI Creator 17 A10SGS | |
| Eluktronics RP-15 | |
| Asus TUF A17 FA706IU-AS76 | |
| Média NVIDIA GeForce RTX 2060 Max-Q (5390 - 6171, n=4) | |
| Alienware 17 R5 | |
| Dell XPS 17 9700 Core i7 RTX 2060 Max-Q | |
| Dell XPS 15 9500 Core i7 4K UHD | |
| Dell XPS 15 7590 9980HK GTX 1650 | |
| 3DMark 11 | |
| 1280x720 Performance GPU | |
| MSI RTX 2060 Gaming Z 6G | |
| MSI Creator 17 A10SGS | |
| Alienware 17 R5 | |
| Eluktronics RP-15 | |
| Asus TUF A17 FA706IU-AS76 | |
| Média NVIDIA GeForce RTX 2060 Max-Q (18863 - 21105, n=4) | |
| Dell XPS 17 9700 Core i7 RTX 2060 Max-Q | |
| Dell XPS 15 9500 Core i7 4K UHD | |
| Dell XPS 15 7590 9980HK GTX 1650 | |
| 1280x720 Performance Combined | |
| MSI Creator 17 A10SGS | |
| Dell XPS 17 9700 Core i7 RTX 2060 Max-Q | |
| Eluktronics RP-15 | |
| MSI RTX 2060 Gaming Z 6G | |
| Média NVIDIA GeForce RTX 2060 Max-Q (12071 - 15054, n=4) | |
| Asus TUF A17 FA706IU-AS76 | |
| Dell XPS 15 9500 Core i7 4K UHD | |
| Alienware 17 R5 | |
| Dell XPS 15 7590 9980HK GTX 1650 | |
| 3DMark 11 Performance | 18021 pontos | |
| 3DMark Cloud Gate Standard Score | 31845 pontos | |
| 3DMark Fire Strike Score | 13173 pontos | |
| 3DMark Time Spy Score | 5637 pontos | |
Ajuda | ||
| The Witcher 3 - 1920x1080 Ultra Graphics & Postprocessing (HBAO+) | |
| Gigabyte Aero 17 HDR XB | |
| MSI RTX 2060 Gaming Z 6G | |
| Dell G5 15 SE 5505 P89F | |
| Média NVIDIA GeForce RTX 2060 Max-Q (51.2 - 62.9, n=4) | |
| Dell XPS 17 9700 Core i7 RTX 2060 Max-Q | |
| Asus TUF A17 FA706IU-AS76 | |
| MSI Bravo 15 A4DCR | |
| MSI GF75 Thin 10SCXR | |
| Asus TUF FX705GM | |
| Shadow of the Tomb Raider - 1920x1080 Highest Preset AA:T | |
| Gigabyte Aero 17 HDR XB | |
| MSI RTX 2060 Gaming Z 6G | |
| Asus TUF A17 FA706IU-AS76 | |
| Média NVIDIA GeForce RTX 2060 Max-Q (65 - 74, n=2) | |
| Dell G5 15 SE 5505 P89F | |
| Dell XPS 17 9700 Core i7 RTX 2060 Max-Q | |
| Asus TUF FX705GM | |
| MSI GF75 Thin 10SCXR | |
| MSI Bravo 15 A4DCR | |
| baixo | média | alto | ultra | 4K | |
|---|---|---|---|---|---|
| The Witcher 3 (2015) | 284.8 | 182.1 | 109 | 56.1 | 24.9 |
| Dota 2 Reborn (2015) | 152 | 140 | 131 | 123 | 75.5 |
| X-Plane 11.11 (2018) | 111 | 97.8 | 79.8 | 63.7 | |
| Shadow of the Tomb Raider (2018) | 118 | 84 | 75 | 65 | 20 |
| Far Cry New Dawn (2019) | 105 | 75 | 70 | 63 | |
| Dirt Rally 2.0 (2019) | 276.7 | 125.3 | 105.3 | 60.5 | 24.4 |
| Control (2019) | 183.7 | 67.1 | 50.4 | ||
| GRID 2019 (2019) | 157.4 | 109.4 | 103.4 | 73.5 | 33.1 |
| Star Wars Jedi Fallen Order (2019) | 92.9 | 88 | 77.8 | ||
| Gears Tactics (2020) | 257.9 | 120.4 | 76.4 | 56.9 | 18.9 |
| Dell XPS 17 9700 Core i7 RTX 2060 Max-Q GeForce RTX 2060 Max-Q, i7-10875H, Micron 2200S 1TB MTFDHBA1T0TCK | Razer Blade Pro 17 RTX 2070 Max-Q 300 Hz GeForce RTX 2070 Max-Q, i7-10875H, Lite-On CA5-8D512 | MSI Creator 17 A10SGS GeForce RTX 2080 Super Max-Q, i7-10875H, Samsung SSD PM981 MZVLB2T0HMLB | HP Envy 17t-cg000 GeForce MX330, i7-1065G7, WDC PC SN520 SDAPNUW-512G | Gigabyte Aero 17 HDR XB GeForce RTX 2070 Super Max-Q, i7-10875H, Samsung SSD PM981a MZVLB512HBJQ | Asus Zephyrus S17 GX701LXS GeForce RTX 2080 Super Max-Q, i7-10875H, Samsung PM981a MZVLB1T0HBLR | |
|---|---|---|---|---|---|---|
| Noise | -4% | -11% | 2% | -16% | -8% | |
| desligado / ambiente * (dB) | 28 | 28.2 -1% | 30 -7% | 28.2 -1% | 30 -7% | 25 11% |
| Idle Minimum * (dB) | 28 | 28.2 -1% | 32 -14% | 28.2 -1% | 35 -25% | 32 -14% |
| Idle Average * (dB) | 28 | 28.2 -1% | 33 -18% | 28.2 -1% | 36 -29% | 35 -25% |
| Idle Maximum * (dB) | 28 | 30.5 -9% | 40 -43% | 29.5 -5% | 38 -36% | 43 -54% |
| Load Average * (dB) | 43.2 | 42.2 2% | 47 -9% | 43.9 -2% | 47 -9% | 44 -2% |
| Witcher 3 ultra * (dB) | 49 | 53 -8% | 46 6% | 43.9 10% | 49 -0% | 41 16% |
| Load Maximum * (dB) | 50.5 | 55.5 -10% | 48 5% | 43.9 13% | 54 -7% | 45 11% |
* ... menor é melhor
Barulho
| Ocioso |
| 28 / 28 / 28 dB |
| Carga |
| 43.2 / 50.5 dB |
 | ||
30 dB silencioso 40 dB(A) audível 50 dB(A) ruidosamente alto |
||
min: | ||
(-) A temperatura máxima no lado superior é 53 °C / 127 F, em comparação com a média de 36.8 °C / 98 F , variando de 21 a 71 °C para a classe Multimedia.
(+) A parte inferior aquece até um máximo de 39.2 °C / 103 F, em comparação com a média de 39.1 °C / 102 F
(+) Em uso inativo, a temperatura média para o lado superior é 31.4 °C / 89 F, em comparação com a média do dispositivo de 31.3 °C / ### class_avg_f### F.
(±) Jogando The Witcher 3, a temperatura média para o lado superior é 37.3 °C / 99 F, em comparação com a média do dispositivo de 31.3 °C / ## #class_avg_f### F.
(+) Os apoios para as mãos e o touchpad estão atingindo a temperatura máxima da pele (34.2 °C / 93.6 F) e, portanto, não estão quentes.
(-) A temperatura média da área do apoio para as mãos de dispositivos semelhantes foi 28.7 °C / 83.7 F (-5.5 °C / -9.9 F).
Dell XPS 17 9700 Core i7 RTX 2060 Max-Q análise de áudio
(±) | o volume do alto-falante é médio, mas bom (###valor### dB)
Graves 100 - 315Hz
(±) | graves reduzidos - em média 8.3% menor que a mediana
(±) | a linearidade dos graves é média (8.6% delta para a frequência anterior)
Médios 400 - 2.000 Hz
(+) | médios equilibrados - apenas 2.2% longe da mediana
(+) | médios são lineares (3.8% delta para frequência anterior)
Altos 2 - 16 kHz
(+) | agudos equilibrados - apenas 2.1% longe da mediana
(+) | os máximos são lineares (5.3% delta da frequência anterior)
Geral 100 - 16.000 Hz
(+) | o som geral é linear (10.9% diferença em relação à mediana)
Comparado com a mesma classe
» 16% de todos os dispositivos testados nesta classe foram melhores, 3% semelhantes, 81% piores
» O melhor teve um delta de 5%, a média foi 17%, o pior foi 45%
Comparado com todos os dispositivos testados
» 6% de todos os dispositivos testados foram melhores, 2% semelhantes, 92% piores
» O melhor teve um delta de 4%, a média foi 23%, o pior foi 134%
Apple MacBook 12 (Early 2016) 1.1 GHz análise de áudio
(+) | os alto-falantes podem tocar relativamente alto (###valor### dB)
Graves 100 - 315Hz
(±) | graves reduzidos - em média 11.3% menor que a mediana
(±) | a linearidade dos graves é média (14.2% delta para a frequência anterior)
Médios 400 - 2.000 Hz
(+) | médios equilibrados - apenas 2.4% longe da mediana
(+) | médios são lineares (5.5% delta para frequência anterior)
Altos 2 - 16 kHz
(+) | agudos equilibrados - apenas 2% longe da mediana
(+) | os máximos são lineares (4.5% delta da frequência anterior)
Geral 100 - 16.000 Hz
(+) | o som geral é linear (10.2% diferença em relação à mediana)
Comparado com a mesma classe
» 7% de todos os dispositivos testados nesta classe foram melhores, 2% semelhantes, 90% piores
» O melhor teve um delta de 5%, a média foi 18%, o pior foi 53%
Comparado com todos os dispositivos testados
» 5% de todos os dispositivos testados foram melhores, 1% semelhantes, 94% piores
» O melhor teve um delta de 4%, a média foi 23%, o pior foi 134%
| desligado | |
| Ocioso | |
| Carga |
|
Key:
min: | |
| Dell XPS 17 9700 Core i7 RTX 2060 Max-Q i7-10875H, GeForce RTX 2060 Max-Q, Micron 2200S 1TB MTFDHBA1T0TCK, IPS, 3840x2400, 17" | Acer Aspire Nitro 5 AN517-51-7887 i7-9750H, GeForce GTX 1660 Ti Mobile, WDC PC SN520 SDAPNUW-512G, IPS, 1920x1080, 17.3" | MSI Creator 17 A10SGS i7-10875H, GeForce RTX 2080 Super Max-Q, Samsung SSD PM981 MZVLB2T0HMLB, Mini-LED IPS-Level, 3840x2160, 17.3" | HP Envy 17t-cg000 i7-1065G7, GeForce MX330, WDC PC SN520 SDAPNUW-512G, IPS, 3840x2160, 17.3" | Gigabyte Aero 17 HDR XB i7-10875H, GeForce RTX 2070 Super Max-Q, Samsung SSD PM981a MZVLB512HBJQ, IPS, 3840x2160, 17.3" | Apple MacBook Pro 16 2019 i9 5500M i9-9880H, Radeon Pro 5500M, Apple SSD AP1024 7171, IPS, 3072x1920, 16" | |
|---|---|---|---|---|---|---|
| Power Consumption | 11% | -78% | 24% | -69% | 18% | |
| Idle Minimum * (Watt) | 5.8 | 3.9 33% | 15 -159% | 6.1 -5% | 16 -176% | 3.7 36% |
| Idle Average * (Watt) | 20.6 | 8.9 57% | 20 3% | 13 37% | 19 8% | 12.1 41% |
| Idle Maximum * (Watt) | 21 | 12.2 42% | 42 -100% | 13.5 36% | 30 -43% | 17 19% |
| Load Average * (Watt) | 104.7 | 83 21% | 150 -43% | 72.7 31% | 109 -4% | 91.5 13% |
| Witcher 3 ultra * (Watt) | 99.2 | 130 -31% | 170 -71% | 62.2 37% | 167 -68% | 103 -4% |
| Load Maximum * (Watt) | 107.6 | 168 -56% | 210 -95% | 97.1 10% | 246 -129% | 102.3 5% |
* ... menor é melhor
| Dell XPS 17 9700 Core i7 RTX 2060 Max-Q i7-10875H, GeForce RTX 2060 Max-Q, 97 Wh | Razer Blade Pro 17 RTX 2070 Max-Q 300 Hz i7-10875H, GeForce RTX 2070 Max-Q, 70 Wh | MSI Creator 17 A10SGS i7-10875H, GeForce RTX 2080 Super Max-Q, 82 Wh | HP Envy 17t-cg000 i7-1065G7, GeForce MX330, 55 Wh | Gigabyte Aero 17 HDR XB i7-10875H, GeForce RTX 2070 Super Max-Q, 94 Wh | Apple MacBook Pro 16 2019 i9 5500M i9-9880H, Radeon Pro 5500M, 99.8 Wh | |
|---|---|---|---|---|---|---|
| Duração da bateria | -49% | -57% | -39% | -26% | -13% | |
| Reader / Idle (h) | 23.8 | 7.2 -70% | 15.4 -35% | 9.9 -58% | ||
| WiFi v1.3 (h) | 9.7 | 4.9 -49% | 4.4 -55% | 4.6 -53% | 6.2 -36% | 12 24% |
| Load (h) | 2 | 1.1 -45% | 1.4 -30% | 2.3 15% | 1 -50% | |
| Witcher 3 ultra (h) | 0.9 |
Pro
Contra
Veredicto — Sem igual
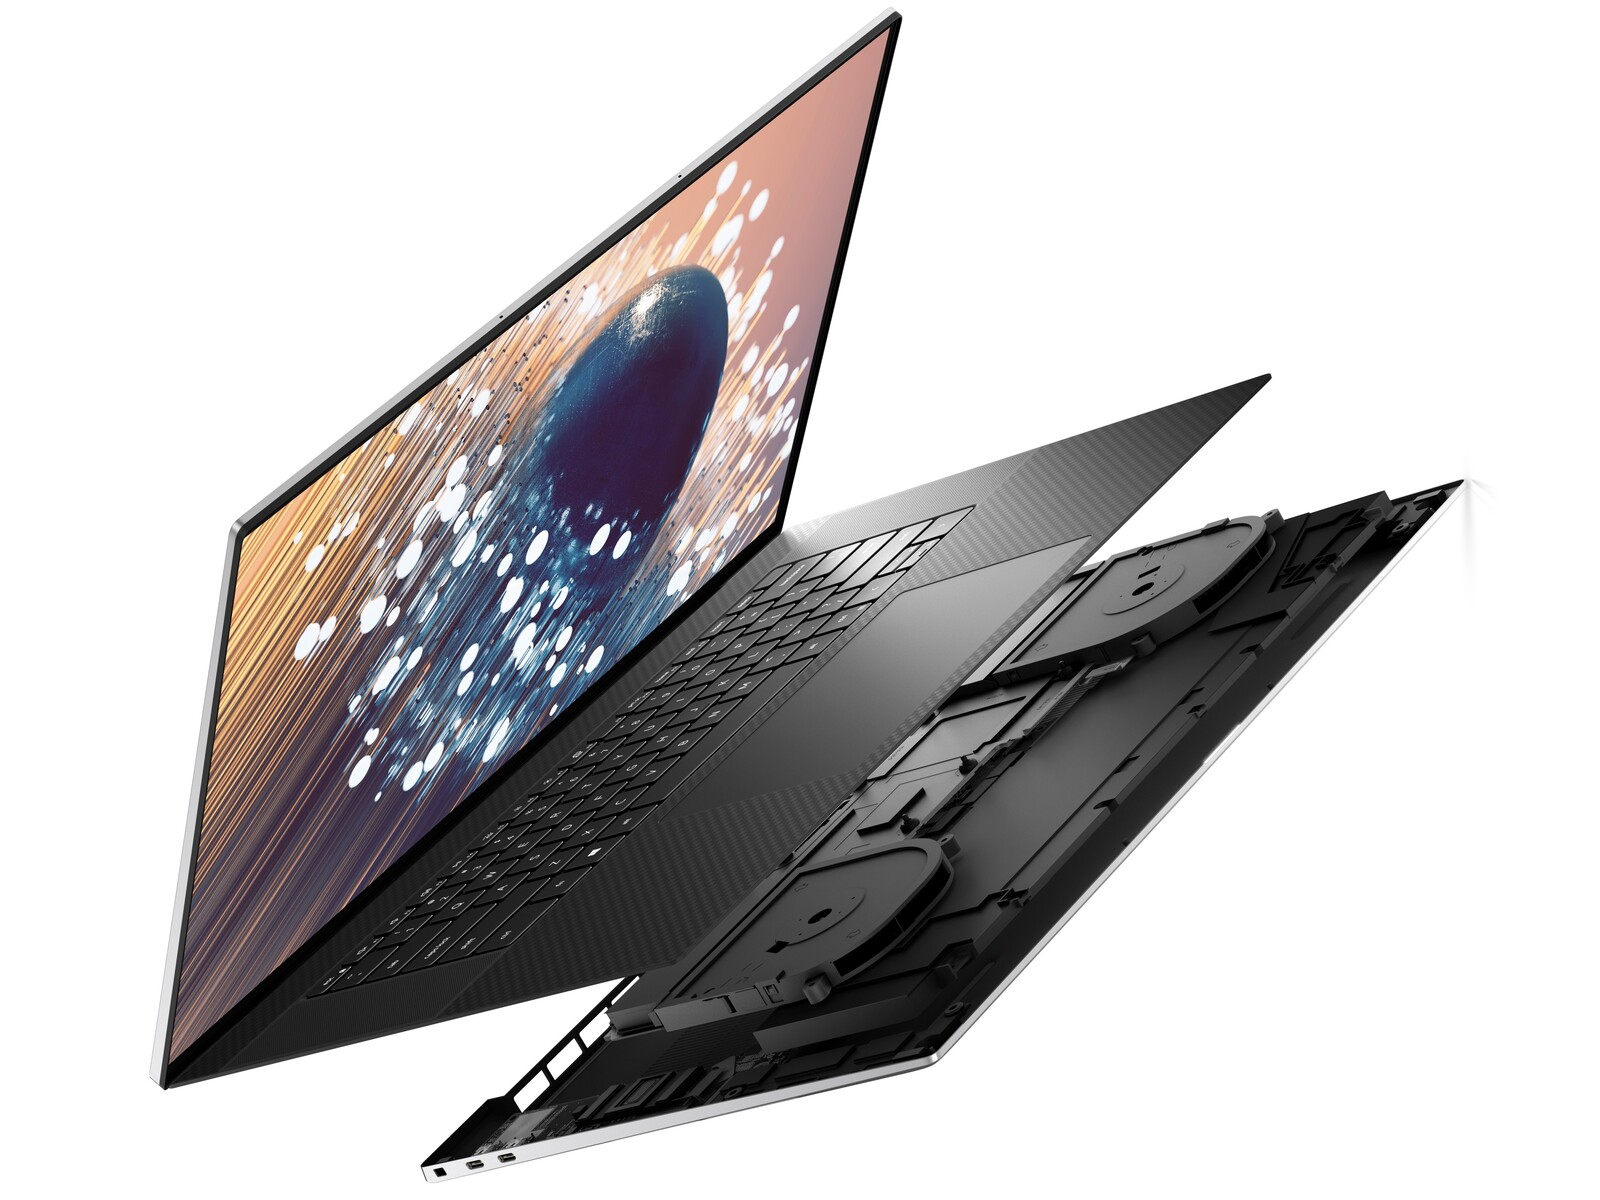
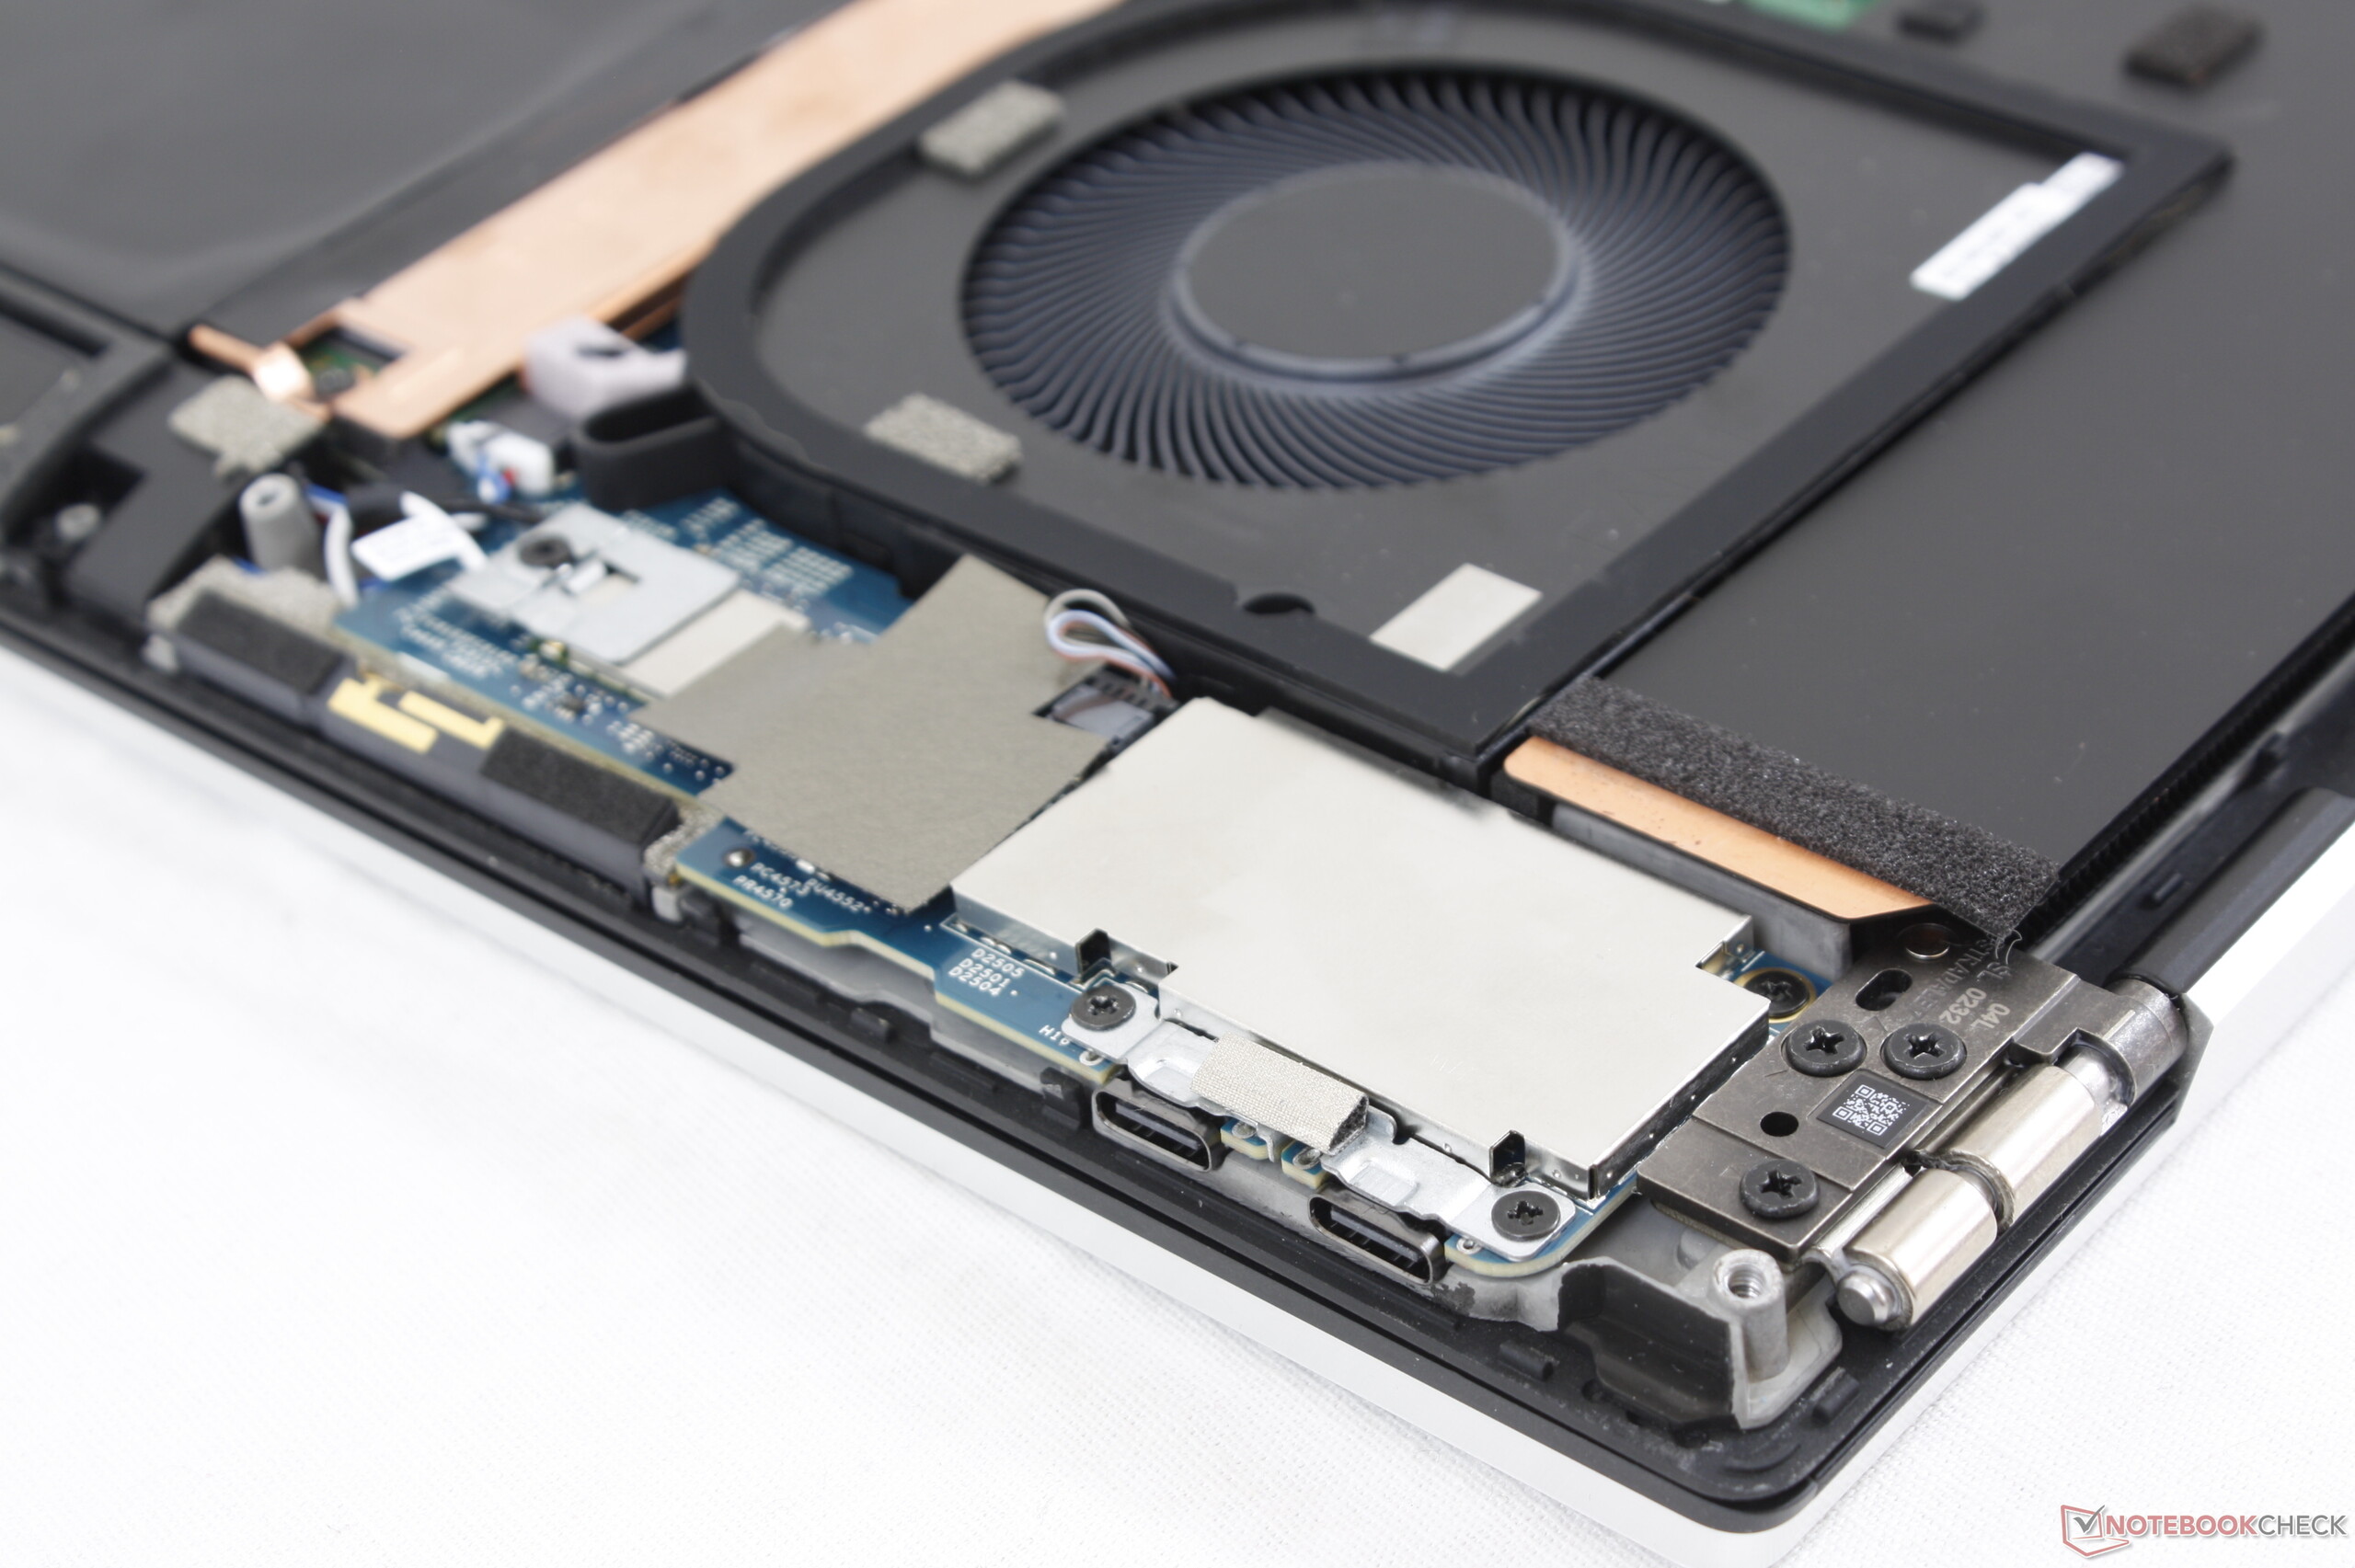
Elogiamos o XPS 17 por ampliar ainda mais os limites do que a maioria dos outros fabricantes oferece. Ninguém mais possui um portátil ultra-fino de 17,0 polegadas com 16:10 e uma CPU Core i7 de 8 núcleos (que em breve será Core i9) rodando a 99 °C em carga máxima, juntamente com uma GPU GeForce RTX 2060 Max-Q equipada com adaptador USB-C. Ele até consegue integrar um resfriador de câmara de vapor - um recurso encontrado principalmente em portáteis de jogos selecionados. Os riscos e o hardware envolvidos são bastante insanos em relação às alternativas que geralmente são mais seguras.
Do nosso tempo com o sistema, achamos que poderia se beneficiar dando um passo atrás e concentrando-se em alguns dos princípios básicos novamente. Fortalecer as dobradiças, tornar as teclas do clickpad mais firmes, integrar um obturador de webcam e melhorar a taxa de carregamento - todos os aspectos que muitos portáteis que custam metade do preço já acertaram em cheio.
Os usuários que pretendem usar o XPS 17 com cargas pesadas de trabalho por longos períodos devem estar cientes de algumas desvantagens. Em primeiro lugar, a bateria pode não recarregar, pois o adaptador USB-C é limitado a 130 W. Há uma razão pela qual a maioria dos outros portáteis equipados com GeForce RTX não funciona com adaptadores USB-C e isso ocorre porque os carregadores proprietários são capazes de fornecer muita mais energia para o exigente sistema. Em segundo lugar, o desempenho sustentado nos jogos pode não ser constante, pois registramos quedas recorrentes na taxa de quadros. Quando combinados com os fantasmas visíveis, os usuários não devem encarar isso como uma máquina de jogos, apesar dos ótimos recursos sem fio e gráficos GeForce RTX.
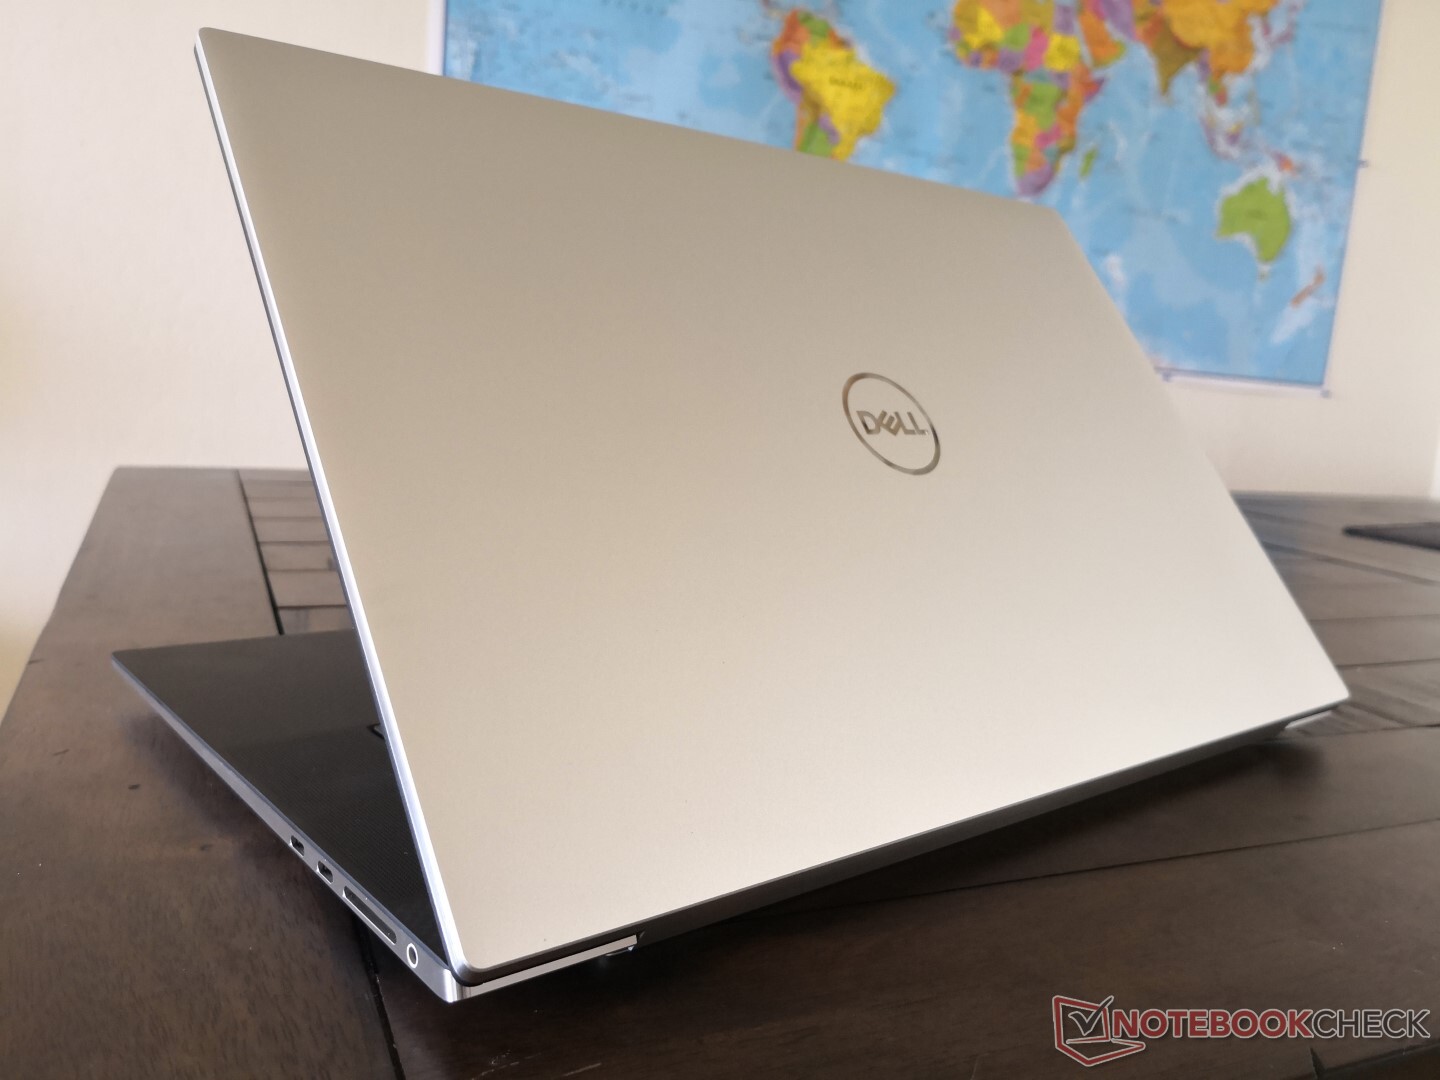
O XPS 17 é o melhor para operações "explosivas", como navegação ou edição de vídeo, nas quais o sistema não está em alta utilização por horas a fio. A tela, o design e o desempenho por volume são o que torna o sistema mais atraente do que a maioria das outras soluções de 15,6 e 17,3 polegadas.
Um potente portátil sem igual de 17 polegadas, sem concorrente direto. O hardware impressionante e o design atraente chamarão a atenção, mas alguns aspectos básicos precisam de mais atenção.
Dell XPS 17 9700 Core i7 RTX 2060 Max-Q
- 07/15/2020 v7 (old)
Allen Ngo
Price comparison
