Dell XPS 17 9710 11ª Gen Intel Laptop Review: Pequenas mudanças que importam
Faz exatamente um ano desde que revisamos o original XPS 17 9700 com Intel da 10ª geração e GeForce RTX 2060 Max-Q gráficos. Agora, a Dell está pronta para enviar sua segunda geração da série XPS 17 9710 atualizada com gráficos Intel da 11ª geração e GeForce RTX 3060. Nossa unidade de teste hoje é uma configuração de médio alcance superior com a CPU Core i7-11800H, GPU RTX 3060 e tela sensível ao toque 2400p por pouco menos de $2900 USD. Outras SKUs incluem o Core i9-11900H ou RTX 3050 com tela de 1200p para preços iniciais mais altos e mais baixos, respectivamente.
O 2021 XPS 17 é fisicamente idêntico à versão 2020 e, portanto, recomendamos verificar nosso duas revisões existentes no modelo do ano passado para saber mais sobre o chassi e suas características. No entanto, há uma mão-cheia de atualizações que fazem com que o XPS 17 9710 valha a pena considerar mais do que o 9700.
As alternativas ao XPS 17 incluem laptops de alto desempenho de 17,3 polegadas, como o Gigabyte Aero 17, LG Ultra 17ou o Razer Blade Pro 17 até certo ponto. Entretanto, o XPS 17 permanece único com sua relação de aspecto de 17,0 polegadas 16:10 4K.
Mais análises da Dell:
potential competitors in comparison
Avaliação | Data | Modelo | Peso | Altura | Size | Resolução | Preço |
|---|---|---|---|---|---|---|---|
| 87.9 % v7 (old) | 07/2021 | Dell XPS 17 9710 Core i7 RTX 3060 i7-11800H, GeForce RTX 3060 Laptop GPU | 2.5 kg | 19.5 mm | 17.00" | 3840x2400 | |
| 87.9 % v7 (old) | 07/2020 | Dell XPS 17 9700 Core i7 RTX 2060 Max-Q i7-10875H, GeForce RTX 2060 Max-Q | 2.5 kg | 19.5 mm | 17.00" | 3840x2400 | |
| 87.8 % v7 (old) | 02/2021 | Razer Blade Pro 17 2021 (QHD Touch) i7-10875H, GeForce RTX 3080 Laptop GPU | 3 kg | 19.9 mm | 17.30" | 3840x2160 | |
| 87.6 % v7 (old) | 01/2021 | Gigabyte Aero 17 HDR YC i9-10980HK, GeForce RTX 3080 Laptop GPU | 2.8 kg | 21.4 mm | 17.30" | 3840x2160 | |
| 82.8 % v7 (old) | 10/2020 | LG Ultra 17U70N i5-10210U, GeForce GTX 1650 Mobile | 2 kg | 20.4 mm | 17.00" | 2560x1600 | |
| 84.3 % v7 (old) | Eluktronics RP-17 R7 4800H, GeForce RTX 2060 Mobile | 2.6 kg | 30 mm | 17.30" | 1920x1080 |
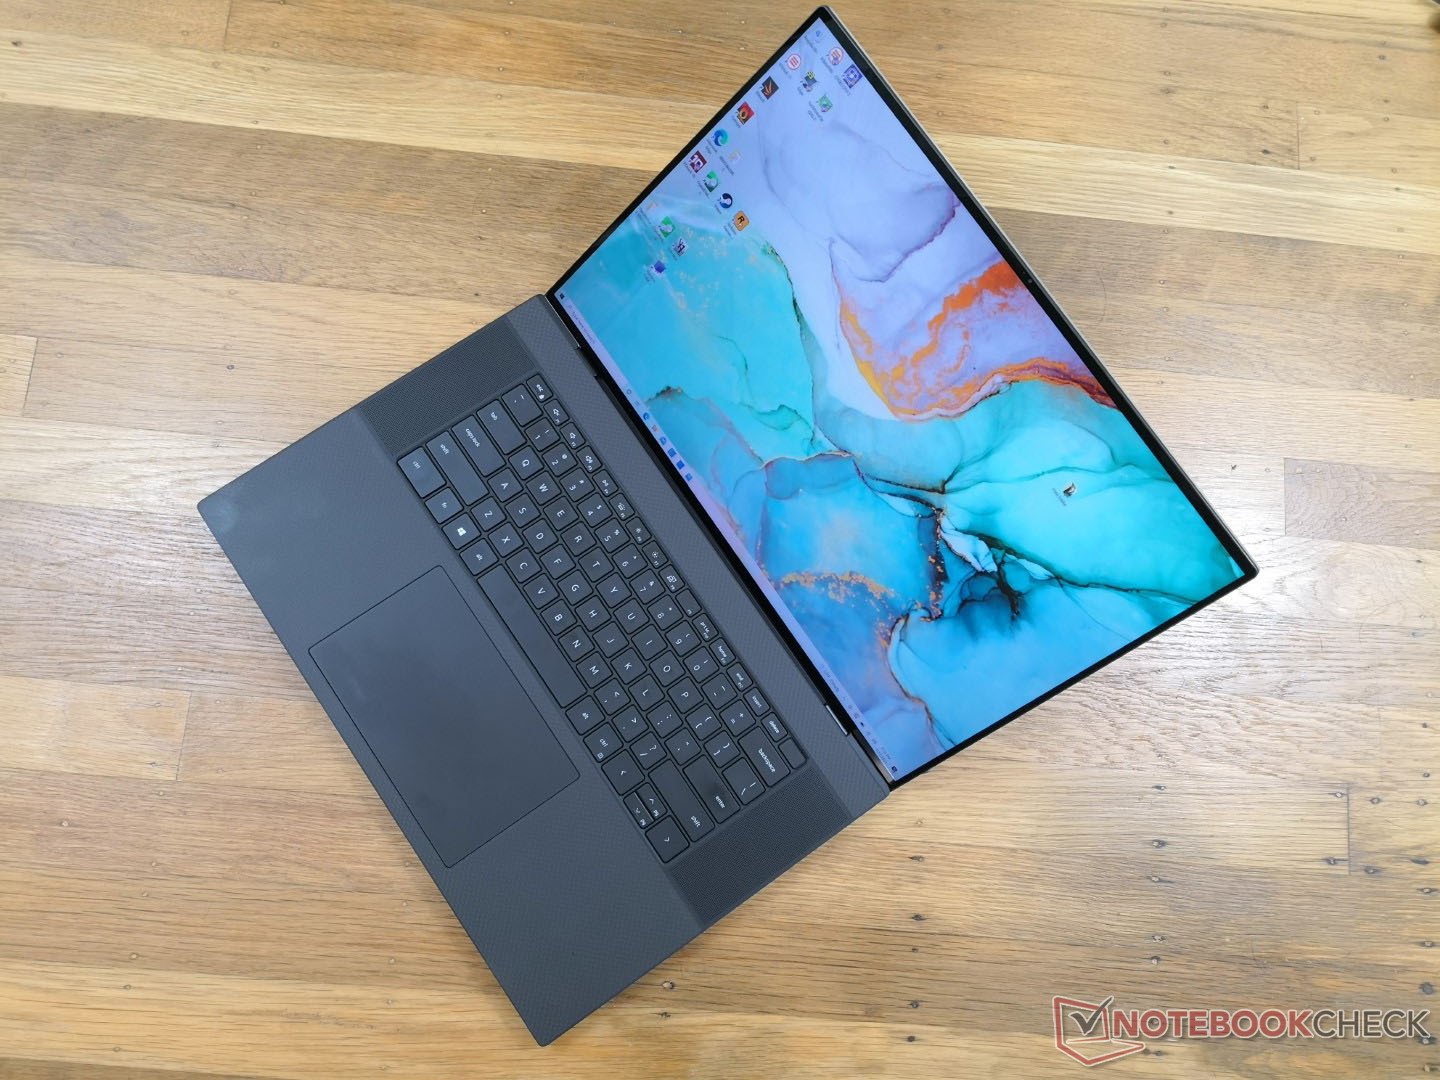
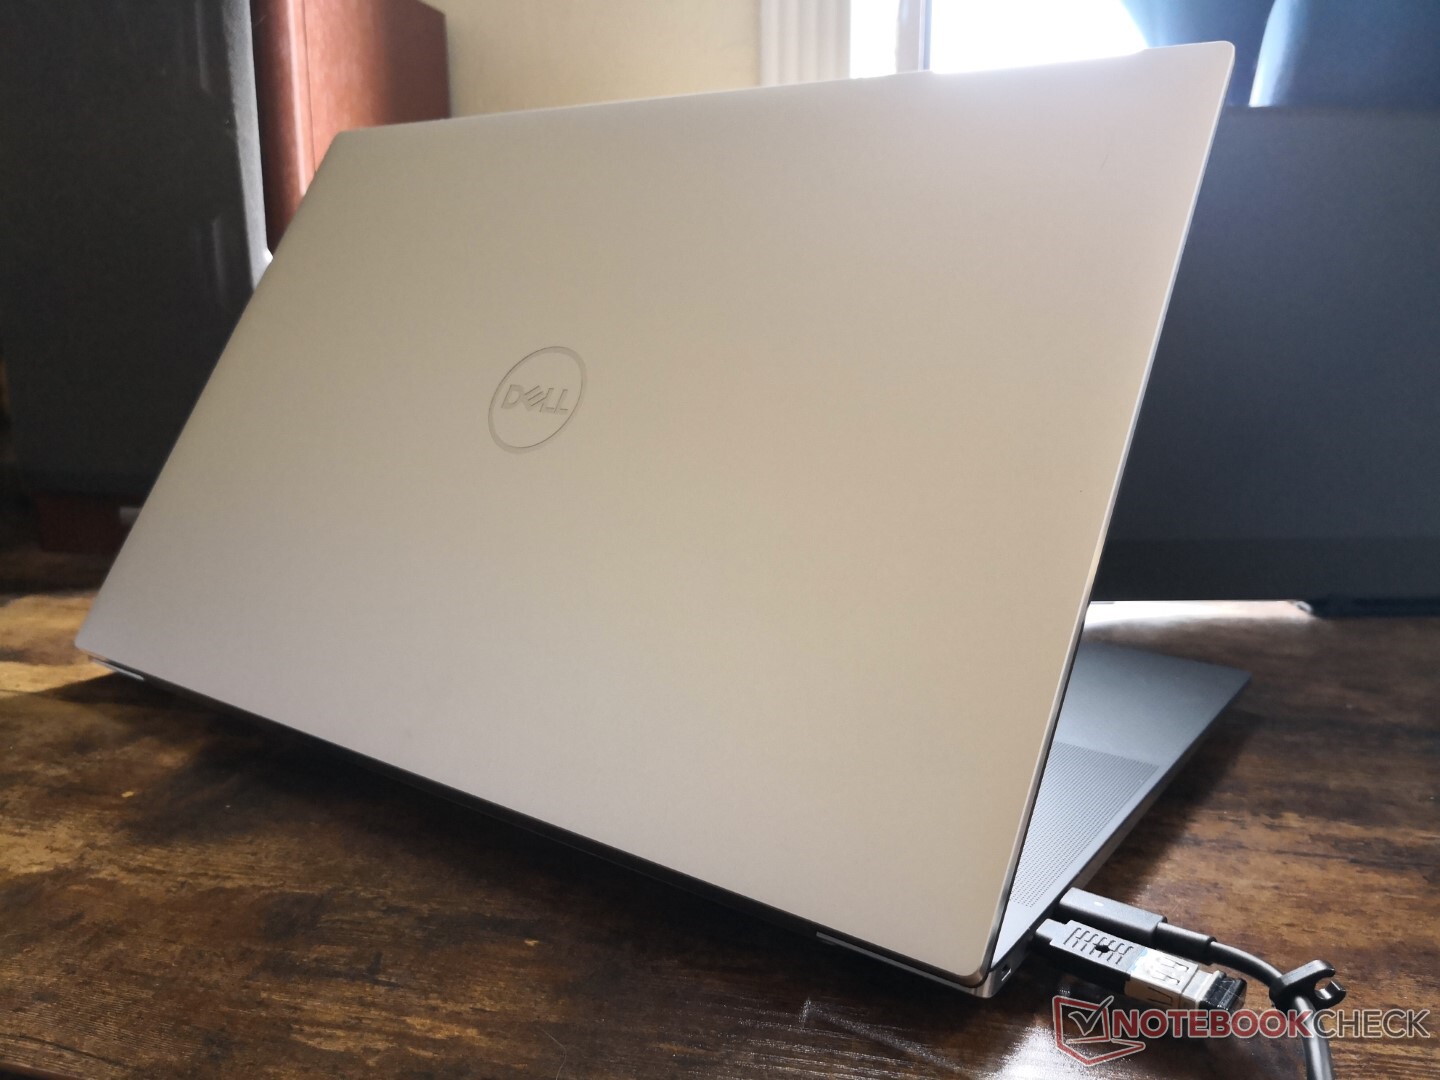
Estojo - Razão tela/corpo incrivelmente alta
O chassi tem apenas um ano de idade e, portanto, a Dell não fez nenhuma alteração no design exterior do XPS 17 9710. Mesmo assim, teria sido ótimo ver pelo menos uma opção de cor adicional como o XPS 13 de fibra de vidro ou até mesmo um obturador de webcam que continua faltando de forma notória.
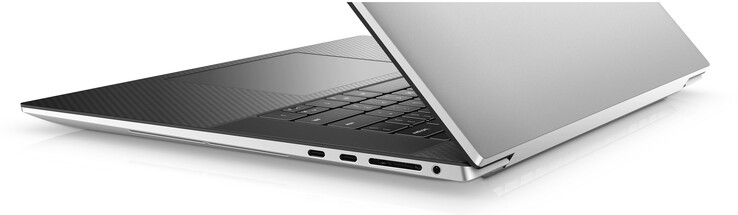
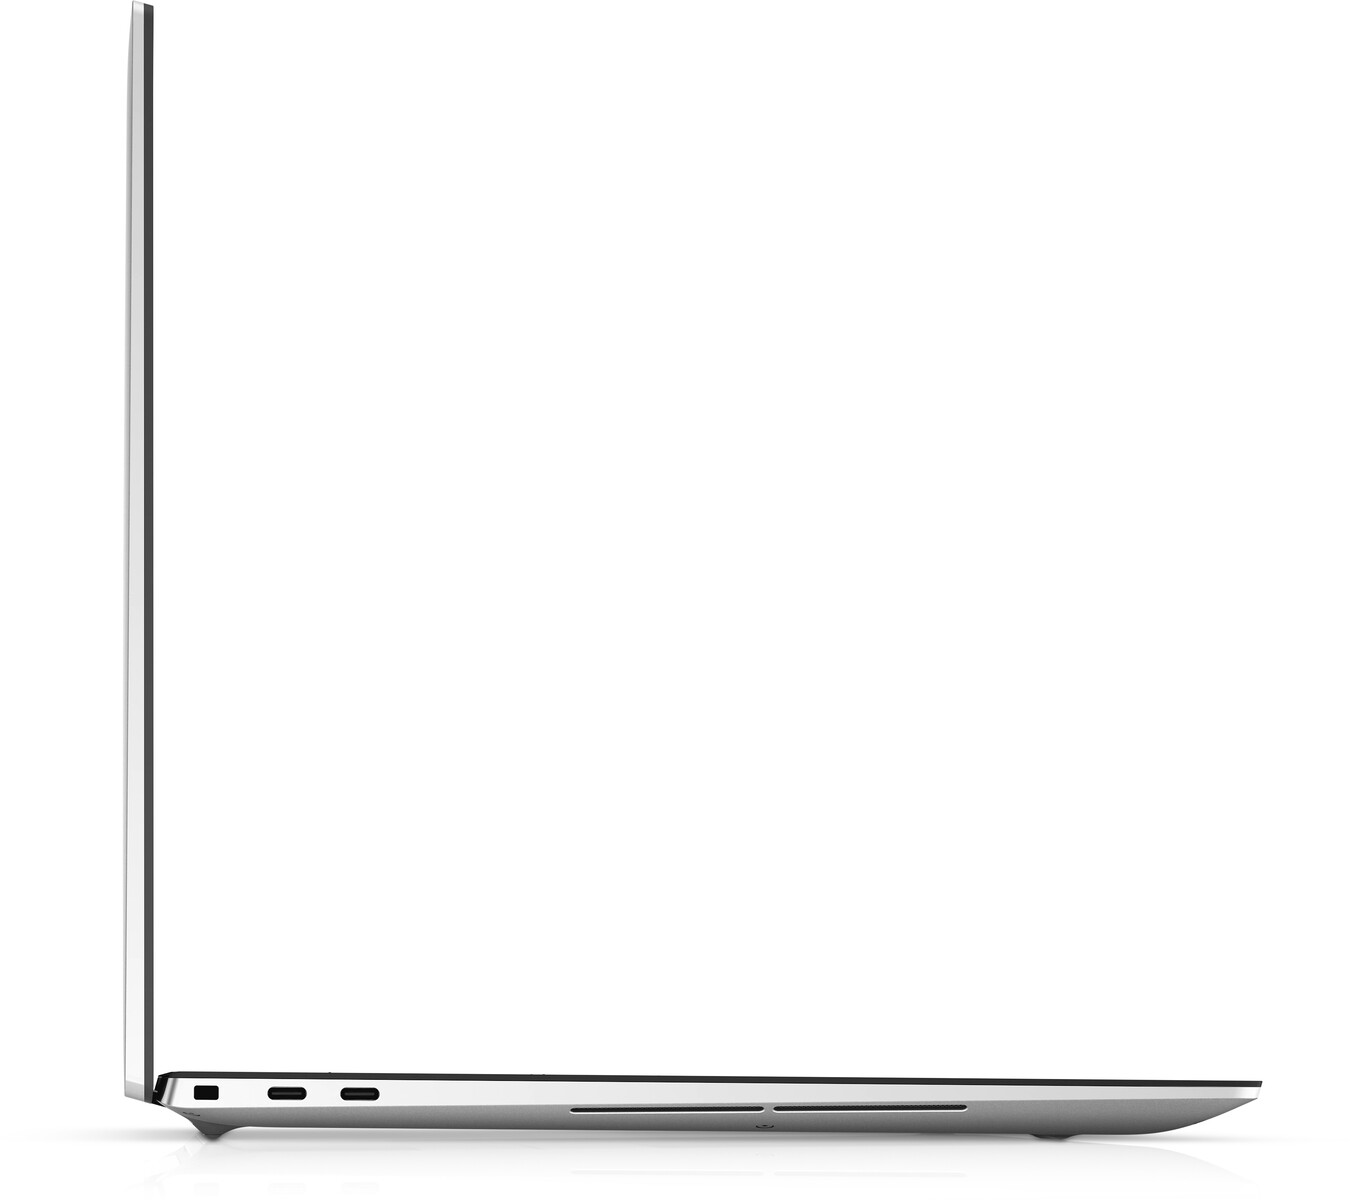
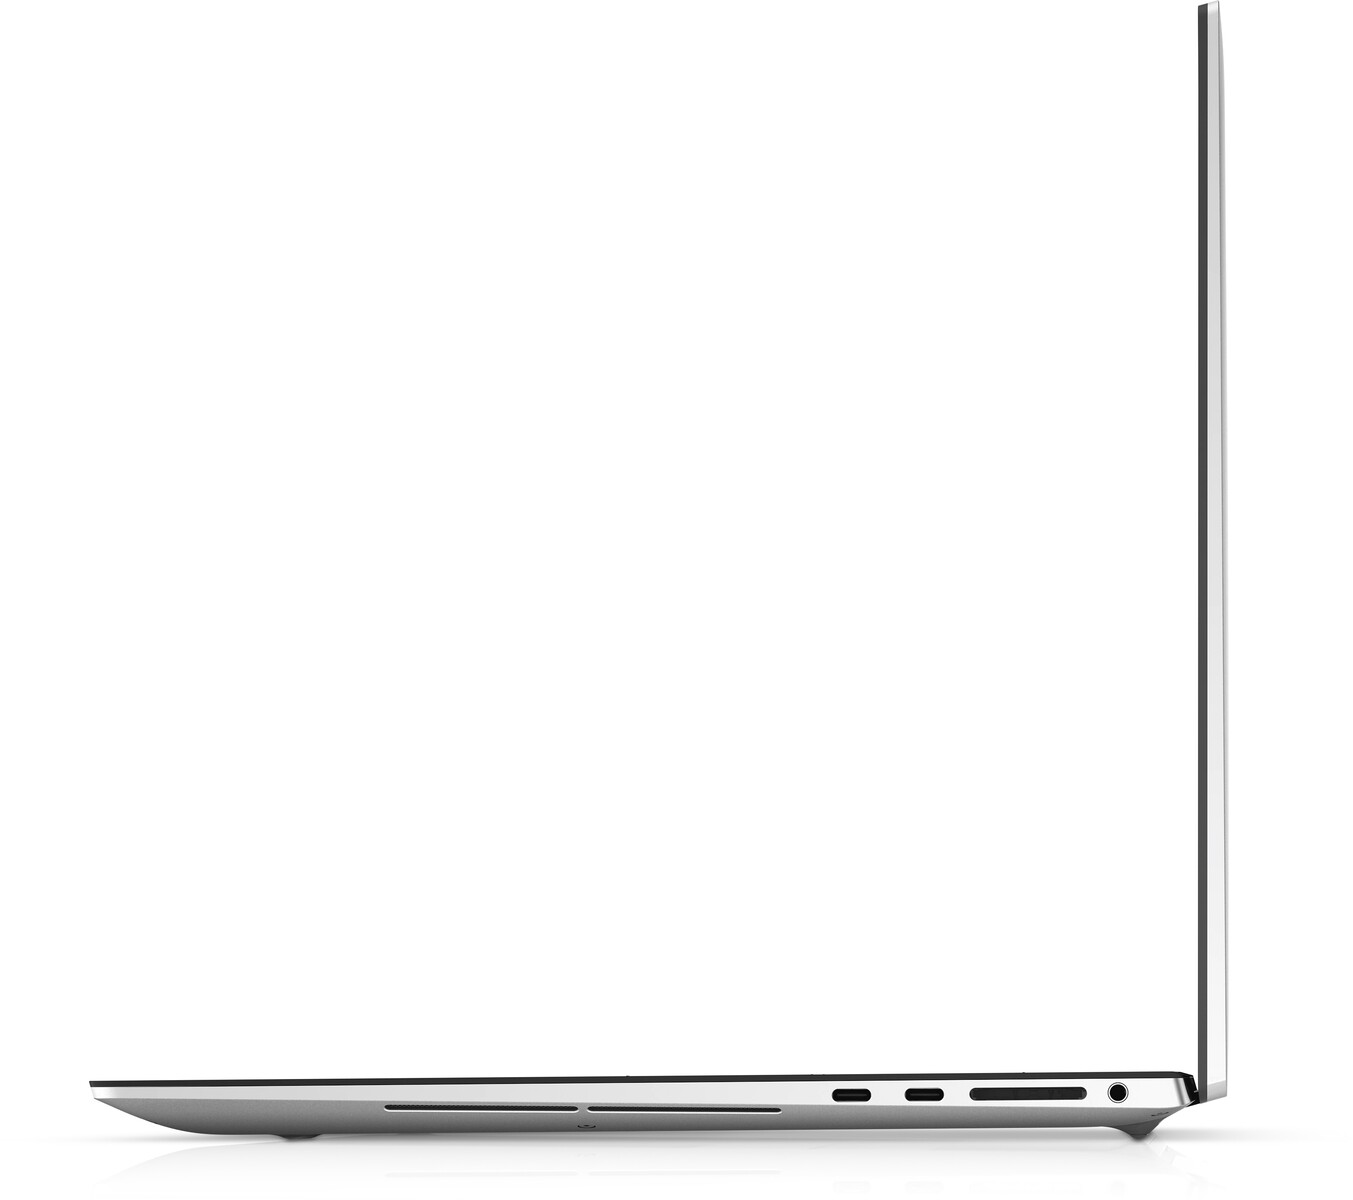
Conectividade - Demasiados trovões 4 portas?
Como se as quatro portas Thunderbolt 3 no XPS 17 9700 não fossem suficientes, todas elas foram atualizadas para Thunderbolt 4 neste último modelo. É improvável que a maioria dos acessórios fora do eGPUs se beneficiem da atualização, já que o Thunderbolt 3 e o Thunderbolt 4 compartilham o mesmo teto de 40 Gbps.
Leitor de cartões SD - Não está morto
O leitor de cartões SD está aqui para ficar e estamos felizes de vê-lo apoiado em modelos de consumo como o XPS 17. A movimentação de 1 GB de fotos de nosso cartão de teste UHS-II leva apenas 5 a 6 segundos.
| SD Card Reader | |
| average JPG Copy Test (av. of 3 runs) | |
| Razer Blade Pro 17 2021 (QHD Touch) (Toshiba Exceria Pro SDXC 64 GB UHS-II) | |
| Dell XPS 17 9700 Core i7 RTX 2060 Max-Q (Toshiba Exceria Pro SDXC 64 GB UHS-II) | |
| Gigabyte Aero 17 HDR YC (Toshiba Exceria Pro SDXC 64 GB UHS-II) | |
| Dell XPS 17 9710 Core i7 RTX 3060 (AV PRO microSD 128 GB V60) | |
| LG Ultra 17U70N (Toshiba Exceria Pro M501 microSDXC 64GB) | |
| Eluktronics RP-17 (Toshiba Exceria Pro SDXC 64 GB UHS-II) | |
| maximum AS SSD Seq Read Test (1GB) | |
| Gigabyte Aero 17 HDR YC (Toshiba Exceria Pro SDXC 64 GB UHS-II) | |
| Dell XPS 17 9700 Core i7 RTX 2060 Max-Q (Toshiba Exceria Pro SDXC 64 GB UHS-II) | |
| Razer Blade Pro 17 2021 (QHD Touch) (Toshiba Exceria Pro SDXC 64 GB UHS-II) | |
| Dell XPS 17 9710 Core i7 RTX 3060 (AV PRO microSD 128 GB V60) | |
| LG Ultra 17U70N (Toshiba Exceria Pro M501 microSDXC 64GB) | |
| Eluktronics RP-17 (Toshiba Exceria Pro SDXC 64 GB UHS-II) | |
Comunicação
O Intel-Killer 1650s vem como padrão para conectividade Wi-Fi 6 e Bluetooth 5.2. A principal diferença entre este e o mais comum Intel AX200/201 é seu suporte para a Software Killer Networking que oferece características adicionais que os entusiastas podem apreciar.
| Networking | |
| iperf3 transmit AX12 | |
| Razer Blade Pro 17 2021 (QHD Touch) | |
| Dell XPS 17 9710 Core i7 RTX 3060 | |
| Eluktronics RP-17 | |
| Gigabyte Aero 17 HDR YC | |
| LG Ultra 17U70N | |
| Dell XPS 17 9700 Core i7 RTX 2060 Max-Q | |
| iperf3 receive AX12 | |
| Dell XPS 17 9710 Core i7 RTX 3060 | |
| Razer Blade Pro 17 2021 (QHD Touch) | |
| Eluktronics RP-17 | |
| Gigabyte Aero 17 HDR YC | |
| LG Ultra 17U70N | |
| Dell XPS 17 9700 Core i7 RTX 2060 Max-Q | |
Webcam
A webcam de 720p permanece a mesma. Teria sido ótimo ver um upgrade de 1080p muito parecido com o último Razer Blade 15.


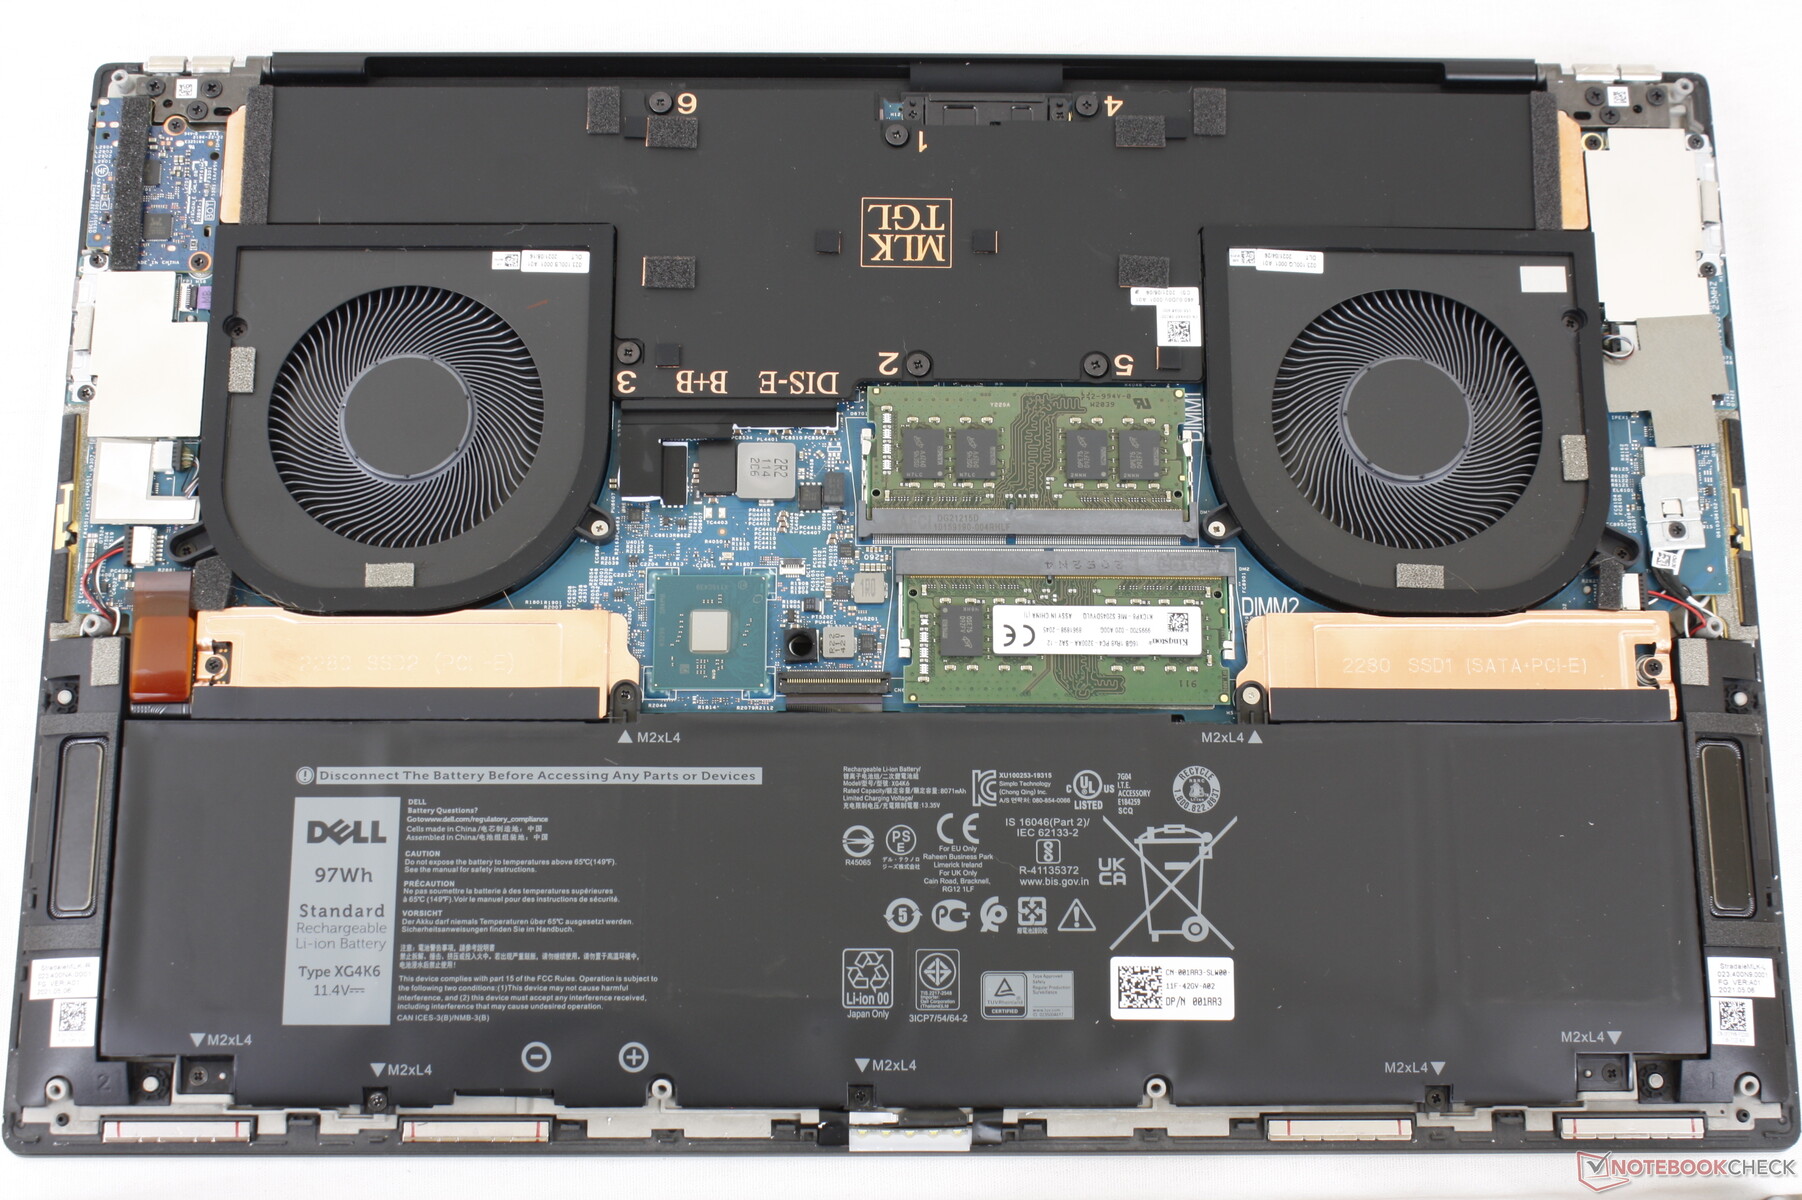
Manutenção
O painel inferior é mais difícil de remover do que no XPS 15, pois suas bordas e cantos são mais apertados e afiados.
Acessórios e Garantia
A Dell inclui um prático adaptador USB-C para HDMI e USB-A para compensar o fato de que o chassi não integra nenhuma dessas portas. A garantia padrão limitada de um ano aplica-se com muitas opções de extensão se encomendada diretamente da Dell.
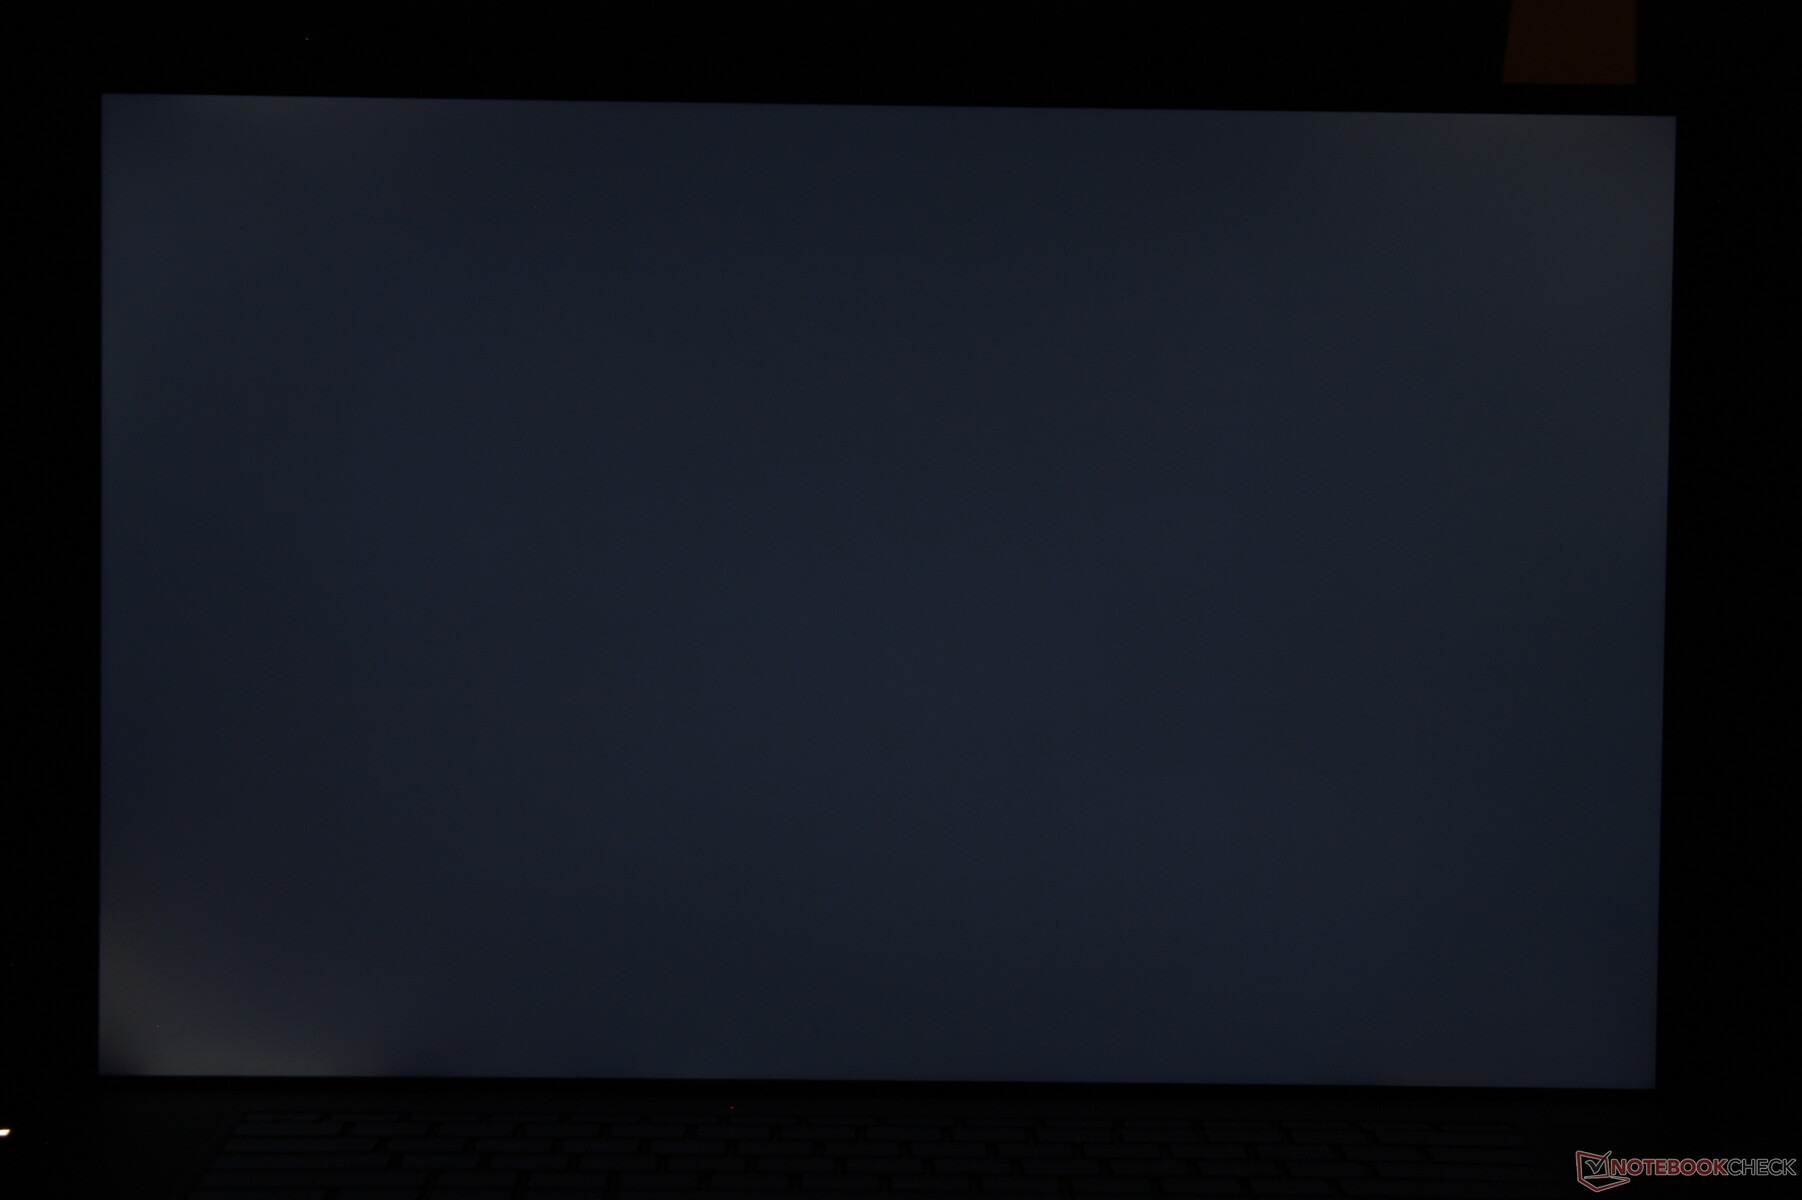
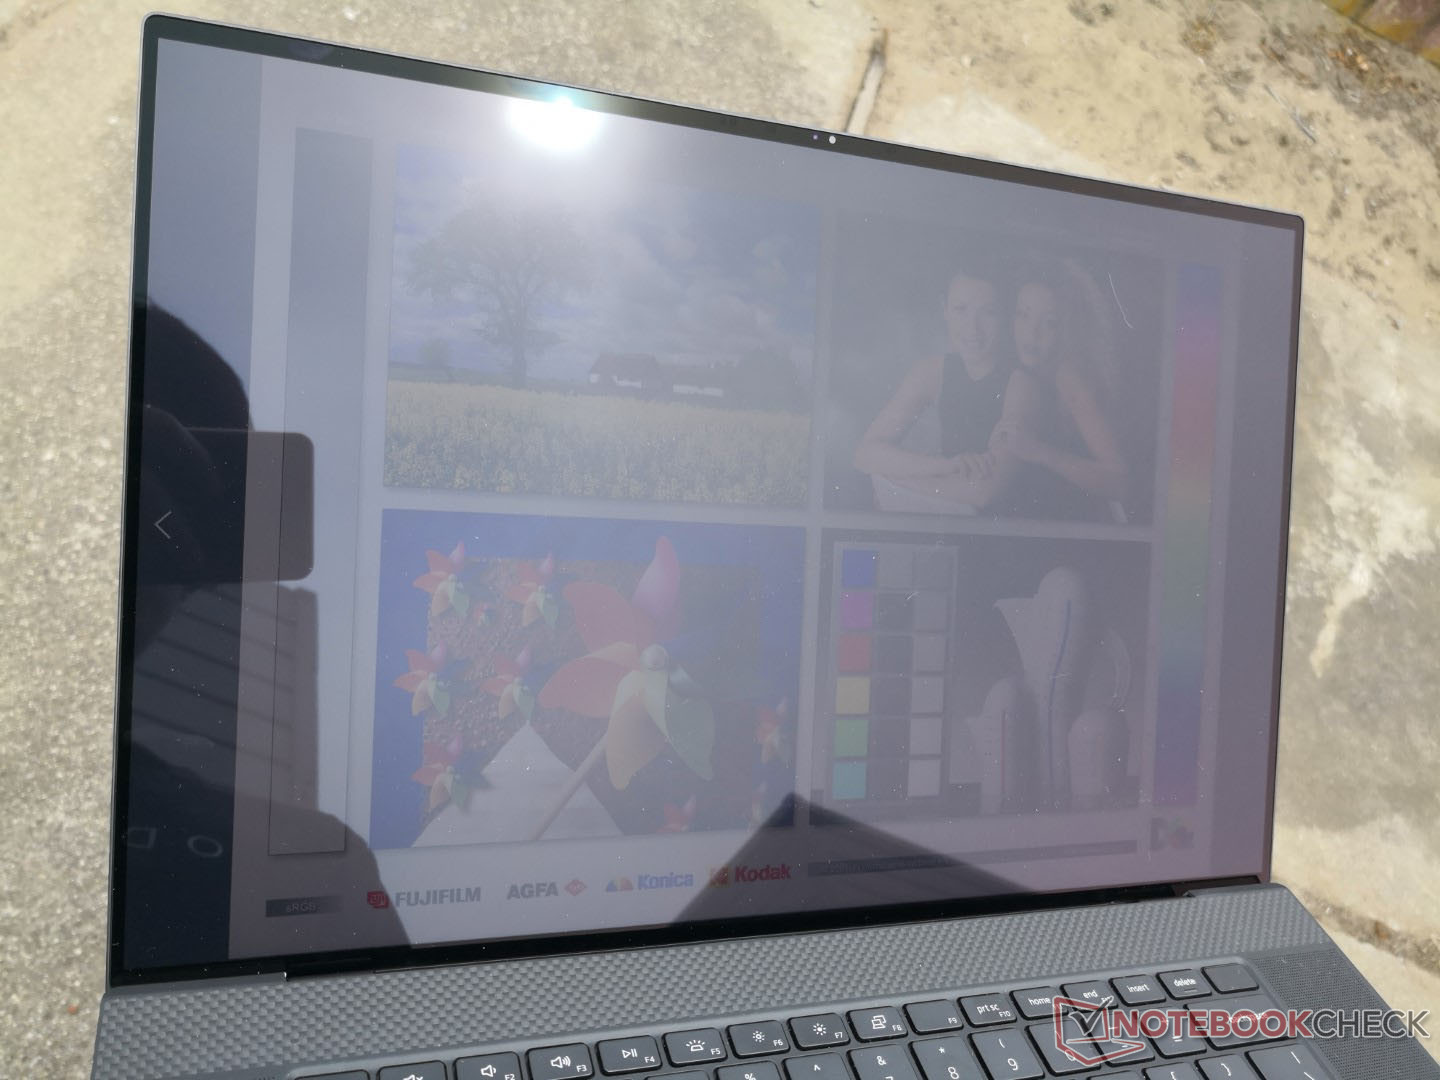
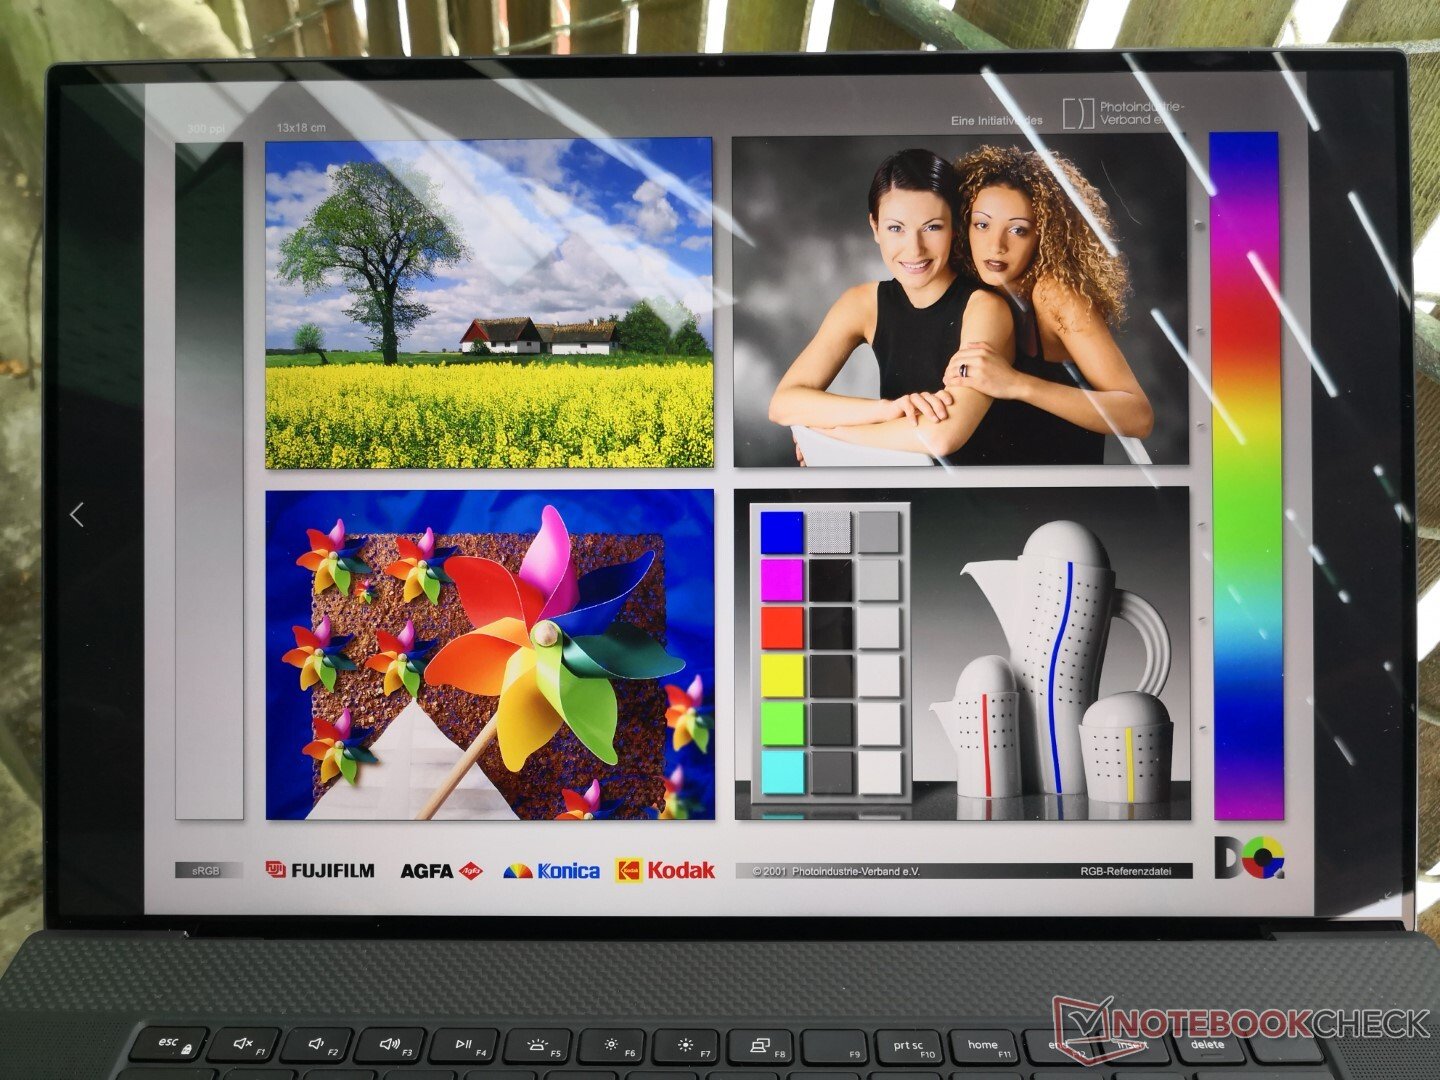
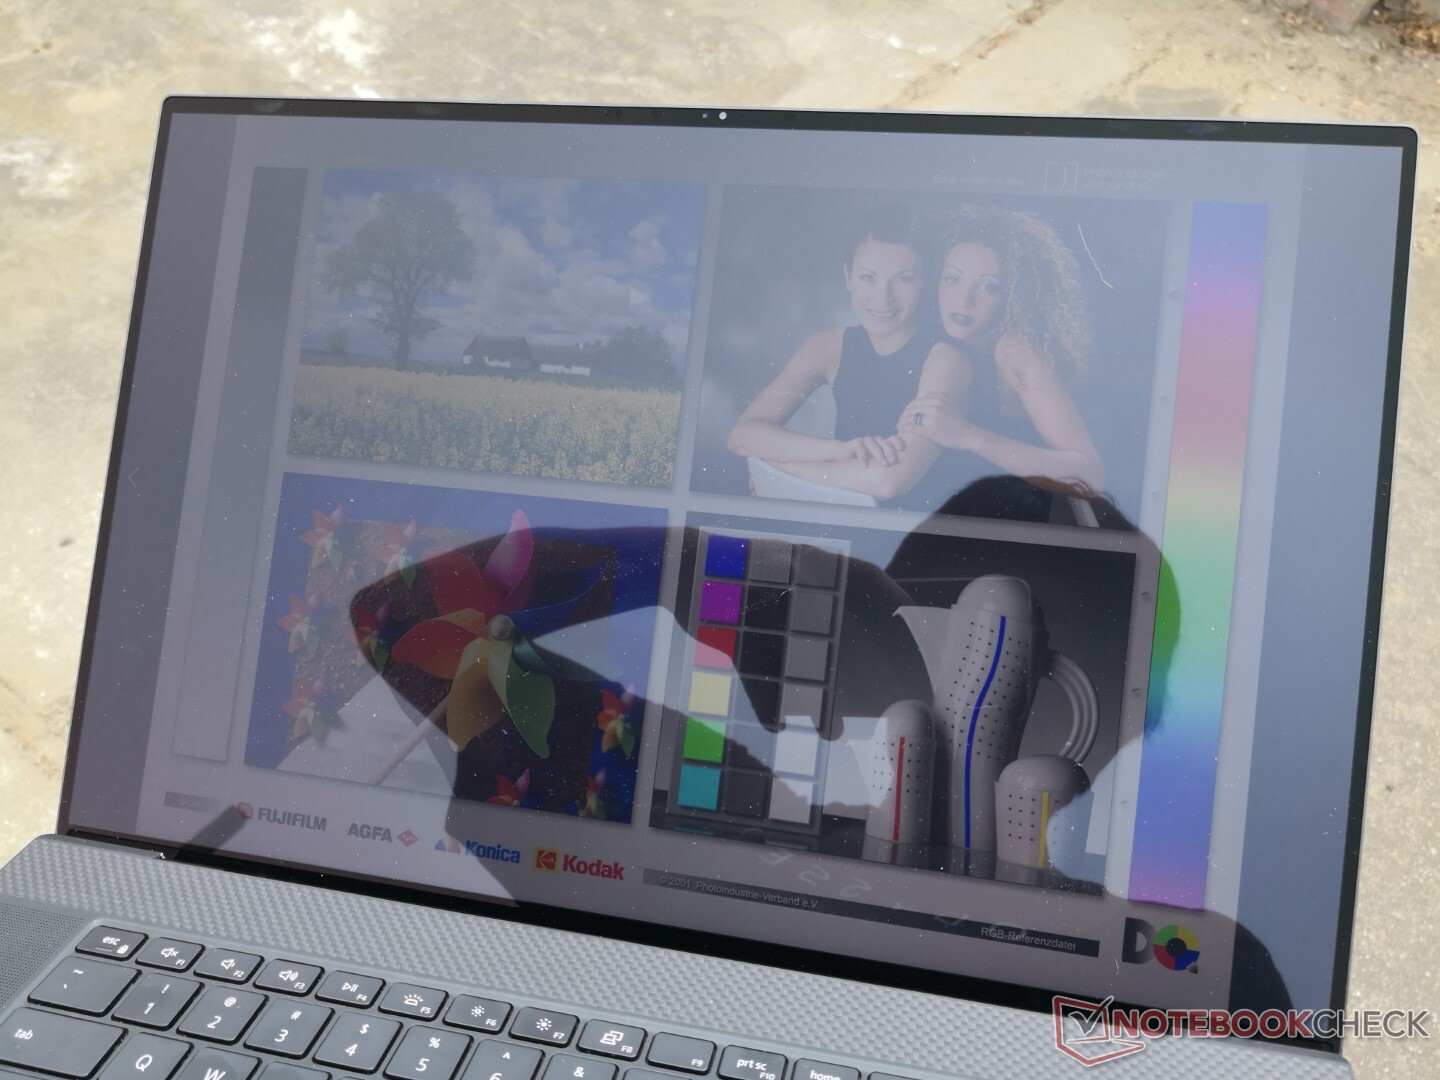
Tela - A primeira tela sensível ao toque de 17,0 polegadas 16:10 4K
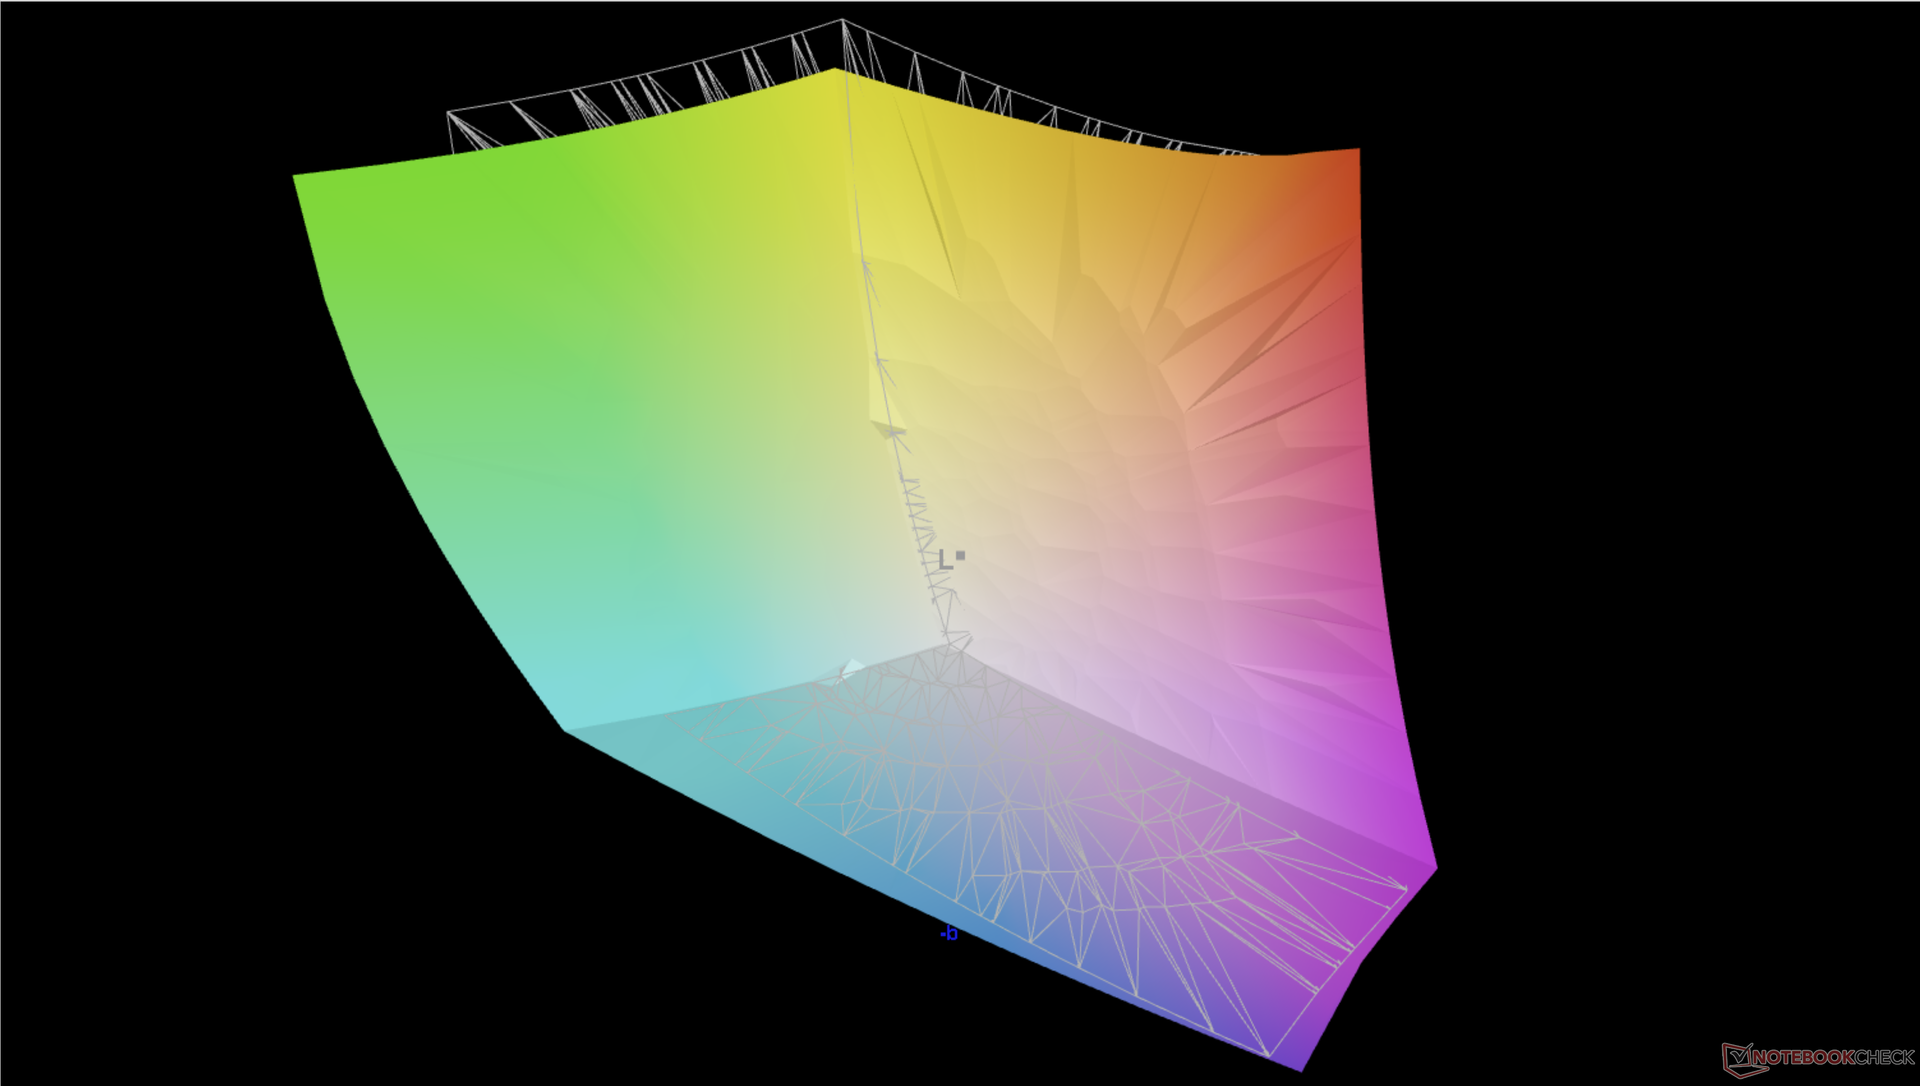
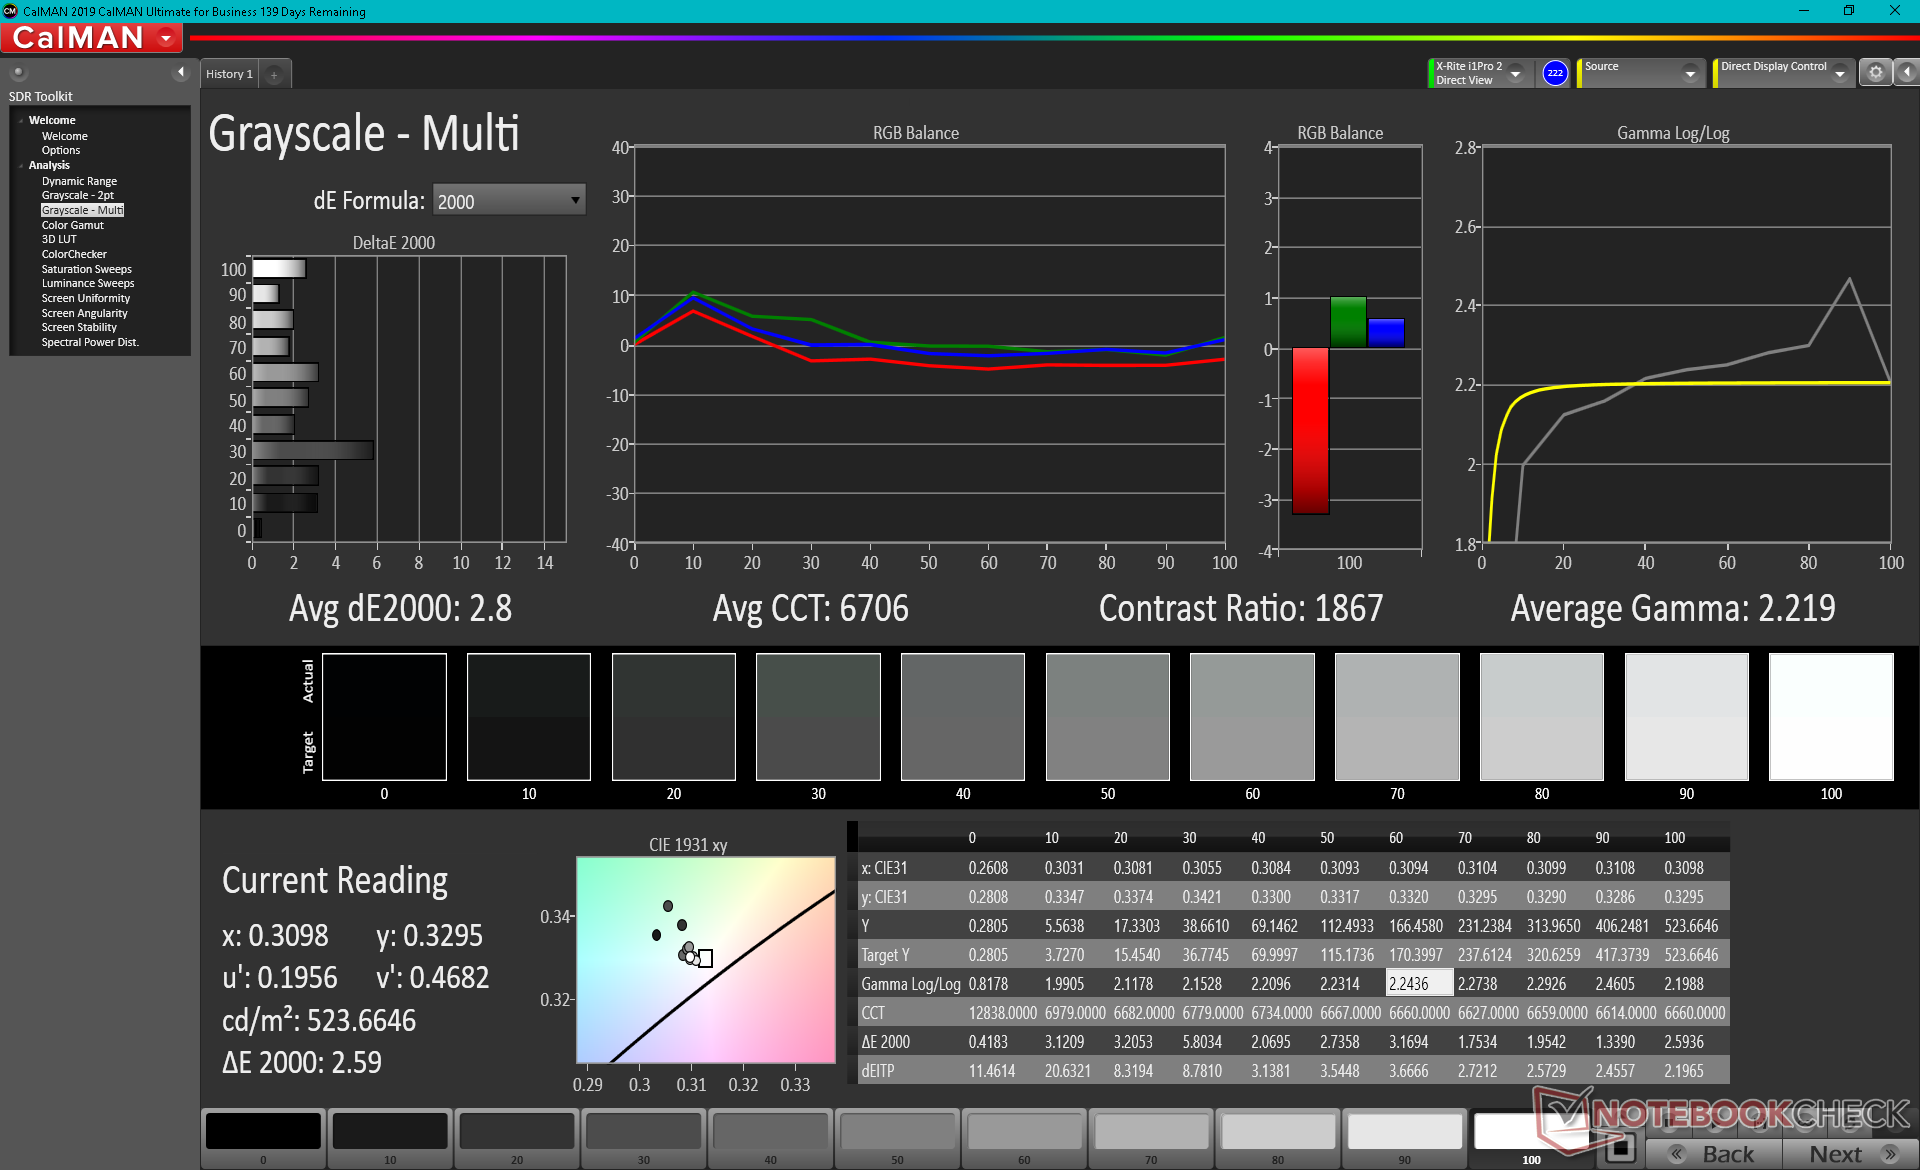
Embora os processadores tenham mudado, o visor não mudou. O 2021 XPS 17 usa o mesmo LQ170R1 3840 x 2400 Sharp touchscreen que foi encontrado na versão 2020 para a mesma experiência visual. Não vemos isto como um problema uma vez que o XPS 17 continua a ter uma das mais altas relações tela/corpo e telas da mais alta qualidade em termos de cobertura de cores (95% DCI-P3), contraste (~1500:1) e brilho (~500 lêndeas) para sua categoria 16:10.

| |||||||||||||||||||||||||
iluminação: 85 %
iluminação com acumulador: 536.5 cd/m²
Contraste: 1450:1 (Preto: 0.37 cd/m²)
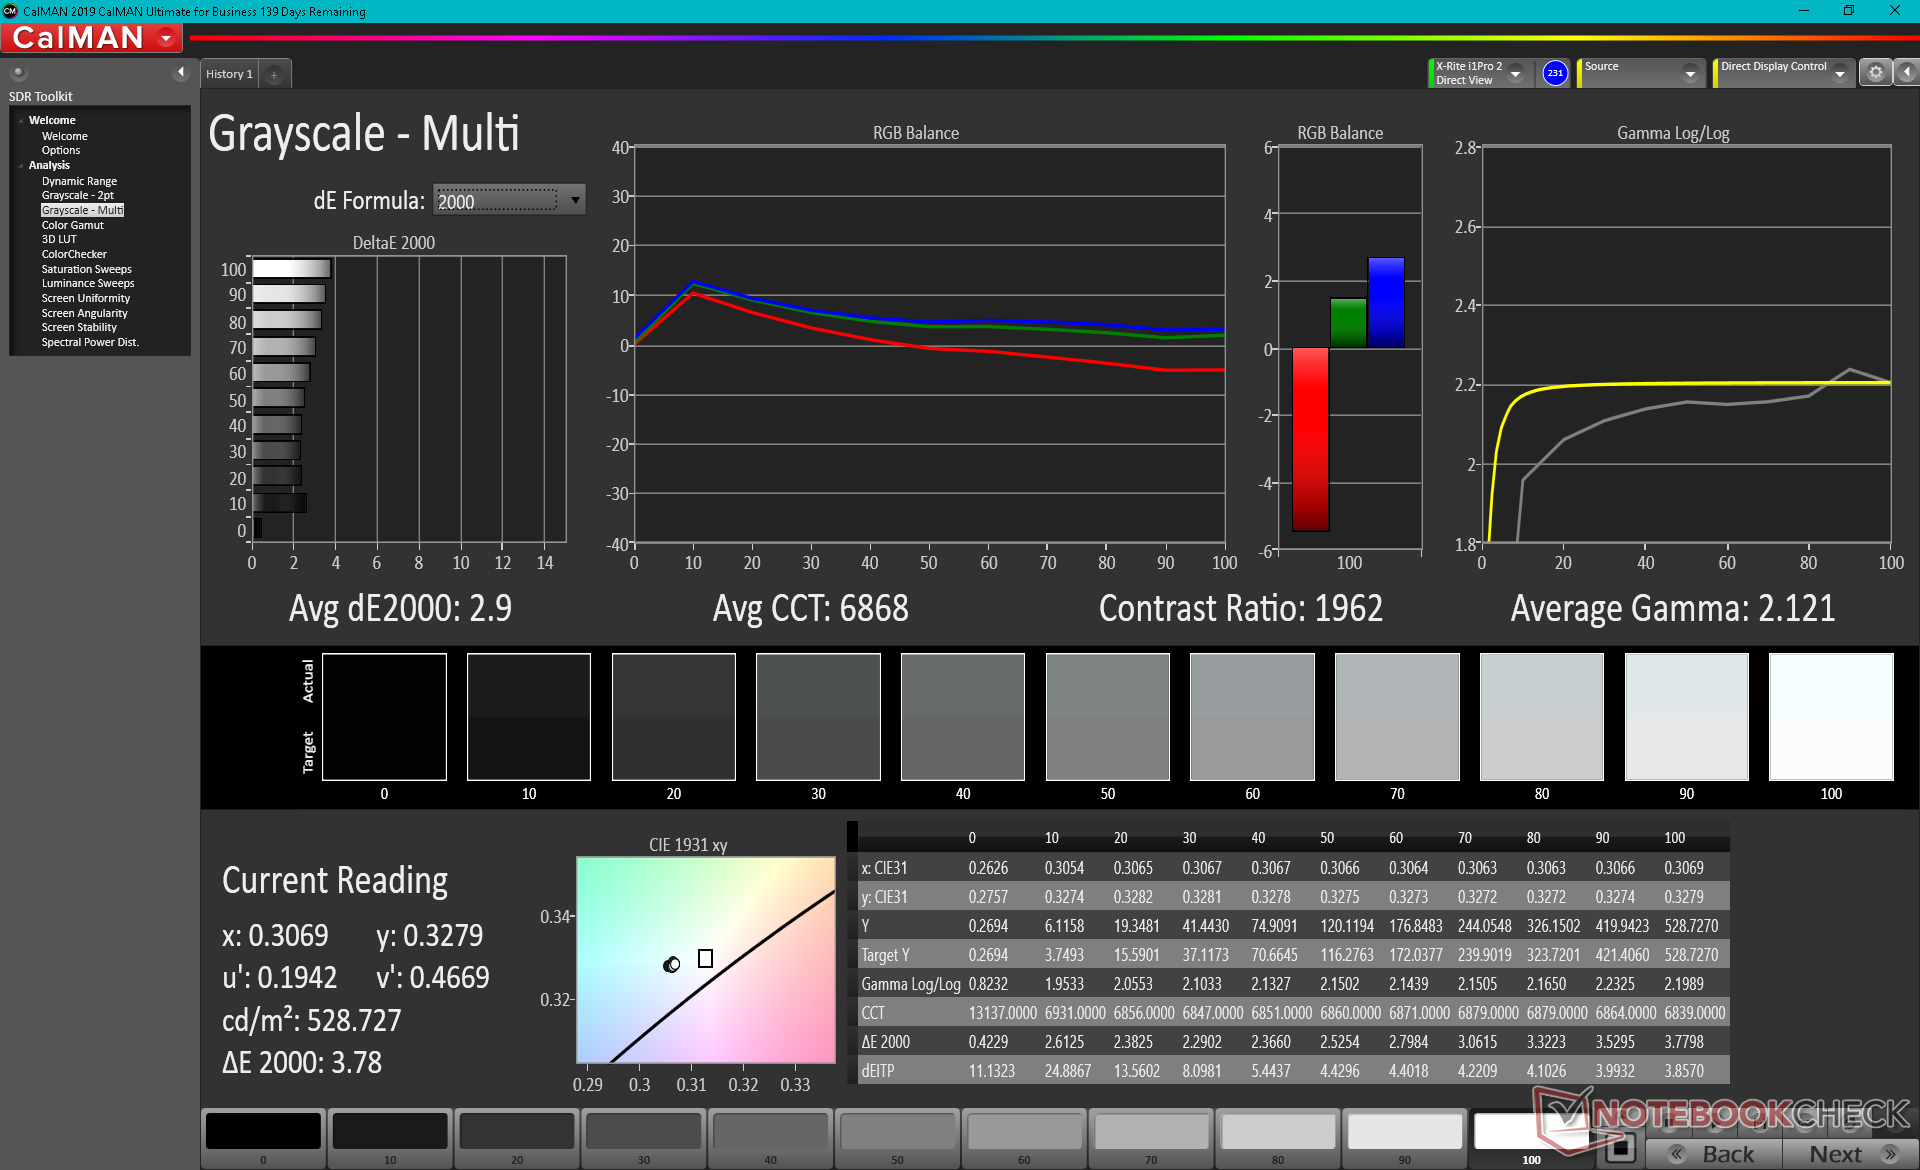
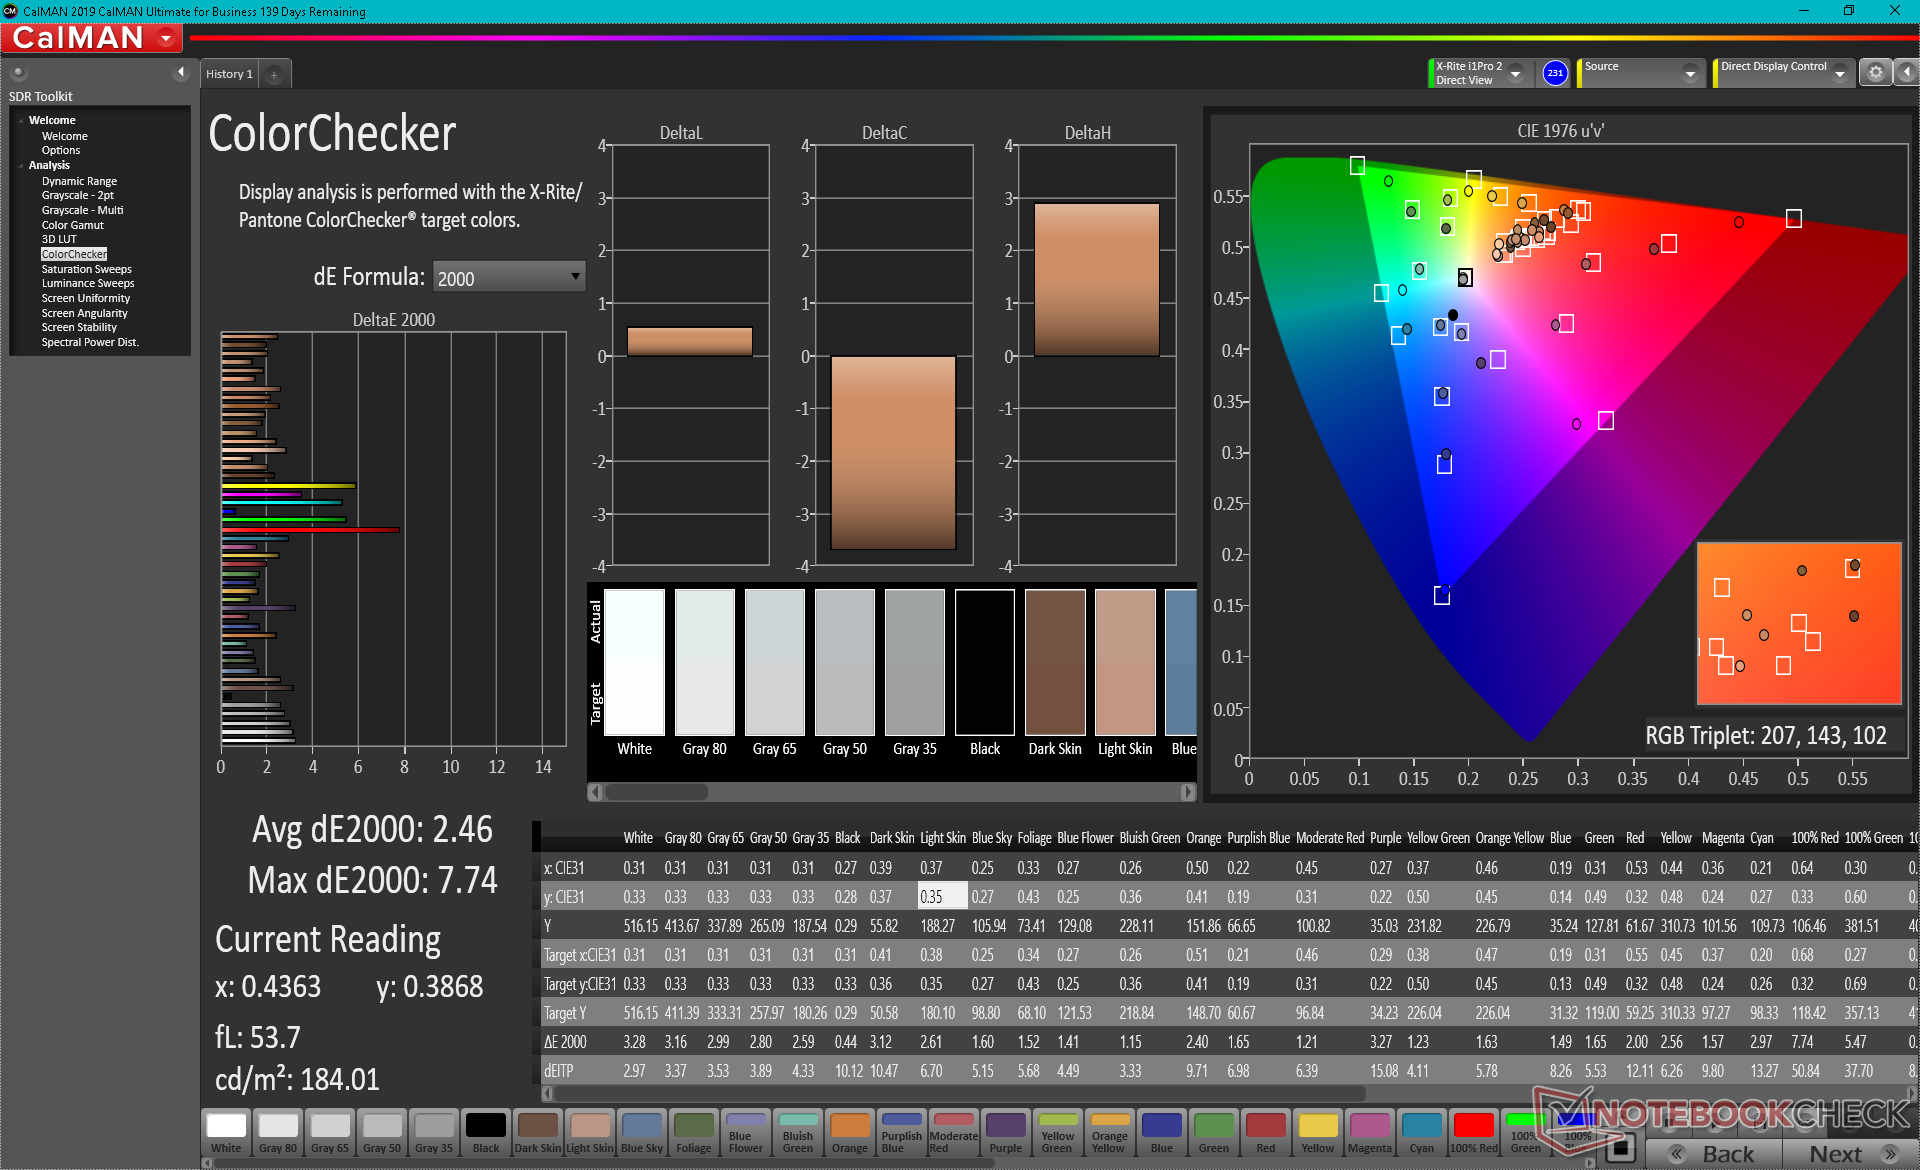
ΔE ColorChecker Calman: 2.46 | ∀{0.5-29.43 Ø4.71}
calibrated: 1.85
ΔE Greyscale Calman: 2.9 | ∀{0.09-98 Ø4.96}
100% AdobeRGB 1998 (Argyll 3D)
100% sRGB (Argyll 3D)
94.8% Display P3 (Argyll 3D)
Gamma: 2.12
CCT: 6868 K
| Dell XPS 17 9710 Core i7 RTX 3060 Sharp LQ170R1, IPS, 17", 3840x2400 | Dell XPS 17 9700 Core i7 RTX 2060 Max-Q Sharp LQ170R1, IPS, 17", 3840x2400 | Razer Blade Pro 17 2021 (QHD Touch) AU Optronics B173ZAN03.3, IPS, 17.3", 3840x2160 | Gigabyte Aero 17 HDR YC AUO B173ZAN03.2 (AUO329B), IPS-Level, 17.3", 3840x2160 | LG Ultra 17U70N LG LP170WQ1-SPA1, IPS, 17", 2560x1600 | Eluktronics RP-17 BOE NV173FHM-N44, IPS, 17.3", 1920x1080 | |
|---|---|---|---|---|---|---|
| Display | -2% | -2% | -3% | -24% | -25% | |
| Display P3 Coverage (%) | 94.8 | 90.5 -5% | 88.6 -7% | 87.3 -8% | 64.2 -32% | 64.7 -32% |
| sRGB Coverage (%) | 100 | 100 0% | 100 0% | 100 0% | 94.5 -5% | 92 -8% |
| AdobeRGB 1998 Coverage (%) | 100 | 99.8 0% | 99.9 0% | 99.9 0% | 65.2 -35% | 65.8 -34% |
| Response Times | -7% | 64% | 4% | 10% | 56% | |
| Response Time Grey 50% / Grey 80% * (ms) | 44.8 ? | 51.2 ? -14% | 15.2 ? 66% | 51.6 ? -15% | 41.2 ? 8% | 22.4 ? 50% |
| Response Time Black / White * (ms) | 32 ? | 32 ? -0% | 12 ? 62% | 24.8 ? 22% | 28.4 ? 11% | 12 ? 62% |
| PWM Frequency (Hz) | 943 | |||||
| Screen | -11% | -68% | 19% | 6% | -25% | |
| Brightness middle (cd/m²) | 536.5 | 539.4 1% | 407.2 -24% | 458 -15% | 415.4 -23% | 311.5 -42% |
| Brightness (cd/m²) | 489 | 494 1% | 403 -18% | 446 -9% | 385 -21% | 301 -38% |
| Brightness Distribution (%) | 85 | 84 -1% | 90 6% | 92 8% | 88 4% | 91 7% |
| Black Level * (cd/m²) | 0.37 | 0.32 14% | 0.42 -14% | 0.37 -0% | 0.24 35% | 0.31 16% |
| Contrast (:1) | 1450 | 1686 16% | 970 -33% | 1238 -15% | 1731 19% | 1005 -31% |
| Colorchecker dE 2000 * | 2.46 | 4.12 -67% | 7.25 -195% | 1.52 38% | 2.42 2% | 4.13 -68% |
| Colorchecker dE 2000 max. * | 7.74 | 7.65 1% | 12.51 -62% | 2.51 68% | 5.55 28% | 7.32 5% |
| Colorchecker dE 2000 calibrated * | 1.85 | 3.91 -111% | 3.62 -96% | 0.66 64% | 1.68 9% | 2.93 -58% |
| Greyscale dE 2000 * | 2.9 | 1.5 48% | 8.1 -179% | 1.9 34% | 2.9 -0% | 3.3 -14% |
| Gamma | 2.12 104% | 2.15 102% | 2.24 98% | 2.145 103% | 2.21 100% | 2.17 101% |
| CCT | 6868 95% | 6438 101% | 5925 110% | 6534 99% | 6864 95% | 7157 91% |
| Color Space (Percent of AdobeRGB 1998) (%) | 90.4 | 88.1 | 100 | 60.2 | 59.5 | |
| Color Space (Percent of sRGB) (%) | 100 | 100 | 100 | 94.2 | 91.6 | |
| Média Total (Programa/Configurações) | -7% /
-8% | -2% /
-35% | 7% /
12% | -3% /
0% | 2% /
-13% |
* ... menor é melhor
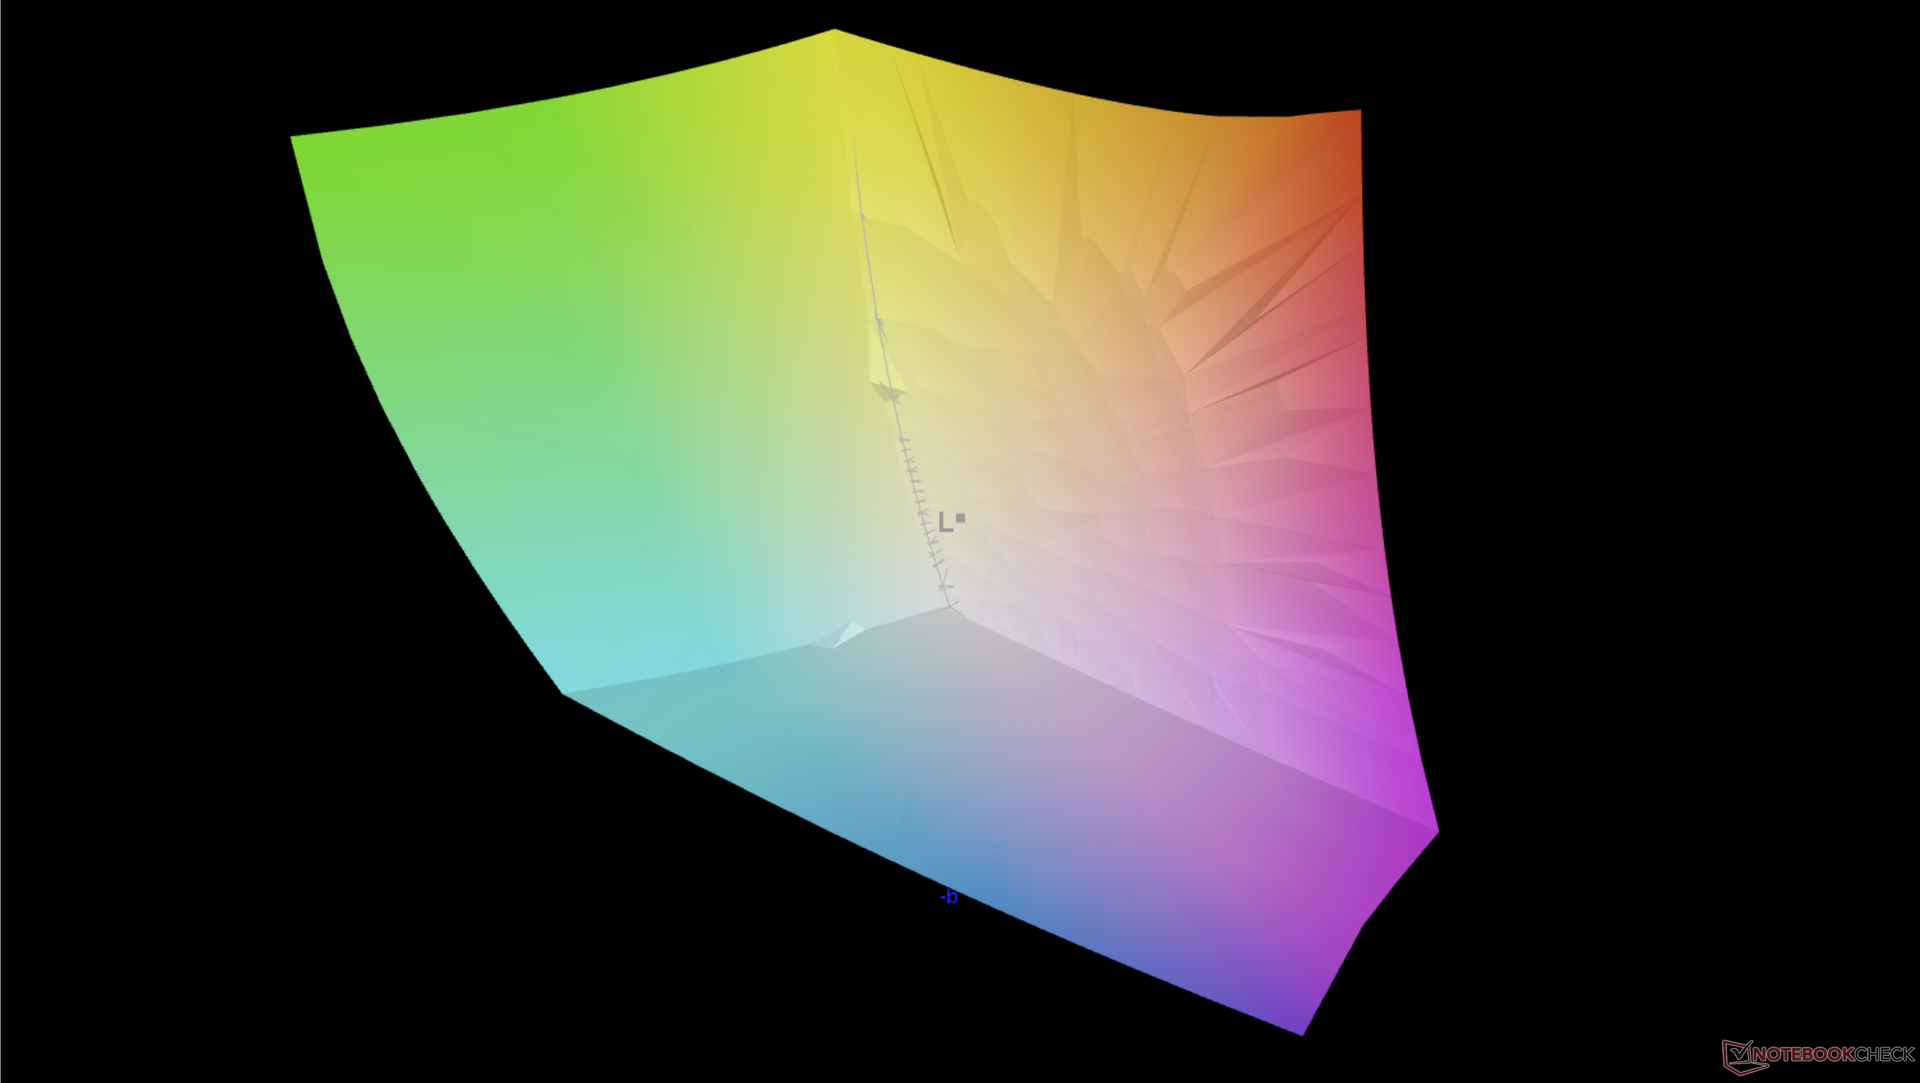
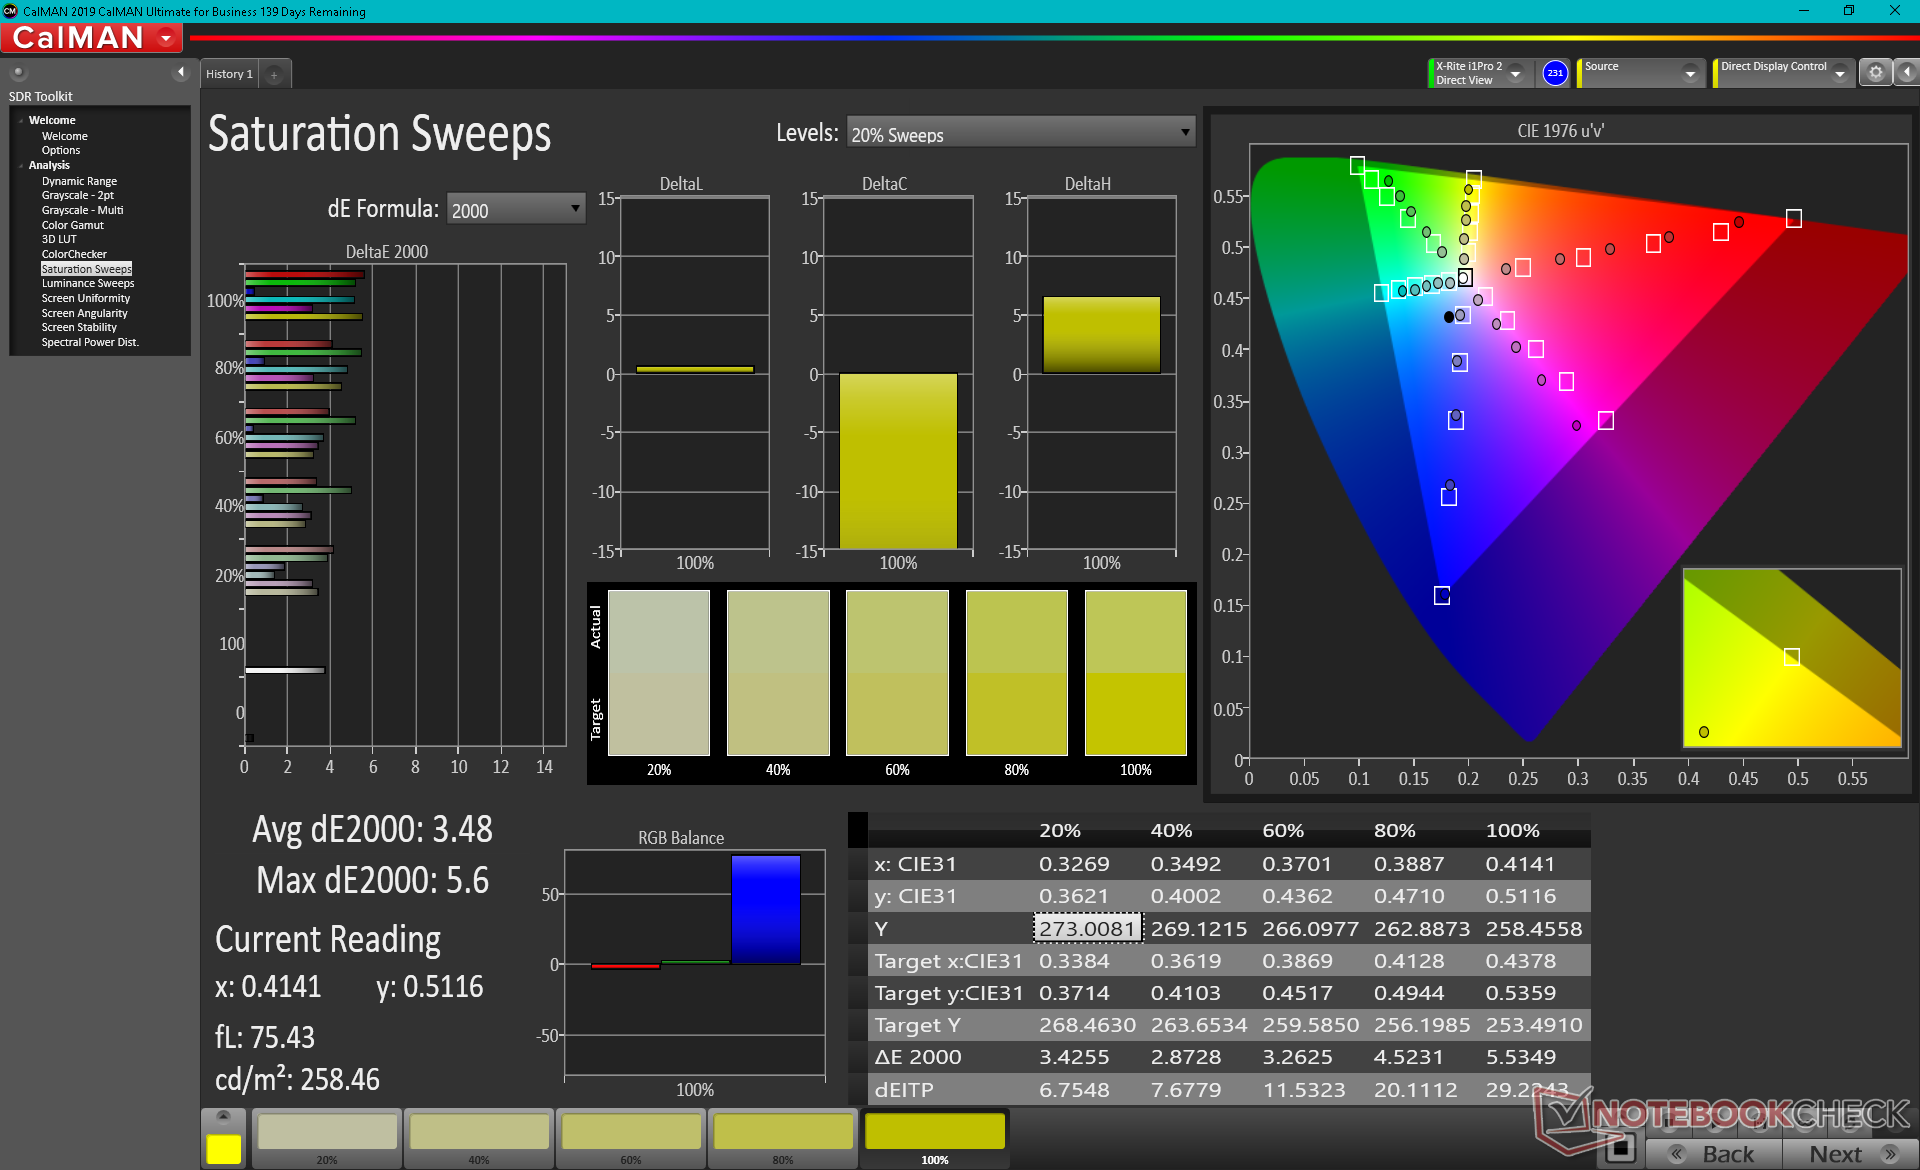
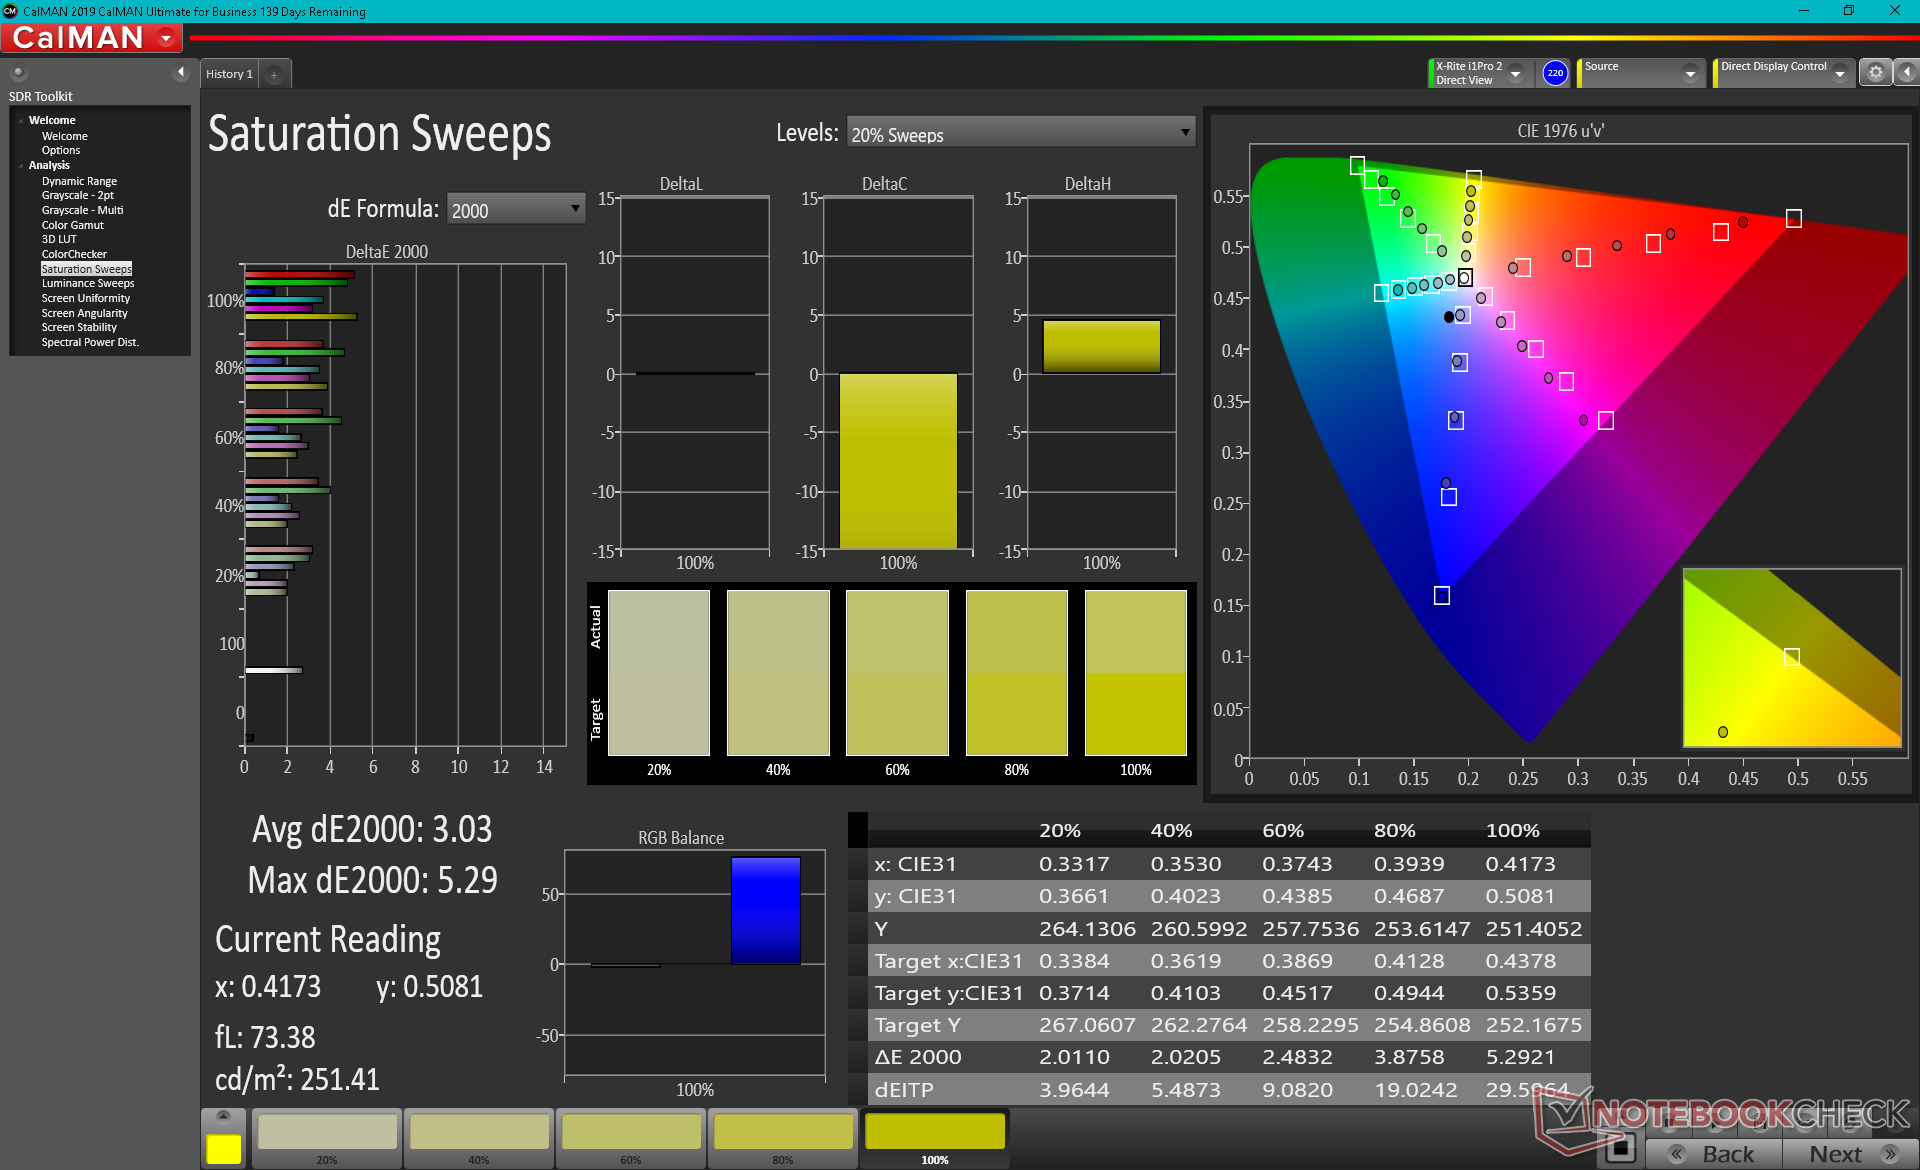
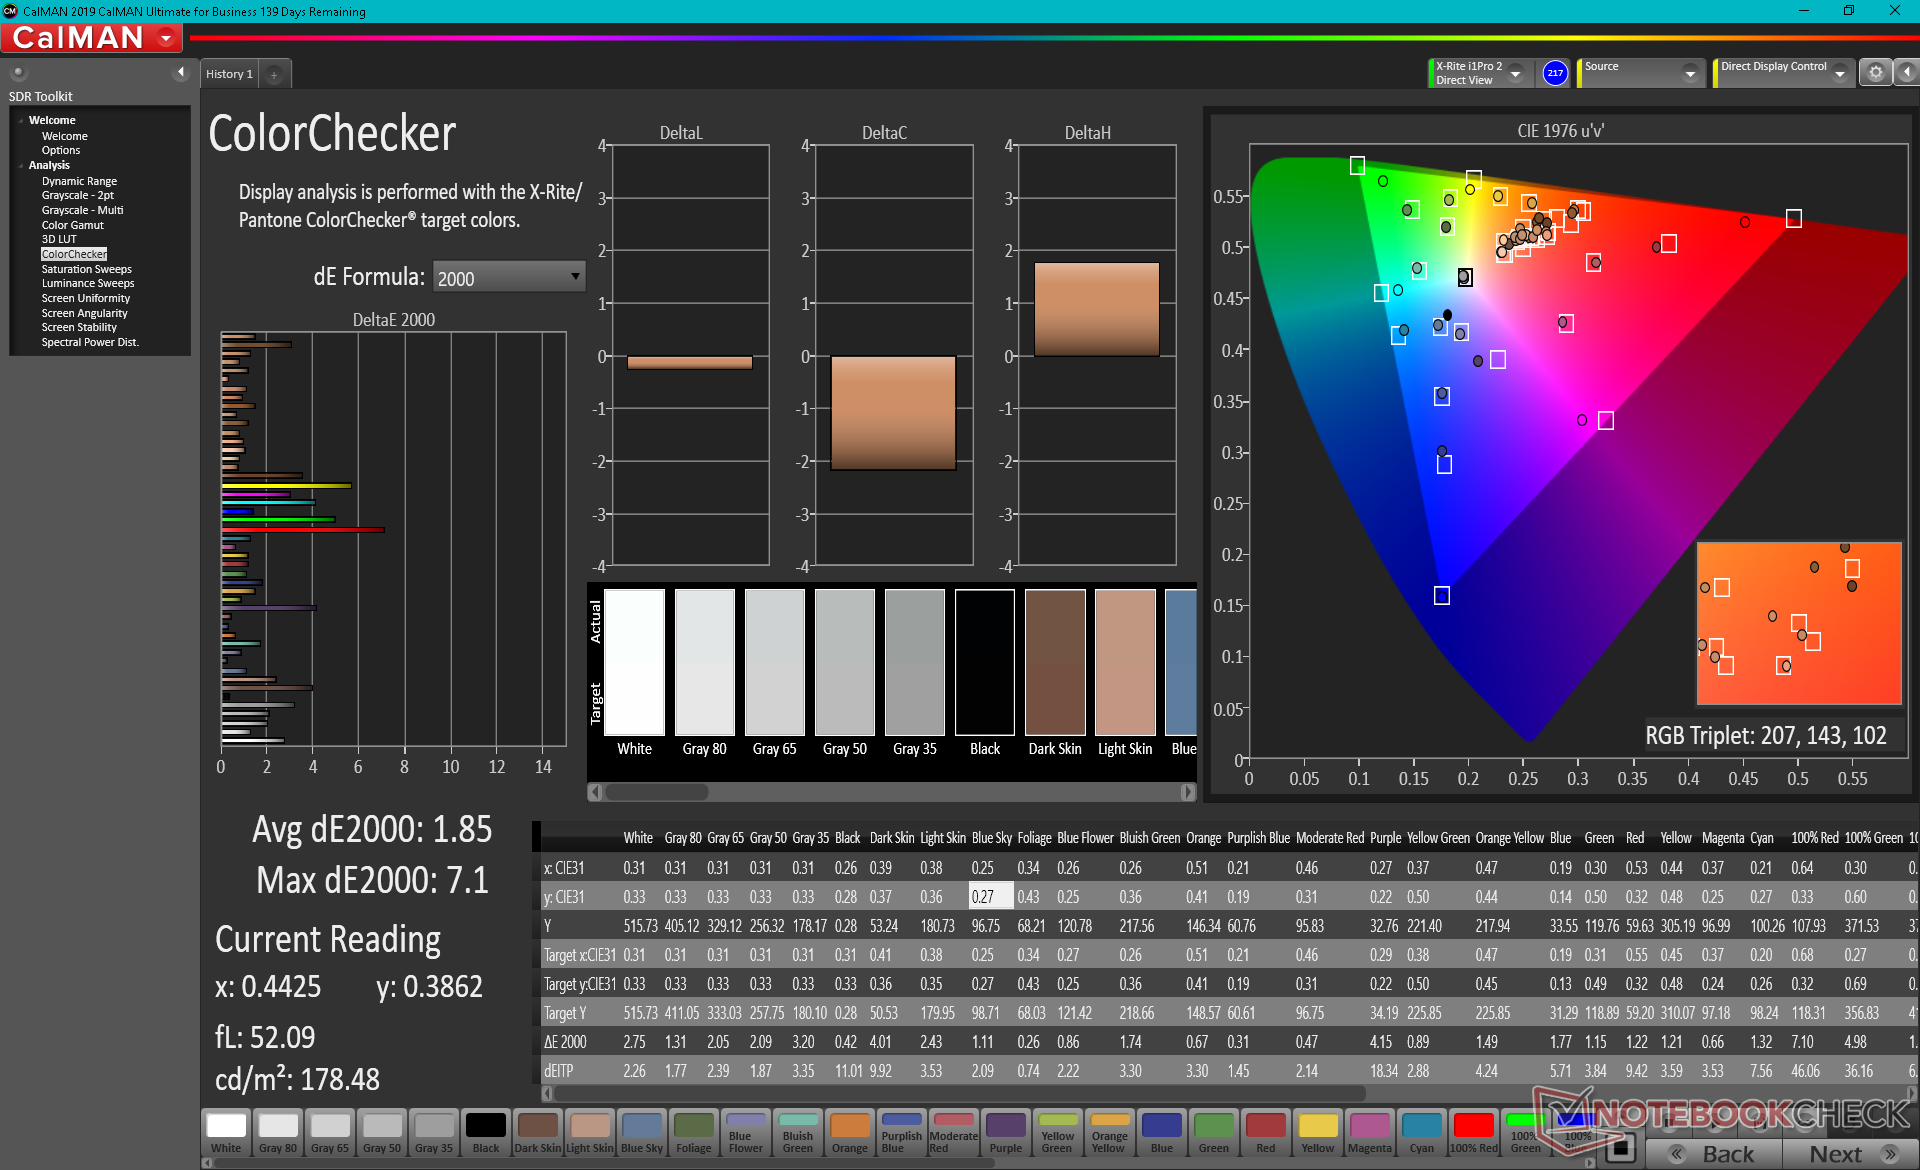
O display é bem calibrado fora da caixa com valores médios de escala de cinza e cor DeltaE de apenas 2,9 e 2,46, respectivamente. Calibrar o painel ainda mais nós mesmos reduziria a média de cores DeltaE para 1,85, mas cores primárias e secundárias sólidas permaneceriam mais imprecisas do que outras cores.
Exibir tempos de resposta
| ↔ Tempo de resposta preto para branco | ||
|---|---|---|
| 32 ms ... ascensão ↗ e queda ↘ combinadas | ↗ 15.6 ms ascensão | 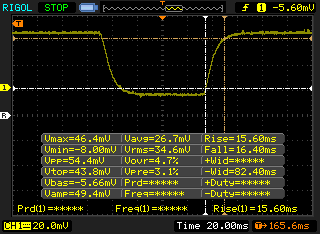 |
| ↘ 16.4 ms queda | ||
| A tela mostra taxas de resposta lentas em nossos testes e será insatisfatória para os jogadores. Em comparação, todos os dispositivos testados variam de 0.1 (mínimo) a 240 (máximo) ms. » 86 % de todos os dispositivos são melhores. Isso significa que o tempo de resposta medido é pior que a média de todos os dispositivos testados (19.8 ms). | ||
| ↔ Tempo de resposta 50% cinza a 80% cinza | ||
| 44.8 ms ... ascensão ↗ e queda ↘ combinadas | ↗ 20.8 ms ascensão | 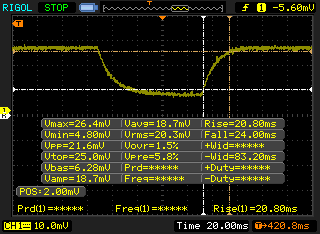 |
| ↘ 24 ms queda | ||
| A tela mostra taxas de resposta lentas em nossos testes e será insatisfatória para os jogadores. Em comparação, todos os dispositivos testados variam de 0.165 (mínimo) a 636 (máximo) ms. » 76 % de todos os dispositivos são melhores. Isso significa que o tempo de resposta medido é pior que a média de todos os dispositivos testados (31 ms). | ||
Cintilação da tela / PWM (modulação por largura de pulso)
| Tela tremeluzindo / PWM não detectado | 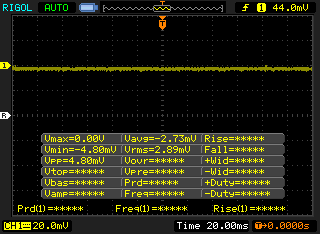 | ||
[pwm_comparison] Em comparação: 52 % de todos os dispositivos testados não usam PWM para escurecer a tela. Se PWM foi detectado, uma média de 7757 (mínimo: 5 - máximo: 343500) Hz foi medida. | |||

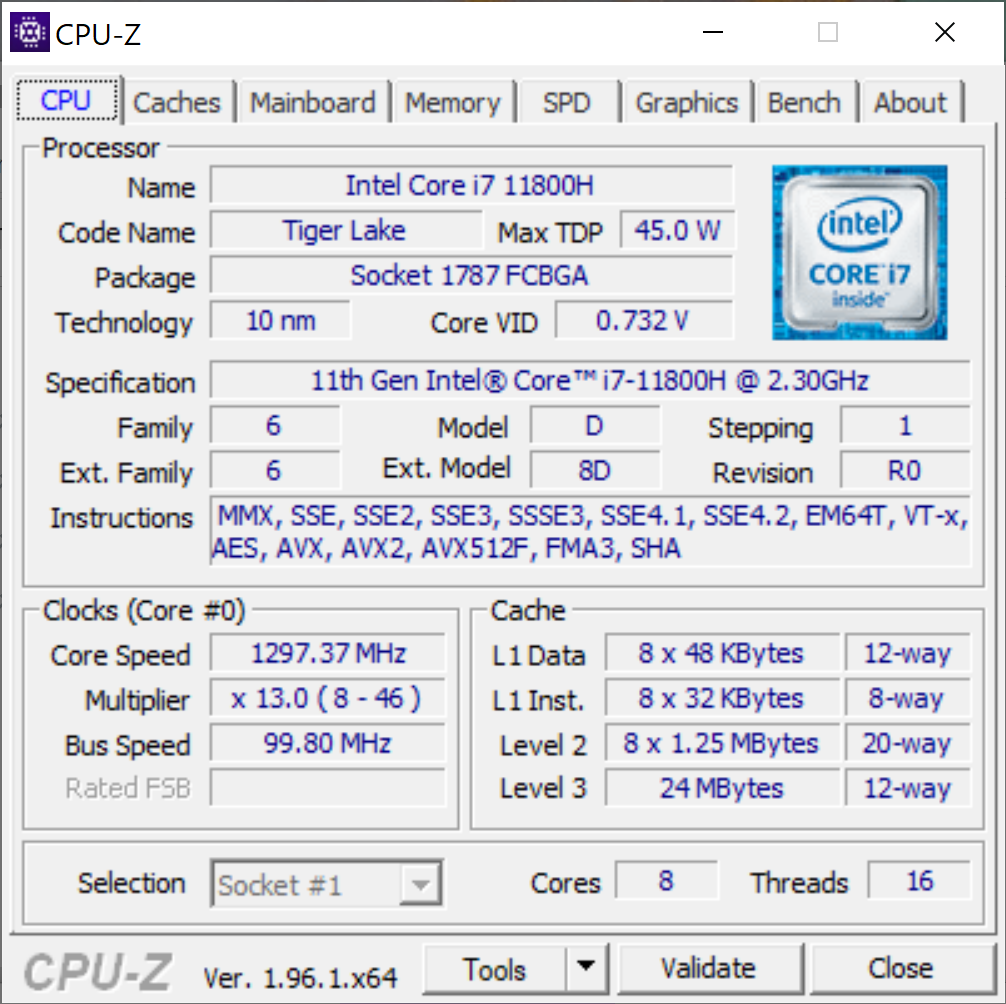
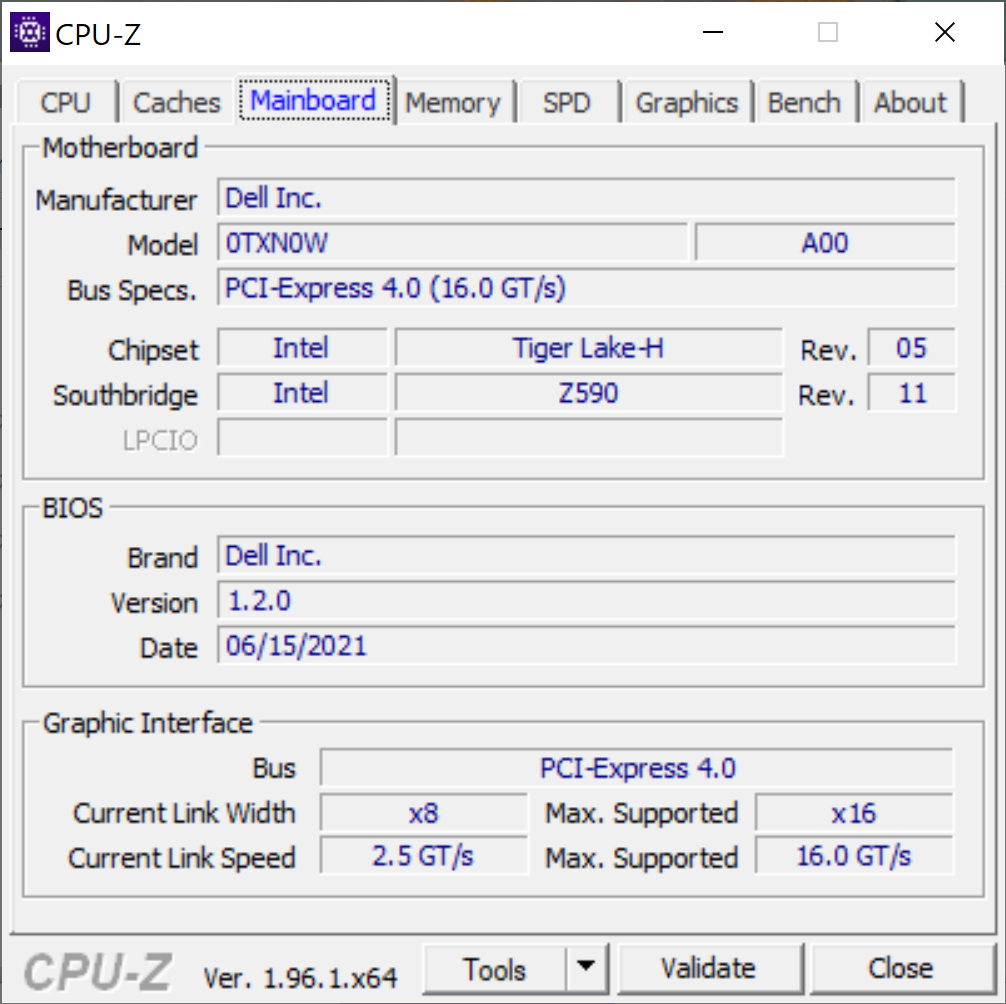
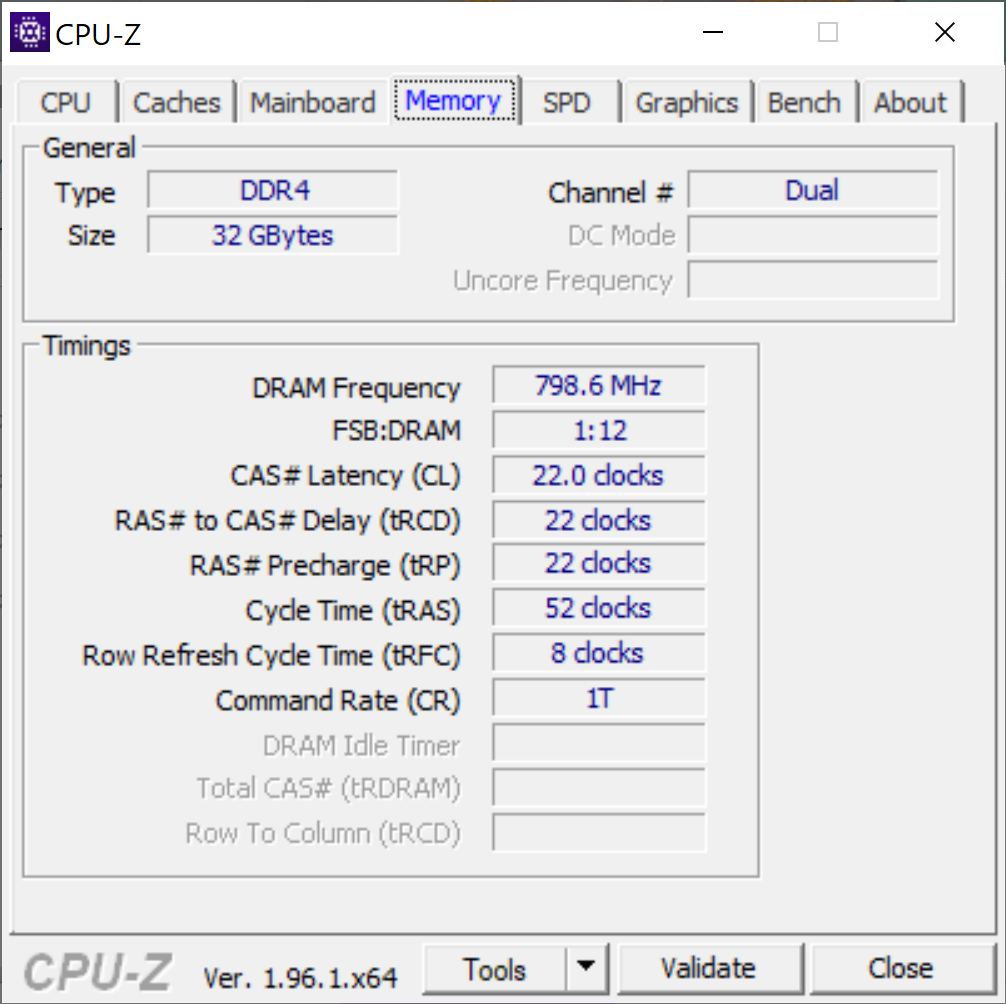
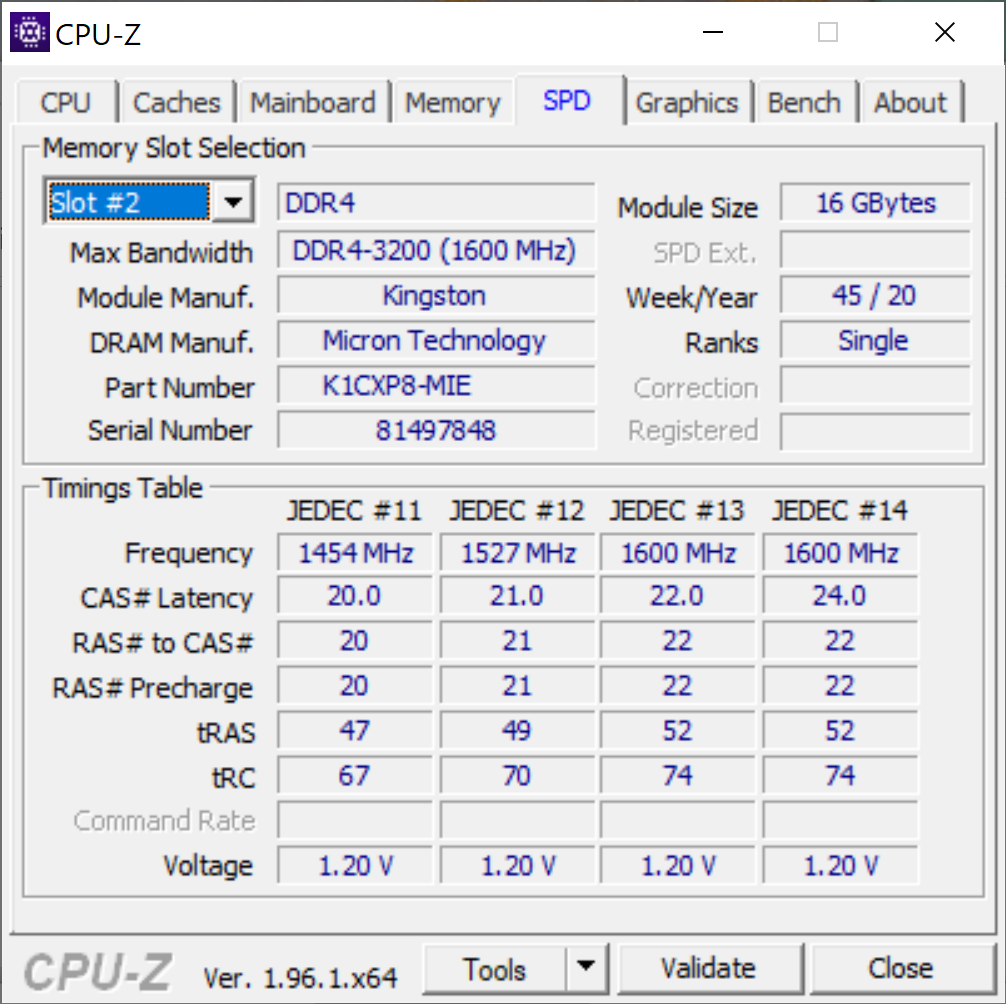
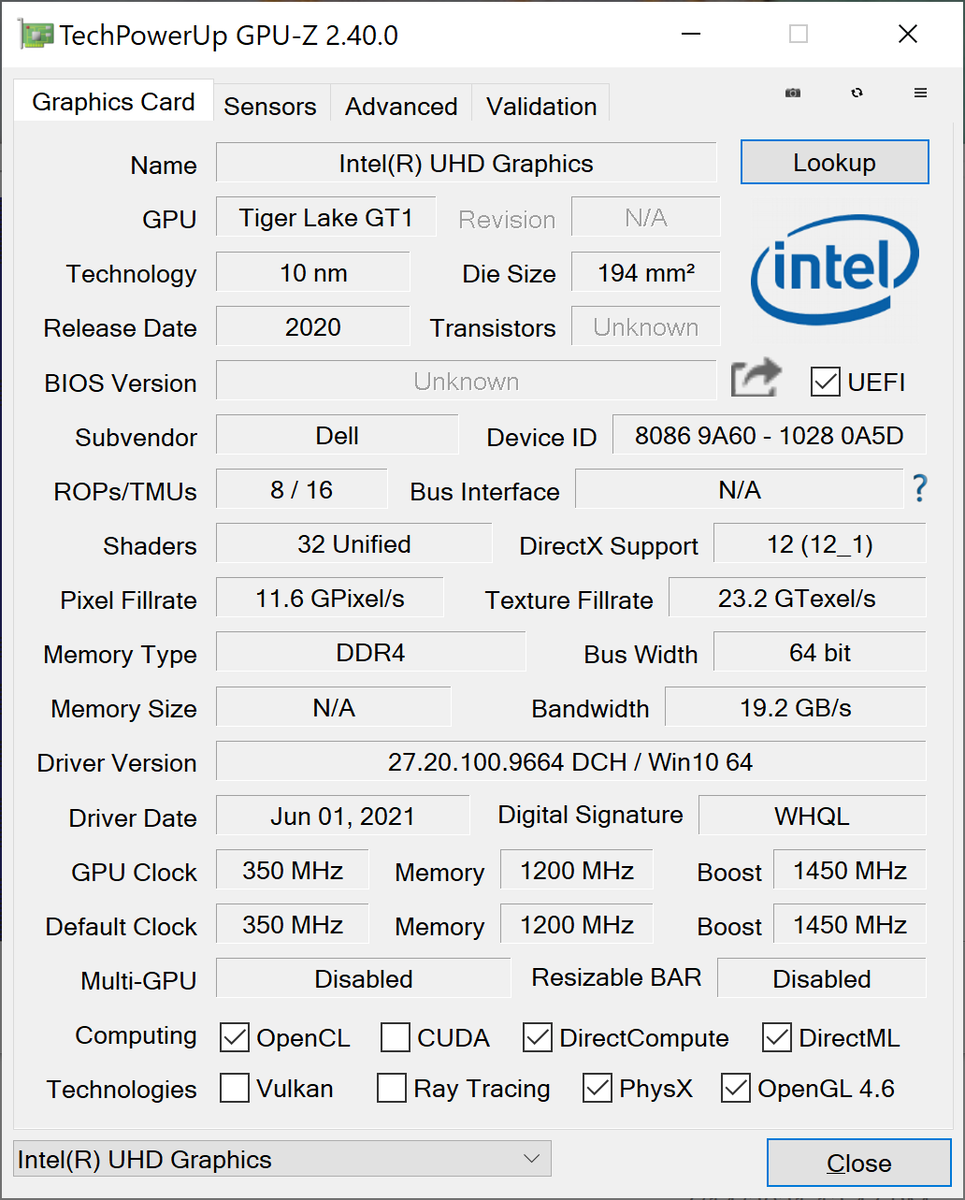
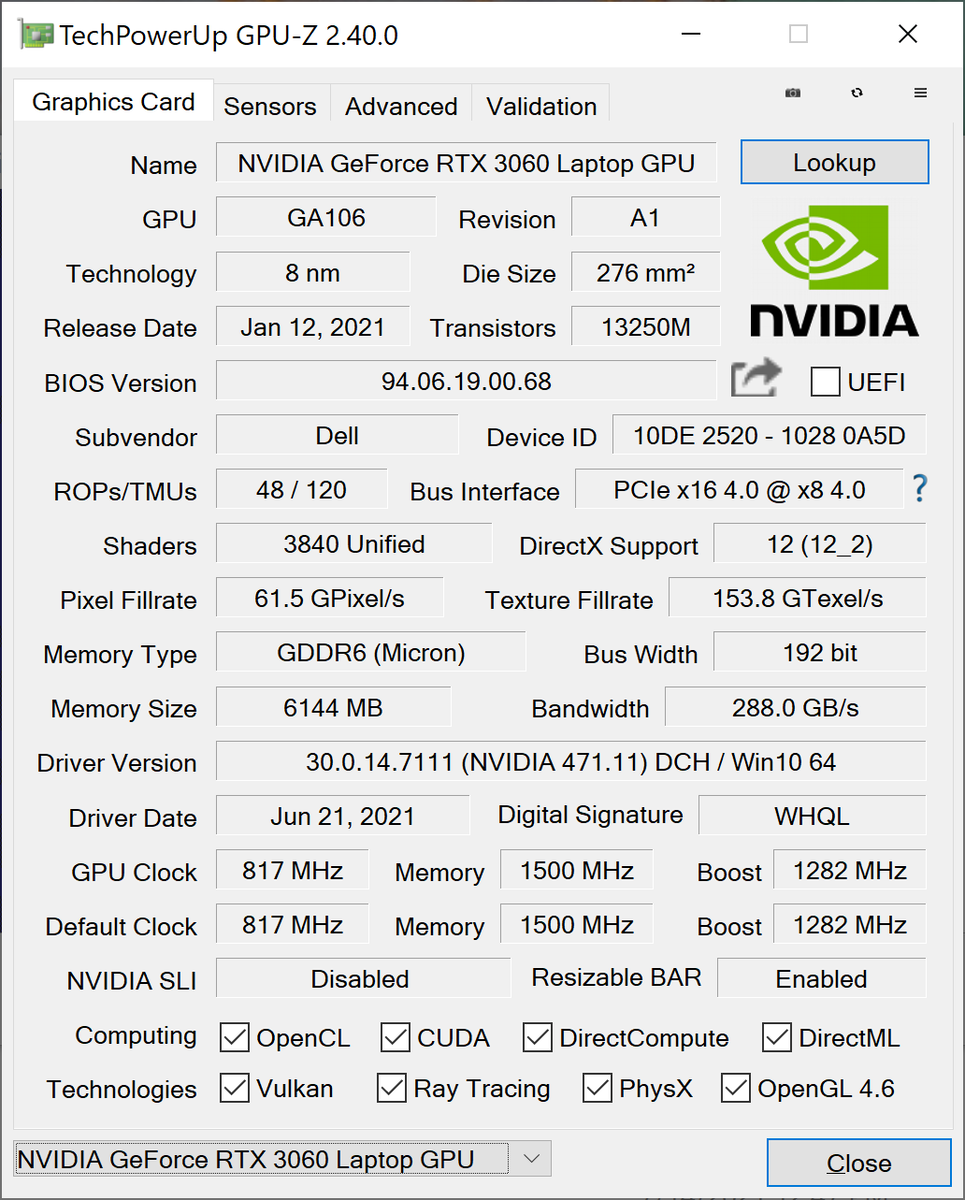
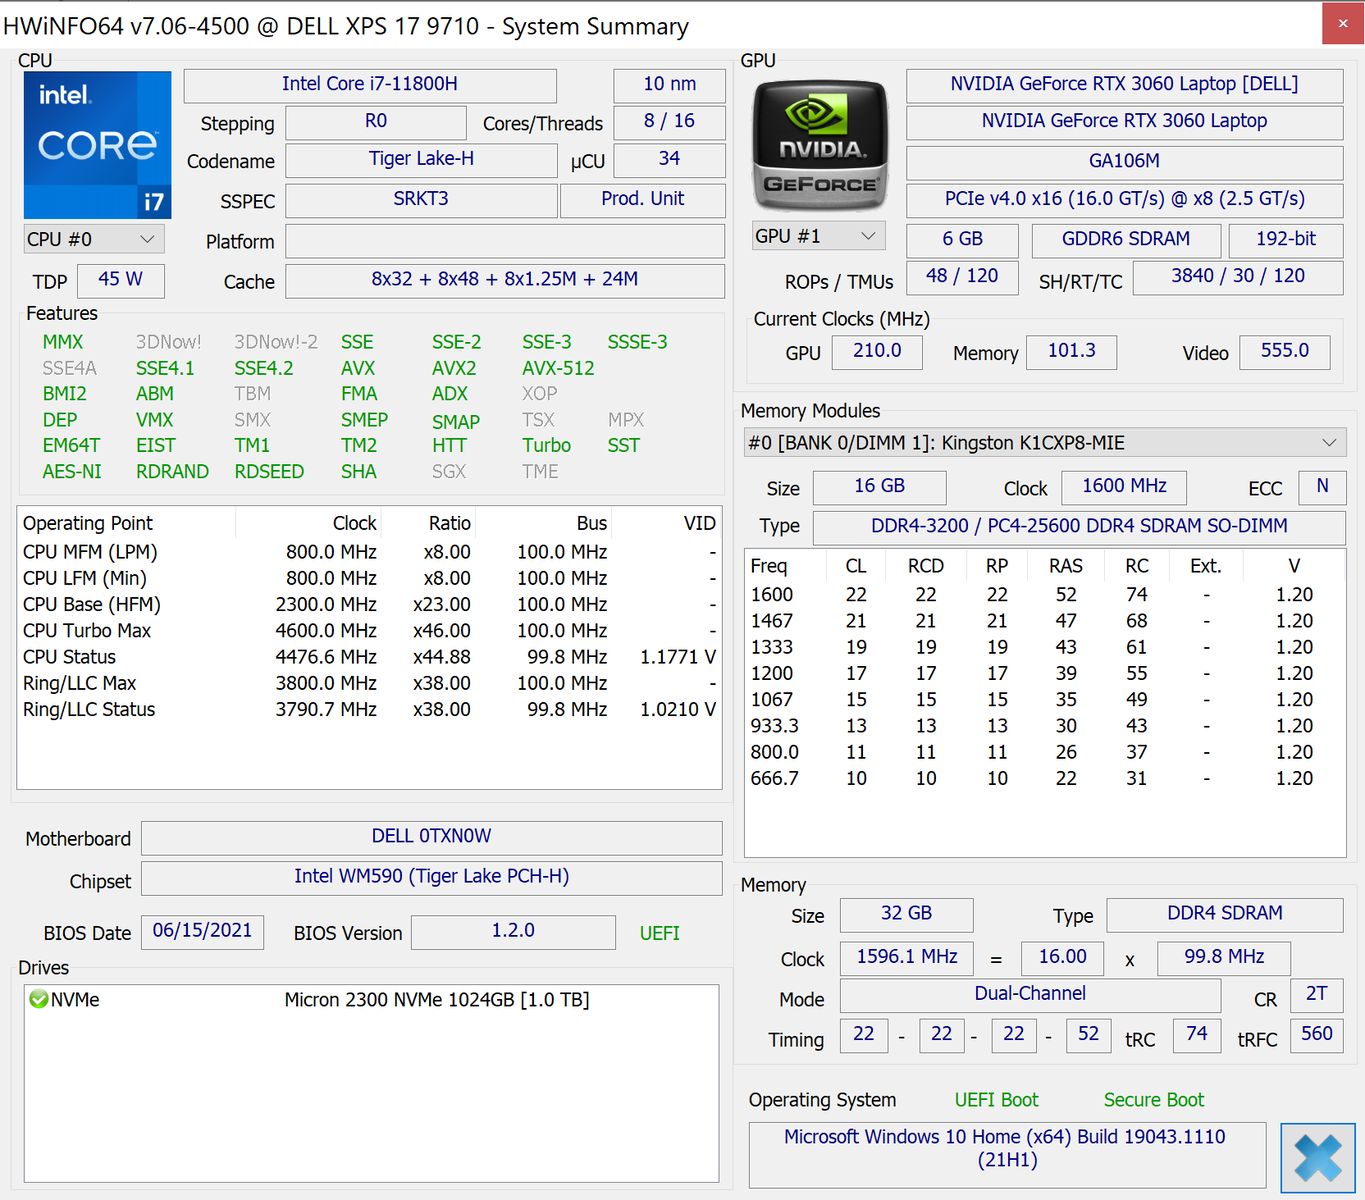
Desempenho - CPU TDP de 45 W com GPU TGP de 70 W
As opções de núcleo incluem o 11º gênero Core i5-11400H, i7-11800H, ou CPU i9-11900H com UHD Graphics, GeForce RTX 3050, ou RTX 3060. A velocidade da RAM (3200 MHz) permanece a mesma que no XPS 17 9700. BAR redimensionável, Optimus e Dynamic Book 2.0 vêm de série se configurados com gráficos dedicados mas sem suporte para G-Sync interno (Advanced Optimus) ou WhisperMode 2.0.
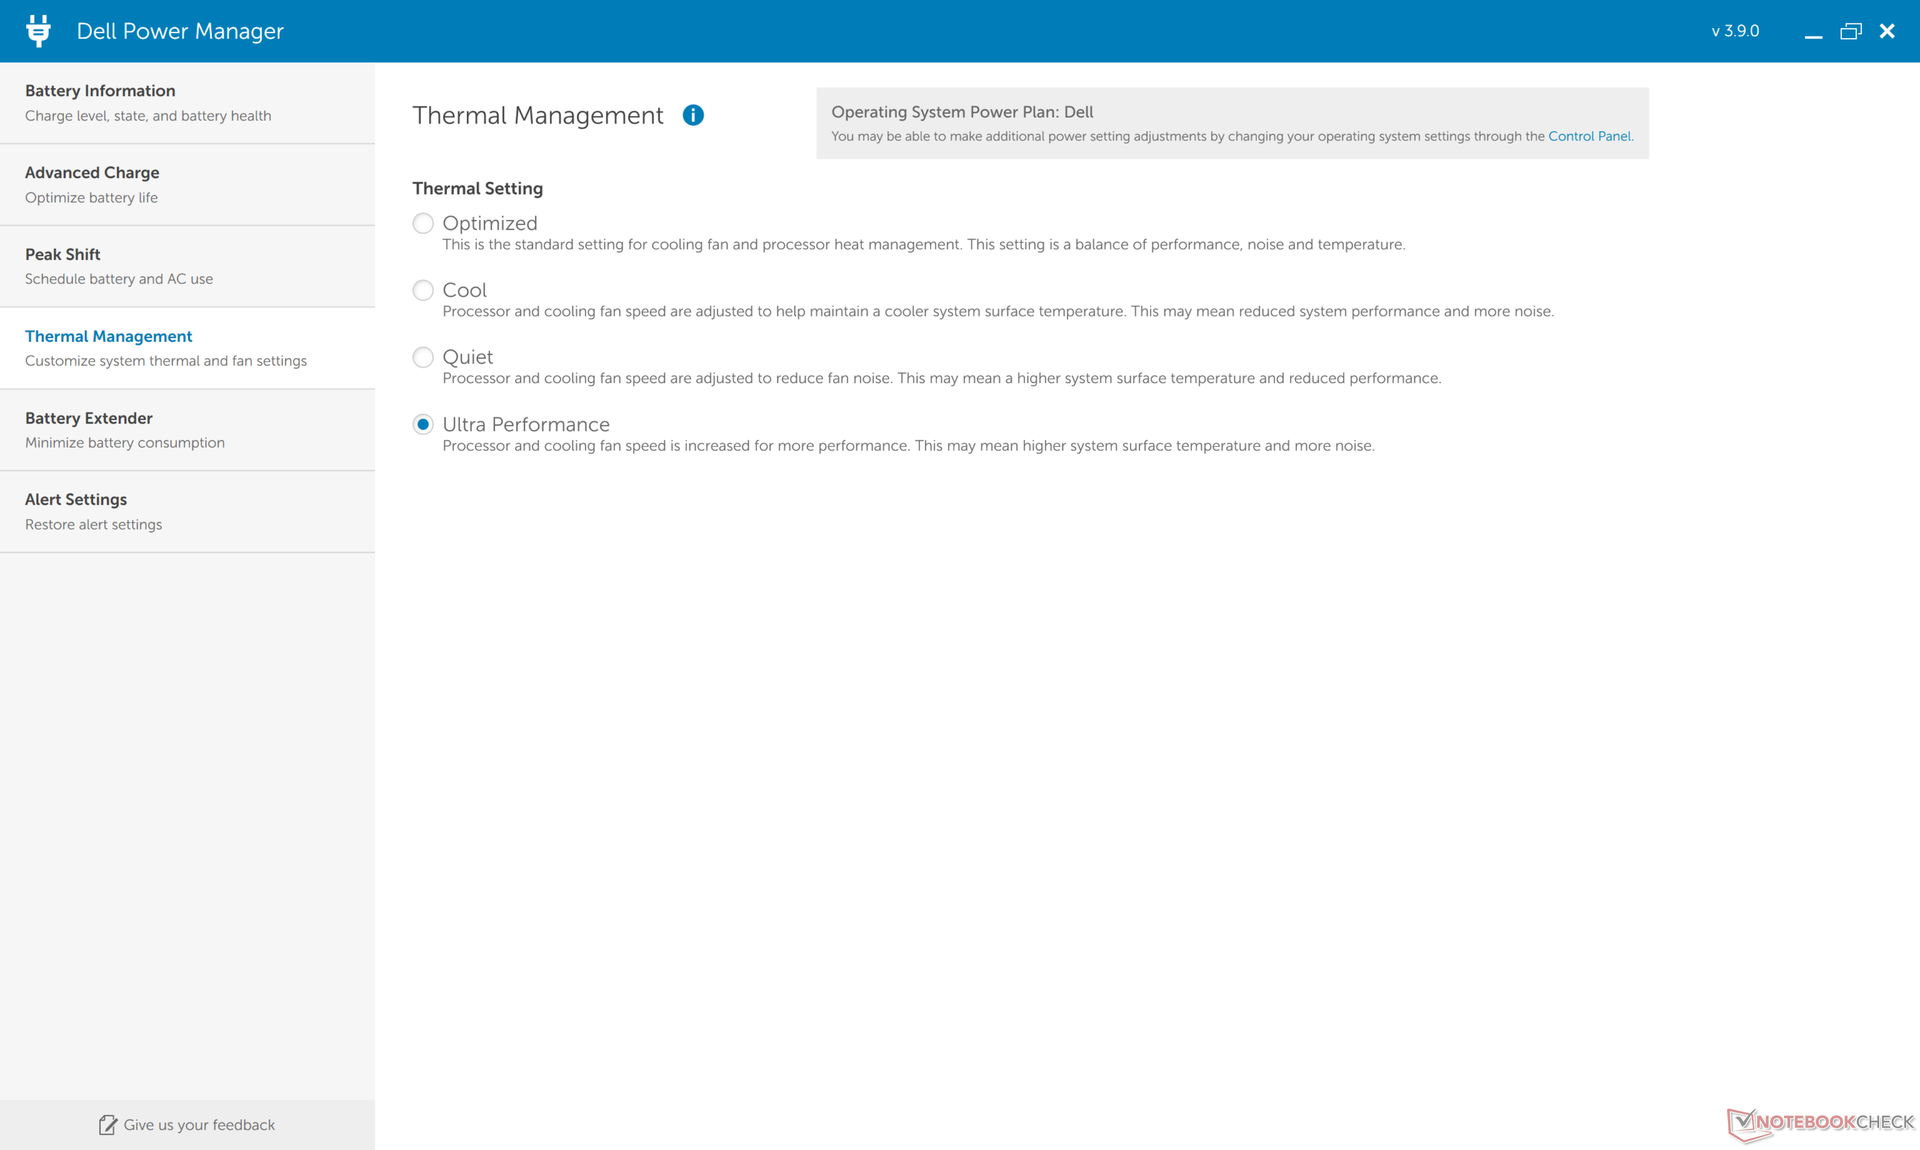
Nossa unidade de teste foi configurada para o modo Ultra Performance via Dell Power Manager para obter as mais altas pontuações possíveis.
Processador
O desempenho de rosca única e rosca múltipla aumentou 20% e 30%, respectivamente, em relação ao Núcleo i7-10875H no modelo do ano passado. A sustentabilidade do desempenho continua sendo excelente, assim como demonstrado pelos resultados de nosso loop do CineBench R15 xT abaixo
Atualização para o modelo mais caro Núcleo i9-11900H É mais do que provável que a SKU traga apenas benefícios de desempenho marginal de apenas alguns pontos percentuais. As temperaturas centrais em nossa i7-11800H já estão pairando em torno de 90 C quando sob carga e, portanto, uma peça de Core i9 com temperatura mais alta terá quase nenhum espaço de manobra adicional.
Cinebench R15 Multi Loop
Cinebench R23: Multi Core | Single Core
Cinebench R15: CPU Multi 64Bit | CPU Single 64Bit
Blender: v2.79 BMW27 CPU
7-Zip 18.03: 7z b 4 -mmt1 | 7z b 4
Geekbench 5.5: Single-Core | Multi-Core
HWBOT x265 Benchmark v2.2: 4k Preset
LibreOffice : 20 Documents To PDF
R Benchmark 2.5: Overall mean
| Cinebench R23 / Multi Core | |
| Schenker XMG Ultra 17 Rocket Lake | |
| Schenker XMG Neo 17 (Early 2021, RTX 3070, 5800H) | |
| Dell XPS 17 9710 Core i7 RTX 3060 | |
| Média Intel Core i7-11800H (6508 - 14088, n=48) | |
| Asus TUF Gaming F17 FX706HM | |
| Gigabyte Aero 17 HDR YC | |
| Razer Blade Pro 17 2021 (QHD Touch) | |
| Cinebench R23 / Single Core | |
| Schenker XMG Ultra 17 Rocket Lake | |
| Asus TUF Gaming F17 FX706HM | |
| Dell XPS 17 9710 Core i7 RTX 3060 | |
| Média Intel Core i7-11800H (1386 - 1522, n=45) | |
| Schenker XMG Neo 17 (Early 2021, RTX 3070, 5800H) | |
| Gigabyte Aero 17 HDR YC | |
| Razer Blade Pro 17 2021 (QHD Touch) | |
Cinebench R23: Multi Core | Single Core
Cinebench R15: CPU Multi 64Bit | CPU Single 64Bit
Blender: v2.79 BMW27 CPU
7-Zip 18.03: 7z b 4 -mmt1 | 7z b 4
Geekbench 5.5: Single-Core | Multi-Core
HWBOT x265 Benchmark v2.2: 4k Preset
LibreOffice : 20 Documents To PDF
R Benchmark 2.5: Overall mean
* ... menor é melhor
Desempenho do sistema
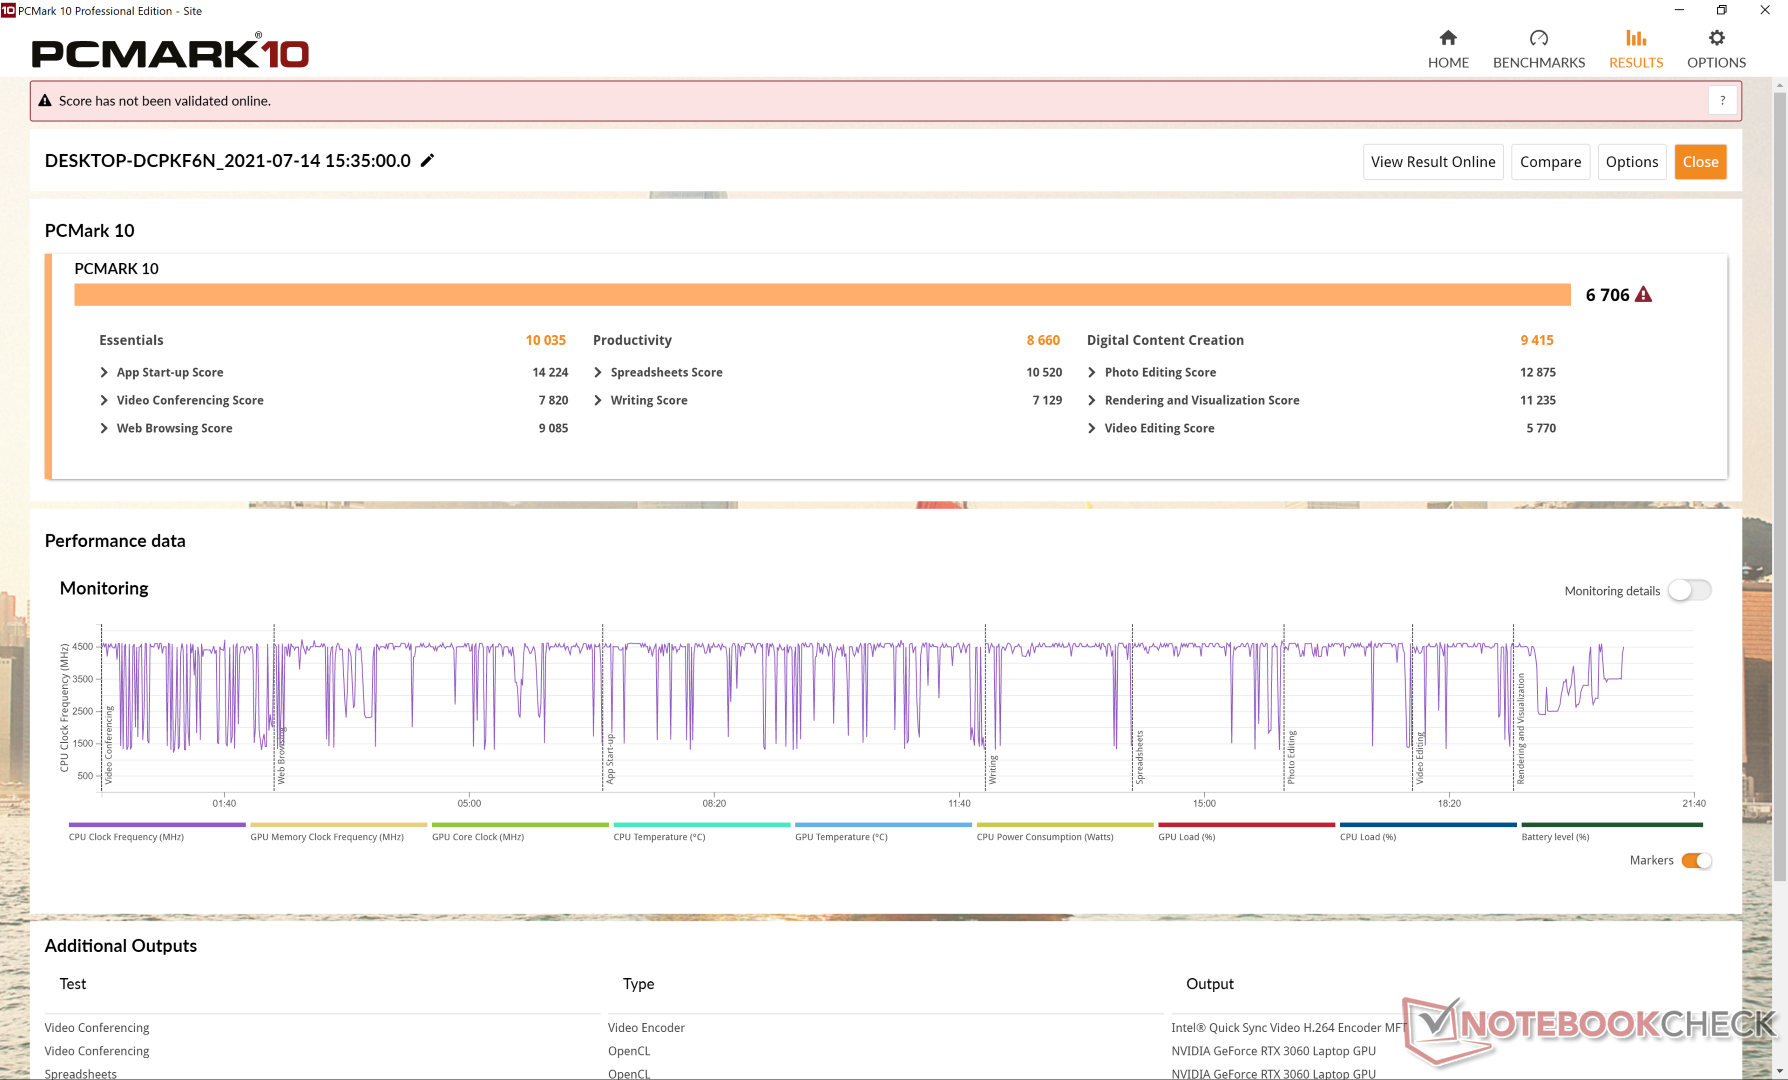
As pontuações da PCMark são consistentemente mais altas do que no XPS 17 9700 do ano passado e na maioria dos outros laptops com CPUs Comet Lake-H mais antigos do 10º gênero. O maior impulso está na Criação de Conteúdo Digital, onde o desempenho gráfico é mais importante.
| PCMark 10 / Score | |
| Dell XPS 17 9710 Core i7 RTX 3060 | |
| Média Intel Core i7-11800H, NVIDIA GeForce RTX 3060 Laptop GPU (6156 - 6865, n=4) | |
| Razer Blade Pro 17 2021 (QHD Touch) | |
| Gigabyte Aero 17 HDR YC | |
| Dell XPS 17 9700 Core i7 RTX 2060 Max-Q | |
| Eluktronics RP-17 | |
| LG Ultra 17U70N | |
| PCMark 10 / Essentials | |
| Dell XPS 17 9710 Core i7 RTX 3060 | |
| Razer Blade Pro 17 2021 (QHD Touch) | |
| Média Intel Core i7-11800H, NVIDIA GeForce RTX 3060 Laptop GPU (9063 - 10522, n=4) | |
| Dell XPS 17 9700 Core i7 RTX 2060 Max-Q | |
| Gigabyte Aero 17 HDR YC | |
| Eluktronics RP-17 | |
| LG Ultra 17U70N | |
| PCMark 10 / Productivity | |
| Gigabyte Aero 17 HDR YC | |
| Dell XPS 17 9710 Core i7 RTX 3060 | |
| Média Intel Core i7-11800H, NVIDIA GeForce RTX 3060 Laptop GPU (8200 - 8874, n=4) | |
| Razer Blade Pro 17 2021 (QHD Touch) | |
| Dell XPS 17 9700 Core i7 RTX 2060 Max-Q | |
| LG Ultra 17U70N | |
| Eluktronics RP-17 | |
| PCMark 10 / Digital Content Creation | |
| Dell XPS 17 9710 Core i7 RTX 3060 | |
| Gigabyte Aero 17 HDR YC | |
| Razer Blade Pro 17 2021 (QHD Touch) | |
| Média Intel Core i7-11800H, NVIDIA GeForce RTX 3060 Laptop GPU (8520 - 9423, n=4) | |
| Dell XPS 17 9700 Core i7 RTX 2060 Max-Q | |
| Eluktronics RP-17 | |
| LG Ultra 17U70N | |
| PCMark 10 Score | 6706 pontos | |
Ajuda | ||
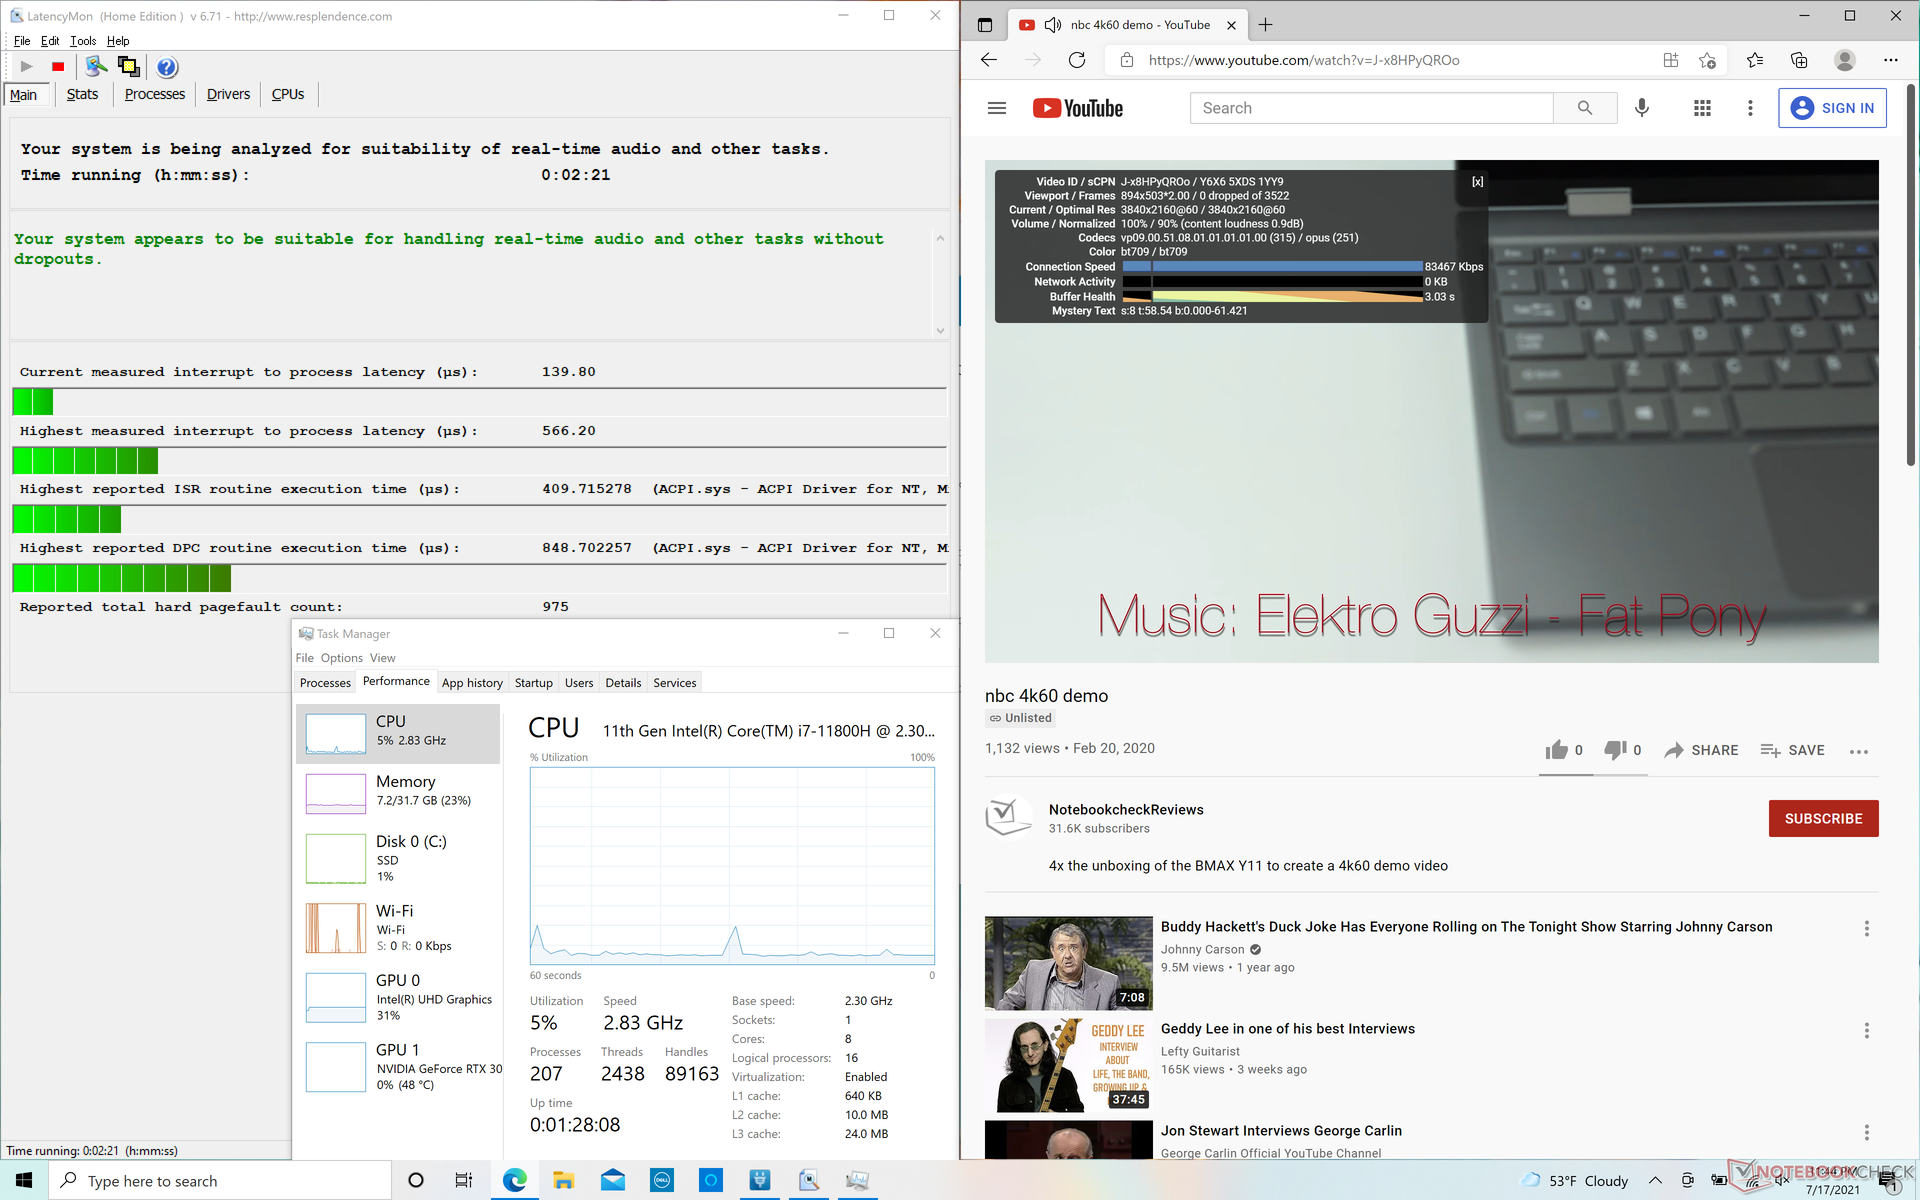
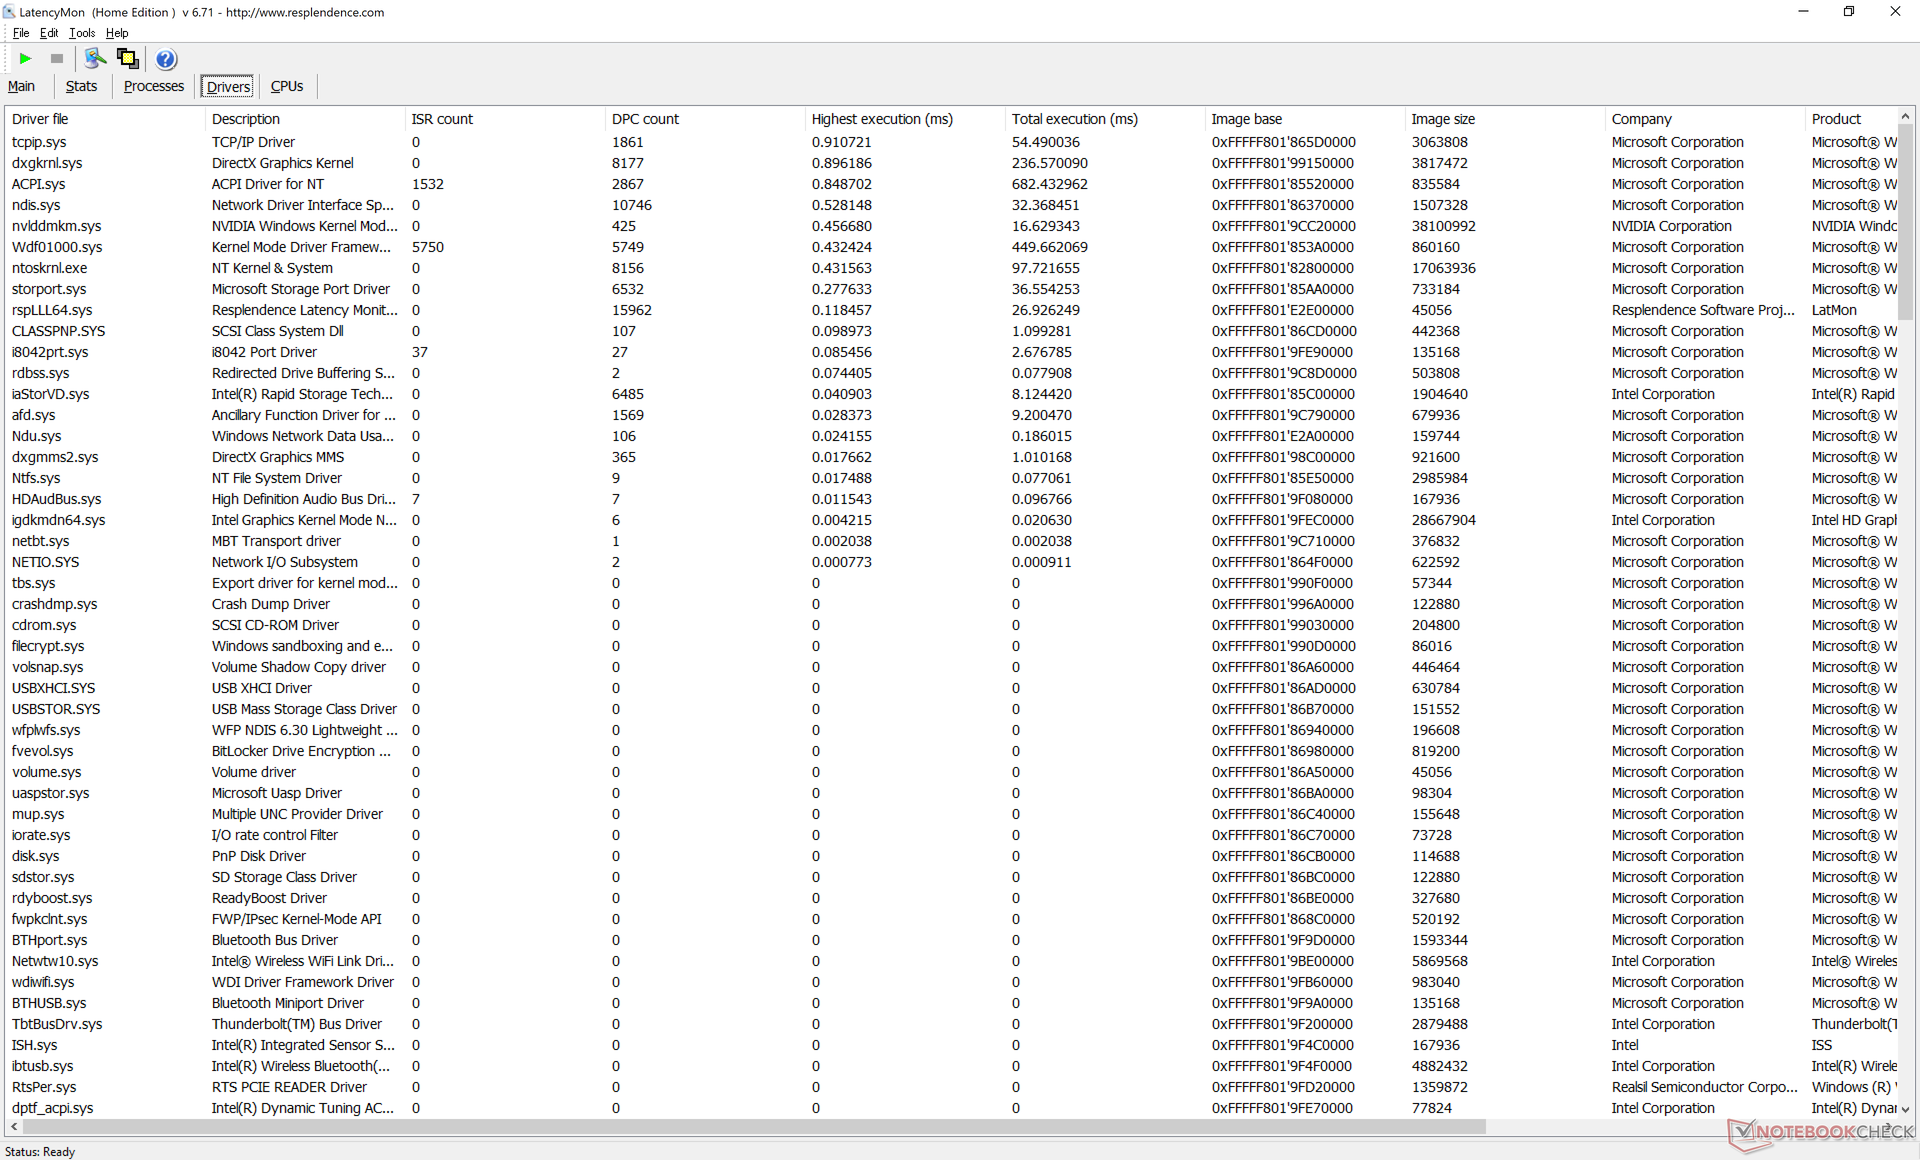
Latência do DPC
LatencyMon não mostra problemas de latência DPC ao navegar por várias abas em nossa página inicial. A reprodução do vídeo 4K a 60 FPS também é suave e sem queda de quadros.
| DPC Latencies / LatencyMon - interrupt to process latency (max), Web, Youtube, Prime95 | |
| Gigabyte Aero 17 HDR YC | |
| Razer Blade Pro 17 2021 (QHD Touch) | |
| Eluktronics RP-17 | |
| LG Ultra 17U70N | |
| Dell XPS 17 9700 Core i7 RTX 2060 Max-Q | |
| Dell XPS 17 9710 Core i7 RTX 3060 | |
* ... menor é melhor
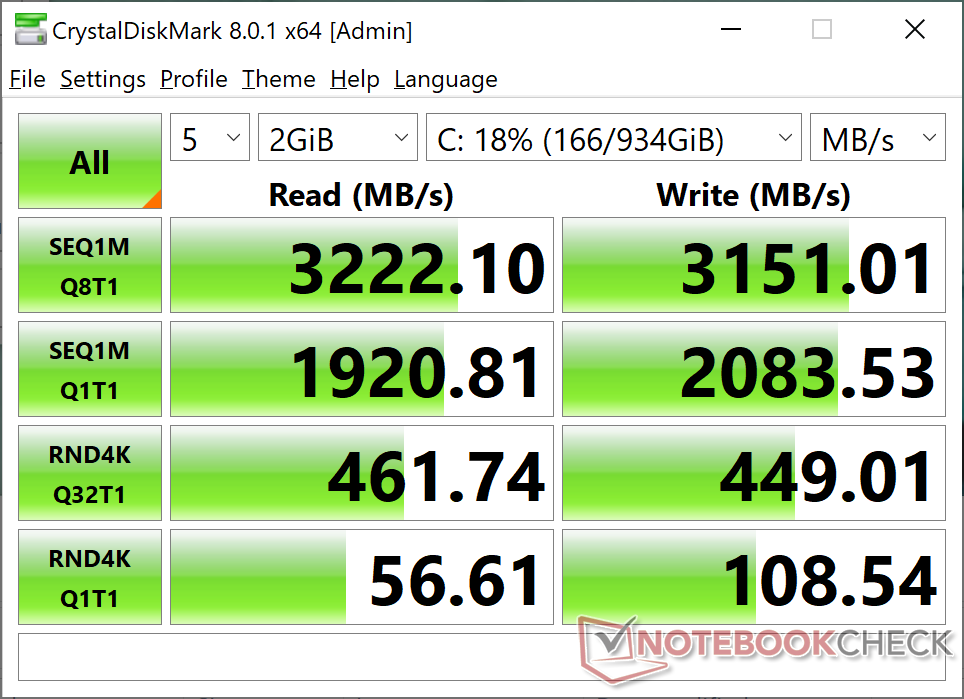
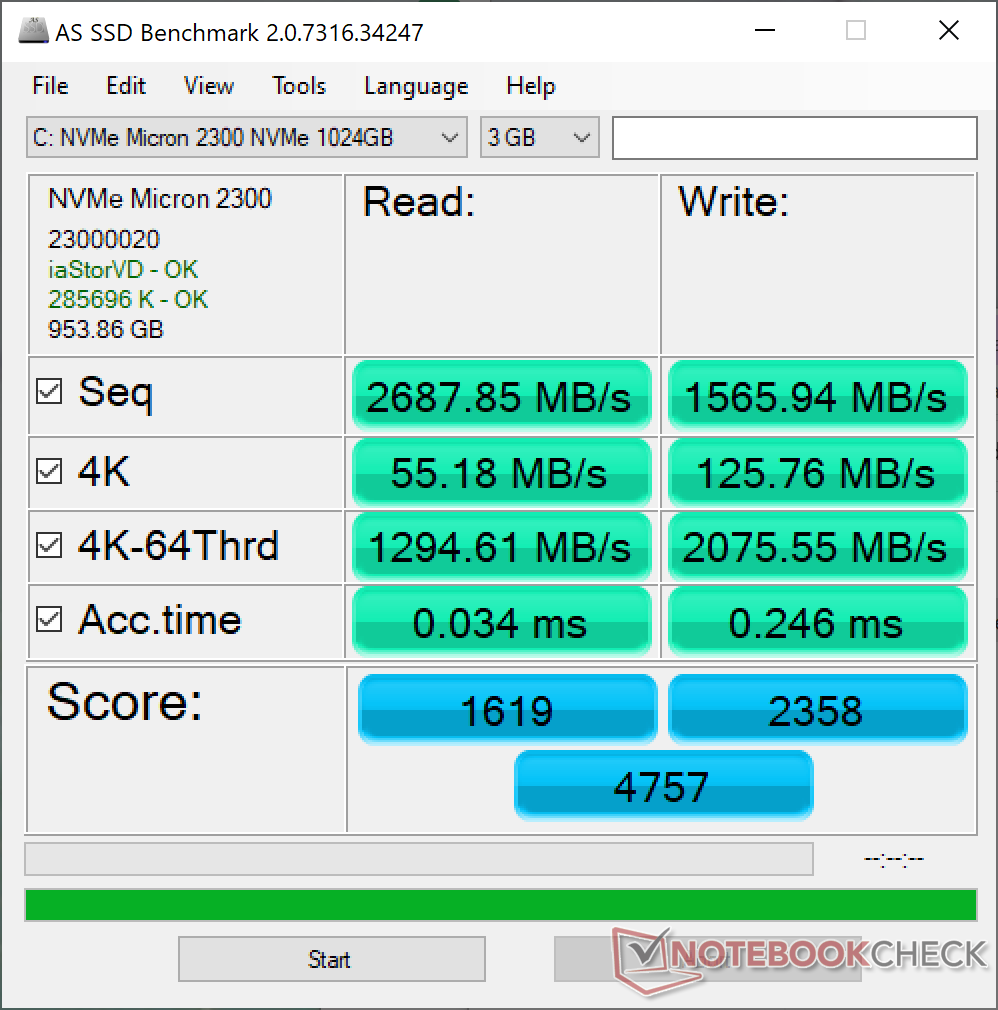
Dispositivos de armazenamento
A Dell atualizou ambos os slots PCIe 3.0 M.2 2280 no XPS 17 9700 para PCIe 4 x4 para o 9710. No entanto, nossa unidade de teste vem com um 1 TB Micron 2300 PCIe 3.0 NVMe SSD que não pode utilizar totalmente a maior largura de banda PCIe 4. O desempenho ainda é muito mais rápido do que o do Micron 2200S que foi enviado em nossa unidade mais antiga XPS 17 9700.
| Dell XPS 17 9710 Core i7 RTX 3060 Micron 2300 1TB MTFDHBA1T0TDV | Dell XPS 17 9700 Core i7 RTX 2060 Max-Q Micron 2200S 1TB MTFDHBA1T0TCK | Razer Blade Pro 17 2021 (QHD Touch) Samsung PM981a MZVLB1T0HBLR | Gigabyte Aero 17 HDR YC ESR01TBTLCG-EAC-4 | Eluktronics RP-17 Phison PS5013 PRO-X-1TB-G2R NVMe SSD | |
|---|---|---|---|---|---|
| AS SSD | -53% | 4% | 11% | -4% | |
| Seq Read (MB/s) | 2688 | 1141 -58% | 2068 -23% | 2674 -1% | 1689 -37% |
| Seq Write (MB/s) | 1566 | 994 -37% | 2047 31% | 2458 57% | 1695 8% |
| 4K Read (MB/s) | 55.2 | 31.98 -42% | 47.85 -13% | 52.1 -6% | 50 -9% |
| 4K Write (MB/s) | 125.8 | 61 -52% | 87.4 -31% | 113.4 -10% | 182.9 45% |
| 4K-64 Read (MB/s) | 1295 | 790 -39% | 1932 49% | 1881 45% | 1043 -19% |
| 4K-64 Write (MB/s) | 2076 | 845 -59% | 2017 -3% | 2849 37% | 1841 -11% |
| Access Time Read * (ms) | 0.034 | 0.063 -85% | 0.055 -62% | 0.102 -200% | 0.04 -18% |
| Access Time Write * (ms) | 0.246 | 0.679 -176% | 0.128 48% | 0.033 87% | 0.102 59% |
| Score Read (Points) | 1619 | 966 -40% | 2187 35% | 2201 36% | 1262 -22% |
| Score Write (Points) | 2358 | 1005 -57% | 2309 -2% | 3208 36% | 2194 -7% |
| Score Total (Points) | 4757 | 2448 -49% | 5612 18% | 6524 37% | 4112 -14% |
| Copy ISO MB/s (MB/s) | 1563 | 1732 11% | 2400 54% | 2124 36% | |
| Copy Program MB/s (MB/s) | 976 | 717 -27% | 684 -30% | 579 -41% | |
| Copy Game MB/s (MB/s) | 1786 | 1343 -25% | 1629 -9% | 1304 -27% | |
| CrystalDiskMark 5.2 / 6 | -29% | -2% | 10% | 4% | |
| Write 4K (MB/s) | 109.2 | 64.1 -41% | 123.5 13% | 141.2 29% | 226.1 107% |
| Read 4K (MB/s) | 56.6 | 39.93 -29% | 45.96 -19% | 46.48 -18% | 54.7 -3% |
| Write Seq (MB/s) | 2073 | 1191 -43% | 1861 -10% | 2433 17% | 1868 -10% |
| Read Seq (MB/s) | 1916 | 1418 -26% | 1584 -17% | 1742 -9% | 1648 -14% |
| Write 4K Q32T1 (MB/s) | 487 | 450.3 -8% | 466.4 -4% | 565 16% | 429.9 -12% |
| Read 4K Q32T1 (MB/s) | 463.2 | 365 -21% | 566 22% | 655 41% | 521 12% |
| Write Seq Q32T1 (MB/s) | 3155 | 1563 -50% | 2981 -6% | 3028 -4% | 2248 -29% |
| Read Seq Q32T1 (MB/s) | 3209 | 2683 -16% | 3260 2% | 3424 7% | 2484 -23% |
| Média Total (Programa/Configurações) | -41% /
-44% | 1% /
2% | 11% /
10% | 0% /
-1% |
* ... menor é melhor

Disk Throttling: DiskSpd Read Loop, Queue Depth 8
Desempenho da GPU - Max-Q no coração
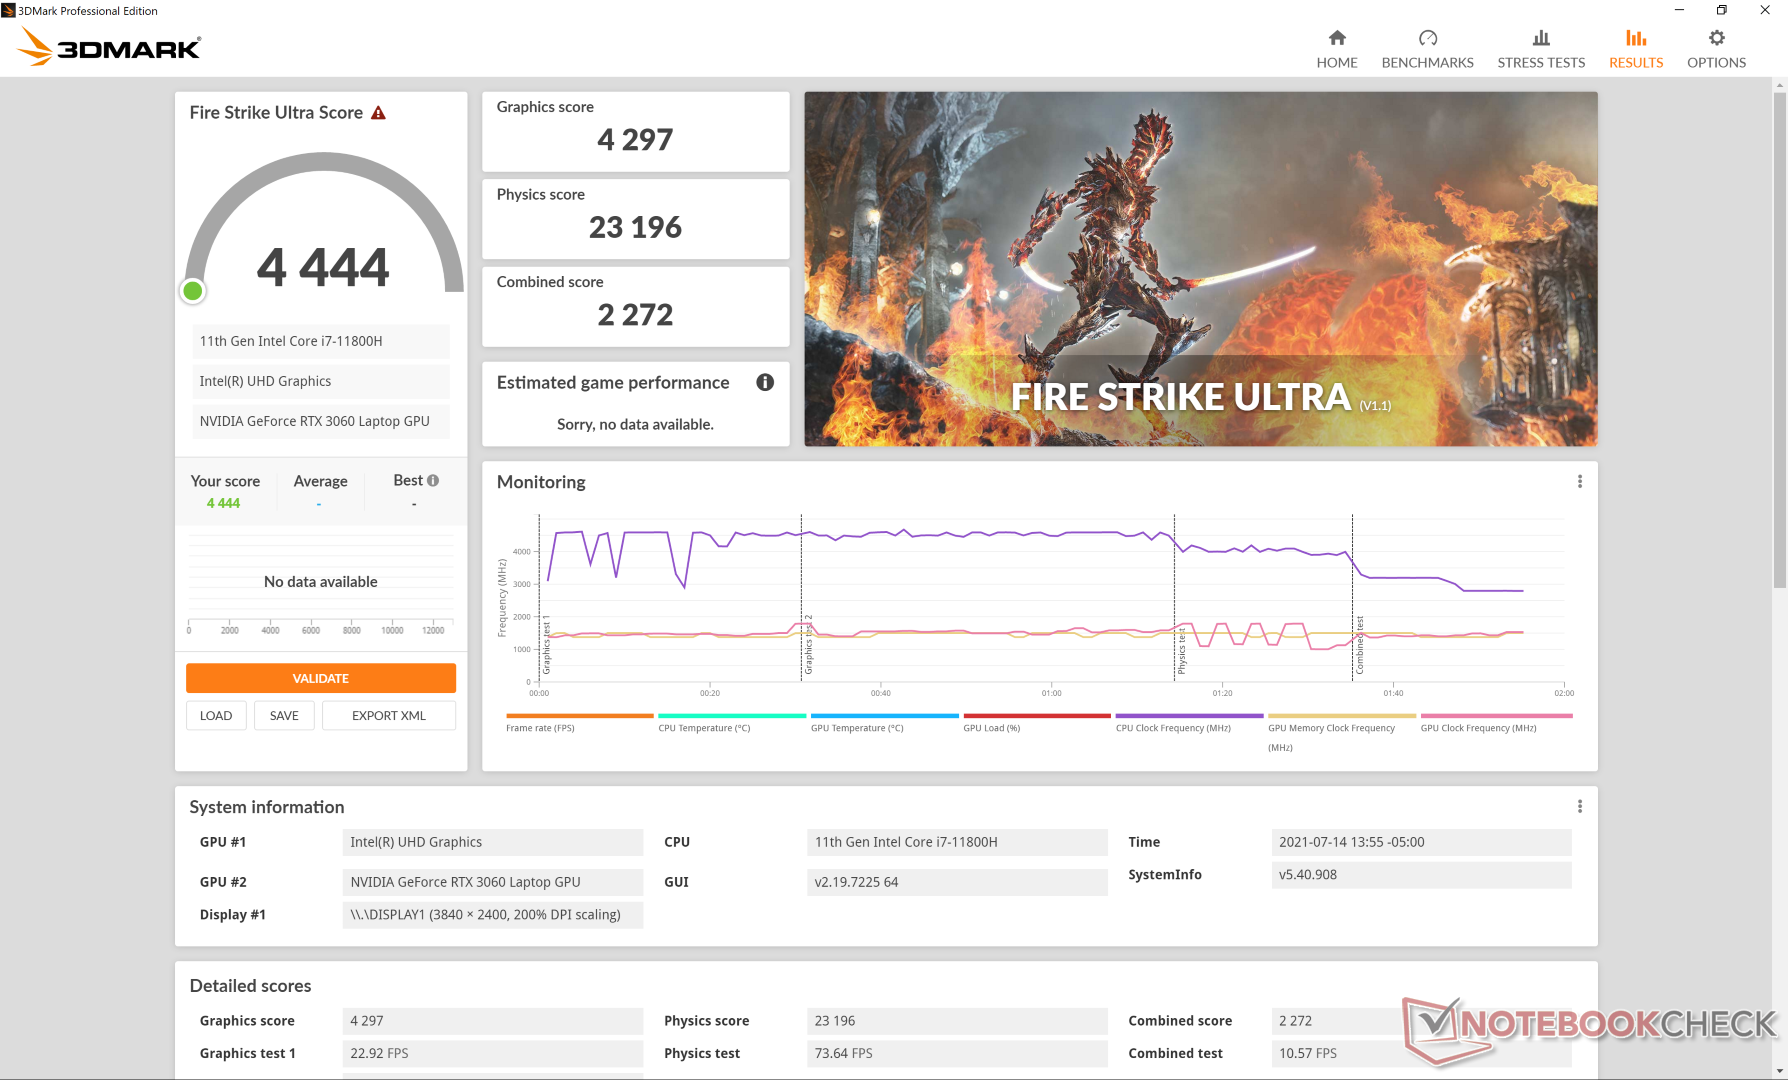
O desempenho gráfico bruto é cerca de 30 por cento mais rápido do que o RTX 2060 Max-Q no XPS 17 9700 do ano passado para ser uma atualização respeitável de ano para ano. Talvez mais surpreendentemente, o desempenho é apenas cerca de 10% mais lento do que 130 W GeForce RTX 3060 apesar do envelope de 70 W TGP muito mais baixo em nossa GPU Dell
O desempenho dos jogos é excelente, com resultados muito próximos aos laptops equipados com GeForce RTX 2070 gráficos. Entretanto, recomendamos jogos em um monitor externo quando possível devido aos lentos tempos de resposta preto-branco e cinza cinza na tela interna do XPS 17 para fantasmas muito perceptíveis. Afinal de contas, os jogos não são o foco principal para os laptops XPS.
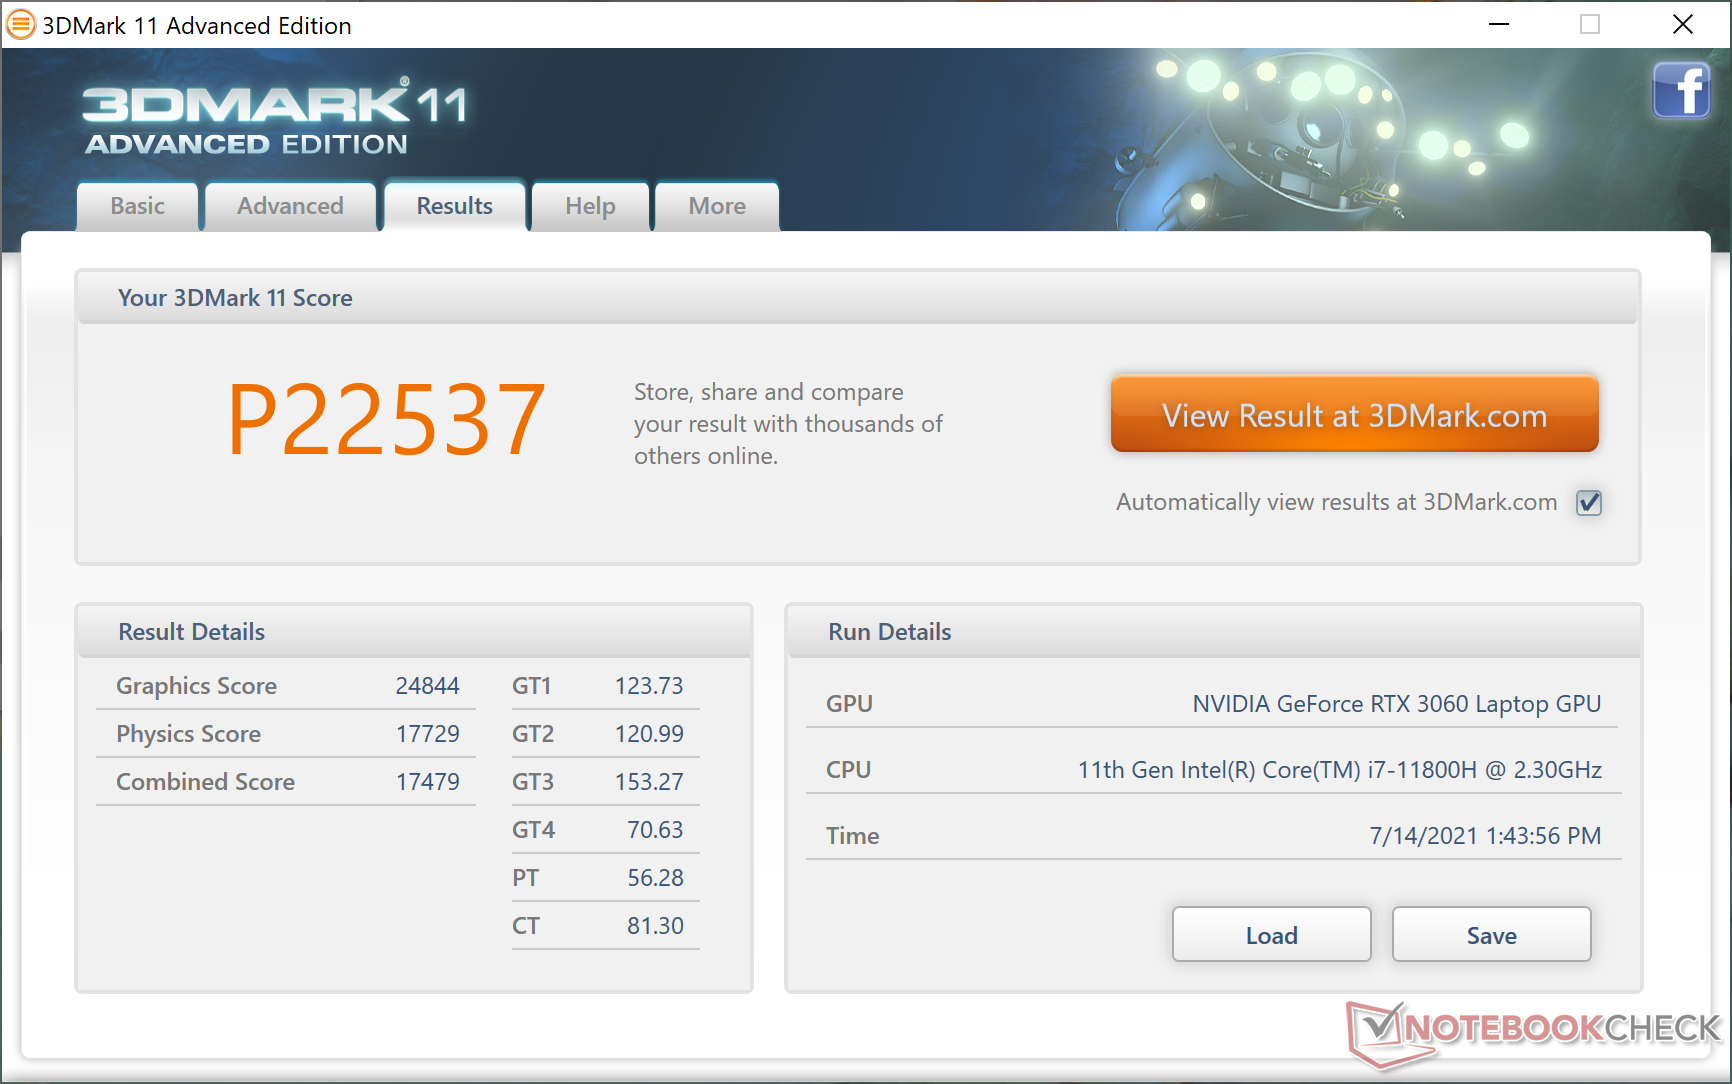

| 3DMark 11 Performance | 22537 pontos | |
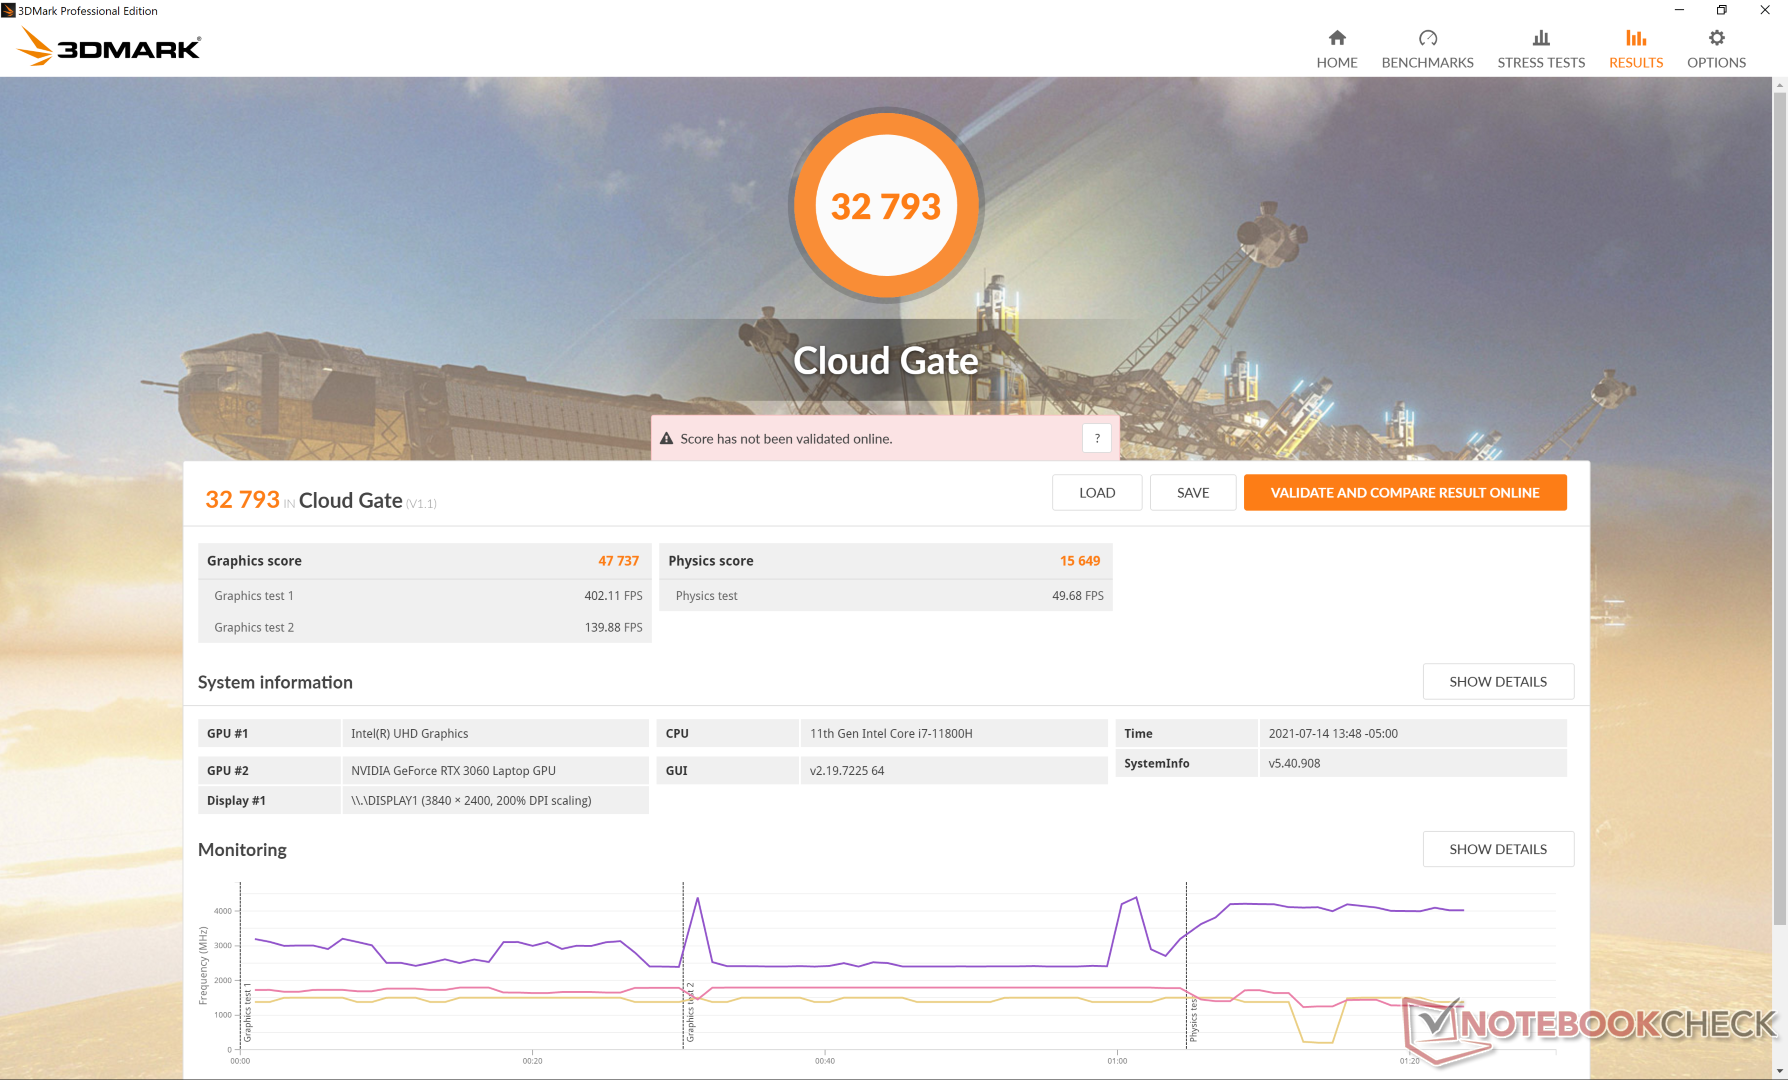
| 3DMark Cloud Gate Standard Score | 32793 pontos | |
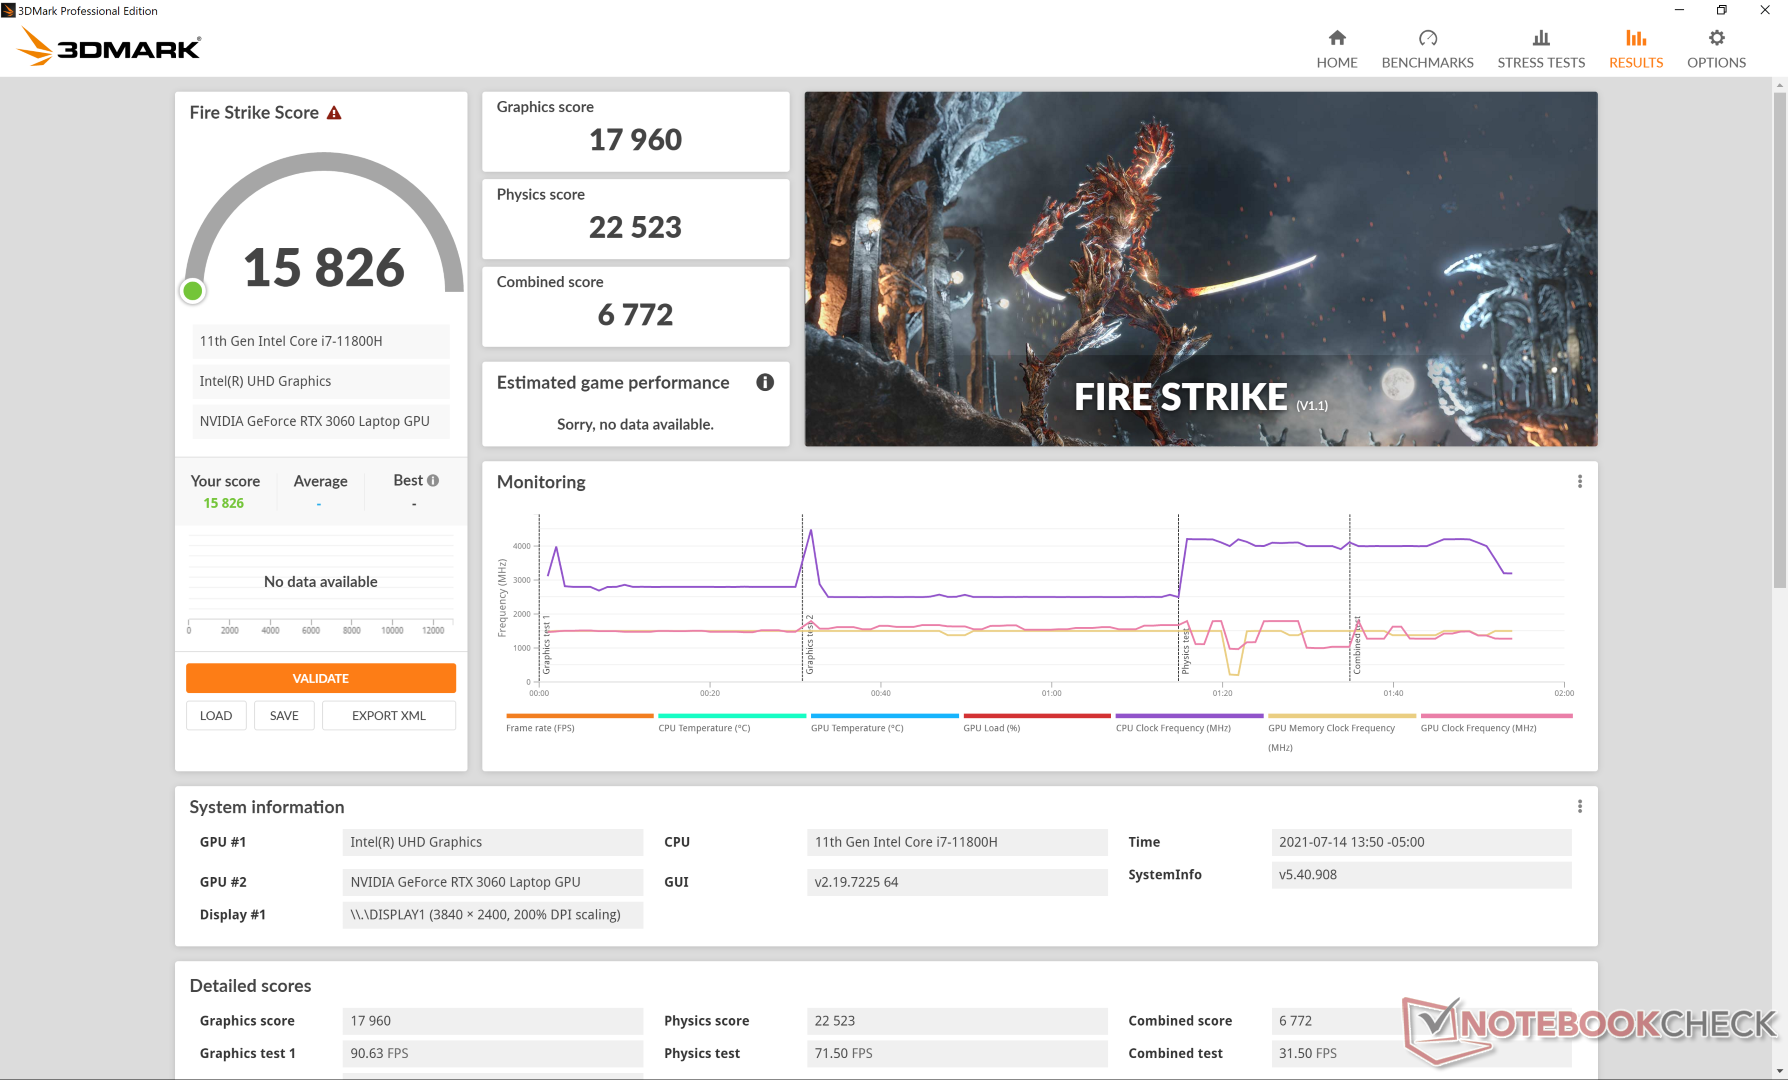
| 3DMark Fire Strike Score | 15826 pontos | |
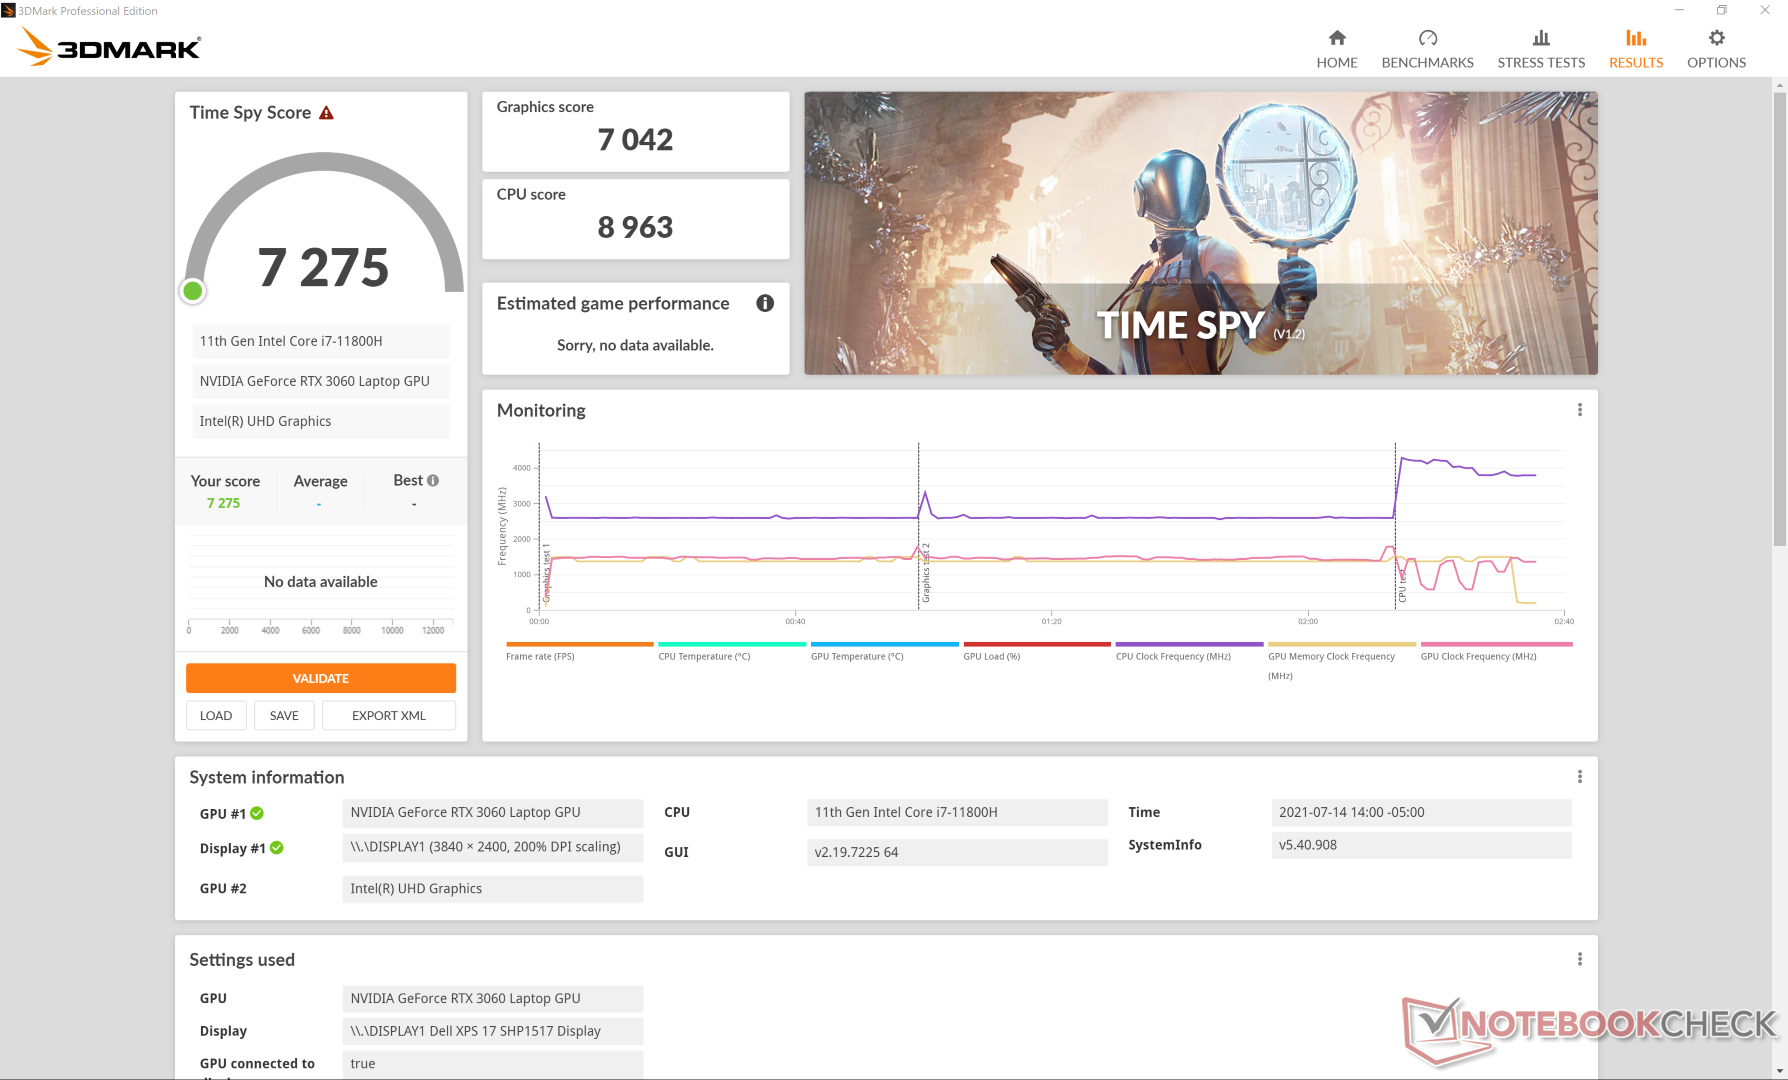
| 3DMark Time Spy Score | 7275 pontos | |
Ajuda | ||
Witcher 3 FPS Chart
| baixo | média | alto | ultra | QHD | 4K | |
|---|---|---|---|---|---|---|
| GTA V (2015) | 181 | 178 | 155 | 81.6 | 63.6 | |
| The Witcher 3 (2015) | 341.6 | 218.1 | 142.2 | 72.3 | ||
| Dota 2 Reborn (2015) | 168 | 148 | 133 | 126 | ||
| Final Fantasy XV Benchmark (2018) | 140 | 98.2 | 73.5 | 54.9 | 31.4 | |
| X-Plane 11.11 (2018) | 125 | 105 | 84.6 | 60.2 | ||
| Strange Brigade (2018) | 348 | 176 | 140 | 123 | 91.1 |
Emissions
Sistema Ruído - Silencioso como um Ultrabook, Alto como um Jogador
O comportamento dos ventiladores não mudou realmente desde que tanto o teto de energia quanto a solução de resfriamento permaneceram os mesmos. Ao executar 3DMark 06 e Witcher 3 nomodo otimizado, o ruído do ventilador se estabilizaria em 29,2 dB(A) e 46,2 dB(A), respectivamente. Quando em funcionamento Witcher 3 no modo Ultra Performance, o ruído dos ventiladores seria superior a 49 dB(A), que é o que gravamos no modelo do ano passado. Esta faixa é mais semelhante aos laptops para jogos do que outros Ultrabooks, uma vez que o XPS 17 está carregando uma GPU de nível de jogo.
É recomendado executar o sistema em modo Otimizado ou inferior e com o iGPU ativo quando o desempenho extra não for necessário. Caso contrário, os ventiladores pulsarão com mais freqüência, especialmente ao lançar as aplicações.
| Dell XPS 17 9710 Core i7 RTX 3060 GeForce RTX 3060 Laptop GPU, i7-11800H, Micron 2300 1TB MTFDHBA1T0TDV | Dell XPS 17 9700 Core i7 RTX 2060 Max-Q GeForce RTX 2060 Max-Q, i7-10875H, Micron 2200S 1TB MTFDHBA1T0TCK | Razer Blade Pro 17 2021 (QHD Touch) GeForce RTX 3080 Laptop GPU, i7-10875H, Samsung PM981a MZVLB1T0HBLR | Gigabyte Aero 17 HDR YC GeForce RTX 3080 Laptop GPU, i9-10980HK, ESR01TBTLCG-EAC-4 | LG Ultra 17U70N GeForce GTX 1650 Mobile, i5-10210U, Samsung SSD PM981a MZVLB512HBJQ | Eluktronics RP-17 GeForce RTX 2060 Mobile, R7 4800H, Phison PS5013 PRO-X-1TB-G2R NVMe SSD | |
|---|---|---|---|---|---|---|
| Noise | -5% | -7% | -10% | -3% | -3% | |
| desligado / ambiente * (dB) | 25.5 | 28 -10% | 26.1 -2% | 26 -2% | 27 -6% | 26.2 -3% |
| Idle Minimum * (dB) | 25.2 | 28 -11% | 26.1 -4% | 30 -19% | 27.3 -8% | 26.2 -4% |
| Idle Average * (dB) | 25.2 | 28 -11% | 26.5 -5% | 32 -27% | 27.3 -8% | 26.2 -4% |
| Idle Maximum * (dB) | 25.2 | 28 -11% | 30.7 -22% | 36 -43% | 31.7 -26% | 30 -19% |
| Load Average * (dB) | 45.9 | 43.2 6% | 43.5 5% | 45 2% | 43.6 5% | 38.5 16% |
| Witcher 3 ultra * (dB) | 49 | 49 -0% | 54 -10% | 42 14% | 45.3 8% | 47.2 4% |
| Load Maximum * (dB) | 50.4 | 50.5 -0% | 55 -9% | 49 3% | 44.7 11% | 54.6 -8% |
* ... menor é melhor
Barulho
| Ocioso |
| 25.2 / 25.2 / 25.2 dB |
| Carga |
| 45.9 / 50.4 dB |
 | ||
30 dB silencioso 40 dB(A) audível 50 dB(A) ruidosamente alto |
||
min: | ||
Temperatura
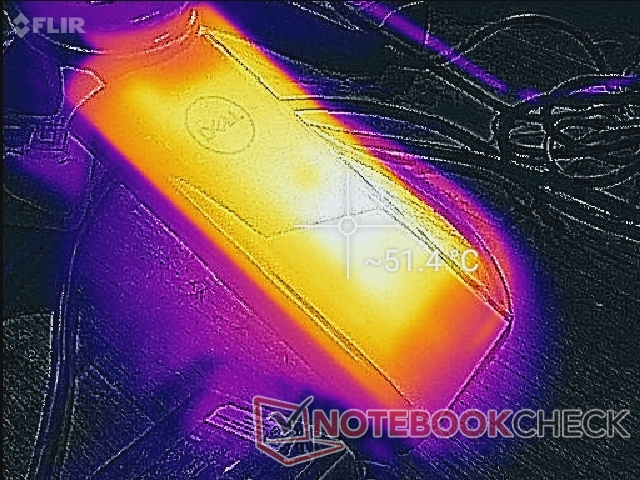
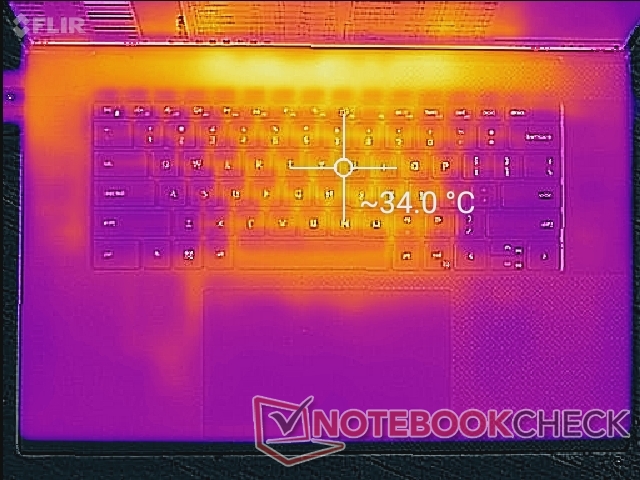
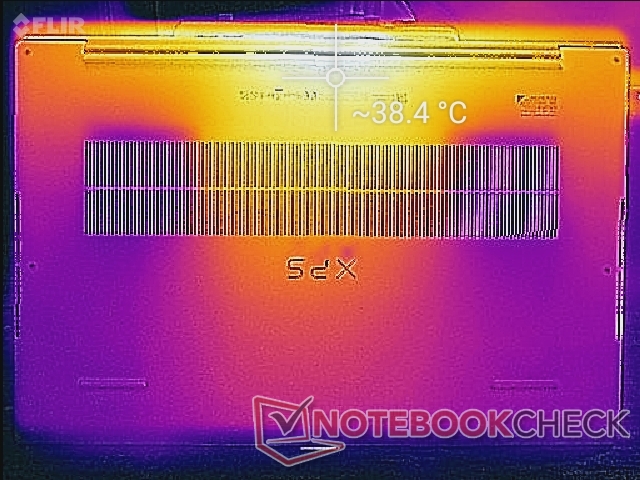
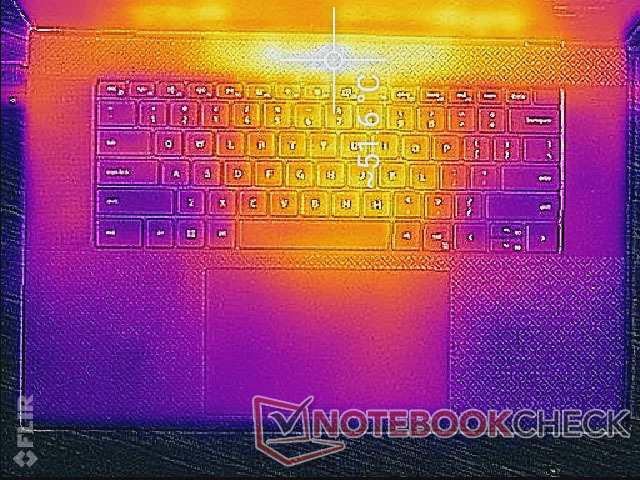
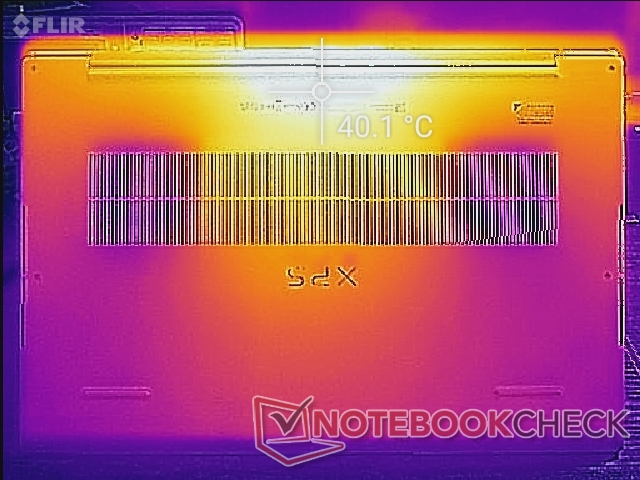
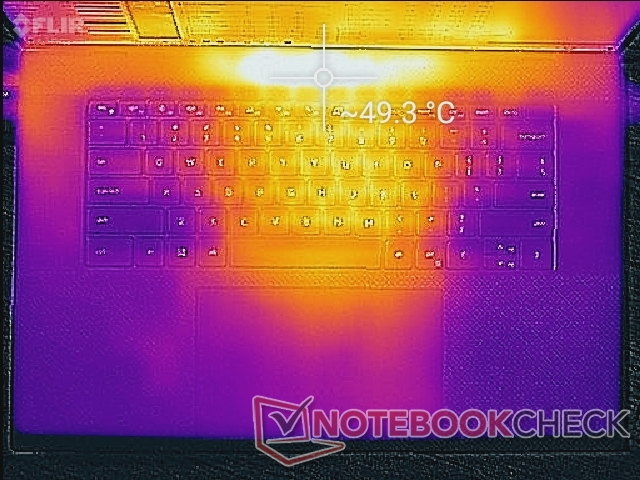
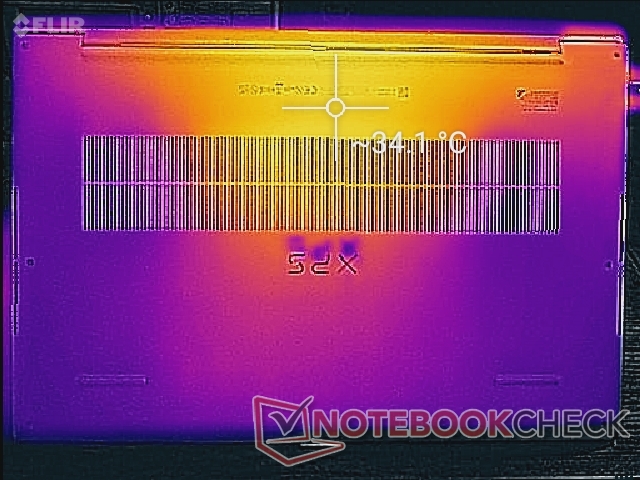
Os pontos quentes quando se corre cargas altas por longos períodos podem chegar a 51 C e 41 C nas superfícies superior e inferior do laptop, respectivamente. Estes mesmos pontos quentes seriam quentes a 34 C a 37 C mesmoquando ociosos na área de trabalho. Entretanto, os pontos quentes estão concentrados em direção ao centro traseiro do chassi, enquanto os apoios das palmas permanecem muito mais frios. Isto é semelhante ao que observamos no Razer Blade Pro 17 mas em um grau ainda maior sobre a Dell.
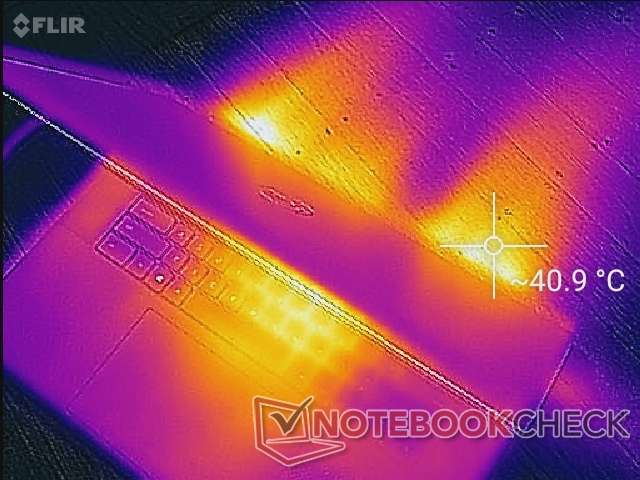
(-) A temperatura máxima no lado superior é 50.2 °C / 122 F, em comparação com a média de 36.8 °C / 98 F , variando de 21 a 71 °C para a classe Multimedia.
(+) A parte inferior aquece até um máximo de 38.4 °C / 101 F, em comparação com a média de 39.1 °C / 102 F
(+) Em uso inativo, a temperatura média para o lado superior é 29.4 °C / 85 F, em comparação com a média do dispositivo de 31.3 °C / ### class_avg_f### F.
(±) Jogando The Witcher 3, a temperatura média para o lado superior é 33.9 °C / 93 F, em comparação com a média do dispositivo de 31.3 °C / ## #class_avg_f### F.
(+) Os apoios para as mãos e o touchpad são mais frios que a temperatura da pele, com um máximo de 29.8 °C / 85.6 F e, portanto, são frios ao toque.
(±) A temperatura média da área do apoio para as mãos de dispositivos semelhantes foi 28.7 °C / 83.7 F (-1.1 °C / -1.9 F).
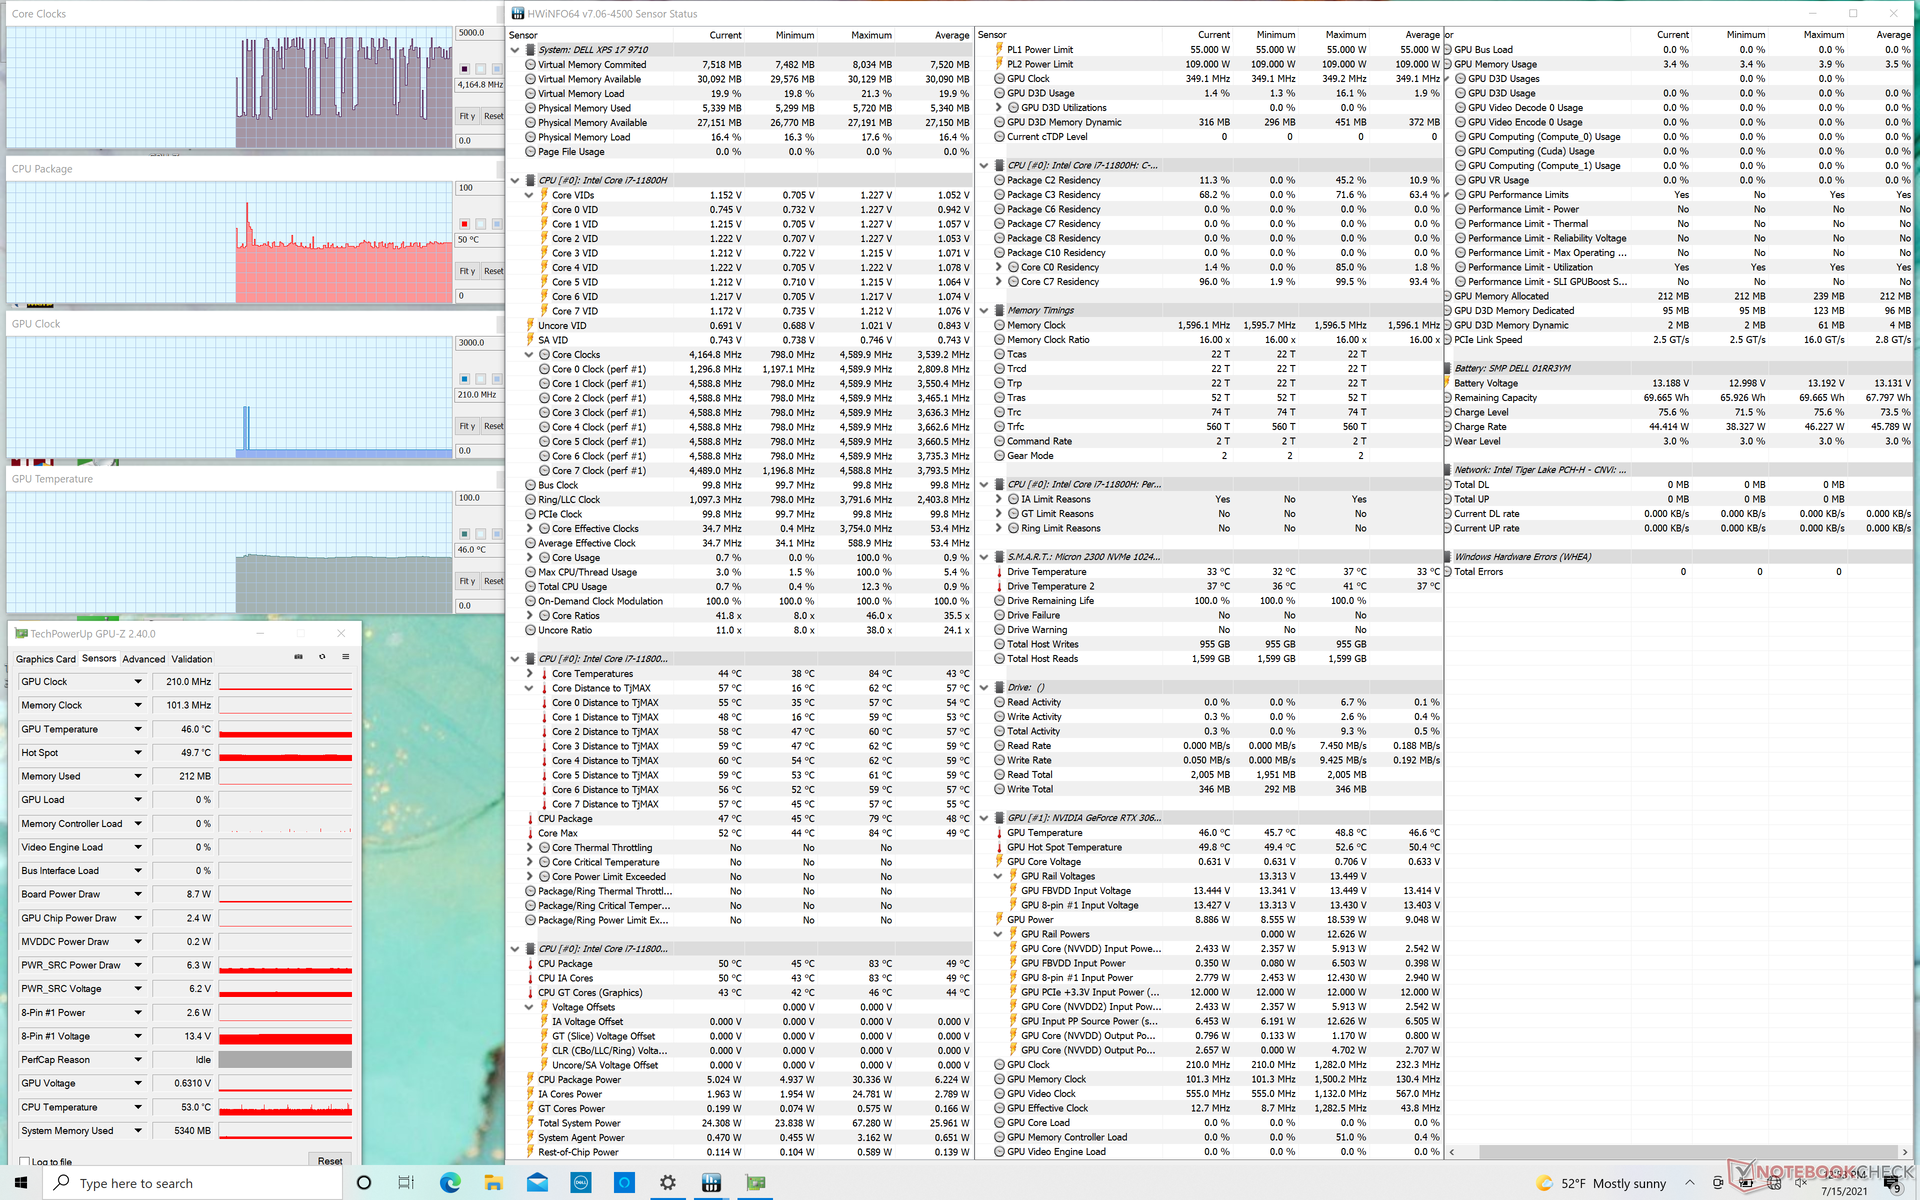
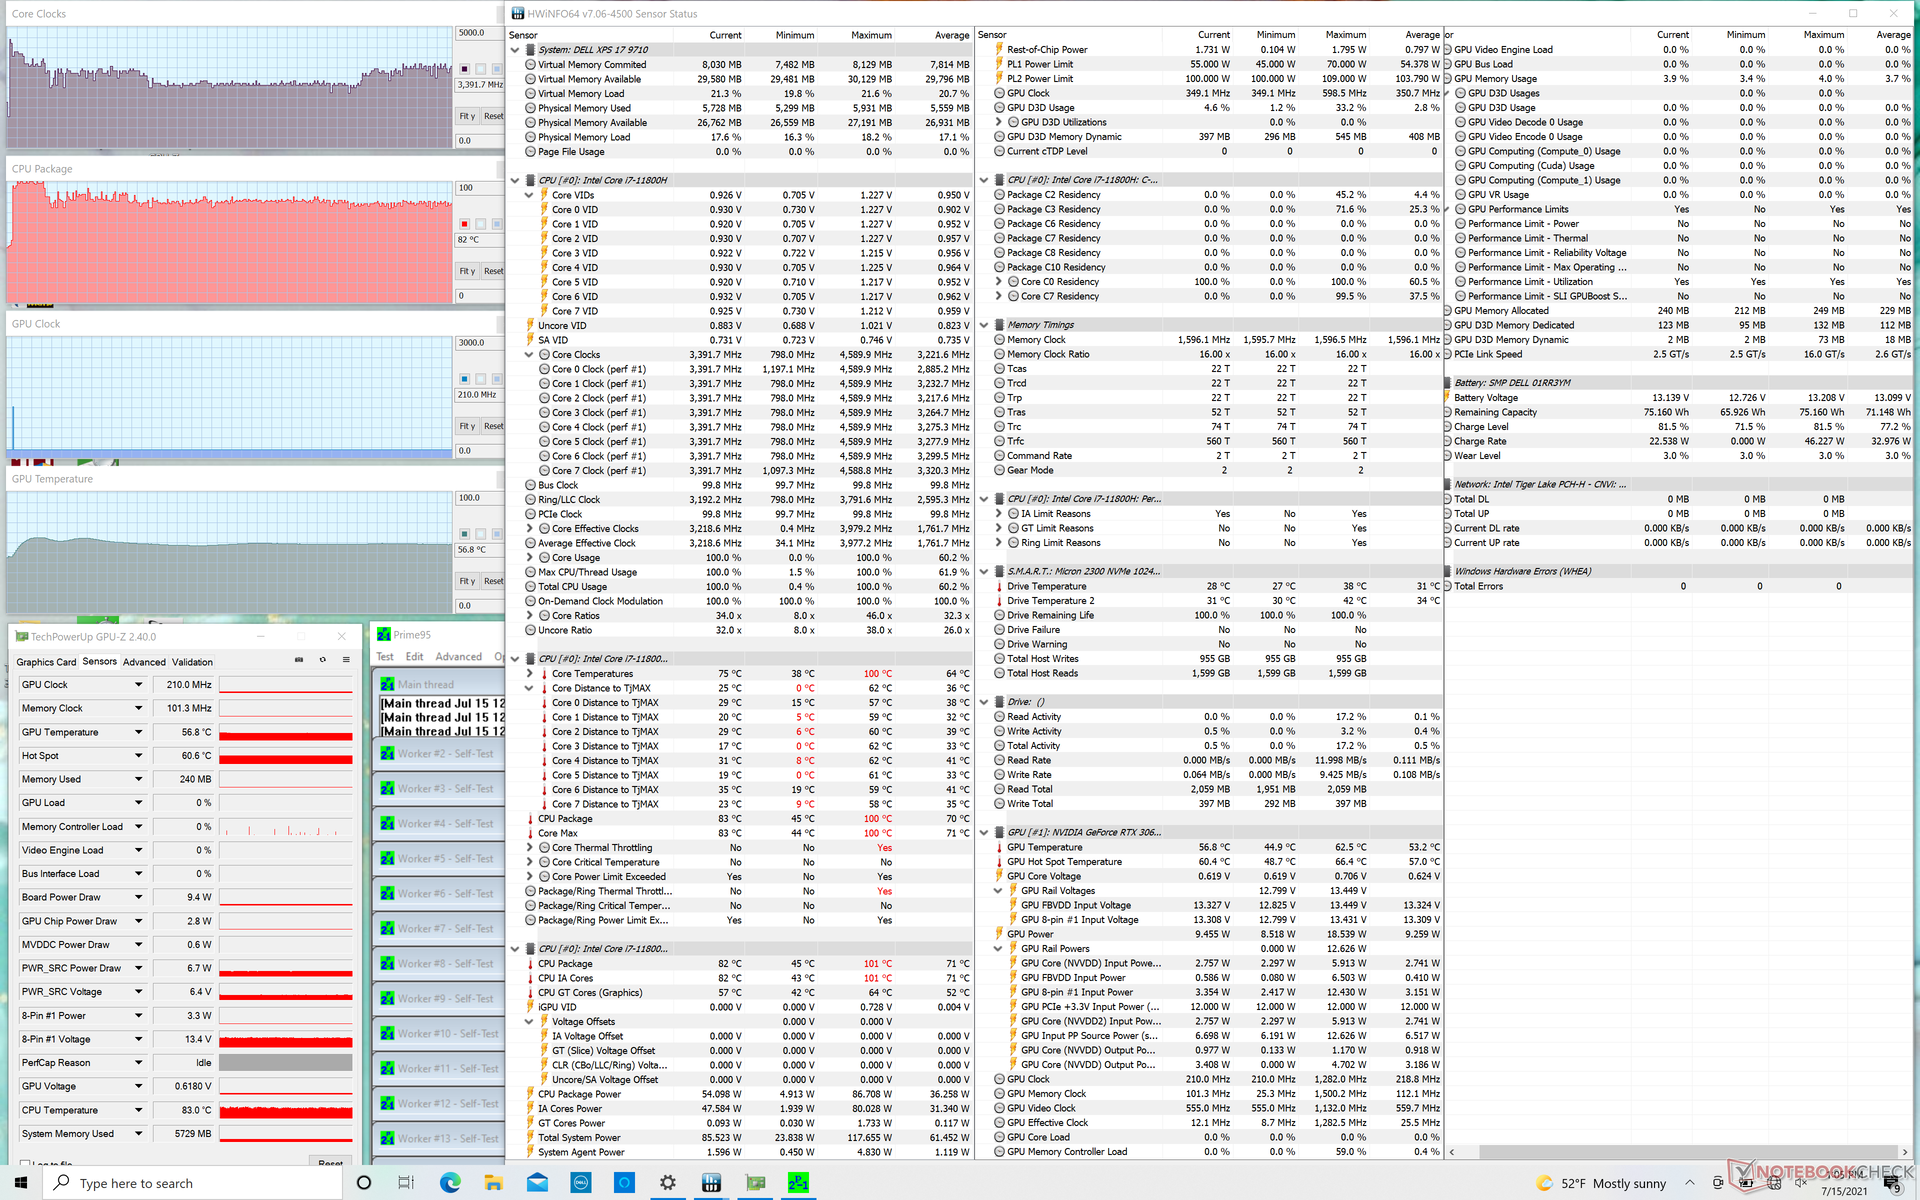
Teste de estresse
Quando estressada com Prime95, a CPU aumentaria para 3,6 a 4 GHz e a uma temperatura central agradável de 100 C. Após cerca de 90 segundos, entretanto, a taxa de clock variaria entre 2,5 GHz e 3,4 GHz para manter uma temperatura central mais fria de 82 C. A execução deste mesmo teste no XPS 17 9700 resultaria em taxas e temperaturas centrais de 2,9 a 3,1 GHz e 99 C, respectivamente, para sugerir que o XPS 19 9710 pode diminuir ainda mais o Turbo Boost da CPU para temperaturas mais baixas quando necessário
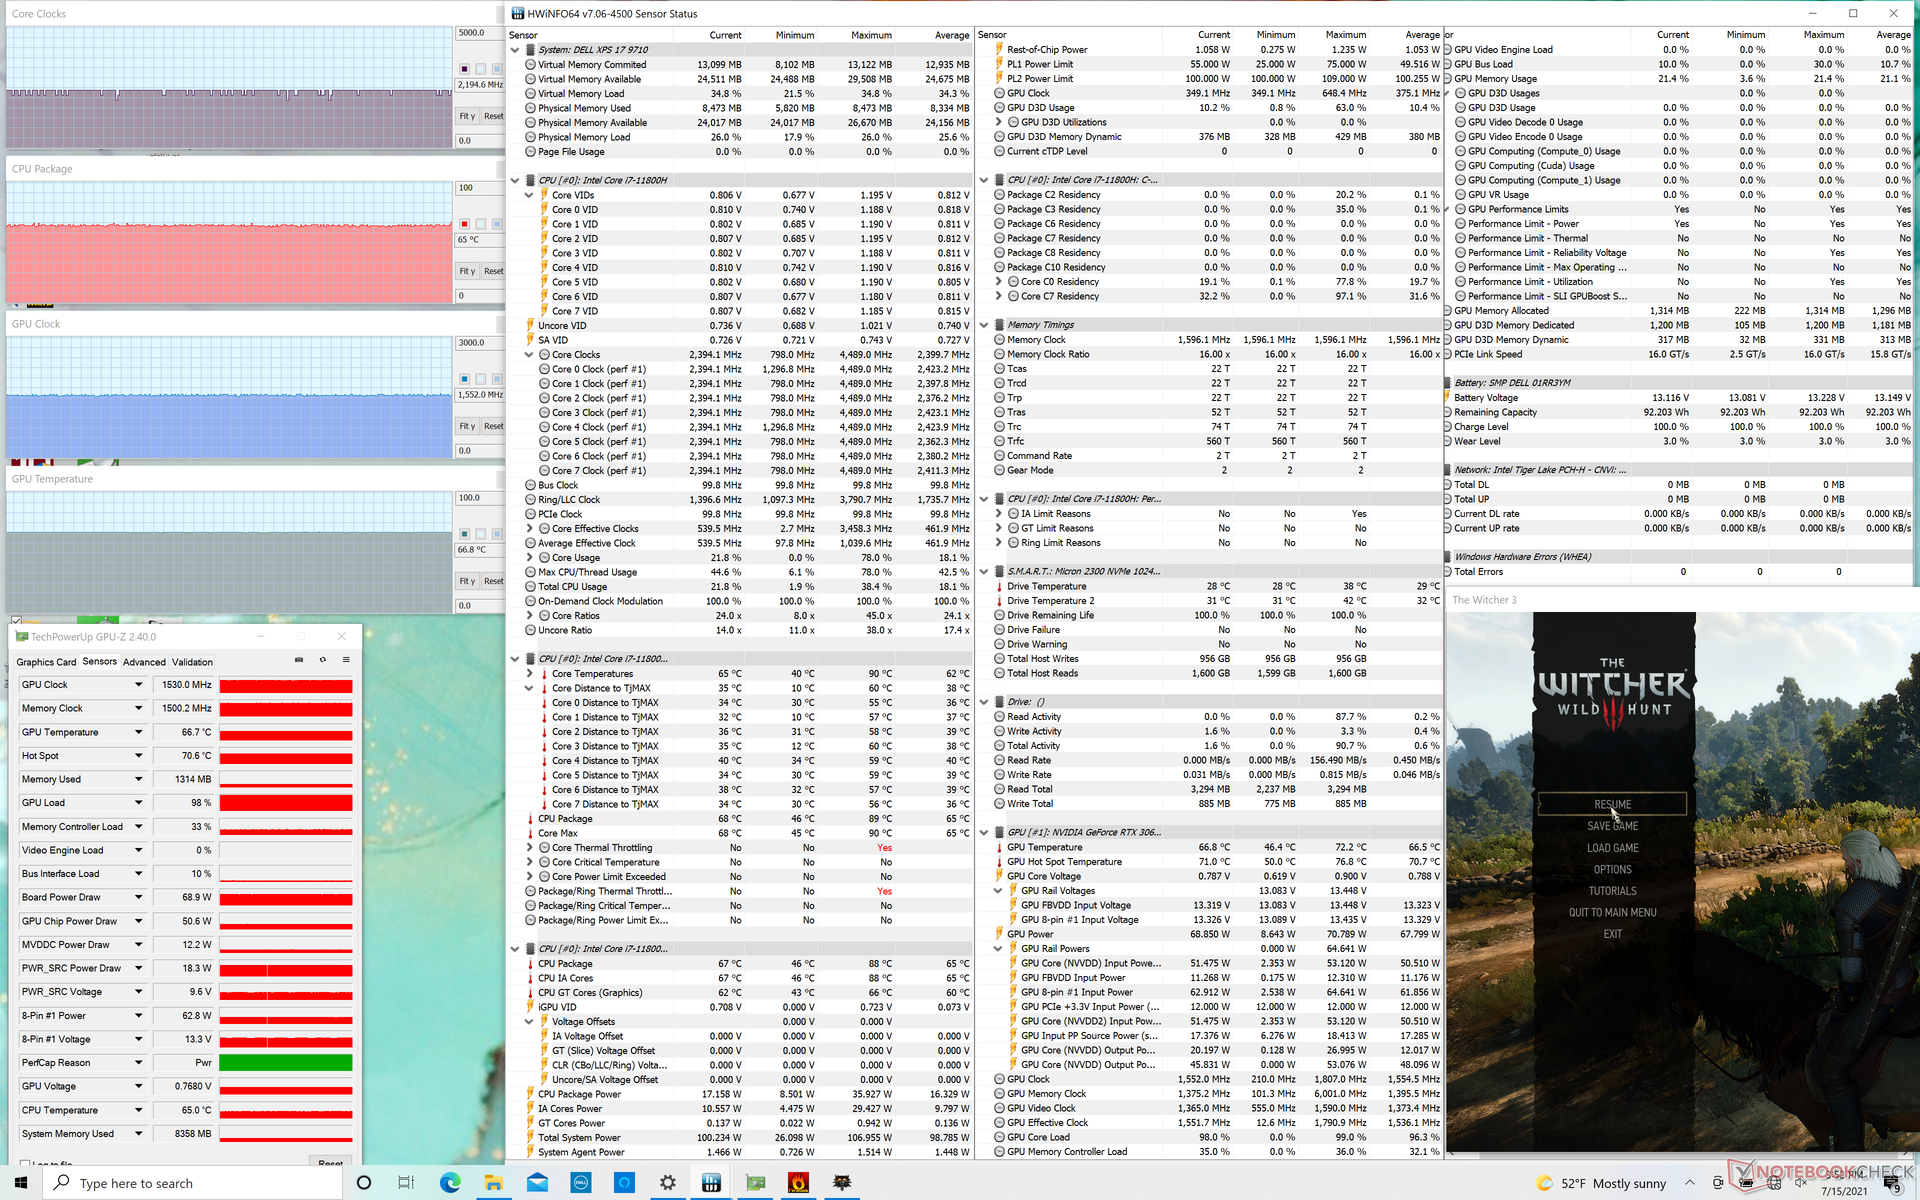
A execução do Witcher 3 mostra relógios GPU e temperaturas centrais mais altas do que no RTX 2060 Max-Q. Por outro lado, as taxas de relógio da CPU são mais baixas para uma temperatura mais baixa da CPU. A distribuição de energia parece ser mais fina no XPS 17 9710 do que no 9700 como resultado. As temperaturas centrais estão na verdade muito próximas ao que observamos no Eluktronics RP-17 que é um laptop mais grosso de 17,3 polegadas, mas com a GPU RTX 2060 mais antiga.
O funcionamento com baterias limitará o desempenho. Um teste Fire Strike sobre a energia da bateria retornaria pontuações de Física e Gráficos de 14102 e 13572 pontos, respectivamente, em comparação com 22523 e 17960 pontos quando em rede elétrica.
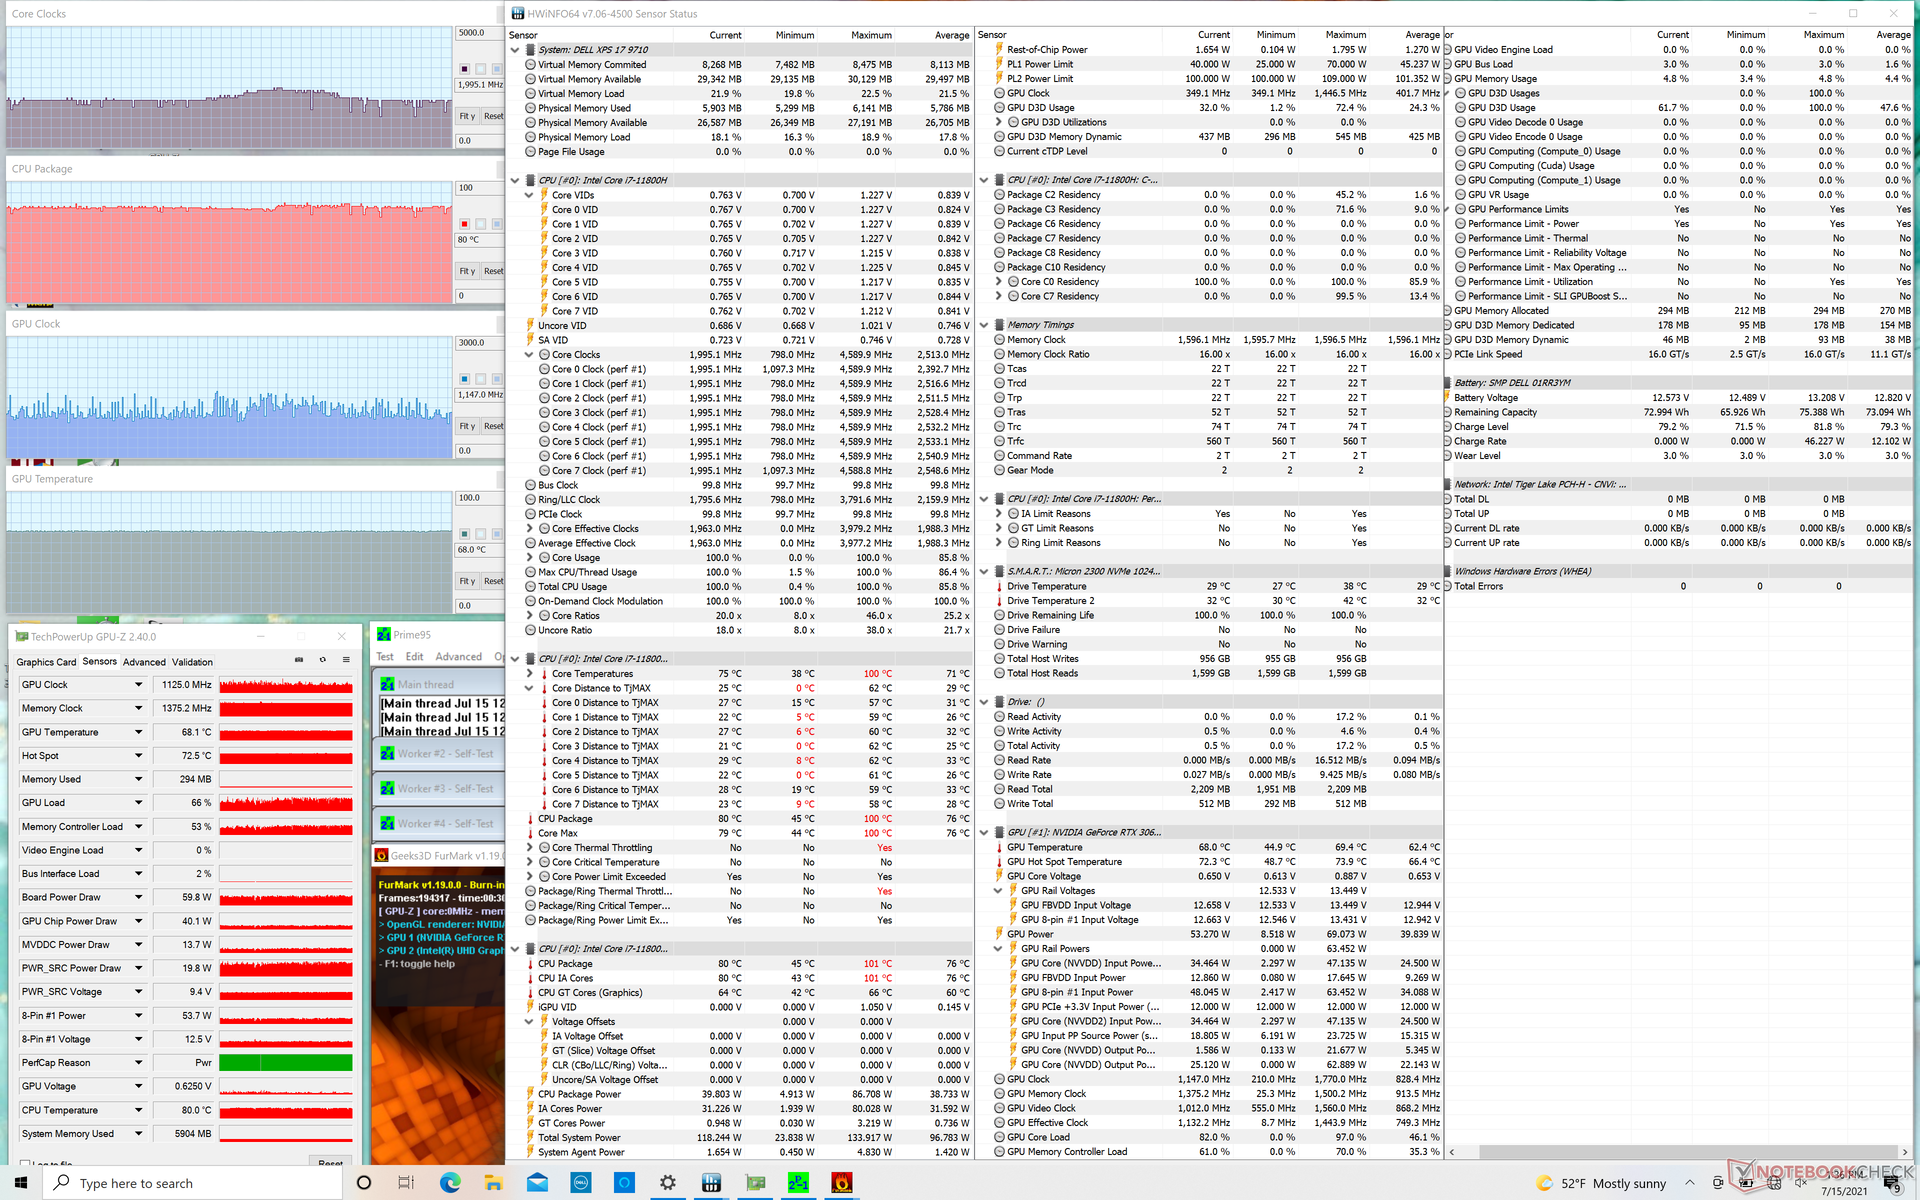
| RelógioCPU (GHz) | RelógioGPU (MHz) | Temperaturamédiada CPU (°C) | Temperaturamédiada GPU (°C) | |
| System Idle | -- | -- | 50 | 46 |
| Prime95 Stress | 2.5 - 3.4 | --82 | 51 | |
| Prime95 + FurMark Stress | 1.7 - 2.5 | ~1147 | 80 | 68 |
| Witcher 3 Stress | 2.2 | 1530 | 65 | 67 |
Oradores
Os alto-falantes quad (2x subwoofer de 2,5 W + 2x tweeters de 1,5 W) permanecem inalterados em relação ao XPS 17 9700 do ano passado. A qualidade de áudio é mais equilibrada do que na maioria dos outros laptops, como exemplificado pela curva de ruído rosa relativamente plana. Entretanto, o volume máximo poderia ter sido um pouco mais alto


Dell XPS 17 9710 Core i7 RTX 3060 análise de áudio
(±) | o volume do alto-falante é médio, mas bom (###valor### dB)
Graves 100 - 315Hz
(±) | graves reduzidos - em média 5.2% menor que a mediana
(±) | a linearidade dos graves é média (10.7% delta para a frequência anterior)
Médios 400 - 2.000 Hz
(+) | médios equilibrados - apenas 2.6% longe da mediana
(+) | médios são lineares (4.5% delta para frequência anterior)
Altos 2 - 16 kHz
(+) | agudos equilibrados - apenas 2.2% longe da mediana
(+) | os máximos são lineares (5% delta da frequência anterior)
Geral 100 - 16.000 Hz
(+) | o som geral é linear (8.7% diferença em relação à mediana)
Comparado com a mesma classe
» 11% de todos os dispositivos testados nesta classe foram melhores, 2% semelhantes, 87% piores
» O melhor teve um delta de 5%, a média foi 17%, o pior foi 45%
Comparado com todos os dispositivos testados
» 3% de todos os dispositivos testados foram melhores, 1% semelhantes, 97% piores
» O melhor teve um delta de 4%, a média foi 23%, o pior foi 134%
Apple MacBook 12 (Early 2016) 1.1 GHz análise de áudio
(+) | os alto-falantes podem tocar relativamente alto (###valor### dB)
Graves 100 - 315Hz
(±) | graves reduzidos - em média 11.3% menor que a mediana
(±) | a linearidade dos graves é média (14.2% delta para a frequência anterior)
Médios 400 - 2.000 Hz
(+) | médios equilibrados - apenas 2.4% longe da mediana
(+) | médios são lineares (5.5% delta para frequência anterior)
Altos 2 - 16 kHz
(+) | agudos equilibrados - apenas 2% longe da mediana
(+) | os máximos são lineares (4.5% delta da frequência anterior)
Geral 100 - 16.000 Hz
(+) | o som geral é linear (10.2% diferença em relação à mediana)
Comparado com a mesma classe
» 7% de todos os dispositivos testados nesta classe foram melhores, 2% semelhantes, 90% piores
» O melhor teve um delta de 5%, a média foi 18%, o pior foi 53%
Comparado com todos os dispositivos testados
» 5% de todos os dispositivos testados foram melhores, 1% semelhantes, 94% piores
» O melhor teve um delta de 4%, a média foi 23%, o pior foi 134%
Energy Management
Consumo de energia
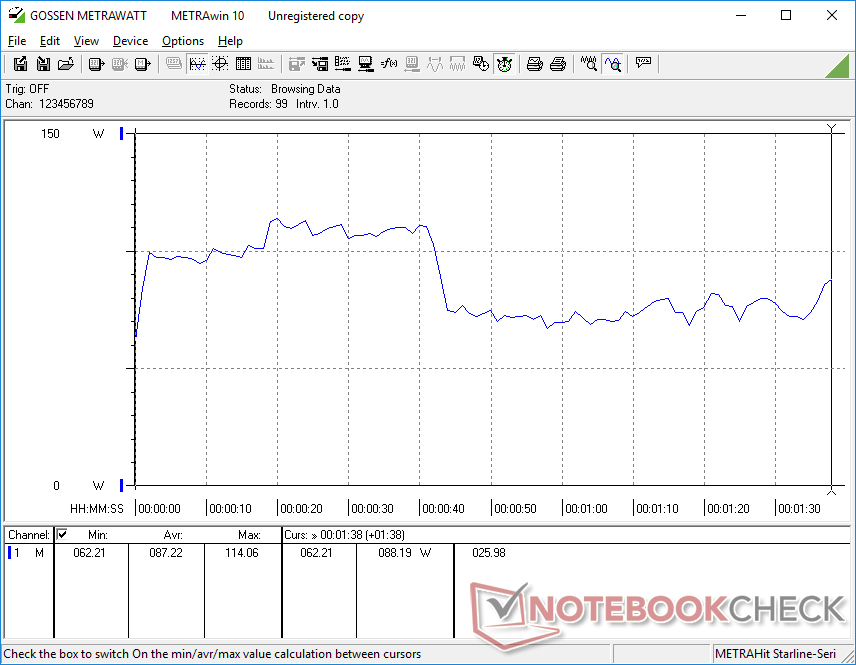
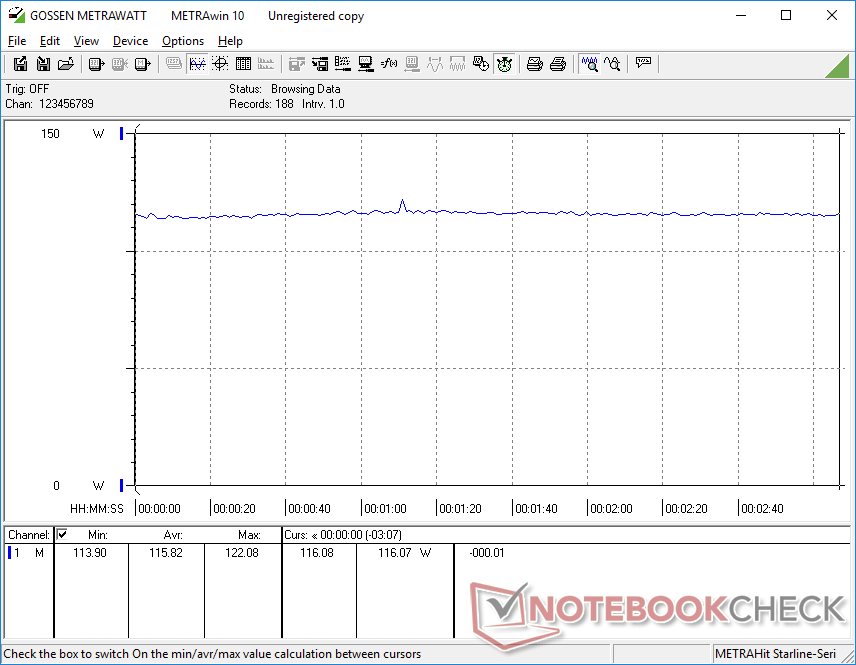
Como observado duas vezes antes deA partir de nosso XPS 17 9700 SKU, registramos leituras de consumo de energia inferior ao esperado, levando ao esgotamento da bateria, mesmo quando conectado a uma tomada. Felizmente, a Dell praticamente solucionou o problema no XPS 17 9710. A bateria não drenará mais quando estiver rodando cargas exigentes e, em vez disso, permanecerá em qualquer carga em que estiver atualmente. Por exemplo, funcionando Witcher 3 a 80% ou 100% de carga da bateria enquanto conectada à rede elétrica não irá drenar nem carregar a bateria em nossos testes
Somos capazes de registrar um novo consumo máximo de 131,6 W a partir do mesmo adaptador de 130 W AC quando tanto a CPU quanto a GPU estiverem em 100% de utilização. A Dell usa seu próprio método de fornecimento de energia USB-C para ultrapassar o limite padrão de 100 W de USB-C. Talvez uma meta ainda maior de 150 W ou mais teria permitido que o laptop carregasse e jogasse simultaneamente.
O sistema Dell será enviado com um adaptador USB-C AC de 90 W ao invés de 130 W se configurado sem gráficos GeForce.
| desligado | |
| Ocioso | |
| Carga |
|
Key:
min: | |
| Dell XPS 17 9710 Core i7 RTX 3060 i7-11800H, GeForce RTX 3060 Laptop GPU, Micron 2300 1TB MTFDHBA1T0TDV, IPS, 3840x2400, 17" | Dell XPS 17 9700 Core i7 RTX 2060 Max-Q i7-10875H, GeForce RTX 2060 Max-Q, Micron 2200S 1TB MTFDHBA1T0TCK, IPS, 3840x2400, 17" | Gigabyte Aero 17 HDR YC i9-10980HK, GeForce RTX 3080 Laptop GPU, ESR01TBTLCG-EAC-4, IPS-Level, 3840x2160, 17.3" | LG Ultra 17U70N i5-10210U, GeForce GTX 1650 Mobile, Samsung SSD PM981a MZVLB512HBJQ, IPS, 2560x1600, 17" | Eluktronics RP-17 R7 4800H, GeForce RTX 2060 Mobile, Phison PS5013 PRO-X-1TB-G2R NVMe SSD, IPS, 1920x1080, 17.3" | |
|---|---|---|---|---|---|
| Power Consumption | 2% | -58% | 21% | -64% | |
| Idle Minimum * (Watt) | 7.5 | 5.8 23% | 17 -127% | 3.7 51% | 20.2 -169% |
| Idle Average * (Watt) | 15.7 | 20.6 -31% | 21 -34% | 8.8 44% | 24.5 -56% |
| Idle Maximum * (Watt) | 23.1 | 21 9% | 33 -43% | 30.6 -32% | 28.7 -24% |
| Load Average * (Watt) | 87.2 | 104.7 -20% | 113 -30% | 67.4 23% | 110.4 -27% |
| Witcher 3 ultra * (Watt) | 116 | 99.2 14% | 157 -35% | 84.5 27% | 166.3 -43% |
| Load Maximum * (Watt) | 131.6 | 107.6 18% | 237 -80% | 114 13% | 217.4 -65% |
* ... menor é melhor
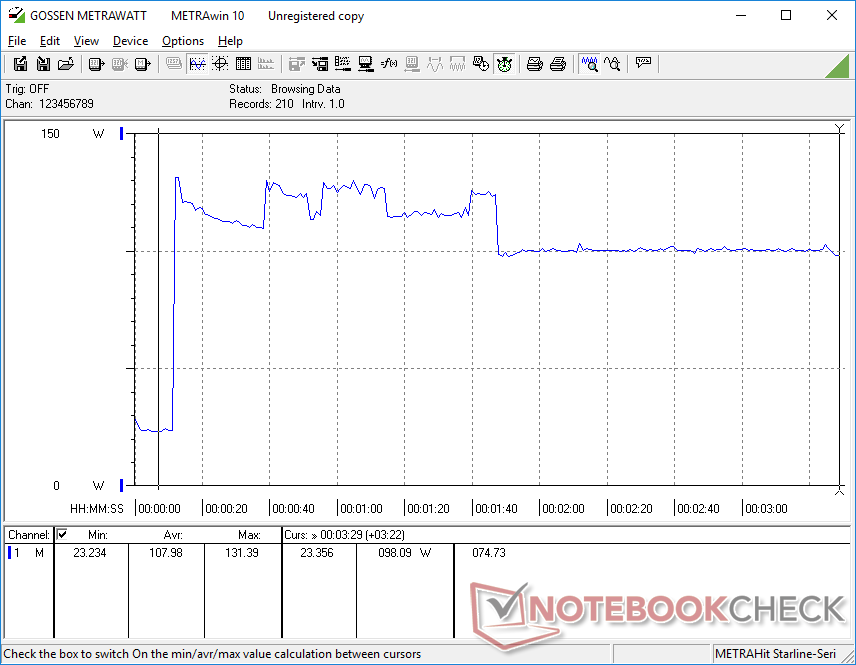
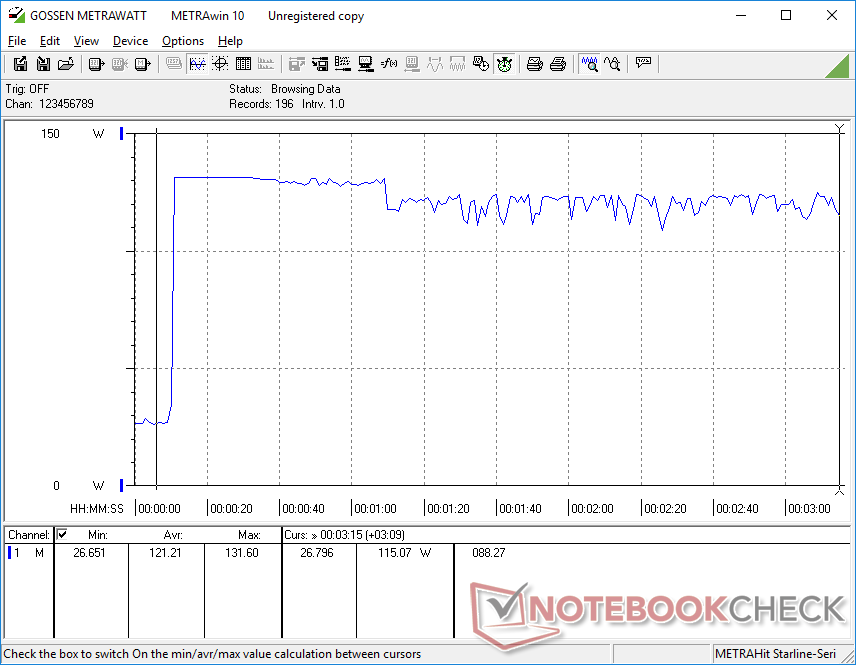
Power Consumption Witcher 3 / Stresstest
Vida útil da bateria
Os tempos de execução são geralmente os mesmos que no XPS 9700, se não um pouco mais curtos. Somos capazes de espremer 7,5 horas de uso da WLAN no mundo real em comparação com as 9,5 horas no modelo do ano passado
Carregar de vazio para cheio leva pouco mais de 2 horas completas em comparação com 1,5 horas na maioria dos outros Ultrabooks desde que o XPS 17 transporta uma bateria de 97 Wh maior que a média.
| Dell XPS 17 9710 Core i7 RTX 3060 i7-11800H, GeForce RTX 3060 Laptop GPU, 97 Wh | Dell XPS 17 9700 Core i7 RTX 2060 Max-Q i7-10875H, GeForce RTX 2060 Max-Q, 97 Wh | Razer Blade Pro 17 2021 (QHD Touch) i7-10875H, GeForce RTX 3080 Laptop GPU, 70.5 Wh | Gigabyte Aero 17 HDR YC i9-10980HK, GeForce RTX 3080 Laptop GPU, 99 Wh | LG Ultra 17U70N i5-10210U, GeForce GTX 1650 Mobile, 72 Wh | Eluktronics RP-17 R7 4800H, GeForce RTX 2060 Mobile, 62 Wh | |
|---|---|---|---|---|---|---|
| Duração da bateria | 13% | -37% | -35% | 23% | -50% | |
| Reader / Idle (h) | 17.7 | 23.8 34% | 9.9 -44% | 10.3 -42% | 24.8 40% | |
| WiFi v1.3 (h) | 7.6 | 9.7 28% | 5.9 -22% | 5.9 -22% | 13.7 80% | 4.4 -42% |
| Load (h) | 2.6 | 2 -23% | 1.4 -46% | 1.5 -42% | 1.3 -50% | 1.1 -58% |
Pro
Contra
Veredicto - O Encanto da Segunda Vez
Se você estava interessado no XPS 17, mas hesitou em comprar um modelo de primeira geração, então esta atualização de segunda geração parece ser a melhor hora para entrar. Não só trata de alguns dos erros que encontramos no modelo do ano passado, mas também consegue aumentar o desempenho da CPU e da GPU em cerca de 30% sem a necessidade de contar com ventiladores mais altos ou novos resfriamentos. O XPS 17 9710 é o modelo mais otimizado que o XPS 17 9700 original deveria ter sido.
As coisas boas vêm para aqueles que esperam. O XPS 17 2021 é a versão mais rápida e otimizada do XPS 17 2020 por essencialmente o mesmo preço de lançamento.
O preço também permaneceu praticamente o mesmo. O XPS 17 9700 do ano passado com Core i7-10875H e RTX 2060 Max-Q lançado por pouco menos de US$ 3.000, enquanto nossa configuração com Core i7-11800H e RTX 3060 chega a cerca de US$ 2900. Os novos proprietários estariam obtendo um desempenho mais rápido sem precisar pagar mais do que os primeiros adotantes.
Outras atualizações menores como as portas Thunderbolt 4 e os slots PCIe 4 SSD são boas adições, mas a maioria dos usuários fora dos entusiastas não apreciarão totalmente estas mudanças. Ainda gostaríamos de ver atualizações mais conspícuas como um obturador de webcam, webcam de maior qualidade, ou opções de cores potenciais para tornar o sistema ainda mais atraente do que ele já é.
Ainda não há muitos concorrentes diretos ao XPS 17 mesmo depois de um ano inteiro no mercado devido à relação de aspecto única do sistema de 17,0 polegadas e 16:10. O mais leveLG Ultra 17 ou Gram 17 mas estas são significativamente mais lentas e de menor qualidade de construção. Os usuários que não se importam com o fator de forma 16:9 de 17,3 polegadas mais comum podem encontrar opções da Razer ou MSI com opções mais rápidas GeForce RTX do que a Dell.
Preço e disponibilidade
O XPS 17 9710 ainda não está amplamente disponível nos principais varejistas a partir deste texto, exceto para https://www.dell.com/en-us/member/shop/laptops/17-new/spd/xps-17-9710-laptop/xn9710cto220s. Nossa configuração exata pode ser encontrada por $2900 USD enquanto SKUs menores com a base Core i5, gráficos integrados, 8 GB RAM, 512 GB SSD, e display FHD+ começam em $1500.
Dell XPS 17 9710 Core i7 RTX 3060
- 07/19/2021 v7 (old)
Allen Ngo
Price comparison

