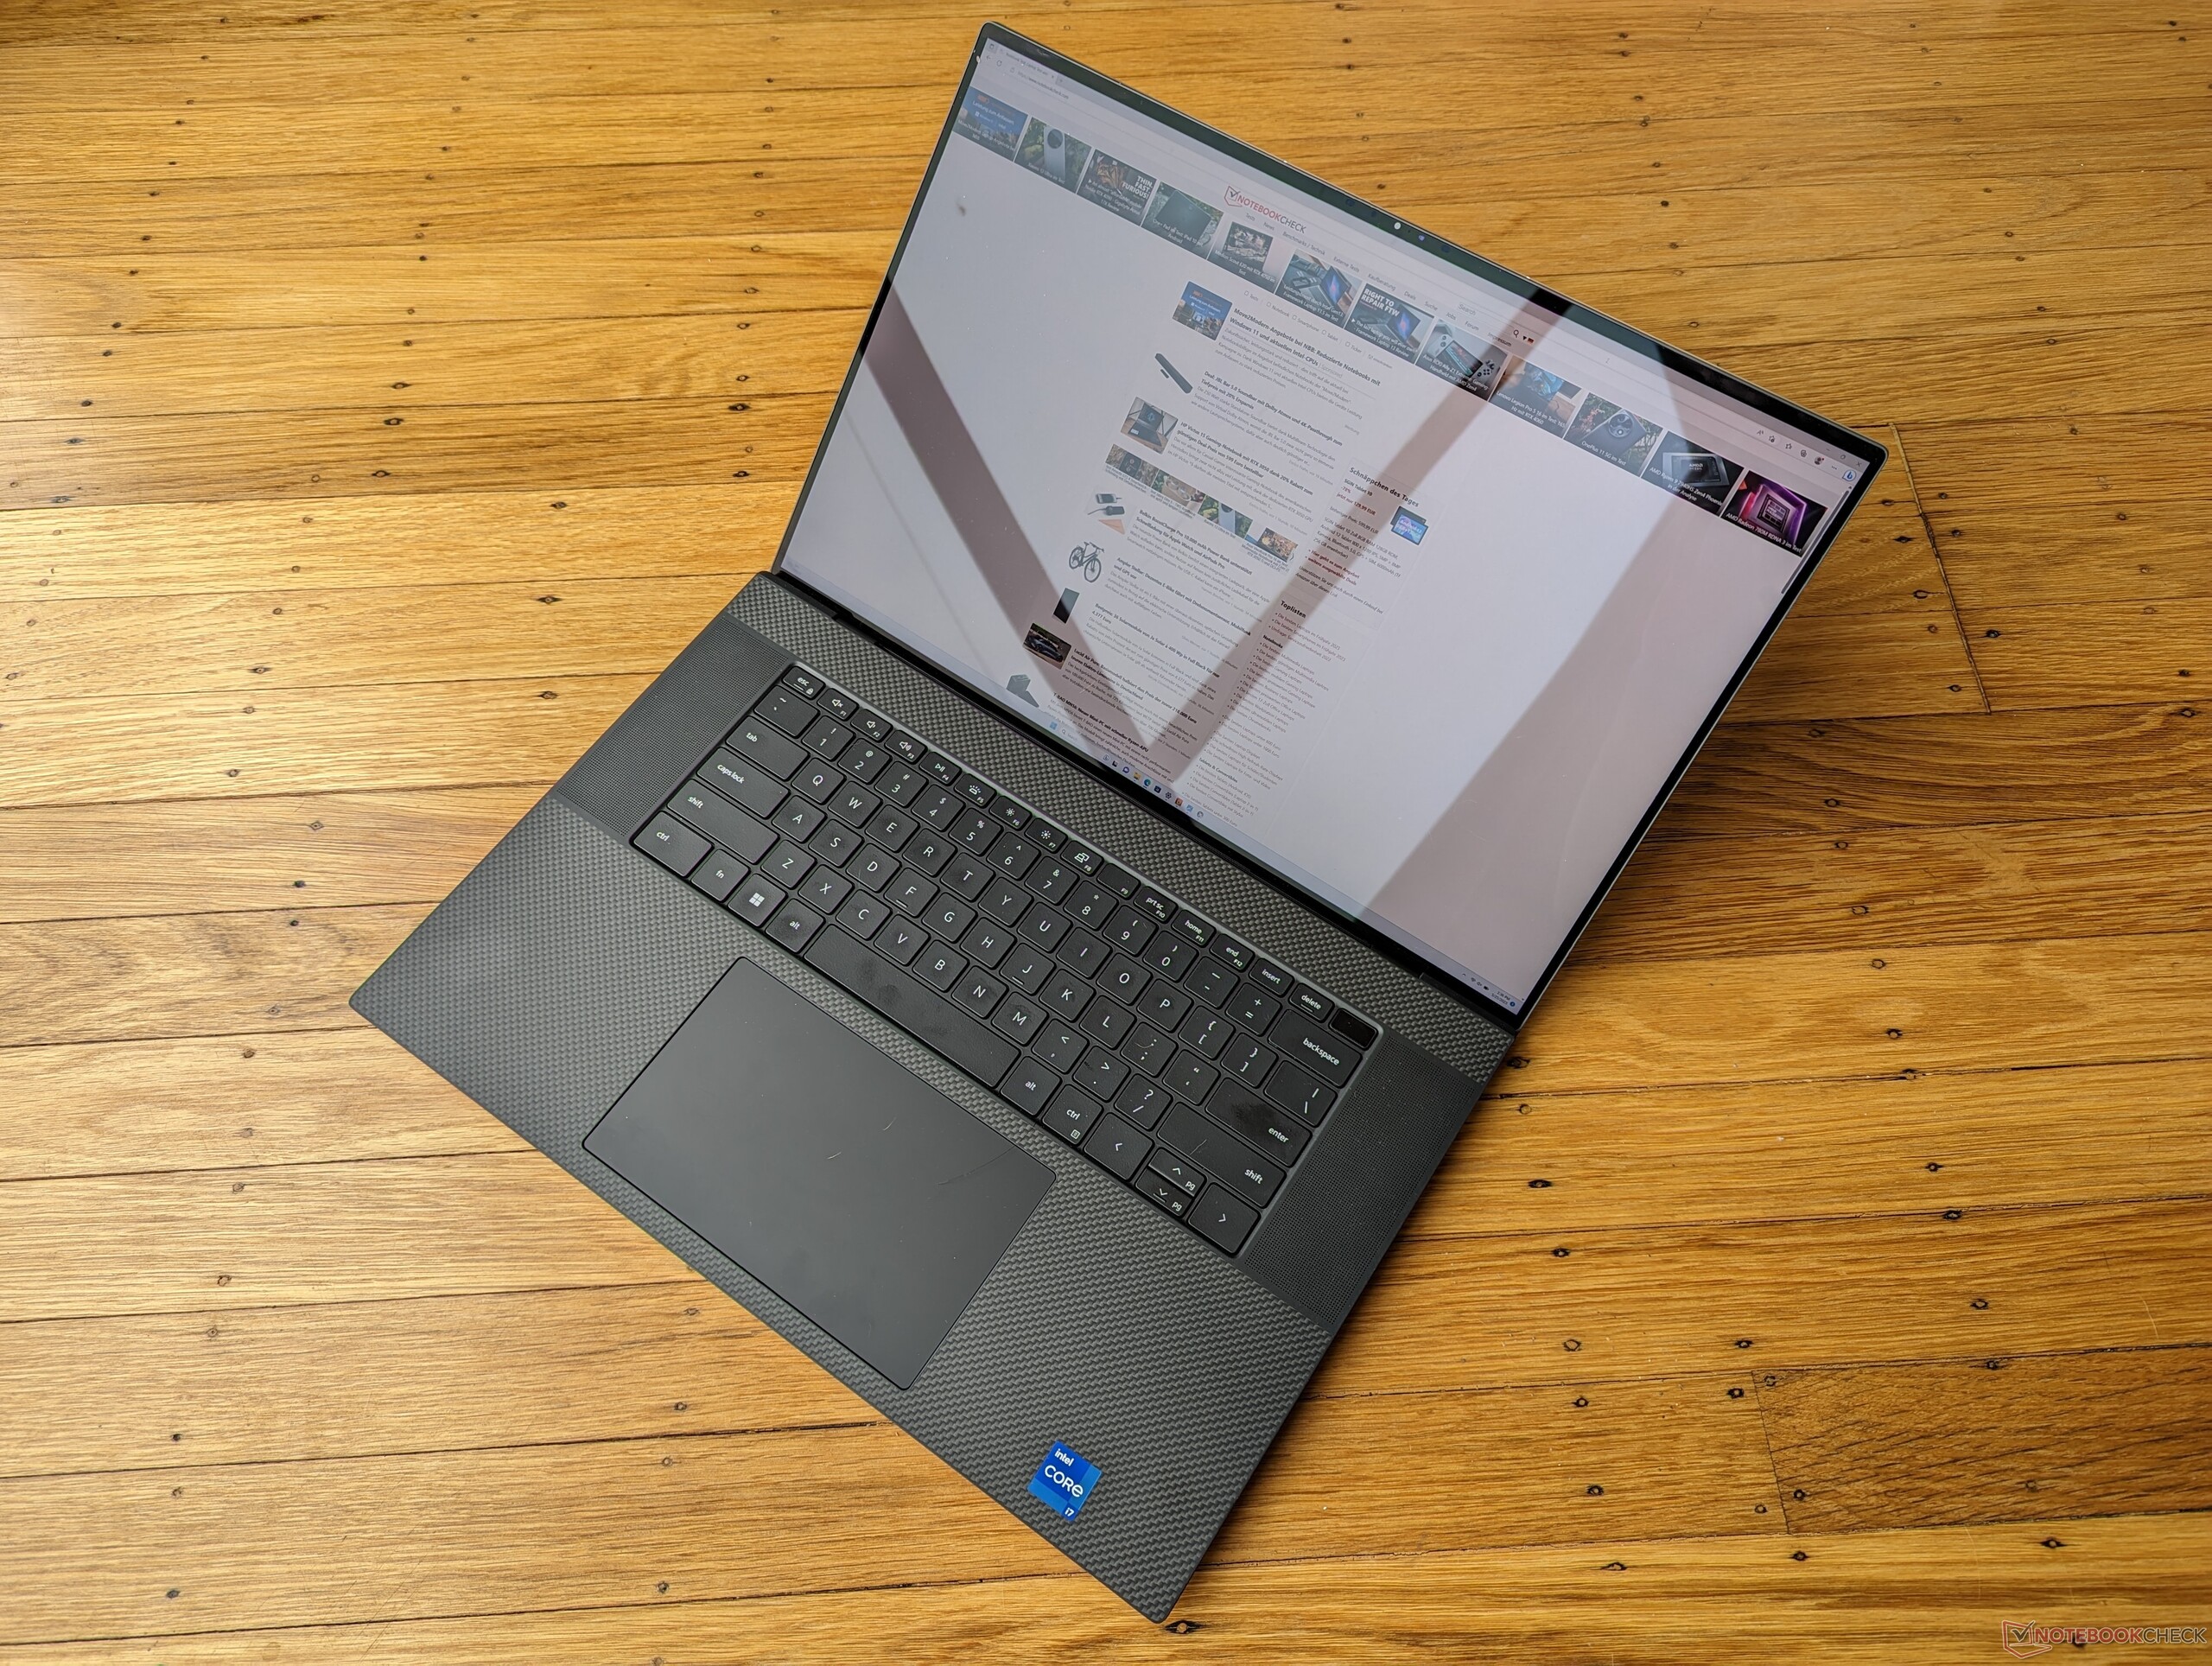
Análise do laptop Dell XPS 17 9730: GeForce Monstro multimídia RTX 4070

O XPS 17 9730 de 2023 é a quarta iteração do xPS 17 9700 original de 2020 original de 2020. Trata-se de uma atualização interna com CPUs Intel Raptor Lake-H de 13ª geração e GPUs Nvidia Ada Lovelace para substituir as opções Alder Lake-H e Ampere de 12ª geração do ano passado, respectivamente. Por outro lado, não há grandes mudanças superficiais e, portanto, recomendamos que você confira nossa análise do xPS 17 9700 original para saber mais sobre os recursos físicos do laptop. Qualquer reformulação futura provavelmente se inspirará na recente série XPS 13 Plus.
Nossa configuração específica em análise é uma SKU de ponta com o Core i7-13700H, GeForce RTX 4070 e tela sensível ao toque brilhante UHD+ 2400p por aproximadamente US$ 3.500 no varejo. Outras SKUs estão disponíveis com o RTX 4050, RTX 4060, RTX 4080, Core i9-13900H ou tela fosca de 1200p. É interessante notar que todas as configurações devem vir com gráficos discretos, enquanto os modelos anteriores do XPS 17 tinham opções mais baratas de UHD integrado ou Iris Xe.
Os concorrentes nesse espaço incluem outros notebooks multimídia de 17 polegadas, como o LG Gram 17, HP Envy 17,MSI Creator Z17ou o MacBook Pro de 16 polegadasApple MacBook Pro 16.
Mais análises da Dell:
Possíveis concorrentes em comparação
Avaliação | Data | Modelo | Peso | Altura | Size | Resolução | Preço |
|---|---|---|---|---|---|---|---|
| 90 % v7 (old) | 05/2023 | Dell XPS 17 9730 RTX 4070 i7-13700H, GeForce RTX 4070 Laptop GPU | 2.5 kg | 19.5 mm | 17.00" | 3840x2400 | |
| 88.8 % v7 (old) | 06/2022 | Dell XPS 17 9720 RTX 3060 i7-12700H, GeForce RTX 3060 Laptop GPU | 2.5 kg | 19.5 mm | 17.00" | 3840x2400 | |
| 86.4 % v7 (old) | 05/2023 | LG Gram 17 (2023) i7-1360P, Iris Xe G7 96EUs | 1.4 kg | 17.8 mm | 17.00" | 2560x1600 | |
| 86.3 % v7 (old) | 04/2023 | HP Envy 17-cr0079ng i7-1255U, GeForce RTX 2050 Mobile | 2.6 kg | 19.6 mm | 17.30" | 3840x2160 | |
| 83.8 % v7 (old) | 09/2022 | MSI Creator Z17 A12UGST-054 i9-12900H, GeForce RTX 3070 Ti Laptop GPU | 2.5 kg | 19 mm | 17.00" | 2560x1600 | |
| 93.7 % v7 (old) | 03/2023 | Apple MacBook Pro 16 2023 M2 Max M2 Max, M2 Max 38-Core GPU | 2.2 kg | 16.8 mm | 16.20" | 3456x2234 |
Caso - Mesmo design por três anos consecutivos
Leitor de cartão SD
| SD Card Reader | |
| average JPG Copy Test (av. of 3 runs) | |
| Dell XPS 17 9720 RTX 3060 (Toshiba Exceria Pro SDXC 64 GB UHS-II) | |
| Dell XPS 17 9730 RTX 4070 (Toshiba Exceria Pro SDXC 64 GB UHS-II) | |
| Apple MacBook Pro 16 2023 M2 Max (Angelbird AV Pro V60) | |
| MSI Creator Z17 A12UGST-054 (AV Pro SD microSD 128 GB V60) | |
| HP Envy 17-cr0079ng (AV Pro SD microSD 128 GB V60) | |
| LG Gram 17 (2023) (AV Pro SD microSD 128 GB V60) | |
| maximum AS SSD Seq Read Test (1GB) | |
| Apple MacBook Pro 16 2023 M2 Max (Angelbird AV Pro V60) | |
| Dell XPS 17 9730 RTX 4070 (Toshiba Exceria Pro SDXC 64 GB UHS-II) | |
| Dell XPS 17 9720 RTX 3060 (Toshiba Exceria Pro SDXC 64 GB UHS-II) | |
| LG Gram 17 (2023) (AV Pro SD microSD 128 GB V60) | |
| MSI Creator Z17 A12UGST-054 (AV Pro SD microSD 128 GB V60) | |
| HP Envy 17-cr0079ng (AV Pro SD microSD 128 GB V60) | |
Comunicação - Sem Wi-Fi 6E
O XPS 15 e o XPS 17 continuam a ser os únicos notebooks na memória recente a serem fornecidos com módulos WLAN Wi-Fi 6E e, ainda assim, NÃO suportarem a conectividade Wi-Fi 6E. Portanto, você não conseguirá se conectar a nenhuma rede Wi-Fi de 6 GHz. Isso não deve ser um grande problema para a maioria dos usuários, mas é decepcionante para um laptop que custa mais de US$ 3.500.
| Networking | |
| iperf3 transmit AXE11000 | |
| LG Gram 17 (2023) | |
| Dell XPS 17 9720 RTX 3060 | |
| HP Envy 17-cr0079ng | |
| Dell XPS 17 9730 RTX 4070 | |
| iperf3 receive AXE11000 | |
| LG Gram 17 (2023) | |
| HP Envy 17-cr0079ng | |
| Dell XPS 17 9720 RTX 3060 | |
| Dell XPS 17 9730 RTX 4070 | |
| iperf3 transmit AXE11000 6GHz | |
| Apple MacBook Pro 16 2023 M2 Max | |
| LG Gram 17 (2023) | |
| HP Envy 17-cr0079ng | |
| MSI Creator Z17 A12UGST-054 | |
| iperf3 receive AXE11000 6GHz | |
| Apple MacBook Pro 16 2023 M2 Max | |
| MSI Creator Z17 A12UGST-054 | |
| HP Envy 17-cr0079ng | |
| LG Gram 17 (2023) | |
Webcam - Somente 720p
O XPS 15 e o XPS 17 são provavelmente os únicos notebooks emblemáticos que ainda são vendidos com webcams de baixa resolução de 1 MP ou 720p e sem obturador de privacidade. Os fabricantes concorrentes, como Lenovo, HP, Asus e outros, já adotaram soluções de 2 MP ou até soluções de 8 MP. A Dell afirma que a moldura superestreita da tela do design do XPS limita a qualidade do sensor da webcam.


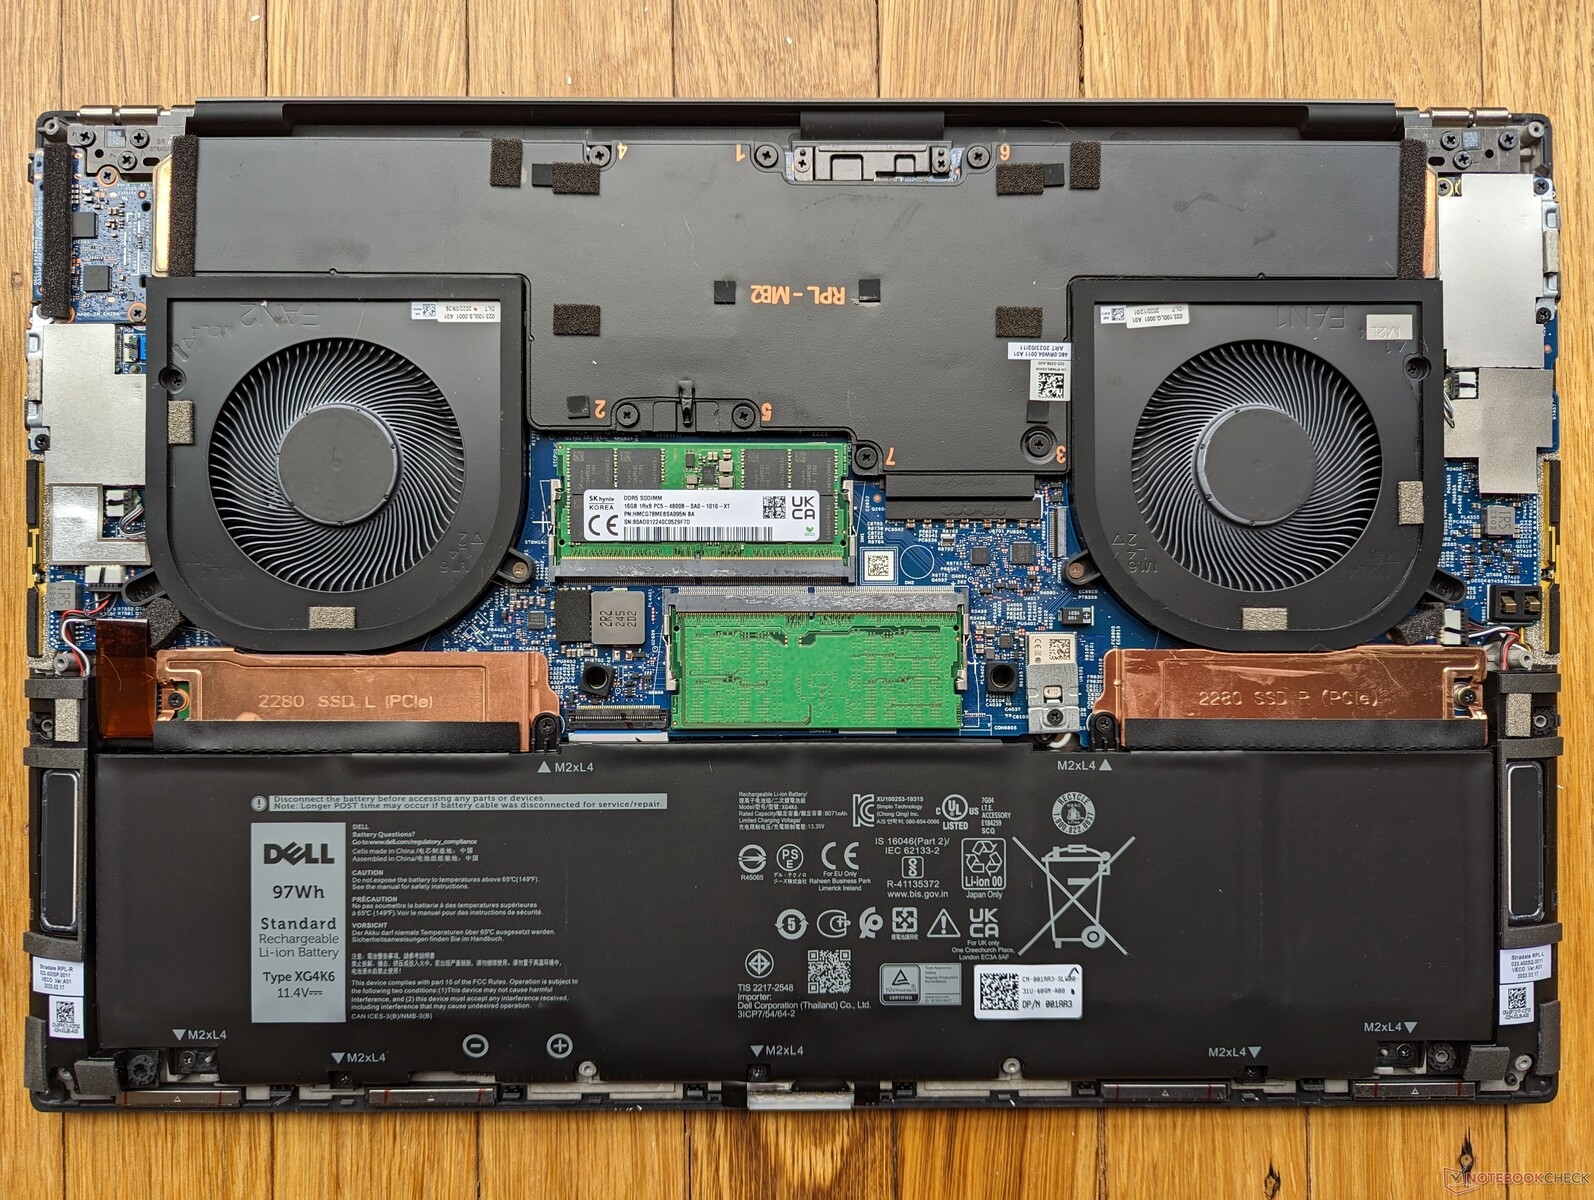
Manutenção
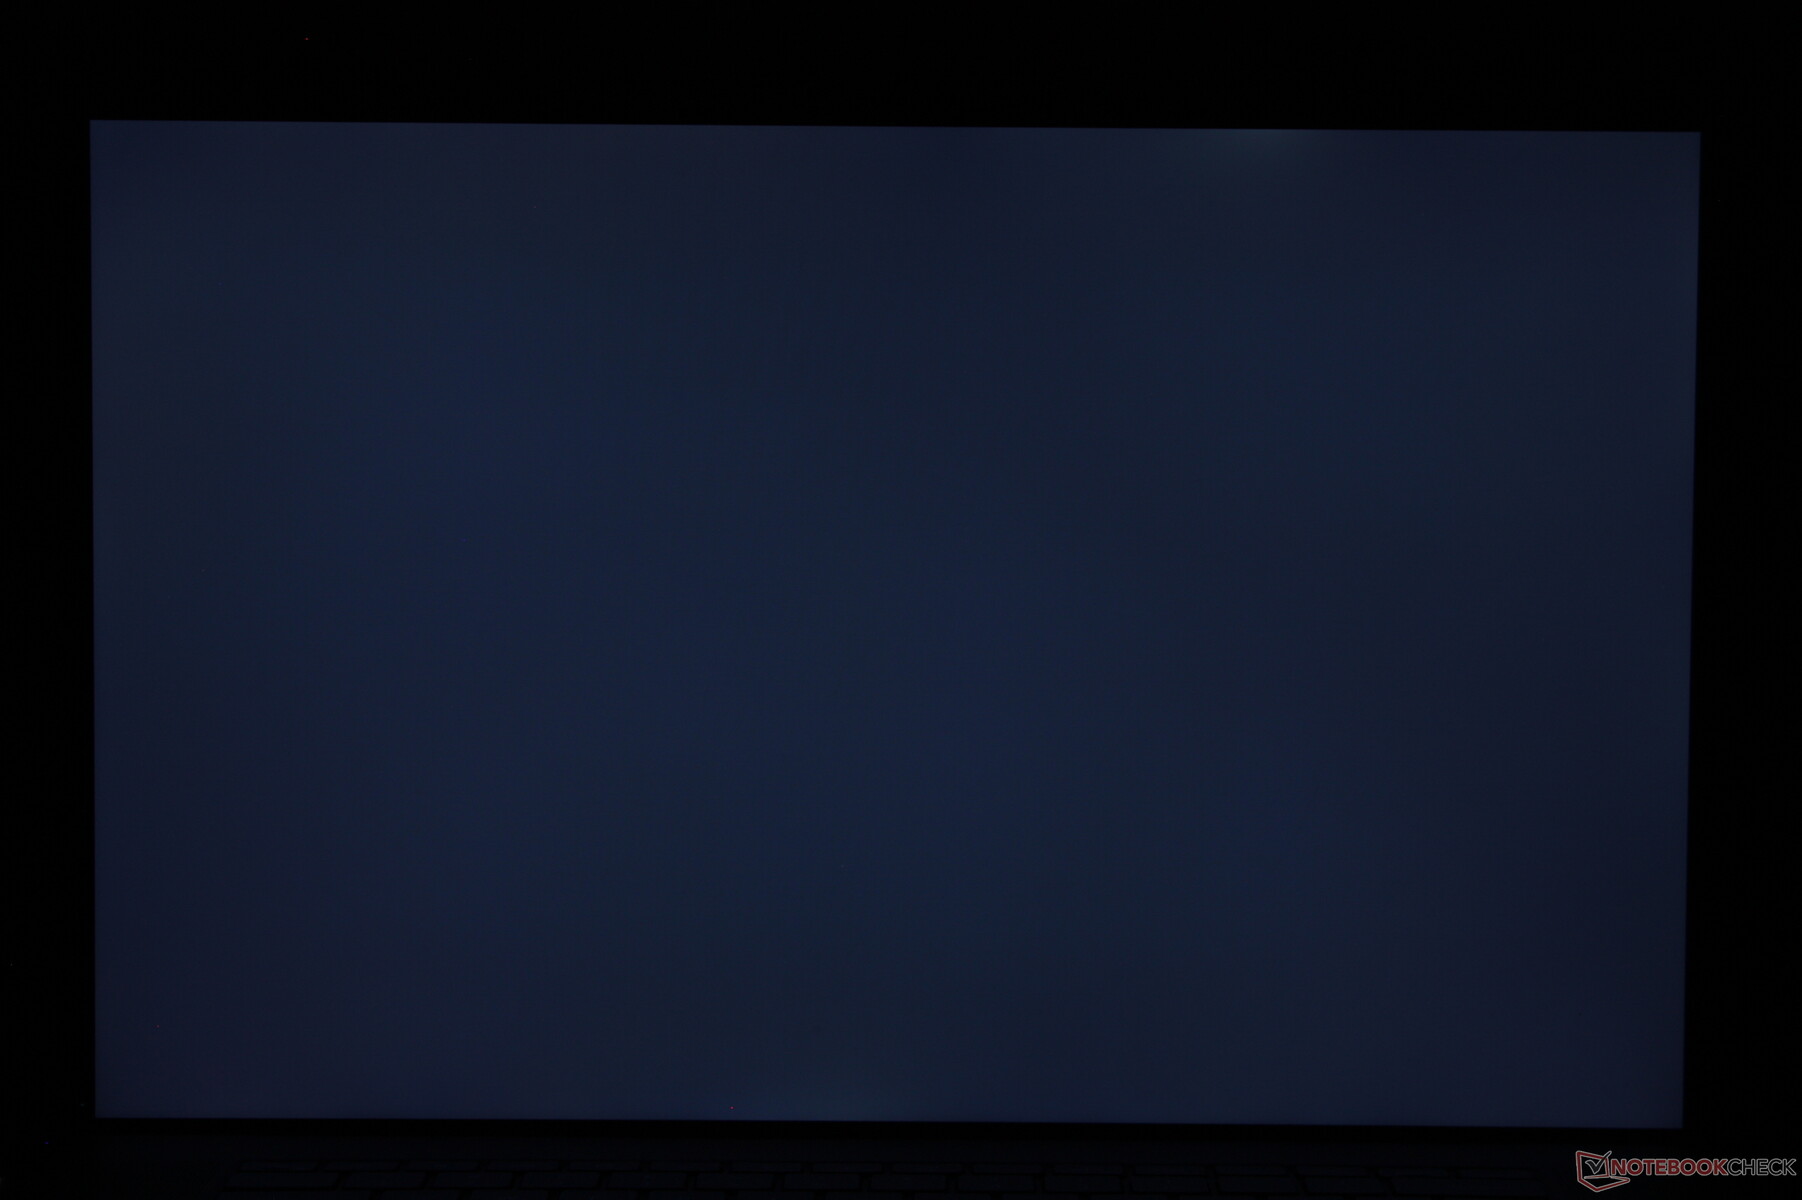
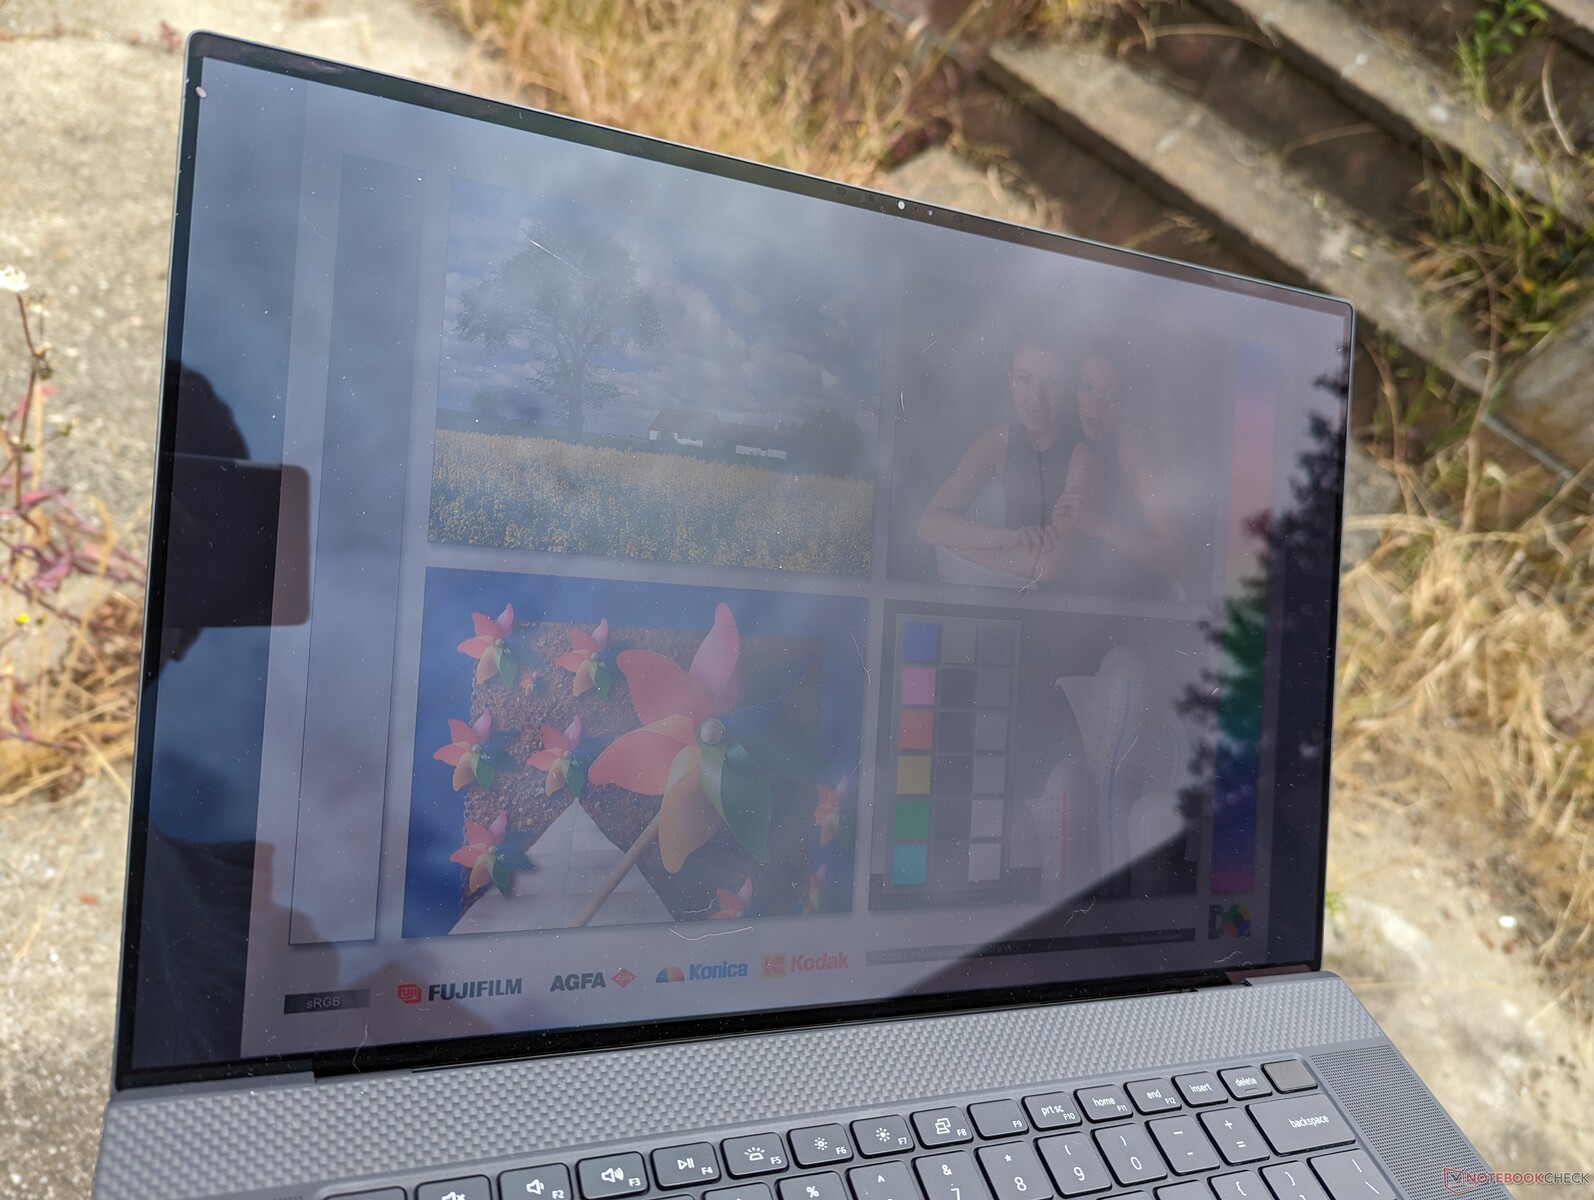
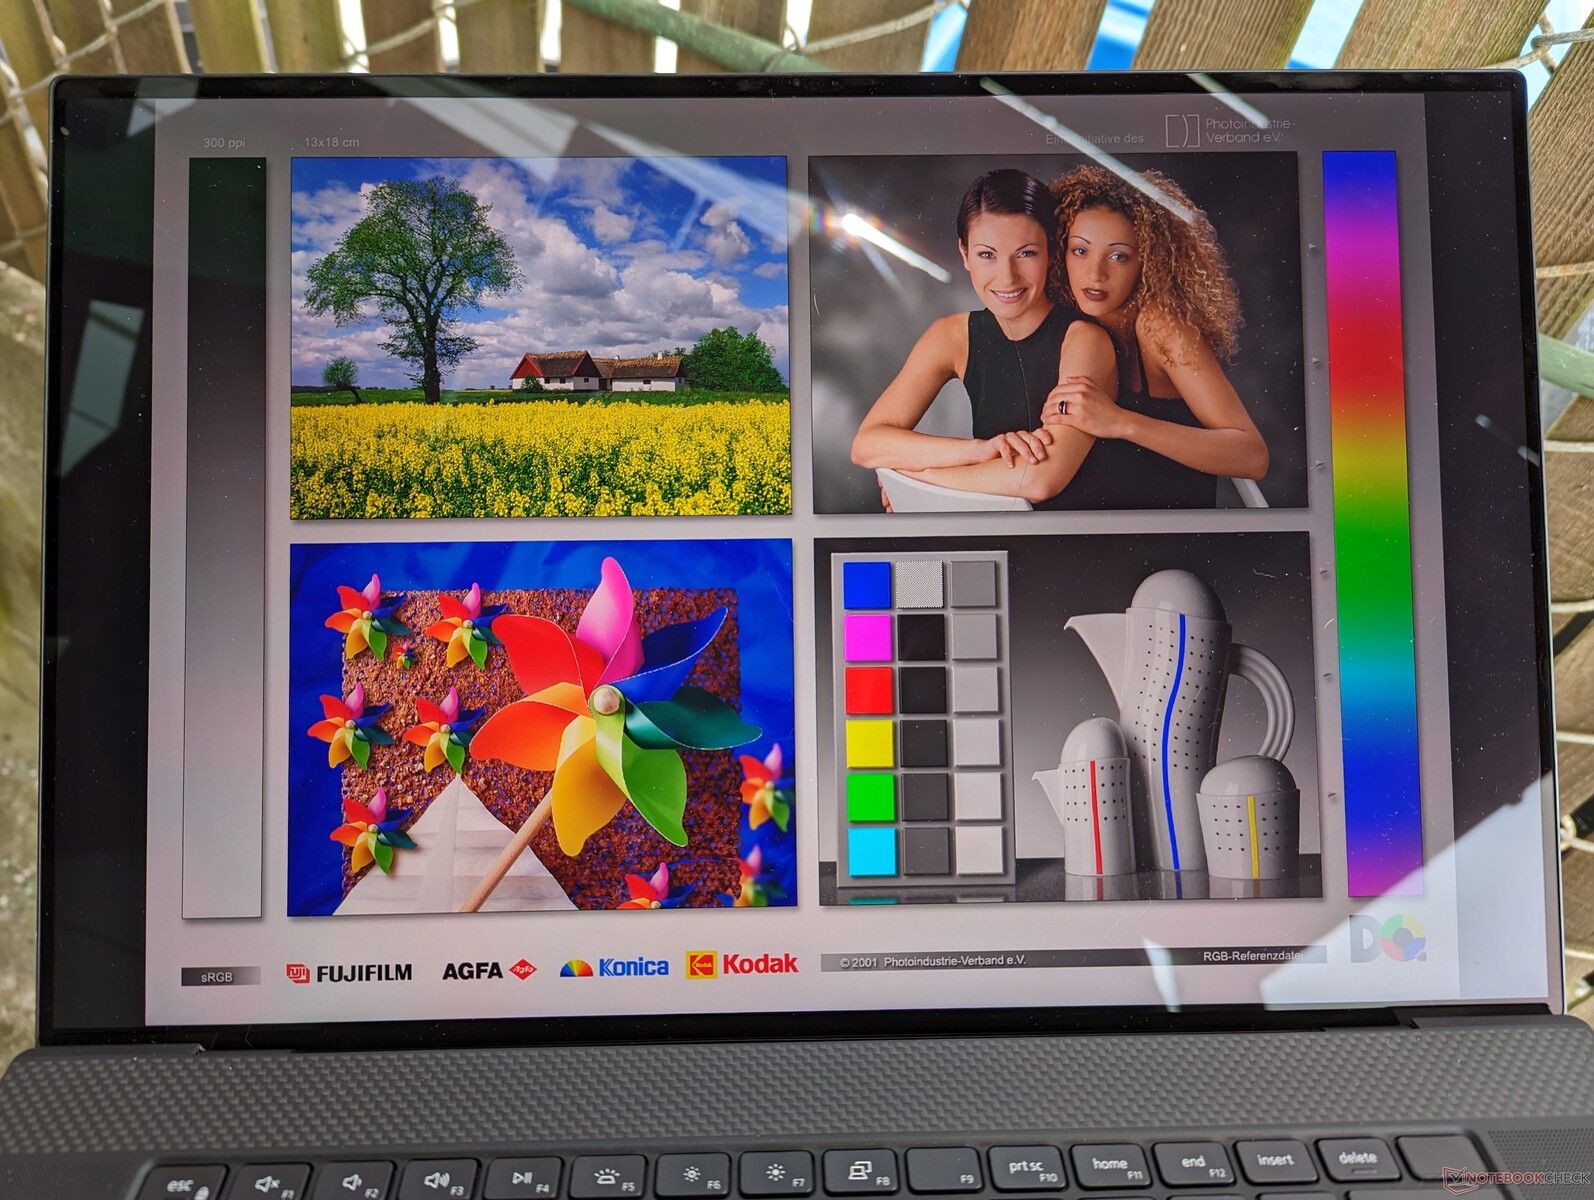
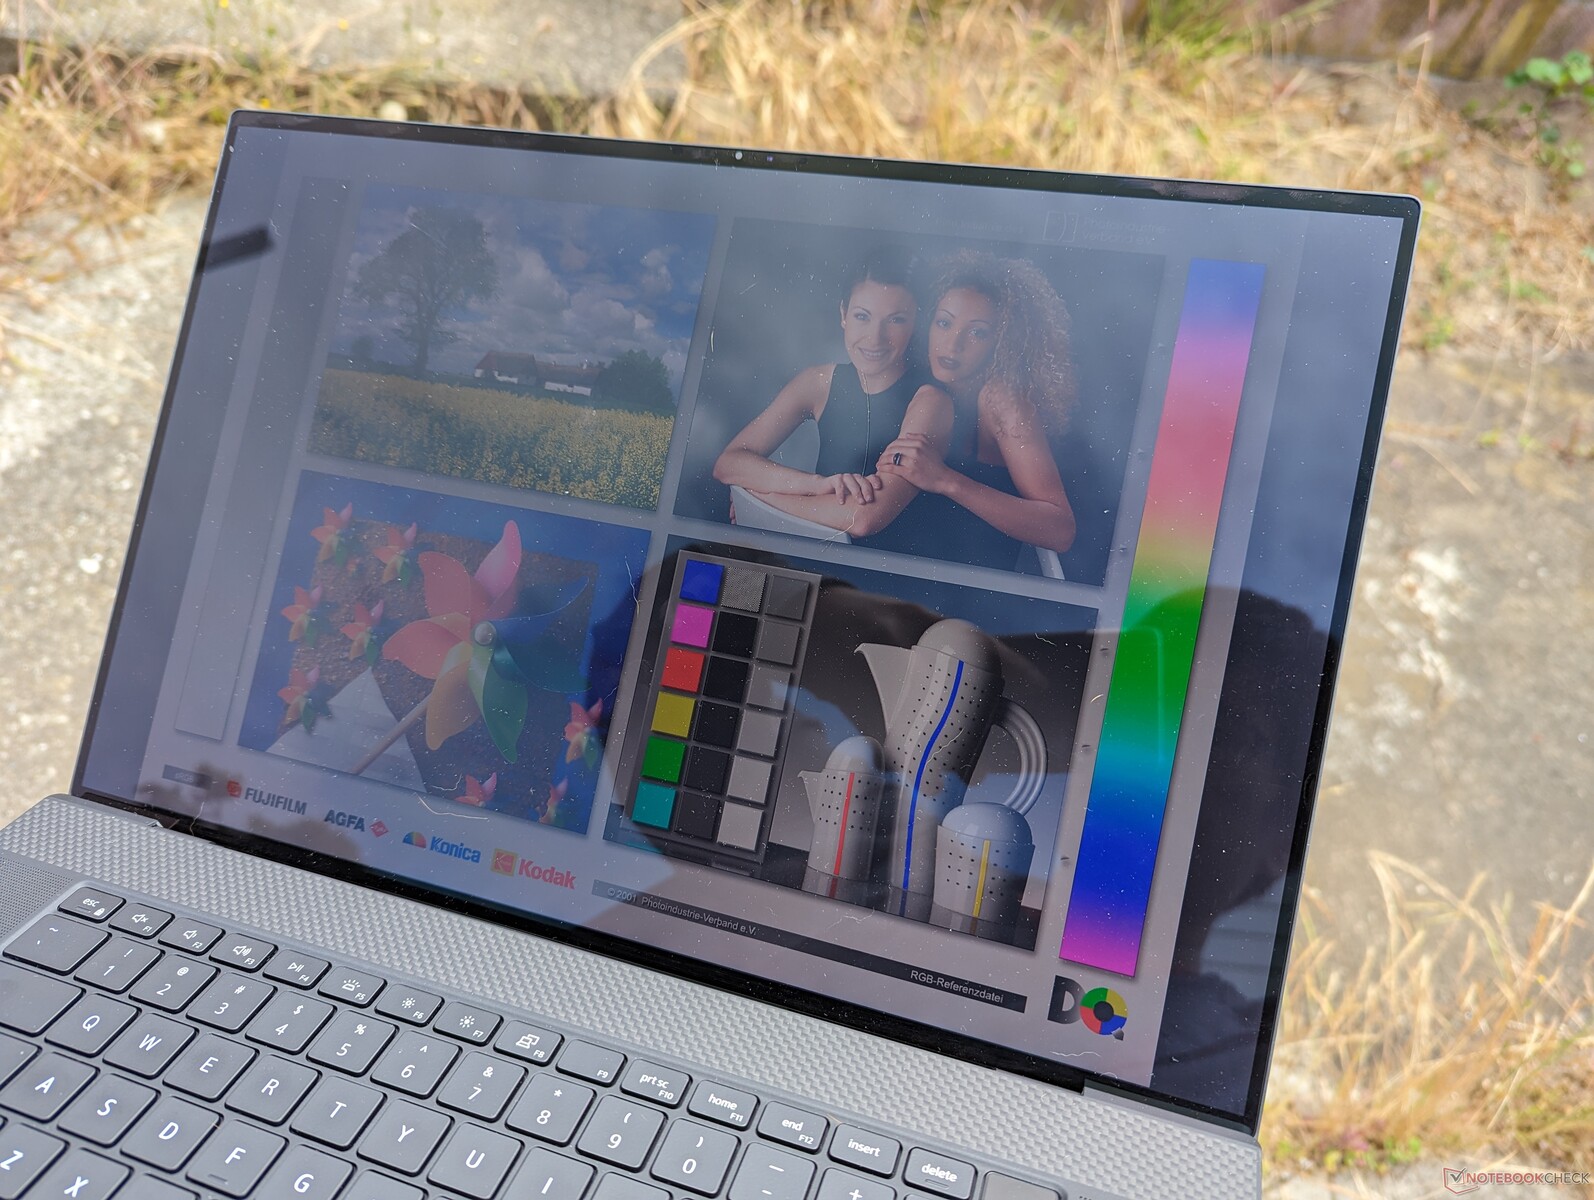
Tela - ainda boa, mas sem opção de 120 Hz
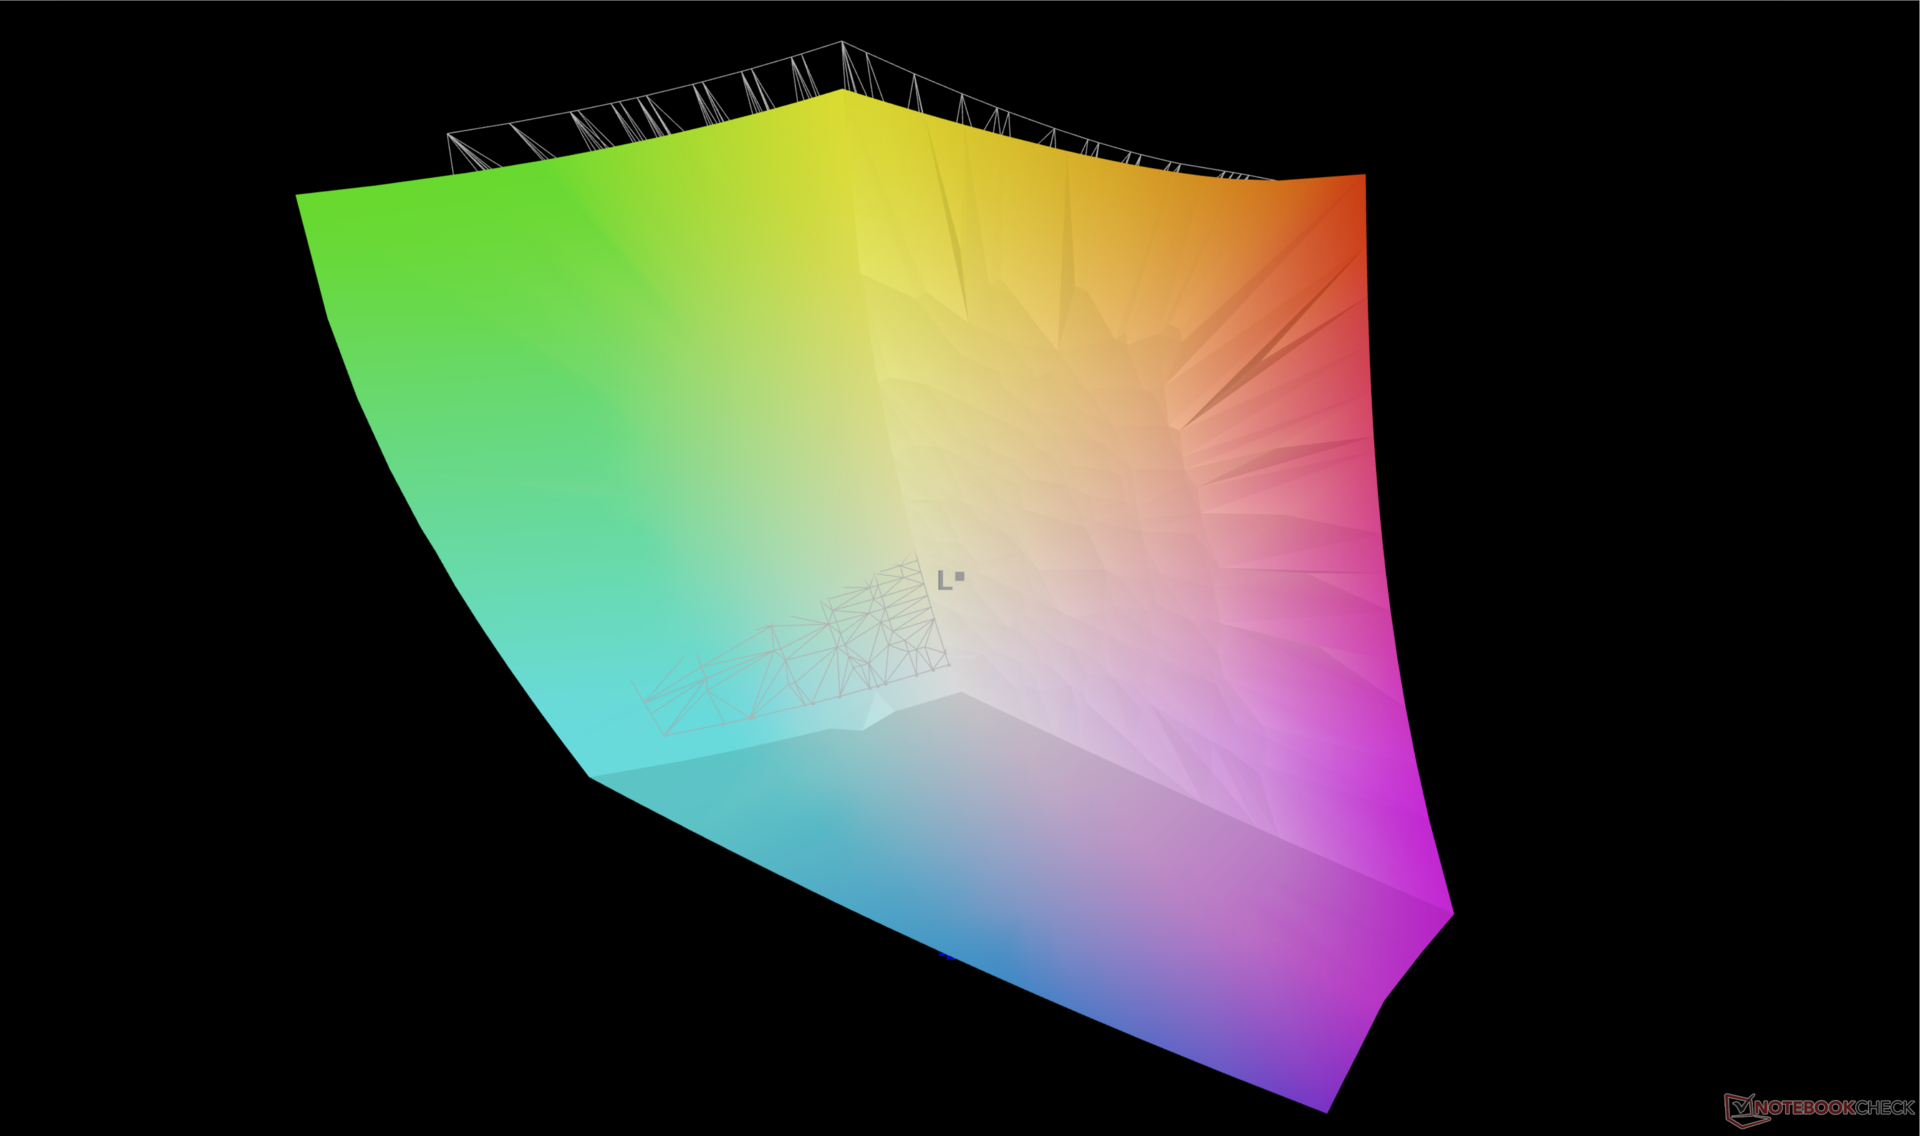
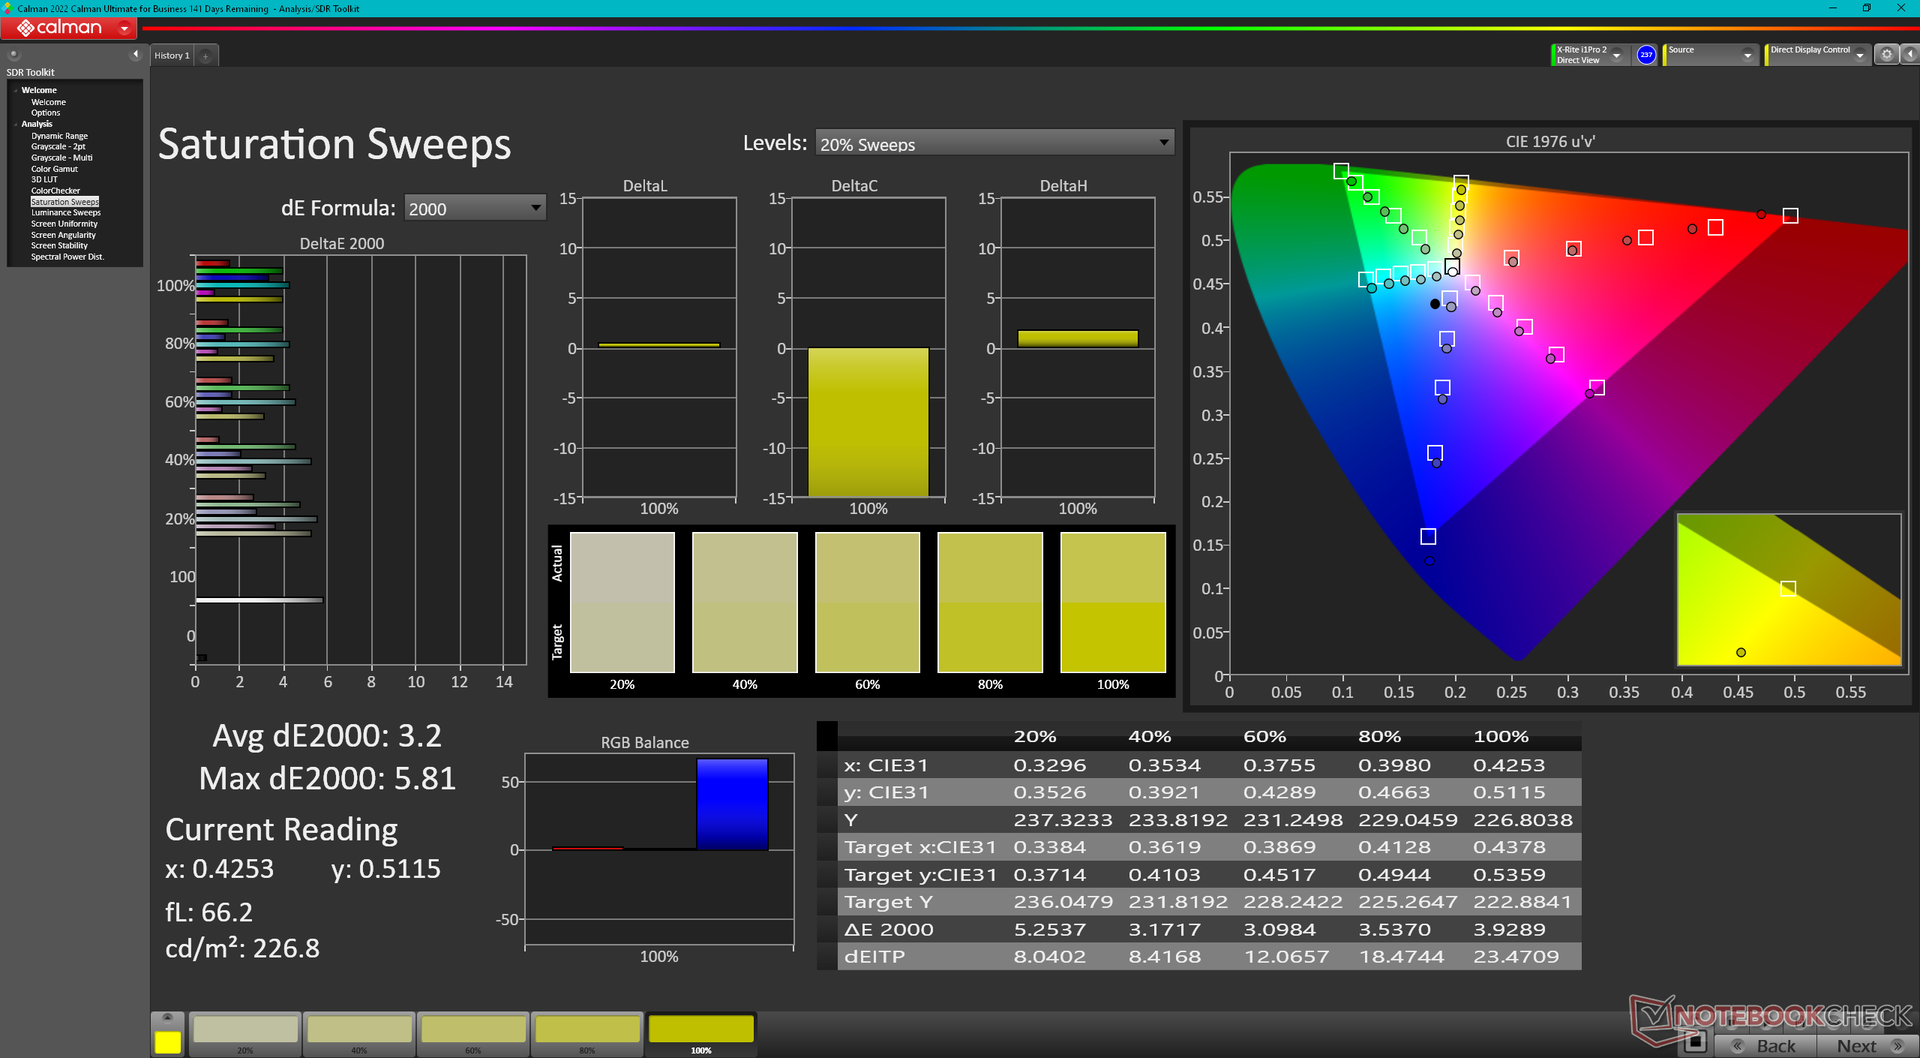
A Dell tem usado exatamente o mesmo painel touchscreen Sharp LQ170R1 IPS de 17,0 polegadas para sua série XPS 17 desde o modelo original de 2020. Portanto, a experiência visual permaneceu idêntica desde então e recomendamos que você confira nossas análises sobre o 9720, 9710ou 9700 para saber mais sobre a tela. Embora as cores DCI-P3 amplas, o bom brilho máximo, a resolução UHD+ nítida e a boa relação de contraste de 1500:1 ainda sejam excelentes até hoje, a taxa de atualização de 60 Hz está começando a mostrar sua idade, pois os painéis de 90 Hz ou mais rápidos estão se tornando comuns em outros notebooks multimídia, como o Asus ZenBook 14 ou o Lenovo Slim 7i.

| |||||||||||||||||||||||||
iluminação: 85 %
iluminação com acumulador: 457.4 cd/m²
Contraste: 1475:1 (Preto: 0.31 cd/m²)
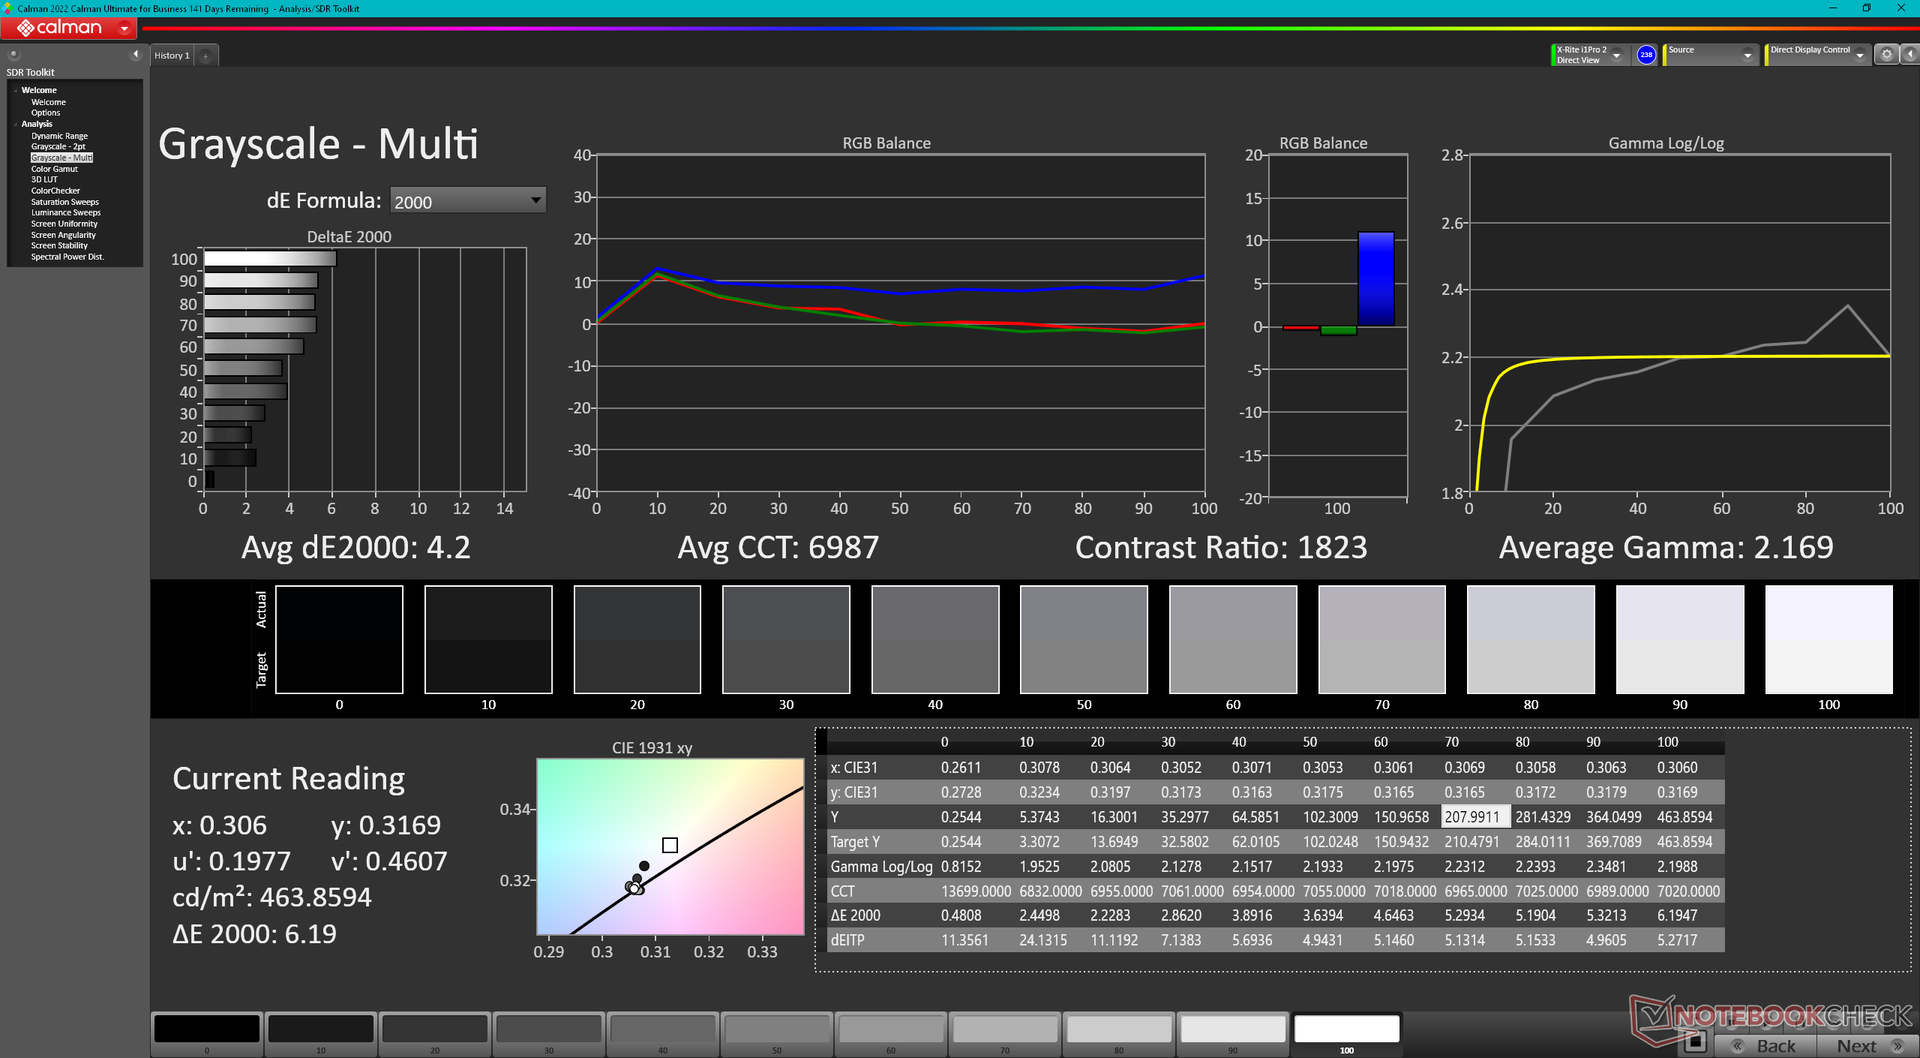
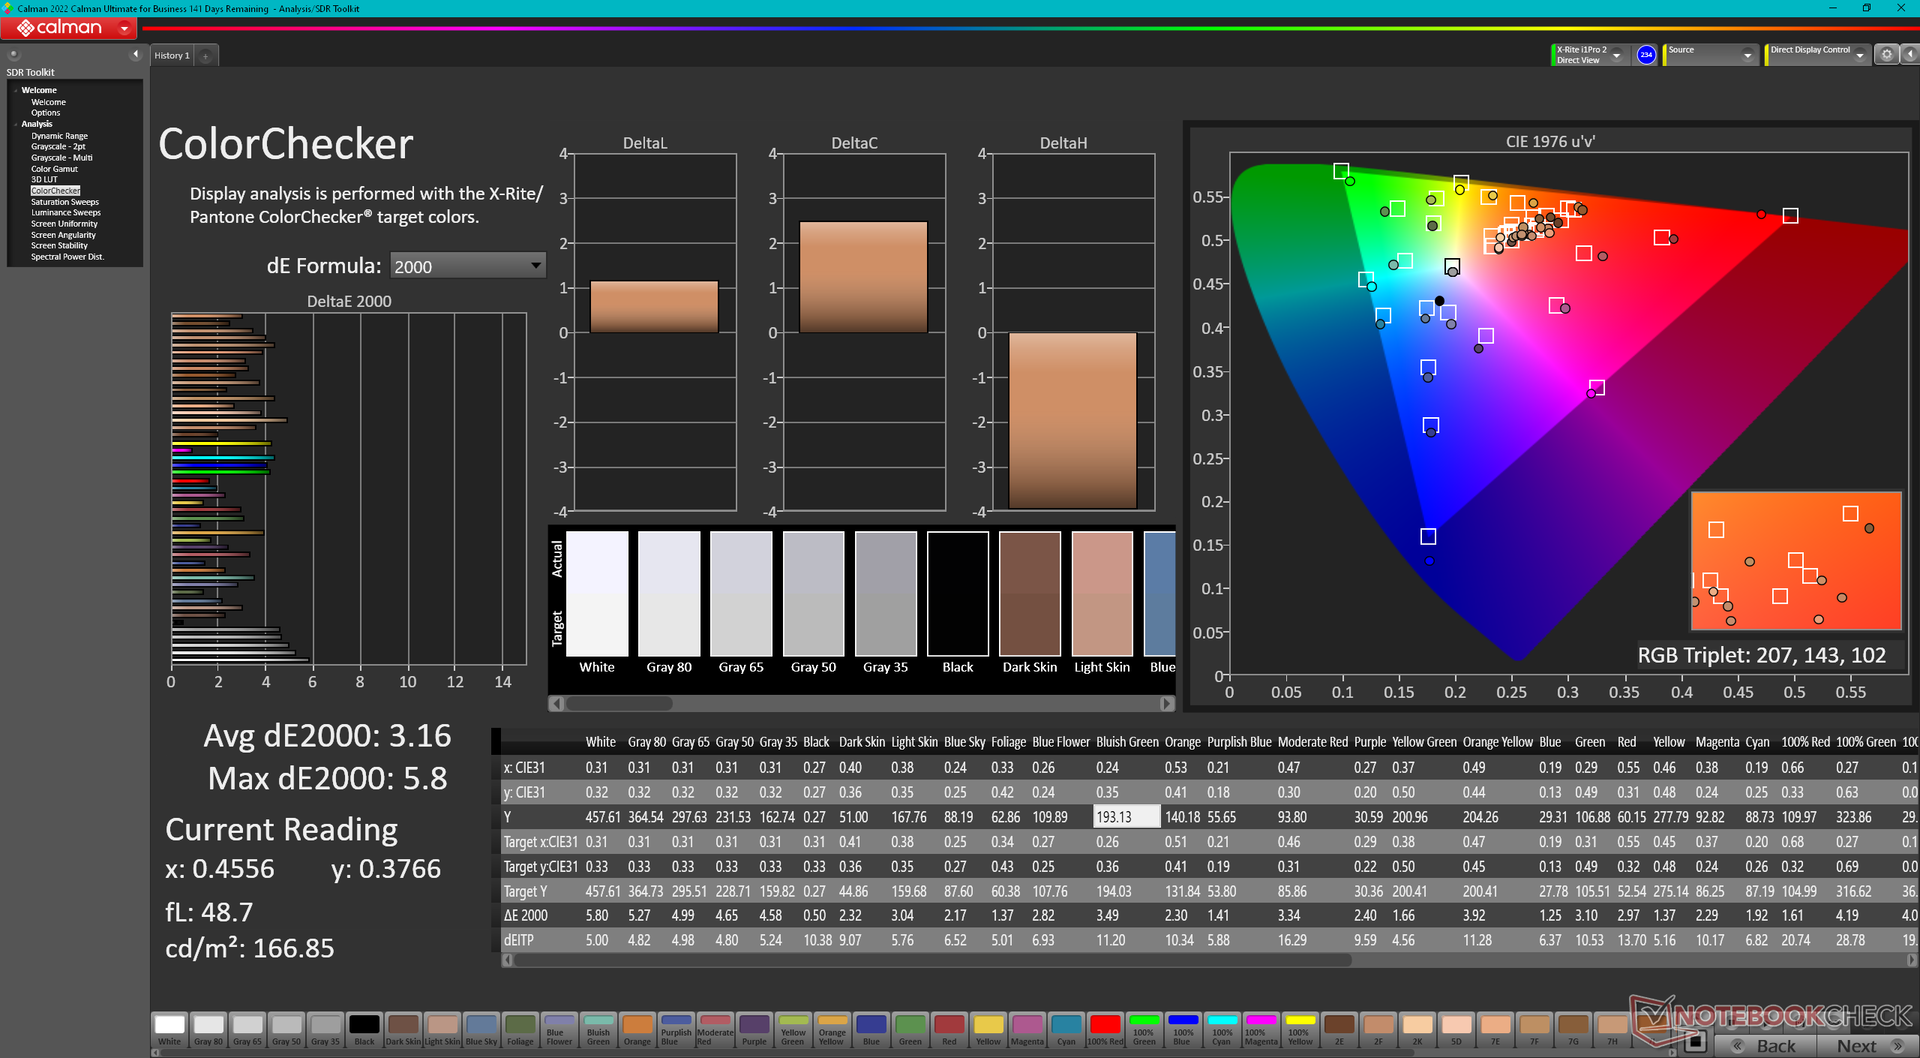
ΔE ColorChecker Calman: 3.16 | ∀{0.5-29.43 Ø4.71}
ΔE Greyscale Calman: 4.2 | ∀{0.09-98 Ø4.96}
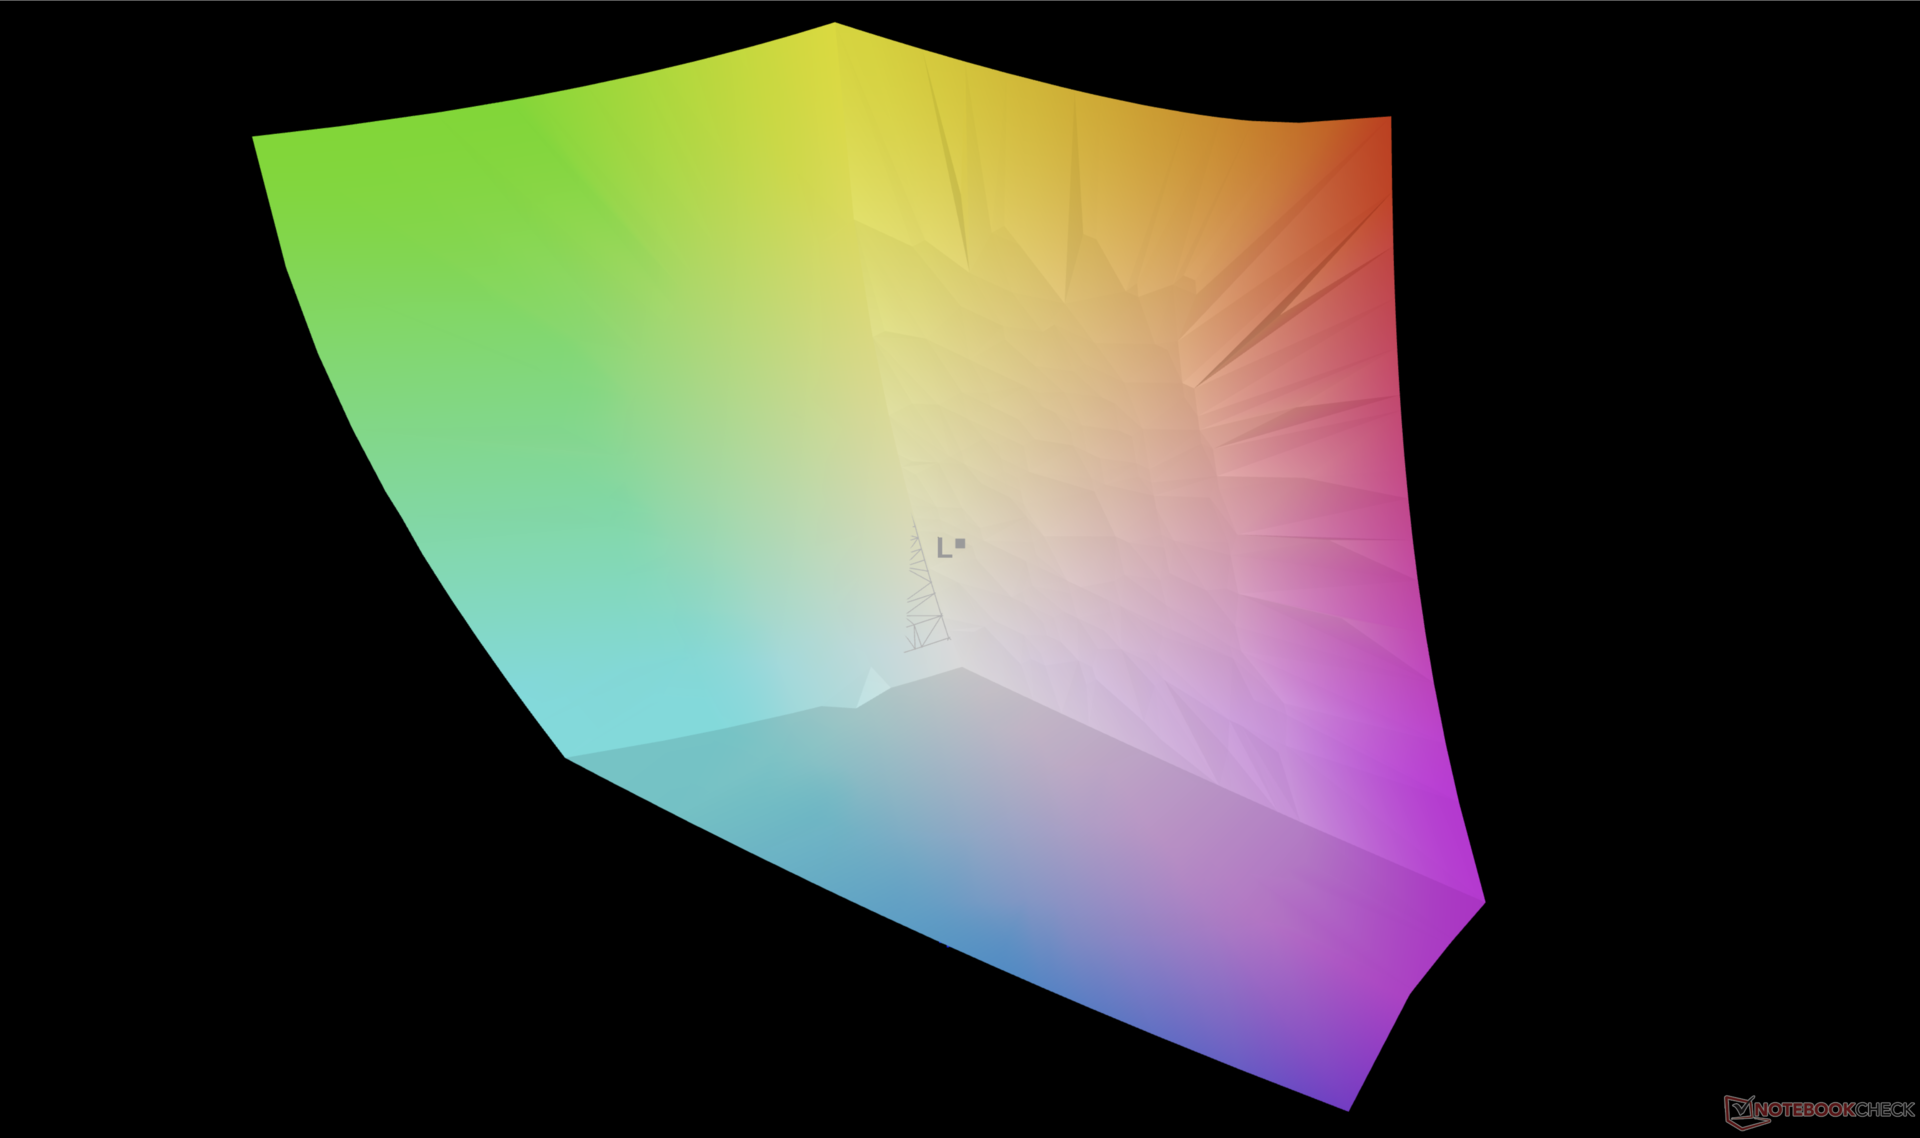
100% AdobeRGB 1998 (Argyll 3D)
100% sRGB (Argyll 3D)
95.2% Display P3 (Argyll 3D)
Gamma: 2.17
CCT: 6987 K
| Dell XPS 17 9730 RTX 4070 10-point capacitive, Sharp LQ170R1, 3840x2400, 17" | Dell XPS 17 9720 RTX 3060 Sharp LQ170R1, IPS, 3840x2400, 17" | LG Gram 17 (2023) LG Display LP170WQ1-SPF2, IPS, 2560x1600, 17" | HP Envy 17-cr0079ng BOE0A66, IPS, 3840x2160, 17.3" | MSI Creator Z17 A12UGST-054 AUO3C9B (B170QAN01.0), IPS, 2560x1600, 17" | Apple MacBook Pro 16 2023 M2 Max Mini-LED, 3456x2234, 16.2" | |
|---|---|---|---|---|---|---|
| Display | -6% | -4% | -3% | -3% | -2% | |
| Display P3 Coverage (%) | 95.2 | 92.9 -2% | 97 2% | 98.31 3% | 98.9 4% | 99 4% |
| sRGB Coverage (%) | 100 | 100 0% | 99.8 0% | 100 0% | 99.9 0% | 100 0% |
| AdobeRGB 1998 Coverage (%) | 100 | 85.3 -15% | 84.9 -15% | 87.03 -13% | 86.4 -14% | 88.5 -11% |
| Response Times | -16% | 80% | 88% | 79% | -70% | |
| Response Time Grey 50% / Grey 80% * (ms) | 42.9 ? | 51.2 ? -19% | 2 ? 95% | 1 98% | 11 ? 74% | 80.5 ? -88% |
| Response Time Black / White * (ms) | 31.3 ? | 35.2 ? -12% | 11 ? 65% | 7 ? 78% | 5 ? 84% | 47.2 ? -51% |
| PWM Frequency (Hz) | 14880 ? | |||||
| Screen | -30% | -6% | 9% | -13% | 4294% | |
| Brightness middle (cd/m²) | 457.4 | 512.7 12% | 405 -11% | 390 -15% | 444 -3% | 504 10% |
| Brightness (cd/m²) | 430 | 463 8% | 363 -16% | 385 -10% | 415 -3% | 487 13% |
| Brightness Distribution (%) | 85 | 85 0% | 82 -4% | 86 1% | 88 4% | 94 11% |
| Black Level * (cd/m²) | 0.31 | 0.32 -3% | 0.225 27% | 0.395 -27% | 0.7 -126% | 0.001 100% |
| Contrast (:1) | 1475 | 1602 9% | 1800 22% | 987 -33% | 634 -57% | 504000 34069% |
| Colorchecker dE 2000 * | 3.16 | 5.98 -89% | 3.35 -6% | 1.66 47% | 2.48 22% | 1.5 53% |
| Colorchecker dE 2000 max. * | 5.8 | 12.09 -108% | 7.96 -37% | 2.9 50% | 3.52 39% | 3.3 43% |
| Greyscale dE 2000 * | 4.2 | 7.2 -71% | 5.28 -26% | 1.83 56% | 3.33 21% | 2.1 50% |
| Gamma | 2.17 101% | 2.54 87% | 2.43 91% | 2.25 98% | 2.33 94% | 2.25 98% |
| CCT | 6987 93% | 6914 94% | 7424 88% | 6727 97% | 6230 104% | 6882 94% |
| Colorchecker dE 2000 calibrated * | 1.34 | 1.16 | 2.91 | |||
| Média Total (Programa/Configurações) | -17% /
-22% | 23% /
7% | 31% /
18% | 21% /
3% | 1407% /
2631% |
* ... menor é melhor
Exibir tempos de resposta
| ↔ Tempo de resposta preto para branco | ||
|---|---|---|
| 31.3 ms ... ascensão ↗ e queda ↘ combinadas | ↗ 16.9 ms ascensão | 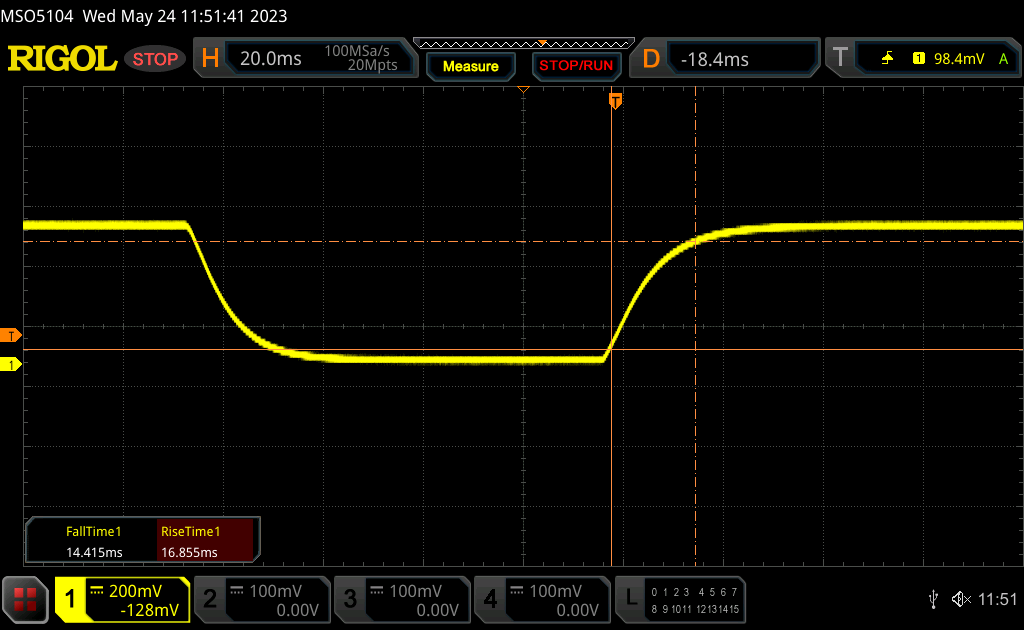 |
| ↘ 14.4 ms queda | ||
| A tela mostra taxas de resposta lentas em nossos testes e será insatisfatória para os jogadores. Em comparação, todos os dispositivos testados variam de 0.1 (mínimo) a 240 (máximo) ms. » 85 % de todos os dispositivos são melhores. Isso significa que o tempo de resposta medido é pior que a média de todos os dispositivos testados (19.8 ms). | ||
| ↔ Tempo de resposta 50% cinza a 80% cinza | ||
| 42.9 ms ... ascensão ↗ e queda ↘ combinadas | ↗ 19.9 ms ascensão | 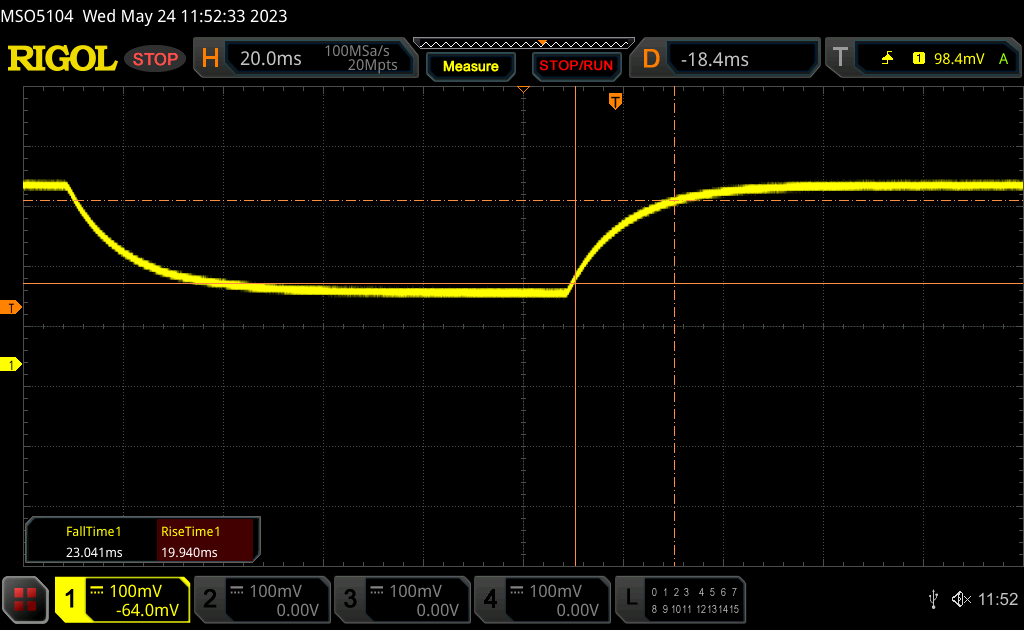 |
| ↘ 23 ms queda | ||
| A tela mostra taxas de resposta lentas em nossos testes e será insatisfatória para os jogadores. Em comparação, todos os dispositivos testados variam de 0.165 (mínimo) a 636 (máximo) ms. » 71 % de todos os dispositivos são melhores. Isso significa que o tempo de resposta medido é pior que a média de todos os dispositivos testados (31 ms). | ||
Cintilação da tela / PWM (modulação por largura de pulso)
| Tela tremeluzindo / PWM não detectado | 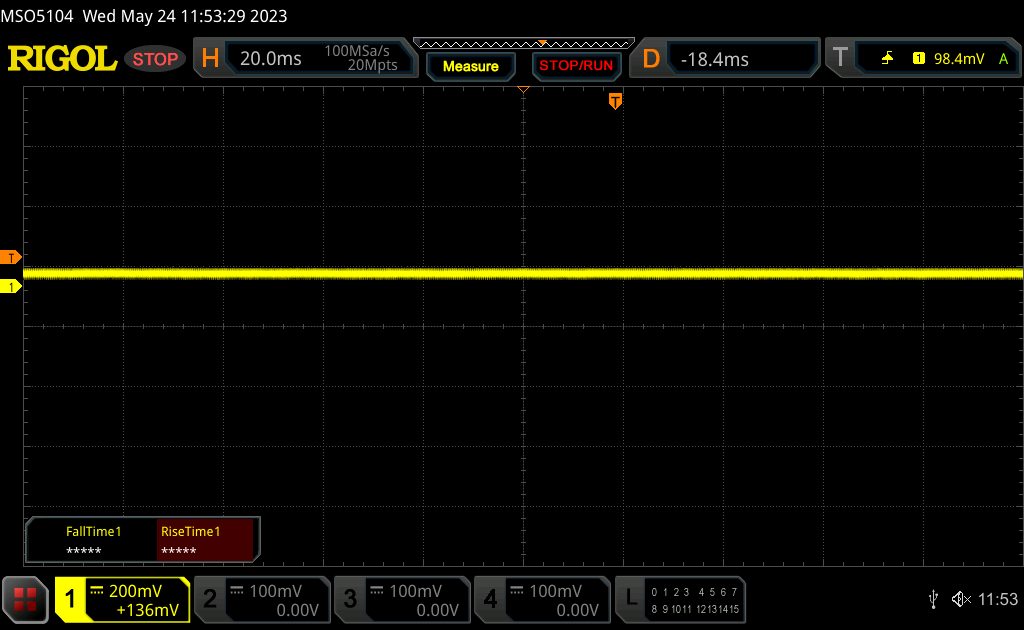 | ||
[pwm_comparison] Em comparação: 52 % de todos os dispositivos testados não usam PWM para escurecer a tela. Se PWM foi detectado, uma média de 7757 (mínimo: 5 - máximo: 343500) Hz foi medida. | |||
Desempenho - Intel de 13ª geração + Nvidia Ada Lovelace
Condições de teste
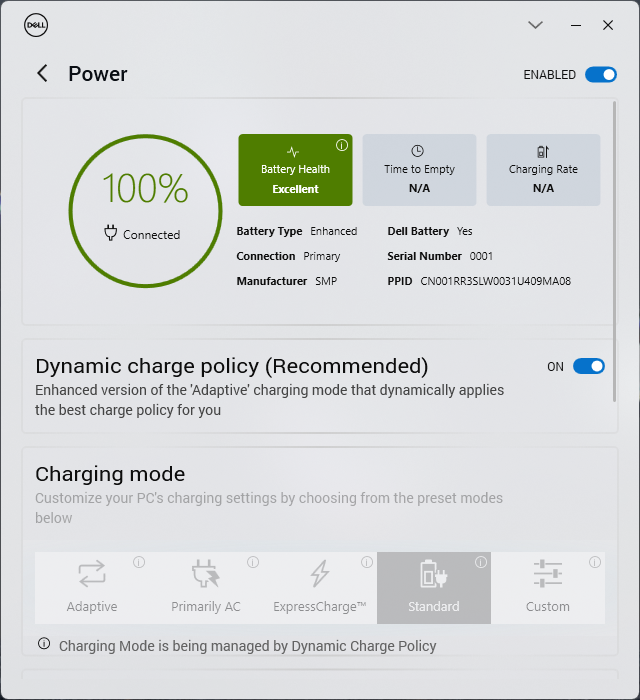
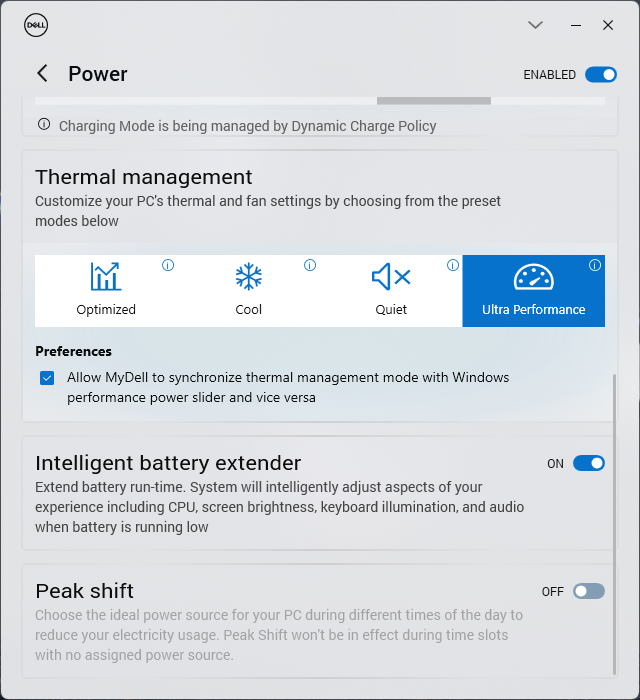
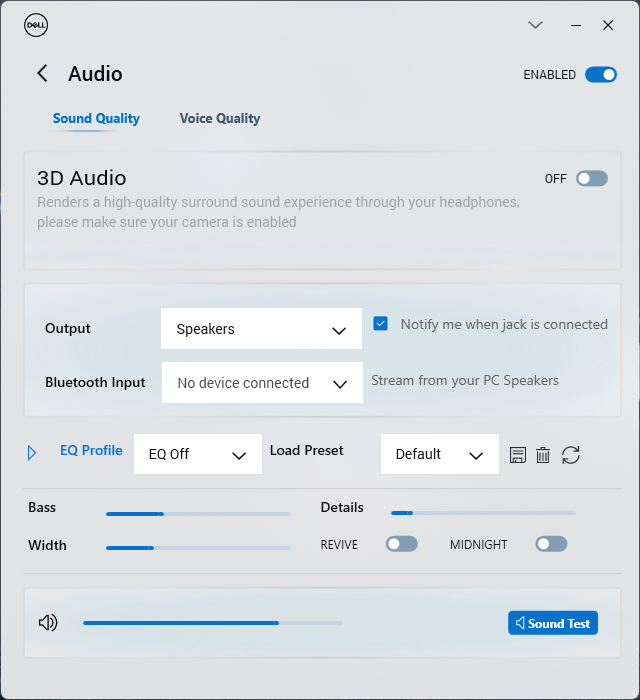
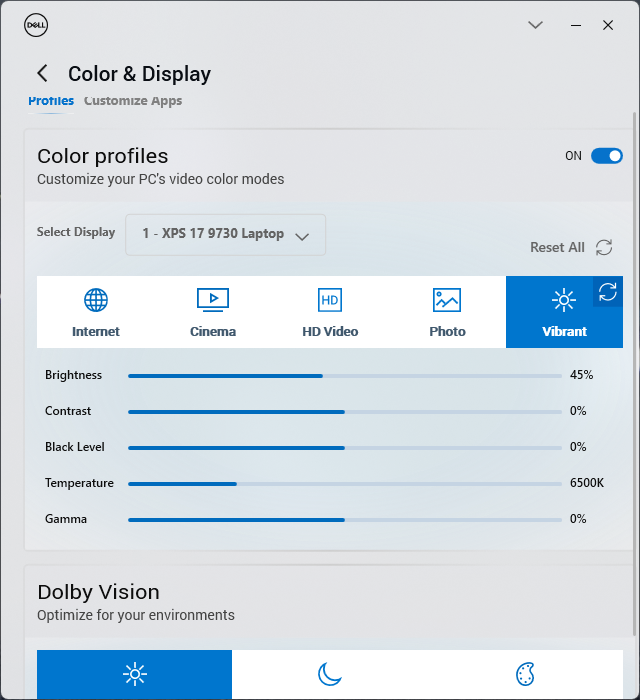
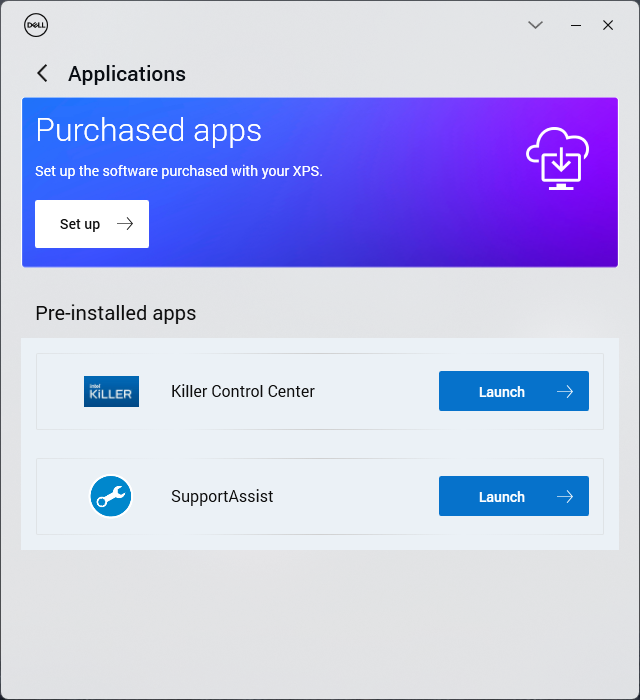
Configuramos nossa unidade para o modo Desempenho por meio do software MyDell antes de executar os benchmarks abaixo. As configurações do perfil de energia da Dell são convenientemente sincronizadas com as configurações do perfil de energia do Windows, ao contrário da maioria dos outros laptops.
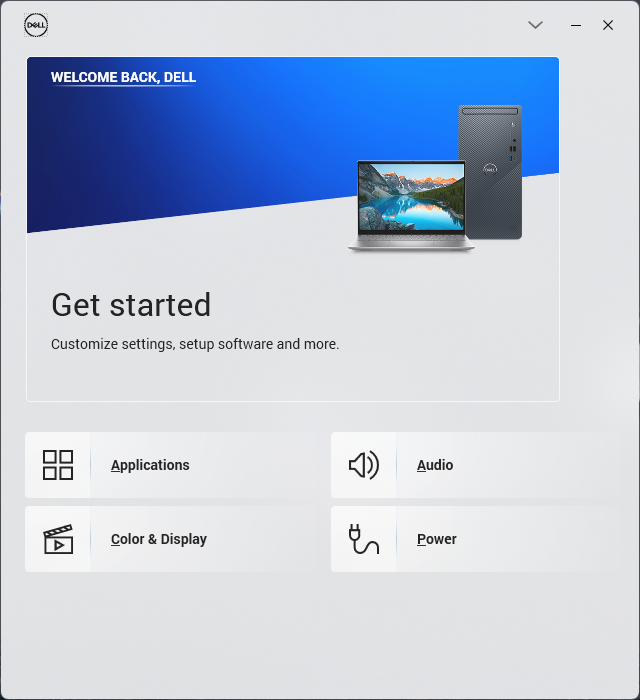
É recomendável que os usuários se familiarizem com o MyDell, pois ele é o hub central para ajustar o áudio, as cores, a energia e outros aplicativos Dell pré-instalados, como o SupportAssist. A Dell redesenhou a interface do usuário do MyDell mais uma vez para ser mais semelhante ao software Dell Optimizer que acompanha muitos laptops comerciais do mesmo fabricante. O que é irritante é que a janela do aplicativo é muito pequena e não pode ser maximizada.
O Optimus vem como padrão para a alternância automática entre a iGPU e a dGPU. Não há suporte para o Advanced Optimus ou MUX.
Processador
O Core i7-13700H no XPS 17 tem um desempenho muito bom, com resultados de benchmark ligeiramente superiores aos da maioria dos outros notebooks em nosso banco de dados equipados com o mesmo processador, incluindo o recente XPS 15 9530. O Turbo Boost, em particular, é impressionante, com uma vantagem de desempenho de 25% sobre o Core i7-12700H do ano passado no XPS 17 9720 do ano passado.
No entanto, é preciso ter em mente um detalhe notável. O Turbo Boost da CPU não é indefinido, conforme mostrado em nosso gráfico abaixo ao executar o CineBench R15 xT em um loop. O desempenho cairia em cerca de 25% após 9 ou 10 execuções, o que é mais acentuado em relação à maioria dos outros notebooks equipados com CPUs da série H. Ao levar em conta esse estrangulamento, o Core i7-13700H teria, na verdade, um desempenho quase idêntico ao do Core i7-12700H. Portanto, o Core i7-13700H tem seu melhor desempenho quando é necessário um alto desempenho em rajadas curtas, como ao iniciar programas, editar imagens ou codificar vídeos curtos. Caso contrário, ele oferece apenas pequenas vantagens de desempenho em relação ao Core i7-12700H do ano passado.
A atualização para o Core i9-13900H deverá aumentar o desempenho multi-thread em cerca de 10 a 20%, com base em nossa experiência com oMSI Stealth 17 Studio. O desempenho de thread único, no entanto, permaneceria praticamente o mesmo, se não um pouco mais lento, com o Core i9.
Cinebench R15 Multi Loop
Cinebench R23: Multi Core | Single Core
Cinebench R20: CPU (Multi Core) | CPU (Single Core)
Cinebench R15: CPU Multi 64Bit | CPU Single 64Bit
Blender: v2.79 BMW27 CPU
7-Zip 18.03: 7z b 4 | 7z b 4 -mmt1
Geekbench 5.5: Multi-Core | Single-Core
HWBOT x265 Benchmark v2.2: 4k Preset
LibreOffice : 20 Documents To PDF
R Benchmark 2.5: Overall mean
* ... menor é melhor
AIDA64: FP32 Ray-Trace | FPU Julia | CPU SHA3 | CPU Queen | FPU SinJulia | FPU Mandel | CPU AES | CPU ZLib | FP64 Ray-Trace | CPU PhotoWorxx
| Performance rating | |
| Dell XPS 17 9730 RTX 4070 | |
| Média Intel Core i7-13700H | |
| MSI Creator Z17 A12UGST-054 | |
| Dell XPS 17 9720 RTX 3060 | |
| LG Gram 17 (2023) | |
| HP Envy 17-cr0079ng | |
| AIDA64 / FP32 Ray-Trace | |
| Dell XPS 17 9730 RTX 4070 | |
| Média Intel Core i7-13700H (4986 - 18908, n=29) | |
| LG Gram 17 (2023) | |
| MSI Creator Z17 A12UGST-054 | |
| HP Envy 17-cr0079ng | |
| Dell XPS 17 9720 RTX 3060 | |
| AIDA64 / FPU Julia | |
| Dell XPS 17 9730 RTX 4070 | |
| Média Intel Core i7-13700H (25360 - 92359, n=29) | |
| HP Envy 17-cr0079ng | |
| LG Gram 17 (2023) | |
| MSI Creator Z17 A12UGST-054 | |
| Dell XPS 17 9720 RTX 3060 | |
| AIDA64 / CPU SHA3 | |
| Dell XPS 17 9730 RTX 4070 | |
| Média Intel Core i7-13700H (1339 - 4224, n=29) | |
| MSI Creator Z17 A12UGST-054 | |
| Dell XPS 17 9720 RTX 3060 | |
| HP Envy 17-cr0079ng | |
| LG Gram 17 (2023) | |
| AIDA64 / CPU Queen | |
| MSI Creator Z17 A12UGST-054 | |
| Dell XPS 17 9720 RTX 3060 | |
| Dell XPS 17 9730 RTX 4070 | |
| Média Intel Core i7-13700H (59324 - 107159, n=29) | |
| LG Gram 17 (2023) | |
| HP Envy 17-cr0079ng | |
| AIDA64 / FPU SinJulia | |
| Dell XPS 17 9730 RTX 4070 | |
| MSI Creator Z17 A12UGST-054 | |
| Dell XPS 17 9720 RTX 3060 | |
| Média Intel Core i7-13700H (4800 - 11050, n=29) | |
| LG Gram 17 (2023) | |
| HP Envy 17-cr0079ng | |
| AIDA64 / FPU Mandel | |
| Dell XPS 17 9730 RTX 4070 | |
| Média Intel Core i7-13700H (12321 - 45118, n=29) | |
| MSI Creator Z17 A12UGST-054 | |
| LG Gram 17 (2023) | |
| Dell XPS 17 9720 RTX 3060 | |
| HP Envy 17-cr0079ng | |
| AIDA64 / CPU AES | |
| MSI Creator Z17 A12UGST-054 | |
| Dell XPS 17 9720 RTX 3060 | |
| Média Intel Core i7-13700H (28769 - 151254, n=29) | |
| Dell XPS 17 9730 RTX 4070 | |
| LG Gram 17 (2023) | |
| HP Envy 17-cr0079ng | |
| AIDA64 / CPU ZLib | |
| Dell XPS 17 9730 RTX 4070 | |
| MSI Creator Z17 A12UGST-054 | |
| Média Intel Core i7-13700H (389 - 1215, n=29) | |
| Dell XPS 17 9720 RTX 3060 | |
| HP Envy 17-cr0079ng | |
| LG Gram 17 (2023) | |
| AIDA64 / FP64 Ray-Trace | |
| Dell XPS 17 9730 RTX 4070 | |
| Média Intel Core i7-13700H (2540 - 10135, n=29) | |
| LG Gram 17 (2023) | |
| MSI Creator Z17 A12UGST-054 | |
| Dell XPS 17 9720 RTX 3060 | |
| HP Envy 17-cr0079ng | |
| AIDA64 / CPU PhotoWorxx | |
| LG Gram 17 (2023) | |
| Dell XPS 17 9730 RTX 4070 | |
| Dell XPS 17 9720 RTX 3060 | |
| Média Intel Core i7-13700H (12872 - 52727, n=29) | |
| MSI Creator Z17 A12UGST-054 | |
| HP Envy 17-cr0079ng | |
Desempenho do sistema
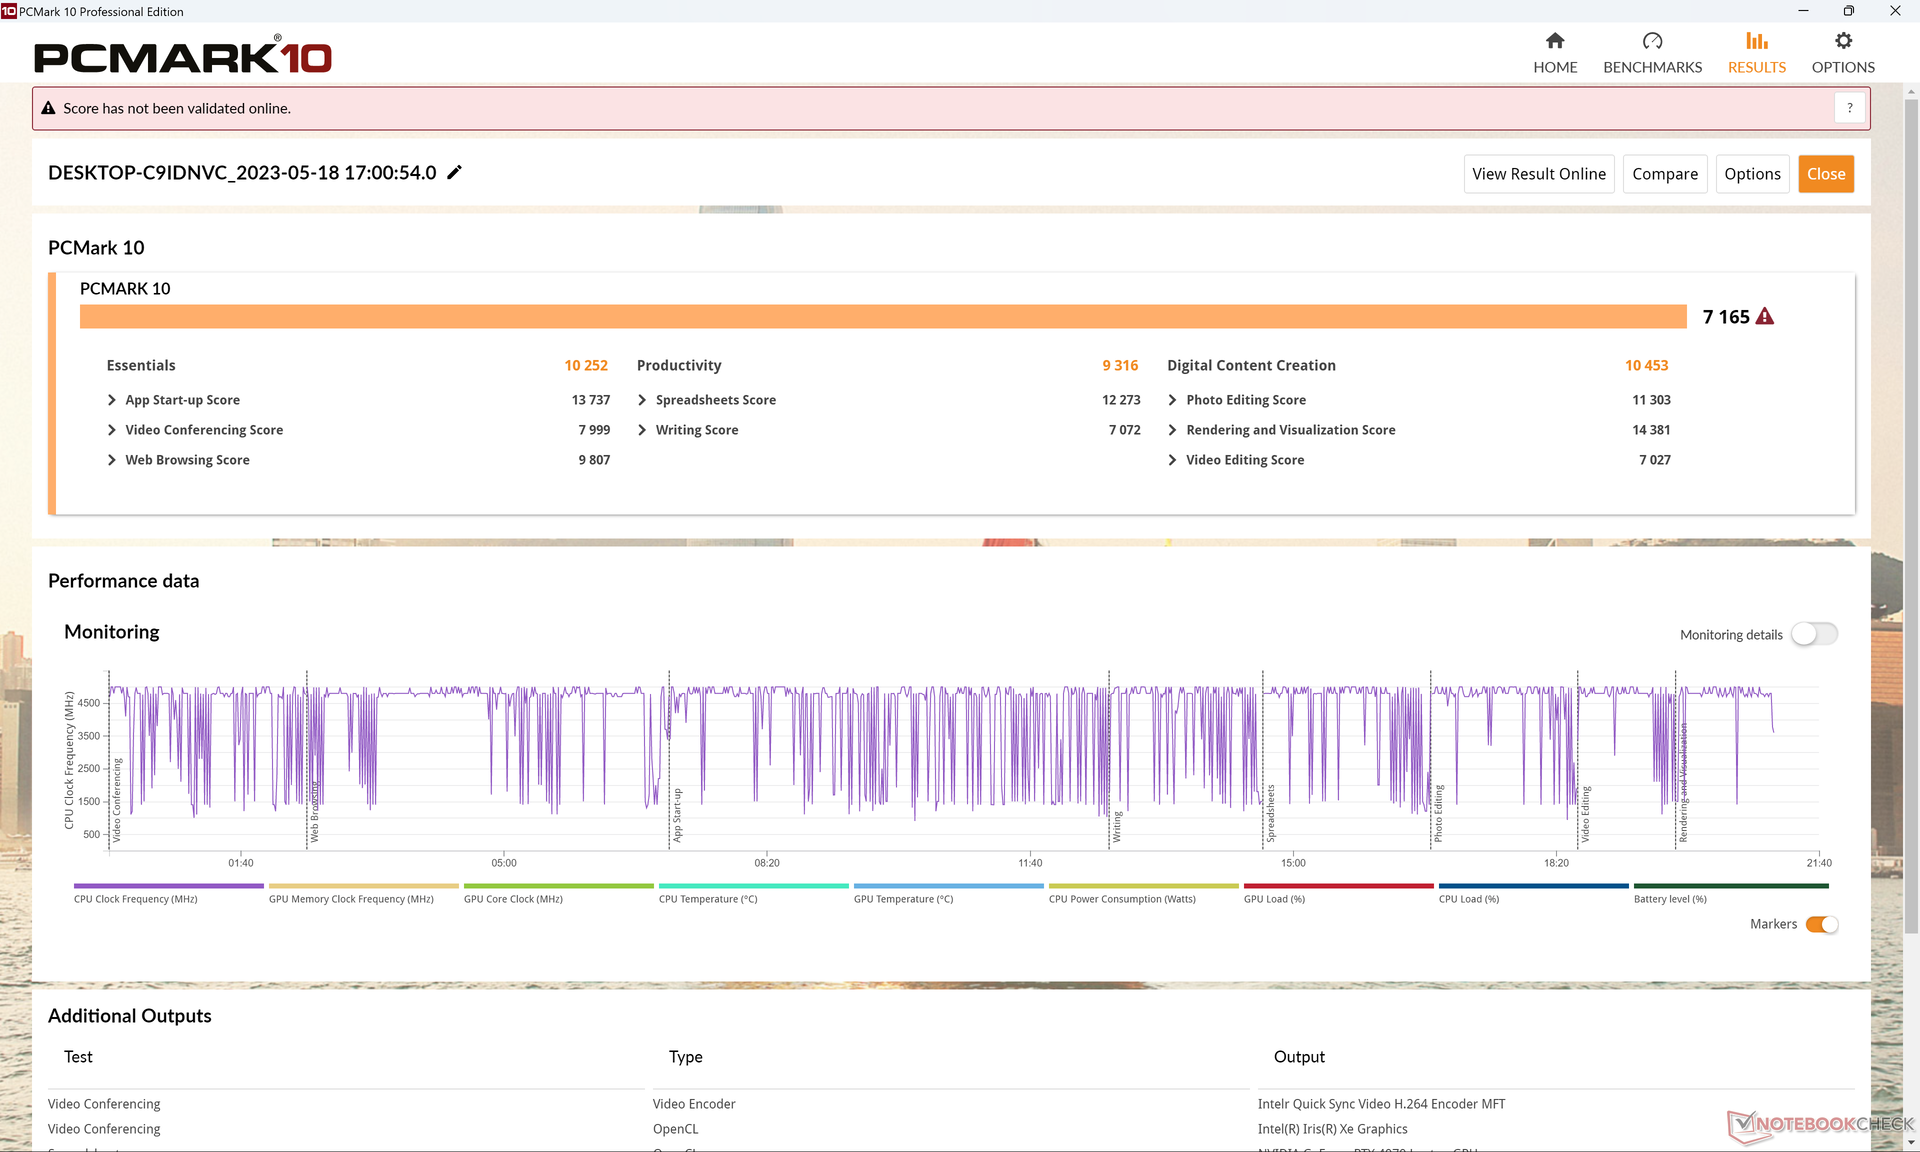
As pontuações do PCMark são praticamente idênticas às do XPS 17 9720 do ano passado, apesar das melhorias de desempenho ano a ano. Isso sugere que as cargas de trabalho diárias e as atividades leves de escritório não são visivelmente mais rápidas no modelo mais recente. Se as suas cargas de trabalho consistem principalmente em navegação na Web, planilhas e processamento de texto, uma configuração menor do XPS 17 com a RTX 4050 pode ser mais adequada do que a nossa configuração com a RTX 4070.
CrossMark: Overall | Productivity | Creativity | Responsiveness
| PCMark 10 / Score | |
| Média Intel Core i7-13700H, NVIDIA GeForce RTX 4070 Laptop GPU (7158 - 7956, n=8) | |
| Dell XPS 17 9720 RTX 3060 | |
| Dell XPS 17 9730 RTX 4070 | |
| MSI Creator Z17 A12UGST-054 | |
| HP Envy 17-cr0079ng | |
| LG Gram 17 (2023) | |
| PCMark 10 / Essentials | |
| LG Gram 17 (2023) | |
| Dell XPS 17 9720 RTX 3060 | |
| Média Intel Core i7-13700H, NVIDIA GeForce RTX 4070 Laptop GPU (10252 - 11449, n=8) | |
| HP Envy 17-cr0079ng | |
| MSI Creator Z17 A12UGST-054 | |
| Dell XPS 17 9730 RTX 4070 | |
| PCMark 10 / Productivity | |
| Média Intel Core i7-13700H, NVIDIA GeForce RTX 4070 Laptop GPU (8501 - 10769, n=8) | |
| MSI Creator Z17 A12UGST-054 | |
| Dell XPS 17 9720 RTX 3060 | |
| Dell XPS 17 9730 RTX 4070 | |
| HP Envy 17-cr0079ng | |
| LG Gram 17 (2023) | |
| PCMark 10 / Digital Content Creation | |
| Média Intel Core i7-13700H, NVIDIA GeForce RTX 4070 Laptop GPU (10358 - 12908, n=8) | |
| Dell XPS 17 9730 RTX 4070 | |
| Dell XPS 17 9720 RTX 3060 | |
| MSI Creator Z17 A12UGST-054 | |
| HP Envy 17-cr0079ng | |
| LG Gram 17 (2023) | |
| CrossMark / Overall | |
| MSI Creator Z17 A12UGST-054 | |
| Apple MacBook Pro 16 2023 M2 Max | |
| Média Intel Core i7-13700H, NVIDIA GeForce RTX 4070 Laptop GPU (1768 - 2073, n=6) | |
| Dell XPS 17 9720 RTX 3060 | |
| Dell XPS 17 9730 RTX 4070 | |
| LG Gram 17 (2023) | |
| HP Envy 17-cr0079ng | |
| CrossMark / Productivity | |
| MSI Creator Z17 A12UGST-054 | |
| Média Intel Core i7-13700H, NVIDIA GeForce RTX 4070 Laptop GPU (1645 - 2006, n=6) | |
| Dell XPS 17 9720 RTX 3060 | |
| Dell XPS 17 9730 RTX 4070 | |
| Apple MacBook Pro 16 2023 M2 Max | |
| LG Gram 17 (2023) | |
| HP Envy 17-cr0079ng | |
| CrossMark / Creativity | |
| Apple MacBook Pro 16 2023 M2 Max | |
| MSI Creator Z17 A12UGST-054 | |
| Dell XPS 17 9720 RTX 3060 | |
| Média Intel Core i7-13700H, NVIDIA GeForce RTX 4070 Laptop GPU (1936 - 2137, n=6) | |
| Dell XPS 17 9730 RTX 4070 | |
| LG Gram 17 (2023) | |
| HP Envy 17-cr0079ng | |
| CrossMark / Responsiveness | |
| MSI Creator Z17 A12UGST-054 | |
| Média Intel Core i7-13700H, NVIDIA GeForce RTX 4070 Laptop GPU (1451 - 2202, n=6) | |
| Dell XPS 17 9720 RTX 3060 | |
| Dell XPS 17 9730 RTX 4070 | |
| LG Gram 17 (2023) | |
| Apple MacBook Pro 16 2023 M2 Max | |
| HP Envy 17-cr0079ng | |
| PCMark 10 Score | 7165 pontos | |
Ajuda | ||
| AIDA64 / Memory Copy | |
| LG Gram 17 (2023) | |
| Dell XPS 17 9730 RTX 4070 | |
| Dell XPS 17 9720 RTX 3060 | |
| MSI Creator Z17 A12UGST-054 | |
| Média Intel Core i7-13700H (24334 - 78081, n=29) | |
| HP Envy 17-cr0079ng | |
| AIDA64 / Memory Read | |
| Dell XPS 17 9730 RTX 4070 | |
| Dell XPS 17 9720 RTX 3060 | |
| MSI Creator Z17 A12UGST-054 | |
| Média Intel Core i7-13700H (23681 - 79656, n=29) | |
| LG Gram 17 (2023) | |
| HP Envy 17-cr0079ng | |
| AIDA64 / Memory Write | |
| LG Gram 17 (2023) | |
| Dell XPS 17 9730 RTX 4070 | |
| Média Intel Core i7-13700H (22986 - 99898, n=29) | |
| MSI Creator Z17 A12UGST-054 | |
| Dell XPS 17 9720 RTX 3060 | |
| HP Envy 17-cr0079ng | |
| AIDA64 / Memory Latency | |
| LG Gram 17 (2023) | |
| MSI Creator Z17 A12UGST-054 | |
| Dell XPS 17 9730 RTX 4070 | |
| Média Intel Core i7-13700H (82.4 - 136.8, n=29) | |
| Dell XPS 17 9720 RTX 3060 | |
| HP Envy 17-cr0079ng | |
* ... menor é melhor
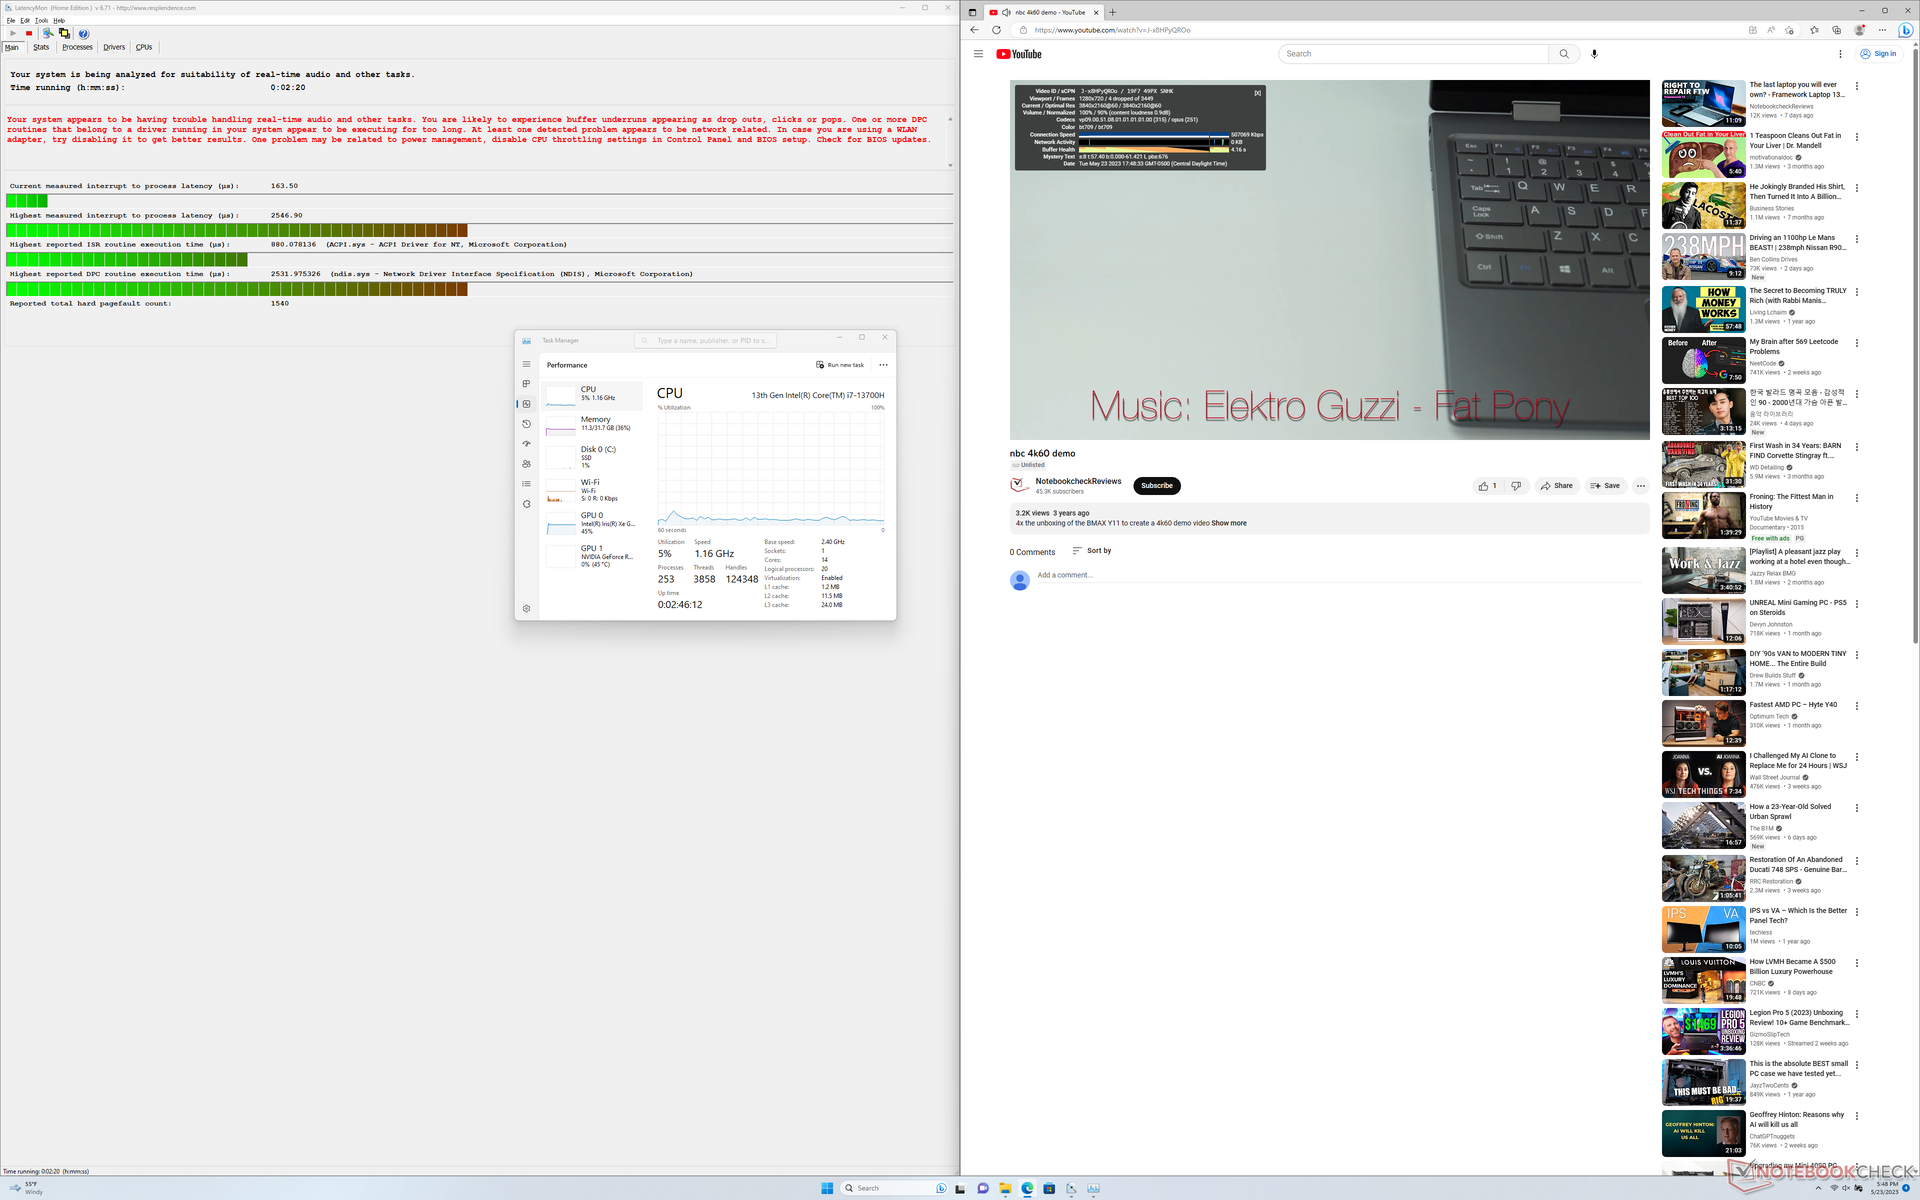
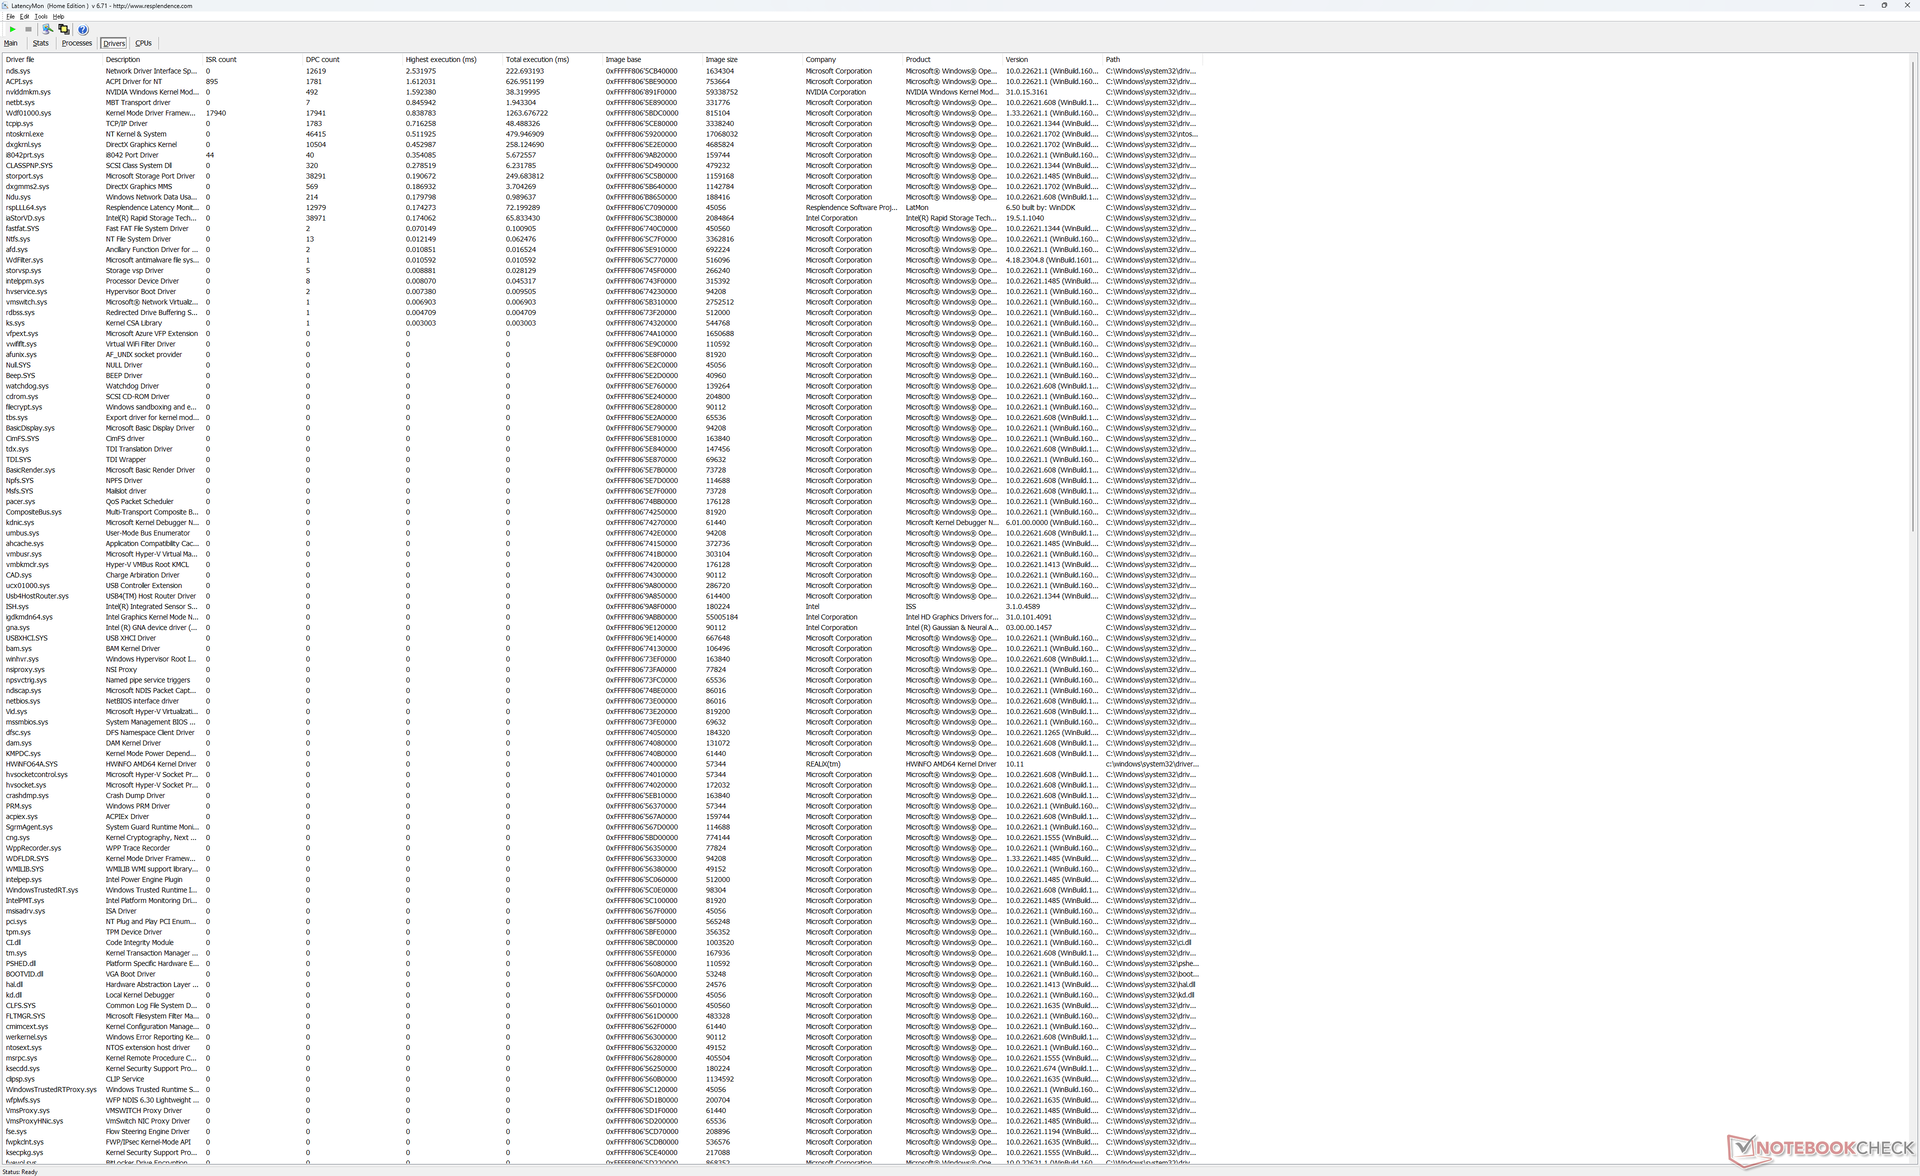
Latência DPC
O LatencyMon revela problemas de DPC ao abrir várias guias do navegador da nossa página inicial, mesmo após várias tentativas. Os resultados são decepcionantes, considerando que não tivemos nenhum problema com o recente XPS 15 9530 ou no XPS 17 9720 do ano passado.
a reprodução de vídeo em 4K a 60 FPS é perfeita, exceto no início, quando sempre há uma queda de 4 quadros. Curiosamente, esse mesmo problema também aparecia no XPS 15 9530.
| DPC Latencies / LatencyMon - interrupt to process latency (max), Web, Youtube, Prime95 | |
| HP Envy 17-cr0079ng | |
| Dell XPS 17 9730 RTX 4070 | |
| LG Gram 17 (2023) | |
| MSI Creator Z17 A12UGST-054 | |
| Dell XPS 15 9530 RTX 4070 | |
| Dell XPS 17 9720 RTX 3060 | |
* ... menor é melhor
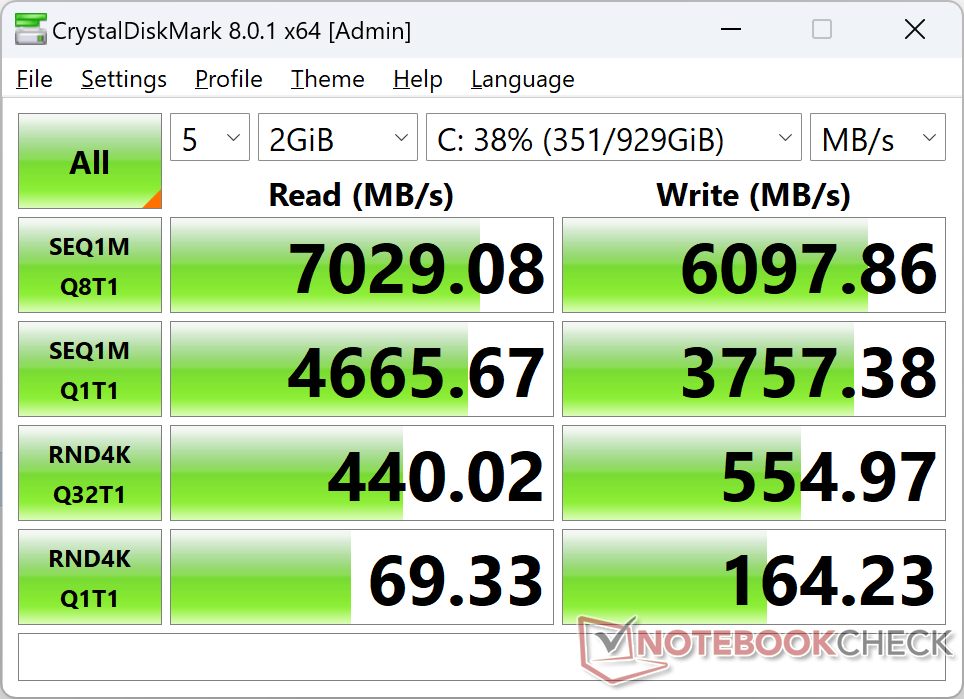
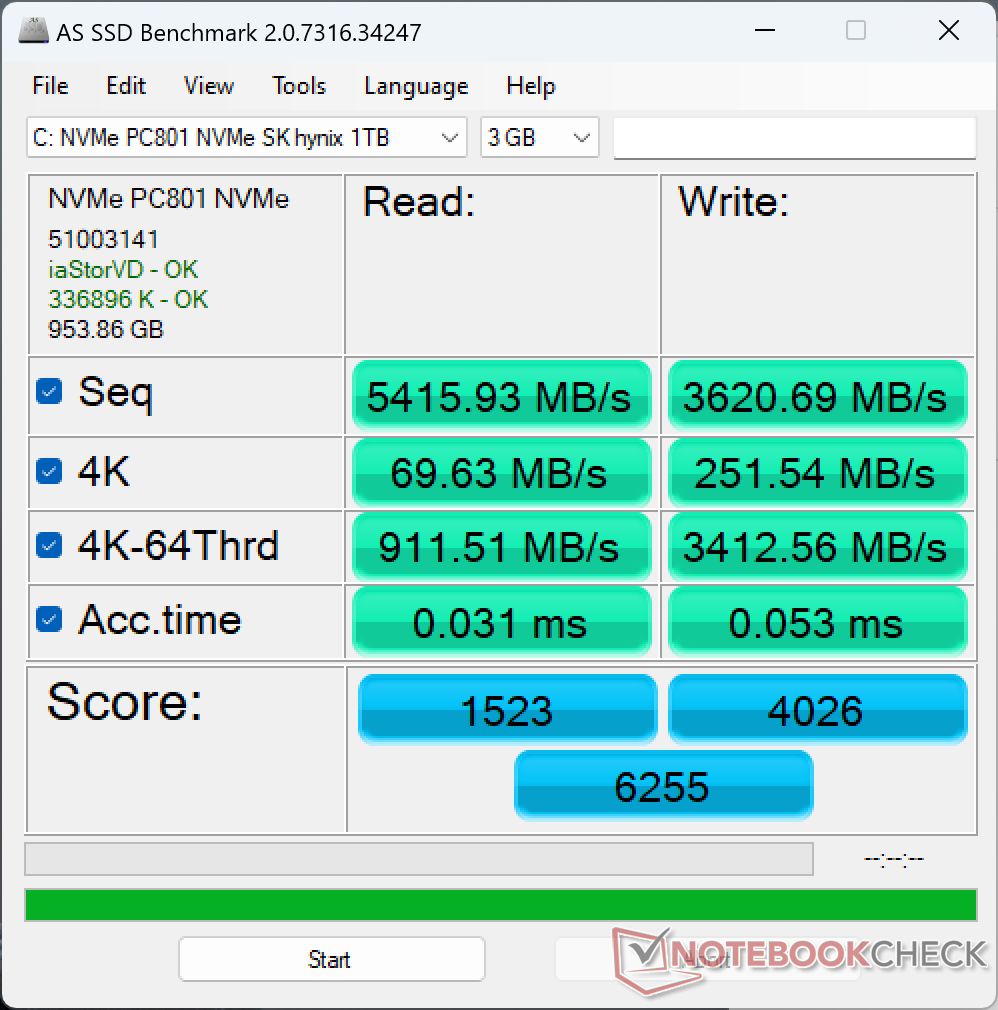
Dispositivos de armazenamento
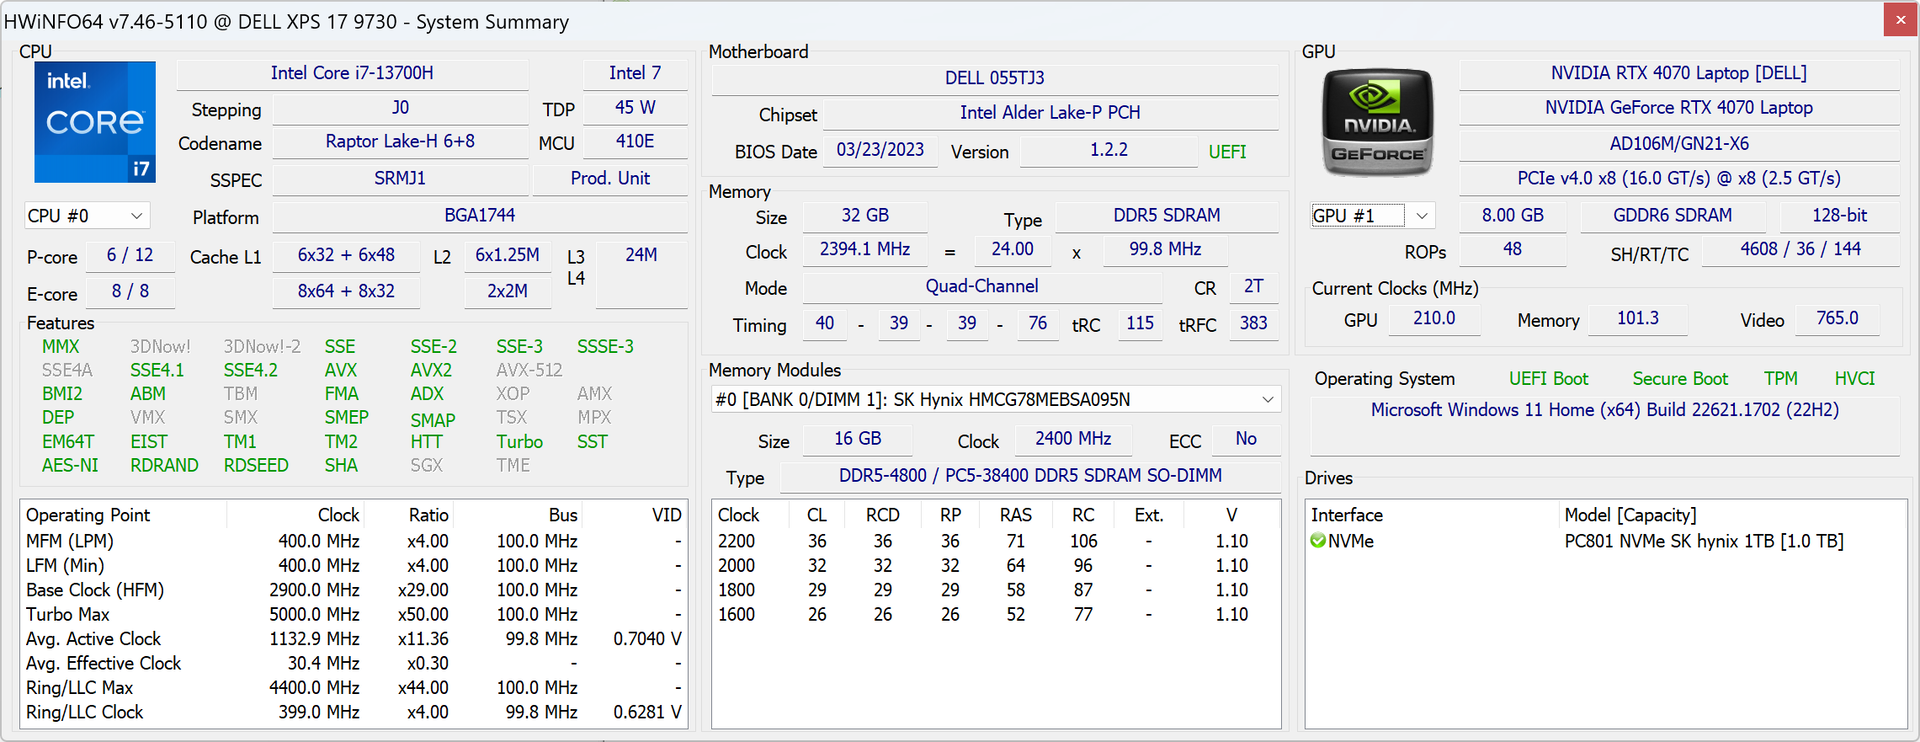
As unidades XPS podem ser fornecidas com SSDs da Samsung, Micron, Western Digital ou SK Hynix. Em nosso caso específico, nossa unidade de teste vem com o SK Hynix PC801 SSD PCIe4 x4 NVMe. O desempenho é excelente e comparável ao do Samsung PM9A1, sem quedas nas taxas de transferência quando estressado.
Um segundo SSD M.2 pode ser instalado, se necessário. Cada um dos dois slots M.2 vem com um dissipador de calor para ajudar no resfriamento das unidades.

| Drive Performance rating - Percent | |
| LG Gram 17 (2023) | |
| MSI Creator Z17 A12UGST-054 | |
| Dell XPS 17 9730 RTX 4070 | |
| Dell XPS 17 9720 RTX 3060 | |
| HP Envy 17-cr0079ng | |
* ... menor é melhor
Disk Throttling: DiskSpd Read Loop, Queue Depth 8
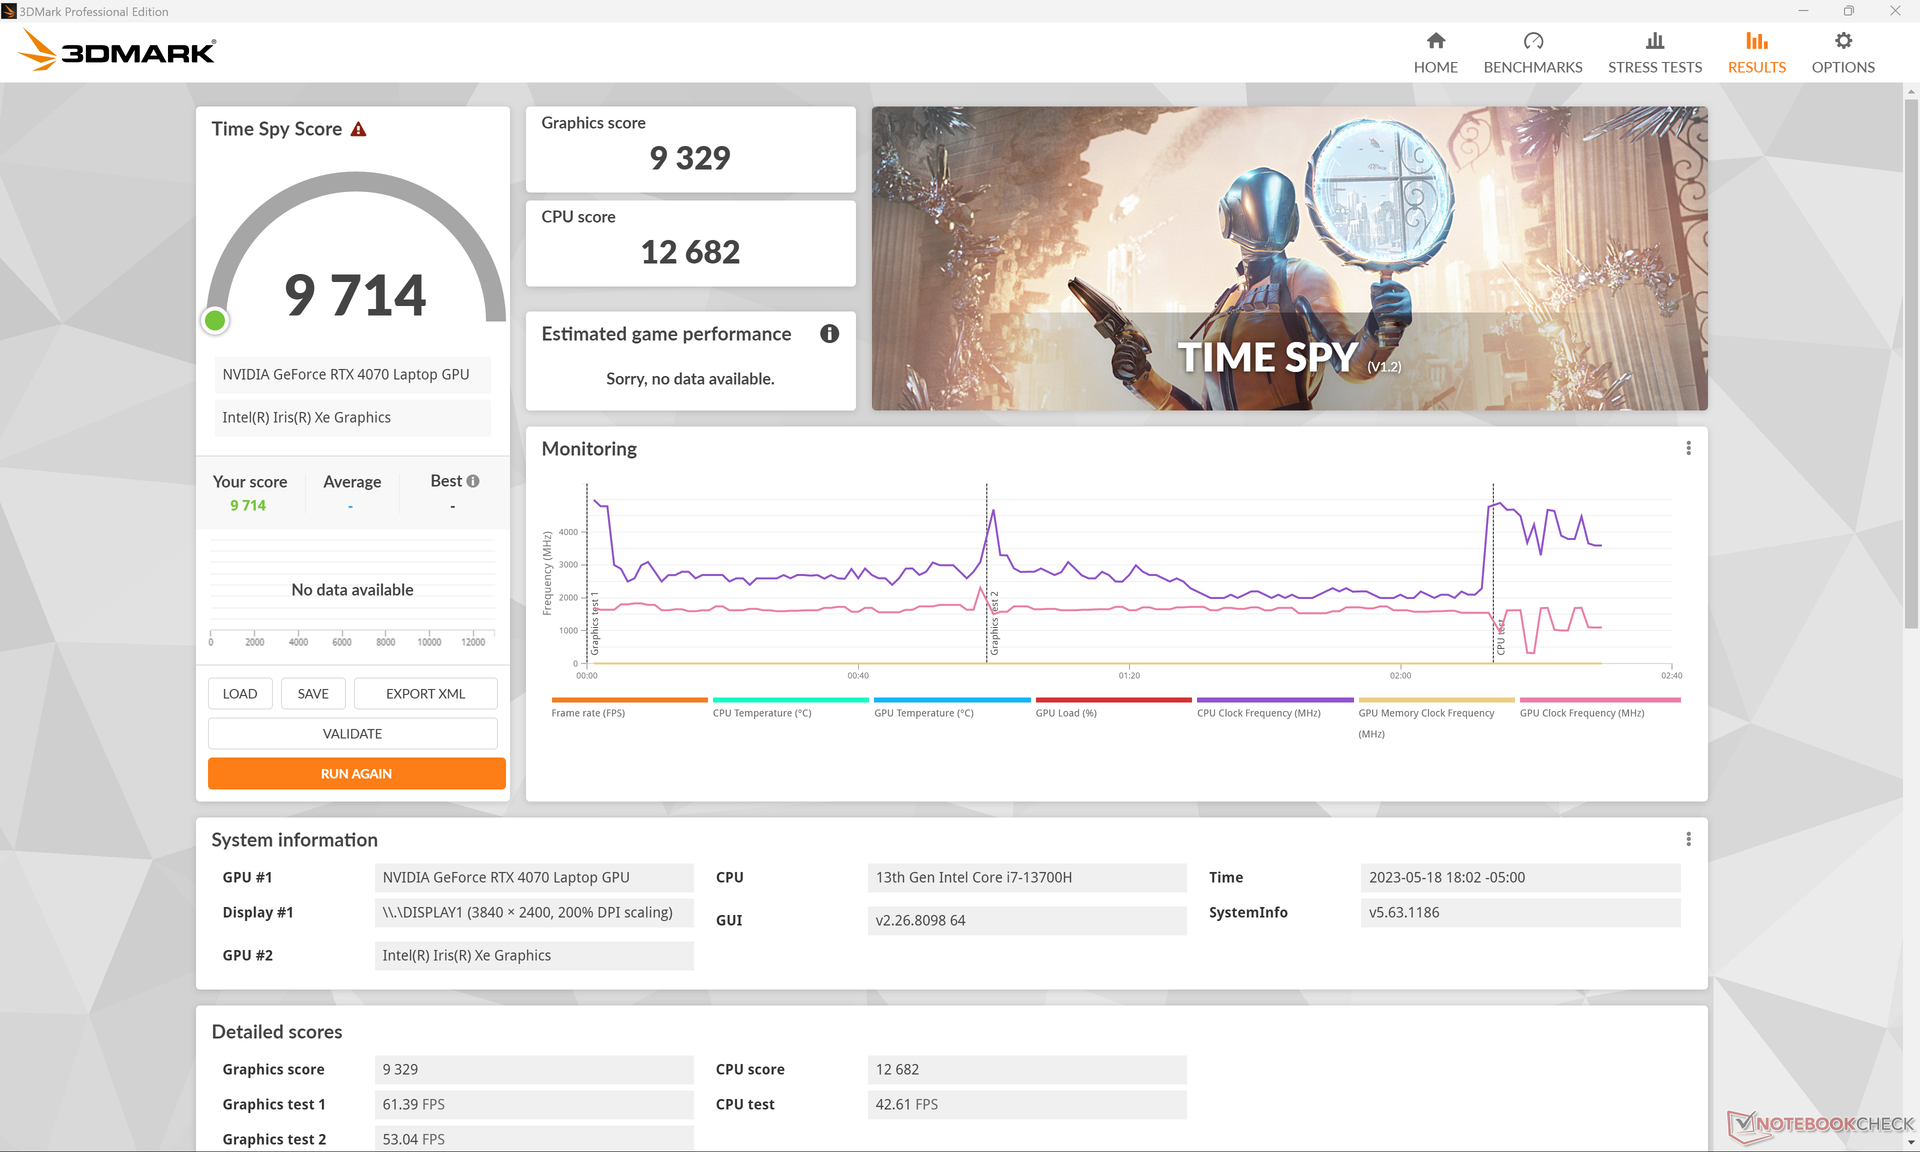
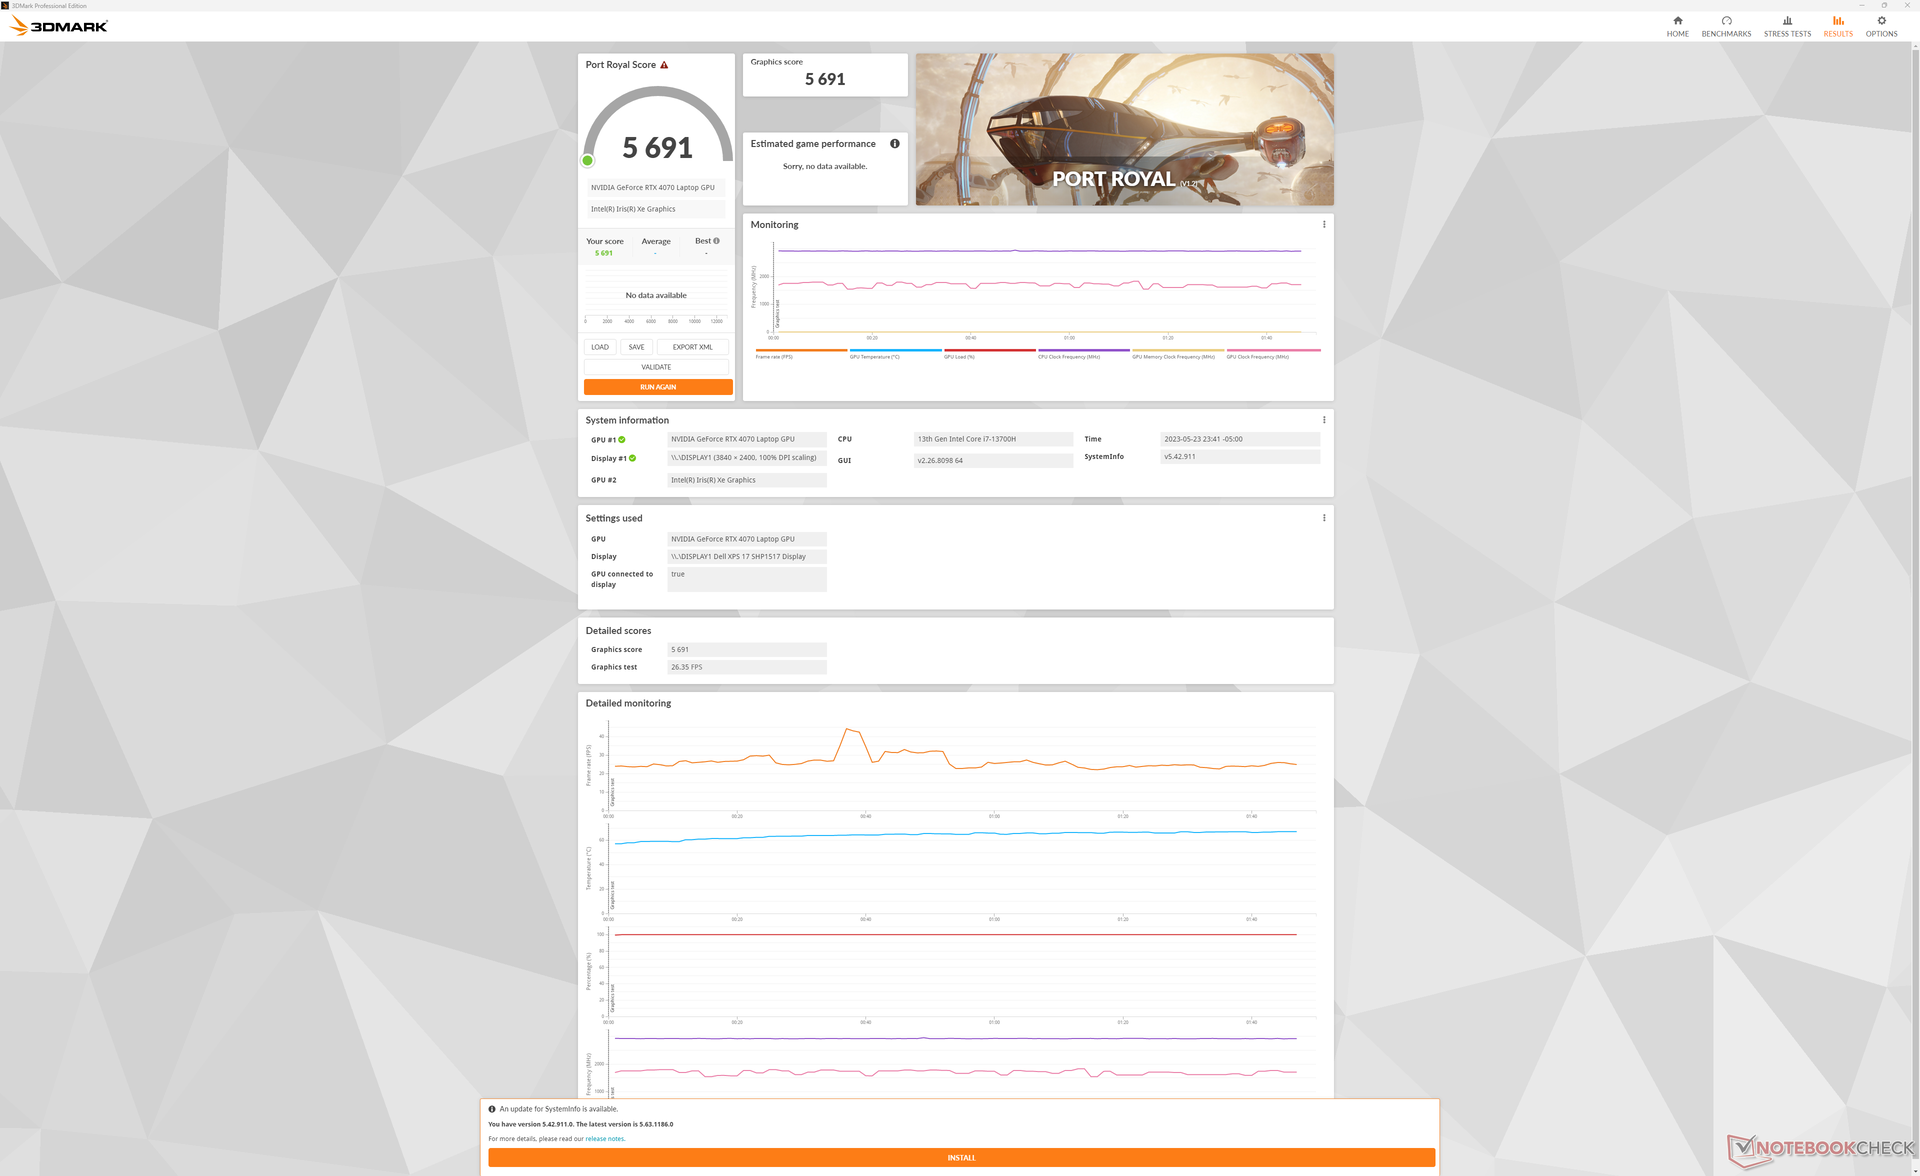
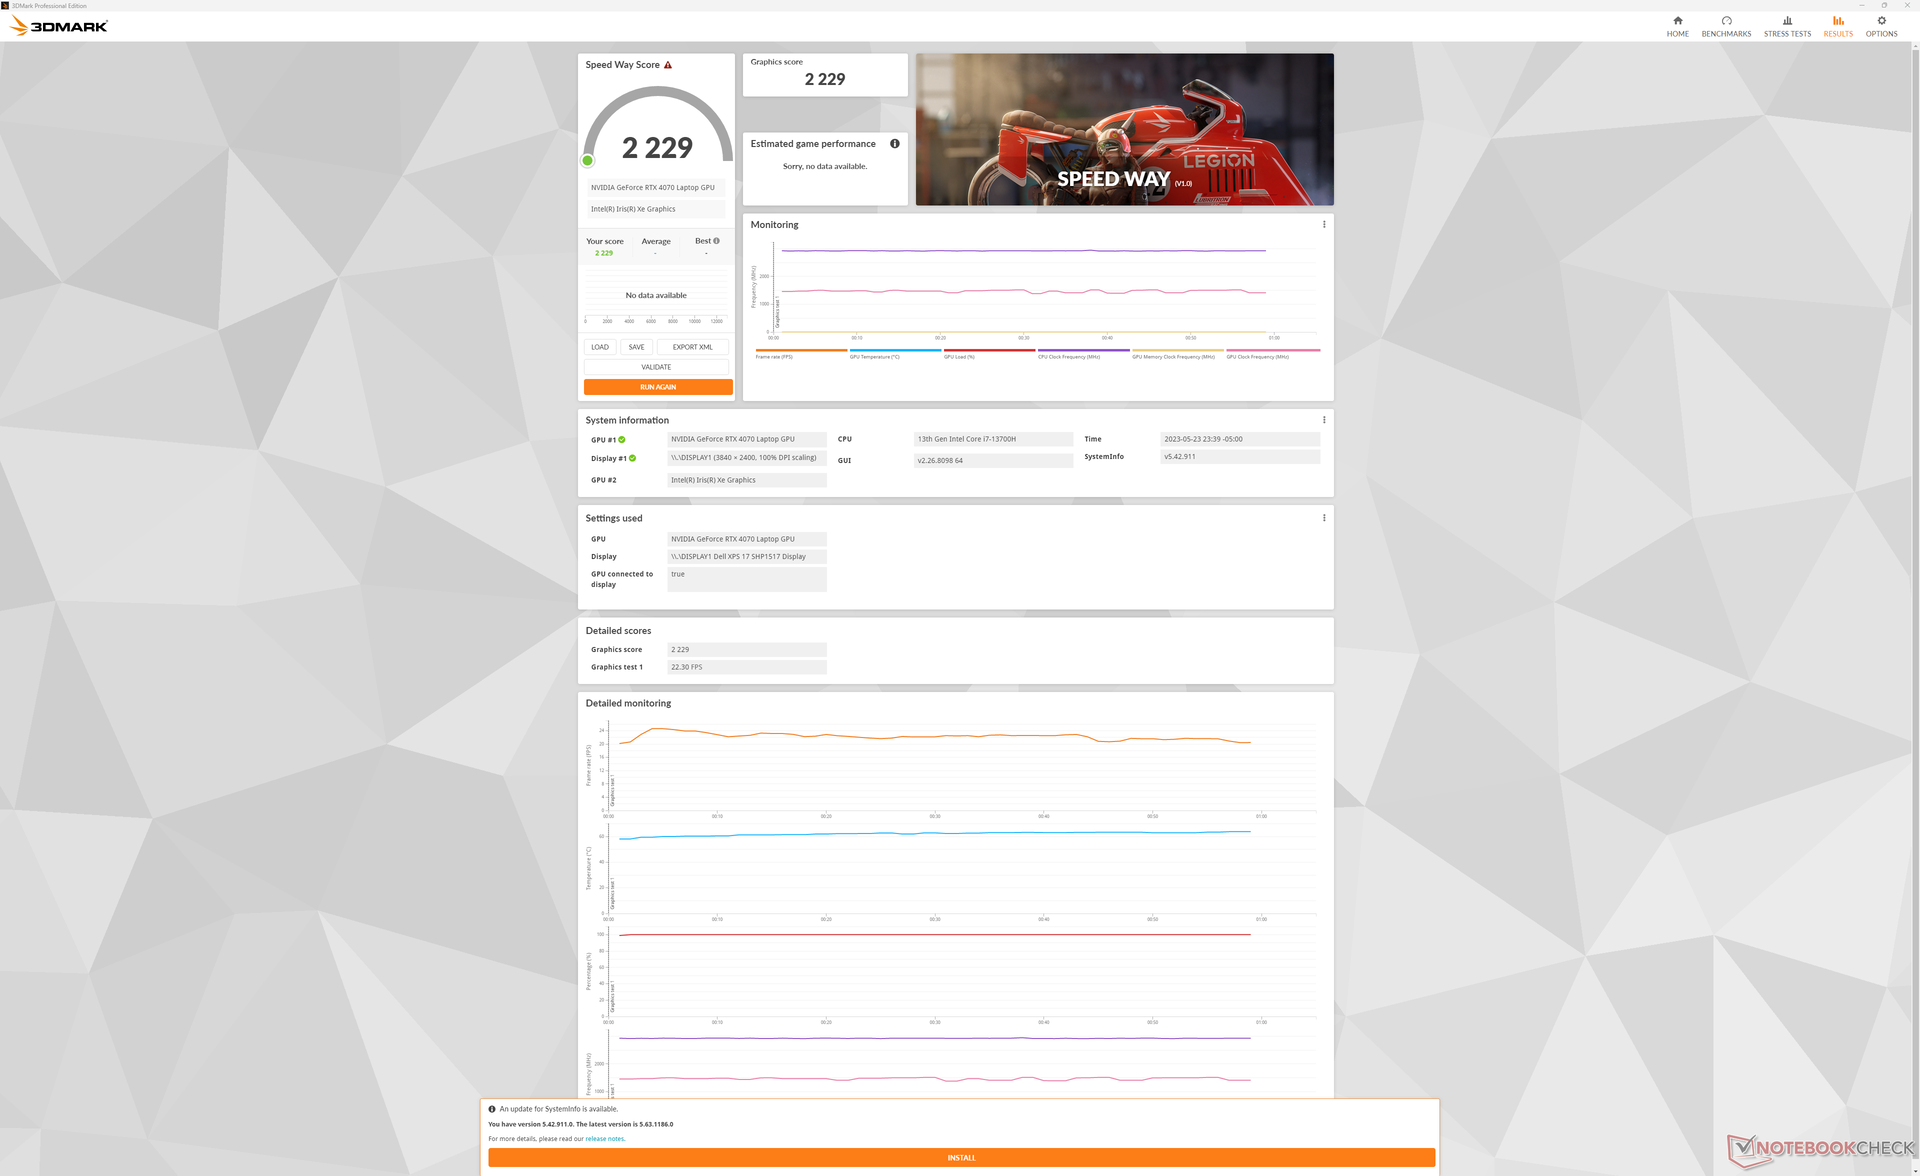
Desempenho da GPU - Muito mais rápido do que o XPS 15 9530
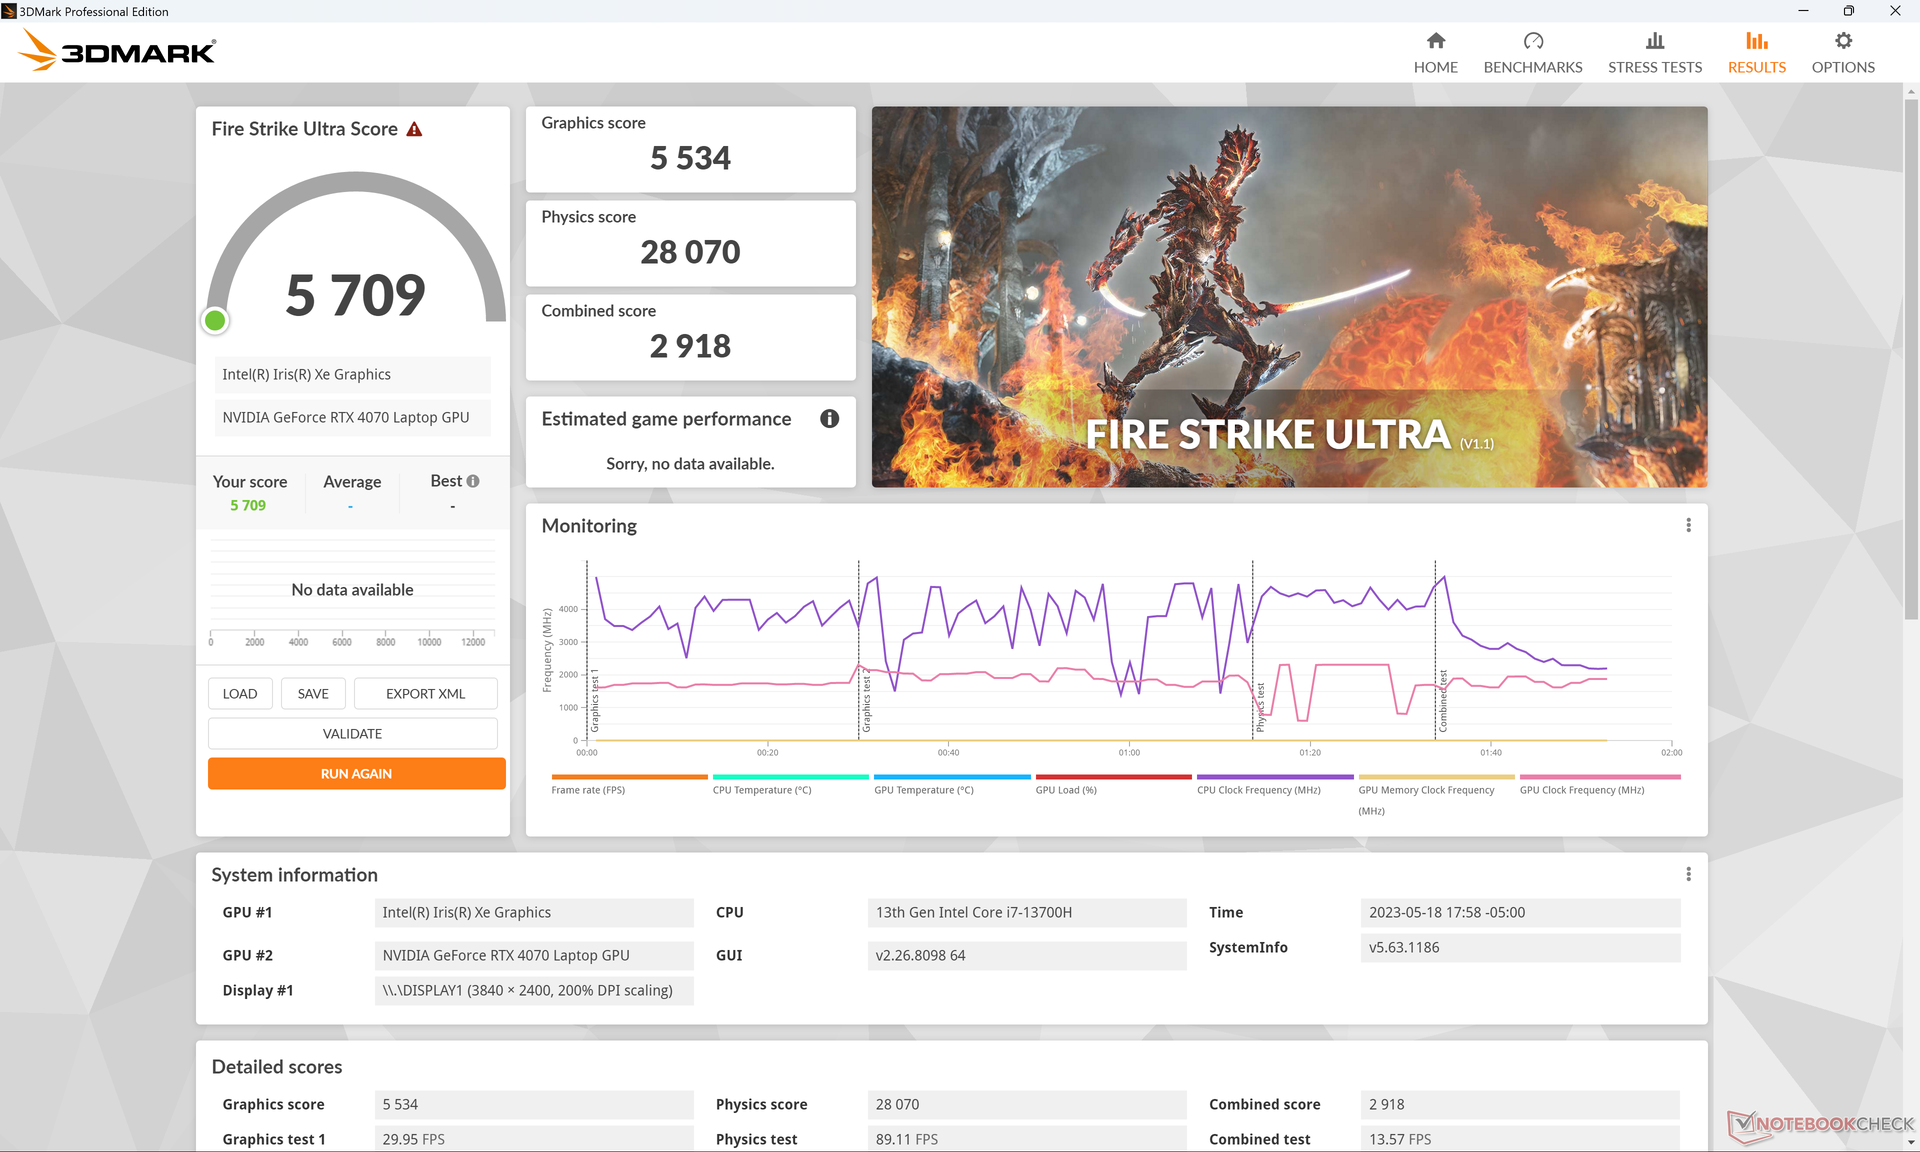
O móvel GeForce RTX 4070 no XPS 17 tem como meta um TGP de 60 W a 70 W, enquanto a mesma GPU no XPS 15 menor tem como meta 40 W. Essa mudança aparentemente pequena faz uma grande diferença, pois as pontuações do 3DMark para os benchmarks DirectX e ray tracing são 50 a 60% mais rápidas no XPS 17 9730 em comparação com o XPS 15. O aumento de desempenho é tão grande que a RTX 4070 no XPS 17 está apenas 10 a 15% atrás do laptop para jogos médio equipado com a mesma GPU. Essa é a faixa de desempenho que esperávamos ver no XPS 15 9530.
A aceleração da GPU do Blender também recebe um impulso quando comparada à mesma GPU do XPS 15. É um aumento menor de 20% no desempenho para alinhar o XPS 17 com a maioria dos outros notebooks RTX 4070.
A Dell oferece uma opção RTX 4080 ainda mais alta para o XPS 17, mas esperamos que ela tenha um desempenho inferior quando comparada à maioria dos outros notebooks RTX 4080 devido à fonte de alimentação USB-C limitada de 130 W. OMSI Stealth 17 Studiopor exemplo, oferece a RTX 4080, embora com um adaptador CA de 240 W muito mais capaz.
A opção de GPU mais alta para a série XPS 17 antes do XPS 17 9730 era a RTX 3060. Quando comparada a essa configuração, nossa RTX 4070 pode oferecer criação de conteúdo e desempenho gráfico 20% e 30% mais rápidos, respectivamente.
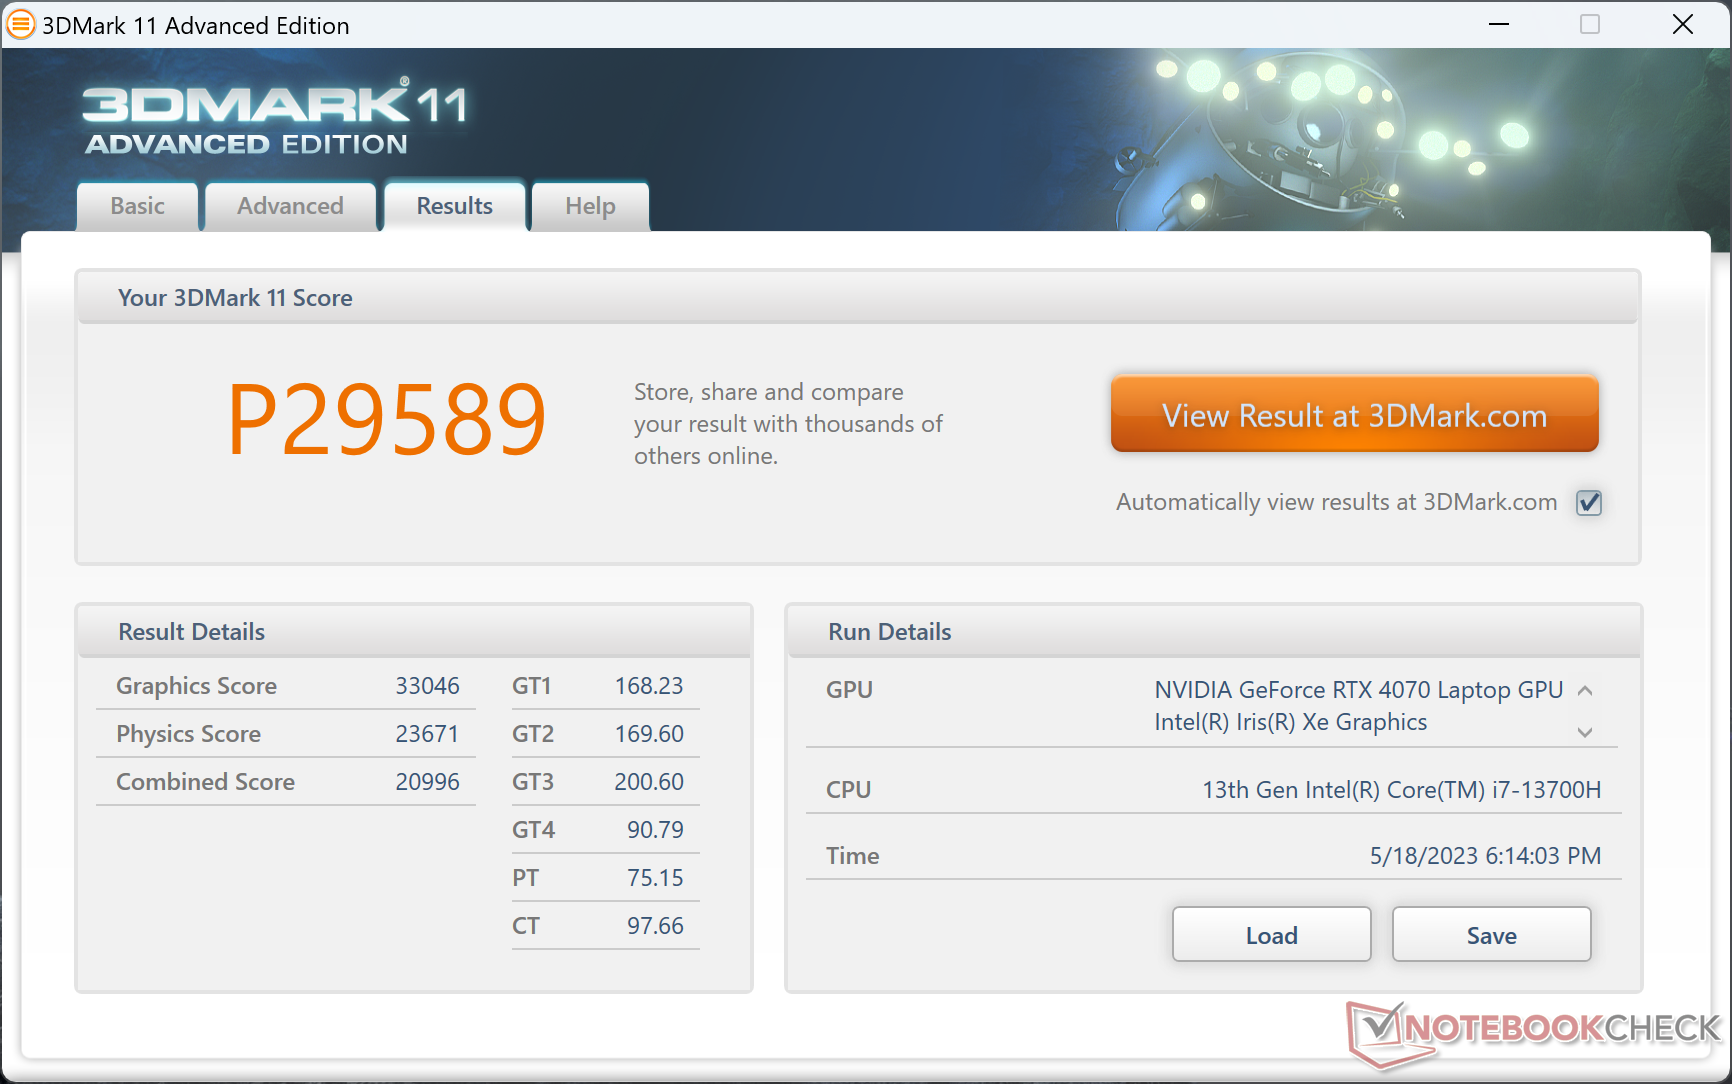
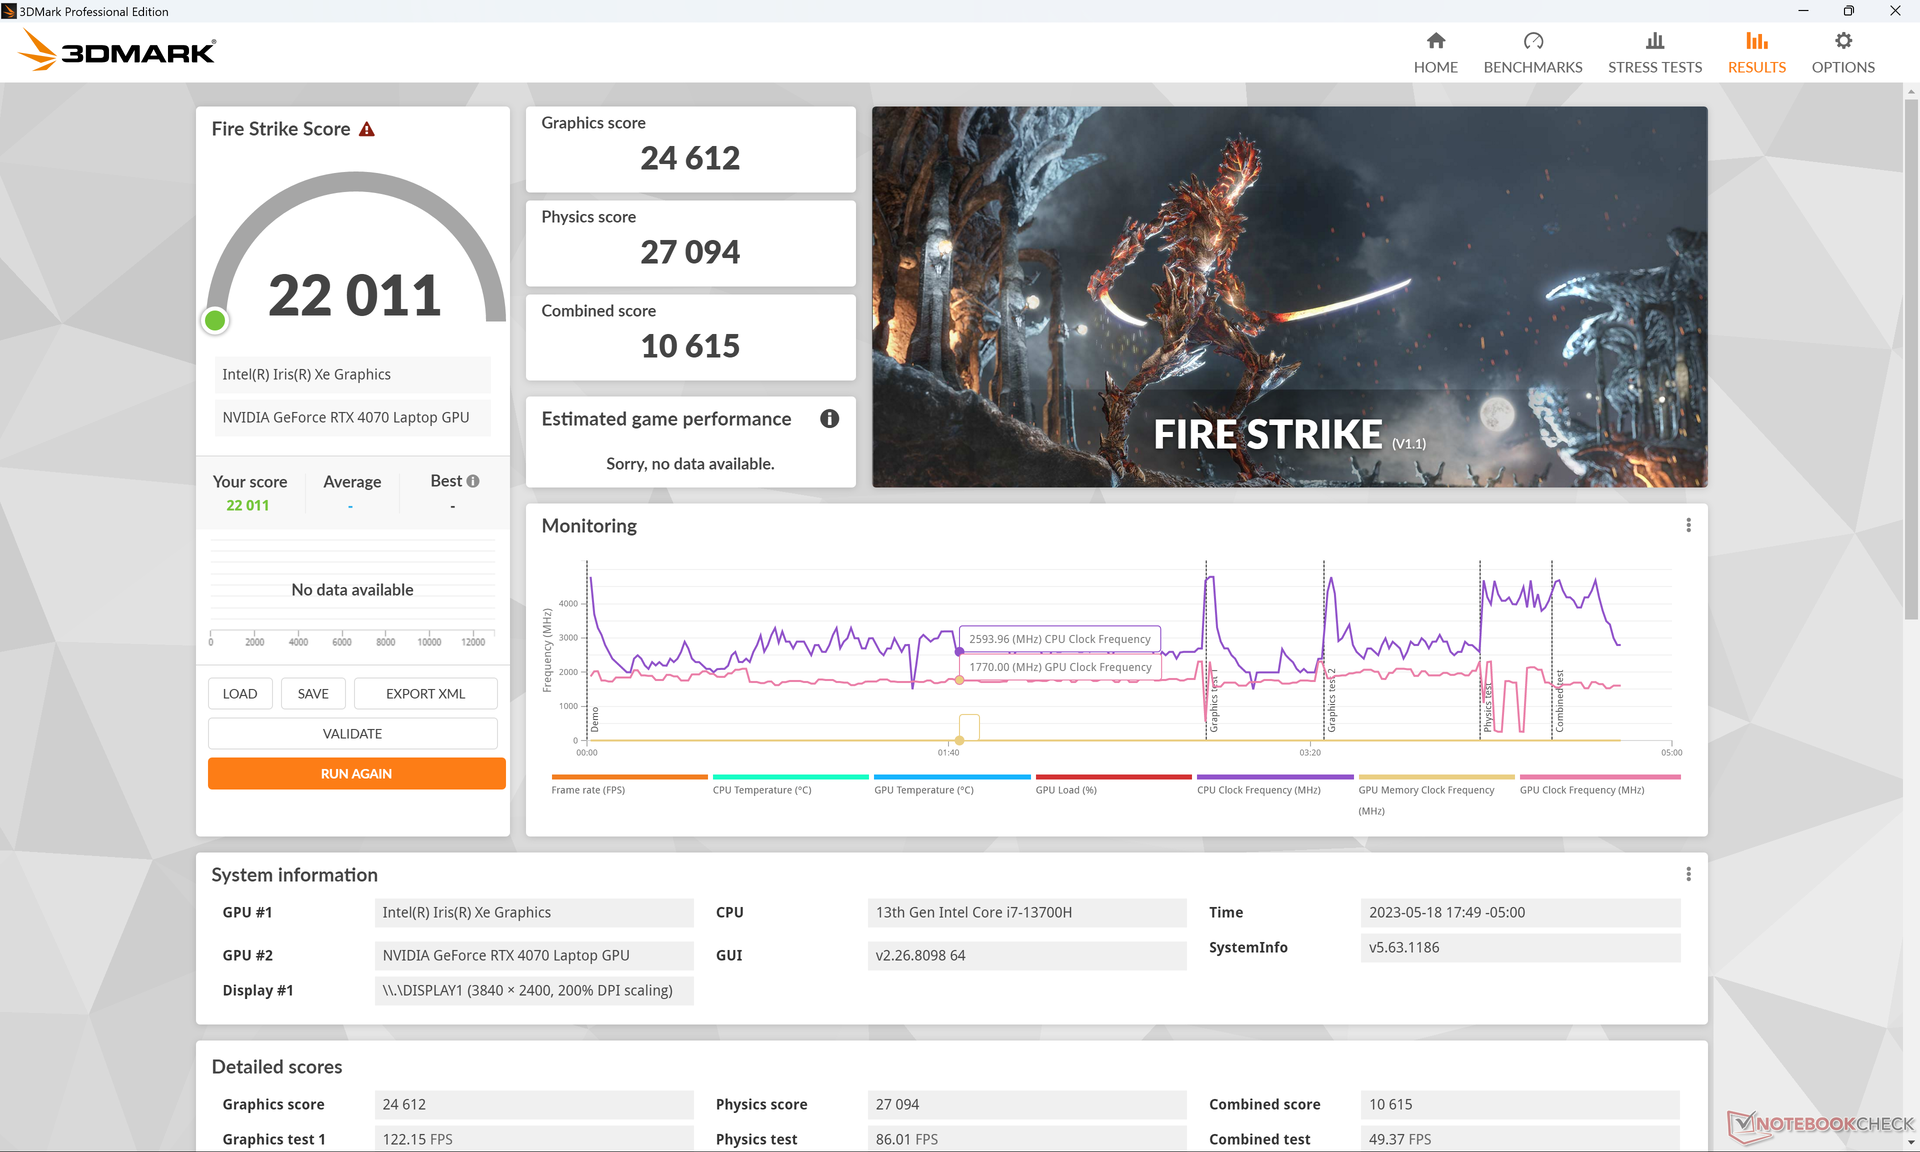
| 3DMark 11 Performance | 29589 pontos | |
| 3DMark Fire Strike Score | 22011 pontos | |
| 3DMark Time Spy Score | 9714 pontos | |
Ajuda | ||
* ... menor é melhor
Desempenho em jogos
O sistema funciona bem como uma máquina secundária para jogos. Como a RTX 4070 de 70 W não é tão fraca quanto a versão de 40 W do XPS 15, o XPS 17 é capaz de executar os jogos mais recentes com resolução QHD e 60 FPS em configurações de médio a médio-alto. a resolução 4K UHD ainda está fora de alcance na maior parte do tempo, mas a GPU combinaria bem com monitores externos FHD ou QHD para fins de jogos.
Talvez os dois fatores notáveis que impedem o XPS 17 de ser um laptop "adequado" para jogos sejam os tempos de resposta relativamente lentos da tela e a falta de suporte ao G-Sync para a tela interna. Queda de quadros, rasgo de tela e fantasmas são, portanto, mais predominantes quando se joga no XPS 17. É claro que muito disso pode ser evitado simplesmente jogando em um monitor externo.
| Returnal | |
| 1280x720 Low Preset | |
| Aorus 17X AZF | |
| Média NVIDIA GeForce RTX 4070 Laptop GPU (126 - 150, n=5) | |
| 1920x1080 Low Preset | |
| Aorus 17X AZF | |
| Média NVIDIA GeForce RTX 4070 Laptop GPU (65 - 119, n=11) | |
| Dell XPS 17 9730 RTX 4070 | |
| 1920x1080 Medium Preset | |
| Aorus 17X AZF | |
| Média NVIDIA GeForce RTX 4070 Laptop GPU (69 - 117, n=12) | |
| Dell XPS 17 9730 RTX 4070 | |
| 1920x1080 High Preset | |
| Aorus 17X AZF | |
| Média NVIDIA GeForce RTX 4070 Laptop GPU (64 - 106, n=12) | |
| Dell XPS 17 9730 RTX 4070 | |
| 1920x1080 Epic Preset | |
| Aorus 17X AZF | |
| Média NVIDIA GeForce RTX 4070 Laptop GPU (54 - 90, n=12) | |
| Dell XPS 17 9730 RTX 4070 | |
| 2560x1440 Epic Preset | |
| Aorus 17X AZF | |
| Média NVIDIA GeForce RTX 4070 Laptop GPU (39 - 66, n=12) | |
| Dell XPS 17 9730 RTX 4070 | |
| 3840x2160 Epic Preset | |
| Aorus 17X AZF | |
| Média NVIDIA GeForce RTX 4070 Laptop GPU (21 - 39, n=8) | |
| Dell XPS 17 9730 RTX 4070 | |
| Tiny Tina's Wonderlands | |
| 1920x1080 Low Preset (DX12) | |
| Aorus 17X AZF | |
| Média NVIDIA GeForce RTX 4070 Laptop GPU (98.1 - 283, n=15) | |
| Dell XPS 17 9730 RTX 4070 | |
| 1920x1080 Medium Preset (DX12) | |
| Aorus 17X AZF | |
| Média NVIDIA GeForce RTX 4070 Laptop GPU (92.5 - 231, n=15) | |
| Dell XPS 17 9730 RTX 4070 | |
| 1920x1080 High Preset (DX12) | |
| Aorus 17X AZF | |
| Média NVIDIA GeForce RTX 4070 Laptop GPU (74.3 - 151.4, n=15) | |
| Dell XPS 17 9730 RTX 4070 | |
| 1920x1080 Badass Preset (DX12) | |
| Aorus 17X AZF | |
| Média NVIDIA GeForce RTX 4070 Laptop GPU (58.6 - 115.9, n=18) | |
| Dell XPS 17 9730 RTX 4070 | |
| 2560x1440 Badass Preset (DX12) | |
| Aorus 17X AZF | |
| Média NVIDIA GeForce RTX 4070 Laptop GPU (49.8 - 79.5, n=17) | |
| Dell XPS 17 9730 RTX 4070 | |
| 3840x2160 Badass Preset (DX12) | |
| Aorus 17X AZF | |
| Média NVIDIA GeForce RTX 4070 Laptop GPU (28.3 - 39.7, n=13) | |
| Dell XPS 17 9730 RTX 4070 | |
Witcher 3 FPS Chart
| baixo | média | alto | ultra | QHD | 4K | |
|---|---|---|---|---|---|---|
| GTA V (2015) | 186.6 | 182.5 | 167.9 | 102.7 | 75.5 | 76.9 |
| The Witcher 3 (2015) | 415.2 | 297.6 | 181.4 | 96.2 | 59 | |
| Dota 2 Reborn (2015) | 193.5 | 174.5 | 165.9 | 156.9 | 108 | |
| Final Fantasy XV Benchmark (2018) | 174.8 | 128.3 | 94.7 | 69.9 | 38.2 | |
| X-Plane 11.11 (2018) | 154.6 | 133.1 | 106.4 | 90 | ||
| Strange Brigade (2018) | 431 | 238 | 192 | 165.4 | 113.6 | 61.7 |
| Cyberpunk 2077 1.6 (2022) | 102.1 | 99.4 | 85.6 | 71 | 43 | 18.7 |
| Tiny Tina's Wonderlands (2022) | 183.5 | 153.3 | 104.9 | 82.4 | 55.7 | 28.3 |
| F1 22 (2022) | 206 | 196.4 | 158.2 | 60.7 | 39.4 | 18.8 |
| Returnal (2023) | 72 | 71 | 67 | 59 | 41 | 21 |
Emissões
Ruído do sistema - alto apenas quando necessário
O ruído do ventilador não mudou drasticamente, apesar das melhorias no desempenho. O XPS 17 normalmente fica em torno de 25,6 dB(A), pouco audível, contra um fundo silencioso de 22,7 dB(A) ao navegar na Web ou fazer streaming de vídeo. No entanto, se estiver executando cargas muito exigentes, como jogos, o ruído da ventoinha começará a se aproximar do nível de alguns notebooks para jogos, chegando a 50 dB(A). Afinal, o modelo XPS oferece especificações de nível para jogos.
Barulho
| Ocioso |
| 22.8 / 22.8 / 22.8 dB |
| Carga |
| 38.9 / 50.2 dB |
 | ||
30 dB silencioso 40 dB(A) audível 50 dB(A) ruidosamente alto |
||
min: | ||
| Dell XPS 17 9730 RTX 4070 GeForce RTX 4070 Laptop GPU, i7-13700H, SK hynix PC801 HFS001TEJ9X101N | Dell XPS 17 9720 RTX 3060 GeForce RTX 3060 Laptop GPU, i7-12700H, Samsung PM9A1 MZVL21T0HCLR | LG Gram 17 (2023) Iris Xe G7 96EUs, i7-1360P, Samsung PM9A1 MZVL21T0HCLR | HP Envy 17-cr0079ng GeForce RTX 2050 Mobile, i7-1255U, Samsung PM991a MZVLQ1T0HBLB | MSI Creator Z17 A12UGST-054 GeForce RTX 3070 Ti Laptop GPU, i9-12900H, Micron 3400 1TB MTFDKBA1T0TFH | Apple MacBook Pro 16 2023 M2 Max M2 Max 38-Core GPU, M2 Max, Apple SSD AP2048Z | |
|---|---|---|---|---|---|---|
| Noise | -4% | -11% | -16% | -28% | 4% | |
| desligado / ambiente * (dB) | 22.7 | 23.8 -5% | 25.2 -11% | 26.5 -17% | 26 -15% | 23.9 -5% |
| Idle Minimum * (dB) | 22.8 | 24.1 -6% | 25.2 -11% | 28.5 -25% | 31.8 -39% | 23.9 -5% |
| Idle Average * (dB) | 22.8 | 24.1 -6% | 25.7 -13% | 28.5 -25% | 31.8 -39% | 23.9 -5% |
| Idle Maximum * (dB) | 22.8 | 24.1 -6% | 29.3 -29% | 29.7 -30% | 31.8 -39% | 23.9 -5% |
| Load Average * (dB) | 38.9 | 43.2 -11% | 44.4 -14% | 39.5 -2% | 53.9 -39% | 36.6 6% |
| Witcher 3 ultra * (dB) | 47.4 | 48 -1% | 53.9 -14% | 35.1 26% | ||
| Load Maximum * (dB) | 50.2 | 48 4% | 45.2 10% | 48 4% | 54.9 -9% | 43.2 14% |
* ... menor é melhor
Temperatura
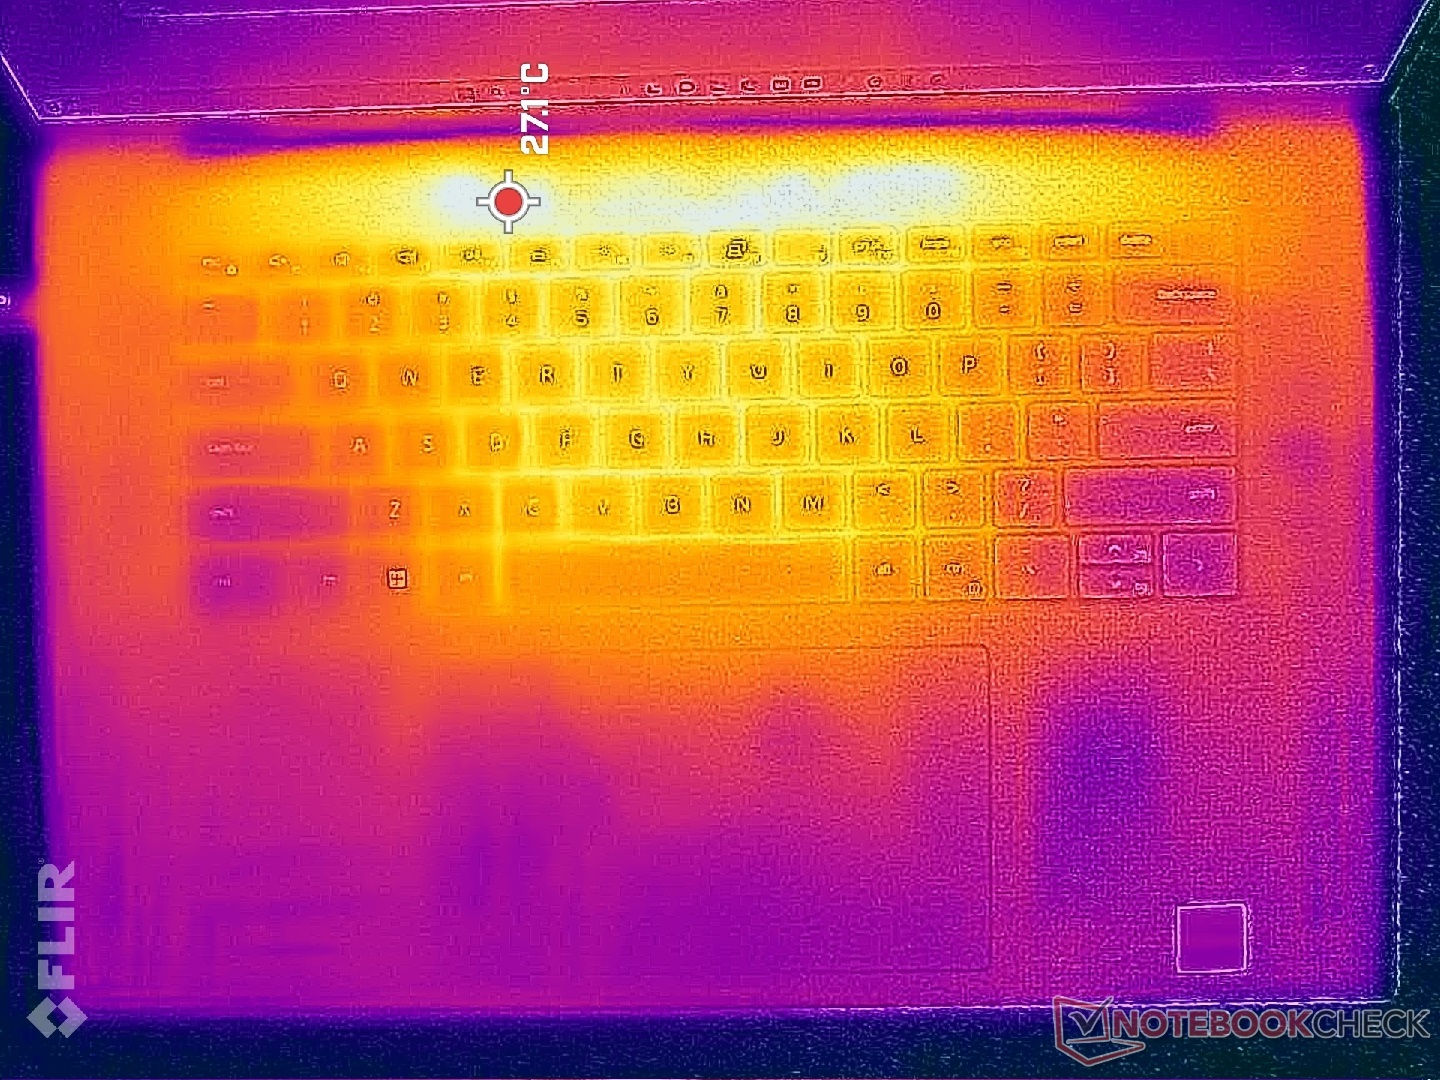
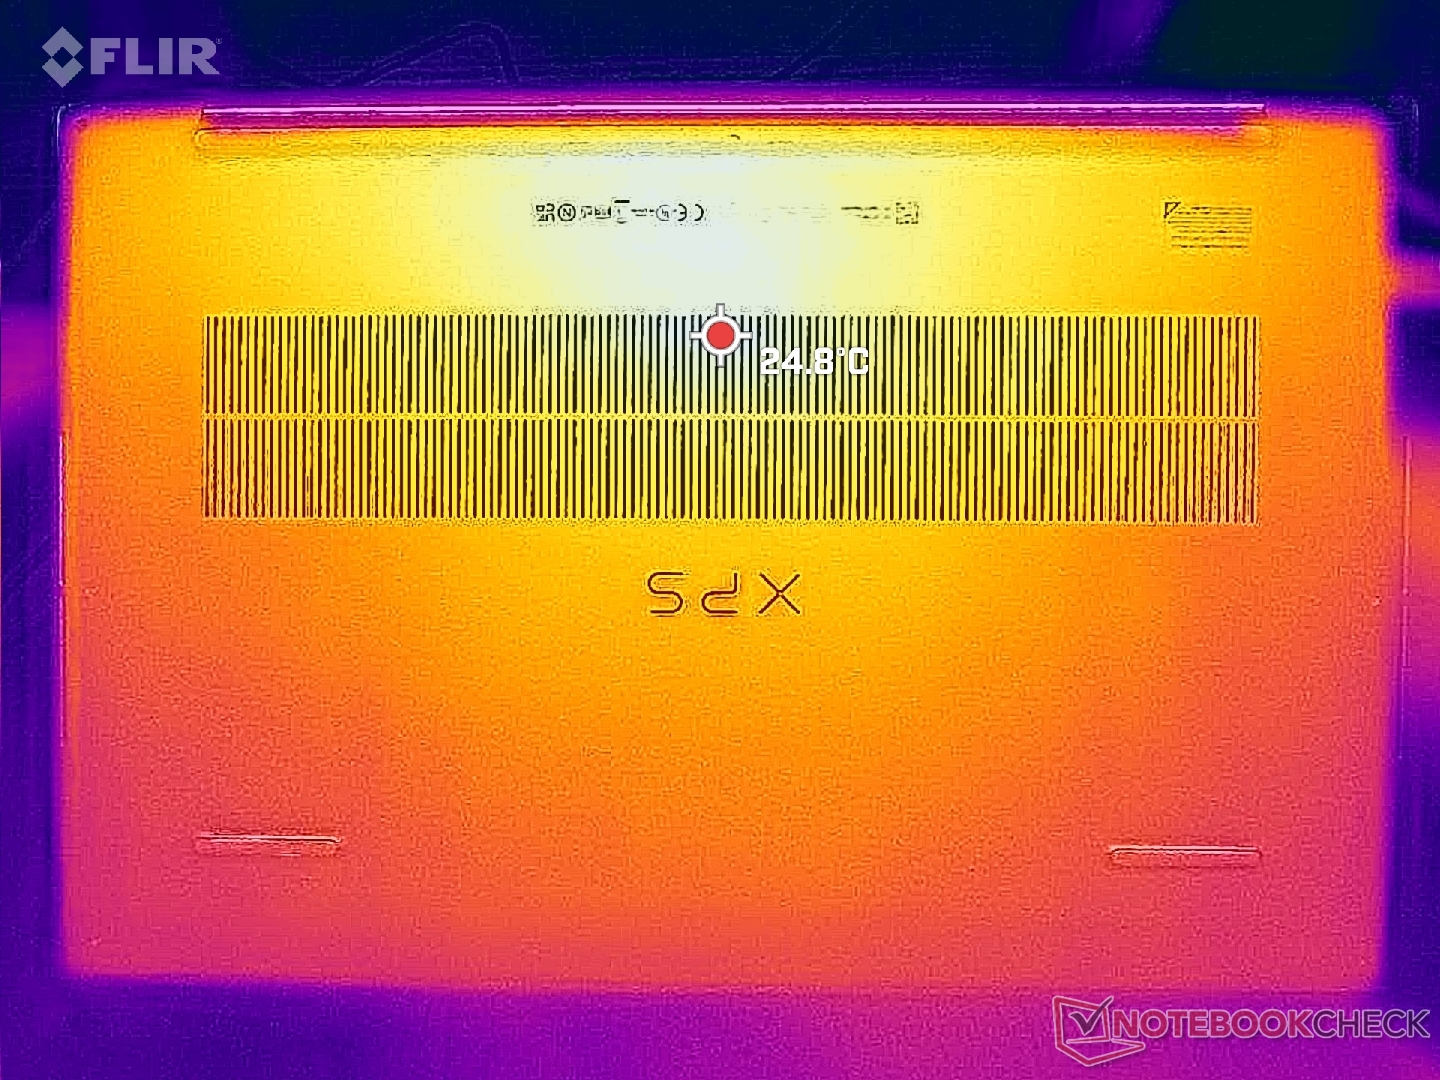
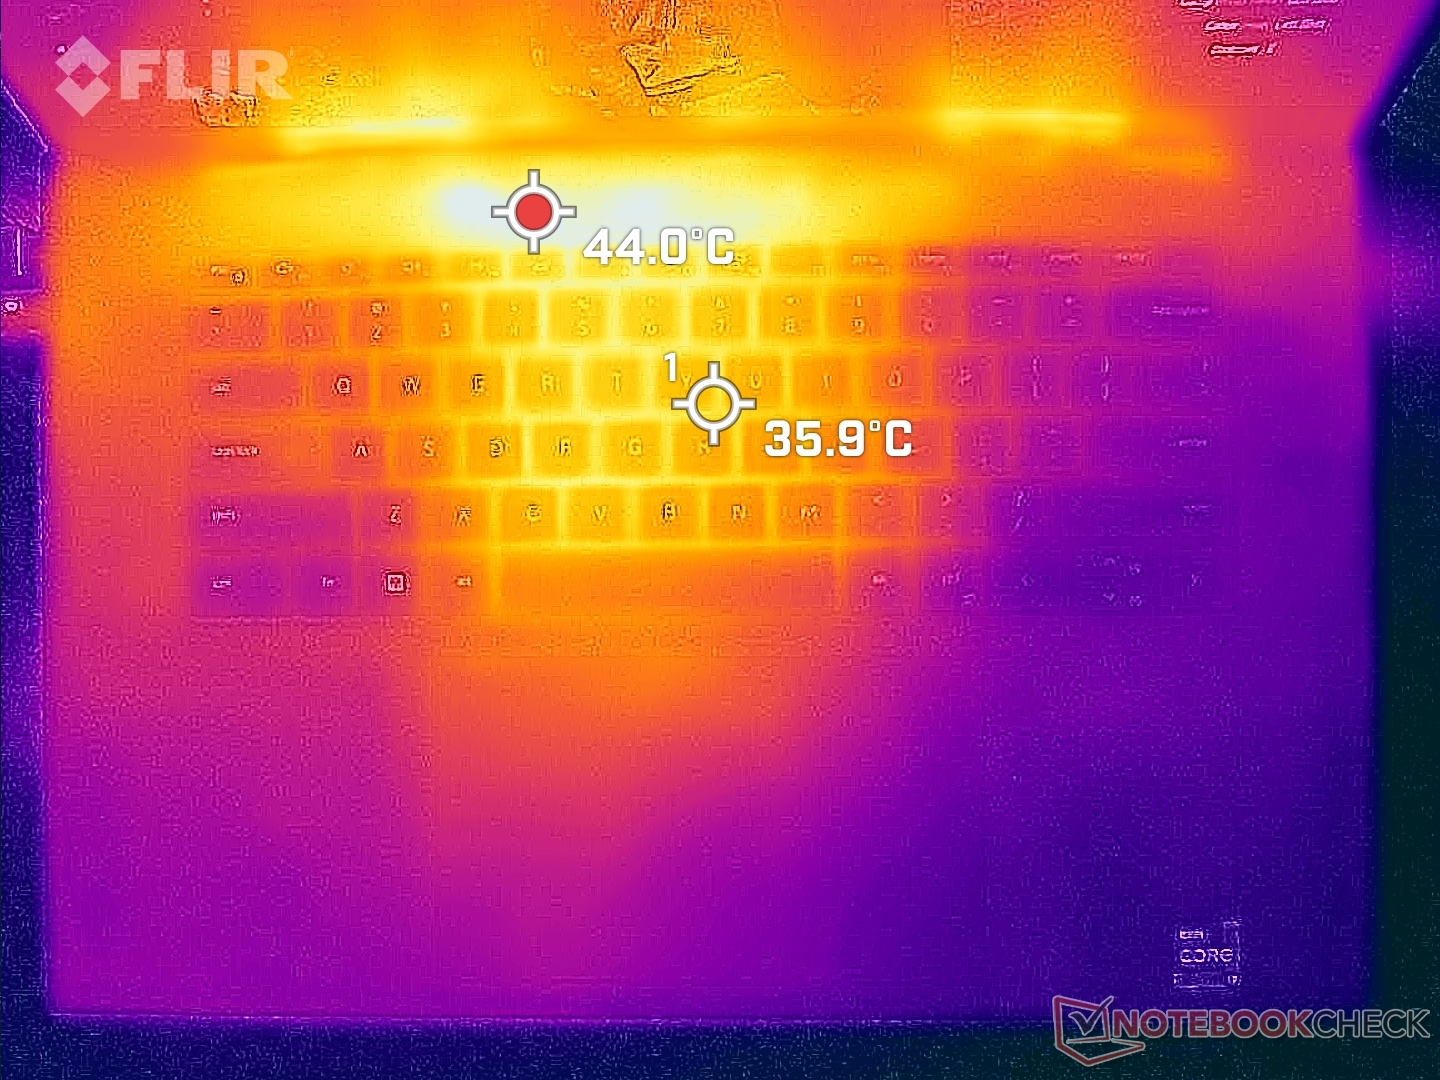
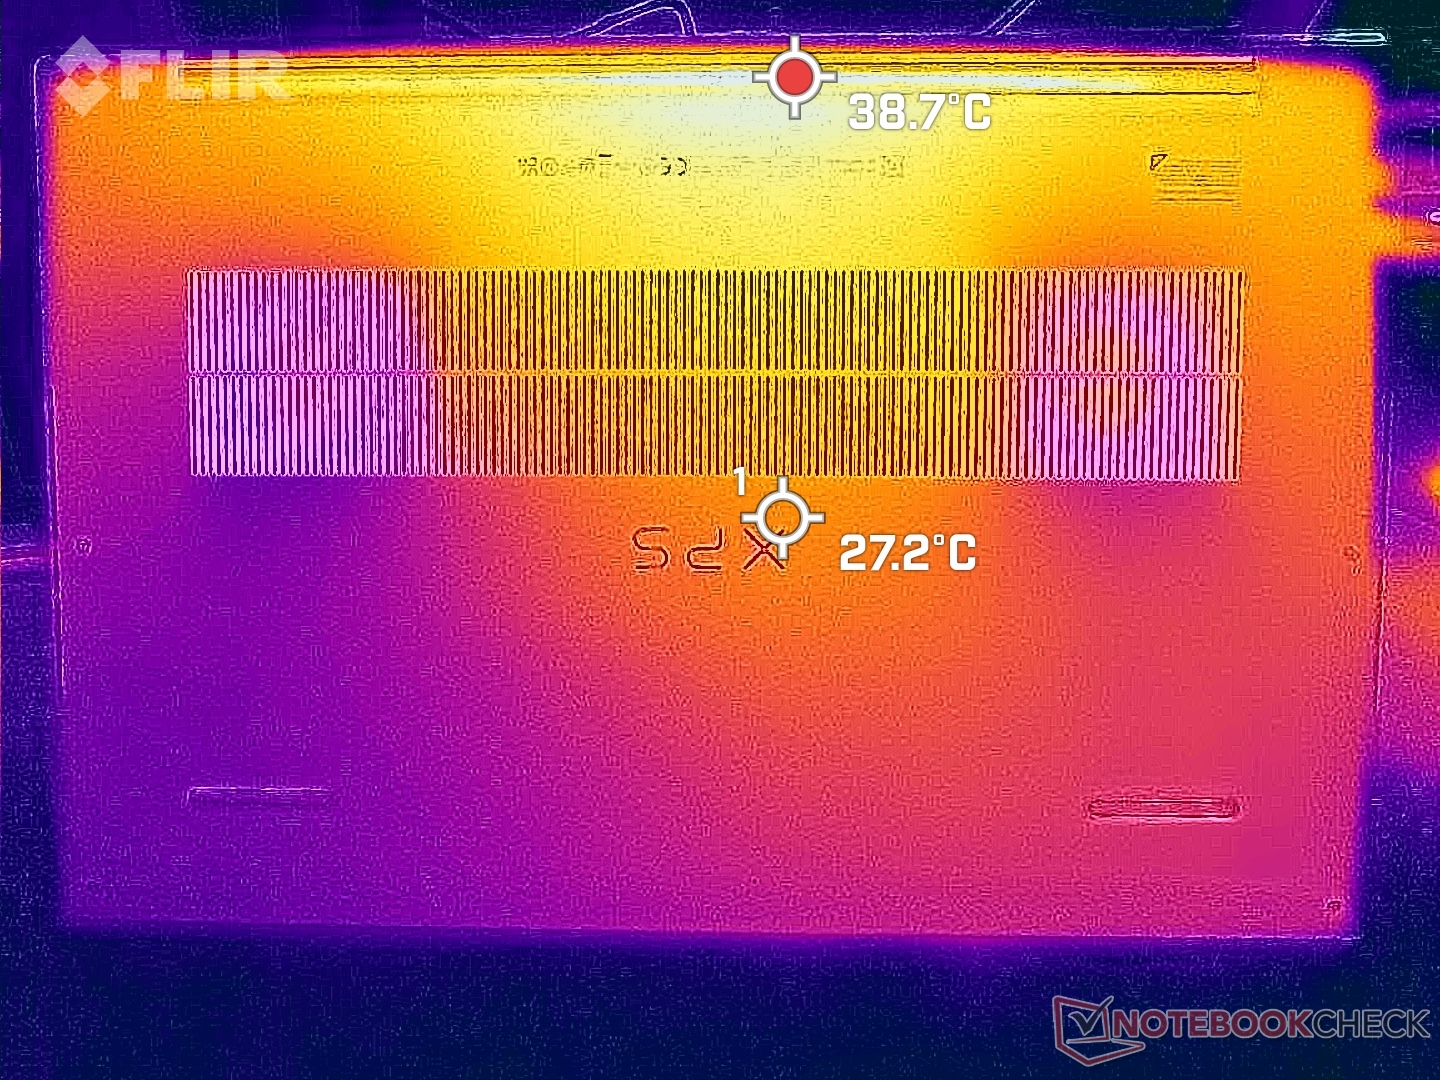
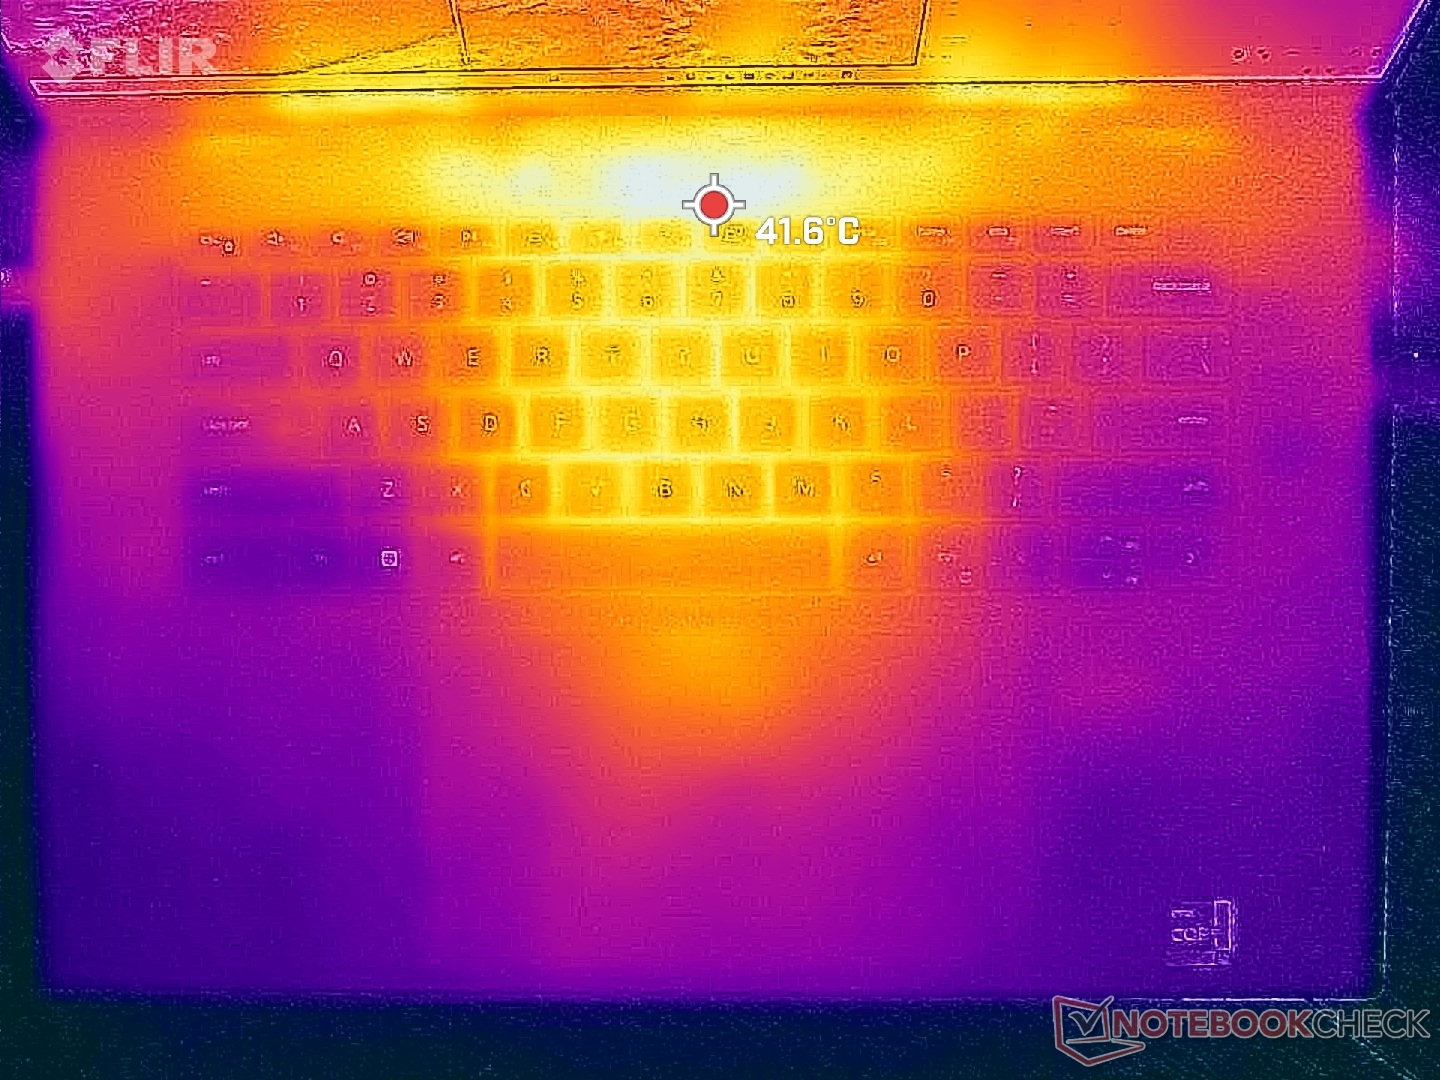
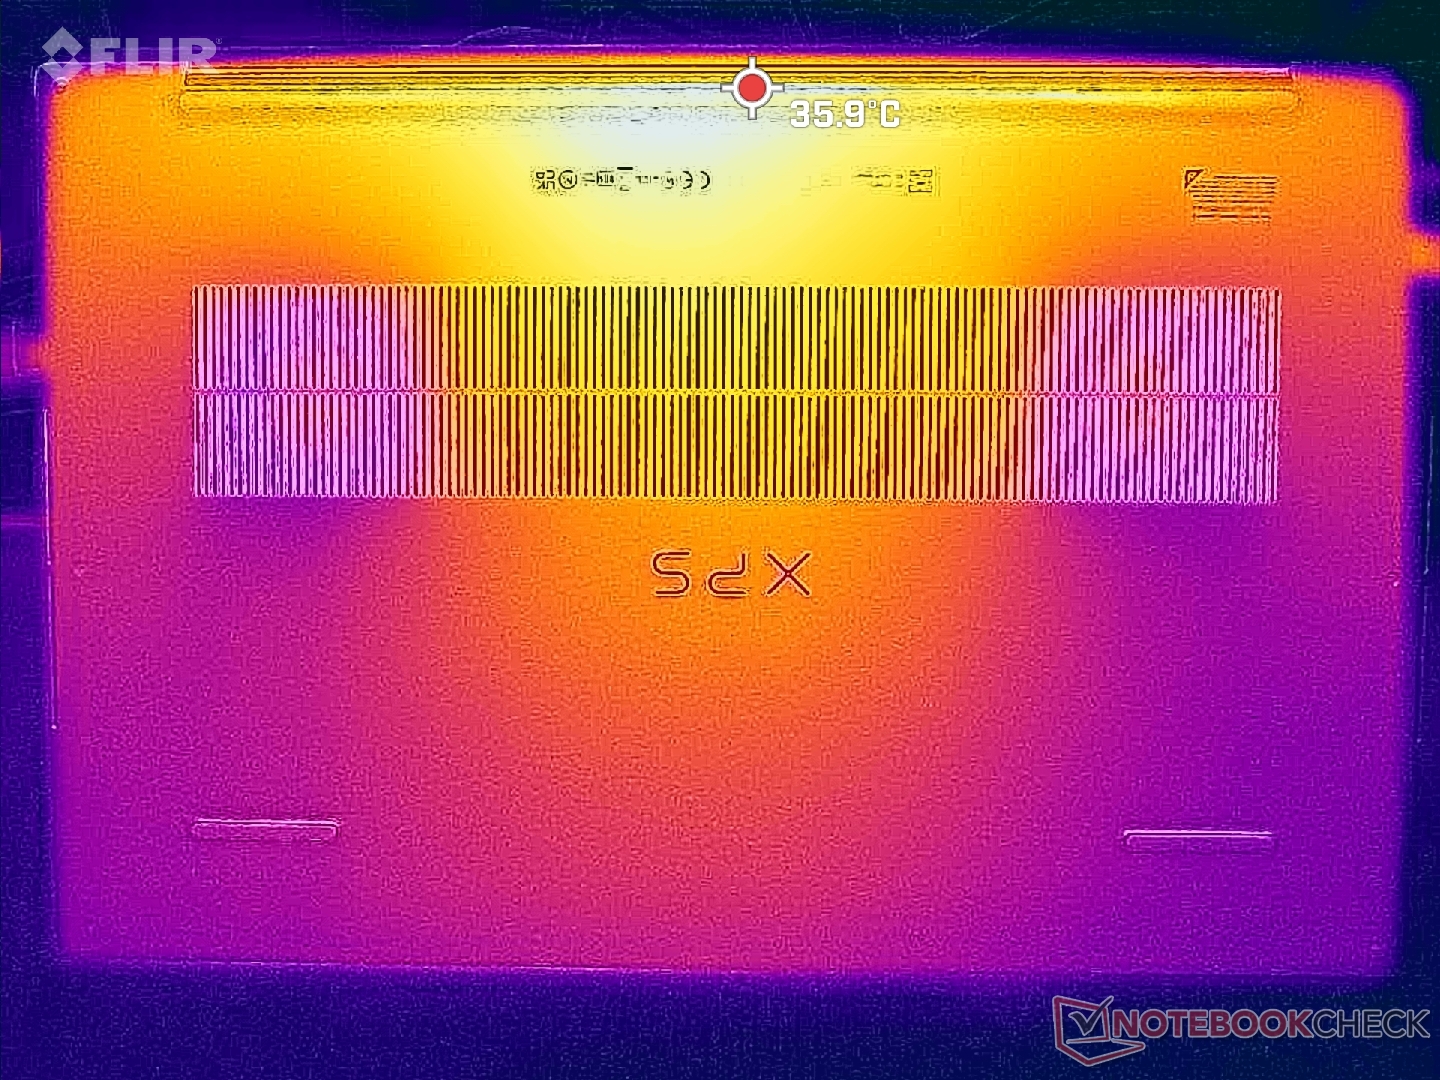
As temperaturas da superfície são mais baixas do que o esperado quando comparadas a outros laptops equipados com CPUs Core série H semelhantes e GPUs GeForce RTX. O concorrenteMSI Creator Z17da MSI, por exemplo, teria pontos quentes de mais de 60 °C, enquanto nosso Dell teria apenas 43 °C ao executar cargas pesadas semelhantes. As temperaturas mais baixas da superfície do Dell podem ser atribuídas ao resfriador da câmara de vapor, ao isolamento térmico GORE e ao envelope de energia geralmente mais baixo.
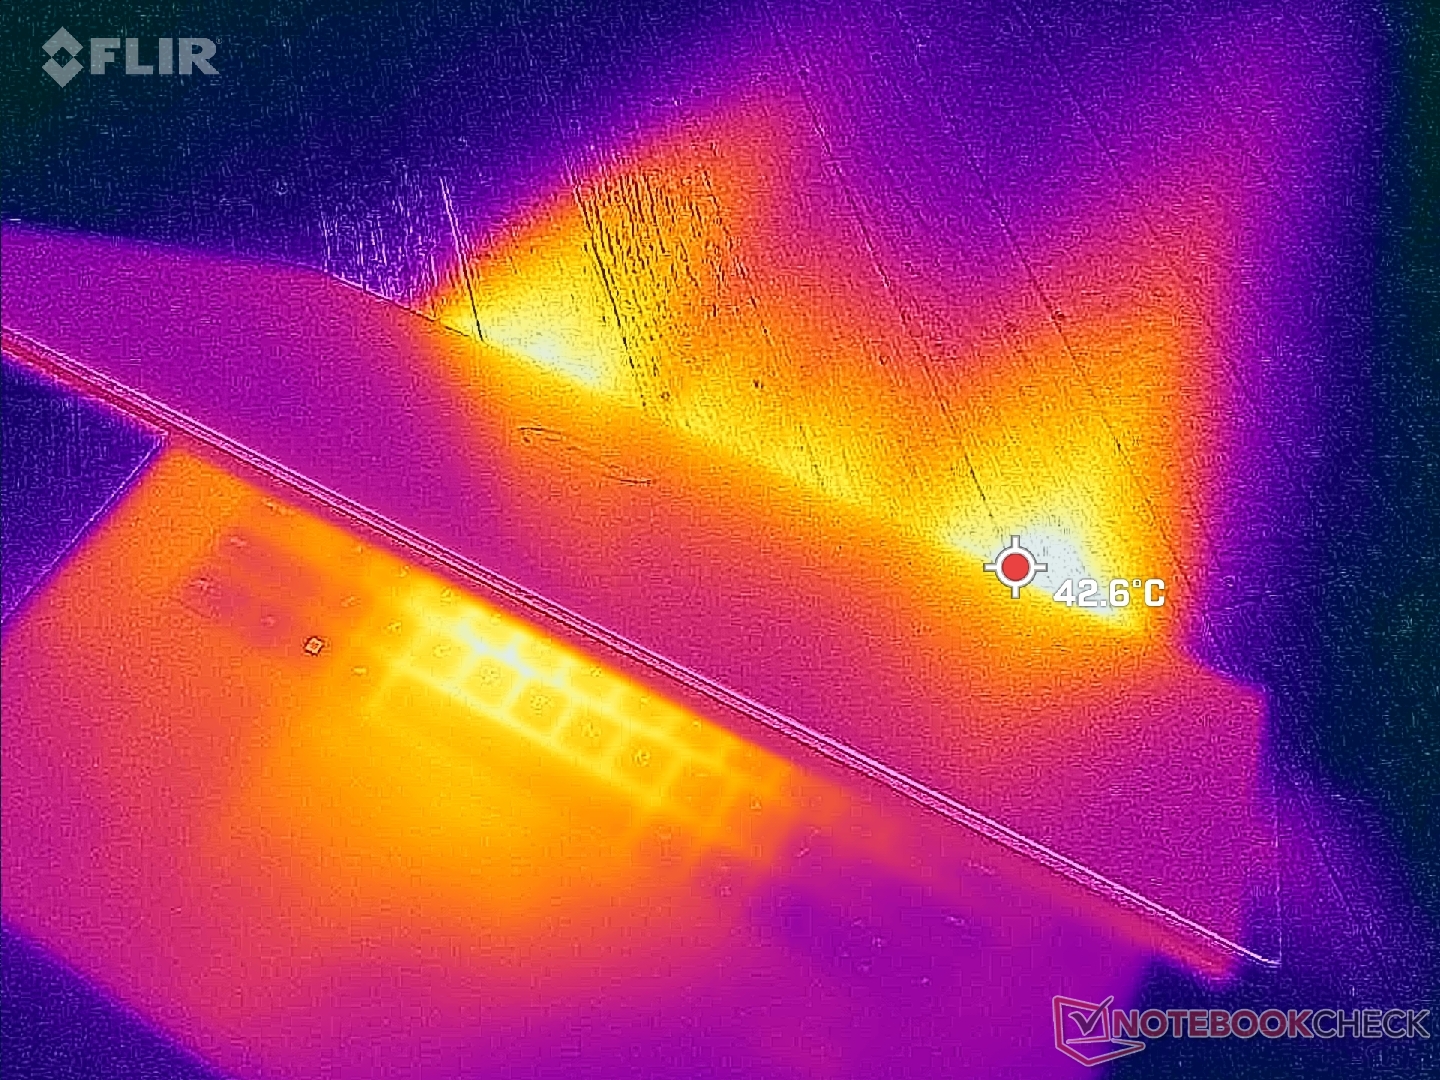
(±) A temperatura máxima no lado superior é 43.2 °C / 110 F, em comparação com a média de 36.8 °C / 98 F , variando de 21 a 71 °C para a classe Multimedia.
(+) A parte inferior aquece até um máximo de 31.8 °C / 89 F, em comparação com a média de 39.1 °C / 102 F
(+) Em uso inativo, a temperatura média para o lado superior é 28.2 °C / 83 F, em comparação com a média do dispositivo de 31.3 °C / ### class_avg_f### F.
(±) Jogando The Witcher 3, a temperatura média para o lado superior é 33.7 °C / 93 F, em comparação com a média do dispositivo de 31.3 °C / ## #class_avg_f### F.
(+) Os apoios para as mãos e o touchpad são mais frios que a temperatura da pele, com um máximo de 31 °C / 87.8 F e, portanto, são frios ao toque.
(-) A temperatura média da área do apoio para as mãos de dispositivos semelhantes foi 28.7 °C / 83.7 F (-2.3 °C / -4.1 F).
| Dell XPS 17 9730 RTX 4070 Intel Core i7-13700H, NVIDIA GeForce RTX 4070 Laptop GPU | Dell XPS 17 9720 RTX 3060 Intel Core i7-12700H, NVIDIA GeForce RTX 3060 Laptop GPU | LG Gram 17 (2023) Intel Core i7-1360P, Intel Iris Xe Graphics G7 96EUs | HP Envy 17-cr0079ng Intel Core i7-1255U, NVIDIA GeForce RTX 2050 Mobile | MSI Creator Z17 A12UGST-054 Intel Core i9-12900H, NVIDIA GeForce RTX 3070 Ti Laptop GPU | Apple MacBook Pro 16 2023 M2 Max Apple M2 Max, Apple M2 Max 38-Core GPU | |
|---|---|---|---|---|---|---|
| Heat | -19% | -7% | -3% | -37% | 5% | |
| Maximum Upper Side * (°C) | 43.2 | 51.8 -20% | 43.9 -2% | 47.1 -9% | 63.9 -48% | 44.2 -2% |
| Maximum Bottom * (°C) | 31.8 | 44.2 -39% | 45.5 -43% | 43.8 -38% | 68 -114% | 42.9 -35% |
| Idle Upper Side * (°C) | 32.8 | 34.8 -6% | 28.4 13% | 25.2 23% | 28.3 14% | 22.4 32% |
| Idle Bottom * (°C) | 29.8 | 33.2 -11% | 28.2 5% | 25.9 13% | 30.2 -1% | 22.3 25% |
* ... menor é melhor
Teste de estresse
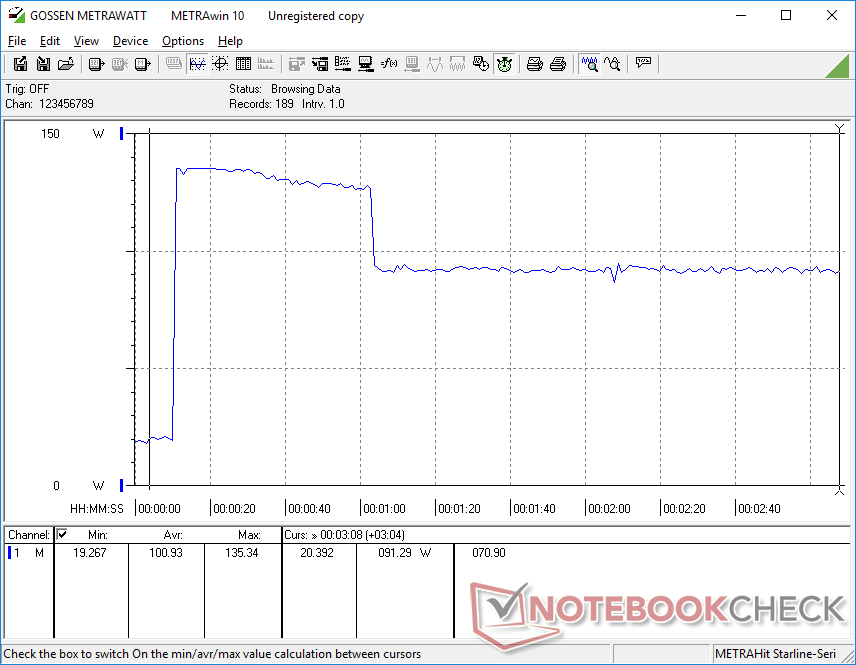
Ao executar o Prime95 para estressar a CPU, as taxas de clock e a potência do pacote aumentavam para 4,1 GHz e 122 W, respectivamente, com duração de apenas alguns segundos. Em seguida, o processador caía de forma constante para 3,4 GHz e 80 W e, finalmente, para 2,6 GHz e 55 W alguns minutos depois. O consumo de energia estável final de 55 W corresponde ao que observamos no XPS 19 9720 DO ANO PASSADO do ano passado, o que explicaria o desempenho semelhante do processador após a contabilização do estrangulamento, conforme mencionado acima. A temperatura do núcleo seria muito alta, entre 95 °C e 100 °C, durante os primeiros minutos do teste, quando o Turbo Boost está mais ativo, antes de cair e se estabilizar em 74 °C.
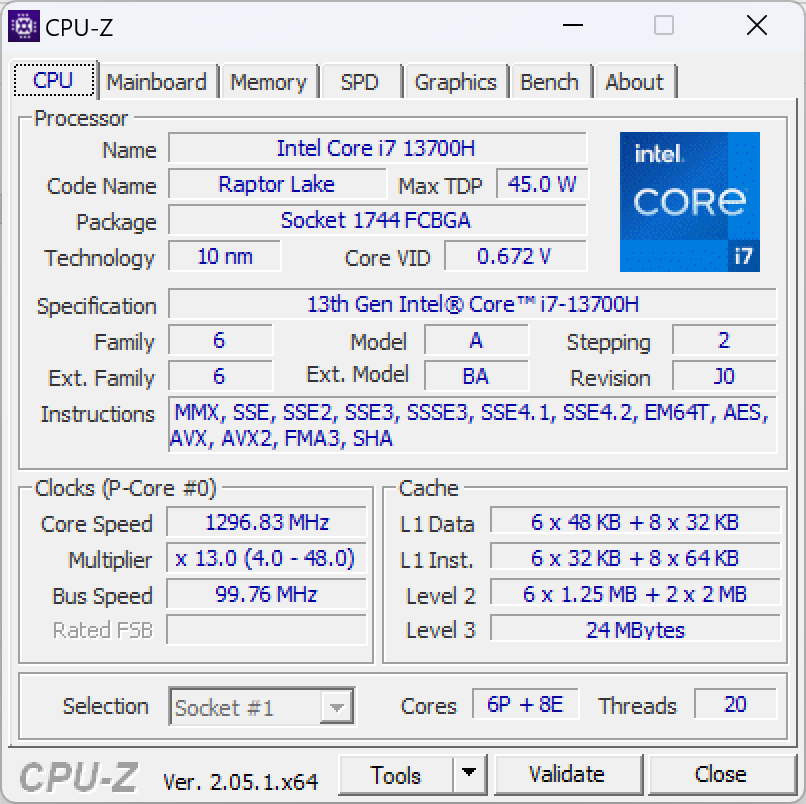
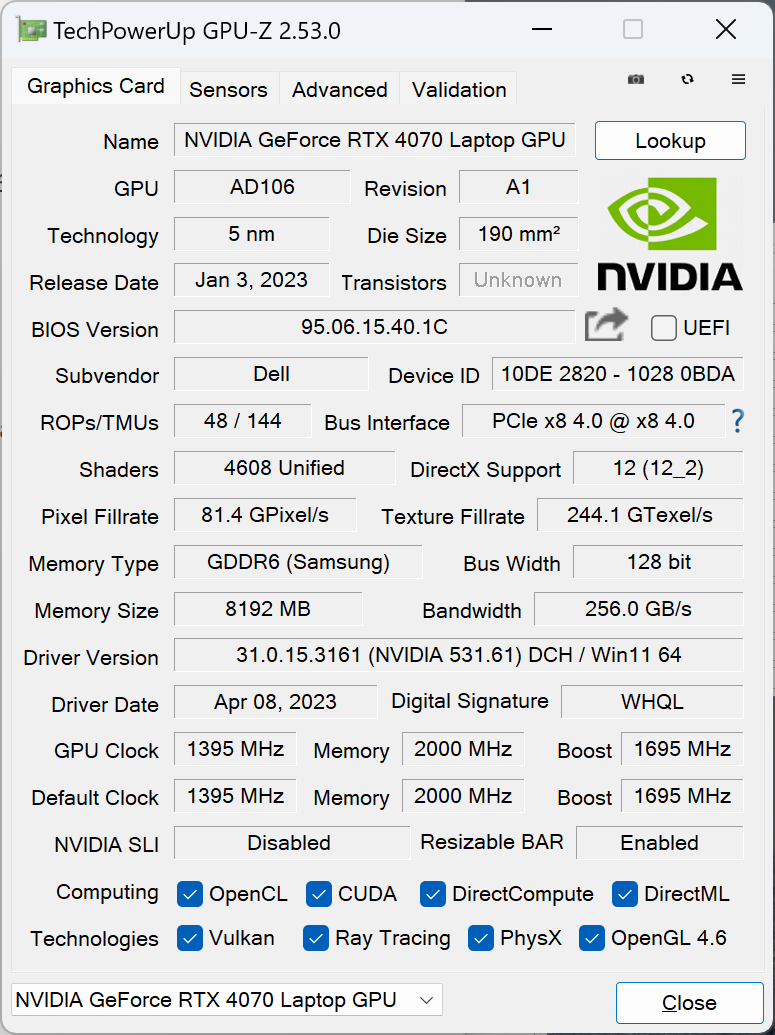
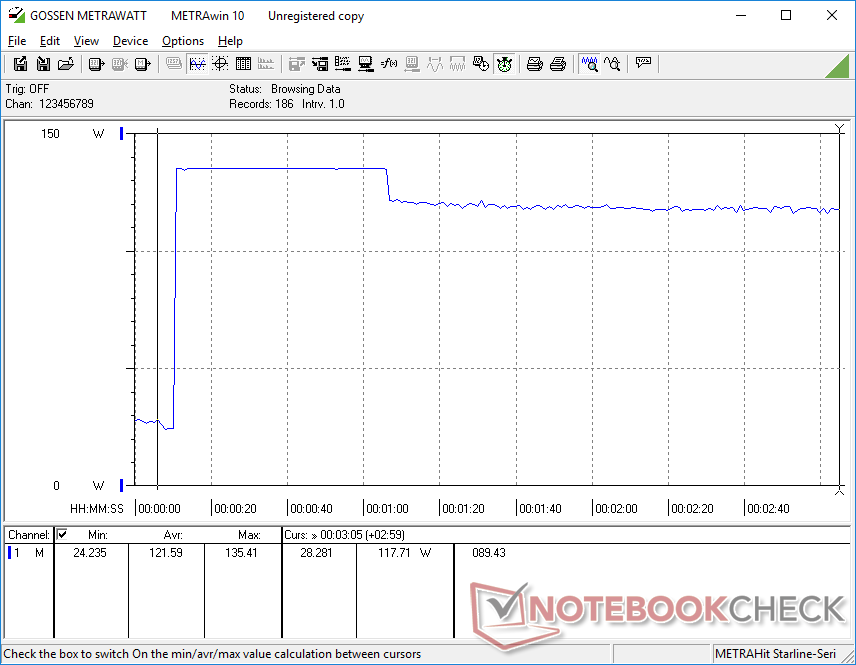
As taxas de clock e a temperatura da GPU durante a execução Witcher 3 se estabilizariam em 2115 MHz e 67 °C, respectivamente, sendo que a última corresponde ao que observamos no XPS 17 9720 com RTX 3060 do ano passado. Curiosamente, o GPU-Z relataria um consumo de energia menor da placa, de 52 W, enquanto o HWiNFO relataria 70 W, conforme mostrado em nossa captura de tela abaixo. No entanto, ambos os valores parecem estar estáveis.
A execução com a energia da bateria limita o desempenho. Um teste do Fire Strike com baterias retornaria pontuações de Física e Gráficos de 24847 e 21172 pontos, respectivamente, em comparação com 27094 e 24612 pontos quando ligado à rede elétrica.
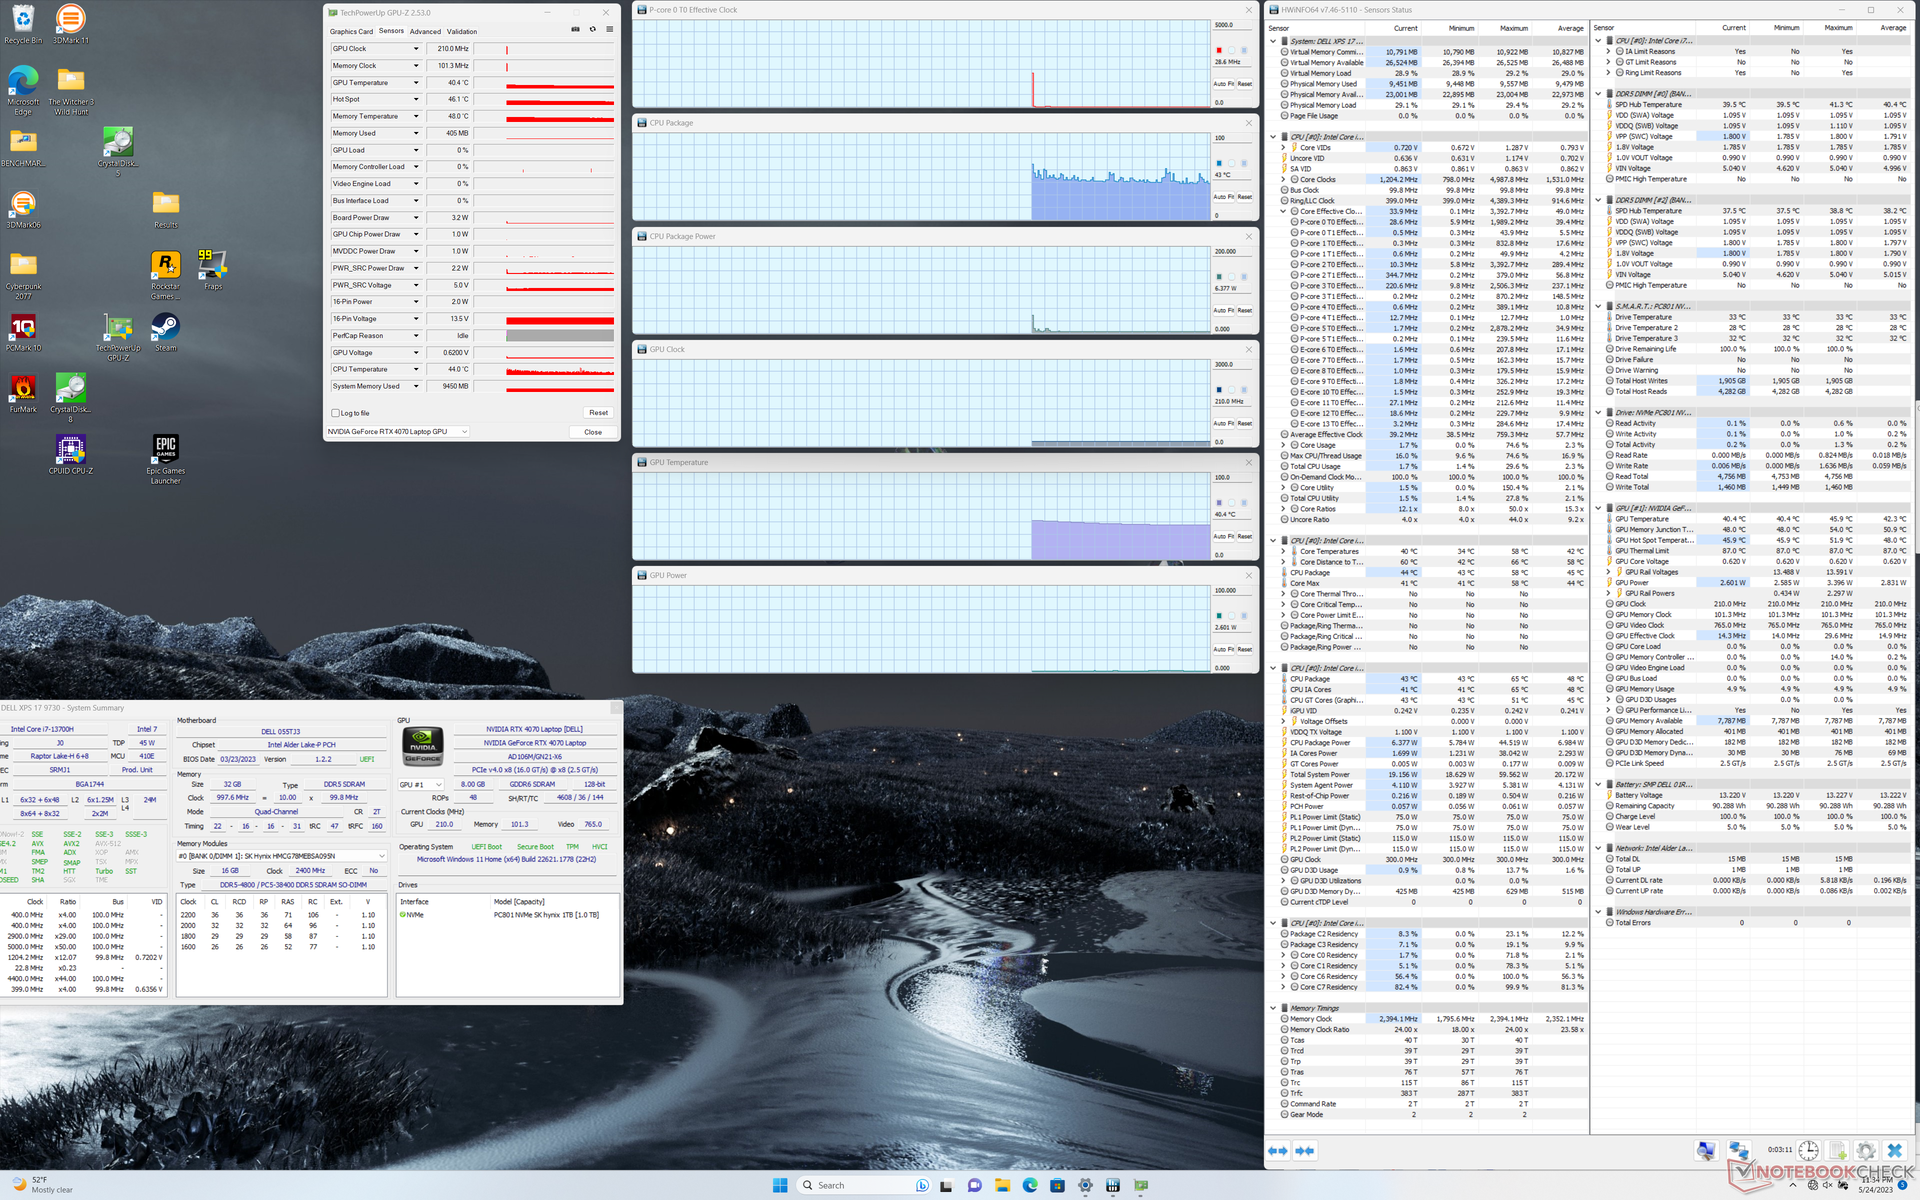
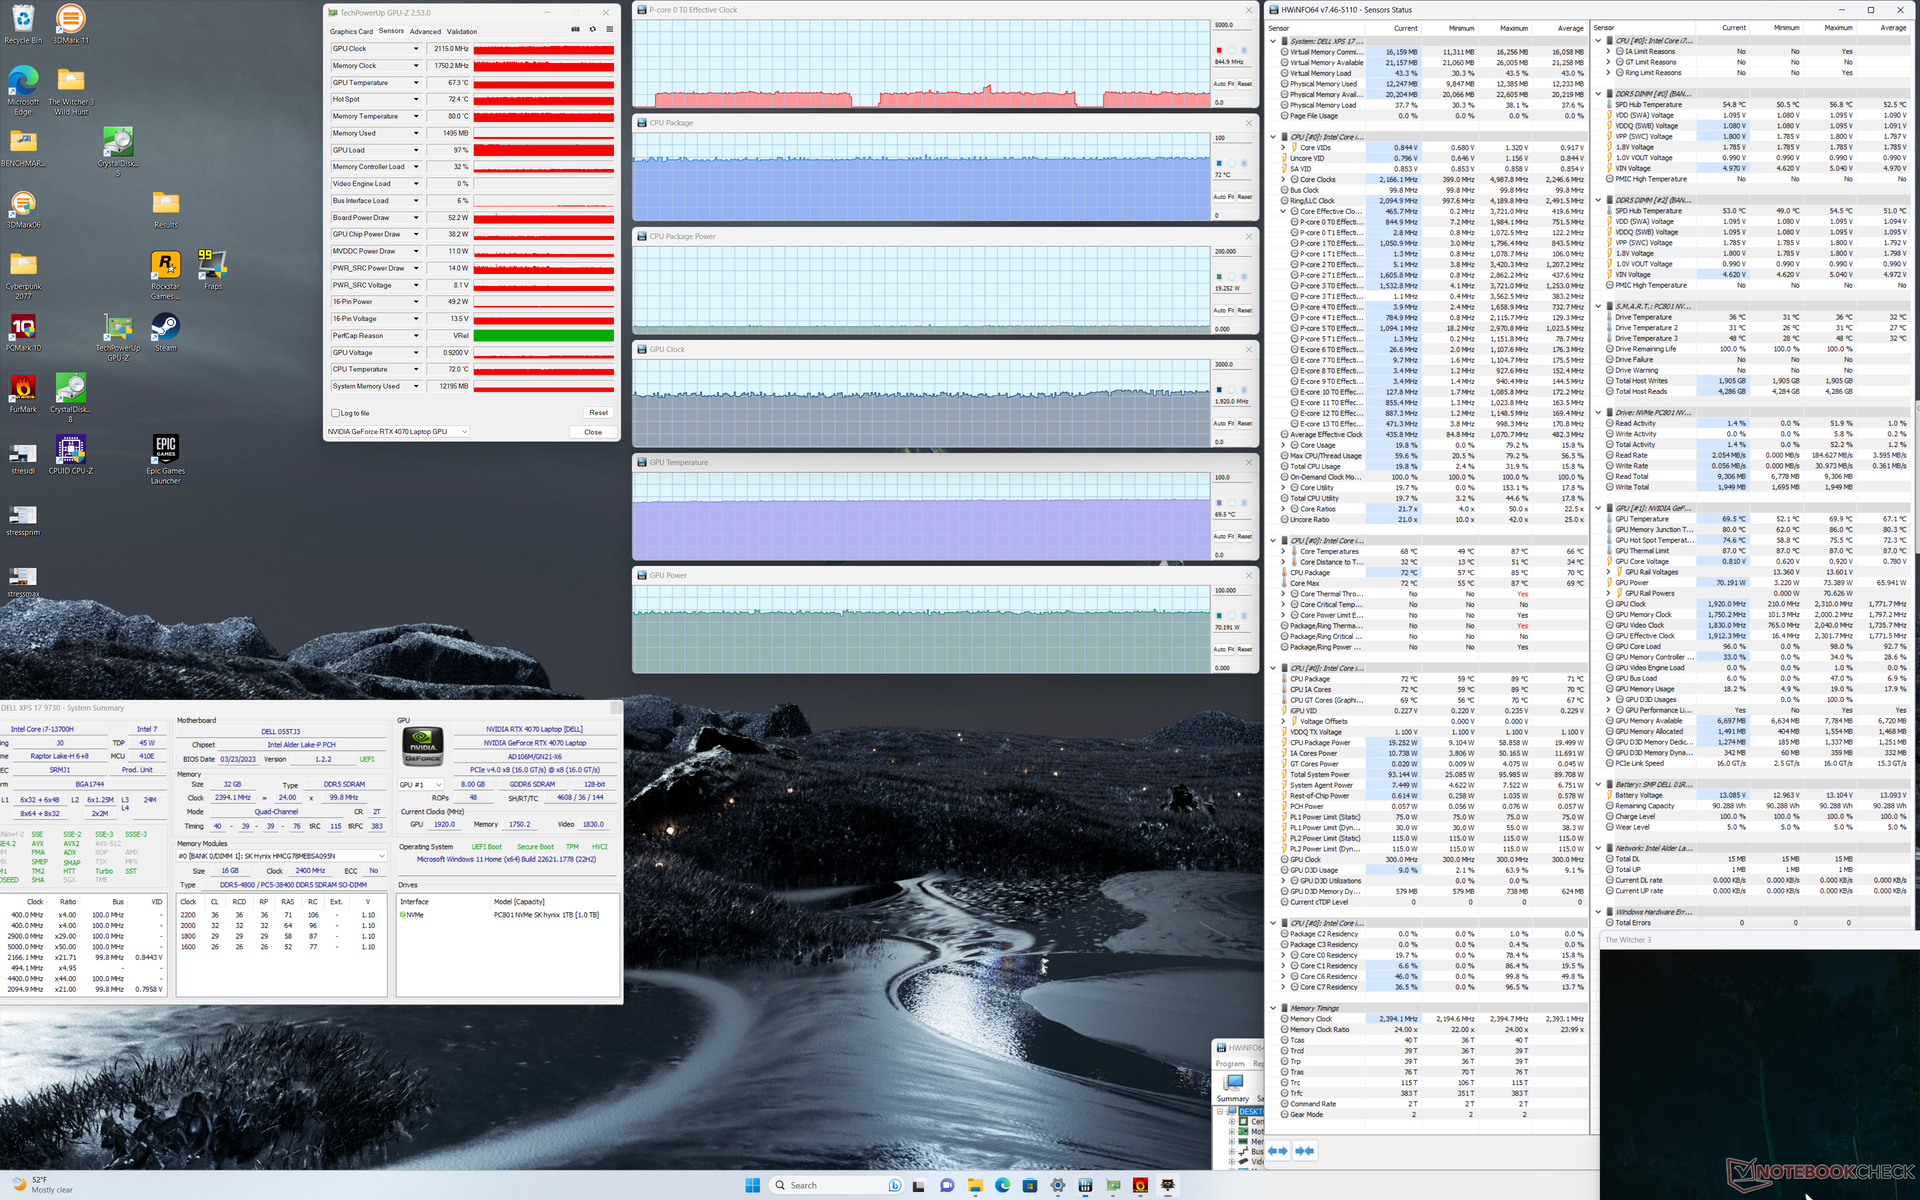
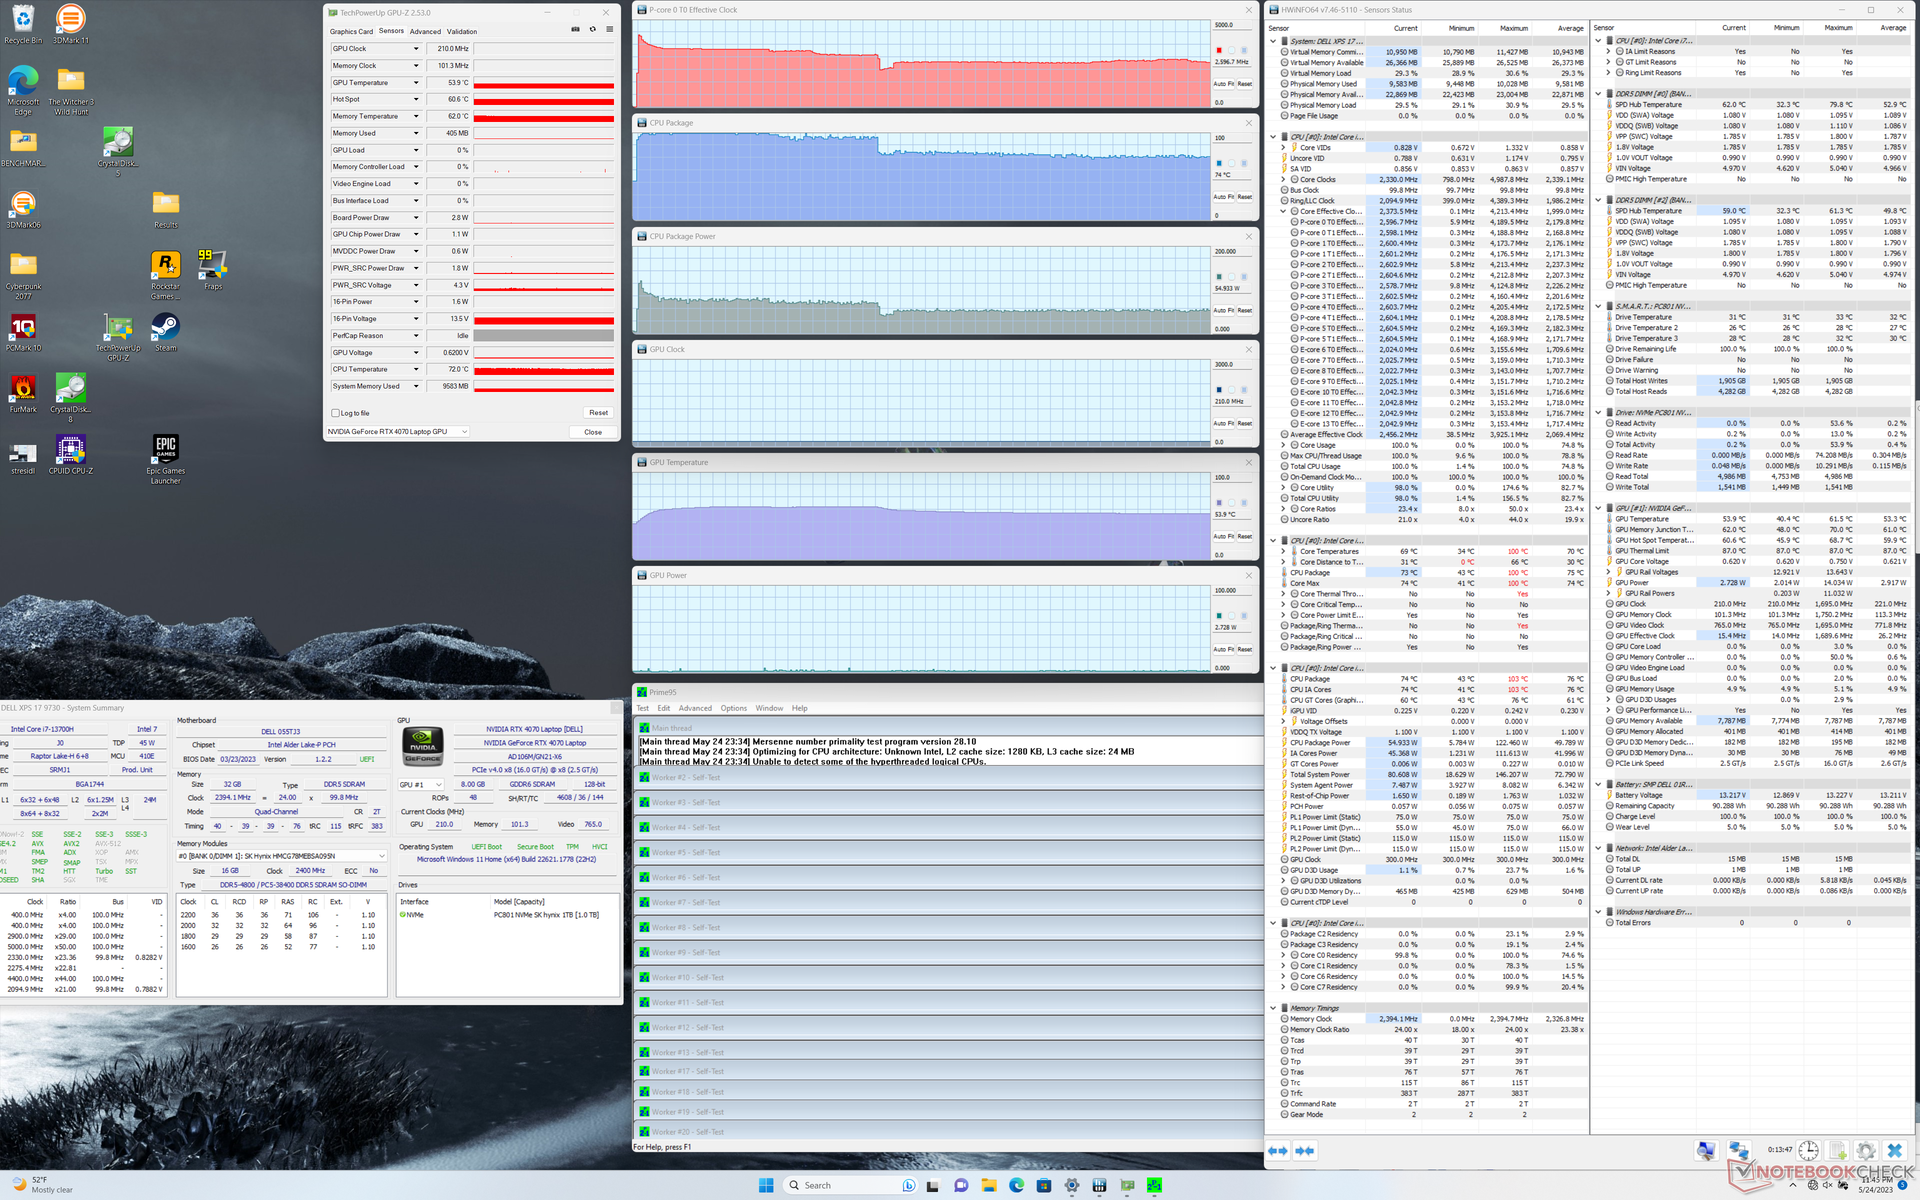
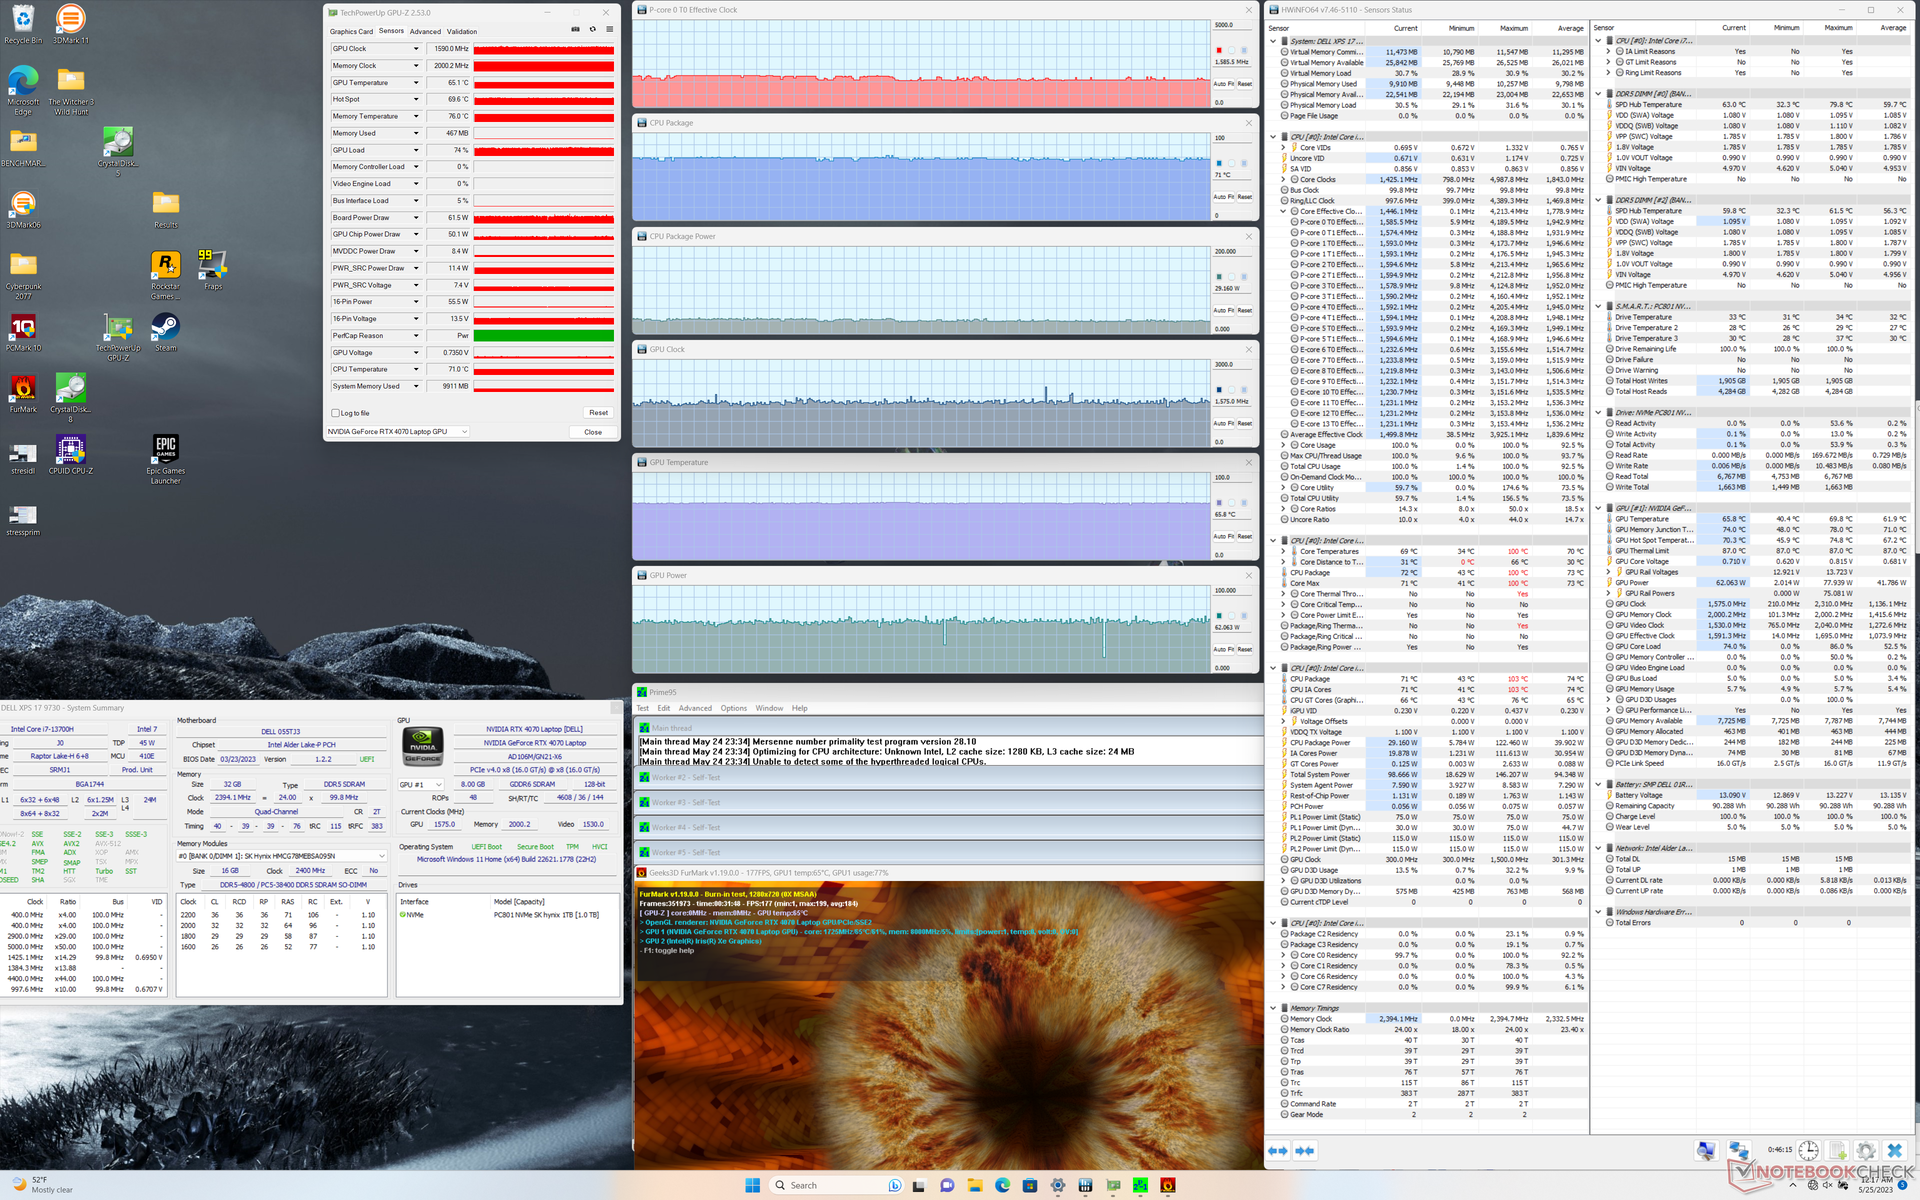
| Clock da CPU (GHz) | Clock da GPU (MHz) | Temperatura média da CPU (°C) | Temperatura média da GPU (°C) | |
| Sistema ocioso | -- | -- | 43 | 40 |
| Estresse doPrime95 | 2.6 | -- | 74 | 54 |
| EstressePrime95 + FurMark | 1.6 | 1590 | 71 | 65 |
| Witcher 3 Estresse | 0,8 | 2115 | 72 | 67 |
Alto-falantes
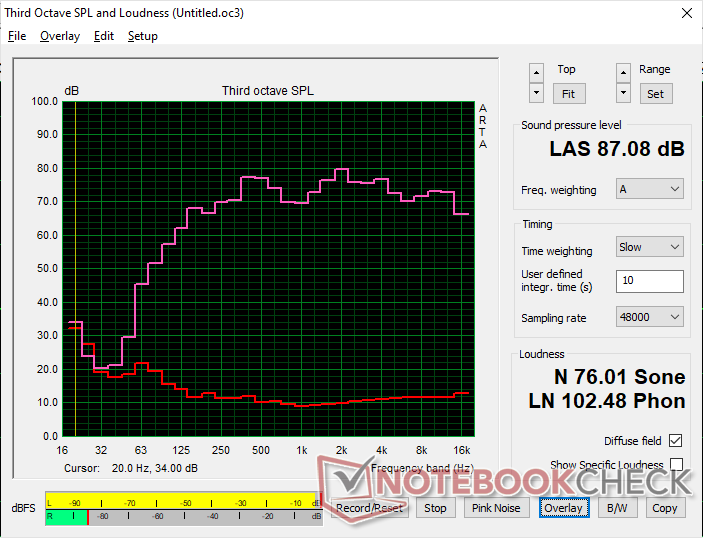
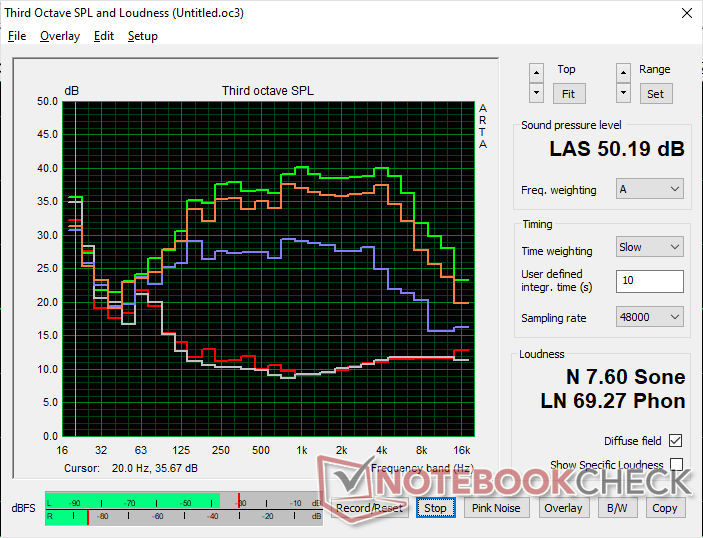
Dell XPS 17 9730 RTX 4070 análise de áudio
(+) | os alto-falantes podem tocar relativamente alto (###valor### dB)
Graves 100 - 315Hz
(±) | graves reduzidos - em média 7.2% menor que a mediana
(+) | o baixo é linear (5.9% delta para a frequência anterior)
Médios 400 - 2.000 Hz
(+) | médios equilibrados - apenas 3.3% longe da mediana
(+) | médios são lineares (5.1% delta para frequência anterior)
Altos 2 - 16 kHz
(+) | agudos equilibrados - apenas 1.9% longe da mediana
(+) | os máximos são lineares (3.4% delta da frequência anterior)
Geral 100 - 16.000 Hz
(+) | o som geral é linear (7% diferença em relação à mediana)
Comparado com a mesma classe
» 5% de todos os dispositivos testados nesta classe foram melhores, 1% semelhantes, 94% piores
» O melhor teve um delta de 5%, a média foi 17%, o pior foi 45%
Comparado com todos os dispositivos testados
» 1% de todos os dispositivos testados foram melhores, 0% semelhantes, 99% piores
» O melhor teve um delta de 4%, a média foi 23%, o pior foi 134%
Apple MacBook Pro 16 2021 M1 Pro análise de áudio
(+) | os alto-falantes podem tocar relativamente alto (###valor### dB)
Graves 100 - 315Hz
(+) | bons graves - apenas 3.8% longe da mediana
(+) | o baixo é linear (5.2% delta para a frequência anterior)
Médios 400 - 2.000 Hz
(+) | médios equilibrados - apenas 1.3% longe da mediana
(+) | médios são lineares (2.1% delta para frequência anterior)
Altos 2 - 16 kHz
(+) | agudos equilibrados - apenas 1.9% longe da mediana
(+) | os máximos são lineares (2.7% delta da frequência anterior)
Geral 100 - 16.000 Hz
(+) | o som geral é linear (4.6% diferença em relação à mediana)
Comparado com a mesma classe
» 0% de todos os dispositivos testados nesta classe foram melhores, 0% semelhantes, 100% piores
» O melhor teve um delta de 5%, a média foi 17%, o pior foi 45%
Comparado com todos os dispositivos testados
» 0% de todos os dispositivos testados foram melhores, 0% semelhantes, 100% piores
» O melhor teve um delta de 4%, a média foi 23%, o pior foi 134%
Gerenciamento de energia - USB-C em funcionamento
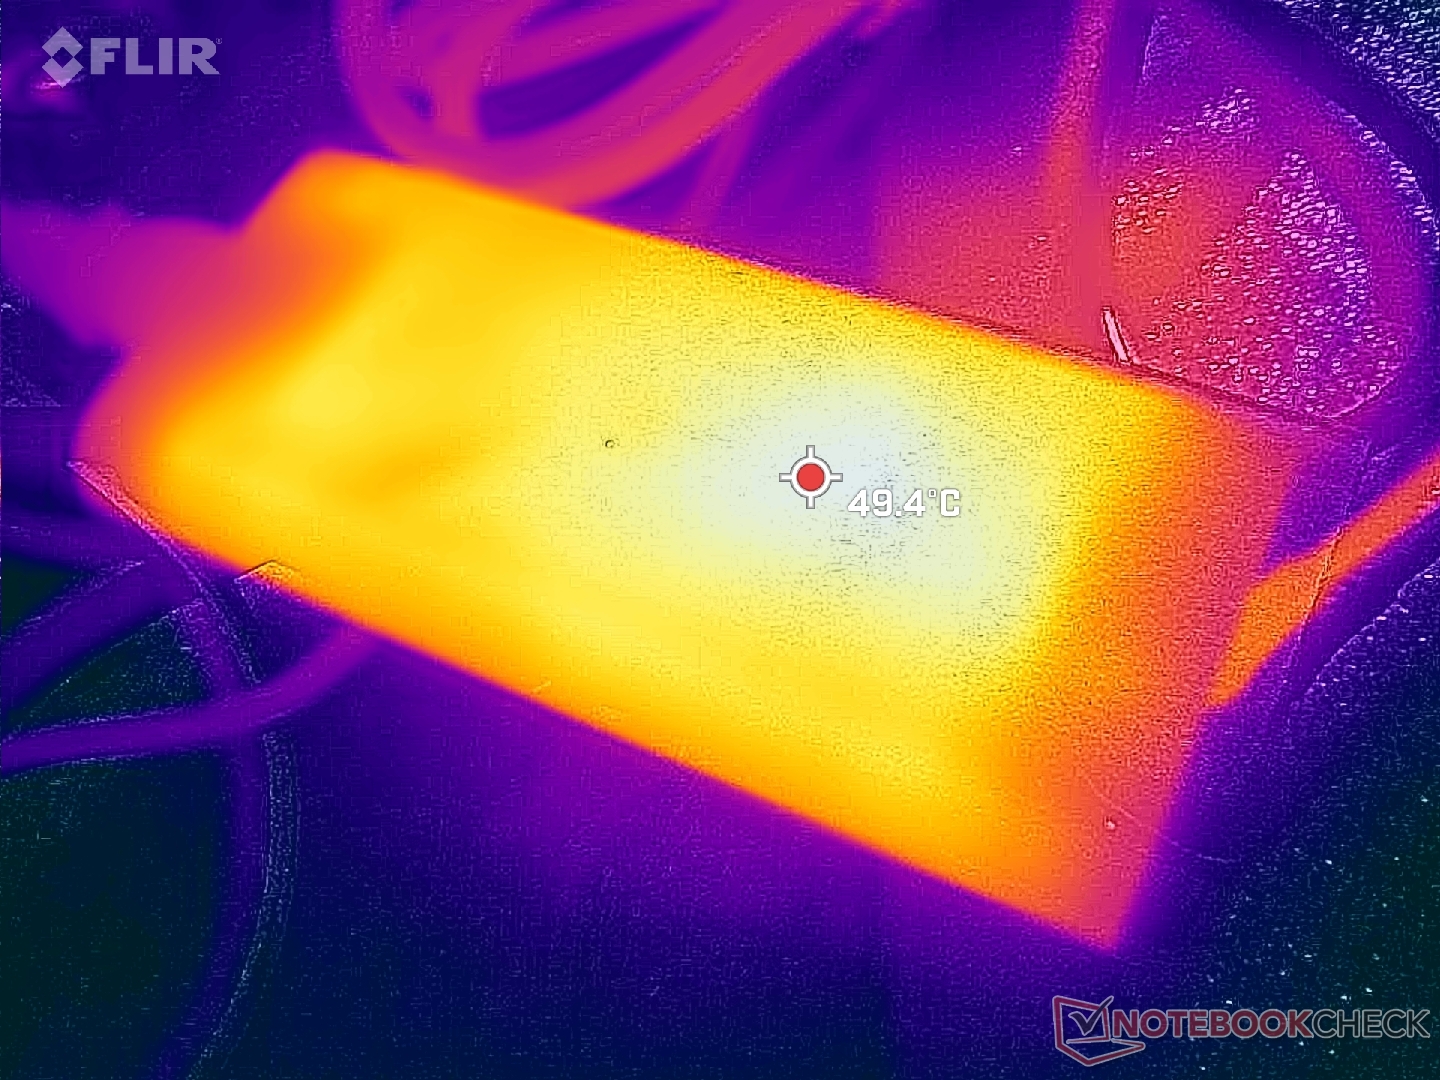
Consumo de energia - 130 W é suficiente?
O consumo de energia não mudou drasticamente em relação ao XPS 17 9720 mais antigo, pois todos os modelos do XPS 17 até o momento são fornecidos com o mesmo adaptador CA USB-C de 130 W. Quando comparado a outros notebooks com CPUs da série H e GPUs GeForce RTX, o adaptador de 130 W da Dell é um dos menores, tanto em tamanho quanto em potência. O pequeno adaptador dispensa o desempenho superior e o carregamento mais rápido em favor da portabilidade.
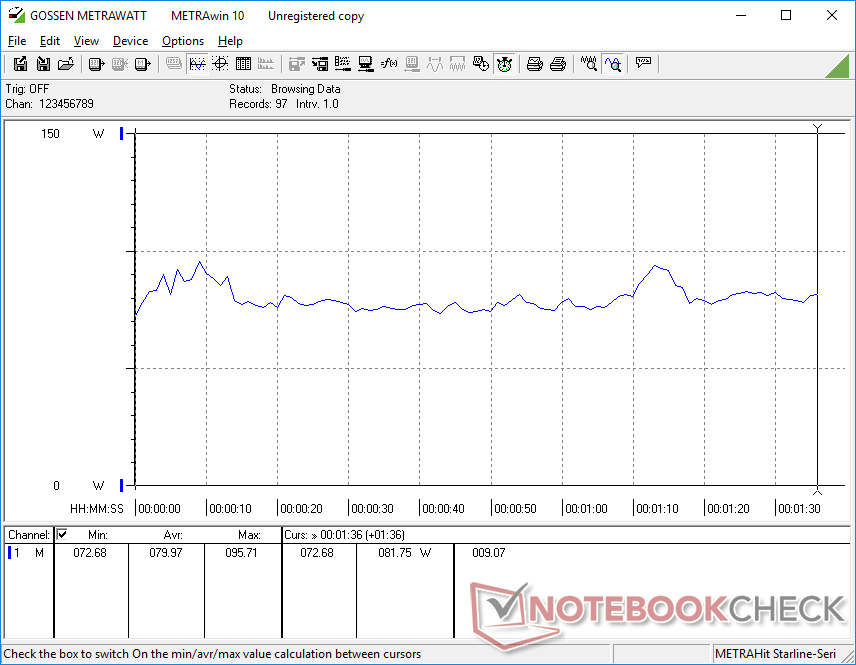
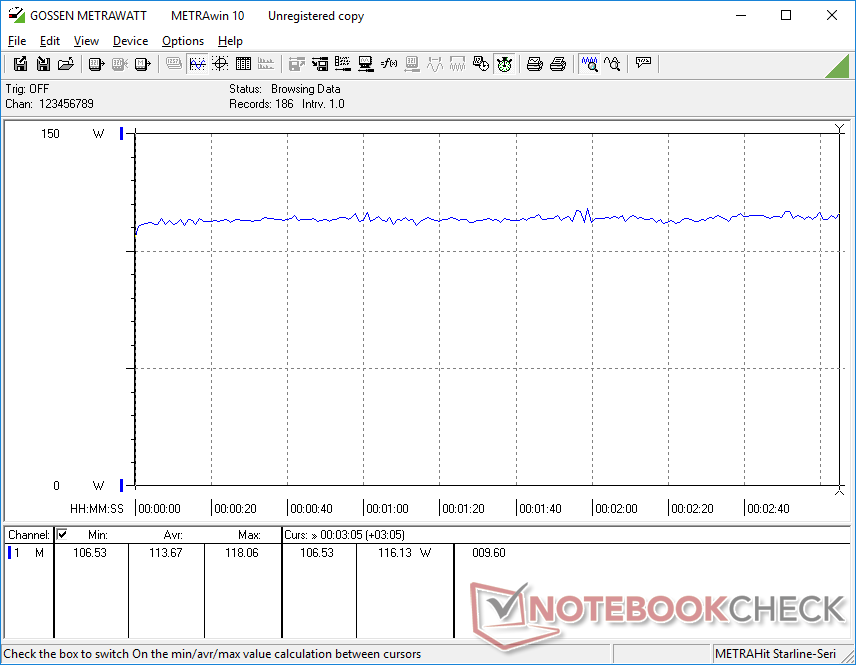
Mesmo assim, o desempenho mais alto por watt de Ada Lovelace em comparação com Ampere ainda permite que o XPS 17 9730 tenha um desempenho melhor do que o modelo do ano passado quando está sob o mesmo envelope de energia. O Running Witcher 3por exemplo, consome cerca de 114 W tanto no XPS 17 9720 quanto no 9730, apesar de o último oferecer um desempenho gráfico 30% mais rápido. O consumo de energia da CPU também seria mais estável com sua maior sustentabilidade do Turbo Boost em relação ao Core i7-12700H, como mencionado acima. Definitivamente, a Dell tem otimizado a CPU e a GPU da melhor forma possível para se ajustar ao orçamento de energia limitado.
| desligado | |
| Ocioso | |
| Carga |
|
Key:
min: | |
| Dell XPS 17 9730 RTX 4070 i7-13700H, GeForce RTX 4070 Laptop GPU, SK hynix PC801 HFS001TEJ9X101N, Sharp LQ170R1, 3840x2400, 17" | Dell XPS 17 9720 RTX 3060 i7-12700H, GeForce RTX 3060 Laptop GPU, Samsung PM9A1 MZVL21T0HCLR, IPS, 3840x2400, 17" | LG Gram 17 (2023) i7-1360P, Iris Xe G7 96EUs, Samsung PM9A1 MZVL21T0HCLR, IPS, 2560x1600, 17" | HP Envy 17-cr0079ng i7-1255U, GeForce RTX 2050 Mobile, Samsung PM991a MZVLQ1T0HBLB, IPS, 3840x2160, 17.3" | MSI Creator Z17 A12UGST-054 i9-12900H, GeForce RTX 3070 Ti Laptop GPU, Micron 3400 1TB MTFDKBA1T0TFH, IPS, 2560x1600, 17" | Apple MacBook Pro 16 2023 M2 Max M2 Max, M2 Max 38-Core GPU, Apple SSD AP2048Z, Mini-LED, 3456x2234, 16.2" | |
|---|---|---|---|---|---|---|
| Power Consumption | 6% | 59% | 34% | -79% | 16% | |
| Idle Minimum * (Watt) | 15 | 5.9 61% | 2.2 85% | 5.8 61% | 34.6 -131% | 5.2 65% |
| Idle Average * (Watt) | 23.6 | 15.8 33% | 8.9 62% | 14.3 39% | 43 -82% | 16.5 30% |
| Idle Maximum * (Watt) | 24.3 | 26.7 -10% | 11 55% | 18.4 24% | 44.9 -85% | 16.8 31% |
| Load Average * (Watt) | 80 | 117.4 -47% | 53 34% | 70 12% | 145 -81% | 113 -41% |
| Witcher 3 ultra * (Watt) | 113.7 | 114.8 -1% | 42.5 63% | 69.4 39% | 152.4 -34% | 92 19% |
| Load Maximum * (Watt) | 135.4 | 136.6 -1% | 64 53% | 93 31% | 220 -62% | 145 -7% |
* ... menor é melhor
Power Consumption Witcher 3 / Stresstest
Power Consumption external Monitor
Duração da bateria - Longa duração, carregamento lento
O tempo de execução da WLAN é cerca de uma hora mais longo do que no XPS 17 9720 do ano passado, totalizando 10 horas de uso de navegação no mundo real. É bom ver que a duração da bateria não foi afetada, apesar dos aumentos anuais no desempenho geral.
O carregamento de uma bateria vazia até a capacidade total é lento, com cerca de 2 a 2,5 horas, em comparação com 1,5 hora na maioria dos outros notebooks. Lembre-se de que o carregamento será ainda mais lento se estiver executando cargas exigentes, como jogos, devido à limitação do adaptador CA de 130 W.
Vale a pena observar que a bateria não se esgotará lentamente quando estiver conectada à rede elétrica e executando jogos ou outras cargas exigentes. Esse problema era específico do XPS 9700 original e foi resolvido a partir do XPS 17 9710.
| Dell XPS 17 9730 RTX 4070 i7-13700H, GeForce RTX 4070 Laptop GPU, 97 Wh | Dell XPS 17 9720 RTX 3060 i7-12700H, GeForce RTX 3060 Laptop GPU, 97 Wh | LG Gram 17 (2023) i7-1360P, Iris Xe G7 96EUs, 80 Wh | HP Envy 17-cr0079ng i7-1255U, GeForce RTX 2050 Mobile, 55 Wh | MSI Creator Z17 A12UGST-054 i9-12900H, GeForce RTX 3070 Ti Laptop GPU, 90 Wh | Apple MacBook Pro 16 2023 M2 Max M2 Max, M2 Max 38-Core GPU, 99.6 Wh | |
|---|---|---|---|---|---|---|
| Duração da bateria | -11% | 63% | -4% | 28% | 24% | |
| Reader / Idle (h) | 19.1 | 25.7 35% | ||||
| WiFi v1.3 (h) | 10 | 8.7 -13% | 12.8 28% | 4.7 -53% | 5.5 -45% | 14.8 48% |
| Load (h) | 1.1 | 1 -9% | 2.5 127% | 1.6 45% | 2.2 100% | 1.1 0% |
| H.264 (h) | 14.5 | 5.5 | 5.5 | 18.7 |
Pro
Contra
Veredicto - Equilibrado e otimizado
Há um ditado que diz que você não deve se lançar em um produto ou projeto de primeira geração por causa dos possíveis problemas ou falhas que precisam ser resolvidos. O xPS 17 9700 originaloriginal, por exemplo, tinha problemas de esgotamento da bateria, problemas de estabilidade da taxa de quadros e desempenho fraco do Turbo Boost da CPU. Após três anos completos de otimizações constantes, o XPS 17 9730 mais recente solucionou diretamente todas essas deficiências para ser uma recomendação muito mais fácil. O consumo de energia não é mais um problema, as taxas de quadros são estáveis e o Turbo Boost é mais duradouro e mais consistente.
O XPS 17 9730 equilibra o alto desempenho com um orçamento de energia limitado de 130 W muito melhor do que no XPS 15 9530. Quando equipado exatamente com a mesma CPU Core i7 e GPU GeForce RTX 4070, nosso XPS 17 superou seu irmão menor em 10 a 15% e 50 a 60%, respectivamente. O aumento da GPU, em particular, é enorme, simplesmente devido à meta de TGP mais alta do XPS 17. Se você está em dúvida entre o XPS 15 e o XPS 17 e o desempenho gráfico é de extrema importância, então o XPS 17 é o vencedor absoluto.
O XPS 17 9730 tem o desempenho, a portabilidade, a tela e o potencial de jogos para satisfazer a maioria dos usuários domésticos e de escritório. No entanto, alguns aspectos do design de três anos atrás estão ficando ultrapassados.
As desvantagens do modelo não podem ser ignoradas. Para um laptop de mais de US$ 3.000,00, a mísera webcam de 1 MP sem obturador de privacidade e sem suporte a Wi-Fi 6E são embaraçosas nessa faixa de preço. A tela IPS de 60 Hz também está ficando obsoleta quando os painéis OLED e de taxa de atualização mais alta já são comuns. O adaptador CA de 130 W está parecendo mais uma parede de tijolos, impedindo que a série XPS 17 atinja taxas de carregamento mais rápidas e metas de TGP mais altas. Há muitas coisas que podem ser melhoradas, sem dúvida, mas pelo menos o desempenho está em um nível confortável, considerando o design fino.
Preço e disponibilidade
O XPS 17 9730 ainda não está amplamente disponível por meio de revendedores. Para obter as opções mais configuráveis e envio imediato, recomendamos comprar diretamente da Dell. Os preços começam em US$ 2.450 para a SKU mais barata e vão até US$ 4.300 a US$ 5.100 se estiver totalmente configurado.
Dell XPS 17 9730 RTX 4070
- 05/27/2023 v7 (old)
Allen Ngo
Transparência
A seleção dos dispositivos a serem analisados é feita pela nossa equipe editorial. A amostra de teste foi fornecida ao autor como empréstimo pelo fabricante ou varejista para fins desta revisão. O credor não teve influência nesta revisão, nem o fabricante recebeu uma cópia desta revisão antes da publicação. Não houve obrigação de publicar esta revisão. Como empresa de mídia independente, a Notebookcheck não está sujeita à autoridade de fabricantes, varejistas ou editores.
É assim que o Notebookcheck está testando
Todos os anos, o Notebookcheck analisa de forma independente centenas de laptops e smartphones usando procedimentos padronizados para garantir que todos os resultados sejam comparáveis. Desenvolvemos continuamente nossos métodos de teste há cerca de 20 anos e definimos padrões da indústria no processo. Em nossos laboratórios de teste, equipamentos de medição de alta qualidade são utilizados por técnicos e editores experientes. Esses testes envolvem um processo de validação em vários estágios. Nosso complexo sistema de classificação é baseado em centenas de medições e benchmarks bem fundamentados, o que mantém a objetividade.Price comparison

