Revisão do Schenker XMG Pro 15 (Clevo PC50HS-D): Laptop para jogos 4K fino e leve

O Schenker XMG Pro 15 do final de 2021 é um laptop leve e compacto de 15,6 polegadas para jogos. Ele é baseado no Clevo barebone (PC50HS-D) e é alimentado por umCore-i7-11800HcPU e um móvelGeForce RTX 3080gPU. Ela compete diretamente com dispositivos como aLenovo Legion S7 15ACH6, MSI Delta 15, Alienware x15e oRazer Blade 15 Advanced (meados de 2021).
Potential competitors in comparison
Avaliação | Data | Modelo | Peso | Altura | Size | Resolução | Preço |
|---|---|---|---|---|---|---|---|
| 84.6 % v7 (old) | 01/2022 | Schenker XMG Pro 15 (Late 2021) i7-11800H, GeForce RTX 3080 Laptop GPU | 2 kg | 19.8 mm | 15.60" | 3840x2160 | |
| 87.9 % v7 (old) | 11/2021 | Lenovo Legion S7 15ACH6 82K80030GE R9 5900HX, GeForce RTX 3060 Laptop GPU | 2 kg | 18.9 mm | 15.60" | 3840x2160 | |
| 87.2 % v7 (old) | 09/2021 | Alienware x15 RTX 3070 P111F i7-11800H, GeForce RTX 3070 Laptop GPU | 2.4 kg | 15.9 mm | 15.60" | 2560x1440 | |
| 88.9 % v7 (old) | 07/2021 | Razer Blade 15 Advanced (Mid 2021) i7-11800H, GeForce RTX 3080 Laptop GPU | 2 kg | 16.99 mm | 15.60" | 1920x1080 |
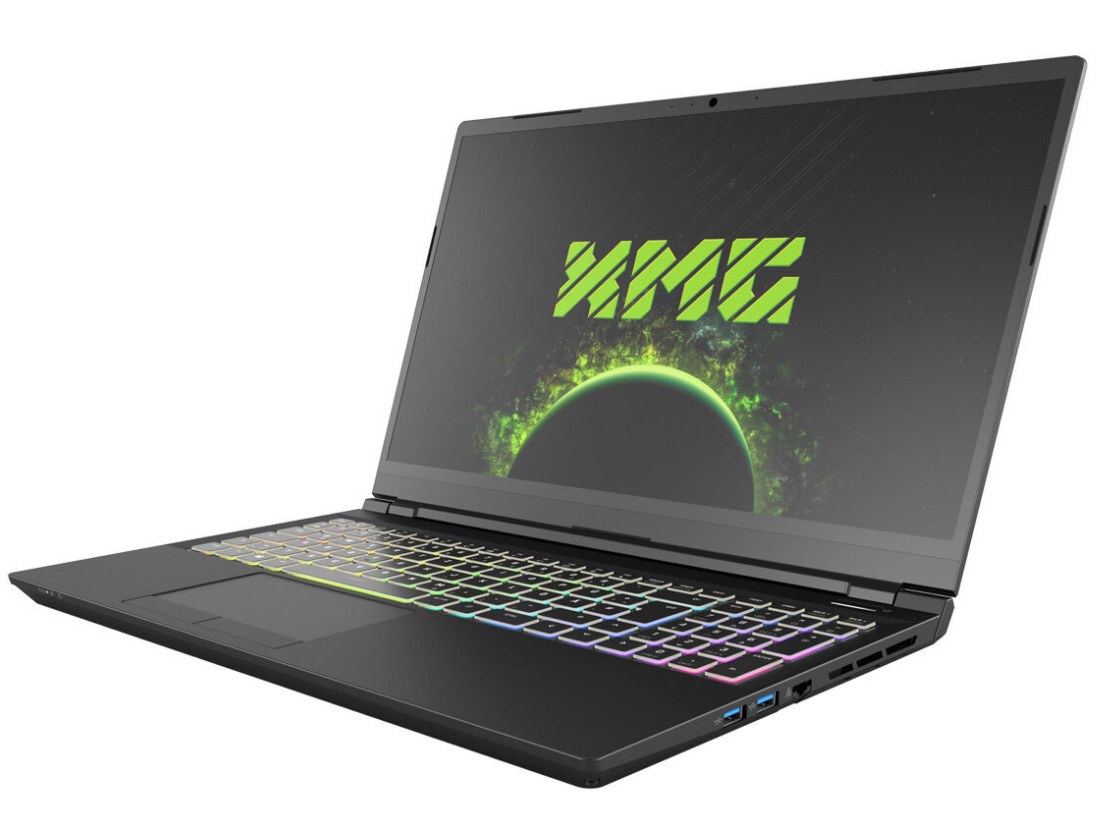
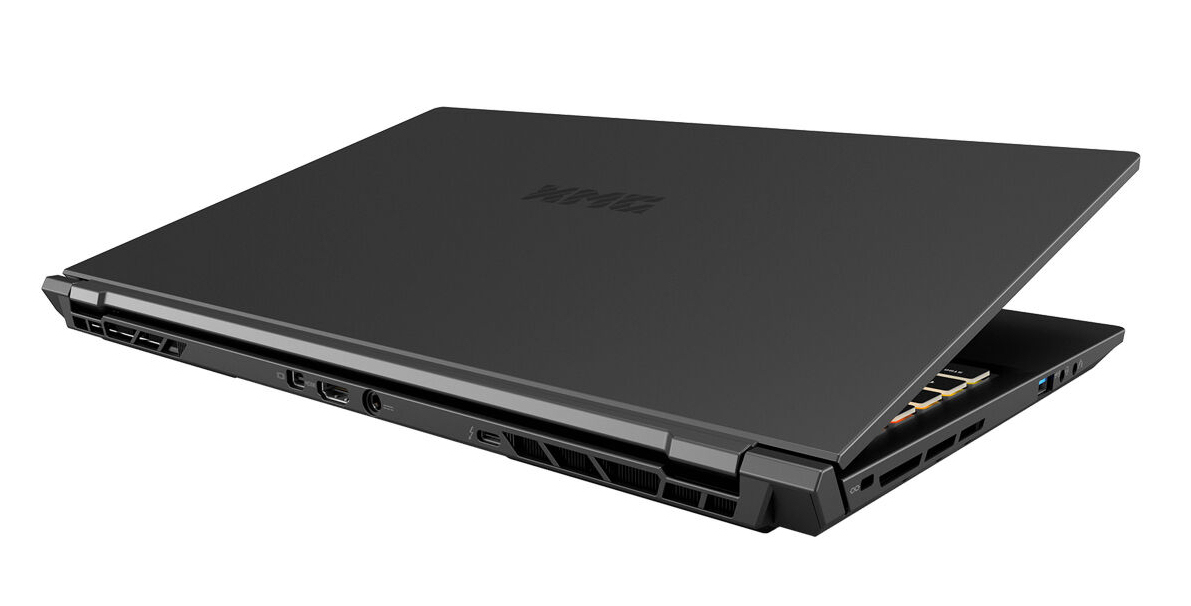
Estojo - Laptop Schenker com um chassi metálico
Para o XMG Pro, a Schenker utiliza um chassi metálico fino em preto fosco. Como o chassi simples e elegante vem sem nenhum acento visual marcante, ele é adequado para ambientes profissionais. Em comparação com oModelo XMG Pro 15 do início de 2021há apenas algumas pequenas diferenças. Não há nenhuma escotilha de manutenção e a bateria é fixa.
A construção não merece críticas. As autorizações são uniformes e não há saliências materiais indesejáveis. Enquanto a tampa e a unidade de base cedem ligeiramente quando torcidas nos cantos, a rigidez ainda é sólida em geral. As dobradiças mantêm a tampa firmemente no lugar, ainda que permitam algumas saliências. O visor pode ser aberto a até 130 graus. É possível abrir o laptop com apenas uma mão.
O XMG Pro é um dos dispositivos mais compactos em nossa comparação e apenas ligeiramente maior do que o Lâmina 15. Na maioria das vezes, todos os laptops em nossa comparação são até mesmo em termos de seu peso. Somente oAlienware x15se afasta disso e pesa cerca de 400 g a mais.
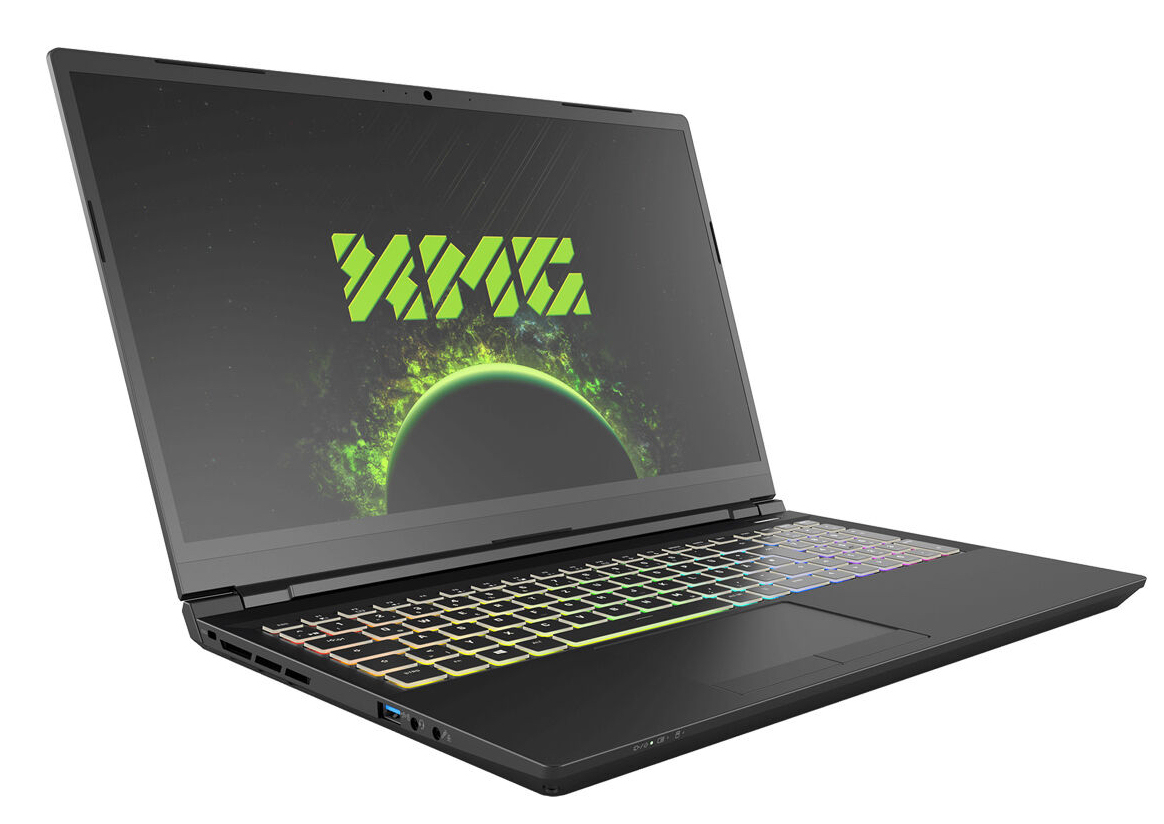
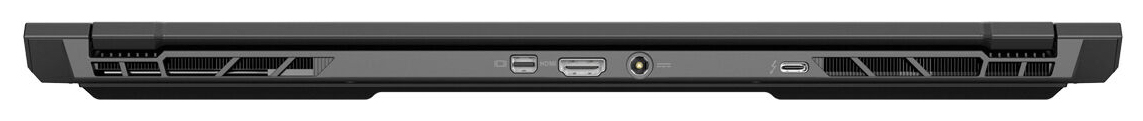
Conectividade - Schenker XMG com Thunderbolt 4
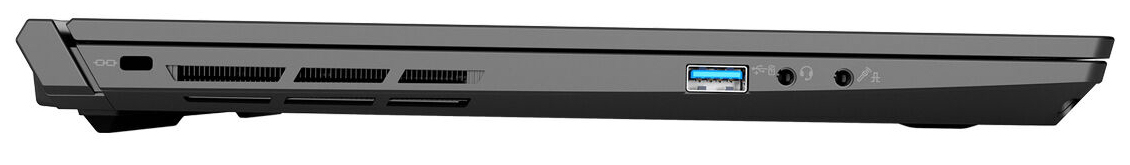
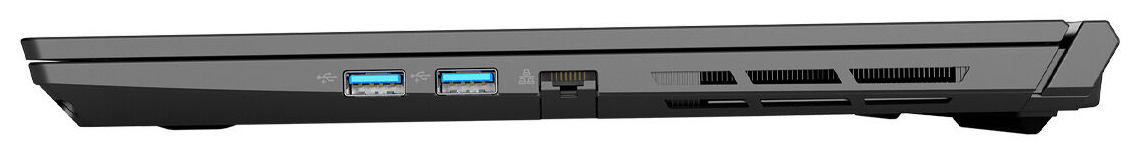
O XMG Pro integra três portas USB tipo A (USB 3.2 Gen 1) e uma porta USB tipo C (Thunderbolt 4). Esta última pode ser conectada a uma estação de acoplamento rica em recursos ou a uma GPU externa. Além disso, a porta suporta DisplayPort via USB-C. Combinado com a Mini DisplayPort e a porta HDMI, há três saídas de vídeo no total. Todas as três saídas de vídeo suportam G-Sync. Para a porta USB tipo C, isto tem que ser habilitado manualmente de dentro da BIOS. Não há um leitor de cartões integrado
As portas estão distribuídas em três lados do notebook. Todas as três saídas de vídeo estão localizadas na parte de trás do dispositivo. Como resultado, os cabos conectados são executados ao longo da parte de trás e não atrapalham
Comunicação
O módulo Wi-Fi é baseado em um chip Intel (AX201) e suporta os padrões 802.11a/b/g/n/ac/ax. Sob condições ideais (nenhum outro dispositivo Wi-Fi nas proximidades, notebook e servidor nas proximidades), observamos excelentes taxas de transferência. Um controlador Realtek Gigabit Ethernet lida com rede com fio. Não encontramos nenhum problema com ele durante nossos testes
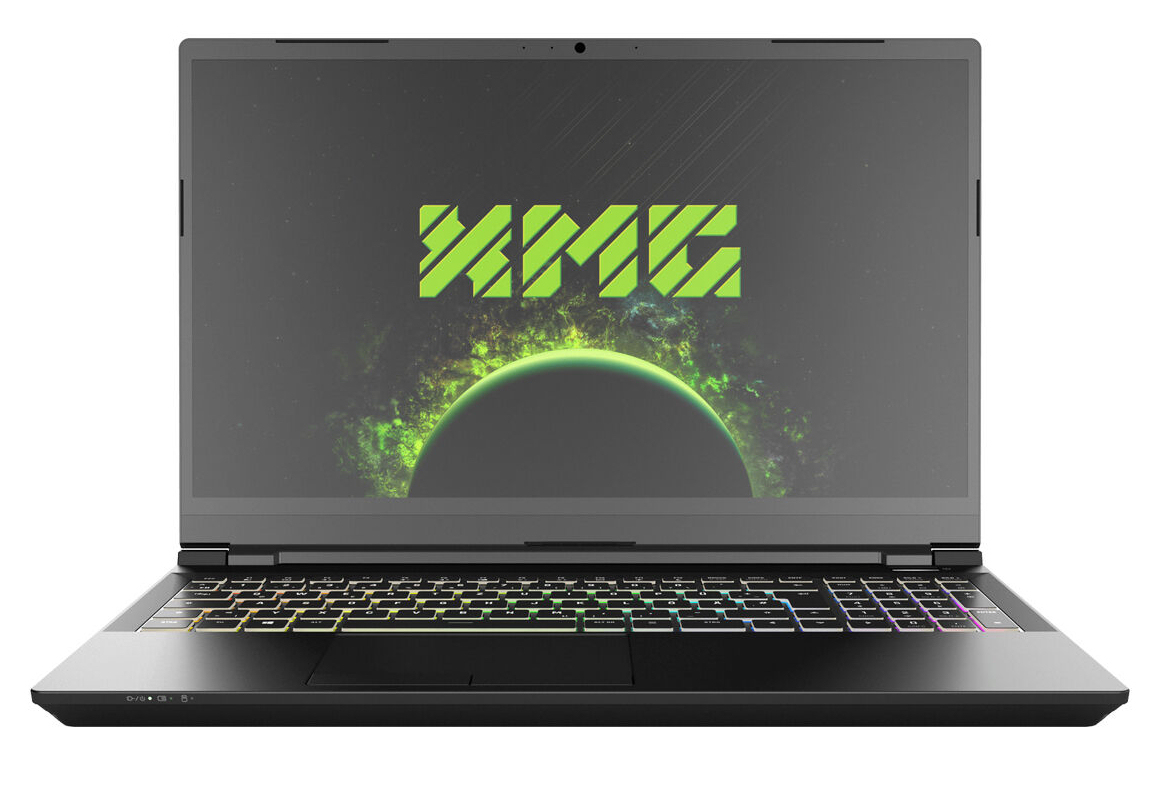
Webcam
A Webcam (0,9 MP) captura imagens com uma resolução máxima de 1280 x 720 pixels. A precisão da cor é pouco brilhante: As cores se desviam significativamente de seus valores ideais

 GeForce RTX 3080 Laptop GPU, i7-11800H, Samsung SSD 980 Pro 1TB MZ-V8P1T0BW")
 GeForce RTX 3080 Laptop GPU, i7-11800H, Samsung SSD 980 Pro 1TB MZ-V8P1T0BW")
Acessórios
Além das informações sobre garantia e um manual, há um DVD de recuperação, um pano de limpeza, um thumbdrive USB e um parafuso M.2 incluído na embalagem
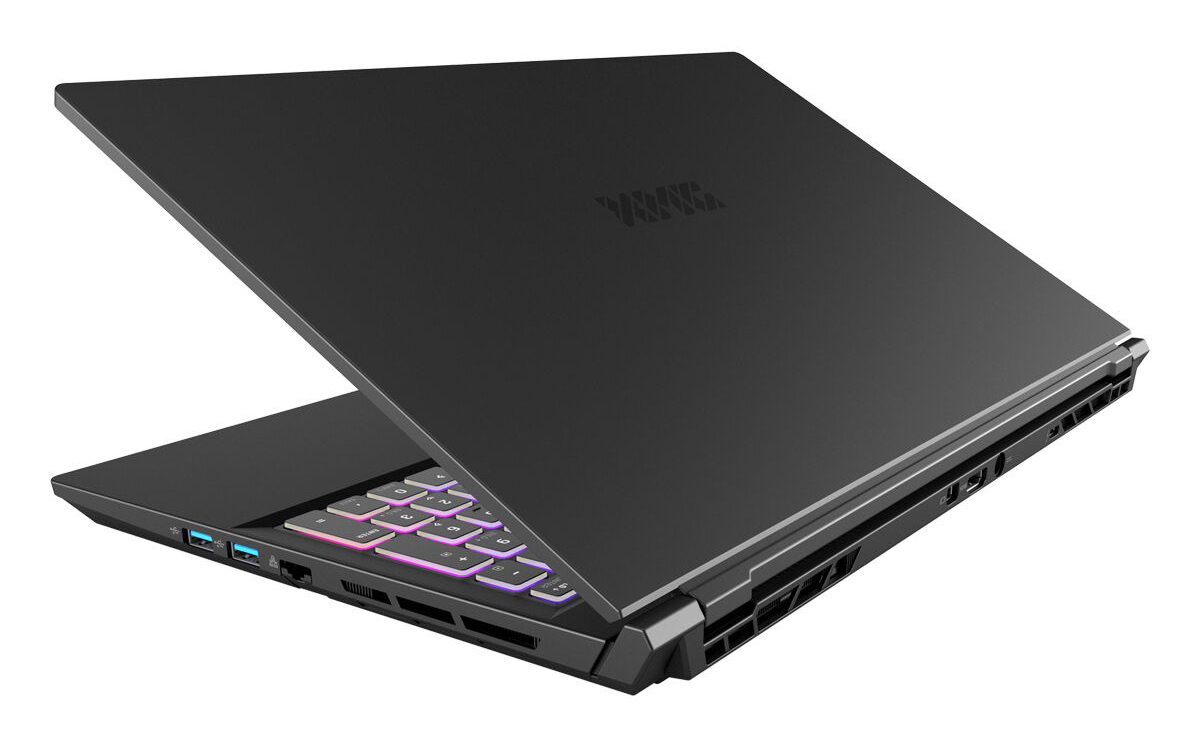
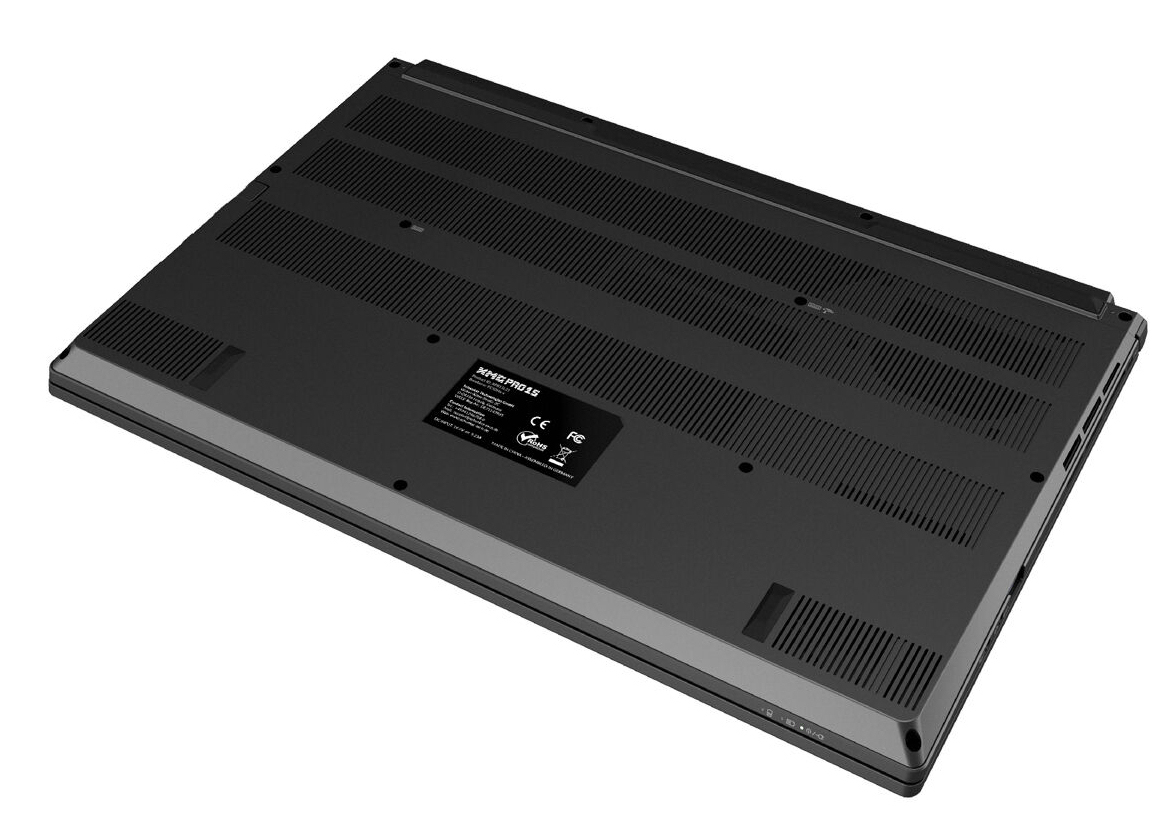
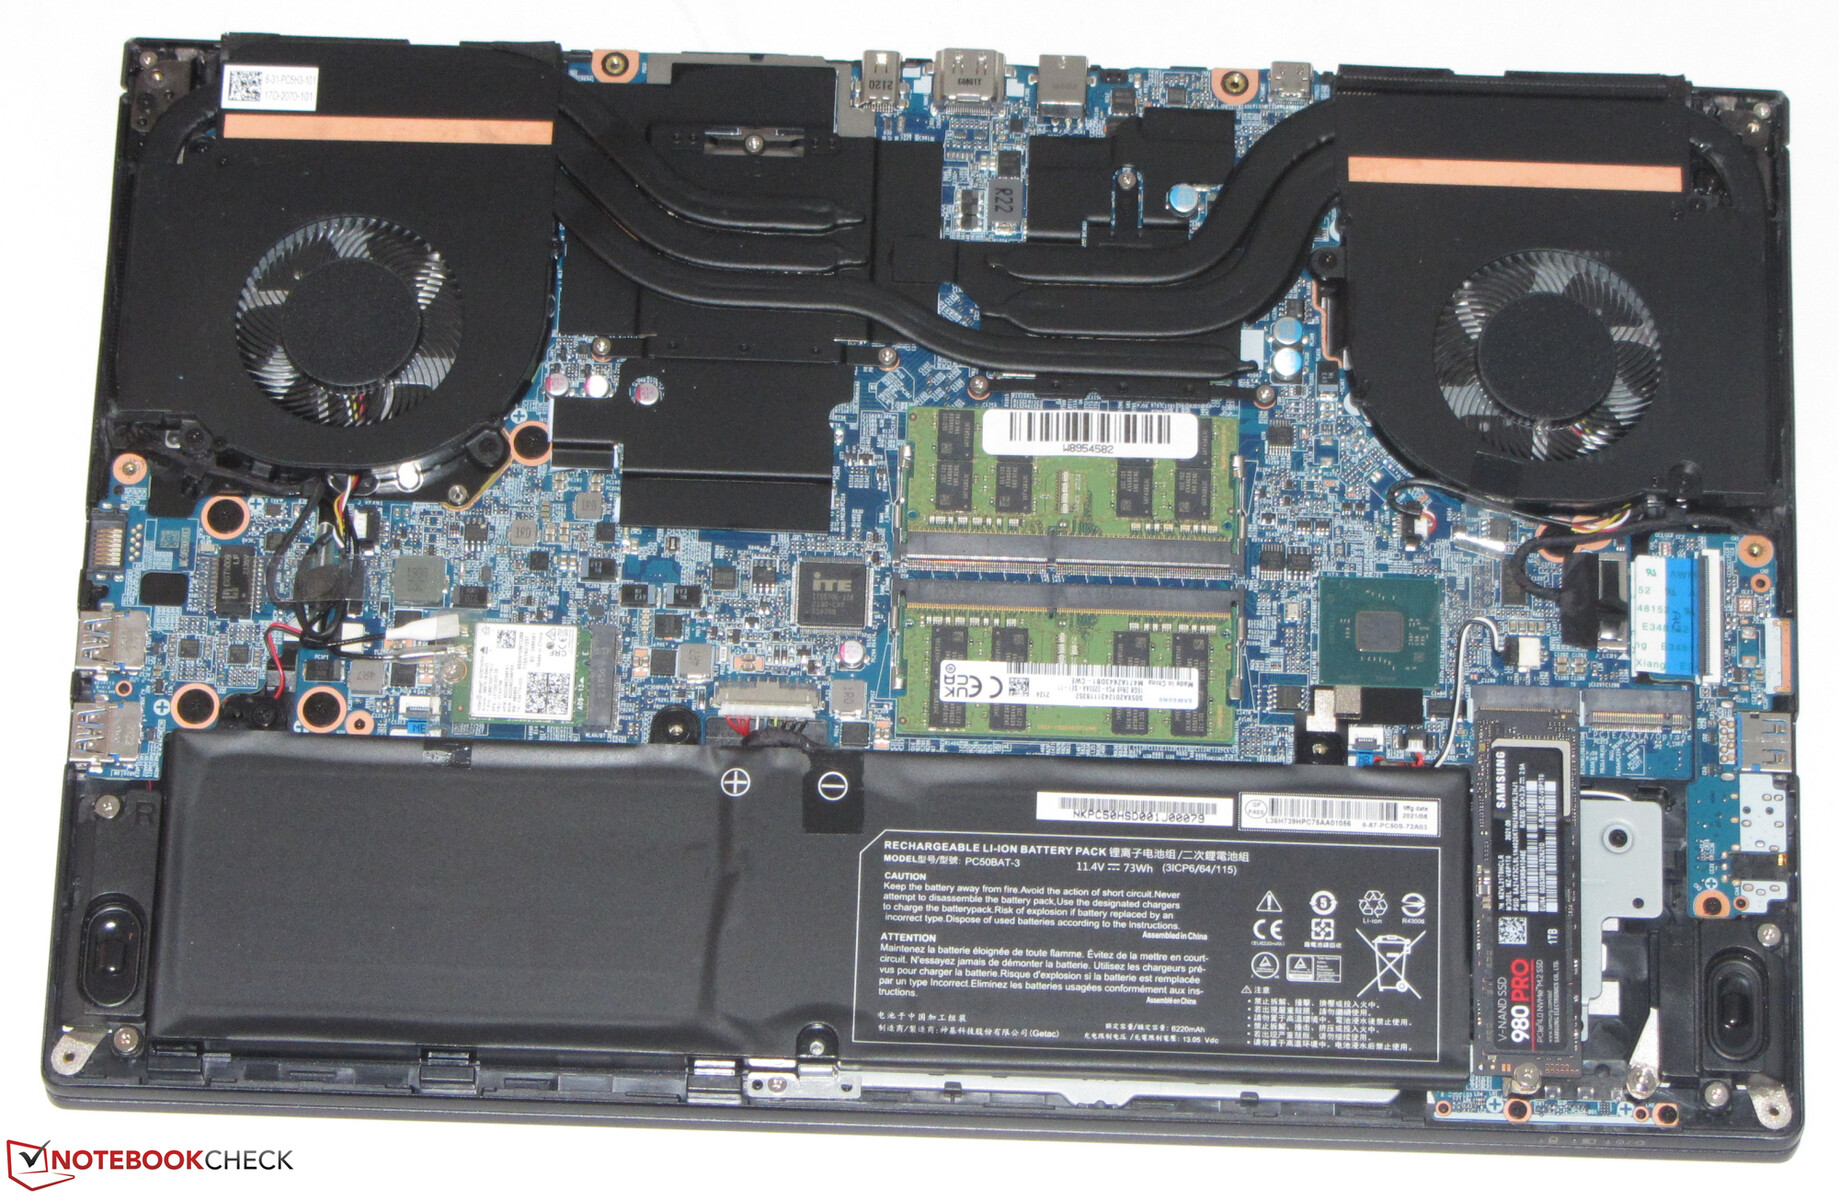
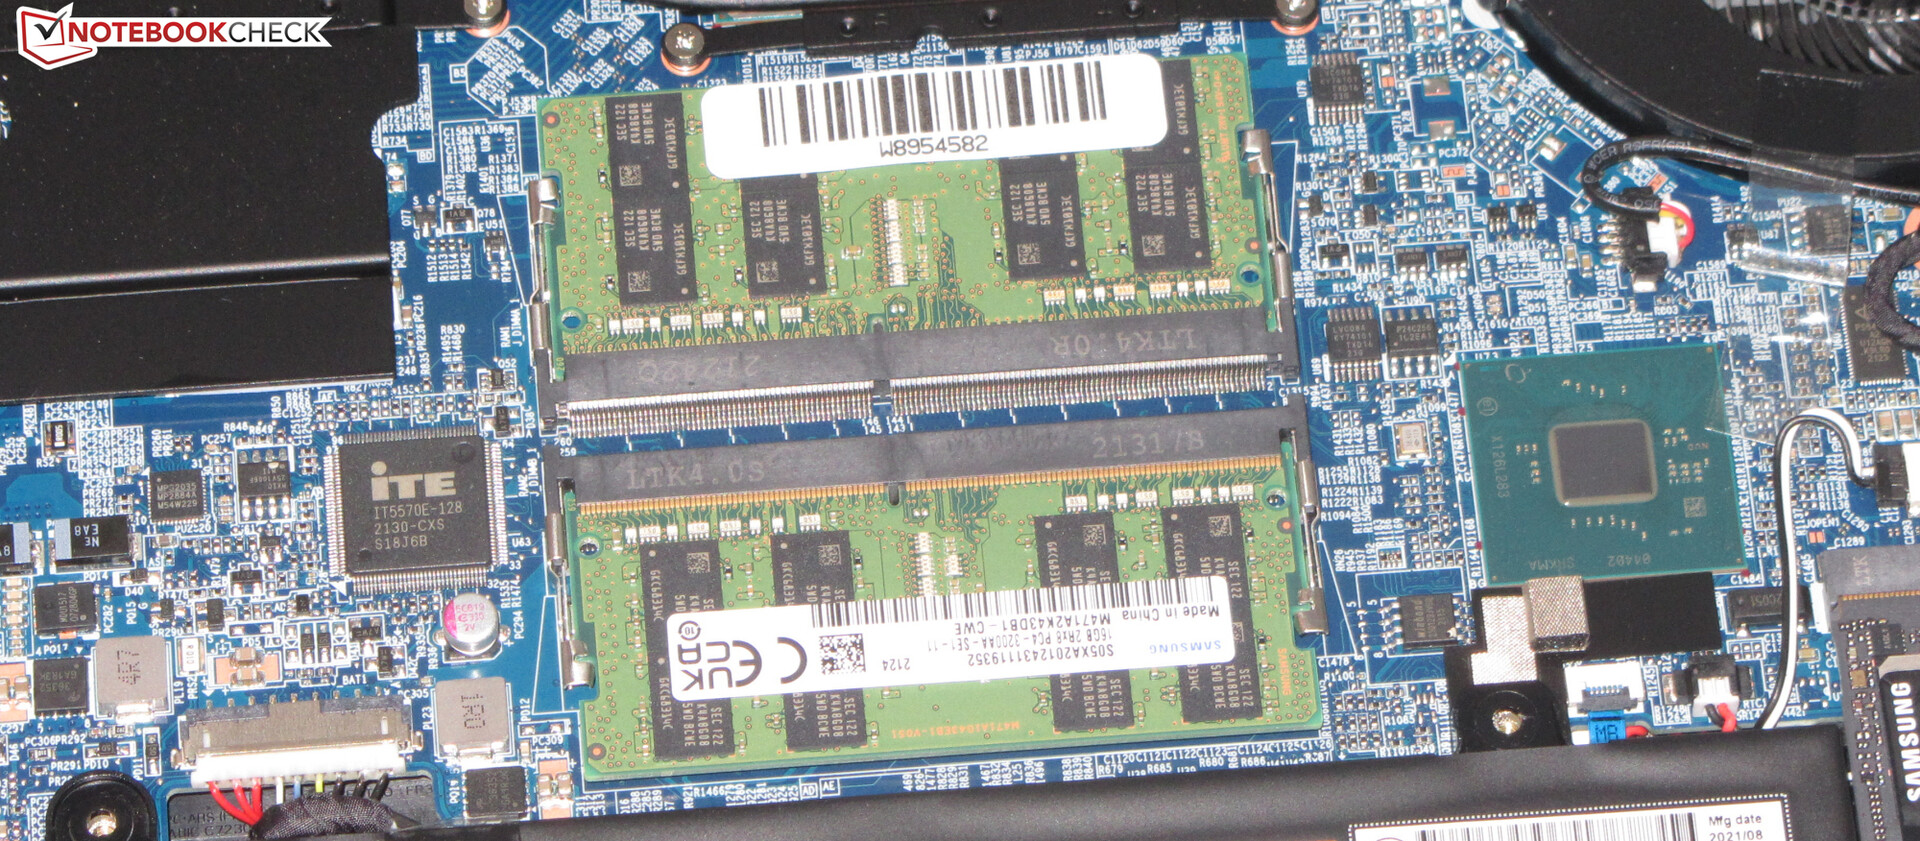
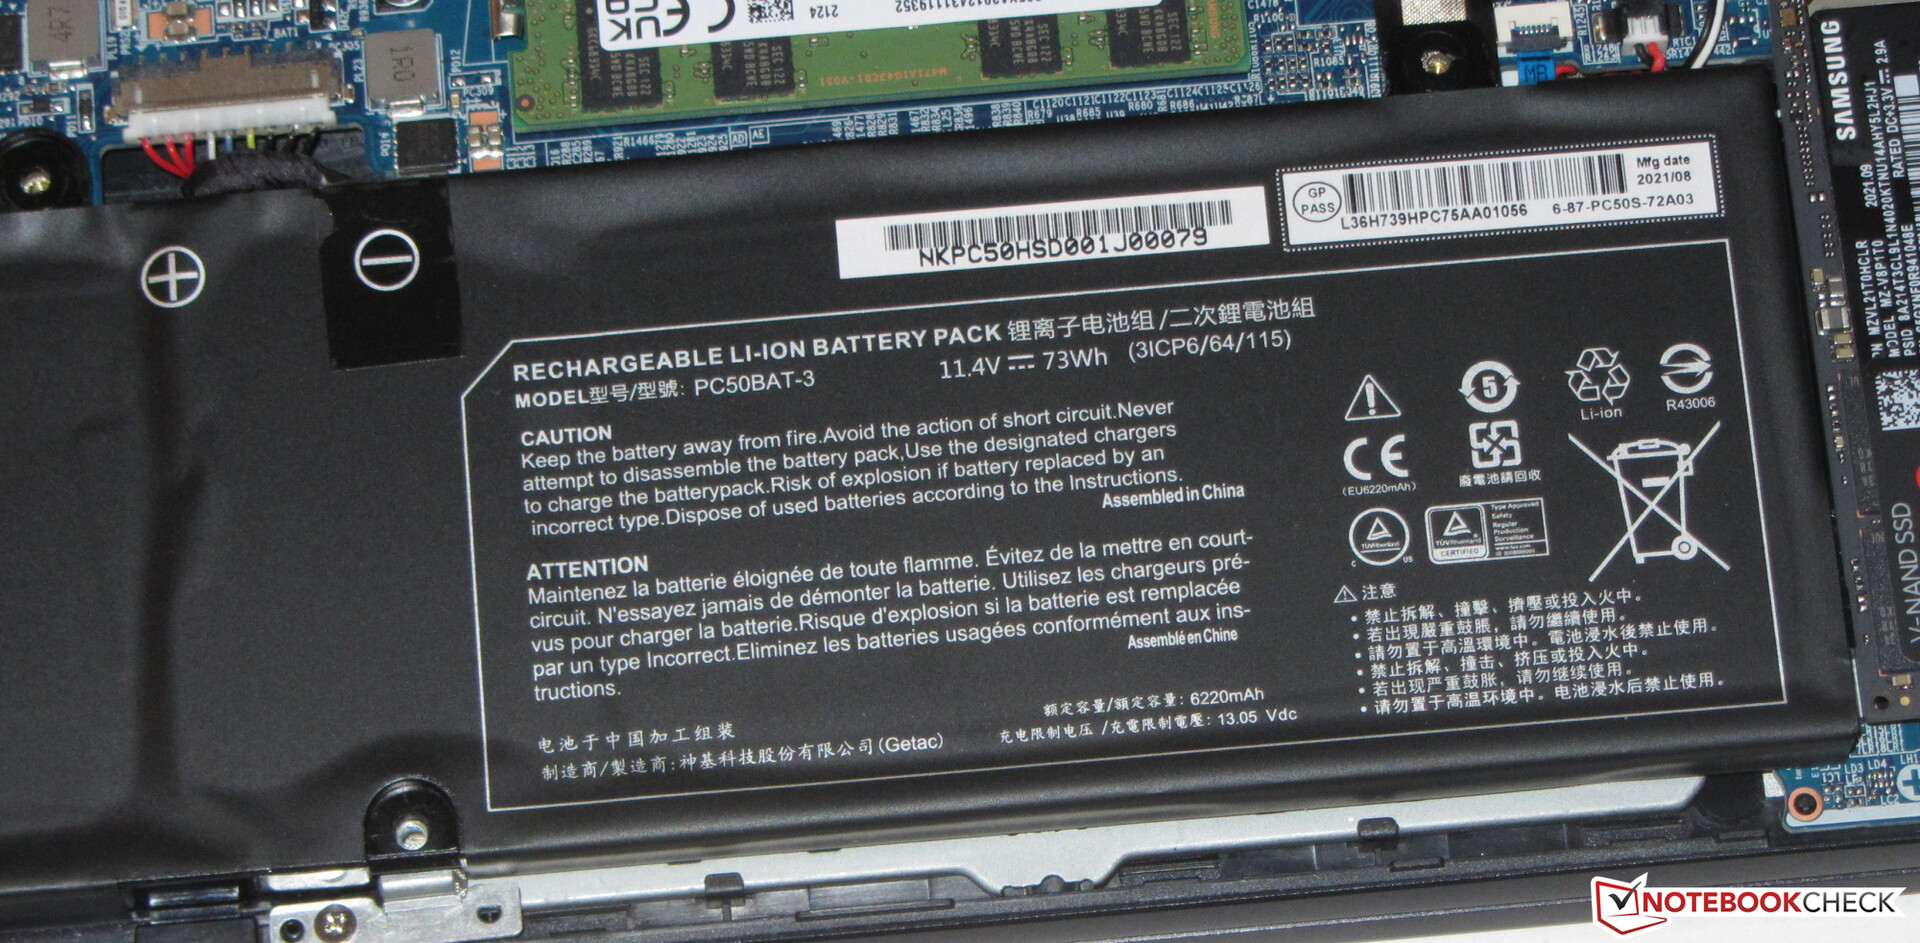
Manutenção
Realizar a manutenção e atualização do sistema é simples. Após soltar todos os parafusos no fundo do dispositivo, a placa inferior pode ser removida com a ajuda de um objeto com uma aresta afiada. Posteriormente, os usuários podem acessar o SSD, o slot secundário M.2, o módulo Wi-Fi, a bateria, a RAM e os ventiladores
Garantia
O fabricante oferece uma garantia básica de dois anos com serviço de coleta e devolução em certos países europeus, assim como um serviço de reparo rápido de 6 meses (reparo dentro de 48 horas). Uma extensão de garantia para 36 meses pode custar de 100-149 Euros (~$110-$170) - dependendo do período de reparo rápido
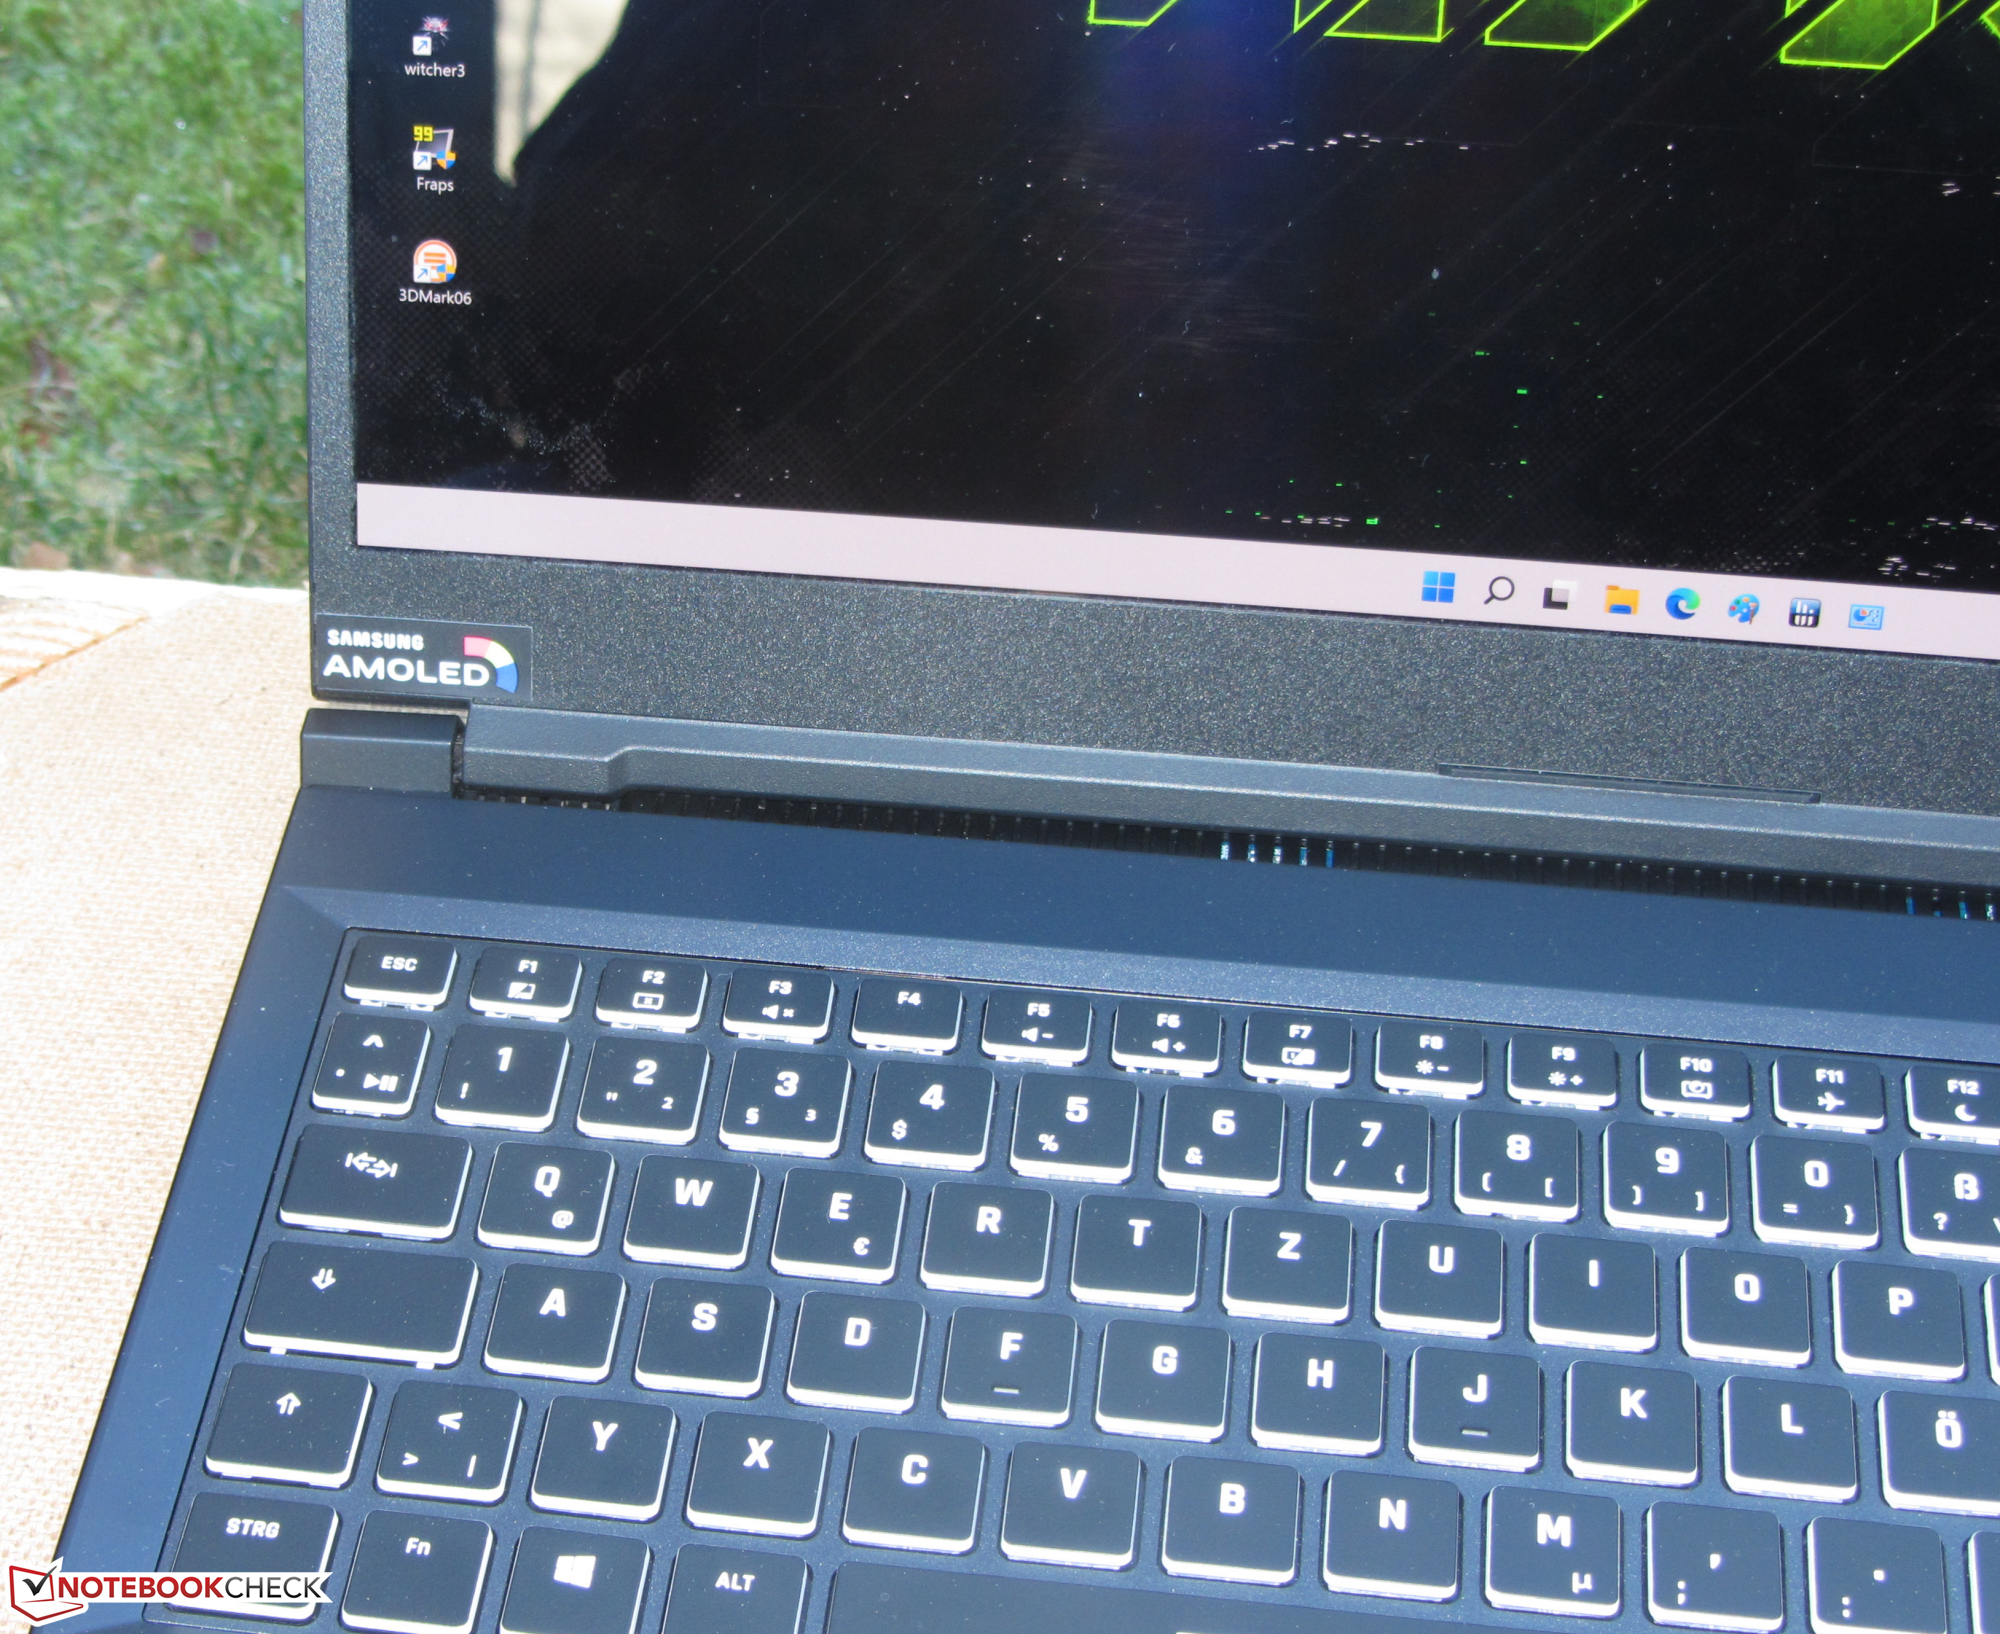
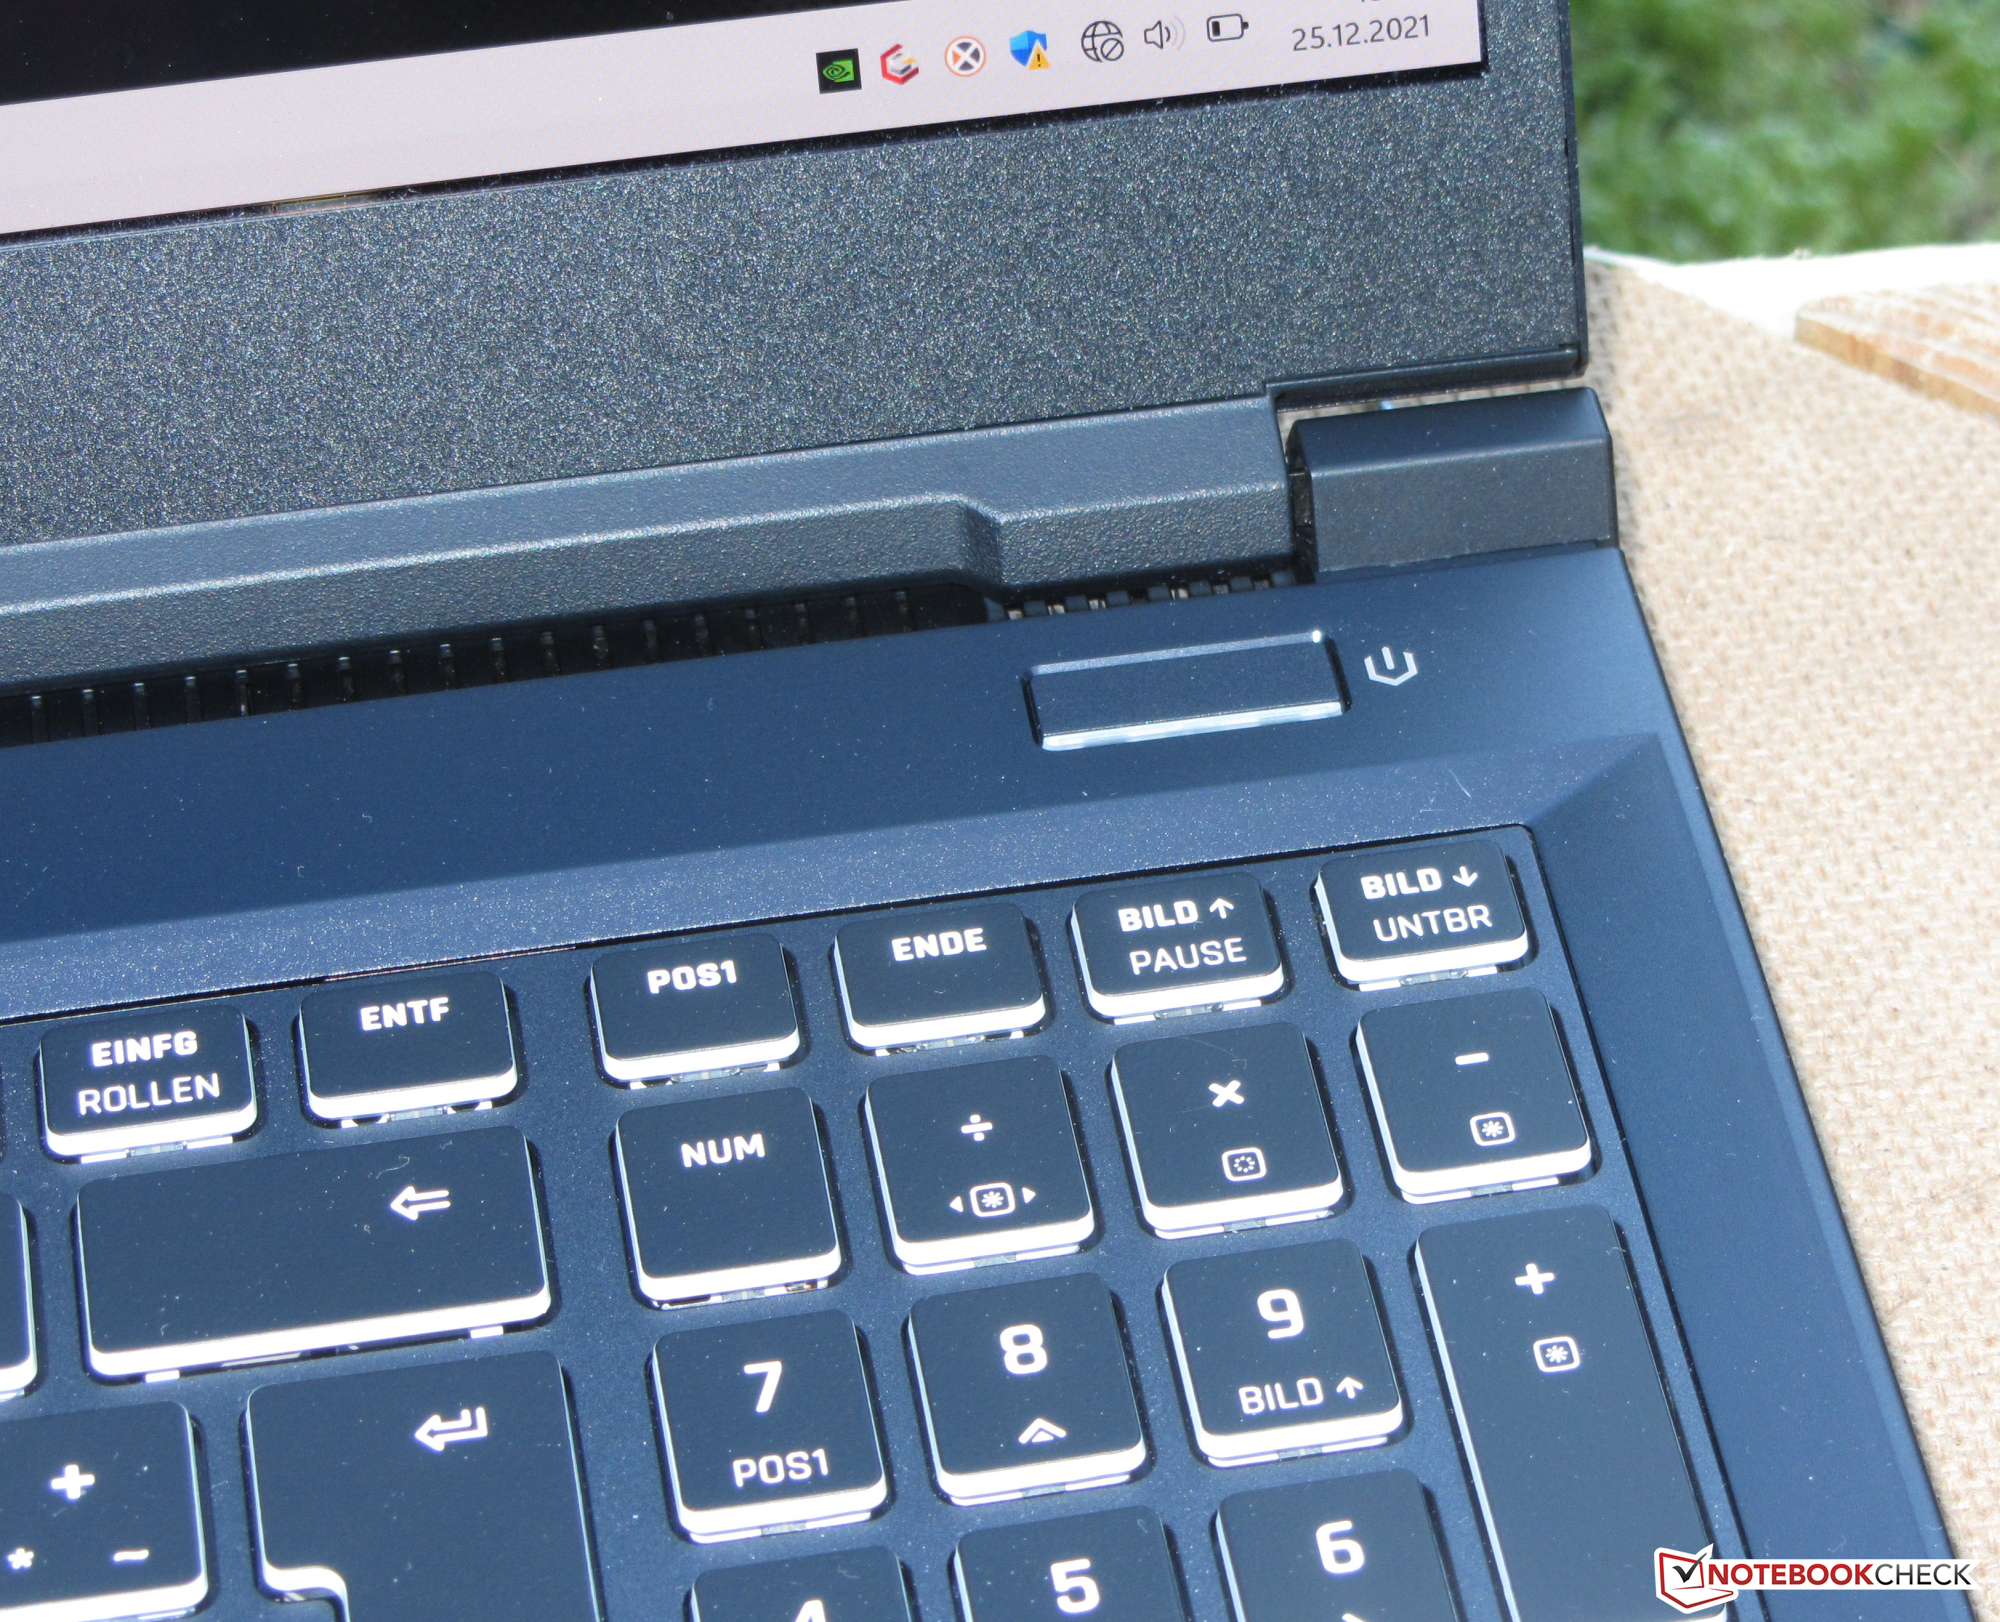
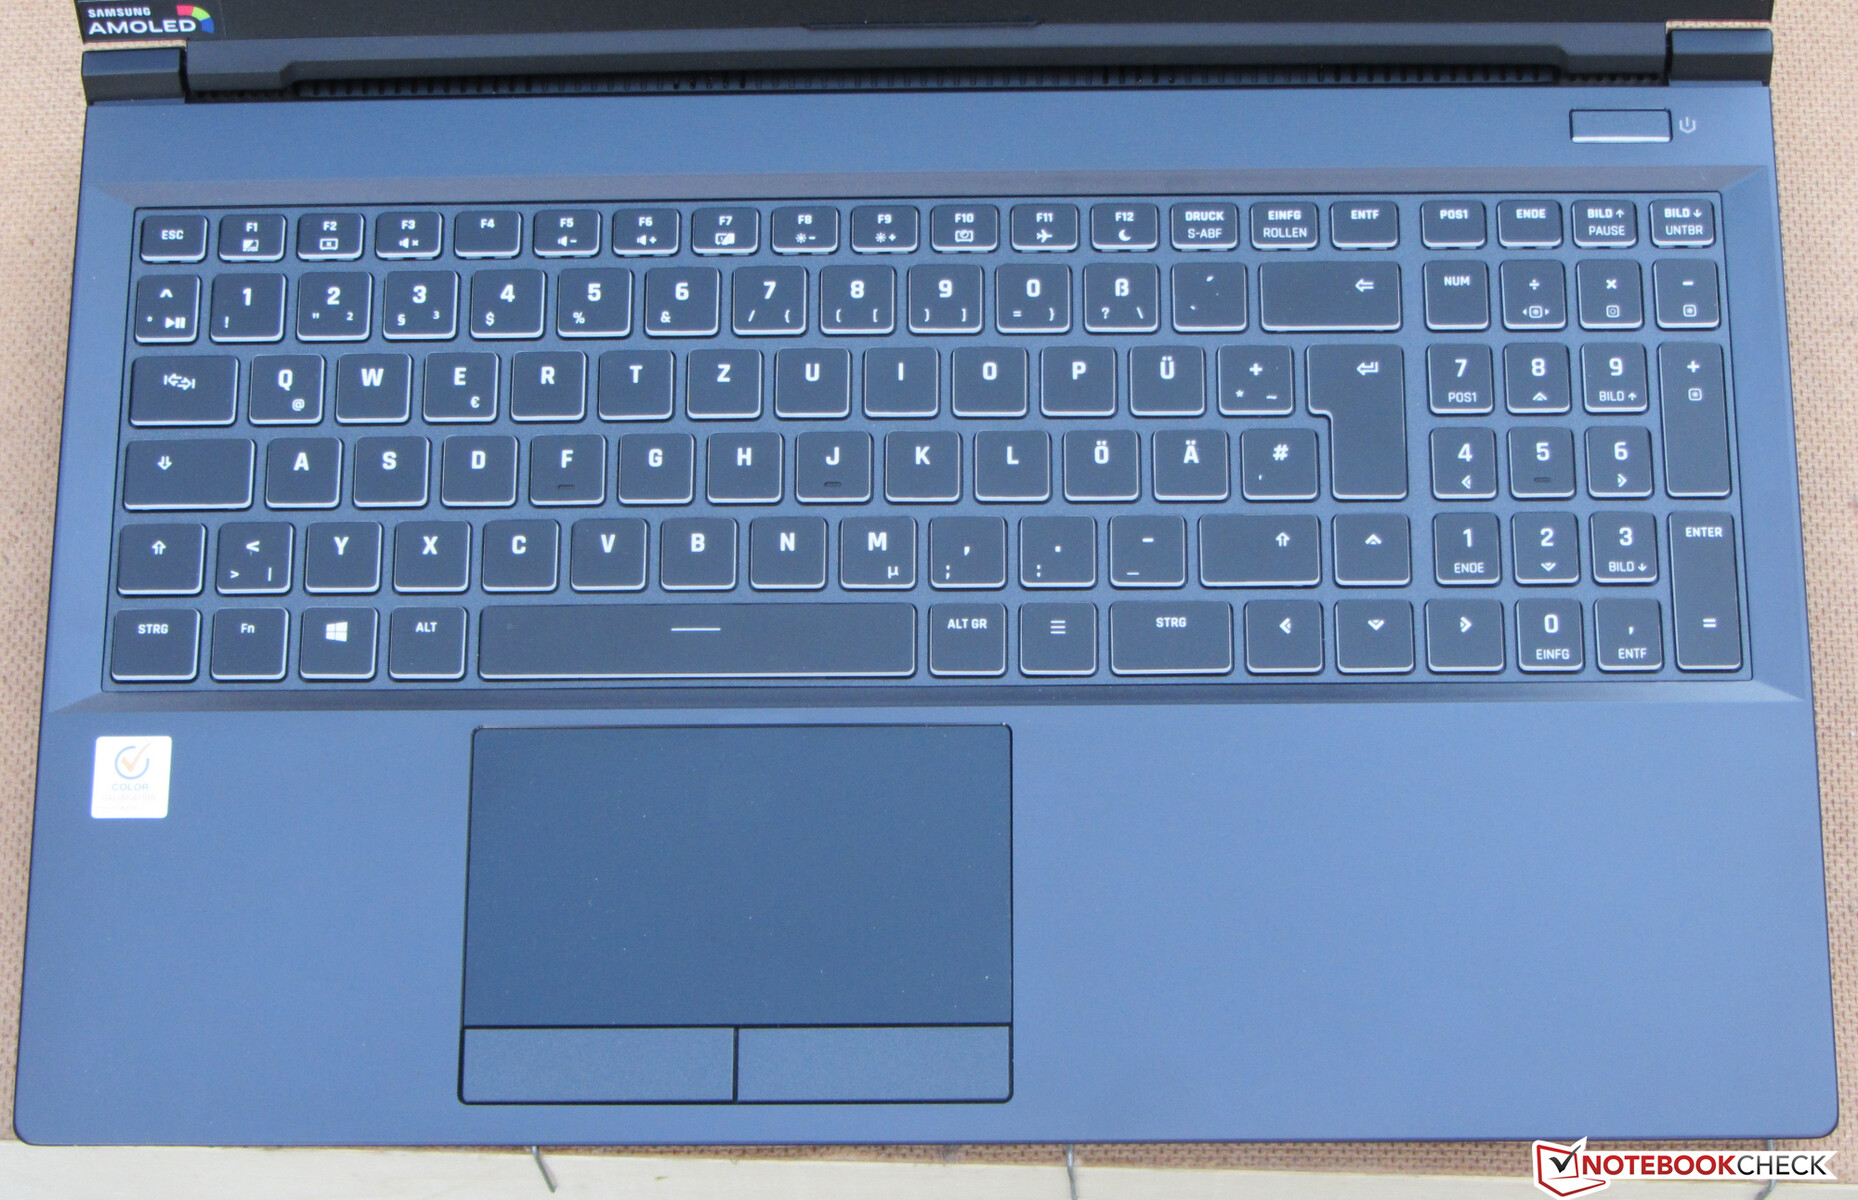
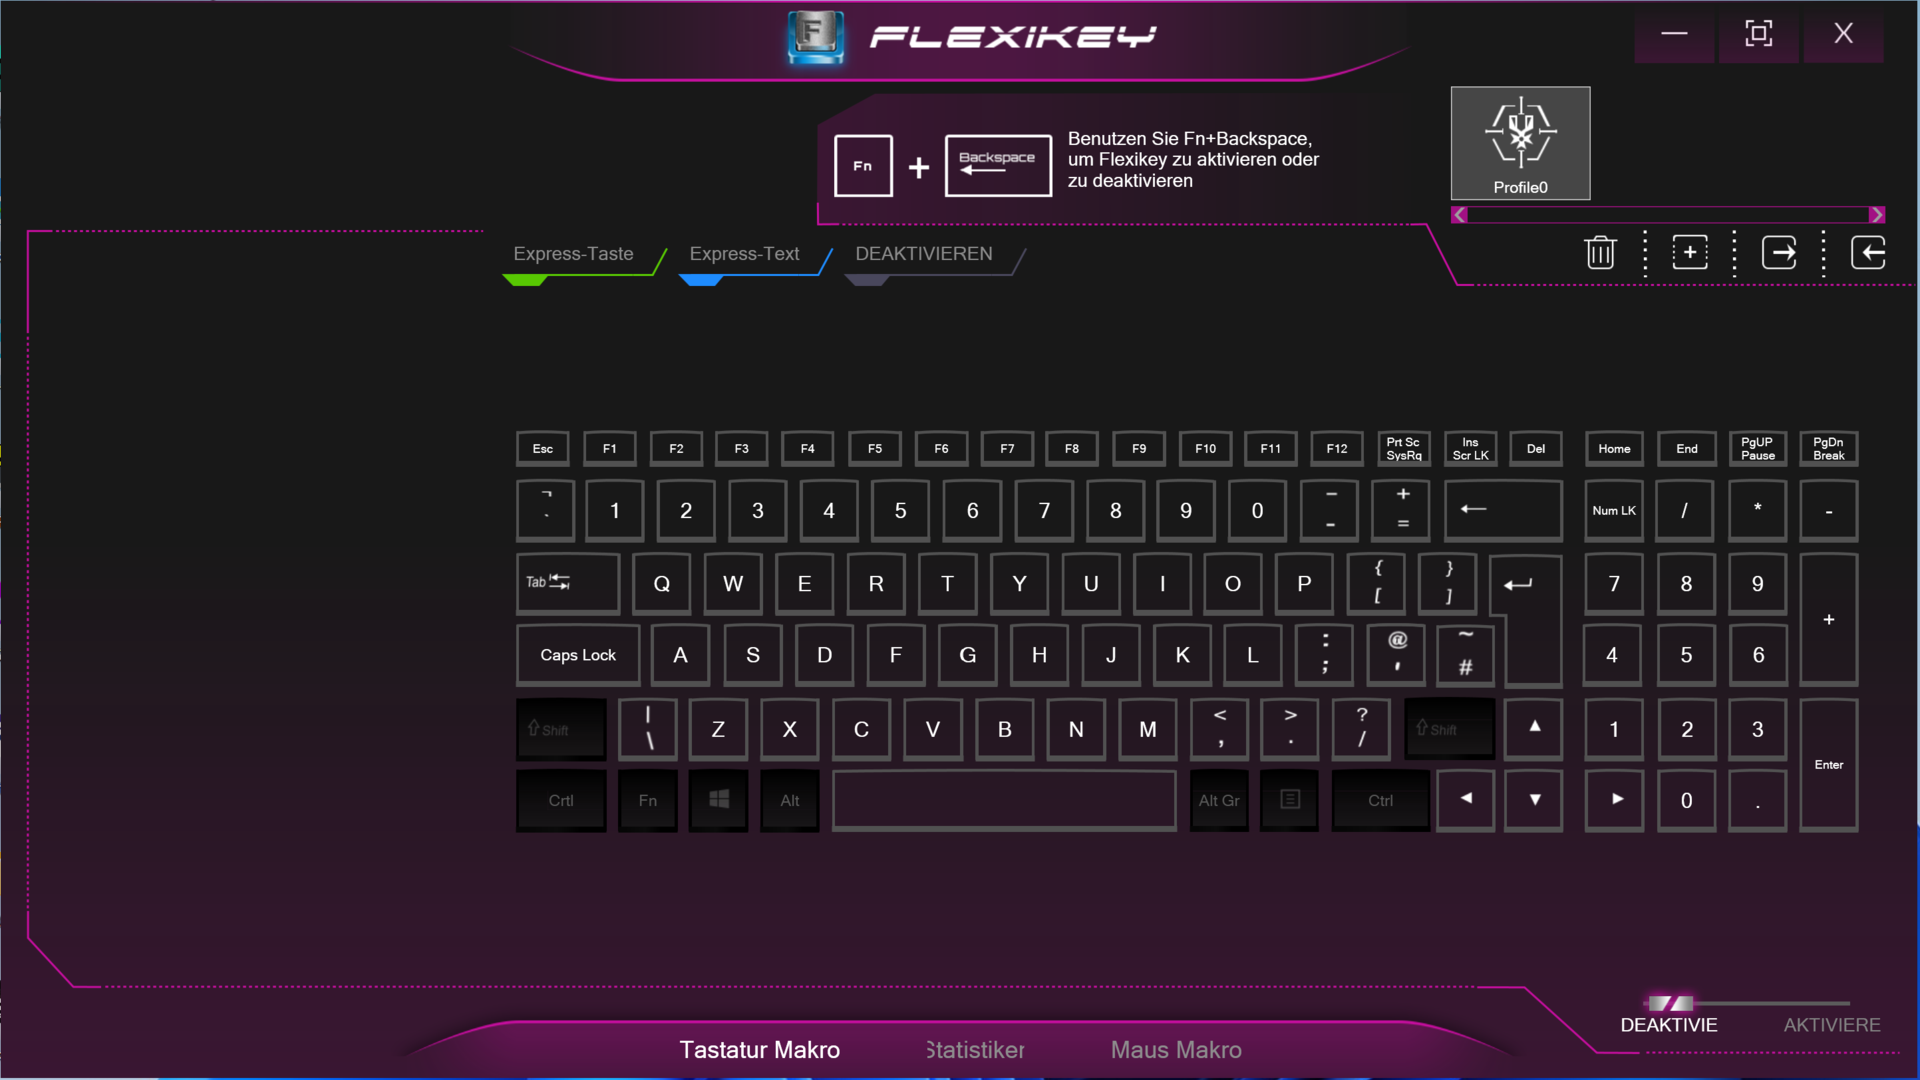
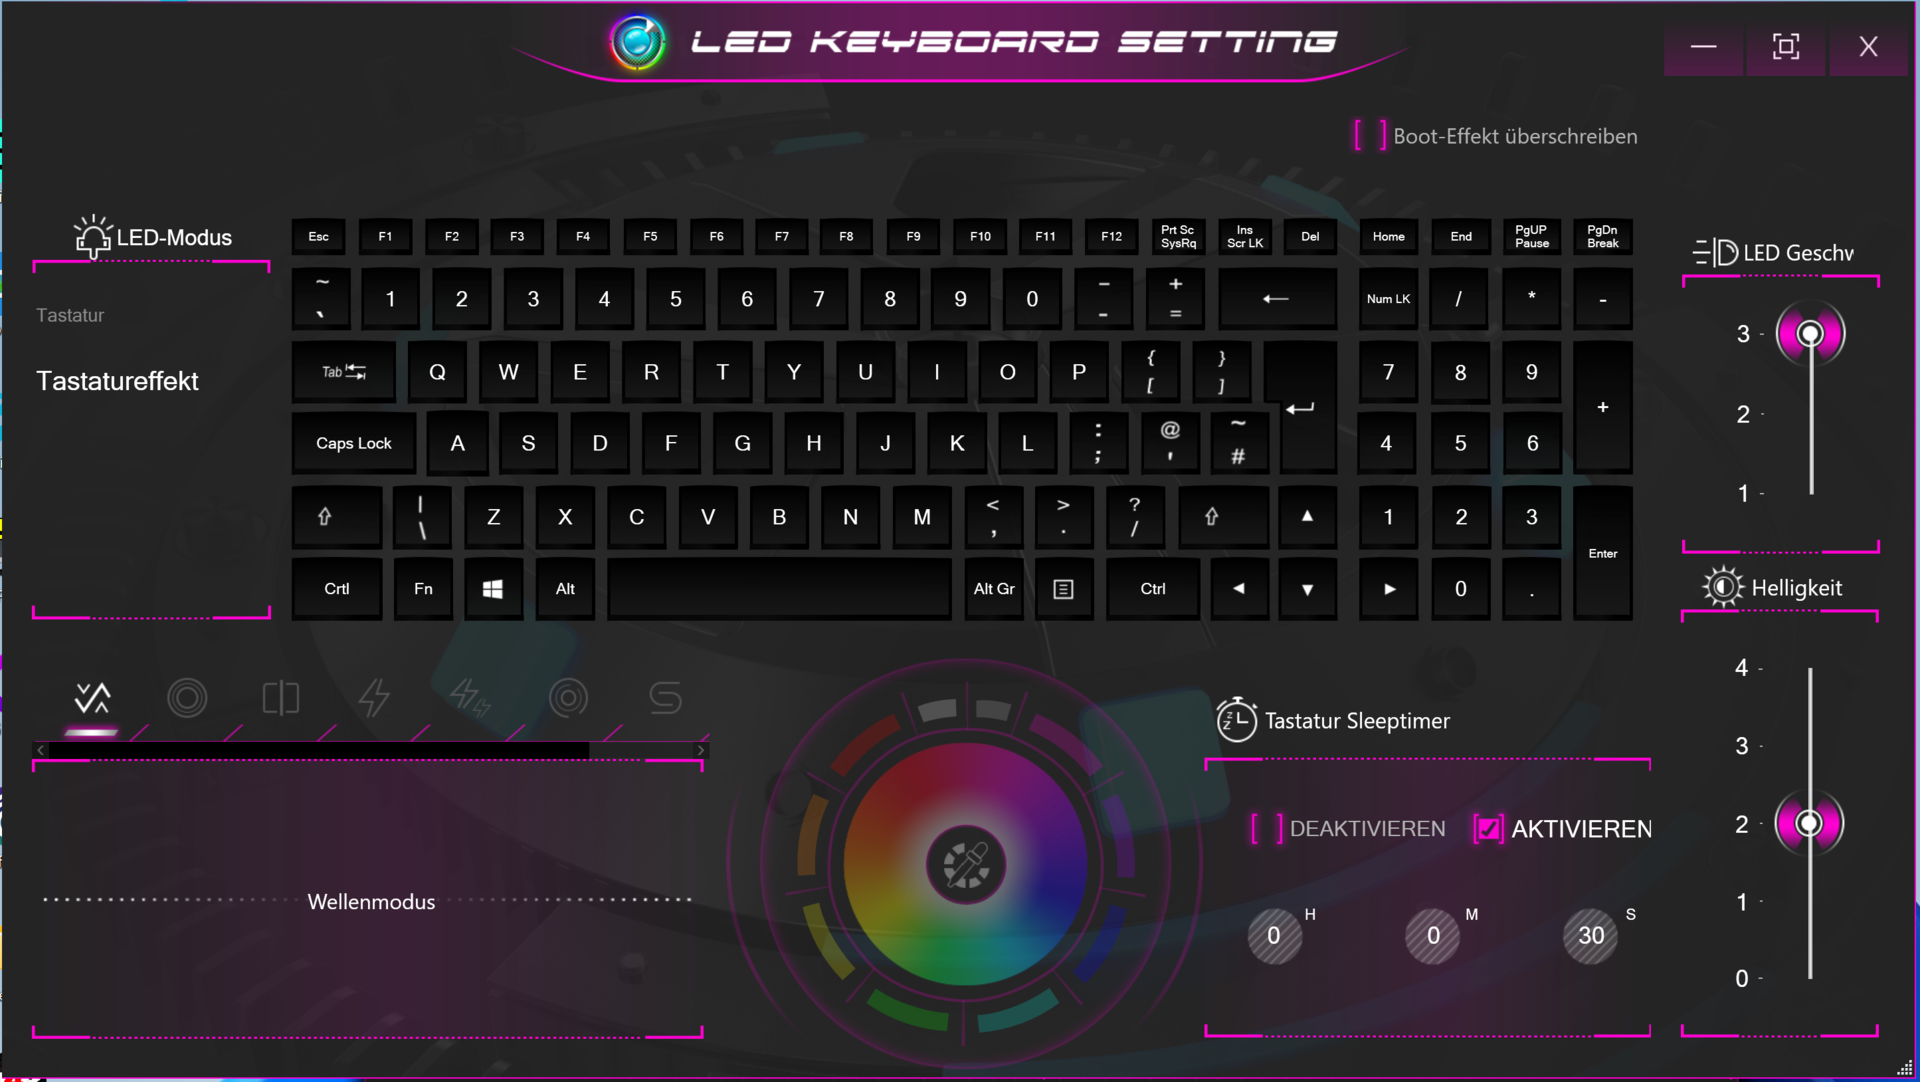
Dispositivos de entrada - Teclado com luz de fundo RGB
Teclado
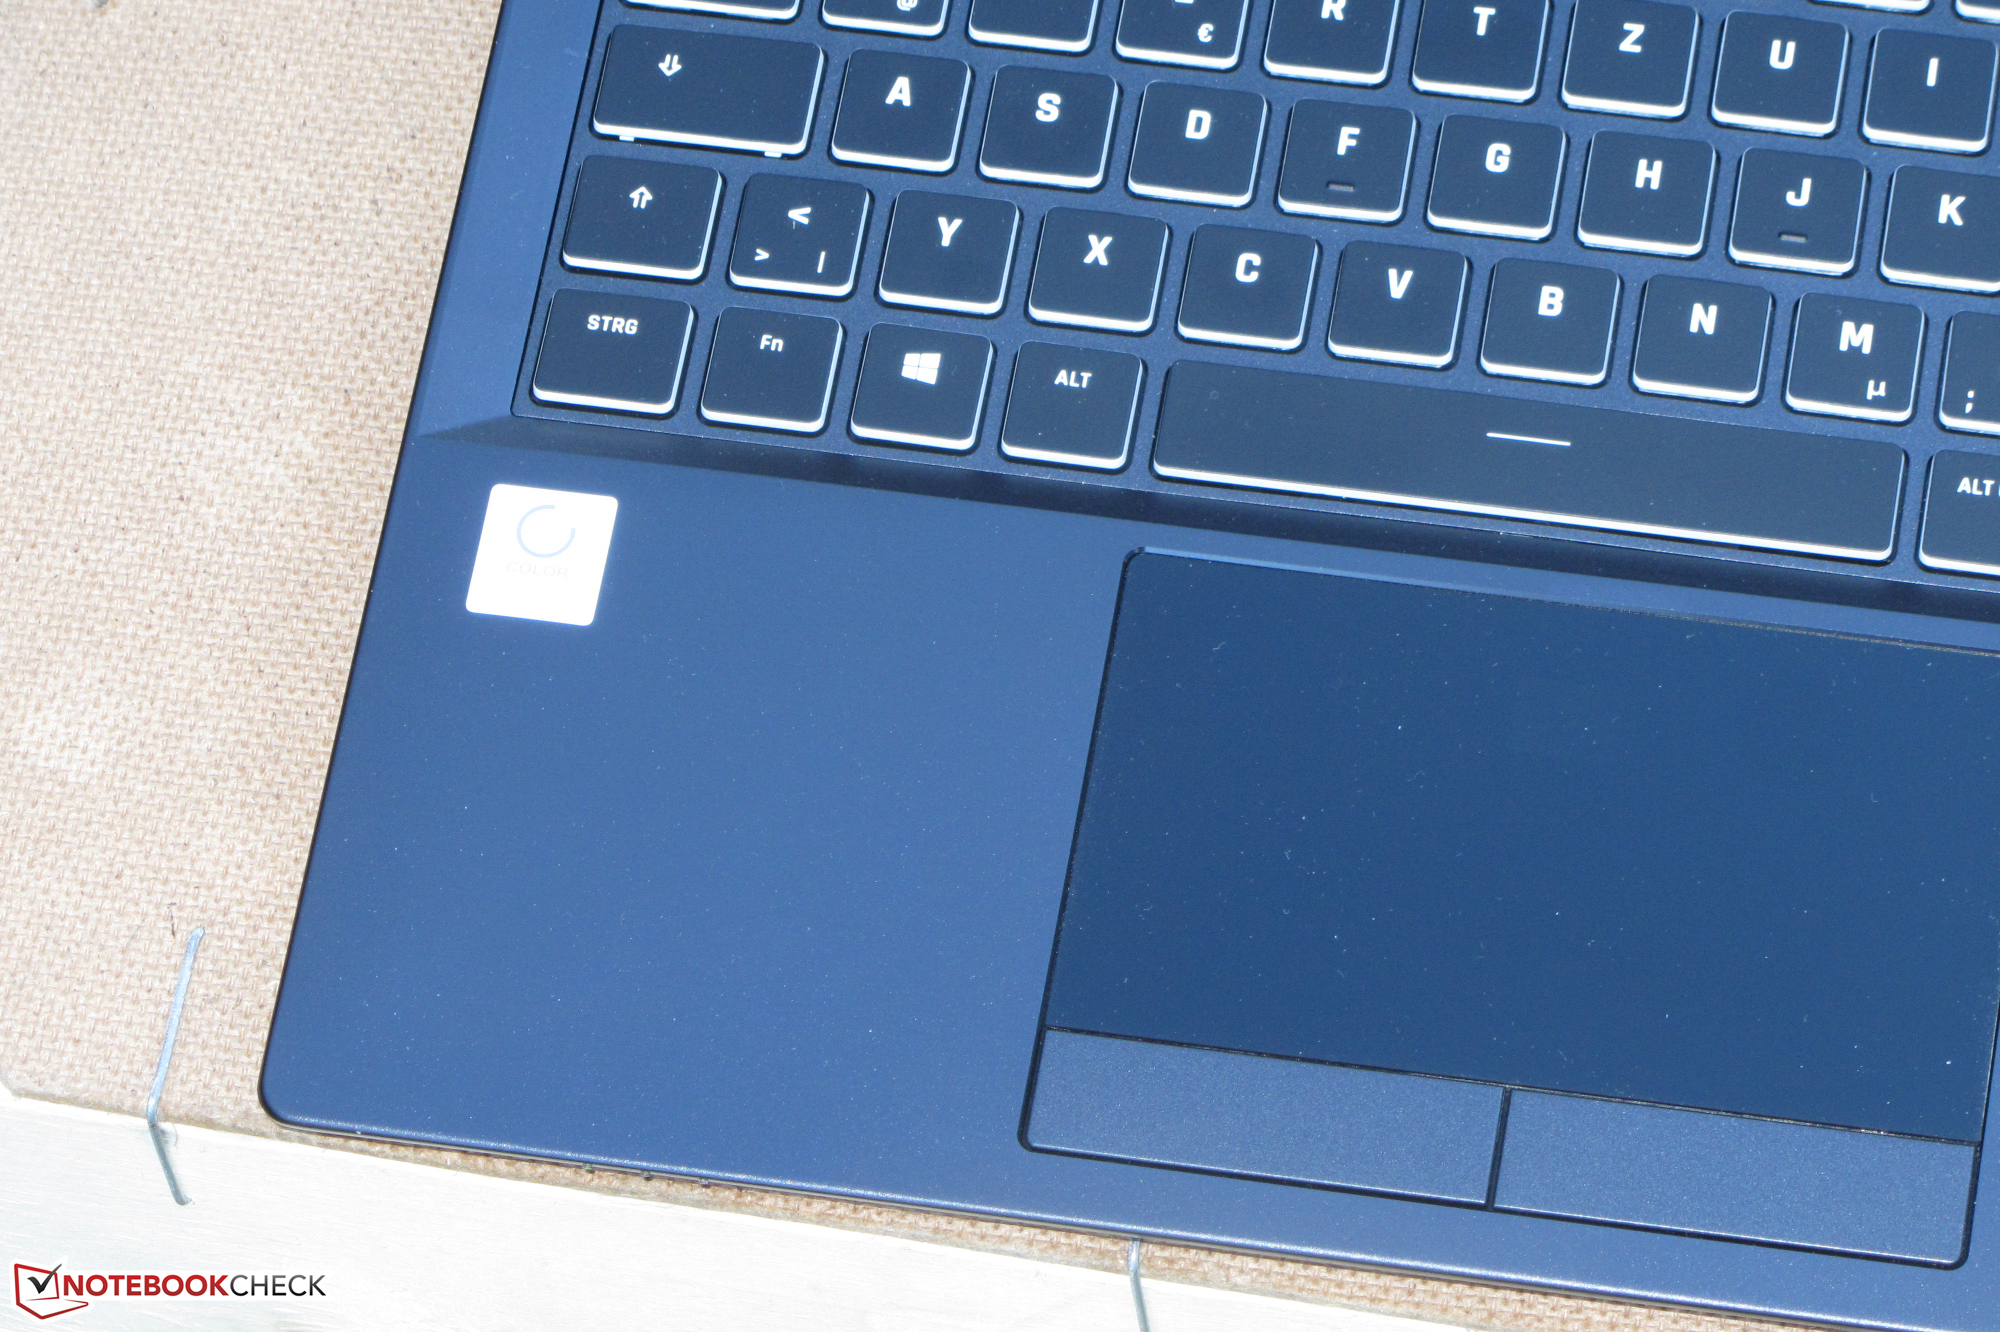
O laptop Schenker é equipado com um teclado em chiclet RGB retroiluminado que inclui um teclado numérico. As teclas planas e suaves oferecem um curso médio e um ponto de atuação distinto. Estamos satisfeitos com o feedback das teclas. A área do teclado cede ligeiramente durante a digitação. Isto não acabou sendo um problema durante nossos testes. A retroiluminação do teclado tem três ajustes de brilho, que podem ser controlados através de duas teclas de função. No geral, o teclado é bem adequado para o uso diário
Touchpad
A superfície lisa (~10,8x6,1 cm) do touchpad suporta gestos multi-toque e tem boas propriedades de deslizamento. Ele responde bem às entradas em todos os cantos. Os dois botões dedicados do mouse oferecem um curso médio e um ponto de atuação distinto
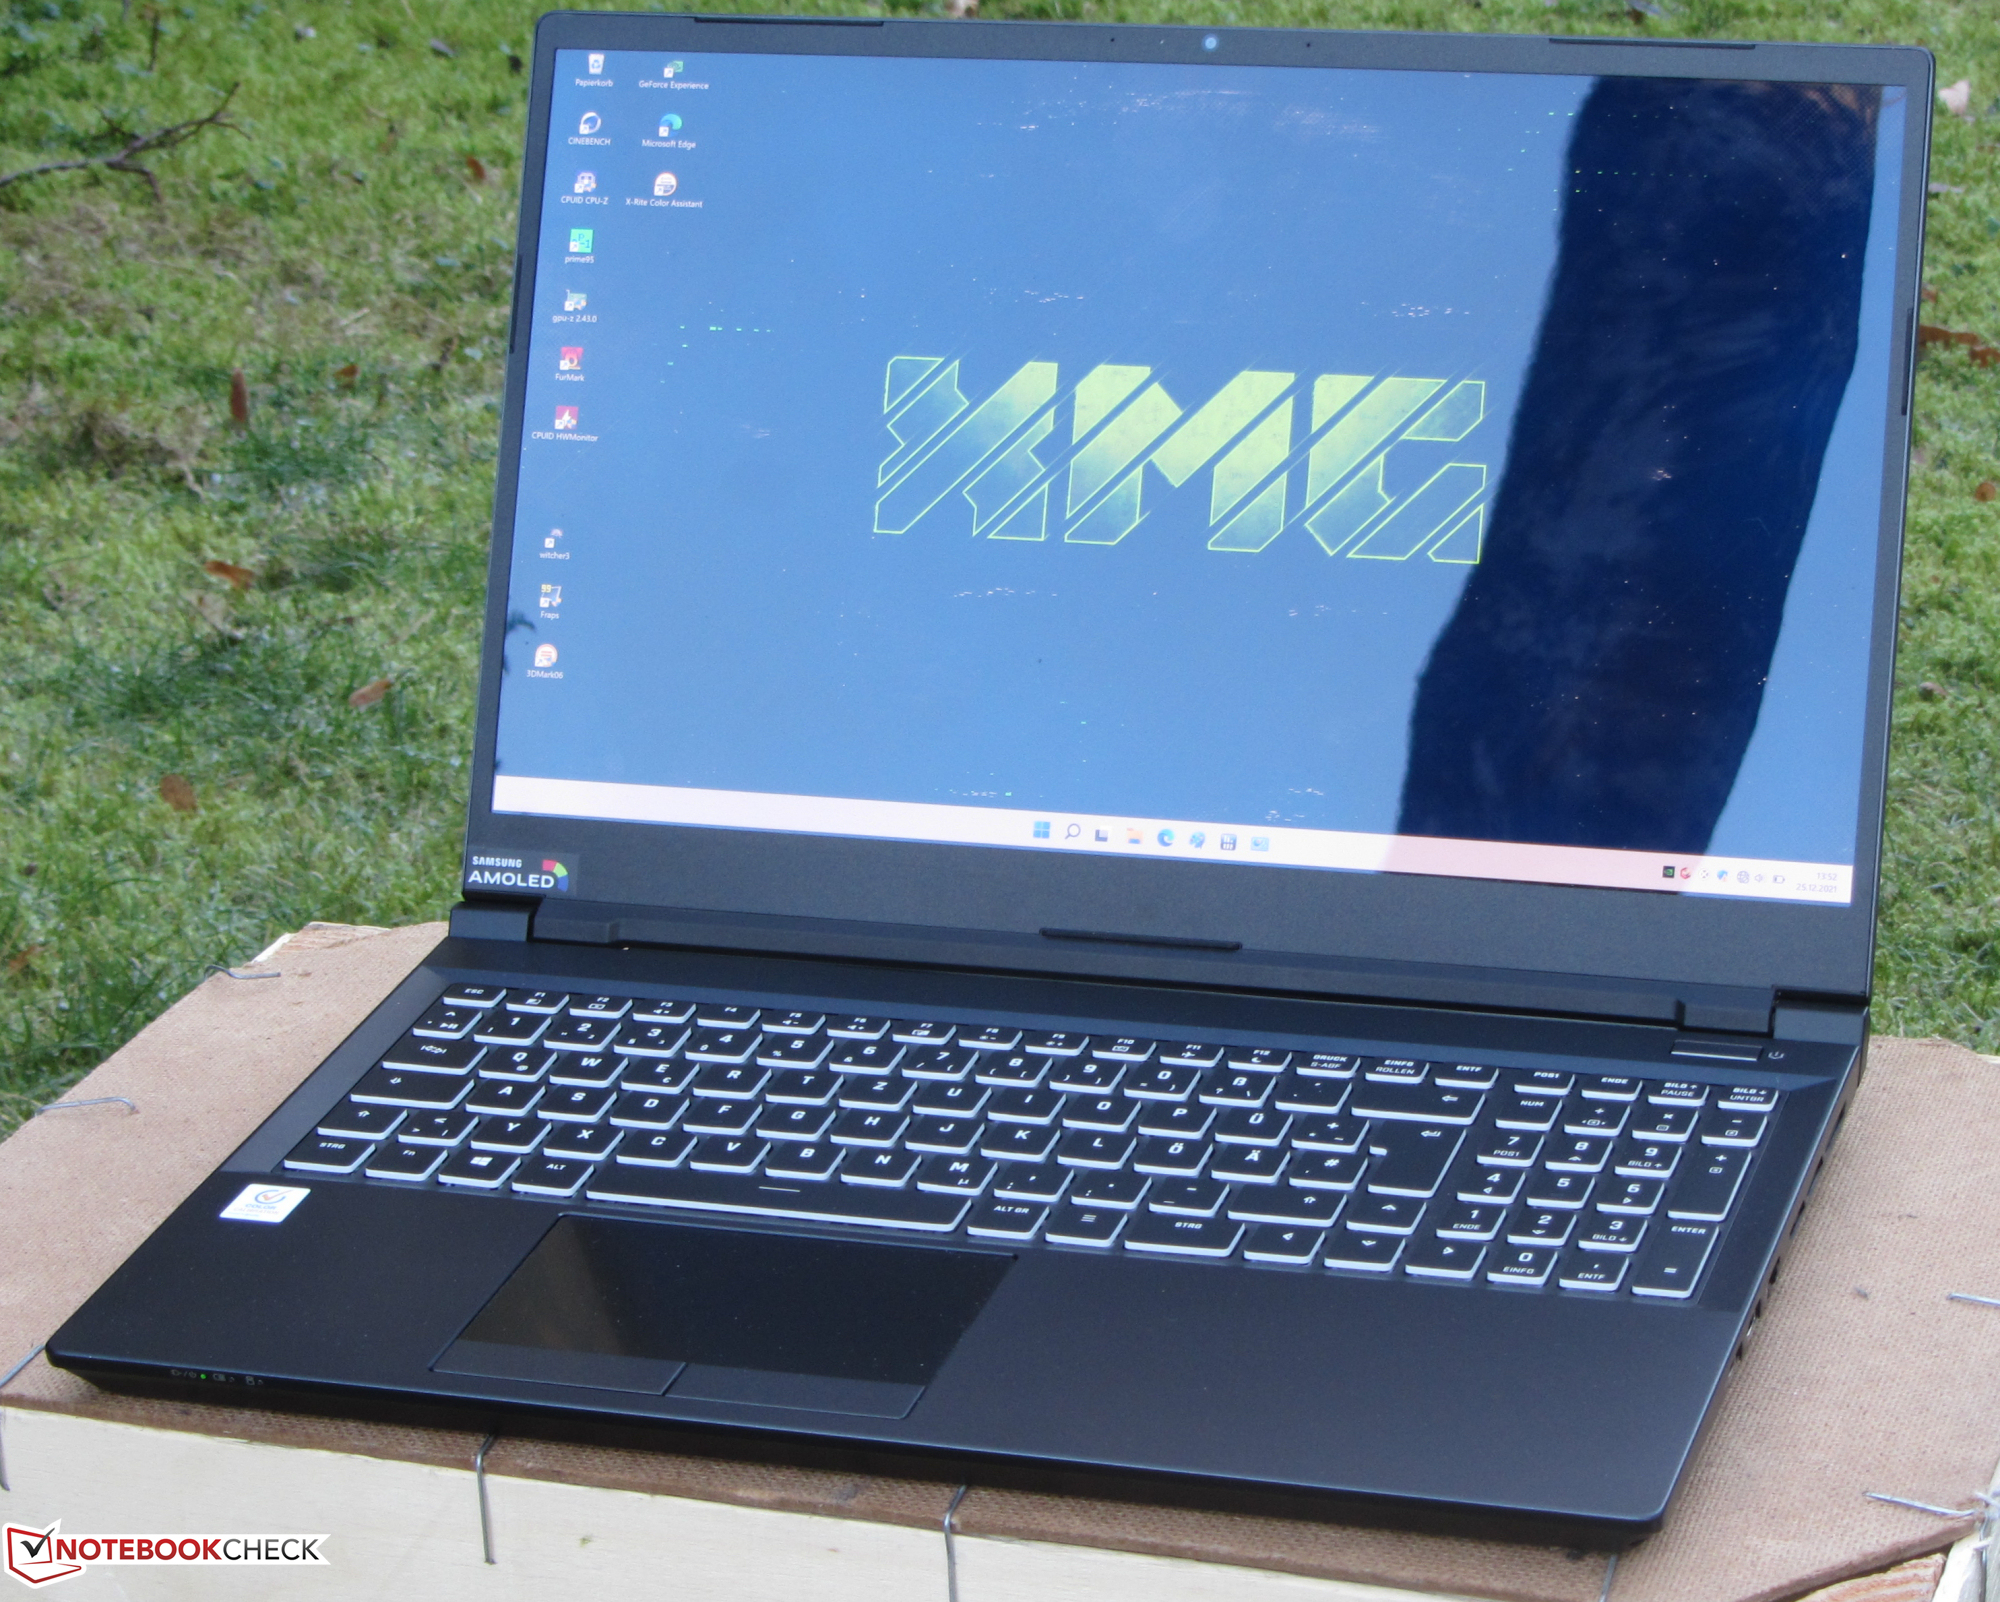
Mostrador - Caderno de jogos com painel OLED 4K
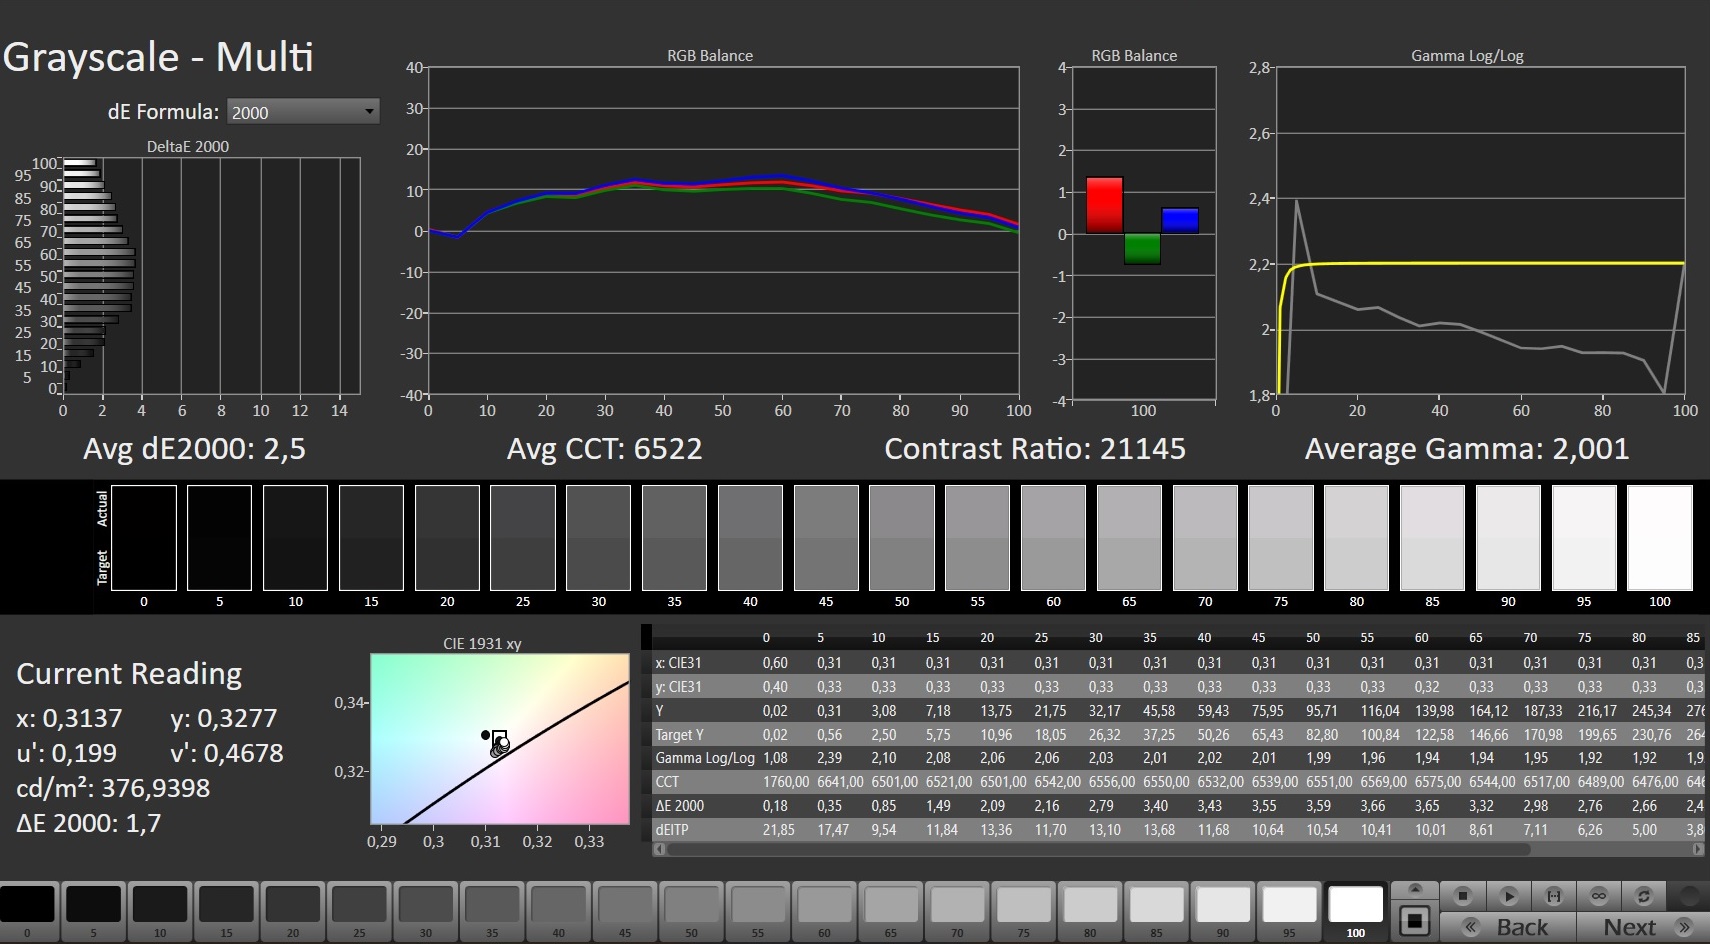
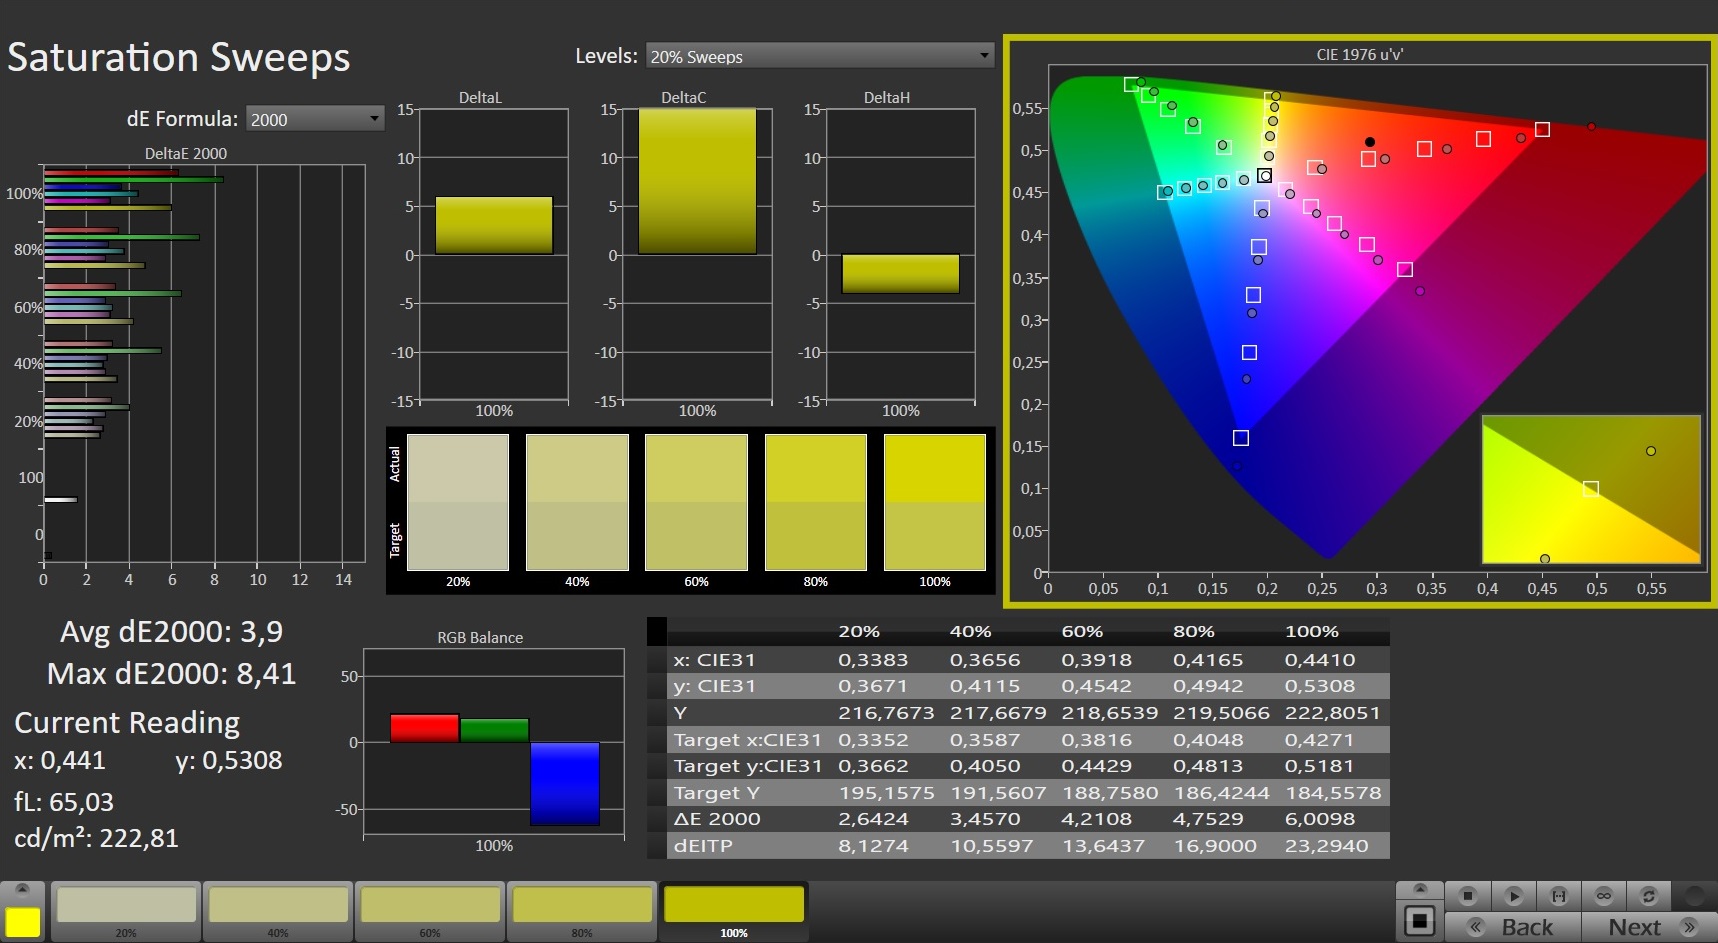
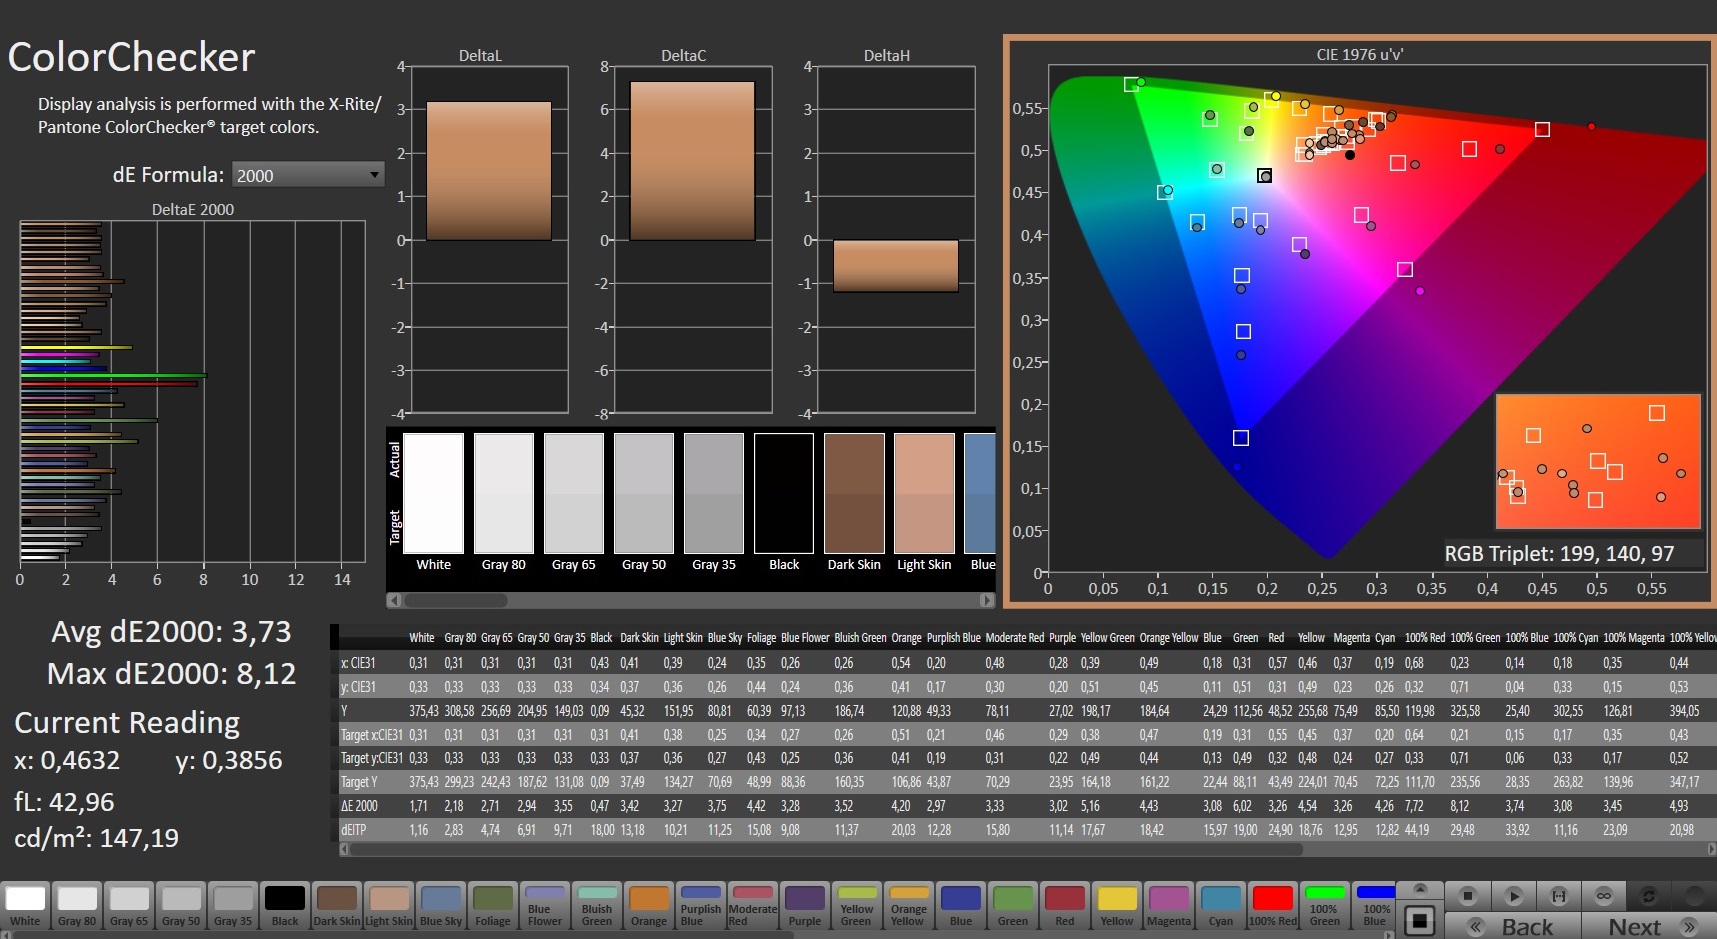
A tela refletiva OLED (3840 x 2160 pixels) oferece uma excelente relação de contraste (22150:1), bem como um valor de preto (0,02) e tempos de resposta curtos. A luminosidade (433,7 lêndeas) também é agradavelmente alta. Em níveis de brilho de 81% e mais baixos, nossos dispositivos de medição detectam cintilação com uma freqüência de 60 a 240 Hz. Devido à baixa freqüência, os usuários sensíveis podem exercer dores de cabeça ou fadiga ocular. Como alternativa ao painel OLED, a Schenker também oferece um display FHD mate (IPS, 300 Hz). O mesmo painel pode ser encontrado no Início de 2021-Modell des XMG Proque também revisamos
| |||||||||||||||||||||||||
iluminação: 94 %
iluminação com acumulador: 443 cd/m²
Contraste: 22150:1 (Preto: 0.02 cd/m²)
ΔE ColorChecker Calman: 3.73 | ∀{0.5-29.43 Ø4.71}
ΔE Greyscale Calman: 2.5 | ∀{0.09-98 Ø4.96}
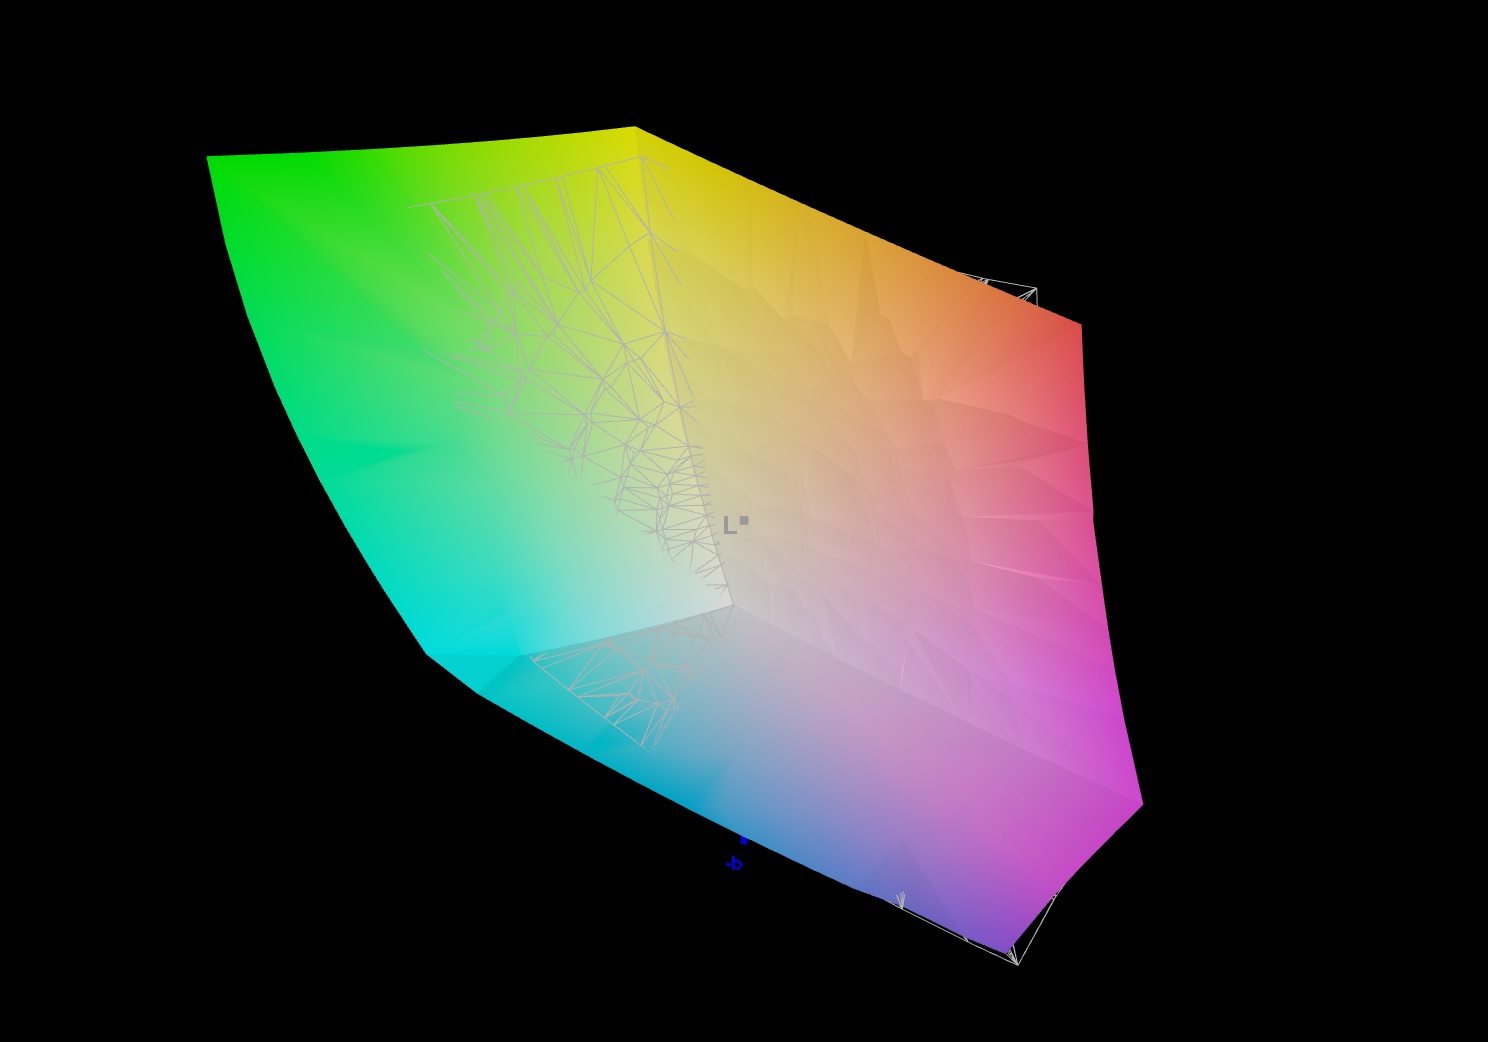
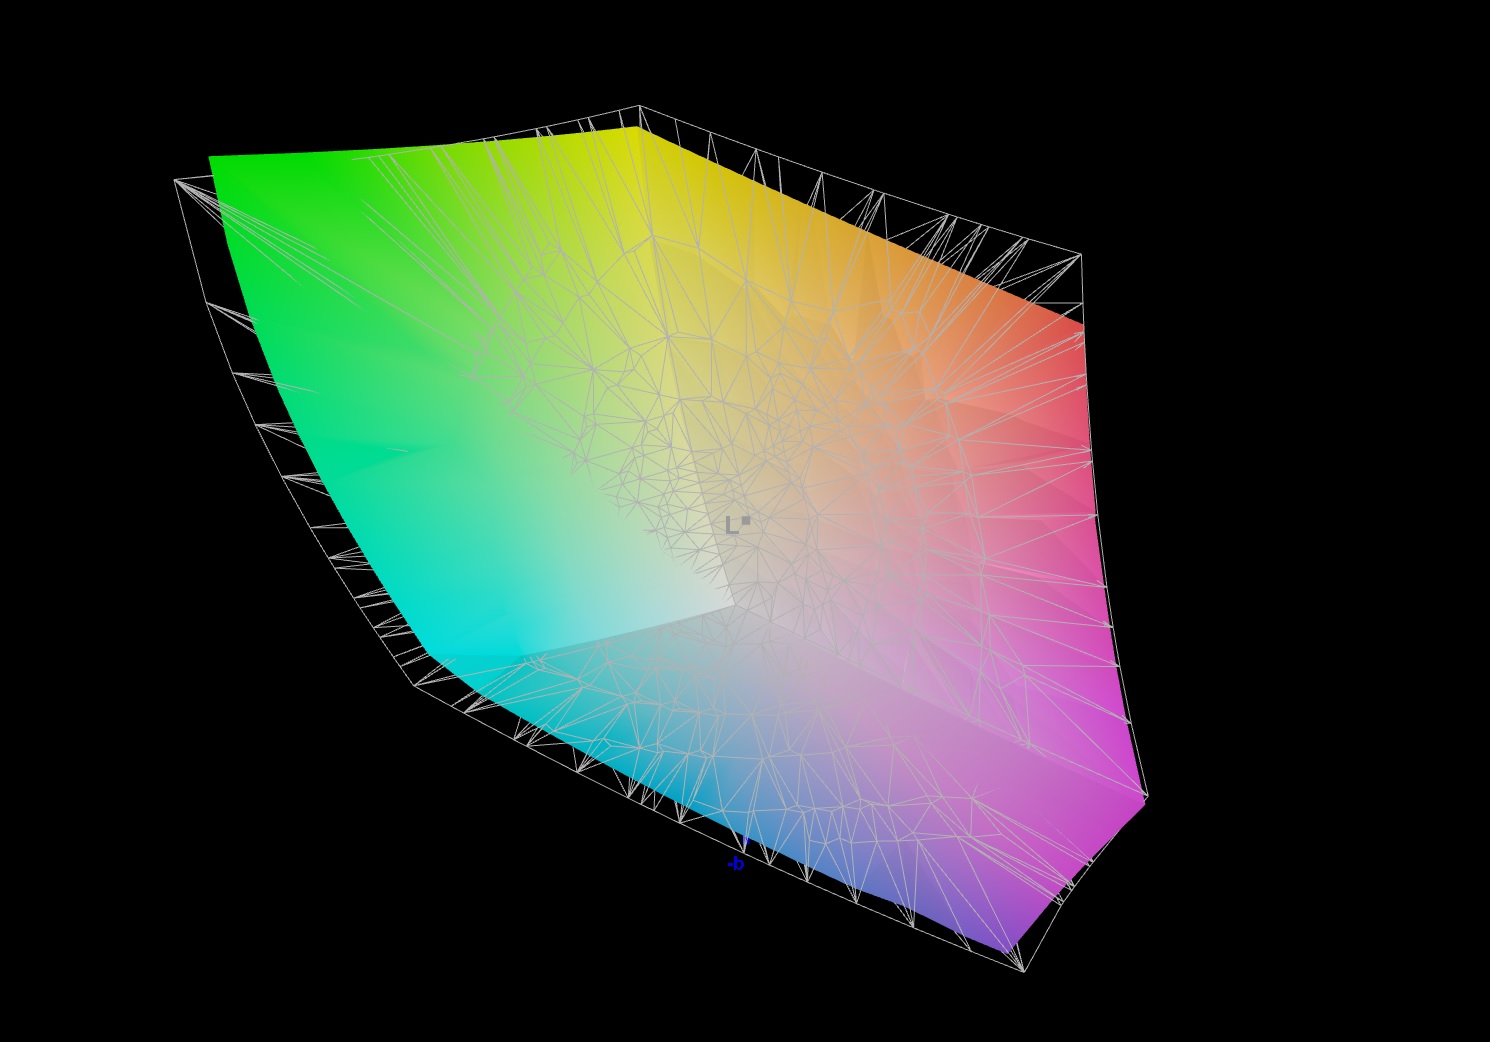
89.1% AdobeRGB 1998 (Argyll 3D)
97.7% sRGB (Argyll 3D)
81.2% Display P3 (Argyll 3D)
Gamma: 2.001
CCT: 6522 K
| Schenker XMG Pro 15 (Late 2021) Samsung ATNA56WR14-0, OLED, 3840x2160, 15.6" | Lenovo Legion S7 15ACH6 82K80030GE CSOT T3 MNF601EA1-6, IPS, 3840x2160, 15.6" | Alienware x15 RTX 3070 P111F LG Philips 156QHG, IPS, 2560x1440, 15.6" | Razer Blade 15 Advanced (Mid 2021) TL156VDXP02-0, IPS, 1920x1080, 15.6" | Schenker XMG Pro 15 (Early 2021, RTX 3080) AU Optronics AUO7A8C (B156HAN12.0), IPS, 1920x1080, 15.6" | MSI Delta 15 A5EFK LQ156M1JW03 (SHP155D), IPS-Level, 1920x1080, 15.6" | |
|---|---|---|---|---|---|---|
| Display | 5% | 11% | -14% | -11% | -14% | |
| Display P3 Coverage (%) | 81.2 | 85.2 5% | 97.8 20% | 66.9 -18% | 69.2 -15% | 66.5 -18% |
| sRGB Coverage (%) | 97.7 | 98.8 1% | 99.9 2% | 97.1 -1% | 99.7 2% | 97.8 0% |
| AdobeRGB 1998 Coverage (%) | 89.1 | 98.2 10% | 69 -23% | 70.8 -21% | 67.6 -24% | |
| Response Times | -894% | -413% | -278% | -269% | -425% | |
| Response Time Grey 50% / Grey 80% * (ms) | 3.2 ? | 31.6 ? -888% | 12 ? -275% | 4.2 ? -31% | 3.6 ? -13% | 12.8 ? -300% |
| Response Time Black / White * (ms) | 1.6 ? | 16 ? -900% | 10.4 ? -550% | 10 ? -525% | 10 ? -525% | 10.4 ? -550% |
| PWM Frequency (Hz) | 60 ? | 23580 ? | ||||
| Screen | -222% | -305% | -194% | -133% | -240% | |
| Brightness middle (cd/m²) | 443 | 607 37% | 409.5 -8% | 353.4 -20% | 327 -26% | 291 -34% |
| Brightness (cd/m²) | 434 | 605 39% | 390 -10% | 340 -22% | 335 -23% | 266 -39% |
| Brightness Distribution (%) | 94 | 93 -1% | 88 -6% | 92 -2% | 89 -5% | 88 -6% |
| Black Level * (cd/m²) | 0.02 | 0.41 -1950% | 0.47 -2250% | 0.31 -1450% | 0.22 -1000% | 0.36 -1700% |
| Contrast (:1) | 22150 | 1480 -93% | 871 -96% | 1140 -95% | 1486 -93% | 808 -96% |
| Colorchecker dE 2000 * | 3.73 | 0.84 77% | 3.48 7% | 2.17 42% | 2.18 42% | 2.98 20% |
| Colorchecker dE 2000 max. * | 8.12 | 3.02 63% | 6.31 22% | 5.69 30% | 4.24 48% | 7.59 7% |
| Greyscale dE 2000 * | 2.5 | 1.1 56% | 5 -100% | 3.4 -36% | 2.6 -4% | 4.2 -68% |
| Gamma | 2.001 110% | 2.131 103% | 2.16 102% | 2.2 100% | 2.123 104% | 2.293 96% |
| CCT | 6522 100% | 6648 98% | 6591 99% | 6830 95% | 6815 95% | 7624 85% |
| Colorchecker dE 2000 calibrated * | 0.69 | 0.89 | 1.05 | 1 | 0.91 | |
| Color Space (Percent of AdobeRGB 1998) (%) | 71 | |||||
| Color Space (Percent of sRGB) (%) | 93 | |||||
| Média Total (Programa/Configurações) | -370% /
-273% | -236% /
-270% | -162% /
-165% | -138% /
-126% | -226% /
-216% |
* ... menor é melhor
A certificação X-Rite da tela garante uma representação natural das cores. Mesmo à saída da fábrica, o desvio de cor é muito baixo e impossível de ser notado a olho nu. A tela não sofre de uma coloração azul. A cobertura do espaço de cor é ampla: A tela pode exibir 98% e 89% dos espaços de cor sRGB e AdobeRGB, respectivamente (podemos re-testar isto, já que a Schenker atinge 100% em seus próprios testes)
Exibir tempos de resposta
| ↔ Tempo de resposta preto para branco | ||
|---|---|---|
| 1.6 ms ... ascensão ↗ e queda ↘ combinadas | ↗ 1 ms ascensão | 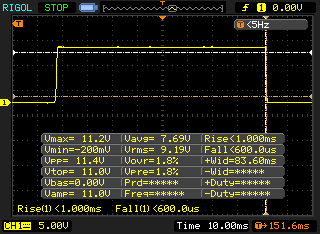 |
| ↘ 0.6 ms queda | ||
| A tela mostra taxas de resposta muito rápidas em nossos testes e deve ser muito adequada para jogos em ritmo acelerado. Em comparação, todos os dispositivos testados variam de 0.1 (mínimo) a 240 (máximo) ms. » 10 % de todos os dispositivos são melhores. Isso significa que o tempo de resposta medido é melhor que a média de todos os dispositivos testados (19.8 ms). | ||
| ↔ Tempo de resposta 50% cinza a 80% cinza | ||
| 3.2 ms ... ascensão ↗ e queda ↘ combinadas | ↗ 1.2 ms ascensão | 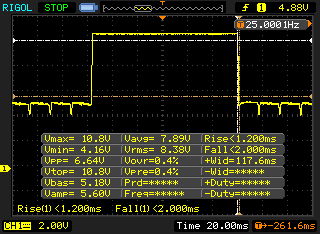 |
| ↘ 2 ms queda | ||
| A tela mostra taxas de resposta muito rápidas em nossos testes e deve ser muito adequada para jogos em ritmo acelerado. Em comparação, todos os dispositivos testados variam de 0.165 (mínimo) a 636 (máximo) ms. » 13 % de todos os dispositivos são melhores. Isso significa que o tempo de resposta medido é melhor que a média de todos os dispositivos testados (31 ms). | ||
Cintilação da tela / PWM (modulação por largura de pulso)
| Tela tremeluzindo/PWM detectado | 60 Hz | ≤ 81 % configuração de brilho | 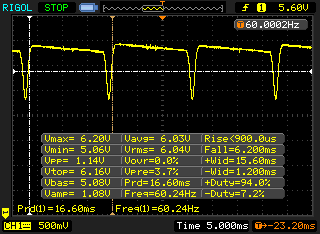 |
A luz de fundo da tela pisca em 60 Hz (pior caso, por exemplo, utilizando PWM) Cintilação detectada em uma configuração de brilho de 81 % e abaixo. Não deve haver cintilação ou PWM acima desta configuração de brilho. A frequência de 60 Hz é muito baixa, portanto a oscilação pode causar fadiga ocular e dores de cabeça após uso prolongado. [pwm_comparison] Em comparação: 52 % de todos os dispositivos testados não usam PWM para escurecer a tela. Se PWM foi detectado, uma média de 7754 (mínimo: 5 - máximo: 343500) Hz foi medida. | |||
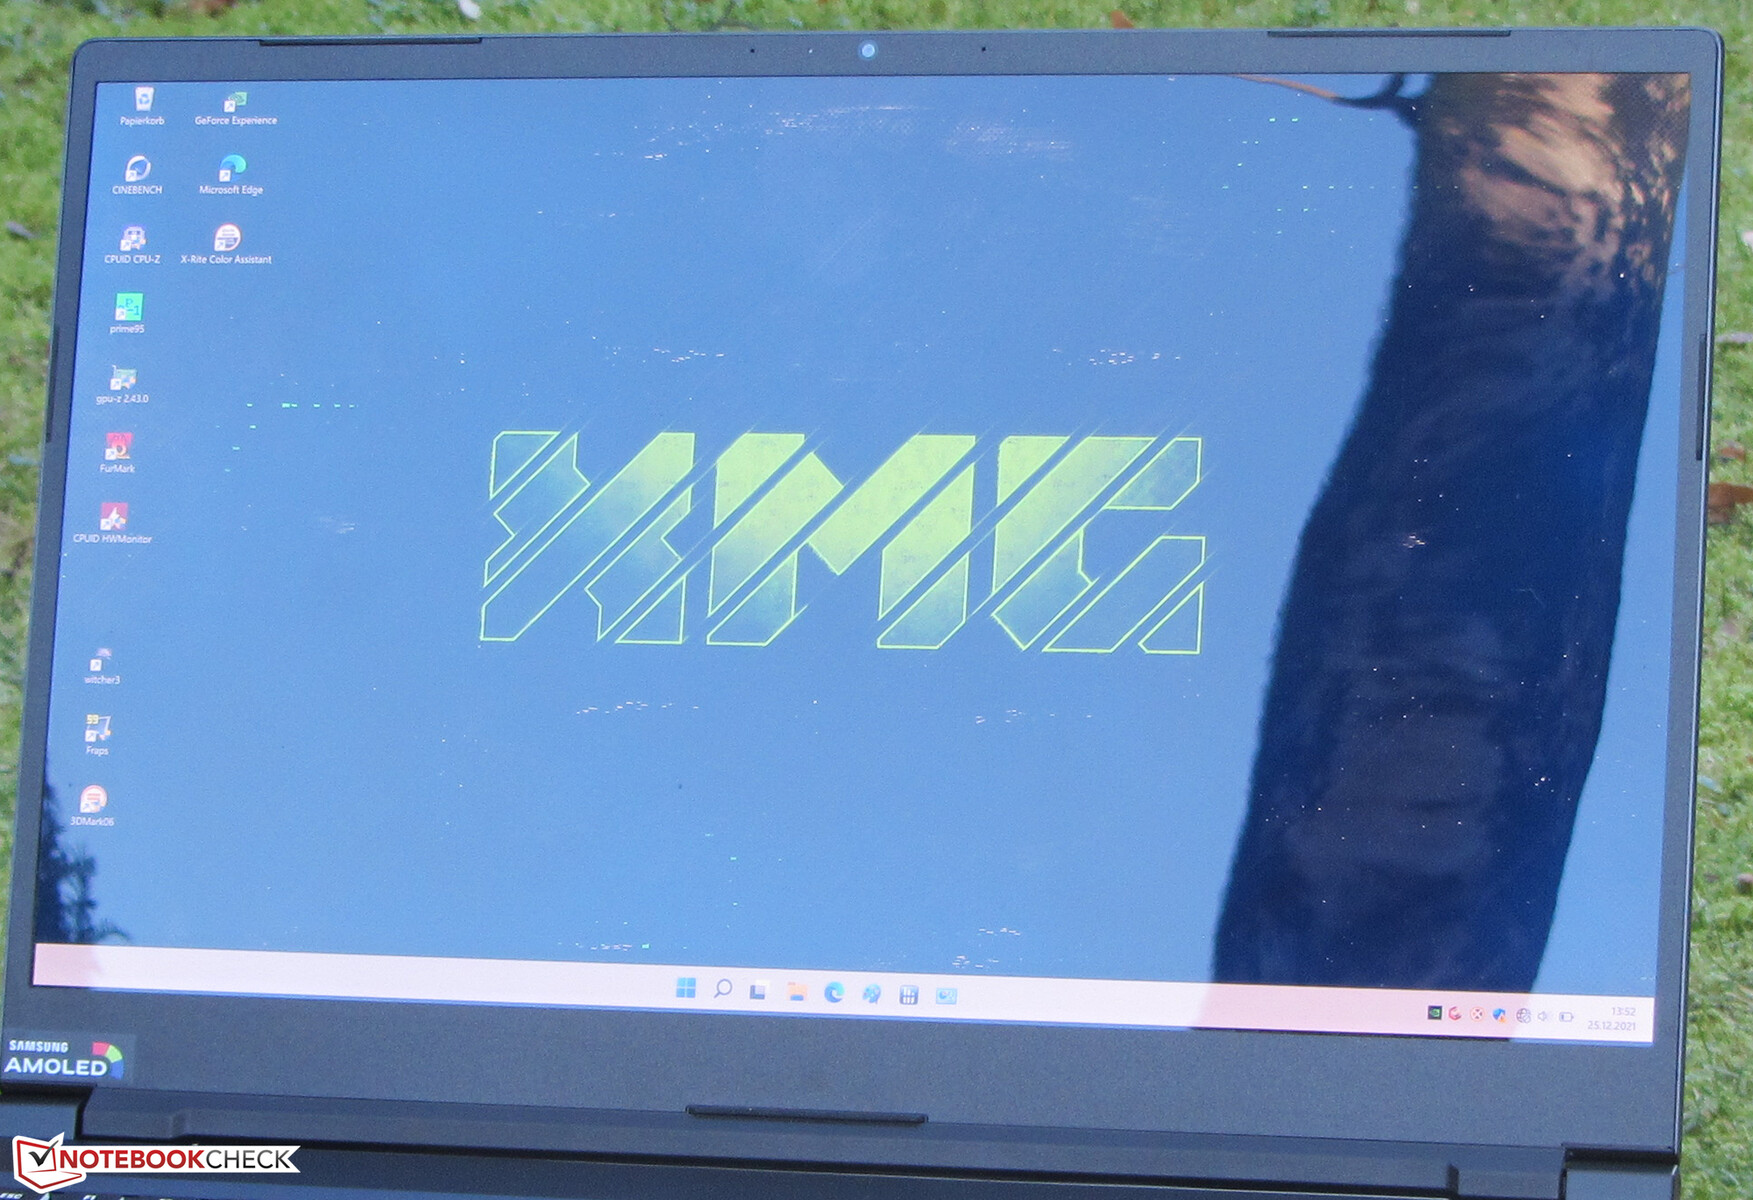
Como o painel tem bons ângulos de visão, ele pode ser lido de qualquer posição. Ao ar livre, a leitura do conteúdo do display pode ser complicada devido à sua natureza reflexiva

Desempenho - Suficiente para os próximos anos
Com o XMG Pro 15, a Schenker criou um notebook para jogos fino e compacto de 15,6 polegadas com reservas de desempenho suficientes para executar todos os jogos atuais sem problemas

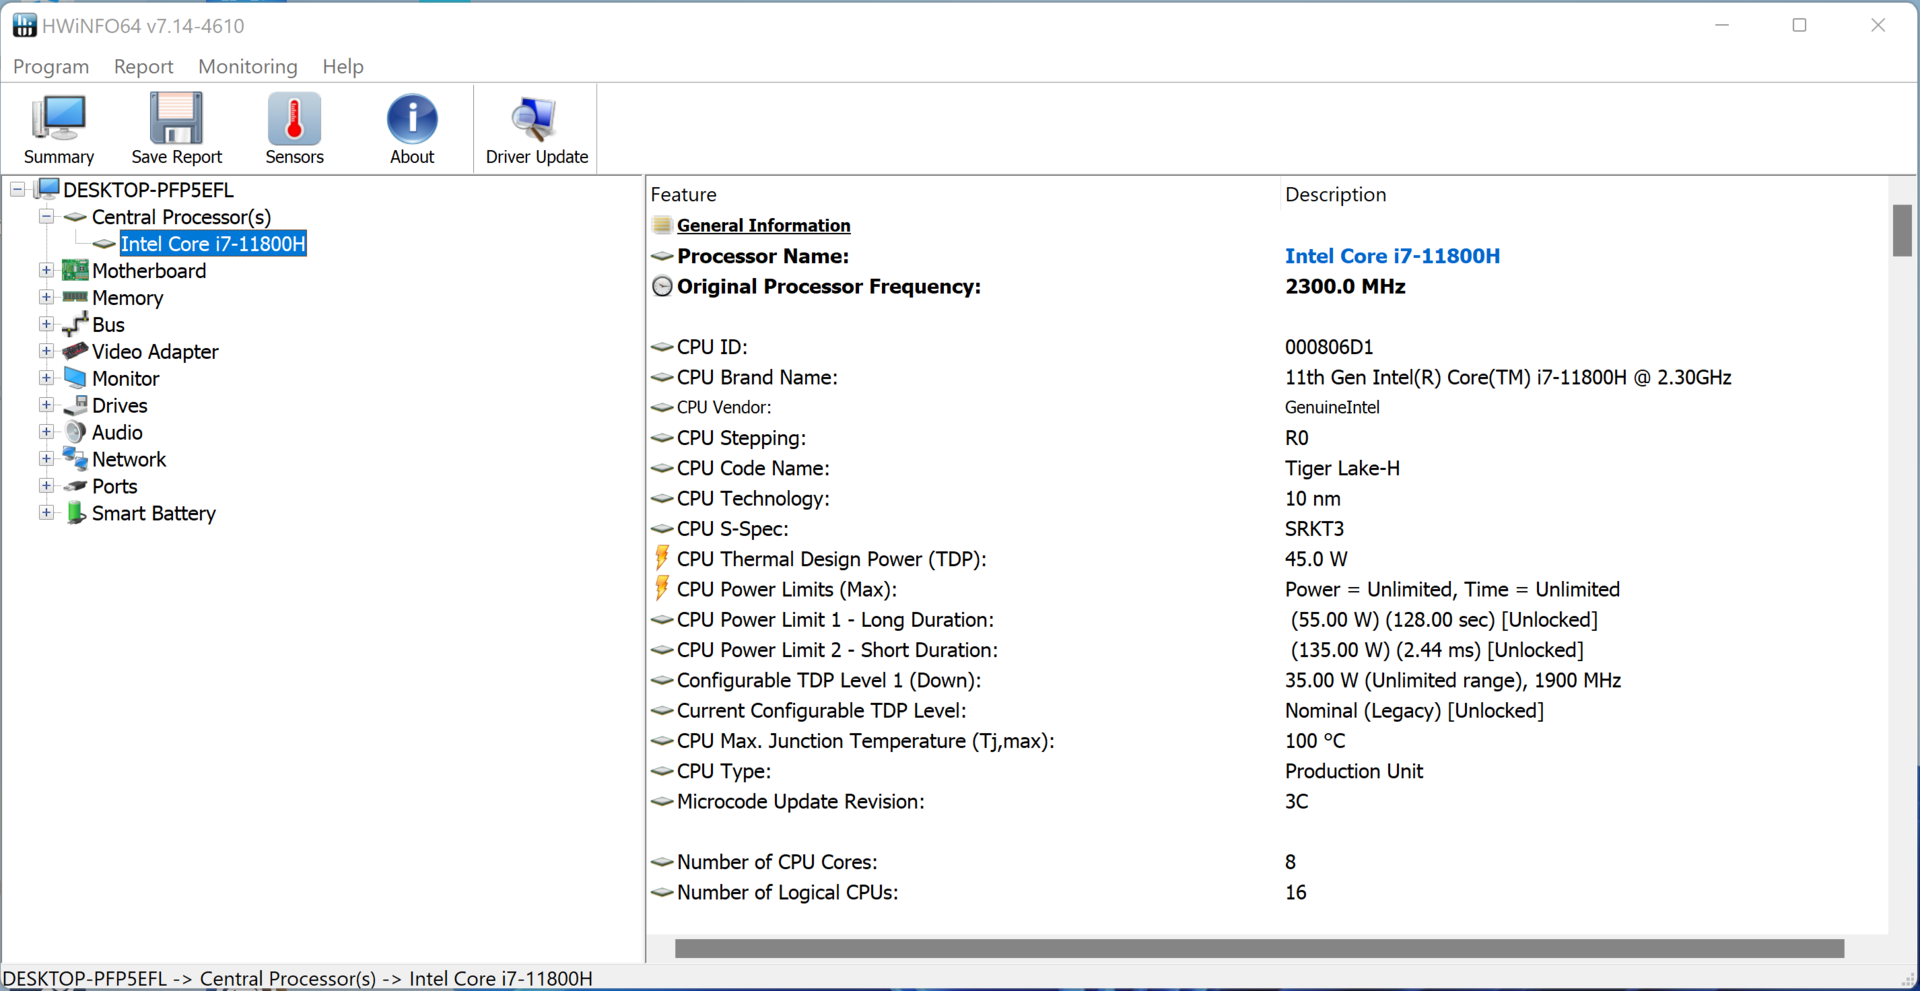
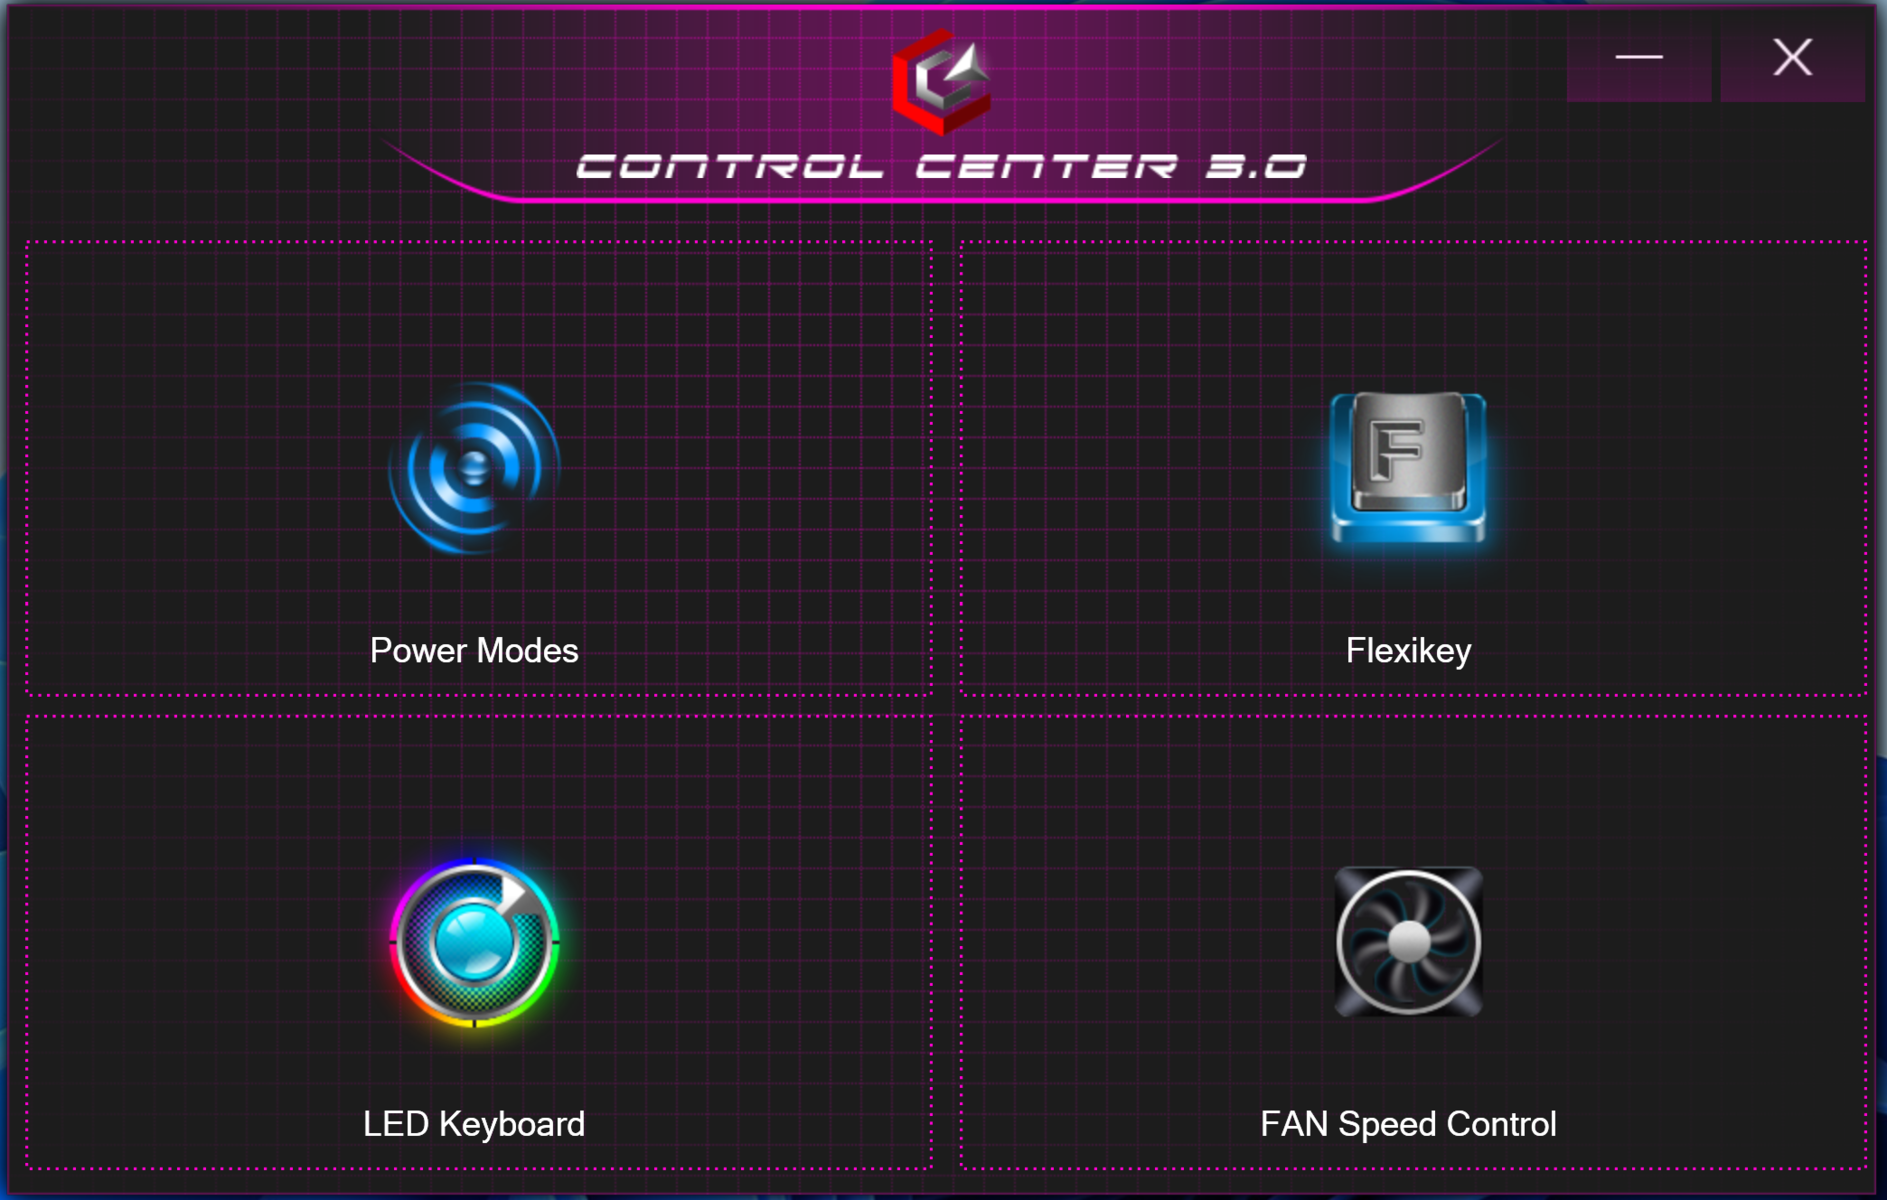
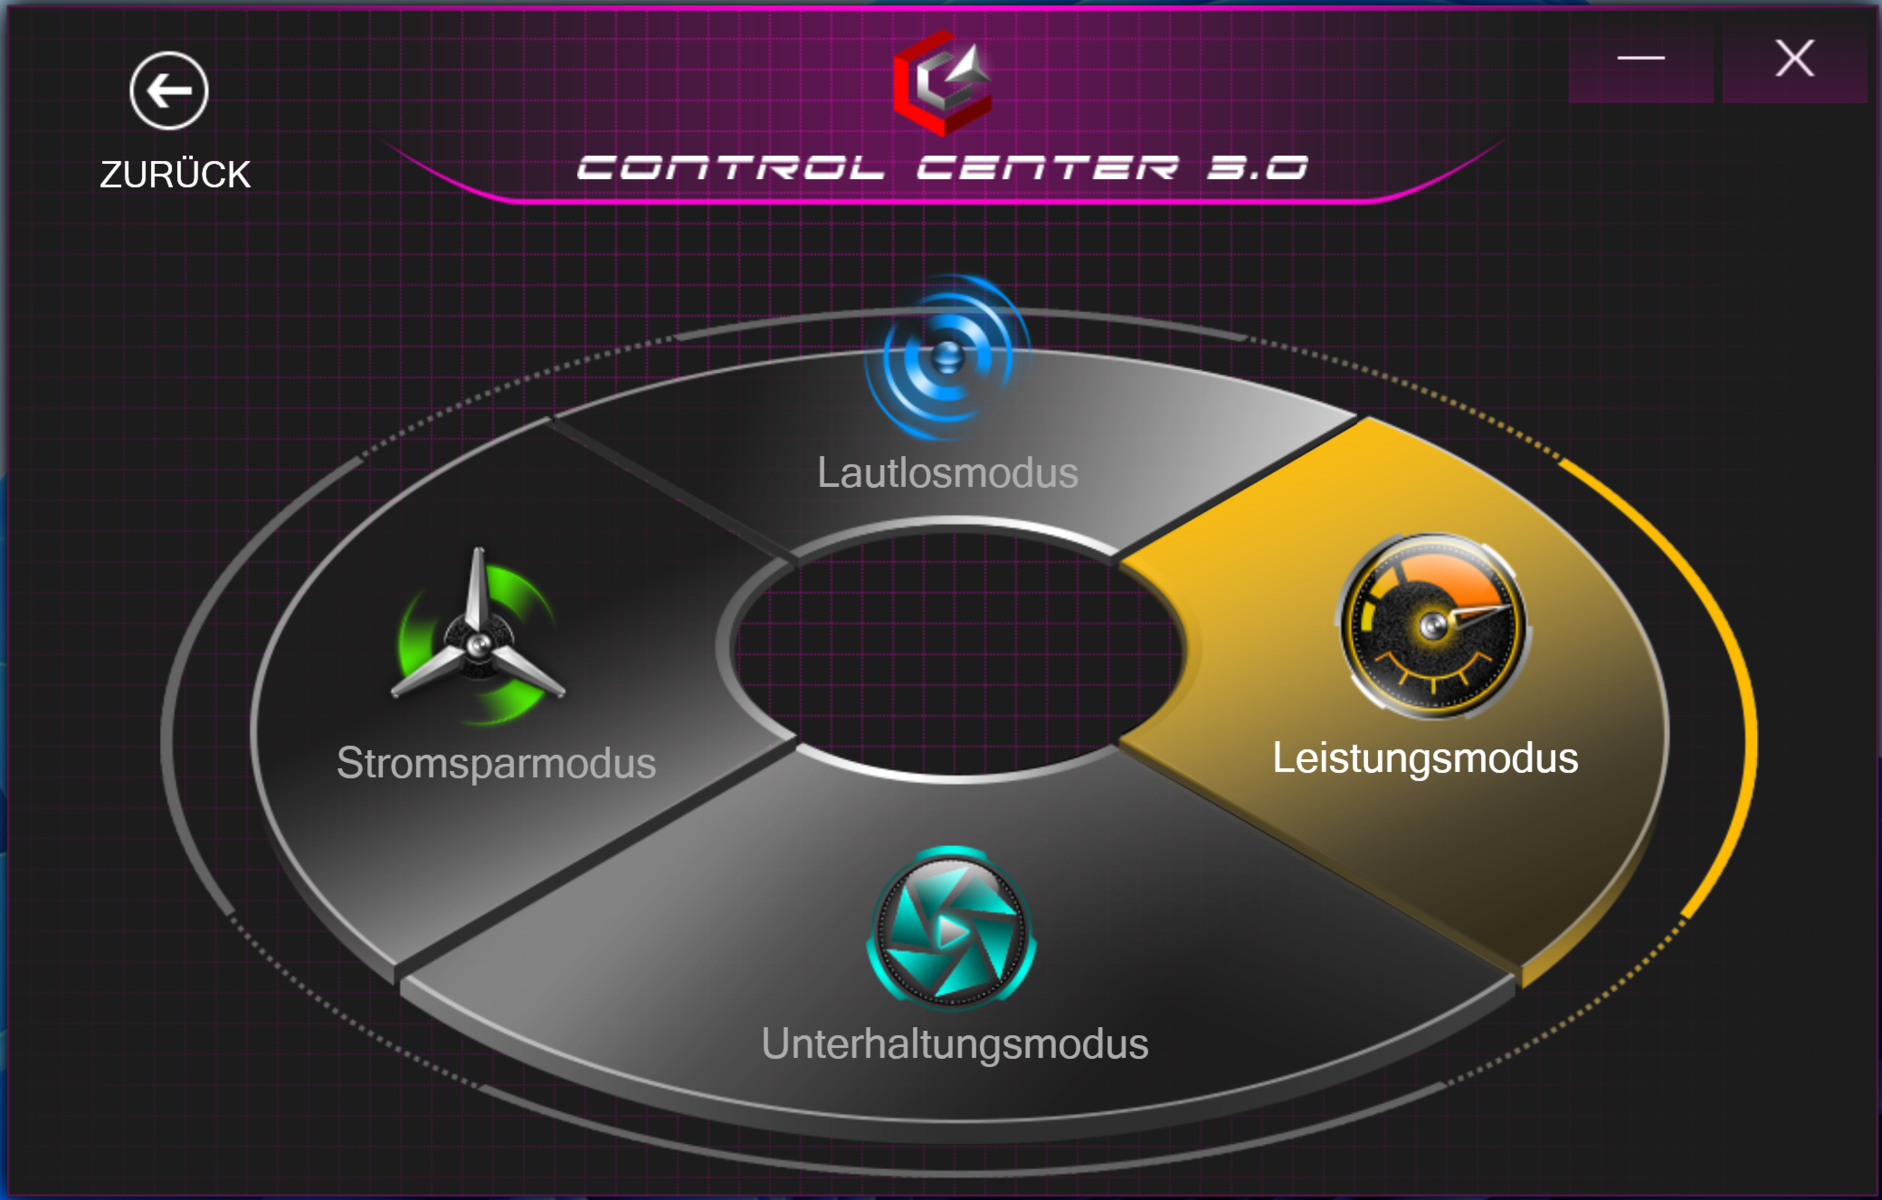
Condições de teste
O software pré-instalado do Centro de Controle permite aos usuários selecionar um perfil de potência (ver tabela), entre outras coisas. O perfil de desempenho com controle automático do ventilador foi selecionado antes da execução de quaisquer benchmarks. Vários pontos de referência também foram executados usando os outros três perfis. Os resultados podem ser encontrados nas tabelas de comparação. Os testes de duração da bateria foram executados usando o "Modo de entretenimento"
| Modo de desempenho | Modo de entretenimento | Modo de economia de energia | Modo silencioso | |
|---|---|---|---|---|
| Limite de potência 1 | 55 watts | 45 watts | 20 watts | 15 watts |
| Limite de potência 2 | 135 watts | 90 watts | 90 watts | 90 watts |
| máximo. TGP | 105 watts | 90 watts | 80 watts | 80 watts |
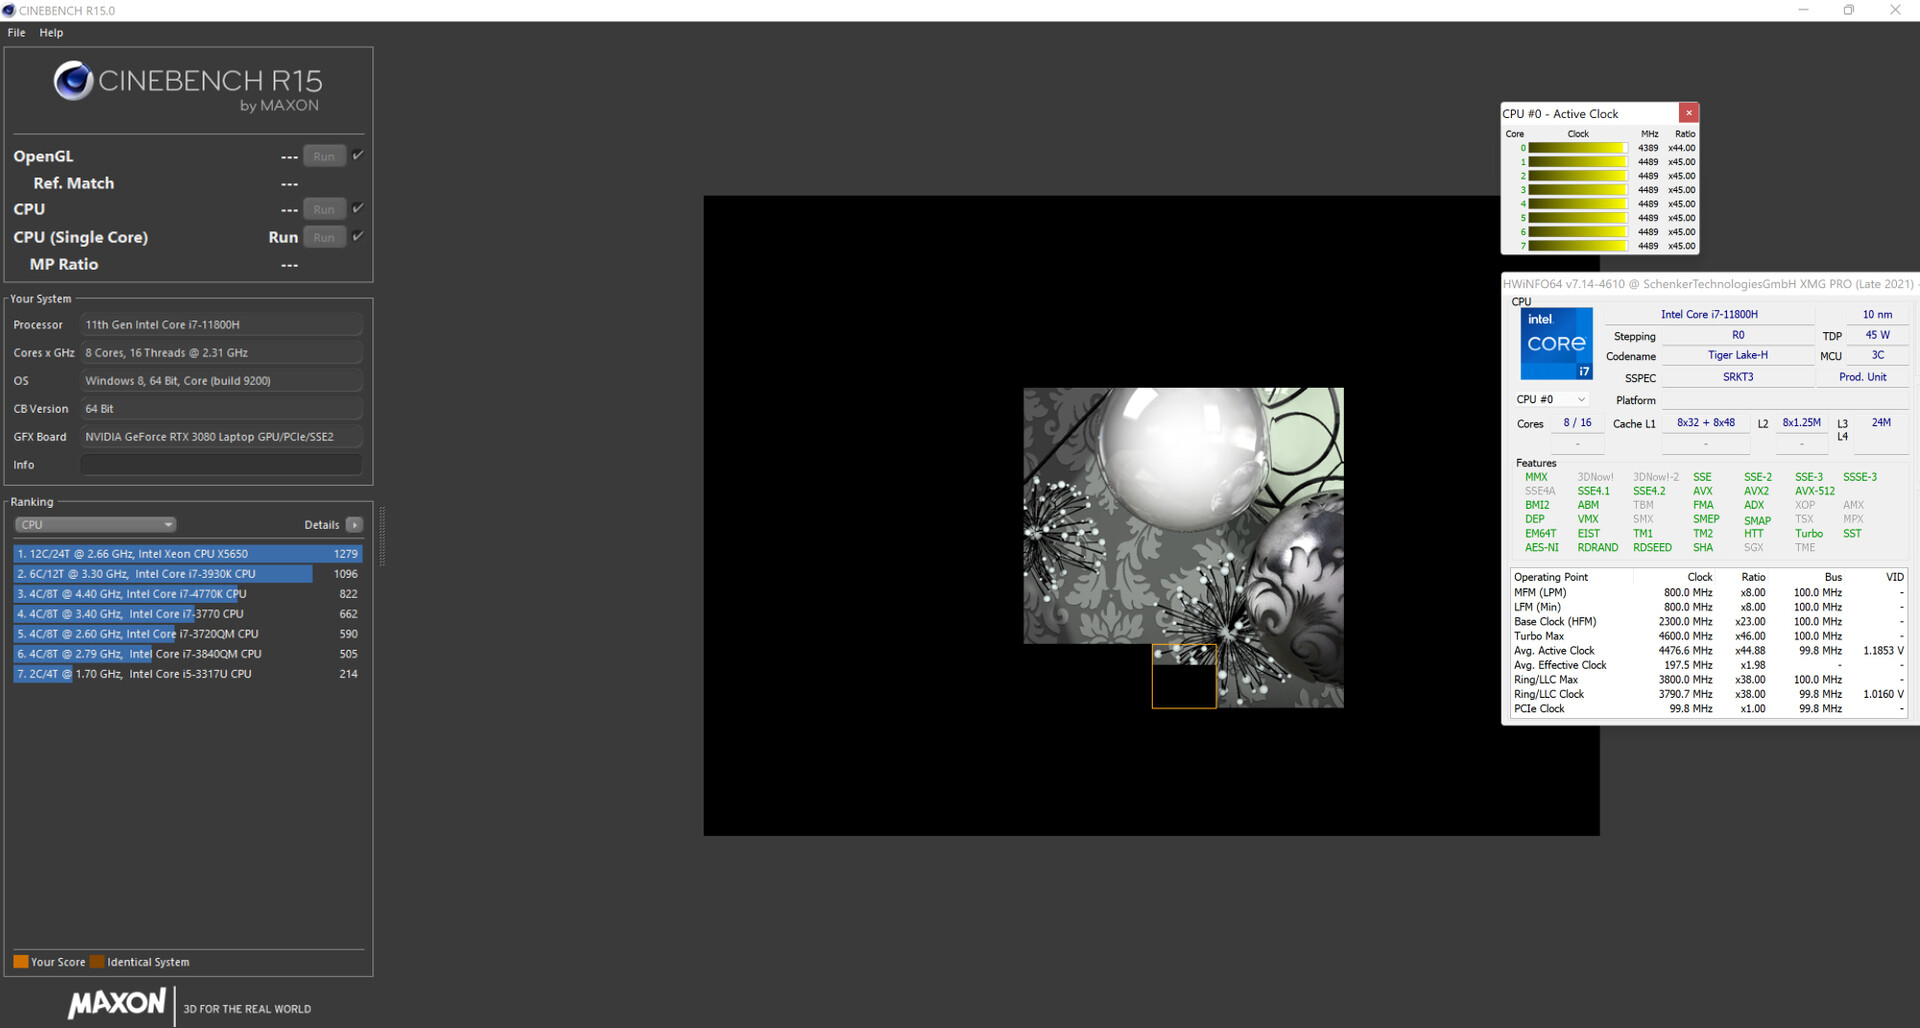
Processador
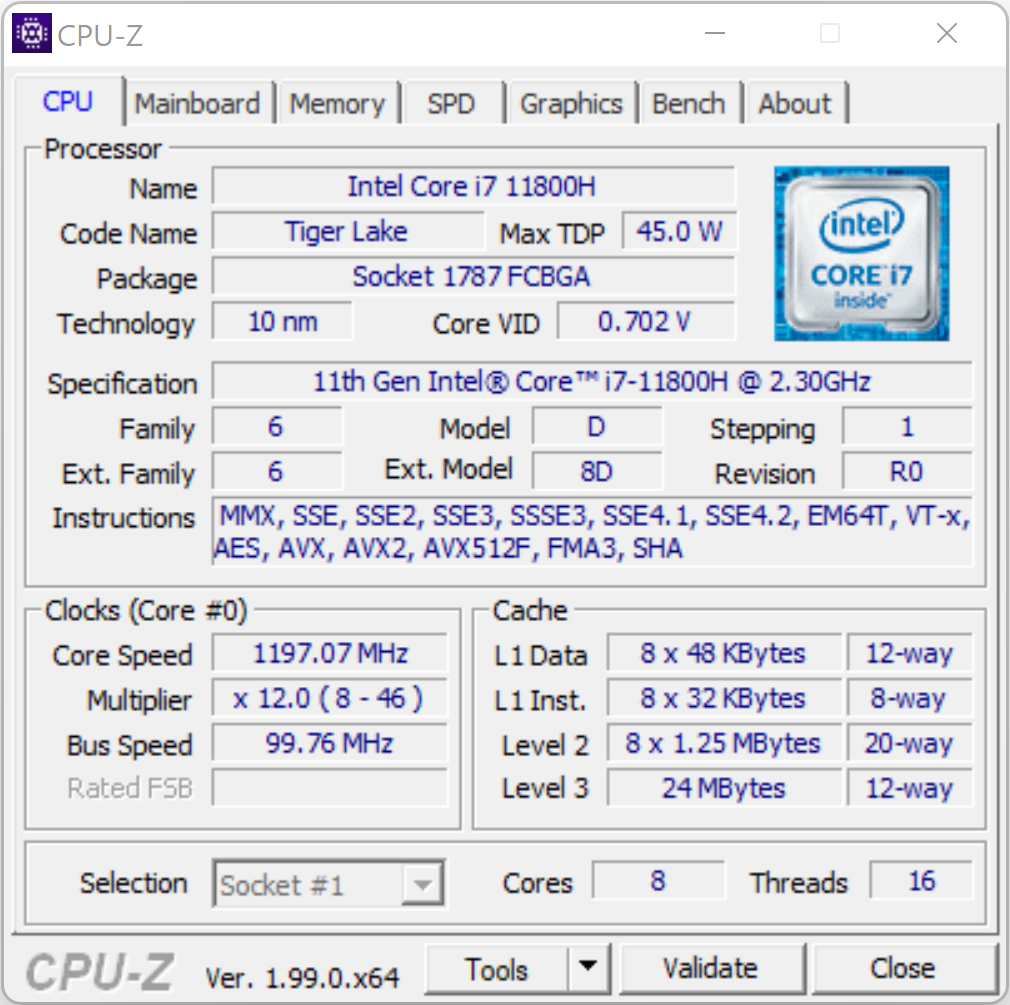
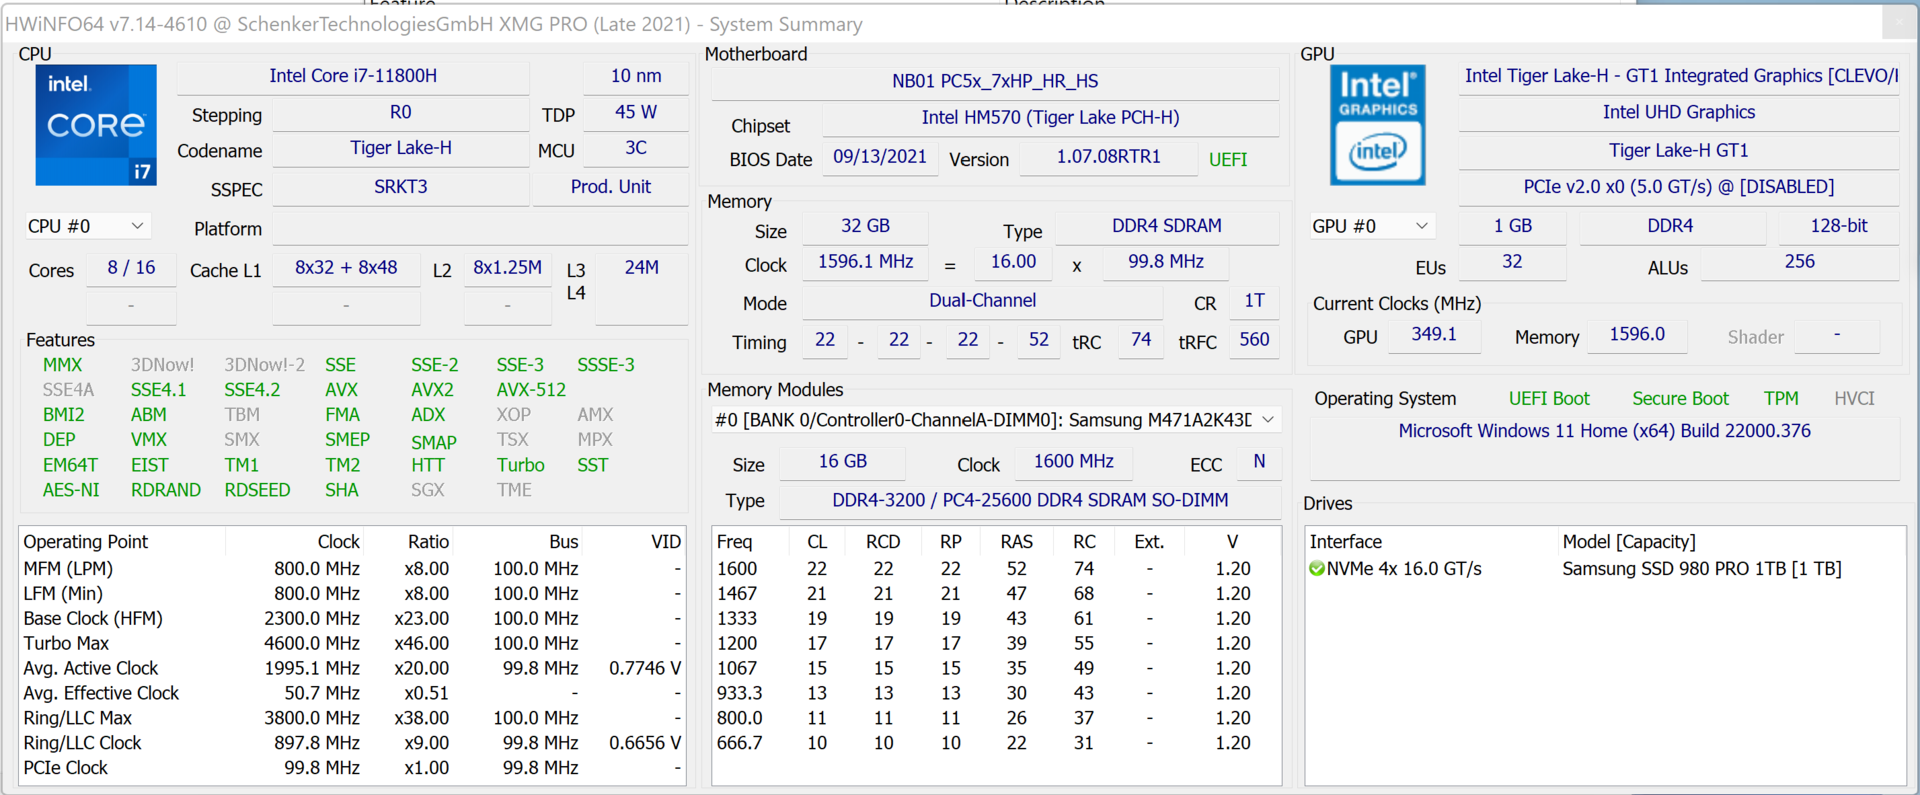
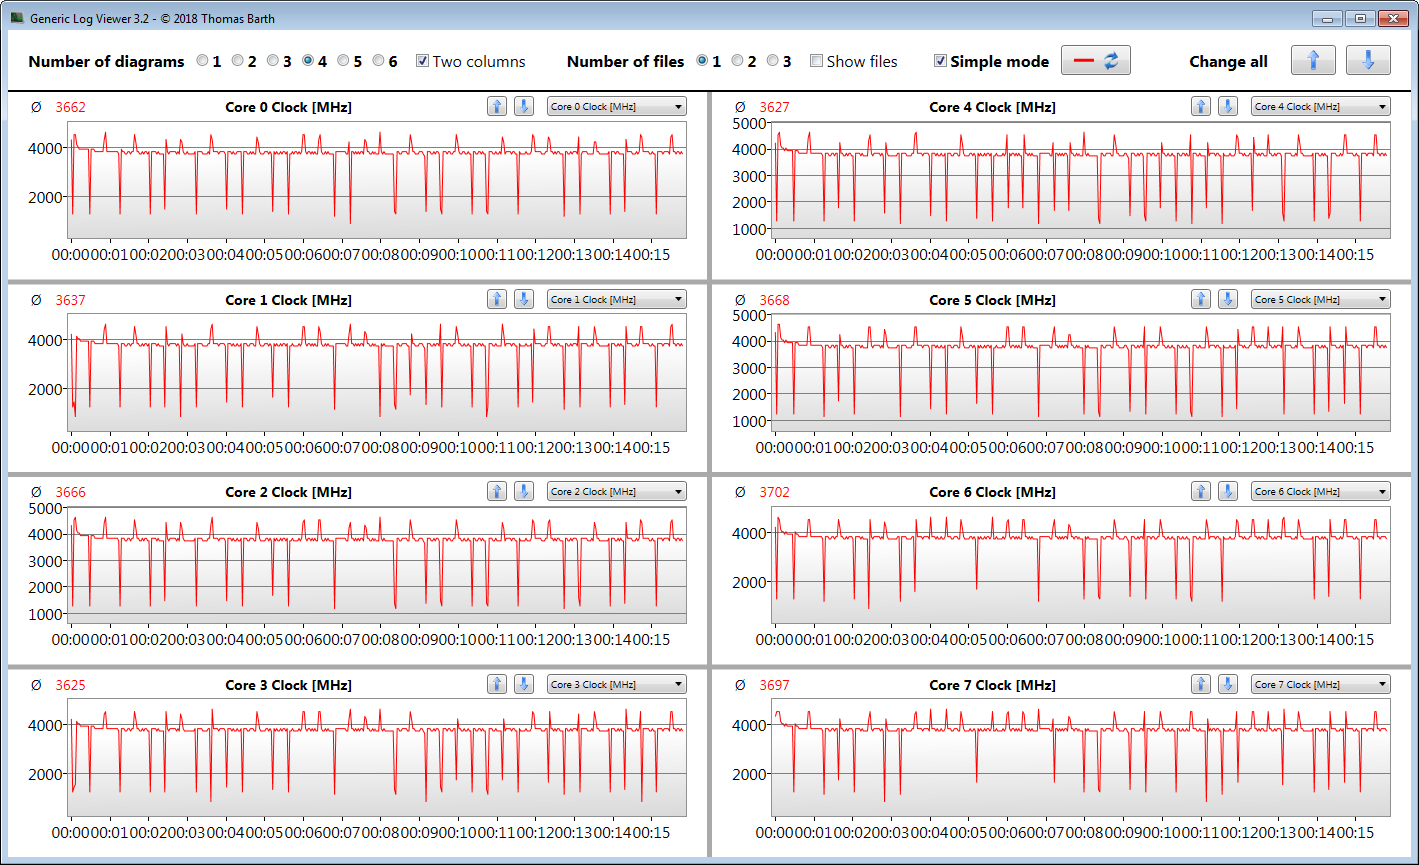
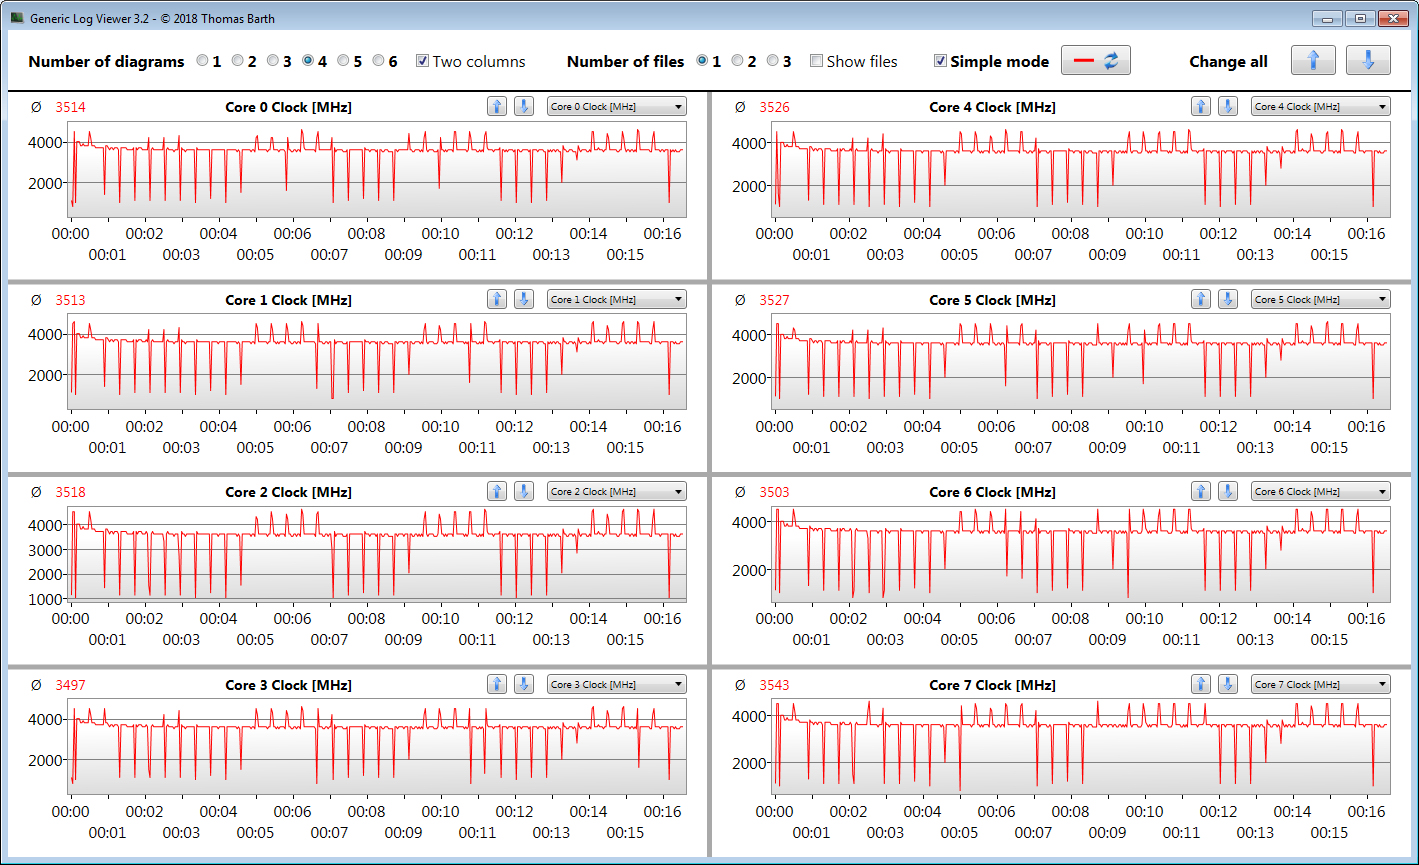
O octa-core do processo Núcleo i7-11800H (Tiger Lake) funciona a um relógio de base de 2,3 GHz. Com o Turbo, ele aumenta para até 4,2 GHz (oito núcleos) ou 4,6 GHz (um núcleo). Suporta hiper-Threading (dois fios por núcleo).
Durante o Cinebench R15 Multi benchmark, a CPU funciona em 4 a 4,1 GHz (na rede elétrica) ou 1 a 4,1 GHz (modo de bateria). Durante o benchmark de rosca única, a CPU funciona em 1,6 a 4,6 GHz em ambos os casos
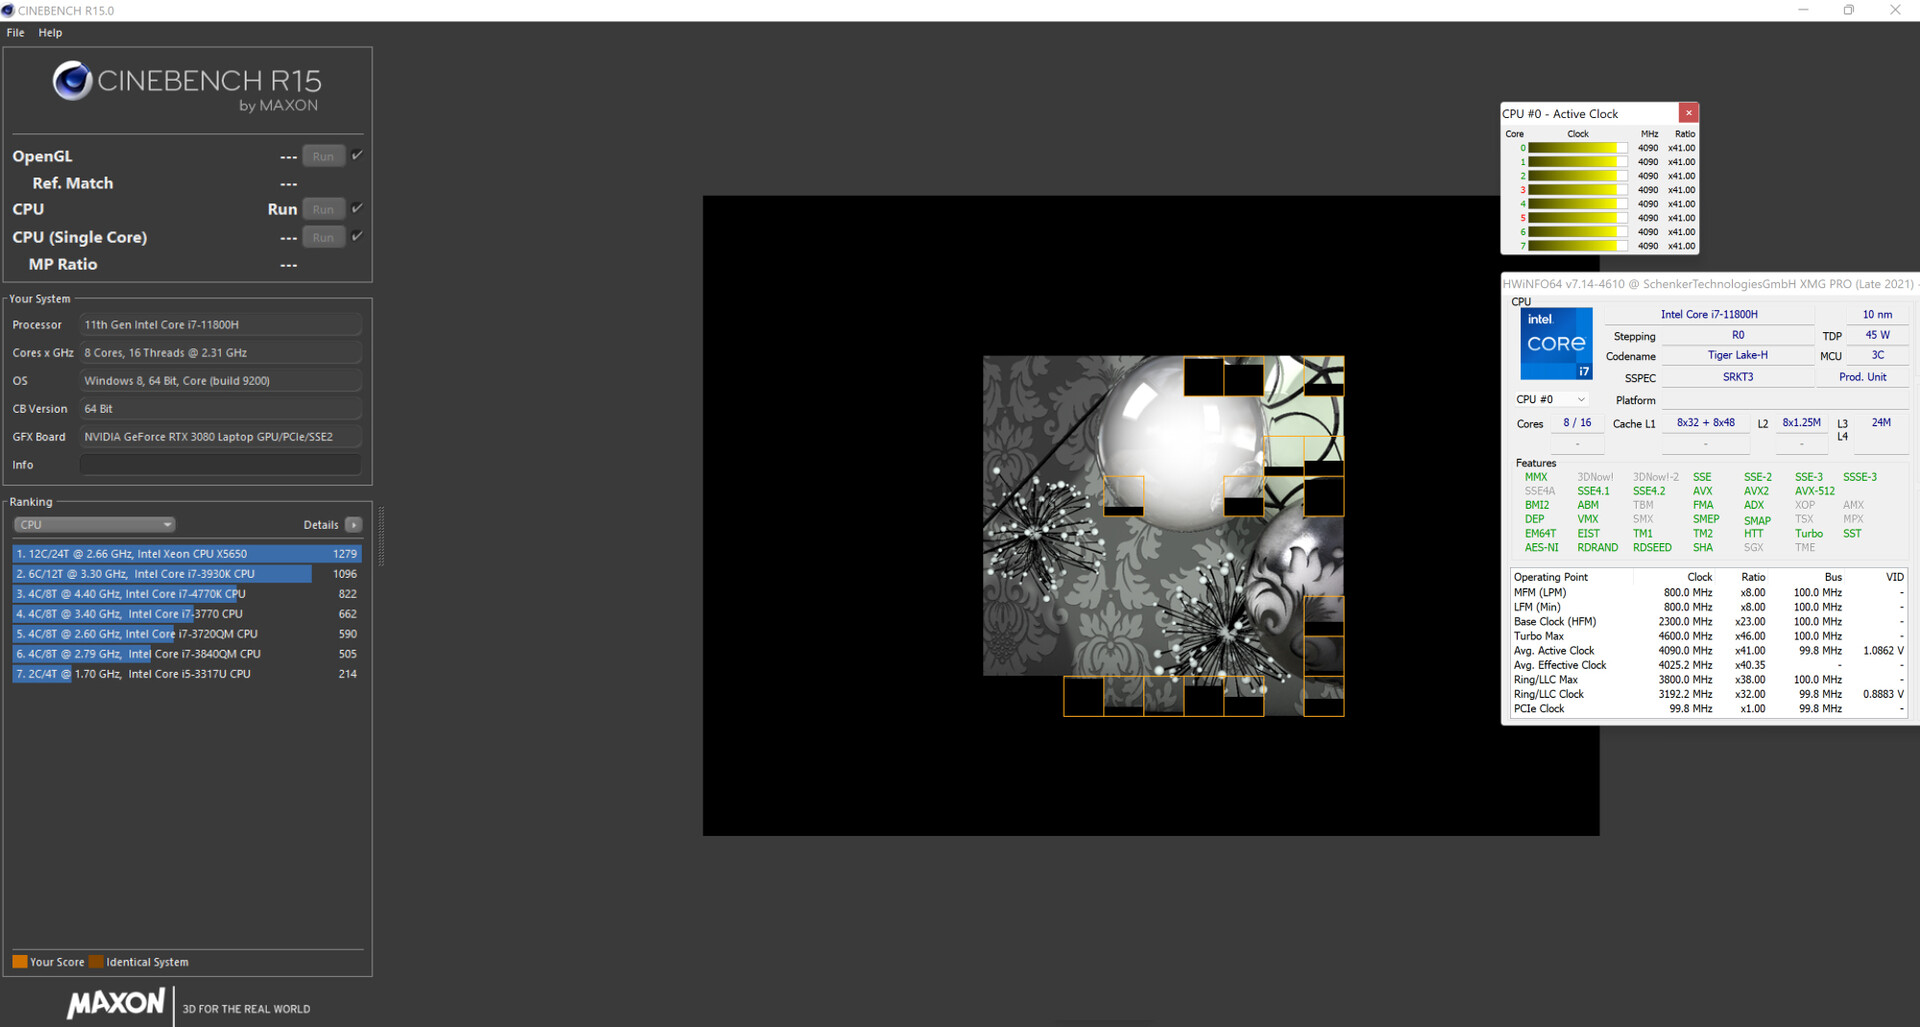
Executando o benchmark Cinebench R15 multithread em um loop por pelo menos 30 minutos, determinamos se o Turbo Boost da CPU está constantemente ativo. Este acaba sendo o caso e o Turbo funciona em altas velocidades de relógio.
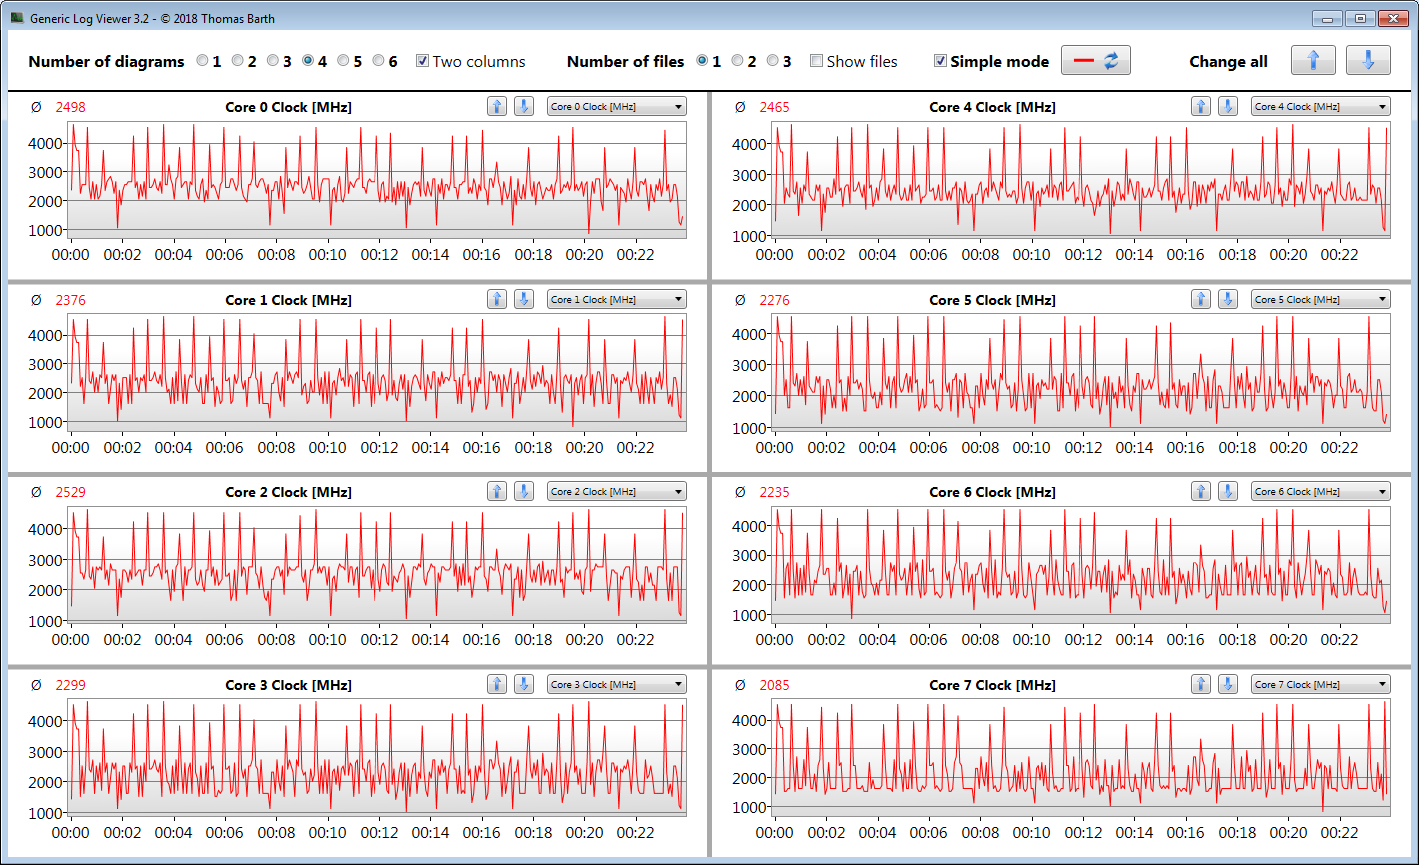
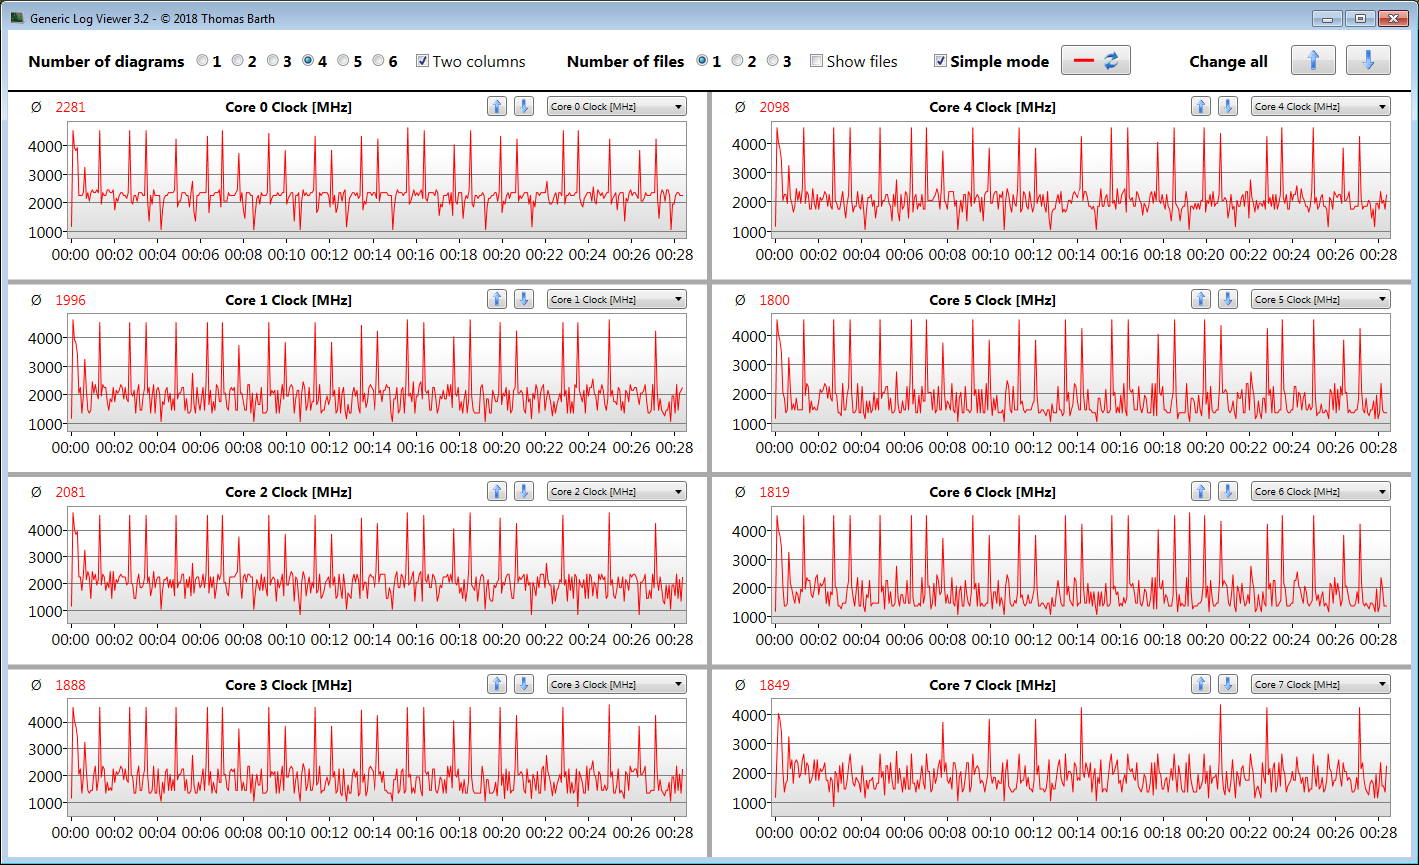
Com o perfil de potência silencioso, o desempenho cai significativamente. As altas freqüências de Turbo Boost são então alcançadas apenas de forma intermitente. Independentemente disso, o desempenho reduzido é mais do que suficiente para cargas de trabalho de escritório e de navegação na web e até mesmo para jogos leves
Cinebench R15 Multi Loop
| CPU Performance rating - Percent | |
| Média da turma Gaming | |
| MSI Delta 15 A5EFK | |
| Schenker XMG Pro 15 (Late 2021) | |
| Alienware x15 RTX 3070 P111F -2! | |
| Lenovo Legion S7 15ACH6 82K80030GE | |
| Schenker XMG Pro 15 (Late 2021) | |
| Razer Blade 15 Advanced (Mid 2021) -2! | |
| Média Intel Core i7-11800H | |
| Schenker XMG Pro 15 (Late 2021) | |
| Schenker XMG Pro 15 (Early 2021, RTX 3080) | |
| Schenker XMG Pro 15 (Late 2021) | |
| Cinebench R23 | |
| Multi Core | |
| Média da turma Gaming (10488 - 42661, n=107, últimos 2 anos) | |
| Alienware x15 RTX 3070 P111F | |
| Lenovo Legion S7 15ACH6 82K80030GE | |
| Schenker XMG Pro 15 (Late 2021) | |
| Schenker XMG Pro 15 (Late 2021) (Unterhaltungsmodus) | |
| Razer Blade 15 Advanced (Mid 2021) | |
| MSI Delta 15 A5EFK | |
| Média Intel Core i7-11800H (6508 - 14088, n=48) | |
| Schenker XMG Pro 15 (Early 2021, RTX 3080) | |
| Schenker XMG Pro 15 (Late 2021) (Stromsparmodus) | |
| Schenker XMG Pro 15 (Late 2021) (Lautlosmodus) | |
| Single Core | |
| Média da turma Gaming (1166 - 2415, n=107, últimos 2 anos) | |
| Razer Blade 15 Advanced (Mid 2021) | |
| Schenker XMG Pro 15 (Late 2021) | |
| Alienware x15 RTX 3070 P111F | |
| Schenker XMG Pro 15 (Late 2021) (Unterhaltungsmodus) | |
| Schenker XMG Pro 15 (Late 2021) (Stromsparmodus) | |
| Schenker XMG Pro 15 (Late 2021) (Lautlosmodus) | |
| Média Intel Core i7-11800H (1386 - 1522, n=45) | |
| Lenovo Legion S7 15ACH6 82K80030GE | |
| MSI Delta 15 A5EFK | |
| Schenker XMG Pro 15 (Early 2021, RTX 3080) | |
| Cinebench R20 | |
| CPU (Multi Core) | |
| Média da turma Gaming (4029 - 16433, n=106, últimos 2 anos) | |
| Alienware x15 RTX 3070 P111F | |
| Lenovo Legion S7 15ACH6 82K80030GE | |
| Schenker XMG Pro 15 (Late 2021) | |
| Razer Blade 15 Advanced (Mid 2021) | |
| Schenker XMG Pro 15 (Late 2021) (Unterhaltungsmodus) | |
| MSI Delta 15 A5EFK | |
| Média Intel Core i7-11800H (2498 - 5408, n=50) | |
| Schenker XMG Pro 15 (Early 2021, RTX 3080) | |
| Schenker XMG Pro 15 (Late 2021) (Stromsparmodus) | |
| Schenker XMG Pro 15 (Late 2021) (Lautlosmodus) | |
| CPU (Single Core) | |
| Média da turma Gaming (442 - 913, n=106, últimos 2 anos) | |
| Schenker XMG Pro 15 (Late 2021) | |
| Razer Blade 15 Advanced (Mid 2021) | |
| Schenker XMG Pro 15 (Late 2021) (Unterhaltungsmodus) | |
| Schenker XMG Pro 15 (Late 2021) (Stromsparmodus) | |
| Alienware x15 RTX 3070 P111F | |
| Schenker XMG Pro 15 (Late 2021) (Lautlosmodus) | |
| Lenovo Legion S7 15ACH6 82K80030GE | |
| MSI Delta 15 A5EFK | |
| Média Intel Core i7-11800H (520 - 586, n=47) | |
| Schenker XMG Pro 15 (Early 2021, RTX 3080) | |
| Cinebench R15 | |
| CPU Multi 64Bit | |
| Média da turma Gaming (1578 - 6330, n=105, últimos 2 anos) | |
| Lenovo Legion S7 15ACH6 82K80030GE | |
| Alienware x15 RTX 3070 P111F | |
| MSI Delta 15 A5EFK | |
| Schenker XMG Pro 15 (Late 2021) | |
| Schenker XMG Pro 15 (Late 2021) (Unterhaltungsmodus) | |
| Média Intel Core i7-11800H (1342 - 2173, n=50) | |
| Razer Blade 15 Advanced (Mid 2021) | |
| Schenker XMG Pro 15 (Early 2021, RTX 3080) | |
| Schenker XMG Pro 15 (Late 2021) (Stromsparmodus) | |
| Schenker XMG Pro 15 (Late 2021) (Lautlosmodus) | |
| CPU Single 64Bit | |
| Média da turma Gaming (188.8 - 350, n=106, últimos 2 anos) | |
| MSI Delta 15 A5EFK | |
| Lenovo Legion S7 15ACH6 82K80030GE | |
| Schenker XMG Pro 15 (Late 2021) (Stromsparmodus) | |
| Schenker XMG Pro 15 (Late 2021) (Lautlosmodus) | |
| Schenker XMG Pro 15 (Late 2021) (Unterhaltungsmodus) | |
| Razer Blade 15 Advanced (Mid 2021) | |
| Alienware x15 RTX 3070 P111F | |
| Schenker XMG Pro 15 (Late 2021) | |
| Média Intel Core i7-11800H (201 - 231, n=46) | |
| Schenker XMG Pro 15 (Early 2021, RTX 3080) | |
| Blender - v2.79 BMW27 CPU | |
| Schenker XMG Pro 15 (Late 2021) (Lautlosmodus) | |
| Schenker XMG Pro 15 (Late 2021) (Stromsparmodus) | |
| Schenker XMG Pro 15 (Early 2021, RTX 3080) | |
| Média Intel Core i7-11800H (217 - 454, n=46) | |
| Razer Blade 15 Advanced (Mid 2021) | |
| Schenker XMG Pro 15 (Late 2021) (Unterhaltungsmodus) | |
| Schenker XMG Pro 15 (Late 2021) | |
| MSI Delta 15 A5EFK | |
| Lenovo Legion S7 15ACH6 82K80030GE | |
| Alienware x15 RTX 3070 P111F | |
| Média da turma Gaming (79 - 330, n=104, últimos 2 anos) | |
| 7-Zip 18.03 | |
| 7z b 4 | |
| Média da turma Gaming (33491 - 148086, n=105, últimos 2 anos) | |
| Lenovo Legion S7 15ACH6 82K80030GE | |
| MSI Delta 15 A5EFK | |
| Schenker XMG Pro 15 (Late 2021) | |
| Razer Blade 15 Advanced (Mid 2021) | |
| Schenker XMG Pro 15 (Late 2021) (Unterhaltungsmodus) | |
| Alienware x15 RTX 3070 P111F | |
| Média Intel Core i7-11800H (33718 - 56758, n=46) | |
| Schenker XMG Pro 15 (Early 2021, RTX 3080) | |
| Schenker XMG Pro 15 (Late 2021) (Stromsparmodus) | |
| Schenker XMG Pro 15 (Late 2021) (Lautlosmodus) | |
| 7z b 4 -mmt1 | |
| Média da turma Gaming (4199 - 7436, n=105, últimos 2 anos) | |
| Lenovo Legion S7 15ACH6 82K80030GE | |
| MSI Delta 15 A5EFK | |
| Schenker XMG Pro 15 (Late 2021) (Lautlosmodus) | |
| Schenker XMG Pro 15 (Late 2021) | |
| Schenker XMG Pro 15 (Late 2021) (Stromsparmodus) | |
| Média Intel Core i7-11800H (5138 - 5732, n=46) | |
| Schenker XMG Pro 15 (Late 2021) (Unterhaltungsmodus) | |
| Razer Blade 15 Advanced (Mid 2021) | |
| Alienware x15 RTX 3070 P111F | |
| Schenker XMG Pro 15 (Early 2021, RTX 3080) | |
| Geekbench 5.5 | |
| Multi-Core | |
| Média da turma Gaming (6460 - 28263, n=105, últimos 2 anos) | |
| Schenker XMG Pro 15 (Late 2021) | |
| Schenker XMG Pro 15 (Late 2021) (Unterhaltungsmodus) | |
| Schenker XMG Pro 15 (Late 2021) (Stromsparmodus) | |
| MSI Delta 15 A5EFK | |
| Lenovo Legion S7 15ACH6 82K80030GE | |
| Média Intel Core i7-11800H (4655 - 9851, n=40) | |
| Schenker XMG Pro 15 (Early 2021, RTX 3080) | |
| Schenker XMG Pro 15 (Late 2021) (Lautlosmodus) | |
| Single-Core | |
| Média da turma Gaming (986 - 2474, n=105, últimos 2 anos) | |
| Schenker XMG Pro 15 (Late 2021) | |
| Schenker XMG Pro 15 (Late 2021) (Stromsparmodus) | |
| MSI Delta 15 A5EFK | |
| Média Intel Core i7-11800H (1429 - 1625, n=40) | |
| Schenker XMG Pro 15 (Late 2021) (Unterhaltungsmodus) | |
| Lenovo Legion S7 15ACH6 82K80030GE | |
| Schenker XMG Pro 15 (Late 2021) (Lautlosmodus) | |
| Schenker XMG Pro 15 (Early 2021, RTX 3080) | |
| HWBOT x265 Benchmark v2.2 - 4k Preset | |
| Média da turma Gaming (11.5 - 44.4, n=105, últimos 2 anos) | |
| Alienware x15 RTX 3070 P111F | |
| Lenovo Legion S7 15ACH6 82K80030GE | |
| Schenker XMG Pro 15 (Late 2021) | |
| MSI Delta 15 A5EFK | |
| Razer Blade 15 Advanced (Mid 2021) | |
| Schenker XMG Pro 15 (Late 2021) (Unterhaltungsmodus) | |
| Média Intel Core i7-11800H (7.38 - 17.4, n=46) | |
| Schenker XMG Pro 15 (Early 2021, RTX 3080) | |
| Schenker XMG Pro 15 (Late 2021) (Stromsparmodus) | |
| Schenker XMG Pro 15 (Late 2021) (Lautlosmodus) | |
| LibreOffice - 20 Documents To PDF | |
| Lenovo Legion S7 15ACH6 82K80030GE | |
| Schenker XMG Pro 15 (Early 2021, RTX 3080) | |
| Schenker XMG Pro 15 (Late 2021) (Unterhaltungsmodus) | |
| MSI Delta 15 A5EFK | |
| Média da turma Gaming (33.2 - 88.8, n=105, últimos 2 anos) | |
| Alienware x15 RTX 3070 P111F | |
| Schenker XMG Pro 15 (Late 2021) | |
| Média Intel Core i7-11800H (38.6 - 59.9, n=45) | |
| Razer Blade 15 Advanced (Mid 2021) | |
| Schenker XMG Pro 15 (Late 2021) (Lautlosmodus) | |
| Schenker XMG Pro 15 (Late 2021) (Stromsparmodus) | |
| R Benchmark 2.5 - Overall mean | |
| Schenker XMG Pro 15 (Early 2021, RTX 3080) | |
| Schenker XMG Pro 15 (Late 2021) (Lautlosmodus) | |
| Schenker XMG Pro 15 (Late 2021) (Stromsparmodus) | |
| Alienware x15 RTX 3070 P111F | |
| Média Intel Core i7-11800H (0.548 - 0.615, n=46) | |
| Schenker XMG Pro 15 (Late 2021) (Unterhaltungsmodus) | |
| Razer Blade 15 Advanced (Mid 2021) | |
| Schenker XMG Pro 15 (Late 2021) | |
| MSI Delta 15 A5EFK | |
| Lenovo Legion S7 15ACH6 82K80030GE | |
| Média da turma Gaming (0.3439 - 0.759, n=106, últimos 2 anos) | |
* ... menor é melhor
AIDA64: FP32 Ray-Trace | FPU Julia | CPU SHA3 | CPU Queen | FPU SinJulia | FPU Mandel | CPU AES | CPU ZLib | FP64 Ray-Trace | CPU PhotoWorxx
| Performance rating | |
| Média da turma Gaming | |
| Lenovo Legion S7 15ACH6 82K80030GE | |
| MSI Delta 15 A5EFK | |
| Schenker XMG Pro 15 (Late 2021) | |
| Média Intel Core i7-11800H | |
| Schenker XMG Pro 15 (Late 2021) | |
| Schenker XMG Pro 15 (Early 2021, RTX 3080) | |
| Schenker XMG Pro 15 (Late 2021) | |
| Alienware x15 RTX 3070 P111F -9! | |
| Razer Blade 15 Advanced (Mid 2021) -9! | |
| AIDA64 / FP32 Ray-Trace | |
| Média da turma Gaming (10227 - 85542, n=105, últimos 2 anos) | |
| Lenovo Legion S7 15ACH6 82K80030GE (v6.33.5700) | |
| Schenker XMG Pro 15 (Late 2021) (v6.50.5800) | |
| MSI Delta 15 A5EFK (v6.33.5700) | |
| Média Intel Core i7-11800H (8772 - 15961, n=20) | |
| Schenker XMG Pro 15 (Early 2021, RTX 3080) (v6.32.5600) | |
| Schenker XMG Pro 15 (Late 2021) (v6.50.5800, Stromsparmodus) | |
| Schenker XMG Pro 15 (Late 2021) (v6.50.5800, Lautlosmodus) | |
| AIDA64 / FPU Julia | |
| Média da turma Gaming (51376 - 238426, n=105, últimos 2 anos) | |
| Lenovo Legion S7 15ACH6 82K80030GE (v6.33.5700) | |
| MSI Delta 15 A5EFK (v6.33.5700) | |
| Schenker XMG Pro 15 (Late 2021) (v6.50.5800) | |
| Schenker XMG Pro 15 (Early 2021, RTX 3080) (v6.32.5600) | |
| Média Intel Core i7-11800H (39404 - 65636, n=20) | |
| Schenker XMG Pro 15 (Late 2021) (v6.50.5800, Stromsparmodus) | |
| Schenker XMG Pro 15 (Late 2021) (v6.50.5800, Lautlosmodus) | |
| AIDA64 / CPU SHA3 | |
| Média da turma Gaming (2180 - 10115, n=105, últimos 2 anos) | |
| Schenker XMG Pro 15 (Late 2021) (v6.50.5800) | |
| Média Intel Core i7-11800H (2599 - 4439, n=20) | |
| Lenovo Legion S7 15ACH6 82K80030GE (v6.33.5700) | |
| Schenker XMG Pro 15 (Early 2021, RTX 3080) (v6.32.5600) | |
| MSI Delta 15 A5EFK (v6.33.5700) | |
| Schenker XMG Pro 15 (Late 2021) (v6.50.5800, Stromsparmodus) | |
| Schenker XMG Pro 15 (Late 2021) (v6.50.5800, Lautlosmodus) | |
| AIDA64 / CPU Queen | |
| Média da turma Gaming (49785 - 173351, n=90, últimos 2 anos) | |
| MSI Delta 15 A5EFK (v6.33.5700) | |
| Lenovo Legion S7 15ACH6 82K80030GE (v6.33.5700) | |
| Schenker XMG Pro 15 (Late 2021) (v6.50.5800) | |
| Schenker XMG Pro 15 (Late 2021) (v6.50.5800, Lautlosmodus) | |
| Schenker XMG Pro 15 (Late 2021) (v6.50.5800, Stromsparmodus) | |
| Média Intel Core i7-11800H (85233 - 91941, n=20) | |
| Schenker XMG Pro 15 (Early 2021, RTX 3080) (v6.32.5600) | |
| AIDA64 / FPU SinJulia | |
| Média da turma Gaming (4424 - 33636, n=105, últimos 2 anos) | |
| MSI Delta 15 A5EFK (v6.33.5700) | |
| Lenovo Legion S7 15ACH6 82K80030GE (v6.33.5700) | |
| Schenker XMG Pro 15 (Late 2021) (v6.50.5800) | |
| Schenker XMG Pro 15 (Early 2021, RTX 3080) (v6.32.5600) | |
| Média Intel Core i7-11800H (6420 - 9792, n=20) | |
| Schenker XMG Pro 15 (Late 2021) (v6.50.5800, Stromsparmodus) | |
| Schenker XMG Pro 15 (Late 2021) (v6.50.5800, Lautlosmodus) | |
| AIDA64 / FPU Mandel | |
| Média da turma Gaming (25115 - 128721, n=105, últimos 2 anos) | |
| Lenovo Legion S7 15ACH6 82K80030GE (v6.33.5700) | |
| MSI Delta 15 A5EFK (v6.33.5700) | |
| Schenker XMG Pro 15 (Late 2021) (v6.50.5800) | |
| Média Intel Core i7-11800H (23365 - 39464, n=20) | |
| Schenker XMG Pro 15 (Early 2021, RTX 3080) (v6.32.5600) | |
| Schenker XMG Pro 15 (Late 2021) (v6.50.5800, Stromsparmodus) | |
| Schenker XMG Pro 15 (Late 2021) (v6.50.5800, Lautlosmodus) | |
| AIDA64 / CPU AES | |
| Schenker XMG Pro 15 (Late 2021) (v6.50.5800) | |
| Lenovo Legion S7 15ACH6 82K80030GE (v6.33.5700) | |
| MSI Delta 15 A5EFK (v6.33.5700) | |
| Média Intel Core i7-11800H (74617 - 149388, n=20) | |
| Média da turma Gaming (39258 - 247074, n=105, últimos 2 anos) | |
| Schenker XMG Pro 15 (Late 2021) (v6.50.5800, Stromsparmodus) | |
| Schenker XMG Pro 15 (Late 2021) (v6.50.5800, Lautlosmodus) | |
| Schenker XMG Pro 15 (Early 2021, RTX 3080) (v6.32.5600) | |
| AIDA64 / CPU ZLib | |
| Média da turma Gaming (574 - 2531, n=105, últimos 2 anos) | |
| Lenovo Legion S7 15ACH6 82K80030GE (v6.33.5700) | |
| MSI Delta 15 A5EFK (v6.33.5700) | |
| Schenker XMG Pro 15 (Late 2021) (v6.50.5800) | |
| Schenker XMG Pro 15 (Early 2021, RTX 3080) (v6.32.5600) | |
| Schenker XMG Pro 15 (Late 2021) (v6.50.5800, Stromsparmodus) | |
| Schenker XMG Pro 15 (Late 2021) (v6.50.5800, Lautlosmodus) | |
| Média Intel Core i7-11800H (461 - 830, n=43) | |
| Razer Blade 15 Advanced (Mid 2021) (v6.33.5700) | |
| Alienware x15 RTX 3070 P111F (v6.33.5700) | |
| AIDA64 / FP64 Ray-Trace | |
| Média da turma Gaming (5509 - 45446, n=105, últimos 2 anos) | |
| Schenker XMG Pro 15 (Late 2021) (v6.50.5800) | |
| Lenovo Legion S7 15ACH6 82K80030GE (v6.33.5700) | |
| MSI Delta 15 A5EFK (v6.33.5700) | |
| Média Intel Core i7-11800H (4545 - 8717, n=21) | |
| Schenker XMG Pro 15 (Early 2021, RTX 3080) (v6.32.5600) | |
| Schenker XMG Pro 15 (Late 2021) (v6.50.5800, Stromsparmodus) | |
| Schenker XMG Pro 15 (Late 2021) (v6.50.5800, Lautlosmodus) | |
| AIDA64 / CPU PhotoWorxx | |
| Média da turma Gaming (12271 - 89891, n=105, últimos 2 anos) | |
| Schenker XMG Pro 15 (Late 2021) (v6.50.5800) | |
| Schenker XMG Pro 15 (Late 2021) (v6.50.5800, Stromsparmodus) | |
| Schenker XMG Pro 15 (Late 2021) (v6.50.5800, Lautlosmodus) | |
| Média Intel Core i7-11800H (11898 - 26757, n=21) | |
| MSI Delta 15 A5EFK (v6.33.5700) | |
| Schenker XMG Pro 15 (Early 2021, RTX 3080) (v6.32.5600) | |
| Lenovo Legion S7 15ACH6 82K80030GE (v6.33.5700) | |
Desempenho do sistema
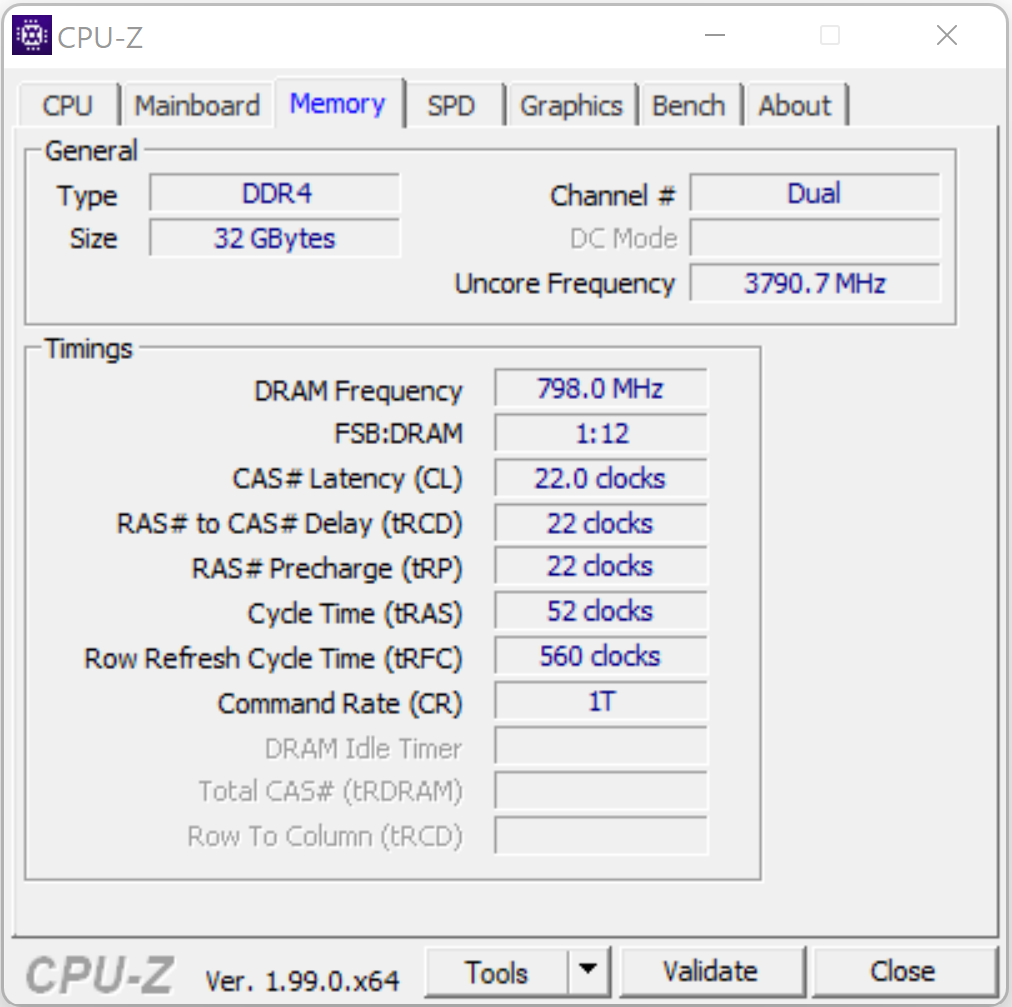
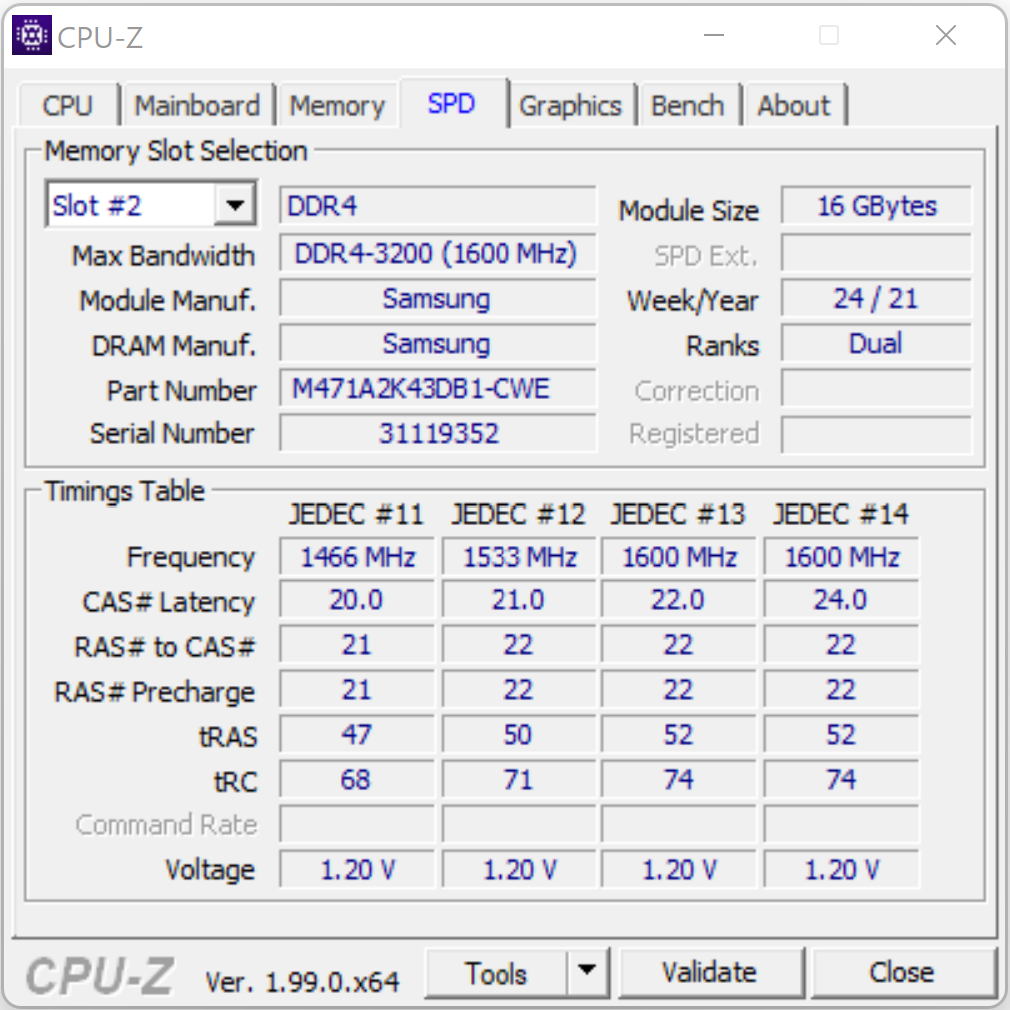
O sistema se sente suave e responsivo. Os componentes são mais do que suficientes para cargas de trabalho exigentes, como jogos, bem como edição de vídeo e fotos. As taxas de transferência da RAM correspondem às nossas expectativas para a RAM DDR4-3200. Finalmente, os resultados do PCMark são excelentes
| PCMark 8 Home Score Accelerated v2 | 3941 pontos | |
| PCMark 8 Creative Score Accelerated v2 | 6411 pontos | |
| PCMark 8 Work Score Accelerated v2 | 4756 pontos | |
| PCMark 10 Score | 6673 pontos | |
Ajuda | ||
| PCMark 10 / Score | |
| Média da turma Gaming (5828 - 12414, n=93, últimos 2 anos) | |
| Razer Blade 15 Advanced (Mid 2021) | |
| MSI Delta 15 A5EFK | |
| Alienware x15 RTX 3070 P111F | |
| Média Intel Core i7-11800H, NVIDIA GeForce RTX 3080 Laptop GPU (6673 - 7470, n=11) | |
| Schenker XMG Pro 15 (Late 2021) | |
| Lenovo Legion S7 15ACH6 82K80030GE | |
| Schenker XMG Pro 15 (Early 2021, RTX 3080) | |
| PCMark 10 / Essentials | |
| Razer Blade 15 Advanced (Mid 2021) | |
| Média da turma Gaming (8810 - 11935, n=97, últimos 2 anos) | |
| MSI Delta 15 A5EFK | |
| Alienware x15 RTX 3070 P111F | |
| Média Intel Core i7-11800H, NVIDIA GeForce RTX 3080 Laptop GPU (9862 - 11064, n=11) | |
| Schenker XMG Pro 15 (Late 2021) | |
| Lenovo Legion S7 15ACH6 82K80030GE | |
| Schenker XMG Pro 15 (Early 2021, RTX 3080) | |
| PCMark 10 / Productivity | |
| Média da turma Gaming (6845 - 25323, n=95, últimos 2 anos) | |
| MSI Delta 15 A5EFK | |
| Média Intel Core i7-11800H, NVIDIA GeForce RTX 3080 Laptop GPU (8278 - 9803, n=11) | |
| Alienware x15 RTX 3070 P111F | |
| Razer Blade 15 Advanced (Mid 2021) | |
| Lenovo Legion S7 15ACH6 82K80030GE | |
| Schenker XMG Pro 15 (Early 2021, RTX 3080) | |
| Schenker XMG Pro 15 (Late 2021) | |
| PCMark 10 / Digital Content Creation | |
| Média da turma Gaming (7602 - 19954, n=95, últimos 2 anos) | |
| Alienware x15 RTX 3070 P111F | |
| Razer Blade 15 Advanced (Mid 2021) | |
| MSI Delta 15 A5EFK | |
| Média Intel Core i7-11800H, NVIDIA GeForce RTX 3080 Laptop GPU (9881 - 11323, n=11) | |
| Schenker XMG Pro 15 (Late 2021) | |
| Schenker XMG Pro 15 (Early 2021, RTX 3080) | |
| Lenovo Legion S7 15ACH6 82K80030GE | |
| AIDA64 / Memory Copy | |
| Média da turma Gaming (21750 - 129946, n=105, últimos 2 anos) | |
| Schenker XMG Pro 15 (Late 2021) | |
| Média Intel Core i7-11800H (24508 - 48144, n=21) | |
| MSI Delta 15 A5EFK | |
| Lenovo Legion S7 15ACH6 82K80030GE | |
| Schenker XMG Pro 15 (Early 2021, RTX 3080) | |
| AIDA64 / Memory Read | |
| Média da turma Gaming (22956 - 118858, n=105, últimos 2 anos) | |
| Schenker XMG Pro 15 (Late 2021) | |
| MSI Delta 15 A5EFK | |
| Lenovo Legion S7 15ACH6 82K80030GE | |
| Média Intel Core i7-11800H (25882 - 50365, n=20) | |
| Schenker XMG Pro 15 (Early 2021, RTX 3080) | |
| AIDA64 / Memory Write | |
| Média da turma Gaming (22297 - 135096, n=105, últimos 2 anos) | |
| Schenker XMG Pro 15 (Late 2021) | |
| MSI Delta 15 A5EFK | |
| Média Intel Core i7-11800H (22240 - 46214, n=20) | |
| Lenovo Legion S7 15ACH6 82K80030GE | |
| Schenker XMG Pro 15 (Early 2021, RTX 3080) | |
| AIDA64 / Memory Latency | |
| Média da turma Gaming (75.3 - 259, n=105, últimos 2 anos) | |
| Schenker XMG Pro 15 (Late 2021) | |
| Lenovo Legion S7 15ACH6 82K80030GE | |
| MSI Delta 15 A5EFK | |
| Schenker XMG Pro 15 (Early 2021, RTX 3080) | |
| Média Intel Core i7-11800H (71.9 - 104.1, n=44) | |
| Razer Blade 15 Advanced (Mid 2021) | |
| Alienware x15 RTX 3070 P111F | |
* ... menor é melhor
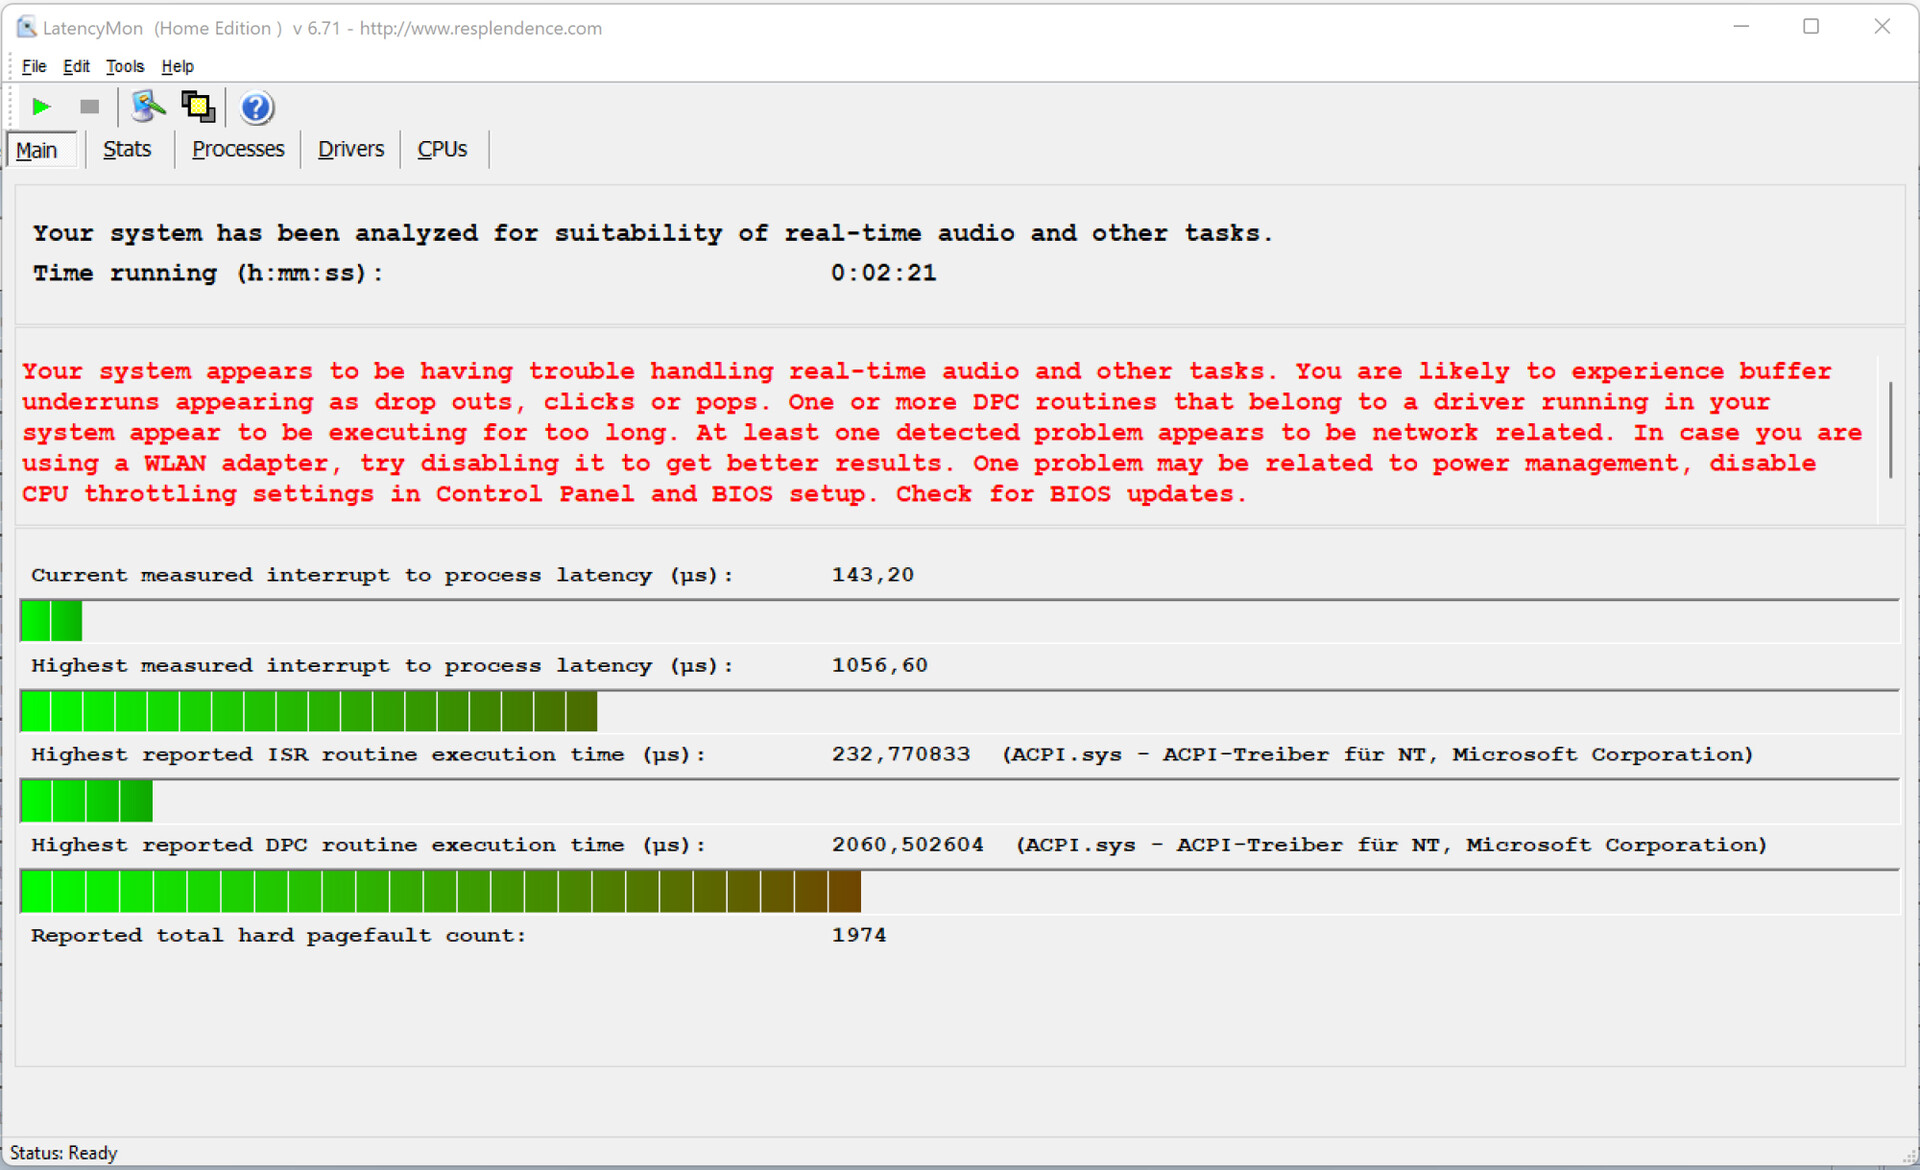
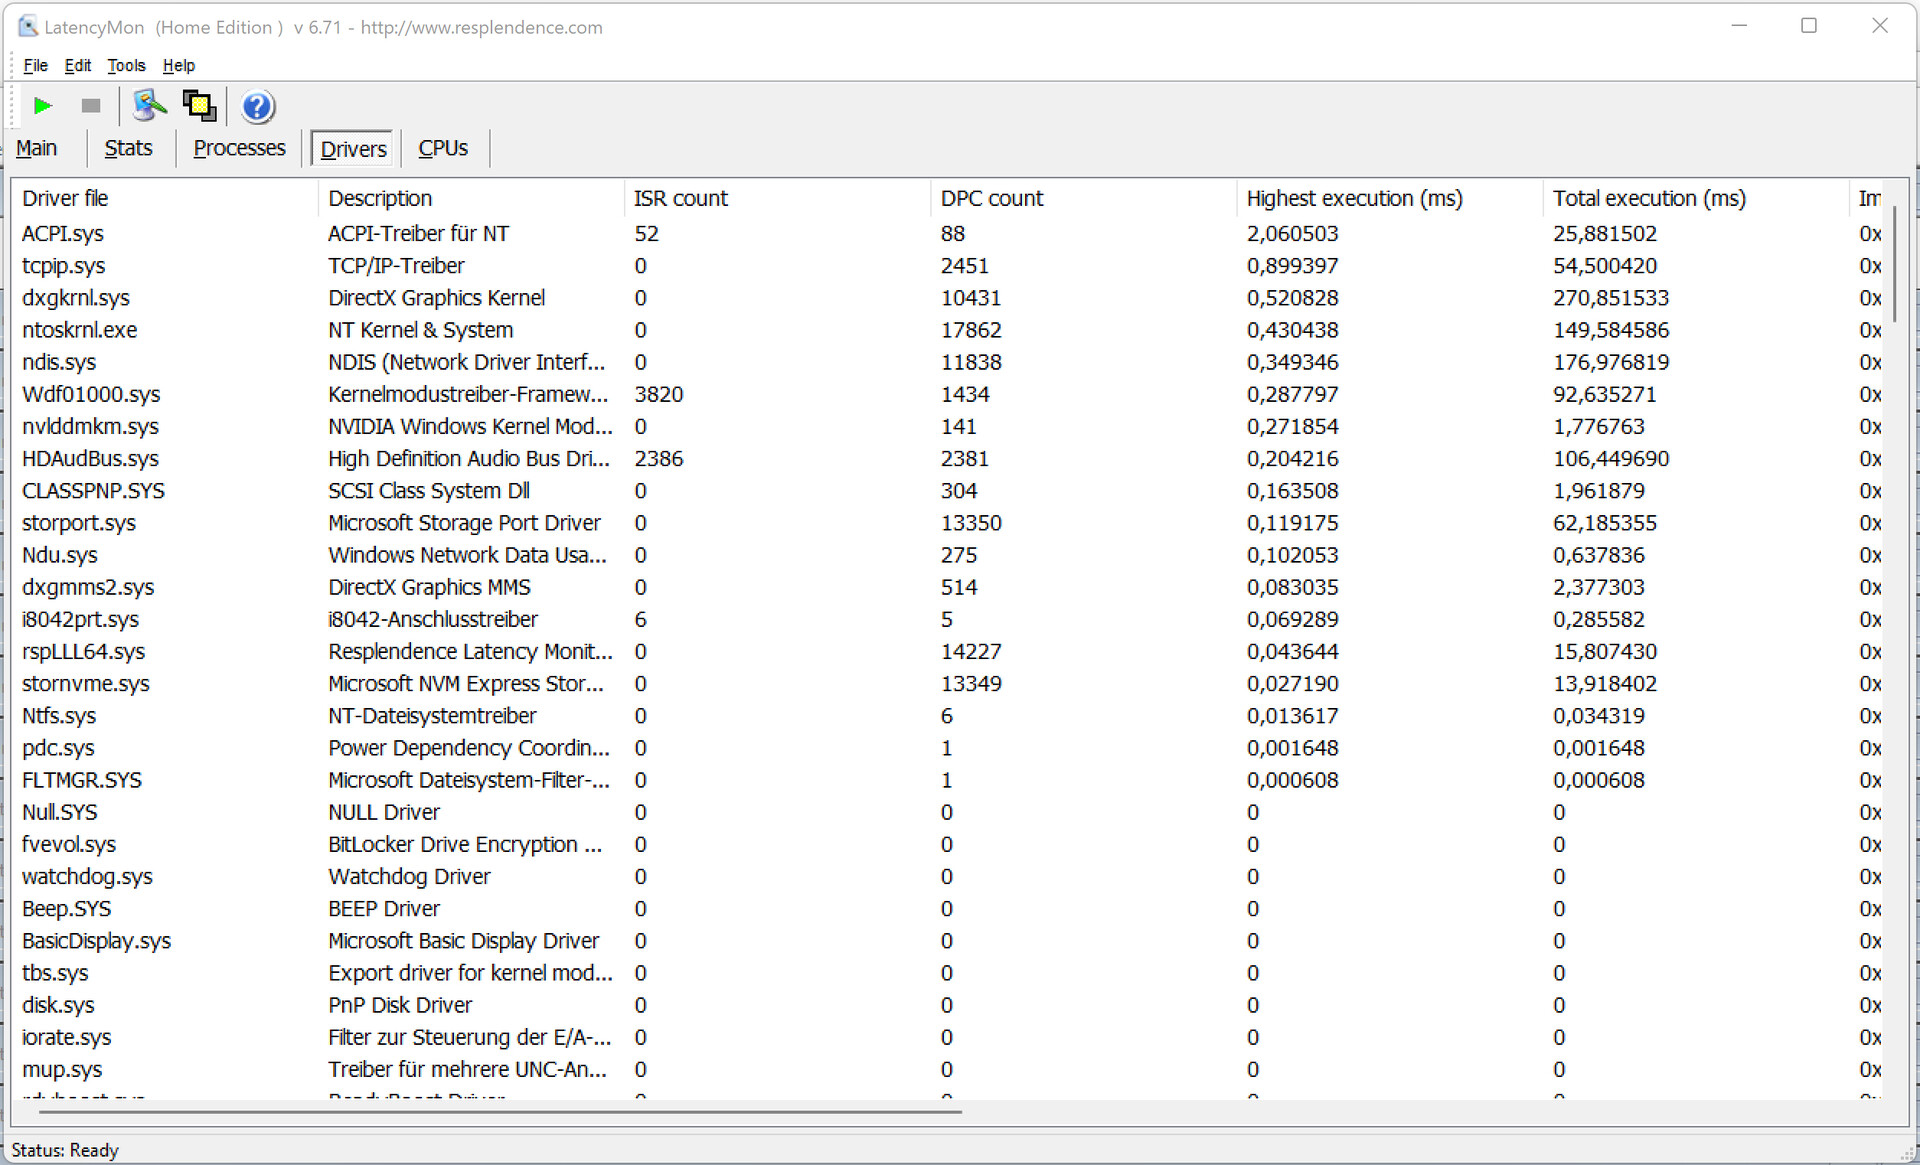
Latências DPC
Nosso teste padronizado LatencyMon (navegação na web, reprodução de vídeo 4K, Prime95 de alta carga) revelou latências DPC potencialmente problemáticas. O sistema não parece ser adequado para edição de vídeo e áudio em tempo real. Futuras atualizações de software podem melhorar ou exacerbar o problema
| DPC Latencies / LatencyMon - interrupt to process latency (max), Web, Youtube, Prime95 | |
| Razer Blade 15 Advanced (Mid 2021) | |
| MSI Delta 15 A5EFK | |
| Alienware x15 RTX 3070 P111F | |
| Schenker XMG Pro 15 (Late 2021) | |
| Schenker XMG Pro 15 (Early 2021, RTX 3080) | |
| Lenovo Legion S7 15ACH6 82K80030GE | |
* ... menor é melhor
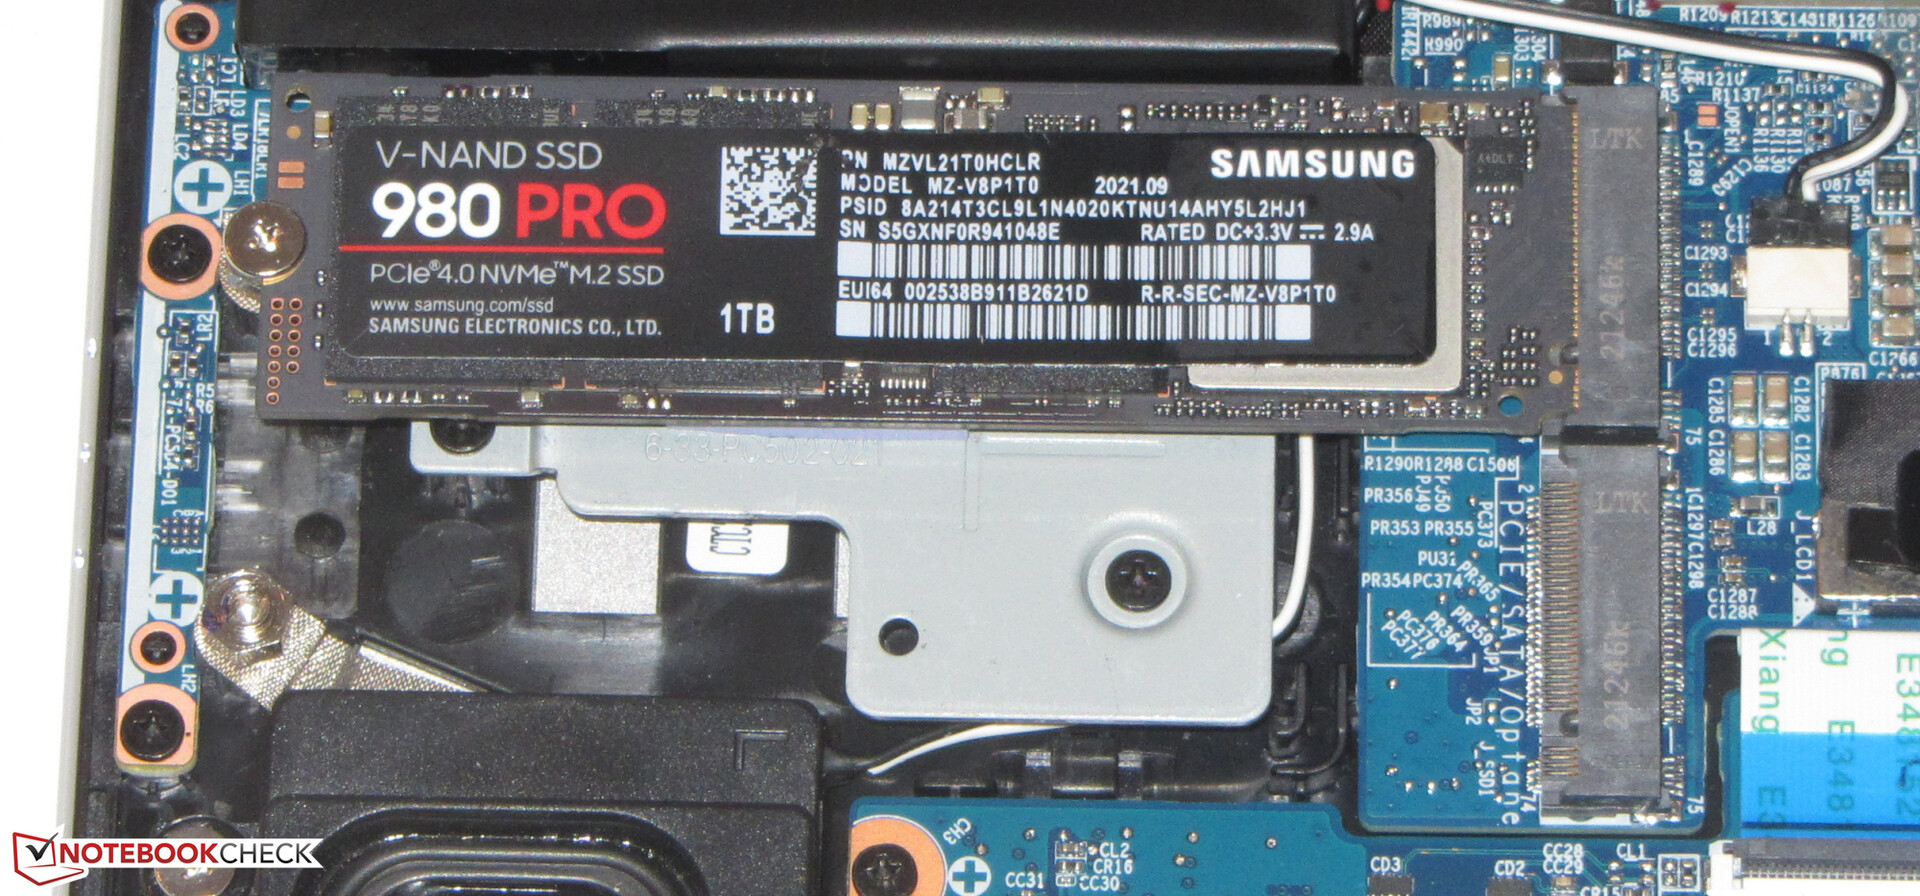
Solução de armazenamento
Um SSD Samsung 1 TB (NVMe, M.2-2280) serve como a unidade do sistema e atinge excelentes taxas de transferência graças a sua interface PCIe 4. O laptop suporta até dois M.2-2280 SSDs (1x PCIe 4.0, 1x PCIe 3.0/SATA) no total. O RAID 0/1 também é suportado

* ... menor é melhor
Disk Throttling: DiskSpd Read Loop, Queue Depth 8
Desempenho da GPU
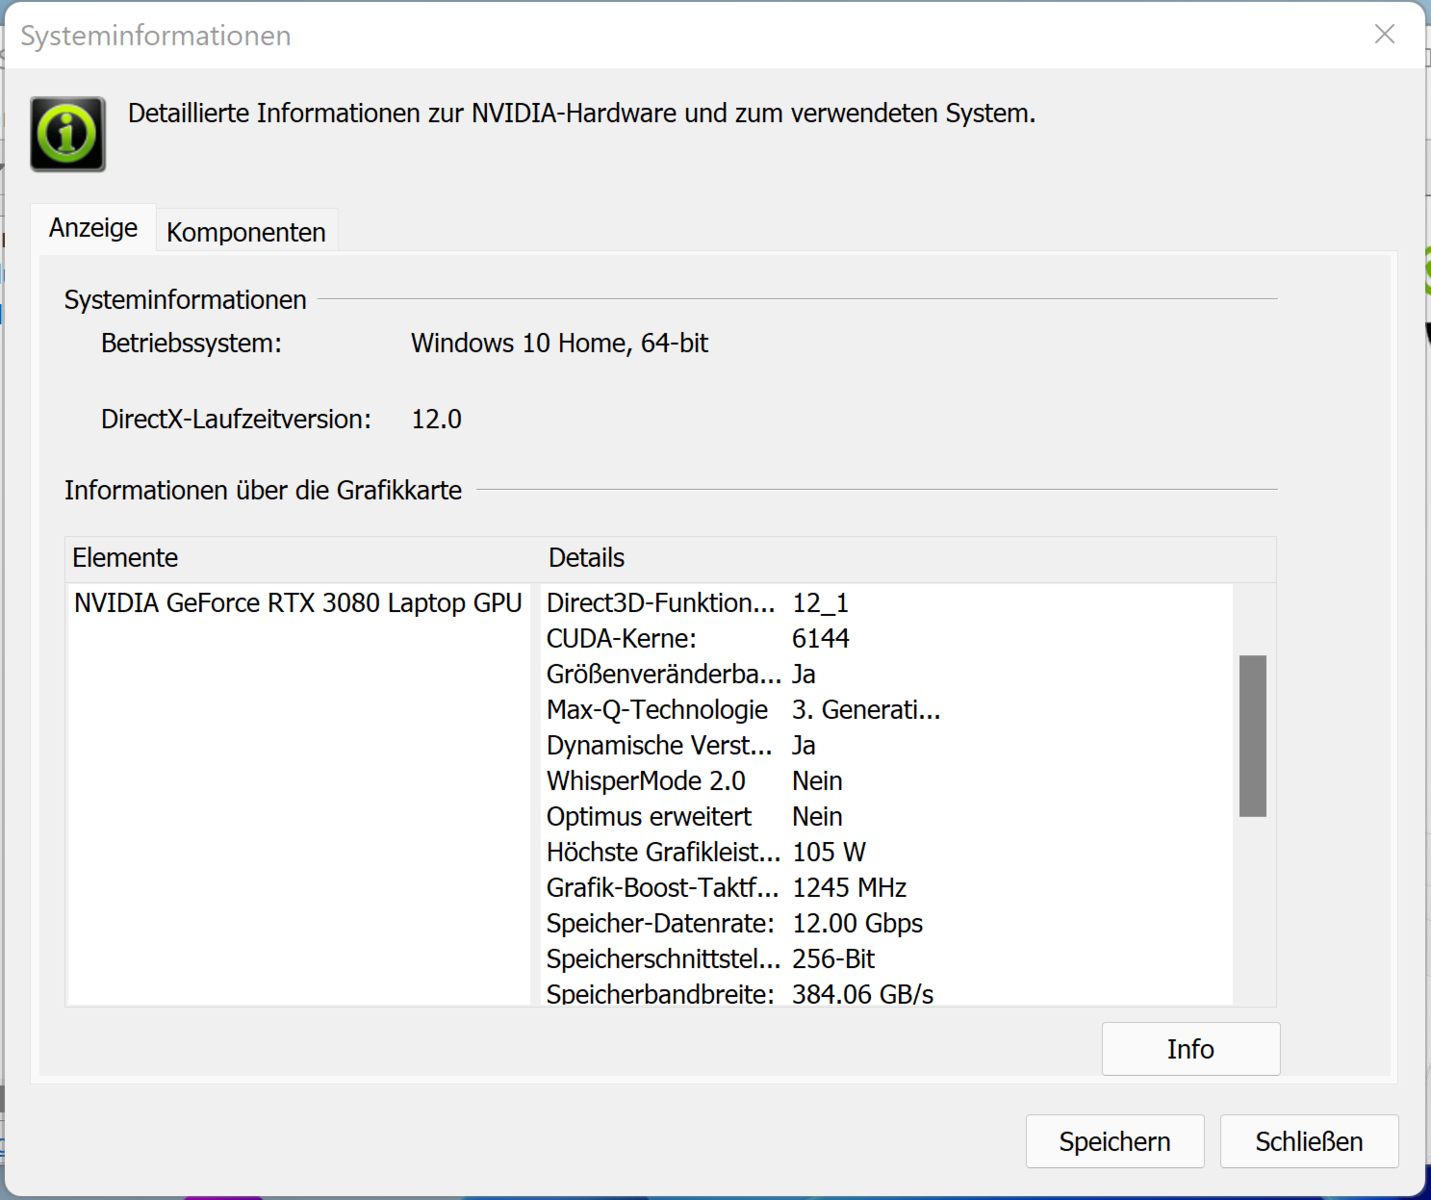
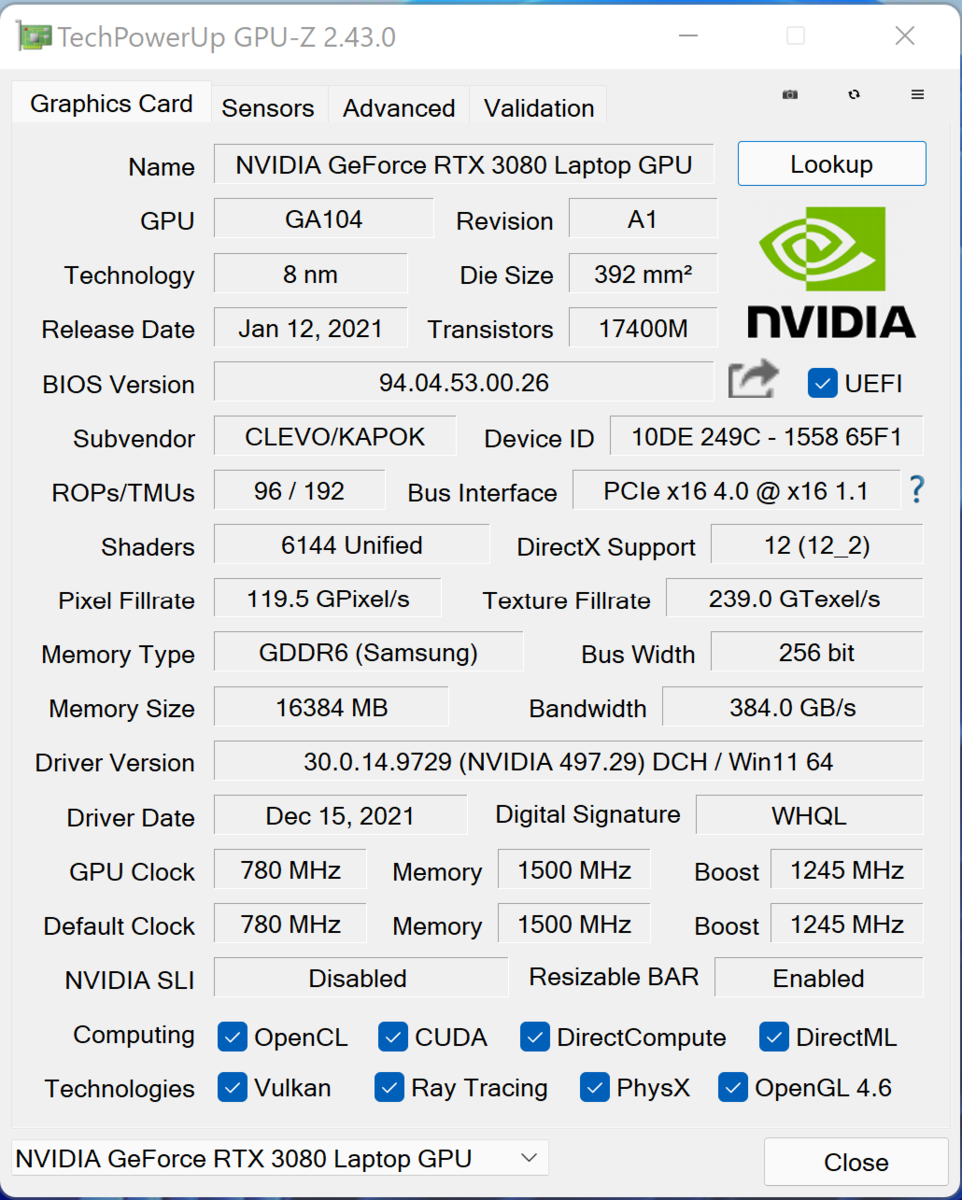
O desempenho real de uma GPU RTX 3000 depende de numerosos fatores: A solução de resfriamento, configuração de memória e TGP máximo, que o fabricante pode definir para um valor dentro de uma faixa que é predefinida pela Nvidia. A Schenker define o TGP máximo da instalação, móvel GeForce RTX 3080 GPU (visão geral de todos os computadores portáteis RTX 3080 e seus TGPs) a 105 watts (90 watts + 15 watts Dynamic Boost)
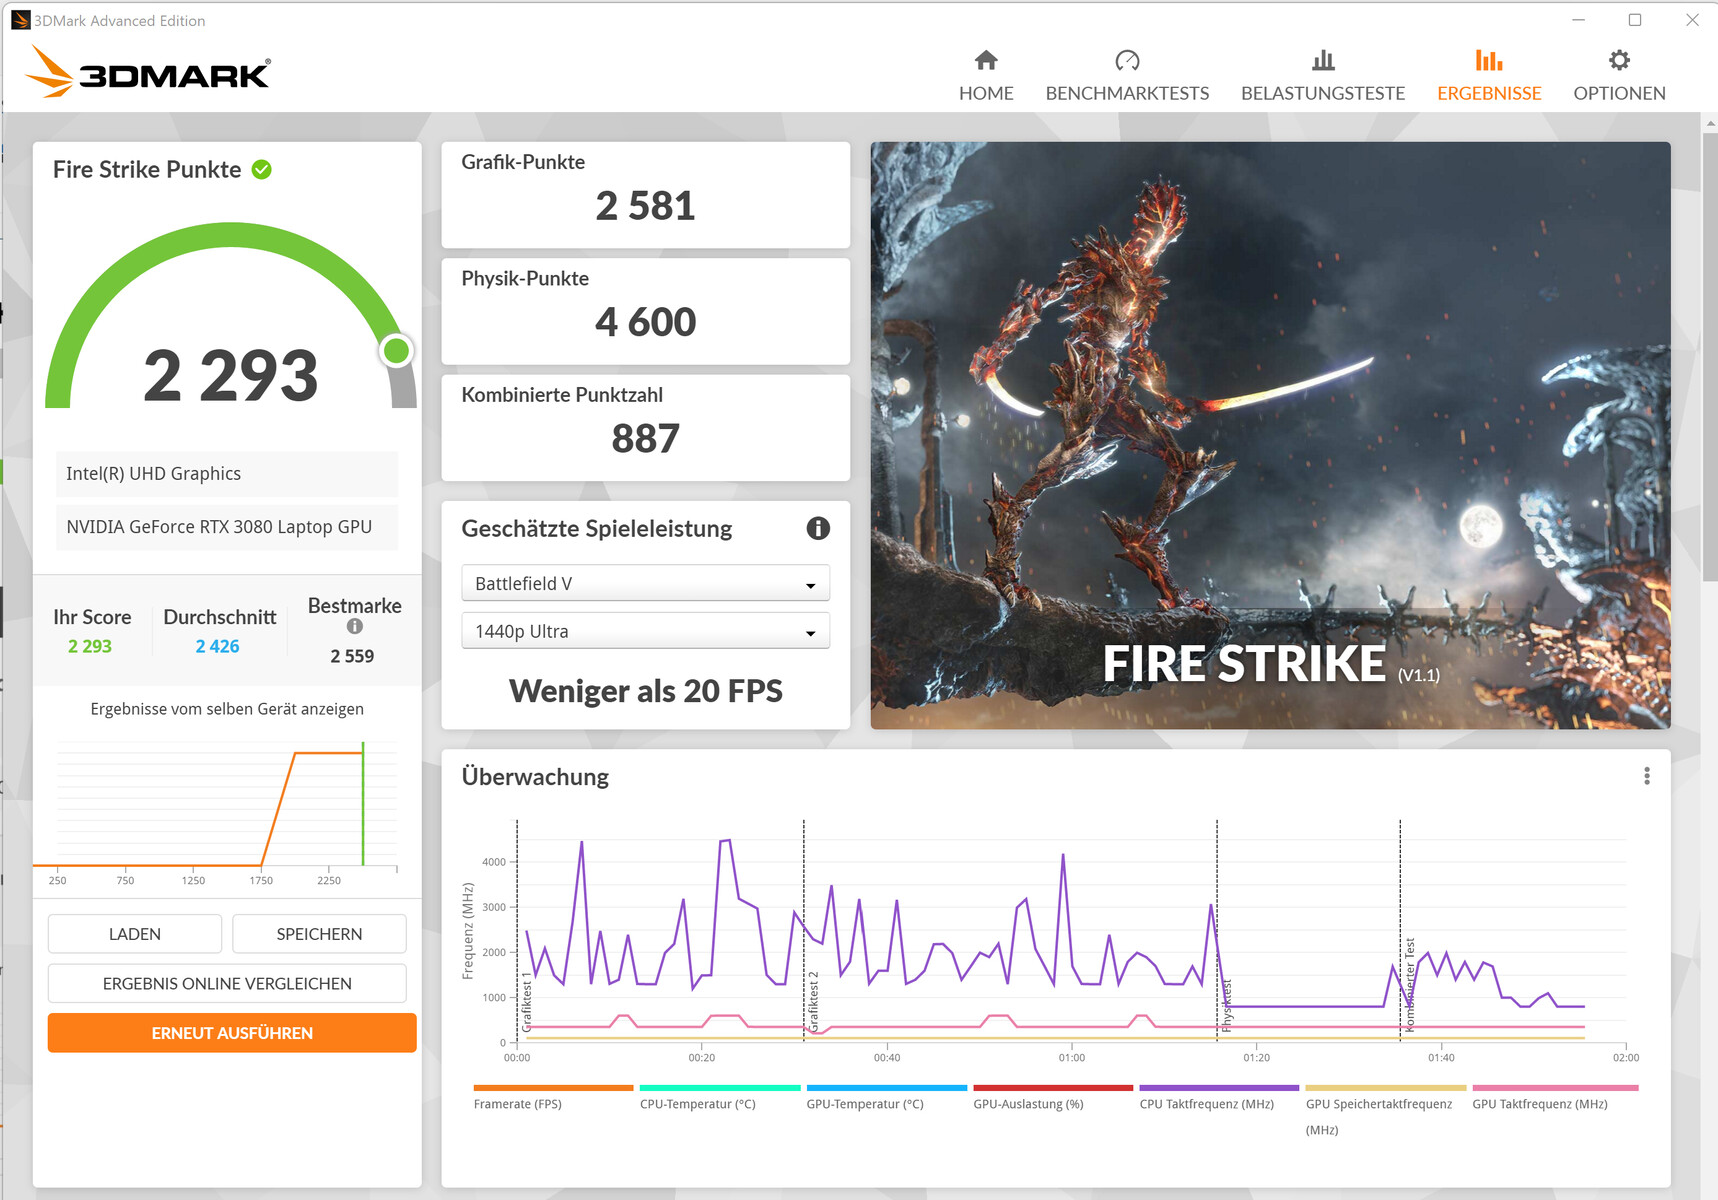
Os resultados do 3DMark são inferiores em comparação com nossa média anterior para o RTX 3080. Aqui, o TGP relativamente baixo se torna aparente. A pontuação de Razer Blade 15 Avançadoque é o concorrente direto de nosso dispositivo de teste, são comparáveis. Nosso Witcher 3 mostra que o TGP máximo pode ser mantido durante um período de tempo prolongado
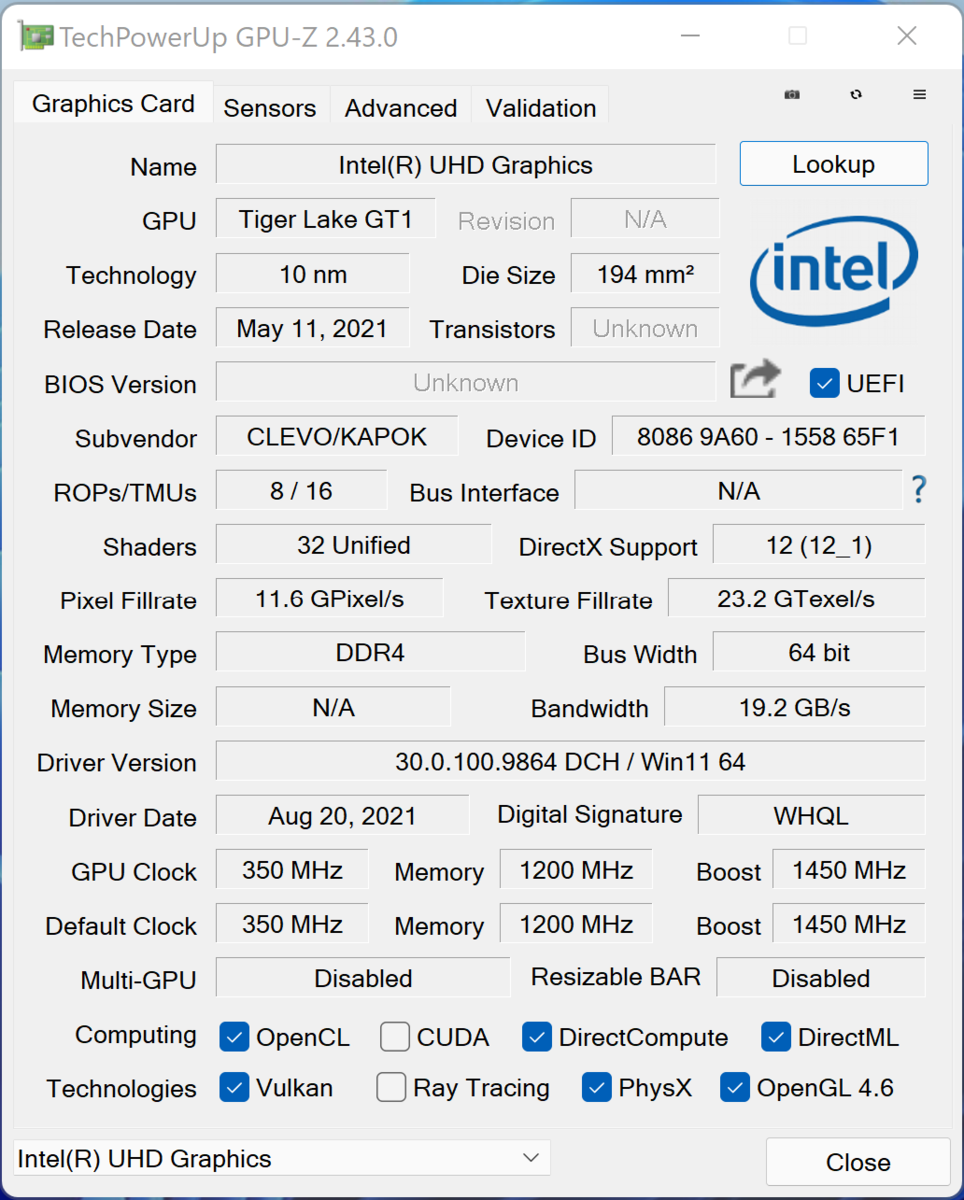
A GPU vem com memória de vídeo GDDR6 rápida (16384 MB). A memória de vídeo UHD Graphics Xe A GPU está habilitada e o laptop usa a tecnologia de comutação gráfica Optimus da Nvidia


| 3DMark 11 Performance | 29001 pontos | |
| 3DMark Fire Strike Score | 19449 pontos | |
| 3DMark Time Spy Score | 9882 pontos | |
Ajuda | ||
| 3DMark Performance rating - Percent | |
| Média da turma Gaming | |
| Média NVIDIA GeForce RTX 3080 Laptop GPU | |
| Razer Blade 15 Advanced (Mid 2021) | |
| Schenker XMG Pro 15 (Late 2021) | |
| Schenker XMG Pro 15 (Early 2021, RTX 3080) | |
| MSI Delta 15 A5EFK | |
| Alienware x15 RTX 3070 P111F | |
| Schenker XMG Pro 15 (Late 2021) -1! | |
| Schenker XMG Pro 15 (Late 2021) -1! | |
| Lenovo Legion S7 15ACH6 82K80030GE | |
| Schenker XMG Pro 15 (Late 2021) -1! | |
| 3DMark | |
| 1920x1080 Fire Strike Graphics | |
| Média da turma Gaming (12242 - 62849, n=115, últimos 2 anos) | |
| MSI Delta 15 A5EFK | |
| Média NVIDIA GeForce RTX 3080 Laptop GPU (16455 - 32366, n=46) | |
| Razer Blade 15 Advanced (Mid 2021) | |
| Schenker XMG Pro 15 (Early 2021, RTX 3080) | |
| Schenker XMG Pro 15 (Late 2021) | |
| Schenker XMG Pro 15 (Late 2021) (Unterhaltungsmodus) | |
| Alienware x15 RTX 3070 P111F | |
| Schenker XMG Pro 15 (Late 2021) (Lautlosmodus) | |
| Lenovo Legion S7 15ACH6 82K80030GE | |
| Schenker XMG Pro 15 (Late 2021) (Stromsparmodus) | |
| 2560x1440 Time Spy Graphics | |
| Média da turma Gaming (5012 - 26212, n=115, últimos 2 anos) | |
| Média NVIDIA GeForce RTX 3080 Laptop GPU (6407 - 13210, n=45) | |
| Razer Blade 15 Advanced (Mid 2021) | |
| Schenker XMG Pro 15 (Early 2021, RTX 3080) | |
| Schenker XMG Pro 15 (Late 2021) | |
| Alienware x15 RTX 3070 P111F | |
| Schenker XMG Pro 15 (Late 2021) (Unterhaltungsmodus) | |
| MSI Delta 15 A5EFK | |
| Schenker XMG Pro 15 (Late 2021) (Lautlosmodus) | |
| Lenovo Legion S7 15ACH6 82K80030GE | |
| Schenker XMG Pro 15 (Late 2021) (Stromsparmodus) | |
Desempenho nos jogos
Com resolução FHD e ajustes de qualidade máxima, o hardware exibe sem esforço todos os jogos atuais sem problemas. Também é possível escolher resoluções mais altas, embora com ajustes reduzidos de detalhes. As taxas de quadros oscilam em torno da média para o RTX 3080 - às vezes o Pro 15 o excede, outras vezes ele fica ligeiramente atrás
| The Witcher 3 - 1920x1080 Ultra Graphics & Postprocessing (HBAO+) | |
| Média da turma Gaming (104.7 - 240, n=7, últimos 2 anos) | |
| Média NVIDIA GeForce RTX 3080 Laptop GPU (85.1 - 123, n=40) | |
| Razer Blade 15 Advanced (Mid 2021) | |
| Alienware x15 RTX 3070 P111F | |
| Schenker XMG Pro 15 (Late 2021) | |
| Schenker XMG Pro 15 (Early 2021, RTX 3080) | |
| MSI Delta 15 A5EFK | |
| Schenker XMG Pro 15 (Late 2021) (Lautlosmodus) | |
| Lenovo Legion S7 15ACH6 82K80030GE | |
| Dota 2 Reborn | |
| 1920x1080 ultra (3/3) best looking | |
| Média da turma Gaming (84.8 - 248, n=107, últimos 2 anos) | |
| Razer Blade 15 Advanced (Mid 2021) | |
| Schenker XMG Pro 15 (Late 2021) | |
| Alienware x15 RTX 3070 P111F | |
| Média NVIDIA GeForce RTX 3080 Laptop GPU (98 - 156, n=45) | |
| Schenker XMG Pro 15 (Late 2021) (Unterhaltungsmodus) | |
| Lenovo Legion S7 15ACH6 82K80030GE | |
| Schenker XMG Pro 15 (Early 2021, RTX 3080) | |
| Schenker XMG Pro 15 (Late 2021) (Stromsparmodus) | |
| MSI Delta 15 A5EFK | |
| Schenker XMG Pro 15 (Late 2021) (Lautlosmodus) | |
| 3840x2160 ultra (3/3) best looking | |
| Média da turma Gaming (114.9 - 199.2, n=32, últimos 2 anos) | |
| Schenker XMG Pro 15 (Late 2021) | |
| Schenker XMG Pro 15 (Late 2021) (Unterhaltungsmodus) | |
| Média NVIDIA GeForce RTX 3080 Laptop GPU (55.2 - 128, n=17) | |
| Lenovo Legion S7 15ACH6 82K80030GE | |
| Schenker XMG Pro 15 (Late 2021) (Lautlosmodus) | |
| Schenker XMG Pro 15 (Late 2021) (Stromsparmodus) | |
| X-Plane 11.11 | |
| 1920x1080 high (fps_test=3) | |
| Média da turma Gaming (55.5 - 143.5, n=109, últimos 2 anos) | |
| Razer Blade 15 Advanced (Mid 2021) | |
| Alienware x15 RTX 3070 P111F | |
| Schenker XMG Pro 15 (Late 2021) | |
| Schenker XMG Pro 15 (Late 2021) (Unterhaltungsmodus) | |
| Média NVIDIA GeForce RTX 3080 Laptop GPU (65.6 - 113, n=44) | |
| Schenker XMG Pro 15 (Early 2021, RTX 3080) | |
| Schenker XMG Pro 15 (Late 2021) (Stromsparmodus) | |
| Lenovo Legion S7 15ACH6 82K80030GE | |
| Schenker XMG Pro 15 (Late 2021) (Lautlosmodus) | |
| 3840x2160 high (fps_test=3) | |
| Média da turma Gaming (60 - 124.1, n=32, últimos 2 anos) | |
| Schenker XMG Pro 15 (Late 2021) | |
| Média NVIDIA GeForce RTX 3080 Laptop GPU (39.9 - 88.6, n=17) | |
| Schenker XMG Pro 15 (Late 2021) (Unterhaltungsmodus) | |
| Schenker XMG Pro 15 (Late 2021) (Stromsparmodus) | |
| Lenovo Legion S7 15ACH6 82K80030GE | |
| Schenker XMG Pro 15 (Late 2021) (Lautlosmodus) | |
| GTA V | |
| 1920x1080 Highest AA:4xMSAA + FX AF:16x | |
| Média da turma Gaming (48.3 - 186.9, n=94, últimos 2 anos) | |
| Razer Blade 15 Advanced (Mid 2021) | |
| Schenker XMG Pro 15 (Late 2021) | |
| Schenker XMG Pro 15 (Late 2021) (Unterhaltungsmodus) | |
| Média NVIDIA GeForce RTX 3080 Laptop GPU (68.6 - 114.6, n=34) | |
| Alienware x15 RTX 3070 P111F | |
| Lenovo Legion S7 15ACH6 82K80030GE | |
| MSI Delta 15 A5EFK | |
| Schenker XMG Pro 15 (Late 2021) (Stromsparmodus) | |
| Schenker XMG Pro 15 (Late 2021) (Lautlosmodus) | |
| 2560x1440 Highest AA:4xMSAA + FX AF:16x | |
| Média da turma Gaming (36.9 - 183.9, n=72, últimos 2 anos) | |
| Média NVIDIA GeForce RTX 3080 Laptop GPU (82.2 - 99.1, n=12) | |
| Schenker XMG Pro 15 (Late 2021) | |
| Alienware x15 RTX 3070 P111F | |
| Lenovo Legion S7 15ACH6 82K80030GE | |
| 3840x2160 Highest AA:4xMSAA + FX AF:16x | |
| Média da turma Gaming (53.9 - 123.2, n=25, últimos 2 anos) | |
| Média NVIDIA GeForce RTX 3080 Laptop GPU (32.4 - 57.8, n=9) | |
| Schenker XMG Pro 15 (Late 2021) | |
| Schenker XMG Pro 15 (Late 2021) (Unterhaltungsmodus) | |
| Schenker XMG Pro 15 (Late 2021) (Stromsparmodus) | |
| Strange Brigade | |
| 1920x1080 ultra AA:ultra AF:16 | |
| Média da turma Gaming (76.3 - 458, n=87, últimos 2 anos) | |
| Média NVIDIA GeForce RTX 3080 Laptop GPU (117 - 219, n=34) | |
| Razer Blade 15 Advanced (Mid 2021) (1.47.22.14 D3D12) | |
| Alienware x15 RTX 3070 P111F (1.47.22.14 D3D12) | |
| Schenker XMG Pro 15 (Late 2021) (1.47.22.14 D3D12) | |
| MSI Delta 15 A5EFK (1.47.22.14 D3D12) | |
| Schenker XMG Pro 15 (Late 2021) (1.47.22.14 D3D12, Unterhaltungsmodus) | |
| Schenker XMG Pro 15 (Late 2021) (1.47.22.14 D3D12, Lautlosmodus) | |
| Lenovo Legion S7 15ACH6 82K80030GE (1.47.22.14 D3D12) | |
| Schenker XMG Pro 15 (Late 2021) (1.47.22.14 D3D12, Stromsparmodus) | |
| 2560x1440 ultra AA:ultra AF:16 | |
| Média da turma Gaming (52.8 - 354, n=76, últimos 2 anos) | |
| Média NVIDIA GeForce RTX 3080 Laptop GPU (123 - 165, n=14) | |
| Alienware x15 RTX 3070 P111F (1.47.22.14 D3D12) | |
| Schenker XMG Pro 15 (Late 2021) (1.47.22.14 D3D12) | |
| Lenovo Legion S7 15ACH6 82K80030GE (1.47.22.14 D3D12) | |
| 3840x2160 ultra AA:ultra AF:16 | |
| Média da turma Gaming (83 - 187.2, n=34, últimos 2 anos) | |
| Média NVIDIA GeForce RTX 3080 Laptop GPU (55.9 - 91.7, n=12) | |
| Schenker XMG Pro 15 (Late 2021) (1.47.22.14 D3D12) | |
| Schenker XMG Pro 15 (Late 2021) (1.47.22.14 D3D12, Unterhaltungsmodus) | |
| Schenker XMG Pro 15 (Late 2021) (1.47.22.14 D3D12, Lautlosmodus) | |
| Lenovo Legion S7 15ACH6 82K80030GE (1.47.22.14 D3D12) | |
| Schenker XMG Pro 15 (Late 2021) (1.47.22.14 D3D12, Stromsparmodus) | |
| F1 2021 | |
| 1920x1080 Ultra High Preset + Raytracing AA:T AF:16x | |
| Schenker XMG Pro 15 (Late 2021) (831795) | |
| Schenker XMG Pro 15 (Late 2021) (831795, Unterhaltungsmodus) | |
| Média NVIDIA GeForce RTX 3080 Laptop GPU (74.9 - 123.7, n=9) | |
| MSI Delta 15 A5EFK | |
| Schenker XMG Pro 15 (Late 2021) (831795, Lautlosmodus) | |
| Lenovo Legion S7 15ACH6 82K80030GE (815237) | |
| Schenker XMG Pro 15 (Late 2021) (831795, Stromsparmodus) | |
| 2560x1440 Ultra High Preset + Raytracing AA:T AF:16x | |
| Média NVIDIA GeForce RTX 3080 Laptop GPU (84 - 90.4, n=4) | |
| Schenker XMG Pro 15 (Late 2021) (831795) | |
| Lenovo Legion S7 15ACH6 82K80030GE (815237) | |
| 3840x2160 Ultra High Preset + Raytracing AA:T AF:16x | |
| Schenker XMG Pro 15 (Late 2021) (831795) | |
| Schenker XMG Pro 15 (Late 2021) (831795, Unterhaltungsmodus) | |
| Média NVIDIA GeForce RTX 3080 Laptop GPU (32.5 - 51.5, n=7) | |
| Schenker XMG Pro 15 (Late 2021) (831795, Lautlosmodus) | |
| Lenovo Legion S7 15ACH6 82K80030GE (815237) | |
| Schenker XMG Pro 15 (Late 2021) (831795, Stromsparmodus) | |
| Far Cry 6 | |
| 1920x1080 Ultra Graphics Quality + HD Textures AA:T | |
| Média da turma Gaming (n=1últimos 2 anos) | |
| Lenovo Legion S7 15ACH6 82K80030GE | |
| Média NVIDIA GeForce RTX 3080 Laptop GPU (55 - 104.4, n=5) | |
| MSI Delta 15 A5EFK | |
| Schenker XMG Pro 15 (Late 2021) | |
| 3840x2160 Ultra Graphics Quality + HD Textures AA:T | |
| Média NVIDIA GeForce RTX 3080 Laptop GPU (40 - 50, n=4) | |
| Schenker XMG Pro 15 (Late 2021) | |
| 1920x1080 Ultra Graphics Quality + HD Textures + DXR AA:T | |
| Média da turma Gaming (n=1últimos 2 anos) | |
| Média NVIDIA GeForce RTX 3080 Laptop GPU (59 - 84.7, n=4) | |
| Lenovo Legion S7 15ACH6 82K80030GE | |
| Schenker XMG Pro 15 (Late 2021) | |
| MSI Delta 15 A5EFK | |
| Guardians of the Galaxy | |
| 1920x1080 Ultra Preset | |
| Média NVIDIA GeForce RTX 3080 Laptop GPU (122 - 145, n=4) | |
| Schenker XMG Pro 15 (Late 2021) | |
| Lenovo Legion S7 15ACH6 82K80030GE | |
| 3840x2160 Ultra Preset | |
| Média NVIDIA GeForce RTX 3080 Laptop GPU (55 - 60, n=4) | |
| Schenker XMG Pro 15 (Late 2021) | |
| Lenovo Legion S7 15ACH6 82K80030GE | |
| 1920x1080 Ultra Preset + Ultra Ray-Tracing | |
| Média NVIDIA GeForce RTX 3080 Laptop GPU (75 - 85, n=4) | |
| Schenker XMG Pro 15 (Late 2021) | |
| Lenovo Legion S7 15ACH6 82K80030GE | |
| Riders Republic | |
| 1920x1080 Ultra Preset | |
| Média NVIDIA GeForce RTX 3080 Laptop GPU (104 - 115, n=2) | |
| Schenker XMG Pro 15 (Late 2021) | |
| Lenovo Legion S7 15ACH6 82K80030GE | |
| 3840x2160 Ultra Preset | |
| Média NVIDIA GeForce RTX 3080 Laptop GPU (41 - 47, n=2) | |
| Schenker XMG Pro 15 (Late 2021) | |
| Lenovo Legion S7 15ACH6 82K80030GE | |
| Forza Horizon 5 | |
| 1920x1080 Extreme Preset | |
| Média NVIDIA GeForce RTX 3080 Laptop GPU (81 - 84, n=4) | |
| Schenker XMG Pro 15 (Late 2021) | |
| 3840x2160 Extreme Preset | |
| Média NVIDIA GeForce RTX 3080 Laptop GPU (48 - 55, n=4) | |
| Schenker XMG Pro 15 (Late 2021) | |
| Battlefield 2042 | |
| 1920x1080 Ultra Preset | |
| Média NVIDIA GeForce RTX 3080 Laptop GPU (88.7 - 104, n=2) | |
| Schenker XMG Pro 15 (Late 2021) | |
| 3840x2160 Ultra Preset | |
| Média NVIDIA GeForce RTX 3080 Laptop GPU (43 - 50.2, n=2) | |
| Schenker XMG Pro 15 (Late 2021) | |
| 1920x1080 Ultra Preset + Ray Tracing | |
| Média NVIDIA GeForce RTX 3080 Laptop GPU (68 - 84.2, n=2) | |
| Schenker XMG Pro 15 (Late 2021) | |
| Halo Infinite | |
| 1920x1080 Ultra Preset | |
| Média NVIDIA GeForce RTX 3080 Laptop GPU (96.1 - 106, n=2) | |
| Schenker XMG Pro 15 (Late 2021) | |
| 3840x2160 Ultra Preset | |
| Média NVIDIA GeForce RTX 3080 Laptop GPU (40.2 - 46.2, n=2) | |
| Schenker XMG Pro 15 (Late 2021) | |
| Alan Wake Remastered | |
| 1920x1080 High Preset | |
| Schenker XMG Pro 15 (Late 2021) | |
| Média NVIDIA GeForce RTX 3080 Laptop GPU (95 - 111, n=2) | |
| Lenovo Legion S7 15ACH6 82K80030GE | |
| 3840x2160 High Preset | |
| Média NVIDIA GeForce RTX 3080 Laptop GPU (64.6 - 73.9, n=2) | |
| Schenker XMG Pro 15 (Late 2021) | |
| Lenovo Legion S7 15ACH6 82K80030GE | |
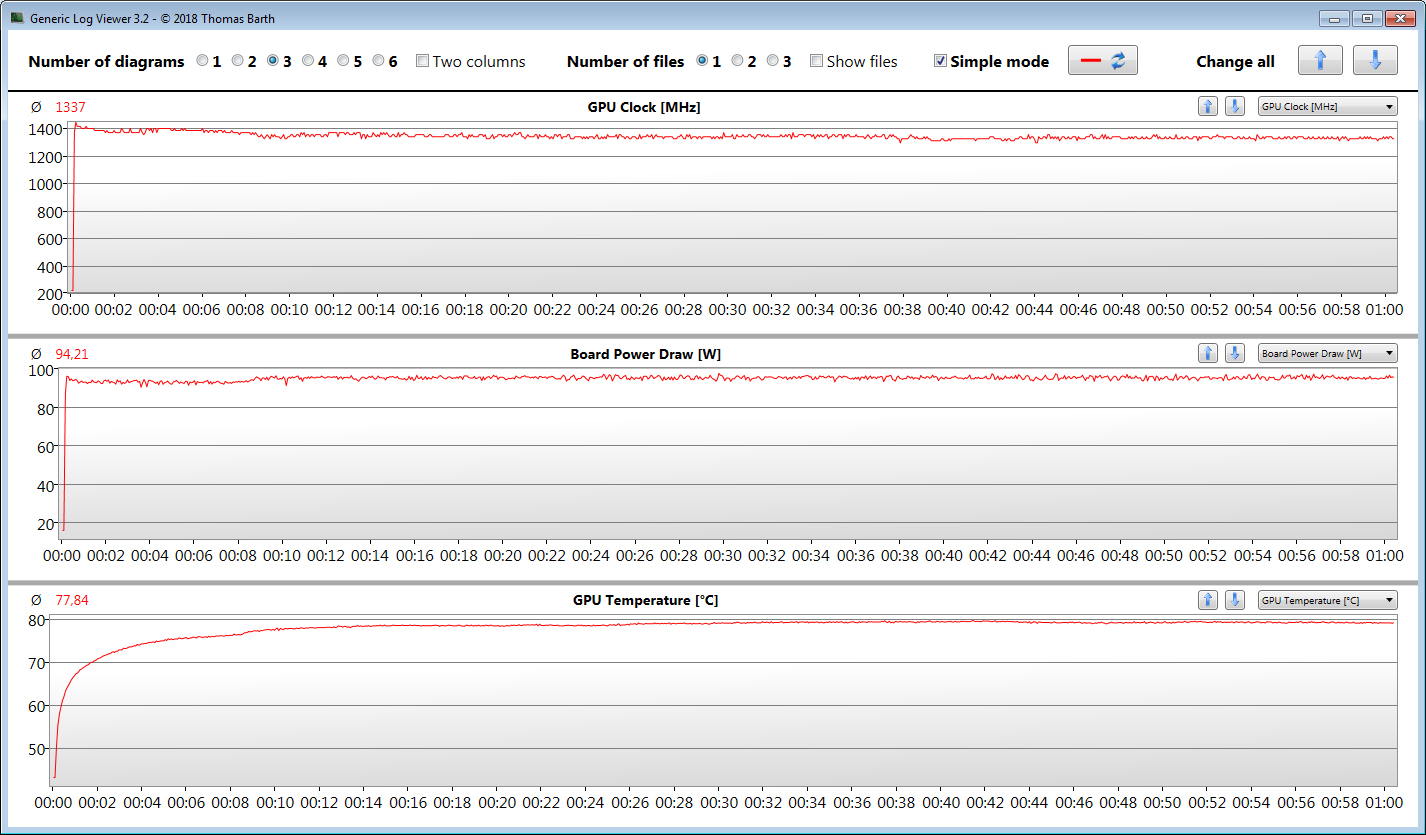
A fim de determinar se as taxas de quadros permanecem constantes durante um período prolongado, nós ociosamos no The Witcher 3 por cerca de 60 minutos na resolução FHD e detalhes máximos. O personagem não foi movido durante todo o período de tempo. Com o modo de desempenho selecionado, não observamos nenhuma queda de quadros
Witcher 3 FPS Diagram
| baixo | média | alto | ultra | QHD | 4K | |
|---|---|---|---|---|---|---|
| GTA V (2015) | 184 | 180 | 166 | 102 | 85.7 | 93 |
| The Witcher 3 (2015) | 399 | 285 | 176 | 100 | 69.6 | |
| Dota 2 Reborn (2015) | 164 | 146 | 137 | 132 | 116 | |
| Final Fantasy XV Benchmark (2018) | 187 | 129 | 97.5 | 74.6 | 44.1 | |
| X-Plane 11.11 (2018) | 128 | 109 | 88.5 | 67.9 | ||
| Far Cry 5 (2018) | 163 | 130 | 123 | 115 | 95 | 54 |
| Strange Brigade (2018) | 465 | 244 | 201 | 176 | 130 | 76 |
| F1 2021 (2021) | 314 | 219 | 190 | 117 | 87.4 | 49.6 |
| Alan Wake Remastered (2021) | 121 | 111 | 108 | 64.6 | ||
| Far Cry 6 (2021) | 101 | 82 | 75 | 70 | 62 | 40 |
| Guardians of the Galaxy (2021) | 130 | 122 | 124 | 122 | 95 | 55 |
| Riders Republic (2021) | 155 | 137 | 113 | 104 | 74 | 41 |
| Forza Horizon 5 (2021) | 214 | 131 | 122 | 81 | 67 | 48 |
| Battlefield 2042 (2021) | 133 | 110 | 99.8 | 88.7 | 69.9 | 43 |
| Halo Infinite (2021) | 118 | 101 | 96.1 | 70.4 | 40.2 |
Emissões - O notebook Schenker faz muito barulho
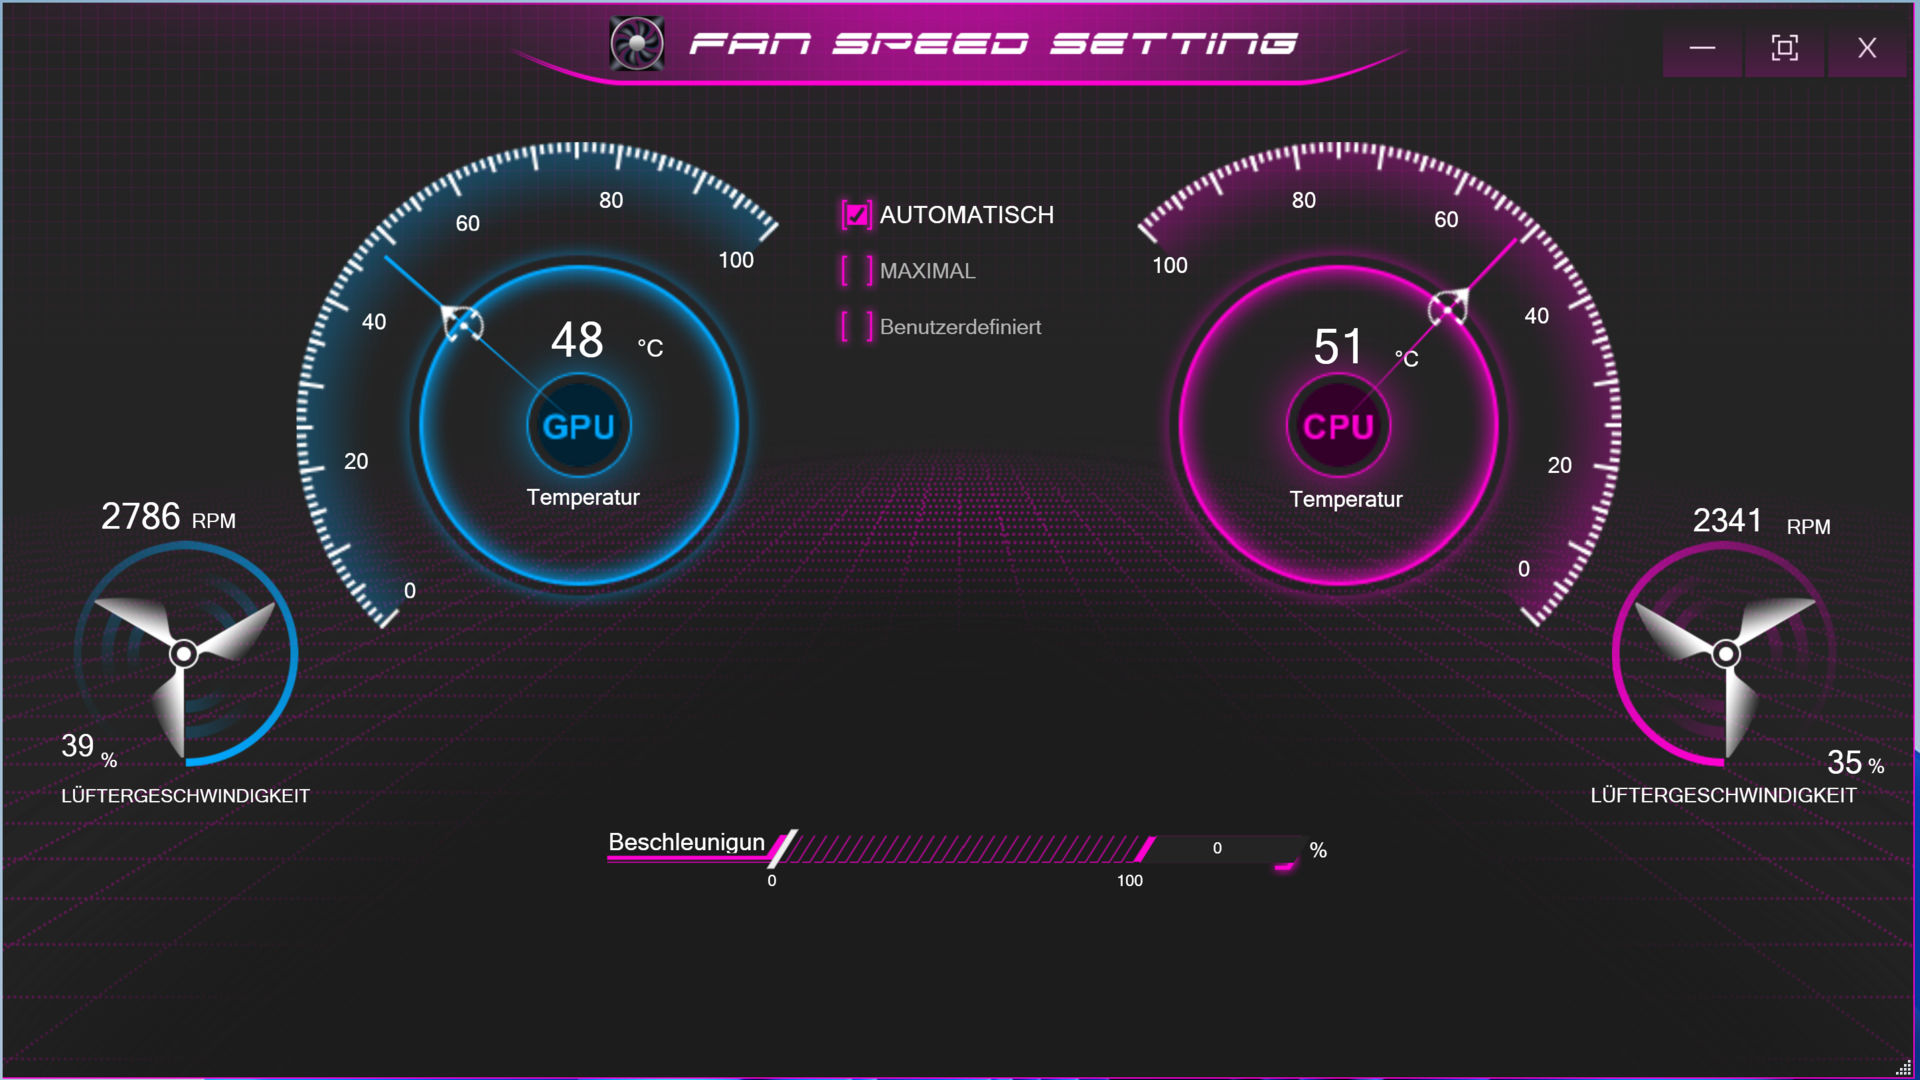
Ruído do sistema
Durante o uso diário (escritório, navegando na web), os dois ventiladores tendem a ser reservados e silenciosos. Entretanto, notamos que os ventiladores ocasionalmente aumentam desnecessariamente - isto aumenta o nível de ruído para até 41 dB(A). Sob carga, as coisas podem tornar-se muito ruidosas com valores máximos de 58 dB(A) (teste de estresse) e 53 dB(A) (Witcher 3 teste). O Lâmina Razer 15 produz consistentemente menos ruído, independentemente da carga do sistema
Os níveis de ruído sob carga podem ser reduzidos através da seleção do perfil de potência silencioso. Os ventiladores então giram muito silenciosamente. Enquanto isso, as taxas de relógio da CPU e da GPU são severamente limitadas. Embora ainda seja possível jogar neste modo, as configurações de qualidade ou resolução provavelmente precisarão ser reduzidas.
Barulho
| Ocioso |
| 31 / 37 / 41 dB |
| Carga |
| 56 / 58 dB |
 | ||
30 dB silencioso 40 dB(A) audível 50 dB(A) ruidosamente alto |
||
min: | ||
| Schenker XMG Pro 15 (Late 2021) i7-11800H, GeForce RTX 3080 Laptop GPU | Lenovo Legion S7 15ACH6 82K80030GE R9 5900HX, GeForce RTX 3060 Laptop GPU | Alienware x15 RTX 3070 P111F i7-11800H, GeForce RTX 3070 Laptop GPU | Razer Blade 15 Advanced (Mid 2021) i7-11800H, GeForce RTX 3080 Laptop GPU | Schenker XMG Pro 15 (Early 2021, RTX 3080) i7-10870H, GeForce RTX 3080 Laptop GPU | MSI Delta 15 A5EFK R9 5900HX, Radeon RX 6700M | |
|---|---|---|---|---|---|---|
| Noise | 11% | 19% | 19% | 4% | 10% | |
| desligado / ambiente * (dB) | 24 | 25 -4% | 24.1 -0% | 25.1 -5% | 25 -4% | 25 -4% |
| Idle Minimum * (dB) | 31 | 25 19% | 26.6 14% | 25.3 18% | 33 -6% | 25 19% |
| Idle Average * (dB) | 37 | 30 19% | 26.6 28% | 25.3 32% | 34 8% | 30 19% |
| Idle Maximum * (dB) | 41 | 36 12% | 26.6 35% | 25.3 38% | 35 15% | 40 2% |
| Load Average * (dB) | 56 | 42 25% | 30.9 45% | 42 25% | 51 9% | 47 16% |
| Witcher 3 ultra * (dB) | 53 | 53 -0% | 49.9 6% | 45.6 14% | 52 2% | 48 9% |
| Load Maximum * (dB) | 58 | 54 7% | 53.5 8% | 51.6 11% | 57 2% | 51 12% |
* ... menor é melhor
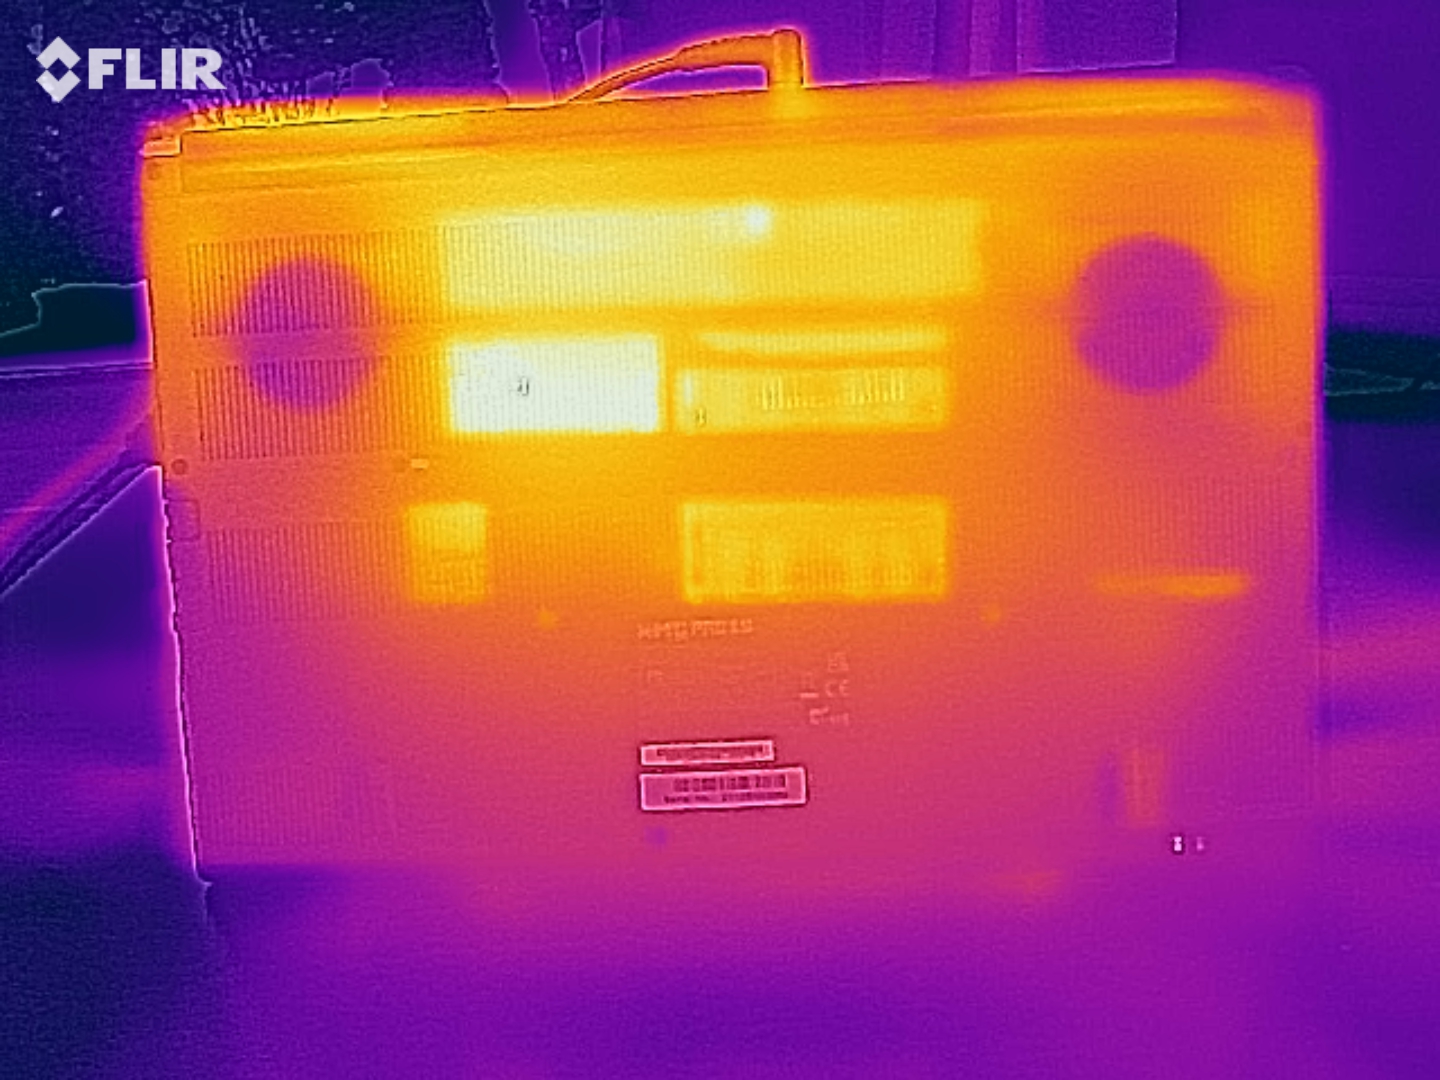
Temperatura
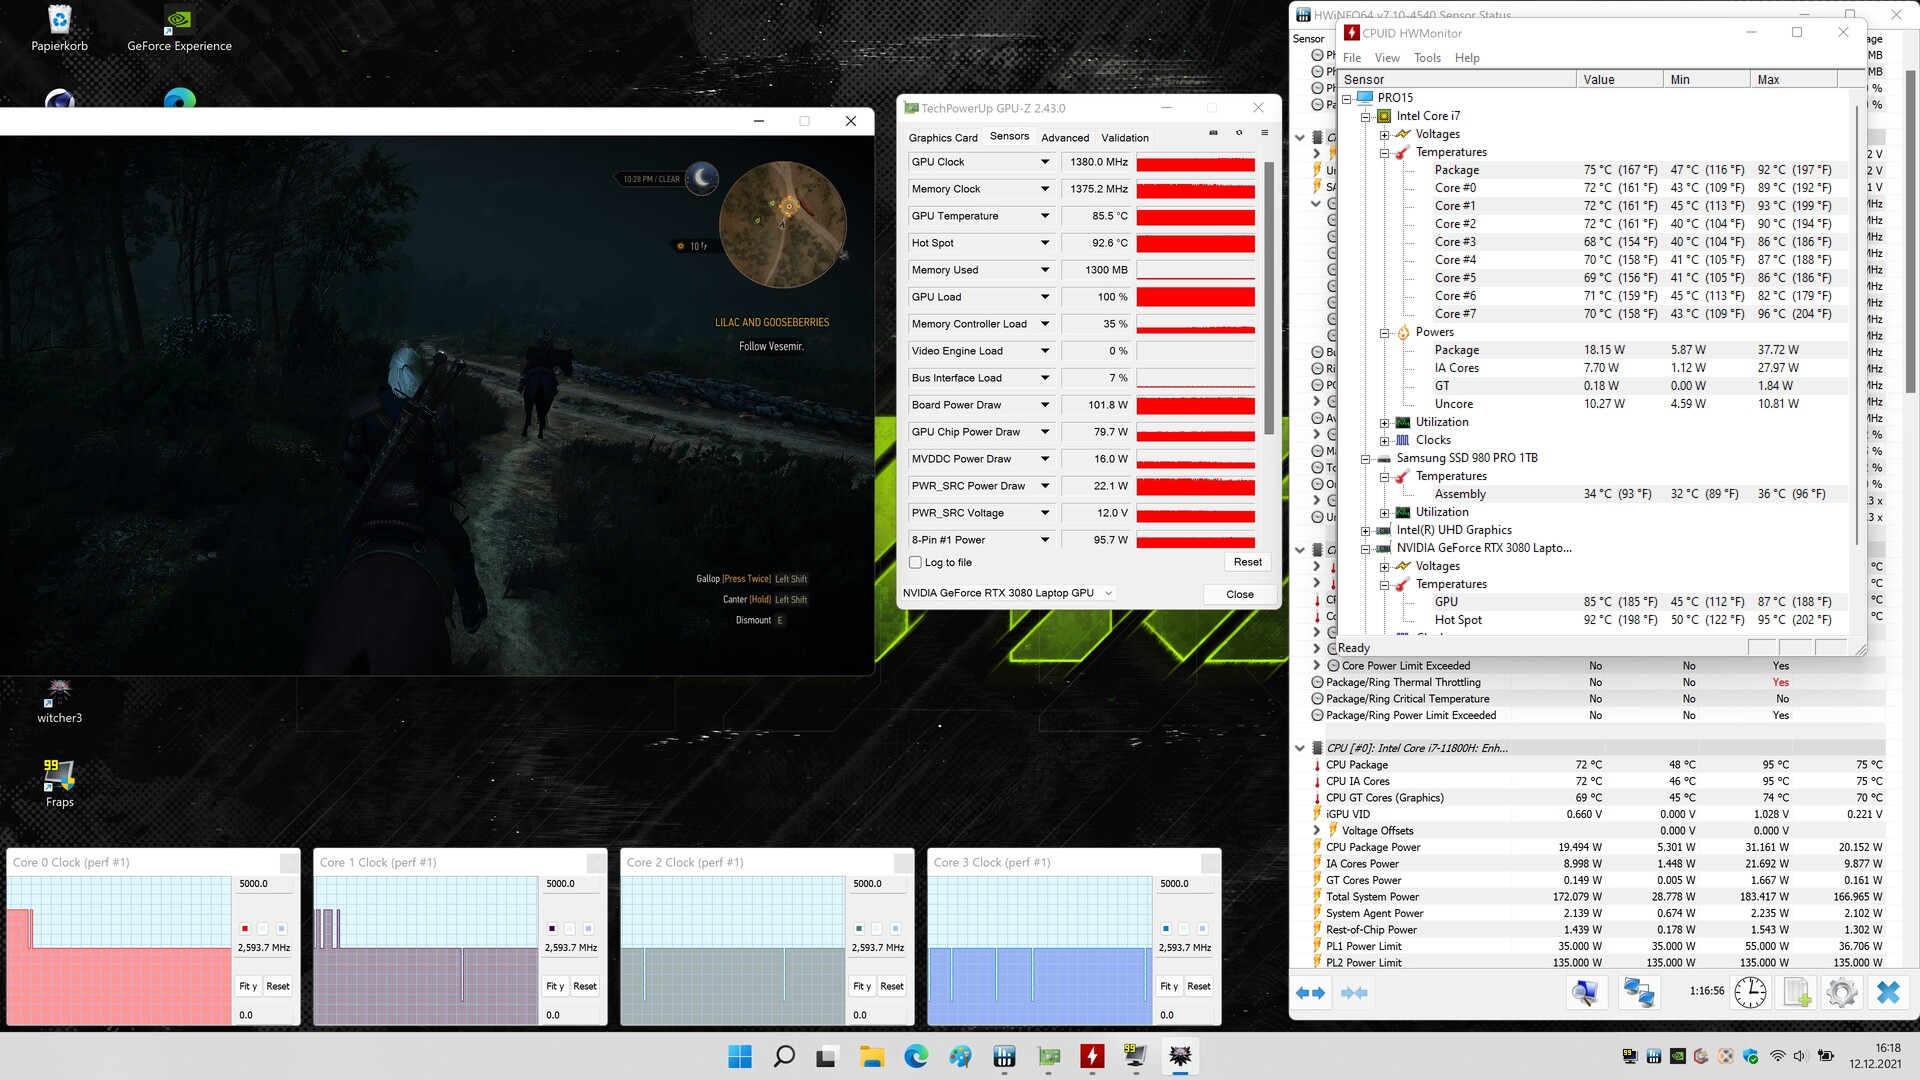
Durante o uso diário (escritório, navegando na web), as temperaturas da superfície permanecem baixas. Sob carga (teste de estresse, Witcher 3), o laptop fica muito quente. Em alguns pontos, medimos temperaturas acima de 60 °C (140 °F). No início do teste, a CPU atinge uma temperatura de 100 °C (212 °F) e, portanto, o máximo especificado pela Intel. Posteriormente, a temperatura estabiliza entre 90 e 100 °C (194-212 °F)
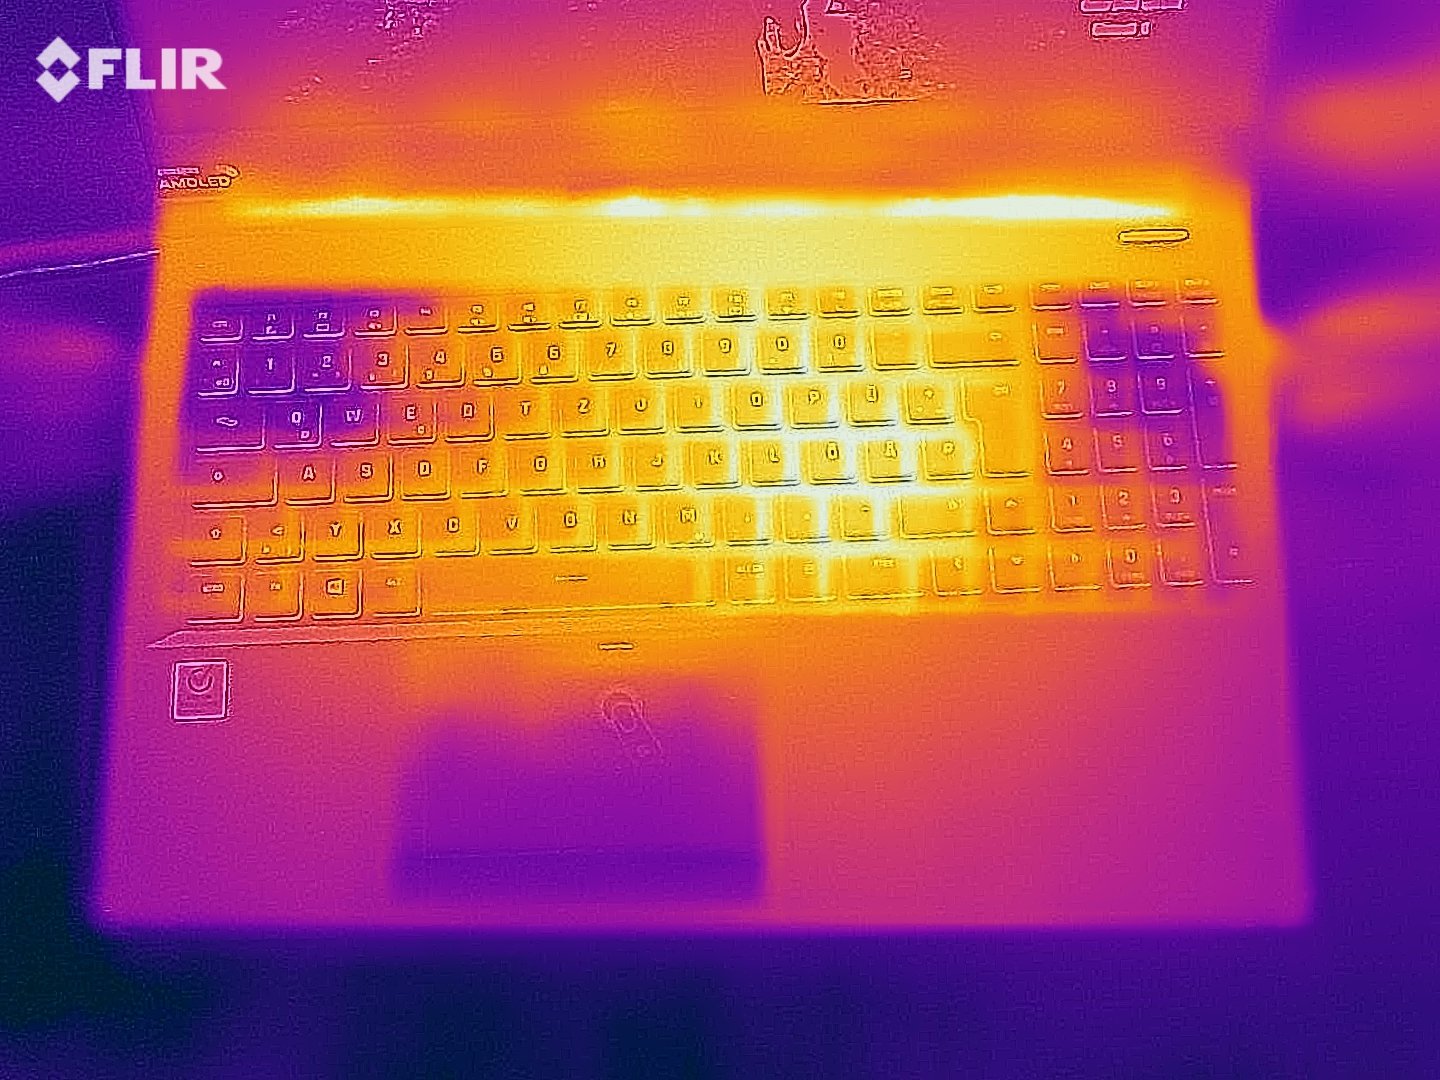
(±) A temperatura máxima no lado superior é 44 °C / 111 F, em comparação com a média de 40.4 °C / 105 F , variando de 21.2 a 68.8 °C para a classe Gaming.
(-) A parte inferior aquece até um máximo de 60 °C / 140 F, em comparação com a média de 43.2 °C / 110 F
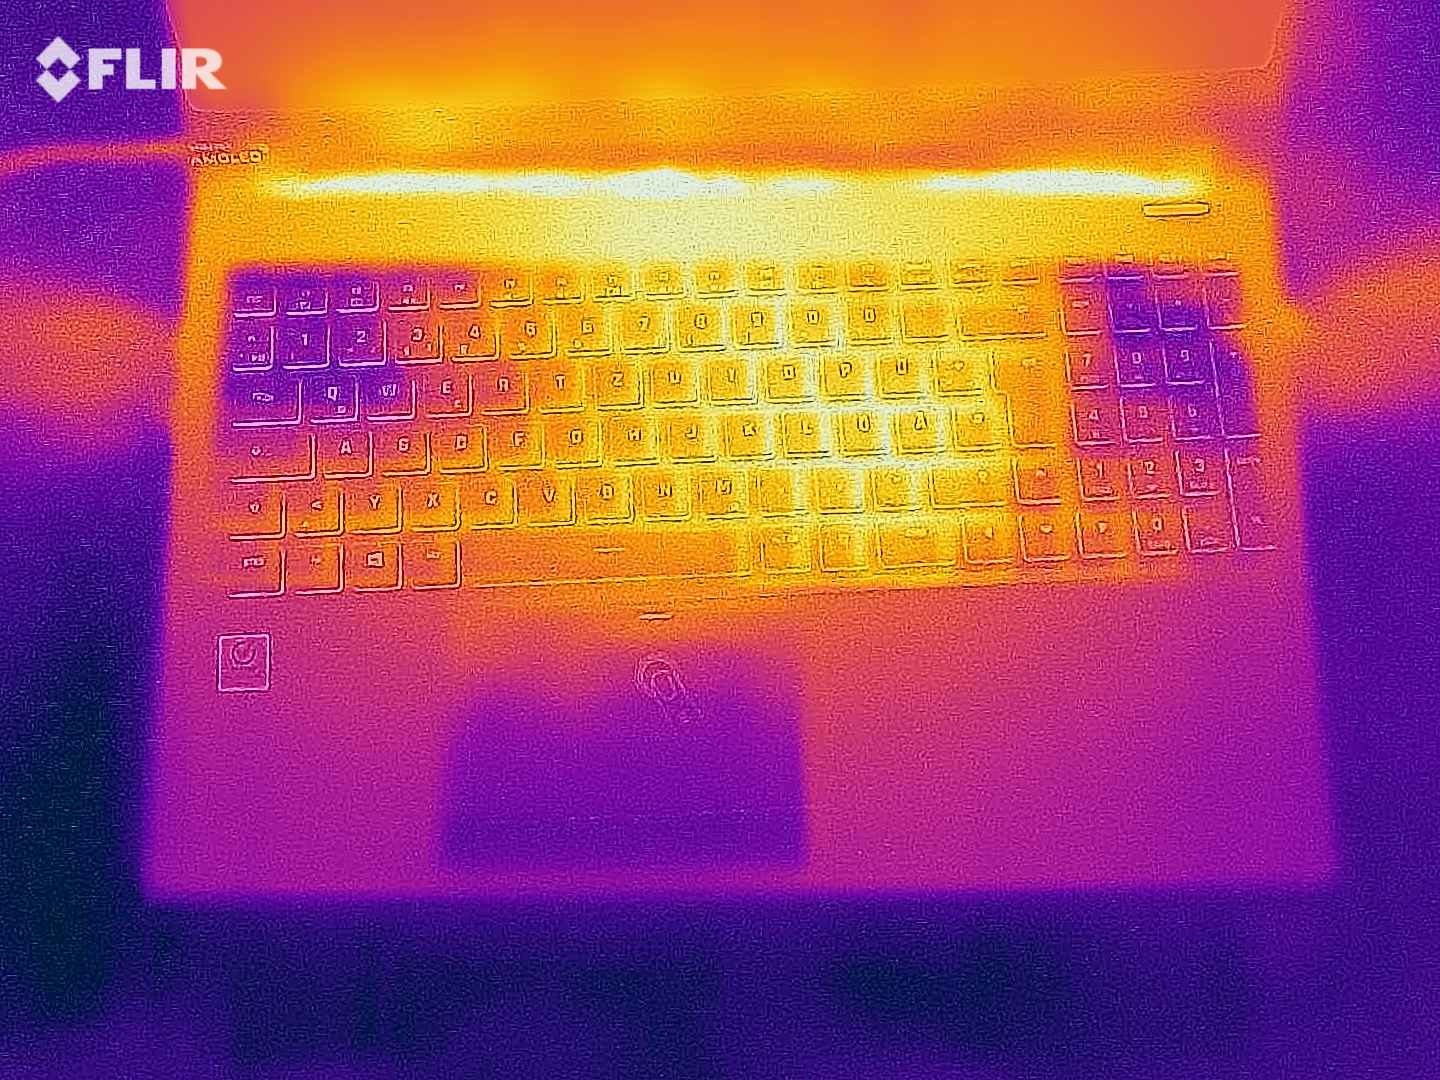
(+) Em uso inativo, a temperatura média para o lado superior é 27.8 °C / 82 F, em comparação com a média do dispositivo de 33.9 °C / ### class_avg_f### F.
(-) Jogando The Witcher 3, a temperatura média para o lado superior é 44.2 °C / 112 F, em comparação com a média do dispositivo de 33.9 °C / ## #class_avg_f### F.
(±) Os apoios para as mãos e o touchpad podem ficar muito quentes ao toque, com um máximo de 38 °C / 100.4 F.
(-) A temperatura média da área do apoio para as mãos de dispositivos semelhantes foi 28.8 °C / 83.8 F (-9.2 °C / -16.6 F).
| Schenker XMG Pro 15 (Late 2021) Intel Core i7-11800H, NVIDIA GeForce RTX 3080 Laptop GPU | Lenovo Legion S7 15ACH6 82K80030GE AMD Ryzen 9 5900HX, NVIDIA GeForce RTX 3060 Laptop GPU | Alienware x15 RTX 3070 P111F Intel Core i7-11800H, NVIDIA GeForce RTX 3070 Laptop GPU | Razer Blade 15 Advanced (Mid 2021) Intel Core i7-11800H, NVIDIA GeForce RTX 3080 Laptop GPU | Schenker XMG Pro 15 (Early 2021, RTX 3080) Intel Core i7-10870H, NVIDIA GeForce RTX 3080 Laptop GPU | MSI Delta 15 A5EFK AMD Ryzen 9 5900HX, AMD Radeon RX 6700M | |
|---|---|---|---|---|---|---|
| Heat | 5% | -3% | -8% | -7% | 1% | |
| Maximum Upper Side * (°C) | 44 | 49 -11% | 59.2 -35% | 51 -16% | 51 -16% | 50 -14% |
| Maximum Bottom * (°C) | 60 | 50 17% | 58 3% | 52 13% | 66 -10% | 55 8% |
| Idle Upper Side * (°C) | 30 | 29 3% | 28.4 5% | 35.2 -17% | 32 -7% | 31 -3% |
| Idle Bottom * (°C) | 34 | 30 12% | 29 15% | 37.8 -11% | 32 6% | 30 12% |
* ... menor é melhor
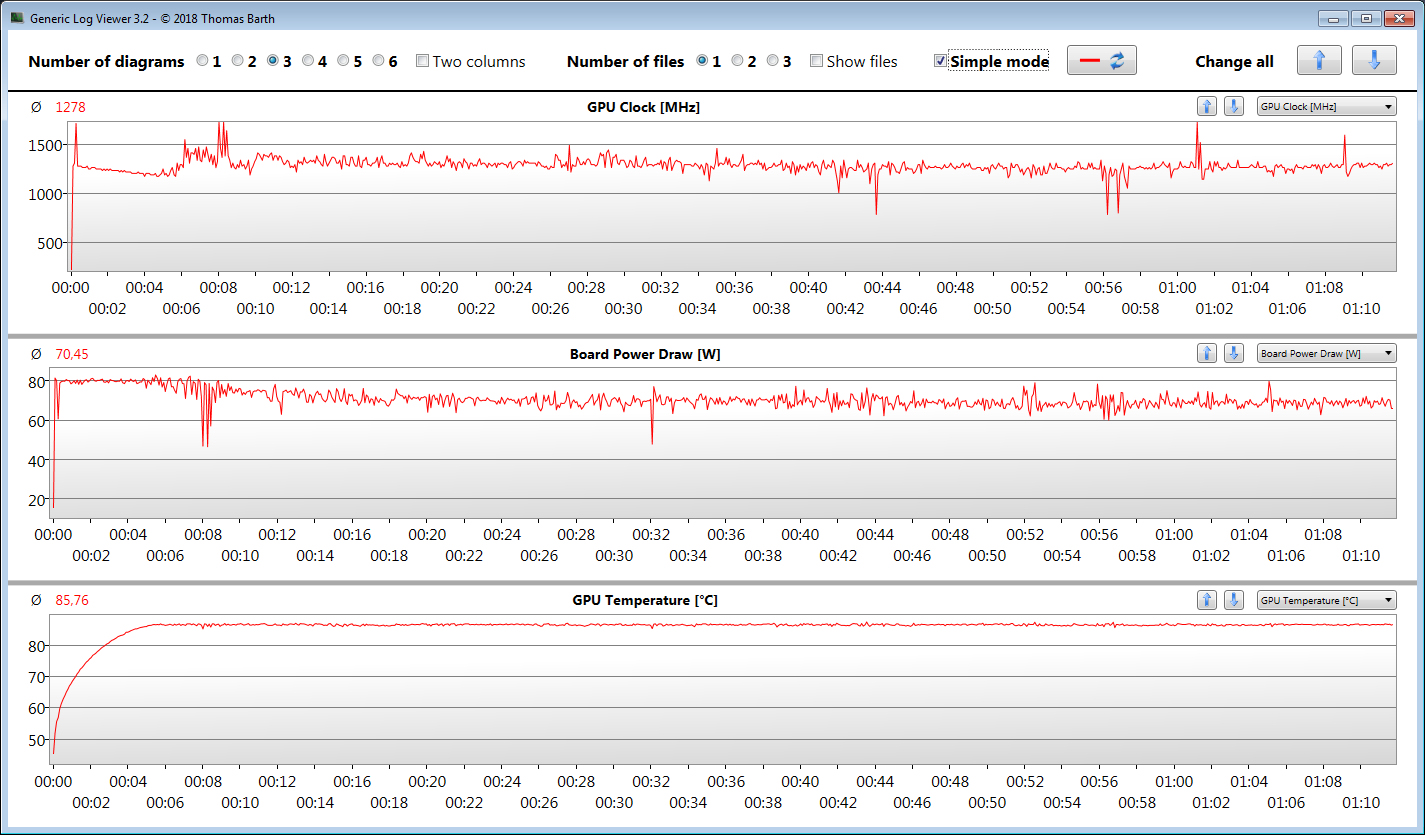
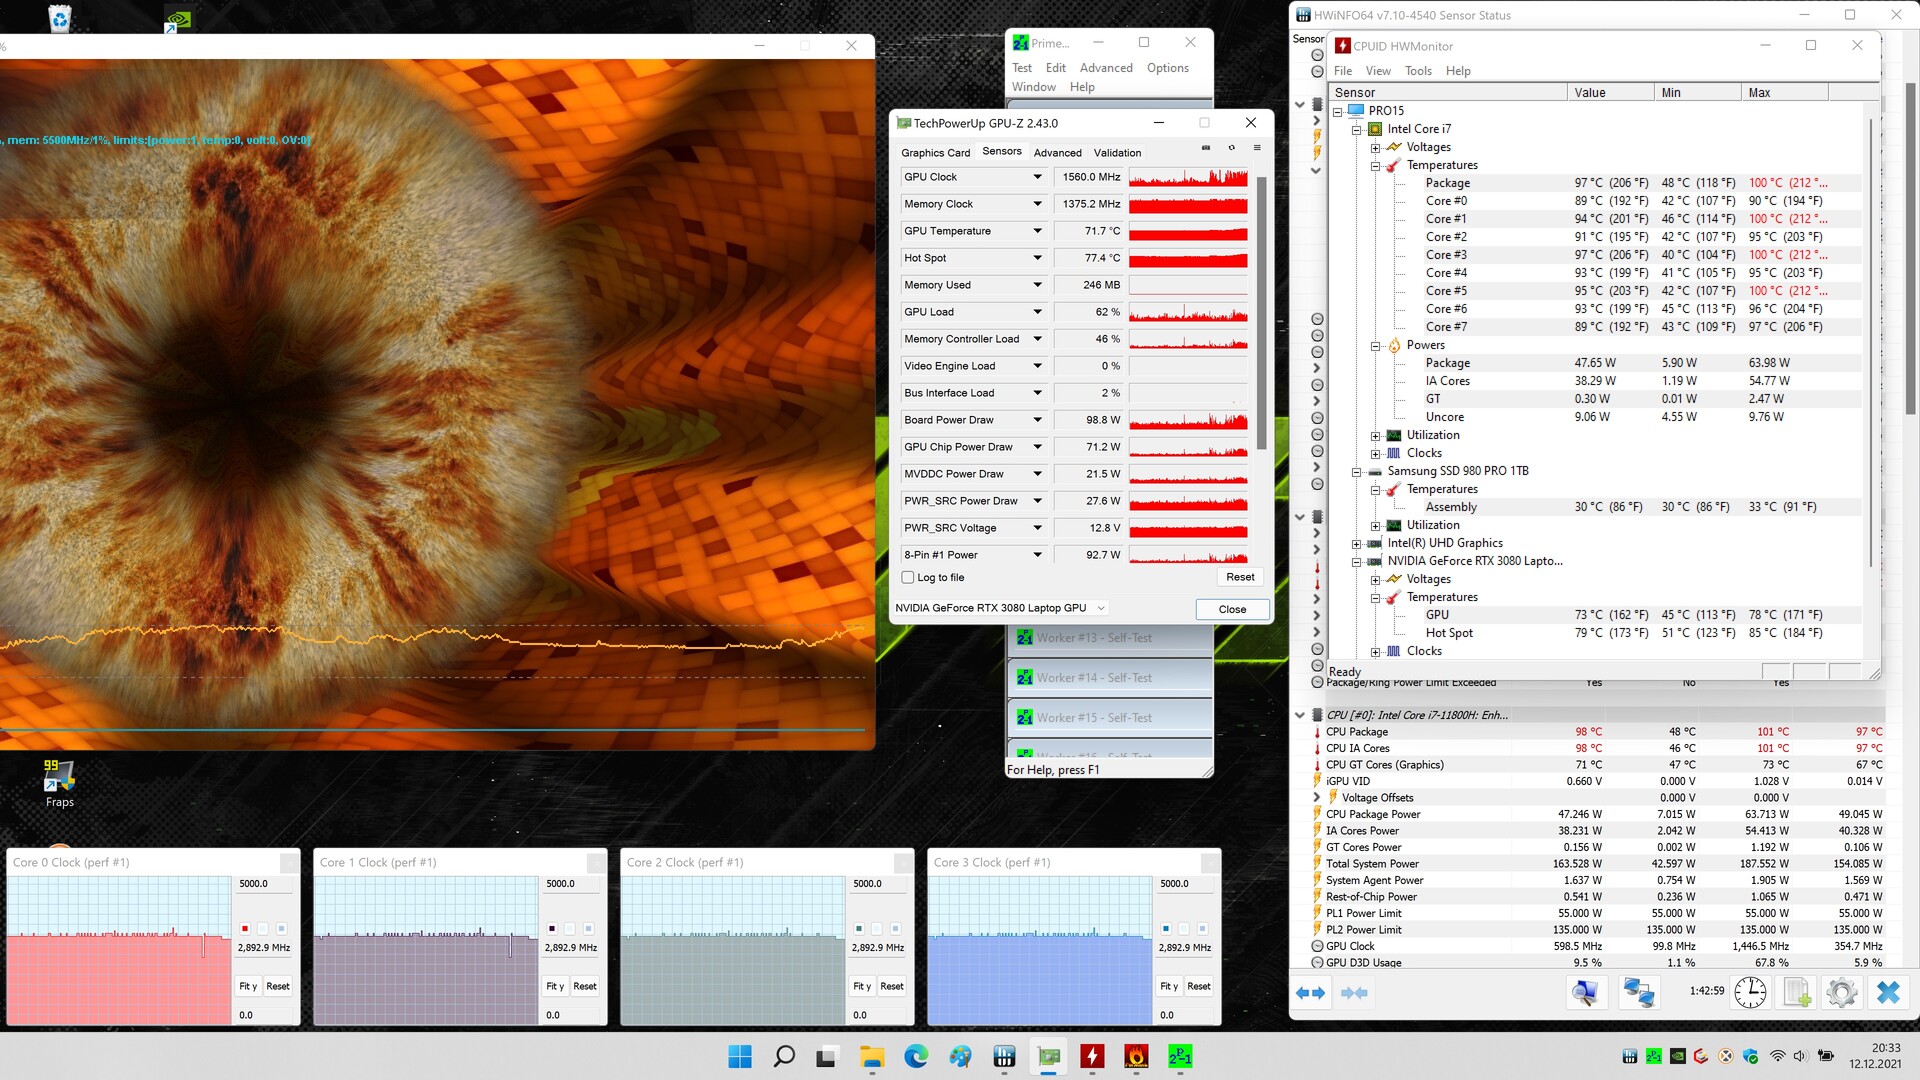
Teste de estresse
No início de nosso teste de estresse (rodando Prime95 e FurMark por pelo menos uma hora) a CPU (3,8 a 4,1 GHz) e a GPU (1300 a 1600 MHz) funcionam em velocidades de relógio bastante altas. Após apenas alguns minutos, as taxas de relógio caem para 2,9 GHz e 500 a 1600 MHz, respectivamente, onde elas permanecem. Este teste de estresse representa um cenário extremo. Utilizamos este teste para determinar se o sistema permanece estável mesmo sob carga máxima
Oradores
Os alto-falantes estéreo produzem um som medíocre que está faltando em termos de graves. O nível máximo de volume é relativamente alto. Recomendamos fones de ouvido ou alto-falantes externos para uma melhor experiência sonora
Schenker XMG Pro 15 (Late 2021) análise de áudio
(+) | os alto-falantes podem tocar relativamente alto (###valor### dB)
Graves 100 - 315Hz
(-) | quase nenhum baixo - em média 26% menor que a mediana
(±) | a linearidade dos graves é média (10.4% delta para a frequência anterior)
Médios 400 - 2.000 Hz
(±) | médios mais altos - em média 10.2% maior que a mediana
(±) | a linearidade dos médios é média (8% delta para frequência anterior)
Altos 2 - 16 kHz
(±) | máximos mais altos - em média 5.1% maior que a mediana
(+) | os máximos são lineares (5.5% delta da frequência anterior)
Geral 100 - 16.000 Hz
(±) | a linearidade do som geral é média (22.5% diferença em relação à mediana)
Comparado com a mesma classe
» 81% de todos os dispositivos testados nesta classe foram melhores, 5% semelhantes, 14% piores
» O melhor teve um delta de 6%, a média foi 18%, o pior foi 132%
Comparado com todos os dispositivos testados
» 66% de todos os dispositivos testados foram melhores, 6% semelhantes, 28% piores
» O melhor teve um delta de 4%, a média foi 23%, o pior foi 134%
Razer Blade 15 Advanced (Mid 2021) análise de áudio
(+) | os alto-falantes podem tocar relativamente alto (###valor### dB)
Graves 100 - 315Hz
(-) | quase nenhum baixo - em média 20.1% menor que a mediana
(±) | a linearidade dos graves é média (12.8% delta para a frequência anterior)
Médios 400 - 2.000 Hz
(+) | médios equilibrados - apenas 3.6% longe da mediana
(+) | médios são lineares (4.1% delta para frequência anterior)
Altos 2 - 16 kHz
(+) | agudos equilibrados - apenas 4.9% longe da mediana
(±) | a linearidade dos máximos é média (8.3% delta para frequência anterior)
Geral 100 - 16.000 Hz
(±) | a linearidade do som geral é média (15.8% diferença em relação à mediana)
Comparado com a mesma classe
» 37% de todos os dispositivos testados nesta classe foram melhores, 7% semelhantes, 56% piores
» O melhor teve um delta de 6%, a média foi 18%, o pior foi 132%
Comparado com todos os dispositivos testados
» 24% de todos os dispositivos testados foram melhores, 5% semelhantes, 70% piores
» O melhor teve um delta de 4%, a média foi 23%, o pior foi 134%
Gerenciamento de energia - Schenker 15 com vida útil decente da bateria
Consumo de energia
O consumo de energia do modelo Schenker não é nada fora do comum. Ele corresponde às nossas expectativas em relação ao hardware instalado. No início de nosso teste de estresse, o consumo de energia sobe para 218 watts e depois cai rapidamente para cerca de 165 watts. Durante nosso teste de Witcher 3 teste, observamos um consumo médio de 186 watts. Como não encontramos drenagem de bateria durante este teste, o carregador incluído parece ser suficiente (classificado para 180 watts)
| desligado | |
| Ocioso | |
| Carga |
|
Key:
min: | |
| Schenker XMG Pro 15 (Late 2021) i7-11800H, GeForce RTX 3080 Laptop GPU | Lenovo Legion S7 15ACH6 82K80030GE R9 5900HX, GeForce RTX 3060 Laptop GPU | Alienware x15 RTX 3070 P111F i7-11800H, GeForce RTX 3070 Laptop GPU | Razer Blade 15 Advanced (Mid 2021) i7-11800H, GeForce RTX 3080 Laptop GPU | Schenker XMG Pro 15 (Early 2021, RTX 3080) i7-10870H, GeForce RTX 3080 Laptop GPU | MSI Delta 15 A5EFK R9 5900HX, Radeon RX 6700M | Média NVIDIA GeForce RTX 3080 Laptop GPU | Média da turma Gaming | |
|---|---|---|---|---|---|---|---|---|
| Power Consumption | 18% | -0% | -8% | 21% | 12% | -10% | 6% | |
| Idle Minimum * (Watt) | 20 | 13 35% | 15.7 22% | 19.5 2% | 8 60% | 10 50% | 19.8 ? 1% | 13 ? 35% |
| Idle Average * (Watt) | 22 | 16 27% | 20.3 8% | 23.3 -6% | 13 41% | 18 18% | 24.3 ? -10% | 19 ? 14% |
| Idle Maximum * (Watt) | 26 | 23 12% | 43 -65% | 40.1 -54% | 22 15% | 25 4% | 33.3 ? -28% | 24.6 ? 5% |
| Load Average * (Watt) | 103 | 95 8% | 94.4 8% | 98.9 4% | 97 6% | 101 2% | 108.1 ? -5% | 110.7 ? -7% |
| Witcher 3 ultra * (Watt) | 186 | 156 16% | 167 10% | 174 6% | 179 4% | 187 -1% | ||
| Load Maximum * (Watt) | 218 | 191 12% | 183.4 16% | 214 2% | 225 -3% | 217 -0% | 230 ? -6% | 259 ? -19% |
* ... menor é melhor
Energy Consumption Witcher 3 / Stress Test
Energy Consumption external Monitor
Vida útil da bateria
O laptop de 15,6 polegadas atinge tempos de execução de 5:14 h e 6:32 h em nossos testes Wi-Fi (acessando páginas da web periodicamente através de um roteiro) e vídeo (curta-metragem Big Buck Bunny in a loop, codec H.264, FHD). Para ambos os testes, desativamos todos os mecanismos de economia de energia do notebook e ajustamos o brilho do display para cerca de 150 cd/m². Para o teste de vídeo, também desativamos os módulos sem fio
Pro
Contra
| Schenker XMG Pro 15 (Late 2021) i7-11800H, GeForce RTX 3080 Laptop GPU, 73 Wh | Lenovo Legion S7 15ACH6 82K80030GE R9 5900HX, GeForce RTX 3060 Laptop GPU, 71 Wh | Alienware x15 RTX 3070 P111F i7-11800H, GeForce RTX 3070 Laptop GPU, 87 Wh | Razer Blade 15 Advanced (Mid 2021) i7-11800H, GeForce RTX 3080 Laptop GPU, 80 Wh | Schenker XMG Pro 15 (Early 2021, RTX 3080) i7-10870H, GeForce RTX 3080 Laptop GPU, 73 Wh | MSI Delta 15 A5EFK R9 5900HX, Radeon RX 6700M, 82 Wh | Média da turma Gaming | |
|---|---|---|---|---|---|---|---|
| Duração da bateria | 19% | -7% | 13% | 6% | 27% | 15% | |
| Reader / Idle (h) | 10.6 | 14 32% | 9.7 -8% | 8.4 -21% | 11.1 5% | 8.27 ? -22% | |
| H.264 (h) | 6.5 | 7.5 15% | 5.5 -15% | 8.32 ? 28% | |||
| WiFi v1.3 (h) | 5.2 | 7 35% | 6.1 17% | 5.9 13% | 7.2 38% | 7.9 52% | 7.11 ? 37% |
| Load (h) | 1.3 | 1.2 -8% | 0.9 -31% | 1.6 23% | 1.6 23% | 1.502 ? 16% |
Veredicto - O Schenker XMG Pro 15 é um caderno de jogos compacto e bem construído
O desempenho de jogo deste laptop fino corresponde à média de um dispositivo RTX 3080. Aqui, o TGP relativamente baixo de 105 watts se torna aparente. Enquanto no FHD, a maioria dos jogos pode ser jogada em configurações de qualidade máxima, executando-os com a resolução de tela nativa (4K) tende a exigir a redução das configurações de qualidade
PCIe 4, Thunderbolt 4, OLED - O Schenker XMG Pro 15 (final de 2021) vem com as mais recentes tecnologias
O Núcleo i7-11800H CPU e GeForce A GPU móvel RTX 3080 tem um bom desempenho consistente. Sob carga, o laptop aquece consideravelmente e gera muito ruído. O perfil de potência silencioso reduz o nível de ruído ao custo de algum desempenho.
Há espaço para dois M.2-2280 SSDs (1x PCIe 4.0, 1x PCIe 3.0/SATA) e suporte a RAID 0/1. Nosso dispositivo de teste é equipado com um SSD PCIe-4 (1 TB) de alta velocidade. Embora seu tempo de execução Wi-Fi no mundo real de cerca de 5 a 7 horas não seja nada para escrever em casa, não seria razoável esperar muito mais de um laptop para jogos com uma tela de 4K. Infelizmente, a bateria não pode ser recarregada através da porta Thunderbolt 4 integrada.
A tela OLED (3840 x 2160 pixels) é o recurso stand-out do Pro 15. Ela oferece um alto brilho máximo, excelente contraste, ótimos ângulos de visão, tempos de resposta curtos, boa precisão de cor e uma ampla gama de cores. Infelizmente, a tela é reflexiva. Além disso, observamos o PWM cintilando.
Uma alternativa para o XMG Pro é o Razer Blade 15 Avançado. É ainda mais compacto e oferece duas portas Thunderbolt 4. Embora sua capacidade de bateria seja maior e "somente" vem com um painel FHD, sua vida útil de bateria não excede significativamente a de nosso laptop Schenker. Enquanto isso, o Lenovo Legion S7 15ACH6 (2000 Euros ou ~$2250). Embora seu desempenho 3D seja significativamente mais lento, ele brilha com uma tela IPS 4K mais brilhante e mate, melhores tempos de funcionamento da bateria e uma garantia de três anos. A maior fraqueza é seu módulo único de RAM soldado
Preço e Disponibilidade
O Schenker XMG Pro 15 (final de 2021) pode ser configurado através da loja on-line Schenker. Nossa configuração pode ser adquirida por cerca de 3000 Euros (~$3400). O modelo básico começa em torno de 2200 Euros (~$2500)
Schenker XMG Pro 15 (Late 2021)
- 01/19/2022 v7 (old)
Sascha Mölck
Price comparison

