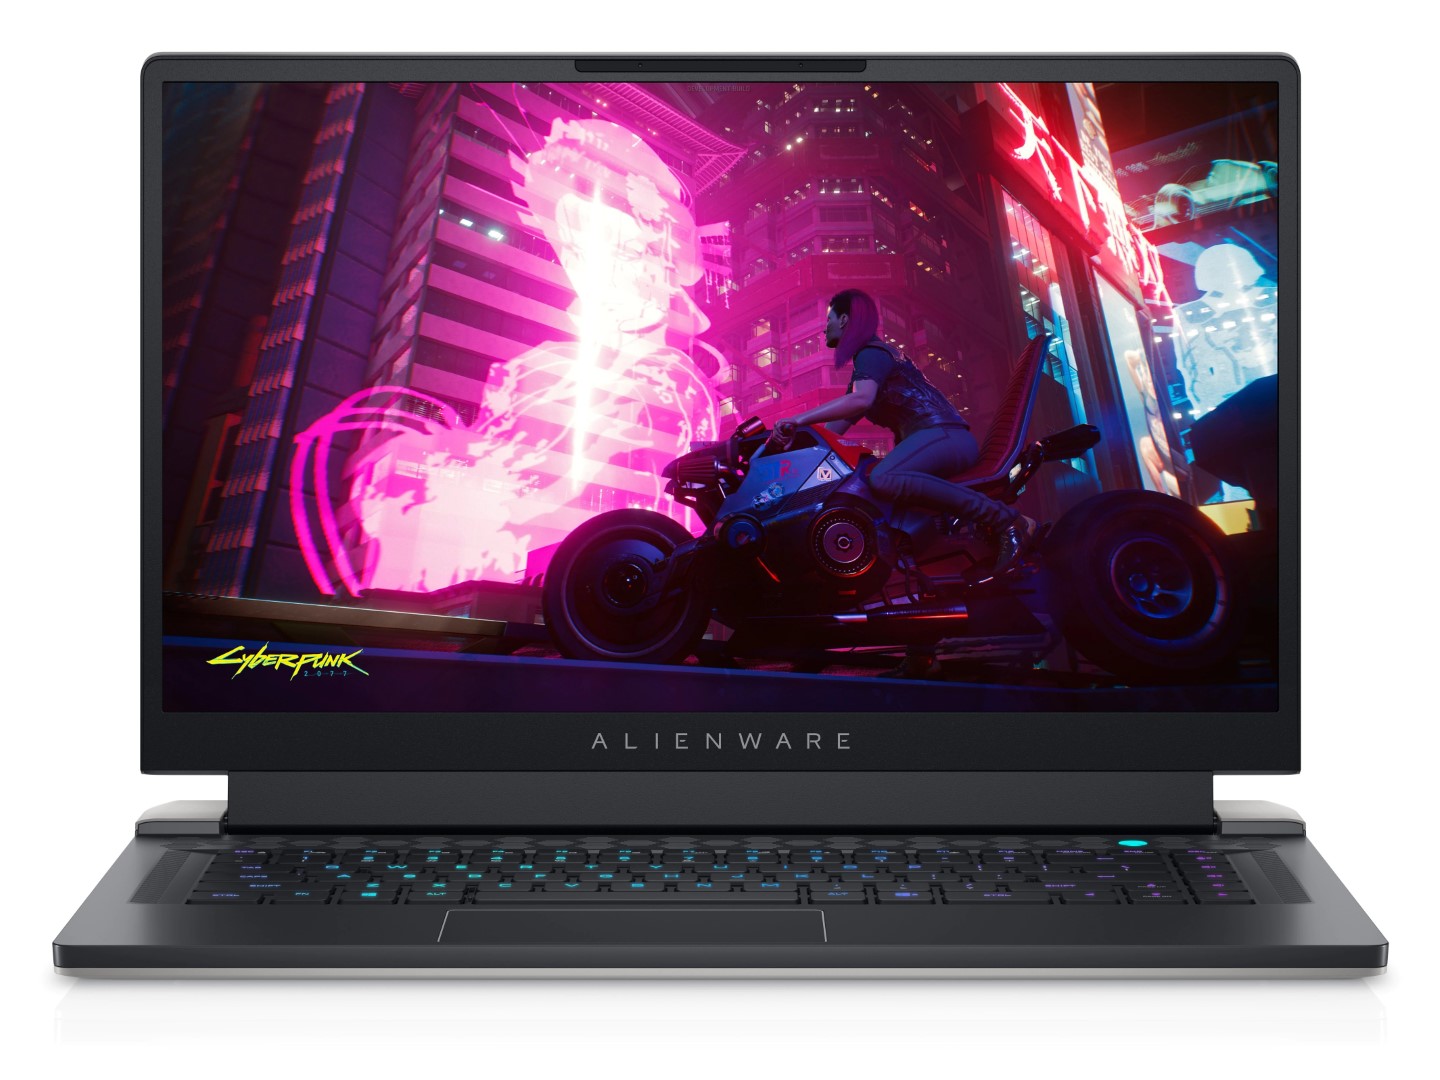
Revisão do laptop Alienware x15 R1: O OVNI mais fino da Dell pousou
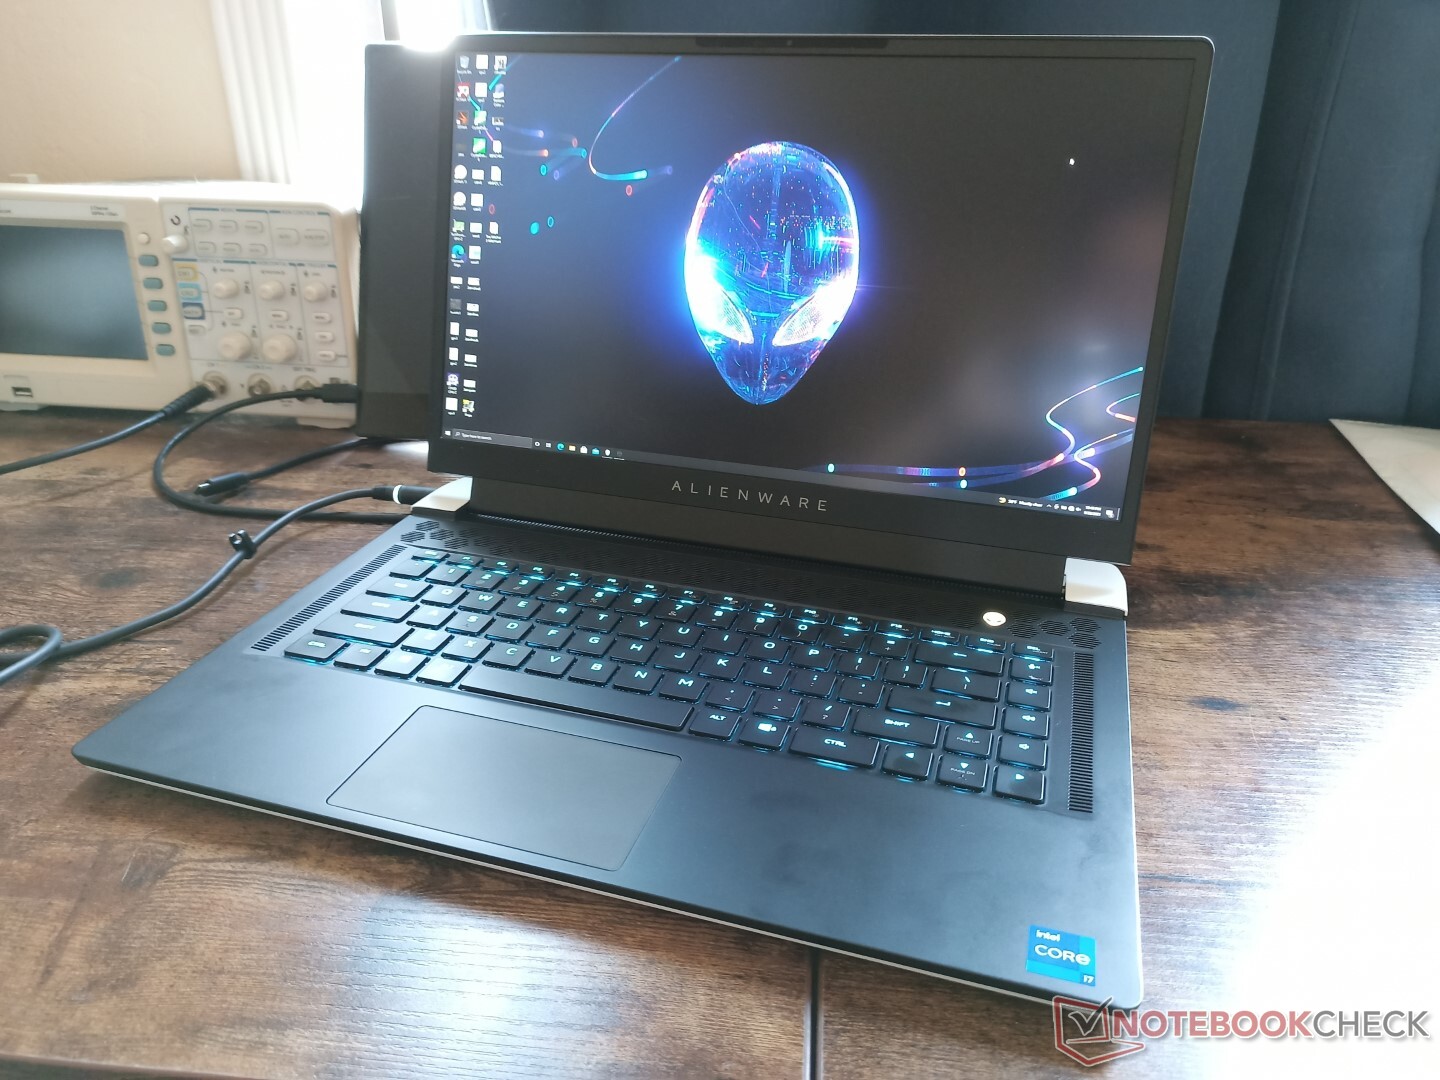
O Alienware x15 R1 inicia uma nova geração de computadores portáteis Alienware de 15,6 polegadas para substituir a antiga série m15 Alienware. Como detalhado no anúncio originalo último modelo renova completamente o projeto do chassi Legend introduzido no Alienware m15 R2 para um aspecto mais fino e mais elegante.
As SKUs atuais vão desde a CPU Core i7-11800H do 11º gênero com gráficos GeForce RTX 3060 e display FHD 165 Hz por cerca de US$ 2000 até o Core i9-11900H com display FHD RTX 3070 e 360 Hz por cerca de US$ 3000. A Dell está planejando lançar as opções do RTX 3080 nos próximos meses. Nossa configuração em revisão é uma SKU média com o display i7-11800H, RTX 3070 e 240 Hz QHD por cerca de $2700 USD.
Os concorrentes ao Alienware x15 R1 incluem outros laptops ultramarinos de 15,6 polegadas como o Razer Blade 15, MSI GS66, Asus Zephyrus S15, Acer Predator Triton 700, ou Aorus 15G. Uma versão maior de 17,3 polegadas do x15 R1 está disponível chamada de Alienware x17 R1.
Mais análises da Dell:
potential competitors in comparison
Avaliação | Data | Modelo | Peso | Altura | Size | Resolução | Preço |
|---|---|---|---|---|---|---|---|
| 87.2 % v7 (old) | 09/2021 | Alienware x15 RTX 3070 P111F i7-11800H, GeForce RTX 3070 Laptop GPU | 2.4 kg | 15.9 mm | 15.60" | 2560x1440 | |
| 86.1 % v7 (old) | 06/2021 | Alienware m15 R4 RTX 3080 i9-10980HK, GeForce RTX 3080 Laptop GPU | 2.4 kg | 20 mm | 15.60" | 1920x1080 | |
| 84 % v7 (old) | 02/2021 | MSI GS66 Stealth 10UG i7-10870H, GeForce RTX 3070 Laptop GPU | 2.1 kg | 19.8 mm | 15.60" | 1920x1080 | |
| 88.9 % v7 (old) | 07/2021 | Razer Blade 15 Advanced (Mid 2021) i7-11800H, GeForce RTX 3080 Laptop GPU | 2 kg | 16.99 mm | 15.60" | 1920x1080 | |
| 82.9 % v7 (old) | 10/2020 | Asus Zephyrus S15 GX502L i7-10875H, GeForce RTX 2070 Super Mobile | 2.1 kg | 19 mm | 15.60" | 1920x1080 | |
| 83.8 % v7 (old) | 07/2021 | Acer Predator Helios 300 PH315-53-786B i7-10750H, GeForce RTX 3070 Laptop GPU | 2.2 kg | 22.9 mm | 15.60" | 1920x1080 |
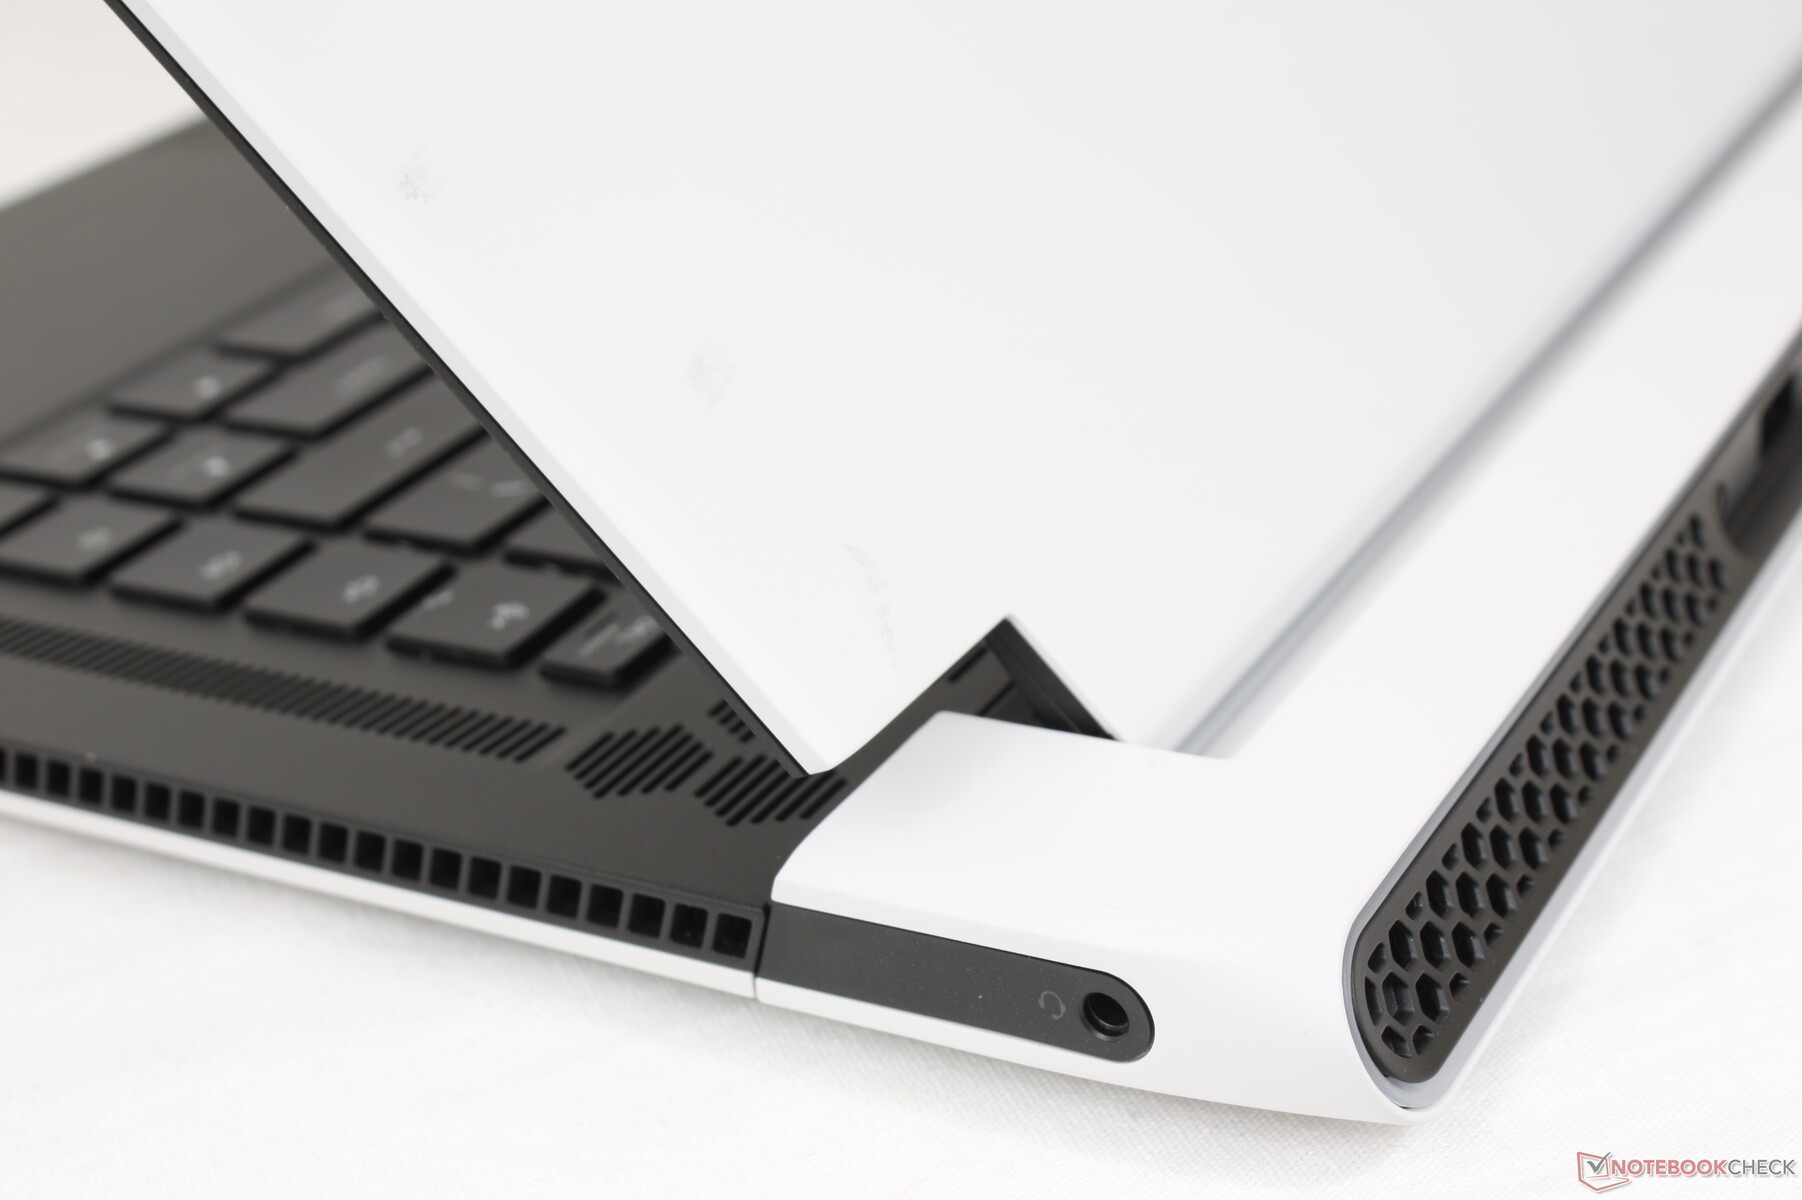
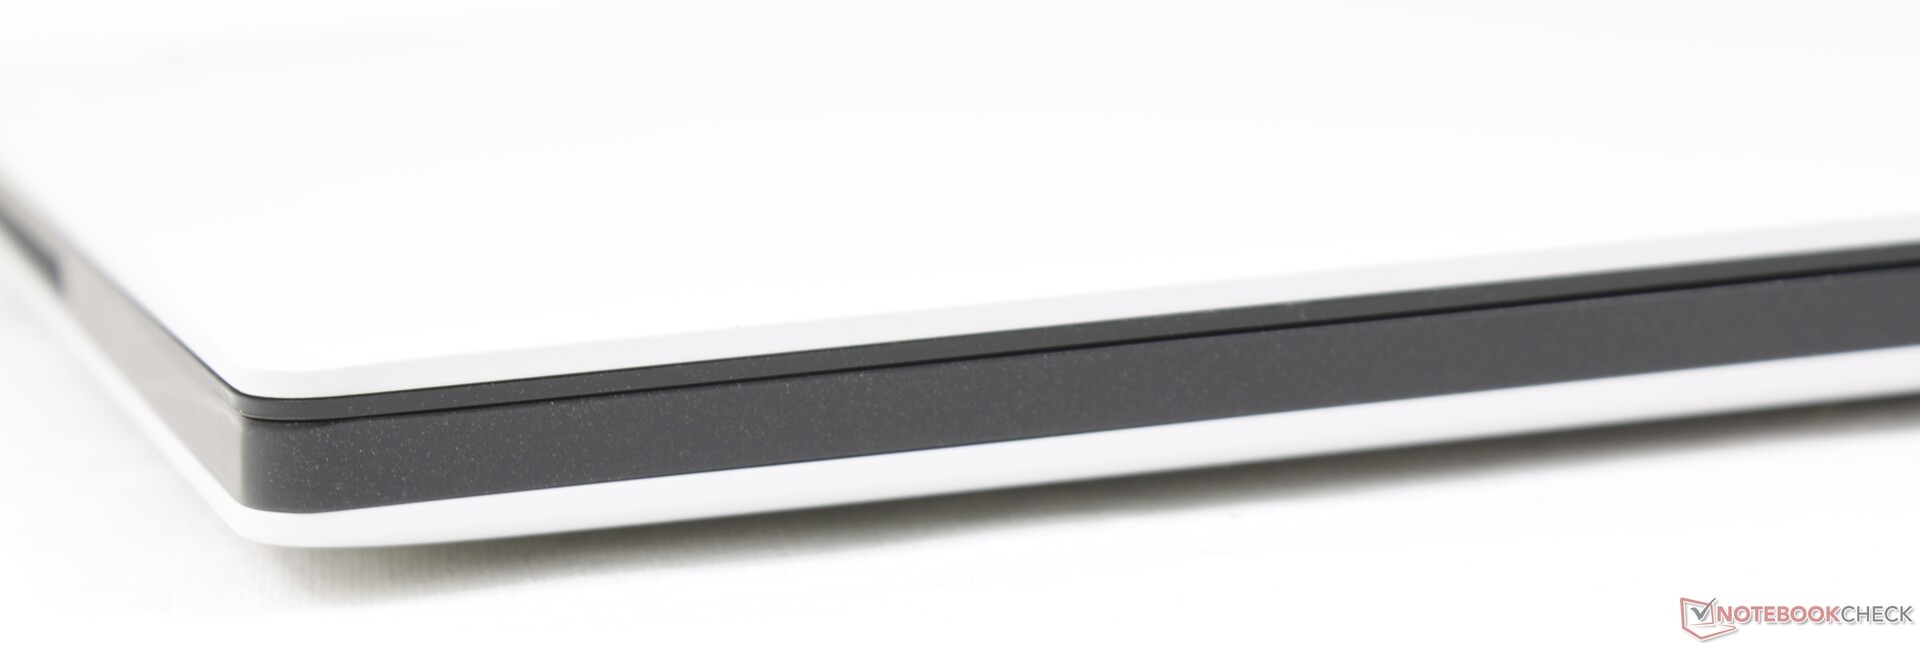
Estojo - Mais fino, mas mais largo
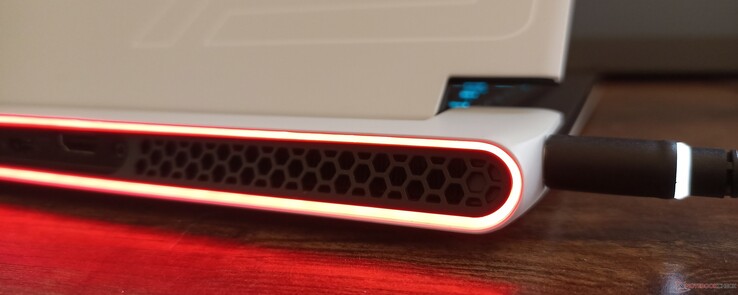
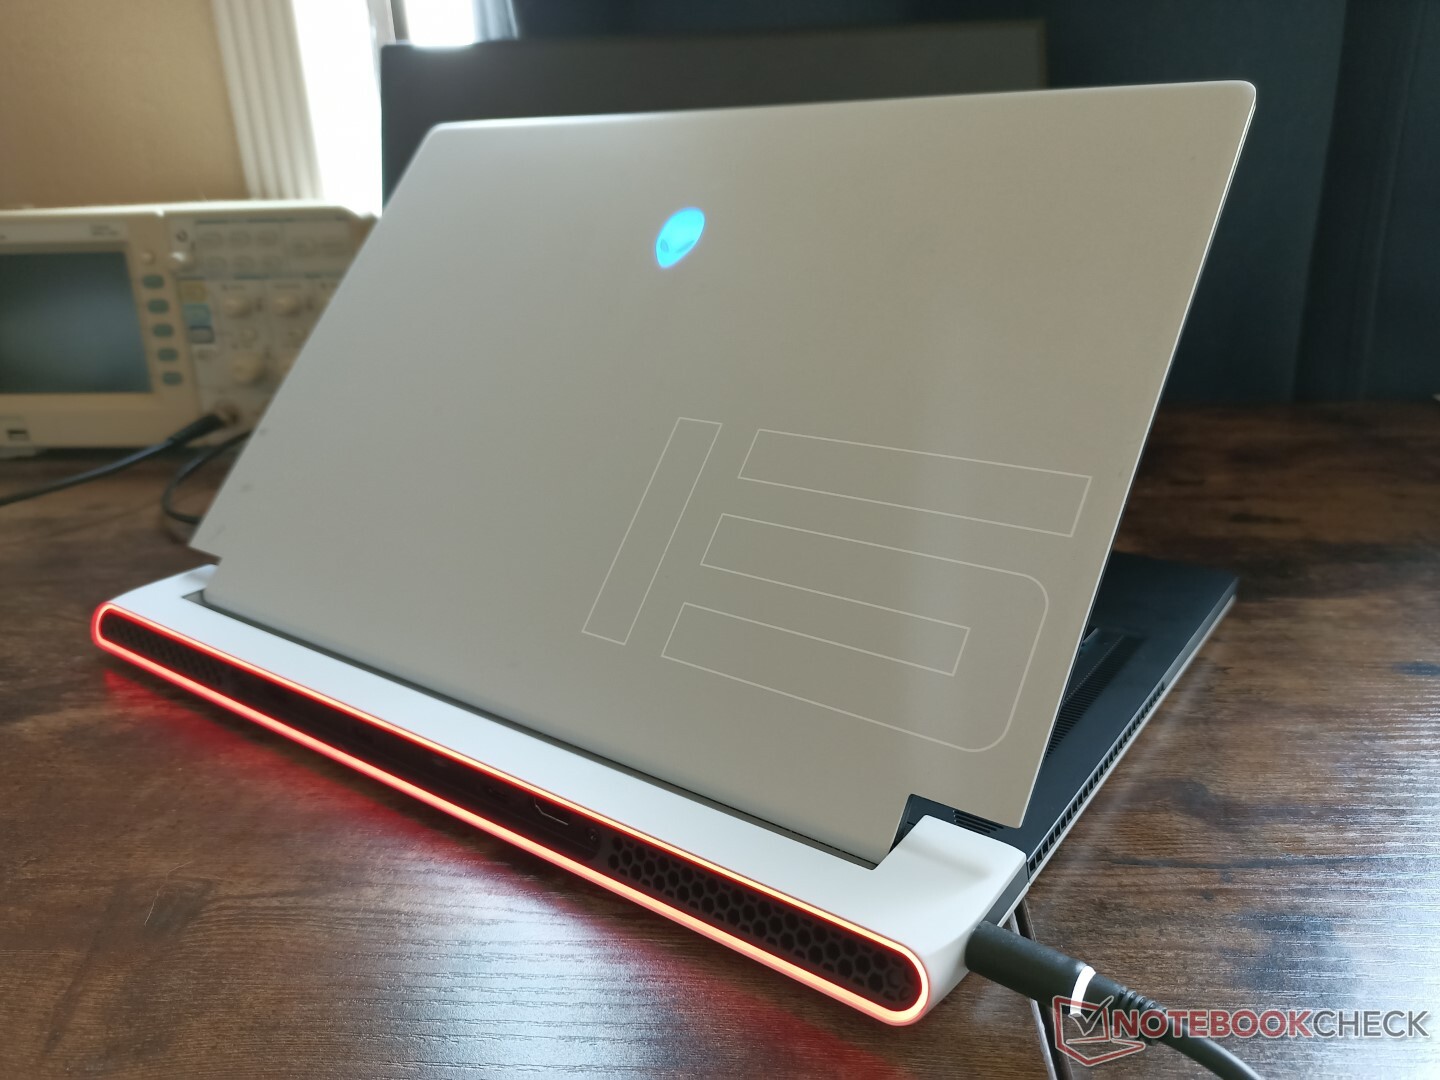
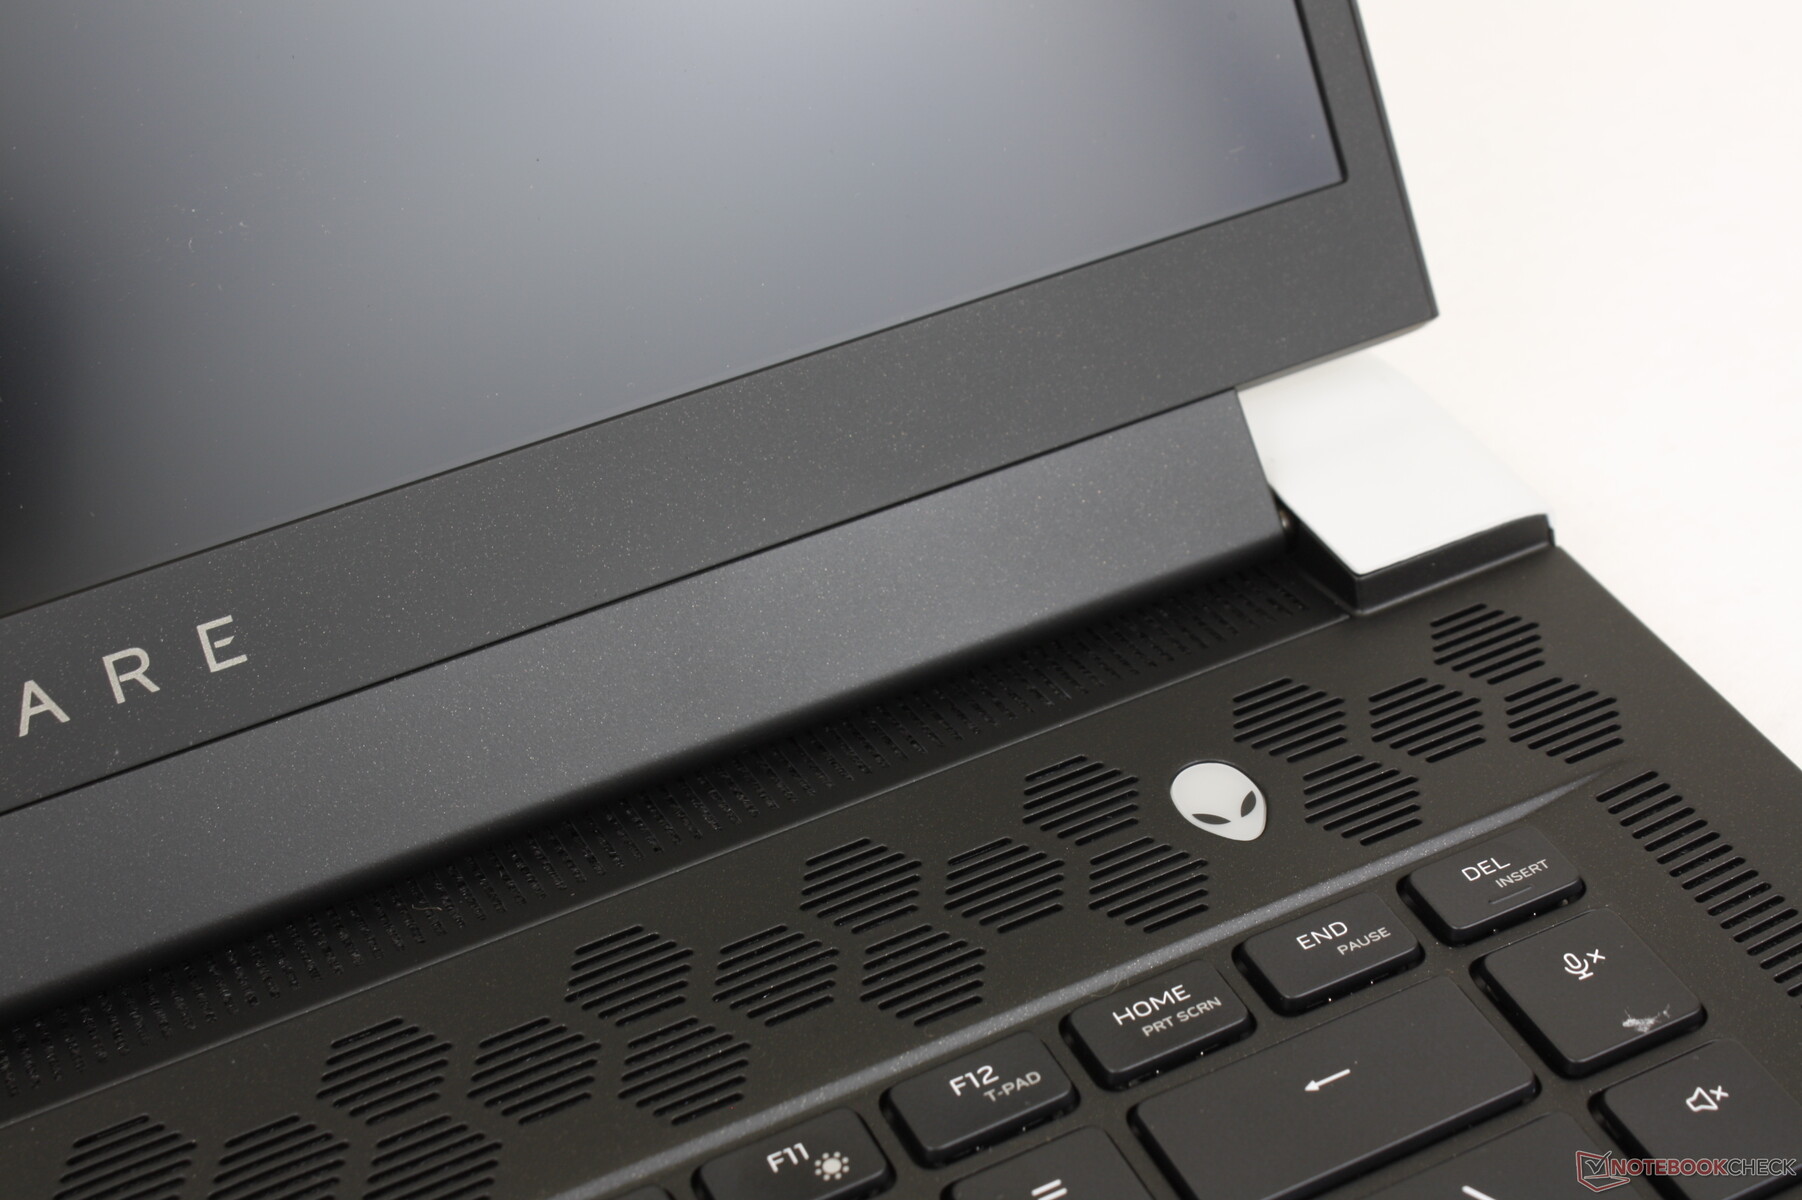
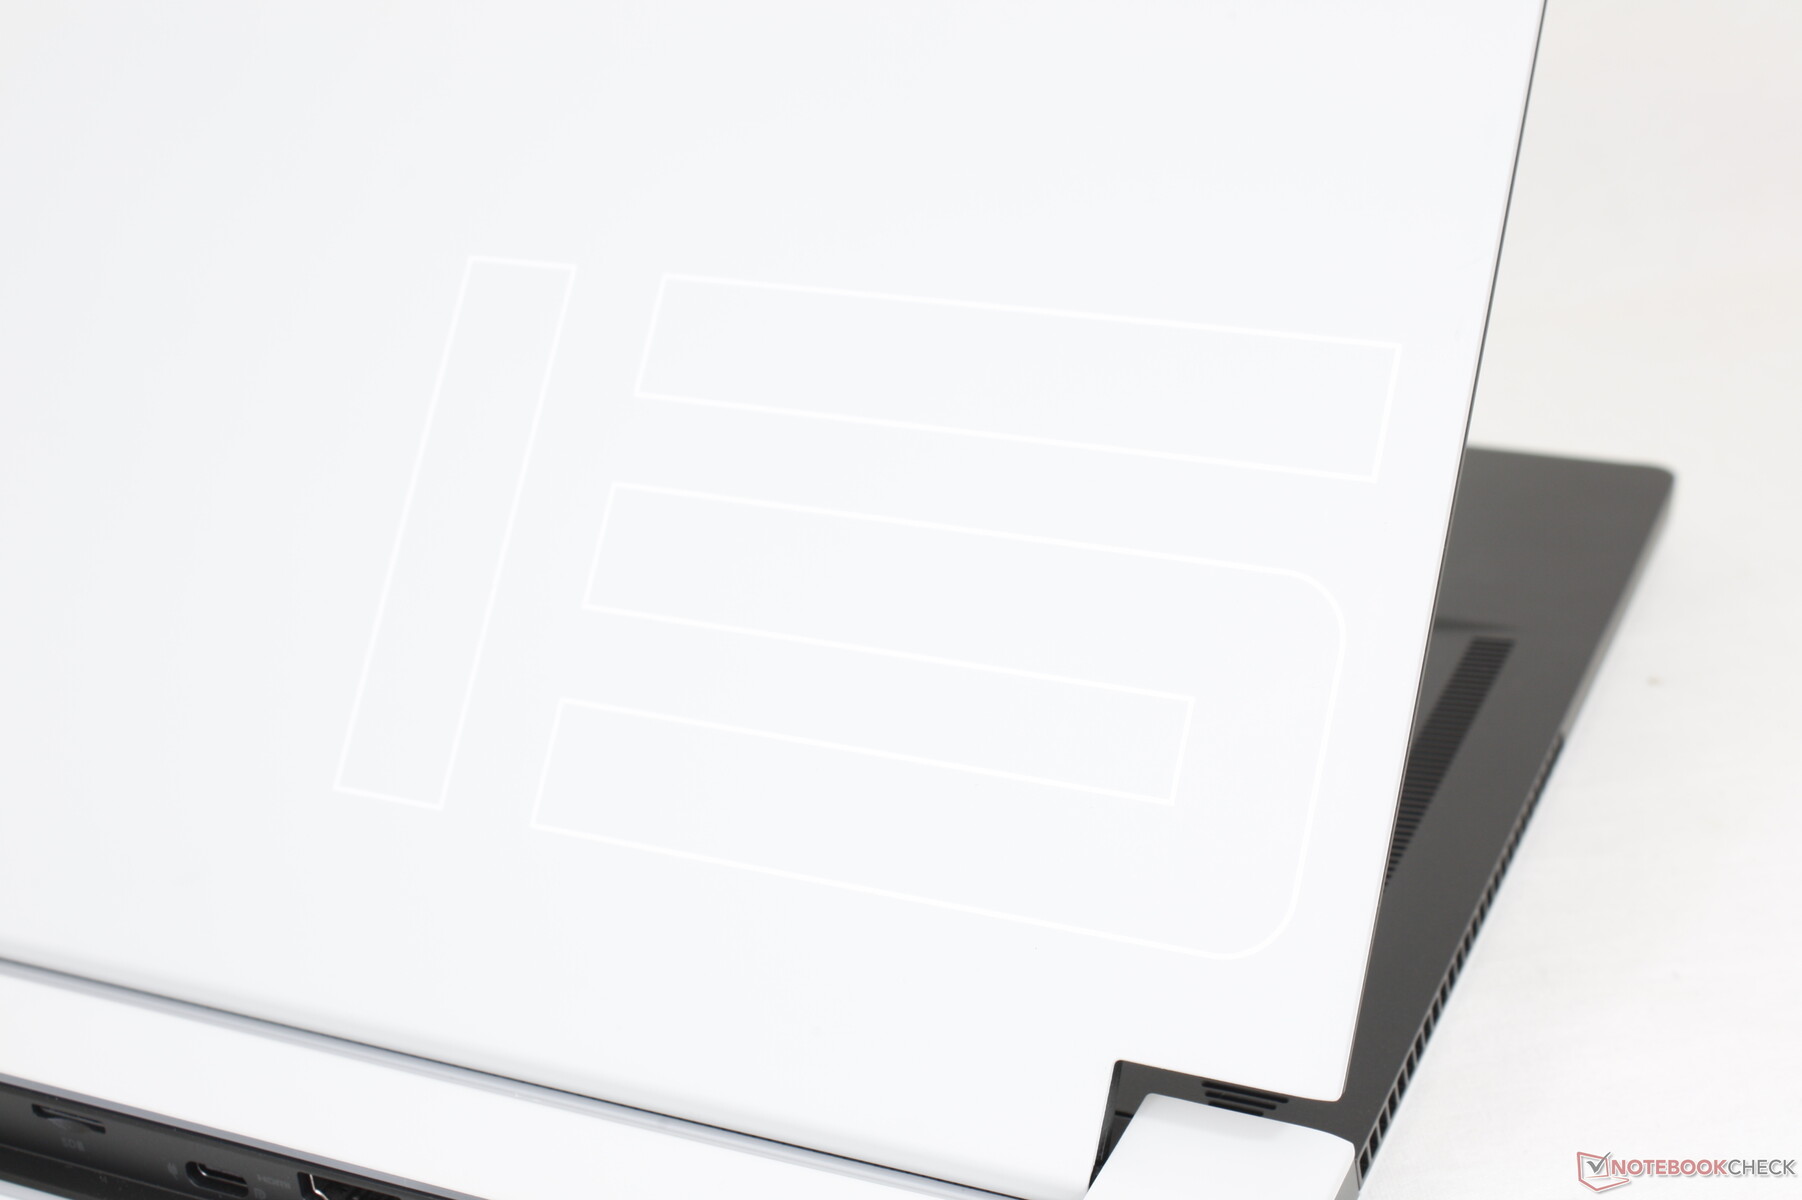
O novo chassi pode ser melhor descrito como um Alienware m15 R2, mas mais plano, já que o x15 R1 é muito parecido em termos de comprimento e largura e usa quase os mesmos materiais de chassi para uma sensação semelhante. Desapareceram as barras de plástico brilhantes e pegajosas ao longo da borda frontal e da luneta inferior para uma construção fosca mais uniforme. O chassi é muito parecido com um Ultrabook, mantendo todos os aspectos originais do design m15 R2 Legend como as grelhas alveolares e o anel LED traseiro RGB.
A rigidez do chassi é uma ligeira diminuição do m15 R2/R3/R4/R5. Tanto a base quanto a tampa flexionam mais prontamente a partir de seus respectivos cantos e com um rangido ligeiramente maior do que no desenho mais grosso mais antigo. A aplicação de pressão no centro do teclado ou na tampa externa também resultará em um pouco de flexão. Achamos que a construção geral é comparável com a MSI GS66 enquanto estava a poucos passos de distância da Razer Blade 15.
Ao contrário do Alienware x17 R1 que na verdade é ligeiramente mais grosso e pesado que o Alienware m17 R4 mais antigo que ele substitui, o Alienware x15 R1 é mais fino que o Alienware m15 R5 enquanto pesa aproximadamente o mesmo. Isto também significa que o x15 continua sendo um dos maiores e mais pesados laptops ultra-finos para jogos em sua categoria de tamanho como modelos concorrentes como o Zephyrus S15 ou Razer Blade 15 são menores e mais leves por margens discerníveis. A grande pegada do x15 é talvez o preço a pagar por um perfil tão fino
Alguns SKUs com o painel FHD 165Hz serão mais espessos que nossos SKU QHD por frações de um milímetro (16,3 vs. 15,9 mm).
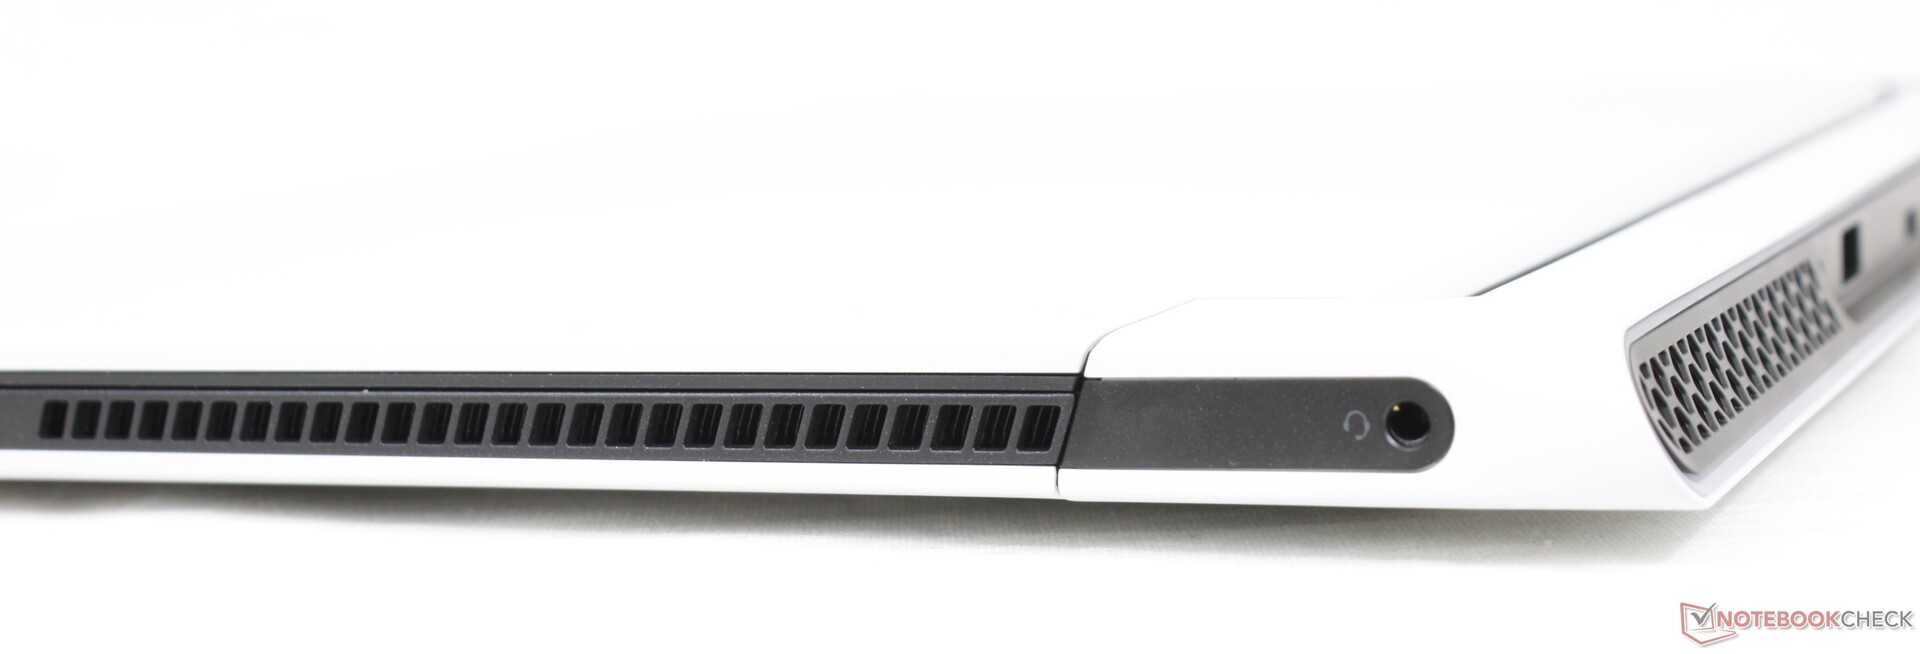
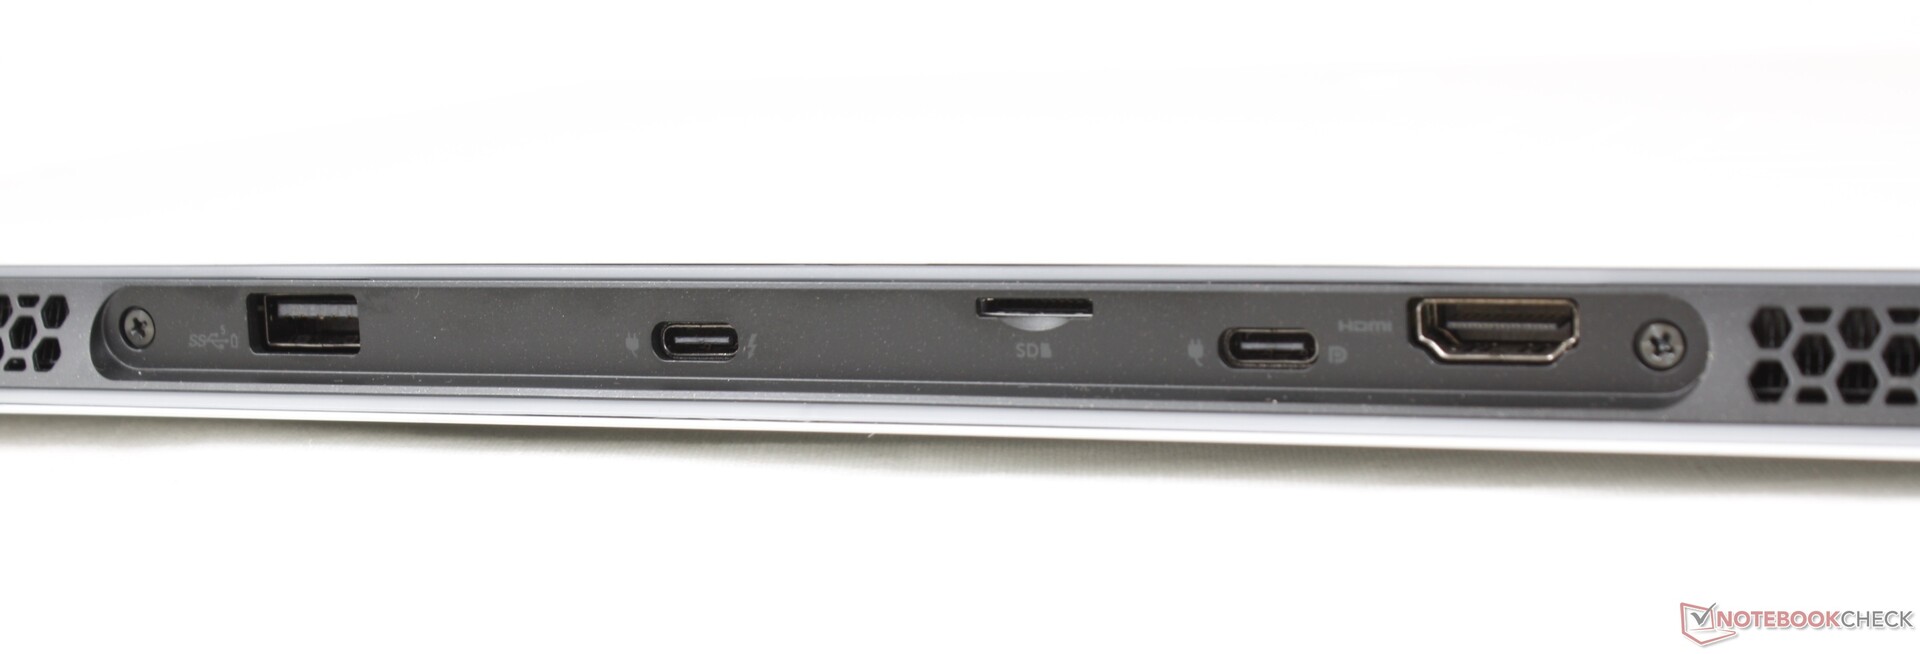
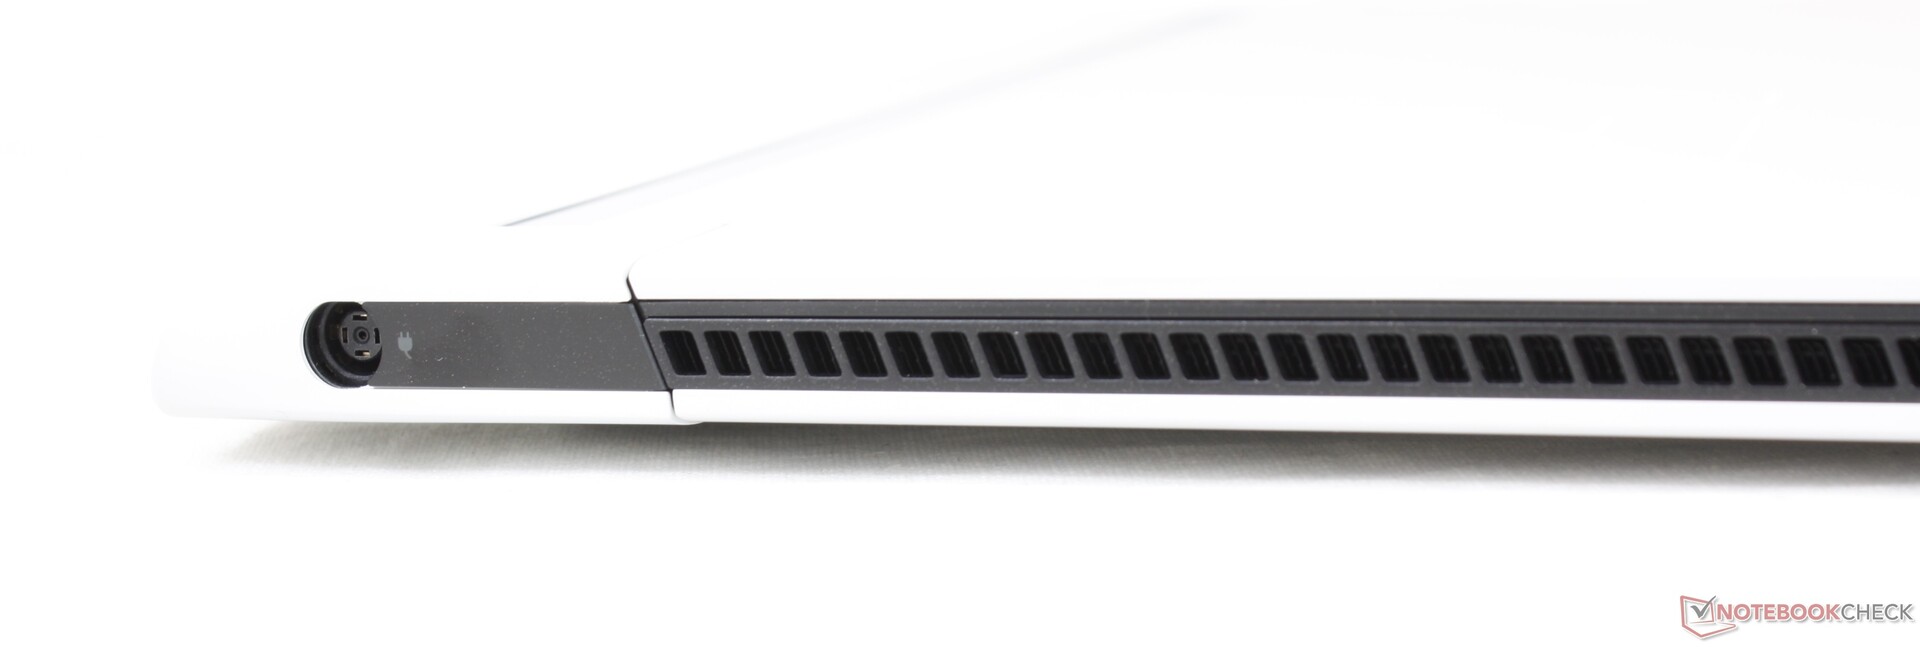
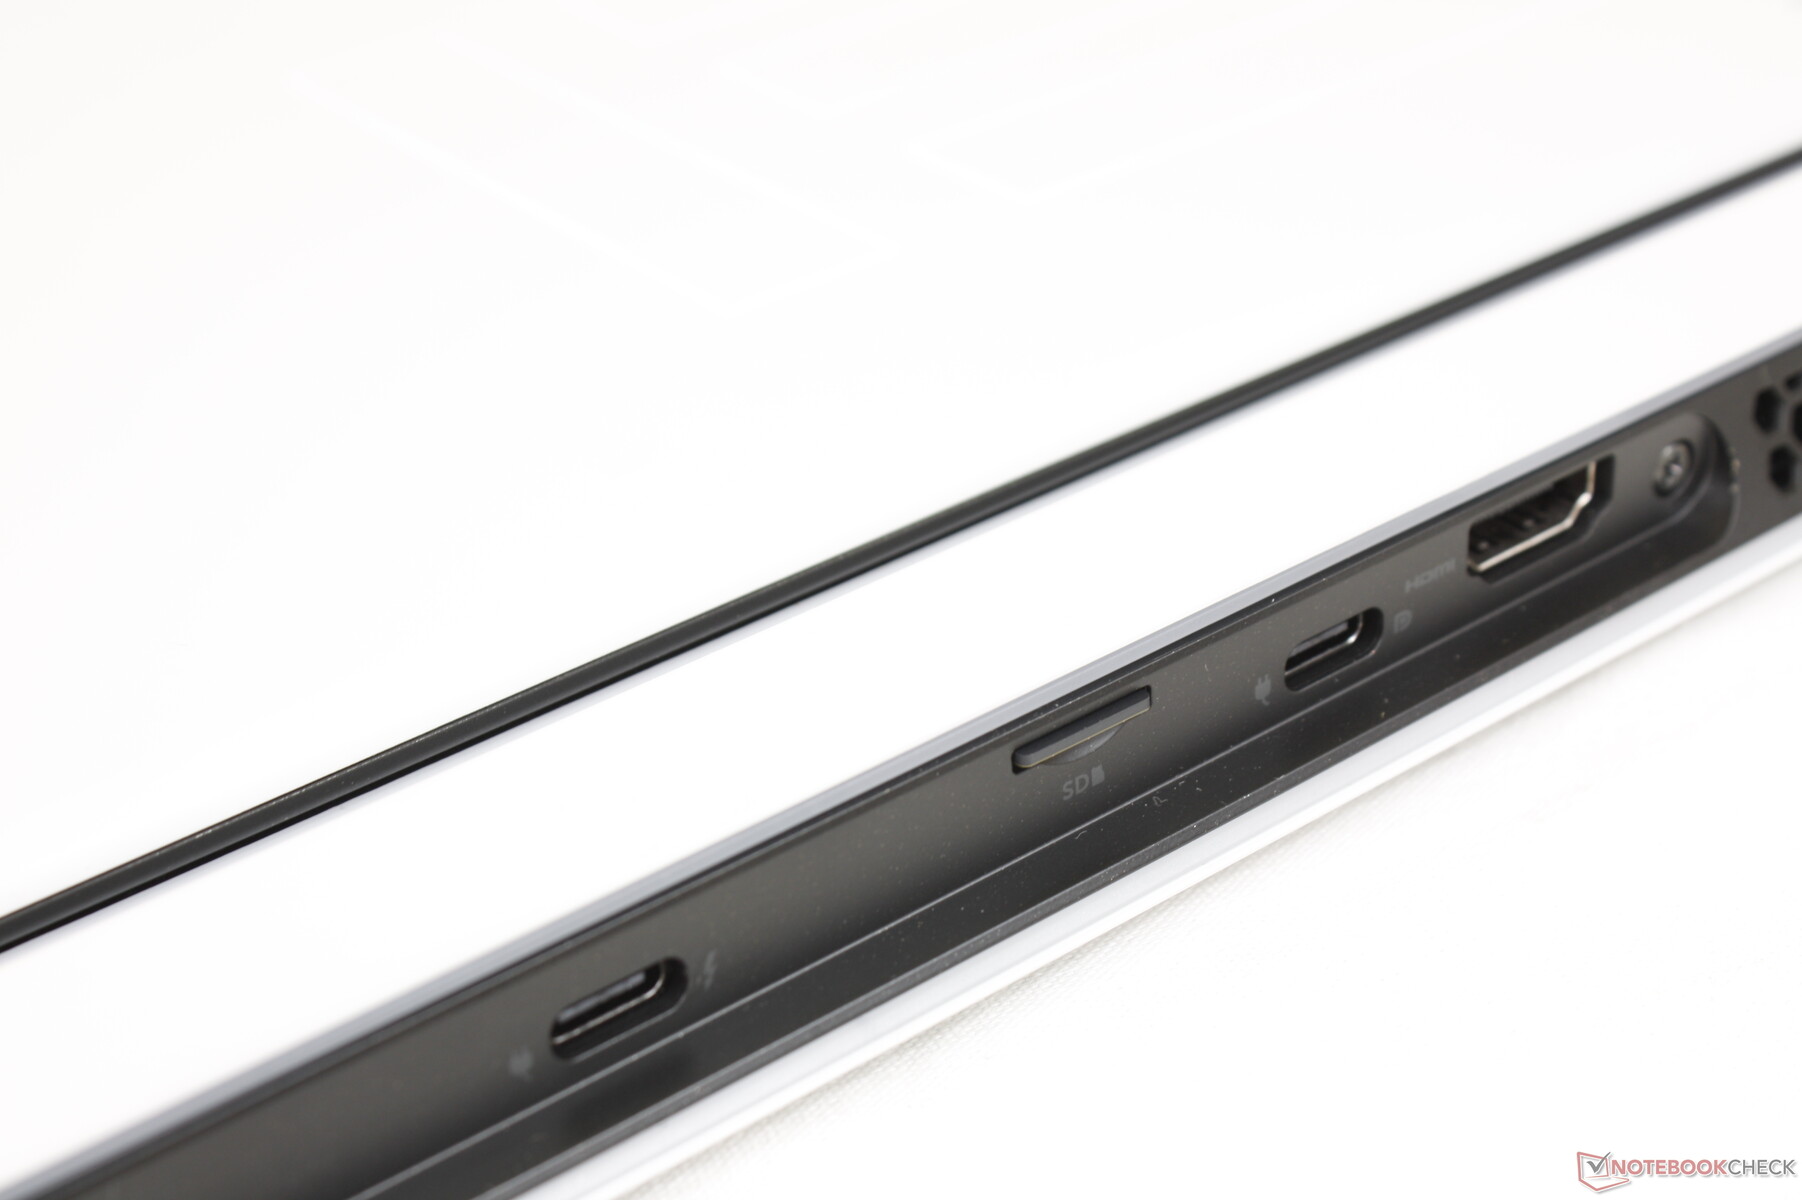
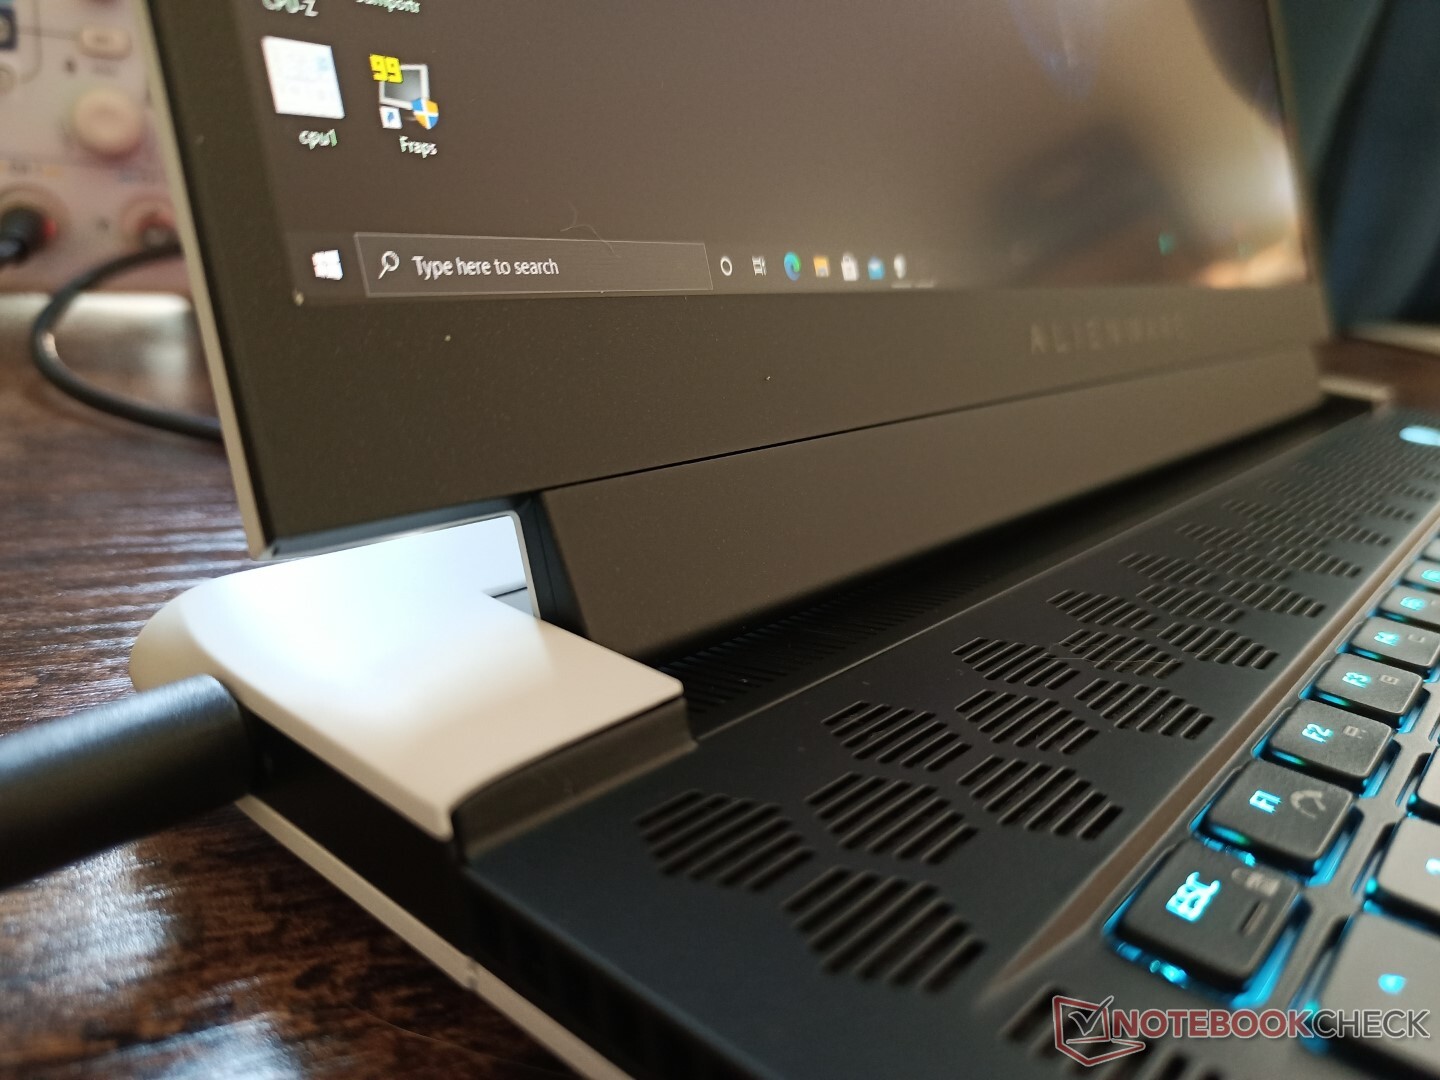
Conectividade - Mais e menos do que antes
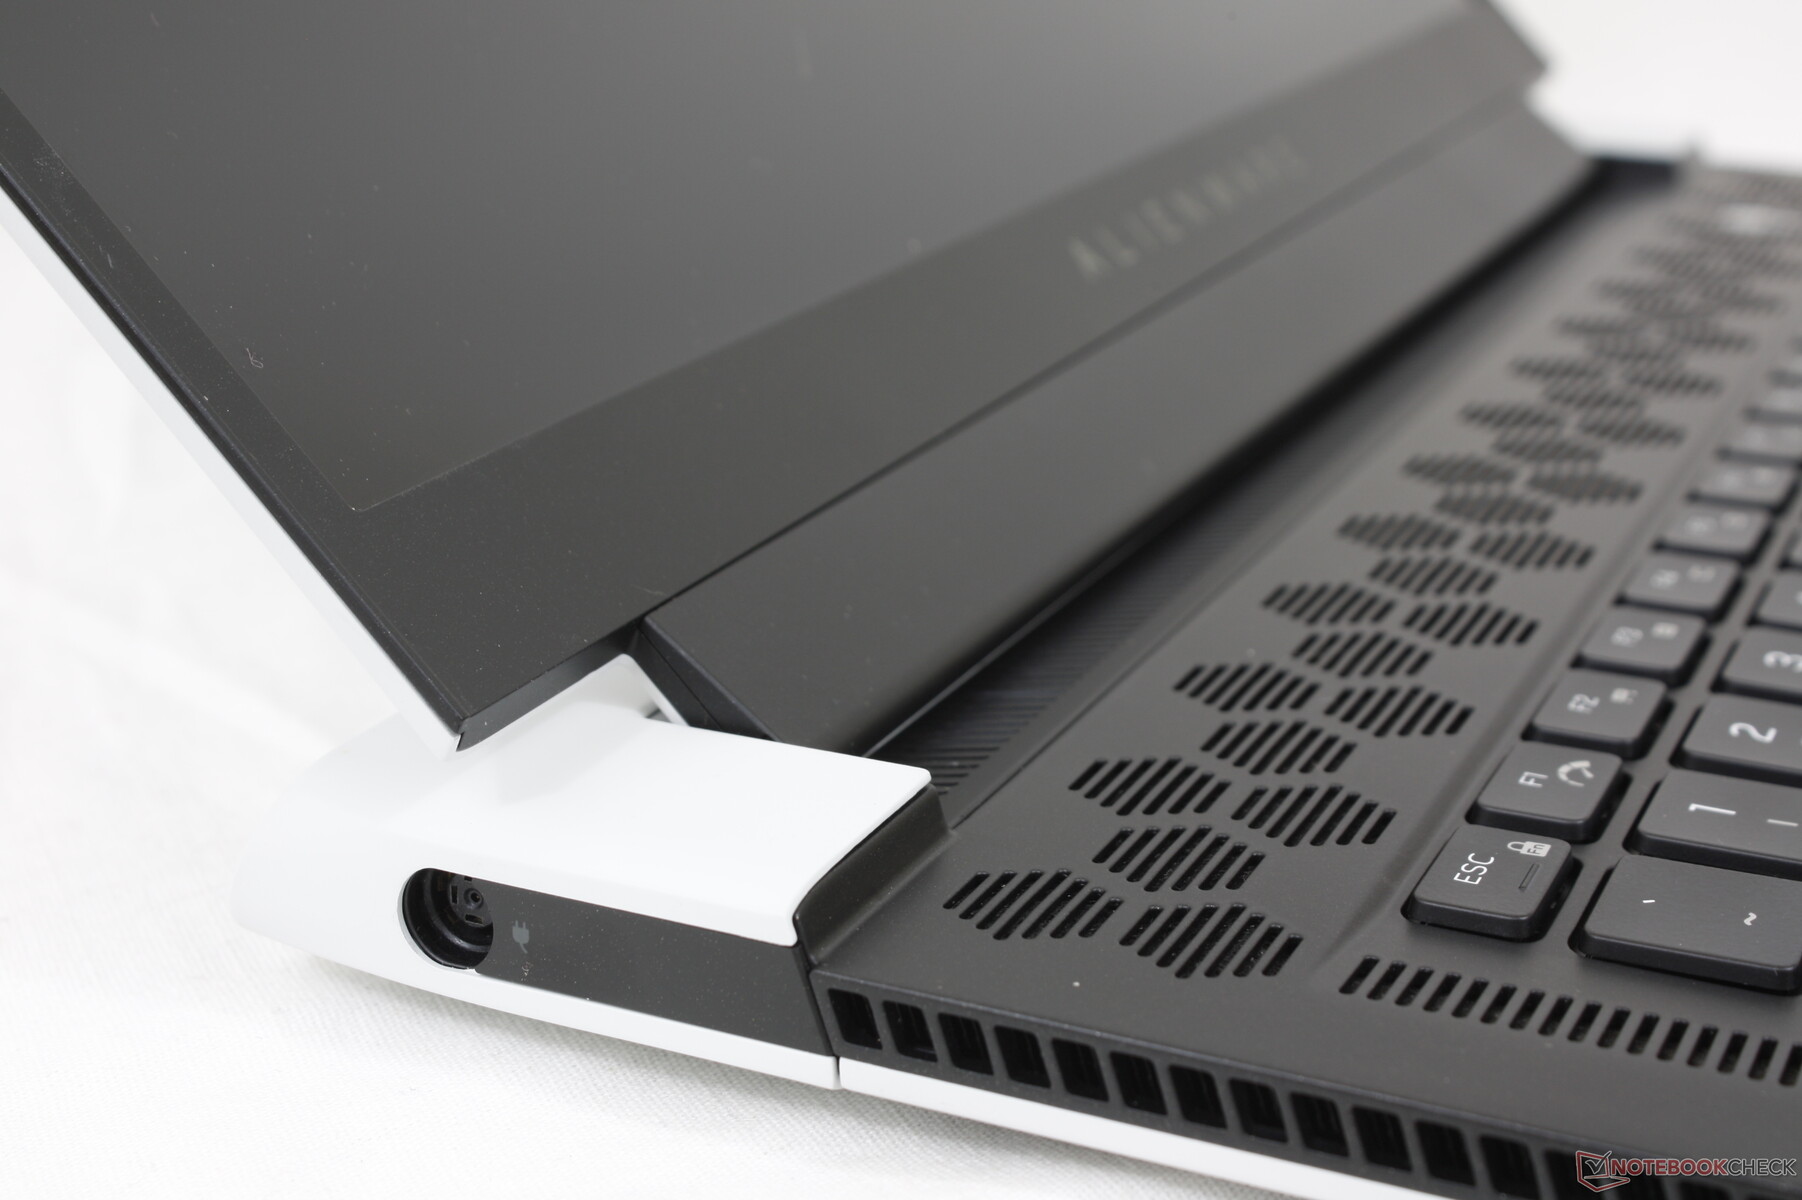
As opções de porta foram cortadas do antigo Alienware m15 R4. Os proprietários agora têm apenas uma porta USB-A ao invés de três, enquanto RJ-45, mini DisplayPort e a porta Amplificadora Graphics foram todas descartadas. O sistema ganha uma segunda porta USB-C que é indiscutivelmente mais versátil, dependendo do cenário
Quase todas as portas estão ao longo da parte traseira do chassi, o que pode dificultar a acessibilidade. Além disso, estas portas podem ser difíceis de ver, pois não acendem ou têm símbolos fáceis de ler.
Leitor de cartões SD
Elogiamos a Dell por integrar um leitor MicroSD, já que a maioria dos computadores portáteis de 15,6 polegadas ultramodernos para jogos não tem nenhum, incluindo o Asus Zephyrus S15, MSI GS66, ou Razer Blade 15. As taxas de transferência são muito rápidas com nosso cartão de teste UHS-II em torno de 200 MB/s.
| SD Card Reader | |
| average JPG Copy Test (av. of 3 runs) | |
| Alienware x15 RTX 3070 P111F (AV Pro V60) | |
| Alienware m15 R4 RTX 3080 (AV PRO microSD 128 GB V60) | |
| maximum AS SSD Seq Read Test (1GB) | |
| Alienware x15 RTX 3070 P111F (AV Pro V60) | |
| Alienware m15 R4 RTX 3080 (AV PRO microSD 128 GB V60) | |
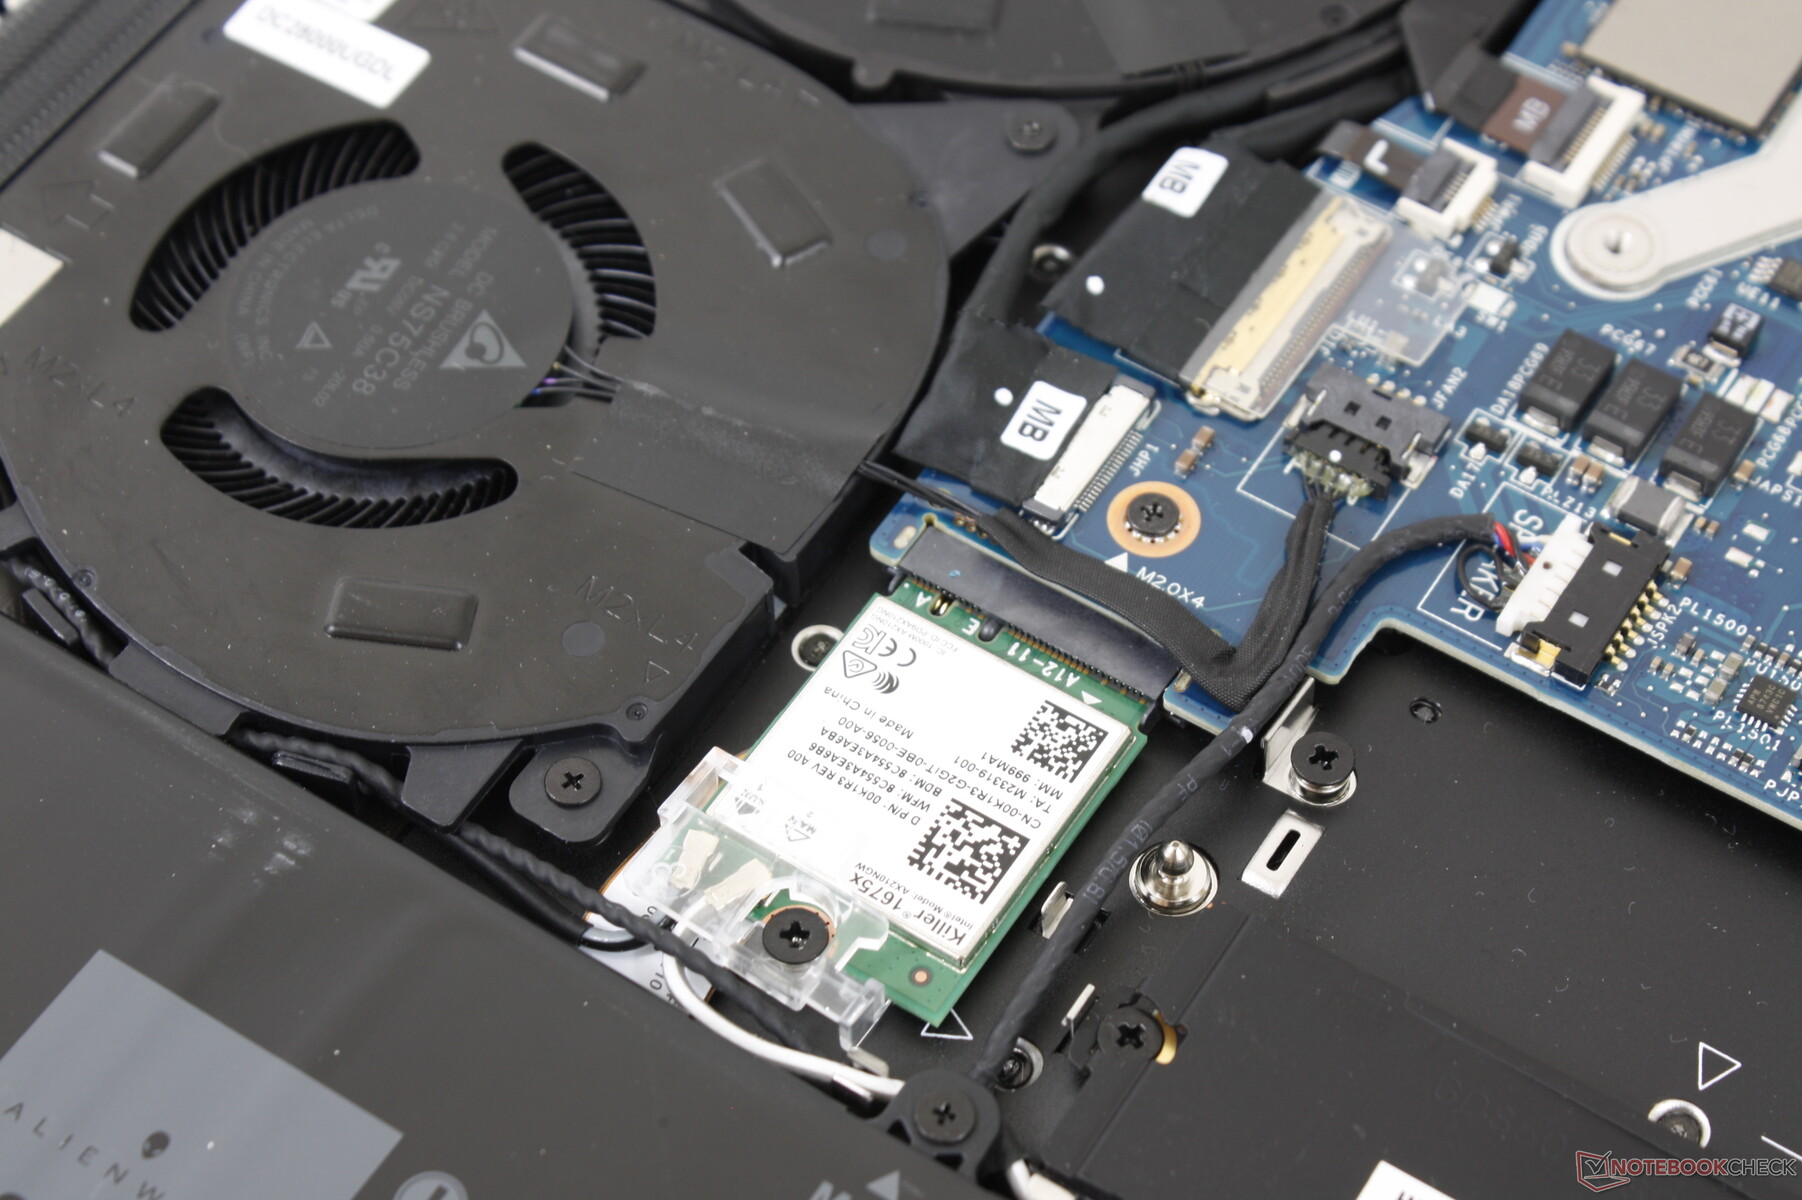
Comunicação - Padrão W-Fi 6E
Todas as SKUs vêm com o módulo Killer Wi-Fi 6E AX1675x WLAN para substituir o Killer AX1650w do ano passado. Ao contrário do Intel AX210, estes módulos Killer são compatíveis com o Killer Performance Suite e todas as suas características de software.
Webcam
A qualidade da câmera continua pobre a apenas 720p e sem o obturador da webcam. IR está incluído para suporte ao Windows Olá.


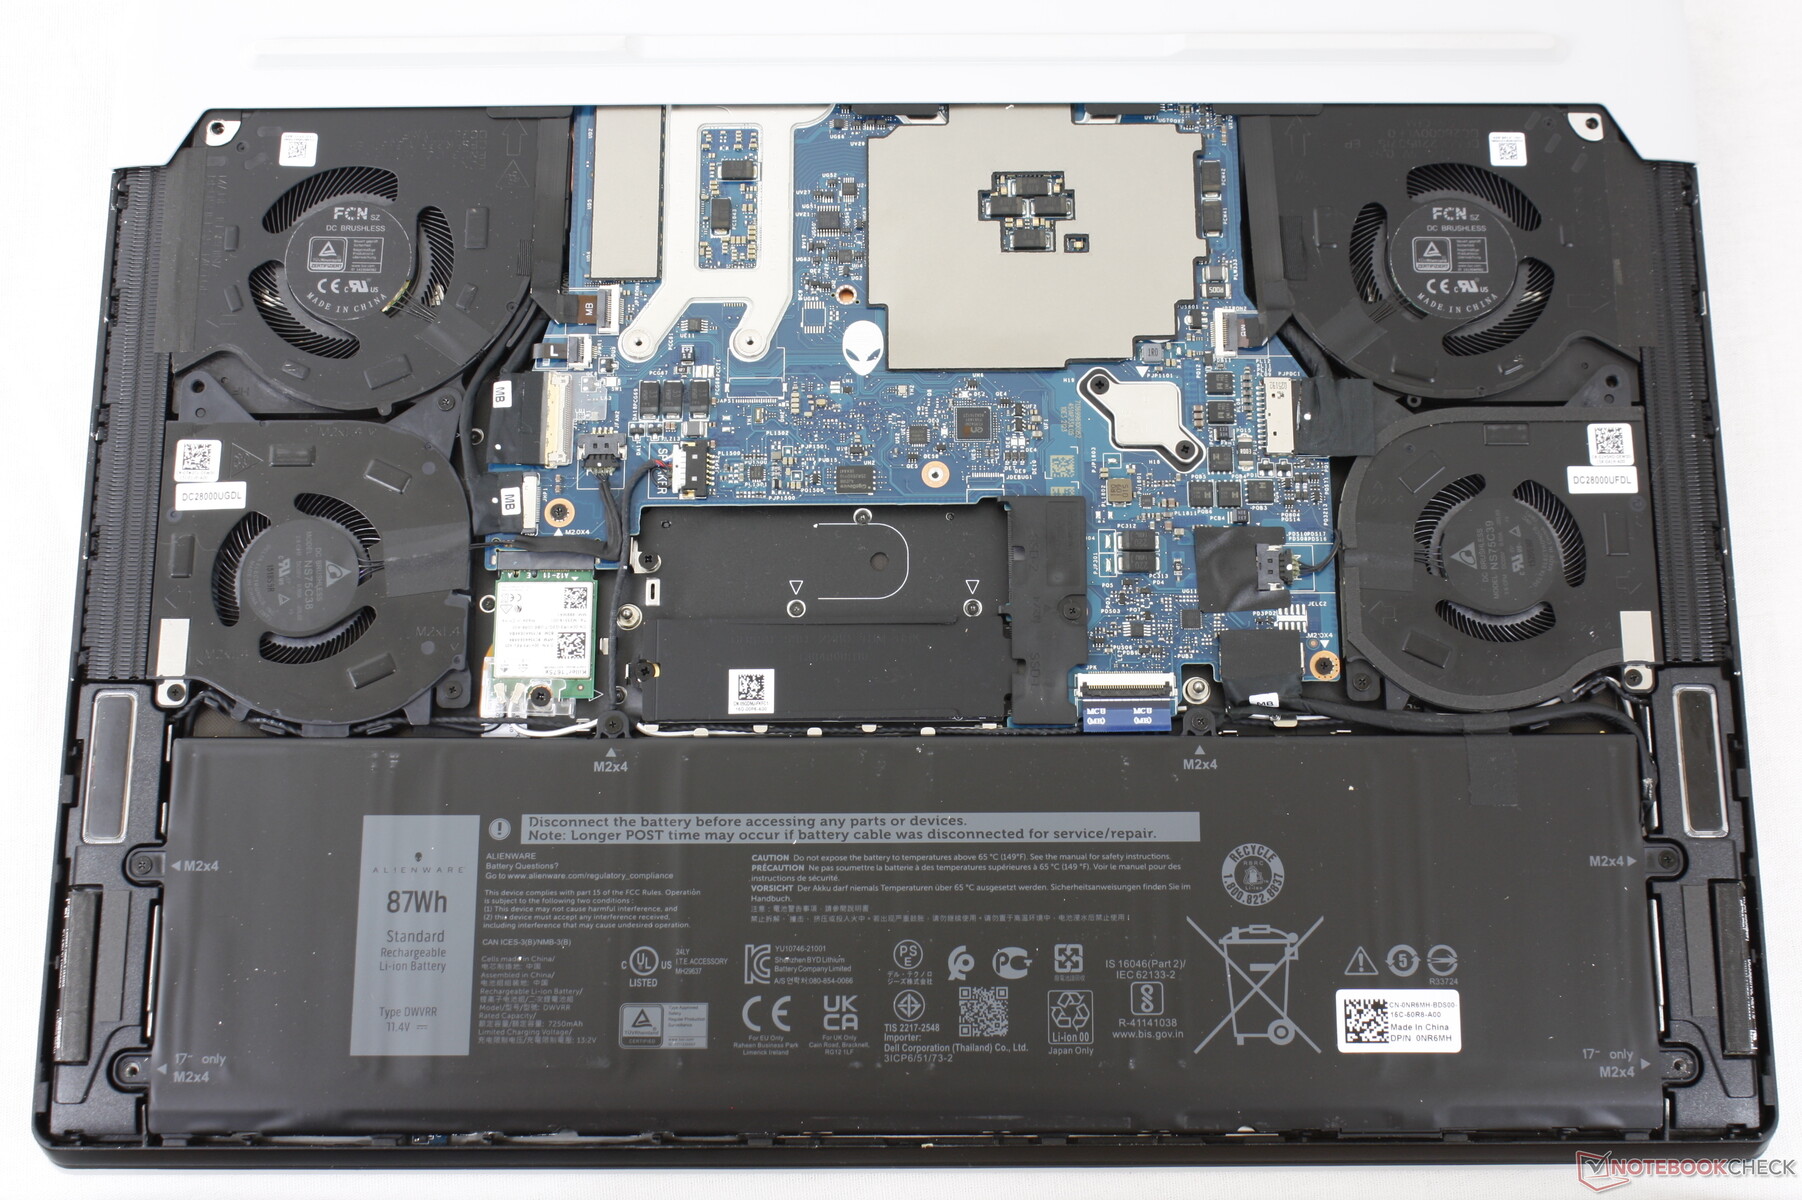
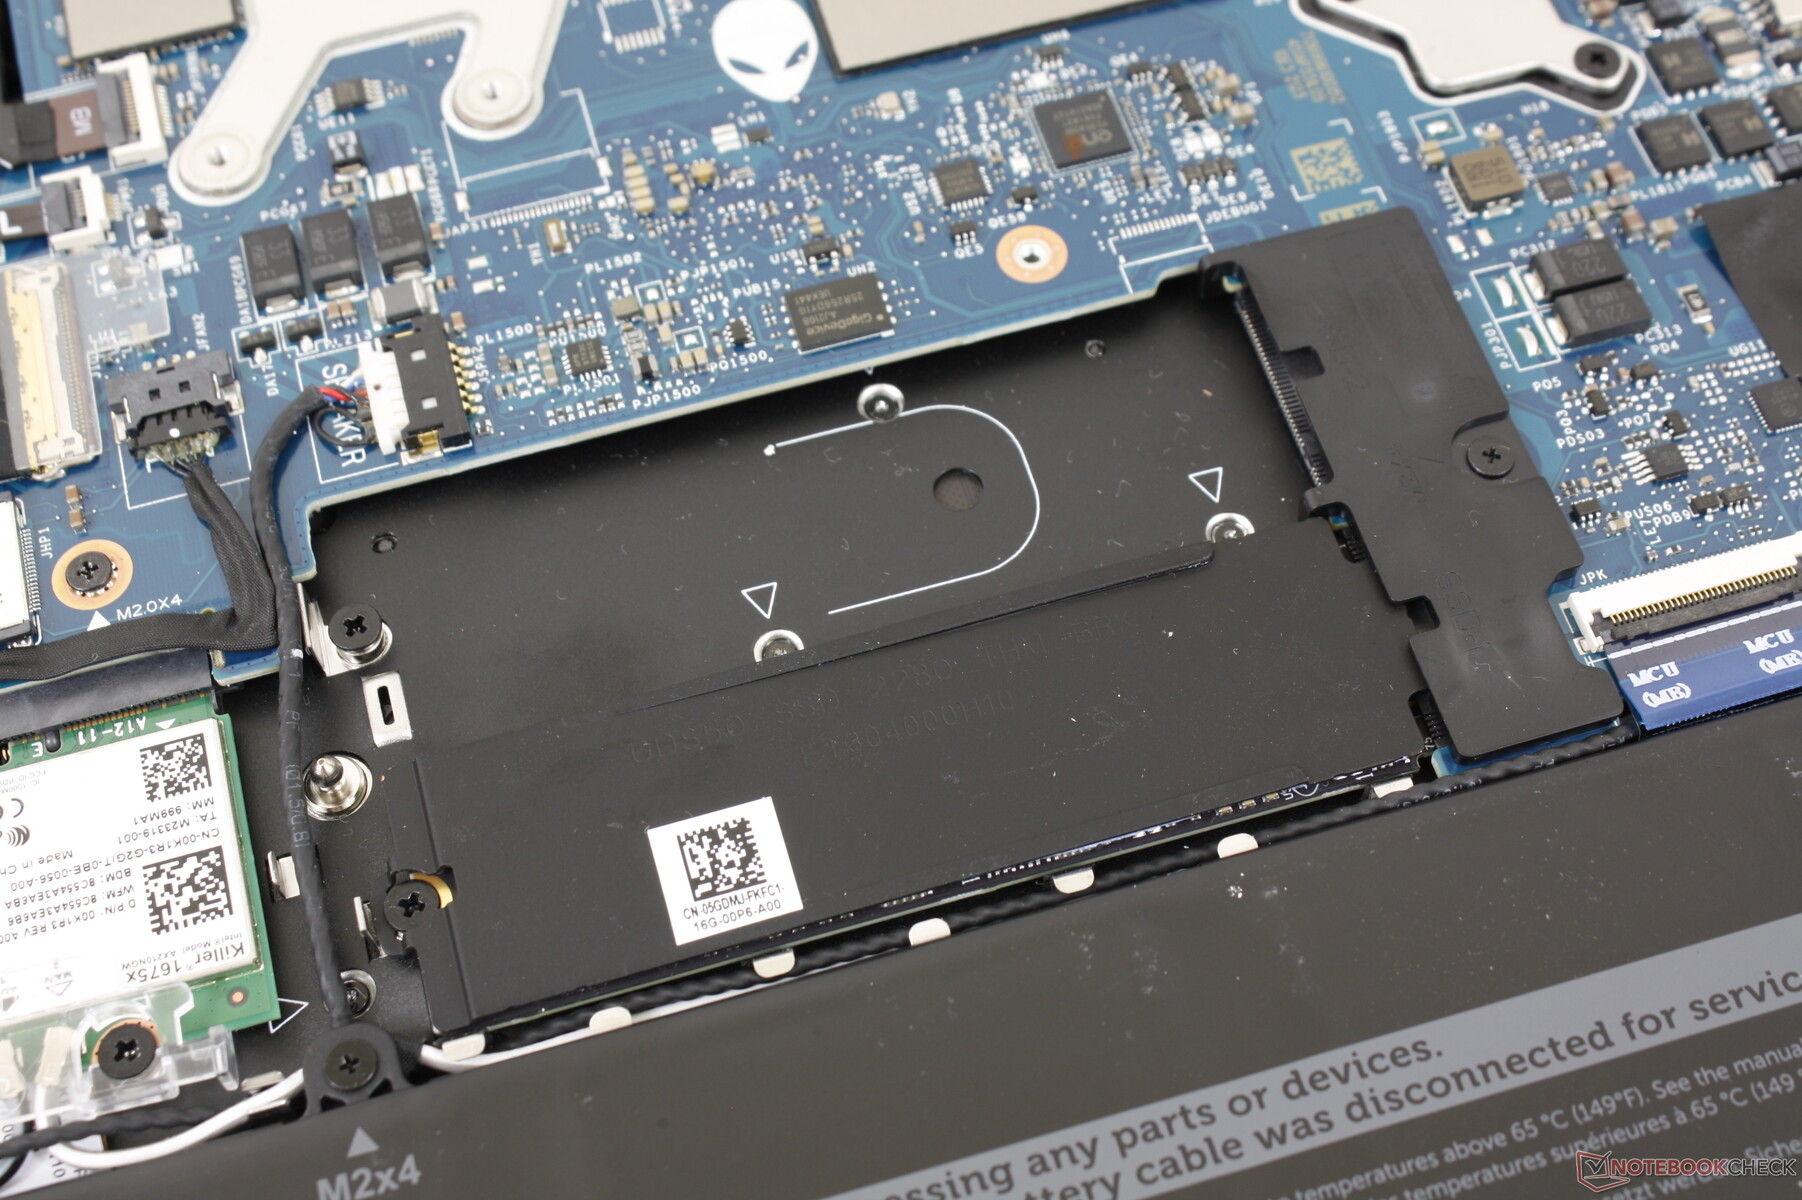
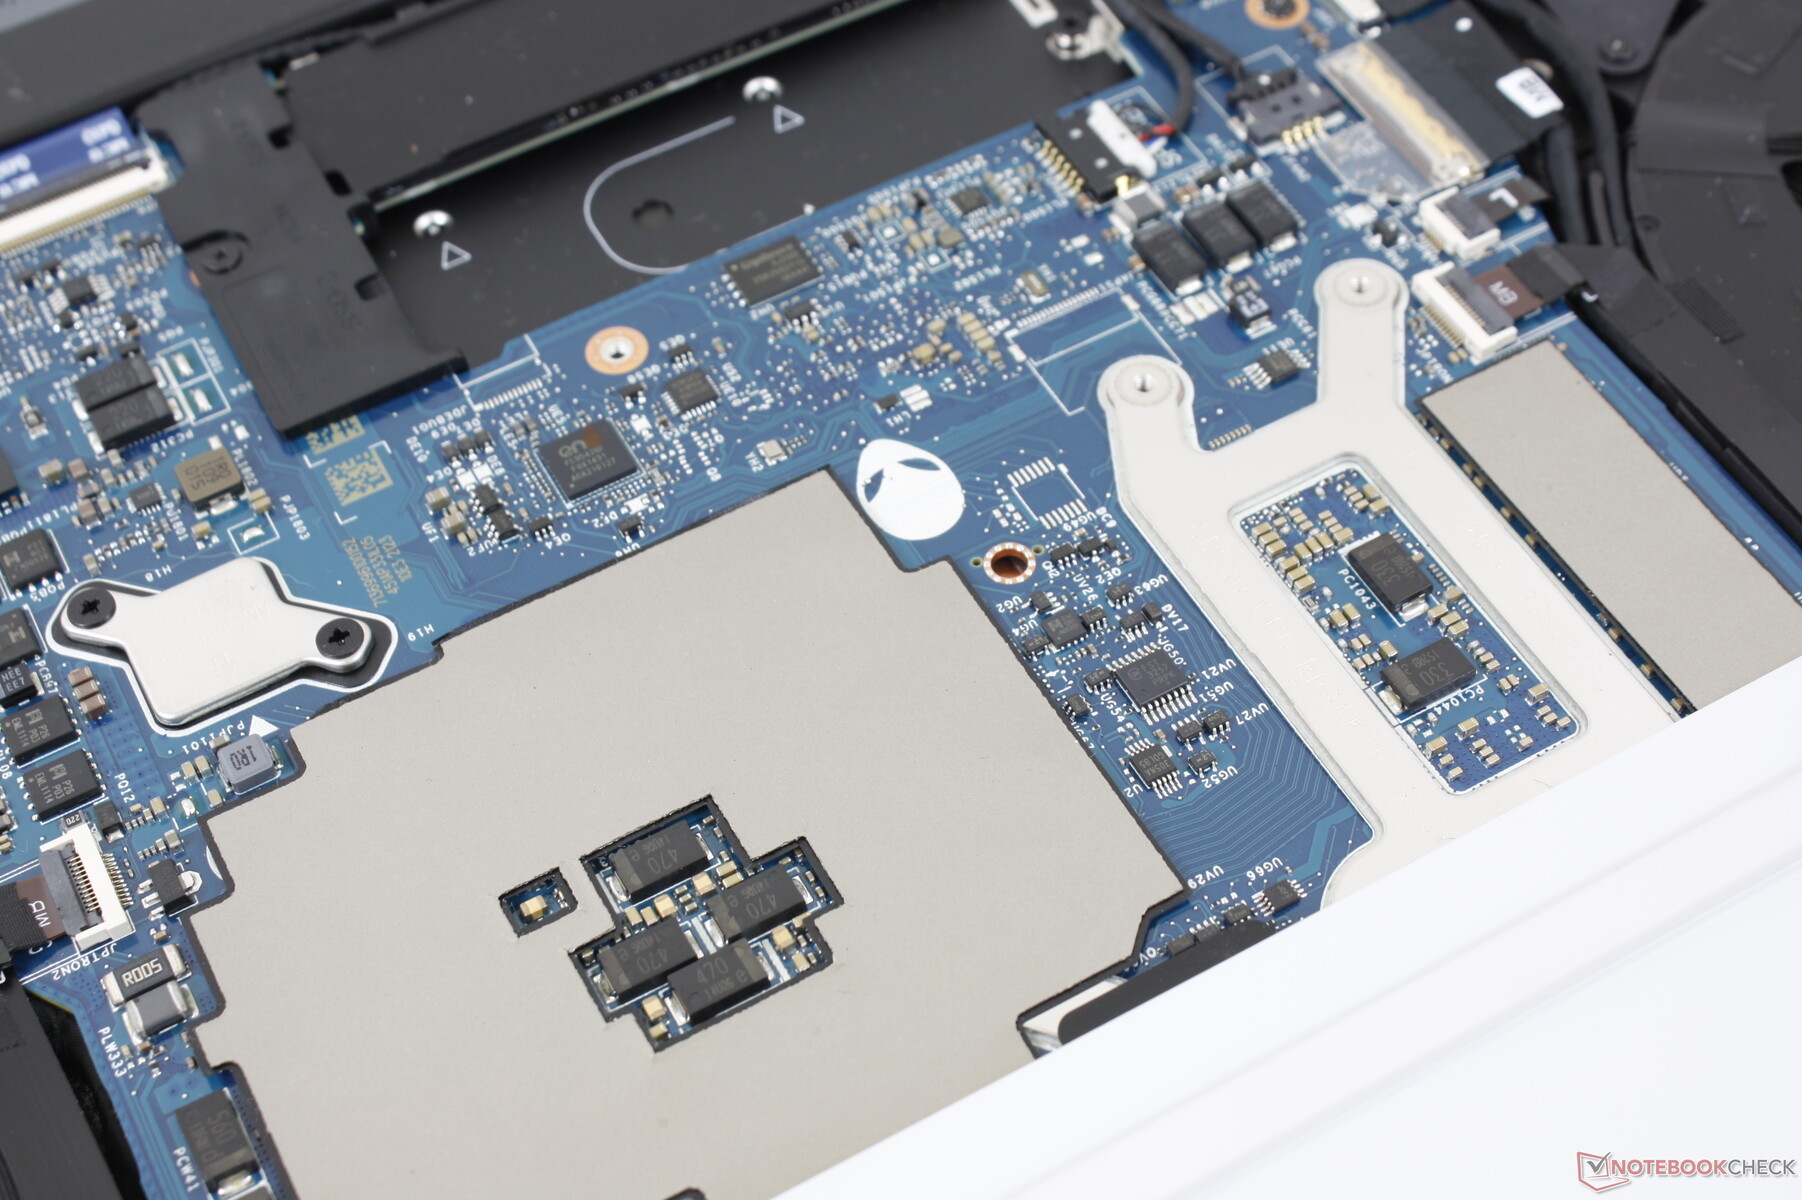
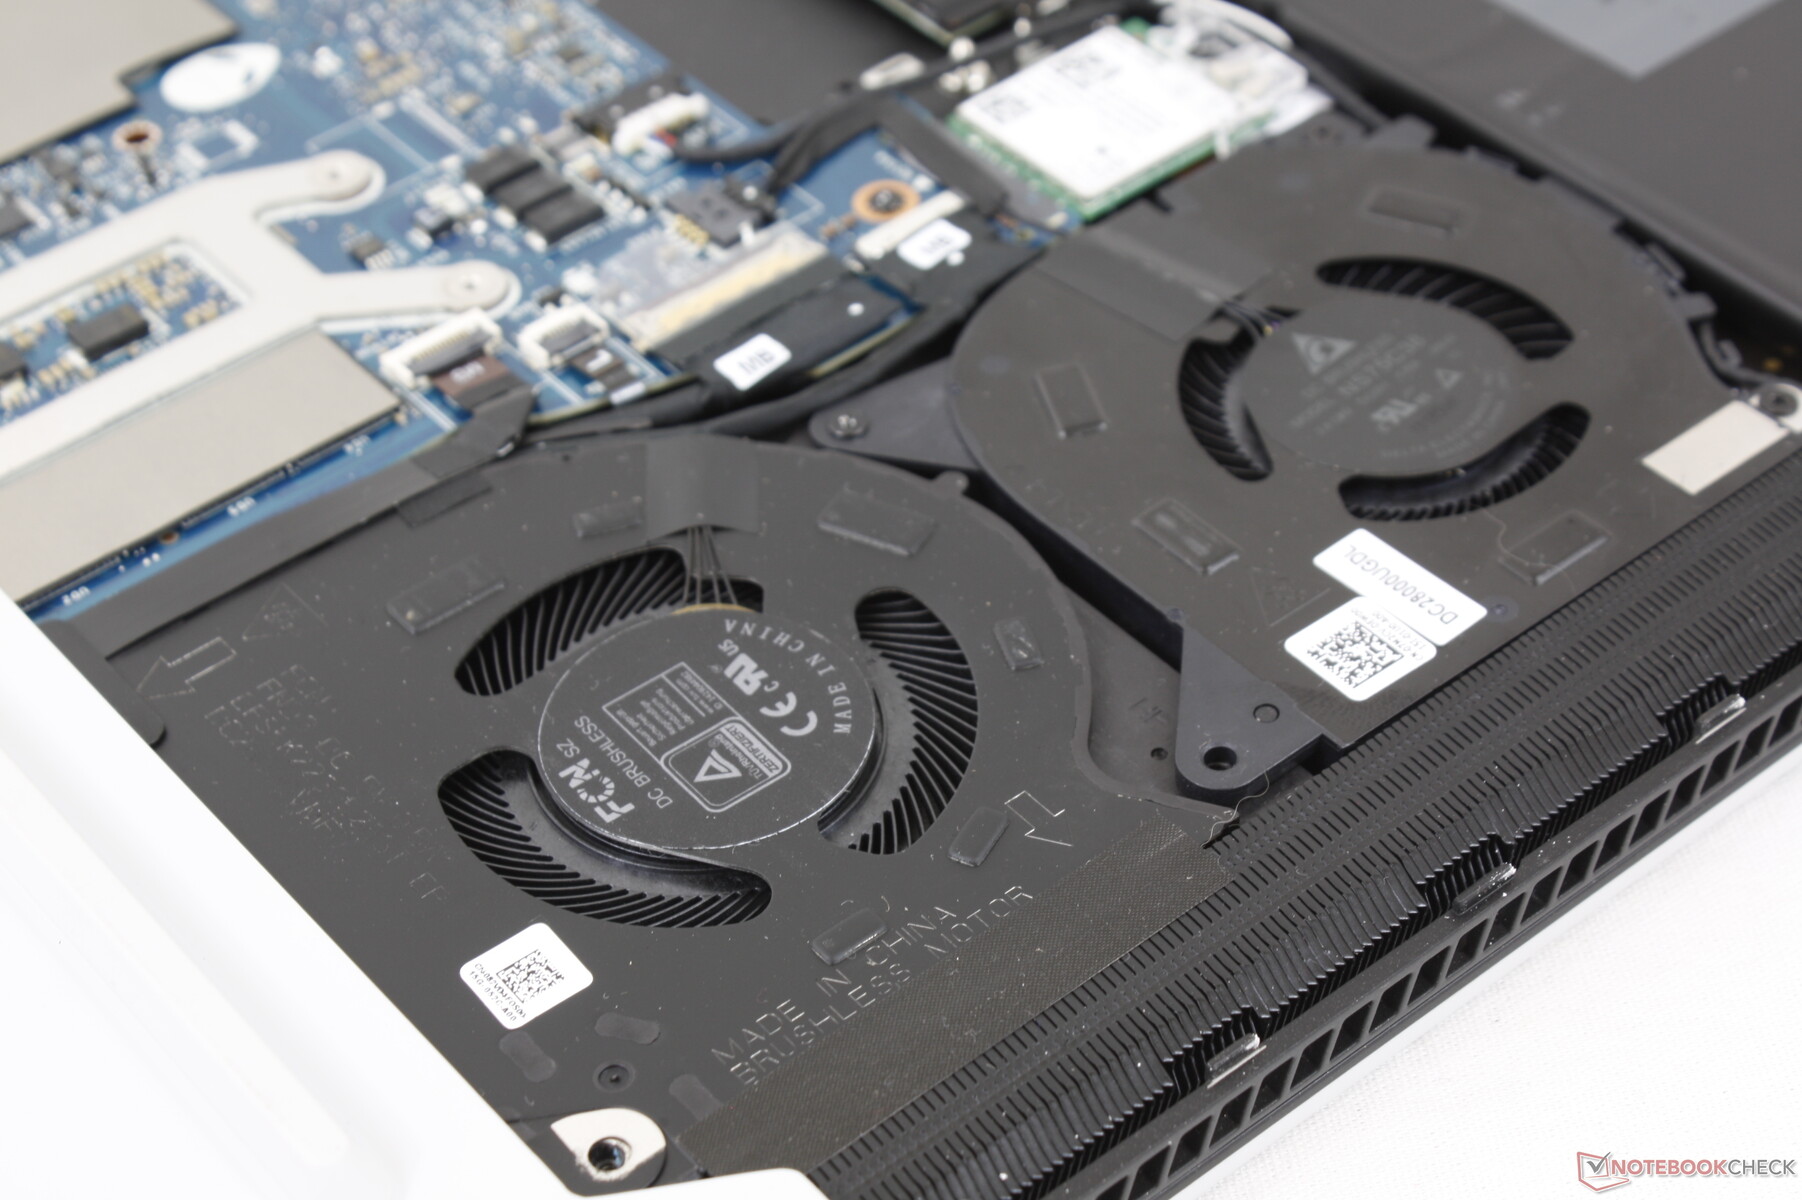
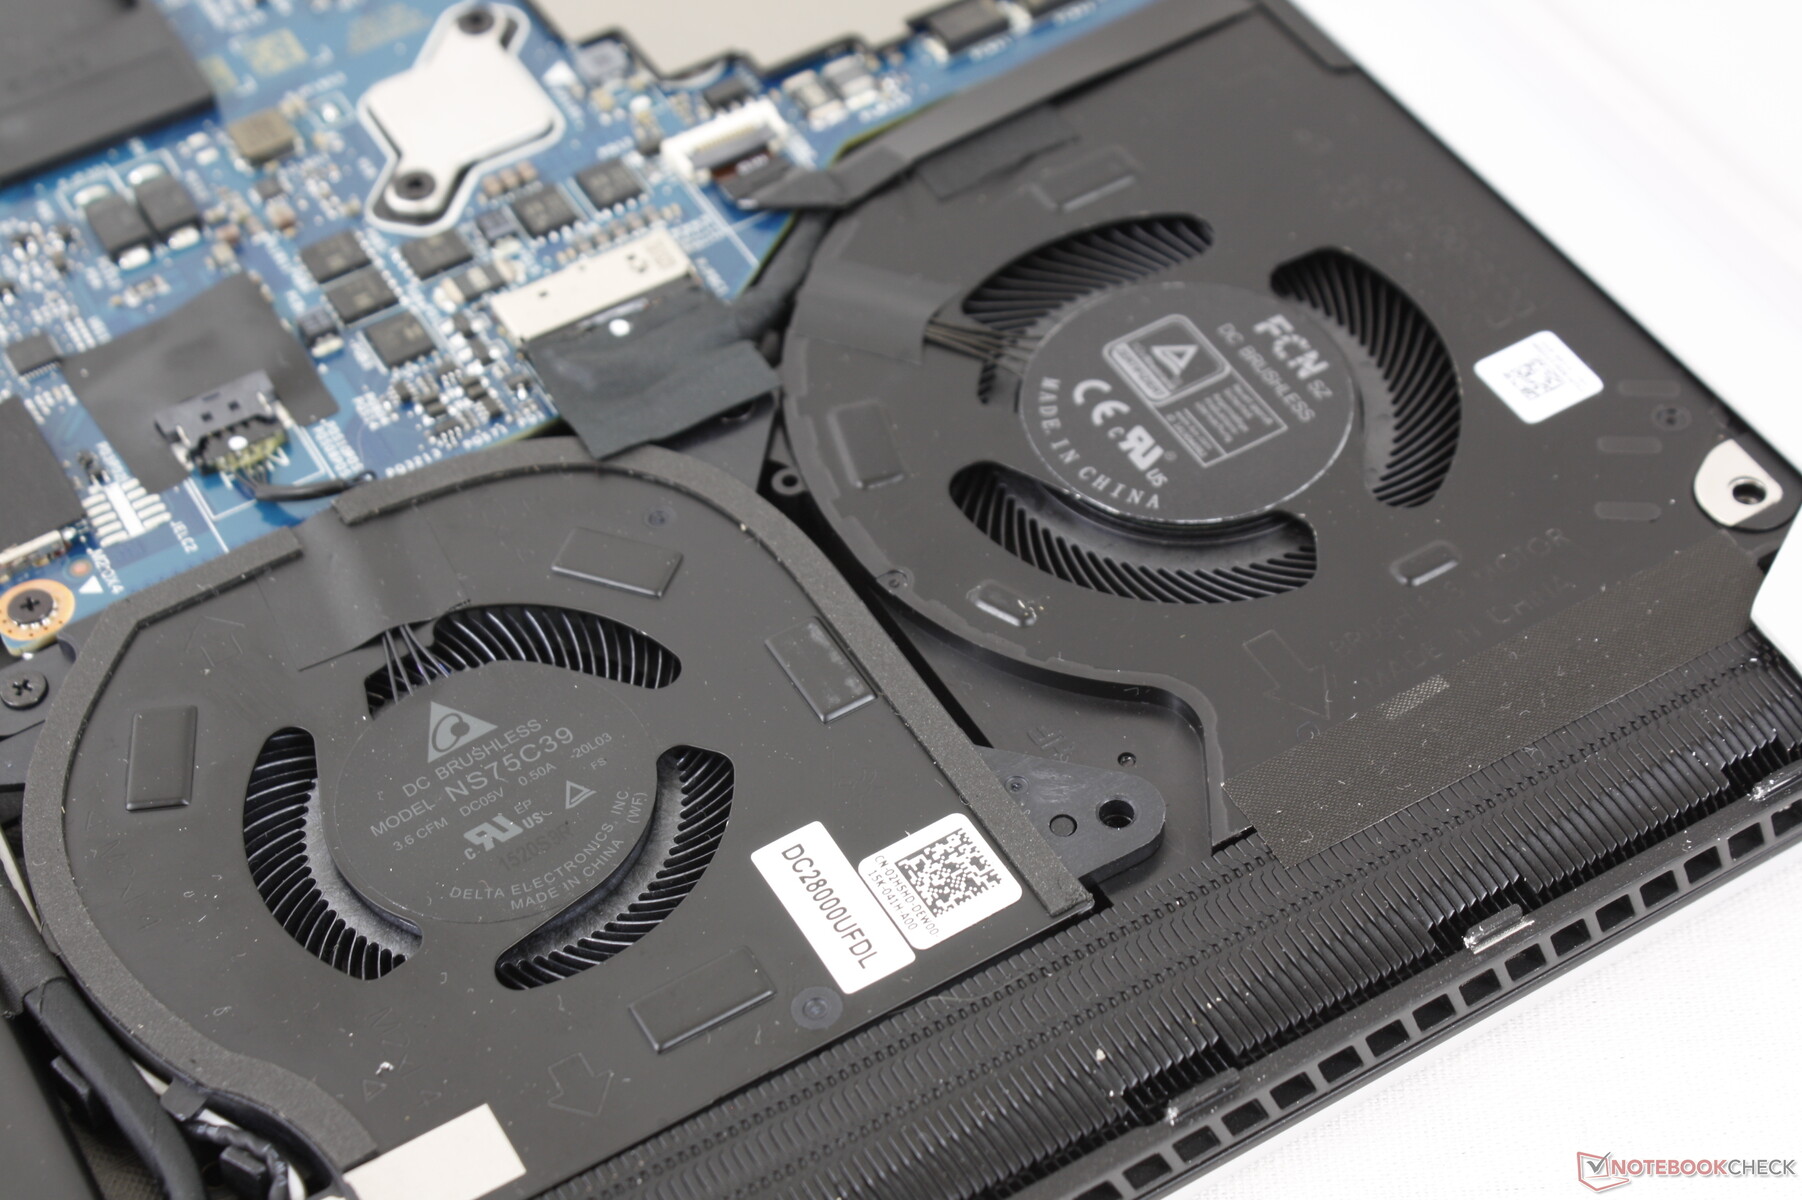
Manutenção
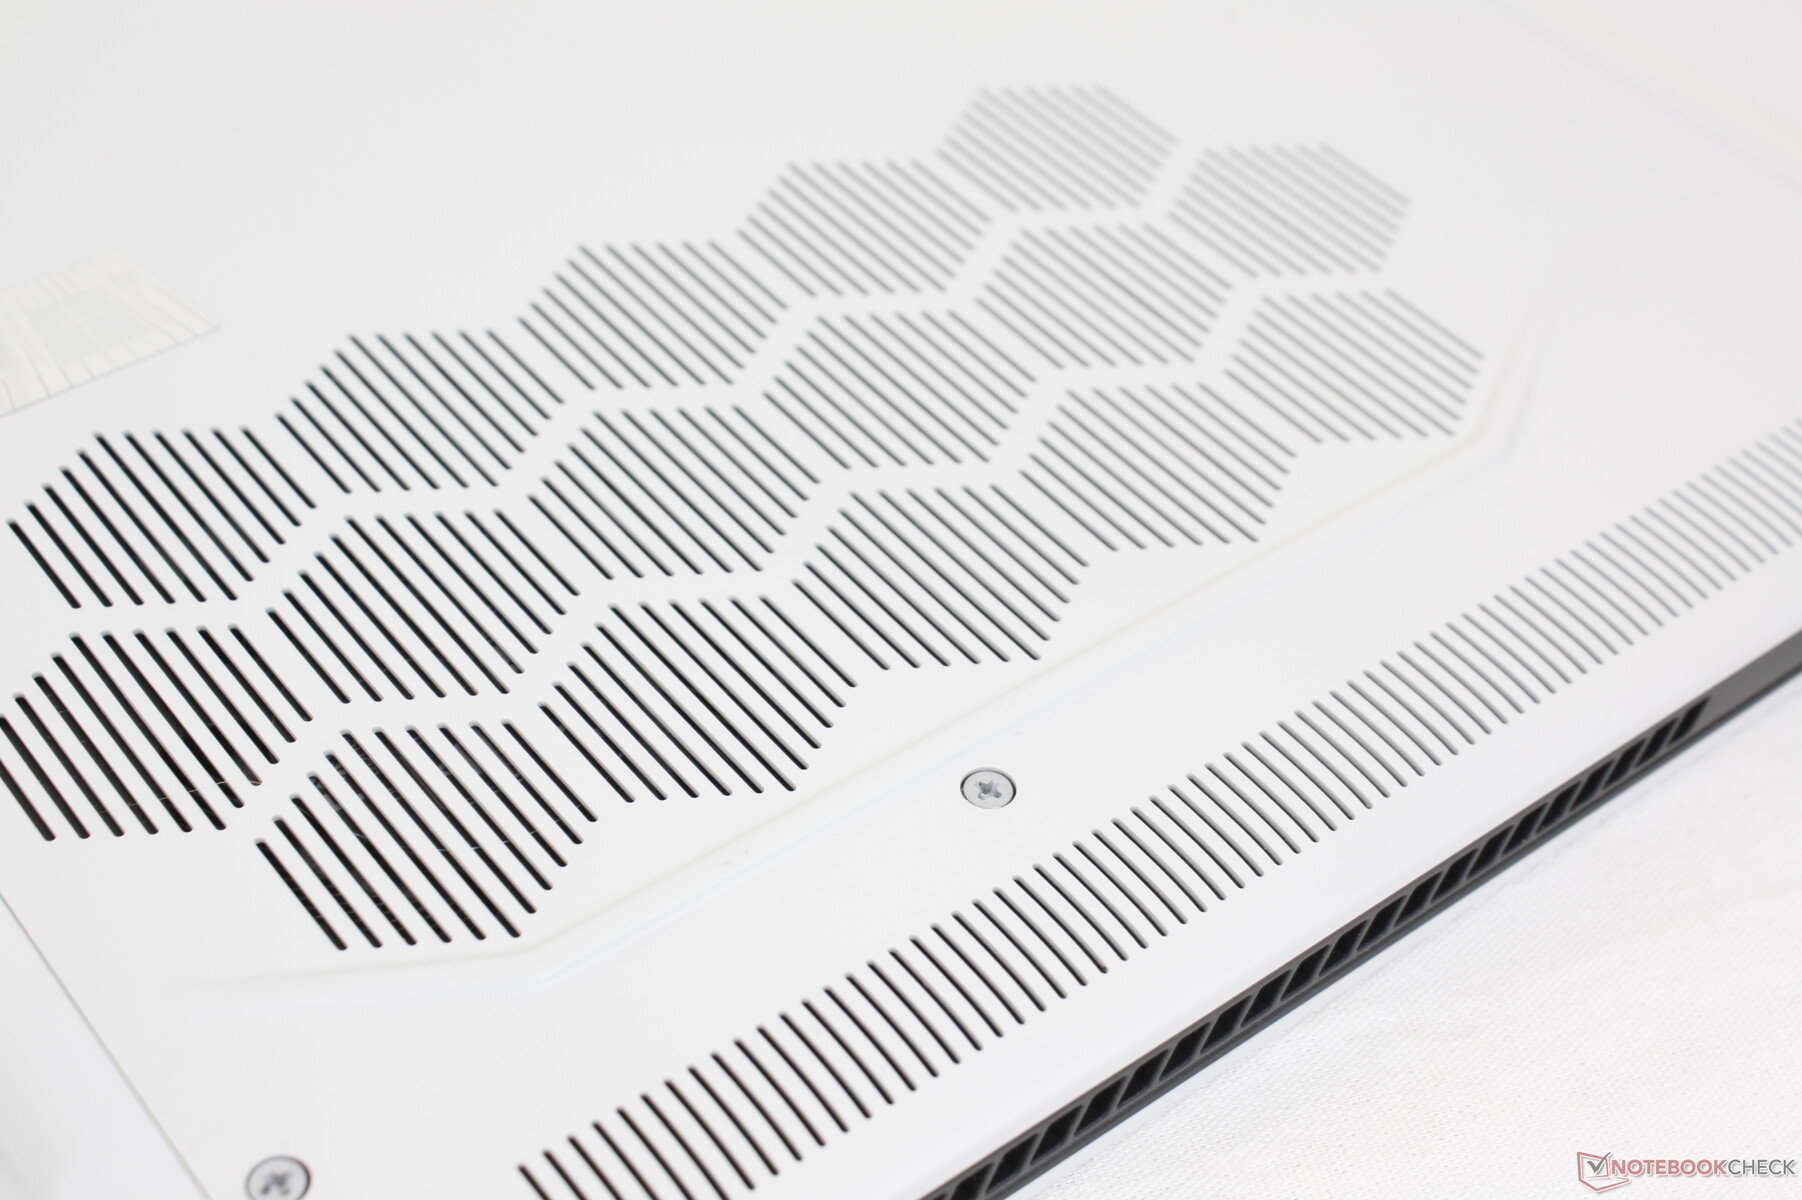
O painel inferior é fixado por apenas seis parafusos Philips para facilitar a manutenção e as atualizações. A RAM é soldada, porém, e assim os usuários só poderão atualizar os M.2 SSDs. Modelos concorrentes como o Razer Blade 15 ou MSI GS66 têm ranhuras SODIMM para atualizações do usuário em comparação.
Acessórios e Garantia
Não há extras na caixa além do adaptador AC e da papelada. A habitual garantia limitada de um ano aplica-se com muitos extras se encomendada da Dell.
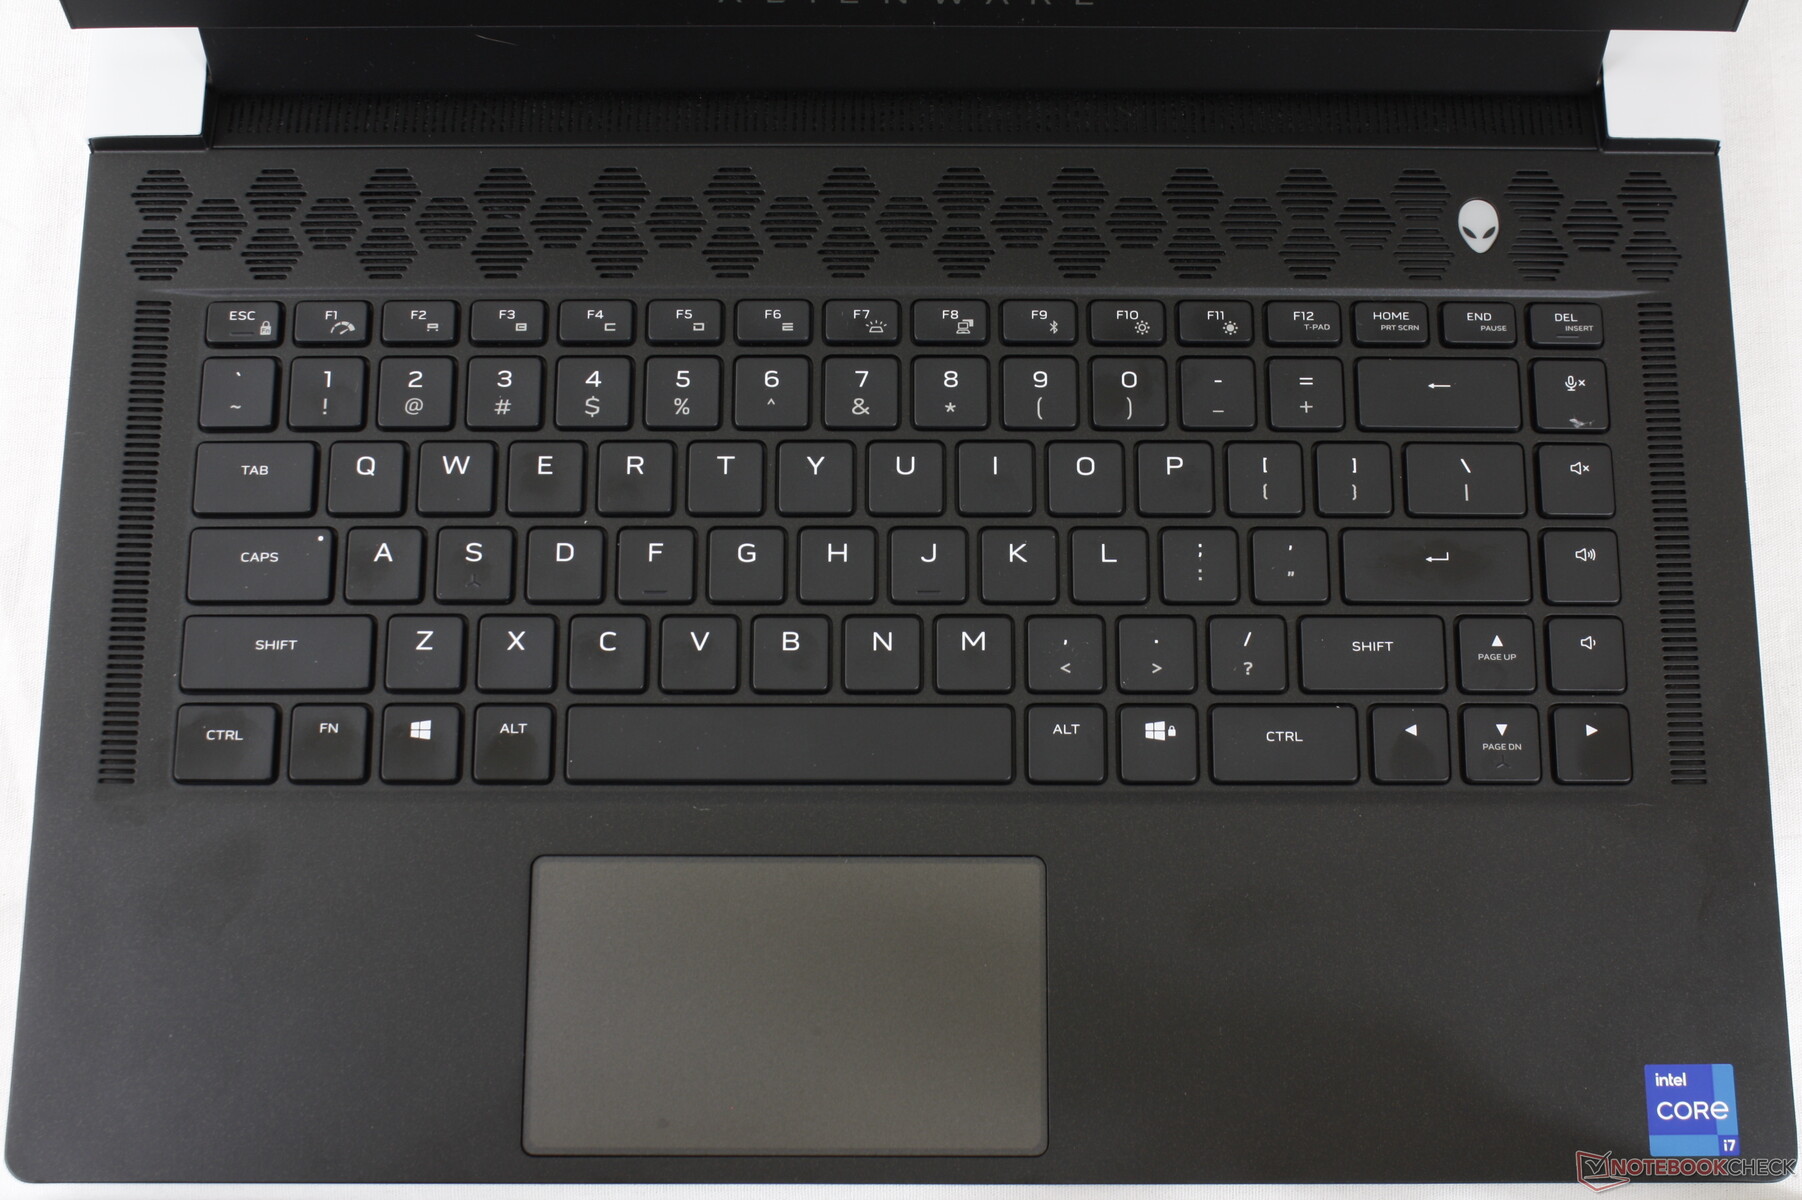
Dispositivos de Entrada - Chaves Crisper
Teclado
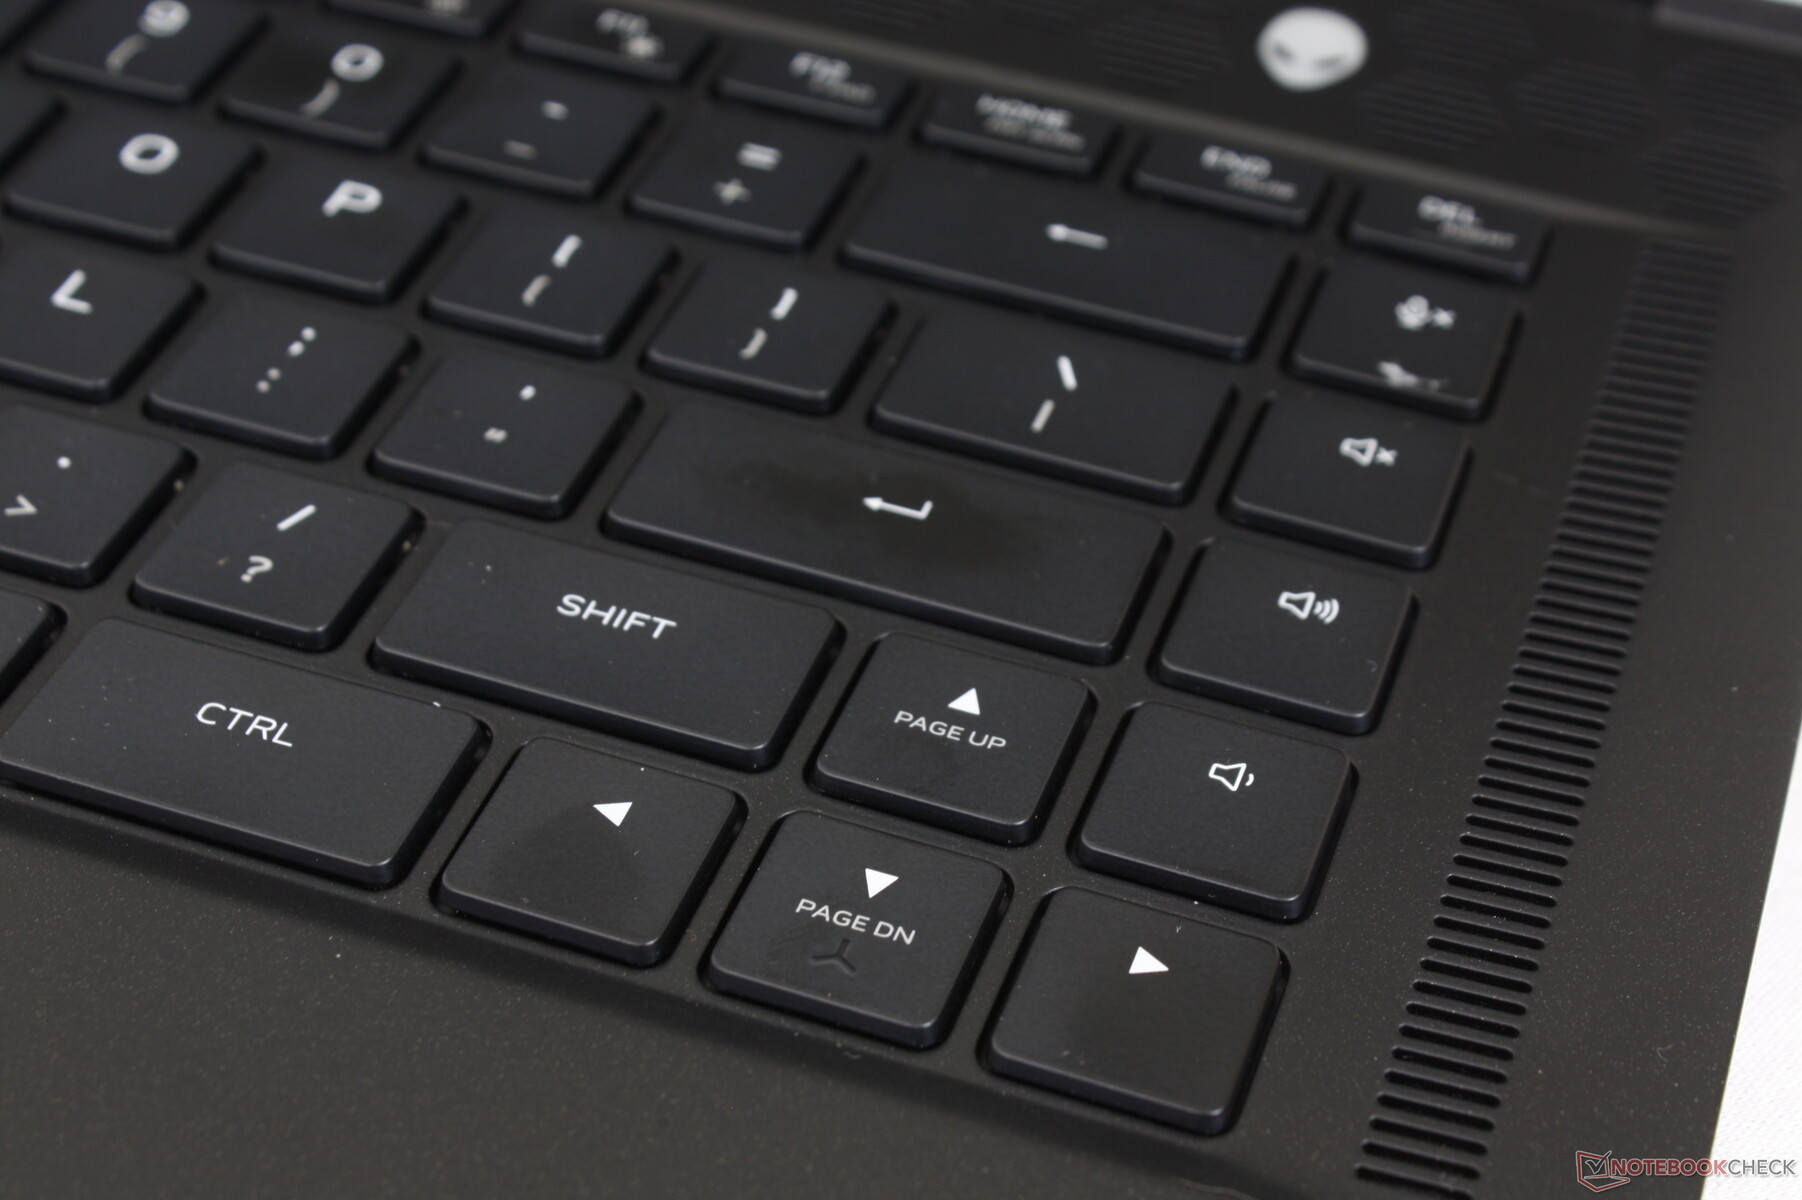
O x15 utiliza chaves padrão baseadas em membrana com retroiluminação RGB por chave, que é uma atualização da iluminação da quad-zona no Alienware m15 R4. O feedback é mais nítido e firme do que o esperado com seu curso de 1,5 mm para evitar as teclas macias e excessivamente rasas na maioria dos Ultrabooks. Achamos o sistema mais confortável para digitação do que na série Asus Zephyrus ou Razer Blade 15. Entretanto, as chaves Enter e Space são significativamente mais altas do que as chaves QWERTY mais silenciosas
Os símbolos das teclas secundárias são irritantemente apagados, ao contrário das da série m15 mais antiga. O teclado x17 R1 também tem este mesmo problema.
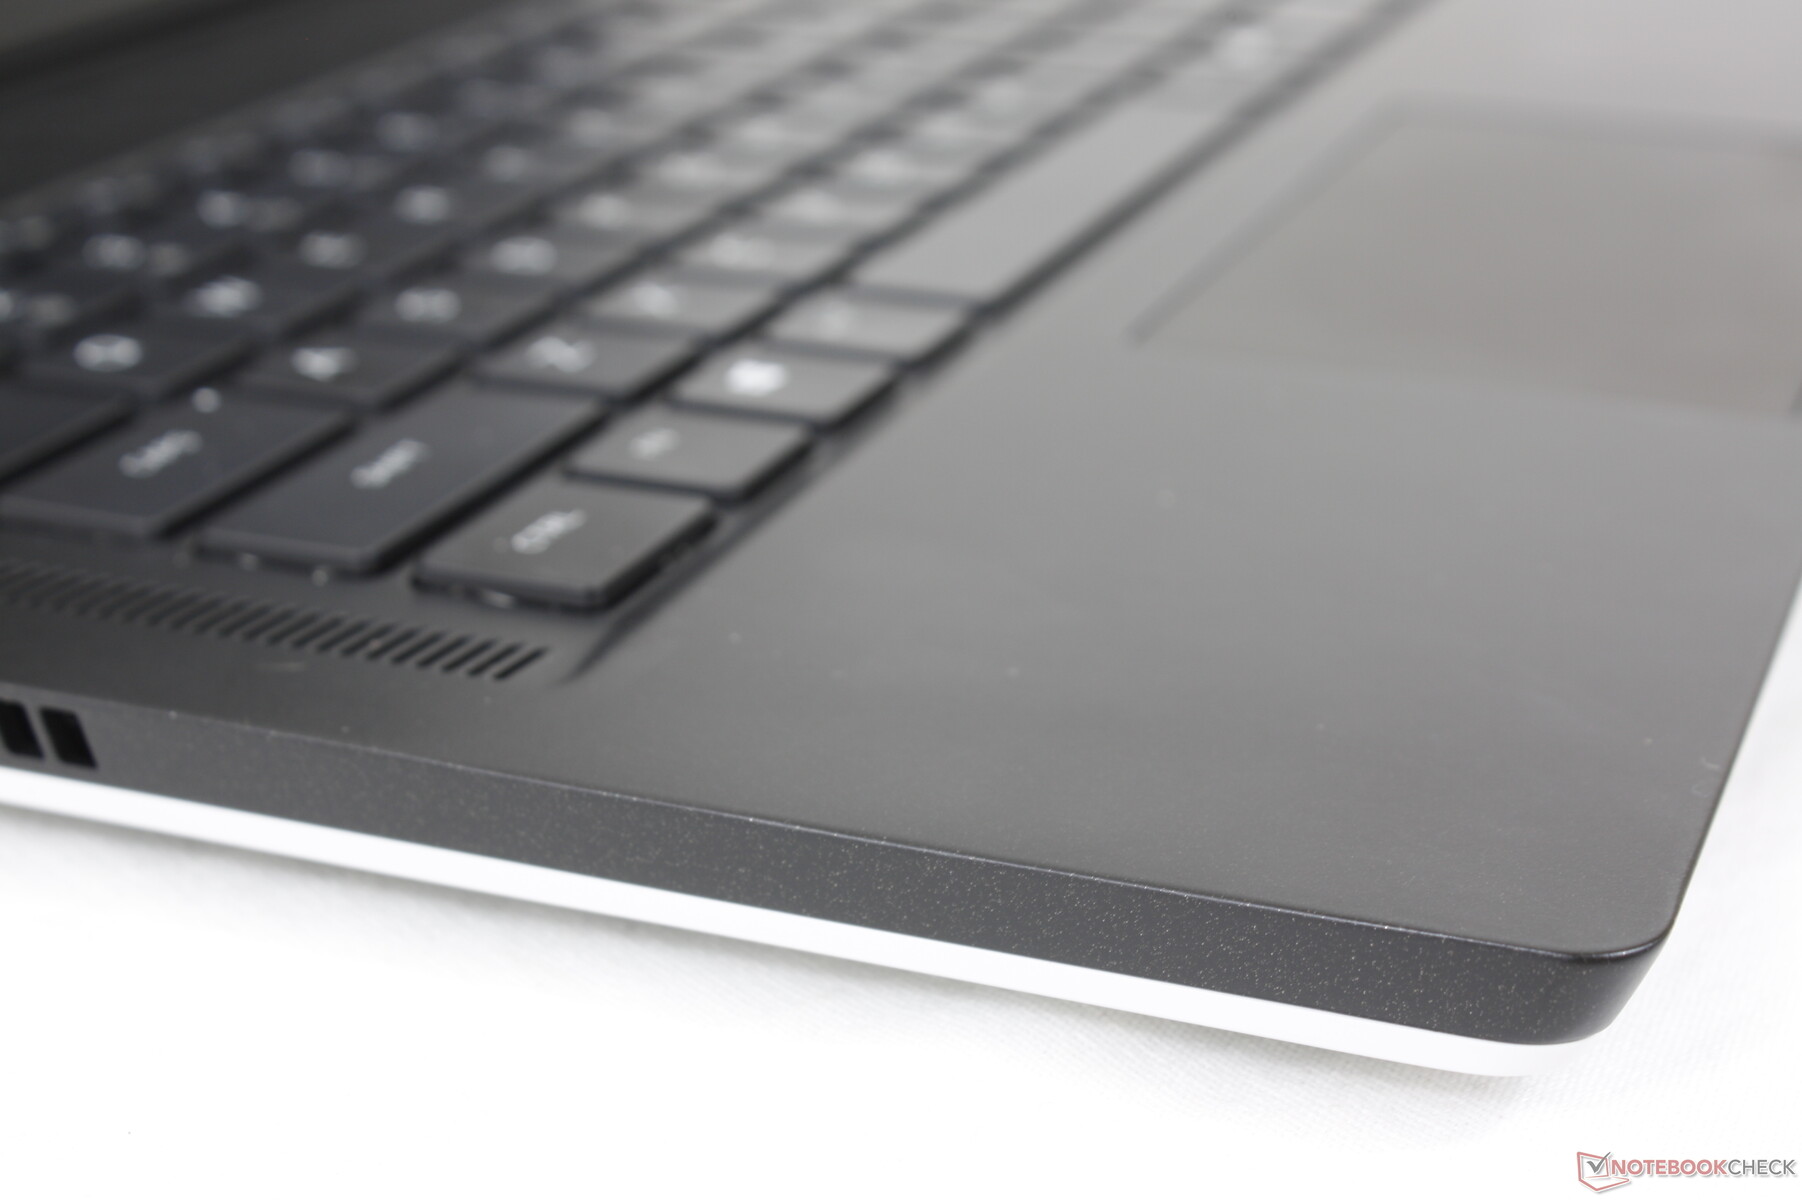
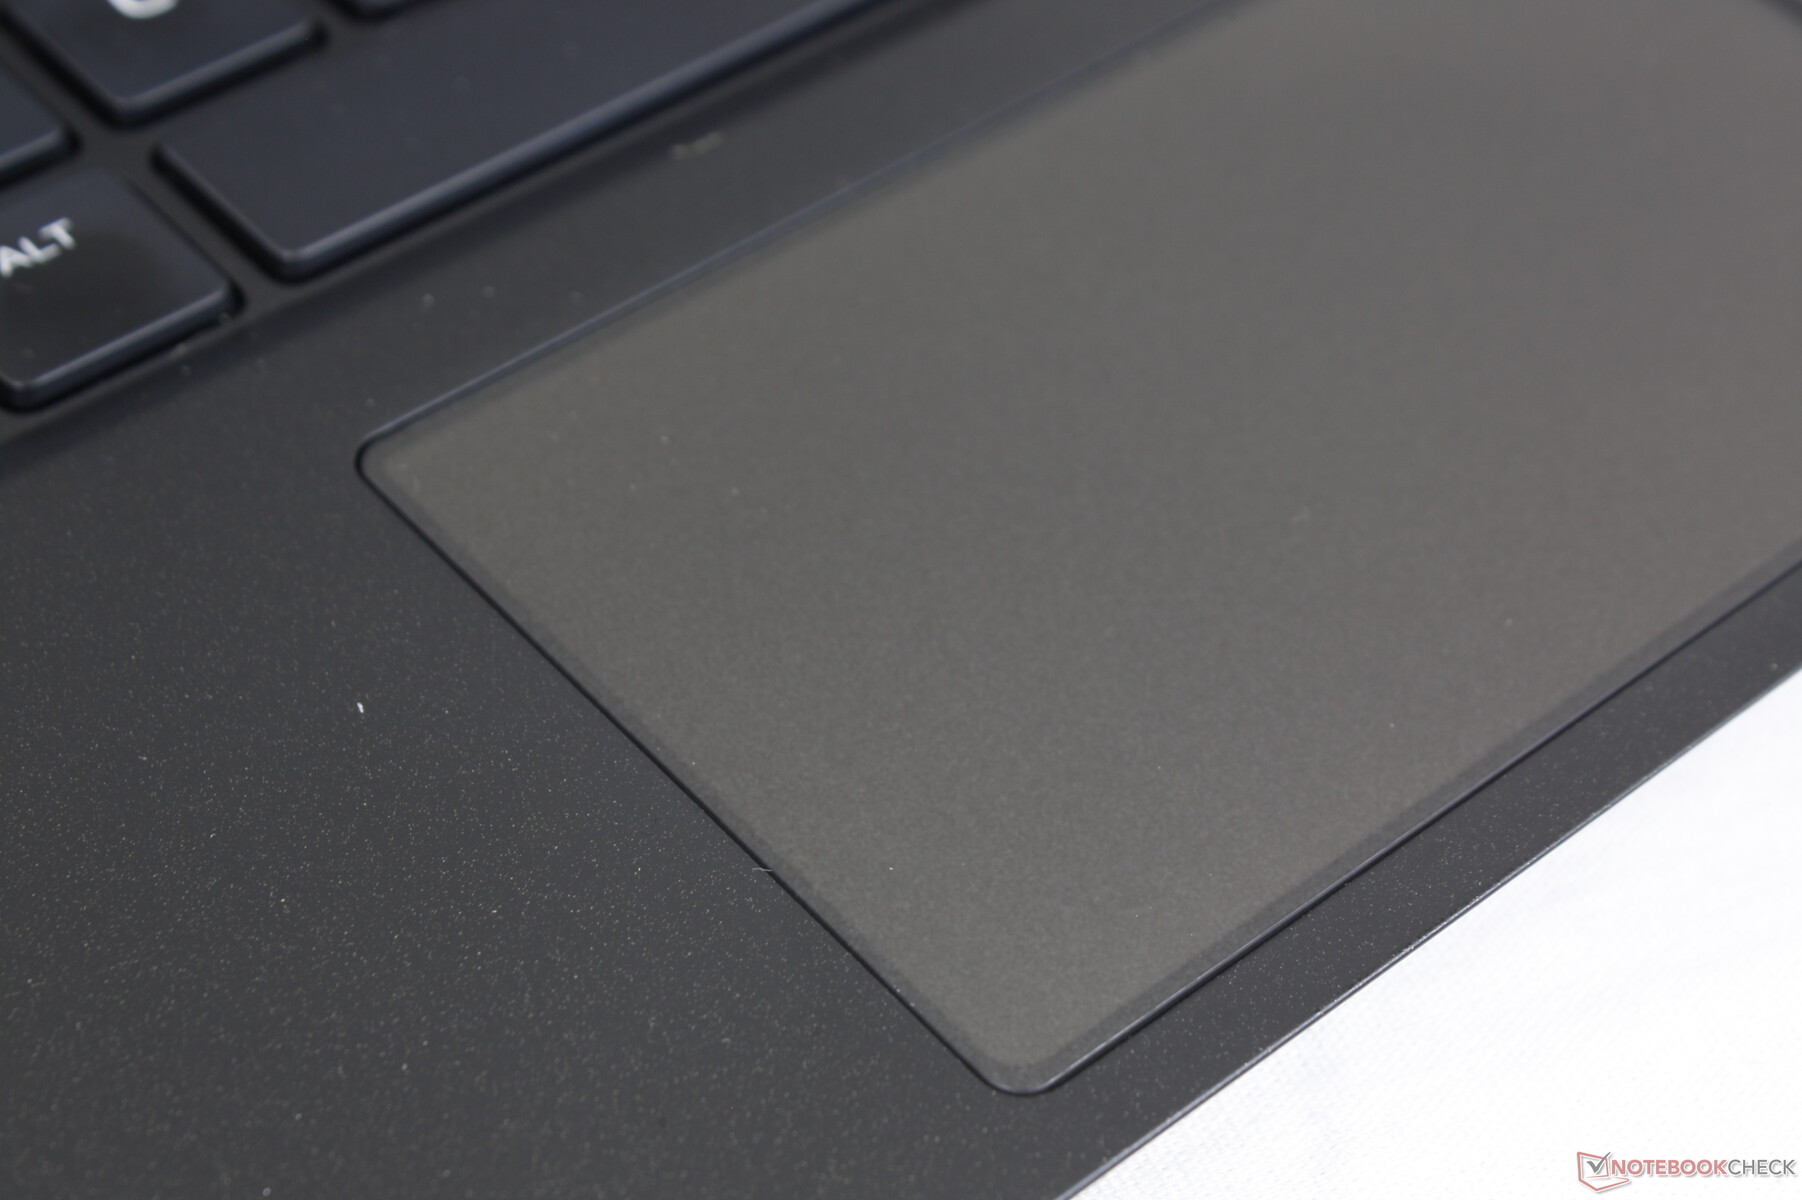
Touchpad
A superfície do Clickpad não mudou em relação ao modelo do ano passado, com apenas 10,5 x 6 cm. A tração é suave ao deslizar em velocidades médias ou mais rápidas, enquanto velocidades mais lentas terão um pouco de aderência para um clique mais preciso. Infelizmente, o clique continua a ser no lado esponjoso para um feedback um pouco insatisfatório. Além disso, a cor cinza escuro acentuará as impressões digitais muito mais prontamente quando comparada com o clickpad branco da série m15 Alienware do ano passado

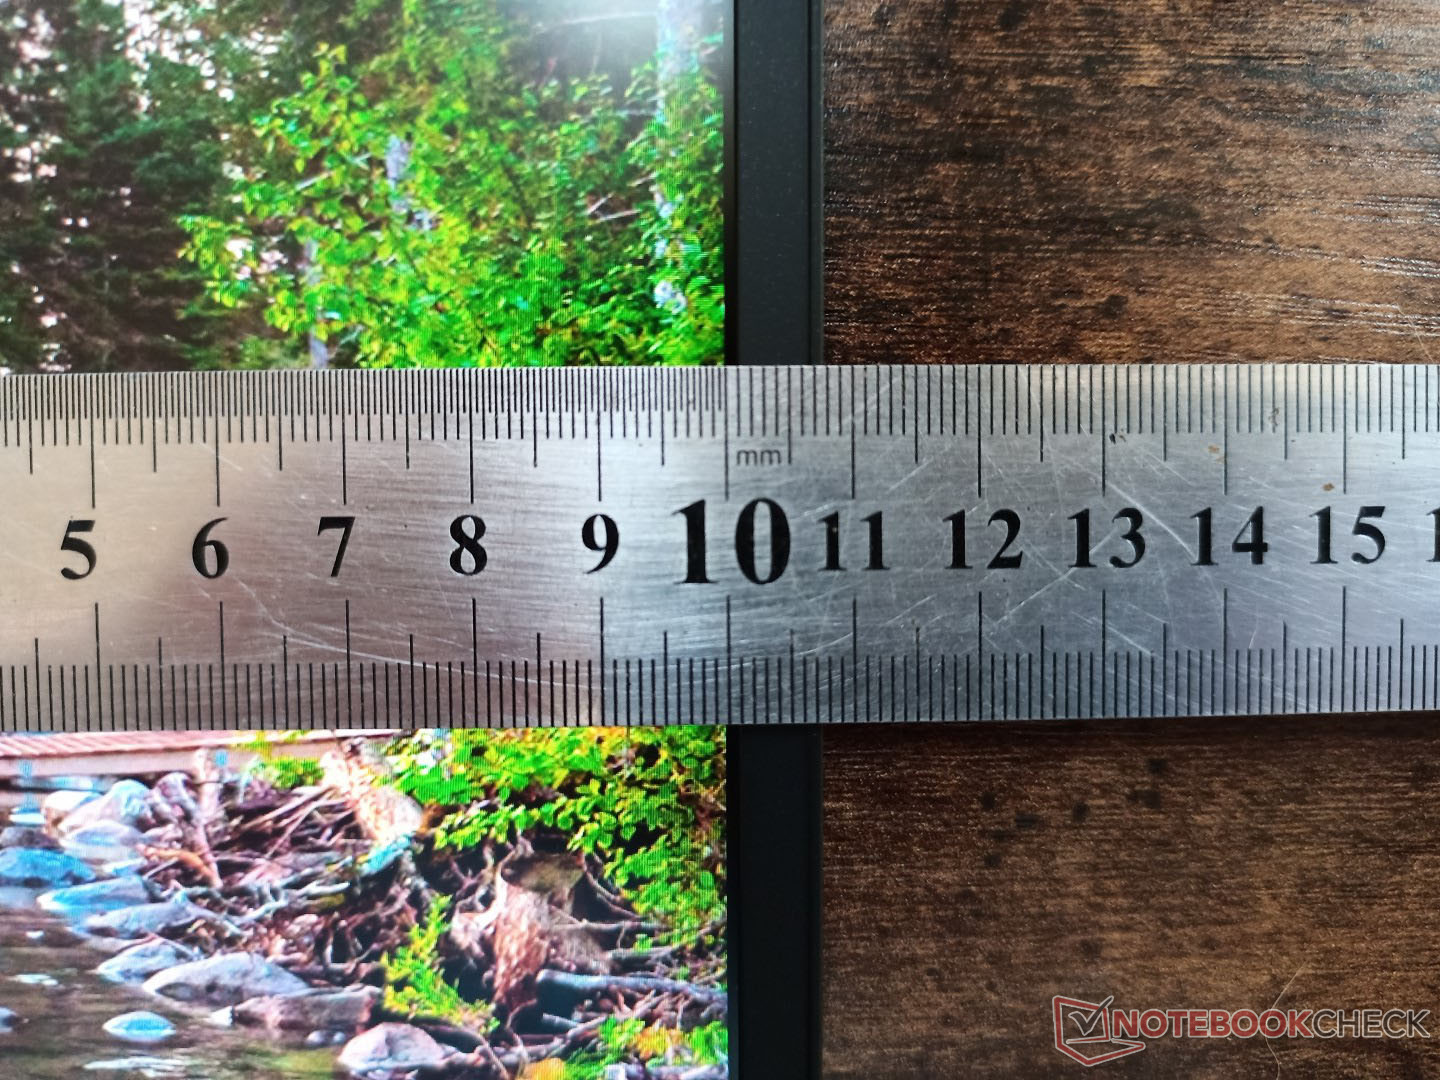
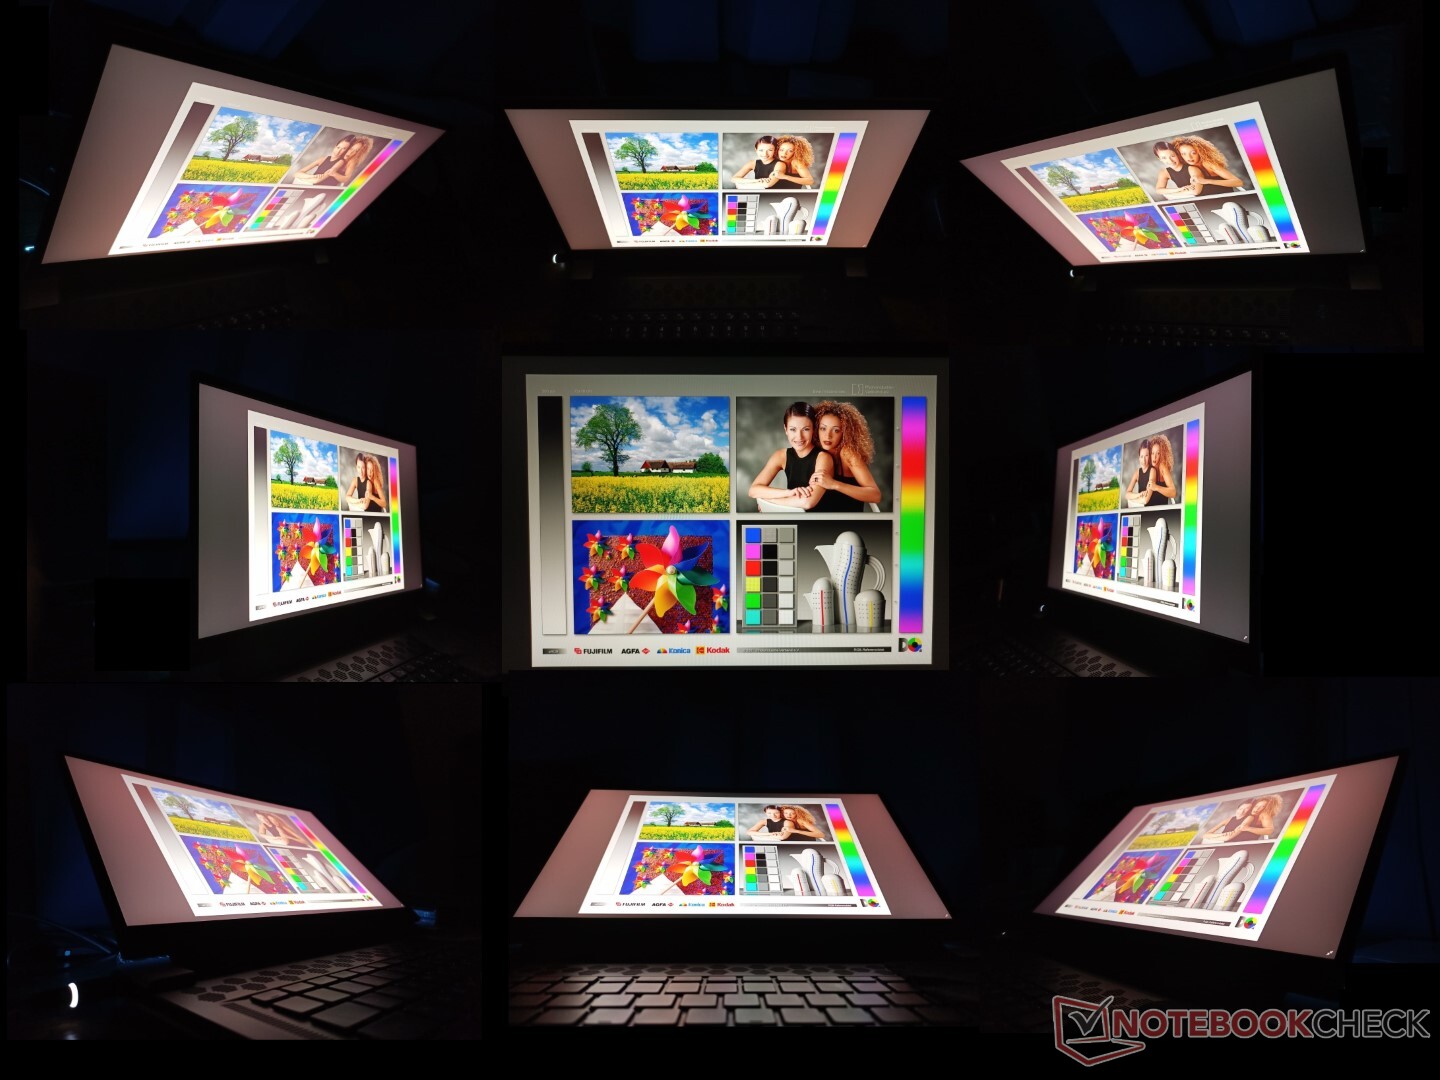
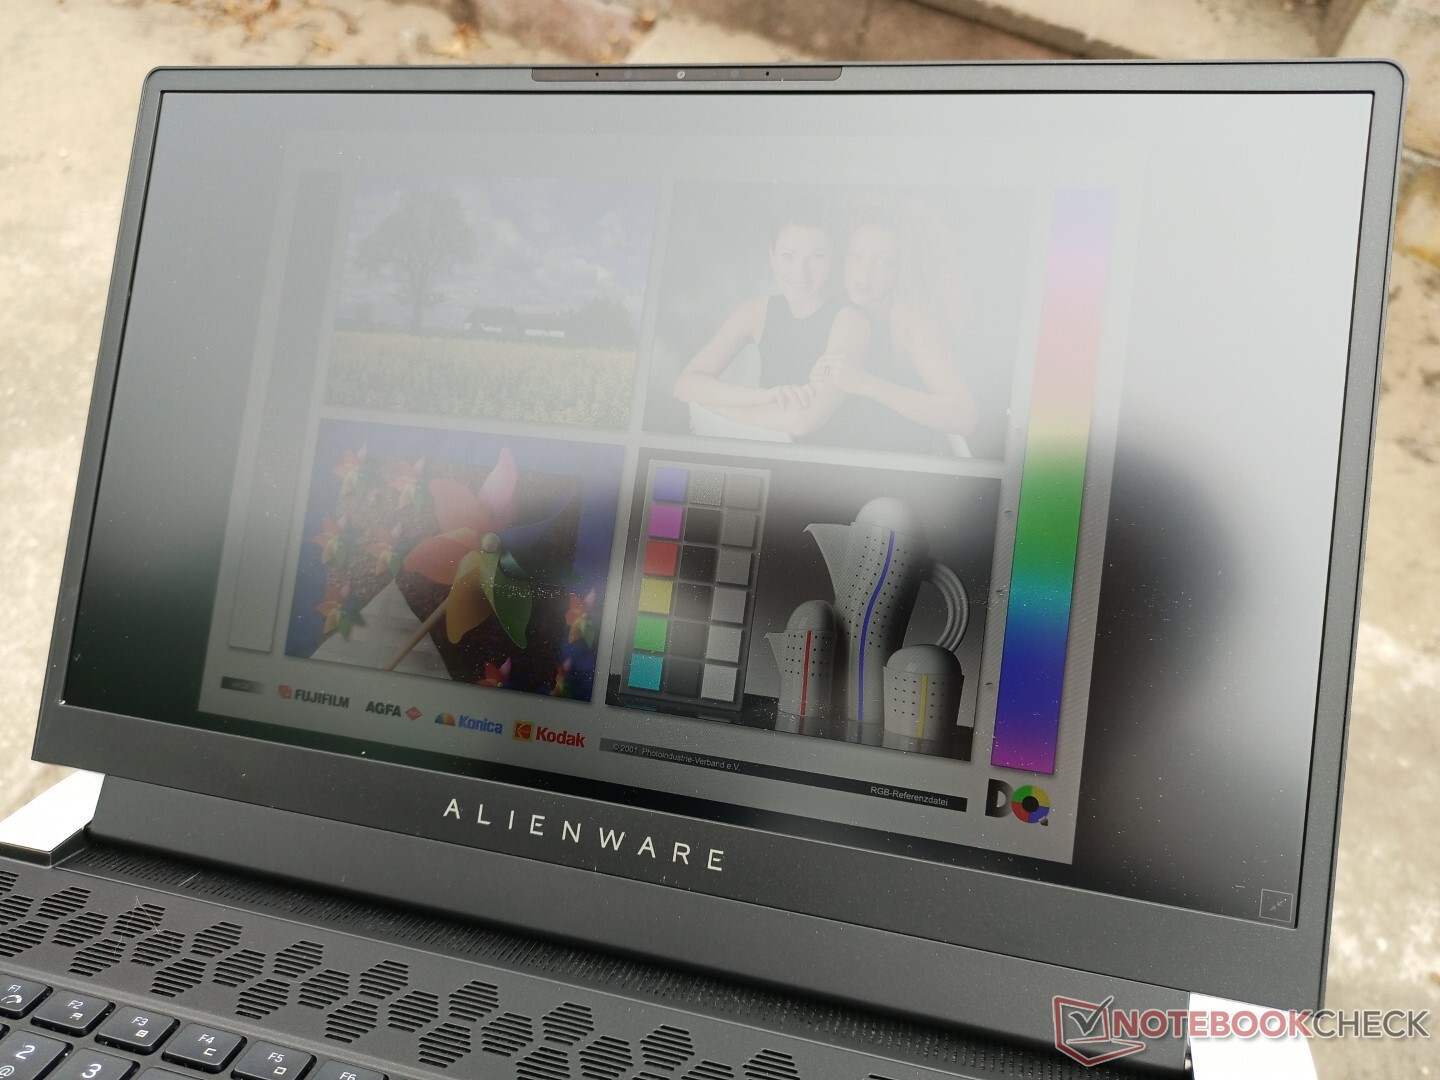
Visor - Não há mais opções OLED
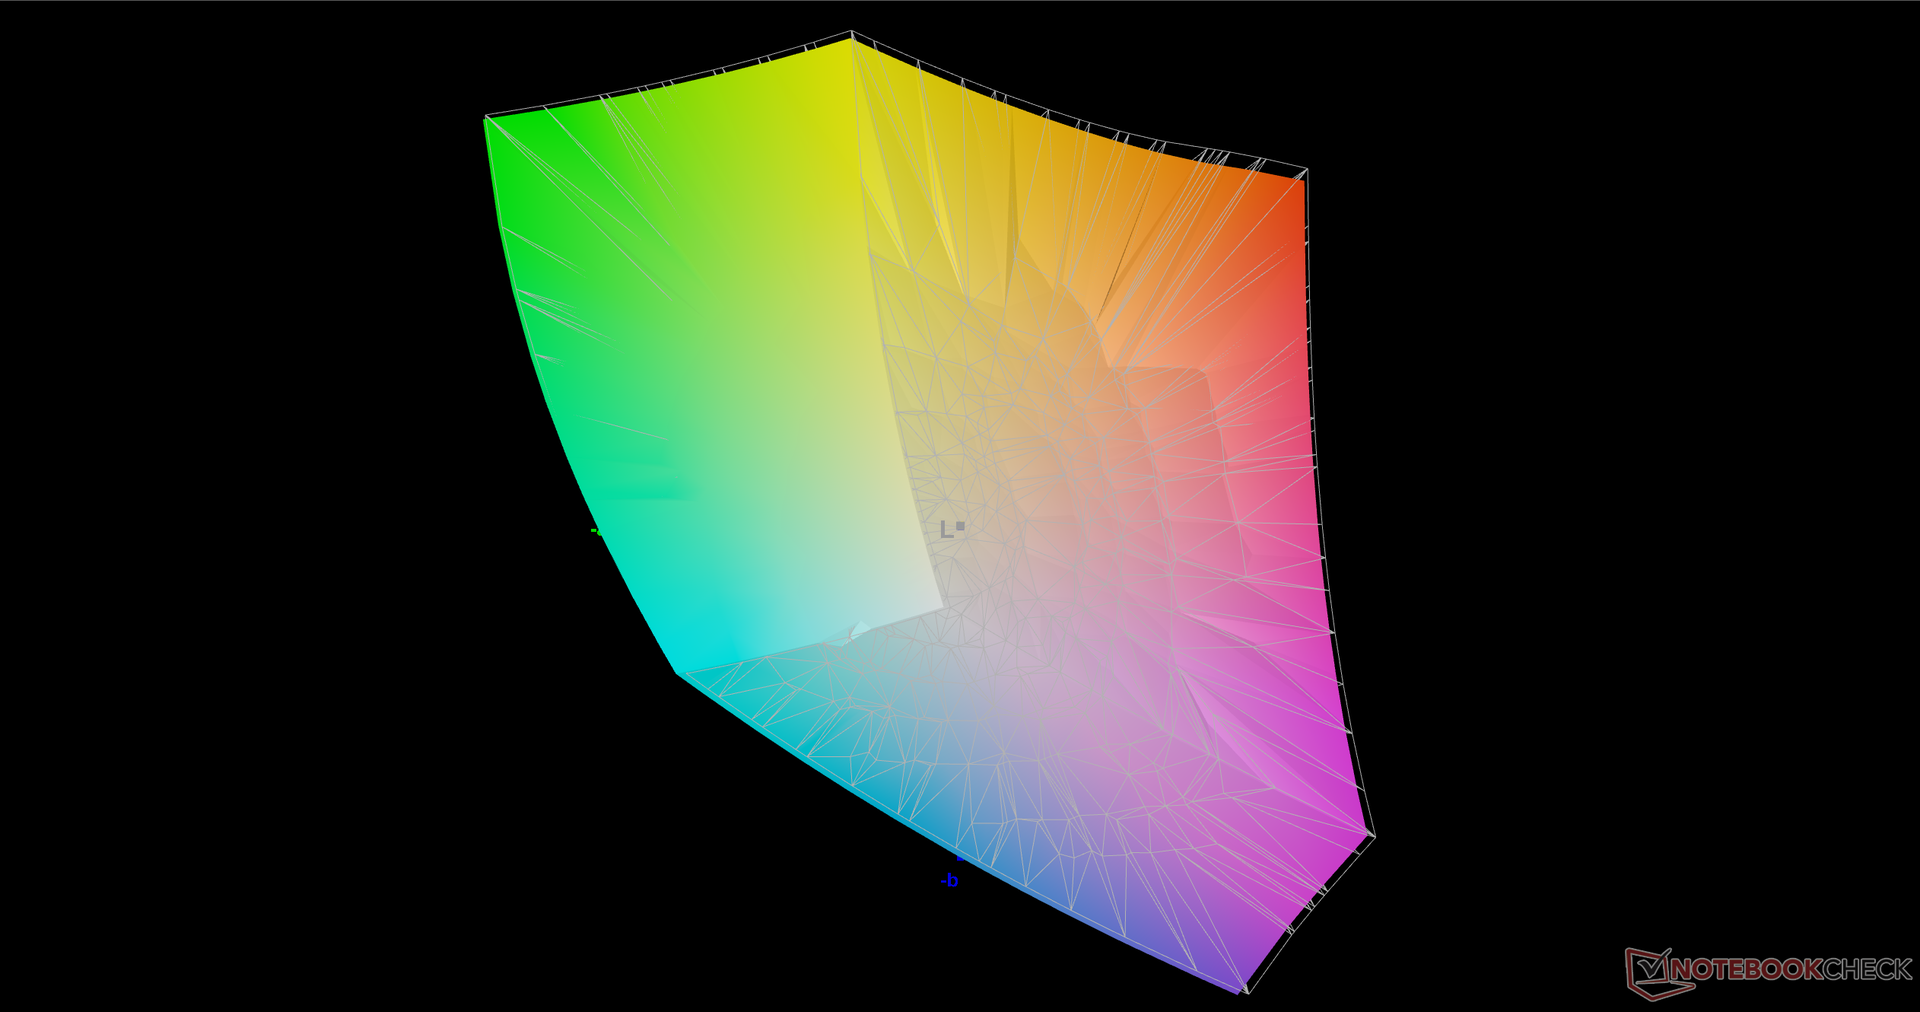
O painel IPS LG Philips 156QHG 1440p é o primeiro a aparecer em nosso banco de dados. Seus atributos são excelentes com tempos de resposta rápidos de 6 ms, rápida taxa de atualização de 240 Hz, ampla cobertura de cores a quase 100% do DCI-P3, e uma retroiluminação brilhante de 400-nit que é mais brilhante do que muitos outros laptops para jogos de 15,6 polegadas, incluindo o novoMSI GS66. Talvez seu maior inconveniente seja sua relação de contraste não conceitual de cerca de 900:1, que é mais no meio da estrada, considerando o preço pedido.
| |||||||||||||||||||||||||
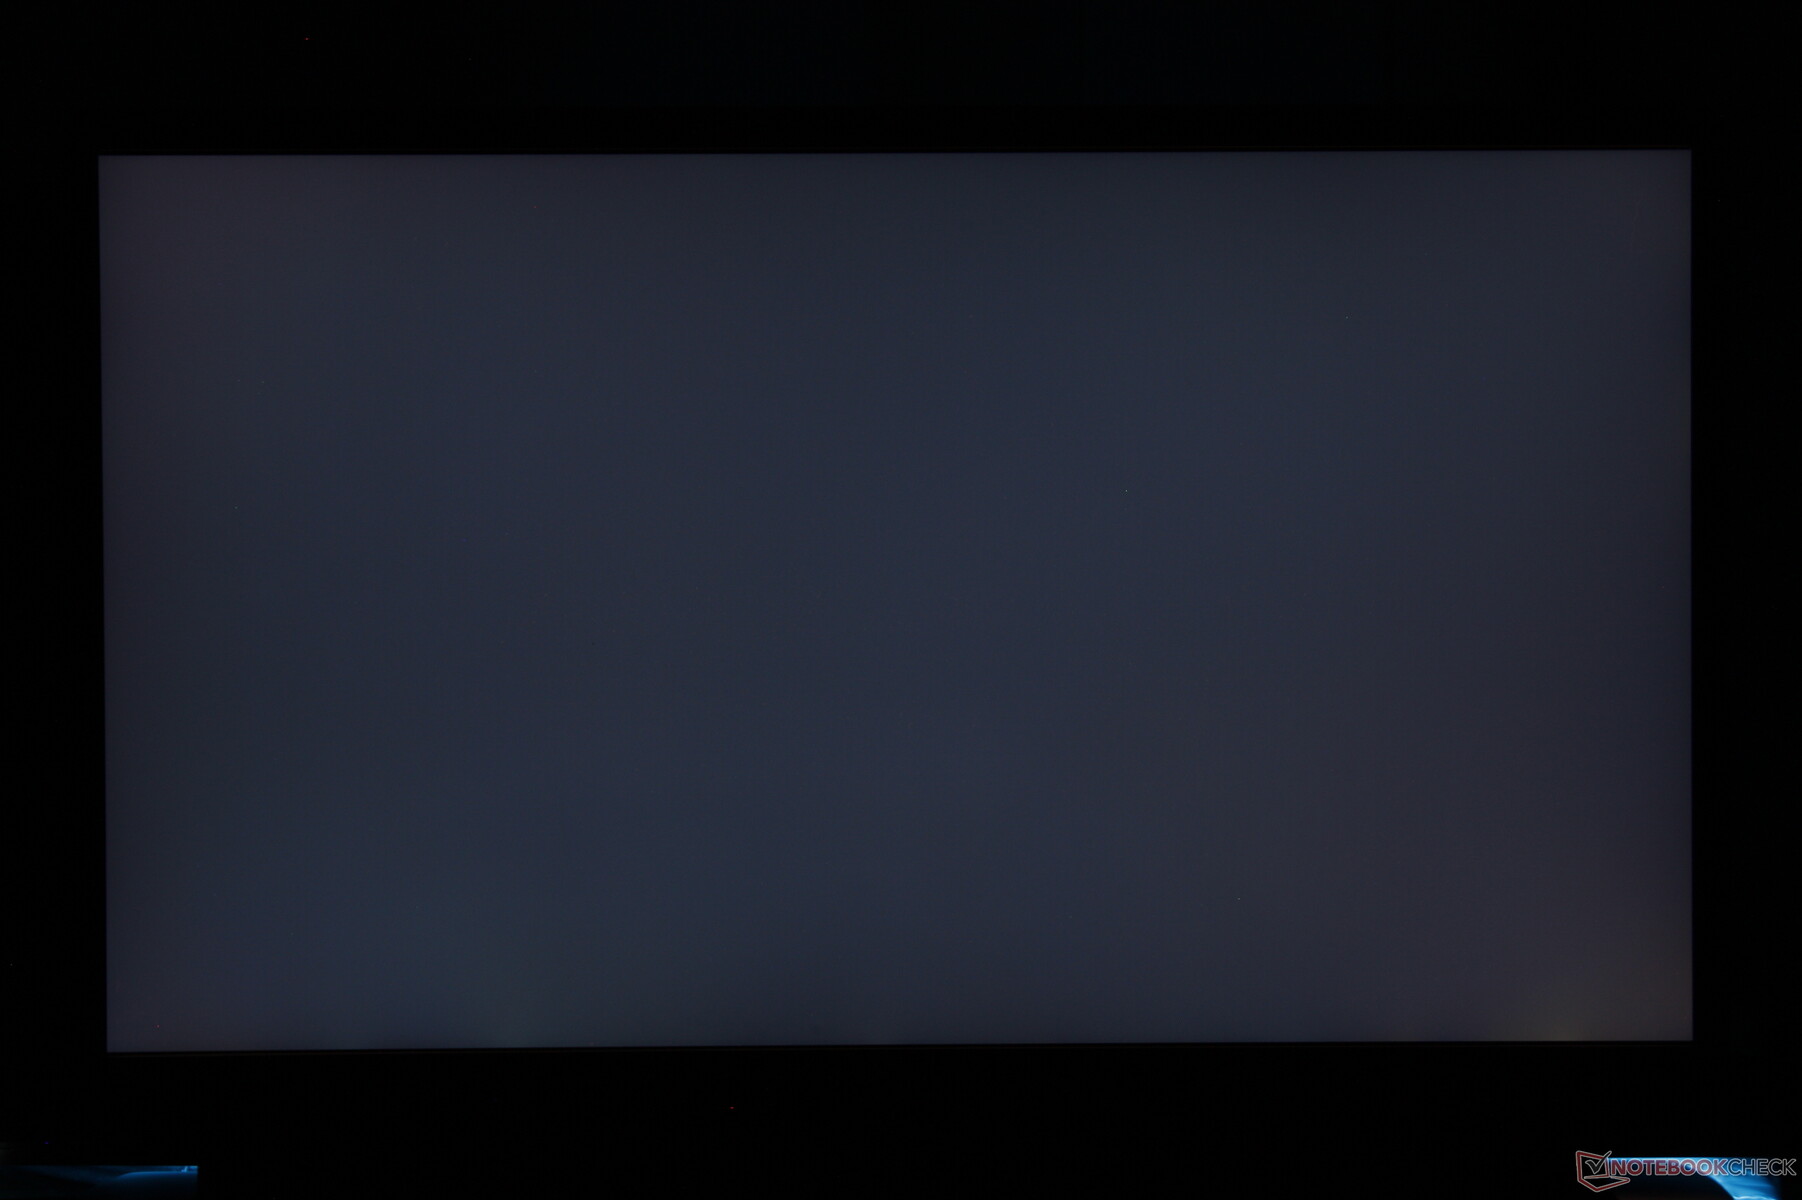
iluminação: 88 %
iluminação com acumulador: 409.5 cd/m²
Contraste: 871:1 (Preto: 0.47 cd/m²)
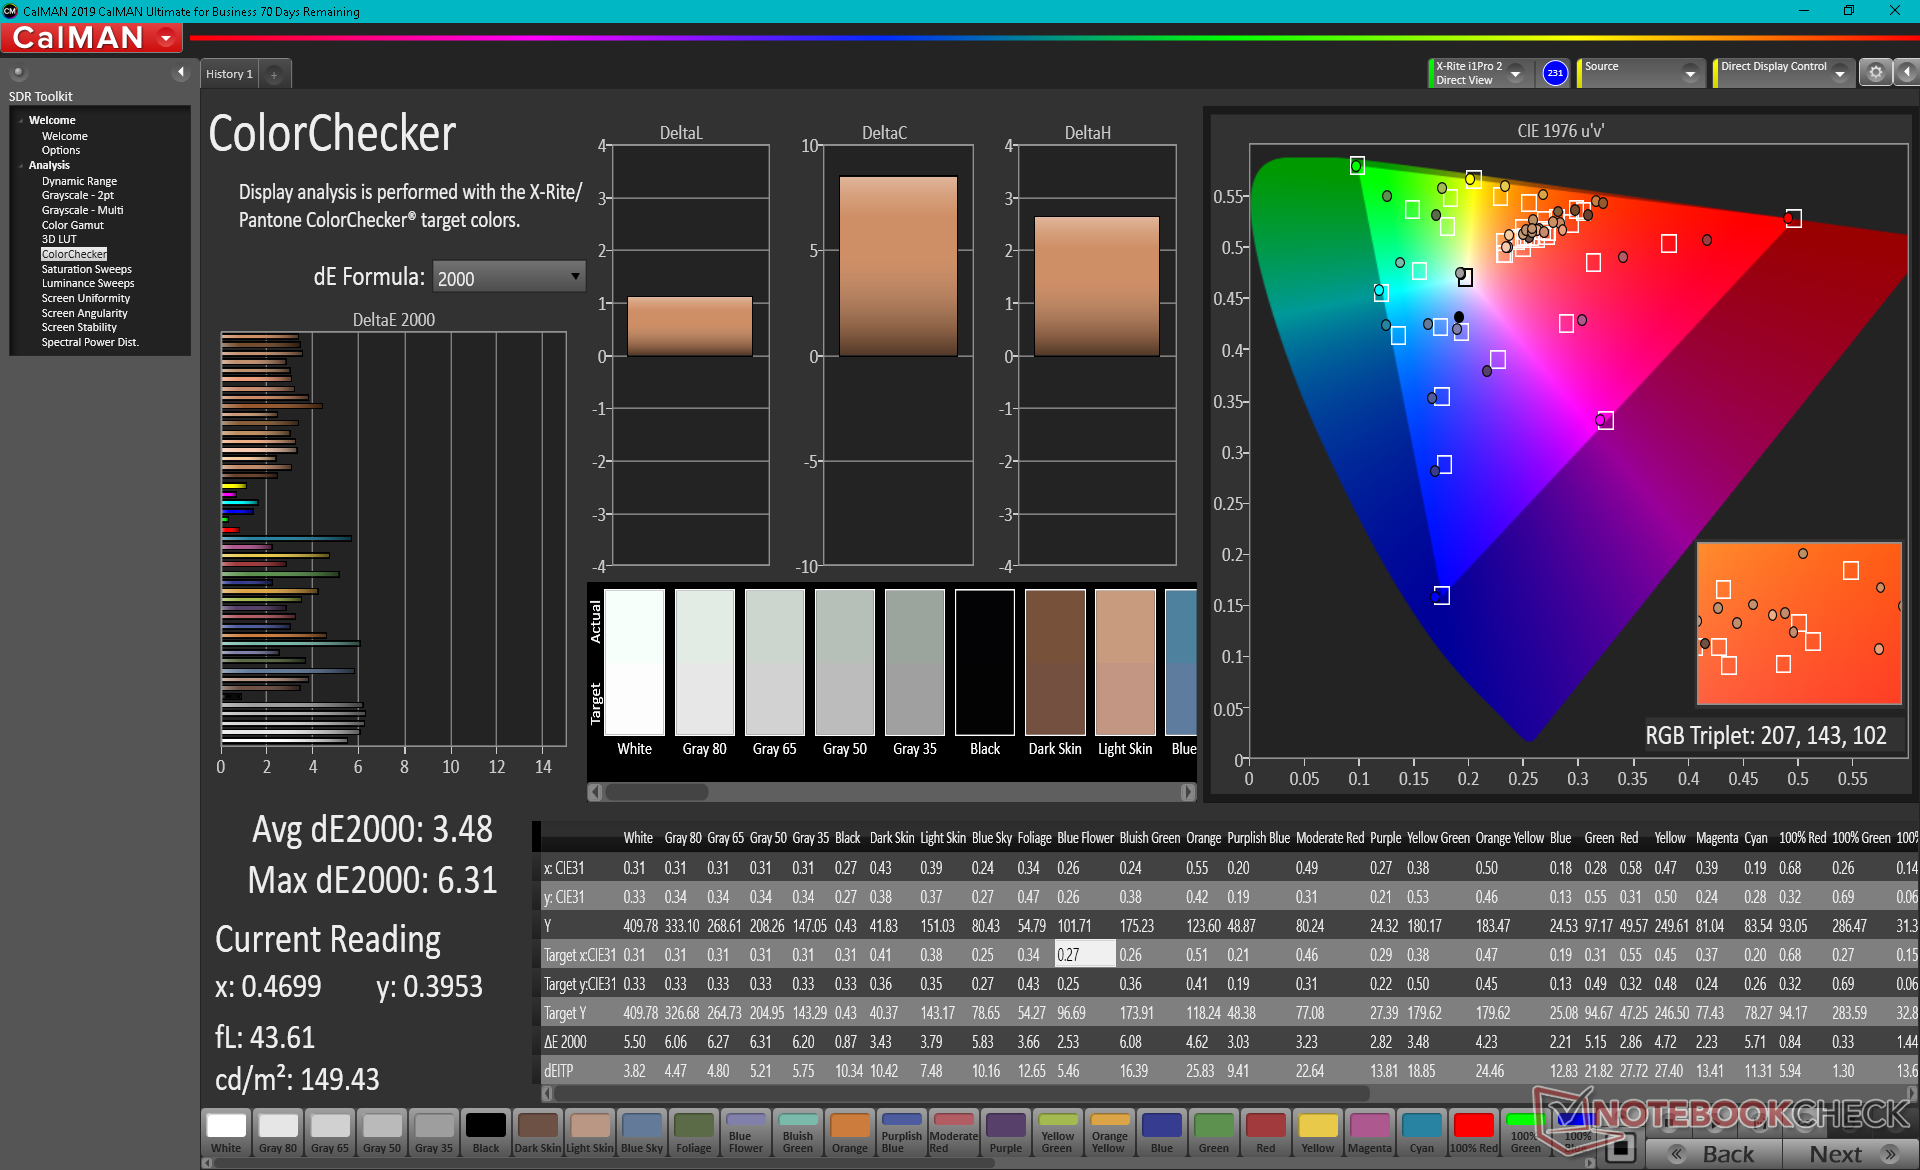
ΔE ColorChecker Calman: 3.48 | ∀{0.5-29.43 Ø4.71}
calibrated: 0.89
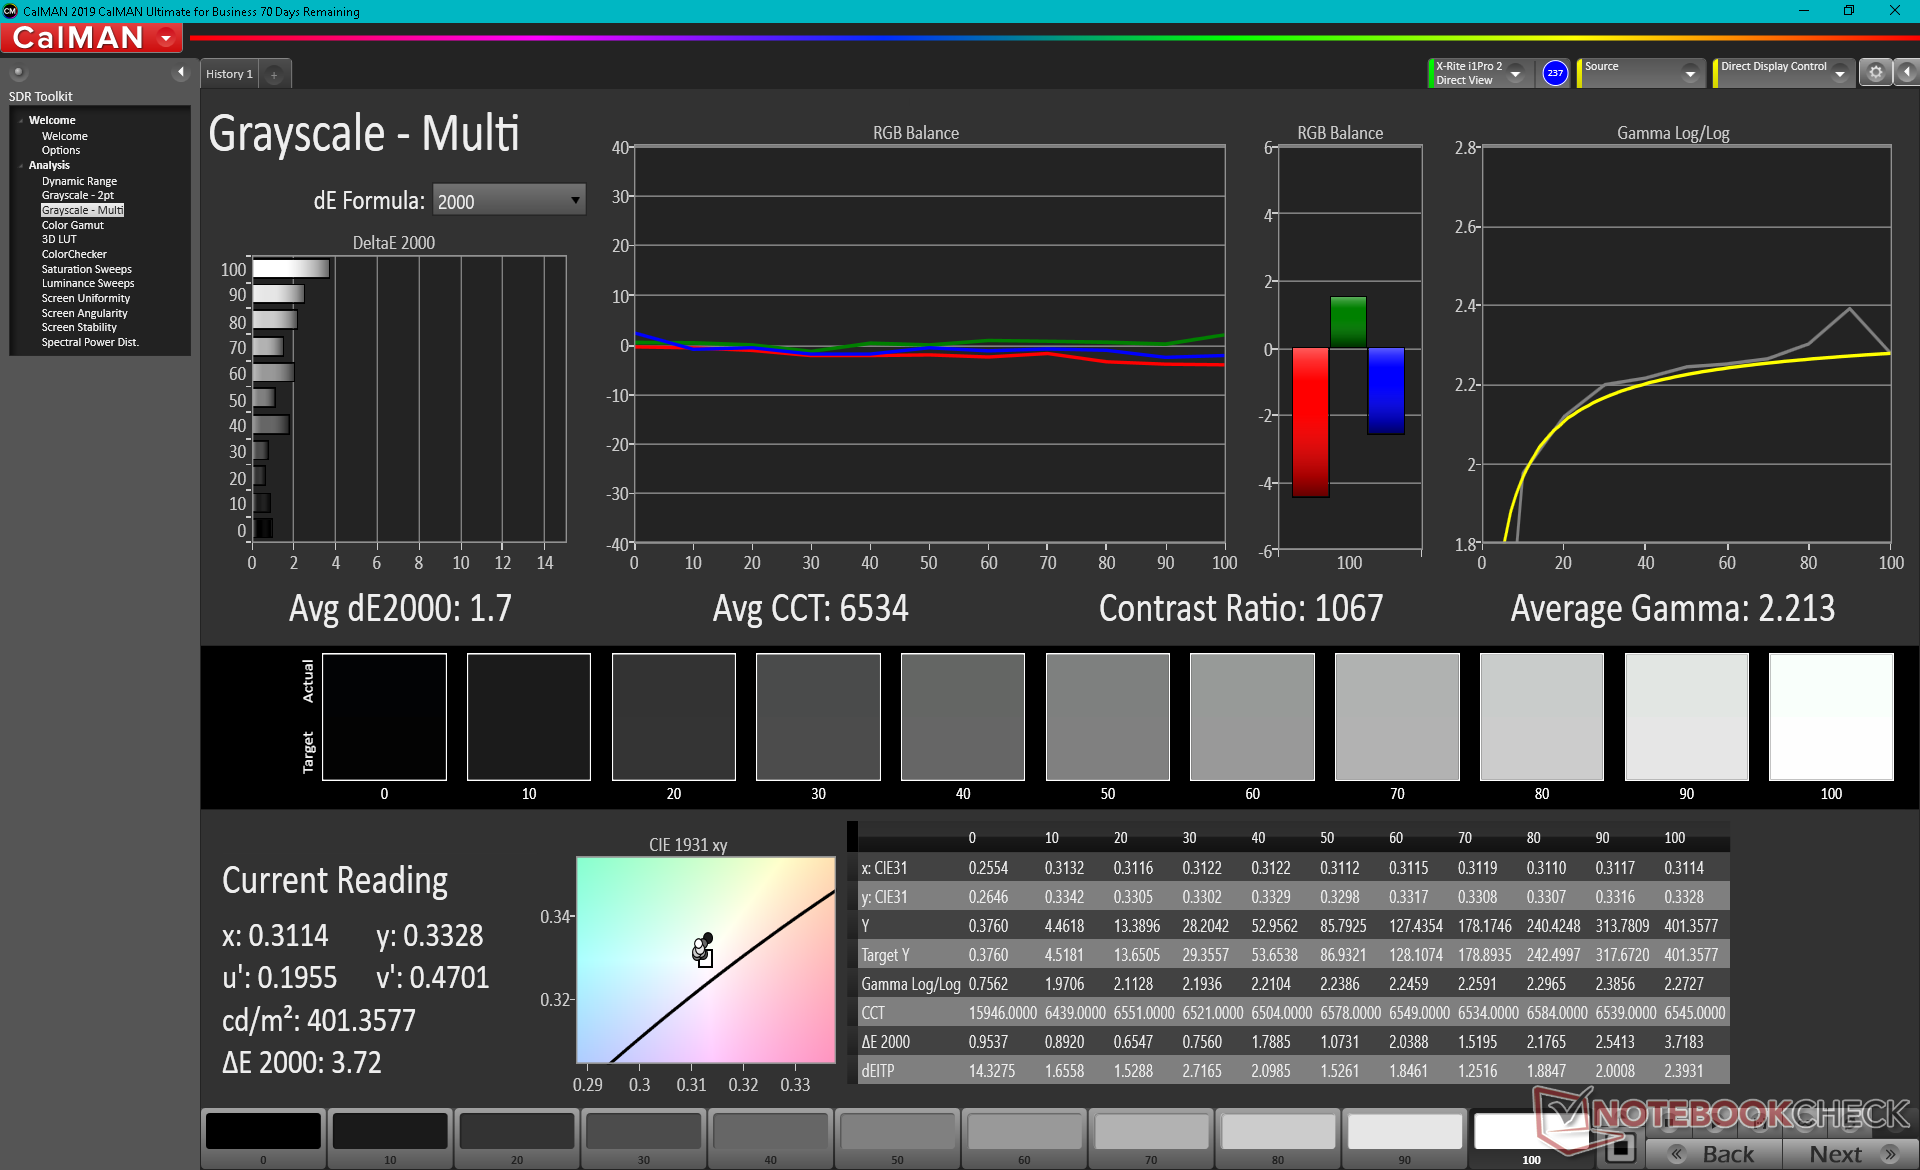
ΔE Greyscale Calman: 5 | ∀{0.09-98 Ø4.96}
99.9% sRGB (Argyll 3D)
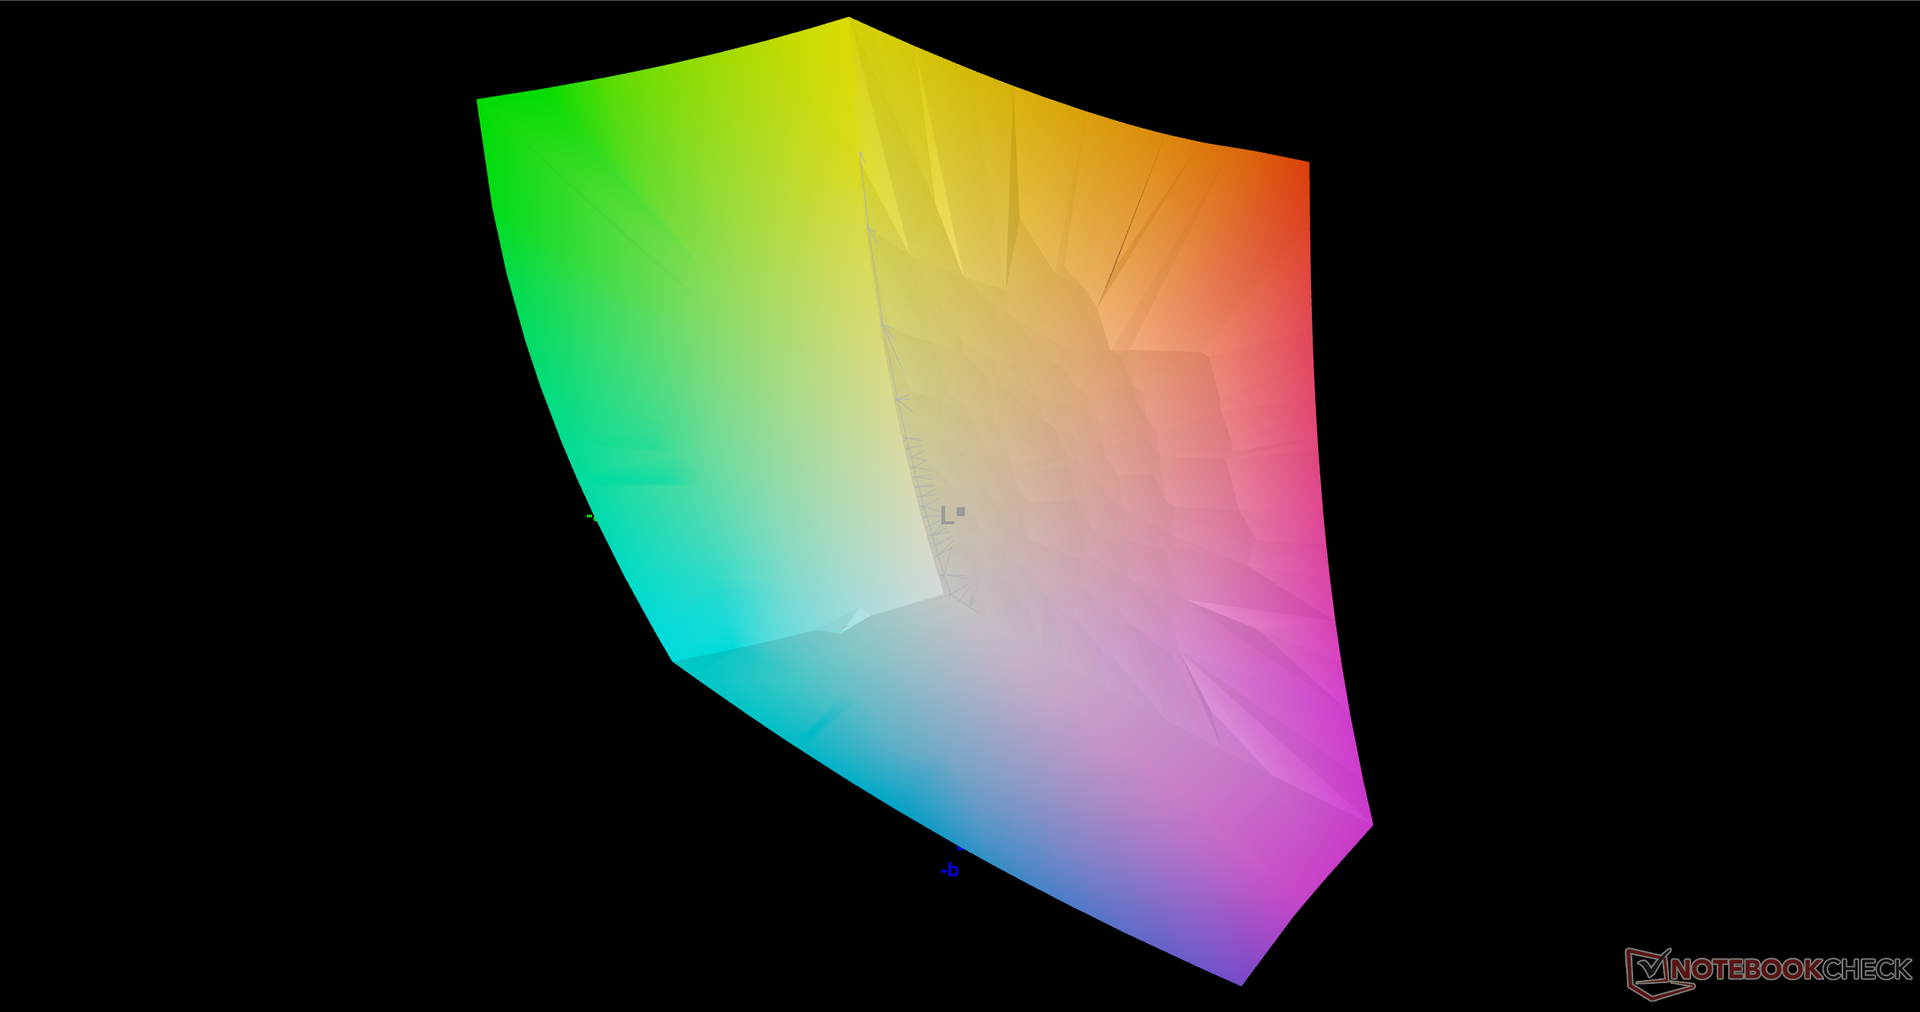
97.8% Display P3 (Argyll 3D)
Gamma: 2.16
CCT: 6591 K
| Alienware x15 RTX 3070 P111F LG Philips 156QHG, IPS, 15.6", 2560x1440 | Alienware m15 R4 RTX 3080 LG Philips LGD066E (156WFG), IPS, 15.6", 1920x1080 | MSI GS66 Stealth 10UG AU Optronics B156HAN12.0, IPS, 15.6", 1920x1080 | Razer Blade 15 Advanced (Mid 2021) TL156VDXP02-0, IPS, 15.6", 1920x1080 | Asus Zephyrus S15 GX502L B156HAN12.0 (AUOBC8C), IPS, 15.6", 1920x1080 | Acer Predator Helios 300 PH315-53-786B Sharp LQ156M1JW09, IPS, 15.6", 1920x1080 | |
|---|---|---|---|---|---|---|
| Display | -14% | -17% | -18% | -15% | -16% | |
| Display P3 Coverage (%) | 97.8 | 70.1 -28% | 67.7 -31% | 66.9 -32% | 69.7 -29% | 68.4 -30% |
| sRGB Coverage (%) | 99.9 | 99.8 0% | 98.4 -2% | 97.1 -3% | 99.7 0% | 99.4 -1% |
| AdobeRGB 1998 Coverage (%) | 71.5 | 69.1 | 69 | 71.1 | 70.4 | |
| Response Times | 23% | -16% | 35% | -5% | -8% | |
| Response Time Grey 50% / Grey 80% * (ms) | 12 ? | 7.6 ? 37% | 14.4 ? -20% | 4.2 ? 65% | 14 ? -17% | 15.2 ? -27% |
| Response Time Black / White * (ms) | 10.4 ? | 9.6 ? 8% | 11.6 ? -12% | 10 ? 4% | 9.6 ? 8% | 9.2 ? 12% |
| PWM Frequency (Hz) | 23580 ? | |||||
| Screen | 19% | -1% | 12% | 9% | 3% | |
| Brightness middle (cd/m²) | 409.5 | 347 -15% | 259.5 -37% | 353.4 -14% | 283 -31% | 312 -24% |
| Brightness (cd/m²) | 390 | 318 -18% | 264 -32% | 340 -13% | 289 -26% | 290 -26% |
| Brightness Distribution (%) | 88 | 86 -2% | 90 2% | 92 5% | 90 2% | 87 -1% |
| Black Level * (cd/m²) | 0.47 | 0.31 34% | 0.25 47% | 0.31 34% | 0.24 49% | 0.32 32% |
| Contrast (:1) | 871 | 1119 28% | 1038 19% | 1140 31% | 1179 35% | 975 12% |
| Colorchecker dE 2000 * | 3.48 | 1.68 52% | 2.52 28% | 2.17 38% | 2.26 35% | 3.03 13% |
| Colorchecker dE 2000 max. * | 6.31 | 3.03 52% | 5.55 12% | 5.69 10% | 5.64 11% | 6.81 -8% |
| Colorchecker dE 2000 calibrated * | 0.89 | 1.08 -21% | 1.93 -117% | 1.05 -18% | 1.11 -25% | 0.71 20% |
| Greyscale dE 2000 * | 5 | 1.8 64% | 1.7 66% | 3.4 32% | 3.4 32% | 4.7 6% |
| Gamma | 2.16 102% | 2.262 97% | 2.04 108% | 2.2 100% | 2.228 99% | 2.177 101% |
| CCT | 6591 99% | 6592 99% | 6414 101% | 6830 95% | 7249 90% | 6676 97% |
| Color Space (Percent of AdobeRGB 1998) (%) | 71 | 63.3 | 71 | |||
| Color Space (Percent of sRGB) (%) | 94 | 98.8 | 93 | |||
| Média Total (Programa/Configurações) | 9% /
15% | -11% /
-6% | 10% /
11% | -4% /
3% | -7% /
-2% |
* ... menor é melhor
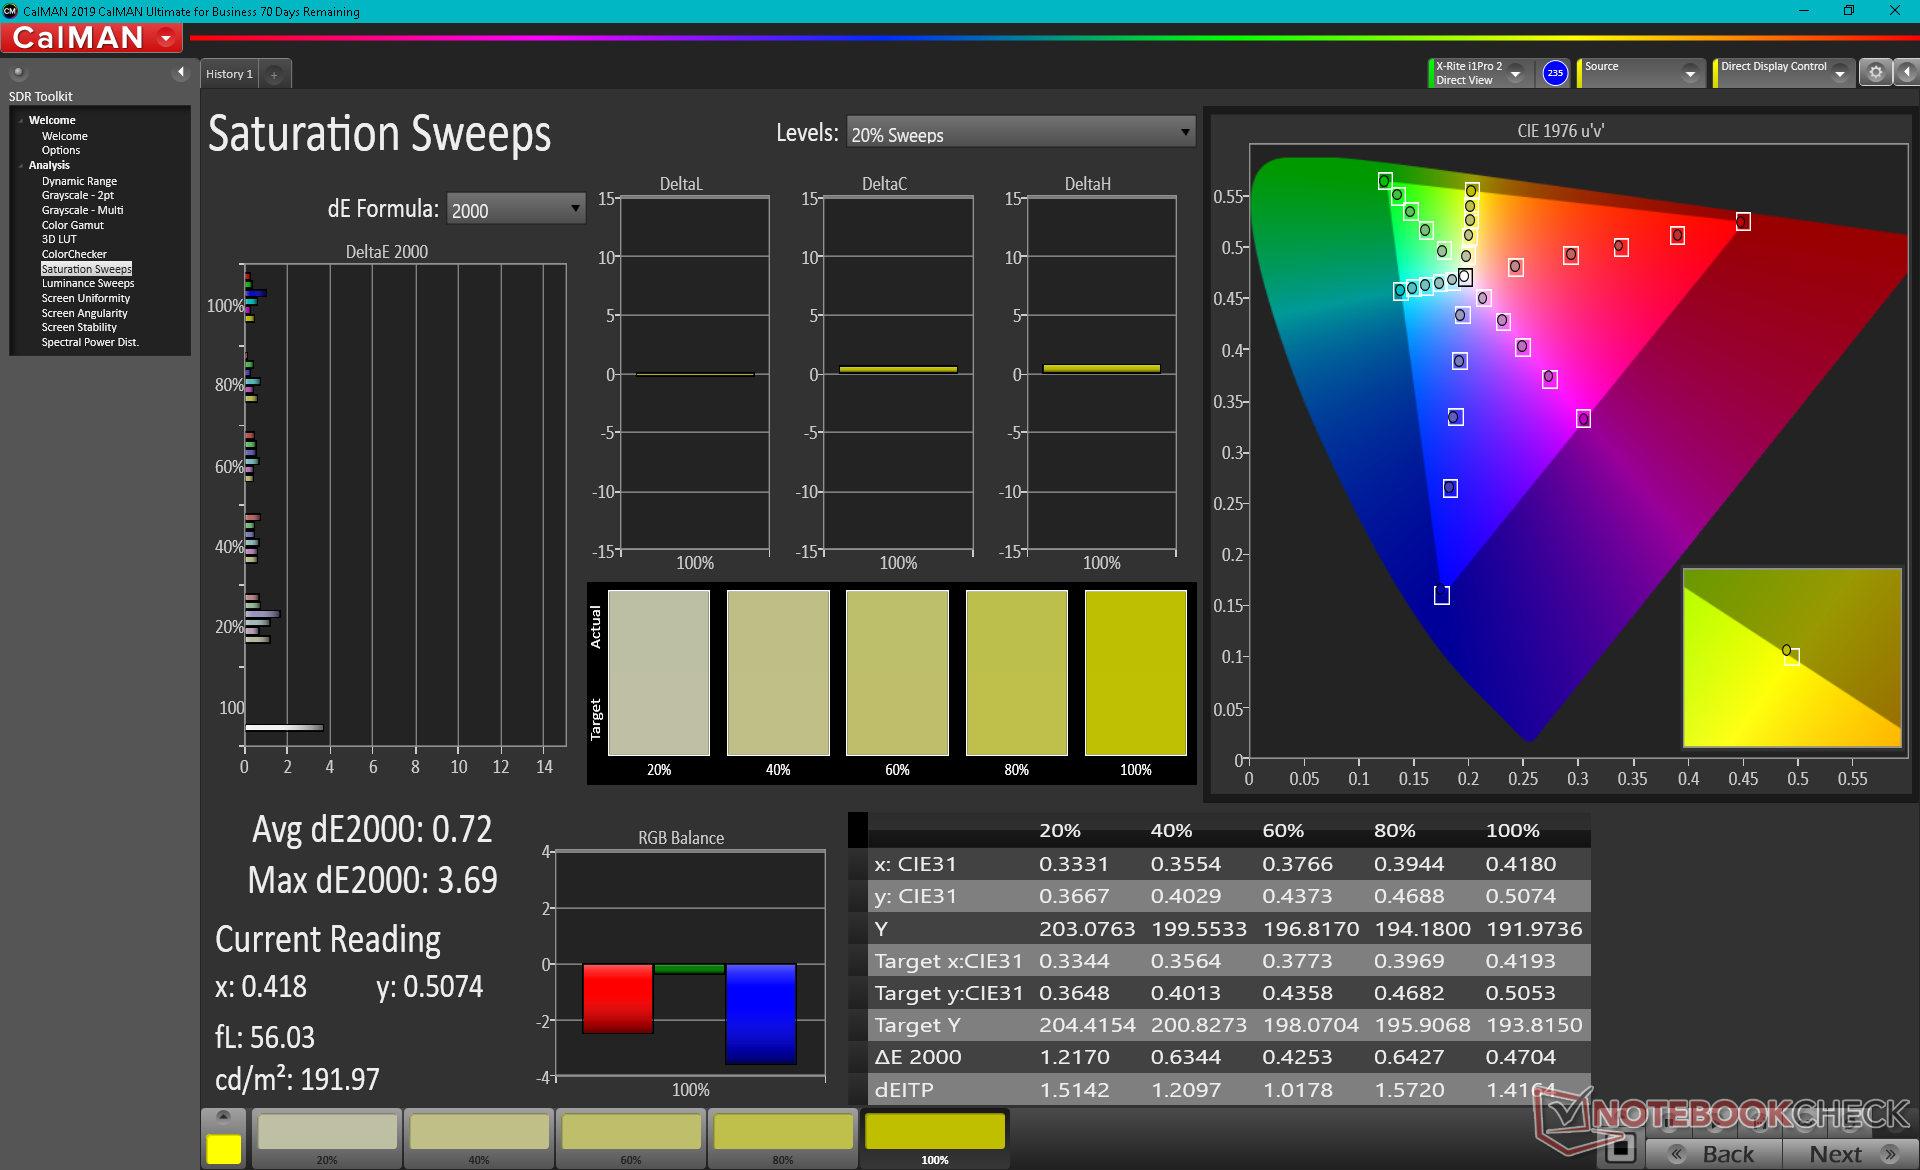
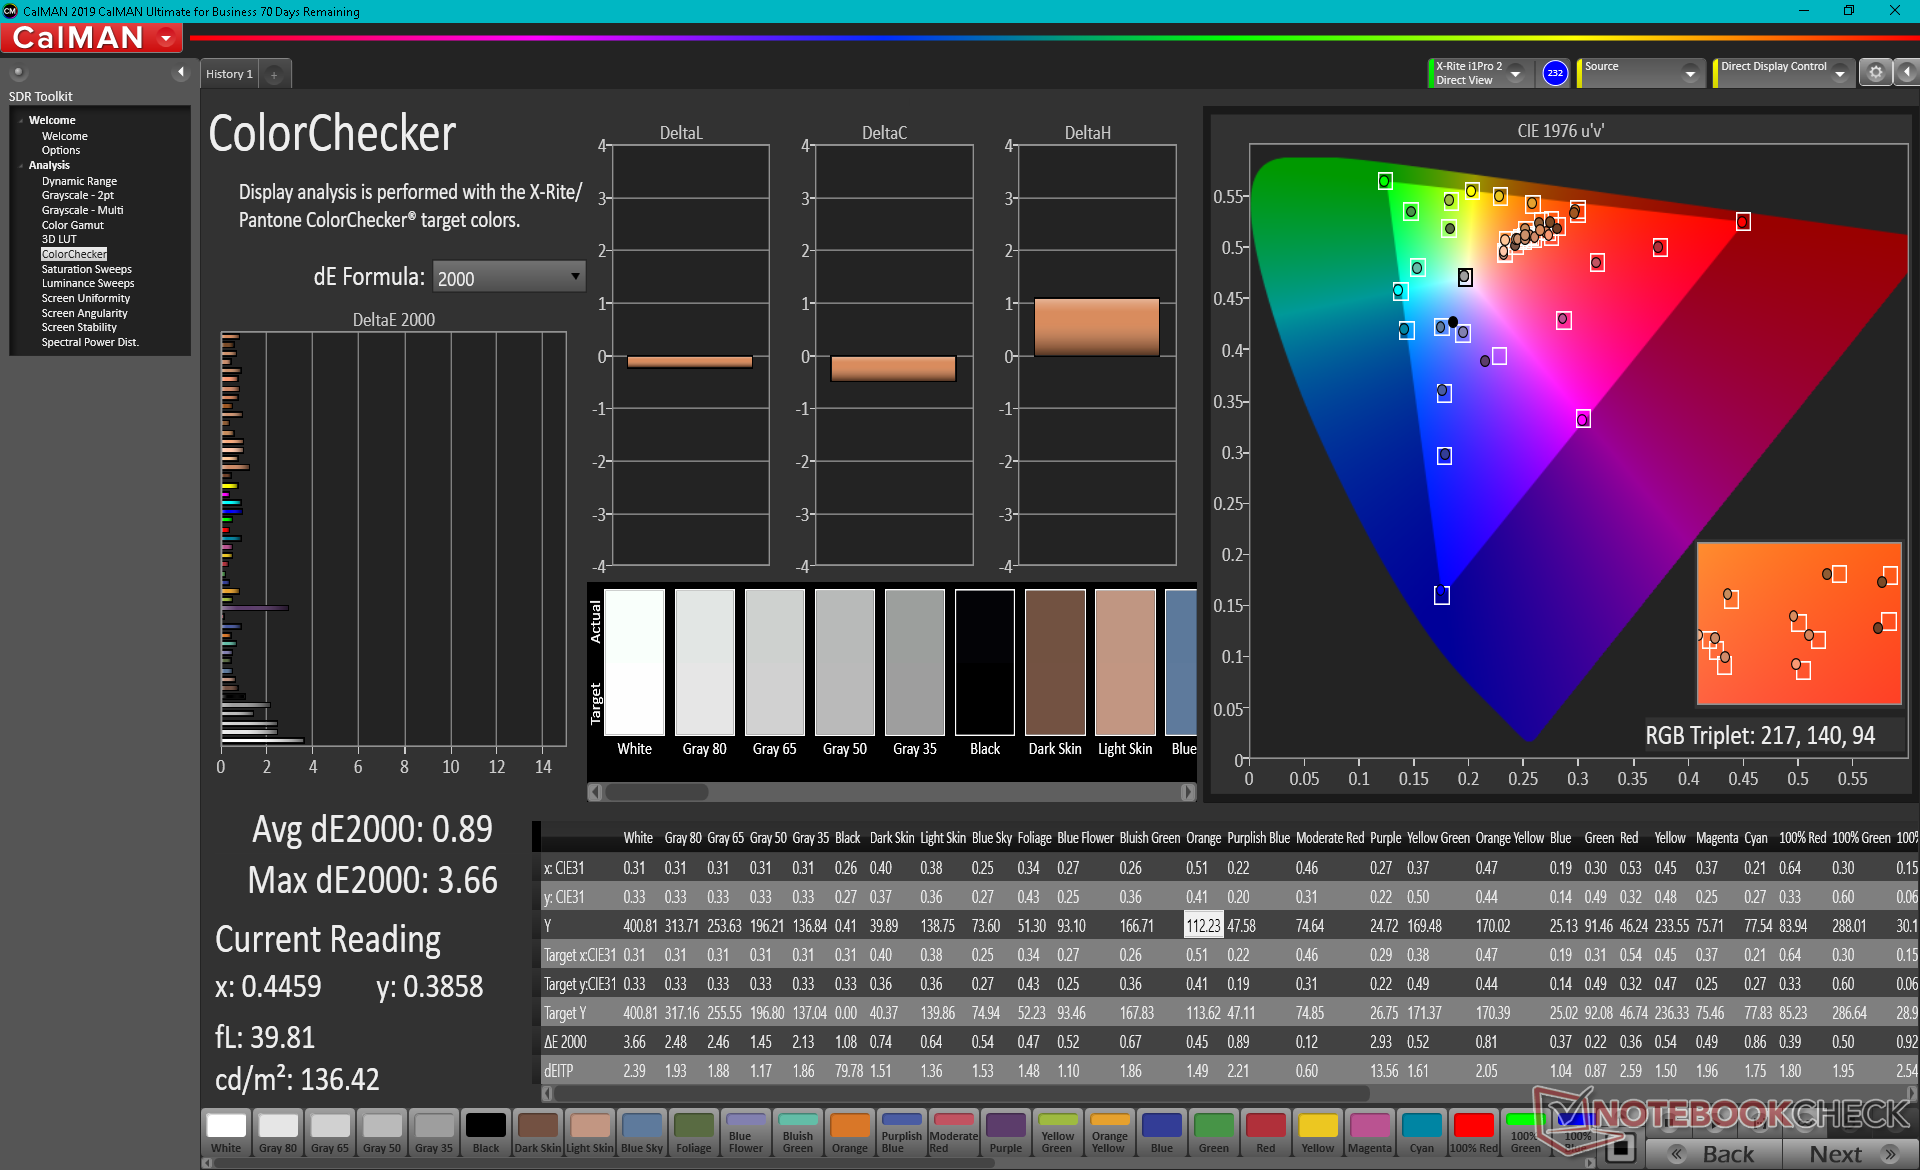
A Dell anuncia 99% de cobertura DCI-P3 que podemos confirmar com nossas próprias medidas independentes. Este painel de 8 bits é, portanto, adequado tanto para jogos quanto para a maioria das edições gráficas, com suas cores profundas e tempos de resposta rápidos.
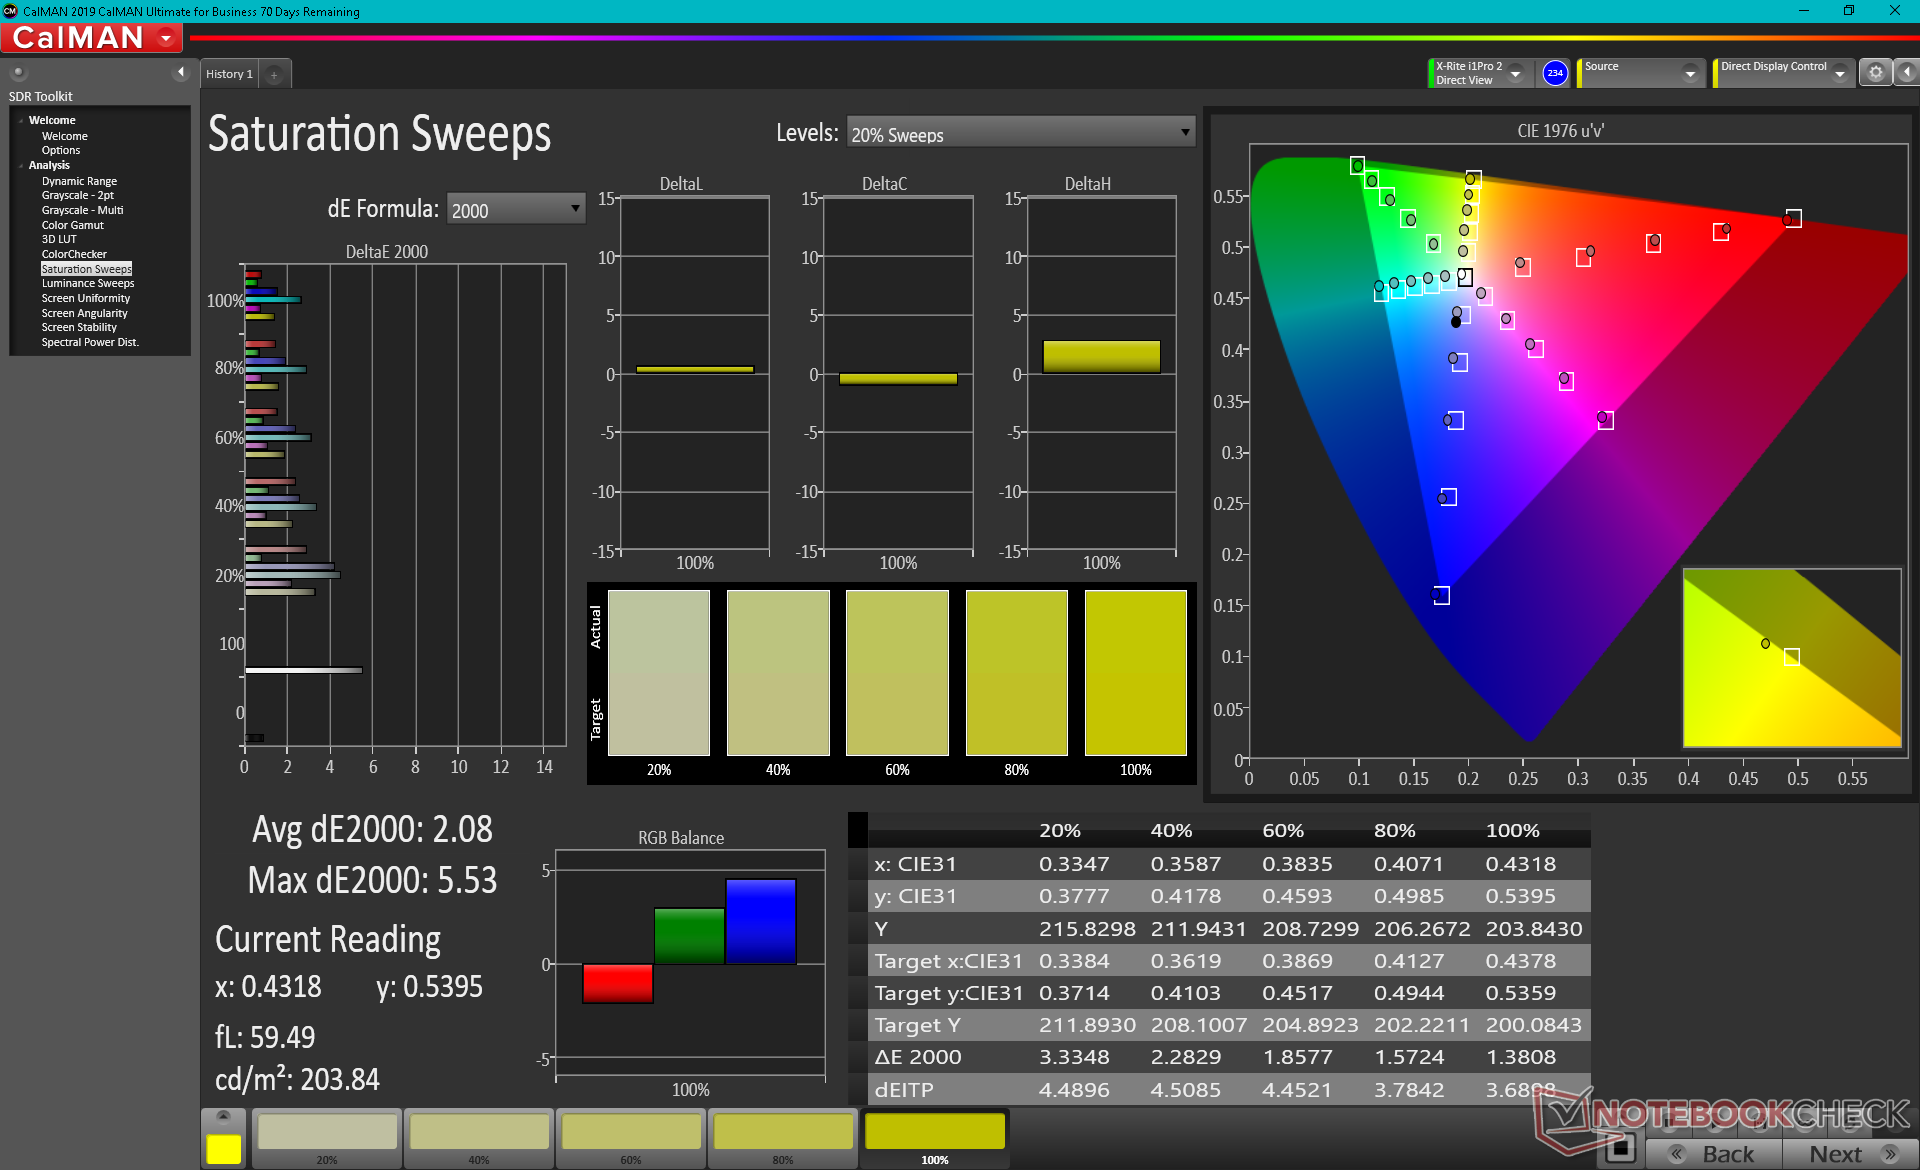
O display é decentemente calibrado fora da caixa com valores médios de escala de cinza e deltaE de cor de 5 e 3,48, respectivamente. Esforços adicionais de calibração podem reduzir esses valores devido à ampla cobertura de cores acima mencionada, como mostrado pelos resultados de nosso CalMan abaixo.

Exibir tempos de resposta
| ↔ Tempo de resposta preto para branco | ||
|---|---|---|
| 10.4 ms ... ascensão ↗ e queda ↘ combinadas | ↗ 6 ms ascensão | 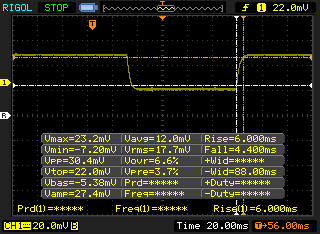 |
| ↘ 4.4 ms queda | ||
| A tela mostra boas taxas de resposta em nossos testes, mas pode ser muito lenta para jogadores competitivos. Em comparação, todos os dispositivos testados variam de 0.1 (mínimo) a 240 (máximo) ms. » 28 % de todos os dispositivos são melhores. Isso significa que o tempo de resposta medido é melhor que a média de todos os dispositivos testados (19.8 ms). | ||
| ↔ Tempo de resposta 50% cinza a 80% cinza | ||
| 12 ms ... ascensão ↗ e queda ↘ combinadas | ↗ 6 ms ascensão | 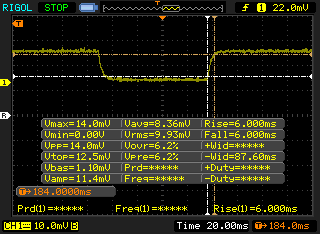 |
| ↘ 6 ms queda | ||
| A tela mostra boas taxas de resposta em nossos testes, mas pode ser muito lenta para jogadores competitivos. Em comparação, todos os dispositivos testados variam de 0.165 (mínimo) a 636 (máximo) ms. » 25 % de todos os dispositivos são melhores. Isso significa que o tempo de resposta medido é melhor que a média de todos os dispositivos testados (31 ms). | ||
Cintilação da tela / PWM (modulação por largura de pulso)
| Tela tremeluzindo / PWM não detectado | 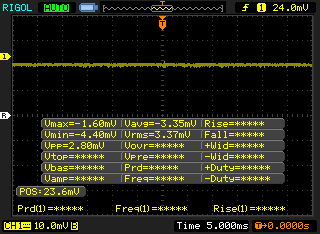 | ||
[pwm_comparison] Em comparação: 52 % de todos os dispositivos testados não usam PWM para escurecer a tela. Se PWM foi detectado, uma média de 7754 (mínimo: 5 - máximo: 343500) Hz foi medida. | |||
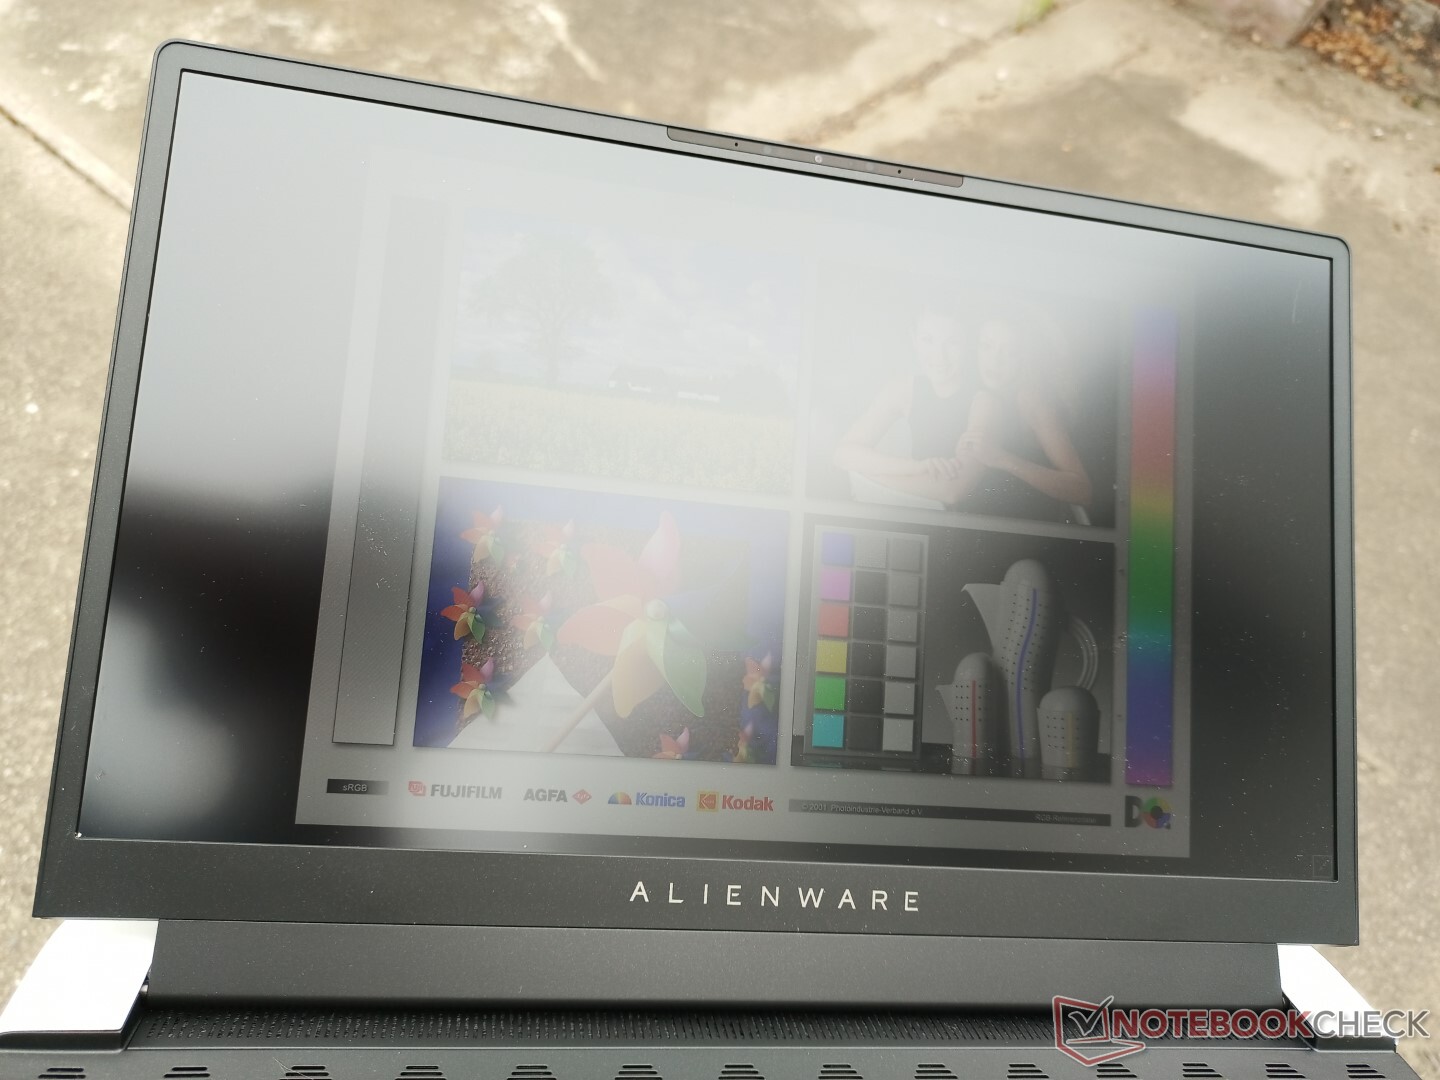
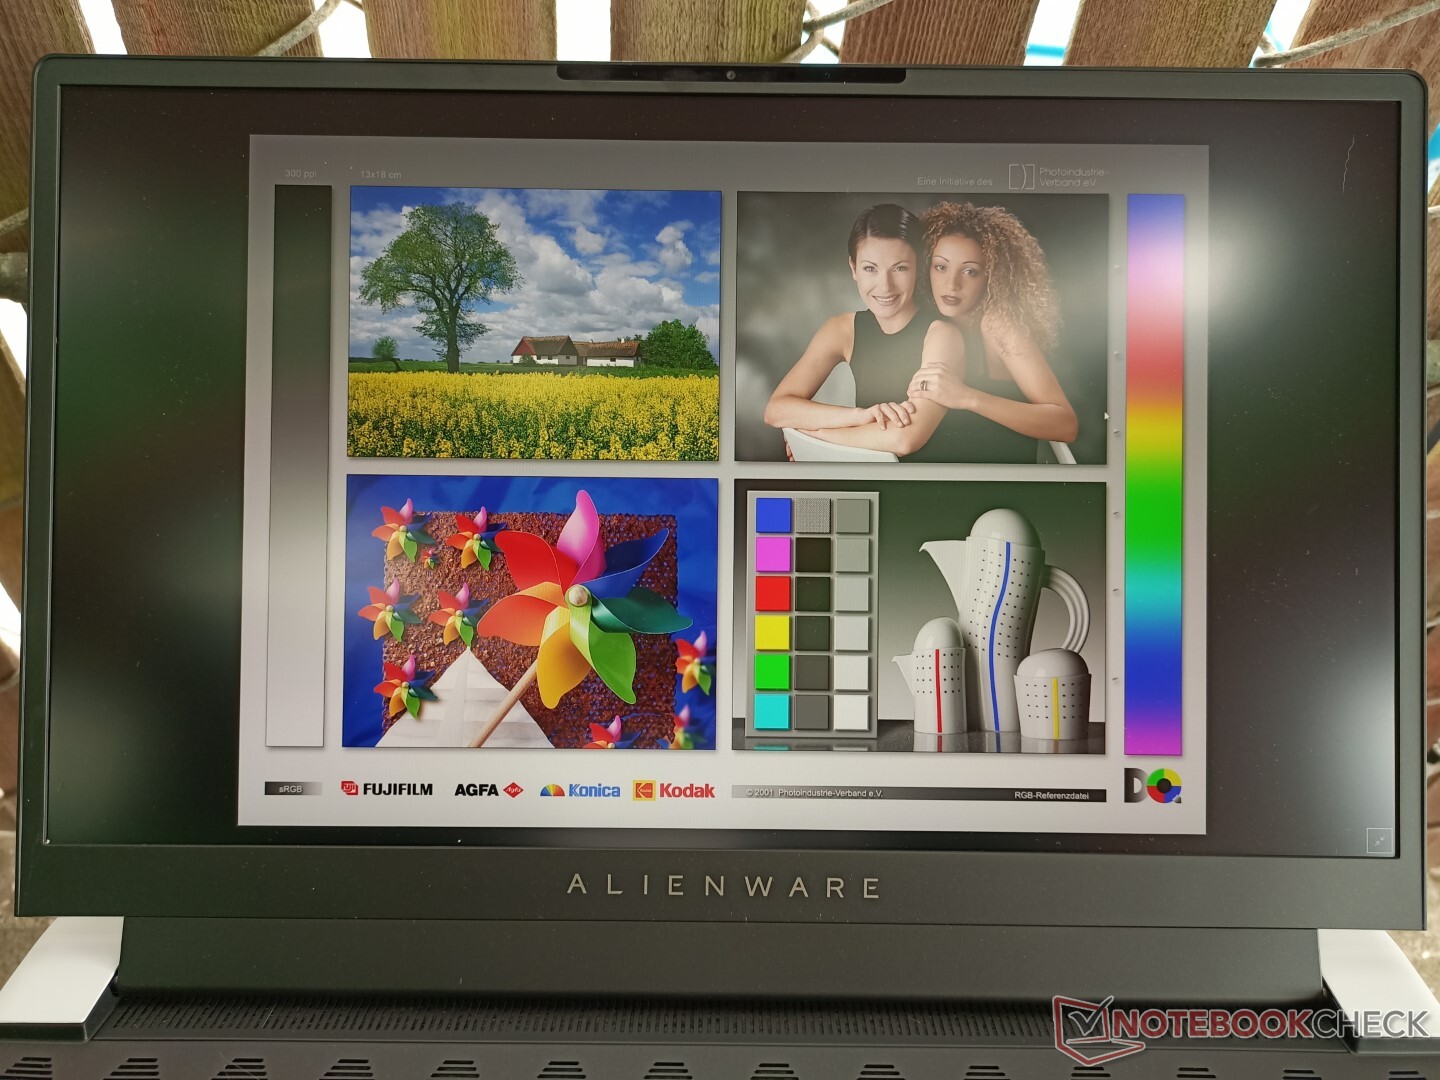
A visibilidade externa é melhor do que em muitos outros laptops de jogos simplesmente devido à luz de fundo mais brilhante de 400-nit quando comparada à média de 300-nit para a categoria. A tela é utilizável quando sob a sombra, como na Dell XPS 15mas os usuários ainda devem evitar a luz direta do sol quando possível.
Desempenho - GPU TGP recebe um ligeiro Downgrade
Os usuários podem escolher entre o 11º gênero Tiger Lake Core i7-11800H ou Core i9-11900H com GeForce RTX 3060, RTX 3070 ou RTX 3080 Ampere gráficos visando 90 W, 110 W ou 110 W TGP, respectivamente. Este é na verdade um downgrade em relação ao ano passado Alienware m15 R4 onde a GPU poderia alcançar até 140 W TGP. É uma GPU Max-Q para todos os fins e propósitos, mesmo que "Max-Q" não faça mais parte do nome.
Dynamic Boost 2.0, WhisperMode 2.0, e Advanced Optimus com G-Sync são todos suportados. Na verdade, o Alienware x15 é um dos poucos laptops para jogos com Advanced Optimus em primeiro lugar. Tenha em mente que o recurso só está disponível nos SKUs QHD de 240 Hz e FHD de 360 Hz. Os usuários também devem instalar o último 1.3.0 BIOS patch que permite a execução apenas em modo GPU discreto.
Nossa unidade de teste foi configurada para o modo High Performance através do software do Centro de Comando Alienware antes de executar nossos benchmarks abaixo para obter as mais altas pontuações possíveis.
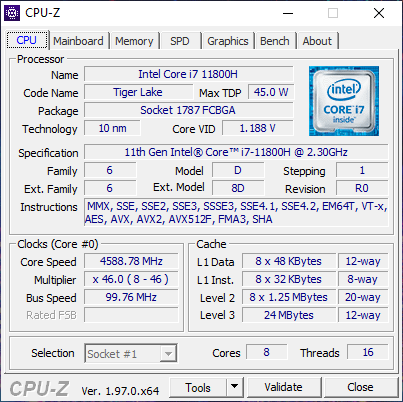
Processador - Mais rápido do que se esperava
O desempenho bruto da CPU é excelente, com resultados multi-tarefas que são 15% mais rápidos do que a média do laptop em nosso banco de dados equipado com o mesmo núcleo i7-11800H CPU, incluindo a Razer Blade 15. Isto coloca nosso sistema pescoço a pescoço com os concorrentes Ryzen 9 5900HX que normalmente é mais rápida que a i7-11800H. A sustentabilidade do desempenho também é excelente, como mostram nossos resultados estáveis do CineBench R15 xT abaixo
Atualização para o Núcleo i9-11900H só deve trazer benefícios de desempenho muito marginais sobre nossa i7-11800H com base em nossas experiências com o processador em outros laptops como o Asus Zephyrus S17.
Cinebench R15 Multi Loop
Cinebench R23: Multi Core | Single Core
Cinebench R15: CPU Multi 64Bit | CPU Single 64Bit
Blender: v2.79 BMW27 CPU
7-Zip 18.03: 7z b 4 -mmt1 | 7z b 4
Geekbench 5.5: Single-Core | Multi-Core
HWBOT x265 Benchmark v2.2: 4k Preset
LibreOffice : 20 Documents To PDF
R Benchmark 2.5: Overall mean
| Cinebench R23 / Multi Core | |
| Alienware x15 RTX 3070 P111F | |
| Asus ROG Strix Scar 15 G533QS | |
| Asus ROG Zephyrus S17 GX703HSD | |
| Acer Nitro 5 AN515-45-R1JH | |
| Média Intel Core i7-11800H (6508 - 14088, n=48) | |
| Alienware m15 R4 RTX 3080 | |
| MSI GS66 Stealth 10UG | |
| Razer Blade 15 Advanced Model Early 2021 | |
| Cinebench R23 / Single Core | |
| Asus ROG Zephyrus S17 GX703HSD | |
| Alienware x15 RTX 3070 P111F | |
| Média Intel Core i7-11800H (1386 - 1522, n=45) | |
| Asus ROG Strix Scar 15 G533QS | |
| Acer Nitro 5 AN515-45-R1JH | |
| MSI GS66 Stealth 10UG | |
| Alienware m15 R4 RTX 3080 | |
| Razer Blade 15 Advanced Model Early 2021 | |
| Geekbench 5.5 / Single-Core | |
| Asus ROG Zephyrus S17 GX703HSD | |
| Média Intel Core i7-11800H (1429 - 1625, n=40) | |
| Acer Nitro 5 AN515-45-R1JH | |
| Alienware m15 R4 RTX 3080 | |
| Razer Blade 15 Advanced Model Early 2021 | |
| MSI GS66 Stealth 10UG | |
| Dell G5 15 SE 5505 P89F | |
| Schenker XMG Pro 15 | |
| Geekbench 5.5 / Multi-Core | |
| Asus ROG Zephyrus S17 GX703HSD | |
| Média Intel Core i7-11800H (4655 - 9851, n=40) | |
| Alienware m15 R4 RTX 3080 | |
| Dell G5 15 SE 5505 P89F | |
| MSI GS66 Stealth 10UG | |
| Acer Nitro 5 AN515-45-R1JH | |
| Razer Blade 15 Advanced Model Early 2021 | |
| Schenker XMG Pro 15 | |
| HWBOT x265 Benchmark v2.2 / 4k Preset | |
| Asus ROG Zephyrus S17 GX703HSD | |
| Alienware x15 RTX 3070 P111F | |
| Asus ROG Strix Scar 15 G533QS | |
| Acer Nitro 5 AN515-45-R1JH | |
| Média Intel Core i7-11800H (7.38 - 17.4, n=46) | |
| Alienware m15 R4 RTX 3080 | |
| Dell G5 15 SE 5505 P89F | |
| MSI GS66 Stealth 10UG | |
| Razer Blade 15 Advanced Model Early 2021 | |
| Schenker XMG Pro 15 | |
| LibreOffice / 20 Documents To PDF | |
| Alienware m15 R4 RTX 3080 | |
| Acer Nitro 5 AN515-45-R1JH | |
| Dell G5 15 SE 5505 P89F | |
| Razer Blade 15 Advanced Model Early 2021 | |
| Asus ROG Strix Scar 15 G533QS | |
| Alienware x15 RTX 3070 P111F | |
| MSI GS66 Stealth 10UG | |
| Média Intel Core i7-11800H (38.6 - 59.9, n=45) | |
| Asus ROG Zephyrus S17 GX703HSD | |
* ... menor é melhor
Desempenho do sistema
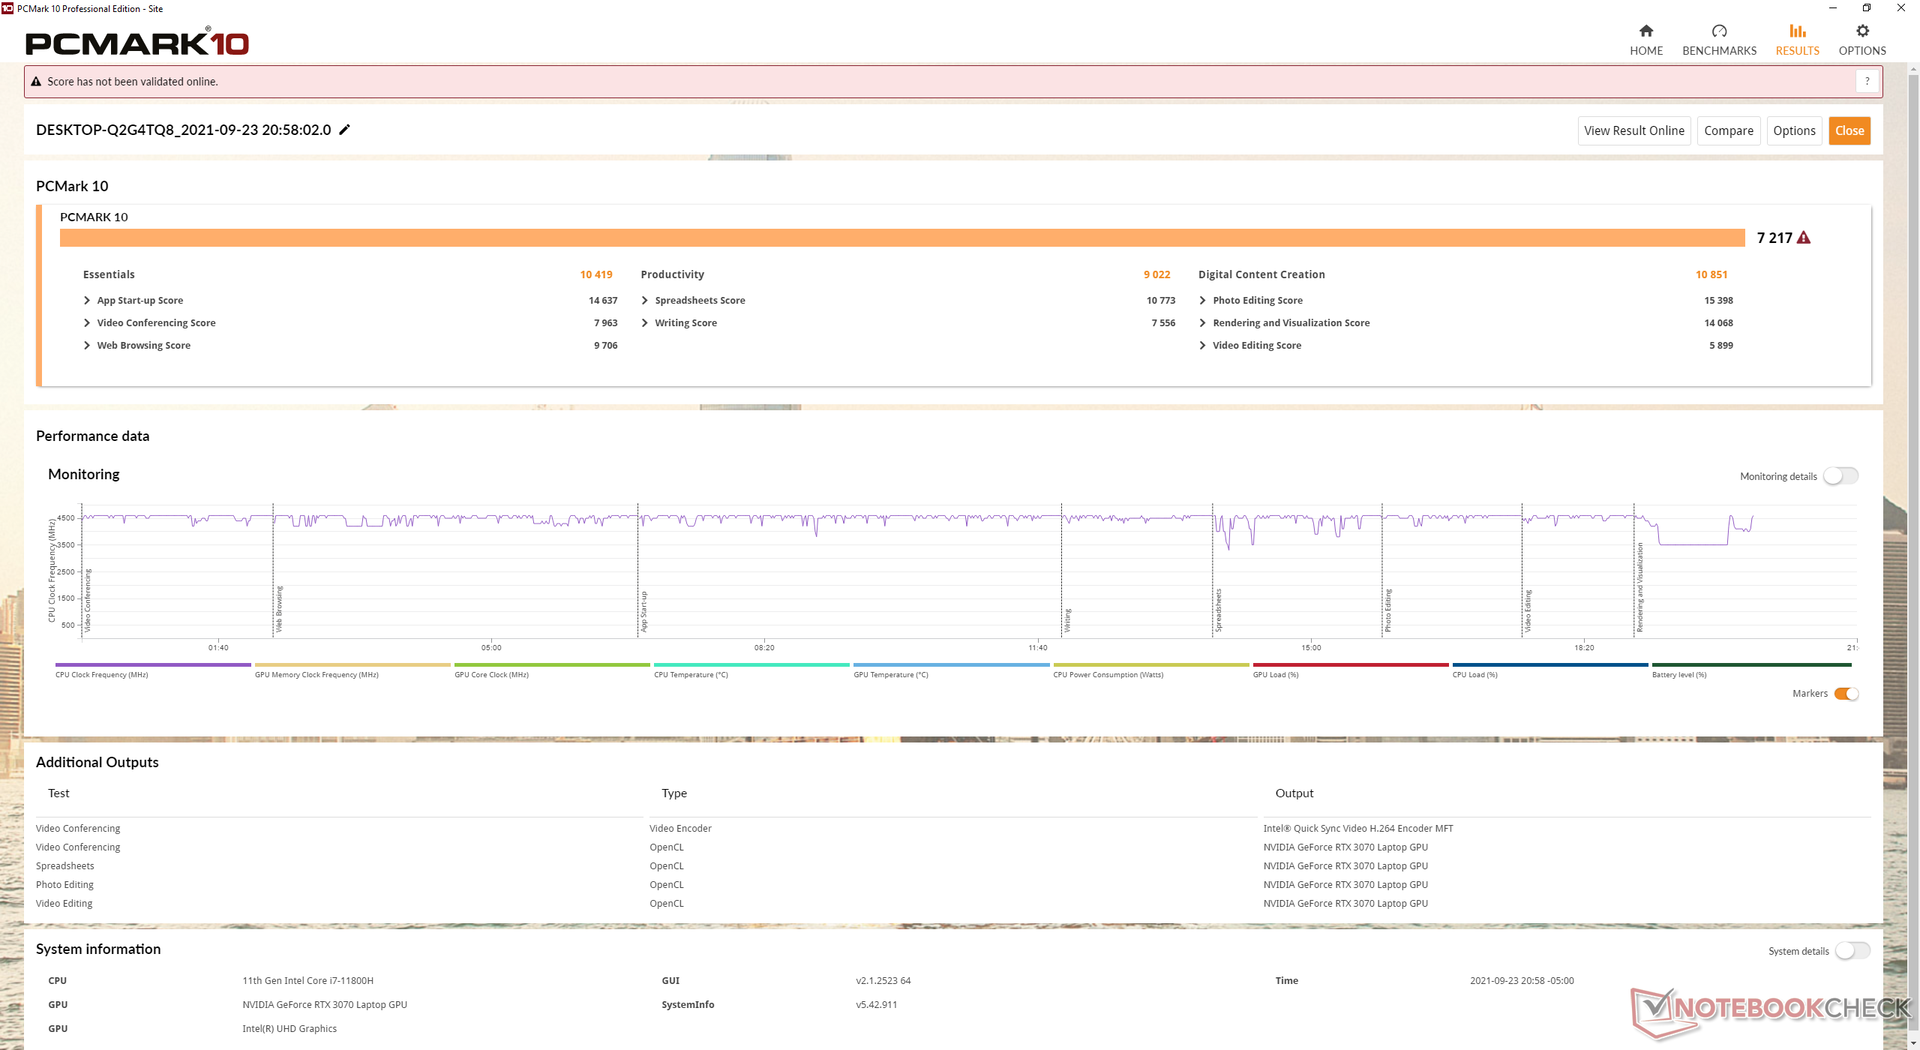
A pontuação PCMark 10 é excelente com resultados que estão consistentemente à frente do Alienware m15 R4 do ano passado, exceto para a categoria de produtividade, uma vez que nosso m15 R4 foi equipado com unidades RAID 0 mais rápidas.
Tivemos um problema com nossa unidade de teste em que a tela de repente ficaria preta ao mudar os perfis térmicos através do software do Centro de Comando Alienware e, portanto, seria necessária uma reinicialização dura. Embora não sejamos capazes de repetir o problema de forma confiável, vale a pena mencionar, no entanto, especialmente porque nossa x17 unidade de teste na semana passada não tinha tais problemas.
| PCMark 10 / Score | |
| Razer Blade 15 Advanced (Mid 2021) | |
| Alienware x15 RTX 3070 P111F | |
| Alienware m15 R4 RTX 3080 | |
| Média Intel Core i7-11800H, NVIDIA GeForce RTX 3070 Laptop GPU (6126 - 7311, n=11) | |
| MSI GS66 Stealth 10UG | |
| Acer Predator Helios 300 PH315-53-786B | |
| Asus Zephyrus S15 GX502L | |
| PCMark 10 / Essentials | |
| Razer Blade 15 Advanced (Mid 2021) | |
| Alienware x15 RTX 3070 P111F | |
| Média Intel Core i7-11800H, NVIDIA GeForce RTX 3070 Laptop GPU (9248 - 10832, n=11) | |
| Alienware m15 R4 RTX 3080 | |
| Asus Zephyrus S15 GX502L | |
| MSI GS66 Stealth 10UG | |
| Acer Predator Helios 300 PH315-53-786B | |
| PCMark 10 / Productivity | |
| Alienware m15 R4 RTX 3080 | |
| Média Intel Core i7-11800H, NVIDIA GeForce RTX 3070 Laptop GPU (8571 - 9669, n=11) | |
| Alienware x15 RTX 3070 P111F | |
| Razer Blade 15 Advanced (Mid 2021) | |
| Asus Zephyrus S15 GX502L | |
| Acer Predator Helios 300 PH315-53-786B | |
| MSI GS66 Stealth 10UG | |
| PCMark 10 / Digital Content Creation | |
| Alienware x15 RTX 3070 P111F | |
| Razer Blade 15 Advanced (Mid 2021) | |
| Alienware m15 R4 RTX 3080 | |
| Média Intel Core i7-11800H, NVIDIA GeForce RTX 3070 Laptop GPU (7627 - 10851, n=11) | |
| MSI GS66 Stealth 10UG | |
| Acer Predator Helios 300 PH315-53-786B | |
| Asus Zephyrus S15 GX502L | |
| PCMark 10 Score | 7217 pontos | |
Ajuda | ||
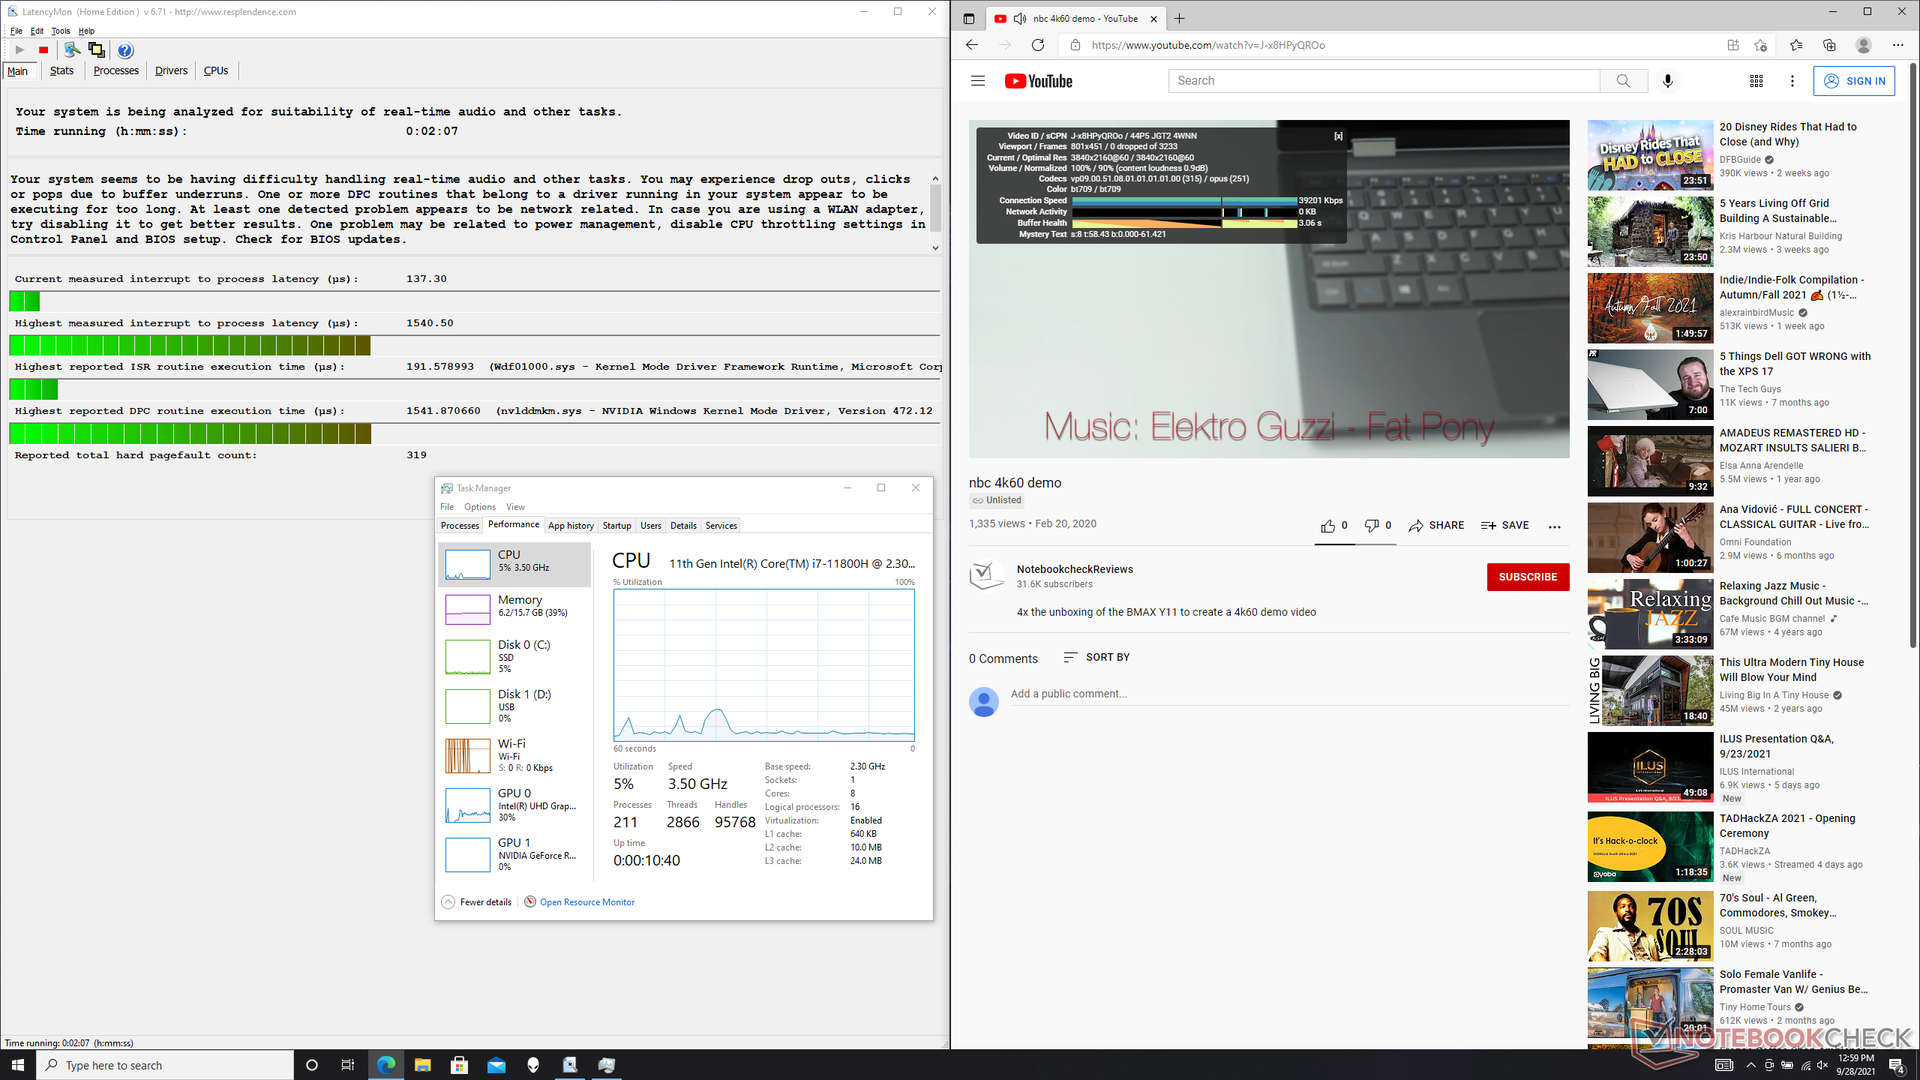
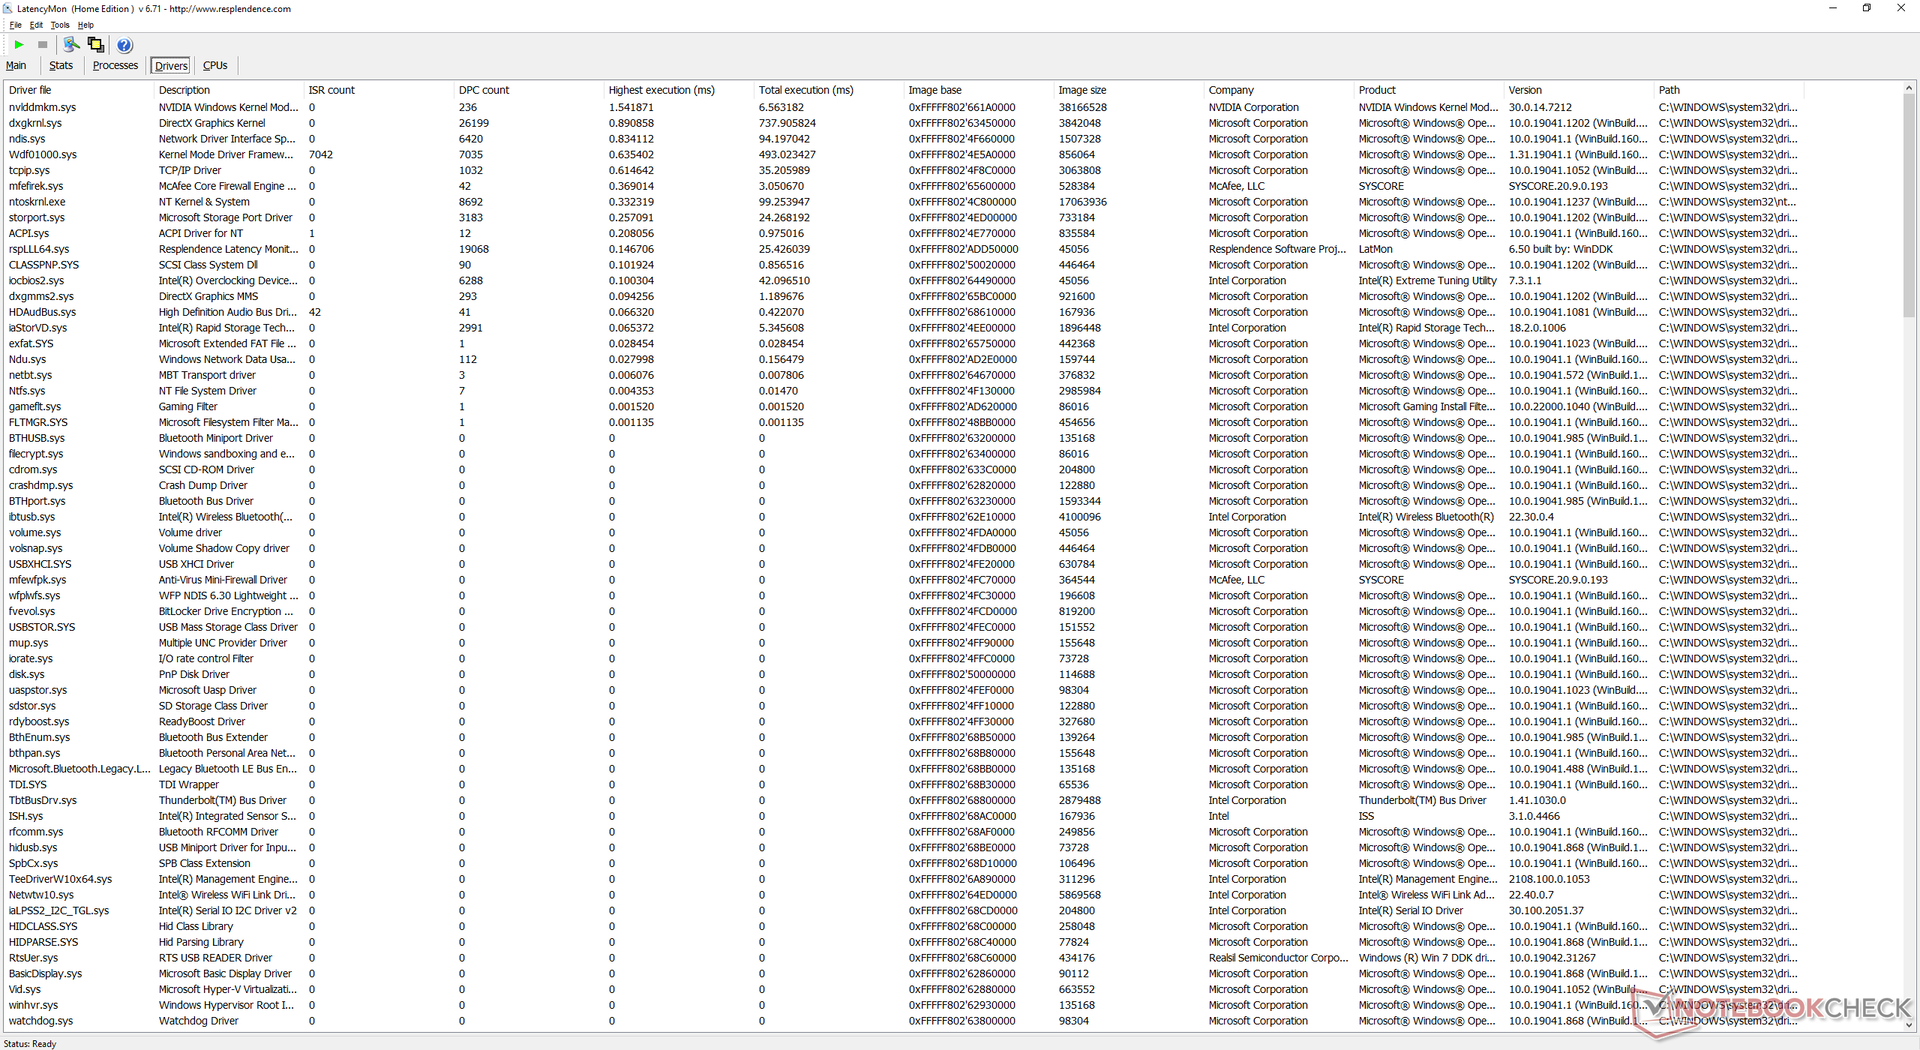
Latência do DPC
LatencyMon mostra pequenos problemas de latência do DPC ao abrir várias abas do navegador em nossa página inicial e ao executar Prime95 para enfatizar a CPU. A reprodução de vídeo de 4K a 60 FPS é perfeita, sem queda de quadros no modo iGPU.
| DPC Latencies / LatencyMon - interrupt to process latency (max), Web, Youtube, Prime95 | |
| Asus Zephyrus S15 GX502L | |
| Razer Blade 15 Advanced (Mid 2021) | |
| Alienware x15 RTX 3070 P111F | |
| Alienware m15 R4 RTX 3080 | |
| MSI GS66 Stealth 10UG | |
| Acer Predator Helios 300 PH315-53-786B | |
* ... menor é melhor
Dispositivos de armazenamento - Suporte PCIe4 x4
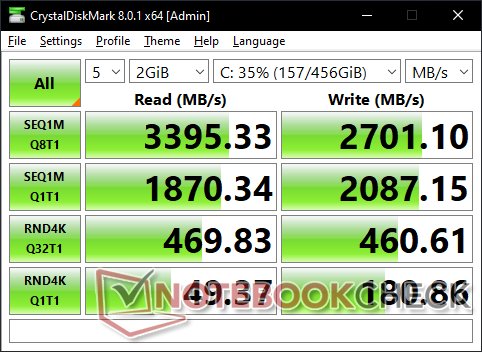
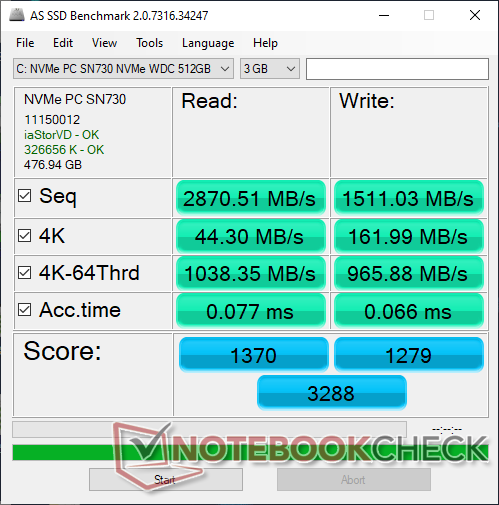
Os usuários podem instalar até dois drives M.2 na configuração RAID 0. Entretanto, apenas um slot é compatível com PCIe4, enquanto o outro pode suportar até PCIe3, como no Alienware x17 R1. As SKUs x15 R1 atuais são fornecidas apenas com SSDs PCIe3 NVMe muito parecidas com as SSDs 512 GB WD SN730 em nossa unidade de teste. As taxas de transferência são geralmente comparáveis às da Samsung PM981a, como encontradas em outras máquinas de jogos de alta tecnologia como a série Razer Blade.
| Alienware x15 RTX 3070 P111F WDC PC SN730 SDBPNTY-512G | Alienware m15 R4 RTX 3080 2x WDC PC SN730 SDBPNTY-512G (RAID 0) | MSI GS66 Stealth 10UG WDC PC SN730 SDBPNTY-1T00 | Razer Blade 15 Advanced (Mid 2021) SSSTC CA6-8D1024 | Acer Predator Helios 300 PH315-53-786B Samsung PM981a MZVLB1T0HBLR | |
|---|---|---|---|---|---|
| AS SSD | 29% | 37% | 90% | 34% | |
| Seq Read (MB/s) | 2871 | 2888 1% | 2198 -23% | 5739 100% | 2792 -3% |
| Seq Write (MB/s) | 1511 | 2786 84% | 2596 72% | 4201 178% | 2311 53% |
| 4K Read (MB/s) | 44.3 | 41.98 -5% | 43.81 -1% | 53.8 21% | 48.34 9% |
| 4K Write (MB/s) | 162 | 108 -33% | 115.5 -29% | 179.2 11% | 93.9 -42% |
| 4K-64 Read (MB/s) | 1038 | 1396 34% | 1692 63% | 2959 185% | 1516 46% |
| 4K-64 Write (MB/s) | 966 | 1234 28% | 2162 124% | 1891 96% | 1940 101% |
| Access Time Read * (ms) | 0.077 | 0.056 27% | 0.056 27% | 0.027 65% | |
| Access Time Write * (ms) | 0.066 | 0.035 47% | 0.098 -48% | 0.154 -133% | 0.04 39% |
| Score Read (Points) | 1370 | 1727 26% | 1956 43% | 3587 162% | 1843 35% |
| Score Write (Points) | 1279 | 1621 27% | 2537 98% | 2490 95% | 2265 77% |
| Score Total (Points) | 3288 | 4227 29% | 5513 68% | 7821 138% | 5030 53% |
| Copy ISO MB/s (MB/s) | 1962 | 1868 -5% | 2236 14% | 3027 54% | 1921 -2% |
| Copy Program MB/s (MB/s) | 407.9 | 812 99% | 690 69% | 1177 189% | 581 42% |
| Copy Game MB/s (MB/s) | 1105 | 1596 44% | 1546 40% | 2170 96% | 1454 32% |
| CrystalDiskMark 5.2 / 6 | -1% | 4% | 81% | -29% | |
| Write 4K (MB/s) | 179.6 | 114.2 -36% | 163.1 -9% | 295.6 65% | 76.2 -58% |
| Read 4K (MB/s) | 49.21 | 43.77 -11% | 48.97 0% | 85.7 74% | 34.32 -30% |
| Write Seq (MB/s) | 2062 | 2607 26% | 4149 101% | 776 -62% | |
| Read Seq (MB/s) | 1849 | 2316 25% | 4203 127% | 2169 17% | |
| Write 4K Q32T1 (MB/s) | 462.9 | 464.5 0% | 338 -27% | 715 54% | 357.3 -23% |
| Read 4K Q32T1 (MB/s) | 470.2 | 546 16% | 475.6 1% | 709 51% | 429.6 -9% |
| Write Seq Q32T1 (MB/s) | 2702 | 3233 20% | 3090 14% | 4681 73% | 788 -71% |
| Read Seq Q32T1 (MB/s) | 3371 | 3473 3% | 3421 1% | 6905 105% | 3542 5% |
| Write 4K Q8T8 (MB/s) | 1375 | ||||
| Read 4K Q8T8 (MB/s) | 1447 | ||||
| Média Total (Programa/Configurações) | 14% /
20% | 21% /
25% | 86% /
87% | 3% /
10% |
* ... menor é melhor

Disk Throttling: DiskSpd Read Loop, Queue Depth 8
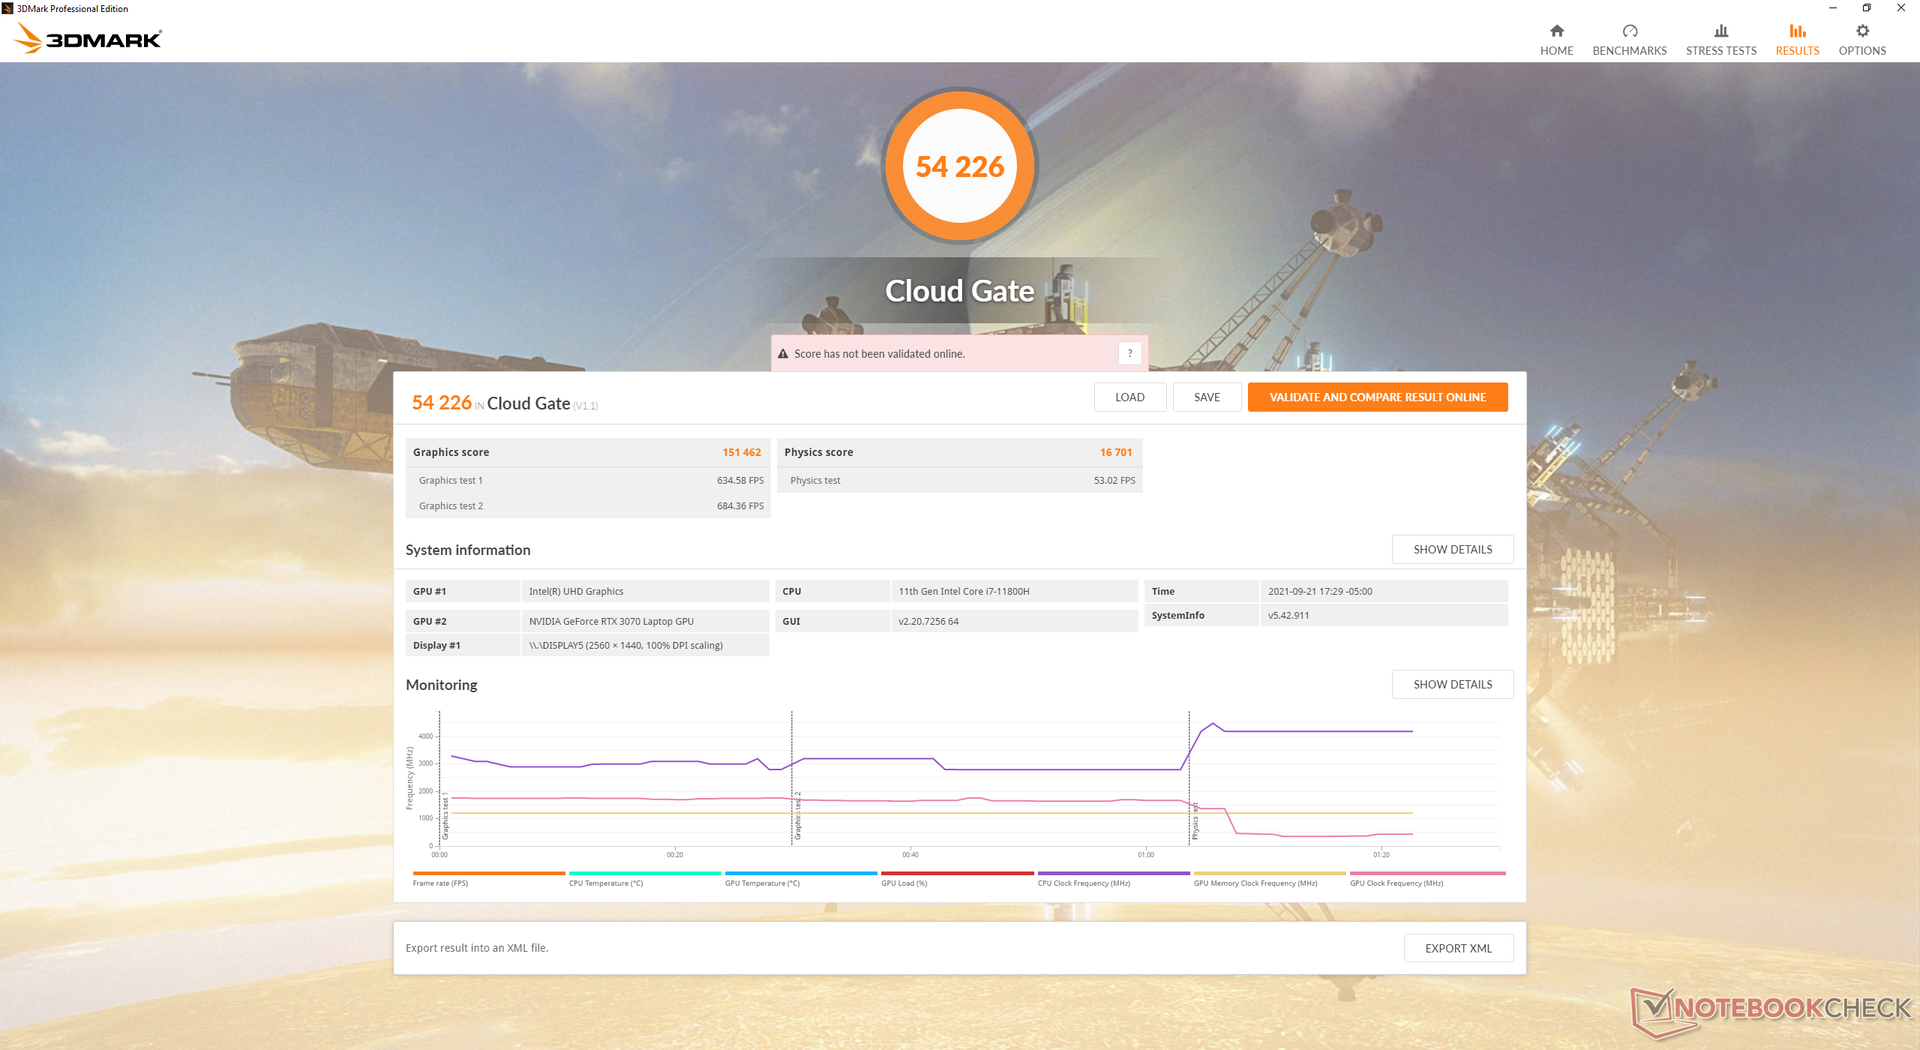
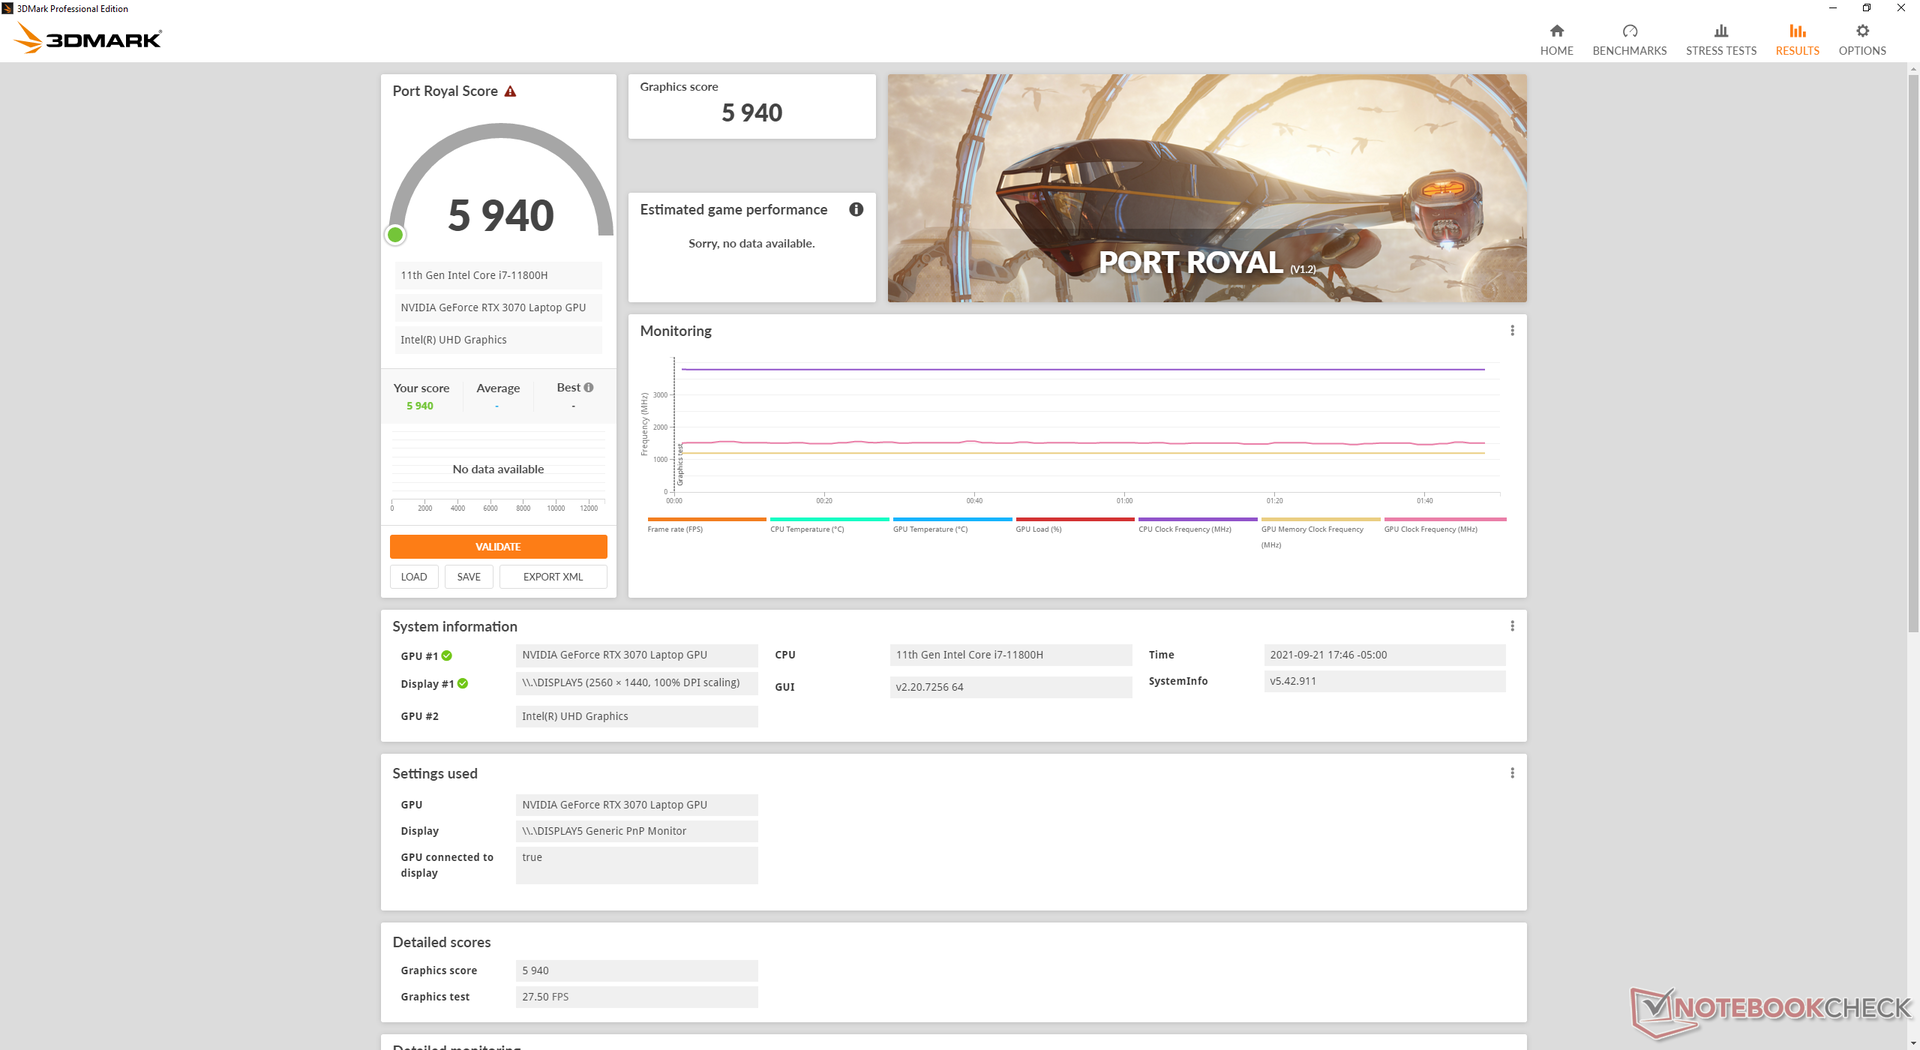
Desempenho da GPU
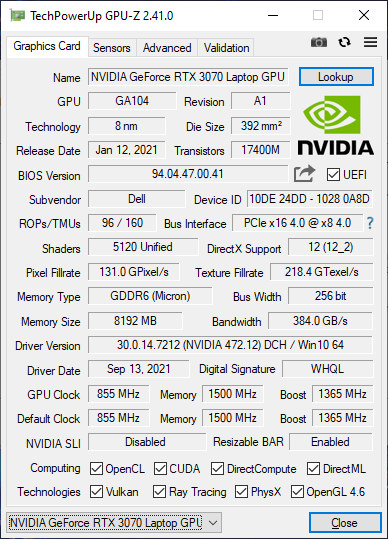
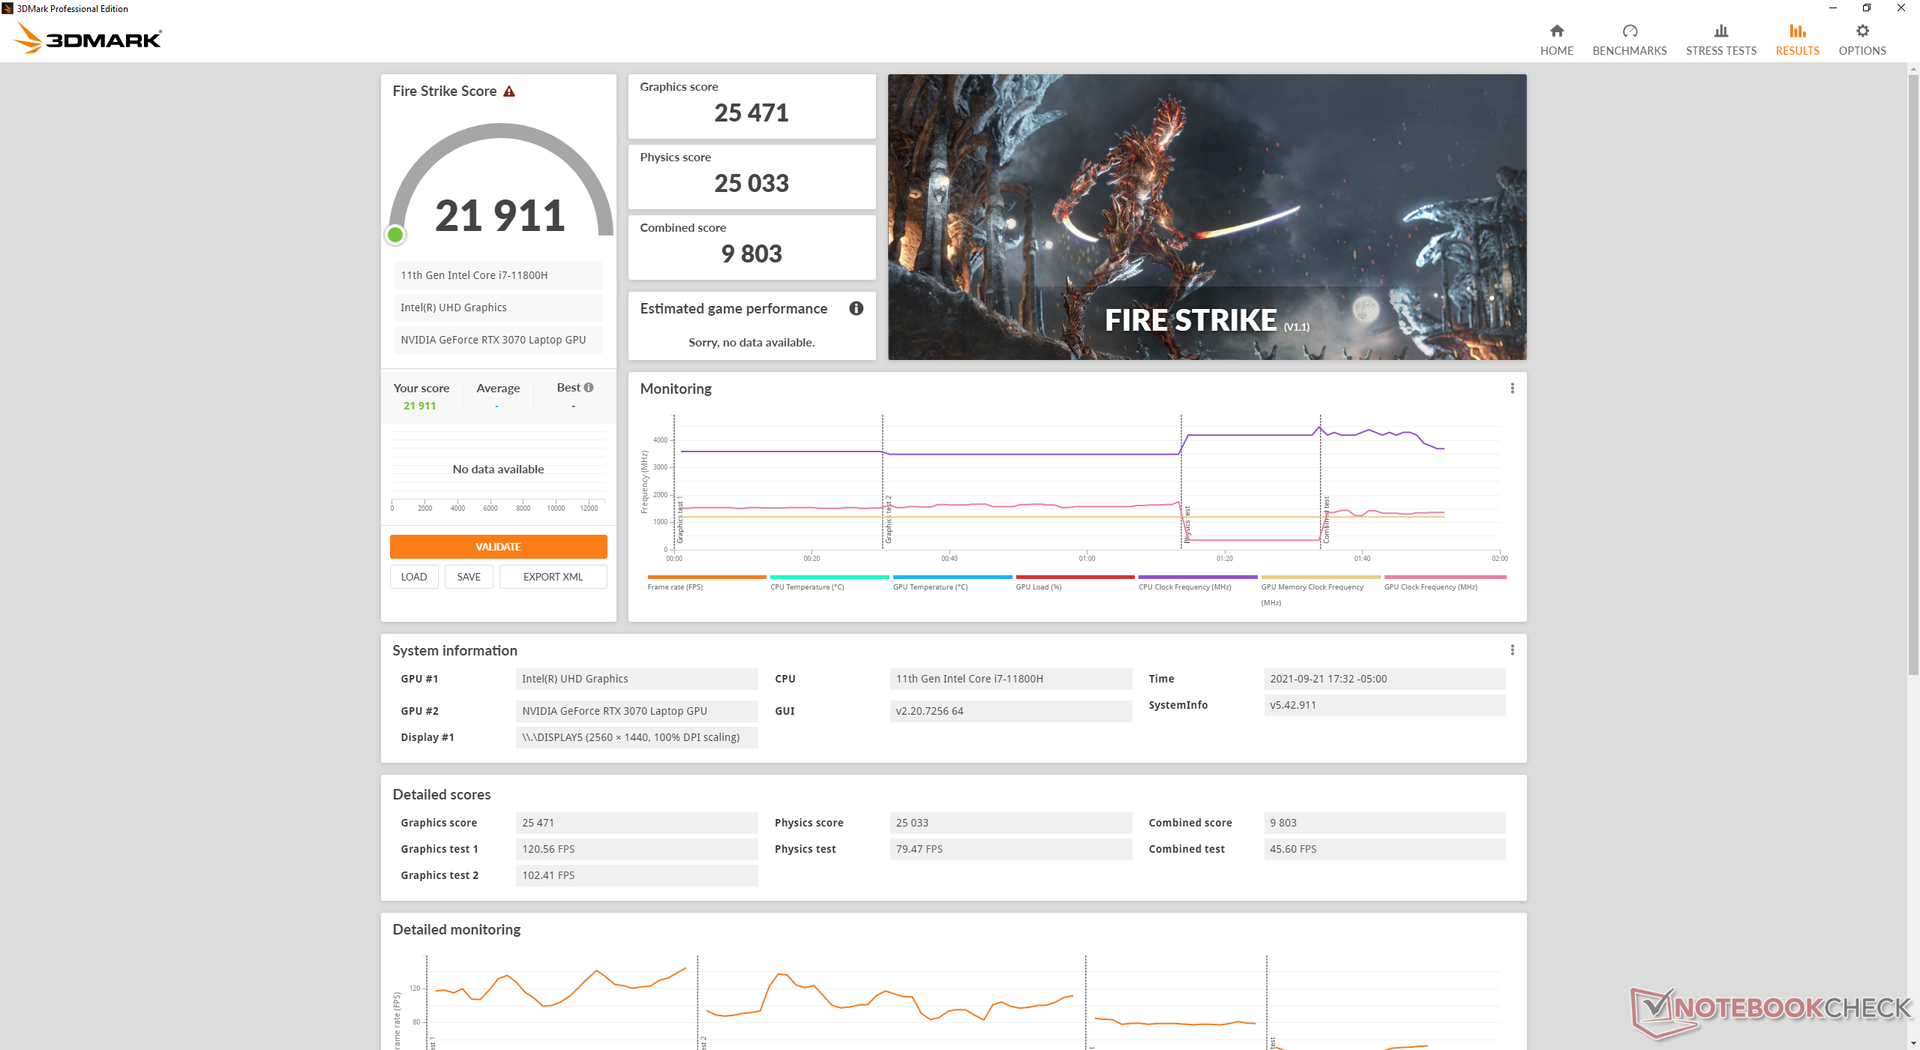
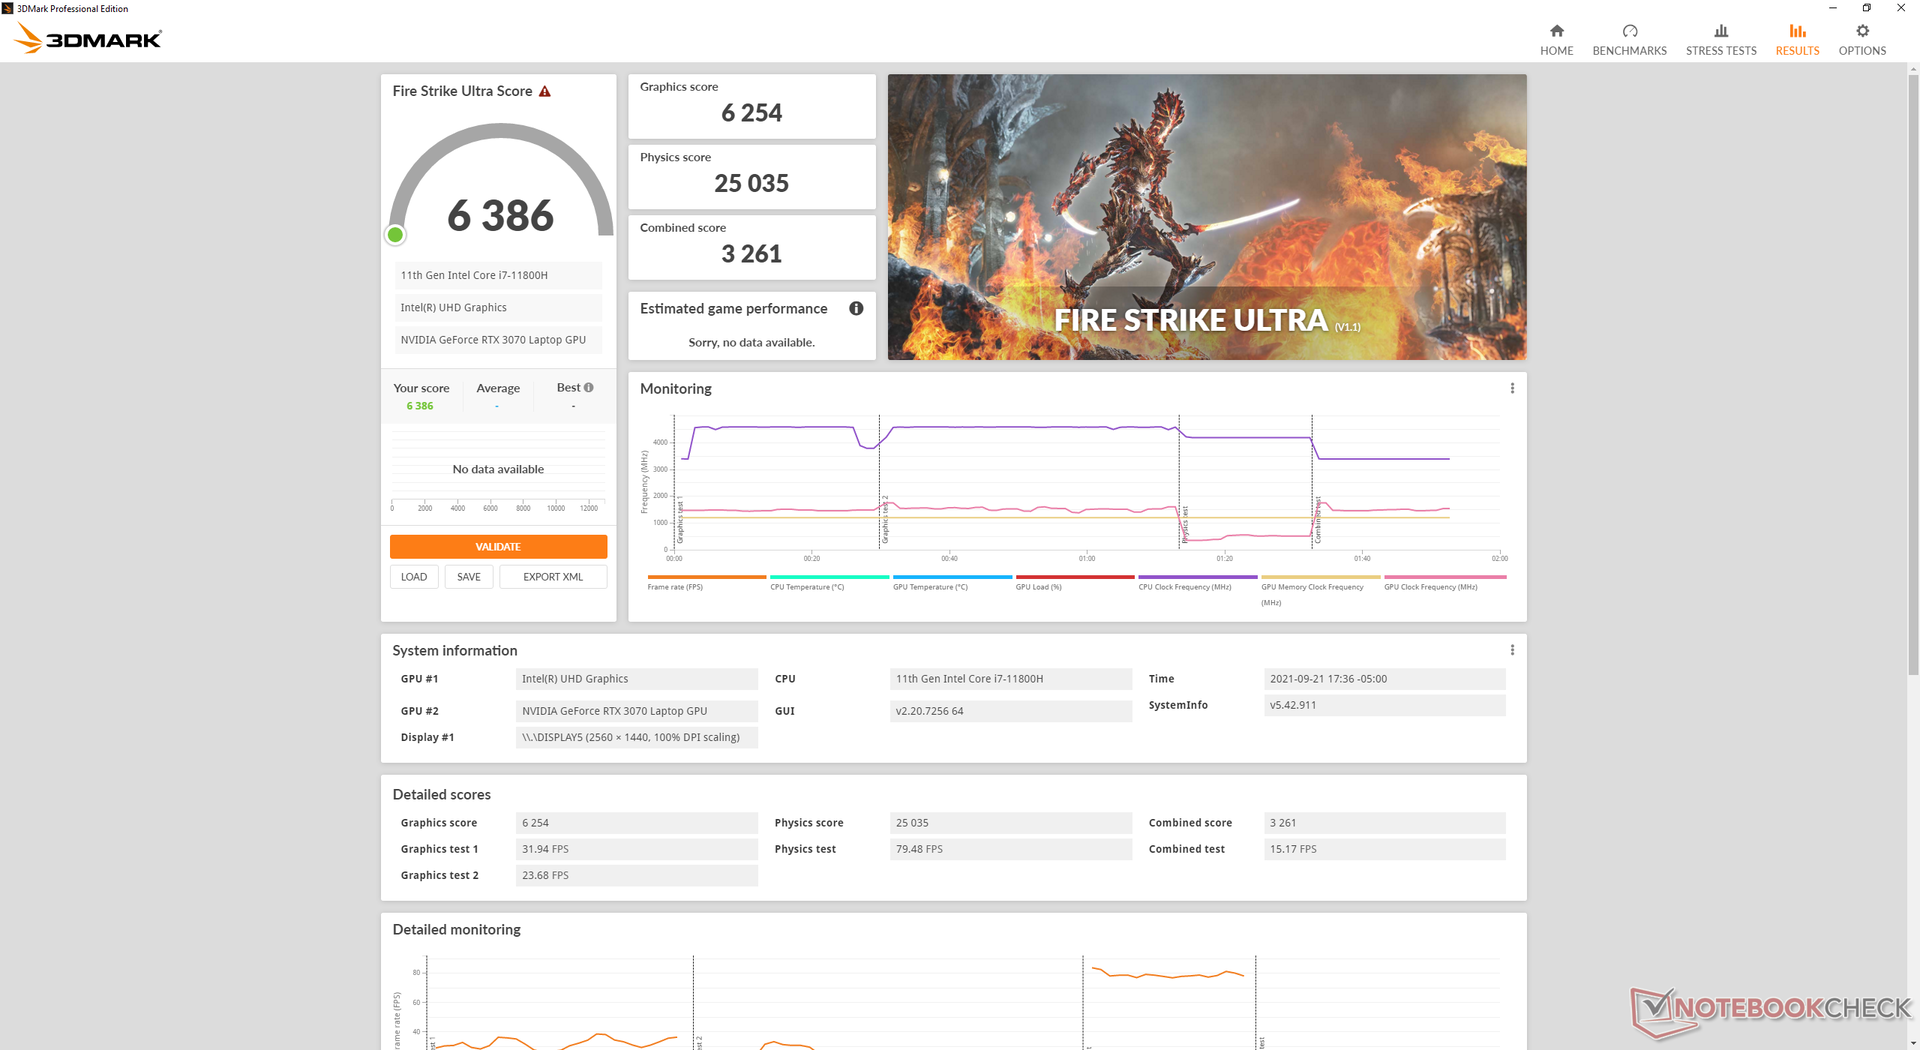
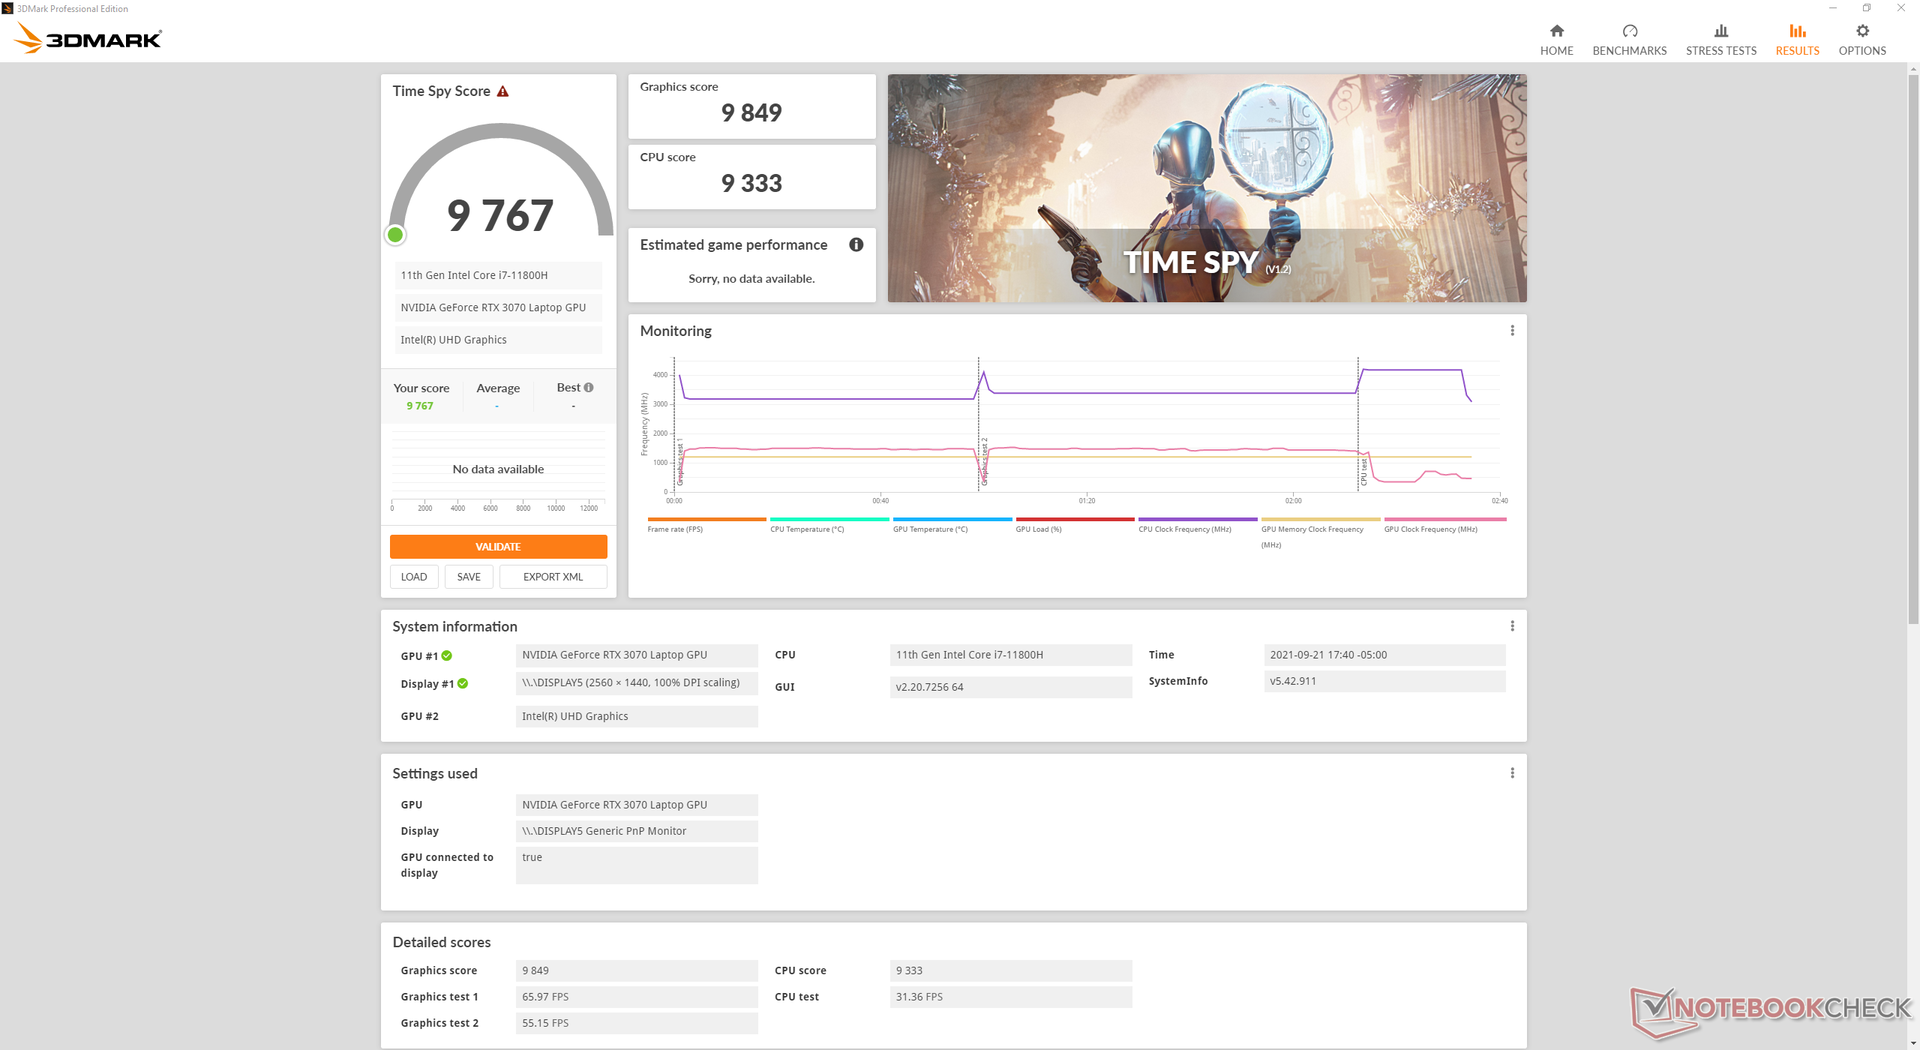
Nosso móvel GeForce RTX 3070 está atuando onde esperamos que seja relativo a outros laptops com a mesma GPU. Infelizmente, isto é um tanto decepcionante porque o antigo Alienware m15 R4 com RTX 3070 superaria de forma consistente nossos novos x15 R1 em 10% em todos os 3DMark benchmarks. Suspeitamos que o alvo TGP comparativamente mais baixo do x15 R1 (110 W vs. 140 W) é responsável pelo desempenho gráfico geral mais lento.
A atualização para o RTX 3080 Não se espera que a SKU aumente significativamente o desempenho gráfico em relação ao nosso RTX 3070, especialmente porque tem como alvo exatamente o mesmo limite de 110 W TGP. Em vez disso, os maiores ganhos serão entre o RTX 3060 e 3070 SKUs.
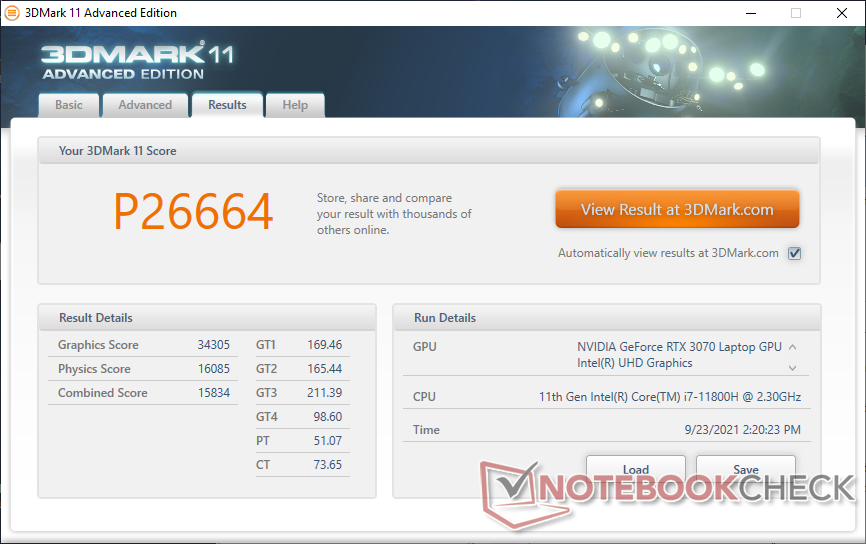
| 3DMark 11 Performance | 26664 pontos | |
| 3DMark Cloud Gate Standard Score | 54226 pontos | |
| 3DMark Fire Strike Score | 21911 pontos | |
| 3DMark Time Spy Score | 9767 pontos | |
Ajuda | ||
Witcher 3 FPS Chart
| baixo | média | alto | ultra | QHD | |
|---|---|---|---|---|---|
| GTA V (2015) | 181 | 174 | 166 | 95.8 | 83.7 |
| The Witcher 3 (2015) | 415.4 | 279.4 | 197.7 | 100.2 | |
| Dota 2 Reborn (2015) | 167 | 148 | 143 | 130 | |
| Final Fantasy XV Benchmark (2018) | 150 | 123 | 93.7 | 73.8 | |
| X-Plane 11.11 (2018) | 129 | 114 | 89.9 | ||
| Far Cry 5 (2018) | 143 | 125 | 118 | 113 | 96 |
| Strange Brigade (2018) | 467 | 253 | 206 | 178 | 132 |
Emissions
Ruído do sistema - Barulho somente quando se joga
O Alienware x15 R1 usa a mesma pasta térmica de gálio-silicone para suas configurações de ventilador da CPU e do Centro de Comando Alienware (Quiet, Performance, e Full Speed) como encontrado no x17 R1. Aplicações pouco exigentes como navegação na web ou streaming de vídeo podem induzir um ruído do ventilador de apenas 26 a 31 dB(A) contra um fundo silencioso de 24,1 dB(A) a ser na maioria das vezes imperceptível e muito mais silencioso do que o que observamos no Alienware m15 R4 onde os ventiladores pulsavam com mais freqüência.
Ao jogar, o ruído do ventilador estaria próximo ao que gravamos no x17 R1 a quase 50 dB(A) em ambos os modos Balanceado ou Performance. Se os ventiladores estiverem no modo Full Speed, então o teto de ruído do ventilador aumentaria para 55 dB(A). O x15 R1 não é necessariamente mais silencioso ou mais alto do que a maioria dos outros laptops de 15,6 polegadas a este respeito, apesar de ter mais ventiladores do que a maioria.
| Alienware x15 RTX 3070 P111F GeForce RTX 3070 Laptop GPU, i7-11800H, WDC PC SN730 SDBPNTY-512G | Alienware m15 R4 RTX 3080 GeForce RTX 3080 Laptop GPU, i9-10980HK, 2x WDC PC SN730 SDBPNTY-512G (RAID 0) | MSI GS66 Stealth 10UG GeForce RTX 3070 Laptop GPU, i7-10870H, WDC PC SN730 SDBPNTY-1T00 | Razer Blade 15 Advanced (Mid 2021) GeForce RTX 3080 Laptop GPU, i7-11800H, SSSTC CA6-8D1024 | Asus Zephyrus S15 GX502L GeForce RTX 2070 Super Mobile, i7-10875H, WDC PC SN730 SDBPNTY-1T00 | Acer Predator Helios 300 PH315-53-786B GeForce RTX 3070 Laptop GPU, i7-10750H, Samsung PM981a MZVLB1T0HBLR | |
|---|---|---|---|---|---|---|
| Noise | -10% | -21% | -2% | -23% | -11% | |
| desligado / ambiente * (dB) | 24.1 | 25 -4% | 26.2 -9% | 25.1 -4% | 25 -4% | 25 -4% |
| Idle Minimum * (dB) | 26.6 | 25 6% | 34 -28% | 25.3 5% | 28 -5% | 25 6% |
| Idle Average * (dB) | 26.6 | 29 -9% | 34 -28% | 25.3 5% | 31 -17% | 27 -2% |
| Idle Maximum * (dB) | 26.6 | 33 -24% | 34 -28% | 25.3 5% | 36 -35% | 35 -32% |
| Load Average * (dB) | 30.9 | 48 -55% | 47.2 -53% | 42 -36% | 56 -81% | 46 -49% |
| Witcher 3 ultra * (dB) | 49.9 | 46 8% | 46.3 7% | 45.6 9% | 55 -10% | 49 2% |
| Load Maximum * (dB) | 53.5 | 49 8% | 58.2 -9% | 51.6 4% | 57 -7% | 51 5% |
* ... menor é melhor
Barulho
| Ocioso |
| 26.6 / 26.6 / 26.6 dB |
| Carga |
| 30.9 / 53.5 dB |
 | ||
30 dB silencioso 40 dB(A) audível 50 dB(A) ruidosamente alto |
||
min: | ||
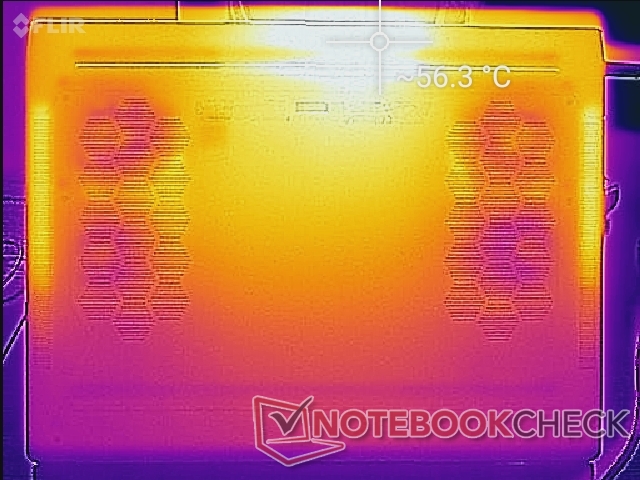
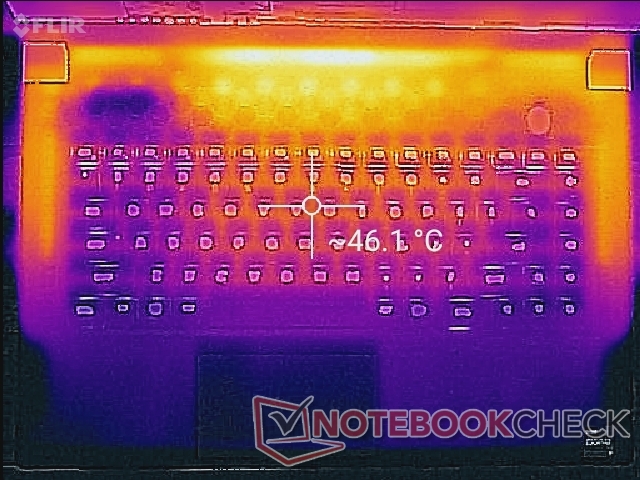
Temperatura - Traseiro Quente
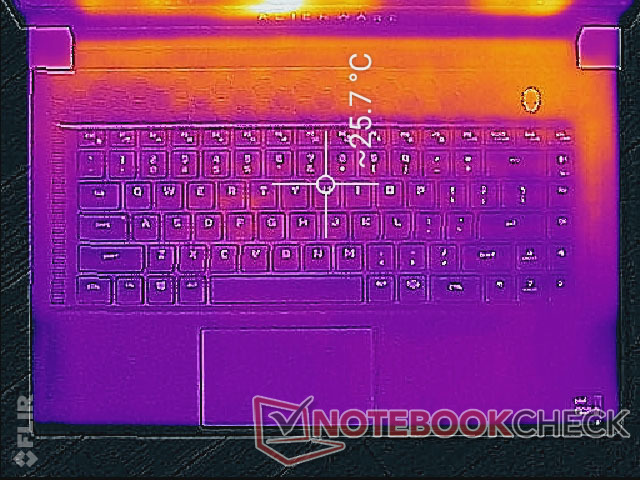
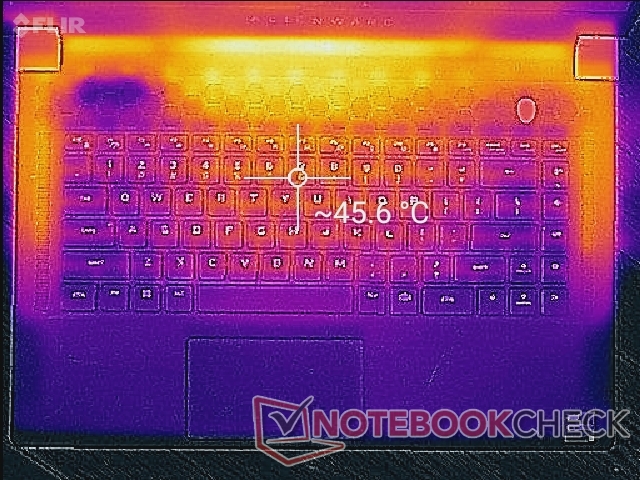
Os computadores portáteis Alienware m15 mais antigos possuíam um descanso de palma muito quente, aproximando-se dos 40 C quando rodavam jogos. Felizmente, os descansos para a palma da mão sobre o x15 R1 são significativamente mais frios em comparação com cerca de 8 C para mãos e dedos mais confortáveis. Note que embora as teclas WASD não sejam tão quentes como antes, as superfícies entre as bordas do chassi e as bordas do teclado podem ser muito quentes, uma vez que há tubos de calor de cobre por baixo.
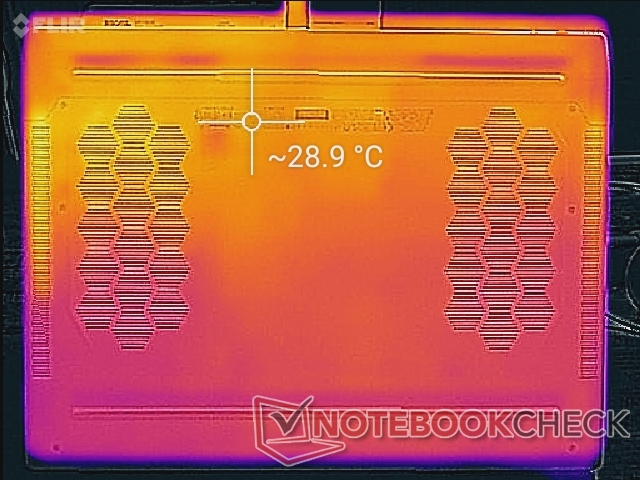
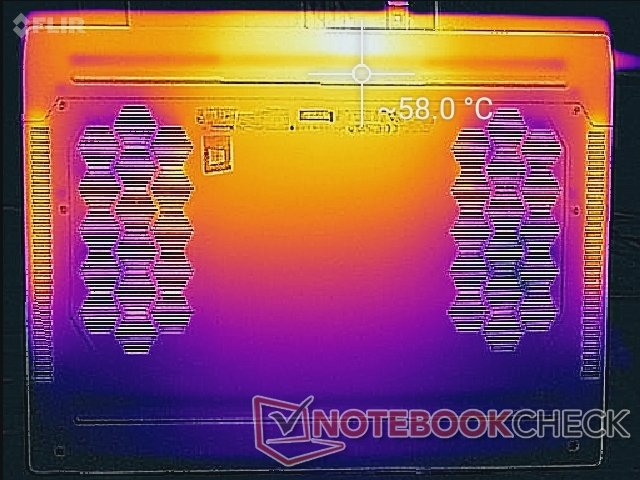
Pontos quentes na parte superior e inferior do chassi podem alcançar quase 60 C cada um, que são similares aos máximos que registramos no design m15 mais antigo. Felizmente, estes pontos estão em direção à traseira, onde é pouco provável que as mãos se toquem.
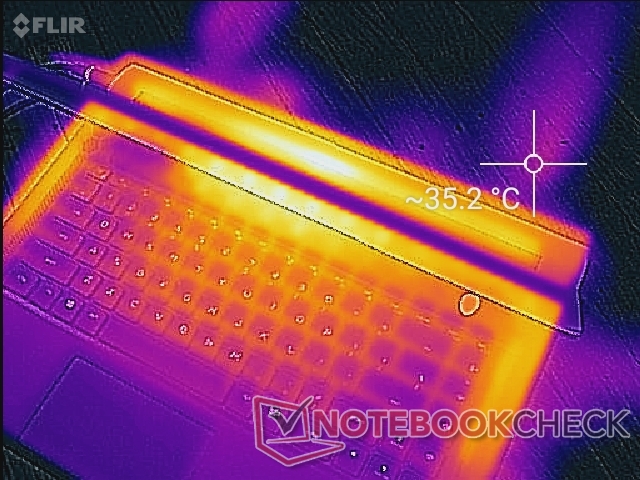
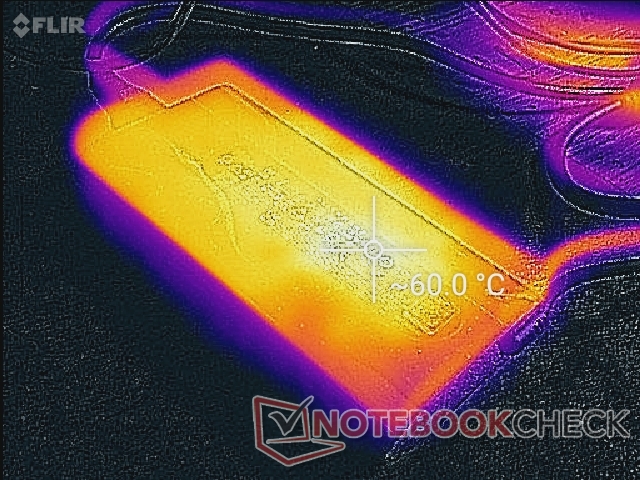
(-) A temperatura máxima no lado superior é 59.2 °C / 139 F, em comparação com a média de 40.4 °C / 105 F , variando de 21.2 a 68.8 °C para a classe Gaming.
(-) A parte inferior aquece até um máximo de 58 °C / 136 F, em comparação com a média de 43.2 °C / 110 F
(+) Em uso inativo, a temperatura média para o lado superior é 26.2 °C / 79 F, em comparação com a média do dispositivo de 33.9 °C / ### class_avg_f### F.
(-) Jogando The Witcher 3, a temperatura média para o lado superior é 43.2 °C / 110 F, em comparação com a média do dispositivo de 33.9 °C / ## #class_avg_f### F.
(+) Os apoios para as mãos e o touchpad estão atingindo a temperatura máxima da pele (32.2 °C / 90 F) e, portanto, não estão quentes.
(-) A temperatura média da área do apoio para as mãos de dispositivos semelhantes foi 28.8 °C / 83.8 F (-3.4 °C / -6.2 F).
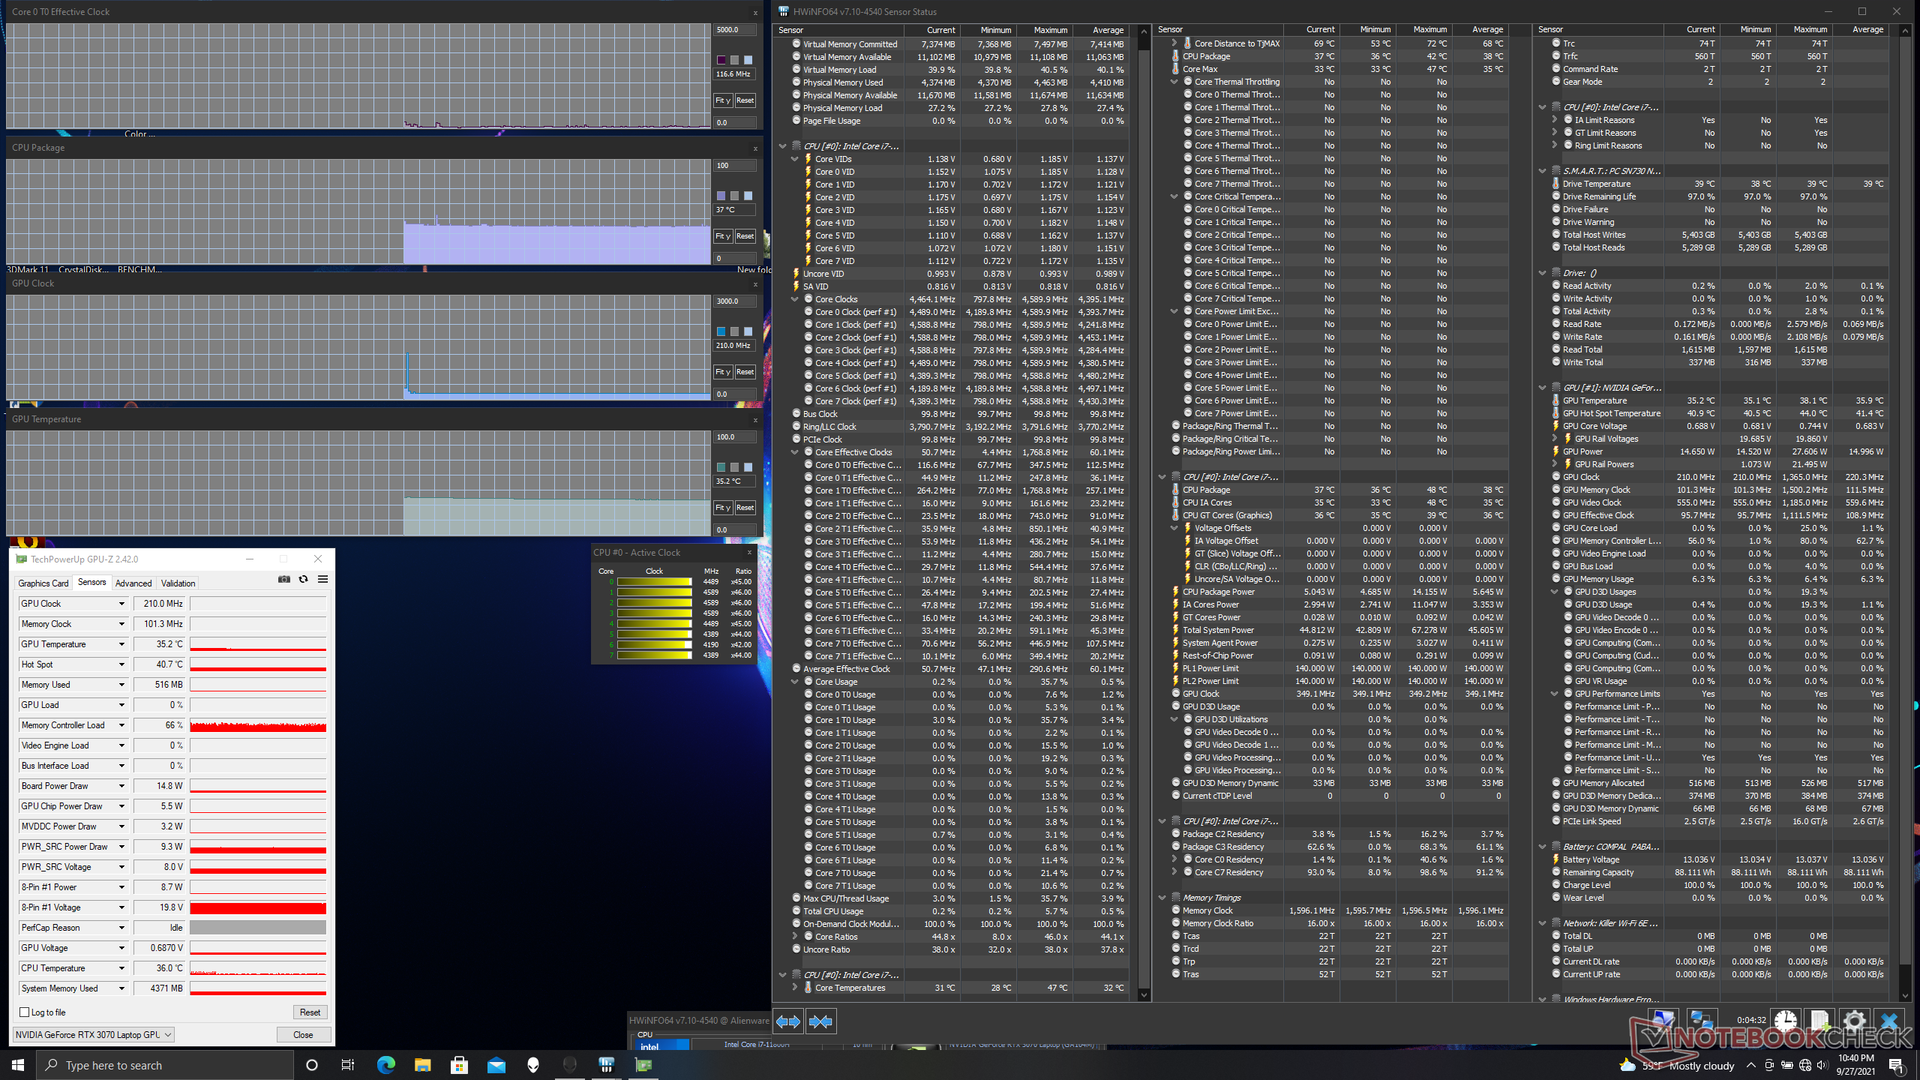
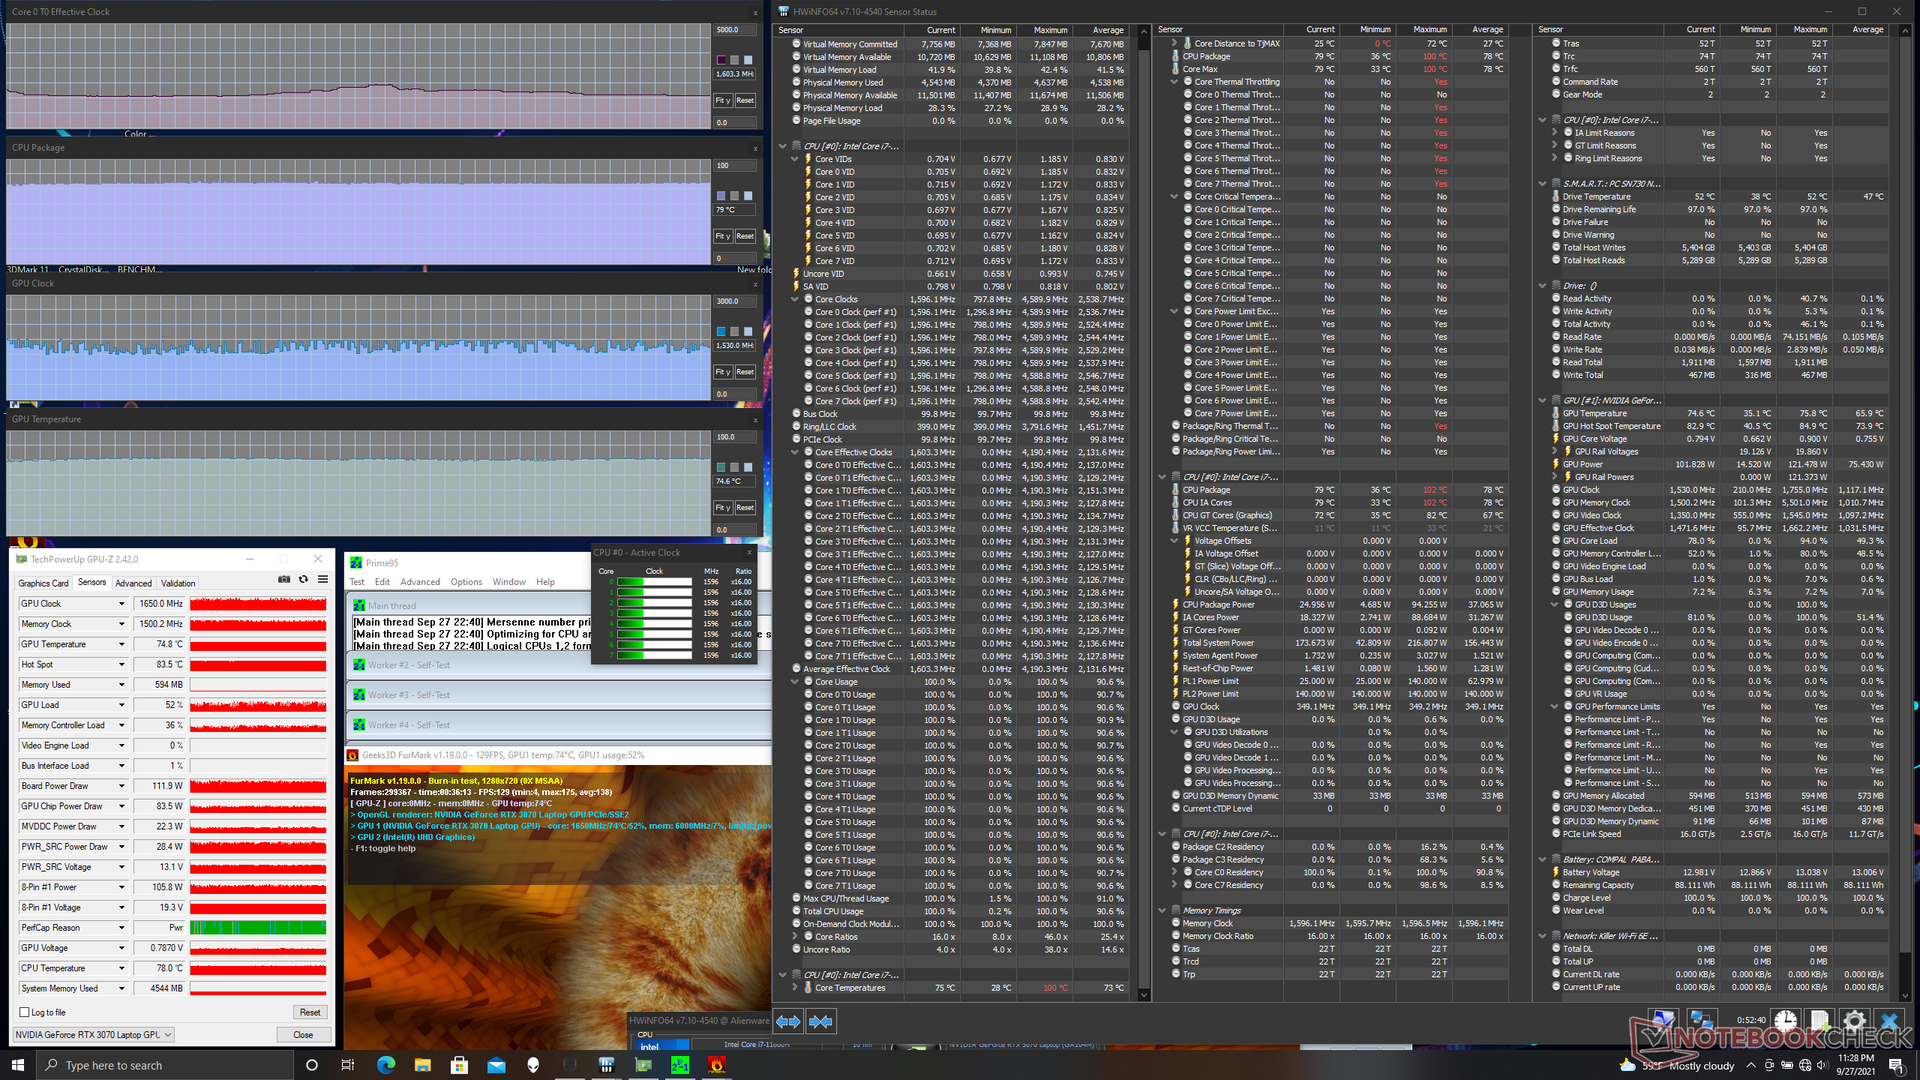
Teste de estresse
Ao executar Prime95 para enfatizar a CPU, as taxas de relógio e a temperatura cicatrizariam entre 3,5 a 4,2 GHz e 90 C a 100 C, respectivamente, com a potência do pacote da CPU variando entre 79 W a 95 W. Este comportamento cíclico também pode ser observado no Alienware x17 R1 quando sujeito às mesmas condições. O processador aqui funciona mais rápido e mais quente do que na maioria dos outros laptops com a mesma CPU, tal como no Razer Blade 15 Modelo avançado onde sua CPU i7-11800H estabilizaria em "apenas" 2,9 GHz e 83 C
A GPU aqui se estabilizaria em 1605 MHz e 74 C quando em funcionamento Witcher 3respectivamente, em comparação com 1680 MHz e 80 C no Alienware m15 R4 RTX 3070. A taxa de relógio de memória em particular é visivelmente mais rápida no antigo m15 R4 quando comparado ao nosso mais novo x15 R1 (1750 MHz vs. 1500 MHz de acordo com GPU-Z). Os relógios ligeiramente mais rápidos no modelo Alienware mais antigo fazem sentido considerando os resultados do 3DMark ligeiramente mais rápidos mencionados acima.
O TGP se estabilizaria em 108 W quando em funcionamento Witcher 3 que está muito próximo da meta de 110 W no máximo. A Dell classifica a GPU em 90 W com um turbo de 20 W, mas parece que o chassi não tem problemas em manter um nível de desempenho próximo à faixa superior da ficha gráfica quando se joga.
Funcionando com energia da bateria, limitará severamente a performance gráfica. Um teste Fire Strike em baterias retornaria pontuações de Física e Gráficos de 24234 e 16281 pontos, respectivamente, em comparação com 25033 e 25471 pontos quando em rede.
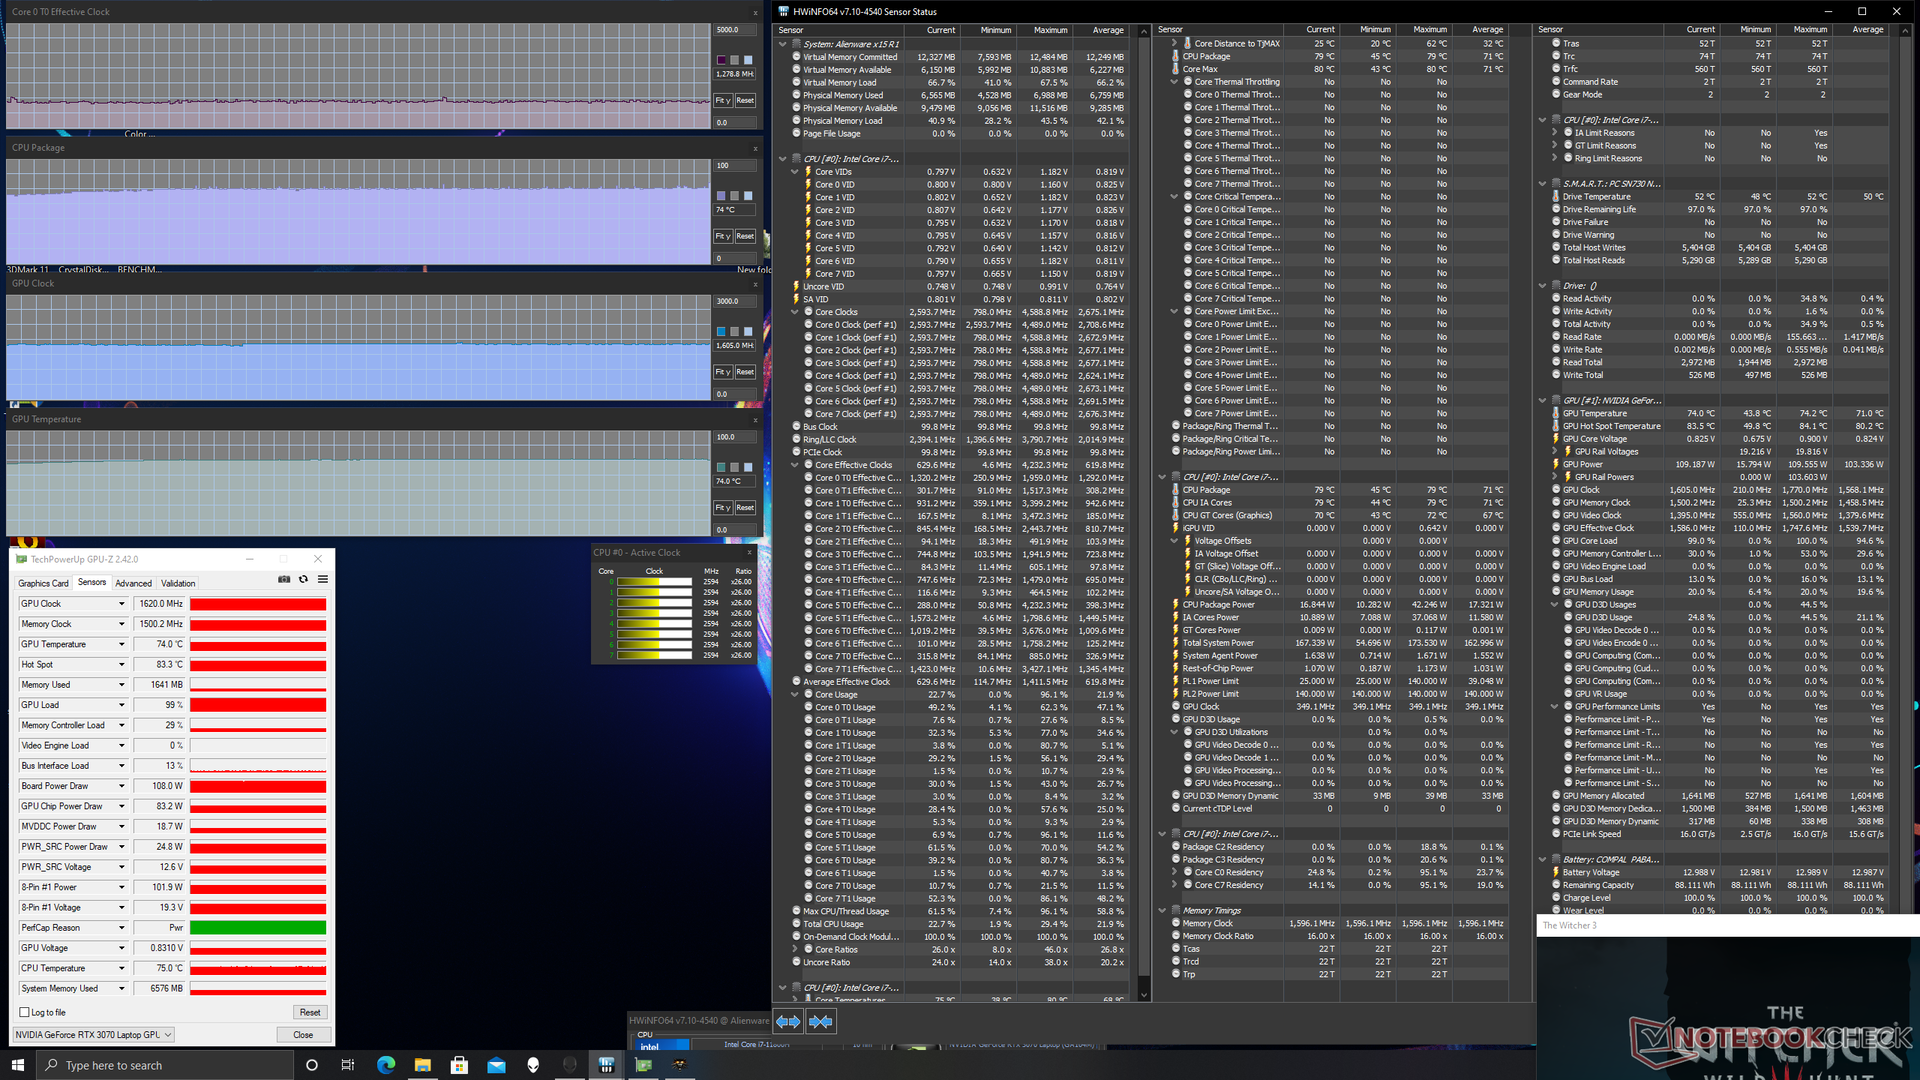
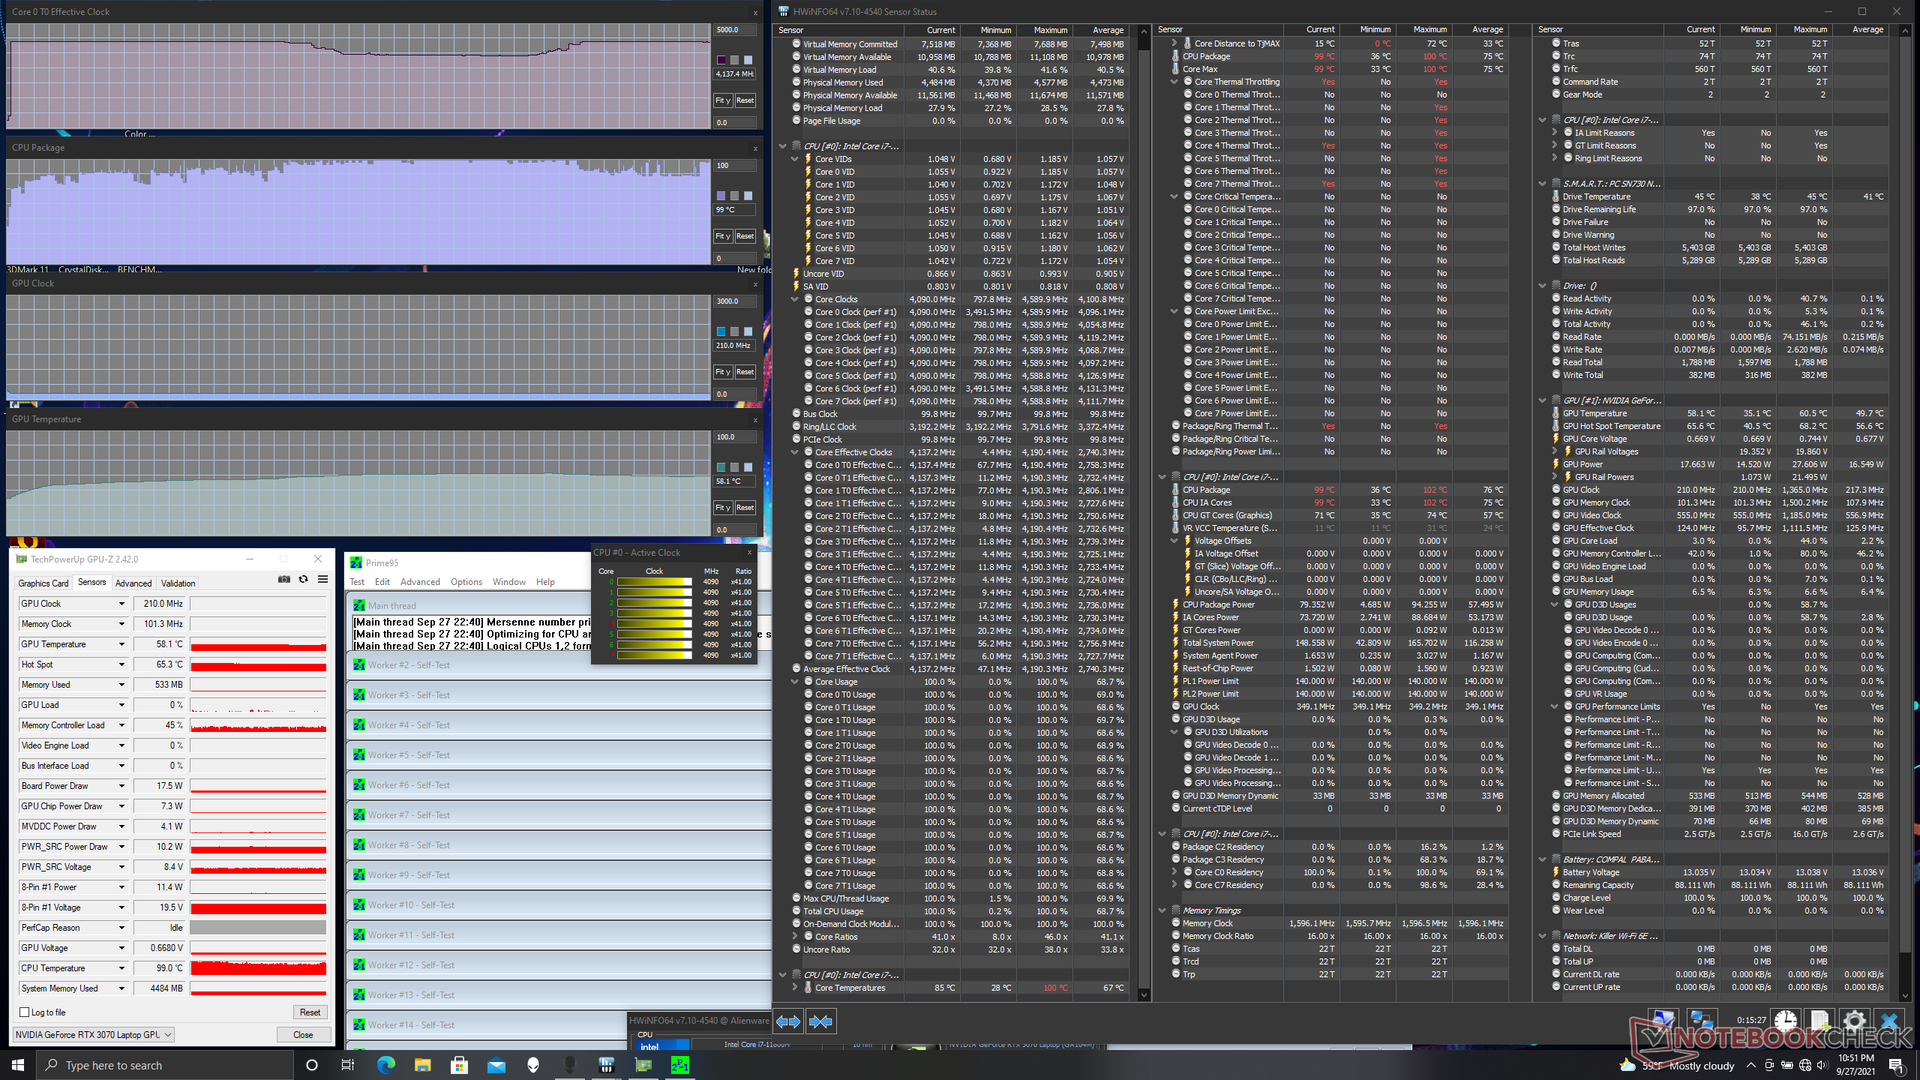
| RelógioCPU (GHz) | RelógioGPU (MHz) | Temperaturamédiada CPU (°C) | Temperaturamédiada GPU (°C) | |
| System Idle | -- | -- | 37 | 35 |
| Prime95 Stress | 3.5 - 4.2 | 90 - 100 | --58 | |
| Prime95 + FurMark Stress | 1.6 - 2.0 | 79 | ~1530 | 75 |
| Witcher 3 Stress | 2.6 | 1605 | 74 | 74 |
Alto-falantes - Qualidade de áudio ultrabook-like
 perto dos cantos dianteiros. A qualidade de áudio é decente, mas faltam tanto em volume quanto em oomph")

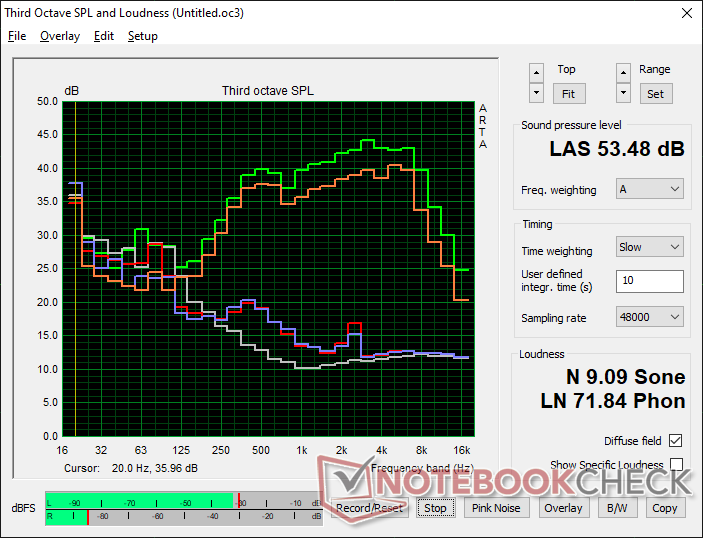
Alienware x15 RTX 3070 P111F análise de áudio
(+) | os alto-falantes podem tocar relativamente alto (###valor### dB)
Graves 100 - 315Hz
(-) | quase nenhum baixo - em média 24.2% menor que a mediana
(±) | a linearidade dos graves é média (11.8% delta para a frequência anterior)
Médios 400 - 2.000 Hz
(±) | médios mais altos - em média 10.3% maior que a mediana
(±) | a linearidade dos médios é média (8.8% delta para frequência anterior)
Altos 2 - 16 kHz
(±) | máximos mais altos - em média 6.1% maior que a mediana
(±) | a linearidade dos máximos é média (8.6% delta para frequência anterior)
Geral 100 - 16.000 Hz
(±) | a linearidade do som geral é média (29.3% diferença em relação à mediana)
Comparado com a mesma classe
» 95% de todos os dispositivos testados nesta classe foram melhores, 2% semelhantes, 3% piores
» O melhor teve um delta de 6%, a média foi 18%, o pior foi 132%
Comparado com todos os dispositivos testados
» 87% de todos os dispositivos testados foram melhores, 3% semelhantes, 10% piores
» O melhor teve um delta de 4%, a média foi 23%, o pior foi 134%
Apple MacBook 12 (Early 2016) 1.1 GHz análise de áudio
(+) | os alto-falantes podem tocar relativamente alto (###valor### dB)
Graves 100 - 315Hz
(±) | graves reduzidos - em média 11.3% menor que a mediana
(±) | a linearidade dos graves é média (14.2% delta para a frequência anterior)
Médios 400 - 2.000 Hz
(+) | médios equilibrados - apenas 2.4% longe da mediana
(+) | médios são lineares (5.5% delta para frequência anterior)
Altos 2 - 16 kHz
(+) | agudos equilibrados - apenas 2% longe da mediana
(+) | os máximos são lineares (4.5% delta da frequência anterior)
Geral 100 - 16.000 Hz
(+) | o som geral é linear (10.2% diferença em relação à mediana)
Comparado com a mesma classe
» 7% de todos os dispositivos testados nesta classe foram melhores, 2% semelhantes, 90% piores
» O melhor teve um delta de 5%, a média foi 18%, o pior foi 53%
Comparado com todos os dispositivos testados
» 5% de todos os dispositivos testados foram melhores, 1% semelhantes, 94% piores
» O melhor teve um delta de 4%, a média foi 23%, o pior foi 134%
Energy Management
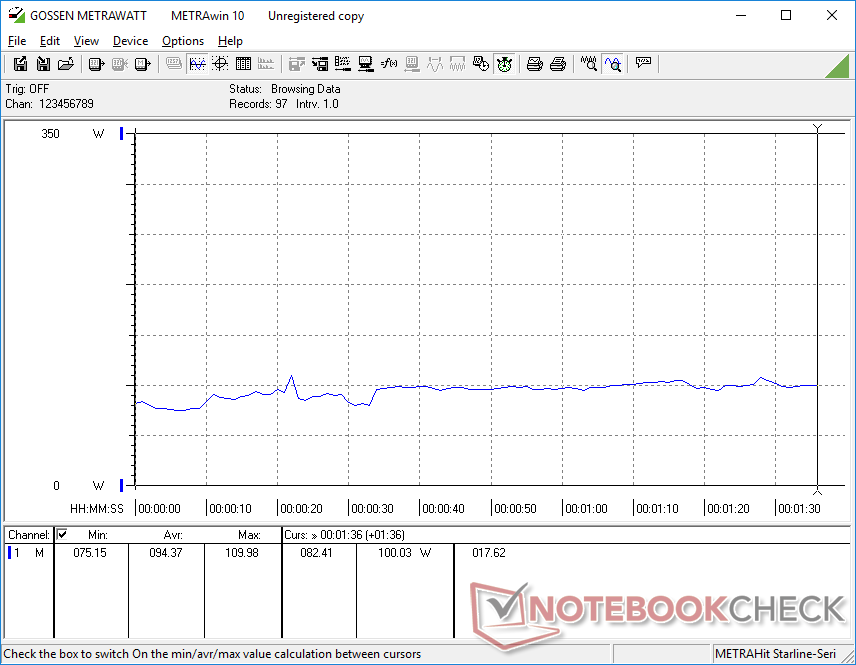
Consumo de energia
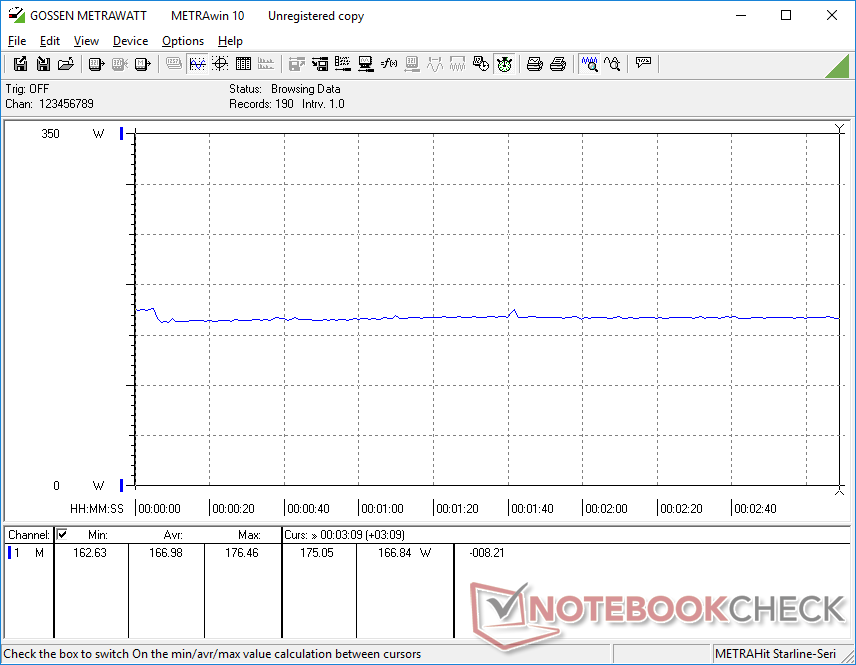
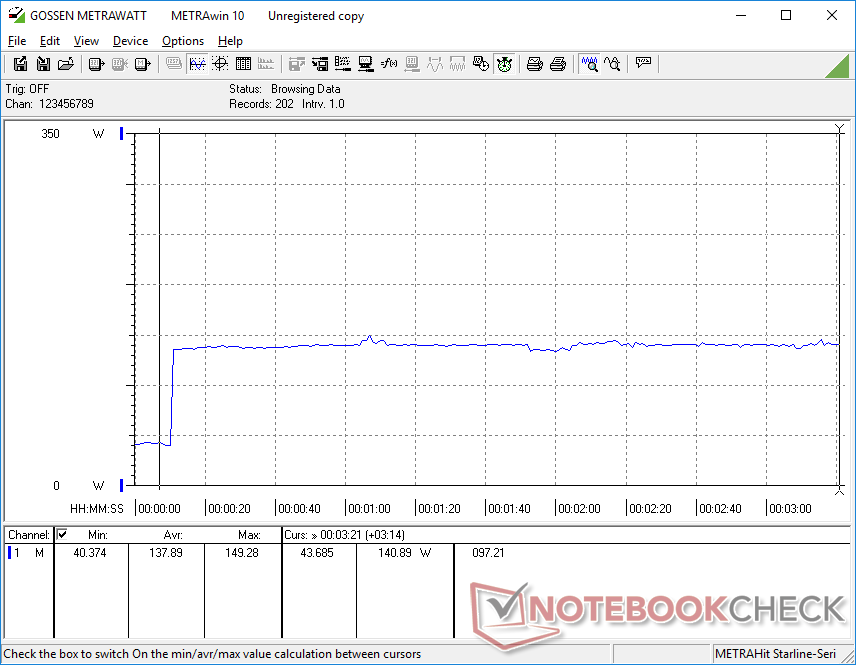
O consumo de energia elétrica melhorou significativamente em relação ao Alienware m15 R4 do ano passado. A manipulação no desktop sem aplicações em execução consumiria apenas 16 W, em comparação com mais de duas vezes o modelo mais antigo. Além disso, rodar Witcher 3 consumiria cerca de 167 W em comparação com 194 W no m15 R4 equipado com a mesma GPU RTX 3070 para representar uma economia de energia de 14%, embora com um déficit de desempenho de 10%. Talvez não coincidentemente, a diferença entre 194 W e 167 W é quase igual à diferença no TGP entre os dois laptops
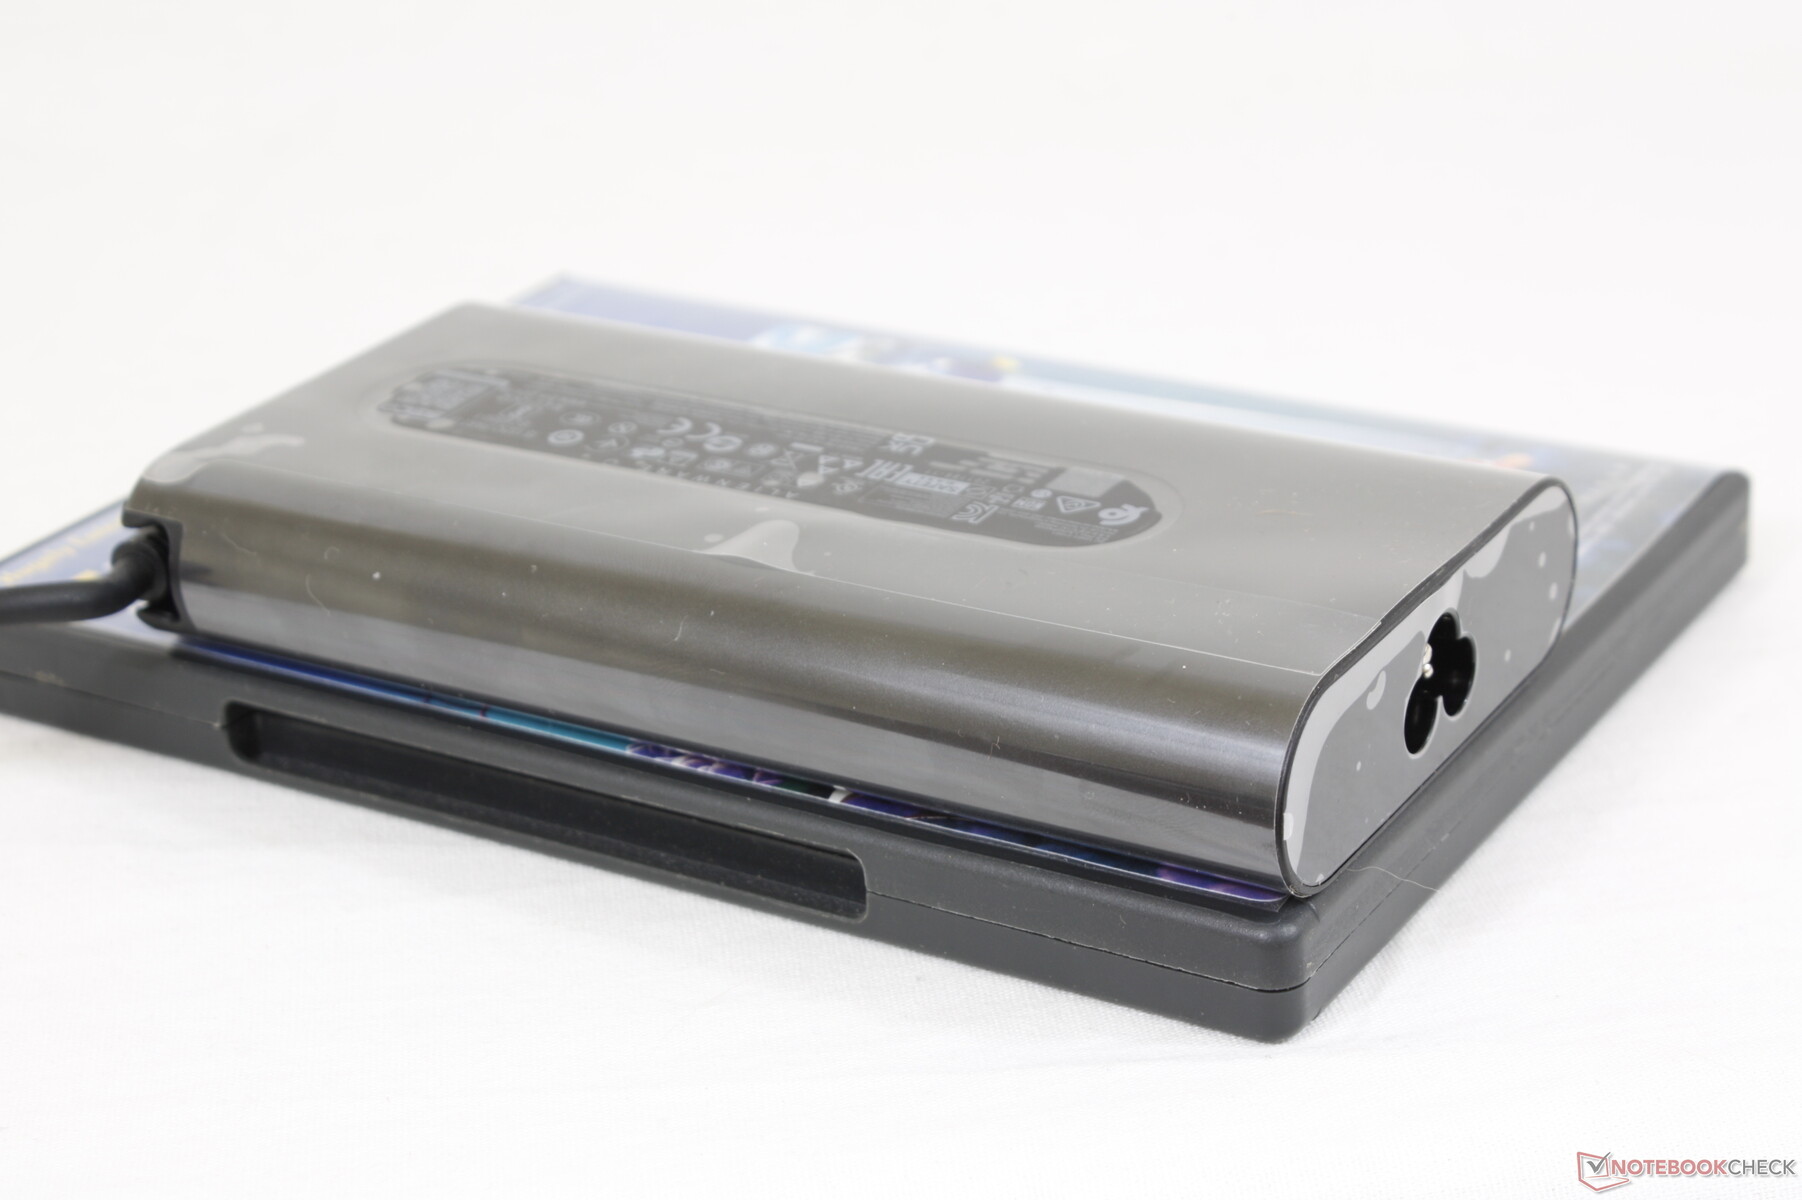
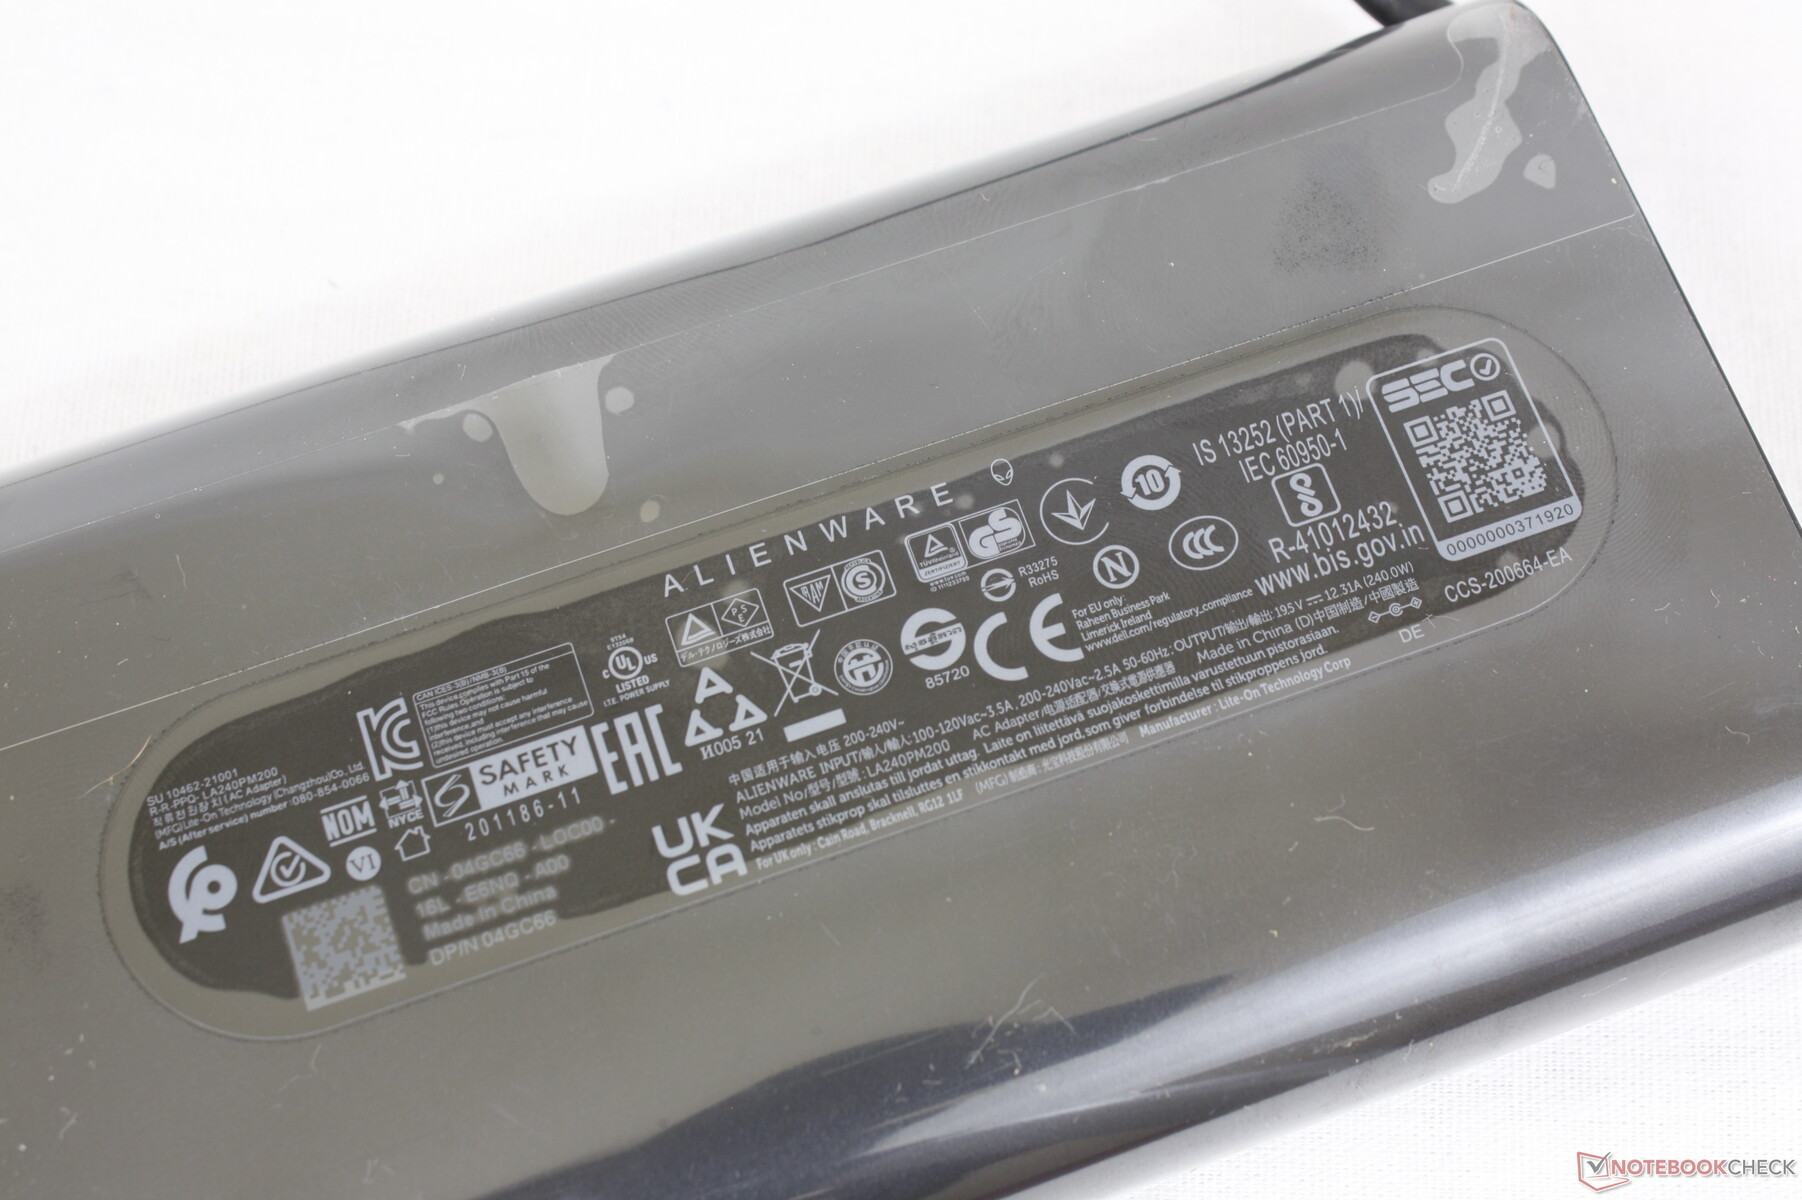
Somos capazes de registrar um consumo máximo temporário de 184 W do adaptador AC de médio porte (~15,2 x 7,6 x 2,4 cm) de 240 W. Este mesmo adaptador AC também é fornecido com certos SKUs inferiores do Alienware x17 R1.
| desligado | |
| Ocioso | |
| Carga |
|
Key:
min: | |
| Alienware x15 RTX 3070 P111F i7-11800H, GeForce RTX 3070 Laptop GPU, WDC PC SN730 SDBPNTY-512G, IPS, 2560x1440, 15.6" | Alienware m15 R4 i9-10980HK, GeForce RTX 3070 Laptop GPU, Micron 2300 1TB MTFDHBA1T0TDV, IPS, 1920x1080, 15.6" | MSI GS66 Stealth 10UG i7-10870H, GeForce RTX 3070 Laptop GPU, WDC PC SN730 SDBPNTY-1T00, IPS, 1920x1080, 15.6" | Razer Blade 15 Advanced (Mid 2021) i7-11800H, GeForce RTX 3080 Laptop GPU, SSSTC CA6-8D1024, IPS, 1920x1080, 15.6" | Asus Zephyrus S15 GX502L i7-10875H, GeForce RTX 2070 Super Mobile, WDC PC SN730 SDBPNTY-1T00, IPS, 1920x1080, 15.6" | Acer Predator Helios 300 PH315-53-786B i7-10750H, GeForce RTX 3070 Laptop GPU, Samsung PM981a MZVLB1T0HBLR, IPS, 1920x1080, 15.6" | |
|---|---|---|---|---|---|---|
| Power Consumption | -54% | 8% | -10% | 8% | 25% | |
| Idle Minimum * (Watt) | 15.7 | 35 -123% | 12.9 18% | 19.5 -24% | 7 55% | 4 75% |
| Idle Average * (Watt) | 20.3 | 39 -92% | 15.4 24% | 23.3 -15% | 13 36% | 11 46% |
| Idle Maximum * (Watt) | 43 | 48 -12% | 27.1 37% | 40.1 7% | 25 42% | 24 44% |
| Load Average * (Watt) | 94.4 | 135 -43% | 98.2 -4% | 98.9 -5% | 148 -57% | 91 4% |
| Witcher 3 ultra * (Watt) | 167 | 194 -16% | 164.9 1% | 174 -4% | 175 -5% | 164 2% |
| Load Maximum * (Watt) | 183.4 | 252 -37% | 232.9 -27% | 214 -17% | 232 -26% | 220 -20% |
* ... menor é melhor
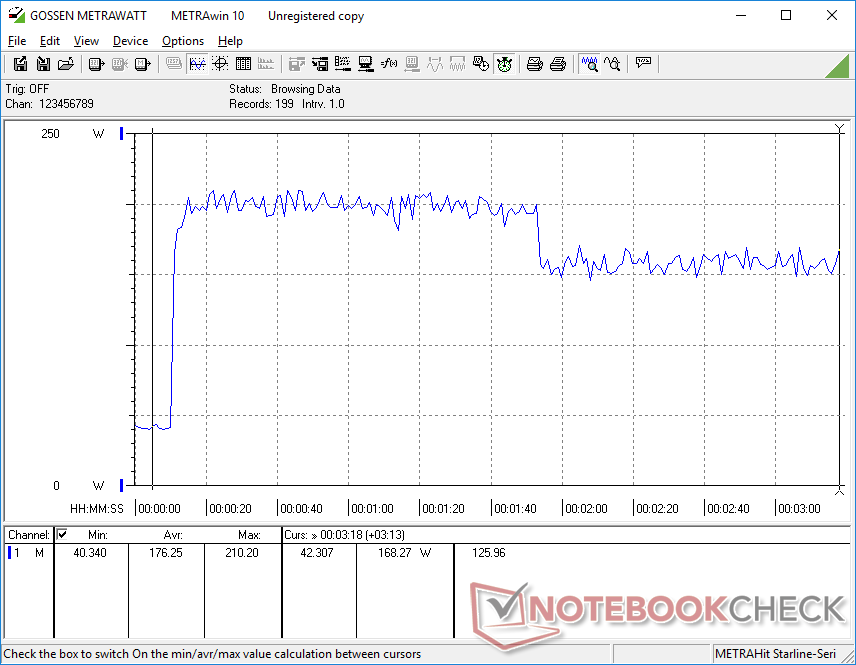
Power Consumption Witcher 3 / Stresstest
Vida útil da bateria - Muito mais longa do que antes
Assim como o salto do Alienware m17 para o x17, o salto do Alienware m15 para o x15 também resultou em ganhos significativos na vida útil geral da bateria devido à maior eficiência energética mencionada acima. Registramos um tempo total de funcionamento da WLAN de pouco mais de 6 horas em comparação com menos de 2 horas no Alienware m15 R4, embora a capacidade da bateria permaneça quase a mesma aos 87 Wh cada.
A carga de vazio a cheio é rápida em cerca de 75 minutos com o adaptador de barril AC incluído. A carga com USB-C é suportada, embora a uma taxa de carga mais lenta.
| Alienware x15 RTX 3070 P111F i7-11800H, GeForce RTX 3070 Laptop GPU, 87 Wh | Alienware m15 R4 RTX 3080 i9-10980HK, GeForce RTX 3080 Laptop GPU, 86 Wh | MSI GS66 Stealth 10UG i7-10870H, GeForce RTX 3070 Laptop GPU, 99.9 Wh | Razer Blade 15 Advanced (Mid 2021) i7-11800H, GeForce RTX 3080 Laptop GPU, 80 Wh | Asus Zephyrus S15 GX502L i7-10875H, GeForce RTX 2070 Super Mobile, 76 Wh | Acer Predator Helios 300 PH315-53-786B i7-10750H, GeForce RTX 3070 Laptop GPU, 58.75 Wh | |
|---|---|---|---|---|---|---|
| Duração da bateria | -41% | 57% | -3% | 2% | 27% | |
| Reader / Idle (h) | 9.7 | 10.8 11% | 8.7 -10% | 10.6 9% | ||
| WiFi v1.3 (h) | 6.1 | 1.8 -70% | 7.1 16% | 5.9 -3% | 3 -51% | 6.4 5% |
| Load (h) | 0.9 | 0.8 -11% | 2.2 144% | 1.5 67% | 1.5 67% | |
| Witcher 3 ultra (h) | 0.8 |
Pro
Contra
Veredicto - Grande Salto em Frente, Poucos Passos para Trás
A Dell procurou criar não apenas o mais fino laptop de 15,6 polegadas Alienware, mas também o mais fino laptop para jogos de 15,6 polegadas com GeForce RTX graphics atualmente disponível. O Alienware x15 R1 merece reconhecimento neste aspecto, mas vem com um punhado de inconvenientes que os usuários devem estar cientes.
Primeiramente, o GPU TGP foi ajustado de 140 W no Alienware m15 R4 para apenas 90 - 110 W no mais novo x15 R1 para um desempenho gráfico ligeiramente mais lento ano após ano. Em segundo lugar, o sistema é mais pesado e maior em pegada do que muitos laptops de 15,6 polegadas concorrentes como o Lâmina Razer 15 ou MSI GS66 apesar da atenção extra ao resfriamento. Em terceiro lugar, os usuários não conseguem atualizar a RAM, o que pode irritar os entusiastas. E por último, o posicionamento incomum da porta pode ser desfavorável para muitos usuários
O Alienware x15 R1 é mais fino, mais enxuto, mais frio e mais duradouro do que o Alienware m15 R5. Não é necessariamente mais rápido, no entanto, em termos de potencial gráfico bruto.
Gen-to-gen, no entanto, o x15 R1 é amplamente melhorado em relação à série m15 de muitas outras maneiras. A duração da bateria, o consumo de energia, o comportamento do ventilador e as temperaturas de superfície em particular são todos muito melhores desta vez, embora o novo design seja mais fino e com muitas das mesmas opções de visualização. Tanto o desempenho do processador quanto o feedback das teclas também são melhores do que o esperado. Se você valoriza a maximização do desempenho da CPU sem se contentar com modelos mais grossos, como o Área-51m ou Série MSI GTentão, o Alienware x15 seria sua melhor solução. Se você pretende viajar com freqüência, então o mais leve e mais compacto Lâmina 15 pode oferecer um desempenho de jogo muito semelhante.
Preço e disponibilidade
Newegg está atualmente com apenas uma SKU do Alienware x15 R1 por $3149 USD enquanto Best Buy tem vários em estoque entre $2399 e $2999 USD. Para a maioria das opções, os usuários podem querer comprar diretamente da Dell.
Alienware x15 RTX 3070 P111F
- 09/30/2021 v7 (old)
Allen Ngo
Price comparison

