Revisão do laptop HP ZBook Power 15 G8: Muito de alta qualidade em uma estação de trabalho acessível
Como uma estação de trabalho acessível, o HP ZBook Power 15 G8 traz atualizações para CPU e GPU na geração atual, com a configuração máxima oferecendo uma Intel Tiger Lake Núcleo i9-11950He Nvidia RTX A2000. Embora além de uma tela de 4K, as CPUs vPRO também estão disponíveis, infelizmente os processadores Xeon e com isso também a RAM ECC não estarão disponíveis este ano. Mas o dispositivo ainda oferece muitas características de uma estação de trabalho de alto nível.
Por cerca de 1600 Euros (~$1630), nossa configuração está equipada com Intel's Núcleo i7-11800H, Nvidia's T600 como GPU profissional, e uma tela de FHD. Como concorrentes diretos no segmento de estações de trabalho de nível básico, temos a Lenovo ThinkPad P15v G2e Dell's Precision 3551. Nosso teste mostrará se o ZBook Power 15 G8 com seus componentes bastante potentes também traz uma boa relação preço-desempenho.
Possíveis concorrentes em comparação
Avaliação | Data | Modelo | Peso | Altura | Size | Resolução | Preço |
|---|---|---|---|---|---|---|---|
| 87.7 % v7 (old) | 07/2022 | HP ZBook Power 15 G8 313S5EA i7-11800H, T600 Laptop GPU | 2 kg | 22.8 mm | 15.60" | 1920x1080 | |
| 90.3 % v7 (old) | 10/2021 | HP ZBook Fury 15 G8 i9-11950H, RTX A5000 Laptop GPU | 2.5 kg | 25.9 mm | 15.60" | 3840x2160 | |
| 87.8 % v7 (old) | 08/2021 | HP ZBook Studio 15 G8 i9-11950H, GeForce RTX 3070 Laptop GPU | 1.9 kg | 18 mm | 15.60" | 3840x2160 | |
| 83.8 % v7 (old) | 04/2021 | HP ZBook Firefly 15 G8 2C9R7EA i7-1165G7, T500 Laptop GPU | 1.8 kg | 19.2 mm | 15.60" | 1920x1080 | |
| 86.2 % v7 (old) | 06/2022 | Lenovo ThinkPad P15v G2 21A9000XGE i7-11800H, T1200 Laptop GPU | 2.3 kg | 22.7 mm | 15.60" | 1920x1080 | |
| 81.2 % v7 (old) | 12/2020 | Dell Precision 3000 3551 i9-10885H, Quadro P620 | 2.2 kg | 24.92 mm | 15.60" | 1920x1080 |
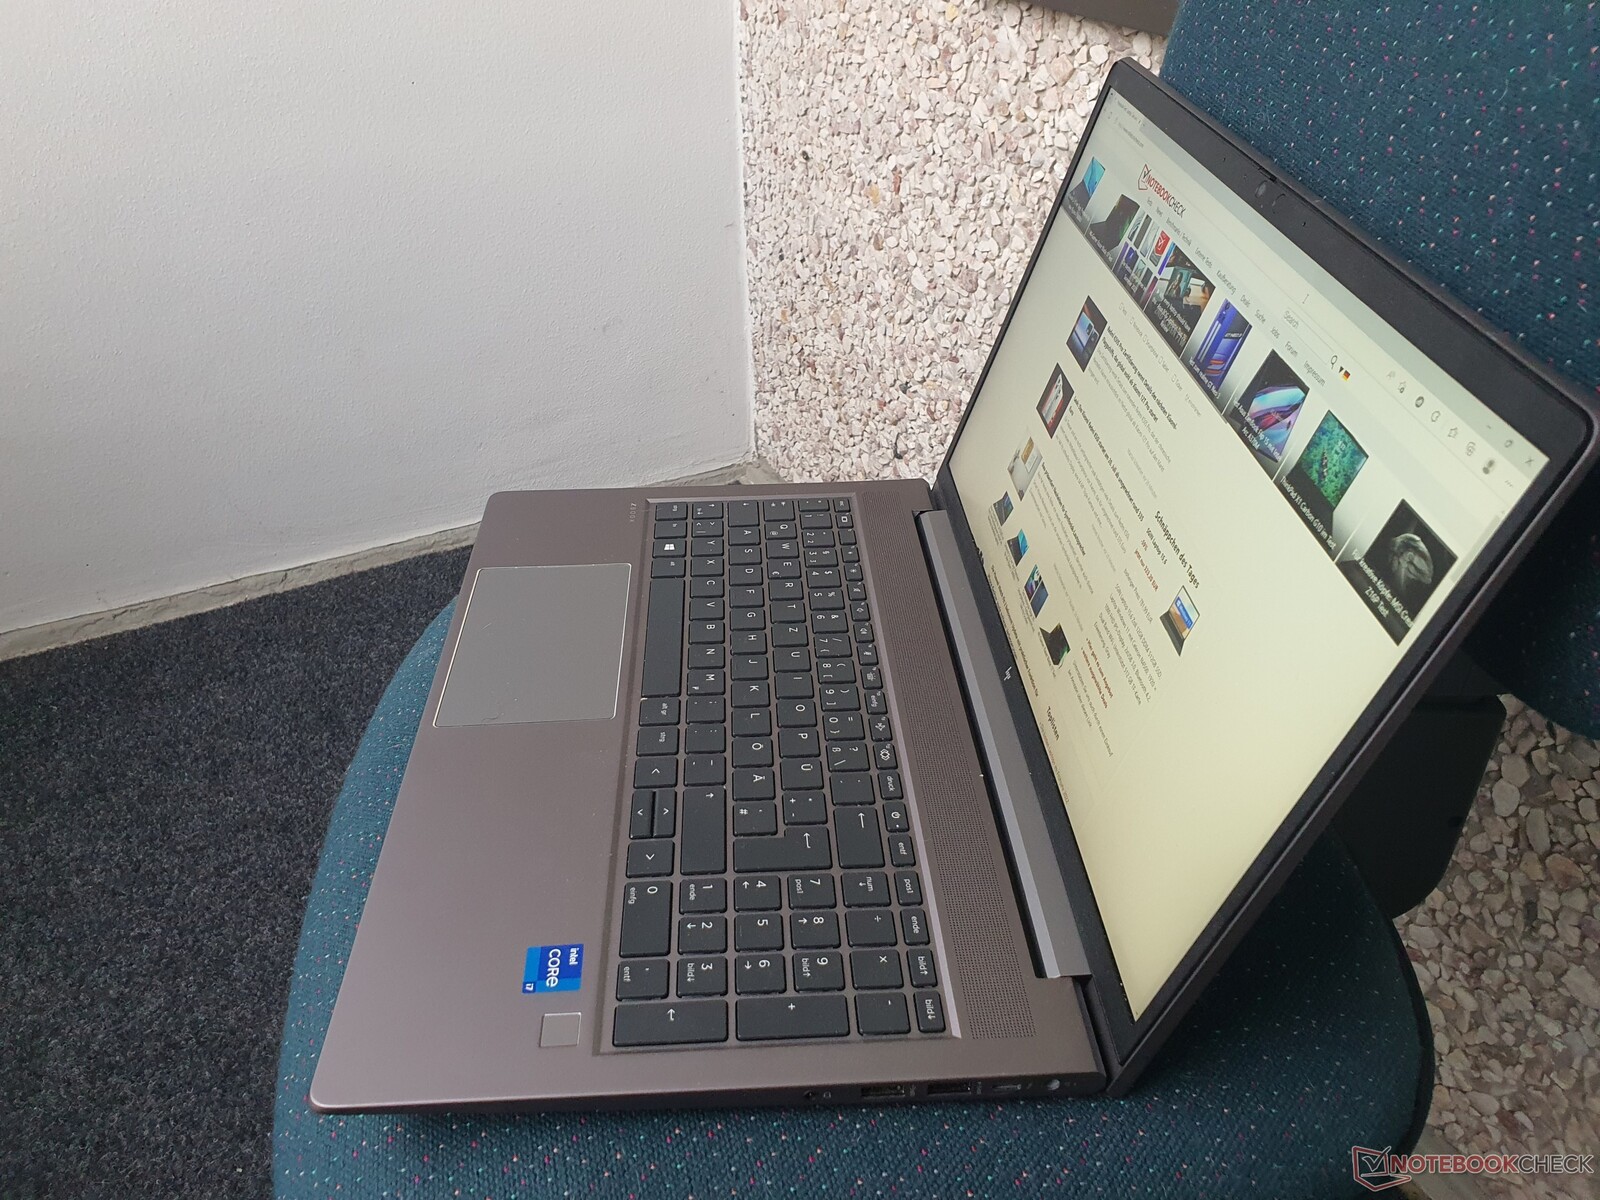
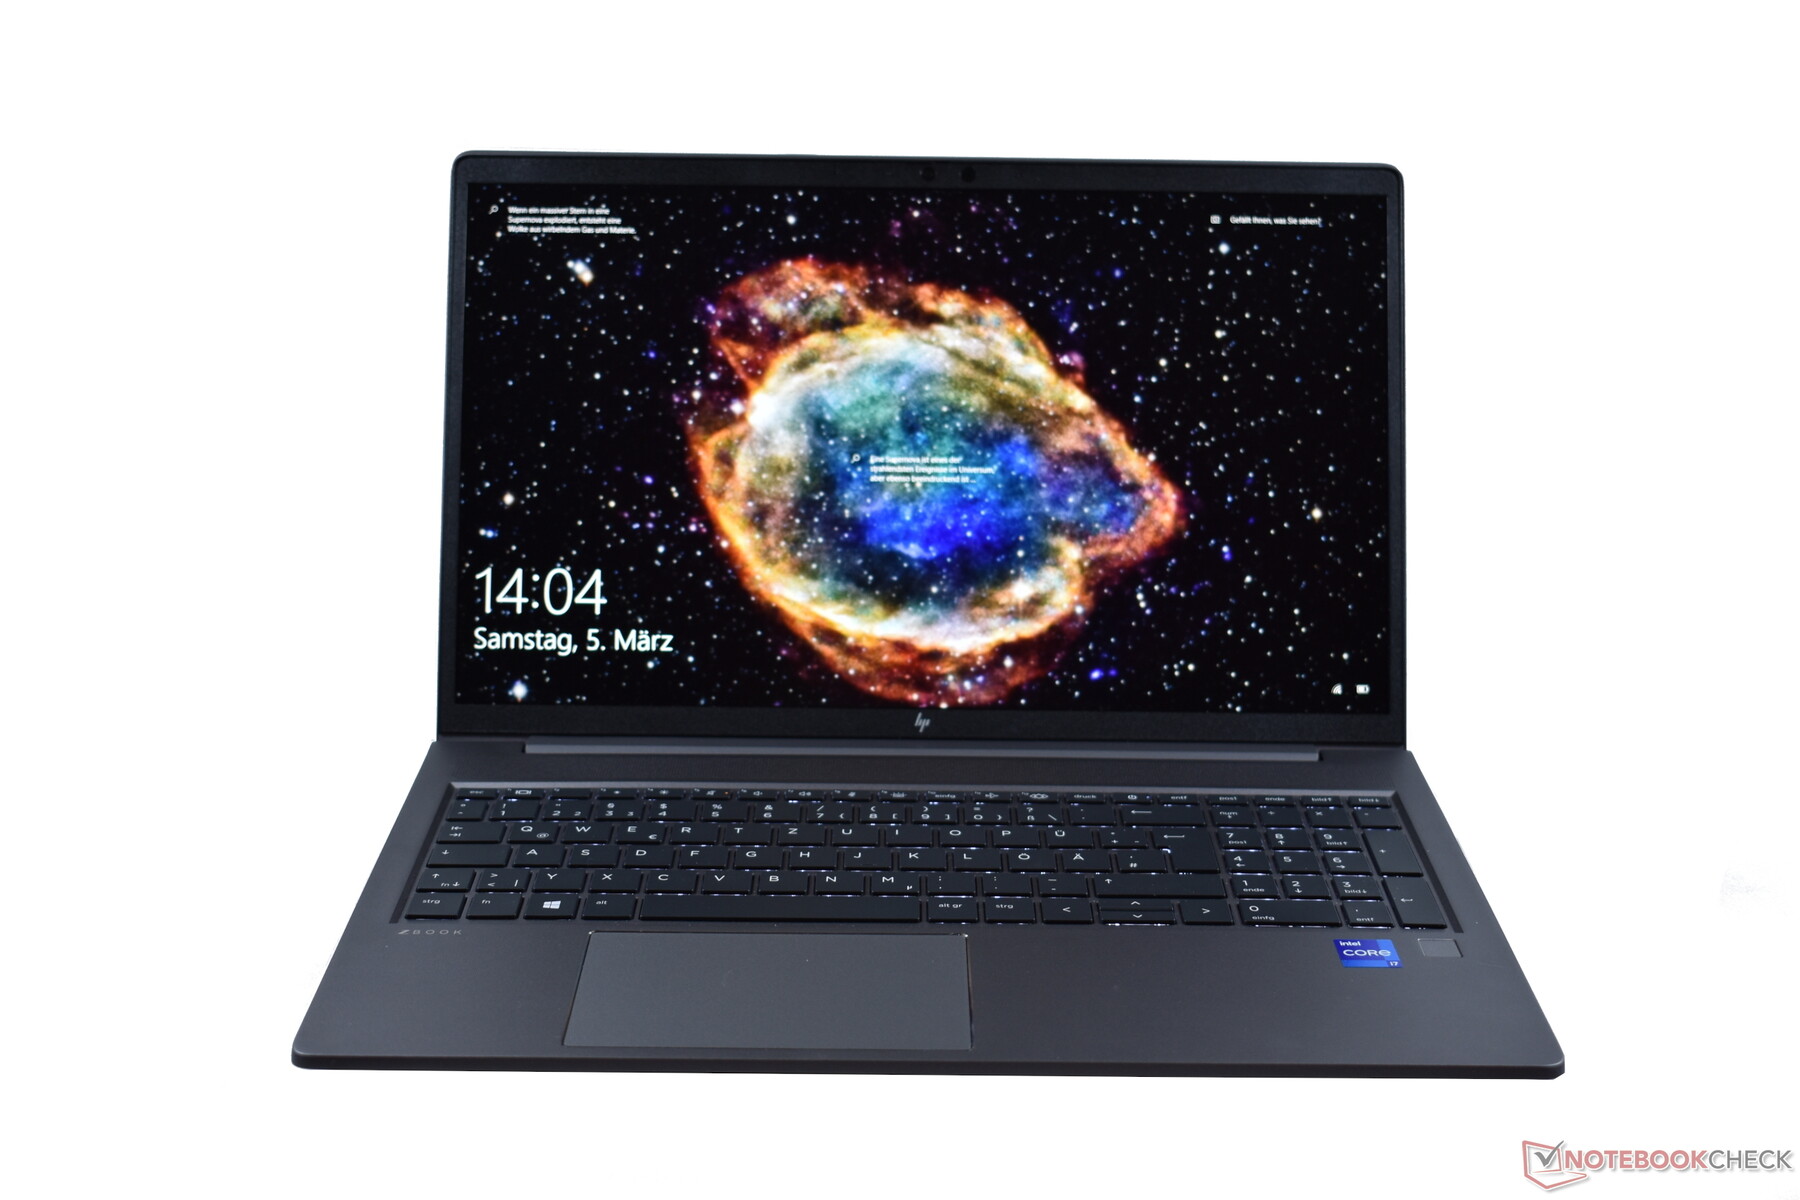
Estojo: ZBook Power feito de alumínio robusto
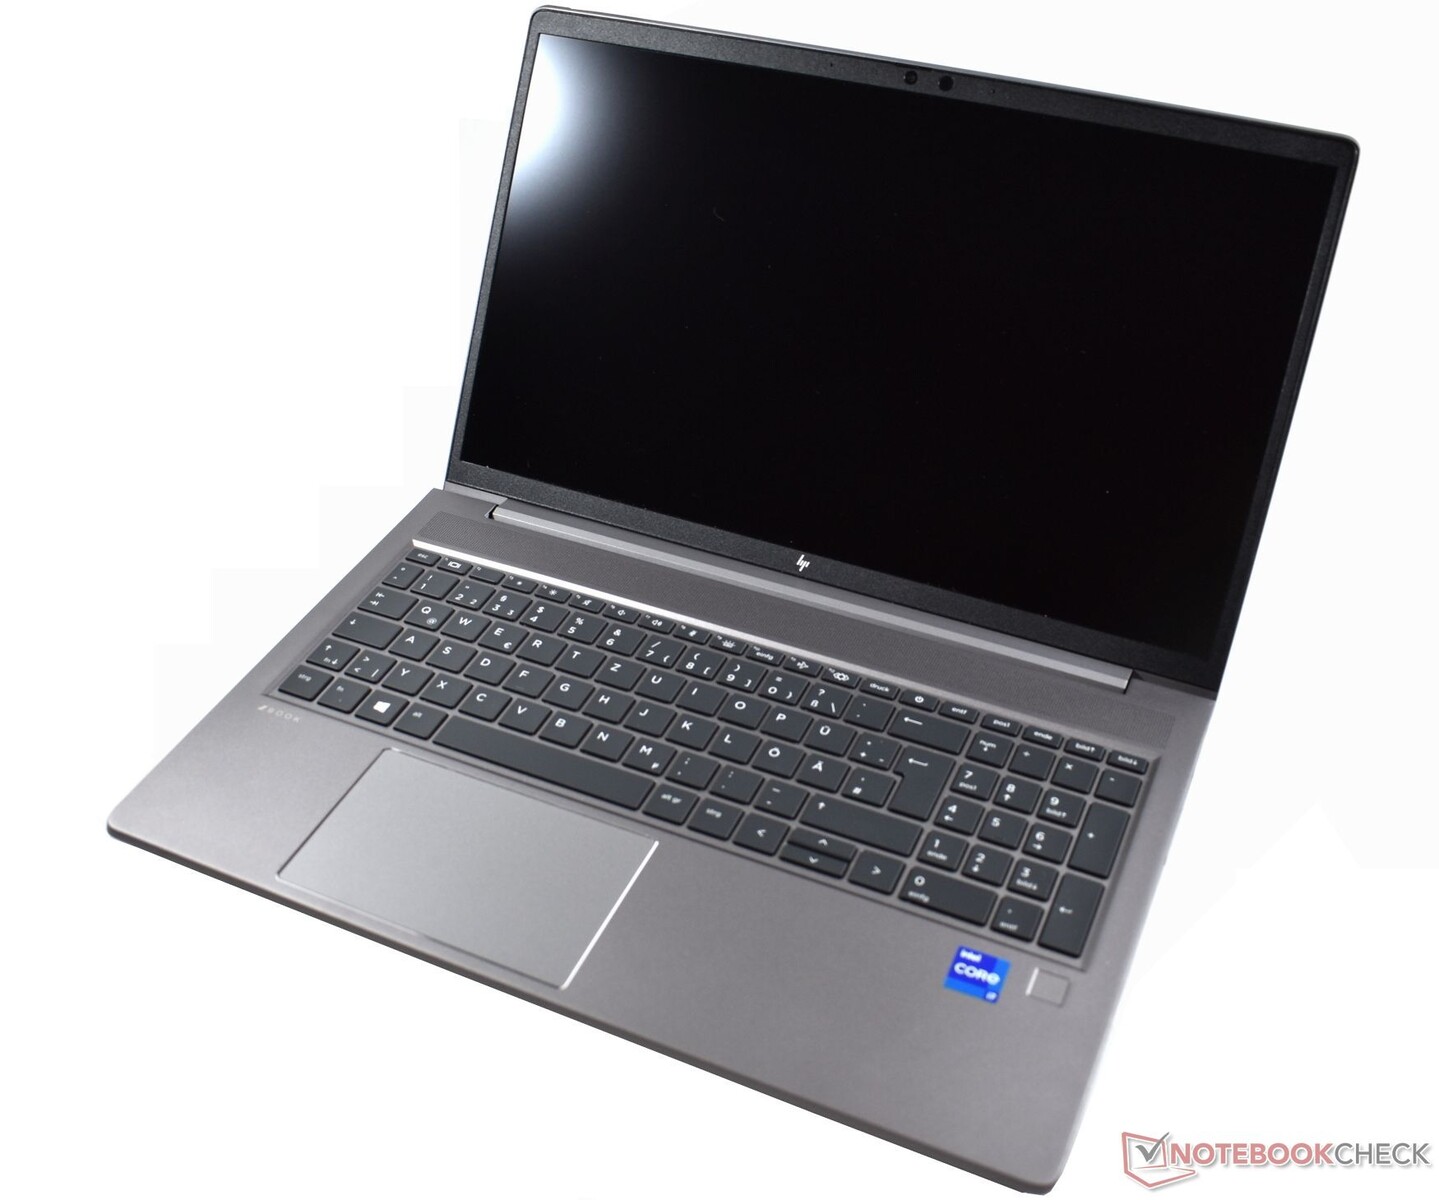
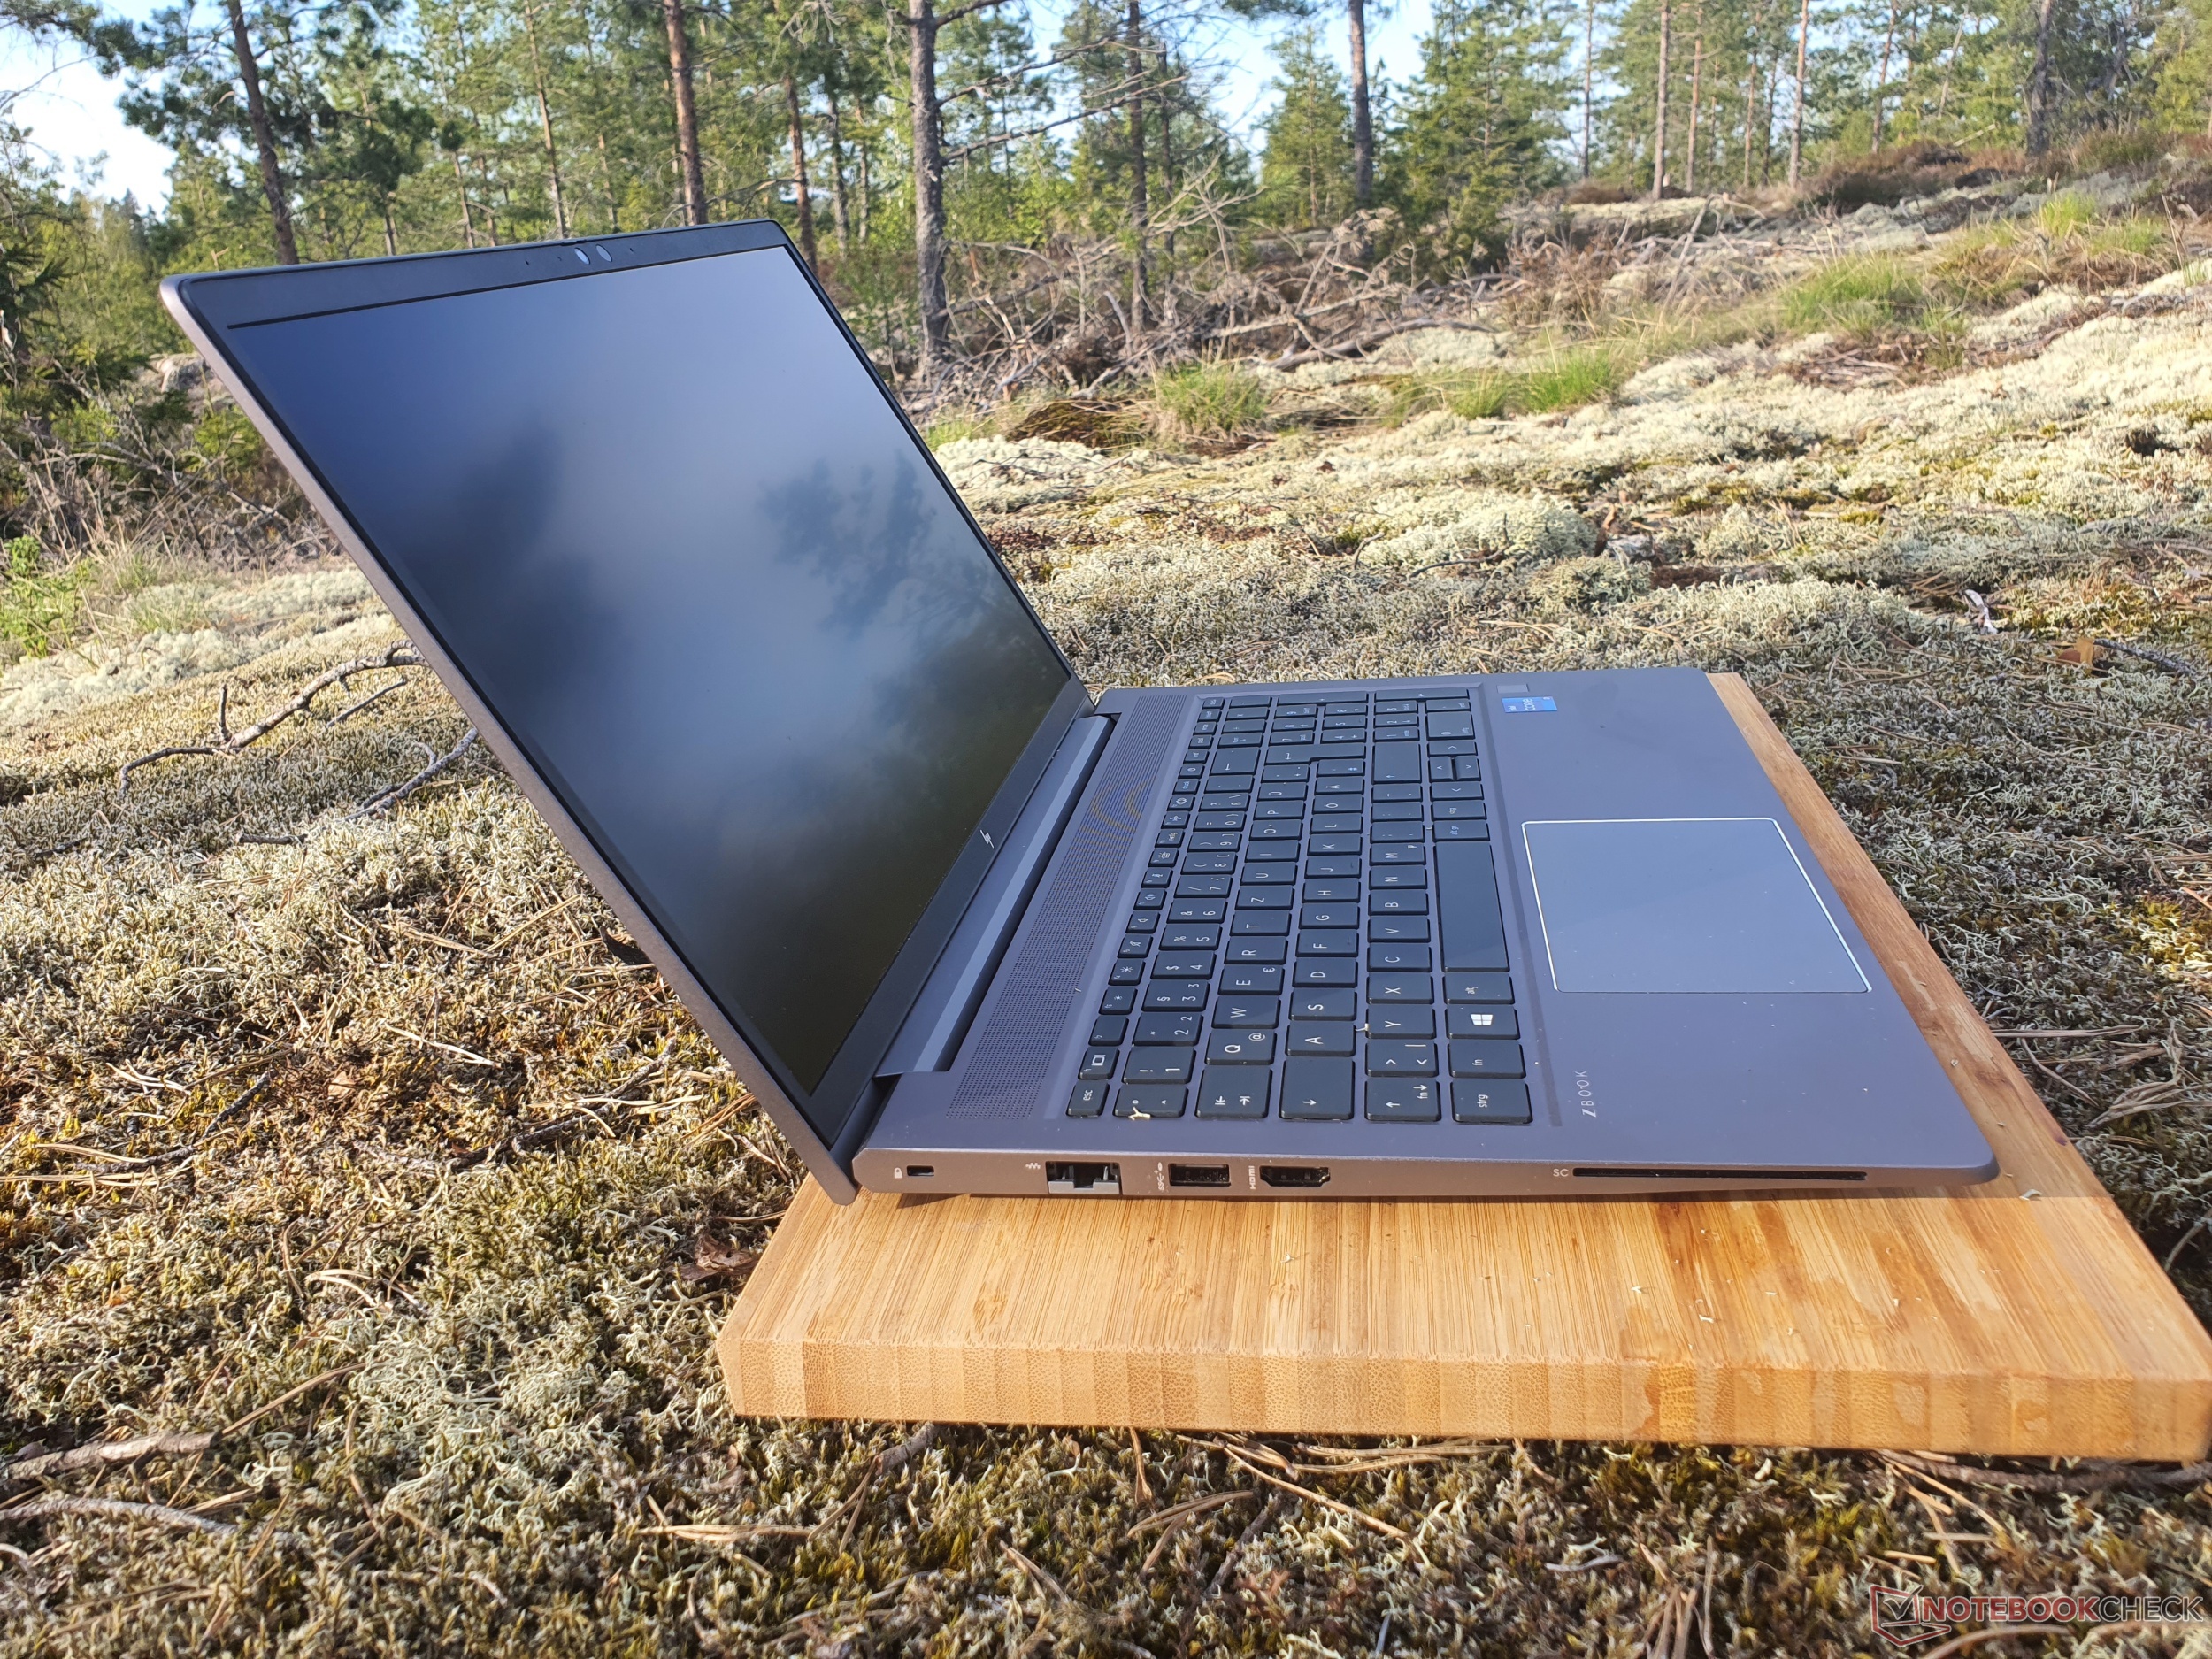
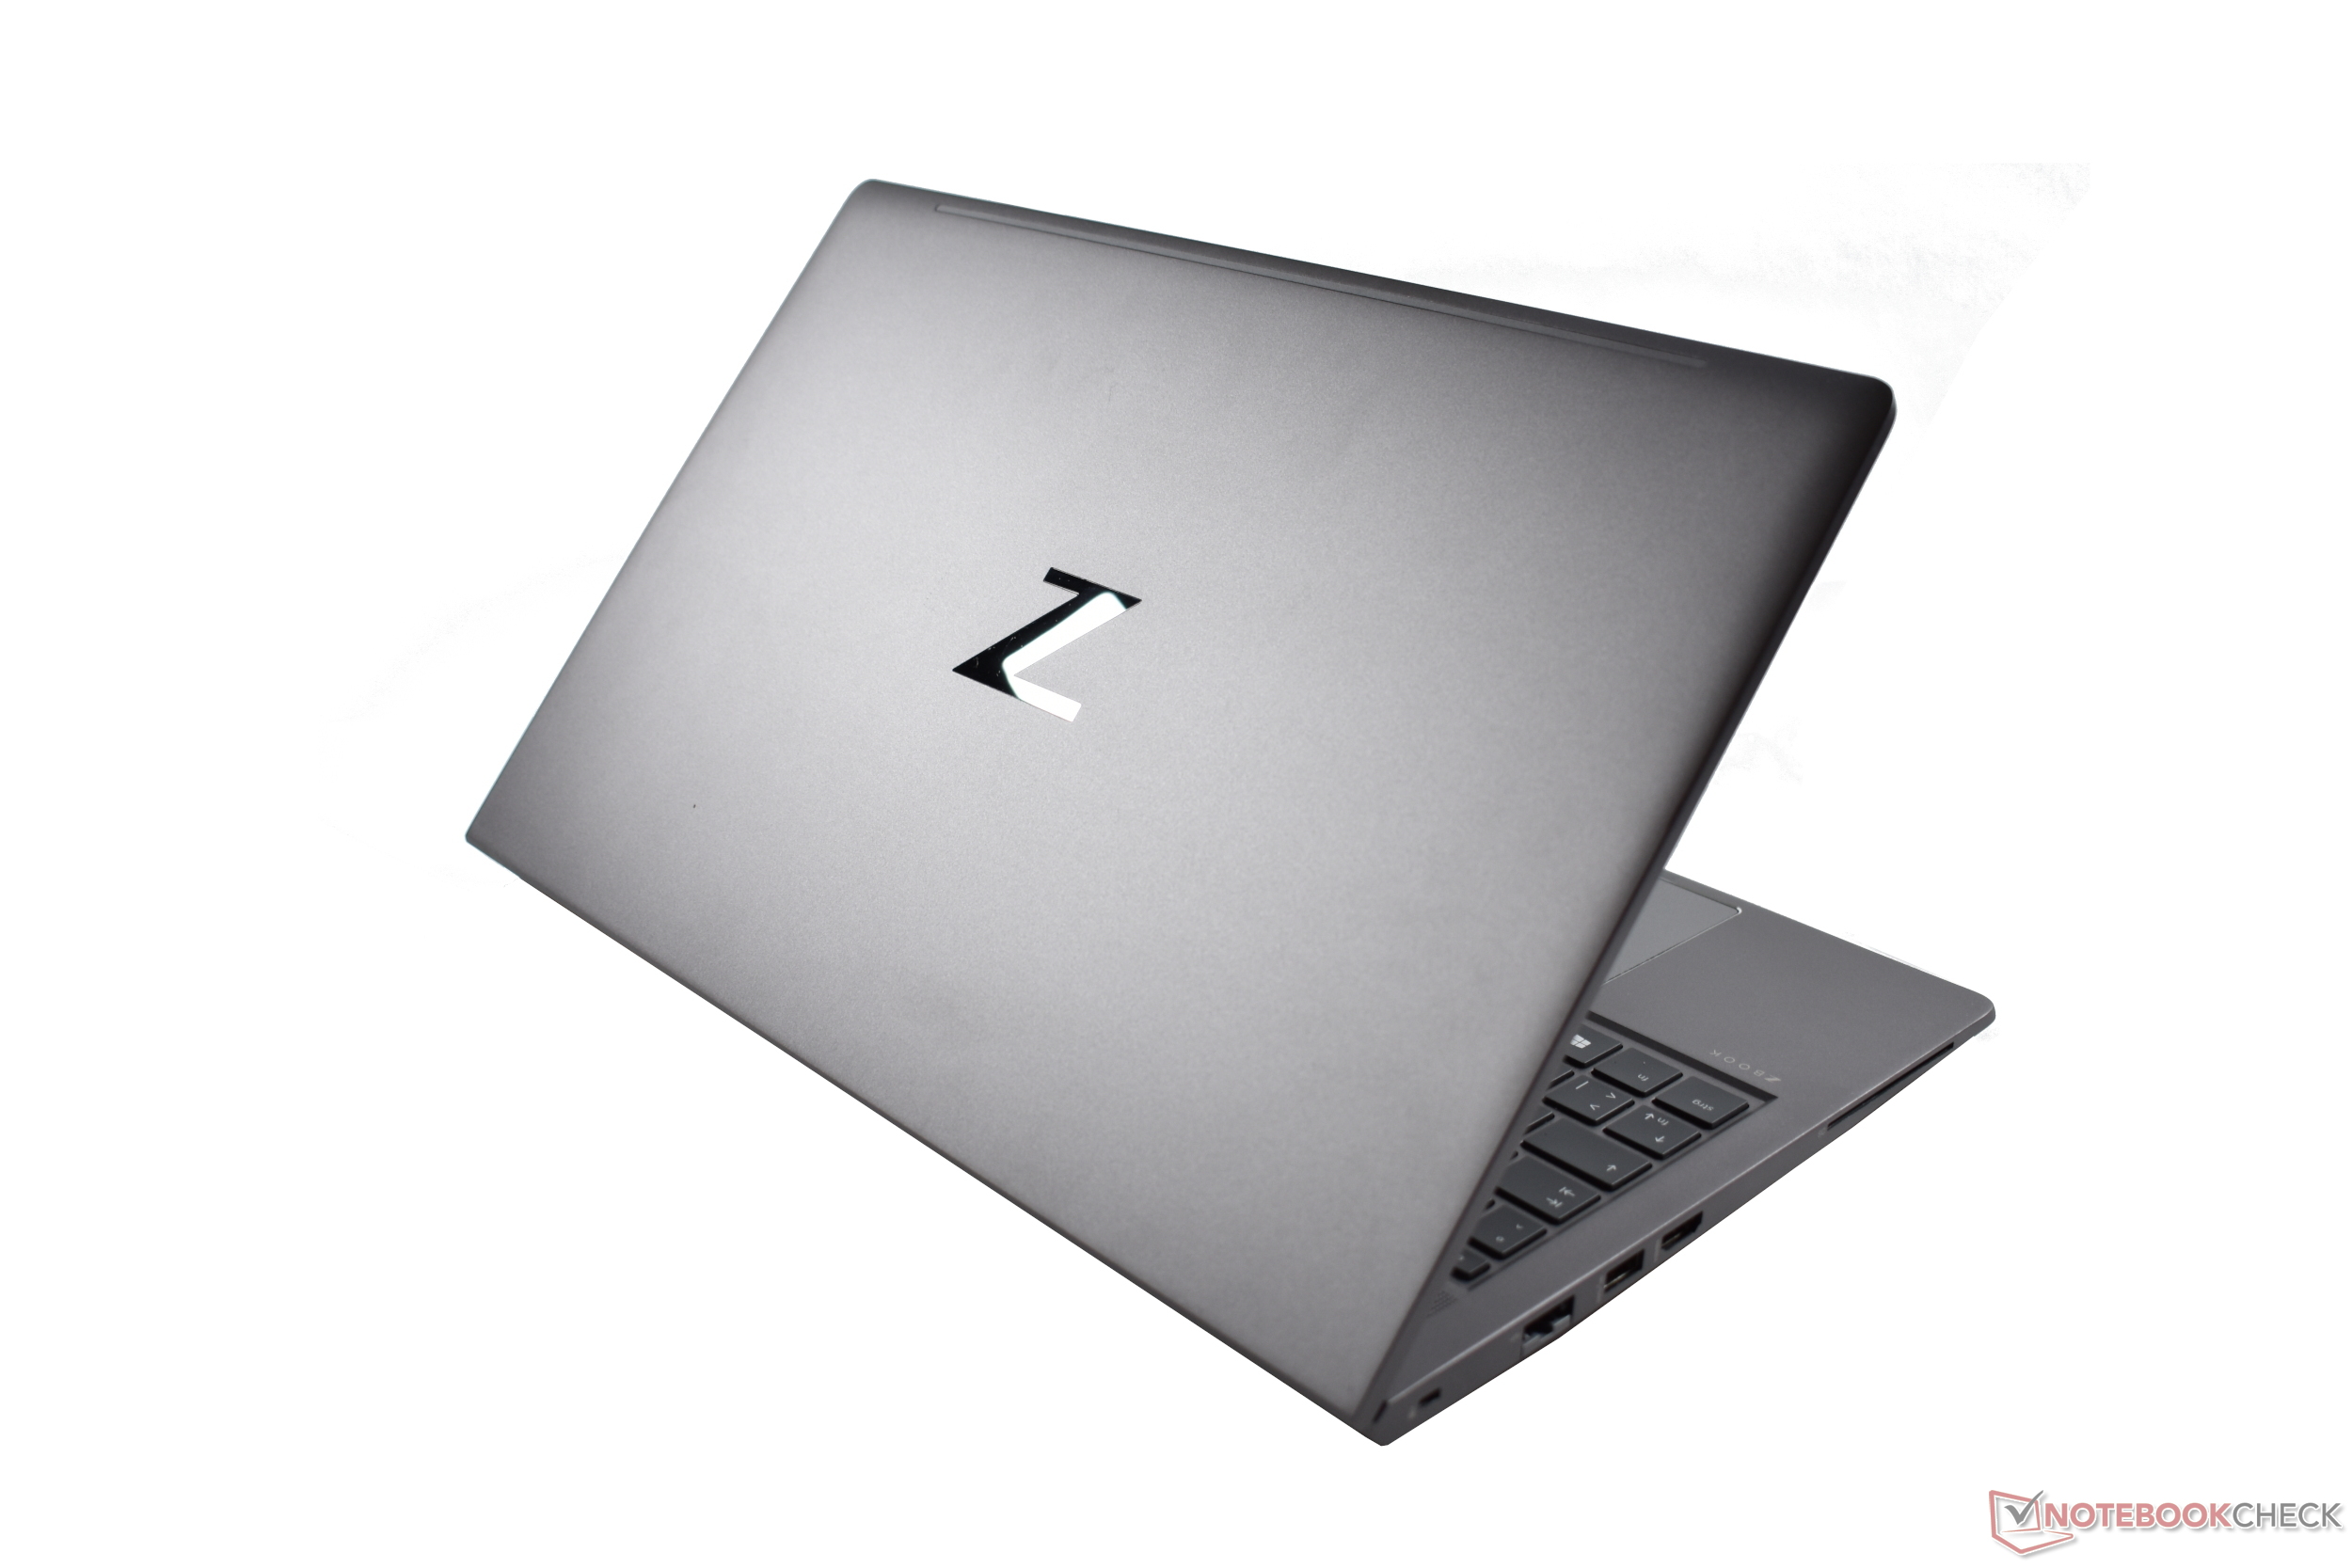
A caixa de alumínio cinza escuro dá ao ZBook Power 15 um aspecto elegante e uma robustez notável, o que também é confirmado por sua certificação MIL STD-810H. A háptica, incluindo as superfícies foscas, também não deixa nada a desejar.
O dispositivo mostra mão-de-obra limpa, e as impressões digitais não são um problema. A tampa pode ser aberta com uma única mão, e a grande dobradiça que atravessa todo o caminho é extremamente robusta.
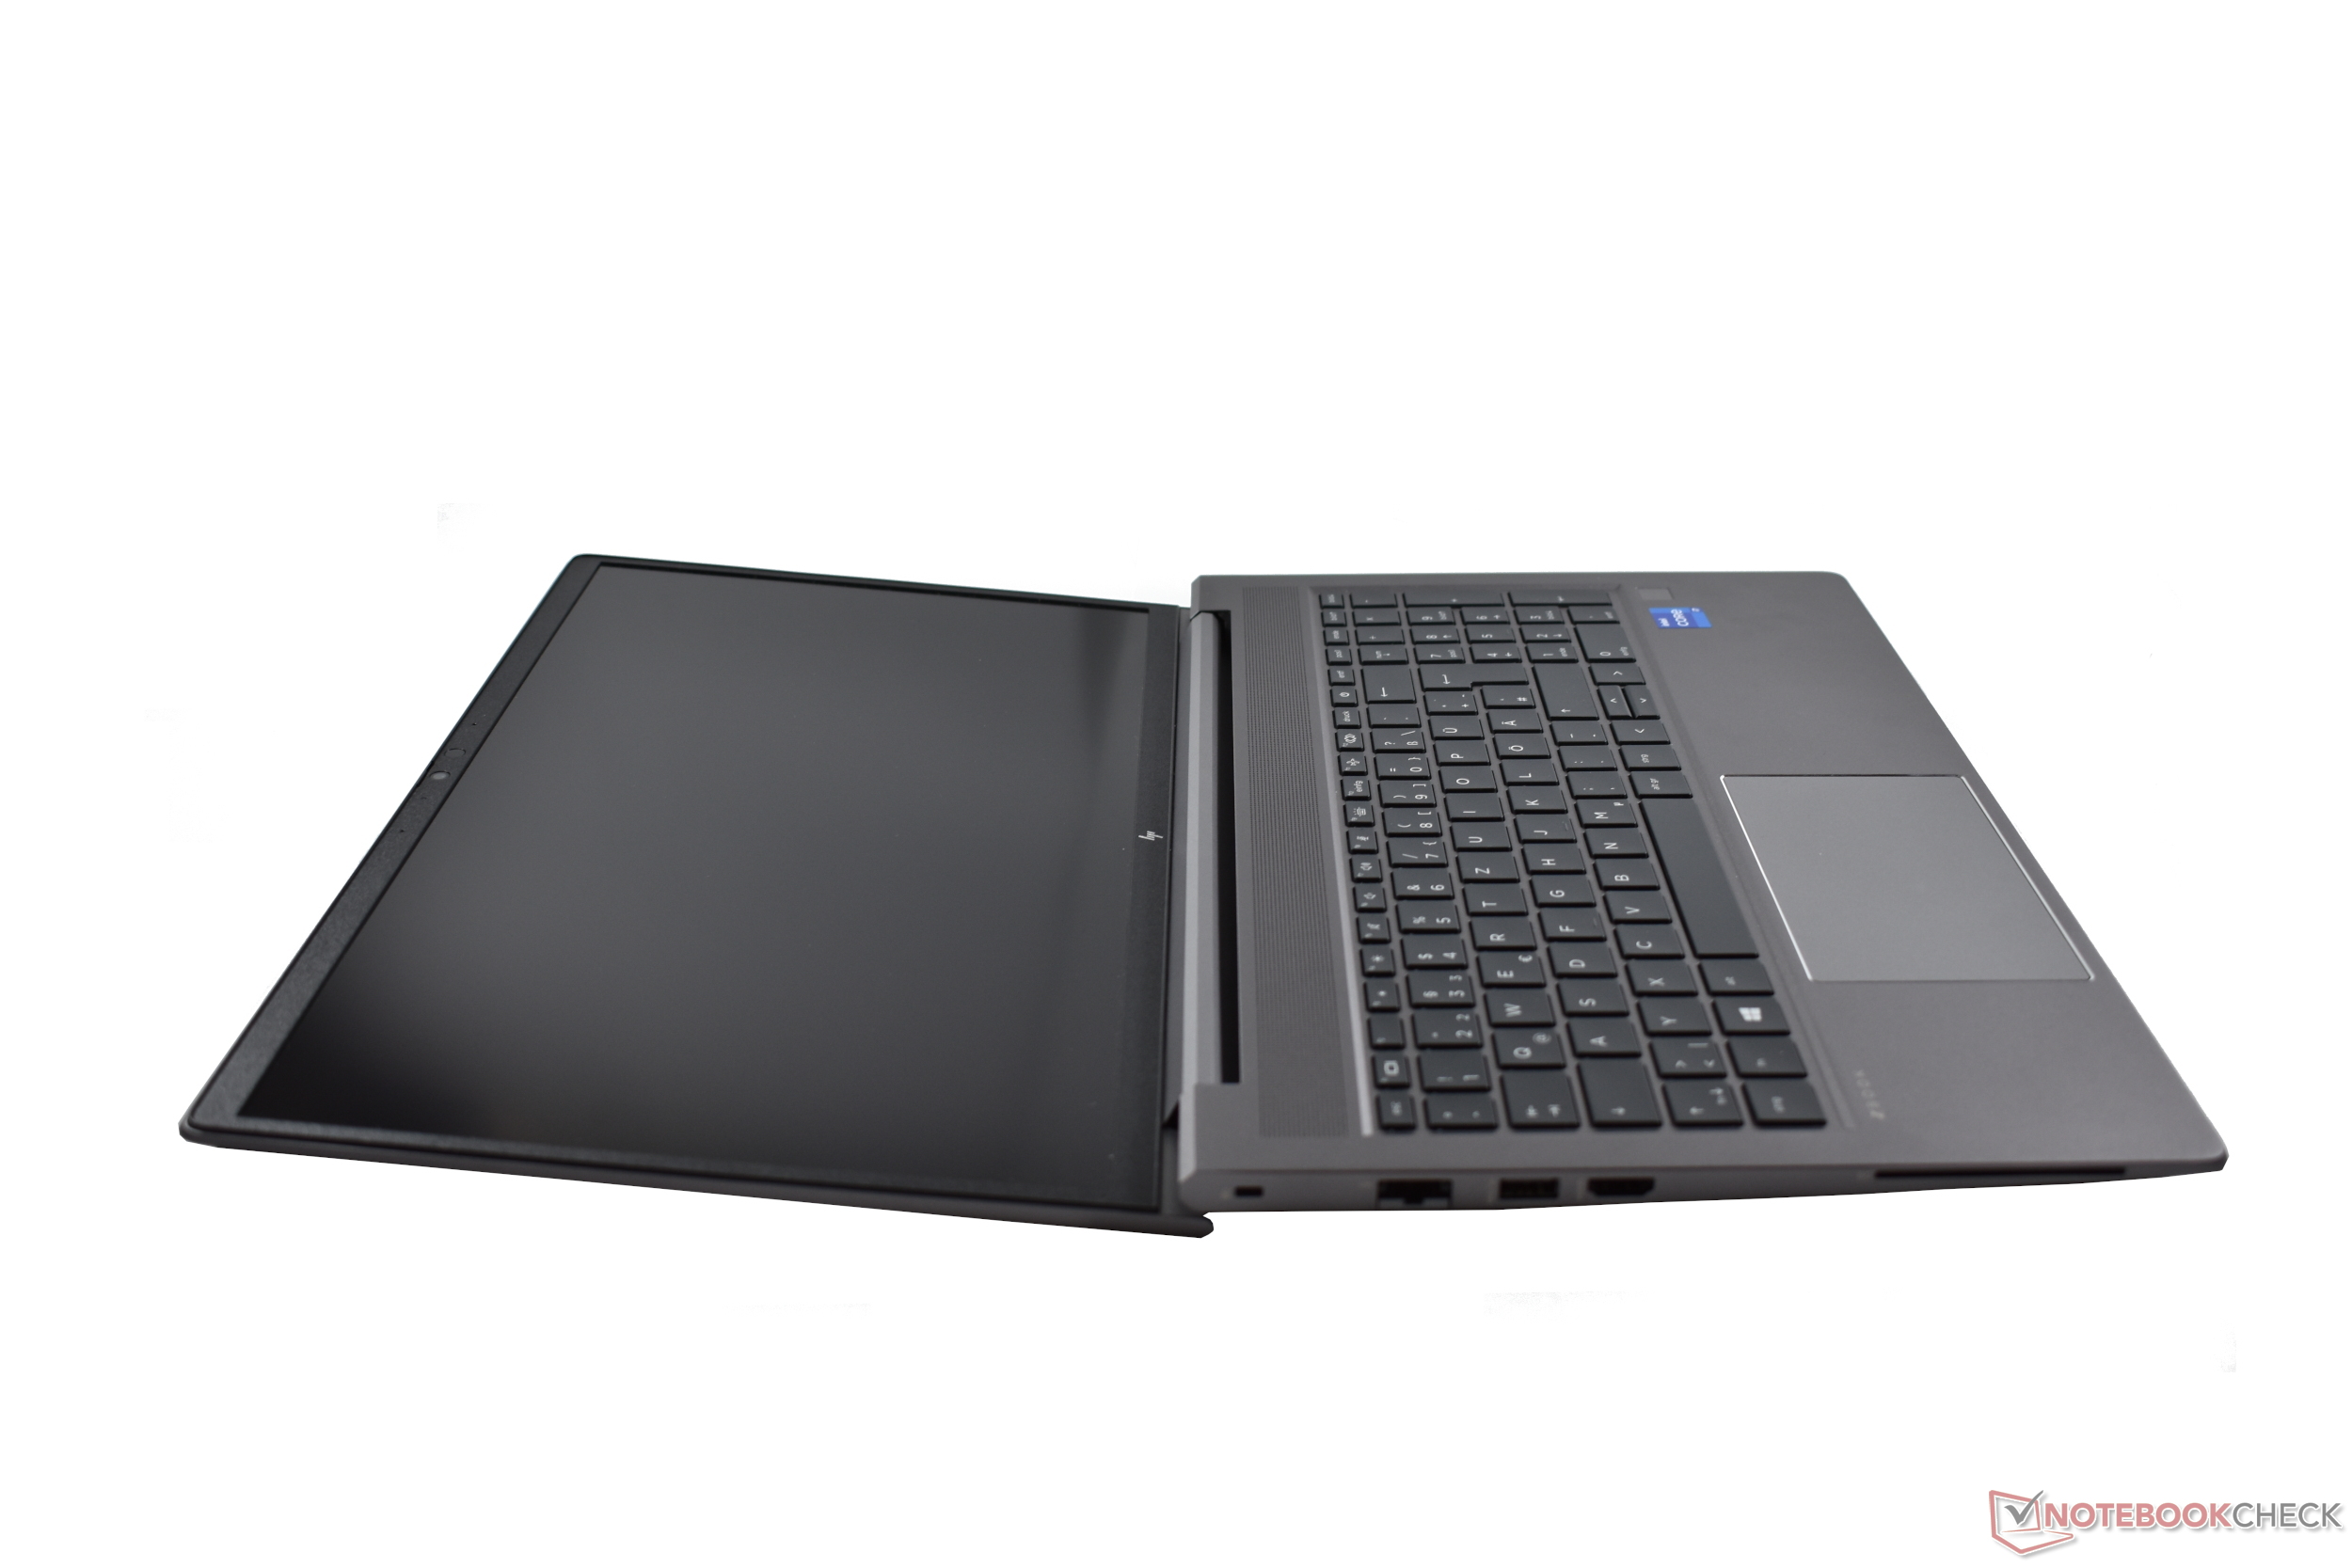
Por outro lado, a parte de trás da tampa pode ser facilmente pressionada para baixo com alguma pressão de ponto único, embora isso não leve a distorções de imagem. Pontos positivos são os fatos de que a tampa com suas lunetas finas só pode ser torcida minimamente e que o ângulo máximo de abertura é de ~180 graus.
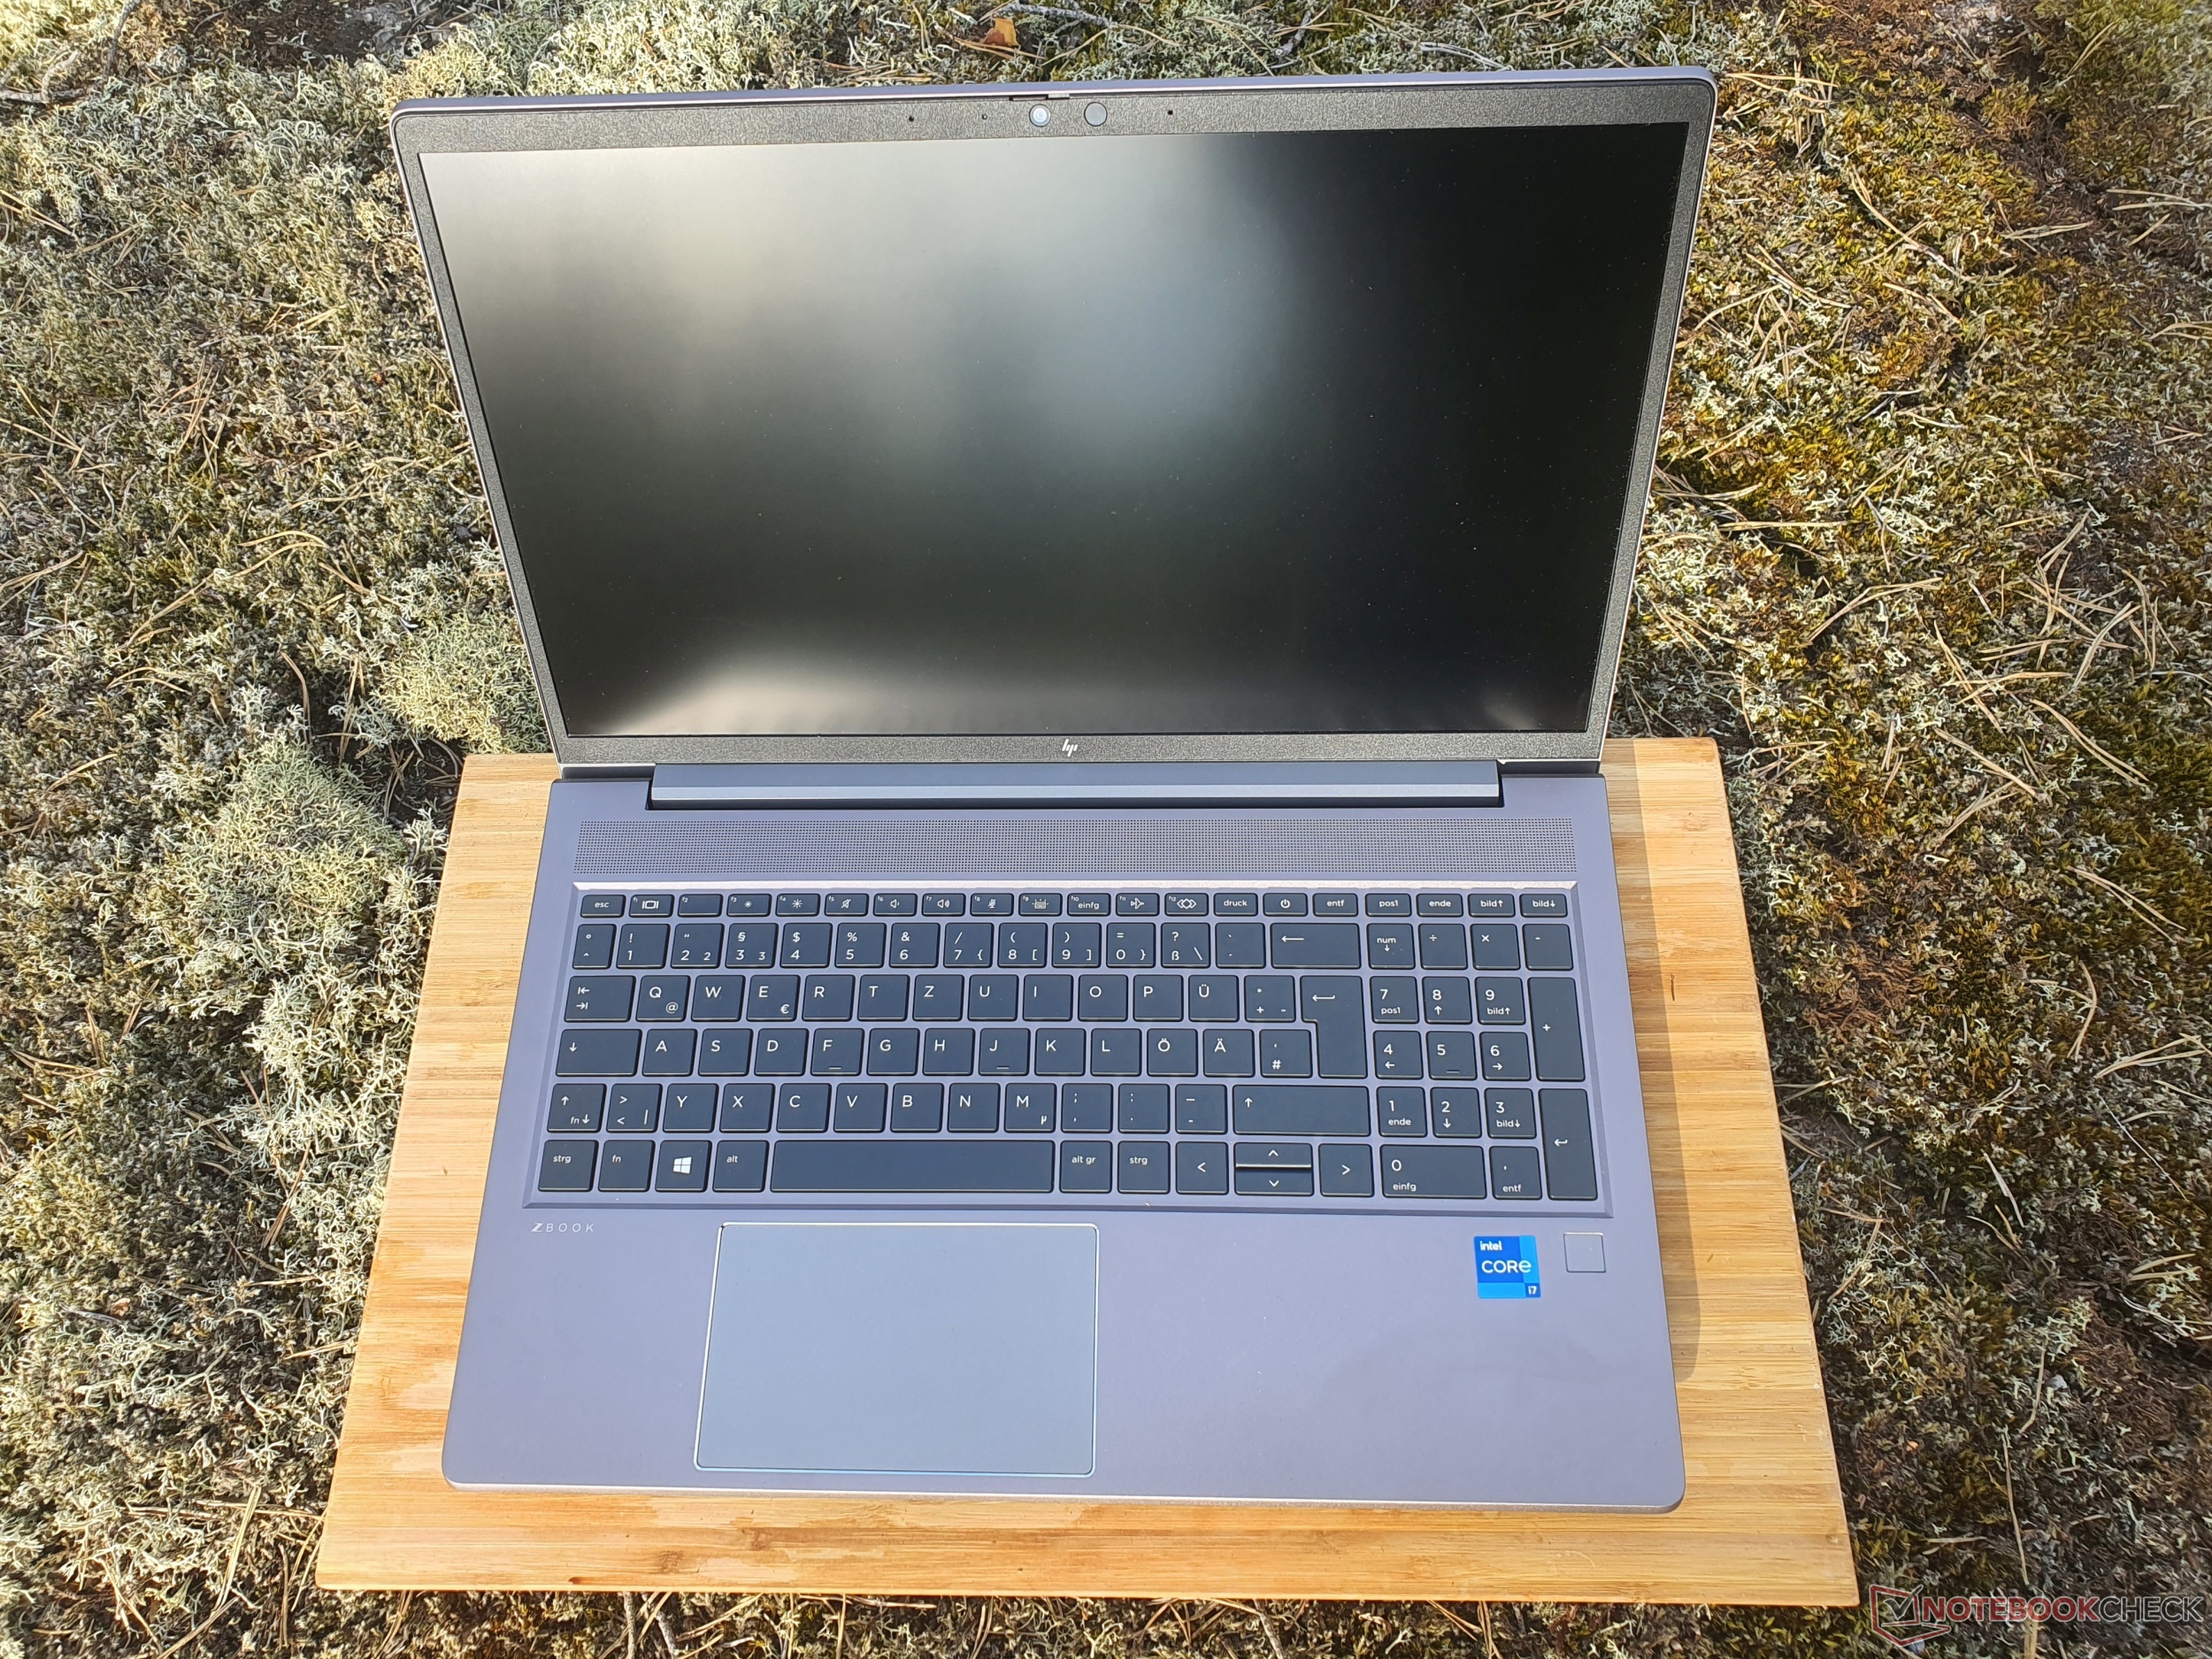
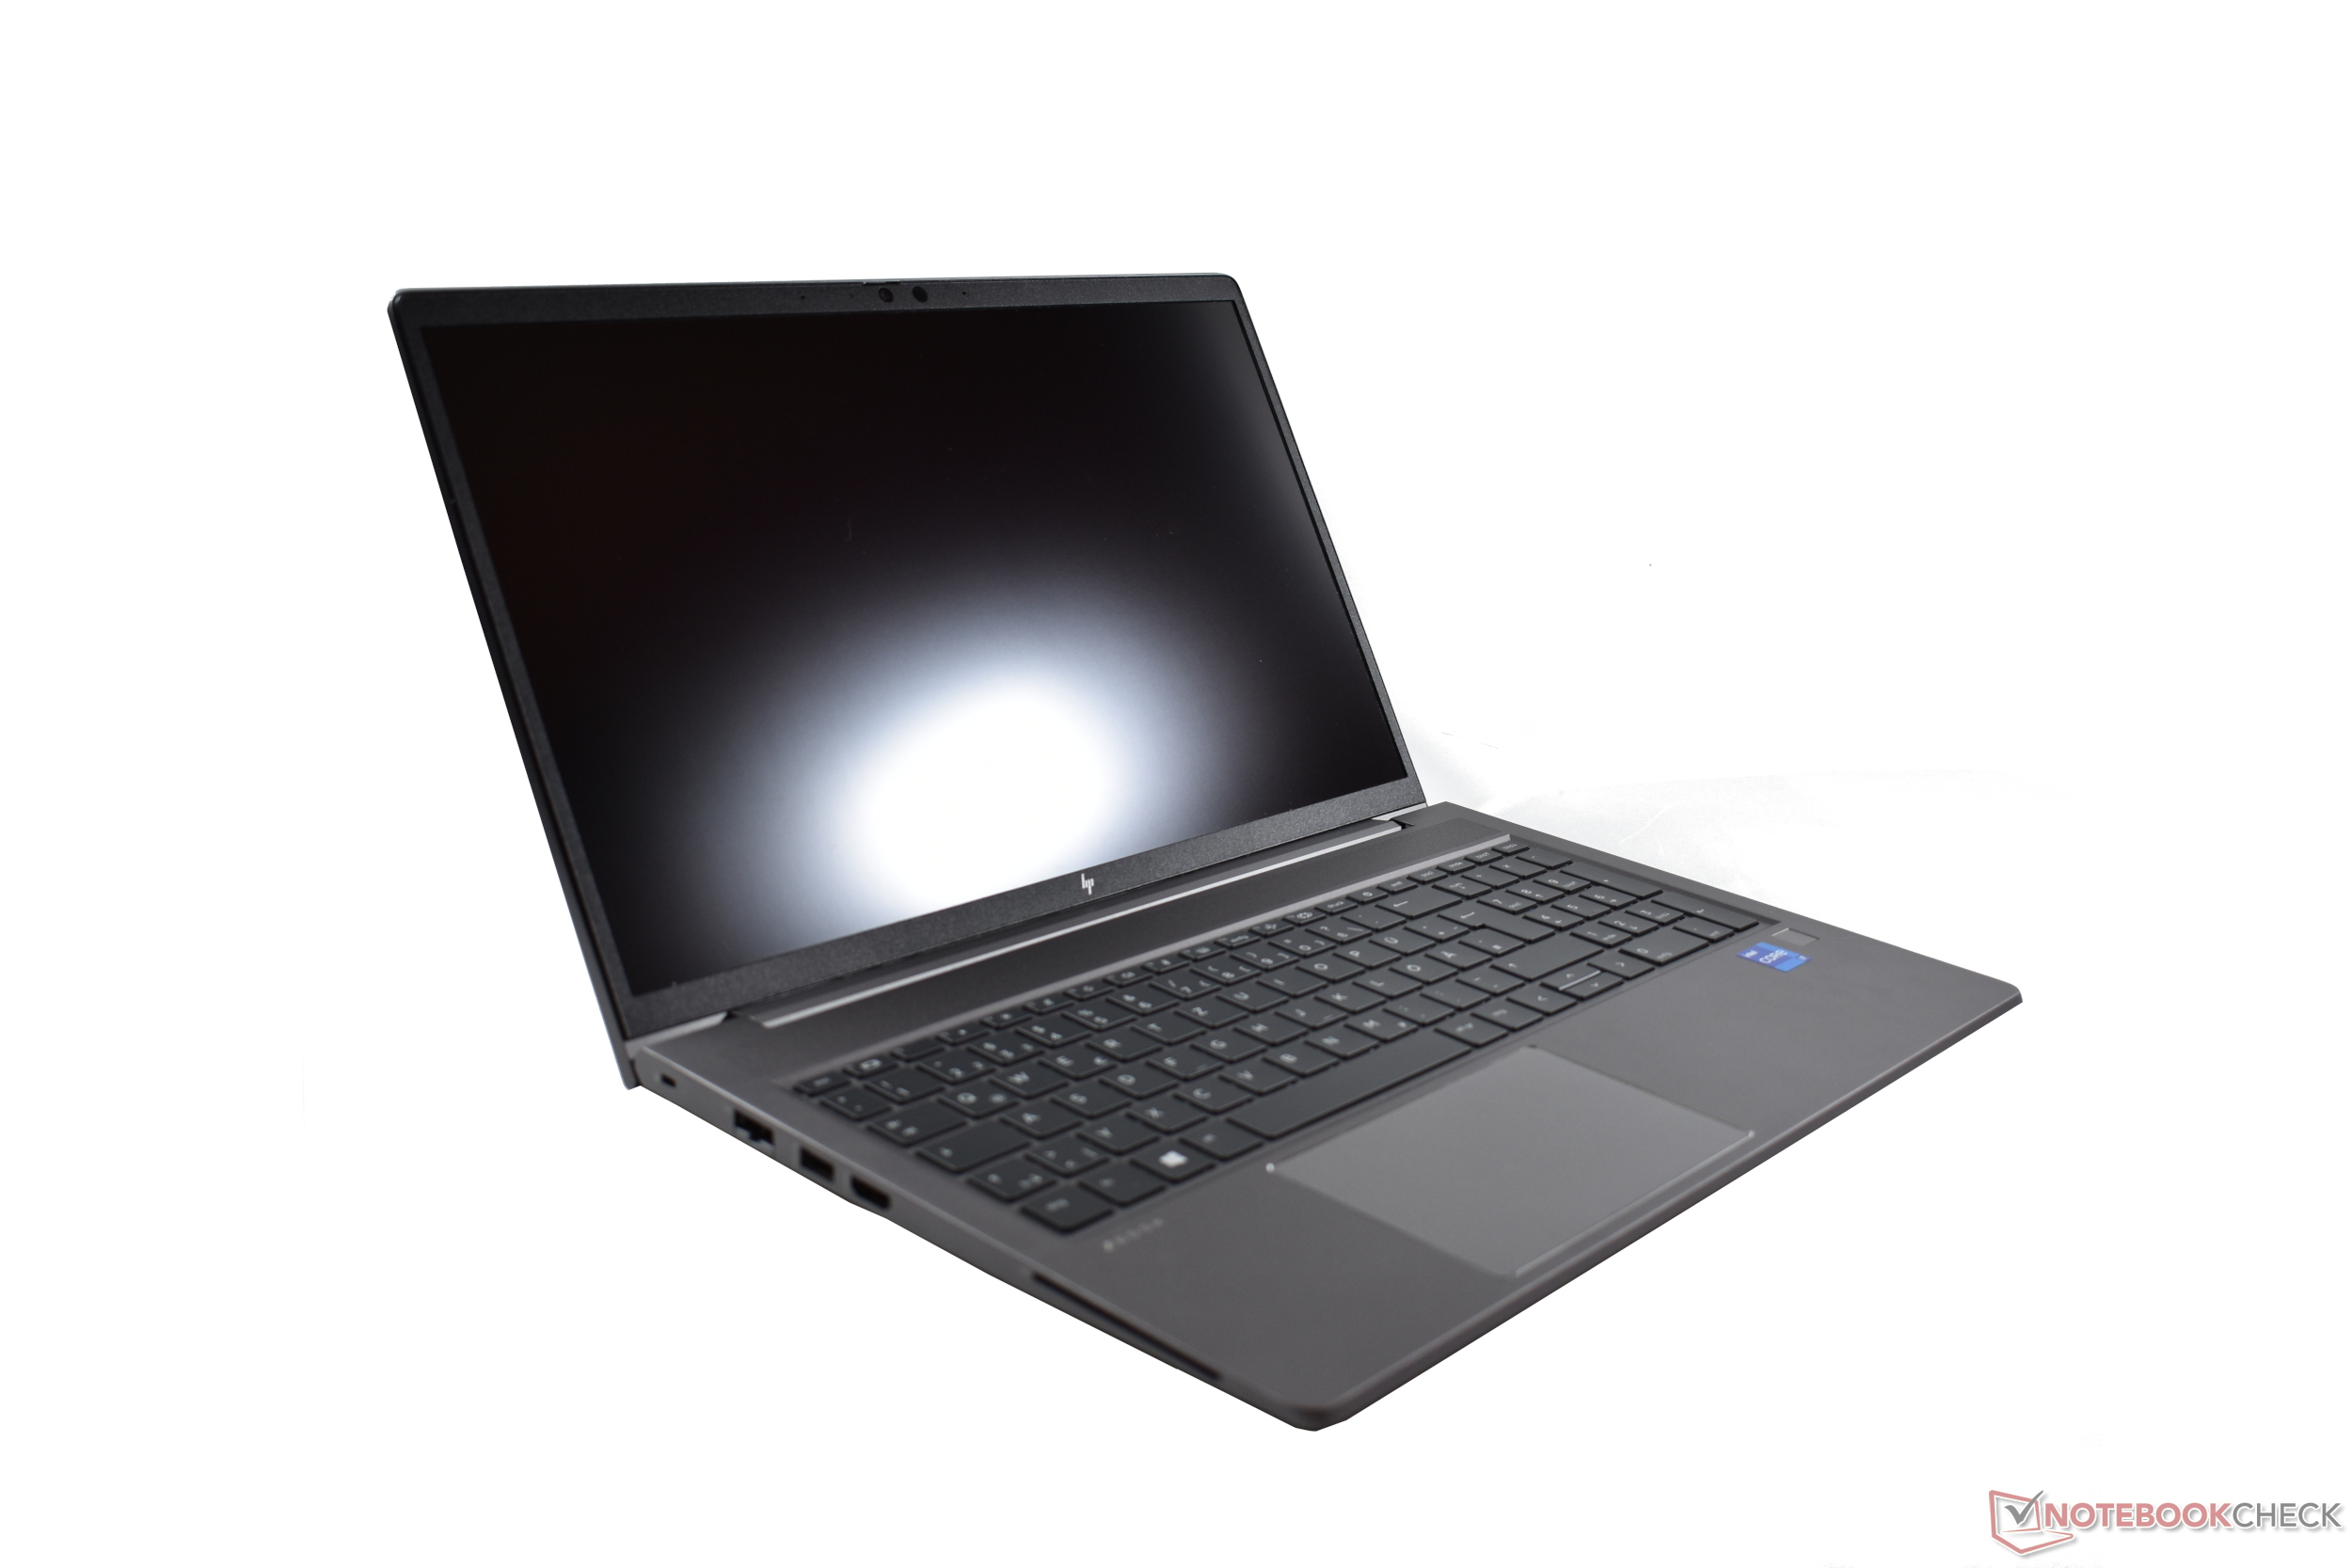
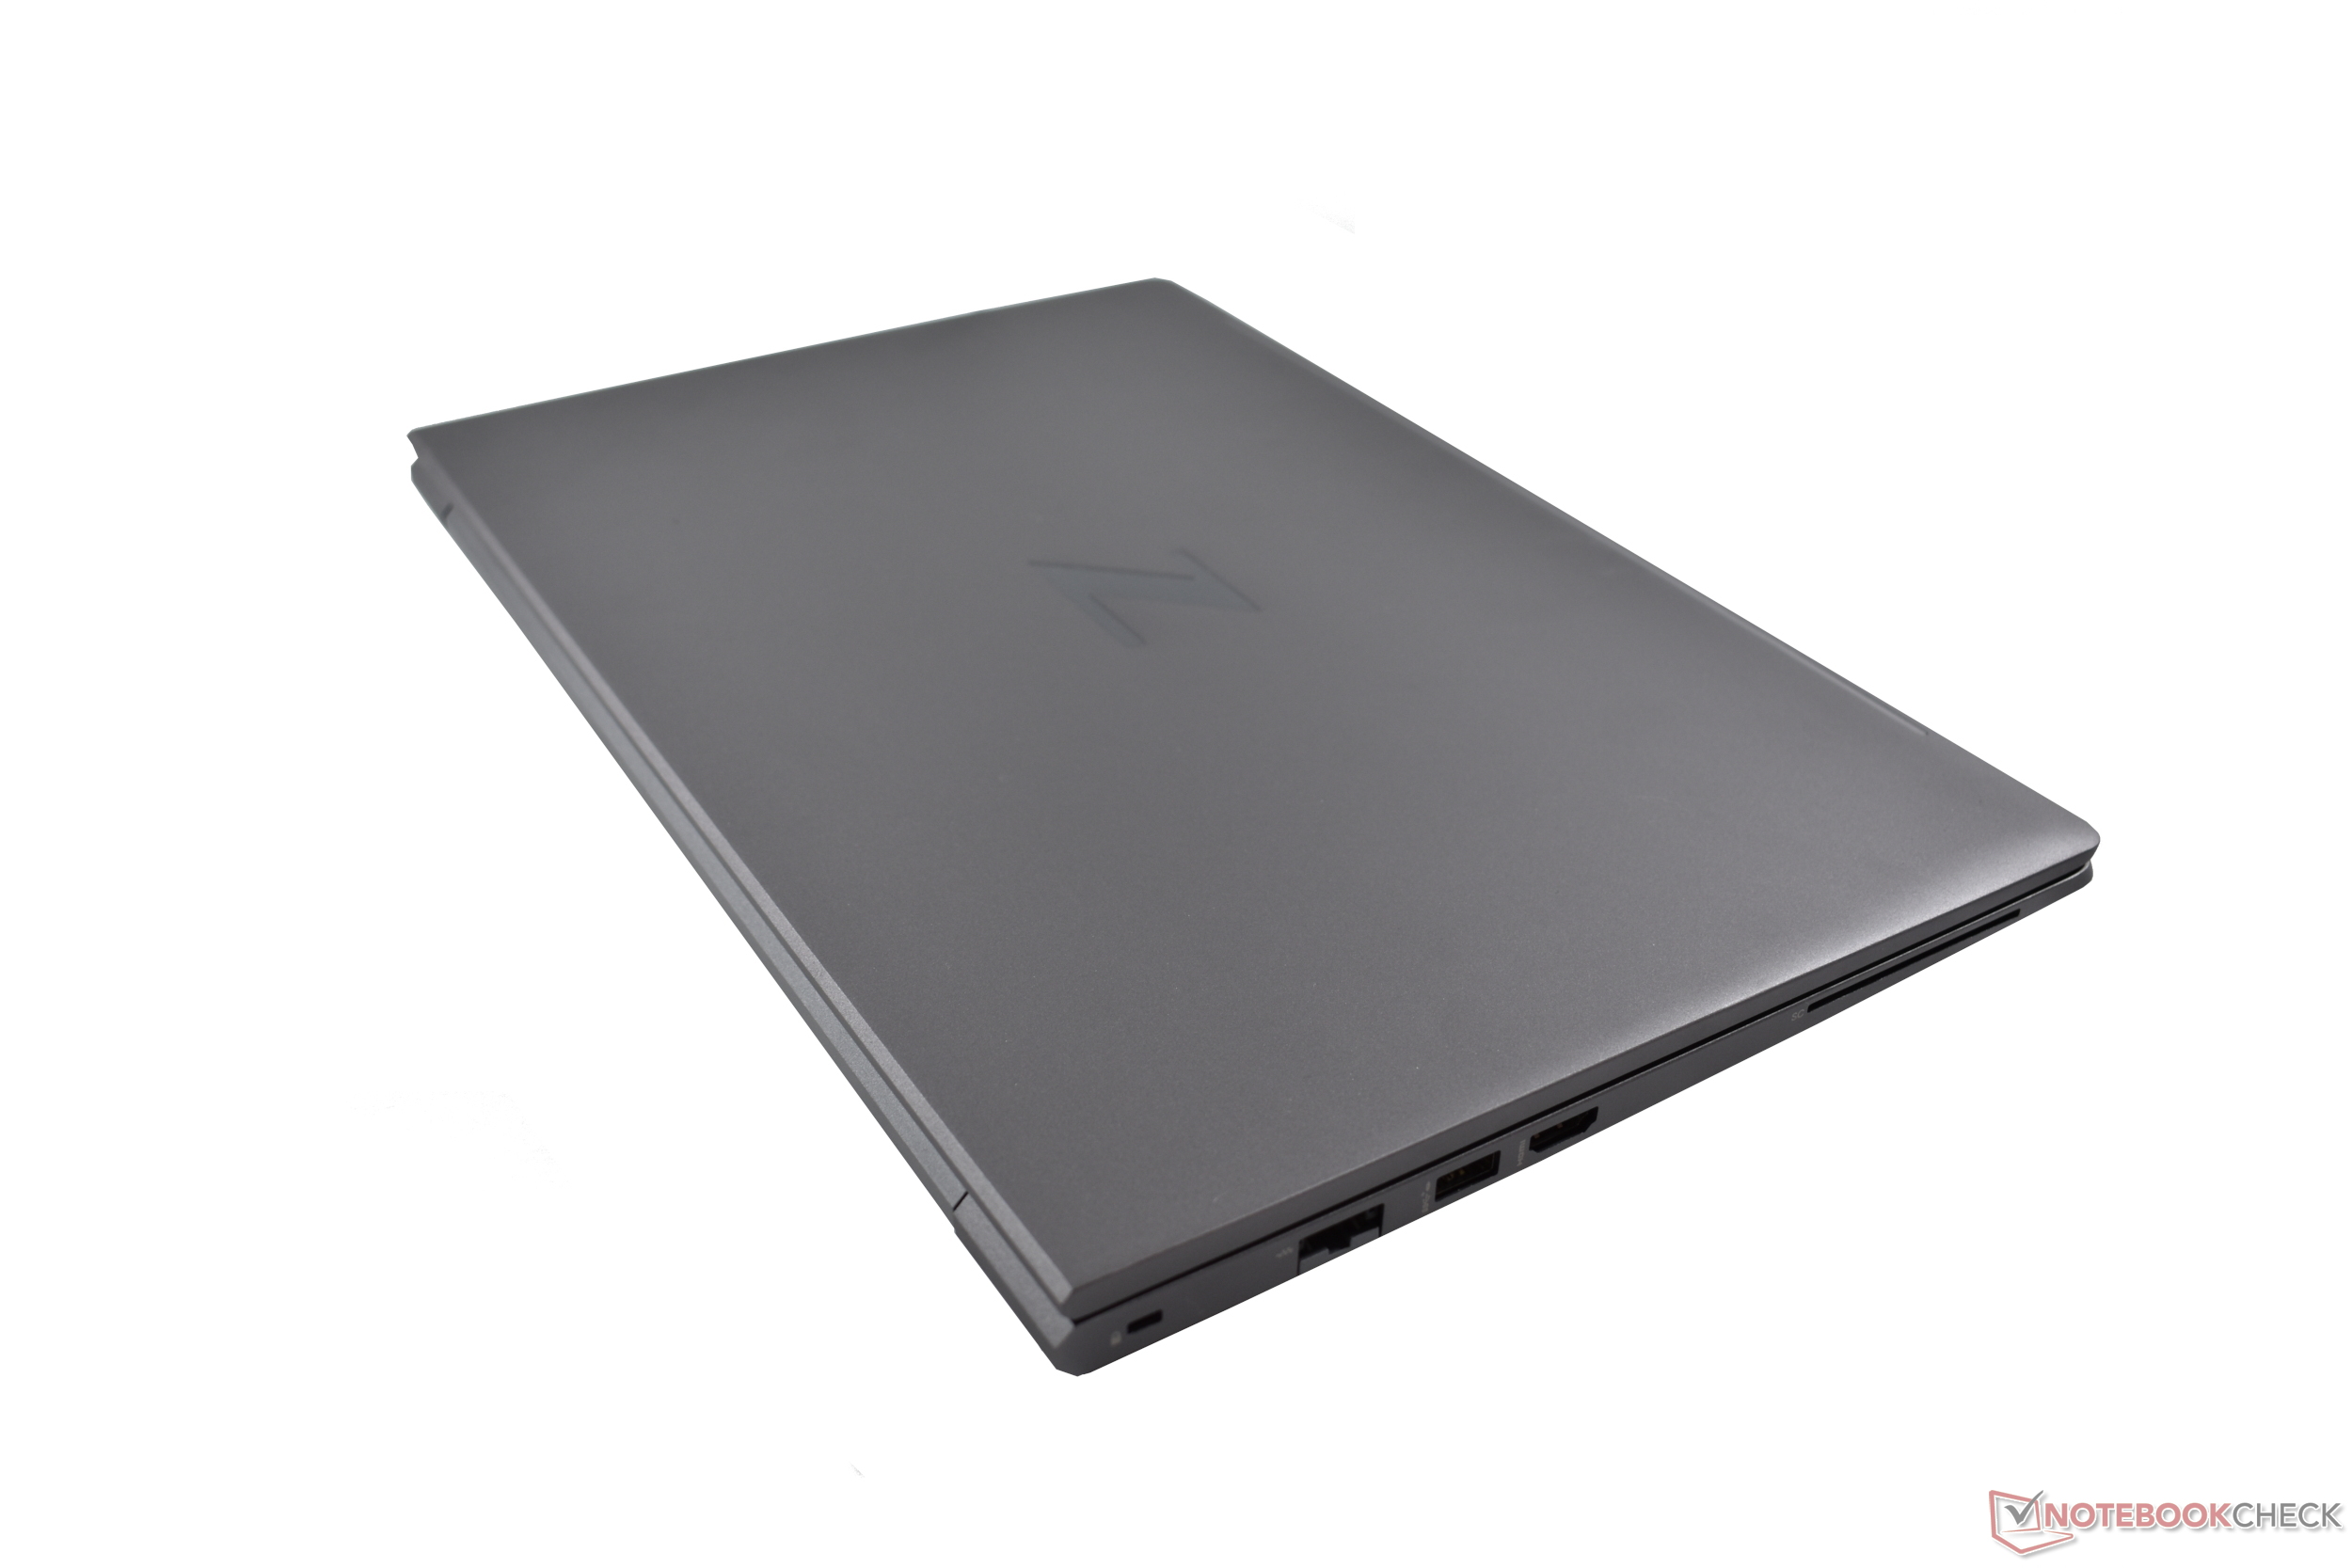
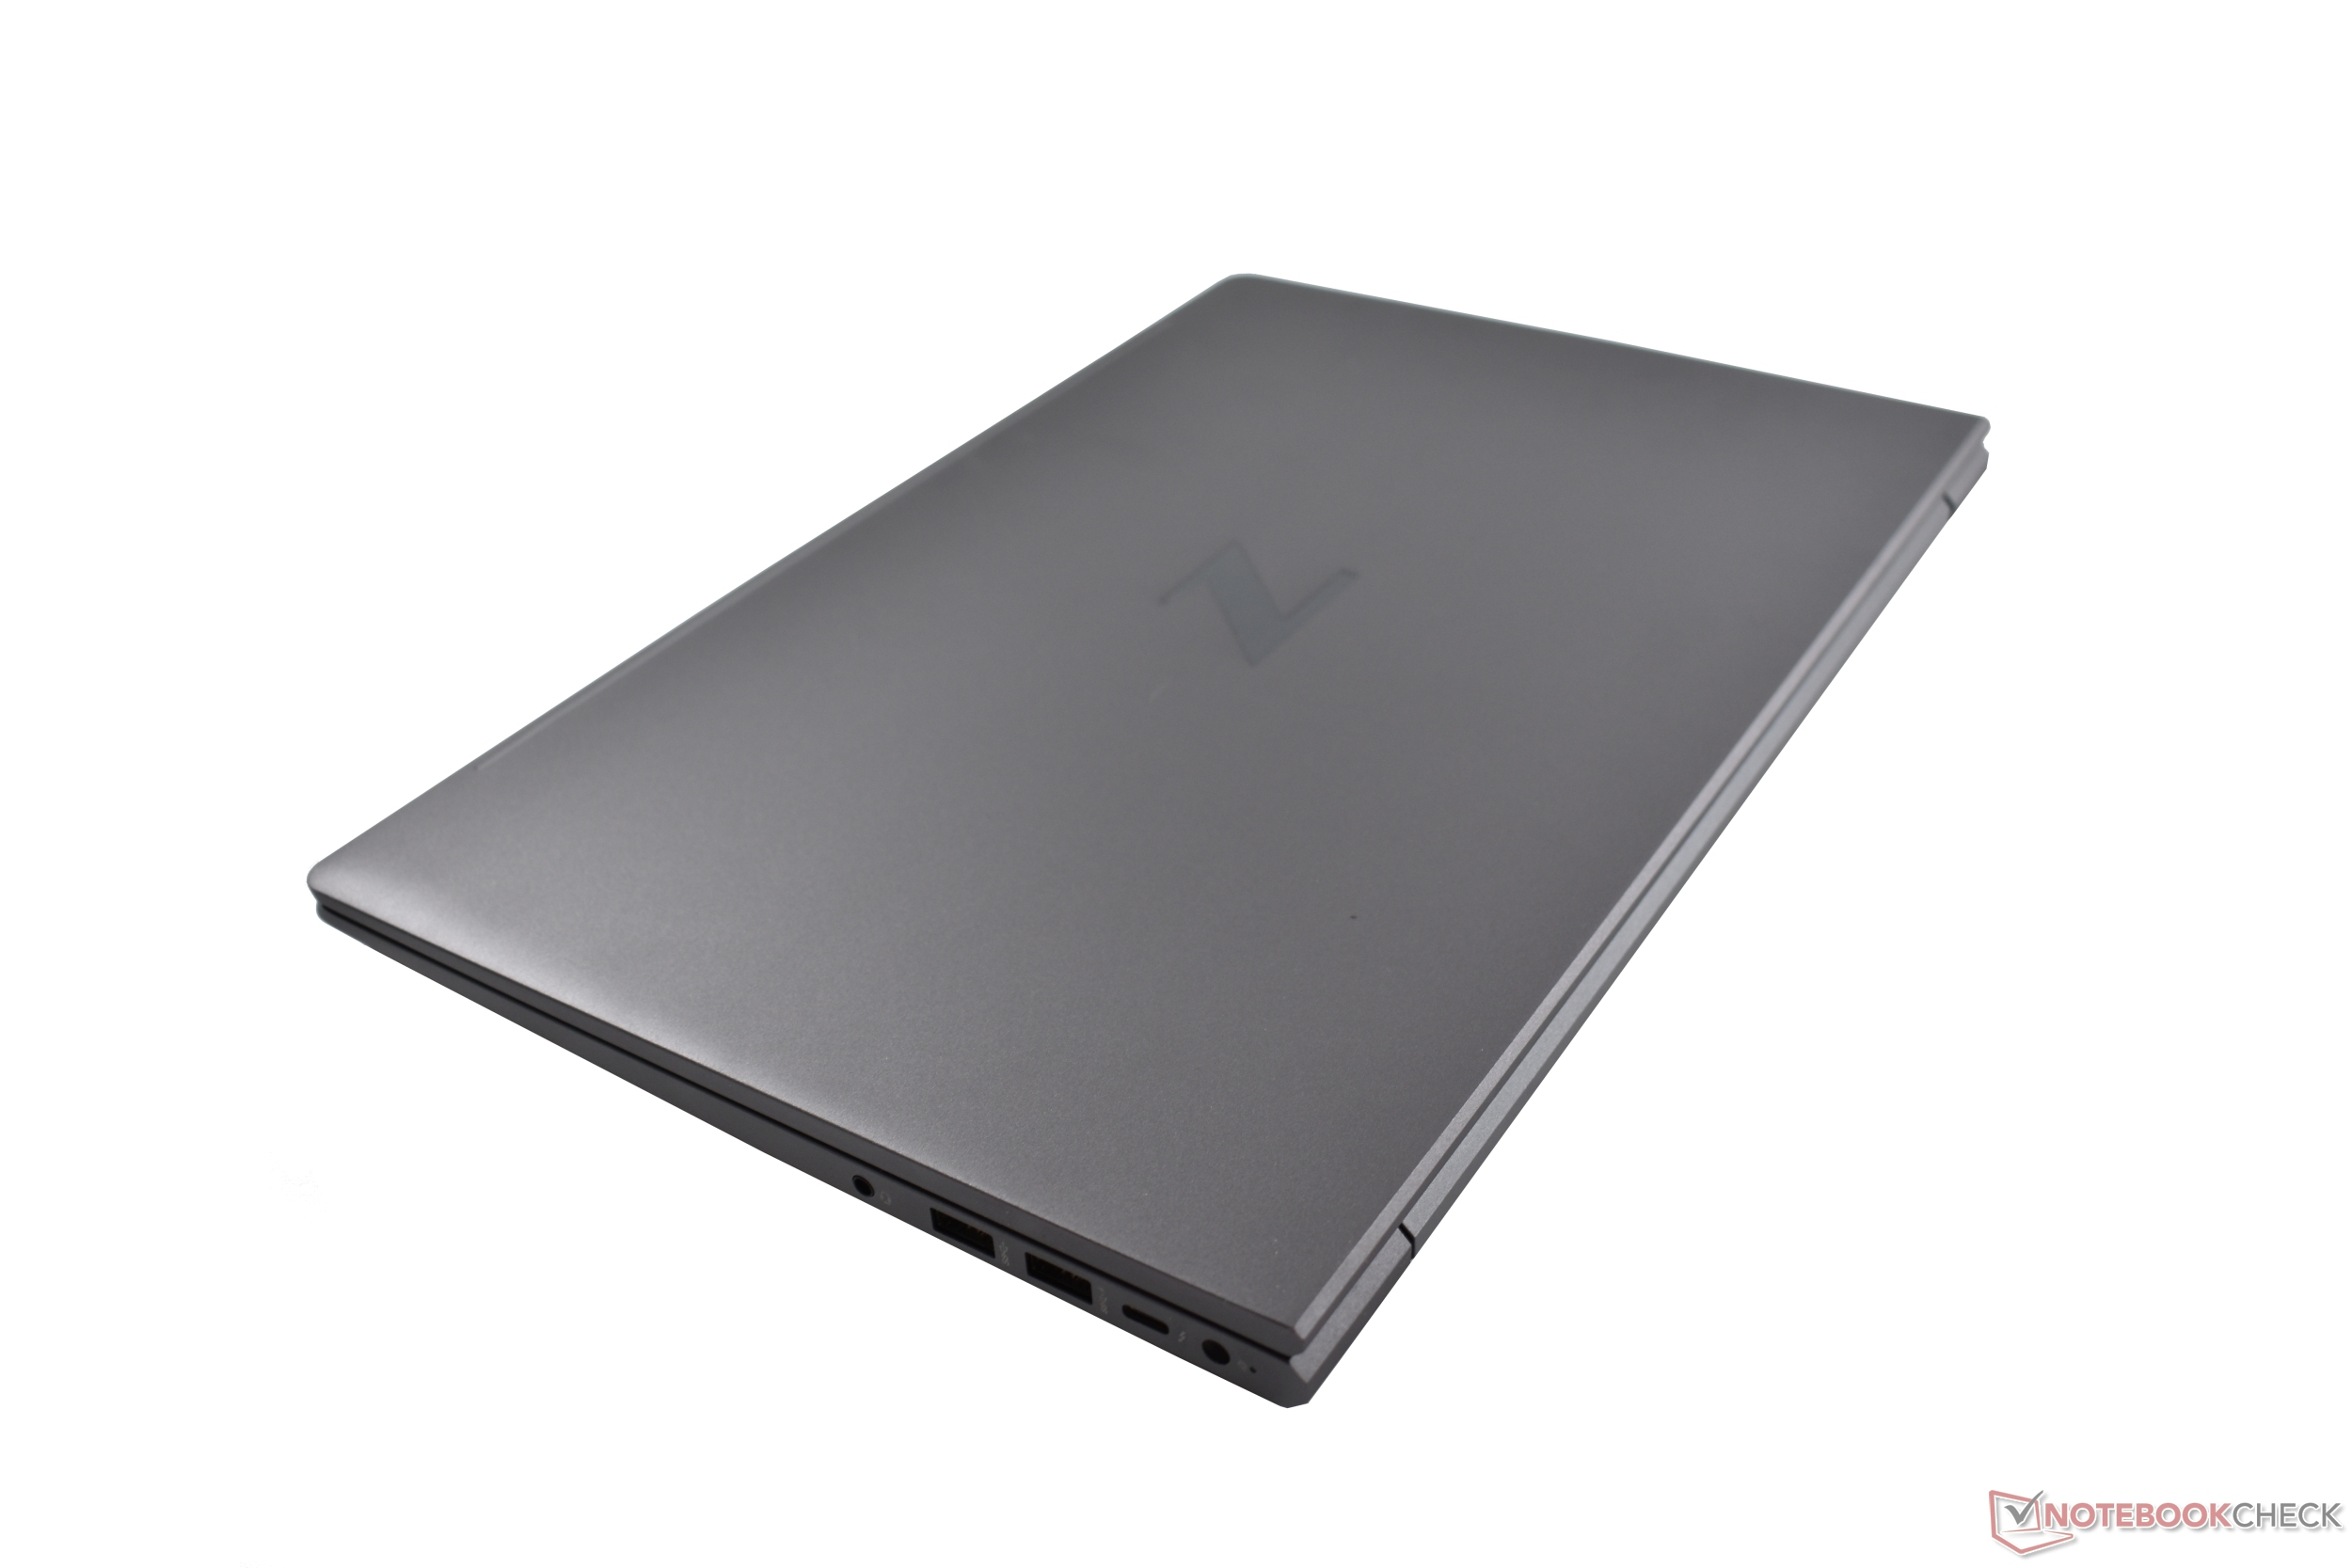
No total, a estação de trabalho é mais leve a 1,97 kg (~4,34 lb) e também mais compacta do que os concorrentes. Entretanto, como uma estação de trabalho premium, os HP's ZBook Studio 15 é novamente mais fino a 18 mm (~0,7 pol.), assim como a estação de trabalho leve e compacta da HP, aFirefly 15que também pesa apenas 1,75 kg (~3,96 lb).
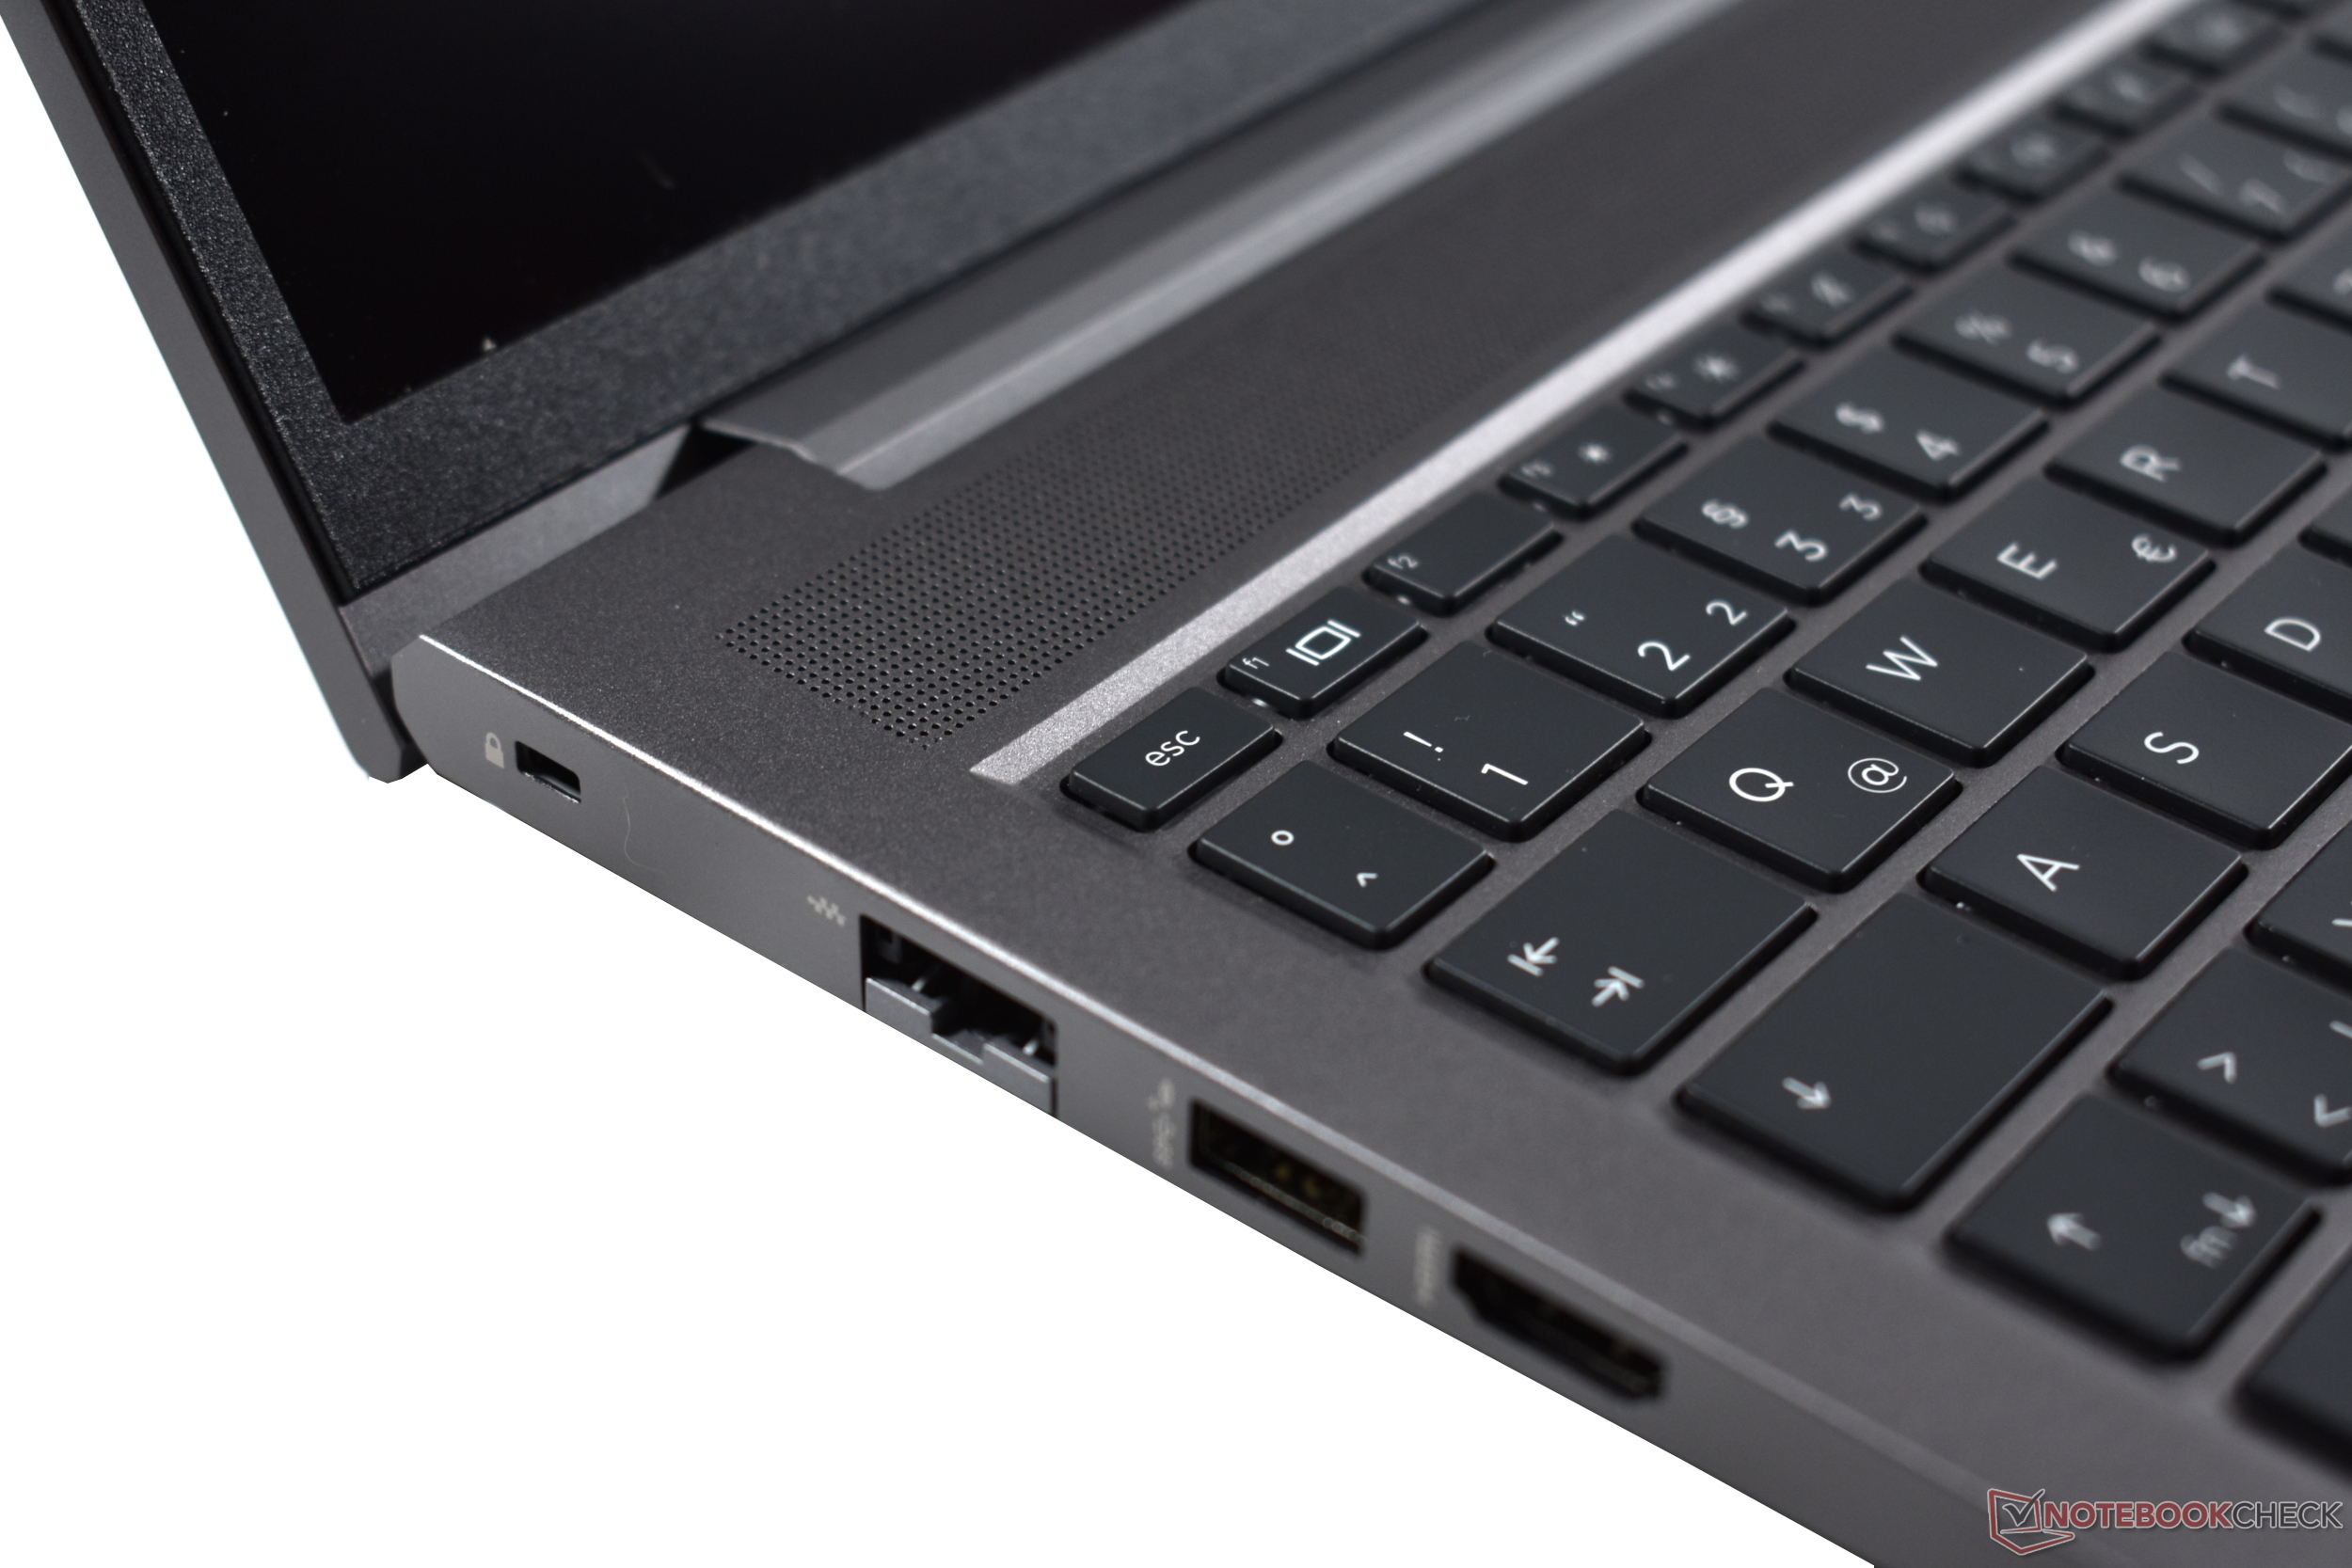
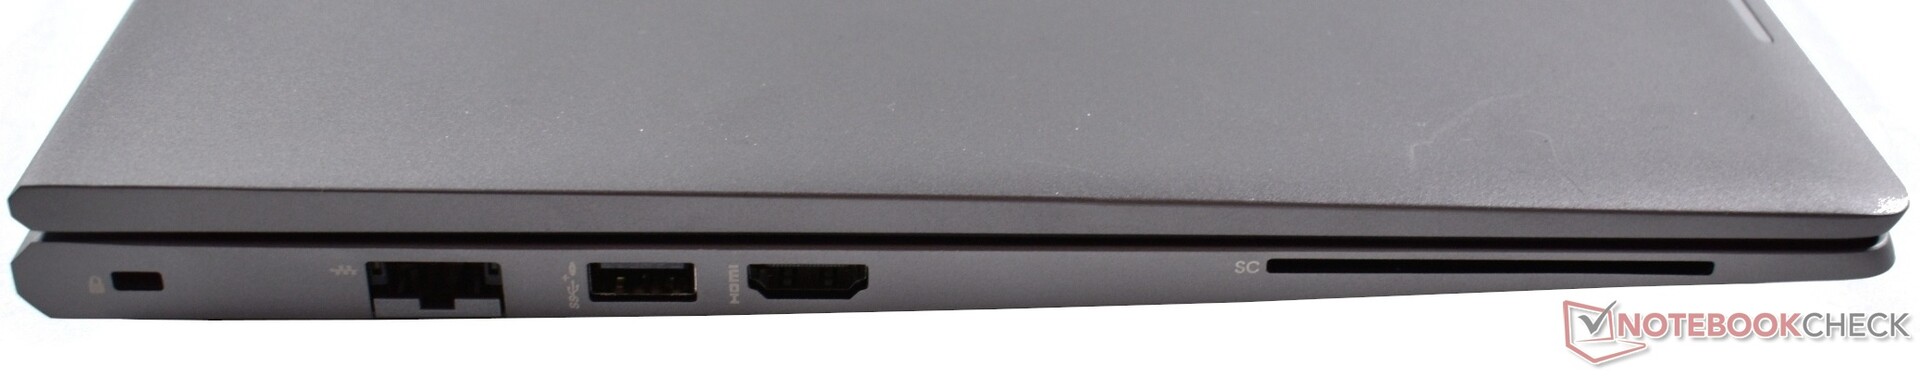
Equipamento: HP ZBook com USB-C PD e WiFi 6 rápido
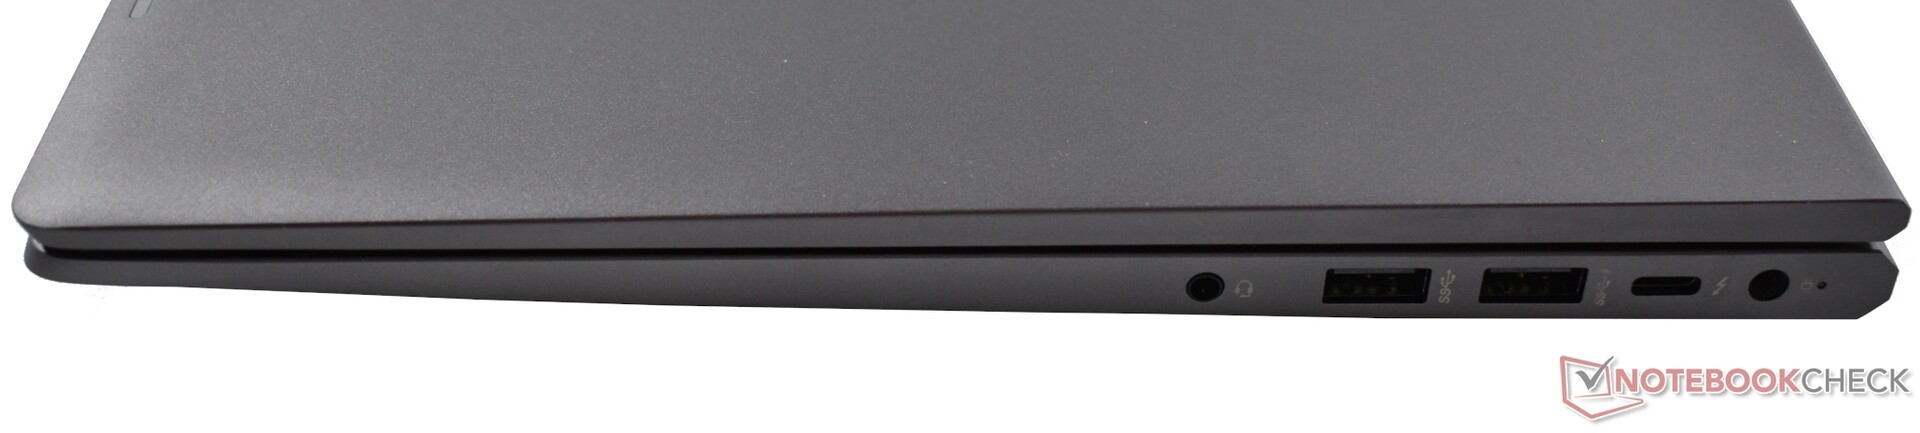
Mesmo como uma estação de trabalho de nível básico, o ZBook 15 G8 oferece muitas conexões importantes: Há Gbit LAN (mesmo que não seja 2,5 Gbps), há um total de três portas USB-A 3.1 Gen1 (5 Gbps), enquanto há apenas uma única conexão Thunderbolt 4, e também oferece DisplayPort 1.4 e Power Delivery em geral. Também apreciamos ver o HDMI na versão 2.0.
Um leitor SmartCard é opcional, mas há sempre um Kensington Lock (nano). Juntamente com a porta de carga proprietária, o pacote completo é arredondado por uma porta de áudio combinada. No entanto, falta um slot de cartão SD.
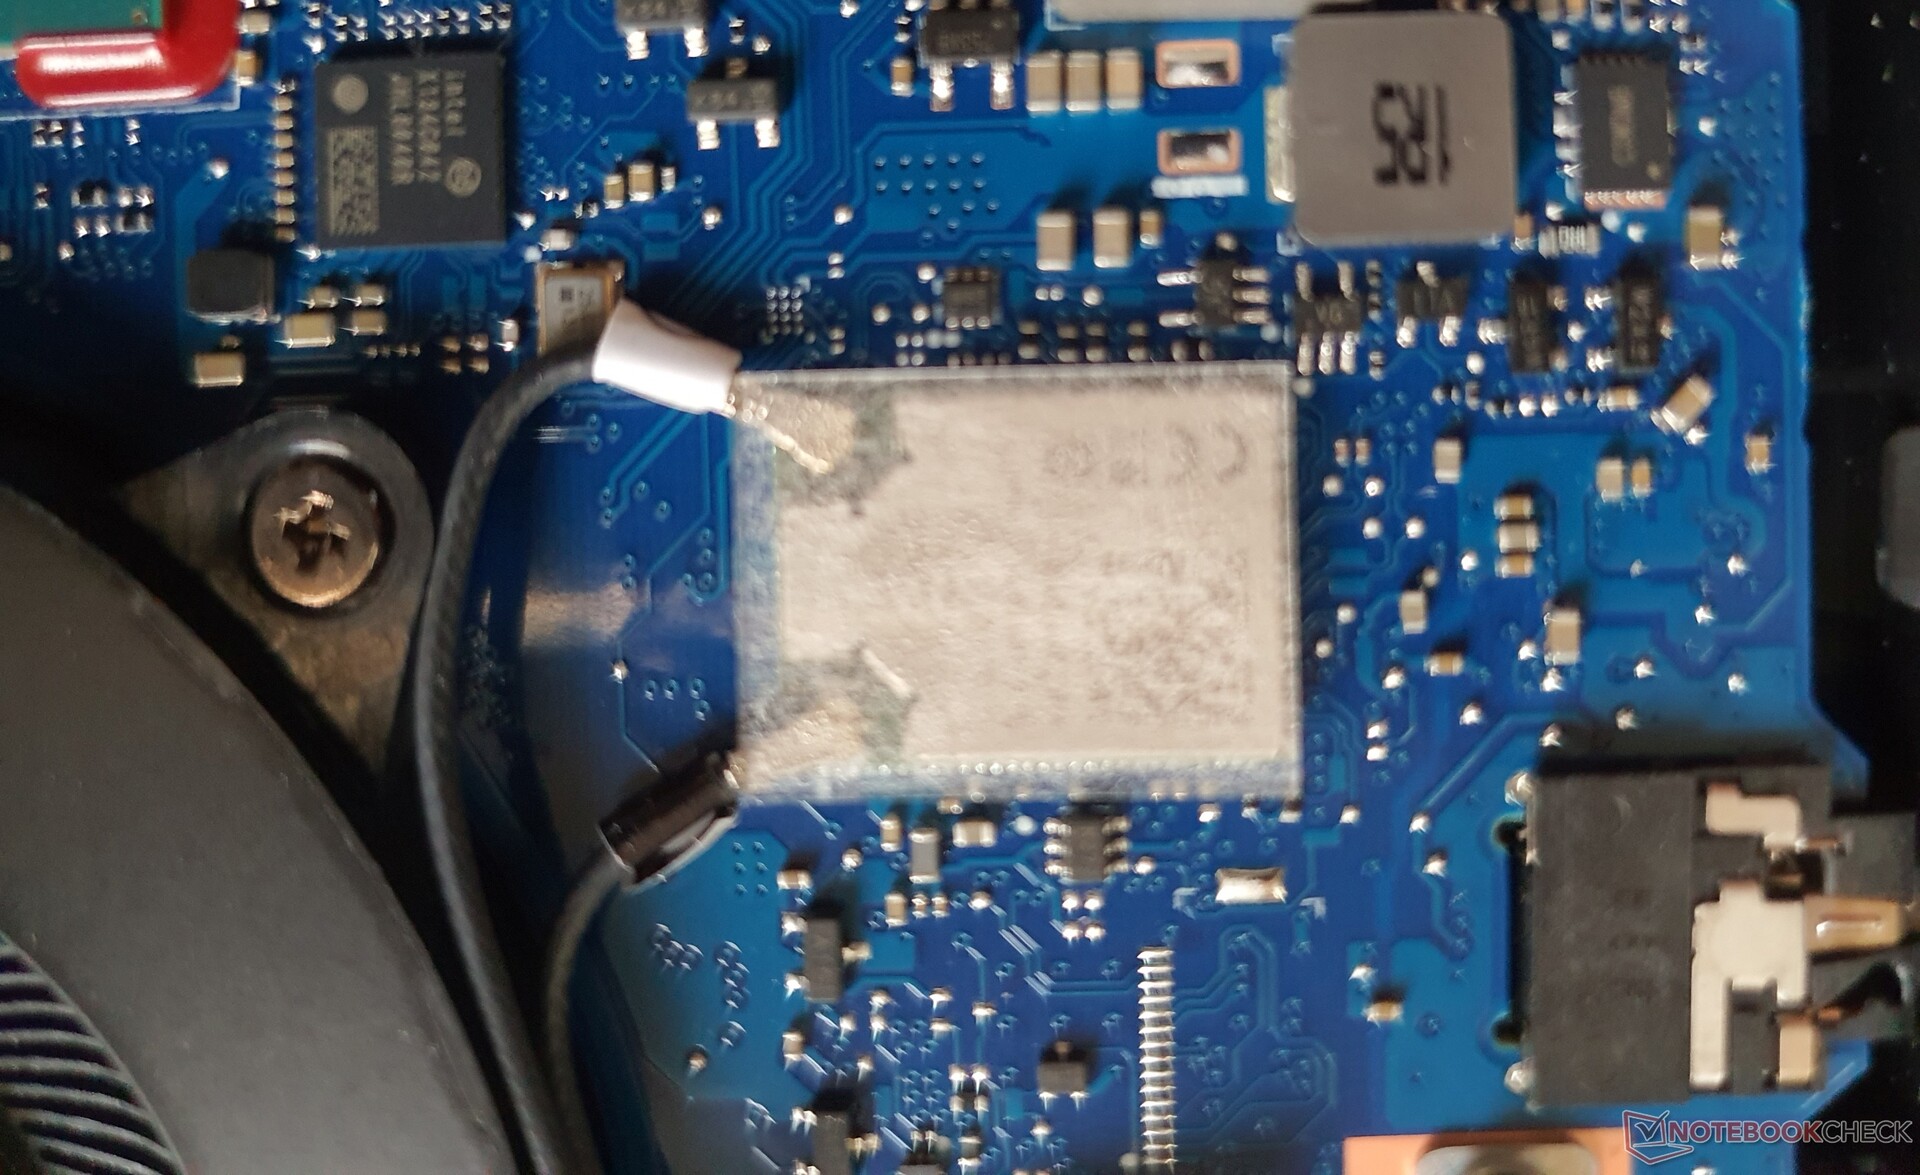
Comunicação
Além da Gbit LAN, o Wi-Fi 6 AX201 + Bluetooth 5.2 da Intel também está disponível na forma soldada. ~1,5 Gbps no envio e 1,33 Gbps na recepção corresponde à alta velocidade Wi-Fi dos concorrentes. Embora não haja um slot WWAN, o NFC está disponível opcionalmente.
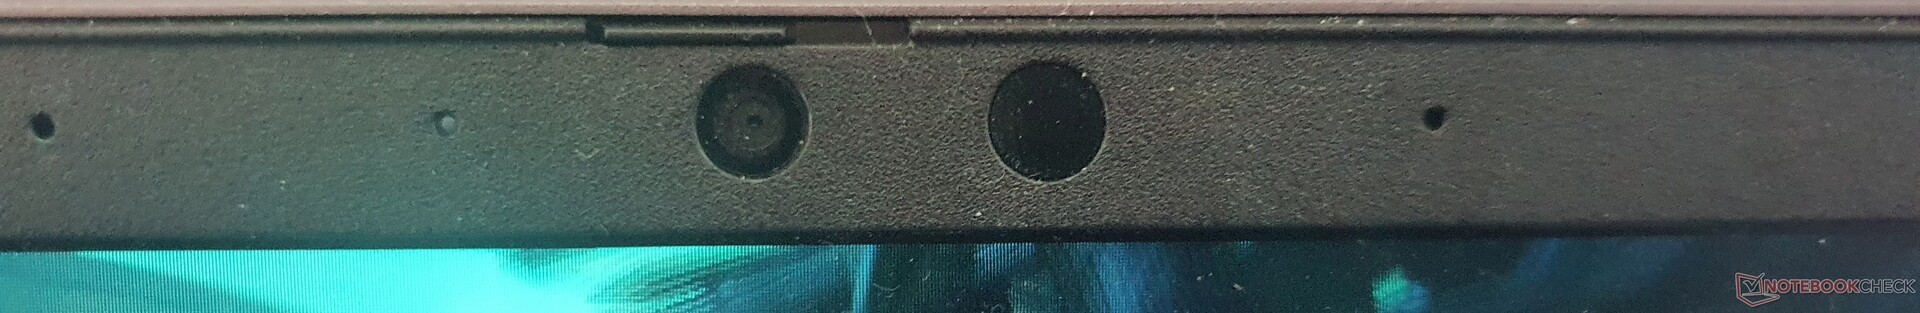
Webcam

A webcam 720p oferece um SureShutter (cobertura), microfones de raios duplos, e infravermelho opcional para Windows Olá. No entanto, a qualidade da imagem é ruidosa.


Segurança
A HP não toma meias-medidas em termos de segurança. Na lateral das opções de hardware, há um leitor SmartCard e uma câmera IR para Windows Olá. Além disso, há um mecanismo para uma trava de segurança, um leitor de impressão digital, TPM 2.0 e um obturador de câmera.
No lado do software, mais segurança é fornecida pela Proteção do Sistema HP contra ataques de firmware ou erros súbitos de firmware, o Gerente de Segurança do Cliente HP, HP Sure Click & Sure Sense contra phishing e malware, e uma BIOS "self healing".
Acessórios
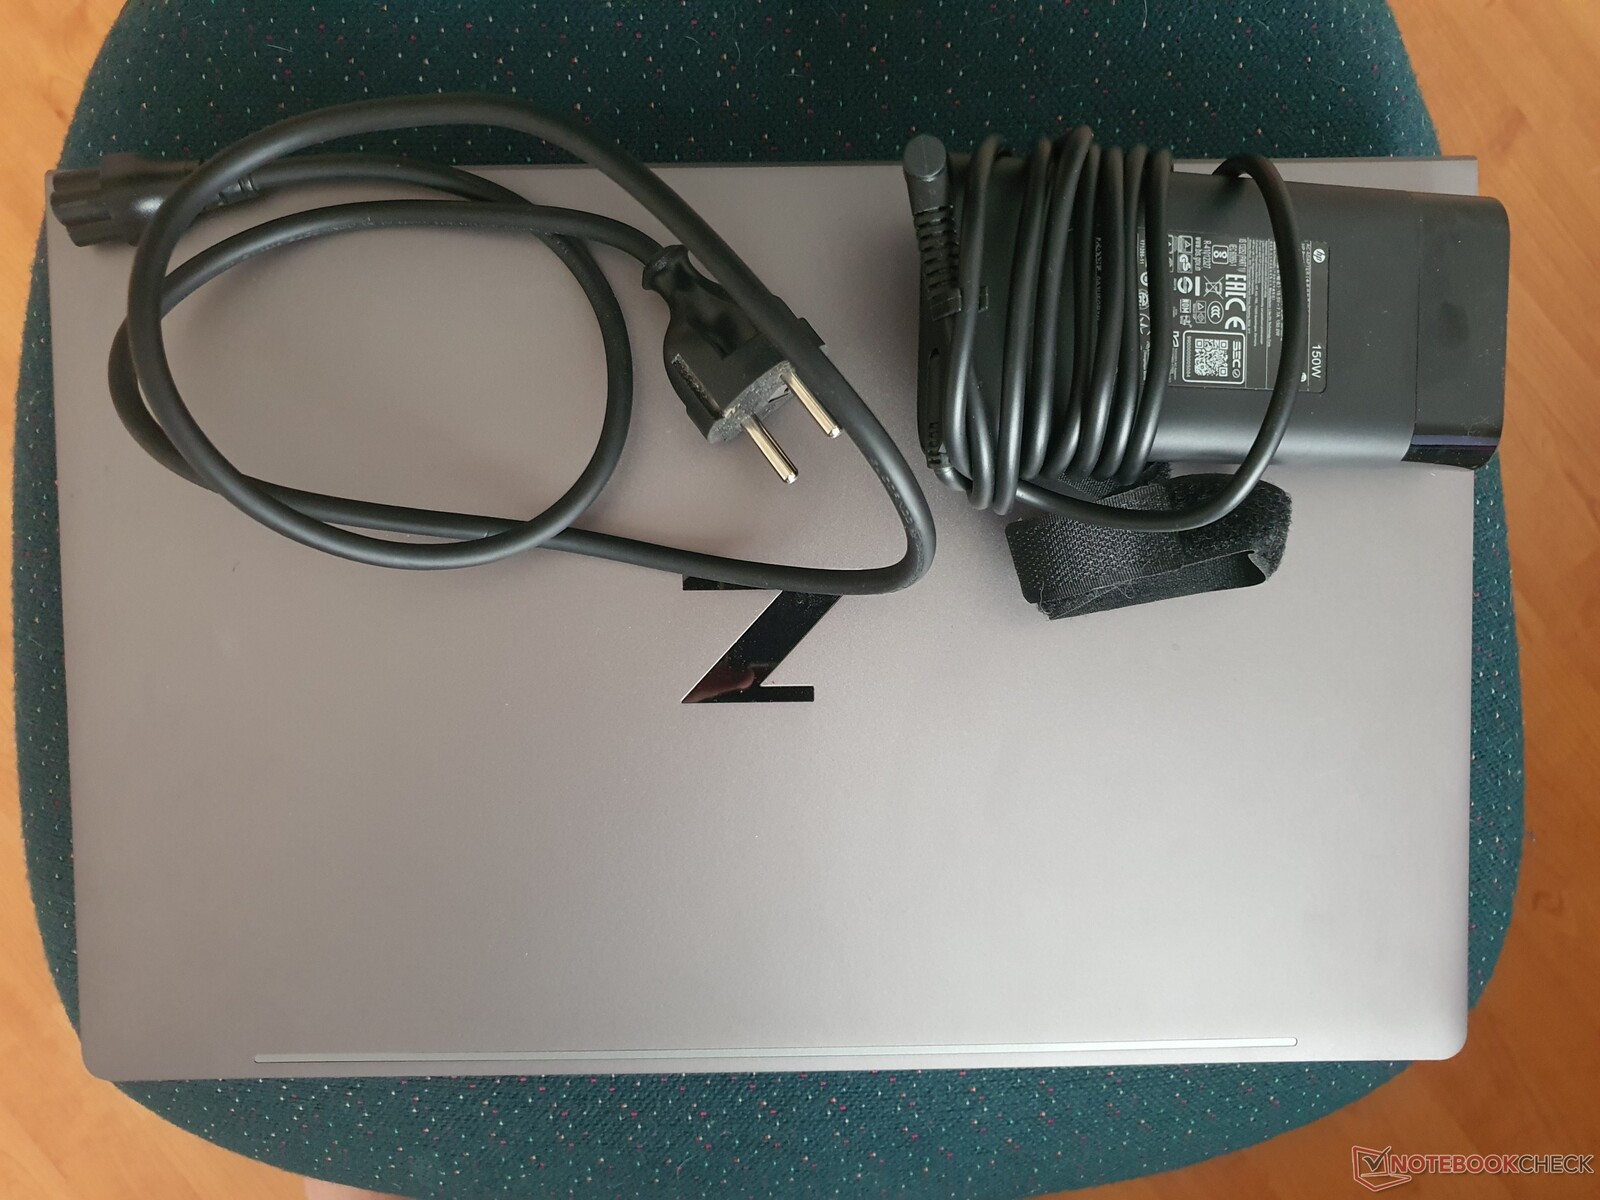
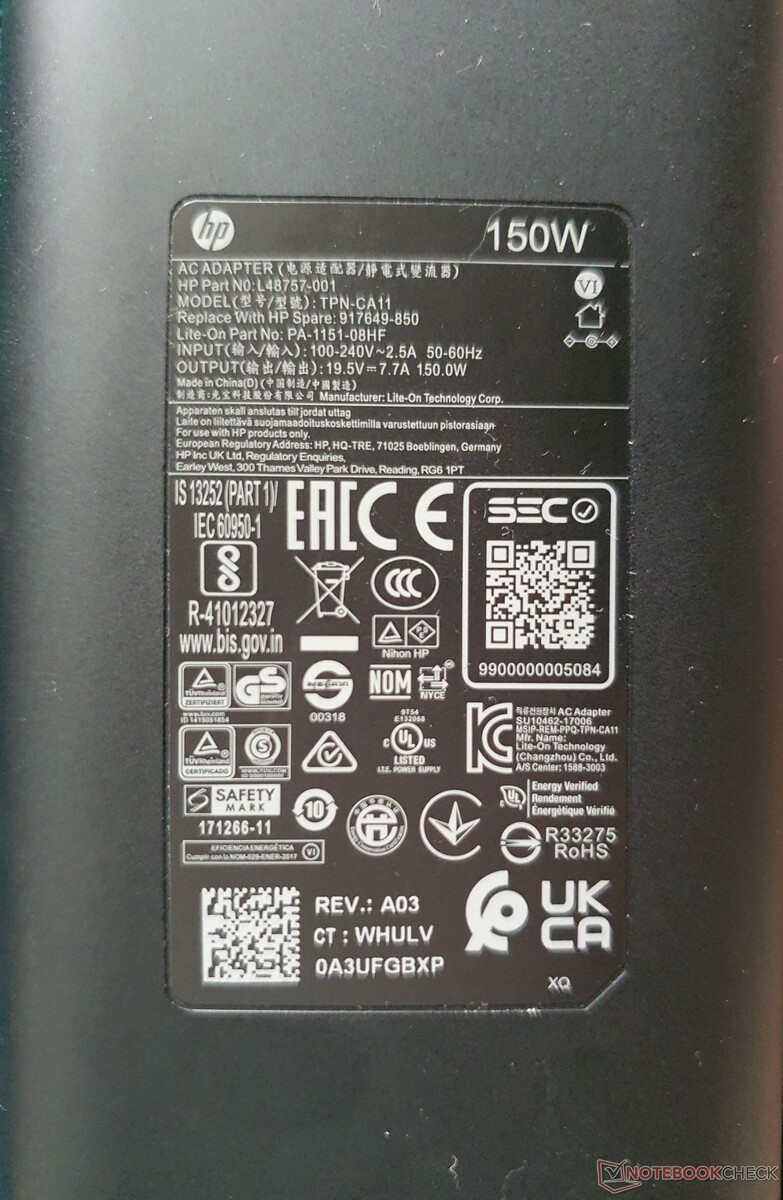
Uma fonte de alimentação de 150 watts (120 watts nas configurações sem dGPU) está incluída. A embalagem é livre de plástico (ou seja, somente 10%), a maior parte é de papelão (45% reciclado) e celulose de papel. Opcionalmente, a HP oferece várias docas USB-C/Thunderbolt, mas somente a Dock G2 HP TB com cabo combinado https://www.hp.com/us-en/shop/pdp/hp-thunderbolt-dock-g2-with-combo-cable (cerca de 200 Euros, ~$204) inclui o fornecimento de energia.
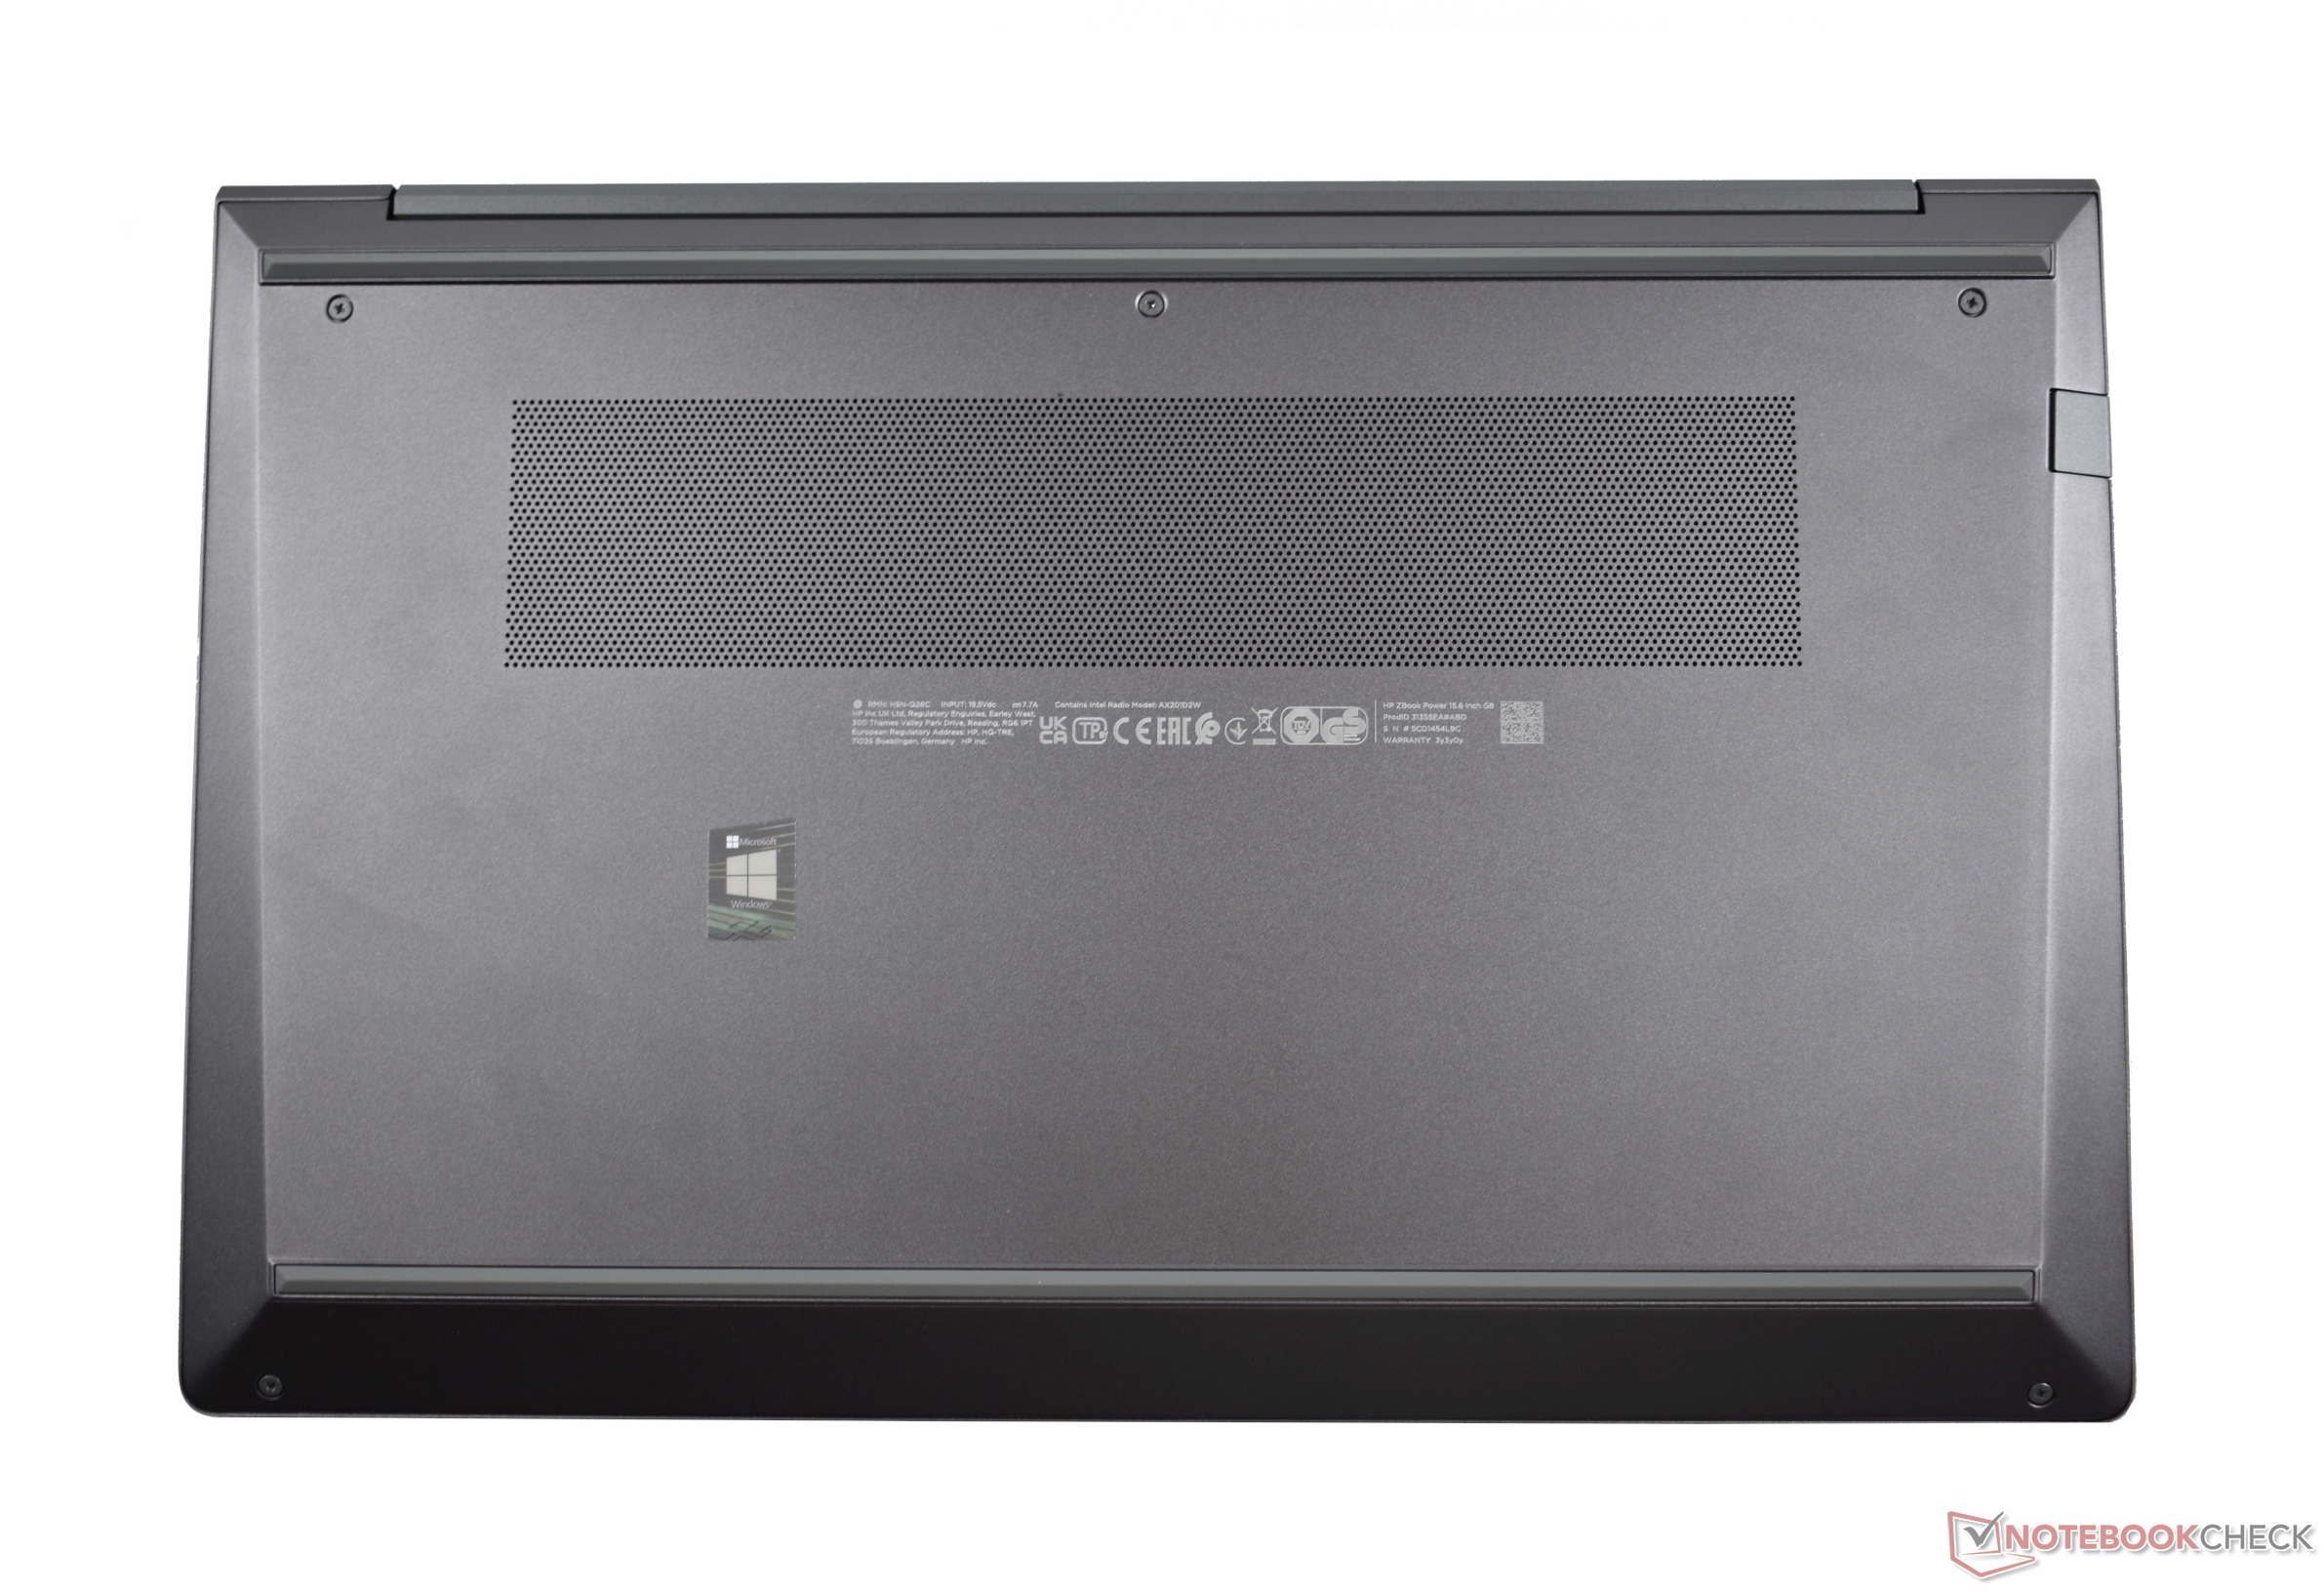
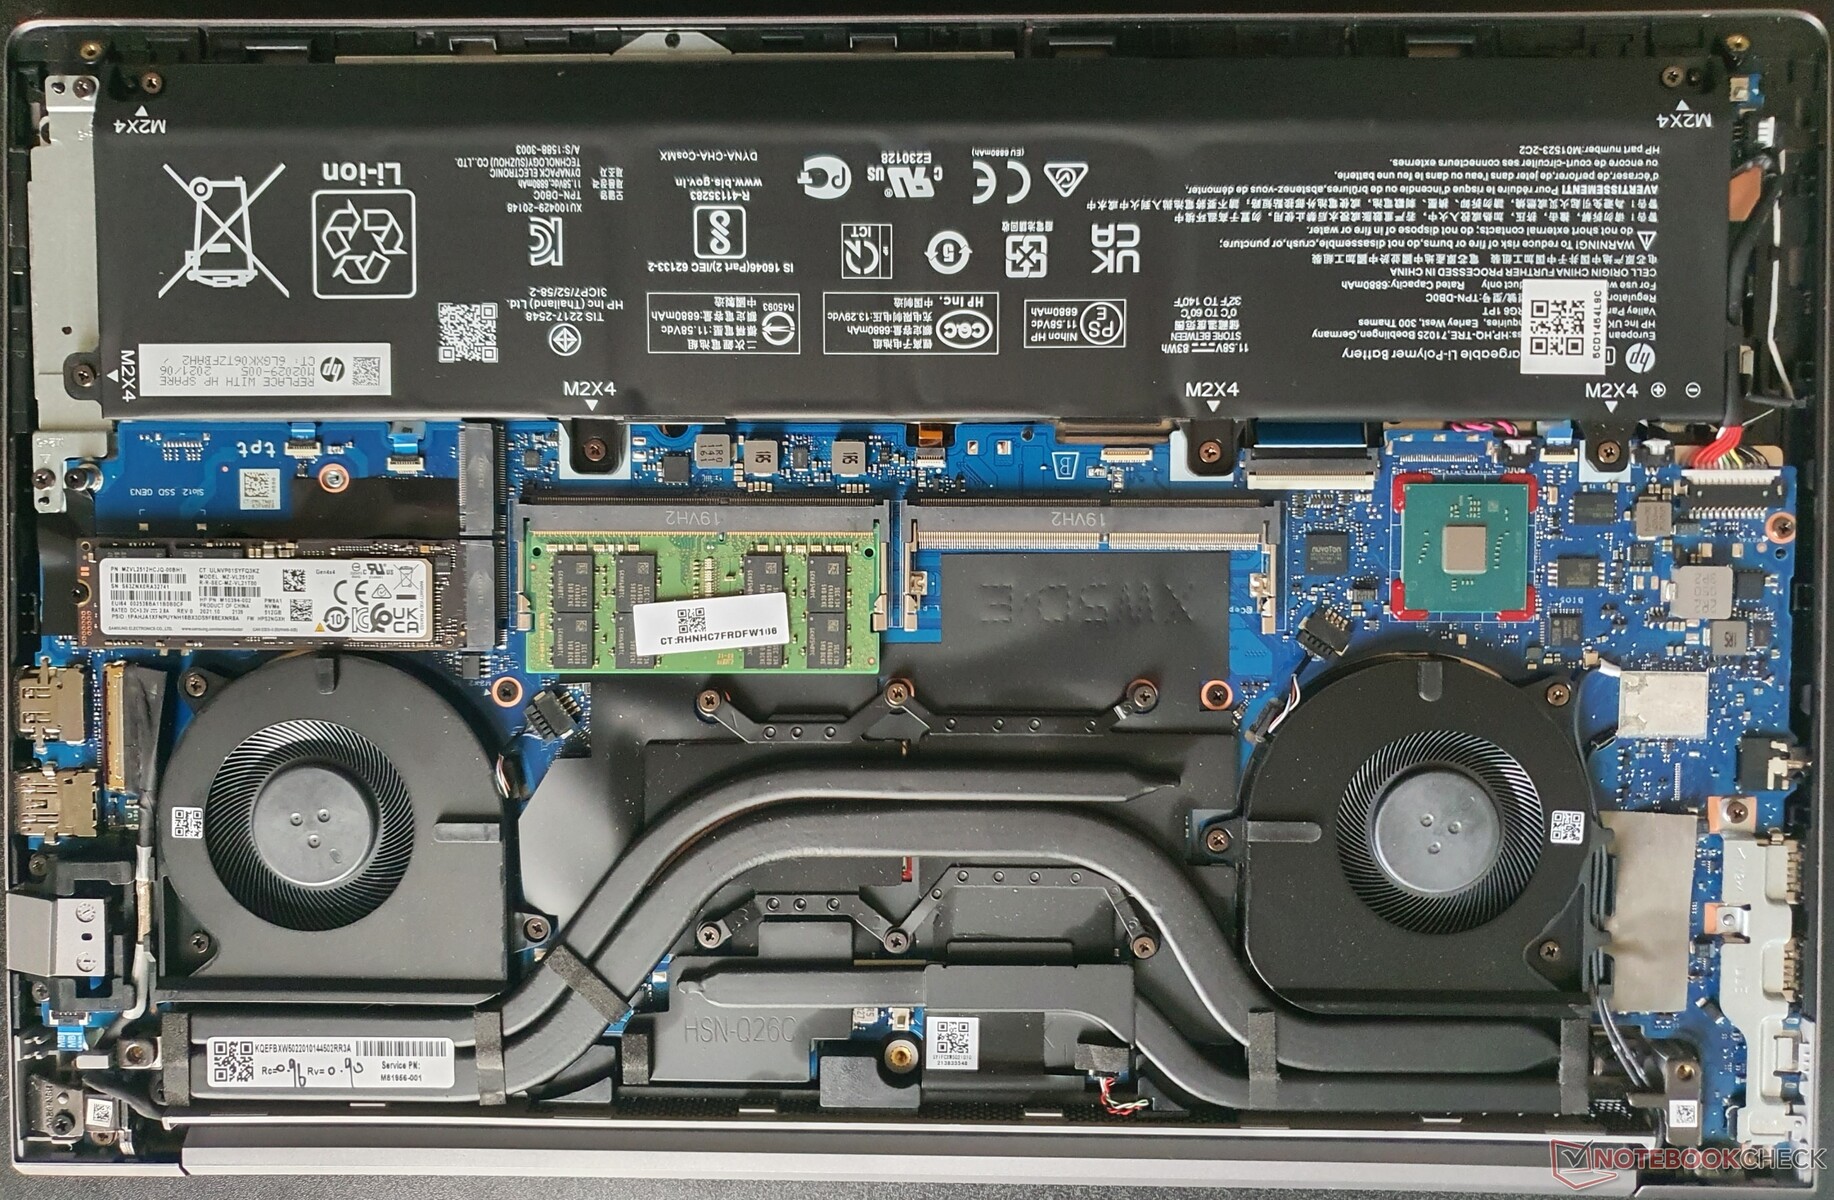
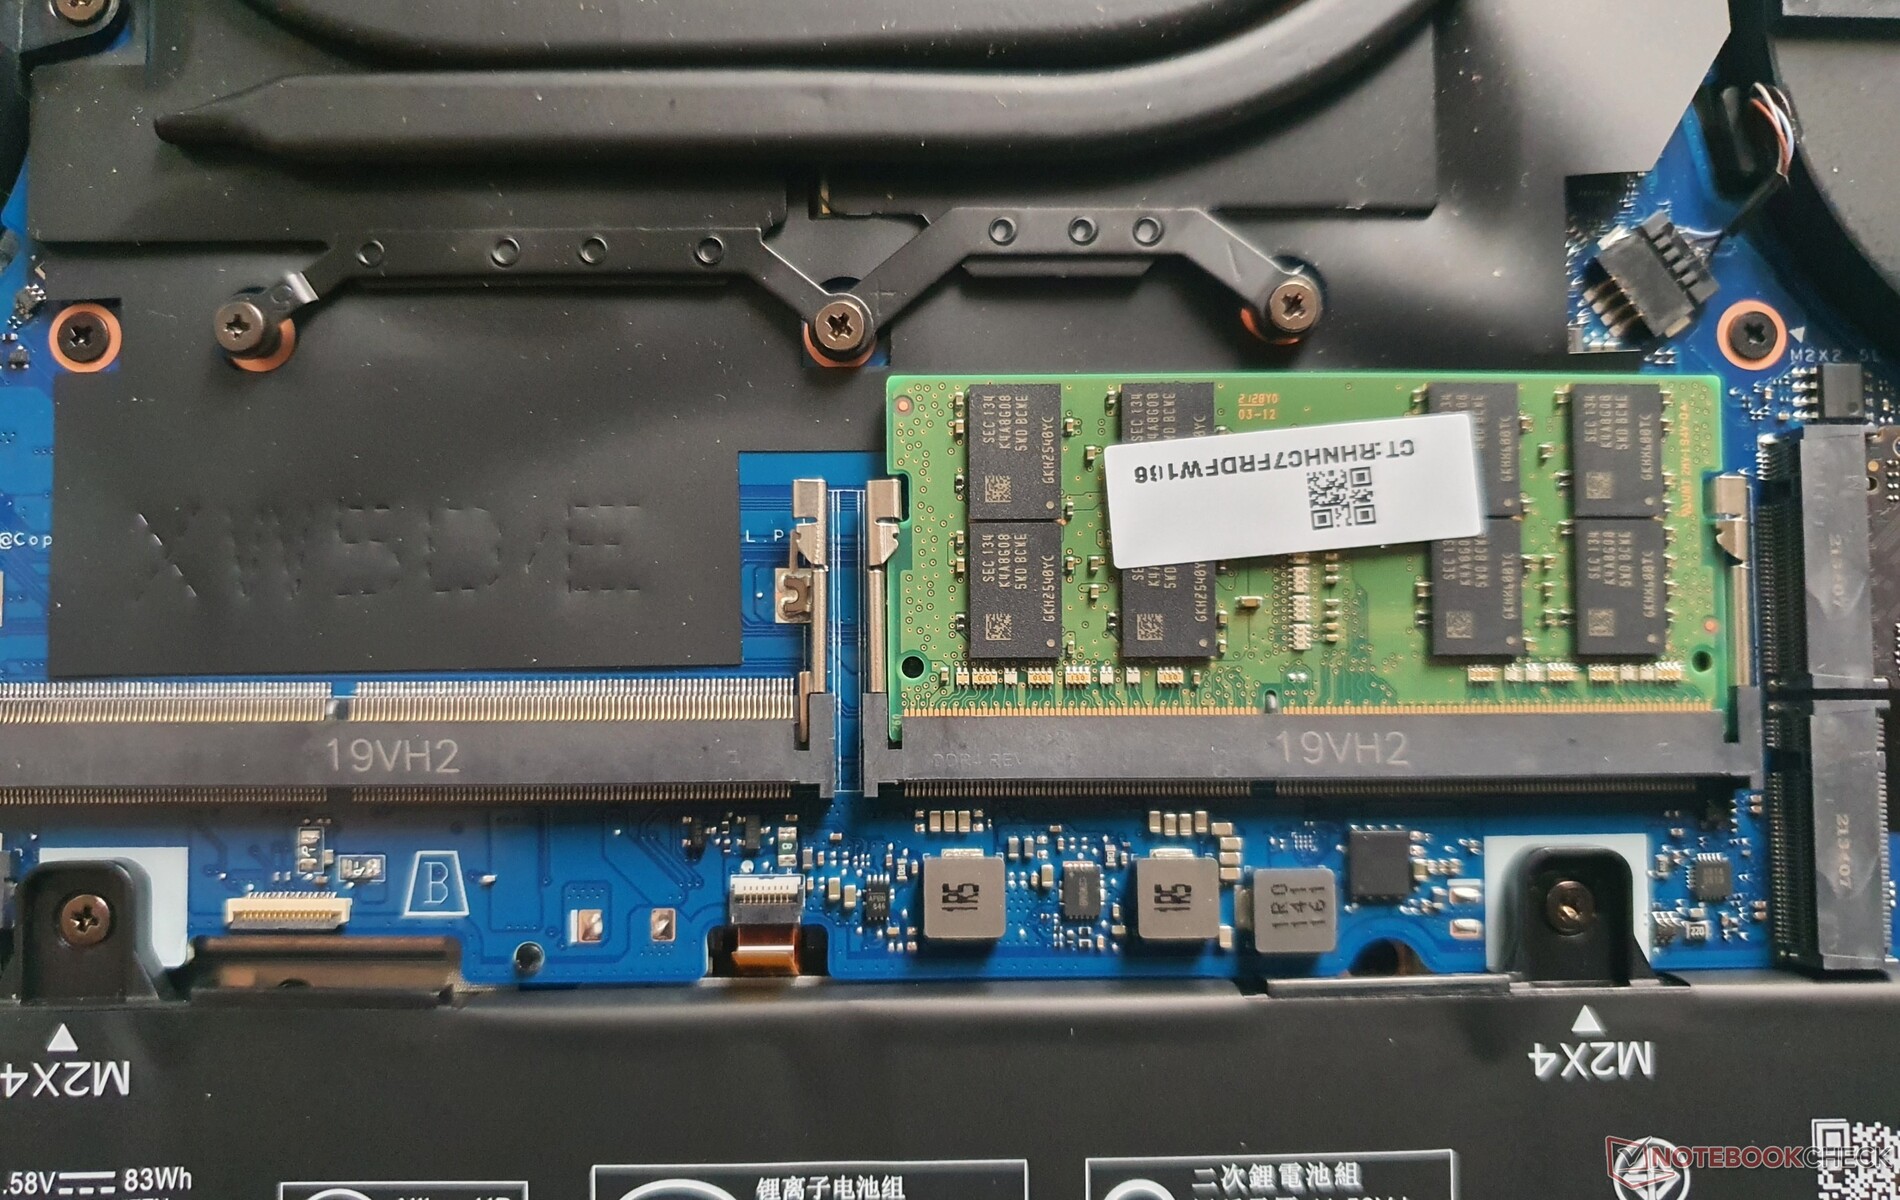
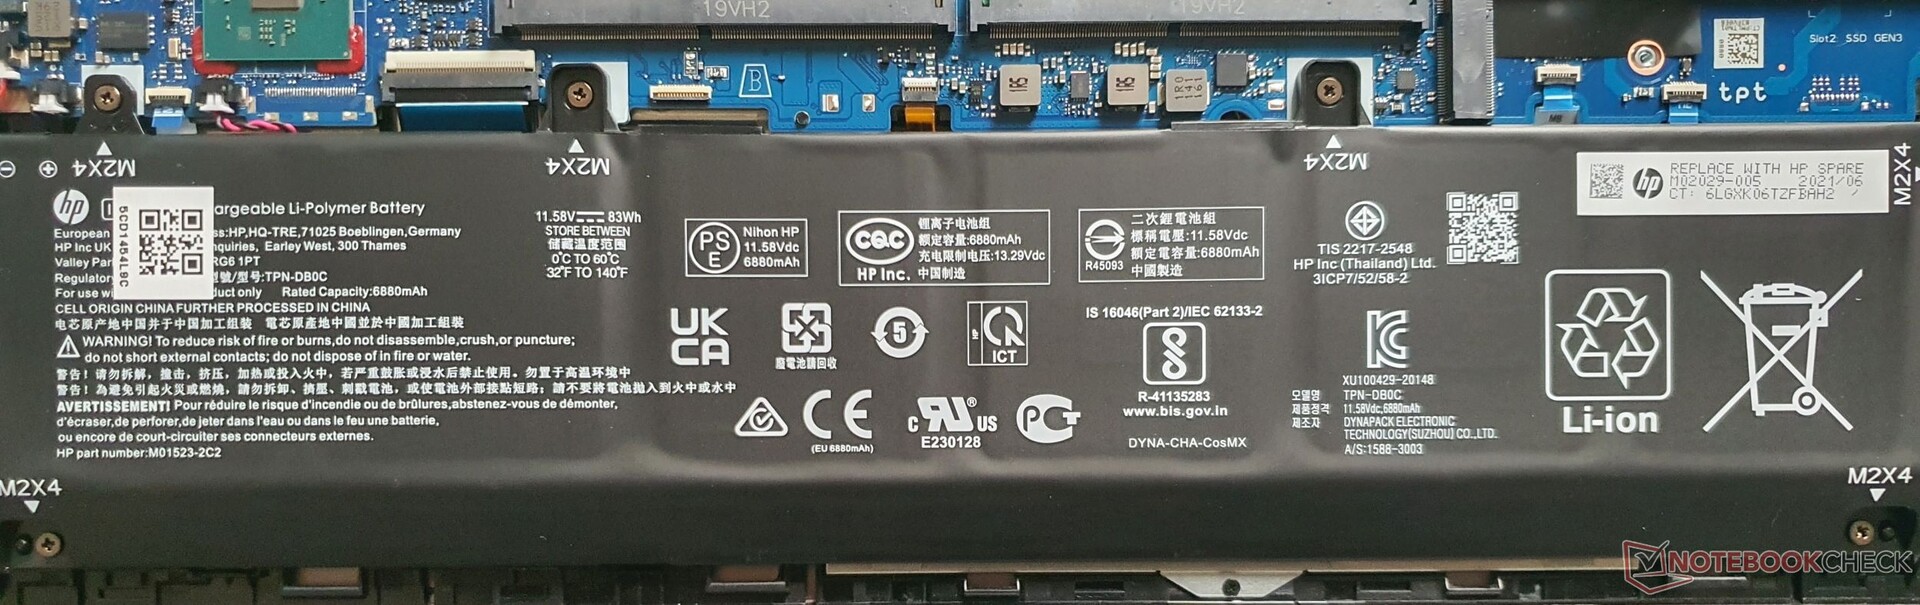
Manutenção
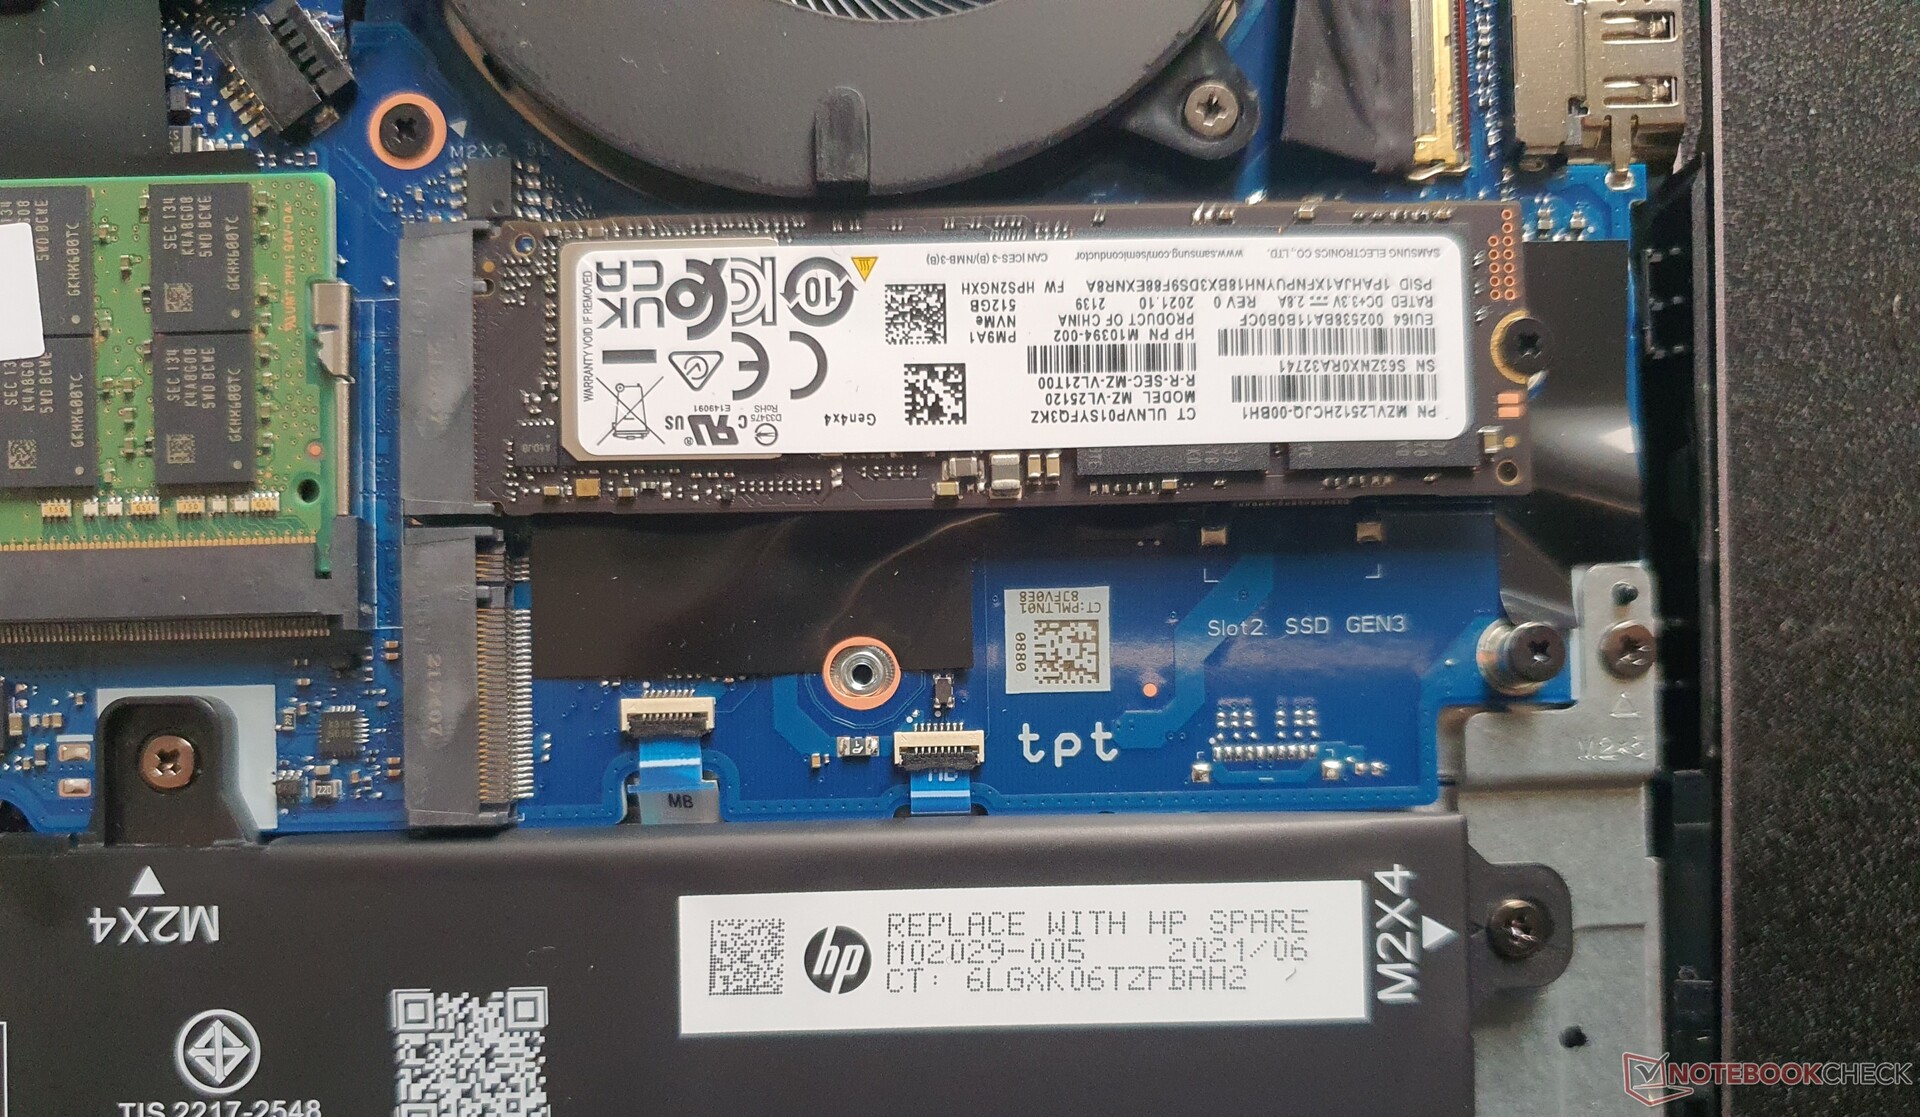
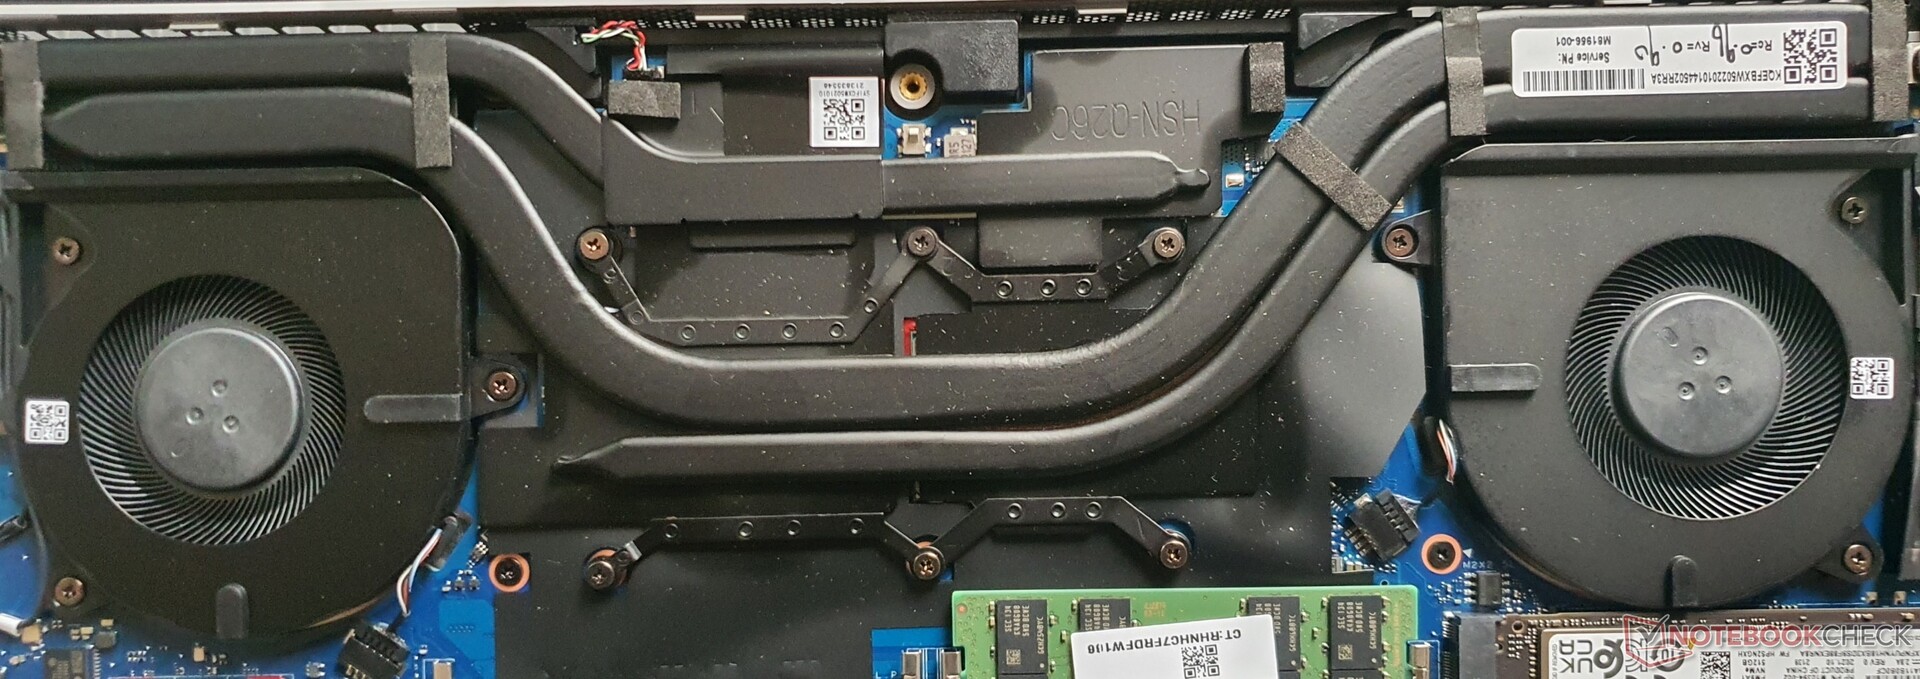
Após remover apenas cinco parafusos Philips, o fundo da caixa pode ser facilmente removido usando uma ferramenta de biselamento de plástico. Desta forma, você tem acesso a 2x SO DIMMs e 2x M.2-2280 slots, enquanto a bateria também é substituível e o sistema de resfriamento parafusado pode ser mantido. O módulo WLAN é soldado, e o teclado também é fixo. Não há WWAN.
Garantia
Na área do idioma alemão, a HP oferece uma garantia padrão de 3 anos, que pode ser expandida até 5 anos. Ela inclui serviço de coleta e devolução, e custos extras de serviço no local. Isto corresponde às políticas da HP para laptops comerciais high-end.
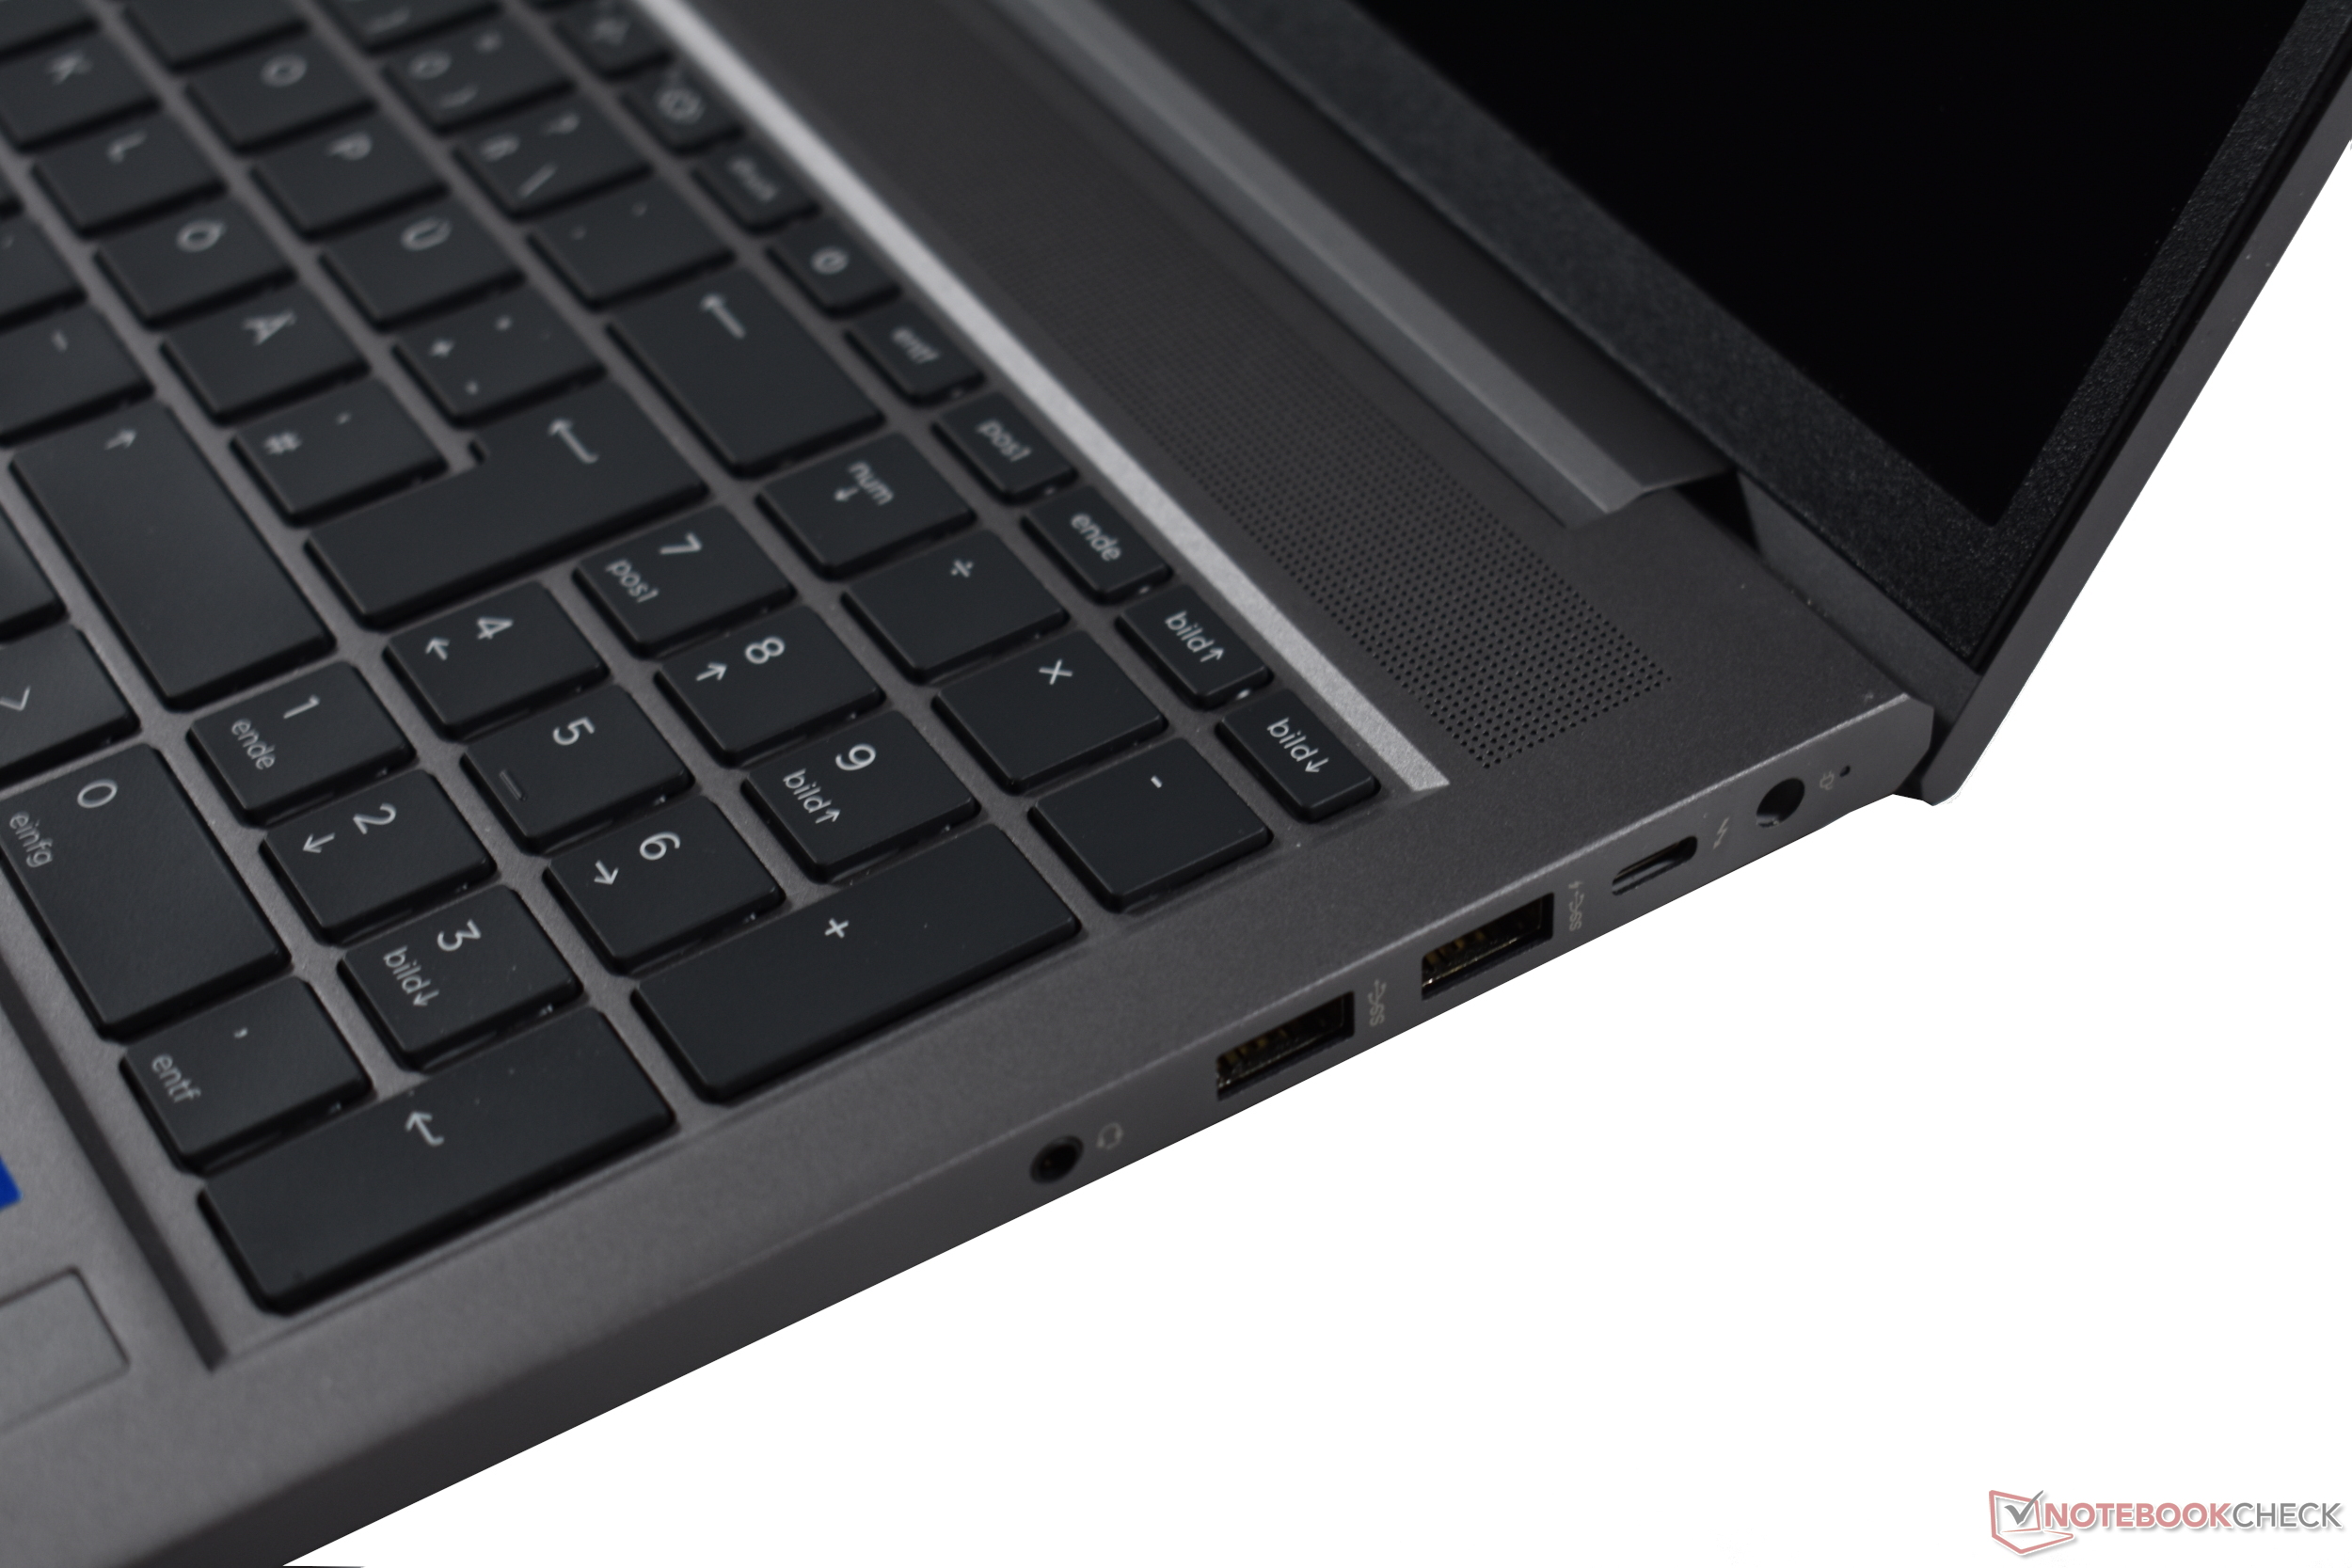
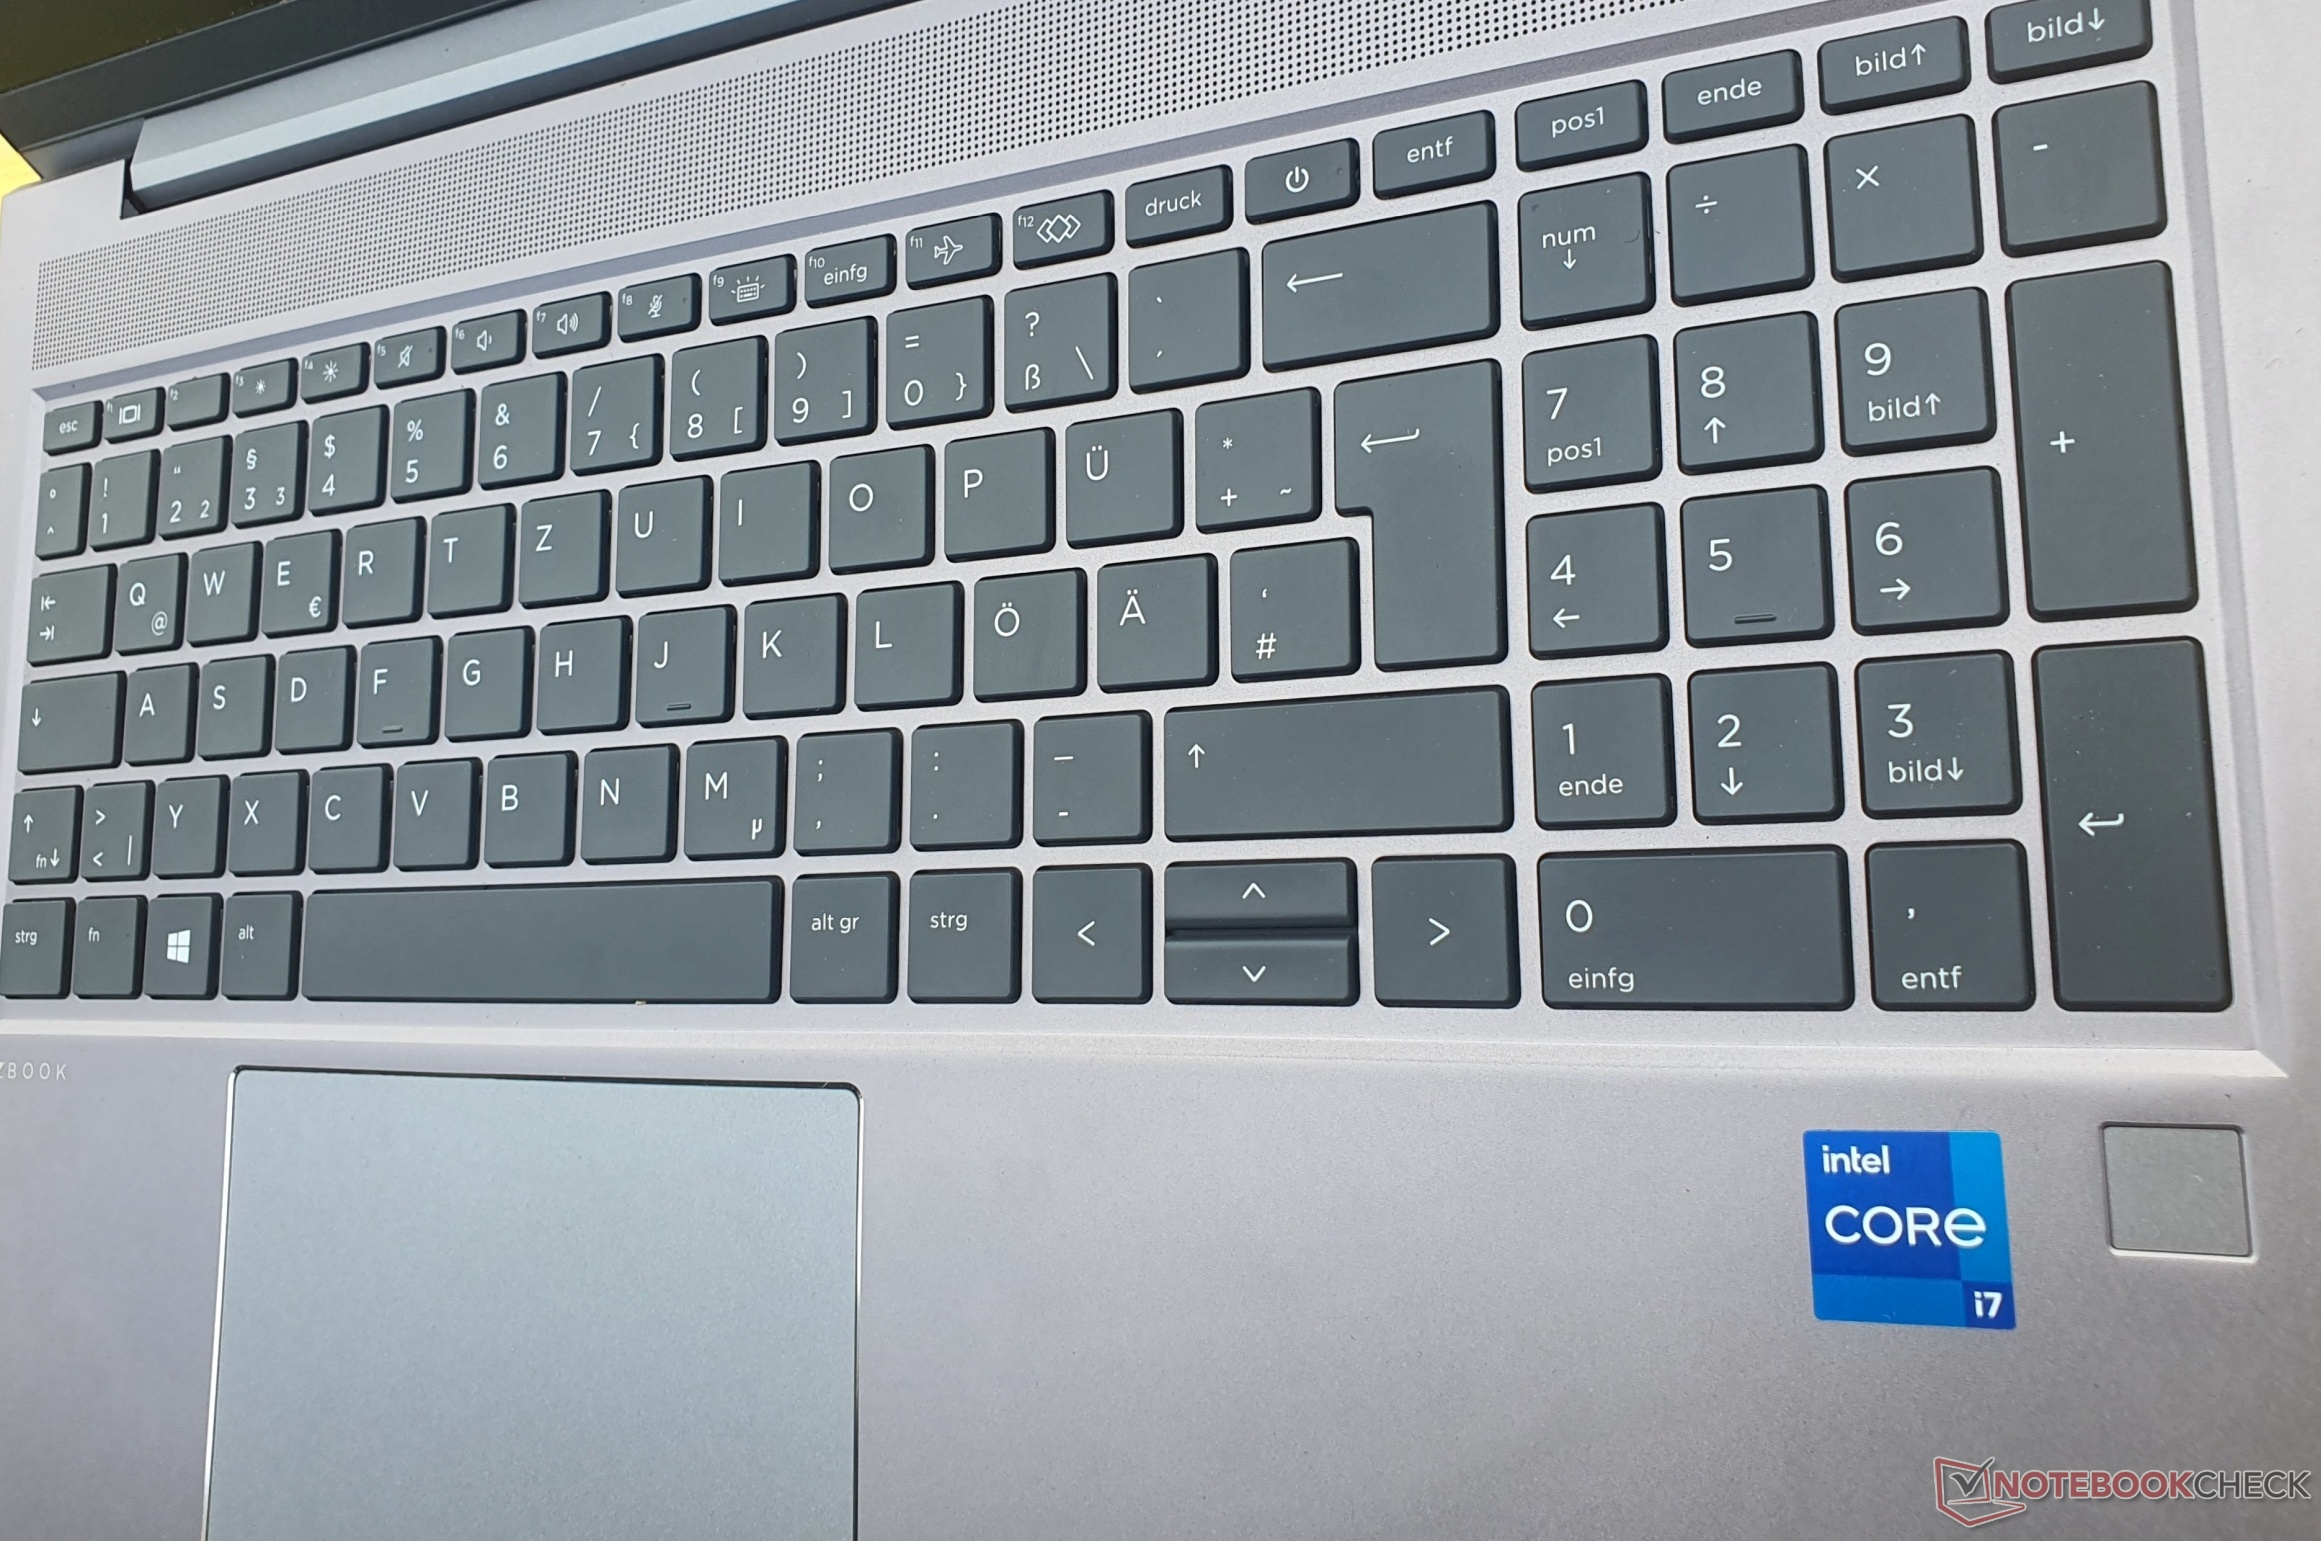
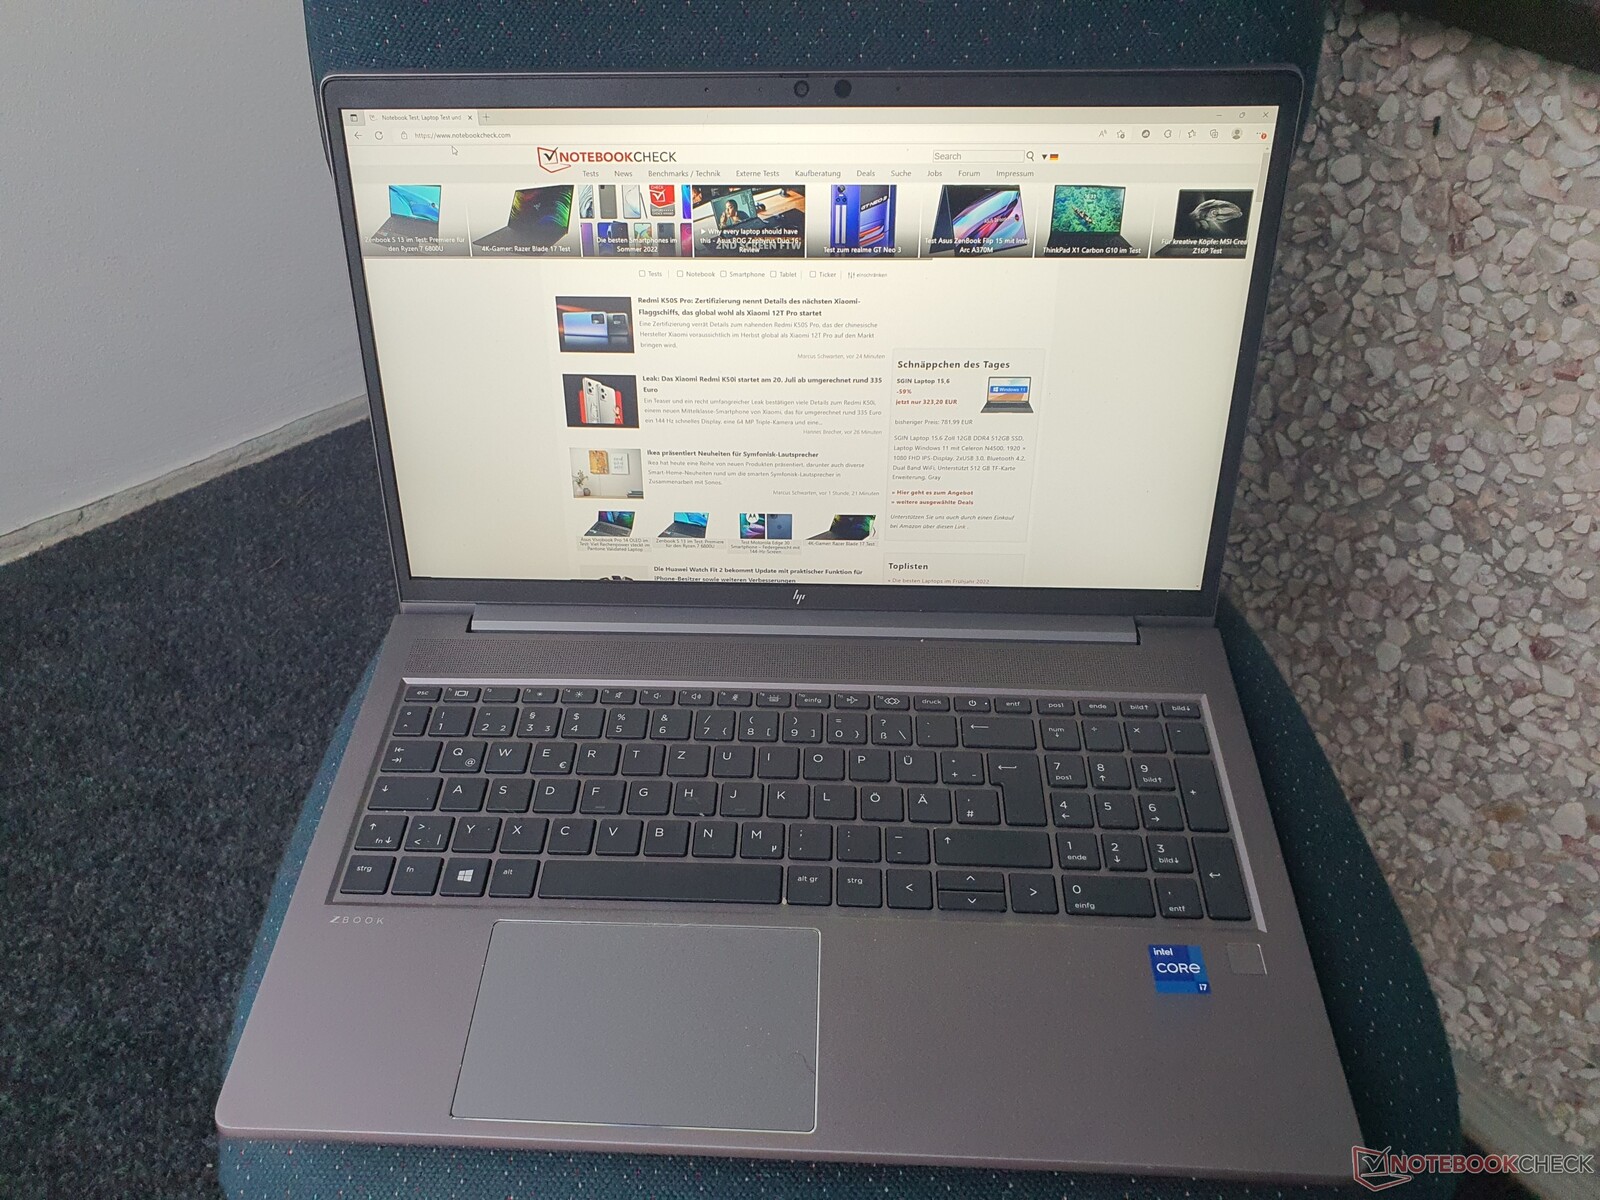
Dispositivos de entrada: ZBook Power impressiona com um teclado nítido
Teclado
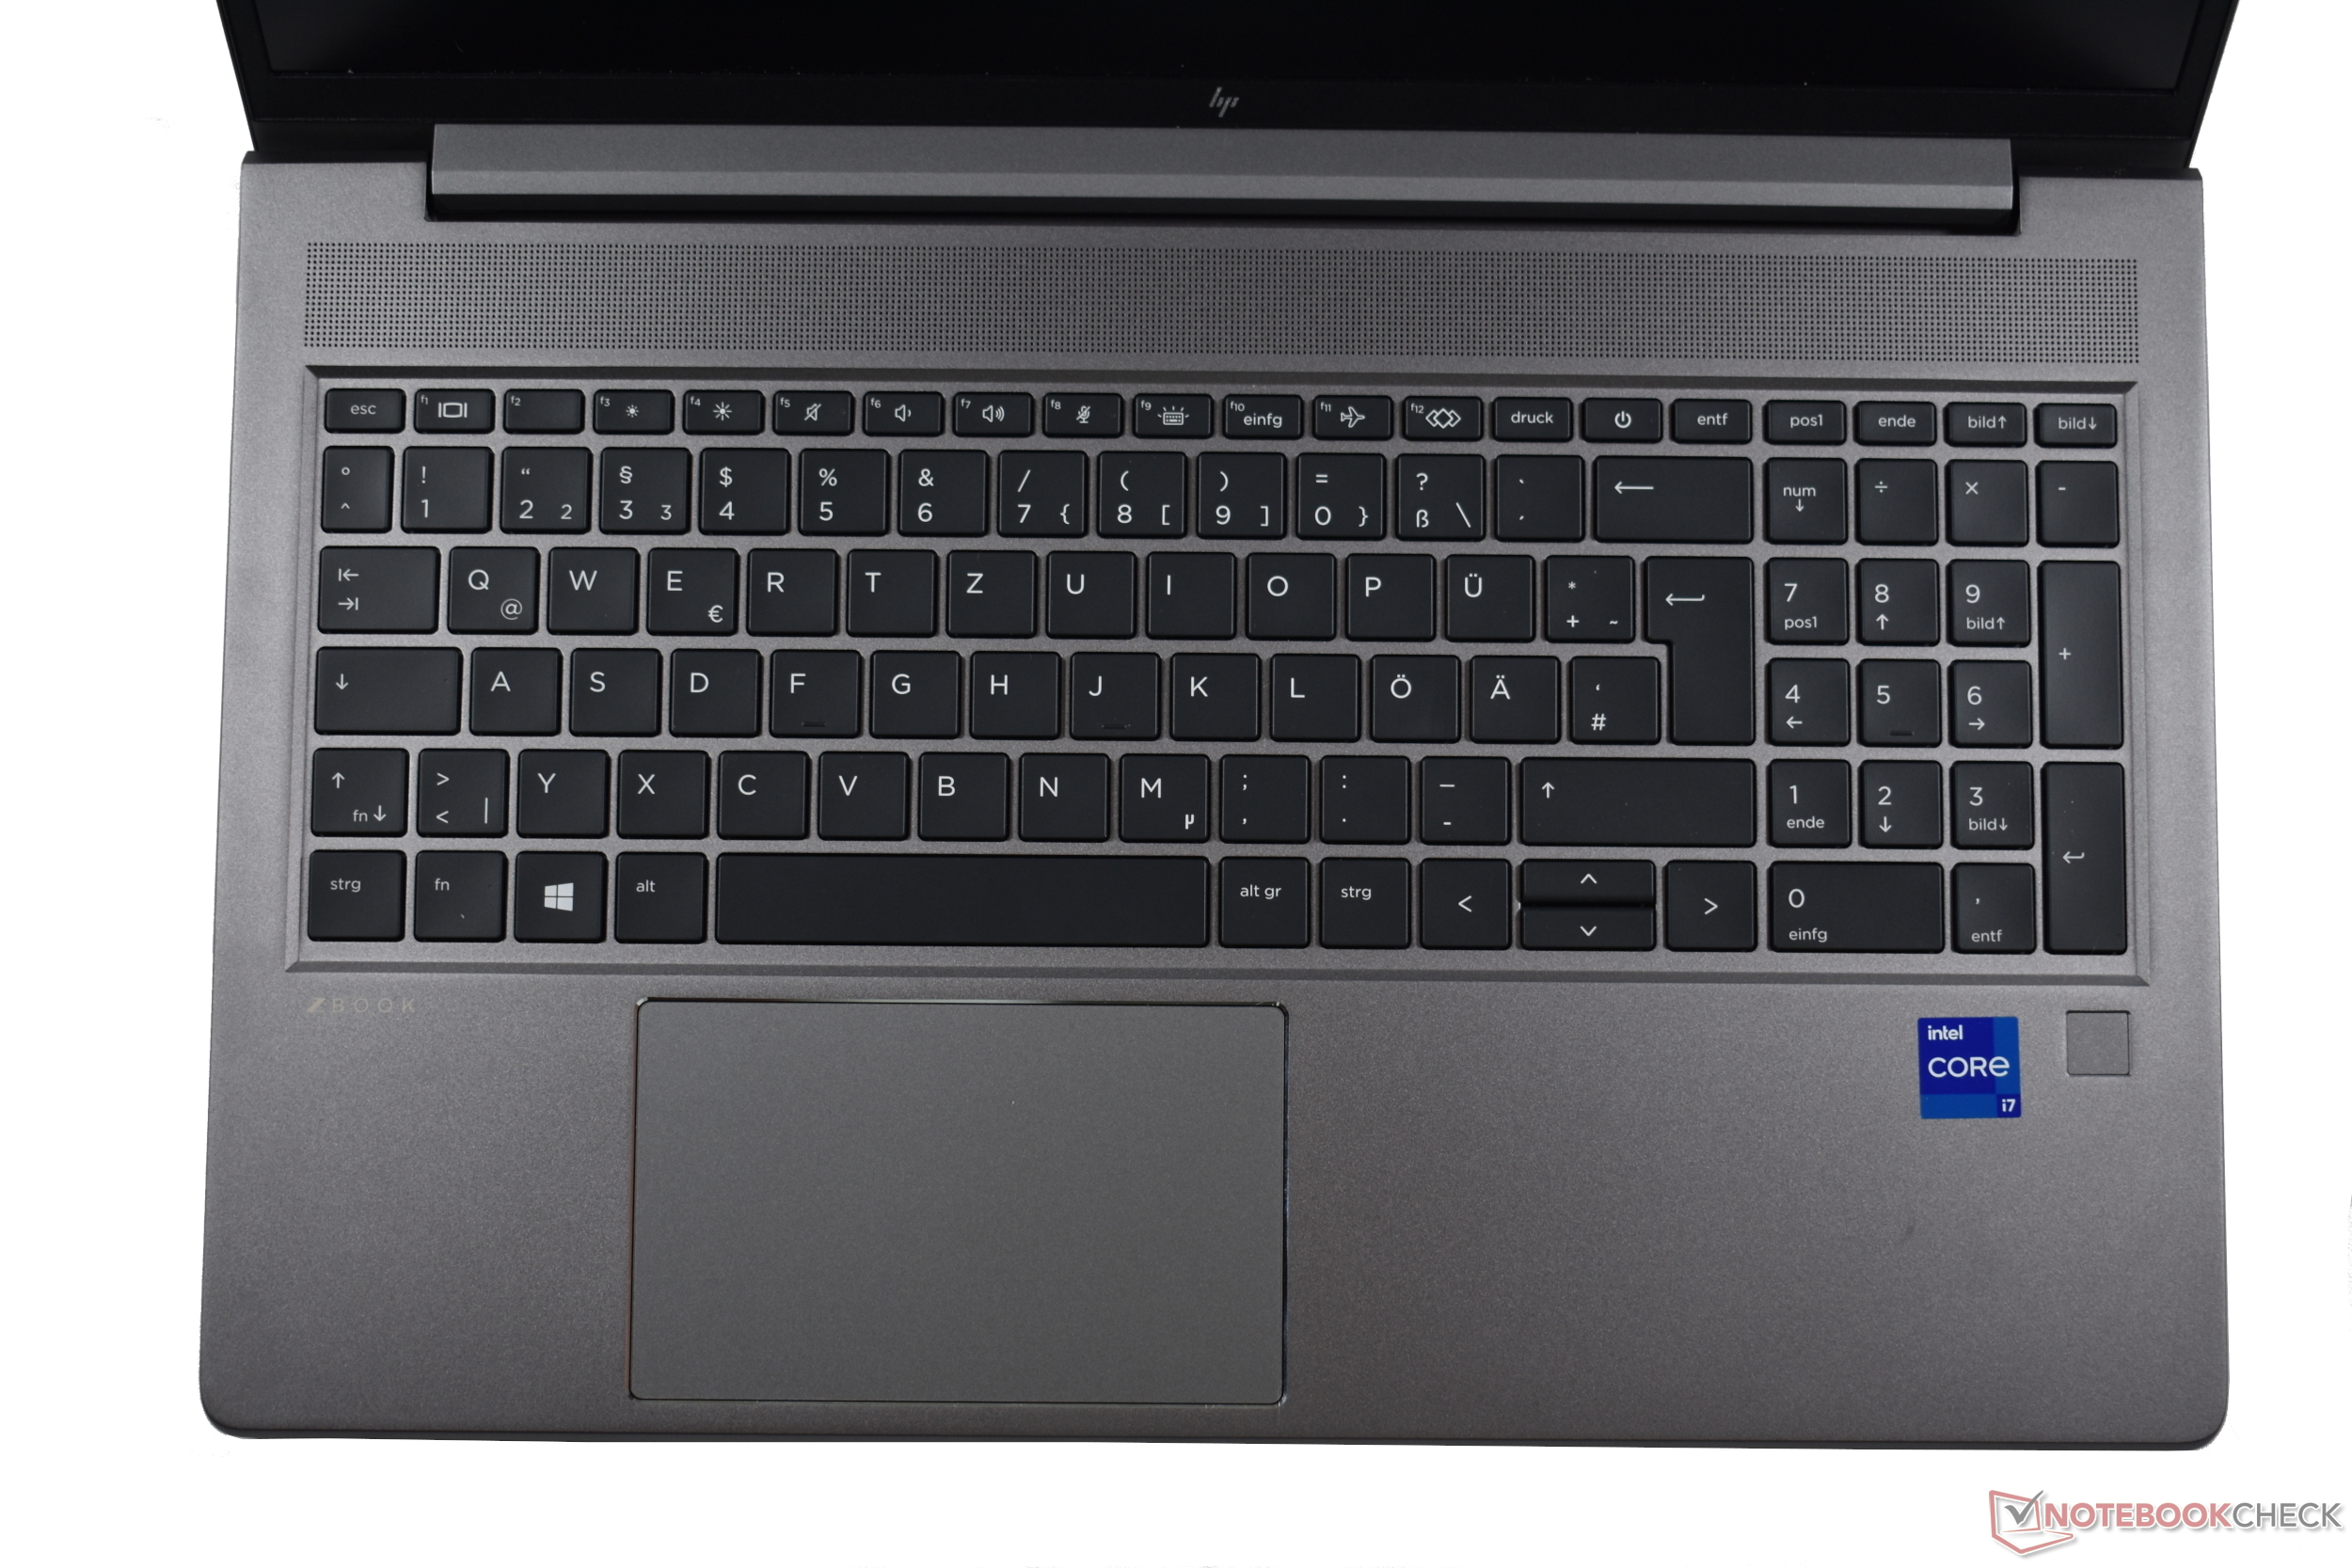
Enquanto o teclado tem teclas ligeiramente menores (15 × 15 mm, ~0,6 x 0,6 pol.) e distâncias, as letras são maiores. Tem uma estreita semelhança com a do ZBook Firefly eZBook Furypor isso, a experiência de digitação é igualmente nítida e o ponto de pressão é claramente perceptível. O curso de ~1,5 mm (~0,06 pol.) aumenta a impressão geral atraente
O teclado é à prova de salpicos e seu funcionamento permanece atrativamente silencioso. Ele só pode ser pressionado muito ligeiramente, aplicando alguma pressão em um único ponto. Não é necessariamente pior do que a do PensePad P15v.
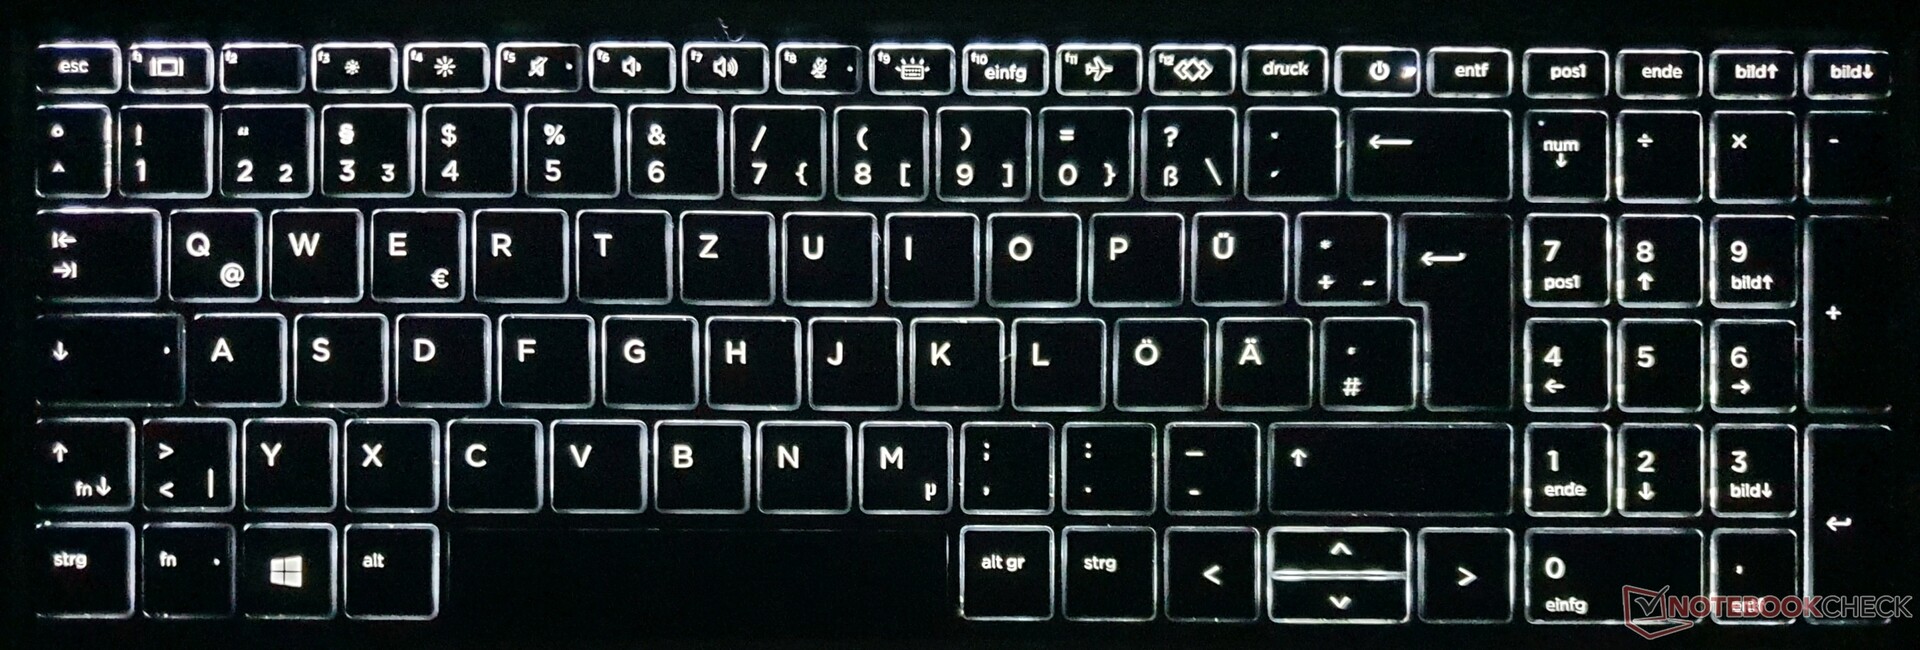
O layout é muito bem sucedido, mas as teclas que são menores incluem as teclas Enter, Shift esquerdo, setas verticais, bloco de números e a linha superior. O botão de alimentação também está integrado na fileira superior, mas pressioná-lo acidentalmente não fará com que o laptop vá dormir. Há uma iluminação de dois passos, e sua duração pode ser configurada na BIOS.
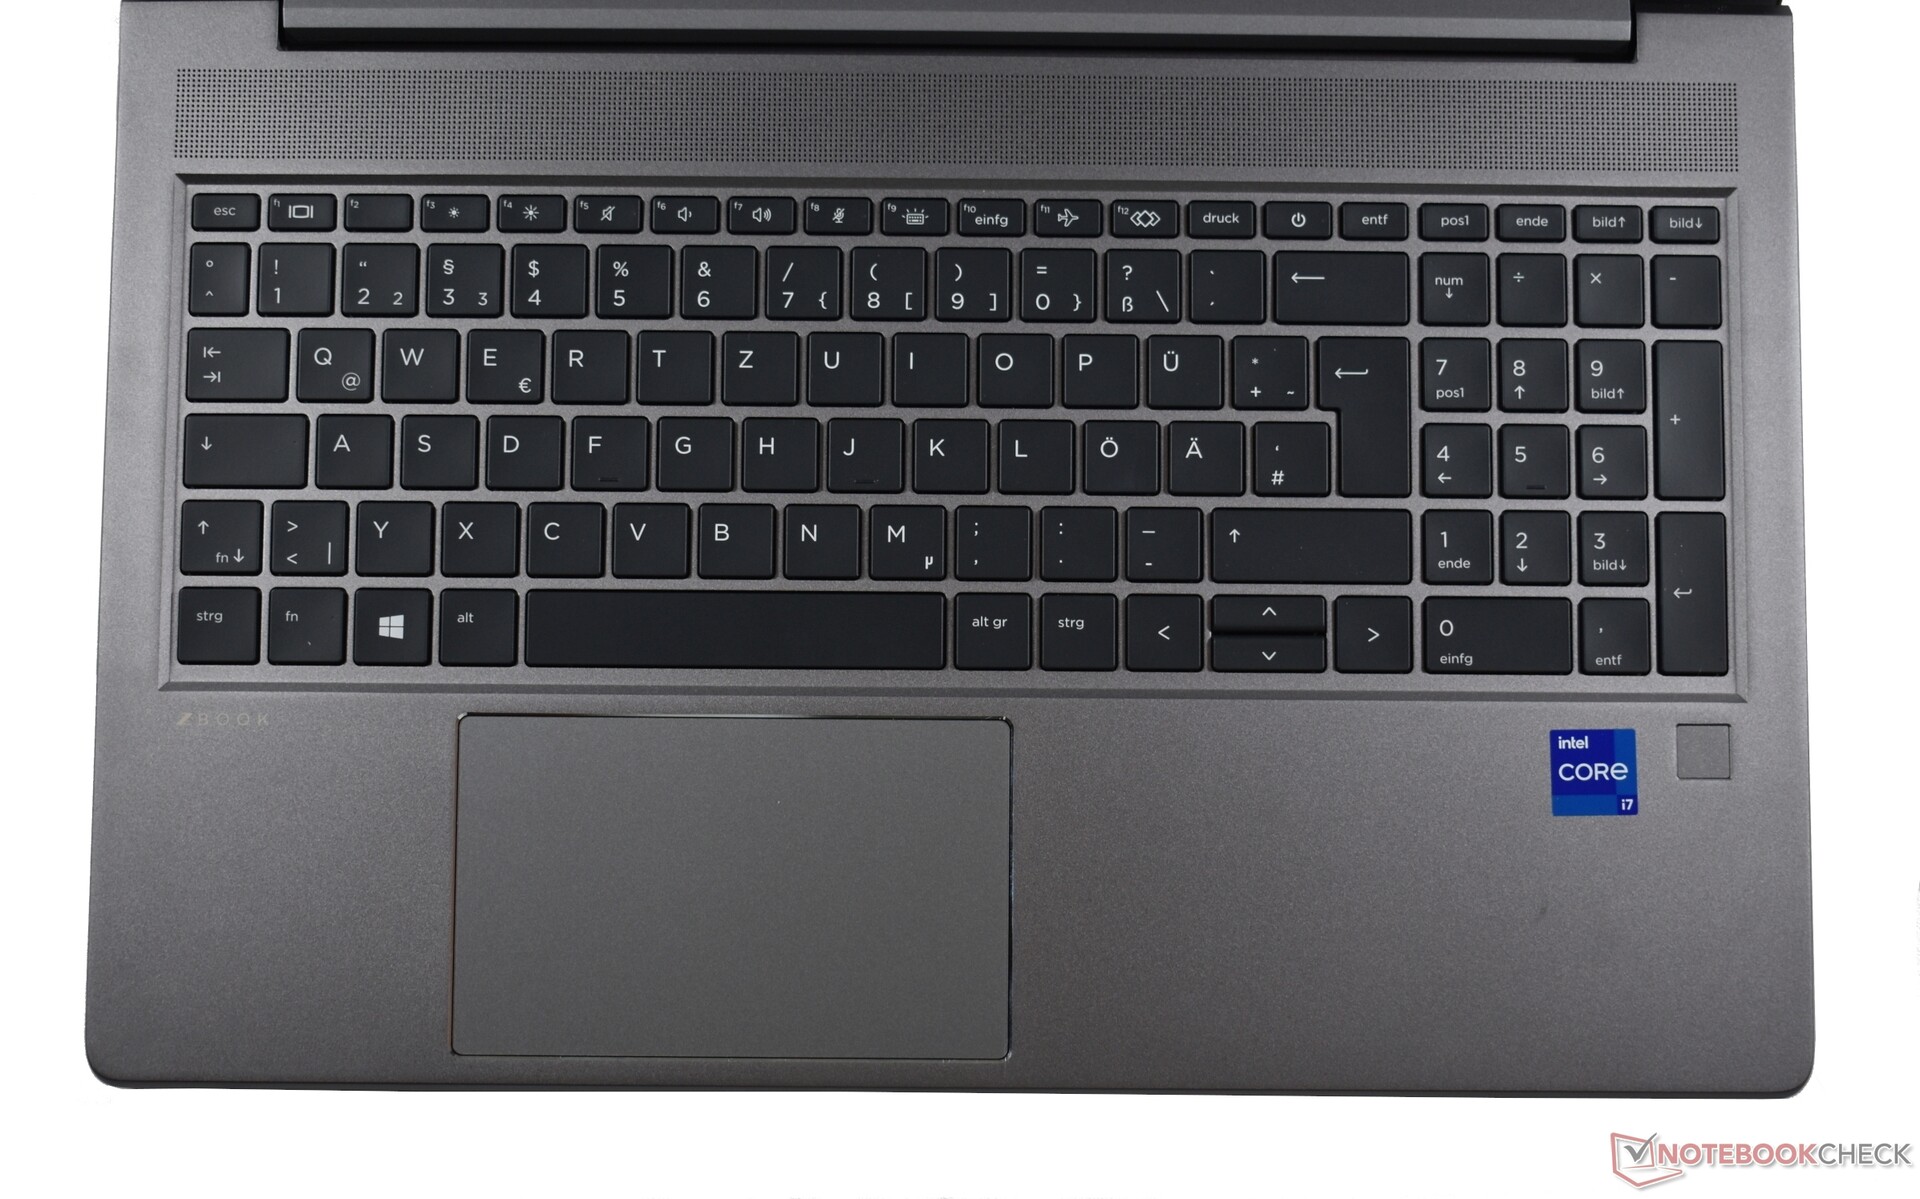
Touchpad
O 11,5 × 7 cm (~4,5 x 2,75 pol.) é extremamente responsivo e preciso. A superfície lisa do vidro oferece características de deslizamento muito boas e todos os gestos são implementados sem falhas. As teclas integradas têm um curso médio e produzem um feedback potente e alto.
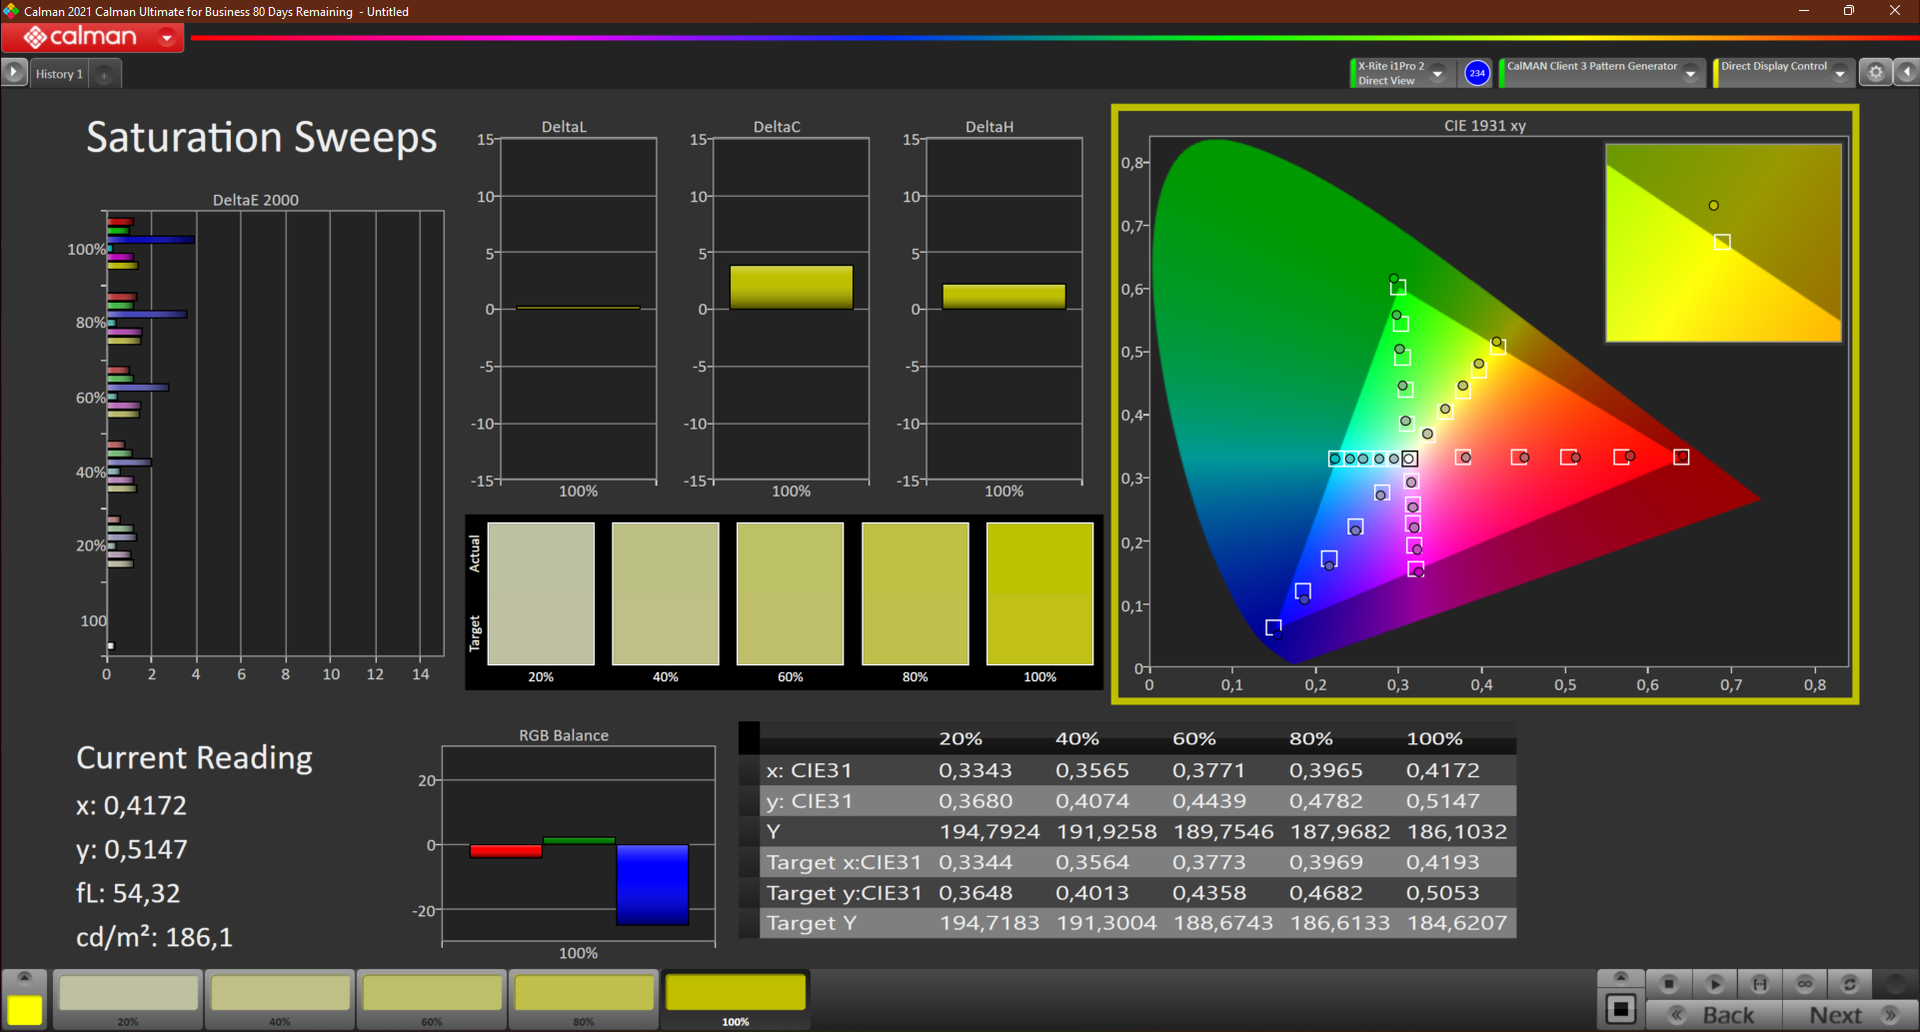
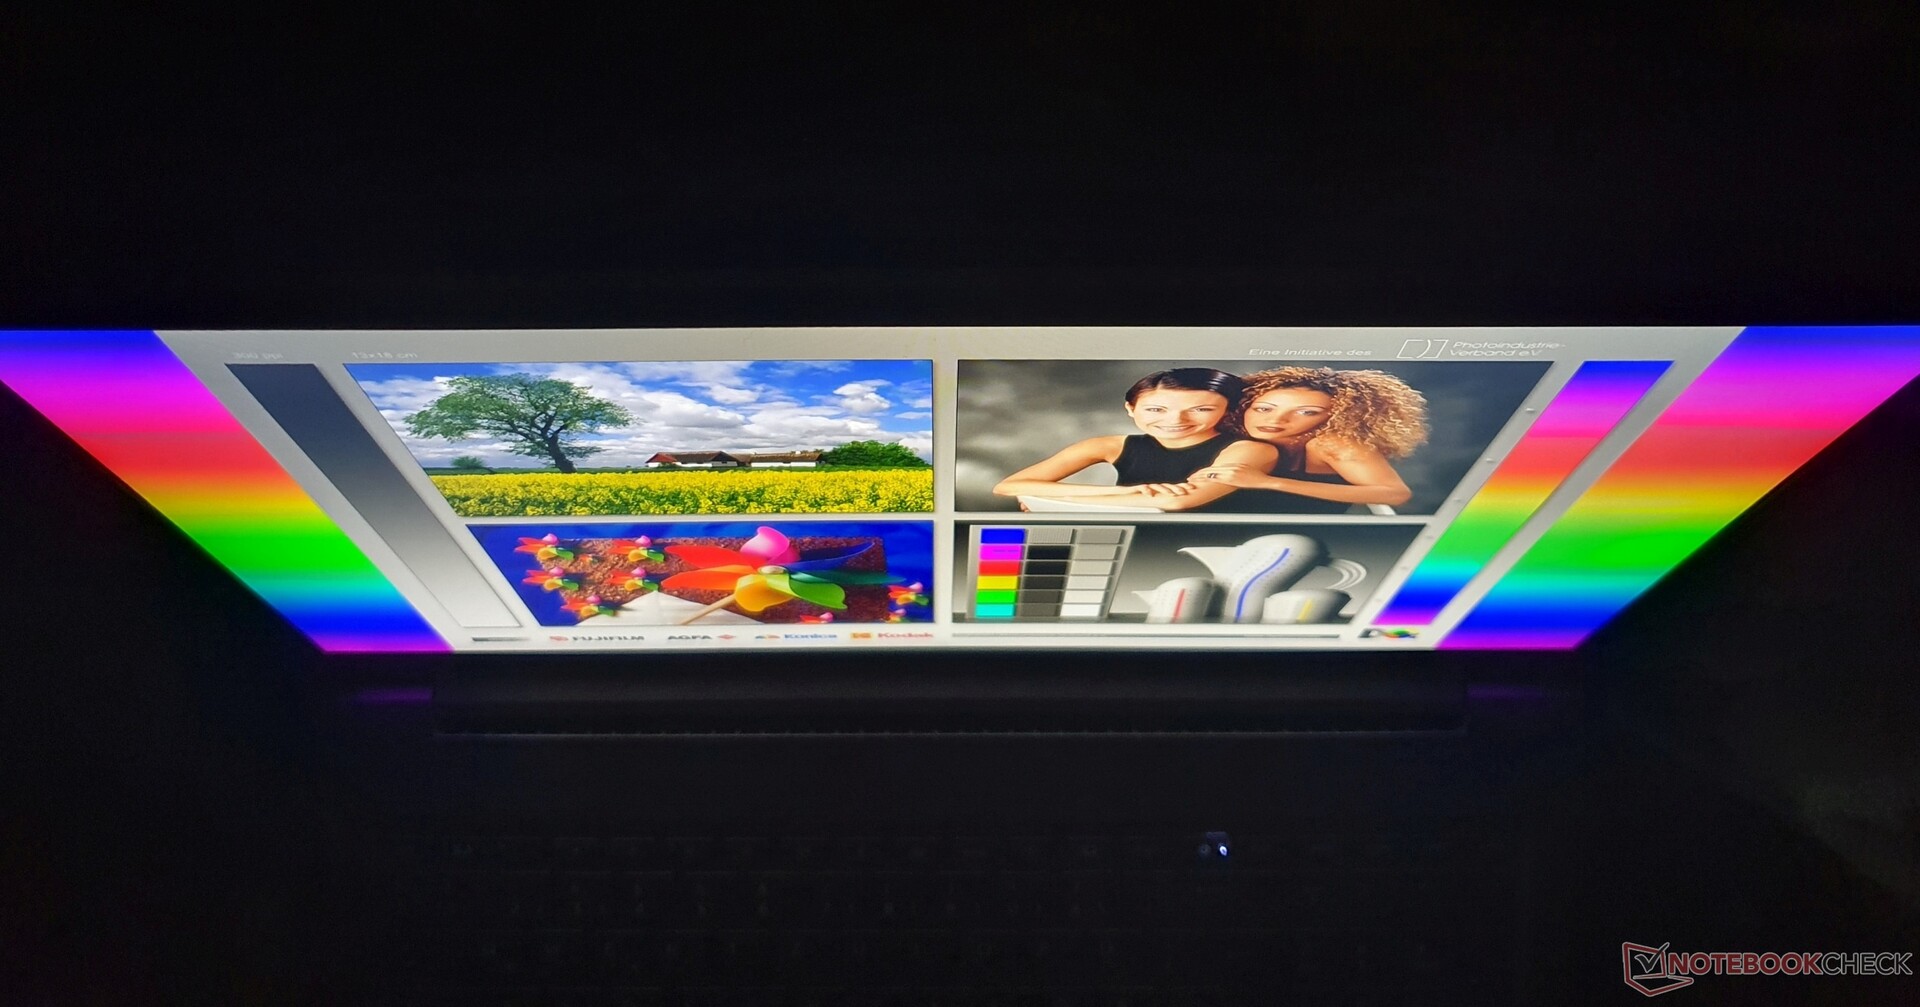
Visor FHD brilhante e de alto contraste no ZBook Power

Nossa configuração inclui o mesmo painel FHD IPS fosco de 15,6 polegadas, brilhante (400 lêndeas), de baixa potência (AUOA08B) no formato 16:9 como o antecessor. Também é usado em vários HP Elite e ProBooks, assim como no HP Envy x360 15.
A opção 4K (3840 x 2160 pixels) deve reduzir notavelmente a vida útil da bateria e, de acordo com a folha de dados, oferece apenas uma cobertura completa do espaço de cor sRGB, como o painel 4K no ZBook Firefly G7 - assim você vai procurar em vão pelo Dreamcolor. O painel de nível básico utiliza FHD IPS com apenas 250 lêndeas de brilho e com toque opcional.
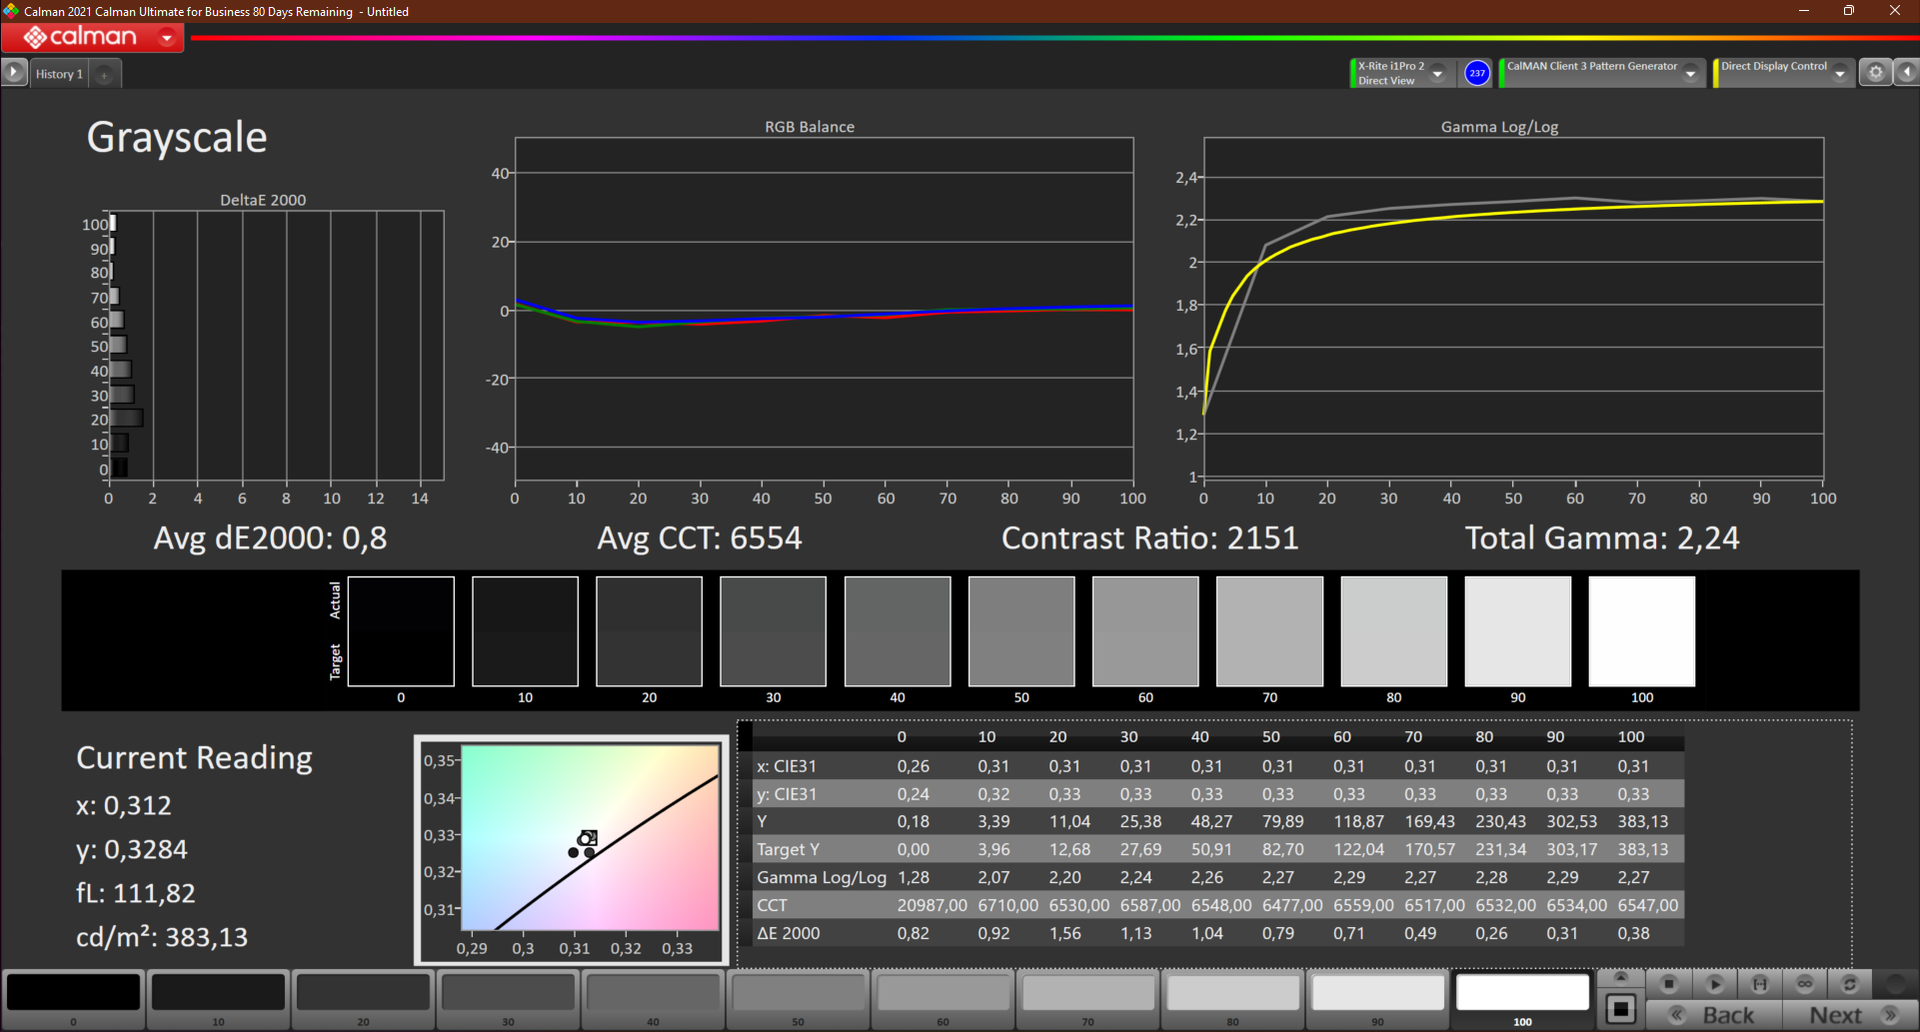
Com uma média de 385 lêndeas, o painel fica significativamente mais brilhante do que o do PensePad P15ve Precision 3551. Os valores DeltaE (< 2) também são muito mais precisos. O contraste é um bom 1574:1 e junto com o valor preto de 0,25 lêndeas produz um preto saturado. Os tempos de resposta lentos são uma desvantagem. Não há cintilação de PWM
| |||||||||||||||||||||||||
iluminação: 78 %
iluminação com acumulador: 393 cd/m²
Contraste: 1572:1 (Preto: 0.25 cd/m²)
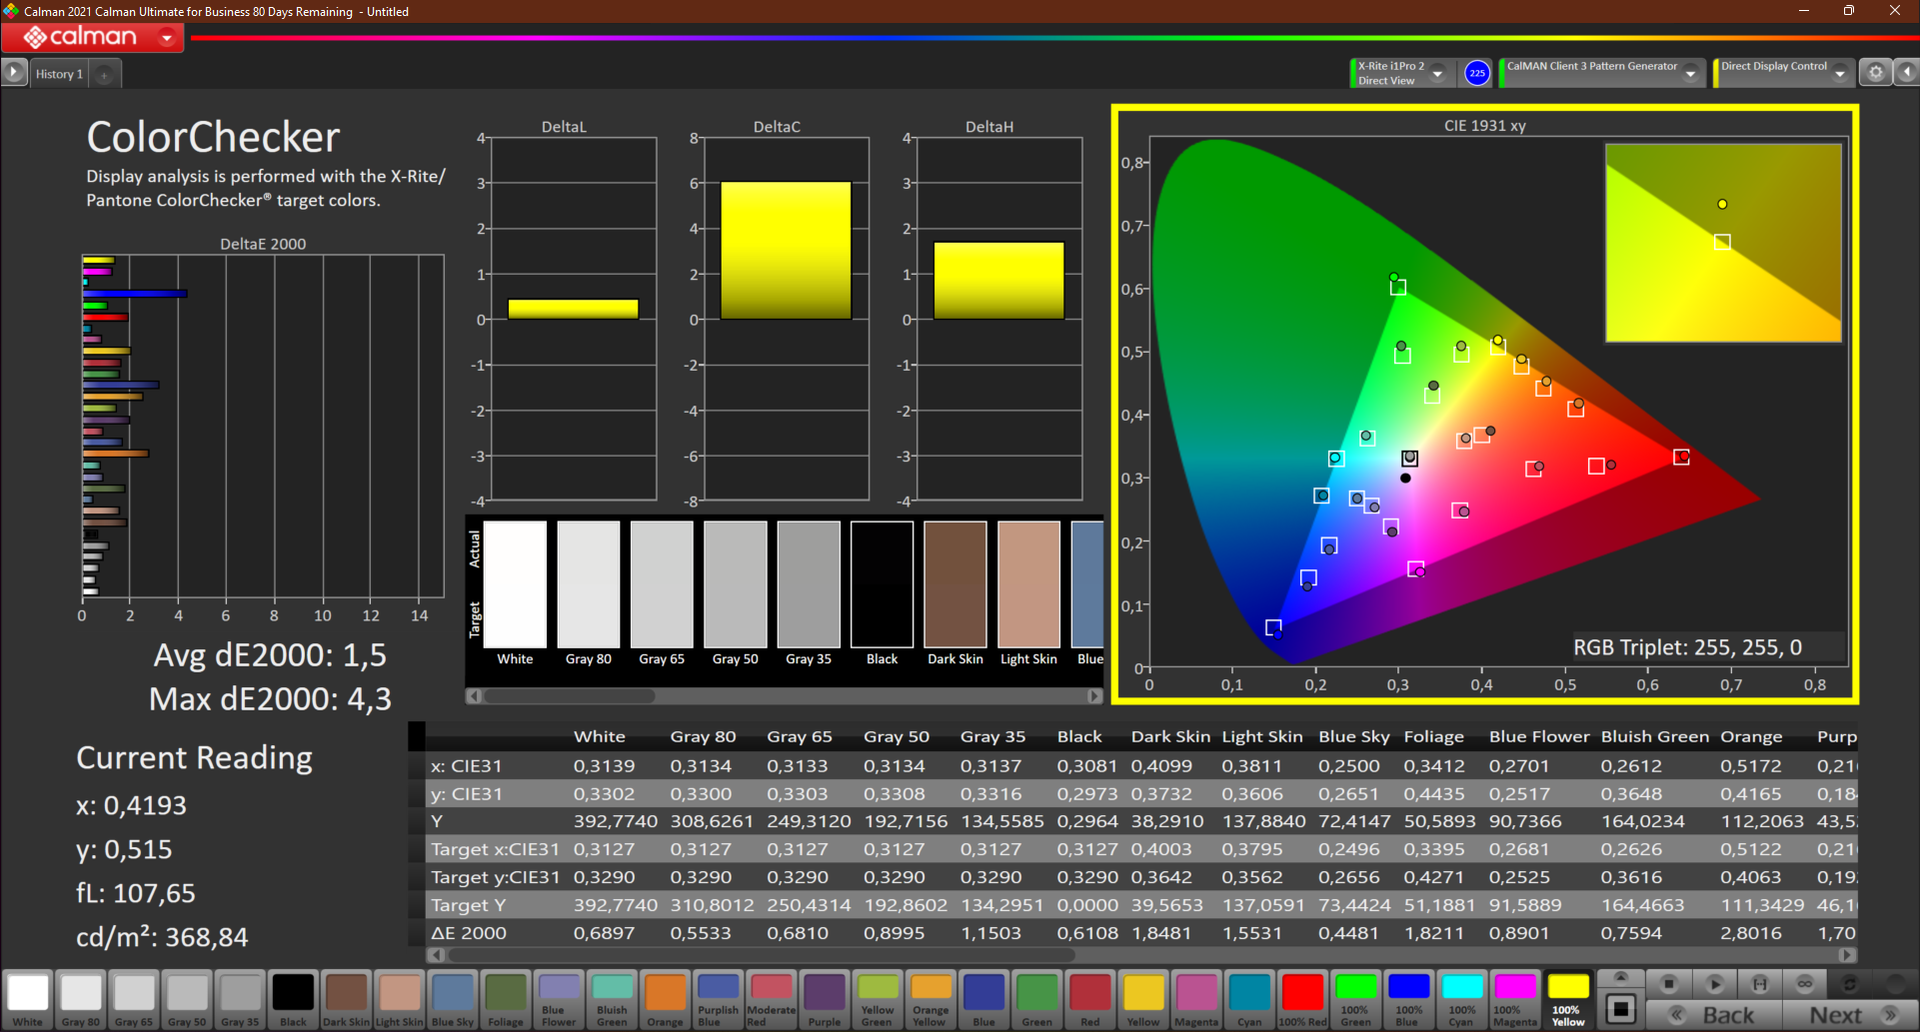
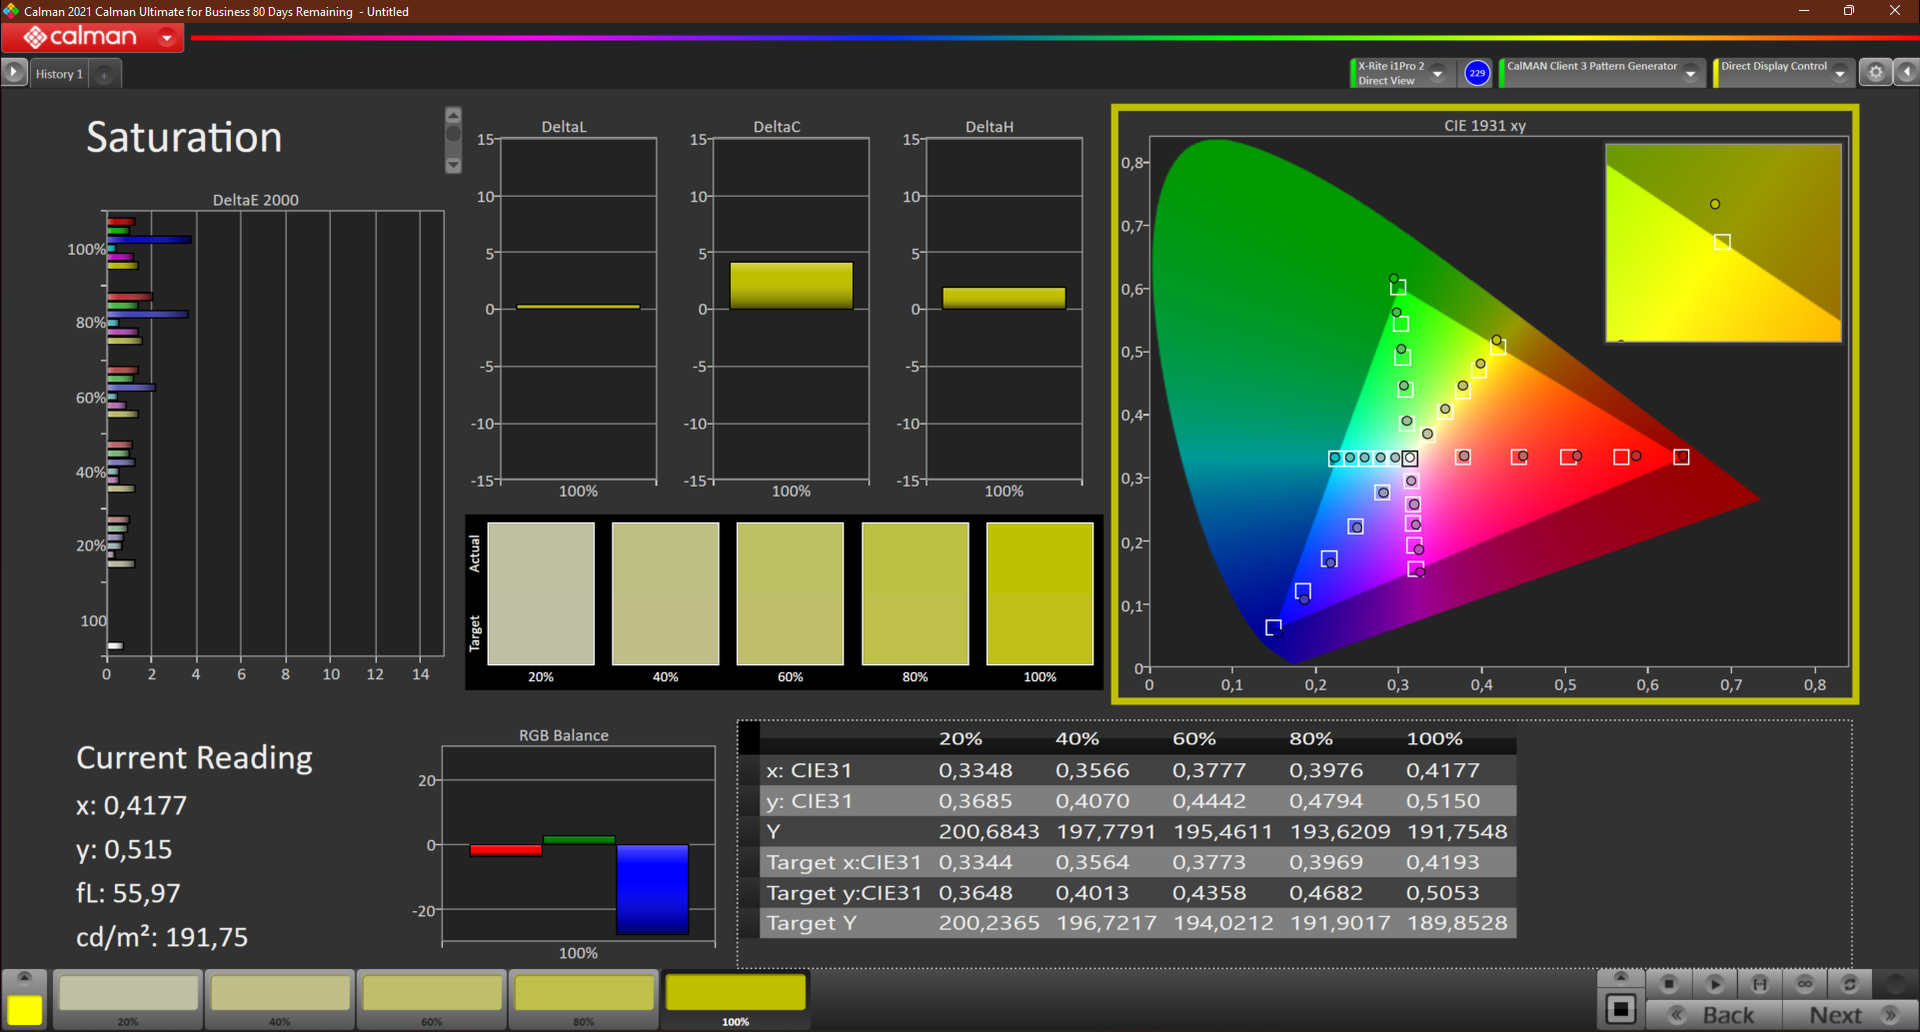
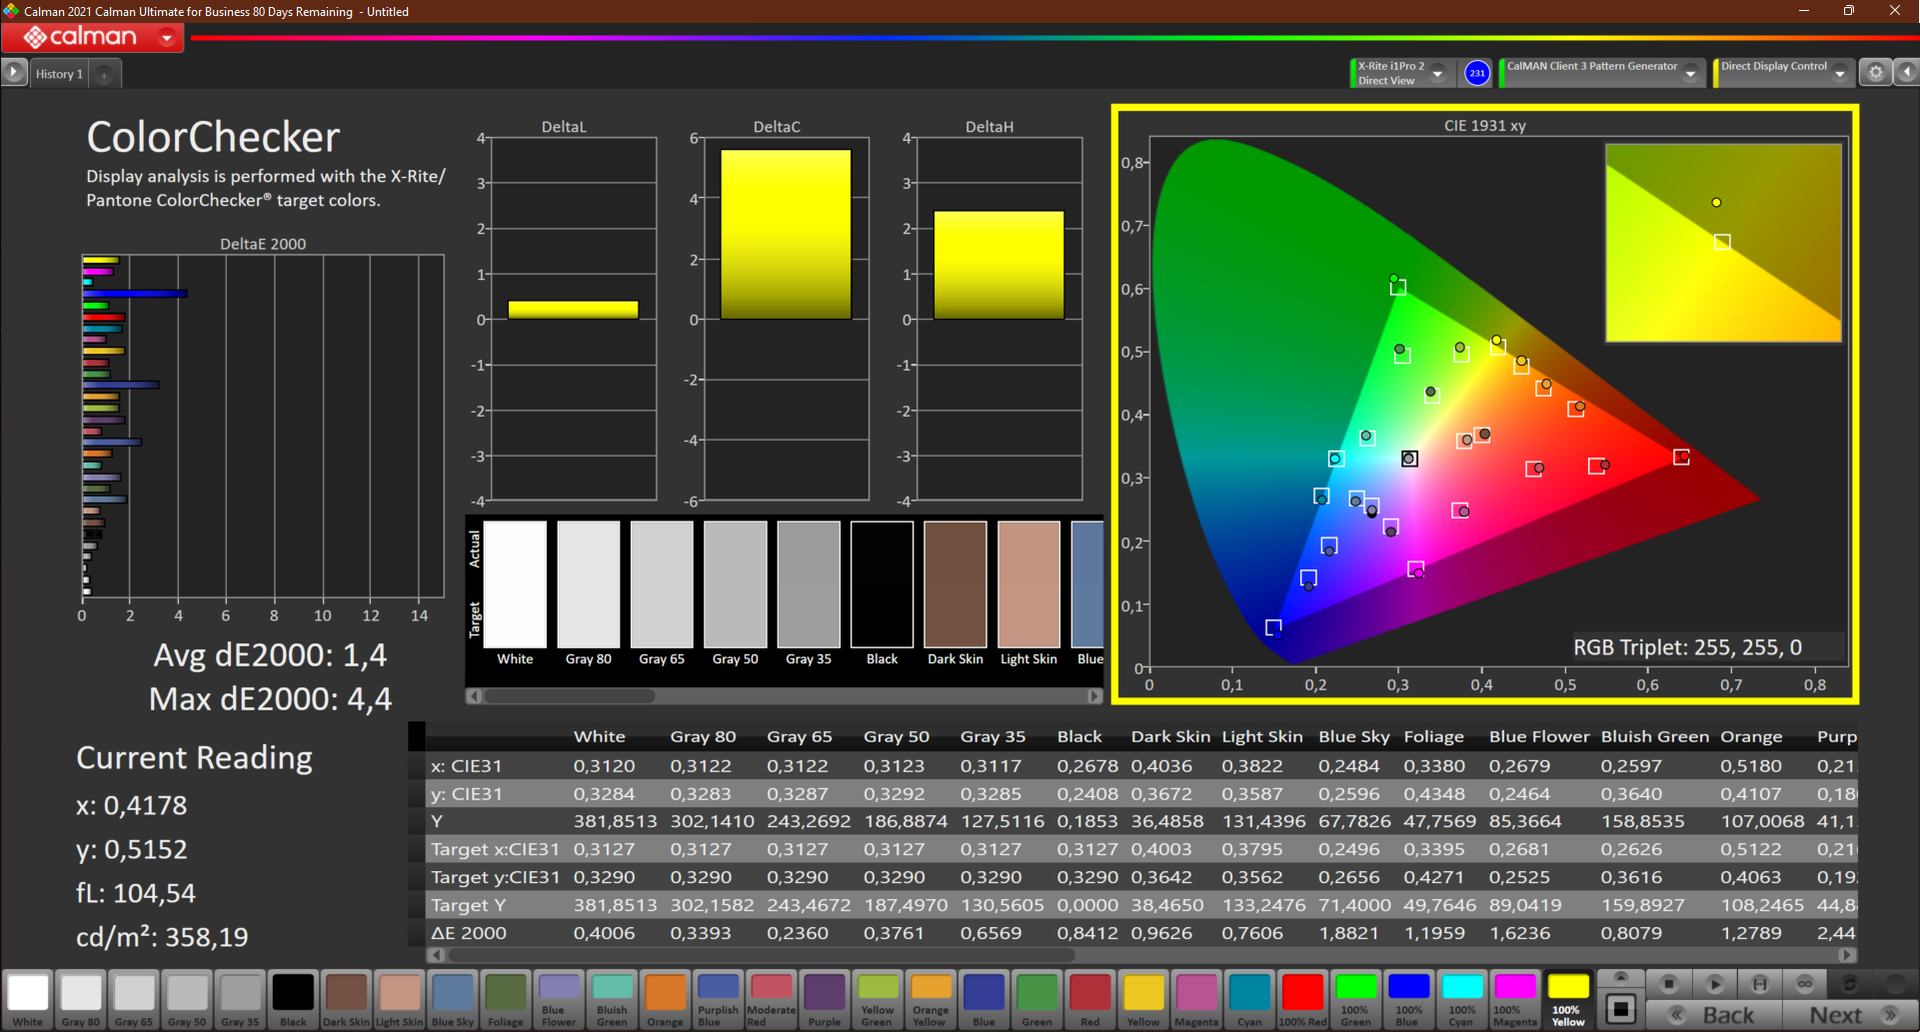
ΔE ColorChecker Calman: 1.5 | ∀{0.5-29.43 Ø4.71}
calibrated: 1.4
ΔE Greyscale Calman: 1.3 | ∀{0.09-98 Ø4.96}
71.3% AdobeRGB 1998 (Argyll 3D)
99% sRGB (Argyll 3D)
70.5% Display P3 (Argyll 3D)
Gamma: 2.26
CCT: 6435 K
| HP ZBook Power 15 G8 313S5EA AUOA08B, IPS LED, 1920x1080, 15.6" | HP ZBook Fury 15 G8 BOE0969, IPS, 3840x2160, 15.6" | HP ZBook Studio 15 G8 SDC4145, OLED, 3840x2160, 15.6" | HP ZBook Firefly 15 G8 2C9R7EA LGD069B, IPS, 1920x1080, 15.6" | Lenovo ThinkPad P15v G2 21A9000XGE N156HCA-EAC, IPS LED, 1920x1080, 15.6" | Dell Precision 3000 3551 LG Philips 156WFD, IPS, 1920x1080, 15.6" | |
|---|---|---|---|---|---|---|
| Display | 20% | 26% | -2% | -36% | -45% | |
| Display P3 Coverage (%) | 70.5 | 95.9 36% | 99.9 42% | 68.6 -3% | 43.7 -38% | 37.5 -47% |
| sRGB Coverage (%) | 99 | 100 1% | 100 1% | 98.5 -1% | 65.1 -34% | 56.5 -43% |
| AdobeRGB 1998 Coverage (%) | 71.3 | 87.3 22% | 95.3 34% | 70 -2% | 45.3 -36% | 38.74 -46% |
| Response Times | 74% | 95% | 12% | 24% | 41% | |
| Response Time Grey 50% / Grey 80% * (ms) | 61 | 14.8 ? 76% | 2.4 ? 96% | 56 ? 8% | 48 ? 21% | 29.6 ? 51% |
| Response Time Black / White * (ms) | 38 ? | 11 ? 71% | 2.4 ? 94% | 32 ? 16% | 28 ? 26% | 26.4 ? 31% |
| PWM Frequency (Hz) | 240.4 ? | |||||
| Screen | -81% | -75% | -90% | -144% | -111% | |
| Brightness middle (cd/m²) | 393 | 626 59% | 379.6 -3% | 397 1% | 305 -22% | 235.5 -40% |
| Brightness (cd/m²) | 385 | 589 53% | 380 -1% | 402 4% | 281 -27% | 228 -41% |
| Brightness Distribution (%) | 78 | 87 12% | 95 22% | 84 8% | 88 13% | 89 14% |
| Black Level * (cd/m²) | 0.25 | 0.58 -132% | 0.13 48% | 0.32 -28% | 0.25 -0% | |
| Contrast (:1) | 1572 | 1079 -31% | 3054 94% | 953 -39% | 942 -40% | |
| Colorchecker dE 2000 * | 1.5 | 5.41 -261% | 5.15 -243% | 5.9 -293% | 5.9 -293% | 5.44 -263% |
| Colorchecker dE 2000 max. * | 4.3 | 9.05 -110% | 7.79 -81% | 9.4 -119% | 20.1 -367% | 13.58 -216% |
| Colorchecker dE 2000 calibrated * | 1.4 | 0.6 57% | 3.1 -121% | 1.1 21% | 4.5 -221% | 5.2 -271% |
| Greyscale dE 2000 * | 1.3 | 6.2 -377% | 2.6 -100% | 8.8 -577% | 5.3 -308% | 3.1 -138% |
| Gamma | 2.26 97% | 2.66 83% | 1.99 111% | 2.47 89% | 2.1 105% | 2.42 91% |
| CCT | 6435 101% | 6101 107% | 6166 105% | 6416 101% | 6307 103% | 7070 92% |
| Color Space (Percent of AdobeRGB 1998) (%) | 63.7 | 35.5 | ||||
| Color Space (Percent of sRGB) (%) | 98.5 | 56.1 | ||||
| Média Total (Programa/Configurações) | 4% /
-37% | 15% /
-22% | -27% /
-57% | -52% /
-97% | -38% /
-75% |
* ... menor é melhor
O espaço de cor sRGB é coberto a 99%, mas apenas ~71% do DCI-P3 e AdobeRGB são reproduzidos. Com isso, você pode usar o laptop para processamento de imagem e vídeo em nível semi-profissional. O ThinkPad P15v G2 também faz muito pior (sRGB < 57%) aqui.
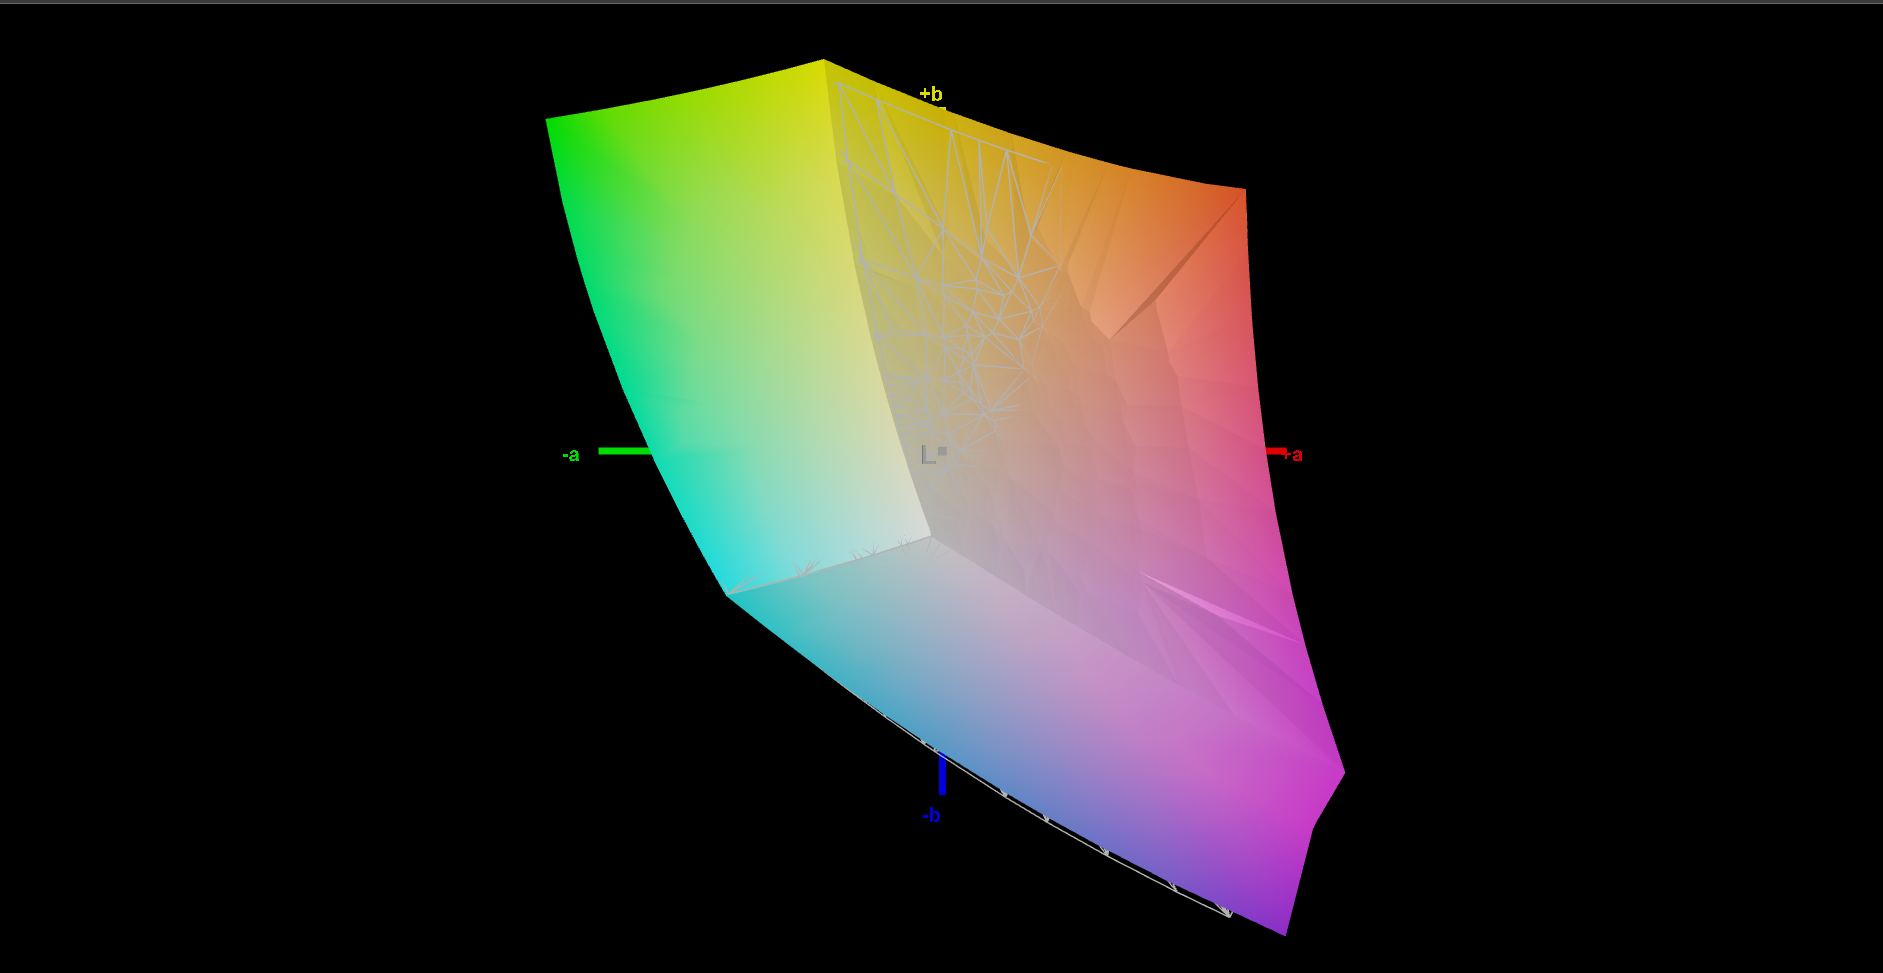
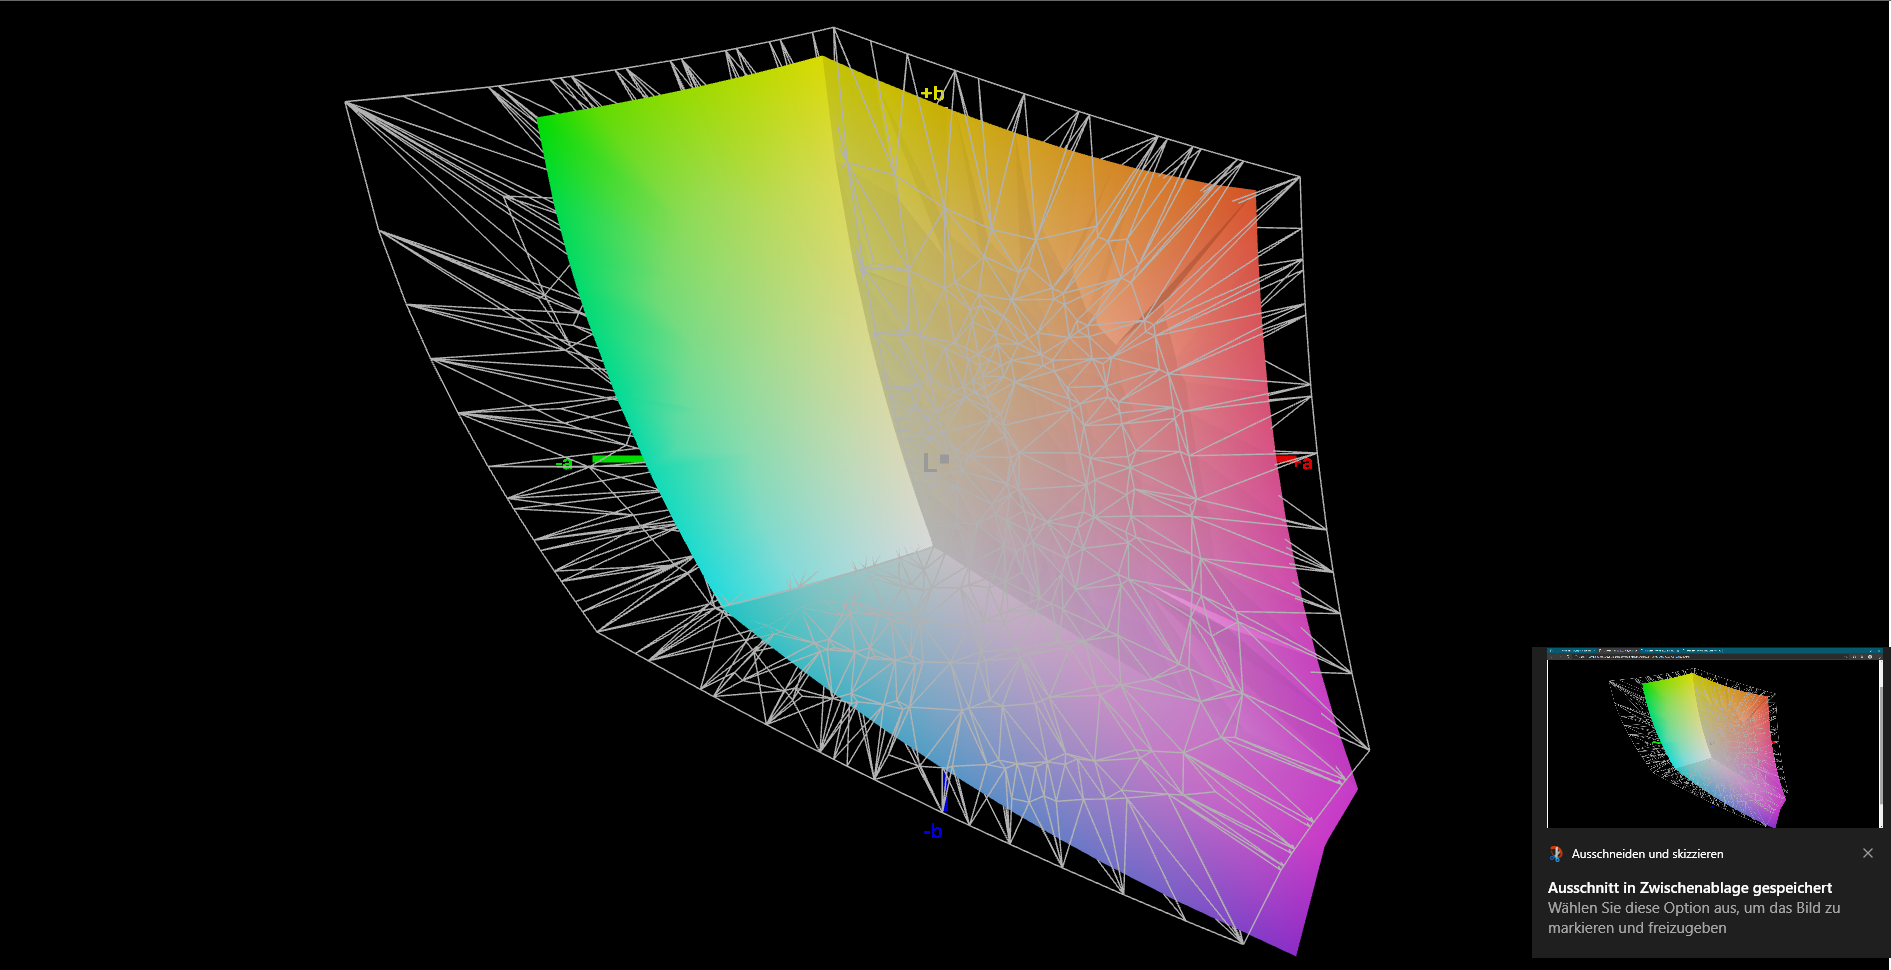
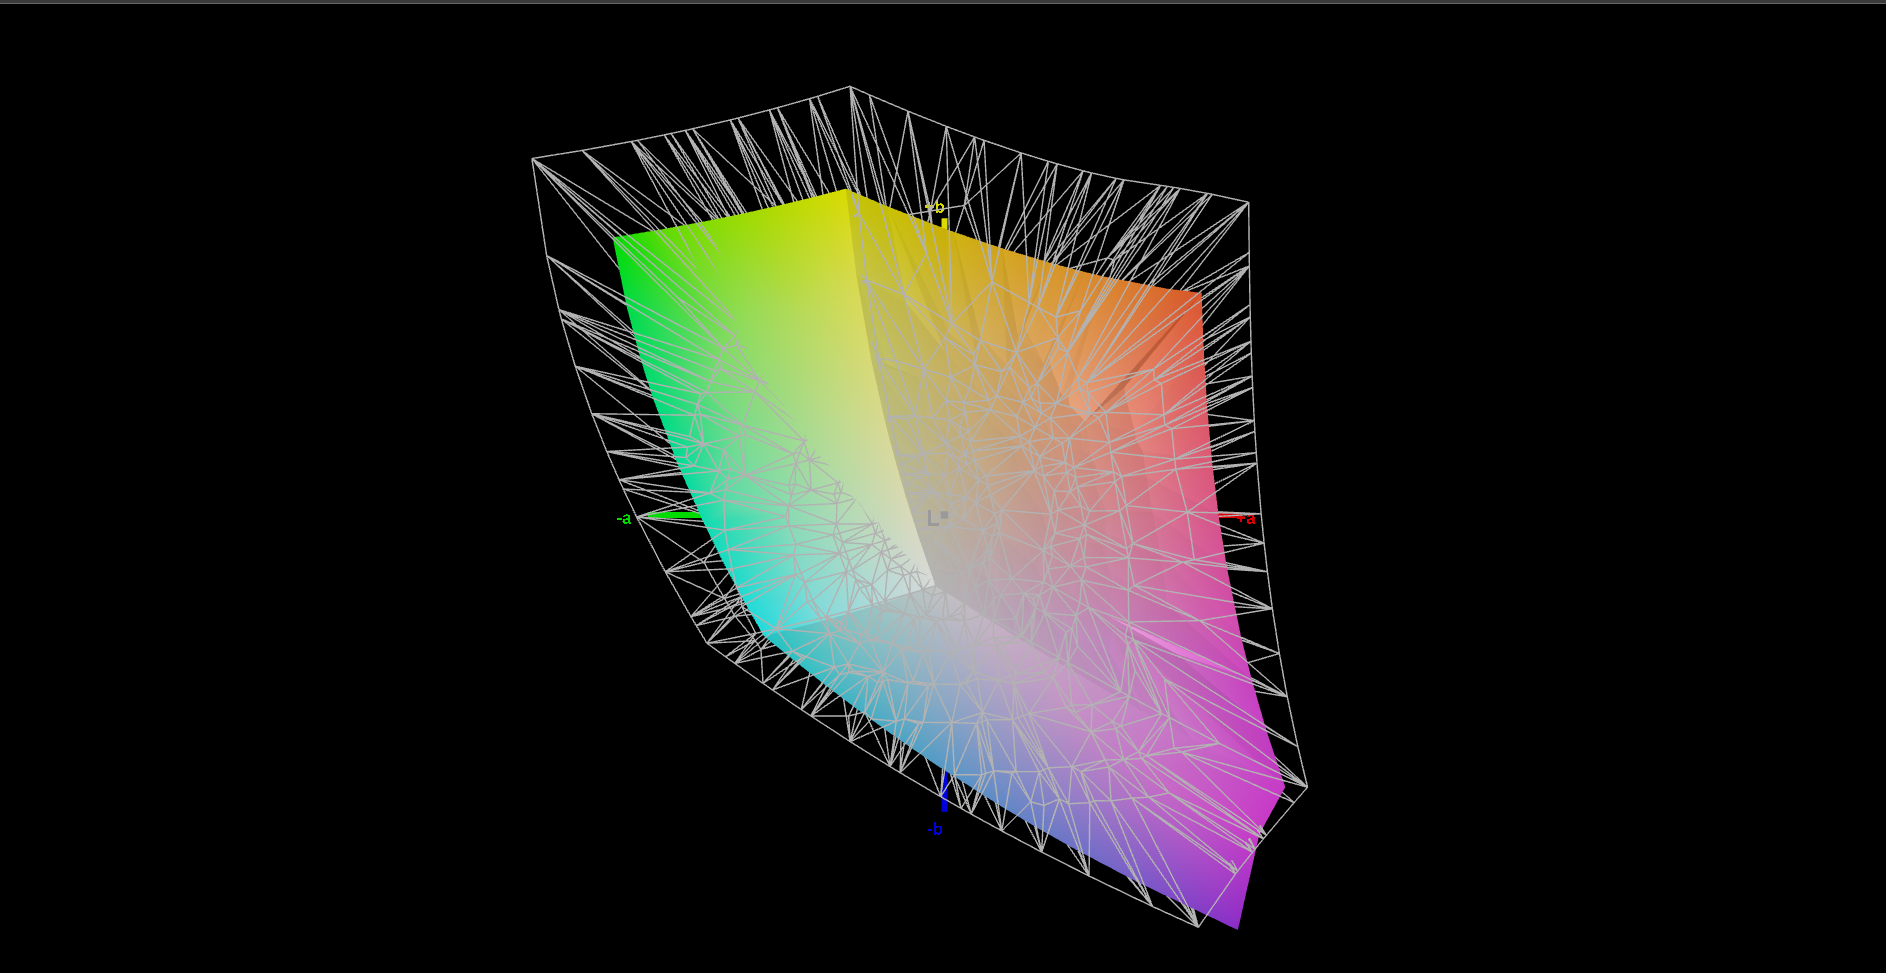
Em um DeltaE de 4,3, o maior desvio está na cor azul, mesmo após a calibração. Entretanto, o balanço RGB é bom em geral. Após a calibração, o contraste até aumenta para 2151:1, enquanto o brilho é reduzido em apenas 10 lêndeas. Como sempre, nosso perfil de cor ICC está disponível para download gratuito ao lado do gráfico de distribuição de brilho acima.

Exibir tempos de resposta
| ↔ Tempo de resposta preto para branco | ||
|---|---|---|
| 38 ms ... ascensão ↗ e queda ↘ combinadas | ↗ 19 ms ascensão | 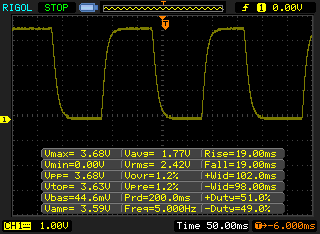 |
| ↘ 19 ms queda | ||
| A tela mostra taxas de resposta lentas em nossos testes e será insatisfatória para os jogadores. Em comparação, todos os dispositivos testados variam de 0.1 (mínimo) a 240 (máximo) ms. » 96 % de todos os dispositivos são melhores. Isso significa que o tempo de resposta medido é pior que a média de todos os dispositivos testados (19.8 ms). | ||
| ↔ Tempo de resposta 50% cinza a 80% cinza | ||
| 61 ms ... ascensão ↗ e queda ↘ combinadas | ↗ ms ascensão | 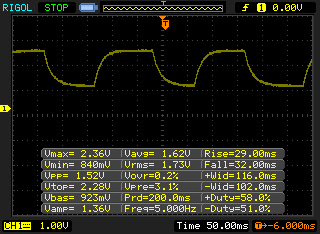 |
| ↘ ms queda | ||
| A tela mostra taxas de resposta lentas em nossos testes e será insatisfatória para os jogadores. Em comparação, todos os dispositivos testados variam de 0.165 (mínimo) a 636 (máximo) ms. » 96 % de todos os dispositivos são melhores. Isso significa que o tempo de resposta medido é pior que a média de todos os dispositivos testados (31 ms). | ||
Cintilação da tela / PWM (modulação por largura de pulso)
| Tela tremeluzindo / PWM não detectado | 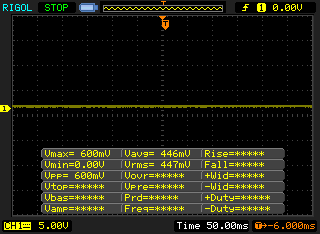 | ||
[pwm_comparison] Em comparação: 52 % de todos os dispositivos testados não usam PWM para escurecer a tela. Se PWM foi detectado, uma média de 7754 (mínimo: 5 - máximo: 343500) Hz foi medida. | |||
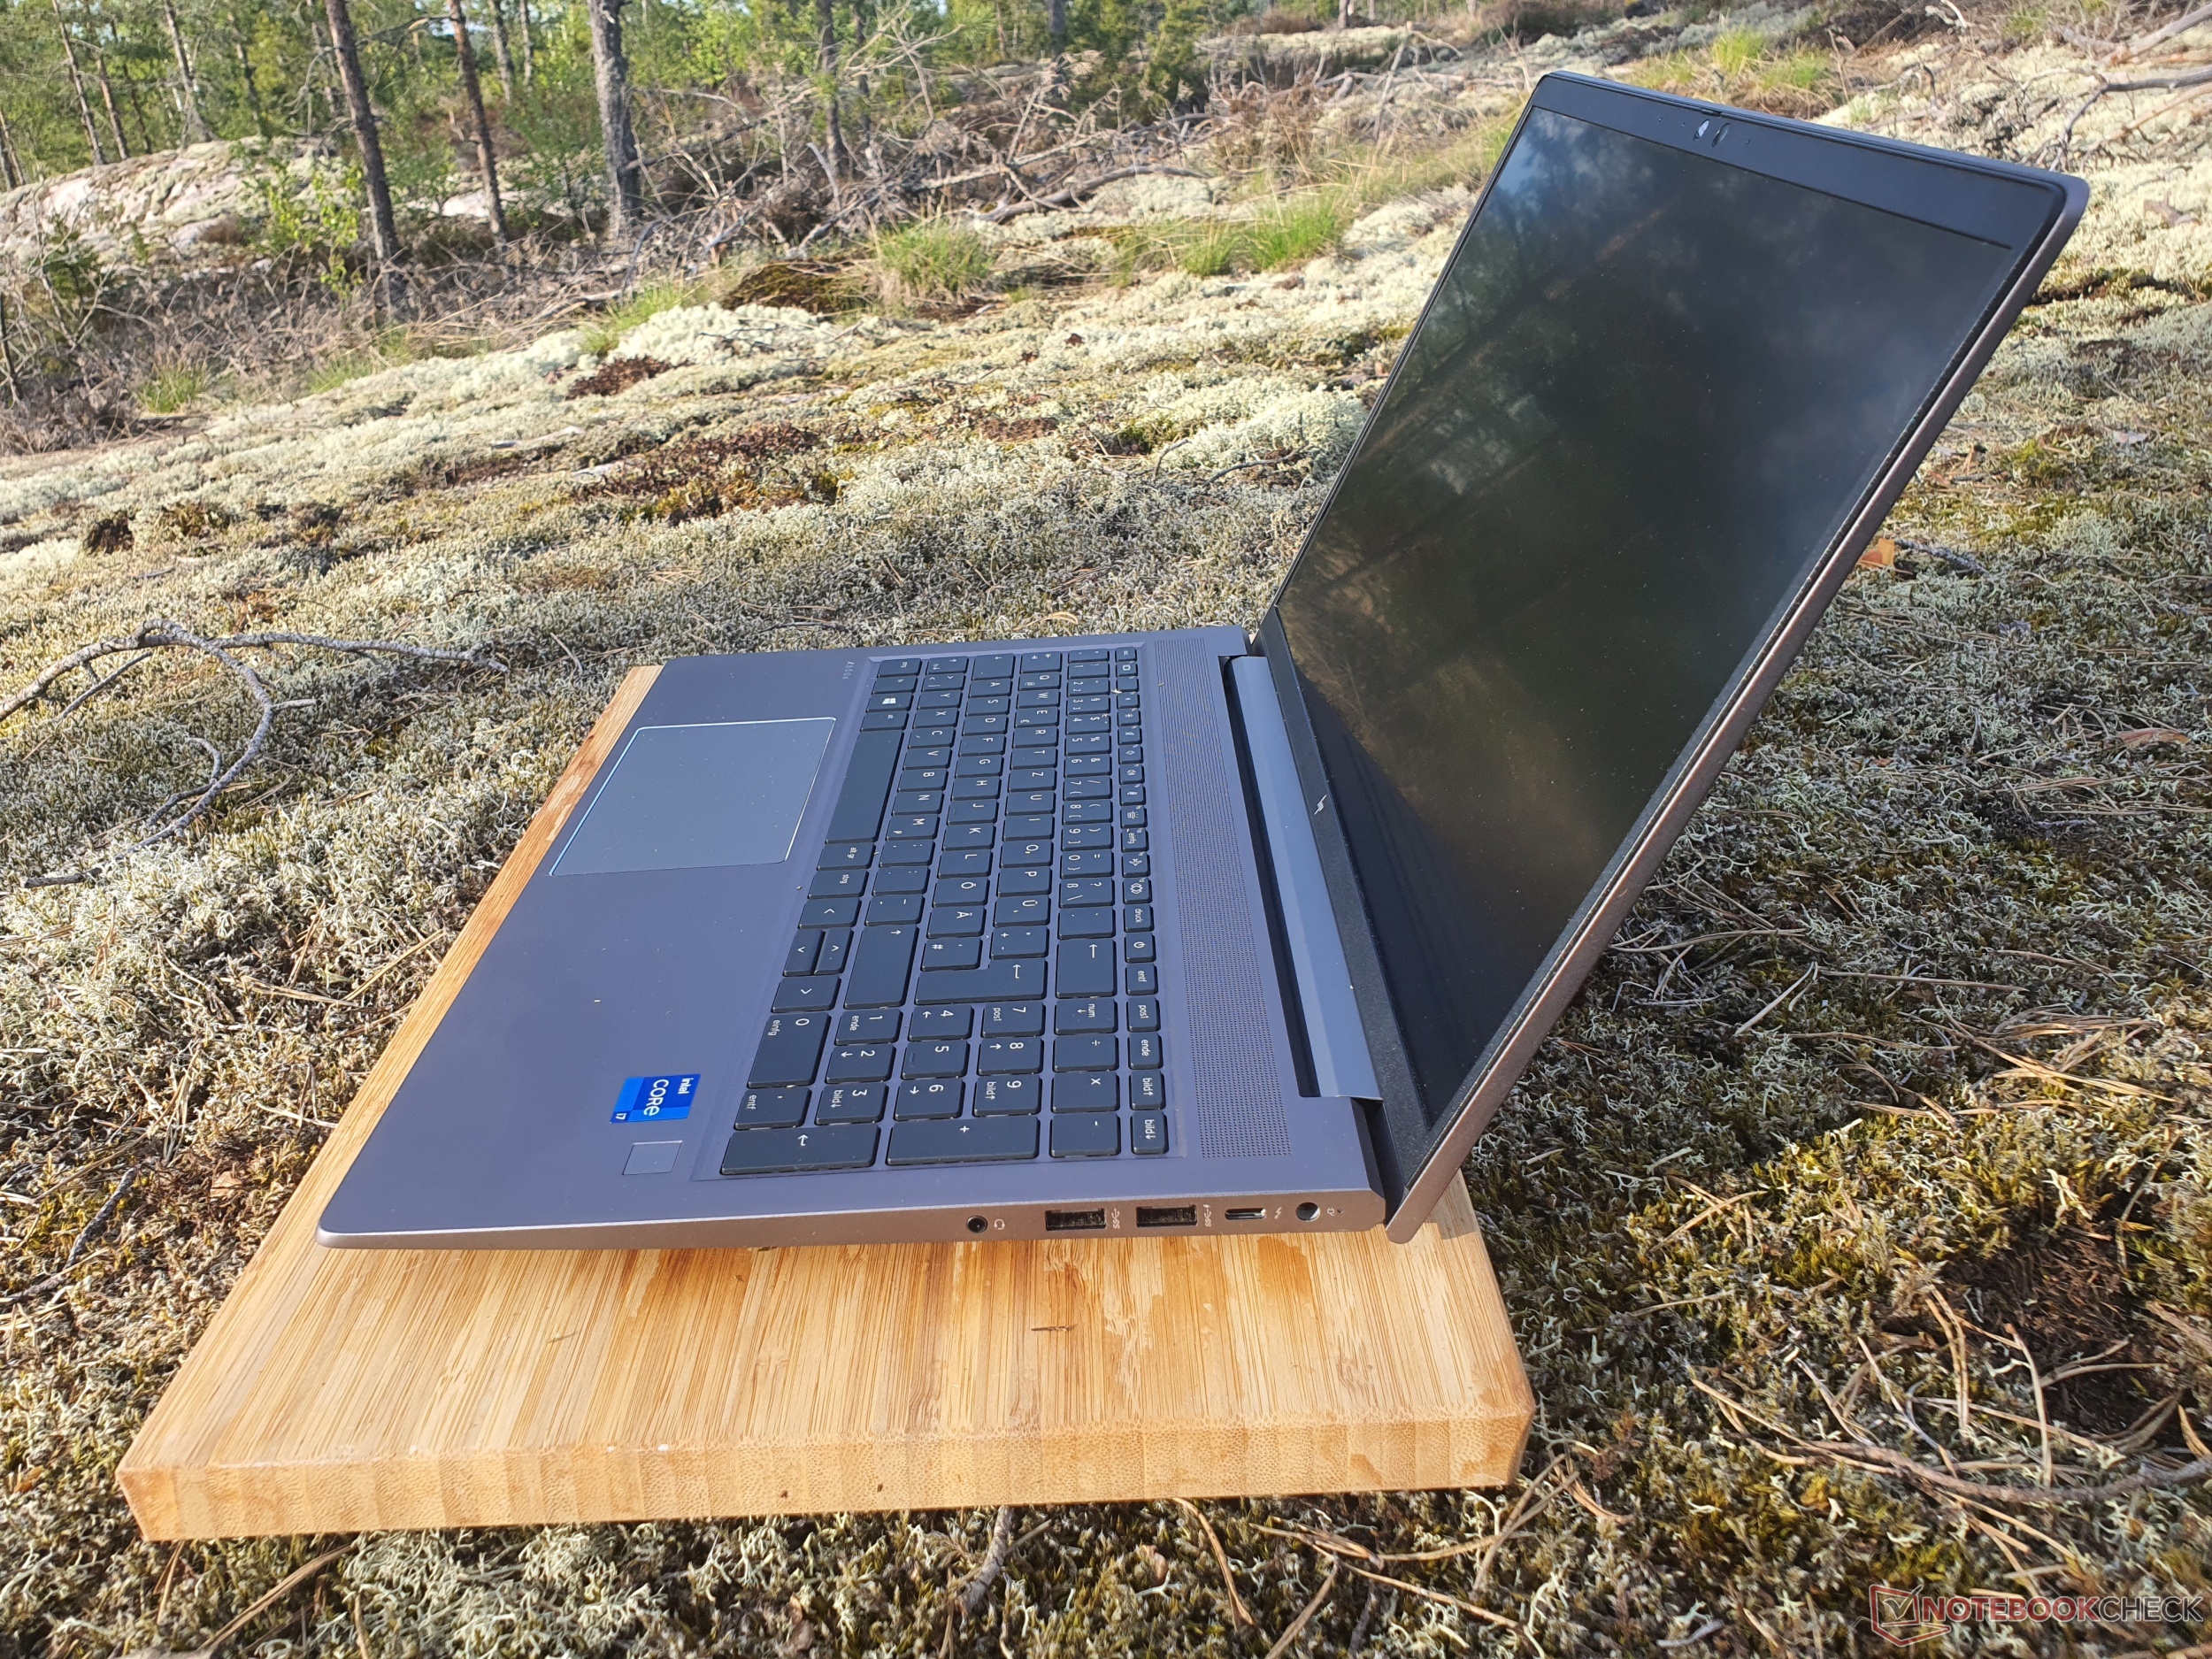
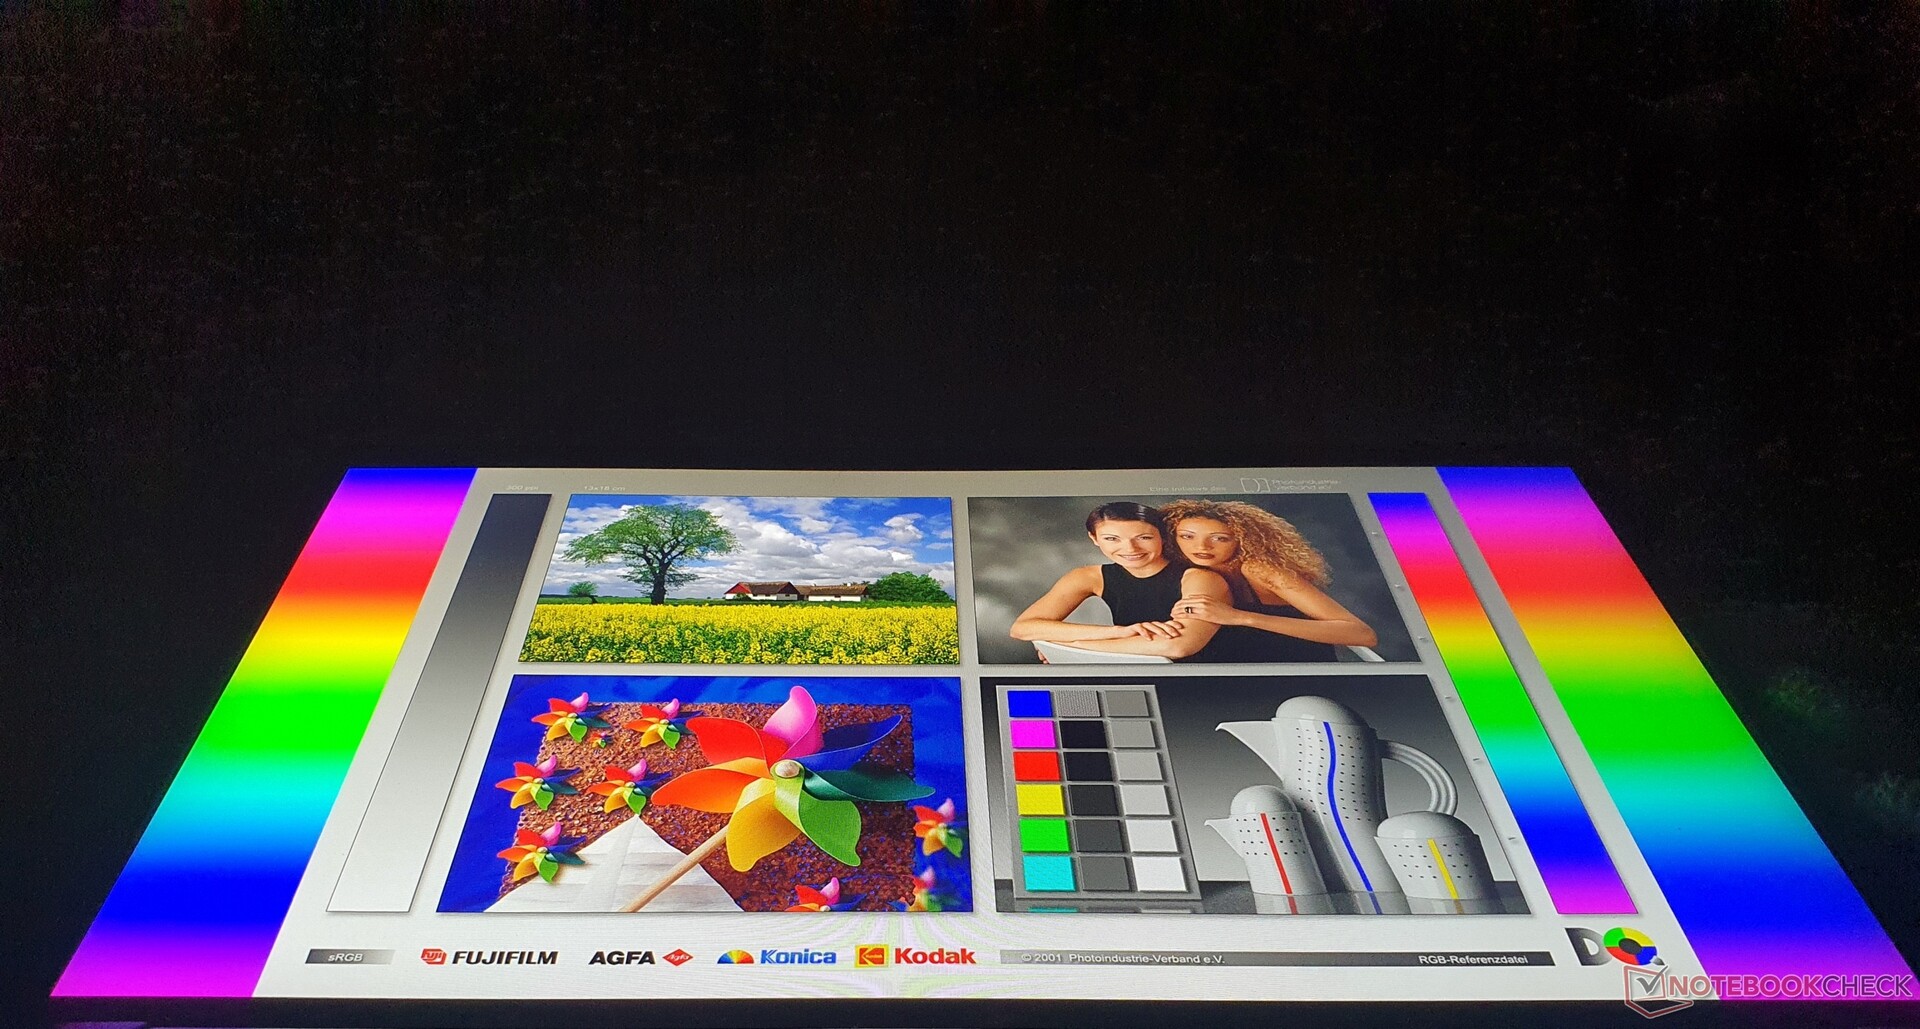
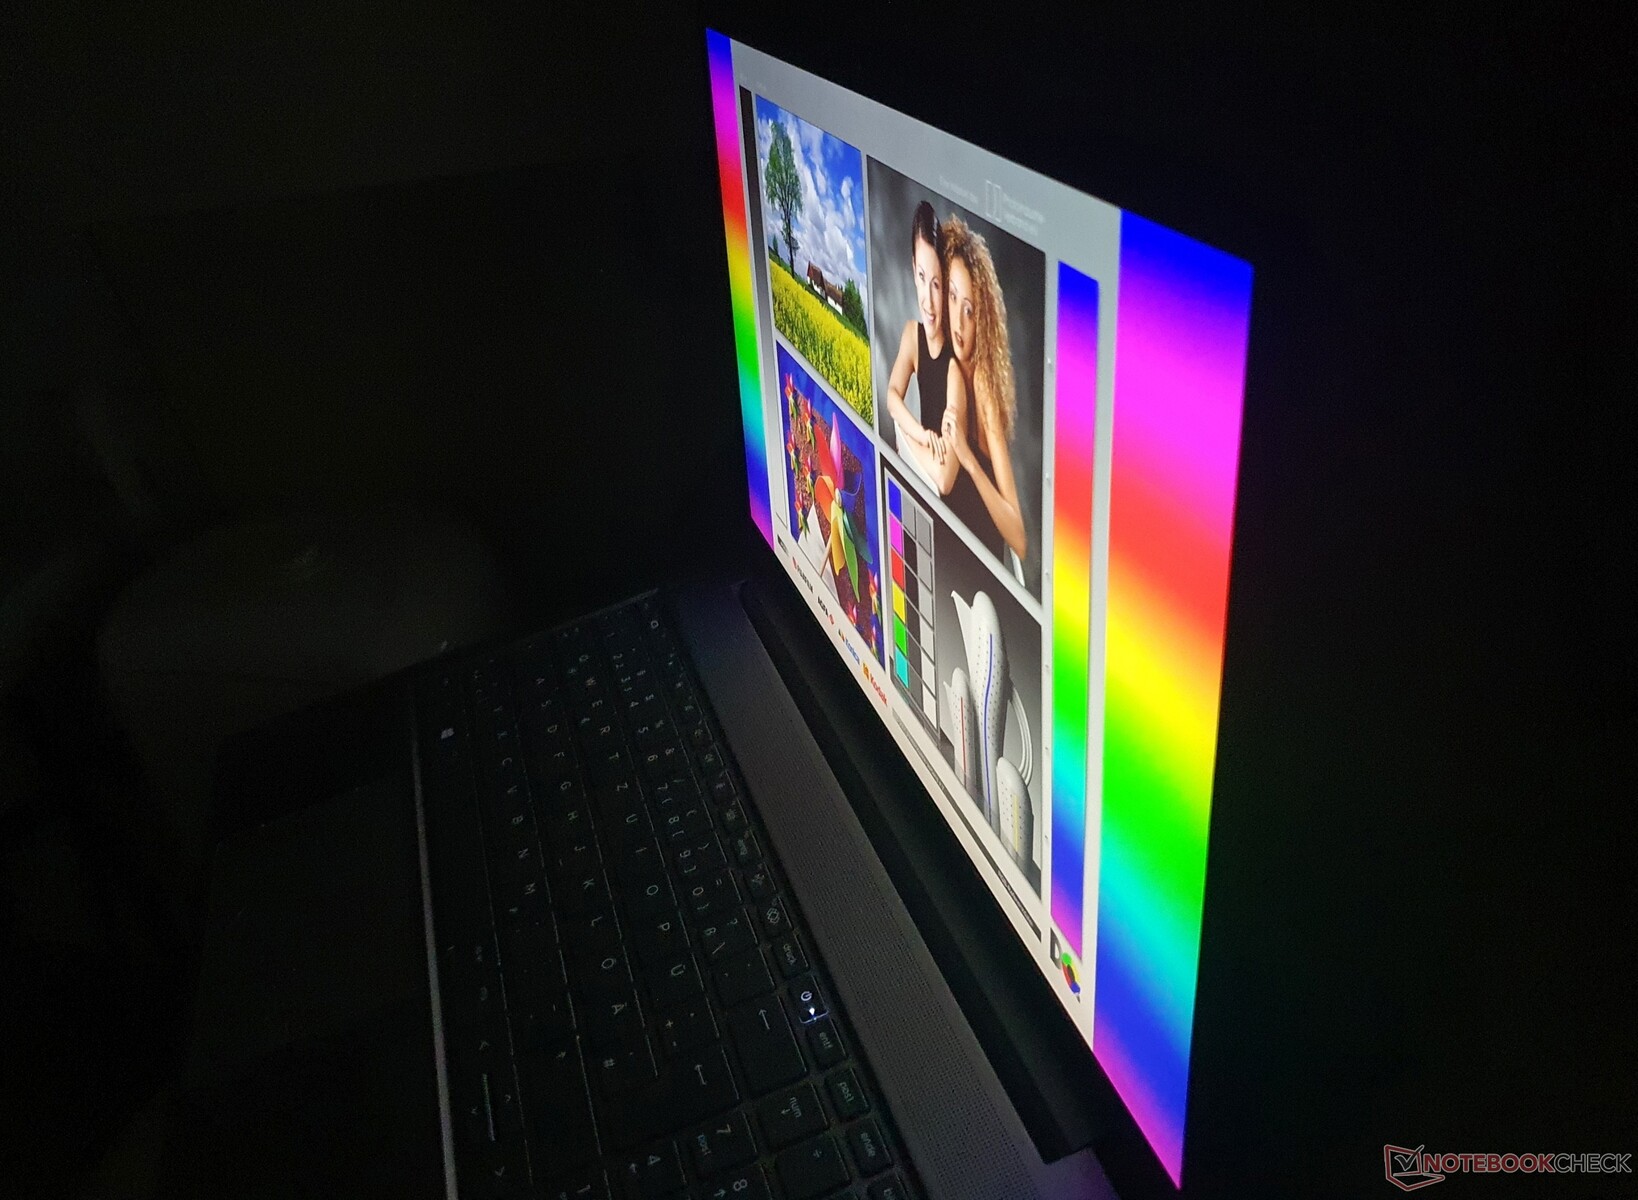
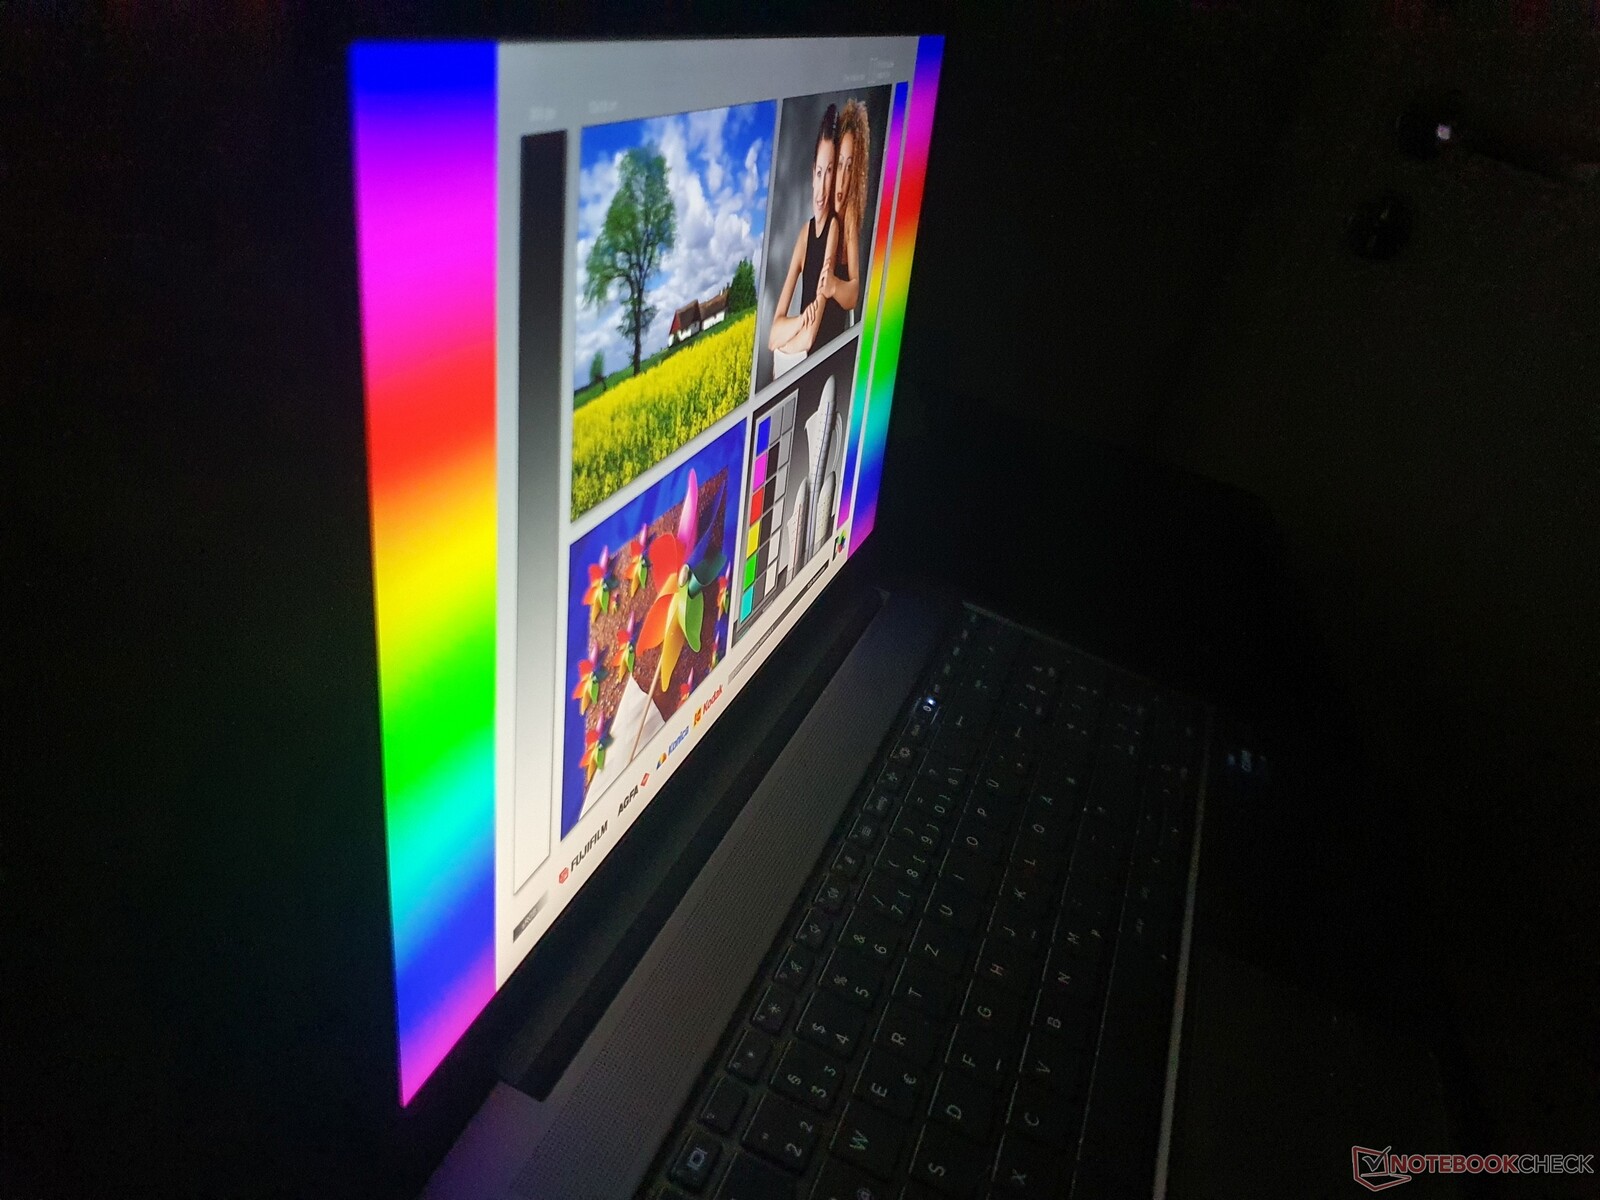
A superfície da tela mate, juntamente com o alto brilho de 385 lêndeas, tornam o ZBook Power 15 adequado para operação ao ar livre. No entanto, você ainda deve evitar a luz direta do sol.
Como é típico das telas IPS, a estabilidade do ângulo de visão está em um nível muito alto, nunca criando problemas, por exemplo, se você quiser assistir a vídeos junto com várias pessoas.
Alto desempenho limitado pela própria IA da HP?
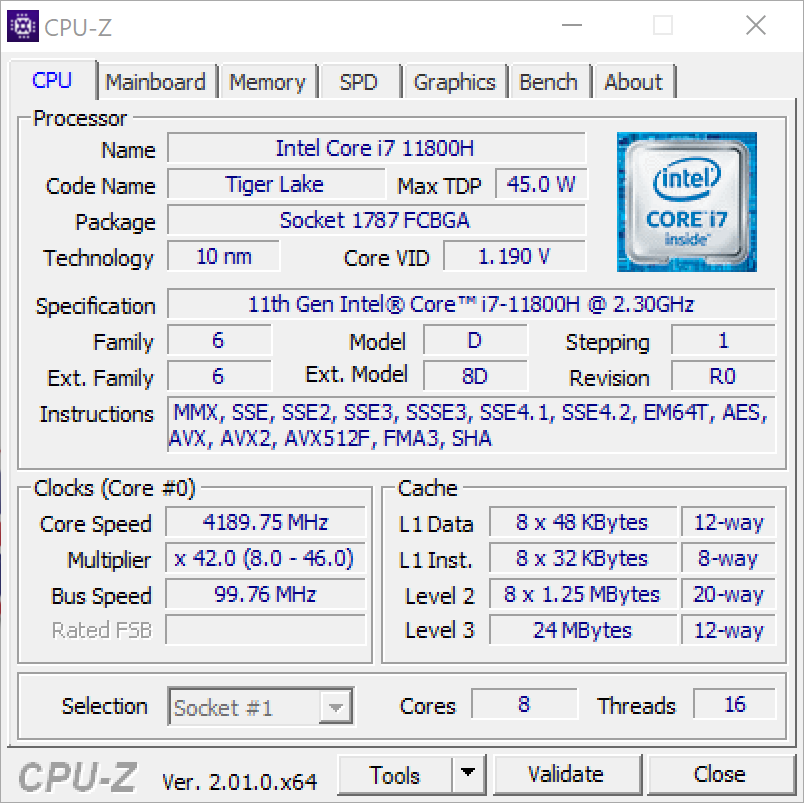
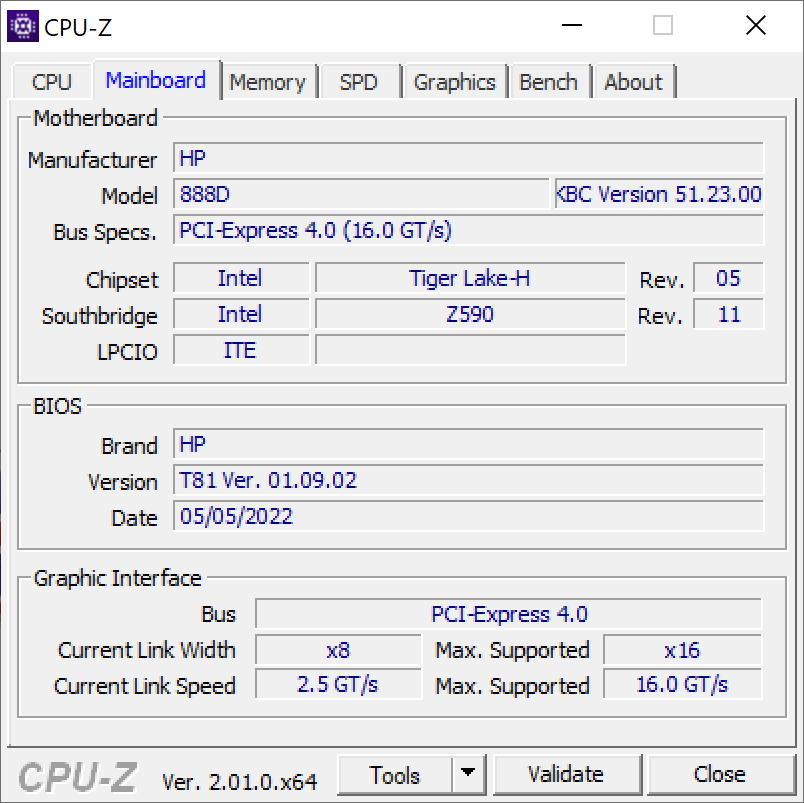
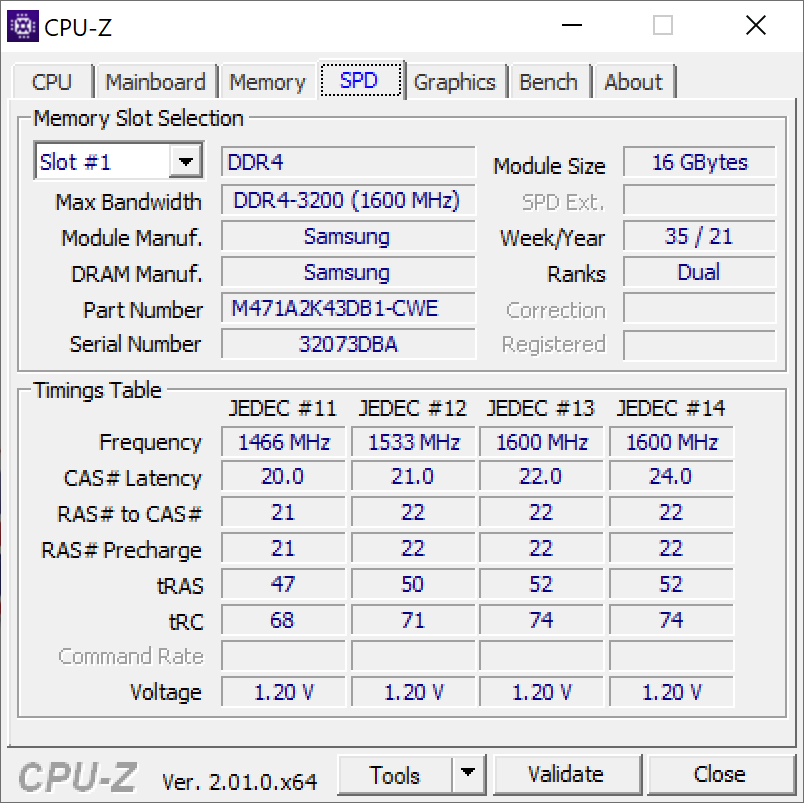
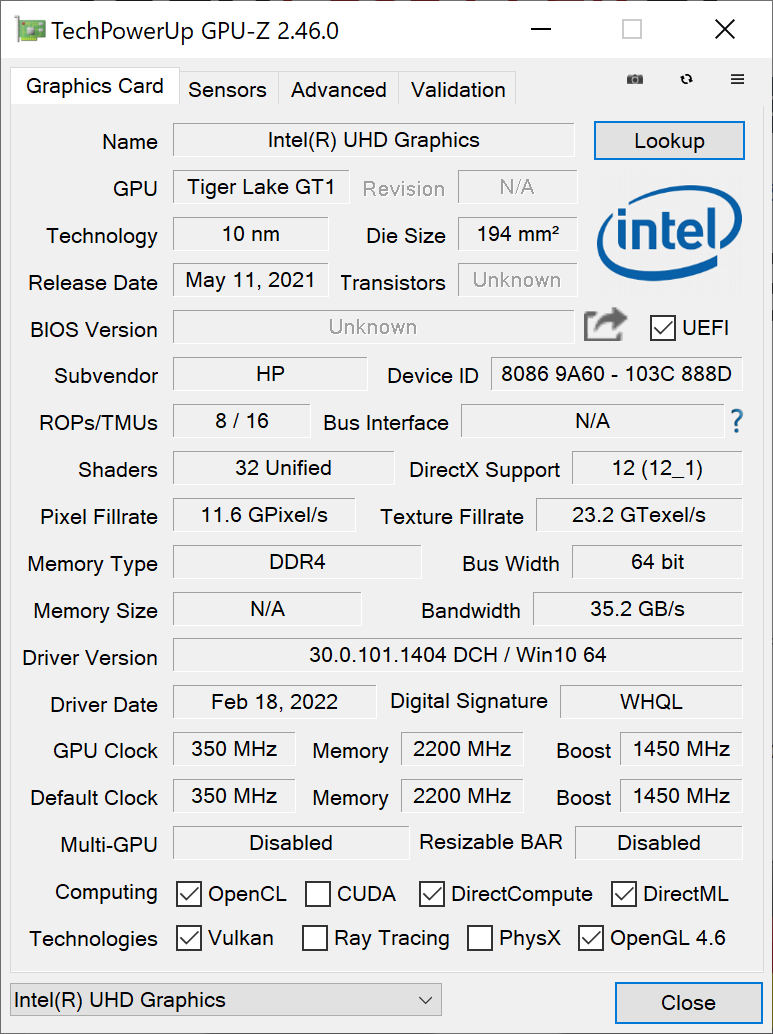
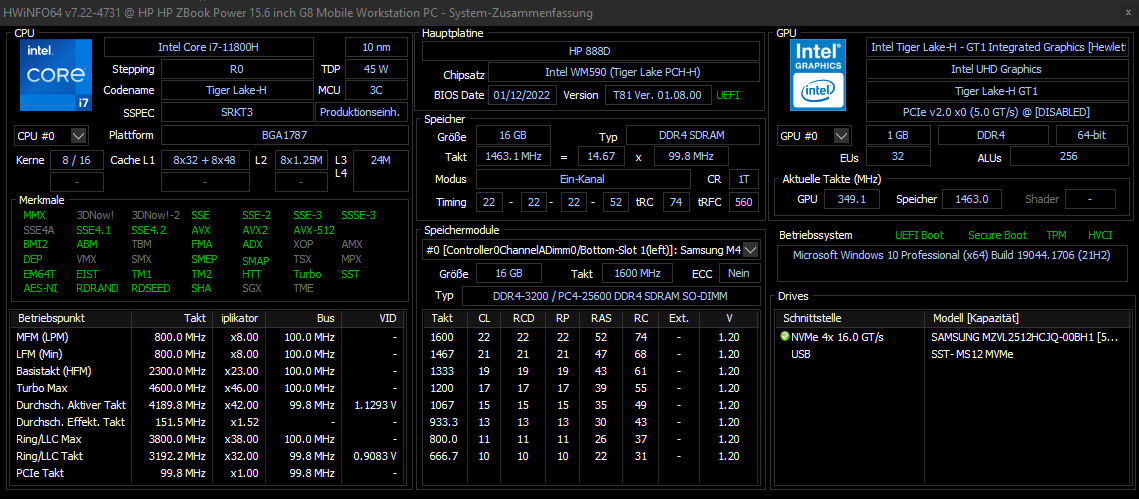
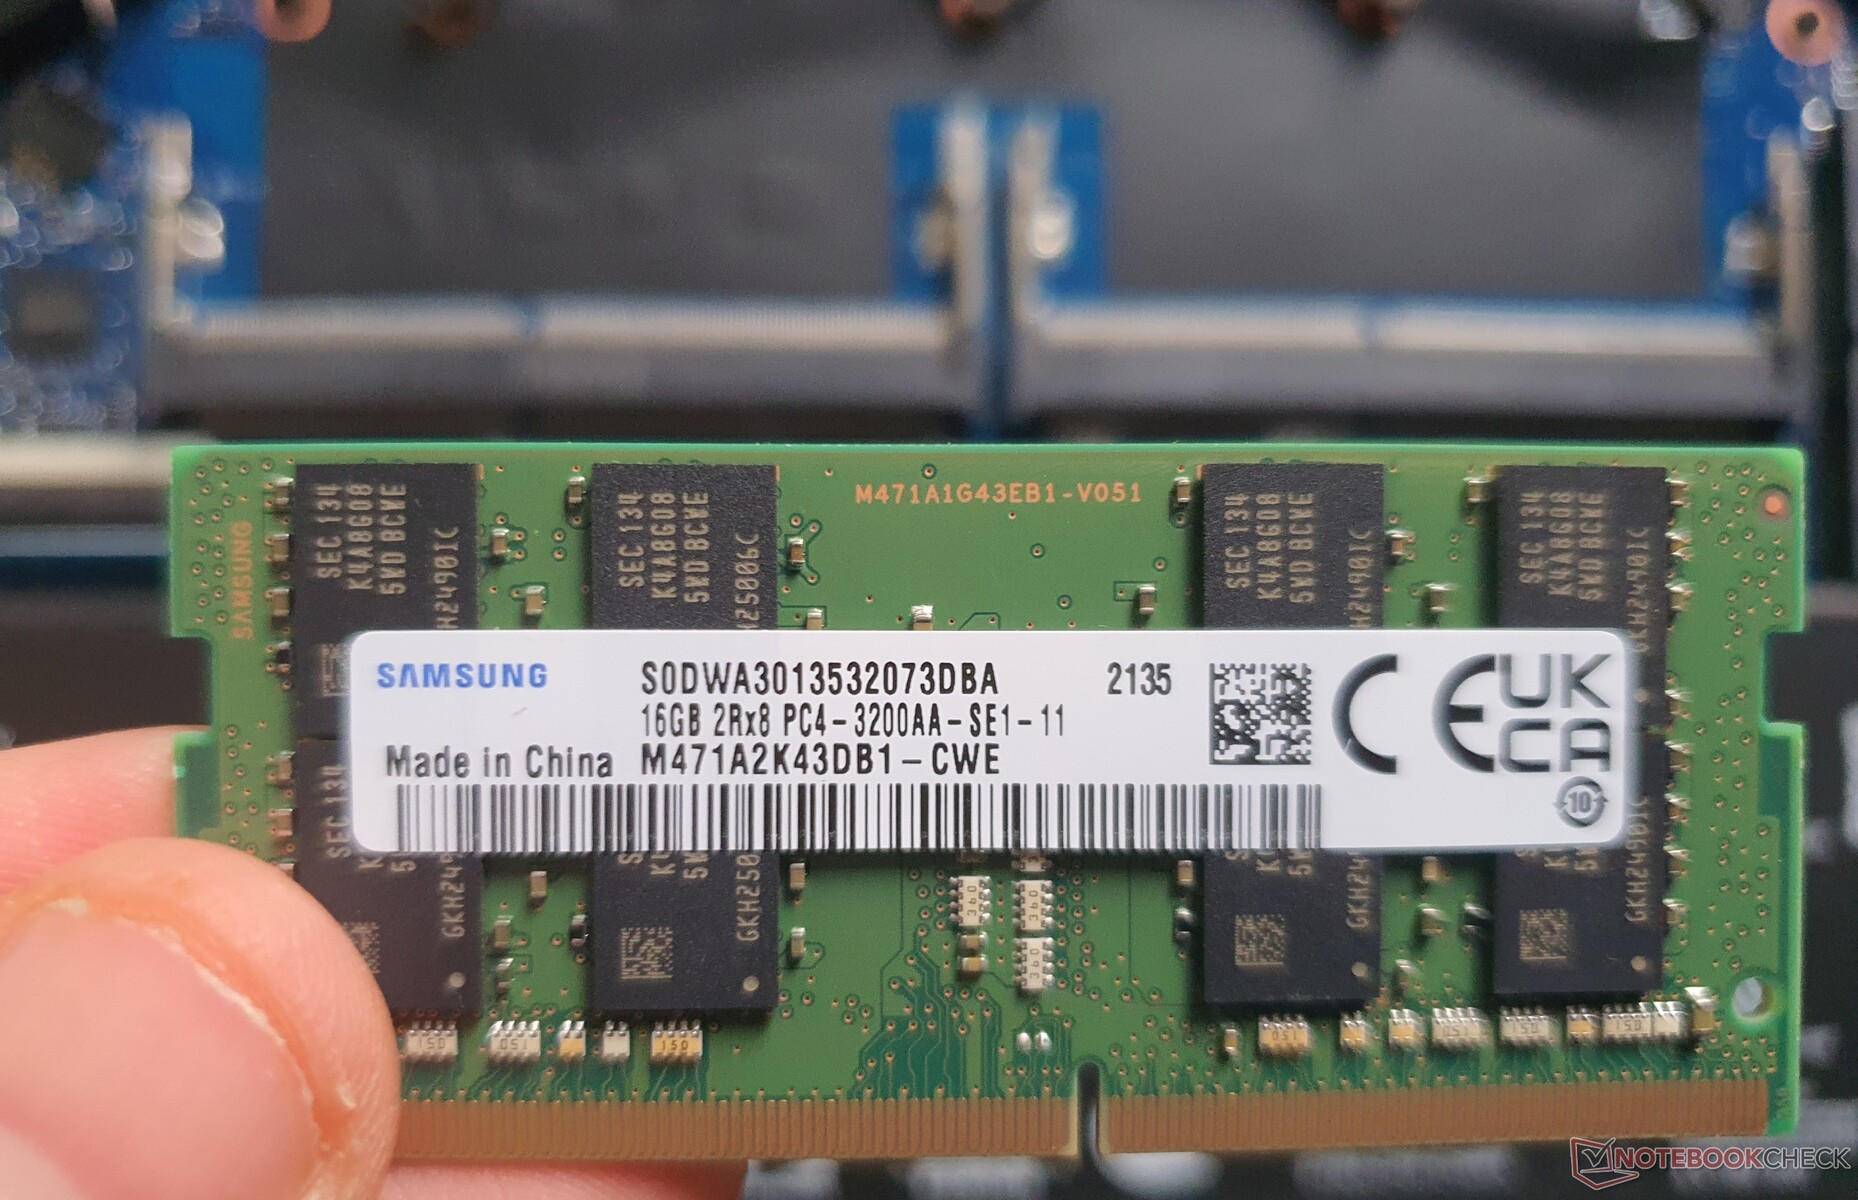
Nossa unidade de teste oferece uma Intel Núcleo i7-11800H (Tiger Lake, sem vPRO) e oNvidia T600 dGPU, juntamente com o Intel UHD Xe (32 EUs). Isto é completado por um módulo RAM de 16-GB (DDR4-3200 @DDR4-2933) e um SSD PCIe4x4 de 512-GB. As CPUs Xeon e a RAM ECC não estão disponíveis este ano.
A configuração máxima inclui Intel'sNúcleo i9-11950H (vPRO), Nvidia's RTX A2000dois módulos de 32-GB RAM, e dois SSDs 2-TB M.2-2280. Modelos mais acessíveis com um Intel Core i5 (hexa-core) e com ou sem GPU Nvidia também estão disponíveis


Condições de teste
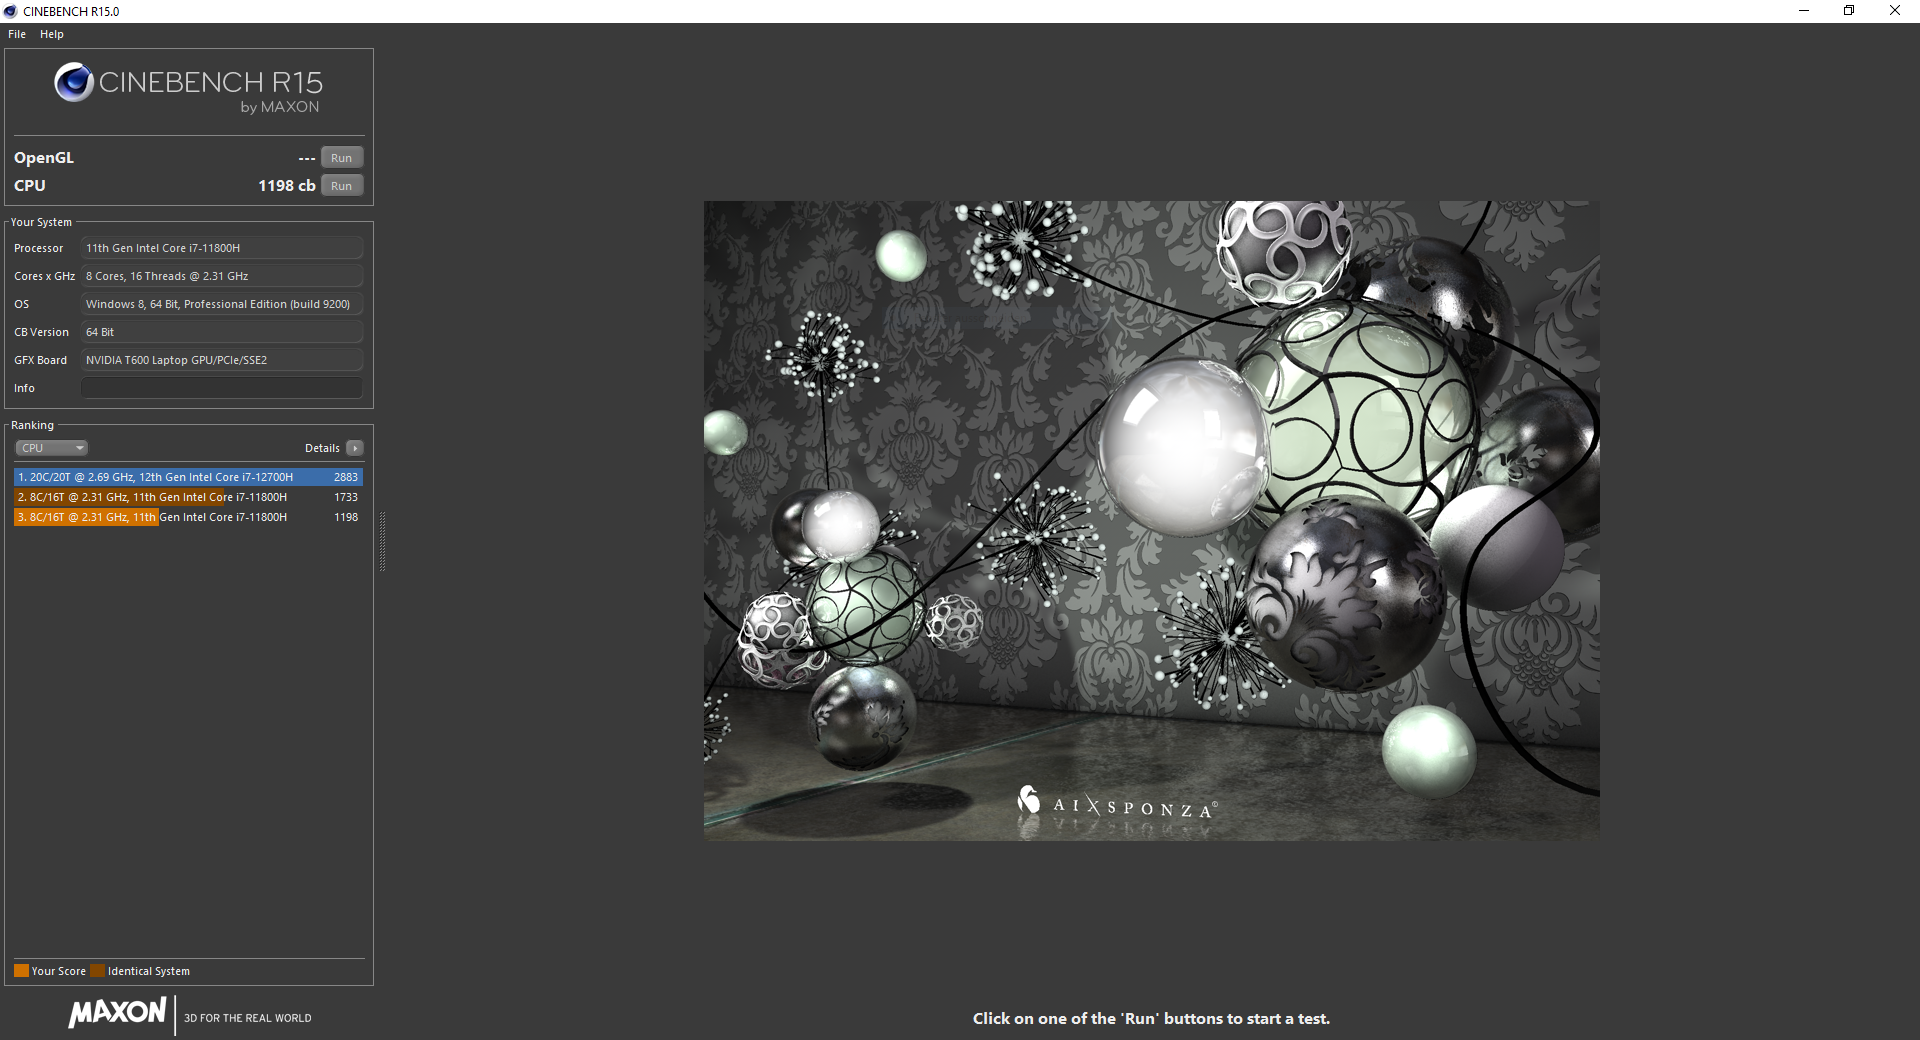
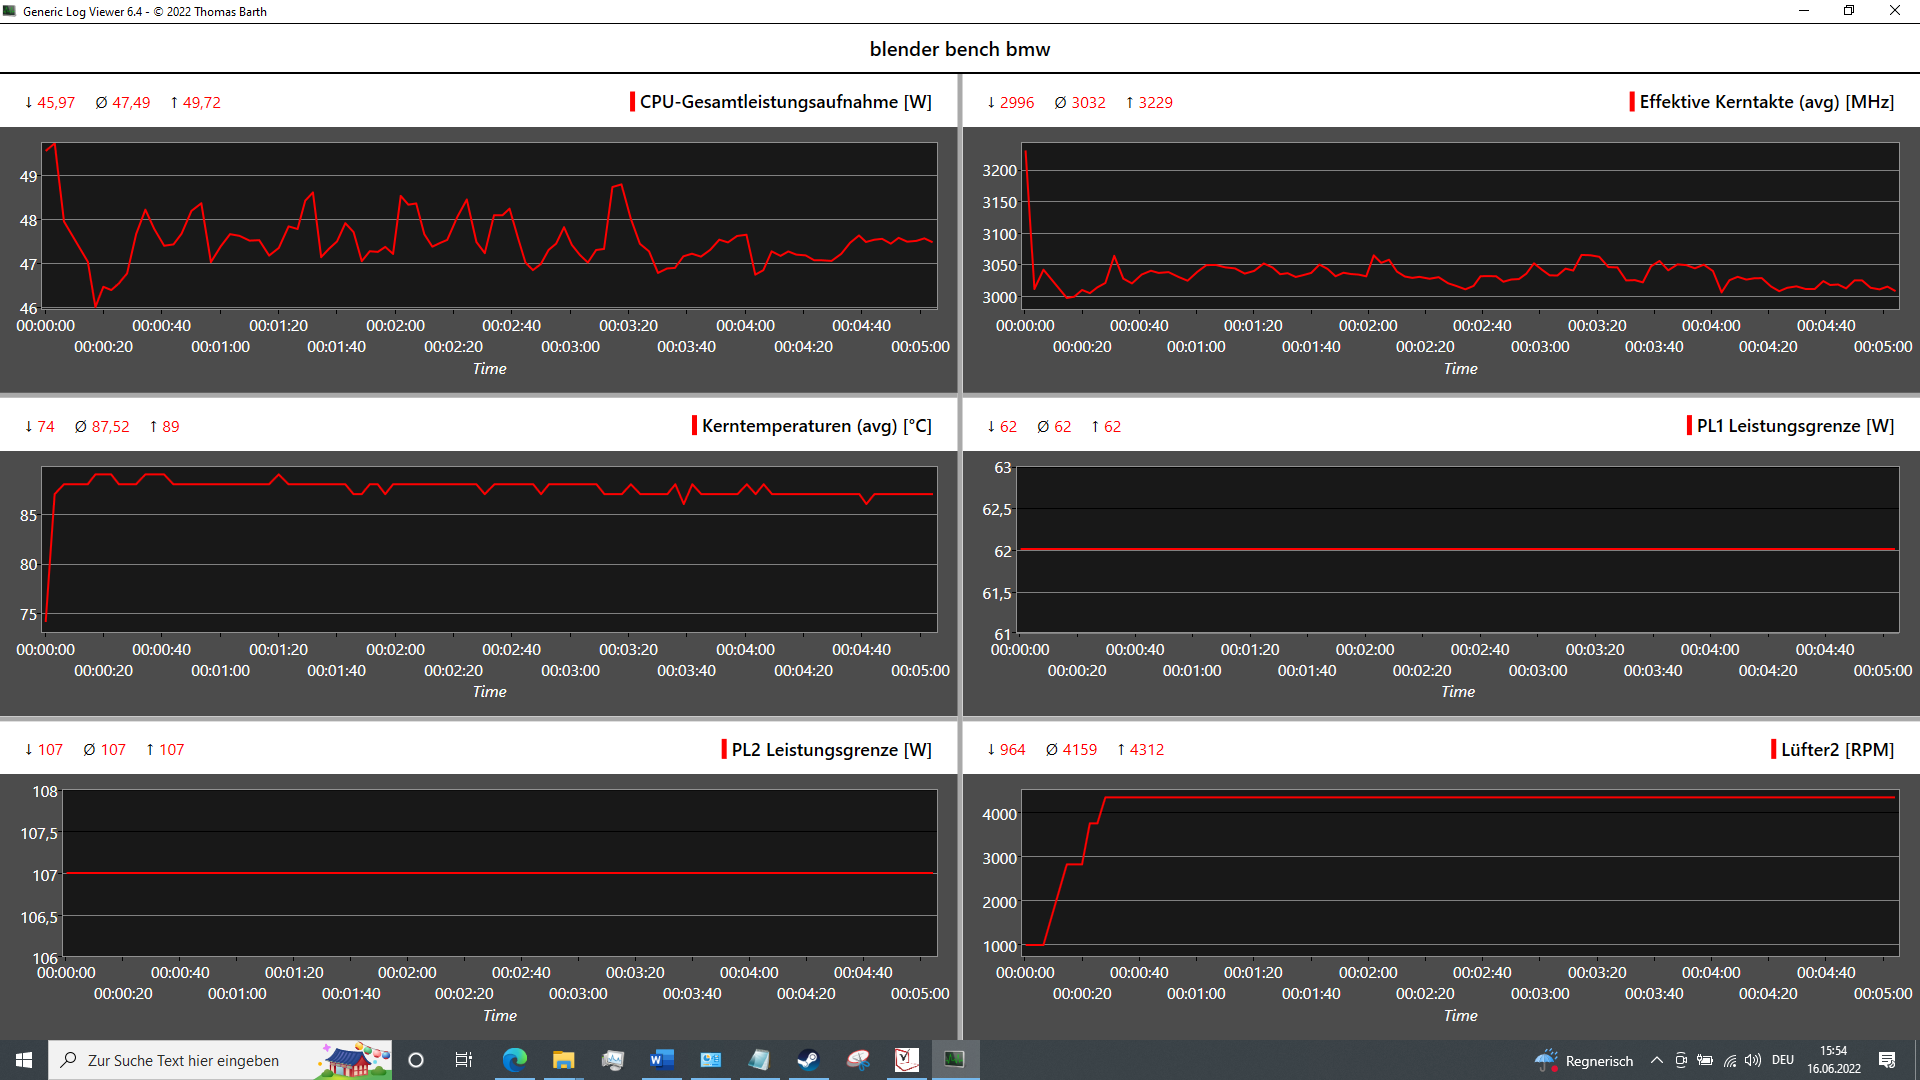
A HP controla o desempenho e o comportamento do ventilador no ZBook 15 G8 usando uma IA chamada "Z Algorithms", que opera usando o Dynamic Tuning da Intel. No entanto, isto não parece estar ainda bastante maduro, uma vez que o desempenho não é constante. Uma vez, nosso loop de teste Cinebench R15 atinge uma constante de 1.550 pontos em 25 corridas, enquanto outro loop resulta em apenas ~1.100 pontos e um terceiro em ~1.300 pontos
Uma atualização da BIOS da v1.01 para a v1.09 não melhorou as coisas, mas resultou no contrário: Os 2.075 pontos inicialmente alcançados (constante: 1.826) na CBR15 não são mais reproduzíveis em nenhum ponto, mas os ventiladores são agora significativamente menos agressivos. Dependendo do resultado, o consumo constante era de 40 watts uma vez e 47 watts outra vez, ou um máximo de 55 watts constantemente.
Processador
Com o comportamento de IA descrito, o desempenho real da Intel Núcleo i7-11800Hem combinação com a capacidade de refrigeração é difícil de fixar.
Enquanto todos os testes de CPU eram realizados com a antiga BIOS v1.01 quando a IA ainda era mais benevolente, o ZBook Power 15 liderava o campo de teste na maioria das vezes. Após a atualização da BIOS, o desempenho cai pouco acima do PensePad P15v G2em média.
Também não parece haver mais um Turbo (PL2) de curto prazo. Além disso, os ventiladores começam a funcionar muito tarde (pouco antes da conclusão da primeira corrida) e funcionam mais silenciosos do que originalmente, seja devido à nova BIOS ou a uma fonte de alimentação que não funciona bem. Na operação com bateria, o desempenho é novamente reduzido em cerca de 25%.
Cinebench R15 Multi Constant Load Test
Cinebench R23: Multi Core | Single Core
Cinebench R20: CPU (Multi Core) | CPU (Single Core)
Cinebench R15: CPU Multi 64Bit | CPU Single 64Bit
Blender: v2.79 BMW27 CPU
7-Zip 18.03: 7z b 4 | 7z b 4 -mmt1
Geekbench 5.5: Multi-Core | Single-Core
HWBOT x265 Benchmark v2.2: 4k Preset
LibreOffice : 20 Documents To PDF
R Benchmark 2.5: Overall mean
Octane V2: Total Score
Jetstream 2: 2.0 Total
| CPU Performance rating | |
| Média da turma Workstation | |
| HP ZBook Studio 15 G8 -1! | |
| HP ZBook Power 15 G8 313S5EA | |
| HP ZBook Fury 15 G8 -3! | |
| Média Intel Core i7-11800H | |
| Lenovo ThinkPad P15v G2 21A9000XGE -3! | |
| Dell Precision 3000 3551 -4! | |
| HP ZBook Firefly 15 G8 2C9R7EA -4! | |
| Cinebench R23 / Multi Core | |
| Média da turma Workstation (14621 - 38520, n=23, últimos 2 anos) | |
| HP ZBook Power 15 G8 313S5EA | |
| HP ZBook Fury 15 G8 | |
| HP ZBook Studio 15 G8 | |
| Média Intel Core i7-11800H (6508 - 14088, n=48) | |
| Lenovo ThinkPad P15v G2 21A9000XGE | |
| Cinebench R23 / Single Core | |
| Média da turma Workstation (1712 - 2228, n=23, últimos 2 anos) | |
| HP ZBook Fury 15 G8 | |
| HP ZBook Studio 15 G8 | |
| HP ZBook Power 15 G8 313S5EA | |
| Média Intel Core i7-11800H (1386 - 1522, n=45) | |
| Cinebench R20 / CPU (Multi Core) | |
| Média da turma Workstation (5760 - 15043, n=23, últimos 2 anos) | |
| HP ZBook Fury 15 G8 | |
| HP ZBook Studio 15 G8 | |
| Média Intel Core i7-11800H (2498 - 5408, n=50) | |
| HP ZBook Power 15 G8 313S5EA | |
| Lenovo ThinkPad P15v G2 21A9000XGE | |
| Dell Precision 3000 3551 | |
| HP ZBook Firefly 15 G8 2C9R7EA | |
| Cinebench R20 / CPU (Single Core) | |
| Média da turma Workstation (671 - 857, n=23, últimos 2 anos) | |
| HP ZBook Fury 15 G8 | |
| HP ZBook Studio 15 G8 | |
| HP ZBook Firefly 15 G8 2C9R7EA | |
| HP ZBook Power 15 G8 313S5EA | |
| Média Intel Core i7-11800H (520 - 586, n=47) | |
| Lenovo ThinkPad P15v G2 21A9000XGE | |
| Dell Precision 3000 3551 | |
| Cinebench R15 / CPU Multi 64Bit | |
| Média da turma Workstation (2489 - 5810, n=23, últimos 2 anos) | |
| HP ZBook Power 15 G8 313S5EA | |
| HP ZBook Power 15 G8 313S5EA | |
| Média Intel Core i7-11800H (1342 - 2173, n=50) | |
| HP ZBook Studio 15 G8 | |
| HP ZBook Fury 15 G8 | |
| Lenovo ThinkPad P15v G2 21A9000XGE | |
| Dell Precision 3000 3551 | |
| HP ZBook Firefly 15 G8 2C9R7EA | |
| Cinebench R15 / CPU Single 64Bit | |
| Média da turma Workstation (191.4 - 328, n=23, últimos 2 anos) | |
| HP ZBook Fury 15 G8 | |
| HP ZBook Studio 15 G8 | |
| HP ZBook Power 15 G8 313S5EA | |
| HP ZBook Firefly 15 G8 2C9R7EA | |
| Média Intel Core i7-11800H (201 - 231, n=46) | |
| Lenovo ThinkPad P15v G2 21A9000XGE | |
| Dell Precision 3000 3551 | |
| Blender / v2.79 BMW27 CPU | |
| HP ZBook Firefly 15 G8 2C9R7EA | |
| Dell Precision 3000 3551 | |
| Lenovo ThinkPad P15v G2 21A9000XGE | |
| Média Intel Core i7-11800H (217 - 454, n=46) | |
| HP ZBook Fury 15 G8 | |
| HP ZBook Power 15 G8 313S5EA | |
| HP ZBook Studio 15 G8 | |
| Média da turma Workstation (91 - 222, n=23, últimos 2 anos) | |
| 7-Zip 18.03 / 7z b 4 | |
| Média da turma Workstation (60489 - 116969, n=23, últimos 2 anos) | |
| HP ZBook Fury 15 G8 | |
| HP ZBook Studio 15 G8 | |
| HP ZBook Power 15 G8 313S5EA | |
| Média Intel Core i7-11800H (33718 - 56758, n=46) | |
| Lenovo ThinkPad P15v G2 21A9000XGE | |
| Dell Precision 3000 3551 | |
| HP ZBook Firefly 15 G8 2C9R7EA | |
| 7-Zip 18.03 / 7z b 4 -mmt1 | |
| Média da turma Workstation (5126 - 6960, n=23, últimos 2 anos) | |
| HP ZBook Studio 15 G8 | |
| HP ZBook Fury 15 G8 | |
| HP ZBook Power 15 G8 313S5EA | |
| Média Intel Core i7-11800H (5138 - 5732, n=46) | |
| HP ZBook Firefly 15 G8 2C9R7EA | |
| Dell Precision 3000 3551 | |
| Lenovo ThinkPad P15v G2 21A9000XGE | |
| Geekbench 5.5 / Multi-Core | |
| Média da turma Workstation (11542 - 25554, n=23, últimos 2 anos) | |
| Média Intel Core i7-11800H (4655 - 9851, n=40) | |
| HP ZBook Power 15 G8 313S5EA | |
| HP ZBook Studio 15 G8 | |
| Dell Precision 3000 3551 | |
| Lenovo ThinkPad P15v G2 21A9000XGE | |
| HP ZBook Firefly 15 G8 2C9R7EA | |
| Geekbench 5.5 / Single-Core | |
| Média da turma Workstation (1783 - 2183, n=23, últimos 2 anos) | |
| HP ZBook Studio 15 G8 | |
| Média Intel Core i7-11800H (1429 - 1625, n=40) | |
| HP ZBook Firefly 15 G8 2C9R7EA | |
| HP ZBook Power 15 G8 313S5EA | |
| Lenovo ThinkPad P15v G2 21A9000XGE | |
| Dell Precision 3000 3551 | |
| HWBOT x265 Benchmark v2.2 / 4k Preset | |
| Média da turma Workstation (17.8 - 40.5, n=23, últimos 2 anos) | |
| HP ZBook Studio 15 G8 | |
| HP ZBook Fury 15 G8 | |
| HP ZBook Power 15 G8 313S5EA | |
| Média Intel Core i7-11800H (7.38 - 17.4, n=46) | |
| Lenovo ThinkPad P15v G2 21A9000XGE | |
| Dell Precision 3000 3551 | |
| HP ZBook Firefly 15 G8 2C9R7EA | |
| LibreOffice / 20 Documents To PDF | |
| Lenovo ThinkPad P15v G2 21A9000XGE | |
| HP ZBook Fury 15 G8 | |
| HP ZBook Studio 15 G8 | |
| Média da turma Workstation (37.1 - 74.7, n=23, últimos 2 anos) | |
| Média Intel Core i7-11800H (38.6 - 59.9, n=45) | |
| Dell Precision 3000 3551 | |
| HP ZBook Power 15 G8 313S5EA | |
| HP ZBook Firefly 15 G8 2C9R7EA | |
| R Benchmark 2.5 / Overall mean | |
| HP ZBook Power 15 G8 313S5EA | |
| Lenovo ThinkPad P15v G2 21A9000XGE | |
| Dell Precision 3000 3551 | |
| Média Intel Core i7-11800H (0.548 - 0.615, n=46) | |
| HP ZBook Firefly 15 G8 2C9R7EA | |
| HP ZBook Studio 15 G8 | |
| HP ZBook Fury 15 G8 | |
| Média da turma Workstation (0.3825 - 0.603, n=23, últimos 2 anos) | |
| Octane V2 / Total Score | |
| Média da turma Workstation (112382 - 129420, n=3, últimos 2 anos) | |
| Média Intel Core i7-11800H (63248 - 70549, n=10) | |
| HP ZBook Power 15 G8 313S5EA | |
| Jetstream 2 / 2.0 Total | |
| Média da turma Workstation (327 - 466, n=4, últimos 2 anos) | |
| HP ZBook Power 15 G8 313S5EA | |
| HP ZBook Fury 15 G8 | |
| HP ZBook Studio 15 G8 | |
| Média Intel Core i7-11800H (159.8 - 214, n=16) | |
* ... menor é melhor
AIDA64: FP32 Ray-Trace | FPU Julia | CPU SHA3 | CPU Queen | FPU SinJulia | FPU Mandel | CPU AES | CPU ZLib | FP64 Ray-Trace | CPU PhotoWorxx
| Performance rating | |
| Média da turma Workstation | |
| HP ZBook Fury 15 G8 | |
| HP ZBook Studio 15 G8 | |
| HP ZBook Power 15 G8 313S5EA | |
| Média Intel Core i7-11800H | |
| Lenovo ThinkPad P15v G2 21A9000XGE | |
| HP ZBook Firefly 15 G8 2C9R7EA | |
| AIDA64 / FP32 Ray-Trace | |
| Média da turma Workstation (16730 - 61611, n=23, últimos 2 anos) | |
| HP ZBook Power 15 G8 313S5EA | |
| HP ZBook Fury 15 G8 | |
| HP ZBook Studio 15 G8 | |
| Média Intel Core i7-11800H (8772 - 15961, n=20) | |
| Lenovo ThinkPad P15v G2 21A9000XGE | |
| HP ZBook Firefly 15 G8 2C9R7EA | |
| AIDA64 / FPU Julia | |
| Média da turma Workstation (89597 - 186971, n=23, últimos 2 anos) | |
| HP ZBook Fury 15 G8 | |
| HP ZBook Studio 15 G8 | |
| HP ZBook Power 15 G8 313S5EA | |
| Média Intel Core i7-11800H (39404 - 65636, n=20) | |
| Lenovo ThinkPad P15v G2 21A9000XGE | |
| HP ZBook Firefly 15 G8 2C9R7EA | |
| AIDA64 / CPU SHA3 | |
| Média da turma Workstation (4178 - 8975, n=23, últimos 2 anos) | |
| HP ZBook Power 15 G8 313S5EA | |
| HP ZBook Fury 15 G8 | |
| HP ZBook Studio 15 G8 | |
| Média Intel Core i7-11800H (2599 - 4439, n=20) | |
| Lenovo ThinkPad P15v G2 21A9000XGE | |
| HP ZBook Firefly 15 G8 2C9R7EA | |
| AIDA64 / CPU Queen | |
| Média da turma Workstation (60778 - 144411, n=23, últimos 2 anos) | |
| HP ZBook Studio 15 G8 | |
| HP ZBook Fury 15 G8 | |
| HP ZBook Power 15 G8 313S5EA | |
| Média Intel Core i7-11800H (85233 - 91941, n=20) | |
| Lenovo ThinkPad P15v G2 21A9000XGE | |
| HP ZBook Firefly 15 G8 2C9R7EA | |
| AIDA64 / FPU SinJulia | |
| Média da turma Workstation (8165 - 29343, n=23, últimos 2 anos) | |
| HP ZBook Fury 15 G8 | |
| HP ZBook Studio 15 G8 | |
| HP ZBook Power 15 G8 313S5EA | |
| Média Intel Core i7-11800H (6420 - 9792, n=20) | |
| Lenovo ThinkPad P15v G2 21A9000XGE | |
| HP ZBook Firefly 15 G8 2C9R7EA | |
| AIDA64 / FPU Mandel | |
| Média da turma Workstation (44497 - 98153, n=23, últimos 2 anos) | |
| HP ZBook Fury 15 G8 | |
| HP ZBook Power 15 G8 313S5EA | |
| HP ZBook Studio 15 G8 | |
| Média Intel Core i7-11800H (23365 - 39464, n=20) | |
| Lenovo ThinkPad P15v G2 21A9000XGE | |
| HP ZBook Firefly 15 G8 2C9R7EA | |
| AIDA64 / CPU AES | |
| Média Intel Core i7-11800H (74617 - 149388, n=20) | |
| Média da turma Workstation (73133 - 187841, n=23, últimos 2 anos) | |
| HP ZBook Power 15 G8 313S5EA | |
| HP ZBook Studio 15 G8 | |
| HP ZBook Fury 15 G8 | |
| Lenovo ThinkPad P15v G2 21A9000XGE | |
| HP ZBook Firefly 15 G8 2C9R7EA | |
| AIDA64 / CPU ZLib | |
| Média da turma Workstation (929 - 2148, n=23, últimos 2 anos) | |
| HP ZBook Power 15 G8 313S5EA | |
| HP ZBook Studio 15 G8 | |
| HP ZBook Fury 15 G8 | |
| Lenovo ThinkPad P15v G2 21A9000XGE | |
| HP ZBook Firefly 15 G8 2C9R7EA | |
| Média Intel Core i7-11800H (461 - 830, n=43) | |
| AIDA64 / FP64 Ray-Trace | |
| Média da turma Workstation (8545 - 32891, n=23, últimos 2 anos) | |
| HP ZBook Power 15 G8 313S5EA | |
| HP ZBook Fury 15 G8 | |
| HP ZBook Studio 15 G8 | |
| Média Intel Core i7-11800H (4545 - 8717, n=21) | |
| Lenovo ThinkPad P15v G2 21A9000XGE | |
| HP ZBook Firefly 15 G8 2C9R7EA | |
| AIDA64 / CPU PhotoWorxx | |
| Média da turma Workstation (37151 - 93684, n=23, últimos 2 anos) | |
| HP ZBook Fury 15 G8 | |
| HP ZBook Studio 15 G8 | |
| Média Intel Core i7-11800H (11898 - 26757, n=21) | |
| HP ZBook Firefly 15 G8 2C9R7EA | |
| HP ZBook Power 15 G8 313S5EA | |
| Lenovo ThinkPad P15v G2 21A9000XGE | |
Desempenho da estação de trabalho
O desempenho nas aplicações relacionadas à estação de trabalho foi avaliado com a nova BIOS (v1.09). Aqui, ele coloca cerca de 10% atrás da PensePad P15v G2com oNvidia T1200enquanto o HP Fireflycom oNvidia T500é ultrapassado em cerca de 45%. Por outro lado, o ZBook Fury comRTX A5000oferece o dobro do desempenho na maior parte do tempo.
ORTX A2000o ZBook Power 15, que é o máximo que você pode selecionar para o ZBook Power 15, deve funcionar cerca de 50% mais rápido.
| V-Ray 5 Benchmark | |
| CPU | |
| HP ZBook Fury 15 G8 | |
| Lenovo ThinkPad P15v G2 21A9000XGE | |
| GPU CUDA | |
| Lenovo ThinkPad P15v G2 21A9000XGE | |
| HP ZBook Power 15 G8 313S5EA | |
| Geekbench 5.5 - OpenCL Score | |
| Lenovo ThinkPad P15v G2 21A9000XGE | |
| HP ZBook Power 15 G8 313S5EA | |
| HP ZBook Firefly 15 G8 2C9R7EA | |
| Dell Precision 3000 3551 | |
Desempenho do sistema
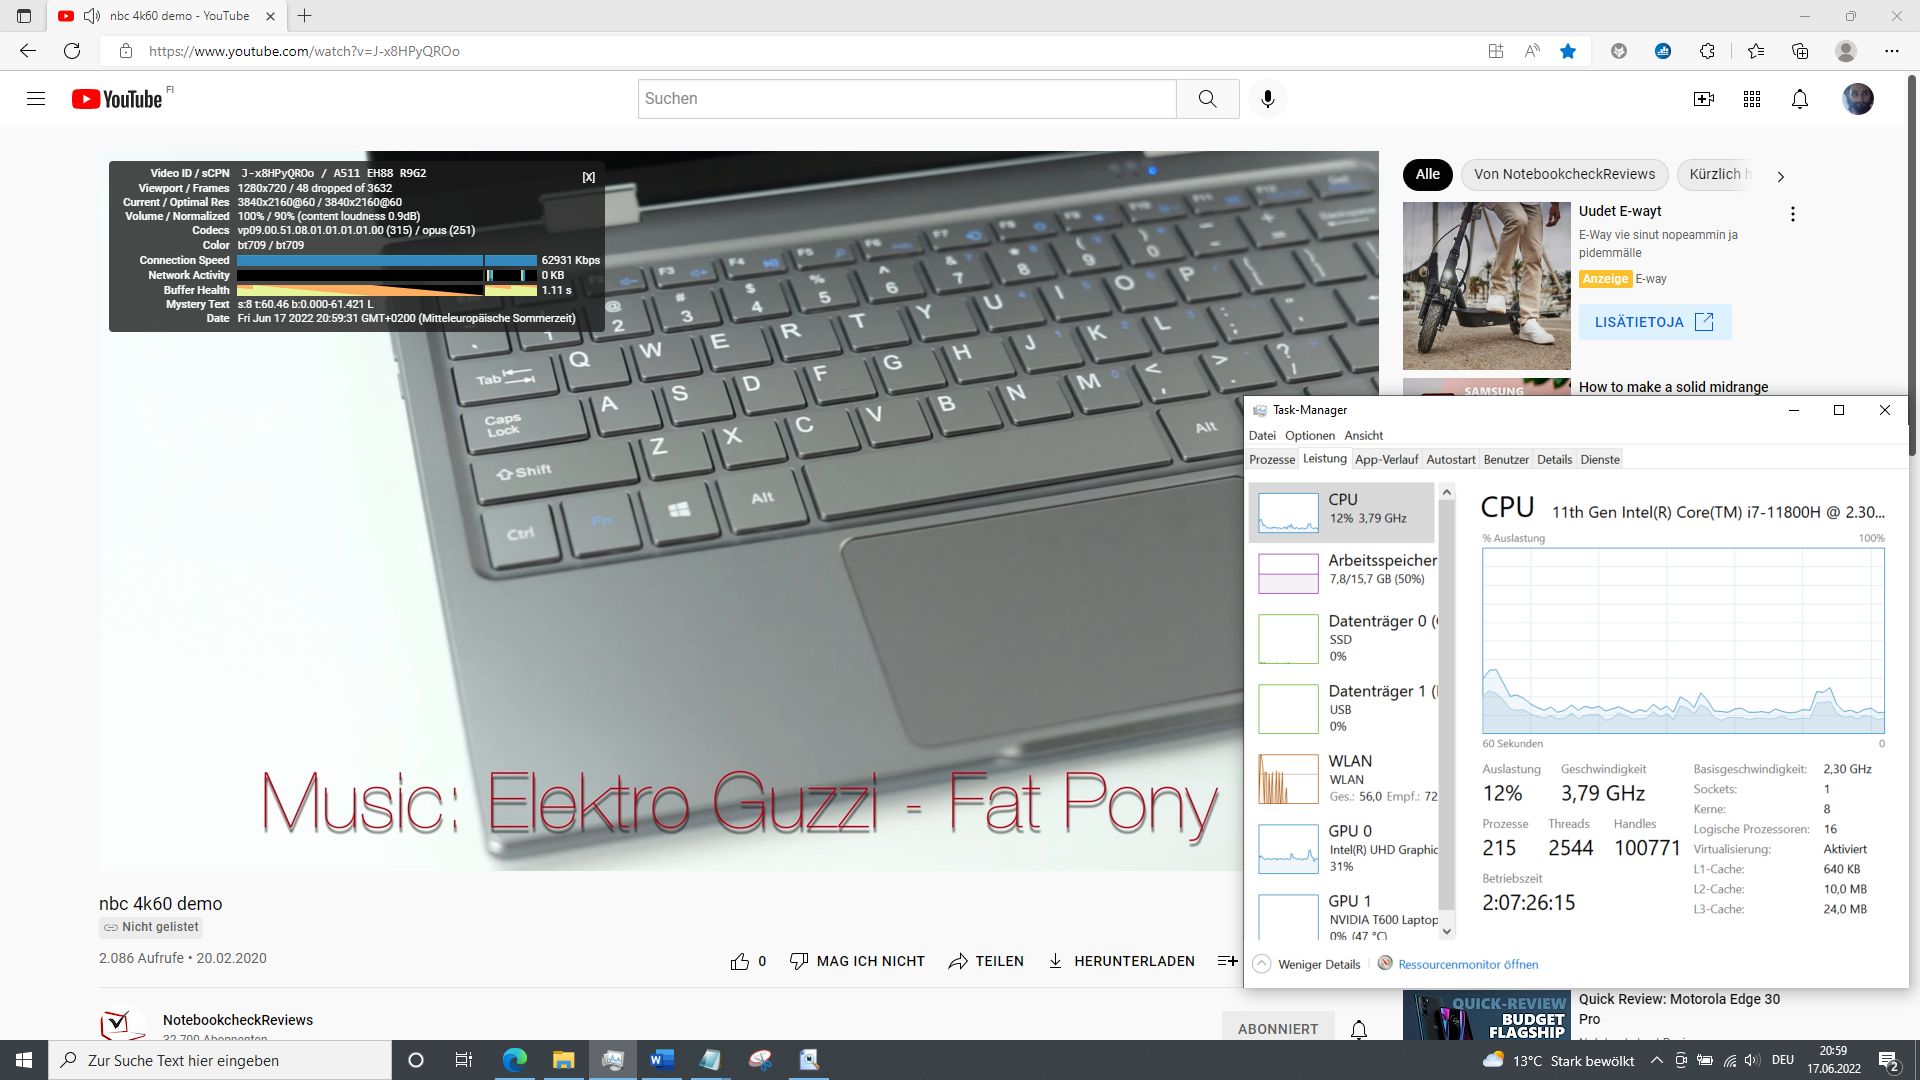
Apesar da RAM de canal único, o sistema funciona absolutamente livre de qualquer atraso, mesmo quando trabalha com várias abas do navegador, enquanto um vídeo de 4K YouTube também é executado em segundo plano.
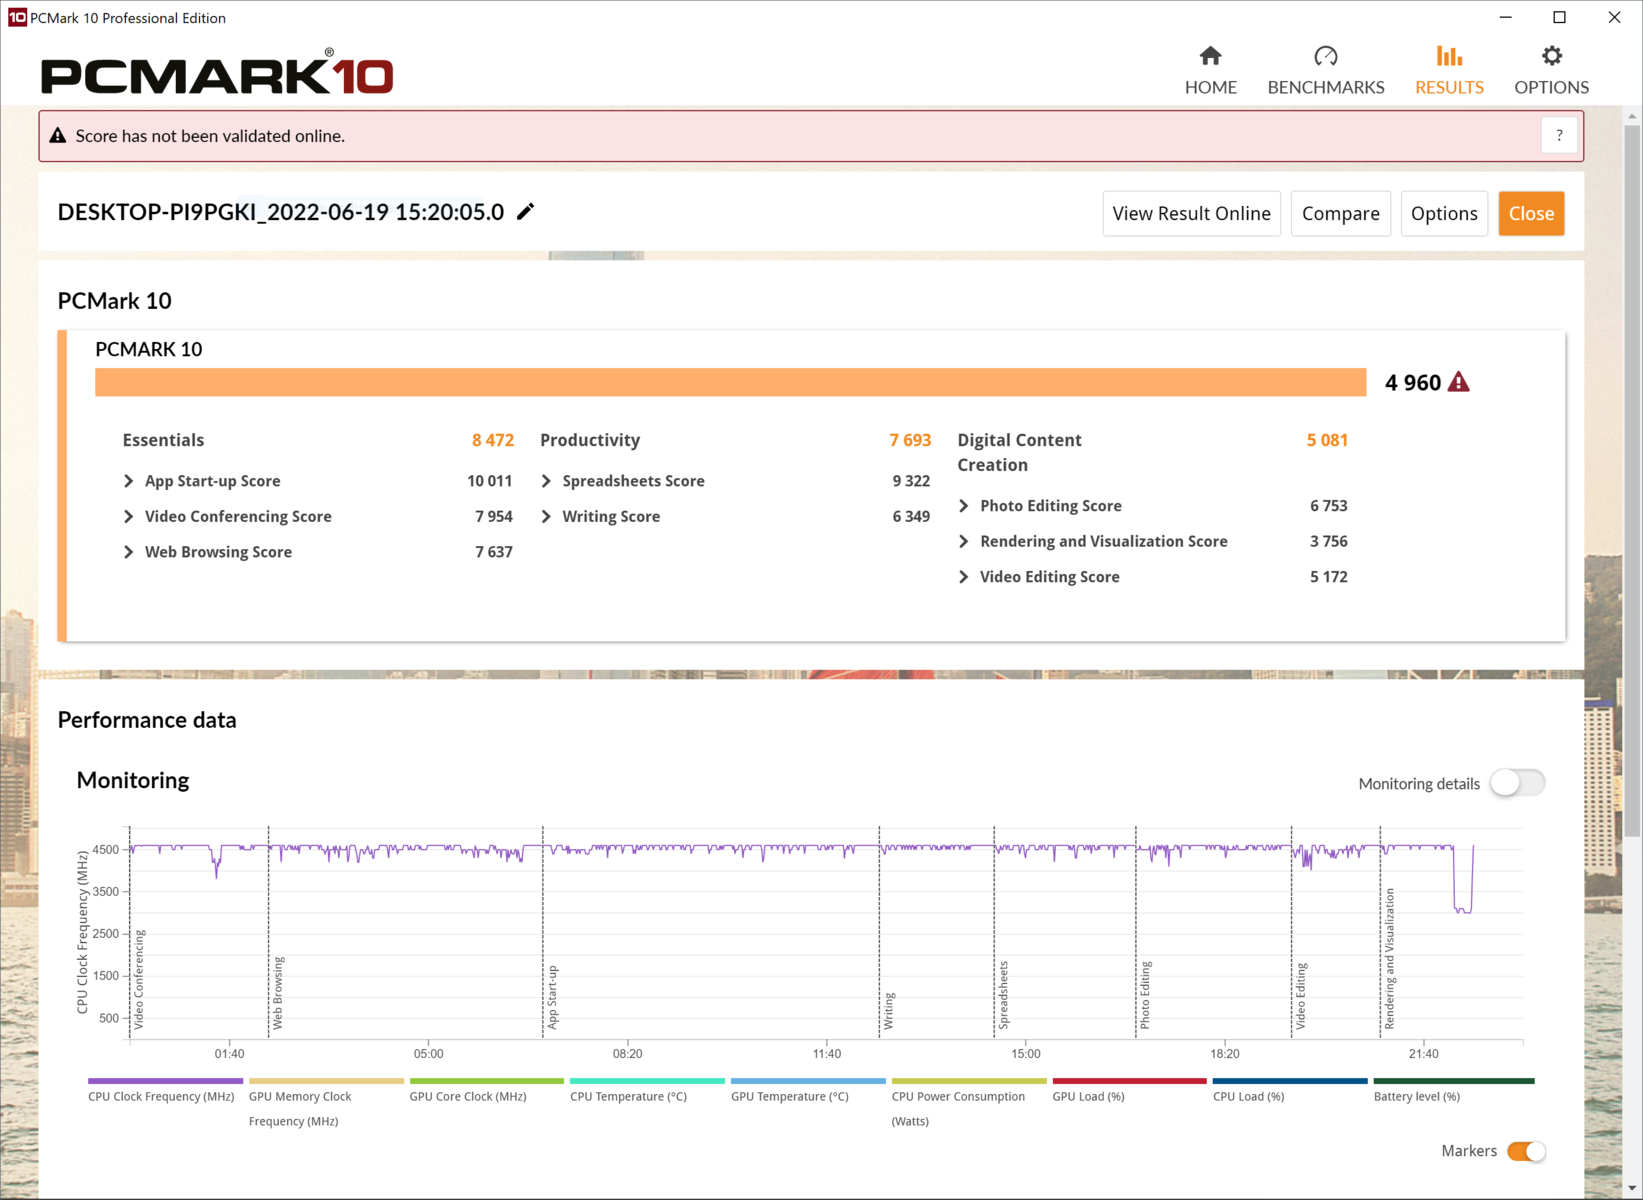
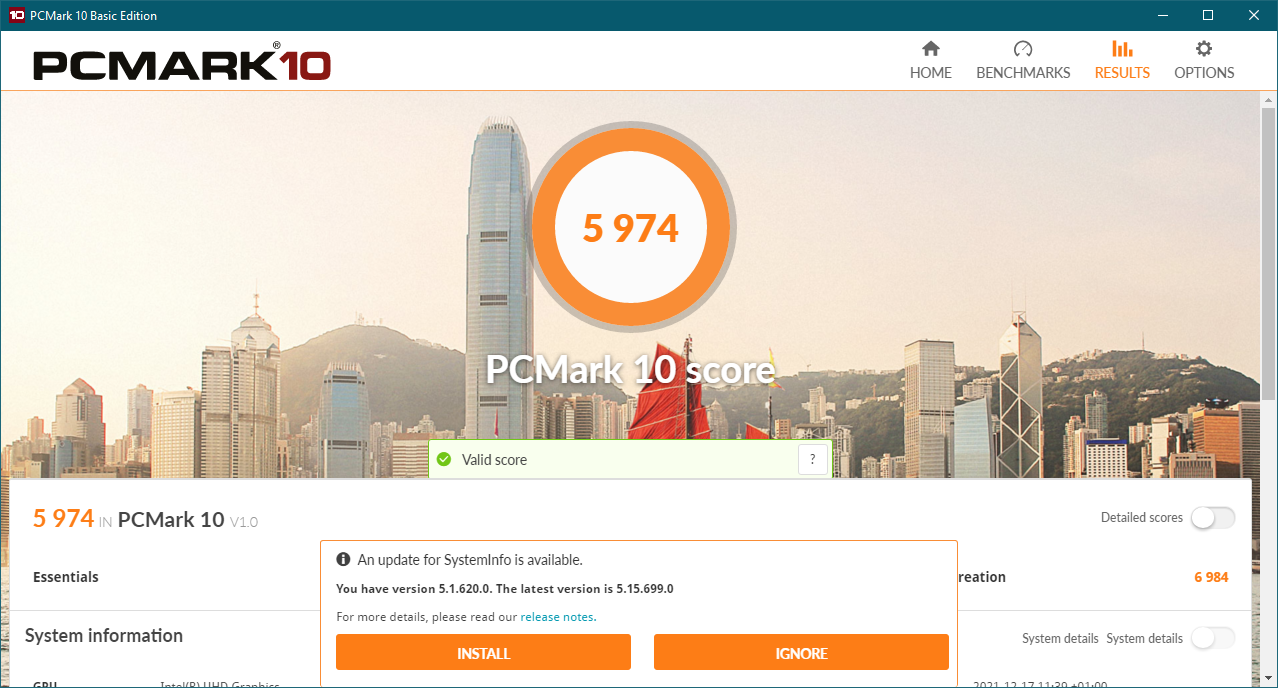
Com a nova BIOS, cerca de 15% do desempenho é perdido, de modo que nossa unidade de teste acaba sendo a última no benchmark PCMark 10. Particularmente a pontuação de Criação de Conteúdo caiu em cerca de 28%.
CrossMark: Overall | Productivity | Creativity | Responsiveness
| PCMark 10 / Score | |
| Média da turma Workstation (6563 - 10409, n=19, últimos 2 anos) | |
| HP ZBook Fury 15 G8 | |
| HP ZBook Studio 15 G8 | |
| Lenovo ThinkPad P15v G2 21A9000XGE | |
| HP ZBook Firefly 15 G8 2C9R7EA | |
| Dell Precision 3000 3551 | |
| HP ZBook Power 15 G8 313S5EA | |
| Média Intel Core i7-11800H, NVIDIA T600 Laptop GPU (n=1) | |
| PCMark 10 / Essentials | |
| Média da turma Workstation (9622 - 11157, n=19, últimos 2 anos) | |
| Dell Precision 3000 3551 | |
| HP ZBook Fury 15 G8 | |
| HP ZBook Studio 15 G8 | |
| Lenovo ThinkPad P15v G2 21A9000XGE | |
| HP ZBook Firefly 15 G8 2C9R7EA | |
| HP ZBook Power 15 G8 313S5EA | |
| Média Intel Core i7-11800H, NVIDIA T600 Laptop GPU (n=1) | |
| PCMark 10 / Productivity | |
| Média da turma Workstation (8789 - 20616, n=19, últimos 2 anos) | |
| HP ZBook Firefly 15 G8 2C9R7EA | |
| HP ZBook Fury 15 G8 | |
| HP ZBook Studio 15 G8 | |
| Lenovo ThinkPad P15v G2 21A9000XGE | |
| Dell Precision 3000 3551 | |
| HP ZBook Power 15 G8 313S5EA | |
| Média Intel Core i7-11800H, NVIDIA T600 Laptop GPU (n=1) | |
| PCMark 10 / Digital Content Creation | |
| Média da turma Workstation (8108 - 15631, n=19, últimos 2 anos) | |
| HP ZBook Fury 15 G8 | |
| HP ZBook Studio 15 G8 | |
| Lenovo ThinkPad P15v G2 21A9000XGE | |
| HP ZBook Firefly 15 G8 2C9R7EA | |
| HP ZBook Power 15 G8 313S5EA | |
| Média Intel Core i7-11800H, NVIDIA T600 Laptop GPU (n=1) | |
| Dell Precision 3000 3551 | |
| CrossMark / Overall | |
| Média da turma Workstation (1307 - 2267, n=22, últimos 2 anos) | |
| HP ZBook Power 15 G8 313S5EA | |
| Média Intel Core i7-11800H, NVIDIA T600 Laptop GPU (n=1) | |
| Lenovo ThinkPad P15v G2 21A9000XGE | |
| CrossMark / Productivity | |
| Média da turma Workstation (1130 - 2122, n=22, últimos 2 anos) | |
| HP ZBook Power 15 G8 313S5EA | |
| Média Intel Core i7-11800H, NVIDIA T600 Laptop GPU (n=1) | |
| Lenovo ThinkPad P15v G2 21A9000XGE | |
| CrossMark / Creativity | |
| Média da turma Workstation (1657 - 2725, n=22, últimos 2 anos) | |
| HP ZBook Power 15 G8 313S5EA | |
| Média Intel Core i7-11800H, NVIDIA T600 Laptop GPU (n=1) | |
| Lenovo ThinkPad P15v G2 21A9000XGE | |
| CrossMark / Responsiveness | |
| Média da turma Workstation (993 - 2096, n=22, últimos 2 anos) | |
| HP ZBook Power 15 G8 313S5EA | |
| Média Intel Core i7-11800H, NVIDIA T600 Laptop GPU (n=1) | |
| Lenovo ThinkPad P15v G2 21A9000XGE | |
| PCMark 10 Score | 4960 pontos | |
Ajuda | ||
| AIDA64 / Memory Copy | |
| Média da turma Workstation (56003 - 164795, n=23, últimos 2 anos) | |
| HP ZBook Fury 15 G8 | |
| HP ZBook Studio 15 G8 | |
| Média Intel Core i7-11800H (24508 - 48144, n=21) | |
| HP ZBook Power 15 G8 313S5EA | |
| HP ZBook Firefly 15 G8 2C9R7EA | |
| Lenovo ThinkPad P15v G2 21A9000XGE | |
| AIDA64 / Memory Read | |
| Média da turma Workstation (55795 - 121563, n=23, últimos 2 anos) | |
| HP ZBook Studio 15 G8 | |
| HP ZBook Fury 15 G8 | |
| Média Intel Core i7-11800H (25882 - 50365, n=20) | |
| HP ZBook Power 15 G8 313S5EA | |
| Lenovo ThinkPad P15v G2 21A9000XGE | |
| HP ZBook Firefly 15 G8 2C9R7EA | |
| AIDA64 / Memory Write | |
| Média da turma Workstation (55663 - 214520, n=23, últimos 2 anos) | |
| HP ZBook Studio 15 G8 | |
| HP ZBook Fury 15 G8 | |
| Média Intel Core i7-11800H (22240 - 46214, n=20) | |
| HP ZBook Firefly 15 G8 2C9R7EA | |
| HP ZBook Power 15 G8 313S5EA | |
| Lenovo ThinkPad P15v G2 21A9000XGE | |
| AIDA64 / Memory Latency | |
| Média da turma Workstation (84.5 - 165.2, n=23, últimos 2 anos) | |
| Lenovo ThinkPad P15v G2 21A9000XGE | |
| HP ZBook Fury 15 G8 | |
| HP ZBook Studio 15 G8 | |
| HP ZBook Power 15 G8 313S5EA | |
| HP ZBook Firefly 15 G8 2C9R7EA | |
| Média Intel Core i7-11800H (71.9 - 104.1, n=44) | |
* ... menor é melhor
Latências DPC
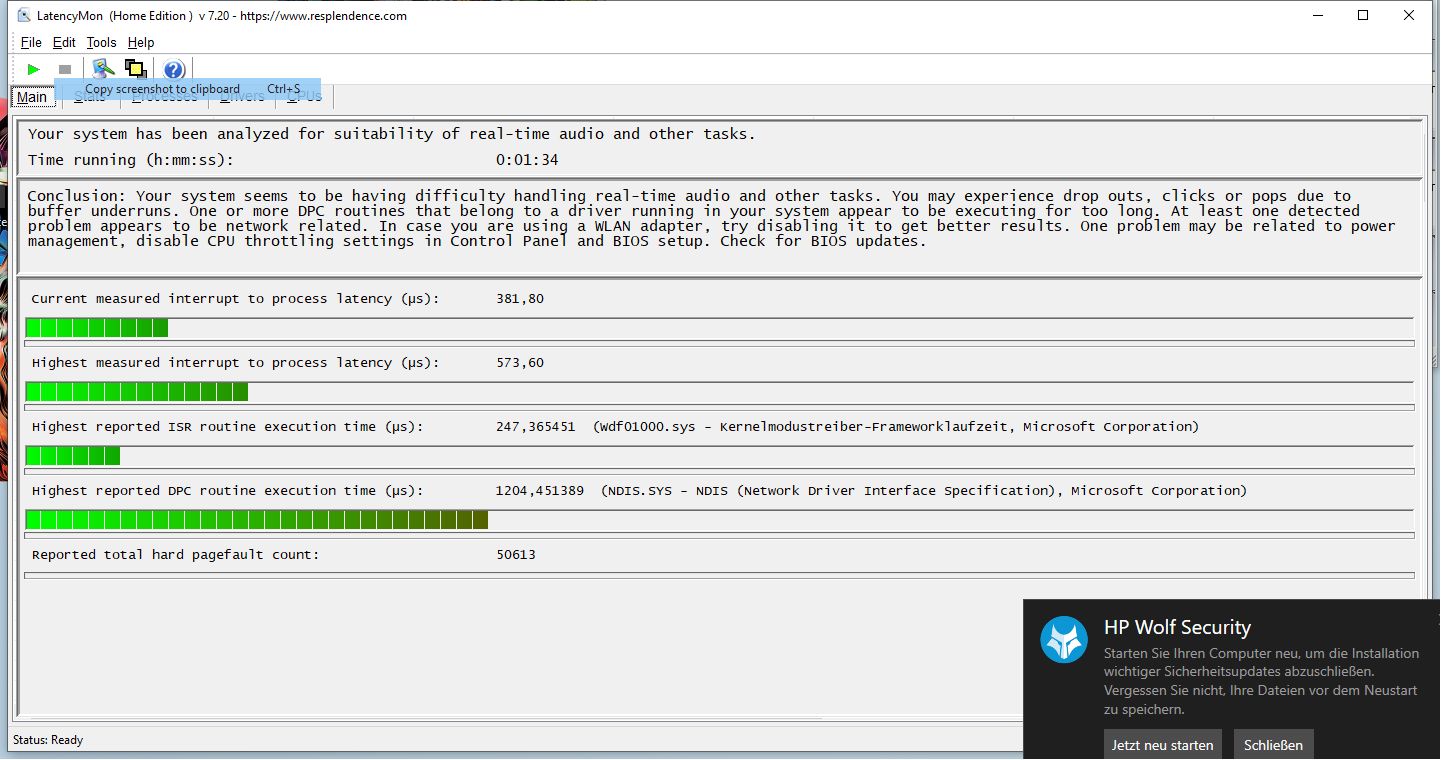
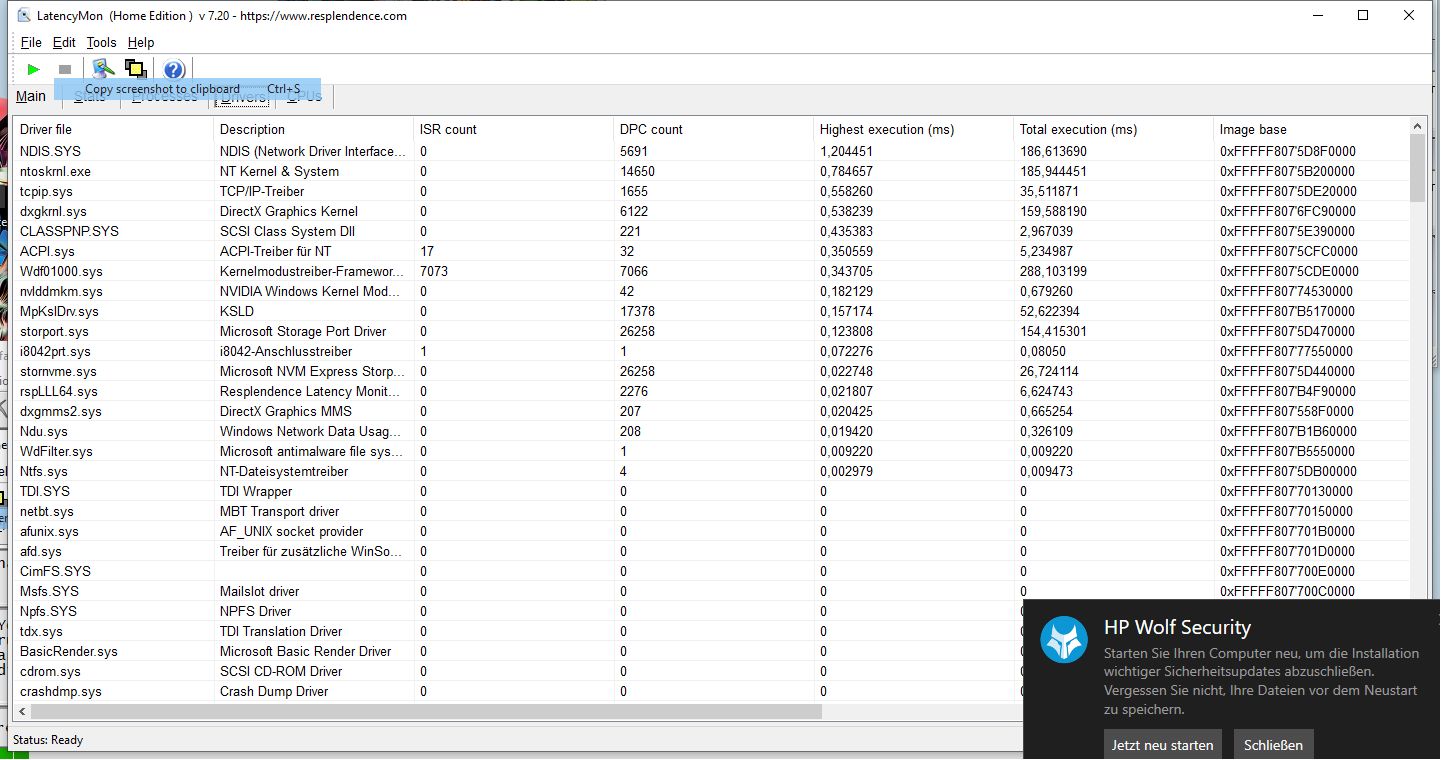
Com apenas 537,6 µs, a latência DPC do ZBook Power 15 parece muito boa. Entretanto, a análise ainda mostra que o driver de rede causa alguns atrasos, de modo que o processamento de vídeo e áudio em tempo real só funcionará sem o uso do AX201 Wi-Fi da Intel
A reprodução de um vídeo 4K do YouTube causa uma carga de 30% no iGPU e 12% na CPU, mas ainda notamos algumas quedas de quadros.
| DPC Latencies / LatencyMon - interrupt to process latency (max), Web, Youtube, Prime95 (classificar por valor) | |
| HP ZBook Power 15 G8 313S5EA | |
| HP ZBook Fury 15 G8 | |
| HP ZBook Firefly 15 G8 2C9R7EA | |
| HP ZBook Studio 15 G8 | |
| Dell Precision 3000 3551 | |
| Lenovo ThinkPad P15v G2 21A9000XGE | |
* ... menor é melhor
Solução de armazenamento
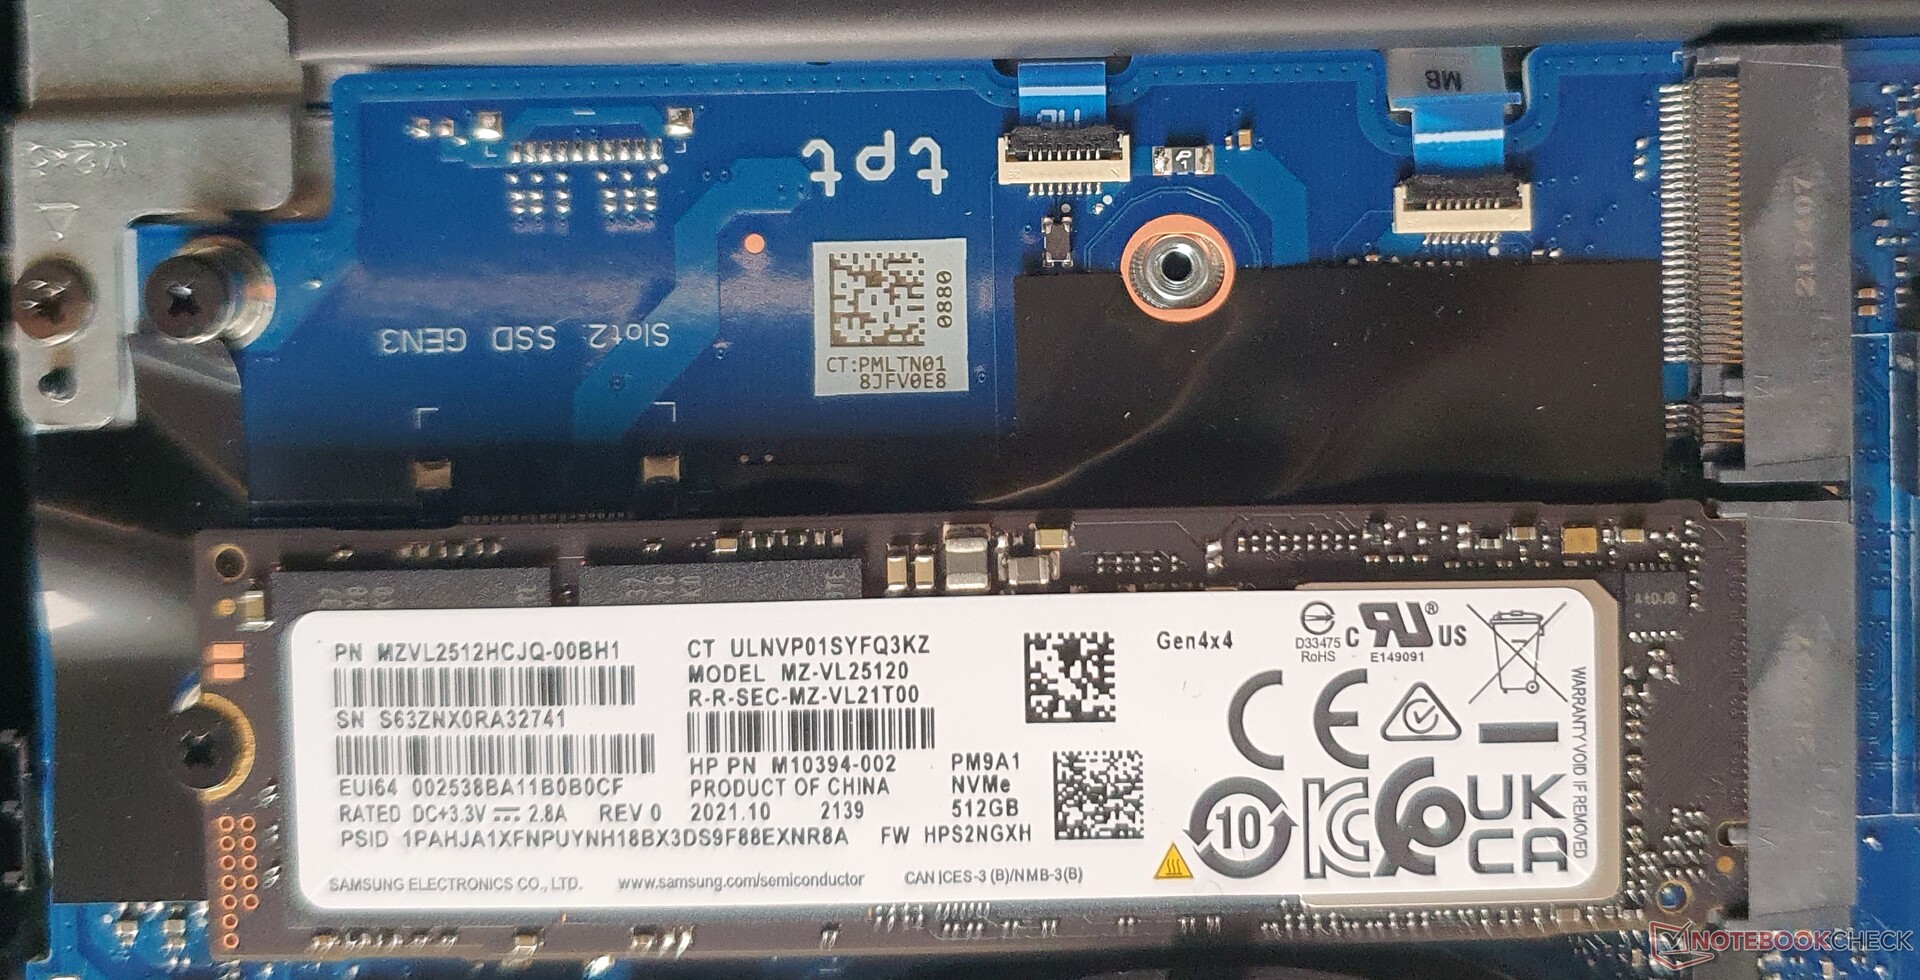
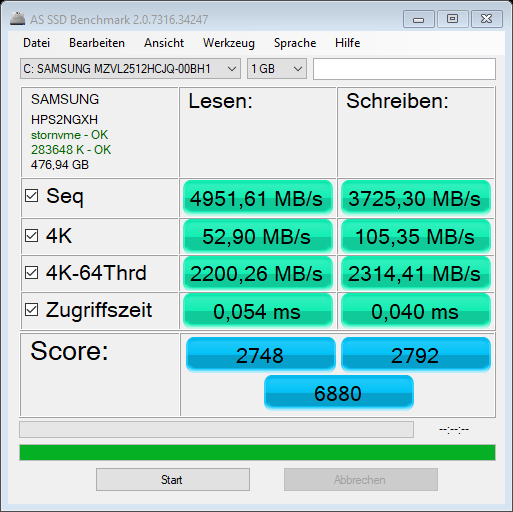
O Samsung PM9A1 oferece espaço para 512 GB, dos quais cerca de 418 GB permanecem disponíveis para o usuário no estado de entrega. Graças à PCIe Gen4x4, as velocidades, incluindo os valores de 4K e os tempos de acesso, parecem muito boas inicialmente. Um segundo slot (PCIe Gen3x4) também está disponível, e ambos são certificados até 2 TB.
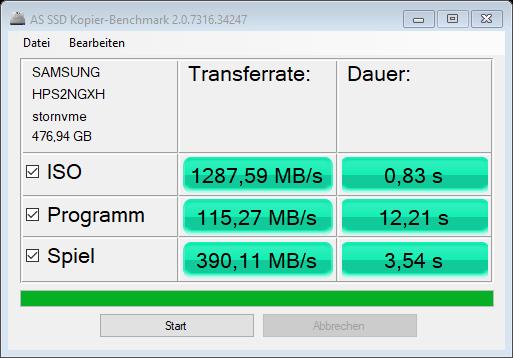
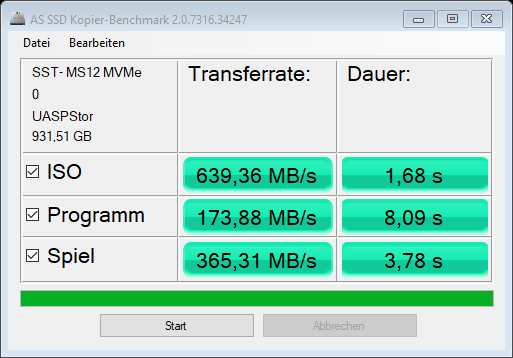
Entretanto, ao copiar um programa maior, por exemplo, o AS SSD mostra taxas de transferência muito fracas de 115 MB/s em vez dos 1074 MB/s doZBook Studio 15 G8. Mesmo os acessíveis Dell Precision 3511 gerencia taxas de cópia significativamente mais altas. Nosso SSD externo de 10 Gbps também copia programas mais rapidamente.
| HP ZBook Power 15 G8 313S5EA T600 Laptop GPU, i7-11800H, Samsung PM9A1 MZVL2512HCJQ | HP ZBook Fury 15 G8 RTX A5000 Laptop GPU, i9-11950H, Samsung PM981a MZVLB1T0HBLR | HP ZBook Studio 15 G8 GeForce RTX 3070 Laptop GPU, i9-11950H, Samsung PM981a MZVLB2T0HALB | HP ZBook Firefly 15 G8 2C9R7EA T500 Laptop GPU, i7-1165G7, Toshiba XG6 KXG60ZNV1T02 | Lenovo ThinkPad P15v G2 21A9000XGE T1200 Laptop GPU, i7-11800H, Toshiba XG6 KXG6AZNV512G | Dell Precision 3000 3551 Quadro P620, i9-10885H, Toshiba Kioxia XG6 KXG60PNV512G | |
|---|---|---|---|---|---|---|
| AS SSD | -35% | 64% | -26% | -9% | 24% | |
| Seq Read (MB/s) | 4951 | 2937 -41% | 2953 -40% | 2599 -48% | 2684 -46% | 1833 -63% |
| Seq Write (MB/s) | 3725 | 1688 -55% | 1691 -55% | 1305 -65% | 1352 -64% | 1283 -66% |
| 4K Read (MB/s) | 52.9 | 44.27 -16% | 43.98 -17% | 49.65 -6% | 43.68 -17% | 44.56 -16% |
| 4K Write (MB/s) | 105.35 | 105.8 0% | 105.4 0% | 128.1 22% | 105.56 0% | 112.4 7% |
| 4K-64 Read (MB/s) | 2200.26 | 873 -60% | 1065 -52% | 1157 -47% | 976.92 -56% | 1106 -50% |
| 4K-64 Write (MB/s) | 2314.41 | 1996 -14% | 1957 -15% | 1475 -36% | 1452.09 -37% | 1262 -45% |
| Access Time Read * (ms) | 0.054 | 0.048 11% | 0.04 26% | 0.057 -6% | 0.124 -130% | 0.084 -56% |
| Access Time Write * (ms) | 0.04 | 0.107 -168% | 0.105 -163% | 0.03 25% | 0.038 5% | 0.105 -163% |
| Score Read (Points) | 2748 | 1211 -56% | 1404 -49% | 1467 -47% | 1289 -53% | 1334 -51% |
| Score Write (Points) | 2792 | 2271 -19% | 2232 -20% | 1734 -38% | 1693 -39% | 1503 -46% |
| Score Total (Points) | 6880 | 4046 -41% | 4297 -38% | 3894 -43% | 3582 -48% | 3498 -49% |
| Copy ISO MB/s (MB/s) | 1287.6 | 901 -30% | 2474 92% | 1760.5 37% | 2940 128% | |
| Copy Program MB/s (MB/s) | 115.3 | 118.7 3% | 1074 831% | 355 208% | 733 536% | |
| Copy Game MB/s (MB/s) | 390.1 | 372 -5% | 1929 394% | 849 118% | 1442 270% |
* ... menor é melhor
* ... menor é melhor
Constant Performance Reading: DiskSpd Read Loop, Queue Depth 8
Placa Gráfica
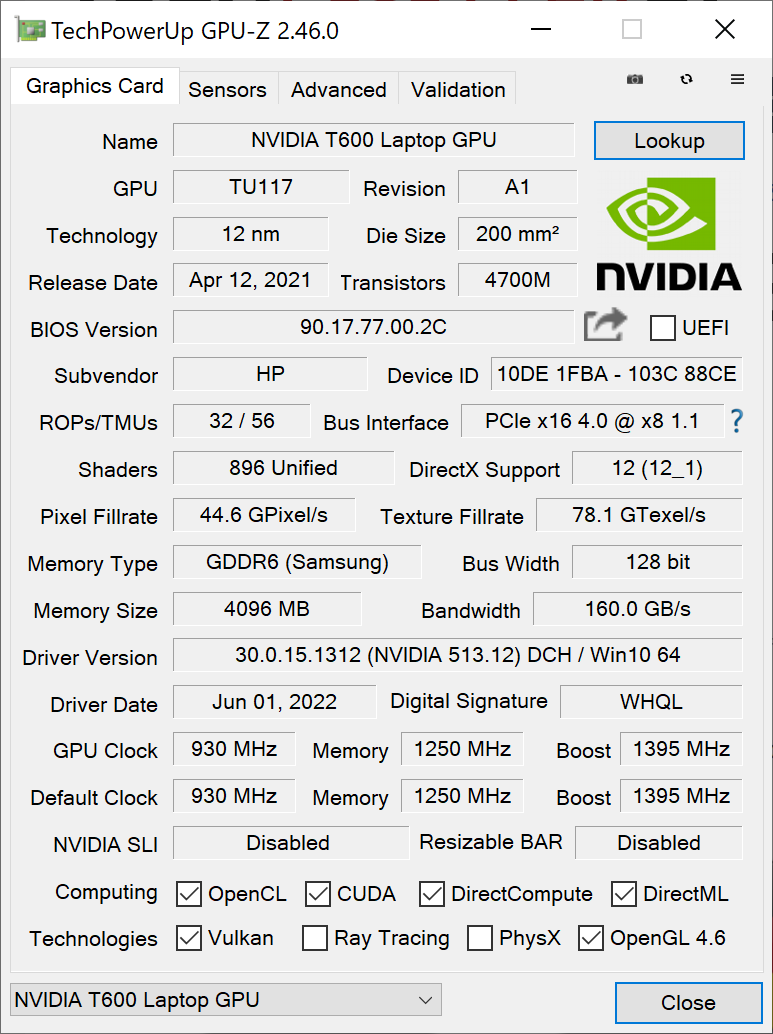
ONvidia T600utilizada aqui é a versão profissional do GeForce GTX 1650 (não-Ti) com 4 GB de VRAM GDDR6 e um TGP de 25 Watt e potencia até 1395 MHz
Em muitos benchmarks, ele permanece ~15% atrás do Nvidia T1200doPensePad P15v G2e entre 30 e 50% à frente do Nvidia T500 noZBook Firefly 15 G8
Em operação com bateria, você perderá cerca de 20% da potência gráfica, o que ainda lhe permitirá trabalhar em tarefas de GPU em operação móvel.

| 3DMark Performance rating - Percent | |
| Média da turma Workstation | |
| HP ZBook Fury 15 G8 -4! | |
| HP ZBook Studio 15 G8 -4! | |
| HP ZBook Power 15 G8 313S5EA | |
| Média NVIDIA T600 Laptop GPU | |
| Lenovo ThinkPad P15v G2 21A9000XGE -3! | |
| Dell Precision 3000 3551 -3! | |
| HP ZBook Firefly 15 G8 2C9R7EA -4! | |
| 3DMark 06 - 1280x1024 Standard Score AA:0x AF:0x | |
| Média da turma Workstation (53112 - 63693, n=3, últimos 2 anos) | |
| HP ZBook Power 15 G8 313S5EA | |
| Média NVIDIA T600 Laptop GPU (n=1) | |
| Lenovo ThinkPad P15v G2 21A9000XGE | |
| Dell Precision 3000 3551 | |
| 3DMark Vantage | |
| 1280x1024 P Result | |
| Média da turma Workstation (71988 - 116321, n=3, últimos 2 anos) | |
| HP ZBook Power 15 G8 313S5EA | |
| Média NVIDIA T600 Laptop GPU (n=1) | |
| 1280x1024 P GPU no PhysX | |
| Média da turma Workstation (66766 - 117151, n=2, últimos 2 anos) | |
| HP ZBook Power 15 G8 313S5EA | |
| Média NVIDIA T600 Laptop GPU (n=1) | |
| 1280x1024 P CPU no PhysX | |
| Média da turma Workstation (94058 - 113900, n=2, últimos 2 anos) | |
| HP ZBook Power 15 G8 313S5EA | |
| Média NVIDIA T600 Laptop GPU (n=1) | |
| 3DMark 06 Standard Score | 43438 pontos | |
| 3DMark Vantage P Result | 39112 pontos | |
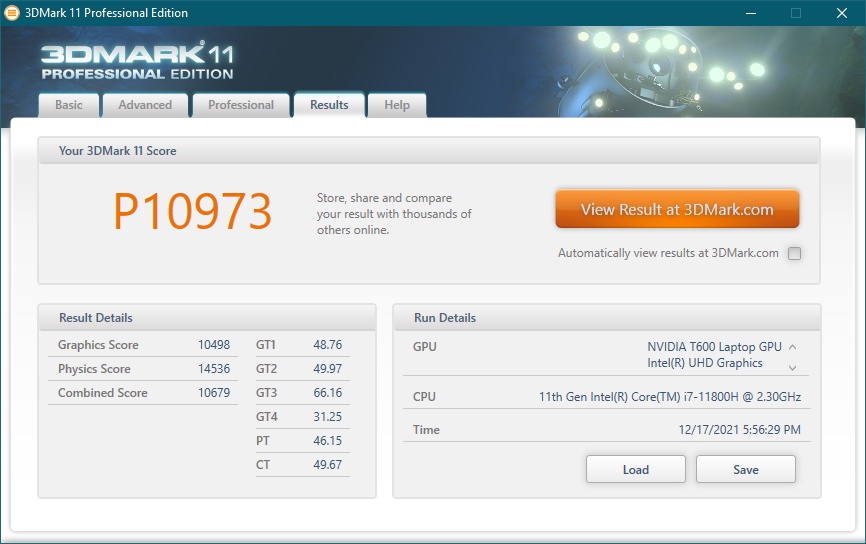
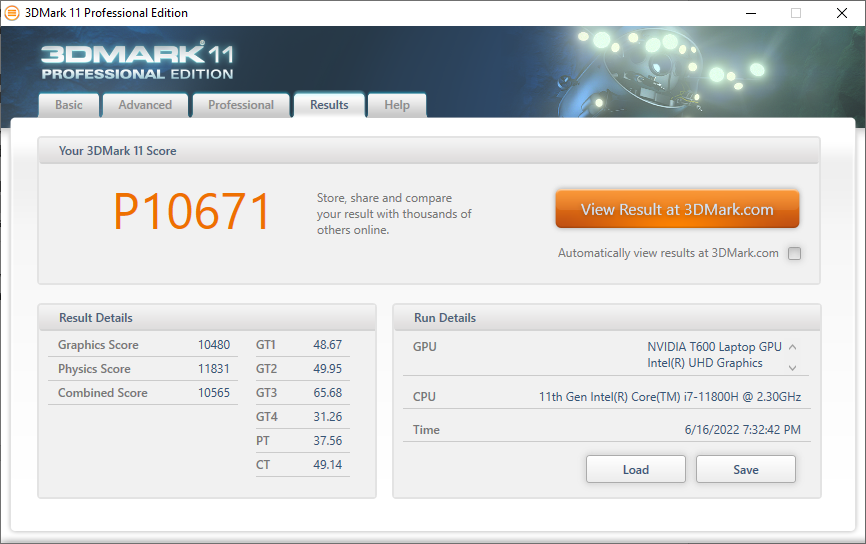
| 3DMark 11 Performance | 10973 pontos | |
| 3DMark Ice Storm Standard Score | 76482 pontos | |
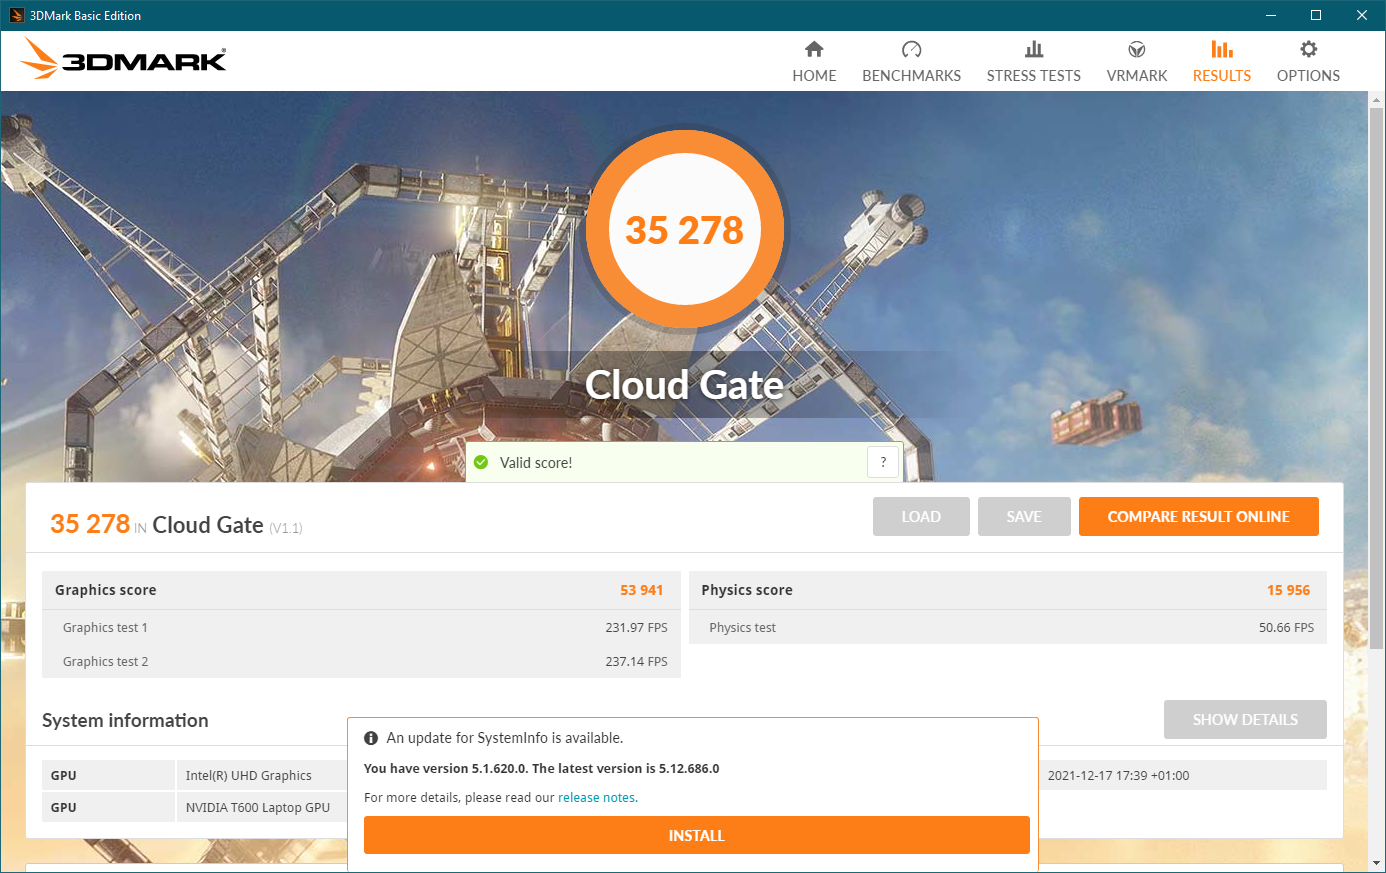
| 3DMark Cloud Gate Standard Score | 35278 pontos | |
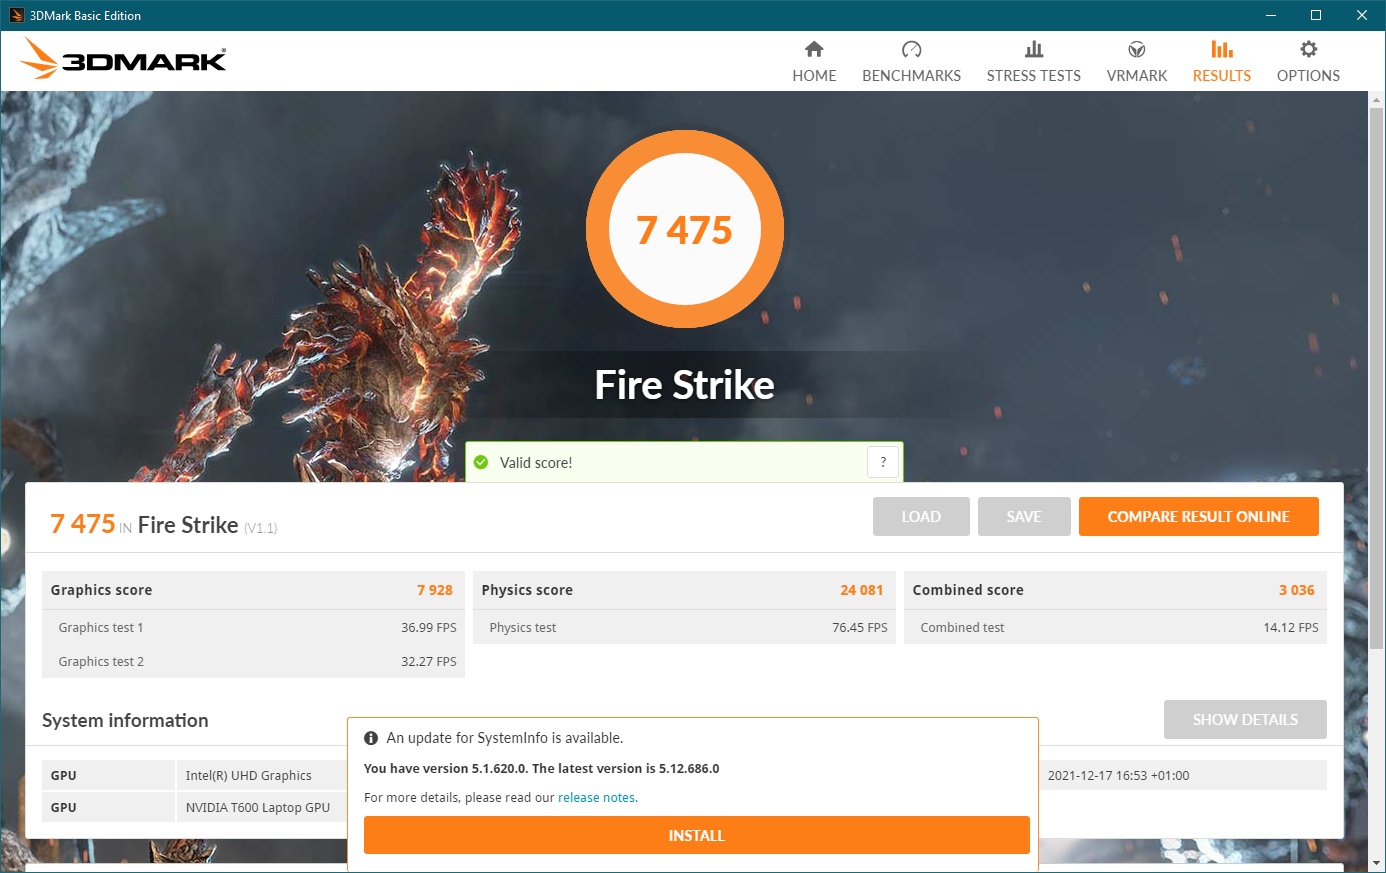
| 3DMark Fire Strike Score | 7475 pontos | |
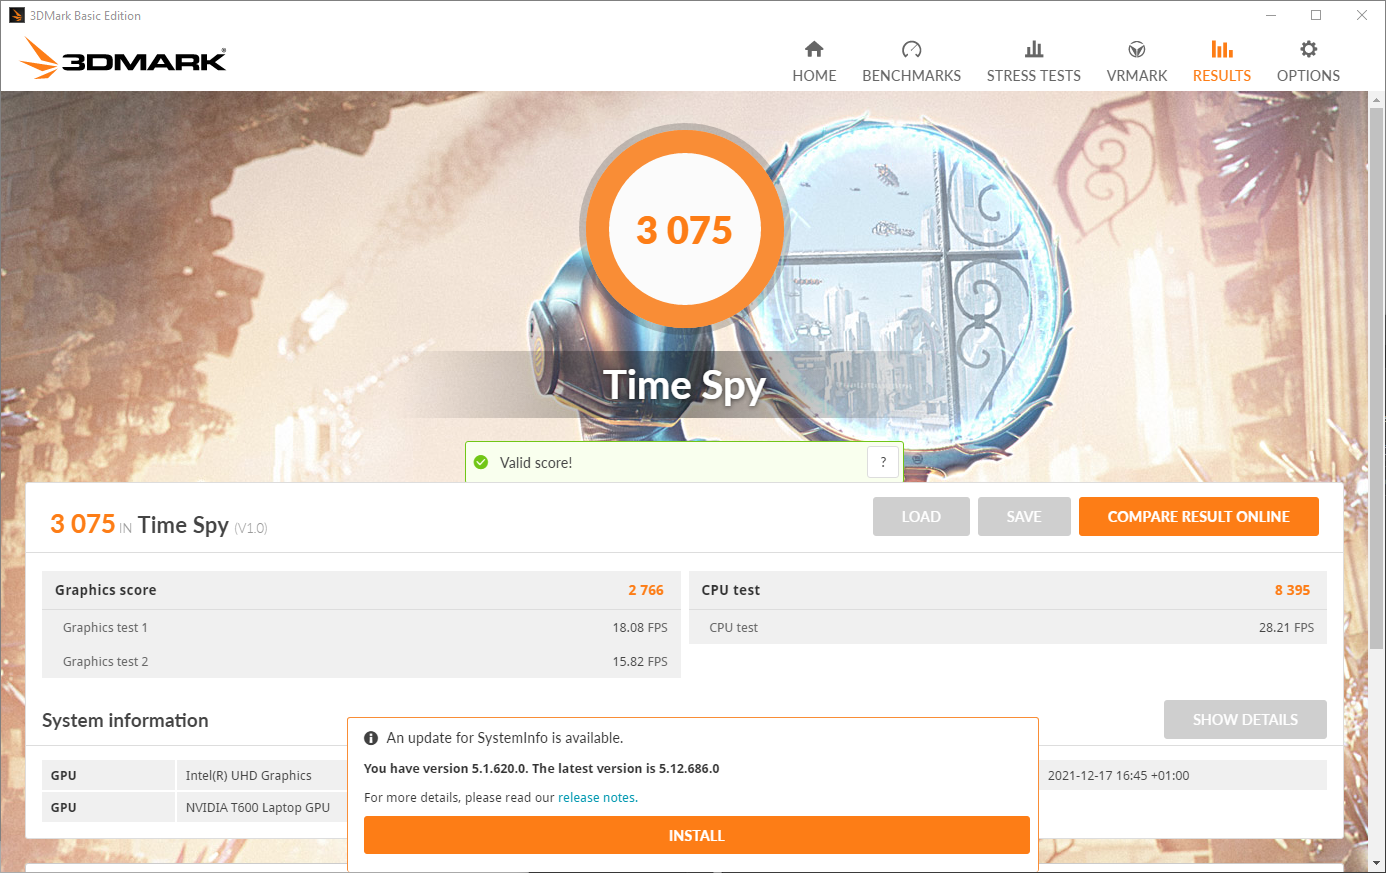
| 3DMark Time Spy Score | 3075 pontos | |
Ajuda | ||
Desempenho nos jogos
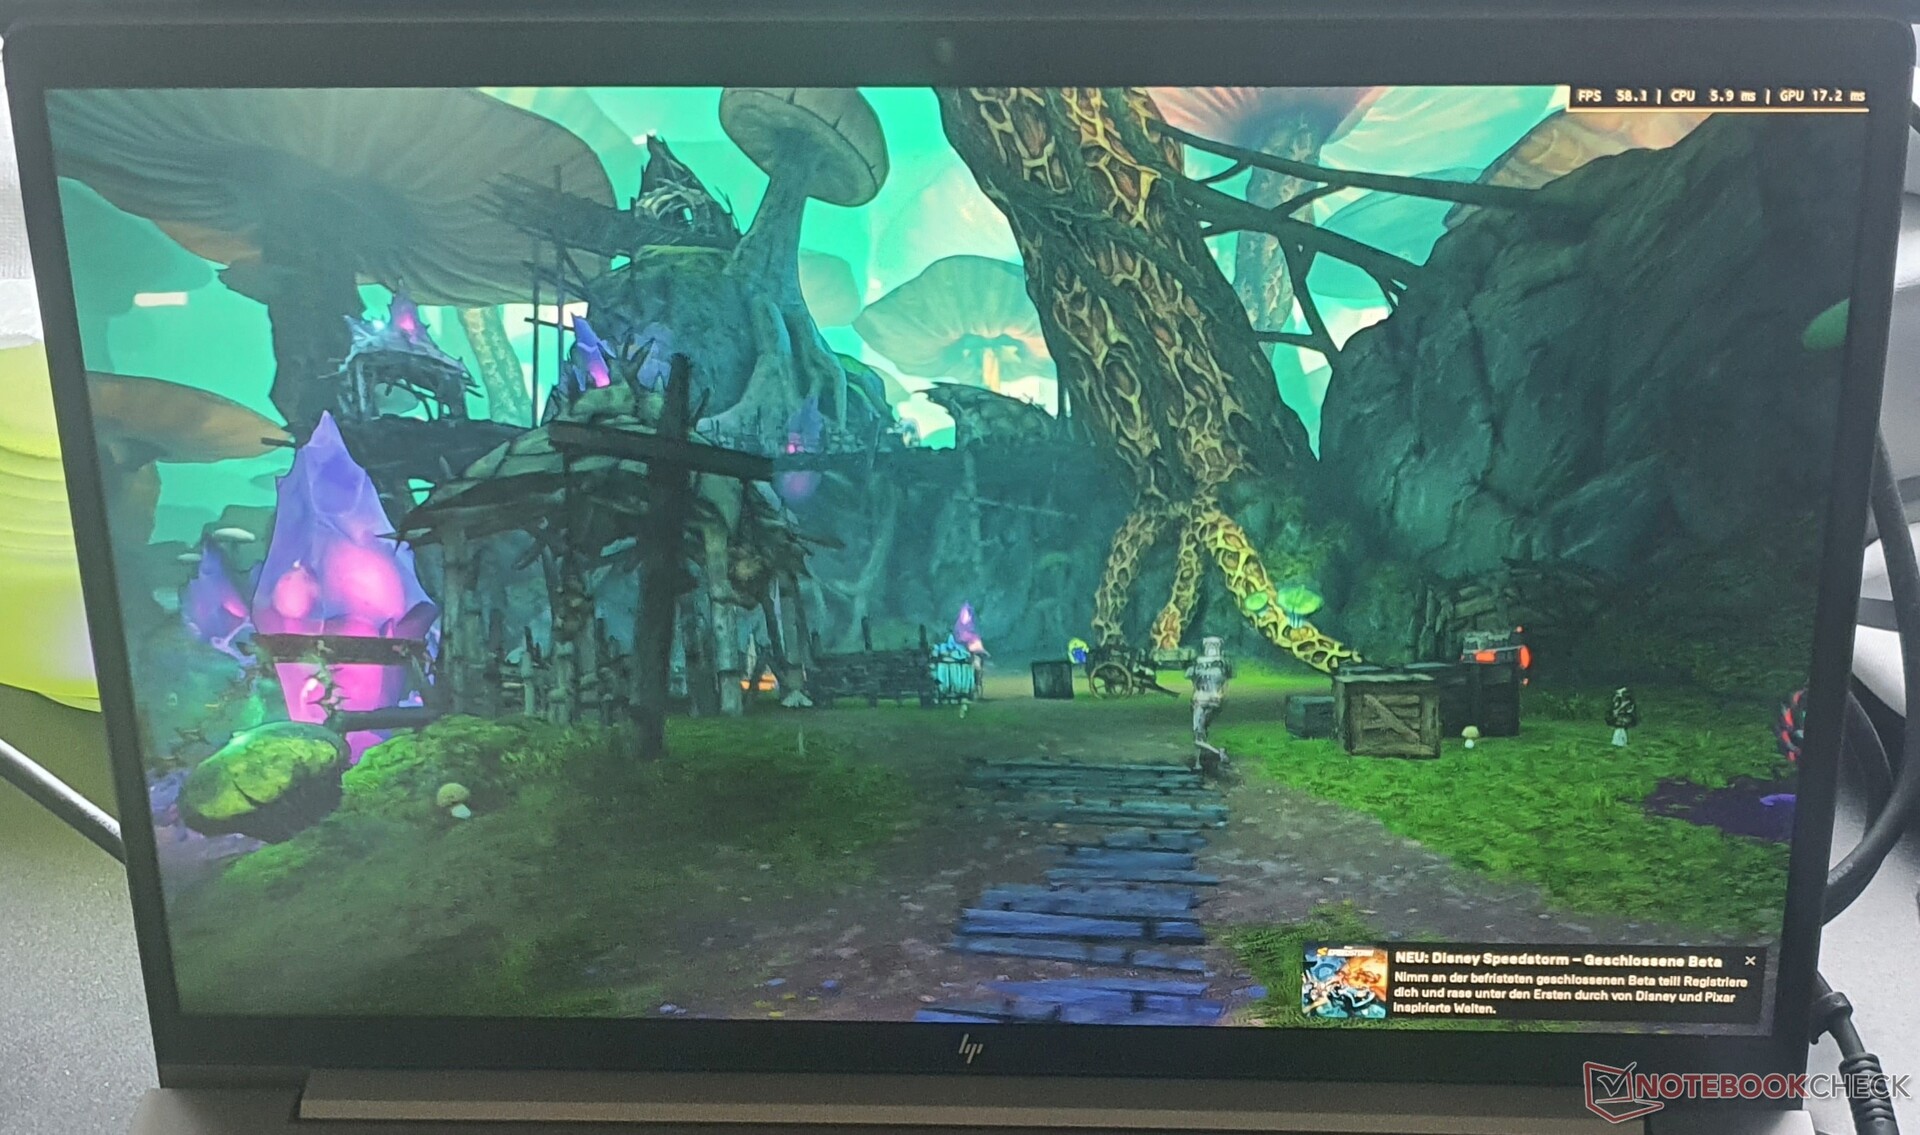
Durante o jogo, o Nvidia T600 é capaz de manter sua velocidade máxima de impulso do relógio. A menos de 60 °C (140 °F), ele não fica particularmente quente. Em jogos modernos, o desempenho é suficiente para detalhes médios com resolução Full HD. Entretanto, o ZBook não é projetado para jogos. O sistema consome ~60 watts neste cenário em geral, com os 25 watts completos indo para a GPU.
Embora o PensePad P15vfornece apenas 10 watts a mais para seu dGPU, ele consome um total de 100 watts durante os jogos, enquanto o Nvidia T1200fornece apenas ~15% mais quadros por segundo. OZBook Firefly 15 com oNvidia T500 é 40% mais lento em média, mas ainda consome os mesmos 60 watts durante os jogos. No teste Witcher 3 de uma hora de duração, não notamos nenhuma queda de desempenho.
The Witcher 3 FPS Chart
| The Witcher 3 | |
| 1366x768 Medium Graphics & Postprocessing | |
| HP ZBook Studio 15 G8 | |
| HP ZBook Fury 15 G8 | |
| HP ZBook Power 15 G8 313S5EA | |
| Média NVIDIA T600 Laptop GPU (n=1) | |
| Dell Precision 3000 3551 | |
| 1920x1080 High Graphics & Postprocessing (Nvidia HairWorks Off) | |
| Média da turma Workstation (n=1últimos 2 anos) | |
| HP ZBook Studio 15 G8 | |
| HP ZBook Fury 15 G8 | |
| Lenovo ThinkPad P15v G2 21A9000XGE | |
| HP ZBook Power 15 G8 313S5EA | |
| Média NVIDIA T600 Laptop GPU (n=1) | |
| Dell Precision 3000 3551 | |
| 1920x1080 Ultra Graphics & Postprocessing (HBAO+) | |
| Média da turma Workstation (n=1últimos 2 anos) | |
| HP ZBook Fury 15 G8 | |
| HP ZBook Studio 15 G8 | |
| Lenovo ThinkPad P15v G2 21A9000XGE | |
| HP ZBook Power 15 G8 313S5EA | |
| Média NVIDIA T600 Laptop GPU (n=1) | |
| HP ZBook Firefly 15 G8 2C9R7EA | |
| Dell Precision 3000 3551 | |
| GTA V | |
| 1366x768 Normal/Off AF:4x | |
| Média da turma Workstation (140.9 - 185.8, n=17, últimos 2 anos) | |
| HP ZBook Fury 15 G8 | |
| Lenovo ThinkPad P15v G2 21A9000XGE | |
| HP ZBook Power 15 G8 313S5EA | |
| Média NVIDIA T600 Laptop GPU (n=1) | |
| 1920x1080 High/On (Advanced Graphics Off) AA:2xMSAA + FX AF:8x | |
| Média da turma Workstation (44.4 - 179.4, n=21, últimos 2 anos) | |
| HP ZBook Fury 15 G8 | |
| Lenovo ThinkPad P15v G2 21A9000XGE | |
| HP ZBook Power 15 G8 313S5EA | |
| Média NVIDIA T600 Laptop GPU (n=1) | |
| 1920x1080 Highest AA:4xMSAA + FX AF:16x | |
| Média da turma Workstation (18.1 - 156.1, n=23, últimos 2 anos) | |
| HP ZBook Fury 15 G8 | |
| Lenovo ThinkPad P15v G2 21A9000XGE | |
| HP ZBook Power 15 G8 313S5EA | |
| Média NVIDIA T600 Laptop GPU (n=1) | |
| Shadow of the Tomb Raider | |
| 1280x720 Lowest Preset | |
| HP ZBook Fury 15 G8 | |
| HP ZBook Power 15 G8 313S5EA | |
| Média NVIDIA T600 Laptop GPU (n=1) | |
| Lenovo ThinkPad P15v G2 21A9000XGE | |
| 1920x1080 Medium Preset | |
| HP ZBook Fury 15 G8 | |
| Lenovo ThinkPad P15v G2 21A9000XGE | |
| HP ZBook Power 15 G8 313S5EA | |
| Média NVIDIA T600 Laptop GPU (n=1) | |
| 1920x1080 High Preset AA:SM | |
| HP ZBook Fury 15 G8 | |
| Lenovo ThinkPad P15v G2 21A9000XGE | |
| HP ZBook Power 15 G8 313S5EA | |
| Média NVIDIA T600 Laptop GPU (n=1) | |
| Elden Ring | |
| 1920x1080 Medium Preset | |
| Lenovo ThinkPad P15v G2 21A9000XGE | |
| HP ZBook Power 15 G8 313S5EA | |
| Média NVIDIA T600 Laptop GPU (n=1) | |
| 1920x1080 High Preset | |
| Lenovo ThinkPad P15v G2 21A9000XGE | |
| HP ZBook Power 15 G8 313S5EA | |
| Média NVIDIA T600 Laptop GPU (n=1) | |
| 1920x1080 Maximum Preset | |
| Lenovo ThinkPad P15v G2 21A9000XGE | |
| HP ZBook Power 15 G8 313S5EA | |
| Média NVIDIA T600 Laptop GPU (n=1) | |
| Resident Evil Village | |
| 1920x1080 Balanced Preset | |
| Lenovo ThinkPad P15v G2 21A9000XGE | |
| HP ZBook Power 15 G8 313S5EA | |
| Média NVIDIA T600 Laptop GPU (n=1) | |
| 1920x1080 Prioritize Graphics Preset | |
| Lenovo ThinkPad P15v G2 21A9000XGE | |
| HP ZBook Power 15 G8 313S5EA | |
| Média NVIDIA T600 Laptop GPU (n=1) | |
| 1920x1080 Max Preset | |
| Lenovo ThinkPad P15v G2 21A9000XGE | |
| HP ZBook Power 15 G8 313S5EA | |
| Média NVIDIA T600 Laptop GPU (n=1) | |
| Vampire Bloodhunt | |
| 1920x1080 Medium Preset | |
| Lenovo ThinkPad P15v G2 21A9000XGE | |
| HP ZBook Power 15 G8 313S5EA | |
| Média NVIDIA T600 Laptop GPU (n=1) | |
| 1920x1080 High Preset | |
| Lenovo ThinkPad P15v G2 21A9000XGE | |
| HP ZBook Power 15 G8 313S5EA | |
| Média NVIDIA T600 Laptop GPU (n=1) | |
| 1920x1080 Ultra Preset | |
| Lenovo ThinkPad P15v G2 21A9000XGE | |
| HP ZBook Power 15 G8 313S5EA | |
| Média NVIDIA T600 Laptop GPU (n=1) | |
| GRID Legends | |
| 1920x1080 Medium Preset | |
| Lenovo ThinkPad P15v G2 21A9000XGE | |
| HP ZBook Power 15 G8 313S5EA | |
| Média NVIDIA T600 Laptop GPU (n=1) | |
| 1920x1080 High Preset | |
| Lenovo ThinkPad P15v G2 21A9000XGE | |
| HP ZBook Power 15 G8 313S5EA | |
| Média NVIDIA T600 Laptop GPU (n=1) | |
| 1920x1080 Ultra Preset | |
| Lenovo ThinkPad P15v G2 21A9000XGE | |
| HP ZBook Power 15 G8 313S5EA | |
| Média NVIDIA T600 Laptop GPU (n=1) | |
| Mafia Definitive Edition | |
| 1280x720 Low Preset | |
| Lenovo ThinkPad P15v G2 21A9000XGE | |
| HP ZBook Power 15 G8 313S5EA | |
| Média NVIDIA T600 Laptop GPU (n=1) | |
| 1920x1080 Medium Preset | |
| Lenovo ThinkPad P15v G2 21A9000XGE | |
| HP ZBook Power 15 G8 313S5EA | |
| Média NVIDIA T600 Laptop GPU (n=1) | |
| 1920x1080 High Preset | |
| Lenovo ThinkPad P15v G2 21A9000XGE | |
| HP ZBook Power 15 G8 313S5EA | |
| Média NVIDIA T600 Laptop GPU (n=1) | |
| Elex 2 | |
| 1920x1080 Medium / On AA:FX AF:16x | |
| Lenovo ThinkPad P15v G2 21A9000XGE | |
| HP ZBook Power 15 G8 313S5EA | |
| Média NVIDIA T600 Laptop GPU (n=1) | |
| 1920x1080 High / On AA:FX AF:16x | |
| Lenovo ThinkPad P15v G2 21A9000XGE | |
| HP ZBook Power 15 G8 313S5EA | |
| Média NVIDIA T600 Laptop GPU (n=1) | |
| 1920x1080 Ultra / On AA:SM AF:16x | |
| Lenovo ThinkPad P15v G2 21A9000XGE | |
| HP ZBook Power 15 G8 313S5EA | |
| Média NVIDIA T600 Laptop GPU (n=1) | |
| Farming Simulator 22 | |
| 1920x1080 Medium Preset | |
| Lenovo ThinkPad P15v G2 21A9000XGE | |
| HP ZBook Power 15 G8 313S5EA | |
| Média NVIDIA T600 Laptop GPU (n=1) | |
| 1920x1080 High Preset | |
| Lenovo ThinkPad P15v G2 21A9000XGE | |
| HP ZBook Power 15 G8 313S5EA | |
| Média NVIDIA T600 Laptop GPU (n=1) | |
| 1920x1080 Very High Preset | |
| Lenovo ThinkPad P15v G2 21A9000XGE | |
| HP ZBook Power 15 G8 313S5EA | |
| Média NVIDIA T600 Laptop GPU (n=1) | |
| Ghostwire Tokyo | |
| 1920x1080 Medium Settings | |
| Lenovo ThinkPad P15v G2 21A9000XGE | |
| HP ZBook Power 15 G8 313S5EA | |
| Média NVIDIA T600 Laptop GPU (n=1) | |
| 1920x1080 High Settings | |
| Lenovo ThinkPad P15v G2 21A9000XGE | |
| HP ZBook Power 15 G8 313S5EA | |
| Média NVIDIA T600 Laptop GPU (n=1) | |
| 1920x1080 Highest Settings | |
| HP ZBook Power 15 G8 313S5EA | |
| Média NVIDIA T600 Laptop GPU (n=1) | |
| Lenovo ThinkPad P15v G2 21A9000XGE | |
| Riders Republic | |
| 1920x1080 Medium Preset | |
| HP ZBook Power 15 G8 313S5EA | |
| Média NVIDIA T600 Laptop GPU (n=1) | |
| Lenovo ThinkPad P15v G2 21A9000XGE | |
| 1920x1080 High Preset | |
| Lenovo ThinkPad P15v G2 21A9000XGE | |
| HP ZBook Power 15 G8 313S5EA | |
| Média NVIDIA T600 Laptop GPU (n=1) | |
| 1920x1080 Ultra Preset | |
| Lenovo ThinkPad P15v G2 21A9000XGE | |
| HP ZBook Power 15 G8 313S5EA | |
| Média NVIDIA T600 Laptop GPU (n=1) | |
| Dying Light 2 | |
| 1920x1080 Low Quality | |
| Lenovo ThinkPad P15v G2 21A9000XGE | |
| HP ZBook Power 15 G8 313S5EA | |
| Média NVIDIA T600 Laptop GPU (n=1) | |
| 1920x1080 Medium Quality | |
| Lenovo ThinkPad P15v G2 21A9000XGE | |
| HP ZBook Power 15 G8 313S5EA | |
| Média NVIDIA T600 Laptop GPU (n=1) | |
| 1920x1080 High Quality | |
| Lenovo ThinkPad P15v G2 21A9000XGE | |
| HP ZBook Power 15 G8 313S5EA | |
| Média NVIDIA T600 Laptop GPU (n=1) | |
| Tiny Tina's Wonderlands | |
| 1920x1080 Medium Preset (DX12) | |
| Média da turma Workstation (115.1 - 233, n=5, últimos 2 anos) | |
| HP ZBook Power 15 G8 313S5EA | |
| Média NVIDIA T600 Laptop GPU (n=1) | |
| 1920x1080 High Preset (DX12) | |
| Média da turma Workstation (80 - 171.4, n=5, últimos 2 anos) | |
| HP ZBook Power 15 G8 313S5EA | |
| Média NVIDIA T600 Laptop GPU (n=1) | |
| 1920x1080 Badass Preset (DX12) | |
| Média da turma Workstation (64.4 - 137.1, n=5, últimos 2 anos) | |
| HP ZBook Power 15 G8 313S5EA | |
| Média NVIDIA T600 Laptop GPU (n=1) | |
| Deathloop | |
| 1920x1080 Medium Preset | |
| HP ZBook Power 15 G8 313S5EA | |
| Média NVIDIA T600 Laptop GPU (n=1) | |
| 1920x1080 High Preset | |
| HP ZBook Power 15 G8 313S5EA | |
| Média NVIDIA T600 Laptop GPU (n=1) | |
| 1920x1080 Ultra Preset | |
| HP ZBook Power 15 G8 313S5EA | |
| Média NVIDIA T600 Laptop GPU (n=1) | |
| Immortals Fenyx Rising | |
| 1920x1080 Medium Preset | |
| HP ZBook Fury 15 G8 | |
| HP ZBook Power 15 G8 313S5EA | |
| Média NVIDIA T600 Laptop GPU (n=1) | |
| 1920x1080 High Preset | |
| HP ZBook Fury 15 G8 | |
| HP ZBook Power 15 G8 313S5EA | |
| Média NVIDIA T600 Laptop GPU (n=1) | |
| 1920x1080 Very High Preset | |
| HP ZBook Fury 15 G8 | |
| HP ZBook Power 15 G8 313S5EA | |
| Média NVIDIA T600 Laptop GPU (n=1) | |
| baixo | média | alto | ultra | |
|---|---|---|---|---|
| GTA V (2015) | 142.6 | 137.6 | 82.3 | 44.1 |
| The Witcher 3 (2015) | 158.6 | 92.7 | 52.2 | 27.6 |
| Dota 2 Reborn (2015) | 149.4 | 127.6 | 115.8 | 107.1 |
| Final Fantasy XV Benchmark (2018) | 86 | 43.9 | 31 | |
| X-Plane 11.11 (2018) | 107.9 | 92.4 | 77 | |
| Far Cry 5 (2018) | 105 | 53 | 49 | 45 |
| Strange Brigade (2018) | 190.4 | 76.2 | 60.7 | 52.7 |
| Shadow of the Tomb Raider (2018) | 98 | 53 | 42 | 36 |
| Mafia Definitive Edition (2020) | 83.6 | 40.4 | 34.9 | |
| Immortals Fenyx Rising (2020) | 72 | 45 | 36 | 31 |
| Resident Evil Village (2021) | 113.6 | 58.6 | 52.1 | 44 |
| Deathloop (2021) | 68.9 | 34.4 | 28.4 | 25.2 |
| Riders Republic (2021) | 91 | 52 | 39 | 30 |
| Farming Simulator 22 (2021) | 175.4 | 87.5 | 63.5 | 53.9 |
| Dying Light 2 (2022) | 31.7 | 23 | 18.3 | |
| GRID Legends (2022) | 104.1 | 71 | 57.7 | 41.9 |
| Elden Ring (2022) | 52.4 | 45 | 39 | 29.9 |
| Elex 2 (2022) | 38.5 | 35.7 | 30.5 | 26.9 |
| Ghostwire Tokyo (2022) | 45.7 | 44.3 | 43.9 | 41.8 |
| Tiny Tina's Wonderlands (2022) | 57.5 | 32.8 | 48.3 | 27.2 |
| Vampire Bloodhunt (2022) | 119 | 64.5 | 61.8 | 60.1 |
Emissões: A estação de trabalho fria do ZBook funciona silenciosamente às vezes
Emissões sonoras
O testador só tem as medidas usando a antiga BIOS, o que ainda permitiu uma velocidade significativamente maior do ventilador e resultou em um nível de ruído de até 51db(A) no cenário de carga. Entretanto, com a BIOS v1.09, a IA da HP só permite uma velocidade máxima do ventilador de cerca de 4300 upm, o que poderia ser uma vantagem em ambientes comerciais sensíveis.
Com seus dois ventiladores e três tubos de calor, o resfriamento deve ser capaz de dissipar mais calor do que o do ThinkPad P15v G2, cujos 75 watts são resfriados com sucesso por seu único ventilador. Entretanto, com a IA limitadora, os ventiladores HP ZBook refrigeram um máximo de 65 a 80 watts sob carga combinada (CPU + GPU). Os ventiladores estão na parte inferior entre o display e a caixa, extraindo ar da parte inferior da caixa, o que faz com que o uso em sua volta seja inferior ao ideal.
Durante a navegação regular na Internet, os ventiladores permanecem silenciosos, mas se você estiver acostumado a trabalhar mais rápido na rede, eles se ligam constantemente e com bastante ruído. Pelo menos não há choradeira de bobina. Com componentes que são igualmente potentes, o ThinkPad P15v G2 da Lenovo é mais moderado em todos os cenários, e o próprio ZBook Fury da HP também funciona mais silencioso. Por outro lado, os ventiladores do Dell's Precision 3551 realmente gostam muito de soprar
.Barulho
| Ocioso |
| 25.54 / 25.54 / 25.54 dB |
| Carga |
| 48.85 / 50.98 dB |
 | ||
30 dB silencioso 40 dB(A) audível 50 dB(A) ruidosamente alto |
||
min: | ||
| HP ZBook Power 15 G8 313S5EA T600 Laptop GPU, i7-11800H, Samsung PM9A1 MZVL2512HCJQ | HP ZBook Fury 15 G8 RTX A5000 Laptop GPU, i9-11950H, Samsung PM981a MZVLB1T0HBLR | HP ZBook Studio 15 G8 GeForce RTX 3070 Laptop GPU, i9-11950H, Samsung PM981a MZVLB2T0HALB | HP ZBook Firefly 15 G8 2C9R7EA T500 Laptop GPU, i7-1165G7, Toshiba XG6 KXG60ZNV1T02 | Lenovo ThinkPad P15v G2 21A9000XGE T1200 Laptop GPU, i7-11800H, Toshiba XG6 KXG6AZNV512G | Dell Precision 3000 3551 Quadro P620, i9-10885H, Toshiba Kioxia XG6 KXG60PNV512G | |
|---|---|---|---|---|---|---|
| Noise | 9% | 3% | 14% | 9% | -1% | |
| desligado / ambiente * (dB) | 25.54 | 24.1 6% | 23.5 8% | 24.1 6% | 25.21 1% | 25.8 -1% |
| Idle Minimum * (dB) | 25.54 | 24.1 6% | 25.3 1% | 24.1 6% | 25.21 1% | 26.2 -3% |
| Idle Average * (dB) | 25.54 | 24.1 6% | 25.3 1% | 24.1 6% | 25.21 1% | 26.2 -3% |
| Idle Maximum * (dB) | 25.54 | 24.8 3% | 25.3 1% | 27.1 -6% | 25.21 1% | 26.2 -3% |
| Load Average * (dB) | 48.85 | 37.8 23% | 41.2 16% | 32.8 33% | 39.09 20% | 51.2 -5% |
| Witcher 3 ultra * (dB) | 46.58 | 44.2 5% | 49.4 -6% | 36.1 22% | 36.6 21% | 42.7 8% |
| Load Maximum * (dB) | 50.98 | 44.2 13% | 49.4 3% | 36.1 29% | 43.53 15% | 50.7 1% |
* ... menor é melhor
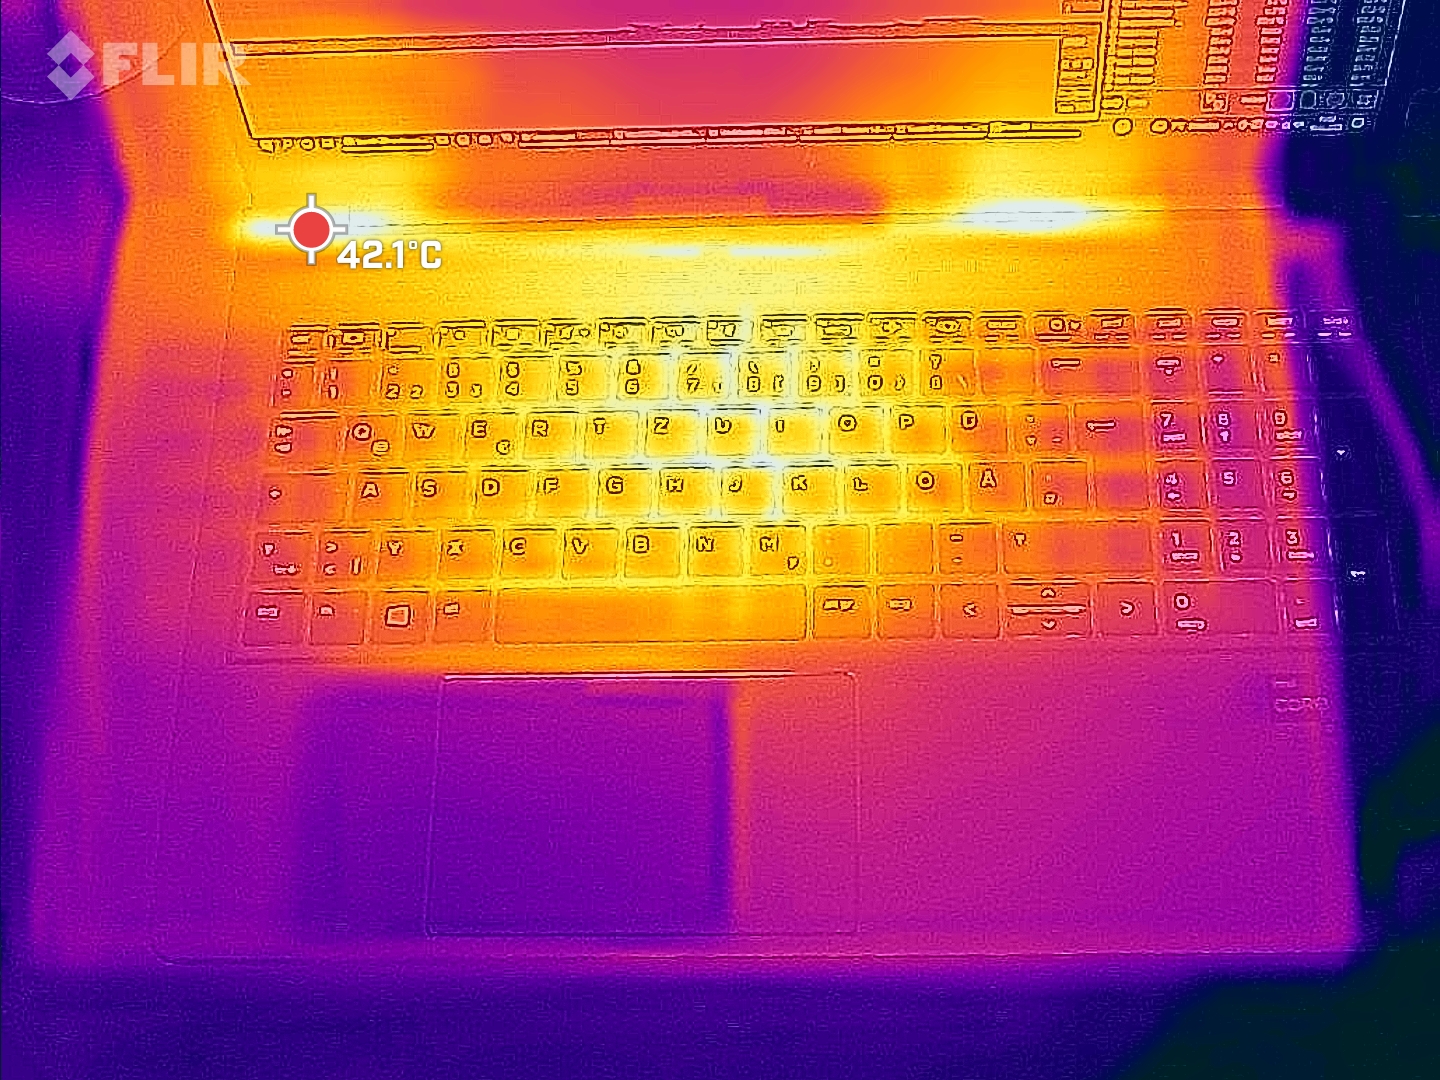
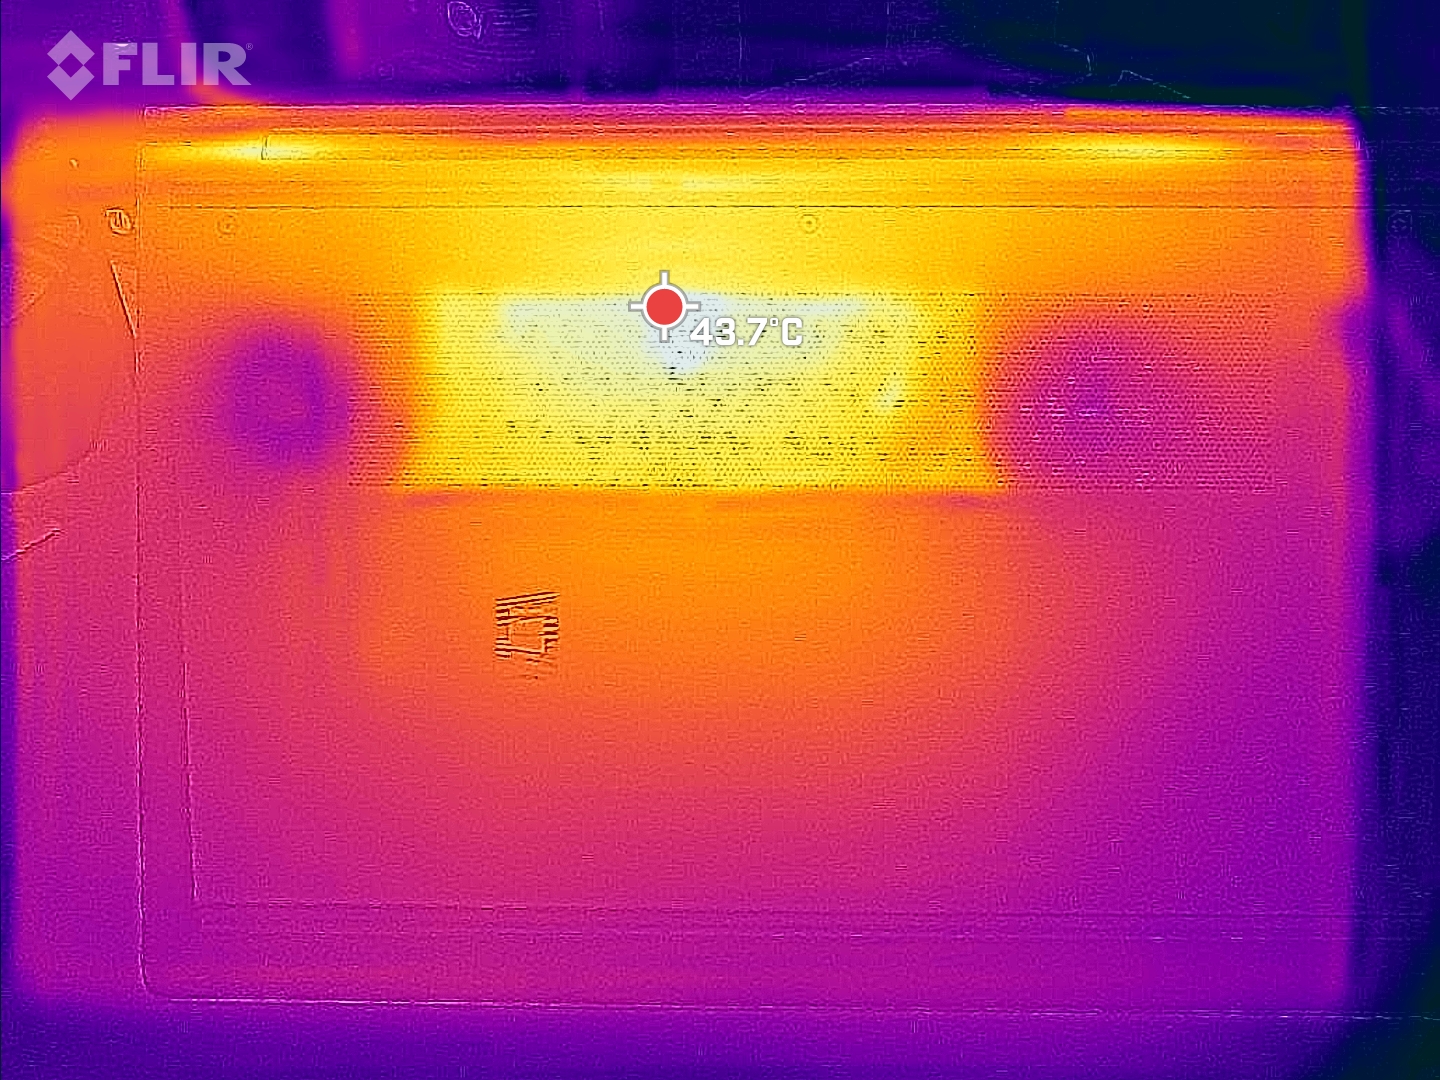
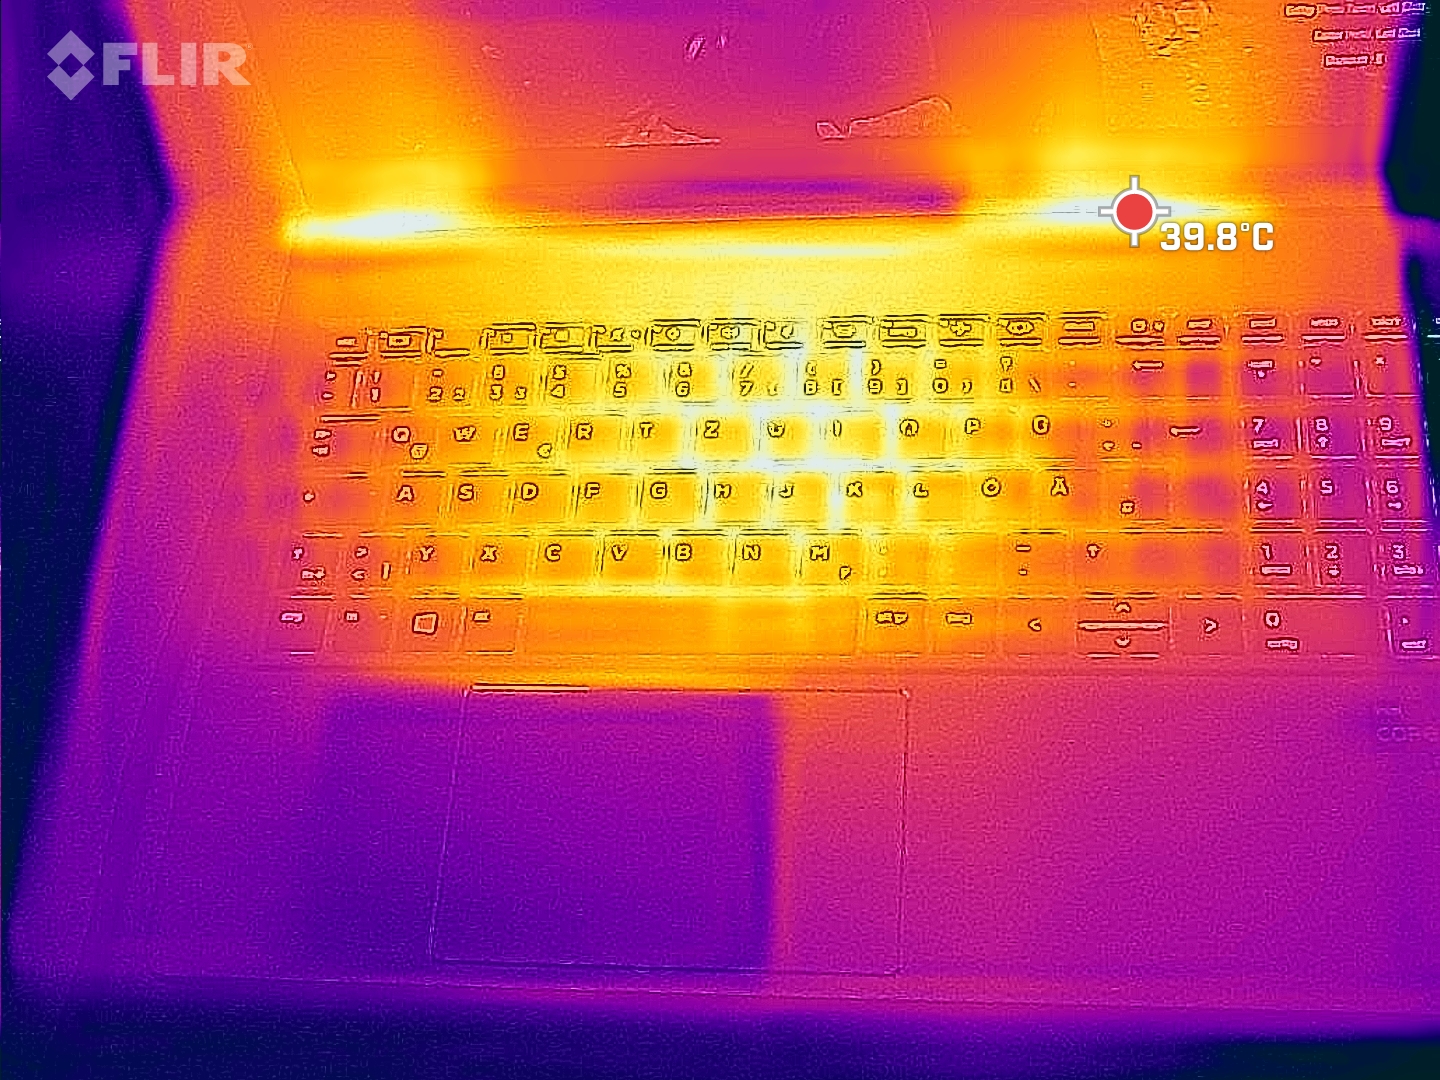
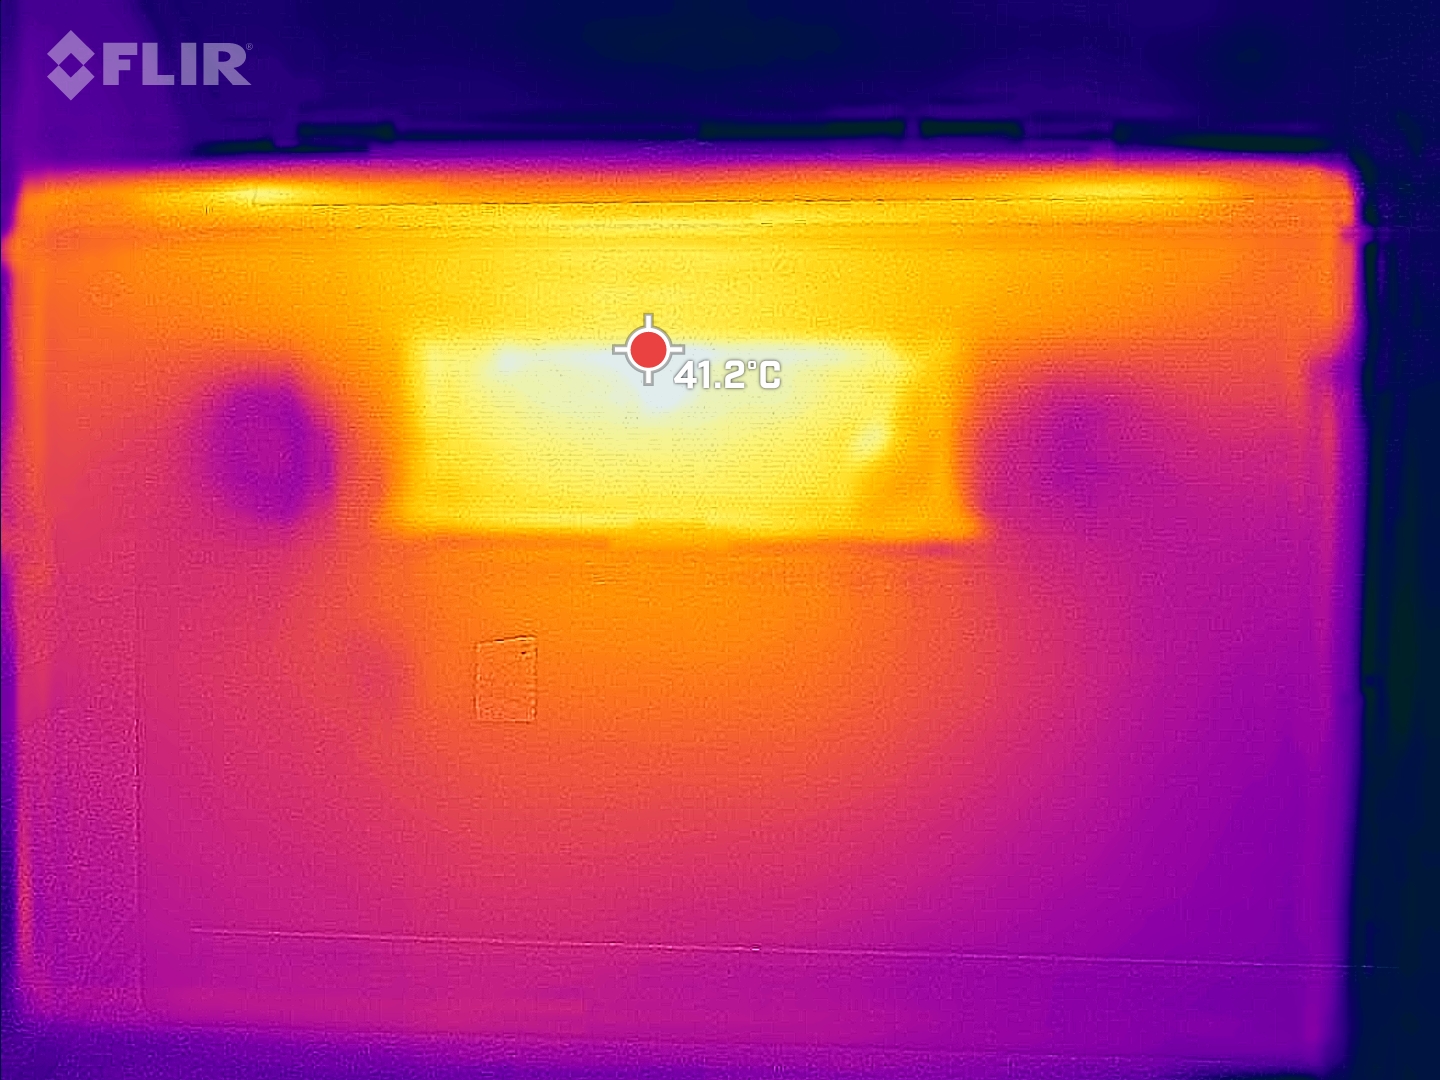
Temperaturas
Os únicos pontos mais quentes estão no centro acima do teclado, bem como no lugar correspondente na parte inferior da caixa, e isso somente durante o teste de estresse. Entretanto, como os ventiladores não aceleram tanto, estes pontos quentes são perceptíveis mesmo durante os jogos ou durante a renderização, e até mesmo no centro do teclado. Mas eles nunca se tornam irritantemente quentes.
(±) A temperatura máxima no lado superior é 41.4 °C / 107 F, em comparação com a média de 38.2 °C / 101 F , variando de 22.2 a 69.8 °C para a classe Workstation.
(±) A parte inferior aquece até um máximo de 41.5 °C / 107 F, em comparação com a média de 41.1 °C / 106 F
(+) Em uso inativo, a temperatura média para o lado superior é 22.9 °C / 73 F, em comparação com a média do dispositivo de 32 °C / ### class_avg_f### F.
(+) Jogando The Witcher 3, a temperatura média para o lado superior é 30.4 °C / 87 F, em comparação com a média do dispositivo de 32 °C / ## #class_avg_f### F.
(+) Os apoios para as mãos e o touchpad são mais frios que a temperatura da pele, com um máximo de 28.4 °C / 83.1 F e, portanto, são frios ao toque.
(±) A temperatura média da área do apoio para as mãos de dispositivos semelhantes foi 27.8 °C / 82 F (-0.6 °C / -1.1 F).
| HP ZBook Power 15 G8 313S5EA Intel Core i7-11800H, NVIDIA T600 Laptop GPU | HP ZBook Fury 15 G8 Intel Core i9-11950H, NVIDIA RTX A5000 Laptop GPU | HP ZBook Studio 15 G8 Intel Core i9-11950H, NVIDIA GeForce RTX 3070 Laptop GPU | HP ZBook Firefly 15 G8 2C9R7EA Intel Core i7-1165G7, NVIDIA T500 Laptop GPU | Lenovo ThinkPad P15v G2 21A9000XGE Intel Core i7-11800H, NVIDIA T1200 Laptop GPU | Dell Precision 3000 3551 Intel Core i9-10885H, NVIDIA Quadro P620 | |
|---|---|---|---|---|---|---|
| Heat | -18% | -20% | -3% | -21% | -20% | |
| Maximum Upper Side * (°C) | 41.4 | 45.6 -10% | 49 -18% | 41.2 -0% | 53.8 -30% | 47 -14% |
| Maximum Bottom * (°C) | 41.5 | 57.6 -39% | 54.2 -31% | 47.2 -14% | 52.1 -26% | 54.6 -32% |
| Idle Upper Side * (°C) | 23.8 | 26 -9% | 26.2 -10% | 23.7 -0% | 27.6 -16% | 27.8 -17% |
| Idle Bottom * (°C) | 25 | 28.8 -15% | 30.2 -21% | 23.9 4% | 27.7 -11% | 29.2 -17% |
* ... menor é melhor
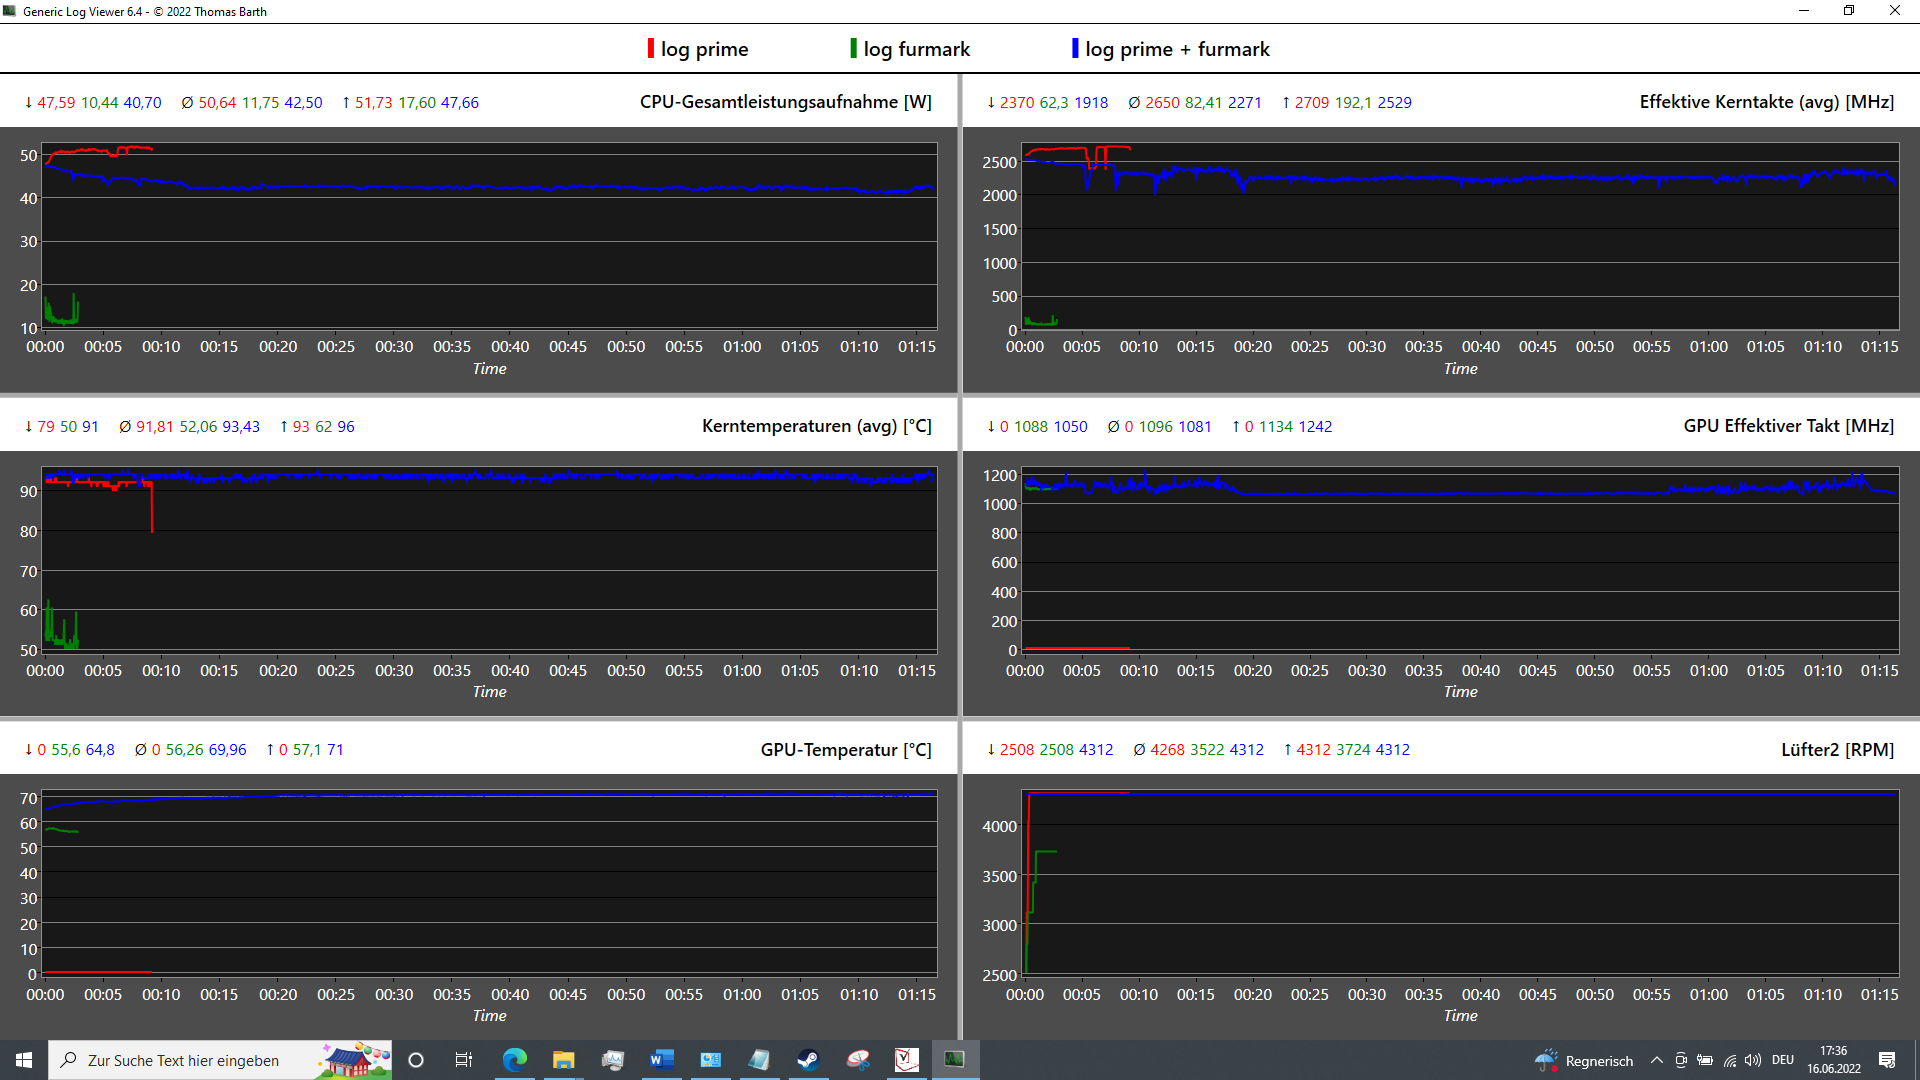
Teste de estresse
A CPU pode se beneficiar da atualização da BIOS somente durante o teste de estresse. No teste de estresse combinado (Prime95 + FurMark), a CPU ainda funciona na velocidade básica do relógio (2,3 GHz), enquanto que antes só funcionava a 1,7 GHz. Por outro lado, a 1080 MHz, a velocidade do relógio GPU cai em 150 MHz. Na tensão da CPU pura, 2,65 GHz são mantidos a um consumo de energia de 50 watts e temperatura de 92 °C (198 °F)
Sob carga gráfica pura, a GPU funciona a ~1100 MHz, que está significativamente abaixo de sua velocidade de impulso de 1395 MHz. Entretanto, a temperatura permanece em apenas 56 °C (133 °F), e suspeitamos de outra inconsistência da IA.
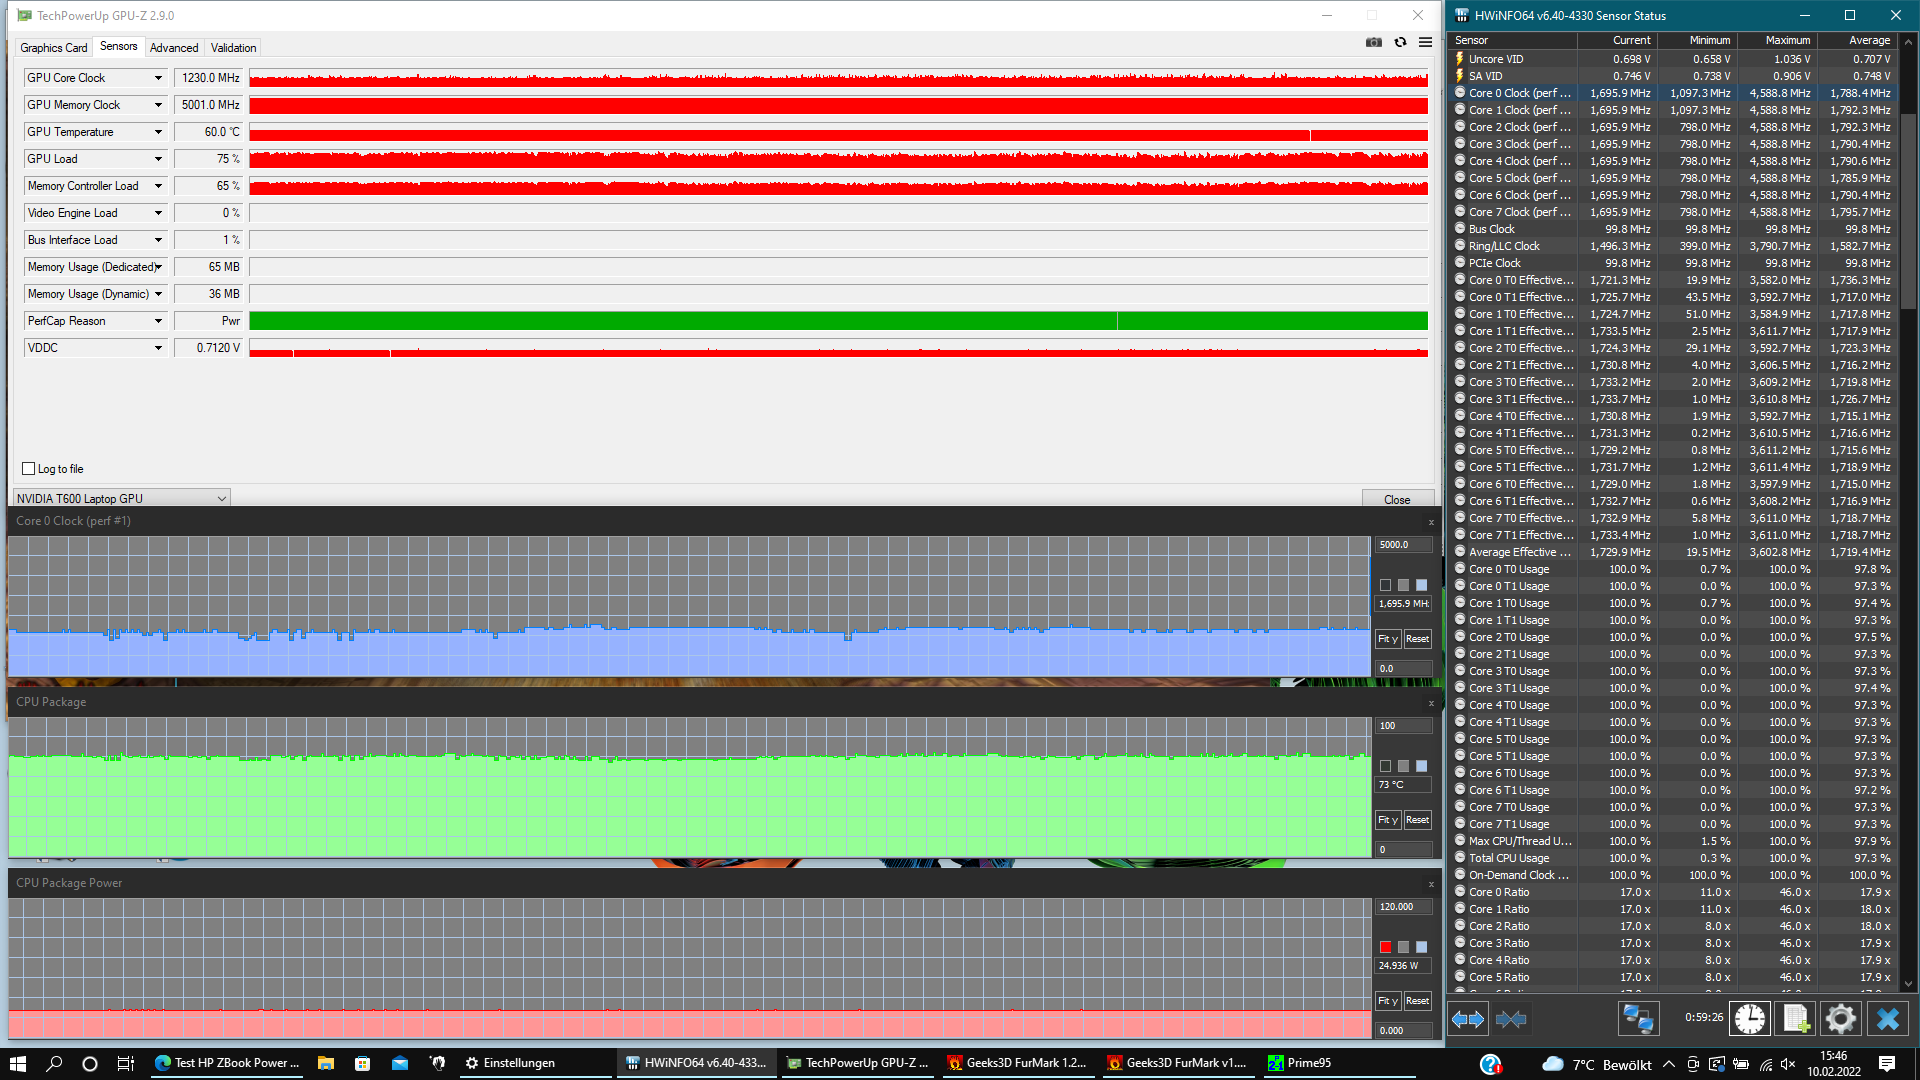
| Relógio CPU (GHz) | Relógio GPU (MHz) | Temperatura média da CPU (°C) | Temperatura média da GPU (°C) | |
| Sistema ocioso | 1.3 | 350 | 35 | 35 |
| Prime95 Stress | 2.65 | 350 | 91.8 | -- |
| Prime95 + FurMark Stress | 2.27 | 1081 | 93.4 | 56 |
| FurMark Stress | 1.3 | 1100 | 52 | 70 |
Oradores
O som dos alto-falantes estéreo de 2 watts para cima é bastante equilibrado, mas eles não têm graves e também não ficam particularmente altos. O HP Fury 15 abriga um sistema de som significativamente mais atraente.
Embora possa ser suficiente para tarefas de escritório, a fim de desfrutar de multimídia, recomendamos o uso da conexão de 3,5 mm ou Bluetooth para periféricos de áudio externos
HP ZBook Power 15 G8 313S5EA análise de áudio
(±) | o volume do alto-falante é médio, mas bom (###valor### dB)
Graves 100 - 315Hz
(-) | quase nenhum baixo - em média 23.3% menor que a mediana
(±) | a linearidade dos graves é média (11.8% delta para a frequência anterior)
Médios 400 - 2.000 Hz
(+) | médios equilibrados - apenas 2.5% longe da mediana
(+) | médios são lineares (5.1% delta para frequência anterior)
Altos 2 - 16 kHz
(+) | agudos equilibrados - apenas 4.1% longe da mediana
(+) | os máximos são lineares (3.1% delta da frequência anterior)
Geral 100 - 16.000 Hz
(±) | a linearidade do som geral é média (21.4% diferença em relação à mediana)
Comparado com a mesma classe
» 77% de todos os dispositivos testados nesta classe foram melhores, 6% semelhantes, 18% piores
» O melhor teve um delta de 7%, a média foi 17%, o pior foi 35%
Comparado com todos os dispositivos testados
» 60% de todos os dispositivos testados foram melhores, 7% semelhantes, 33% piores
» O melhor teve um delta de 4%, a média foi 23%, o pior foi 134%
Lenovo ThinkPad P15v G2 21A9000XGE análise de áudio
(-) | alto-falantes não muito altos (###valor### dB)
Graves 100 - 315Hz
(±) | graves reduzidos - em média 13.4% menor que a mediana
(±) | a linearidade dos graves é média (13.6% delta para a frequência anterior)
Médios 400 - 2.000 Hz
(+) | médios equilibrados - apenas 4.7% longe da mediana
(+) | médios são lineares (6.2% delta para frequência anterior)
Altos 2 - 16 kHz
(+) | agudos equilibrados - apenas 3.2% longe da mediana
(+) | os máximos são lineares (5.7% delta da frequência anterior)
Geral 100 - 16.000 Hz
(±) | a linearidade do som geral é média (21.2% diferença em relação à mediana)
Comparado com a mesma classe
» 76% de todos os dispositivos testados nesta classe foram melhores, 6% semelhantes, 18% piores
» O melhor teve um delta de 7%, a média foi 17%, o pior foi 35%
Comparado com todos os dispositivos testados
» 59% de todos os dispositivos testados foram melhores, 7% semelhantes, 34% piores
» O melhor teve um delta de 4%, a média foi 23%, o pior foi 134%
Gerenciamento de energia: O ZBook Power é tão eficiente quanto um ultrabook
Consumo de energia
Com uma média de 6,32 watts, os valores ociosos do ZBook Power 15 são tão bons quanto os de sistemas com uma CPU de 15 watts. OZBook Furye ZBook Powerconsomem quase três vezes mais. Durante a espera, o ZBook Power consome apenas 0,95 watts, de modo que você não terá que recarregá-lo por quase quatro dias quando estiver dobrado. A fonte de alimentação de 150 watts também é capaz de lidar com os picos de carga de 110 watts sem qualquer problema e recarregar o ZBook até 80% em cerca de 1,5 horas.
| desligado | |
| Ocioso | |
| Carga |
|
Key:
min: | |
| HP ZBook Power 15 G8 313S5EA i7-11800H, T600 Laptop GPU, Samsung PM9A1 MZVL2512HCJQ, IPS LED, 1920x1080, 15.6" | HP ZBook Fury 15 G8 i9-11950H, RTX A5000 Laptop GPU, Samsung PM981a MZVLB1T0HBLR, IPS, 3840x2160, 15.6" | HP ZBook Studio 15 G8 i9-11950H, GeForce RTX 3070 Laptop GPU, Samsung PM981a MZVLB2T0HALB, OLED, 3840x2160, 15.6" | HP ZBook Firefly 15 G8 2C9R7EA i7-1165G7, T500 Laptop GPU, Toshiba XG6 KXG60ZNV1T02, IPS, 1920x1080, 15.6" | Lenovo ThinkPad P15v G2 21A9000XGE i7-11800H, T1200 Laptop GPU, Toshiba XG6 KXG6AZNV512G, IPS LED, 1920x1080, 15.6" | Dell Precision 3000 3551 i9-10885H, Quadro P620, Toshiba Kioxia XG6 KXG60PNV512G, IPS, 1920x1080, 15.6" | Média NVIDIA T600 Laptop GPU | Média da turma Workstation | |
|---|---|---|---|---|---|---|---|---|
| Power Consumption | -130% | -155% | 14% | -33% | -23% | 0% | -94% | |
| Idle Minimum * (Watt) | 4.17 | 8.3 -99% | 11 -164% | 3.3 21% | 5.96 -43% | 5.7 -37% | 4.17 ? -0% | 9.11 ? -118% |
| Idle Average * (Watt) | 6.32 | 19.9 -215% | 18.8 -197% | 5.6 11% | 8.37 -32% | 8.7 -38% | 6.32 ? -0% | 13.8 ? -118% |
| Idle Maximum * (Watt) | 7.1 | 21.8 -207% | 31.7 -346% | 8.7 -23% | 9.05 -27% | 9 -27% | 7.1 ? -0% | 17.9 ? -152% |
| Load Average * (Watt) | 80.41 | 110.9 -38% | 105.2 -31% | 64.4 20% | 91.82 -14% | 100.2 -25% | 80.4 ? -0% | 96 ? -19% |
| Witcher 3 ultra * (Watt) | 62.3 | 165 -165% | 148 -138% | 53 15% | 102 -64% | 56 10% | ||
| Load Maximum * (Watt) | 110.18 | 171.8 -56% | 171.8 -56% | 69 37% | 126.38 -15% | 133.2 -21% | 110.2 ? -0% | 180.3 ? -64% |
* ... menor é melhor
Power Consumption The Witcher 3 / Stress Test
Power Consumption With External Monitor
Vida útil da bateria
Enquanto navega na web a 150 lêndeas, o ZBook tem uma duração surpreendente de 12:19 horas. O ThinkPad P15v permanece significativamente atrasado em apenas ~7,5 horas, enquanto Dell's Precision 3551é capaz de quebrar a marca das 13 horas. Com mais de 2 horas sob carga, o ZBook dura bastante tempo, o que também se deve em parte ao seu estrangulamento.
| HP ZBook Power 15 G8 313S5EA i7-11800H, T600 Laptop GPU, 83 Wh | HP ZBook Fury 15 G8 i9-11950H, RTX A5000 Laptop GPU, 94 Wh | HP ZBook Studio 15 G8 i9-11950H, GeForce RTX 3070 Laptop GPU, 83 Wh | HP ZBook Firefly 15 G8 2C9R7EA i7-1165G7, T500 Laptop GPU, 56 Wh | Lenovo ThinkPad P15v G2 21A9000XGE i7-11800H, T1200 Laptop GPU, 68 Wh | Dell Precision 3000 3551 i9-10885H, Quadro P620, 97 Wh | Média da turma Workstation | |
|---|---|---|---|---|---|---|---|
| Duração da bateria | -50% | -26% | 15% | -26% | 11% | 4% | |
| Reader / Idle (h) | 14.9 | 12.9 -13% | 17.2 15% | 26.1 ? 75% | |||
| H.264 (h) | 10.1 | 15.3 51% | 8 -21% | 10.1 ? 0% | |||
| WiFi v1.3 (h) | 12.3 | 6.2 -50% | 6.2 -50% | 10.5 -15% | 7.5 -39% | 13.6 11% | 8.55 ? -30% |
| Load (h) | 2.1 | 1.8 -14% | 2.3 10% | 0.9 -57% | 1.441 ? -31% |
Pro
Contra
Veredicto: ZBook Power 15 acessível para criadores profissionais
A um preço de cerca de 1300 Euros (~$1324), o ZBook Power 15 G8 (Core i7, Nvidia T600, 8 GB / 256 GB) oferece algumas claras vantagens em termos de preço-desempenho, mantendo ao mesmo tempo muitas características de uma estação de trabalho de alta qualidade. Os pontos fortes do ZBook incluem os dispositivos de entrada, duração da bateria, características de segurança, capacidade de atualização, bem como um bom desempenho da estação de trabalho.
Embora nossa tela FHD testada não seja totalmente adequada para o projeto do produto e Adobe, ela ainda oferece bons valores de brilho e contraste. O grupo alvo desta configuração consiste principalmente de estudantes e profissionais na área de Autodesk SolidWorks, desenvolvimento de produtos, arquitetura, construção, engenharia, design 2D e criação de realidade virtual.
As desvantagens incluem o desenvolvimento inconsistente do desempenho, mas não podemos confirmar se isto se deve à própria IA da HP. Além disso, você tem que viver sem processadores Xeon junto com a RAM ECC nesta estação de trabalho acessível. Também lhe falta o WWAN e um leitor de cartões SD e só oferece uma única porta Thunderbolt 4. E finalmente, a reprodução de som e a webcam são bastante abismais.
"O HP ZBook Power 15 G8 é uma estação de trabalho sólida para estudantes, engenheiros e (semi-)profissionais, sem exigências de alto nível. Infelizmente, o painel opcional 4K não expande o grupo alvo para tarefas criativas, onde uma alta precisão de cor é necessária. Caso contrário, todos os outros aspectos centrais estão em um alto nível"
OPensePad P15v G2oferece um desempenho semelhante e dispositivos de entrada, também a um bom preço. Entretanto, ele funciona significativamente mais silencioso e oferece um leitor de cartões SD e possivelmente a opção de display 4K mais preciso em cores. Por outro lado, o ThinkPad não suporta carregamento via USB-C, e a vida útil da bateria é significativamente menor. Além disso, ele é mais pesado e volumoso Dell's Precision 3551 é também um campeão de resistência que não é muito pior do que o ZBook Power, exceto em termos de desempenho bruto, desde que você o equipe com a exibição certa. Entretanto, seu sucessor deve oferecer um desempenho superior.
Preço e Disponibilidade
Uma configuração da estação de trabalho móvel HP ZBook Power G8 com um Core i7-11850H, 32 GB de RAM e 512 GB de SSD está atualmente disponível por ~$2400 da Amazon. A loja on-line HP também oferece muitas opções configuráveis.
HP ZBook Power 15 G8 313S5EA
- 07/07/2022 v7 (old)
Marvin Gollor
Price comparison

