Revisão do HP ZBook Studio 15 G8 Laptop: Mais opções do que nunca
Como seu nome sugere, o HP ZBook Studio 15 G8 é o sucessor do ZBook Studio 15 G7 com processadores atualizados e novos recursos não disponíveis nos modelos anteriores. O novo modelo também substitui o ZBook Create G7 que era essencialmente o mesmo laptop que o ZBook Studio G7, embora com GeForce em vez de gráficos Quadro. Assim, o ZBook Studio G8 consolidou e herdou todas as configurações dos dois modelos G7 mais antigos para uma longa lista de opções configuráveis que vão de vPro a não vPro Tiger Lake-H CPUs e ambas as GPUs Quadro e GeForce.
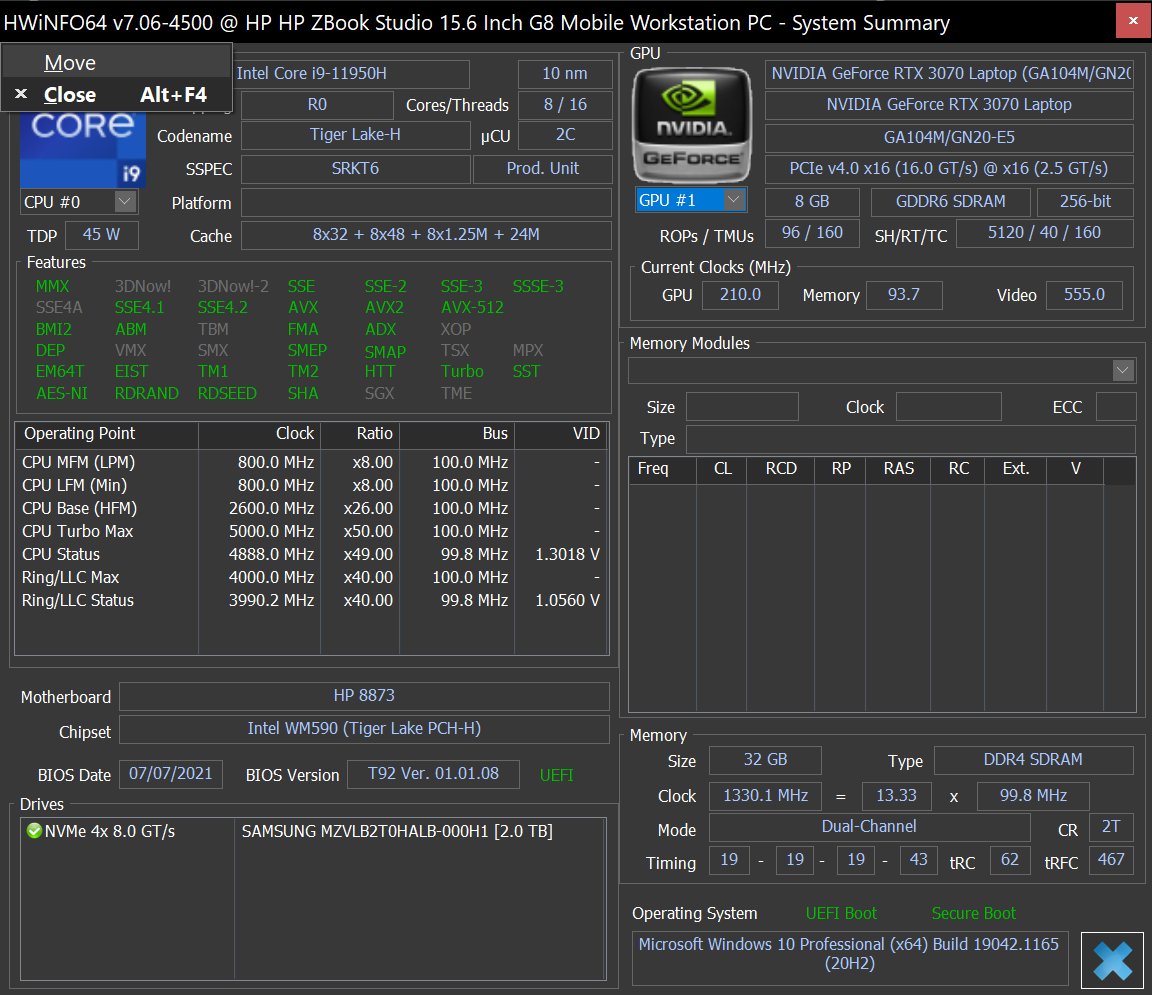
Nossa unidade de teste é uma configuração de ponta superior equipada com a CPU vPro Core i9-11950H, GPU RTX 3070 e tela tátil OLED 4K por aproximadamente $4200 USD. SKUs menores com o Core i7-11800H, somente gráficos Iris Xe integrados, display FHD, ou gráficos Quadro T1200 estão disponíveis por significativamente menos. No entanto, não há opções Xeon.
Os concorrentes diretos incluem outras estações de trabalho móveis ultramarinas movidas a Core-H, como a MSI WS66, Estúdio Razer Blade 15, Asus ProArtou o Lenovo ThinkPad P15s.
Mais análises da HP:
potential competitors in comparison
Avaliação | Data | Modelo | Peso | Altura | Size | Resolução | Preço |
|---|---|---|---|---|---|---|---|
| 87.8 % v7 (old) | 08/2021 | HP ZBook Studio 15 G8 i9-11950H, GeForce RTX 3070 Laptop GPU | 1.9 kg | 18 mm | 15.60" | 3840x2160 | |
| 83.8 % v7 (old) | 04/2021 | HP ZBook Firefly 15 G8 2C9R7EA i7-1165G7, T500 Laptop GPU | 1.8 kg | 19.2 mm | 15.60" | 1920x1080 | |
| 90.6 % v7 (old) | 03/2021 | HP ZBook Studio G7 i9-10885H, Quadro RTX 3000 Max-Q | 2 kg | 18 mm | 15.60" | 3840x2160 | |
| 87.8 % v7 (old) | 08/2020 | Dell Precision 7550 W-10885M, Quadro RTX 5000 Max-Q | 2.8 kg | 27.36 mm | 15.60" | 3840x2160 | |
| 85.3 % v7 (old) | 06/2021 | Lenovo ThinkPad P15s Gen2-20W6000GGE i7-1165G7, T500 Laptop GPU | 1.9 kg | 19.1 mm | 15.60" | 3840x2160 | |
| 83.1 % v7 (old) | 11/2020 | Asus ProArt StudioBook Pro 15 W500G5T i7-9750H, Quadro RTX 5000 Max-Q | 2 kg | 18.9 mm | 15.60" | 3840x2160 |
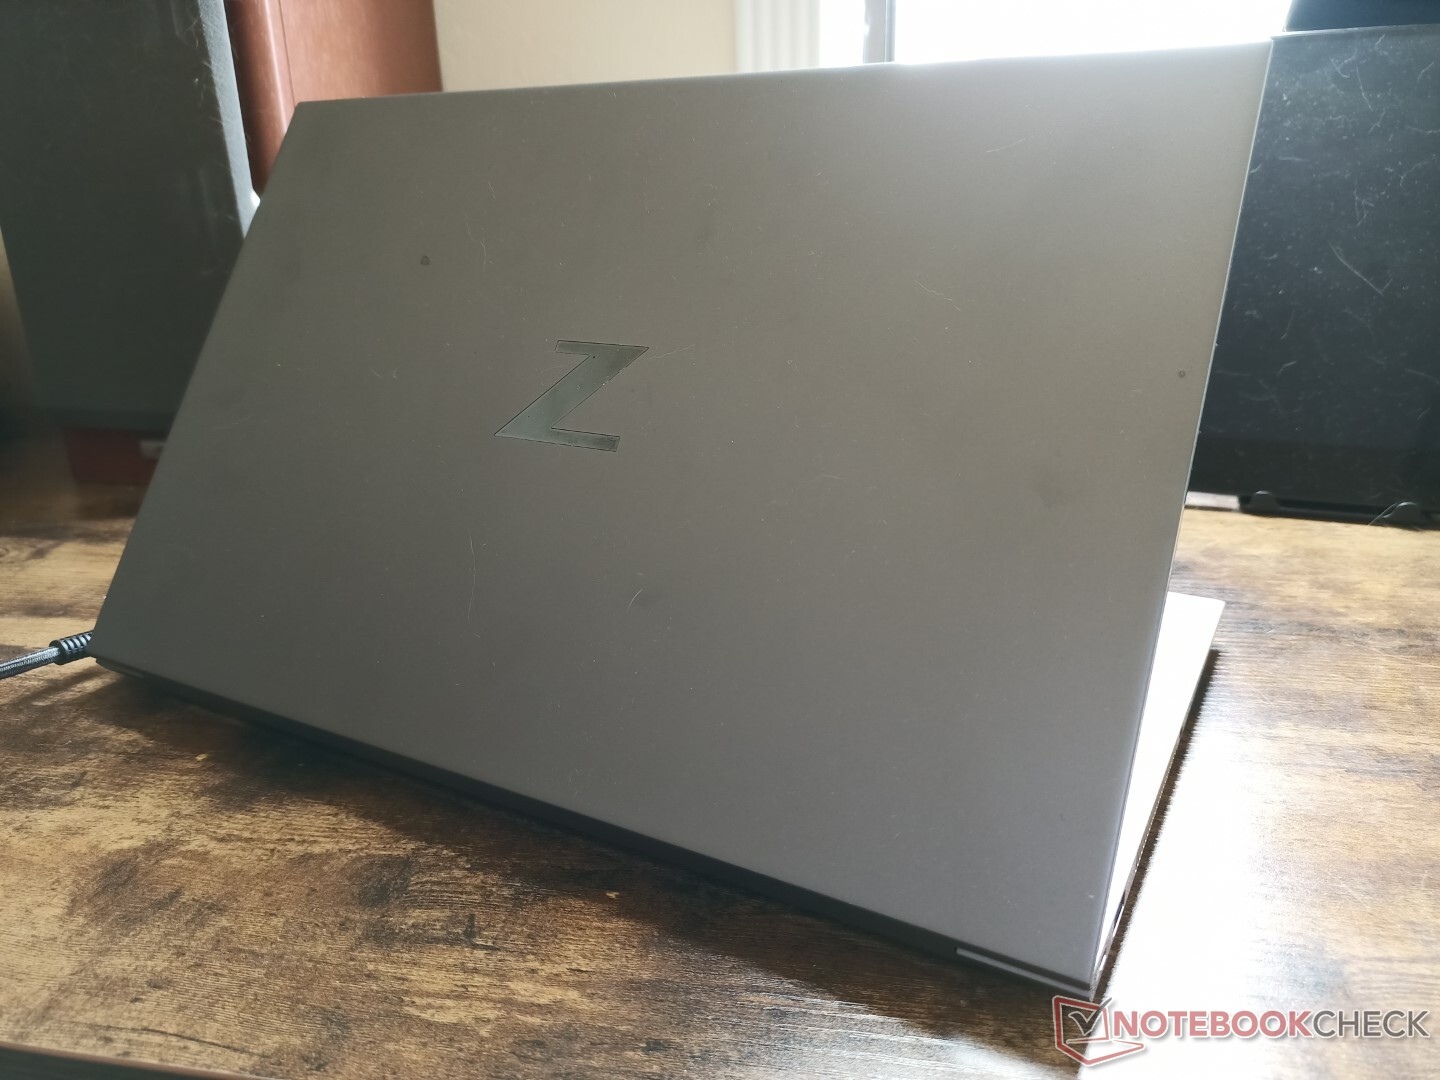
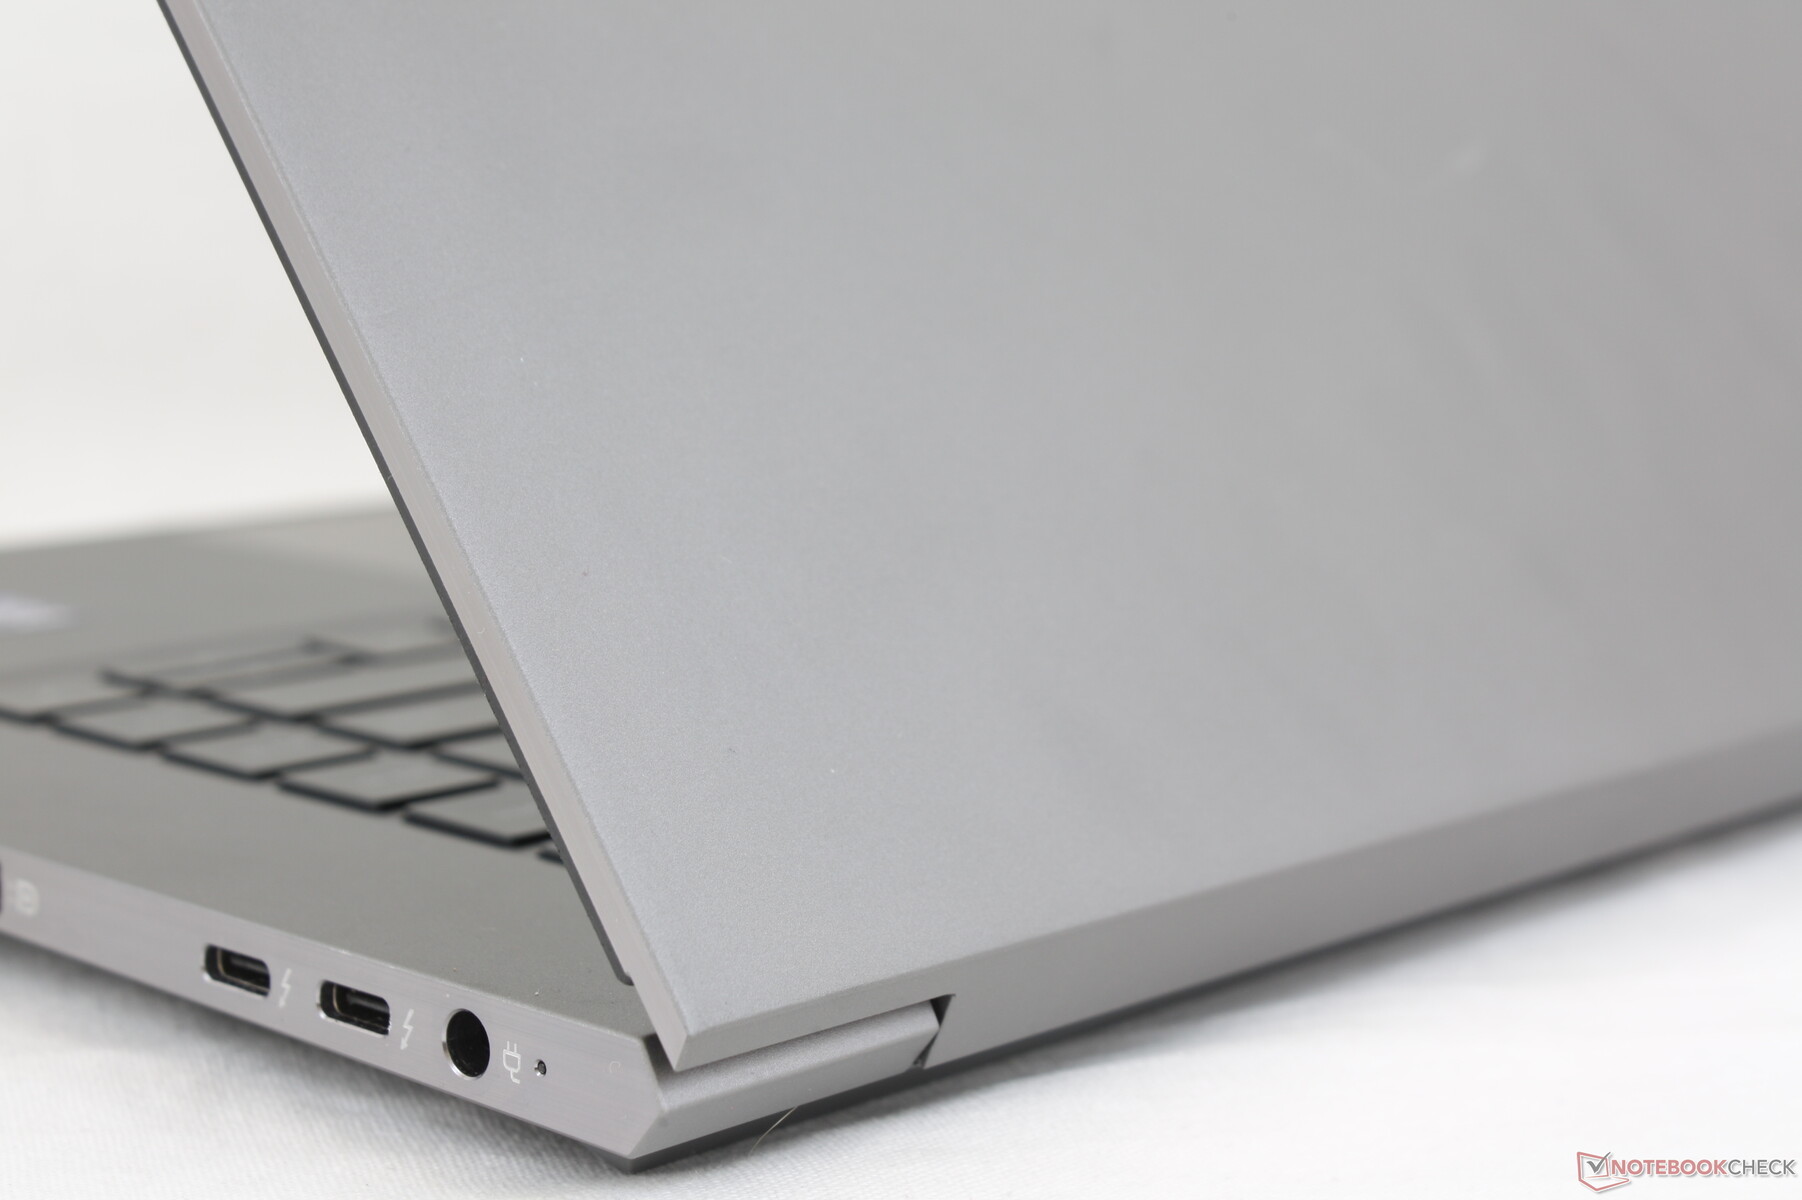
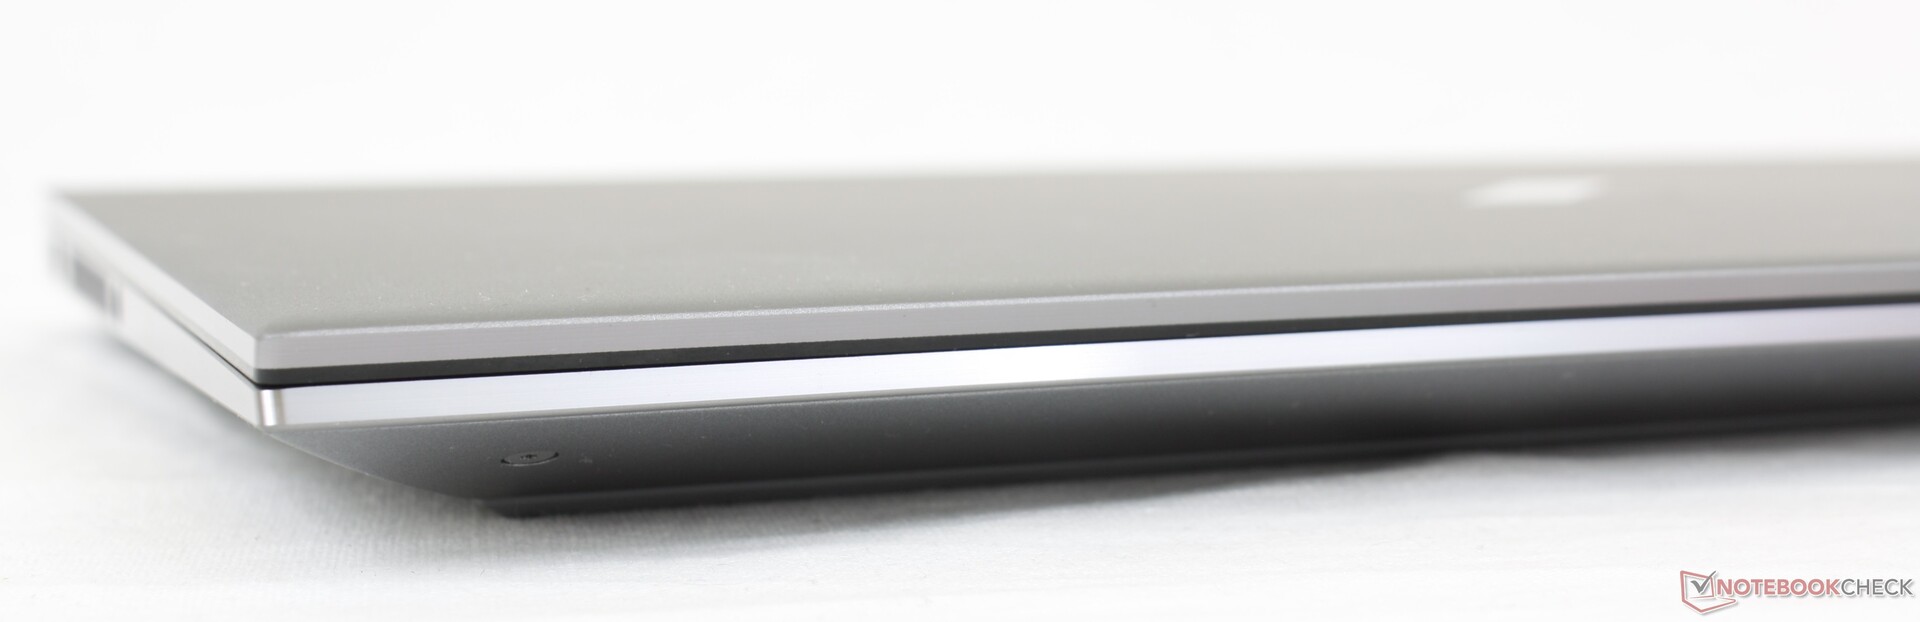
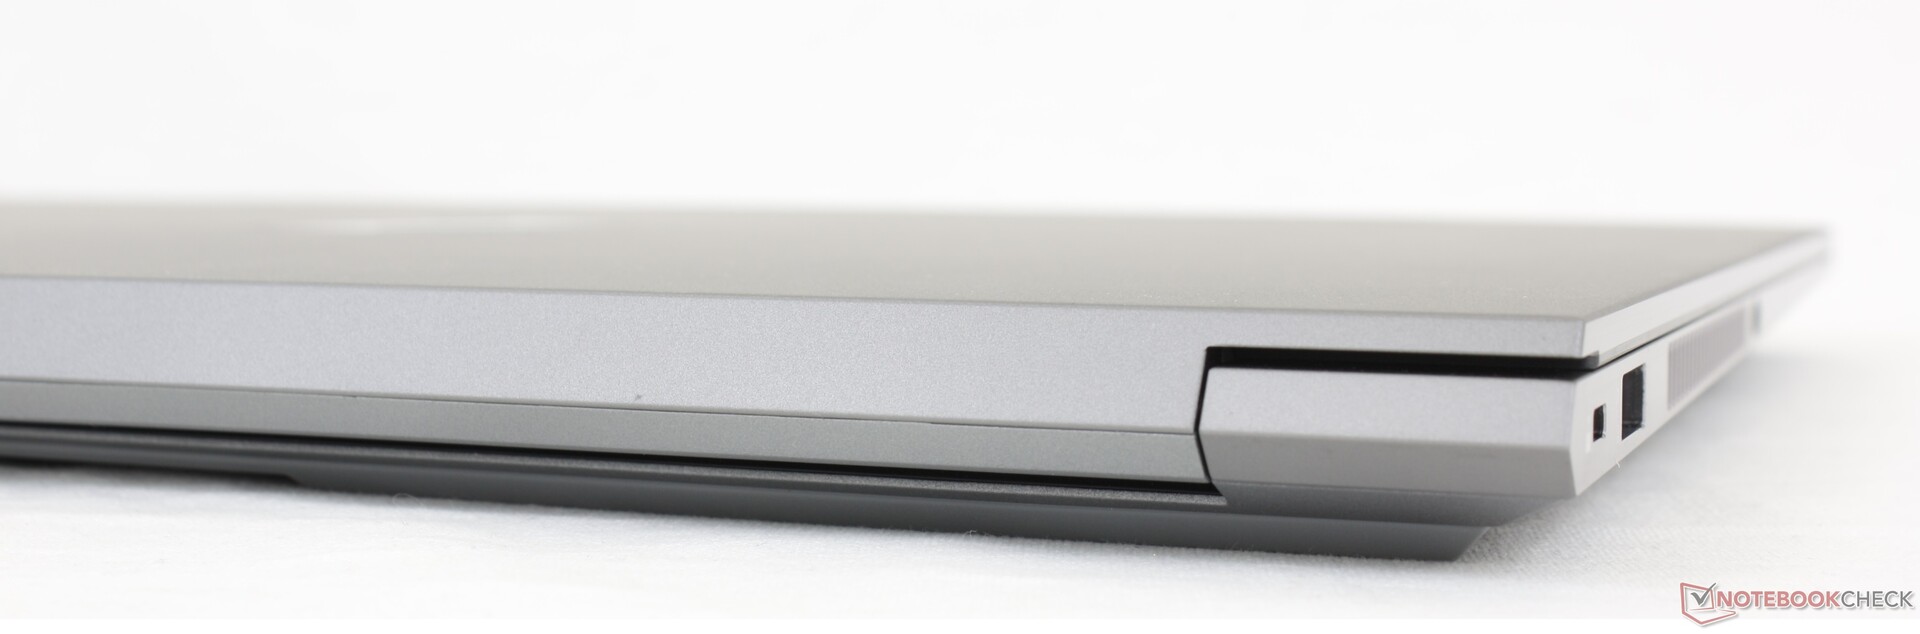
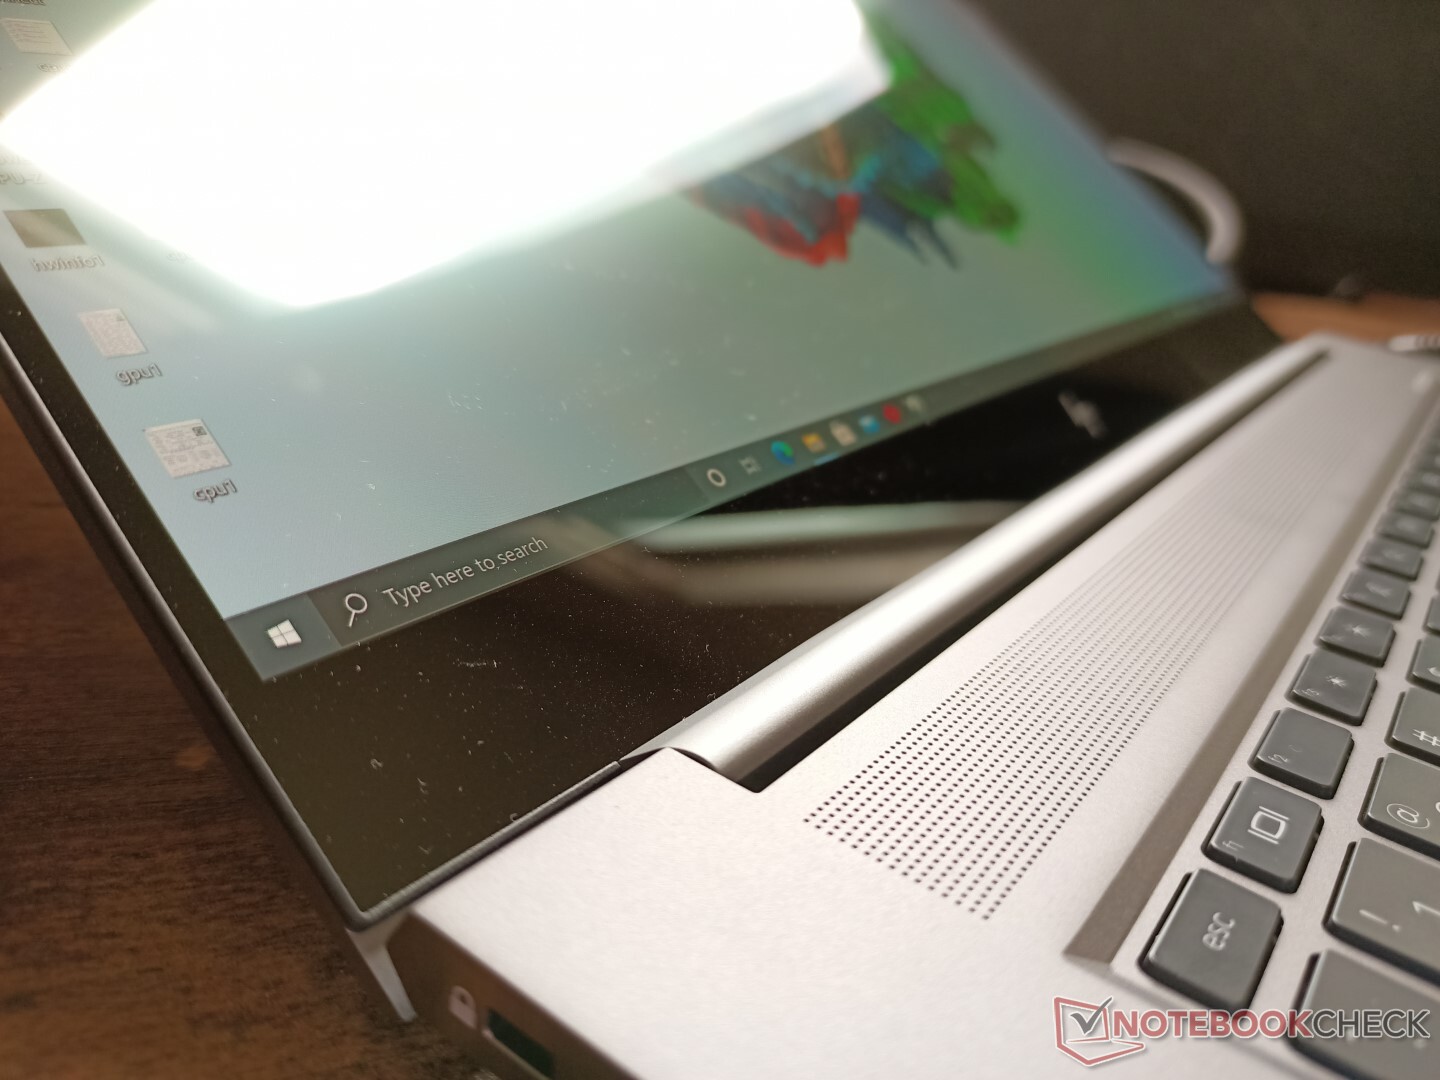
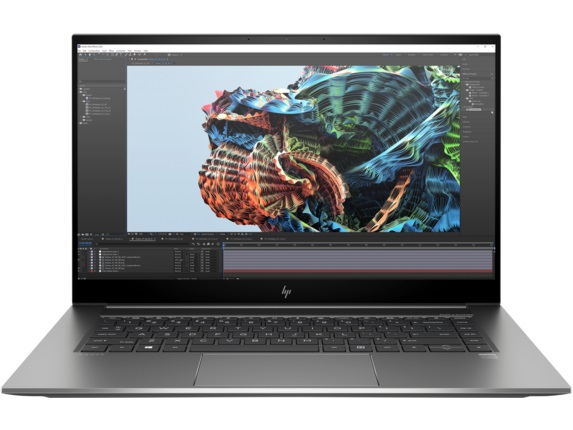
Caso - Idêntico visualmente ao ZBook 15 G7
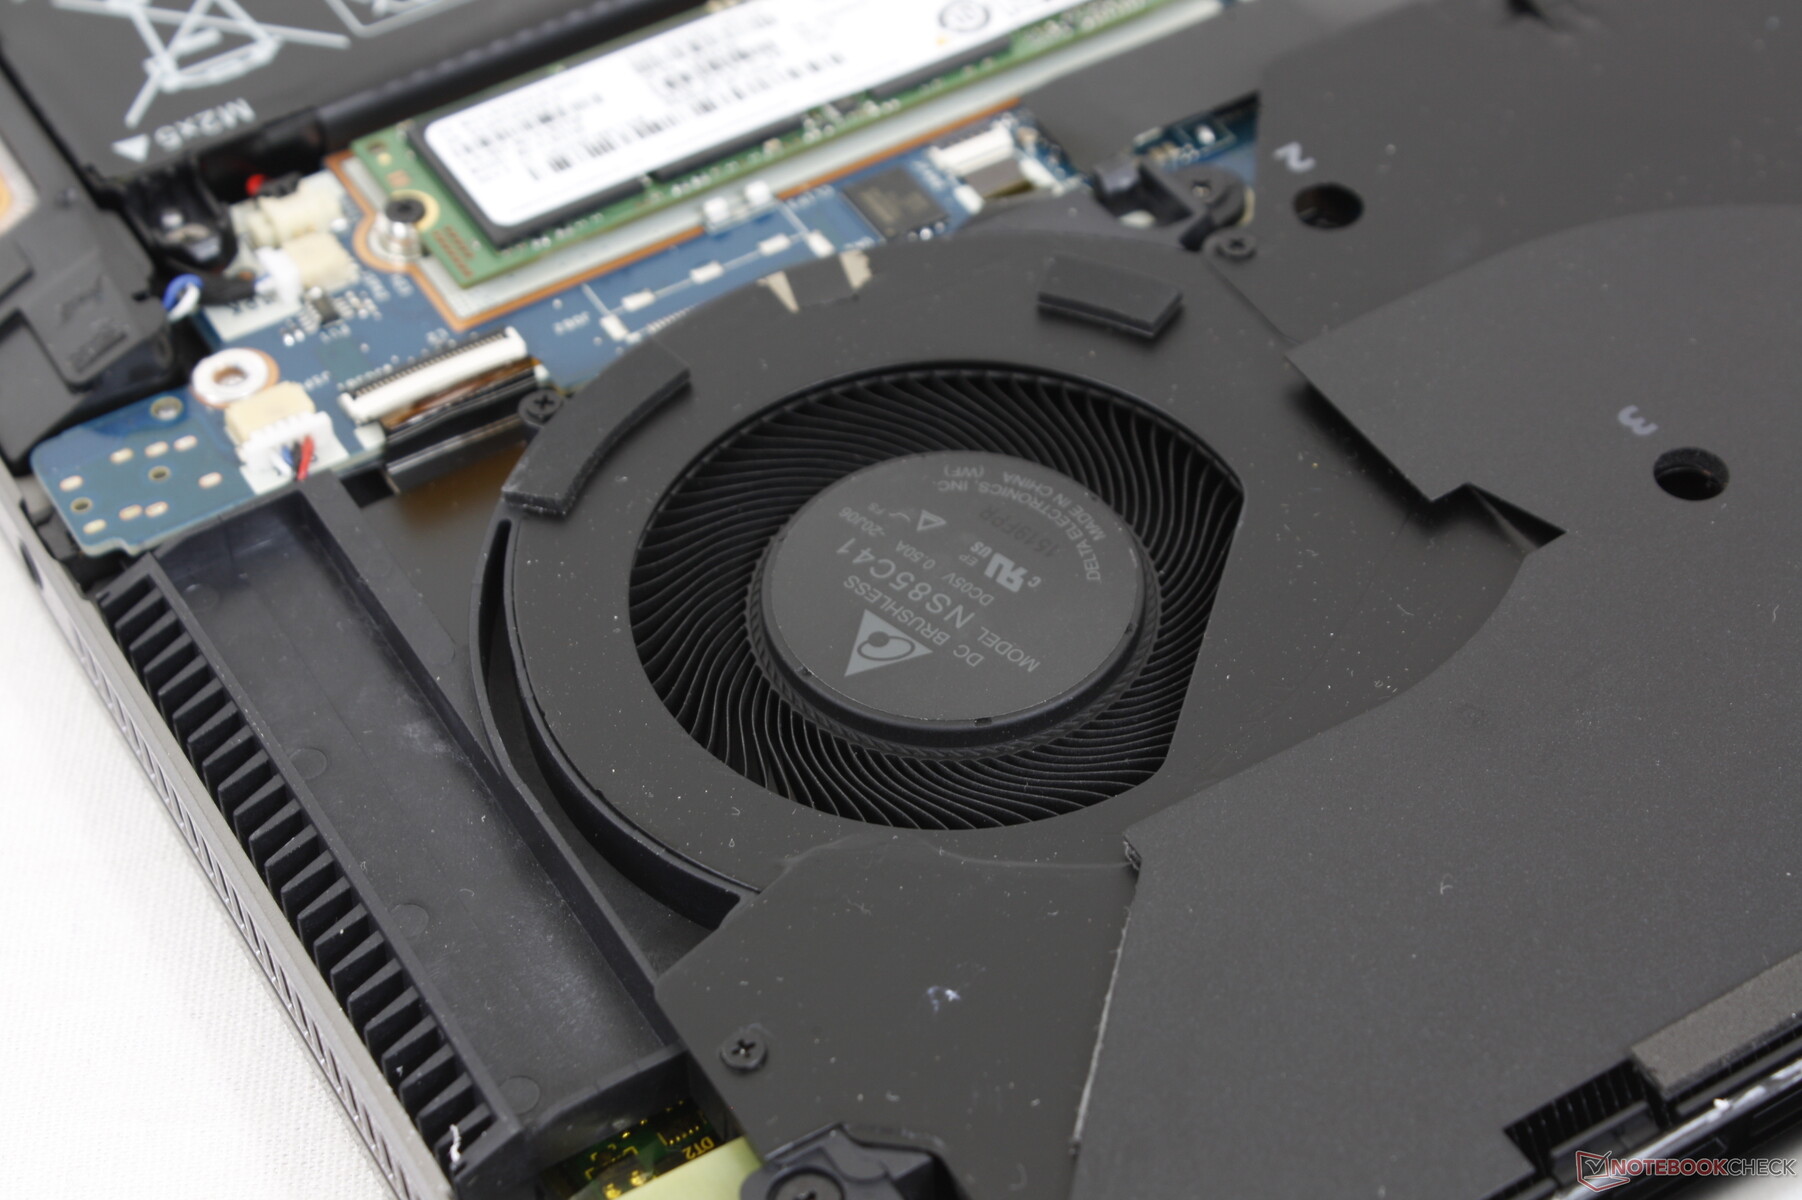
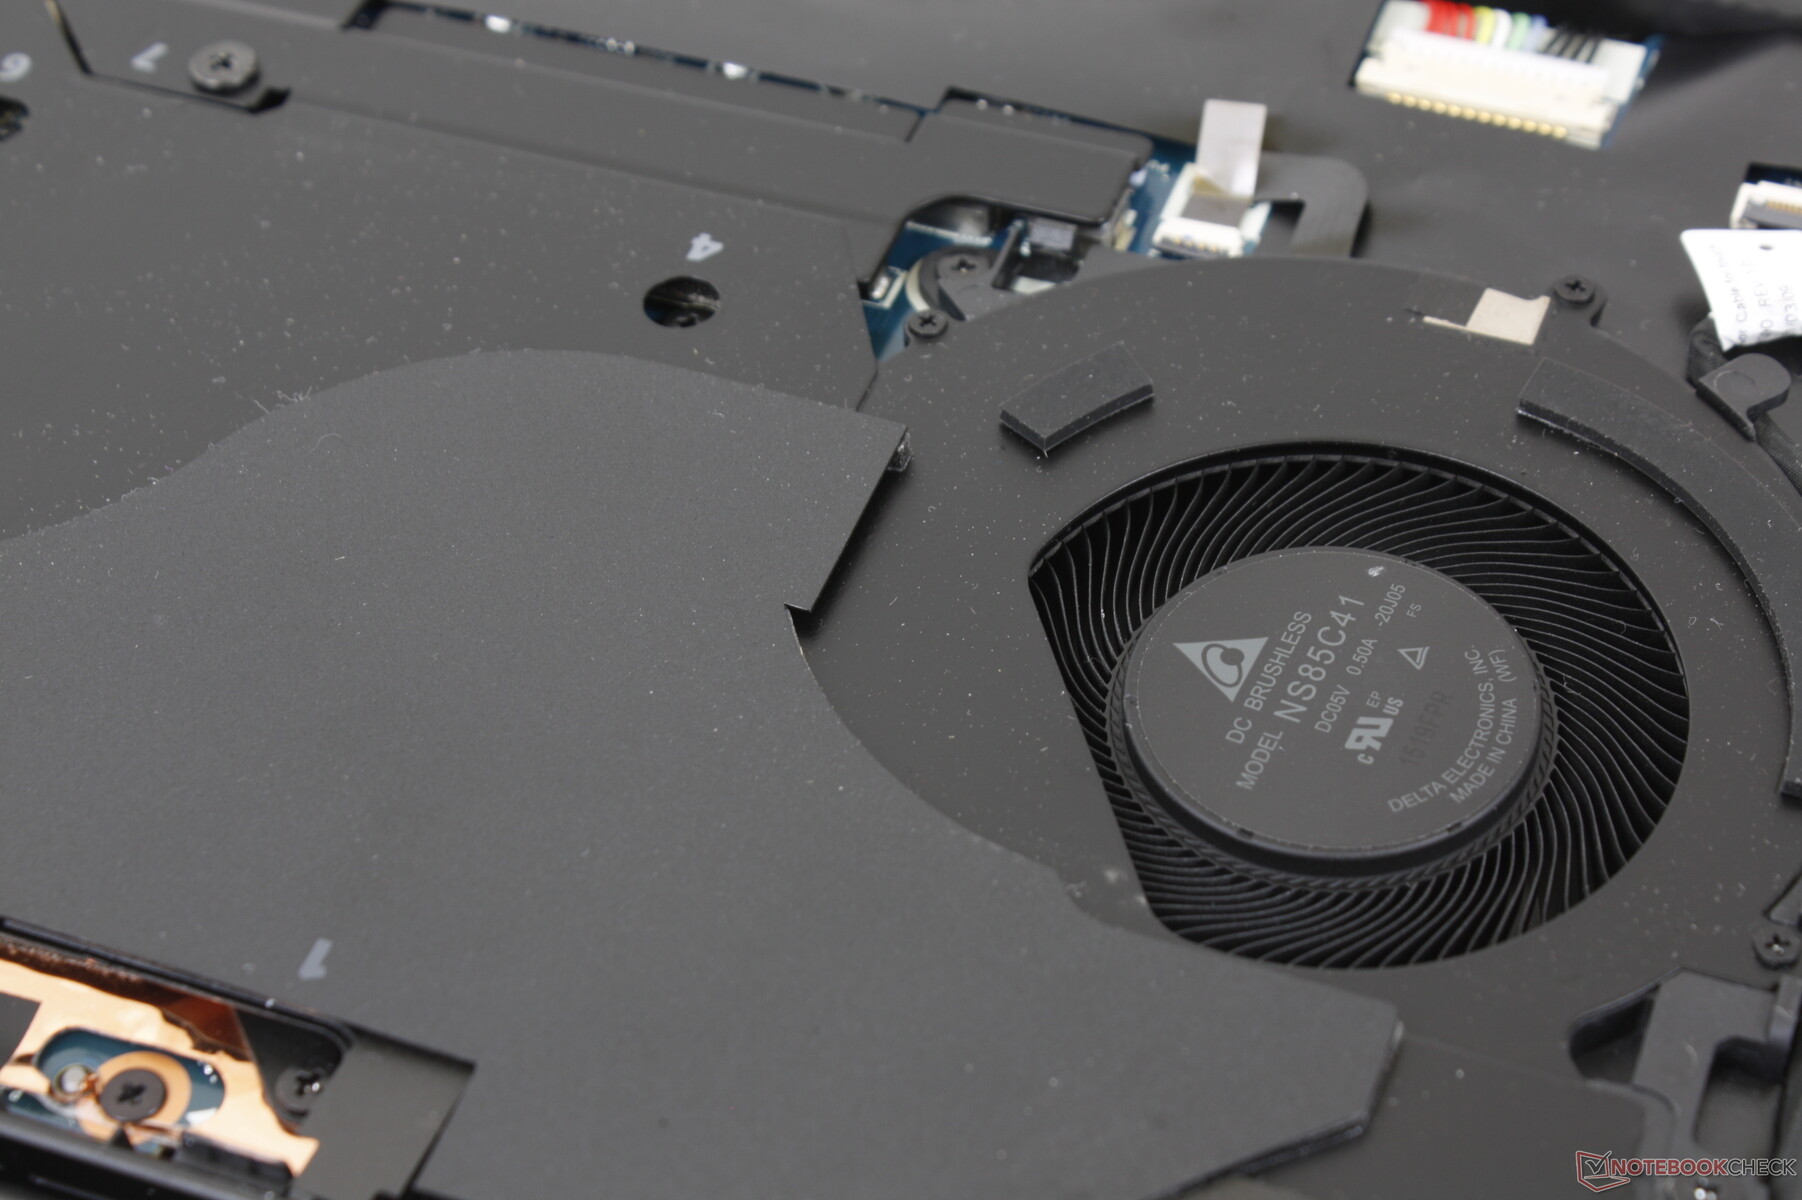
HP não alterou o projeto do chassi externo e, portanto, nosso comentários originais no ZBook Studio 15 G7 também se aplicam aqui. Em vez disso, as mudanças são internas, incluindo iluminação RGB opcional por chave e uma solução de resfriamento revista para puxar mais ar do que no modelo do ano passado.
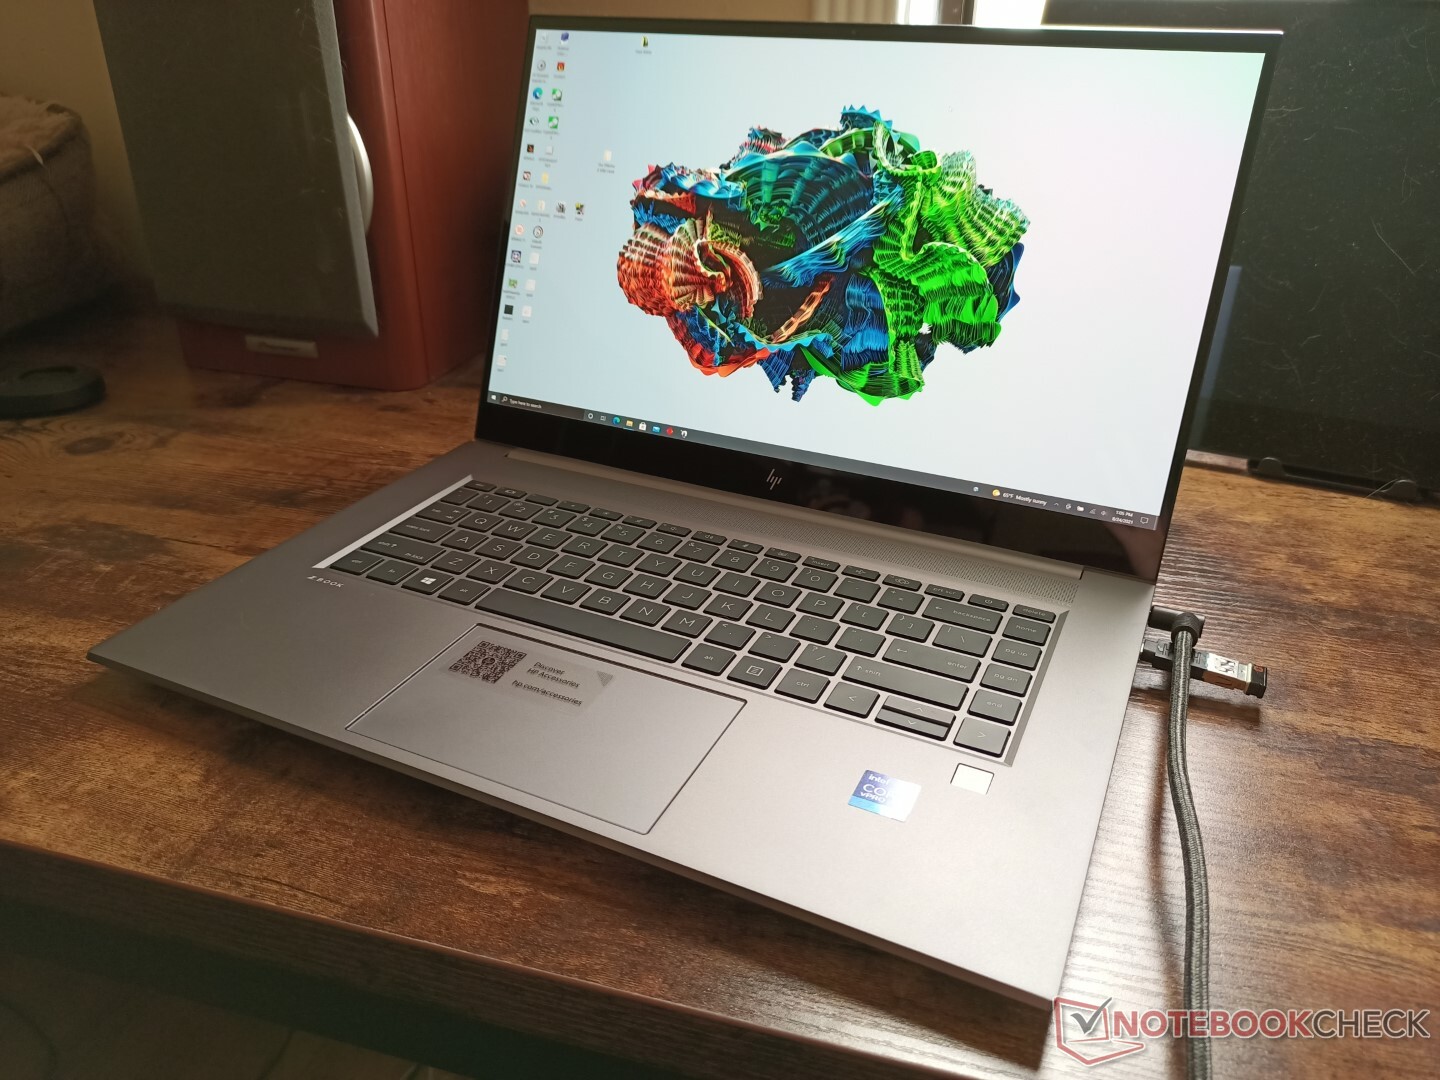
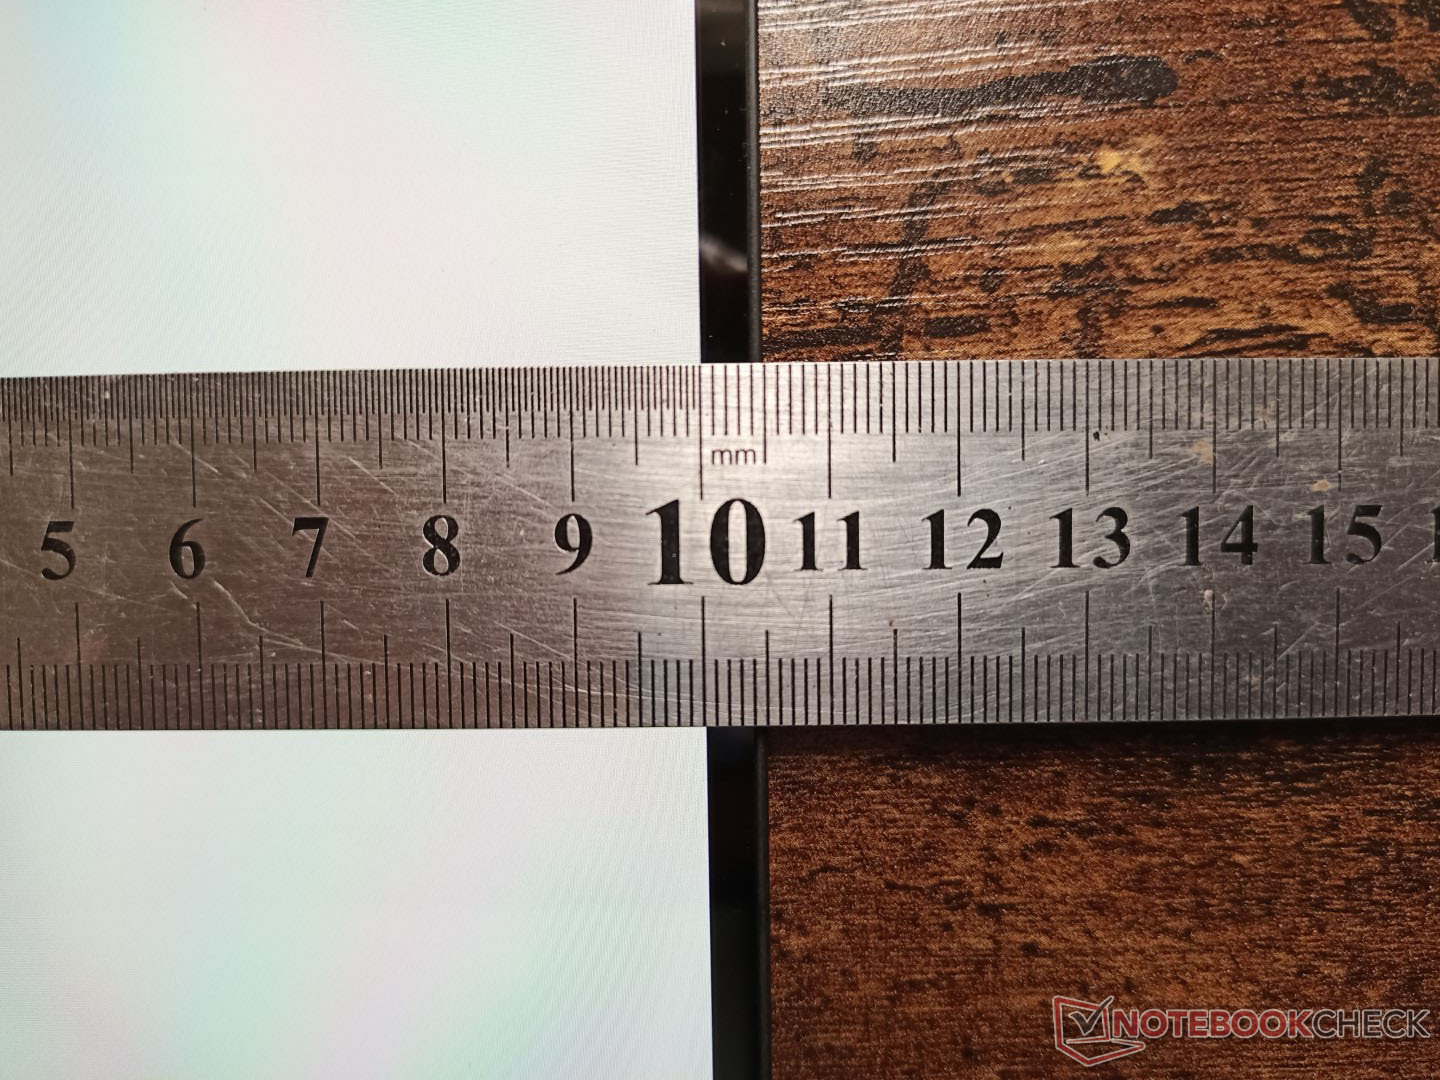
O modelo continua sendo uma das menores estações de trabalho de 15,6 polegadas disponíveis com CPUs da série Core-H e GeForce/Quadro, apesar de seu "velho" design de chassis. É ainda menor do que o ZBook Firefly G8 que vem com internos mais lentos do que nosso ZBook Studio G8.
Vale notar que as SKUs com tela sensível ao toque são cada vez mais espessas do que as SKUs sem toque por um centésimo de polegada (0,70" vs. 0,69").
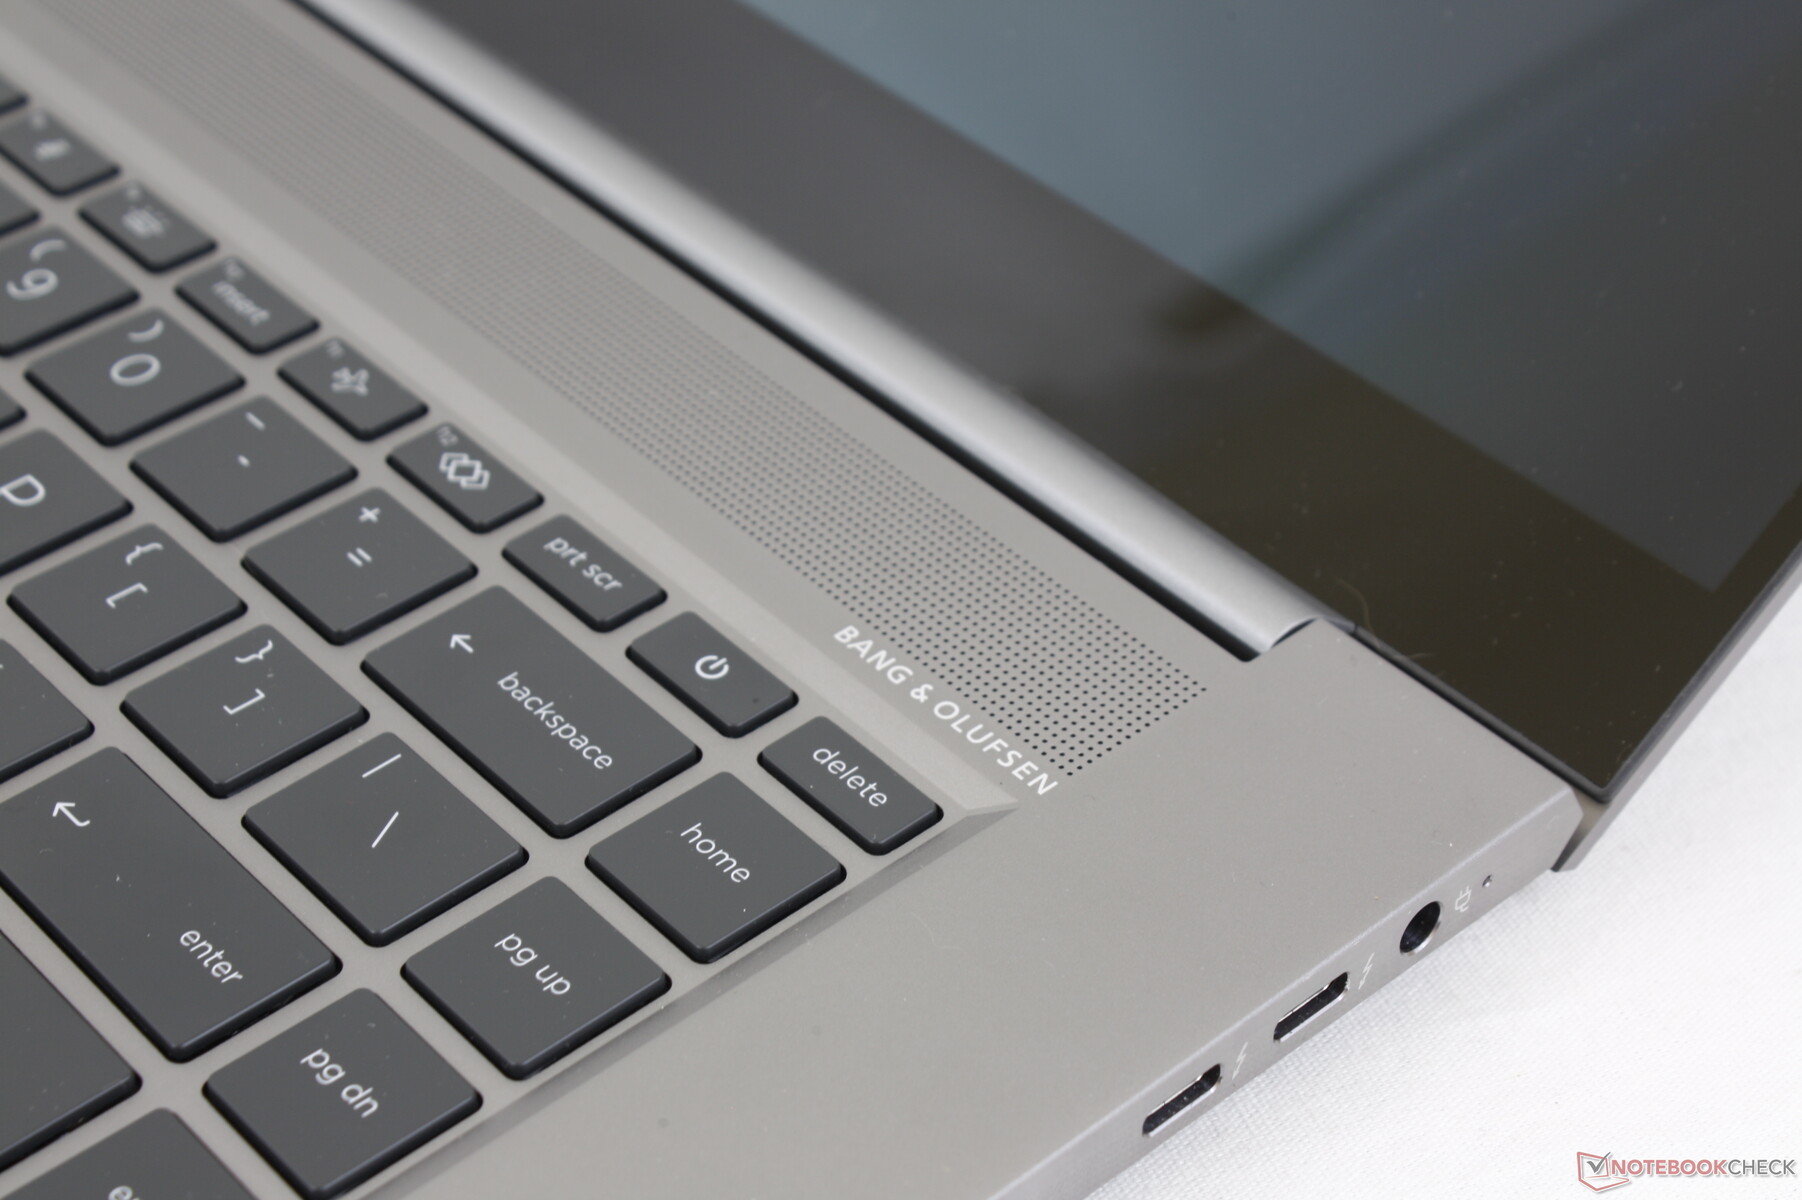
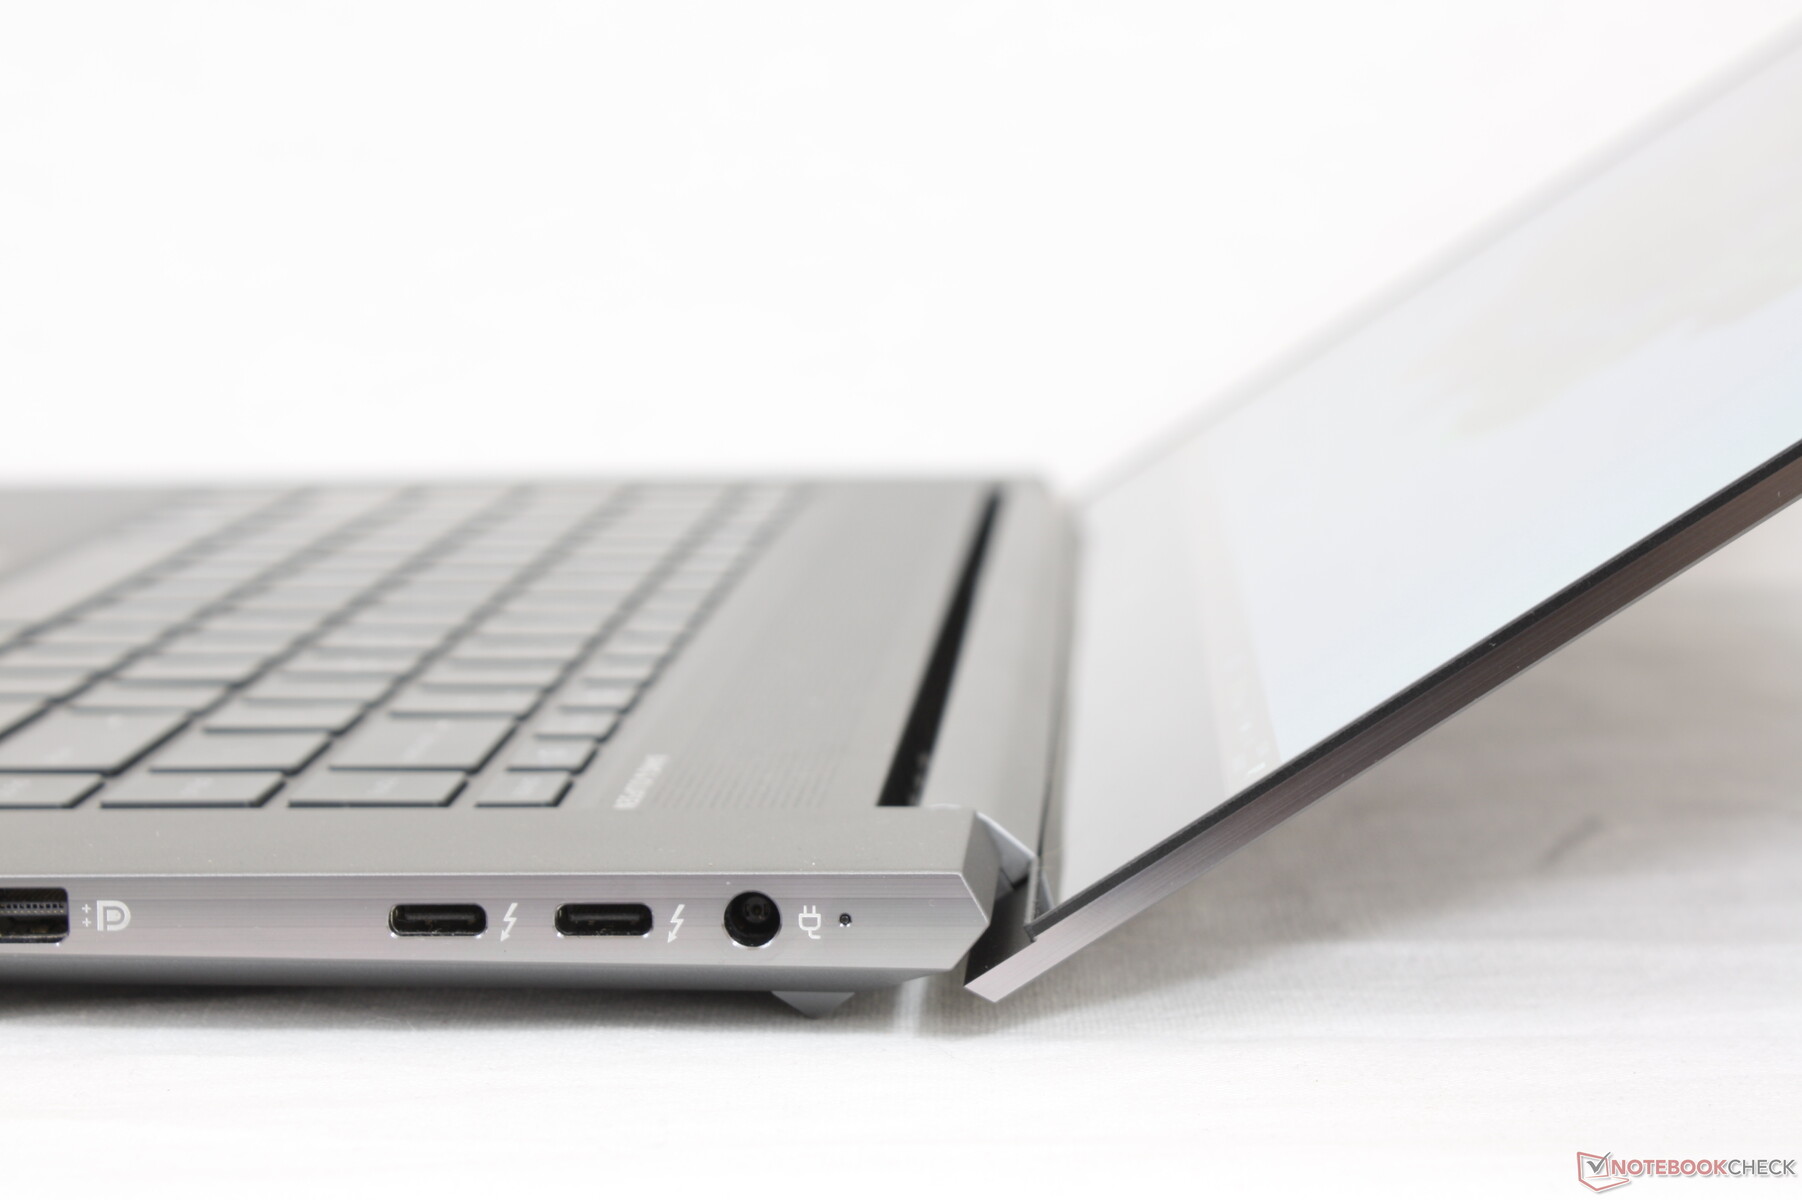
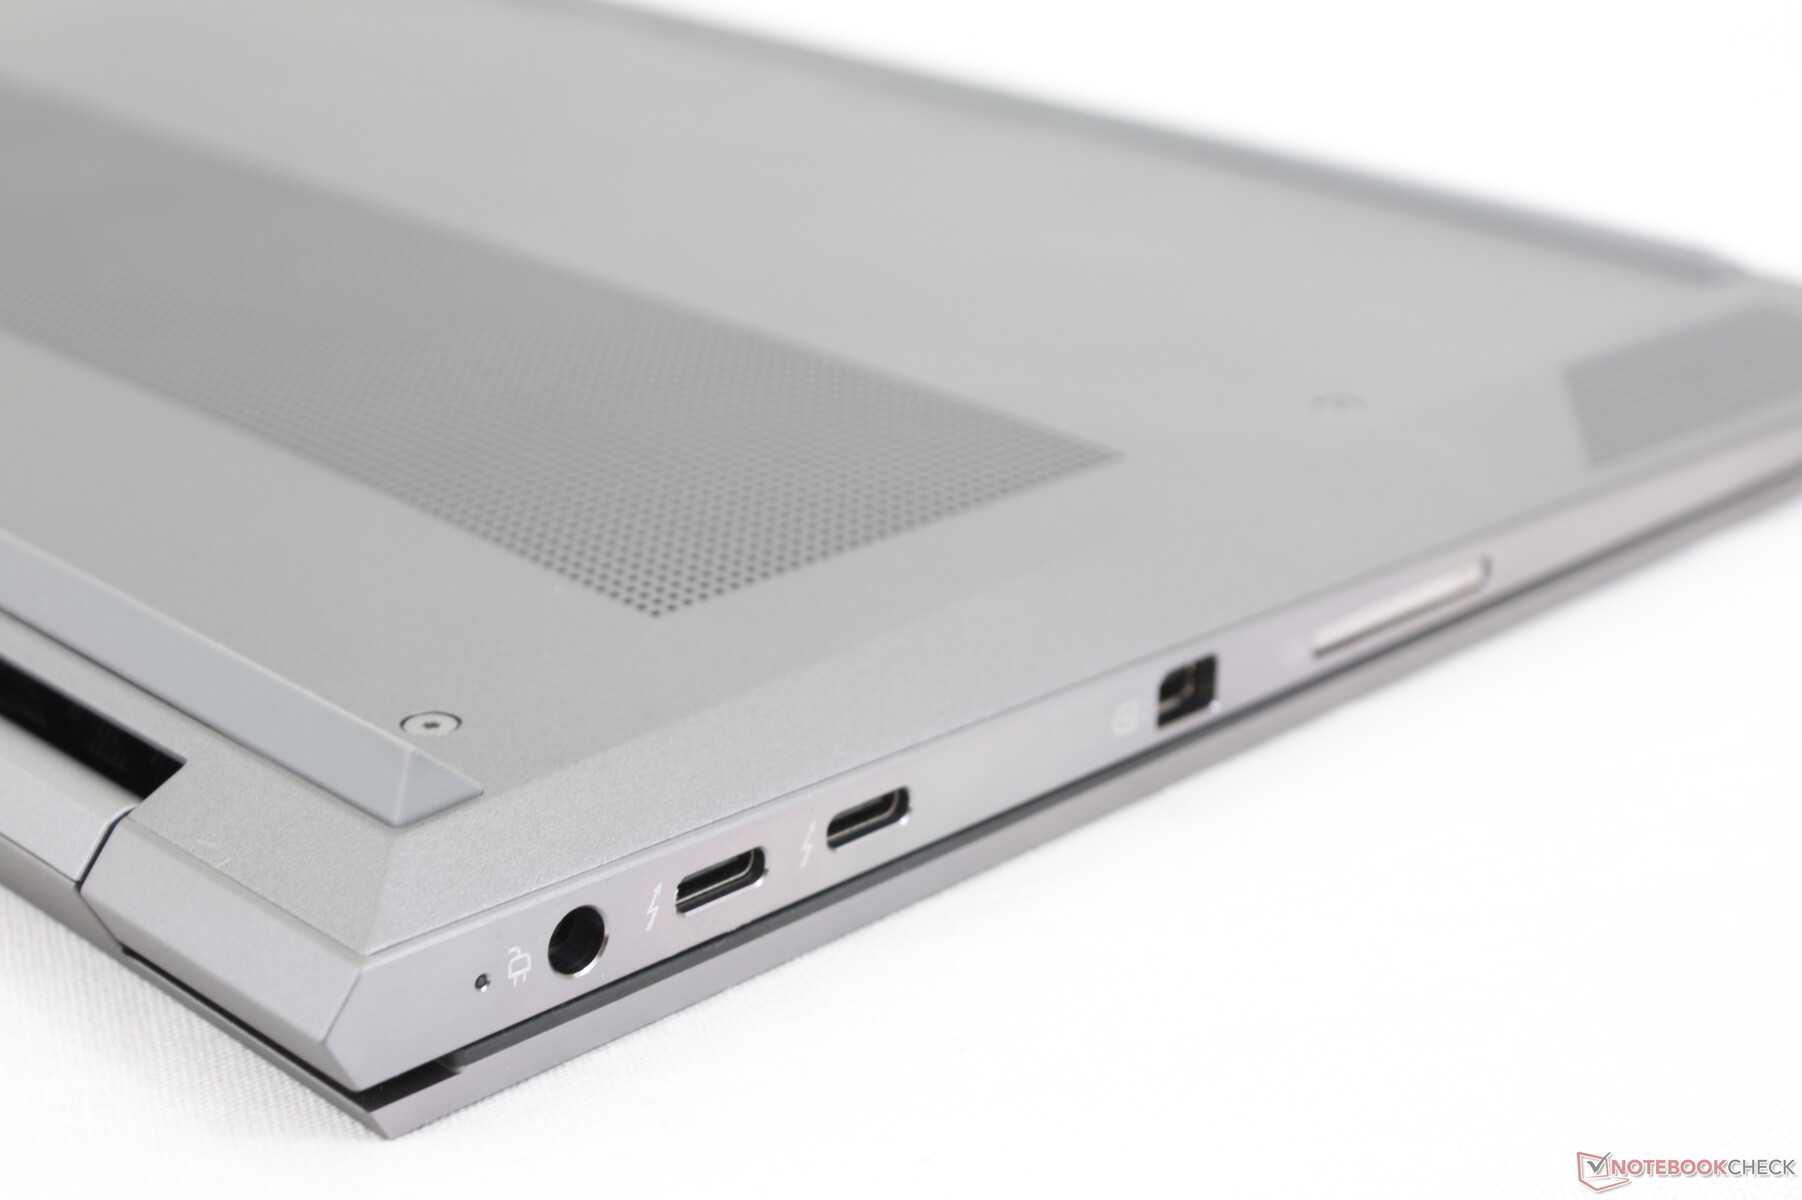
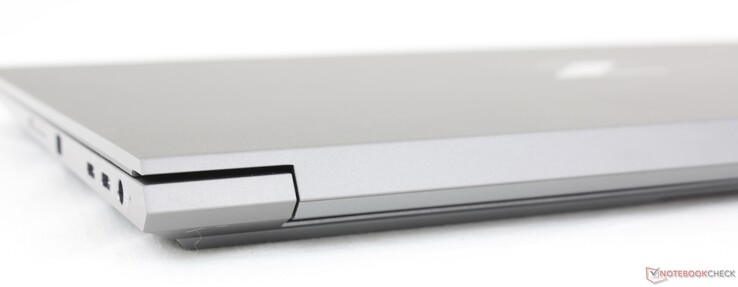
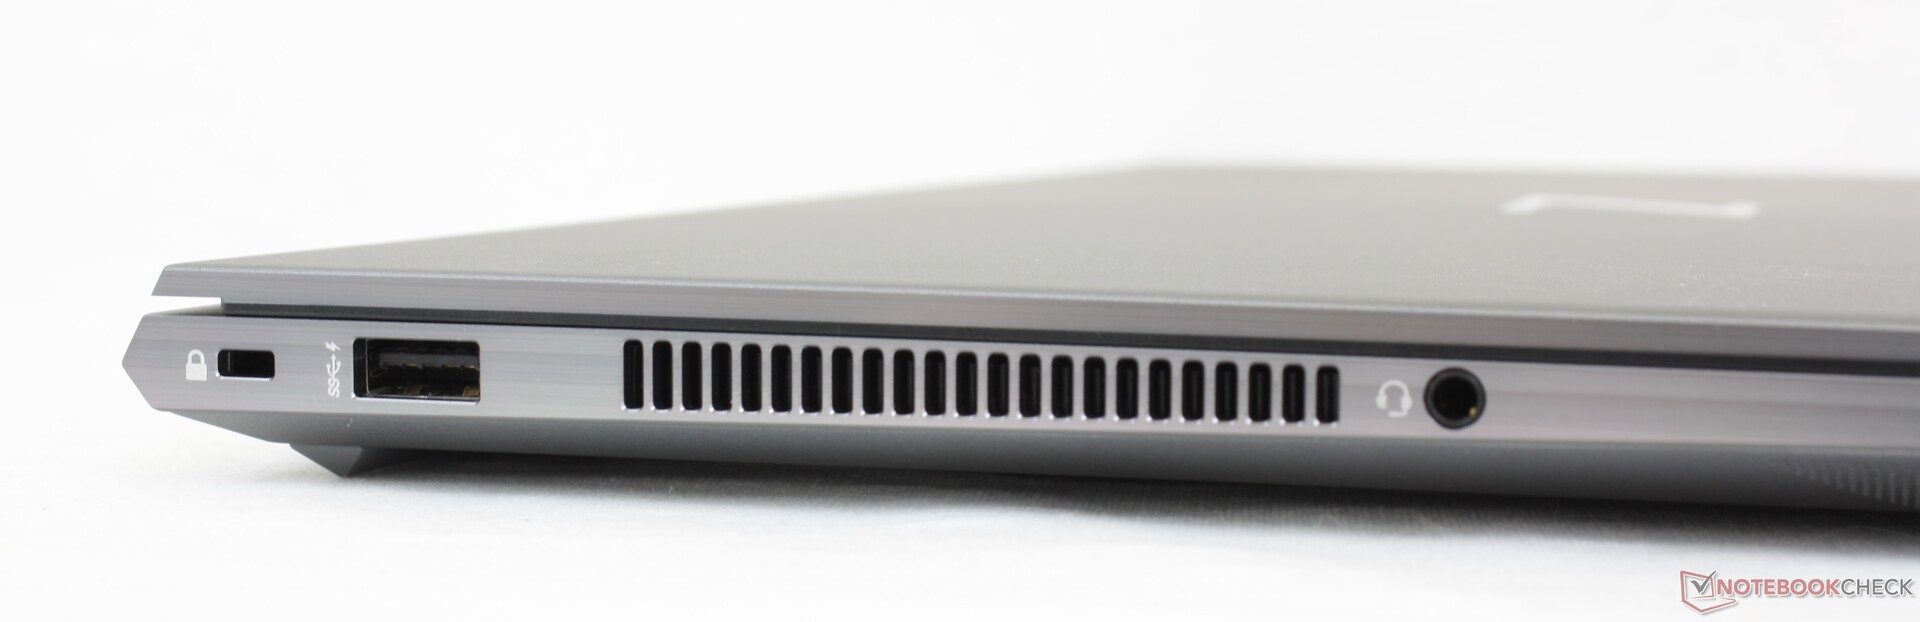
Conectividade - Agora com o Thunderbolt 4
As opções de porto são menores do que noDell Precision 7550 pois este último integra tudo no ZBook Studio G8 mais gigabit RJ-45, HDMI, e uma porta USB-A extra. Os usuários terão que aproveitar as duas portas Thunderbolt 4 integradas para explorar plenamente as capacidades de acoplamento do sistema HP.
O posicionamento das portas é um pouco apertado entre a porta do adaptador AC proprietário e as duas portas USB-C ao longo da borda direita. Cabos mais grossos ou dispositivos USB-C podem bloquear o acesso às portas adjacentes.
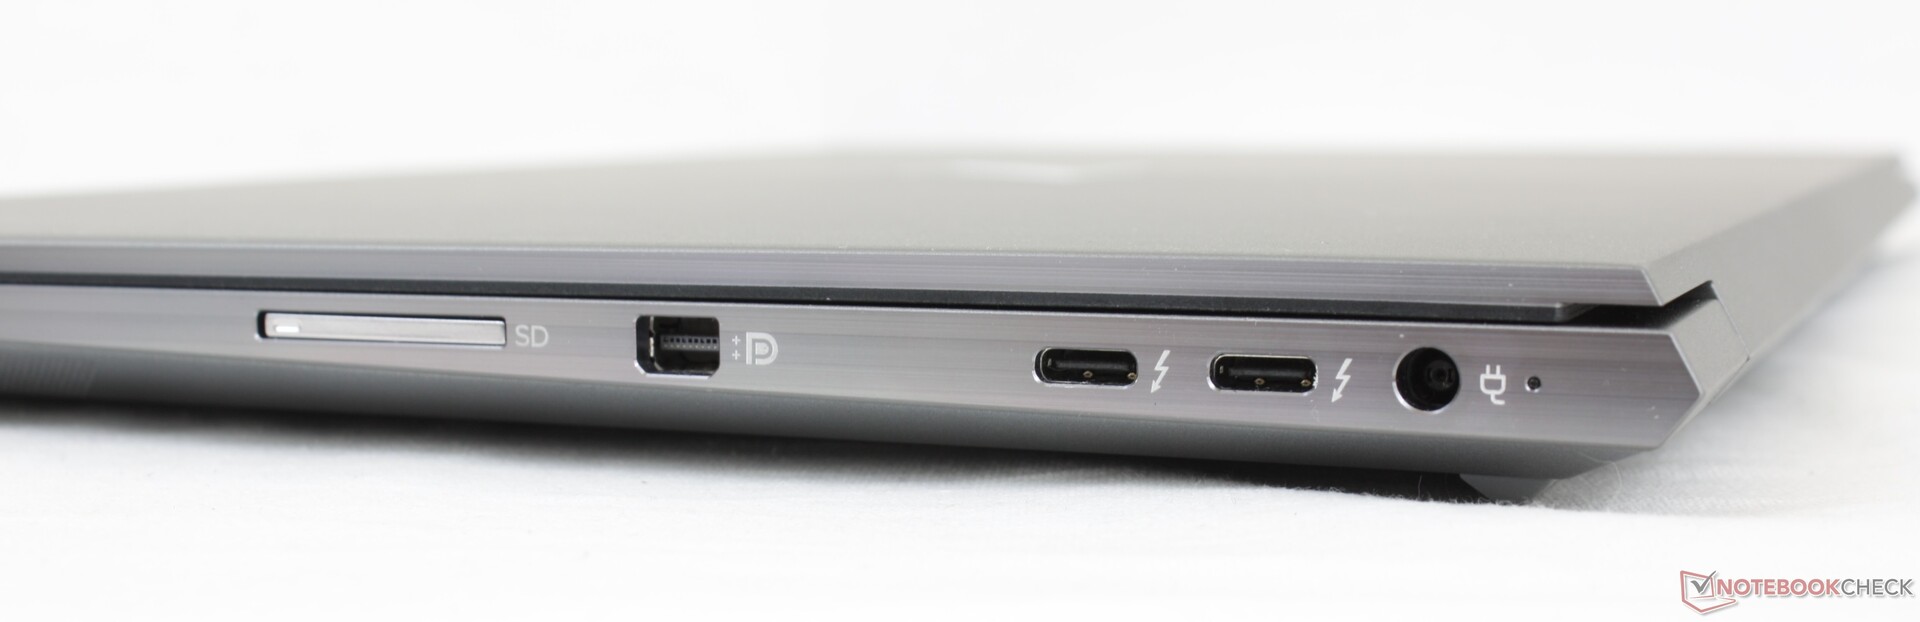
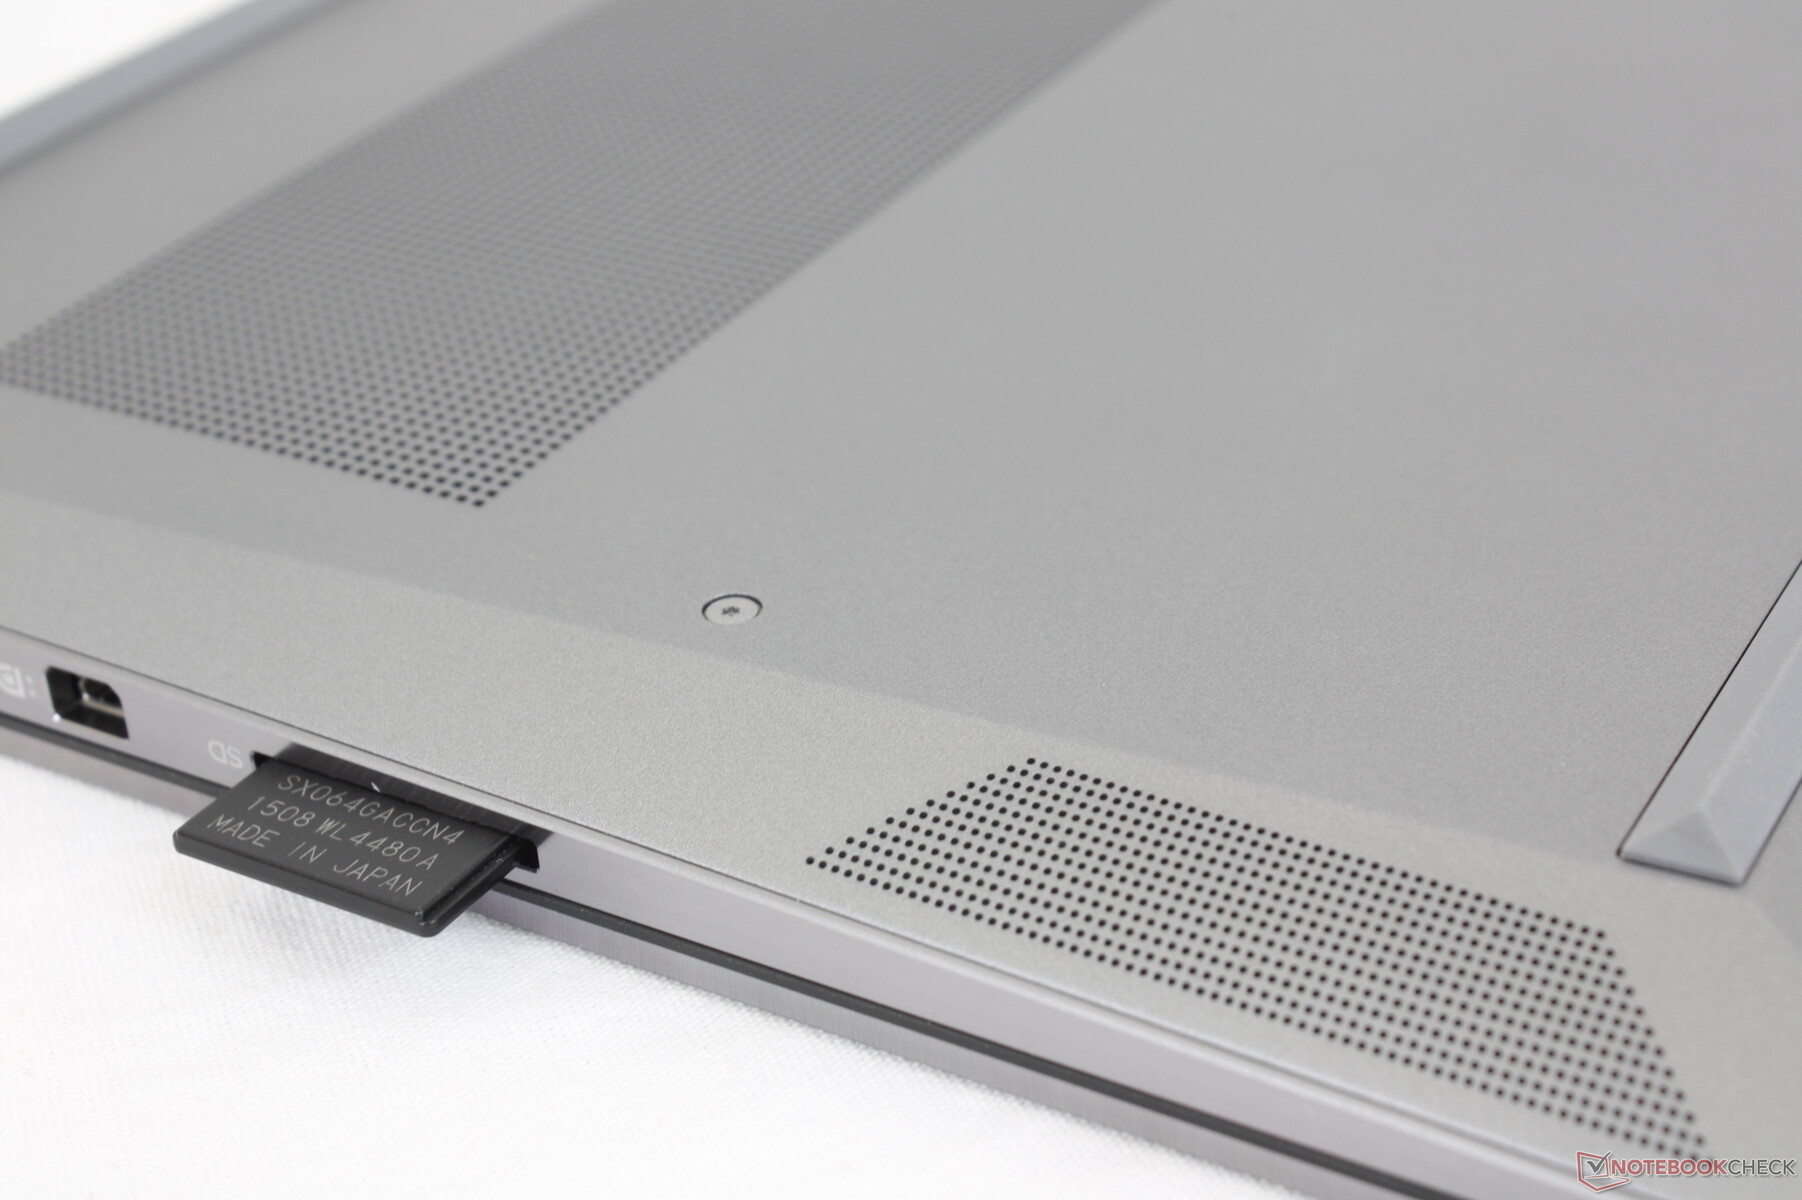
Leitor de cartões SD
A HP realmente rebaixou o leitor de cartões SD este ano. A transferência de 1 GB de imagens de nosso cartão de teste UHS-II para a área de trabalho leva cerca de 14 segundos, em comparação com menos da metade do que no ZBook Studio G7. Não sabemos ao certo por que a HP faria isso, mas é decepcionante, especialmente para os criadores de conteúdo que confiam no leitor de cartão.
| SD Card Reader | |
| average JPG Copy Test (av. of 3 runs) | |
| Dell Precision 7550 (Toshiba Exceria Pro SDXC 64 GB UHS-II) | |
| HP ZBook Studio G7 (AV Pro V60) | |
| HP ZBook Studio 15 G8 (AV Pro V60) | |
| Lenovo ThinkPad P15s Gen2-20W6000GGE (AV Pro V60) | |
| maximum AS SSD Seq Read Test (1GB) | |
| Dell Precision 7550 (Toshiba Exceria Pro SDXC 64 GB UHS-II) | |
| HP ZBook Studio G7 (AV Pro V60) | |
| Lenovo ThinkPad P15s Gen2-20W6000GGE (AV Pro V60) | |
| HP ZBook Studio 15 G8 (AV Pro V60) | |
Comunicação
O Intel AX201 vem como padrão para conectividade Wi-Fi 6 e Bluetooth 5.2. As taxas de transferência são estáveis em torno de 1400 Mbps em ambas as direções quando emparelhadas com nosso roteador de teste Netgear RAX200.
Webcam


Segurança
A HP tem um conjunto completo de software e medidas de proteção de baixo nível incluindo Sure Click, Secure Erase, BIOSphere, Sure Start, Sure Run, Tamper Lock, Sure View opcional, e muito mais sobre o habitual leitor de impressões digitais e TPM. No entanto, um simples obturador de webcam está faltando flagrantemente, o que nos parece uma supervisão maciça por parte da HP.
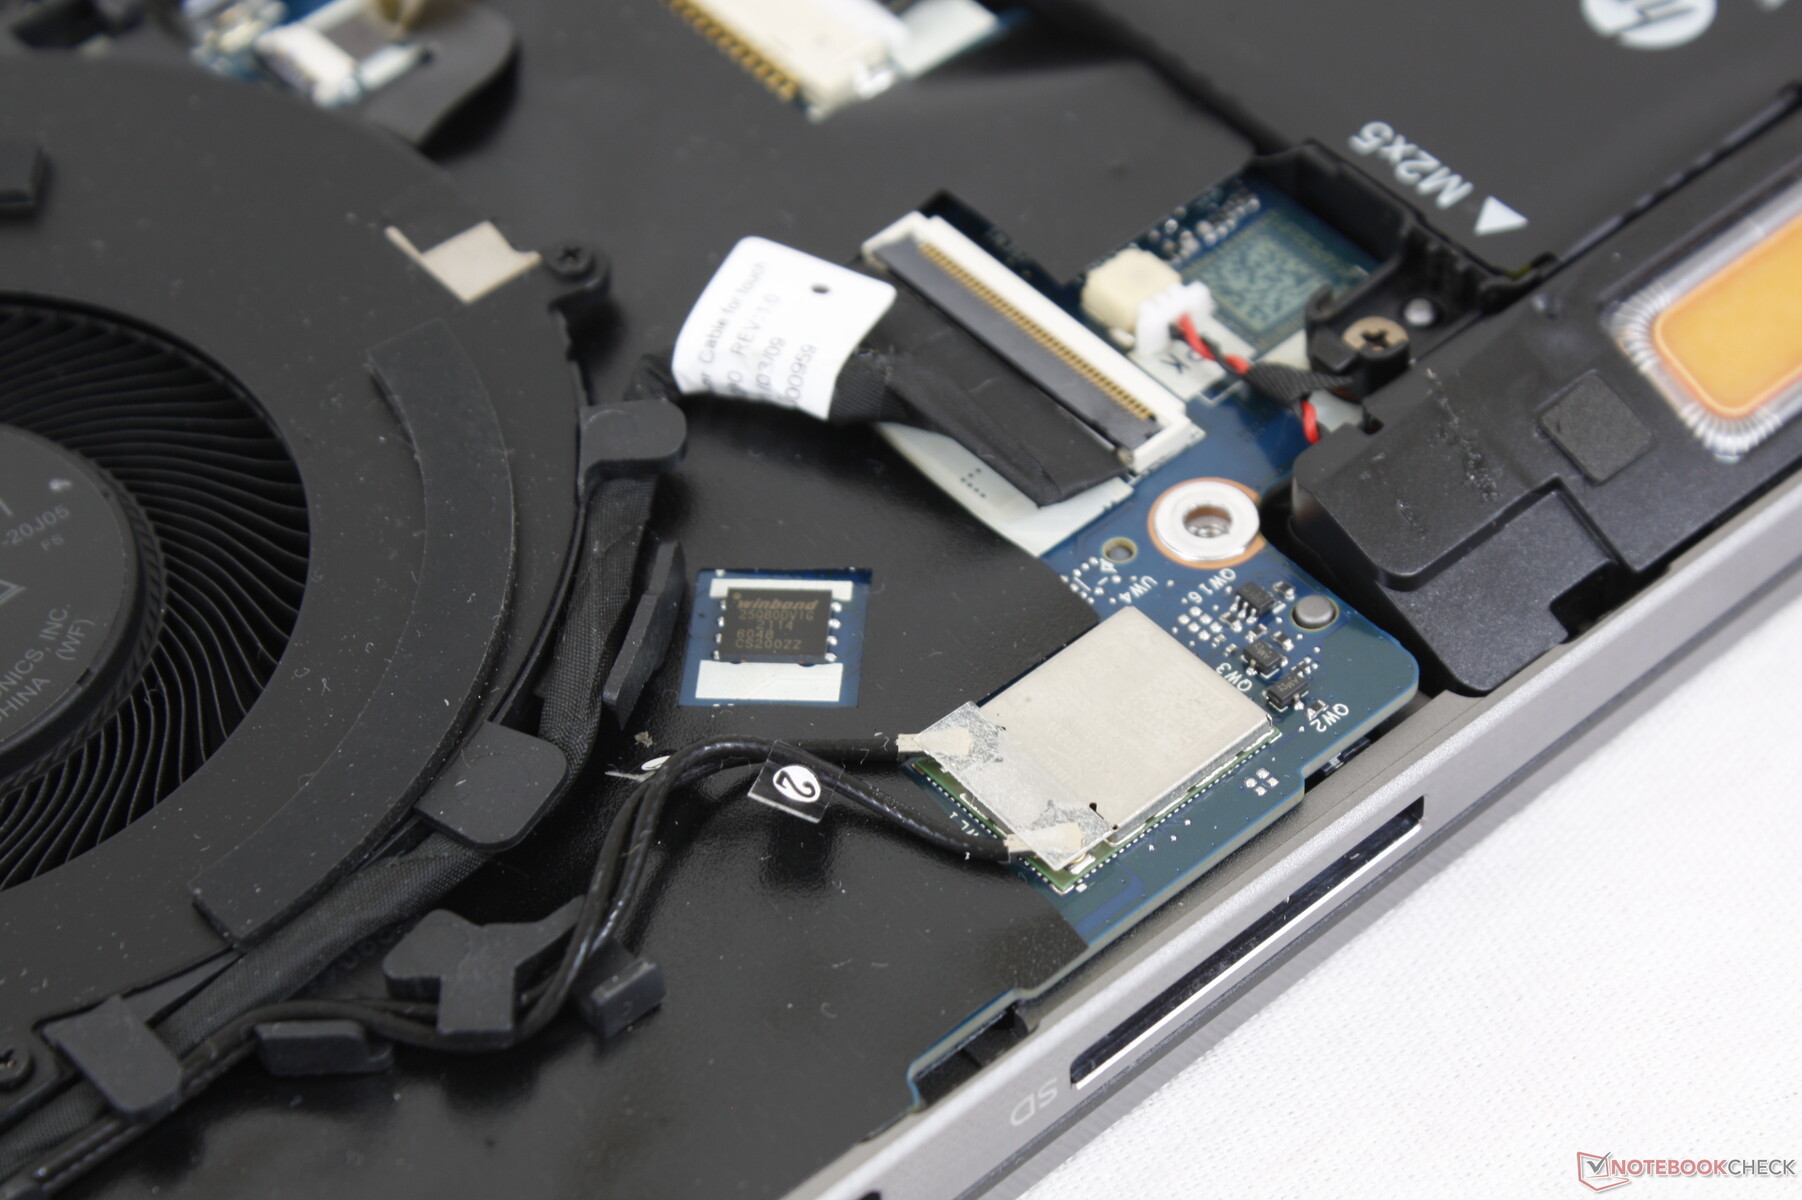
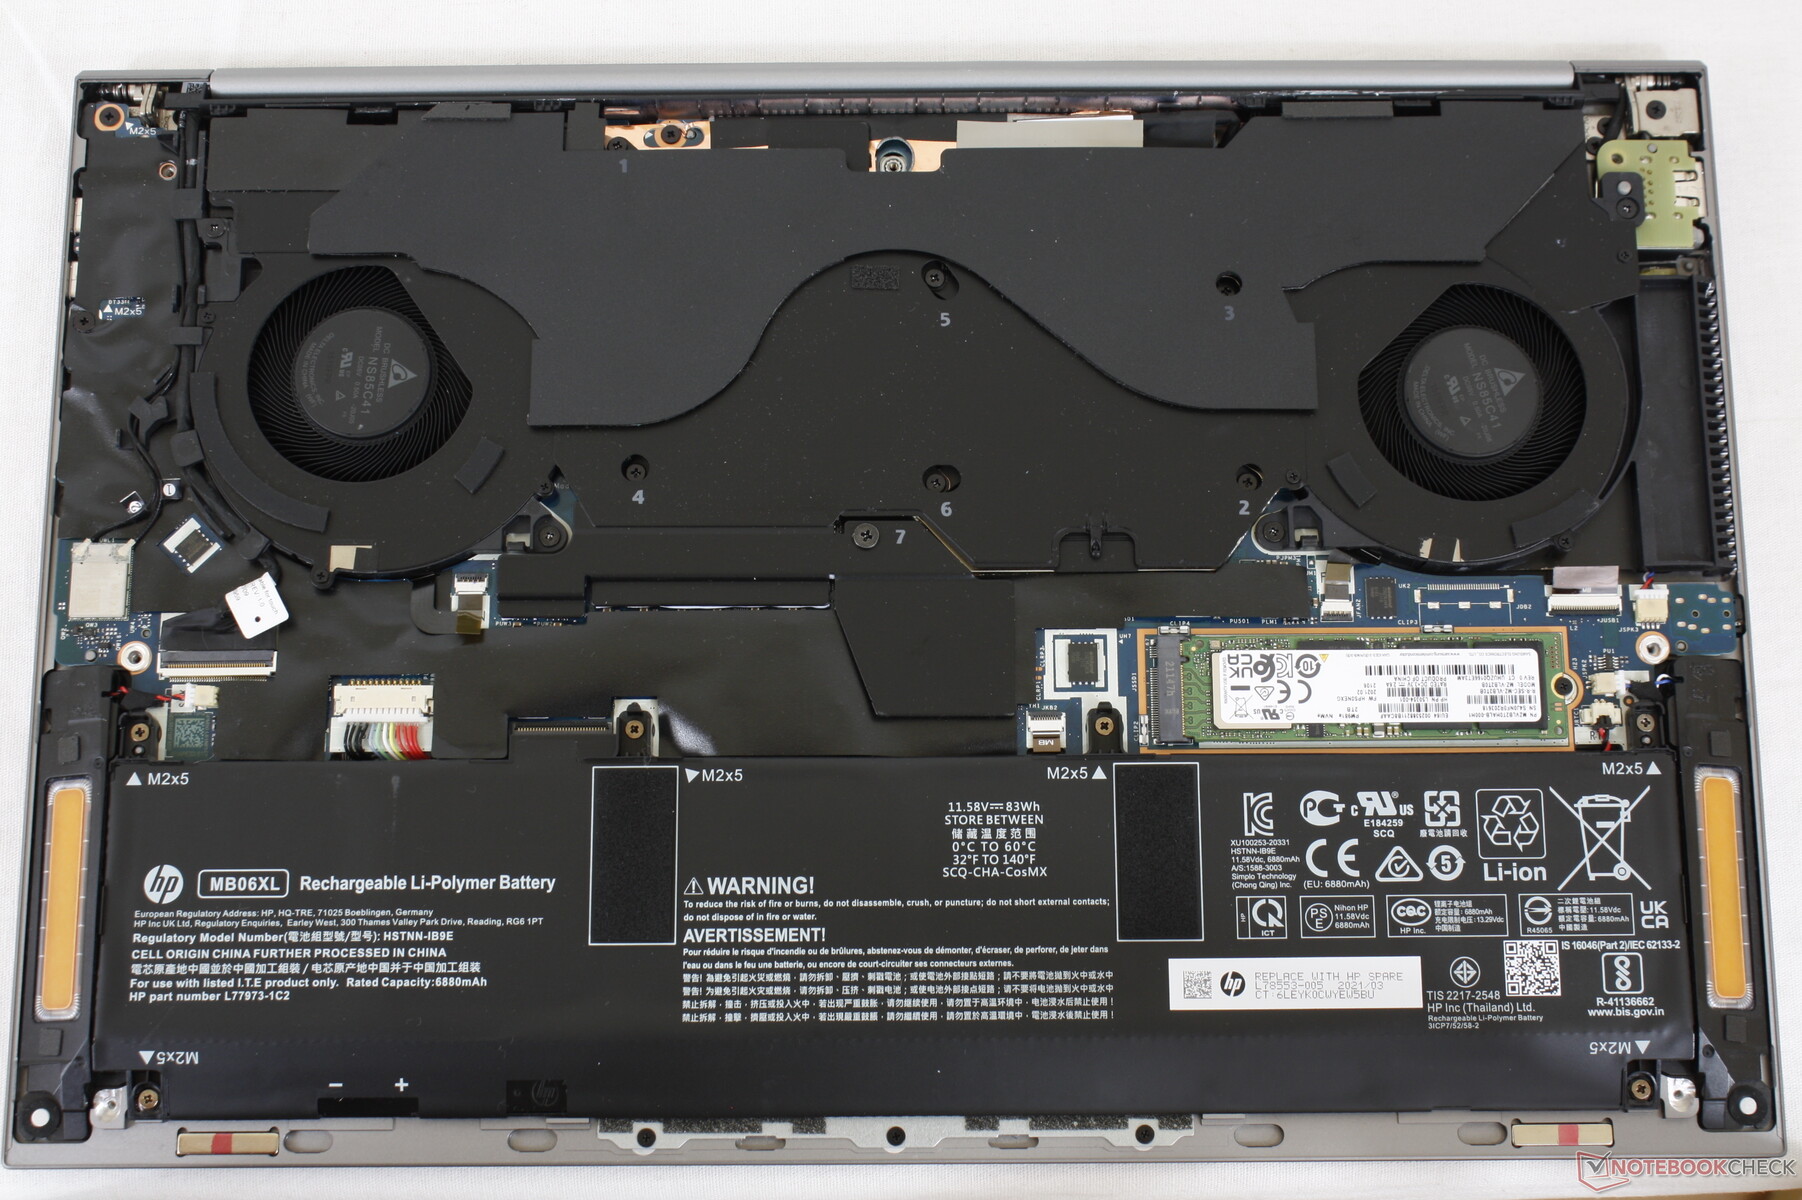
Manutenção
O painel inferior requer uma chave de fenda Philips e uma aresta afiada para abrir. No entanto, não há muito a ser melhorado uma vez dentro, pois os módulos de RAM e WLAN são soldados.
Acessórios e Garantia
A caixa de varejo não inclui extras fora do adaptador AC e papelada. Uma garantia básica de um ano vem como padrão em vez da garantia de dois ou três anos que as estações de trabalho de ponta tendem a oferecer sem custo adicional.
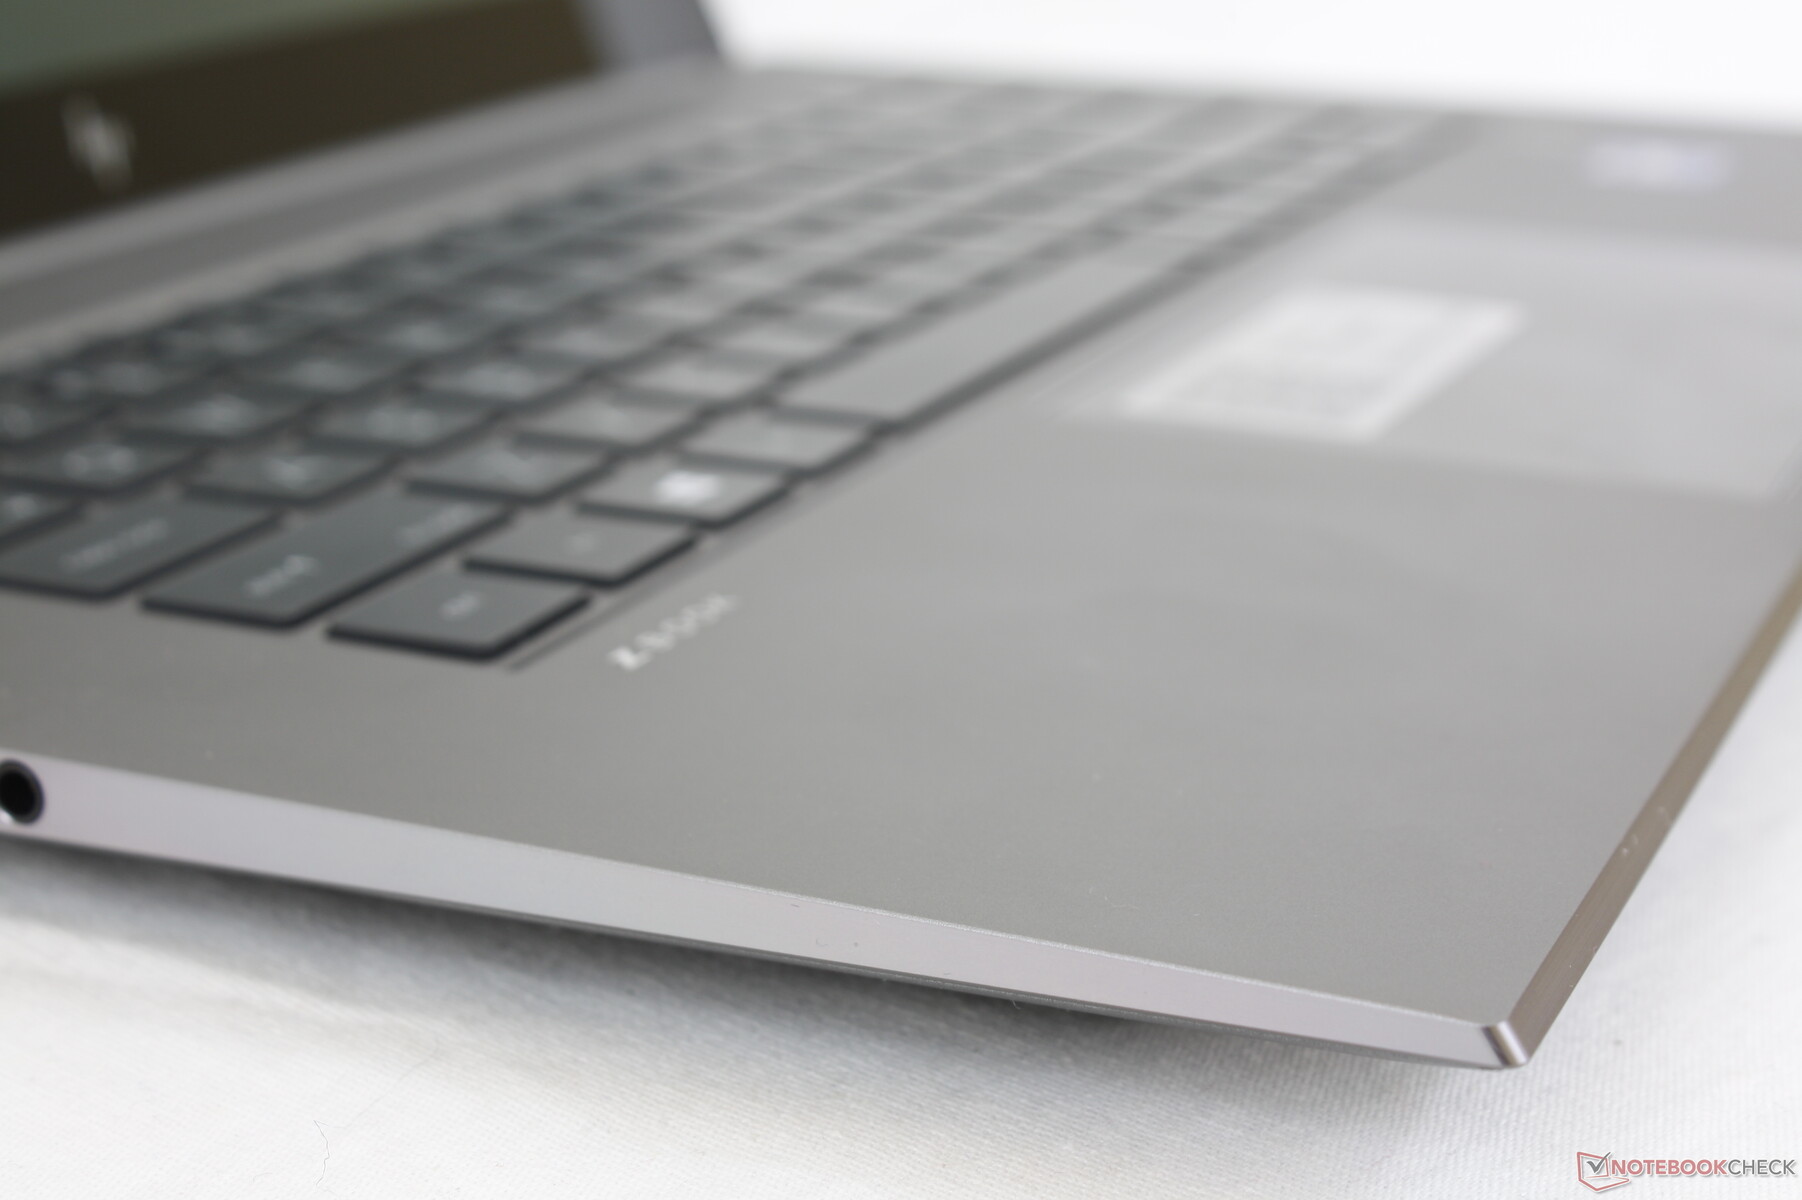
Dispositivos de Entrada - Sentimos falta das Chaves Dedicadas do Rato e do TrackPoint
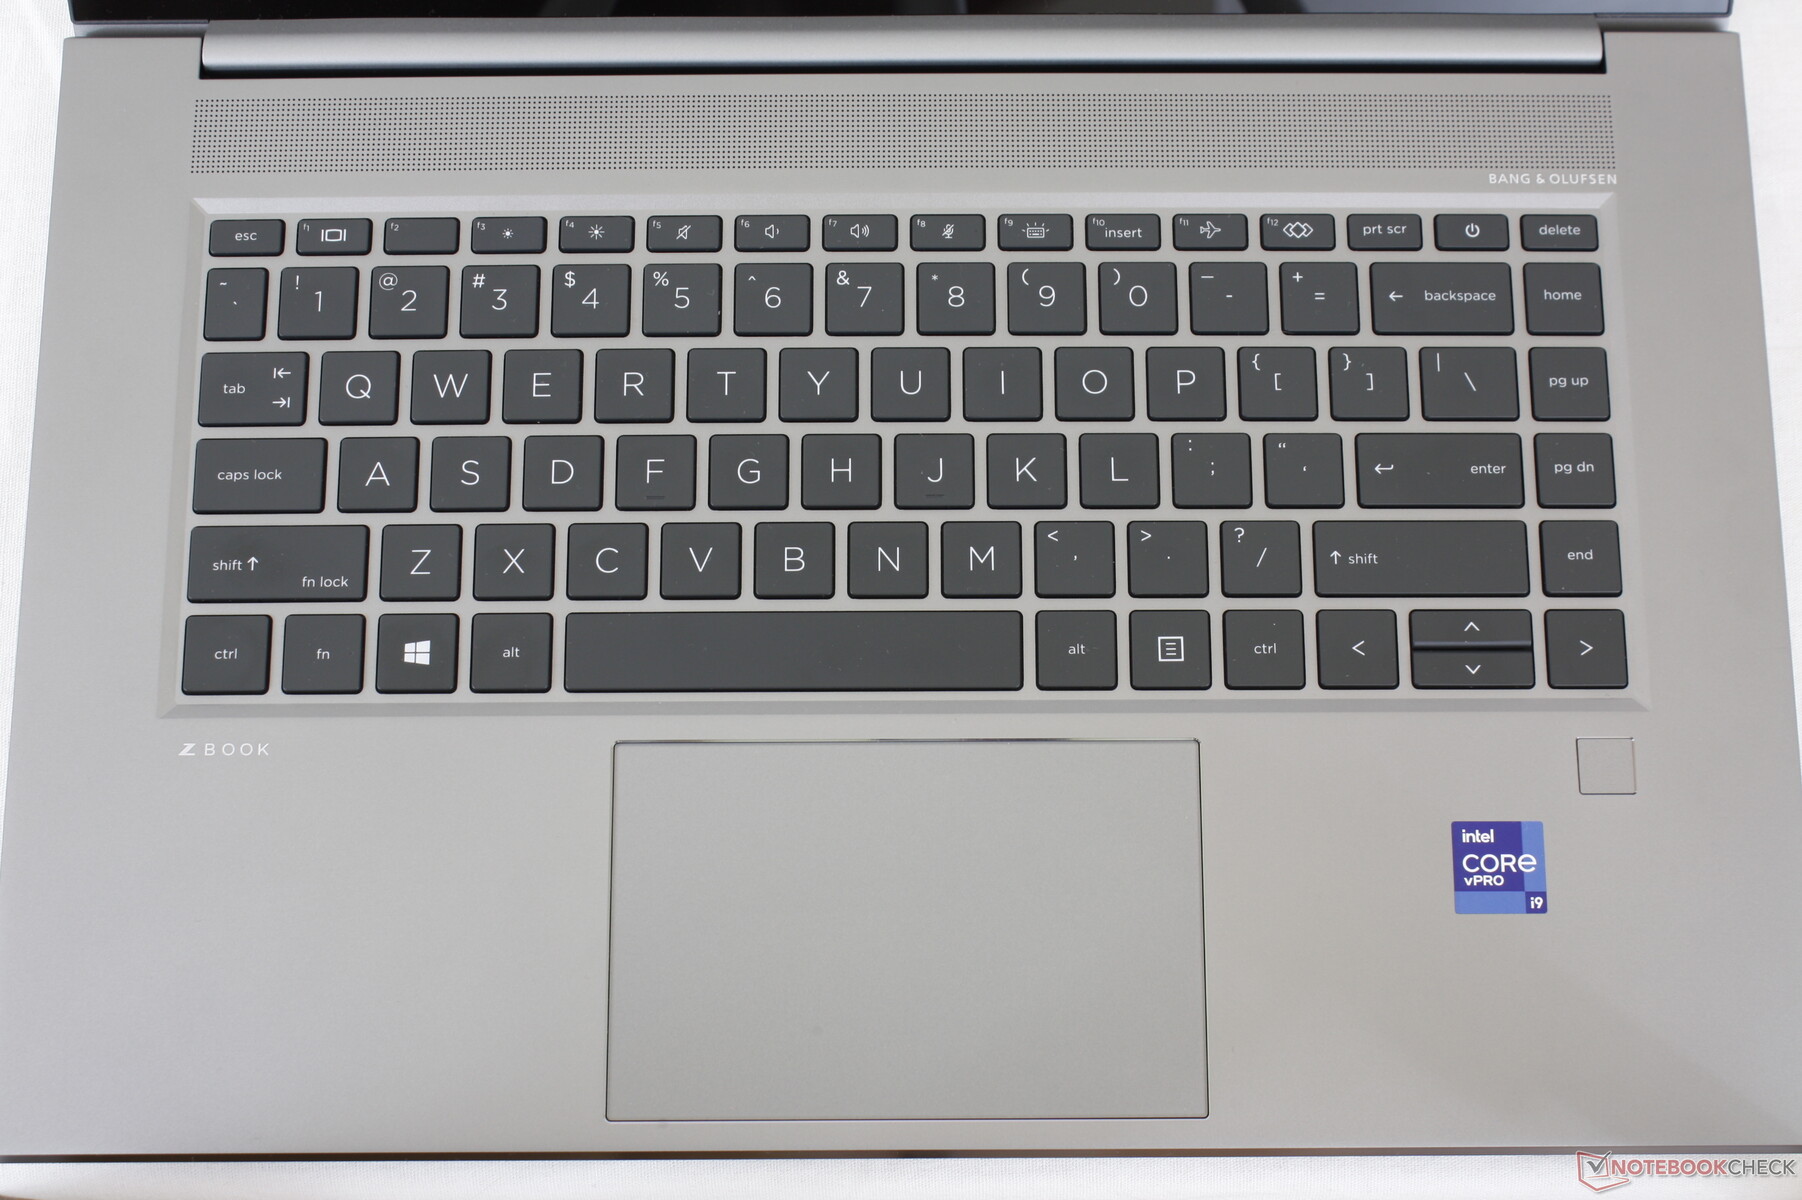
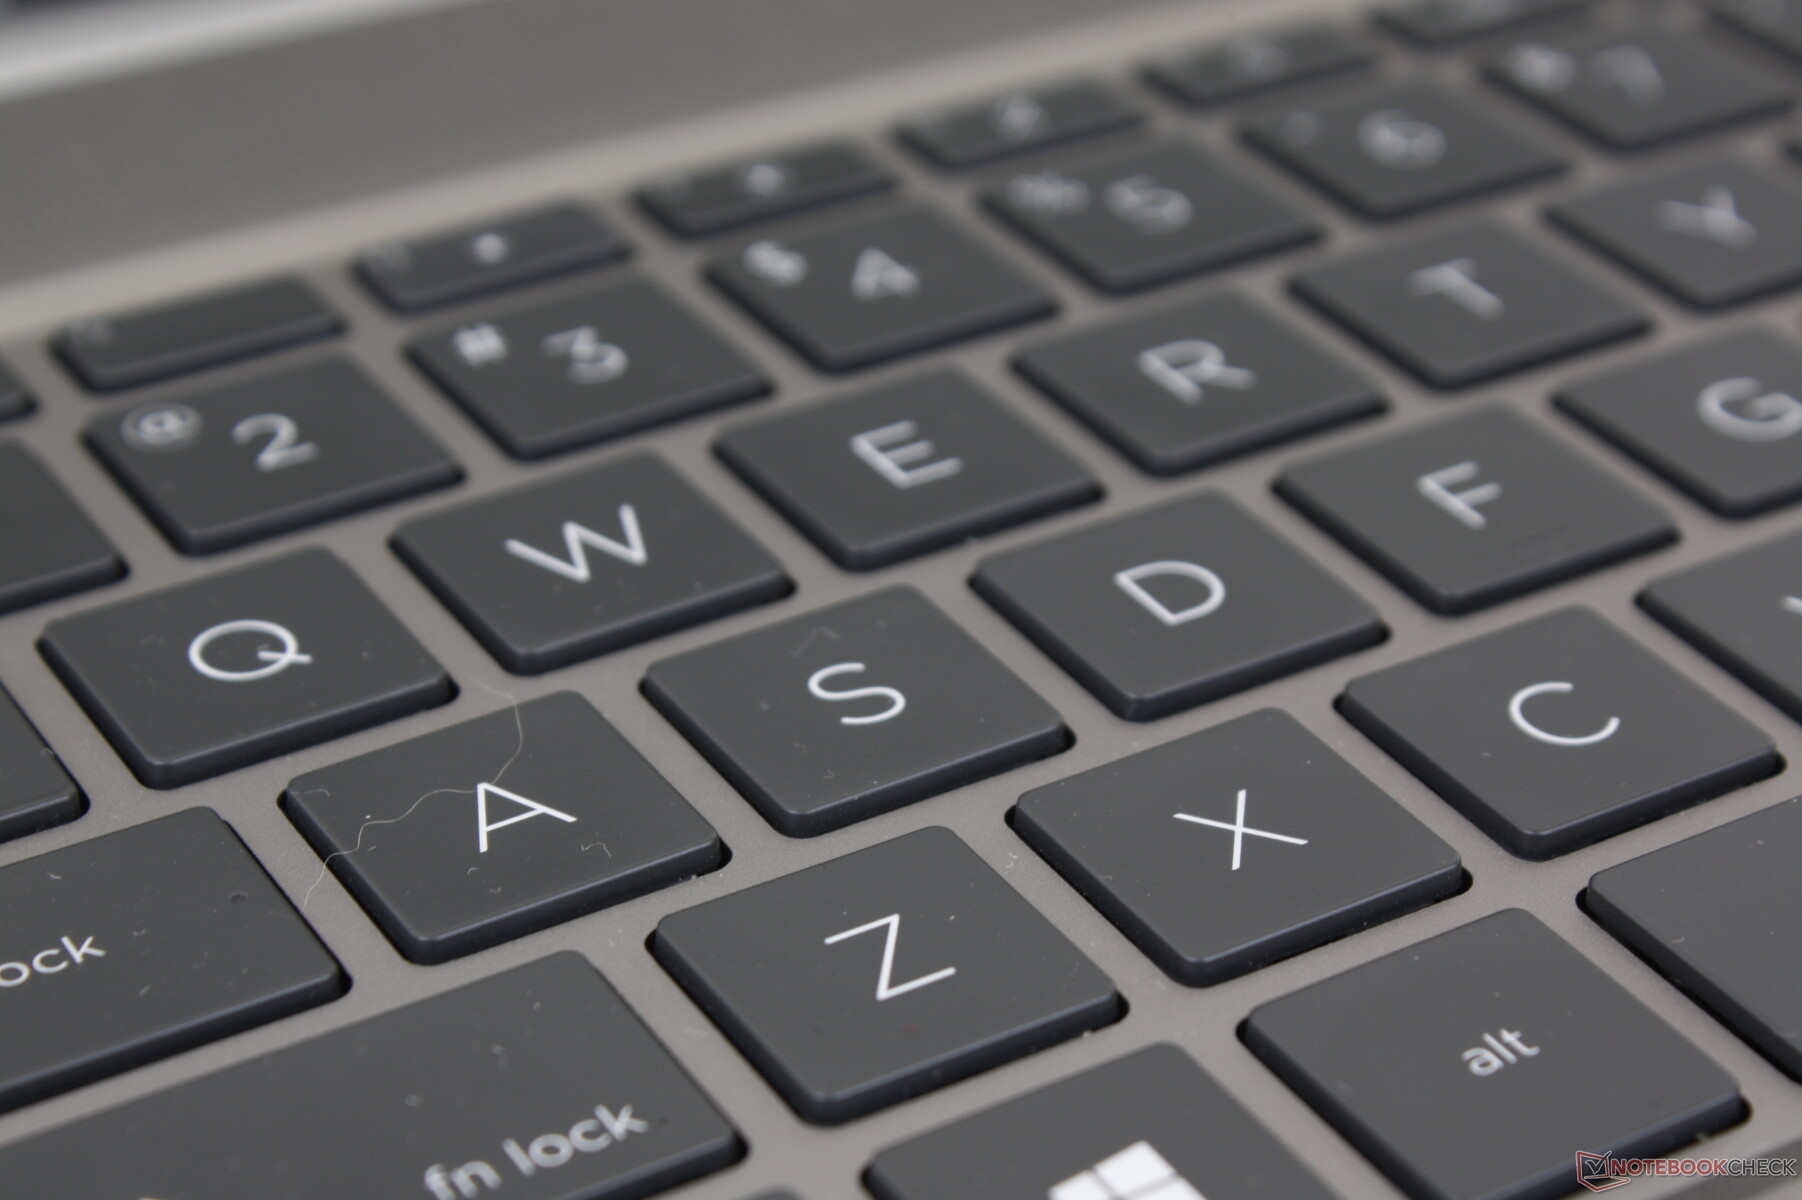
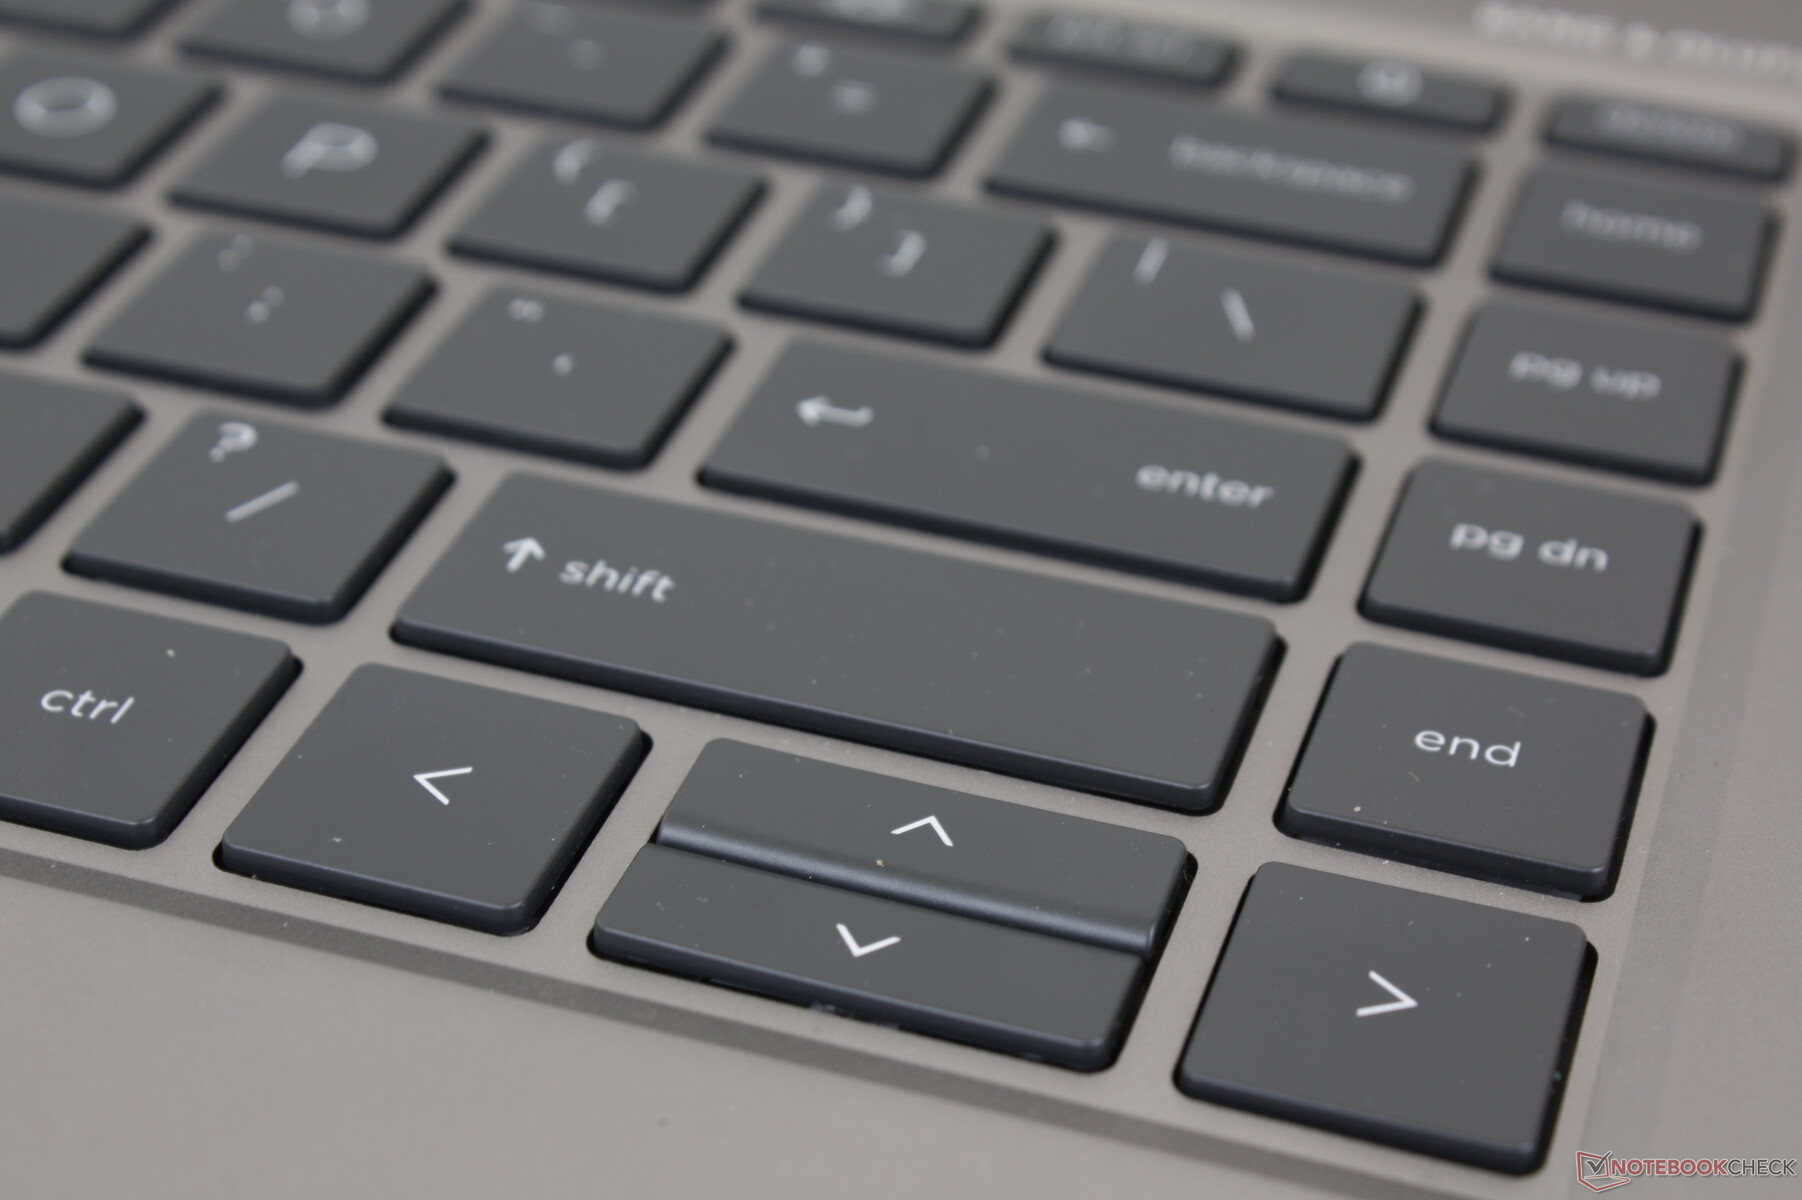
Teclado
Modelos HP de alto nível como o Envy, Spectre, EliteBook ou ZBook têm alguns dos melhores teclados do mercado de laptops. Suas teclas tendem a ser mais nítidas e profundas para um feedback mais forte e uma experiência de digitação mais satisfatória. A principal desvantagem é o maior ruído de teclas quando comparado com as teclas mais macias e silenciosas do MSI WS66 ou Razer Blade Studio
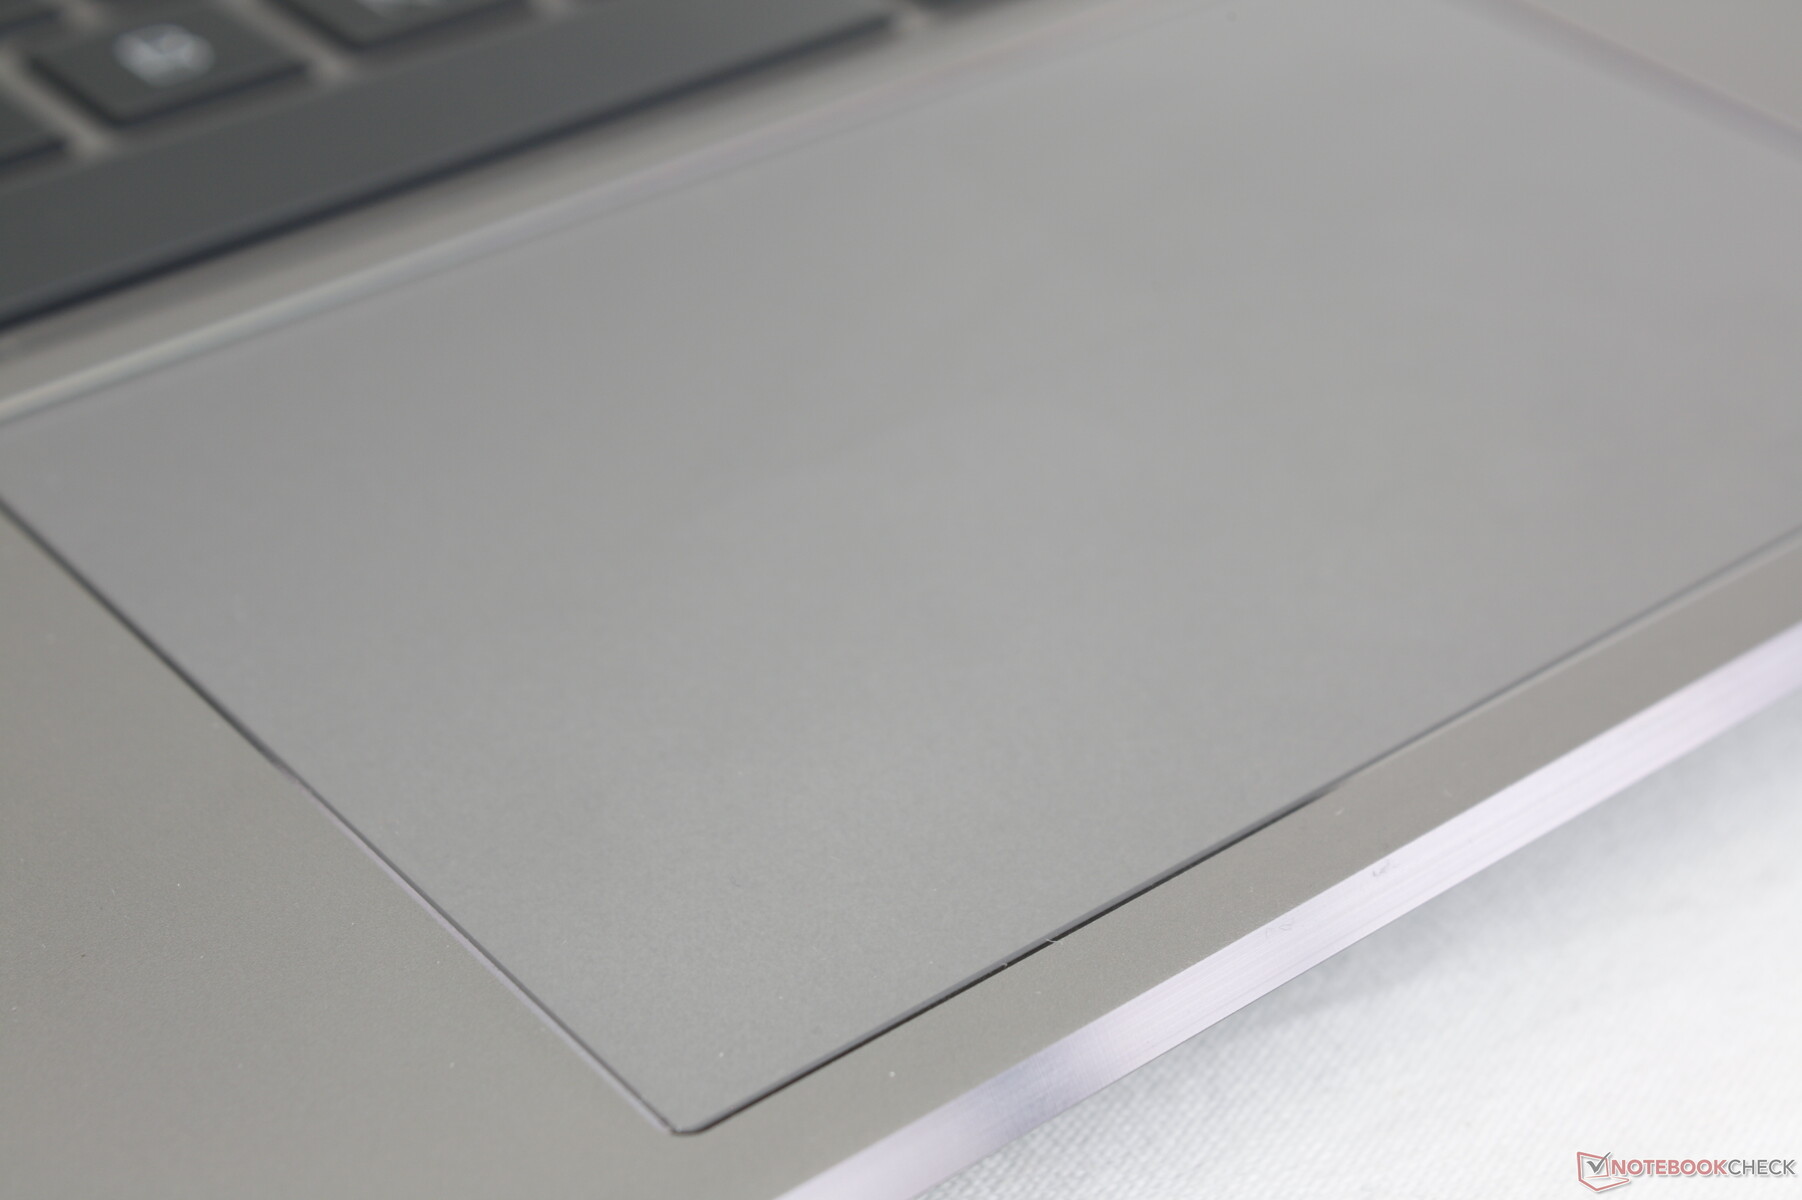
Touchpad
O teclado liso (11,5 x 7,3 cm) carece de botões dedicados, ao contrário do Firefly ZBook, ZBook Fury e a maioria das outras estações de trabalho móveis tradicionais para esse fim. No entanto, o clickpad não é tão esponjoso quanto no Razer Blade Studio para um clique mais confiável e entradas multi-toque.
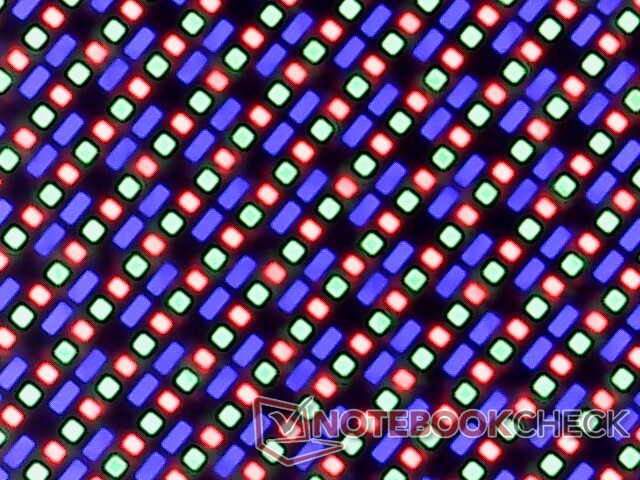
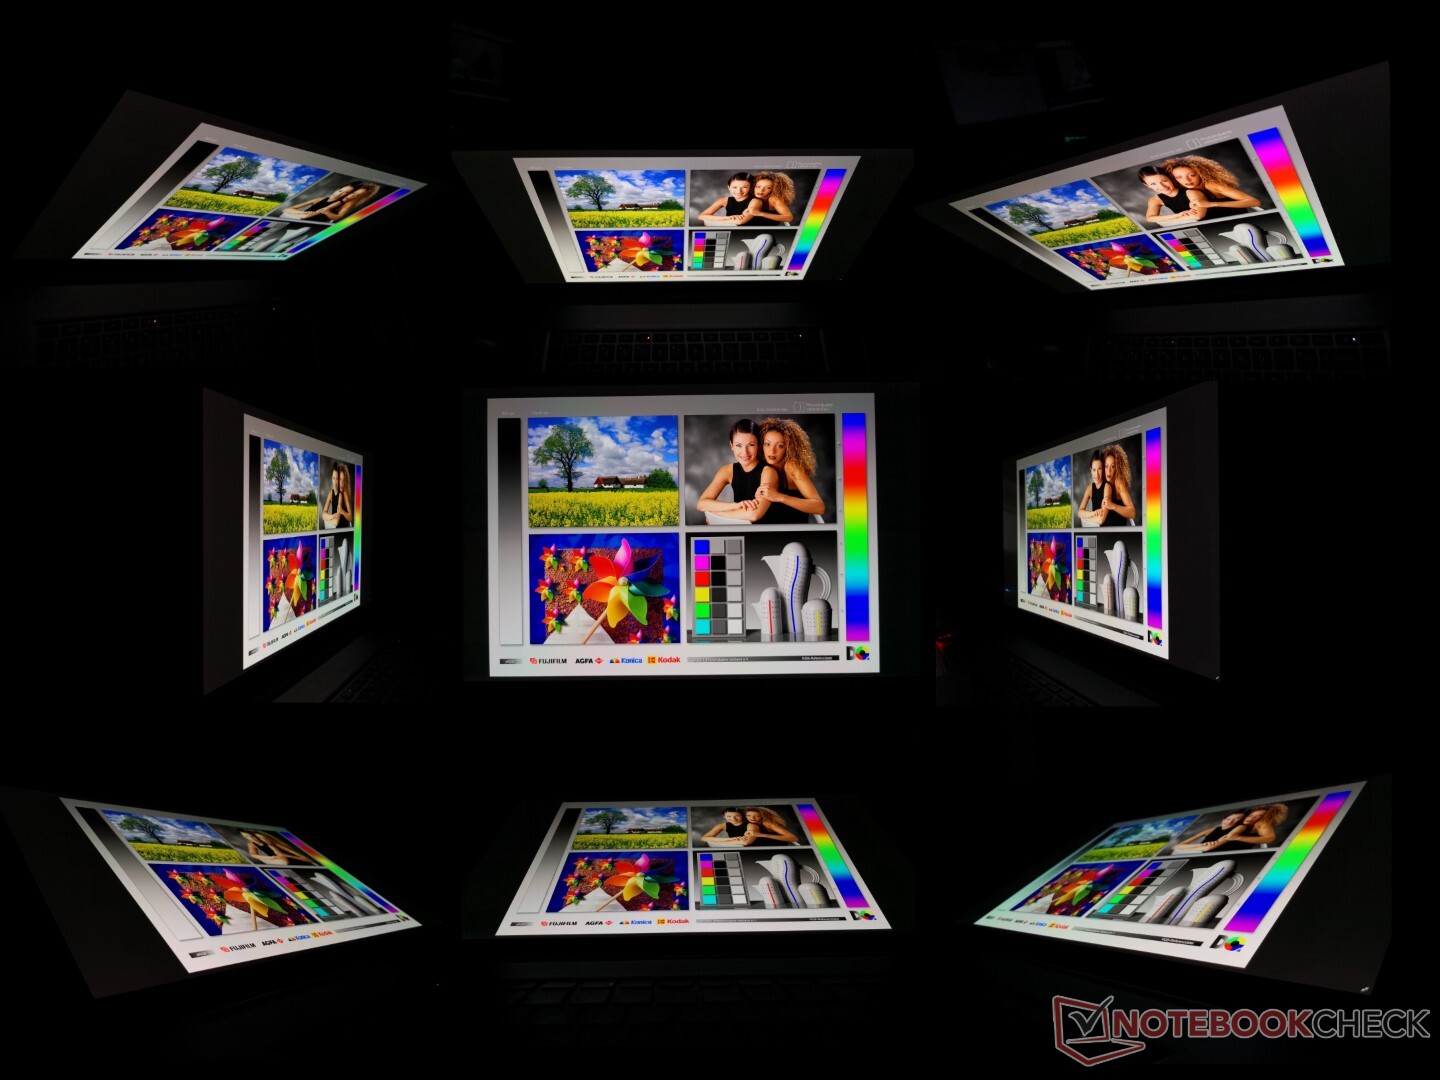
Visor - OLED tem alguns inconvenientes
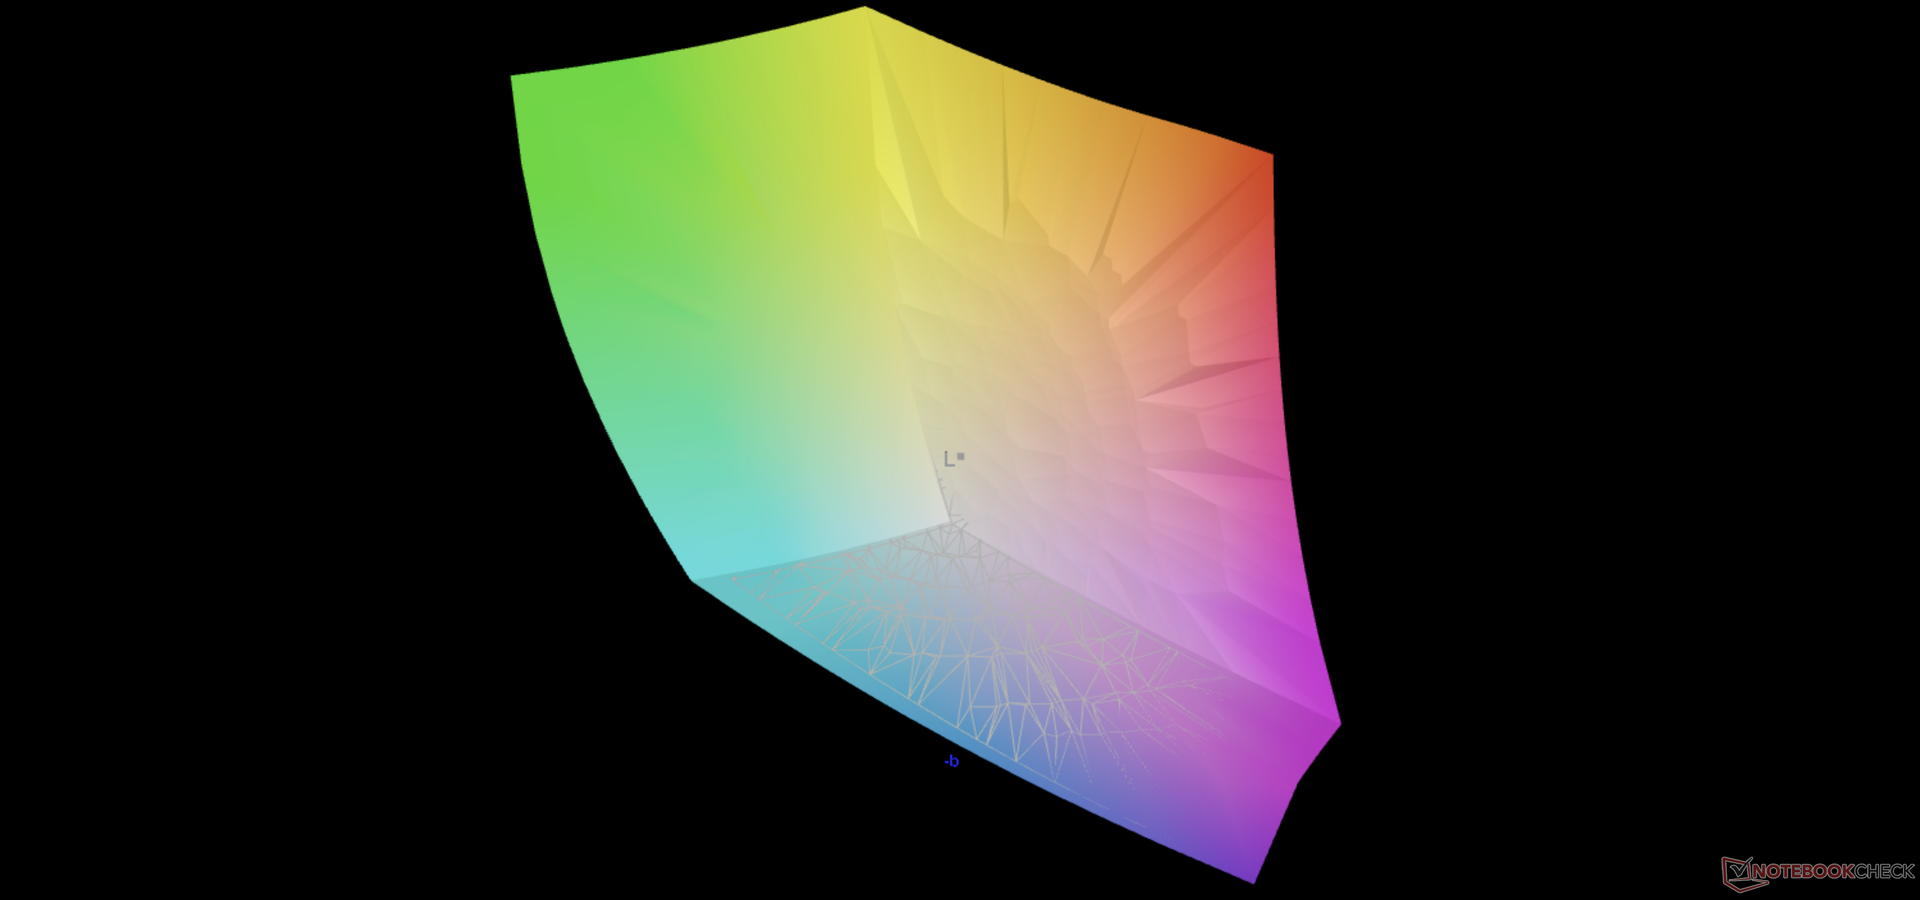
Enquanto a HP usa LG para sua opção IPS 4K, esta opção OLED 4K vem da Samsung. As maiores vantagens do OLED são seus níveis perfeitos de preto, gama mais ampla e tempos de resposta extremamente rápidos de preto-branco e cinza-cinza para cores mais vivas e essencialmente zero fantasmas.
Por outro lado, os principais inconvenientes deste painel OLED são seu brilho de 400-nit, taxa de atualização de 60 Hz, presença de modulação de largura de pulso e maior consumo de energia do que o IPS. Embora 400 lêndeas não seja de forma alguma fraca, é a opção mais fraca disponível para este modelo. Da mesma forma, a taxa de atualização de 60 Hz não é necessariamente lenta, mas a HP oferece 120 Hz somente para IPS. A modulação por largura de pulso ou a cintilação da tela está presente em freqüências de 240 Hz e 59 Hz em níveis de brilho de 0 a 52% e 53% e 99%, respectivamente, o que pode causar fadiga ocular a alguns usuários. E finalmente, o maior consumo de energia é um fato conhecido como detalhado aqui em outros laptops que utilizam tecnologia OLED similar.

| |||||||||||||||||||||||||
iluminação: 95 %
iluminação com acumulador: 379.6 cd/m²
Contraste: ∞:1 (Preto: 0 cd/m²)
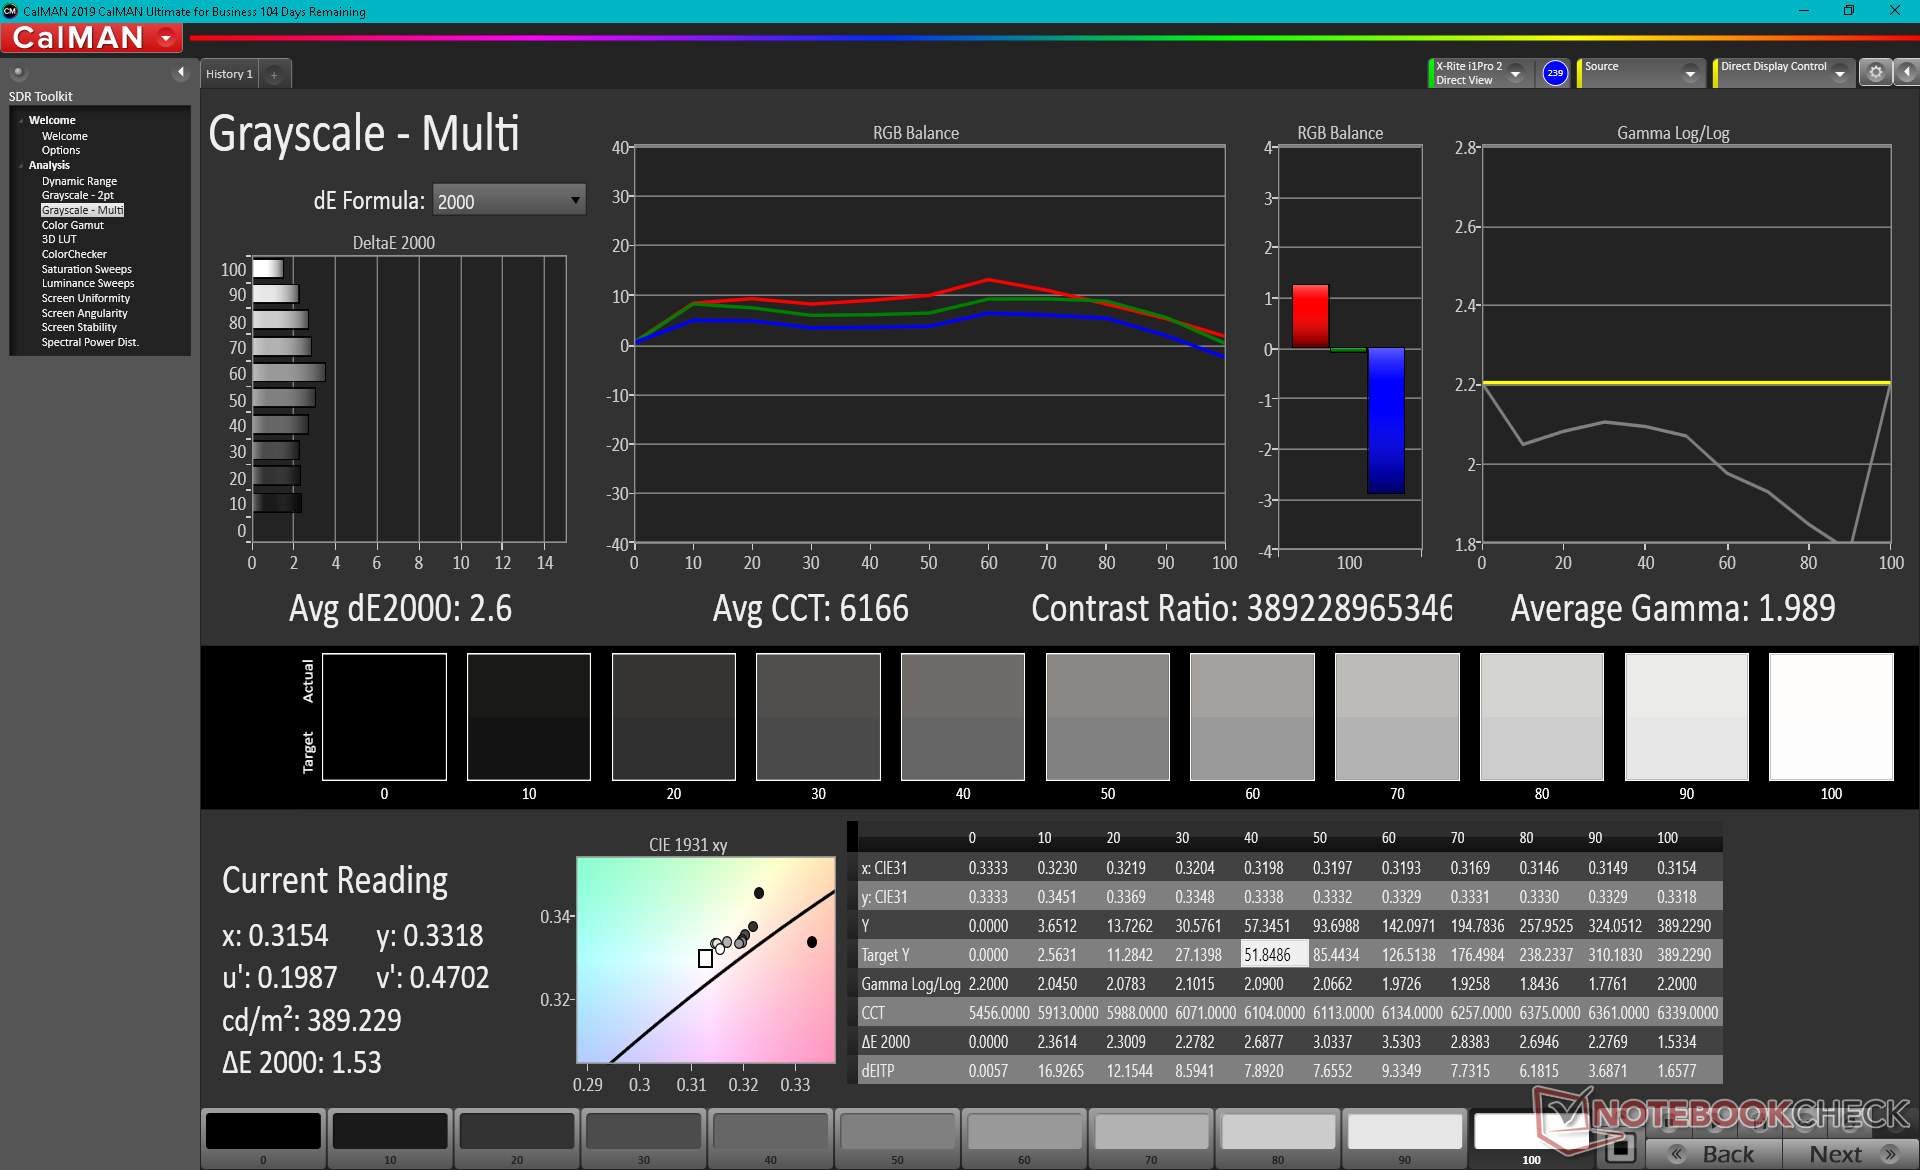
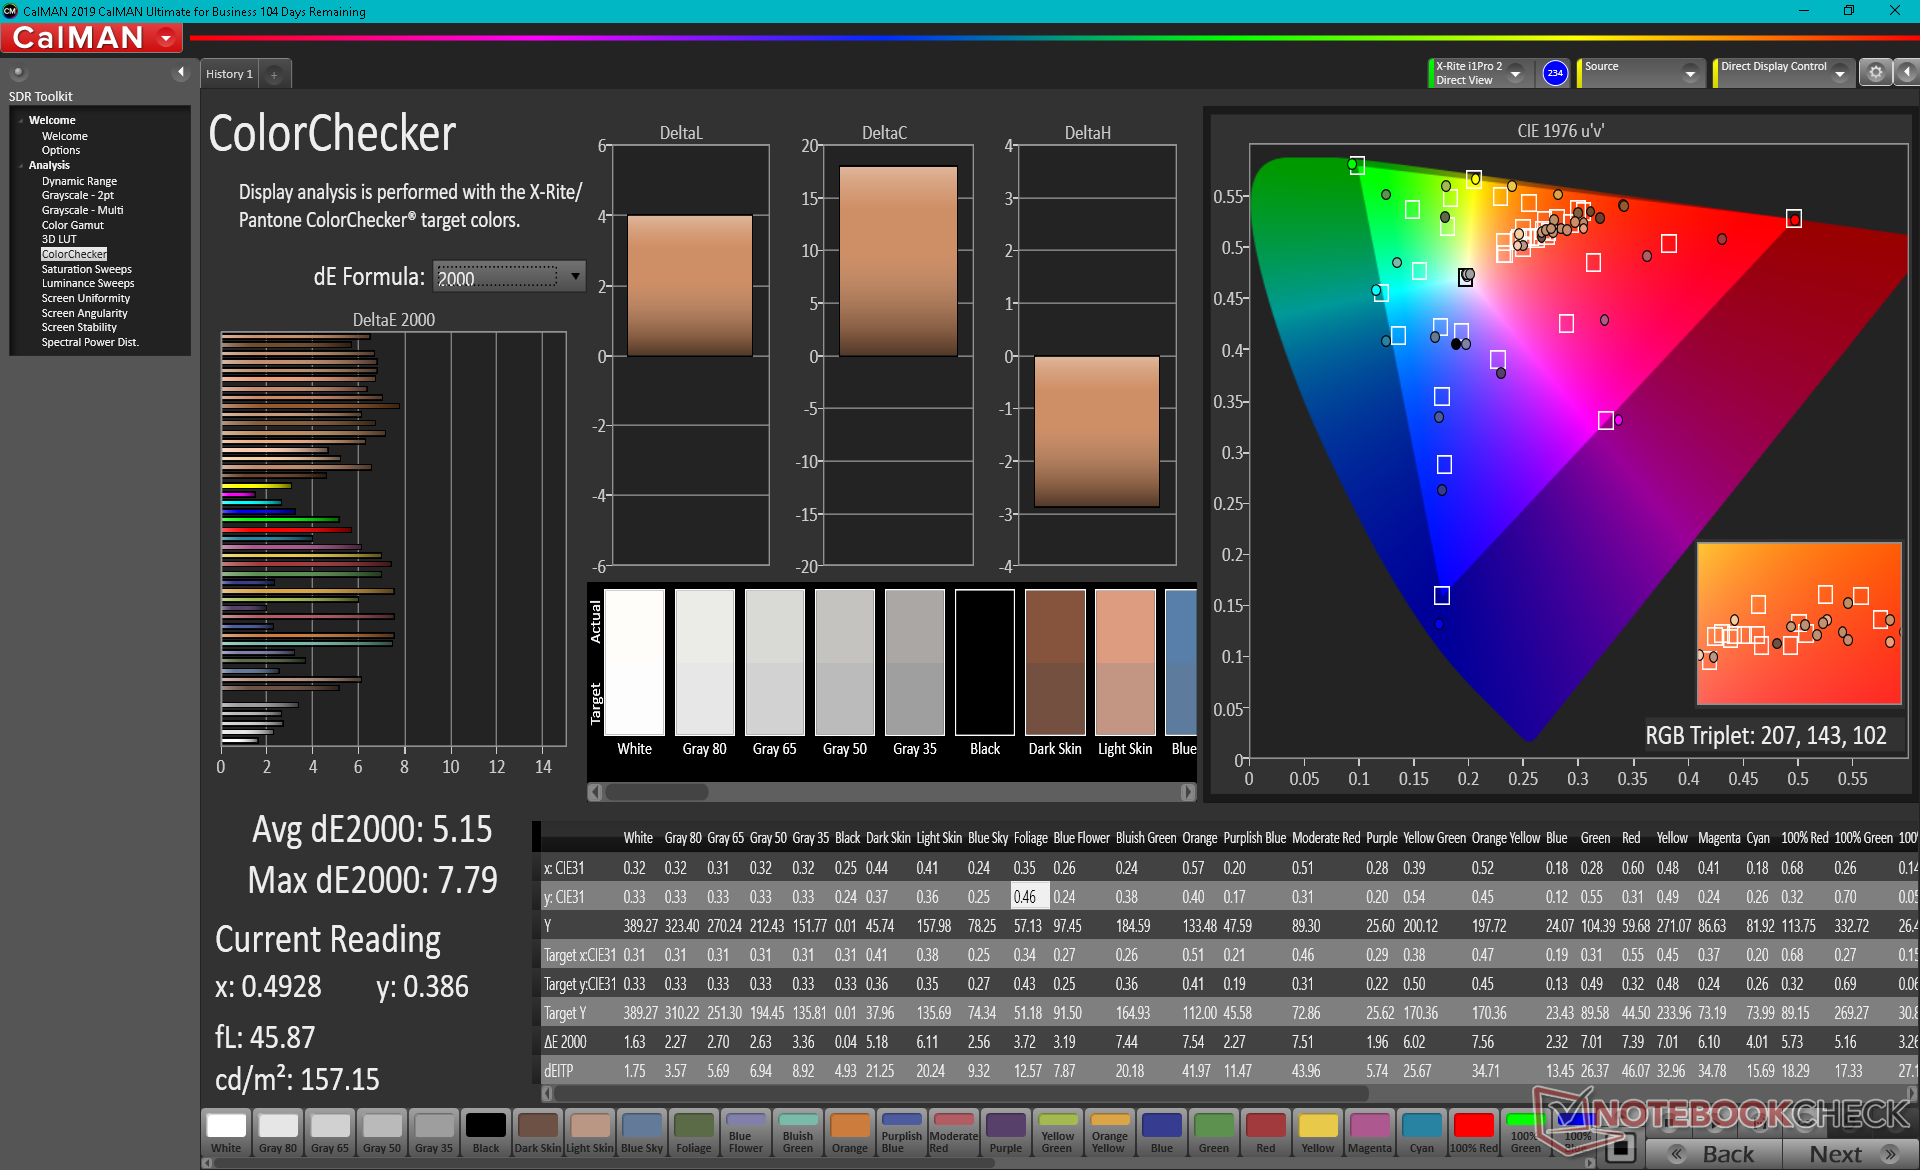
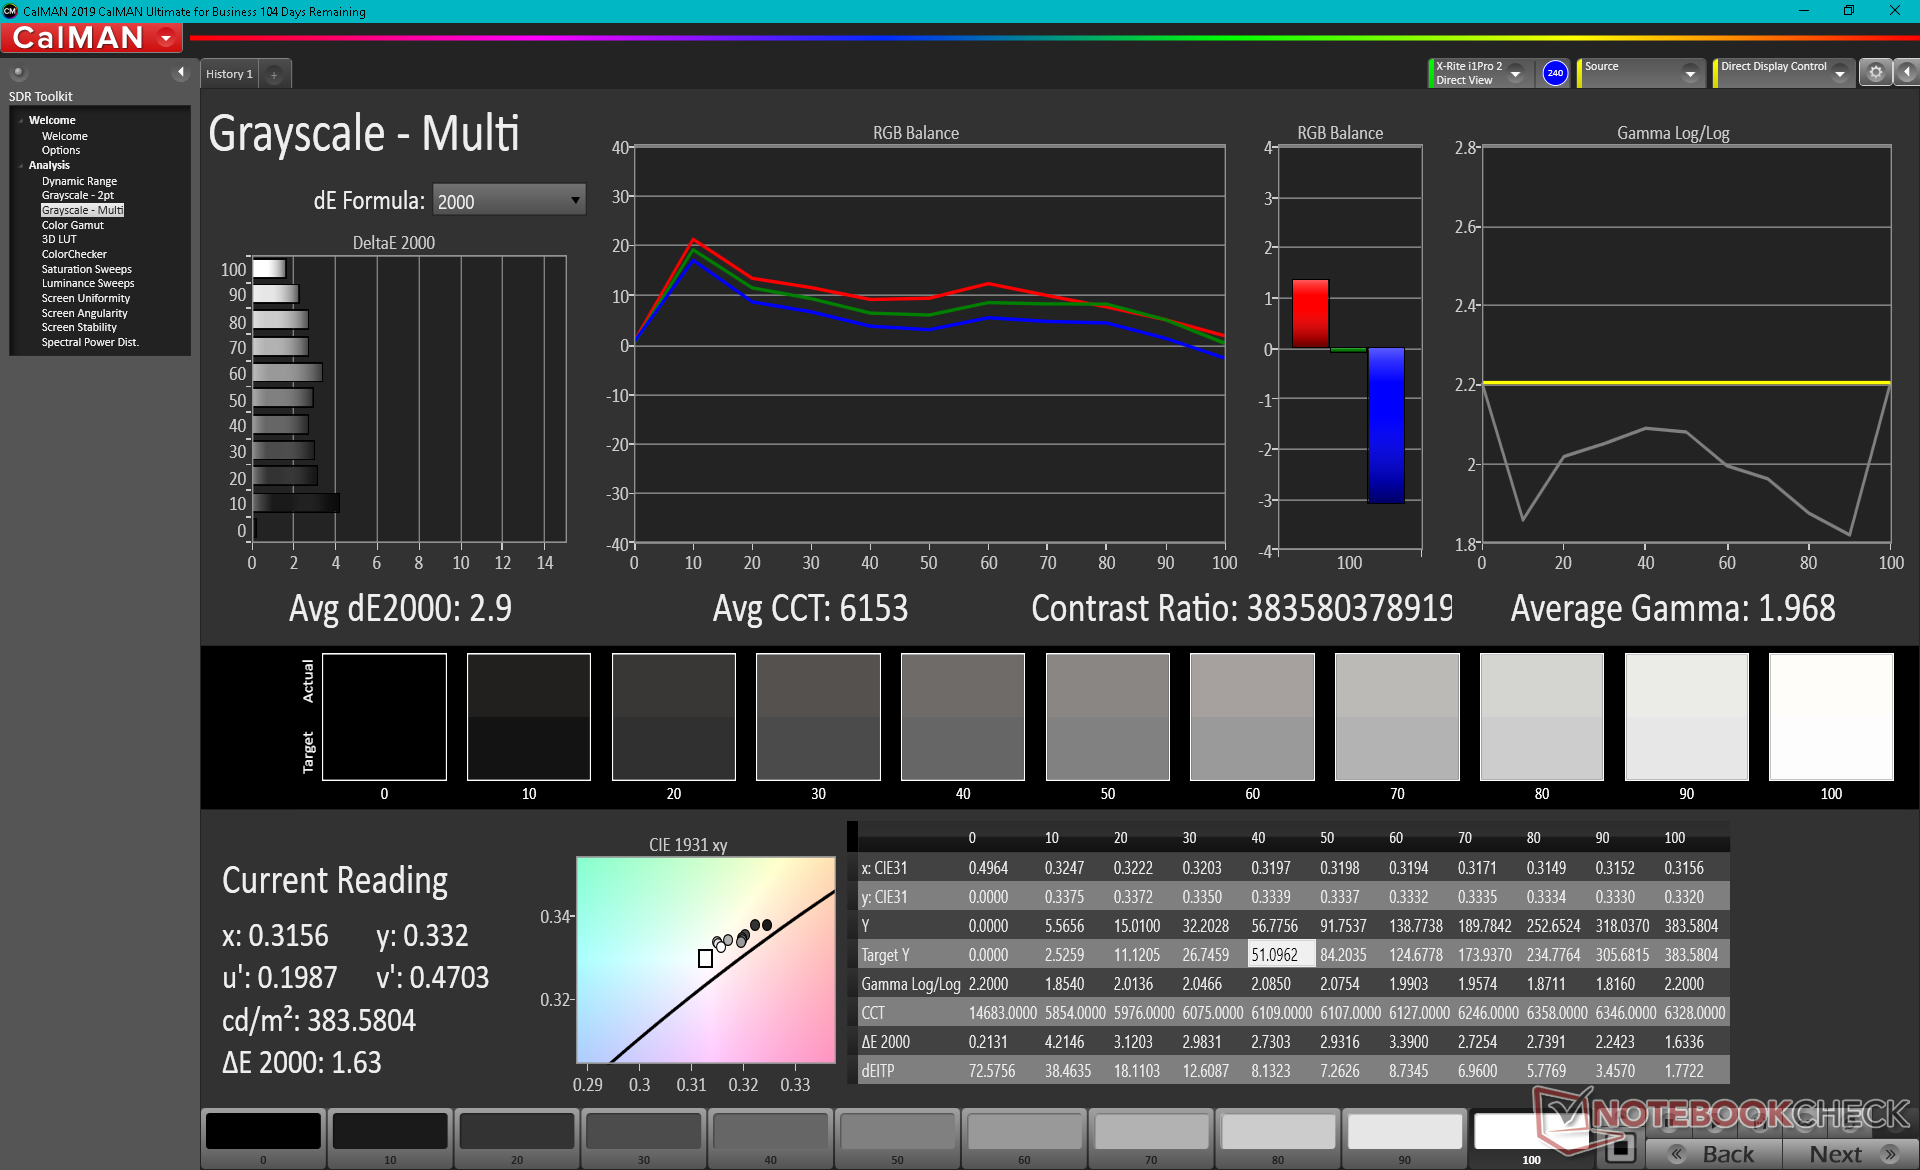
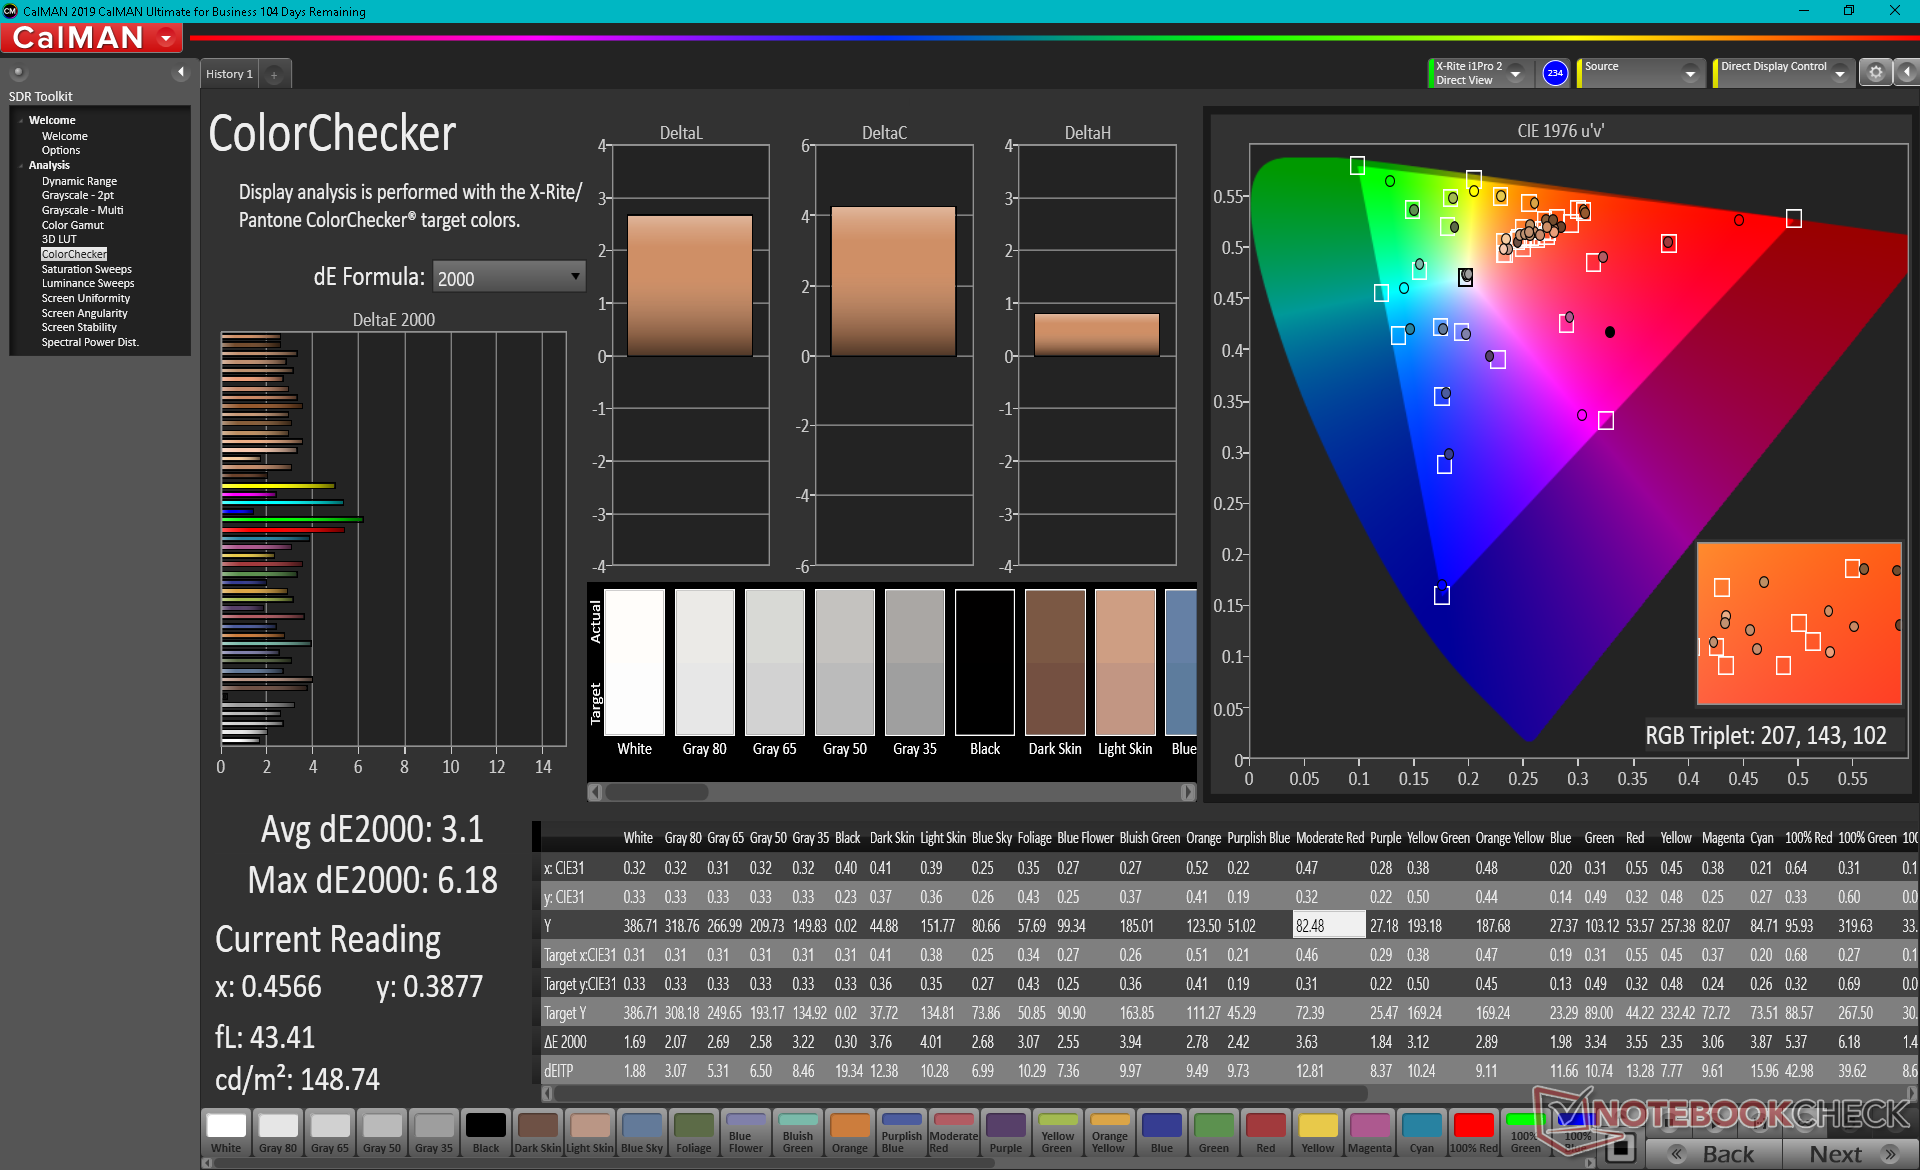
ΔE ColorChecker Calman: 5.15 | ∀{0.5-29.43 Ø4.71}
calibrated: 3.1
ΔE Greyscale Calman: 2.6 | ∀{0.09-98 Ø4.96}
95.3% AdobeRGB 1998 (Argyll 3D)
100% sRGB (Argyll 3D)
99.9% Display P3 (Argyll 3D)
Gamma: 1.99
CCT: 6166 K
| HP ZBook Studio 15 G8 SDC4145, OLED, 15.6", 3840x2160 | HP ZBook Firefly 15 G8 2C9R7EA LGD069B, IPS, 15.6", 1920x1080 | HP ZBook Studio G7 LGD0661, IPS, 15.6", 3840x2160 | Dell Precision 7550 AU Optronics B156ZAN, IPS, 15.6", 3840x2160 | Lenovo ThinkPad P15s Gen2-20W6000GGE MNF601EA1-1, IPS LED, 15.6", 3840x2160 | |
|---|---|---|---|---|---|
| Display | -20% | -4% | -5% | -4% | |
| Display P3 Coverage (%) | 99.9 | 68.6 -31% | 98.2 -2% | 82.1 -18% | 84.5 -15% |
| sRGB Coverage (%) | 100 | 98.5 -1% | 99.9 0% | 99.6 0% | 98.7 -1% |
| AdobeRGB 1998 Coverage (%) | 95.3 | 70 -27% | 86.5 -9% | 96.8 2% | 97.8 3% |
| Response Times | -1733% | -1859% | -1675% | -1217% | |
| Response Time Grey 50% / Grey 80% * (ms) | 2.4 ? | 56 ? -2233% | 56.4 ? -2250% | 51.2 ? -2033% | 40 ? -1567% |
| Response Time Black / White * (ms) | 2.4 ? | 32 ? -1233% | 37.6 ? -1467% | 34 ? -1317% | 23.2 ? -867% |
| PWM Frequency (Hz) | 240.4 ? | ||||
| Screen | -30% | 59% | -11% | 57% | |
| Brightness middle (cd/m²) | 379.6 | 397 5% | 723 90% | 473.5 25% | 604 59% |
| Brightness (cd/m²) | 380 | 402 6% | 707 86% | 461 21% | 609 60% |
| Brightness Distribution (%) | 95 | 84 -12% | 92 -3% | 90 -5% | 91 -4% |
| Black Level * (cd/m²) | 0.13 | 0.35 | 0.55 | 0.34 | |
| Colorchecker dE 2000 * | 5.15 | 5.9 -15% | 1.4 73% | 4.8 7% | 0.9 83% |
| Colorchecker dE 2000 max. * | 7.79 | 9.4 -21% | 2.9 63% | 8.73 -12% | 2.6 67% |
| Colorchecker dE 2000 calibrated * | 3.1 | 1.1 65% | 0.5 84% | 3.08 1% | 0.8 74% |
| Greyscale dE 2000 * | 2.6 | 8.8 -238% | 2 23% | 5.6 -115% | 1.1 58% |
| Gamma | 1.99 111% | 2.47 89% | 2.14 103% | 2.34 94% | 2.15 102% |
| CCT | 6166 105% | 6416 101% | 6484 100% | 7549 86% | 6656 98% |
| Contrast (:1) | 3054 | 2066 | 861 | 1776 | |
| Color Space (Percent of AdobeRGB 1998) (%) | 63.7 | 77.3 | 86.4 | 84.5 | |
| Color Space (Percent of sRGB) (%) | 98.5 | 99.9 | 99.7 | 98.6 | |
| Média Total (Programa/Configurações) | -594% /
-311% | -601% /
-276% | -564% /
-287% | -388% /
-171% |
* ... menor é melhor
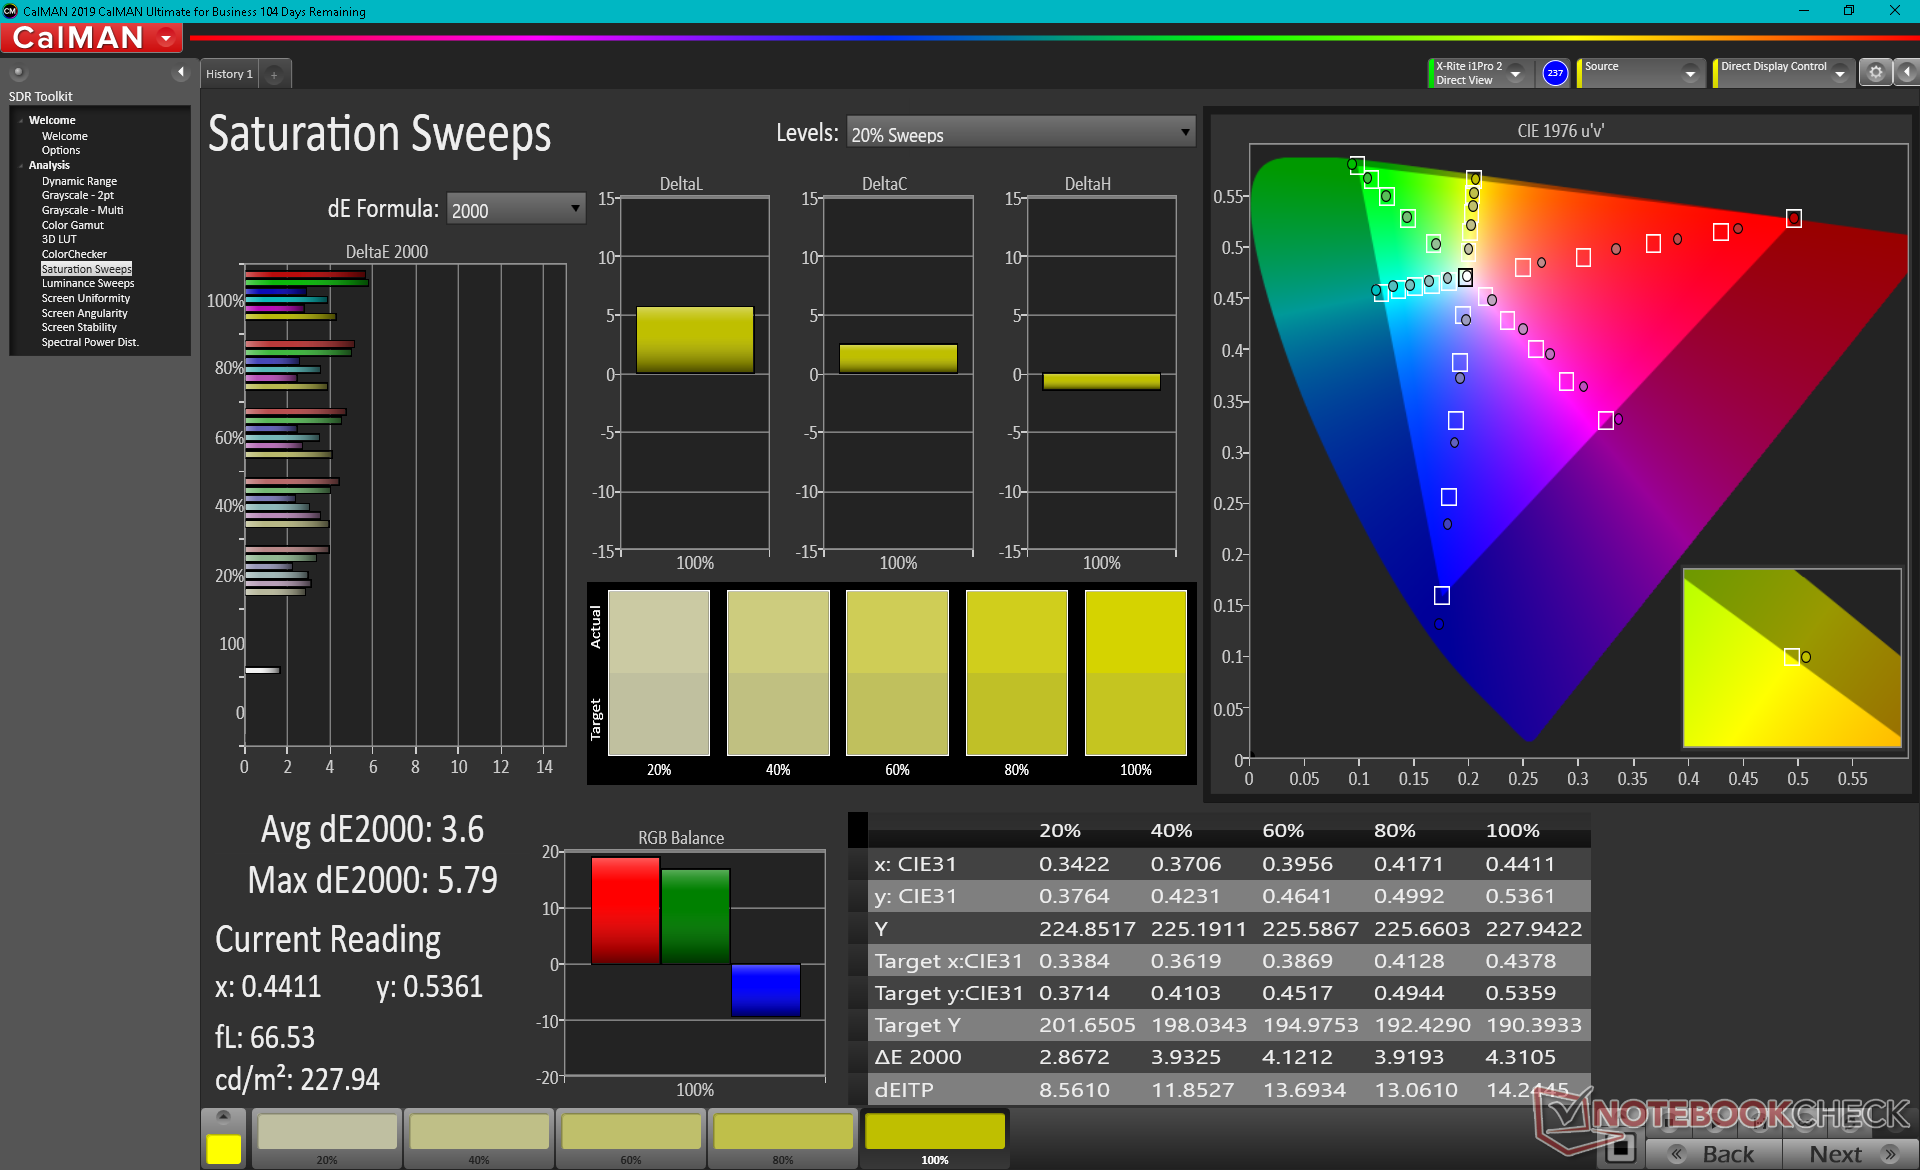
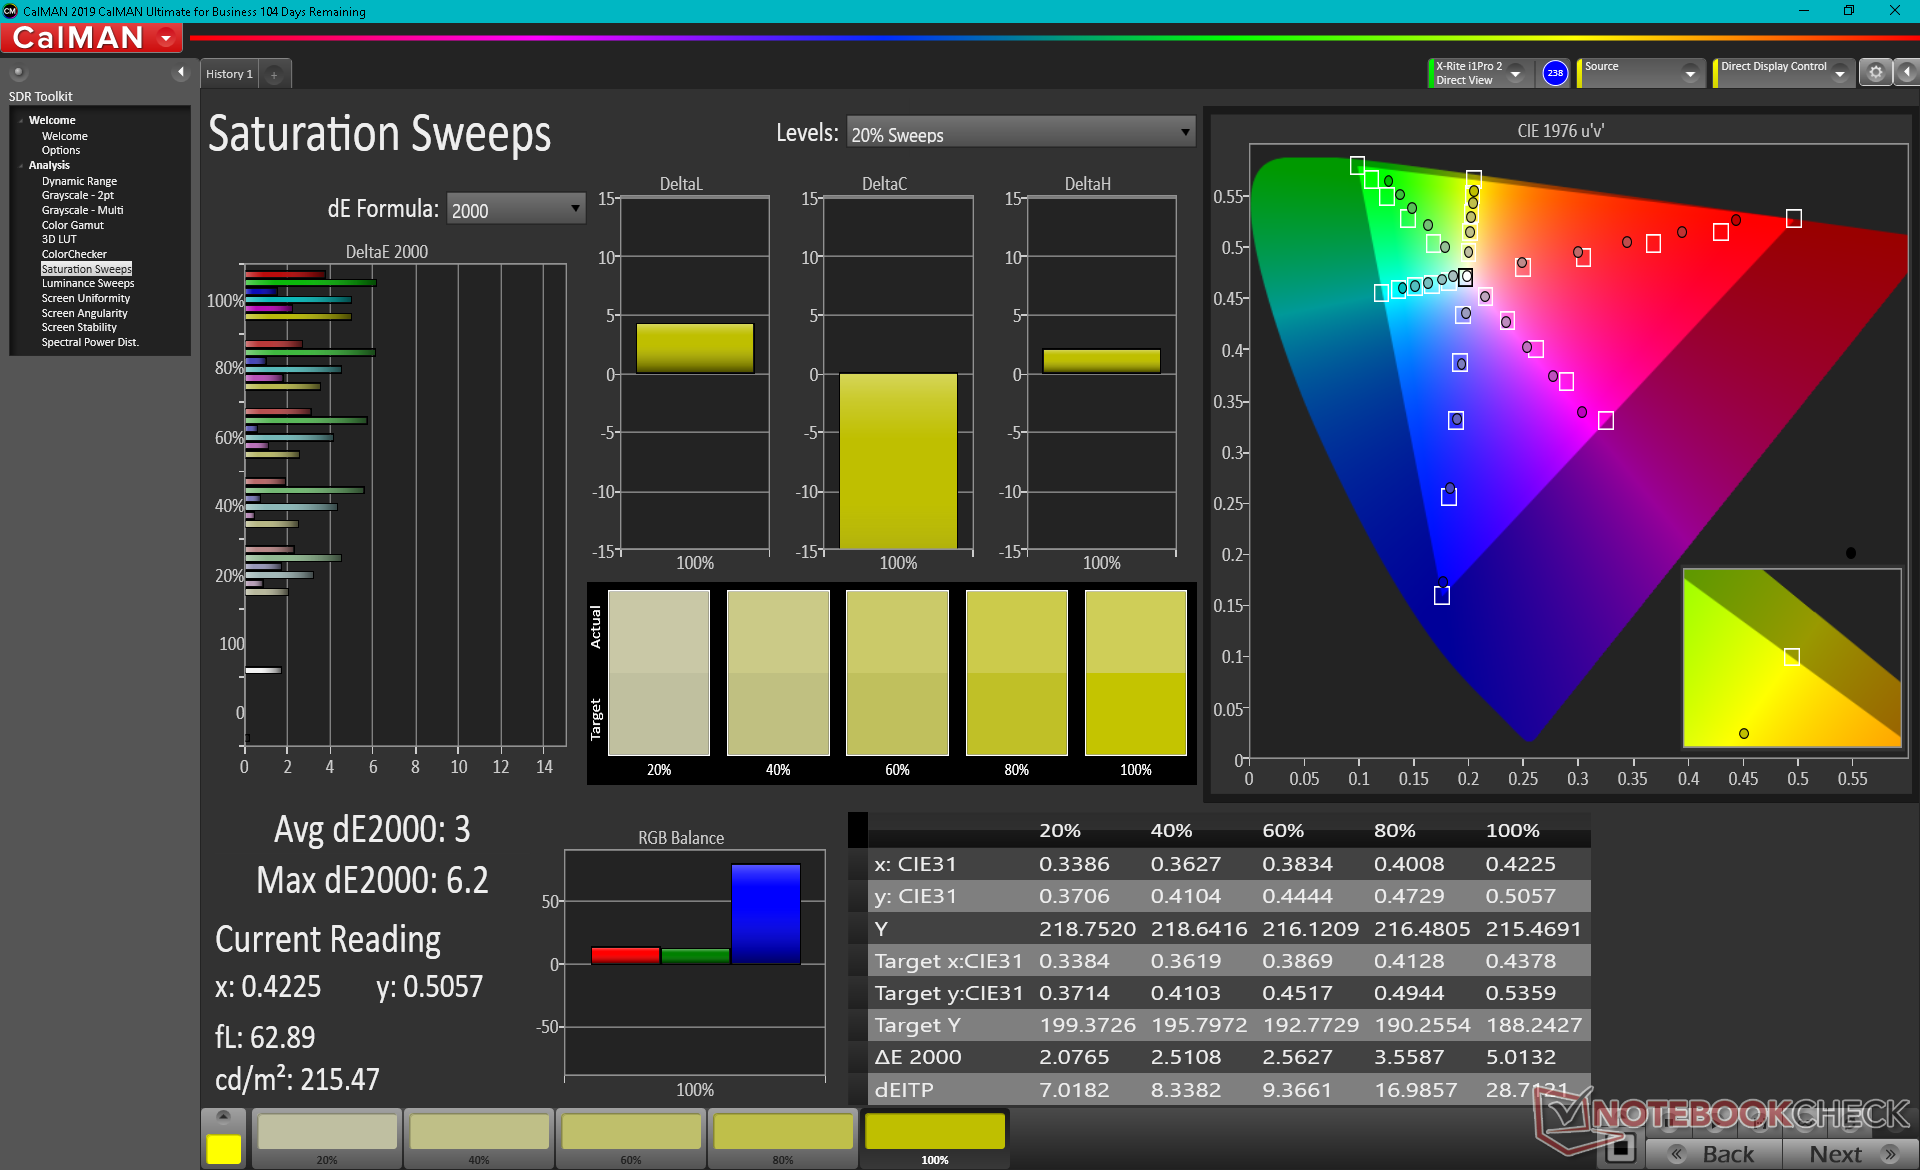
OLED normalmente oferece cores mais profundas que o IPS e nosso ZBook Studio G8 não é exceção. Os usuários terão cobertura total do DCI-P3, ao contrário de apenas sRGB na maioria dos painéis de 1080p de resolução mais baixa.
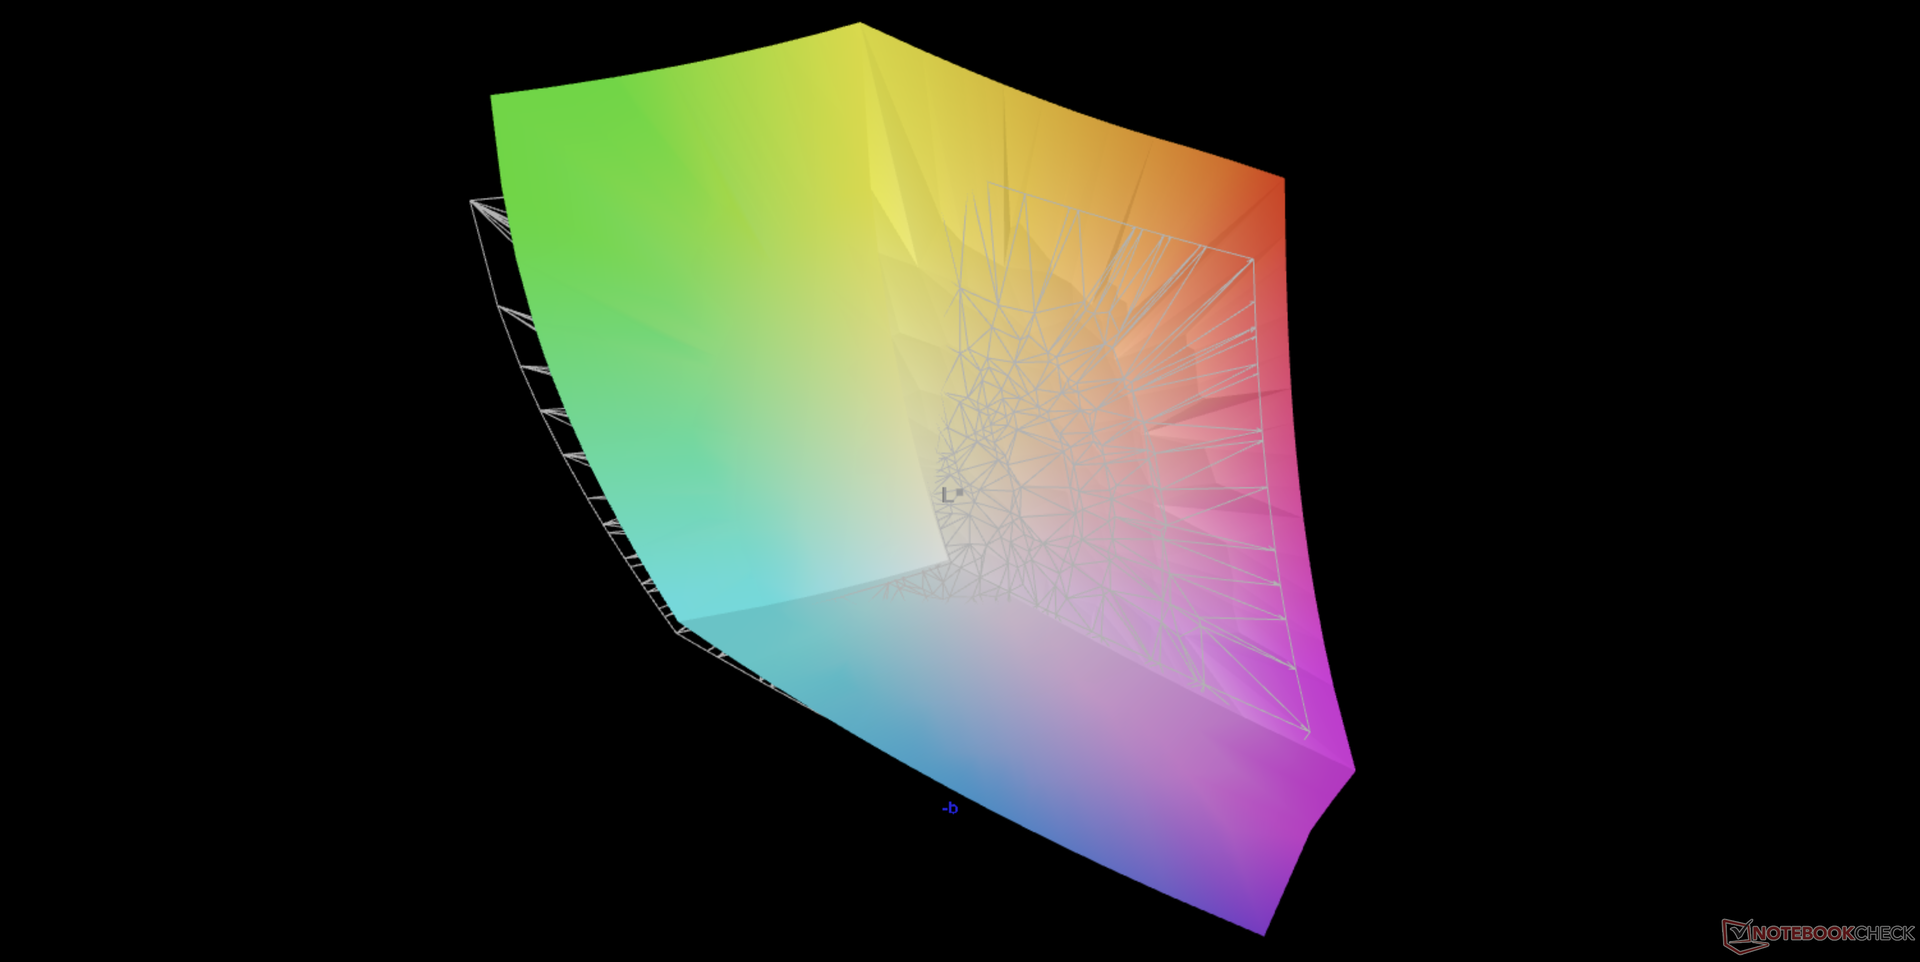
As medições do colorímetro X-Rite mostram que a temperatura da cor deve estar ligeiramente no lado quente em torno de 6200K em vez dos habituais 6500K na maioria dos outros mostradores calibrados que têm como alvo o sRGB. Ao contrário da maioria dos modelos Dell Precision, a HP não tem um software pré-instalado aqui projetado especificamente para o ajuste de cores.
Exibir tempos de resposta
| ↔ Tempo de resposta preto para branco | ||
|---|---|---|
| 2.4 ms ... ascensão ↗ e queda ↘ combinadas | ↗ 1.1 ms ascensão | 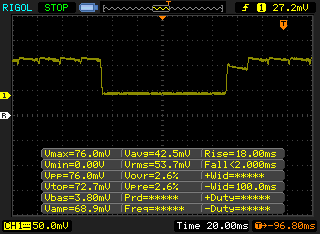 |
| ↘ 1.3 ms queda | ||
| A tela mostra taxas de resposta muito rápidas em nossos testes e deve ser muito adequada para jogos em ritmo acelerado. Em comparação, todos os dispositivos testados variam de 0.1 (mínimo) a 240 (máximo) ms. » 13 % de todos os dispositivos são melhores. Isso significa que o tempo de resposta medido é melhor que a média de todos os dispositivos testados (19.8 ms). | ||
| ↔ Tempo de resposta 50% cinza a 80% cinza | ||
| 2.4 ms ... ascensão ↗ e queda ↘ combinadas | ↗ 1 ms ascensão | 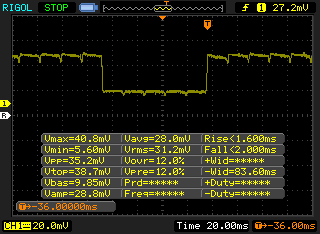 |
| ↘ 1.4 ms queda | ||
| A tela mostra taxas de resposta muito rápidas em nossos testes e deve ser muito adequada para jogos em ritmo acelerado. Em comparação, todos os dispositivos testados variam de 0.165 (mínimo) a 636 (máximo) ms. » 11 % de todos os dispositivos são melhores. Isso significa que o tempo de resposta medido é melhor que a média de todos os dispositivos testados (31 ms). | ||
Cintilação da tela / PWM (modulação por largura de pulso)
| Tela tremeluzindo/PWM detectado | 240.4 Hz | ≤ 52 % configuração de brilho | 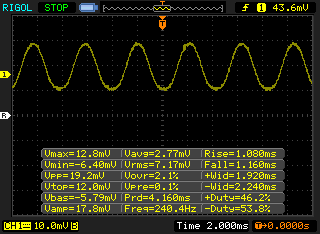  |
A luz de fundo da tela pisca em 240.4 Hz (pior caso, por exemplo, utilizando PWM) Cintilação detectada em uma configuração de brilho de 52 % e abaixo. Não deve haver cintilação ou PWM acima desta configuração de brilho. A frequência de 240.4 Hz é relativamente baixa, portanto, usuários sensíveis provavelmente notarão cintilação e sentirão fadiga ocular na configuração de brilho indicada e abaixo. [pwm_comparison] Em comparação: 52 % de todos os dispositivos testados não usam PWM para escurecer a tela. Se PWM foi detectado, uma média de 7757 (mínimo: 5 - máximo: 343500) Hz foi medida. | |||
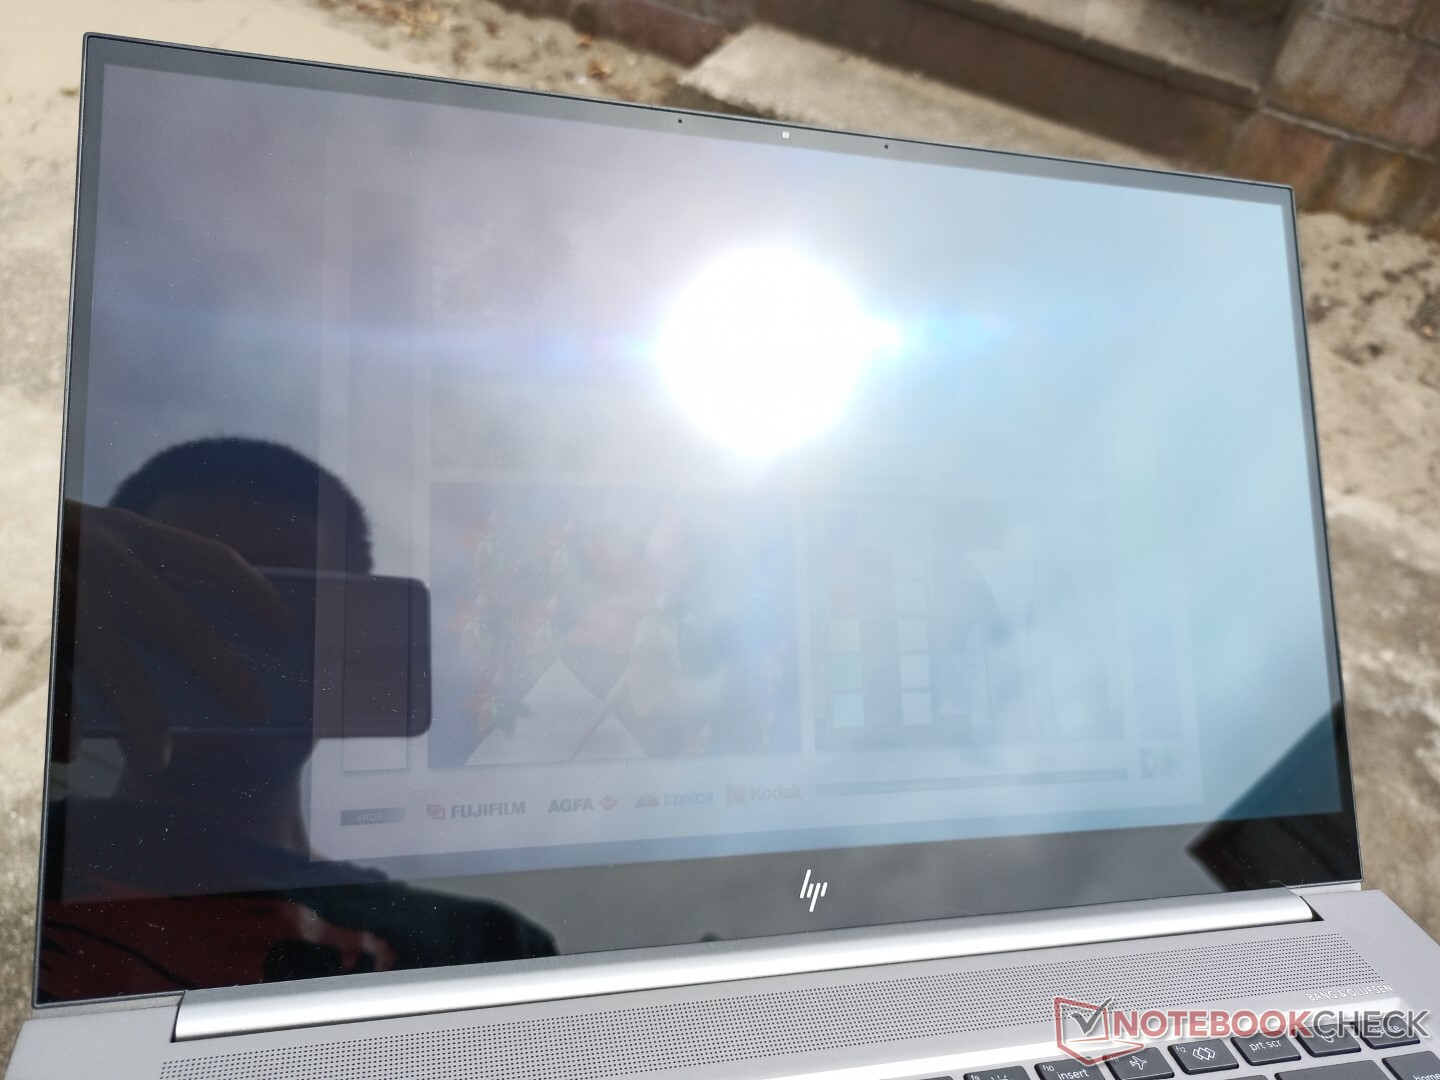
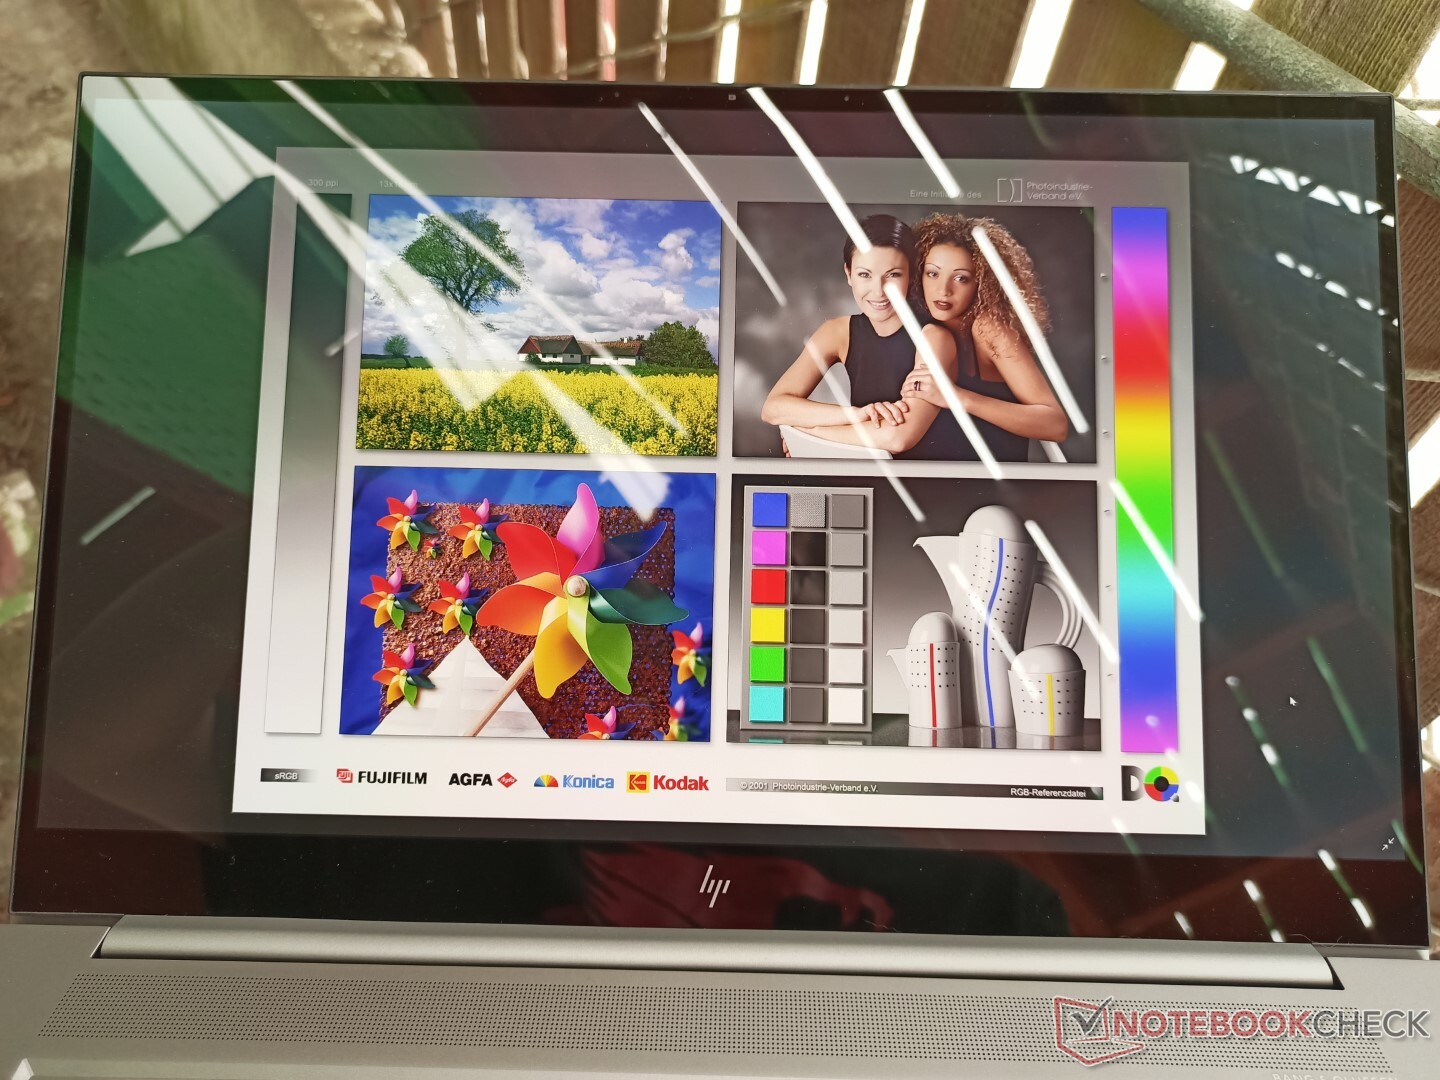
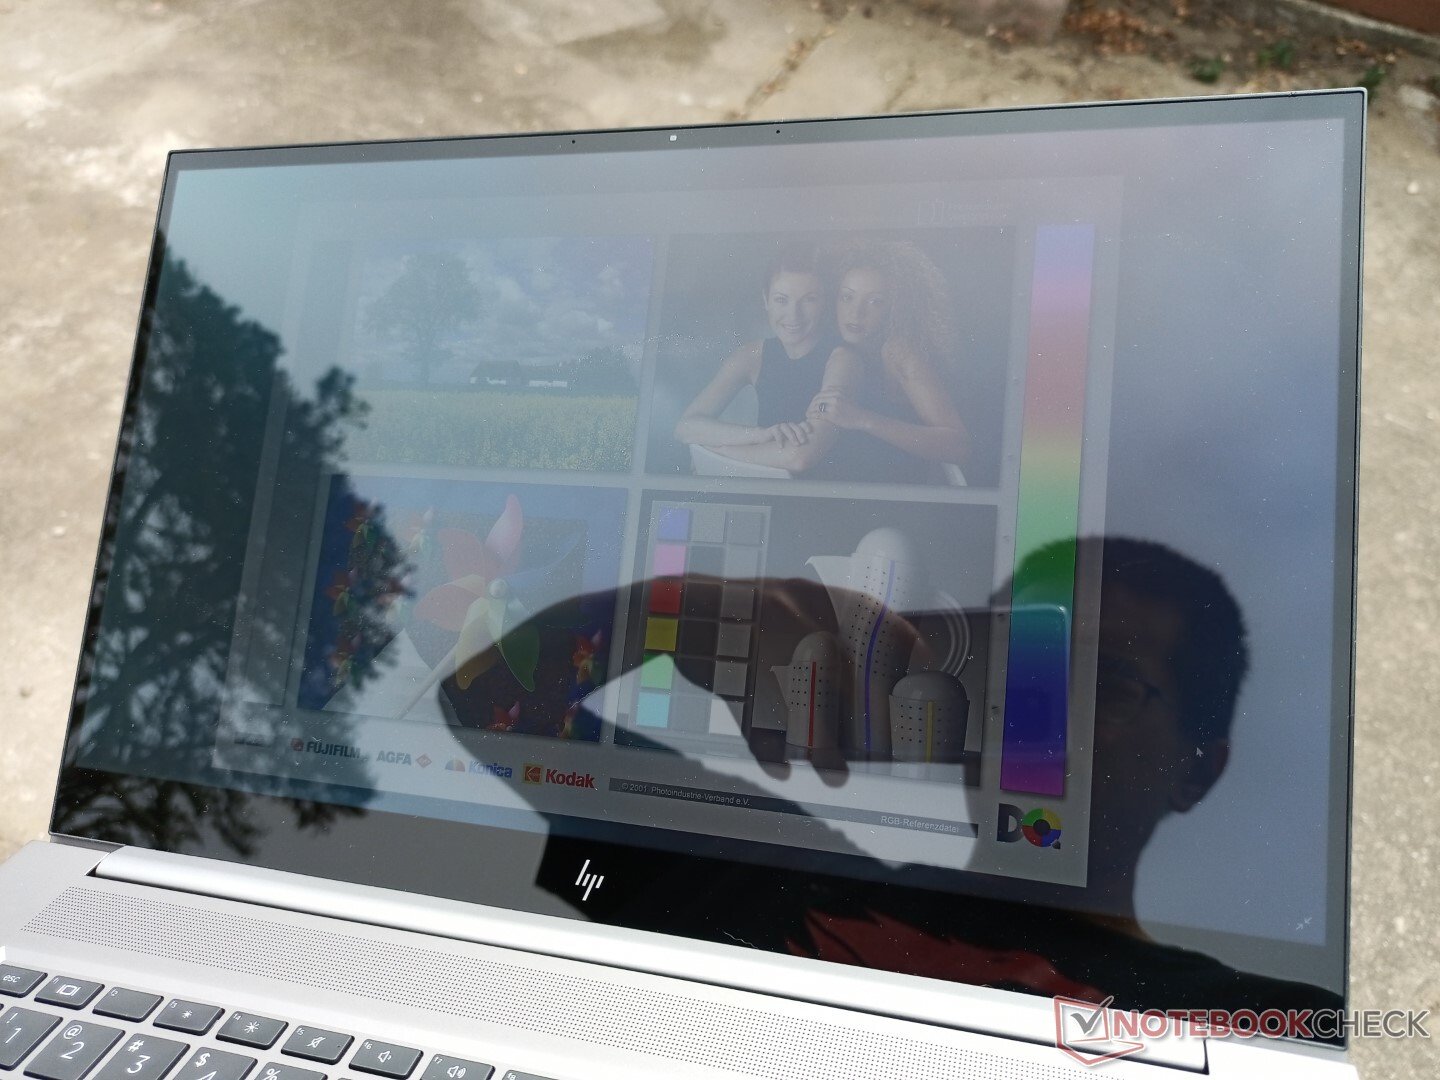
A sobreposição brilhante contribui para um brilho perceptível quando ao ar livre, como mostram as fotos abaixo. Os usuários que planejam usar o laptop ao ar livre com freqüência devem considerar a possibilidade de atualizar para a opção de painel de 1000-nit. Com base em nossa experiência com painéis de 1000-nit da HP, o brilho máximo do mundo real estará mais próximo de 700 nits em vez de 1000 nits, que ainda seriam quase duas vezes mais brilhantes do que nosso painel base de 400-nit. Entretanto, somente o painel IPS FHD está disponível com a configuração de 1000 lêndeas.
Desempenho - Muito por onde escolher
As opções de CPU incluem o 11º gênero Intel Core i7-11800H ou i9-11900H junto com seus respectivos i7-11850H ou i9-11950H vPro equivalentes. Estes são alguns dos mais rápidos CPUs de núcleo octa-core série H da Intel no momento, rivalizando com a série AMD Ryzen 9, como o 5900HX.
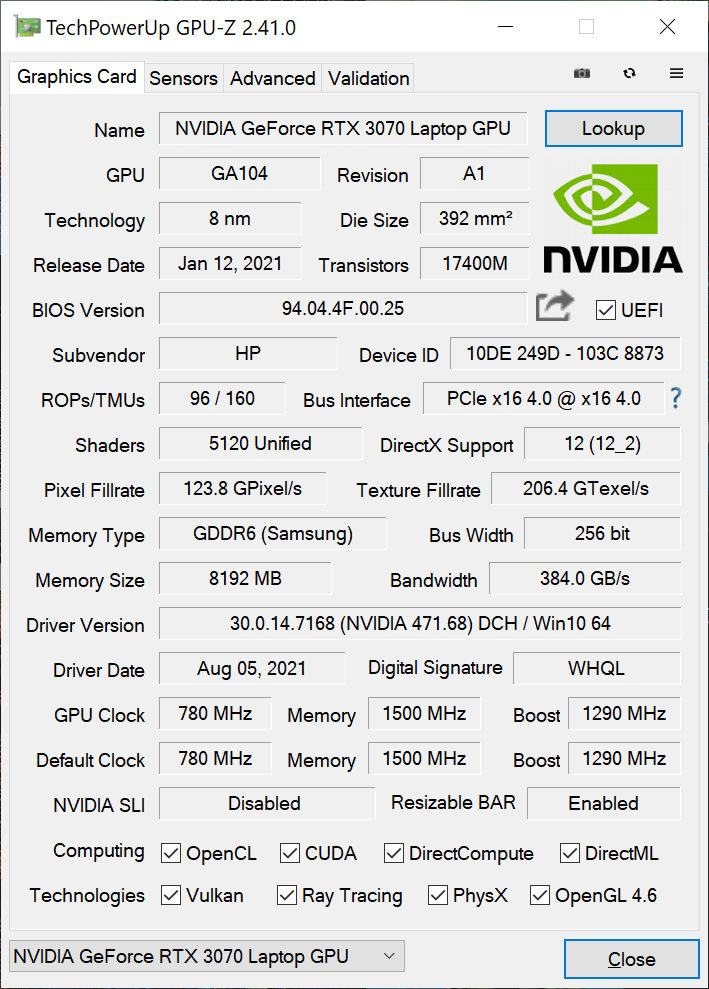
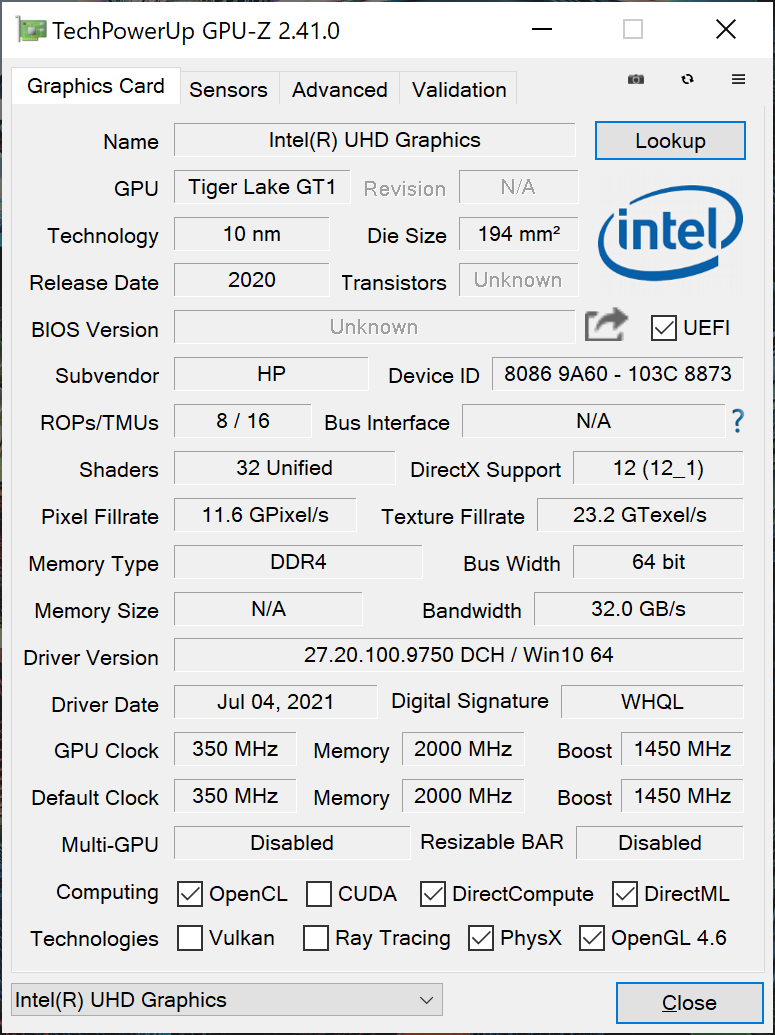
O GeForce RTX 3070 em nosso sistema é uma variante TGP de 85 W em comparação com a versão mais comum de 100 W ou superior na maioria dos outros laptops. O desempenho será, portanto, um pouco mais lento, o que nossos benchmarks de GPU abaixo mostrarão. Na verdade, é tecnicamente uma parte "Max-Q" de acordo com o Painel de Controle da Nvidia. Tanto o Optimus 1.0 como a Barra Redimensionável são suportados.
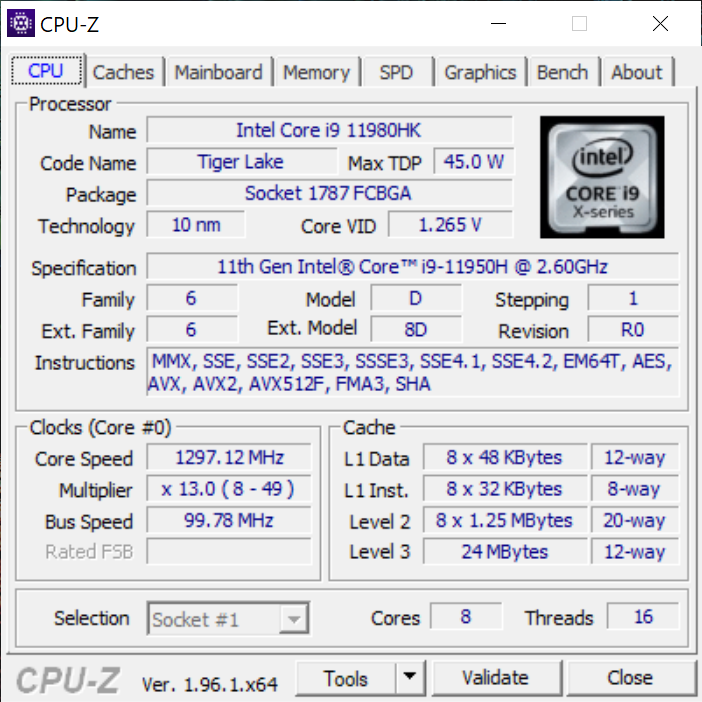
Processador
Como esperado, o desempenho da CPU é cada vez mais baixo do que o doNúcleo i9-11900H devido à sobrecarga de desempenho necessária para o suporte vPro. De geração a geração, o desempenho bruto multi-tarefa é cerca de 20 a 25% mais rápido do que o anterior Núcleo i9-10885H no ZBook Studio G7
A sustentabilidade do desempenho é estável, sem grandes quedas ao longo do tempo ao executar o CineBench R15 xT em um loop contínuo.
Cinebench R15 Multi Loop
Cinebench R23: Multi Core | Single Core
Cinebench R15: CPU Multi 64Bit | CPU Single 64Bit
Blender: v2.79 BMW27 CPU
7-Zip 18.03: 7z b 4 -mmt1 | 7z b 4
Geekbench 5.5: Single-Core | Multi-Core
HWBOT x265 Benchmark v2.2: 4k Preset
LibreOffice : 20 Documents To PDF
R Benchmark 2.5: Overall mean
| Cinebench R23 / Multi Core | |
| Asus ROG Strix Scar 15 G533QS | |
| Asus ROG Zephyrus S17 GX703HSD | |
| Média Intel Core i9-11950H (12048 - 13113, n=4) | |
| HP ZBook Studio 15 G8 | |
| Schenker XMG Core 15 Ampere | |
| Dell XPS 15 9510 11800H RTX 3050 Ti OLED | |
| HP ZBook Studio G7 | |
| Cinebench R23 / Single Core | |
| Média Intel Core i9-11950H (1569 - 1633, n=4) | |
| Asus ROG Zephyrus S17 GX703HSD | |
| HP ZBook Studio 15 G8 | |
| Dell XPS 15 9510 11800H RTX 3050 Ti OLED | |
| Asus ROG Strix Scar 15 G533QS | |
| HP ZBook Studio G7 | |
| Schenker XMG Core 15 Ampere | |
| HWBOT x265 Benchmark v2.2 / 4k Preset | |
| Asus ROG Zephyrus S17 GX703HSD | |
| Asus ROG Strix Scar 15 G533QS | |
| HP ZBook Studio 15 G8 | |
| Média Intel Core i9-11950H (13.8 - 14.5, n=4) | |
| Schenker XMG Core 15 Ampere | |
| Asus TUF Gaming A15 FA506QR-AZ061T | |
| MSI WS66 10TMT-207US | |
| HP ZBook Studio G7 | |
| Dell XPS 15 9510 11800H RTX 3050 Ti OLED | |
| Dell Precision 5550 P91F | |
* ... menor é melhor
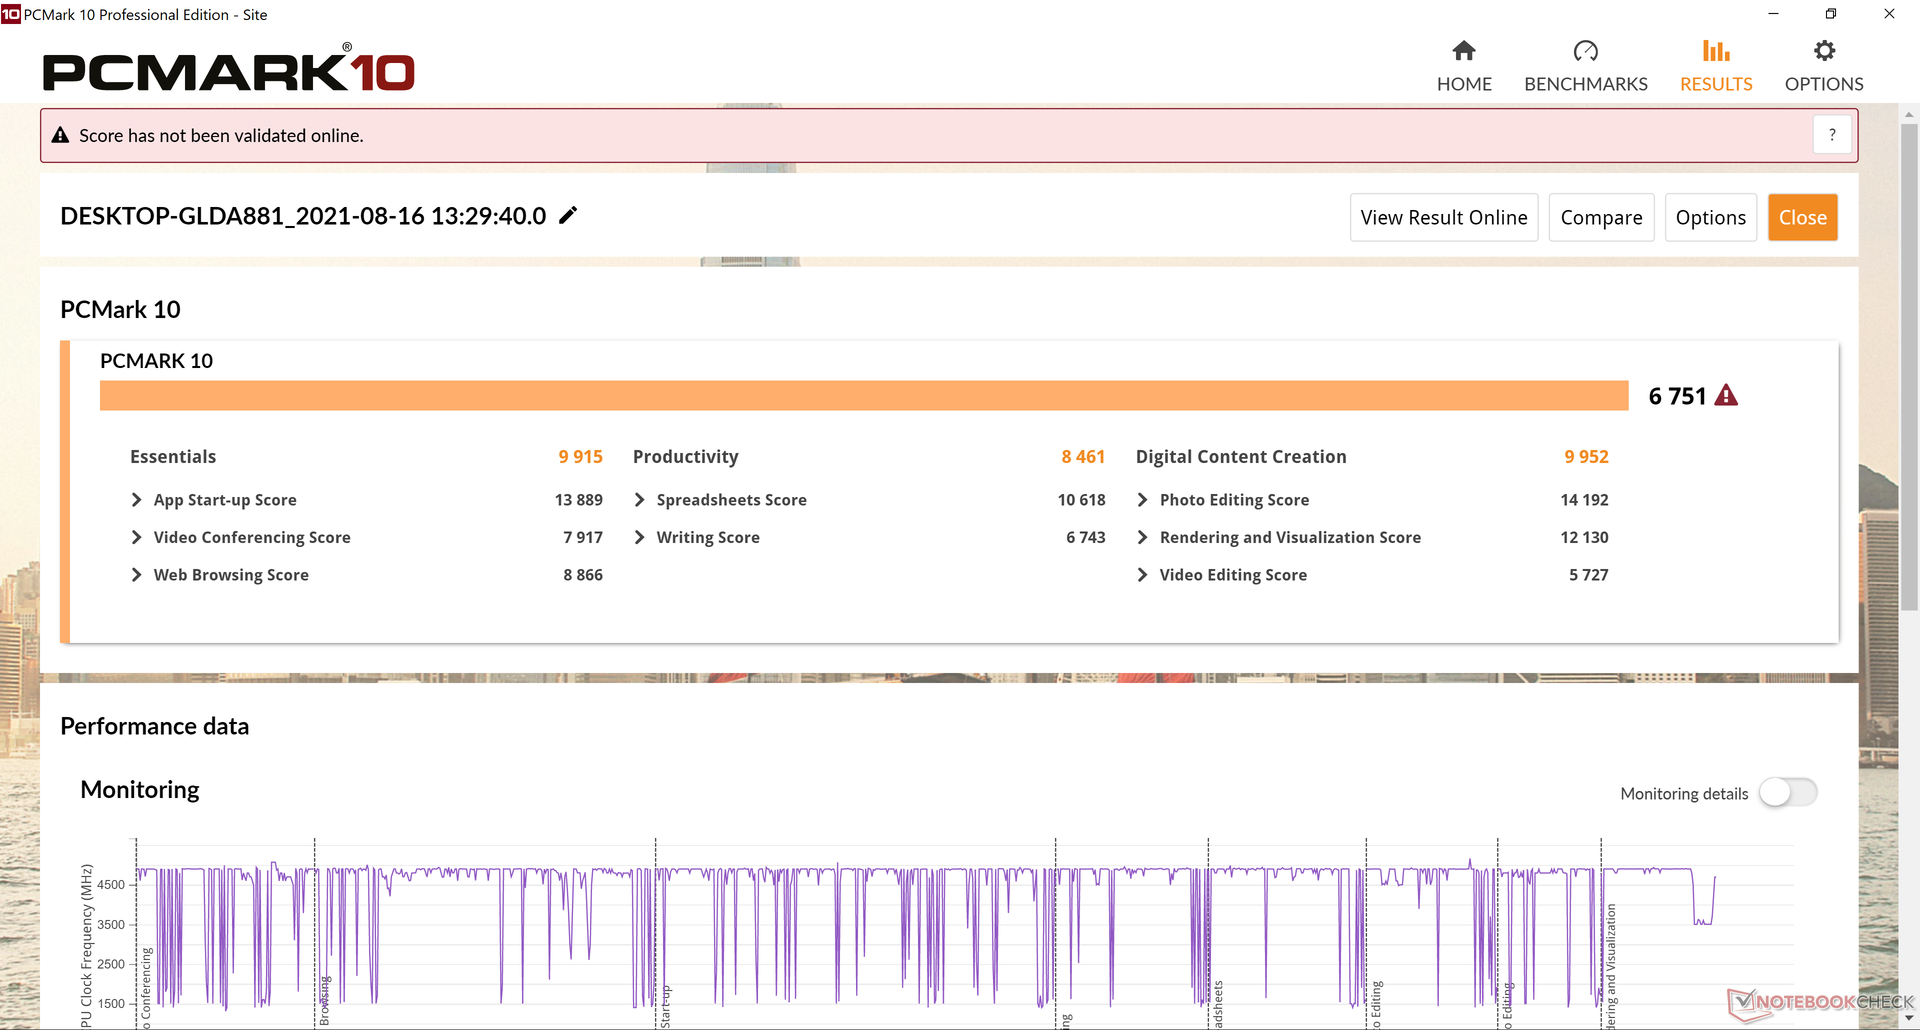
Desempenho do sistema
| PCMark 10 / Score | |
| HP ZBook Studio 15 G8 | |
| Dell Precision 7550 | |
| HP ZBook Firefly 15 G8 2C9R7EA | |
| HP ZBook Studio G7 | |
| Lenovo ThinkPad P15s Gen2-20W6000GGE | |
| Asus ProArt StudioBook Pro 15 W500G5T | |
| PCMark 10 / Essentials | |
| HP ZBook Studio 15 G8 | |
| Dell Precision 7550 | |
| Lenovo ThinkPad P15s Gen2-20W6000GGE | |
| HP ZBook Firefly 15 G8 2C9R7EA | |
| Asus ProArt StudioBook Pro 15 W500G5T | |
| HP ZBook Studio G7 | |
| PCMark 10 / Productivity | |
| Lenovo ThinkPad P15s Gen2-20W6000GGE | |
| HP ZBook Firefly 15 G8 2C9R7EA | |
| HP ZBook Studio 15 G8 | |
| Dell Precision 7550 | |
| Asus ProArt StudioBook Pro 15 W500G5T | |
| HP ZBook Studio G7 | |
| PCMark 10 / Digital Content Creation | |
| HP ZBook Studio 15 G8 | |
| Dell Precision 7550 | |
| HP ZBook Studio G7 | |
| HP ZBook Firefly 15 G8 2C9R7EA | |
| Asus ProArt StudioBook Pro 15 W500G5T | |
| Lenovo ThinkPad P15s Gen2-20W6000GGE | |
| PCMark 10 Score | 6751 pontos | |
Ajuda | ||
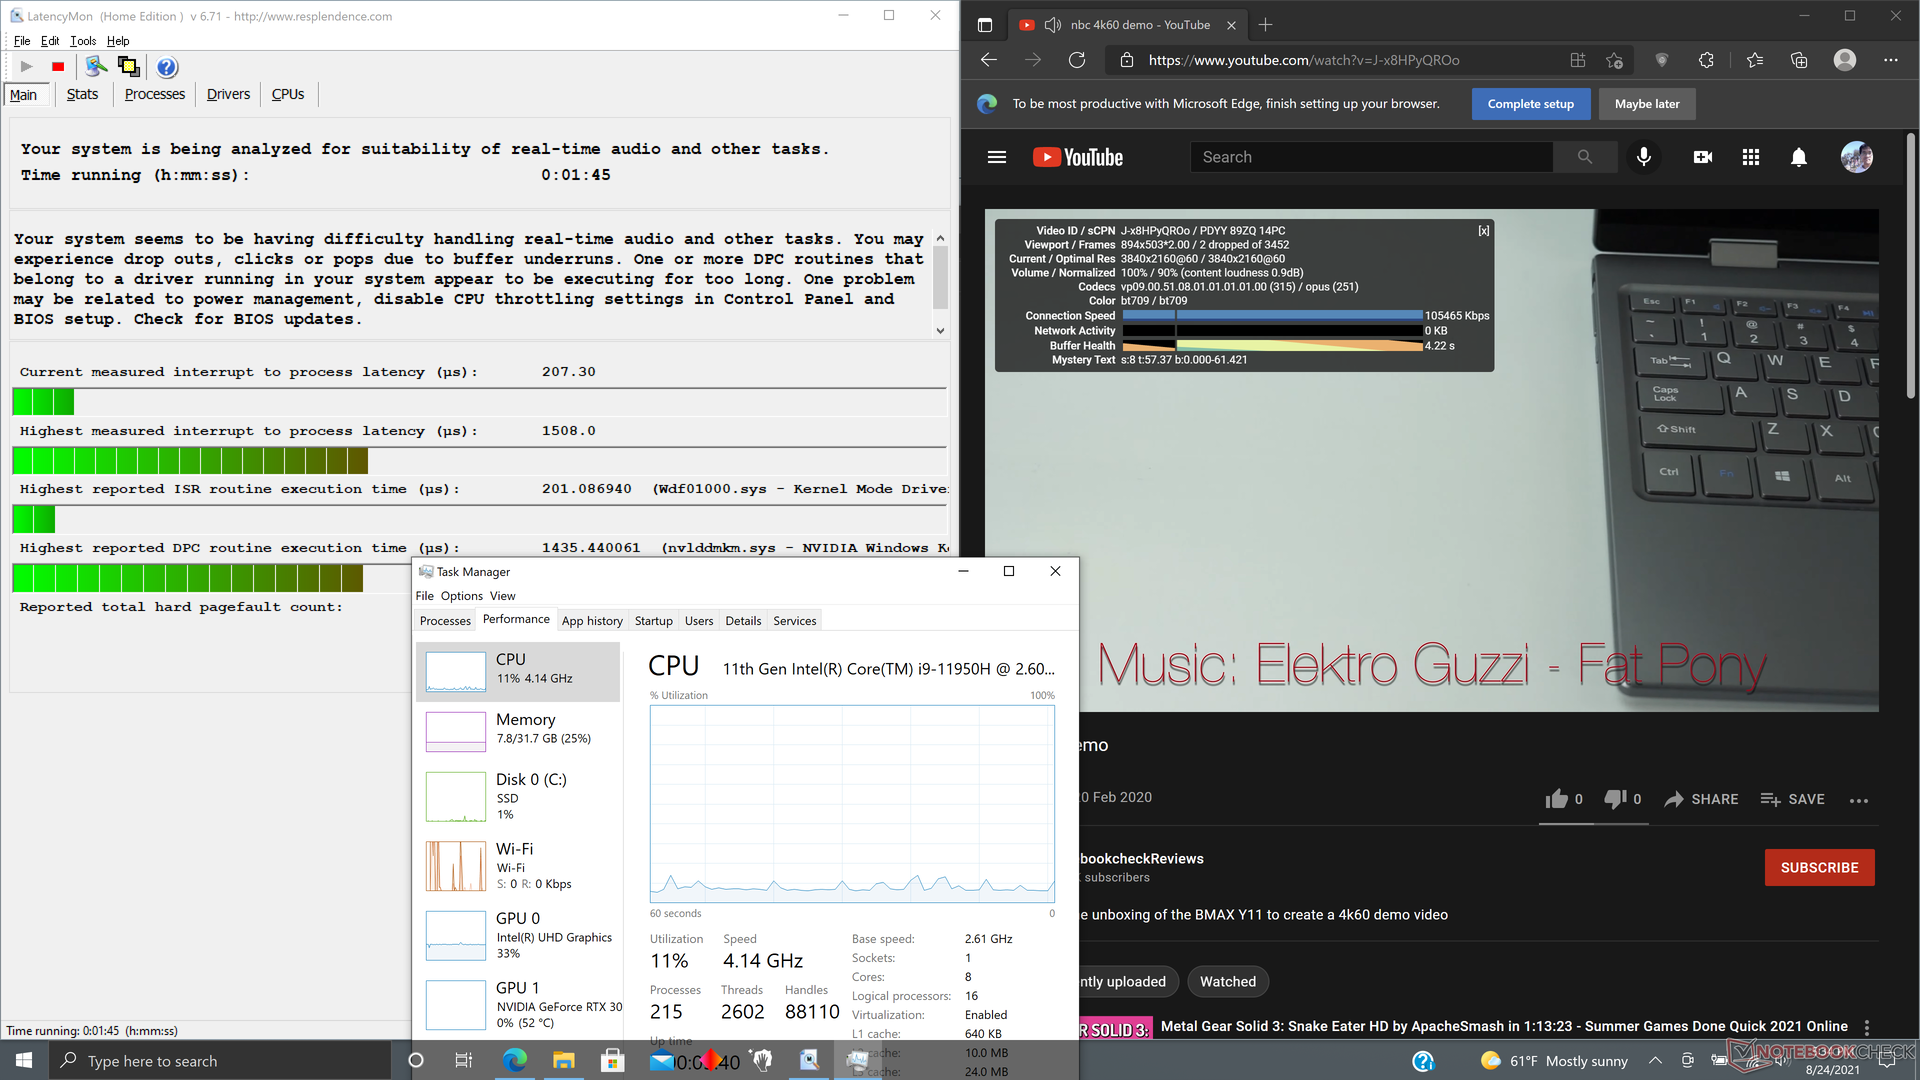
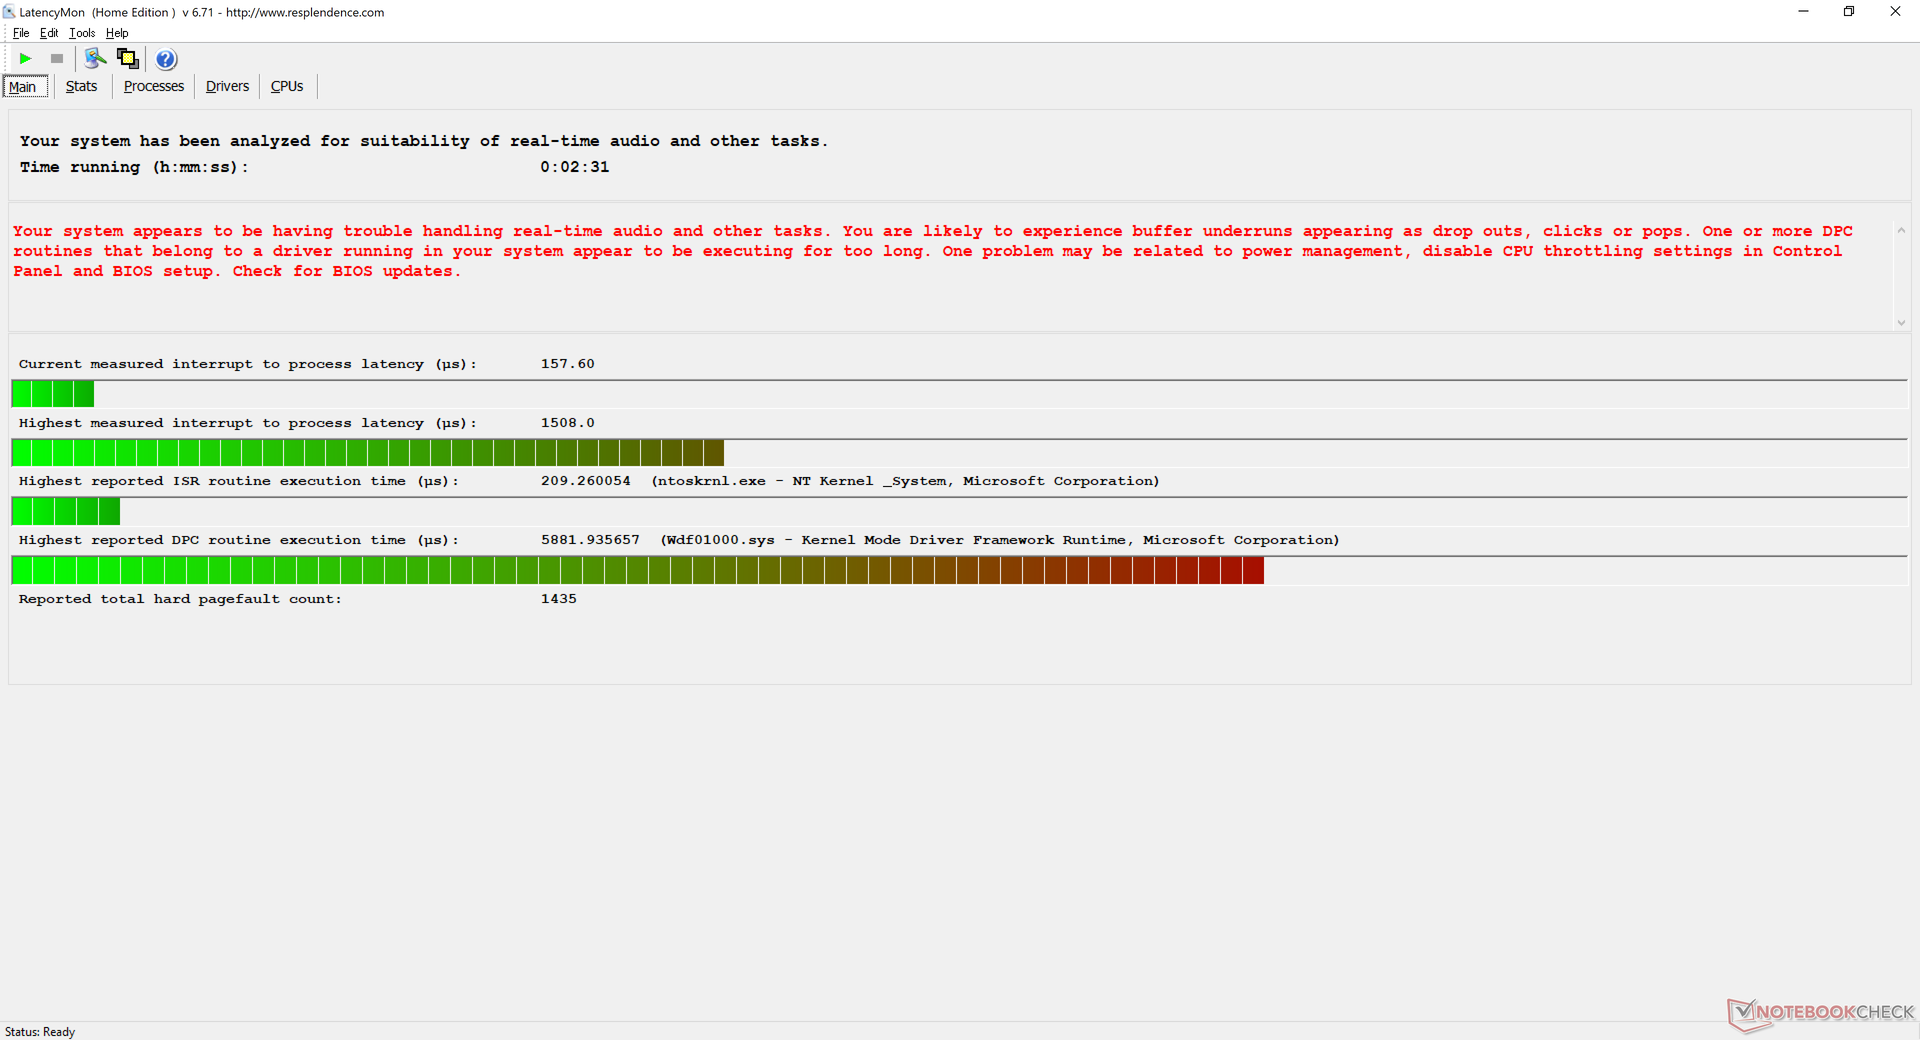
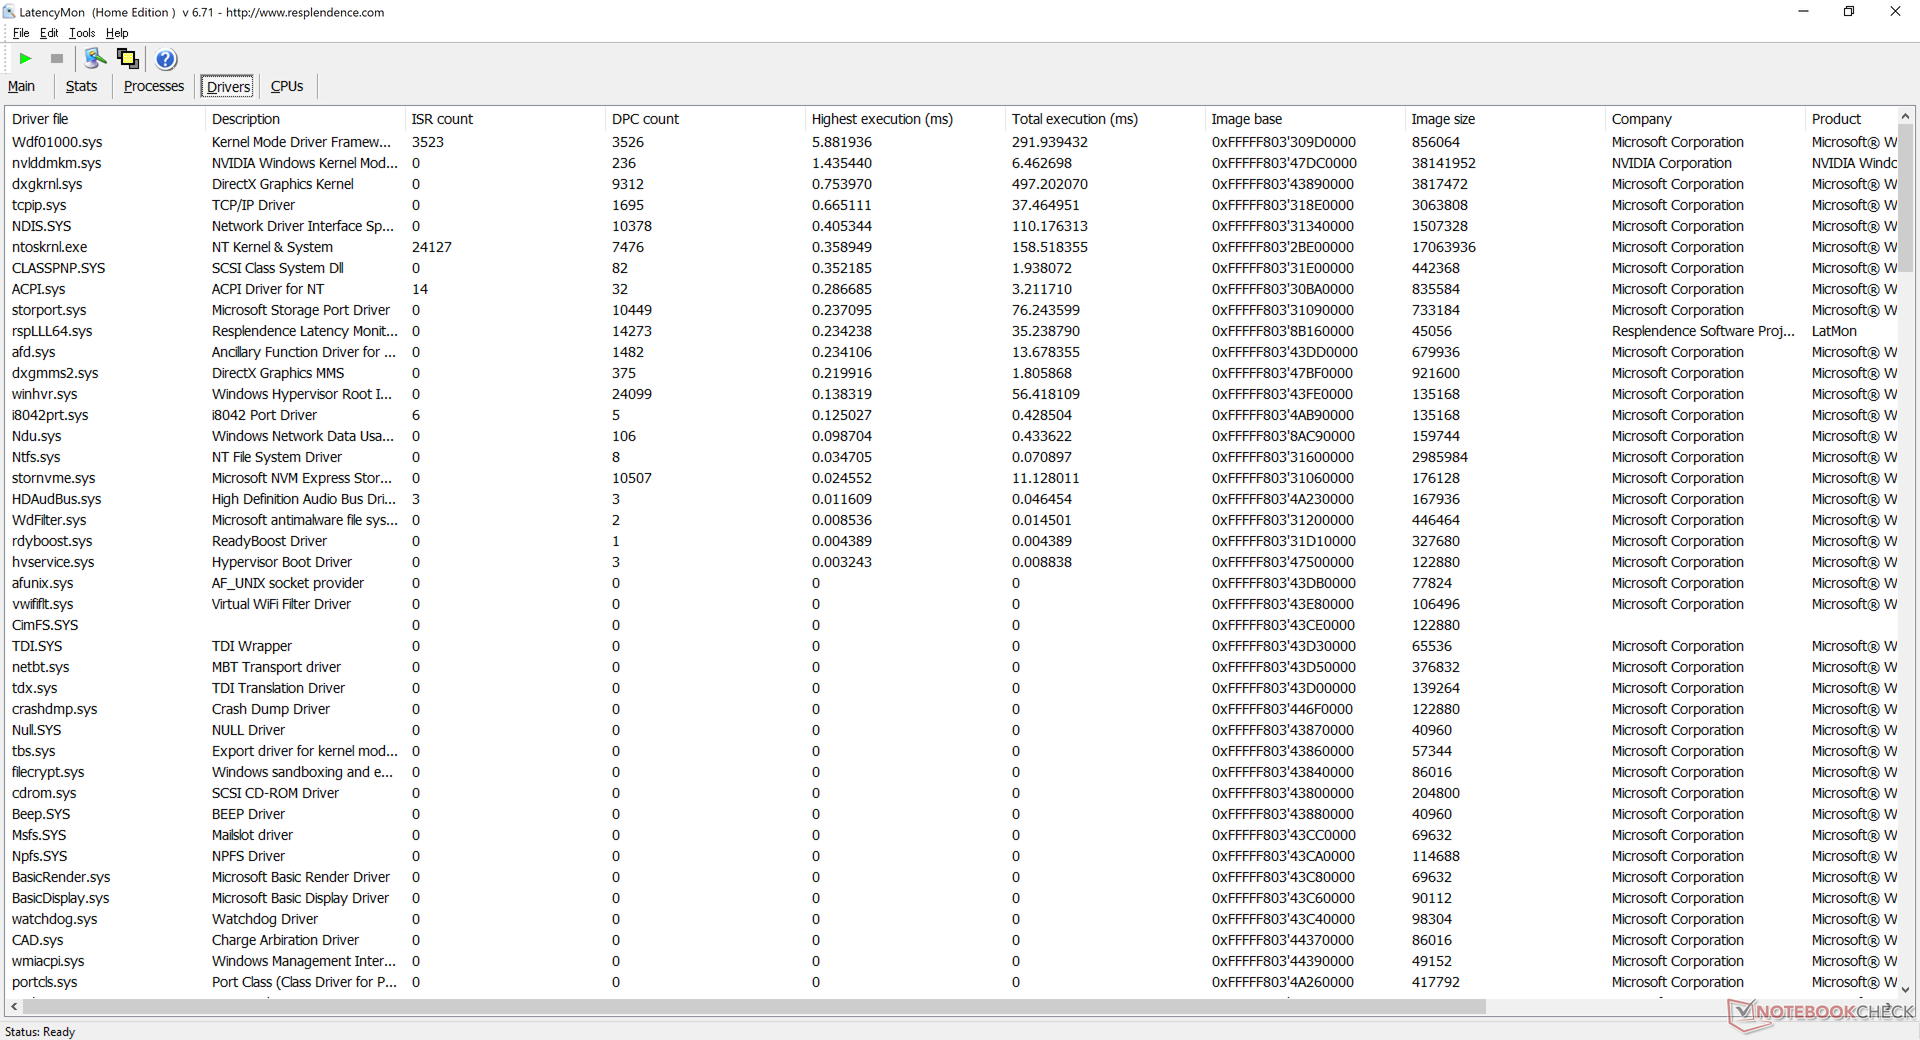
Latência do DPC
LatencyMon revela problemas de latência ao abrir várias abas do navegador em nossa página inicial e também ao executar Prime95 stress. A reprodução do vídeo de 4K a 60 FPS é, de outra forma, suave, com apenas 2 quadros descartados durante nosso vídeo de teste de minutos.
| DPC Latencies / LatencyMon - interrupt to process latency (max), Web, Youtube, Prime95 | |
| Dell Precision 7550 | |
| HP ZBook Studio G7 | |
| Lenovo ThinkPad P15s Gen2-20W6000GGE | |
| Asus ProArt StudioBook Pro 15 W500G5T | |
| HP ZBook Studio 15 G8 | |
| HP ZBook Firefly 15 G8 2C9R7EA | |
* ... menor é melhor
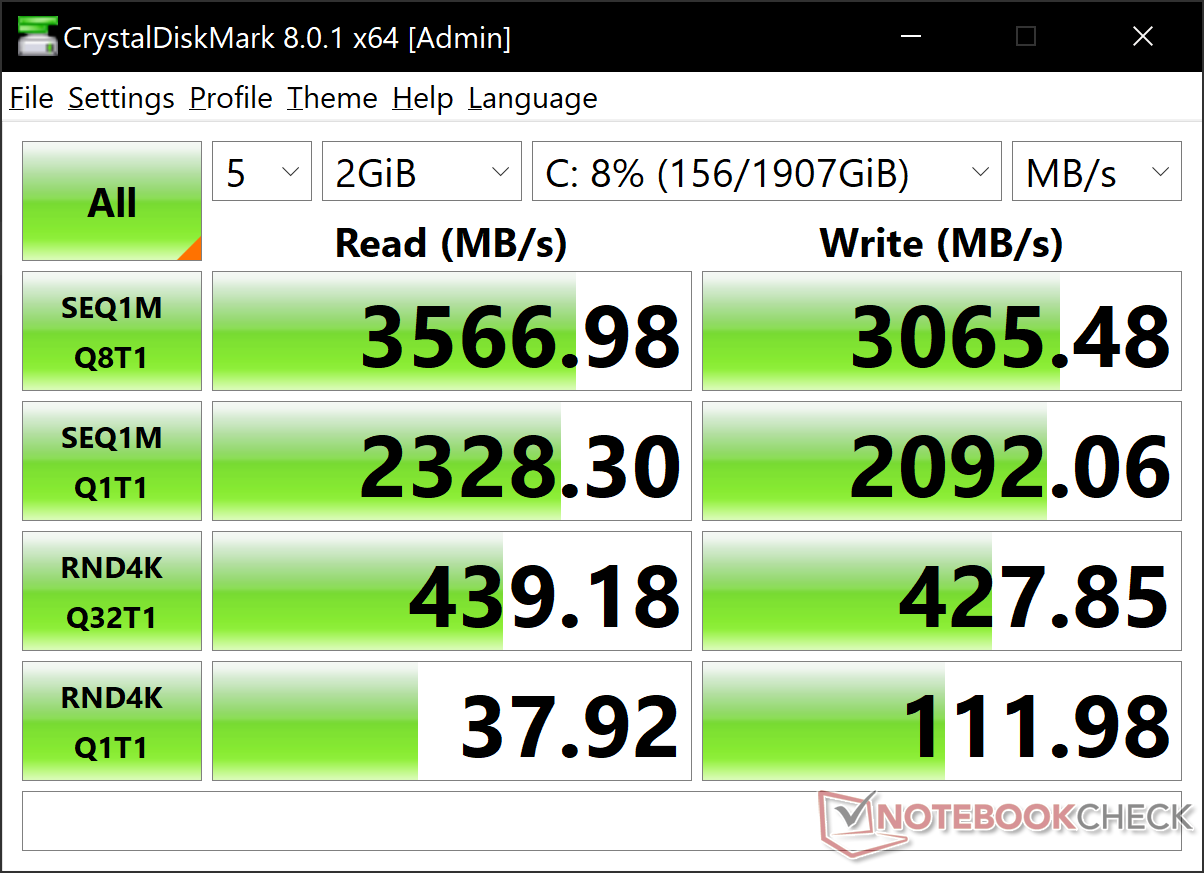
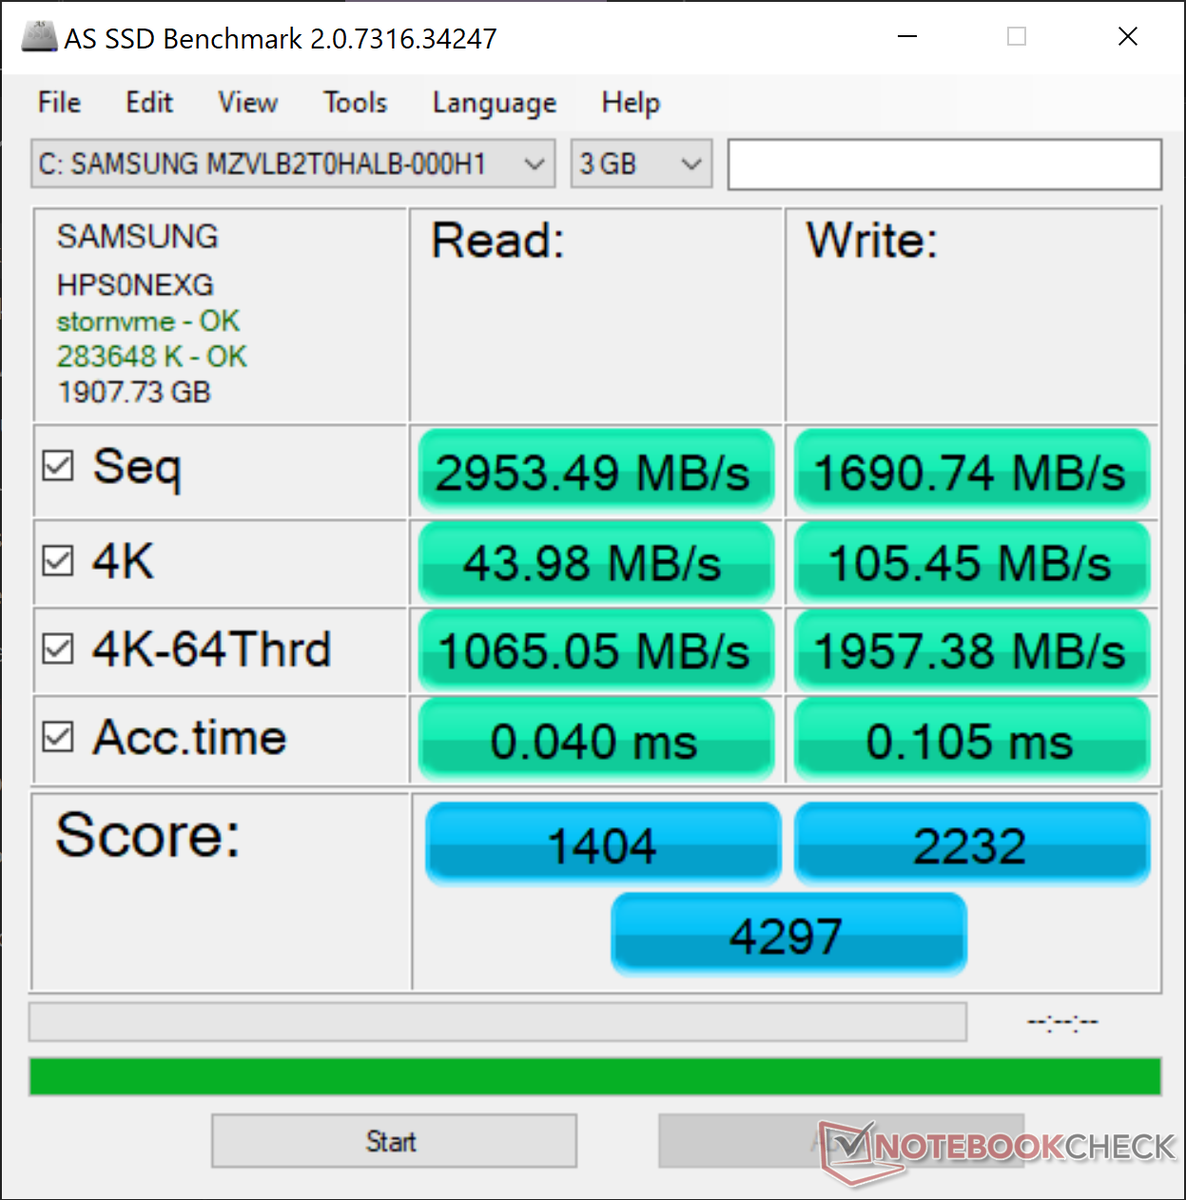
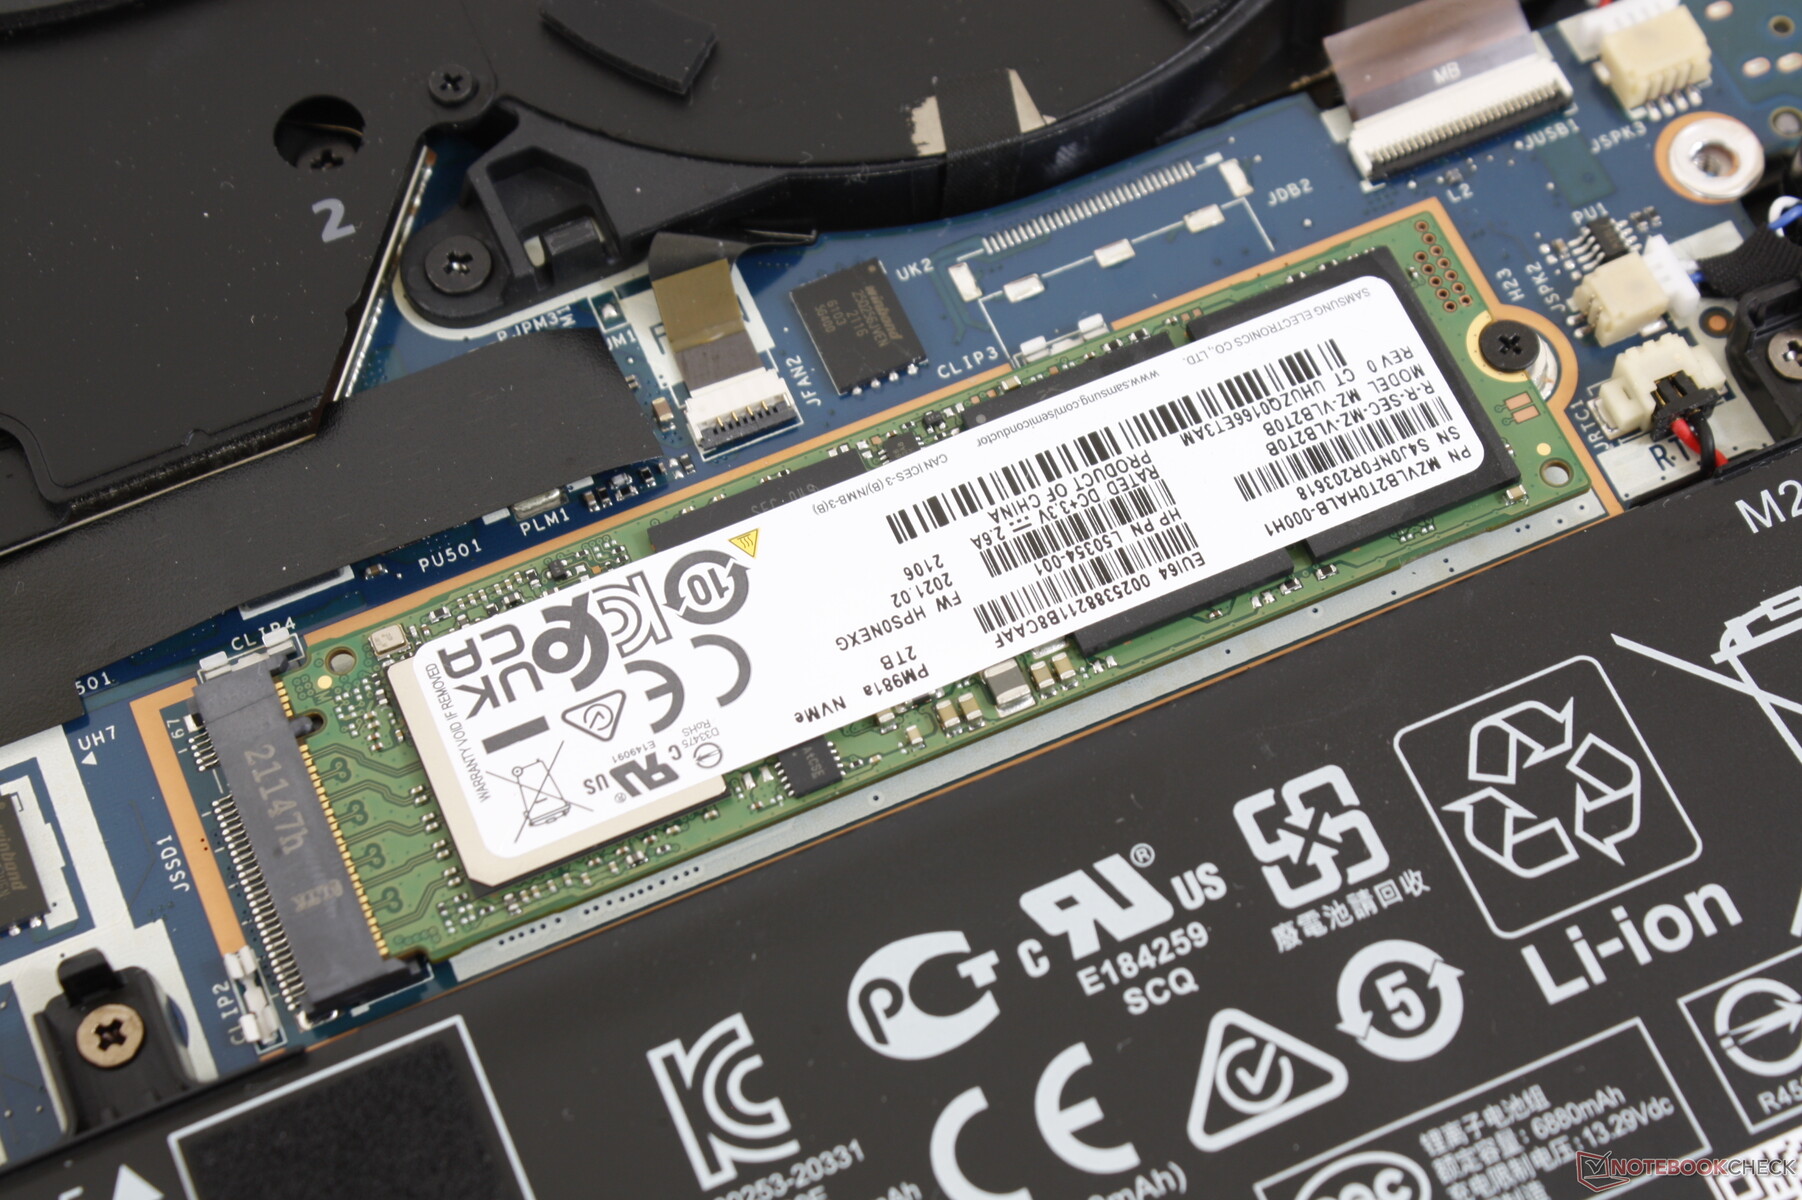
Dispositivos de armazenamento
Há apenas um único slot interno M.2 2280 PCIe 3 x4, sem opções secundárias. Embora possamos compreender o espaço limitado disponível, teria sido ótimo ver pelo menos uma atualização para PCIe 4 especialmente para um sistema tão caro. Nossa unidade de teste específica vem com o Samsung MZVLB2T0HALB para taxas rápidas de leitura e gravação sequencial de 3500 MB/s e 3000 MB/s, respectivamente. A HP oferece SSDs SED opcionais como uma camada adicional de segurança.
| HP ZBook Studio 15 G8 Samsung PM981a MZVLB2T0HALB | HP ZBook Firefly 15 G8 2C9R7EA Toshiba XG6 KXG60ZNV1T02 | HP ZBook Studio G7 Micron 2300 1TB MTFDHBA1T0TDV | Dell Precision 7550 SK Hynix PC601A NVMe 1TB | Lenovo ThinkPad P15s Gen2-20W6000GGE WDC PC SN720 SDAQNTW-1T00 | Asus ProArt StudioBook Pro 15 W500G5T Samsung SSD PM981 MZVLB1T0HALR | |
|---|---|---|---|---|---|---|
| AS SSD | -1% | -16% | -20% | 11% | 4% | |
| Seq Read (MB/s) | 2953 | 2599 -12% | 2548 -14% | 2028 -31% | 2796 -5% | 2702 -8% |
| Seq Write (MB/s) | 1691 | 1305 -23% | 1312 -22% | 1193 -29% | 2525 49% | 2348 39% |
| 4K Read (MB/s) | 43.98 | 49.65 13% | 45.38 3% | 42.31 -4% | 50.9 16% | 37.59 -15% |
| 4K Write (MB/s) | 105.4 | 128.1 22% | 83 -21% | 105.5 0% | 211.9 101% | 107.1 2% |
| 4K-64 Read (MB/s) | 1065 | 1157 9% | 935 -12% | 1128 6% | 1505 41% | 1491 40% |
| 4K-64 Write (MB/s) | 1957 | 1475 -25% | 2314 18% | 1537 -21% | 949 -52% | 1794 -8% |
| Access Time Read * (ms) | 0.04 | 0.057 -43% | 0.057 -43% | 0.069 -73% | 0.081 -103% | 0.046 -15% |
| Access Time Write * (ms) | 0.105 | 0.03 71% | 0.098 7% | 0.106 -1% | 0.019 82% | 0.034 68% |
| Score Read (Points) | 1404 | 1467 4% | 1235 -12% | 1373 -2% | 1835 31% | 1798 28% |
| Score Write (Points) | 2232 | 1734 -22% | 2528 13% | 1762 -21% | 1413 -37% | 2136 -4% |
| Score Total (Points) | 4297 | 3894 -9% | 4342 1% | 3801 -12% | 4177 -3% | 4835 13% |
| Copy ISO MB/s (MB/s) | 2474 | 3142 27% | 1768 -29% | 2302 -7% | ||
| Copy Program MB/s (MB/s) | 1074 | 126.1 -88% | 627 -42% | 564 -47% | ||
| Copy Game MB/s (MB/s) | 1929 | 477.4 -75% | 1477 -23% | 1336 -31% | ||
| CrystalDiskMark 5.2 / 6 | 1% | -9% | -8% | 22% | 106% | |
| Write 4K (MB/s) | 110.5 | 140.6 27% | 95.5 -14% | 121 10% | 237.6 115% | 1107 902% |
| Read 4K (MB/s) | 51.8 | 52.8 2% | 48.99 -5% | 42.16 -19% | 54.7 6% | 43.38 -16% |
| Write Seq (MB/s) | 2071 | 1844 -11% | 2001 -3% | 2150 4% | 2603 26% | 2387 15% |
| Read Seq (MB/s) | 2505 | 2108 -16% | 1600 -36% | 1755 -30% | 1889 -25% | 2431 -3% |
| Write 4K Q32T1 (MB/s) | 429.8 | 418 -3% | 410.2 -5% | 395.3 -8% | 505 17% | 340.7 -21% |
| Read 4K Q32T1 (MB/s) | 418.3 | 476.8 14% | 394.7 -6% | 381.8 -9% | 606 45% | 397.8 -5% |
| Write Seq Q32T1 (MB/s) | 3060 | 3064 0% | 3148 3% | 2730 -11% | 2795 -9% | 2390 -22% |
| Read Seq Q32T1 (MB/s) | 3539 | 3289 -7% | 3227 -9% | 3468 -2% | 3448 -3% | 3502 -1% |
| Média Total (Programa/Configurações) | 0% /
-0% | -13% /
-13% | -14% /
-16% | 17% /
15% | 55% /
41% |
* ... menor é melhor

Disk Throttling: DiskSpd Read Loop, Queue Depth 8
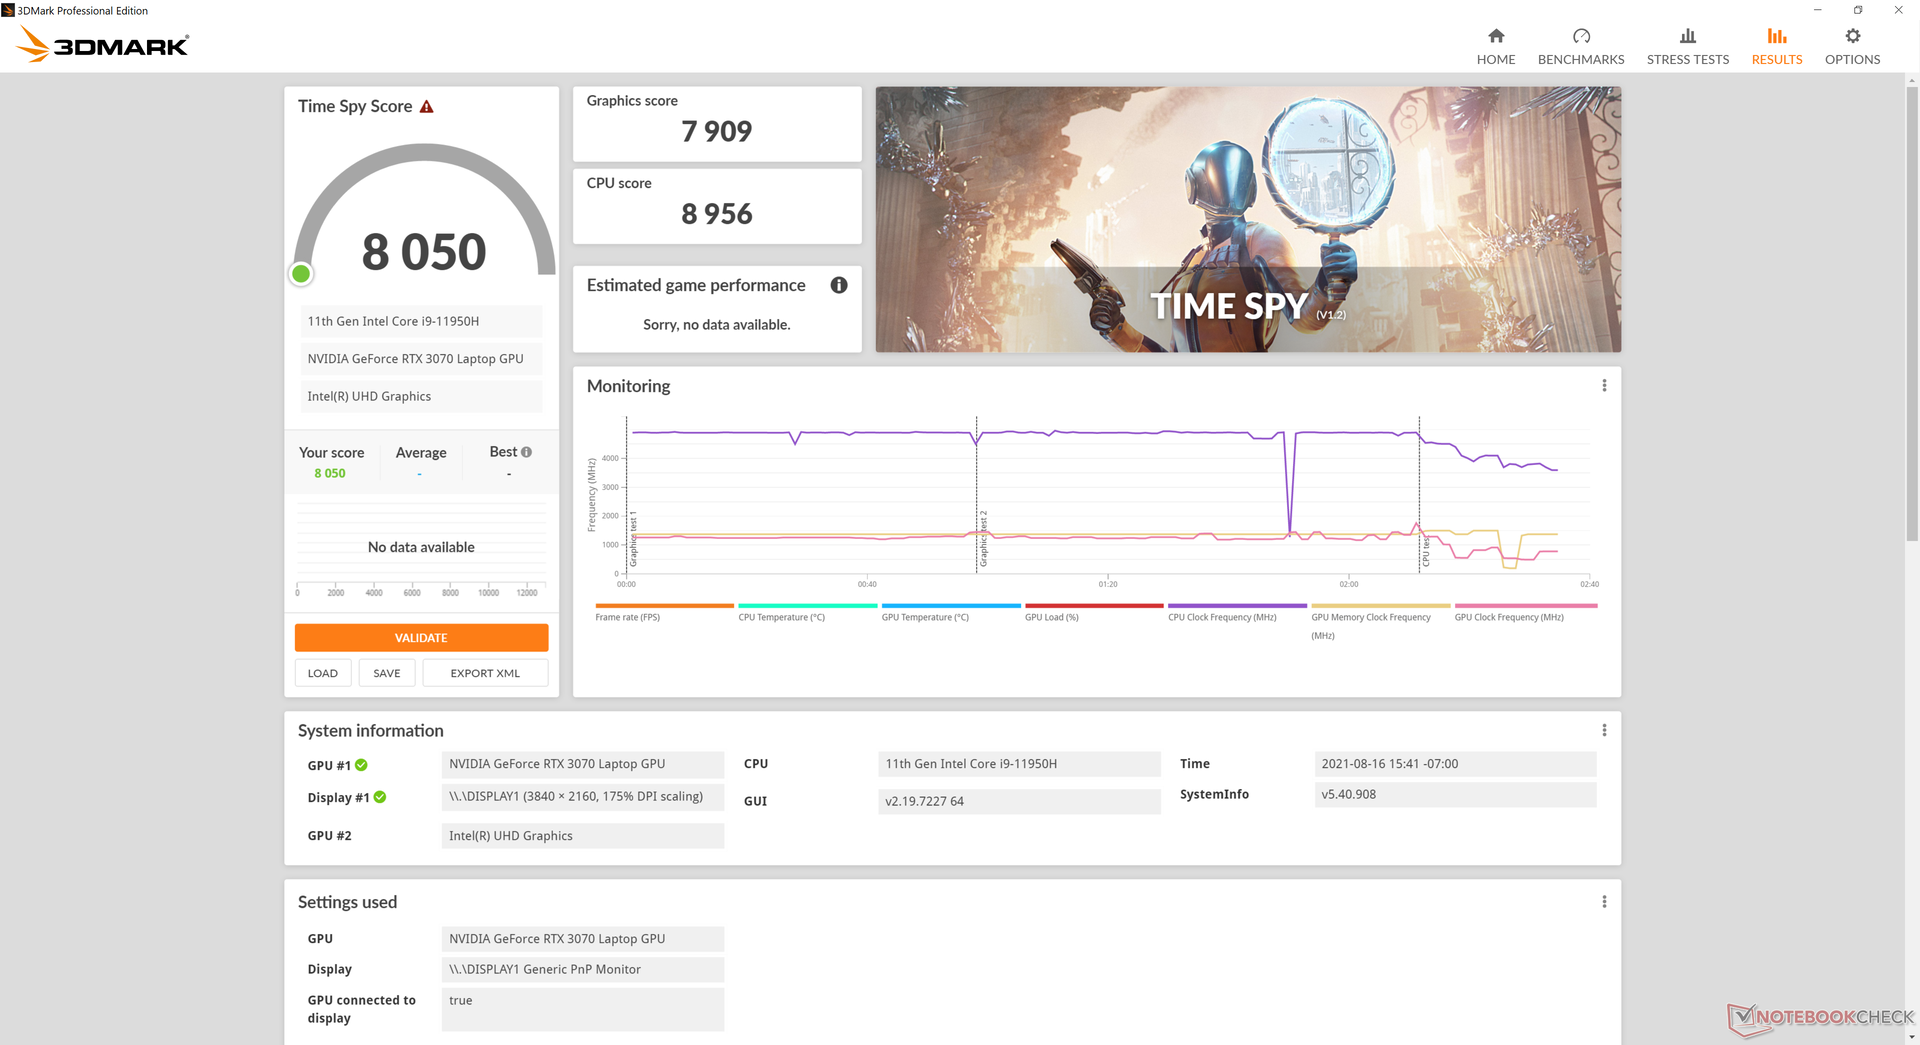
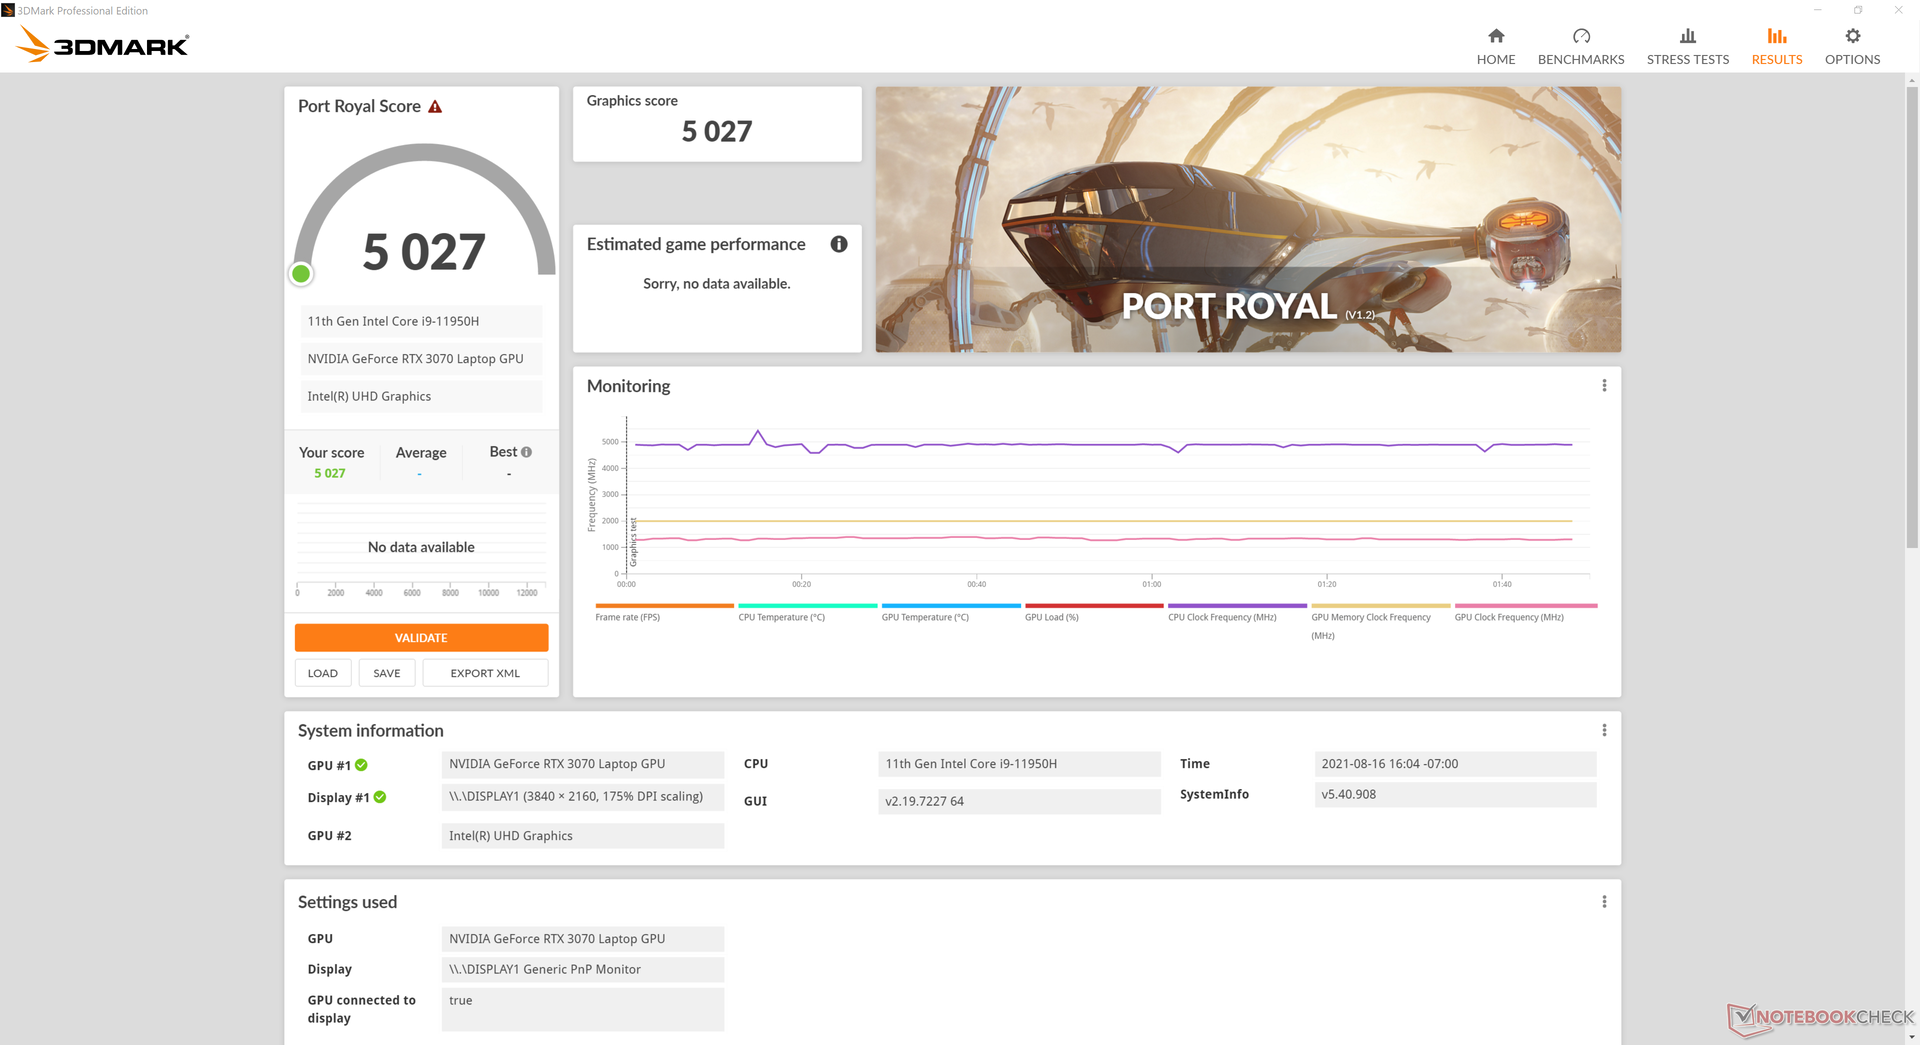
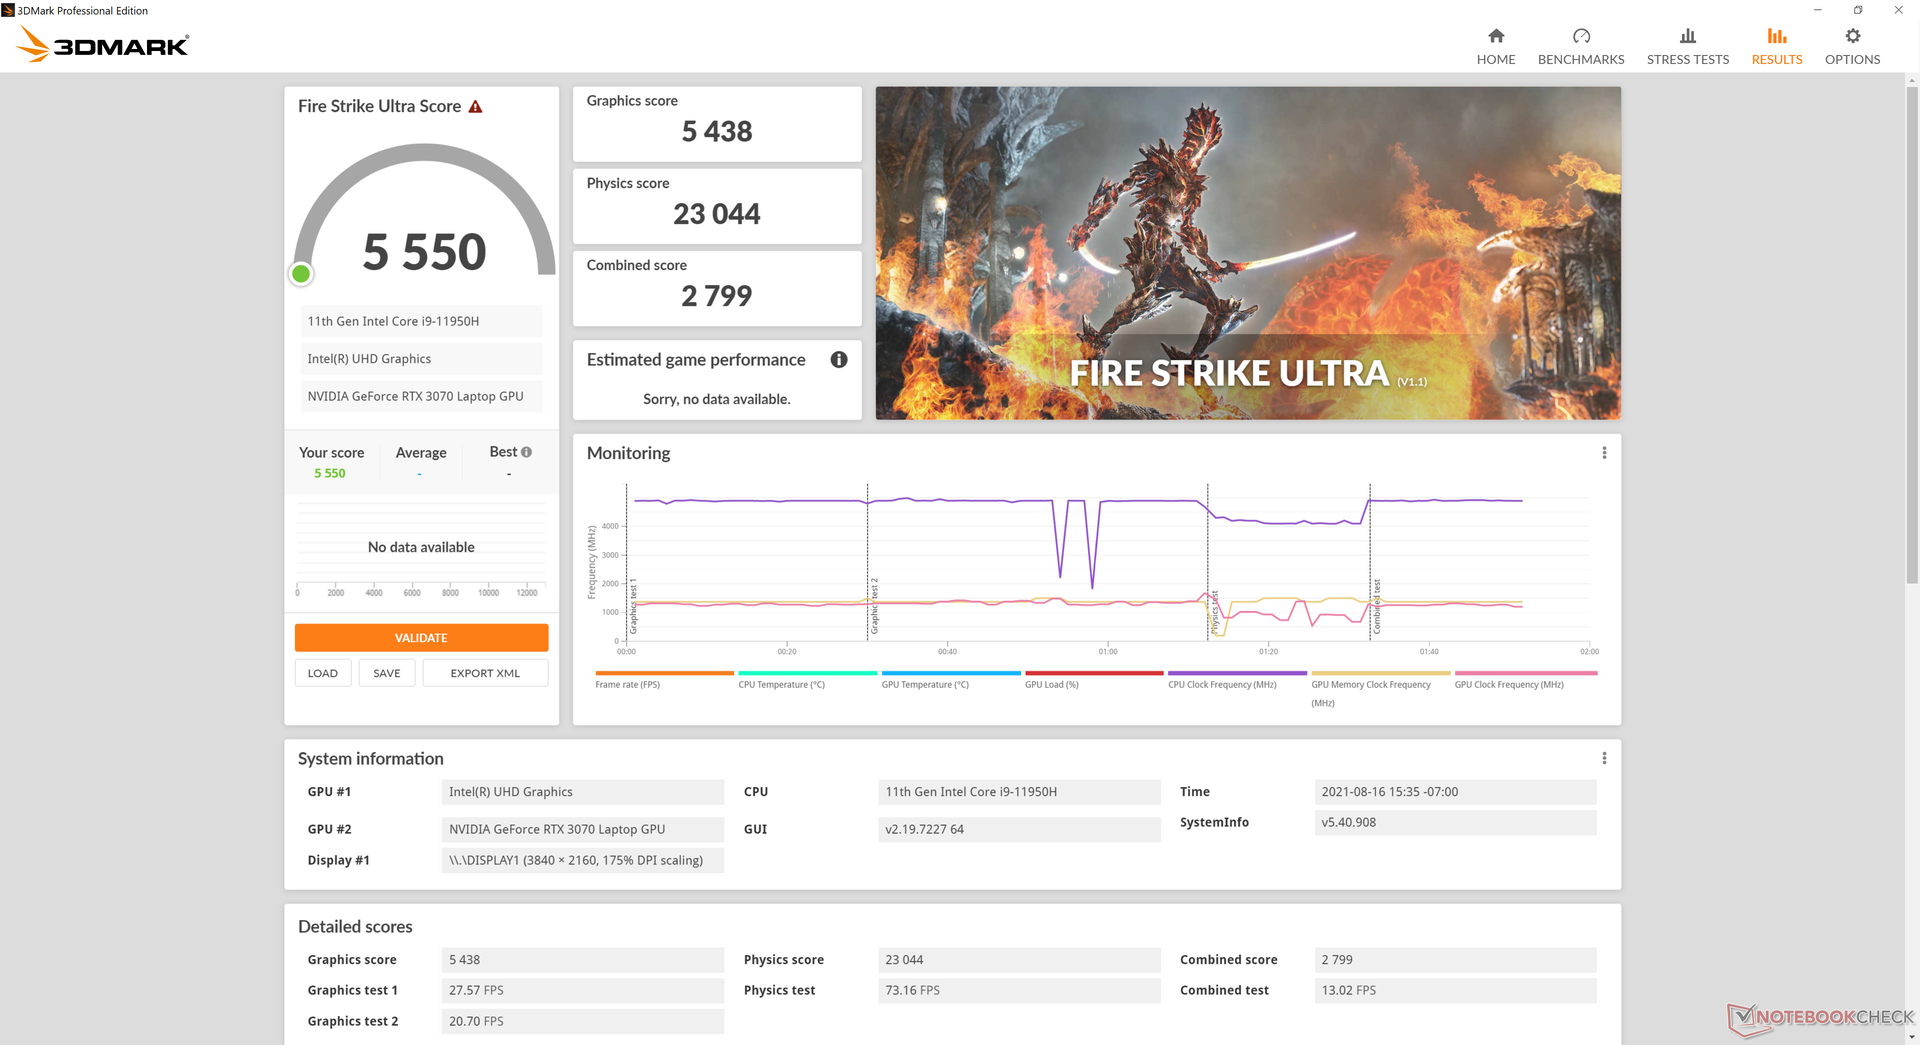
GPU Performance - TGP 85 W
O desempenho gráfico é 10 a 15% mais lento do que o média RTX 3070 laptop em nosso banco de dados. O déficit é suficientemente grande que mesmo alguns mais antigos RTX 2070 ou RTX 3060 laptops como oSchenker XMG Core 15 pode, às vezes, superar nosso sistema RTX 3070, mais caro. Não é um laptop lento de forma alguma, mas certamente poderia ter sido mais rápido com base em nossa experiência com dezenas de outros sistemas com a mesma GPU RTX 3070
Os usuários podem trocar a GPU GeForce pela Quadro RTX A3000 ou A4000 para maximizar o CAD, CGI e outras cargas de trabalho específicas da estação de trabalho.
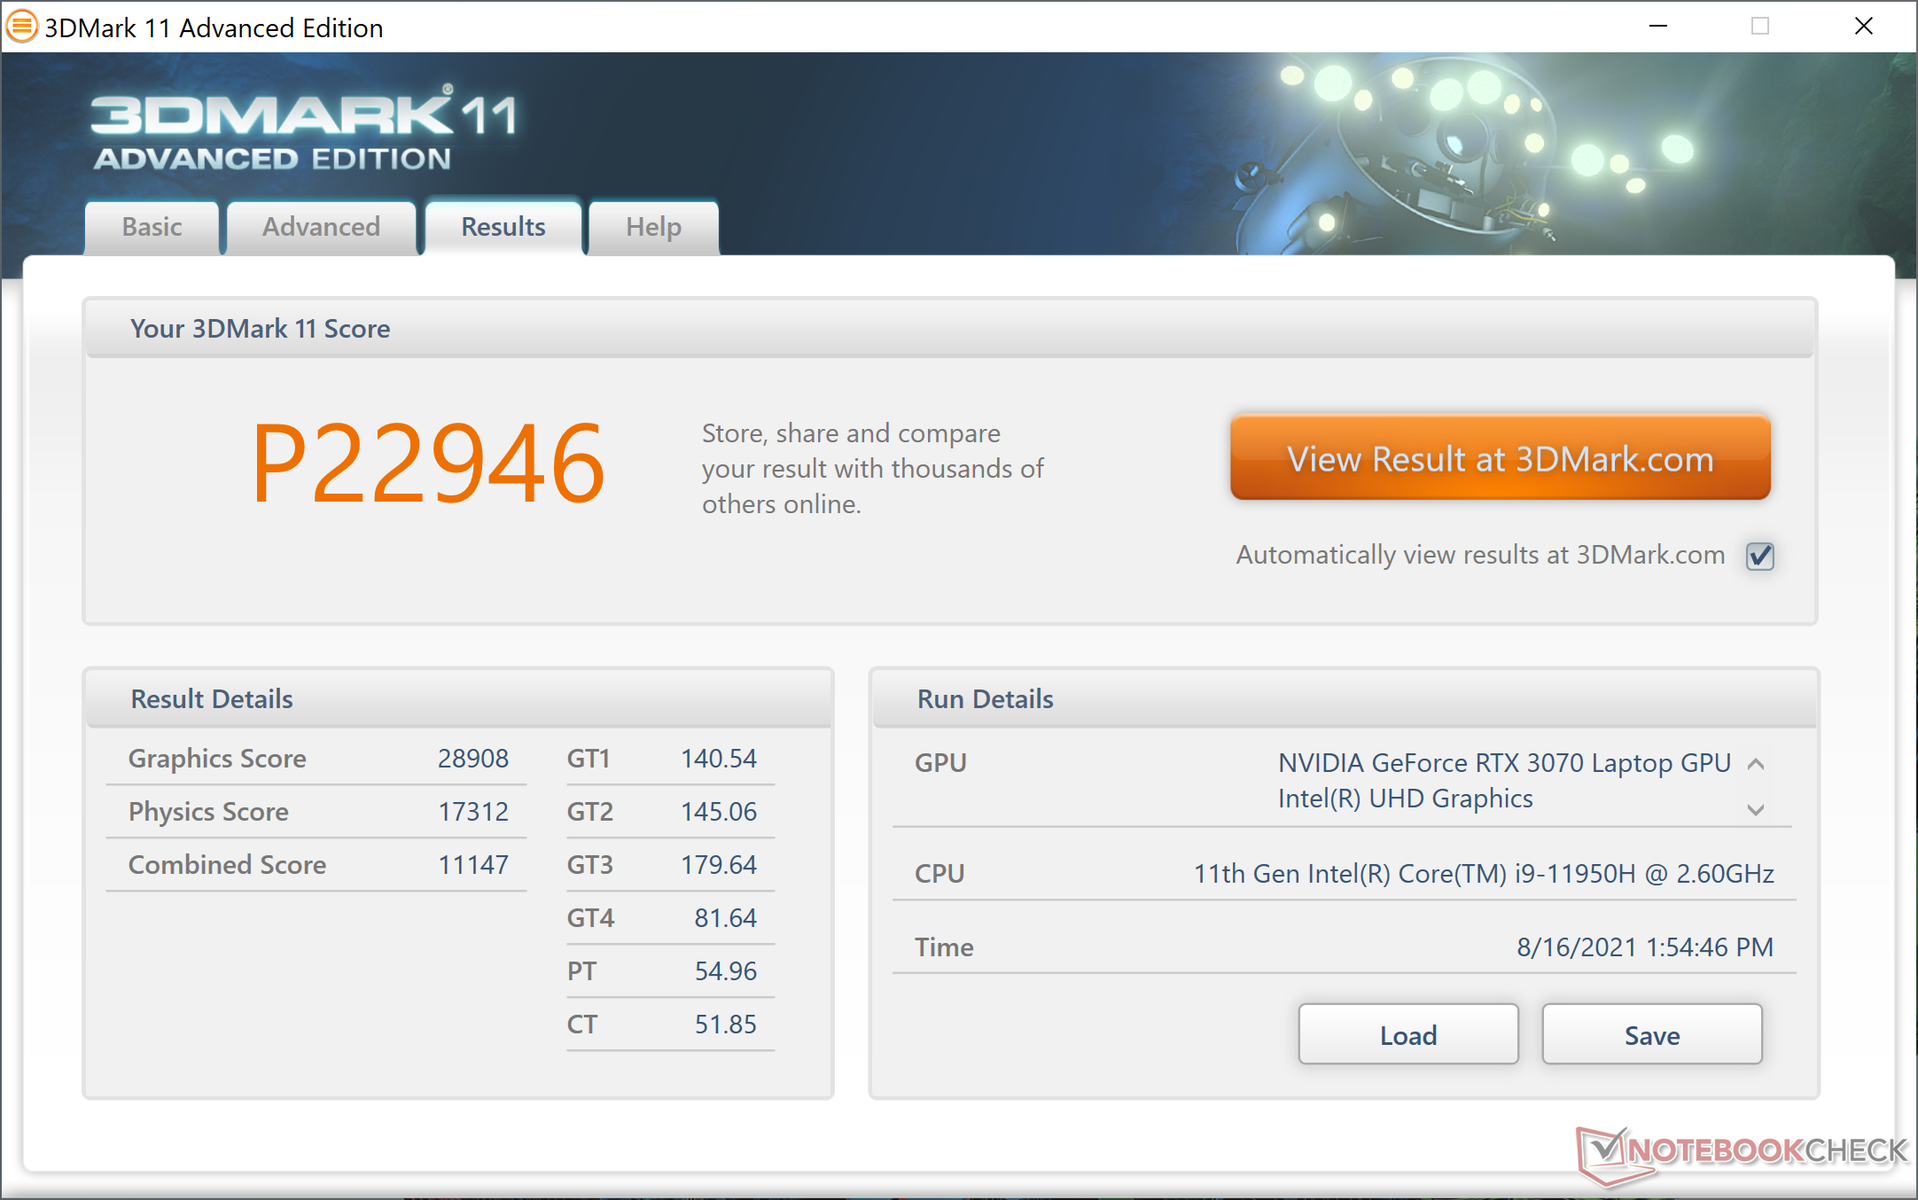
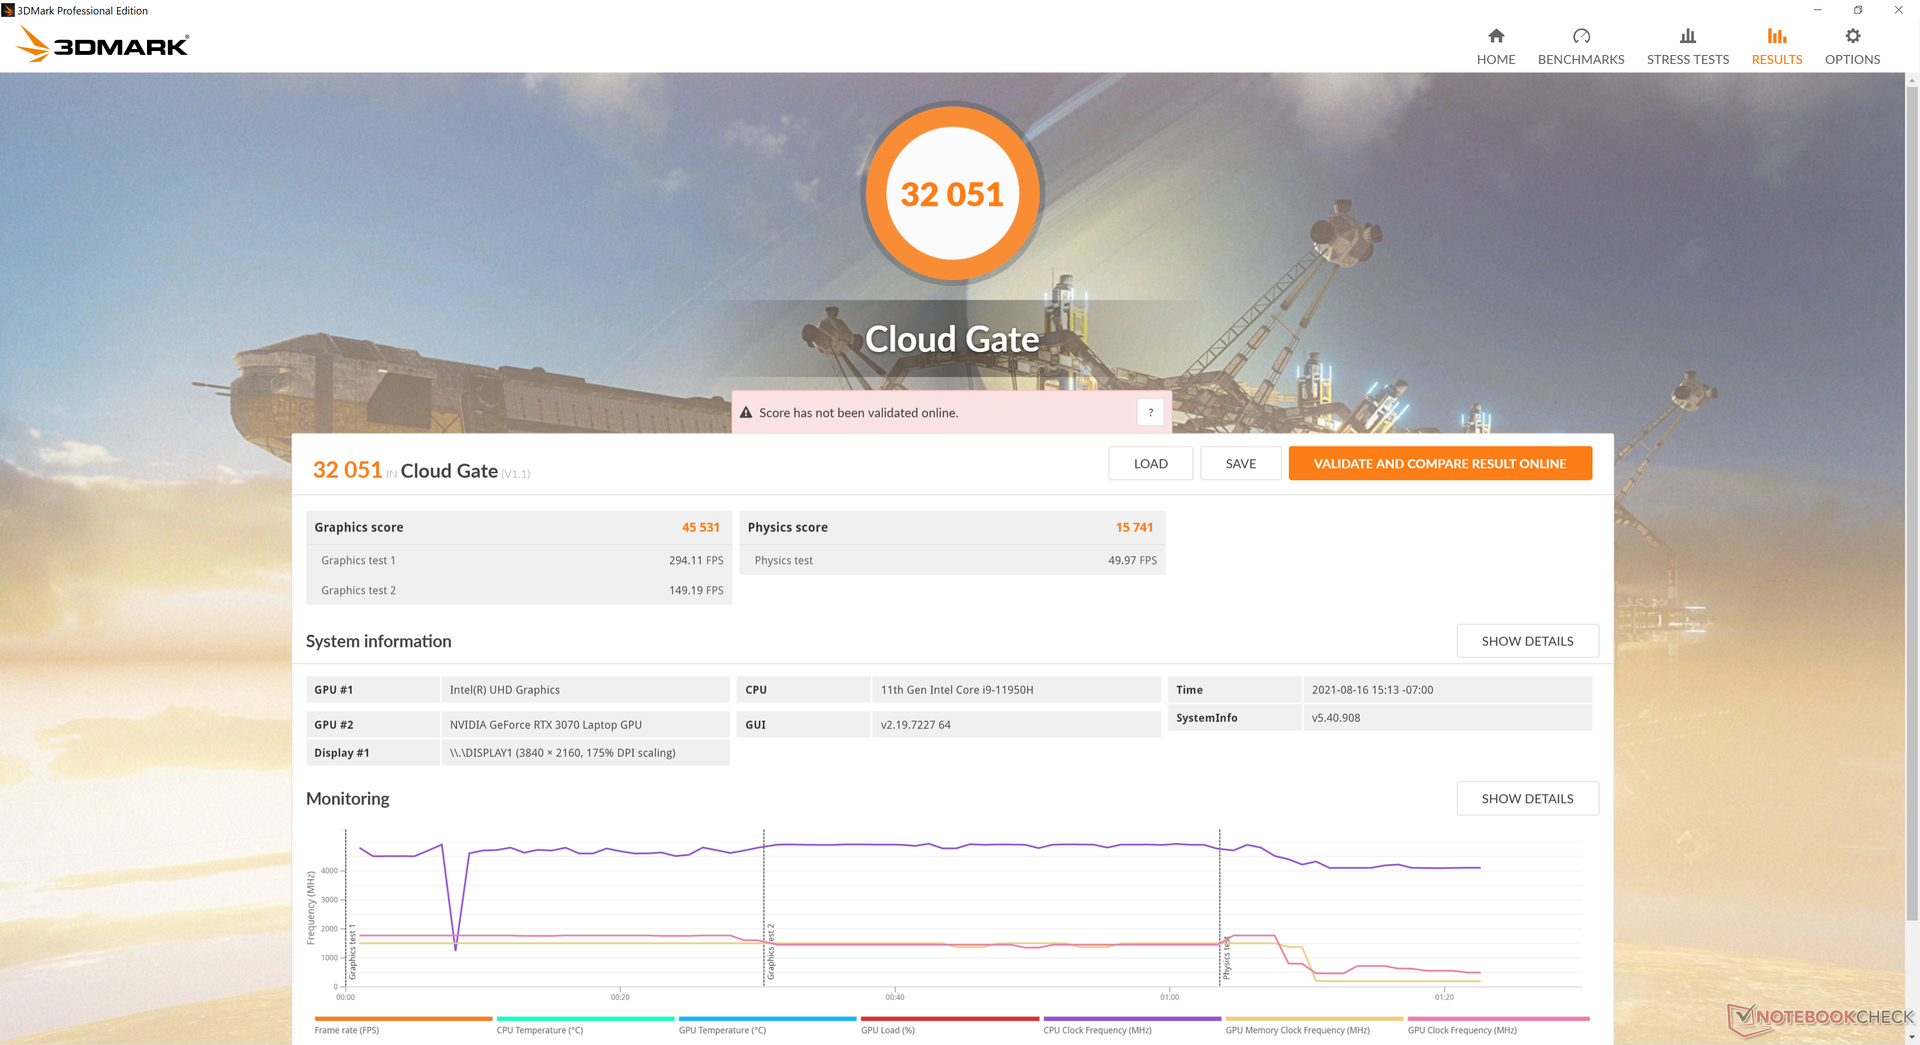
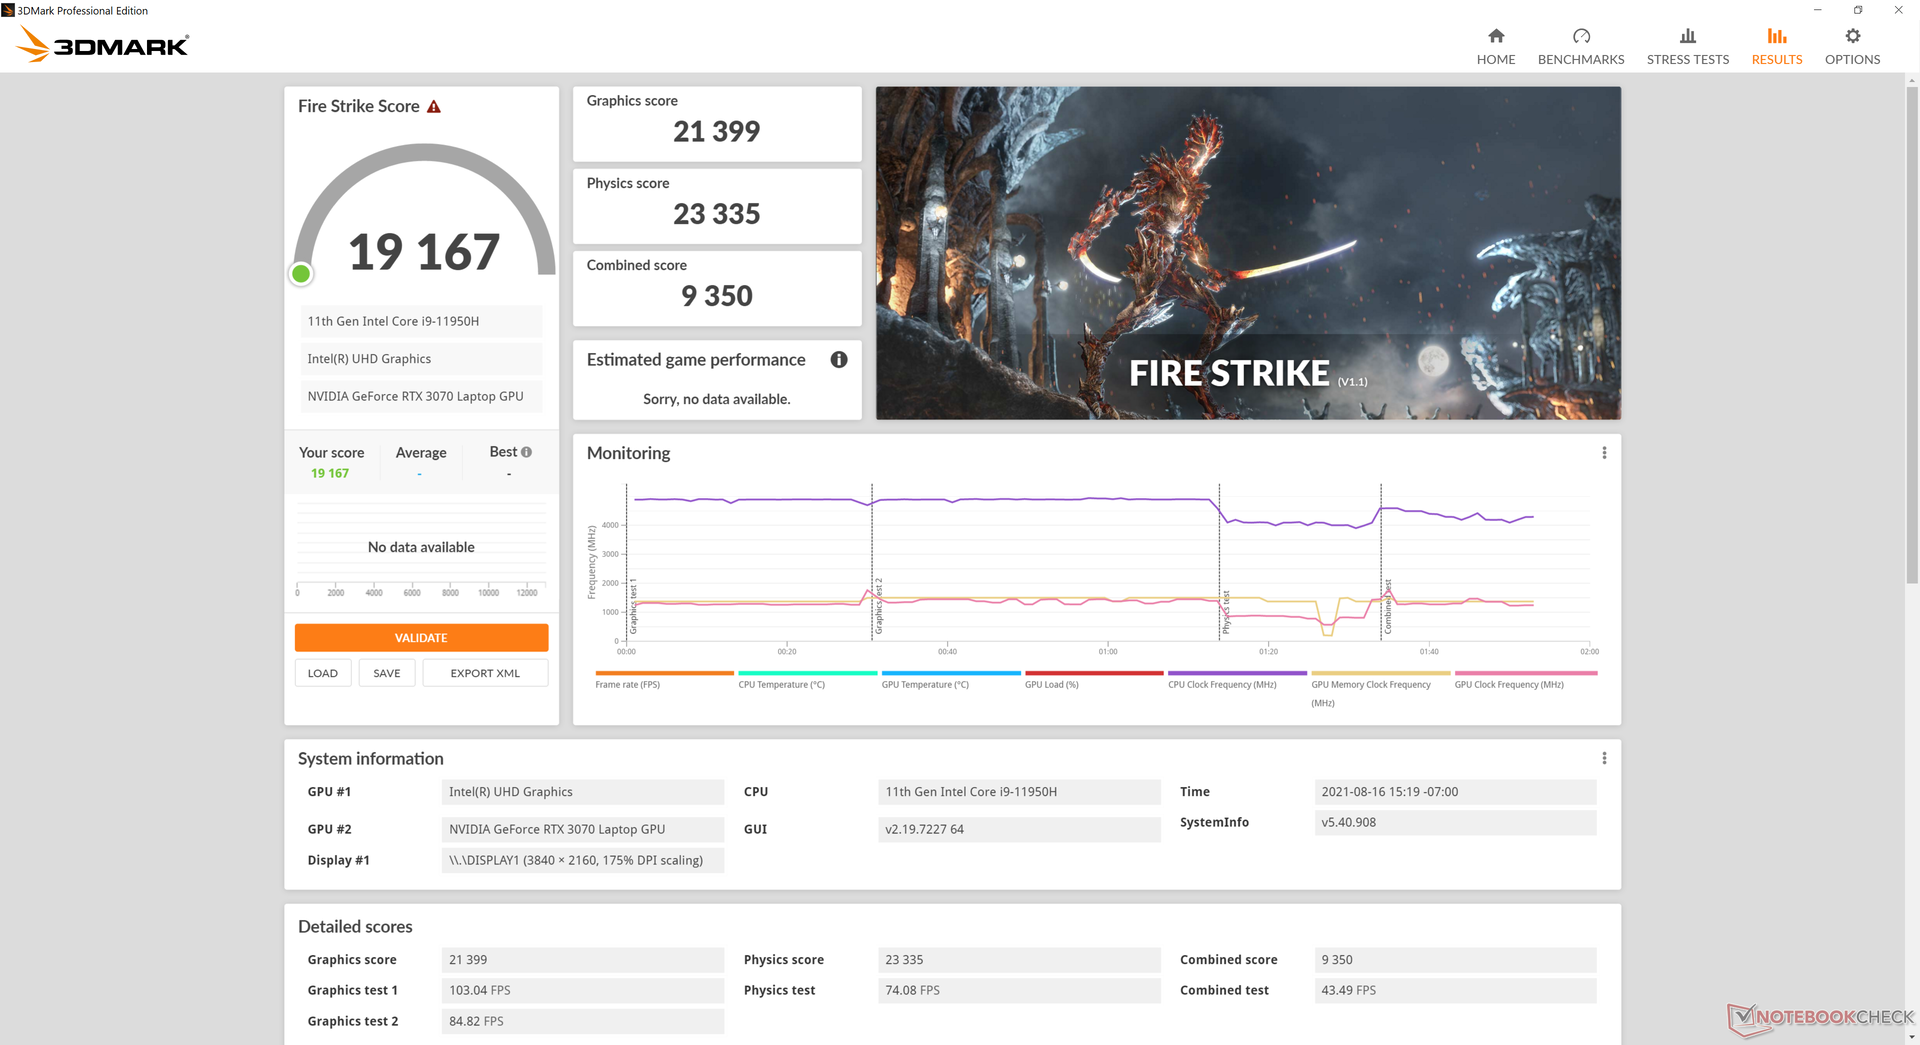
| 3DMark 11 Performance | 22946 pontos | |
| 3DMark Cloud Gate Standard Score | 32051 pontos | |
| 3DMark Fire Strike Score | 19167 pontos | |
| 3DMark Time Spy Score | 8050 pontos | |
Ajuda | ||
Witcher 3 FPS Chart
| baixo | média | alto | ultra | QHD | 4K | |
|---|---|---|---|---|---|---|
| The Witcher 3 (2015) | 365.9 | 252.2 | 154.2 | 81.5 | 40.3 | |
| Dota 2 Reborn (2015) | 162.5 | 144.1 | 135.8 | 116.3 | 93.1 | |
| Final Fantasy XV Benchmark (2018) | 144 | 104 | 78.5 | 61.3 | 36.2 | |
| X-Plane 11.11 (2018) | 120 | 104 | 83.5 | 54.4 | ||
| Far Cry 5 (2018) | 125 | 100 | 93 | 89 | 81 | 44 |
Emissions
Ruído do Sistema - Não Mais Quieto
O esmagamento de processadores de alto desempenho em um chassi fino levará inevitavelmente a ventiladores barulhentos. Com quase 50 dB(A) ao rodar jogos ou outras cargas altas, o ZBook G8 pode ficar mais alto do que a concorrência, incluindo o Razer Blade 15 Studio e o ZBook Studio G7 do ano passado. Os fãs nunca estão realmente ociosos, o que significa que sempre haverá um pouco de barulho mesmo quando ociosos na área de trabalho, sem aplicações em execução. Espere um ruído tolerável do ventilador de até 29,3 dB(A) contra um fundo de 23,5 dB(A) durante cargas não exigentes como processamento de texto, transmissão de vídeo, ou navegação.
| HP ZBook Studio 15 G8 GeForce RTX 3070 Laptop GPU, i9-11950H, Samsung PM981a MZVLB2T0HALB | HP ZBook Firefly 15 G8 2C9R7EA T500 Laptop GPU, i7-1165G7, Toshiba XG6 KXG60ZNV1T02 | HP ZBook Studio G7 Quadro RTX 3000 Max-Q, i9-10885H, Micron 2300 1TB MTFDHBA1T0TDV | Dell Precision 7550 Quadro RTX 5000 Max-Q, W-10885M, SK Hynix PC601A NVMe 1TB | Lenovo ThinkPad P15s Gen2-20W6000GGE T500 Laptop GPU, i7-1165G7, WDC PC SN720 SDAQNTW-1T00 | Asus ProArt StudioBook Pro 15 W500G5T Quadro RTX 5000 Max-Q, i7-9750H, Samsung SSD PM981 MZVLB1T0HALR | |
|---|---|---|---|---|---|---|
| Noise | 11% | 2% | -7% | 6% | -8% | |
| desligado / ambiente * (dB) | 23.5 | 24.1 -3% | 24.4 -4% | 25.8 -10% | 24.3 -3% | 25.2 -7% |
| Idle Minimum * (dB) | 25.3 | 24.1 5% | 24.4 4% | 25.8 -2% | 25.5 -1% | 27.9 -10% |
| Idle Average * (dB) | 25.3 | 24.1 5% | 24.4 4% | 25.8 -2% | 25.5 -1% | 27.9 -10% |
| Idle Maximum * (dB) | 25.3 | 27.1 -7% | 27.9 -10% | 25.9 -2% | 25.5 -1% | 27.9 -10% |
| Load Average * (dB) | 41.2 | 32.8 20% | 38.8 6% | 51.2 -24% | 35.65 13% | 47 -14% |
| Witcher 3 ultra * (dB) | 49.4 | 36.1 27% | 46.3 6% | 51.9 -5% | ||
| Load Maximum * (dB) | 49.4 | 36.1 27% | 46.3 6% | 51.9 -5% | 35.65 28% | 46.9 5% |
* ... menor é melhor
Barulho
| Ocioso |
| 25.3 / 25.3 / 25.3 dB |
| Carga |
| 41.2 / 49.4 dB |
 | ||
30 dB silencioso 40 dB(A) audível 50 dB(A) ruidosamente alto |
||
min: | ||
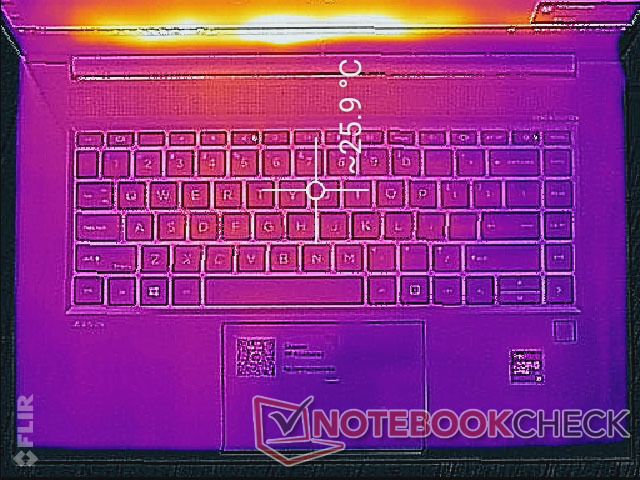
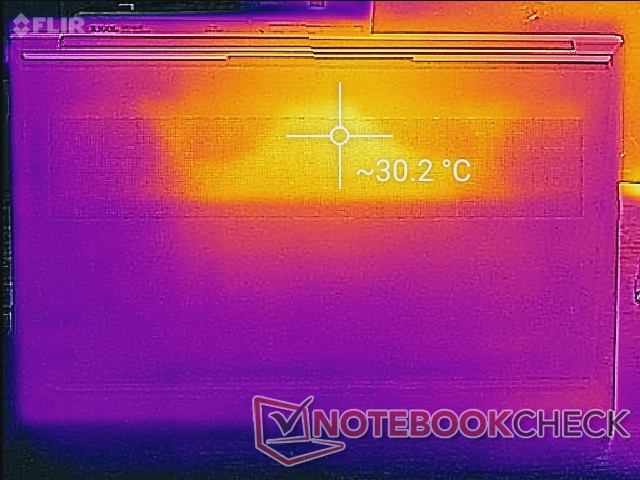
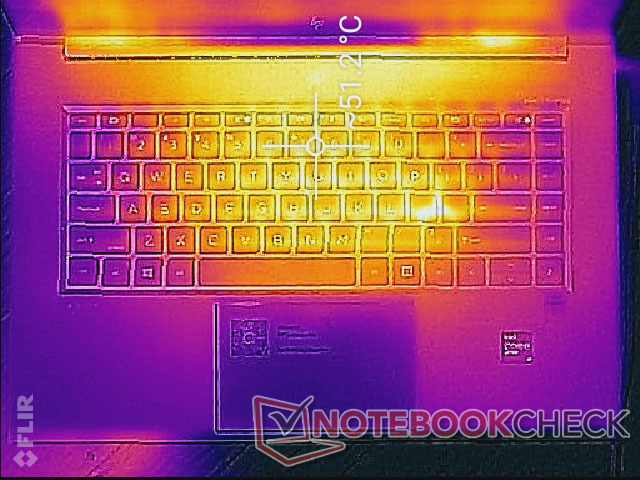
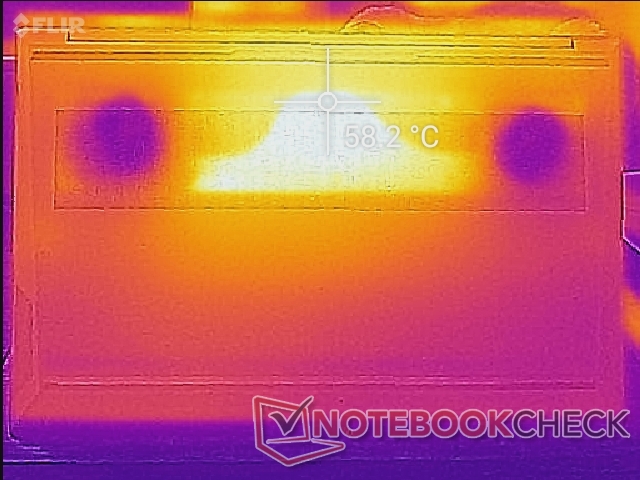
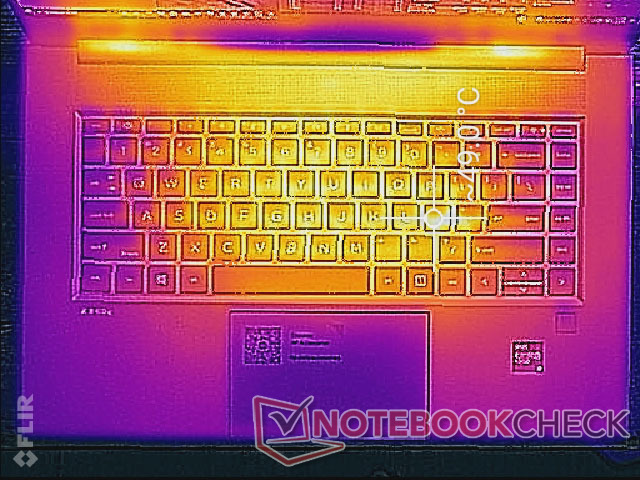
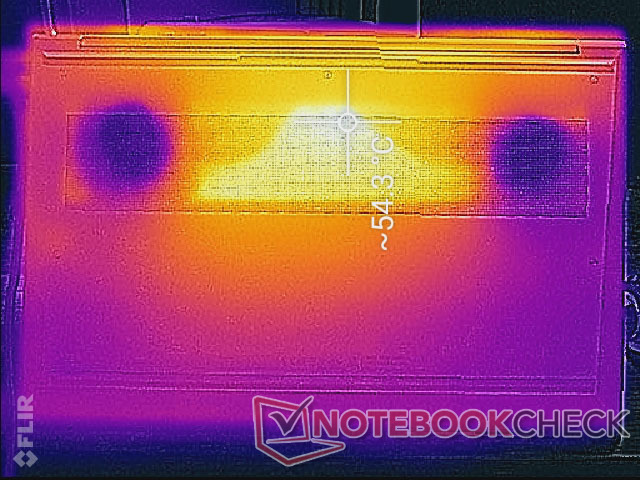
Temperatura - Descansos Quentes para Palma
As temperaturas da superfície são simétricas devido à solução de resfriamento simétrico dentro dela. O ponto quente está perto do centro do teclado onde pode alcançar mais de 51 C quando se trabalha com cargas elevadas em comparação com 49 C no Dell Precision 7550. Os apoios de palma também podem ficar bem quentes por volta de 38 C devido ao desenho denso da base metálica. As temperaturas mais quentes não são desconfortáveis para as mãos, mas certamente são perceptíveis.
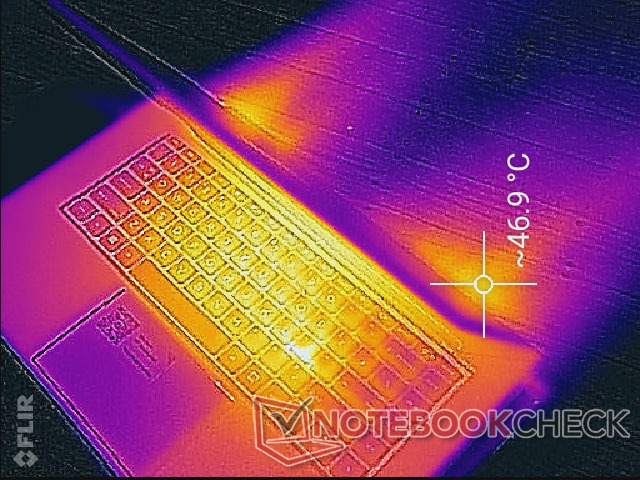
(-) A temperatura máxima no lado superior é 49 °C / 120 F, em comparação com a média de 38.2 °C / 101 F , variando de 22.2 a 69.8 °C para a classe Workstation.
(-) A parte inferior aquece até um máximo de 54.2 °C / 130 F, em comparação com a média de 41.1 °C / 106 F
(+) Em uso inativo, a temperatura média para o lado superior é 25.4 °C / 78 F, em comparação com a média do dispositivo de 32 °C / ### class_avg_f### F.
(-) Jogando The Witcher 3, a temperatura média para o lado superior é 43.2 °C / 110 F, em comparação com a média do dispositivo de 32 °C / ## #class_avg_f### F.
(±) Os apoios para as mãos e o touchpad podem ficar muito quentes ao toque, com um máximo de 38.4 °C / 101.1 F.
(-) A temperatura média da área do apoio para as mãos de dispositivos semelhantes foi 27.8 °C / 82 F (-10.6 °C / -19.1 F).
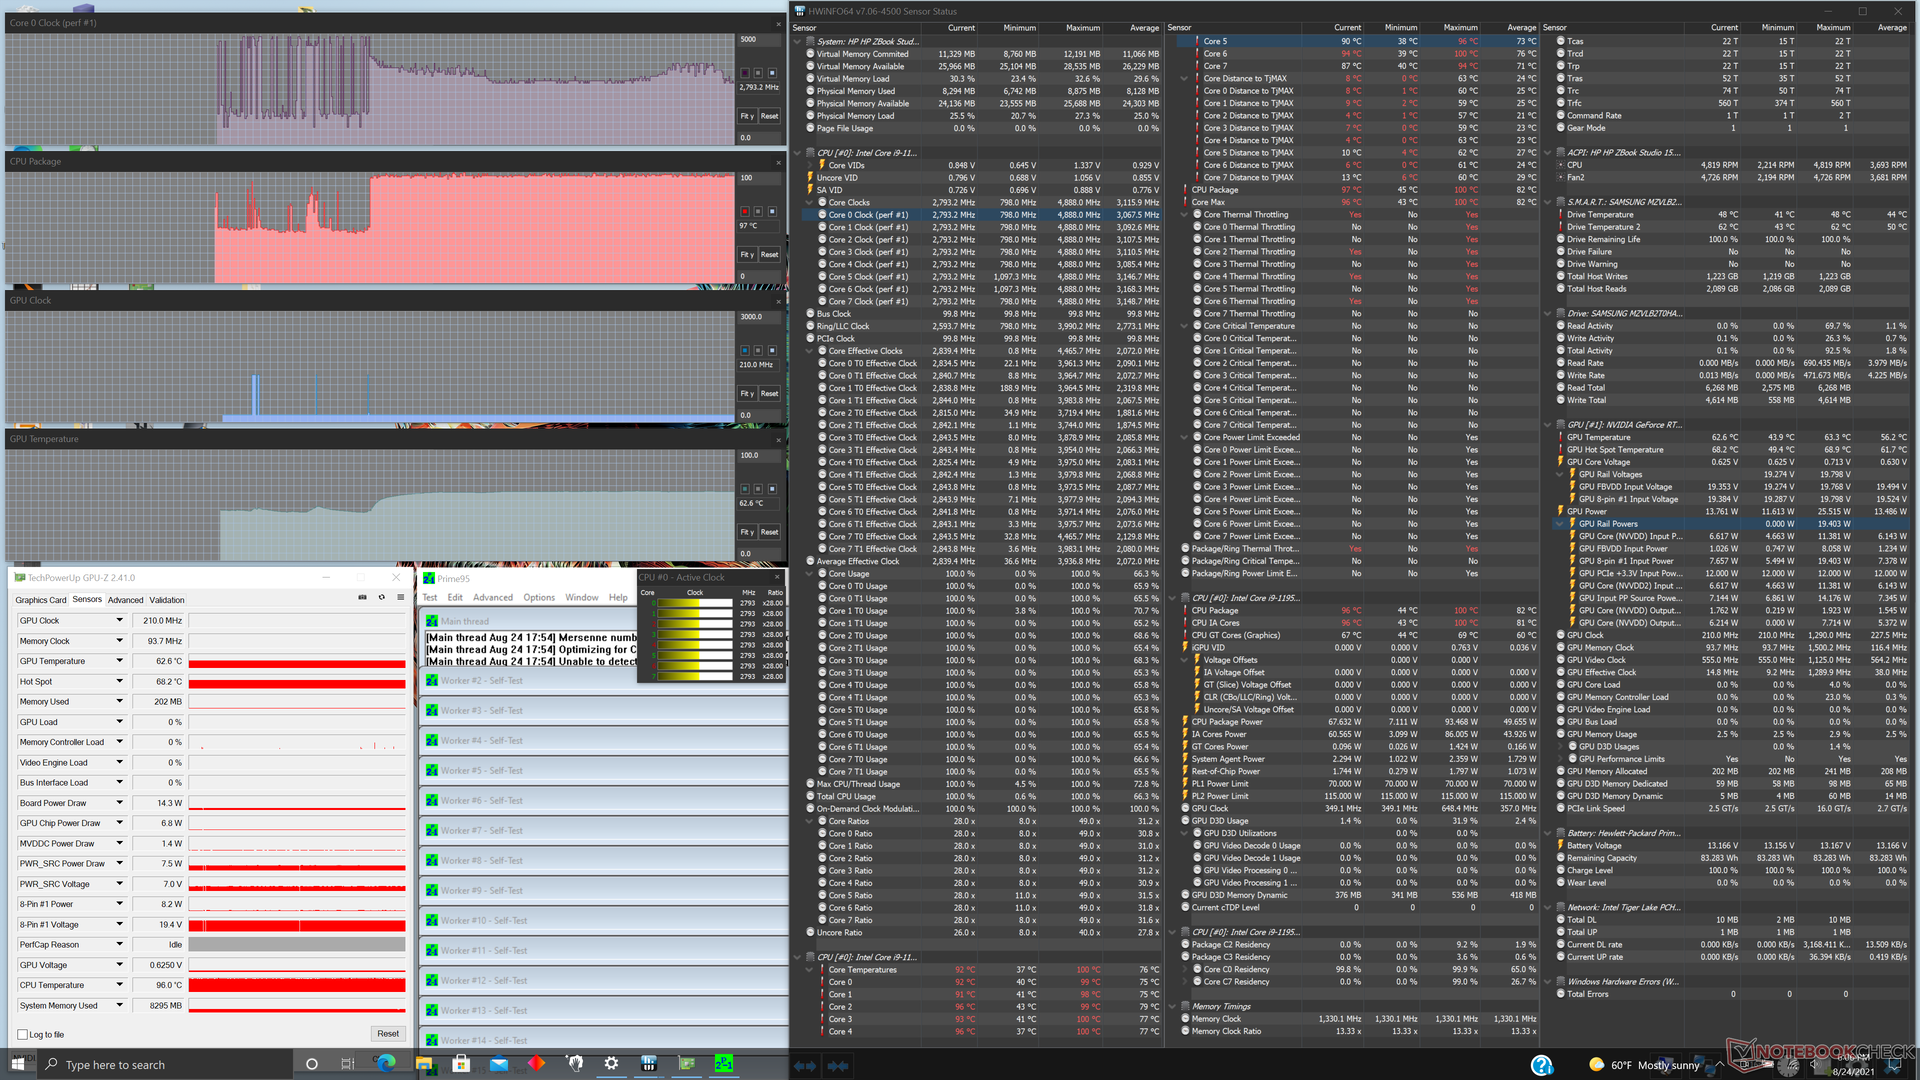
Teste de estresse
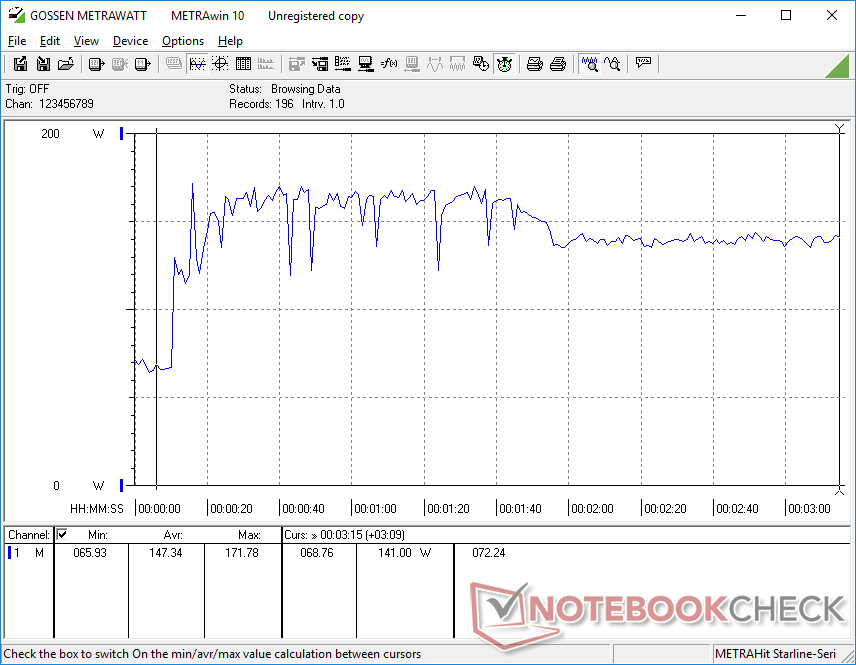
Quando sob estresse Prime95, a CPU aumentaria para 4 GHz apenas no primeiro segundo ou dois antes de atingir uma temperatura central de 97 C. As taxas de relógio se estabilizariam então na faixa de 2,8 a 3,3 GHz a fim de evitar que as temperaturas centrais subissem ainda mais. A execução deste mesmo teste no ZBook Fury 15 G7 mostraria resultados similares de temperatura central
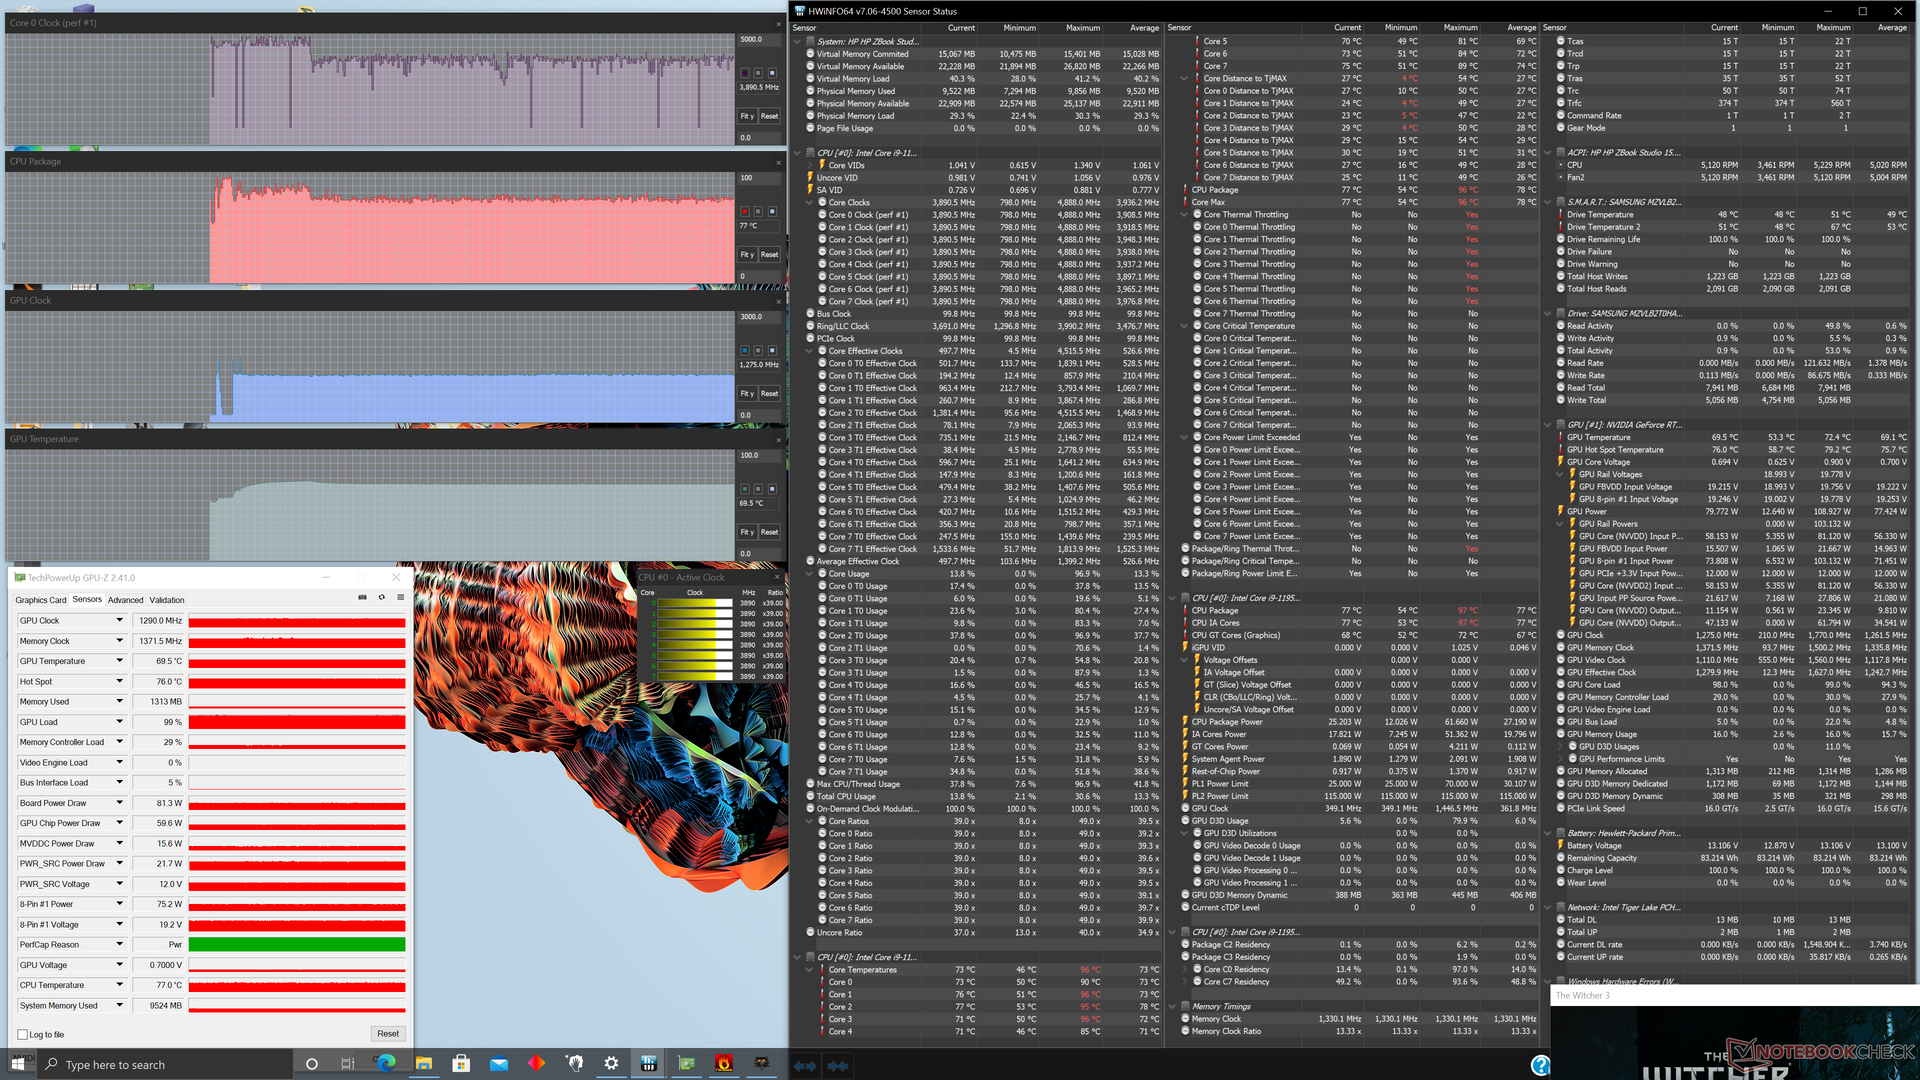
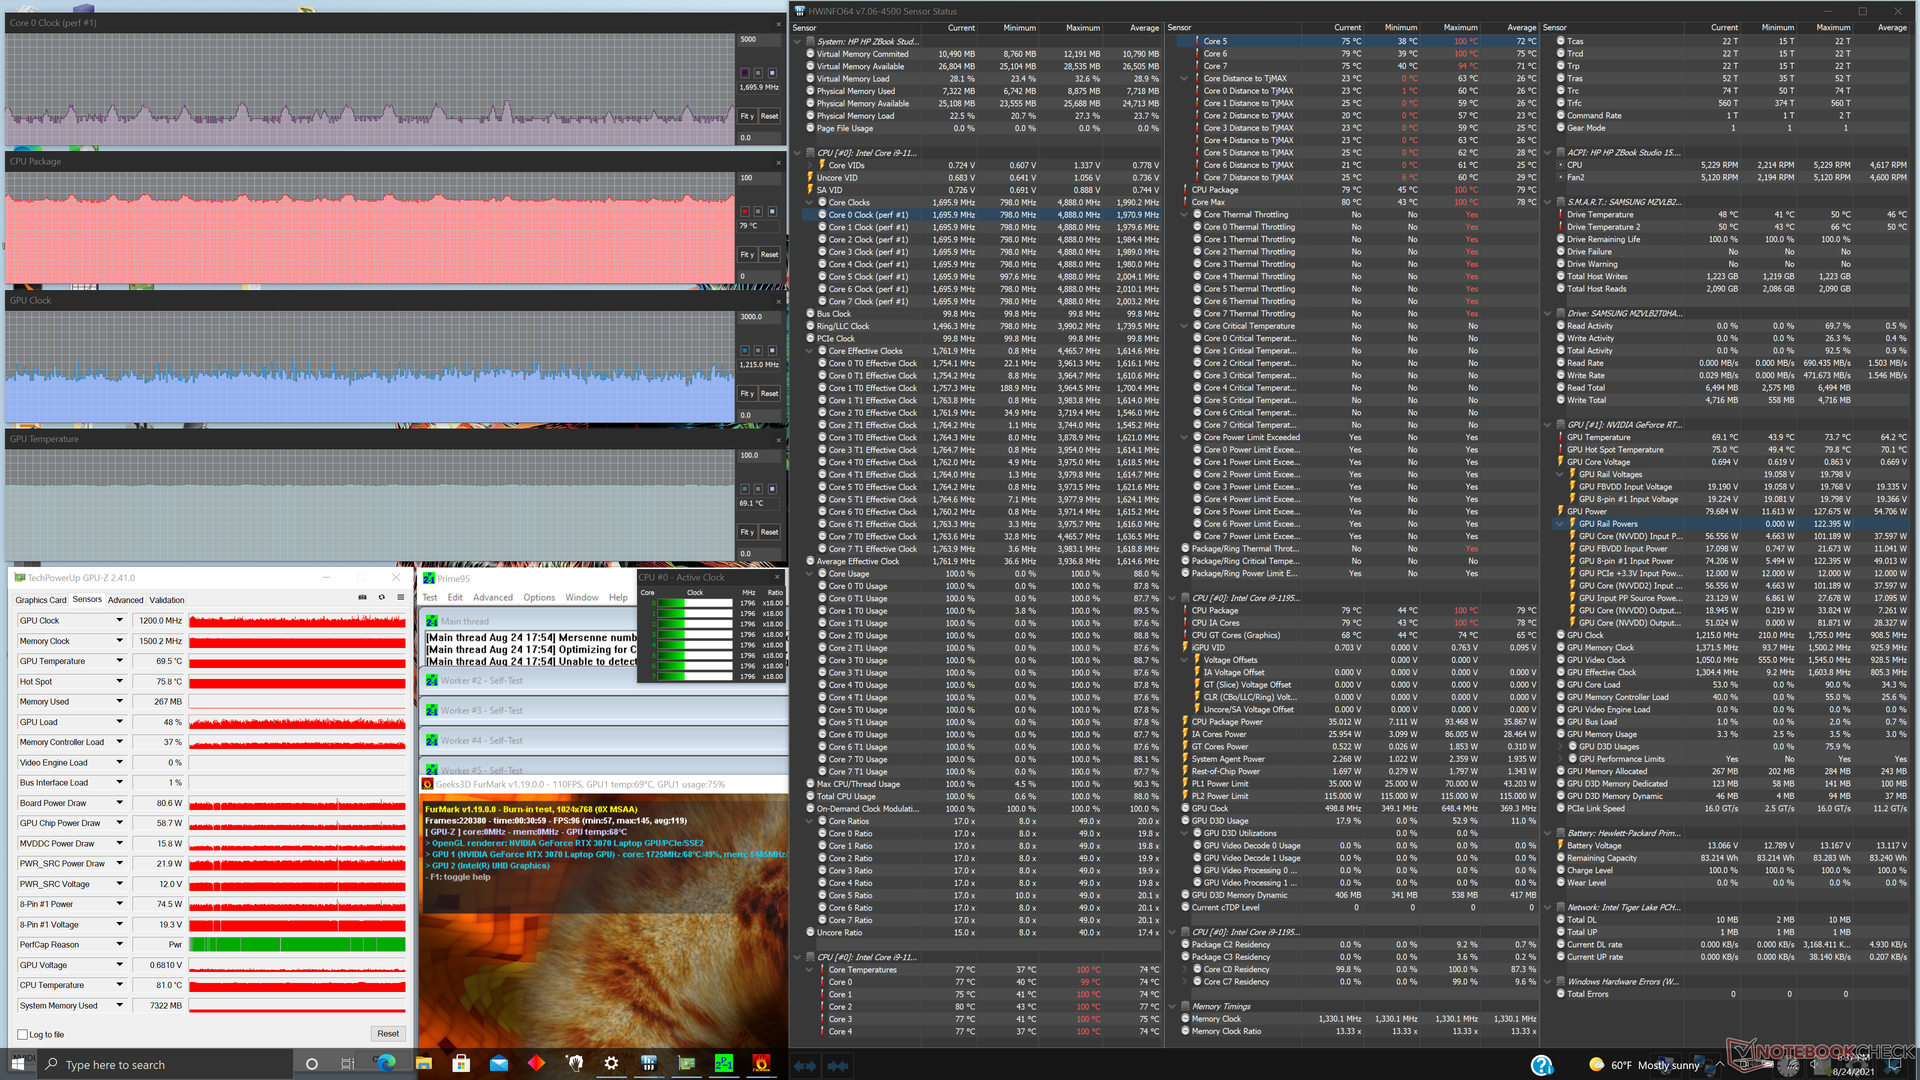
A CPU e GPU se estabilizariam em 77 C e 70 C, respectivamente, quando em funcionamento Witcher 3 que é apenas ligeiramente mais frio do que o que observamos no Dell Precision 5750 ou ZBook Fury 15 G7
Funcionando com energia de bateria, limitará severamente o desempenho. Um teste 3DMark 11 com baterias retornaria pontuações de Física e Gráfica de 10388 e 9950, respectivamente, em comparação com 17312 e 28908 pontos quando em rede elétrica.
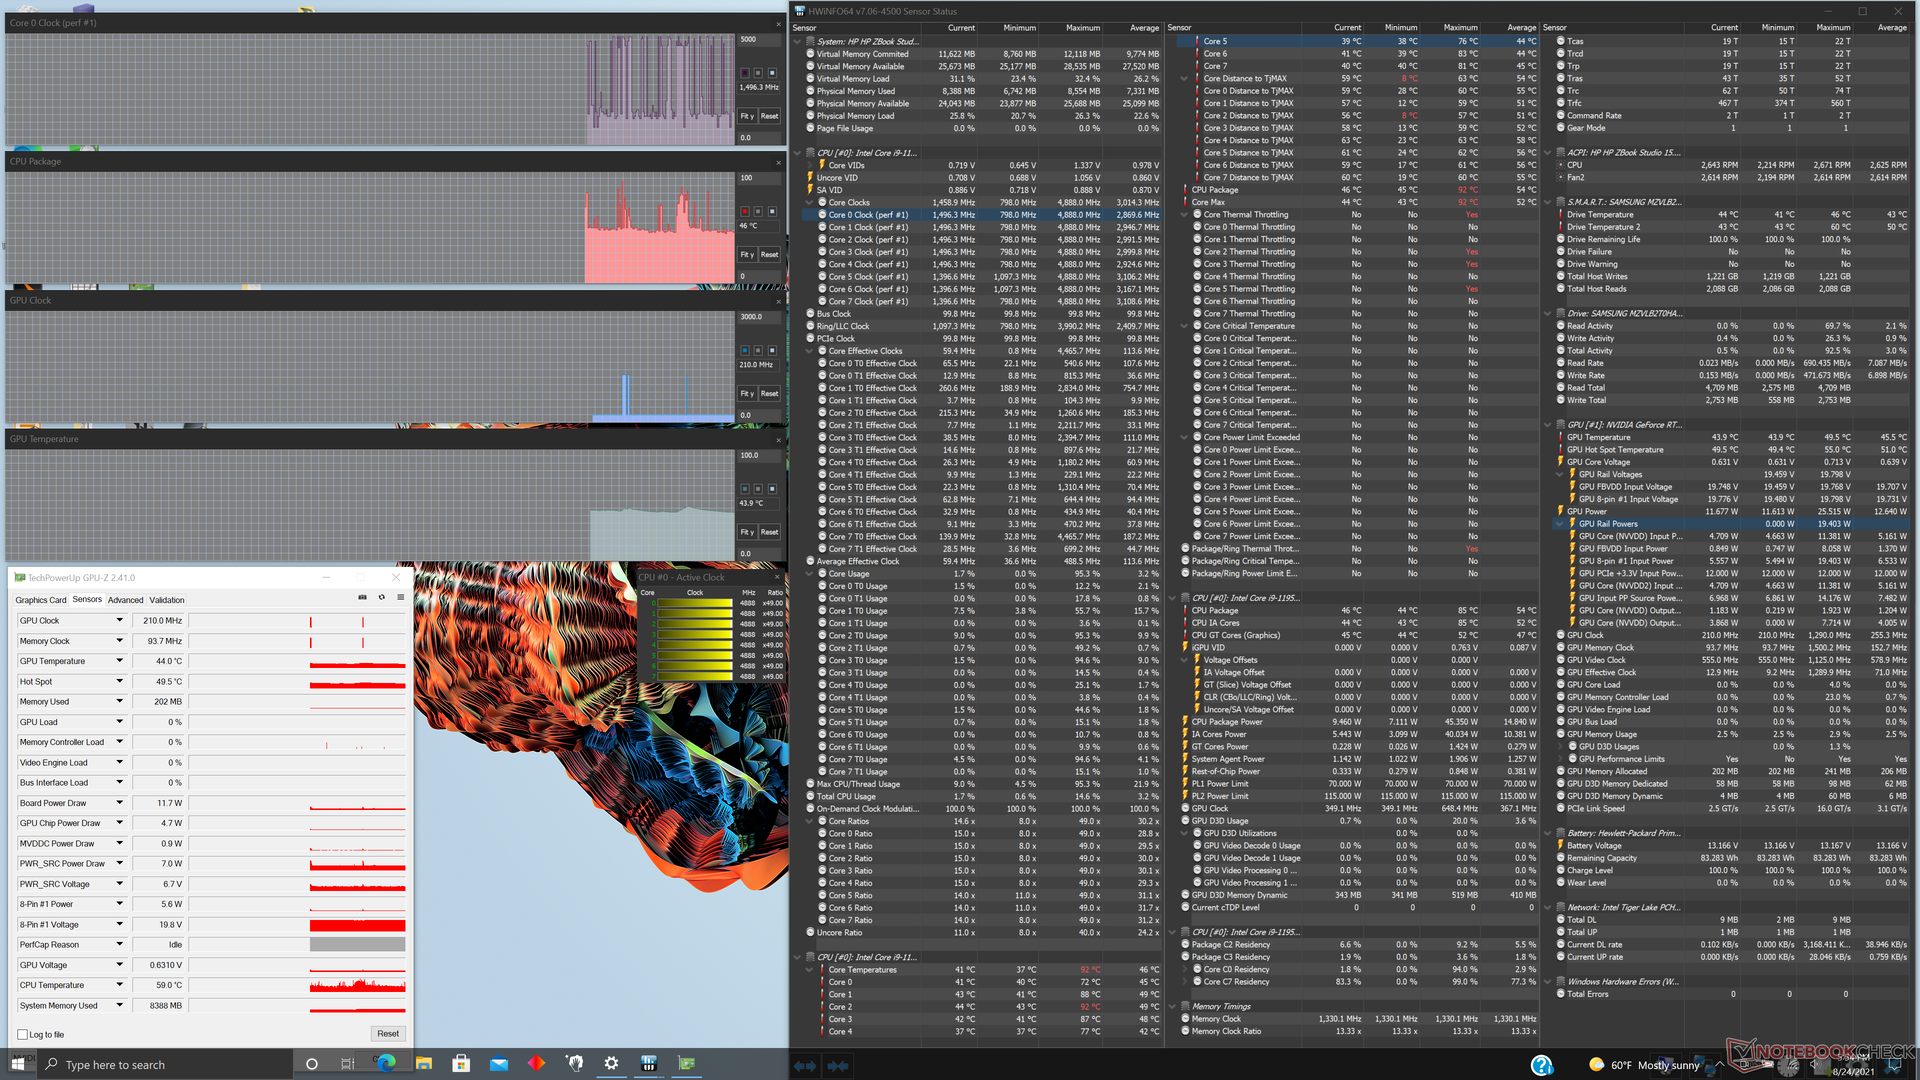
| RelógioCPU (GHz) | RelógioGPU (MHz) | Temperaturamédiada CPU (°C) | Temperaturamédiada GPU (°C) | |
| System Idle | -- | --46 | 44 | |
| Prime95 Stress | 2.8 - 3.3 | -98 | 63 | |
| Prime95 + FurMark Stress | 1.0 - 1.8 | 990 - 1695 | 73 - 81 | 69 |
| Witcher 3 Stress | ~3.8 | 1275 | 77 | 70 |
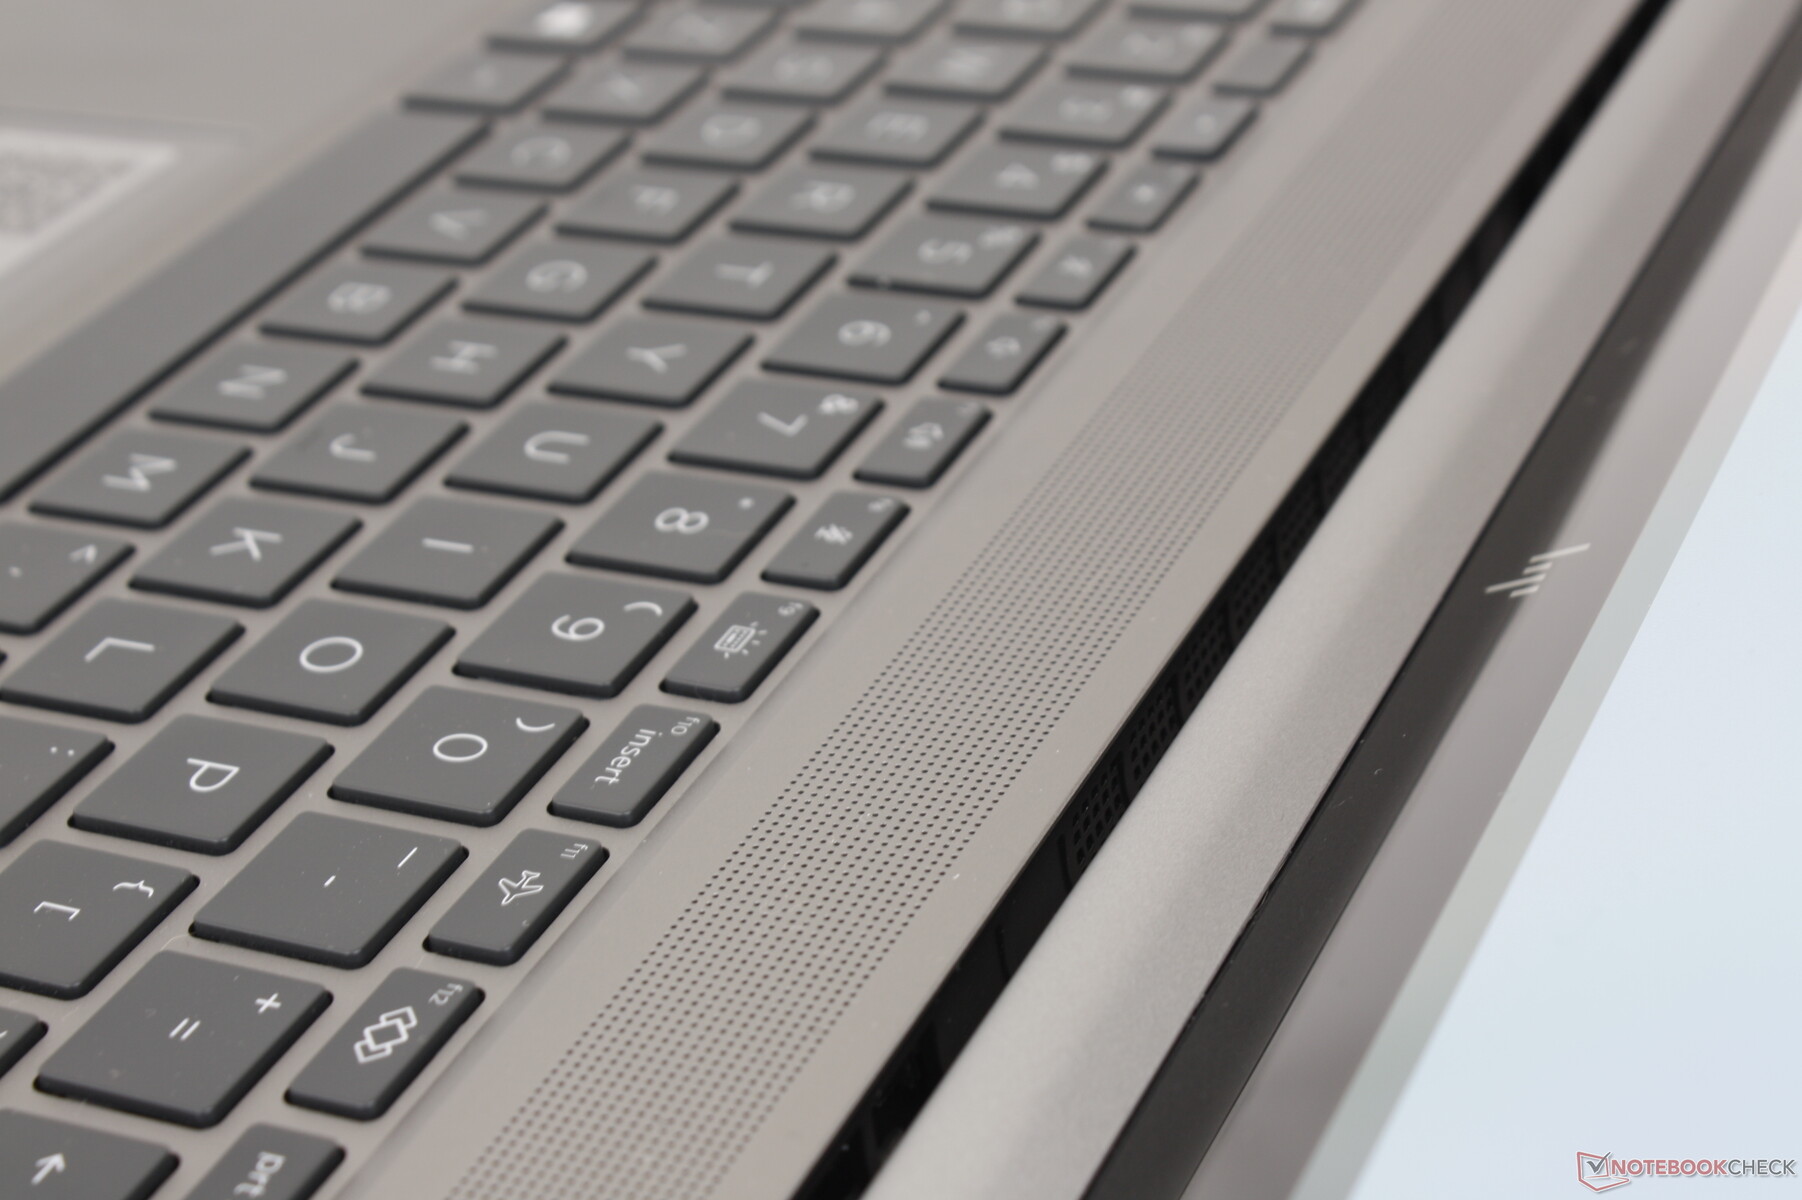
Oradores
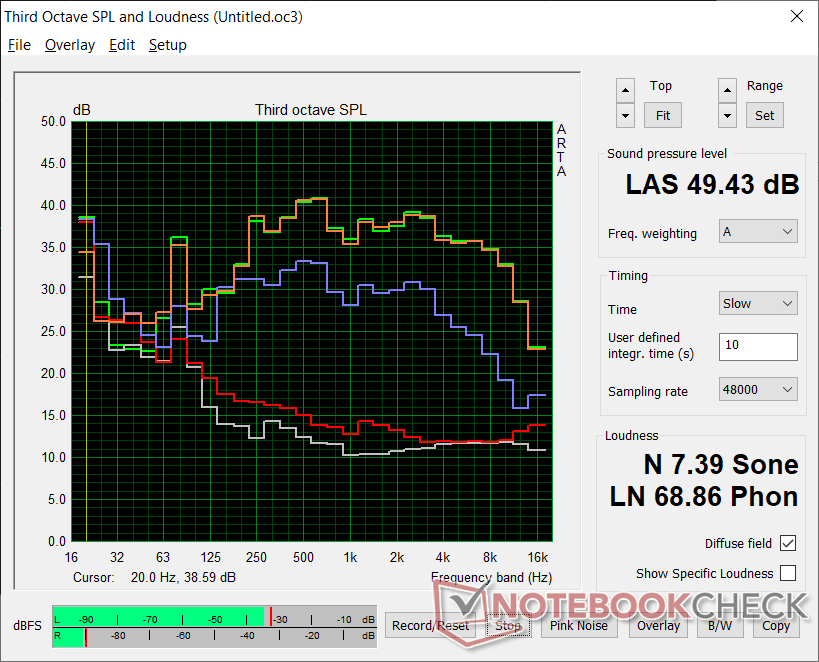
Os alto-falantes quádruplos integrados (2x tweeters + 2x woofers) proporcionam um som excelente com bom equilíbrio e reprodução decente dos graves. A qualidade poderia facilmente passar em um laptop de jogos ou multimídia como um modelo HP Omen ou MSI série GT.


HP ZBook Studio 15 G8 análise de áudio
(+) | os alto-falantes podem tocar relativamente alto (###valor### dB)
Graves 100 - 315Hz
(±) | graves reduzidos - em média 6% menor que a mediana
(±) | a linearidade dos graves é média (8.2% delta para a frequência anterior)
Médios 400 - 2.000 Hz
(+) | médios equilibrados - apenas 3.8% longe da mediana
(+) | médios são lineares (3.9% delta para frequência anterior)
Altos 2 - 16 kHz
(+) | agudos equilibrados - apenas 3.4% longe da mediana
(+) | os máximos são lineares (6.5% delta da frequência anterior)
Geral 100 - 16.000 Hz
(+) | o som geral é linear (8% diferença em relação à mediana)
Comparado com a mesma classe
» 1% de todos os dispositivos testados nesta classe foram melhores, 1% semelhantes, 99% piores
» O melhor teve um delta de 7%, a média foi 17%, o pior foi 35%
Comparado com todos os dispositivos testados
» 2% de todos os dispositivos testados foram melhores, 1% semelhantes, 98% piores
» O melhor teve um delta de 4%, a média foi 23%, o pior foi 134%
Apple MacBook 12 (Early 2016) 1.1 GHz análise de áudio
(+) | os alto-falantes podem tocar relativamente alto (###valor### dB)
Graves 100 - 315Hz
(±) | graves reduzidos - em média 11.3% menor que a mediana
(±) | a linearidade dos graves é média (14.2% delta para a frequência anterior)
Médios 400 - 2.000 Hz
(+) | médios equilibrados - apenas 2.4% longe da mediana
(+) | médios são lineares (5.5% delta para frequência anterior)
Altos 2 - 16 kHz
(+) | agudos equilibrados - apenas 2% longe da mediana
(+) | os máximos são lineares (4.5% delta da frequência anterior)
Geral 100 - 16.000 Hz
(+) | o som geral é linear (10.2% diferença em relação à mediana)
Comparado com a mesma classe
» 7% de todos os dispositivos testados nesta classe foram melhores, 2% semelhantes, 90% piores
» O melhor teve um delta de 5%, a média foi 18%, o pior foi 53%
Comparado com todos os dispositivos testados
» 5% de todos os dispositivos testados foram melhores, 1% semelhantes, 94% piores
» O melhor teve um delta de 4%, a média foi 23%, o pior foi 134%
Energy Management
Consumo de energia
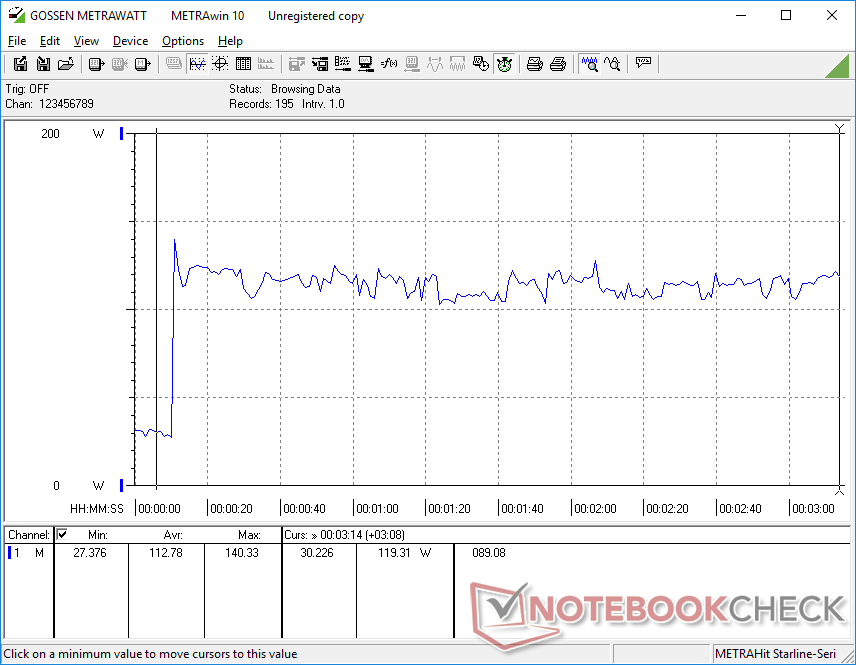
Nossa configuração consome mais energia do que a maioria das outras estações de trabalho de 15,6 polegadas, mesmo quando ociosas na área de trabalho devido a seu painel OLED. Nós temos comprovado que o OLED pode ser significativamente mais sedento de energia do que o típico IPS, especialmente quando exibe cores brancas brilhantes. Como a maioria do conteúdo online tem fundo branco, nossa unidade OLED pode consumir até 2x ou 3x mais energia apenas ao ficar ociosa na configuração de brilho máximo
Executando cargas maiores como jogos, consumirá cerca de 23% mais energia do que no Quadro RTX 3000 Max-Q- Powered ZBook G7. O desempenho por watt ainda é superior em nosso mais novo modelo G8, uma vez que o desempenho da CPU bruta e o desempenho gráfico são cerca de 25% e 50% maiores de gen-to-gen, respectivamente
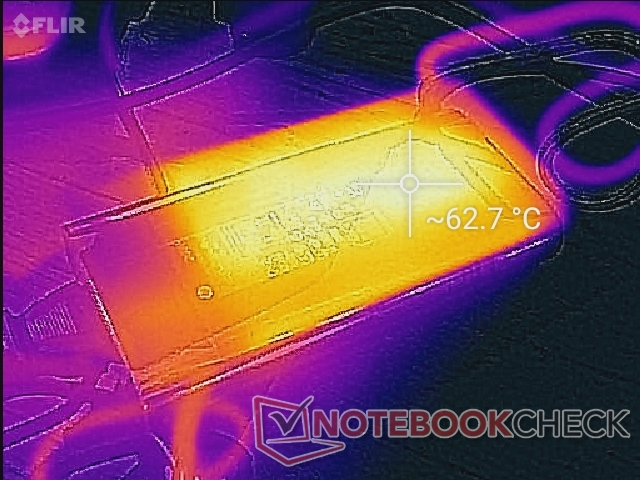
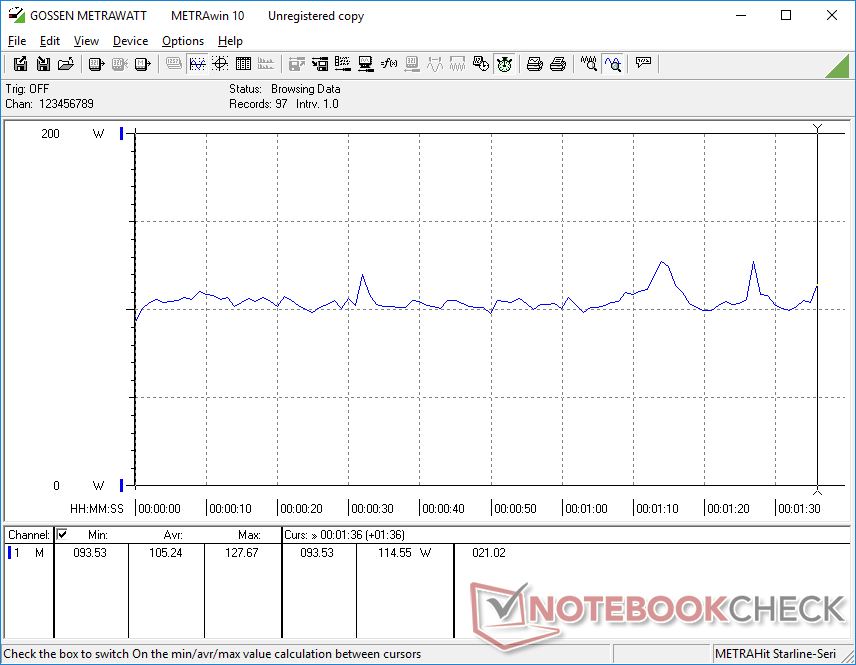
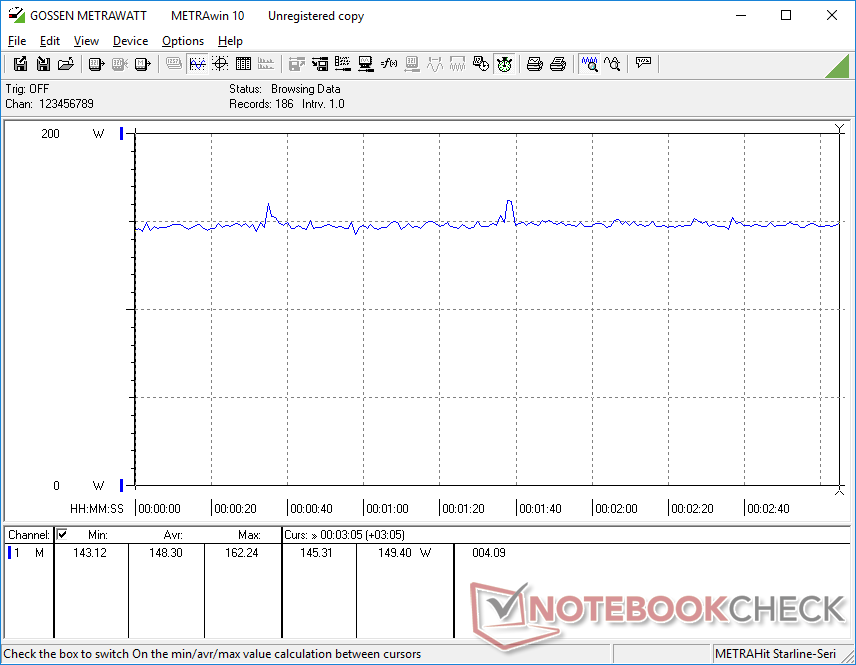
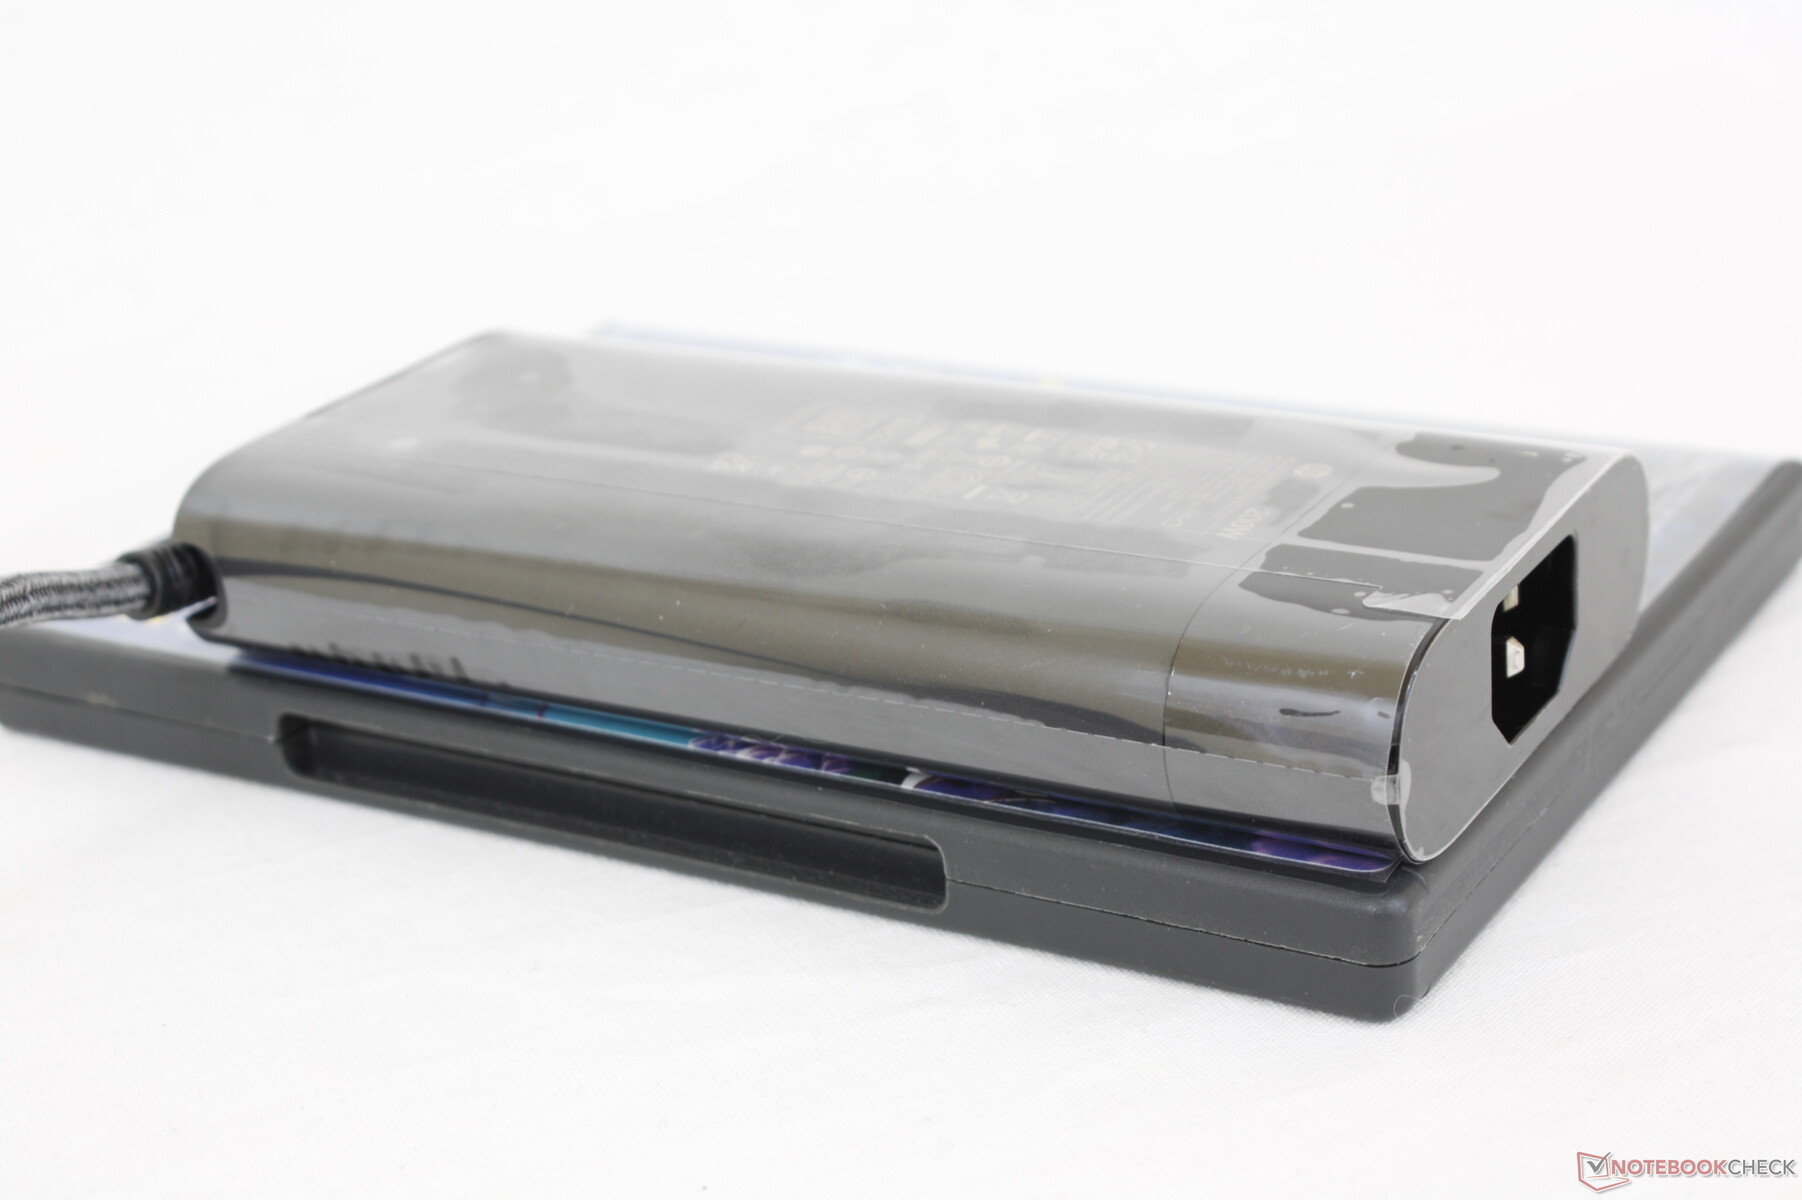
Somos capazes de registrar um consumo máximo de 172 W a partir do adaptador AC de tamanho médio (~15,3 x 7,5 x 2,4 cm) 200 W. O sistema pode executar cargas elevadas e ainda recarregar a uma taxa decente simultaneamente, ao contrário do que acontece com o versão anterior da Dell Precision 5750. então o ZBook G8 será enviado com um adaptador menor de 150 W AC Se configurado apenas com gráficos Iris Xe.
| desligado | |
| Ocioso | |
| Carga |
|
Key:
min: | |
| HP ZBook Studio 15 G8 i9-11950H, GeForce RTX 3070 Laptop GPU, Samsung PM981a MZVLB2T0HALB, OLED, 3840x2160, 15.6" | HP ZBook Firefly 15 G8 2C9R7EA i7-1165G7, T500 Laptop GPU, Toshiba XG6 KXG60ZNV1T02, IPS, 1920x1080, 15.6" | HP ZBook Studio G7 i9-10885H, Quadro RTX 3000 Max-Q, Micron 2300 1TB MTFDHBA1T0TDV, IPS, 3840x2160, 15.6" | Dell Precision 7550 W-10885M, Quadro RTX 5000 Max-Q, SK Hynix PC601A NVMe 1TB, IPS, 3840x2160, 15.6" | Lenovo ThinkPad P15s Gen2-20W6000GGE i7-1165G7, T500 Laptop GPU, WDC PC SN720 SDAQNTW-1T00, IPS LED, 3840x2160, 15.6" | Asus ProArt StudioBook Pro 15 W500G5T i7-9750H, Quadro RTX 5000 Max-Q, Samsung SSD PM981 MZVLB1T0HALR, IPS, 3840x2160, 15.6" | |
|---|---|---|---|---|---|---|
| Power Consumption | 63% | 19% | 2% | 54% | 6% | |
| Idle Minimum * (Watt) | 11 | 3.3 70% | 5.5 50% | 8.2 25% | 5.8 47% | 11.6 -5% |
| Idle Average * (Watt) | 18.8 | 5.6 70% | 13.7 27% | 16.8 11% | 13.3 29% | 19 -1% |
| Idle Maximum * (Watt) | 31.7 | 8.7 73% | 16.6 48% | 24.4 23% | 15.6 51% | 20.6 35% |
| Load Average * (Watt) | 105.2 | 64.4 39% | 118.4 -13% | 131 -25% | 43.2 59% | 102 3% |
| Witcher 3 ultra * (Watt) | 148 | 53 64% | 120 19% | 156.6 -6% | 37.1 75% | |
| Load Maximum * (Watt) | 171.8 | 69 60% | 203.3 -18% | 201.8 -17% | 67.3 61% | 178 -4% |
* ... menor é melhor
Power Consumption Witcher 3 / Stresstest
Vida útil da bateria - Mais curta por causa do OLED
Os tempos de execução parecem ser mais curtos do que no ZBook Studio G7 do ano passado por várias horas. Só conseguimos um pouco mais de 6 horas de uso da WLAN no mundo real em comparação com quase 8 horas no G7, mesmo quando configurado para a GPU integrada. O painel OLED mais faminto de energia em nosso G8 é um provável culpado pela vida útil truncada da bateria.
Felizmente, o carregamento é rápido em cerca de 90 minutos, desde a capacidade vazia até a plena capacidade. Os usuários também podem recarregar o sistema via USB-C.
| HP ZBook Studio 15 G8 i9-11950H, GeForce RTX 3070 Laptop GPU, 83 Wh | HP ZBook Firefly 15 G8 2C9R7EA i7-1165G7, T500 Laptop GPU, 56 Wh | HP ZBook Studio G7 i9-10885H, Quadro RTX 3000 Max-Q, 83 Wh | Dell Precision 7550 W-10885M, Quadro RTX 5000 Max-Q, 95 Wh | Lenovo ThinkPad P15s Gen2-20W6000GGE i7-1165G7, T500 Laptop GPU, 57 Wh | Asus ProArt StudioBook Pro 15 W500G5T i7-9750H, Quadro RTX 5000 Max-Q, 76 Wh | |
|---|---|---|---|---|---|---|
| Duração da bateria | 49% | 8% | -5% | 15% | -24% | |
| Reader / Idle (h) | 12.9 | 11.1 -14% | ||||
| WiFi v1.3 (h) | 6.2 | 10.5 69% | 7.8 26% | 8.9 44% | 7.7 24% | 4.7 -24% |
| Load (h) | 1.8 | 2.3 28% | 1.6 -11% | 1 -44% | 1.9 6% |
Pro
Contra
Veredicto - Bons Ganhos de CPU, Ganhos de GPU pouco inspiradores
HP tem três modelos ZBook G8 para escolher no momento: o ZBook Studio G8, o ZBook Fury G8 e o ZBook Fury G8 ZBook Firefly G8. O Fury G8 grosso preenche o espaço tradicional da estação de trabalho enquanto o Firefly G8 fino e leve utiliza o software ULV para maior portabilidade. Nosso ZBook Studio G8 é a solução de meio-termo para usuários que desejam o desempenho da série Core H sem o volume do Firefly.
Esta solução de meio-terra significa renunciar a algumas características encontradas no Fury. O painel inferior de liberação rápida, numpad, botões do mouse, TrackPoint, CPUs Xeon, RAM ECC atualizável, obturador de webcam e muito mais estão todos faltando no ZBook Studio G8. Os usuários podem querer considerar o modelo Fury mais grosso, se tais características forem desejáveis.
O confiável ZBook Studio G8 funciona muito bem e parece ainda melhor apesar de seu design de um ano de idade. No entanto, o GeForce RTX 3070 é pouco atraente, enquanto o painel OLED tem alguns inconvenientes notáveis quando comparado com as opções mais baratas de IPS.
Quando comparado com concorrentes mais imediatos como o MSI WS66 ou Estúdio Razer Blade 15O sistema MSI oferece opções Xeon enquanto ambos podem conter até dois M.2 SSDs em vez de apenas um. As temperaturas da CPU ao executar cargas altas também poderiam ser muito mais frias no HP. Mesmo o ZBook Studio G8 tem a melhor qualidade de construção do que o MSI e um teclado mais confortável do que qualquer uma das alternativas.
Preço e disponibilidade
O ZBook Studio G8 ainda não está amplamente disponível nos canais de varejo de terceiros a partir desta redação. Os usuários interessados devem, ao invés disso, encomendar diretamente da HP onde as opções configuráveis são abundantes. Nossa configuração específica de varejo por cerca de $4200 USD.
HP ZBook Studio 15 G8
- 08/31/2022 v7 (old)
Allen Ngo
Price comparison

