Revisão do laptop Lenovo ThinkPad P15v G2: Estação de trabalho comercial de baixo custo
O Lenovo ThinkPad P15v Gen2 é uma estação de trabalho de 15 polegadas que está posicionada entre o ThinkPad P15s e P15 como este último grupo, ele utiliza um grupo de computadores portáteis Intel Núcleo i7-11800Hmas vem com a opção de uma Nvidia GeForce RTX A2000 como a GPU mais poderosa disponível para esta variante. O ThinkPad T15p Gen2 utiliza o mais lento Nvidia GeForce GTX 1650que é configurada como uma variante profissional (Nvidia T1200) em nosso P15v G2.
Ambos os dispositivos podem ser equipados com um display de 4K (600 lêndeas), assim como o T15p Gen1. O ThinkPad T15g mais volumoso, por outro lado, é uma variante de estação de trabalho do ThinkPad P15 que se deslocou na direção do jogo. A série P15v oferece assim componentes potentes a um peso e preço não muito altos (cerca de 1.800 Euros). A Lenovo anuncia sua estação de trabalho para pessoas criativas: se esta afirmação se justifica, particularmente no que diz respeito à exibição, será revelada na revisão seguinte.
Nota para leitores internacionais: O Lenovo ThinkPad P15v Gen2 também está disponível em outros países em várias configurações a vários preços (ver "Preço e Disponibilidade" no final desta resenha para exemplos)
| Modell | Área de aplicação |
|---|---|
| ThinkPad P15 | Estação de trabalho clássica |
| ThinkPad T15g | Estação de trabalho para jogos |
| ThinkPad P15s | Estação de trabalho Ultrabook |
| ThinkPad T15 | Negócios |
| ThinkPad P15v | Posto de trabalho de nível básico |
| ThinkPad T15p | Desempenho comercial |
Possíveis concorrentes em comparação
Avaliação | Data | Modelo | Peso | Altura | Size | Resolução | Preço |
|---|---|---|---|---|---|---|---|
| 86.2 % v7 (old) | 06/2022 | Lenovo ThinkPad P15v G2 21A9000XGE i7-11800H, T1200 Laptop GPU | 2.3 kg | 22.7 mm | 15.60" | 1920x1080 | |
| 87.2 % v7 (old) | 10/2021 | Lenovo ThinkPad P15 G2-20YQ001JGE i7-11800H, RTX A3000 Laptop GPU | 2.9 kg | 31.5 mm | 15.60" | 1920x1080 | |
| 86.3 % v7 (old) | 03/2021 | Lenovo ThinkPad T15g-20UR000GGE i7-10750H, GeForce RTX 2070 Super Max-Q | 2.8 kg | 31.45 mm | 15.60" | 1920x1080 | |
| 86.6 % v7 (old) | 02/2021 | Lenovo ThinkPad T15p-20TN0006GE i7-10750H, GeForce GTX 1050 Mobile | 2.2 kg | 22.7 mm | 15.60" | 3840x2160 | |
| 85.3 % v7 (old) | 06/2021 | Lenovo ThinkPad P15s Gen2-20W6000GGE i7-1165G7, T500 Laptop GPU | 1.9 kg | 19.1 mm | 15.60" | 3840x2160 | |
| 87.7 % v7 (old) | 07/2022 | HP ZBook Power 15 G8 313S5EA i7-11800H, T600 Laptop GPU | 2 kg | 22.8 mm | 15.60" | 1920x1080 | |
| 88.3 % v7 (old) | 10/2021 | Dell Precision 5000 5560 i7-11850H, RTX A2000 Laptop GPU | 2 kg | 18 mm | 15.60" | 3840x2400 |
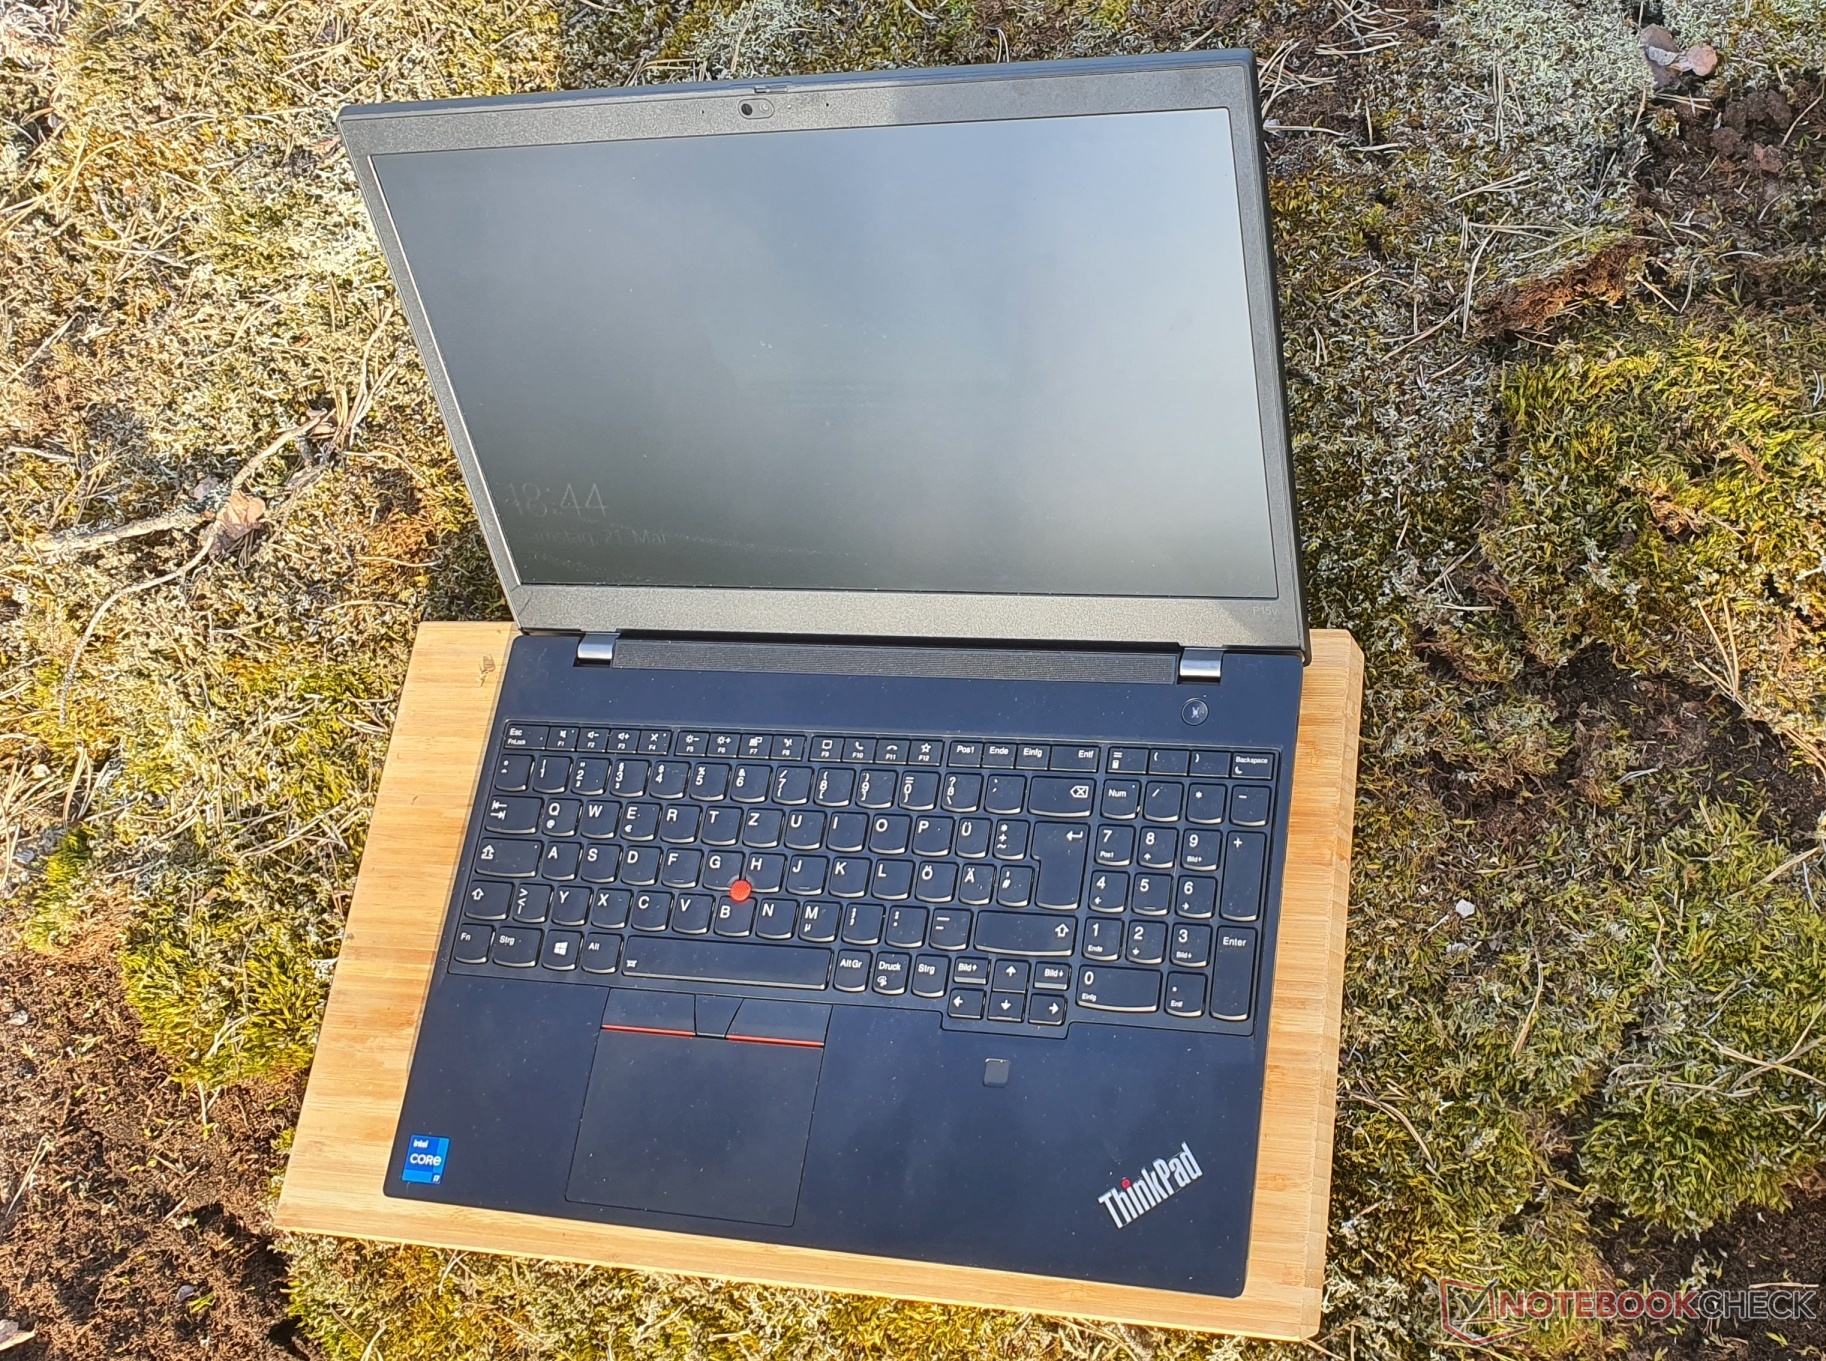
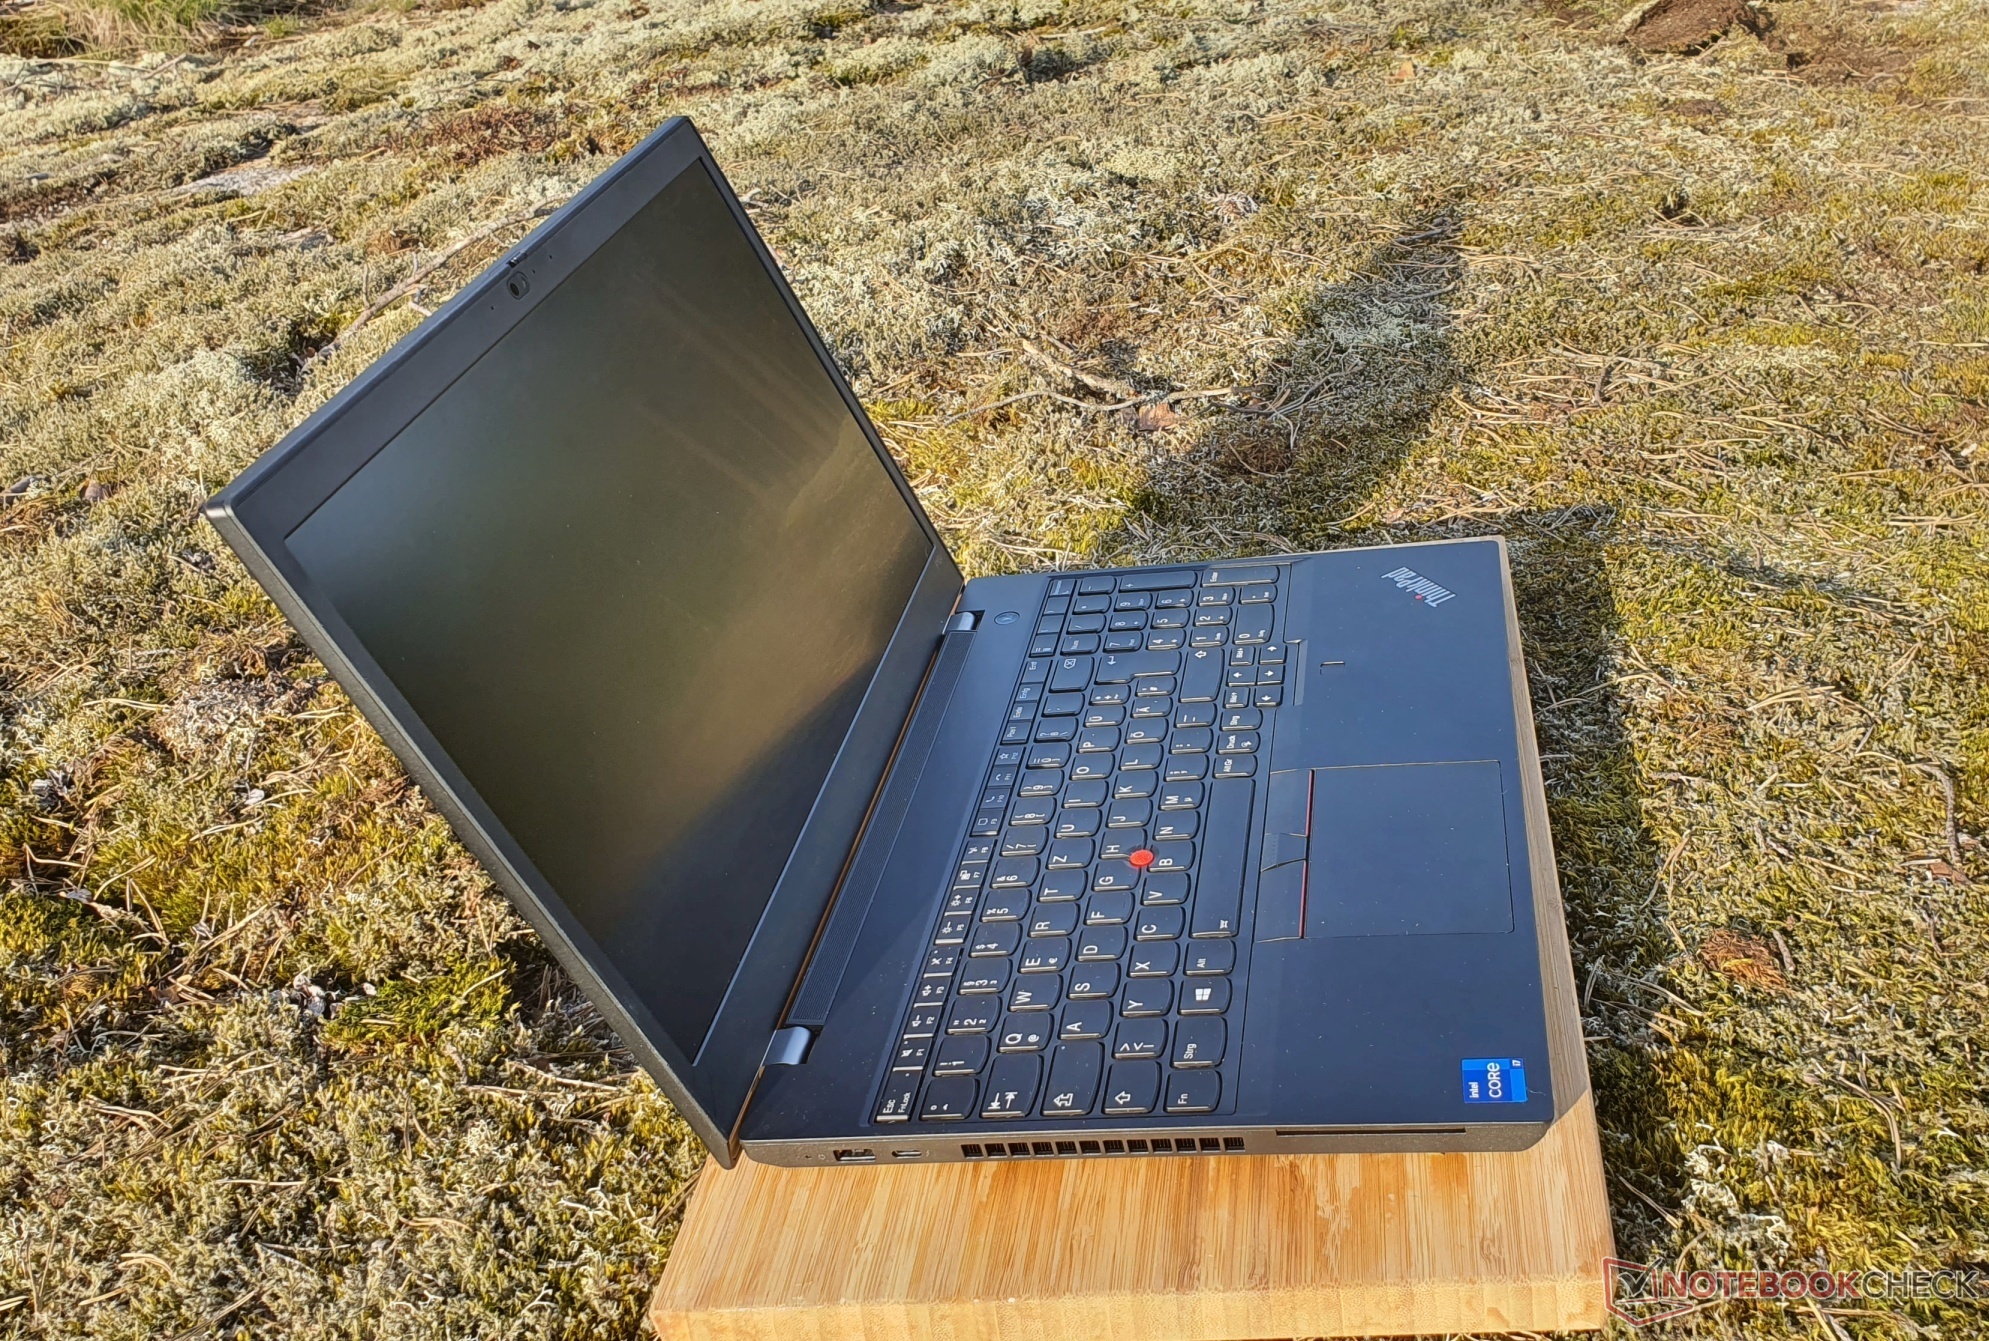
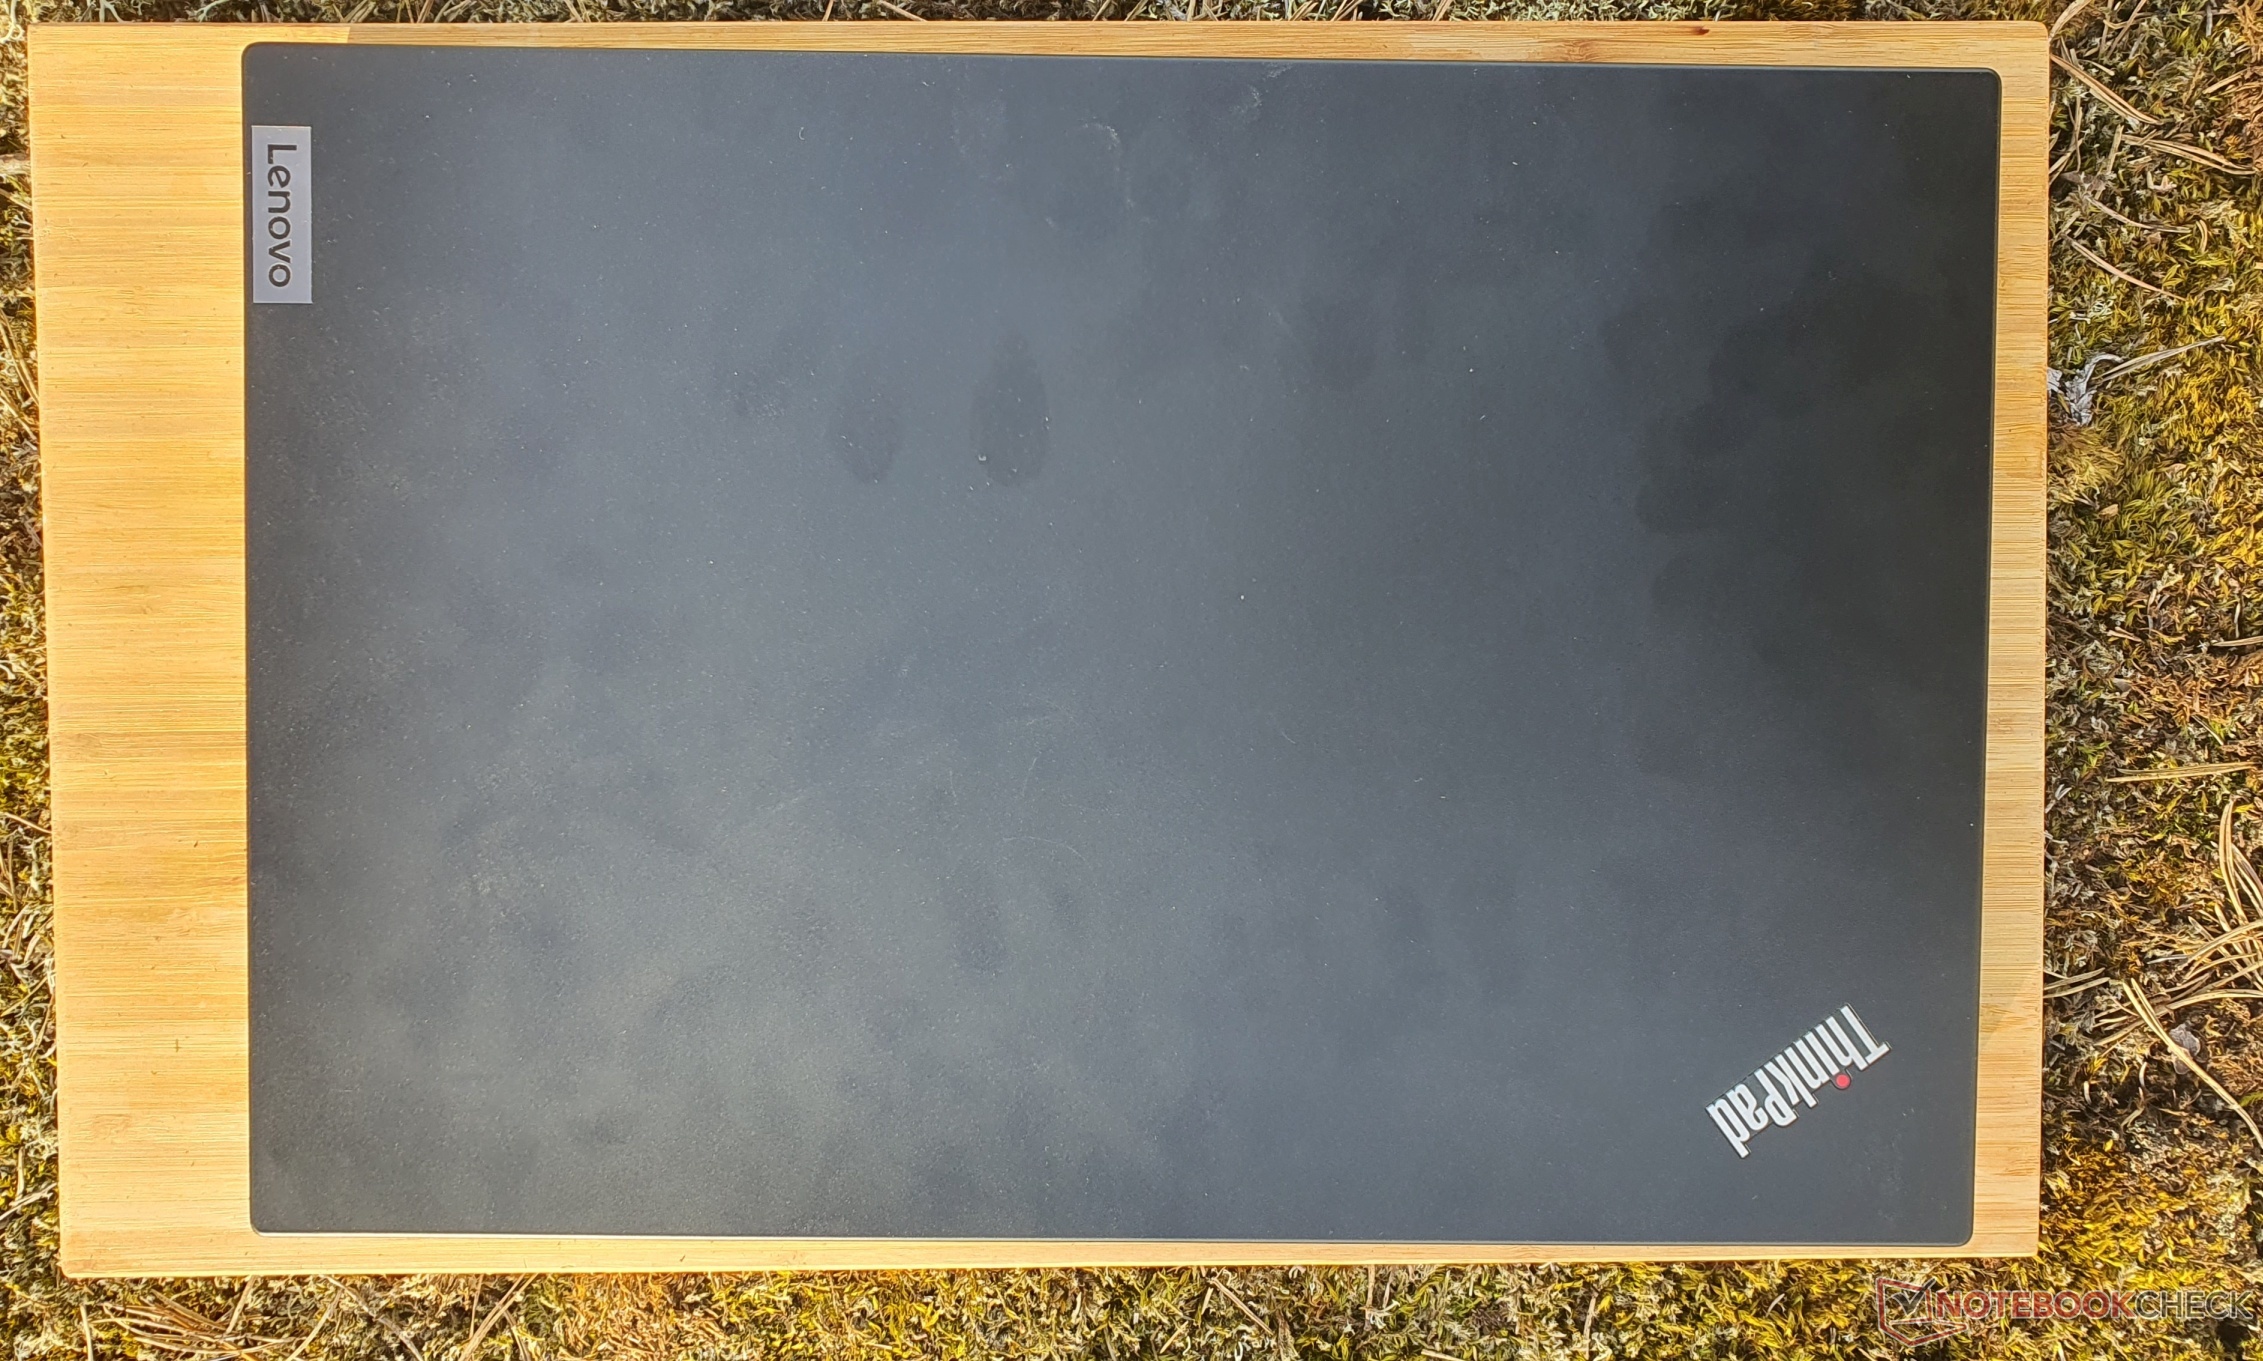
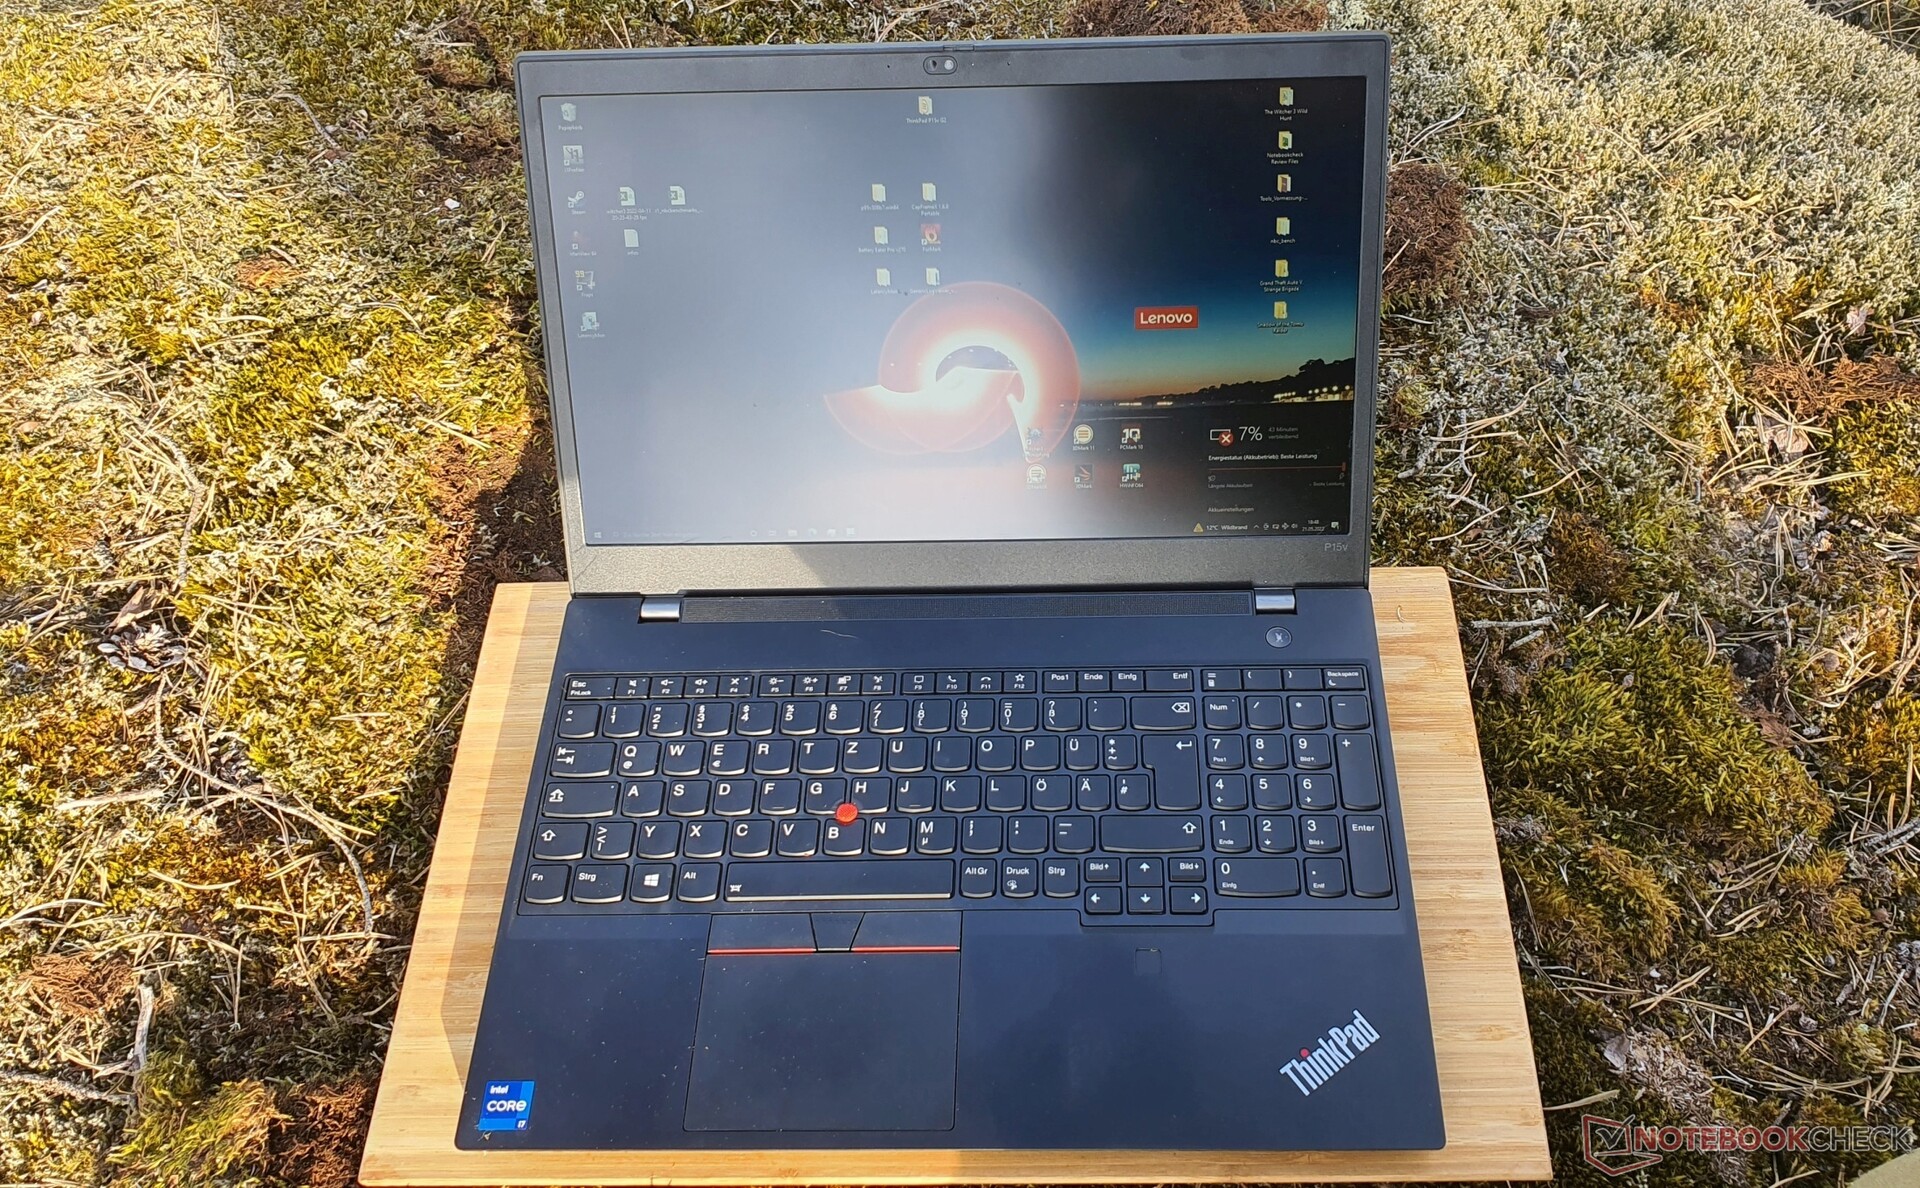
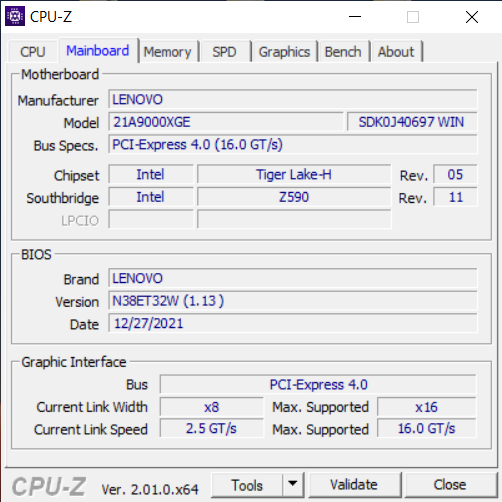
Estojo: Plástico estável para o ThinkPad fosco
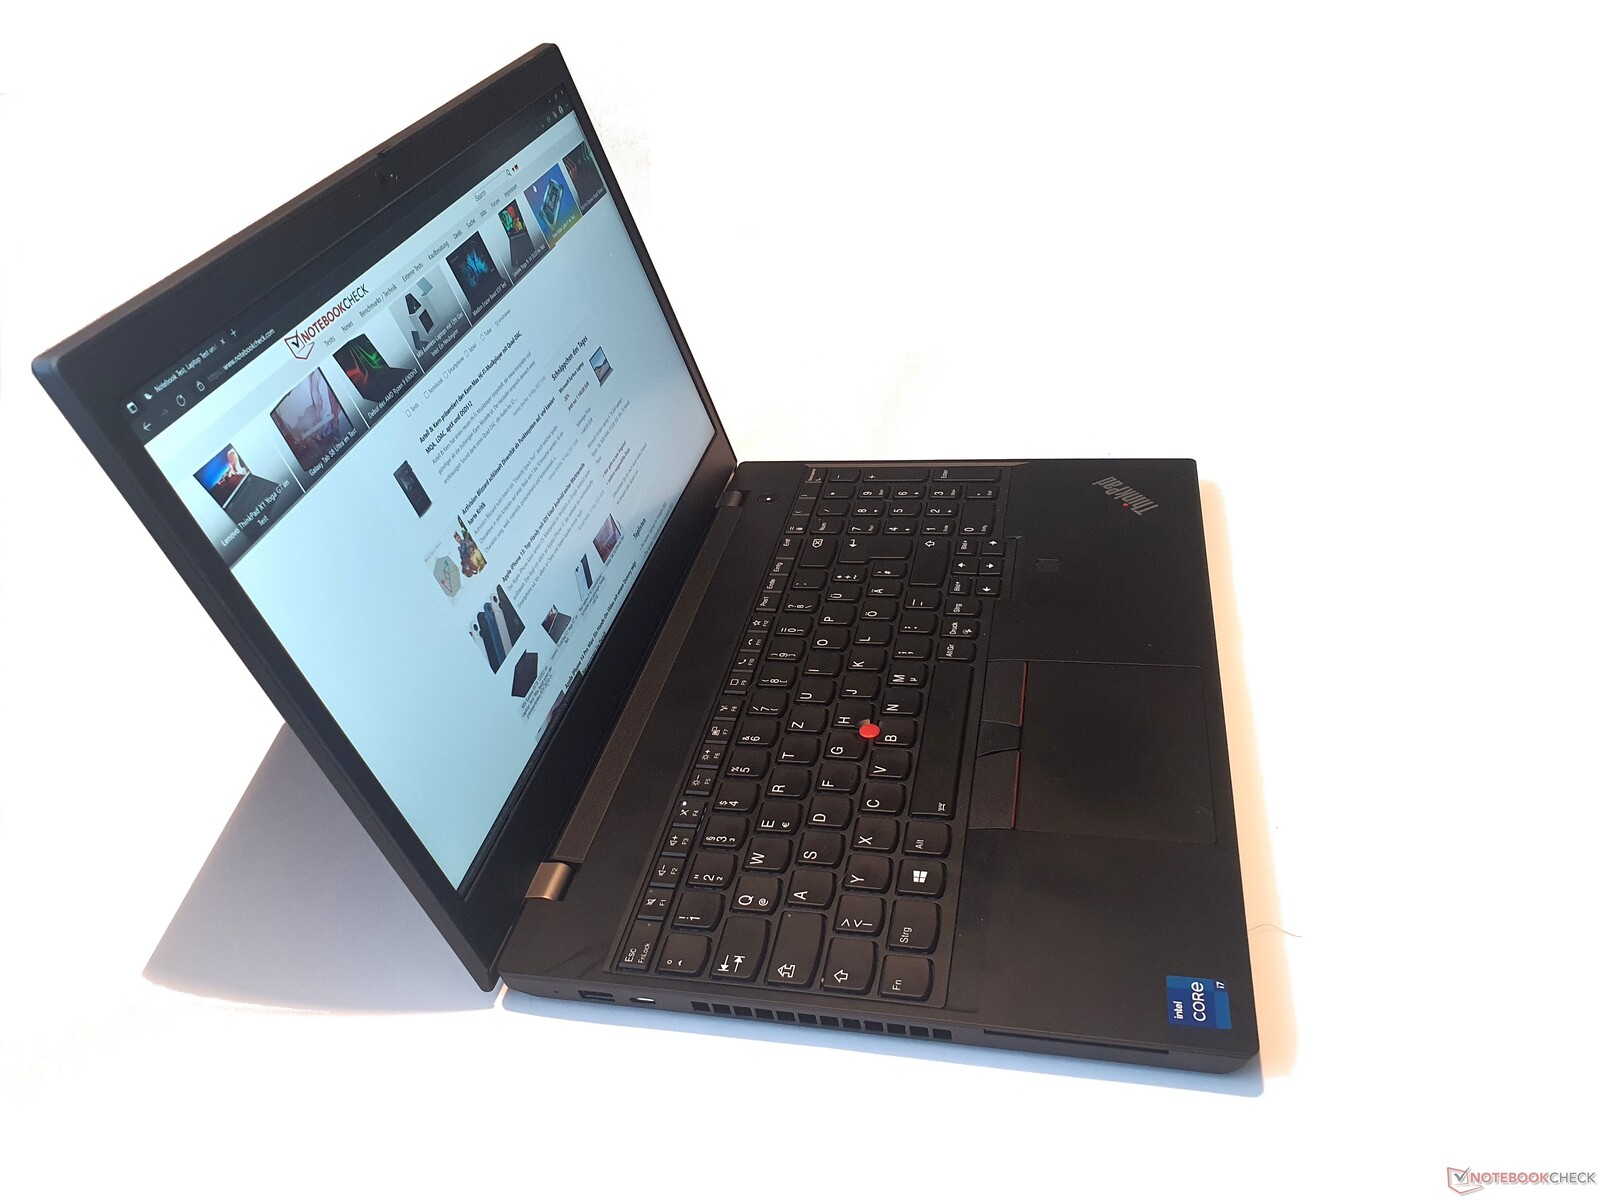
O caso do ThinkPad P15v parece semelhante aoThinkPad P15smas é mais alto (em cerca de 3,6 mm) e mais pesado (em 360 gramas). A tampa também é consideravelmente mais grossa, oferecendo maior resistência à torção, mas ainda pode ser torcida visivelmente.
O mesmo caso que a PensePad T15p é usado aqui, o que significa plástico ABS estável e fosco em toda a volta, mas sem o reforço de fibra de vidro dos P15s. Também estão faltando os revestimentos de borracha agradáveis, o que faz com que a parte inferior seja muito áspera, como é conhecido no orçamento ThinkPads, como oL15ou o ThinkPad R500 de um passado distante.
Não há falhas na mão-de-obra, e a estabilidade está em um nível elevado. A unidade de base reforçada com magnésio não pode ser torcida por qualquer extensão da imaginação, e a unidade de teclado só cede ligeiramente no centro quando é aplicada pressão dirigida. As dobradiças são muito esticadas, mas ainda permitem a abertura com uma só mão até um ângulo de 180°. Infelizmente, o ThinkPad é um ímã para impressões digitais.

Devido a suas placas gráficas mais poderosas e sistemas de refrigeração mais fortes, o ThinkPad P15 e T15g os laptops são significativamente mais espessos em estações de trabalho com cerca de 31,5 mm em comparação com os 22,7 mm "finos" e, portanto, mais leves P15v, resultando em uma diferença de peso de 600 gramas
De acordo com o s-suffix (fino), o ThinkPad P15s é ainda mais fino e leve.Dell's Precision 5560continua imbatível com seu laptop de 14 polegadas, enquanto o ZBook Power 15 da HP tem dimensões similares ao ThinkPad P15v, mas é quase 300 gramas mais leve a 1,97 kg.
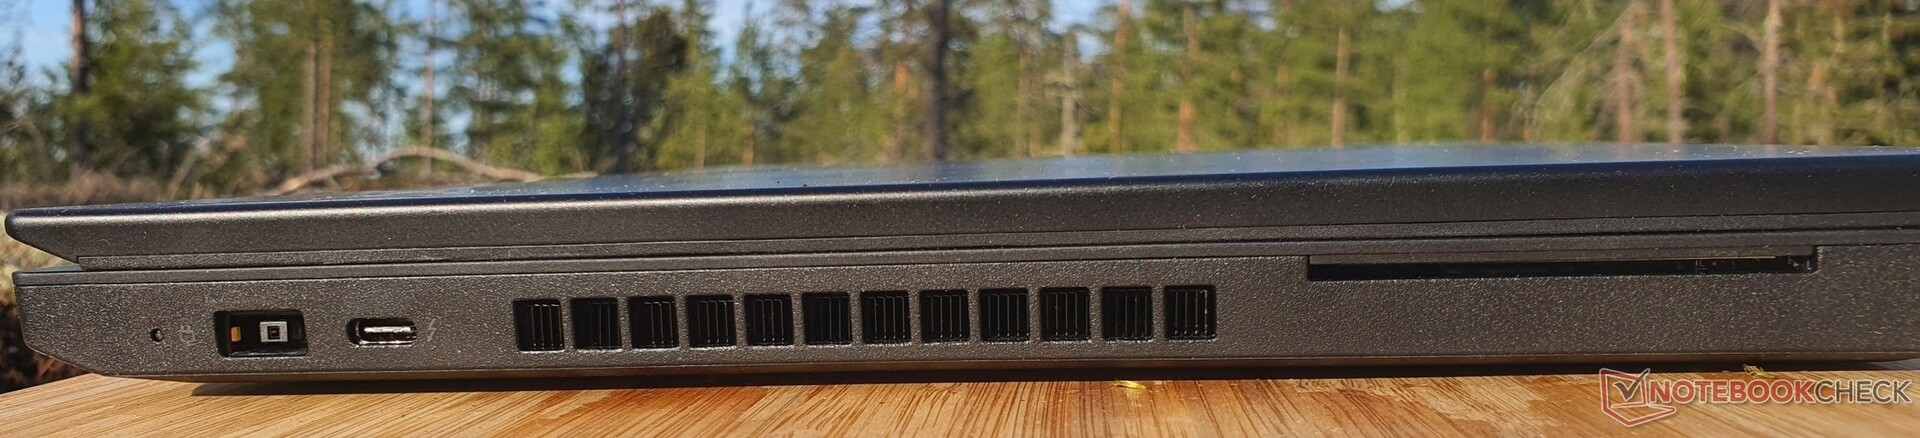
Conectividade: Lenovo com Wi-Fi 6 fixo e leitor de cartões SD
O ThinkPad P15v G2 oferece muitas portas: do lado esquerdo está a porta de carga de ponta fina proprietária e uma porta Thunderbolt 4, que infelizmente não suporta carga. Além disso, há um leitor de cartões inteligentes e slots de ventilação, para que o desperdício de calor não represente um problema quando se usa um mouse no lado direito
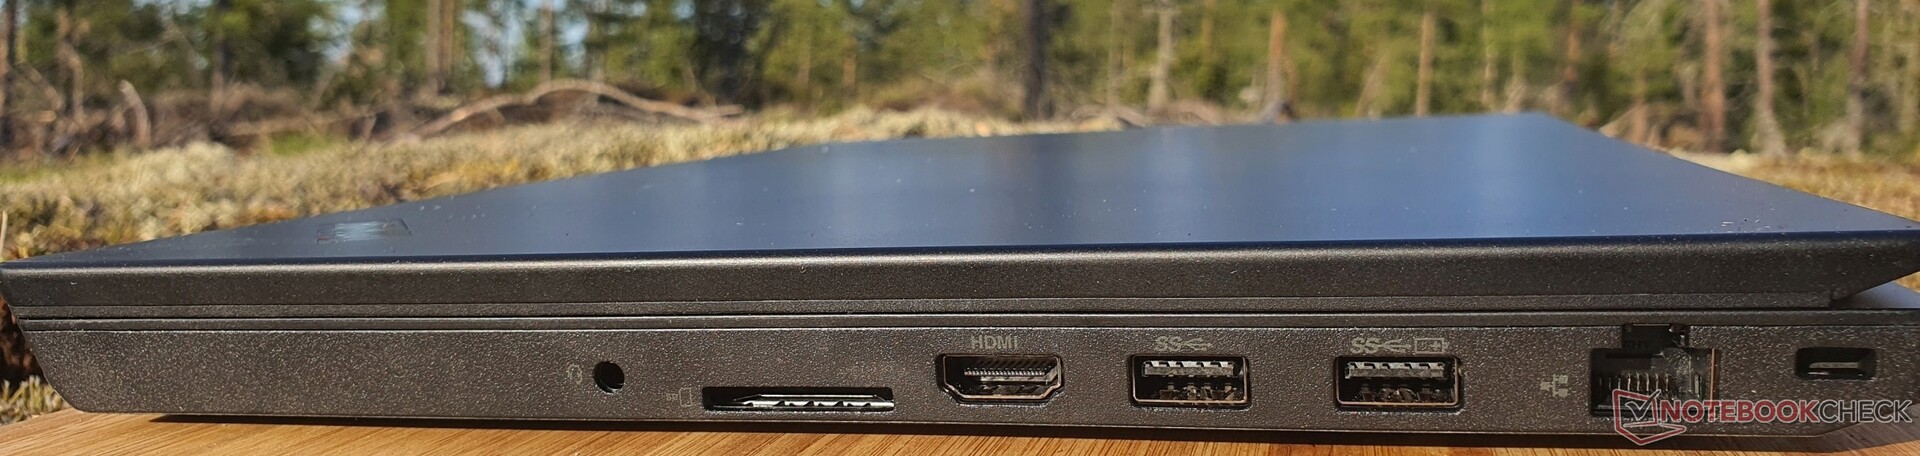
As características no lado direito incluem duas portas USB-A 3.2 Gen1 (Always On), HDMI 2.0, GBit Ethernet e um leitor de cartões SD de tamanho completo, que não são mais oferecidos em ThinkPads puros de negócios como os P15s. Os modelos com WWAN têm um slot de cartão SIM na parte de trás do dispositivo que atua como um slot de cartão µSD se nenhuma WWAN tiver sido configurada.
Leitor de cartões SD
Com relação às taxas de leitura de arquivos de 1 GB, o ThinkPad P15v G2 sai em primeiro lugar em sua classe. No teste de cópia, entretanto, ele fica bem atrás dos 200 MB/s do ThinkPad P15 e Dell Precision 5560 estações de trabalho com cerca de 96 MB/s.
| SD Card Reader | |
| average JPG Copy Test (av. of 3 runs) | |
| Lenovo ThinkPad P15 G2-20YQ001JGE (AV Pro V60) | |
| Dell Precision 5000 5560 (AV Pro V60) | |
| Lenovo ThinkPad T15g-20UR000GGE (Toshiba Exceria Pro SDXC 64 GB UHS-II) | |
| Média da turma Workstation (49.6 - 681, n=14, últimos 2 anos) | |
| Lenovo ThinkPad P15v G2 21A9000XGE | |
| Lenovo ThinkPad T15p-20TN0006GE (Toshiba Exceria Pro SDXC 64 GB UHS-II) | |
| Lenovo ThinkPad P15s Gen2-20W6000GGE (AV Pro V60) | |
| maximum AS SSD Seq Read Test (1GB) | |
| Lenovo ThinkPad P15v G2 21A9000XGE | |
| Média da turma Workstation (87.6 - 1455, n=14, últimos 2 anos) | |
| Lenovo ThinkPad P15 G2-20YQ001JGE (AV Pro V60) | |
| Lenovo ThinkPad T15g-20UR000GGE (Toshiba Exceria Pro SDXC 64 GB UHS-II) | |
| Dell Precision 5000 5560 (AV Pro V60) | |
| Lenovo ThinkPad T15p-20TN0006GE (Toshiba Exceria Pro SDXC 64 GB UHS-II) | |
| Lenovo ThinkPad P15s Gen2-20W6000GGE (AV Pro V60) | |
Comunicação
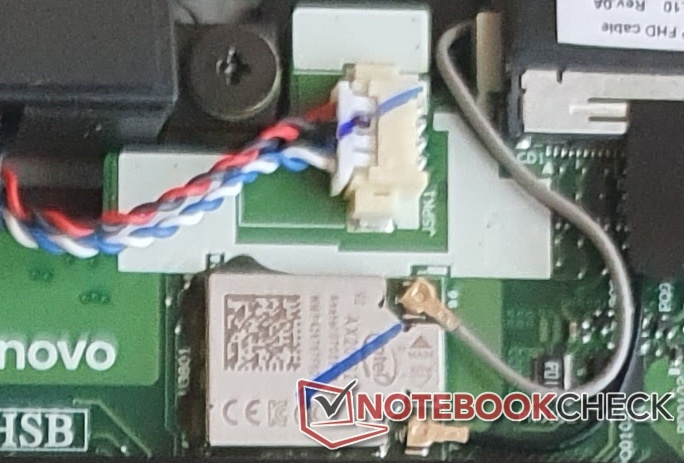
RJ45 Ethernet (1 GBit/s) está disponível. Há também o Wi-Fi 6 AX201 da Intel (permanentemente instalado), que permite ao ThinkPad P15v G2 transferir dados de rede dez vezes mais rápido do que via cabo, que está no alto nível da concorrência. Um M.2-Slot existente (e os cabos de antena correspondentes) permite a instalação de uma placa WWAN, mas esta também pode ser encomendada pré-instalada
Webcam

Embora a câmera só ofereça uma mísera 720p, as qualidades do modelo do usuário podem ser vistas.


Segurança
Puros laptops comerciais como o ThinkPad P15v oferecem inúmeros recursos de segurança, tais como um leitor de cartões inteligentes, um leitor de impressões digitais no apoio da palma da mão, uma trava de segurança Kensington, TPM 2.0, e uma câmera infravermelha para Windows Olá com um ThinkShutter (obturador com webcam) integrado.
Acessórios
Fora do adaptador de potência bastante compacto de 135 watts, não há acessórios incluídos no momento da compra. Uma porta de acoplamento explícita também é omitida e faltam soluções Thunderbolt devido à impossibilidade de carregar via USB-C. Somente uma variante especial de doca que combina a porta de carga proprietária com o Thunderbolt pode ser usada: oThinkPad Thunderbolt 3 Workstation Dock Gen 2.
A embalagem da Lenovo não pode ser realmente descrita como ambientalmente correta, mesmo que a embalagem e a caixa sejam mantidas muito simples.
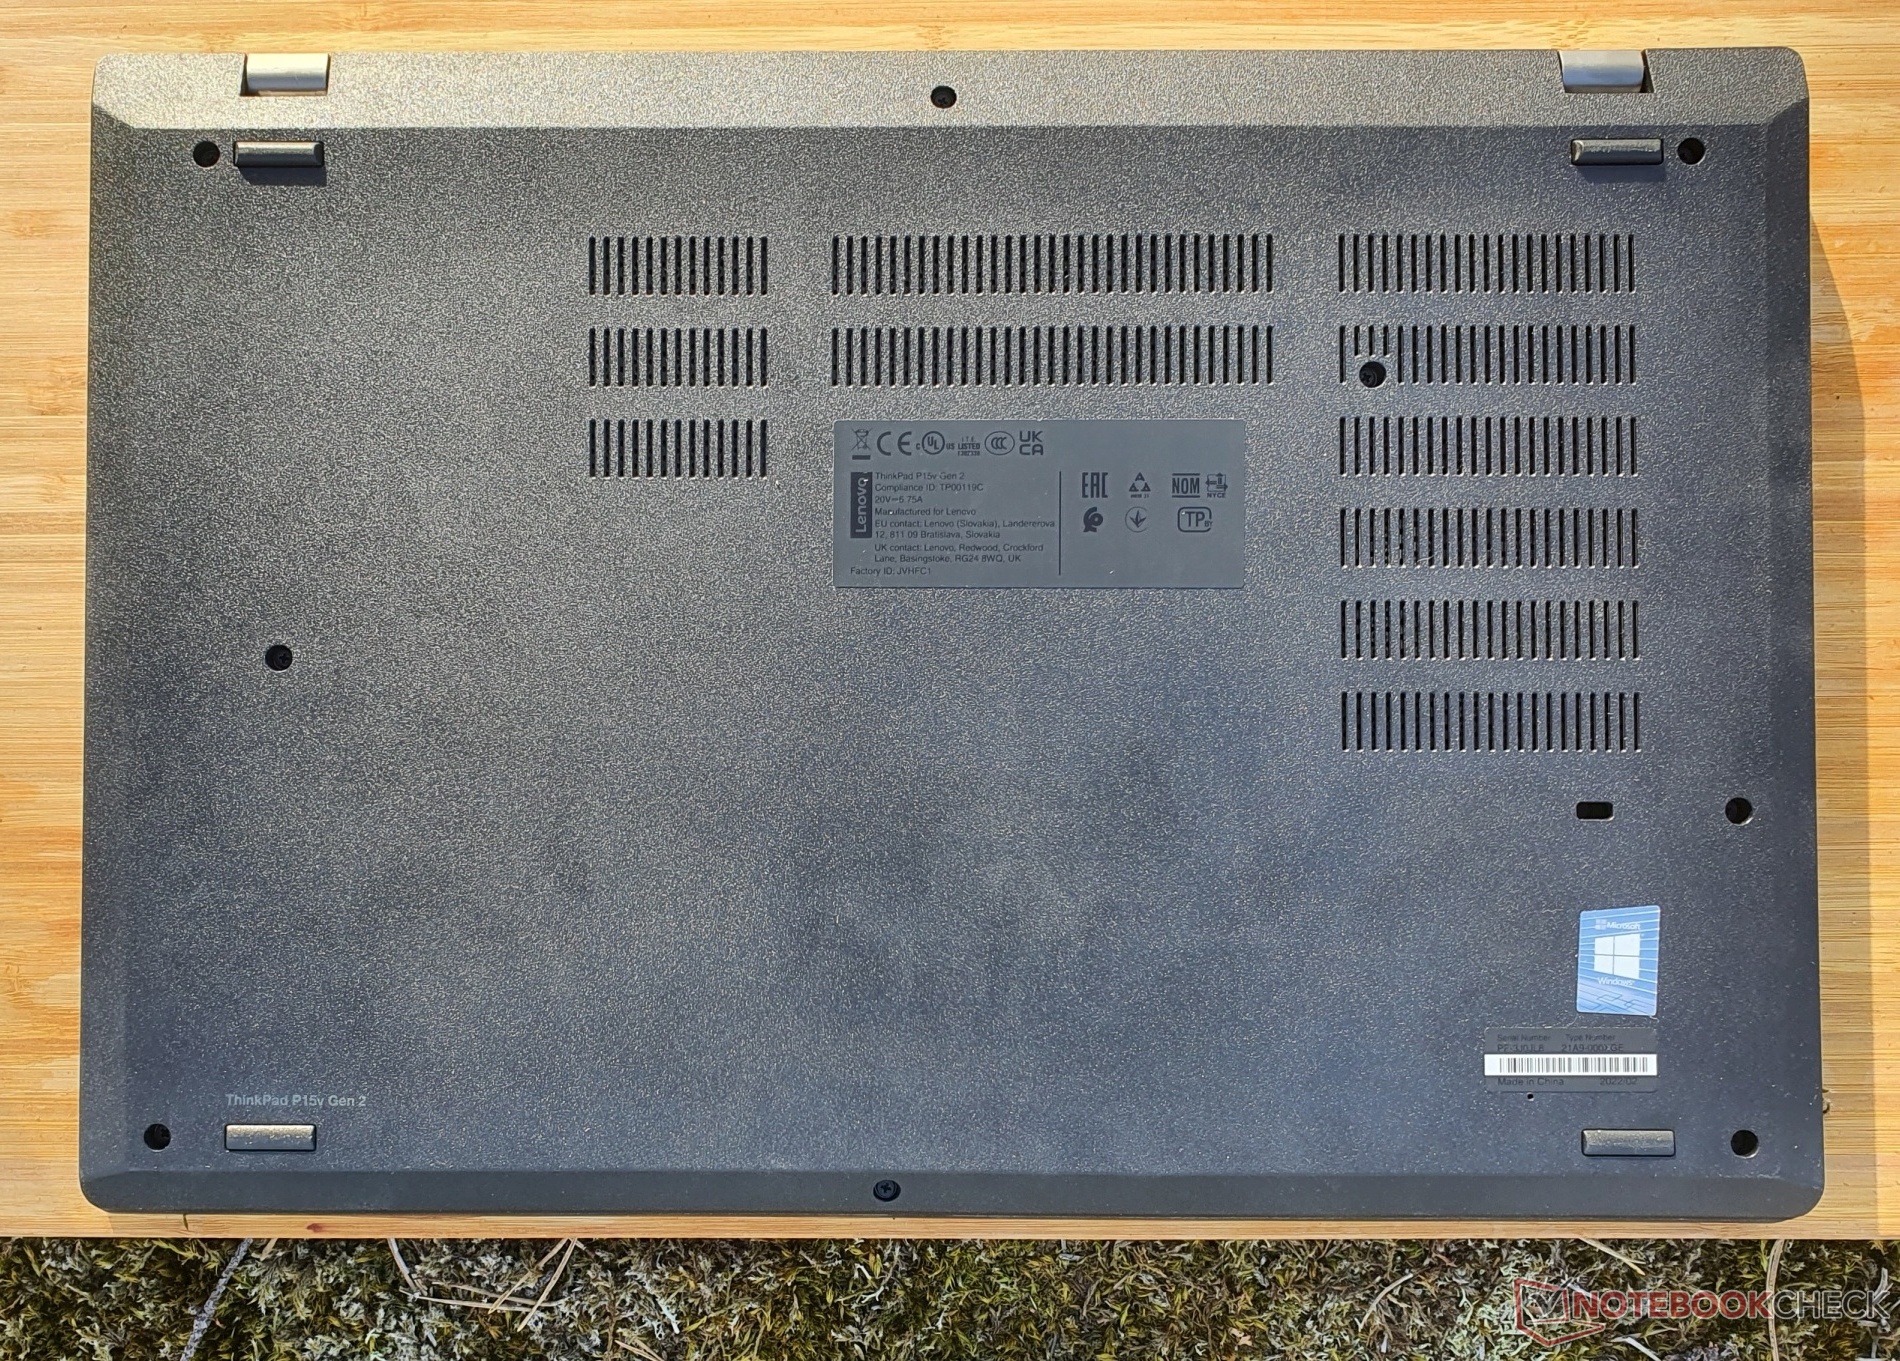
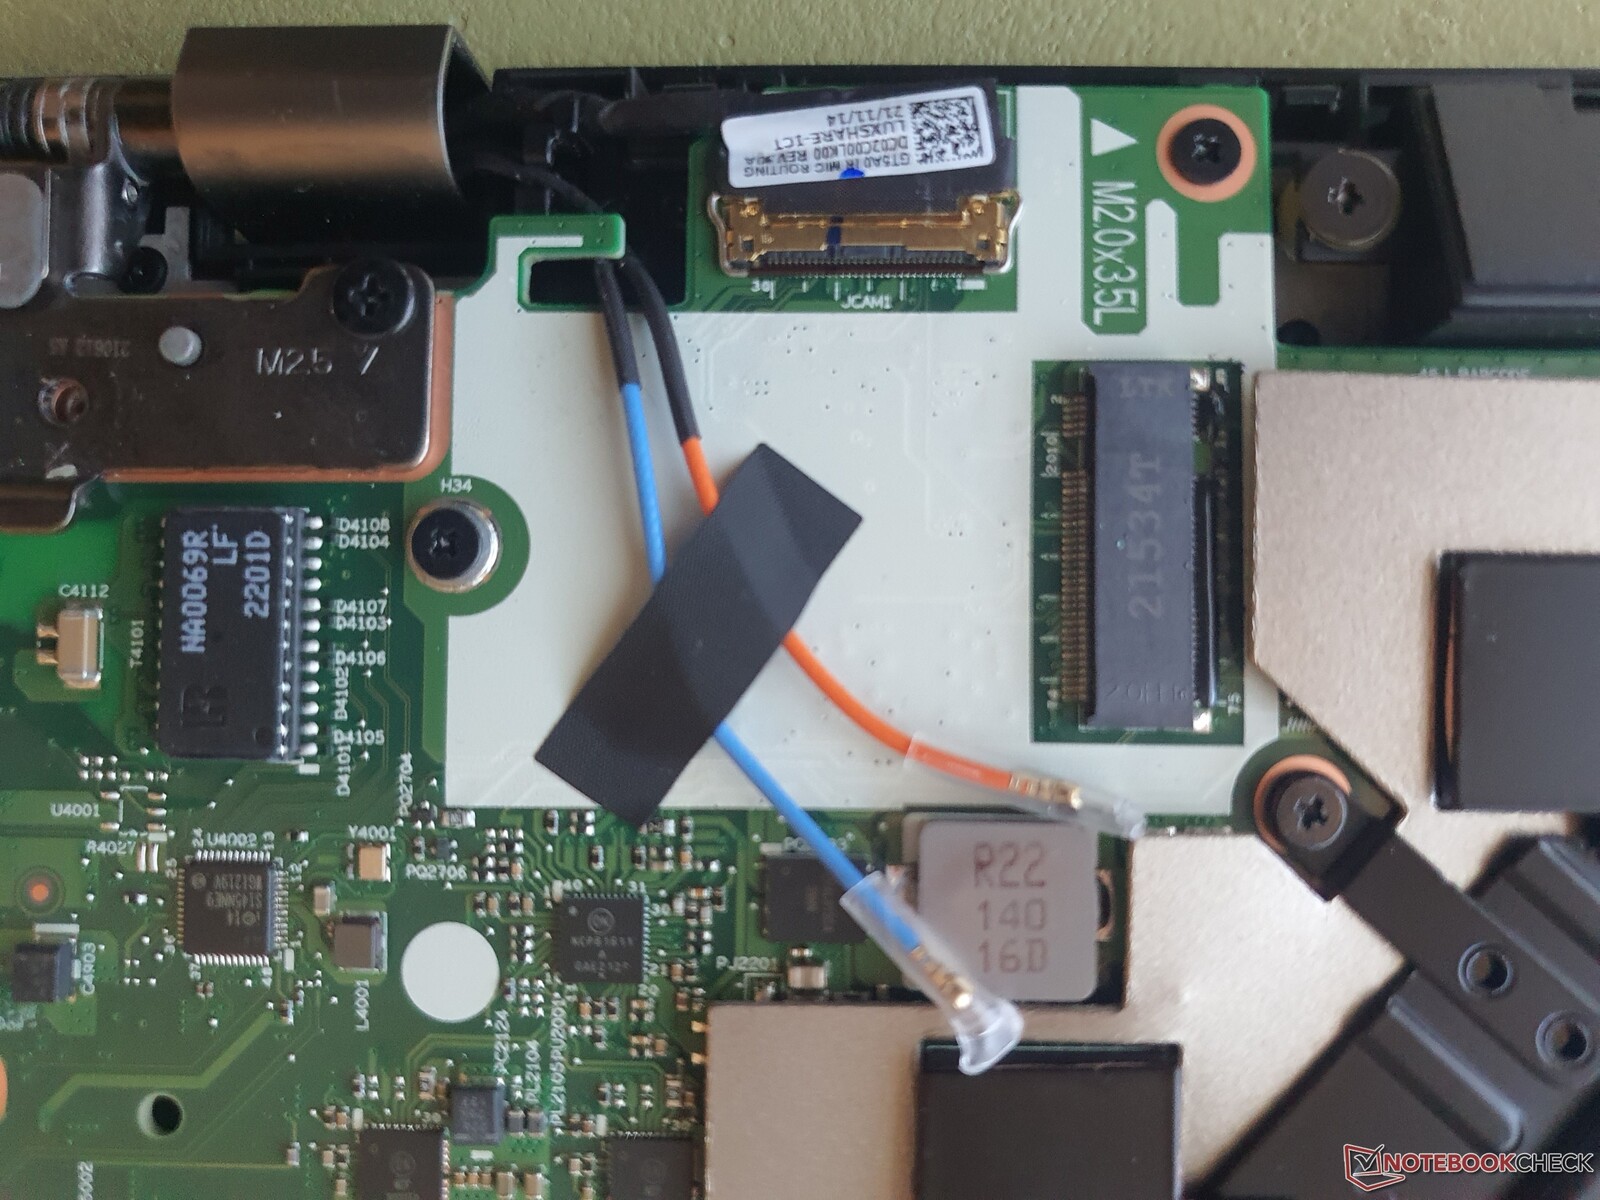
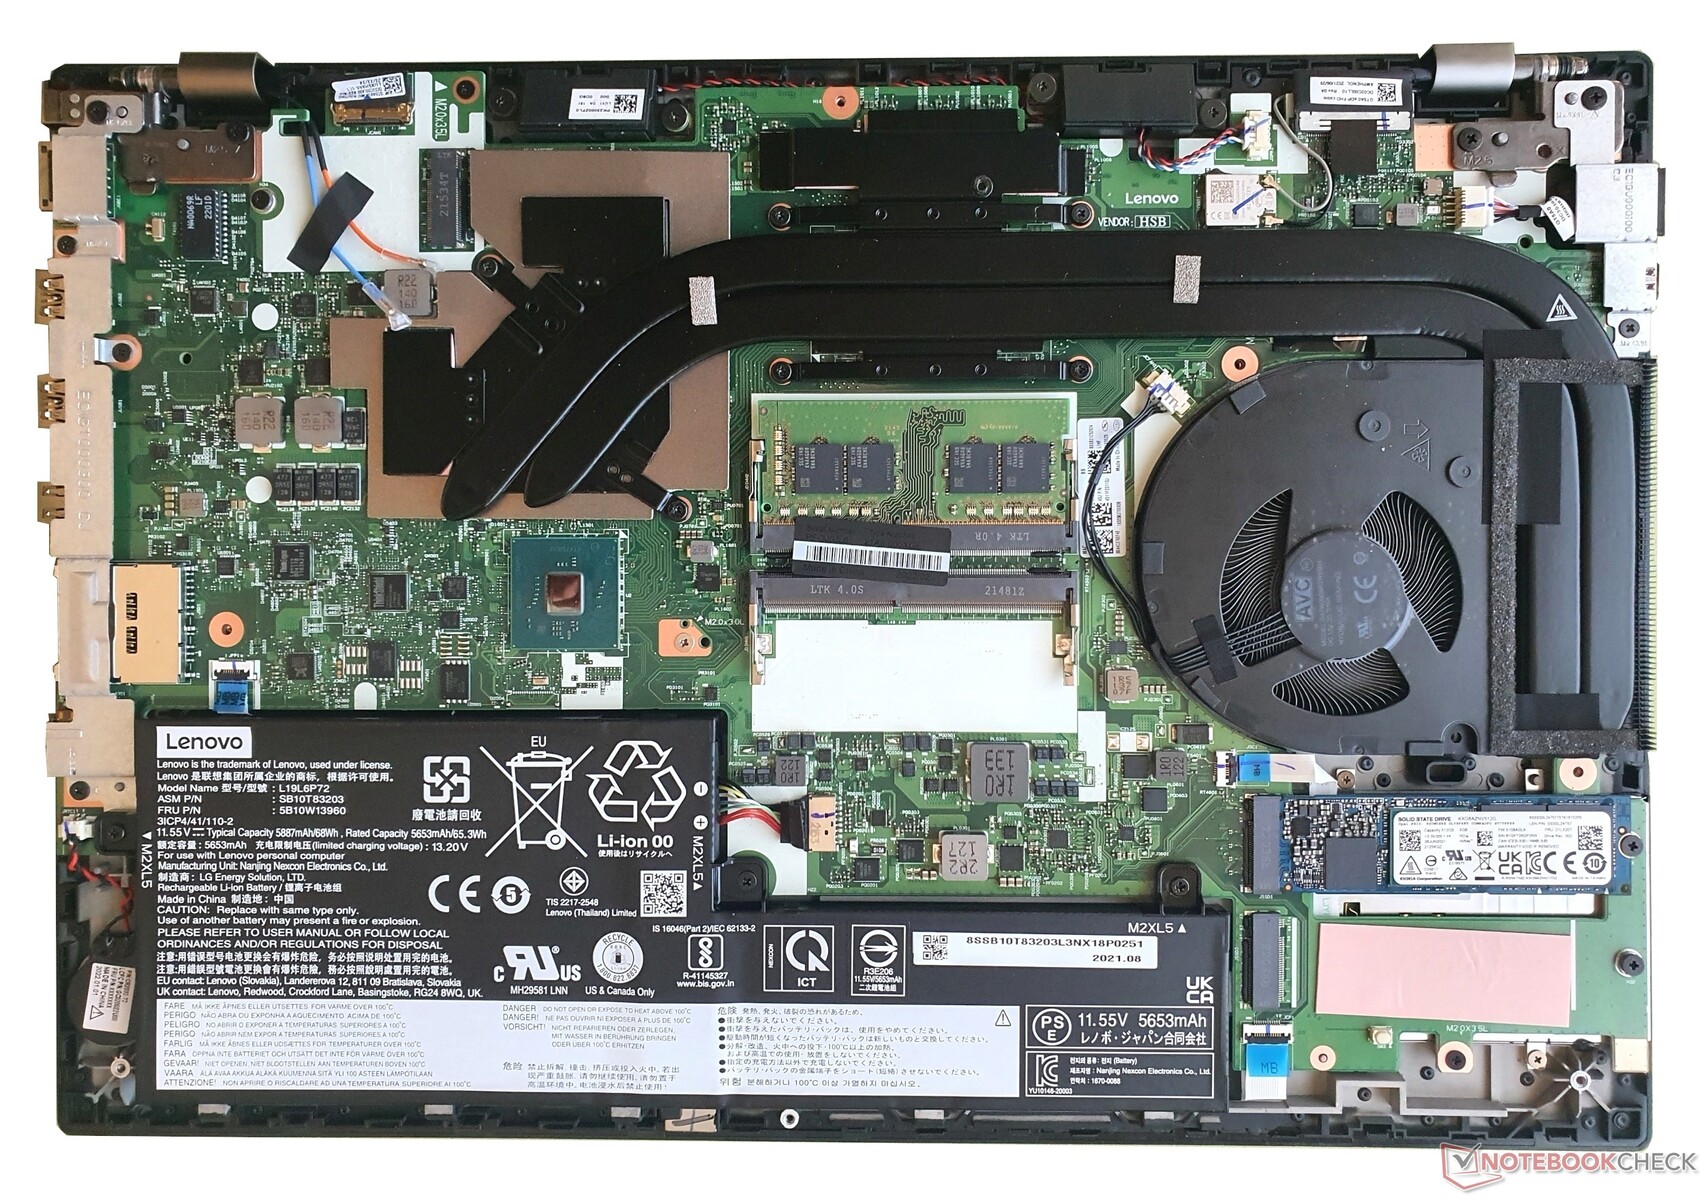
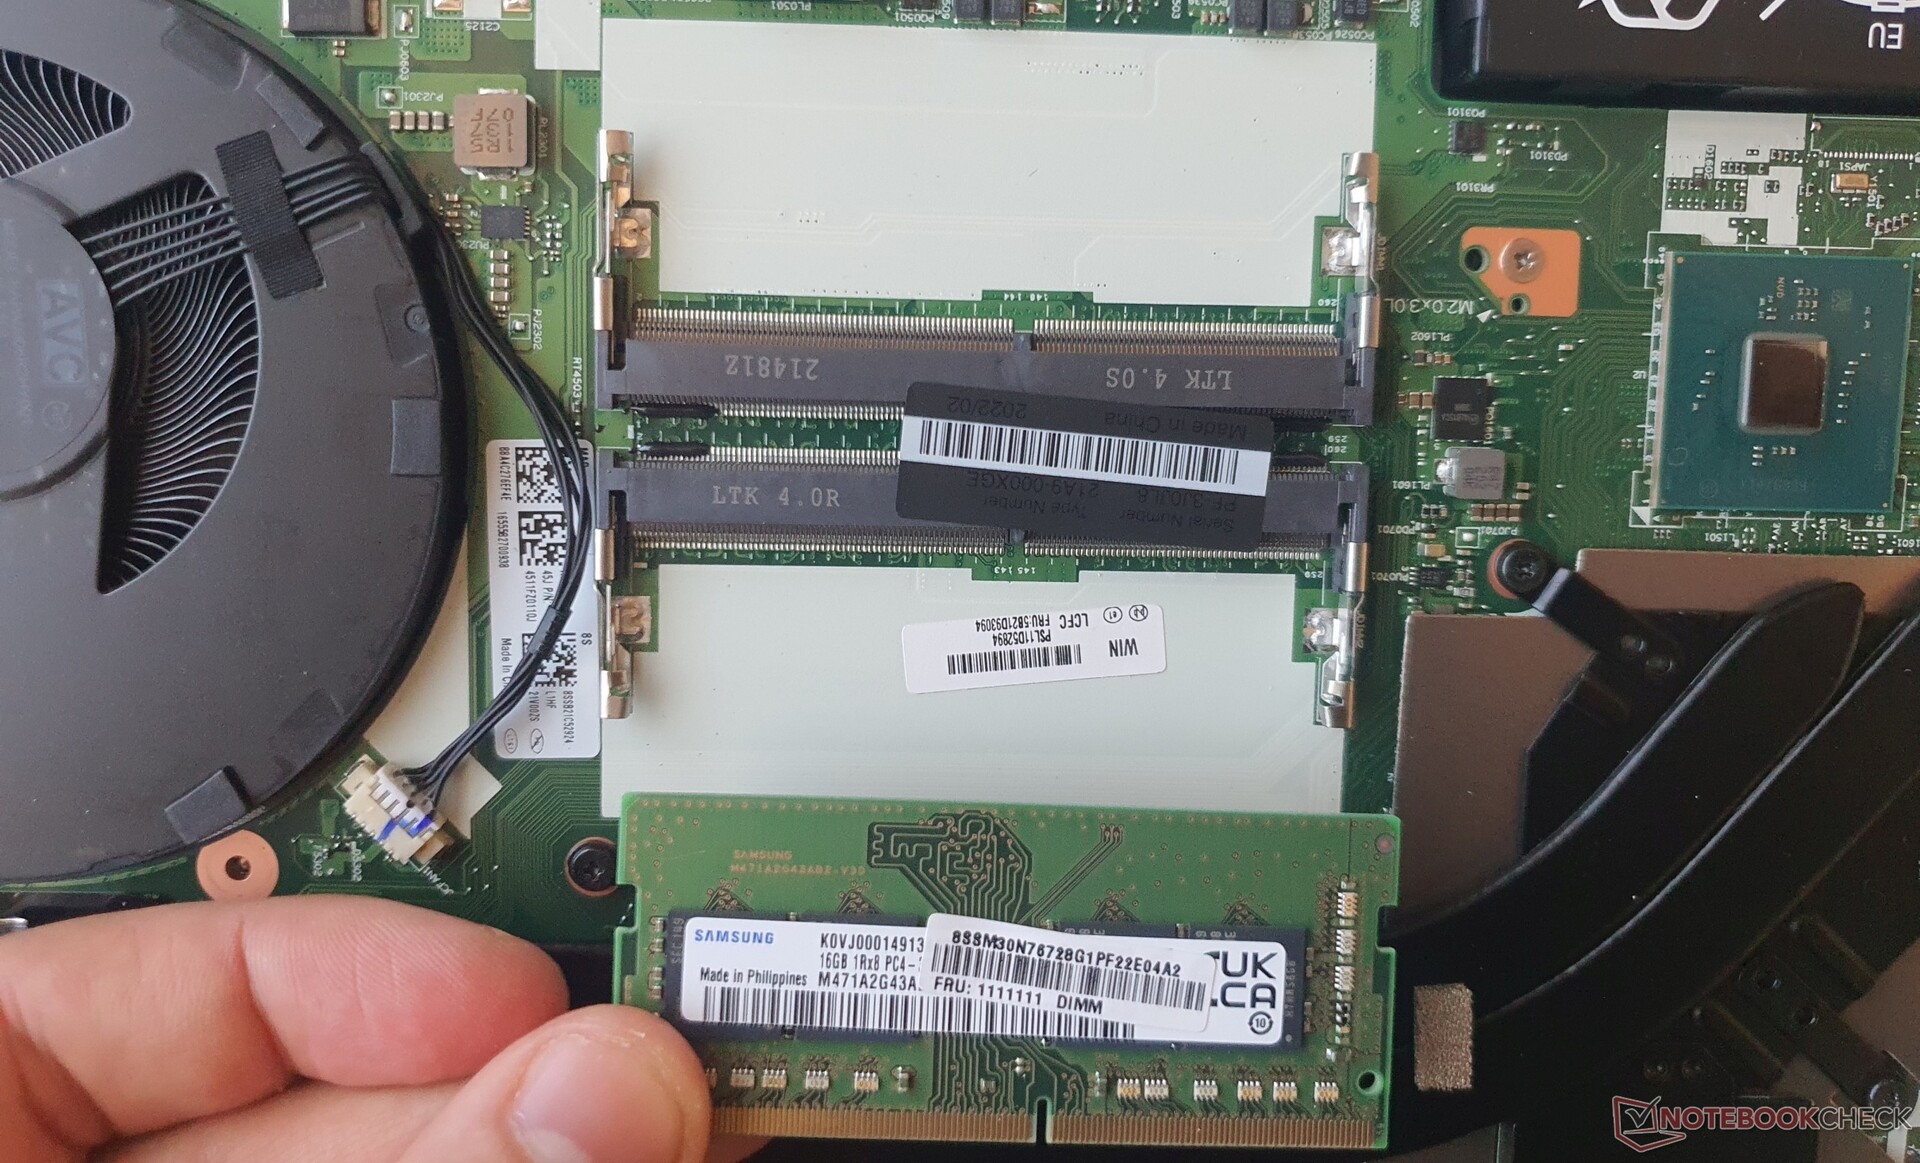
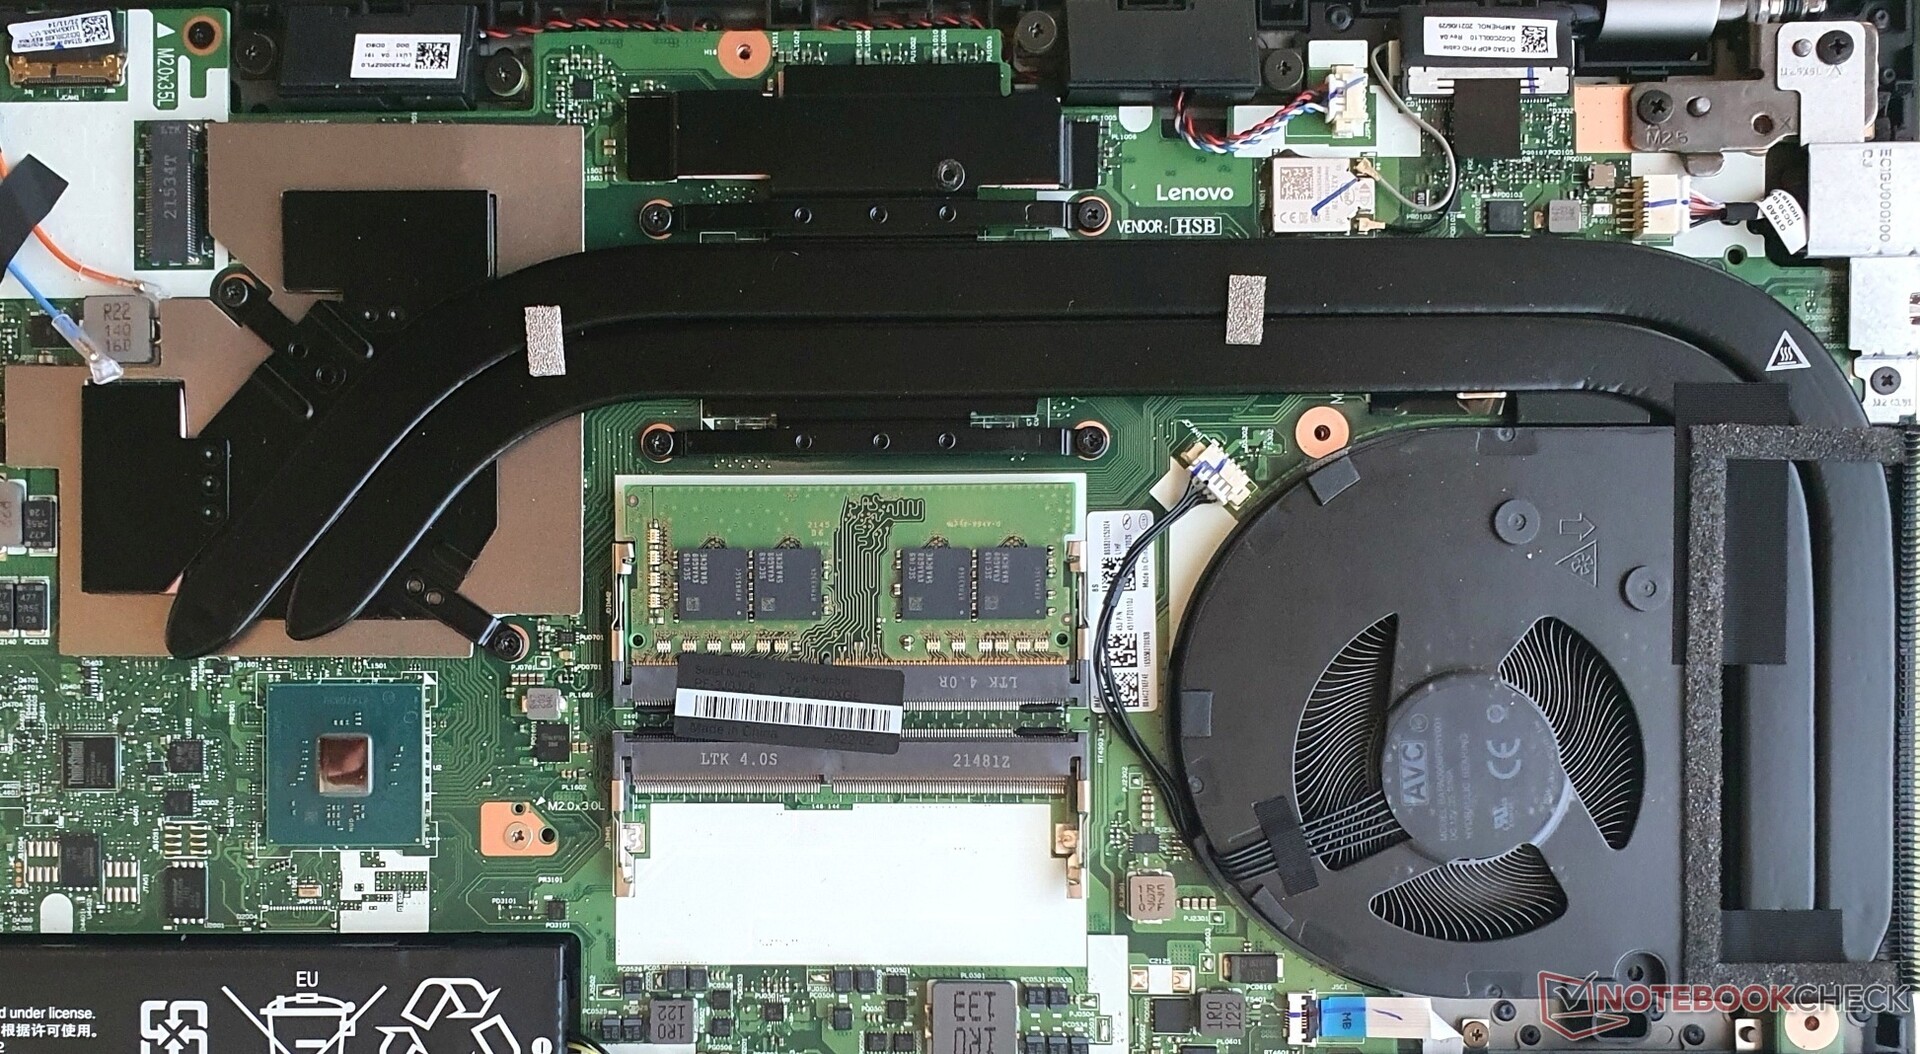
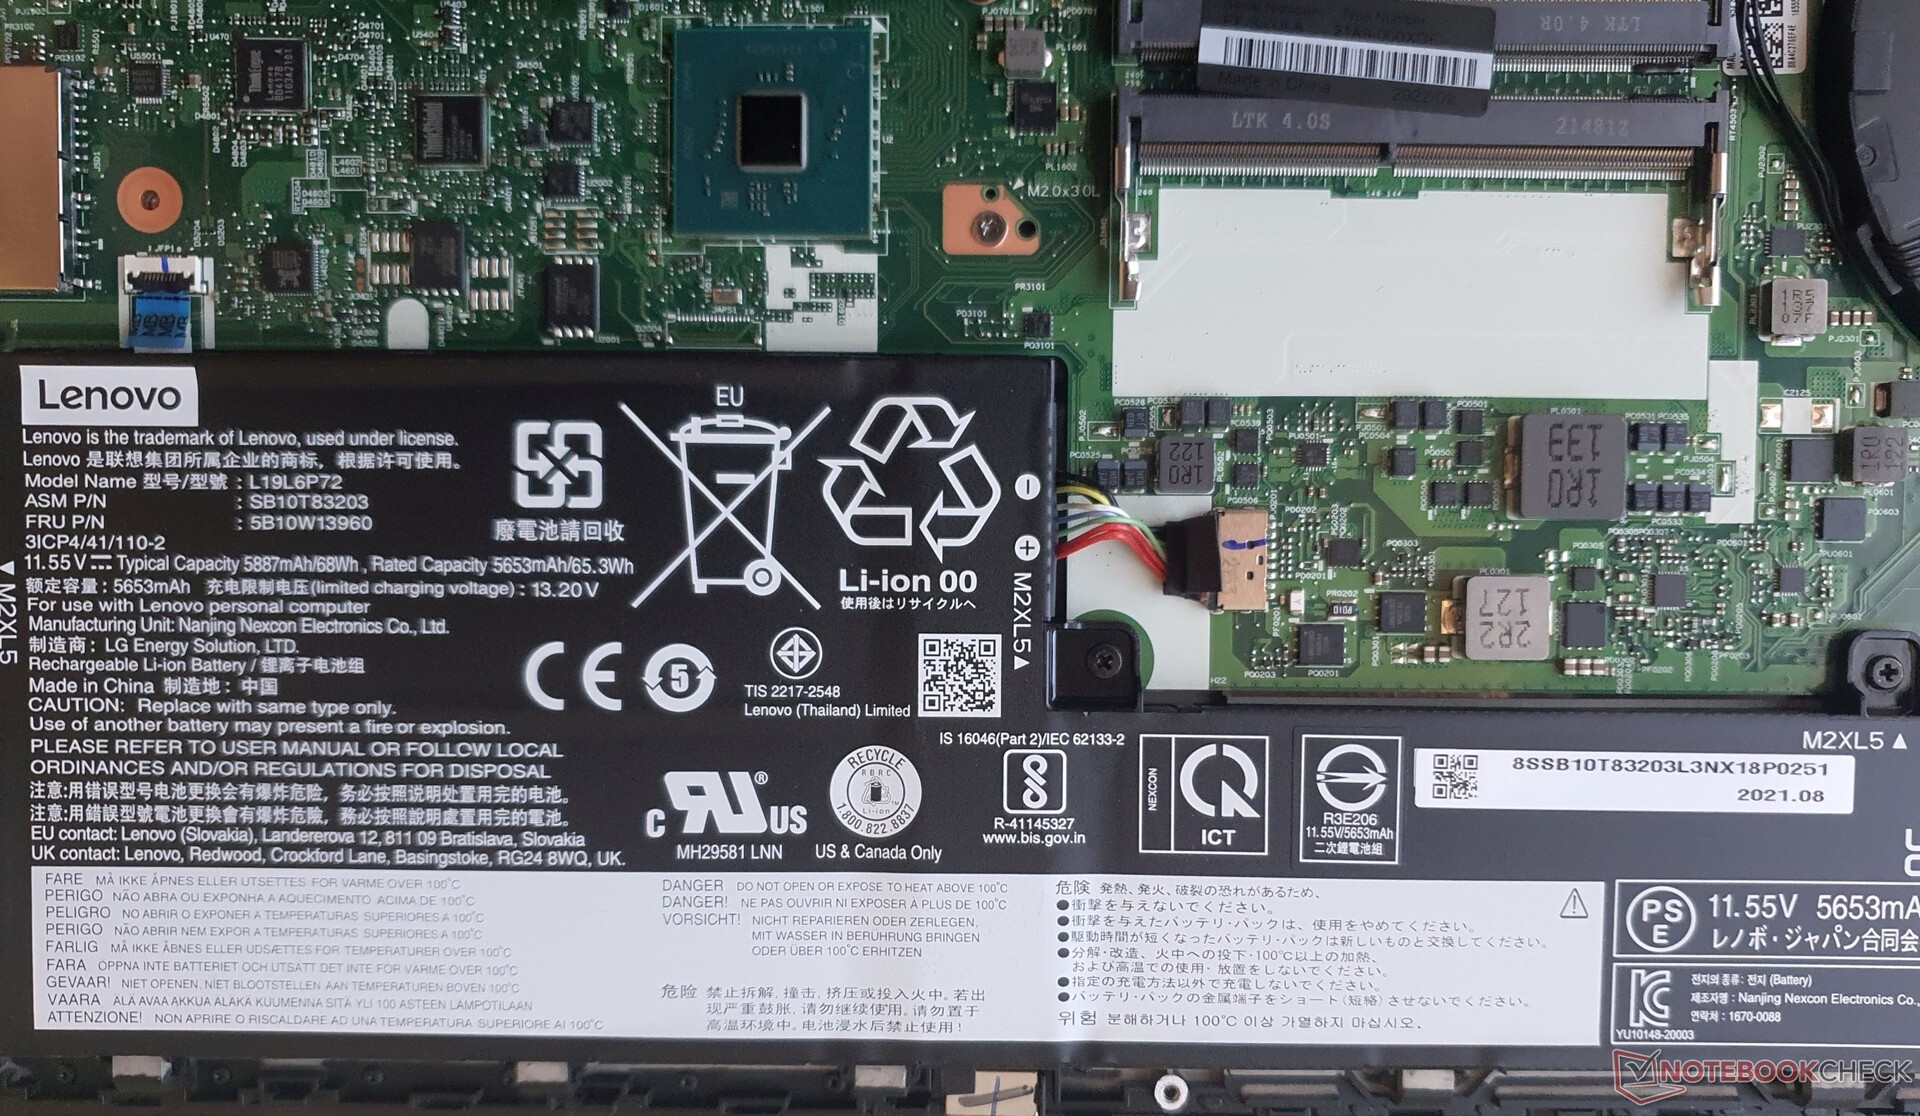
Manutenção
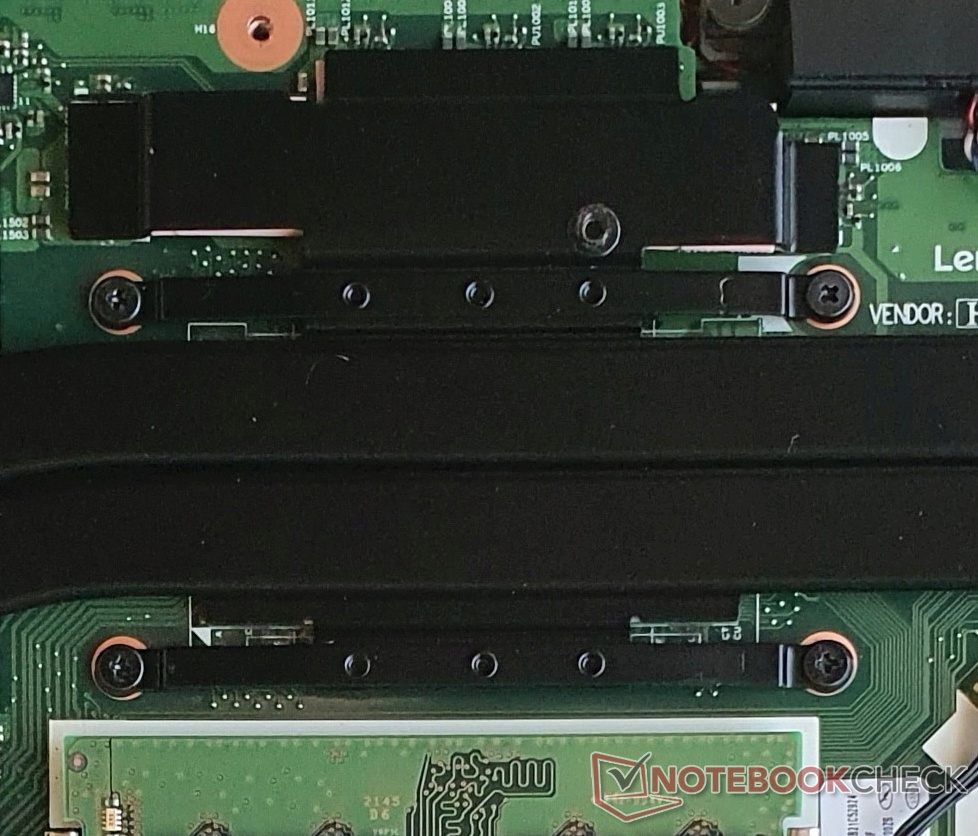
Apesar de vários clipes plásticos, a placa base é bastante fácil de remover. Os nove parafusos são desapertados rapidamente, enquanto alguns deles permanecem presos na caixa. Ao abrir, é necessário ter acesso à RAM (1 slot livre), ao M.2-2280-SSD (1 slot livre), ao ventilador, que é substituível (incluindo o tubo de calor), e à bateria 68 Wh, que também é substituível. O módulo WLAN é instalado permanentemente
Outro aspecto útil é que o teclado pode ser facilmente substituído se ele se desgastar ou apresentar defeito após anos de digitação.
Garantia
Como todos os ThinkPads de gama superior (série T/X/P), a Lenovo Alemanha oferece uma garantia de três anos para o laptop P15v G2, incluindo Pickup & Return. Reparos no local também são possíveis por uma sobretaxa, assim como Proteção contra Danos Acidentais, Premier Support ou extensão da garantia para 5 anos.
Nota para leitores internacionais: A política de garantia da Lenovo pode diferir de região para região, portanto certifique-se de verificar o website da Lenovo (onde aplicável) para o país de compra
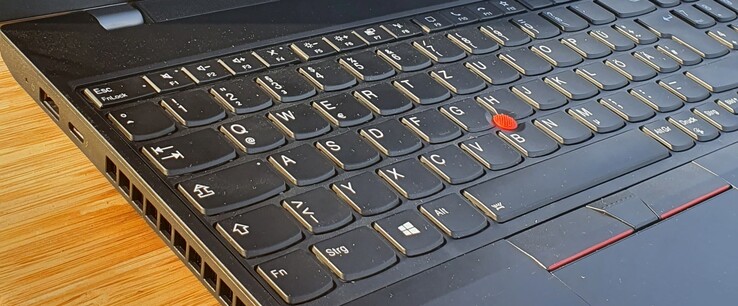
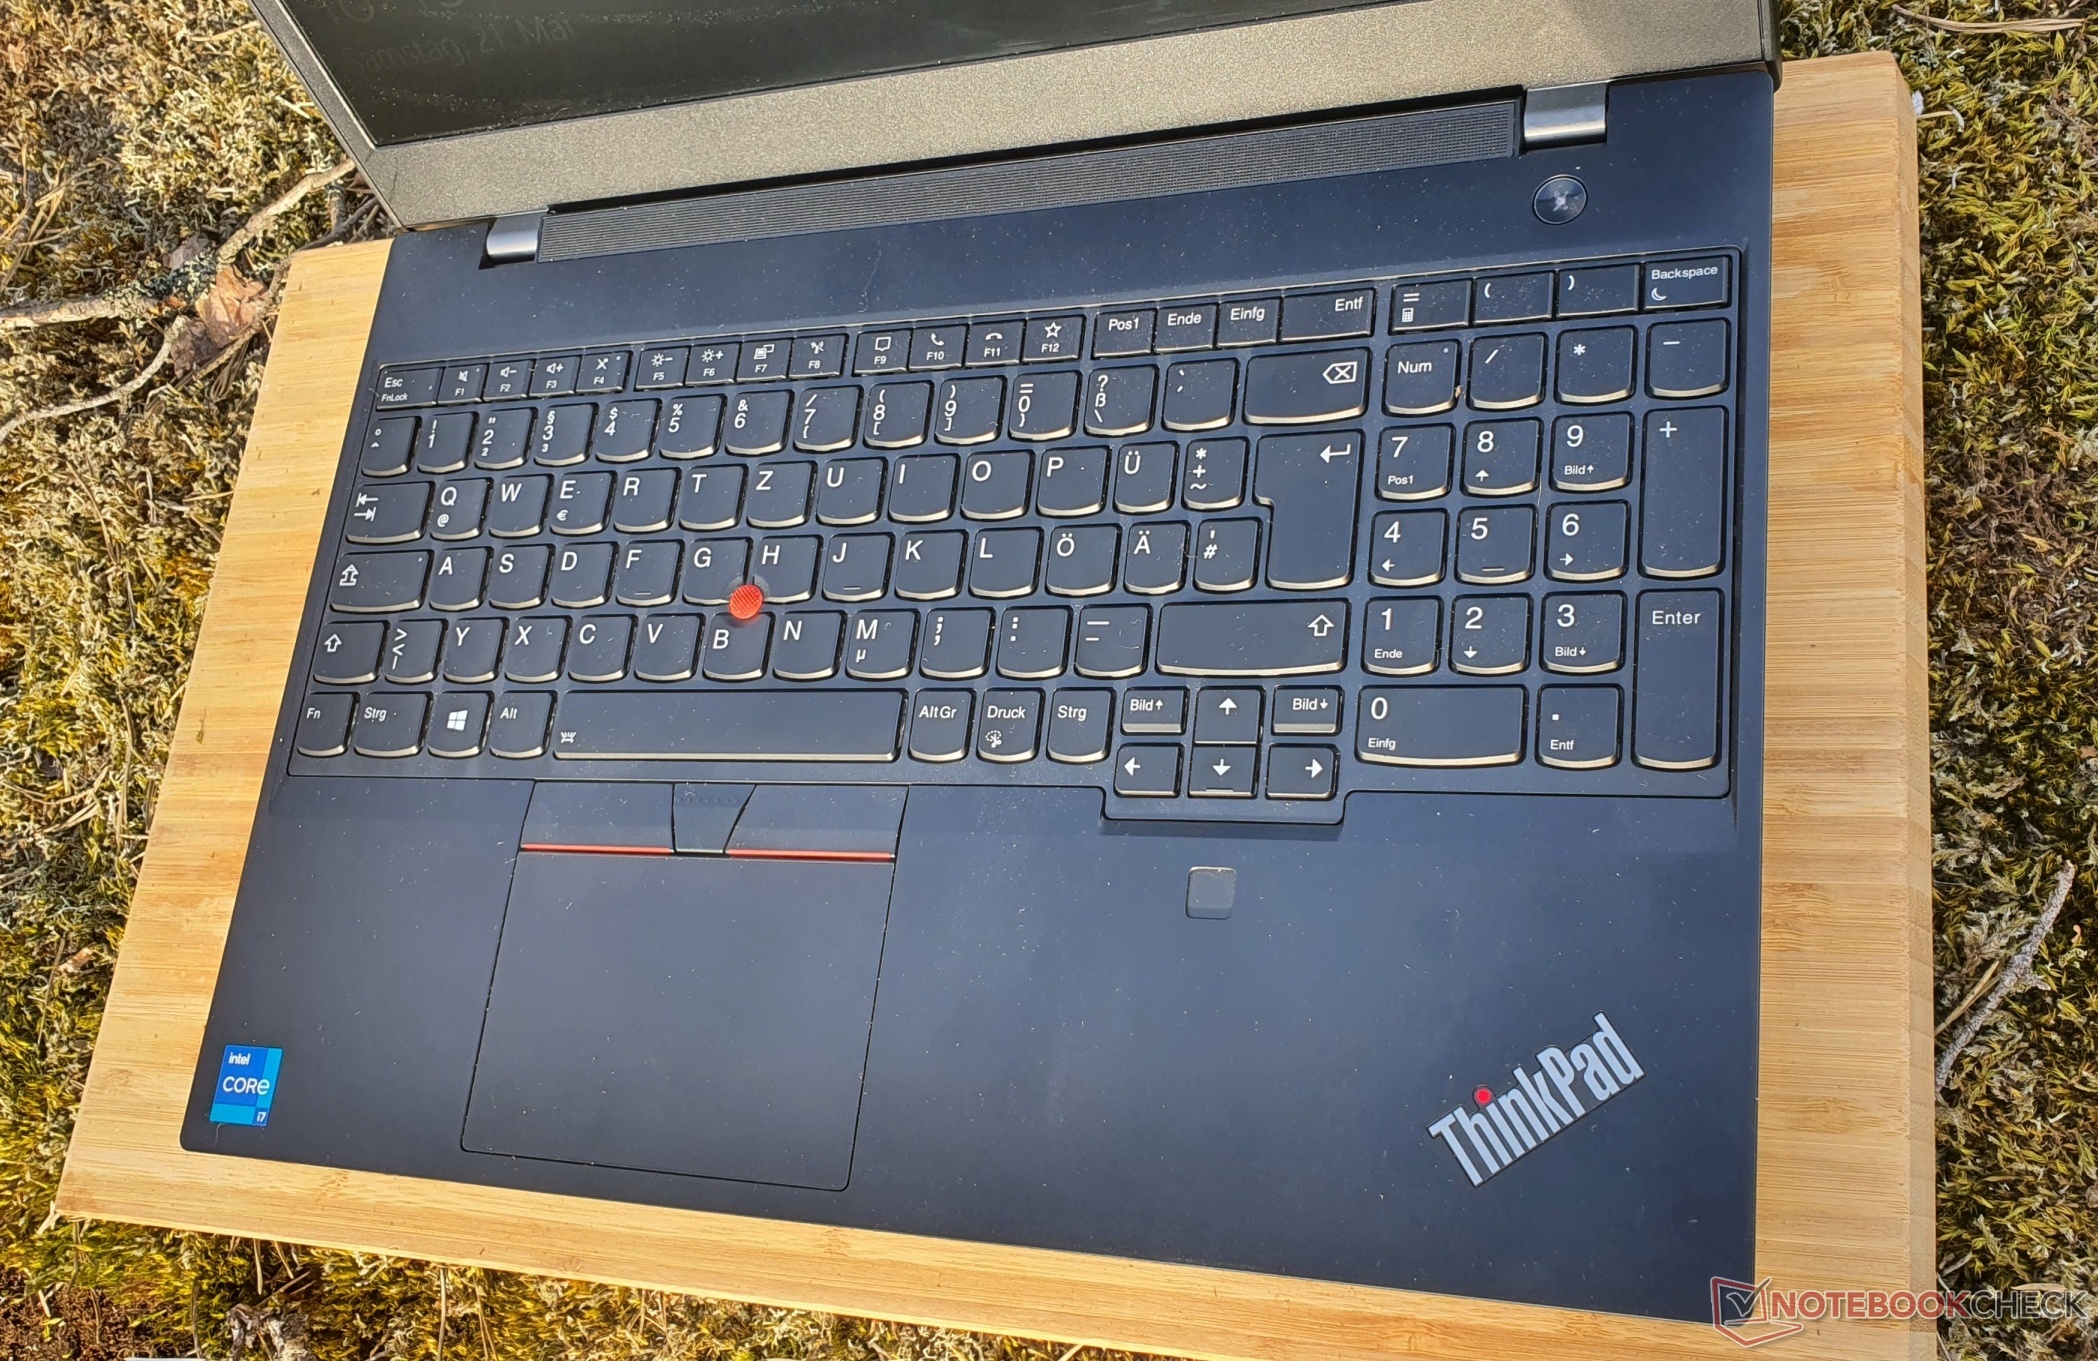
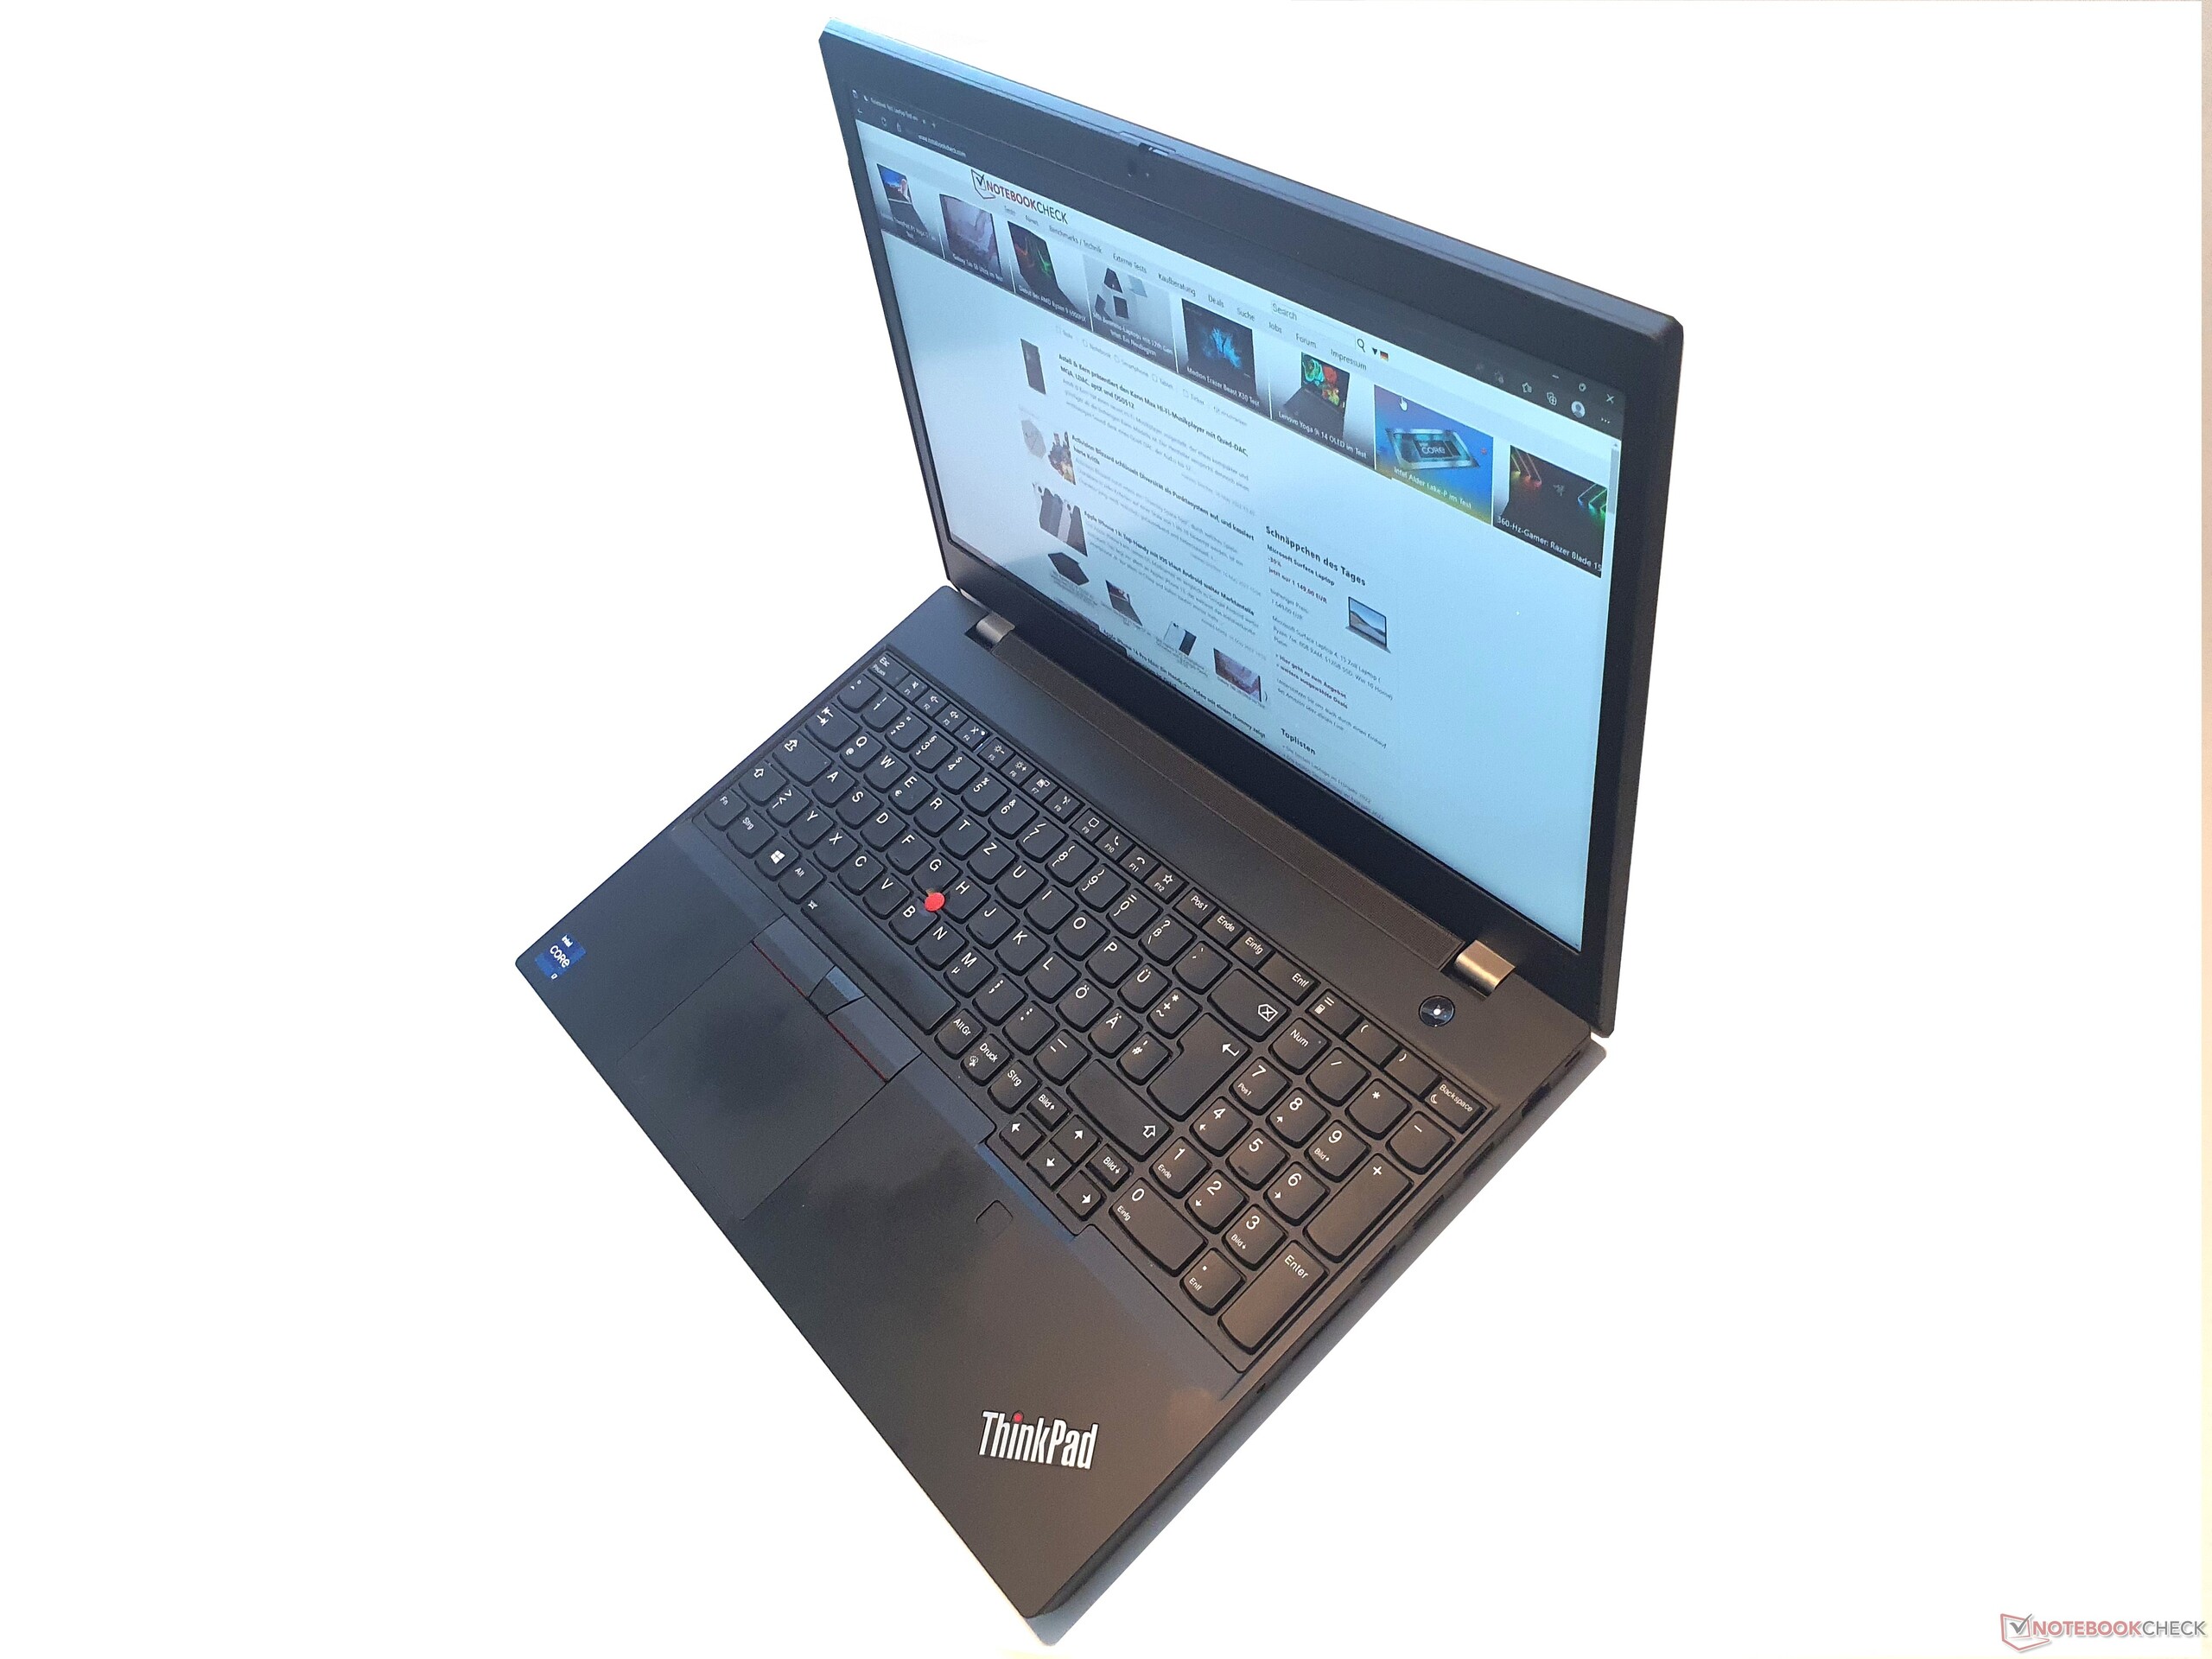
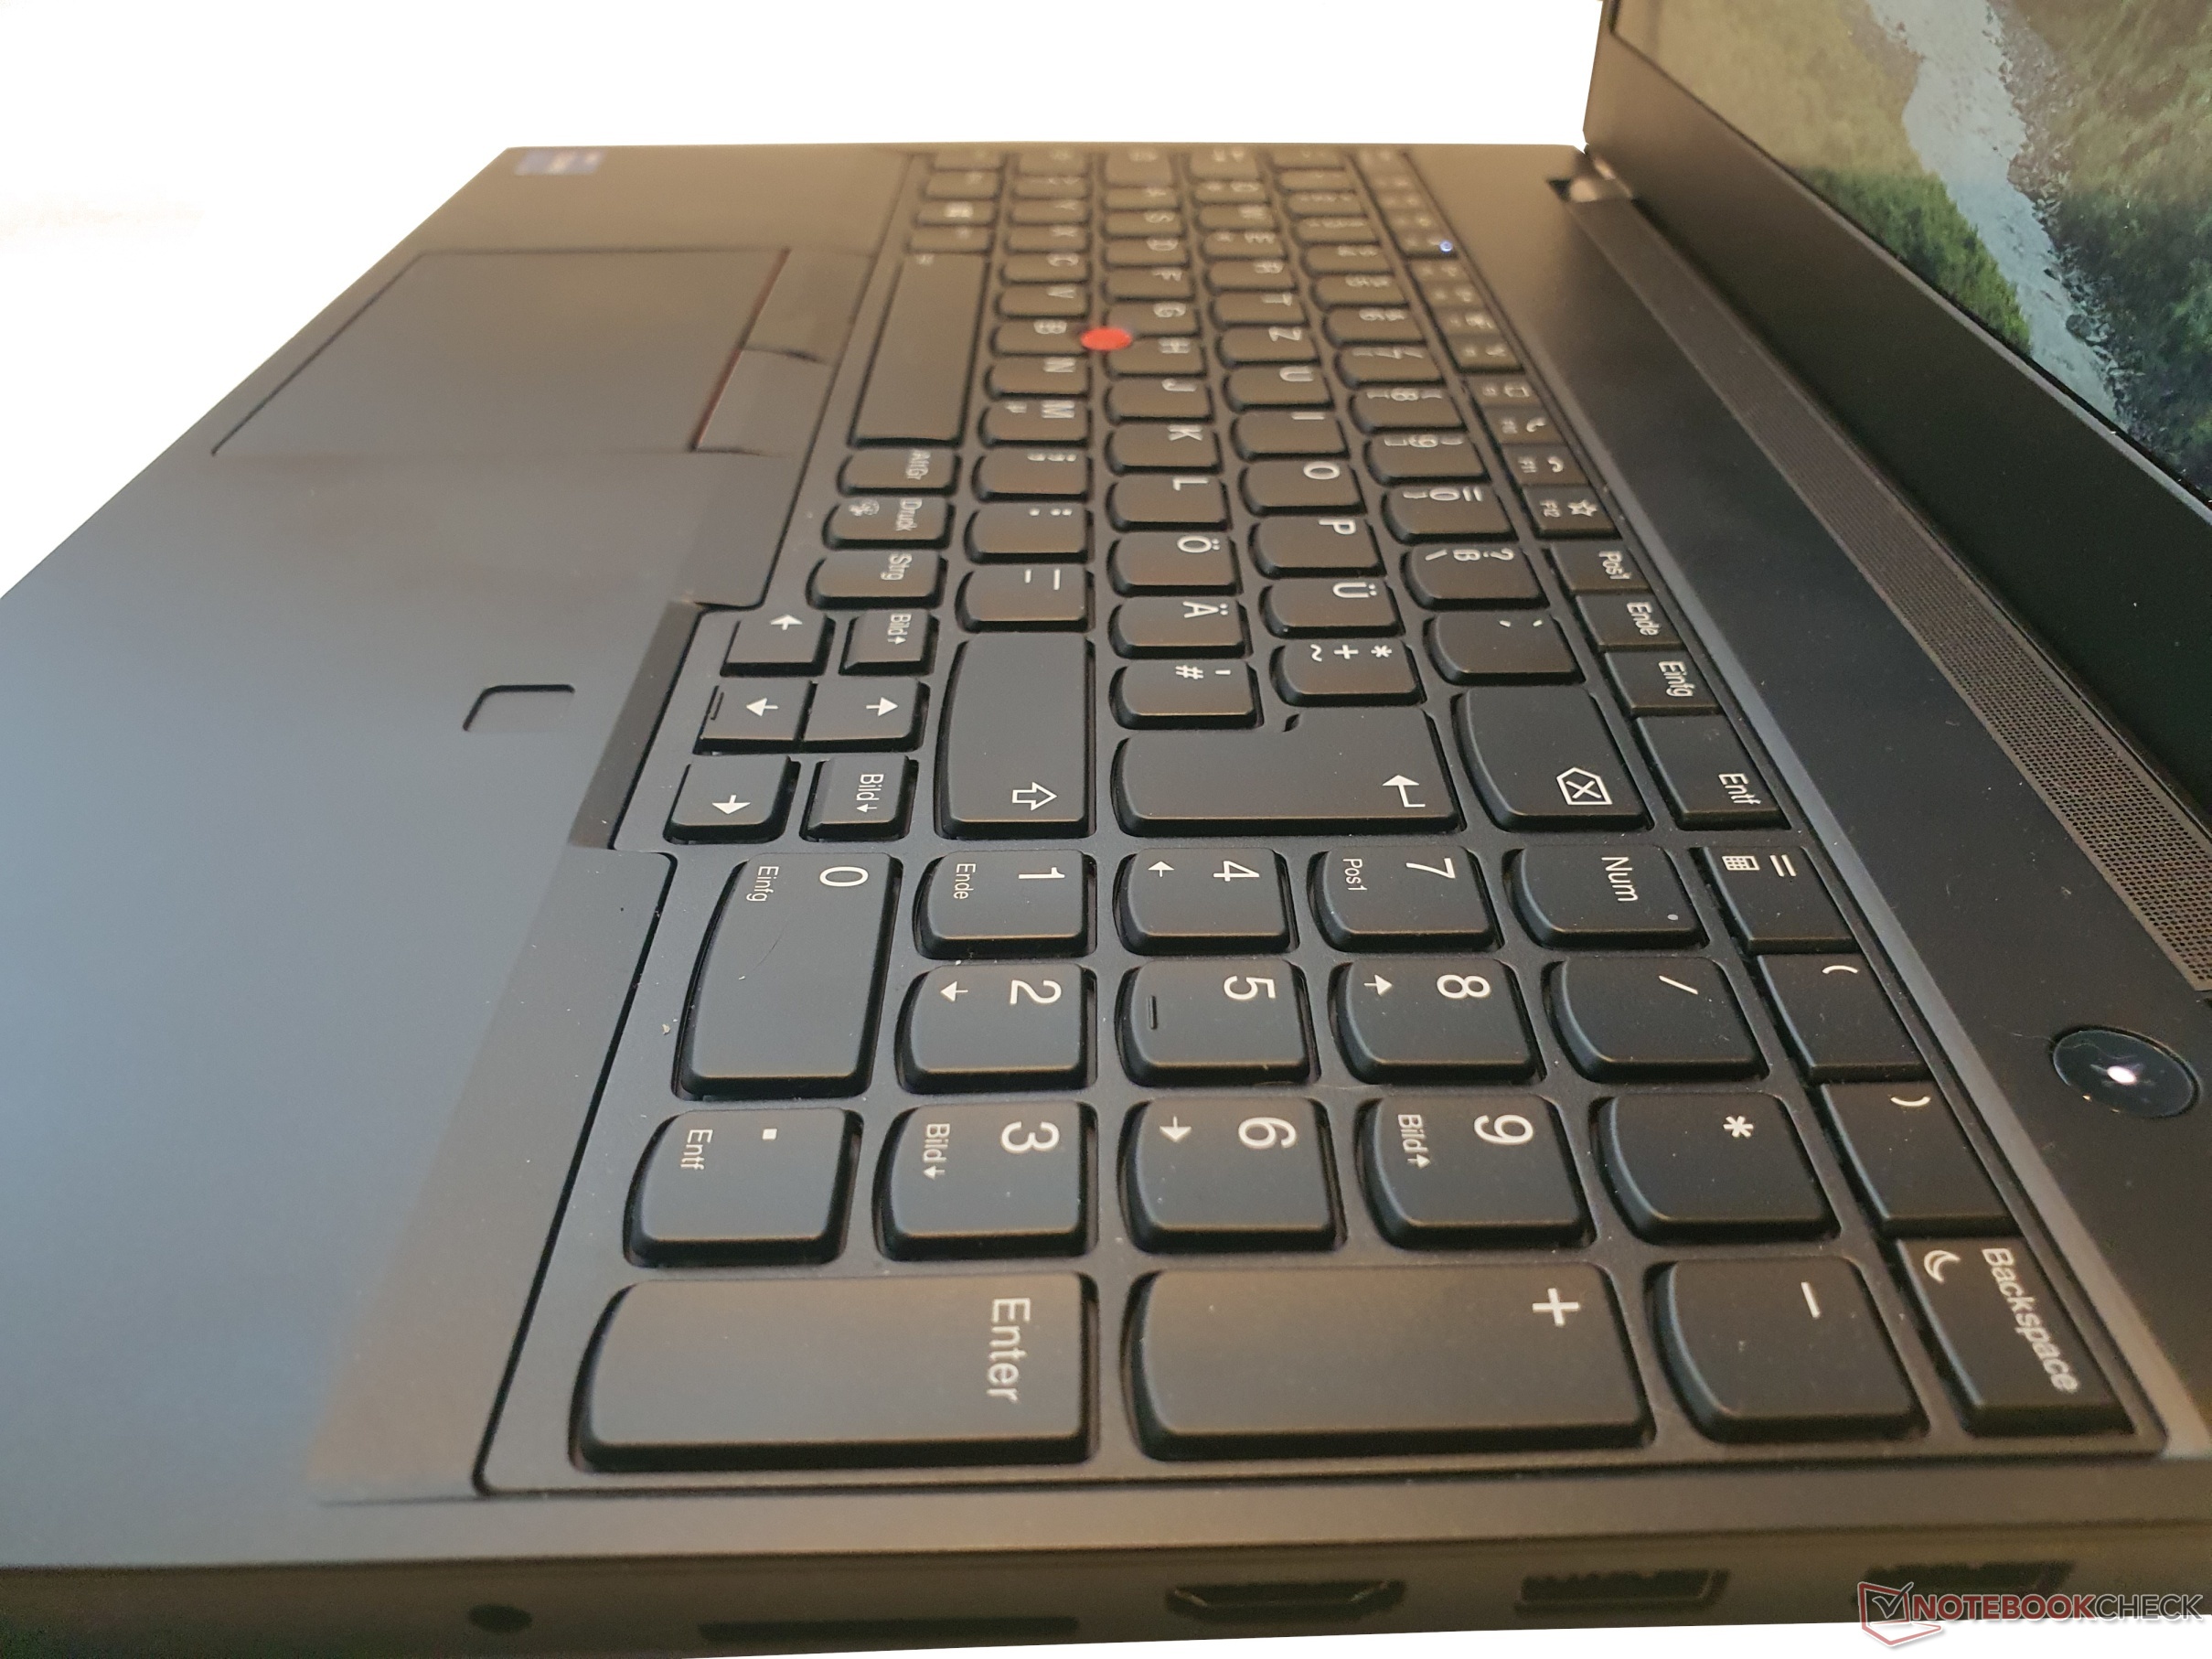
Dispositivos de entrada do ThinkPad: Lenovo com deslocamento decente de 1,8 mm
Teclado
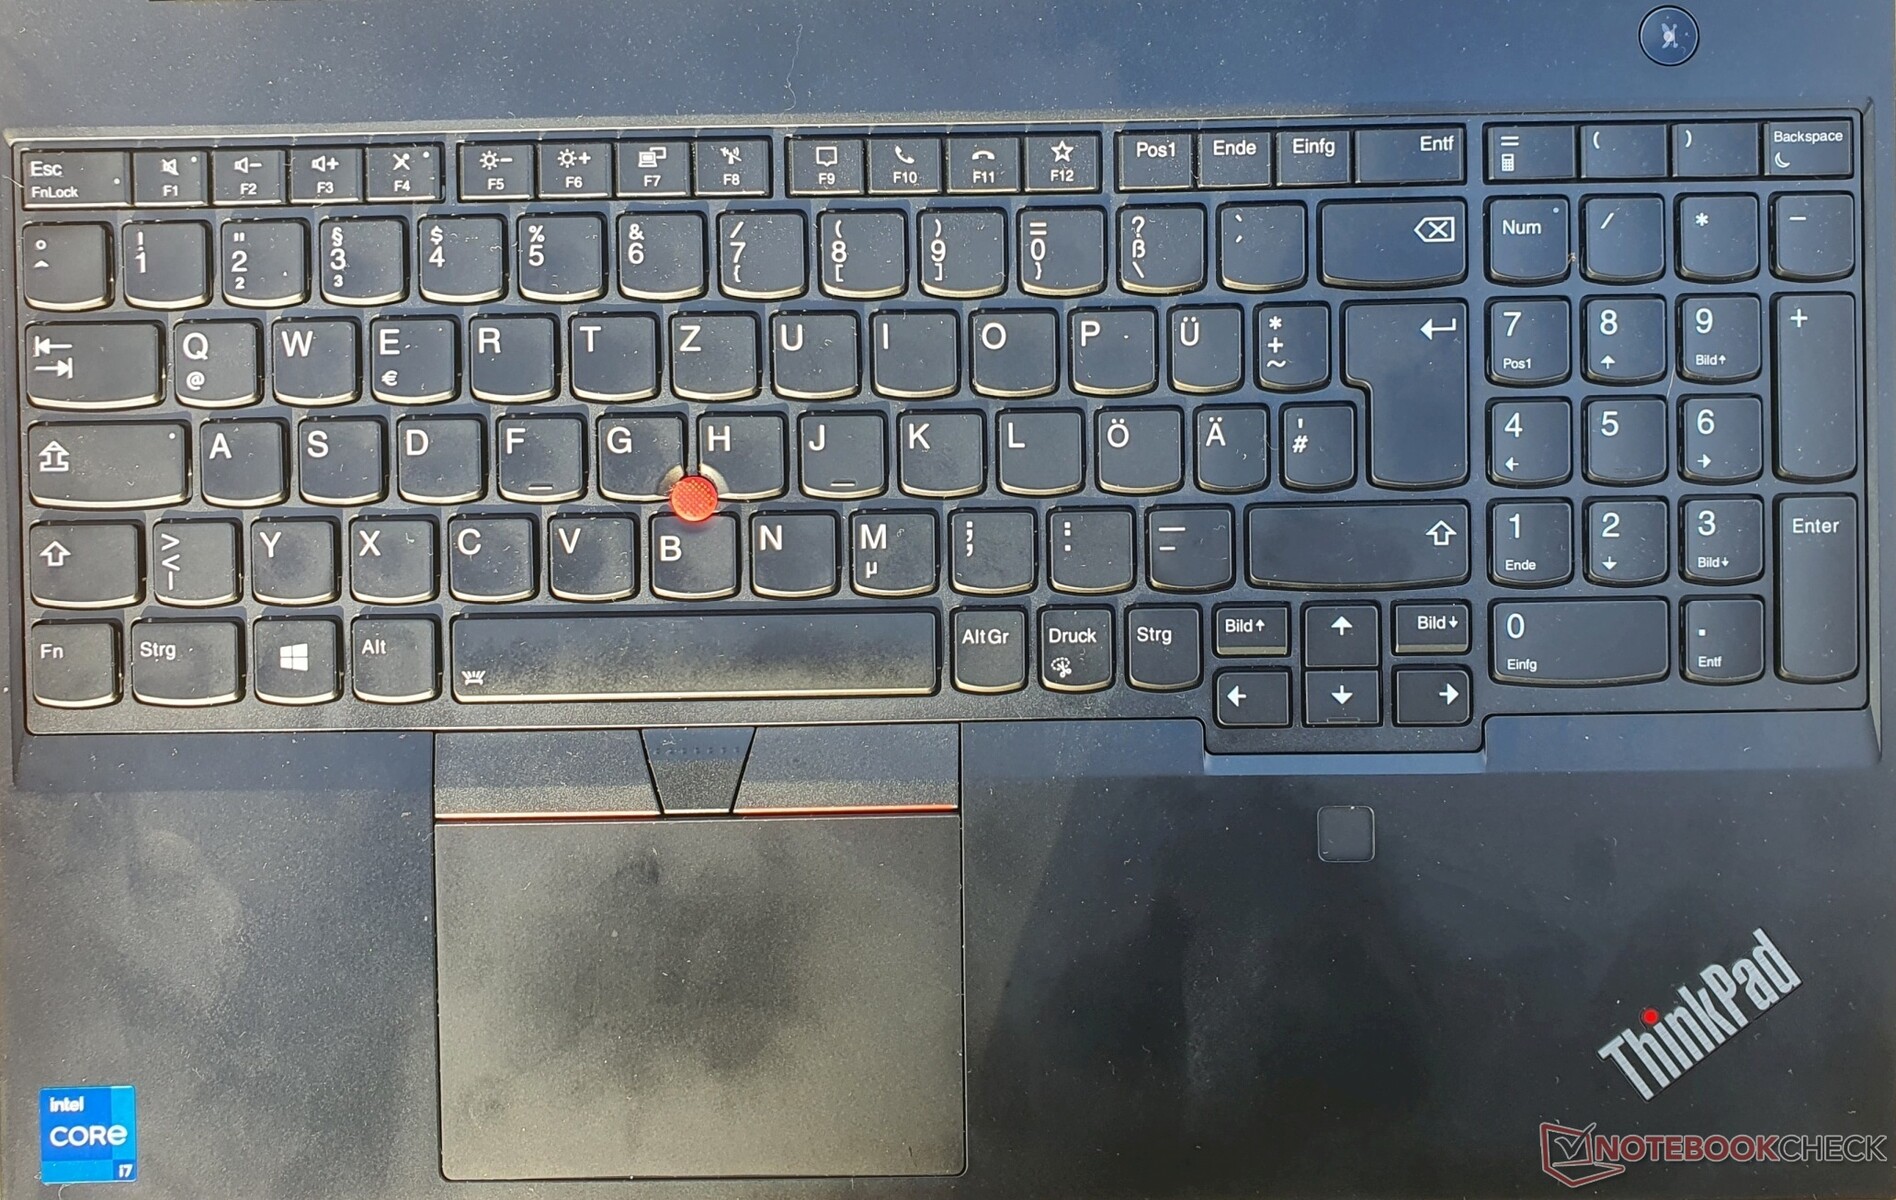
O teclado à prova de respingos da Lenovo é muito confortável de usar com suas teclas de 15 x 15 mm e curso de 1,8 mm. Isto já foi reduzido para 1,5 mm em muitos ThinkPads. O ponto de pressão das teclas lisas e ligeiramente côncavas é claramente perceptível e o curso é muito satisfatório. Por outro lado, o teclado do HP ZBook Power 15 tem um ponto de pressão ainda mais nítido (na opinião do testador), mas um curso mais curto. Quando em dúvida, teste os teclados antes de comprar.
No geral, o layout é muito bom, também graças à navegação dedicada e às teclas de seta bastante grandes. Apenas as quatro teclas à esquerda do Enter e as da linha superior são um pouco menores. Há também um teclado numérico, que pode simplificar a entrada de dados relacionados à estação de trabalho. Mesmo sob pressão direcionada, o teclado não cede. A iluminação de fundo tem dois níveis de ajuste.
Touchpad & TrackPoint
O touchpad de tamanho médio mede 10 x 7 cm e tem uma superfície Mylar lisa com qualidades de deslizamento decentes. Os botões de clique integrados têm uma queda total e um ponto de pressão bem doseado.
Com um pouco de prática, o TrackPoint e seus três botões permitem que o cursor do mouse seja controlado com muita precisão e tem a vantagem de não ter que tirar a mão do teclado. A rolagem em combinação com o botão do meio também é útil.
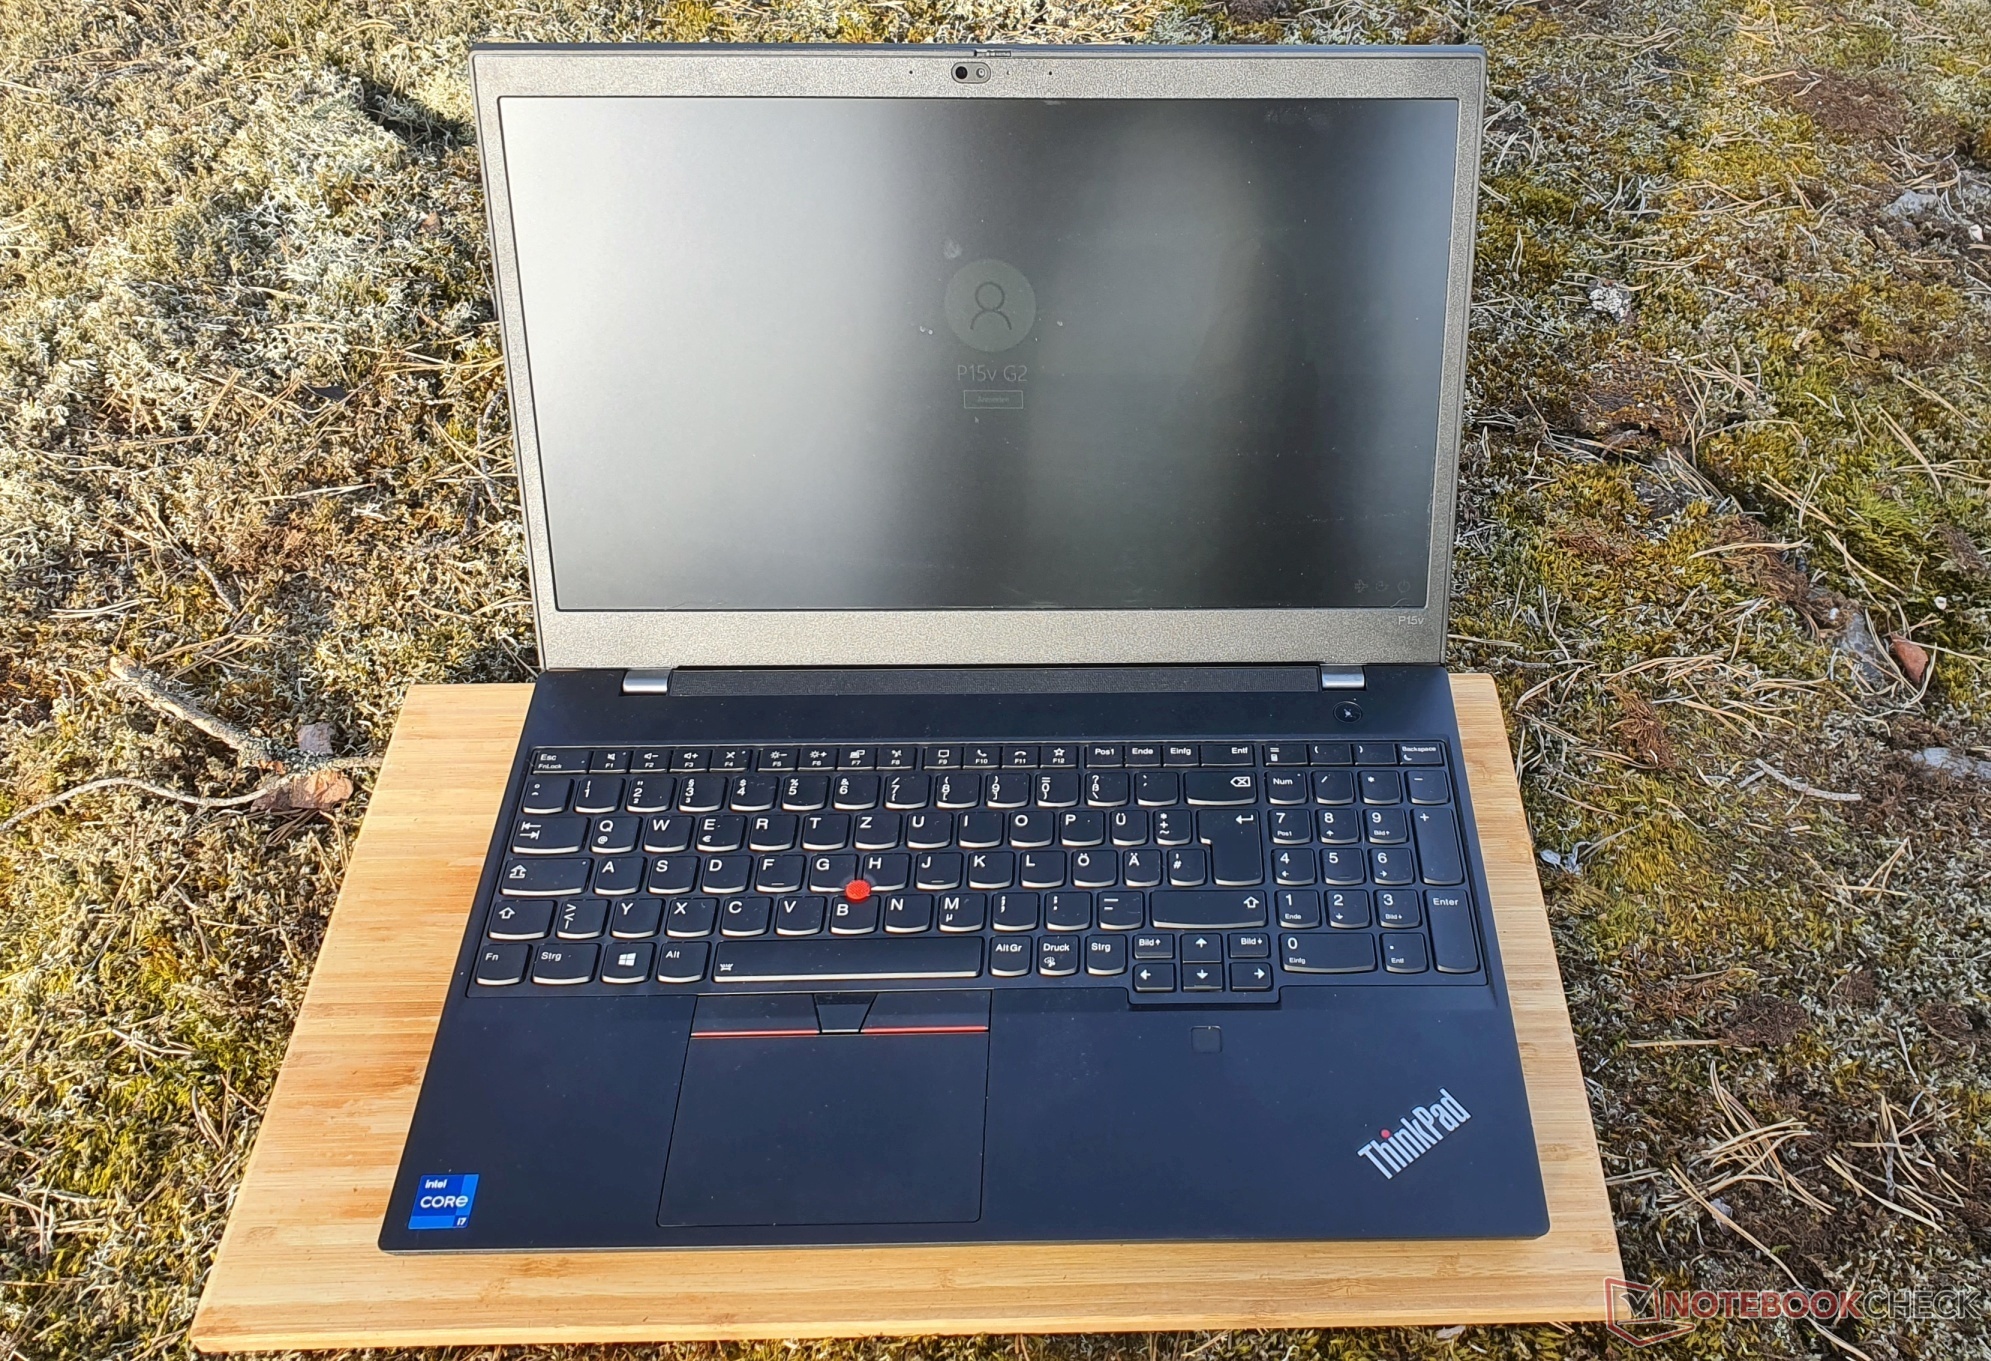
Display opcional 4K no ThinkPad P15v G2

A Lenovo oferece um total de quatro opções de display mate de 15,6 polegadas no formato 16:9 para o ThinkPad P15v G2:
FHD (1920x1080) IPS, 300 lêndeas, 45% NTSC.
FHD (1920x1080) IPS touch, 300 lêndeas, 45% sRGB
FHD (1920x1080) IPS, 300 lêndeas, 100% sRGB
UHD (3840x2160) IPS, 600 lêndeas, 100% AdobeRGB, HDR400, X-Rite
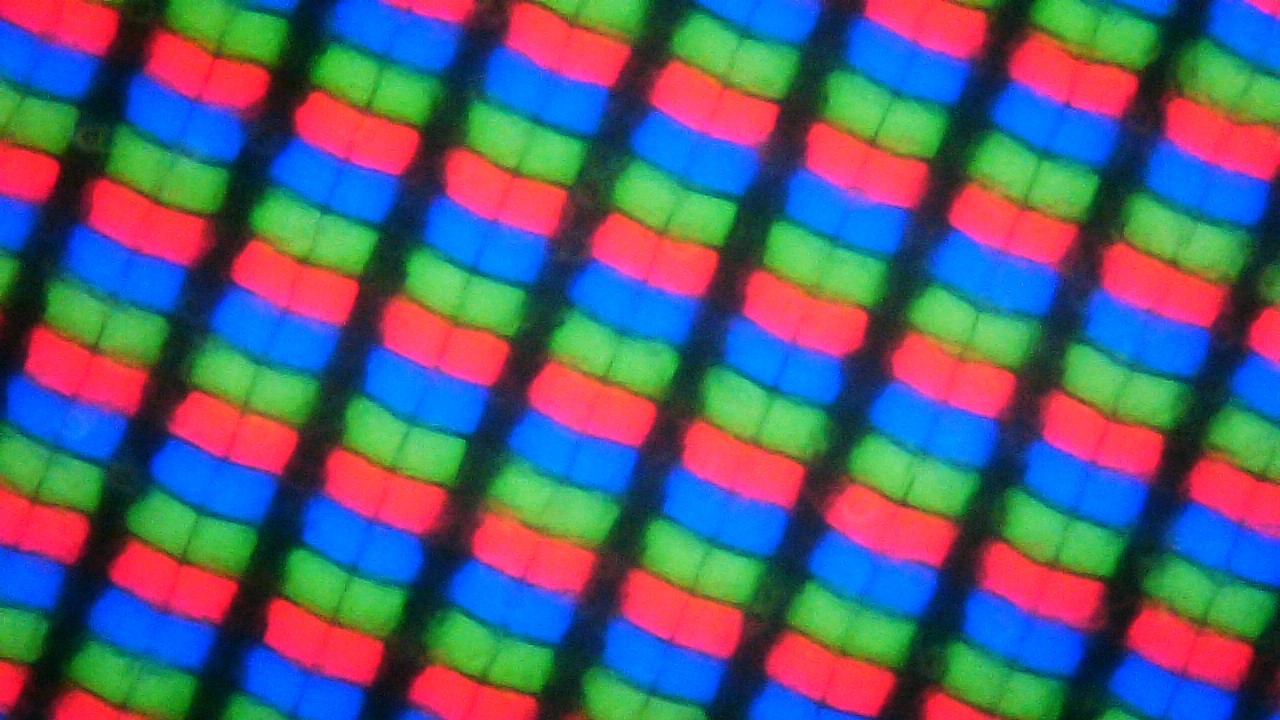
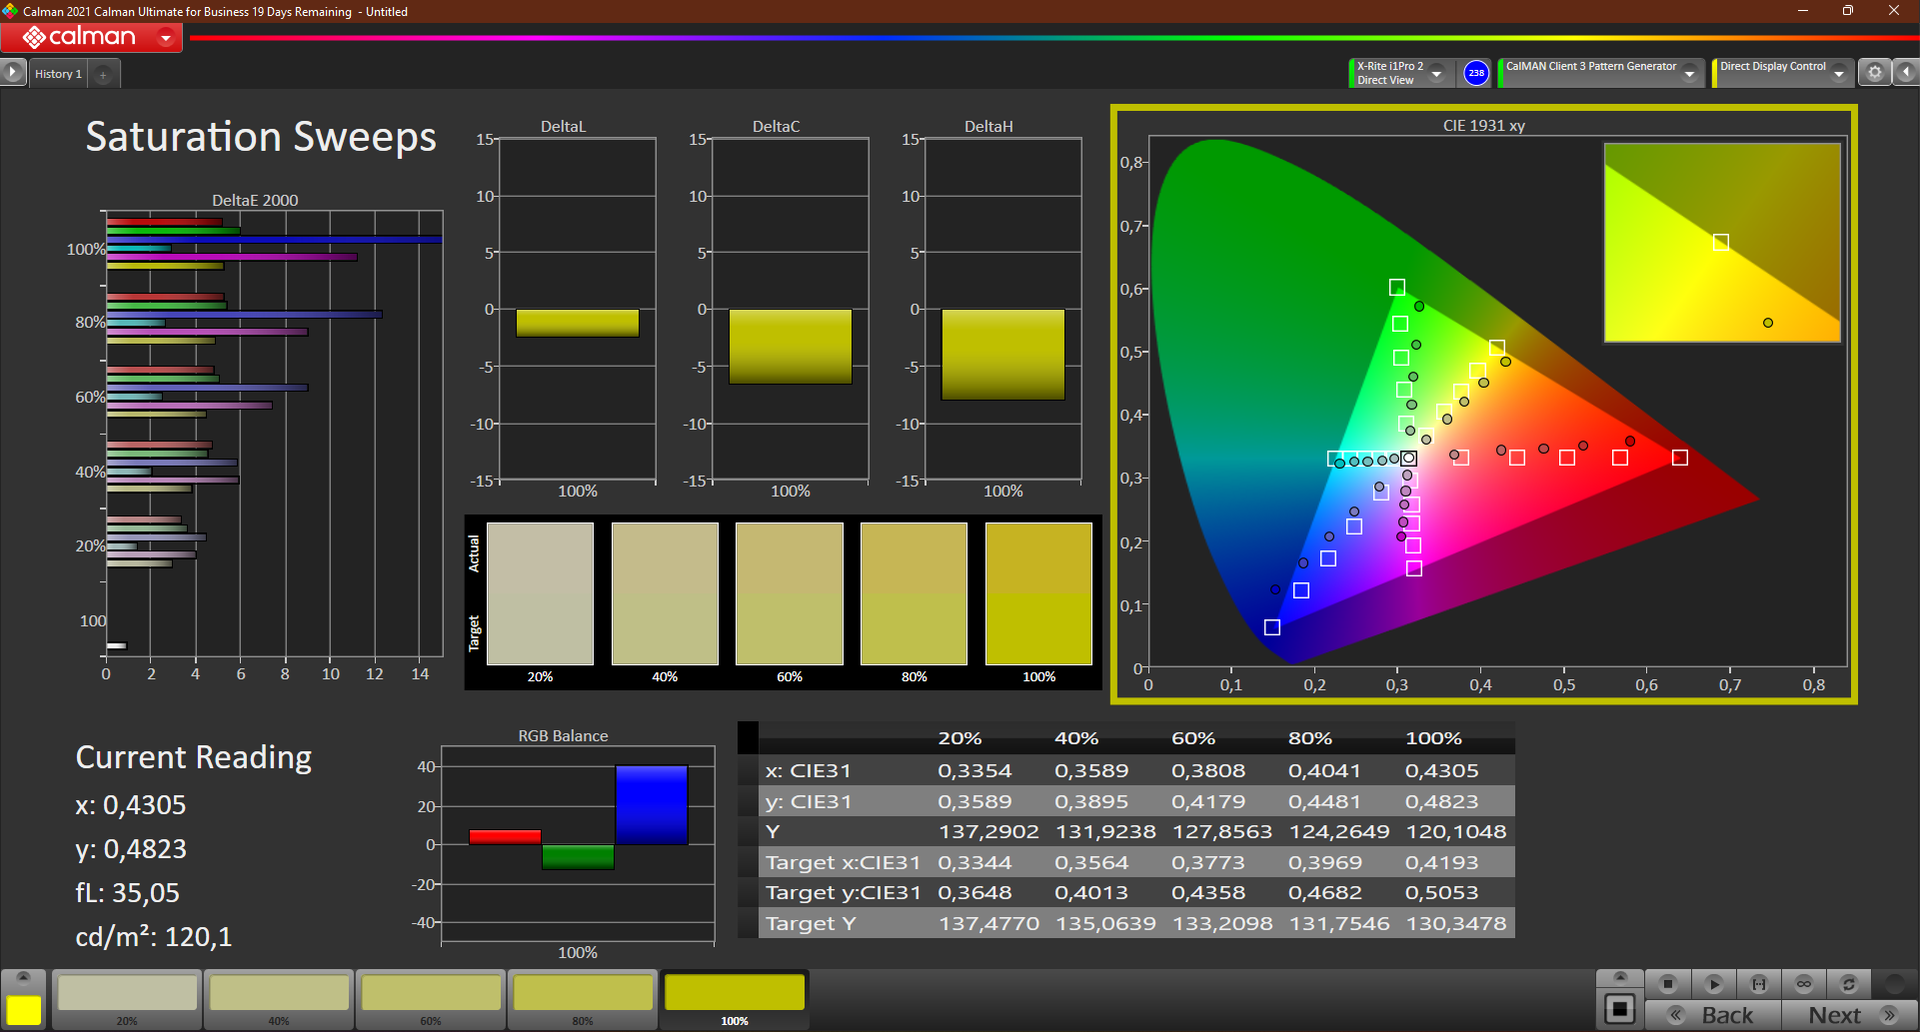
Nosso painel representa a variante de nível de entrada e tem uma resolução de 1920x1080, de modo que o conteúdo é exibido suficientemente nítido. A escala, que pode ser ajustada para 100%, também é vantajosa, proporcionando um conteúdo ainda mais nítido e prevenindo problemas de escala.
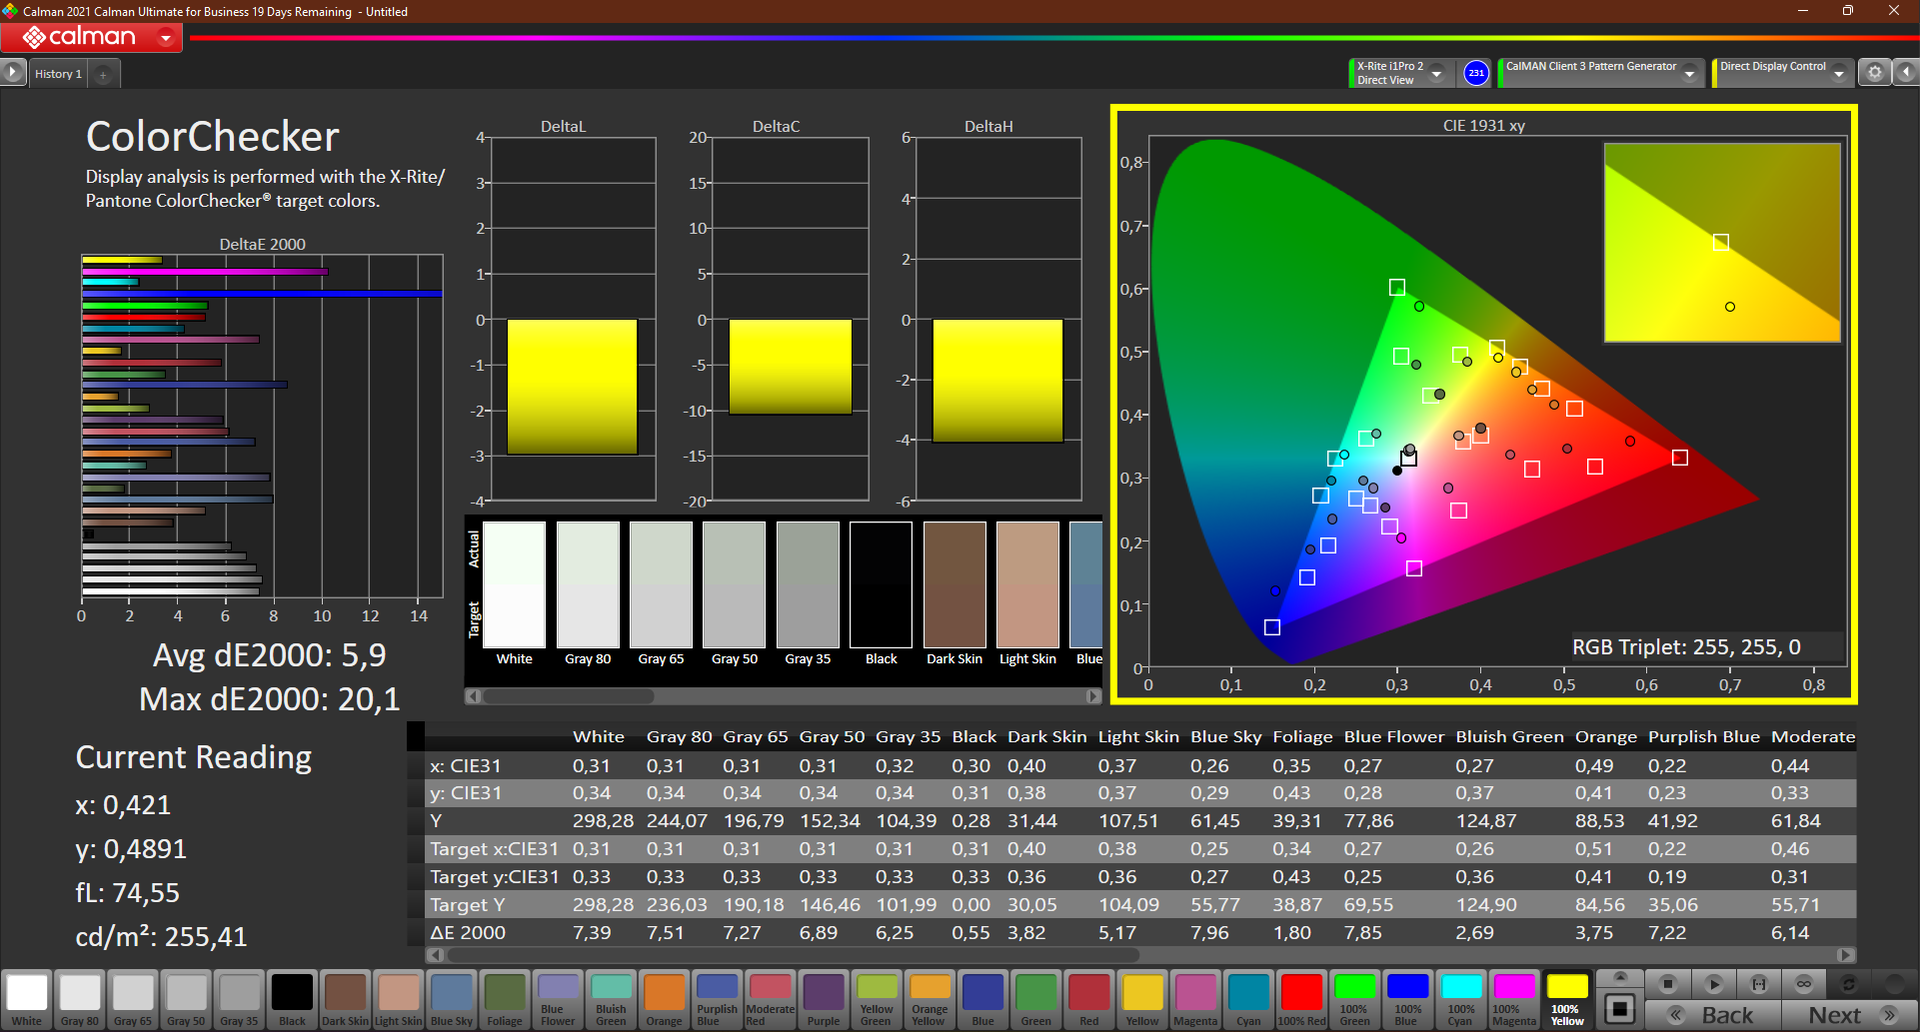
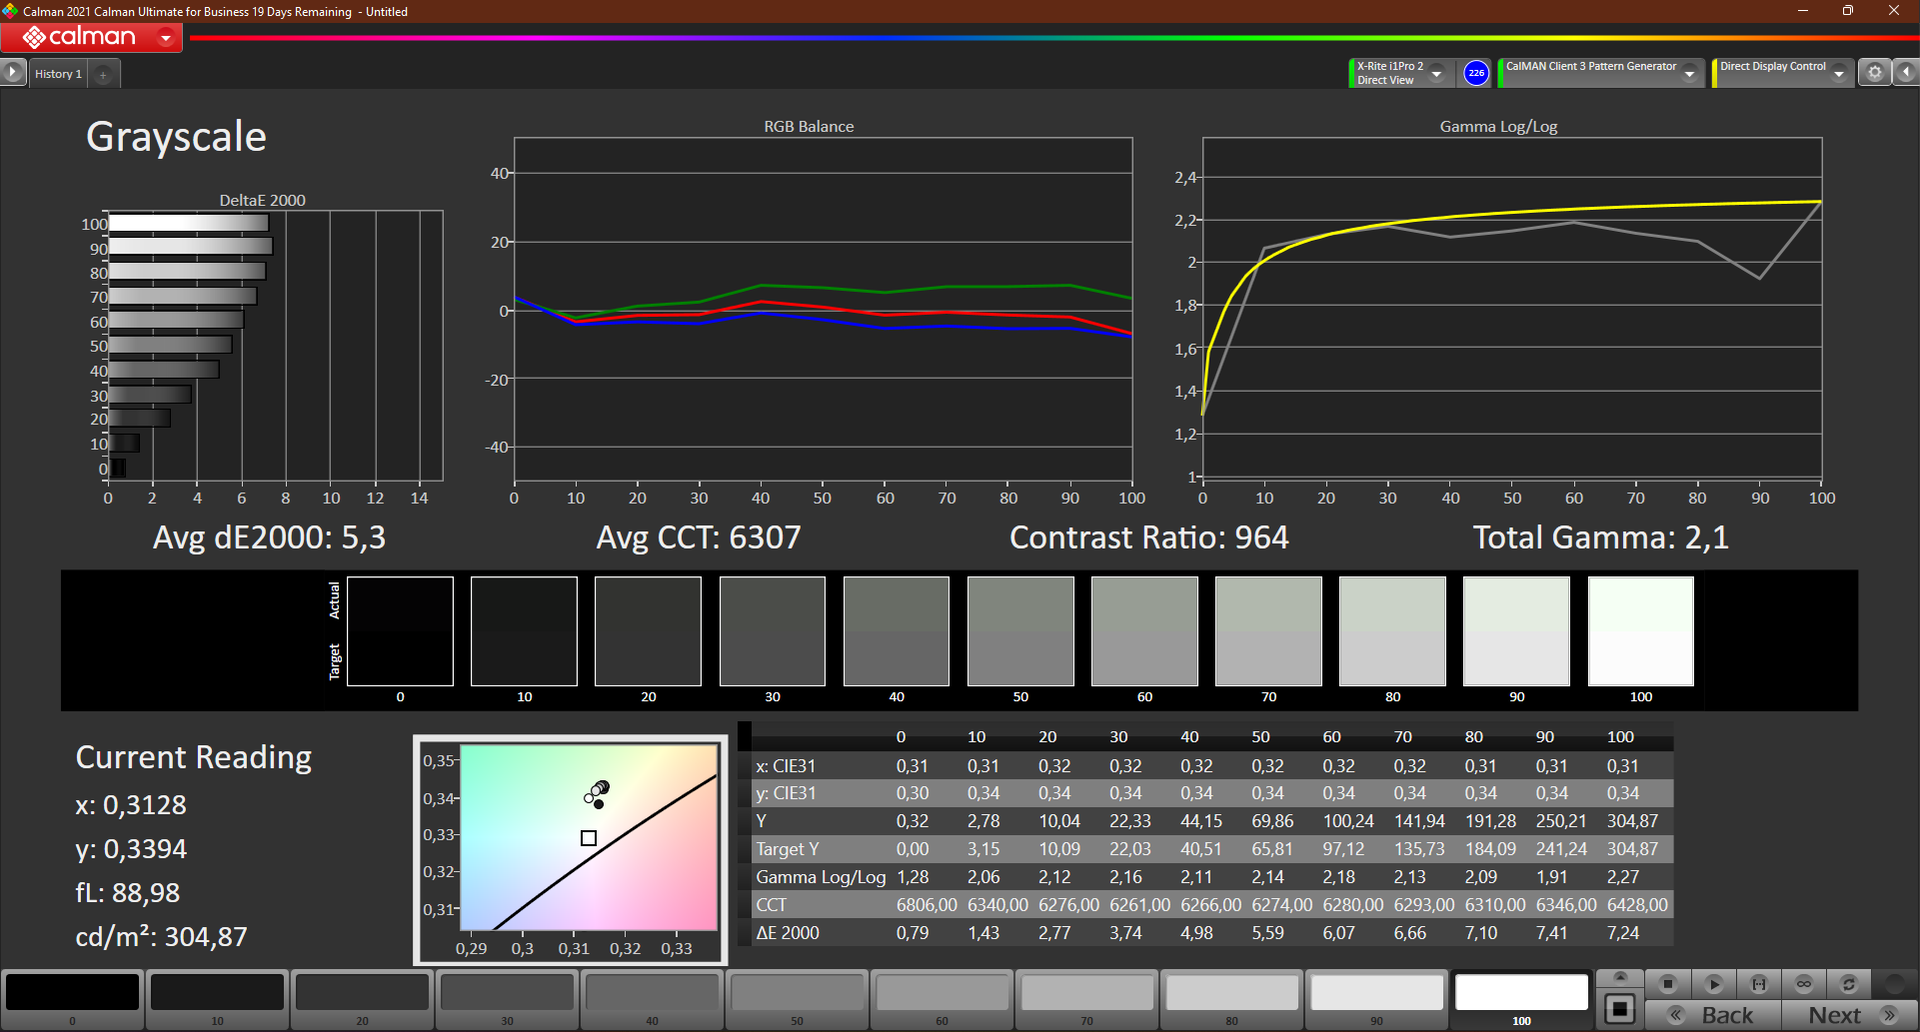
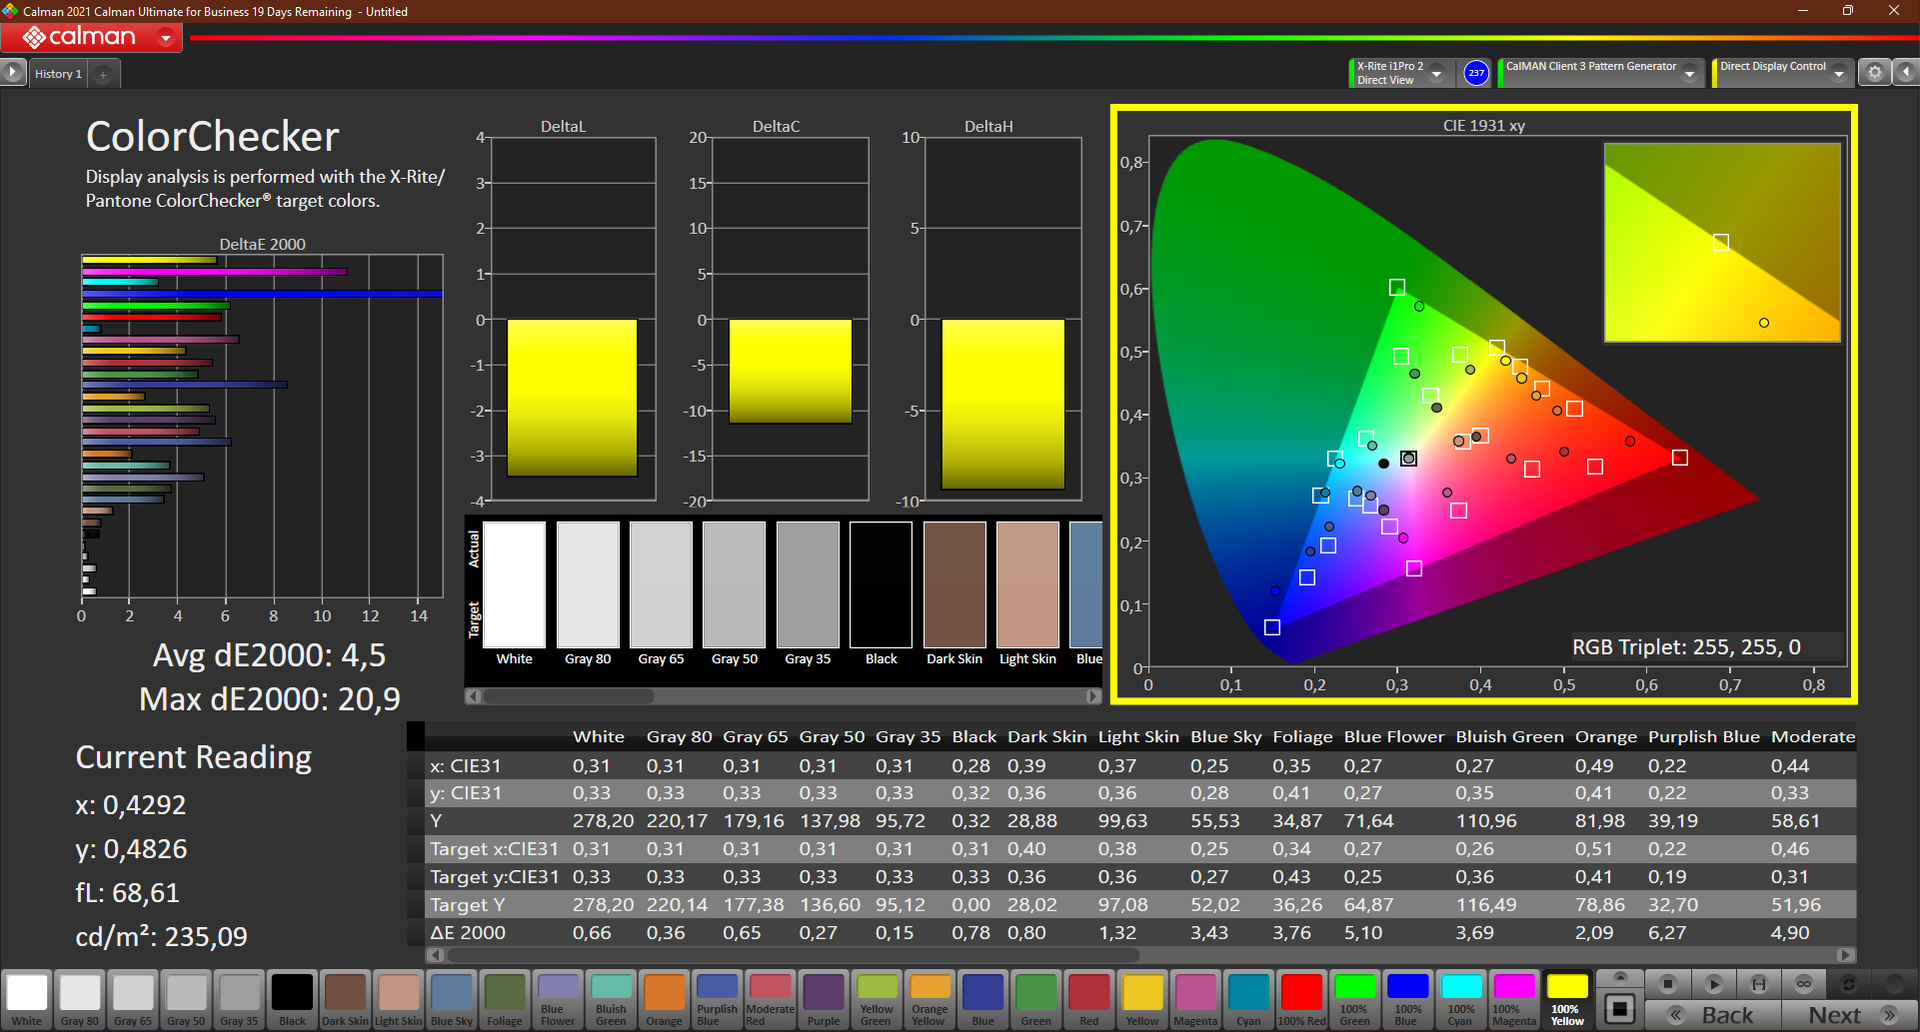
O brilho de cerca de 280 lêndeas não é ideal, mas ainda é aceitável em ambientes internos. A relação de contraste de 953:1 é OK, assim como o valor de preto de 0,32. A calibração resulta em um preto mais rico, e também conseguimos reduzir o valor correspondente da escala de cinza DeltaE de 5,3 para um bom valor de 0,9. Entretanto, o valor de cor Delta E permanece alto em 4,5
Subjetivamente, a qualidade da imagem é boa, não menos por causa dos subpixels relativamente claros e do preto rico. O HP ZBook Power 15 e todos os outros dispositivos de comparação oferecem taxas muito melhores em papel. Os tempos de resposta do painel são medíocres para diminuir a velocidade e, portanto, não são ótimos para jogos. Não foi detectada nenhuma cintilação do PWM.
| |||||||||||||||||||||||||
iluminação: 88 %
iluminação com acumulador: 305 cd/m²
Contraste: 953:1 (Preto: 0.32 cd/m²)
ΔE ColorChecker Calman: 5.9 | ∀{0.5-29.43 Ø4.71}
calibrated: 4.5
ΔE Greyscale Calman: 5.3 | ∀{0.09-98 Ø4.96}
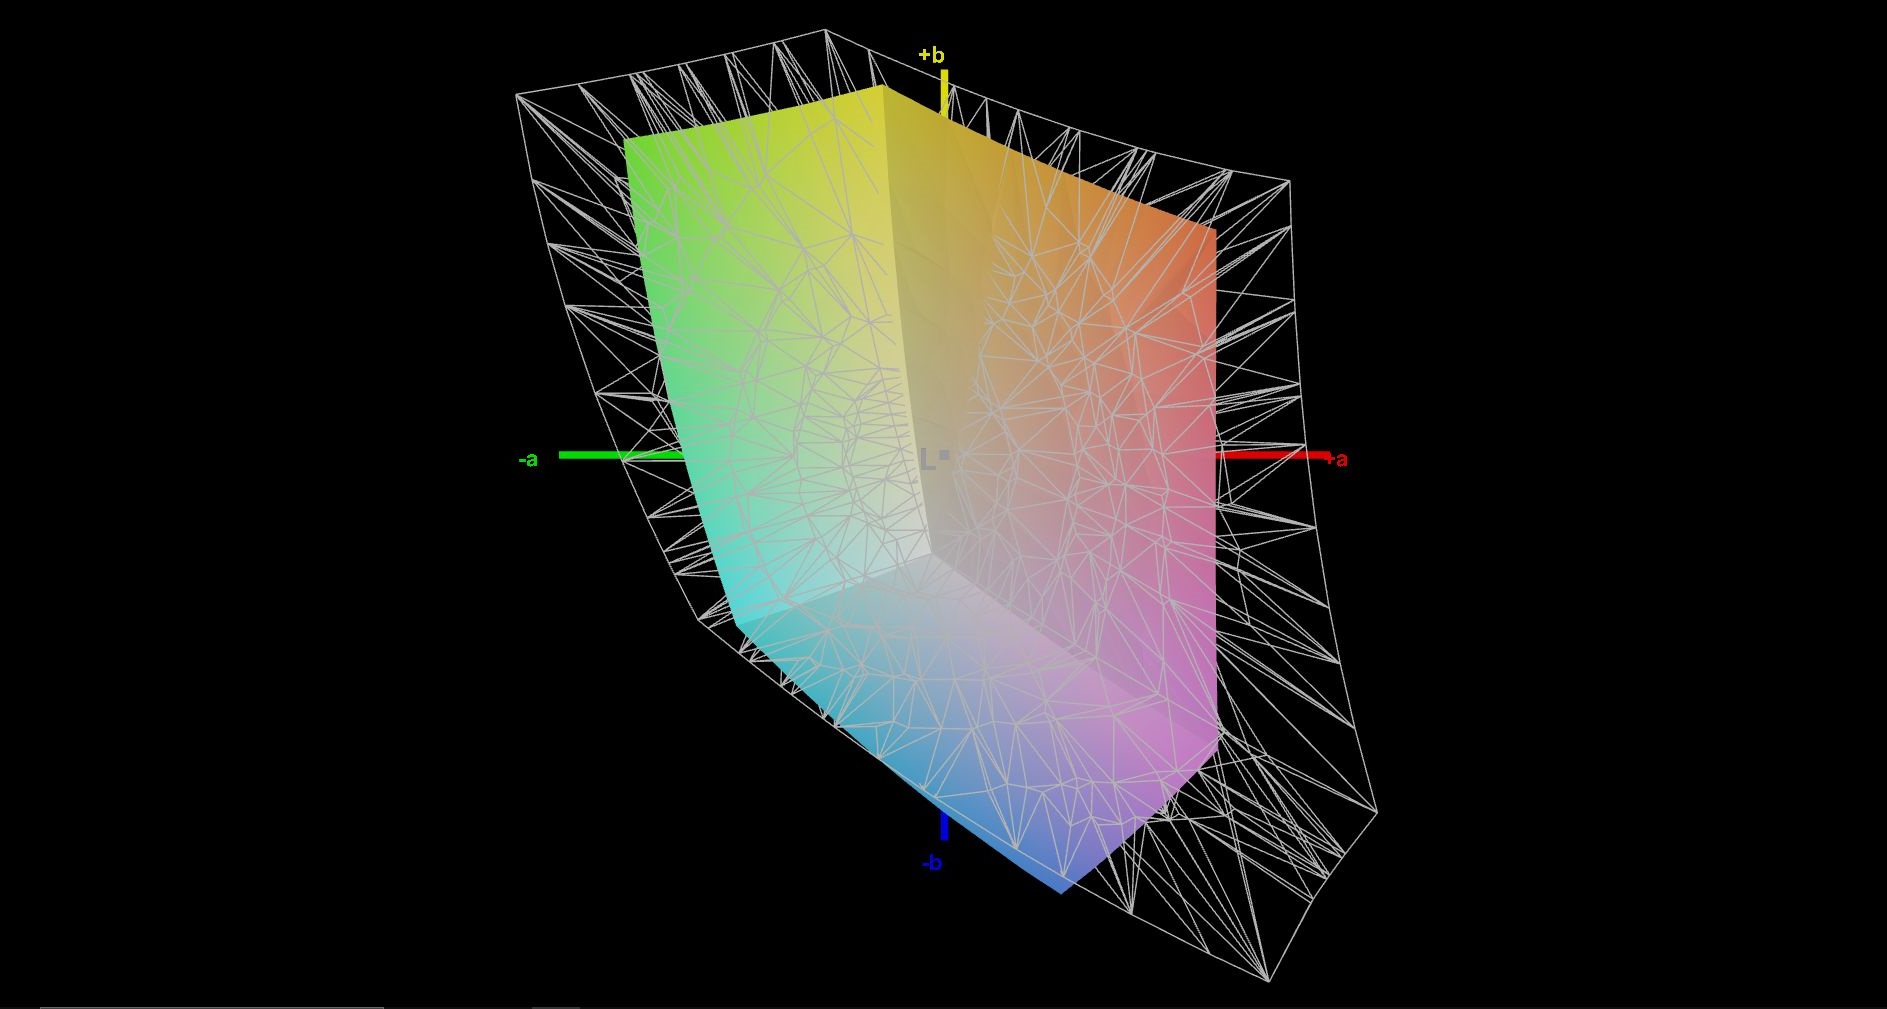
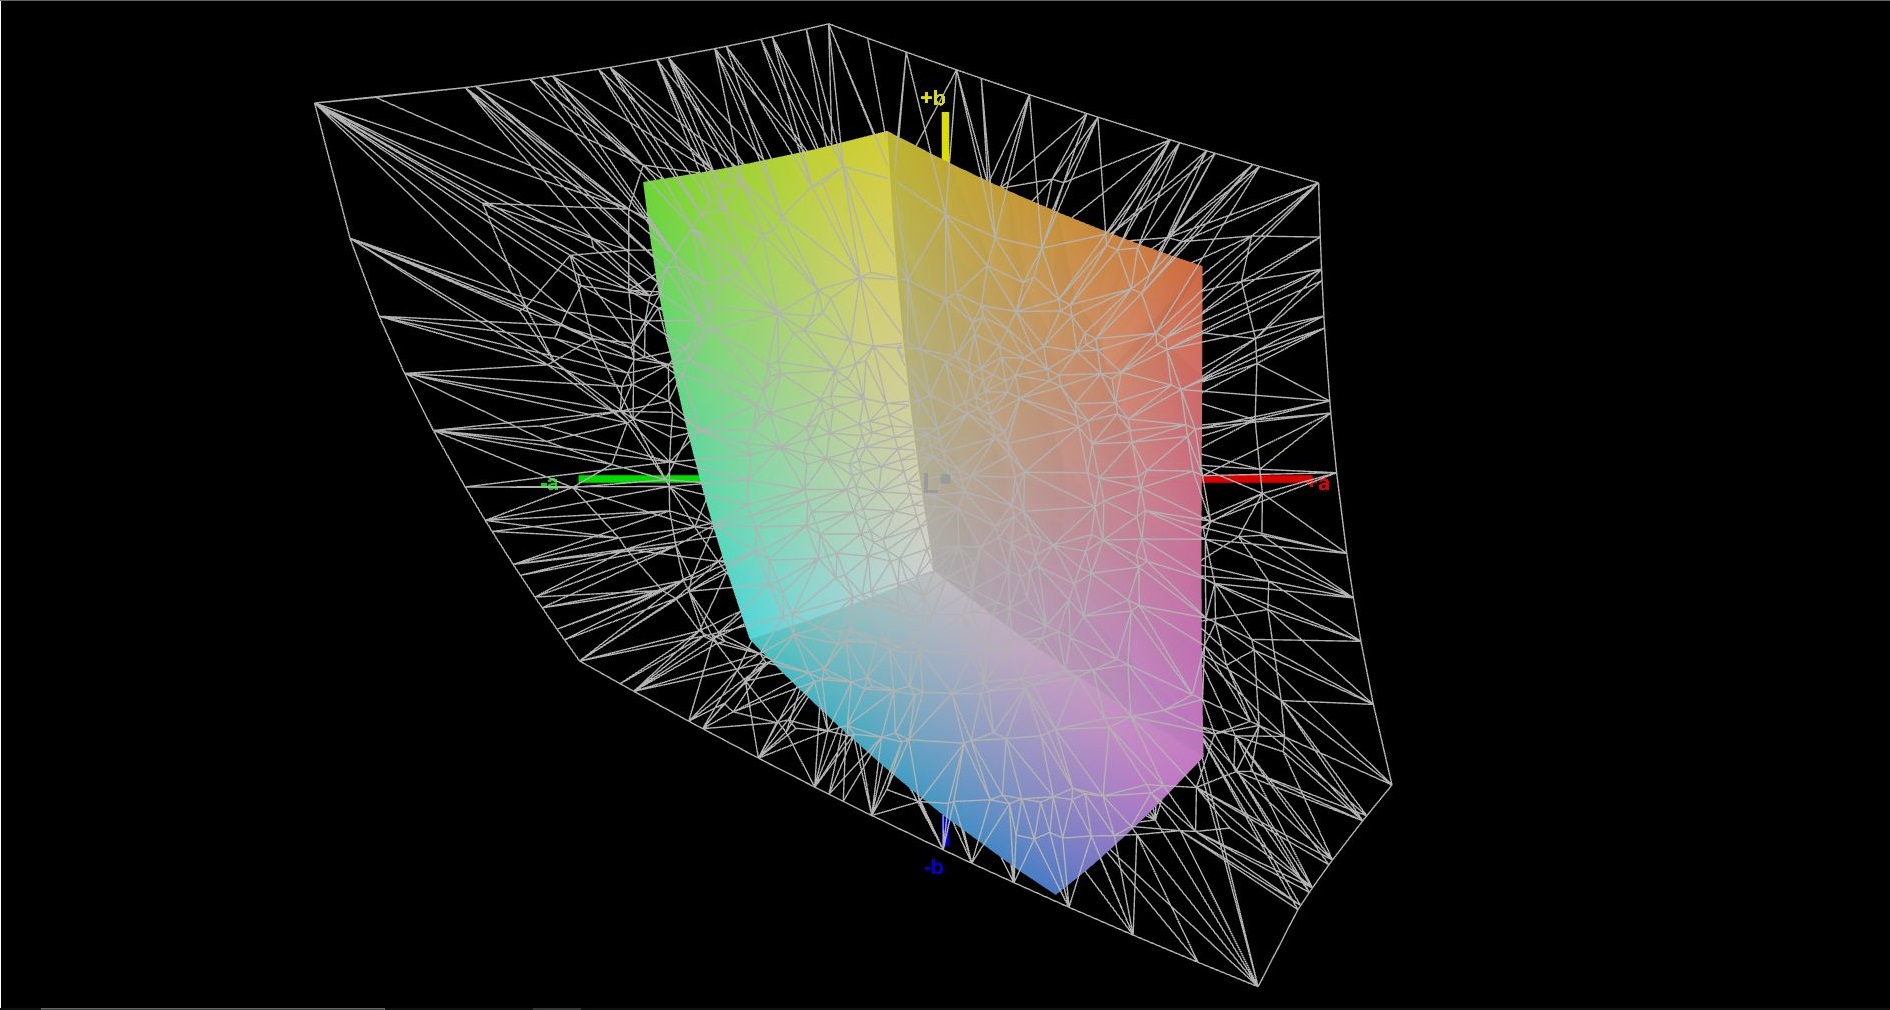
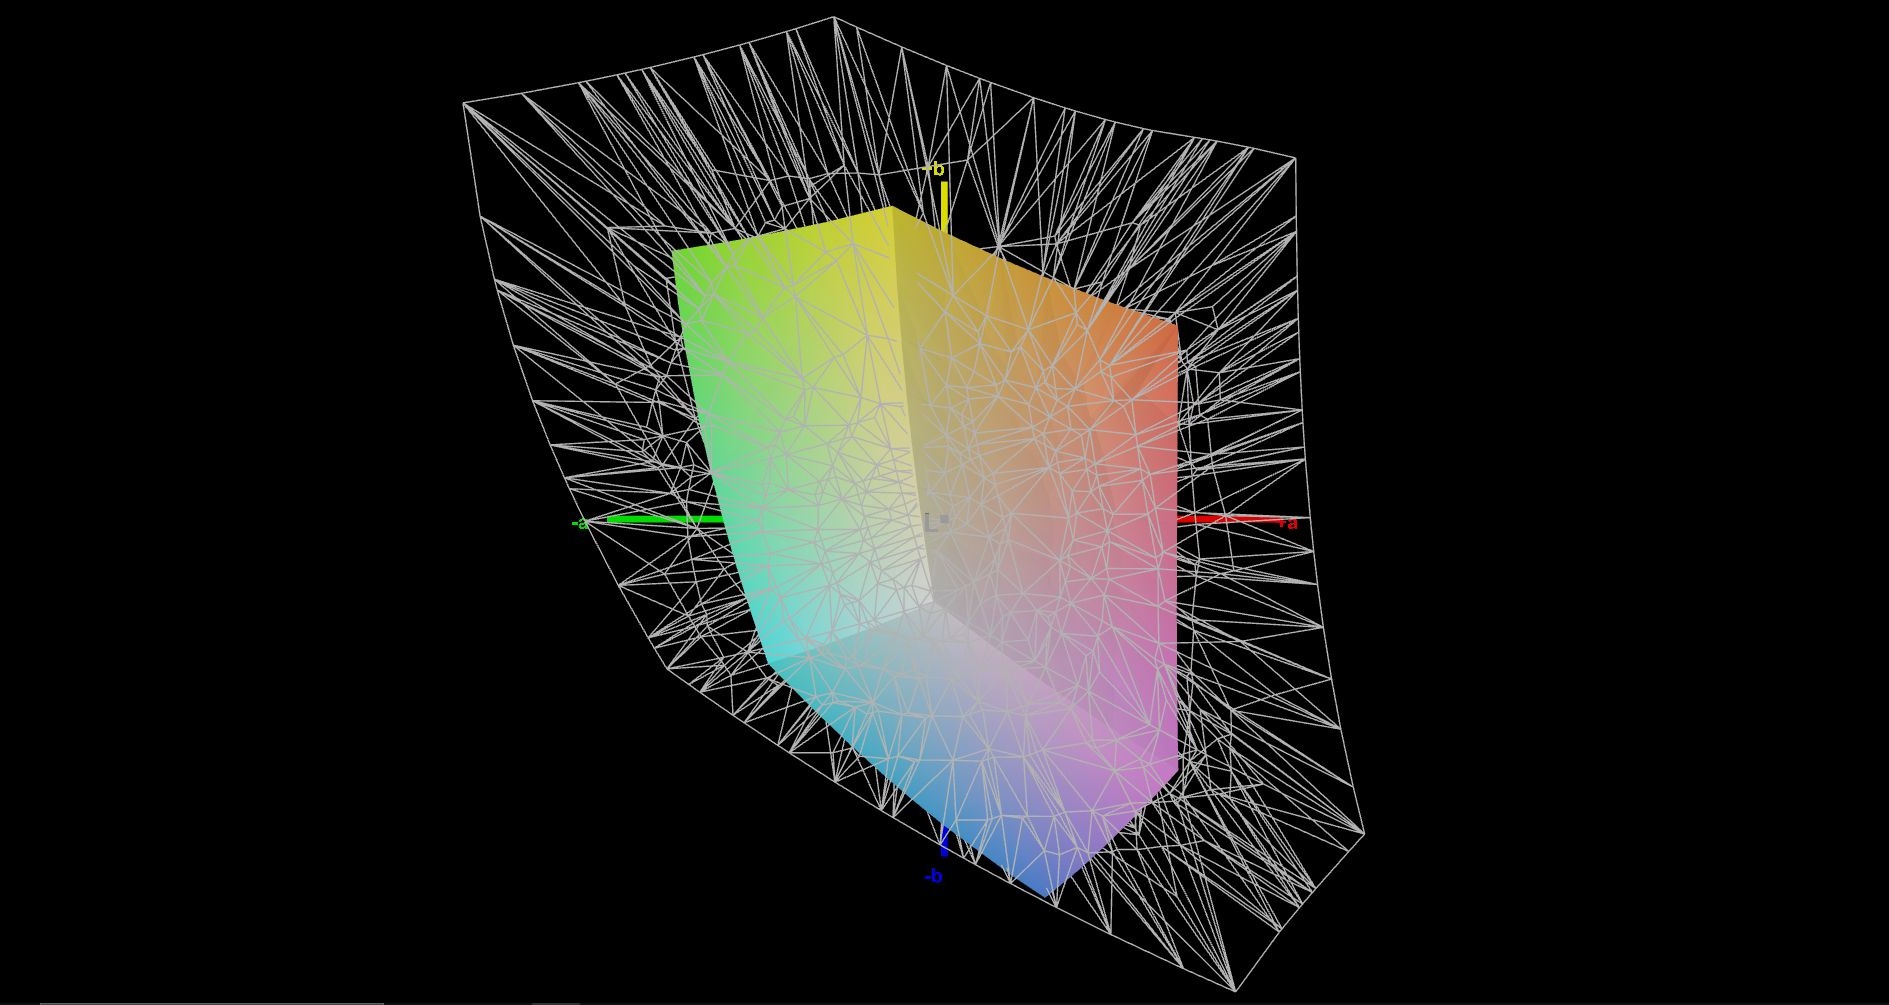
45.3% AdobeRGB 1998 (Argyll 3D)
65.1% sRGB (Argyll 3D)
43.7% Display P3 (Argyll 3D)
Gamma: 2.1
CCT: 6307 K
| Lenovo ThinkPad P15v G2 21A9000XGE N156HCA-EAC, IPS LED, 1920x1080, 15.6" | Lenovo ThinkPad P15 G2-20YQ001JGE N156HCE_GN1, IPS, 1920x1080, 15.6" | Lenovo ThinkPad T15g-20UR000GGE N156HCE-GN1, IPS, 1920x1080, 15.6" | Lenovo ThinkPad T15p-20TN0006GE MNF601EA1-1, IPS LED, 3840x2160, 15.6" | Lenovo ThinkPad P15s Gen2-20W6000GGE MNF601EA1-1, IPS LED, 3840x2160, 15.6" | HP ZBook Power 15 G8 313S5EA AUOA08B, IPS LED, 1920x1080, 15.6" | Dell Precision 5000 5560 Sharp LQ156R1, IPS, 3840x2400, 15.6" | |
|---|---|---|---|---|---|---|---|
| Display | 55% | 39% | 90% | 87% | 57% | 97% | |
| Display P3 Coverage (%) | 43.7 | 68.6 57% | 61.3 40% | 86.8 99% | 84.5 93% | 70.5 61% | 94.9 117% |
| sRGB Coverage (%) | 65.1 | 99.8 53% | 90.5 39% | 99.3 53% | 98.7 52% | 99 52% | 100 54% |
| AdobeRGB 1998 Coverage (%) | 45.3 | 70.6 56% | 62.3 38% | 98.5 117% | 97.8 116% | 71.3 57% | 100 121% |
| Response Times | 33% | 31% | 19% | 17% | -32% | -4% | |
| Response Time Grey 50% / Grey 80% * (ms) | 48 ? | 37.6 ? 22% | 38 ? 21% | 41.6 ? 13% | 40 ? 17% | 61 -27% | 47.2 ? 2% |
| Response Time Black / White * (ms) | 28 ? | 16 ? 43% | 16.8 ? 40% | 21.2 ? 24% | 23.2 ? 17% | 38 ? -36% | 30.4 ? -9% |
| PWM Frequency (Hz) | 26040 ? | 26040 ? | |||||
| Screen | 46% | 44% | 70% | 70% | 49% | 34% | |
| Brightness middle (cd/m²) | 305 | 498 63% | 504 65% | 595 95% | 604 98% | 393 29% | 501.5 64% |
| Brightness (cd/m²) | 281 | 490 74% | 476 69% | 594 111% | 609 117% | 385 37% | 467 66% |
| Brightness Distribution (%) | 88 | 95 8% | 90 2% | 94 7% | 91 3% | 78 -11% | 83 -6% |
| Black Level * (cd/m²) | 0.32 | 0.39 -22% | 0.34 -6% | 0.32 -0% | 0.34 -6% | 0.25 22% | 0.44 -38% |
| Contrast (:1) | 953 | 1277 34% | 1482 56% | 1859 95% | 1776 86% | 1572 65% | 1140 20% |
| Colorchecker dE 2000 * | 5.9 | 2.1 64% | 2.9 51% | 1.2 80% | 0.9 85% | 1.5 75% | 4.73 20% |
| Colorchecker dE 2000 max. * | 20.1 | 5.6 72% | 7.1 65% | 2.5 88% | 2.6 87% | 4.3 79% | 8.45 58% |
| Colorchecker dE 2000 calibrated * | 4.5 | 0.8 82% | 1.3 71% | 1 78% | 0.8 82% | 1.4 69% | 0.51 89% |
| Greyscale dE 2000 * | 5.3 | 3.4 36% | 4.3 19% | 1.4 74% | 1.1 79% | 1.3 75% | 3.6 32% |
| Gamma | 2.1 105% | 2.32 95% | 2.25 98% | 2.1 105% | 2.15 102% | 2.26 97% | 2.08 106% |
| CCT | 6307 103% | 7162 91% | 7265 89% | 6492 100% | 6656 98% | 6435 101% | 6447 101% |
| Color Space (Percent of AdobeRGB 1998) (%) | 57.7 | 85.3 | 84.5 | ||||
| Color Space (Percent of sRGB) (%) | 90.8 | 99.2 | 98.6 | ||||
| Média Total (Programa/Configurações) | 45% /
46% | 38% /
41% | 60% /
67% | 58% /
66% | 25% /
39% | 42% /
42% |
* ... menor é melhor
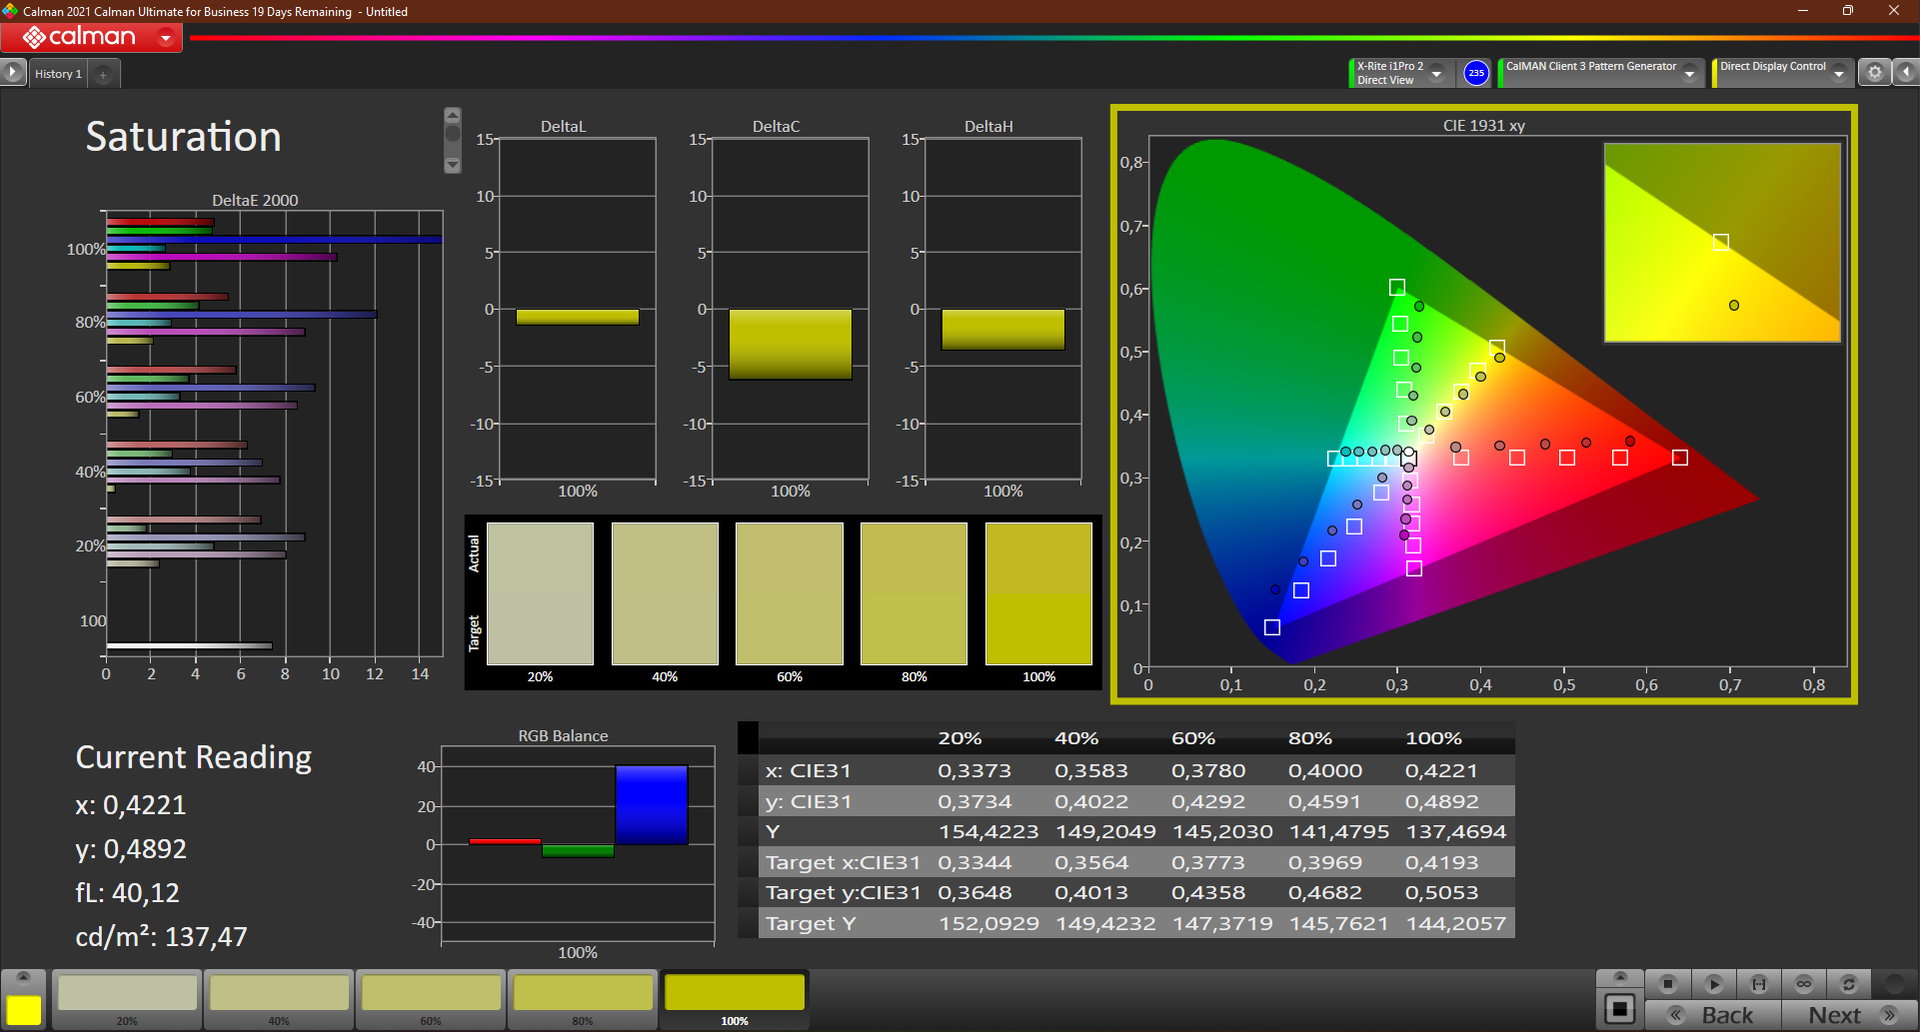
O menor espaço de cor que medimos (sRGB) é coberto em apenas 65%. Se você precisar de espaços de cor maiores, você deve usar outras opções de exibição, uma vez que nosso modelo testado se mostra inadequado para uma edição de imagem ambiciosa.
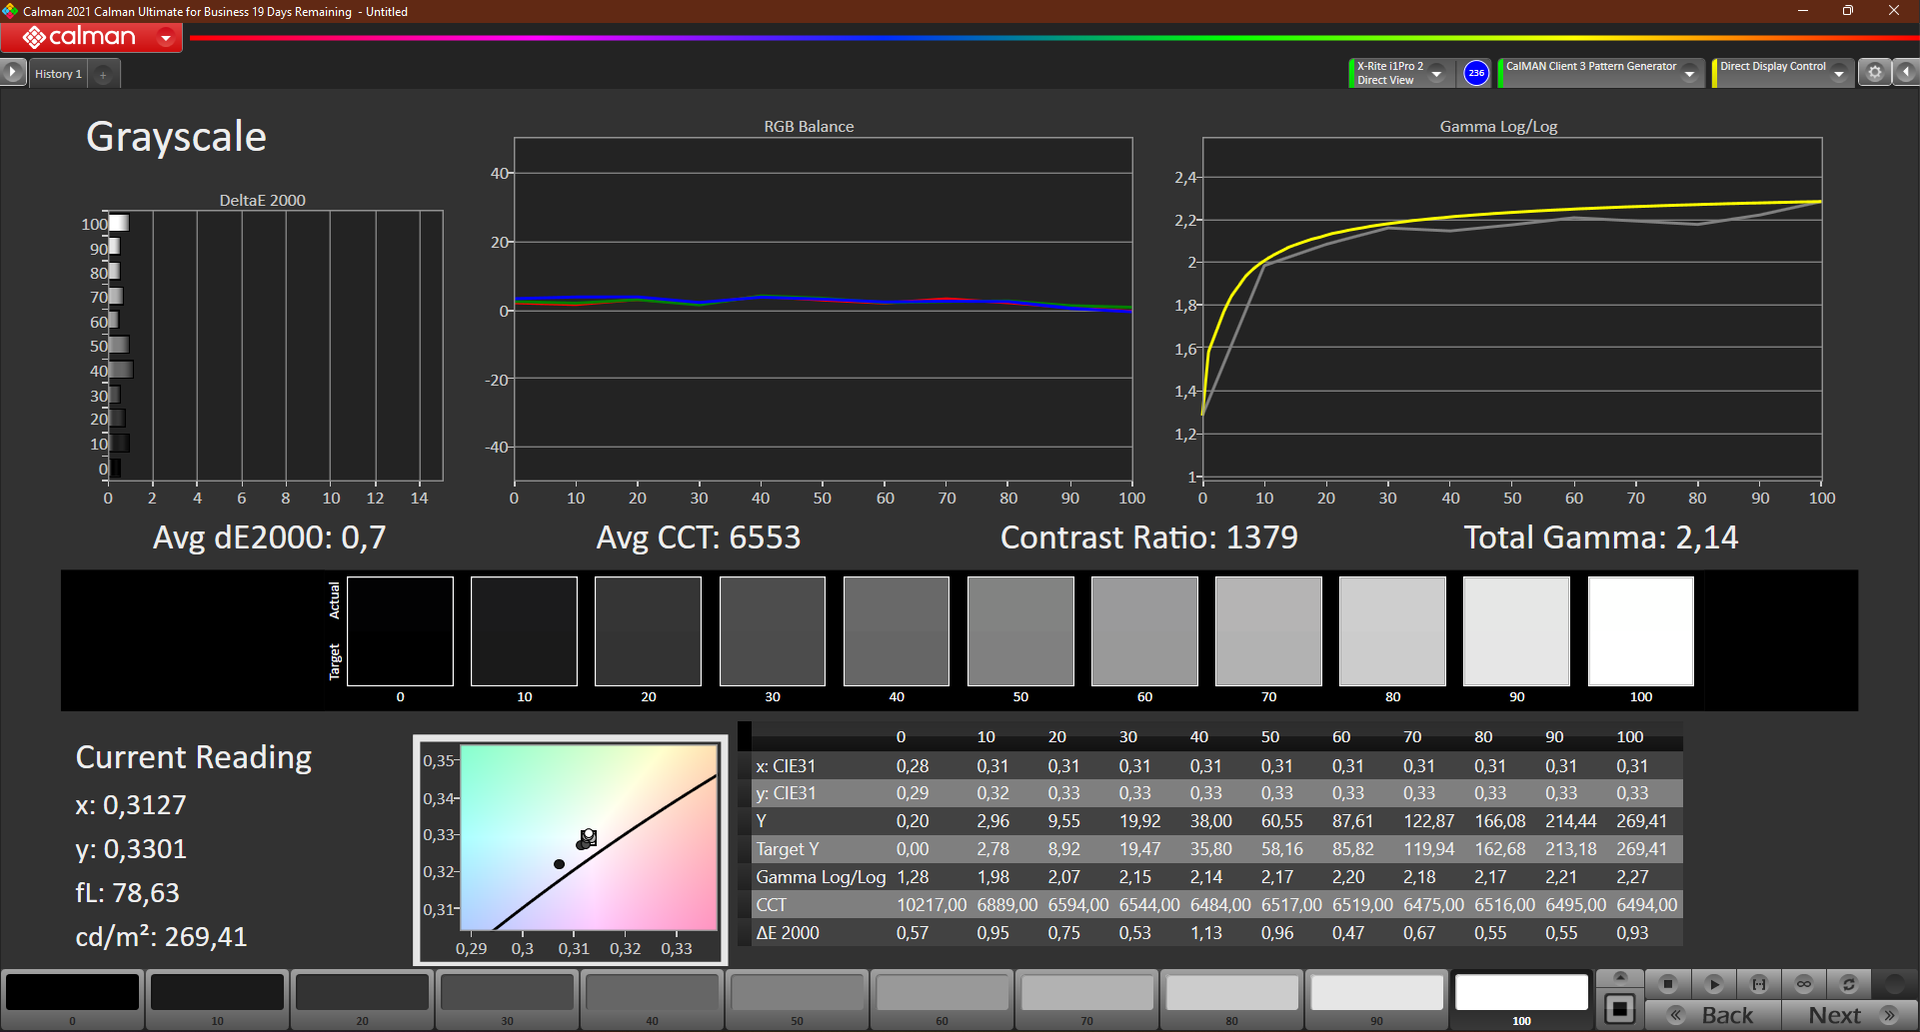
O balanço do RGB melhorou após a calibração usando CalMan e o colorímetro X-Rite i1 Pro 2. O azul, em particular, se desvia significativamente com um valor DeltaE de ~15. A relação de contraste também aumentou em 45% para 1.379:1. Entretanto, o brilho diminuiu em cerca de 20 lêndeas devido ao processo. Como sempre, nosso perfil de cor ICC está disponível para download ao lado do gráfico de iluminação.
Exibir tempos de resposta
| ↔ Tempo de resposta preto para branco | ||
|---|---|---|
| 28 ms ... ascensão ↗ e queda ↘ combinadas | ↗ 17 ms ascensão | 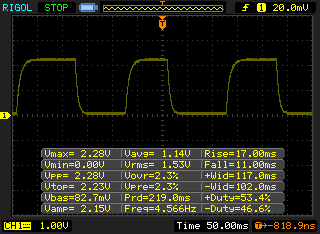 |
| ↘ 11 ms queda | ||
| A tela mostra taxas de resposta relativamente lentas em nossos testes e pode ser muito lenta para os jogadores. Em comparação, todos os dispositivos testados variam de 0.1 (mínimo) a 240 (máximo) ms. » 71 % de todos os dispositivos são melhores. Isso significa que o tempo de resposta medido é pior que a média de todos os dispositivos testados (19.8 ms). | ||
| ↔ Tempo de resposta 50% cinza a 80% cinza | ||
| 48 ms ... ascensão ↗ e queda ↘ combinadas | ↗ 26 ms ascensão | 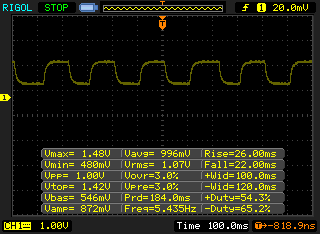 |
| ↘ 22 ms queda | ||
| A tela mostra taxas de resposta lentas em nossos testes e será insatisfatória para os jogadores. Em comparação, todos os dispositivos testados variam de 0.165 (mínimo) a 636 (máximo) ms. » 82 % de todos os dispositivos são melhores. Isso significa que o tempo de resposta medido é pior que a média de todos os dispositivos testados (31 ms). | ||
Cintilação da tela / PWM (modulação por largura de pulso)
| Tela tremeluzindo / PWM não detectado | 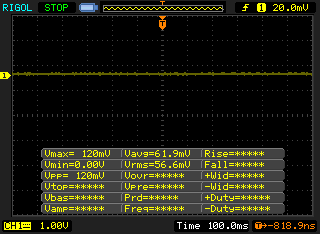 | ||
[pwm_comparison] Em comparação: 52 % de todos os dispositivos testados não usam PWM para escurecer a tela. Se PWM foi detectado, uma média de 7757 (mínimo: 5 - máximo: 343500) Hz foi medida. | |||
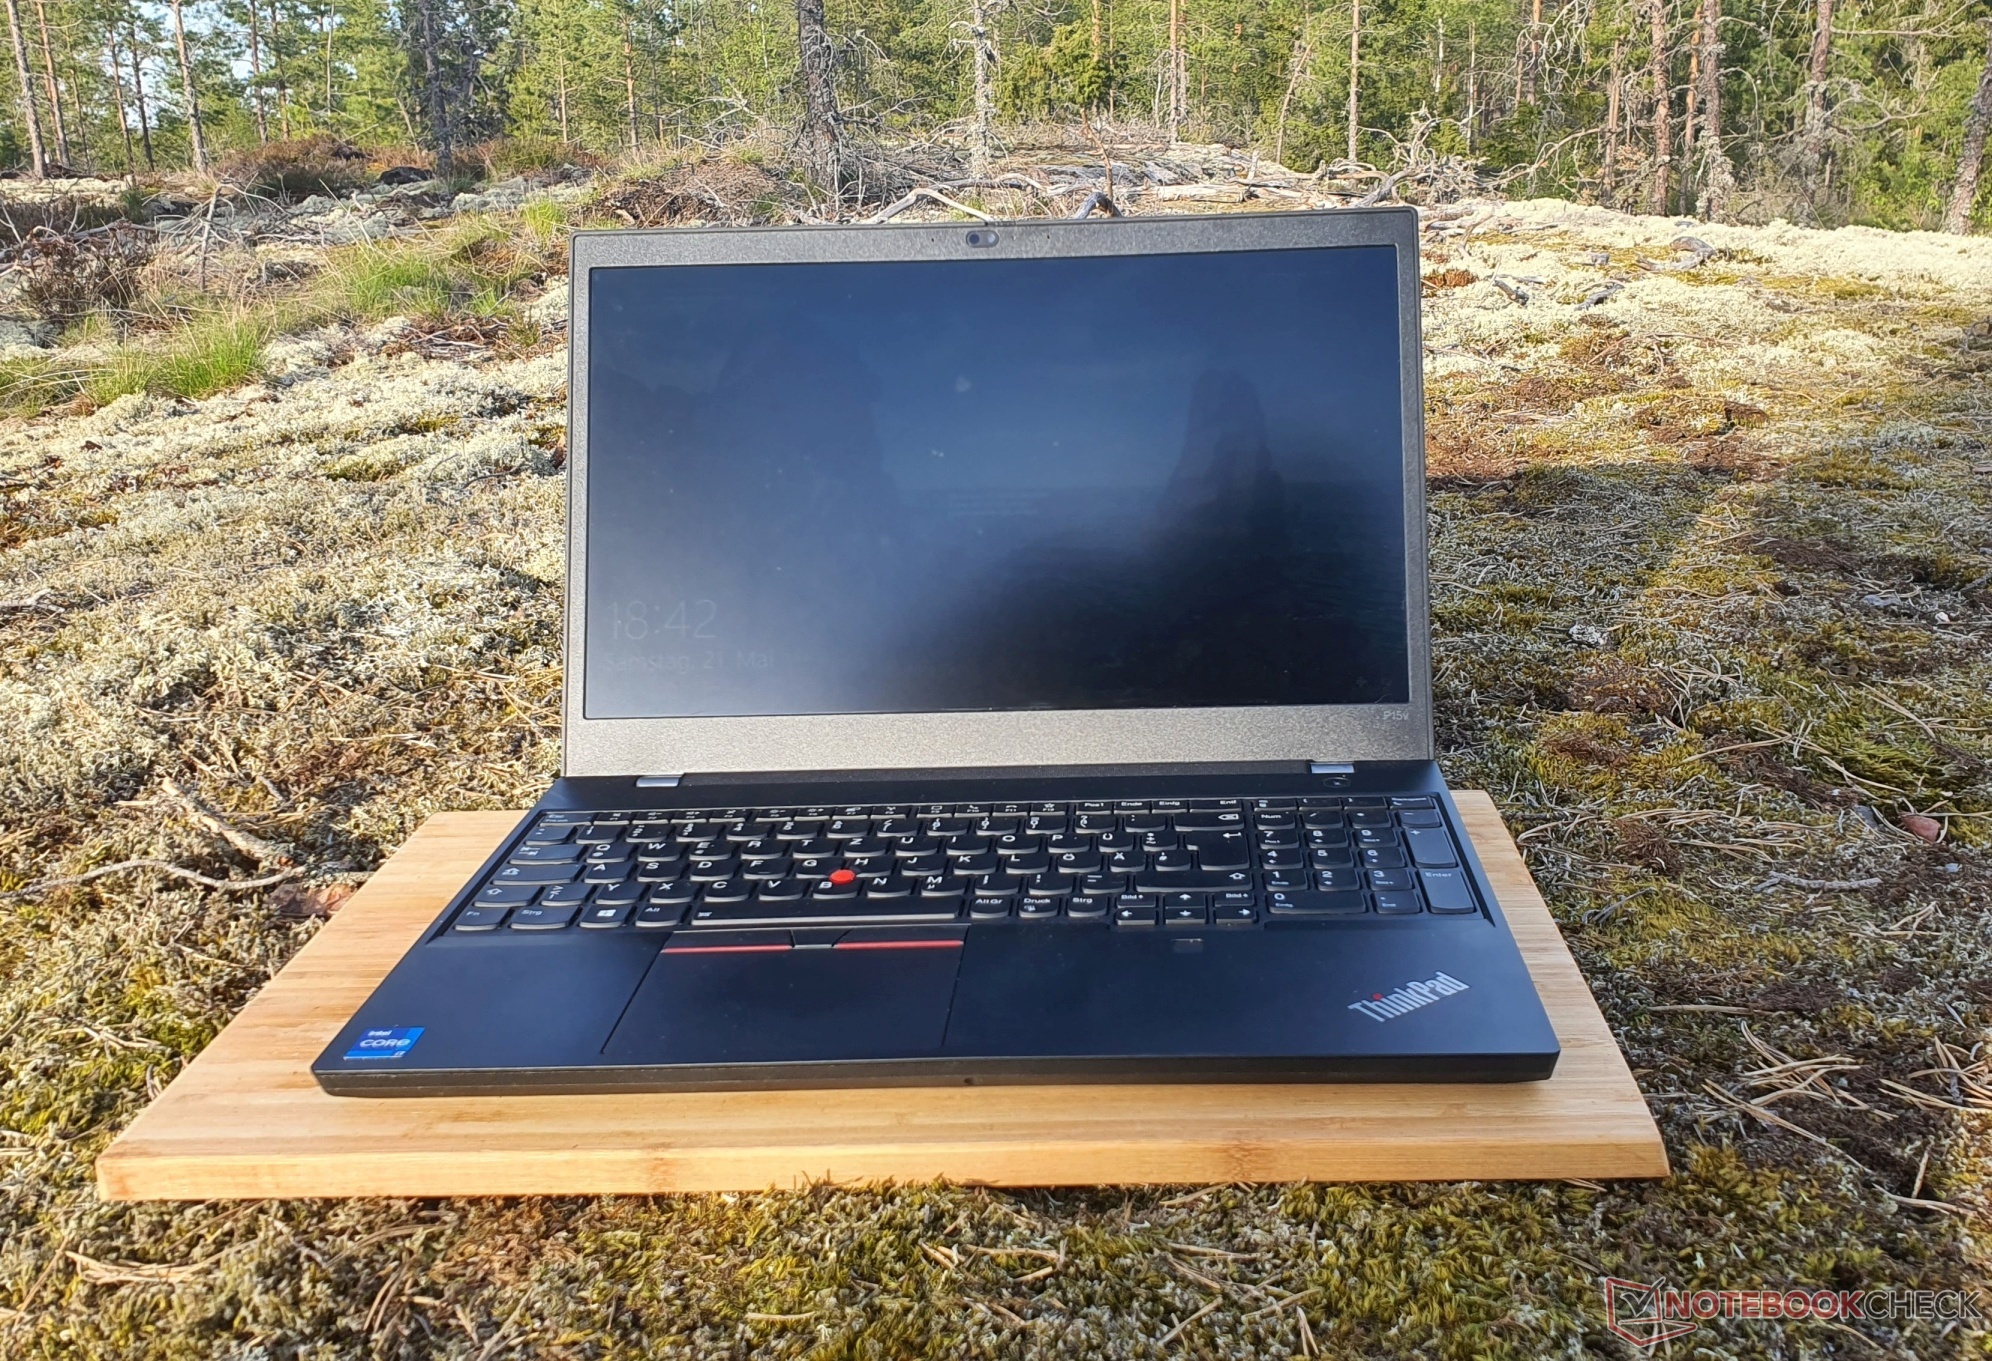
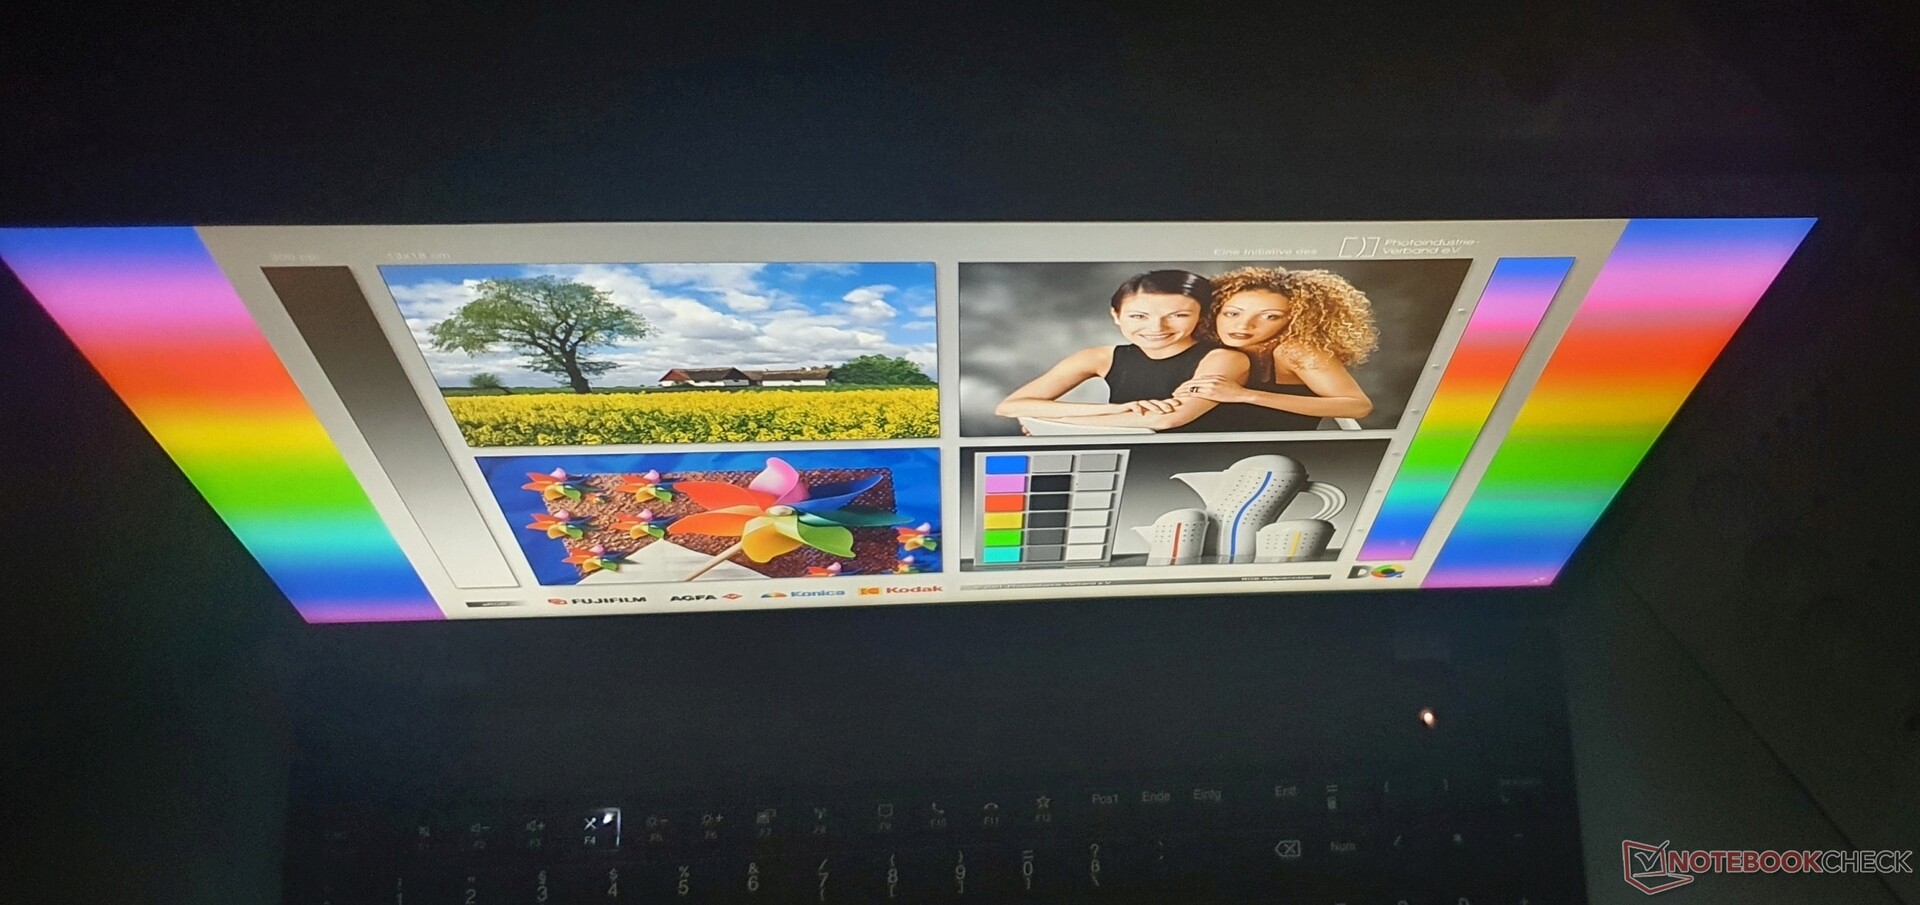
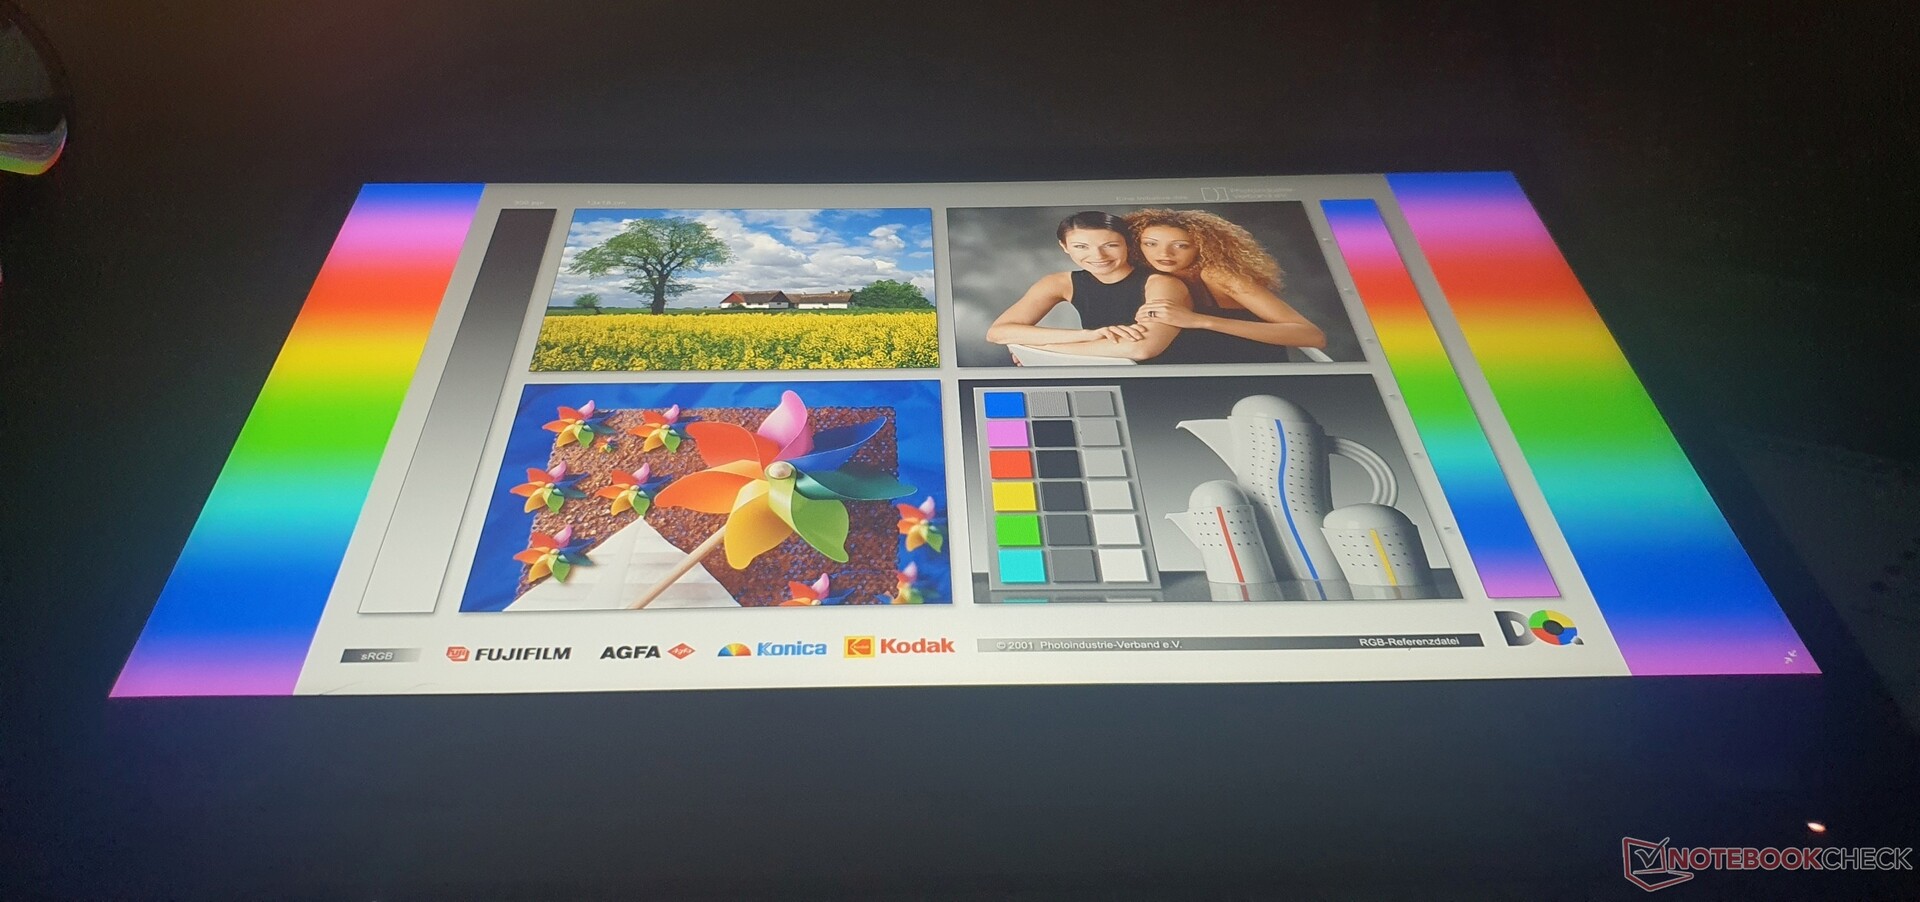
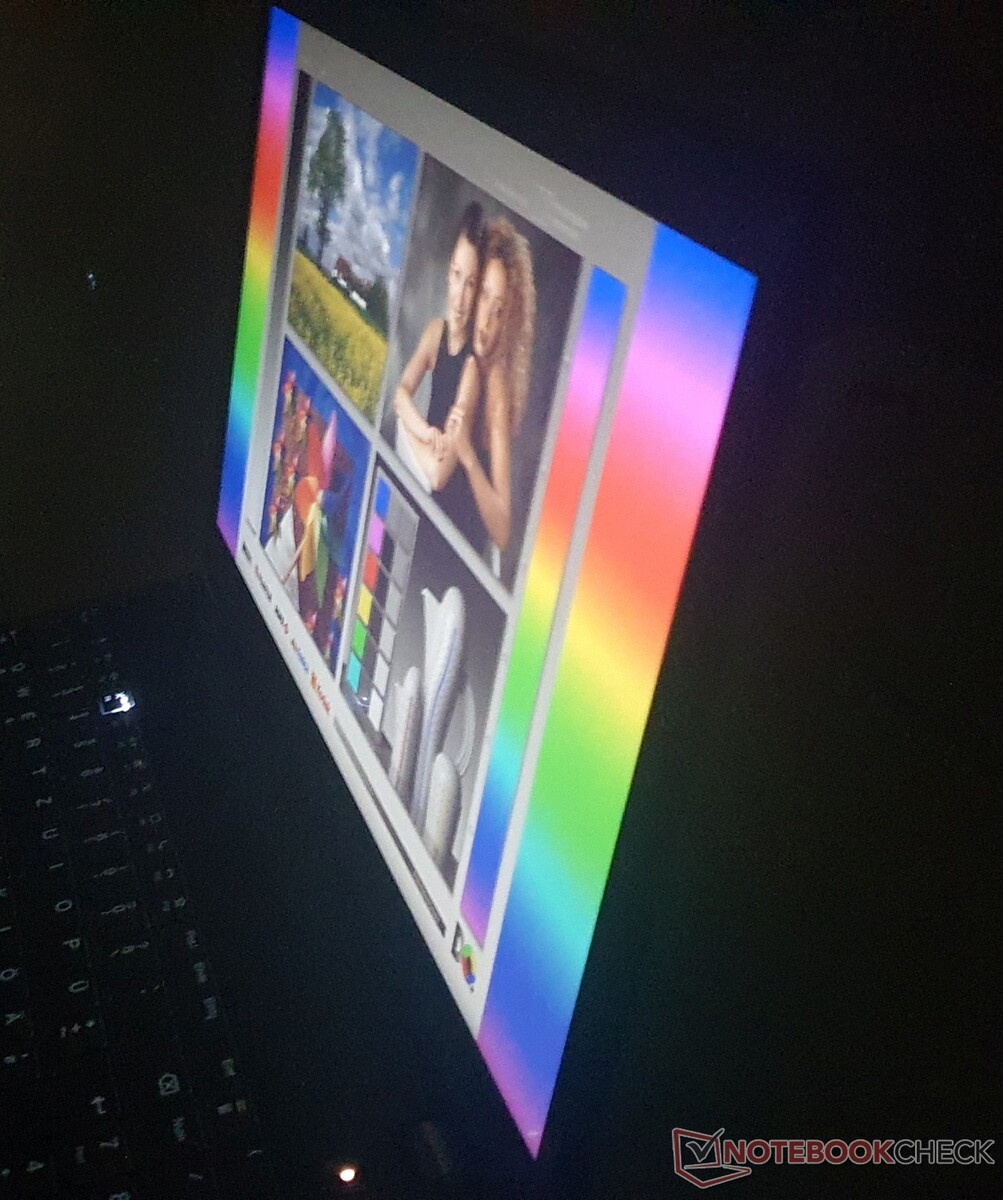
Ao ar livre ao sol, a tela com suas 280 lêndeas não é suficientemente brilhante apesar da superfície fosca. Mas o P15v pode ser usado na sombra
A legibilidade do visor é muito boa até um ângulo de visão de aproximadamente 170°, o que é típico do IPS. Os OLEDs têm um desempenho ainda melhor.
Desempenho: ThinkPad P15v G2 melhor com Intel Core i9
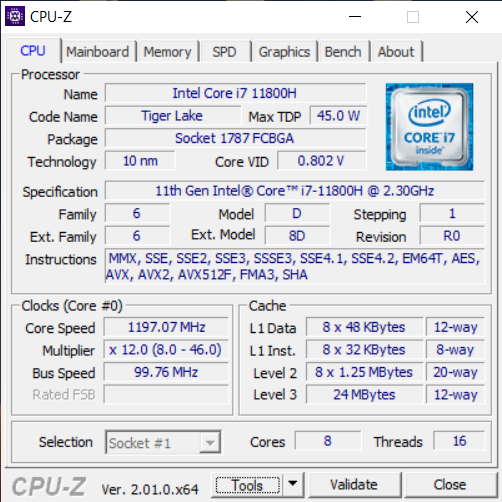
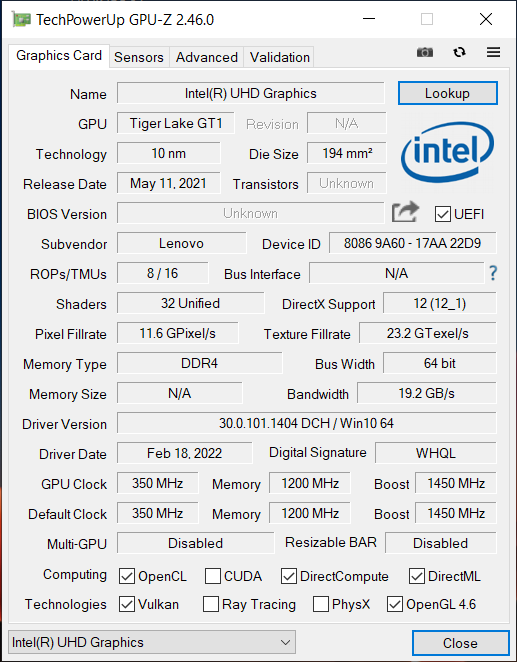
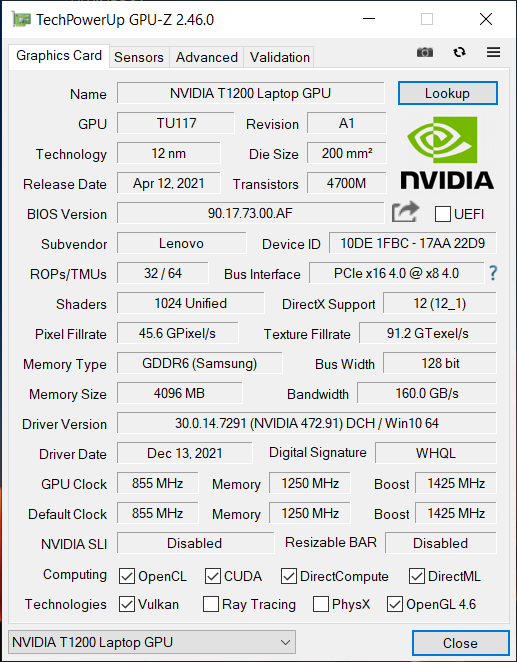
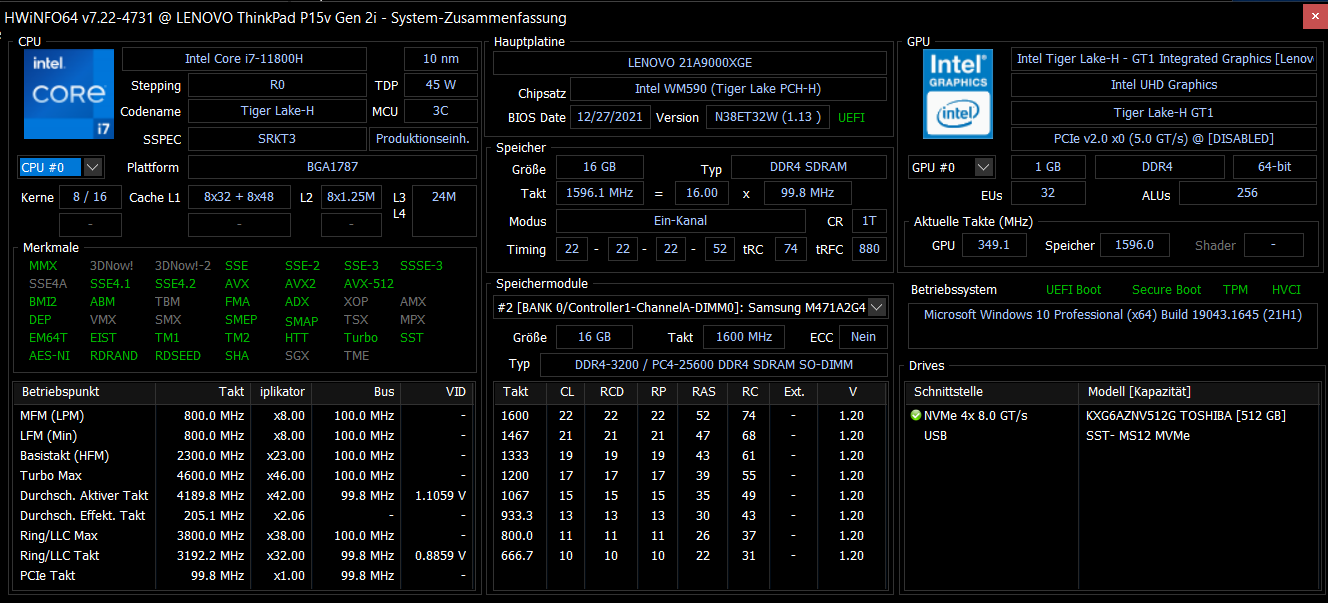
Nosso modelo de revisão vem com um Intel Tiger-LakeNúcleo i7-11800H como alternativa, você pode optar por uma CPU de núcleo Núcleo i9-11950Hno lado gráfico, ao lado do integrado Intel Xe-iGPU (32/16 EUs), você pode escolher entre uma Nvidia T600, T1200 (nosso modelo) ou um RTX A2000cada uma com certificações ISV. As CPUs Xeon e ECC RAM não são destinadas ao que se supõe ser uma estação de trabalho barata.
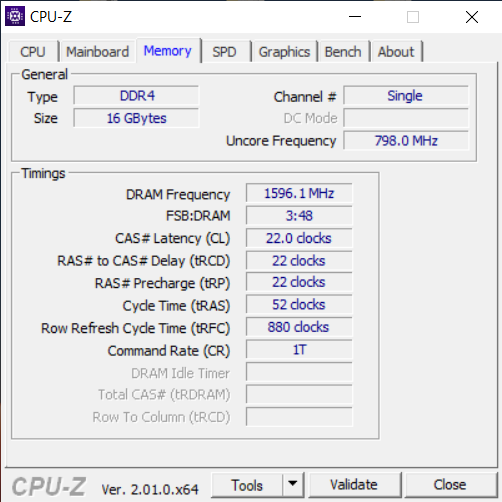
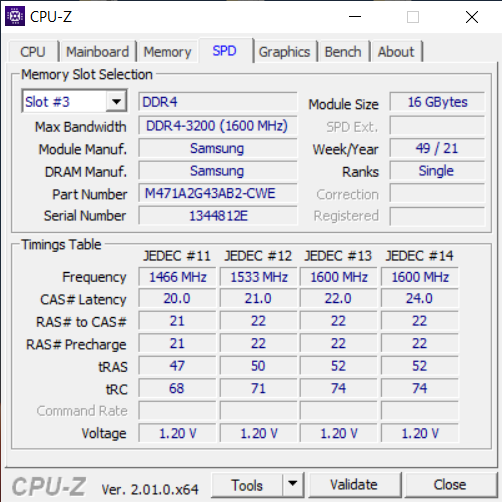
Dois SODIMMs suportam até 64 GB de DDR4-3200 RAM, enquanto nosso modelo está equipado com um módulo de 16 GB no modo monocanal. Há também dois slots PCIe 4.0 que permitem um máximo de 2 TB de SSDs NVMe no formato M.2 2280
Processador
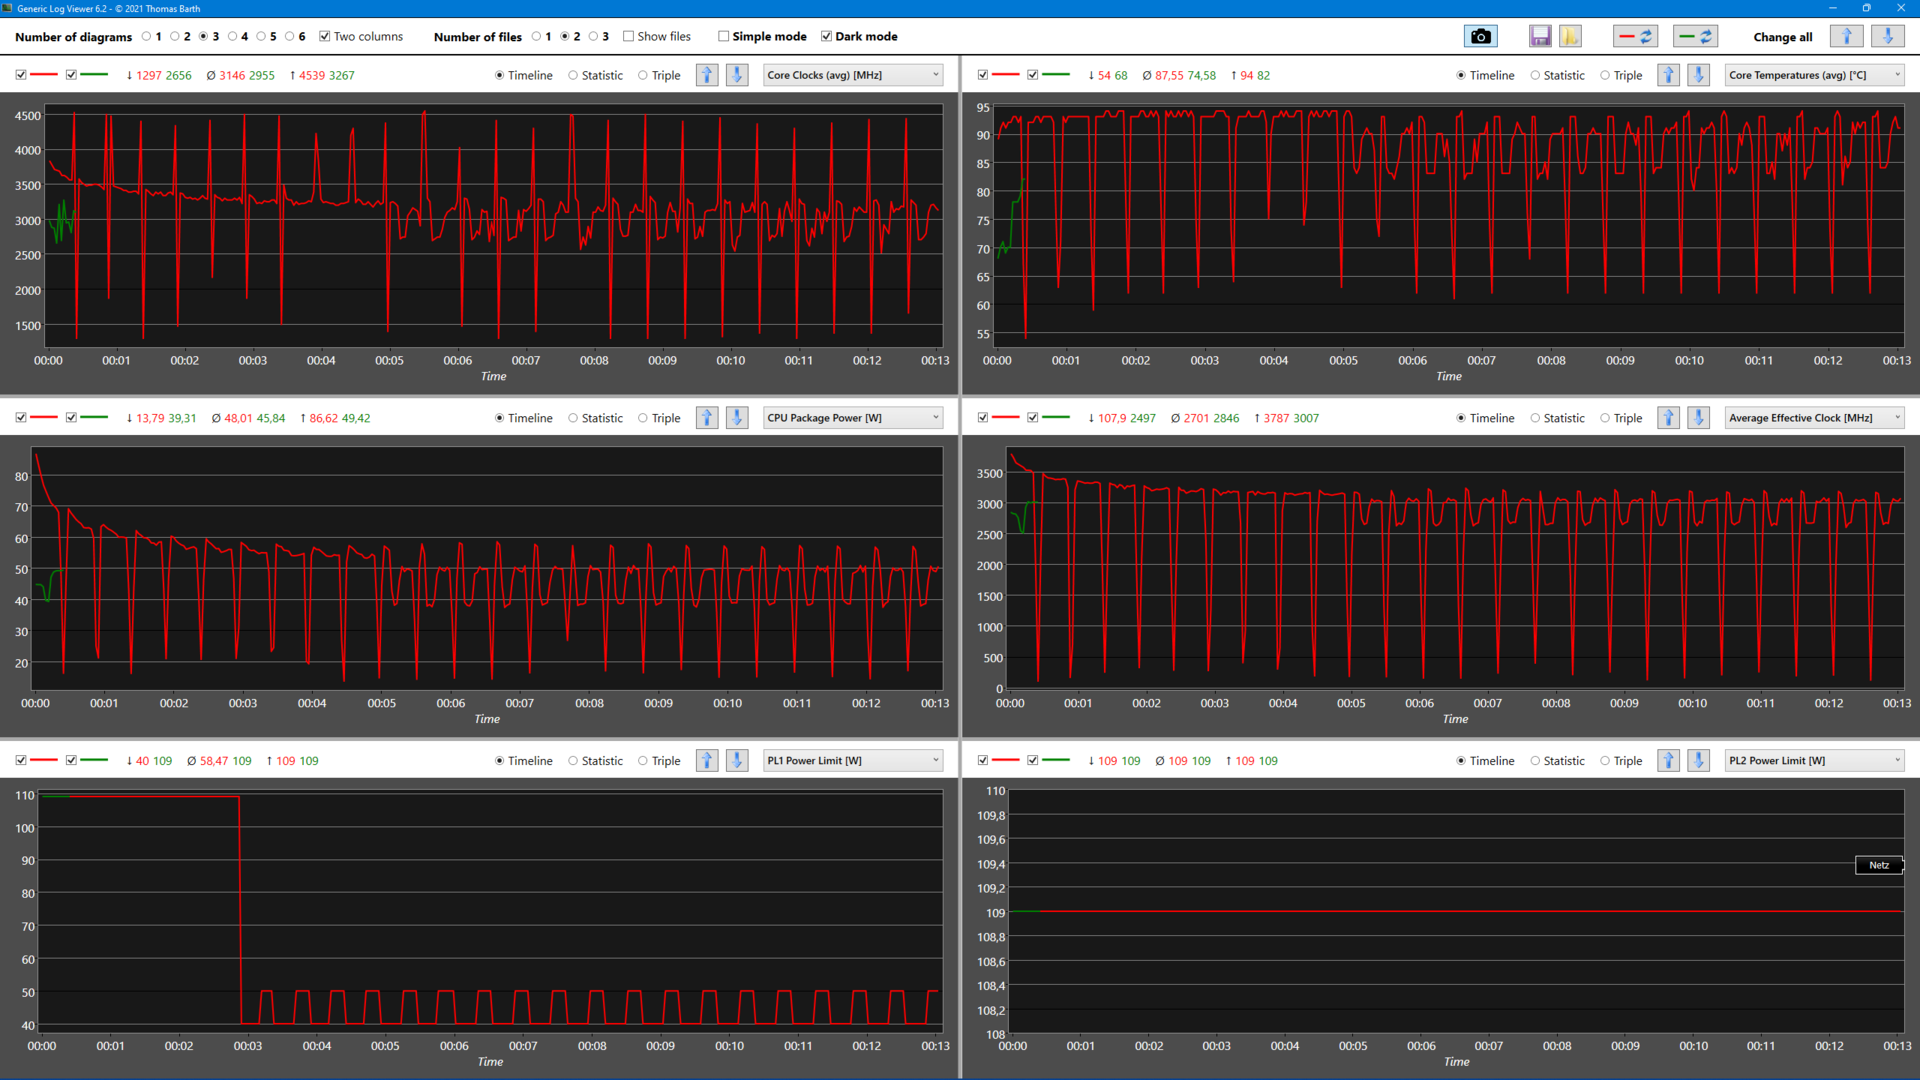
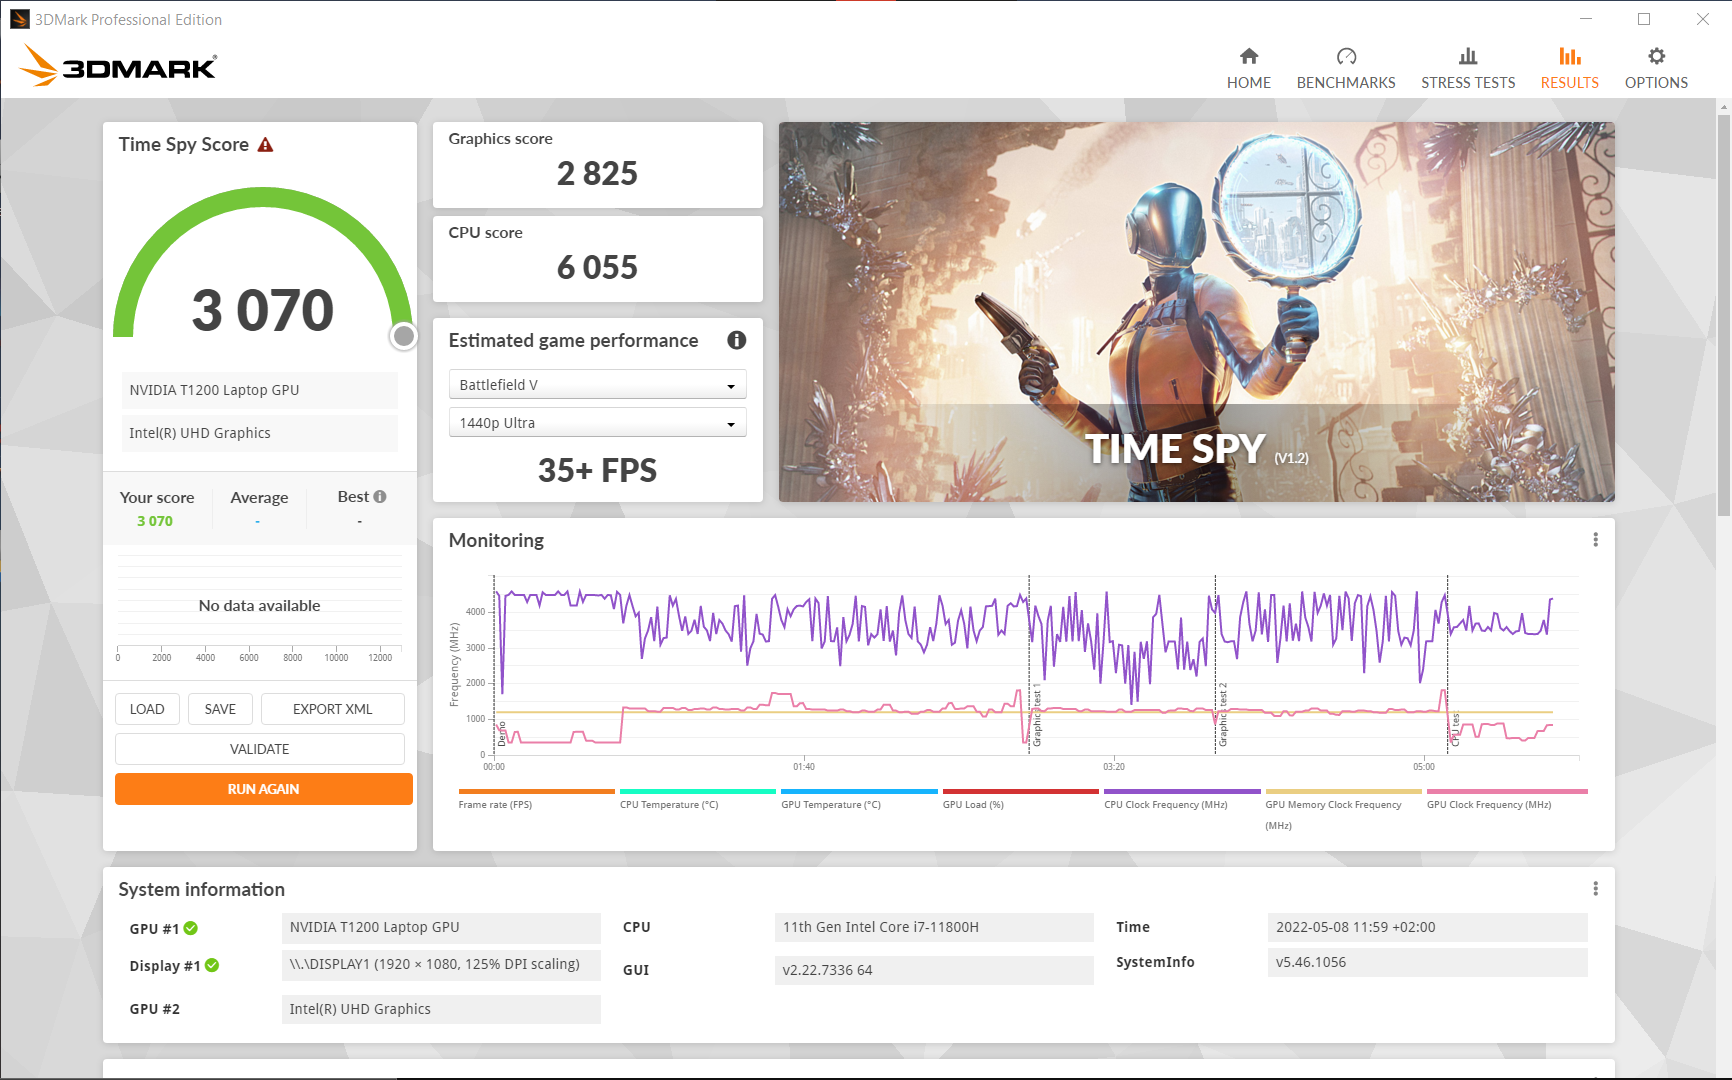
A Intel Núcleo i7-11800Hpromete muita potência com seus oito núcleos, mas a CPU não está configurada de forma ideal no ThinkPad P15v G2 na prática. No decorrer do loop CB15, 4,6 GHz é atingido repetidamente, enquanto a média é de 3,15 GHz. Após 10 corridas, apenas 1.400 pontos são alcançados consistentemente. A espessura PensePad P15 G2alcança 1.768 pontos com a mesma CPU.
Mesmo o ThinkPad P1 G3 muito mais fino do testador atinge uma sustentação de ~1.700 pontos com o Core i9 de pré-geração. Sob PL2 (inicial), 87 de 109 watts são utilizados, mas o problema surge dos 60 watts (@4,6 GHz) empurrados para além de PL1 (50 watts). Como resultado, a CPU atinge regularmente a marca de 94 °C e está sujeita a estrangulamento térmico faseado.
Cerca de 25% do desempenho é desperdiçado em algumas aplicações. Uma limitação manual do TDP a 50 ou mesmo 45 watts através da ferramenta "ThrottleStop" também leva a um comportamento flutuante. Curiosamente, não houve estrangulamento sob um consumo constante de 50 watts durante o teste de estresse com Prime95. Uma atualização da BIOS não ajudou. Ainda é questionável se esta queda de desempenho pode ser remediada com um Core i9 mais flexível, e esta opção é cara. No mínimo, o desempenho do predecessor é claramente superior aqui, mas o ZBook Power 15 da HP é ~30% mais rápido com o mesmo Core i7.
A pontuação do OpenCL relacionado à estação de trabalho é apenas metade da pontuação do ThinkPad P15, principalmente devido à GPU mais fraca. Esta discrepância é ainda mais extrema no CUDA V-Ray 5. No modo de bateria, a performance cai em cerca de 20% (@45 watts).
Cinebench R15 Multi Sustained Load
Cinebench R23: Multi Core | Single Core
Cinebench R20: CPU (Multi Core) | CPU (Single Core)
Cinebench R15: CPU Multi 64Bit | CPU Single 64Bit
Blender: v2.79 BMW27 CPU
7-Zip 18.03: 7z b 4 | 7z b 4 -mmt1
Geekbench 5.5: Multi-Core | Single-Core
HWBOT x265 Benchmark v2.2: 4k Preset
LibreOffice : 20 Documents To PDF
R Benchmark 2.5: Overall mean
V-Ray 5 Benchmark: GPU CUDA
Geekbench 5.5: OpenCL Score
SPECviewperf 13: Solidworks (sw-04) | Siemens NX (snx-03) | Showcase (showcase-02) | Medical (medical-02) | Maya (maya-05) | Energy (energy-02) | Creo (creo-02) | Catia (catia-05) | 3ds Max (3dsmax-06)
SPECviewperf 2020: 1920x1080 Solidworks (solidworks-05) | 1920x1080 Siemens NX (snx-04) | 1920x1080 Medical (medical-03) | 1920x1080 Maya (maya-06) | 1920x1080 Energy (energy-03) | 1920x1080 Creo (creo-03) | 1920x1080 CATIA (catia-06) | 1920x1080 3ds Max (3dsmax-07)
| CPU Performance rating | |
| Média da turma Workstation | |
| Lenovo ThinkPad P15 G2-20YQ001JGE -1! | |
| Média Intel Core i7-11800H | |
| Dell Precision 5000 5560 -4! | |
| Lenovo ThinkPad T15g-20UR000GGE -1! | |
| HP ZBook Power 15 G8 313S5EA | |
| Lenovo ThinkPad T15p-20TN0006GE -18! | |
| Lenovo ThinkPad P15v G2 21A9000XGE -1! | |
| Lenovo ThinkPad P15s Gen2-20W6000GGE -1! | |
| Cinebench R23 / Multi Core | |
| Média da turma Workstation (14621 - 38520, n=23, últimos 2 anos) | |
| HP ZBook Power 15 G8 313S5EA | |
| Média Intel Core i7-11800H (6508 - 14088, n=48) | |
| Lenovo ThinkPad P15 G2-20YQ001JGE | |
| Lenovo ThinkPad P15v G2 21A9000XGE | |
| Dell Precision 5000 5560 | |
| Lenovo ThinkPad T15g-20UR000GGE | |
| Lenovo ThinkPad T15p-20TN0006GE | |
| Lenovo ThinkPad P15s Gen2-20W6000GGE | |
| Cinebench R23 / Single Core | |
| Média da turma Workstation (1712 - 2228, n=23, últimos 2 anos) | |
| HP ZBook Power 15 G8 313S5EA | |
| Dell Precision 5000 5560 | |
| Lenovo ThinkPad P15 G2-20YQ001JGE | |
| Média Intel Core i7-11800H (1386 - 1522, n=45) | |
| Lenovo ThinkPad P15s Gen2-20W6000GGE | |
| Lenovo ThinkPad T15g-20UR000GGE | |
| Lenovo ThinkPad T15p-20TN0006GE | |
| Cinebench R20 / CPU (Multi Core) | |
| Média da turma Workstation (5760 - 15043, n=23, últimos 2 anos) | |
| Média Intel Core i7-11800H (2498 - 5408, n=50) | |
| Lenovo ThinkPad P15 G2-20YQ001JGE | |
| HP ZBook Power 15 G8 313S5EA | |
| Dell Precision 5000 5560 | |
| Lenovo ThinkPad P15v G2 21A9000XGE | |
| Lenovo ThinkPad T15p-20TN0006GE | |
| Lenovo ThinkPad T15g-20UR000GGE | |
| Lenovo ThinkPad P15s Gen2-20W6000GGE | |
| Cinebench R20 / CPU (Single Core) | |
| Média da turma Workstation (671 - 857, n=23, últimos 2 anos) | |
| HP ZBook Power 15 G8 313S5EA | |
| Dell Precision 5000 5560 | |
| Lenovo ThinkPad P15 G2-20YQ001JGE | |
| Média Intel Core i7-11800H (520 - 586, n=47) | |
| Lenovo ThinkPad P15v G2 21A9000XGE | |
| Lenovo ThinkPad P15s Gen2-20W6000GGE | |
| Lenovo ThinkPad T15g-20UR000GGE | |
| Lenovo ThinkPad T15p-20TN0006GE | |
| Cinebench R15 / CPU Multi 64Bit | |
| Média da turma Workstation (2489 - 5810, n=23, últimos 2 anos) | |
| HP ZBook Power 15 G8 313S5EA | |
| HP ZBook Power 15 G8 313S5EA | |
| Média Intel Core i7-11800H (1342 - 2173, n=50) | |
| Lenovo ThinkPad P15 G2-20YQ001JGE | |
| Lenovo ThinkPad P15v G2 21A9000XGE | |
| Dell Precision 5000 5560 | |
| Lenovo ThinkPad T15g-20UR000GGE | |
| Lenovo ThinkPad T15p-20TN0006GE | |
| Lenovo ThinkPad P15s Gen2-20W6000GGE | |
| Cinebench R15 / CPU Single 64Bit | |
| Média da turma Workstation (191.4 - 328, n=23, últimos 2 anos) | |
| Dell Precision 5000 5560 | |
| HP ZBook Power 15 G8 313S5EA | |
| Lenovo ThinkPad P15 G2-20YQ001JGE | |
| Média Intel Core i7-11800H (201 - 231, n=46) | |
| Lenovo ThinkPad P15v G2 21A9000XGE | |
| Lenovo ThinkPad P15s Gen2-20W6000GGE | |
| Lenovo ThinkPad T15g-20UR000GGE | |
| Lenovo ThinkPad T15p-20TN0006GE | |
| Blender / v2.79 BMW27 CPU | |
| Lenovo ThinkPad P15s Gen2-20W6000GGE | |
| Lenovo ThinkPad T15p-20TN0006GE | |
| Lenovo ThinkPad T15g-20UR000GGE | |
| Lenovo ThinkPad P15v G2 21A9000XGE | |
| Dell Precision 5000 5560 | |
| Média Intel Core i7-11800H (217 - 454, n=46) | |
| Lenovo ThinkPad P15 G2-20YQ001JGE | |
| HP ZBook Power 15 G8 313S5EA | |
| Média da turma Workstation (91 - 222, n=23, últimos 2 anos) | |
| 7-Zip 18.03 / 7z b 4 | |
| Média da turma Workstation (60489 - 116969, n=23, últimos 2 anos) | |
| Lenovo ThinkPad P15 G2-20YQ001JGE | |
| HP ZBook Power 15 G8 313S5EA | |
| Média Intel Core i7-11800H (33718 - 56758, n=46) | |
| Dell Precision 5000 5560 | |
| Lenovo ThinkPad P15v G2 21A9000XGE | |
| Lenovo ThinkPad T15g-20UR000GGE | |
| Lenovo ThinkPad T15p-20TN0006GE | |
| Lenovo ThinkPad P15s Gen2-20W6000GGE | |
| 7-Zip 18.03 / 7z b 4 -mmt1 | |
| Média da turma Workstation (5126 - 6960, n=23, últimos 2 anos) | |
| Dell Precision 5000 5560 | |
| HP ZBook Power 15 G8 313S5EA | |
| Média Intel Core i7-11800H (5138 - 5732, n=46) | |
| Lenovo ThinkPad P15 G2-20YQ001JGE | |
| Lenovo ThinkPad P15s Gen2-20W6000GGE | |
| Lenovo ThinkPad T15g-20UR000GGE | |
| Lenovo ThinkPad P15v G2 21A9000XGE | |
| Lenovo ThinkPad T15p-20TN0006GE | |
| Geekbench 5.5 / Multi-Core | |
| Média da turma Workstation (11542 - 25554, n=23, últimos 2 anos) | |
| Lenovo ThinkPad P15 G2-20YQ001JGE | |
| Média Intel Core i7-11800H (4655 - 9851, n=40) | |
| HP ZBook Power 15 G8 313S5EA | |
| Lenovo ThinkPad T15g-20UR000GGE | |
| Lenovo ThinkPad P15v G2 21A9000XGE | |
| Lenovo ThinkPad T15p-20TN0006GE | |
| Lenovo ThinkPad P15s Gen2-20W6000GGE | |
| Geekbench 5.5 / Single-Core | |
| Média da turma Workstation (1783 - 2183, n=23, últimos 2 anos) | |
| Lenovo ThinkPad P15 G2-20YQ001JGE | |
| Média Intel Core i7-11800H (1429 - 1625, n=40) | |
| Lenovo ThinkPad P15s Gen2-20W6000GGE | |
| HP ZBook Power 15 G8 313S5EA | |
| Lenovo ThinkPad P15v G2 21A9000XGE | |
| Lenovo ThinkPad T15g-20UR000GGE | |
| Lenovo ThinkPad T15p-20TN0006GE | |
| HWBOT x265 Benchmark v2.2 / 4k Preset | |
| Média da turma Workstation (17.8 - 40.5, n=23, últimos 2 anos) | |
| Lenovo ThinkPad P15 G2-20YQ001JGE | |
| HP ZBook Power 15 G8 313S5EA | |
| Média Intel Core i7-11800H (7.38 - 17.4, n=46) | |
| Dell Precision 5000 5560 | |
| Lenovo ThinkPad P15v G2 21A9000XGE | |
| Lenovo ThinkPad T15g-20UR000GGE | |
| Lenovo ThinkPad T15p-20TN0006GE | |
| Lenovo ThinkPad P15s Gen2-20W6000GGE | |
| LibreOffice / 20 Documents To PDF | |
| Lenovo ThinkPad P15v G2 21A9000XGE | |
| Lenovo ThinkPad P15 G2-20YQ001JGE | |
| Lenovo ThinkPad T15g-20UR000GGE | |
| Dell Precision 5000 5560 | |
| Média da turma Workstation (37.1 - 74.7, n=23, últimos 2 anos) | |
| Média Intel Core i7-11800H (38.6 - 59.9, n=45) | |
| Lenovo ThinkPad P15s Gen2-20W6000GGE | |
| Lenovo ThinkPad T15p-20TN0006GE | |
| HP ZBook Power 15 G8 313S5EA | |
| R Benchmark 2.5 / Overall mean | |
| Lenovo ThinkPad T15p-20TN0006GE | |
| HP ZBook Power 15 G8 313S5EA | |
| Lenovo ThinkPad P15v G2 21A9000XGE | |
| Lenovo ThinkPad T15g-20UR000GGE | |
| Lenovo ThinkPad P15 G2-20YQ001JGE | |
| Média Intel Core i7-11800H (0.548 - 0.615, n=46) | |
| Lenovo ThinkPad P15s Gen2-20W6000GGE | |
| Dell Precision 5000 5560 | |
| Média da turma Workstation (0.3825 - 0.603, n=23, últimos 2 anos) | |
| V-Ray 5 Benchmark / GPU CUDA | |
| Média da turma Workstation (989 - 3239, n=9, últimos 2 anos) | |
| Média Intel Core i7-11800H (164 - 1238, n=16) | |
| Lenovo ThinkPad P15v G2 21A9000XGE | |
| HP ZBook Power 15 G8 313S5EA | |
| Geekbench 5.5 / OpenCL Score | |
| Média da turma Workstation (33651 - 272866, n=23, últimos 2 anos) | |
| Lenovo ThinkPad P15 G2-20YQ001JGE | |
| Lenovo ThinkPad T15g-20UR000GGE | |
| Média Intel Core i7-11800H (8476 - 129333, n=46) | |
| Lenovo ThinkPad P15v G2 21A9000XGE | |
| HP ZBook Power 15 G8 313S5EA | |
| Lenovo ThinkPad P15s Gen2-20W6000GGE | |
| Lenovo ThinkPad T15p-20TN0006GE | |
| SPECviewperf 13 / Solidworks (sw-04) | |
| Média da turma Workstation (147.5 - 230, n=10, últimos 2 anos) | |
| Lenovo ThinkPad P15 G2-20YQ001JGE | |
| Dell Precision 5000 5560 | |
| Lenovo ThinkPad P15v G2 21A9000XGE | |
| Média Intel Core i7-11800H (45.5 - 156.7, n=10) | |
| HP ZBook Power 15 G8 313S5EA | |
| Lenovo ThinkPad P15s Gen2-20W6000GGE | |
| Lenovo ThinkPad T15g-20UR000GGE | |
| SPECviewperf 13 / Siemens NX (snx-03) | |
| Média da turma Workstation (331 - 879, n=10, últimos 2 anos) | |
| Lenovo ThinkPad P15 G2-20YQ001JGE | |
| Dell Precision 5000 5560 | |
| Lenovo ThinkPad P15v G2 21A9000XGE | |
| HP ZBook Power 15 G8 313S5EA | |
| Média Intel Core i7-11800H (5.45 - 250, n=10) | |
| Lenovo ThinkPad P15s Gen2-20W6000GGE | |
| Lenovo ThinkPad T15g-20UR000GGE | |
| SPECviewperf 13 / Showcase (showcase-02) | |
| Média da turma Workstation (85.3 - 319, n=10, últimos 2 anos) | |
| Lenovo ThinkPad T15g-20UR000GGE | |
| Lenovo ThinkPad P15 G2-20YQ001JGE | |
| Média Intel Core i7-11800H (11.3 - 138, n=10) | |
| Dell Precision 5000 5560 | |
| Lenovo ThinkPad P15v G2 21A9000XGE | |
| HP ZBook Power 15 G8 313S5EA | |
| Lenovo ThinkPad P15s Gen2-20W6000GGE | |
| SPECviewperf 13 / Medical (medical-02) | |
| Média da turma Workstation (169.9 - 363, n=10, últimos 2 anos) | |
| Lenovo ThinkPad P15 G2-20YQ001JGE | |
| Dell Precision 5000 5560 | |
| Média Intel Core i7-11800H (4.96 - 89.2, n=10) | |
| Lenovo ThinkPad P15v G2 21A9000XGE | |
| Lenovo ThinkPad T15g-20UR000GGE | |
| HP ZBook Power 15 G8 313S5EA | |
| Lenovo ThinkPad P15s Gen2-20W6000GGE | |
| SPECviewperf 13 / Maya (maya-05) | |
| Média da turma Workstation (287 - 448, n=5, últimos 2 anos) | |
| Lenovo ThinkPad P15 G2-20YQ001JGE | |
| Lenovo ThinkPad T15g-20UR000GGE | |
| Média Intel Core i7-11800H (32 - 337, n=10) | |
| Dell Precision 5000 5560 | |
| Lenovo ThinkPad P15v G2 21A9000XGE | |
| HP ZBook Power 15 G8 313S5EA | |
| Lenovo ThinkPad P15s Gen2-20W6000GGE | |
| SPECviewperf 13 / Energy (energy-02) | |
| Média da turma Workstation (49.5 - 174.7, n=10, últimos 2 anos) | |
| Lenovo ThinkPad P15 G2-20YQ001JGE | |
| Dell Precision 5000 5560 | |
| Média Intel Core i7-11800H (1.15 - 41.2, n=10) | |
| Lenovo ThinkPad T15g-20UR000GGE | |
| Lenovo ThinkPad P15v G2 21A9000XGE | |
| HP ZBook Power 15 G8 313S5EA | |
| Lenovo ThinkPad P15s Gen2-20W6000GGE | |
| SPECviewperf 13 / Creo (creo-02) | |
| Média da turma Workstation (262 - 589, n=10, últimos 2 anos) | |
| Lenovo ThinkPad P15 G2-20YQ001JGE | |
| Dell Precision 5000 5560 | |
| Lenovo ThinkPad T15g-20UR000GGE | |
| Média Intel Core i7-11800H (22.5 - 225, n=10) | |
| Lenovo ThinkPad P15v G2 21A9000XGE | |
| HP ZBook Power 15 G8 313S5EA | |
| Lenovo ThinkPad P15s Gen2-20W6000GGE | |
| SPECviewperf 13 / Catia (catia-05) | |
| Média da turma Workstation (301 - 552, n=10, últimos 2 anos) | |
| Lenovo ThinkPad P15 G2-20YQ001JGE | |
| Dell Precision 5000 5560 | |
| Média Intel Core i7-11800H (31.9 - 257, n=10) | |
| Lenovo ThinkPad P15v G2 21A9000XGE | |
| HP ZBook Power 15 G8 313S5EA | |
| Lenovo ThinkPad T15g-20UR000GGE | |
| Lenovo ThinkPad P15s Gen2-20W6000GGE | |
| SPECviewperf 13 / 3ds Max (3dsmax-06) | |
| Média da turma Workstation (202 - 422, n=10, últimos 2 anos) | |
| Lenovo ThinkPad P15 G2-20YQ001JGE | |
| Lenovo ThinkPad T15g-20UR000GGE | |
| Média Intel Core i7-11800H (27.2 - 235, n=10) | |
| Dell Precision 5000 5560 | |
| Lenovo ThinkPad P15v G2 21A9000XGE | |
| HP ZBook Power 15 G8 313S5EA | |
| Lenovo ThinkPad P15s Gen2-20W6000GGE | |
| SPECviewperf 2020 / Solidworks (solidworks-05) | |
| Média da turma Workstation (50.6 - 542, n=9, últimos 2 anos) | |
| Lenovo ThinkPad T15g-20UR000GGE | |
| Lenovo ThinkPad P15 G2-20YQ001JGE | |
| Dell Precision 5000 5560 | |
| Média Intel Core i7-11800H (73.4 - 147.9, n=6) | |
| Lenovo ThinkPad P15v G2 21A9000XGE | |
| HP ZBook Power 15 G8 313S5EA | |
| Lenovo ThinkPad P15s Gen2-20W6000GGE | |
| SPECviewperf 2020 / Siemens NX (snx-04) | |
| Média da turma Workstation (22.3 - 903, n=23, últimos 2 anos) | |
| Lenovo ThinkPad P15 G2-20YQ001JGE | |
| Dell Precision 5000 5560 | |
| Lenovo ThinkPad P15v G2 21A9000XGE | |
| Média Intel Core i7-11800H (18.7 - 250, n=8) | |
| HP ZBook Power 15 G8 313S5EA | |
| Lenovo ThinkPad P15s Gen2-20W6000GGE | |
| Lenovo ThinkPad T15g-20UR000GGE | |
| SPECviewperf 2020 / Medical (medical-03) | |
| Média da turma Workstation (28.8 - 227, n=23, últimos 2 anos) | |
| Lenovo ThinkPad P15 G2-20YQ001JGE | |
| Dell Precision 5000 5560 | |
| Média Intel Core i7-11800H (18.7 - 42.7, n=8) | |
| Lenovo ThinkPad T15g-20UR000GGE | |
| Lenovo ThinkPad P15v G2 21A9000XGE | |
| HP ZBook Power 15 G8 313S5EA | |
| Lenovo ThinkPad P15s Gen2-20W6000GGE | |
| SPECviewperf 2020 / Maya (maya-06) | |
| Média da turma Workstation (117.8 - 724, n=22, últimos 2 anos) | |
| Lenovo ThinkPad P15 G2-20YQ001JGE | |
| Lenovo ThinkPad T15g-20UR000GGE | |
| Dell Precision 5000 5560 | |
| Média Intel Core i7-11800H (125 - 294, n=8) | |
| Lenovo ThinkPad P15v G2 21A9000XGE | |
| HP ZBook Power 15 G8 313S5EA | |
| Lenovo ThinkPad P15s Gen2-20W6000GGE | |
| SPECviewperf 2020 / Energy (energy-03) | |
| Média da turma Workstation (17.3 - 176.7, n=23, últimos 2 anos) | |
| Lenovo ThinkPad P15 G2-20YQ001JGE | |
| Dell Precision 5000 5560 | |
| Média Intel Core i7-11800H (16 - 43.1, n=8) | |
| Lenovo ThinkPad T15g-20UR000GGE | |
| Lenovo ThinkPad P15v G2 21A9000XGE | |
| HP ZBook Power 15 G8 313S5EA | |
| Lenovo ThinkPad P15s Gen2-20W6000GGE | |
| SPECviewperf 2020 / Creo (creo-03) | |
| Média da turma Workstation (49.2 - 261, n=23, últimos 2 anos) | |
| Lenovo ThinkPad P15 G2-20YQ001JGE | |
| Dell Precision 5000 5560 | |
| Média Intel Core i7-11800H (67.3 - 124.5, n=8) | |
| Lenovo ThinkPad T15g-20UR000GGE | |
| Lenovo ThinkPad P15v G2 21A9000XGE | |
| HP ZBook Power 15 G8 313S5EA | |
| Lenovo ThinkPad P15s Gen2-20W6000GGE | |
| SPECviewperf 2020 / CATIA (catia-06) | |
| Média da turma Workstation (27.1 - 182.2, n=23, últimos 2 anos) | |
| Lenovo ThinkPad P15 G2-20YQ001JGE | |
| Dell Precision 5000 5560 | |
| Média Intel Core i7-11800H (33.1 - 80.5, n=8) | |
| Lenovo ThinkPad T15g-20UR000GGE | |
| Lenovo ThinkPad P15v G2 21A9000XGE | |
| HP ZBook Power 15 G8 313S5EA | |
| Lenovo ThinkPad P15s Gen2-20W6000GGE | |
| SPECviewperf 2020 / 3ds Max (3dsmax-07) | |
| Média da turma Workstation (24.7 - 251, n=23, últimos 2 anos) | |
| Lenovo ThinkPad T15g-20UR000GGE | |
| Lenovo ThinkPad P15 G2-20YQ001JGE | |
| Média Intel Core i7-11800H (40.9 - 109.4, n=8) | |
| Dell Precision 5000 5560 | |
| Lenovo ThinkPad P15v G2 21A9000XGE | |
| HP ZBook Power 15 G8 313S5EA | |
| Lenovo ThinkPad P15s Gen2-20W6000GGE | |
* ... menor é melhor
AIDA64: FP32 Ray-Trace | FPU Julia | CPU SHA3 | CPU Queen | FPU SinJulia | FPU Mandel | CPU AES | CPU ZLib | FP64 Ray-Trace | CPU PhotoWorxx
| Performance rating | |
| Média da turma Workstation | |
| HP ZBook Power 15 G8 313S5EA | |
| Média Intel Core i7-11800H | |
| Lenovo ThinkPad P15v G2 21A9000XGE | |
| Lenovo ThinkPad T15g-20UR000GGE | |
| Lenovo ThinkPad T15p-20TN0006GE | |
| Lenovo ThinkPad P15s Gen2-20W6000GGE | |
| AIDA64 / FP32 Ray-Trace | |
| Média da turma Workstation (16730 - 61611, n=23, últimos 2 anos) | |
| HP ZBook Power 15 G8 313S5EA | |
| Média Intel Core i7-11800H (8772 - 15961, n=20) | |
| Lenovo ThinkPad P15v G2 21A9000XGE | |
| Lenovo ThinkPad T15g-20UR000GGE | |
| Lenovo ThinkPad T15p-20TN0006GE | |
| Lenovo ThinkPad P15s Gen2-20W6000GGE | |
| AIDA64 / FPU Julia | |
| Média da turma Workstation (89597 - 186971, n=23, últimos 2 anos) | |
| HP ZBook Power 15 G8 313S5EA | |
| Média Intel Core i7-11800H (39404 - 65636, n=20) | |
| Lenovo ThinkPad P15v G2 21A9000XGE | |
| Lenovo ThinkPad T15g-20UR000GGE | |
| Lenovo ThinkPad T15p-20TN0006GE | |
| Lenovo ThinkPad P15s Gen2-20W6000GGE | |
| AIDA64 / CPU SHA3 | |
| Média da turma Workstation (4178 - 8975, n=23, últimos 2 anos) | |
| HP ZBook Power 15 G8 313S5EA | |
| Média Intel Core i7-11800H (2599 - 4439, n=20) | |
| Lenovo ThinkPad P15v G2 21A9000XGE | |
| Lenovo ThinkPad T15g-20UR000GGE | |
| Lenovo ThinkPad T15p-20TN0006GE | |
| Lenovo ThinkPad P15s Gen2-20W6000GGE | |
| AIDA64 / CPU Queen | |
| Média da turma Workstation (60778 - 144411, n=23, últimos 2 anos) | |
| HP ZBook Power 15 G8 313S5EA | |
| Média Intel Core i7-11800H (85233 - 91941, n=20) | |
| Lenovo ThinkPad P15v G2 21A9000XGE | |
| Lenovo ThinkPad T15p-20TN0006GE | |
| Lenovo ThinkPad T15g-20UR000GGE | |
| Lenovo ThinkPad P15s Gen2-20W6000GGE | |
| AIDA64 / FPU SinJulia | |
| Média da turma Workstation (8165 - 29343, n=23, últimos 2 anos) | |
| HP ZBook Power 15 G8 313S5EA | |
| Média Intel Core i7-11800H (6420 - 9792, n=20) | |
| Lenovo ThinkPad P15v G2 21A9000XGE | |
| Lenovo ThinkPad T15p-20TN0006GE | |
| Lenovo ThinkPad T15g-20UR000GGE | |
| Lenovo ThinkPad P15s Gen2-20W6000GGE | |
| AIDA64 / FPU Mandel | |
| Média da turma Workstation (44497 - 98153, n=23, últimos 2 anos) | |
| HP ZBook Power 15 G8 313S5EA | |
| Média Intel Core i7-11800H (23365 - 39464, n=20) | |
| Lenovo ThinkPad P15v G2 21A9000XGE | |
| Lenovo ThinkPad T15g-20UR000GGE | |
| Lenovo ThinkPad T15p-20TN0006GE | |
| Lenovo ThinkPad P15s Gen2-20W6000GGE | |
| AIDA64 / CPU AES | |
| Média Intel Core i7-11800H (74617 - 149388, n=20) | |
| Média da turma Workstation (73133 - 187841, n=23, últimos 2 anos) | |
| HP ZBook Power 15 G8 313S5EA | |
| Lenovo ThinkPad P15v G2 21A9000XGE | |
| Lenovo ThinkPad P15s Gen2-20W6000GGE | |
| Lenovo ThinkPad T15p-20TN0006GE | |
| Lenovo ThinkPad T15g-20UR000GGE | |
| AIDA64 / CPU ZLib | |
| Média da turma Workstation (929 - 2148, n=23, últimos 2 anos) | |
| HP ZBook Power 15 G8 313S5EA | |
| Lenovo ThinkPad P15v G2 21A9000XGE | |
| Lenovo ThinkPad T15g-20UR000GGE | |
| Lenovo ThinkPad T15p-20TN0006GE | |
| Lenovo ThinkPad P15s Gen2-20W6000GGE | |
| Média Intel Core i7-11800H (461 - 830, n=43) | |
| AIDA64 / FP64 Ray-Trace | |
| Média da turma Workstation (8545 - 32891, n=23, últimos 2 anos) | |
| HP ZBook Power 15 G8 313S5EA | |
| Média Intel Core i7-11800H (4545 - 8717, n=21) | |
| Lenovo ThinkPad P15v G2 21A9000XGE | |
| Lenovo ThinkPad T15g-20UR000GGE | |
| Lenovo ThinkPad T15p-20TN0006GE | |
| Lenovo ThinkPad P15s Gen2-20W6000GGE | |
| AIDA64 / CPU PhotoWorxx | |
| Média da turma Workstation (37151 - 93684, n=23, últimos 2 anos) | |
| Lenovo ThinkPad P15s Gen2-20W6000GGE | |
| Lenovo ThinkPad T15g-20UR000GGE | |
| Média Intel Core i7-11800H (11898 - 26757, n=21) | |
| HP ZBook Power 15 G8 313S5EA | |
| Lenovo ThinkPad T15p-20TN0006GE | |
| Lenovo ThinkPad P15v G2 21A9000XGE | |
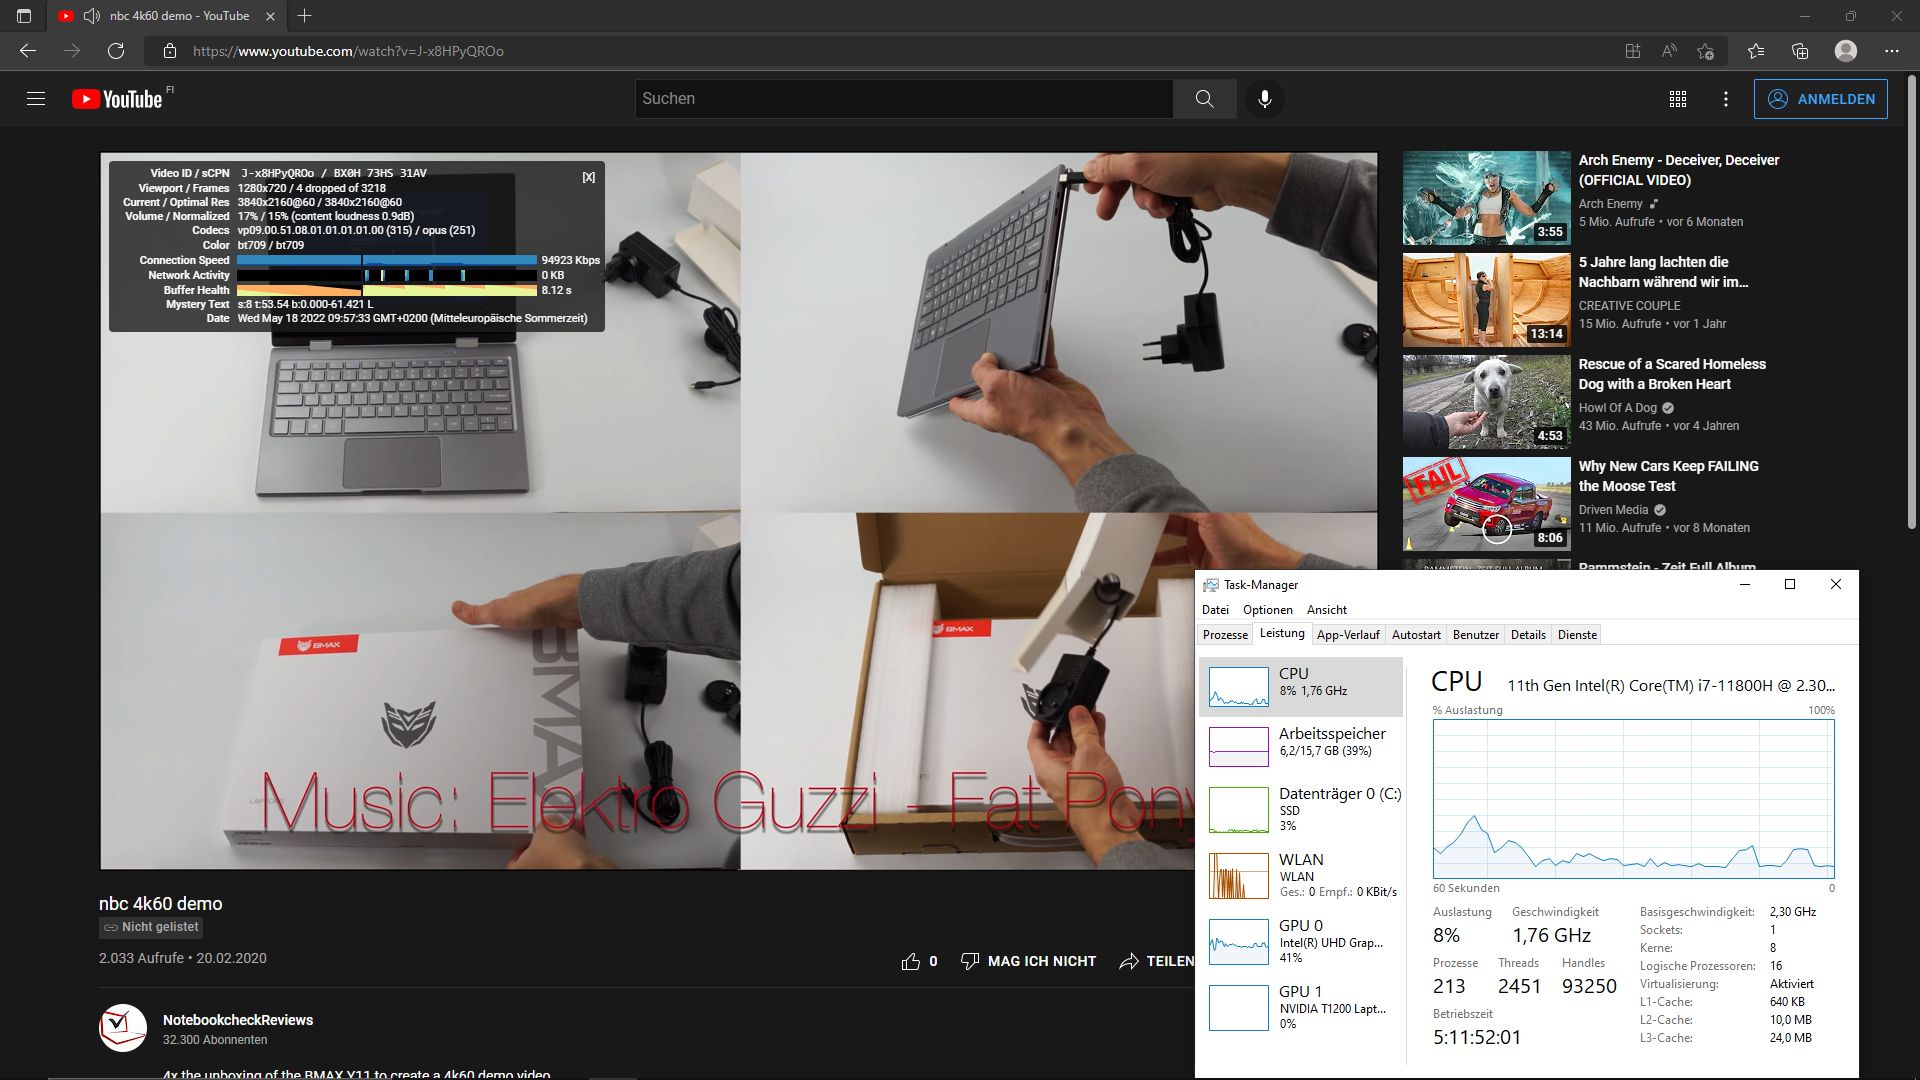
Desempenho do sistema
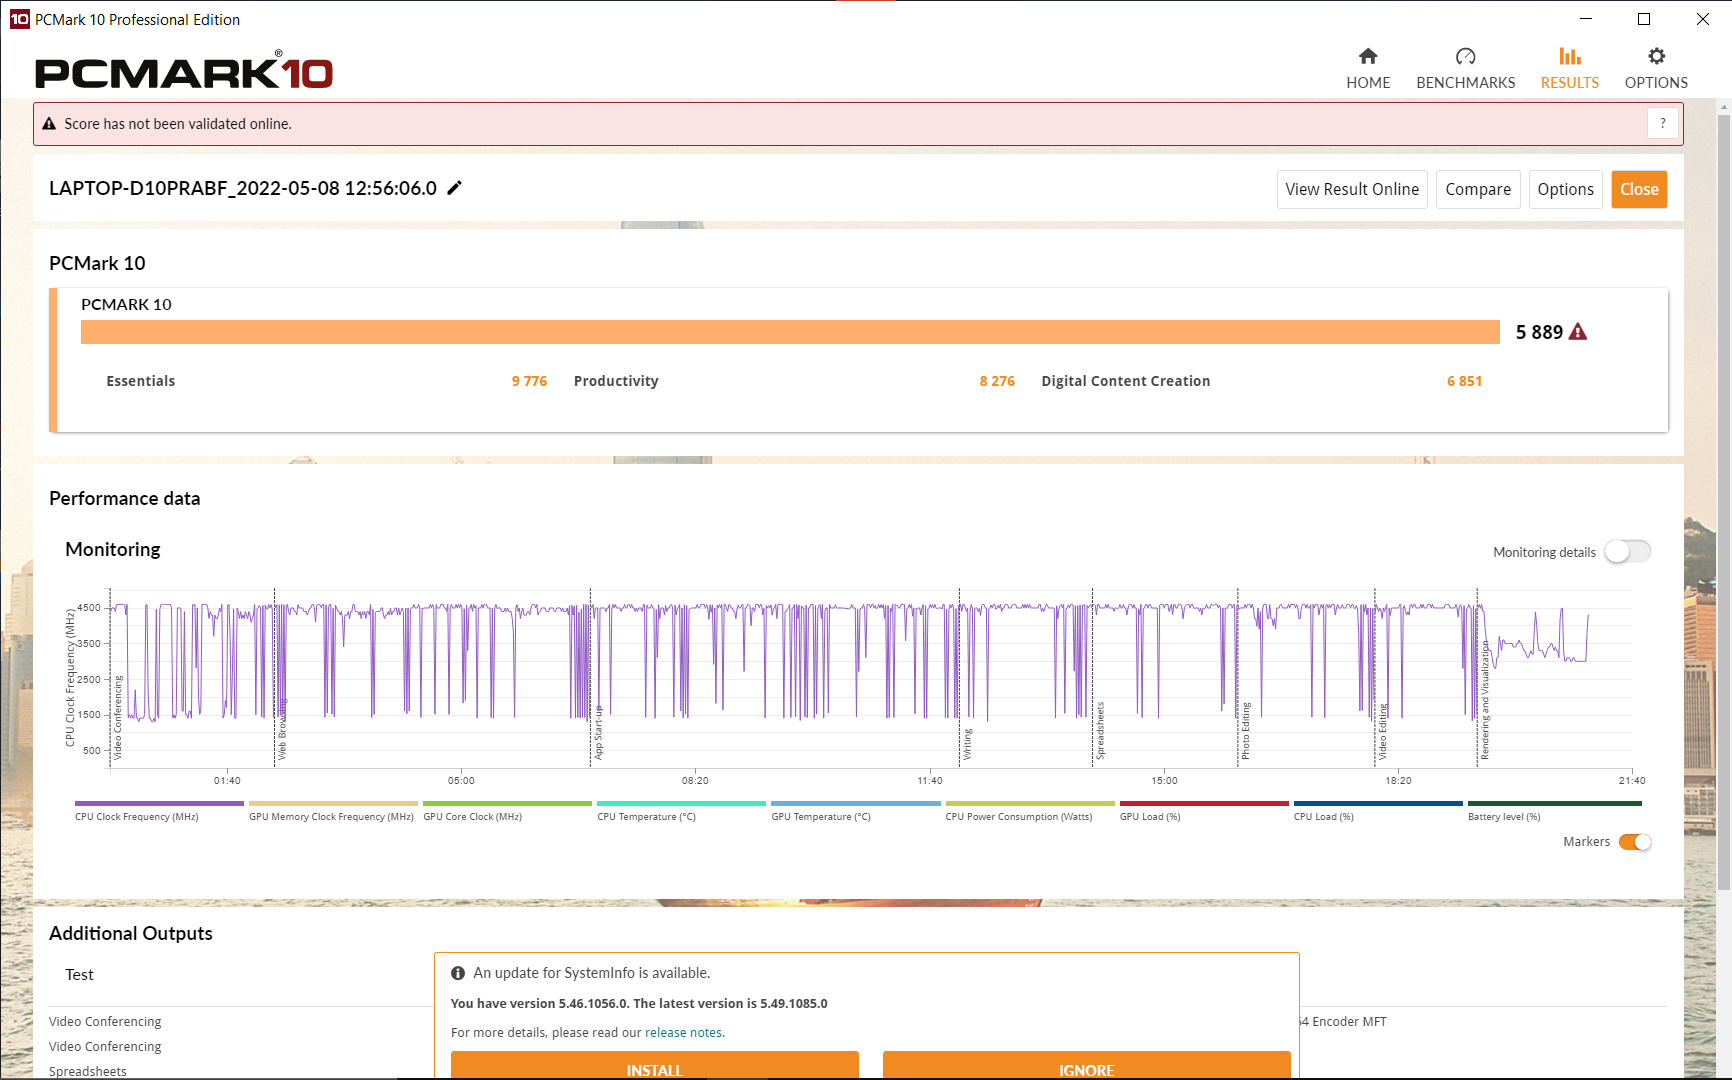
A navegação com várias abas durante a reprodução de um vídeo de 4k no YouTube corre sem problemas.
Os resultados de referência estão em um bom nível, que pode ser melhorado ainda mais usando um segundo módulo RAM (modo de canal duplo).
CrossMark: Overall | Productivity | Creativity | Responsiveness
| PCMark 10 / Score | |
| Média da turma Workstation (6563 - 10409, n=19, últimos 2 anos) | |
| Dell Precision 5000 5560 | |
| Lenovo ThinkPad P15 G2-20YQ001JGE | |
| Lenovo ThinkPad T15g-20UR000GGE | |
| Média Intel Core i7-11800H, NVIDIA T1200 Laptop GPU (5889 - 6147, n=3) | |
| Lenovo ThinkPad P15v G2 21A9000XGE | |
| Lenovo ThinkPad P15s Gen2-20W6000GGE | |
| Lenovo ThinkPad T15p-20TN0006GE | |
| HP ZBook Power 15 G8 313S5EA | |
| PCMark 10 / Essentials | |
| Dell Precision 5000 5560 | |
| Média da turma Workstation (9622 - 11157, n=19, últimos 2 anos) | |
| Lenovo ThinkPad P15 G2-20YQ001JGE | |
| Média Intel Core i7-11800H, NVIDIA T1200 Laptop GPU (9776 - 9956, n=3) | |
| Lenovo ThinkPad P15v G2 21A9000XGE | |
| Lenovo ThinkPad P15s Gen2-20W6000GGE | |
| Lenovo ThinkPad T15g-20UR000GGE | |
| Lenovo ThinkPad T15p-20TN0006GE | |
| HP ZBook Power 15 G8 313S5EA | |
| PCMark 10 / Productivity | |
| Média da turma Workstation (8789 - 20616, n=19, últimos 2 anos) | |
| Lenovo ThinkPad P15s Gen2-20W6000GGE | |
| Dell Precision 5000 5560 | |
| Lenovo ThinkPad P15 G2-20YQ001JGE | |
| Média Intel Core i7-11800H, NVIDIA T1200 Laptop GPU (8276 - 8445, n=3) | |
| Lenovo ThinkPad P15v G2 21A9000XGE | |
| Lenovo ThinkPad T15g-20UR000GGE | |
| HP ZBook Power 15 G8 313S5EA | |
| Lenovo ThinkPad T15p-20TN0006GE | |
| PCMark 10 / Digital Content Creation | |
| Média da turma Workstation (8108 - 15631, n=19, últimos 2 anos) | |
| Lenovo ThinkPad P15 G2-20YQ001JGE | |
| Dell Precision 5000 5560 | |
| Lenovo ThinkPad T15g-20UR000GGE | |
| Média Intel Core i7-11800H, NVIDIA T1200 Laptop GPU (6851 - 7581, n=3) | |
| Lenovo ThinkPad P15v G2 21A9000XGE | |
| Lenovo ThinkPad T15p-20TN0006GE | |
| HP ZBook Power 15 G8 313S5EA | |
| Lenovo ThinkPad P15s Gen2-20W6000GGE | |
| CrossMark / Overall | |
| Média da turma Workstation (1307 - 2267, n=22, últimos 2 anos) | |
| HP ZBook Power 15 G8 313S5EA | |
| Média Intel Core i7-11800H, NVIDIA T1200 Laptop GPU (1367 - 1526, n=2) | |
| Lenovo ThinkPad P15v G2 21A9000XGE | |
| CrossMark / Productivity | |
| Média da turma Workstation (1130 - 2122, n=22, últimos 2 anos) | |
| HP ZBook Power 15 G8 313S5EA | |
| Média Intel Core i7-11800H, NVIDIA T1200 Laptop GPU (1389 - 1521, n=2) | |
| Lenovo ThinkPad P15v G2 21A9000XGE | |
| CrossMark / Creativity | |
| Média da turma Workstation (1657 - 2725, n=22, últimos 2 anos) | |
| HP ZBook Power 15 G8 313S5EA | |
| Média Intel Core i7-11800H, NVIDIA T1200 Laptop GPU (1430 - 1606, n=2) | |
| Lenovo ThinkPad P15v G2 21A9000XGE | |
| CrossMark / Responsiveness | |
| Média da turma Workstation (993 - 2096, n=22, últimos 2 anos) | |
| Média Intel Core i7-11800H, NVIDIA T1200 Laptop GPU (1137 - 1323, n=2) | |
| HP ZBook Power 15 G8 313S5EA | |
| Lenovo ThinkPad P15v G2 21A9000XGE | |
| PCMark 10 Score | 5889 pontos | |
Ajuda | ||
| AIDA64 / Memory Copy | |
| Média da turma Workstation (56003 - 164795, n=23, últimos 2 anos) | |
| Lenovo ThinkPad P15s Gen2-20W6000GGE | |
| Média Intel Core i7-11800H (24508 - 48144, n=21) | |
| Lenovo ThinkPad T15g-20UR000GGE | |
| HP ZBook Power 15 G8 313S5EA | |
| Lenovo ThinkPad P15v G2 21A9000XGE | |
| Lenovo ThinkPad T15p-20TN0006GE | |
| AIDA64 / Memory Read | |
| Média da turma Workstation (55795 - 121563, n=23, últimos 2 anos) | |
| Lenovo ThinkPad P15s Gen2-20W6000GGE | |
| Média Intel Core i7-11800H (25882 - 50365, n=20) | |
| Lenovo ThinkPad T15g-20UR000GGE | |
| HP ZBook Power 15 G8 313S5EA | |
| Lenovo ThinkPad P15v G2 21A9000XGE | |
| Lenovo ThinkPad T15p-20TN0006GE | |
| AIDA64 / Memory Write | |
| Média da turma Workstation (55663 - 214520, n=23, últimos 2 anos) | |
| Lenovo ThinkPad P15s Gen2-20W6000GGE | |
| Lenovo ThinkPad T15g-20UR000GGE | |
| Média Intel Core i7-11800H (22240 - 46214, n=20) | |
| HP ZBook Power 15 G8 313S5EA | |
| Lenovo ThinkPad P15v G2 21A9000XGE | |
| Lenovo ThinkPad T15p-20TN0006GE | |
| AIDA64 / Memory Latency | |
| Média da turma Workstation (84.5 - 165.2, n=23, últimos 2 anos) | |
| Lenovo ThinkPad P15v G2 21A9000XGE | |
| Lenovo ThinkPad P15s Gen2-20W6000GGE | |
| Lenovo ThinkPad T15p-20TN0006GE | |
| HP ZBook Power 15 G8 313S5EA | |
| Lenovo ThinkPad T15g-20UR000GGE | |
| Média Intel Core i7-11800H (71.9 - 104.1, n=44) | |
* ... menor é melhor
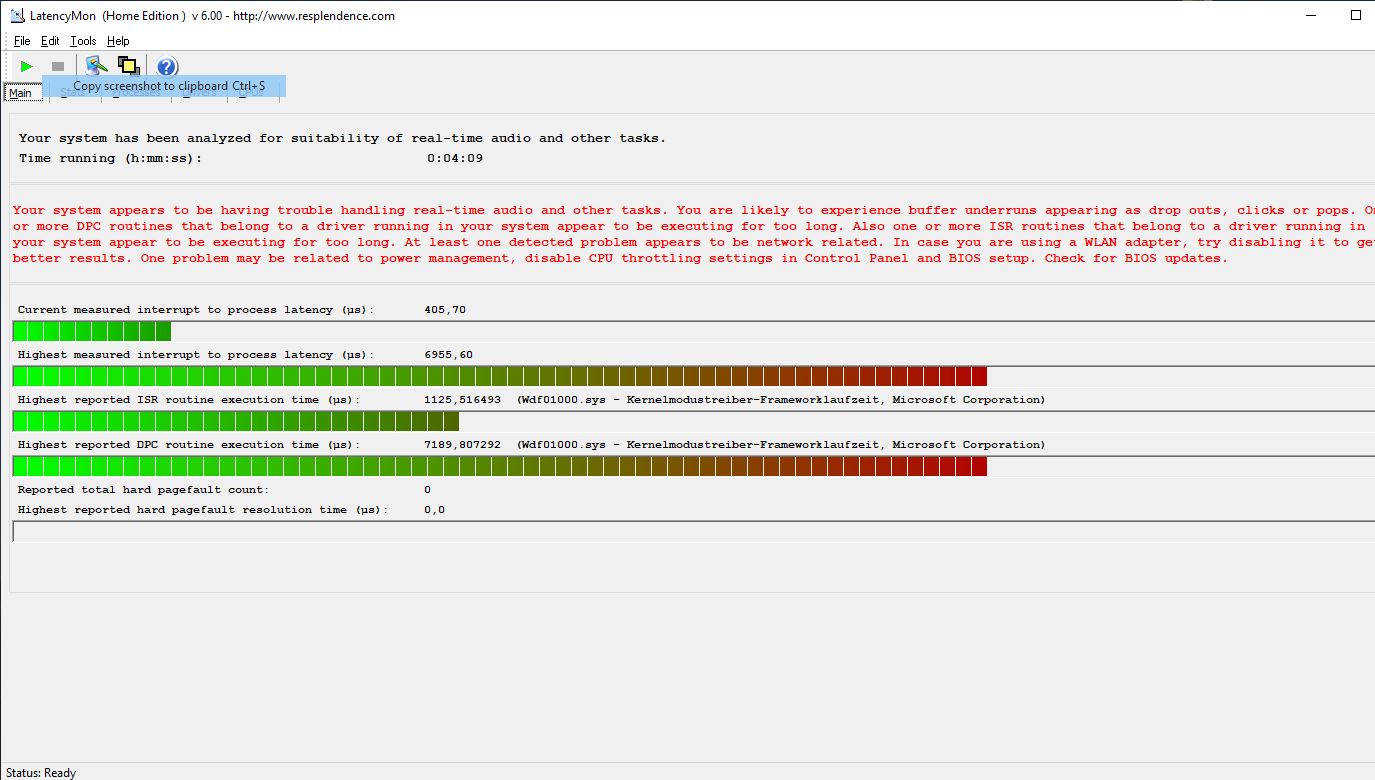
Latências DPC
Como o mais grosso PensePad P15 G2a DPC, latências DPC provou ser péssima com os últimos drivers e BIOS no momento dos testes. Como tantas vezes, o módulo do kernel e os drivers de rede são responsáveis. O P15v G2 é, portanto, inadequado para o processamento de vídeo e áudio em tempo real Dell's Precision 5560 as tarifas aqui são muito melhores.
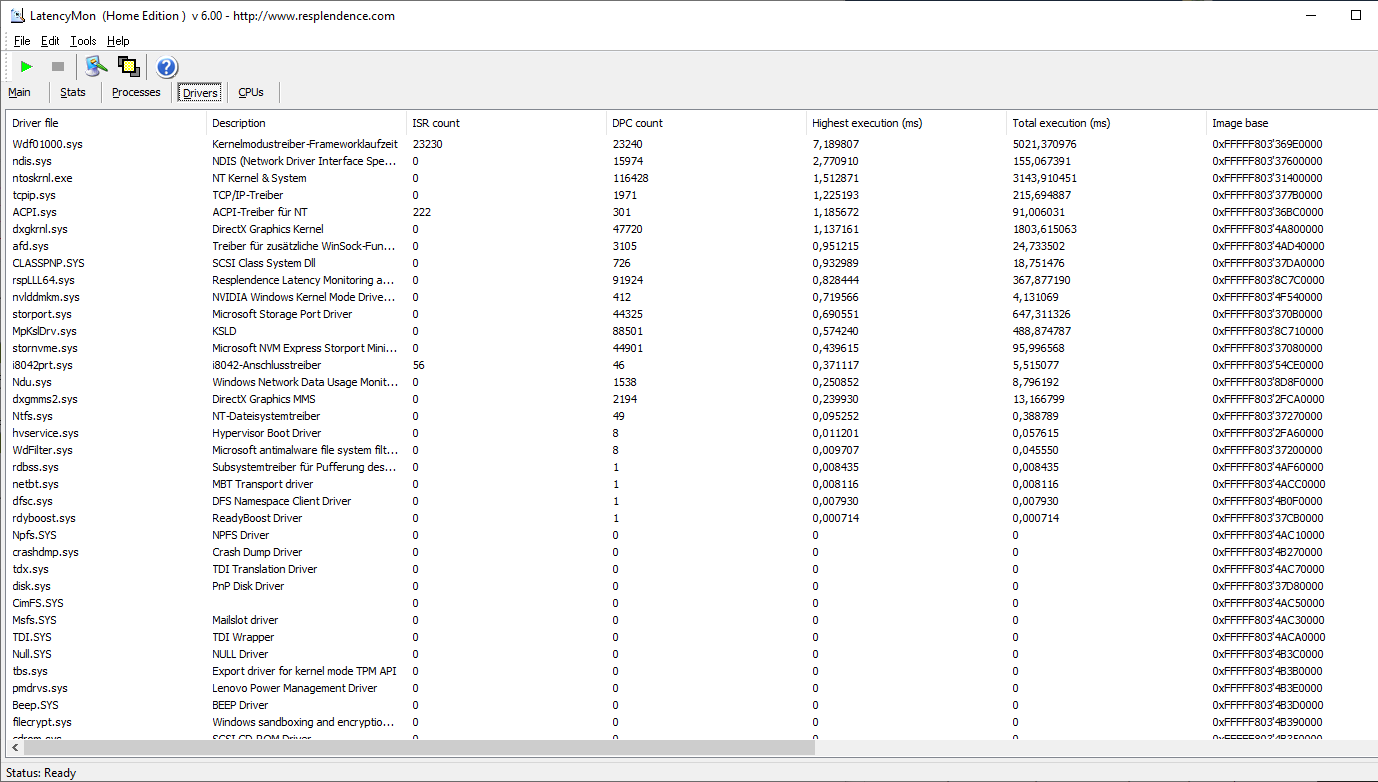
| DPC Latencies / LatencyMon - interrupt to process latency (max), Web, Youtube, Prime95 | |
| Lenovo ThinkPad P15v G2 21A9000XGE | |
| Lenovo ThinkPad P15 G2-20YQ001JGE | |
| Lenovo ThinkPad P15s Gen2-20W6000GGE | |
| Lenovo ThinkPad T15g-20UR000GGE | |
| Lenovo ThinkPad T15p-20TN0006GE | |
| Dell Precision 5000 5560 | |
| HP ZBook Power 15 G8 313S5EA | |
* ... menor é melhor
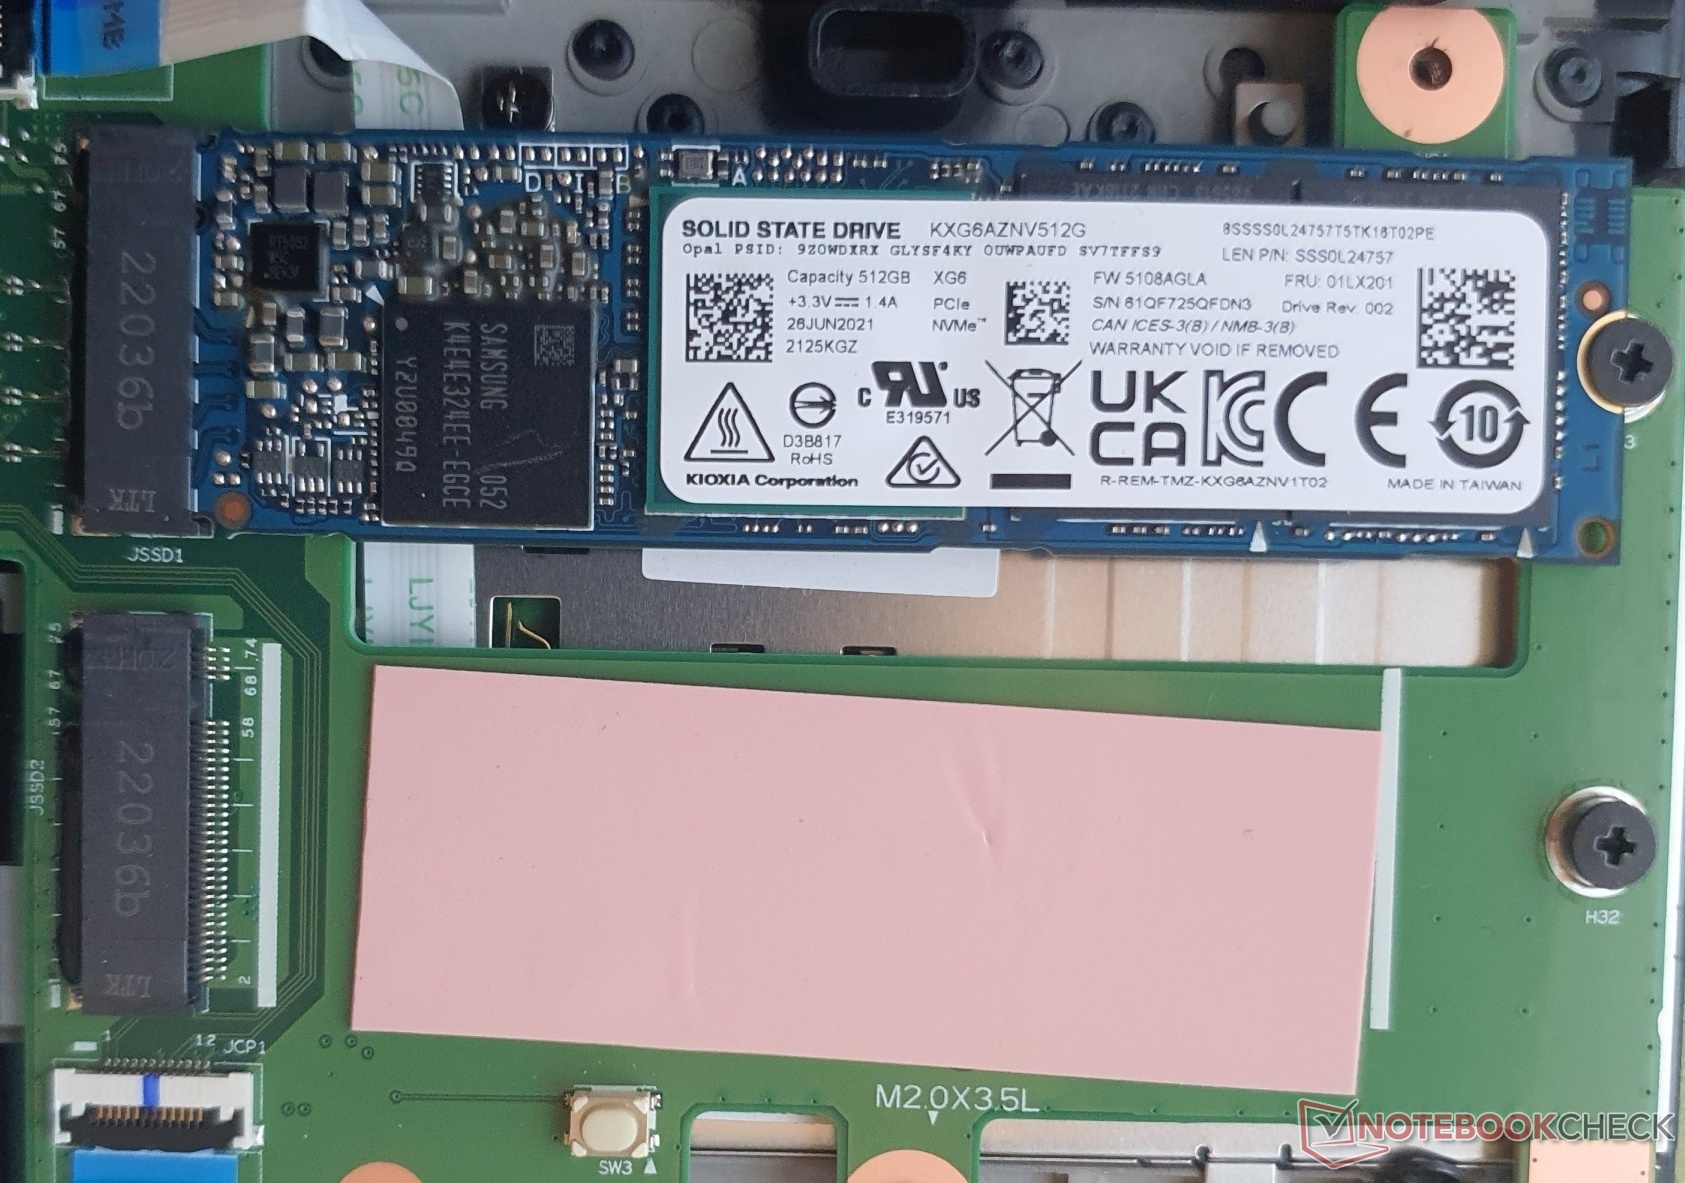
Dispositivos de armazenamento
O SSD NVMe da Toshiba tem uma capacidade de 512 GB. A velocidade é a esperada para a PCIe 3.0, mas nem sempre necessariamente suficiente para uma estação de trabalho.
Por outro lado, é possível atualizar até duas SSDs PCIe 4.0 mais rápidas e também operá-las em uma configuração RAID (0.1). ZBook Power 15 G8 da HP, Dell's Precision 5560e o ThinkPad P15 atinge cerca do dobro das velocidades.
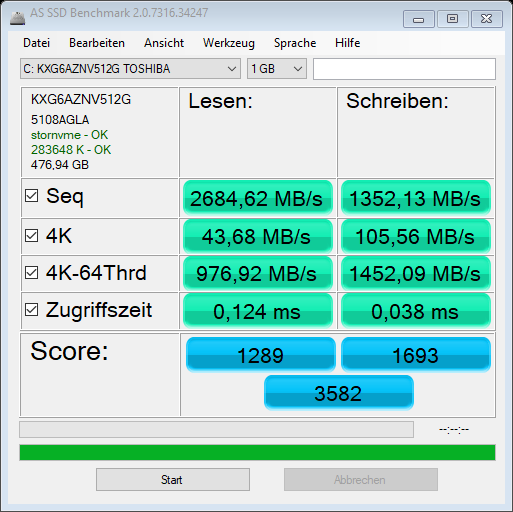
| Lenovo ThinkPad P15v G2 21A9000XGE T1200 Laptop GPU, i7-11800H, Toshiba XG6 KXG6AZNV512G | Lenovo ThinkPad P15 G2-20YQ001JGE RTX A3000 Laptop GPU, i7-11800H, Kioxia XG7 KXG7AZNV512G | Lenovo ThinkPad T15g-20UR000GGE GeForce RTX 2070 Super Max-Q, i7-10750H, SK Hynix PC401 512GB M.2 (HFS512GD9TNG) | Lenovo ThinkPad T15p-20TN0006GE GeForce GTX 1050 Mobile, i7-10750H, WDC PC SN730 SDBQNTY-512GB | Lenovo ThinkPad P15s Gen2-20W6000GGE T500 Laptop GPU, i7-1165G7, WDC PC SN720 SDAQNTW-1T00 | Dell Precision 5000 5560 RTX A2000 Laptop GPU, i7-11850H, Samsung PM9A1 MZVL22T0HBLB | |
|---|---|---|---|---|---|---|
| AS SSD | 53% | 49% | 16% | 32% | 57% | |
| Seq Read (MB/s) | 2684 | 5105 90% | 2889 8% | 2505 -7% | 2796 4% | 5169 93% |
| Seq Write (MB/s) | 1352 | 1815 34% | 2424 79% | 1230 -9% | 2525 87% | 1986 47% |
| 4K Read (MB/s) | 43.68 | 47.46 9% | 55.6 27% | 42.4 -3% | 50.9 17% | 78 79% |
| 4K Write (MB/s) | 105.56 | 137.3 30% | 144.6 37% | 116.5 10% | 211.9 101% | 214.6 103% |
| 4K-64 Read (MB/s) | 976.92 | 2112 116% | 1569 61% | 1416 45% | 1505 54% | 1232 26% |
| 4K-64 Write (MB/s) | 1452.09 | 1702 17% | 1922 32% | 1809 25% | 949 -35% | 2719 87% |
| Access Time Read * (ms) | 0.124 | 0.065 48% | 0.07 44% | 0.109 12% | 0.081 35% | 0.024 81% |
| Access Time Write * (ms) | 0.038 | 0.03 21% | 0.026 32% | 0.032 16% | 0.019 50% | 0.059 -55% |
| Score Read (Points) | 1289 | 2670 107% | 1914 48% | 1708 33% | 1835 42% | 1827 42% |
| Score Write (Points) | 1693 | 2021 19% | 2309 36% | 2048 21% | 1413 -17% | 3133 85% |
| Score Total (Points) | 3582 | 5885 64% | 5185 45% | 4568 28% | 4177 17% | 5753 61% |
| Copy ISO MB/s (MB/s) | 1760.5 | 2054 17% | 2489 41% | 3201 82% | ||
| Copy Program MB/s (MB/s) | 355 | 714 101% | 728 105% | 415.8 17% | ||
| Copy Game MB/s (MB/s) | 849 | 1431 69% | 1670 97% | 1212 43% |
* ... menor é melhor

* ... menor é melhor
Sustained Read Performance: DiskSpd Read Loop, Queue Depth 8
Placa Gráfica

O Nvidia T1200é a variante profissional do GeForce GTX 1650 Tio GDDR6 VRAM de 4 GB e é potenciado até 1.425 MHz. É mais que duas vezes mais rápido que o GeForce GTX 1050 do predecessor e seu modelo irmão em muitos pontos de referência. Uma diferença ainda maior resulta do RTX A2000.
No modo de bateria, o TGP de 40-W é reduzido para 30 watts e a velocidade do relógio cai em 250 MHz. O desempenho cai em 15% como resultado. Neste cenário, a CPU se trata de mais 7 watts a partir do TDP compartilhado.
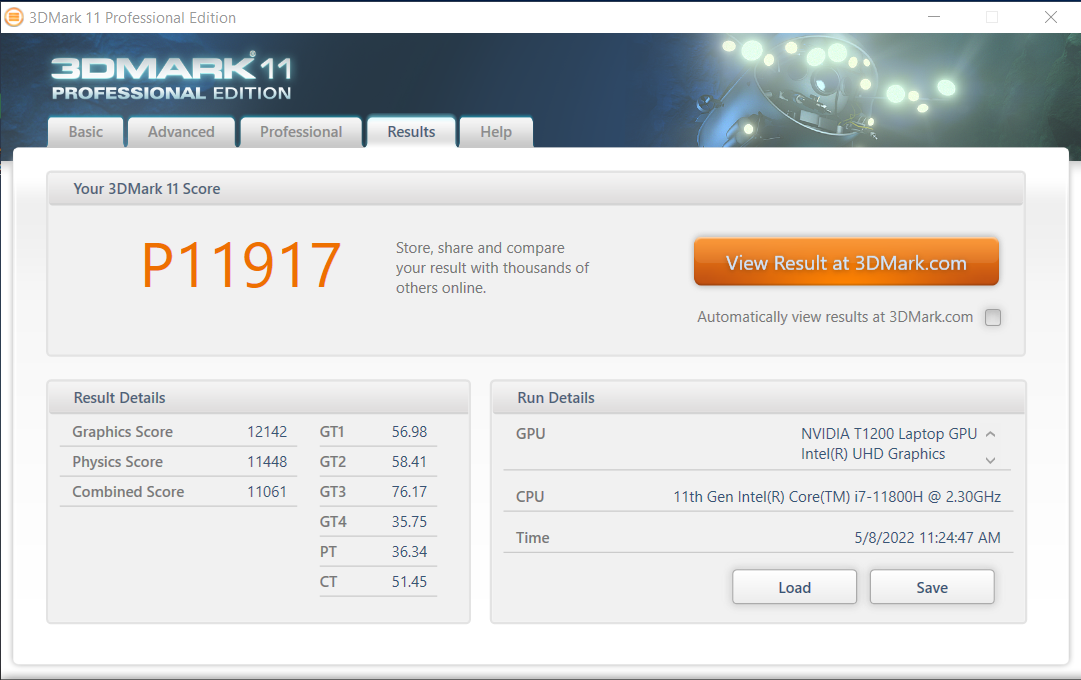
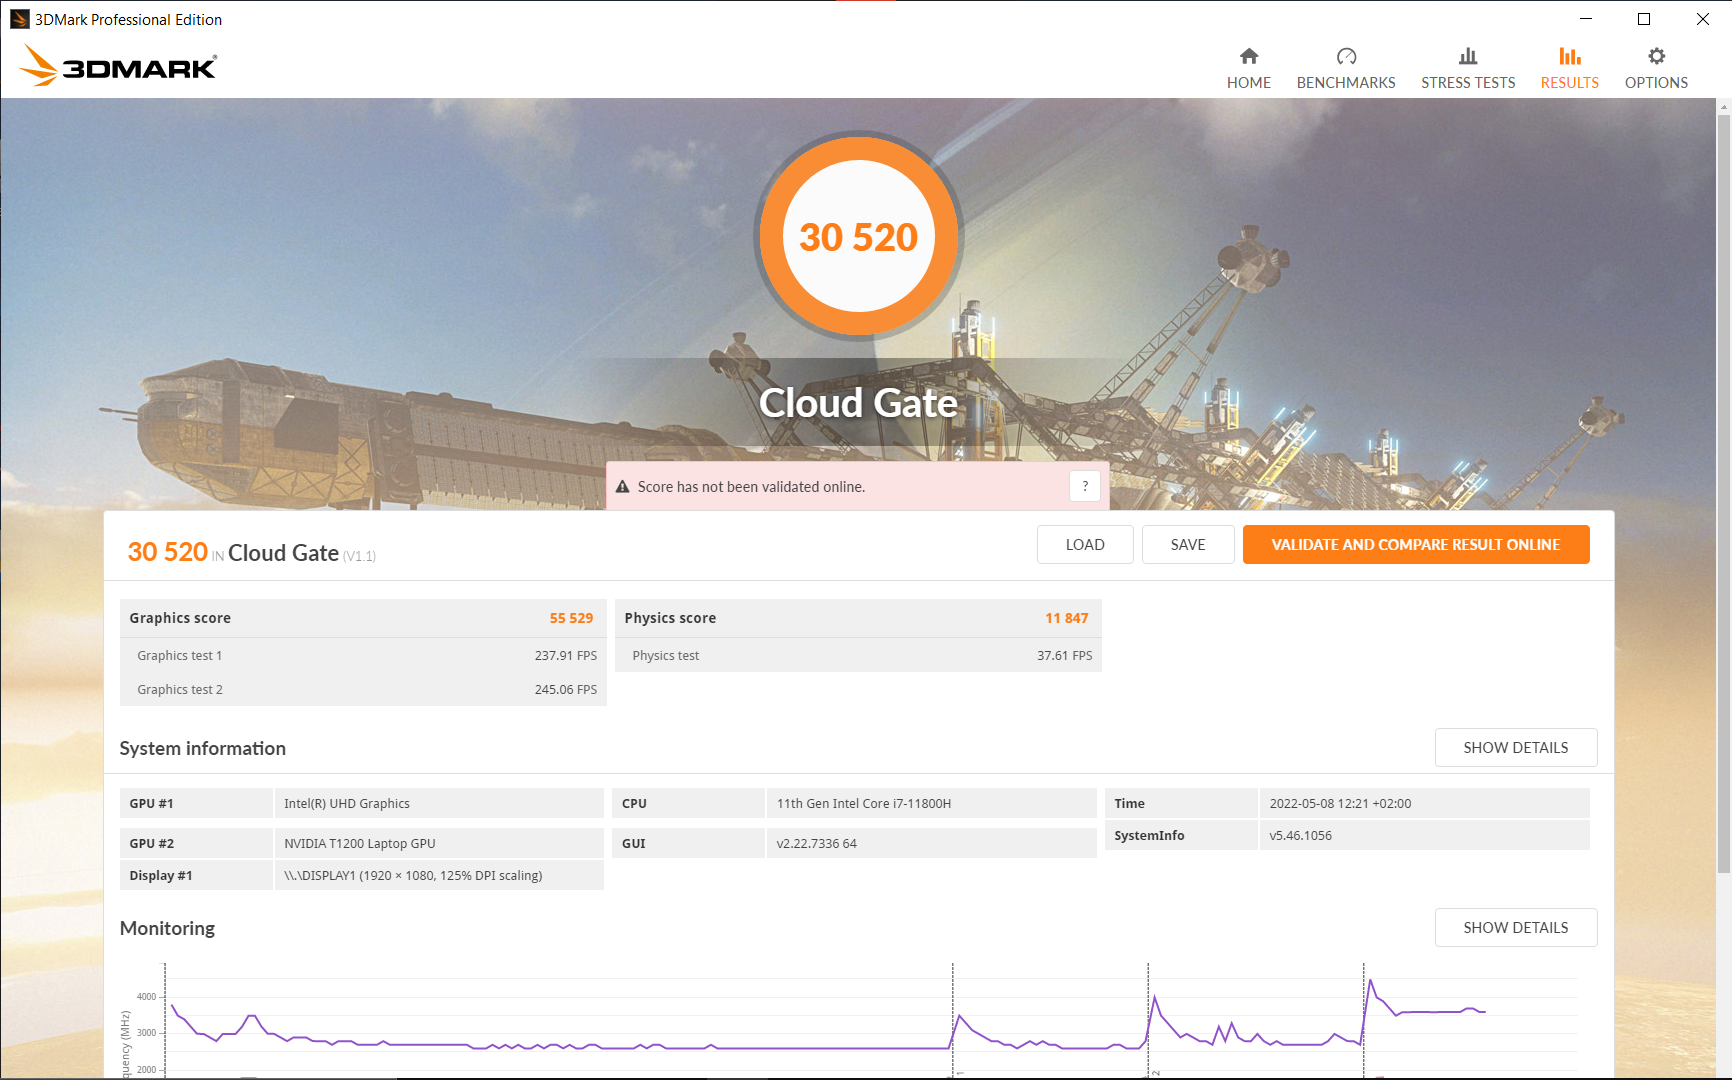
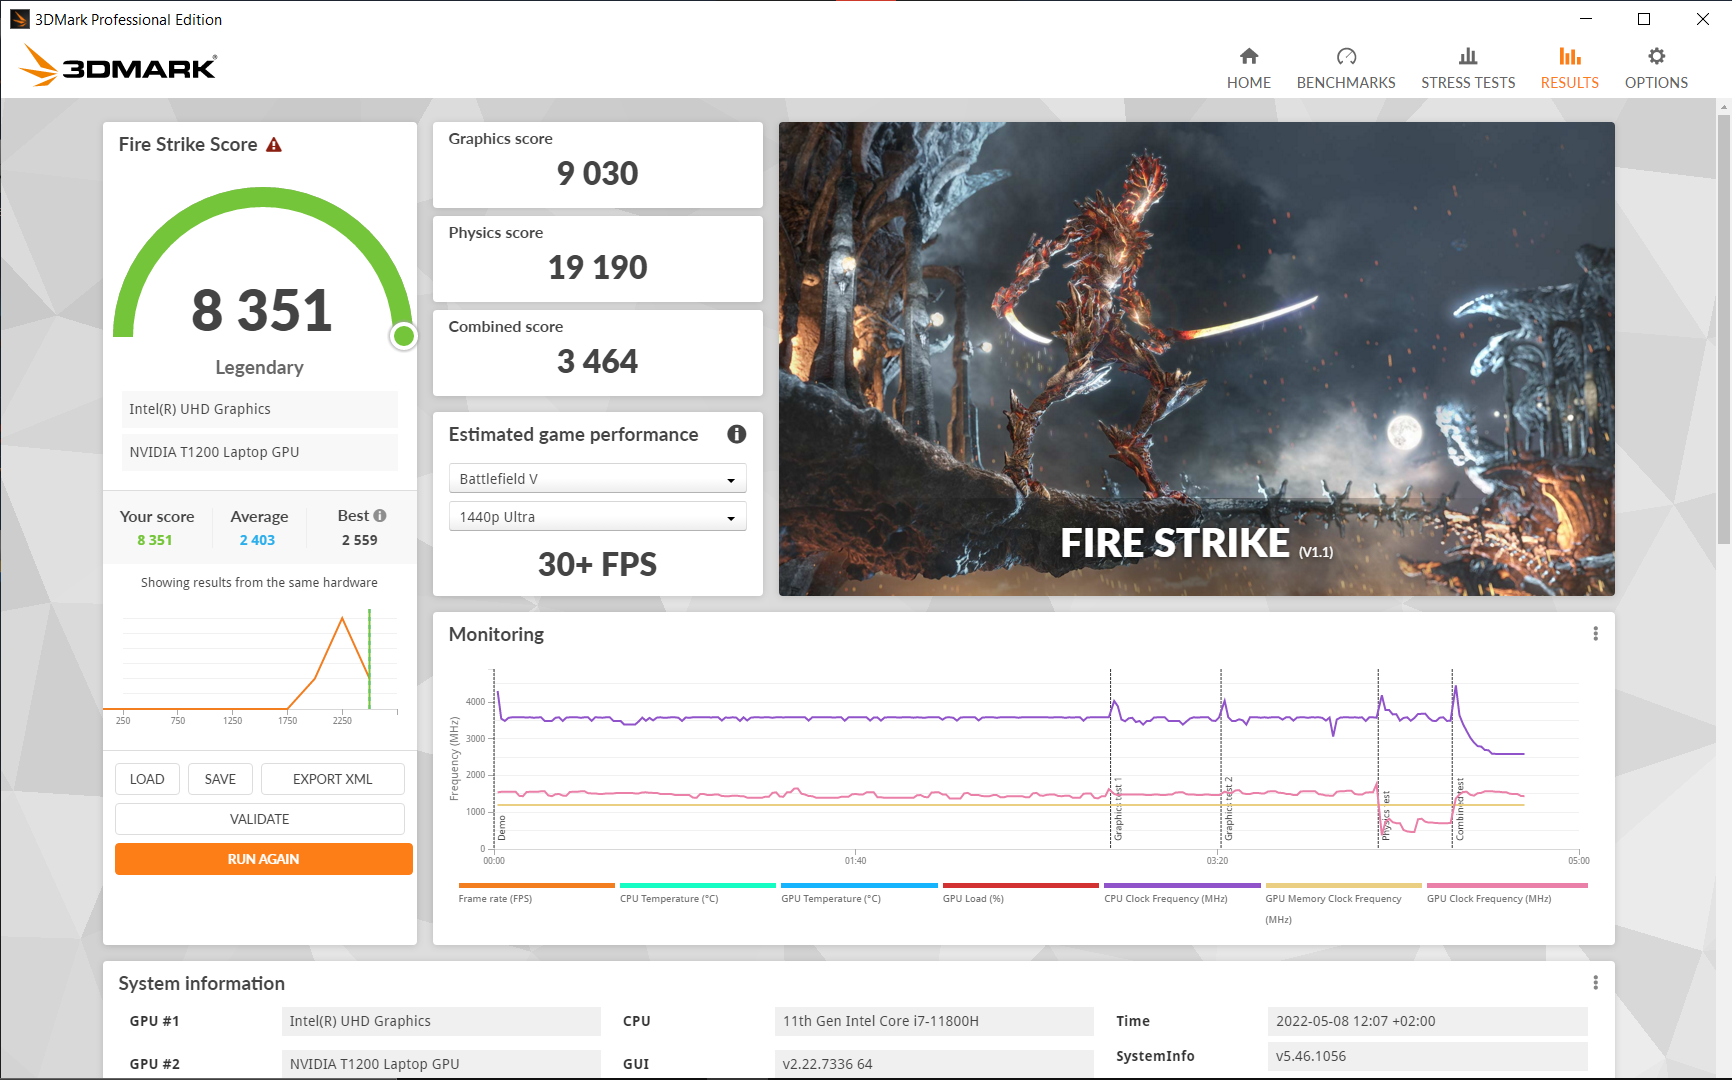
| 3DMark 06 Standard Score | 38139 pontos | |
| 3DMark 11 Performance | 11917 pontos | |
| 3DMark Cloud Gate Standard Score | 30520 pontos | |
| 3DMark Fire Strike Score | 8351 pontos | |
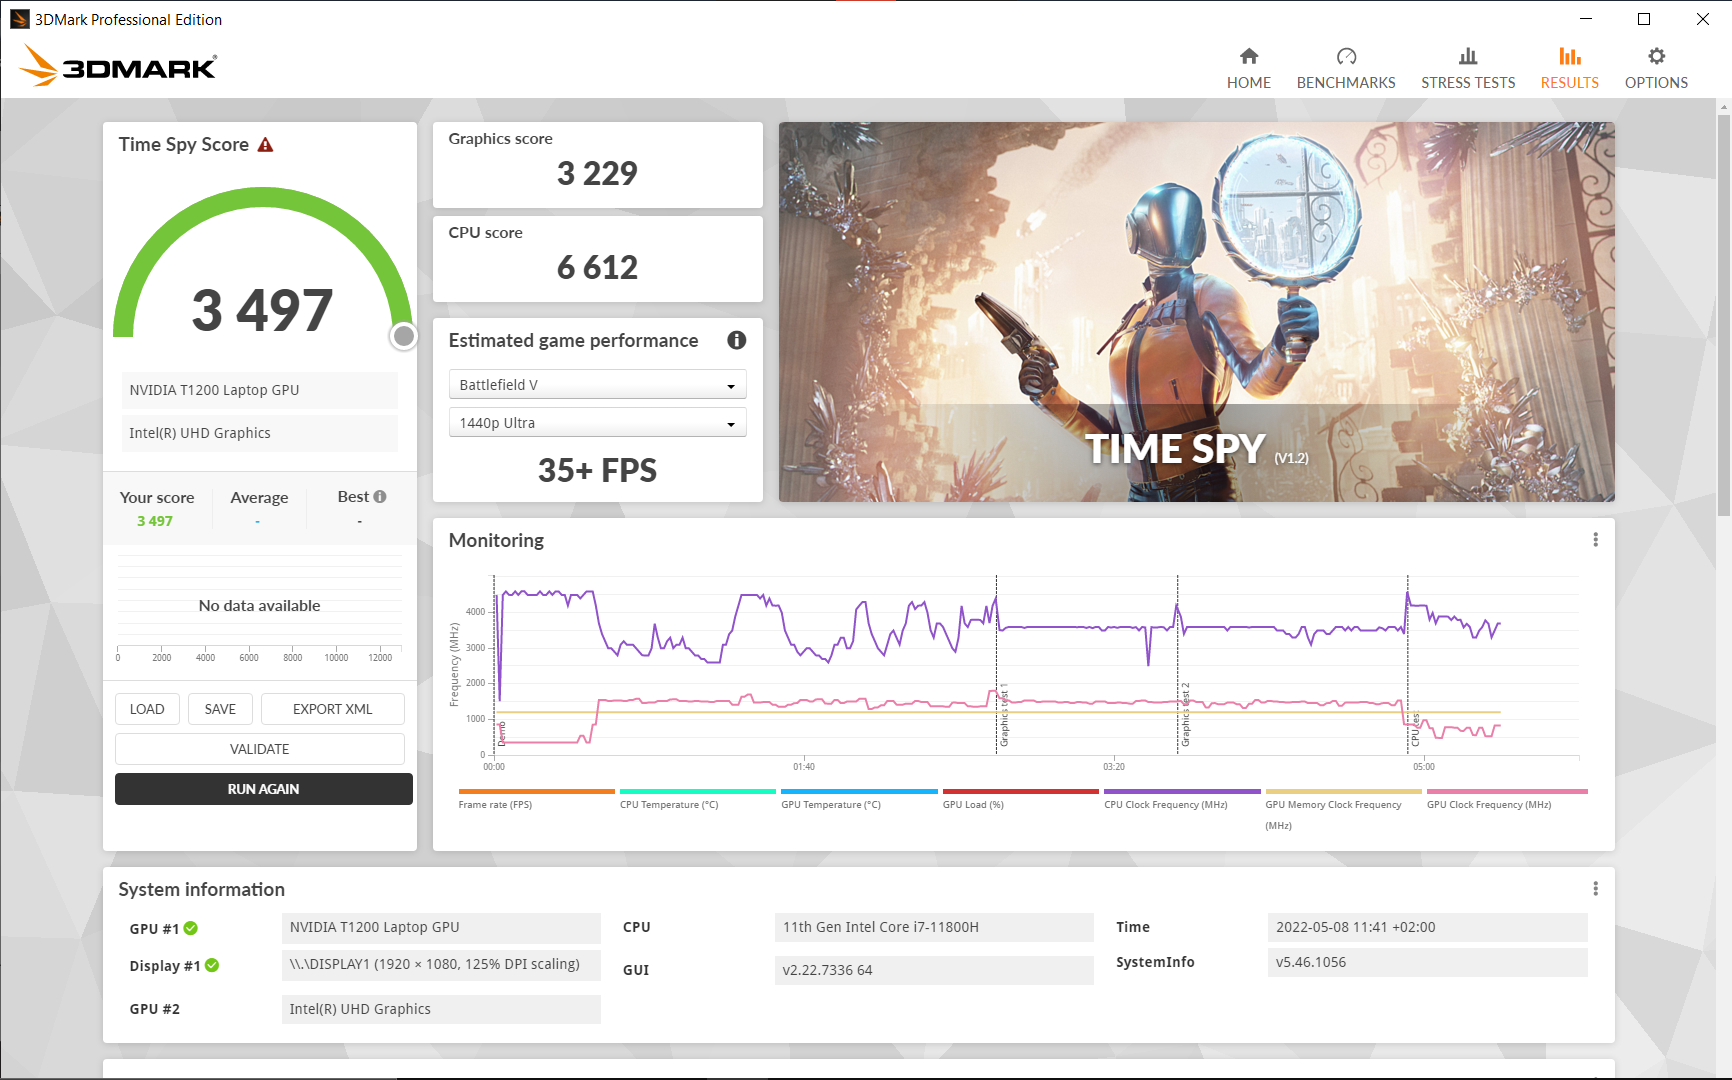
| 3DMark Time Spy Score | 3497 pontos | |
Ajuda | ||
Desempenho nos jogos
O Nvidia T1200 pode executar jogos mais antigos em grandes detalhes, sem problemas. Os novos jogos são jogáveis em detalhes médios. Nenhuma queda de desempenho foi observada durante o teste de uma hora Witcher 3.
Witcher 3 FPS Chart
| baixo | média | alto | ultra | |
|---|---|---|---|---|
| BioShock Infinite (2013) | 352.2 | 235.8 | 207.9 | 88.1 |
| GTA V (2015) | 169.9 | 158.5 | 89.7 | 48.5 |
| The Witcher 3 (2015) | 59 | 33.2 | ||
| Dota 2 Reborn (2015) | 133.3 | 116.5 | 107.8 | 100.4 |
| Final Fantasy XV Benchmark (2018) | 88 | 49.5 | 35 | |
| X-Plane 11.11 (2018) | 96.2 | 77.5 | 64.8 | |
| Far Cry 5 (2018) | 107 | 60 | 53 | 51 |
| Strange Brigade (2018) | 208 | 84 | 68.5 | 59.3 |
| Shadow of the Tomb Raider (2018) | 96 | 59 | 48 | 39 |
| Mafia Definitive Edition (2020) | 84 | 43.4 | 39.2 | |
| Resident Evil Village (2021) | 114.3 | 64.3 | 57.9 | 49.8 |
| Riders Republic (2021) | 93 | 50 | 41 | 40 |
| Farming Simulator 22 (2021) | 171.9 | 96.6 | 70.1 | 61.2 |
| Dying Light 2 (2022) | 36.1 | 25.7 | 21.2 | |
| GRID Legends (2022) | 103 | 73 | 61.7 | 45.7 |
| Elden Ring (2022) | 52.9 | 47 | 39.5 | 36.8 |
| Elex 2 (2022) | 43.1 | 39.3 | 34.2 | 29.6 |
| Ghostwire Tokyo (2022) | 50.7 | 47.3 | 44.6 | 41.2 |
| Vampire Bloodhunt (2022) | 121.8 | 72.9 | 69.9 | 69.5 |
Emissões: Laptop Lenovo silencioso com hotspots
Ruído
O ventilador permanece em silêncio enquanto está ocioso e também enquanto navega. Somente sob carga o ThinkPad é claramente audível a 39 dB. Medimos 43,5 dB no teste de estresse absoluto. O ventilador também se torna perceptível durante a navegação intensiva na web, mas é tudo menos barulhento. Não foi detectada nenhuma lamúria na bobina.
Todos os dispositivos em nosso campo de comparação são geralmente mais altos, como o HP ZBook Power 15, que registra cerca de 10% a mais de ruído em cenários de carga.
Barulho
| Ocioso |
| 25.21 / 25.21 / 25.21 dB |
| Carga |
| 39.09 / 43.53 dB |
 | ||
30 dB silencioso 40 dB(A) audível 50 dB(A) ruidosamente alto |
||
min: | ||
| Lenovo ThinkPad P15v G2 21A9000XGE T1200 Laptop GPU, i7-11800H, Toshiba XG6 KXG6AZNV512G | Lenovo ThinkPad P15 G2-20YQ001JGE RTX A3000 Laptop GPU, i7-11800H, Kioxia XG7 KXG7AZNV512G | Lenovo ThinkPad T15g-20UR000GGE GeForce RTX 2070 Super Max-Q, i7-10750H, SK Hynix PC401 512GB M.2 (HFS512GD9TNG) | Lenovo ThinkPad T15p-20TN0006GE GeForce GTX 1050 Mobile, i7-10750H, WDC PC SN730 SDBQNTY-512GB | Lenovo ThinkPad P15s Gen2-20W6000GGE T500 Laptop GPU, i7-1165G7, WDC PC SN720 SDAQNTW-1T00 | HP ZBook Power 15 G8 313S5EA T600 Laptop GPU, i7-11800H, Samsung PM9A1 MZVL2512HCJQ | Dell Precision 5000 5560 RTX A2000 Laptop GPU, i7-11850H, Samsung PM9A1 MZVL22T0HBLB | |
|---|---|---|---|---|---|---|---|
| Noise | -8% | -1% | -13% | 5% | -10% | 8% | |
| desligado / ambiente * (dB) | 25.21 | 24.3 4% | 24 5% | 29.3 -16% | 24.3 4% | 25.54 -1% | 23.4 7% |
| Idle Minimum * (dB) | 25.21 | 24.3 4% | 24 5% | 29.3 -16% | 25.5 -1% | 25.54 -1% | 23.6 6% |
| Idle Average * (dB) | 25.21 | 24.3 4% | 24 5% | 29.3 -16% | 25.5 -1% | 25.54 -1% | 23.6 6% |
| Idle Maximum * (dB) | 25.21 | 28.6 -13% | 24 5% | 30.6 -21% | 25.5 -1% | 25.54 -1% | 23.6 6% |
| Load Average * (dB) | 39.09 | 47.5 -22% | 36.1 8% | 42.7 -9% | 35.65 9% | 48.85 -25% | 25.8 34% |
| Witcher 3 ultra * (dB) | 36.6 | 46 -26% | 42.7 -17% | 46.58 -27% | 40.1 -10% | ||
| Load Maximum * (dB) | 43.53 | 54.9 -26% | 46 -6% | 42.7 2% | 35.65 18% | 50.98 -17% | 41.4 5% |
* ... menor é melhor
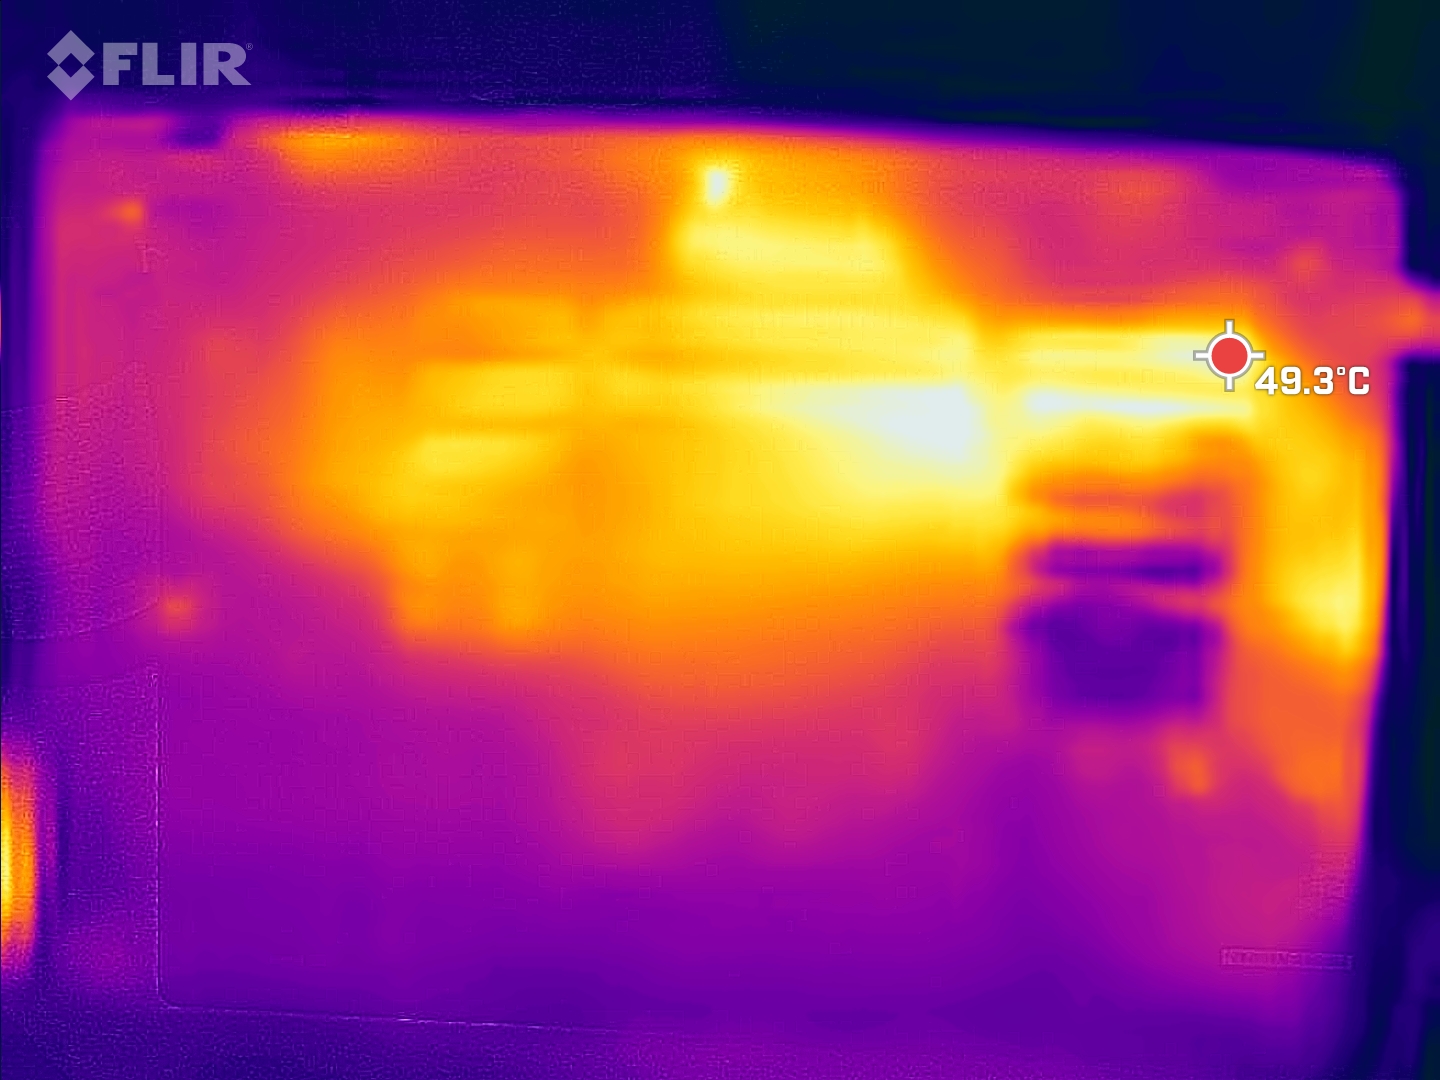
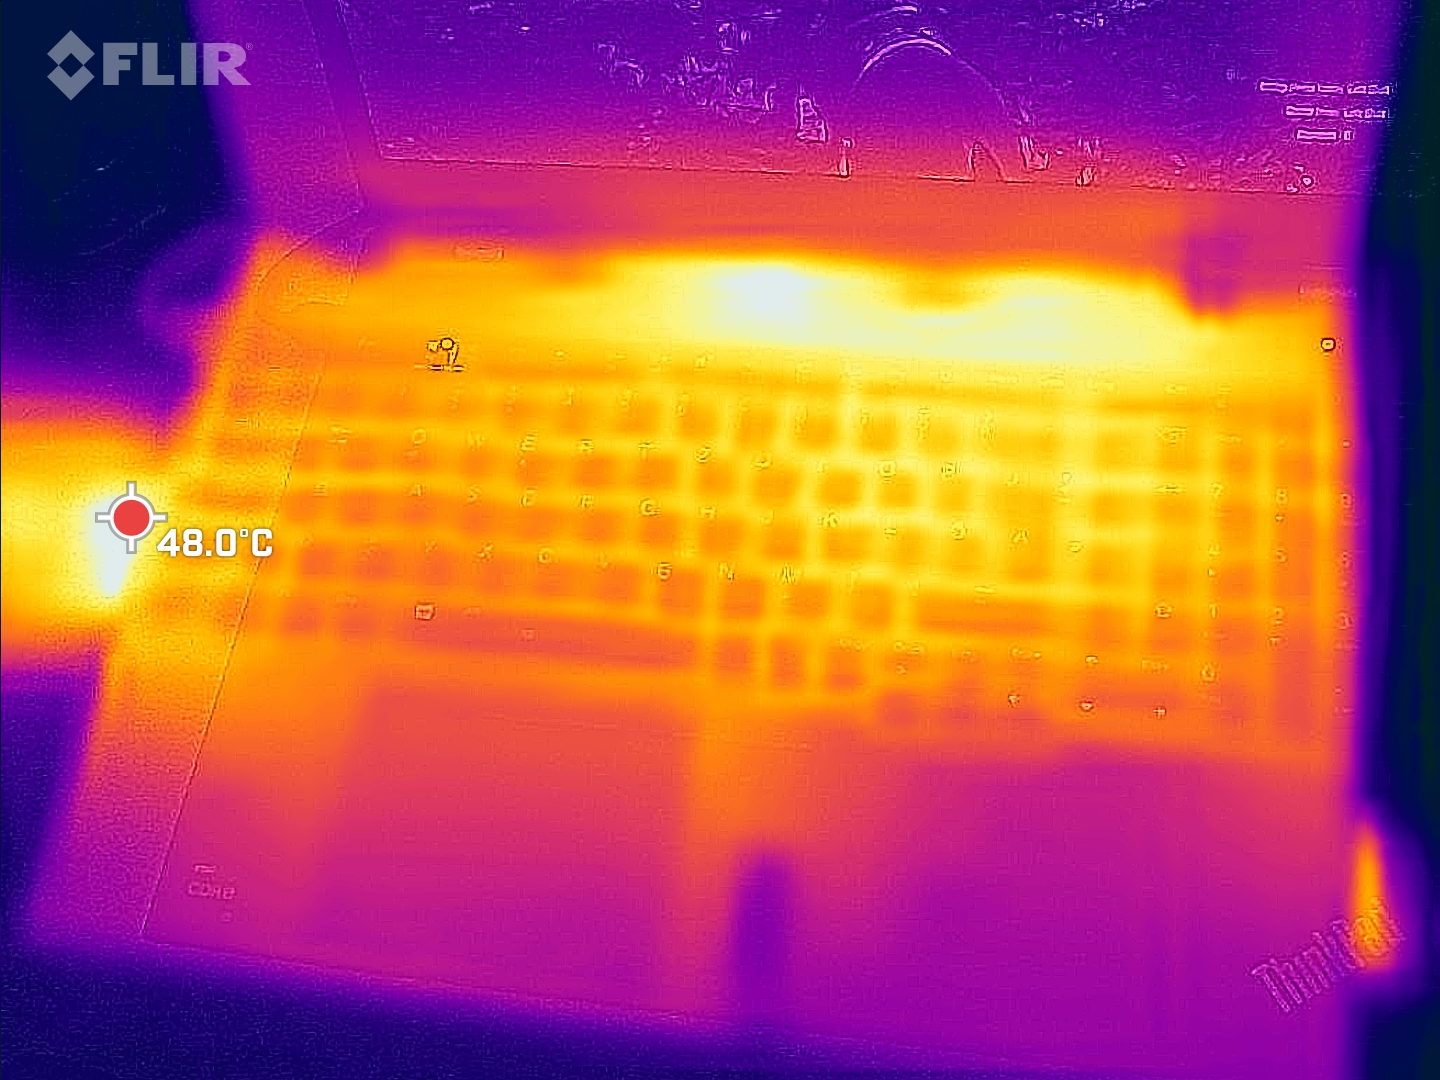
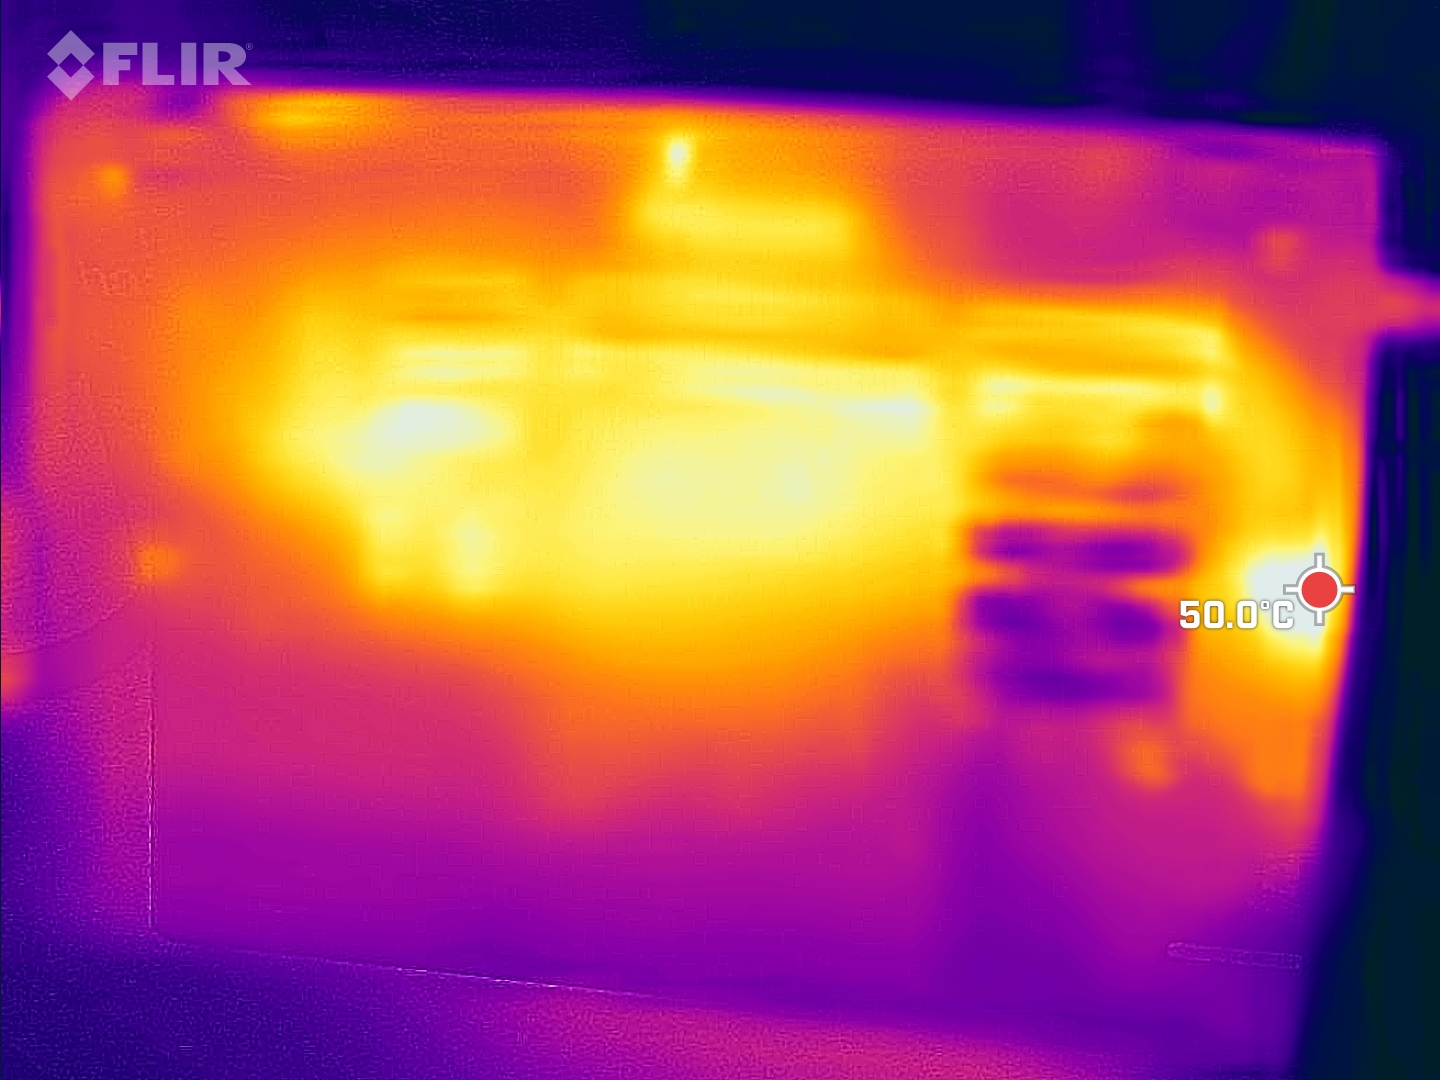
Temperatura
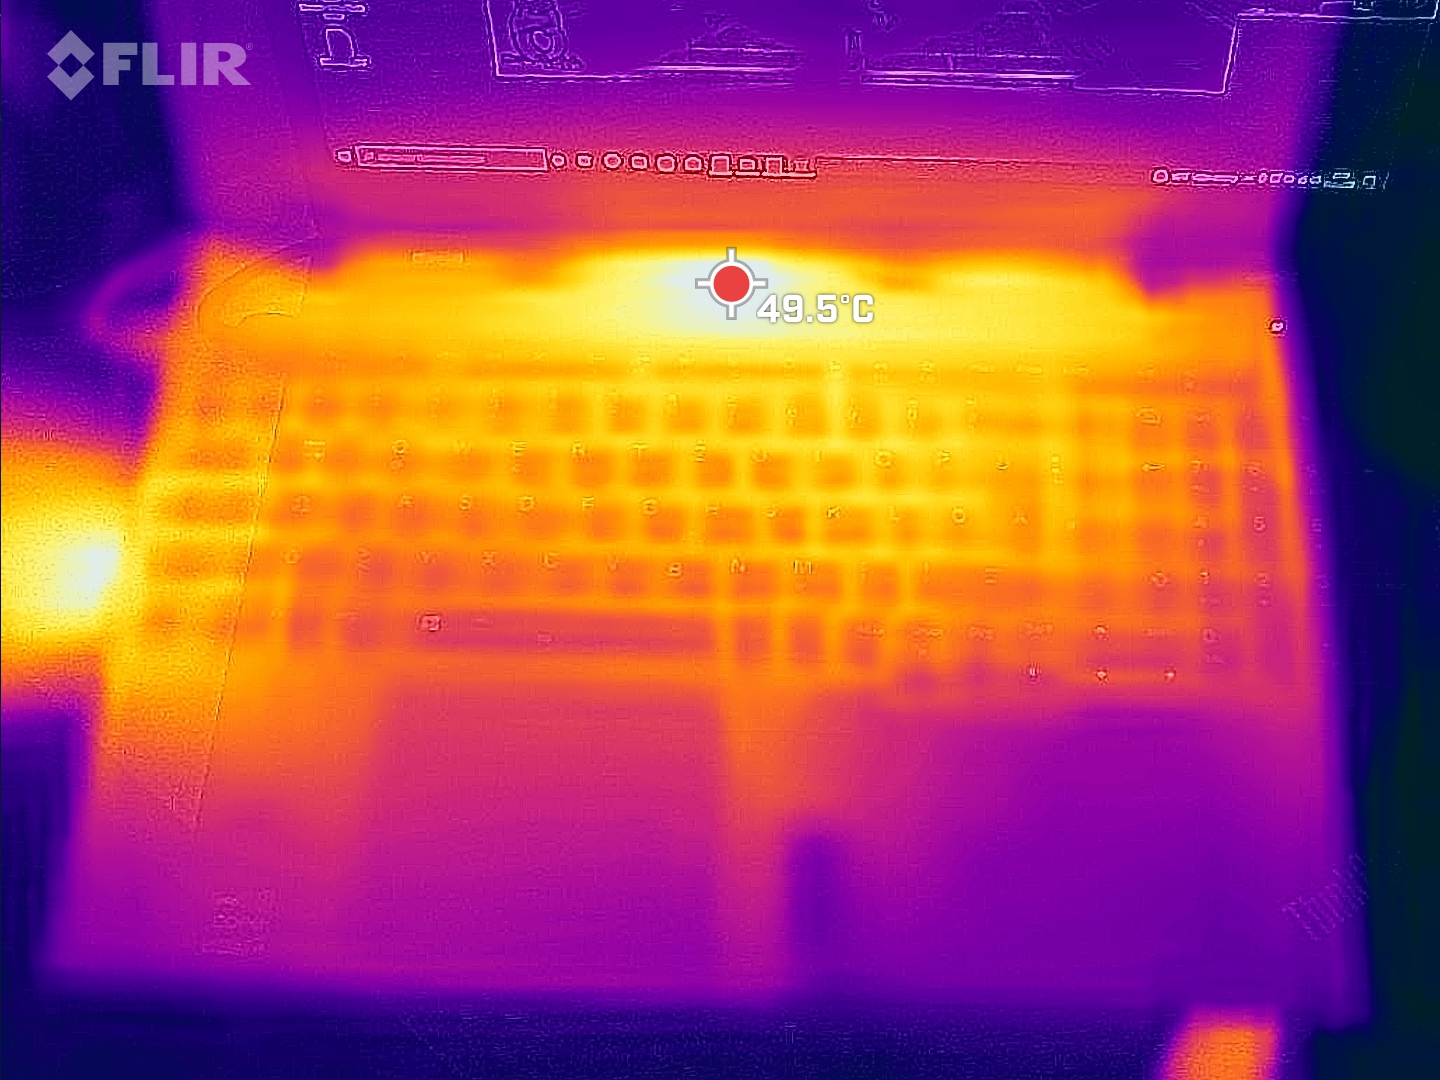
Sob carga e também durante os jogos, o ThinkPad P15v se torna muito quente a 53,8 °C no centro acima do teclado. O ZBook Power 15 é significativamente mais frio a 41,5 °C, mas ao custo de níveis de ruído significativamente mais altos.
(-) A temperatura máxima no lado superior é 53.8 °C / 129 F, em comparação com a média de 38.2 °C / 101 F , variando de 22.2 a 69.8 °C para a classe Workstation.
(-) A parte inferior aquece até um máximo de 52.1 °C / 126 F, em comparação com a média de 41.1 °C / 106 F
(+) Em uso inativo, a temperatura média para o lado superior é 25.6 °C / 78 F, em comparação com a média do dispositivo de 32 °C / ### class_avg_f### F.
(-) Jogando The Witcher 3, a temperatura média para o lado superior é 41.4 °C / 107 F, em comparação com a média do dispositivo de 32 °C / ## #class_avg_f### F.
(+) Os apoios para as mãos e o touchpad estão atingindo a temperatura máxima da pele (35.6 °C / 96.1 F) e, portanto, não estão quentes.
(-) A temperatura média da área do apoio para as mãos de dispositivos semelhantes foi 27.8 °C / 82 F (-7.8 °C / -14.1 F).
| Lenovo ThinkPad P15v G2 21A9000XGE Intel Core i7-11800H, NVIDIA T1200 Laptop GPU | Lenovo ThinkPad P15 G2-20YQ001JGE Intel Core i7-11800H, NVIDIA RTX A3000 Laptop GPU | Lenovo ThinkPad T15g-20UR000GGE Intel Core i7-10750H, NVIDIA GeForce RTX 2070 Super Max-Q | Lenovo ThinkPad T15p-20TN0006GE Intel Core i7-10750H, NVIDIA GeForce GTX 1050 Mobile | Lenovo ThinkPad P15s Gen2-20W6000GGE Intel Core i7-1165G7, NVIDIA T500 Laptop GPU | HP ZBook Power 15 G8 313S5EA Intel Core i7-11800H, NVIDIA T600 Laptop GPU | Dell Precision 5000 5560 Intel Core i7-11850H, NVIDIA RTX A2000 Laptop GPU | |
|---|---|---|---|---|---|---|---|
| Heat | -5% | -15% | 4% | 2% | 17% | -6% | |
| Maximum Upper Side * (°C) | 53.8 | 49.7 8% | 47.7 11% | 53.8 -0% | 42.8 20% | 41.4 23% | 48.2 10% |
| Maximum Bottom * (°C) | 52.1 | 63.2 -21% | 62.1 -19% | 56.6 -9% | 59.1 -13% | 41.5 20% | 42.6 18% |
| Idle Upper Side * (°C) | 27.6 | 27.1 2% | 31.3 -13% | 24.7 11% | 26.4 4% | 23.8 14% | 34.8 -26% |
| Idle Bottom * (°C) | 27.7 | 29.8 -8% | 38.8 -40% | 24.2 13% | 28.9 -4% | 25 10% | 35.2 -27% |
* ... menor é melhor
Teste de estresse
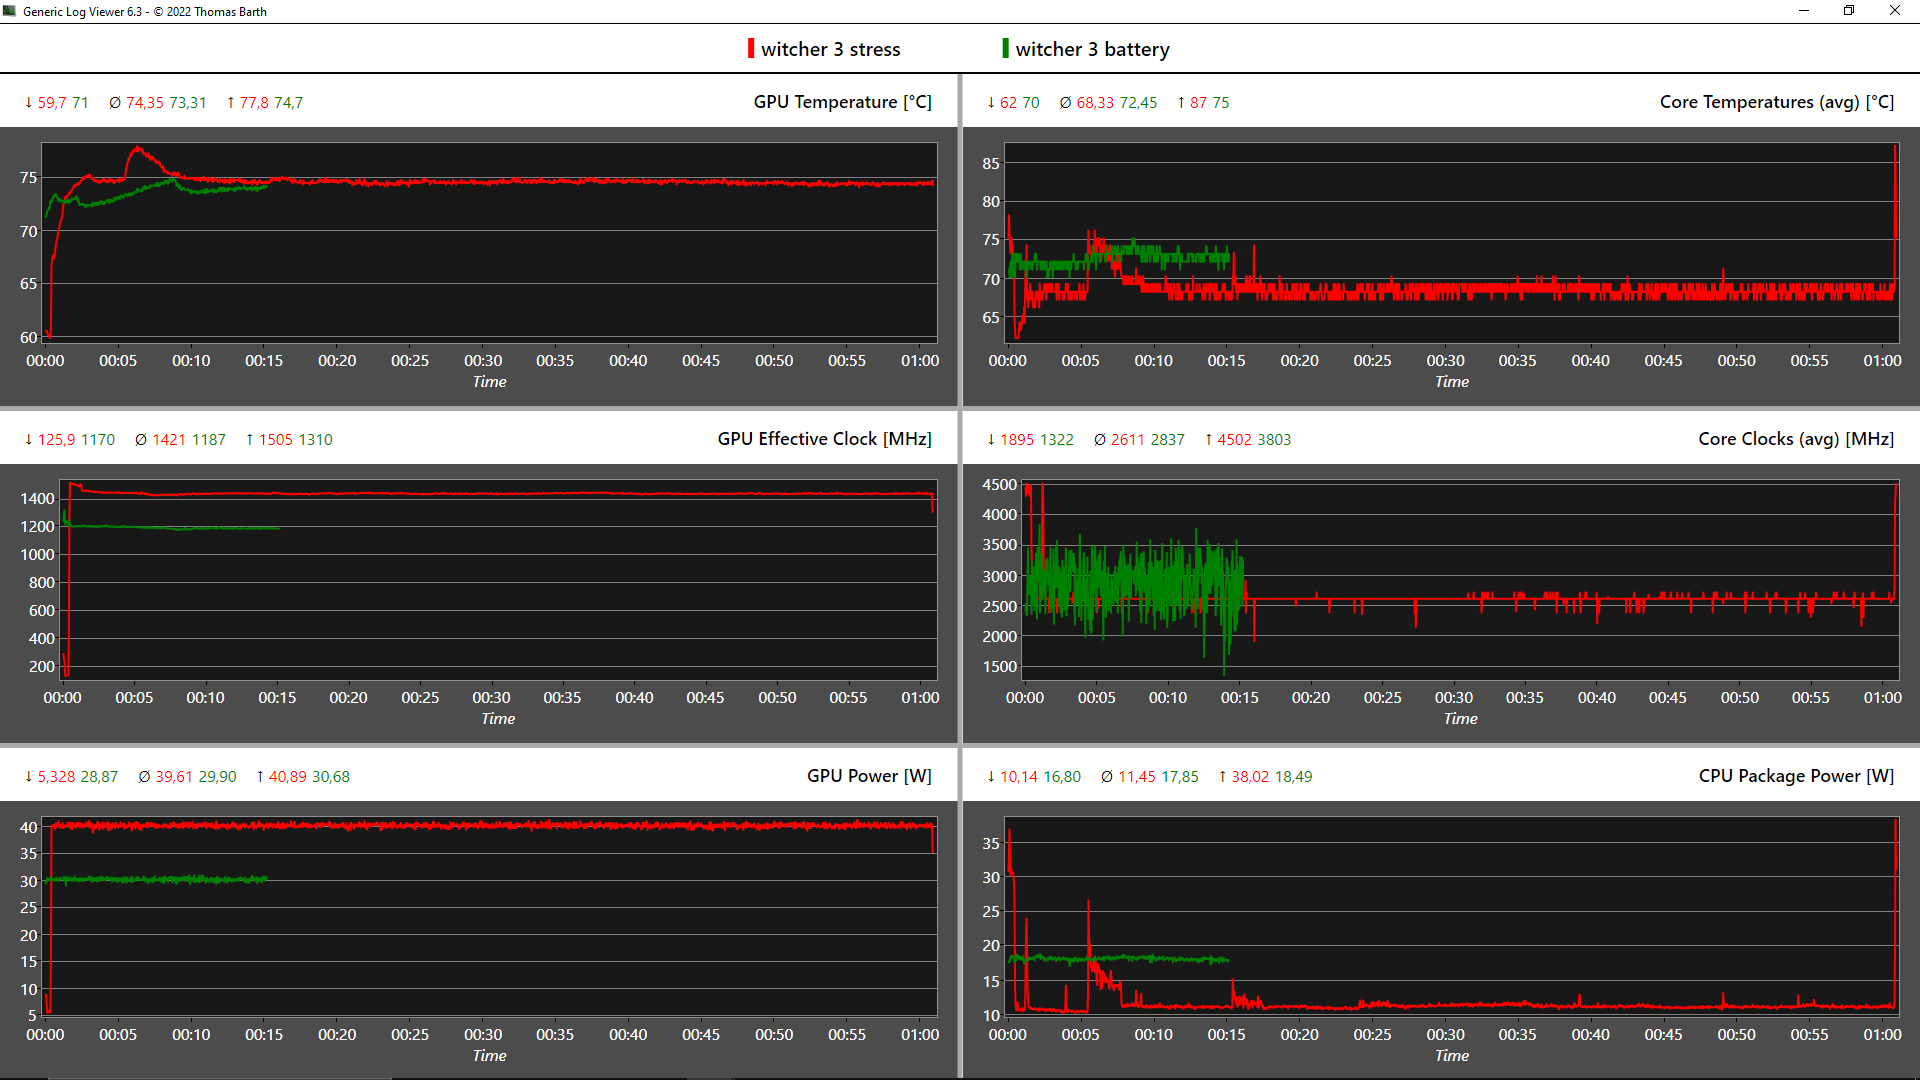
Após uma hora de testes de estresse combinados (FurMark + Prime95), a CPU paira em torno de 2,15 GHz, que está apenas um pouco abaixo do relógio de base de 2,3 GHz. As temperaturas atingem quase 94 °C e o consumo é de 40 watts, enquanto a GPU Nvidia consome seus 35 watts especificados, mas não explora totalmente seu potencial de relógio a 986 MHz.
Sob estresse puro da GPU, a placa gráfica extrai 40 watts e assim alcança os 1.445 MHz completos a temperaturas não críticas. Sob estresse exclusivo da CPU, a Núcleo i7-11800H relógios a 2,55 GHz estáveis, consome uma constante de 50 watts e aquece até 91,6 °C.
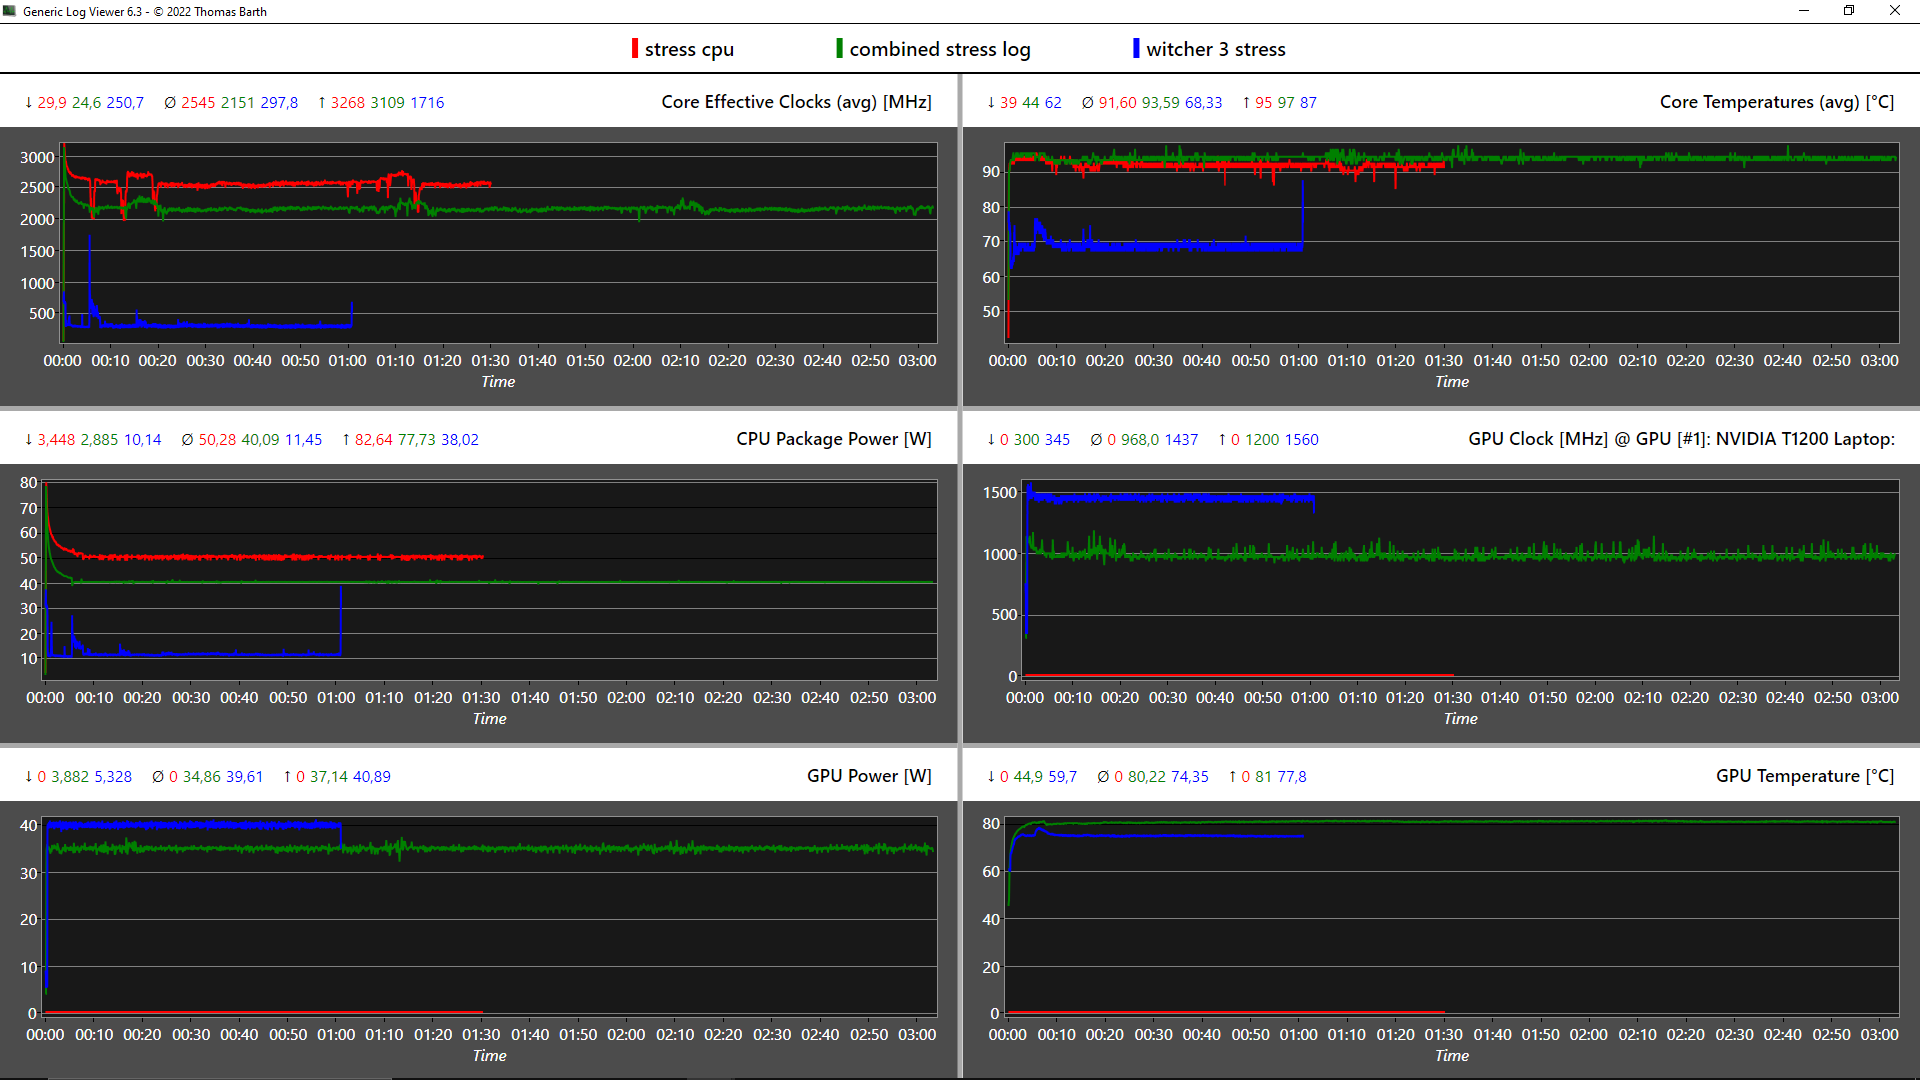
| Relógio CPU (GHz) | Relógio GPU (MHz) | Temperatura média da CPU (°C) | Temperatura média da GPU (°C) | |
| Sistema ocioso | 1,2 | 300 | 42 | 44,8 |
| Prime95 Stress | 2,5 | 300 | 91,6 | 46,4 |
| Prime95 + FurMark Stress | 2,2 | 970 | 93,6 | 80,2 |
| Witcher 3 Estresse | 0,3 | 1.445 | 68,3 | 74,4 |
Oradores
Os alto-falantes de 2x2 watts voltados para cima não são particularmente altos, mas o som é claro e os graves estão presentes até certo ponto. No geral, eles servem ao seu propósito e superam os alto-falantes de muitos outros cadernos de escritório
Lenovo ThinkPad P15v G2 21A9000XGE análise de áudio
(-) | alto-falantes não muito altos (###valor### dB)
Graves 100 - 315Hz
(±) | graves reduzidos - em média 13.4% menor que a mediana
(±) | a linearidade dos graves é média (13.6% delta para a frequência anterior)
Médios 400 - 2.000 Hz
(+) | médios equilibrados - apenas 4.7% longe da mediana
(+) | médios são lineares (6.2% delta para frequência anterior)
Altos 2 - 16 kHz
(+) | agudos equilibrados - apenas 3.2% longe da mediana
(+) | os máximos são lineares (5.7% delta da frequência anterior)
Geral 100 - 16.000 Hz
(±) | a linearidade do som geral é média (21.2% diferença em relação à mediana)
Comparado com a mesma classe
» 76% de todos os dispositivos testados nesta classe foram melhores, 6% semelhantes, 18% piores
» O melhor teve um delta de 7%, a média foi 17%, o pior foi 35%
Comparado com todos os dispositivos testados
» 59% de todos os dispositivos testados foram melhores, 7% semelhantes, 34% piores
» O melhor teve um delta de 4%, a média foi 23%, o pior foi 134%
HP ZBook Power 15 G8 313S5EA análise de áudio
(±) | o volume do alto-falante é médio, mas bom (###valor### dB)
Graves 100 - 315Hz
(-) | quase nenhum baixo - em média 23.3% menor que a mediana
(±) | a linearidade dos graves é média (11.8% delta para a frequência anterior)
Médios 400 - 2.000 Hz
(+) | médios equilibrados - apenas 2.5% longe da mediana
(+) | médios são lineares (5.1% delta para frequência anterior)
Altos 2 - 16 kHz
(+) | agudos equilibrados - apenas 4.1% longe da mediana
(+) | os máximos são lineares (3.1% delta da frequência anterior)
Geral 100 - 16.000 Hz
(±) | a linearidade do som geral é média (21.4% diferença em relação à mediana)
Comparado com a mesma classe
» 77% de todos os dispositivos testados nesta classe foram melhores, 6% semelhantes, 18% piores
» O melhor teve um delta de 7%, a média foi 17%, o pior foi 35%
Comparado com todos os dispositivos testados
» 60% de todos os dispositivos testados foram melhores, 7% semelhantes, 33% piores
» O melhor teve um delta de 4%, a média foi 23%, o pior foi 134%
Gestão de energia: Média para o ThinkPad P15v
Consumo de energia
O consumo de 1,6 watt em standby sugere que um tempo de execução de 2 dias não é possível. Por outro lado, as taxas de ociosidade são muito boas para uma estação de trabalho e só podem ser superadas pelo ZBook Power 15.
No início do teste de estresse, são consumidos 127 watts e 108 watts continuamente. A fonte de alimentação de 135 W é, portanto, suficientemente dimensionada e capaz de absorver quaisquer picos de carga. Uma recarga completa do ThinkPad dura cerca de 90 minutos.
| desligado | |
| Ocioso | |
| Carga |
|
Key:
min: | |
| Lenovo ThinkPad P15v G2 21A9000XGE i7-11800H, T1200 Laptop GPU, Toshiba XG6 KXG6AZNV512G, IPS LED, 1920x1080, 15.6" | Lenovo ThinkPad P15 G2-20YQ001JGE i7-11800H, RTX A3000 Laptop GPU, Kioxia XG7 KXG7AZNV512G, IPS, 1920x1080, 15.6" | Lenovo ThinkPad T15g-20UR000GGE i7-10750H, GeForce RTX 2070 Super Max-Q, SK Hynix PC401 512GB M.2 (HFS512GD9TNG), IPS, 1920x1080, 15.6" | Lenovo ThinkPad T15p-20TN0006GE i7-10750H, GeForce GTX 1050 Mobile, WDC PC SN730 SDBQNTY-512GB, IPS LED, 3840x2160, 15.6" | Lenovo ThinkPad P15s Gen2-20W6000GGE i7-1165G7, T500 Laptop GPU, WDC PC SN720 SDAQNTW-1T00, IPS LED, 3840x2160, 15.6" | HP ZBook Power 15 G8 313S5EA i7-11800H, T600 Laptop GPU, Samsung PM9A1 MZVL2512HCJQ, IPS LED, 1920x1080, 15.6" | Dell Precision 5000 5560 i7-11850H, RTX A2000 Laptop GPU, Samsung PM9A1 MZVL22T0HBLB, IPS, 3840x2400, 15.6" | Média NVIDIA T1200 Laptop GPU | Média da turma Workstation | |
|---|---|---|---|---|---|---|---|---|---|
| Power Consumption | -31% | -36% | -20% | 6% | 23% | -38% | -23% | -53% | |
| Idle Minimum * (Watt) | 5.96 | 6.3 -6% | 5.8 3% | 6 -1% | 5.8 3% | 4.17 30% | 6.2 -4% | 7.85 ? -32% | 9.11 ? -53% |
| Idle Average * (Watt) | 8.37 | 10.7 -28% | 11.4 -36% | 12.8 -53% | 13.3 -59% | 6.32 24% | 13.9 -66% | 11.4 ? -36% | 13.8 ? -65% |
| Idle Maximum * (Watt) | 9.05 | 11.6 -28% | 13.9 -54% | 16.1 -78% | 15.6 -72% | 7.1 22% | 23.8 -163% | 12 ? -33% | 17.9 ? -98% |
| Load Average * (Watt) | 91.82 | 99.3 -8% | 93.2 -2% | 95.6 -4% | 43.2 53% | 80.41 12% | 95.7 -4% | 93.8 ? -2% | 96 ? -5% |
| Witcher 3 ultra * (Watt) | 102 | 154 -51% | 145 -42% | 84 18% | 37.1 64% | 62.3 39% | 87 15% | ||
| Load Maximum * (Watt) | 126.38 | 210 -66% | 234 -85% | 131.1 -4% | 67.3 47% | 110.18 13% | 132.6 -5% | 143.7 ? -14% | 180.3 ? -43% |
* ... menor é melhor
Power Consumption Witcher 3 / Stresstest
Power Consumption Witcher 3 / Stress test (external monitor)
Vida útil da bateria
A bateria 68 Wh consegue alimentar nosso teste Wi-Fi por 7,5 horas, o que corresponde às próprias reivindicações da Lenovo. Outras estações de trabalho conseguem tempos de funcionamento significativamente mais longos com baterias maiores.
O ZBook Power 15 da HP também dura significativamente mais tempo na navegação na web em quase 12,5 horas Dell's Precision 5560com sua tela de 4K, registra uma mísera 6,5 horas.
| Lenovo ThinkPad P15v G2 21A9000XGE i7-11800H, T1200 Laptop GPU, 68 Wh | Lenovo ThinkPad P15 G2-20YQ001JGE i7-11800H, RTX A3000 Laptop GPU, 94 Wh | Lenovo ThinkPad T15g-20UR000GGE i7-10750H, GeForce RTX 2070 Super Max-Q, 94 Wh | Lenovo ThinkPad T15p-20TN0006GE i7-10750H, GeForce GTX 1050 Mobile, 68 Wh | Lenovo ThinkPad P15s Gen2-20W6000GGE i7-1165G7, T500 Laptop GPU, 57 Wh | HP ZBook Power 15 G8 313S5EA i7-11800H, T600 Laptop GPU, 83 Wh | Dell Precision 5000 5560 i7-11850H, RTX A2000 Laptop GPU, 86 Wh | Média da turma Workstation | |
|---|---|---|---|---|---|---|---|---|
| Duração da bateria | 34% | 47% | 5% | 46% | 53% | 18% | 38% | |
| Reader / Idle (h) | 17.2 | 14.9 -13% | 12 -30% | 26.1 ? 52% | ||||
| H.264 (h) | 8 | 10 25% | 12.7 59% | 7.7 -4% | 9.9 24% | 10.1 26% | 10.1 ? 26% | |
| WiFi v1.3 (h) | 7.5 | 9.9 32% | 11.2 49% | 7.3 -3% | 7.7 3% | 12.3 64% | 6.3 -16% | 8.55 ? 14% |
| Load (h) | 0.9 | 1.3 44% | 1.2 33% | 1.1 22% | 1.9 111% | 2.1 133% | 1.8 100% | 1.441 ? 60% |
Pro
Contra
Veredicto: ThinkPad P15v G2 para criativos conscientes do preço?


O ThinkPad P15v G2 gerencia muito bem o ato de equilíbrio entre o laptop comercial e a estação de trabalho, considerando que ele se destina a um grupo alvo que pode prescindir de certas características high-end como CPUs Xeon, ECC RAM, o hardware mais rápido e algumas outras coisas. Dito isto, o desempenho é geralmente bom, embora uma queda de 25% possa ser vista em alguns cenários
A opção de exibição só será suficiente para pessoas criativas e no campo CAD se um monitor externo for utilizado principalmente e para aqueles que têm que fazer cálculos mais complexos a um preço justo. O desempenho gráfico é adequado considerando o preço de menos de 2.000 Euros, e os dispositivos de entrada estão em um nível elevado. Há alguns inconvenientes em relação a uma exibição um tanto escura com baixa cobertura de espaço de cor. Felizmente, existe uma opção de 4K
A conectividade é ampla e o ThinkPad é facilmente expansível. No geral, ele pontua muito bem no geral contra o mais fino ThinkPad P15s. O estojo também é robusto, mesmo que outros ThinkPads tenham uma tampa de exibição reforçada. A quantidade de plástico pode ser desagradável para alguns em termos de sensação e aparência. Os tempos de funcionamento da bateria não são os melhores, mas as emissões são orientadas para os negócios e muito boas, exceto por alguns pequenos pontos quentes longe do teclado e do descanso para as mãos. O sistema de resfriamento foi mantido bastante simples em geral em favor do preço. O carregamento via USB-C também não está disponível, e o módulo Wi-Fi é soldado. Mas o WWAN pode ser instalado posteriormente
O ThinkPad P15v G2 não precisa necessariamente de um display Core i9 e 4K para ser um cavalo de batalha sólido. Embora brilhe principalmente devido a seu preço de entrada razoável, ele continua sendo um produto de nicho com limitações, especialmente em termos de monitor e CPU.
Excluindo o modelo irmão (T15p G2), existem duas alternativas diretas no mesmo segmento de preço: O ZBook Power 15 da HP, que tem um desempenho consistente de alto nível, tem uma tela muito mais brilhante e melhor, um teclado bem projetado, bem como tempos de funcionamento da bateria muito melhores, mas também é irritantemente barulhento. O Dell's Precision 3651 pesa apenas 1,79 kg, oferece um painel de 4K e carregamento USB-C.
Preço e Disponibilidade
O site oficial da Lenovo oferece o Lenovo ThinkPad P15v G2 em várias configurações a vários preços, dependendo do país de compra. Por exemplo:
US, começando em US$ 1.391,42
Reino Unido, começando em GBP£ 1.758,63
Canadá, começando em CAD$ 1.780,02
Austrália, começando em AUD$ 2.119,47
Nova Zelândia, começando em NZ$ 4.699,00
Lenovo ThinkPad P15v G2 21A9000XGE
- 05/30/2022 v7 (old)
Marvin Gollor
Price comparison

