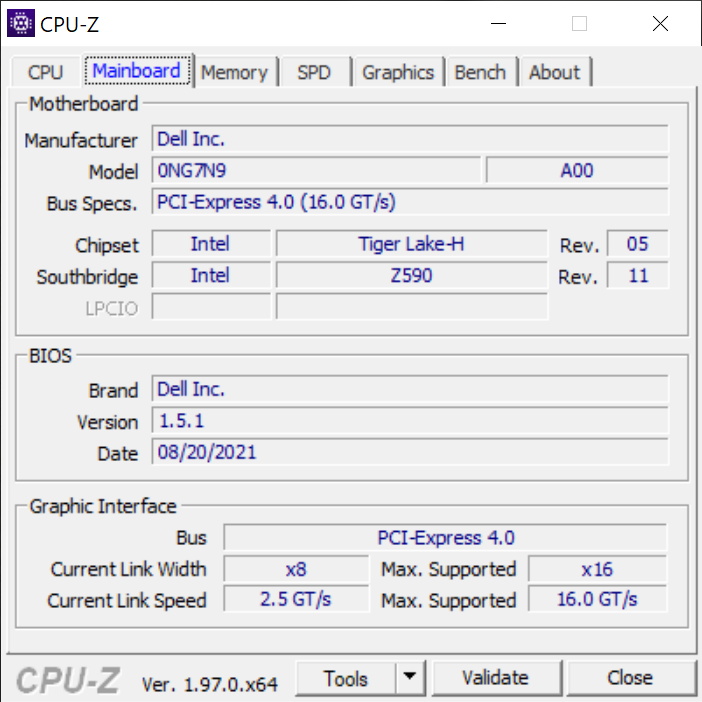
Dell Precision 5560 revisão da estação de trabalho: O impulso Quadro RTX A2000
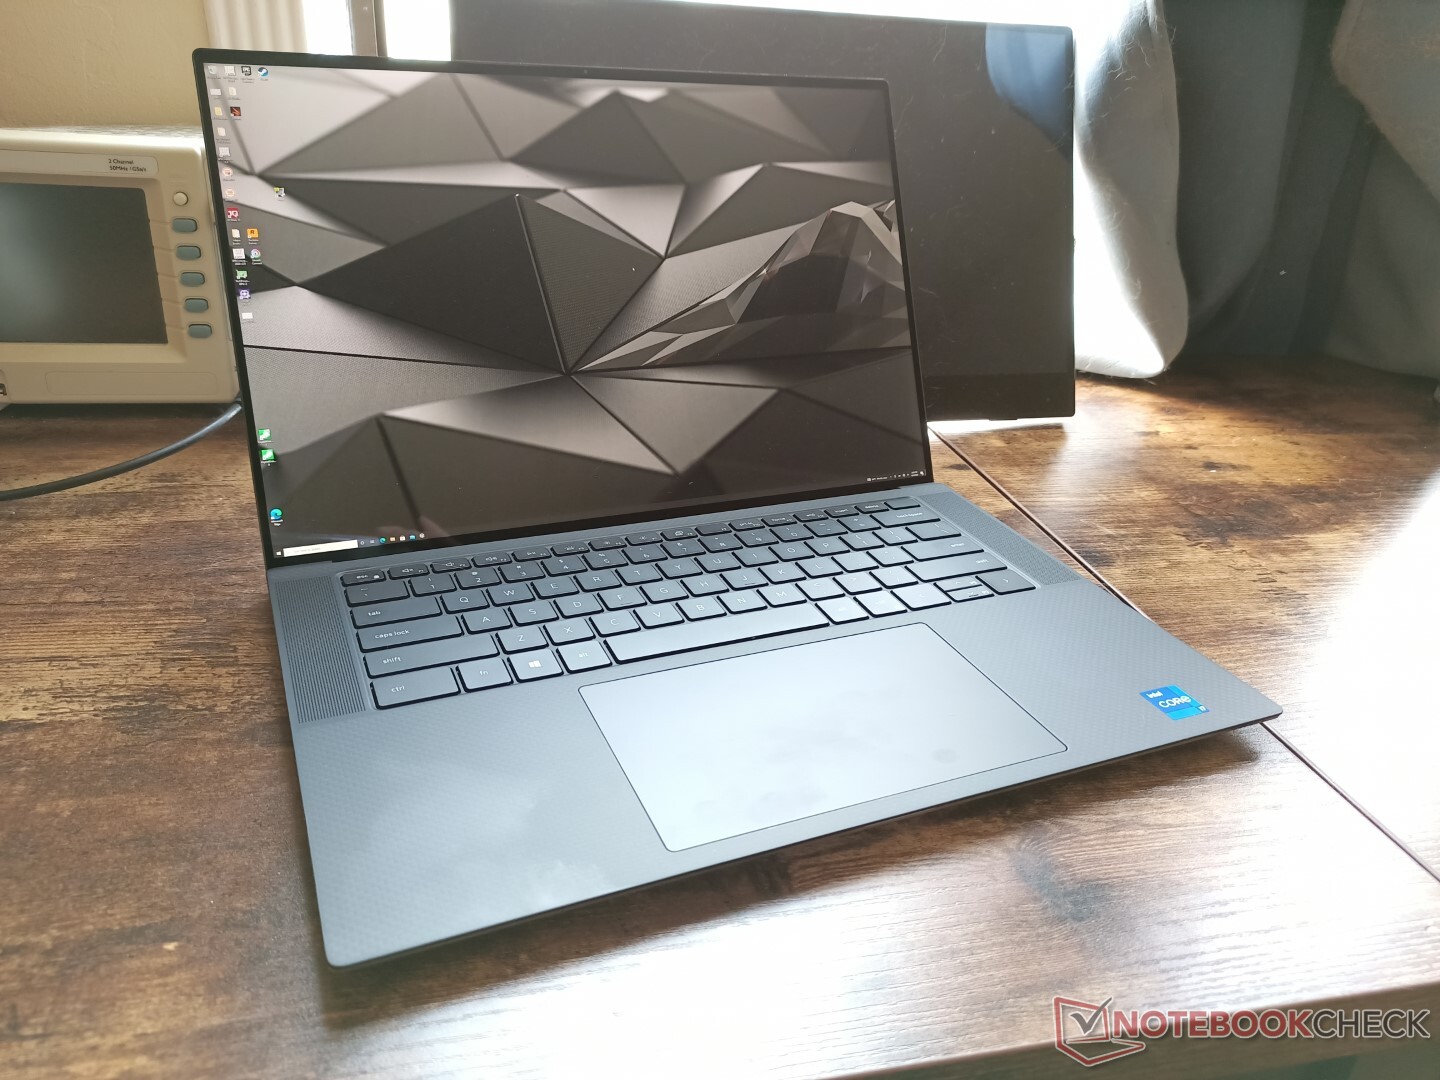
A Dell Precision 5560 é uma atualização interna do site Precision 5550 do ano passado. Ambos os modelos são baseados no novo XPS 15 9500/9510 e assim todos os modelos carregam painéis 16:10 similares e outras características físicas. Como tal, recomendamos verificar nossas revisões sobre o Precision 5550, XPS 15 9500ou XPS 15 9510 uma vez que muitos de nossos comentários ainda se aplicam aqui para o site Precision 5560
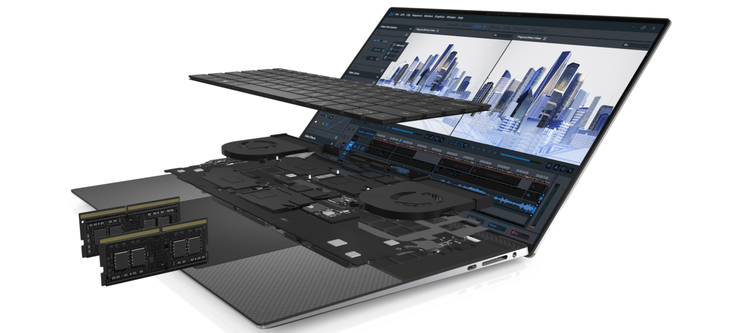
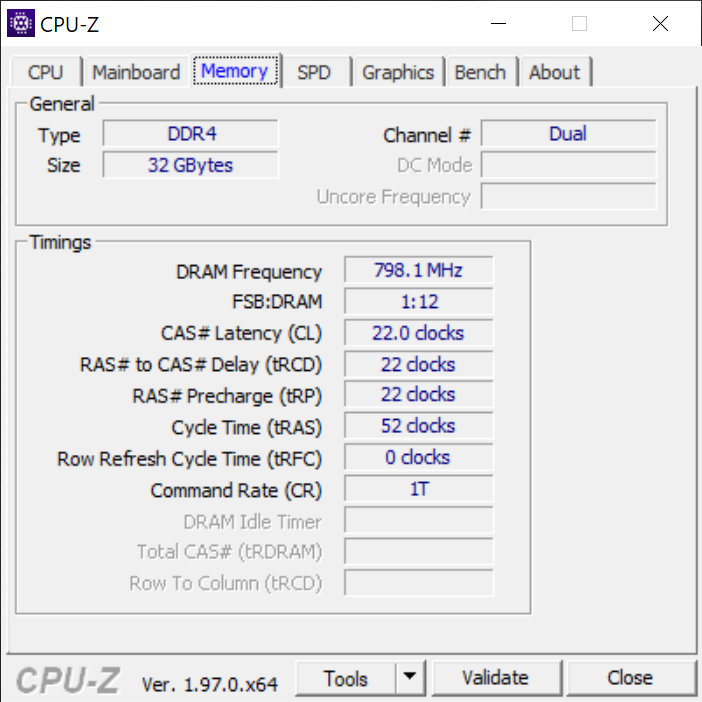
Quando comparado ao Precision 5550, o Precision 5560 vem com as CPUs da 11ª geração Tiger Lake-H e GPUs Nvidia Ampere para substituir as CPUs Comet Lake-H da 10ª geração e Turing GPUs, respectivamente. As SKUs vão desde a base Core i5-11500H com gráficos Quadro T1200, tela de 1200p e 8 GB de RAM por US$ 2000 até a CPU i9-11950H ou Xeon W-11955M vPro com gráficos Quadro RTX A2000, tela de toque 2400p e 64 GB de RAM ECC por mais de US$ 4000. Nossa unidade de teste específica é uma configuração de médio alcance de varejo por pouco mais de US$ 3.000,00
Os concorrentes neste espaço incluem outras estações de trabalho móveis ultra-finas de 15,6 polegadas como o HP ZBook Studio 15 G8,Asus ProArt StudioBook Pro 15,Lenovo ThinkPad P15 Gen 2, MSI WS66, ouRazer Blade 15 Studio Edition. Uma versão de 17 polegadas de nosso modelo está disponível no site Precision 5750 com base no XPS 17.
Mais análises da Dell:
potential competitors in comparison
Avaliação | Data | Modelo | Peso | Altura | Size | Resolução | Preço |
|---|---|---|---|---|---|---|---|
| 88.3 % v7 (old) | 10/2021 | Dell Precision 5000 5560 i7-11850H, RTX A2000 Laptop GPU | 2 kg | 18 mm | 15.60" | 3840x2400 | |
| 87.2 % v7 (old) | 10/2021 | Lenovo ThinkPad P15 G2-20YQ001JGE i7-11800H, RTX A3000 Laptop GPU | 2.9 kg | 31.5 mm | 15.60" | 1920x1080 | |
| 87.8 % v7 (old) | 08/2021 | HP ZBook Studio 15 G8 i9-11950H, GeForce RTX 3070 Laptop GPU | 1.9 kg | 18 mm | 15.60" | 3840x2160 | |
| 83.1 % v7 (old) | 11/2020 | Asus ProArt StudioBook Pro 15 W500G5T i7-9750H, Quadro RTX 5000 Max-Q | 2 kg | 18.9 mm | 15.60" | 3840x2160 | |
| 87.8 % v7 (old) | 08/2020 | Dell Precision 7550 W-10885M, Quadro RTX 5000 Max-Q | 2.8 kg | 27.36 mm | 15.60" | 3840x2160 | |
| 86.3 % v7 (old) | 08/2020 | Dell Precision 5550 P91F i7-10875H, Quadro T2000 Max-Q | 2 kg | 18 mm | 15.60" | 3840x2400 | |
| 87 % v7 (old) | 08/2020 | Razer Blade 15 Studio Edition 2020 i7-10875H, Quadro RTX 5000 Max-Q | 2.2 kg | 13.98 mm | 15.60" | 3840x2160 |
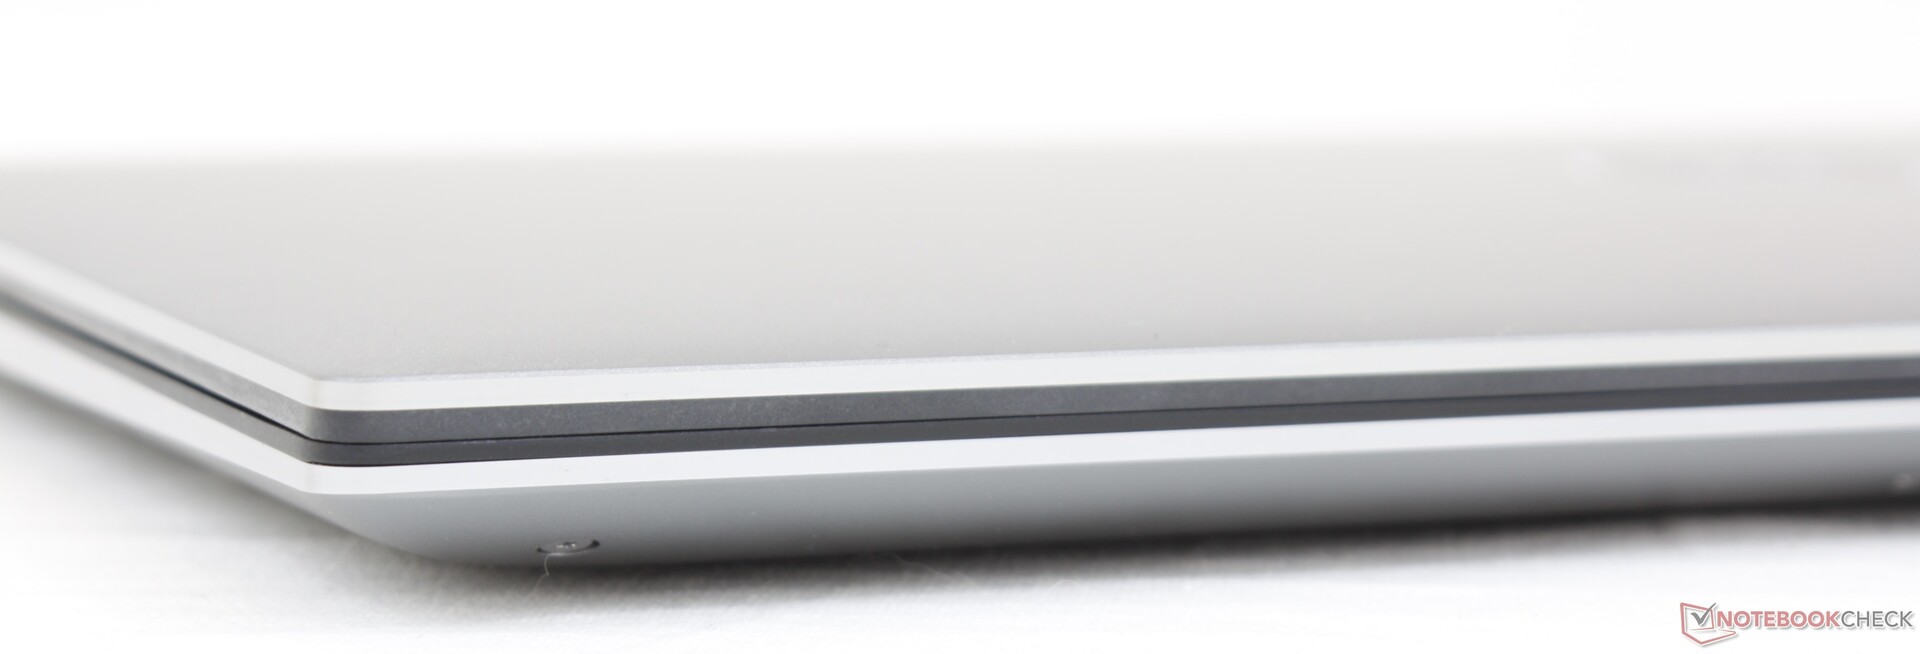
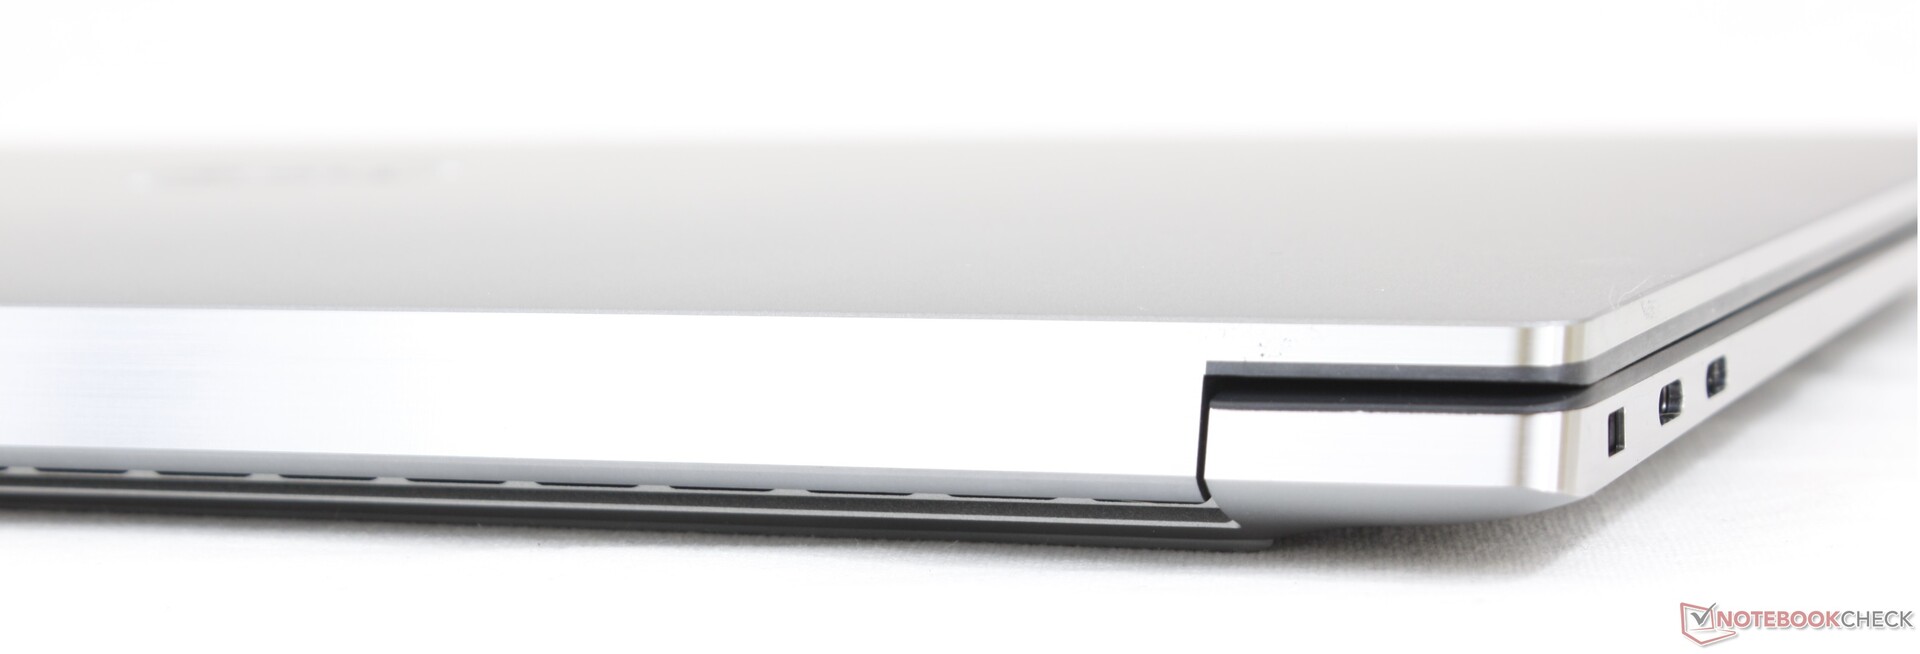
Estojo - XPS Profissional
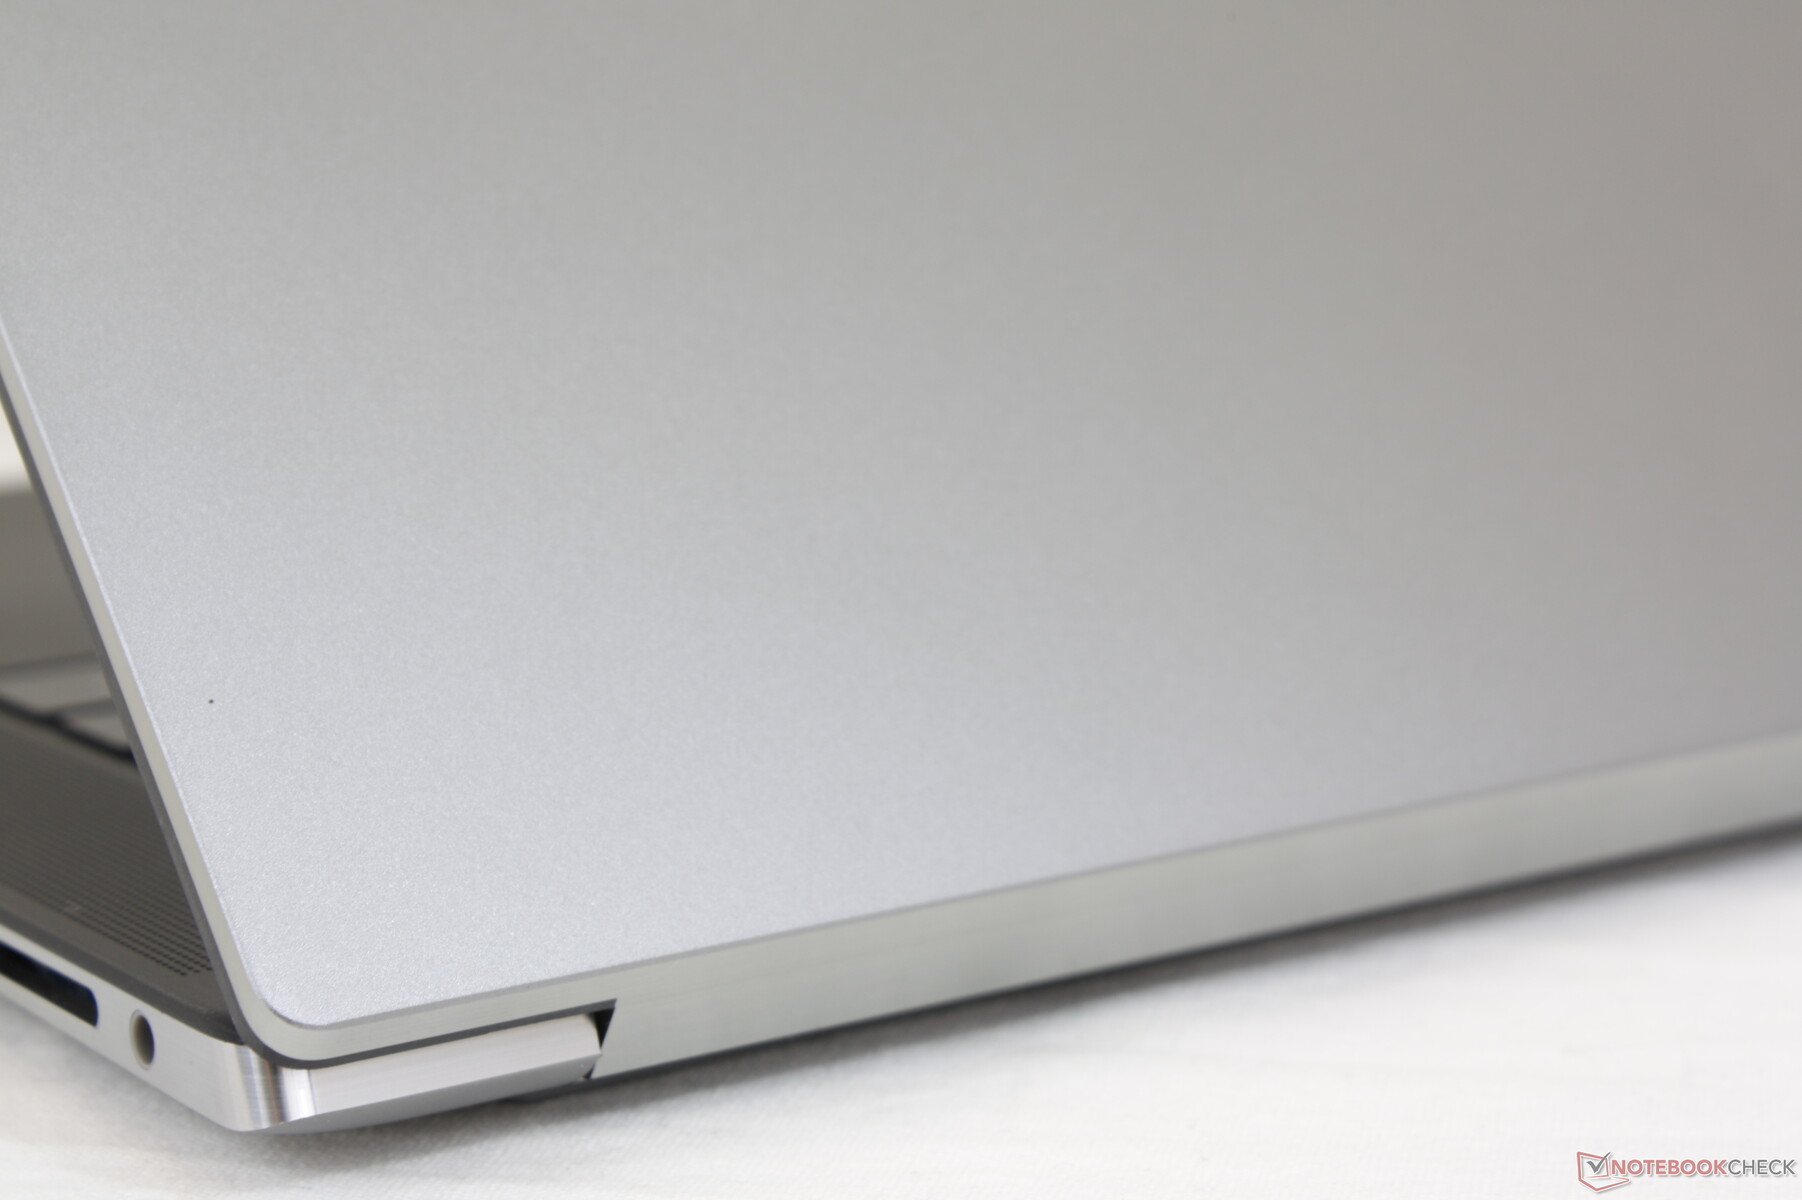
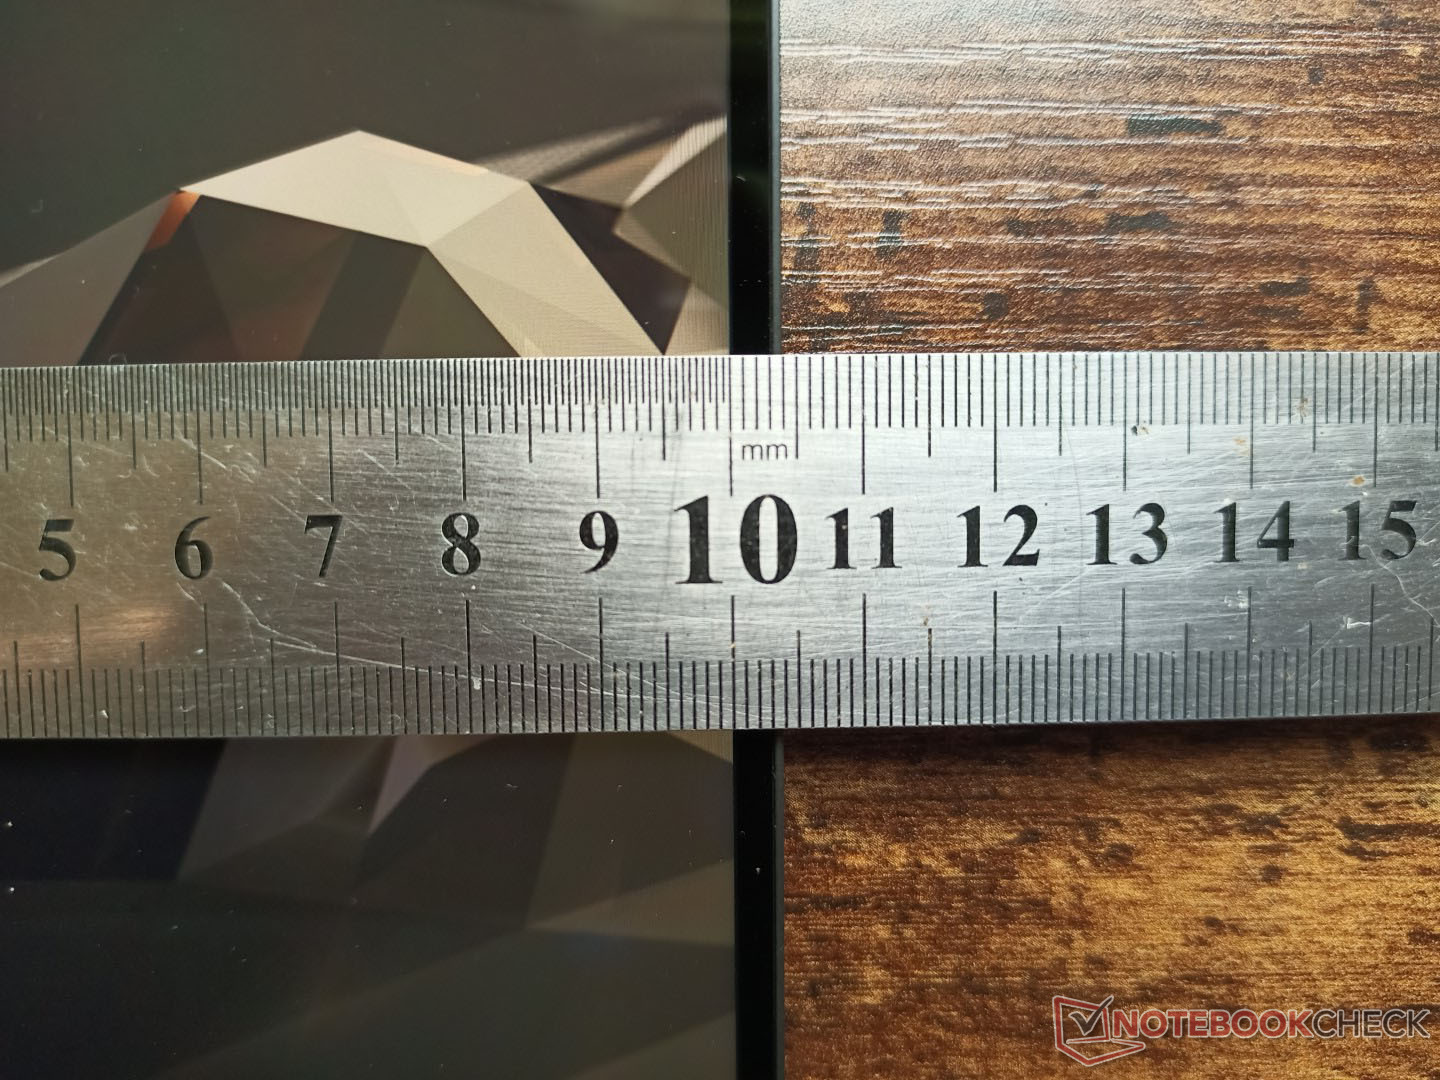
O chassi e as dimensões são idênticos ao XPS 15 9500 ou 9510 a 18 x 344,72 x 230,14 mm. Entretanto, a página oficial do produto Dell afirma que o Precision 5560 é muito mais fino a 11,64 mm de seu ponto mais grosso, o que é absolutamente falso. Suspeitamos que a Dell mudou a forma como medem a espessura, o que pode ser muito enganador para os consumidores. Observamos uma discrepância de espessura semelhante em Revisão 2-em-1 do Dell XPS 13 9310: Melhor que o XPS 13 7390 2 em 1 de uma forma específica entre o XPS 13 7390 2 em 1 e o XPS 13 9310 2 em 1 idêntico também.
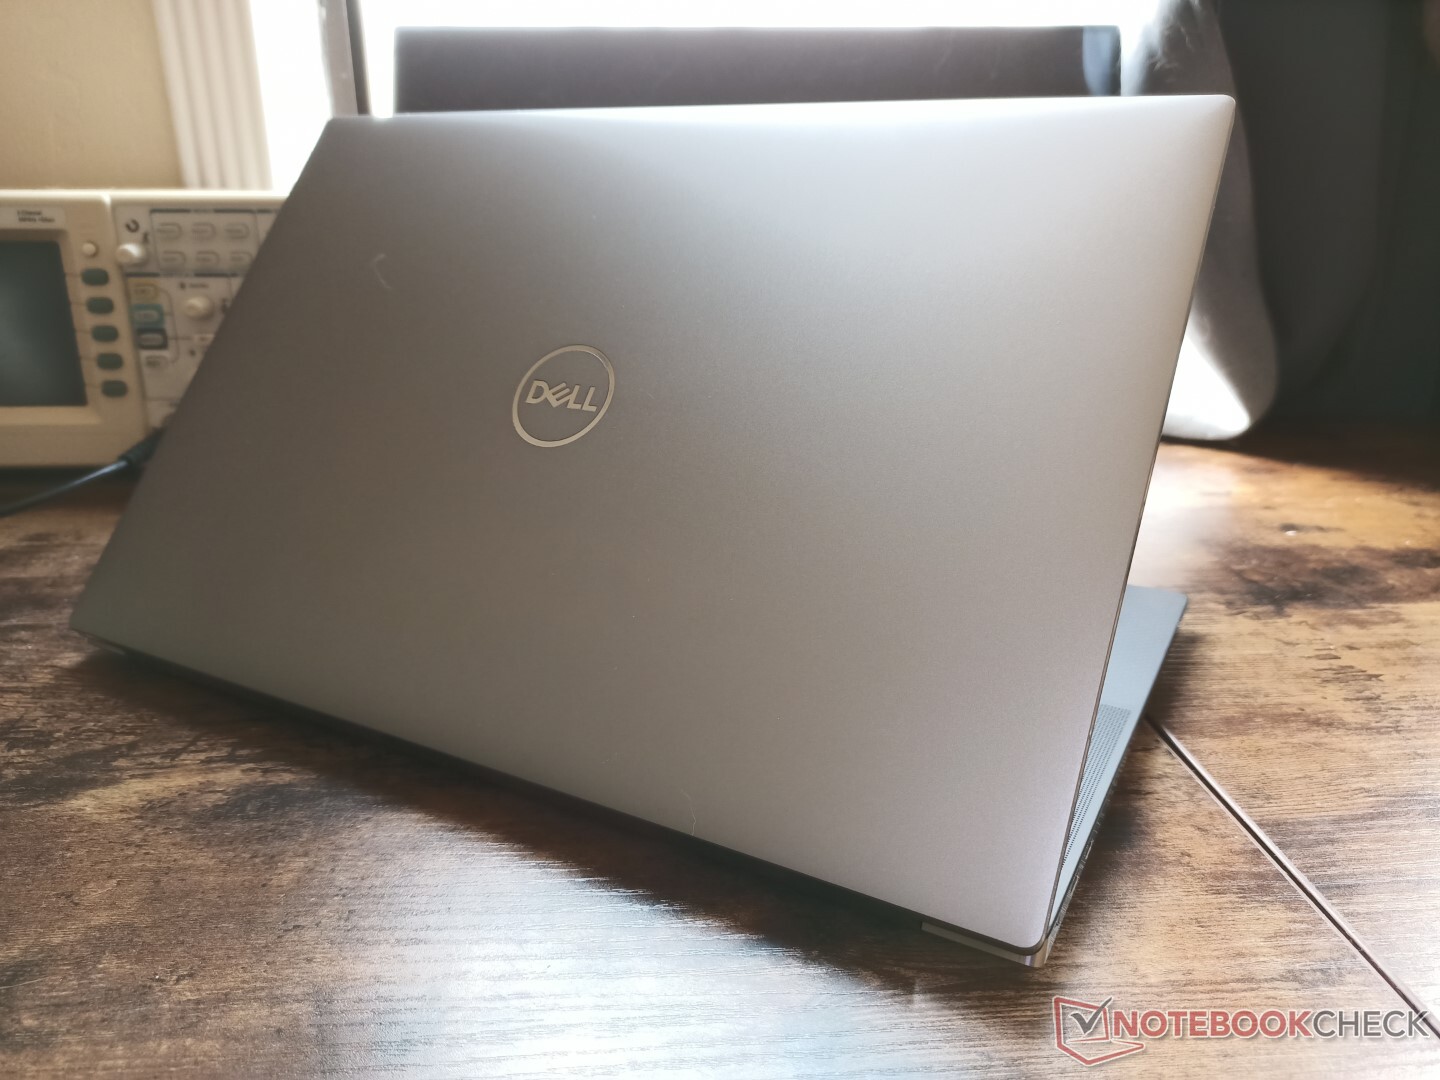
Como sempre. a tampa externa da liga de magnésio é um pouco mais escura quando comparada ao típico XPS 15 para ajudar a identificar visualmente a série Precision 55x0 da série XPS 15.
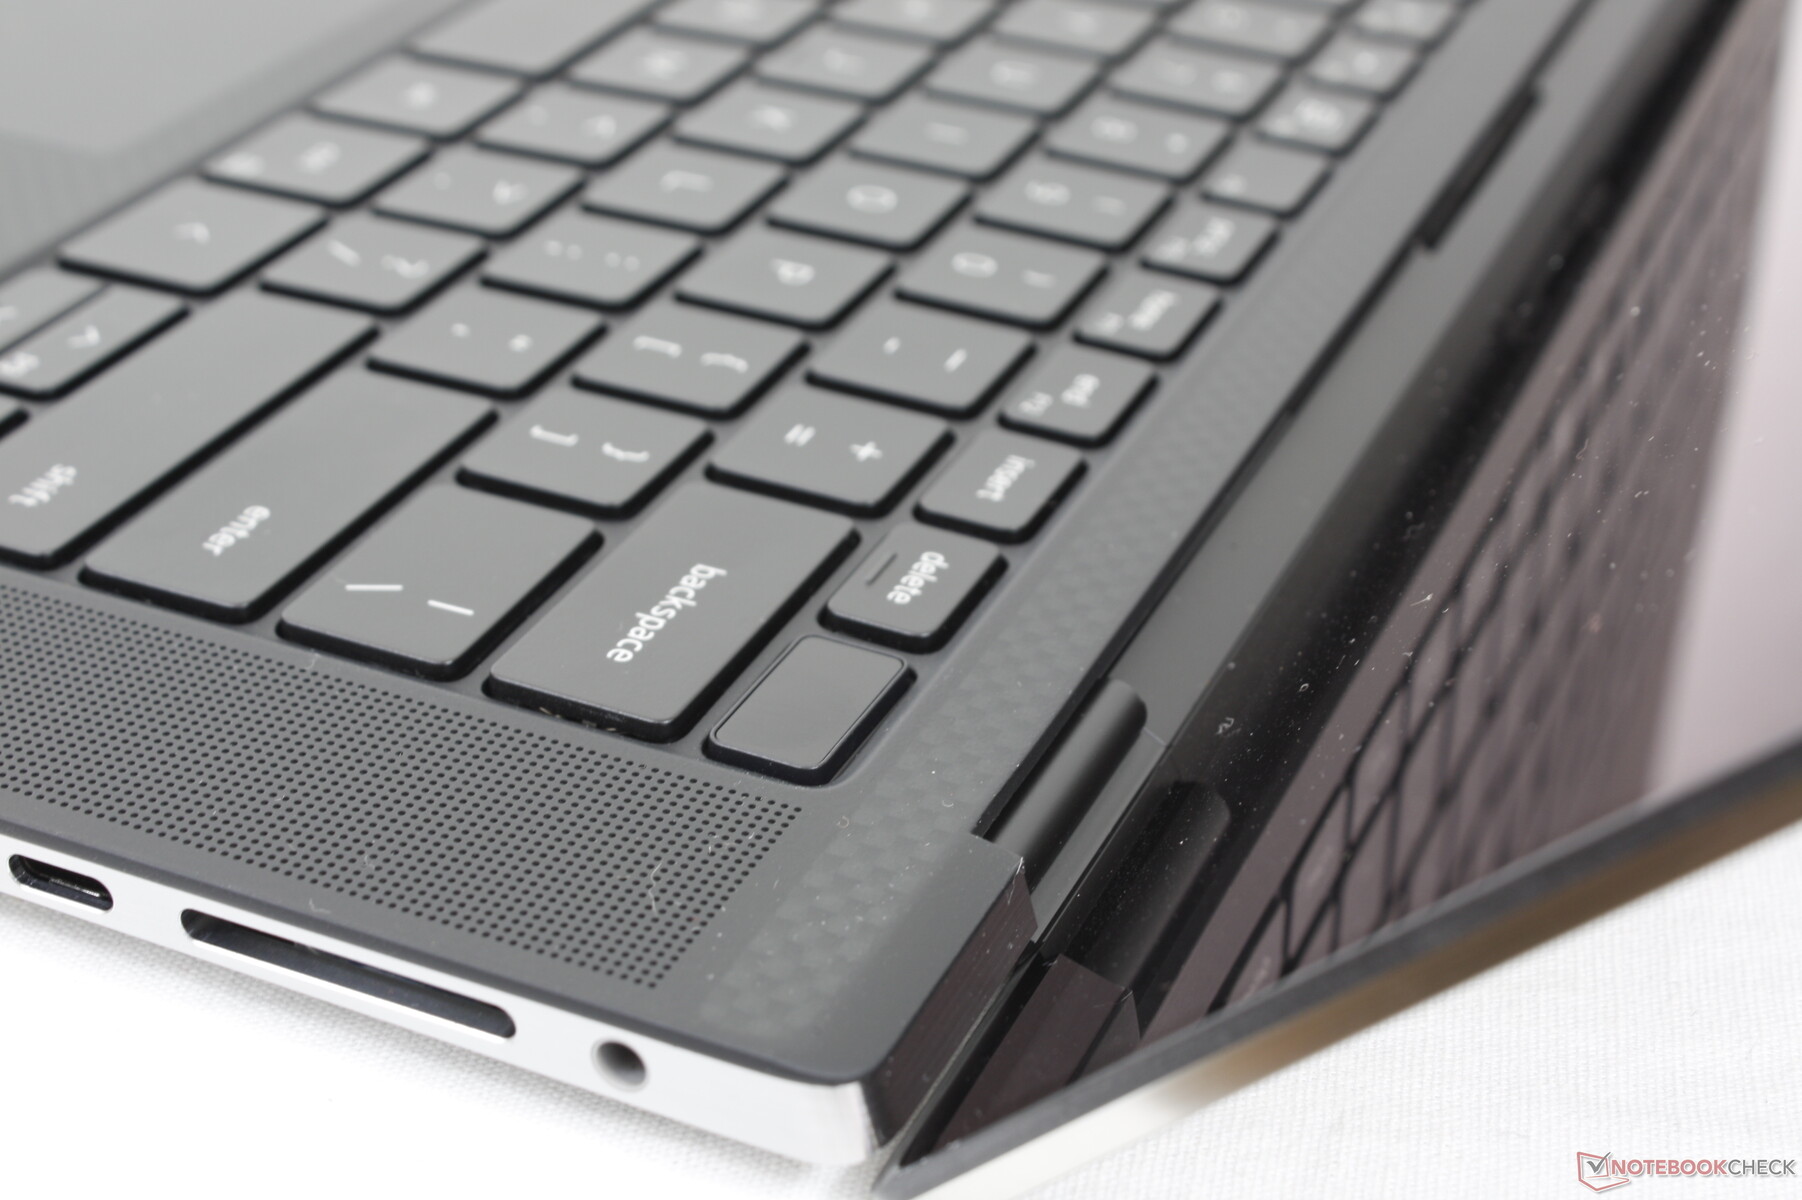
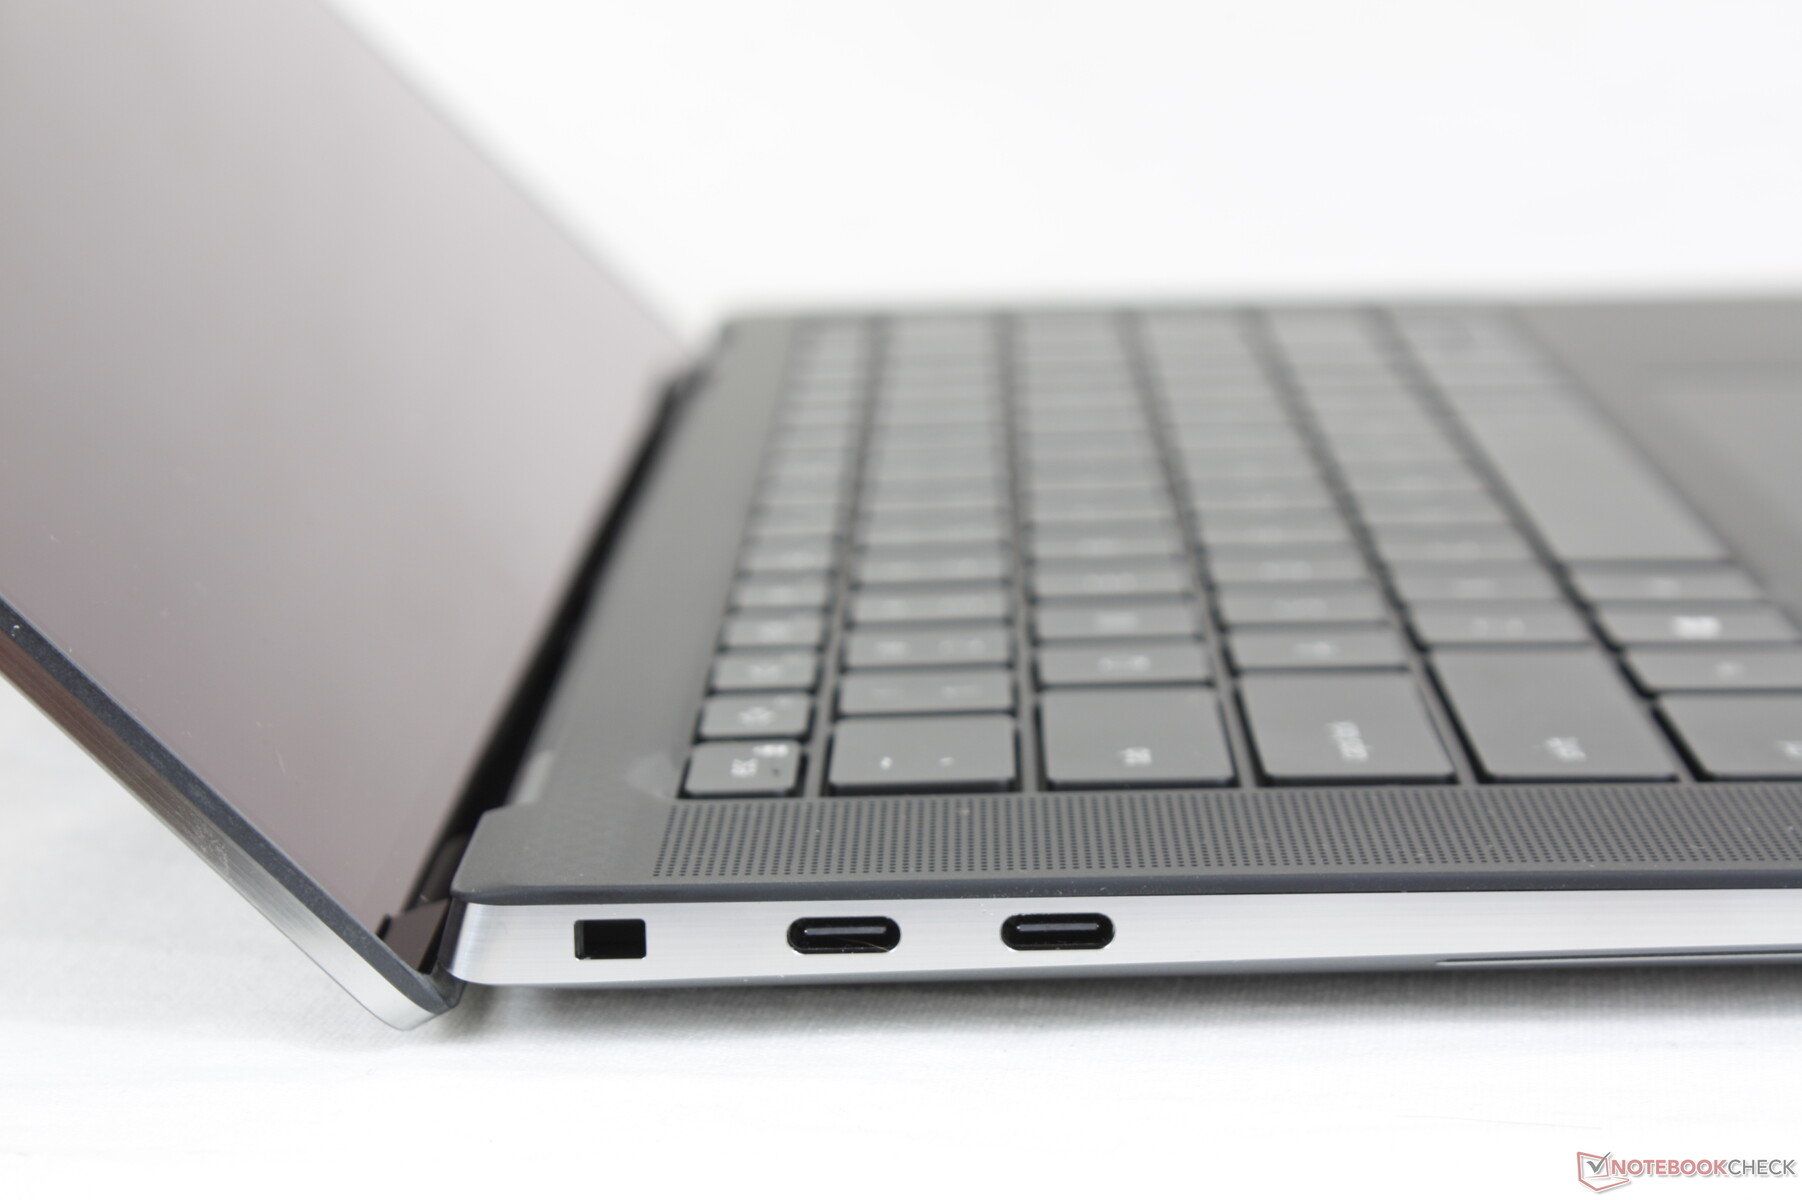
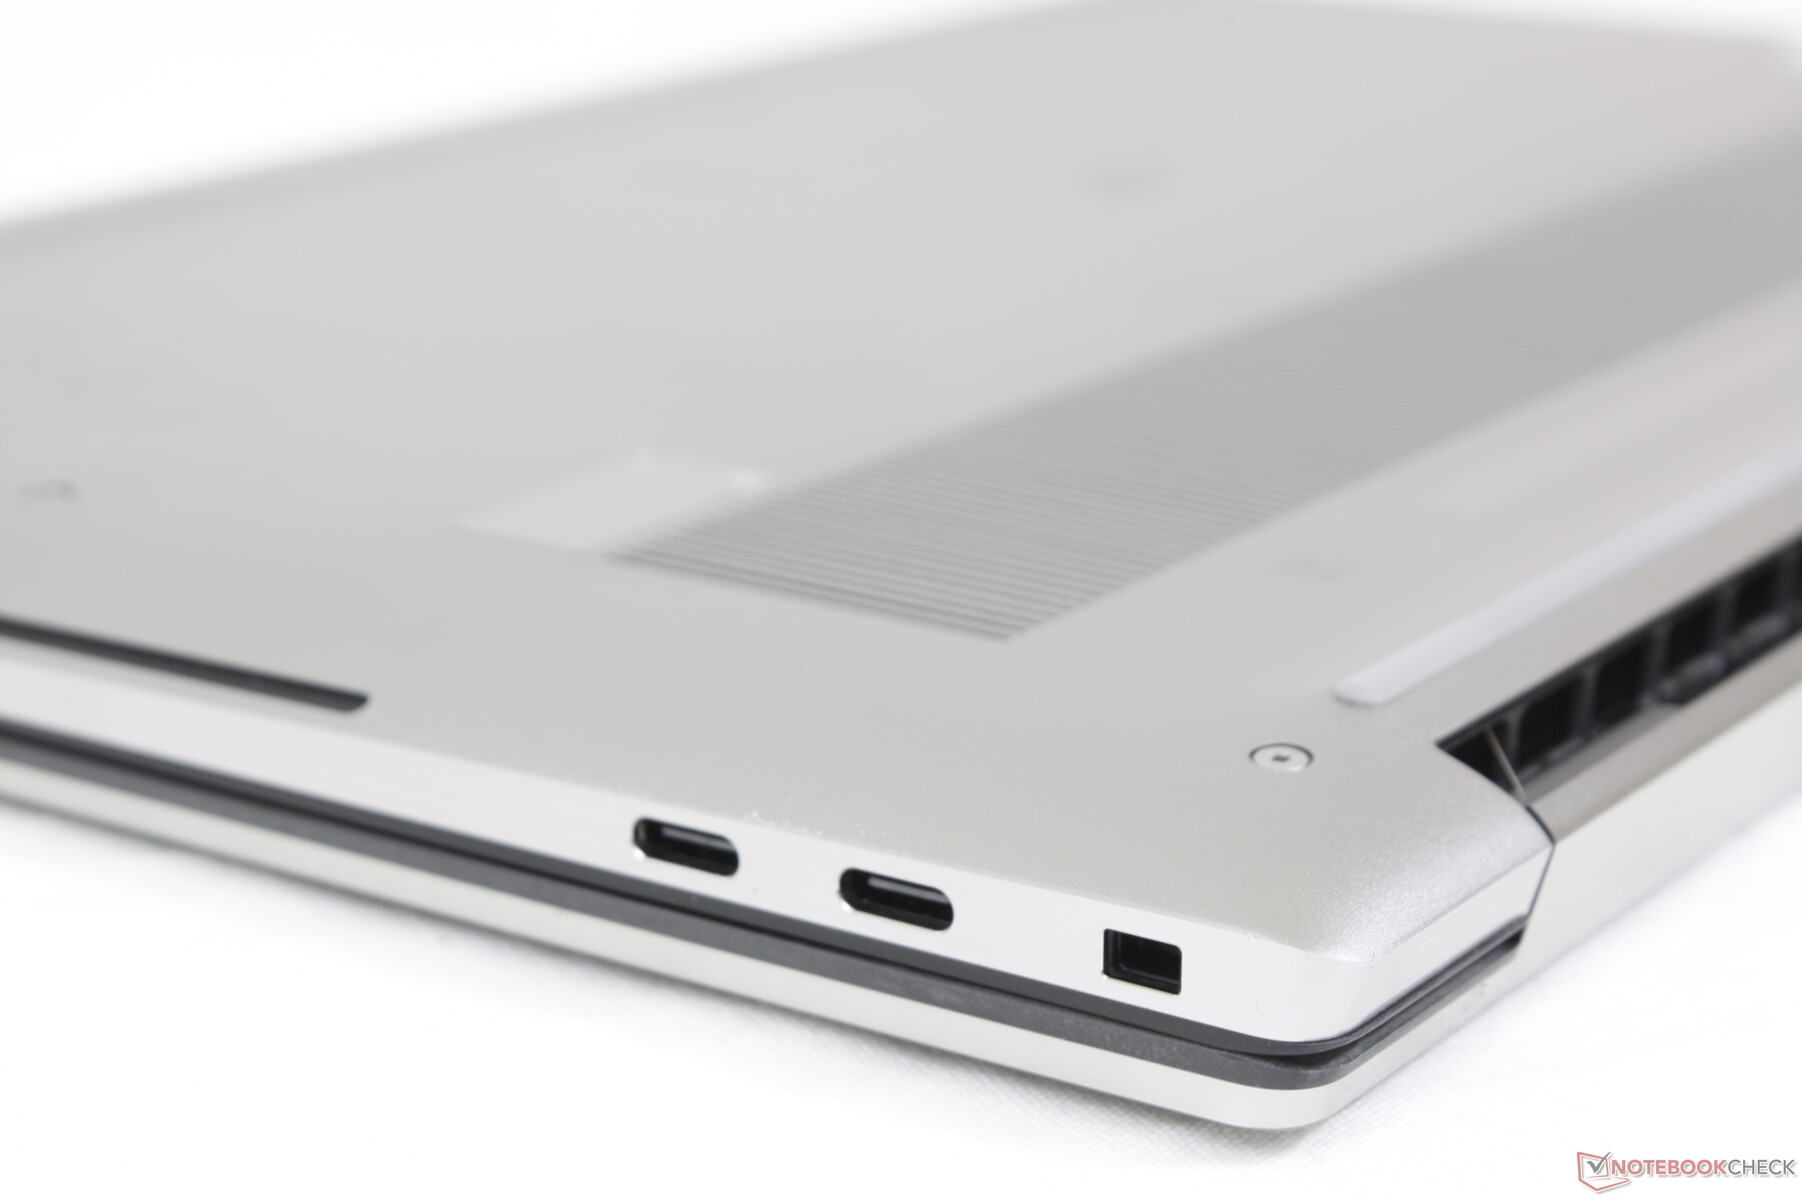
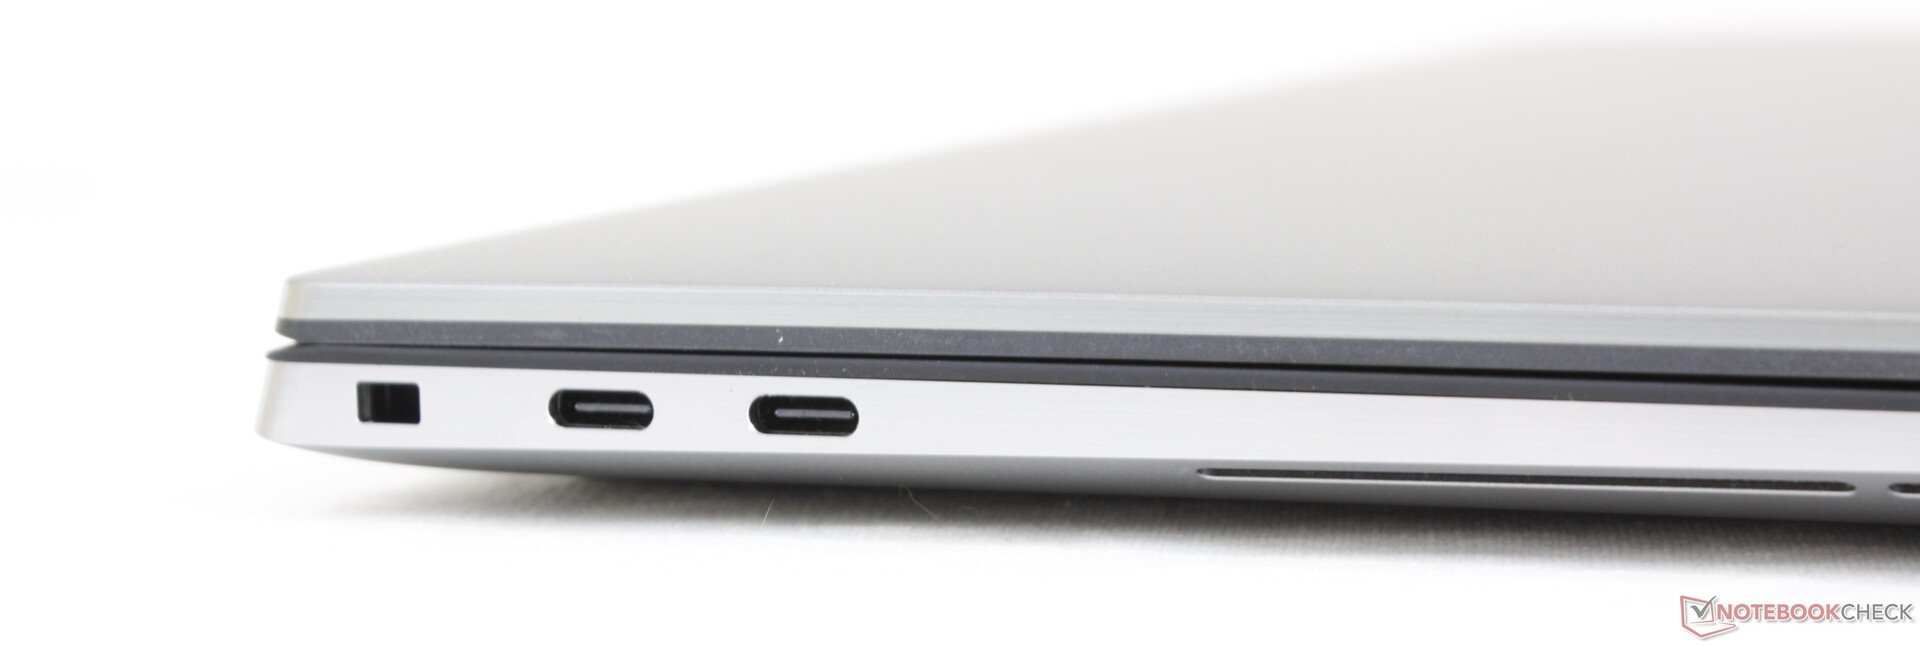
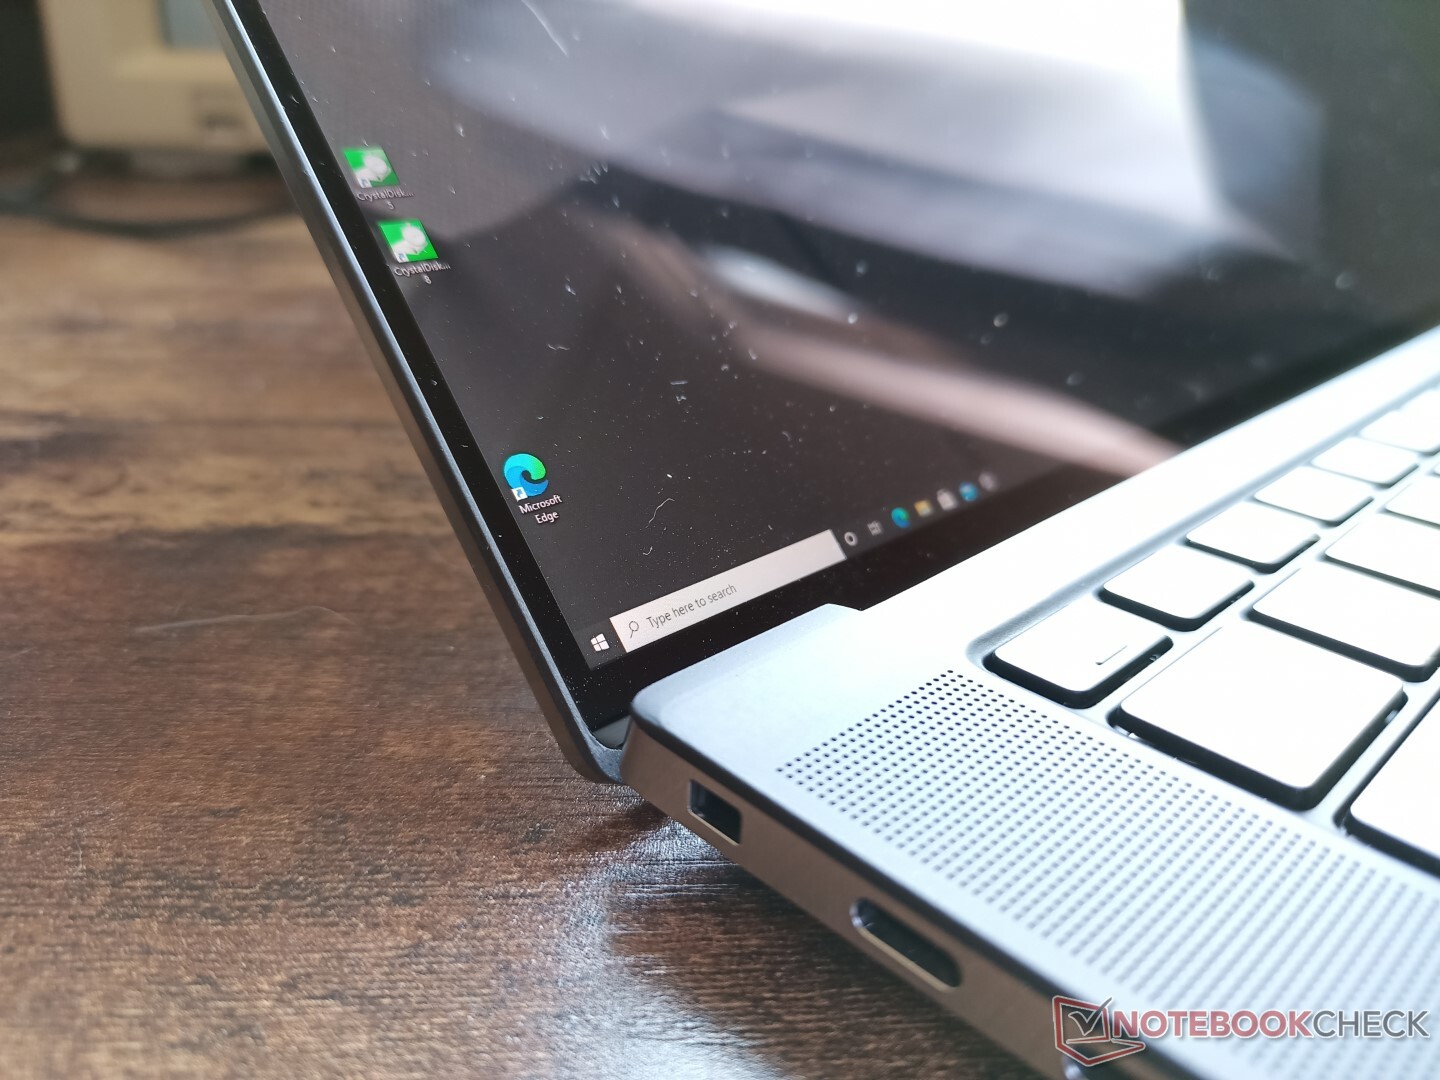
Conectividade - Thunderbolt 4 Ready to Go
As opções de porta incluem apenas USB-C, portanto esteja preparado para ter adaptadores em qualquer lugar que você vá. Todas as três portas USB-C suportam tanto DisplayPort quanto Power Delivery, mas apenas as duas portas USB-C esquerdas suportam dispositivos Thunderbolt. Estas duas portas em particular foram atualizadas do Thunderbolt 3 no Precision 5550 para o Thunderbolt 4 no Precision 5560.
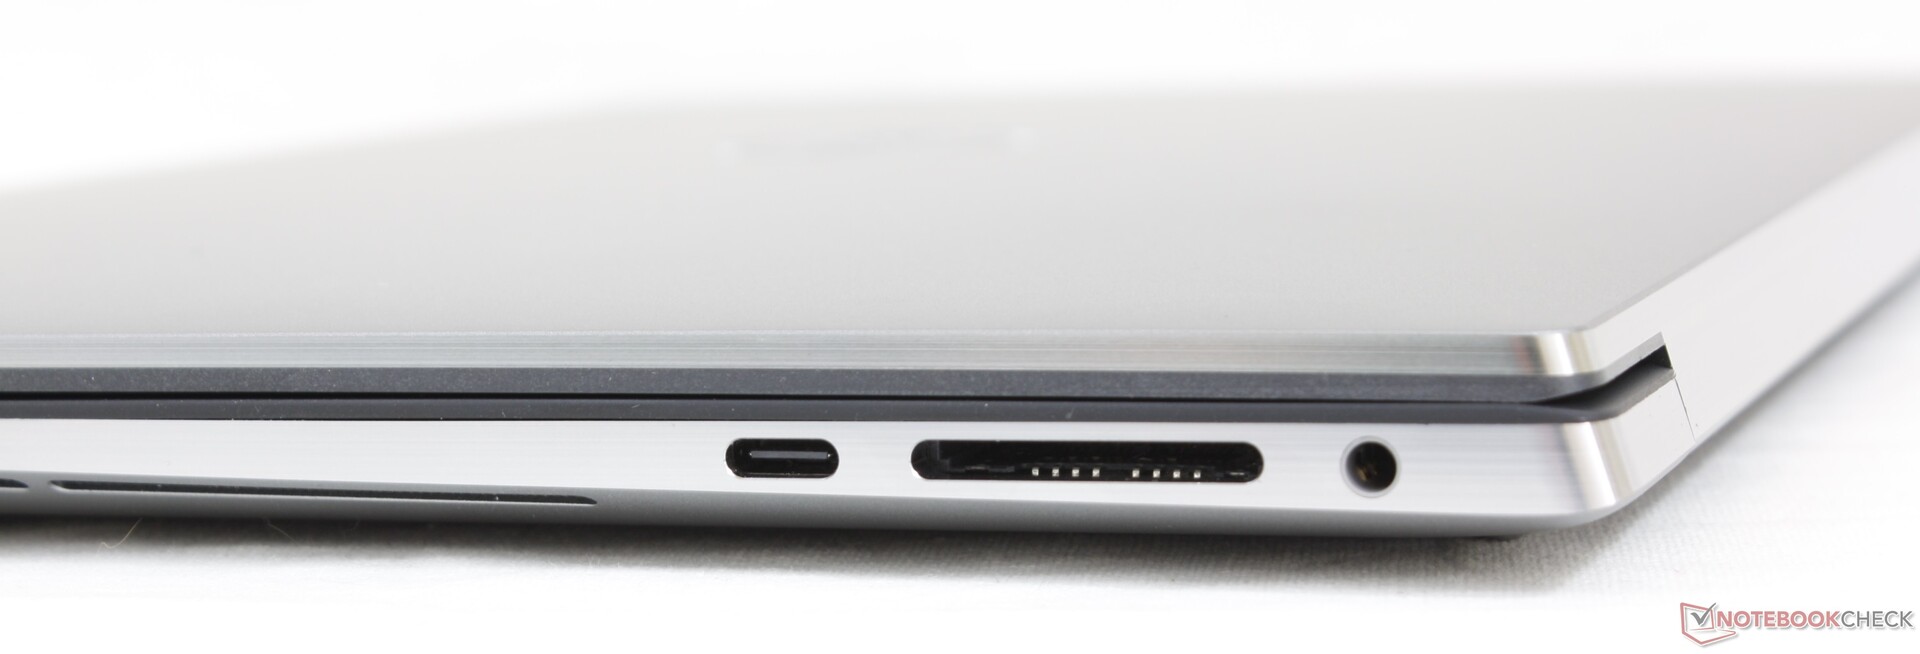
Leitor de cartões SD
As taxas de transferência se aproximam muito rapidamente de quase 200 MB/s em nossa placa de teste UHS-II. O slot não é carregado por mola e, portanto, o cartão SD se projetará sobre a borda.
| SD Card Reader | |
| average JPG Copy Test (av. of 3 runs) | |
| Lenovo ThinkPad P15 G2-20YQ001JGE (AV Pro V60) | |
| Dell Precision 5000 5560 (AV Pro V60) | |
| Dell Precision 5550 P91F (Toshiba Exceria Pro SDXC 64 GB UHS-II) | |
| Dell Precision 7550 (Toshiba Exceria Pro SDXC 64 GB UHS-II) | |
| Razer Blade 15 Studio Edition 2020 (Toshiba Exceria Pro SDXC 64 GB UHS-II) | |
| HP ZBook Studio 15 G8 (AV Pro V60) | |
| maximum AS SSD Seq Read Test (1GB) | |
| Lenovo ThinkPad P15 G2-20YQ001JGE (AV Pro V60) | |
| Dell Precision 5000 5560 (AV Pro V60) | |
| Dell Precision 5550 P91F (Toshiba Exceria Pro SDXC 64 GB UHS-II) | |
| Dell Precision 7550 (Toshiba Exceria Pro SDXC 64 GB UHS-II) | |
| HP ZBook Studio 15 G8 (AV Pro V60) | |
Comunicação
Webcam - Ainda sem obturador de privacidade


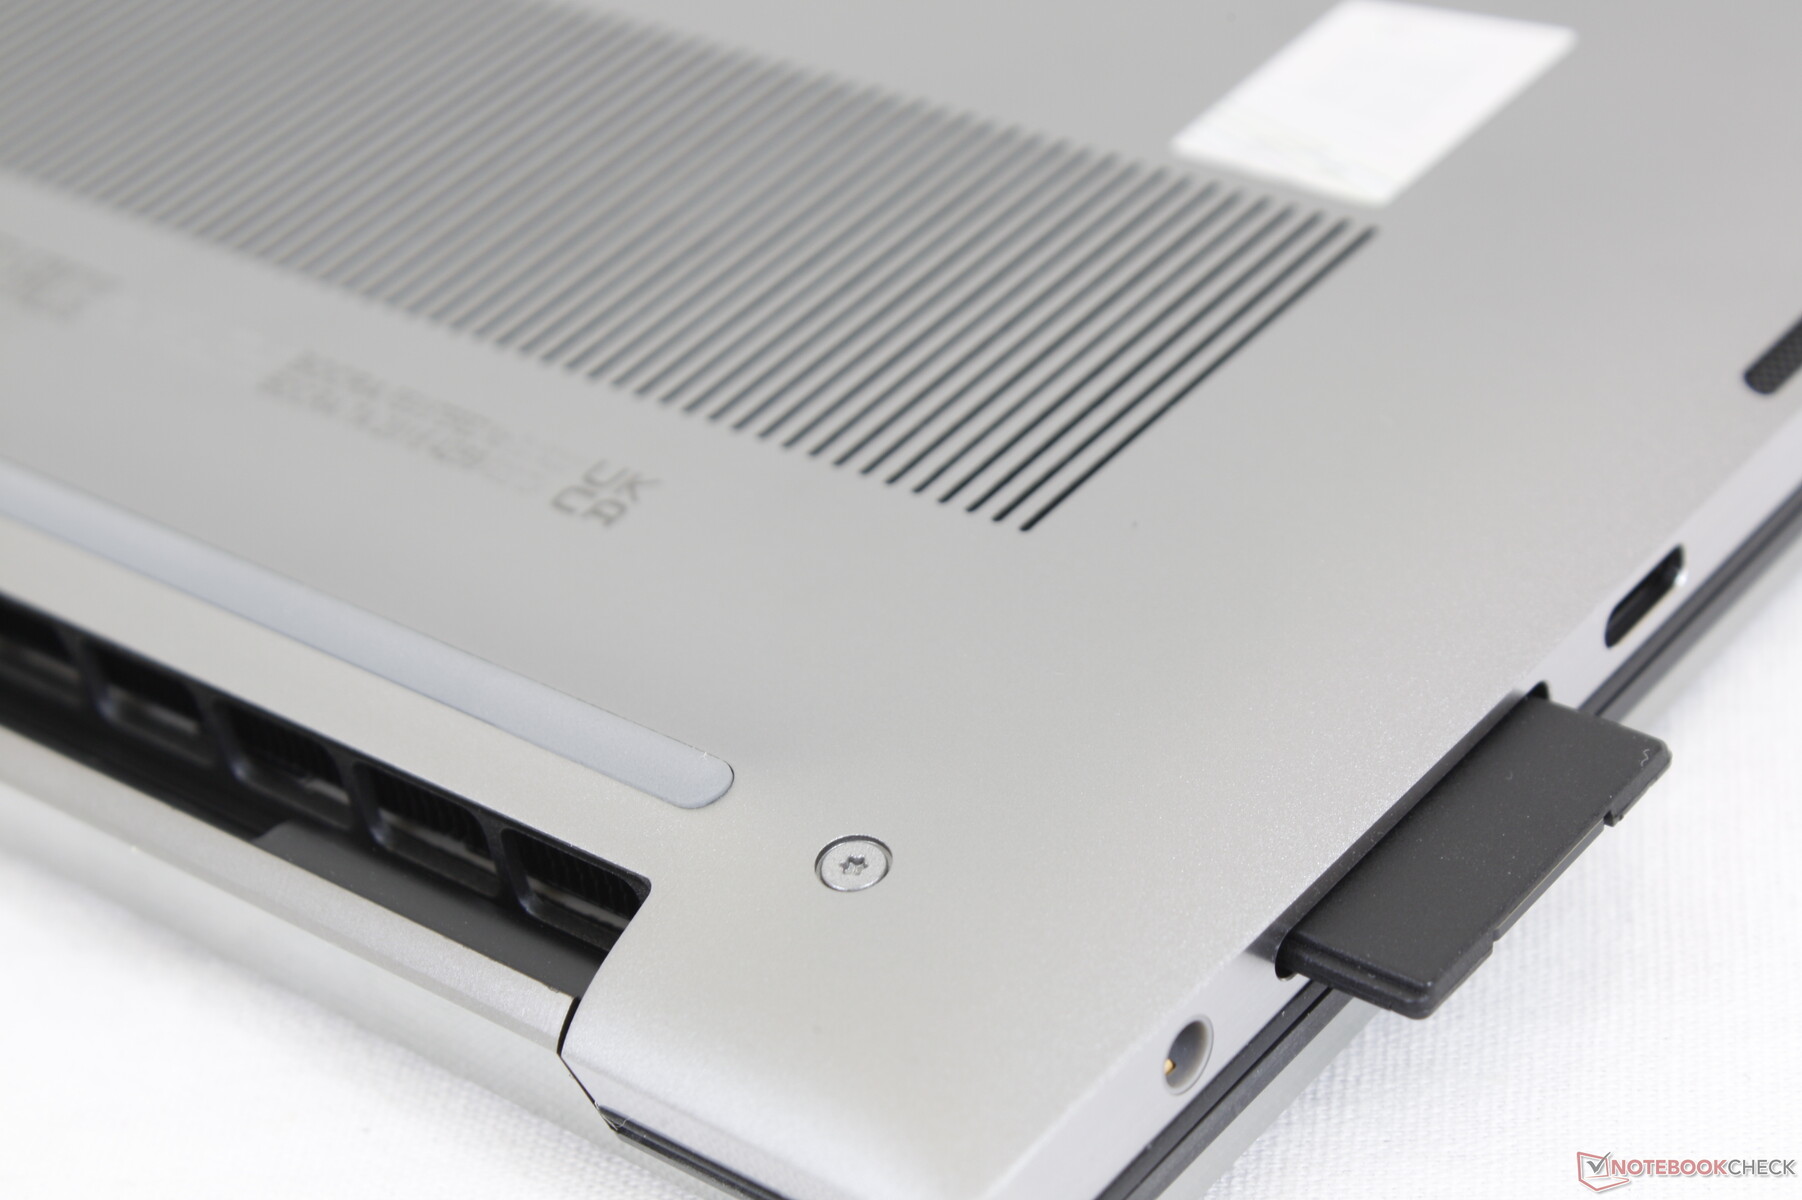
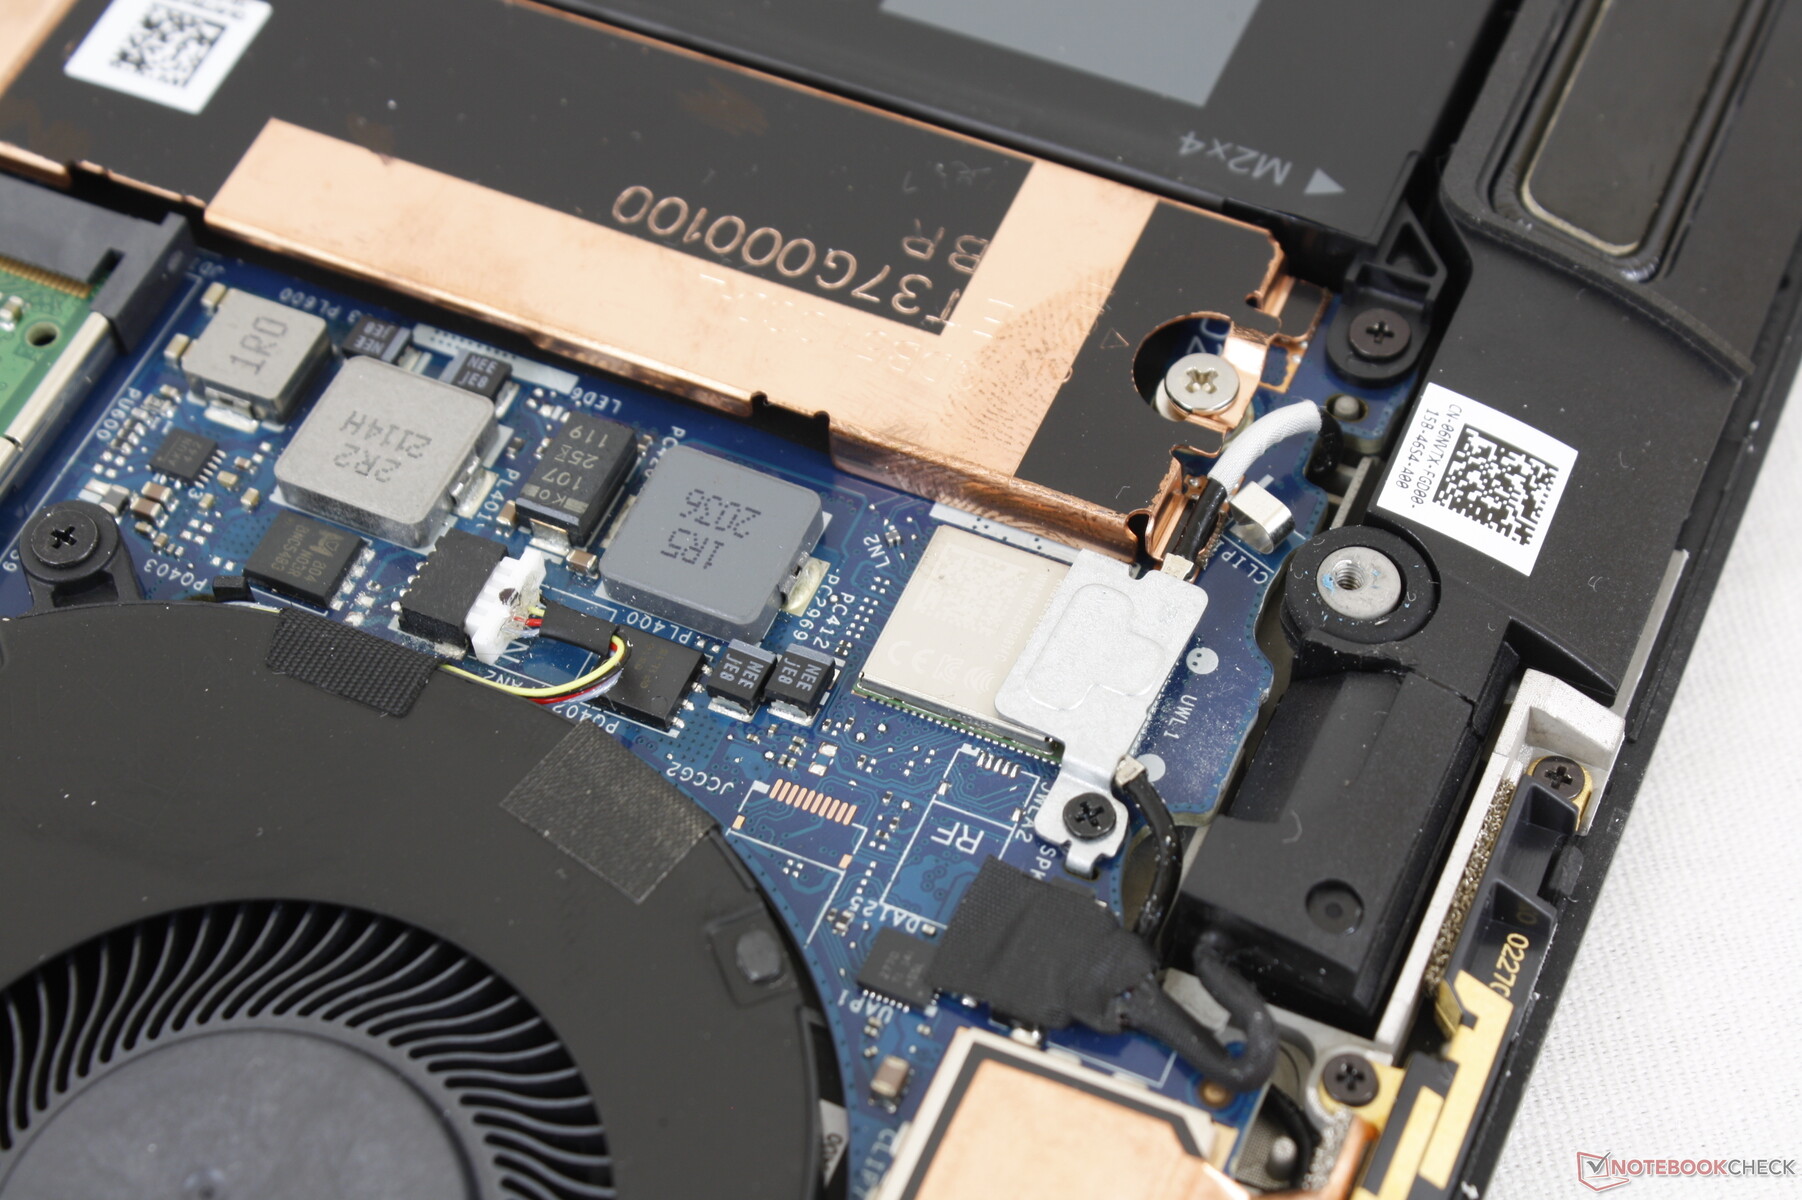
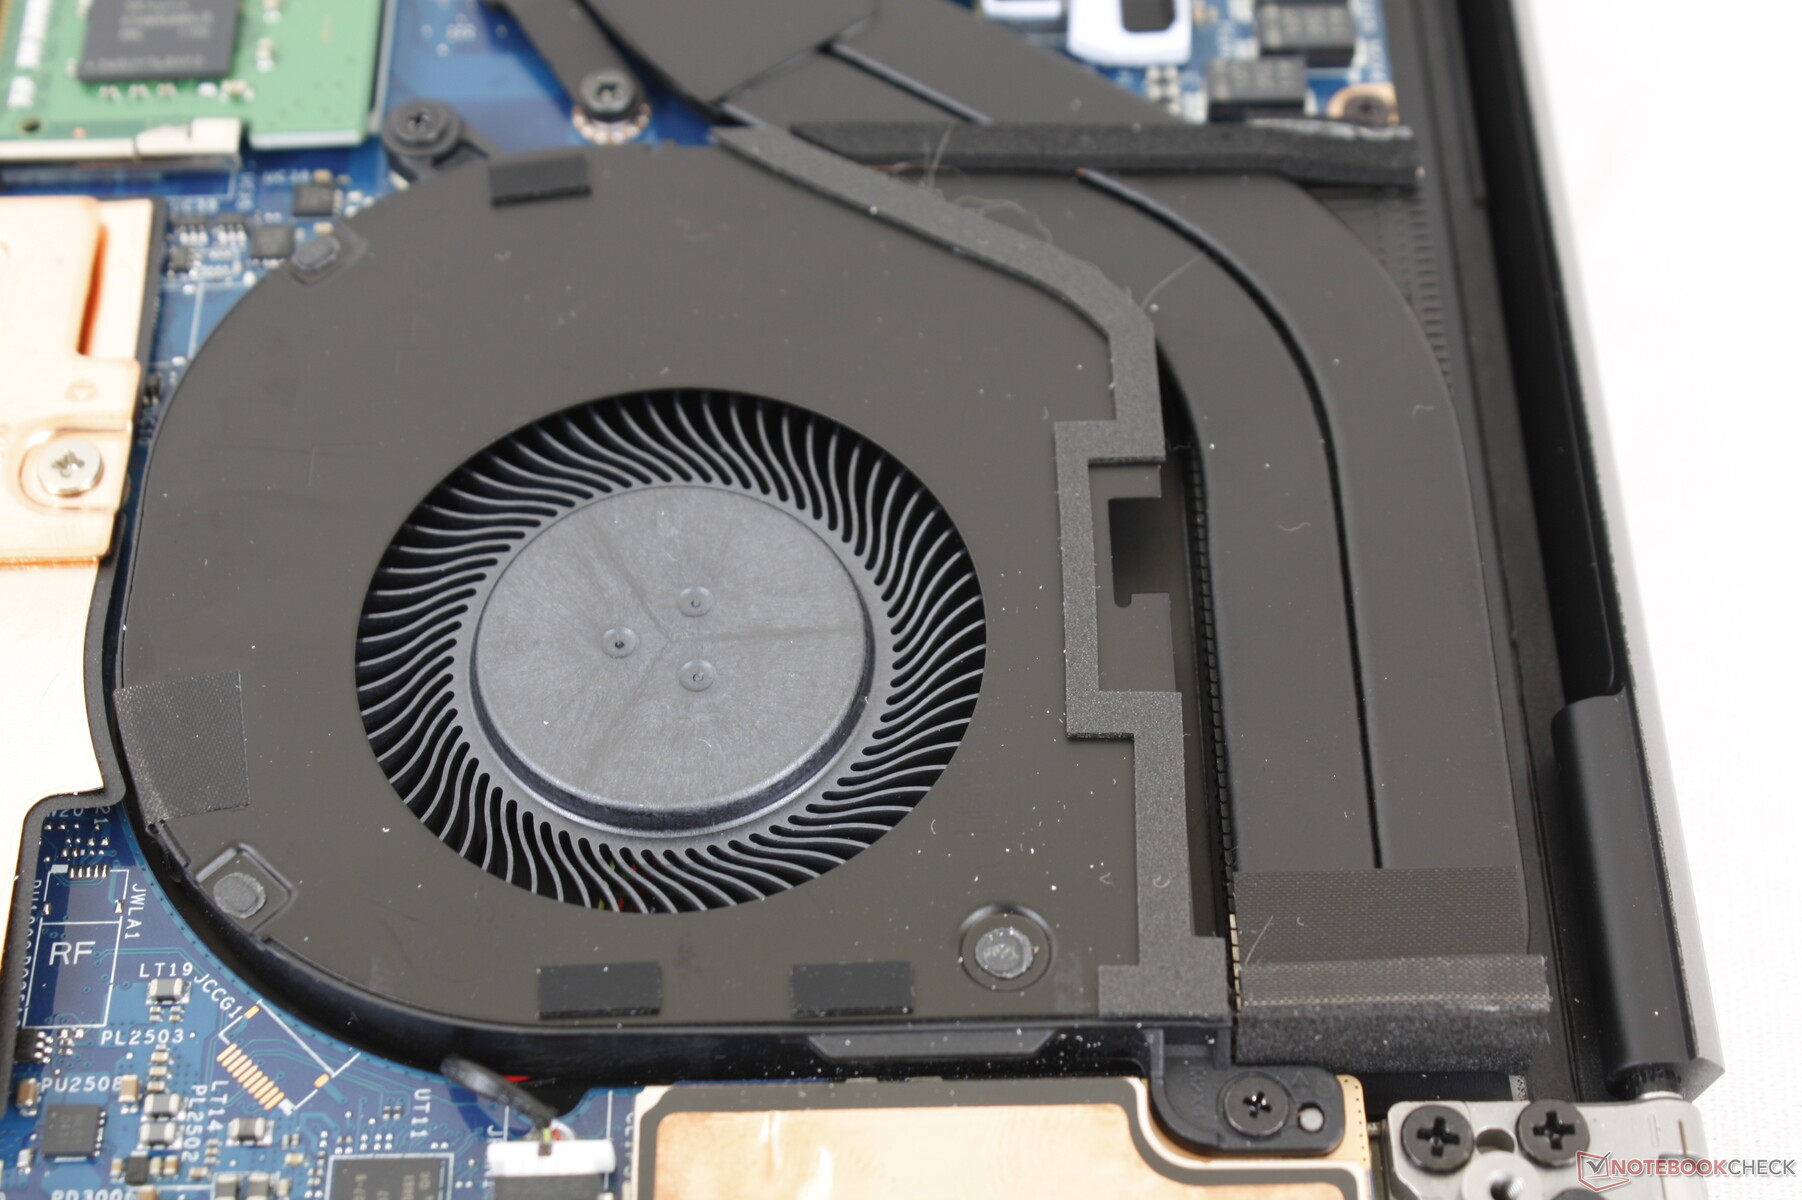
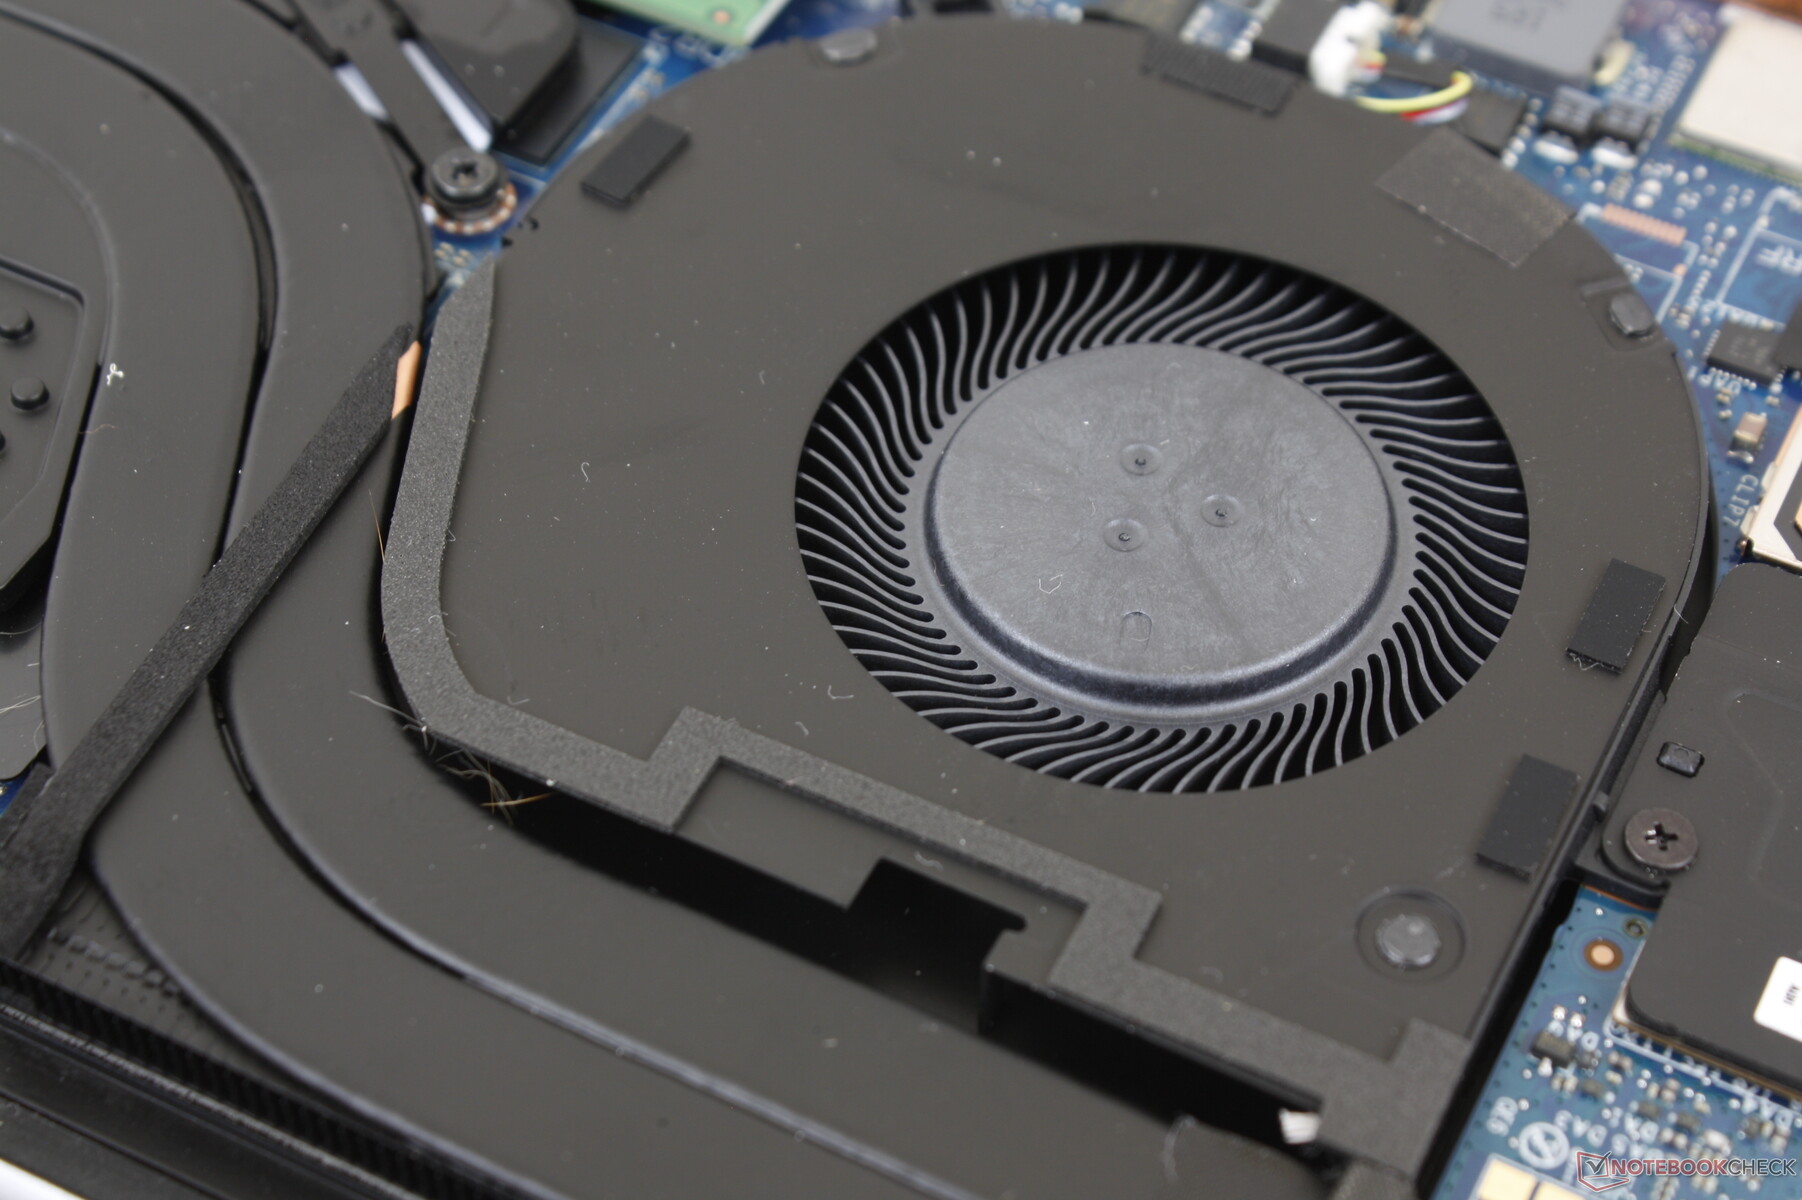
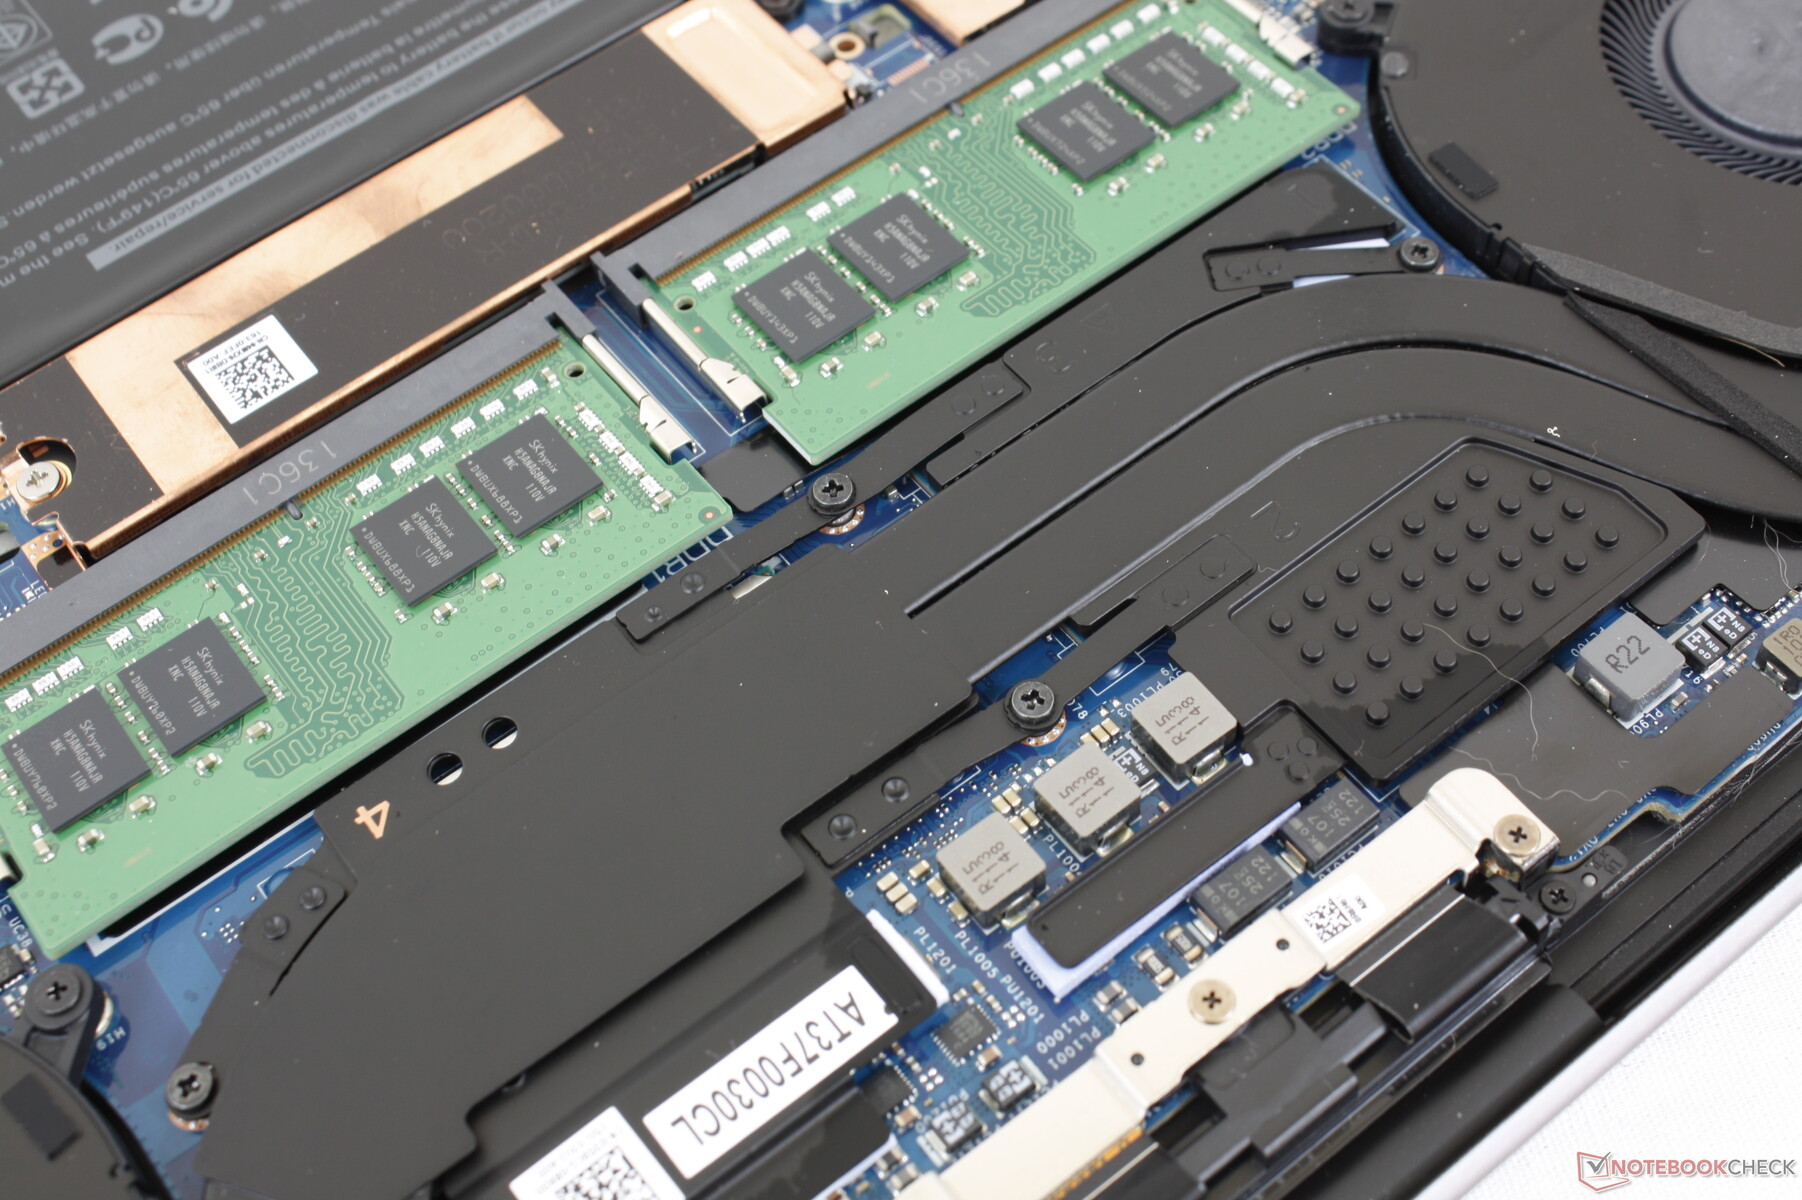
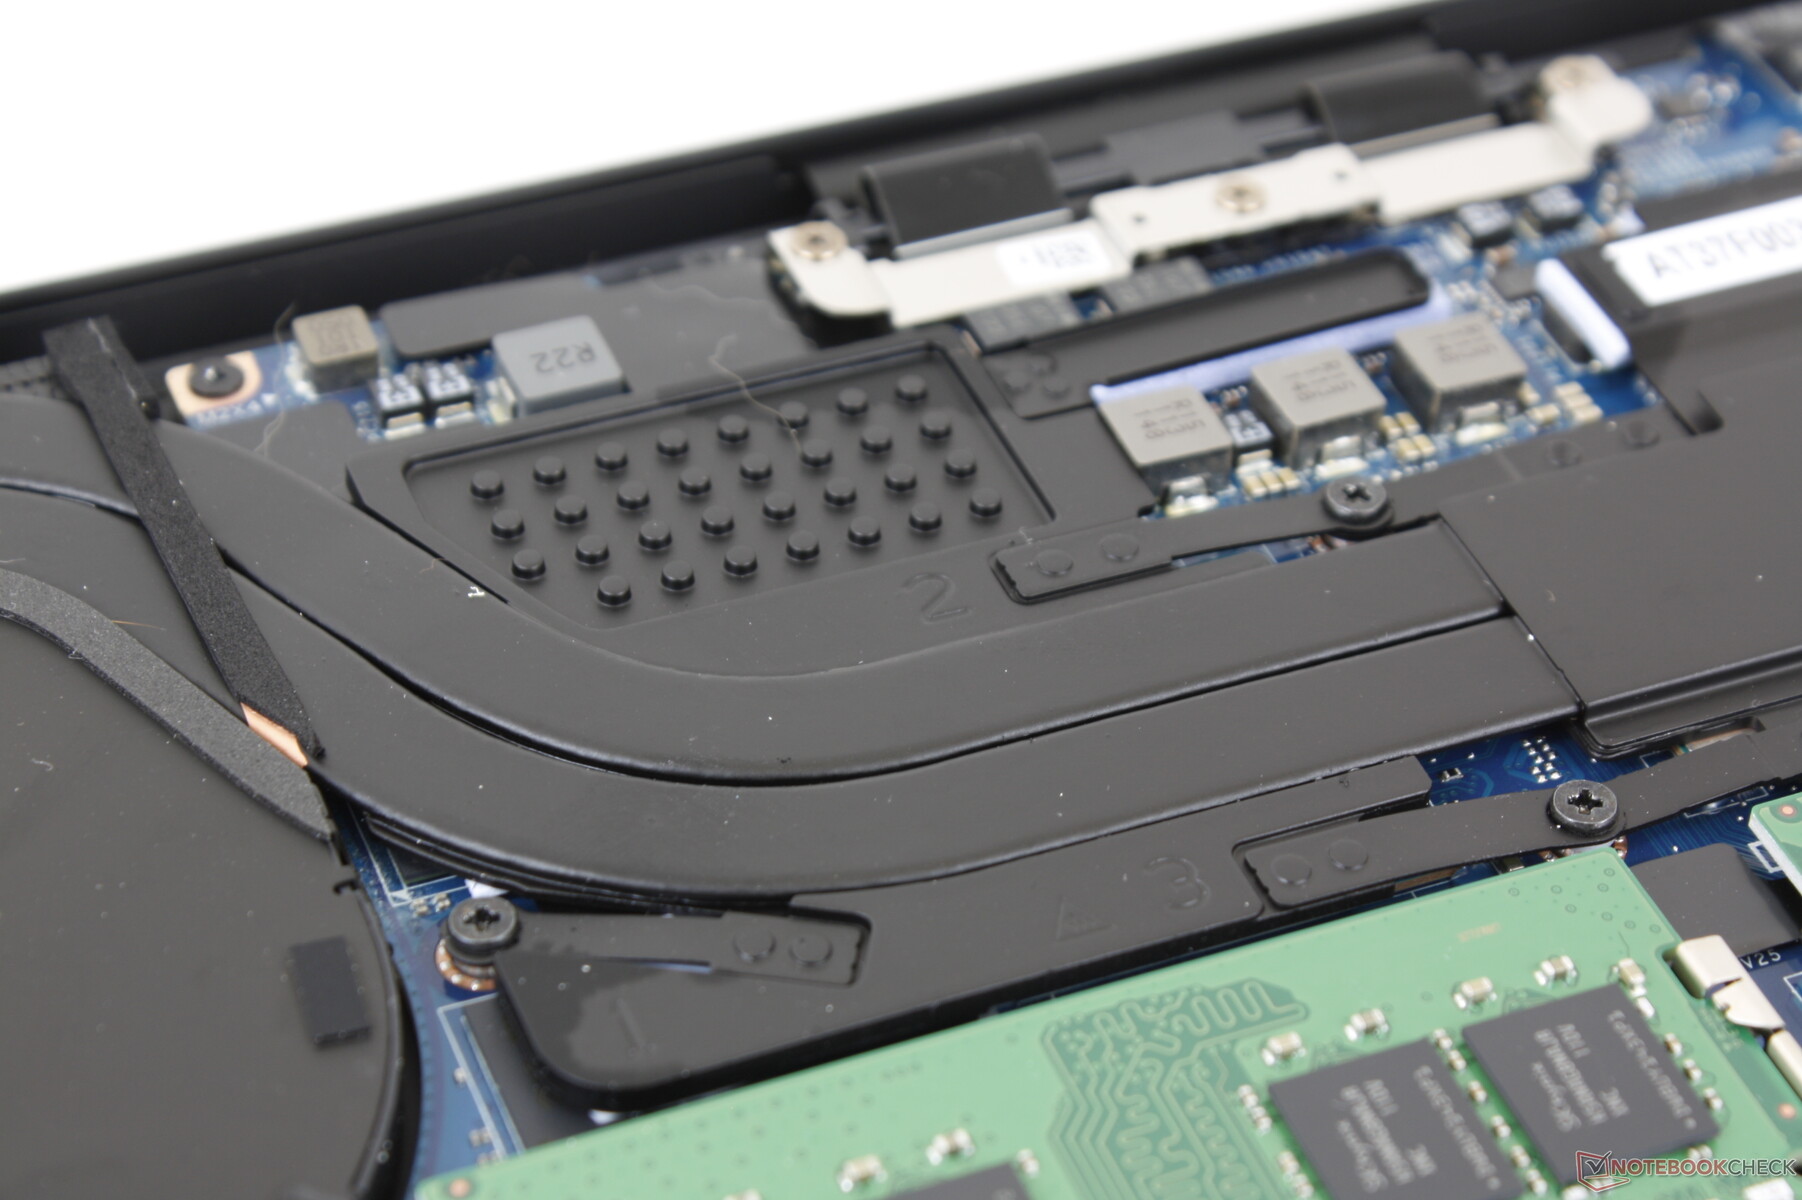
Manutenção
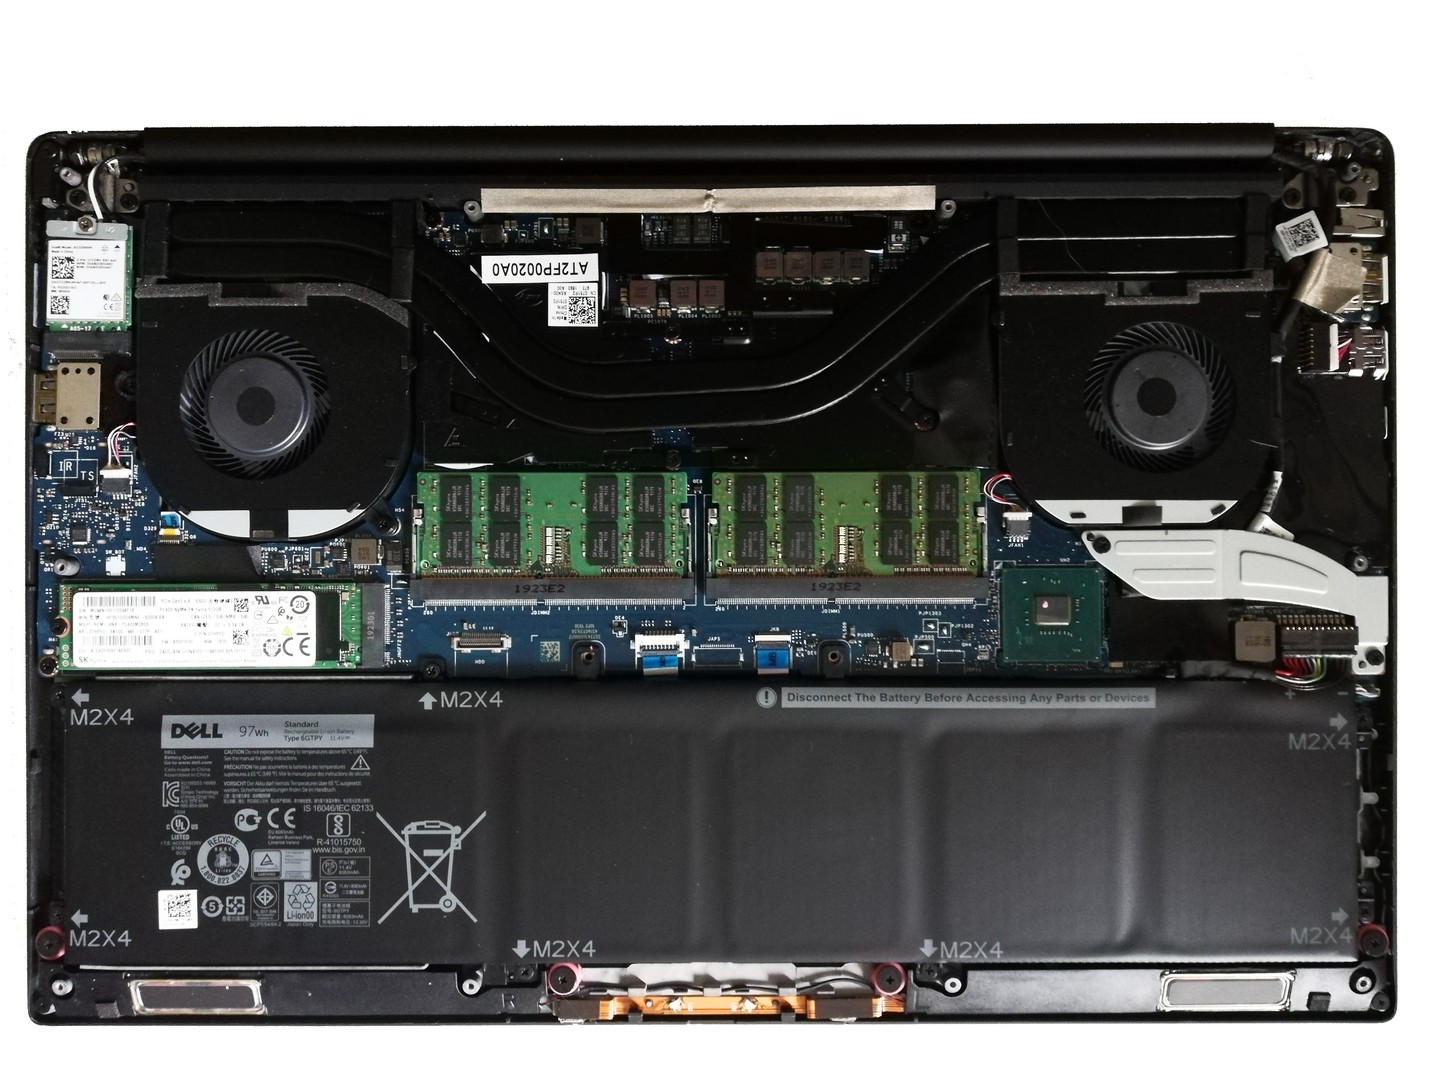
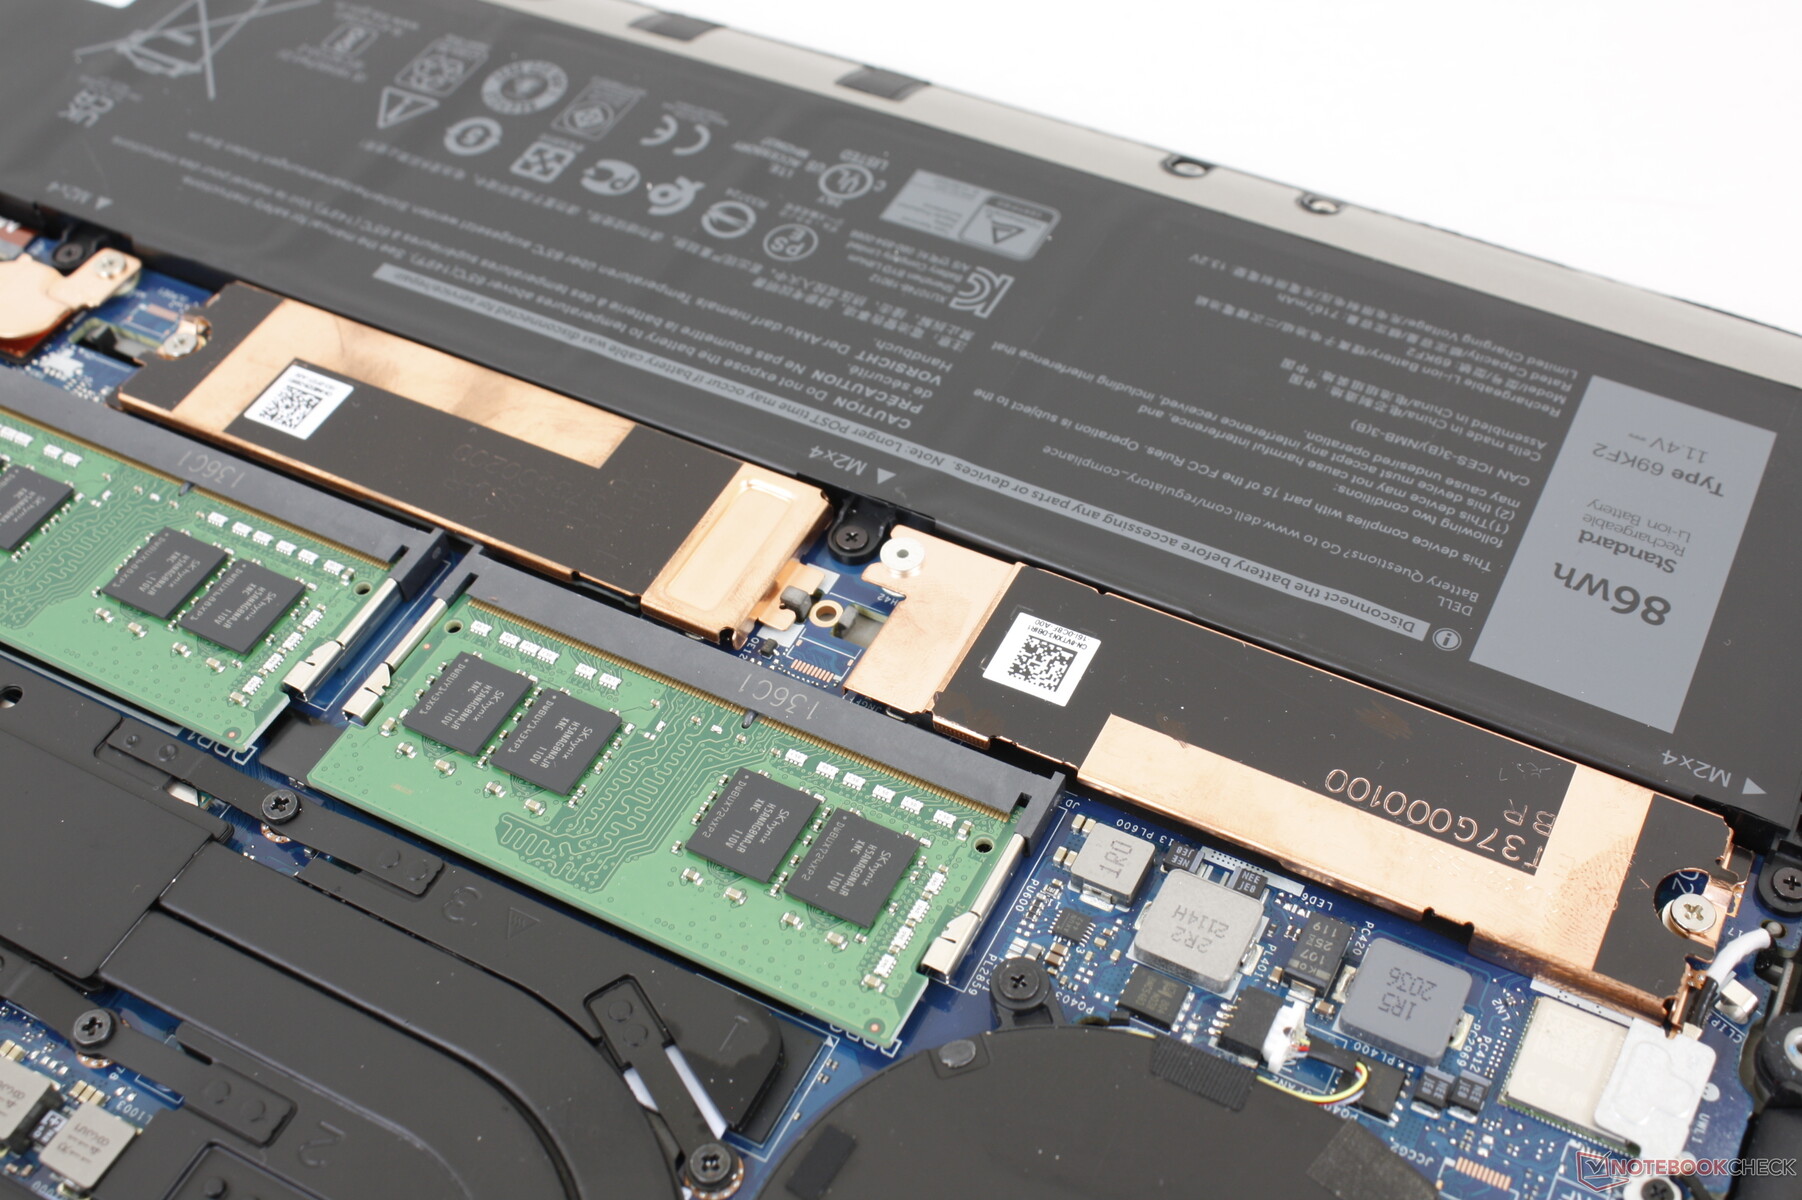
O painel inferior é mais difícil de remover quando comparado com o antigo design Precision 5540. O layout interno é essencialmente idêntico ao do Precision 5550.
Acessórios e Garantia
A caixa de varejo inclui um prático adaptador USB-C para USB-A de tamanho completo e adaptador HDMI muito parecido com o XPS 15.
Decepcionantemente, a garantia base é de apenas um ano em vez de dois ou três anos em muitas outras estações de trabalho móveis. Os usuários teriam que atualizar para a série superior Precision 7000 para a garantia base mais longa.
Dispositivos de entrada

Mostrar
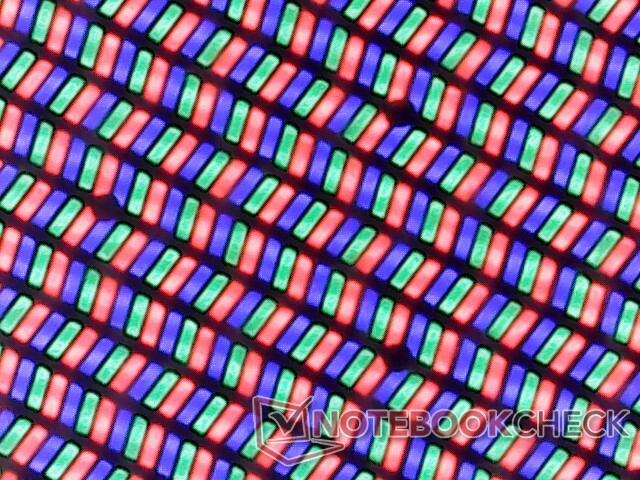
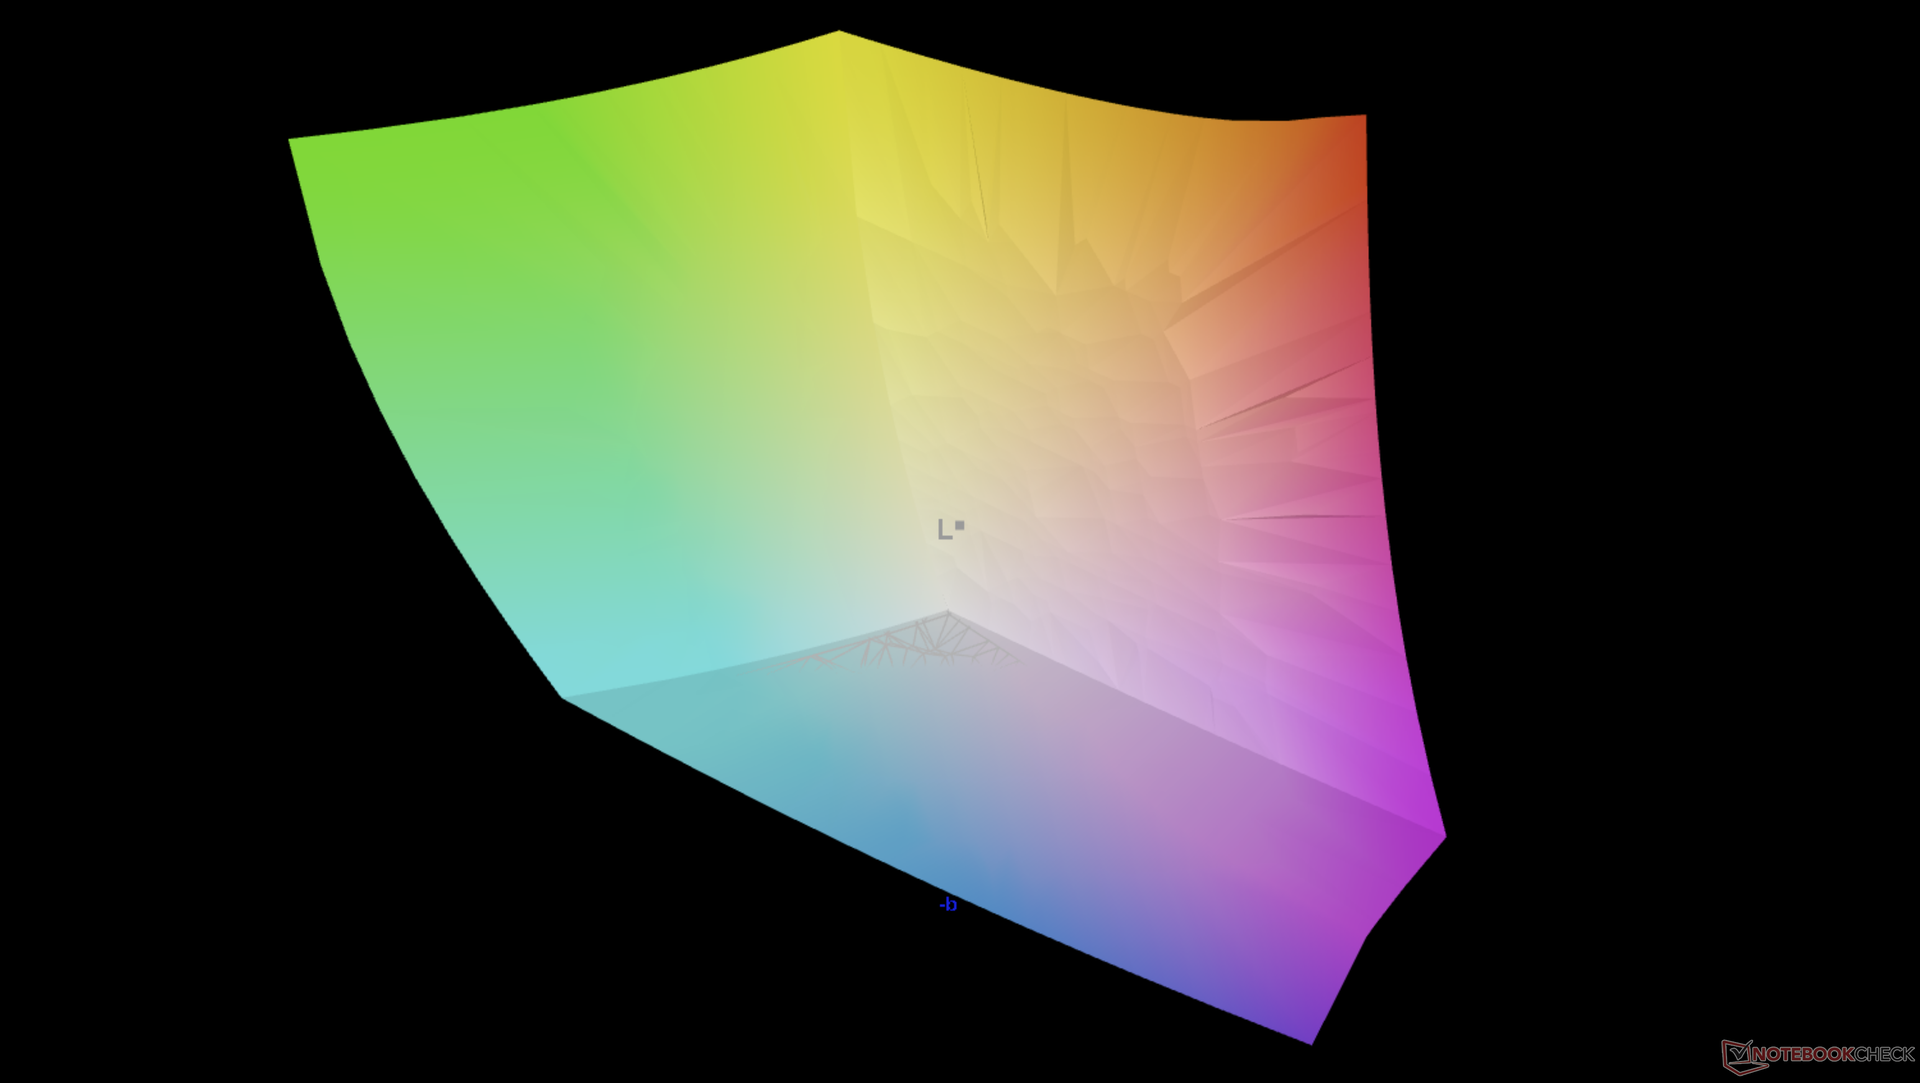
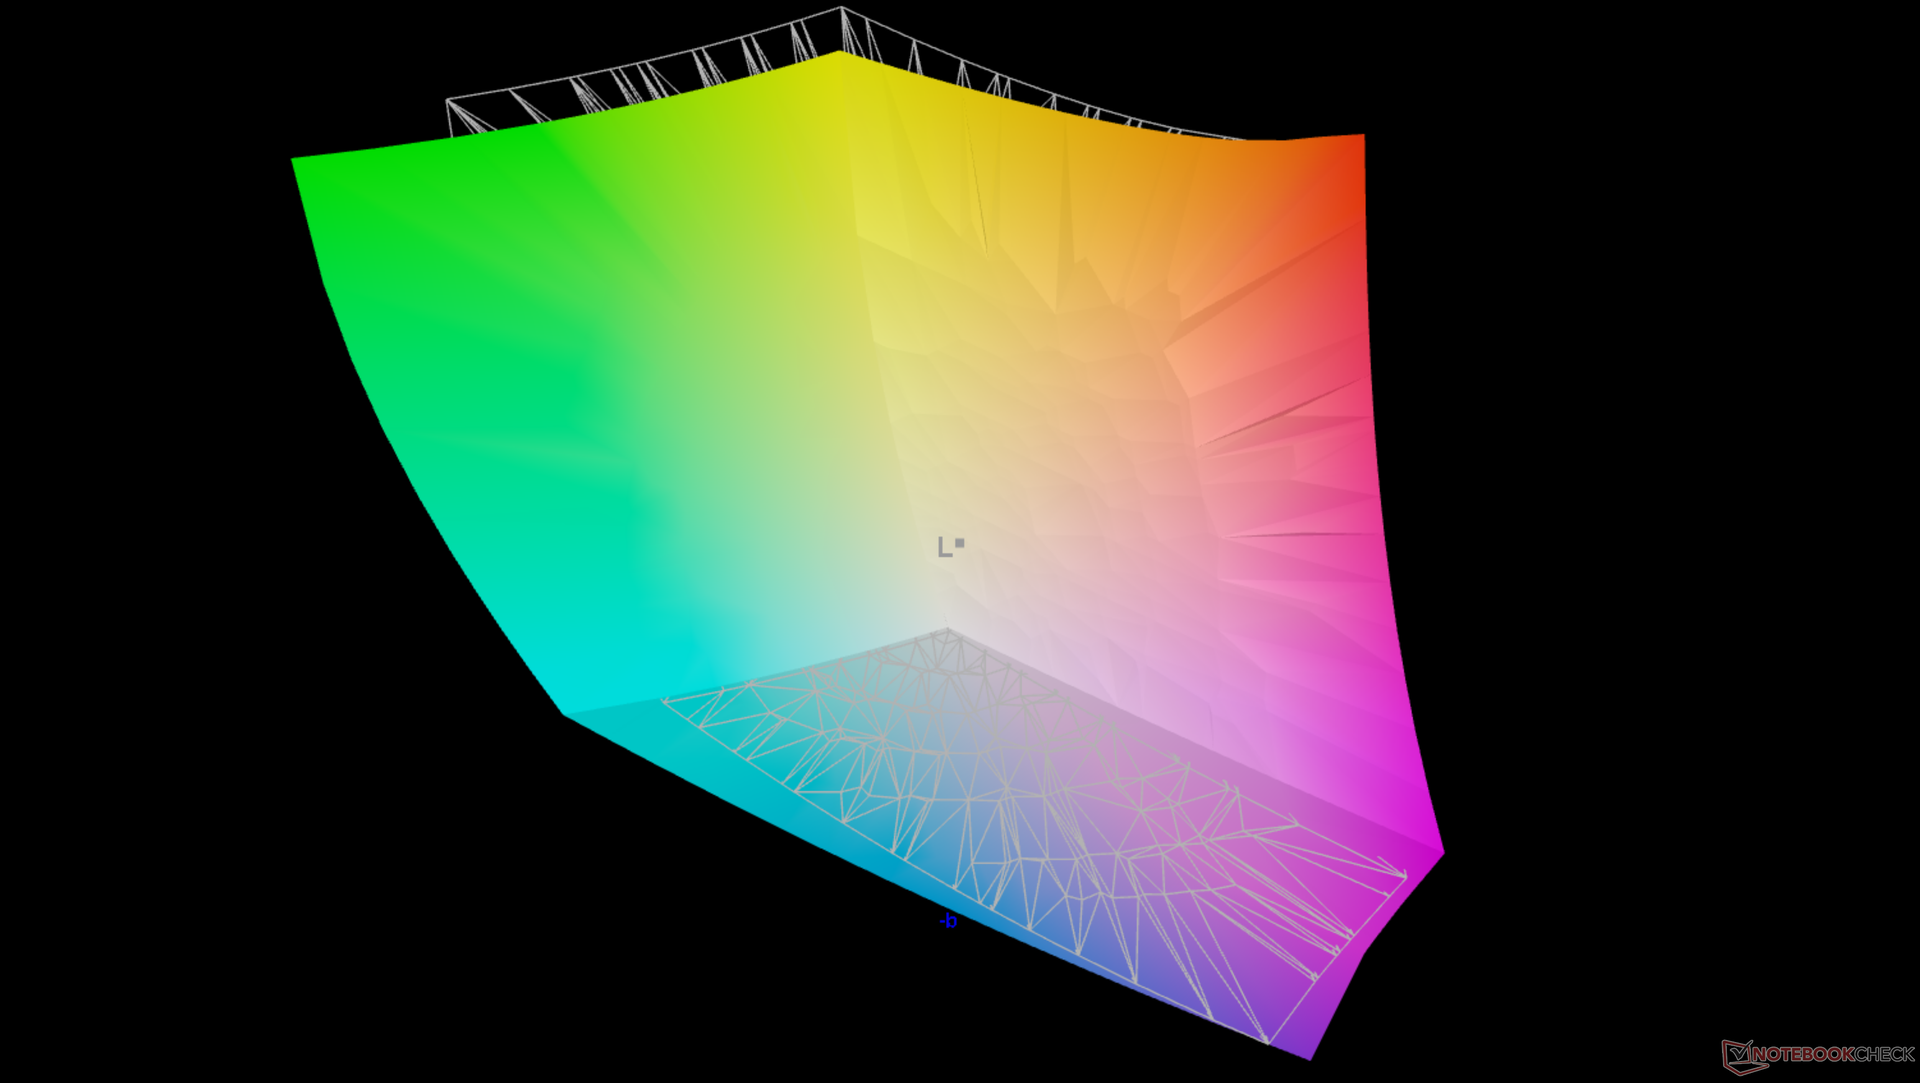
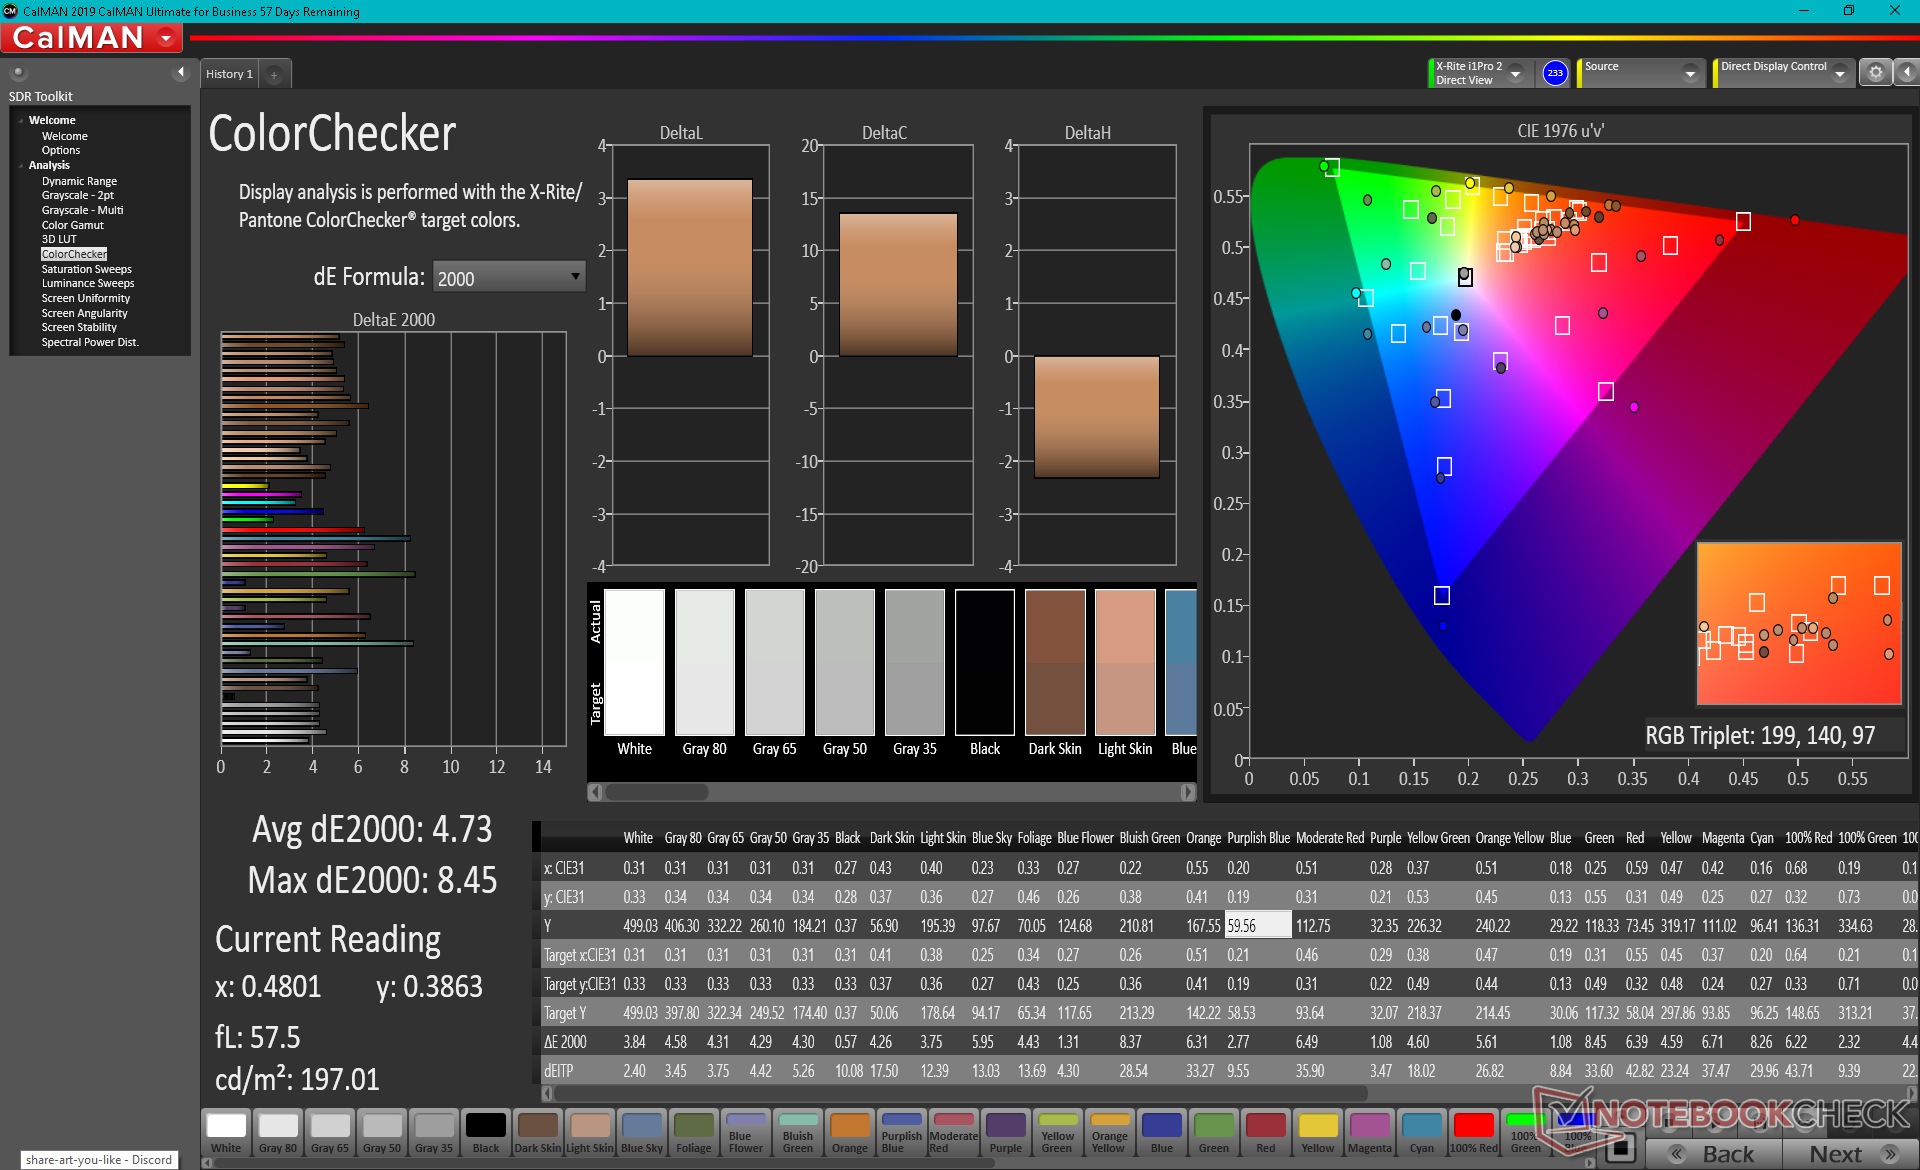
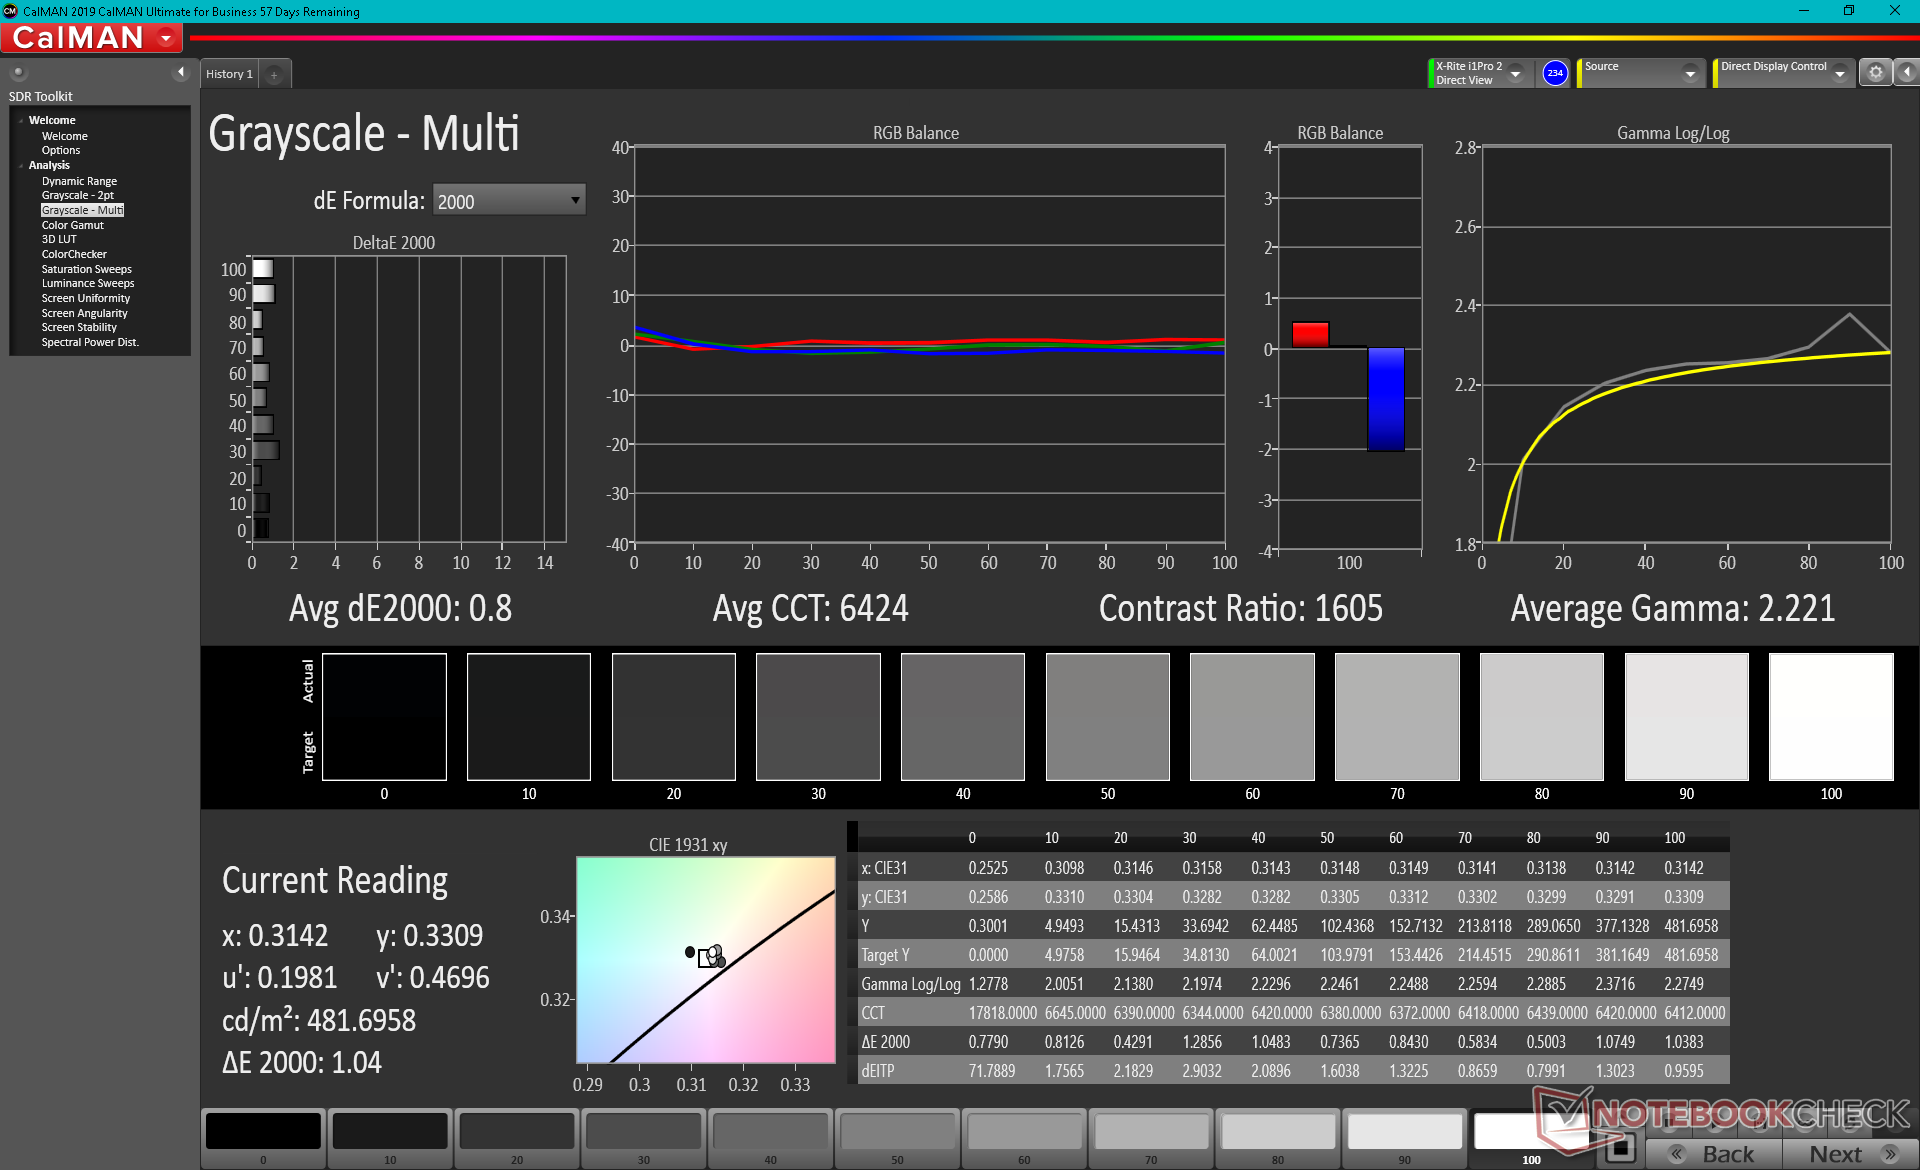
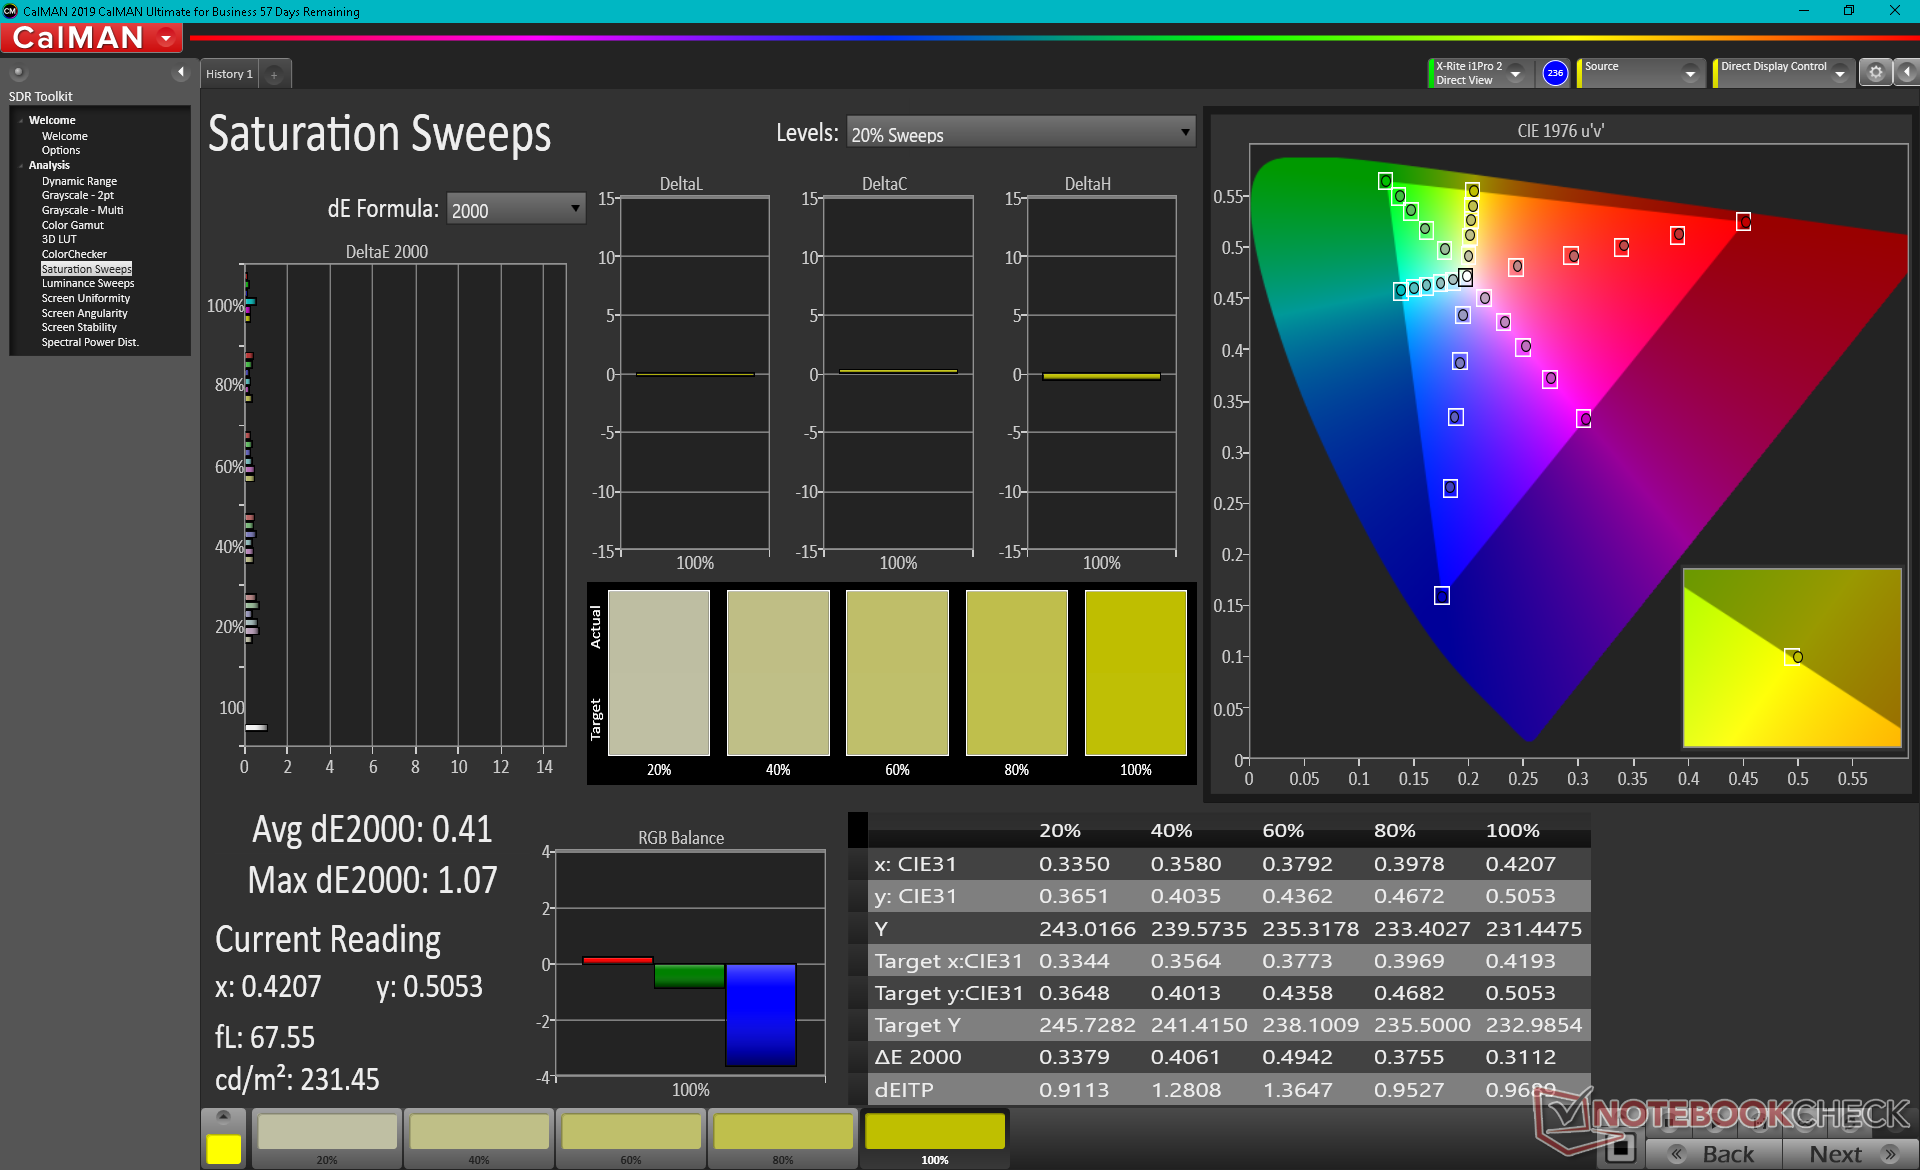
A Dell continua usando a mesma tela tátil Sharp LQ156R1 IPS em todas as suas 16:10 XPS 15 e Precision 5550/5560 4K SKUs, o que é ótimo porque este ainda é um painel high-end com cobertura total AdobeRGB, alta relação de contraste >1000:1, e brilhante ~500 nit backlight. A experiência de visualização é portanto consistente entre os últimos modelos XPS 15 e Precision 55x0. Um visor mate menor de 1200p sem toque está disponível em alguns SKUs como no XPS 15, mas o OLED é curiosamente omitido no Precision 5560
O lento tempo de resposta preto-branco e cinza cinza continuam a ser a principal desvantagem, o que significa que o fantasma é muito perceptível, especialmente quando comparado ao OLED. Isto não será um grande problema para a maioria das aplicações do tipo CAD.
| |||||||||||||||||||||||||
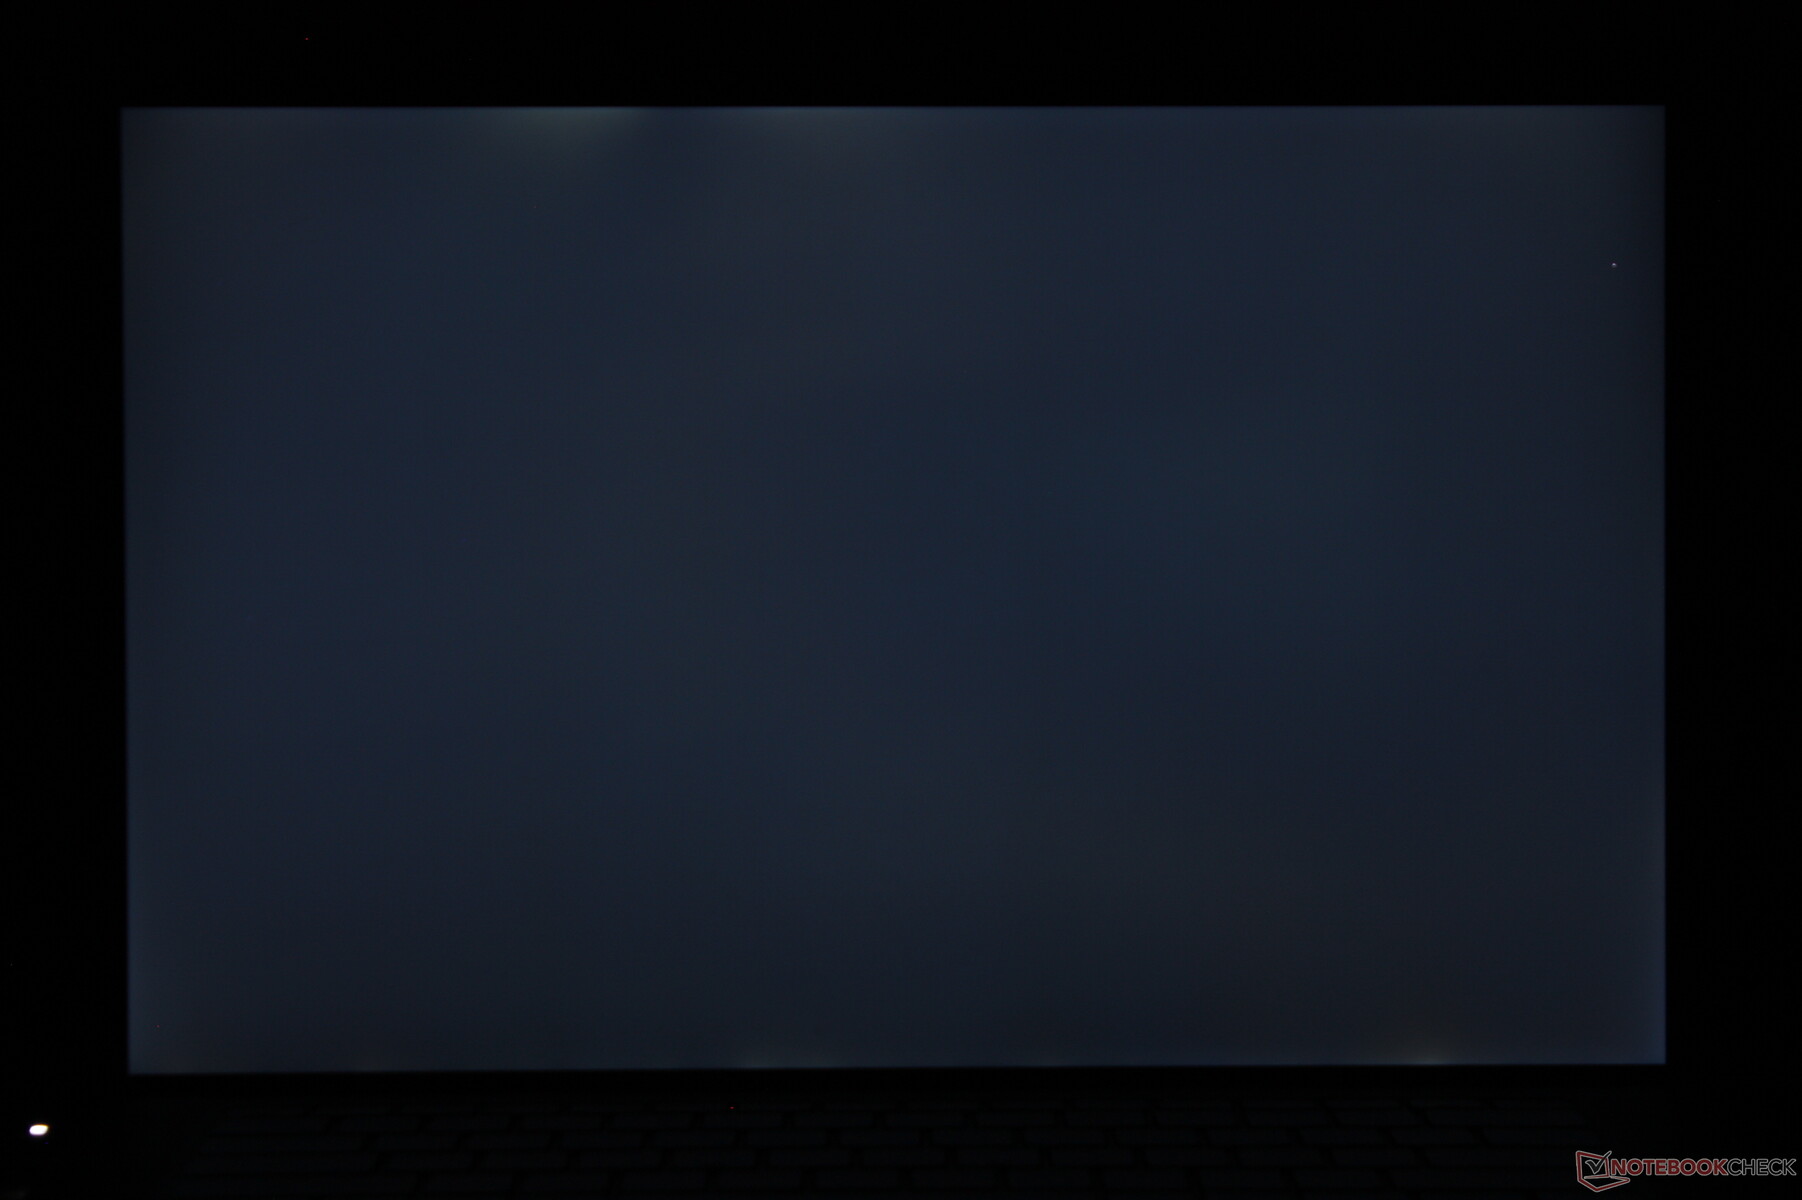
iluminação: 83 %
iluminação com acumulador: 501.5 cd/m²
Contraste: 1140:1 (Preto: 0.44 cd/m²)
ΔE ColorChecker Calman: 4.73 | ∀{0.5-29.43 Ø4.71}
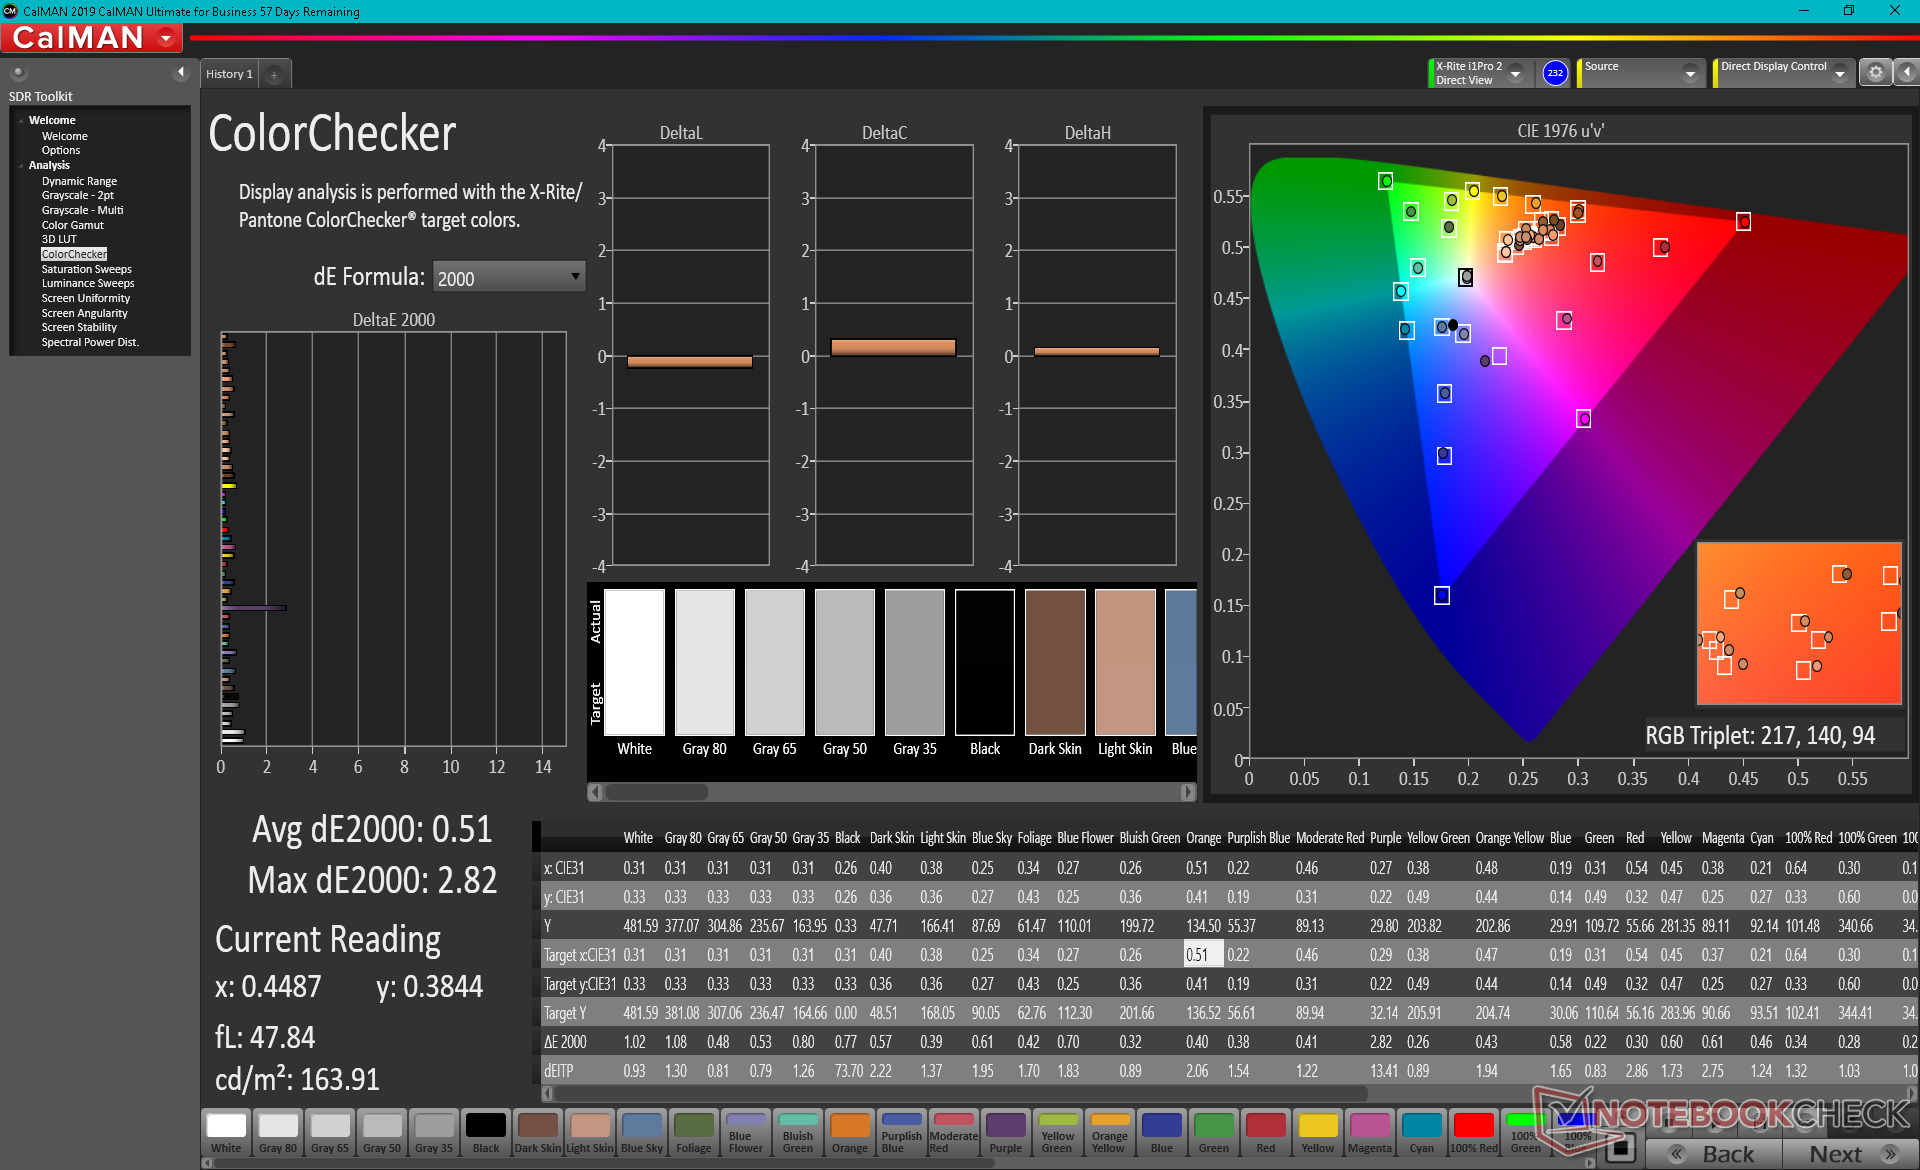
calibrated: 0.51
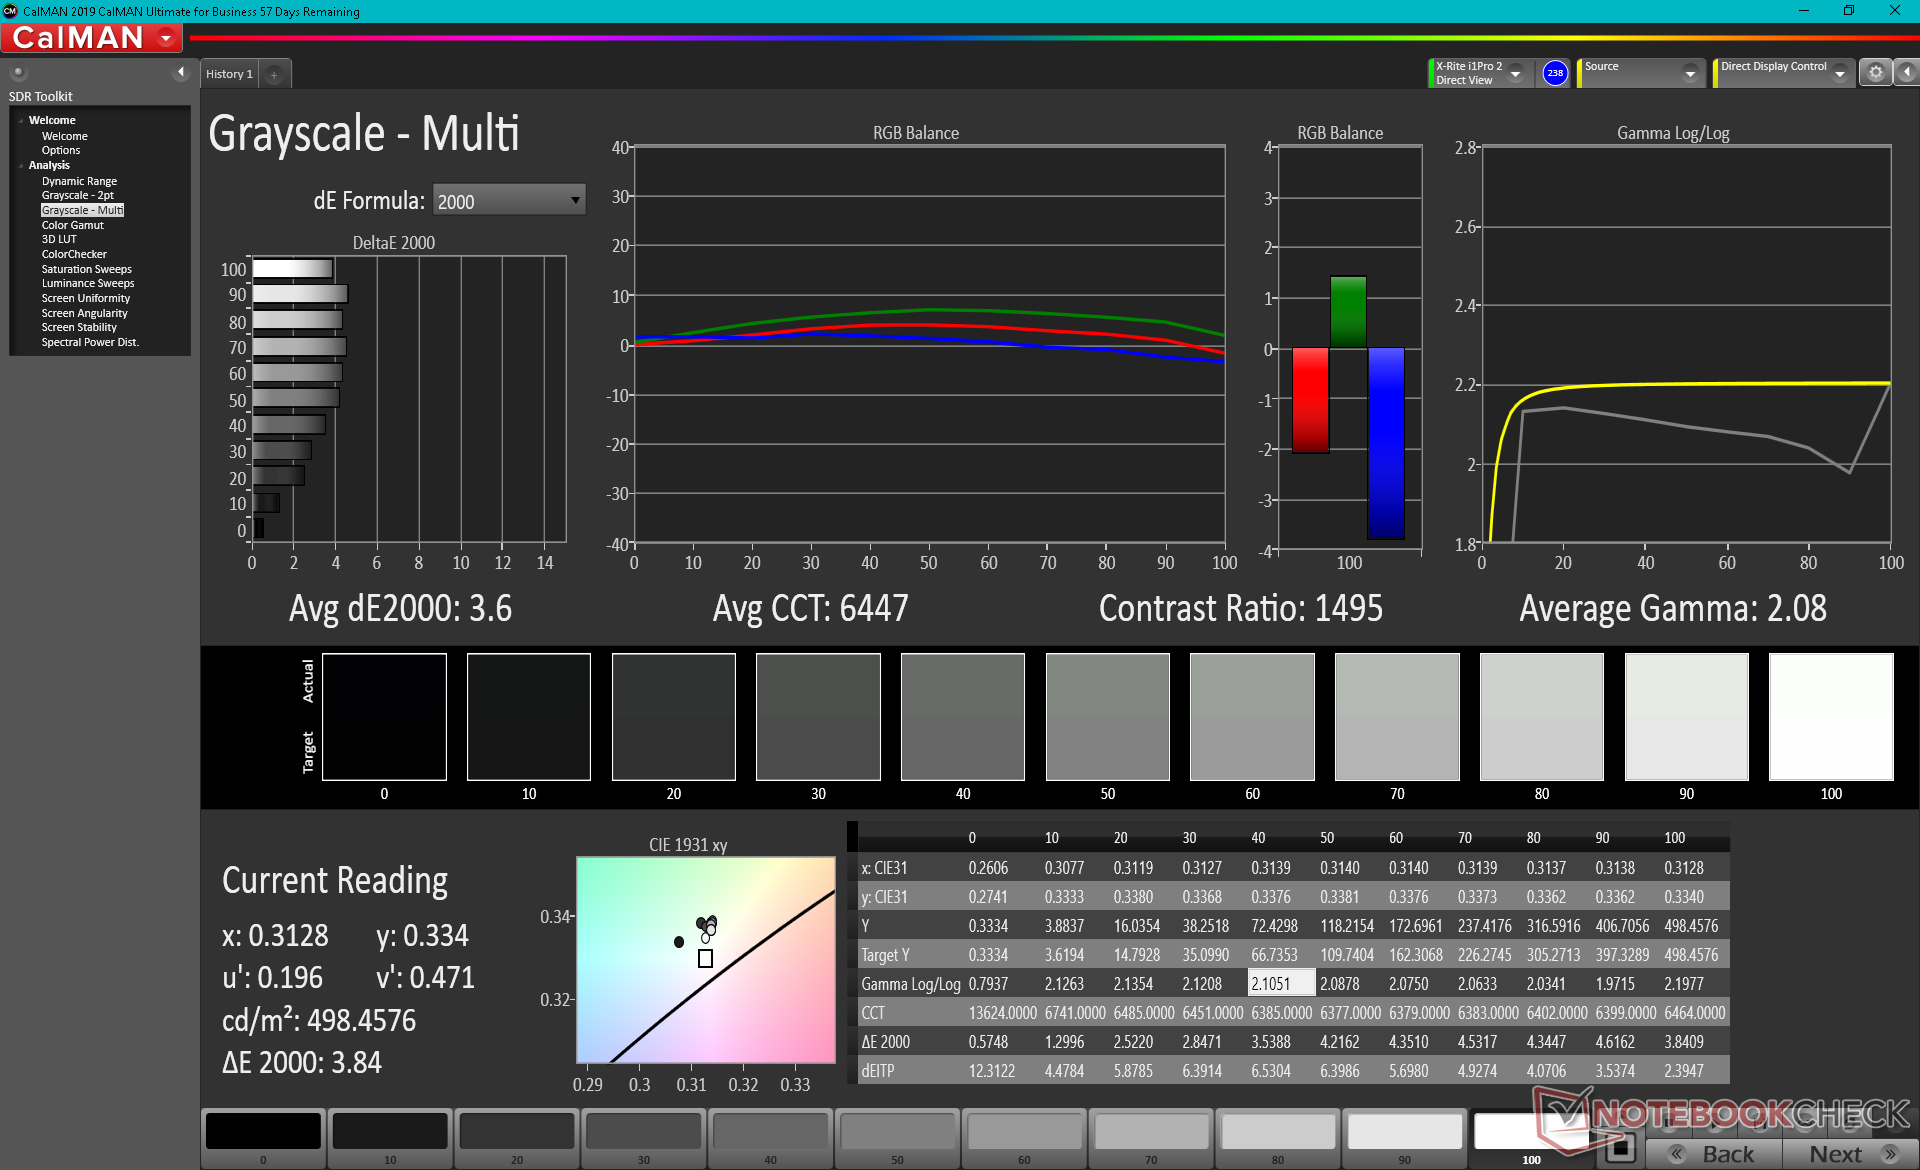
ΔE Greyscale Calman: 3.6 | ∀{0.09-98 Ø4.96}
100% AdobeRGB 1998 (Argyll 3D)
100% sRGB (Argyll 3D)
94.9% Display P3 (Argyll 3D)
Gamma: 2.08
CCT: 6447 K
| Dell Precision 5000 5560 Sharp LQ156R1, IPS, 15.6", 3840x2400 | Lenovo ThinkPad P15 G2-20YQ001JGE N156HCE_GN1, IPS, 15.6", 1920x1080 | HP ZBook Studio 15 G8 SDC4145, OLED, 15.6", 3840x2160 | Asus ProArt StudioBook Pro 15 W500G5T AU Optronics B156ZAN03.1, IPS, 15.6", 3840x2160 | Dell Precision 7550 AU Optronics B156ZAN, IPS, 15.6", 3840x2160 | Dell Precision 5550 P91F Sharp LQ156R1, IPS, 15.6", 3840x2400 | Razer Blade 15 Studio Edition 2020 Samsung SDCA029, OLED, 15.6", 3840x2160 | |
|---|---|---|---|---|---|---|---|
| Display | -19% | 0% | -7% | -5% | -2% | 1% | |
| Display P3 Coverage (%) | 94.9 | 68.6 -28% | 99.9 5% | 82.1 -13% | 82.1 -13% | 89.9 -5% | 99.9 5% |
| sRGB Coverage (%) | 100 | 99.8 0% | 100 0% | 97.6 -2% | 99.6 0% | 100 0% | 100 0% |
| AdobeRGB 1998 Coverage (%) | 100 | 70.6 -29% | 95.3 -5% | 95 -5% | 96.8 -3% | 99.9 0% | 97.3 -3% |
| Response Times | 34% | 94% | -19% | -10% | -5% | 90% | |
| Response Time Grey 50% / Grey 80% * (ms) | 47.2 ? | 37.6 ? 20% | 2.4 ? 95% | 58 ? -23% | 51.2 ? -8% | 46 ? 3% | 4 ? 92% |
| Response Time Black / White * (ms) | 30.4 ? | 16 ? 47% | 2.4 ? 92% | 35 ? -15% | 34 ? -12% | 34 ? -12% | 4 ? 87% |
| PWM Frequency (Hz) | 26040 ? | 240.4 ? | |||||
| Screen | 9% | -73% | 10% | -68% | -79% | 140% | |
| Brightness middle (cd/m²) | 501.5 | 498 -1% | 379.6 -24% | 344 -31% | 473.5 -6% | 469.8 -6% | 380 -24% |
| Brightness (cd/m²) | 467 | 490 5% | 380 -19% | 335 -28% | 461 -1% | 464 -1% | 388 -17% |
| Brightness Distribution (%) | 83 | 95 14% | 95 14% | 93 12% | 90 8% | 85 2% | 93 12% |
| Black Level * (cd/m²) | 0.44 | 0.39 11% | 0.37 16% | 0.55 -25% | 0.42 5% | 0.018 96% | |
| Contrast (:1) | 1140 | 1277 12% | 930 -18% | 861 -24% | 1119 -2% | 21111 1752% | |
| Colorchecker dE 2000 * | 4.73 | 2.1 56% | 5.15 -9% | 1.76 63% | 4.8 -1% | 5.16 -9% | 5.47 -16% |
| Colorchecker dE 2000 max. * | 8.45 | 5.6 34% | 7.79 8% | 4.31 49% | 8.73 -3% | 9.33 -10% | 8.19 3% |
| Colorchecker dE 2000 calibrated * | 0.51 | 0.8 -57% | 3.1 -508% | 3.08 -504% | 3.75 -635% | 3.04 -496% | |
| Greyscale dE 2000 * | 3.6 | 3.4 6% | 2.6 28% | 3.12 13% | 5.6 -56% | 5.5 -53% | 5.3 -47% |
| Gamma | 2.08 106% | 2.32 95% | 1.99 111% | 2.2 100% | 2.34 94% | 2 110% | 2.15 102% |
| CCT | 6447 101% | 7162 91% | 6166 105% | 6563 99% | 7549 86% | 6198 105% | 6128 106% |
| Color Space (Percent of AdobeRGB 1998) (%) | 85 | 86.4 | 89.2 | 86 | |||
| Color Space (Percent of sRGB) (%) | 98 | 99.7 | 100 | 100 | |||
| Média Total (Programa/Configurações) | 8% /
6% | 7% /
-27% | -5% /
1% | -28% /
-46% | -29% /
-52% | 77% /
103% |
* ... menor é melhor
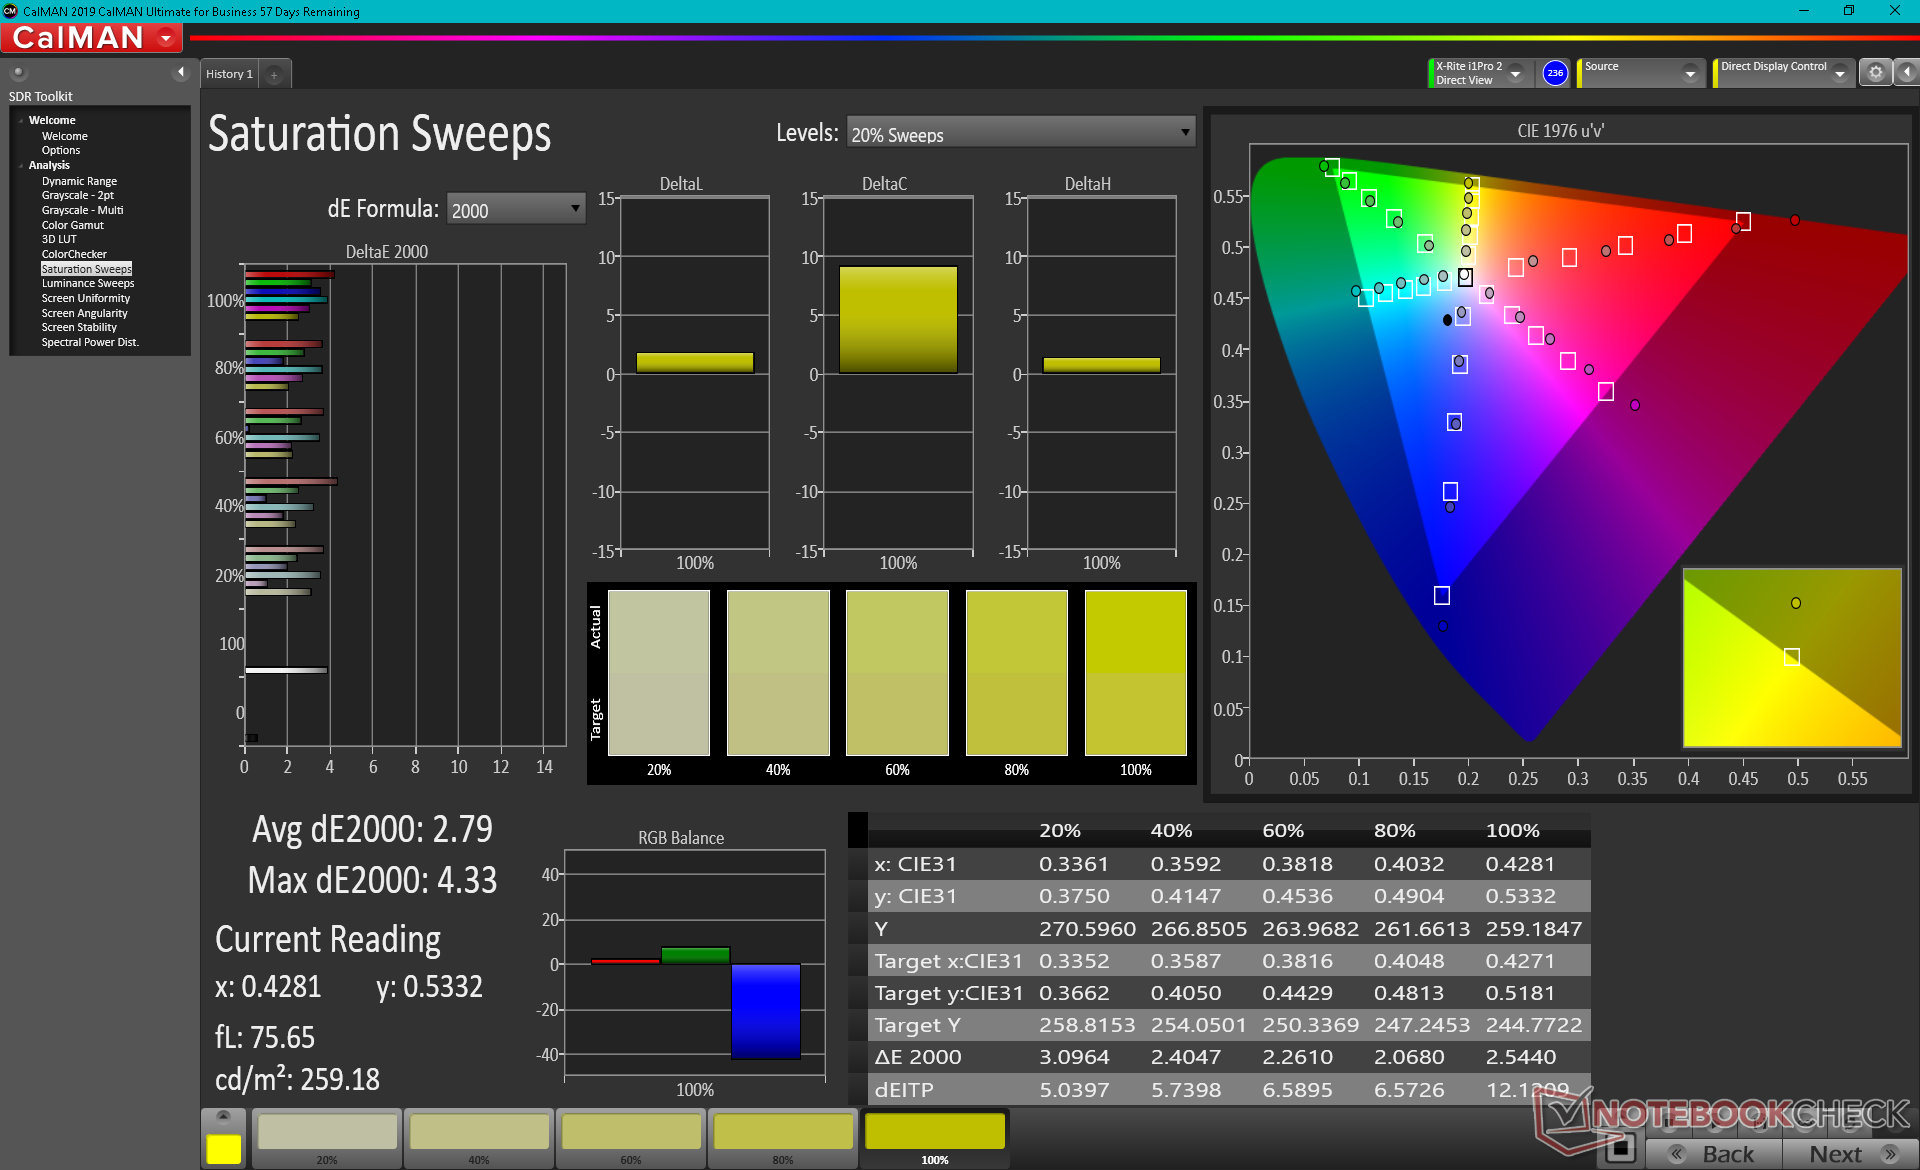
As cores poderiam ter sido melhor calibradas fora da caixa, pois os valores médios de escala de cinza e deltaE de cor são apenas decentes em 3,6 e 4,73, respectivamente. Somos capazes de elevar os dois valores a menos de um cada um após calibrarmos com nosso colorímetro X-Rite.
Exibir tempos de resposta
| ↔ Tempo de resposta preto para branco | ||
|---|---|---|
| 30.4 ms ... ascensão ↗ e queda ↘ combinadas | ↗ 16.4 ms ascensão | 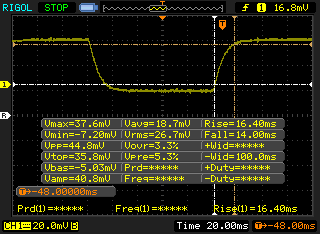 |
| ↘ 14 ms queda | ||
| A tela mostra taxas de resposta lentas em nossos testes e será insatisfatória para os jogadores. Em comparação, todos os dispositivos testados variam de 0.1 (mínimo) a 240 (máximo) ms. » 82 % de todos os dispositivos são melhores. Isso significa que o tempo de resposta medido é pior que a média de todos os dispositivos testados (19.8 ms). | ||
| ↔ Tempo de resposta 50% cinza a 80% cinza | ||
| 47.2 ms ... ascensão ↗ e queda ↘ combinadas | ↗ 25.2 ms ascensão | 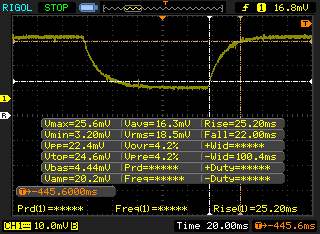 |
| ↘ 22 ms queda | ||
| A tela mostra taxas de resposta lentas em nossos testes e será insatisfatória para os jogadores. Em comparação, todos os dispositivos testados variam de 0.165 (mínimo) a 636 (máximo) ms. » 82 % de todos os dispositivos são melhores. Isso significa que o tempo de resposta medido é pior que a média de todos os dispositivos testados (31 ms). | ||
Cintilação da tela / PWM (modulação por largura de pulso)
| Tela tremeluzindo / PWM não detectado | 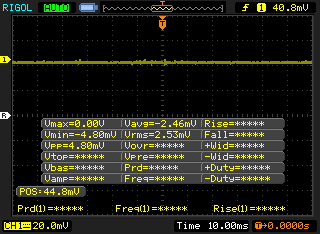 | ||
[pwm_comparison] Em comparação: 52 % de todos os dispositivos testados não usam PWM para escurecer a tela. Se PWM foi detectado, uma média de 7757 (mínimo: 5 - máximo: 343500) Hz foi medida. | |||
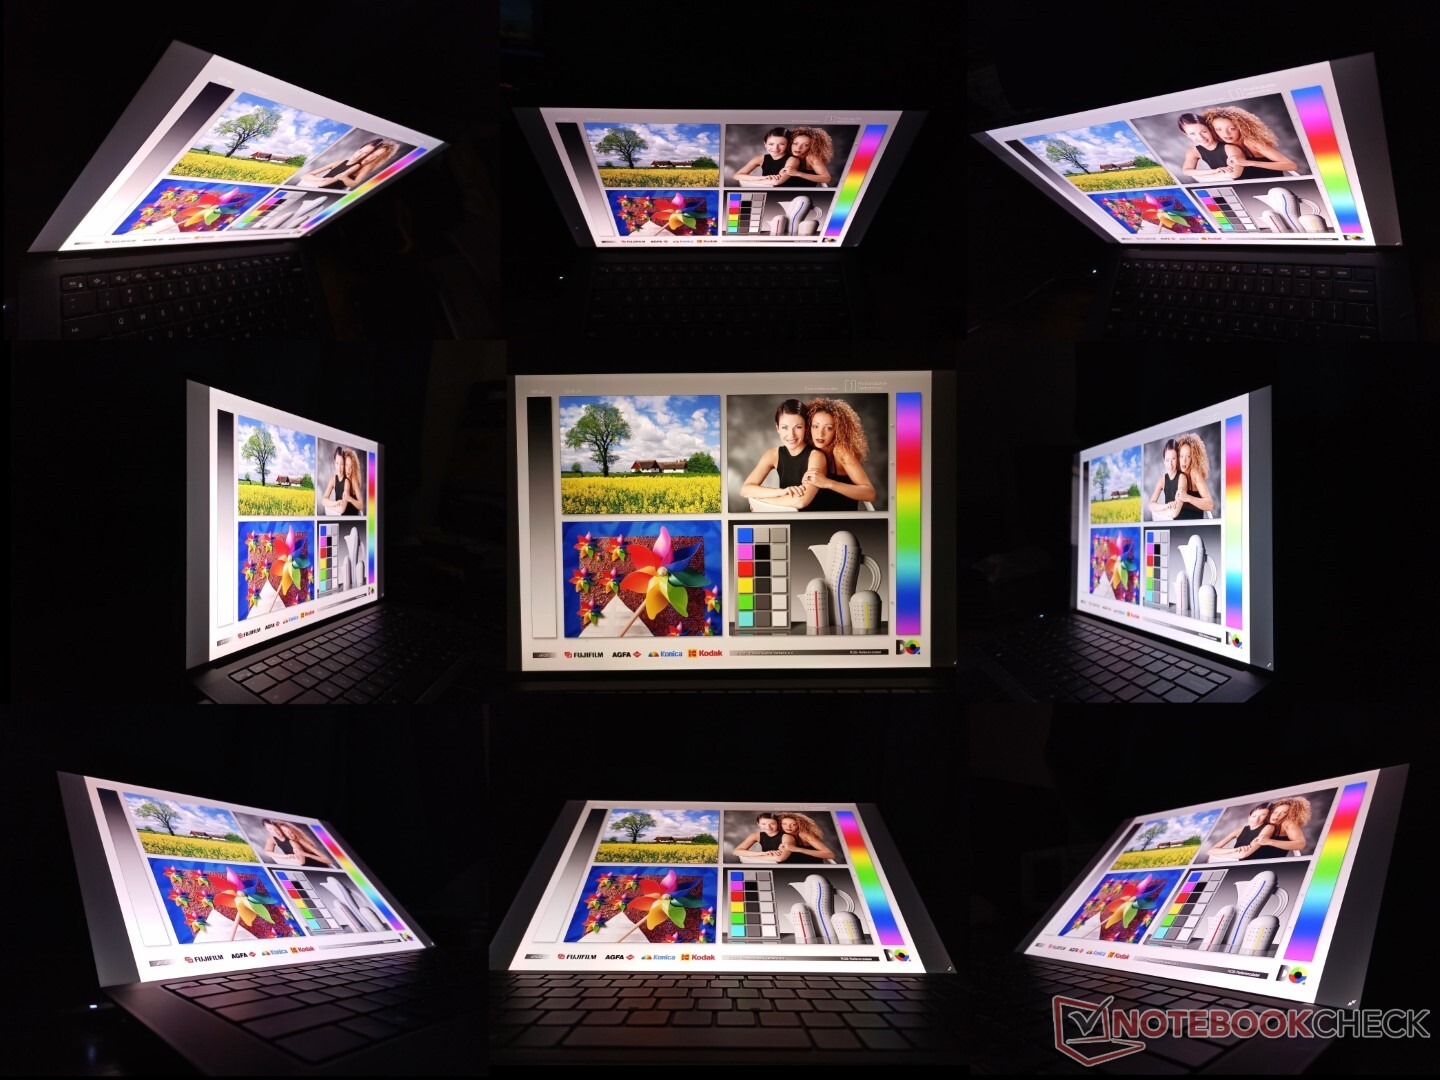
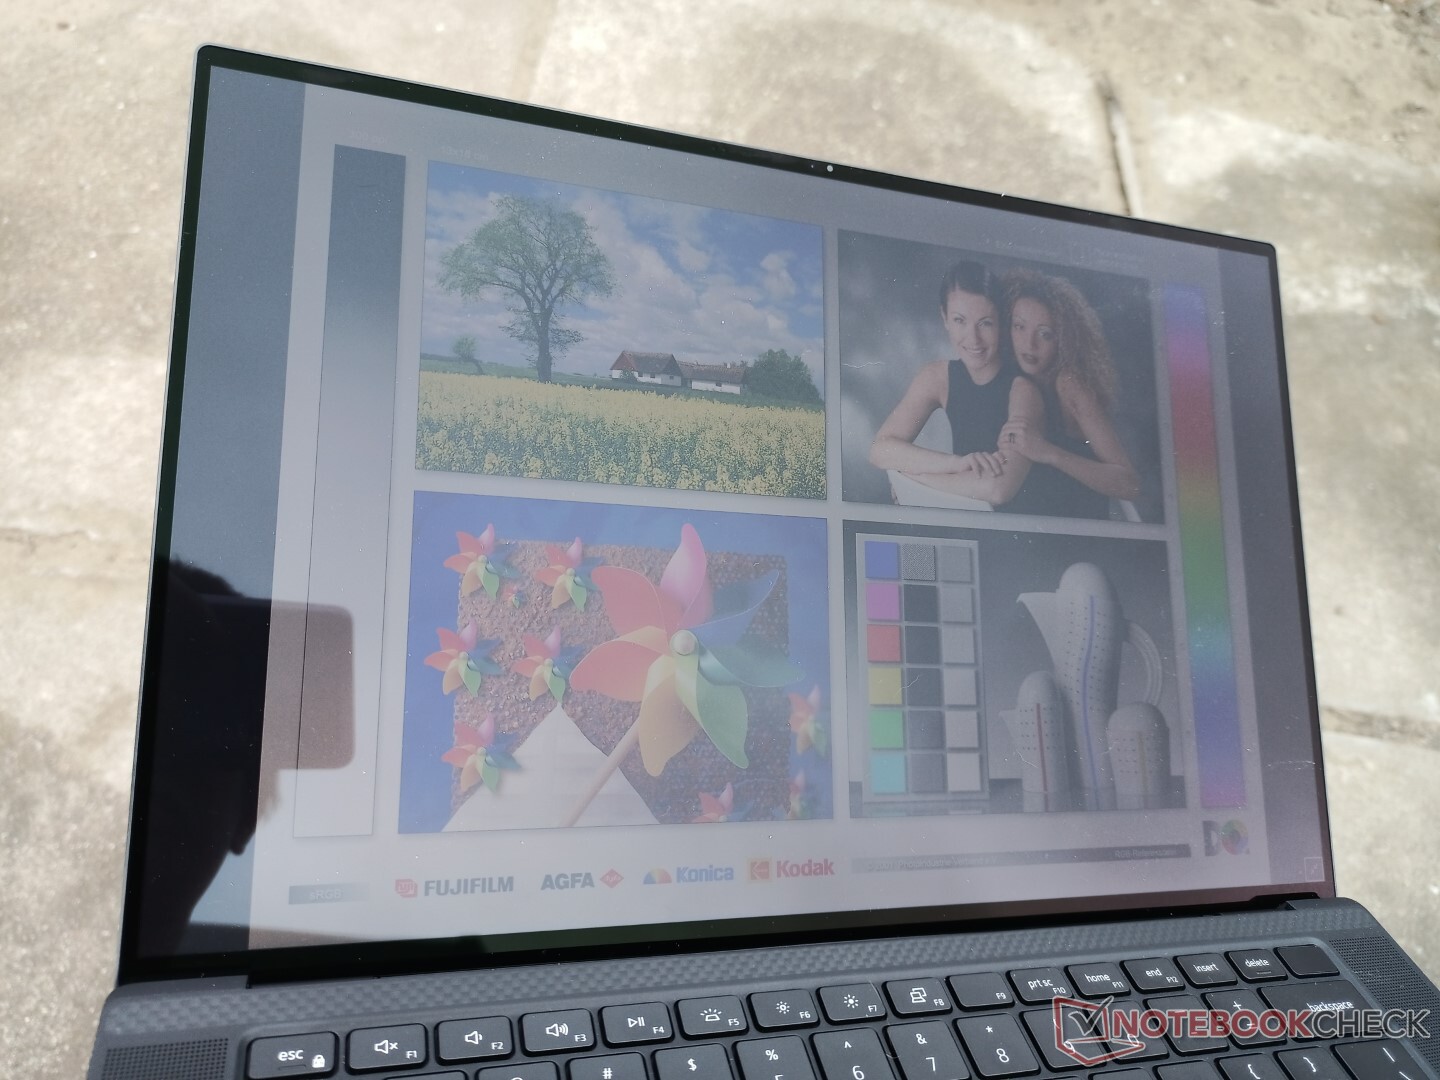
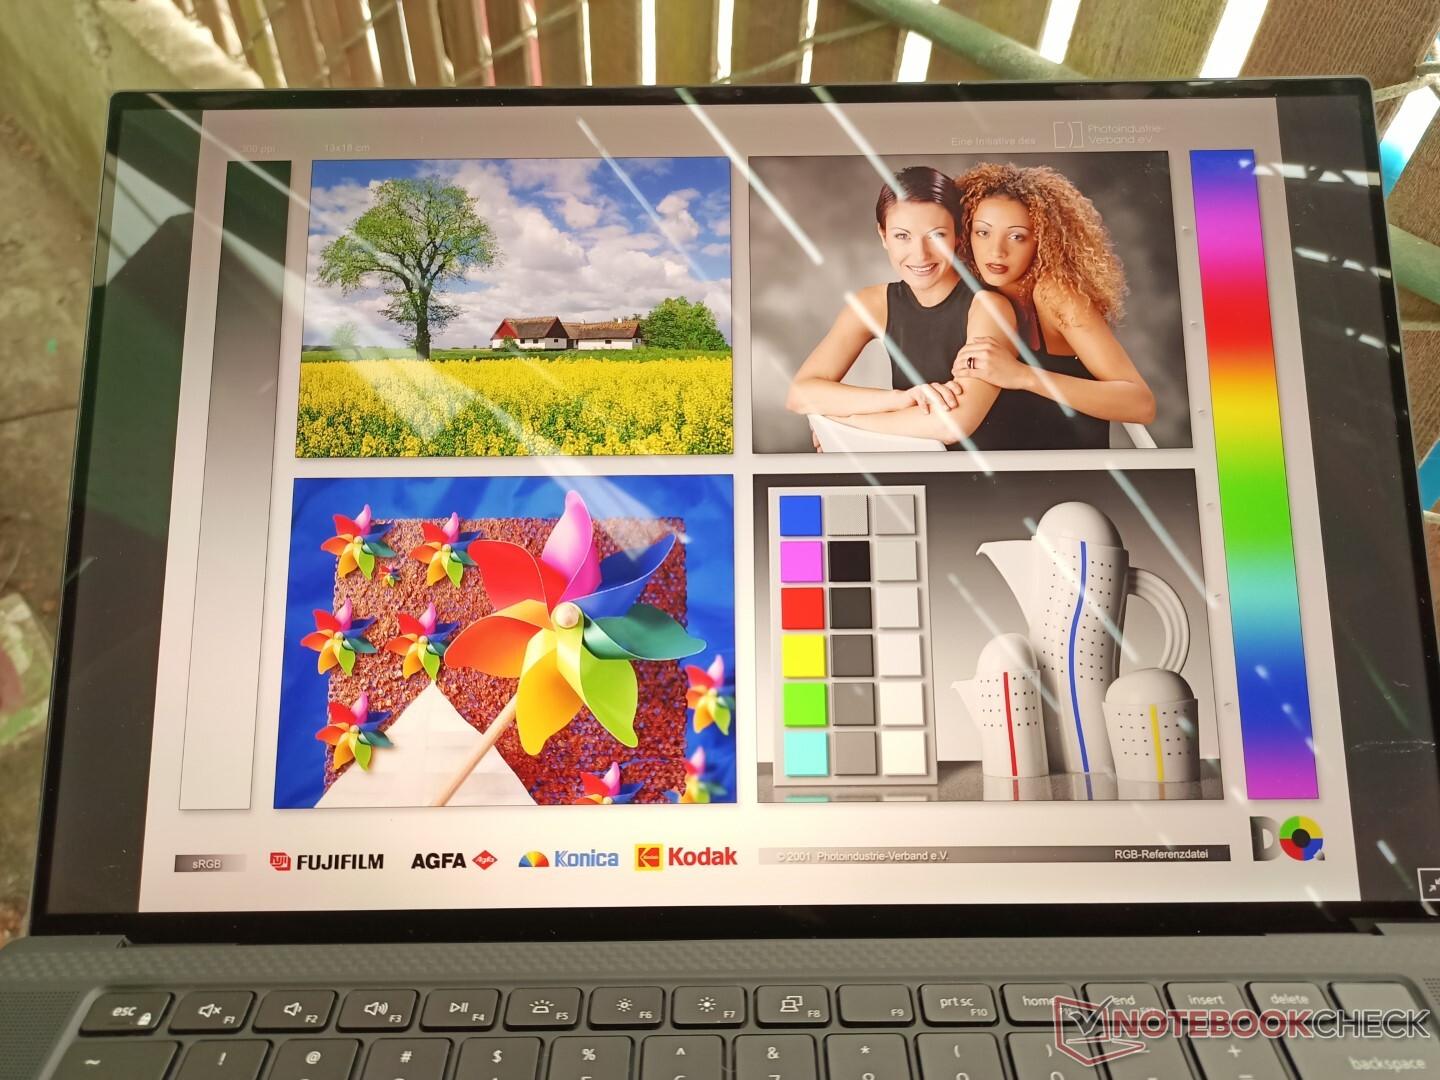
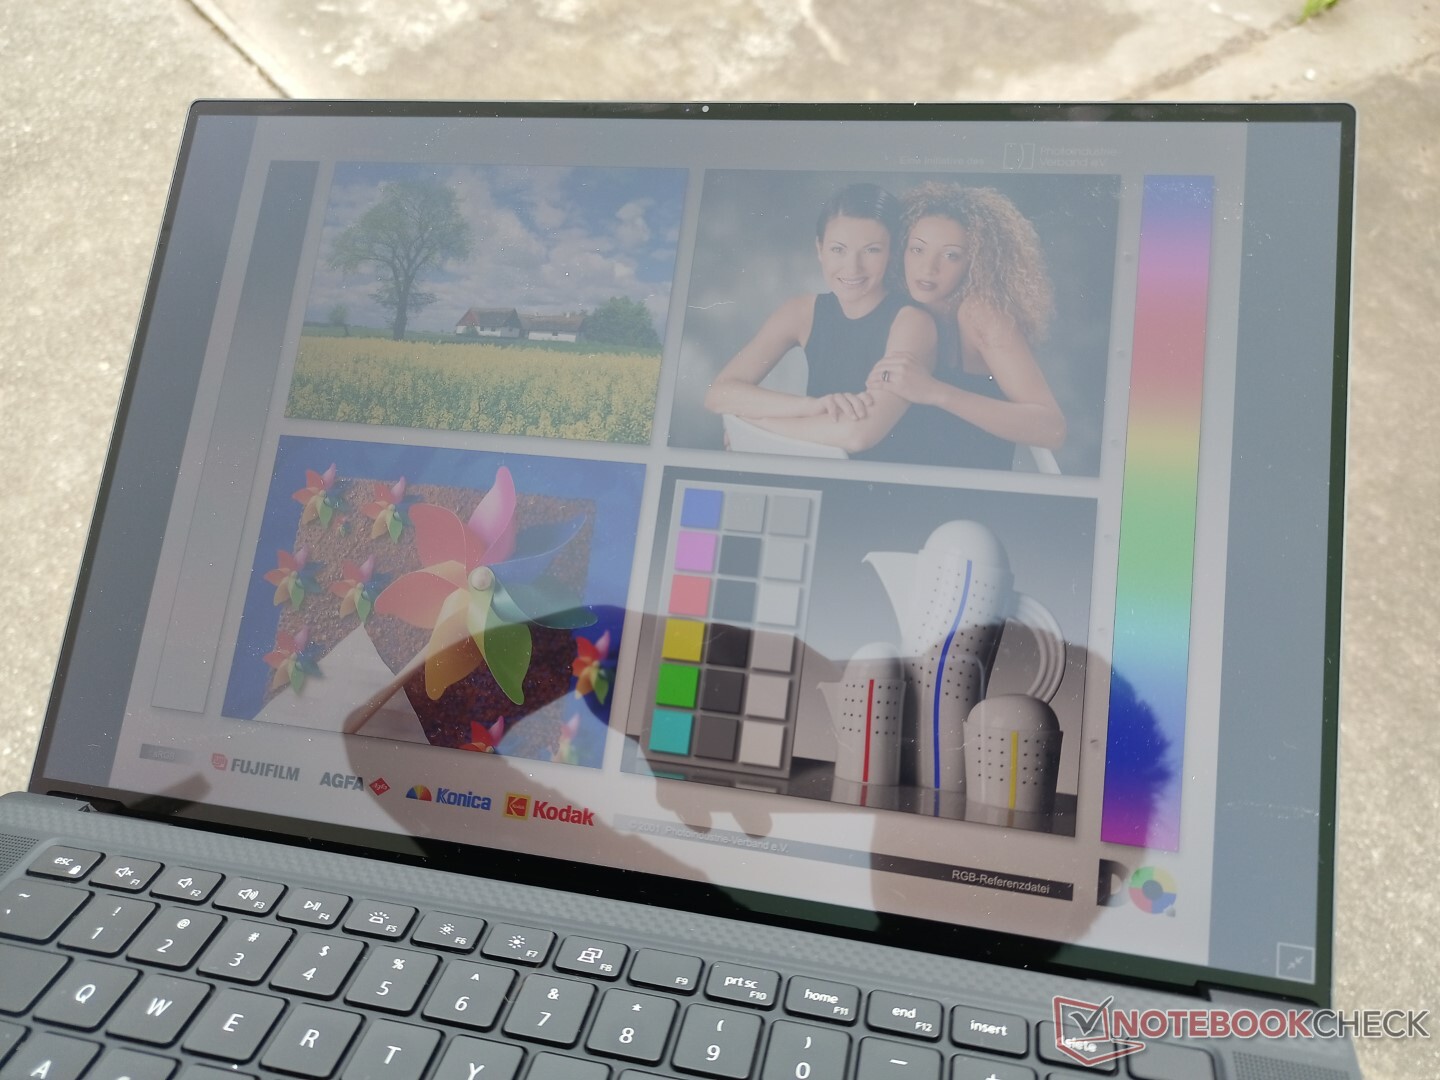
A visibilidade ao ar livre é melhor do que na Estúdio Razer Blade 15 ou Asus ProArt devido à luz de fundo mais brilhante em nosso Precision 5560. No entanto, algum brilho estará sempre presente na camada de brilho. Os usuários podem querer considerar a opção de tela mate 1200p para reduzir o brilho.
Desempenho - Gráficos de 45 W TGP Quadro RTX
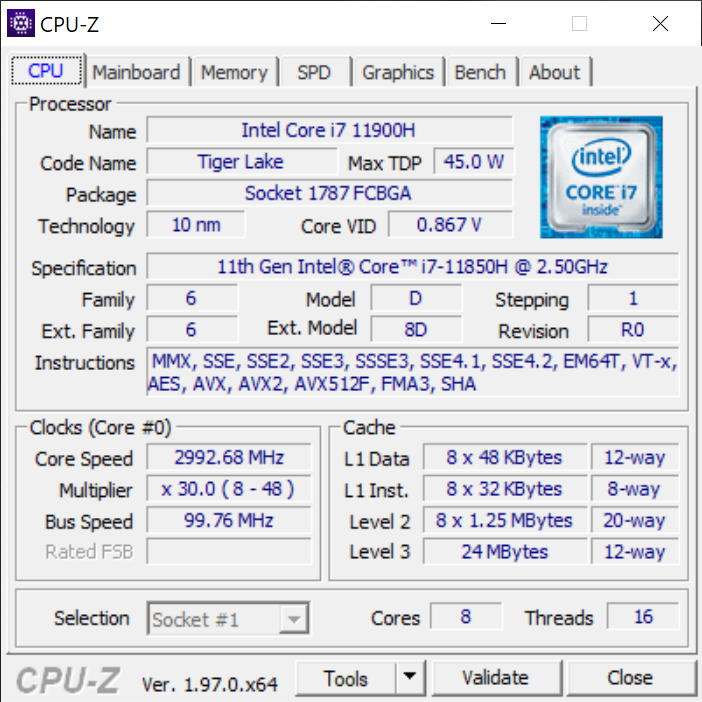
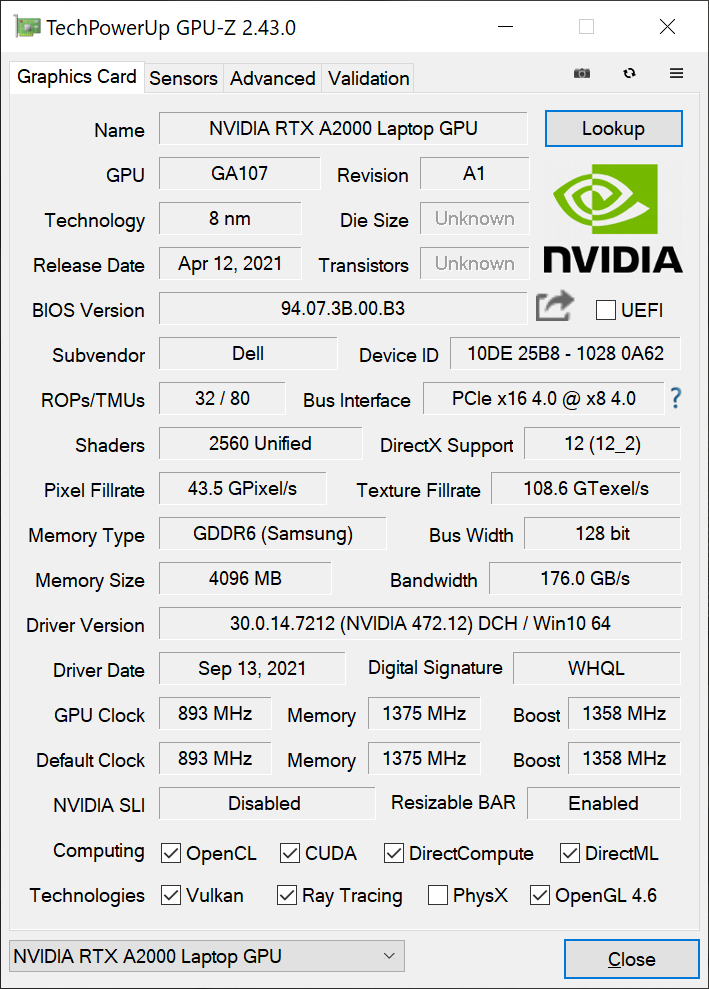
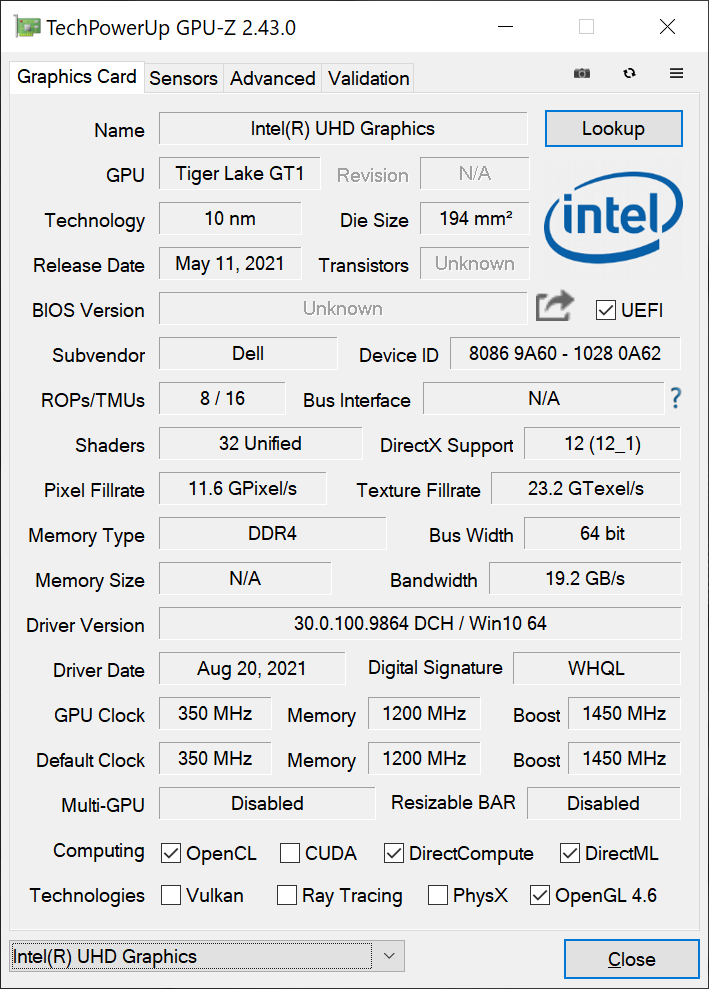
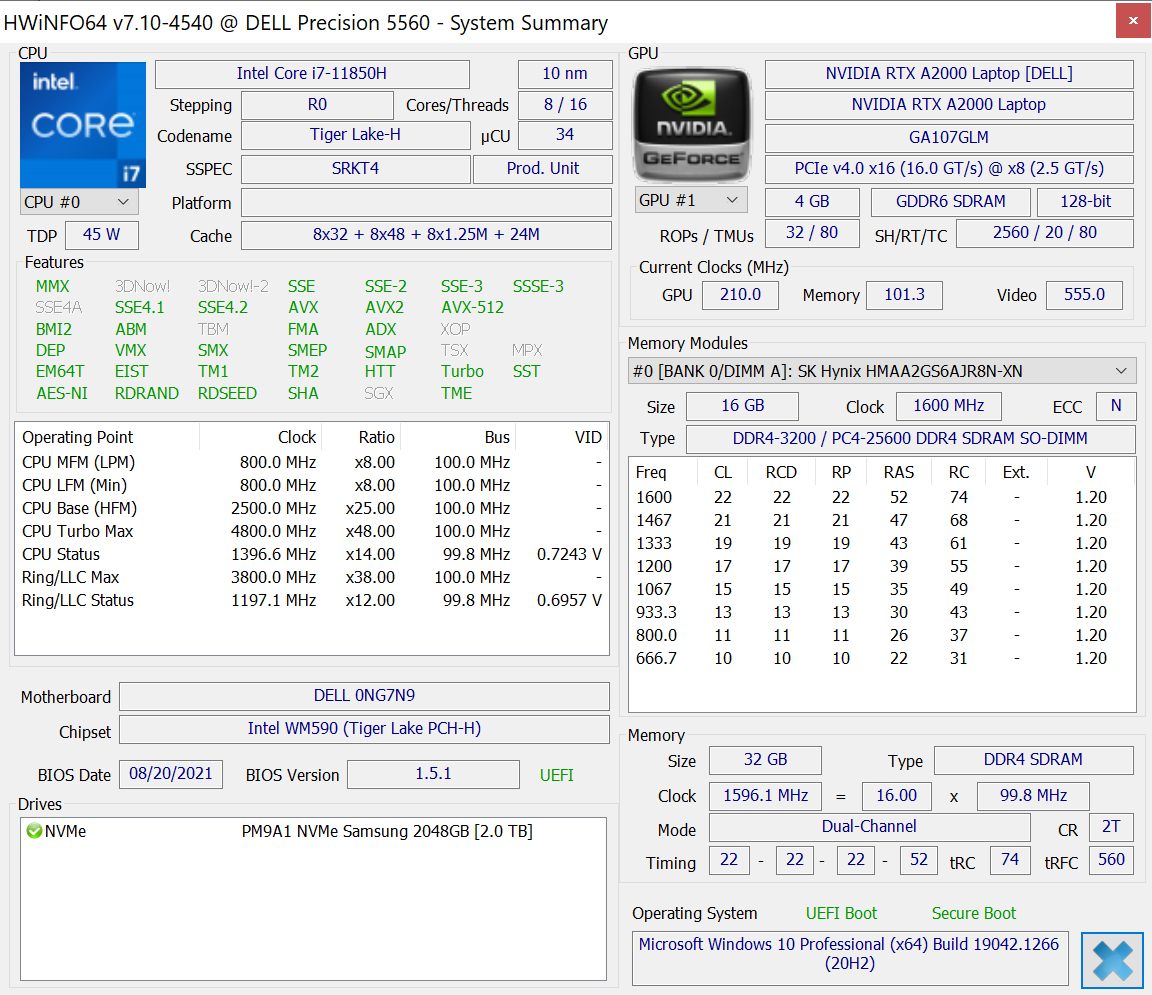
A Dell oferece ambos os produtos não-vPro (i5-11500H, i7-11800H) e vPro (i7-11850H, i9-11950H, Xeon W-11955M) Tiger Lake-H opções ao lado das GPUs Nvidia Quadro (NVIDIA T1200, RTX A2000) para quase todas as configurações. Estas GPUs, vPro CPUs, e a RAM ECC opcional associada são o que separa o Precision 5560 da série XPS 15 a nível de consumidor
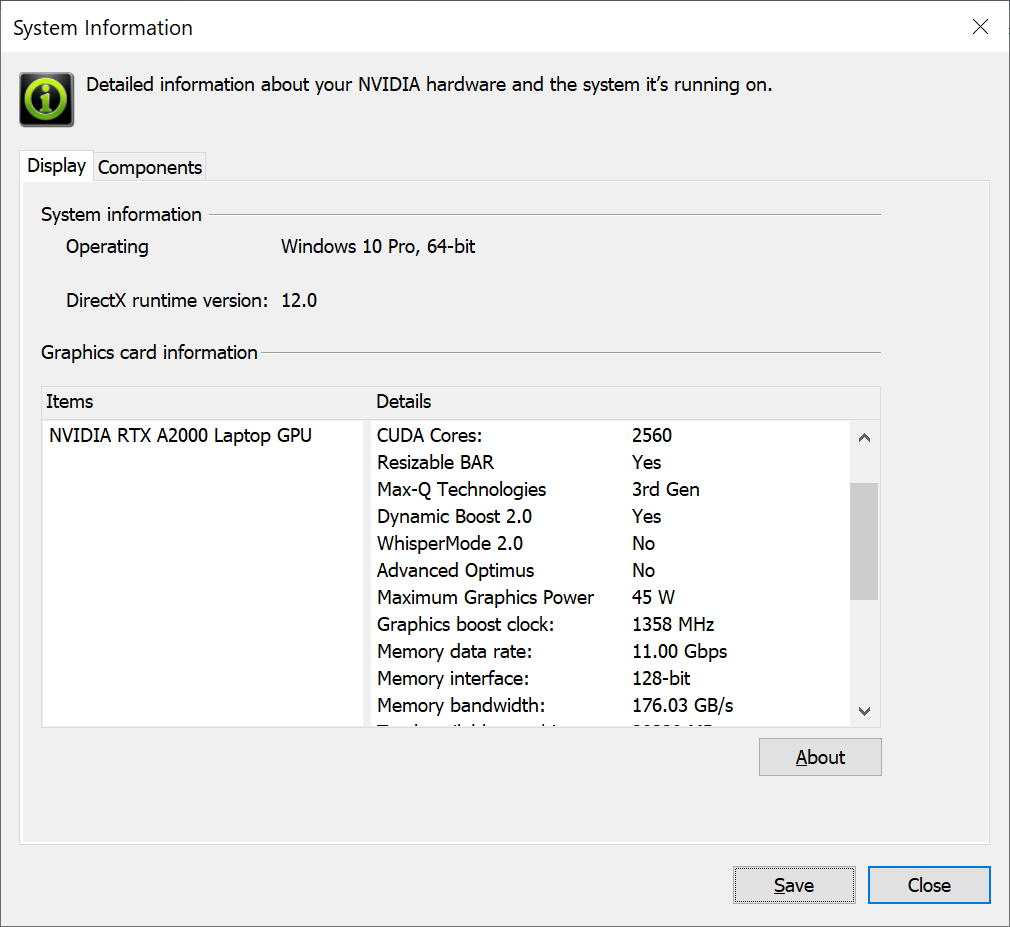
A GPU Quadro RTX A2000 em nossa unidade de teste suporta Barra Redimensionável e Dynamic Boost 2.0, mas sem suporte para Advanced Optimus ou WhisperMode 2.0. Com apenas 45 W TGP, esta é tecnicamente uma GPU Max-Q, mesmo que Max-Q não esteja no nome. O antigo Quadro T2000 Max-Q no Precision 5550 foi estimado para a faixa de 40 W TGP em comparação
Nossa unidade foi ajustada para o modo Ultra Performance através do software Dell Power Manager antes de executar nossos benchmarks abaixo para as mais altas pontuações possíveis.
Processador
O desempenho geral multi-tarefa é cerca de 15% mais lento que o Core i7-11800H, que é o preço a pagar pelo suporte vPro integrado. Espera-se que a atualização para o Core i9-11950H aumente o desempenho multi-tarefa em até 20% com base em nossa experiência com o HP ZBook Studio 15 G8. No entanto, o desempenho com uma única linha permanece quase idêntico
A sustentabilidade do desempenho é excelente, como mostram os resultados consistentes do CineBench R15 xT abaixo.
Cinebench R15 Multi Loop
Cinebench R23: Multi Core | Single Core
Cinebench R15: CPU Multi 64Bit | CPU Single 64Bit
Blender: v2.79 BMW27 CPU
7-Zip 18.03: 7z b 4 -mmt1 | 7z b 4
Geekbench 5.5: Single-Core | Multi-Core
HWBOT x265 Benchmark v2.2: 4k Preset
LibreOffice : 20 Documents To PDF
R Benchmark 2.5: Overall mean
| Cinebench R23 / Multi Core | |
| Lenovo Legion 5 15ACH-82JU00C6GE-FL | |
| HP ZBook Studio 15 G8 | |
| Lenovo ThinkPad P15 G2-20YQ001JGE | |
| Média Intel Core i7-11850H (9779 - 11935, n=2) | |
| HP ZBook Studio G7 | |
| Dell Precision 5000 5560 | |
| Lenovo ThinkPad P15 Gen1-20ST000DGE | |
| Lenovo ThinkPad P15s Gen2-20W6000GGE | |
| Cinebench R23 / Single Core | |
| HP ZBook Studio 15 G8 | |
| Média Intel Core i7-11850H (1513 - 1552, n=2) | |
| Dell Precision 5000 5560 | |
| Lenovo ThinkPad P15 G2-20YQ001JGE | |
| Lenovo ThinkPad P15s Gen2-20W6000GGE | |
| Lenovo Legion 5 15ACH-82JU00C6GE-FL | |
| HP ZBook Studio G7 | |
| Lenovo ThinkPad P15 Gen1-20ST000DGE | |
Cinebench R23: Multi Core | Single Core
Cinebench R15: CPU Multi 64Bit | CPU Single 64Bit
Blender: v2.79 BMW27 CPU
7-Zip 18.03: 7z b 4 -mmt1 | 7z b 4
Geekbench 5.5: Single-Core | Multi-Core
HWBOT x265 Benchmark v2.2: 4k Preset
LibreOffice : 20 Documents To PDF
R Benchmark 2.5: Overall mean
* ... menor é melhor
Desempenho do sistema
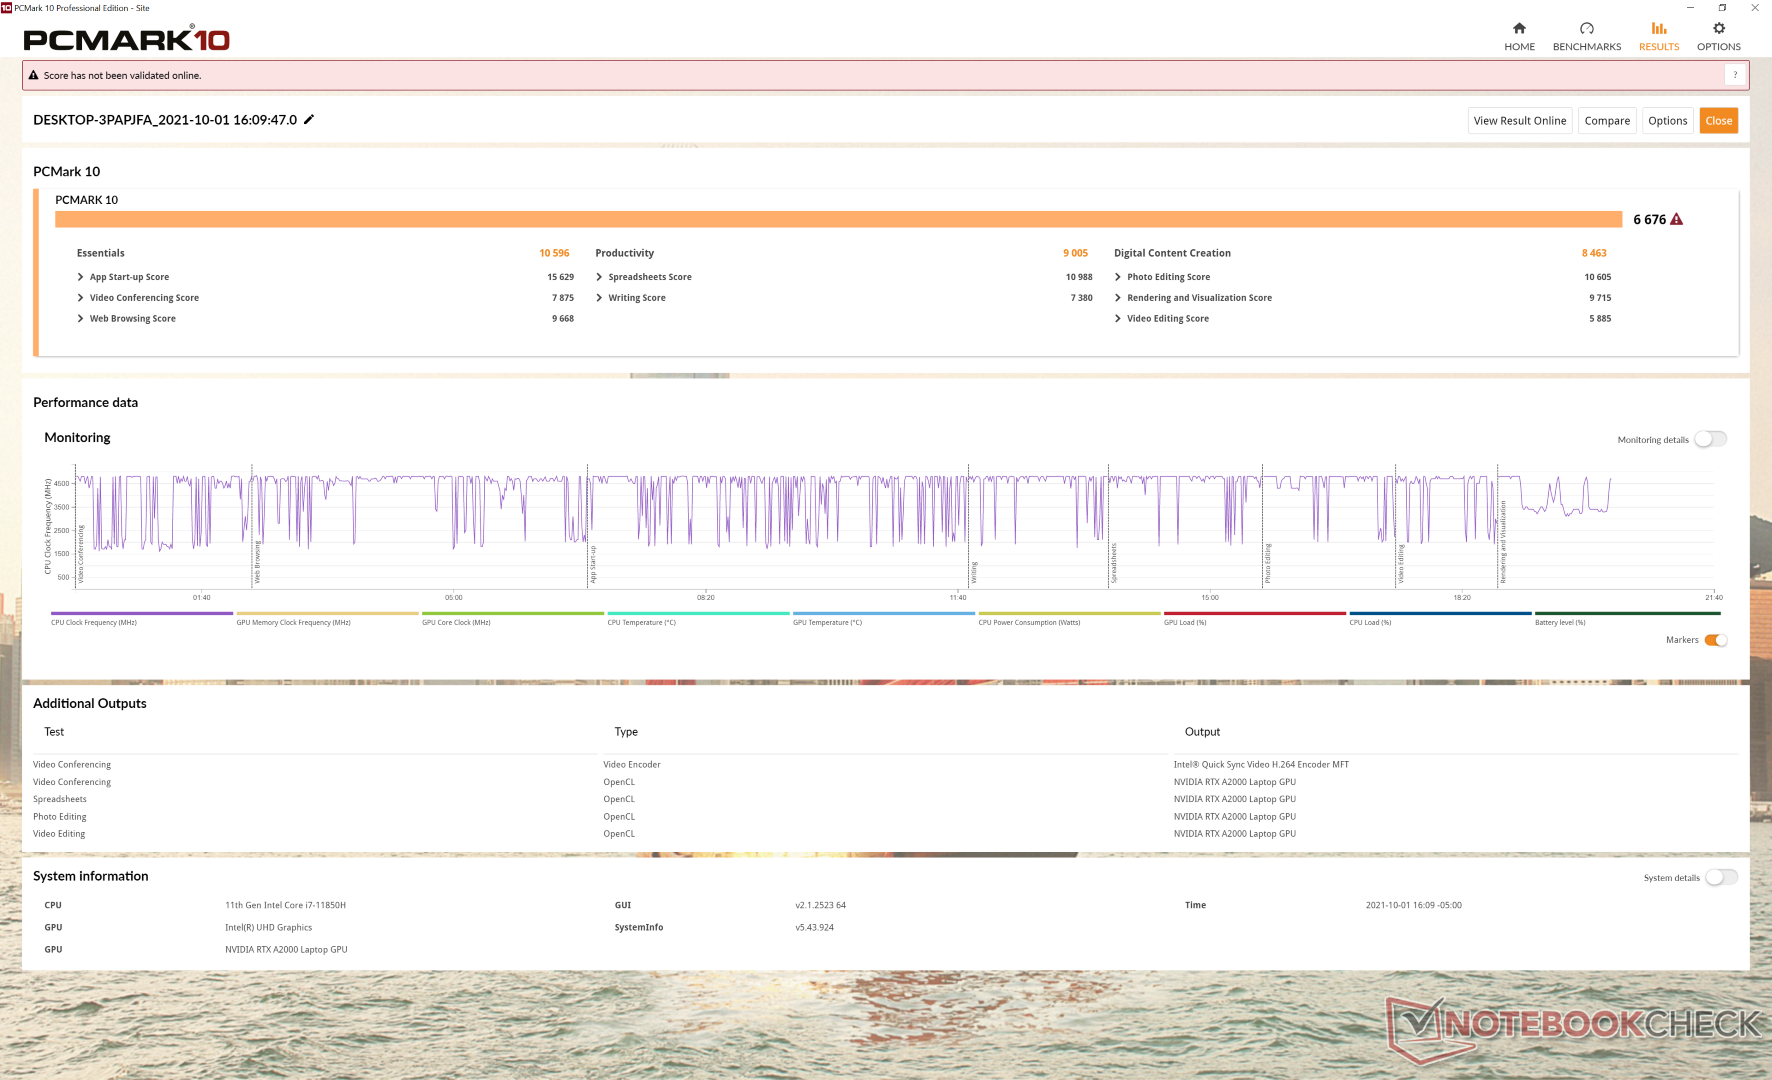
As pontuações da PCMark são consistentemente mais altas do que no Precision 5550, especialmente no benchmark de Criação de Conteúdo Digital Pesado por GPU, onde o RTX A2000 pode flexionar sobre o Quadro T2000 Max-Q.
| PCMark 10 / Score | |
| HP ZBook Studio 15 G8 | |
| Dell Precision 5000 5560 | |
| Média Intel Core i7-11850H, NVIDIA RTX A2000 Laptop GPU (n=1) | |
| Lenovo ThinkPad P15 G2-20YQ001JGE | |
| Dell Precision 7550 | |
| Dell Precision 5550 P91F | |
| Razer Blade 15 Studio Edition 2020 | |
| Asus ProArt StudioBook Pro 15 W500G5T | |
| PCMark 10 / Essentials | |
| Dell Precision 5000 5560 | |
| Média Intel Core i7-11850H, NVIDIA RTX A2000 Laptop GPU (n=1) | |
| Lenovo ThinkPad P15 G2-20YQ001JGE | |
| HP ZBook Studio 15 G8 | |
| Dell Precision 5550 P91F | |
| Dell Precision 7550 | |
| Razer Blade 15 Studio Edition 2020 | |
| Asus ProArt StudioBook Pro 15 W500G5T | |
| PCMark 10 / Productivity | |
| Dell Precision 5000 5560 | |
| Média Intel Core i7-11850H, NVIDIA RTX A2000 Laptop GPU (n=1) | |
| HP ZBook Studio 15 G8 | |
| Lenovo ThinkPad P15 G2-20YQ001JGE | |
| Razer Blade 15 Studio Edition 2020 | |
| Dell Precision 7550 | |
| Dell Precision 5550 P91F | |
| Asus ProArt StudioBook Pro 15 W500G5T | |
| PCMark 10 / Digital Content Creation | |
| HP ZBook Studio 15 G8 | |
| Lenovo ThinkPad P15 G2-20YQ001JGE | |
| Dell Precision 5000 5560 | |
| Média Intel Core i7-11850H, NVIDIA RTX A2000 Laptop GPU (n=1) | |
| Dell Precision 7550 | |
| Dell Precision 5550 P91F | |
| Asus ProArt StudioBook Pro 15 W500G5T | |
| Razer Blade 15 Studio Edition 2020 | |
| PCMark 10 Score | 6676 pontos | |
Ajuda | ||
Latência do DPC
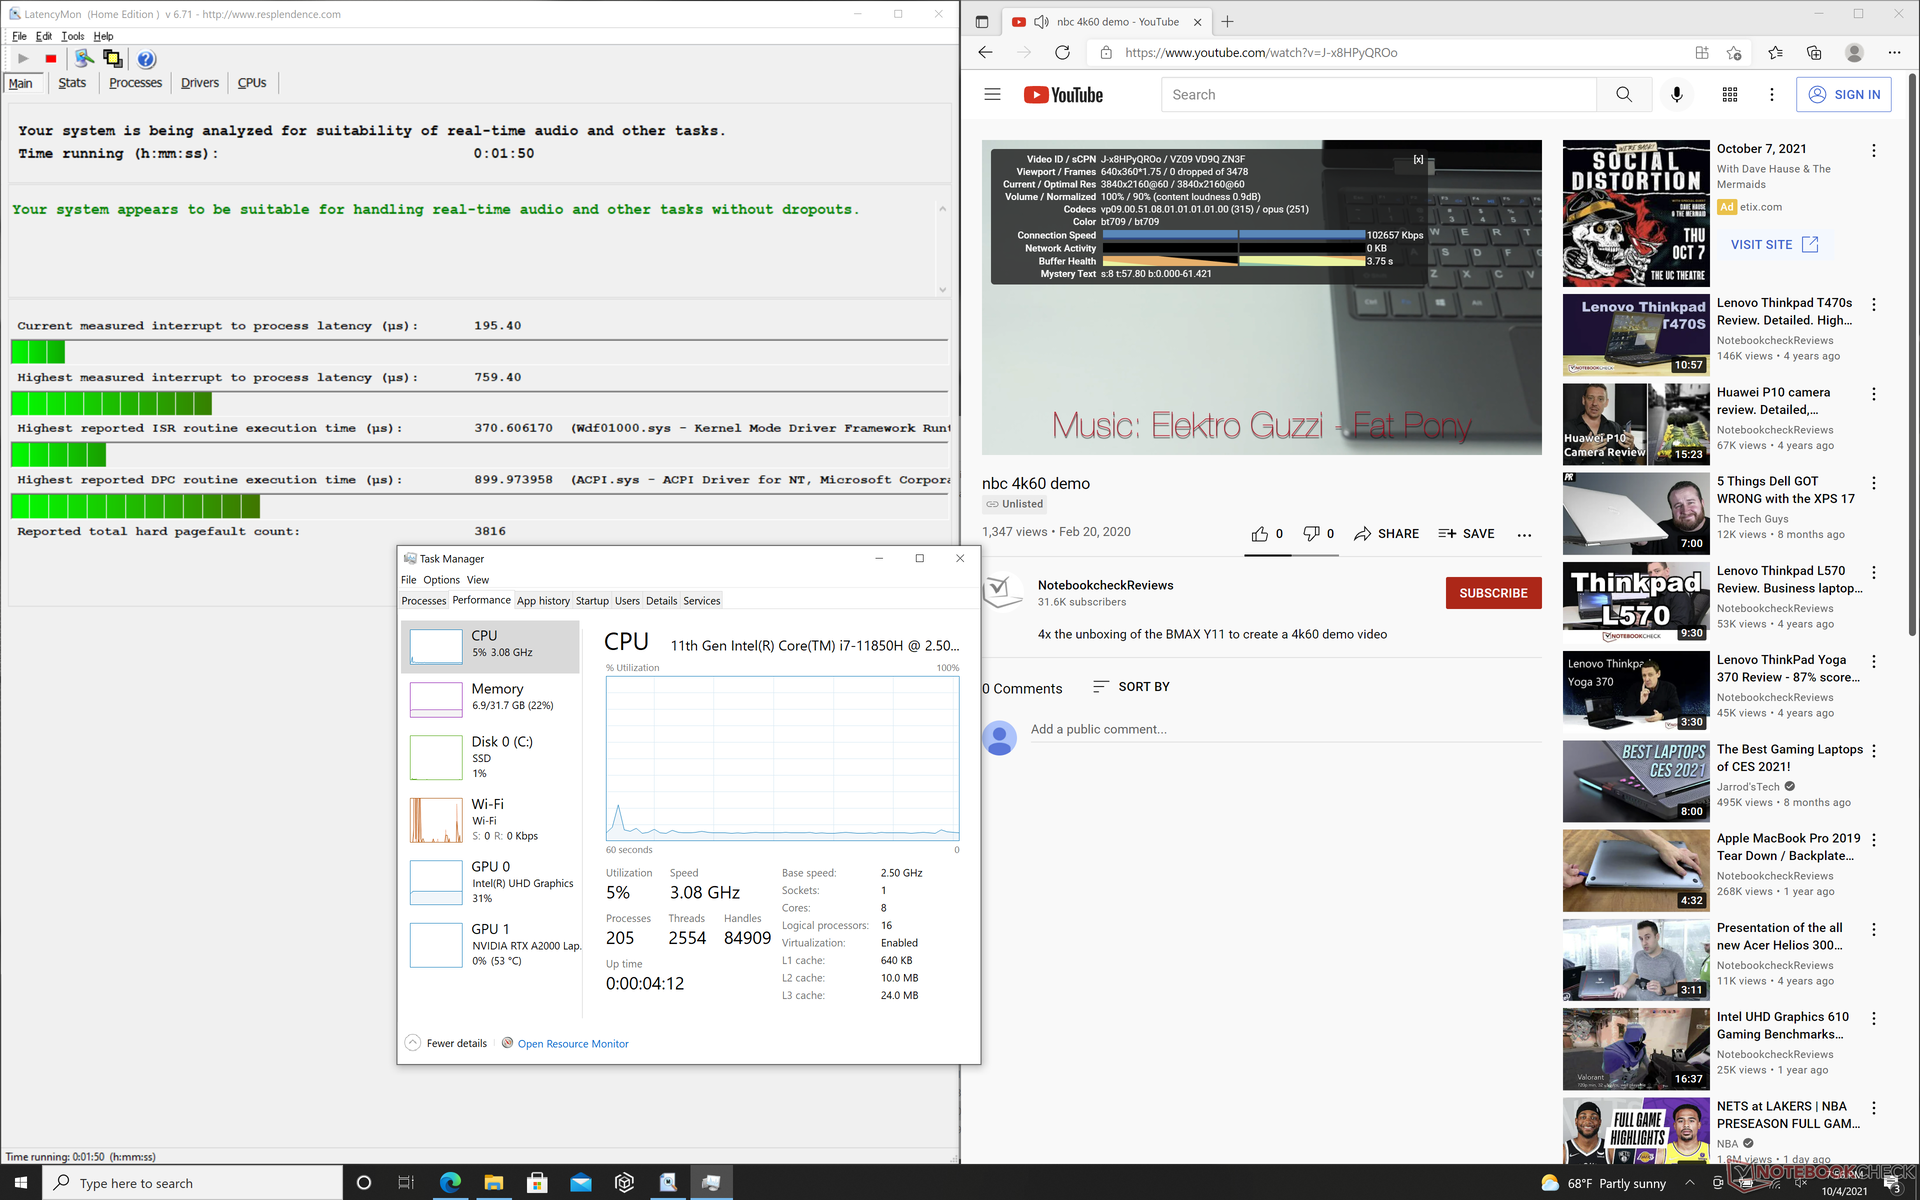
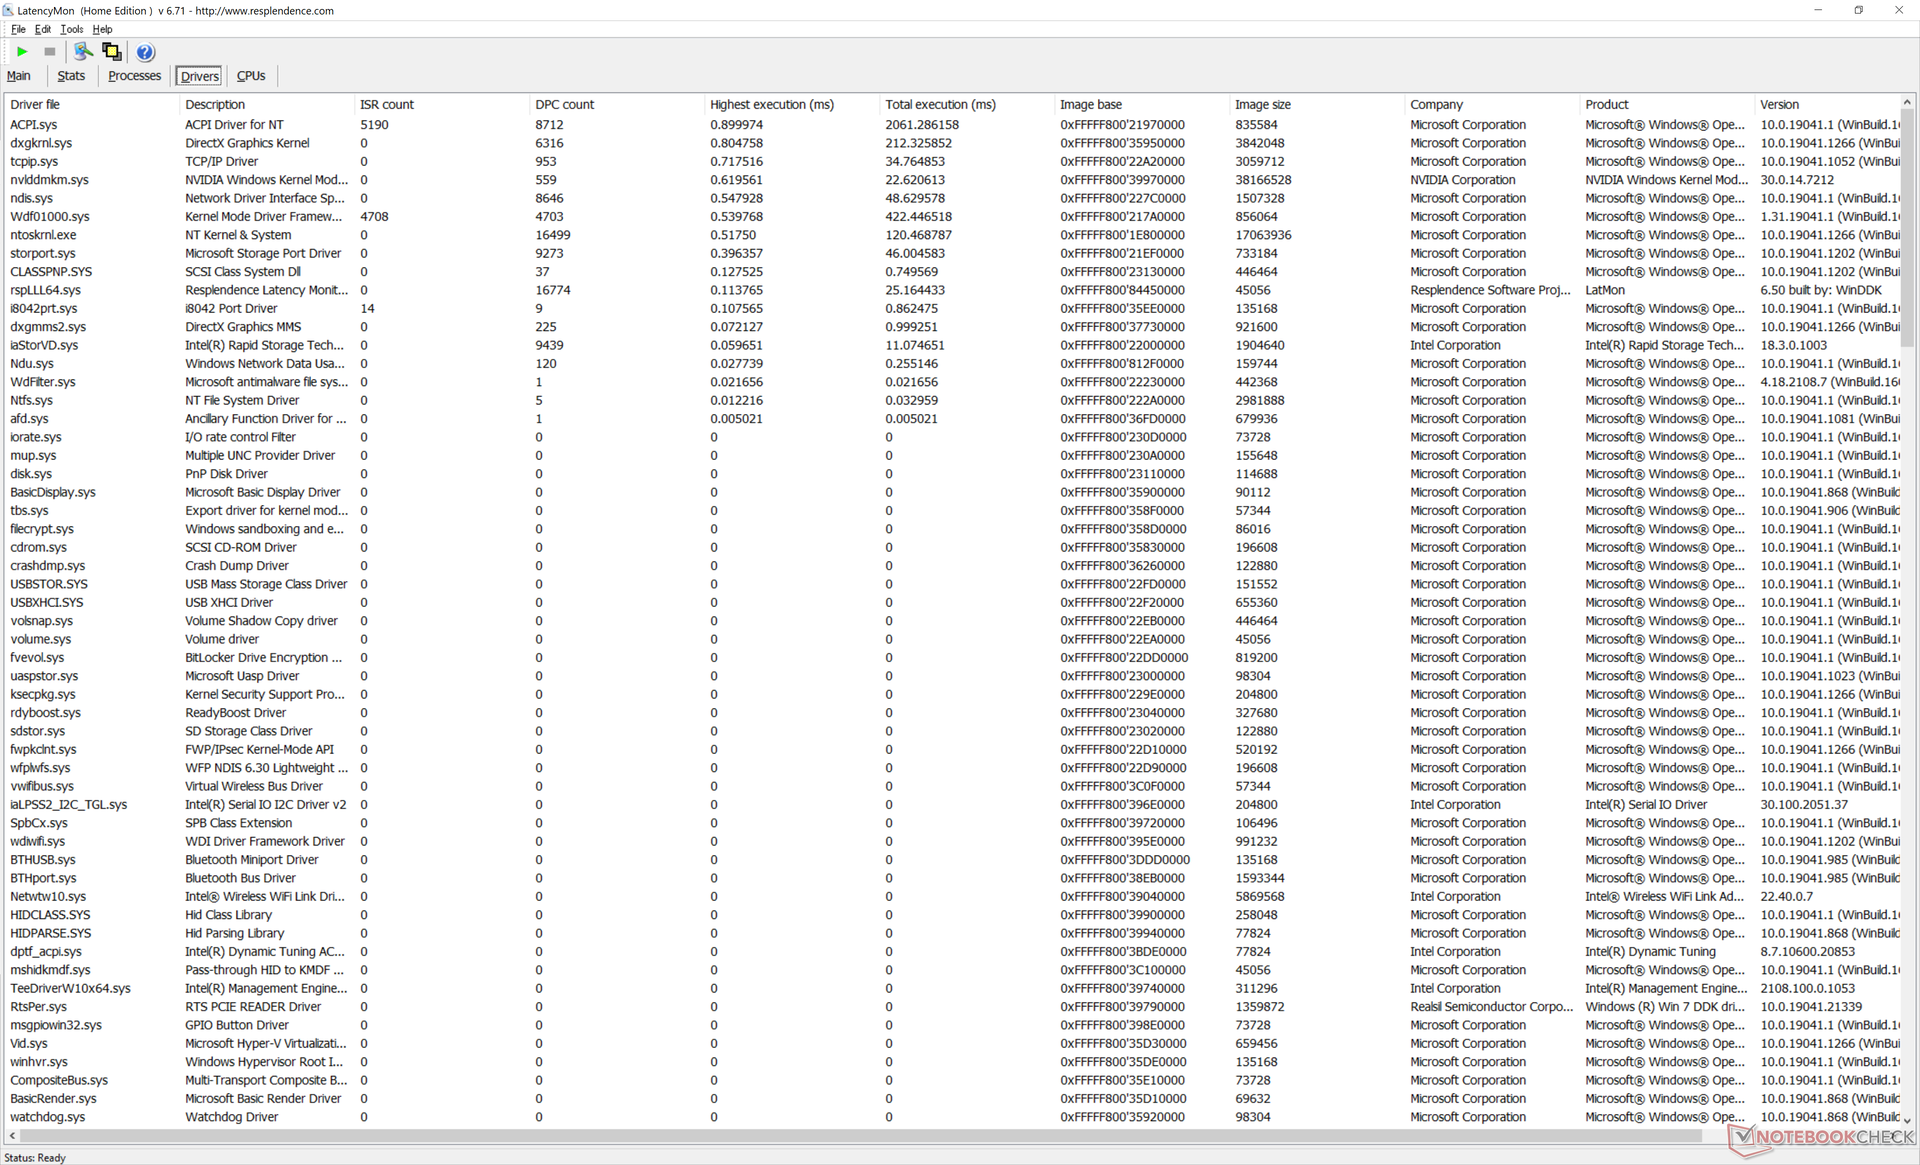
LatencyMon não mostra problemas de latência DPC ao abrir várias abas do navegador ou ao executar Prime95. A reprodução do vídeo 4K a 60 FPS também é completamente suave e sem queda de quadros. Não esperamos menos de nenhuma estação de trabalho.
| DPC Latencies / LatencyMon - interrupt to process latency (max), Web, Youtube, Prime95 | |
| Dell Precision 7550 | |
| Lenovo ThinkPad P15 G2-20YQ001JGE | |
| Asus ProArt StudioBook Pro 15 W500G5T | |
| HP ZBook Studio 15 G8 | |
| Dell Precision 5000 5560 | |
| Razer Blade 15 Studio Edition 2020 | |
| Dell Precision 5550 P91F | |
* ... menor é melhor
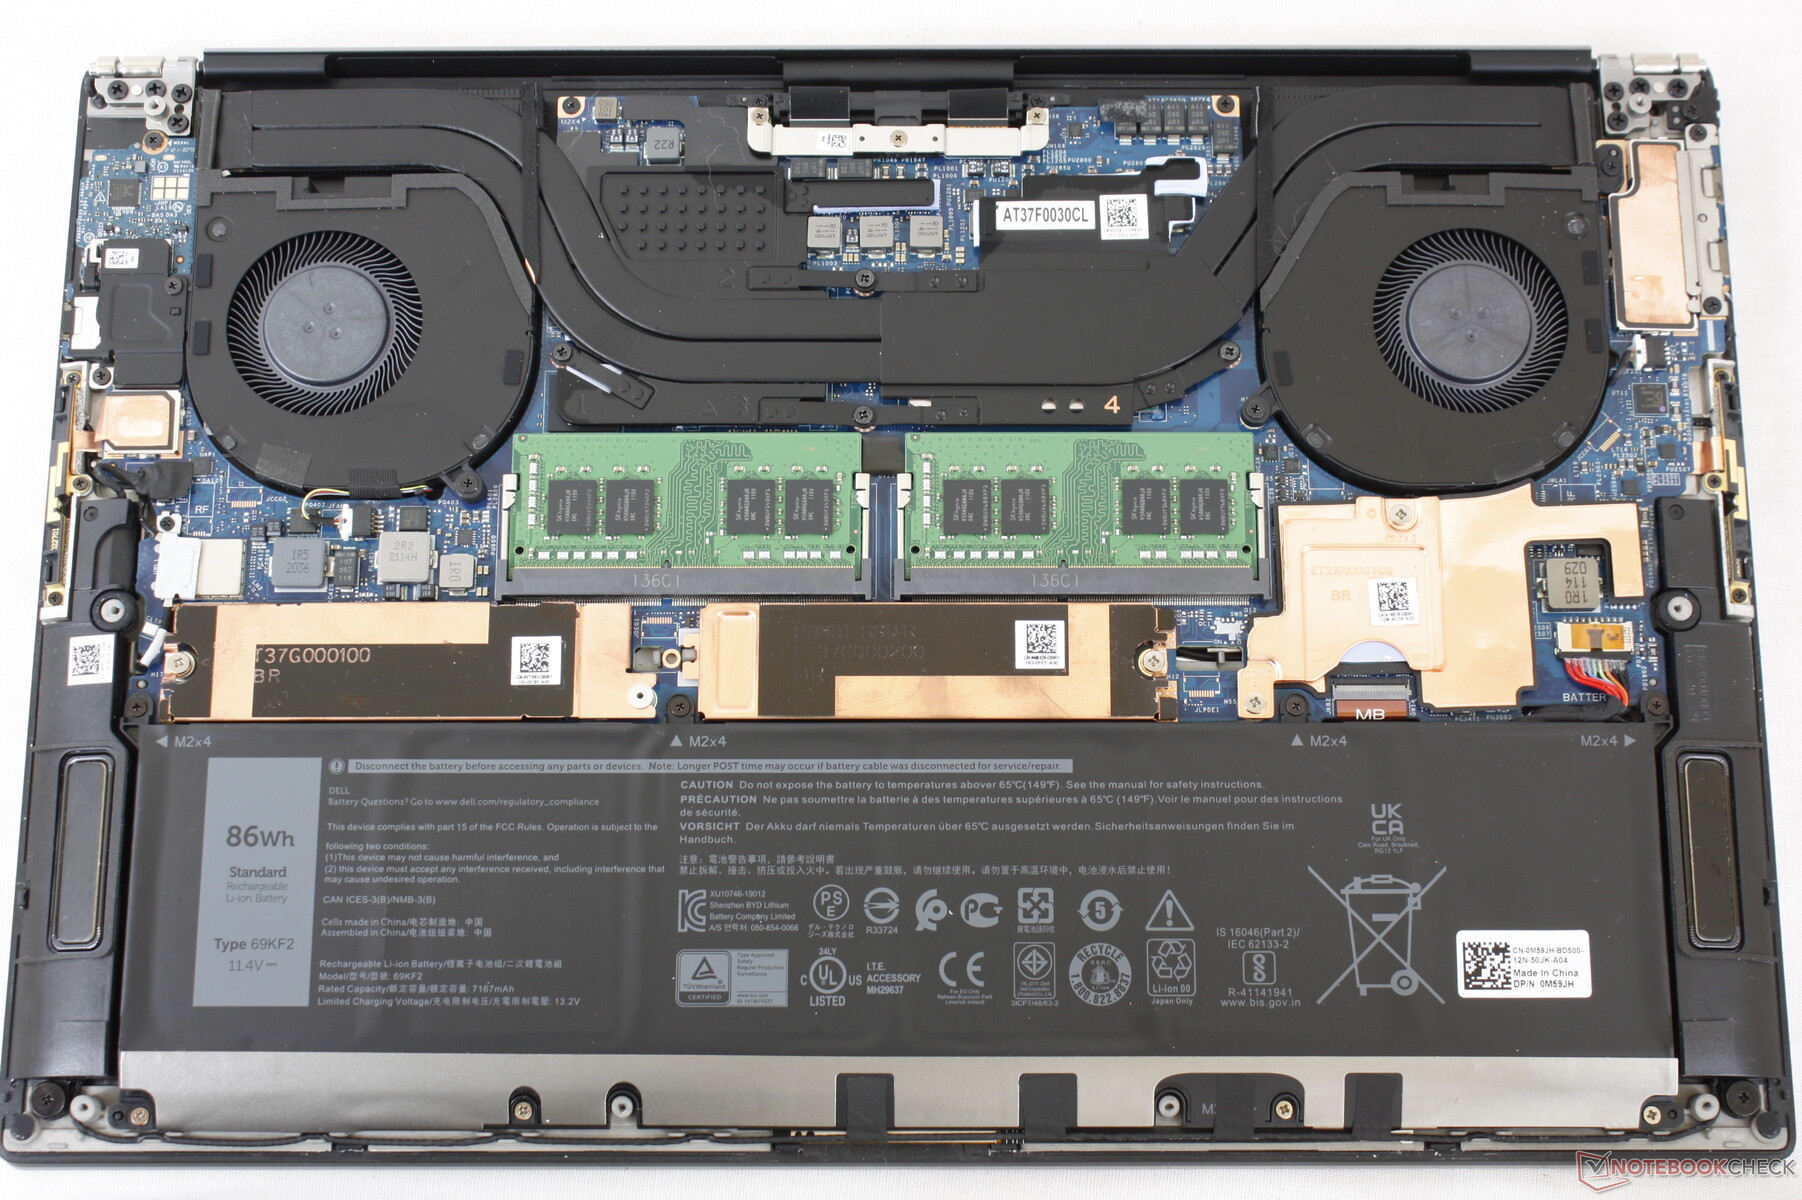
Dispositivos de armazenamento
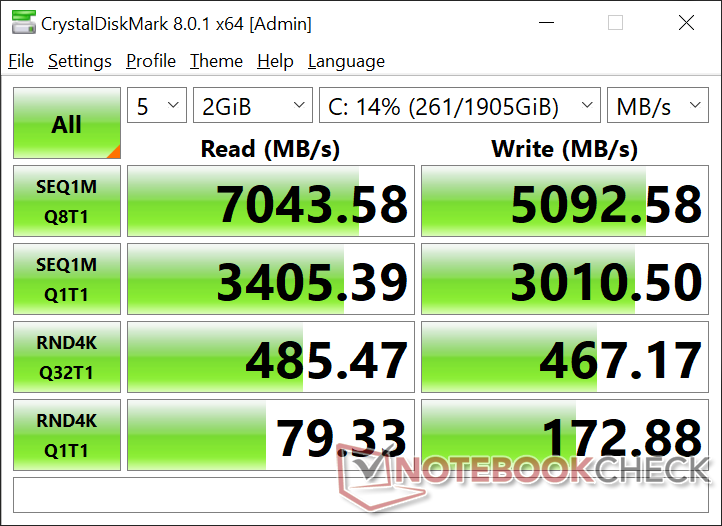
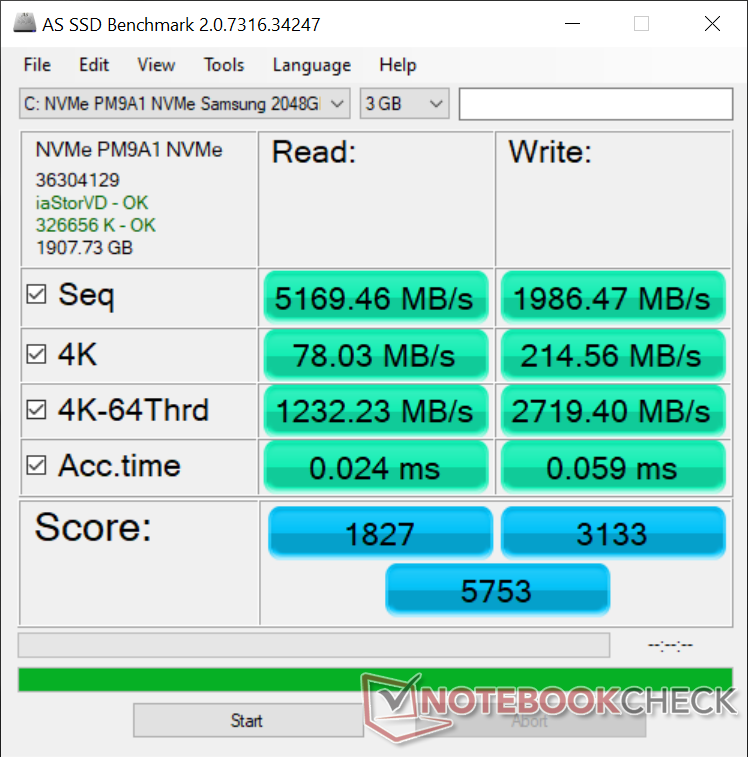
A Dell confirmou conosco que ambos os compartimentos de armazenamento M.2 suportam PCIe4 x4 SSDs em comparação com apenas PCIe3 no site Precision 5550. Mesmo os Alienware x17 R1 só pode suportar apenas um SSD PCIe4 x4, apesar de ter dois slots M.2 SSD. Nossa unidade de teste é fornecida com um Samsung PM9A1 que é um dos mais rápidos SSDs PCIe4 de consumo atualmente disponíveis e, consequentemente, é uma enorme atualização de desempenho do SK Hynix PC601A no modelo do ano passado.
| Dell Precision 5000 5560 Samsung PM9A1 MZVL22T0HBLB | Lenovo ThinkPad P15 G2-20YQ001JGE Kioxia XG7 KXG7AZNV512G | HP ZBook Studio 15 G8 Samsung PM981a MZVLB2T0HALB | Asus ProArt StudioBook Pro 15 W500G5T Samsung SSD PM981 MZVLB1T0HALR | Dell Precision 7550 SK Hynix PC601A NVMe 1TB | Dell Precision 5550 P91F SK Hynix PC601A NVMe 1TB | Razer Blade 15 Studio Edition 2020 Samsung PM981a MZVLB1T0HBLR | |
|---|---|---|---|---|---|---|---|
| AS SSD | -8% | -16% | -16% | -42% | -142% | -33% | |
| Seq Read (MB/s) | 5169 | 5105 -1% | 2953 -43% | 2702 -48% | 2028 -61% | 2039 -61% | 1982 -62% |
| Seq Write (MB/s) | 1986 | 1815 -9% | 1691 -15% | 2348 18% | 1193 -40% | 1376 -31% | 2252 13% |
| 4K Read (MB/s) | 78 | 47.46 -39% | 43.98 -44% | 37.59 -52% | 42.31 -46% | 44.11 -43% | 47.13 -40% |
| 4K Write (MB/s) | 214.6 | 137.3 -36% | 105.4 -51% | 107.1 -50% | 105.5 -51% | 113.3 -47% | 88.2 -59% |
| 4K-64 Read (MB/s) | 1232 | 2112 71% | 1065 -14% | 1491 21% | 1128 -8% | 1094 -11% | 1481 20% |
| 4K-64 Write (MB/s) | 2719 | 1702 -37% | 1957 -28% | 1794 -34% | 1537 -43% | 1630 -40% | 1842 -32% |
| Access Time Read * (ms) | 0.024 | 0.065 -171% | 0.04 -67% | 0.046 -92% | 0.069 -188% | 0.059 -146% | 0.087 -262% |
| Access Time Write * (ms) | 0.059 | 0.03 49% | 0.105 -78% | 0.034 42% | 0.106 -80% | 0.99 -1578% | 0.04 32% |
| Score Read (Points) | 1827 | 2670 46% | 1404 -23% | 1798 -2% | 1373 -25% | 1342 -27% | 1726 -6% |
| Score Write (Points) | 3133 | 2021 -35% | 2232 -29% | 2136 -32% | 1762 -44% | 1881 -40% | 2155 -31% |
| Score Total (Points) | 5753 | 5885 2% | 4297 -25% | 4835 -16% | 3801 -34% | 3883 -33% | 4781 -17% |
| Copy ISO MB/s (MB/s) | 3201 | 2054 -36% | 2474 -23% | 2302 -28% | 1768 -45% | 2489 -22% | 1982 -38% |
| Copy Program MB/s (MB/s) | 415.8 | 714 72% | 1074 158% | 564 36% | 627 51% | 682 64% | 501 20% |
| Copy Game MB/s (MB/s) | 1212 | 1431 18% | 1929 59% | 1336 10% | 1477 22% | 1515 25% | 1140 -6% |
| CrystalDiskMark 5.2 / 6 | -9% | -29% | 38% | -35% | -36% | -26% | |
| Write 4K (MB/s) | 172.4 | 141.1 -18% | 110.5 -36% | 1107 542% | 121 -30% | 122.6 -29% | 132.9 -23% |
| Read 4K (MB/s) | 78.8 | 58.8 -25% | 51.8 -34% | 43.38 -45% | 42.16 -46% | 42.4 -46% | 46.73 -41% |
| Write Seq (MB/s) | 2991 | 3320 11% | 2071 -31% | 2387 -20% | 2150 -28% | 2167 -28% | 2214 -26% |
| Read Seq (MB/s) | 3351 | 2994 -11% | 2505 -25% | 2431 -27% | 1755 -48% | 1747 -48% | 2018 -40% |
| Write 4K Q32T1 (MB/s) | 459.2 | 626 36% | 429.8 -6% | 340.7 -26% | 395.3 -14% | 388.8 -15% | 478.9 4% |
| Read 4K Q32T1 (MB/s) | 484.3 | 401.8 -17% | 418.3 -14% | 397.8 -18% | 381.8 -21% | 367.3 -24% | 540 12% |
| Write Seq Q32T1 (MB/s) | 4761 | 3742 -21% | 3060 -36% | 2390 -50% | 2730 -43% | 2629 -45% | 2975 -38% |
| Read Seq Q32T1 (MB/s) | 7071 | 5097 -28% | 3539 -50% | 3502 -50% | 3468 -51% | 3460 -51% | 3195 -55% |
| Média Total (Programa/Configurações) | -9% /
-8% | -23% /
-21% | 11% /
4% | -39% /
-40% | -89% /
-103% | -30% /
-31% |
* ... menor é melhor

Disk Throttling: DiskSpd Read Loop, Queue Depth 8
Desempenho da GPU
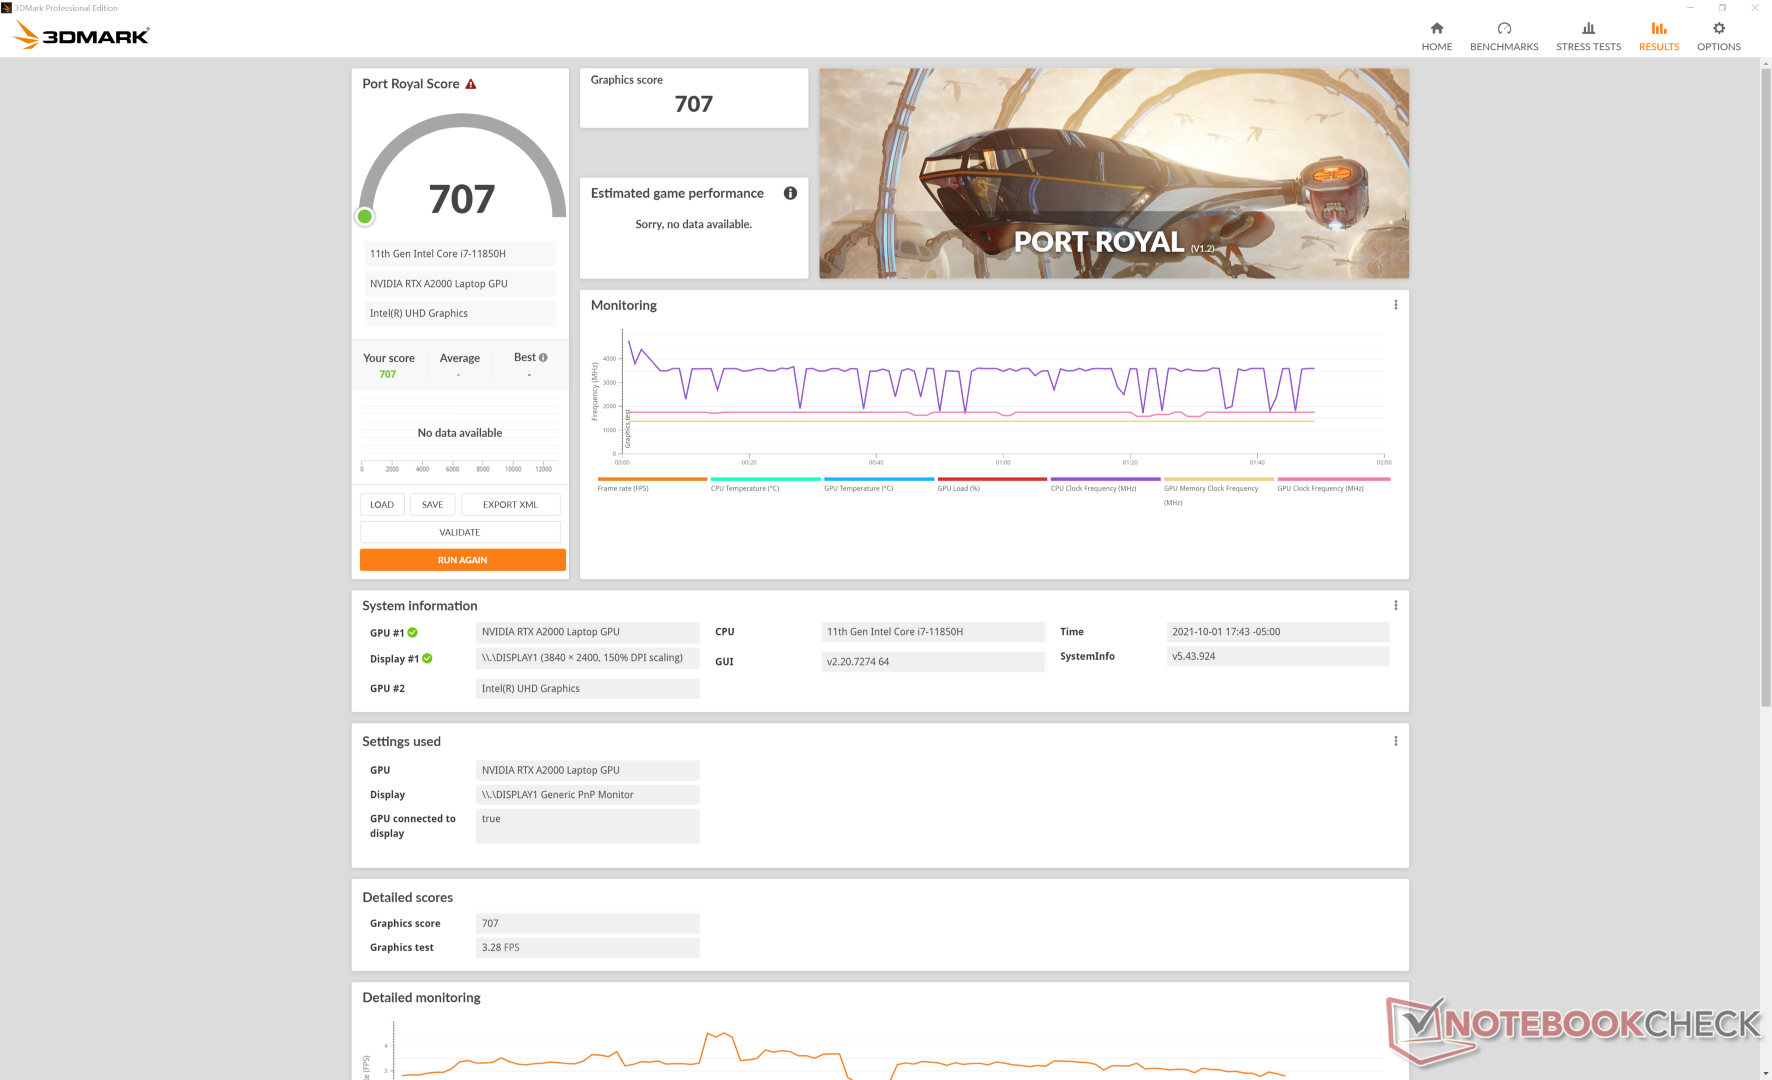
Desempenho gráfico bruto do Quadro RTX A2000 fica confortavelmente entre o consumidor GeForce GTX 1650 Ti e GTX 1660 Ti ou cerca de 10% mais lento do que os mais velhos Quadro RTX 3000 Max-Q. O aumento de desempenho é mais significativo em 40 a 50% quando comparado com o Quadro T2000 Max-Q no Precision 5550.A atualização para Quadro RTX A3000, que não está disponível na série Precision 5560, pode trazer um aumento de desempenho de 30 a 40% em relação ao nosso Quadro RTX A2000
Curiosamente, as pontuações SpecViewPerf estão mais próximas do que o esperado entre nosso RTX A2000 e a Quadro RTX 3000 Max-Q de última geração, apesar da GPU Turing mais antiga, mais consumidora de energia, sugerir uma melhor otimização nas cargas do tipo estação de trabalho para nossa GPU Ampere
Se jogar, espera-se que a performance seja cerca de 20 a 30% mais lenta que a GTX 1660 Ti, uma vez que as GPUs Quadro não são otimizadas para jogos. A Strange Brigade, por exemplo, às vezes, colidiria um ou dois minutos com o benchmark.
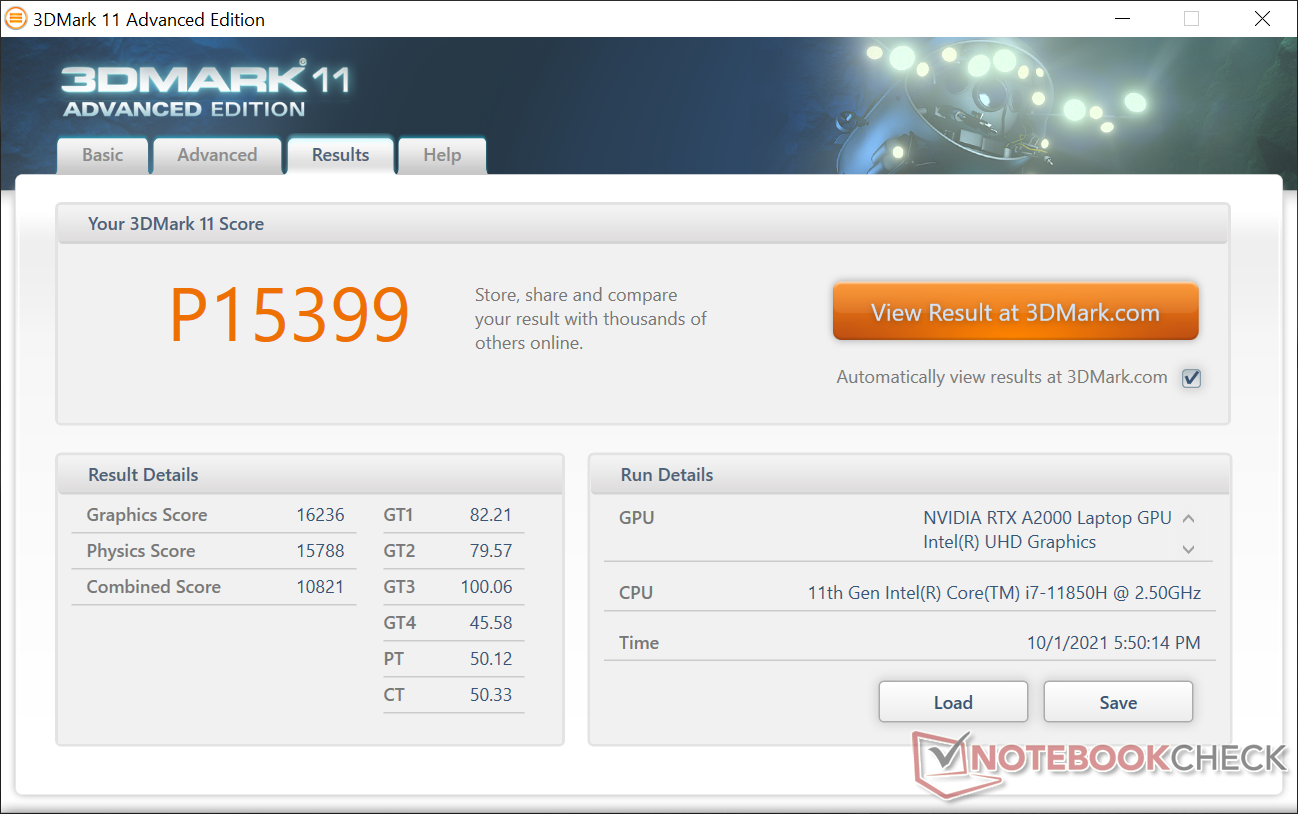
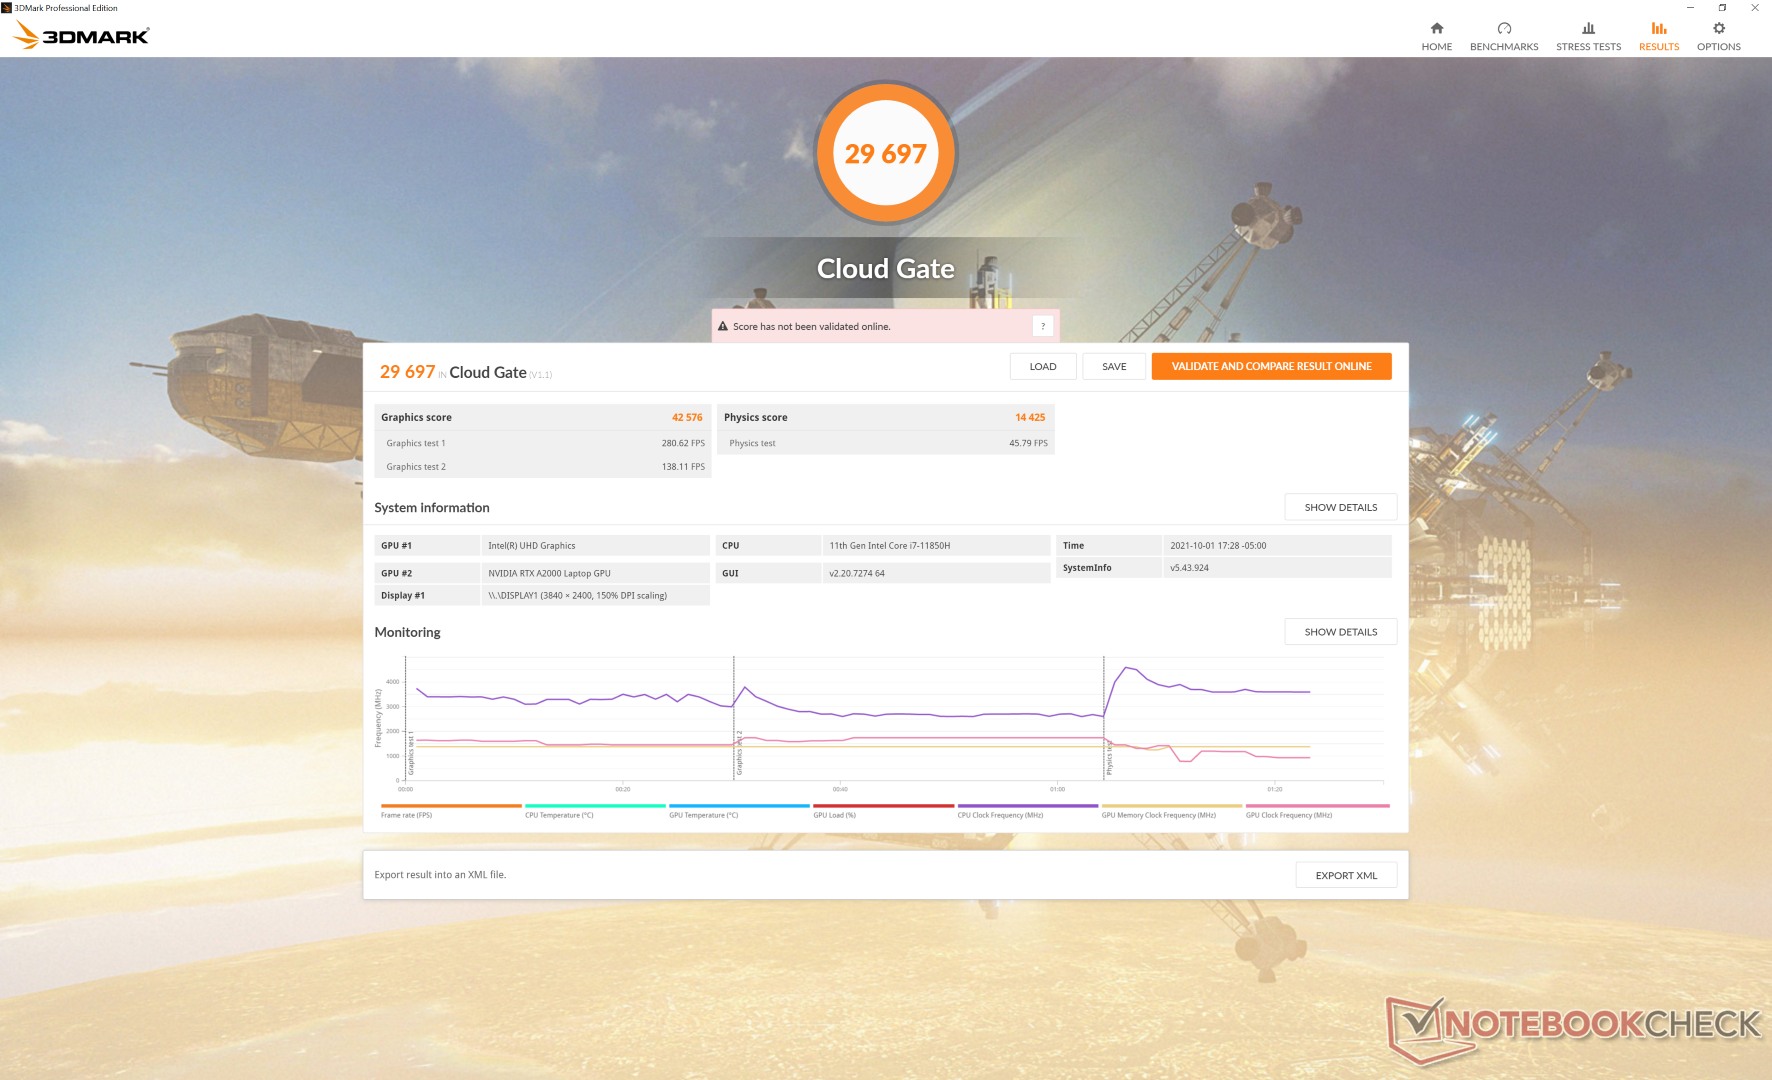
| 3DMark 11 Performance | 15399 pontos | |
| 3DMark Cloud Gate Standard Score | 29697 pontos | |
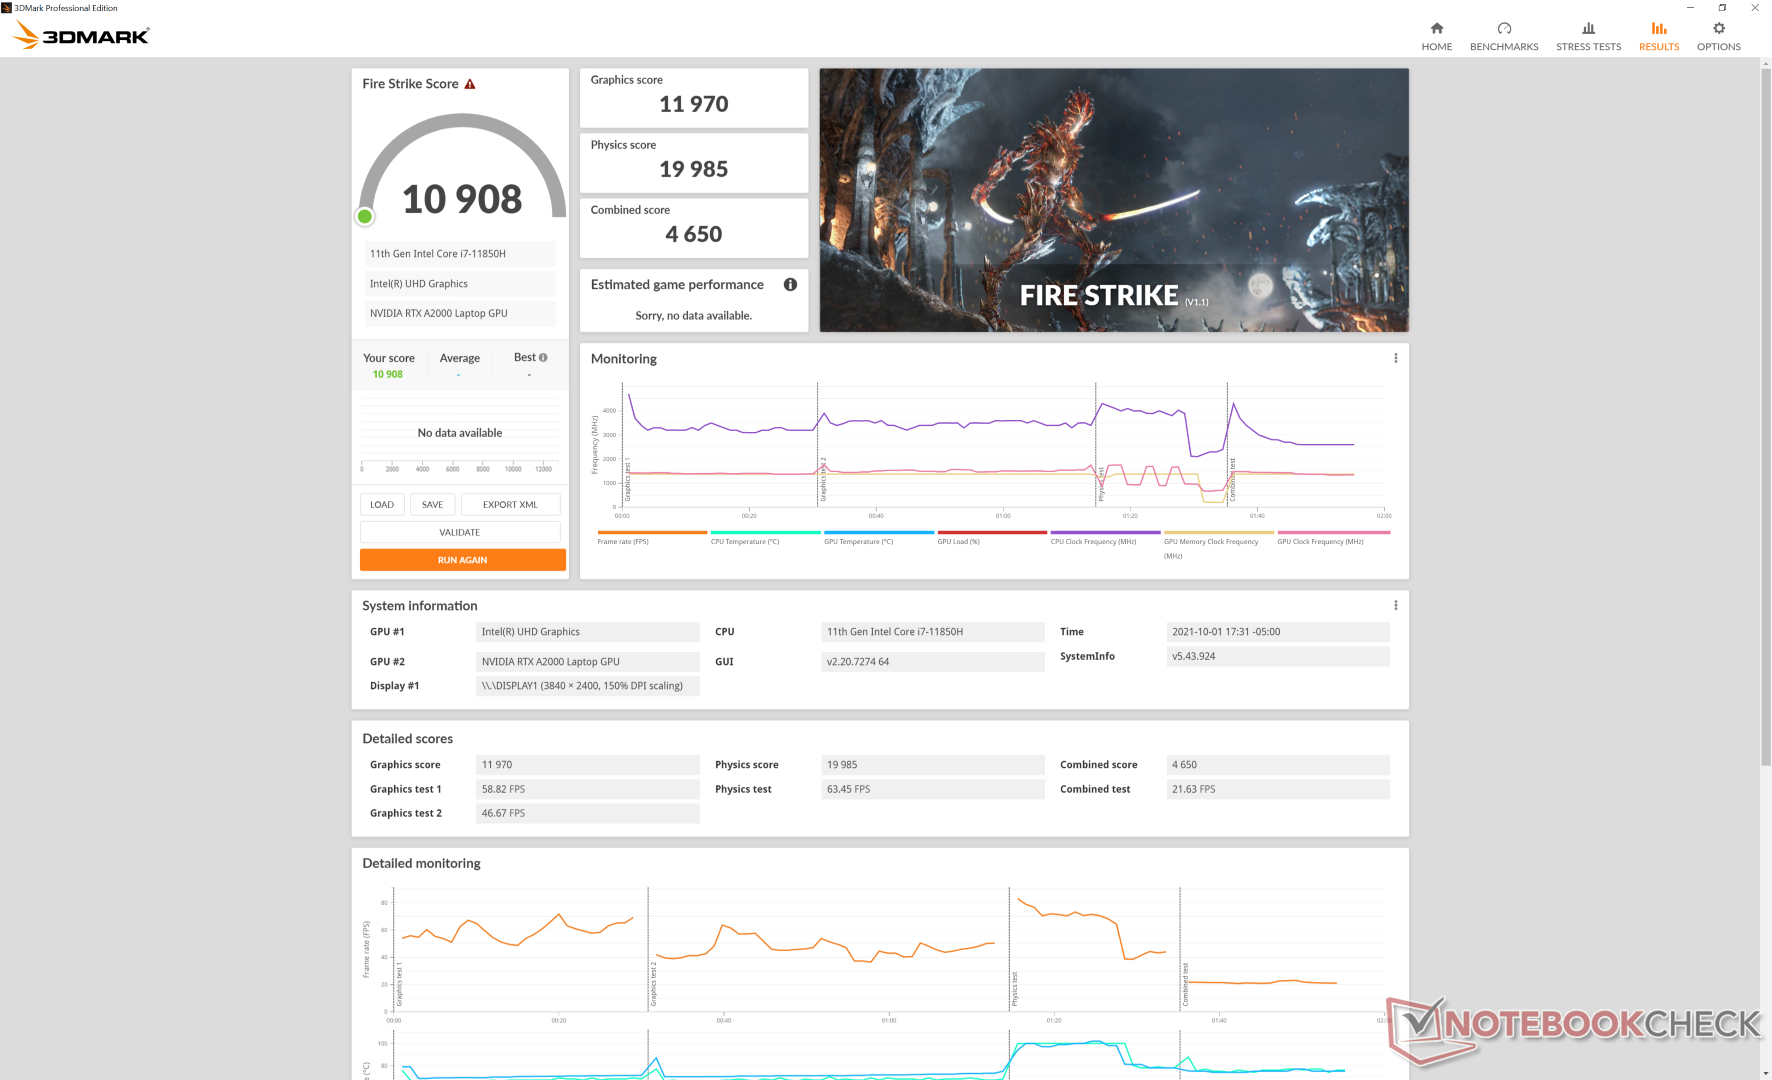
| 3DMark Fire Strike Score | 10908 pontos | |
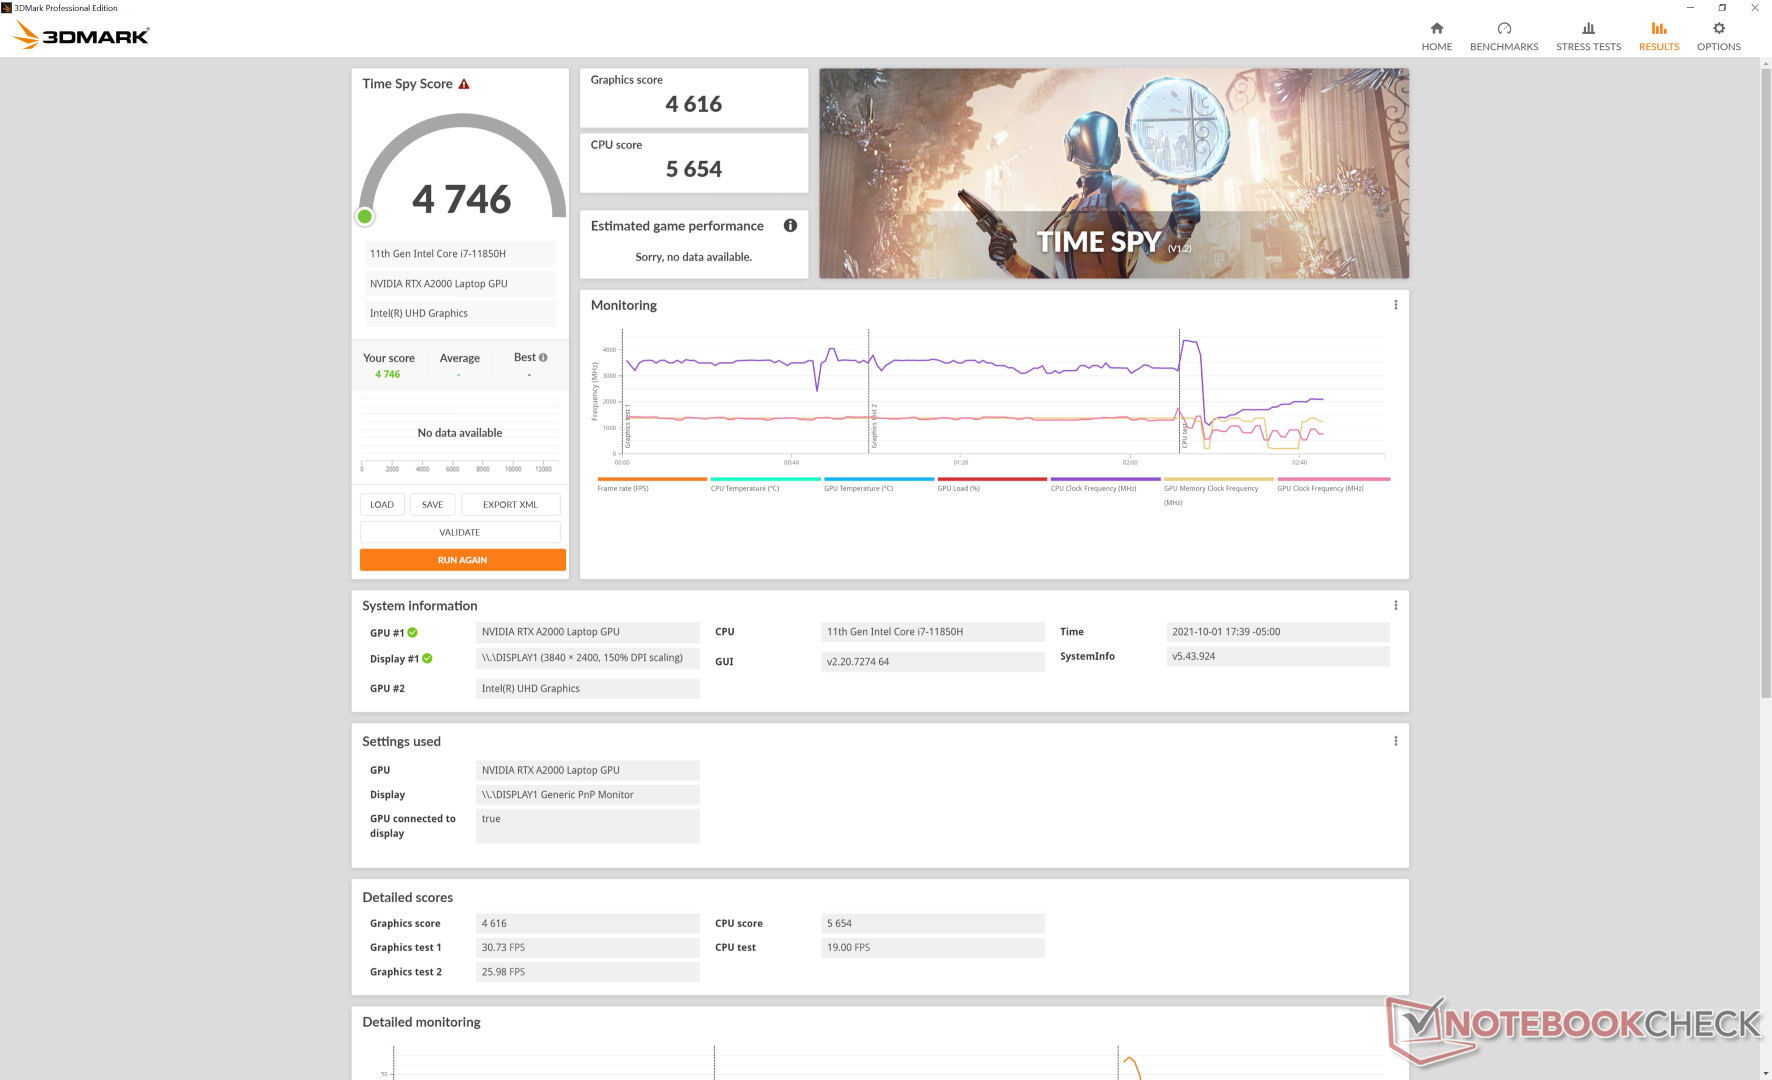
| 3DMark Time Spy Score | 4746 pontos | |
Ajuda | ||
Witcher 3 FPS Chart
| baixo | média | alto | ultra | QHD | 4K | |
|---|---|---|---|---|---|---|
| GTA V (2015) | 179 | 170 | 112 | 57.8 | 42.9 | |
| The Witcher 3 (2015) | 259.8 | 151.9 | 92.4 | 50 | 33.1 | |
| Dota 2 Reborn (2015) | 173 | 155 | 130 | 119 | 62.9 | |
| Final Fantasy XV Benchmark (2018) | 86.9 | 63.2 | 46.6 | 34.4 | 19.3 | |
| X-Plane 11.11 (2018) | 112 | 89.2 | 75.1 | 45.3 | ||
| Far Cry 5 (2018) | 120 | 82 | 77 | 69 | 49 | |
| Strange Brigade (2018) | 251 | 60.4 | ||||
| Shadow of the Tomb Raider (2018) | 107 | 62 | 58 | 55 | 40 | 17 |
| Far Cry New Dawn (2019) | 106 | 72 | 71 | 59 | 49 | |
| Metro Exodus (2019) | 110.4 | 55.1 | 42.3 | 34.9 | 27 | |
| Borderlands 3 (2019) | 115.5 | 60.7 | 46.2 | 36 | ||
| Gears Tactics (2020) | 104.3 | 113.7 | 77.5 | 53.4 | 37.3 | |
| Horizon Zero Dawn (2020) | 81 | 60 | 55 | 49 | 41 | |
| Watch Dogs Legion (2020) | 86 | 62 | 51 | 29 | 20 | |
| Dirt 5 (2020) | 86.3 | 68 | 54.6 | 41.9 | 34 | |
| Assassin´s Creed Valhalla (2020) | 80 | 55 | 39 | 32 | 27 | |
| Immortals Fenyx Rising (2020) | 107 | 80 | 72 | 64 | 53 | |
| Hitman 3 (2021) | 166.6 | 83.4 | 78.6 | 73.9 | 48.4 | |
| F1 2021 (2021) | 114 | 120 | 104 | 37 | 24 |
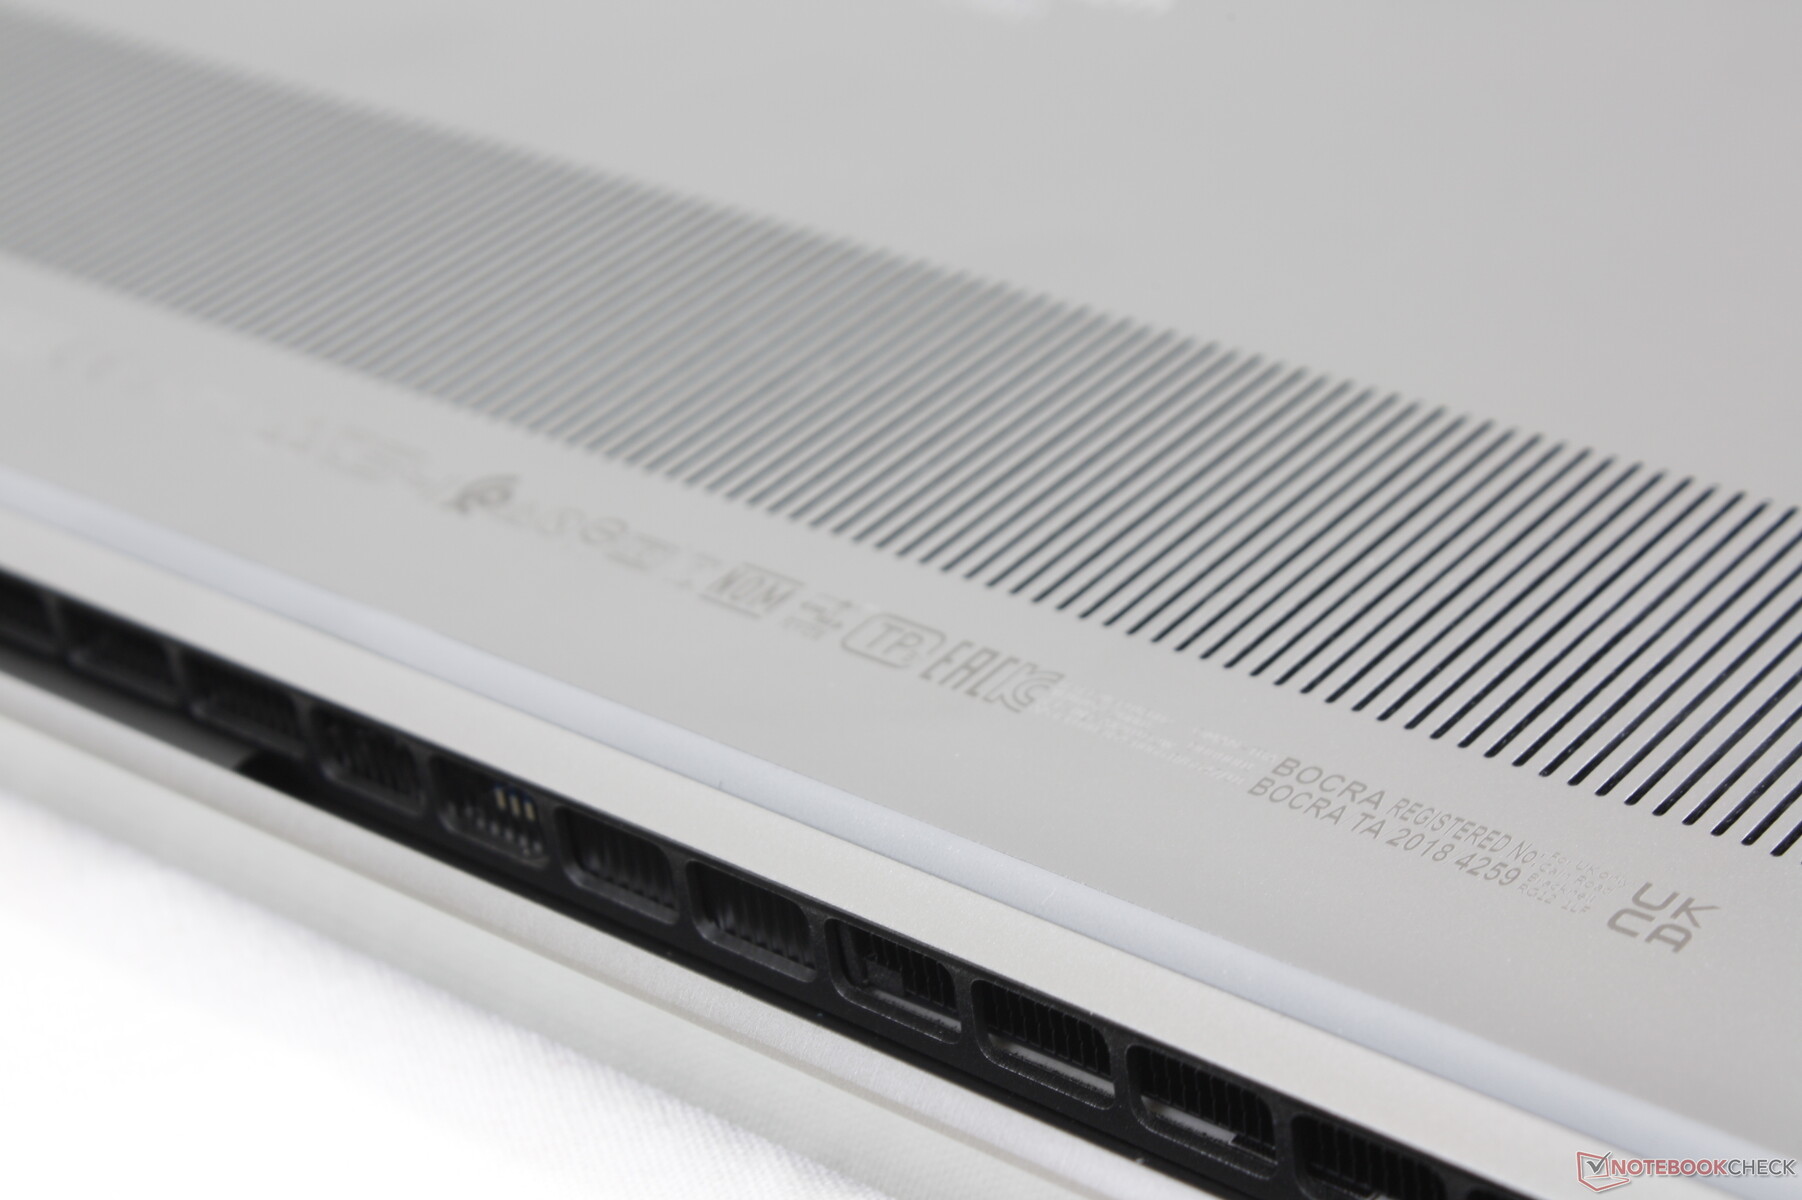
Emissions
Ruído do sistema
Curiosamente, o ruído do ventilador é visivelmente mais silencioso do que o que observamos no site Precision 5550. Enquanto o ruído dos ventiladores pode atingir mais de 50 dB(A) no Precision 5550, nós só conseguimos atingir até 41,4 dB(A) no máximo em nosso Precision 5560, mesmo quando sujeito às mesmas condições estressantes. Este teto mais baixo do ventilador no modelo mais novo é apreciado e na verdade ajuda o sistema a ser uma das estações de trabalho móveis ultraleves mais silenciosas do mercado, mas isto vem ao custo de temperaturas centrais mais altas. Nossa seção de Teste de Estresse abaixo mostrará uma diferença de temperatura da CPU de 16 C entre os dois laptops ao executar Prime95.
| Dell Precision 5000 5560 RTX A2000 Laptop GPU, i7-11850H, Samsung PM9A1 MZVL22T0HBLB | Lenovo ThinkPad P15 G2-20YQ001JGE RTX A3000 Laptop GPU, i7-11800H, Kioxia XG7 KXG7AZNV512G | HP ZBook Studio 15 G8 GeForce RTX 3070 Laptop GPU, i9-11950H, Samsung PM981a MZVLB2T0HALB | Asus ProArt StudioBook Pro 15 W500G5T Quadro RTX 5000 Max-Q, i7-9750H, Samsung SSD PM981 MZVLB1T0HALR | Dell Precision 7550 Quadro RTX 5000 Max-Q, W-10885M, SK Hynix PC601A NVMe 1TB | Dell Precision 5550 P91F Quadro T2000 Max-Q, i7-10875H, SK Hynix PC601A NVMe 1TB | Razer Blade 15 Studio Edition 2020 Quadro RTX 5000 Max-Q, i7-10875H, Samsung PM981a MZVLB1T0HBLR | |
|---|---|---|---|---|---|---|---|
| Noise | -25% | -18% | -26% | -27% | -17% | -28% | |
| desligado / ambiente * (dB) | 23.4 | 24.3 -4% | 23.5 -0% | 25.2 -8% | 25.8 -10% | 26.2 -12% | 30.1 -29% |
| Idle Minimum * (dB) | 23.6 | 24.3 -3% | 25.3 -7% | 27.9 -18% | 25.8 -9% | 26.2 -11% | 30.1 -28% |
| Idle Average * (dB) | 23.6 | 24.3 -3% | 25.3 -7% | 27.9 -18% | 25.8 -9% | 26.2 -11% | 30.1 -28% |
| Idle Maximum * (dB) | 23.6 | 28.6 -21% | 25.3 -7% | 27.9 -18% | 25.9 -10% | 26.2 -11% | 30.1 -28% |
| Load Average * (dB) | 25.8 | 47.5 -84% | 41.2 -60% | 47 -82% | 51.2 -98% | 39.2 -52% | 42.3 -64% |
| Witcher 3 ultra * (dB) | 40.1 | 49.4 -23% | 51.9 -29% | 39 3% | 48.2 -20% | ||
| Load Maximum * (dB) | 41.4 | 54.9 -33% | 49.4 -19% | 46.9 -13% | 51.9 -25% | 50.6 -22% | 42.1 -2% |
* ... menor é melhor
Barulho
| Ocioso |
| 23.6 / 23.6 / 23.6 dB |
| Carga |
| 25.8 / 41.4 dB |
 | ||
30 dB silencioso 40 dB(A) audível 50 dB(A) ruidosamente alto |
||
min: | ||
Temperatura
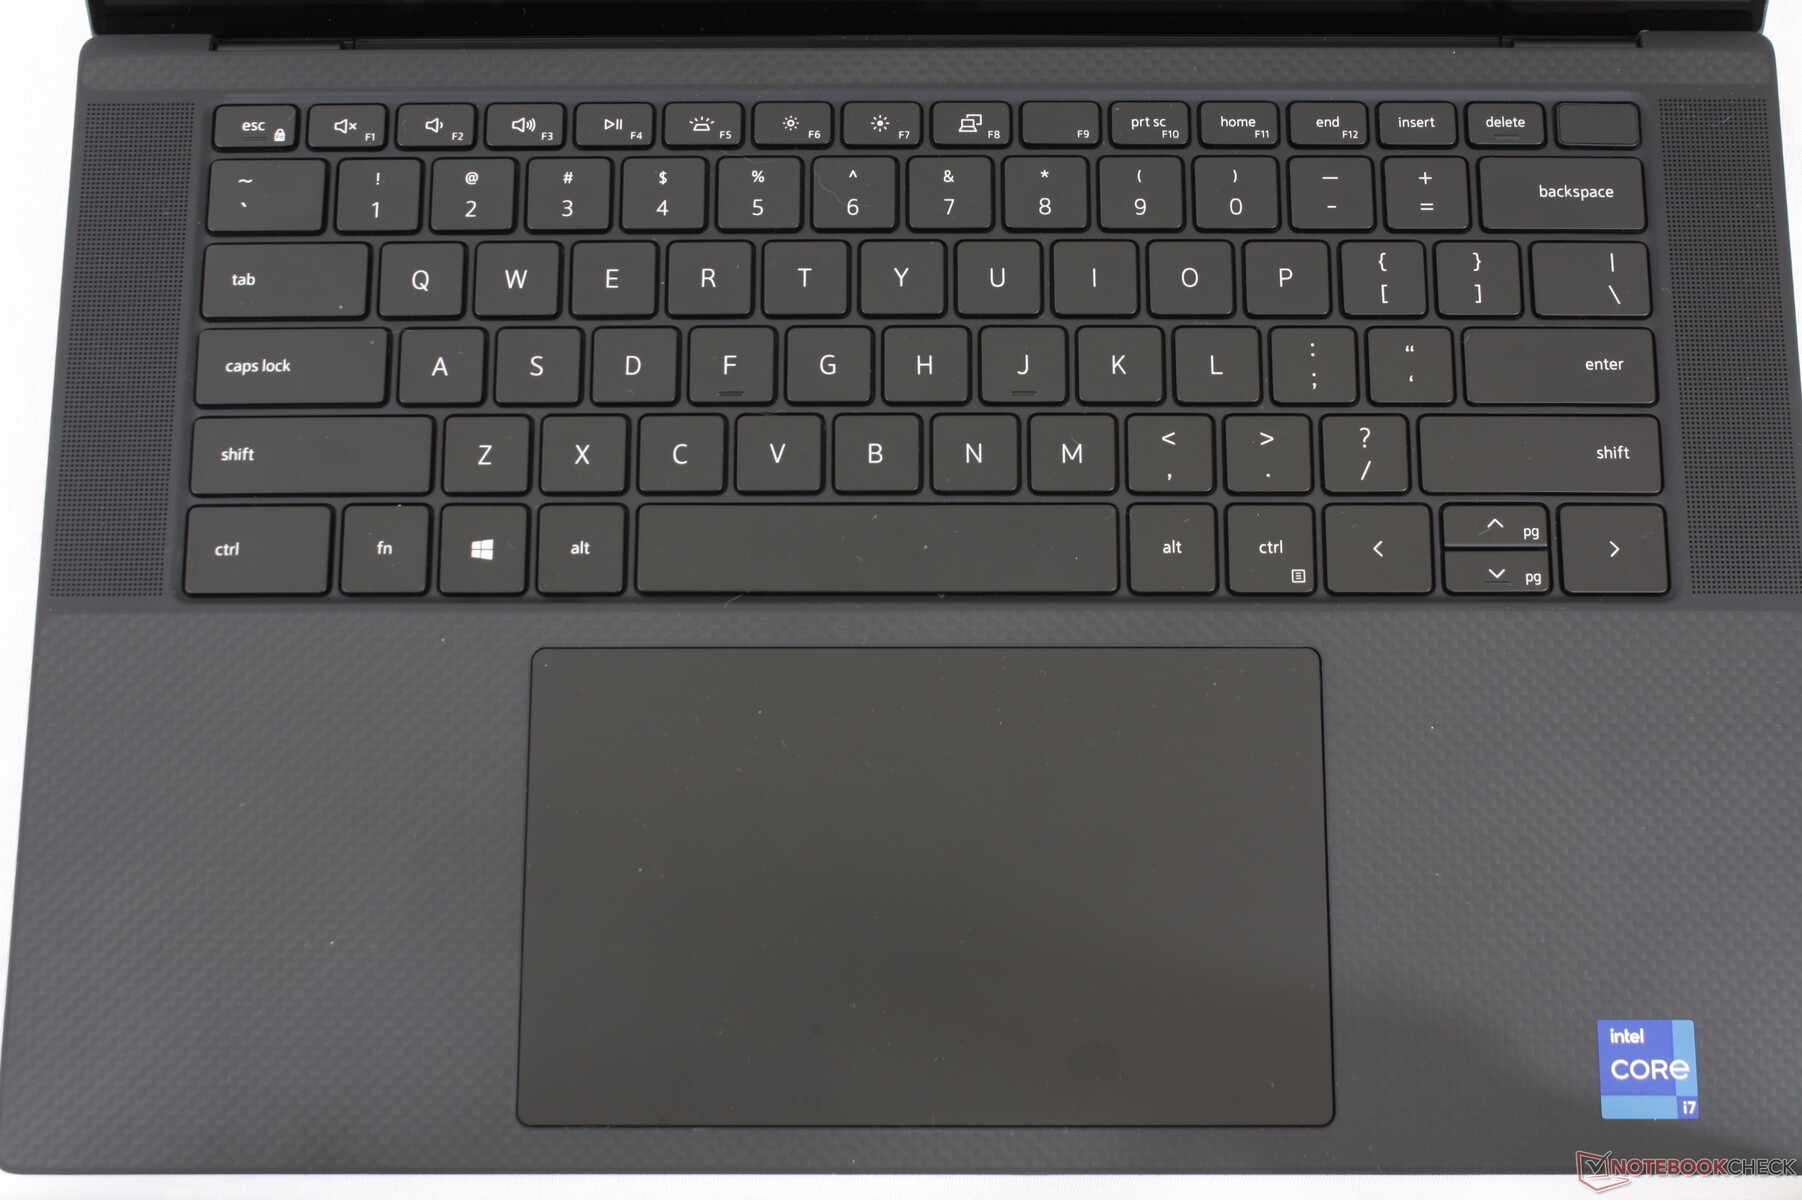
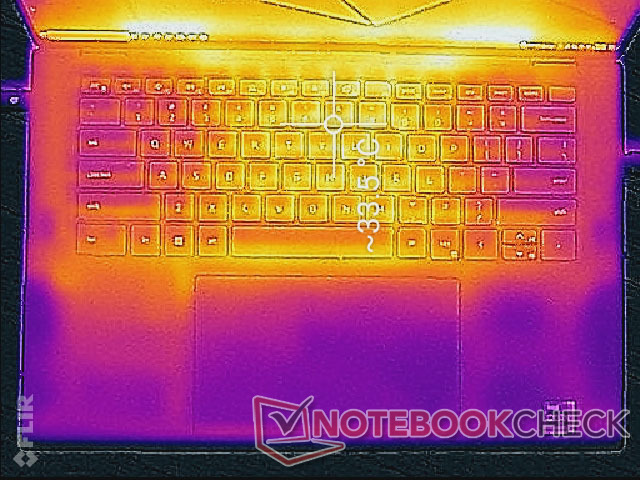
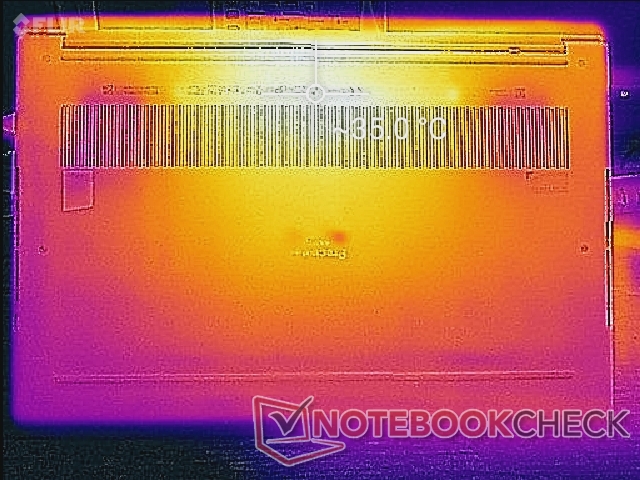
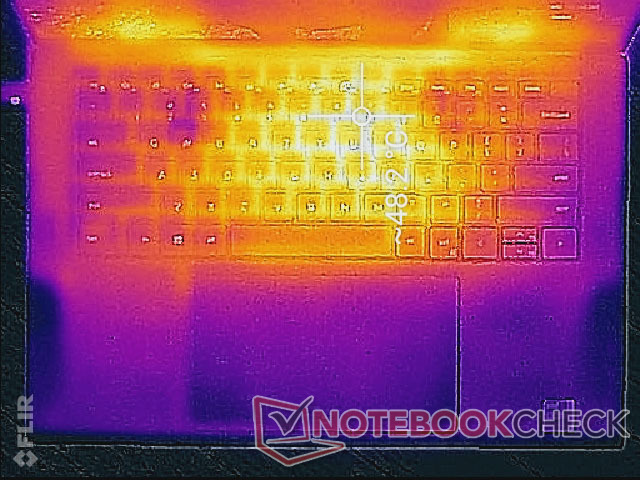
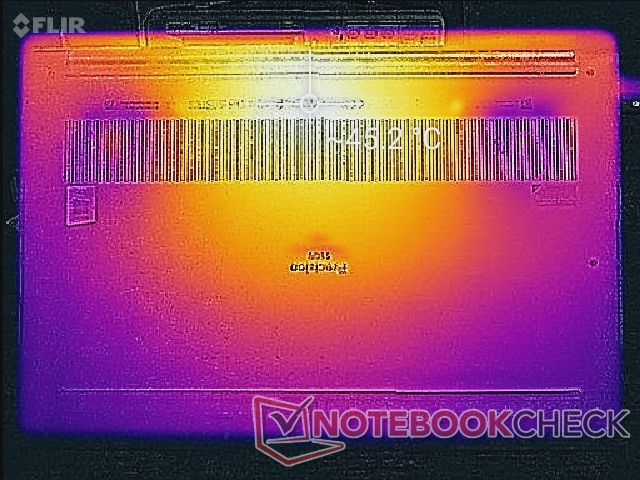
As temperaturas de superfície quando sob carga são similares às que registramos no site Precision 5550 com pontos quentes aproximando-se de 49 C e 45 C na parte superior e inferior, respectivamente. O desenvolvimento da temperatura é largamente simétrico devido à solução de resfriamento simétrico dentro e, portanto, o centro do teclado será muito mais quente do que os apoios ou bordas da palma da mão. OPensePad P15 Gen 2 é uma estação de trabalho móvel mais poderosa que nossa Precision 5560, mas seus pontos quentes podem se tornar muito mais quentes a mais de 63 C como resultado.
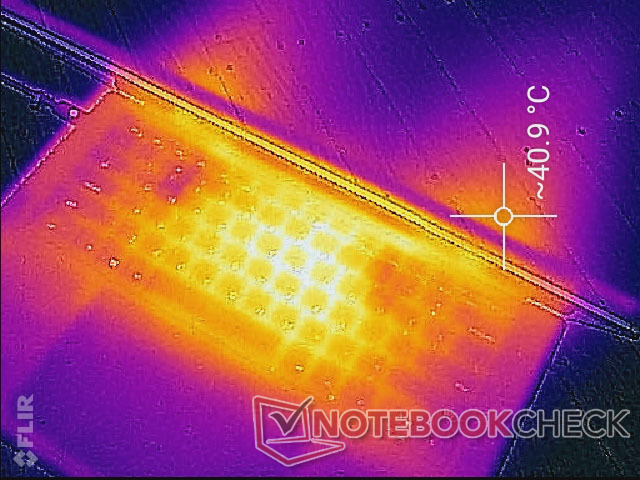
(-) A temperatura máxima no lado superior é 48.2 °C / 119 F, em comparação com a média de 38.2 °C / 101 F , variando de 22.2 a 69.8 °C para a classe Workstation.
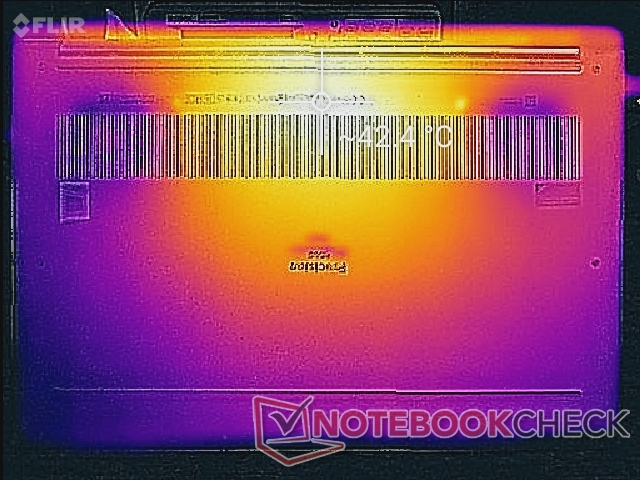
(±) A parte inferior aquece até um máximo de 42.6 °C / 109 F, em comparação com a média de 41.1 °C / 106 F
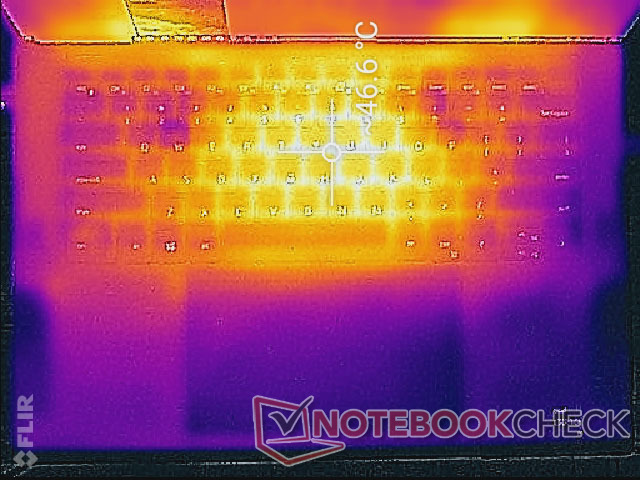
(+) Em uso inativo, a temperatura média para o lado superior é 30.6 °C / 87 F, em comparação com a média do dispositivo de 32 °C / ### class_avg_f### F.
(±) Jogando The Witcher 3, a temperatura média para o lado superior é 35.4 °C / 96 F, em comparação com a média do dispositivo de 32 °C / ## #class_avg_f### F.
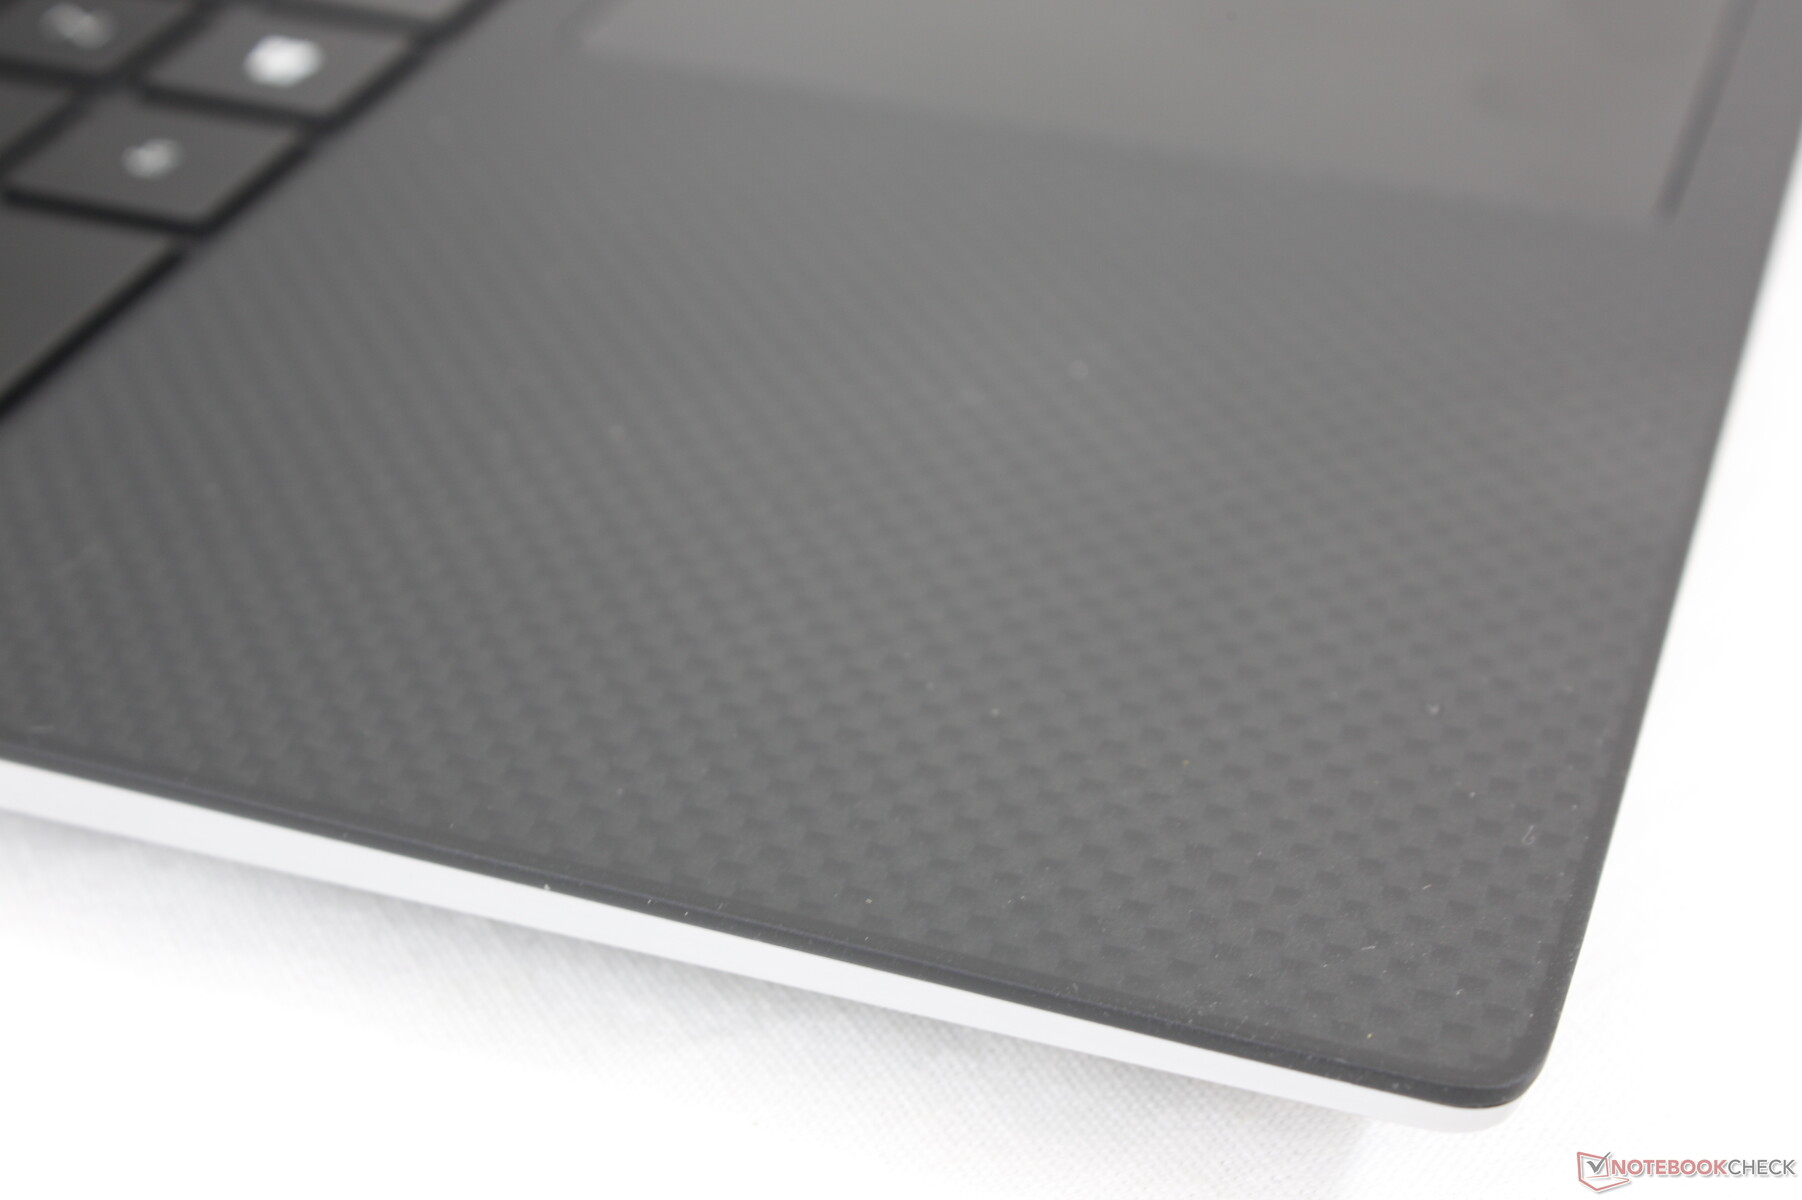
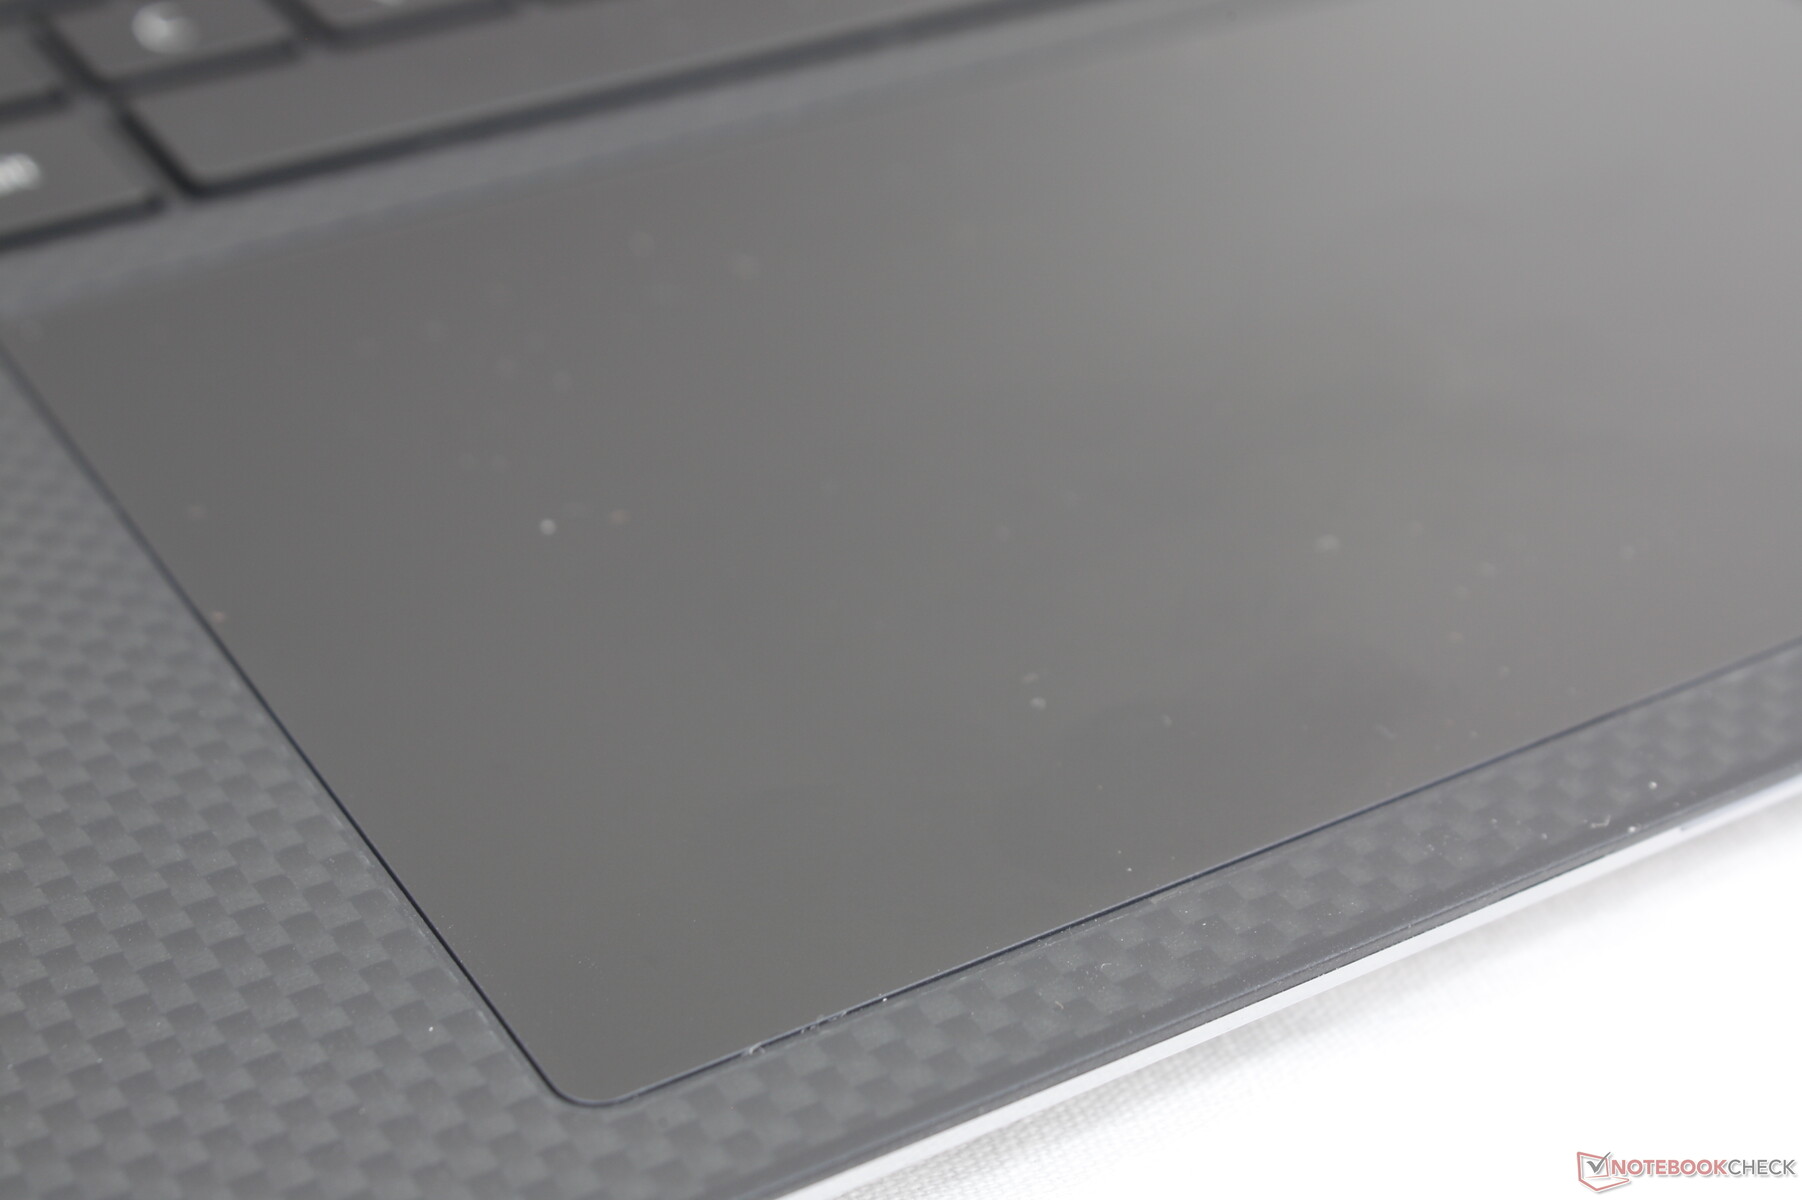
(+) Os apoios para as mãos e o touchpad são mais frios que a temperatura da pele, com um máximo de 30.8 °C / 87.4 F e, portanto, são frios ao toque.
(-) A temperatura média da área do apoio para as mãos de dispositivos semelhantes foi 27.8 °C / 82 F (-3 °C / -5.4 F).
Teste de estresse
Ao rodar Prime95, a CPU aumentaria para 3,8 GHz durante os primeiros segundos antes de atingir uma temperatura central de 100 C. As taxas do relógio cairiam então para a faixa de 2,8 a 3,0 GHz durante os próximos minutos, aproximadamente, antes de cair ainda mais para a faixa de 2,5 a 2,8 GHz. A temperatura central eventualmente se estabilizaria em torno de 90 C em comparação com 98 C no HP ZBook Studio 15 G8 ou apenas 74 C no Precision 5550
Quando em funcionamento Witcher 3 para representar cargas estressantes, a CPU e a GPU se estabilizariam em 69 C e 75 C, respectivamente, em comparação com 66 C e 67 C no site Precision 5550. A potência da placa GPU em tempo real seria estável em 45 W em comparação com 40 W no Precision 5550, o que pode explicar em parte a temperatura ligeiramente mais alta da GPU de nosso Precision 5560
O funcionamento com a energia da bateria terá impacto no desempenho. Um teste 3DMark 11 com baterias retornaria pontuações de Física e Gráficos de 14330 e 12191 pontos, respectivamente, em comparação com 15788 e 16236 pontos quando em rede elétrica.
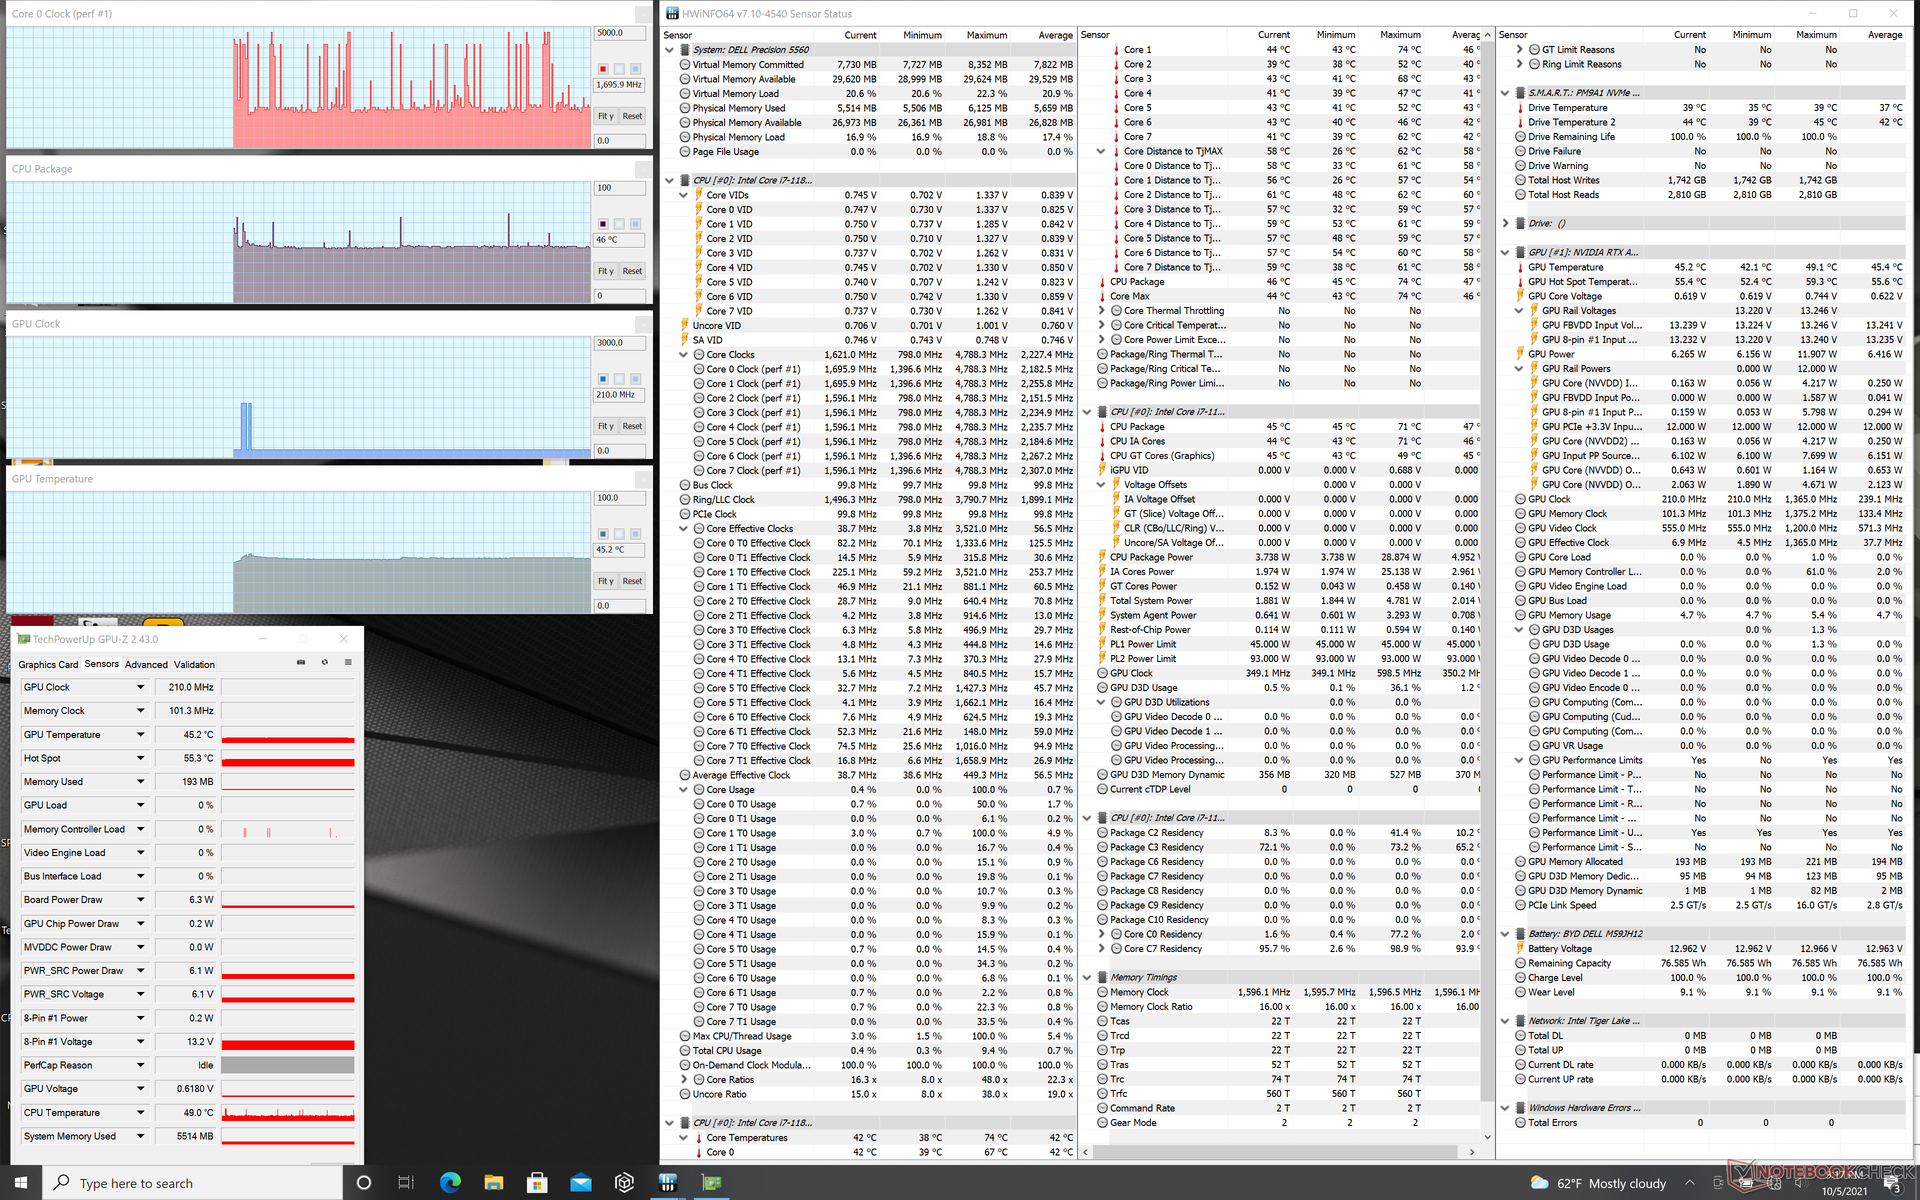
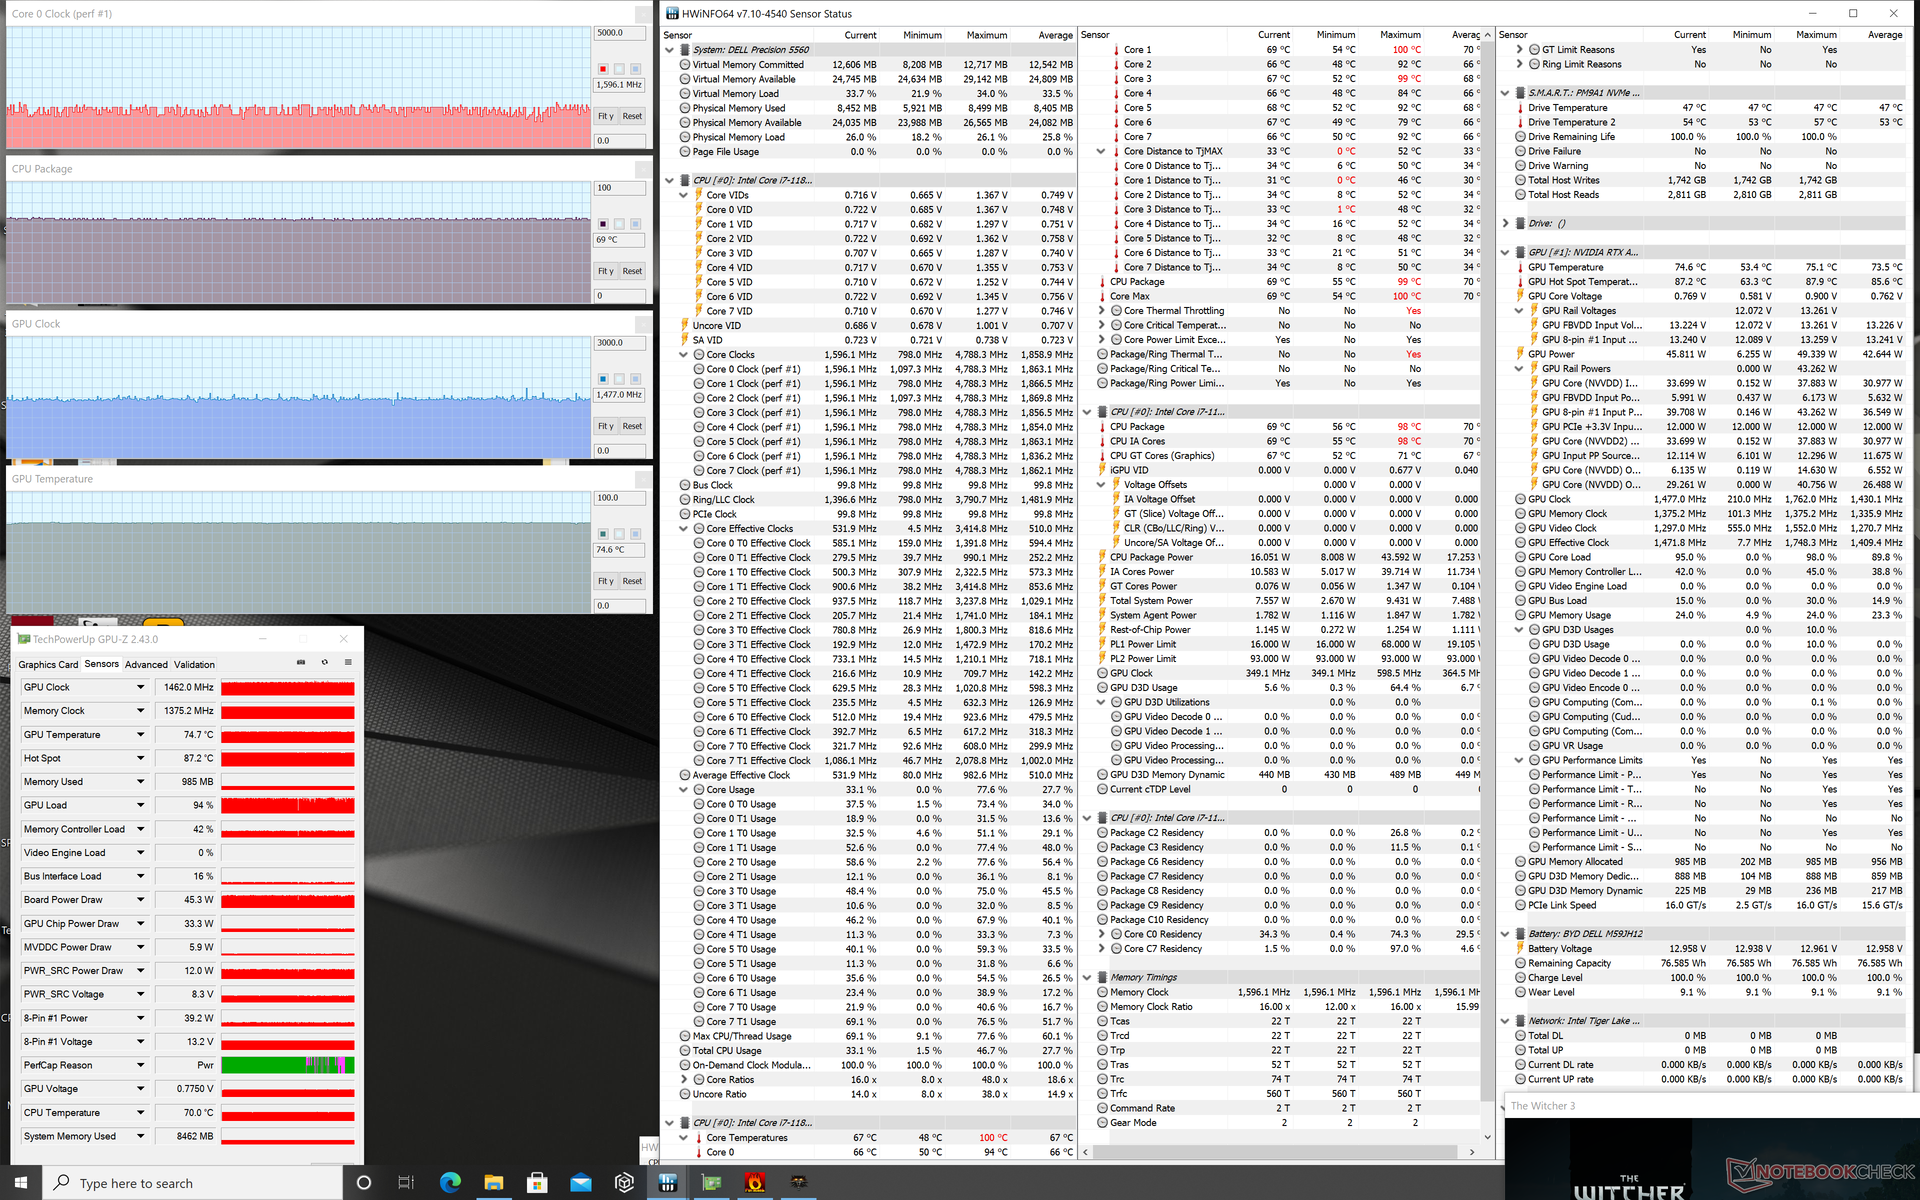
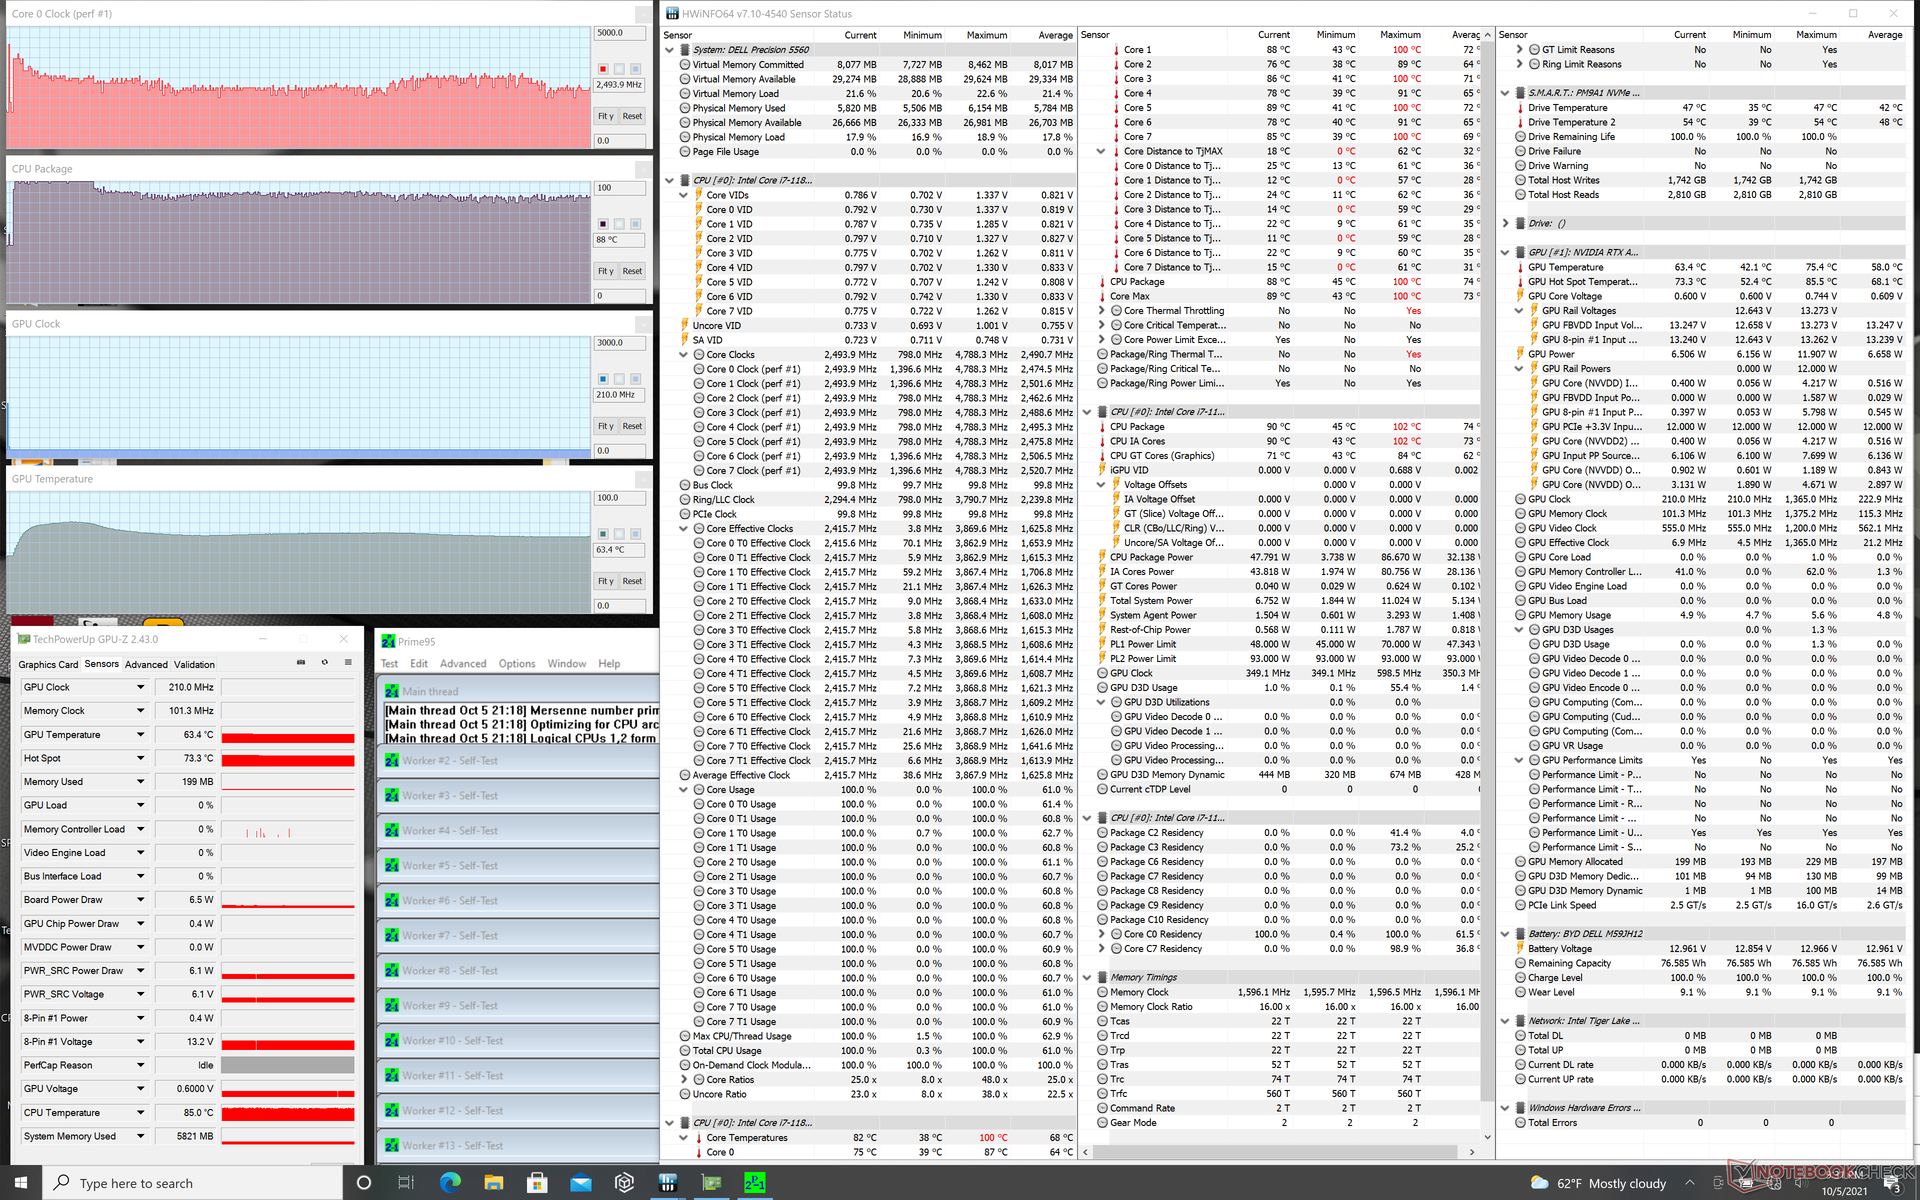
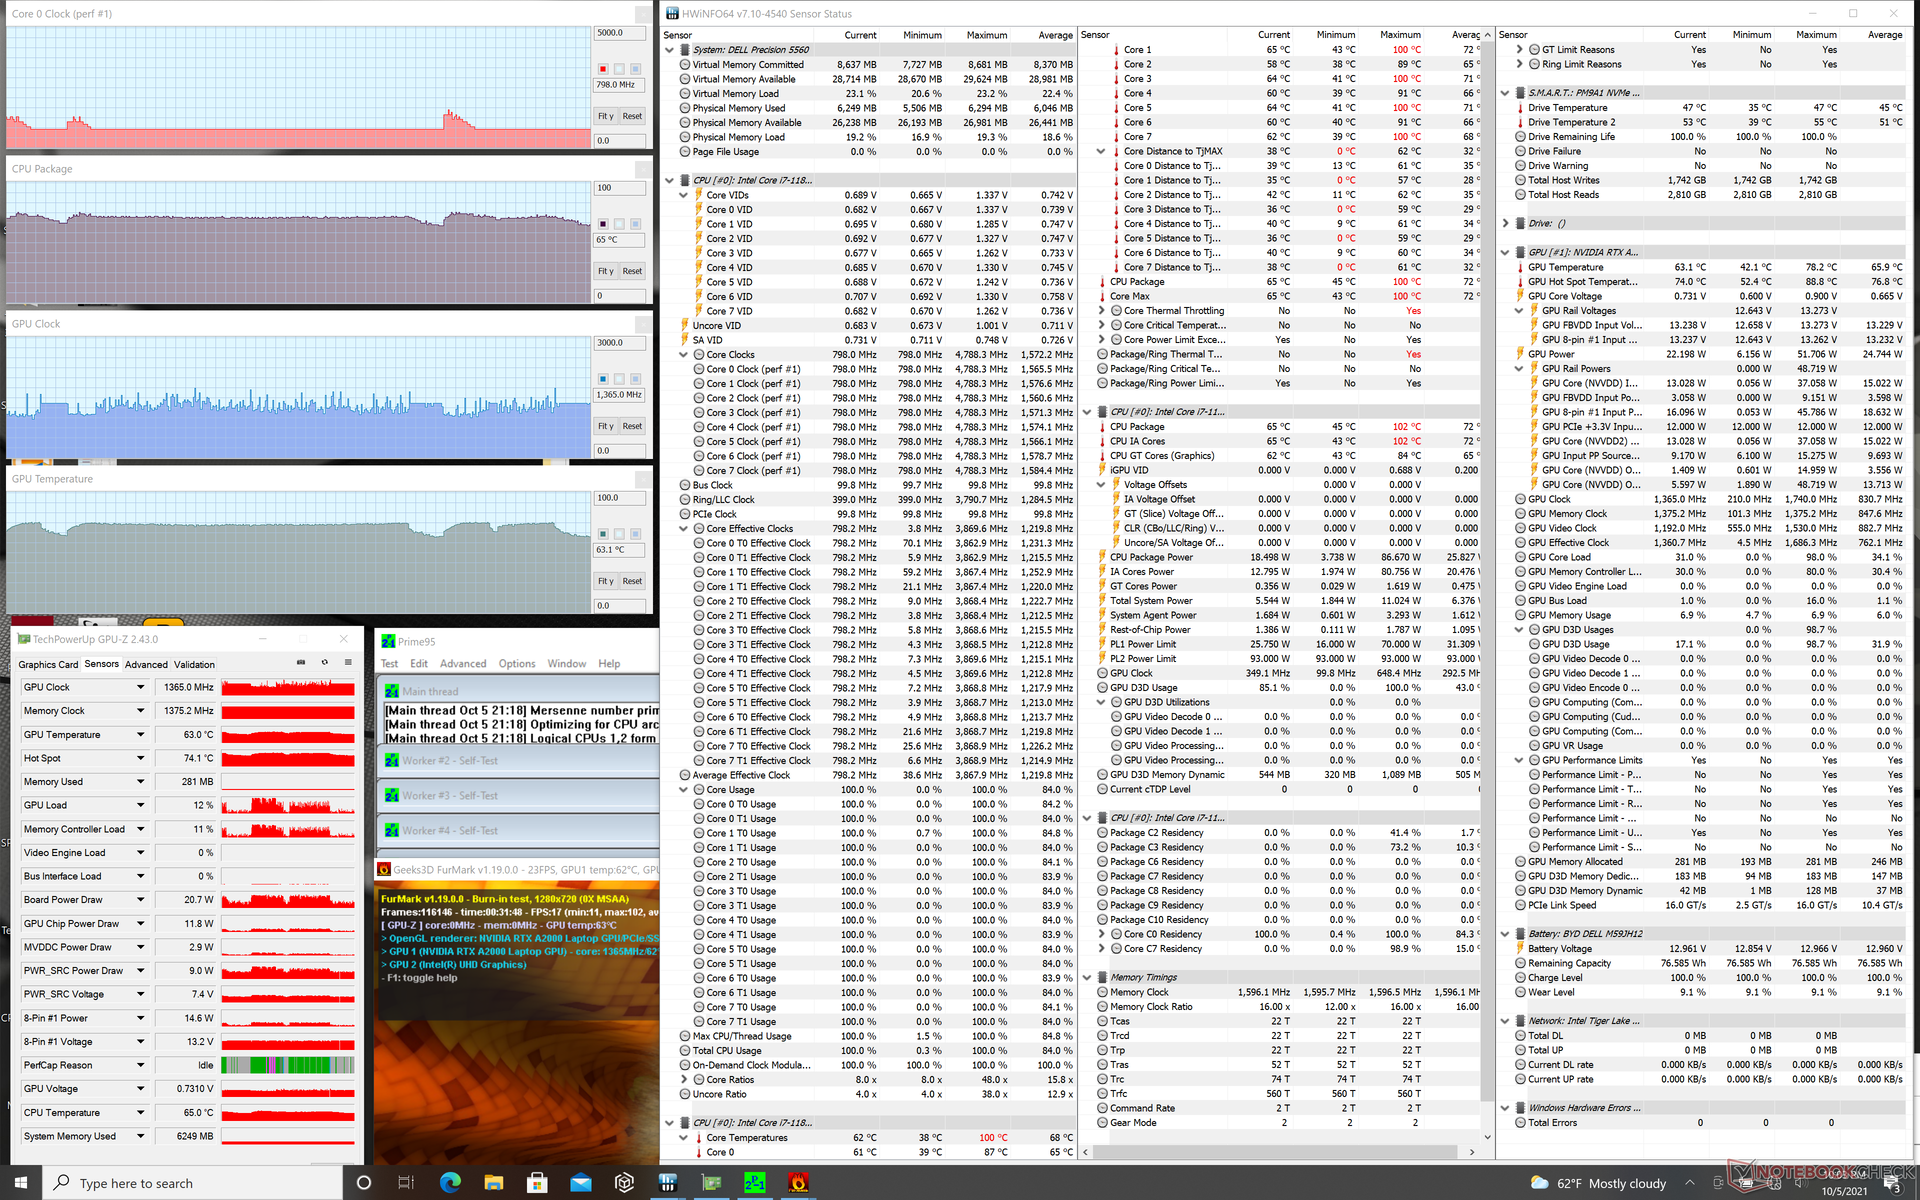
| RelógioCPU (GHz) | RelógioGPU (MHz) | Temperaturamédiada CPU (°C) | Temperaturamédiada GPU (°C) | |
| System Idle | -- | --46 | 45 | |
| Prime95 Stress | 2.5 - 2.8 | -- | ~90 | 63 |
| Prime95 + FurMark Stress | 0.8 - 1.4 | 1000 - 1400 | 64 - 75 | 63 - 75 |
| Witcher 3 Stress | ~1.6 | 1462 | 69 | 75 |
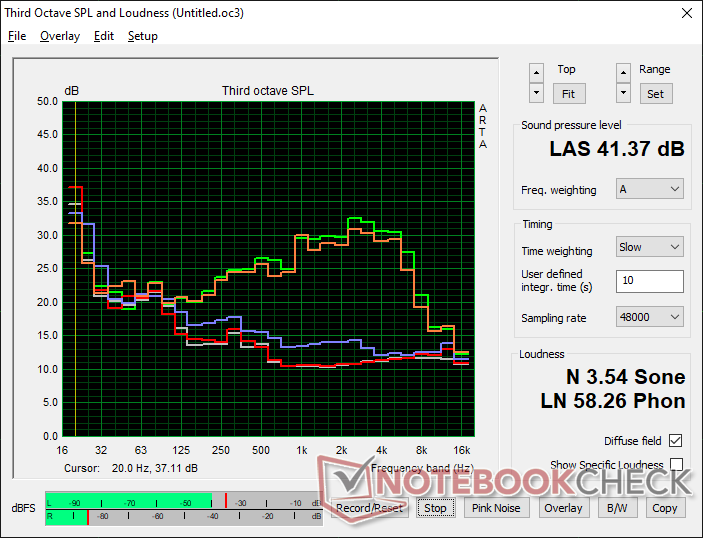
Oradores

Dell Precision 5000 5560 análise de áudio
(±) | o volume do alto-falante é médio, mas bom (###valor### dB)
Graves 100 - 315Hz
(±) | graves reduzidos - em média 9.8% menor que a mediana
(±) | a linearidade dos graves é média (8.8% delta para a frequência anterior)
Médios 400 - 2.000 Hz
(±) | médios mais altos - em média 5.7% maior que a mediana
(+) | médios são lineares (3.7% delta para frequência anterior)
Altos 2 - 16 kHz
(+) | agudos equilibrados - apenas 2.7% longe da mediana
(+) | os máximos são lineares (6.4% delta da frequência anterior)
Geral 100 - 16.000 Hz
(+) | o som geral é linear (14.8% diferença em relação à mediana)
Comparado com a mesma classe
» 33% de todos os dispositivos testados nesta classe foram melhores, 6% semelhantes, 61% piores
» O melhor teve um delta de 7%, a média foi 17%, o pior foi 35%
Comparado com todos os dispositivos testados
» 20% de todos os dispositivos testados foram melhores, 4% semelhantes, 76% piores
» O melhor teve um delta de 4%, a média foi 23%, o pior foi 134%
Apple MacBook 12 (Early 2016) 1.1 GHz análise de áudio
(+) | os alto-falantes podem tocar relativamente alto (###valor### dB)
Graves 100 - 315Hz
(±) | graves reduzidos - em média 11.3% menor que a mediana
(±) | a linearidade dos graves é média (14.2% delta para a frequência anterior)
Médios 400 - 2.000 Hz
(+) | médios equilibrados - apenas 2.4% longe da mediana
(+) | médios são lineares (5.5% delta para frequência anterior)
Altos 2 - 16 kHz
(+) | agudos equilibrados - apenas 2% longe da mediana
(+) | os máximos são lineares (4.5% delta da frequência anterior)
Geral 100 - 16.000 Hz
(+) | o som geral é linear (10.2% diferença em relação à mediana)
Comparado com a mesma classe
» 7% de todos os dispositivos testados nesta classe foram melhores, 2% semelhantes, 90% piores
» O melhor teve um delta de 5%, a média foi 18%, o pior foi 53%
Comparado com todos os dispositivos testados
» 5% de todos os dispositivos testados foram melhores, 1% semelhantes, 94% piores
» O melhor teve um delta de 4%, a média foi 23%, o pior foi 134%
Energy Management
Consumo de energia
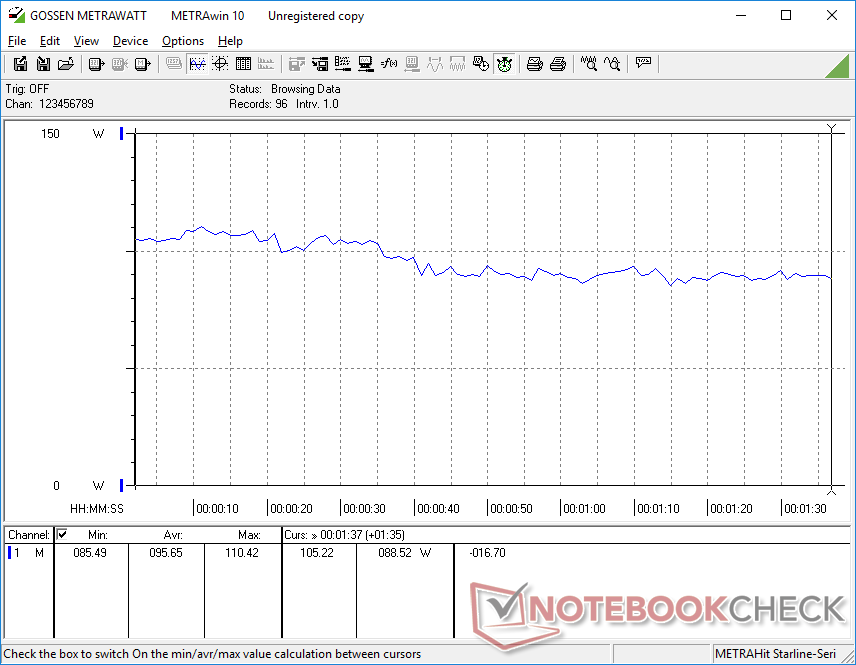
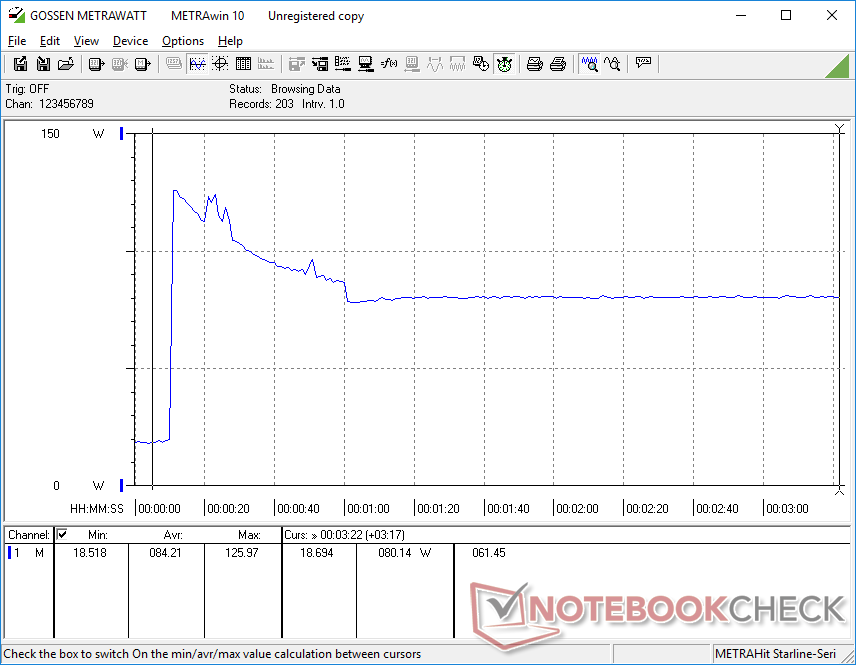
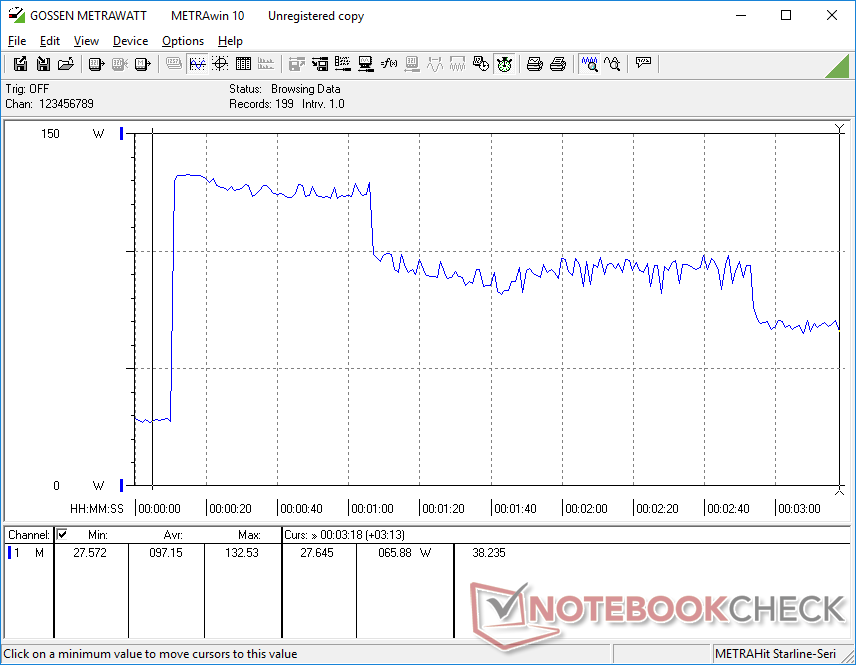
O consumo de energia é um saco misto. Quando sob cargas menores, nossa unidade estaria mais sedenta de energia do que a Precision 5550 (6 W a 24 W vs. 5 W a 19 W), o que provavelmente contribuiu para o menor tempo de vida útil da bateria em nossa próxima seção. Por outro lado, o consumo de energia permaneceria praticamente o mesmo que o do Precision 5550 ao executar cargas mais altas como jogos, embora nossa CPU e GPU possam ser até 15% e 50% mais rápidos que o Core i7-10875H e Quadro Quadro T2000 Max-Q, respectivamente. O desempenho por watt é, portanto, maior ano após ano quando executando aplicações exigentes.
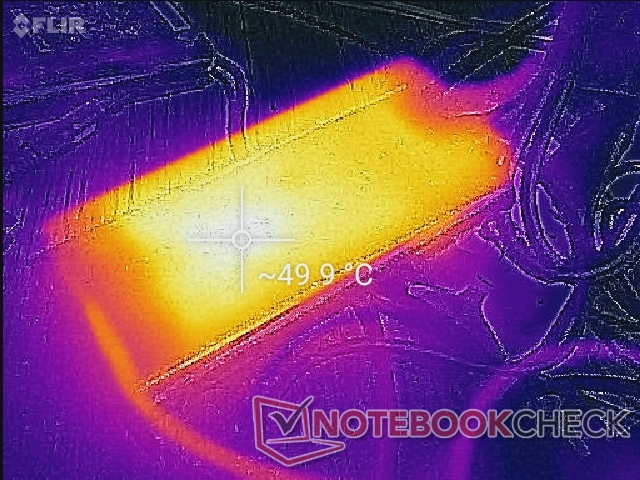
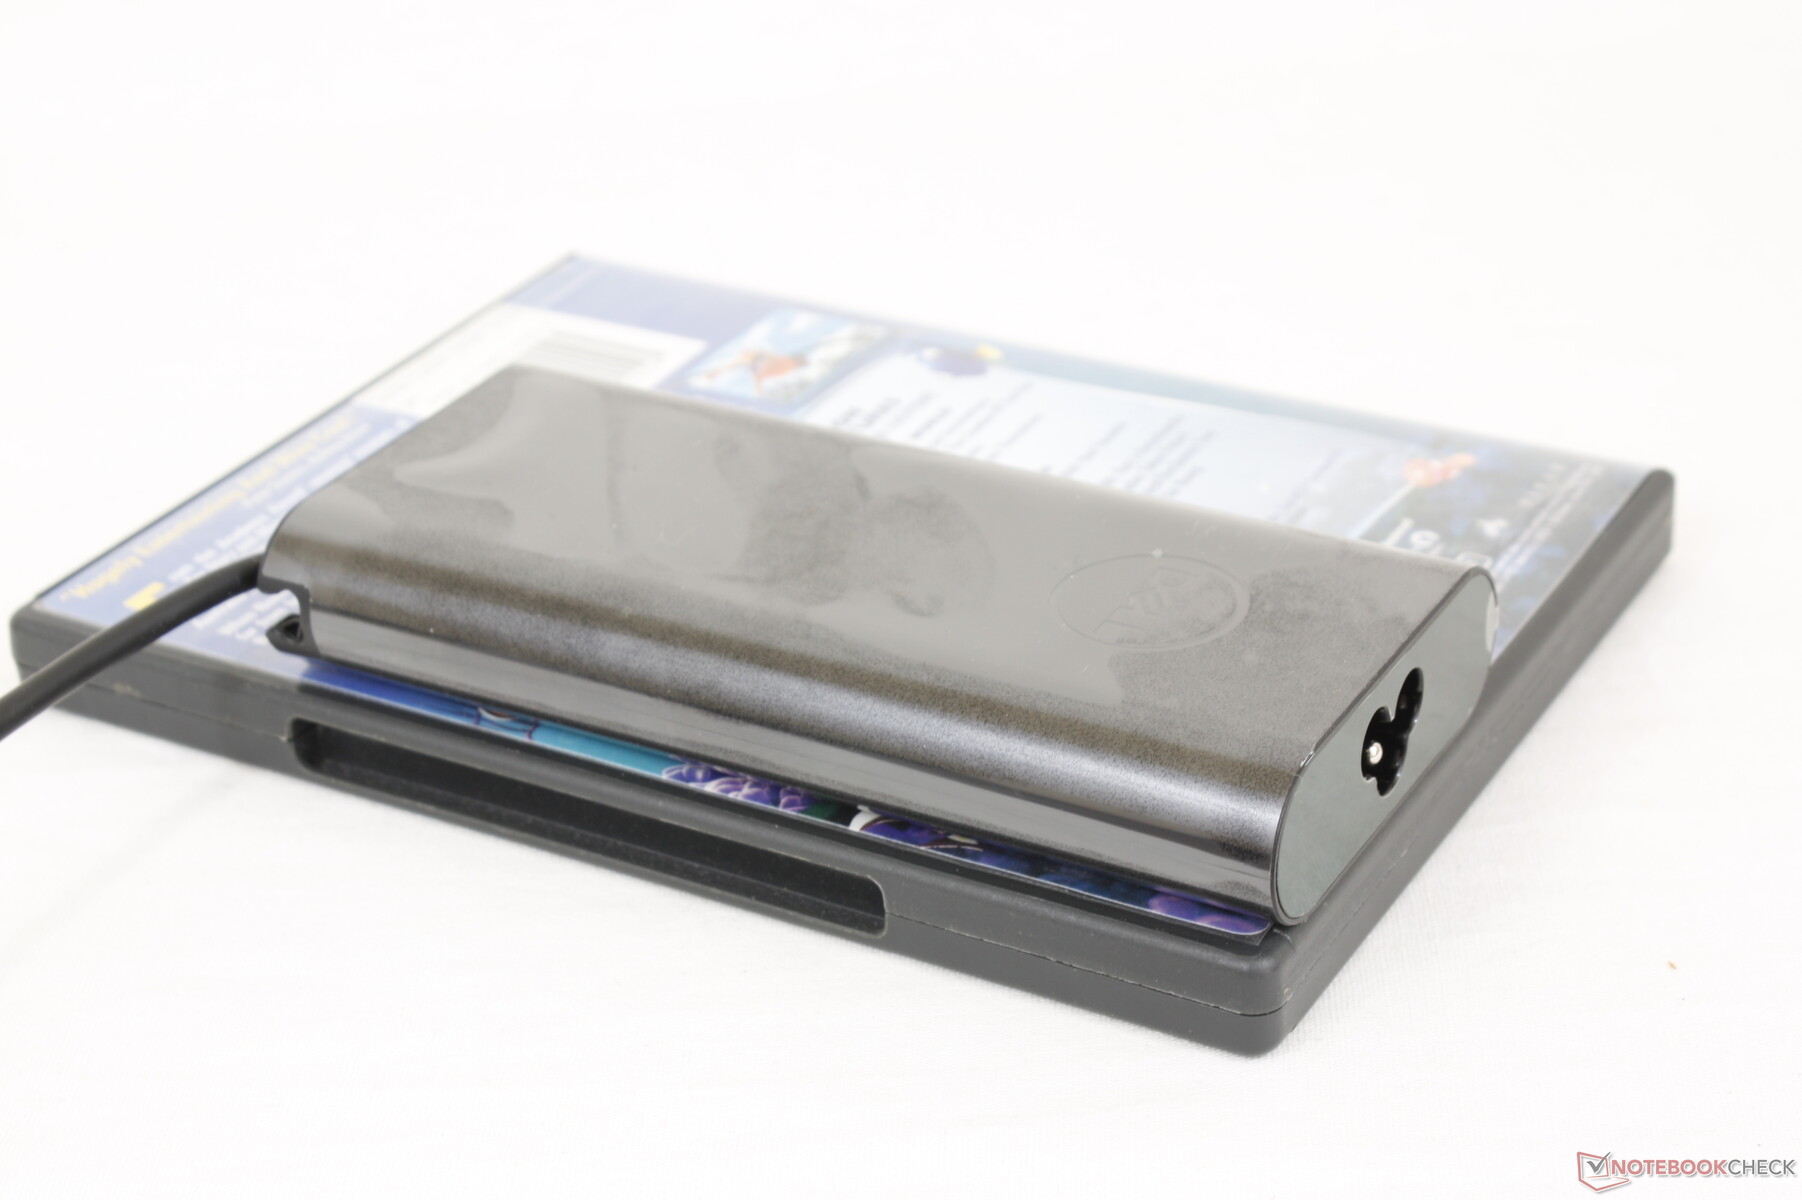
Somos capazes de registrar um consumo máximo temporário de 133 W do pequeno (~14,3 x 6,5 x 2,2 cm) adaptador USB-C AC de 130 W. O consumo cai com o tempo, como mostram nossos gráficos abaixo, devido a limitações térmicas. A bateria não irá esgotar quando conectada à rede elétrica, o que não é o caso em alguns dos primeiros modelos Precision 5750.

| desligado | |
| Ocioso | |
| Carga |
|
Key:
min: | |
| Dell Precision 5000 5560 i7-11850H, RTX A2000 Laptop GPU, Samsung PM9A1 MZVL22T0HBLB, IPS, 3840x2400, 15.6" | Lenovo ThinkPad P15 G2-20YQ001JGE i7-11800H, RTX A3000 Laptop GPU, Kioxia XG7 KXG7AZNV512G, IPS, 1920x1080, 15.6" | HP ZBook Studio 15 G8 i9-11950H, GeForce RTX 3070 Laptop GPU, Samsung PM981a MZVLB2T0HALB, OLED, 3840x2160, 15.6" | Asus ProArt StudioBook Pro 15 W500G5T i7-9750H, Quadro RTX 5000 Max-Q, Samsung SSD PM981 MZVLB1T0HALR, IPS, 3840x2160, 15.6" | Dell Precision 7550 W-10885M, Quadro RTX 5000 Max-Q, SK Hynix PC601A NVMe 1TB, IPS, 3840x2160, 15.6" | Dell Precision 5550 P91F i7-10875H, Quadro T2000 Max-Q, SK Hynix PC601A NVMe 1TB, IPS, 3840x2400, 15.6" | Razer Blade 15 Studio Edition 2020 i7-10875H, Quadro RTX 5000 Max-Q, Samsung PM981a MZVLB1T0HBLR, OLED, 3840x2160, 15.6" | |
|---|---|---|---|---|---|---|---|
| Power Consumption | -11% | -43% | -30% | -38% | 7% | -44% | |
| Idle Minimum * (Watt) | 6.2 | 6.3 -2% | 11 -77% | 11.6 -87% | 8.2 -32% | 5.6 10% | 13.4 -116% |
| Idle Average * (Watt) | 13.9 | 10.7 23% | 18.8 -35% | 19 -37% | 16.8 -21% | 11.2 19% | 18 -29% |
| Idle Maximum * (Watt) | 23.8 | 11.6 51% | 31.7 -33% | 20.6 13% | 24.4 -3% | 18.4 23% | 26.1 -10% |
| Load Average * (Watt) | 95.7 | 99.3 -4% | 105.2 -10% | 102 -7% | 131 -37% | 114 -19% | 115 -20% |
| Witcher 3 ultra * (Watt) | 87 | 154 -77% | 148 -70% | 156.6 -80% | 76.7 12% | 145 -67% | |
| Load Maximum * (Watt) | 132.6 | 210 -58% | 171.8 -30% | 178 -34% | 201.8 -52% | 134.2 -1% | 165 -24% |
* ... menor é melhor
Power Consumption Witcher 3 / Stresstest
Vida útil da bateria
Os tempos de execução são geralmente mais curtos do que o que registramos no ano passado Precision 5550. O uso da WLAN no mundo real só duraria cerca de 6,5 horas em comparação com 9 horas no modelo mais antigo, mesmo quando ambos estão definidos para perfis de potência balanceados idênticos com Optimus ativo
O carregamento da capacidade vazia para a capacidade total leva cerca de 2 horas. Apreciamos que o sistema pode ser recarregado através de qualquer uma de suas três portas USB-C, enquanto alguns laptops suportariam o carregamento em apenas uma porta USB-C. Este mesmo carregador Dell também pode ser usado para carregar os modernos laptops XPS.
| Dell Precision 5000 5560 i7-11850H, RTX A2000 Laptop GPU, 86 Wh | Lenovo ThinkPad P15 G2-20YQ001JGE i7-11800H, RTX A3000 Laptop GPU, 94 Wh | HP ZBook Studio 15 G8 i9-11950H, GeForce RTX 3070 Laptop GPU, 83 Wh | Asus ProArt StudioBook Pro 15 W500G5T i7-9750H, Quadro RTX 5000 Max-Q, 76 Wh | Dell Precision 7550 W-10885M, Quadro RTX 5000 Max-Q, 95 Wh | Dell Precision 5550 P91F i7-10875H, Quadro T2000 Max-Q, 86 Wh | Razer Blade 15 Studio Edition 2020 i7-10875H, Quadro RTX 5000 Max-Q, 80 Wh | |
|---|---|---|---|---|---|---|---|
| Duração da bateria | 15% | 2% | -25% | -3% | 36% | -9% | |
| Reader / Idle (h) | 12 | 12.9 8% | 11.1 -7% | 22.6 88% | 8.8 -27% | ||
| WiFi v1.3 (h) | 6.3 | 9.9 57% | 6.2 -2% | 4.7 -25% | 8.9 41% | 9 43% | 5.7 -10% |
| Load (h) | 1.8 | 1.3 -28% | 1.8 0% | 1 -44% | 1.4 -22% | 2 11% |
Pro
Contra
Veredicto - A mesma aparência, gráficos muito mais rápidos
Por que comprar o Precision 5560 quando ele é visualmente idêntico ao Precision 5550? O salto na potência da GPU será o principal motivo para considerar o modelo mais novo em relação ao modelo mais antigo. A Quadro RTX A2000 da Nvidia é uma geração à frente da Quadro T2000 Max-Q para proporcionar um desempenho de GPU até 50% mais rápido a um custo mínimo de consumo de energia, vida útil da bateria, peso, temperatura da superfície e até mesmo ruído do ventilador. Os ganhos de desempenho por watt por si só ajudam a fazer com que o sistema tenha um desempenho mais rápido do que seu perfil ultraleve poderia sugerir. Os usuários também terão um aumento no desempenho da CPU, embora por margens muito menores.
Um enorme aumento na potência da GPU sobre o Precision 5550. Se o Quadro RTX A2000 não for de seu interesse, no entanto, talvez você queira considerar o modelo visualmente idêntico do ano passado.
Por qualquer razão, nosso Precision 5560 não pode alcançar o mesmo teto máximo de ruído do ventilador que experimentamos no 5550. Isto poderia ter sido de propósito pelo fabricante numa tentativa de diminuir o ruído do ventilador, mas tem algum impacto sobre as temperaturas centrais.
Os usuários que sabem que podem se beneficiar do aumento da potência gráfica vão querer pular o Precision 5550 para o 5560. Caso contrário, o 5550 pode oferecer uma experiência de usuário idêntica em termos de características físicas e de exibição. Concorrentes como a MSI WS66, Estúdio Razer Blade 15ou Lenovo ThinkPad P15 G2 são ligeiramente mais espessas, mas carregam GPUs ainda mais rápidas da Quadro RTX A3000 e superiores que não estão disponíveis na série Precision 5000.
Preço e disponibilidade
Dell Precision 5000 5560
- 10/06/2021 v7 (old)
Allen Ngo
Price comparison

