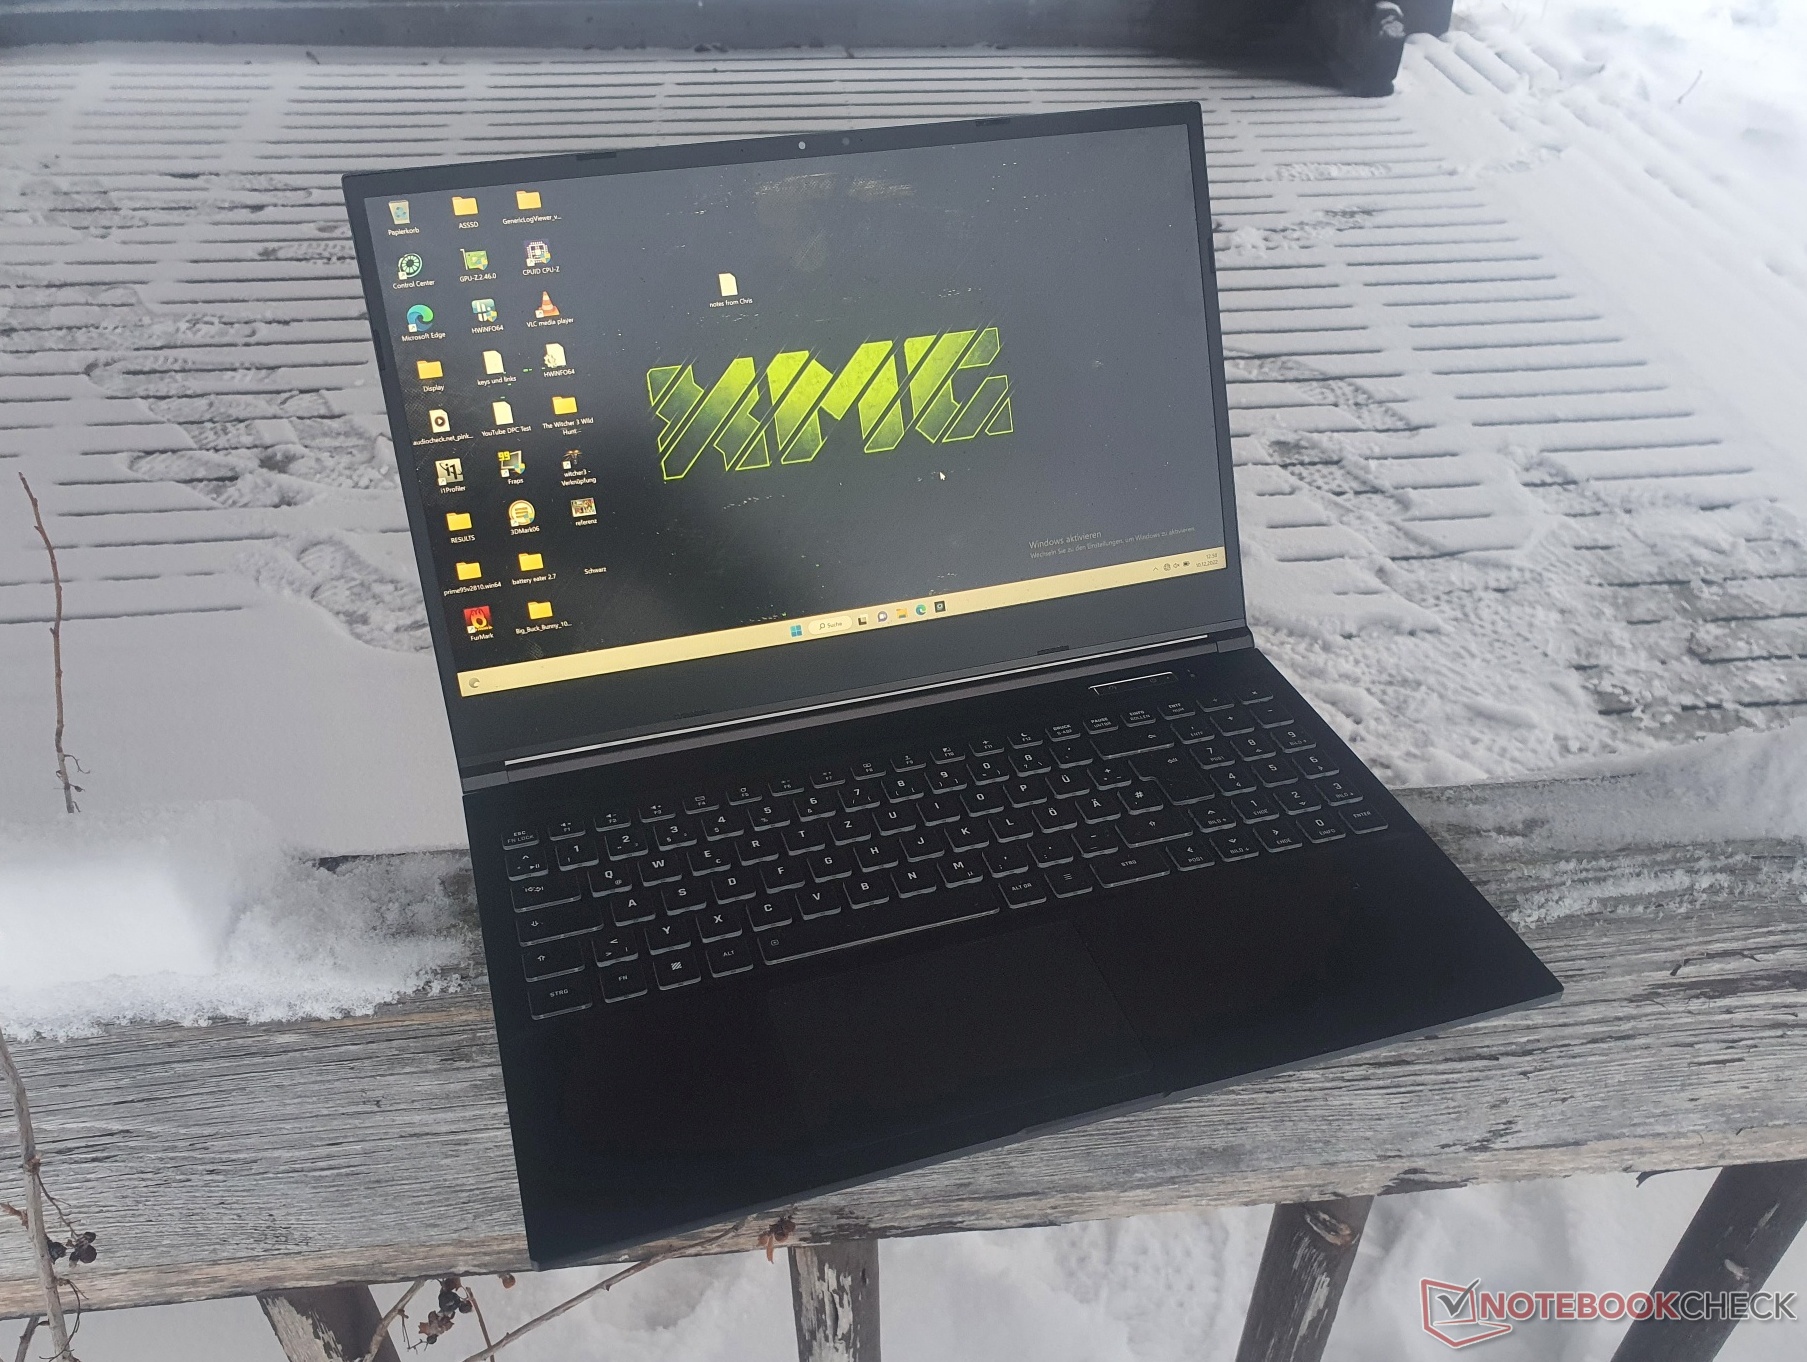
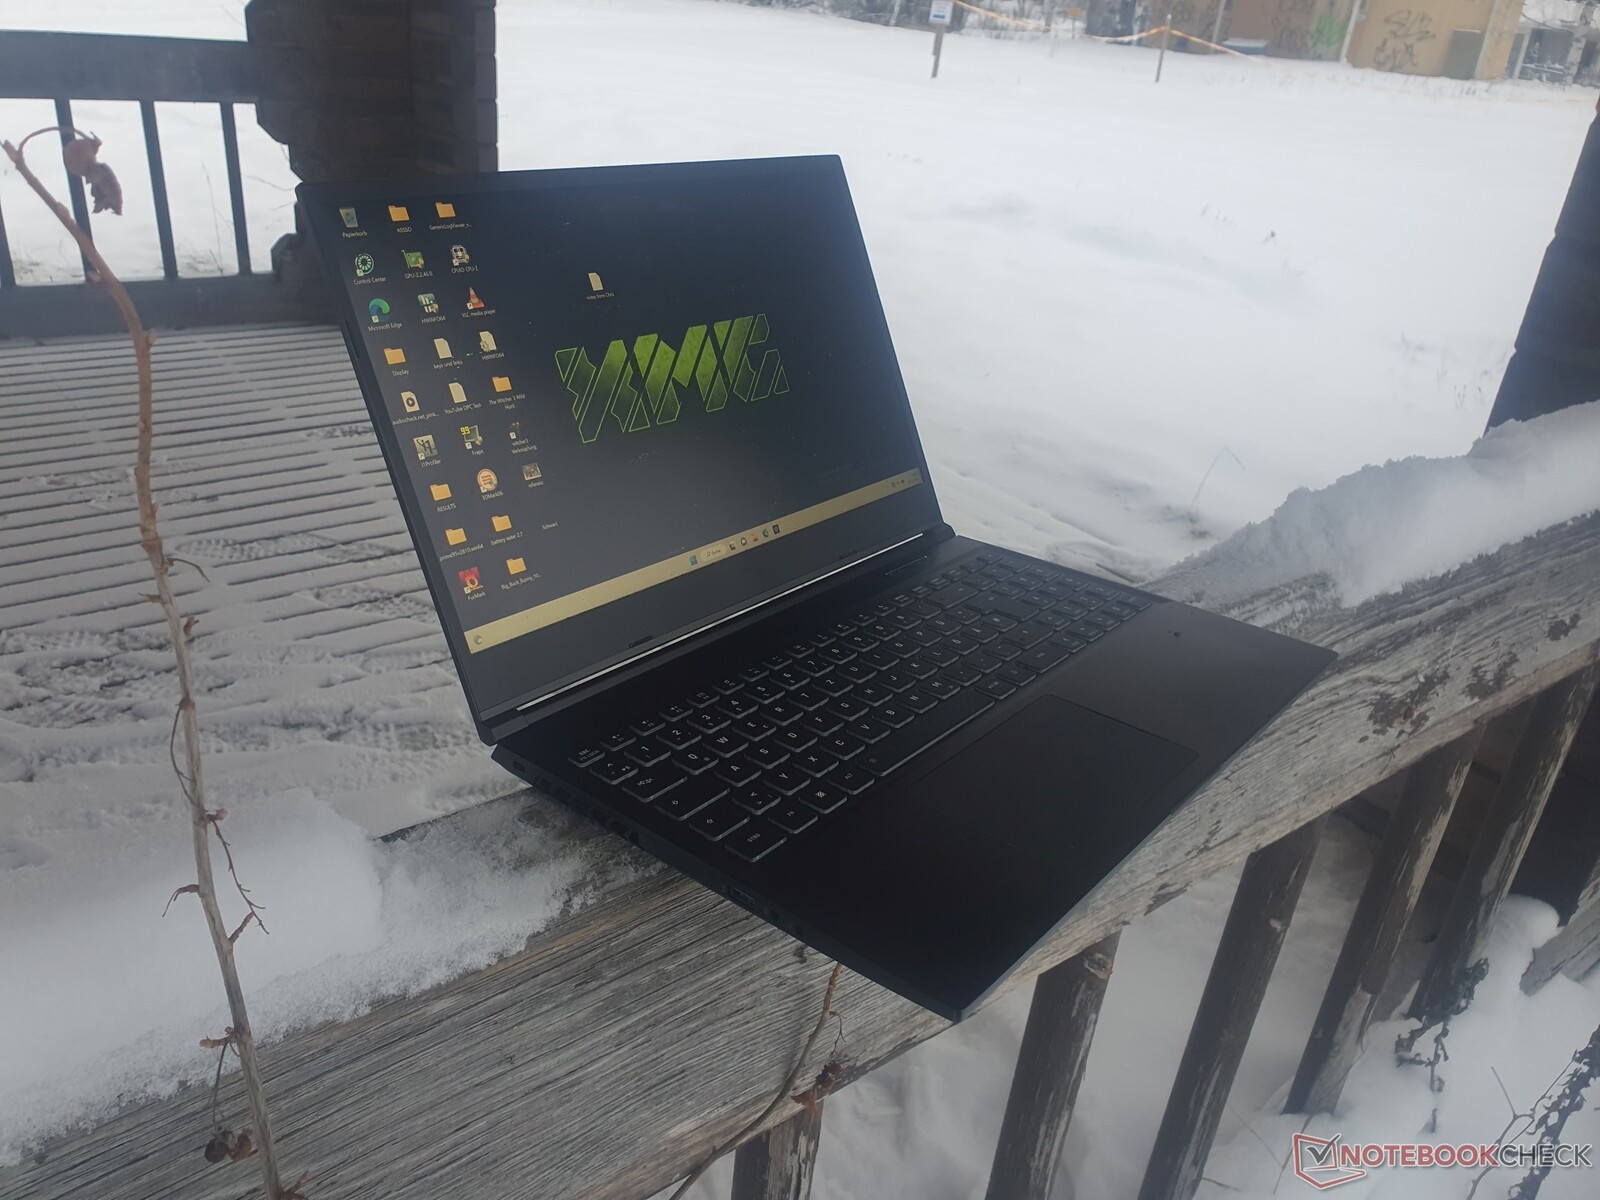
Schenker XMG Core 15 M22 em revisão: Jogo de médio alcance com conexão de água
A Schenker fez seu objetivo de entregar um forte laptop de médio alcance superior com o XMG Core 15 (M22). Assim, este não só oferece o TGP máximo de 140 W da Nvidia GeForce RTX 3060 incluindo o interruptor MUX, mas também um rápido AMD Ryzen 7 6800H.
Você obtém um painel WQHD rápido de 165 Hz, bem como o suporte de um resfriamento externo de água, que de outra forma só é usado na classe superior absoluta da Schenker, que vimos, por exemplo, no XMG Neo 15que já testamos em detalhes. Tudo isso está disponível por 1.817 Euros (~$1935). O Core 15 classifica entre Ápice 15 e Neo 15.
Há muita concorrência no segmento de médio porte, por exemplo, o AsusTUF Gaming F15, Lenovo's Legion 5e o Alienware m15. O próprio Fusion 15 do XMG também é interessante para nossa comparação.
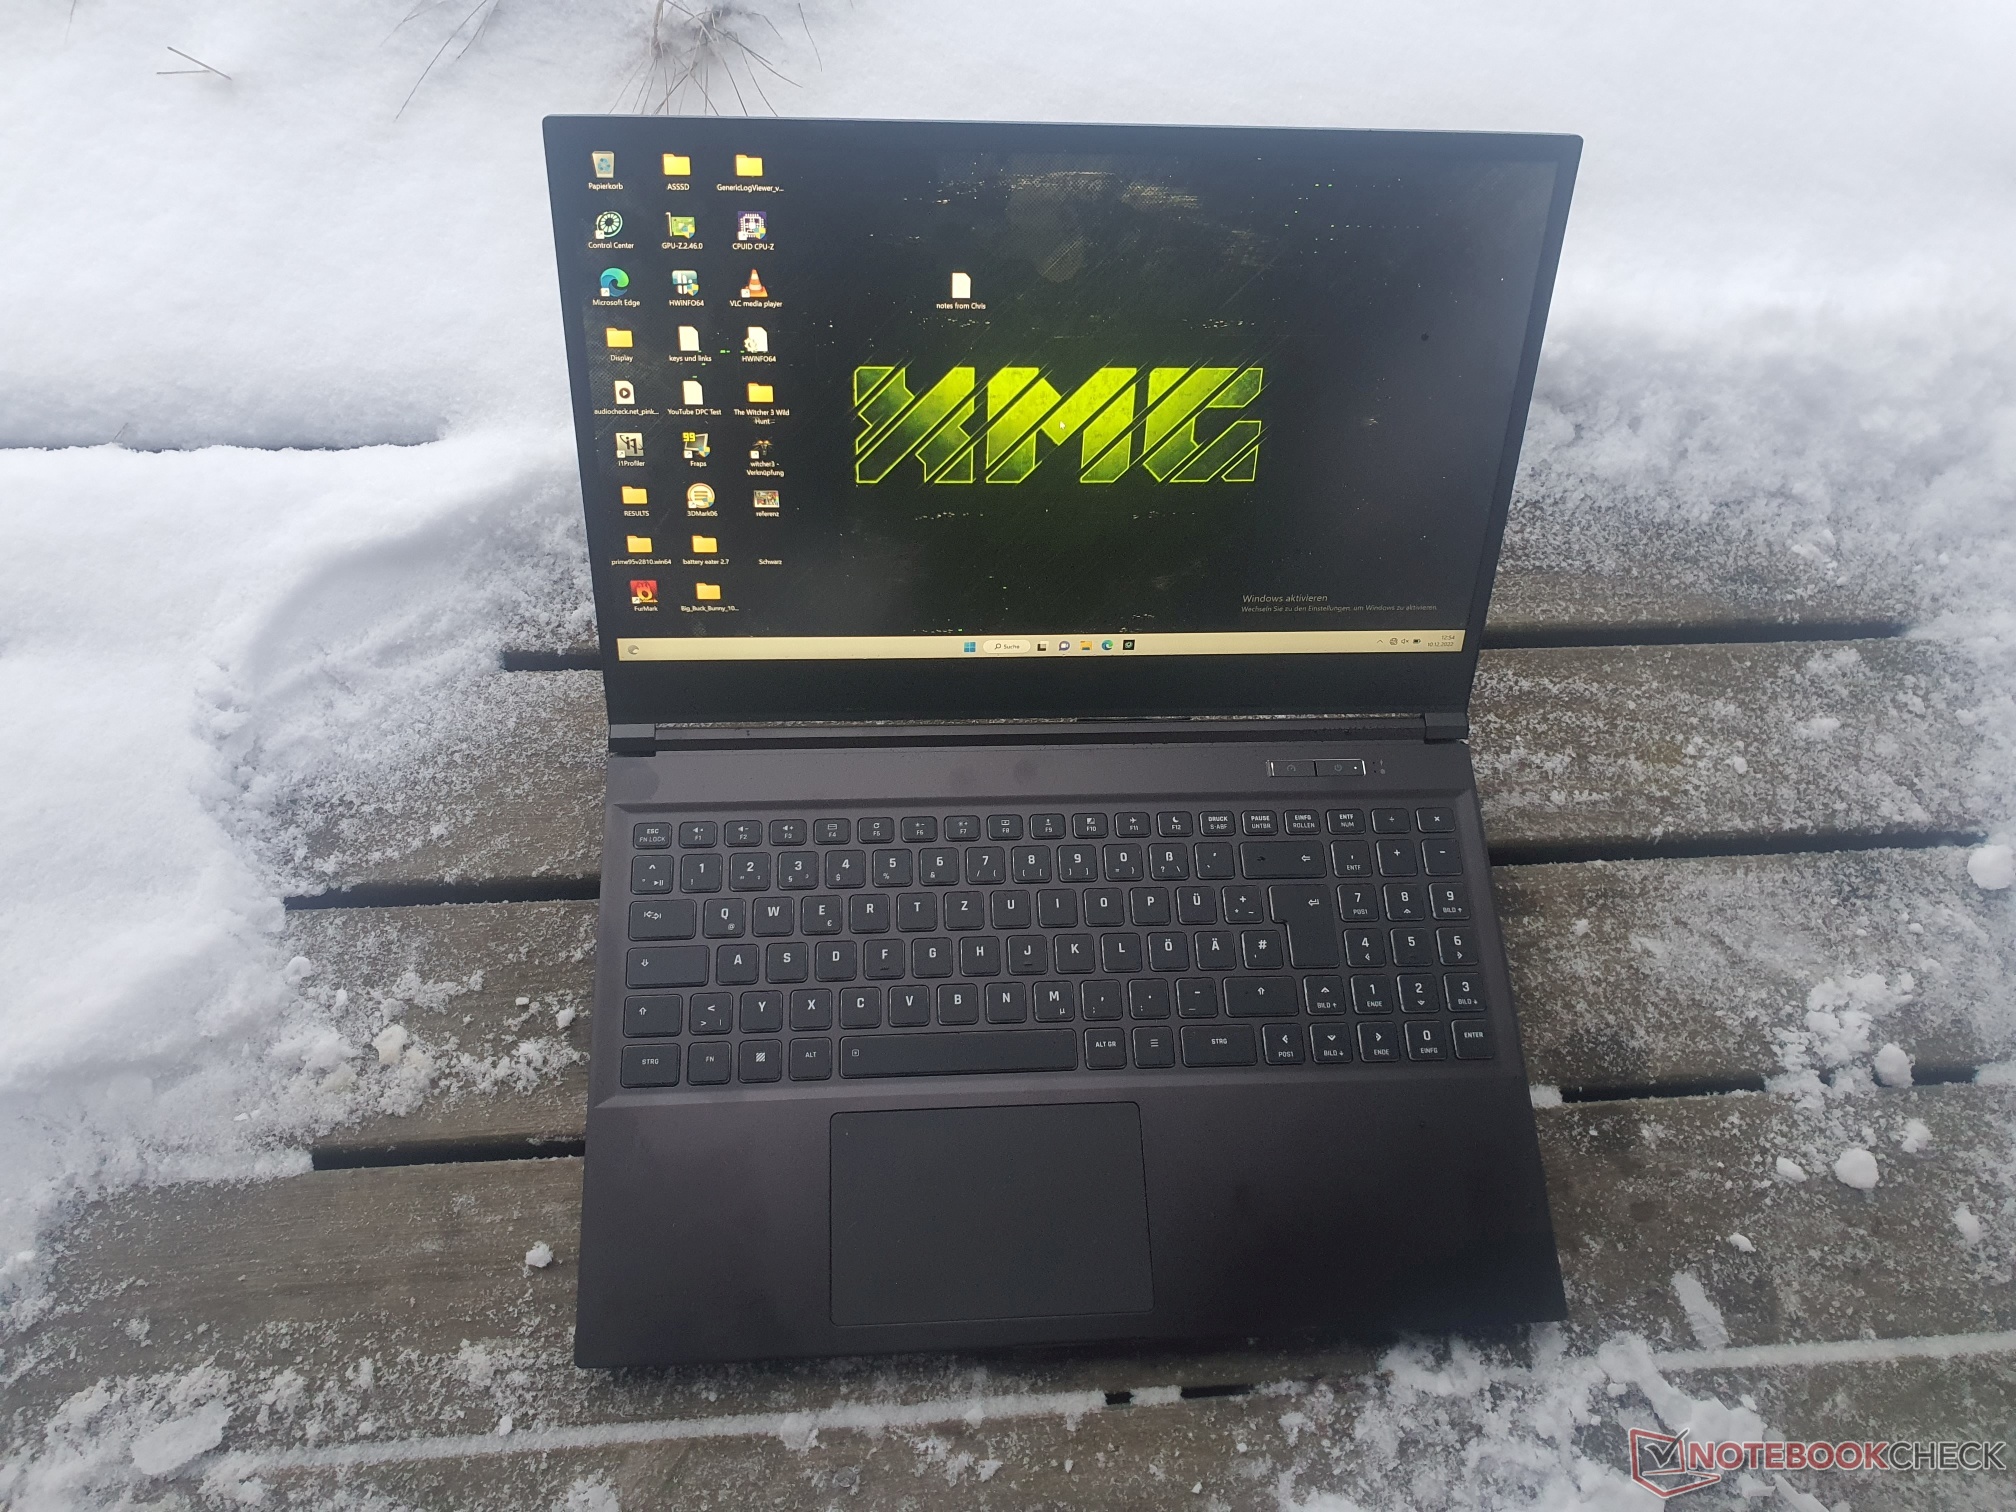
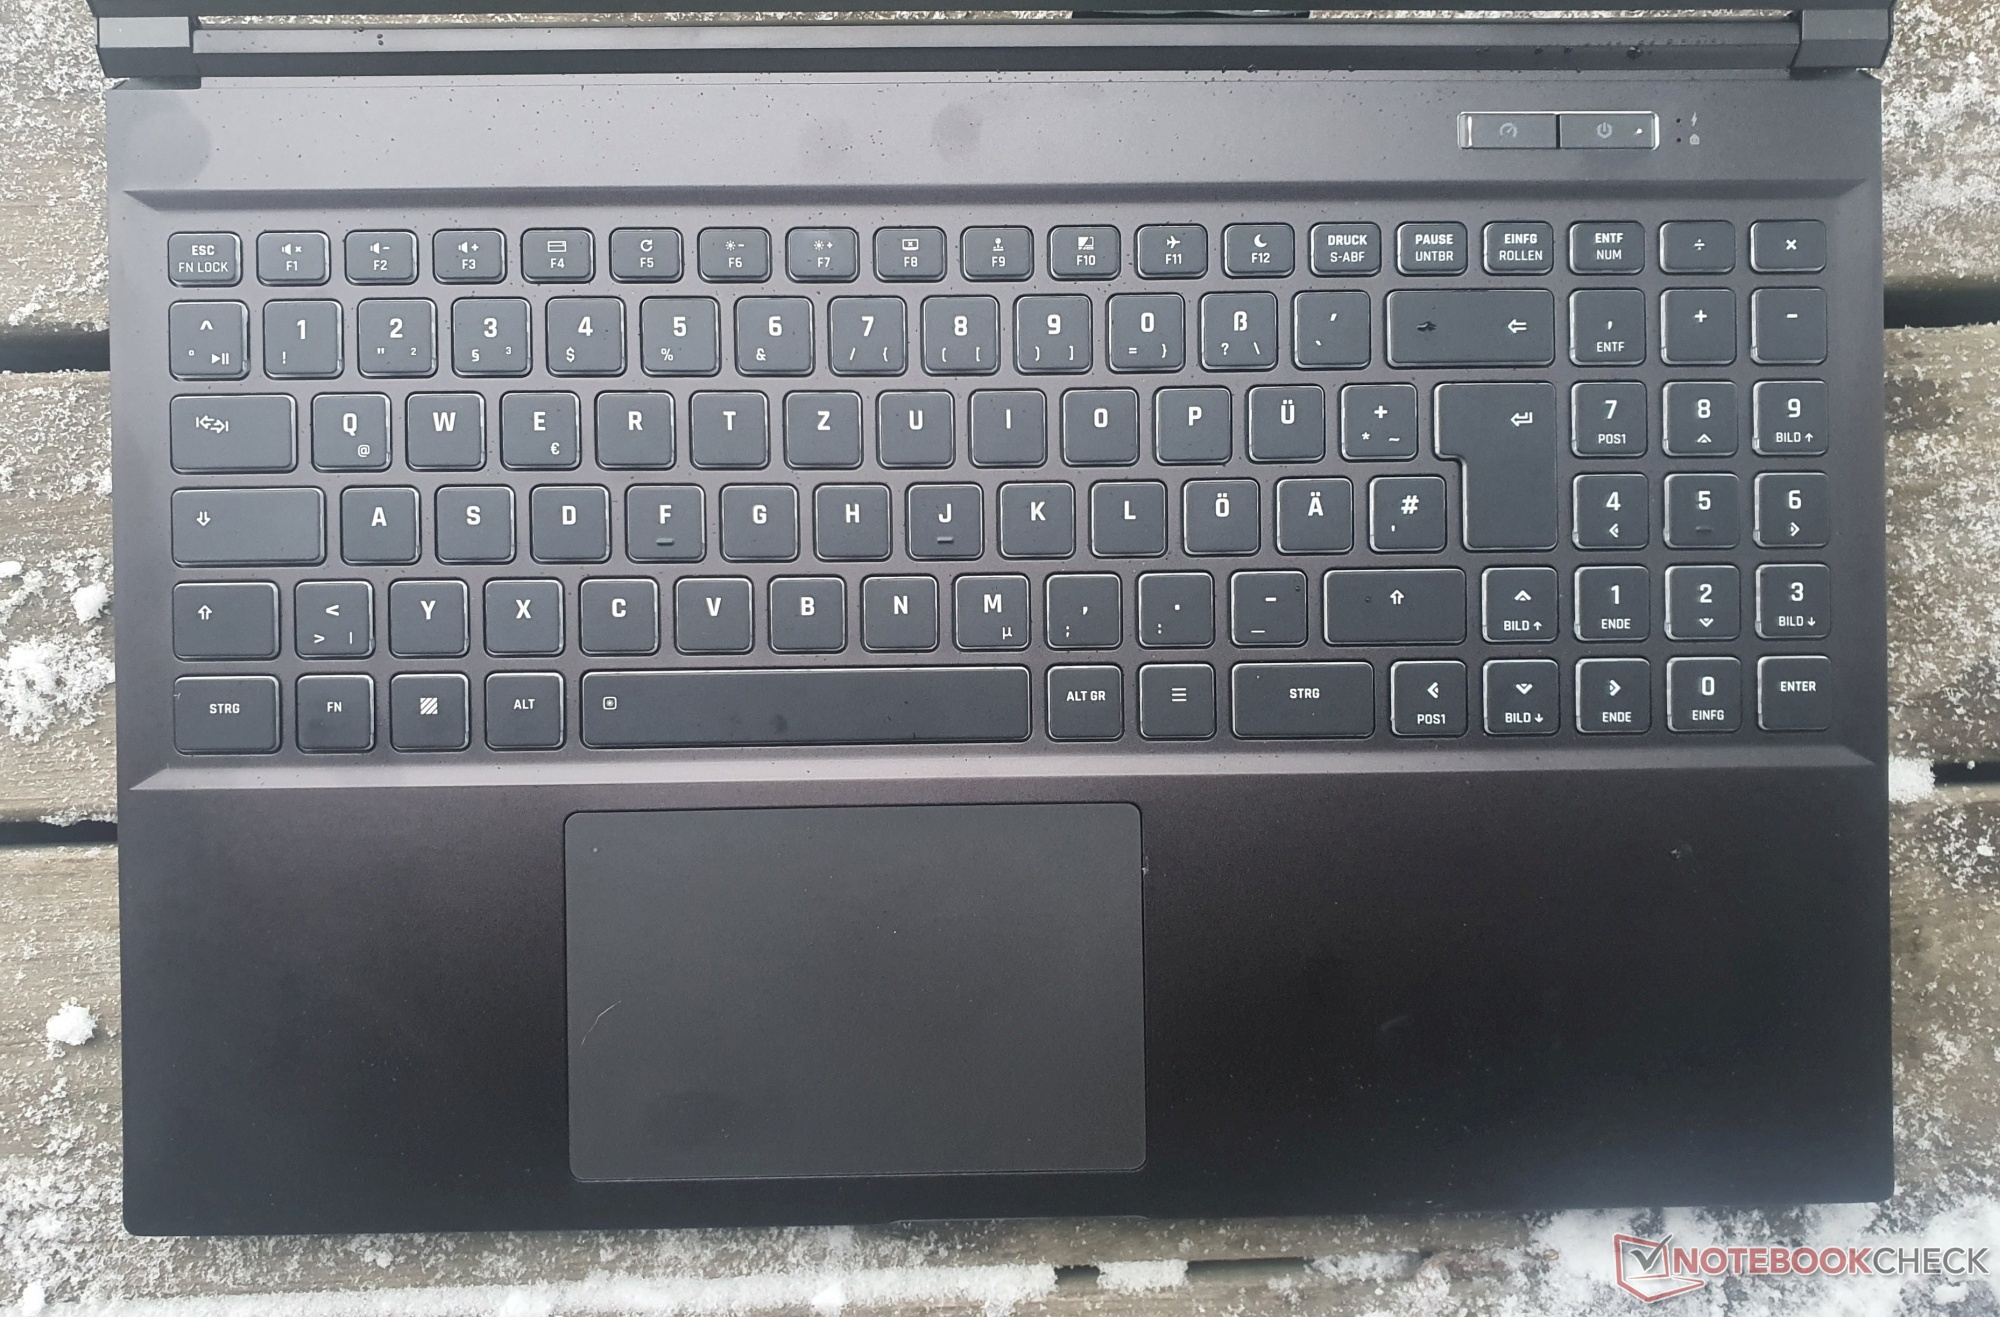
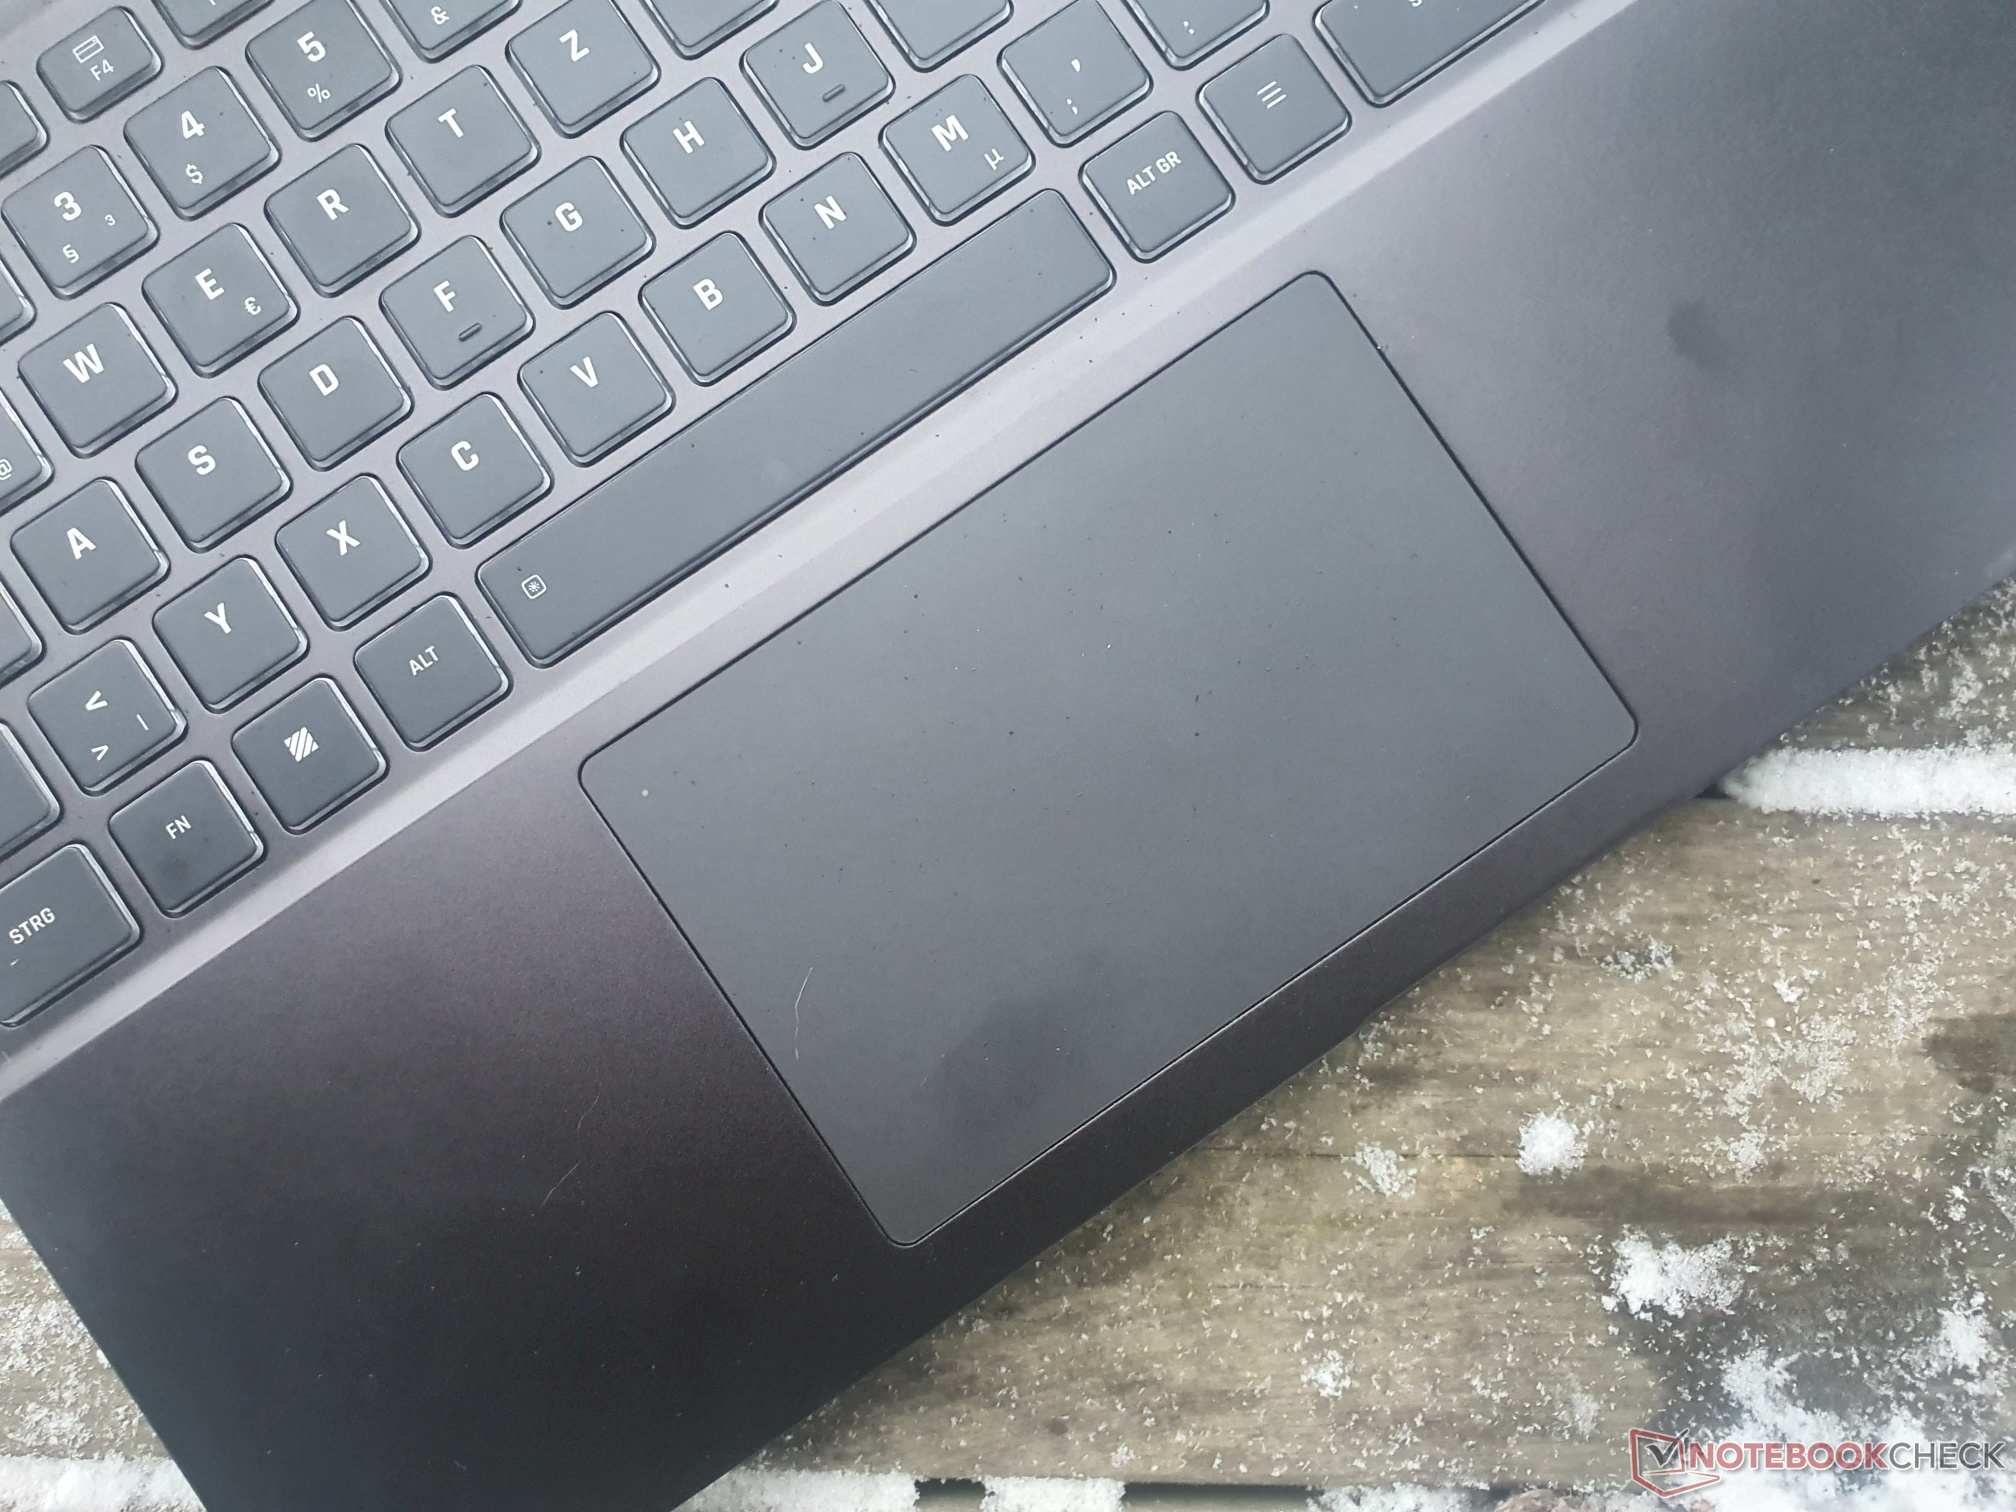
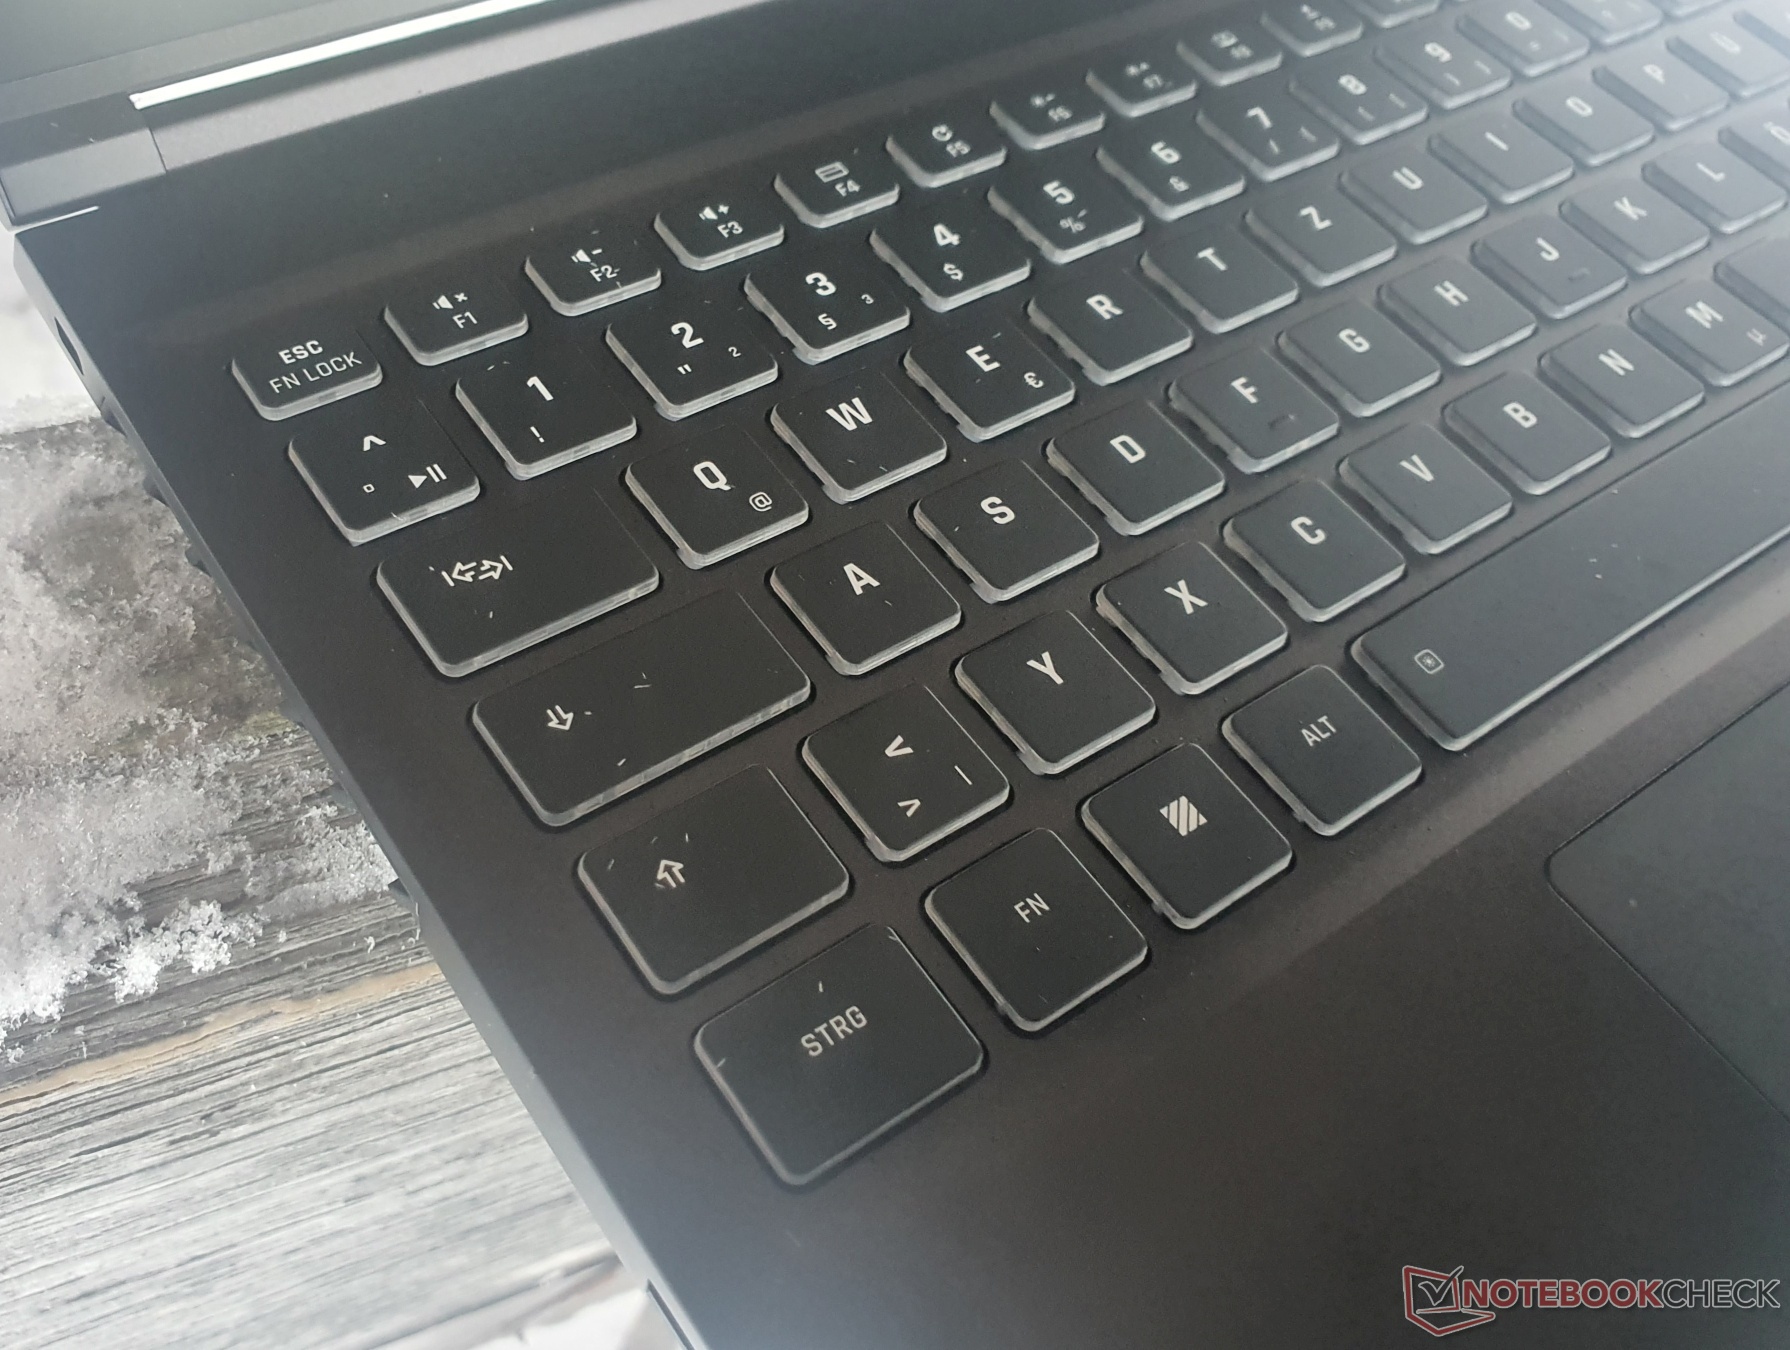
O caso do Core 15 permaneceu basicamente o mesmo, portanto você pode ler sobre os detalhes e os dispositivos de entrada em nosso Revisão do modelo antecessor.
Mais revisões Schenker:
XMG Neo 15(Ryzen 9 6900HXrTX 3070 Titeclado mecânico, XMG Oasis)
XMG Neo 17 (Ryzen 9 6900HX, RTX 3080 Titeclado mecânico, XMG Oasis)
XMG Fusion 15(Núcleo i7-11800H, RTX 3070teclado mecânico)
XMG Pro 15(Núcleo i7-12700HrTX 3080 Ti)
XMG Pro 17(Núcleo i9-12900HrTX 3080 Ti)
XMG Apex 15 Max(Ryzen 9 5900XcPU de mesa, RTX 3070)
Possíveis concorrentes em comparação
Avaliação | Data | Modelo | Peso | Altura | Size | Resolução | Preço |
|---|---|---|---|---|---|---|---|
| 87.9 % v7 (old) | 01/2023 | Schenker XMG Core 15 (M22) R7 6800H, GeForce RTX 3060 Laptop GPU | 2.1 kg | 23 mm | 15.60" | 2560x1440 | |
| 87.5 % v7 (old) | 11/2022 | Lenovo Legion 5 15IAH7H 82RB i7-12700H, GeForce RTX 3060 Laptop GPU | 2.4 kg | 19.99 mm | 15.60" | 1920x1080 | |
| 87.4 % v7 (old) | 08/2022 | Schenker XMG Fusion 15 (Mid 22) i7-11800H, GeForce RTX 3070 Laptop GPU | 1.9 kg | 21.65 mm | 15.60" | 2560x1440 | |
| 87.2 % v7 (old) | 03/2022 | Asus TUF Gaming F15 FX507ZM i7-12700H, GeForce RTX 3060 Laptop GPU | 2.1 kg | 24.95 mm | 15.60" | 1920x1080 | |
| 84.7 % v7 (old) | 06/2021 | Alienware m15 R5 Ryzen Edition R7 5800H, GeForce RTX 3060 Laptop GPU | 2.5 kg | 22.85 mm | 15.60" | 1920x1080 | |
| 84.9 % v7 (old) | 03/2021 | Schenker XMG Core 15 Ampere R7 4800H, GeForce RTX 3060 Laptop GPU | 2 kg | 22.9 mm | 15.60" | 2560x1440 |
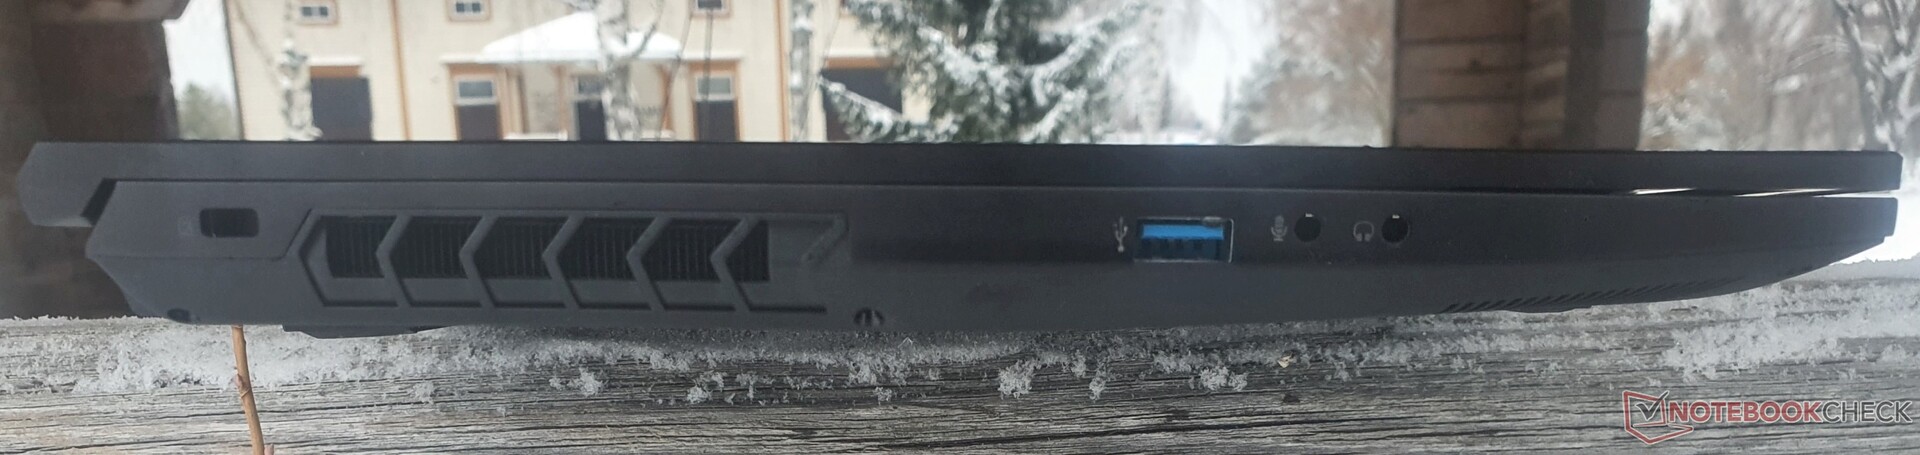
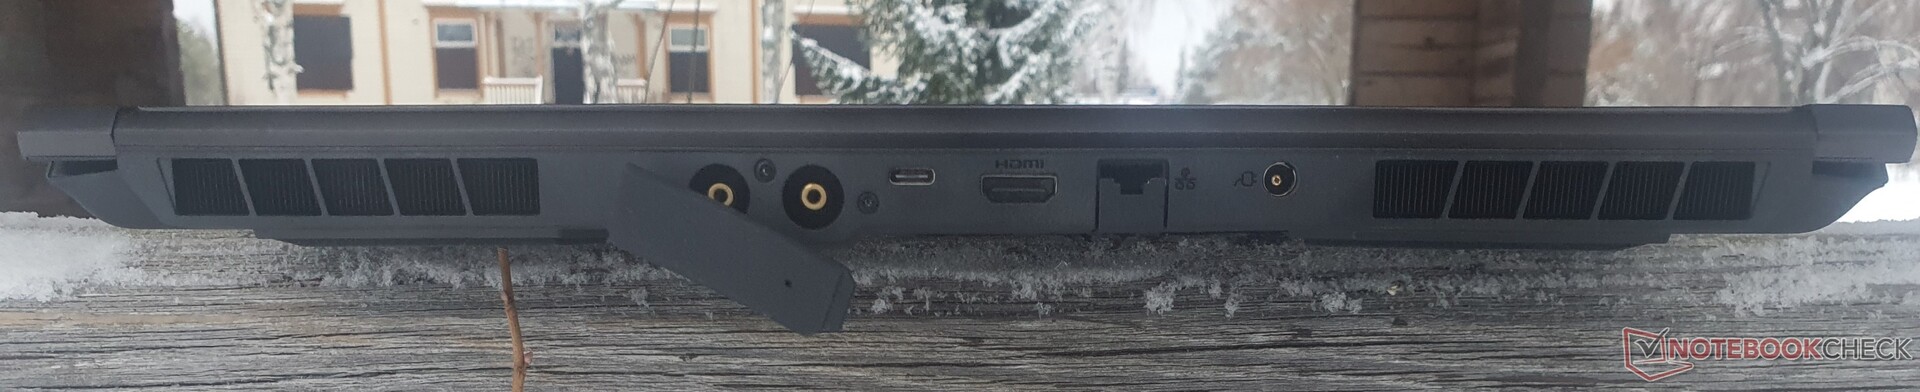
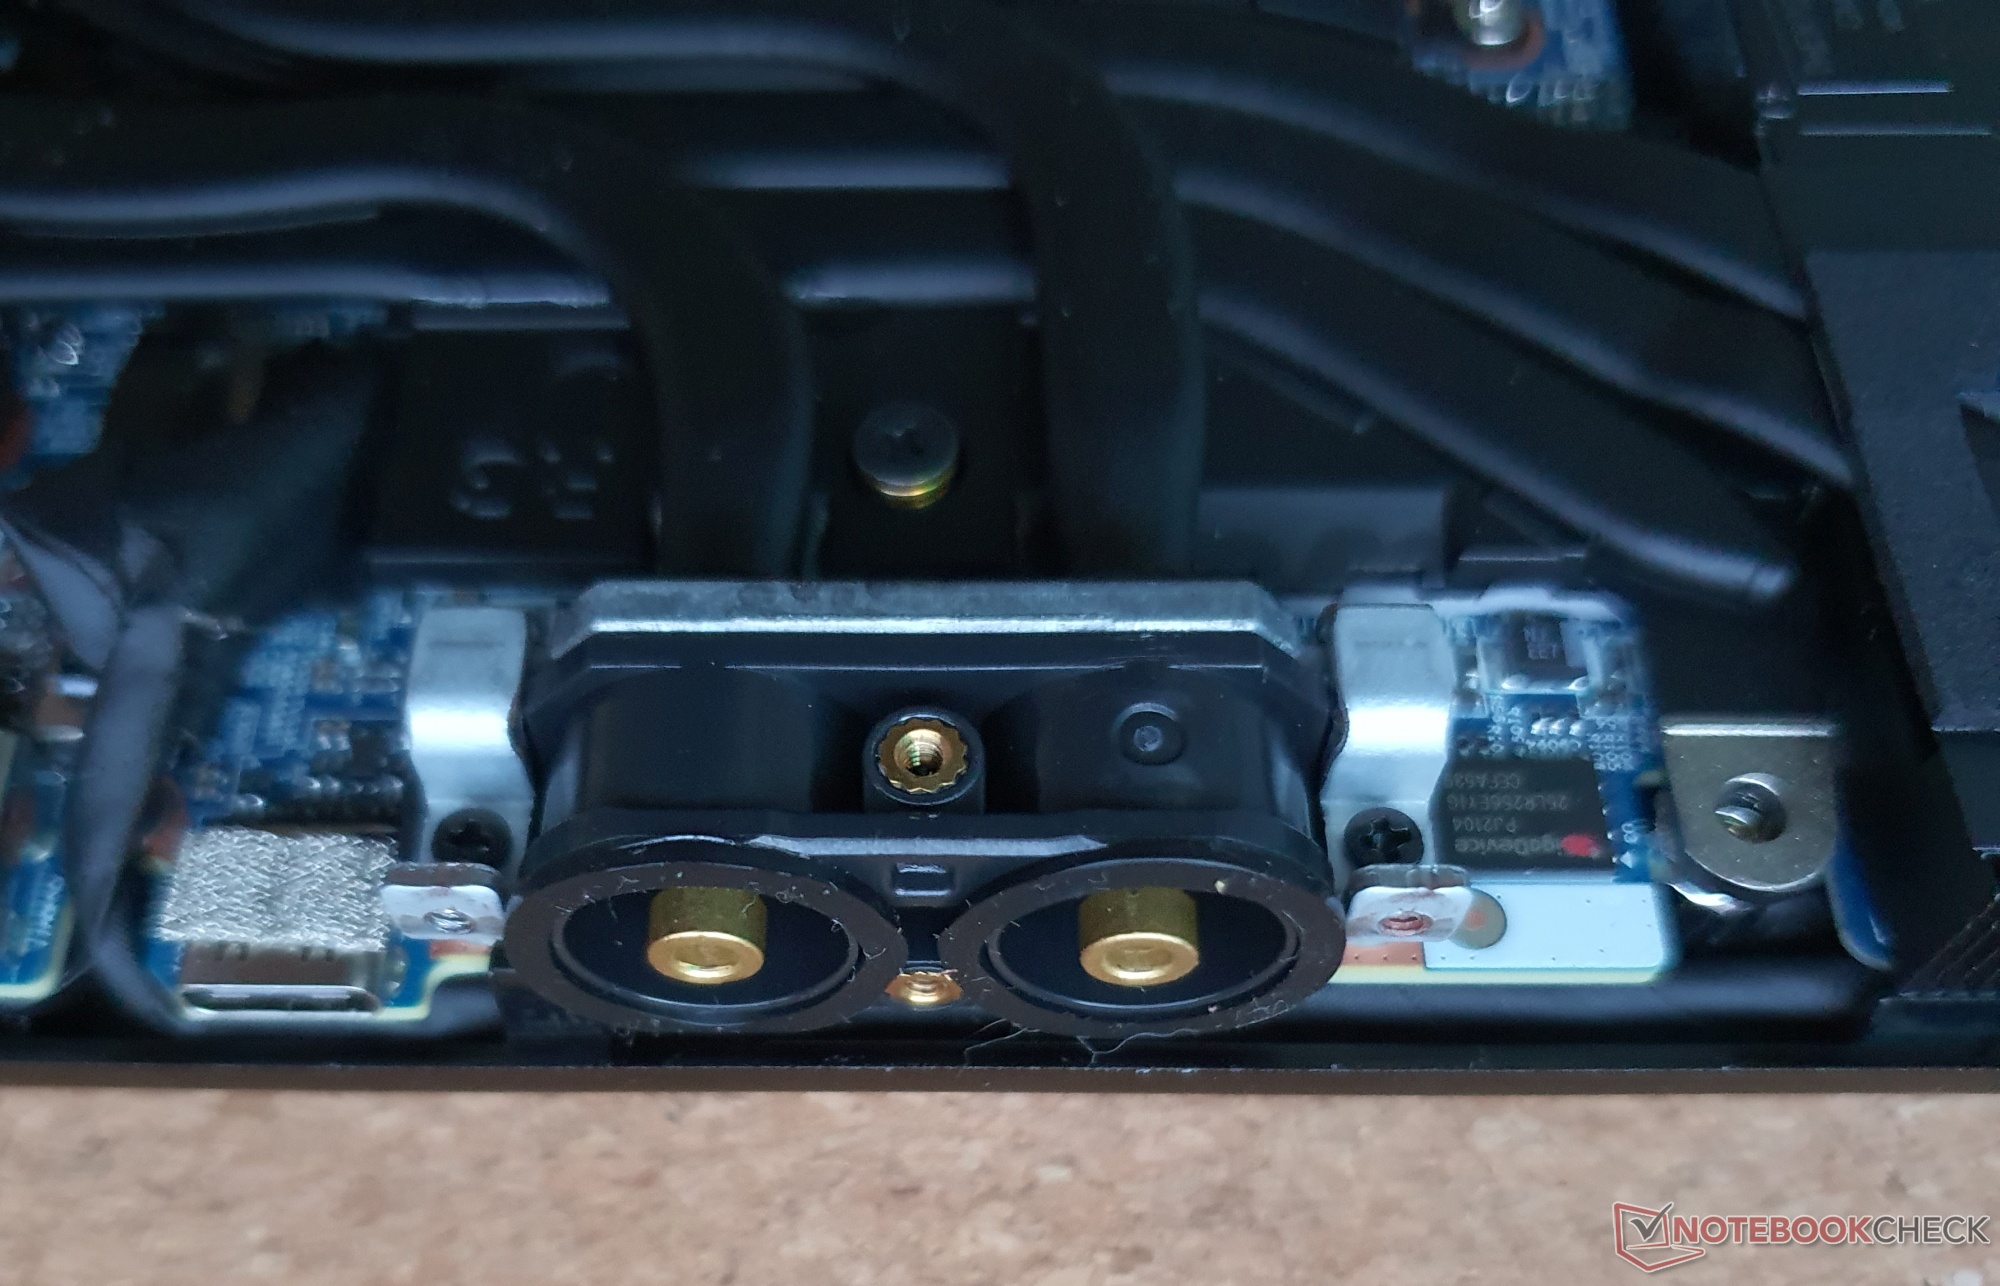
Características: porta de água, mas sem USB4 & USB-C-PD
Em comparação com o predecessor, a porta para o resfriamento externo do XMG Oasis é uma inovação interessante e útil. A porta USB 2.0 no lado esquerdo dá lugar a um USB-A 3.2 Gen2 mais rápido, enquanto ainda sentimos falta do USB4 e do carregamento via USB-C.
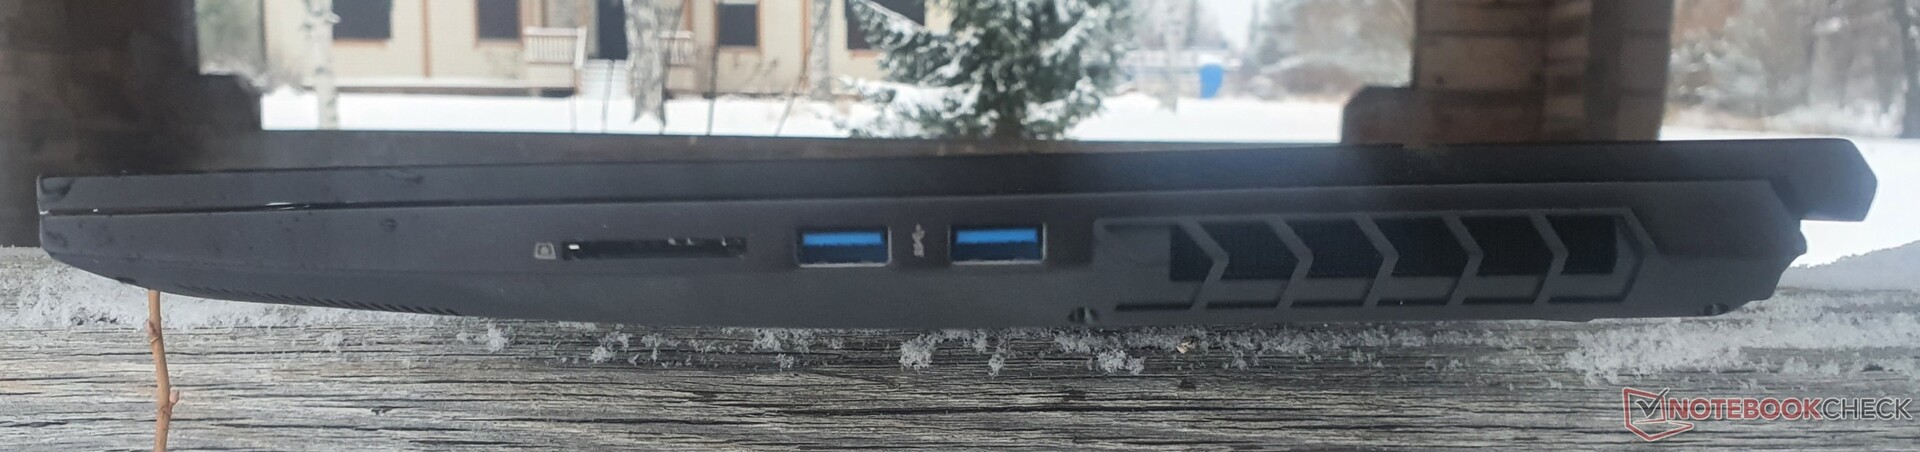
Leitor de cartões SD
| SD Card Reader | |
| average JPG Copy Test (av. of 3 runs) | |
| Média da turma Gaming (20.9 - 210, n=54, últimos 2 anos) | |
| Schenker XMG Core 15 Ampere (Toshiba Exceria Pro SDXC 64 GB UHS-II) | |
| Schenker XMG Apex 15 Max (AV PRO microSD 128 GB V60) | |
| Schenker XMG Fusion 15 (Mid 22) (AV PRO microSD 128 GB V60) | |
| Schenker XMG Core 15 (M22) (AV PRO microSD 128 GB V60) | |
| maximum AS SSD Seq Read Test (1GB) | |
| Média da turma Gaming (25.5 - 261, n=51, últimos 2 anos) | |
| Schenker XMG Apex 15 Max (AV PRO microSD 128 GB V60) | |
| Schenker XMG Core 15 Ampere (Toshiba Exceria Pro SDXC 64 GB UHS-II) | |
| Schenker XMG Core 15 (M22) (AV PRO microSD 128 GB V60) | |
Comunicação
| Networking | |
| iperf3 receive AXE11000 6GHz | |
| Lenovo Legion 5 15IAH7H 82RB | |
| Schenker XMG Core 15 (M22) | |
| Média MediaTek RZ608 (430 - 961, n=16) | |
| iperf3 receive AXE11000 | |
| Schenker XMG Fusion 15 (Mid 22) | |
| Lenovo Legion 5 15IAH7H 82RB | |
| Schenker XMG Core 15 (M22) | |
| Média MediaTek RZ608 (430 - 975, n=20) | |
| iperf3 transmit AXE11000 6GHz | |
| Lenovo Legion 5 15IAH7H 82RB | |
| Schenker XMG Core 15 (M22) | |
| Média MediaTek RZ608 (572 - 980, n=16) | |
| iperf3 transmit AXE11000 | |
| Lenovo Legion 5 15IAH7H 82RB | |
| Schenker XMG Fusion 15 (Mid 22) | |
| Schenker XMG Core 15 (M22) | |
| Média MediaTek RZ608 (572 - 979, n=20) | |
| iperf3 receive AX12 | |
| Asus TUF Gaming F15 FX507ZM | |
| Schenker XMG Core 15 Ampere | |
| Alienware m15 R5 Ryzen Edition | |
| Média MediaTek RZ608 (837 - 880, n=2) | |
| iperf3 transmit AX12 | |
| Schenker XMG Core 15 Ampere | |
| Alienware m15 R5 Ryzen Edition | |
| Asus TUF Gaming F15 FX507ZM | |
| Média MediaTek RZ608 (657 - 821, n=2) | |

 GeForce RTX 3060 Laptop GPU, R7 6800H, Samsung SSD 980 Pro 1TB MZ-V8P1T0BW")
 GeForce RTX 3060 Laptop GPU, R7 6800H, Samsung SSD 980 Pro 1TB MZ-V8P1T0BW")
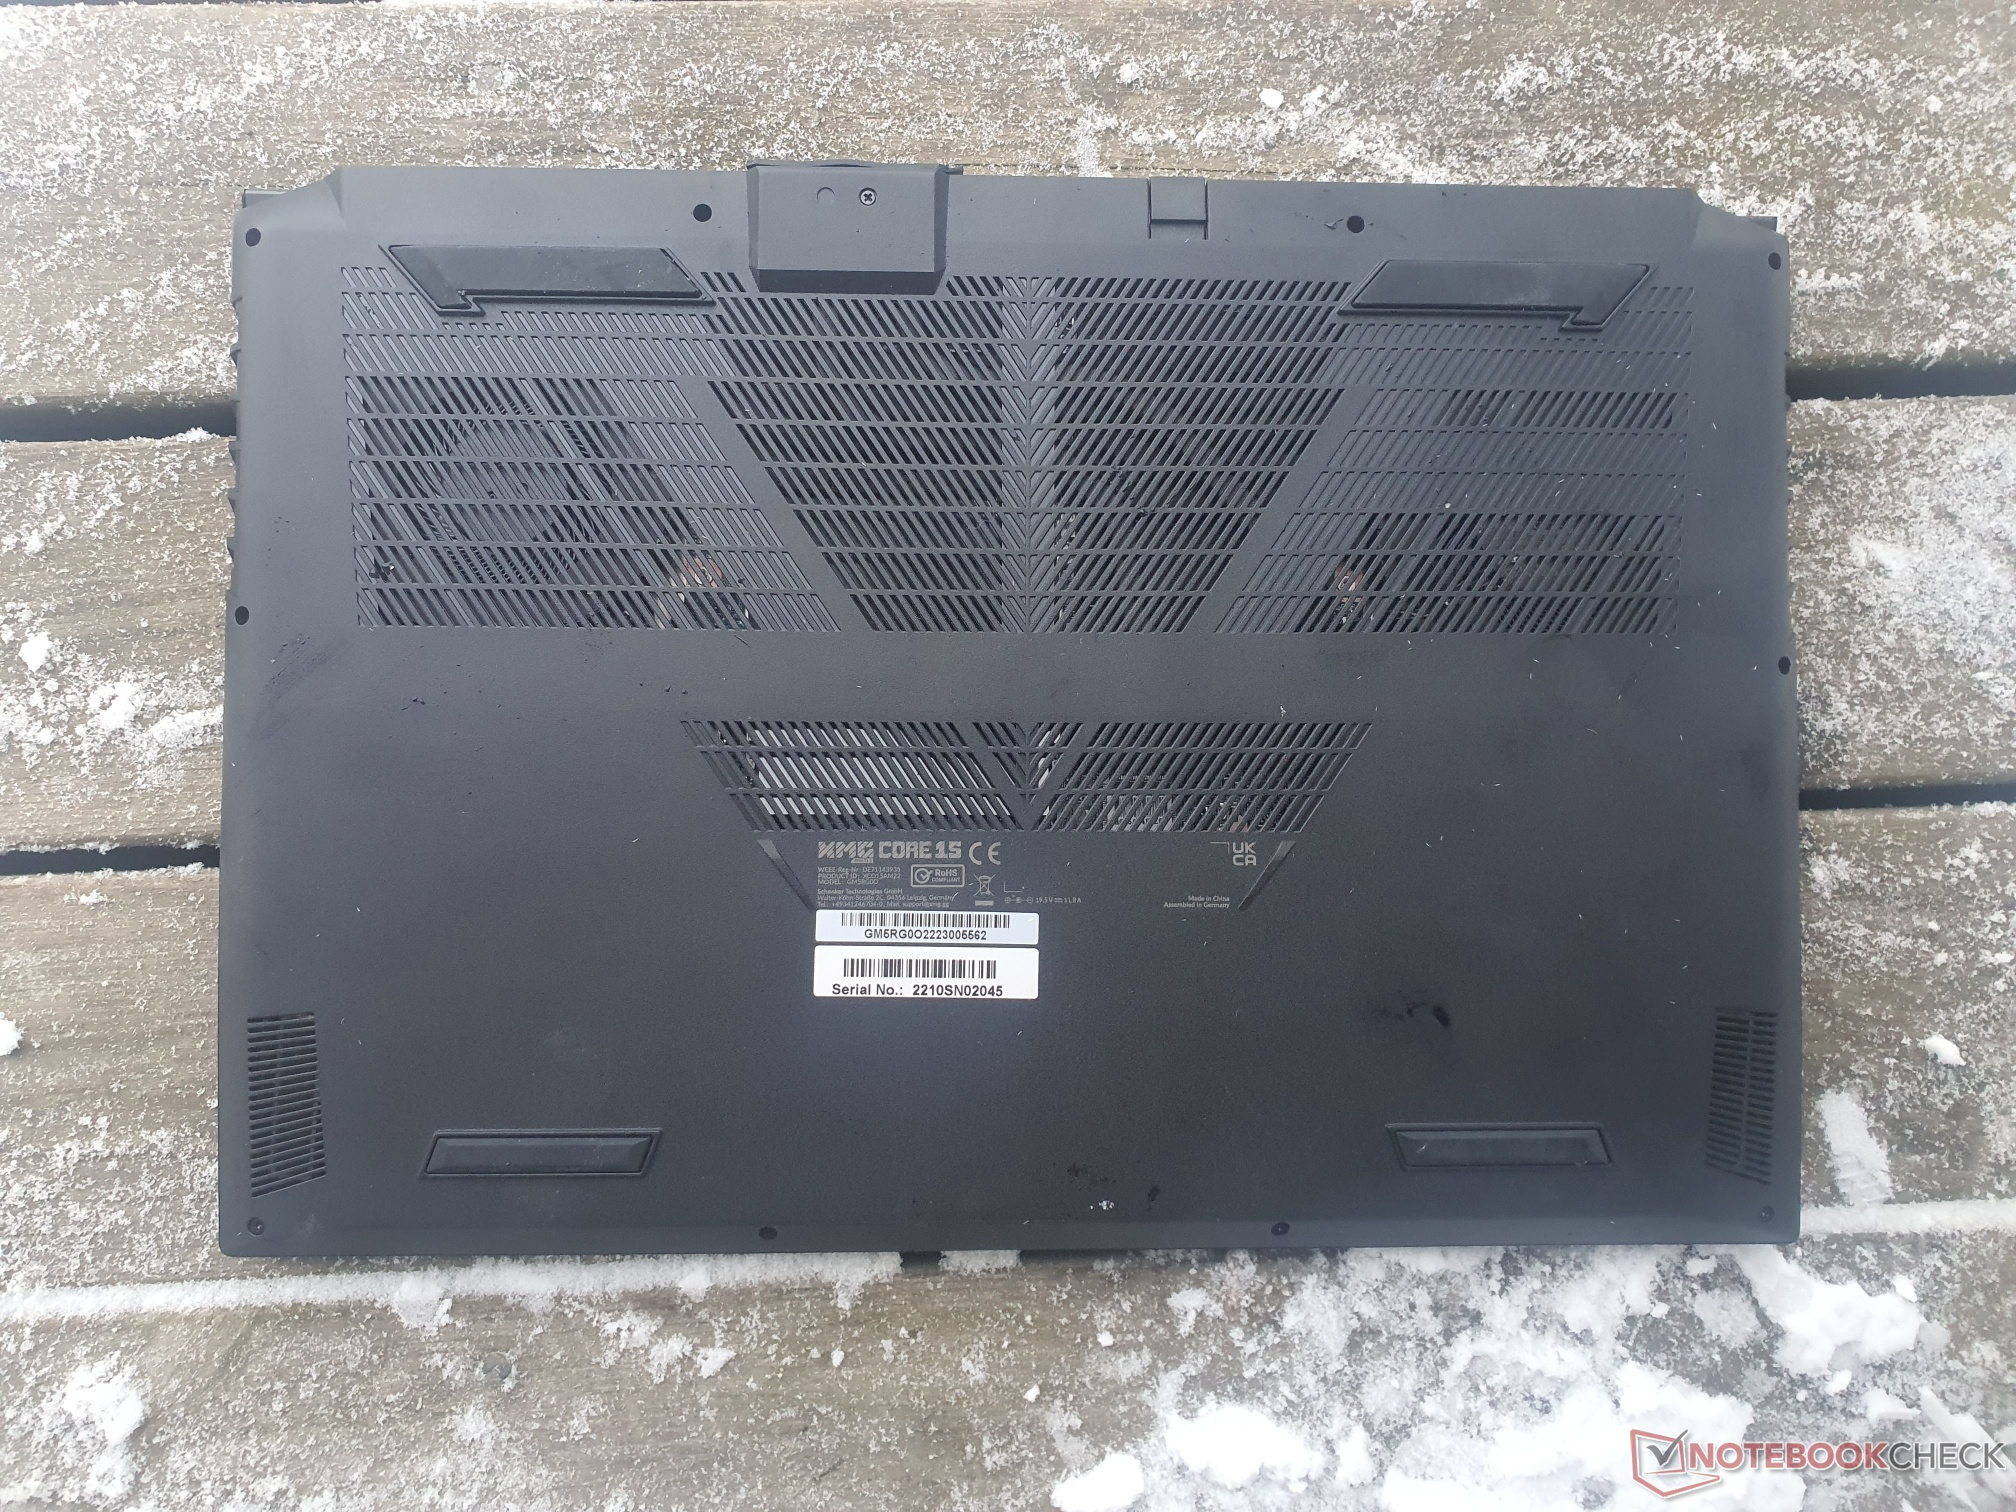
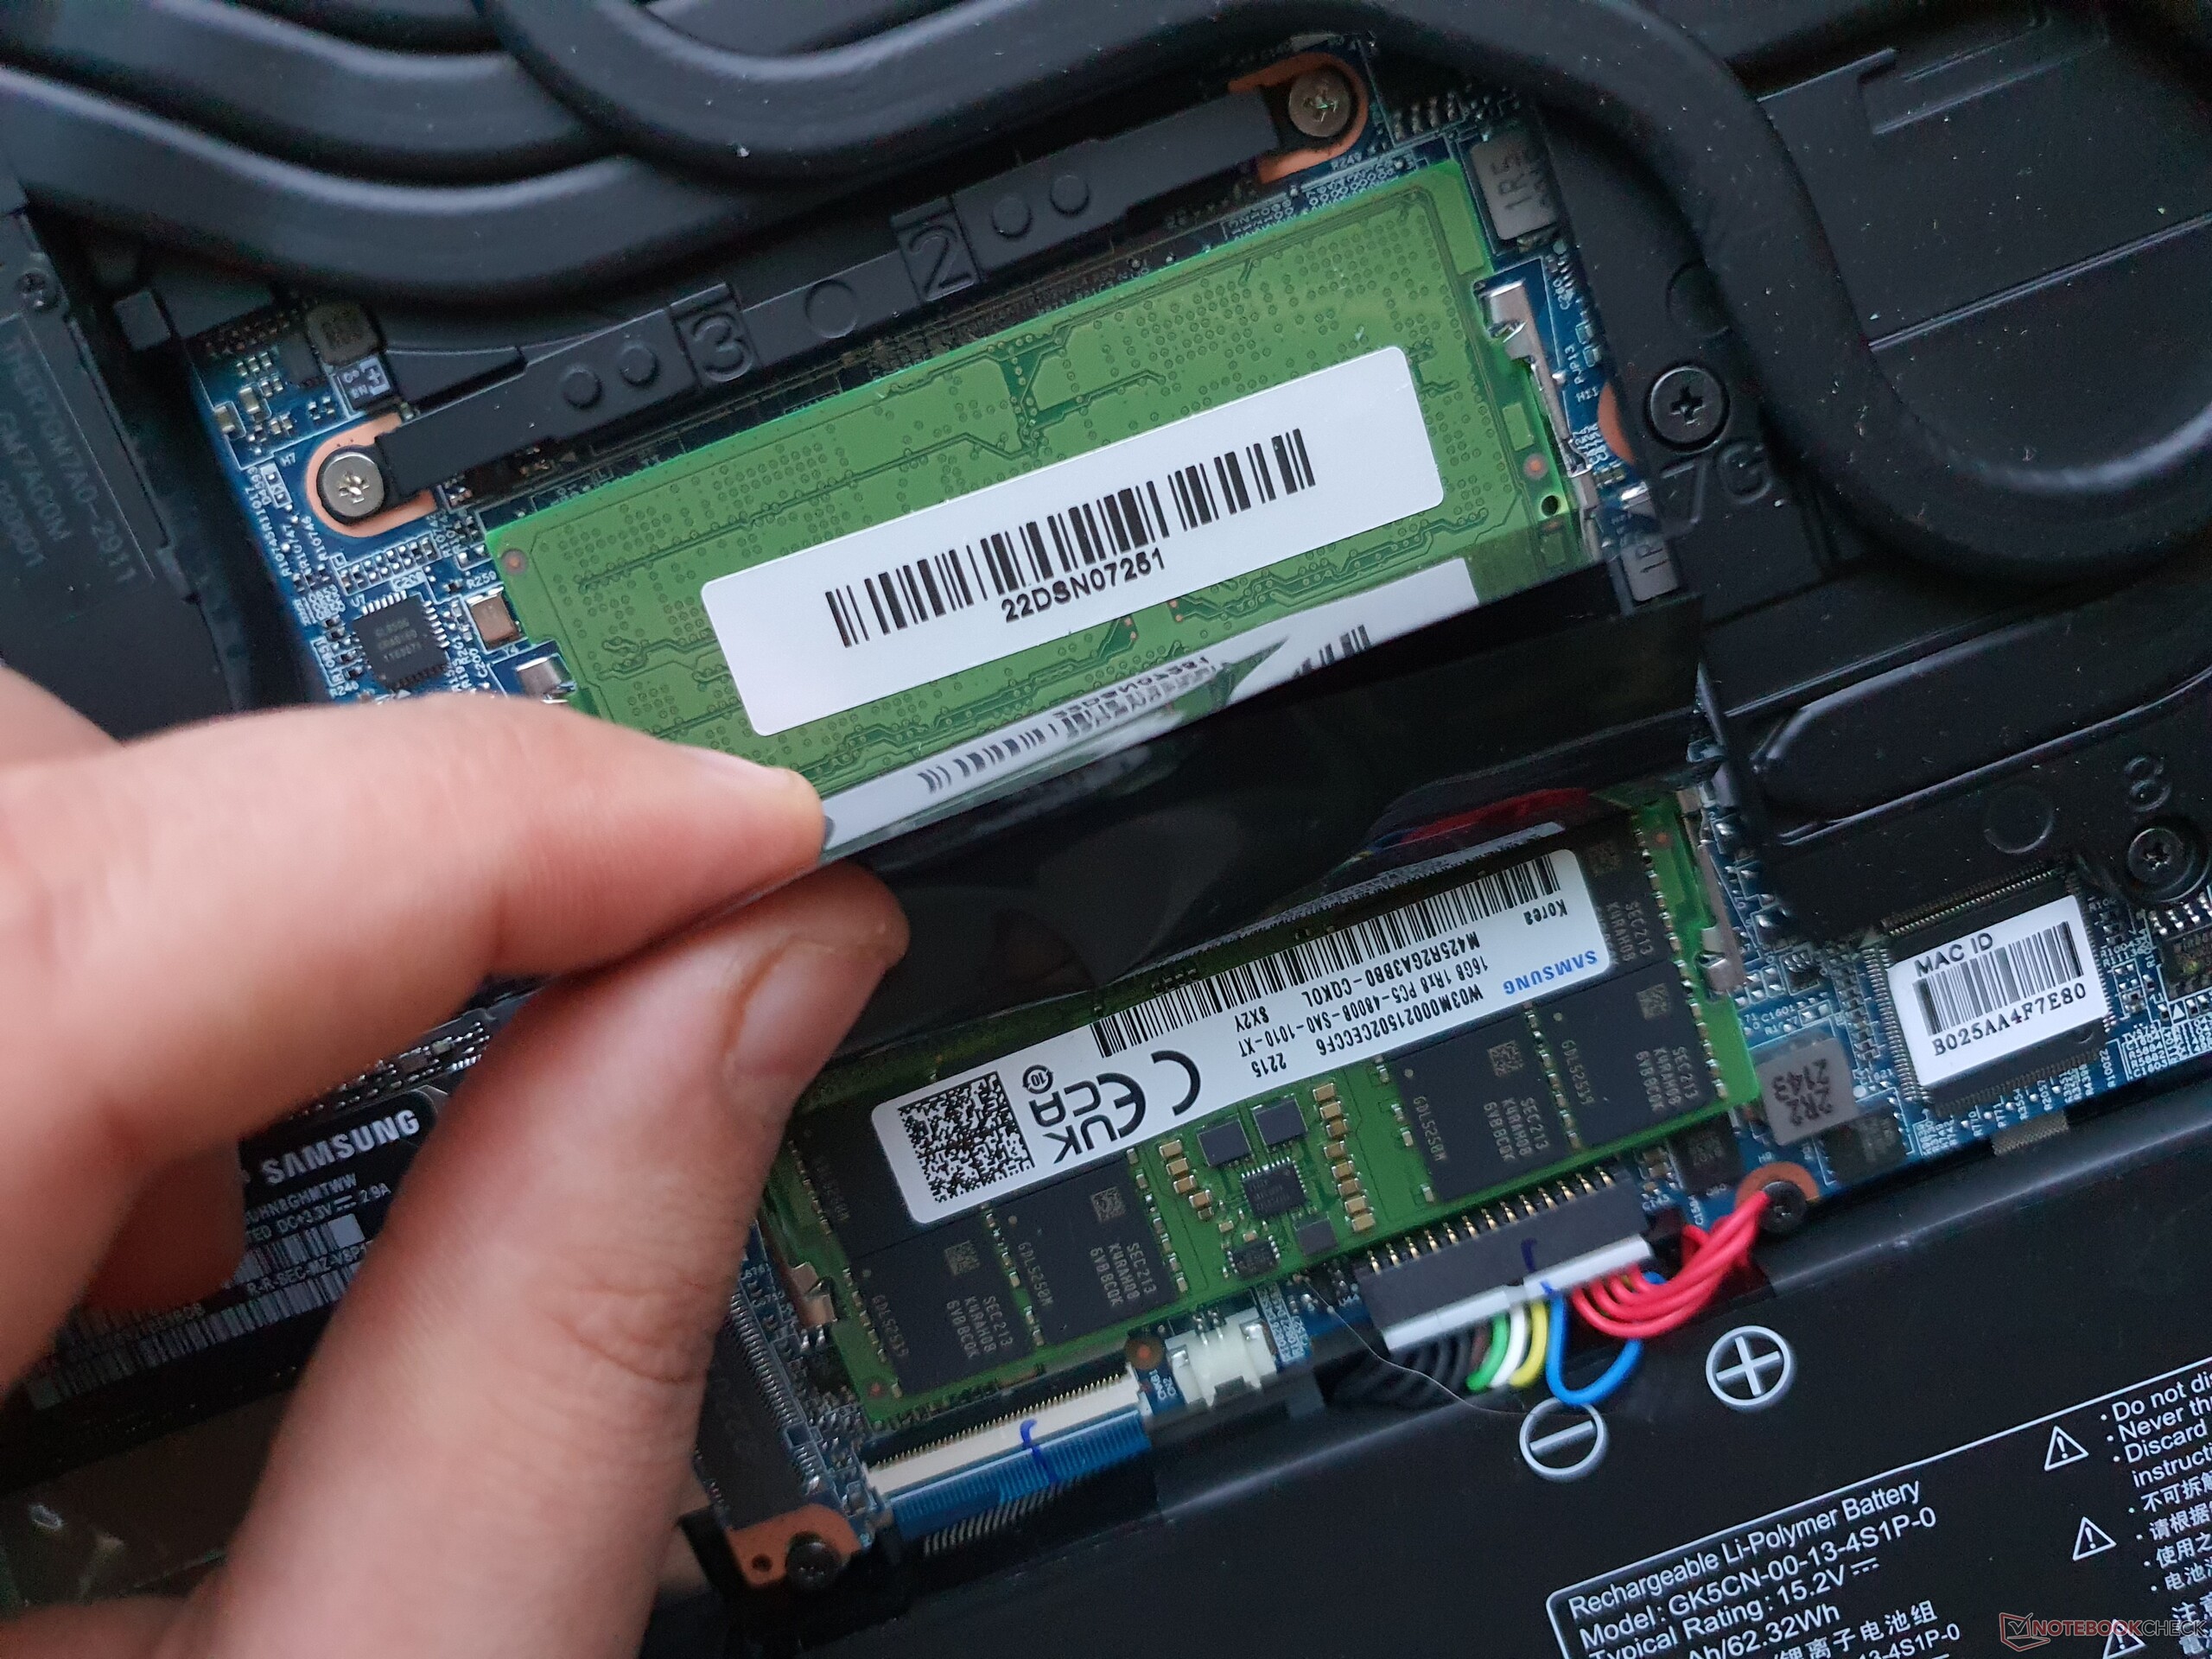
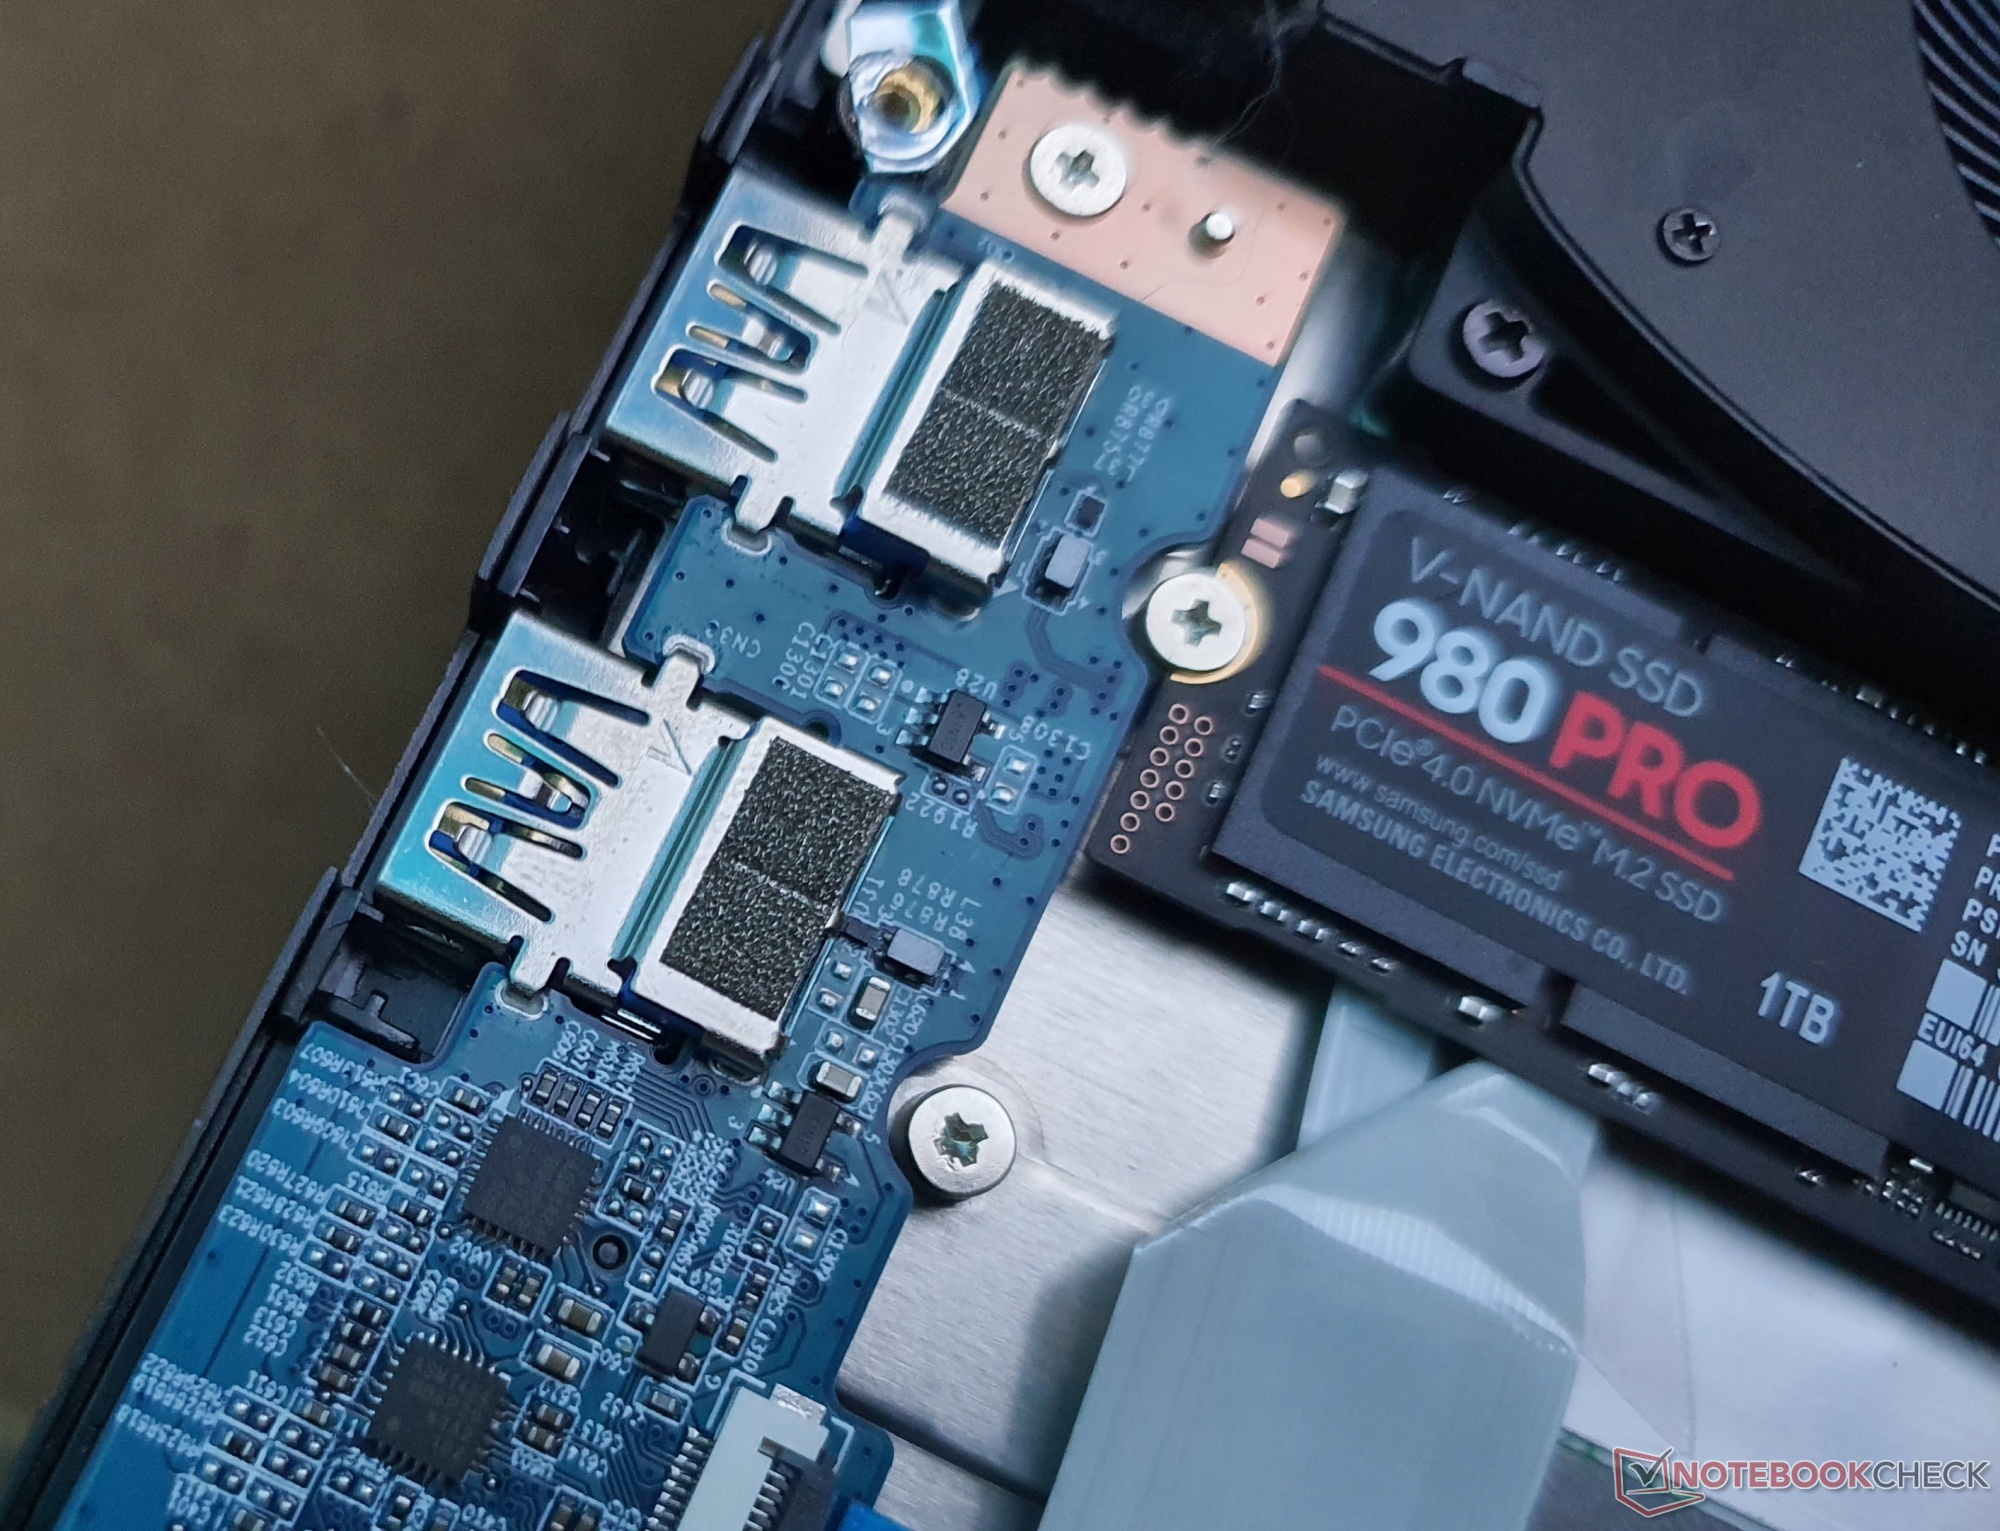
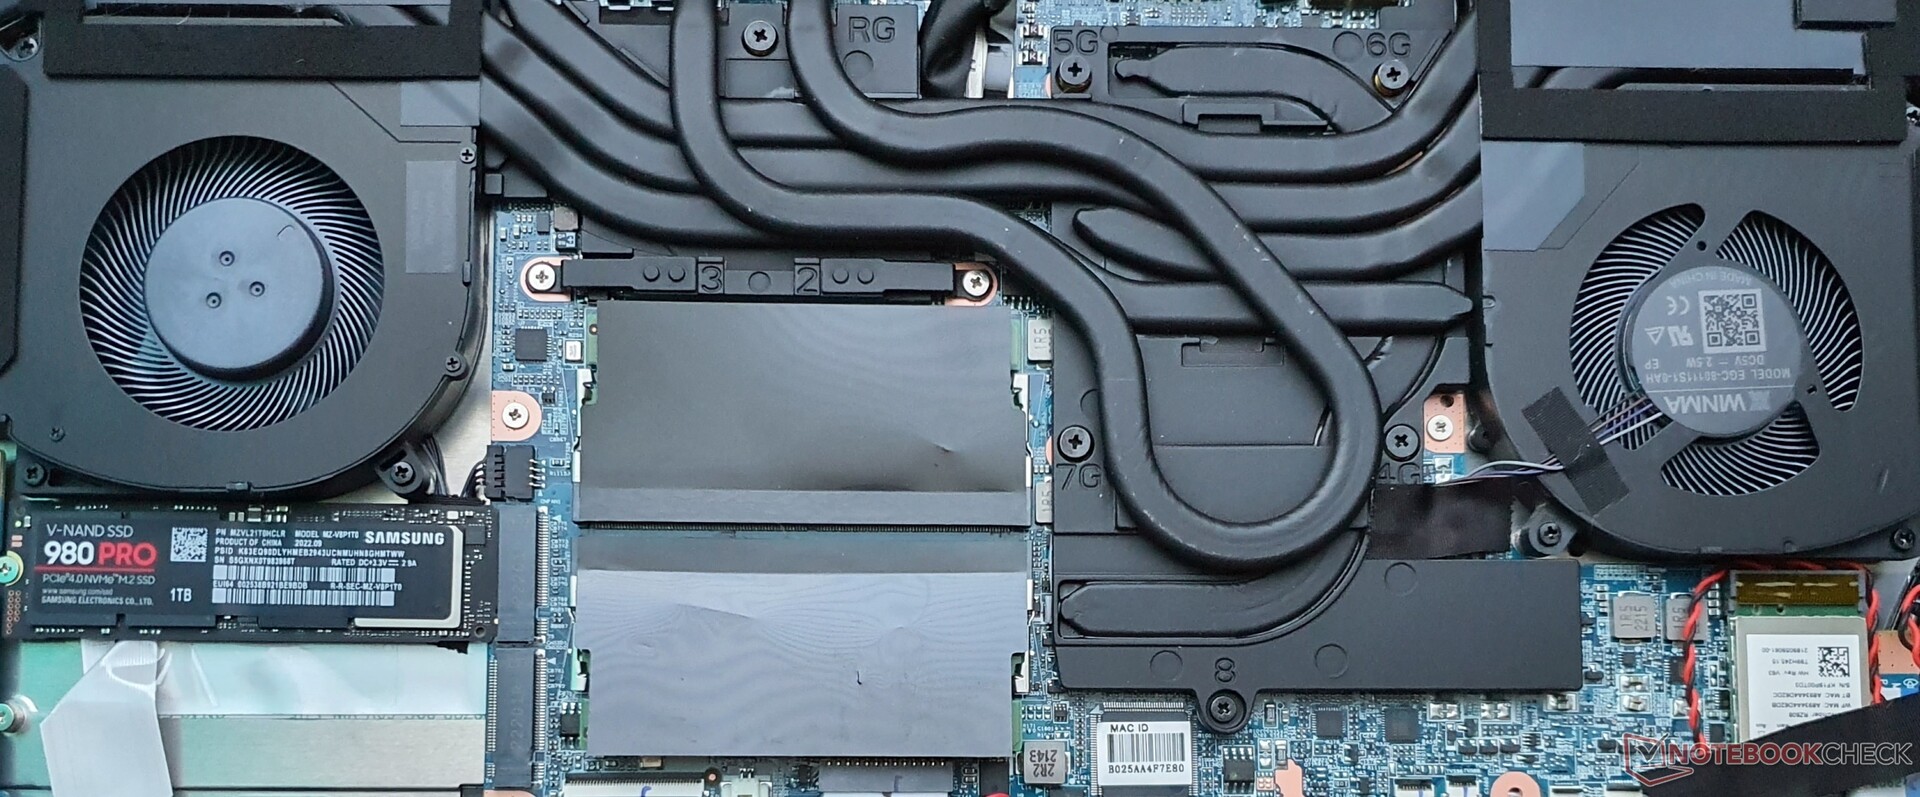
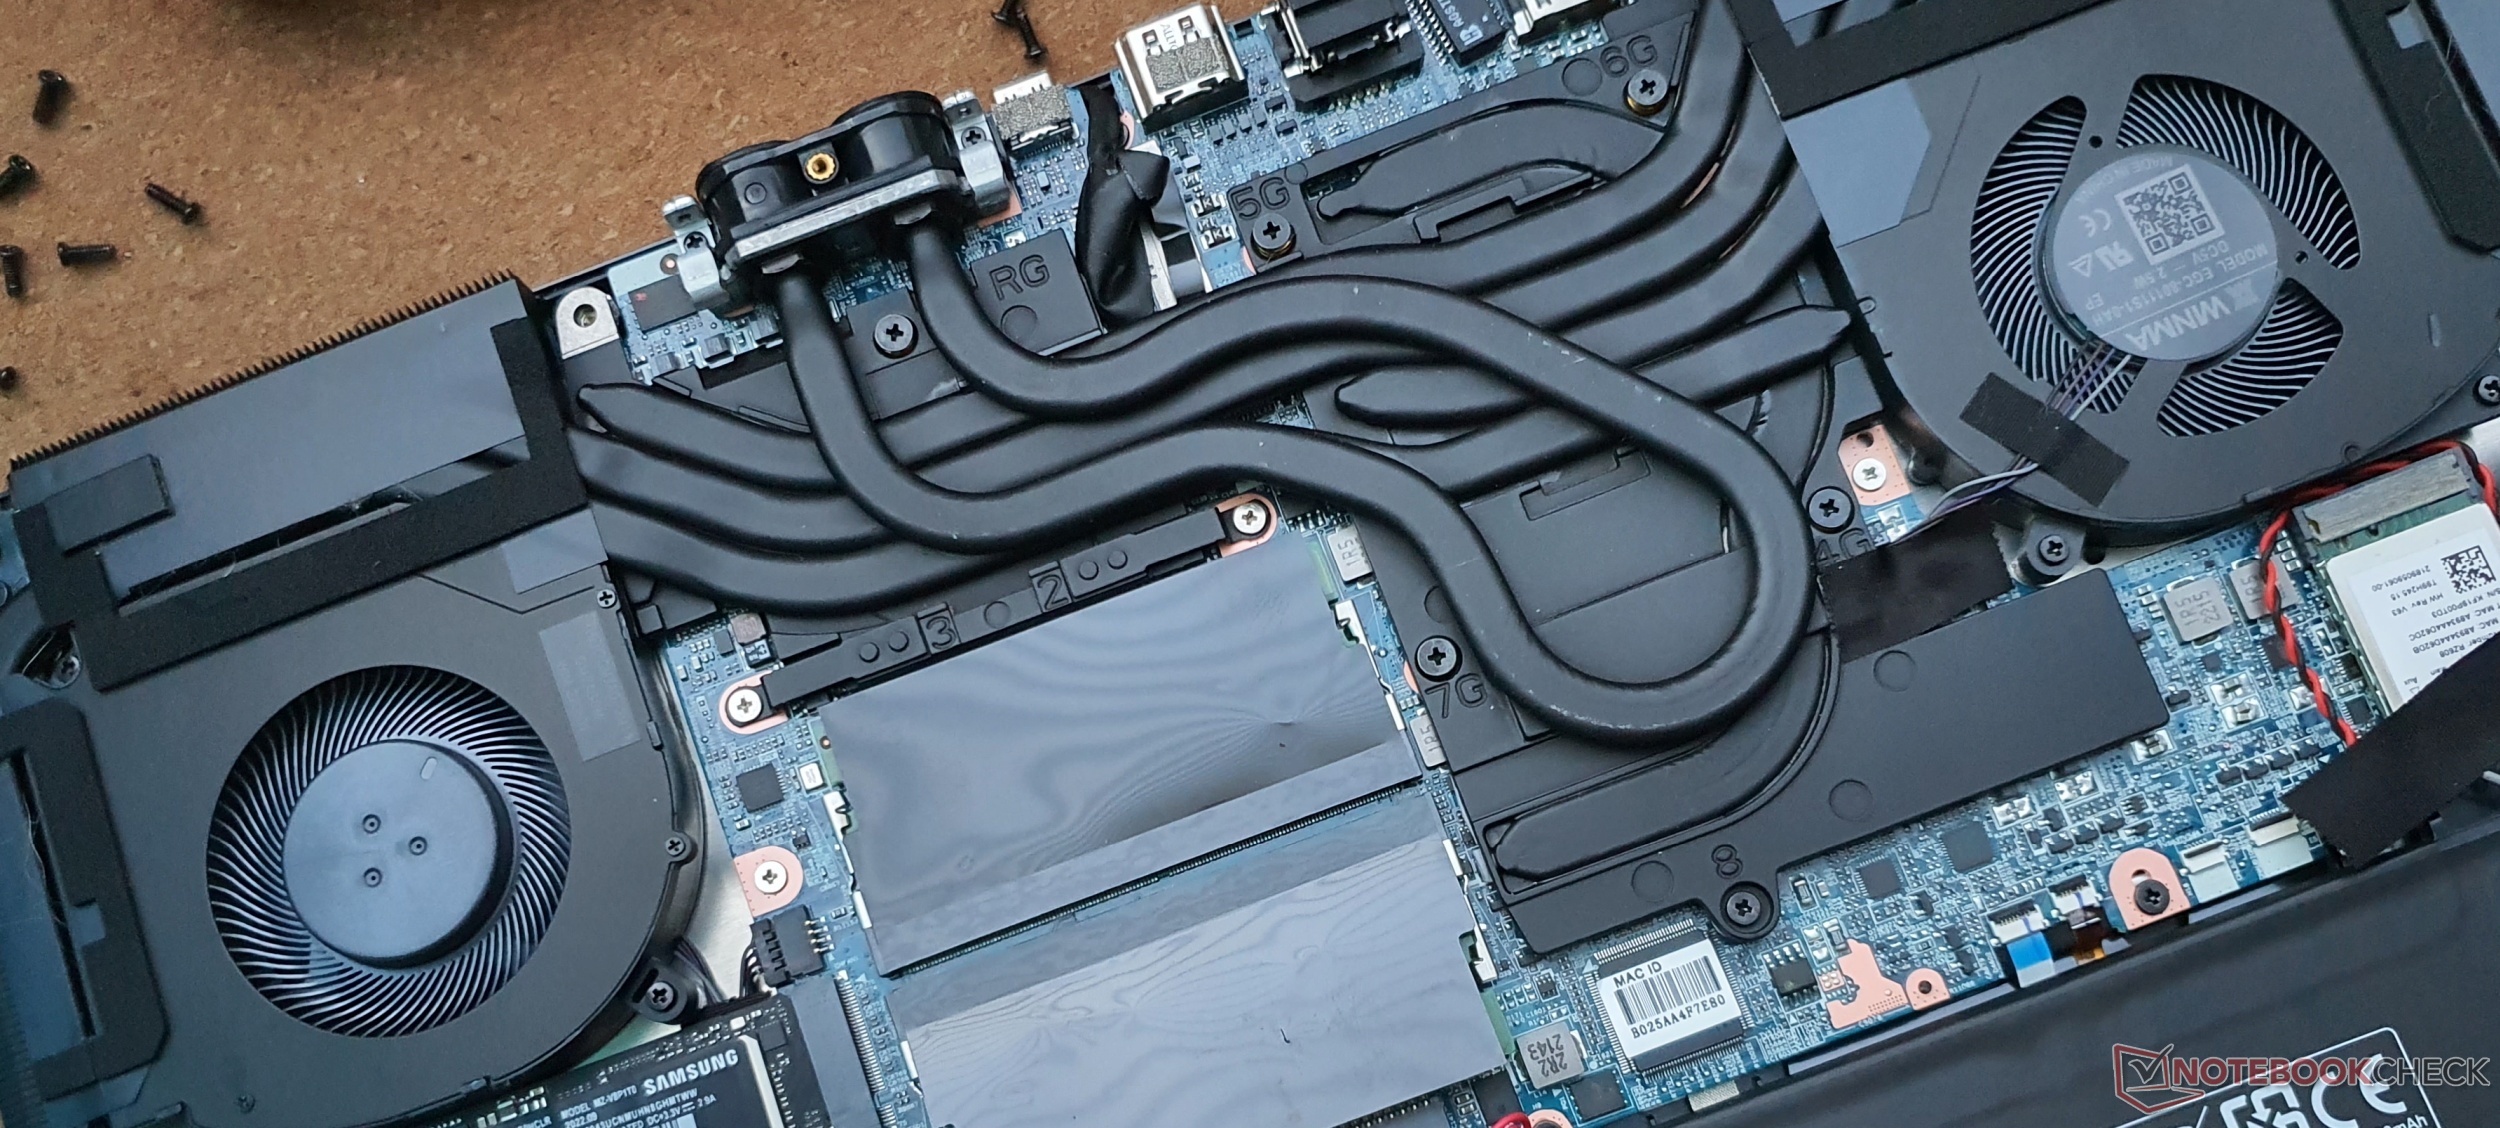
Manutenção


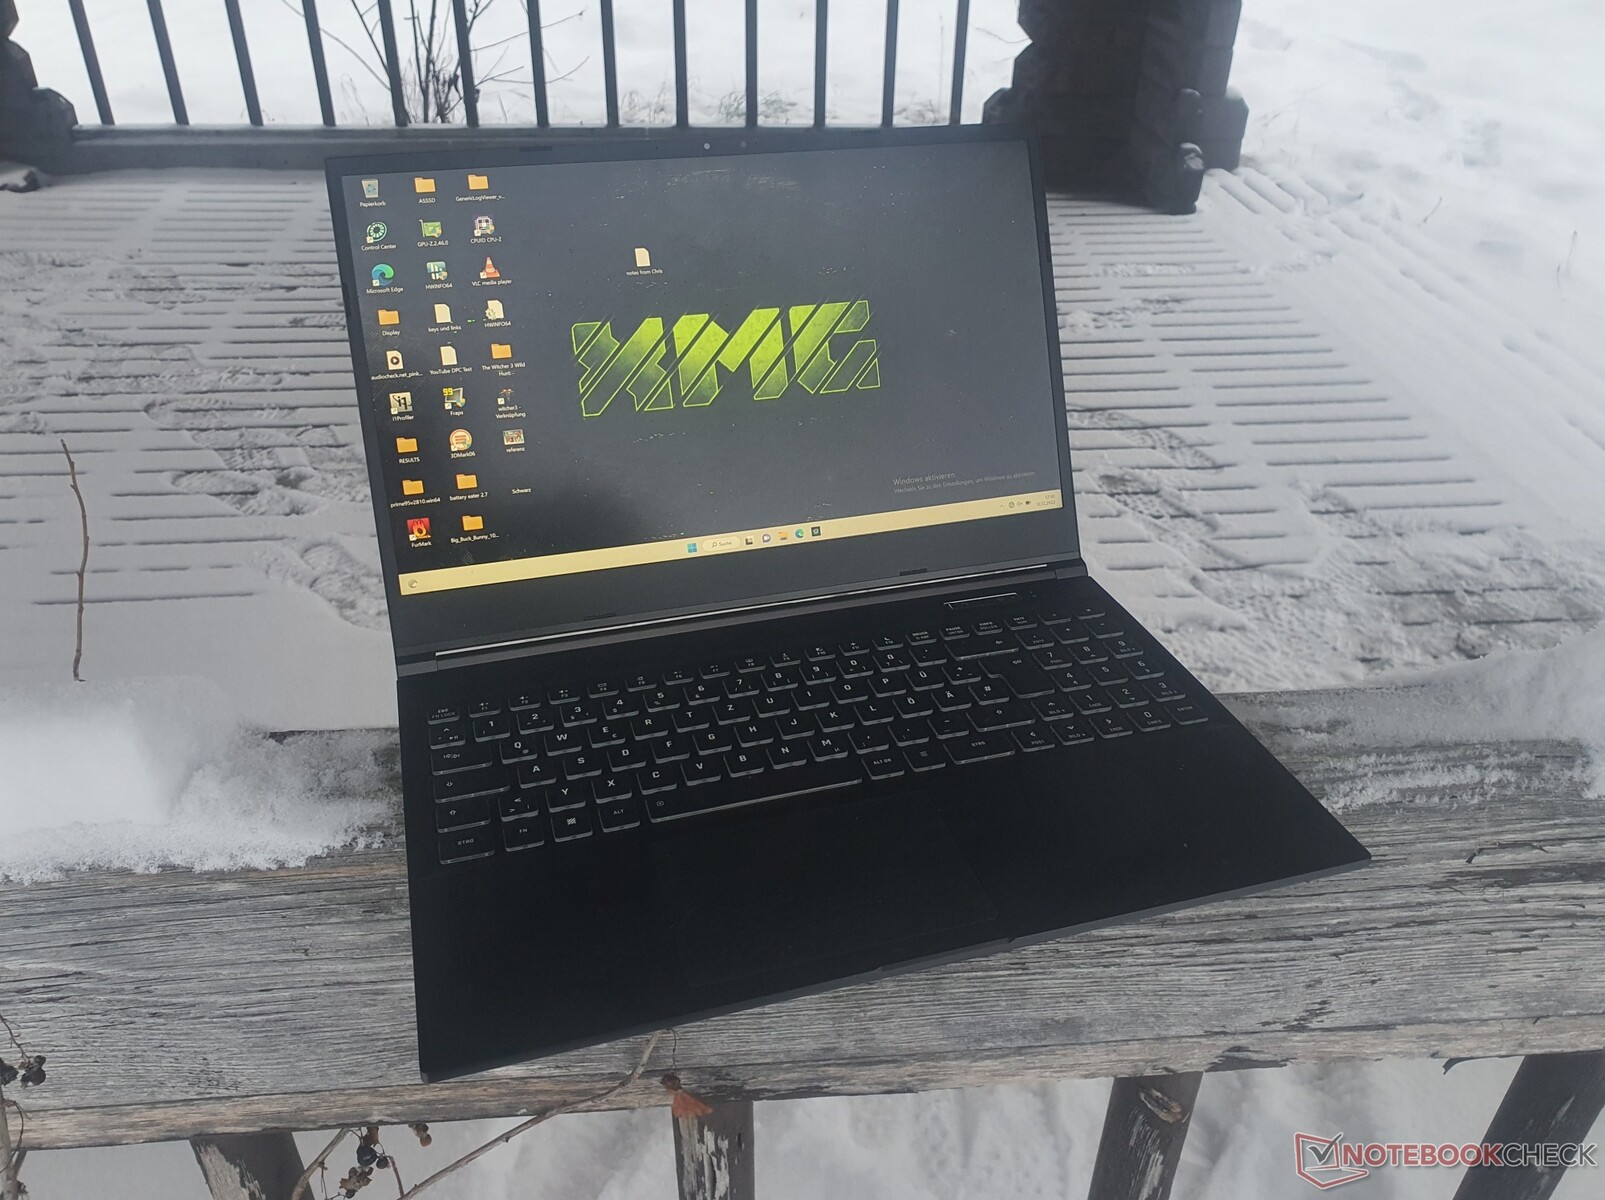
Mostrar: WQHD 165 Hz com tempos de resposta rápidos
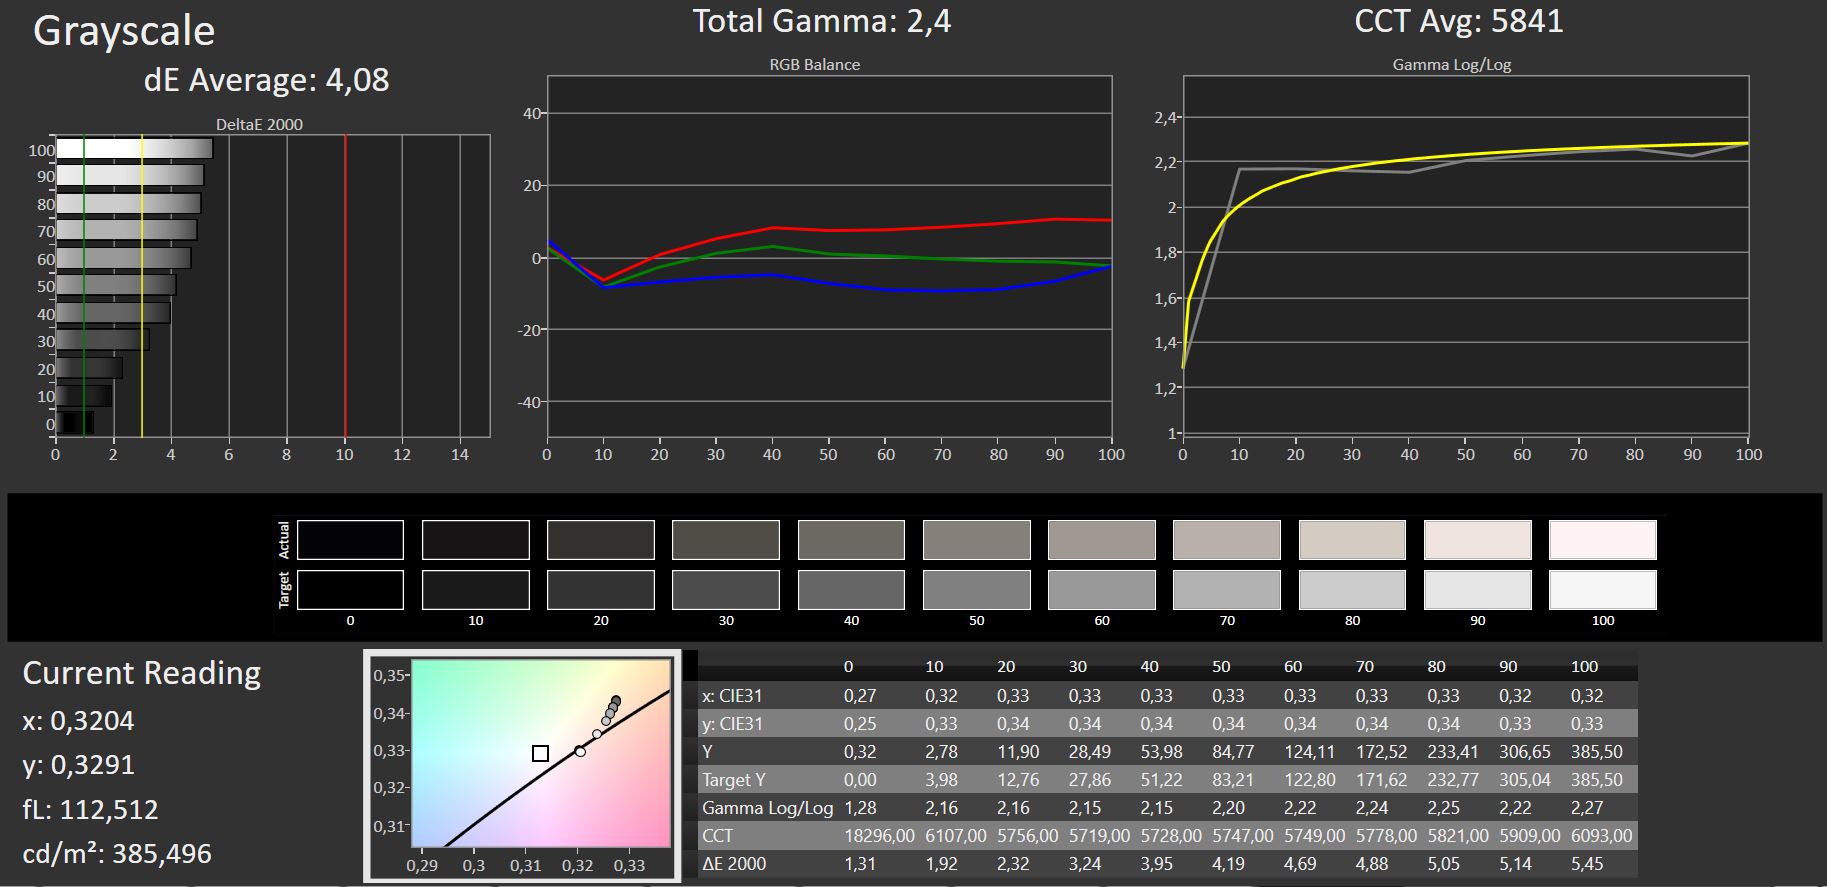
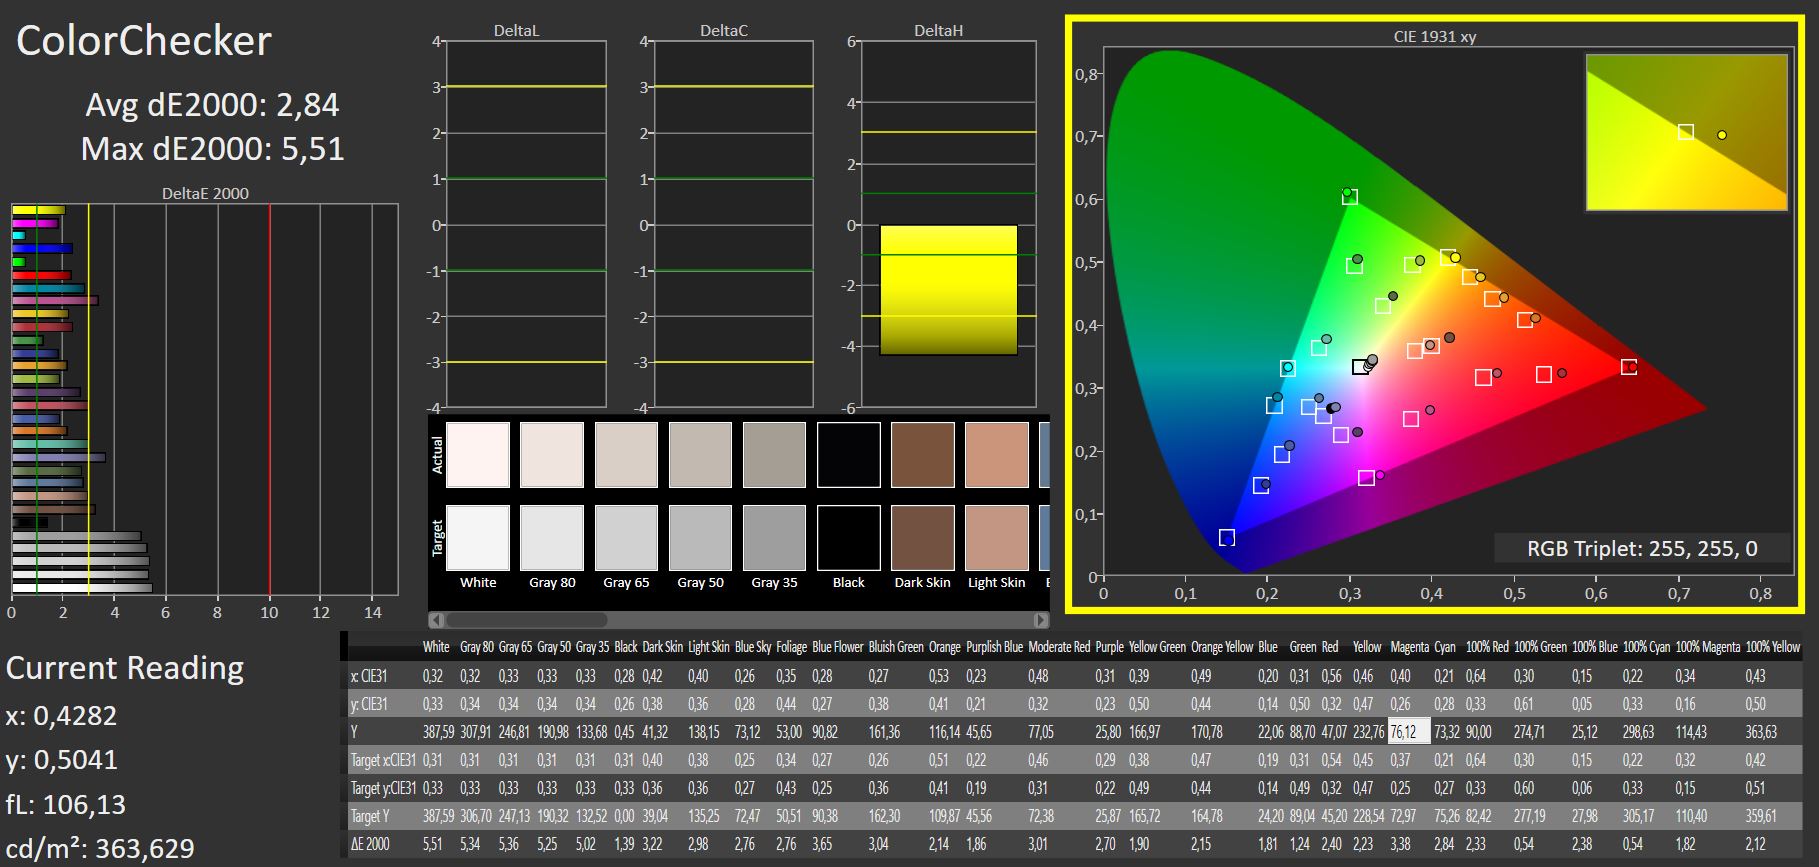
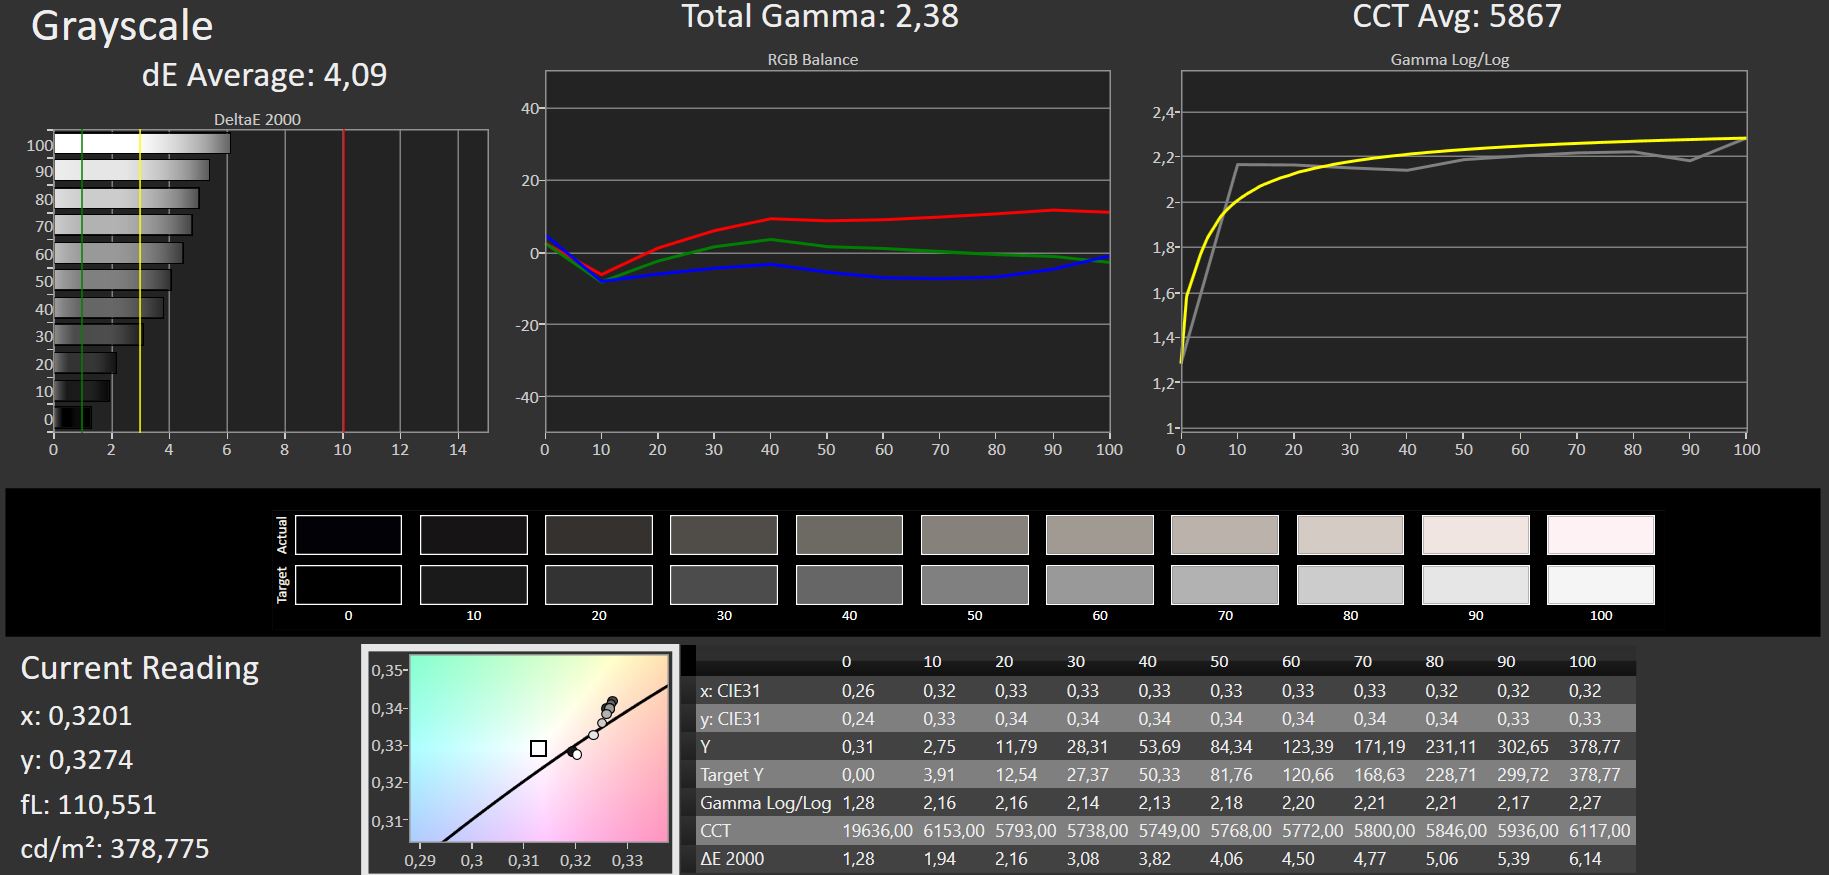
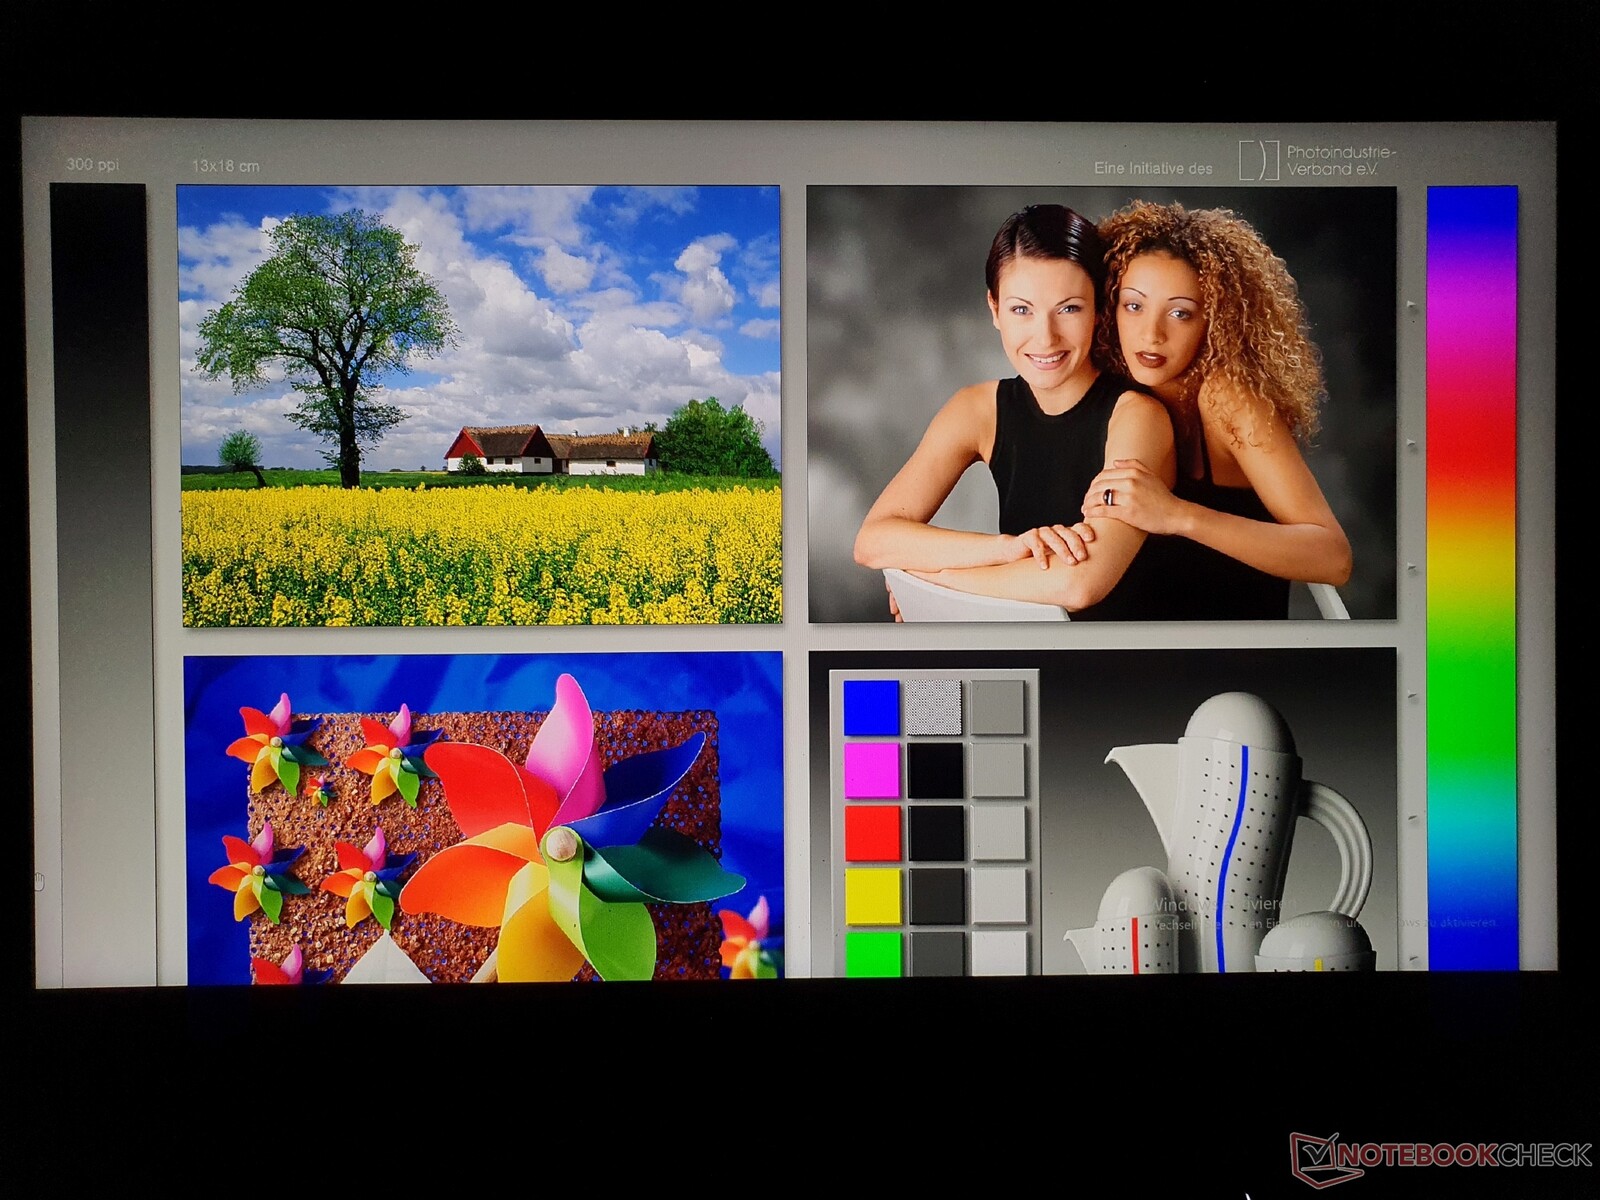
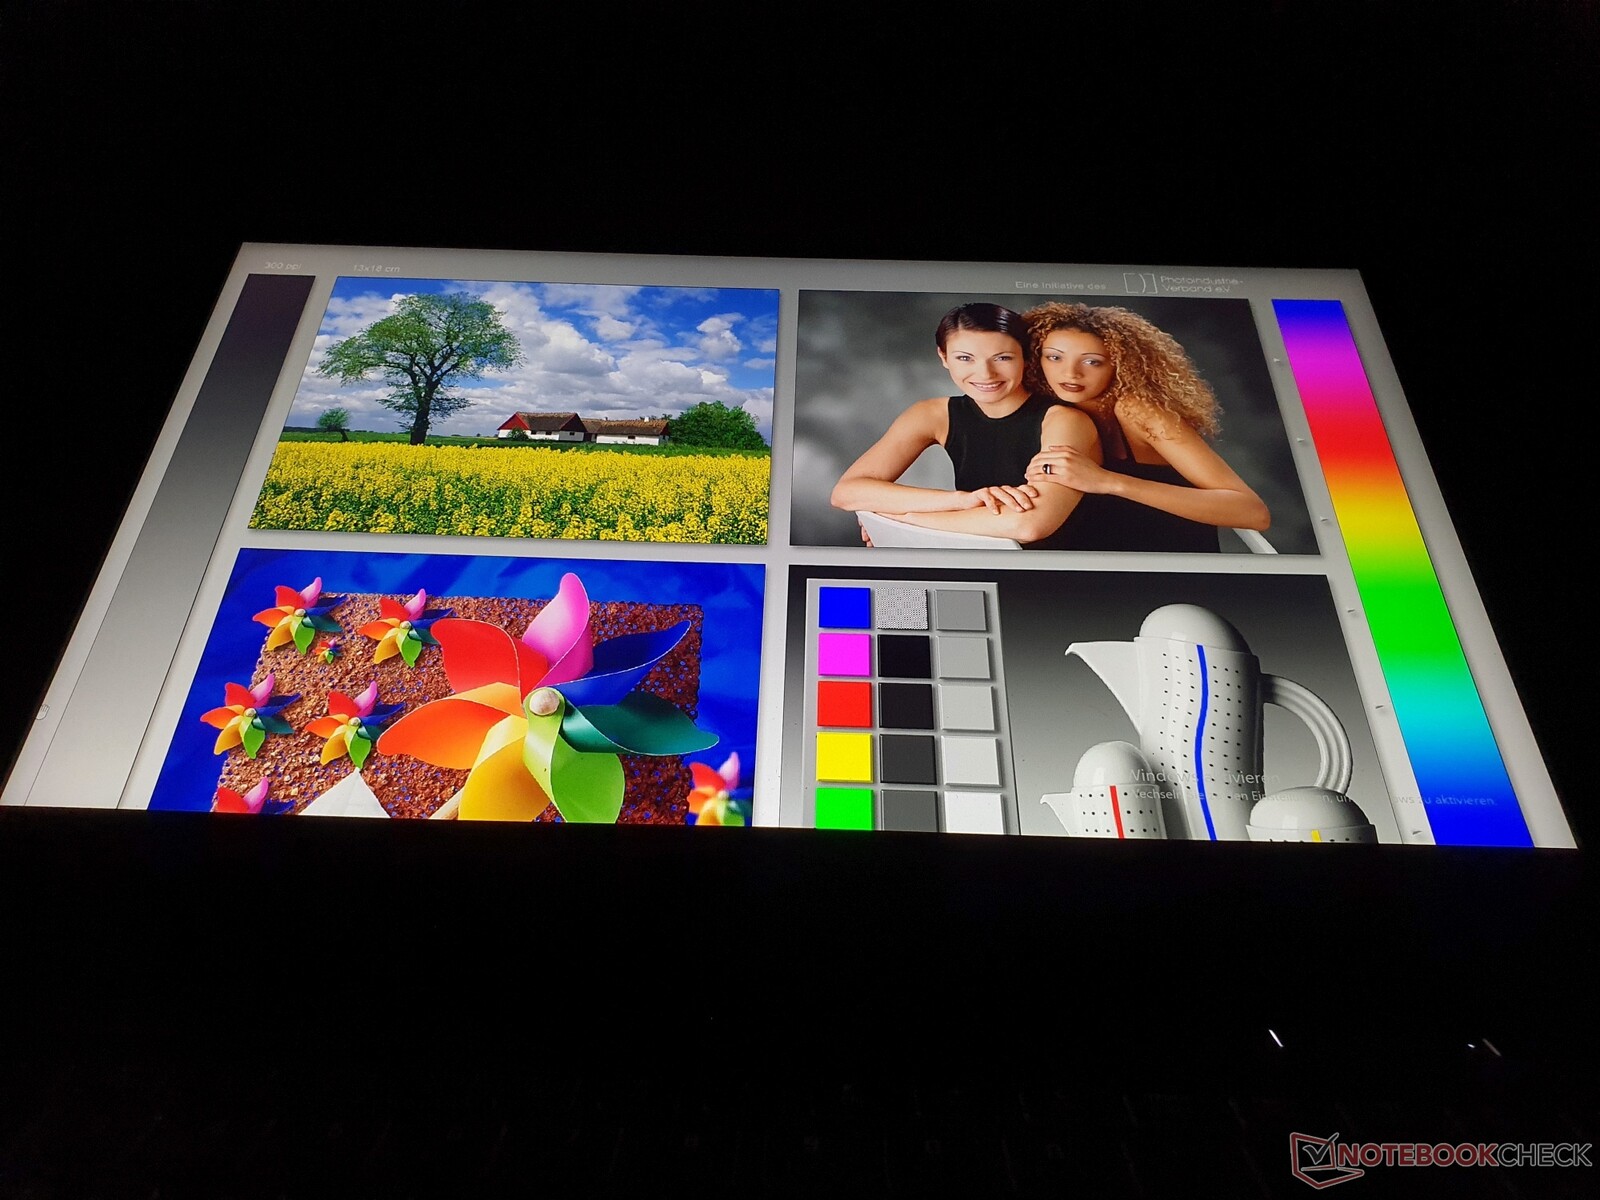
A Schenker oferece duas opções de display para o XMG Core 15: FHD 144 Hz com 300 cd/m² e 90% sRGB, bem como o painel WQHD (2.560 x 1.440) instalado no dispositivo testado com 165 Hz (83-165 Hz dinâmico), especificado 350 cd/m² e 95% sRGB. A especificação de brilho da tela mate 16:9 é excedida com uma média de 371 cd/m². O Legion 5 Proé mais brilhante com 500 cd/m², o que é útil no uso externo.
O contraste e o nível de preto estão em um bom nível com 1.145:1 e 0,32 cd/m², respectivamente, enquanto a iluminação é bastante uniforme. O valor branco de 5.841K está um pouco longe do ótimo (6.500K).
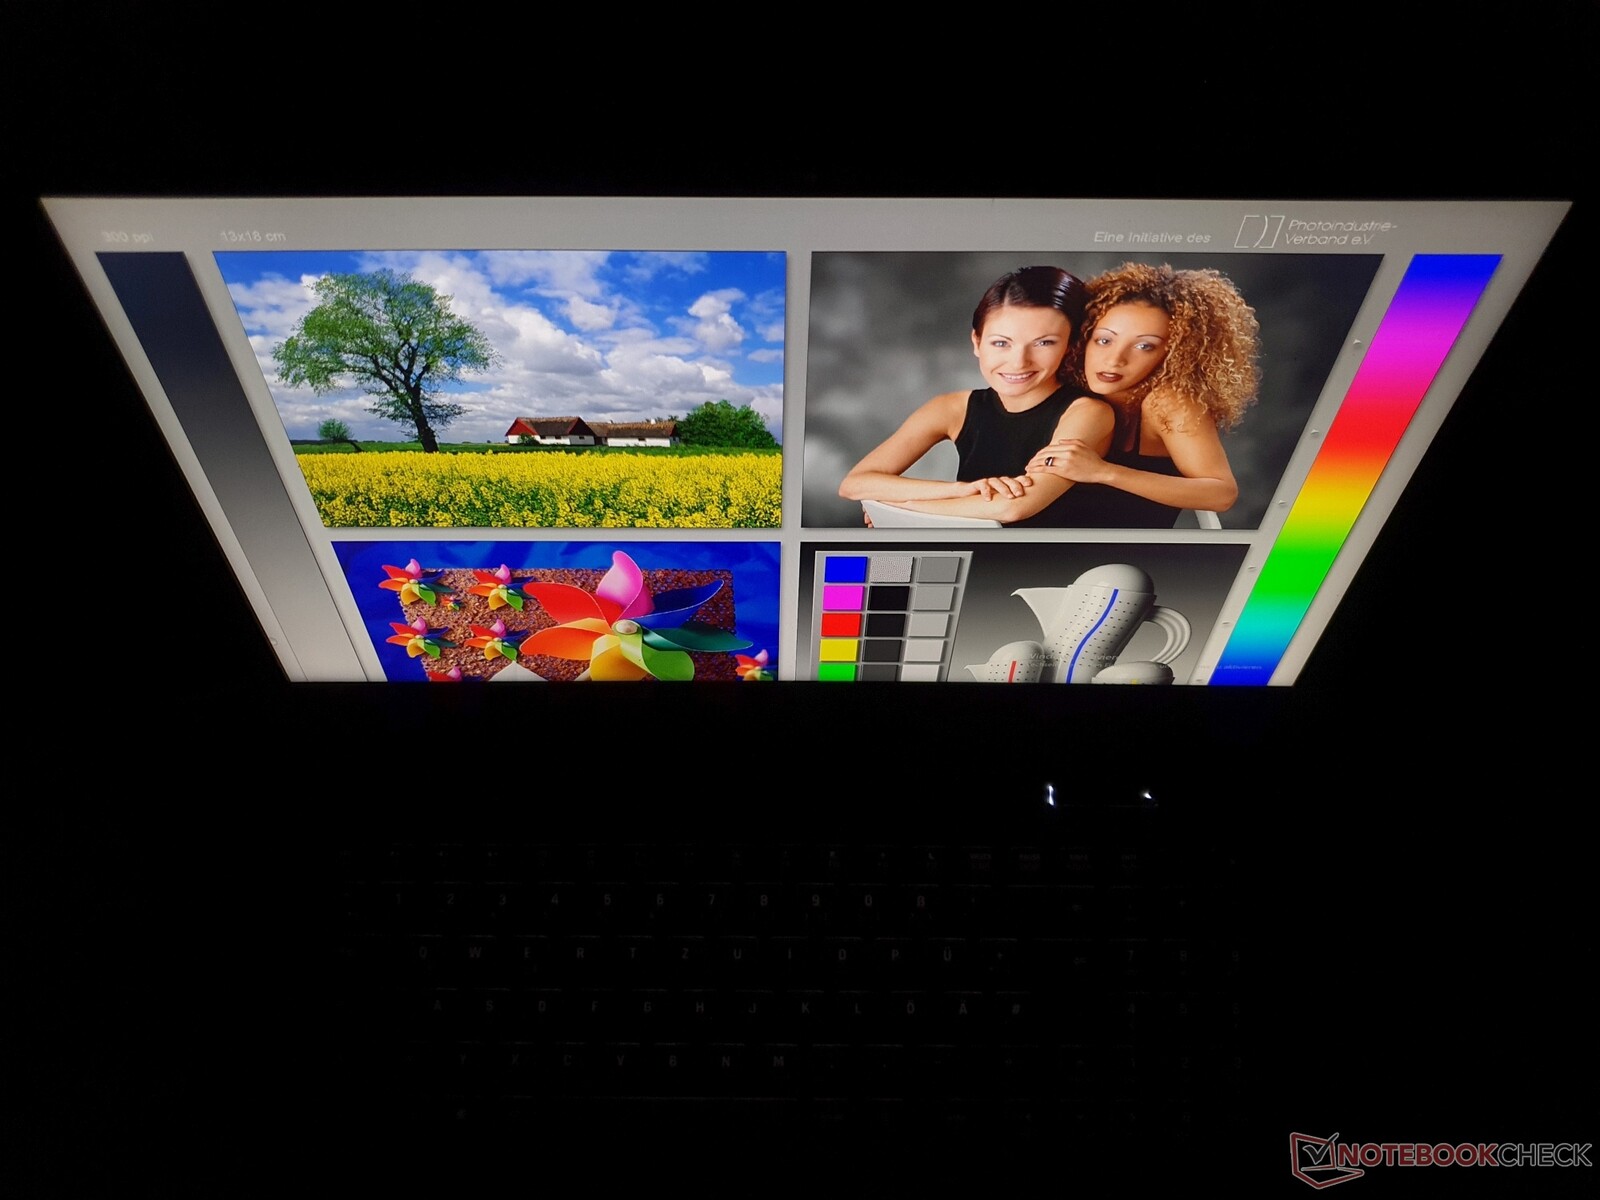
Os tempos de resposta são curtos a muito curtos com 16 ms (GtG), assim como 7,6 ms (BtW), enquanto apenas o Alienware m15 alcança uma vantagem significativa nesta área. Não pudemos determinar nenhum PWM cintilante.
| |||||||||||||||||||||||||
iluminação: 93 %
iluminação com acumulador: 384 cd/m²
Contraste: 1145:1 (Preto: 0.33 cd/m²)
ΔE ColorChecker Calman: 2.84 | ∀{0.5-29.43 Ø4.71}
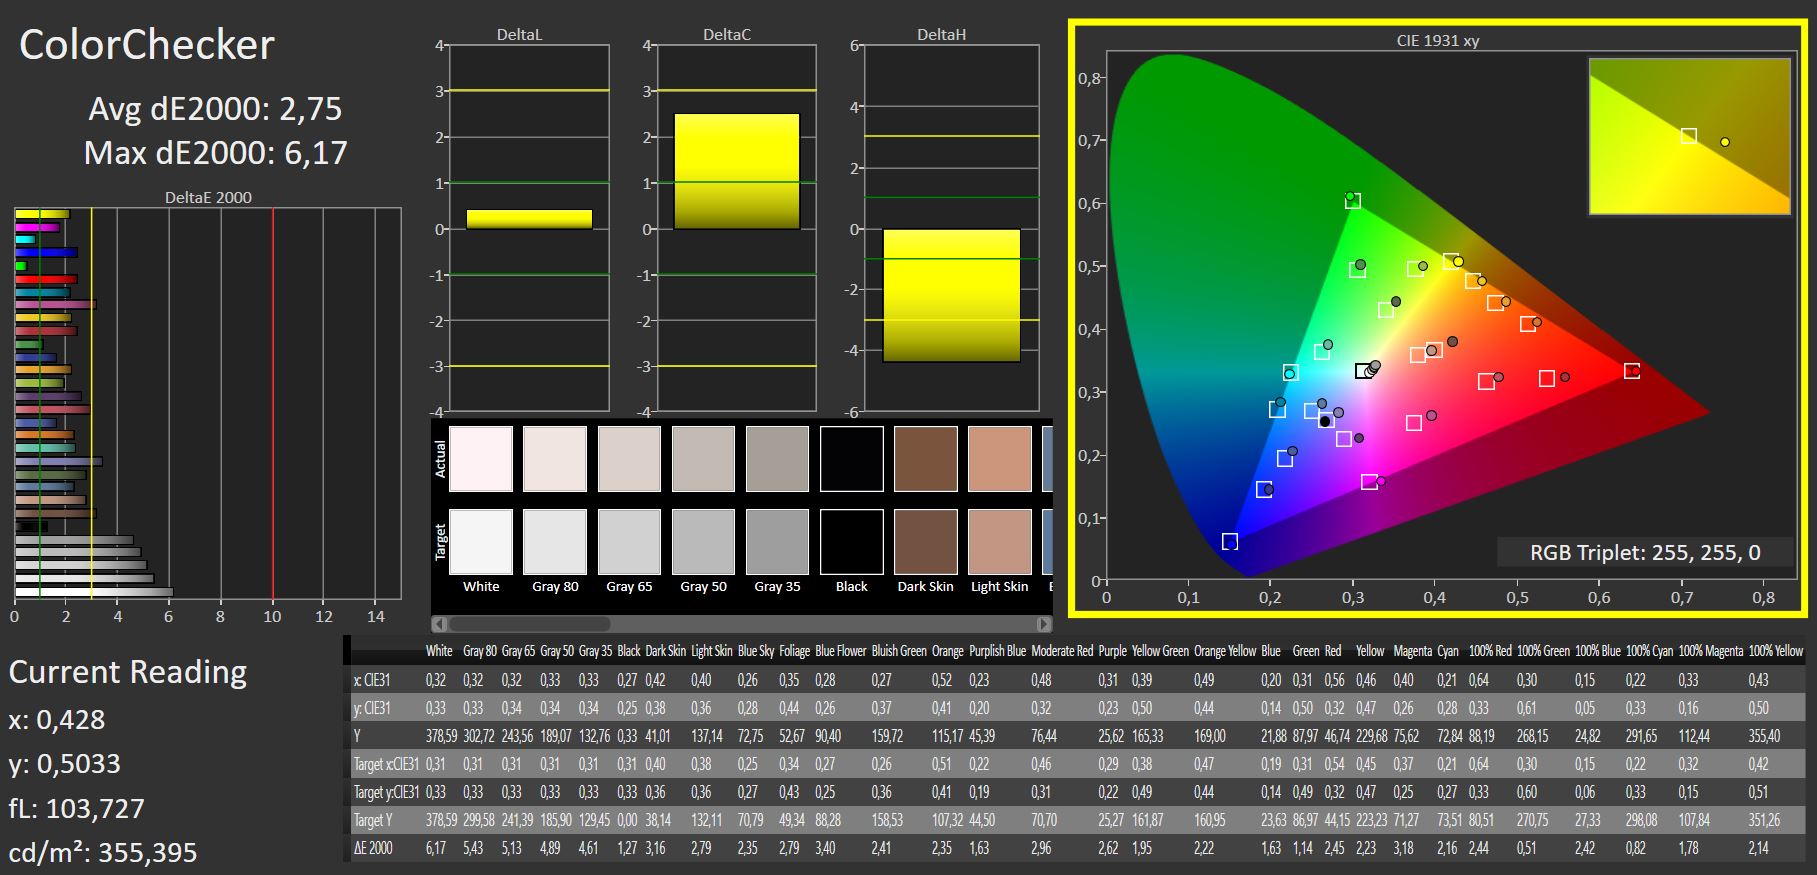
calibrated: 2.75
ΔE Greyscale Calman: 4.08 | ∀{0.09-98 Ø4.96}
69.9% AdobeRGB 1998 (Argyll 3D)
99.3% sRGB (Argyll 3D)
68.8% Display P3 (Argyll 3D)
Gamma: 2.4
CCT: 5841 K
| Schenker XMG Core 15 (M22) CSOT MNF601CA1-1, IPS, 2560x1440, 15.6" | Schenker XMG Fusion 15 (Mid 22) BOE CQ NE156QHM-NY2, IPS, 2560x1440, 15.6" | Lenovo Legion 5 15IAH7H 82RB CSOT MNF601CA1-3, IPS, 1920x1080, 15.6" | Asus TUF Gaming F15 FX507ZM TL156VDXP0101, IPS, 1920x1080, 15.6" | Alienware m15 R5 Ryzen Edition B156HAN, IPS, 1920x1080, 15.6" | Schenker XMG Core 15 Ampere BOE CQ NE156QHM-NY2, IPS, 2560x1440, 15.6" | |
|---|---|---|---|---|---|---|
| Display | -2% | 0% | -2% | 0% | ||
| Display P3 Coverage (%) | 68.8 | 67.3 -2% | 69.1 0% | 66.4 -3% | 69.8 1% | |
| sRGB Coverage (%) | 99.3 | 96.7 -3% | 99.5 0% | 97 -2% | 98.8 -1% | |
| AdobeRGB 1998 Coverage (%) | 69.9 | 68.2 -2% | 70 0% | 68.5 -2% | 70.7 1% | |
| Response Times | 18% | -26% | -2% | 32% | -15% | |
| Response Time Grey 50% / Grey 80% * (ms) | 16 ? | 11.6 ? 27% | 14.8 ? 7% | 5.6 ? 65% | 4 ? 75% | 14.8 ? 7% |
| Response Time Black / White * (ms) | 7.6 ? | 7 ? 8% | 12 ? -58% | 12.8 ? -68% | 8.4 ? -11% | 10.4 ? -37% |
| PWM Frequency (Hz) | ||||||
| Screen | -11% | -13% | 19% | 10% | 23% | |
| Brightness middle (cd/m²) | 378 | 326 -14% | 363.5 -4% | 353.7 -6% | 329 -13% | 347 -8% |
| Brightness (cd/m²) | 371 | 303 -18% | 350 -6% | 340 -8% | 321 -13% | 328 -12% |
| Brightness Distribution (%) | 93 | 89 -4% | 89 -4% | 89 -4% | 92 -1% | 89 -4% |
| Black Level * (cd/m²) | 0.33 | 0.33 -0% | 0.39 -18% | 0.34 -3% | 0.27 18% | 0.27 18% |
| Contrast (:1) | 1145 | 988 -14% | 932 -19% | 1040 -9% | 1219 6% | 1285 12% |
| Colorchecker dE 2000 * | 2.84 | 2.73 4% | 3.68 -30% | 1.74 39% | 2.78 2% | 1.66 42% |
| Colorchecker dE 2000 max. * | 5.51 | 9.54 -73% | 8.92 -62% | 3.63 34% | 4.88 11% | 3.03 45% |
| Colorchecker dE 2000 calibrated * | 2.75 | 1.36 51% | 0.53 81% | 0.5 82% | 1.63 41% | 1.23 55% |
| Greyscale dE 2000 * | 4.08 | 5.2 -27% | 6.5 -59% | 2.1 49% | 2.5 39% | 1.6 61% |
| Gamma | 2.4 92% | 2.074 106% | 2.2 100% | 2.3 96% | 2.106 104% | 2.278 97% |
| CCT | 5841 111% | 6911 94% | 5995 108% | 6257 104% | 6201 105% | 6430 101% |
| Color Space (Percent of AdobeRGB 1998) (%) | 76 | 71 | ||||
| Color Space (Percent of sRGB) (%) | 99 | 94 | ||||
| Média Total (Programa/Configurações) | 2% /
-5% | -13% /
-12% | 5% /
12% | 21% /
14% | 3% /
13% |
* ... menor é melhor
O espaço de cores sRGB é coberto por 99,3%, o que permite a edição profissional de imagens no campo digital. Entretanto, espaços de cores maiores, como o DCI-P3 para edição de vídeo e AdobeRGB para o objetivo de impressão profissional de imagens editadas, são cobertos apenas pelo Alienware m15 e o HP Envy 16 cobri-los quase completamente.
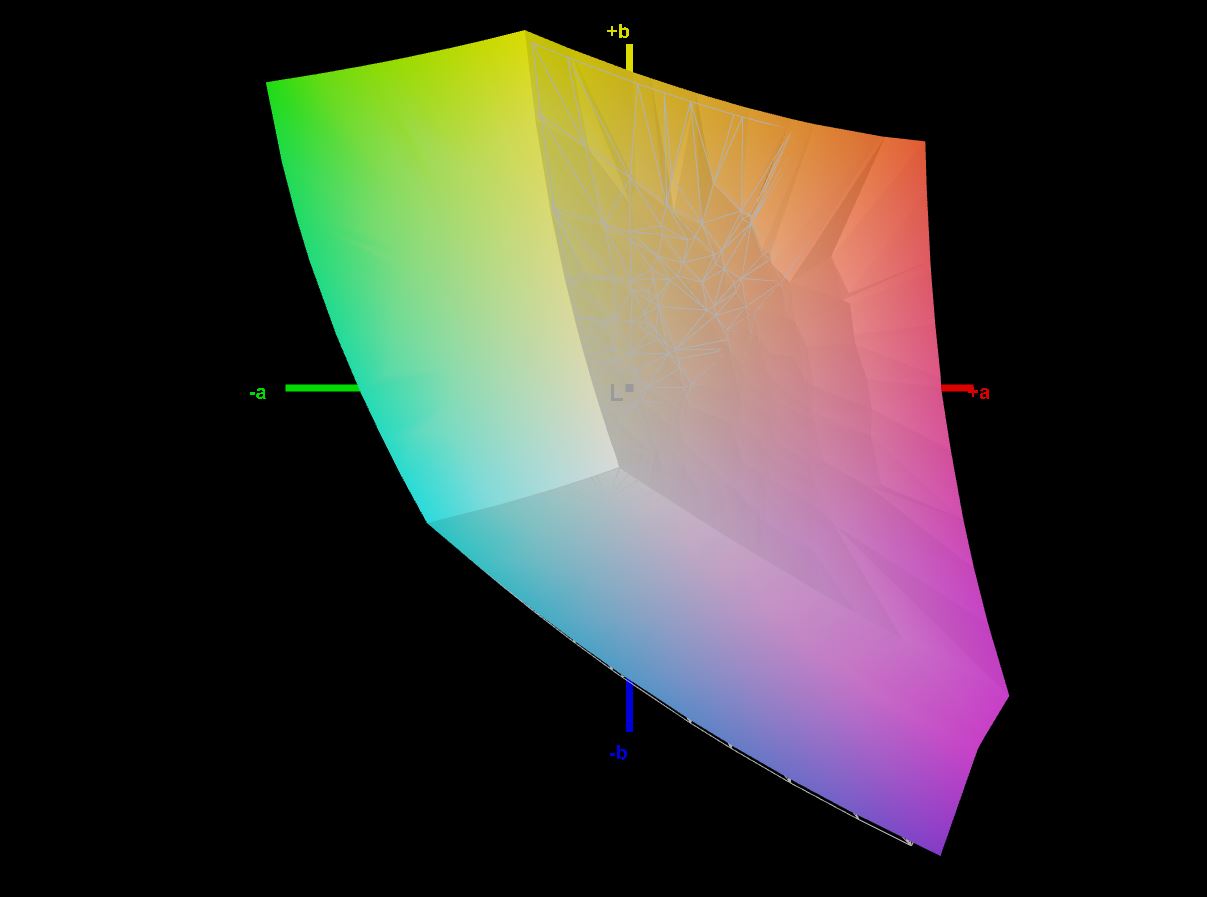
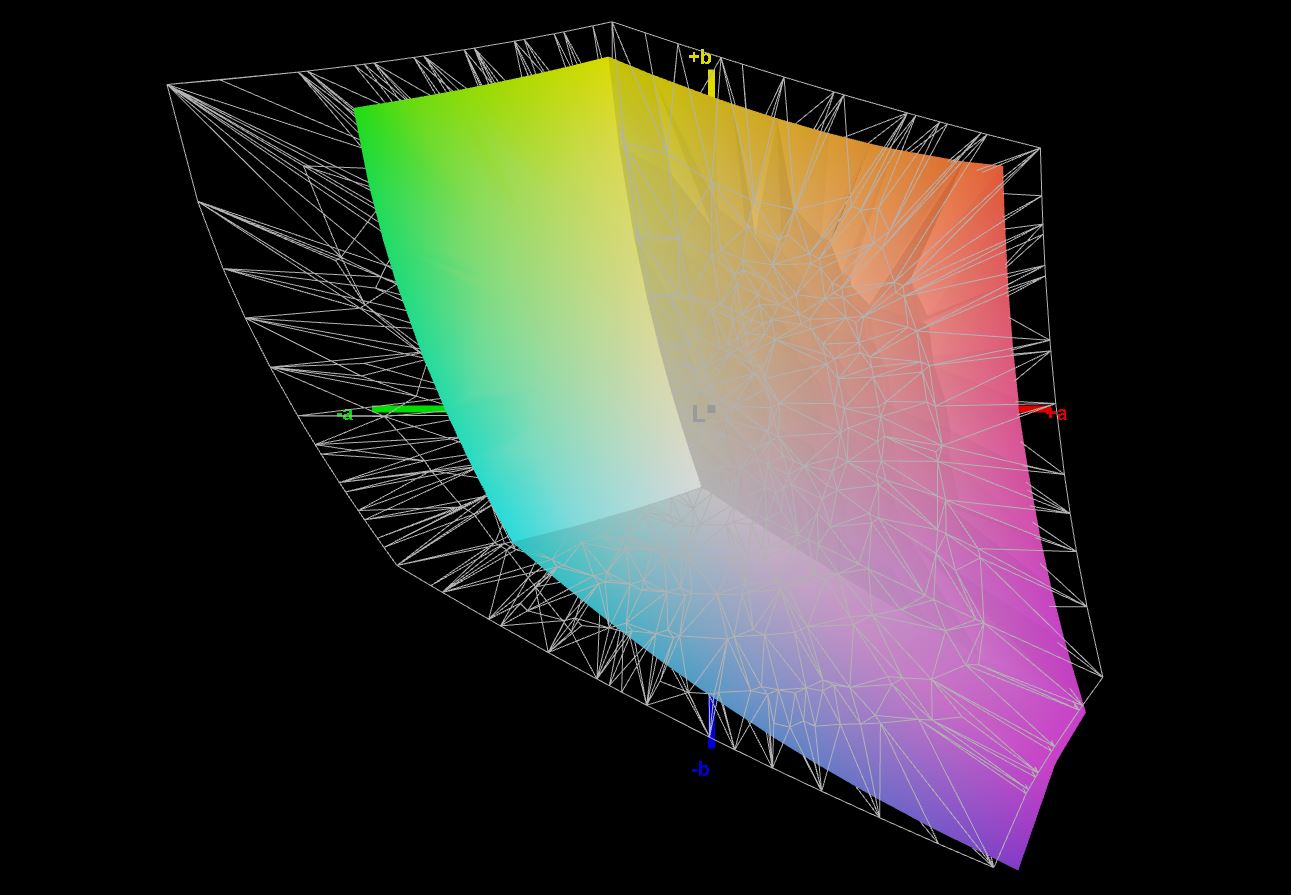
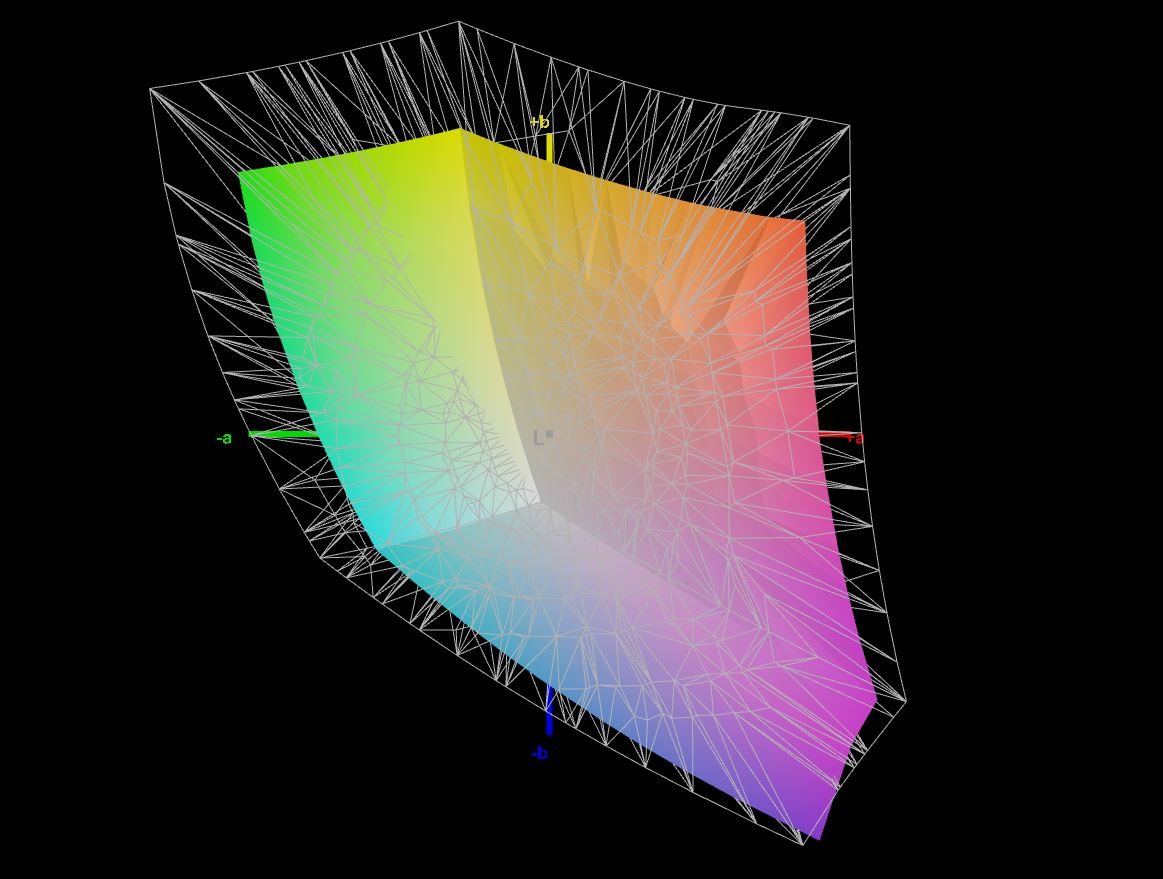
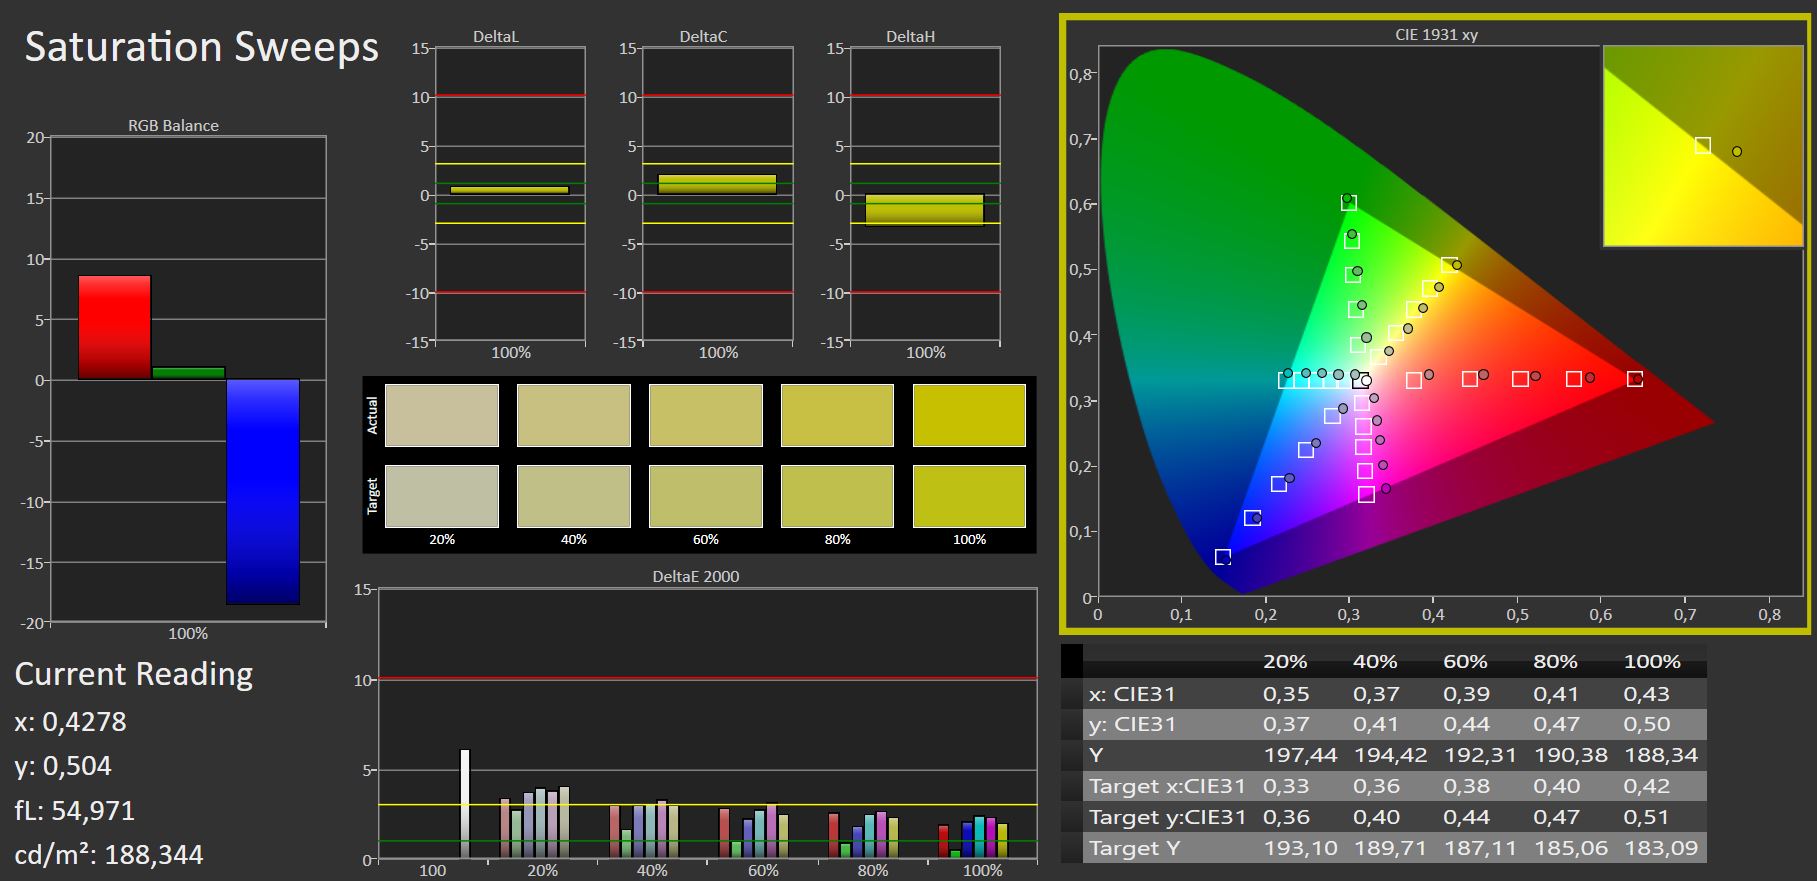
Quase todas as cores ficam abaixo do limiar do DeltaE 3. No entanto, um leve molde vermelho é visível à saída da fábrica, que não desaparece mesmo após nossa calibração. Nosso perfil de cor calibrado pode ser baixadoaqui.

Exibir tempos de resposta
| ↔ Tempo de resposta preto para branco | ||
|---|---|---|
| 7.6 ms ... ascensão ↗ e queda ↘ combinadas | ↗ 3 ms ascensão | 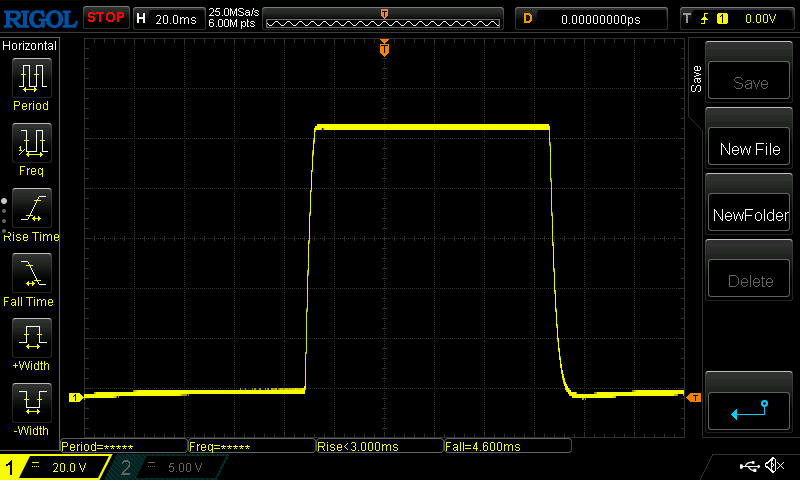 |
| ↘ 4.6 ms queda | ||
| A tela mostra taxas de resposta muito rápidas em nossos testes e deve ser muito adequada para jogos em ritmo acelerado. Em comparação, todos os dispositivos testados variam de 0.1 (mínimo) a 240 (máximo) ms. » 22 % de todos os dispositivos são melhores. Isso significa que o tempo de resposta medido é melhor que a média de todos os dispositivos testados (19.8 ms). | ||
| ↔ Tempo de resposta 50% cinza a 80% cinza | ||
| 16 ms ... ascensão ↗ e queda ↘ combinadas | ↗ 7 ms ascensão | 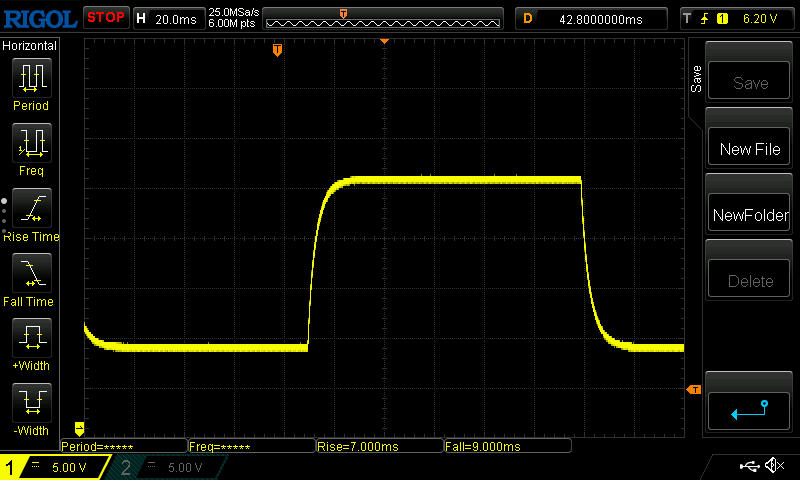 |
| ↘ 9 ms queda | ||
| A tela mostra boas taxas de resposta em nossos testes, mas pode ser muito lenta para jogadores competitivos. Em comparação, todos os dispositivos testados variam de 0.165 (mínimo) a 636 (máximo) ms. » 30 % de todos os dispositivos são melhores. Isso significa que o tempo de resposta medido é melhor que a média de todos os dispositivos testados (31 ms). | ||
Cintilação da tela / PWM (modulação por largura de pulso)
| Tela tremeluzindo / PWM não detectado | 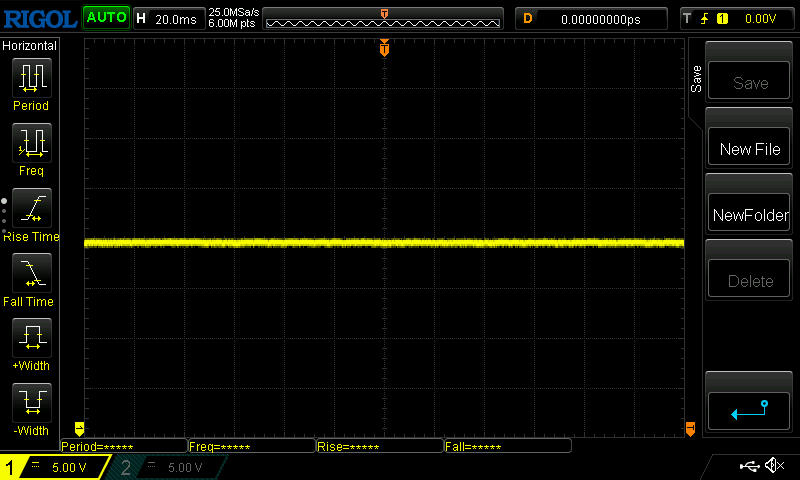 | ||
[pwm_comparison] Em comparação: 52 % de todos os dispositivos testados não usam PWM para escurecer a tela. Se PWM foi detectado, uma média de 7757 (mínimo: 5 - máximo: 343500) Hz foi medida. | |||
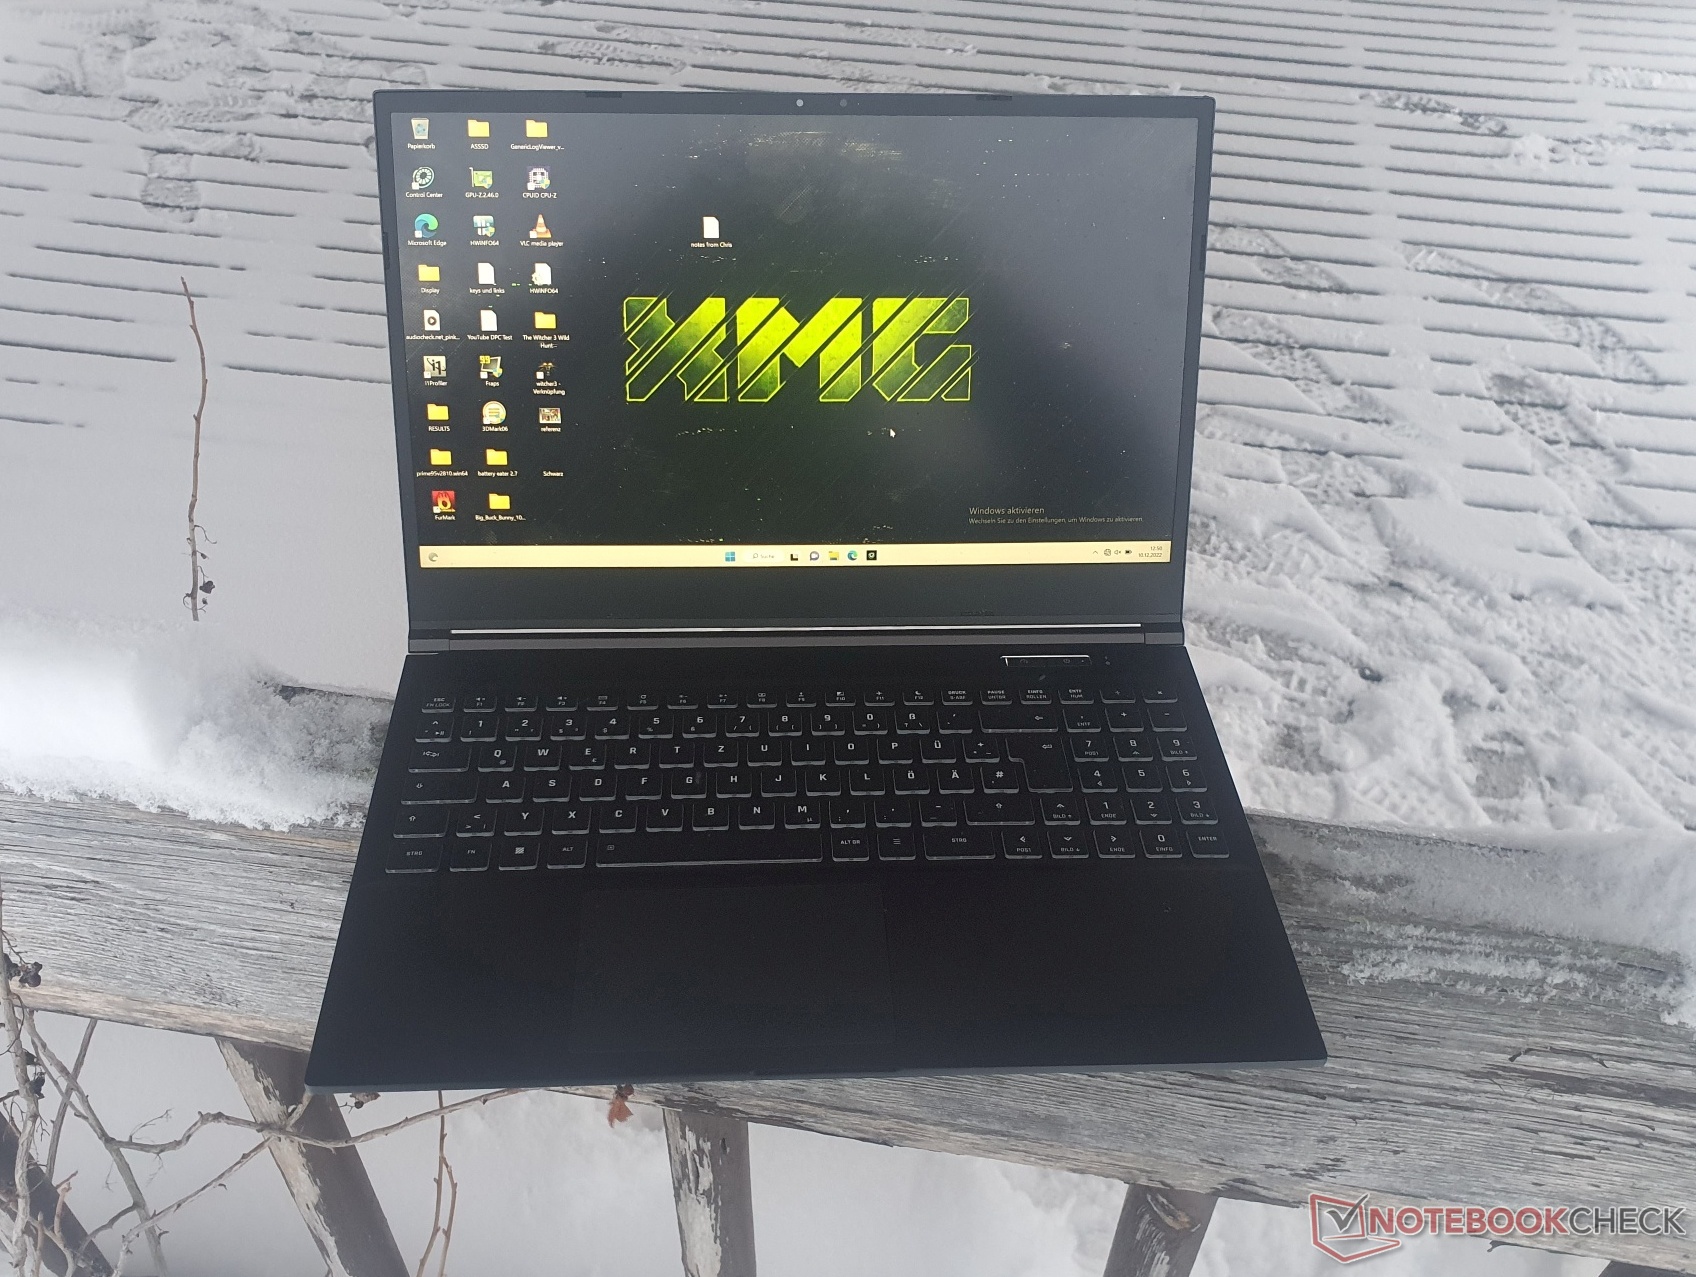
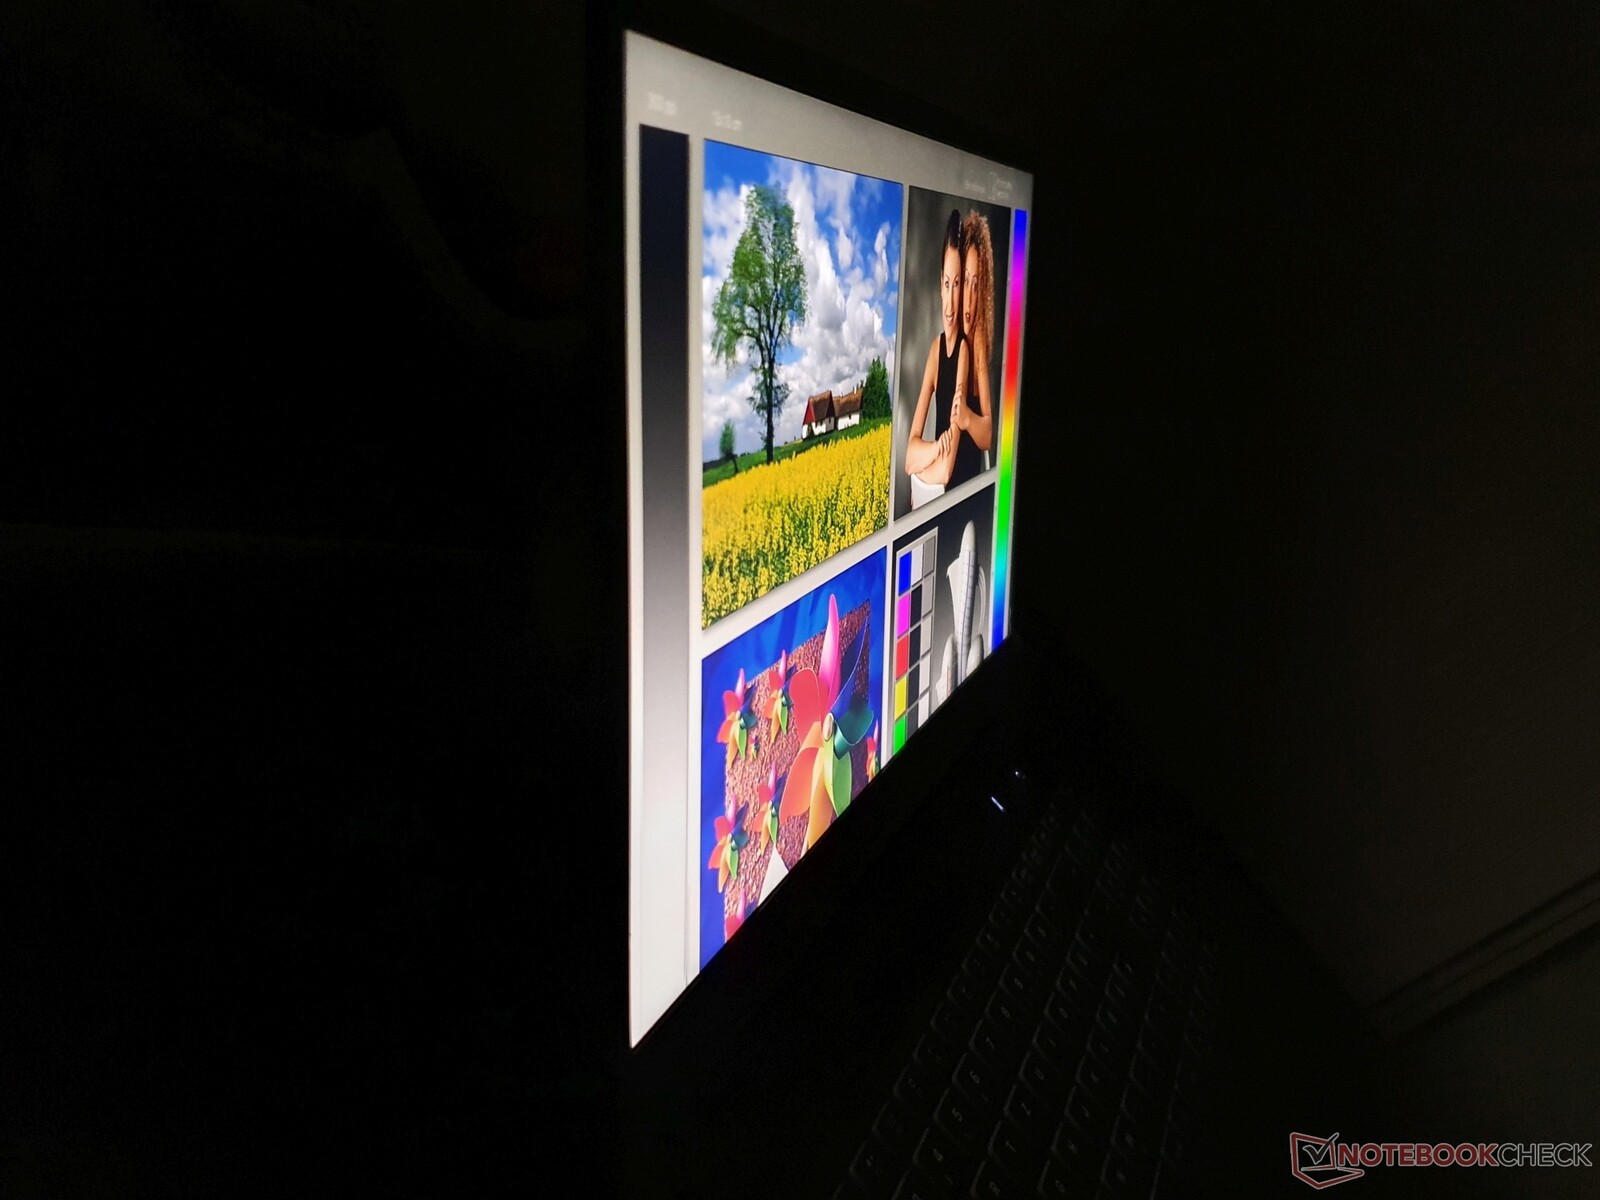
O display de 371 cd/m² só pode ser lido bem sem luz solar direta na parte de trás, apesar de seu acabamento mate.

Desempenho: RTX 3060 com TGP máximo, mas há TGP mais rápido
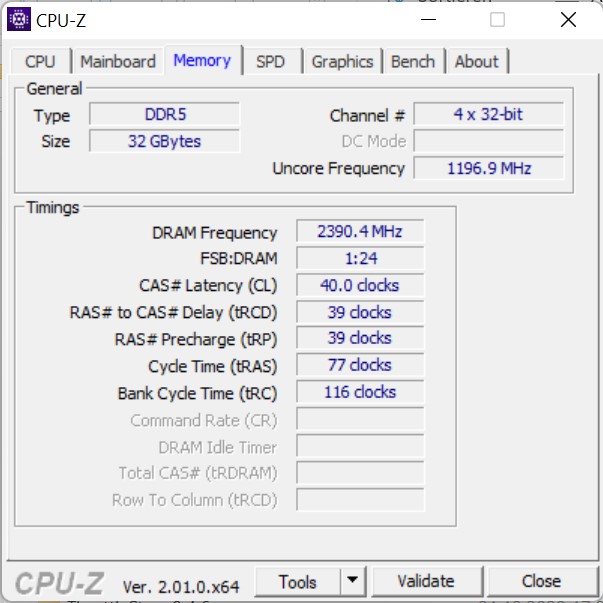
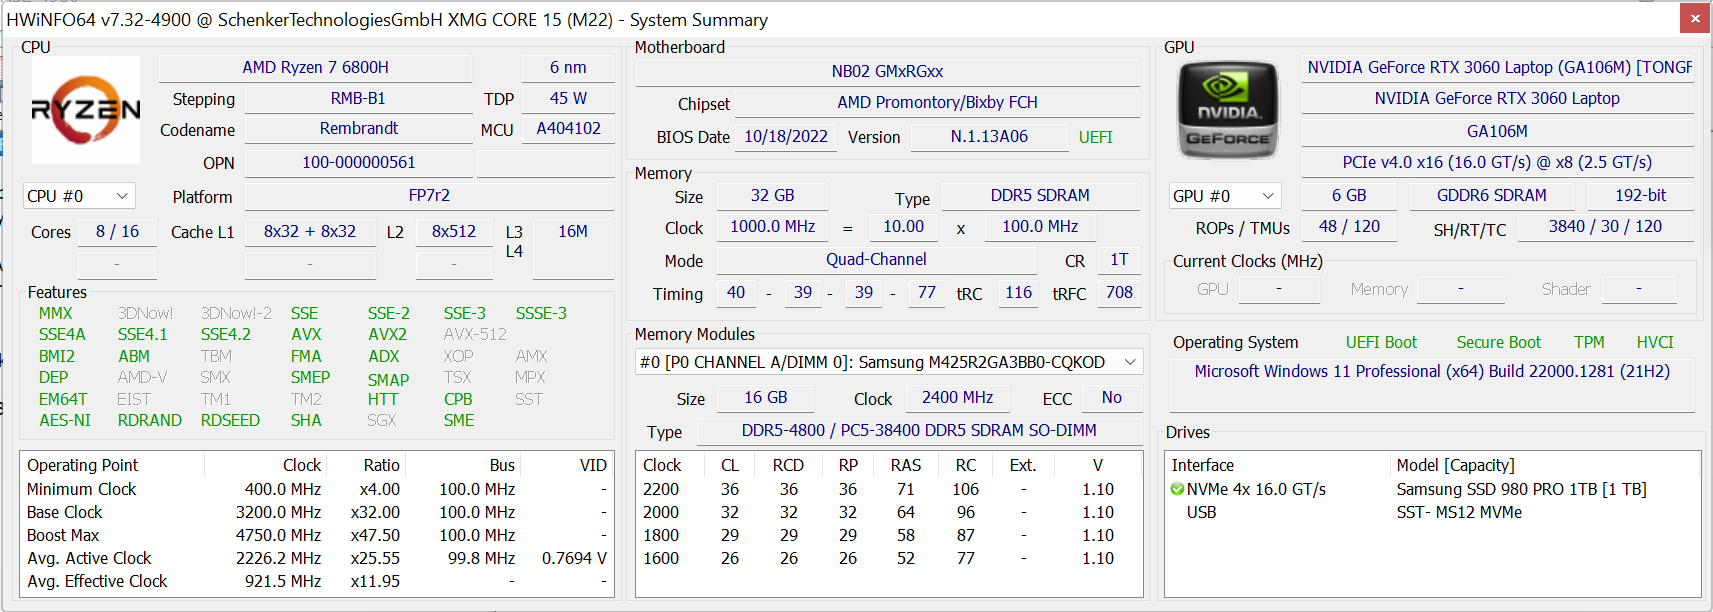
O laptop para jogos de 15,6 polegadas é muito poderoso graças a seu Nvidia RTX 3060 com um TGP de 140 W projetado para jogos atuais, não há outra opção de GPU. O processador Ryzen 7 6800H também é forte e é a única opção. RAM e armazenamento em massa são generosos com 32 GB DDR5-4800 (máximo 64 GB) e um SSD de 1 TB PCIe 4.0, respectivamente. As tarefas da estação de trabalho e o trabalho em vídeo também são concluídos rapidamente e produzem emissões muito baixas quando se utiliza o resfriamento externo de água.
Condições de teste
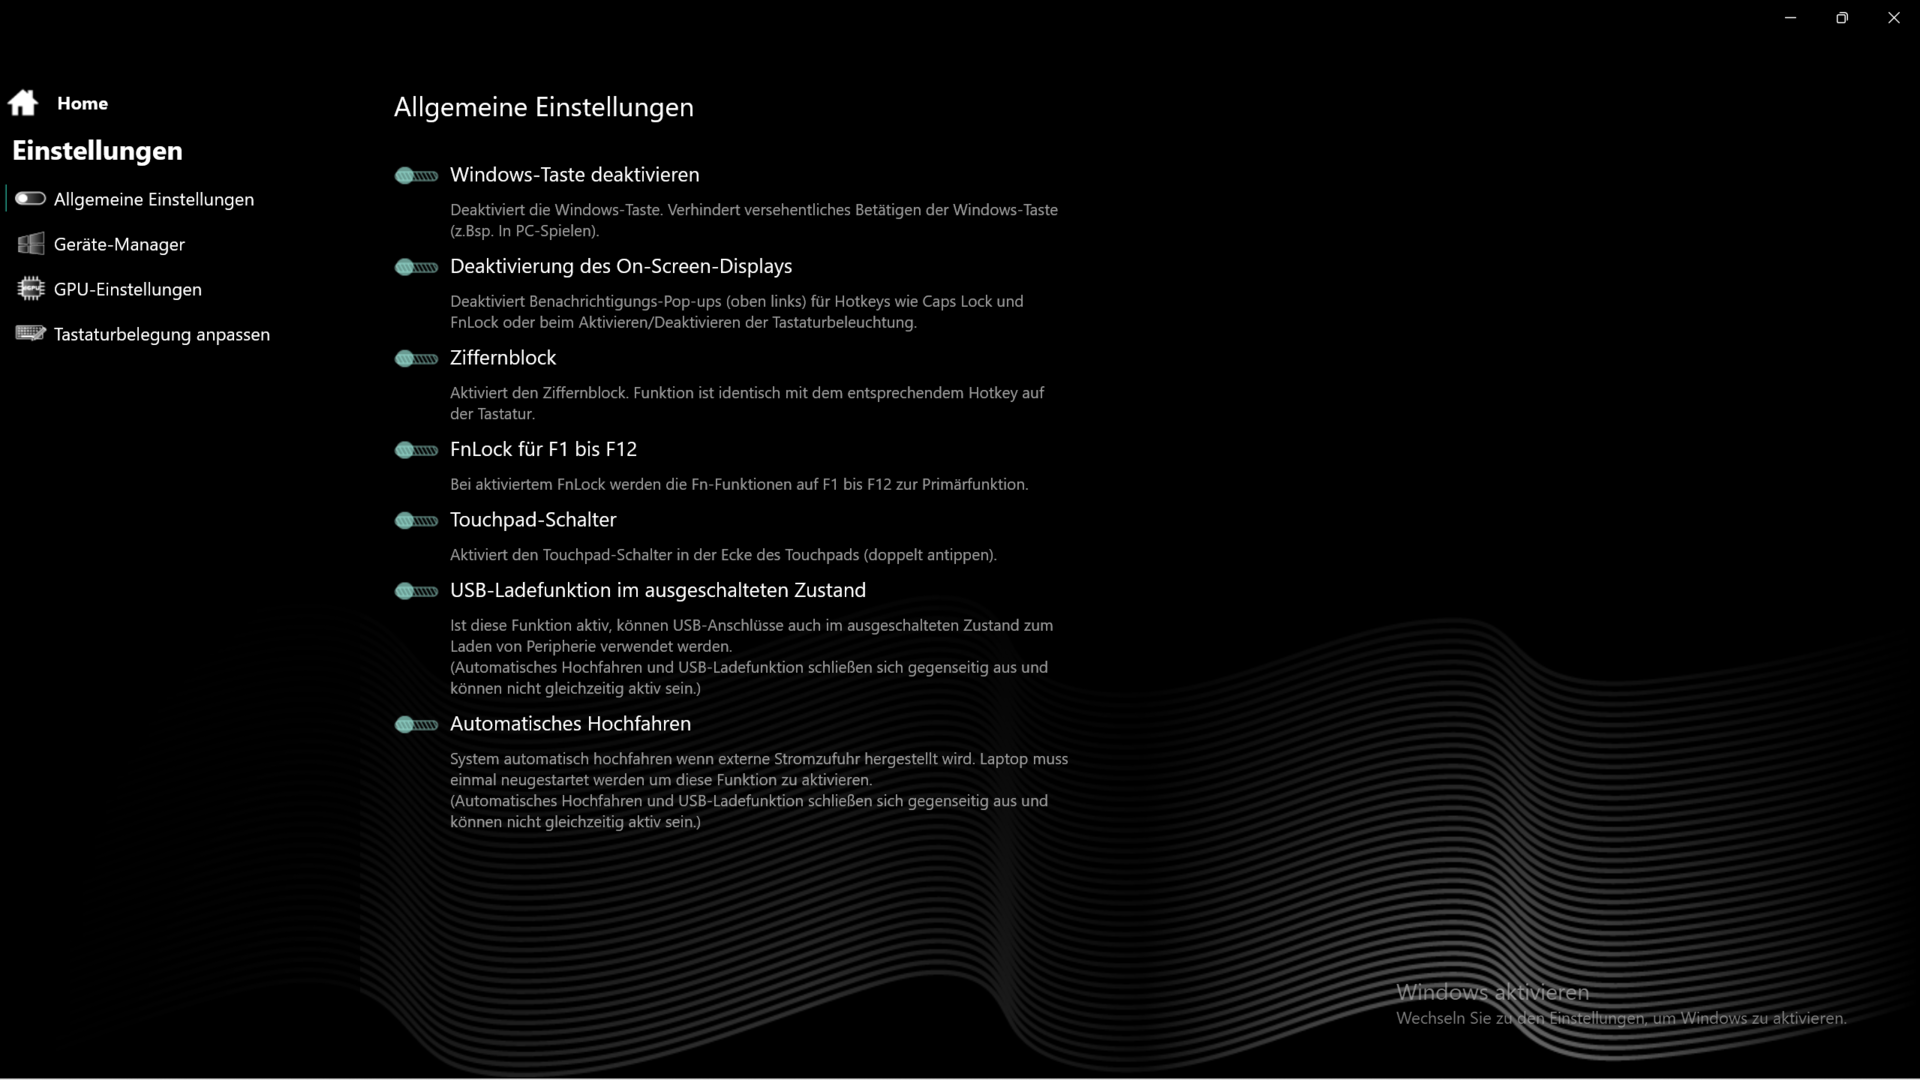
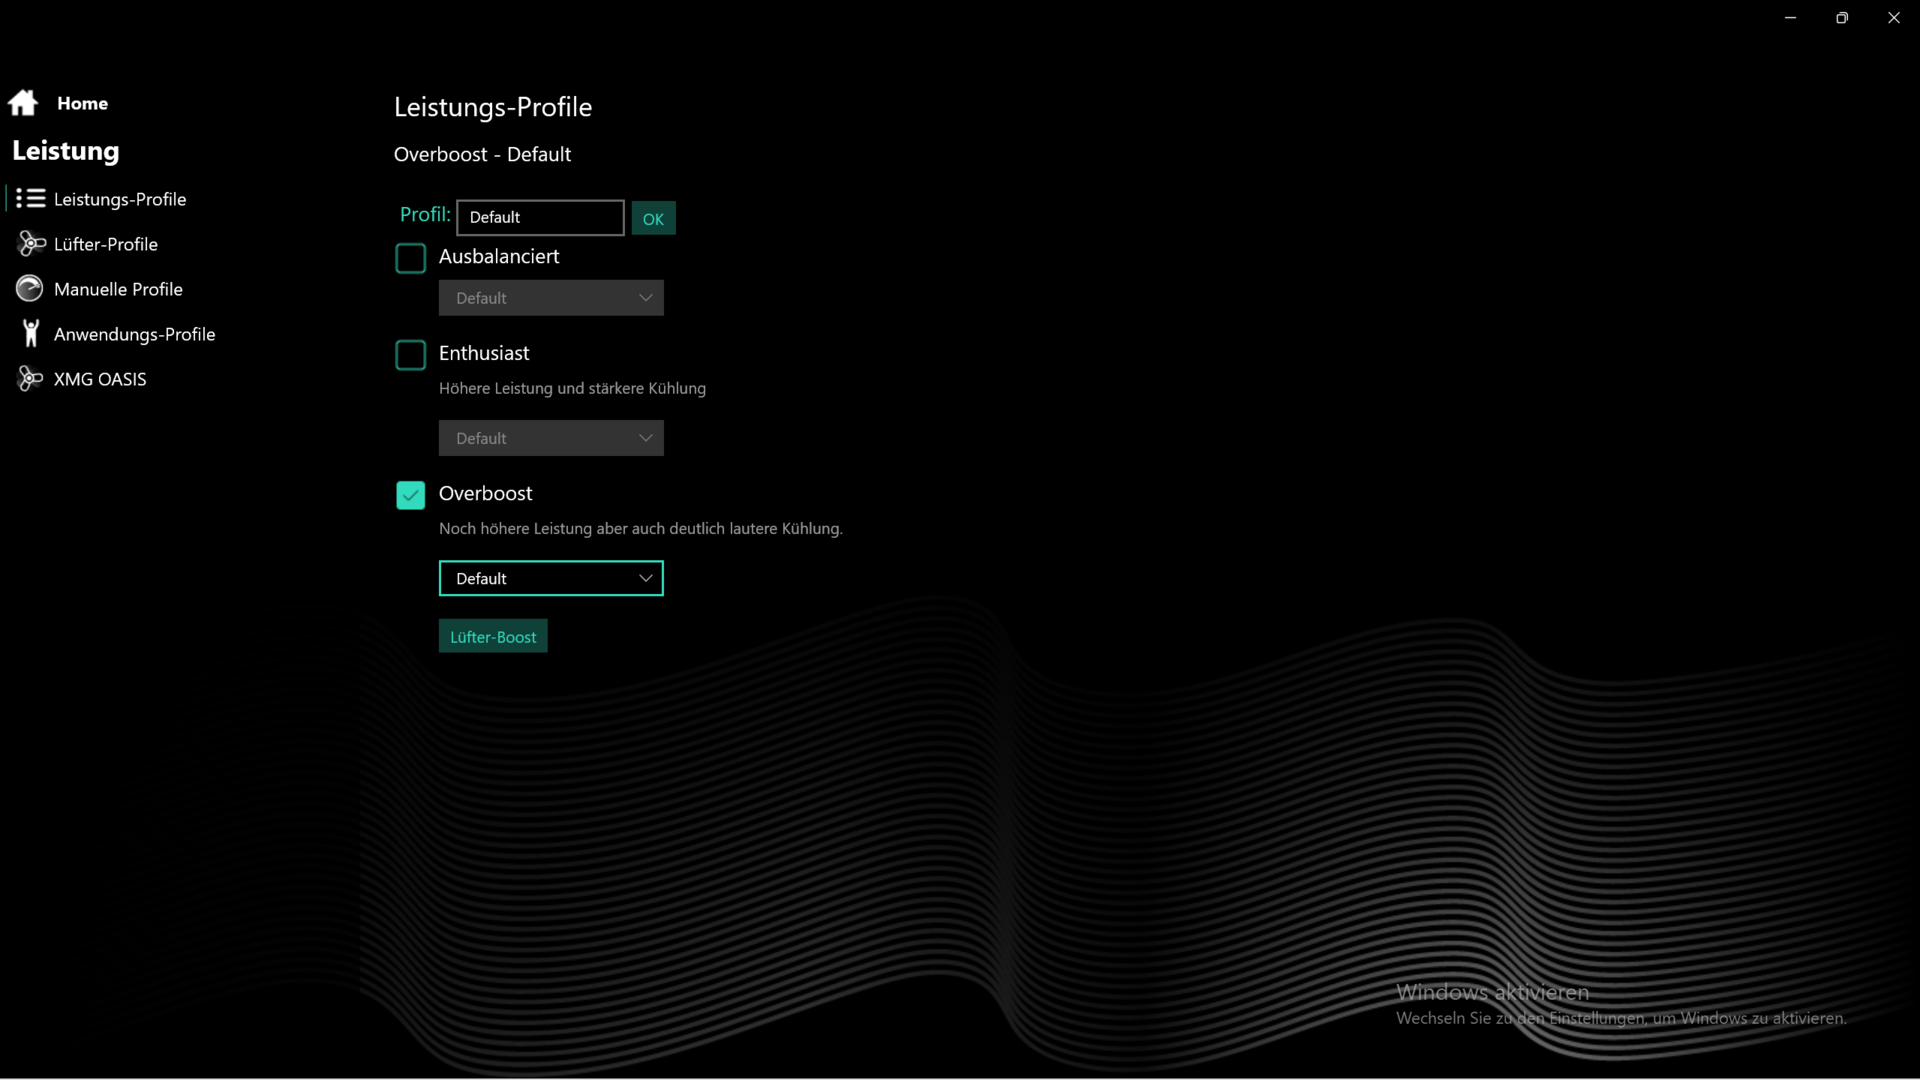
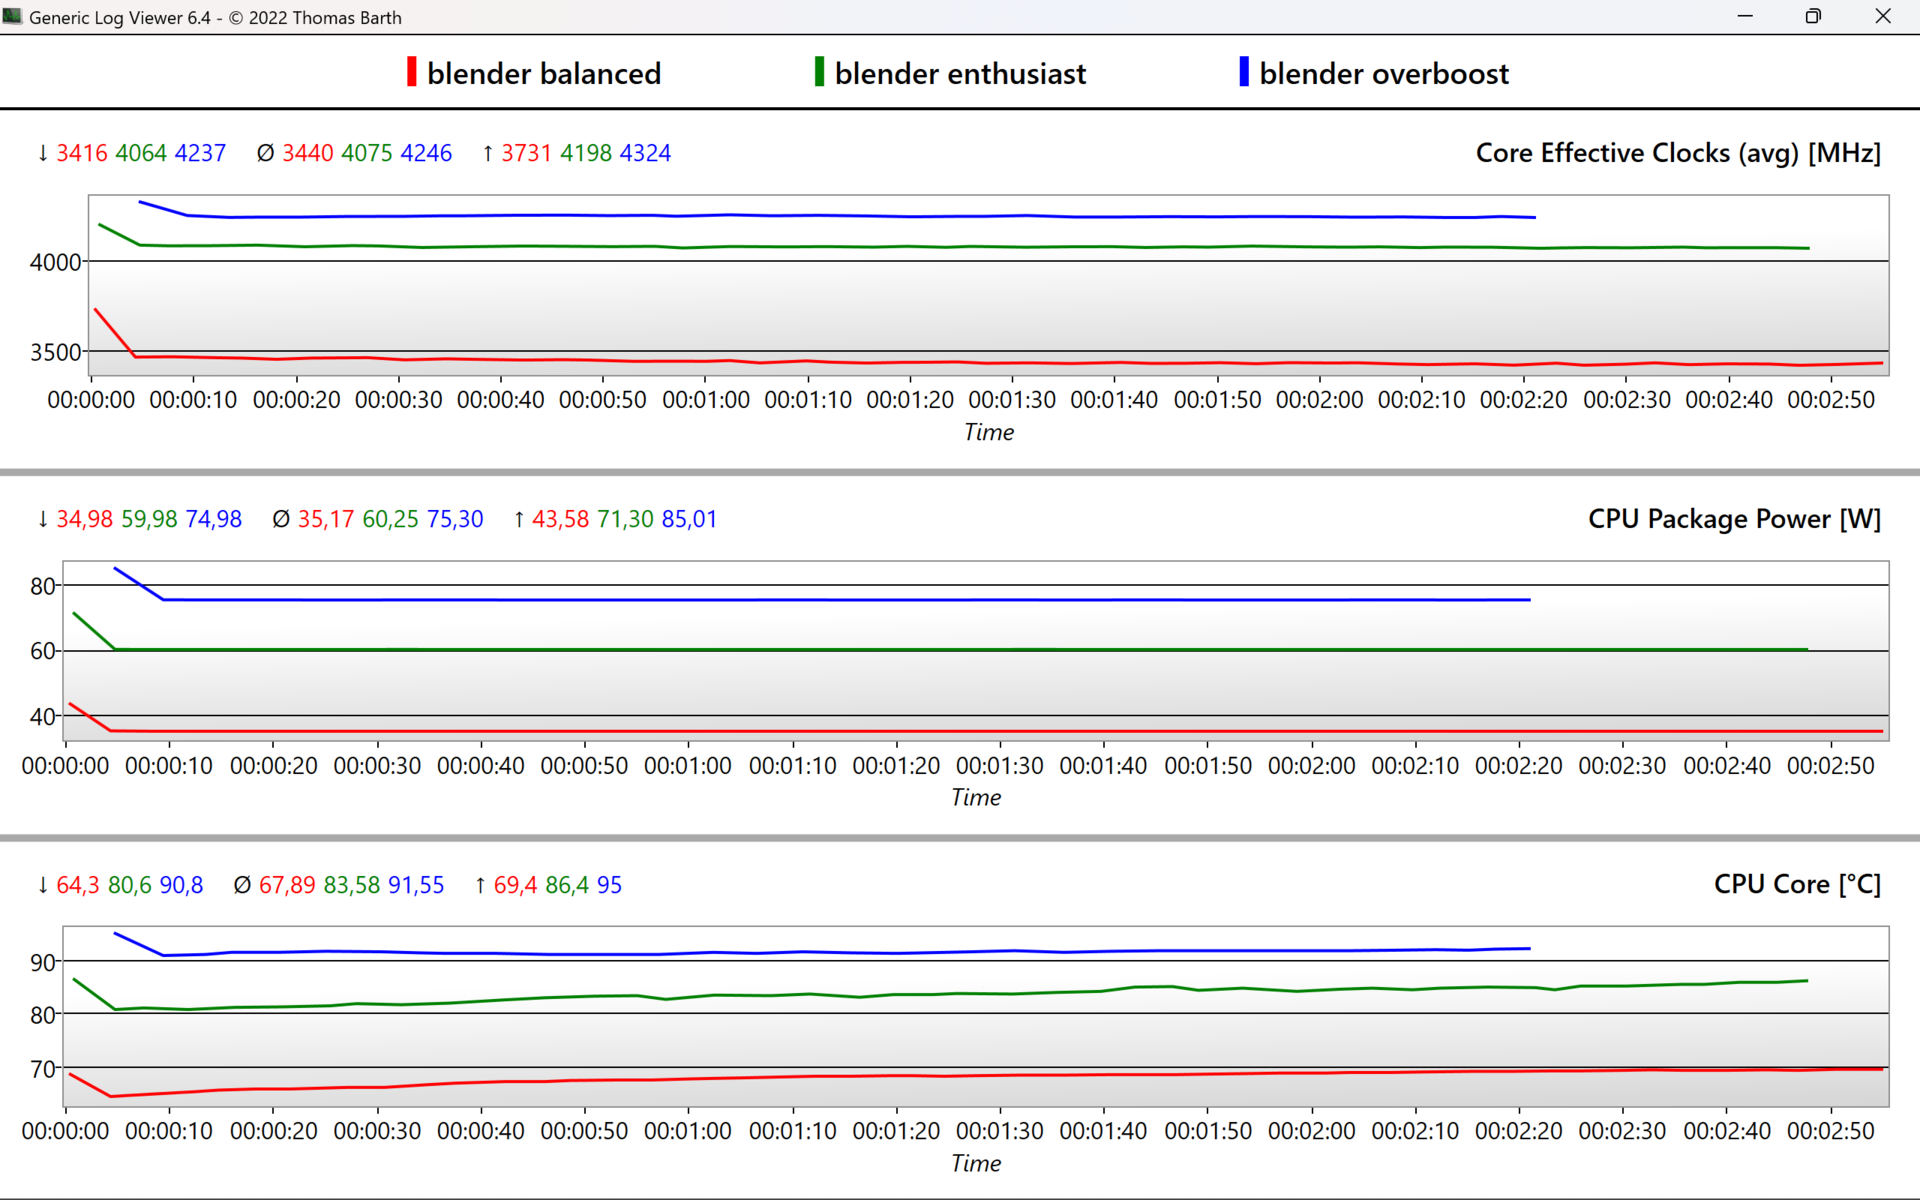
A Schenker oferece três modos de potência no Core 15, mas também perfis individuais. O botão à esquerda do botão de força pode ser usado para (des)ativar um perfil, o que pode ser útil para muitos cenários. O overboost permite um limite de potência permanente de 75 W para a CPU, 60 W em Enthusiast e 35 watts em modo Equilibrado. Há também o recurso Fan Boost, que mantém a CPU mais fria em cerca de 5 °C com um nível de ruído muito mais alto.
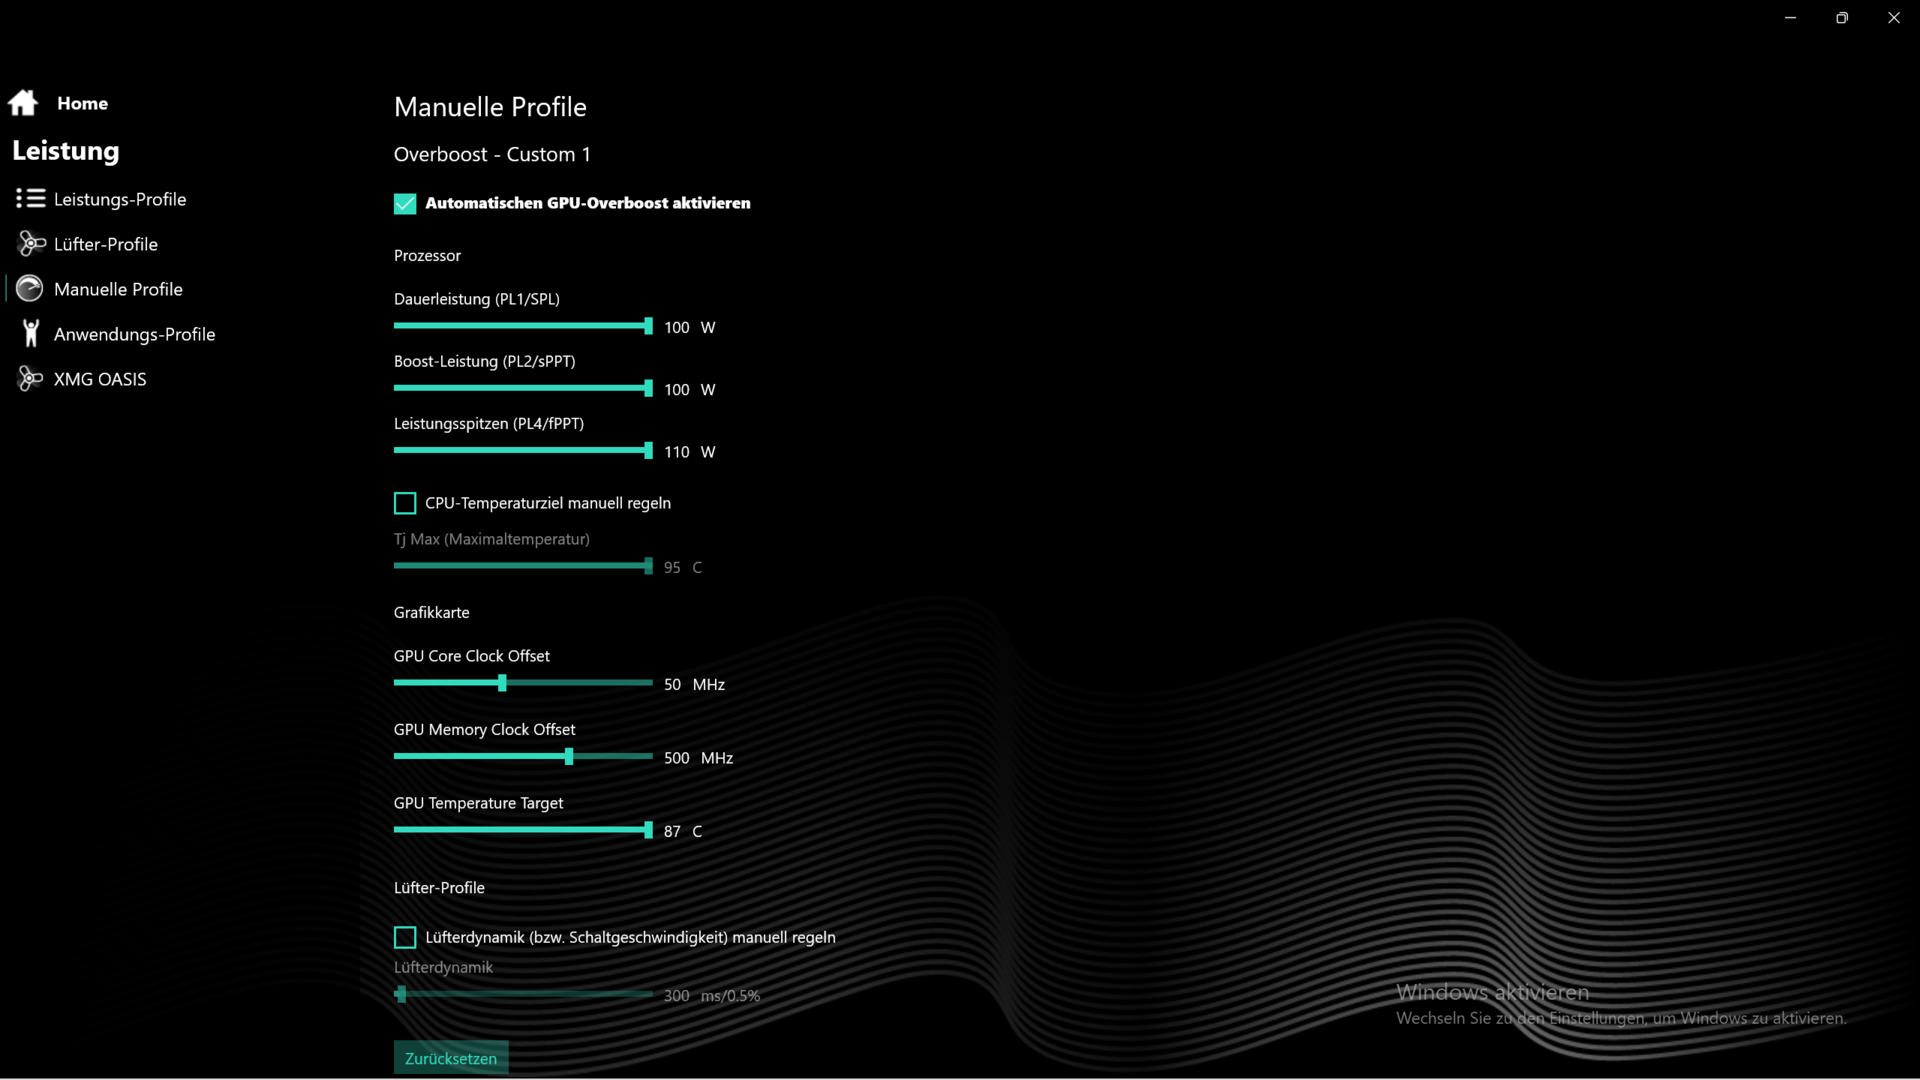
Os benchmarks de desempenho foram executados na predefinição Overboost, mas ainda recomendamos a Enthusiast, que é basicamente o mesmo desempenho com ruído mais silencioso. Movendo os controles deslizantes do TDP para 100 W apenas adicionou 5 W ao limite de potência, enquanto o overclocking da GPU para os valores recomendados (veja a captura de tela "GPU settings") adicionou algumas porcentagens de bônus.
Processador
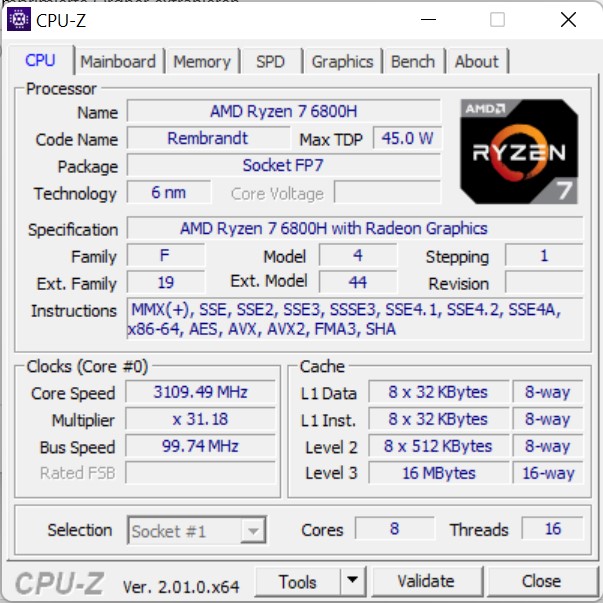
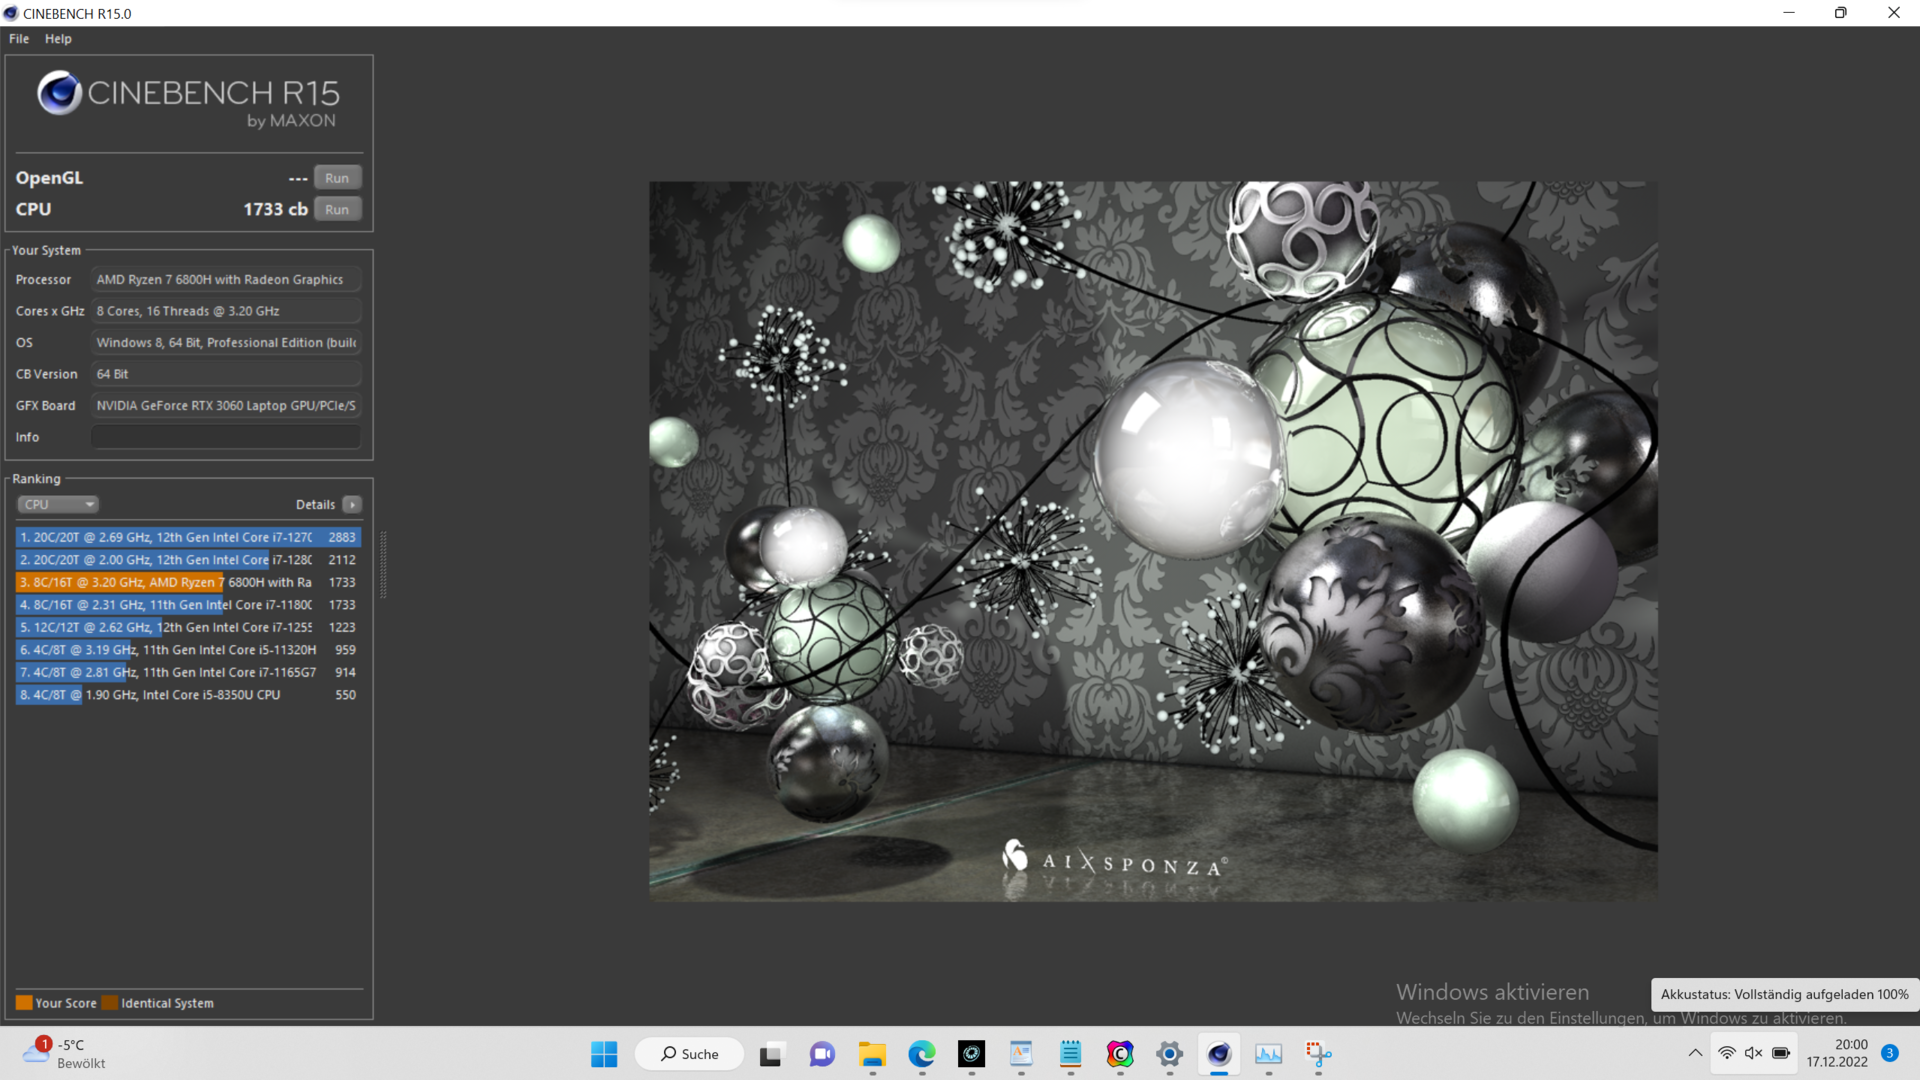
AMD's Ryzen 7 6800H é uma CPU de 45 W e funciona permanentemente com 75 W no XMG Core 15, de modo que um relógio de 4,3 GHz para todos os oito núcleos pode ser mantido a cerca de 92 °C (~198 °F). Por alguns segundos, 85 W é fornecido ao processador.
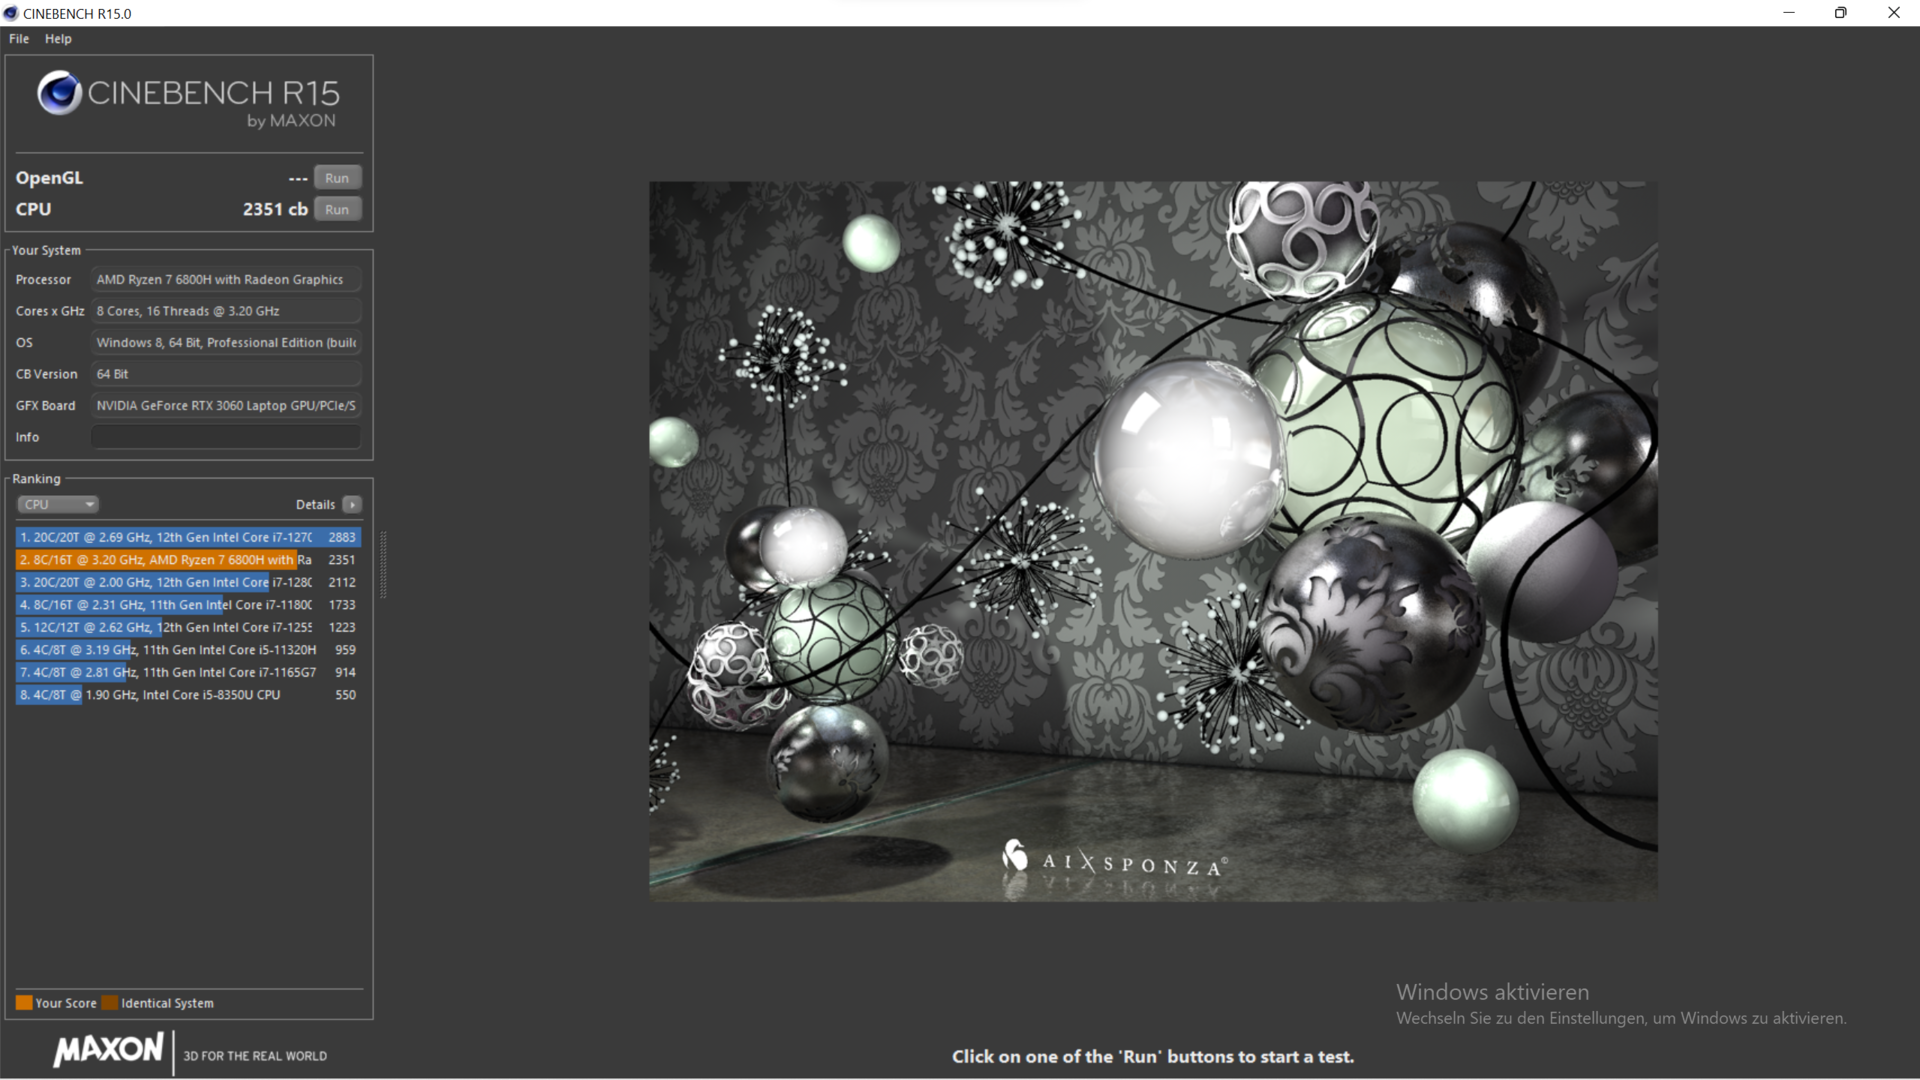
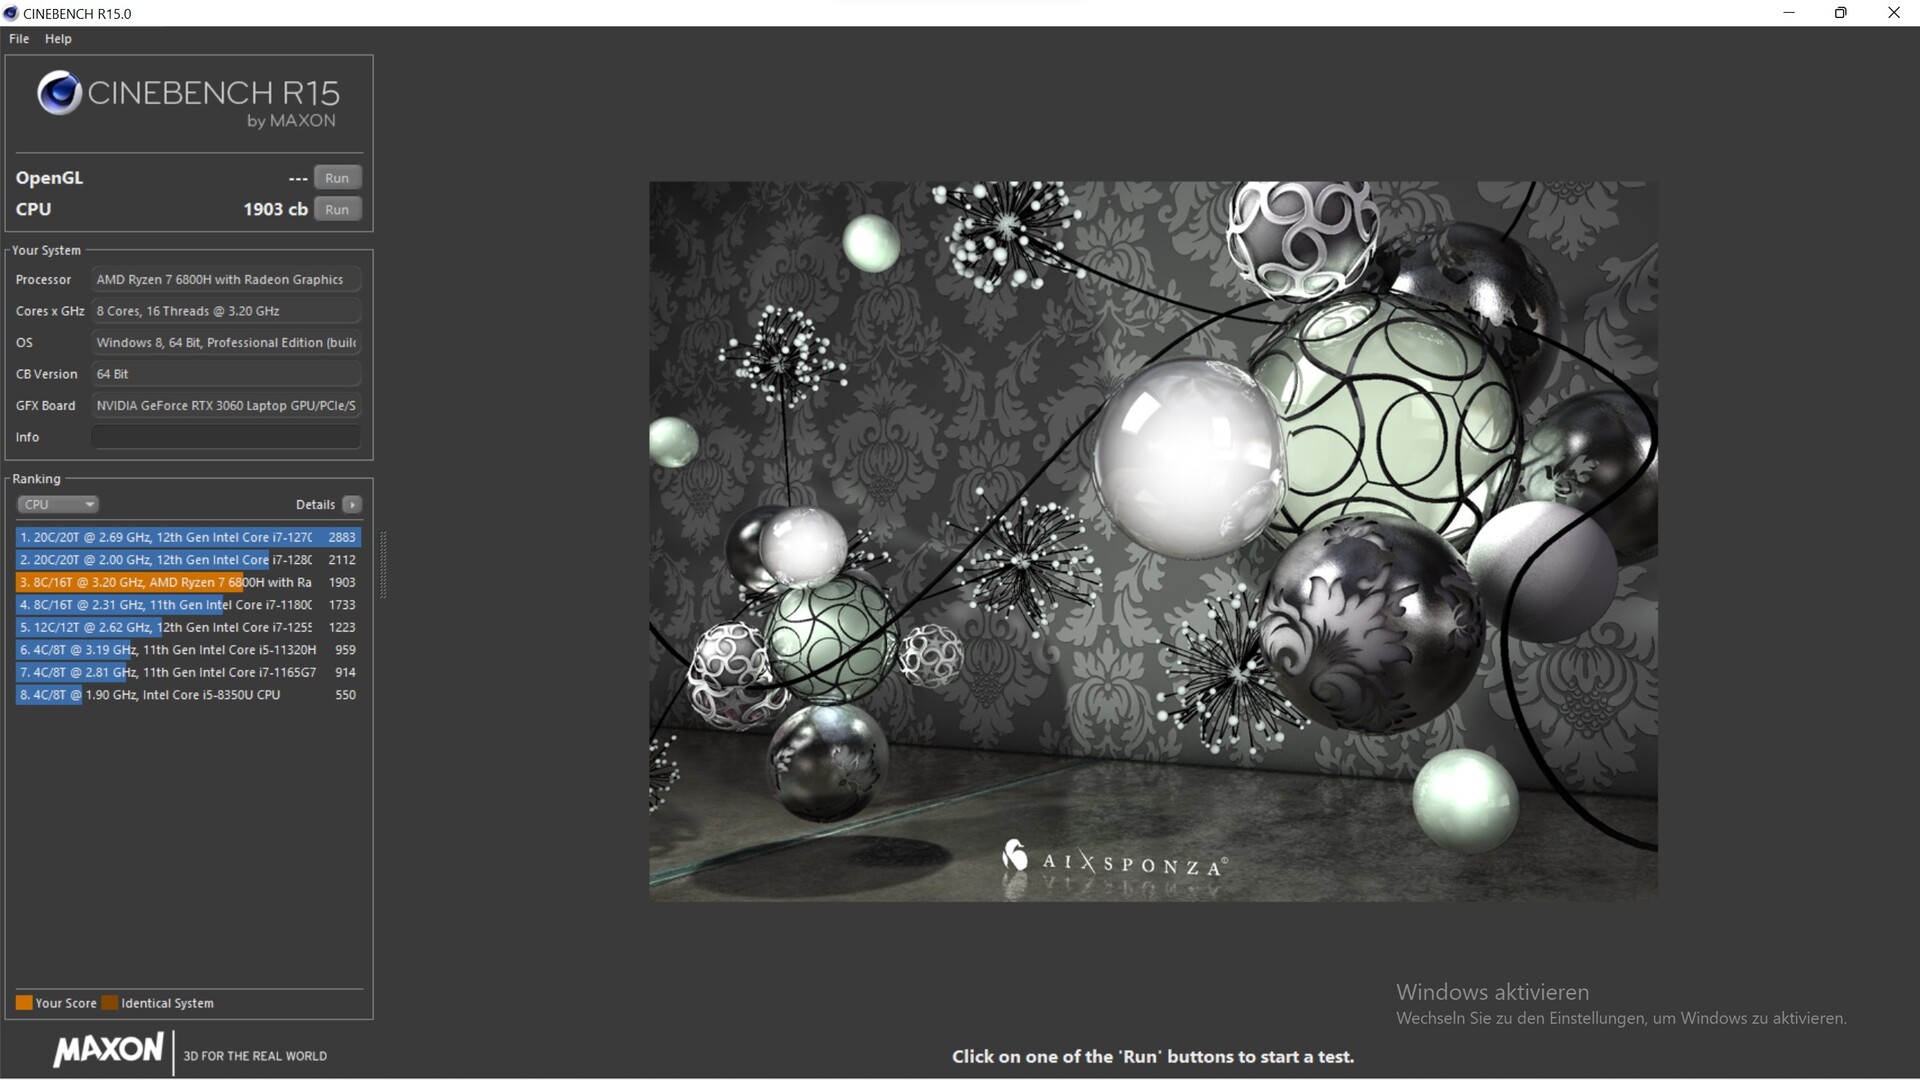
Nosso loop Cinebench R15 mostra que o Core i7-12700H funciona significativamente mais rápido no Legion 5 e TUF Gaming F15 , embora o XMG explore o potencial do Ryzen 7 6800H. Com um limite de potência de 35 W (modo balanceado), o desempenho da eficiente CPU Ryzen só diminui em 20%
No modo de bateria, o desempenho é reduzido em cerca de 25%, apesar doOverboost.

Cinebench R15 Multi endurance test
Cinebench R23: Multi Core | Single Core
Cinebench R20: CPU (Multi Core) | CPU (Single Core)
Cinebench R15: CPU Multi 64Bit | CPU Single 64Bit
Blender: v2.79 BMW27 CPU
7-Zip 18.03: 7z b 4 | 7z b 4 -mmt1
Geekbench 5.5: Multi-Core | Single-Core
HWBOT x265 Benchmark v2.2: 4k Preset
LibreOffice : 20 Documents To PDF
R Benchmark 2.5: Overall mean
| CPU Performance rating | |
| Média da turma Gaming | |
| Lenovo Legion 5 15IAH7H 82RB | |
| Asus TUF Gaming F15 FX507ZM | |
| Schenker XMG Core 15 (M22) | |
| Média AMD Ryzen 7 6800H | |
| Alienware m15 R5 Ryzen Edition | |
| Schenker XMG Fusion 15 (Mid 22) | |
| Schenker XMG Core 15 Ampere | |
| Cinebench R23 / Multi Core | |
| Média da turma Gaming (10488 - 42661, n=107, últimos 2 anos) | |
| Lenovo Legion 5 15IAH7H 82RB | |
| Asus TUF Gaming F15 FX507ZM | |
| Schenker XMG Core 15 (M22) | |
| Média AMD Ryzen 7 6800H (11481 - 14660, n=11) | |
| Alienware m15 R5 Ryzen Edition | |
| Schenker XMG Core 15 Ampere | |
| Schenker XMG Fusion 15 (Mid 22) | |
| Cinebench R23 / Single Core | |
| Média da turma Gaming (1166 - 2415, n=107, últimos 2 anos) | |
| Lenovo Legion 5 15IAH7H 82RB | |
| Asus TUF Gaming F15 FX507ZM | |
| Schenker XMG Core 15 (M22) | |
| Média AMD Ryzen 7 6800H (1500 - 1552, n=9) | |
| Schenker XMG Fusion 15 (Mid 22) | |
| Alienware m15 R5 Ryzen Edition | |
| Schenker XMG Core 15 Ampere | |
| Cinebench R20 / CPU (Multi Core) | |
| Média da turma Gaming (4029 - 16433, n=106, últimos 2 anos) | |
| Lenovo Legion 5 15IAH7H 82RB | |
| Asus TUF Gaming F15 FX507ZM | |
| Schenker XMG Core 15 (M22) | |
| Média AMD Ryzen 7 6800H (4460 - 5661, n=9) | |
| Alienware m15 R5 Ryzen Edition | |
| Schenker XMG Core 15 Ampere | |
| Schenker XMG Fusion 15 (Mid 22) | |
| Cinebench R20 / CPU (Single Core) | |
| Média da turma Gaming (442 - 913, n=106, últimos 2 anos) | |
| Lenovo Legion 5 15IAH7H 82RB | |
| Asus TUF Gaming F15 FX507ZM | |
| Schenker XMG Core 15 (M22) | |
| Média AMD Ryzen 7 6800H (580 - 605, n=9) | |
| Schenker XMG Fusion 15 (Mid 22) | |
| Alienware m15 R5 Ryzen Edition | |
| Schenker XMG Core 15 Ampere | |
| Cinebench R15 / CPU Multi 64Bit | |
| Média da turma Gaming (1578 - 6330, n=105, últimos 2 anos) | |
| Lenovo Legion 5 15IAH7H 82RB | |
| Asus TUF Gaming F15 FX507ZM | |
| Schenker XMG Core 15 (M22) | |
| Média AMD Ryzen 7 6800H (1585 - 2366, n=10) | |
| Alienware m15 R5 Ryzen Edition | |
| Schenker XMG Core 15 Ampere | |
| Schenker XMG Fusion 15 (Mid 22) | |
| Cinebench R15 / CPU Single 64Bit | |
| Média da turma Gaming (188.8 - 350, n=106, últimos 2 anos) | |
| Lenovo Legion 5 15IAH7H 82RB | |
| Asus TUF Gaming F15 FX507ZM | |
| Schenker XMG Core 15 (M22) | |
| Média AMD Ryzen 7 6800H (182.7 - 250, n=10) | |
| Alienware m15 R5 Ryzen Edition | |
| Schenker XMG Fusion 15 (Mid 22) | |
| Schenker XMG Core 15 Ampere | |
| Blender / v2.79 BMW27 CPU | |
| Schenker XMG Fusion 15 (Mid 22) | |
| Alienware m15 R5 Ryzen Edition | |
| Schenker XMG Core 15 Ampere | |
| Média AMD Ryzen 7 6800H (213 - 268, n=8) | |
| Schenker XMG Core 15 (M22) | |
| Asus TUF Gaming F15 FX507ZM | |
| Lenovo Legion 5 15IAH7H 82RB | |
| Média da turma Gaming (79 - 330, n=104, últimos 2 anos) | |
| 7-Zip 18.03 / 7z b 4 | |
| Média da turma Gaming (33491 - 148086, n=105, últimos 2 anos) | |
| Lenovo Legion 5 15IAH7H 82RB | |
| Asus TUF Gaming F15 FX507ZM | |
| Schenker XMG Core 15 (M22) | |
| Média AMD Ryzen 7 6800H (55067 - 64817, n=8) | |
| Alienware m15 R5 Ryzen Edition | |
| Schenker XMG Core 15 Ampere | |
| Schenker XMG Fusion 15 (Mid 22) | |
| 7-Zip 18.03 / 7z b 4 -mmt1 | |
| Média da turma Gaming (4199 - 7436, n=105, últimos 2 anos) | |
| Lenovo Legion 5 15IAH7H 82RB | |
| Schenker XMG Core 15 (M22) | |
| Média AMD Ryzen 7 6800H (5521 - 5803, n=8) | |
| Alienware m15 R5 Ryzen Edition | |
| Schenker XMG Fusion 15 (Mid 22) | |
| Asus TUF Gaming F15 FX507ZM | |
| Schenker XMG Core 15 Ampere | |
| Geekbench 5.5 / Multi-Core | |
| Média da turma Gaming (6460 - 28263, n=105, últimos 2 anos) | |
| Lenovo Legion 5 15IAH7H 82RB | |
| Asus TUF Gaming F15 FX507ZM | |
| Schenker XMG Core 15 (M22) | |
| Média AMD Ryzen 7 6800H (8898 - 10355, n=10) | |
| Schenker XMG Fusion 15 (Mid 22) | |
| Schenker XMG Core 15 Ampere | |
| Alienware m15 R5 Ryzen Edition | |
| Geekbench 5.5 / Single-Core | |
| Média da turma Gaming (986 - 2474, n=105, últimos 2 anos) | |
| Lenovo Legion 5 15IAH7H 82RB | |
| Asus TUF Gaming F15 FX507ZM | |
| Schenker XMG Fusion 15 (Mid 22) | |
| Schenker XMG Core 15 (M22) | |
| Média AMD Ryzen 7 6800H (1518 - 1568, n=10) | |
| Alienware m15 R5 Ryzen Edition | |
| Schenker XMG Core 15 Ampere | |
| HWBOT x265 Benchmark v2.2 / 4k Preset | |
| Média da turma Gaming (11.5 - 44.4, n=105, últimos 2 anos) | |
| Lenovo Legion 5 15IAH7H 82RB | |
| Asus TUF Gaming F15 FX507ZM | |
| Schenker XMG Core 15 (M22) | |
| Média AMD Ryzen 7 6800H (14.9 - 18.5, n=9) | |
| Alienware m15 R5 Ryzen Edition | |
| Schenker XMG Core 15 Ampere | |
| Schenker XMG Fusion 15 (Mid 22) | |
| LibreOffice / 20 Documents To PDF | |
| Schenker XMG Core 15 (M22) | |
| Schenker XMG Core 15 Ampere | |
| Alienware m15 R5 Ryzen Edition | |
| Média AMD Ryzen 7 6800H (48.7 - 79.5, n=8) | |
| Asus TUF Gaming F15 FX507ZM | |
| Média da turma Gaming (33.2 - 88.8, n=105, últimos 2 anos) | |
| Schenker XMG Fusion 15 (Mid 22) | |
| Lenovo Legion 5 15IAH7H 82RB | |
| R Benchmark 2.5 / Overall mean | |
| Schenker XMG Core 15 Ampere | |
| Schenker XMG Fusion 15 (Mid 22) | |
| Alienware m15 R5 Ryzen Edition | |
| Média AMD Ryzen 7 6800H (0.4783 - 0.515, n=8) | |
| Schenker XMG Core 15 (M22) | |
| Asus TUF Gaming F15 FX507ZM | |
| Lenovo Legion 5 15IAH7H 82RB | |
| Média da turma Gaming (0.3439 - 0.759, n=106, últimos 2 anos) | |
* ... menor é melhor
AIDA64: FP32 Ray-Trace | FPU Julia | CPU SHA3 | CPU Queen | FPU SinJulia | FPU Mandel | CPU AES | CPU ZLib | FP64 Ray-Trace | CPU PhotoWorxx
| Performance rating | |
| Média da turma Gaming | |
| Lenovo Legion 5 15IAH7H 82RB | |
| Schenker XMG Core 15 (M22) | |
| Média AMD Ryzen 7 6800H | |
| Alienware m15 R5 Ryzen Edition | |
| Schenker XMG Core 15 Ampere | |
| Schenker XMG Fusion 15 (Mid 22) | |
| Asus TUF Gaming F15 FX507ZM | |
| AIDA64 / FP32 Ray-Trace | |
| Média da turma Gaming (10227 - 85542, n=105, últimos 2 anos) | |
| Lenovo Legion 5 15IAH7H 82RB | |
| Schenker XMG Core 15 (M22) | |
| Média AMD Ryzen 7 6800H (12876 - 17031, n=8) | |
| Schenker XMG Core 15 Ampere | |
| Alienware m15 R5 Ryzen Edition | |
| Schenker XMG Fusion 15 (Mid 22) | |
| Asus TUF Gaming F15 FX507ZM | |
| AIDA64 / FPU Julia | |
| Média da turma Gaming (51376 - 238426, n=105, últimos 2 anos) | |
| Schenker XMG Core 15 (M22) | |
| Média AMD Ryzen 7 6800H (82673 - 105987, n=8) | |
| Alienware m15 R5 Ryzen Edition | |
| Lenovo Legion 5 15IAH7H 82RB | |
| Schenker XMG Core 15 Ampere | |
| Schenker XMG Fusion 15 (Mid 22) | |
| Asus TUF Gaming F15 FX507ZM | |
| AIDA64 / CPU SHA3 | |
| Média da turma Gaming (2180 - 10115, n=105, últimos 2 anos) | |
| Lenovo Legion 5 15IAH7H 82RB | |
| Schenker XMG Fusion 15 (Mid 22) | |
| Schenker XMG Core 15 (M22) | |
| Asus TUF Gaming F15 FX507ZM | |
| Média AMD Ryzen 7 6800H (2886 - 3634, n=8) | |
| Alienware m15 R5 Ryzen Edition | |
| Schenker XMG Core 15 Ampere | |
| AIDA64 / CPU Queen | |
| Média da turma Gaming (49785 - 173351, n=90, últimos 2 anos) | |
| Lenovo Legion 5 15IAH7H 82RB | |
| Asus TUF Gaming F15 FX507ZM | |
| Schenker XMG Core 15 Ampere | |
| Média AMD Ryzen 7 6800H (75117 - 106322, n=8) | |
| Alienware m15 R5 Ryzen Edition | |
| Schenker XMG Core 15 (M22) | |
| Schenker XMG Fusion 15 (Mid 22) | |
| AIDA64 / FPU SinJulia | |
| Média da turma Gaming (4424 - 33636, n=105, últimos 2 anos) | |
| Schenker XMG Core 15 Ampere | |
| Schenker XMG Core 15 (M22) | |
| Média AMD Ryzen 7 6800H (11771 - 13120, n=8) | |
| Alienware m15 R5 Ryzen Edition | |
| Lenovo Legion 5 15IAH7H 82RB | |
| Asus TUF Gaming F15 FX507ZM | |
| Schenker XMG Fusion 15 (Mid 22) | |
| AIDA64 / FPU Mandel | |
| Média da turma Gaming (25115 - 128721, n=105, últimos 2 anos) | |
| Schenker XMG Core 15 (M22) | |
| Média AMD Ryzen 7 6800H (45287 - 58327, n=8) | |
| Alienware m15 R5 Ryzen Edition | |
| Lenovo Legion 5 15IAH7H 82RB | |
| Schenker XMG Core 15 Ampere | |
| Schenker XMG Fusion 15 (Mid 22) | |
| Asus TUF Gaming F15 FX507ZM | |
| AIDA64 / CPU AES | |
| Lenovo Legion 5 15IAH7H 82RB | |
| Schenker XMG Fusion 15 (Mid 22) | |
| Alienware m15 R5 Ryzen Edition | |
| Média AMD Ryzen 7 6800H (67816 - 137383, n=8) | |
| Média da turma Gaming (39258 - 247074, n=105, últimos 2 anos) | |
| Schenker XMG Core 15 Ampere | |
| Schenker XMG Core 15 (M22) | |
| Asus TUF Gaming F15 FX507ZM | |
| AIDA64 / CPU ZLib | |
| Média da turma Gaming (574 - 2531, n=105, últimos 2 anos) | |
| Asus TUF Gaming F15 FX507ZM | |
| Lenovo Legion 5 15IAH7H 82RB | |
| Schenker XMG Core 15 (M22) | |
| Schenker XMG Core 15 Ampere | |
| Média AMD Ryzen 7 6800H (732 - 901, n=8) | |
| Alienware m15 R5 Ryzen Edition | |
| Schenker XMG Fusion 15 (Mid 22) | |
| AIDA64 / FP64 Ray-Trace | |
| Média da turma Gaming (5509 - 45446, n=105, últimos 2 anos) | |
| Lenovo Legion 5 15IAH7H 82RB | |
| Schenker XMG Core 15 (M22) | |
| Média AMD Ryzen 7 6800H (6917 - 8980, n=8) | |
| Schenker XMG Core 15 Ampere | |
| Alienware m15 R5 Ryzen Edition | |
| Schenker XMG Fusion 15 (Mid 22) | |
| Asus TUF Gaming F15 FX507ZM | |
| AIDA64 / CPU PhotoWorxx | |
| Média da turma Gaming (12271 - 89891, n=105, últimos 2 anos) | |
| Lenovo Legion 5 15IAH7H 82RB | |
| Asus TUF Gaming F15 FX507ZM | |
| Schenker XMG Core 15 (M22) | |
| Média AMD Ryzen 7 6800H (26496 - 30360, n=8) | |
| Schenker XMG Core 15 Ampere | |
| Schenker XMG Fusion 15 (Mid 22) | |
| Alienware m15 R5 Ryzen Edition | |
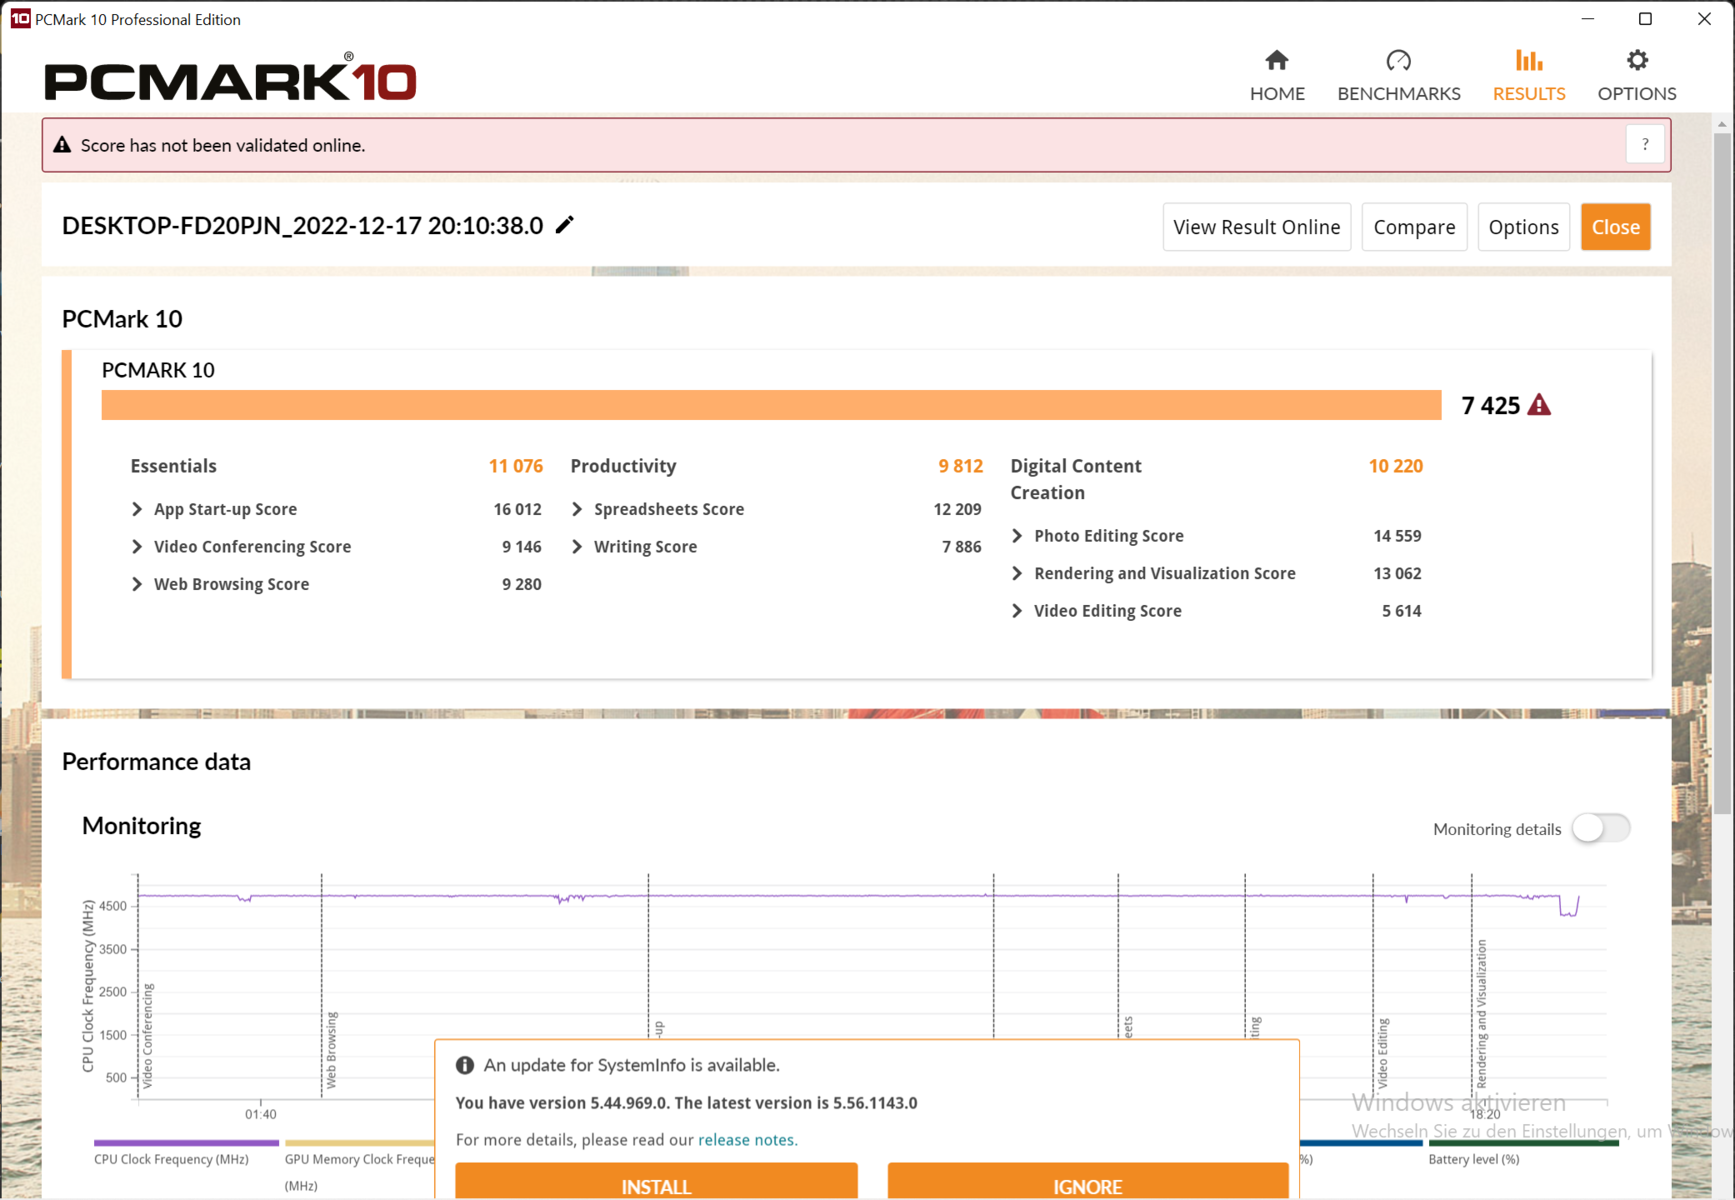
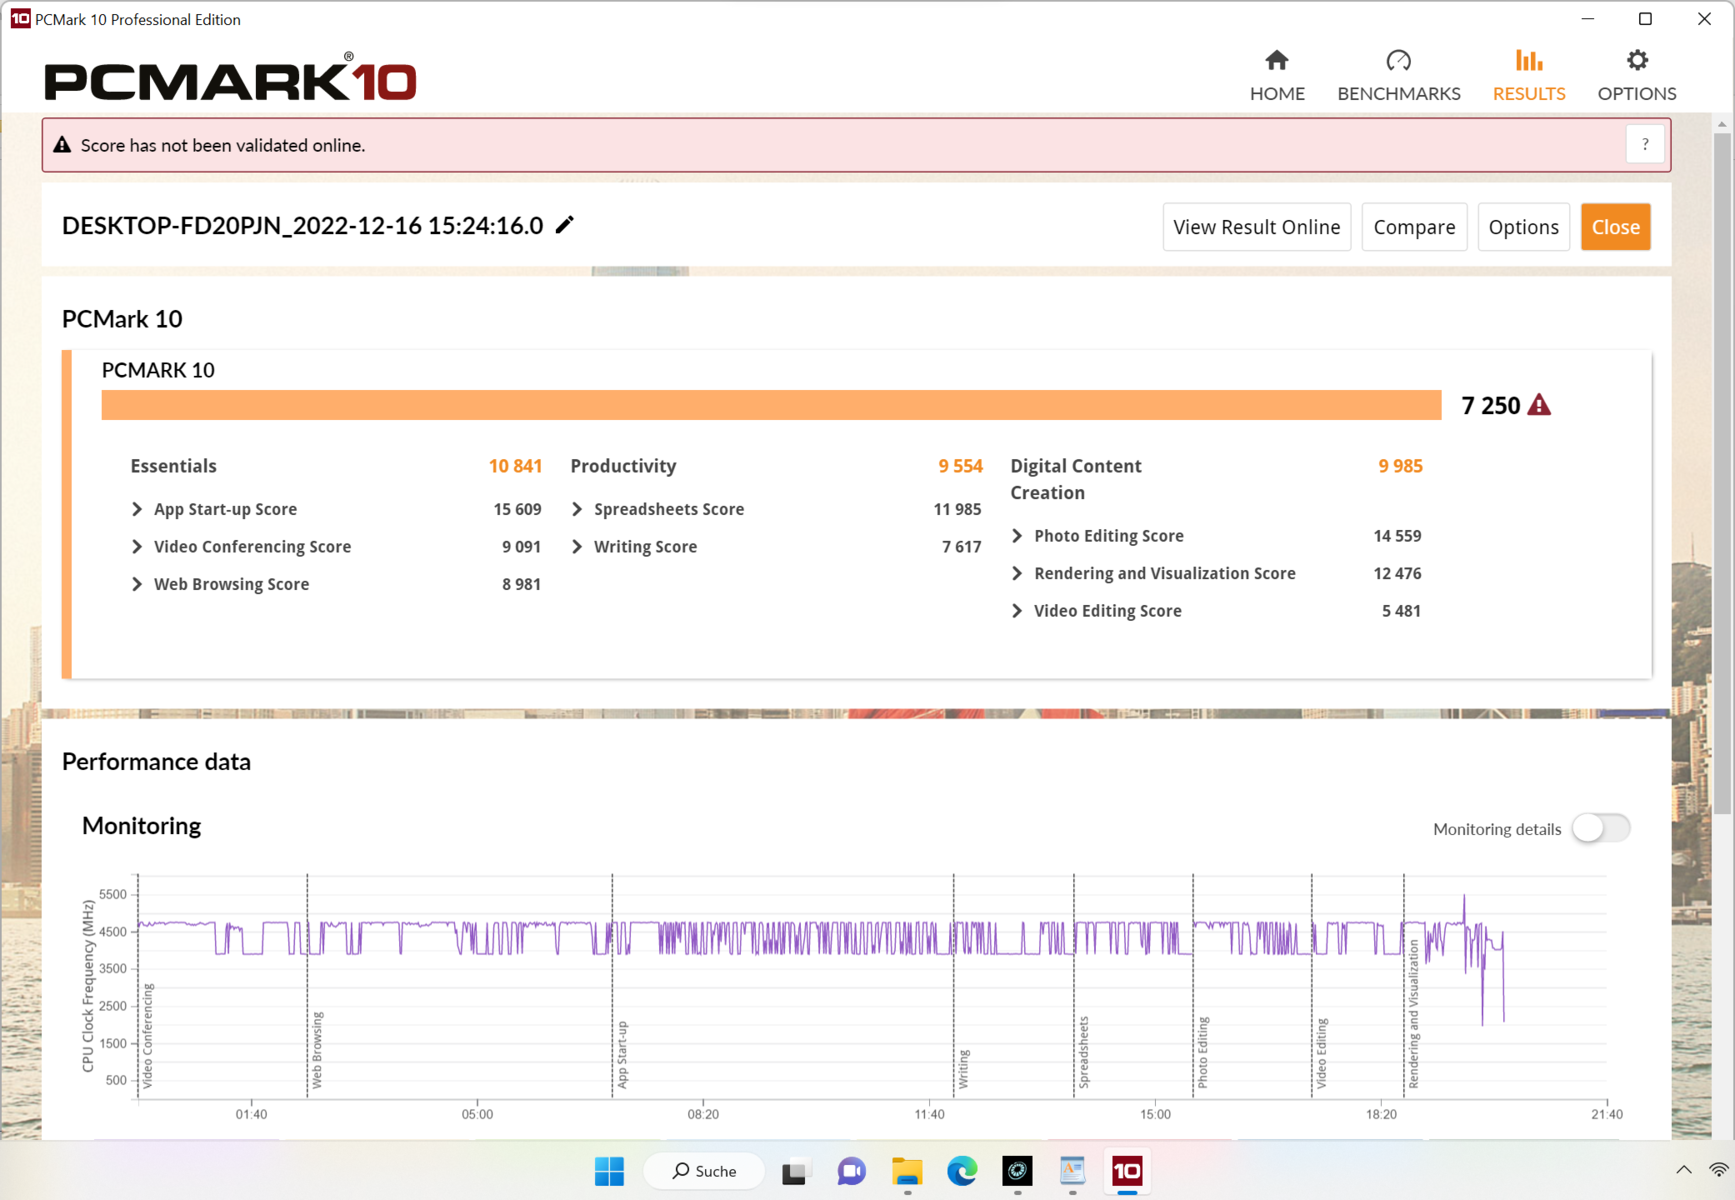
Desempenho do sistema
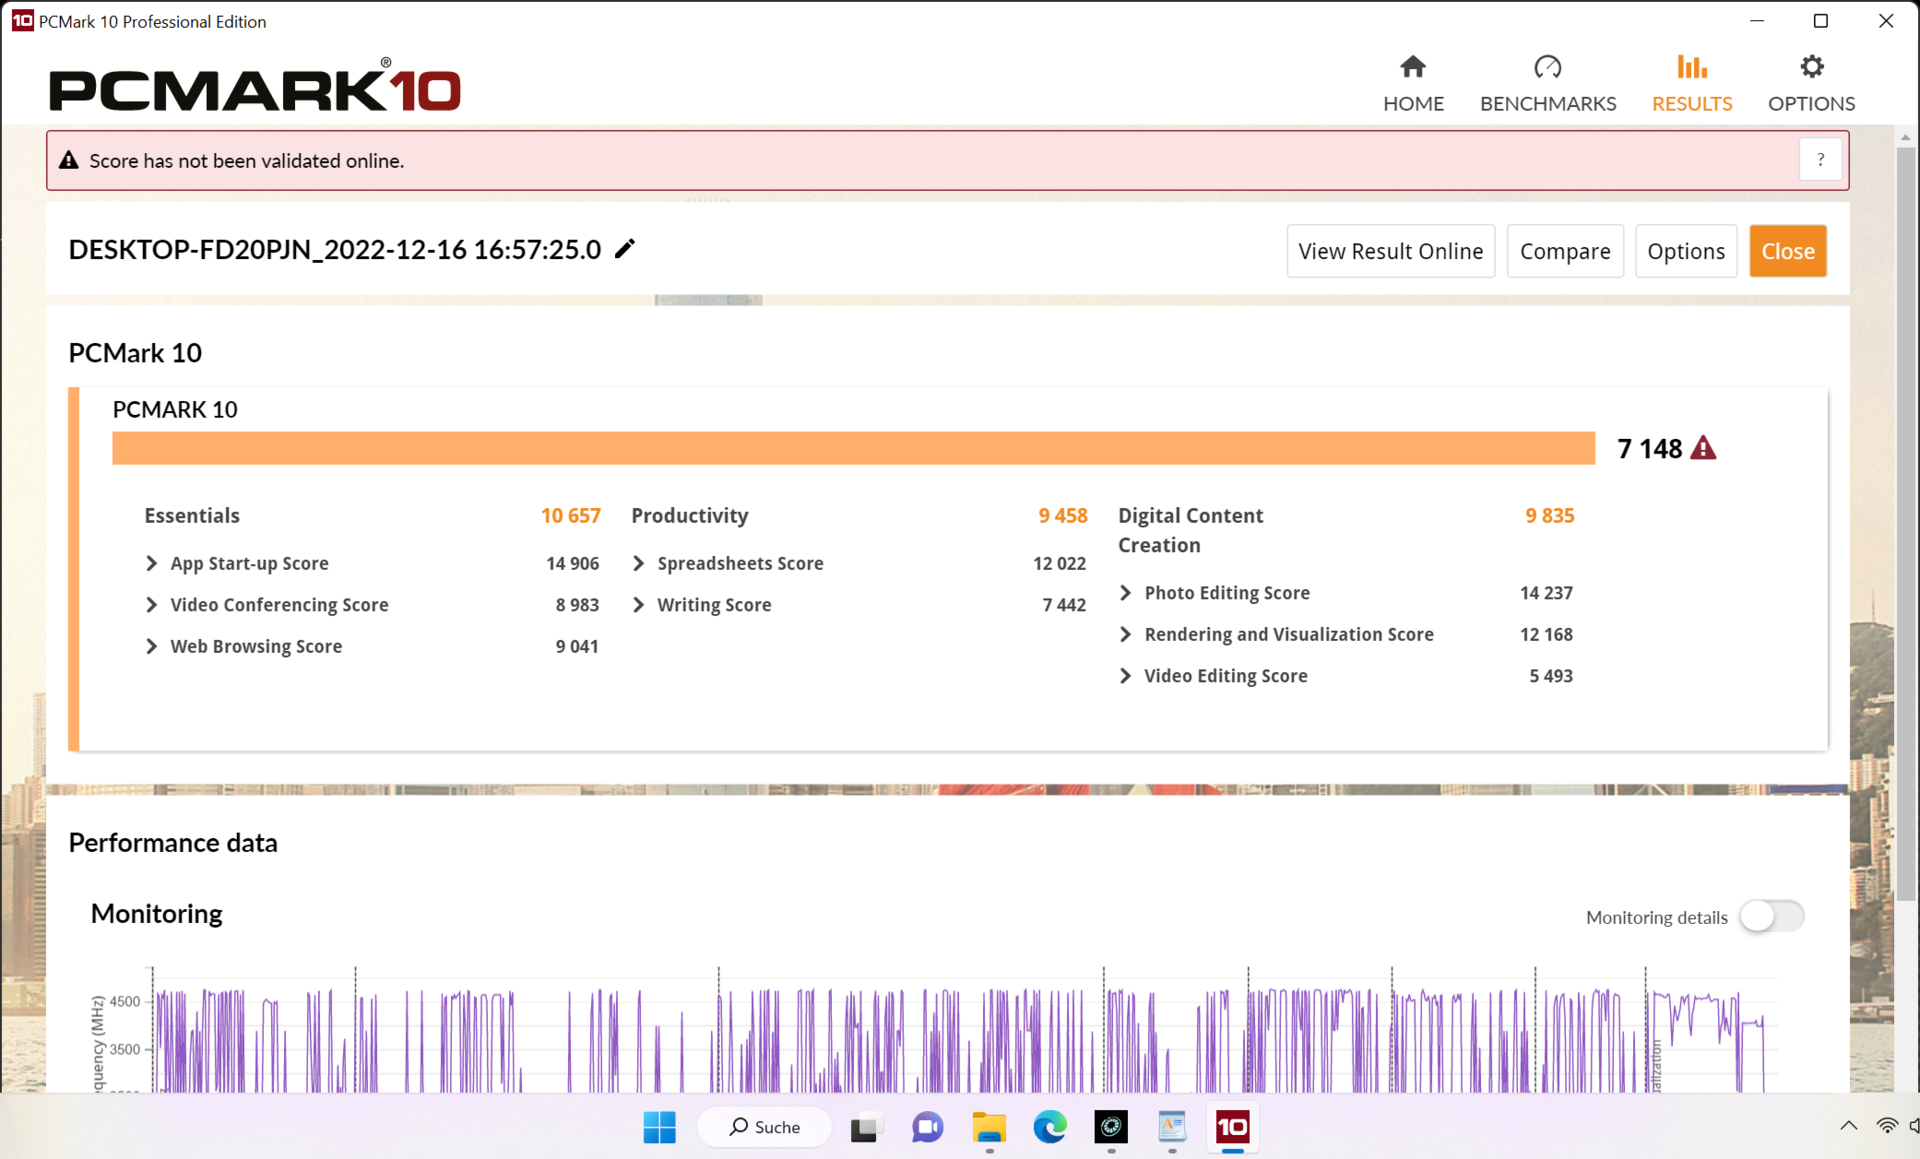
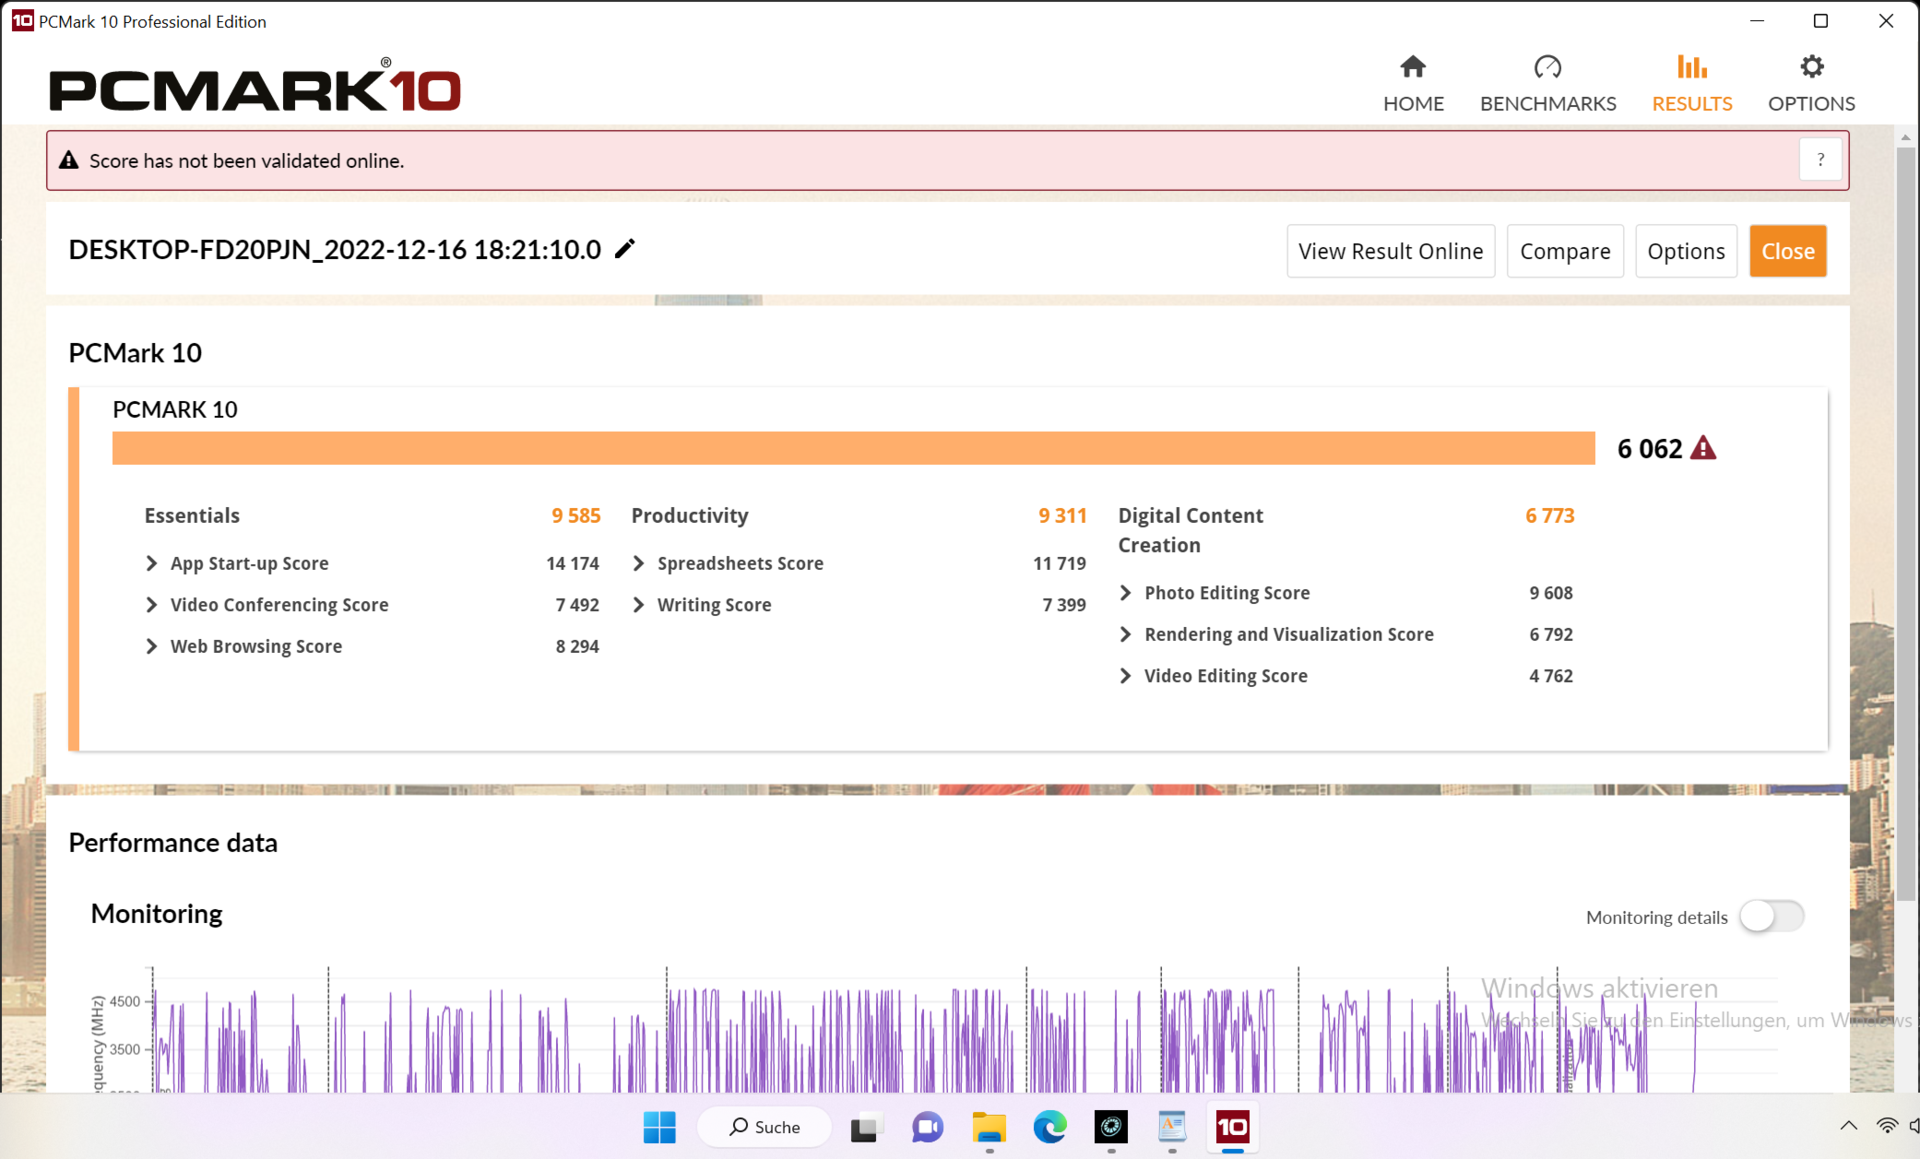
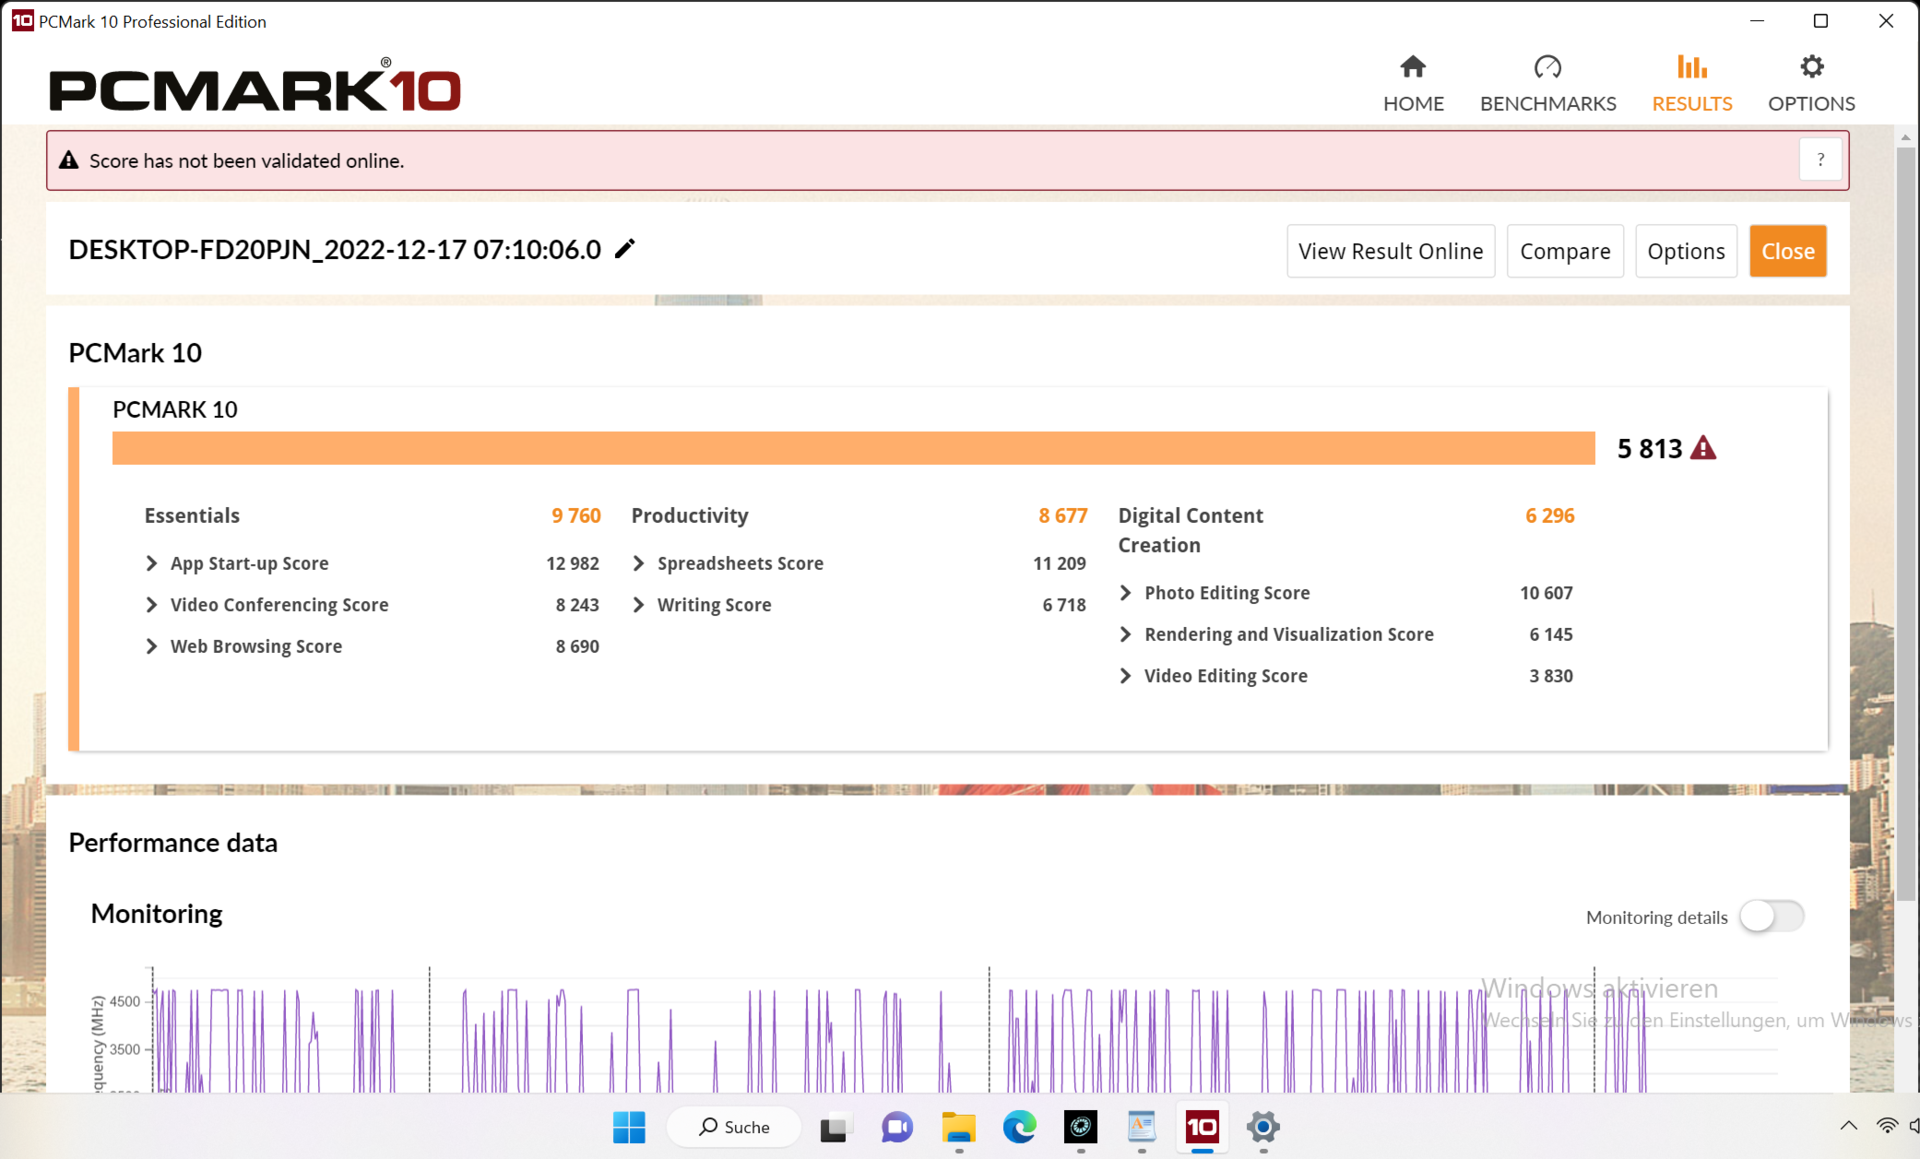
O benchmark PCMark 10 revela um resultado no nível esperado para a configuração do sistema. As tarefas diárias são processadas de forma rápida e sem atrasos.
A navegação na Web é um pouco mais rápida nos sistemas Intel devido ao desempenho mais forte do Turbo e do núcleo único - mas a diferença é quase imperceptível na prática.
CrossMark: Overall | Productivity | Creativity | Responsiveness
Mozilla Kraken 1.1: Total
Speedometer 2.0: Result 2.0
Octane V2: Total Score
Jetstream 2: 2.0 Total
WebXPRT 3: Overall
WebXPRT 4: Overall
| PCMark 10 / Score | |
| Média da turma Gaming (5828 - 12414, n=93, últimos 2 anos) | |
| Lenovo Legion 5 15IAH7H 82RB | |
| Asus TUF Gaming F15 FX507ZM | |
| Schenker XMG Core 15 (M22) | |
| Média AMD Ryzen 7 6800H, NVIDIA GeForce RTX 3060 Laptop GPU (n=1) | |
| Alienware m15 R5 Ryzen Edition | |
| Schenker XMG Fusion 15 (Mid 22) | |
| Schenker XMG Core 15 Ampere | |
| PCMark 10 / Essentials | |
| Lenovo Legion 5 15IAH7H 82RB | |
| Schenker XMG Core 15 (M22) | |
| Média AMD Ryzen 7 6800H, NVIDIA GeForce RTX 3060 Laptop GPU (n=1) | |
| Média da turma Gaming (8810 - 11935, n=97, últimos 2 anos) | |
| Asus TUF Gaming F15 FX507ZM | |
| Alienware m15 R5 Ryzen Edition | |
| Schenker XMG Fusion 15 (Mid 22) | |
| Schenker XMG Core 15 Ampere | |
| PCMark 10 / Productivity | |
| Média da turma Gaming (6845 - 25323, n=95, últimos 2 anos) | |
| Lenovo Legion 5 15IAH7H 82RB | |
| Schenker XMG Core 15 (M22) | |
| Média AMD Ryzen 7 6800H, NVIDIA GeForce RTX 3060 Laptop GPU (n=1) | |
| Asus TUF Gaming F15 FX507ZM | |
| Alienware m15 R5 Ryzen Edition | |
| Schenker XMG Fusion 15 (Mid 22) | |
| Schenker XMG Core 15 Ampere | |
| PCMark 10 / Digital Content Creation | |
| Média da turma Gaming (7602 - 19954, n=95, últimos 2 anos) | |
| Lenovo Legion 5 15IAH7H 82RB | |
| Asus TUF Gaming F15 FX507ZM | |
| Schenker XMG Core 15 (M22) | |
| Média AMD Ryzen 7 6800H, NVIDIA GeForce RTX 3060 Laptop GPU (n=1) | |
| Alienware m15 R5 Ryzen Edition | |
| Schenker XMG Core 15 Ampere | |
| Schenker XMG Fusion 15 (Mid 22) | |
| CrossMark / Overall | |
| Lenovo Legion 5 15IAH7H 82RB | |
| Média da turma Gaming (1366 - 2409, n=94, últimos 2 anos) | |
| Schenker XMG Fusion 15 (Mid 22) | |
| Schenker XMG Core 15 (M22) | |
| Média AMD Ryzen 7 6800H, NVIDIA GeForce RTX 3060 Laptop GPU (n=1) | |
| CrossMark / Productivity | |
| Lenovo Legion 5 15IAH7H 82RB | |
| Média da turma Gaming (1386 - 2254, n=94, últimos 2 anos) | |
| Schenker XMG Fusion 15 (Mid 22) | |
| Schenker XMG Core 15 (M22) | |
| Média AMD Ryzen 7 6800H, NVIDIA GeForce RTX 3060 Laptop GPU (n=1) | |
| CrossMark / Creativity | |
| Média da turma Gaming (1343 - 2786, n=94, últimos 2 anos) | |
| Lenovo Legion 5 15IAH7H 82RB | |
| Schenker XMG Core 15 (M22) | |
| Média AMD Ryzen 7 6800H, NVIDIA GeForce RTX 3060 Laptop GPU (n=1) | |
| Schenker XMG Fusion 15 (Mid 22) | |
| CrossMark / Responsiveness | |
| Lenovo Legion 5 15IAH7H 82RB | |
| Média da turma Gaming (1226 - 2334, n=94, últimos 2 anos) | |
| Schenker XMG Fusion 15 (Mid 22) | |
| Schenker XMG Core 15 (M22) | |
| Média AMD Ryzen 7 6800H, NVIDIA GeForce RTX 3060 Laptop GPU (n=1) | |
| Mozilla Kraken 1.1 / Total | |
| Schenker XMG Core 15 Ampere | |
| Schenker XMG Fusion 15 (Mid 22) | |
| Alienware m15 R5 Ryzen Edition | |
| Schenker XMG Core 15 (M22) | |
| Média AMD Ryzen 7 6800H, NVIDIA GeForce RTX 3060 Laptop GPU (n=1) | |
| Asus TUF Gaming F15 FX507ZM | |
| Lenovo Legion 5 15IAH7H 82RB | |
| Média da turma Gaming (391 - 590, n=100, últimos 2 anos) | |
| Speedometer 2.0 / Result 2.0 | |
| Média da turma Gaming (29 - 736, n=27, últimos 2 anos) | |
| Schenker XMG Core 15 (M22) | |
| Média AMD Ryzen 7 6800H, NVIDIA GeForce RTX 3060 Laptop GPU (n=1) | |
| Alienware m15 R5 Ryzen Edition | |
| Octane V2 / Total Score | |
| Média da turma Gaming (93292 - 139447, n=27, últimos 2 anos) | |
| Schenker XMG Core 15 (M22) | |
| Média AMD Ryzen 7 6800H, NVIDIA GeForce RTX 3060 Laptop GPU (n=1) | |
| Alienware m15 R5 Ryzen Edition | |
| Jetstream 2 / 2.0 Total | |
| Média da turma Gaming (334 - 516, n=27, últimos 2 anos) | |
| Lenovo Legion 5 15IAH7H 82RB | |
| Asus TUF Gaming F15 FX507ZM | |
| Schenker XMG Core 15 (M22) | |
| Média AMD Ryzen 7 6800H, NVIDIA GeForce RTX 3060 Laptop GPU (n=1) | |
| Alienware m15 R5 Ryzen Edition | |
| WebXPRT 3 / Overall | |
| Lenovo Legion 5 15IAH7H 82RB | |
| Média da turma Gaming (220 - 532, n=98, últimos 2 anos) | |
| Asus TUF Gaming F15 FX507ZM | |
| Schenker XMG Core 15 (M22) | |
| Média AMD Ryzen 7 6800H, NVIDIA GeForce RTX 3060 Laptop GPU (n=1) | |
| Alienware m15 R5 Ryzen Edition | |
| Schenker XMG Fusion 15 (Mid 22) | |
| Schenker XMG Core 15 Ampere | |
| WebXPRT 4 / Overall | |
| Média da turma Gaming (165 - 354, n=98, últimos 2 anos) | |
| Lenovo Legion 5 15IAH7H 82RB | |
| Schenker XMG Core 15 (M22) | |
| Média AMD Ryzen 7 6800H, NVIDIA GeForce RTX 3060 Laptop GPU (n=1) | |
| Schenker XMG Fusion 15 (Mid 22) | |
* ... menor é melhor
| PCMark 10 Score | 7250 pontos | |
Ajuda | ||
| AIDA64 / Memory Copy | |
| Média da turma Gaming (21750 - 129946, n=105, últimos 2 anos) | |
| Asus TUF Gaming F15 FX507ZM | |
| Lenovo Legion 5 15IAH7H 82RB | |
| Schenker XMG Core 15 (M22) | |
| Média AMD Ryzen 7 6800H (48209 - 51186, n=8) | |
| Schenker XMG Fusion 15 (Mid 22) | |
| Schenker XMG Core 15 Ampere | |
| Alienware m15 R5 Ryzen Edition | |
| AIDA64 / Memory Read | |
| Média da turma Gaming (22956 - 118858, n=105, últimos 2 anos) | |
| Lenovo Legion 5 15IAH7H 82RB | |
| Asus TUF Gaming F15 FX507ZM | |
| Schenker XMG Core 15 (M22) | |
| Média AMD Ryzen 7 6800H (43828 - 51778, n=8) | |
| Schenker XMG Fusion 15 (Mid 22) | |
| Schenker XMG Core 15 Ampere | |
| Alienware m15 R5 Ryzen Edition | |
| AIDA64 / Memory Write | |
| Média da turma Gaming (22297 - 135096, n=105, últimos 2 anos) | |
| Lenovo Legion 5 15IAH7H 82RB | |
| Asus TUF Gaming F15 FX507ZM | |
| Schenker XMG Core 15 (M22) | |
| Média AMD Ryzen 7 6800H (51116 - 55307, n=8) | |
| Schenker XMG Fusion 15 (Mid 22) | |
| Schenker XMG Core 15 Ampere | |
| Alienware m15 R5 Ryzen Edition | |
| AIDA64 / Memory Latency | |
| Média da turma Gaming (75.3 - 259, n=105, últimos 2 anos) | |
| Lenovo Legion 5 15IAH7H 82RB | |
| Schenker XMG Fusion 15 (Mid 22) | |
| Média AMD Ryzen 7 6800H (83.1 - 104.1, n=8) | |
| Schenker XMG Core 15 (M22) | |
| Schenker XMG Core 15 Ampere | |
| Alienware m15 R5 Ryzen Edition | |
| Asus TUF Gaming F15 FX507ZM | |
* ... menor é melhor
Latências DPC
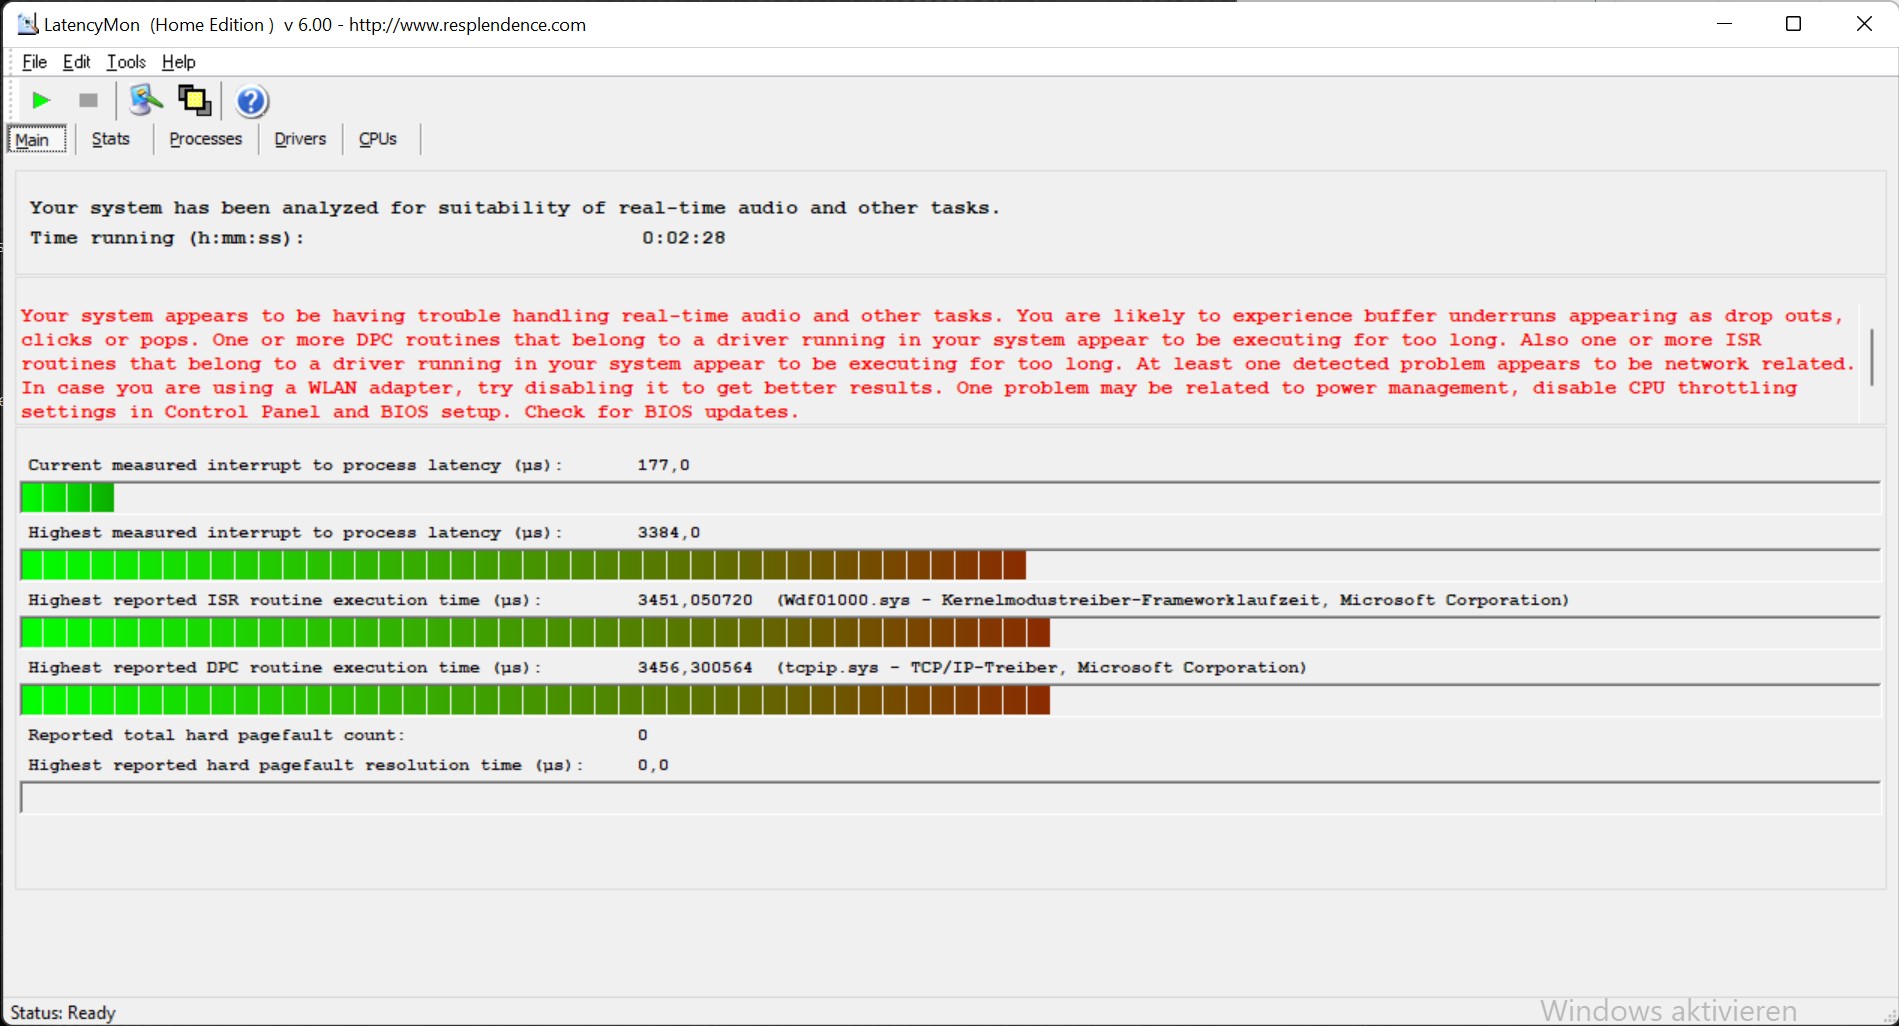
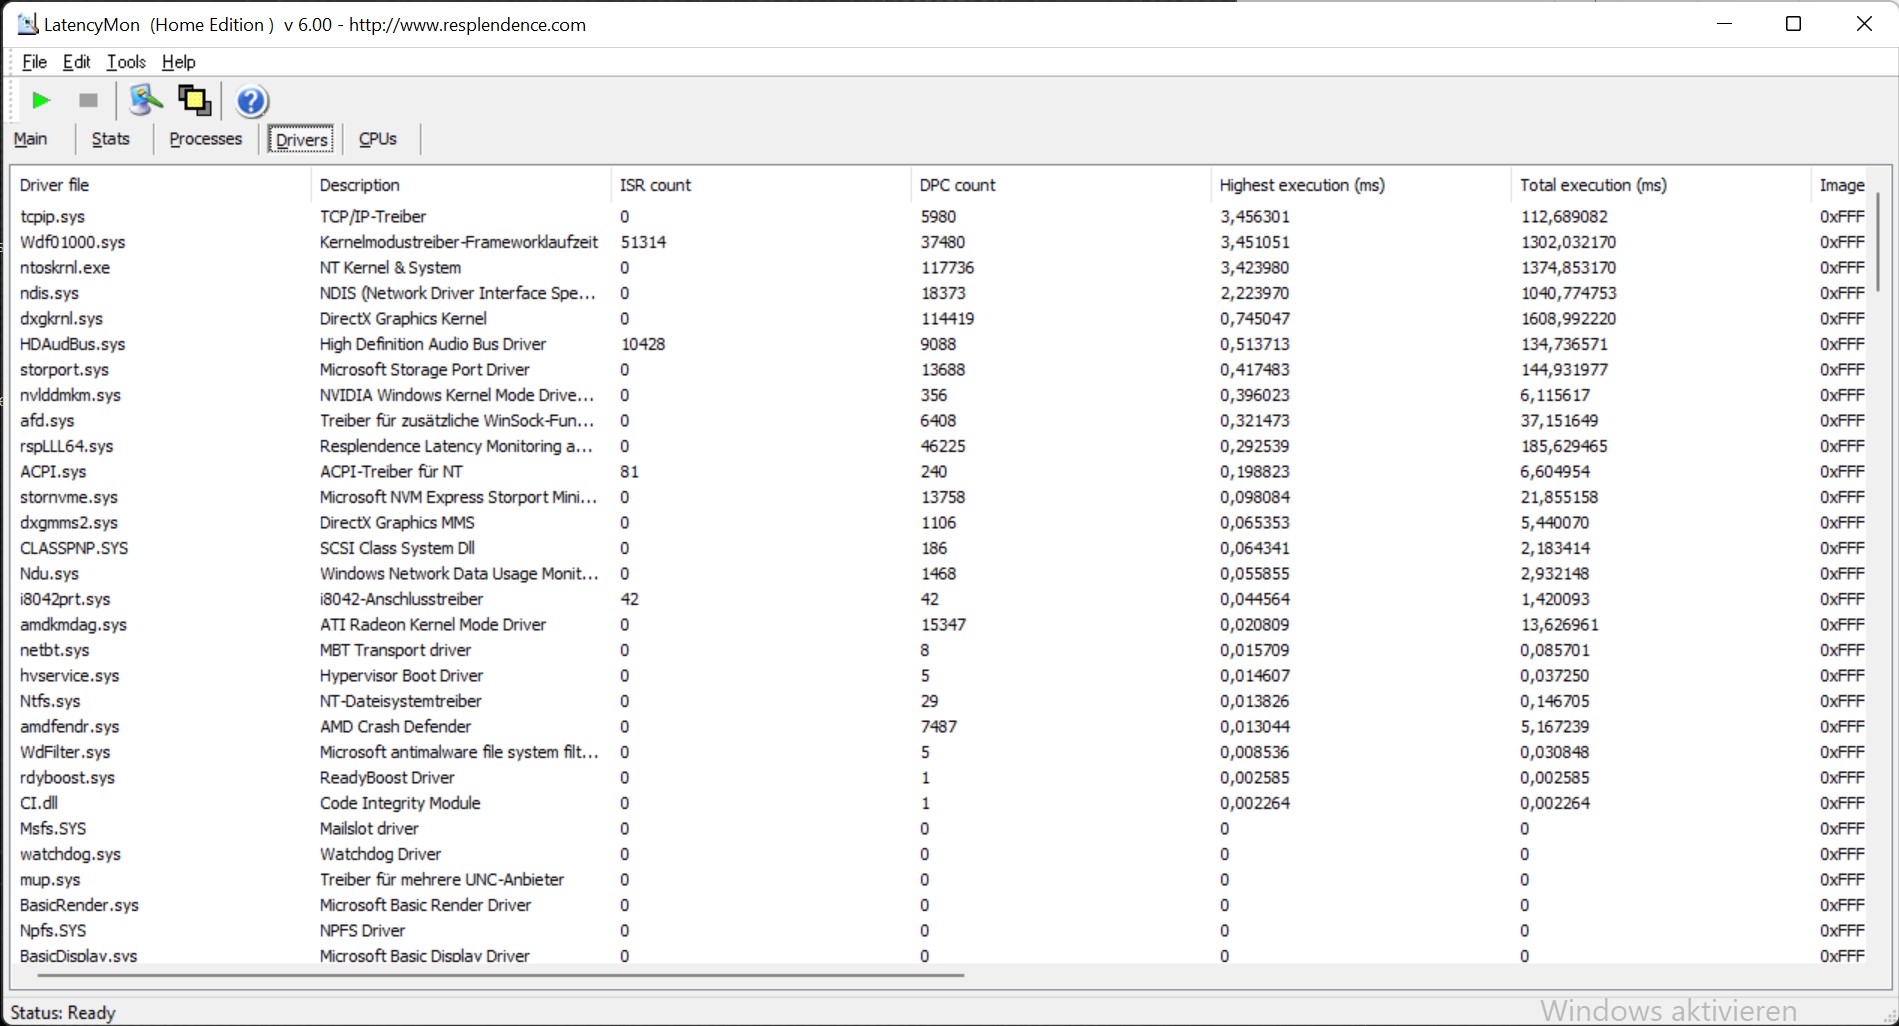
| DPC Latencies / LatencyMon - interrupt to process latency (max), Web, Youtube, Prime95 | |
| Schenker XMG Core 15 (M22) | |
| Schenker XMG Fusion 15 (Mid 22) | |
| Lenovo Legion 5 15IAH7H 82RB | |
| Asus TUF Gaming F15 FX507ZM | |
| Schenker XMG Core 15 Ampere | |
| Alienware m15 R5 Ryzen Edition | |
* ... menor é melhor
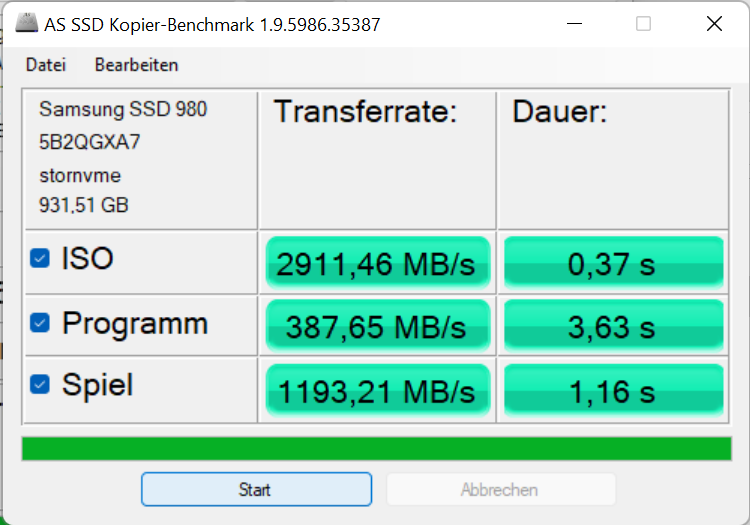
Armazenamento em massa
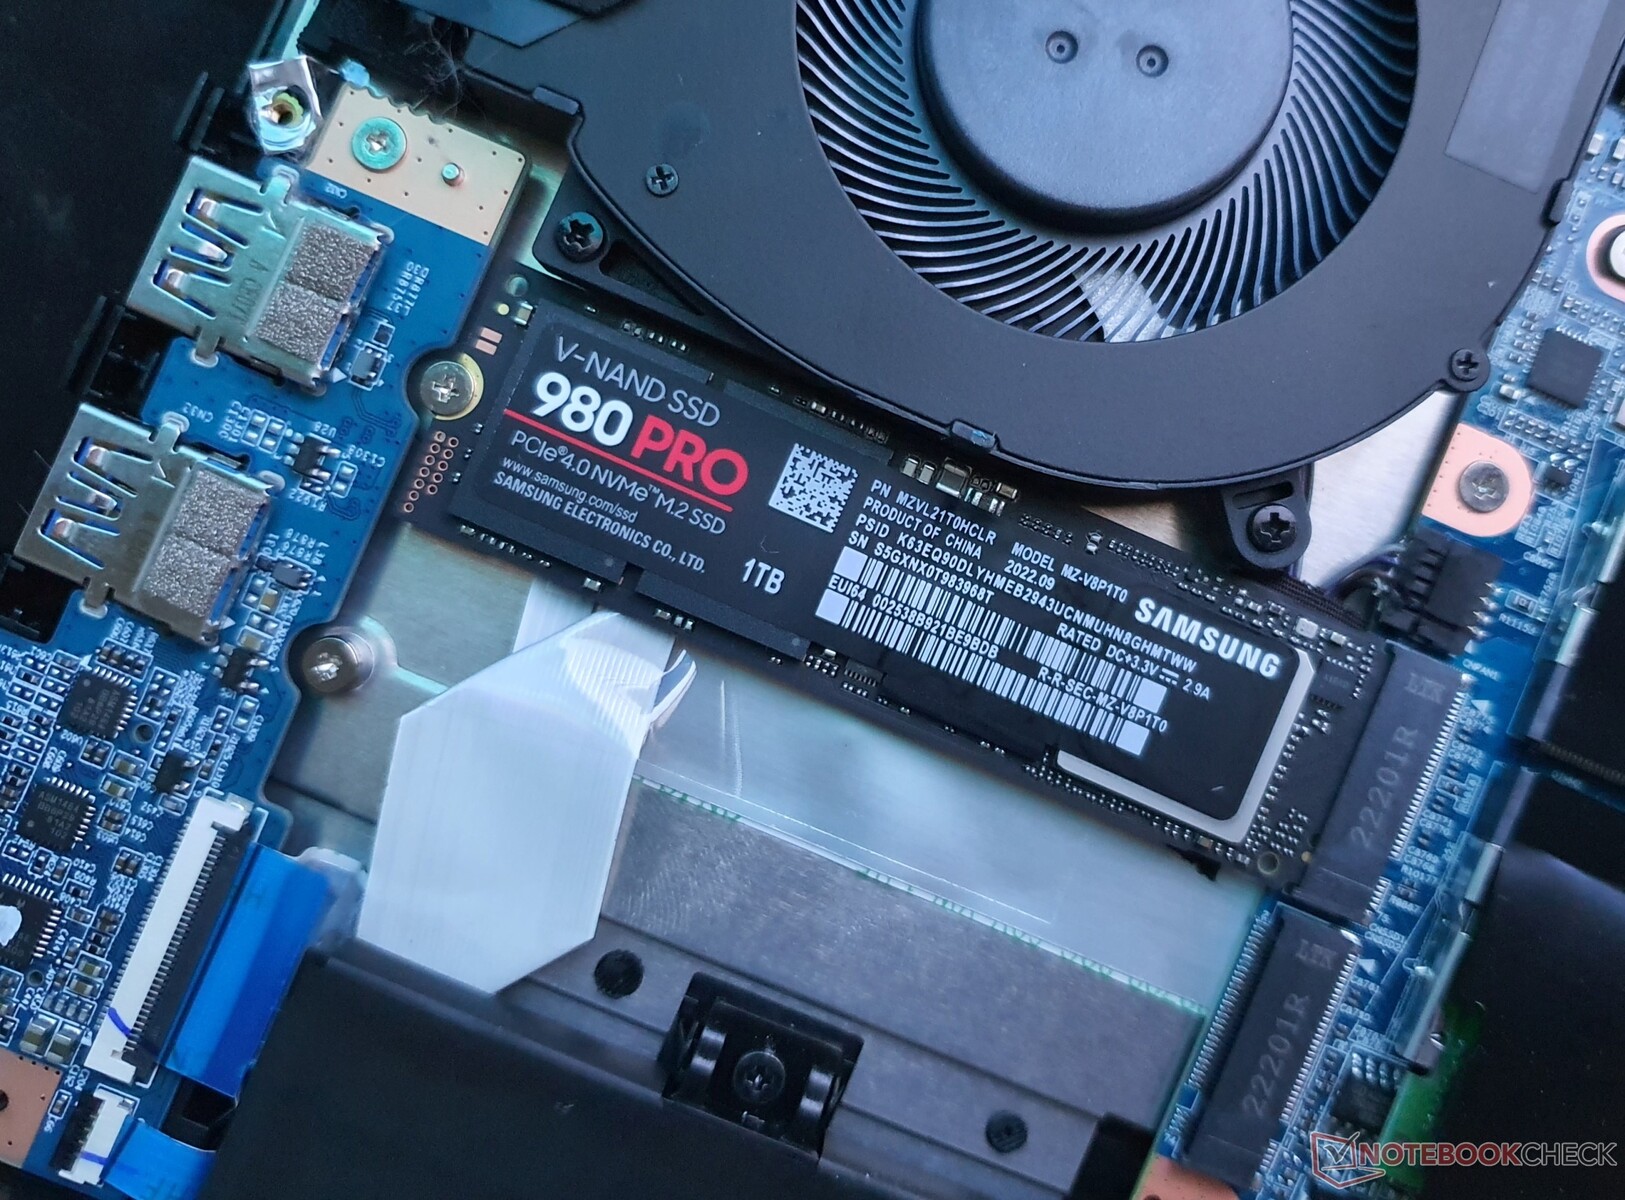
O Samsung 980 Pro 1 TB instalado atinge velocidades PCIe 4.0 mesmo sob carga permanente, mas luta com 32 a 64 processos simultâneos de leitura/gravação de 4K no laptop XMG, o que é relevante principalmente para servidores. O mesmo SSD é mais rápido no XMG Fusion 15, portanto, seu potencial não é totalmente explorado pelo Core 15.
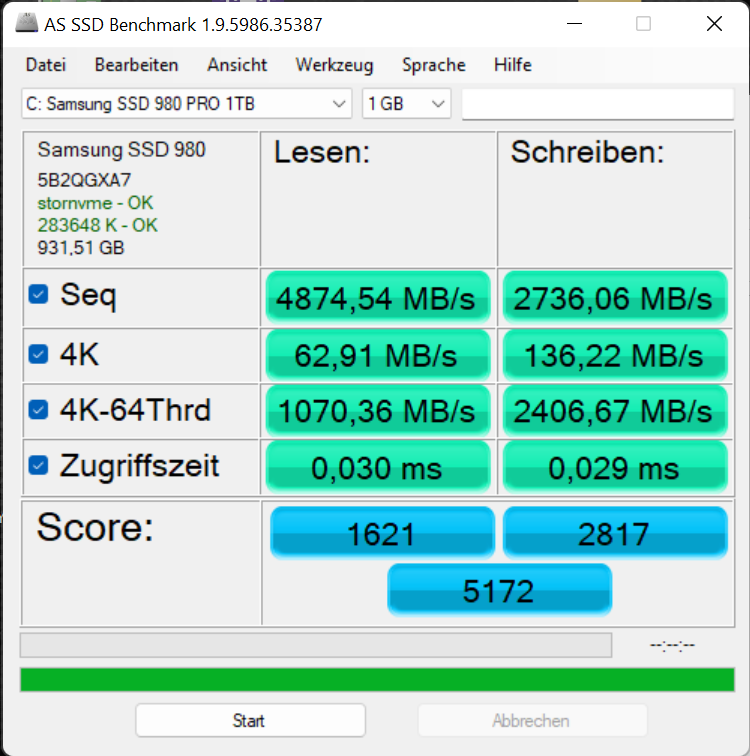
| Schenker XMG Core 15 (M22) Samsung SSD 980 Pro 1TB MZ-V8P1T0BW | Lenovo Legion 5 15IAH7H 82RB | Schenker XMG Fusion 15 (Mid 22) Samsung SSD 980 Pro 1TB MZ-V8P1T0BW | Asus TUF Gaming F15 FX507ZM SK Hynix HFM001TD3JX013N | Alienware m15 R5 Ryzen Edition Toshiba KBG40ZNS512G NVMe | Schenker XMG Core 15 Ampere Samsung SSD 970 EVO Plus 1TB | |
|---|---|---|---|---|---|---|
| AS SSD | 37% | 21% | 7% | -78% | 5% | |
| Seq Read (MB/s) | 4874 | 5844.9 20% | 5171.96 6% | 3013 -38% | 2082 -57% | 2829 -42% |
| Seq Write (MB/s) | 2711 | 2038.42 -25% | 3881.37 43% | 2768 2% | 825 -70% | 2646 -2% |
| 4K Read (MB/s) | 63 | 71.99 14% | 66.29 5% | 66.9 6% | 42.41 -33% | 54.8 -13% |
| 4K Write (MB/s) | 136 | 310.54 128% | 189.98 40% | 184.8 36% | 98.3 -28% | 179.1 32% |
| 4K-64 Read (MB/s) | 1070 | 2771.98 159% | 2539.3 137% | 1923 80% | 1255 17% | 1734 62% |
| 4K-64 Write (MB/s) | 2407 | 4007.67 67% | 3144.88 31% | 2198 -9% | 738 -69% | 2396 0% |
| Access Time Read * (ms) | 0.03 | 0.037 -23% | 0.07 -133% | 0.03 -0% | 0.109 -263% | 0.033 -10% |
| Access Time Write * (ms) | 0.029 | 0.053 -83% | 0.022 24% | 0.081 -179% | 0.17 -486% | 0.021 28% |
| Score Read (Points) | 1621 | 3428 111% | 3123 93% | 2291 41% | 1506 -7% | 2072 28% |
| Score Write (Points) | 2814 | 4522 61% | 3723 32% | 2660 -5% | 918 -67% | 2839 1% |
| Score Total (Points) | 5168 | 9510 84% | 8376 62% | 6117 18% | 3136 -39% | 5965 15% |
| Copy ISO MB/s (MB/s) | 2911 | 2320.82 -20% | 2364.44 -19% | 2143 -26% | 1391 -52% | 2119 -27% |
| Copy Program MB/s (MB/s) | 388 | 429.5 11% | 329.45 -15% | 871 124% | 645 66% | 406.1 5% |
| Copy Game MB/s (MB/s) | 1193 | 1290.19 8% | 1079.59 -10% | 1840 54% | 1101 -8% | 1086 -9% |
| DiskSpd | 135% | 174% | 80% | -24% | 84% | |
| seq read (MB/s) | 3429 | 5217 52% | 4199 22% | 2383 -31% | 1726 -50% | 2367 -31% |
| seq write (MB/s) | 3148 | 4897 56% | 4299 37% | 2894 -8% | 1520 -52% | 2601 -17% |
| seq q8 t1 read (MB/s) | 6850 | 7087 3% | 6847 0% | 3554 -48% | 2314 -66% | 3347 -51% |
| seq q8 t1 write (MB/s) | 4927 | 1498 -70% | 4999 1% | 2869 -42% | 1449 -71% | 3263 -34% |
| 4k q1 t1 read (MB/s) | 61.1 | 74.8 22% | 77.9 27% | 69.4 14% | 48.3 -21% | 52.3 -14% |
| 4k q1 t1 write (MB/s) | 132.2 | 369 179% | 239 81% | 211 60% | 121 -8% | 204 54% |
| 4k q32 t16 read (MB/s) | 1010 | 4443 340% | 4309 327% | 2217 120% | 1301 29% | 1853 83% |
| 4k q32 t16 write (MB/s) | 345 | 2050 494% | 3435 896% | 2314 571% | 497 44% | 2683 678% |
| Média Total (Programa/Configurações) | 86% /
72% | 98% /
77% | 44% /
34% | -51% /
-59% | 45% /
33% |
* ... menor é melhor
* ... menor é melhor
Continuous: DiskSpd Read Loop, Queue Depth 8
Placa gráfica
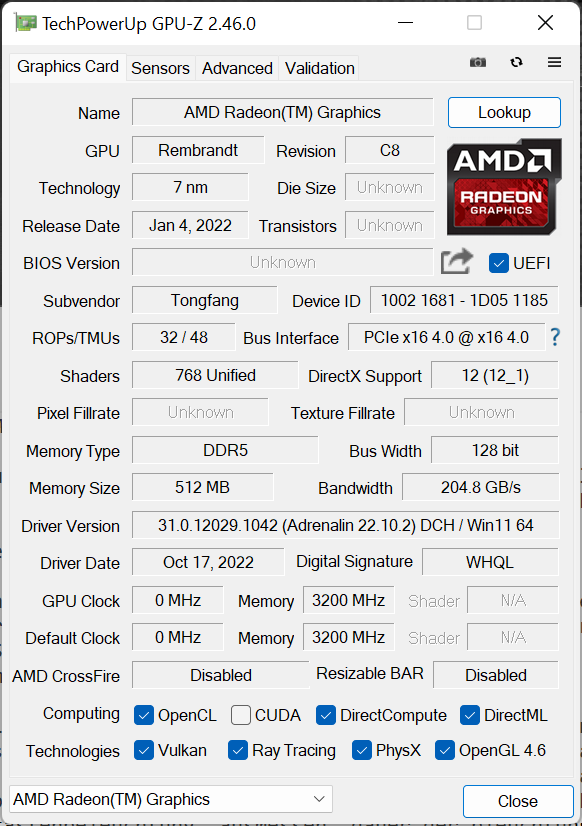
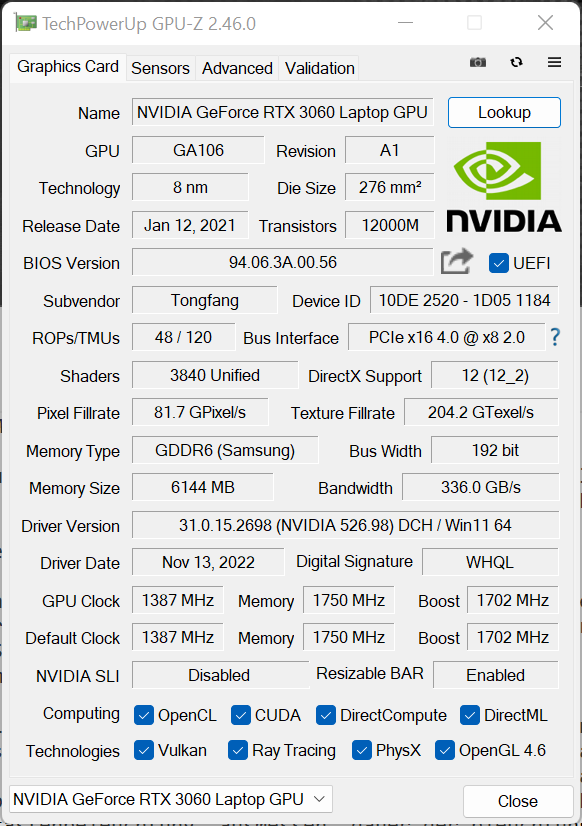
Além de um Radeon 680M integrado, o laptop para jogos tem naturalmente uma unidade gráfica dedicada - no caso do XMG Core 15, um GeForce RTX 3060 com TGP de 140-W
.Muitos jogos mais novos podem ser renderizados suavemente em resolução WQHD nativa, mas jogos muito exigentes em termos de desempenho provavelmente terão que ser desfrutados em FullHD ou em níveis mais baixos de detalhes.
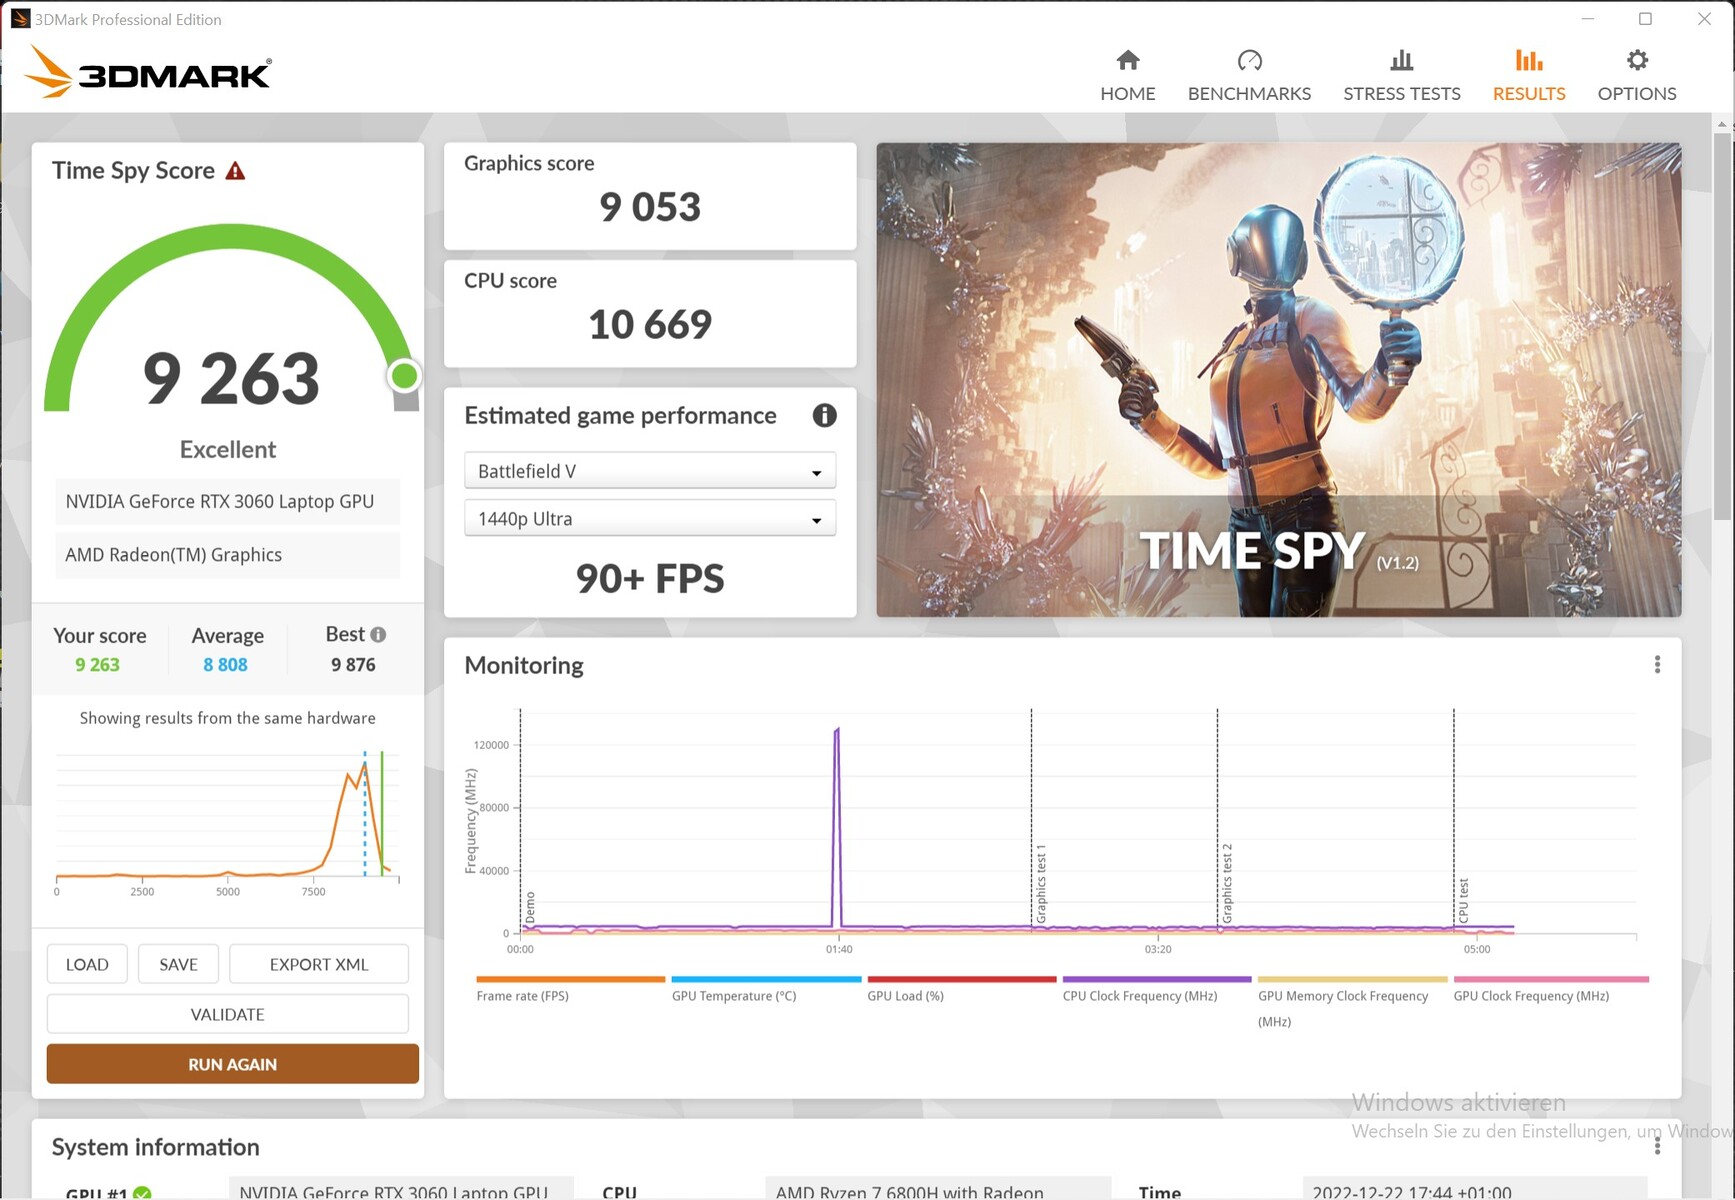
A função de overclock do Centro de Controle XMG pode aumentar o desempenho em 3-4%, dependendo da aplicação 3D, e a chave MUX (reinício necessário) adiciona ~5%. No entanto, o Core 15 tem que admitir a derrota contra outros jogadores RTX 3060, mesmo que a diferença não seja muito grande.
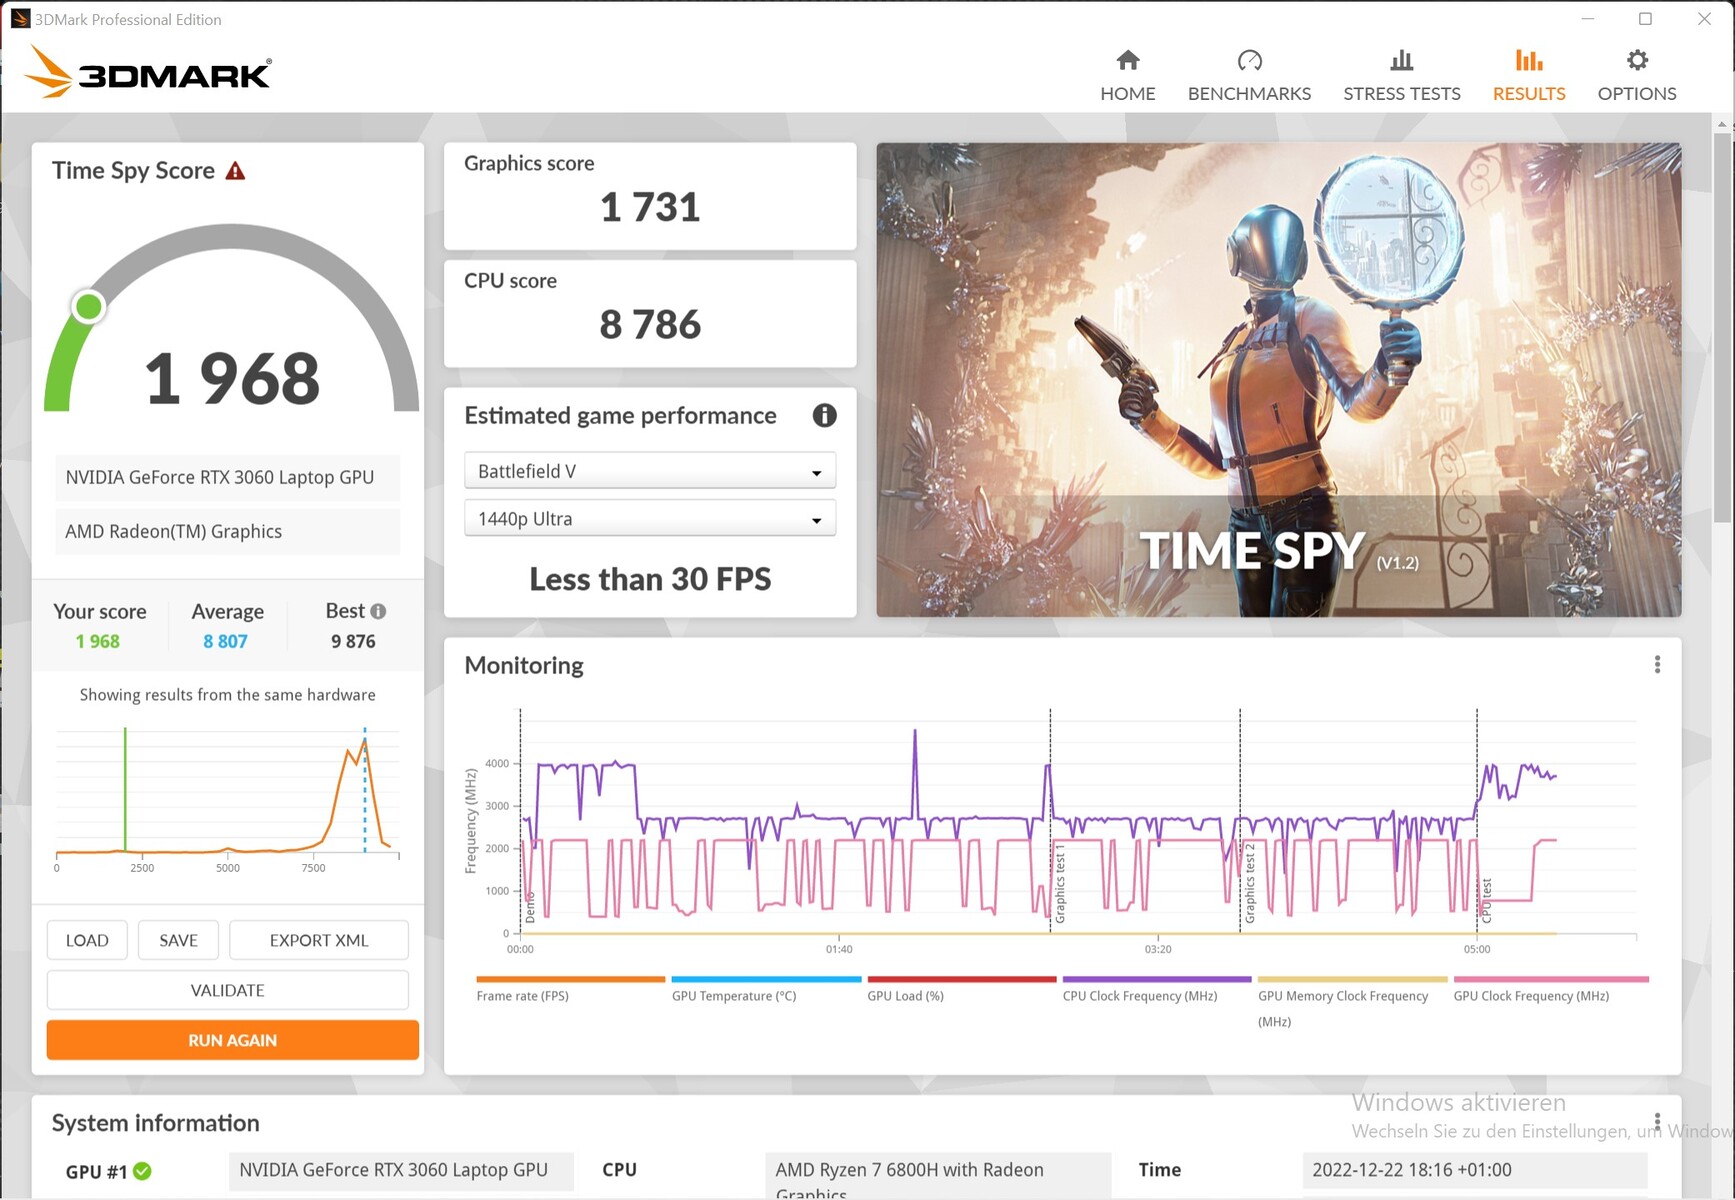
O desempenho gráfico cai significativamente com a energia da bateria, de modo que apenas 25% do desempenho original permanece. Isto é em parte devido à pequena bateria 62 Wh, que de outra forma descarregaria muito rapidamente.
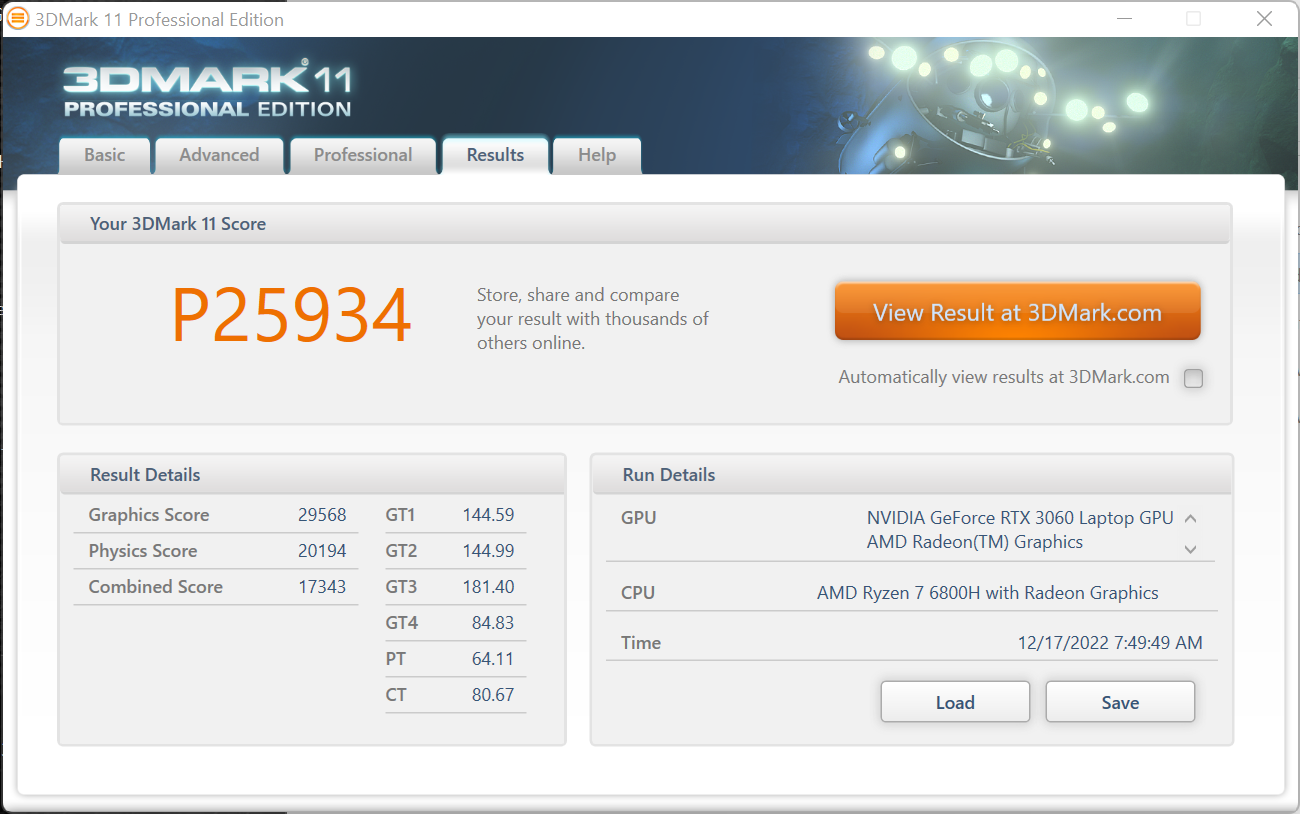
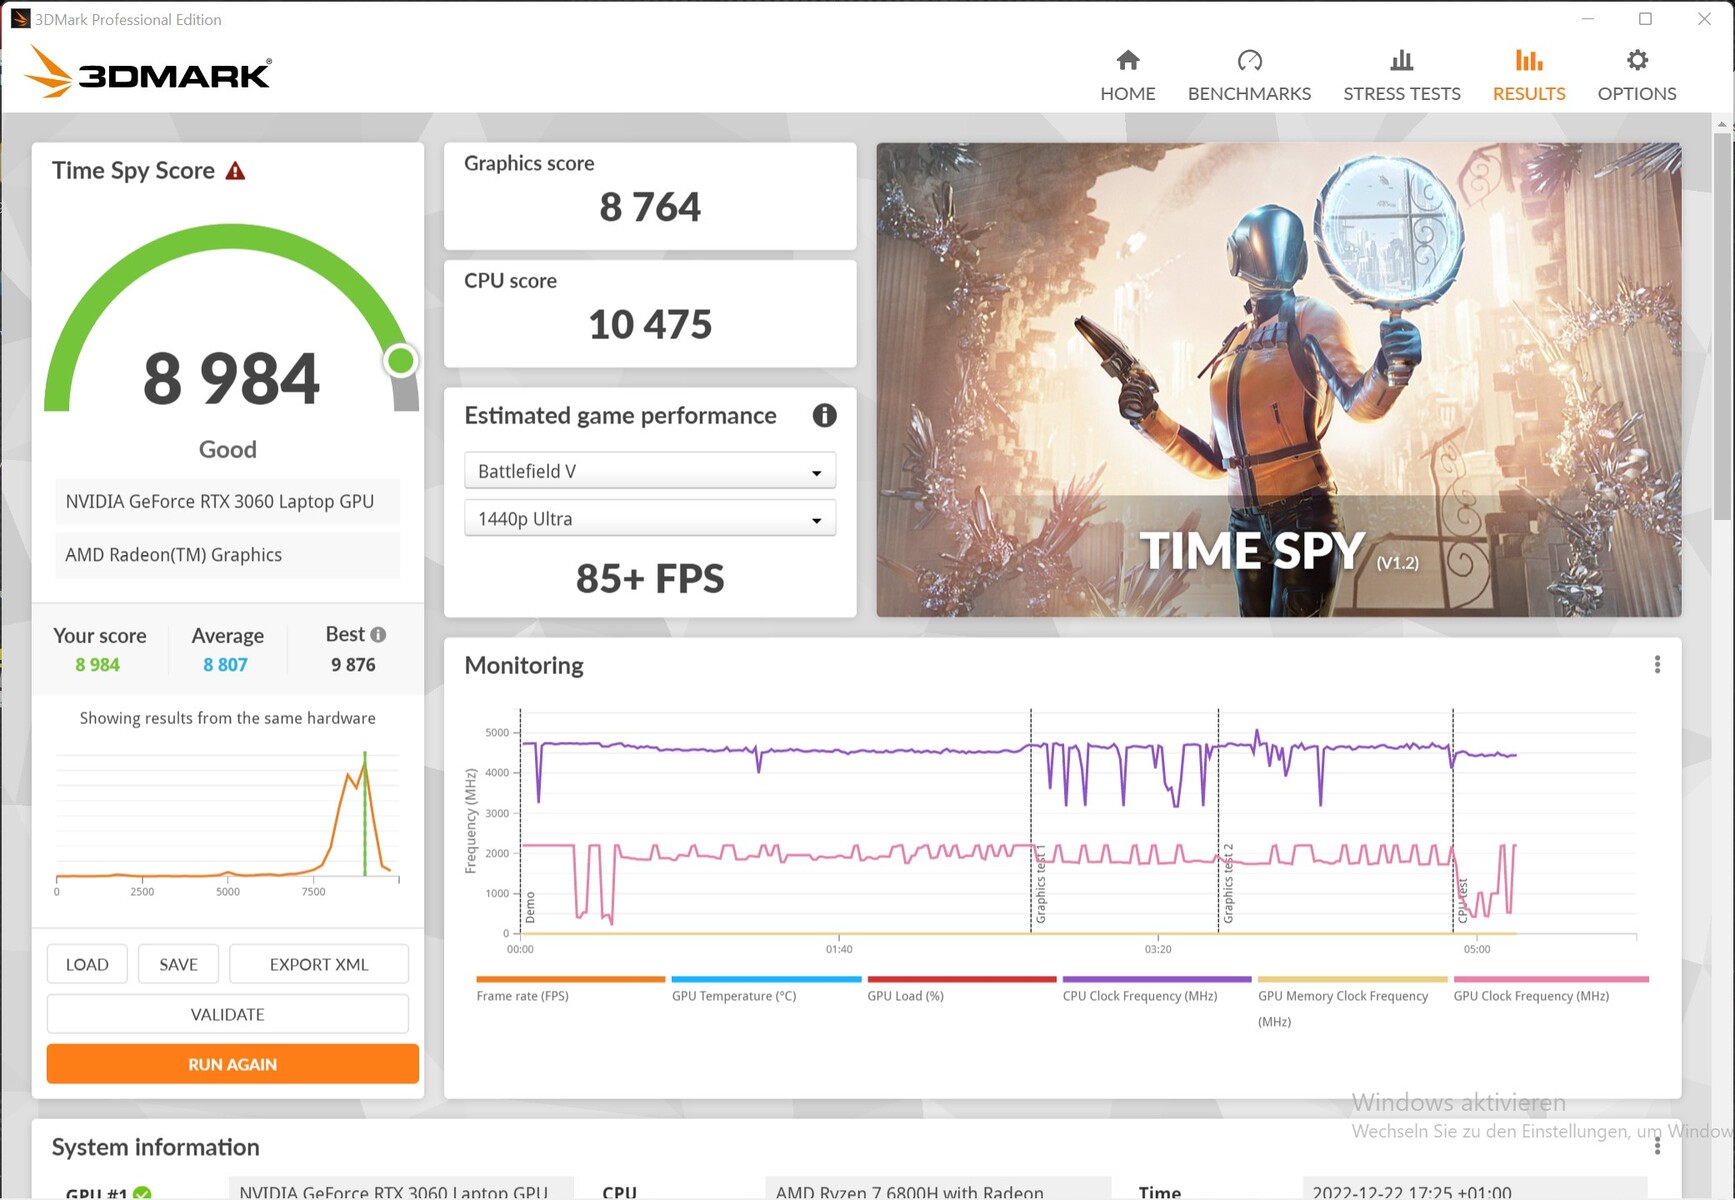
| 3DMark 11 Performance | 25934 pontos | |
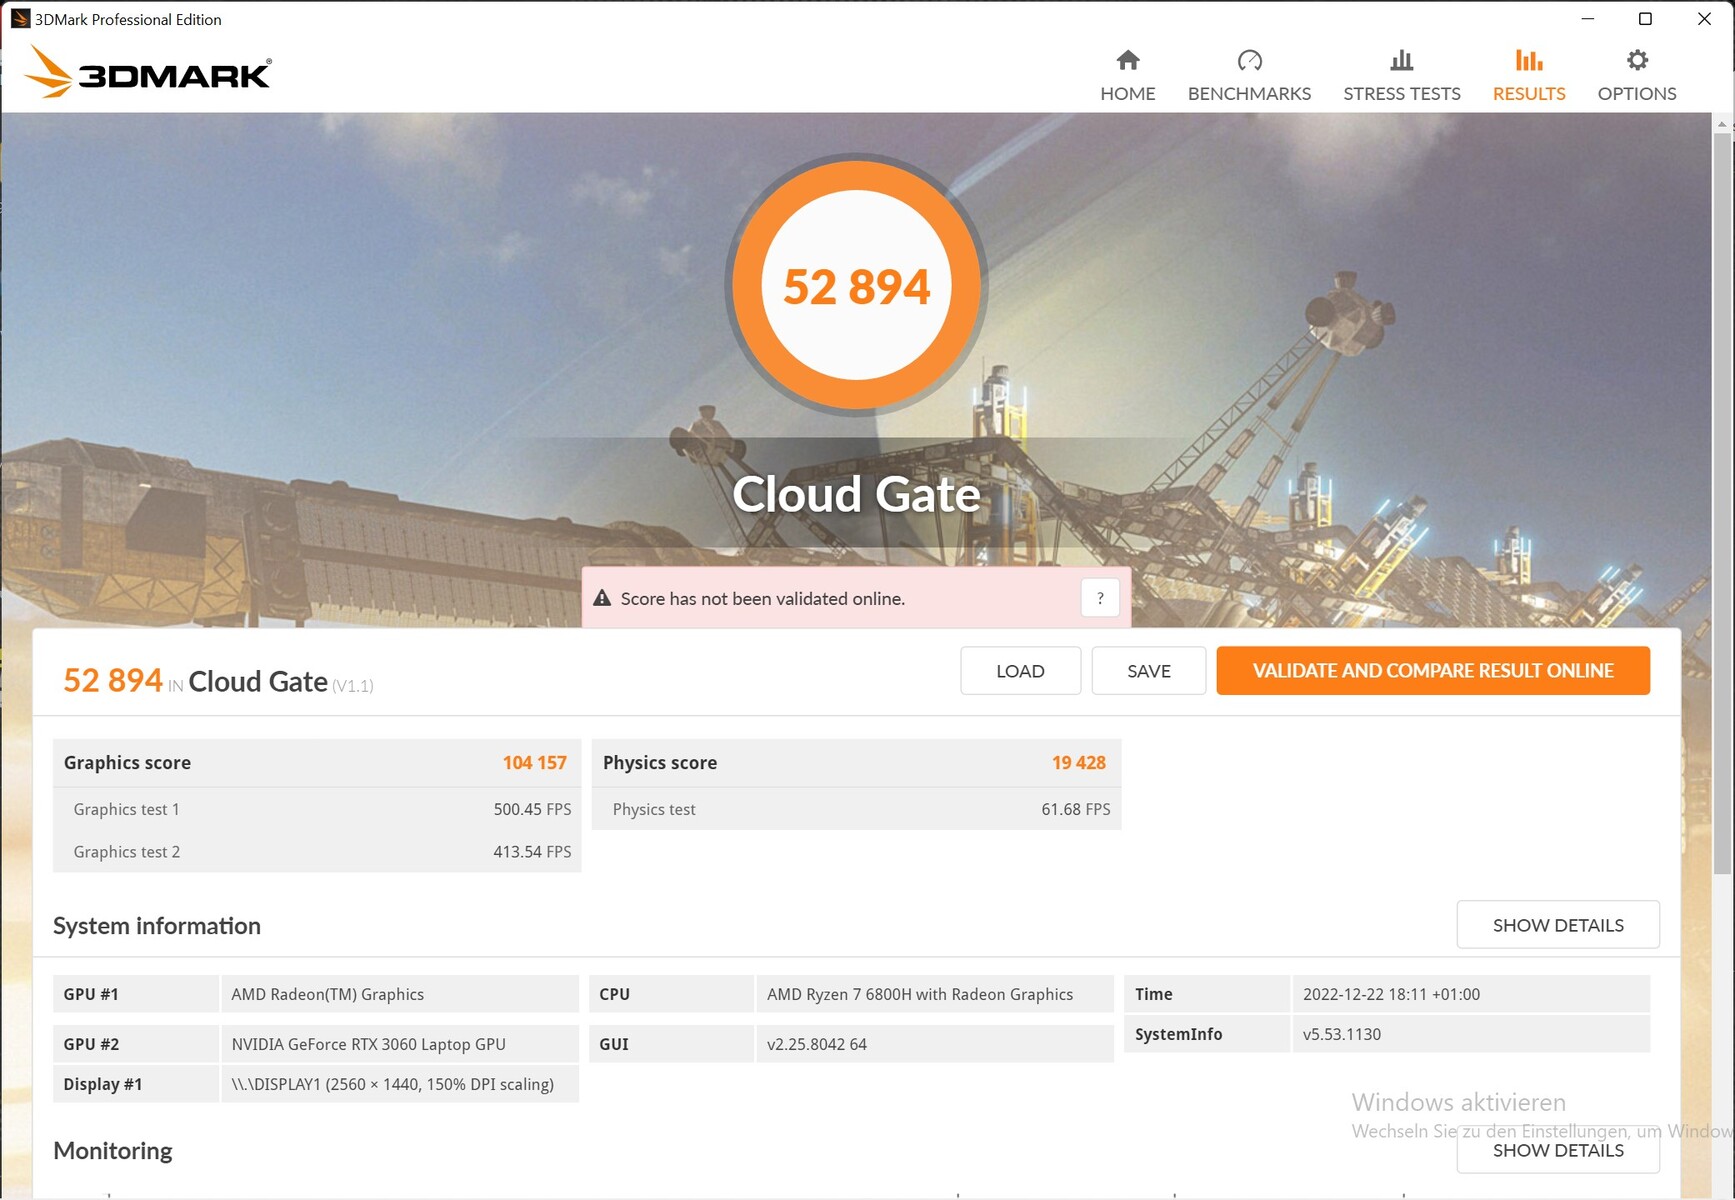
| 3DMark Cloud Gate Standard Score | 52894 pontos | |
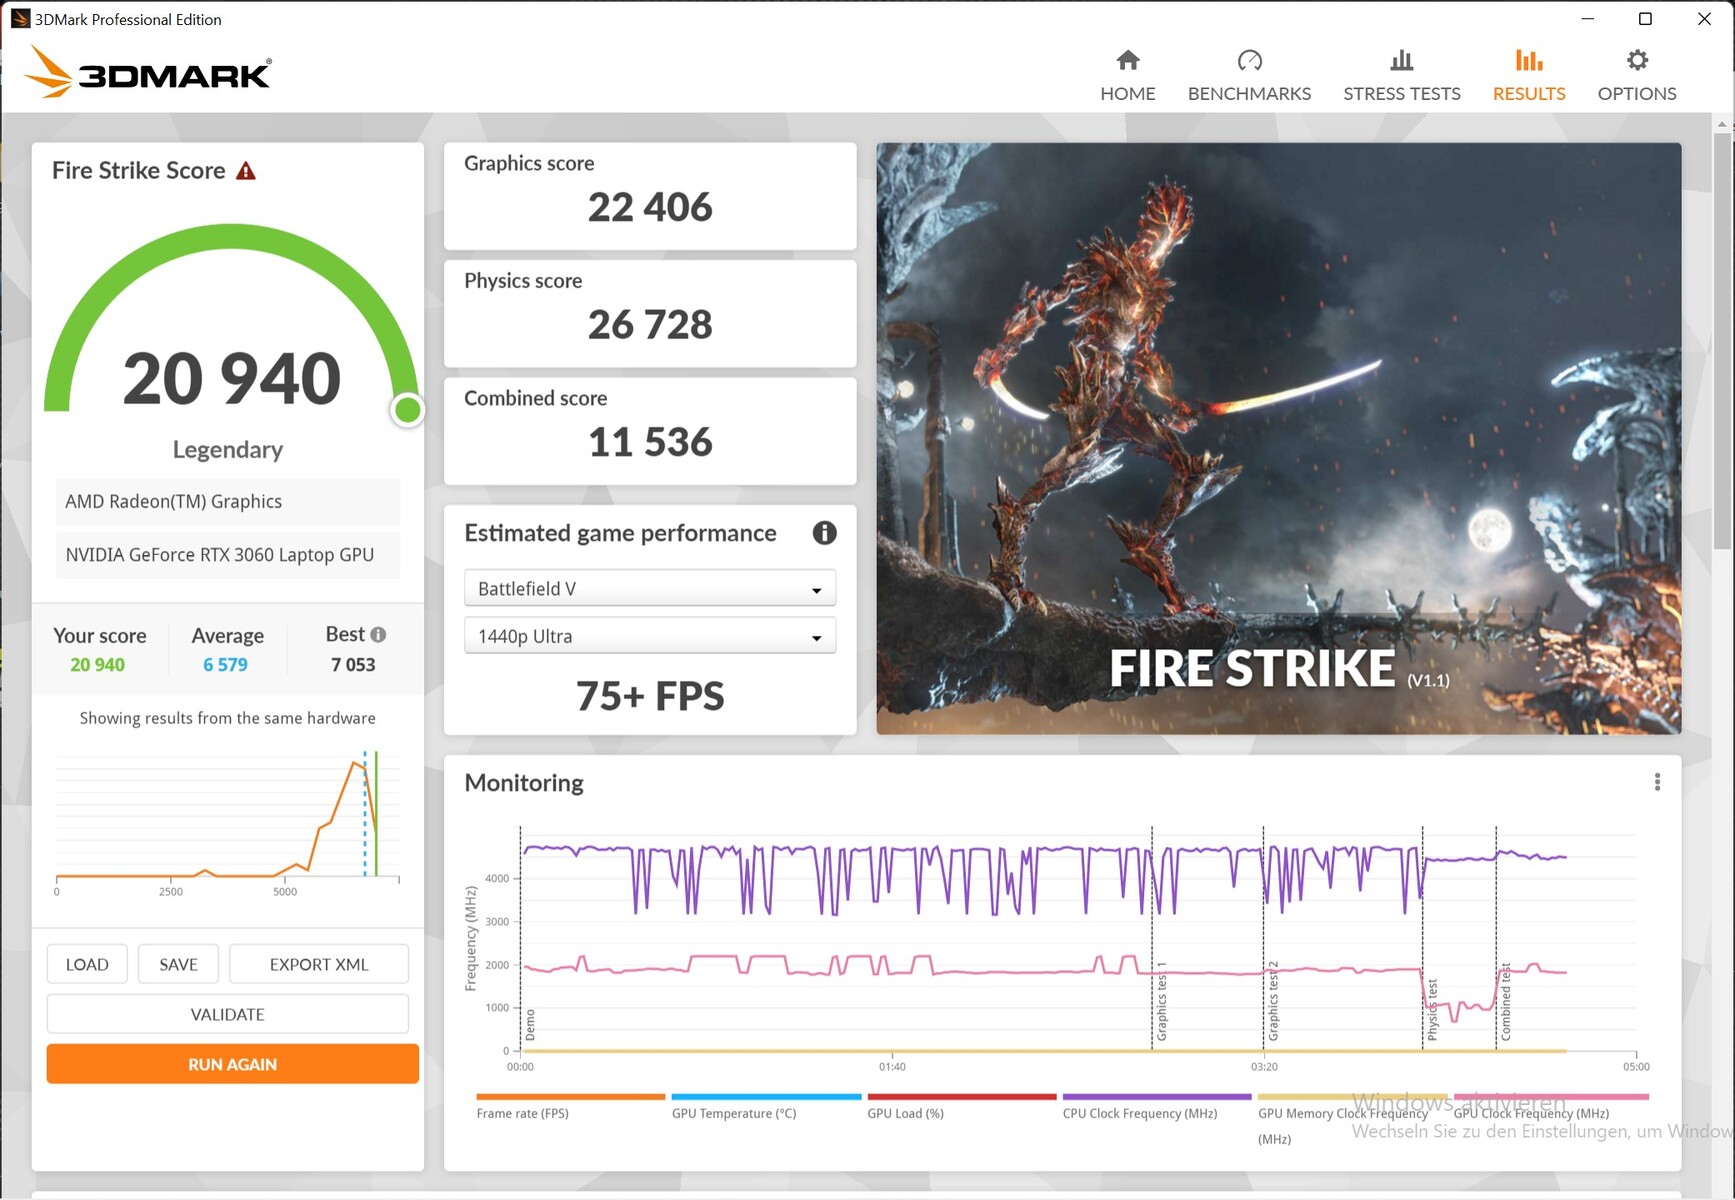
| 3DMark Fire Strike Score | 20940 pontos | |
| 3DMark Time Spy Score | 8984 pontos | |
Ajuda | ||
* ... menor é melhor
Desempenho do jogo
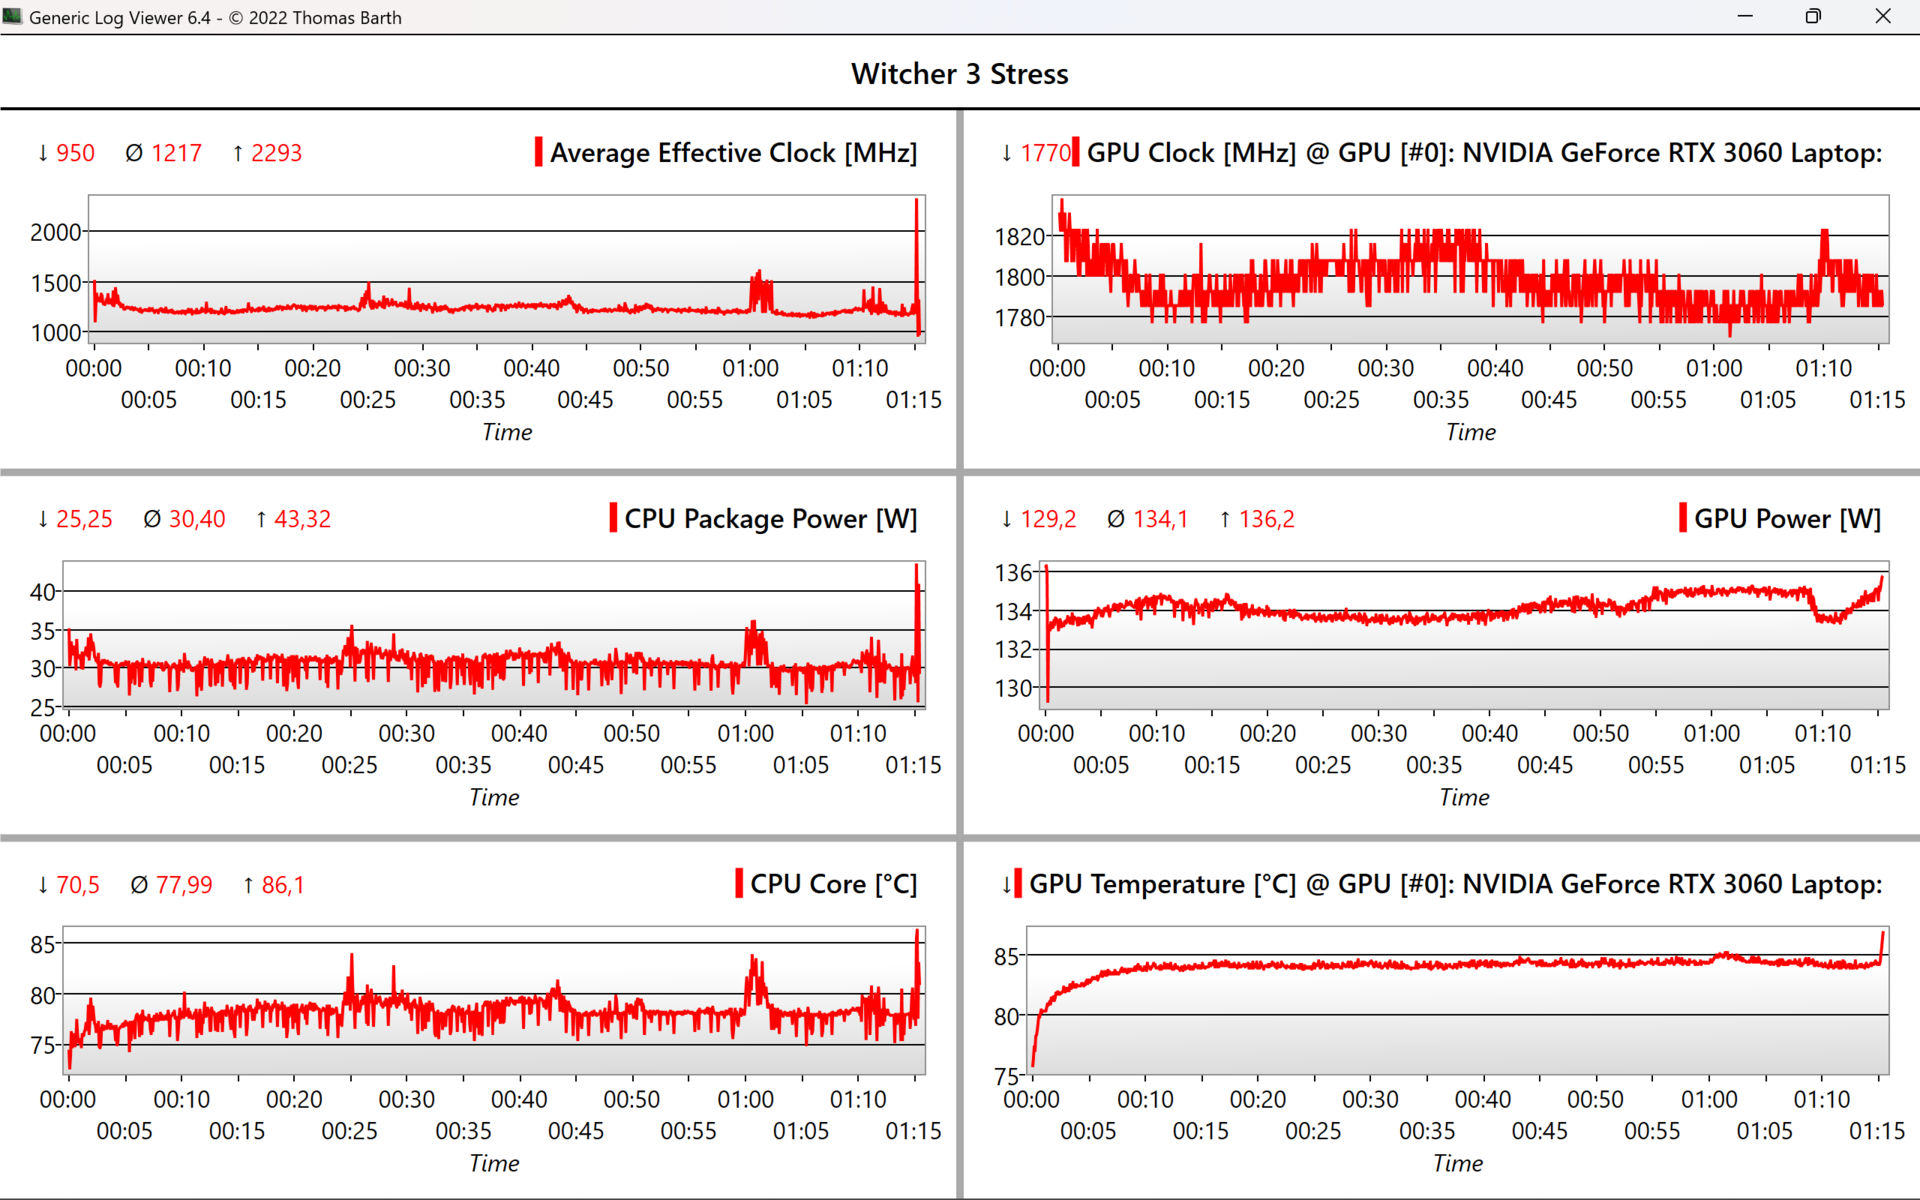
A concorrência com a mesma unidade gráfica supera o XMG Core 15 em até 13% nos jogos, apesar da alta TGP, que medimos a 134 W, enquanto que pelo menos não fica muito quente a 84 °C (~183 °F). O relógio do núcleo de ~1.800 MHz já está acima da especificação de 1.702 MHz. O desempenho corresponde à faixa média superior.
As taxas do relógio permanecem estáveis mesmo depois de uma hora no The Witcher 3 e, portanto, também no FPS, como mostram os dois gráficos a seguir.
Witcher 3 FPS-Diagram
| baixo | média | alto | ultra | QHD | |
|---|---|---|---|---|---|
| GTA V (2015) | 178.7 | 172.1 | 158.4 | 97.3 | 86.5 |
| The Witcher 3 (2015) | 303 | 253 | 159.7 | 81.5 | |
| Dota 2 Reborn (2015) | 136.8 | 126.5 | 117.6 | 112.3 | |
| Final Fantasy XV Benchmark (2018) | 178.4 | 119.5 | 91.9 | 67.5 | |
| X-Plane 11.11 (2018) | 104.8 | 93.3 | 74.2 | ||
| Far Cry 5 (2018) | 118 | 107 | 90 | ||
| Strange Brigade (2018) | 273 | 200 | 171.7 | 152.7 | |
| God of War (2022) | 92.6 | 73.1 | 51.5 | 44 |
Emissões: Jogos silenciosos com FPS elevado possível com o XMG Core 15
Emissões sonoras
A maioria dos ventiladores ficam desligados quando ociosos e também quando navegando na web. Embora um ruído de 42 dB(A) esteja presente durante a carga total da CPU, isto pode ser contido especialmente pelo modo balanceado, que ainda tem muita energia no estado pronto.
Fica muito alto com 55 dB(A) durante os jogos, mas o ruído de baixa freqüência permanece relativamente agradável. Aqui também, o modo equilibrado proporciona um remédio claro, enquanto o FPS caiu apenas 5% em GTA V, por exemplo, o que é um resultado muito bom. Ex-fábrica, o XMG Fusion 15 e Alienware m15 permanecem significativamente mais silenciosos quando se joga com 46 e 48 dB(A), respectivamente
..
Barulho
| Ocioso |
| 23 / 23 / 23 dB |
| Carga |
| 42.41 / 55.05 dB |
 | ||
30 dB silencioso 40 dB(A) audível 50 dB(A) ruidosamente alto |
||
min: | ||
| Schenker XMG Core 15 (M22) R7 6800H, GeForce RTX 3060 Laptop GPU | Lenovo Legion 5 15IAH7H 82RB i7-12700H, GeForce RTX 3060 Laptop GPU | Schenker XMG Fusion 15 (Mid 22) i7-11800H, GeForce RTX 3070 Laptop GPU | Asus TUF Gaming F15 FX507ZM i7-12700H, GeForce RTX 3060 Laptop GPU | Alienware m15 R5 Ryzen Edition R7 5800H, GeForce RTX 3060 Laptop GPU | Schenker XMG Core 15 Ampere R7 4800H, GeForce RTX 3060 Laptop GPU | |
|---|---|---|---|---|---|---|
| Noise | 3% | -9% | -1% | -7% | -8% | |
| desligado / ambiente * (dB) | 23 | 23.3 -1% | 26 -13% | 23.2 -1% | 24 -4% | 24 -4% |
| Idle Minimum * (dB) | 23 | 23.5 -2% | 26 -13% | 23.6 -3% | 24 -4% | 26 -13% |
| Idle Average * (dB) | 23 | 23.5 -2% | 28 -22% | 23.6 -3% | 25 -9% | 28 -22% |
| Idle Maximum * (dB) | 23 | 26.8 -17% | 31 -35% | 25.4 -10% | 35 -52% | 30 -30% |
| Load Average * (dB) | 42.41 | 29.3 31% | 45 -6% | 38 10% | 44 -4% | 42 1% |
| Witcher 3 ultra * (dB) | 54.71 | 51.4 6% | 46 16% | 54.1 1% | 48 12% | 50 9% |
| Load Maximum * (dB) | 55.05 | 53 4% | 48 13% | 57.2 -4% | 50 9% | 52 6% |
* ... menor é melhor
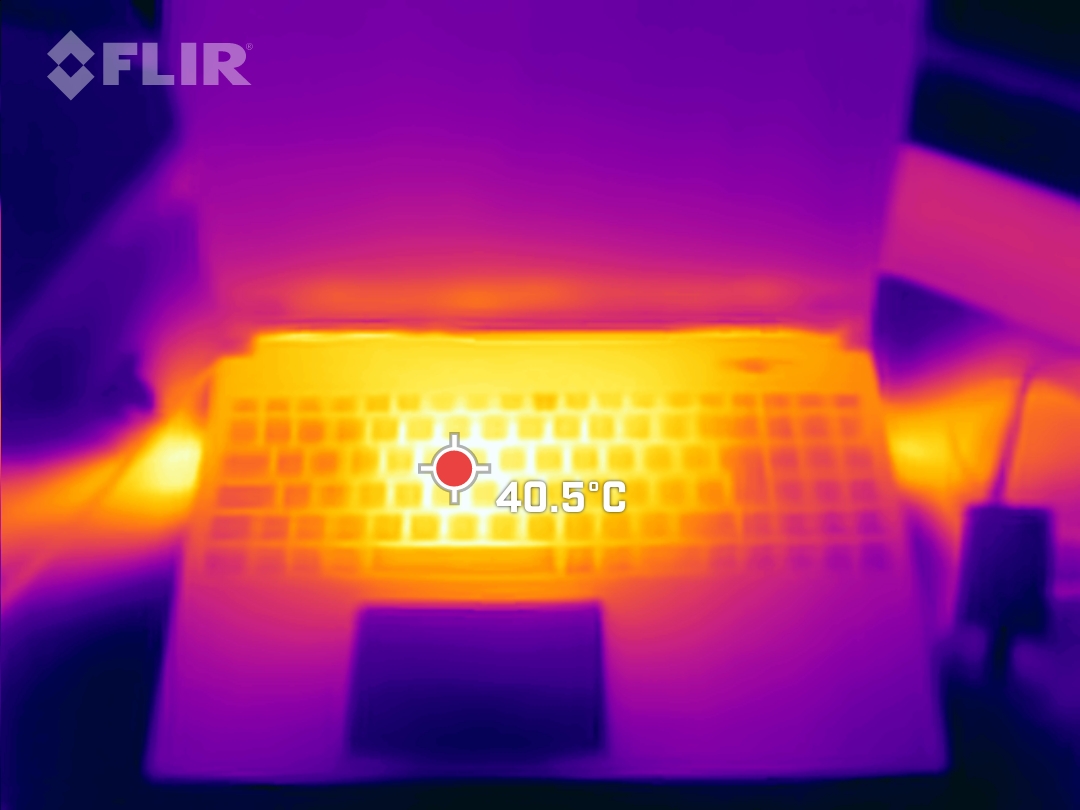
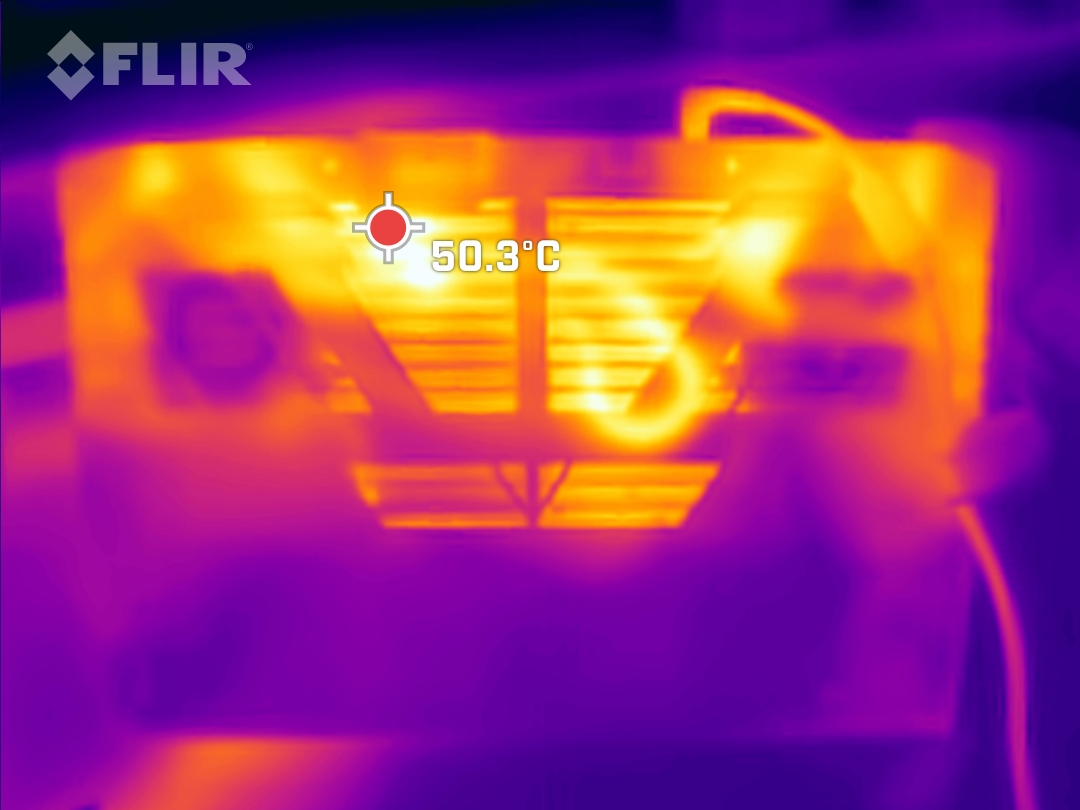
Temperatura
As temperaturas nunca estão em território quente, mesmo durante os jogos. Sob carga máxima, há um hotspot de 51 °C (~124 °F) no fundo do dispositivo, enquanto o Alienware m15 e o Schenker XMG Fusion 15 funcionam muito mais quentes a 61 °C e 63 °C (~142 e ~145 °F), respectivamente.
(-) A temperatura máxima no lado superior é 48 °C / 118 F, em comparação com a média de 40.4 °C / 105 F , variando de 21.2 a 68.8 °C para a classe Gaming.
(-) A parte inferior aquece até um máximo de 51 °C / 124 F, em comparação com a média de 43.2 °C / 110 F
(+) Em uso inativo, a temperatura média para o lado superior é 25.6 °C / 78 F, em comparação com a média do dispositivo de 33.9 °C / ### class_avg_f### F.
(±) Jogando The Witcher 3, a temperatura média para o lado superior é 34.9 °C / 95 F, em comparação com a média do dispositivo de 33.9 °C / ## #class_avg_f### F.
(+) Os apoios para as mãos e o touchpad são mais frios que a temperatura da pele, com um máximo de 28 °C / 82.4 F e, portanto, são frios ao toque.
(±) A temperatura média da área do apoio para as mãos de dispositivos semelhantes foi 28.8 °C / 83.8 F (+0.8 °C / 1.4 F).
| Schenker XMG Core 15 (M22) AMD Ryzen 7 6800H, NVIDIA GeForce RTX 3060 Laptop GPU | Lenovo Legion 5 15IAH7H 82RB Intel Core i7-12700H, NVIDIA GeForce RTX 3060 Laptop GPU | Schenker XMG Fusion 15 (Mid 22) Intel Core i7-11800H, NVIDIA GeForce RTX 3070 Laptop GPU | Asus TUF Gaming F15 FX507ZM Intel Core i7-12700H, NVIDIA GeForce RTX 3060 Laptop GPU | Alienware m15 R5 Ryzen Edition AMD Ryzen 7 5800H, NVIDIA GeForce RTX 3060 Laptop GPU | Schenker XMG Core 15 Ampere AMD Ryzen 7 4800H, NVIDIA GeForce RTX 3060 Laptop GPU | |
|---|---|---|---|---|---|---|
| Heat | 11% | -20% | -11% | -20% | 2% | |
| Maximum Upper Side * (°C) | 48 | 37.8 21% | 52 -8% | 44.4 7% | 62 -29% | 48 -0% |
| Maximum Bottom * (°C) | 51 | 51 -0% | 63 -24% | 48.8 4% | 61 -20% | 50 2% |
| Idle Upper Side * (°C) | 28 | 25.8 8% | 37 -32% | 37.8 -35% | 36 -29% | 28 -0% |
| Idle Bottom * (°C) | 33 | 28.8 13% | 38 -15% | 39.6 -20% | 33 -0% | 31 6% |
* ... menor é melhor
Teste de estresse
Mesmo no teste de esforço combinado, a CPU ainda computa um pouco acima do relógio base de 3,2 GHz, enquanto aquece até 86 °C (~187 °F) nos primeiros 40 minutos e 93 °C (~199 °F) depois, à medida que o TDP combinado se desloca em favor da CPU e assim se recupera para 4 GHz. A temperatura da GPU aqui é de 86 °C enquanto ainda está em ~1.400 MHz.
Um benchmark de GPU executado logo em seguida foi executado sem perdas de performance.
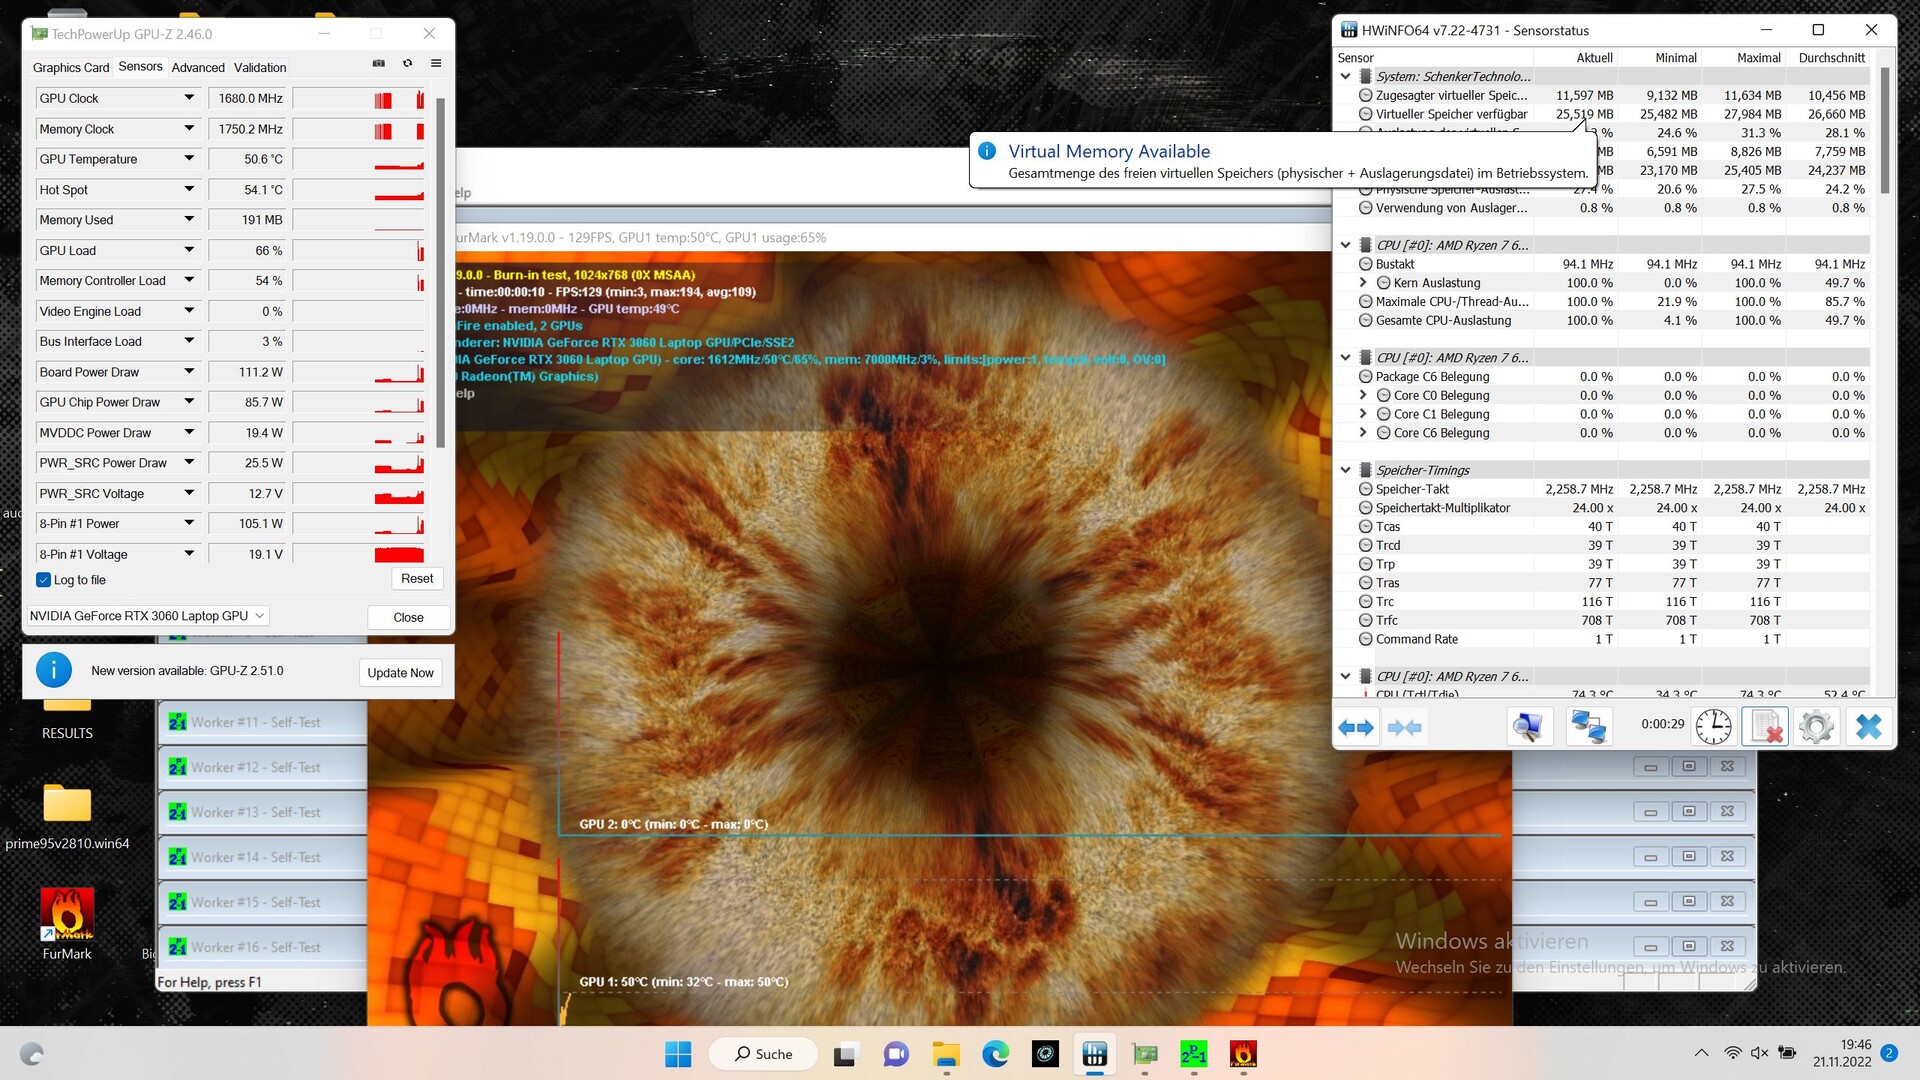
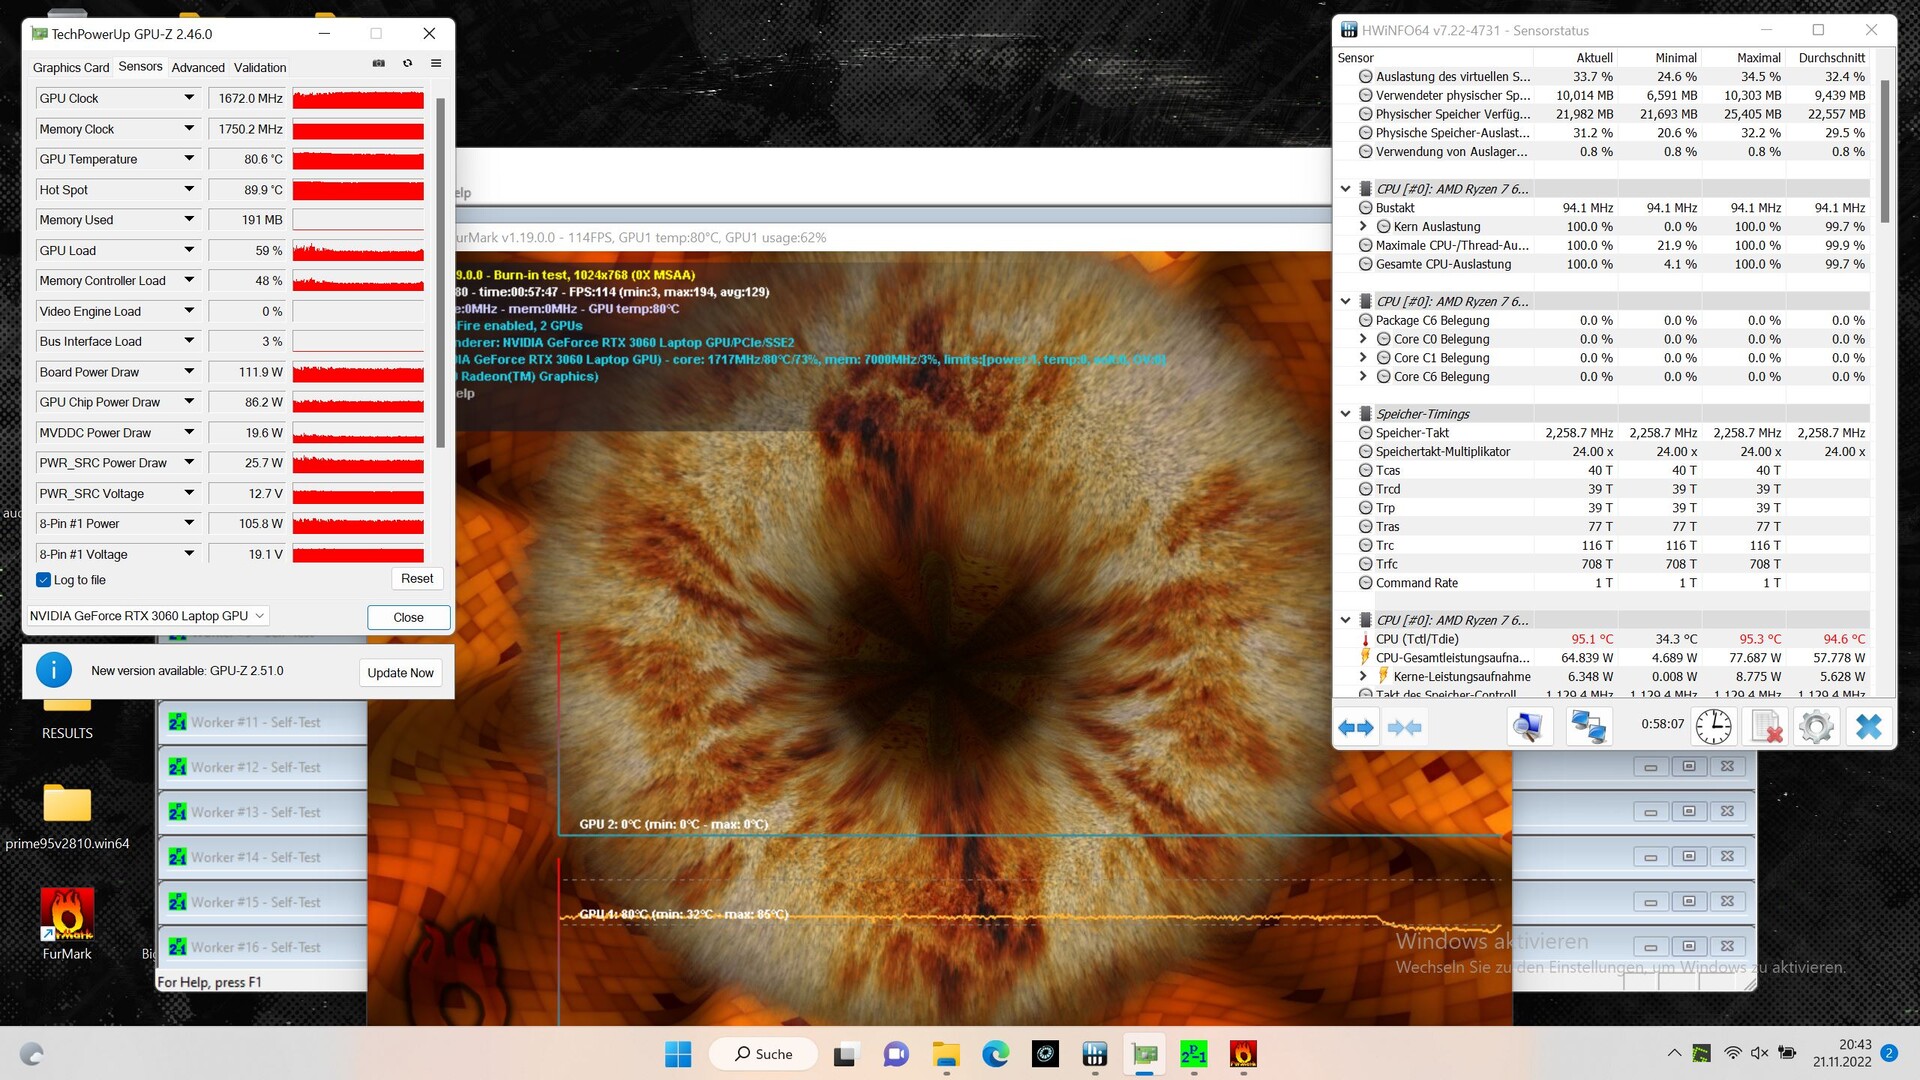
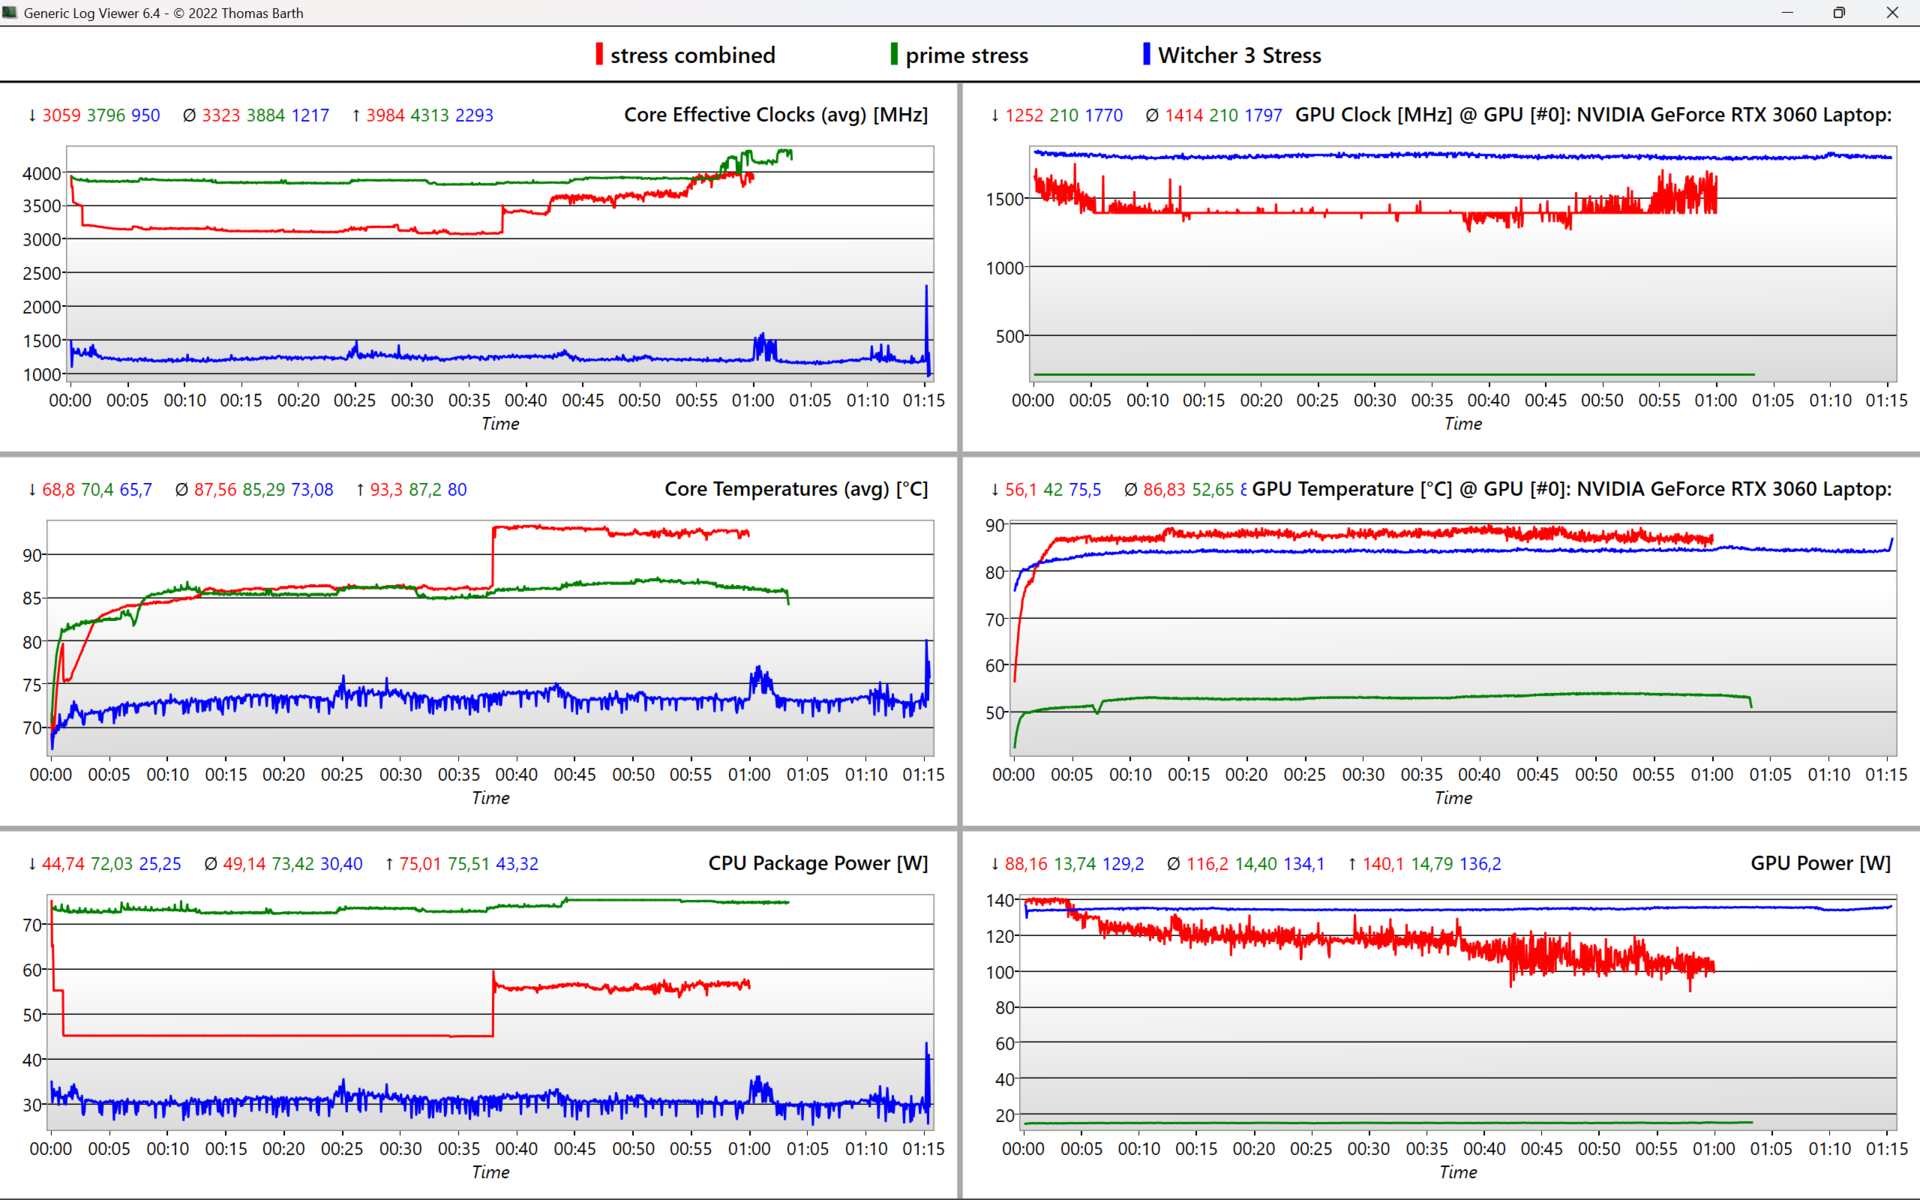
| Relógio CPU (GHz) | Relógio GPU (MHz) | Temperatura média da CPU (°C) | Temperatura média da GPU (°C) | |
| Sistema ocioso | 0.15 | 200 | 34 | 42 |
| Prime95, Stress | 3.9 | 200 | 85 | 53 |
| Prime95 + FurMark, Stress | 3.3 | 1.400 | 93 | 87 |
| Witcher 3, Stress | 1.2 | 1.800 | 73 | 84 |
Orador
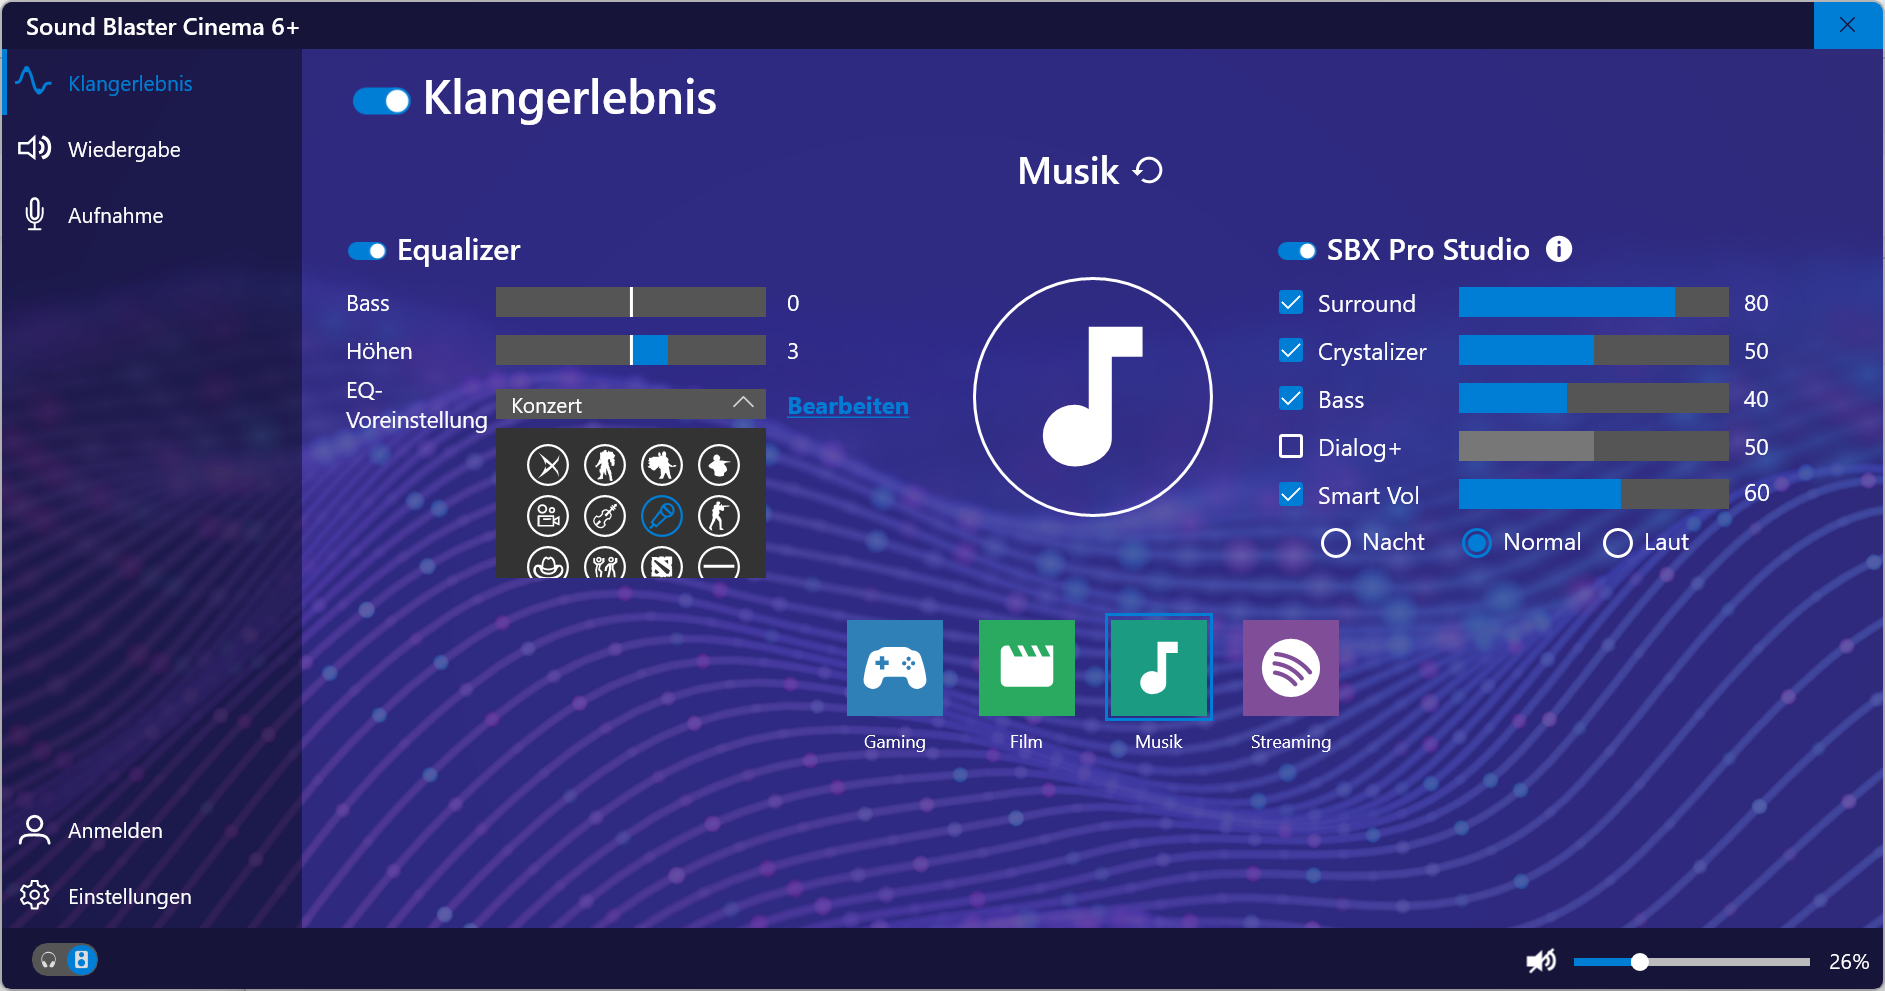
O sistema de som estéreo oferece agudos lineares e equilibrados e tem até mesmo graves implícitos. O software Sound Blaster Cinema 6+ melhora o som ao selecionar diferentes modos. Para uma melhor experiência sonora, fones de ouvido ou um sistema de som externo ainda devem ser conectados via conector ou Bluetooth.
Schenker XMG Core 15 (M22) análise de áudio
(±) | o volume do alto-falante é médio, mas bom (###valor### dB)
Graves 100 - 315Hz
(-) | quase nenhum baixo - em média 19.8% menor que a mediana
(+) | o baixo é linear (6.4% delta para a frequência anterior)
Médios 400 - 2.000 Hz
(±) | médios mais altos - em média 6.2% maior que a mediana
(±) | a linearidade dos médios é média (7.9% delta para frequência anterior)
Altos 2 - 16 kHz
(+) | agudos equilibrados - apenas 1.8% longe da mediana
(+) | os máximos são lineares (4.8% delta da frequência anterior)
Geral 100 - 16.000 Hz
(±) | a linearidade do som geral é média (17.1% diferença em relação à mediana)
Comparado com a mesma classe
» 46% de todos os dispositivos testados nesta classe foram melhores, 12% semelhantes, 43% piores
» O melhor teve um delta de 6%, a média foi 18%, o pior foi 132%
Comparado com todos os dispositivos testados
» 31% de todos os dispositivos testados foram melhores, 8% semelhantes, 61% piores
» O melhor teve um delta de 4%, a média foi 23%, o pior foi 134%
Lenovo Legion Slim 7-16IAH 82TF004YGE análise de áudio
(±) | o volume do alto-falante é médio, mas bom (###valor### dB)
Graves 100 - 315Hz
(±) | graves reduzidos - em média 10% menor que a mediana
(±) | a linearidade dos graves é média (13.4% delta para a frequência anterior)
Médios 400 - 2.000 Hz
(+) | médios equilibrados - apenas 1.2% longe da mediana
(+) | médios são lineares (3.3% delta para frequência anterior)
Altos 2 - 16 kHz
(±) | máximos mais altos - em média 5.5% maior que a mediana
(±) | a linearidade dos máximos é média (10.6% delta para frequência anterior)
Geral 100 - 16.000 Hz
(+) | o som geral é linear (13% diferença em relação à mediana)
Comparado com a mesma classe
» 18% de todos os dispositivos testados nesta classe foram melhores, 3% semelhantes, 79% piores
» O melhor teve um delta de 6%, a média foi 18%, o pior foi 132%
Comparado com todos os dispositivos testados
» 13% de todos os dispositivos testados foram melhores, 3% semelhantes, 85% piores
» O melhor teve um delta de 4%, a média foi 23%, o pior foi 134%
Gerenciamento de energia: AMD laptop para jogos com vida útil da bateria
Consumo de energia
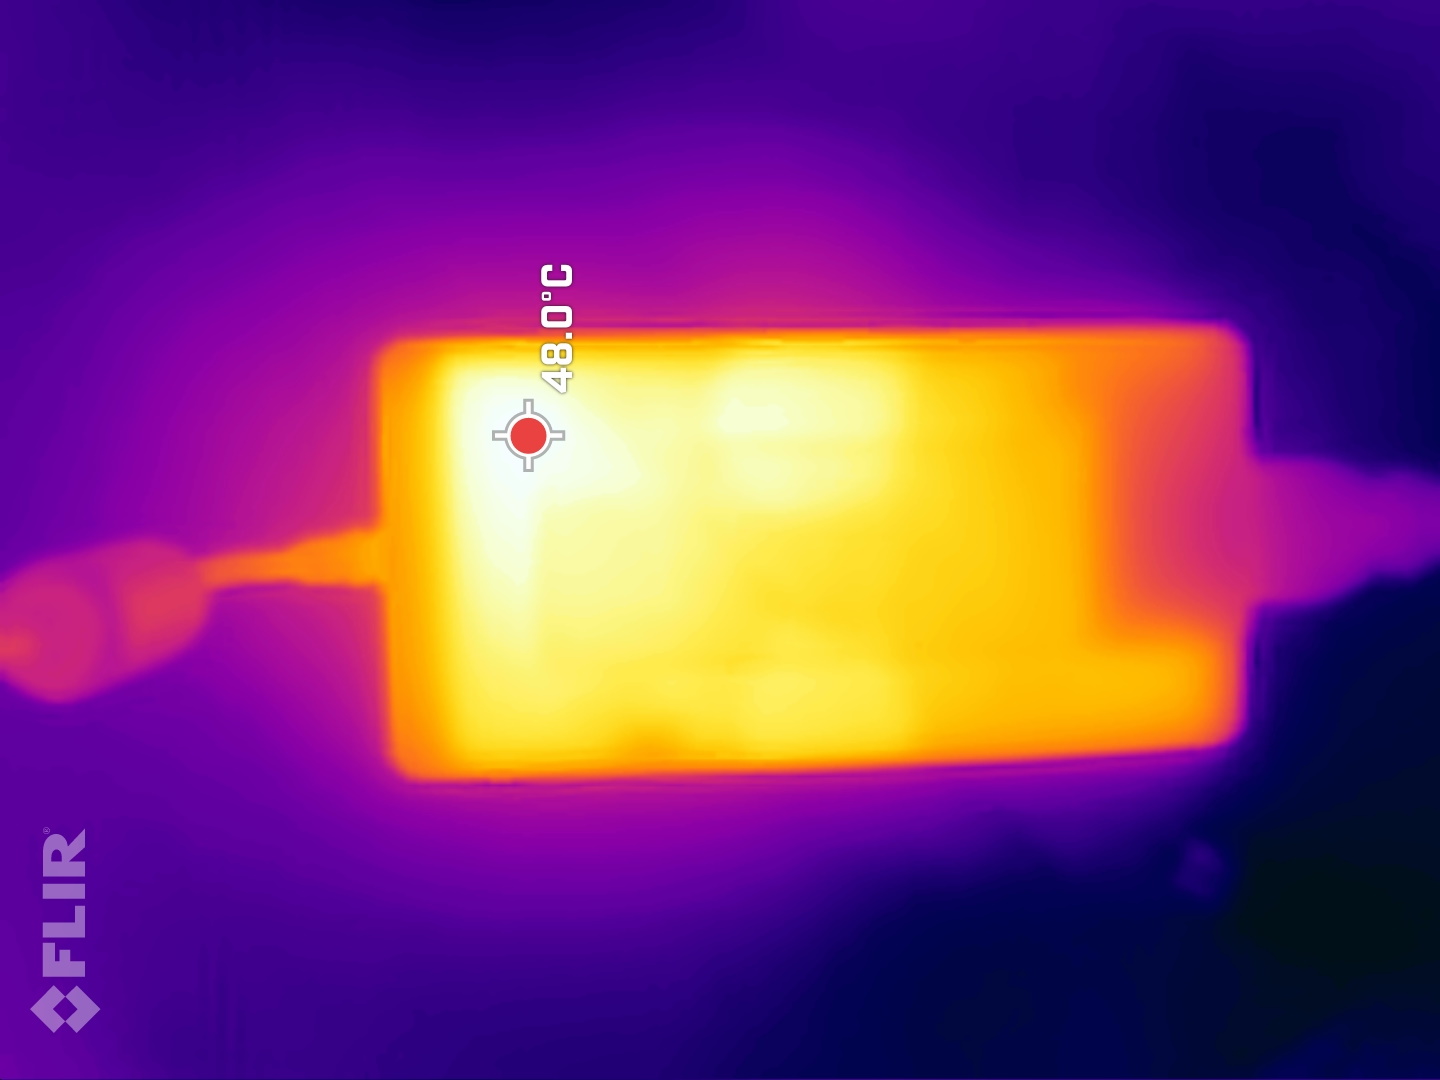
O consumo de energia está basicamente no nível esperado e está aproximadamente no mesmo nível que a concorrência em nosso campo de comparação. Somente o Legion 5 retira consideravelmente mais suco da tomada em modo inativo, enquanto o TUF Gaming F15 é o mais frugal em ociosidade em nossa comparação. O fornecimento de energia de 230 W está à altura de sua tarefa, pois raramente atinge 236 W no pico.
| Ocioso | |
| Carga |
|
Key:
min: | |
| Schenker XMG Core 15 (M22) R7 6800H, GeForce RTX 3060 Laptop GPU, Samsung SSD 980 Pro 1TB MZ-V8P1T0BW, IPS, 2560x1440, 15.6" | Lenovo Legion 5 15IAH7H 82RB i7-12700H, GeForce RTX 3060 Laptop GPU, , IPS, 1920x1080, 15.6" | Schenker XMG Fusion 15 (Mid 22) i7-11800H, GeForce RTX 3070 Laptop GPU, Samsung SSD 980 Pro 1TB MZ-V8P1T0BW, IPS, 2560x1440, 15.6" | Asus TUF Gaming F15 FX507ZM i7-12700H, GeForce RTX 3060 Laptop GPU, SK Hynix HFM001TD3JX013N, IPS, 1920x1080, 15.6" | Alienware m15 R5 Ryzen Edition R7 5800H, GeForce RTX 3060 Laptop GPU, Toshiba KBG40ZNS512G NVMe, IPS, 1920x1080, 15.6" | Schenker XMG Core 15 Ampere R7 4800H, GeForce RTX 3060 Laptop GPU, Samsung SSD 970 EVO Plus 1TB, IPS, 2560x1440, 15.6" | Média NVIDIA GeForce RTX 3060 Laptop GPU | Média da turma Gaming | |
|---|---|---|---|---|---|---|---|---|
| Power Consumption | -64% | -10% | -1% | -12% | -2% | -5% | -25% | |
| Idle Minimum * (Watt) | 11.8 | 19.8 -68% | 12 -2% | 6.3 47% | 11 7% | 11 7% | 10.4 ? 12% | 13 ? -10% |
| Idle Average * (Watt) | 14.7 | 26.2 -78% | 17 -16% | 9.8 33% | 14 5% | 14 5% | 14.5 ? 1% | 19 ? -29% |
| Idle Maximum * (Watt) | 15 | 48.2 -221% | 24 -60% | 26.5 -77% | 25 -67% | 20 -33% | 21.4 ? -43% | 24.6 ? -64% |
| Load Average * (Watt) | 100 | 102.9 -3% | 106 -6% | 103.8 -4% | 123 -23% | 94 6% | 109.3 ? -9% | 110.7 ? -11% |
| Witcher 3 ultra * (Watt) | 184 | 186.7 -1% | 159.9 13% | 189 -3% | 176 4% | 167 9% | ||
| Load Maximum * (Watt) | 237 | 268 -13% | 208 12% | 241.9 -2% | 226 5% | 251 -6% | 206 ? 13% | 259 ? -9% |
* ... menor é melhor
Energy consumption Witcher 3 / Stress test
Energy consumption with external monitor
Duração da bateria
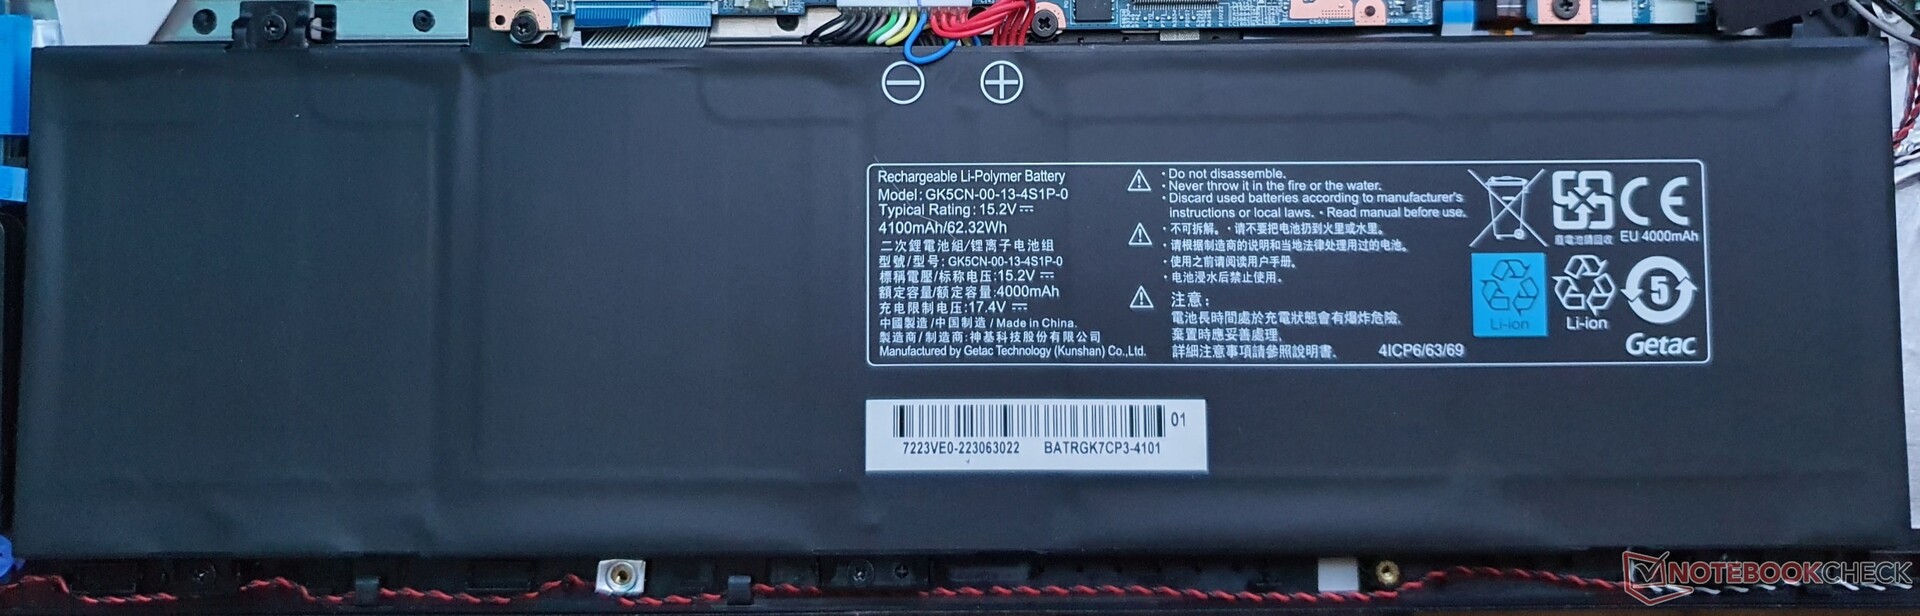
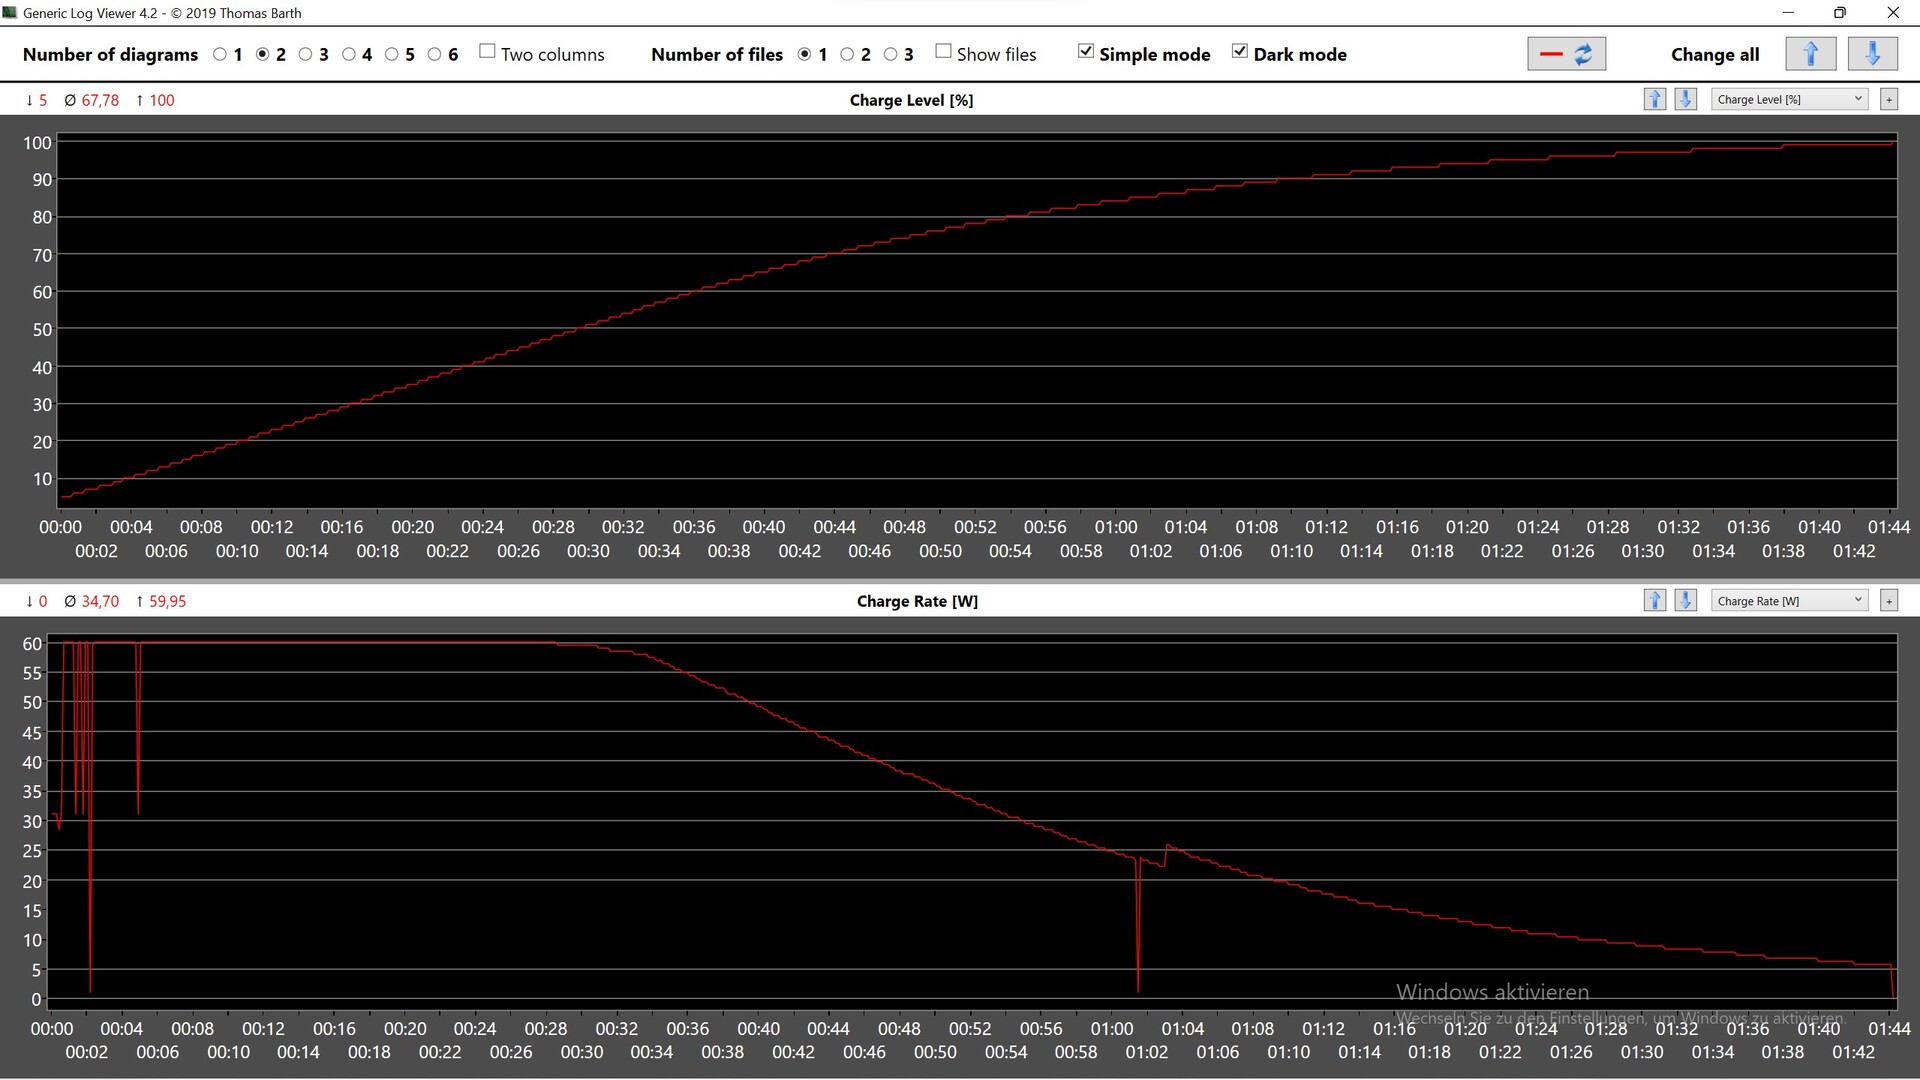
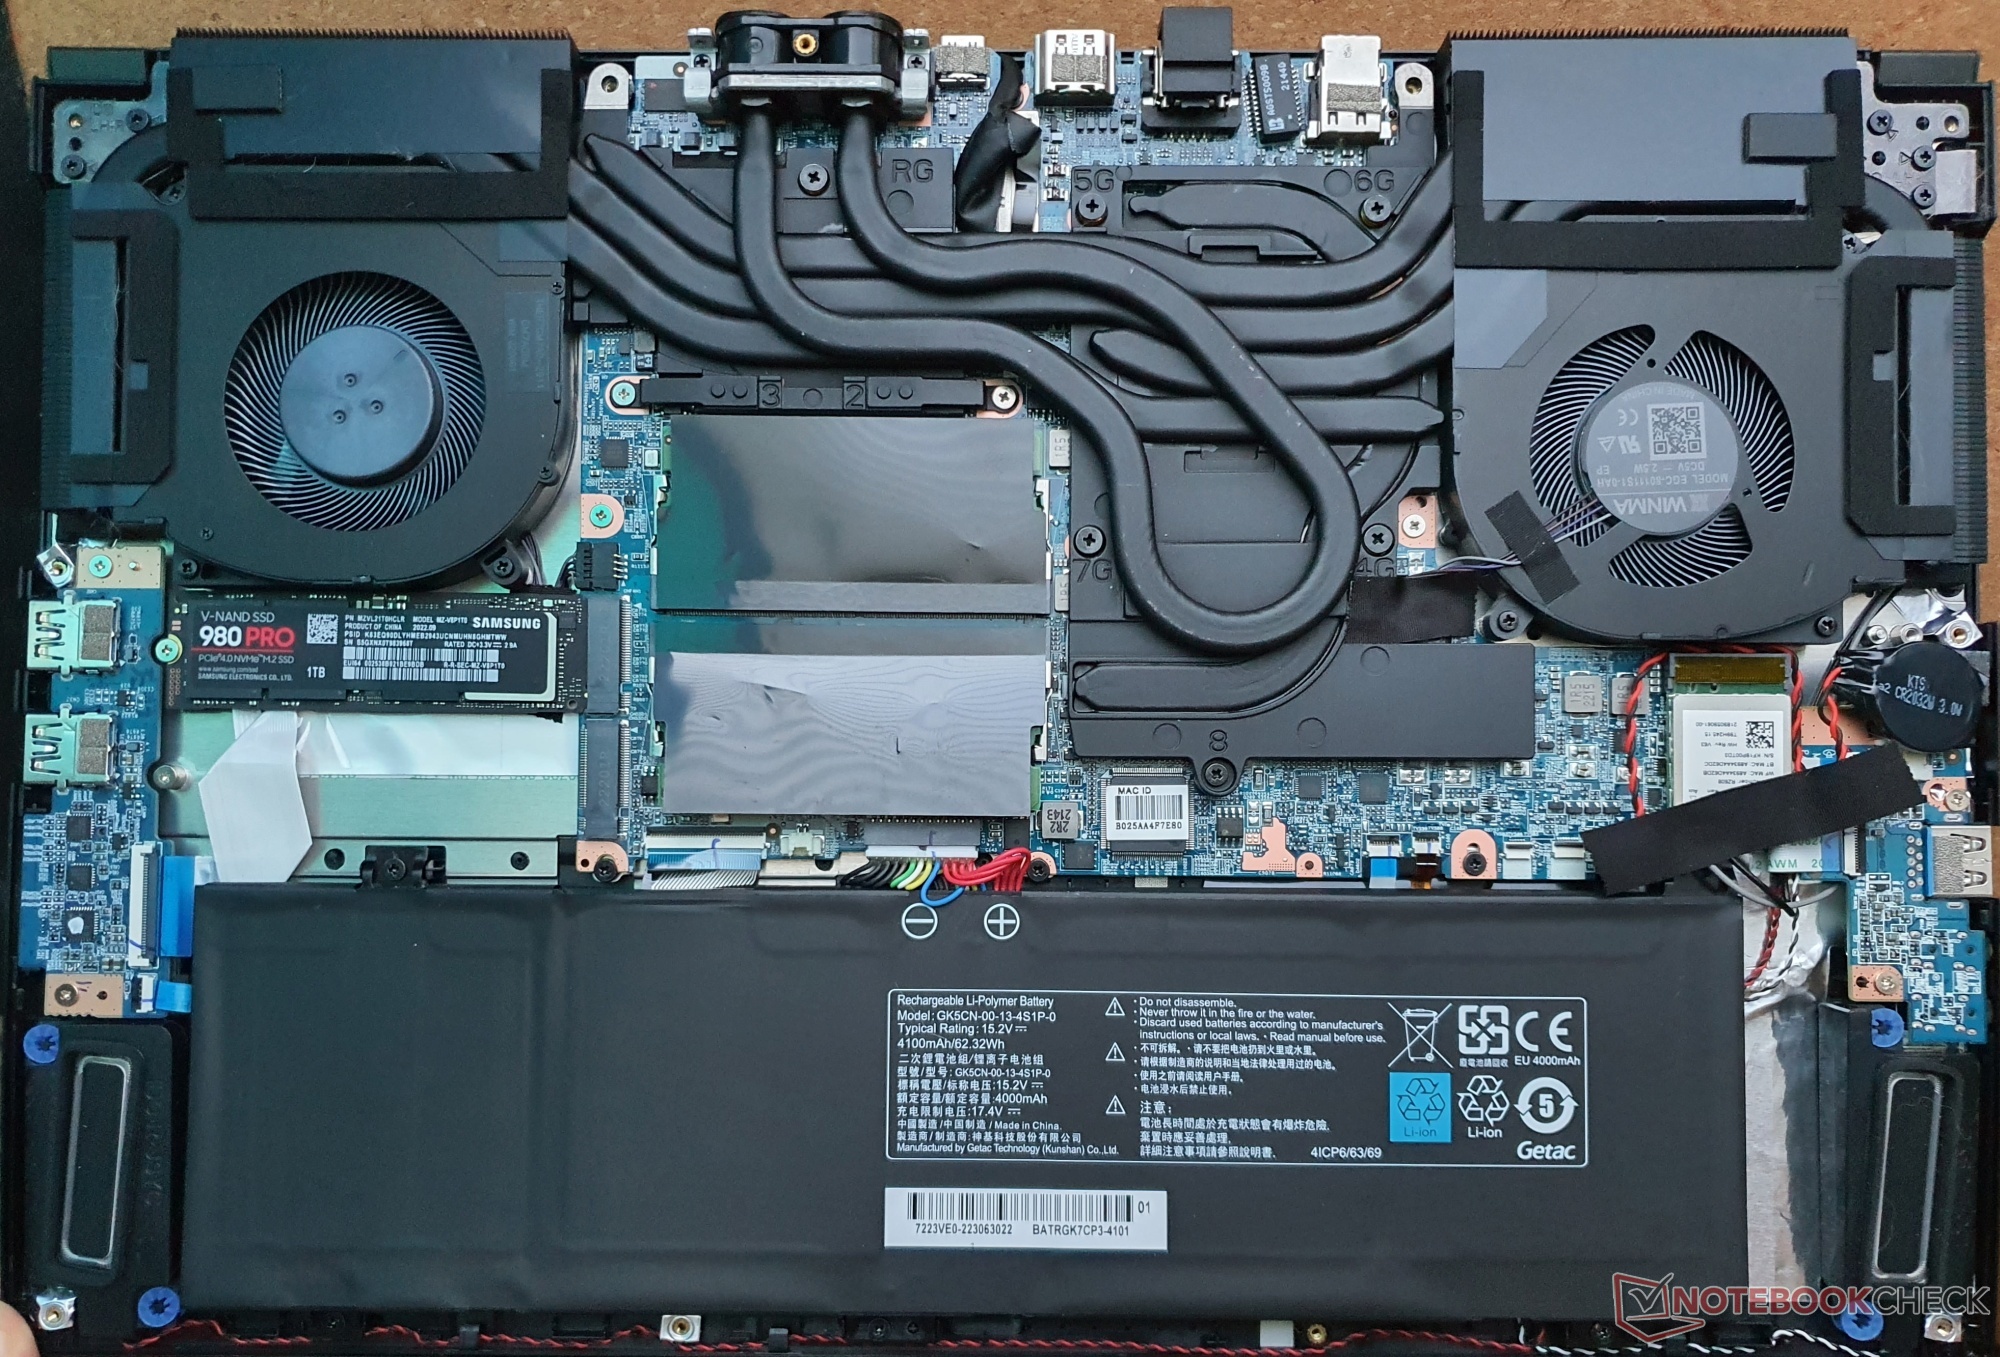
Apesar da pequena bateria de 62 Wh, os tempos de execução de 7:45 h, por exemplo, quando se navega na web a 150 cd/m², são bastante decentes. Testamos em modo Enthusiast , enquanto a taxa de atualização é automaticamente reduzida para 60 Hz com a energia da bateria.
O XMG Core 15 é, portanto, o que dura mais tempo em nosso campo de comparação e é um jogador eficiente, já que a concorrência depende de baterias ainda maiores, com 80 a 93 Wh. A bateria é meia recarregada em 30 minutos.
| Schenker XMG Core 15 (M22) R7 6800H, GeForce RTX 3060 Laptop GPU, 62 Wh | Lenovo Legion 5 15IAH7H 82RB i7-12700H, GeForce RTX 3060 Laptop GPU, 80 Wh | Schenker XMG Fusion 15 (Mid 22) i7-11800H, GeForce RTX 3070 Laptop GPU, 93.48 Wh | Asus TUF Gaming F15 FX507ZM i7-12700H, GeForce RTX 3060 Laptop GPU, 90 Wh | Alienware m15 R5 Ryzen Edition R7 5800H, GeForce RTX 3060 Laptop GPU, 86 Wh | Schenker XMG Core 15 Ampere R7 4800H, GeForce RTX 3060 Laptop GPU, 62 Wh | Média da turma Gaming | |
|---|---|---|---|---|---|---|---|
| Duração da bateria | -18% | 30% | -19% | -27% | -9% | 14% | |
| WiFi v1.3 (h) | 7.8 | 5 -36% | 7.4 -5% | 4.8 -38% | 5.1 -35% | 5.8 -26% | 7.11 ? -9% |
| Load (h) | 1.1 | 1.1 0% | 1.8 64% | 1.1 0% | 0.9 -18% | 1.2 9% | 1.502 ? 37% |
| H.264 (h) | 7.5 | 8.8 | 6 | 8.32 ? | |||
| Witcher 3 ultra (h) | 1.6 |
Pro
Contra
Veredicto: Fast Schenker laptop para jogos com RTX 3060
No geral, o XMG Core 15 da Schenker acaba se tornando um sólido jogador de médio alcance superior. O desempenho 3D está em um nível acima da média, mas alguns modelos com o mesmo TGP, como o Asus TUF Gaming ou o Asus ROG Strix Scar, são ainda mais rápidos. A AMD Ryzen 7 6800H pelo menos contribui para uma operação frugal, mesmo que esteja (minimamente) atrás dos rivais da Intel com a i7-12700H.
Apesar da pequena bateria de 62 Wh, o portátil compacto para jogos atinge a maior duração da bateria de 7:45 h em nosso campo de comparação, enquanto a tela WQHD mate com 165 Hz e tempos de resposta rápidos também é mais do que respeitável. O jogo silencioso é possível sem grandes perdas de desempenho graças ao modo balanceado , mas o prazer do jogo é muito limitado longe da tomada elétrica.
Aqueles que podem prescindir de USB4, fornecimento de energia e jogos com bateria receberão um jogador sólido e potencialmente silencioso de médio alcance com resfriamento de água opcional por 1.817 Euros (~$1935).
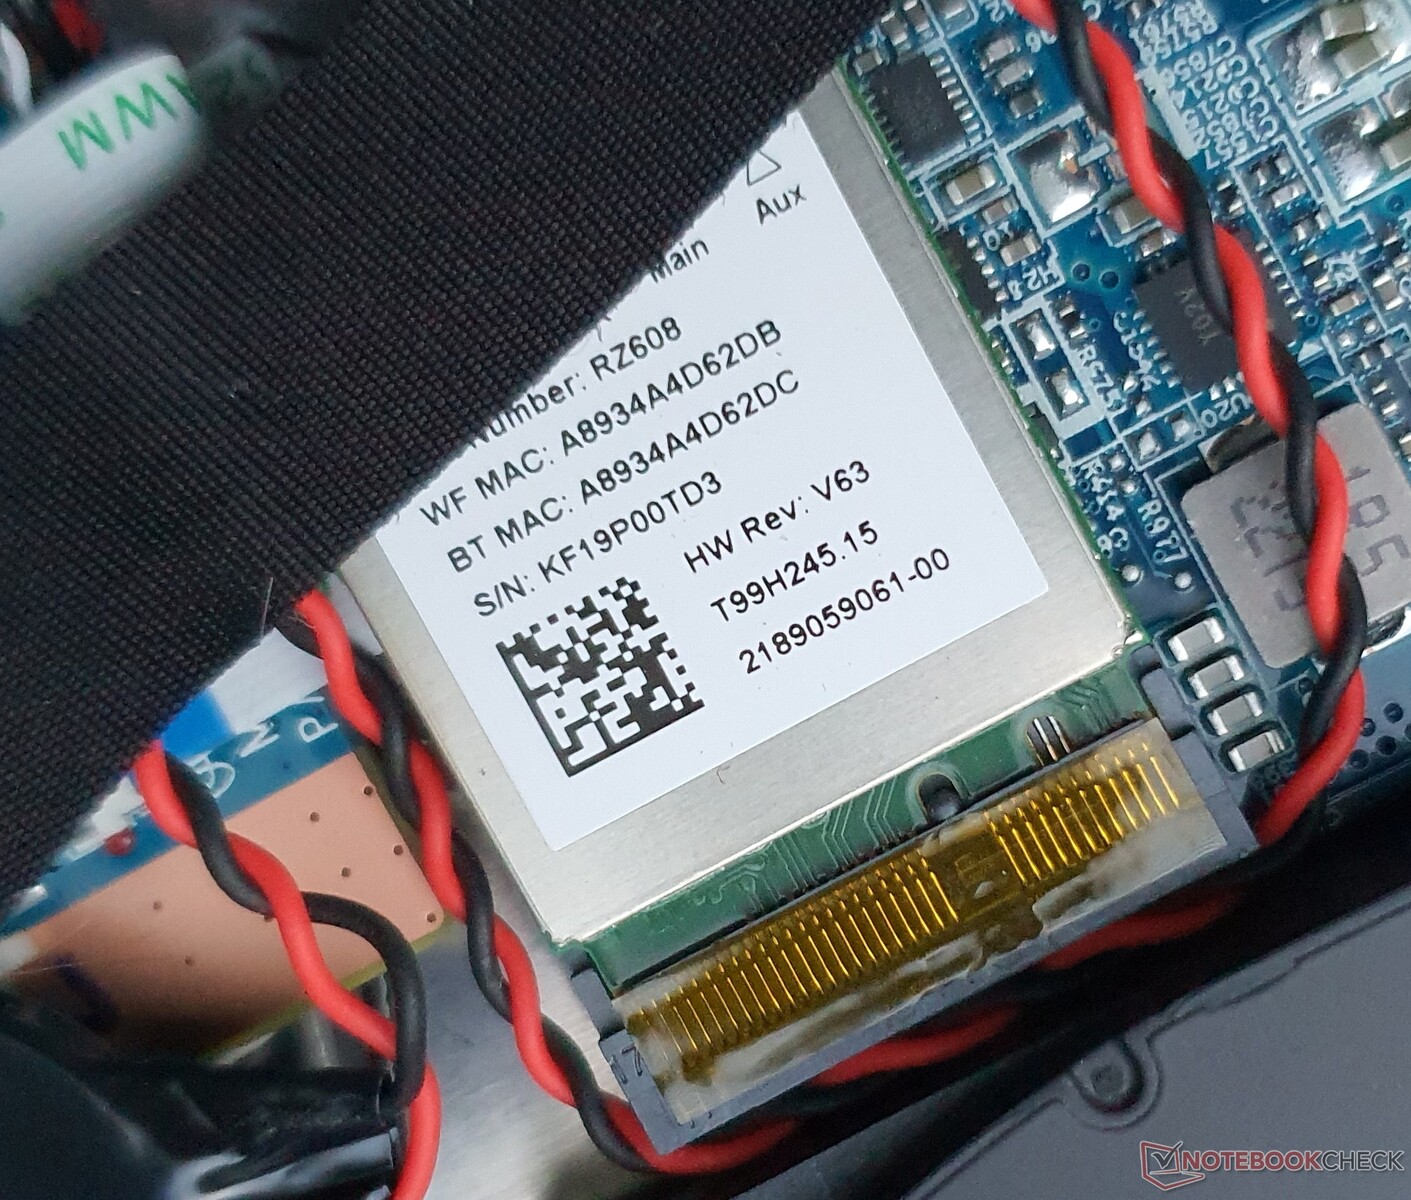
A manutenção é facilitada, pois há dois slots M.2-2280 para SSDs PCIe 4.0, mais dois slots de RAM, e o módulo WiFi um pouco lento também pode ser trocado. O Per-Key RGB e o Advanced Optimus têm que ser dispensados, mas um switch MUX está disponível, assim como a opção de overclock da GPU.
A Lenovo's Legion 5 Pro oferece um RTX 3070 potencialmente mais rápido, uma tela 16:10 mais brilhante e maior, e o melhor teclado a um preço similar. O XMG Fusion 15 da Lenovo oferece um ainda melhor, uma vez que é mecânico. O Legion Slim 7i também é uma recomendação, já que já está disponível por 1.529 Euros (~$1629) em uma configuração similar no momento desta revisão
..
Preço e disponibilidade
O XMG Core 15 (M22) da Schenker é atualmente oferecido na configuração testada por 1.817 Euro (~$1935) no Bestware. O modelo mais barato atualmente com a mesma CPU+GPU, mas menos memória e painel FHD 144 Hz está disponível por apenas 1.492 Euros (~$1589).
Schenker XMG Core 15 (M22)
- 01/02/2023 v7 (old)
Marvin Gollor
Price comparison
