O portátil Core i7-12700H mais rápido que você pode comprar: Lenovo Legion 5 15IAH7H revisão
O 2022 Legion 5 15 é uma grande atualização sobre o 2021 Legion 5 15. Ela utiliza a mesma GPU, embora com uma meta TGP mais alta (140 W vs. 130 W), enquanto atualiza a CPU para a última série Alder Lake-H do 12º gênero. O chassi externo também foi atualizado para um visual mais novo e mais elegante.
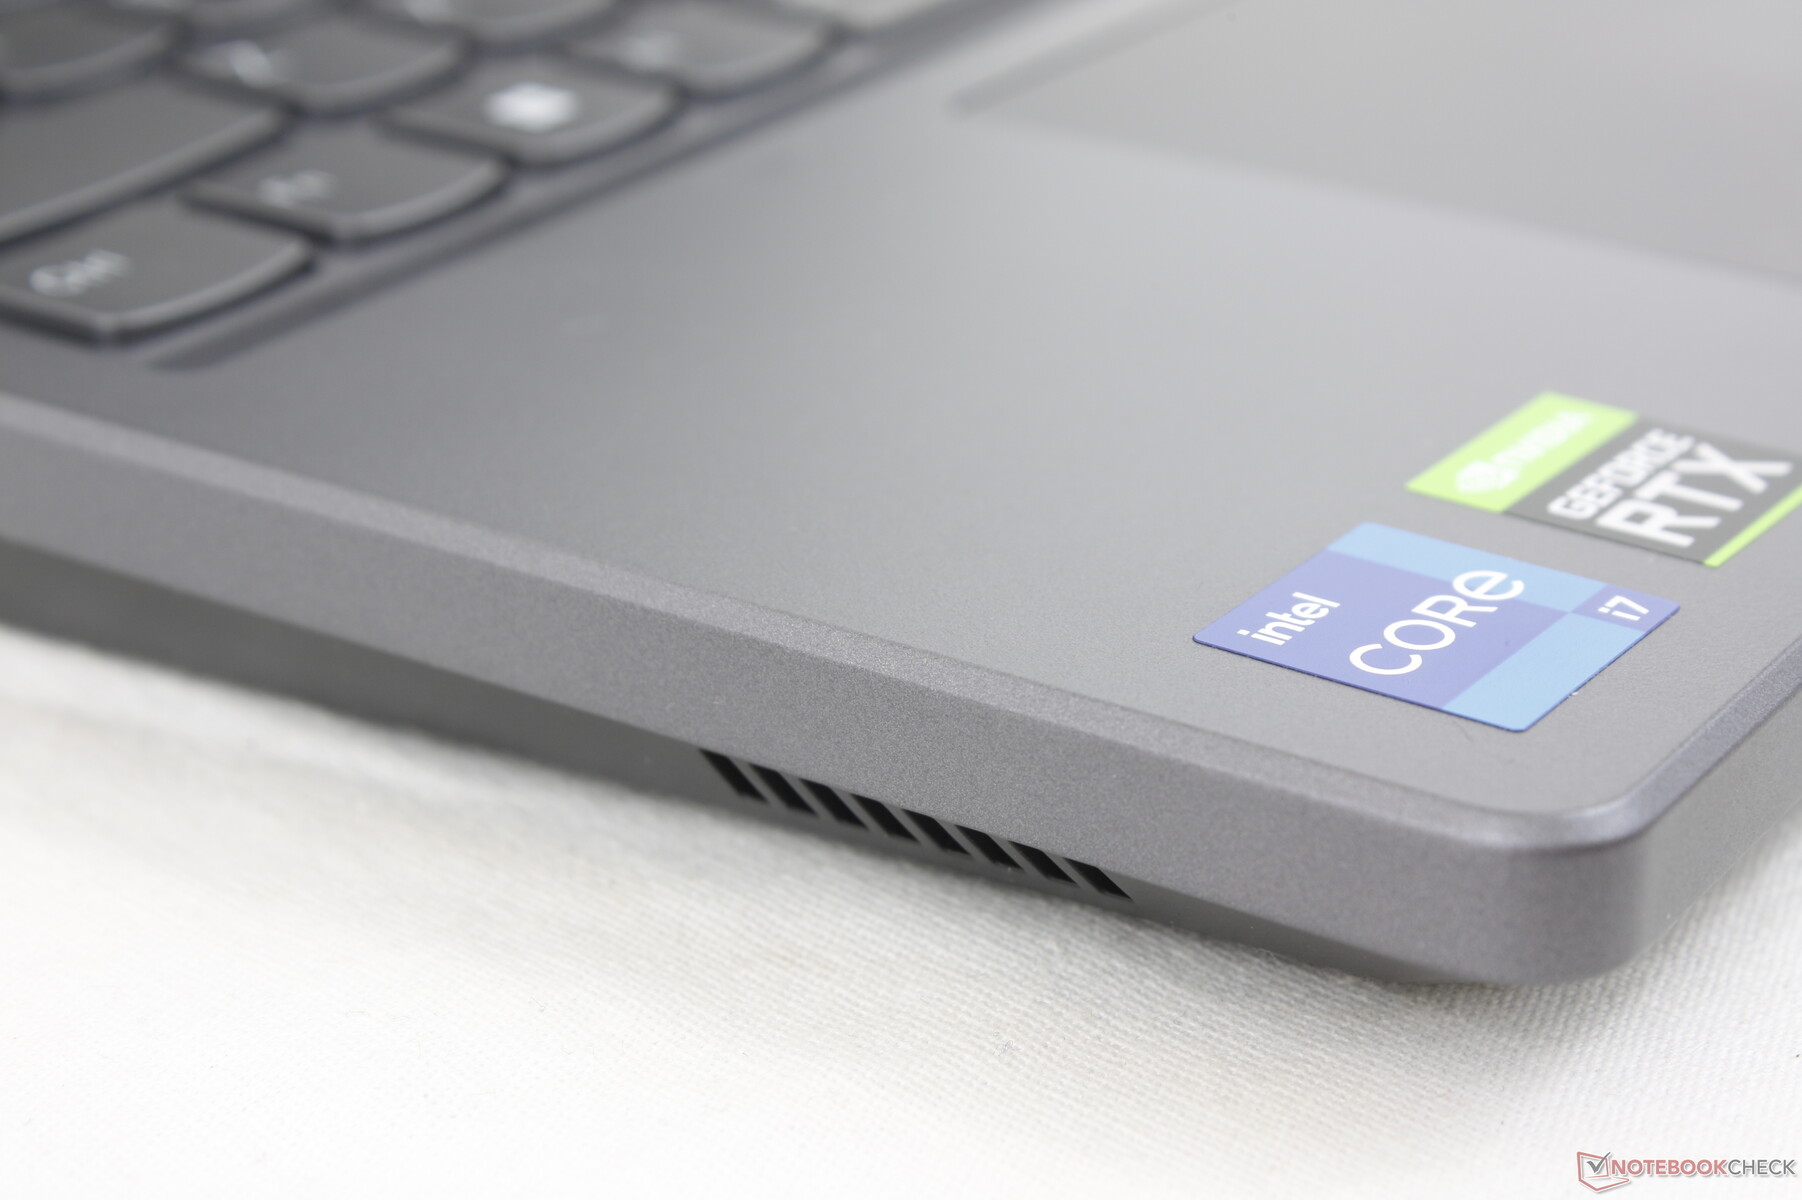
Nossa configuração em revisão é uma configuração de médio alcance com o Core i7-12700H, GeForce RTX 3060 GPU, e 1080p165 1080p IPS display por aproximadamente $1600 USD varejo. Outras SKUs estão disponíveis com o menor CPU Core i5-12500H, display 144 Hz, ou mais rápido GeForce RTX 3070 Ti
.
Os concorrentes do Legion 5 15 incluem outros laptops de 15,6 polegadas de médio alcance como o Razer Blade 15 Base Edition, Asus TUF Gaming F15, MSI Bravo 15, ou Acer Aspire Nitro 5. O Legion 5 15 não deve ser confundido com o Legion 5 Pro que é um projeto maior de 16 polegadas.
Todas as opções de especificação podem ser encontradas no PDF oficial da Lenovo aqui.
Mais análises da Lenovo:
Possíveis concorrentes em comparação
Avaliação | Data | Modelo | Peso | Altura | Size | Resolução | Preço |
|---|---|---|---|---|---|---|---|
| 87.5 % v7 (old) | 11/2022 | Lenovo Legion 5 15IAH7H 82RB i7-12700H, GeForce RTX 3060 Laptop GPU | 2.4 kg | 19.99 mm | 15.60" | 1920x1080 | |
| 83.4 % v7 (old) | 09/2021 | Lenovo Legion 5 15ACH-82JU00C6GE-FL R7 5800H, GeForce RTX 3060 Laptop GPU | 2.5 kg | 26 mm | 15.60" | 1920x1080 | |
| 78.2 % v7 (old) | 04/2022 | MSI Bravo 15 B5DD-010US R5 5600H, Radeon RX 5500M | 2.3 kg | 24.95 mm | 15.60" | 1920x1080 | |
| 87.2 % v7 (old) | 03/2022 | Asus TUF Gaming F15 FX507ZM i7-12700H, GeForce RTX 3060 Laptop GPU | 2.1 kg | 24.95 mm | 15.60" | 1920x1080 | |
| 80.5 % v7 (old) | 05/2021 | Acer Aspire Nitro 5 AN515-55-57GF i5-10300H, GeForce RTX 3060 Laptop GPU | 2.3 kg | 23.9 mm | 15.60" | 1920x1080 | |
| 85.5 % v7 (old) | 03/2021 | Razer Blade 15 Base Edition 2021, i7-10750H RTX 3060 i7-10750H, GeForce RTX 3060 Laptop GPU | 2.1 kg | 19.9 mm | 15.60" | 1920x1080 |
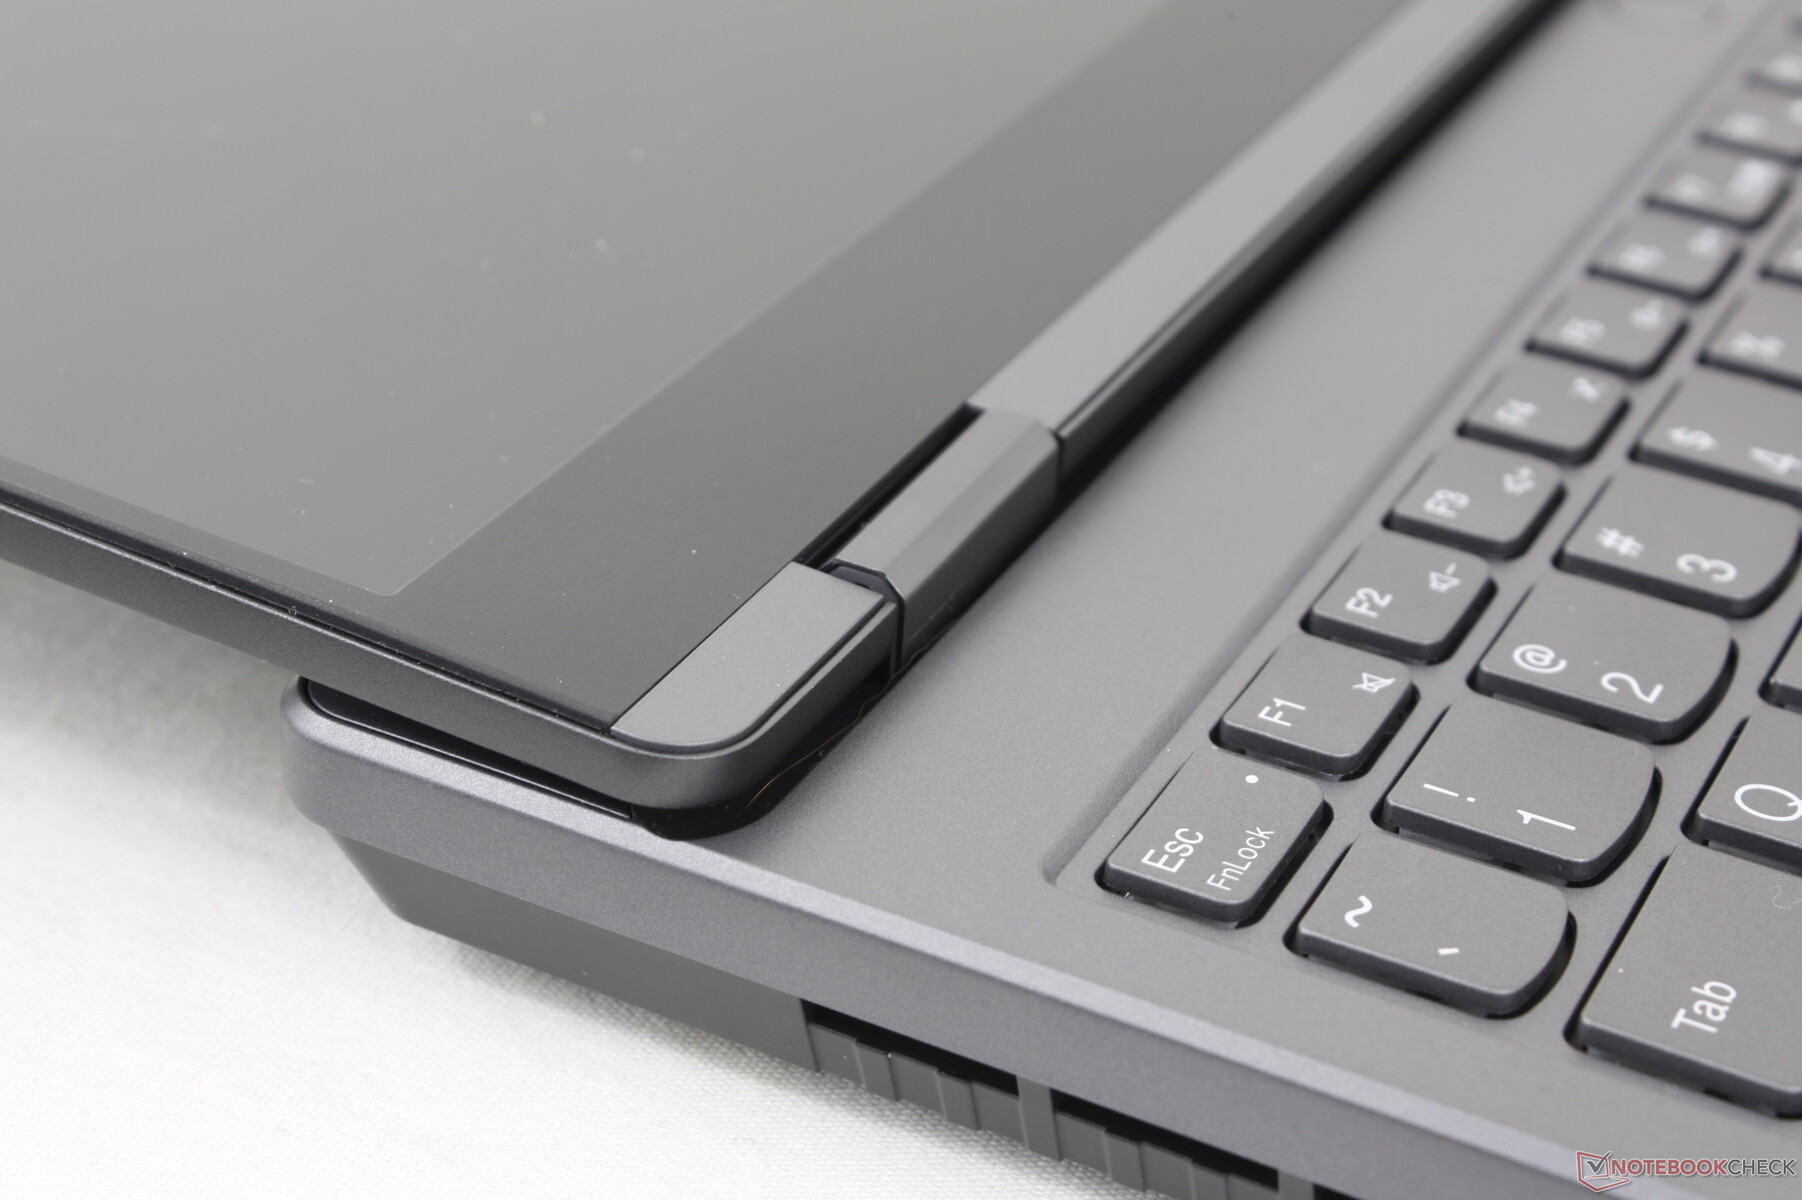
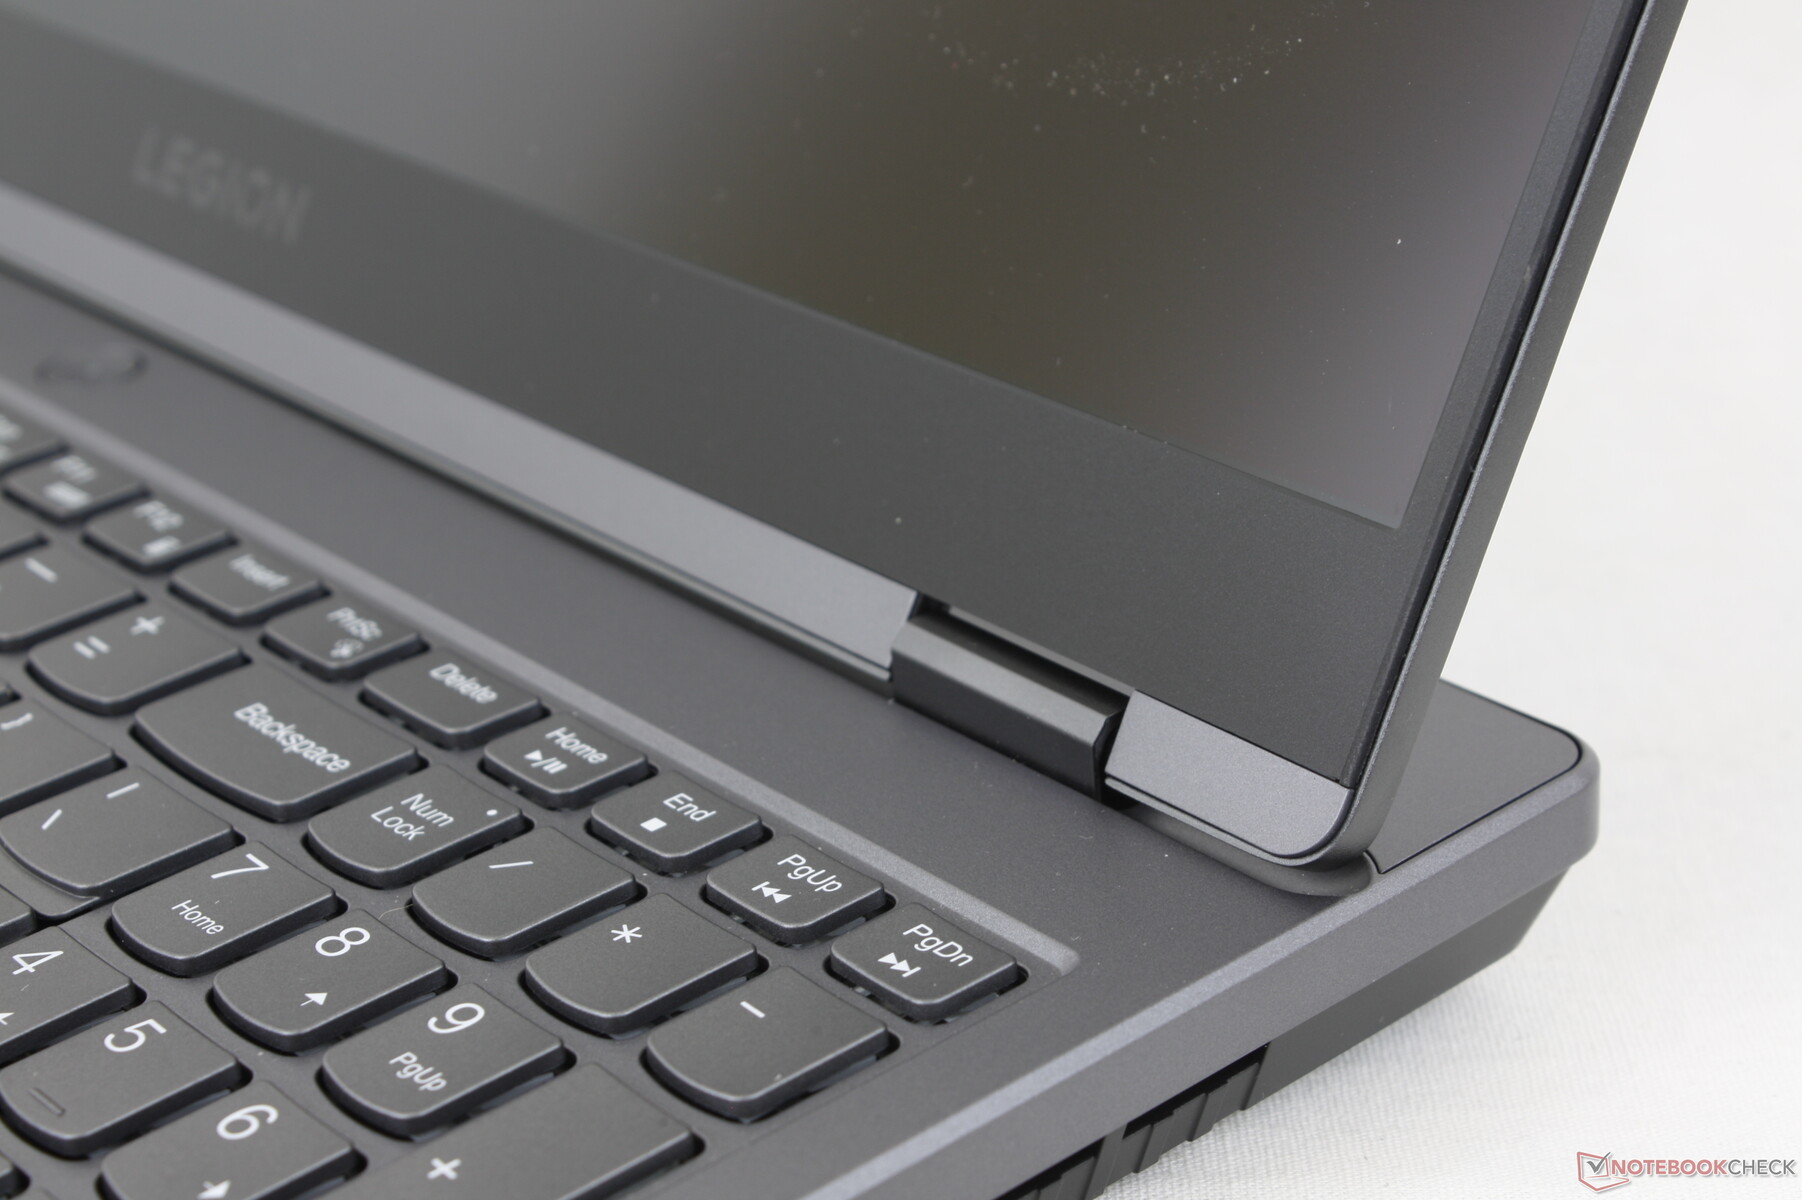
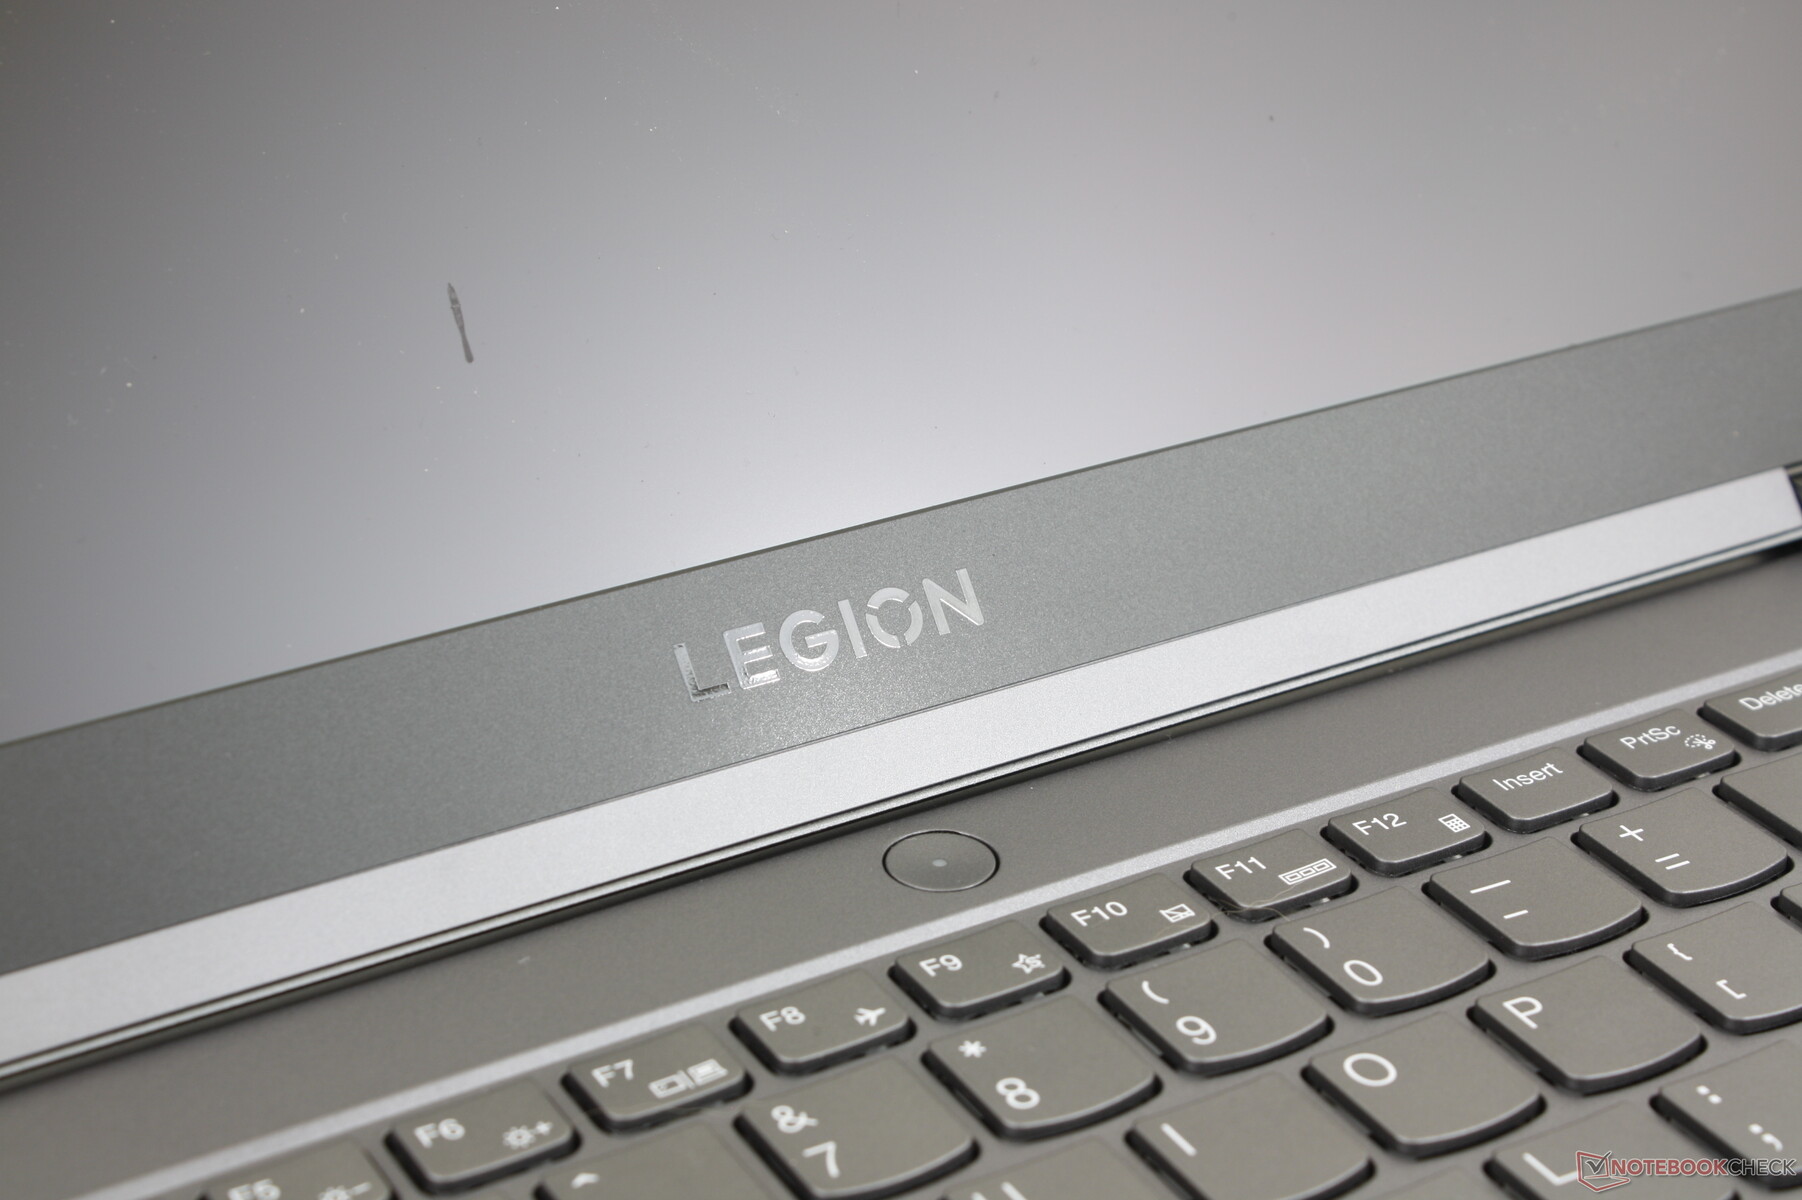
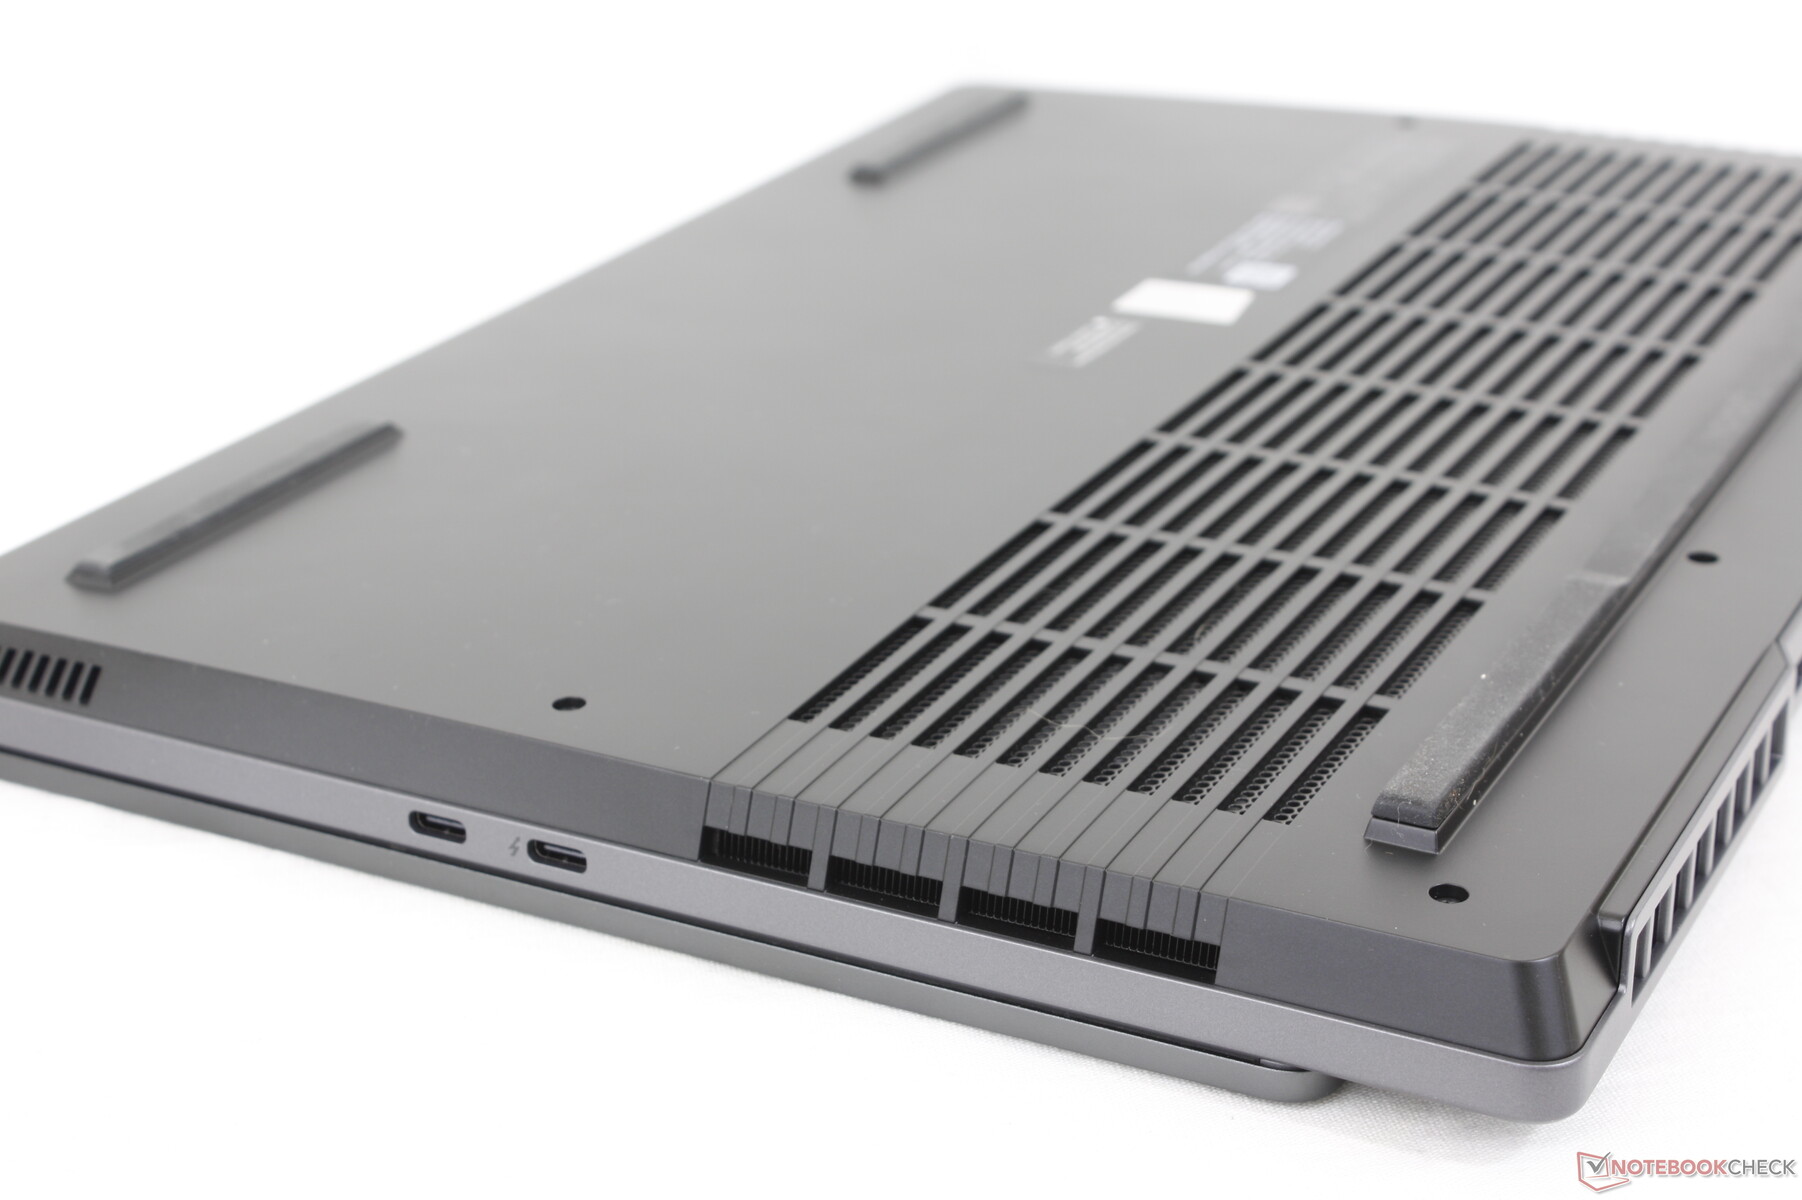
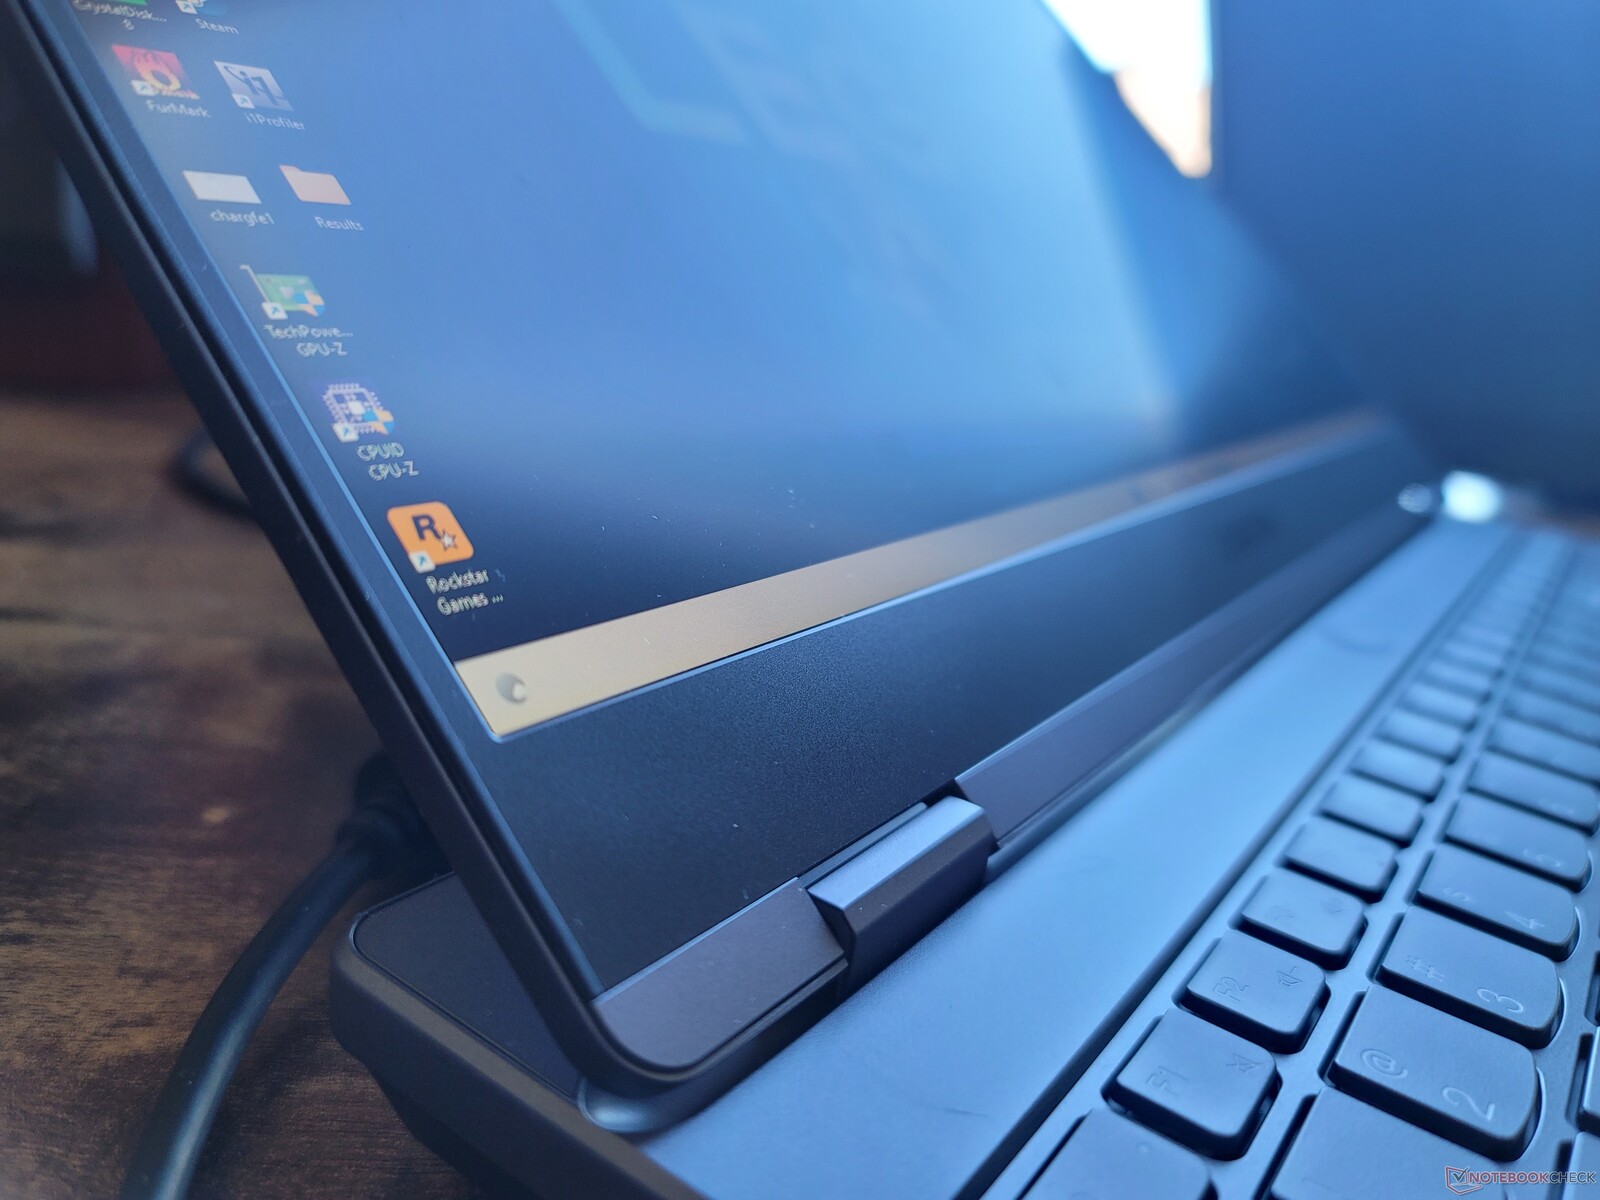
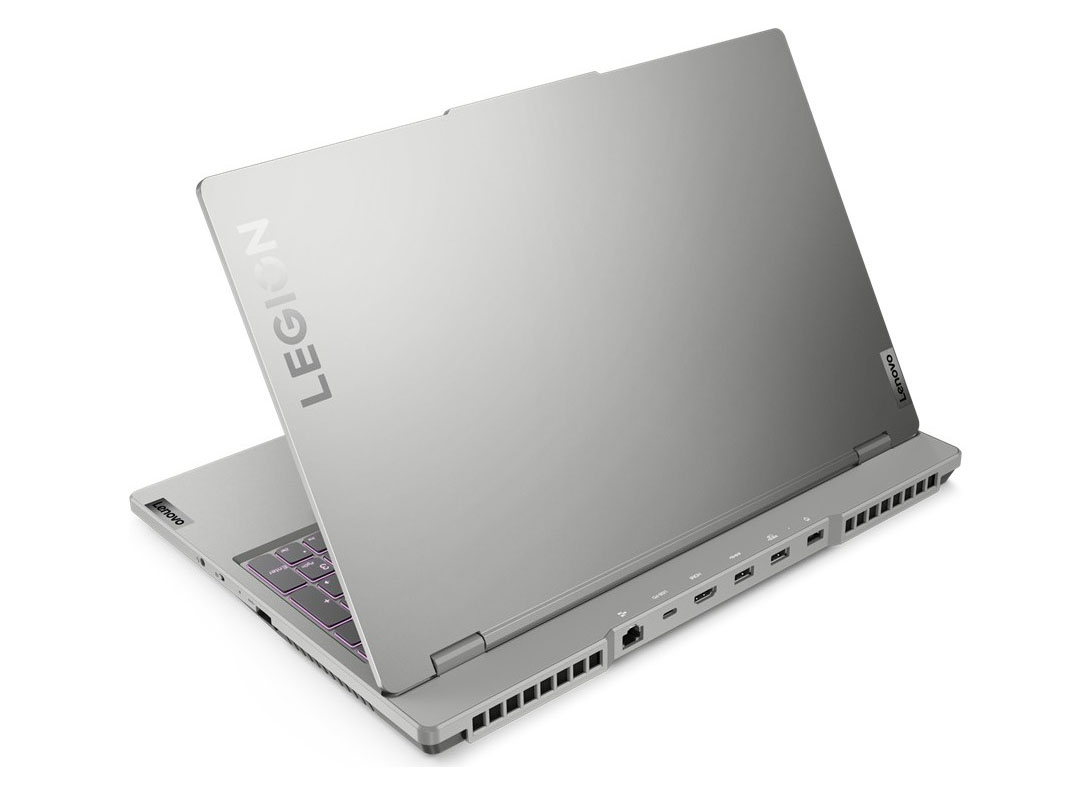
Estojo - Legion Com um traço do ThinkBook
O chassi mantém a estética geral do modelo do ano passado, mas com cantos arredondados em todos os lados e grelhas de ventilação redesenhadas. O visual de limpeza se assemelha mais ao Série ThinkBook o que provavelmente não é uma coincidência. Quando comparada à série concorrente Asus TUF/ROG ou à série MSI, a nova Legion 5 15 parece muito menos gamer-y e mais voltada para o semi-profissional.
A rigidez do chassi é forte, mas não é bem lá em cima com o Lâmina Razer série. Ao tentar torcer a base, por exemplo, a Lenovo exibiria um pouco mais de empenos e rangidos e o mesmo pode ser dito de sua exibição. As dobradiças são satisfatórias, mas não tão fortes quanto as dobradiças superdimensionadas da série Asus TUF.
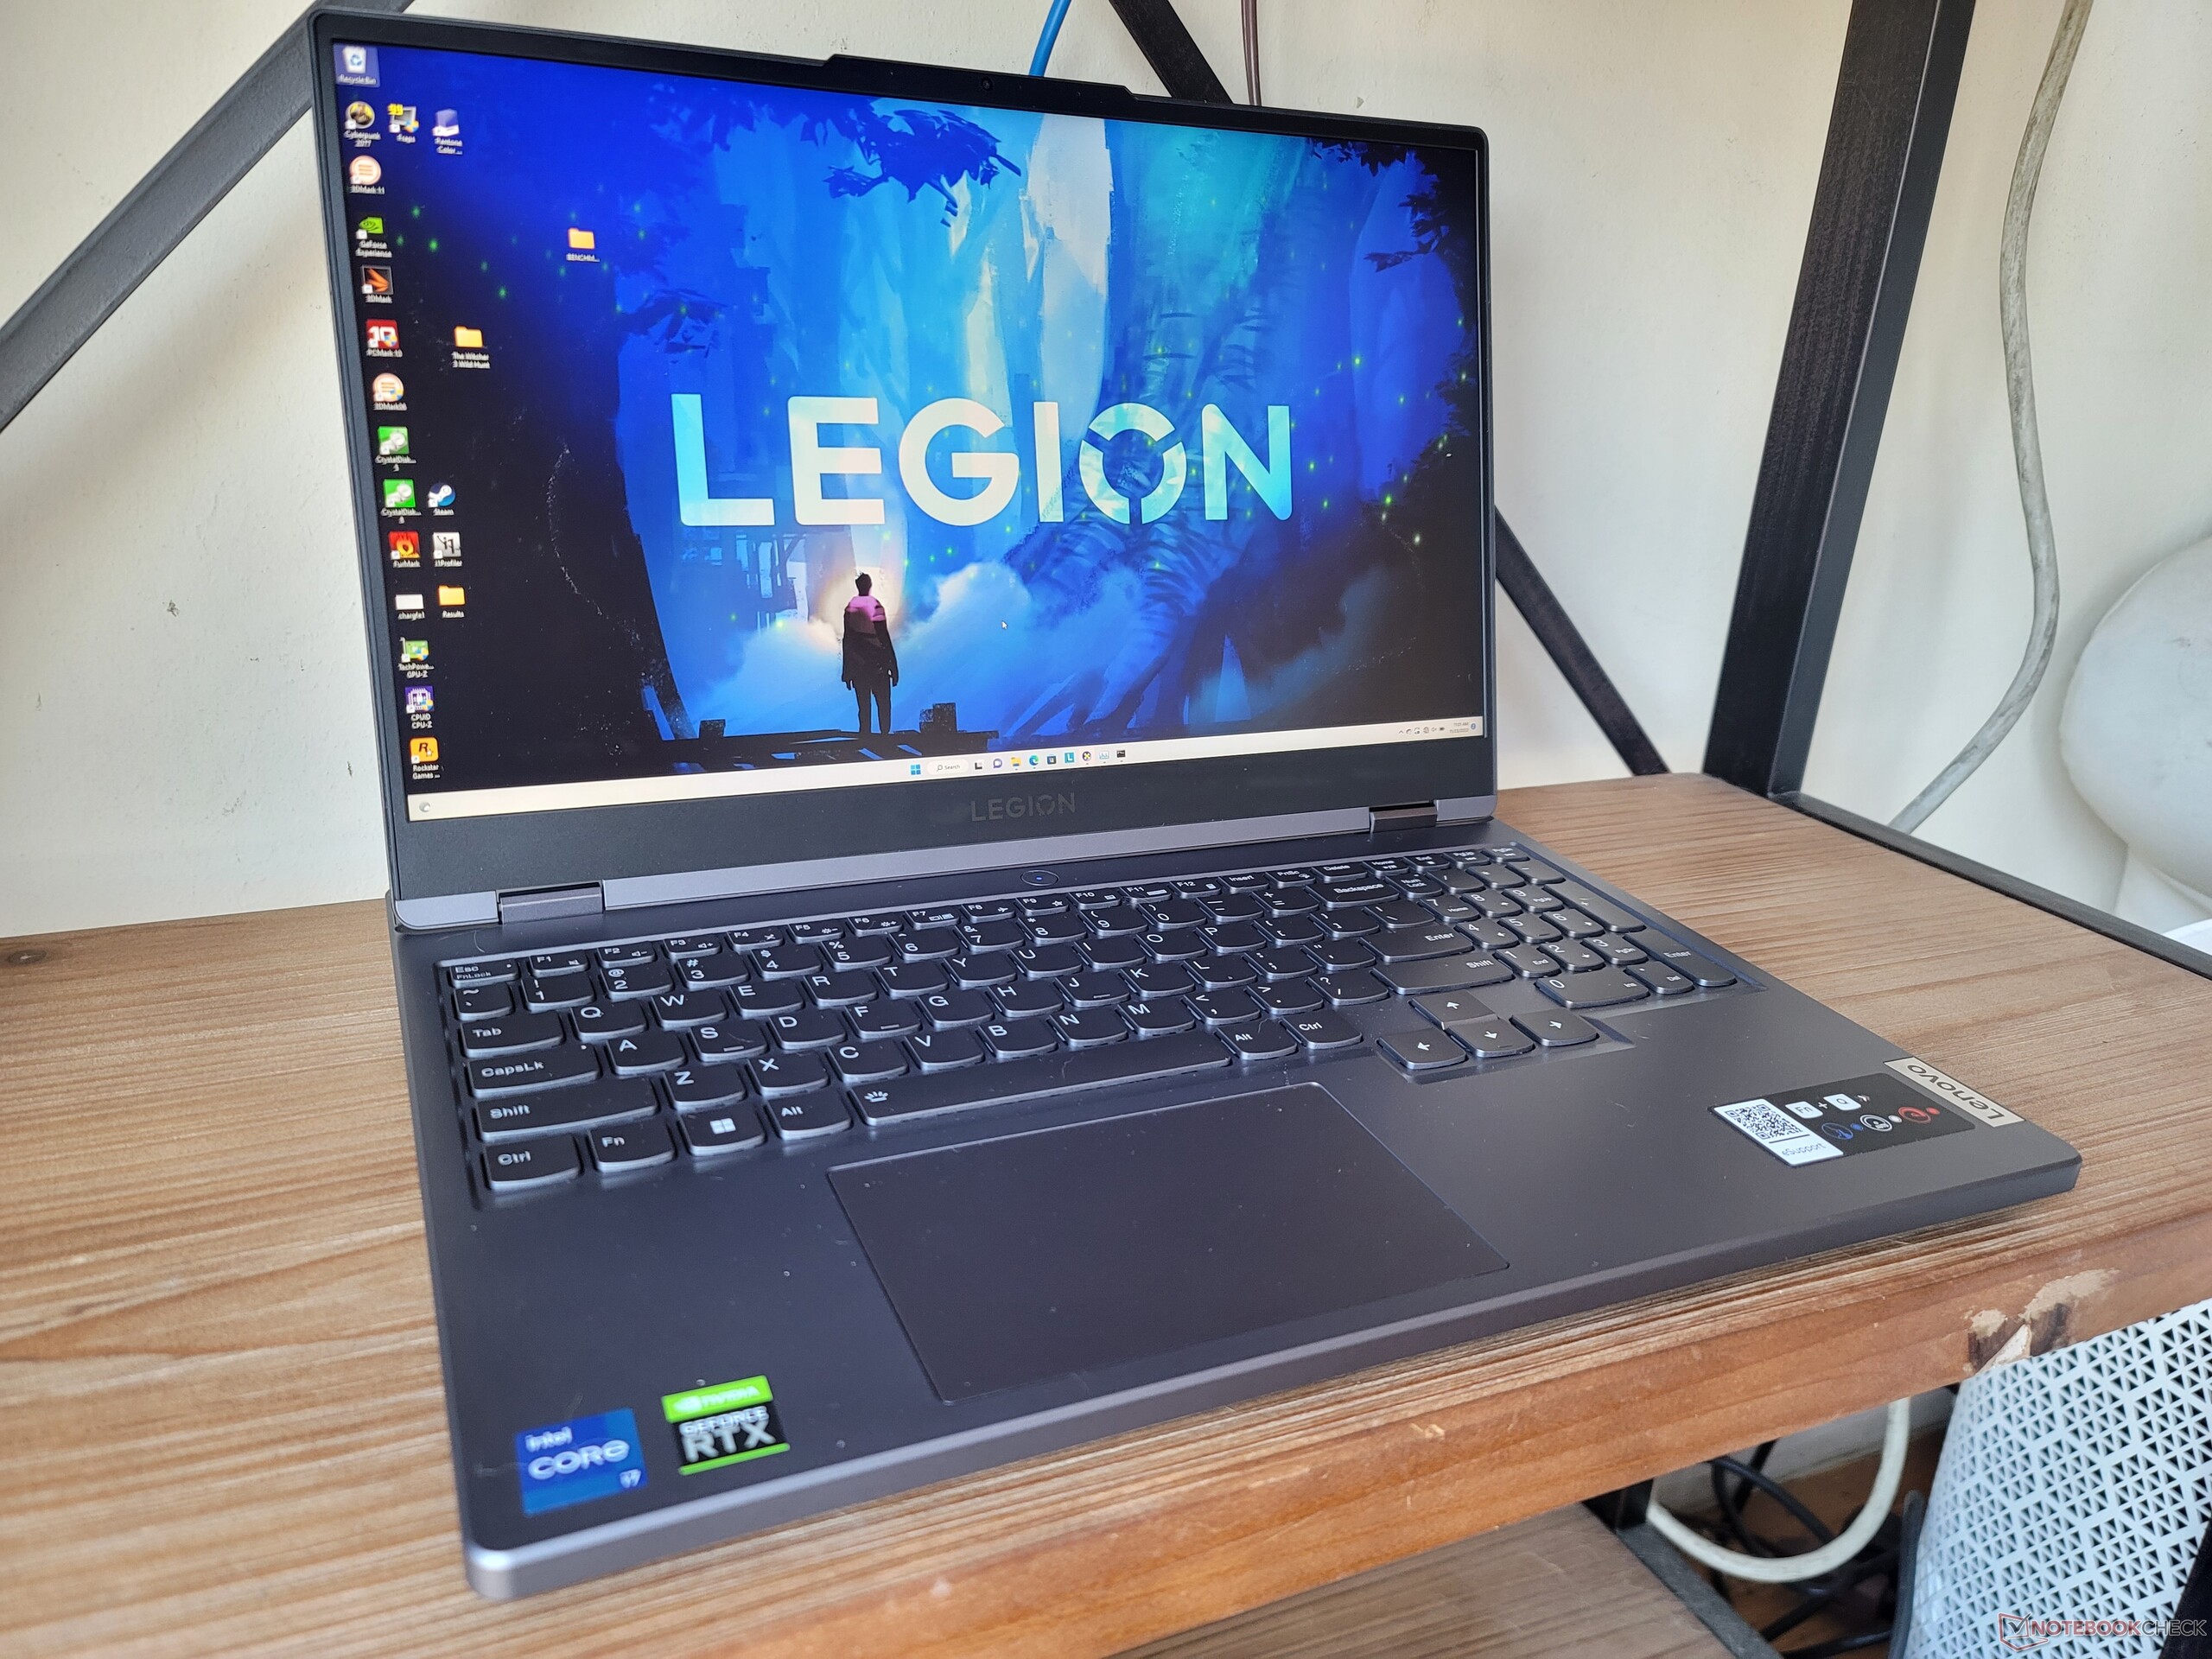
O modelo é mais largo e, portanto, mais pesado que muitos outros laptops de 15,6 polegadas devido à grande parte traseira protuberante do design Legion. Embora isto ajude no resfriamento e no desempenho, o inconveniente é um laptop mais desajeitado que não é tão adequado para viajar como muitas alternativas como a Razer Blade 15 Base Edition.
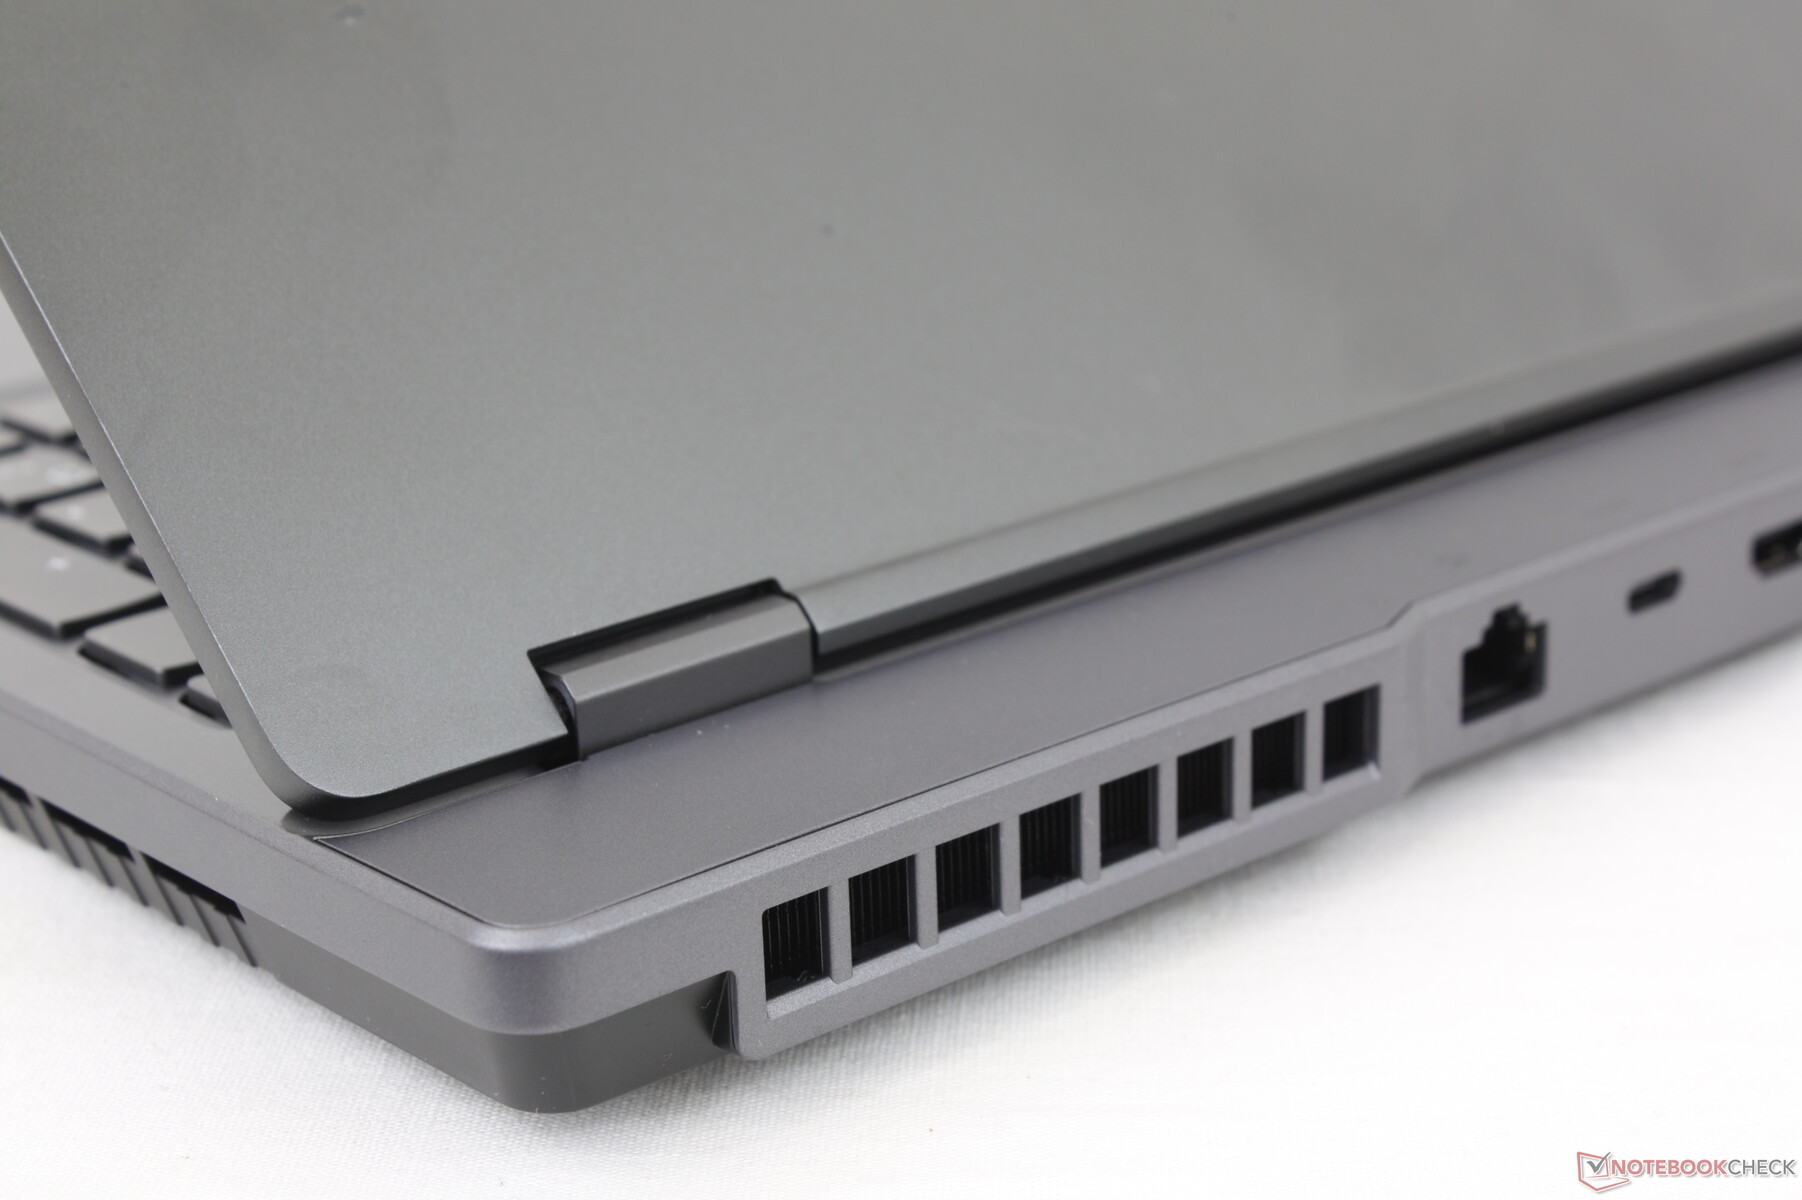
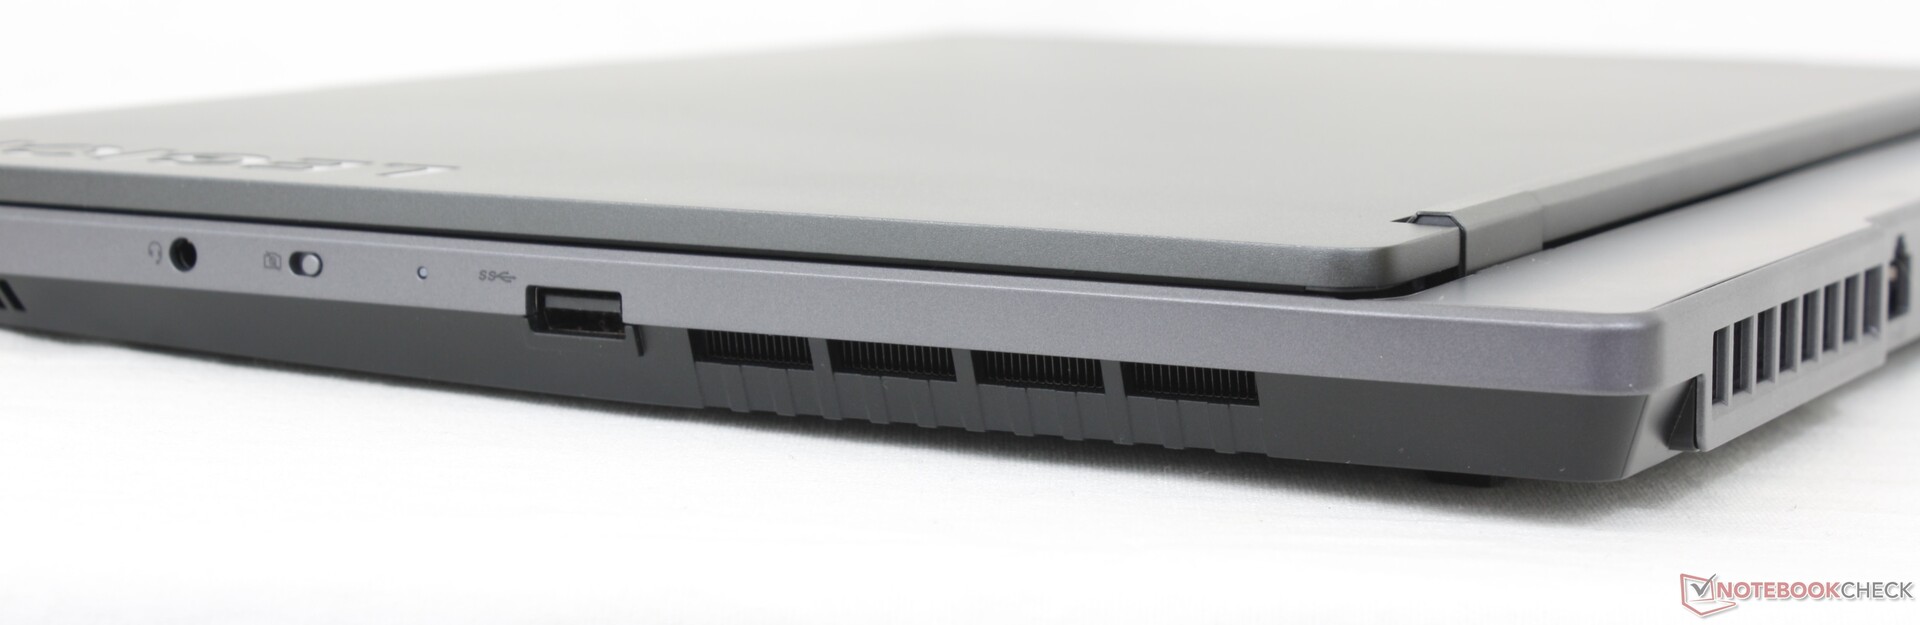
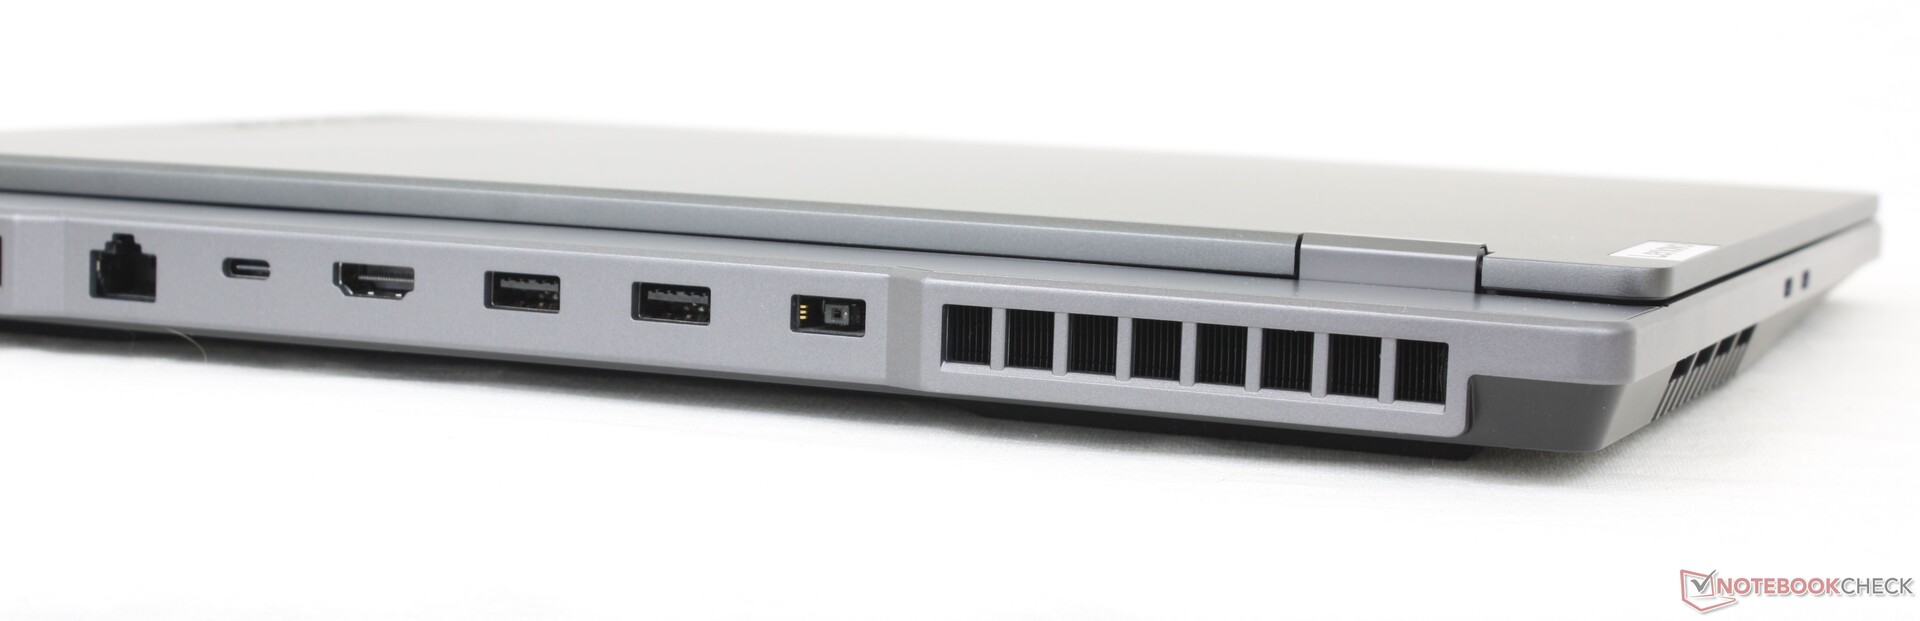
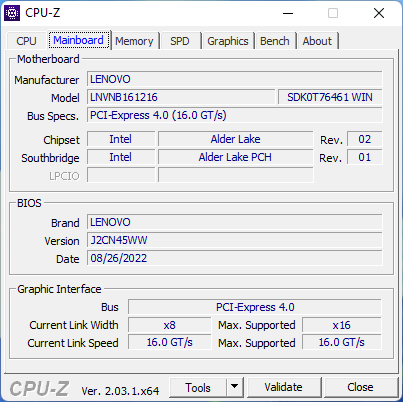
Conectividade - Suporte Thunderbolt 4
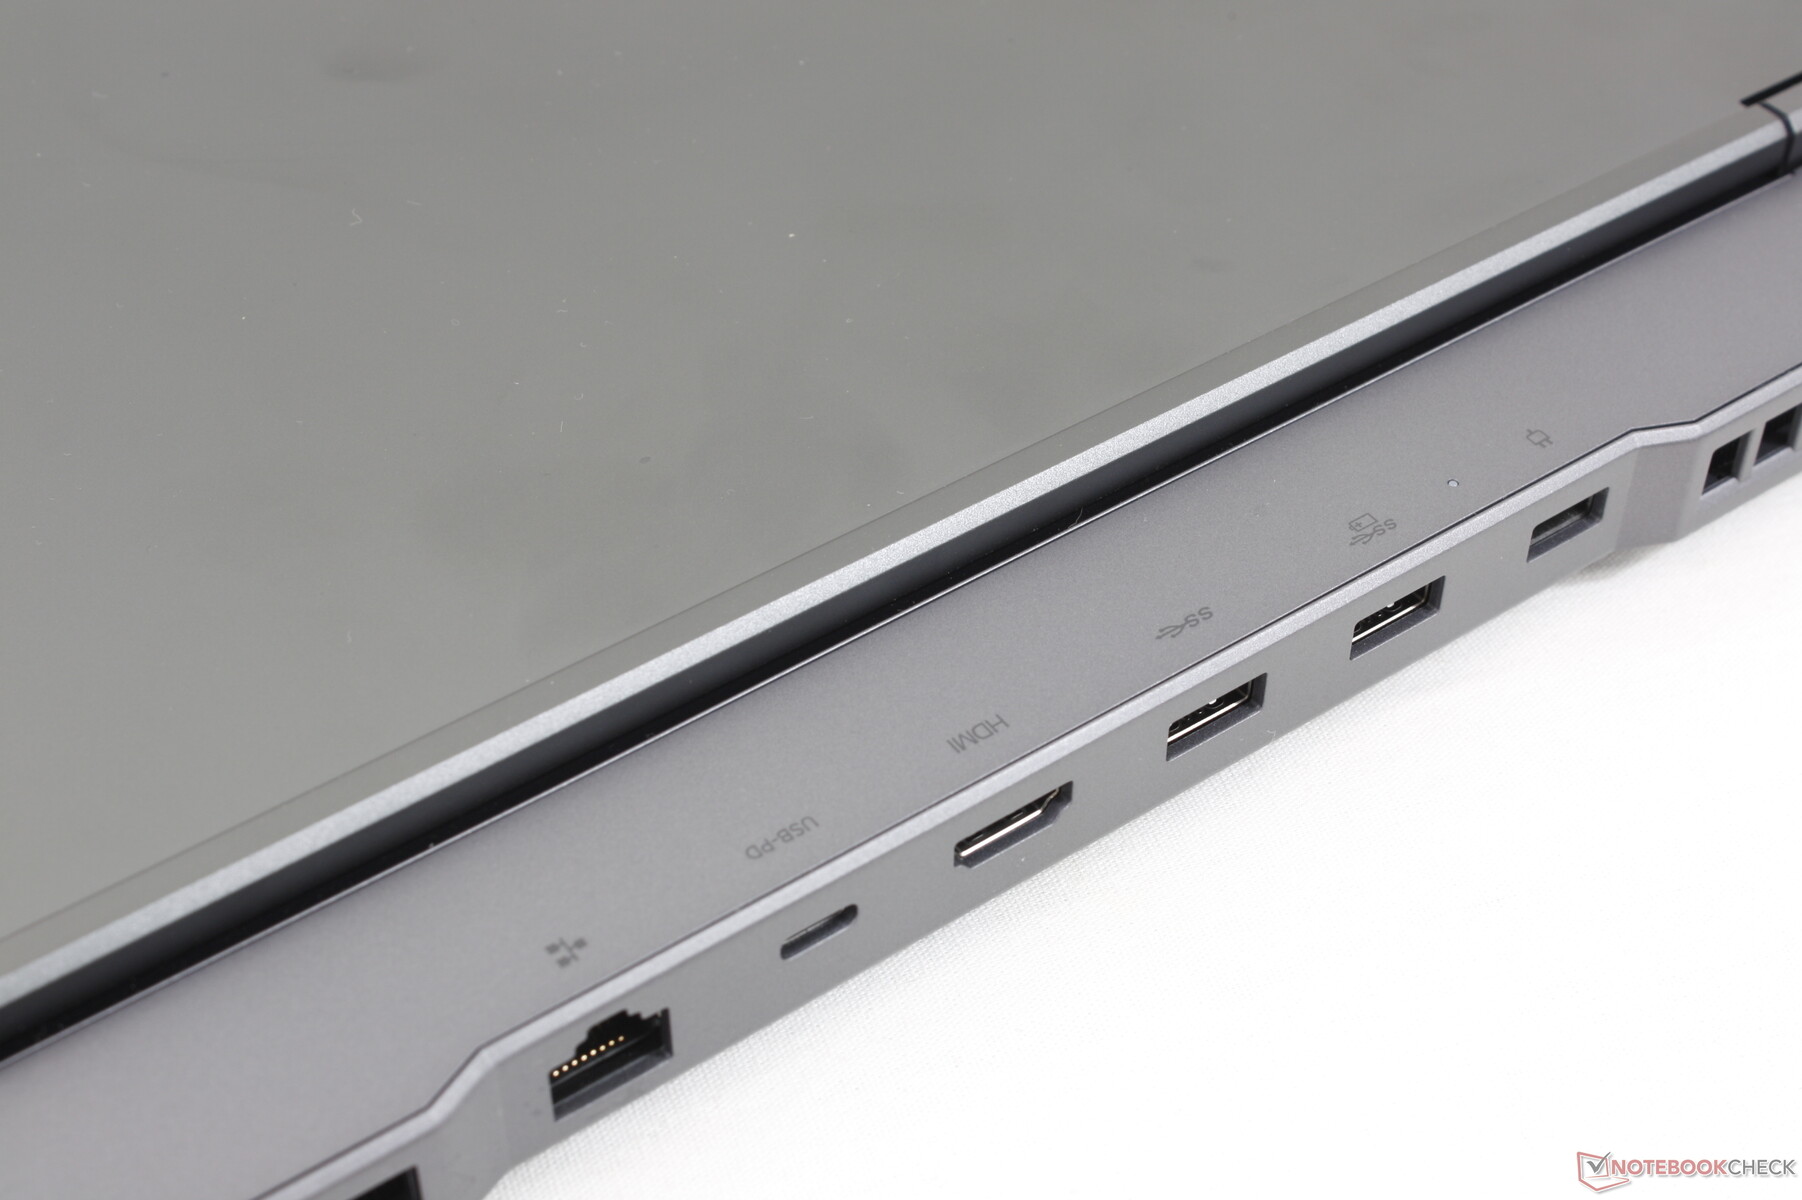
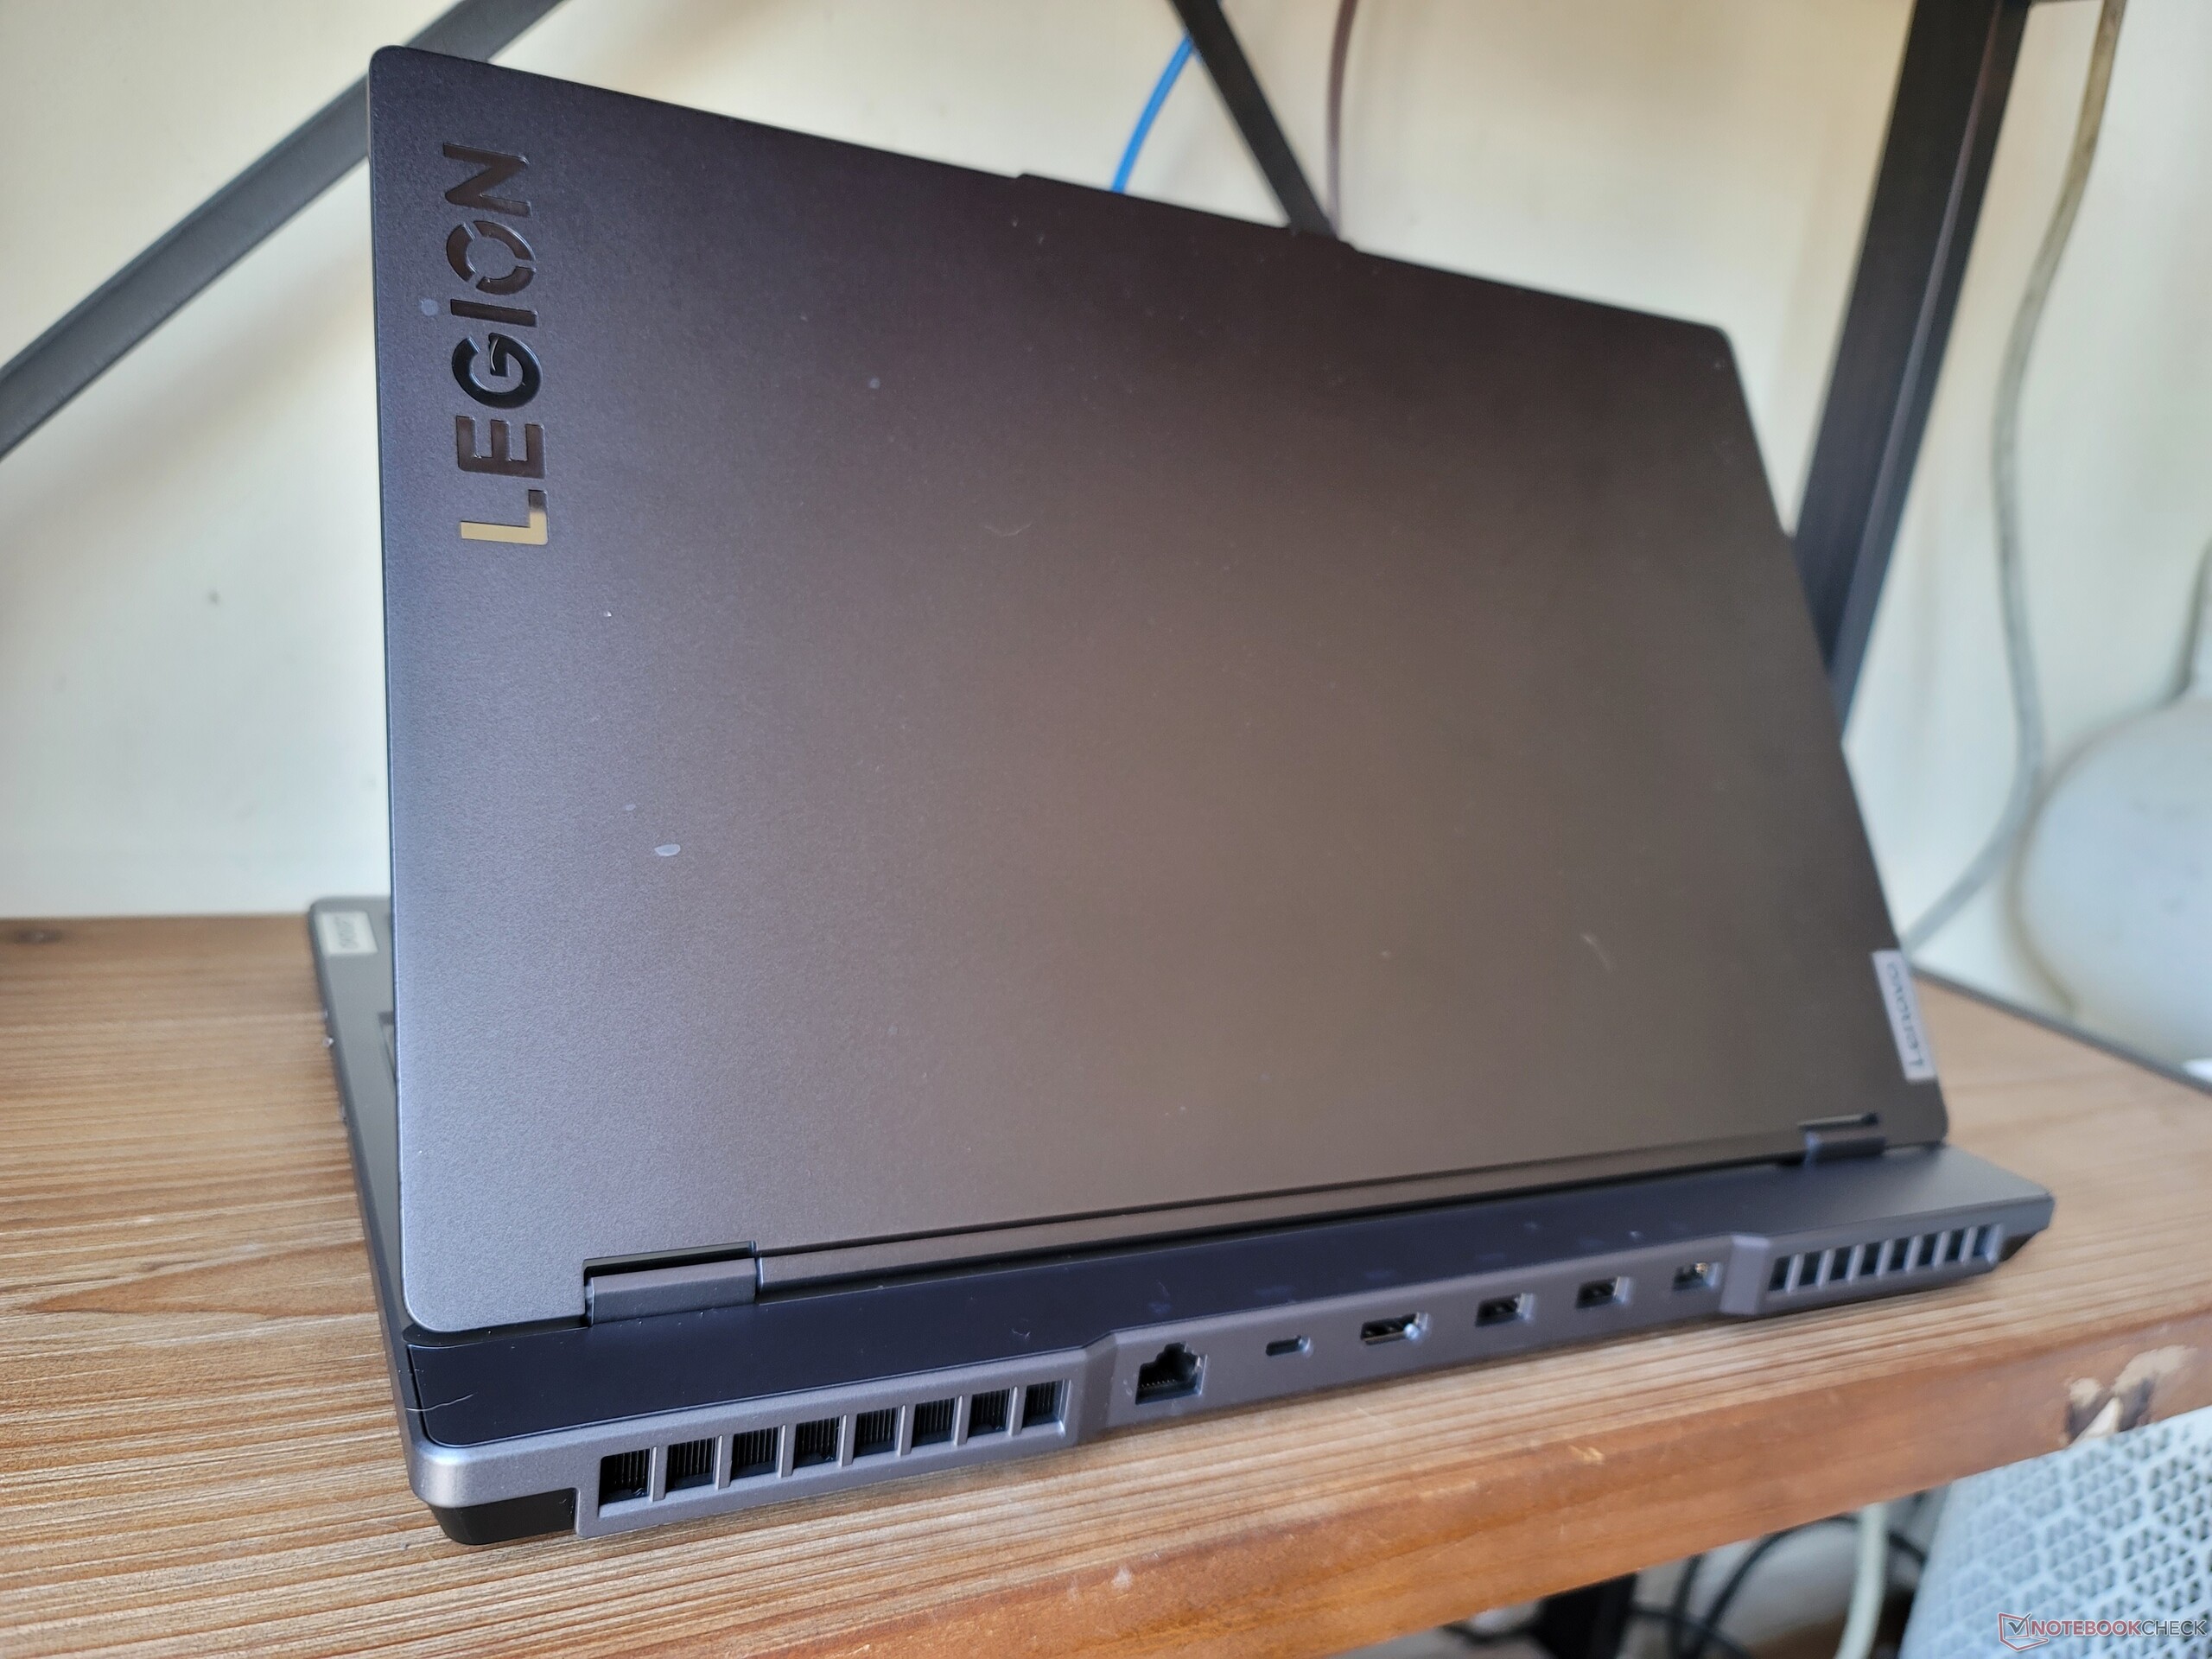
Quando comparado com o modelo AMD 2021, nosso modelo Intel troca uma porta USB-A por uma porta USB-C. As opções de porta são idênticas entre os dois modelos, embora com posicionamento rearranjado. A maioria das portas estão ao longo da traseira, ao contrário da maioria dos outros laptops para melhor ou pior.
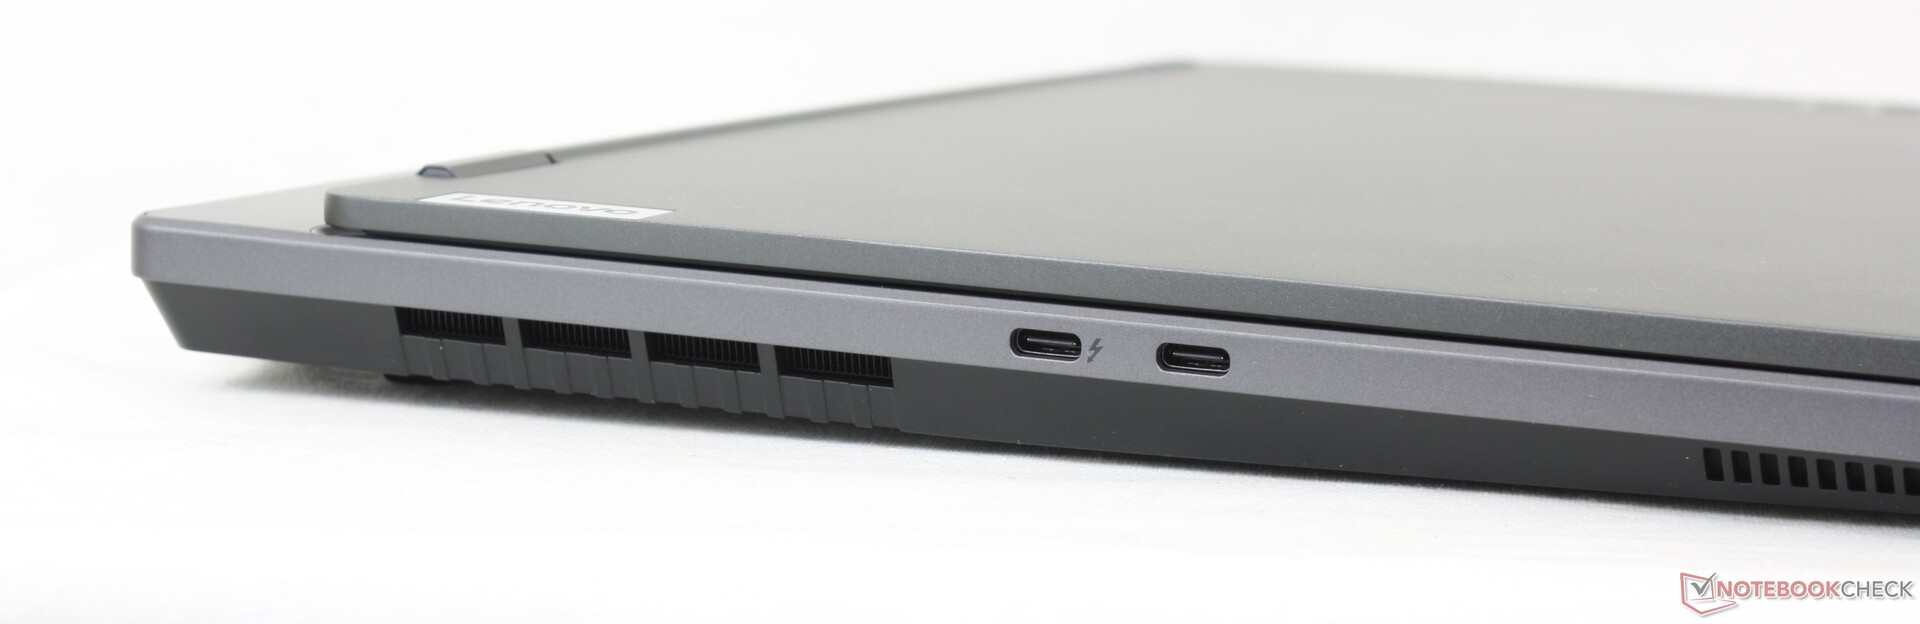
O Thunderbolt 4 é suportado somente na porta USB-C rotulada ao longo da borda esquerda.
Comunicação
O Intel AX211 vem como padrão na maioria das SKUs para compatibilidade com Wi-Fi 6E e Bluetooth 5.2. Não tivemos nenhum problema quando emparelhados com nossa rede de 6 GHz.
| Networking | |
| iperf3 transmit AX12 | |
| Razer Blade 15 Base Edition 2021, i7-10750H RTX 3060 | |
| Acer Aspire Nitro 5 AN515-55-57GF | |
| MSI Bravo 15 B5DD-010US | |
| Asus TUF Gaming F15 FX507ZM | |
| Lenovo Legion 5 15ACH-82JU00C6GE-FL | |
| iperf3 receive AX12 | |
| Razer Blade 15 Base Edition 2021, i7-10750H RTX 3060 | |
| Asus TUF Gaming F15 FX507ZM | |
| MSI Bravo 15 B5DD-010US | |
| Lenovo Legion 5 15ACH-82JU00C6GE-FL | |
| Acer Aspire Nitro 5 AN515-55-57GF | |
| iperf3 receive AXE11000 6GHz | |
| Lenovo Legion 5 15IAH7H 82RB | |
| iperf3 receive AXE11000 | |
| Lenovo Legion 5 15IAH7H 82RB | |
| iperf3 transmit AXE11000 | |
| Lenovo Legion 5 15IAH7H 82RB | |
| iperf3 transmit AXE11000 6GHz | |
| Lenovo Legion 5 15IAH7H 82RB | |
Webcam - Baixa qualidade de 1 MP
A qualidade da câmera é lamacenta a partir da webcam 720p. Windows Hello também não é suportado.


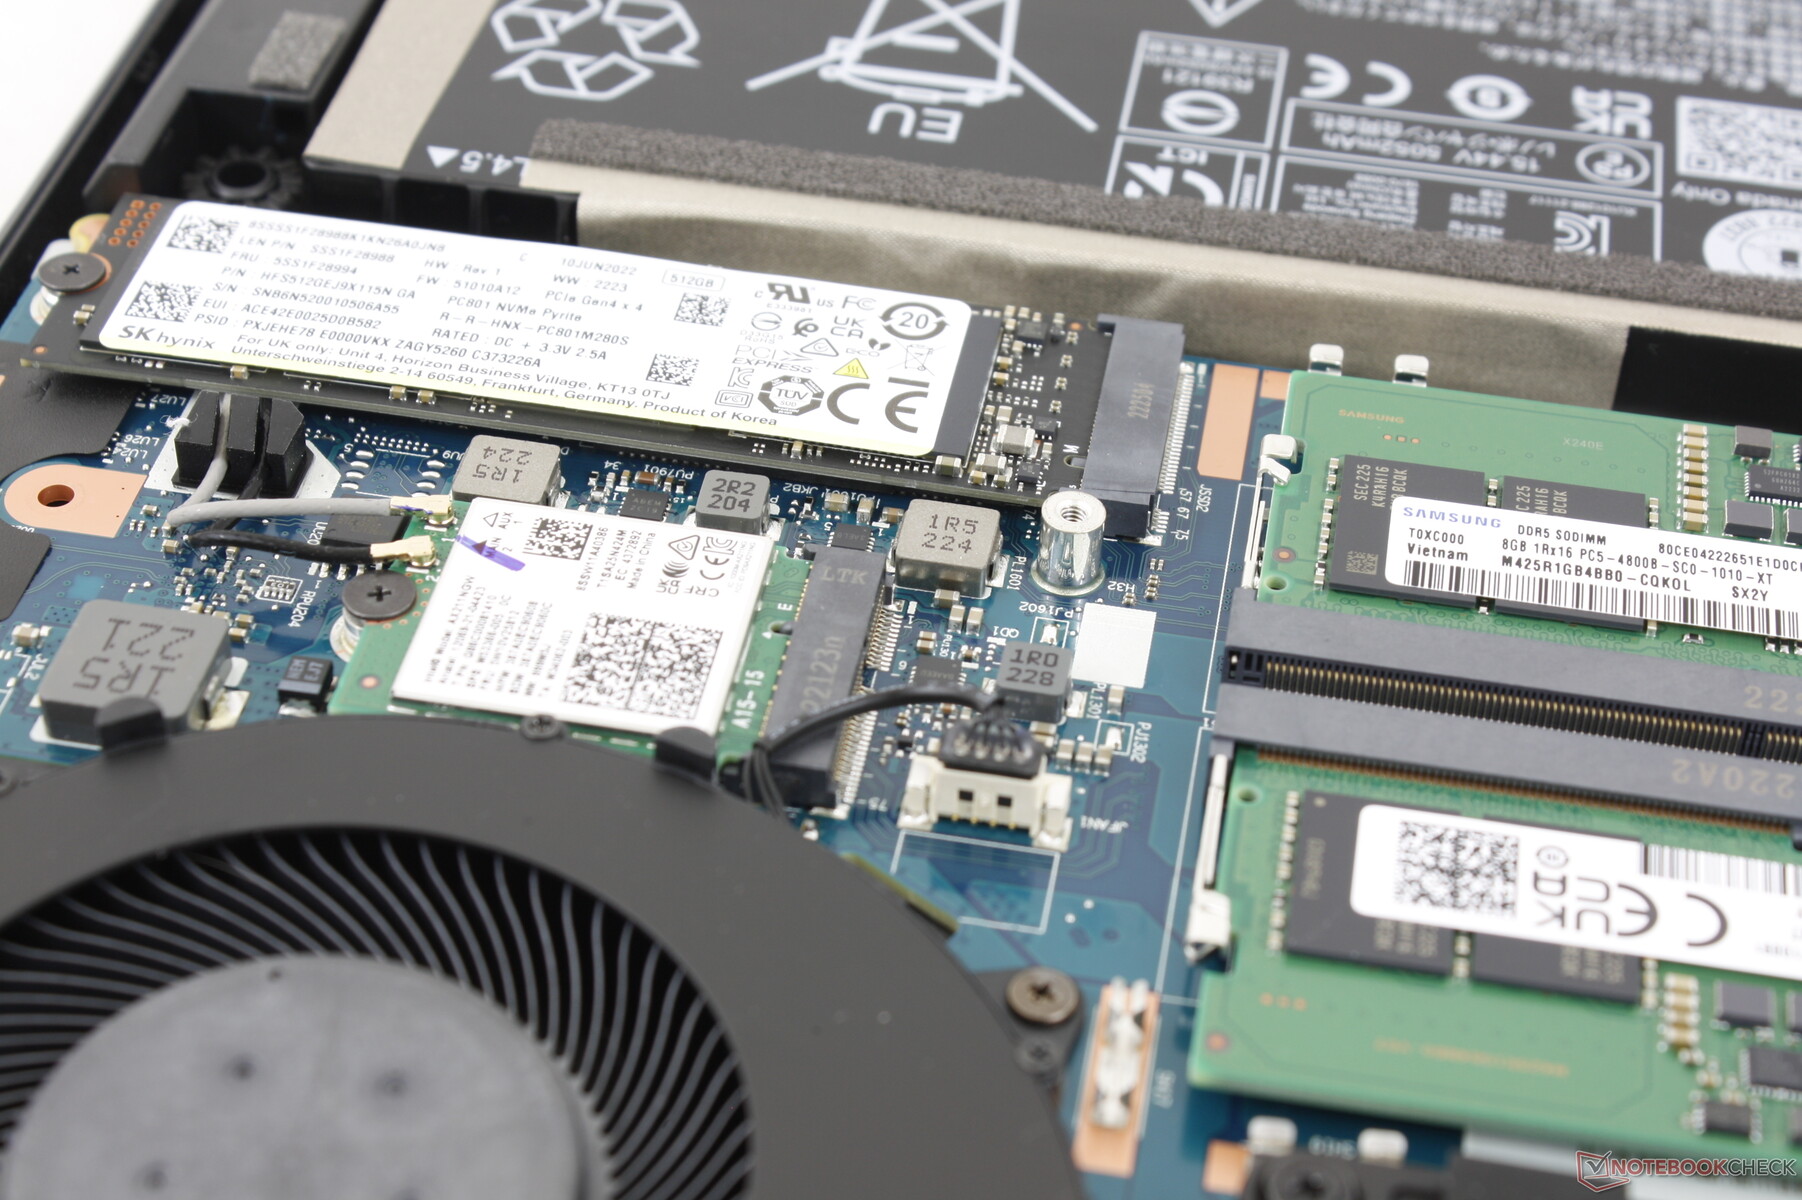
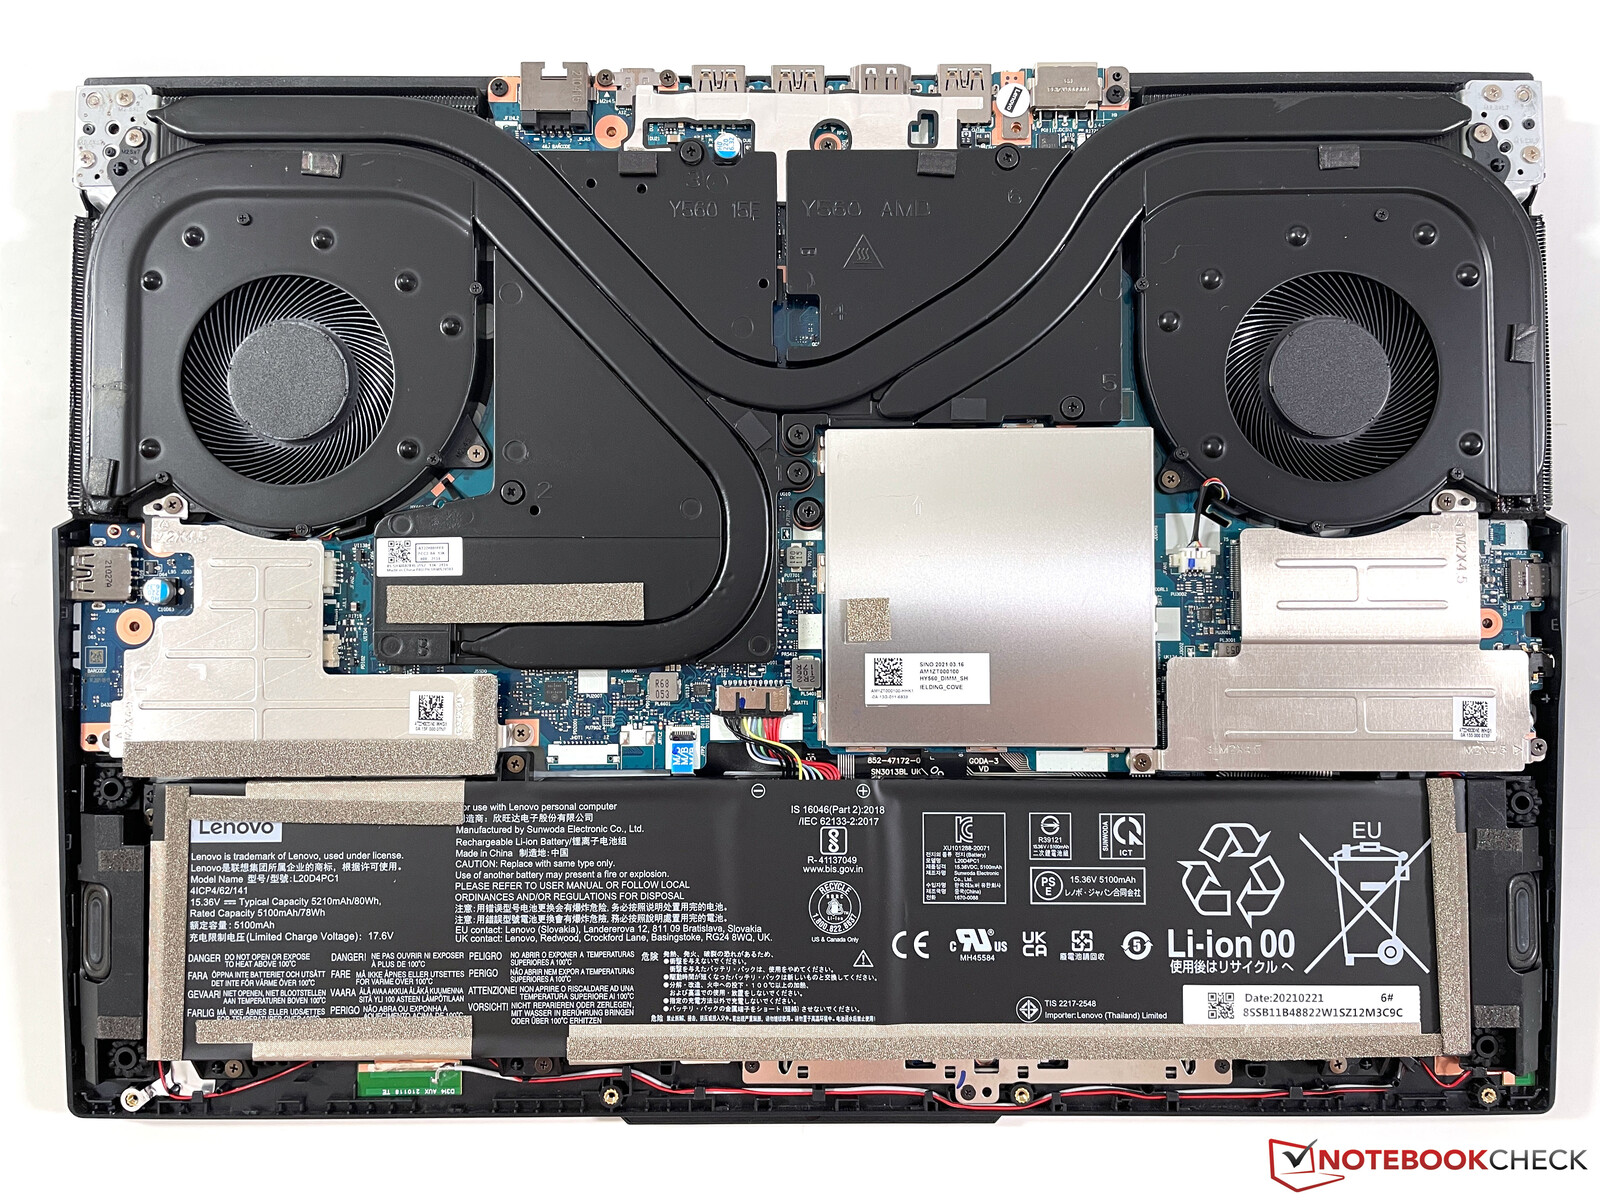
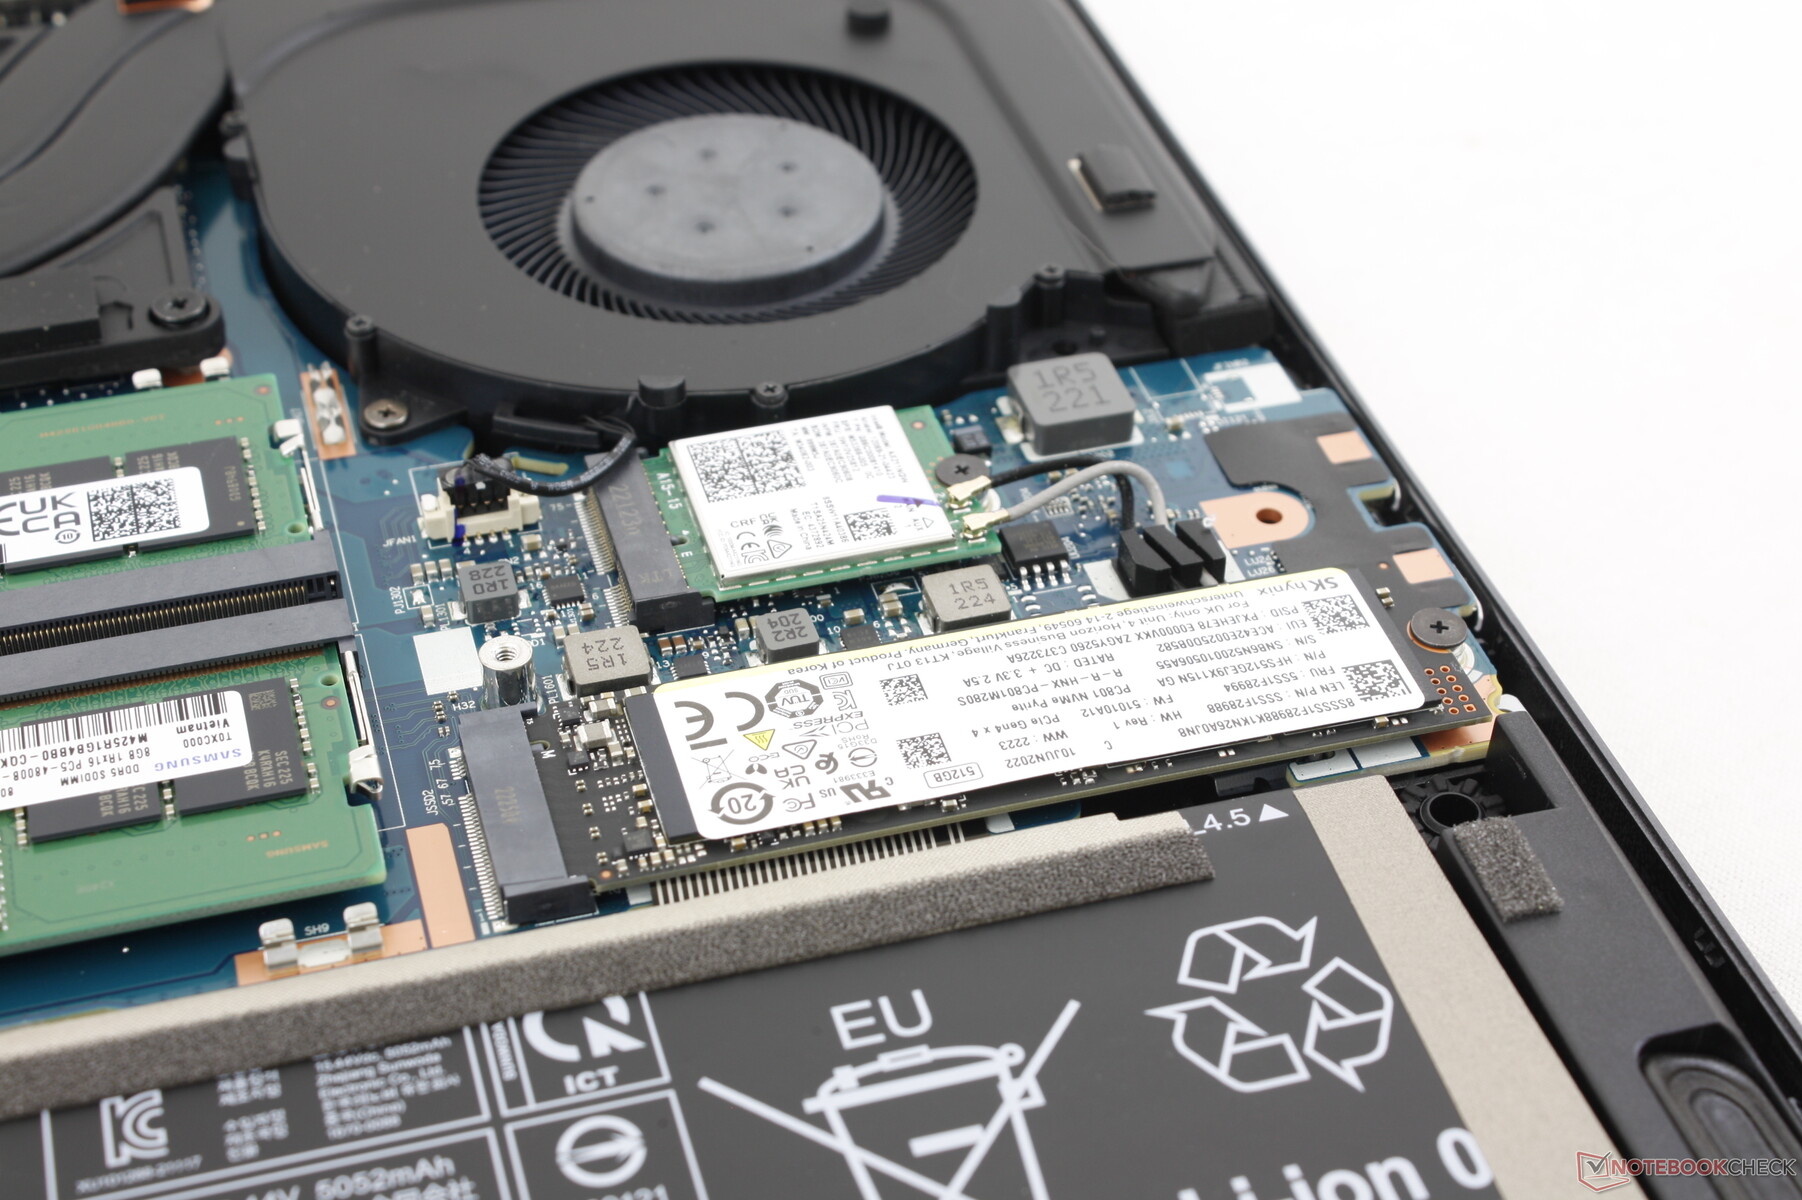
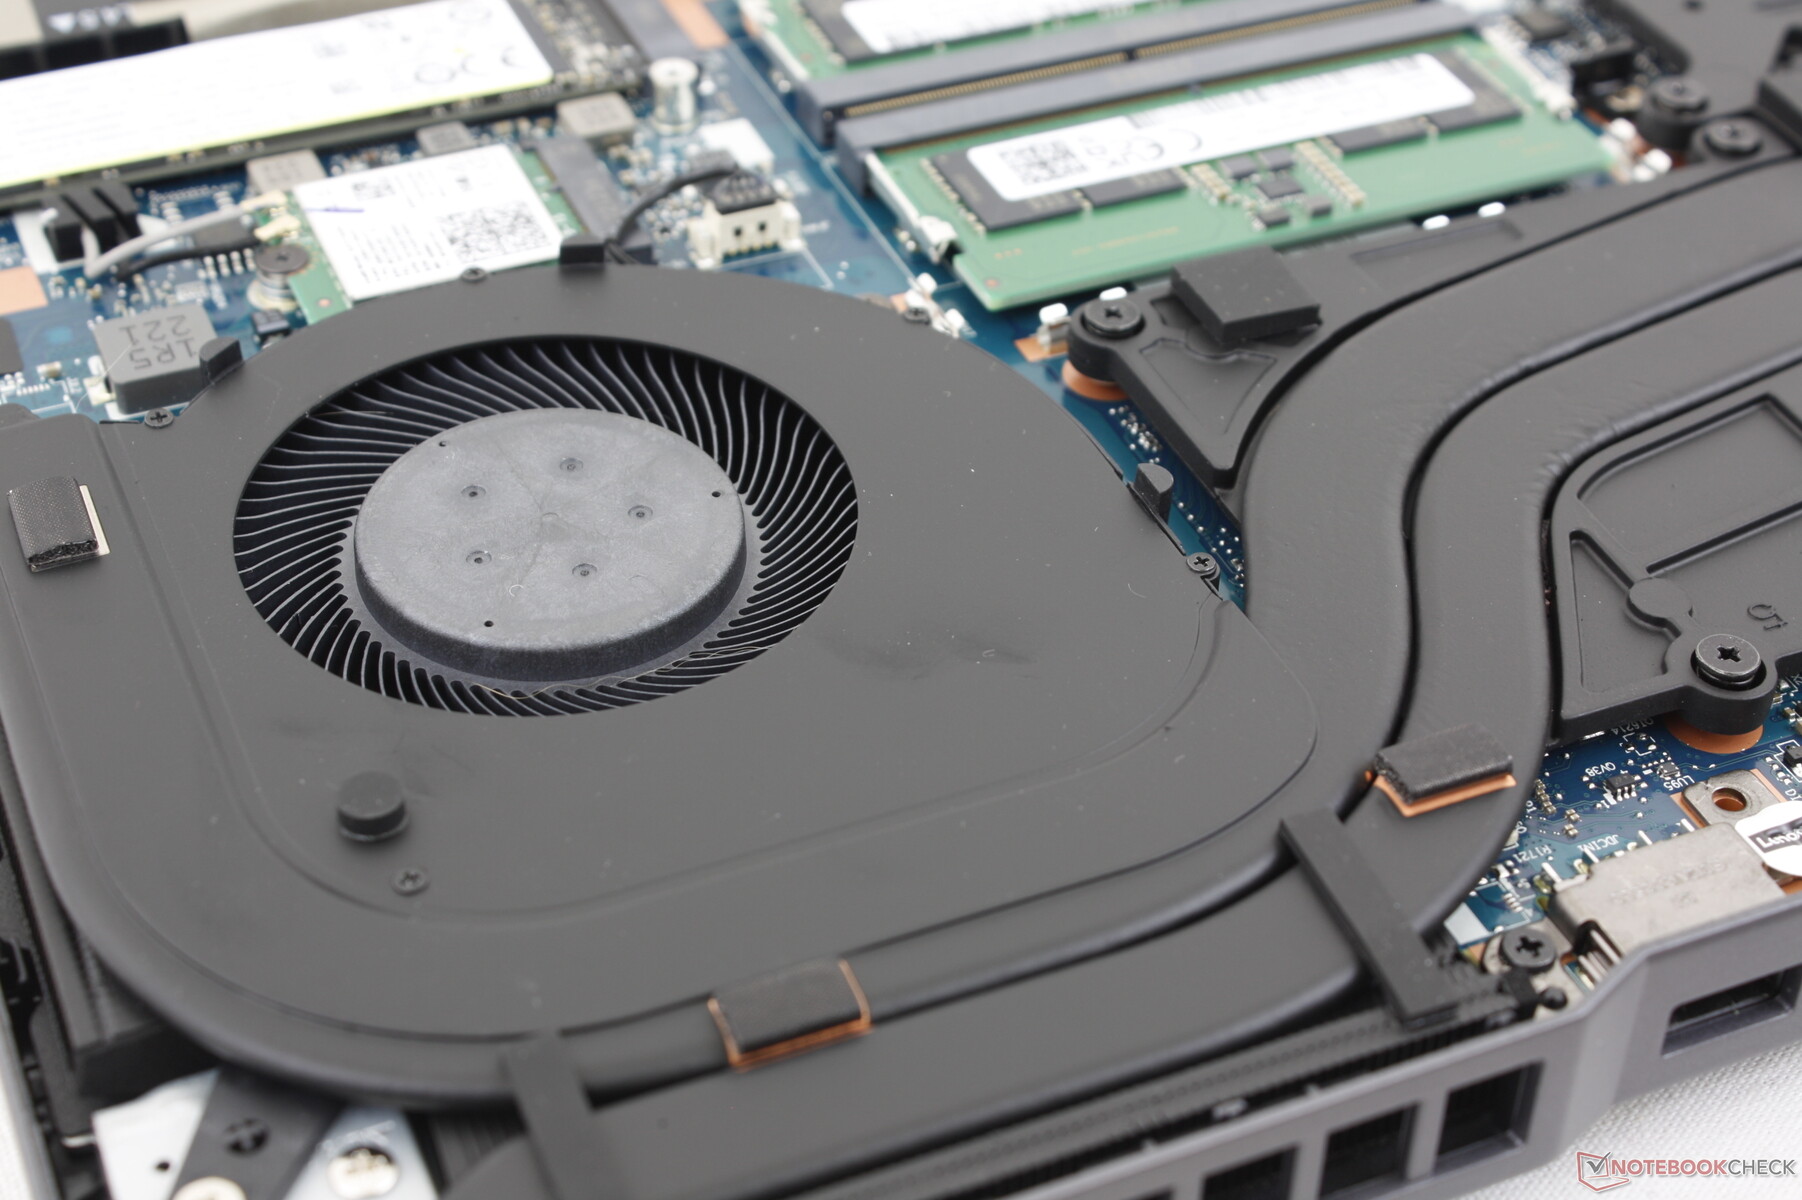
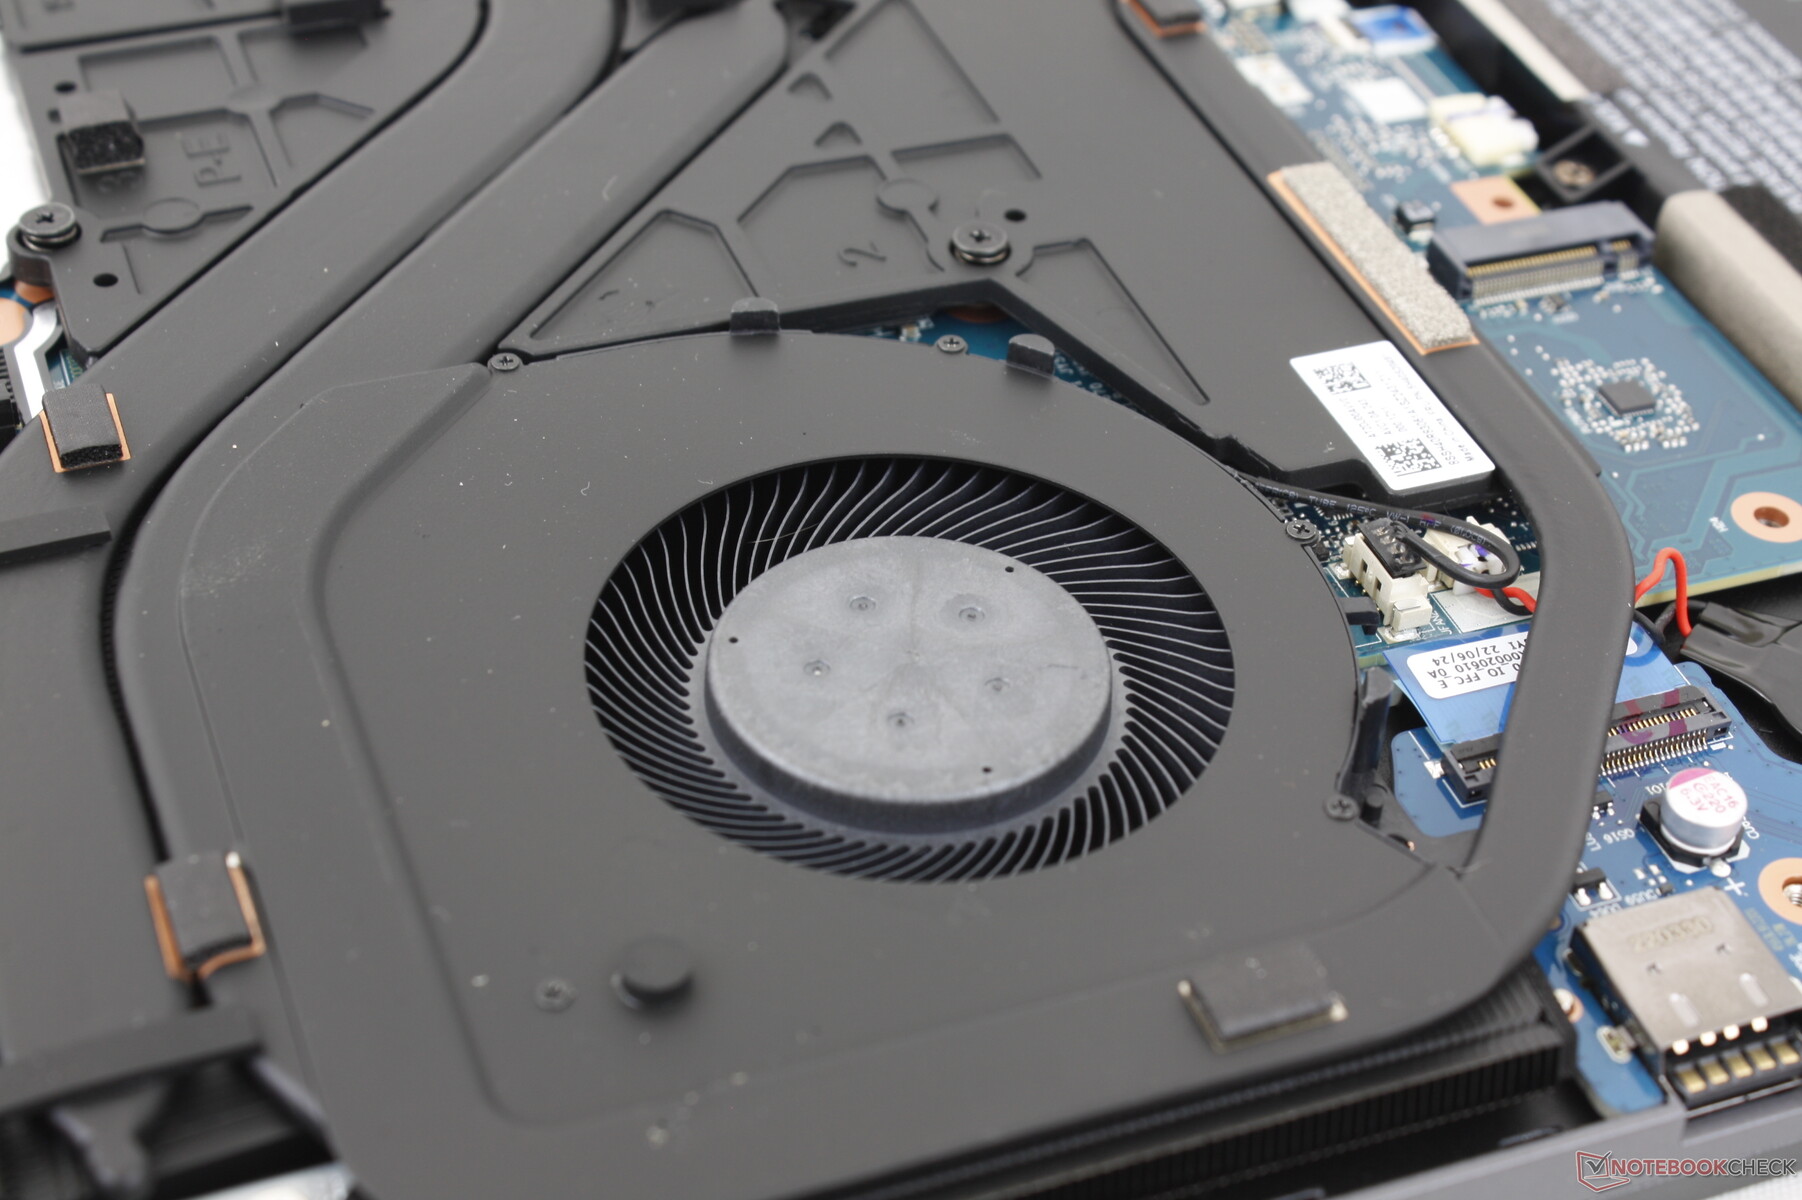
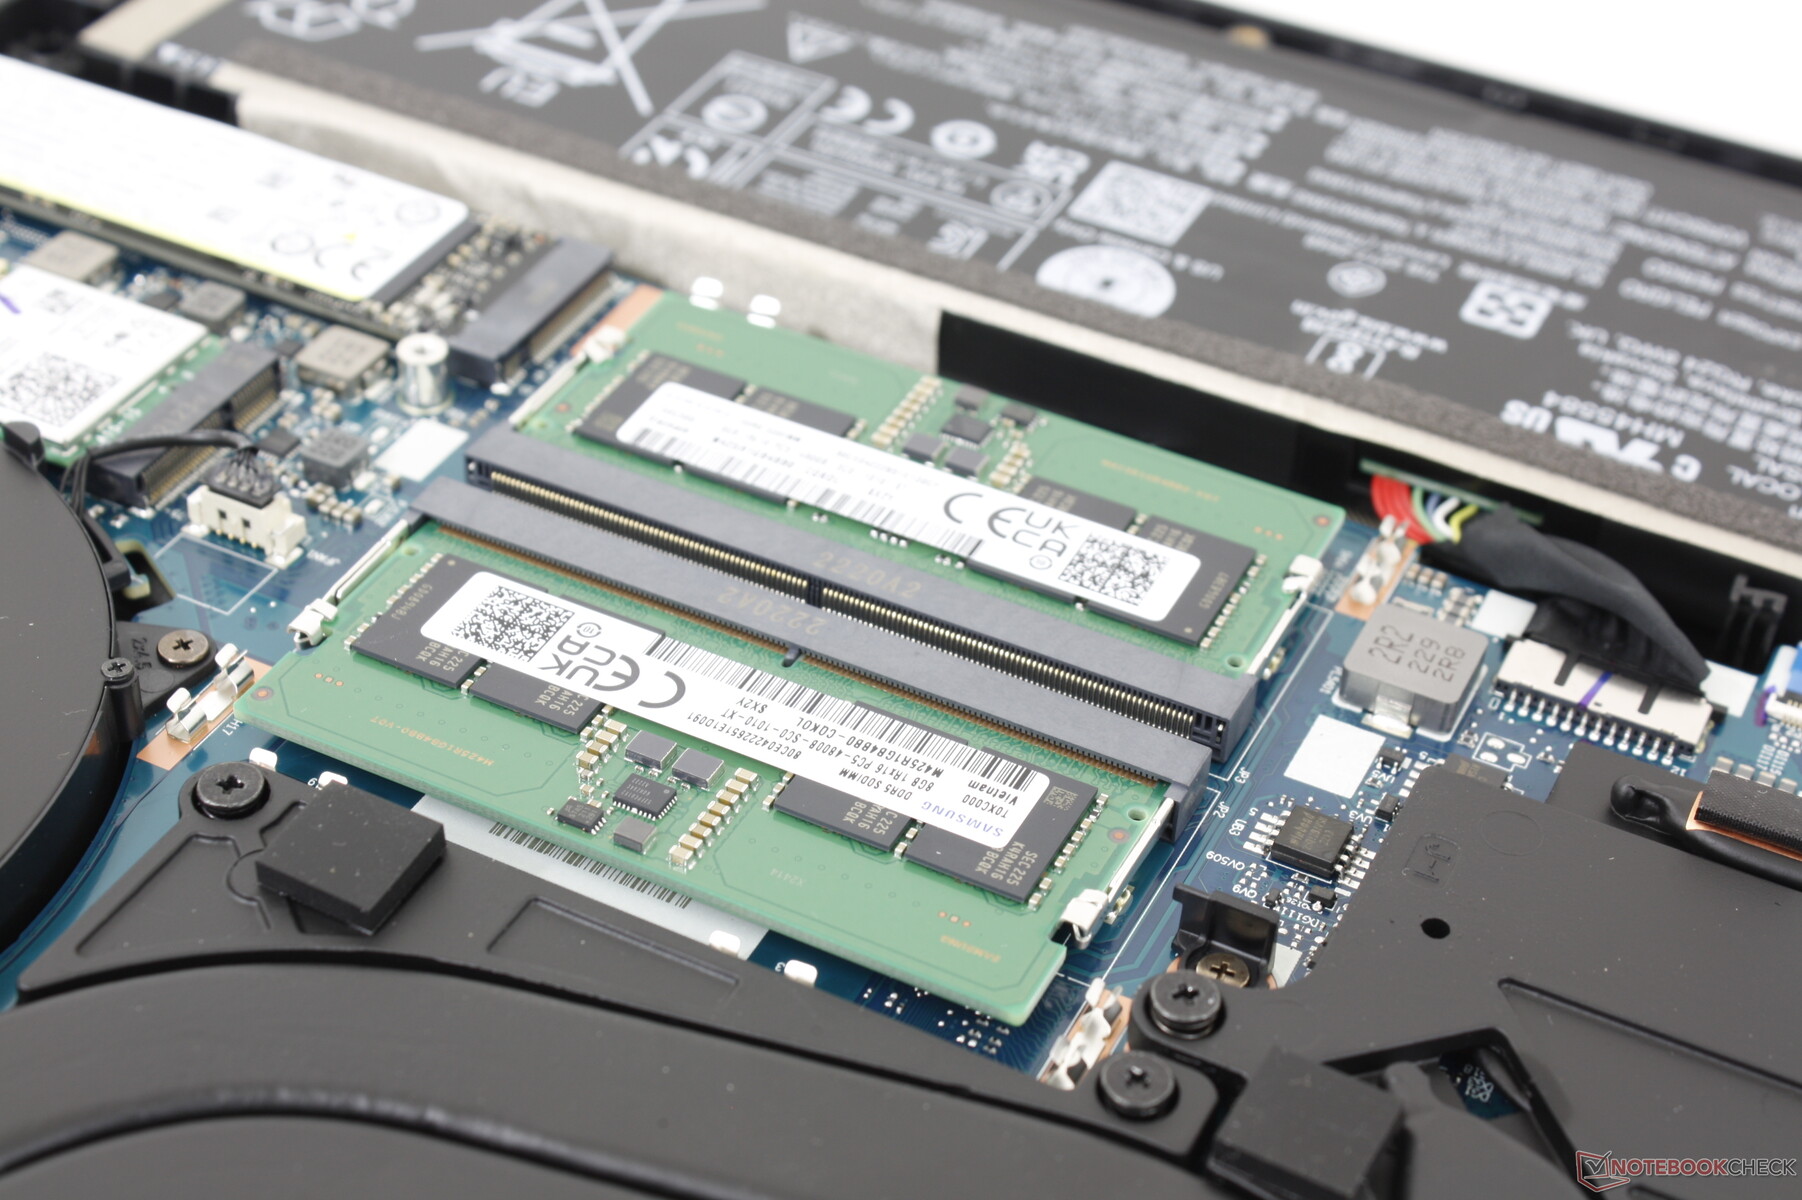
Manutenção
O painel inferior necessitava apenas de uma chave de fenda Philips para ser removido. Os usuários podem adicionar/remover até dois módulos DDR5 SODIMM, dois M.2 PCIe4 x4 2280 SSDs, e um módulo M.2 WLAN.
Acessórios e Garantia
Não há extras na caixa além do adaptador AC e da papelada. Aplica-se a garantia padrão limitada de um ano do fabricante.
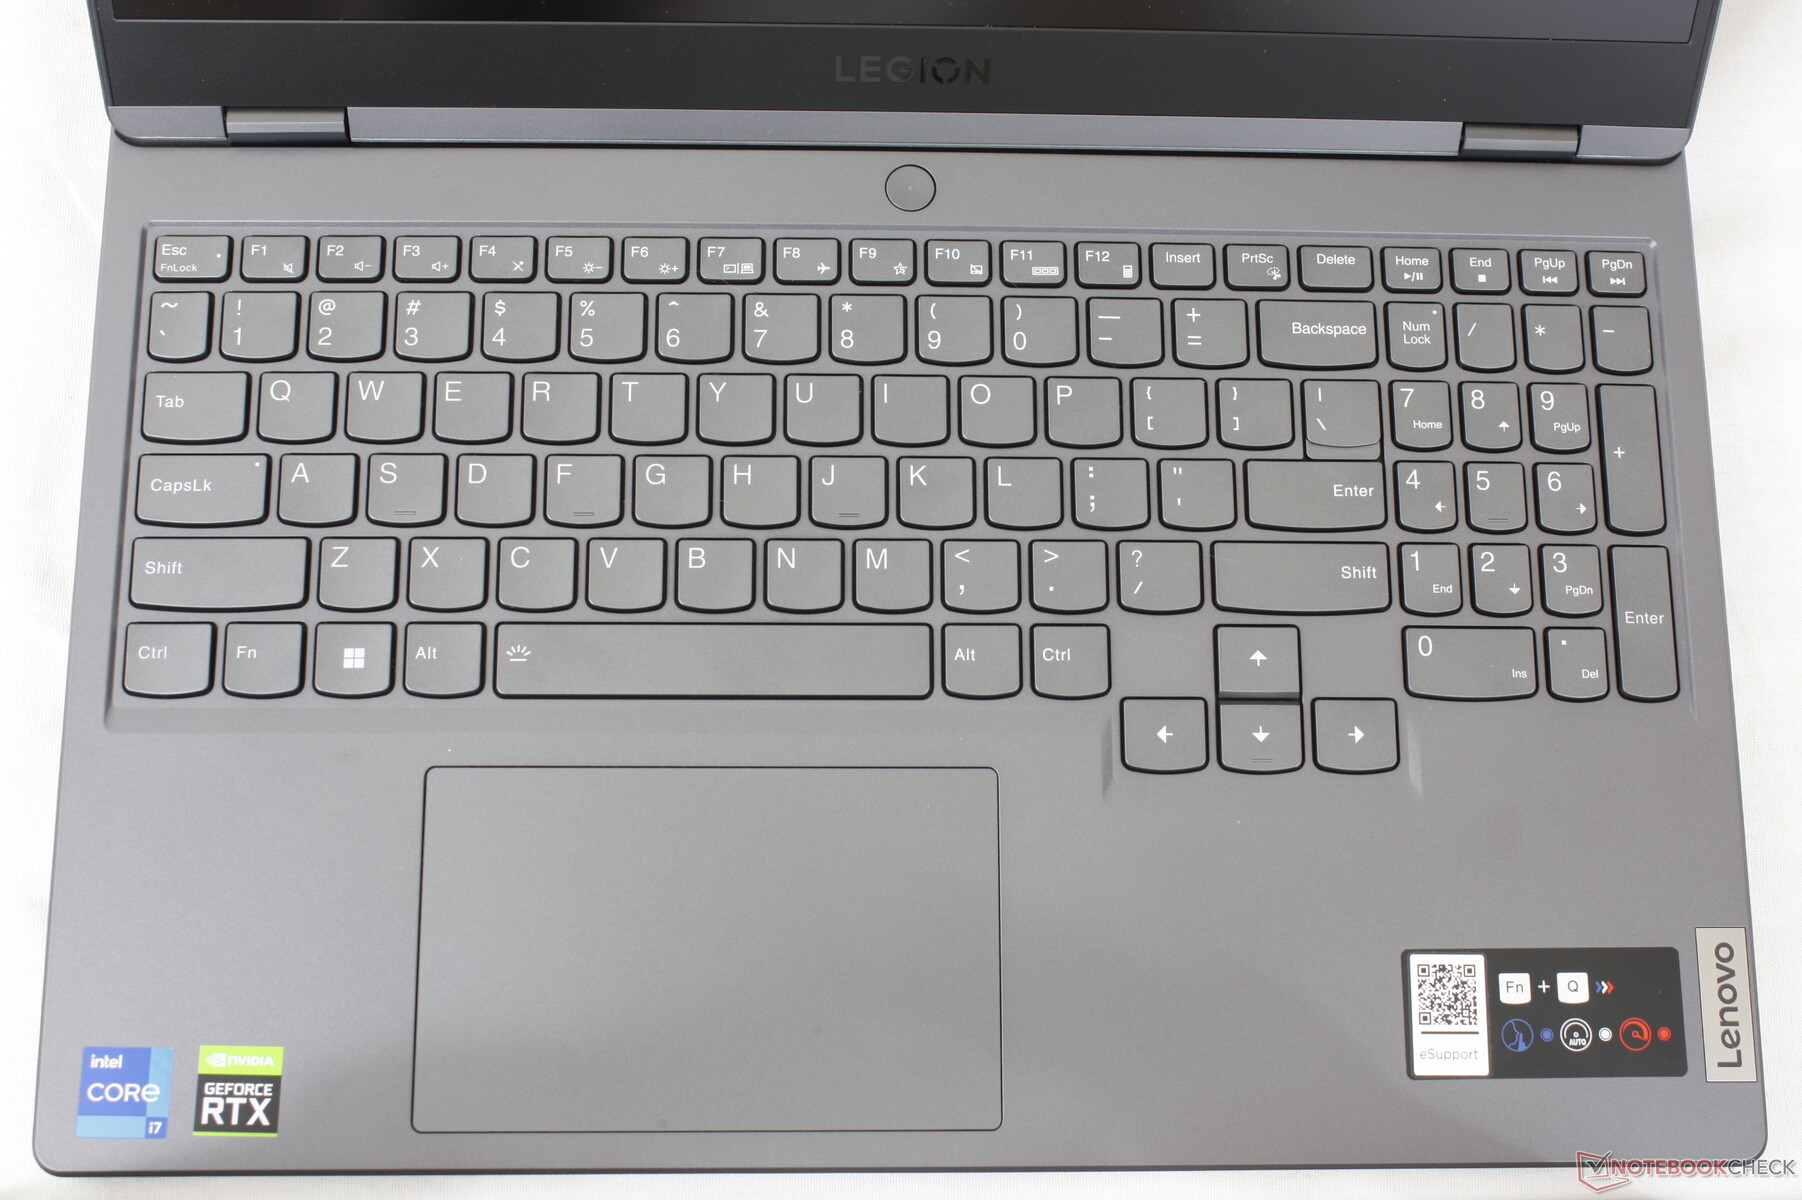
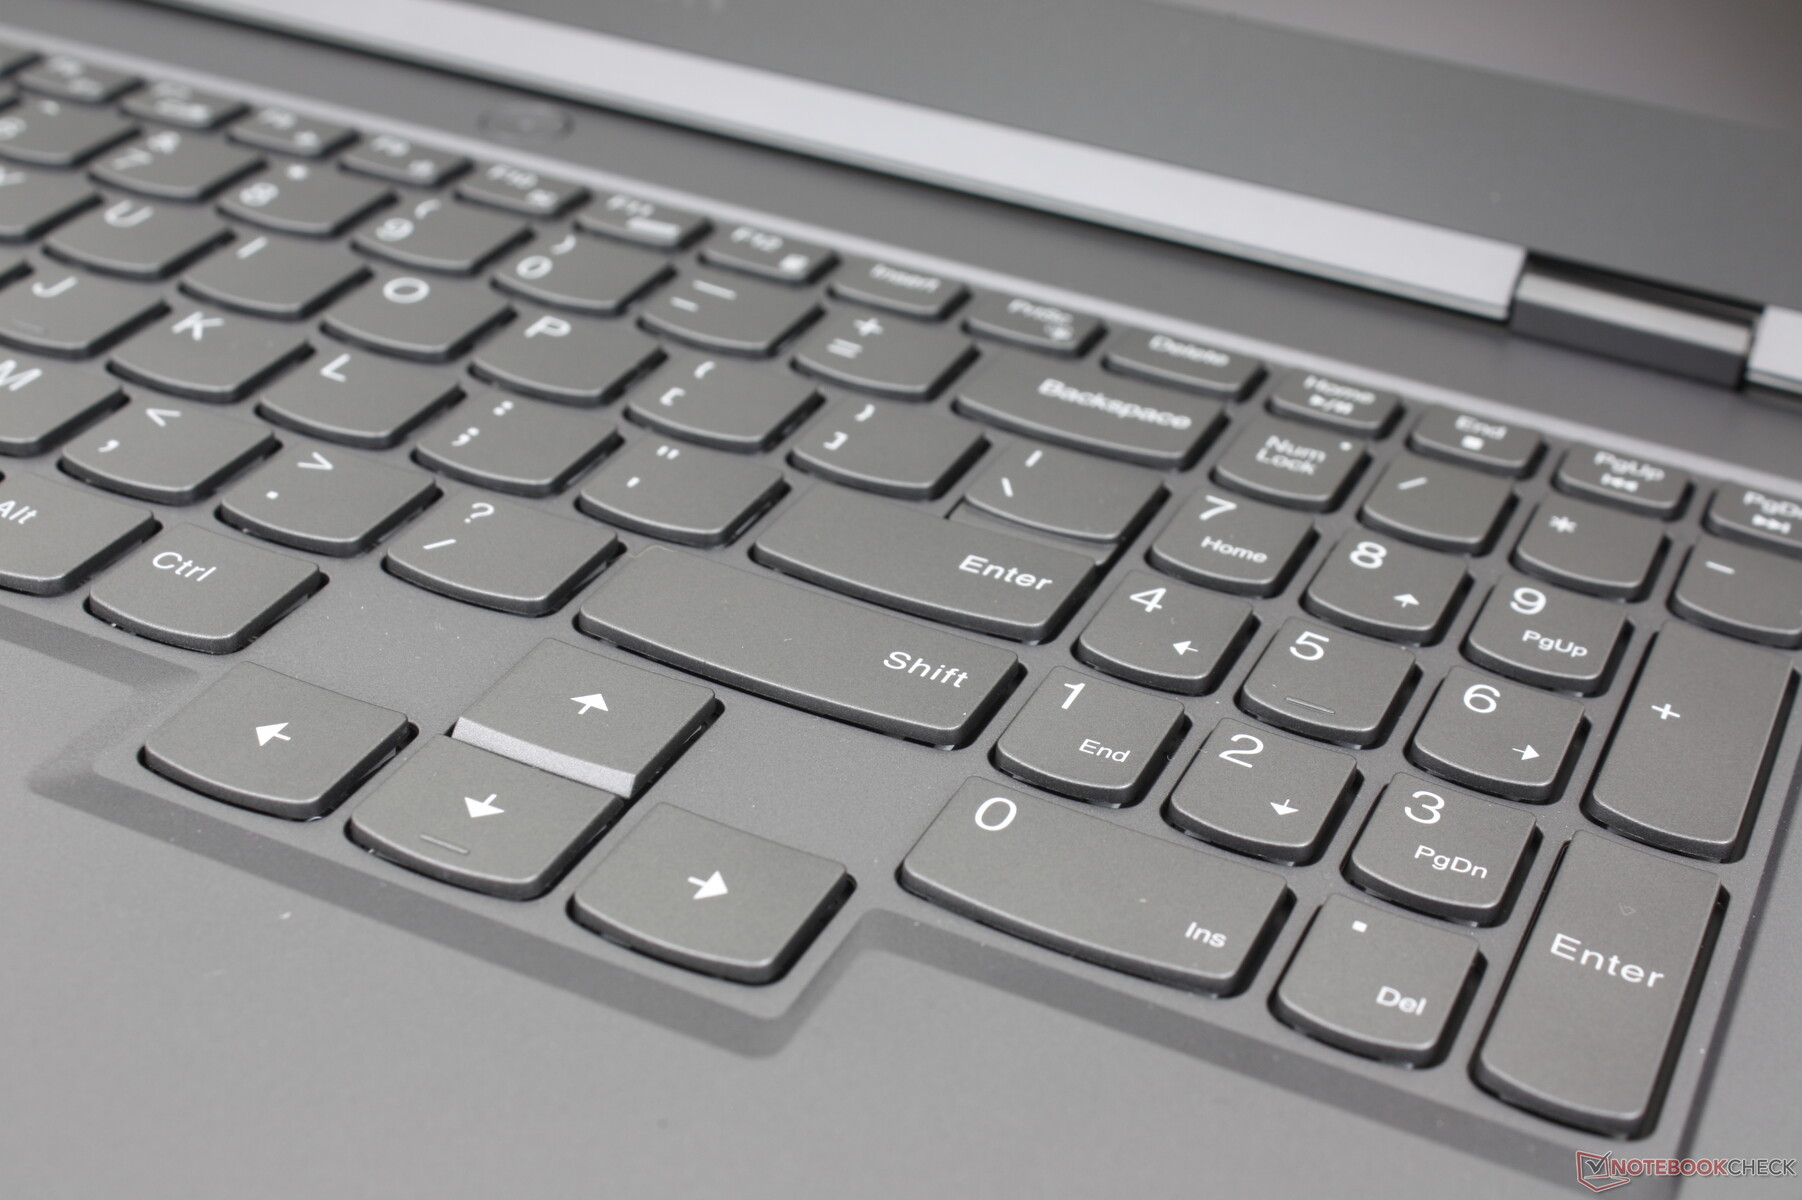
Dispositivos de entrada - Grande Teclado, Clickpad Esponja
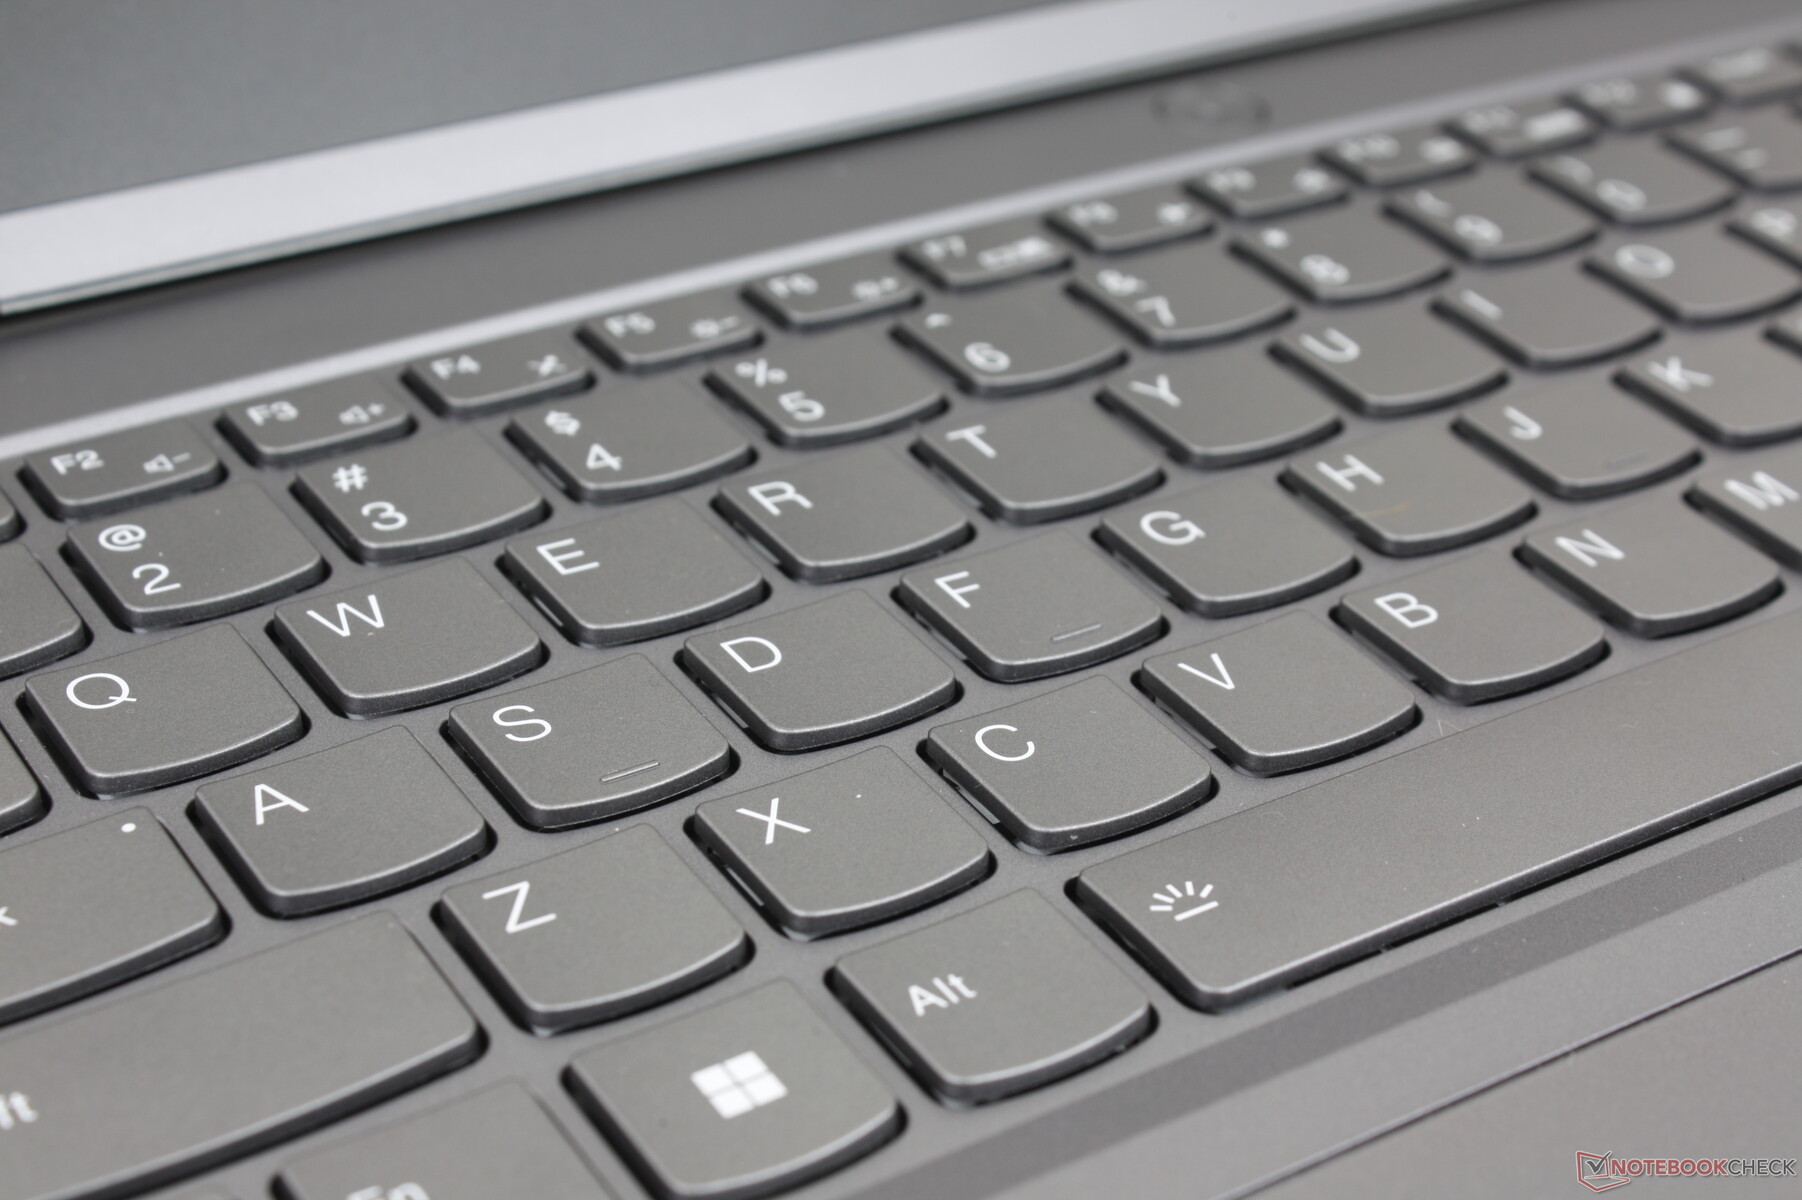
Teclado
O Legion 5 15 utiliza chaves tradicionais baseadas em membrana em vez de chaves mecânicas, como as encontradas em alguns modelos de ponta mais alta, como o Alienware série m15. No entanto, o feedback das chaves e as viagens são mais nítidas e profundas no Legion, quando comparadas com as chaves dos Ultrabooks normais. Se você fizer muita digitação, então você pode achar o teclado aqui para ser mais confortável para tarefas de escritório do que em um IdeaPad ou Dell Inspiron mais baratos
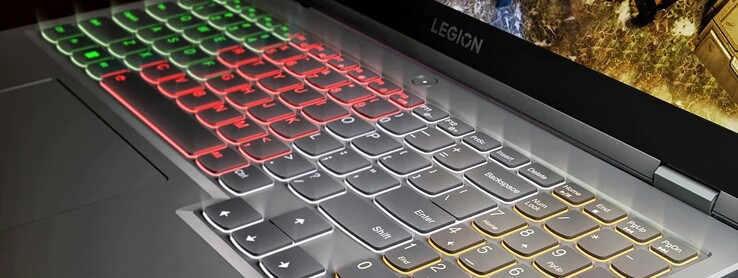
Uma luz de fundo de teclado está incluída em todas as configurações, mas algumas são apenas de uma zona branca enquanto outras são de quatro zonas RGB. Não há nenhuma opção RGB por tecla que possa economizar em custos. Todas as teclas e símbolos ficam iluminados.
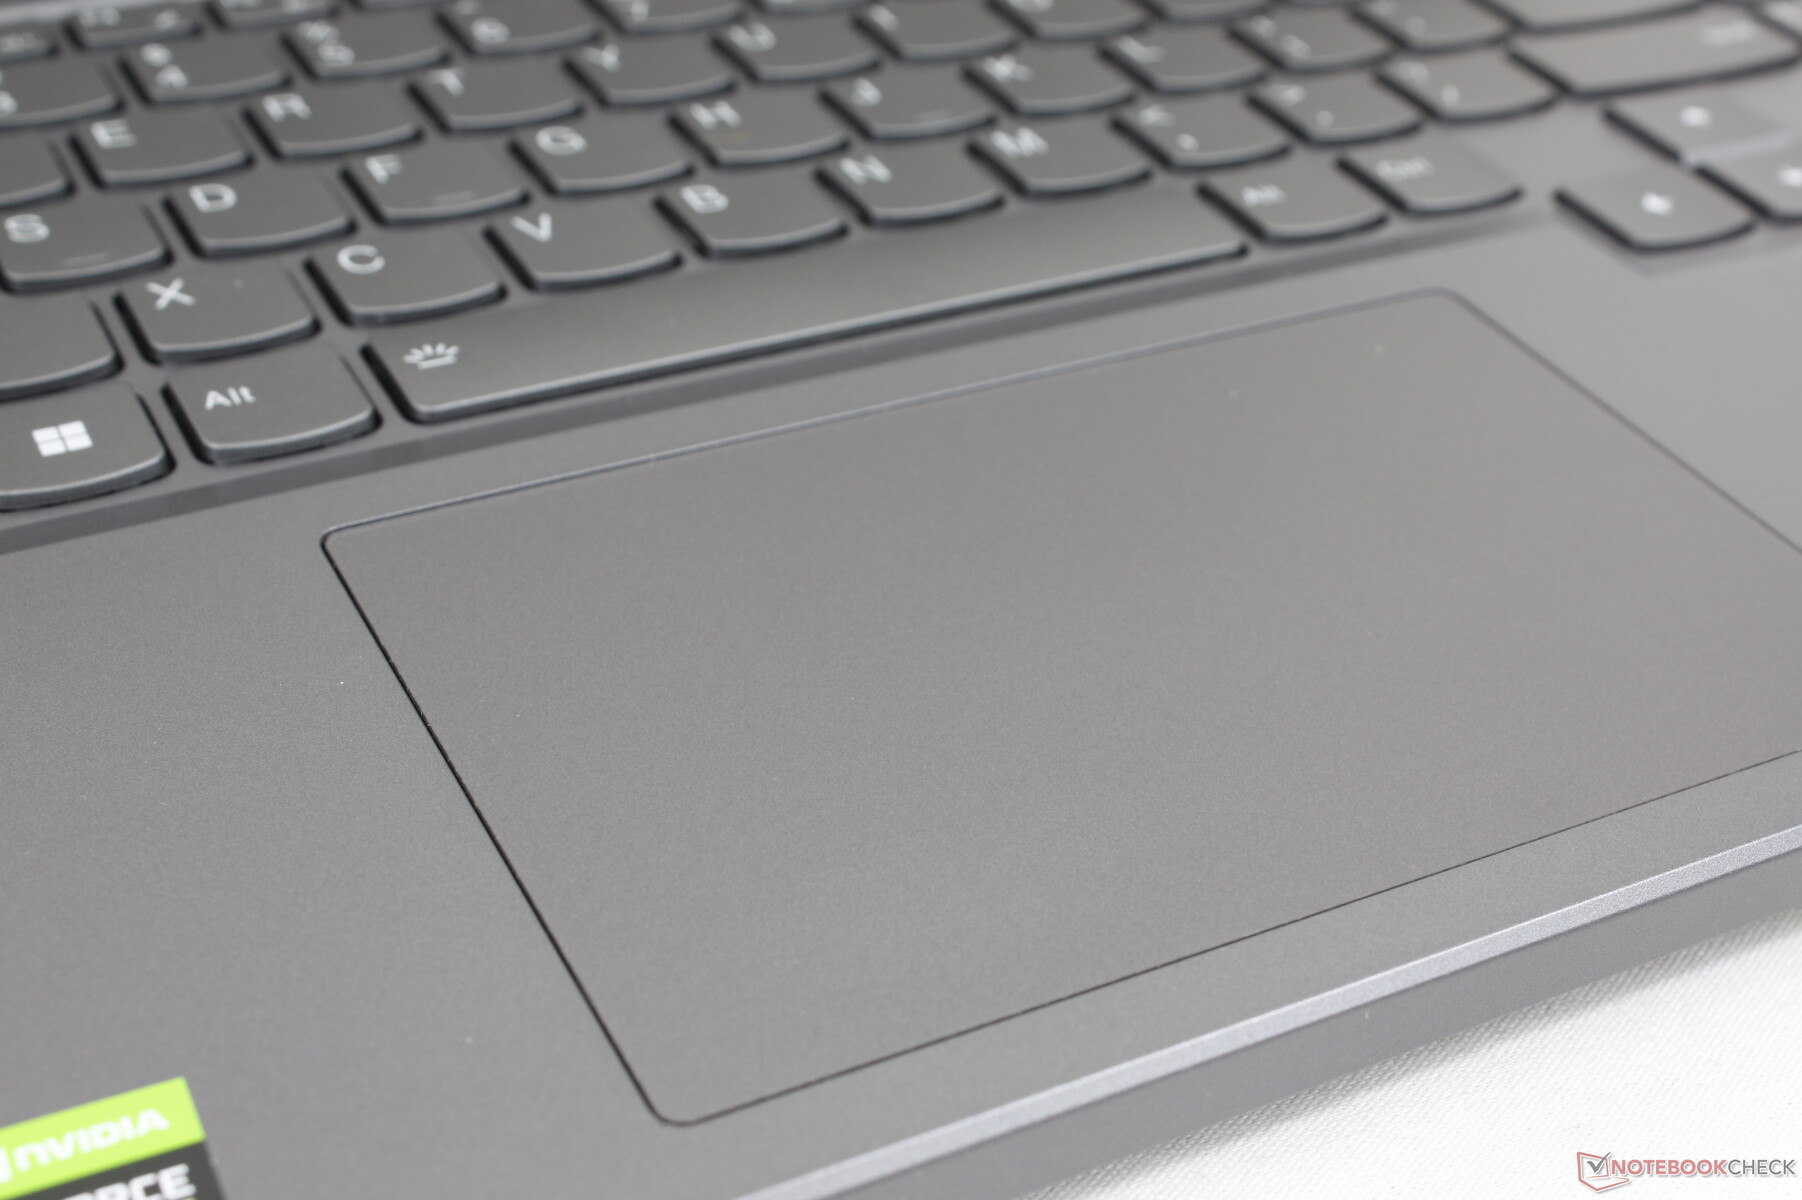
Touchpad
O tamanho do clickpad é idêntico ao do clickpad do preço Legion 7 16 a 12 x 7,5 cm. O feedback também é idêntico e, portanto, os usuários podem esperar um clique um pouco esponjoso e insatisfatório quando pressionado. A superfície do clickpad é lisa como nos apoios das palmas ao redor, mas recomendamos o uso de um mouse externo para facilitar o clique e o arrastar.
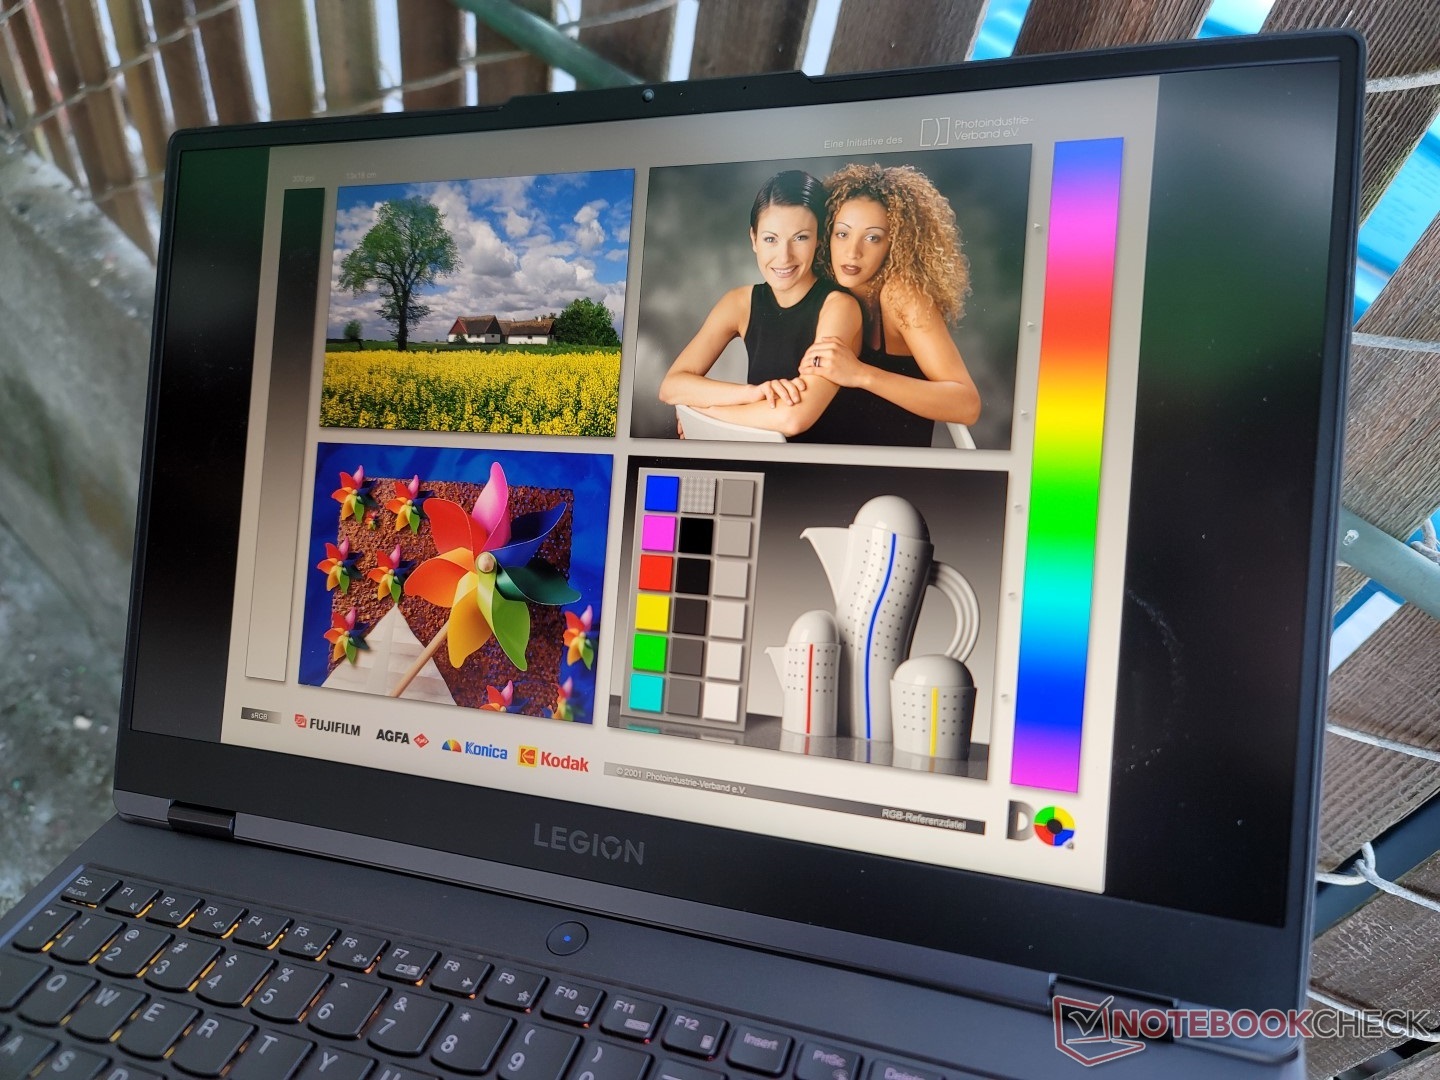
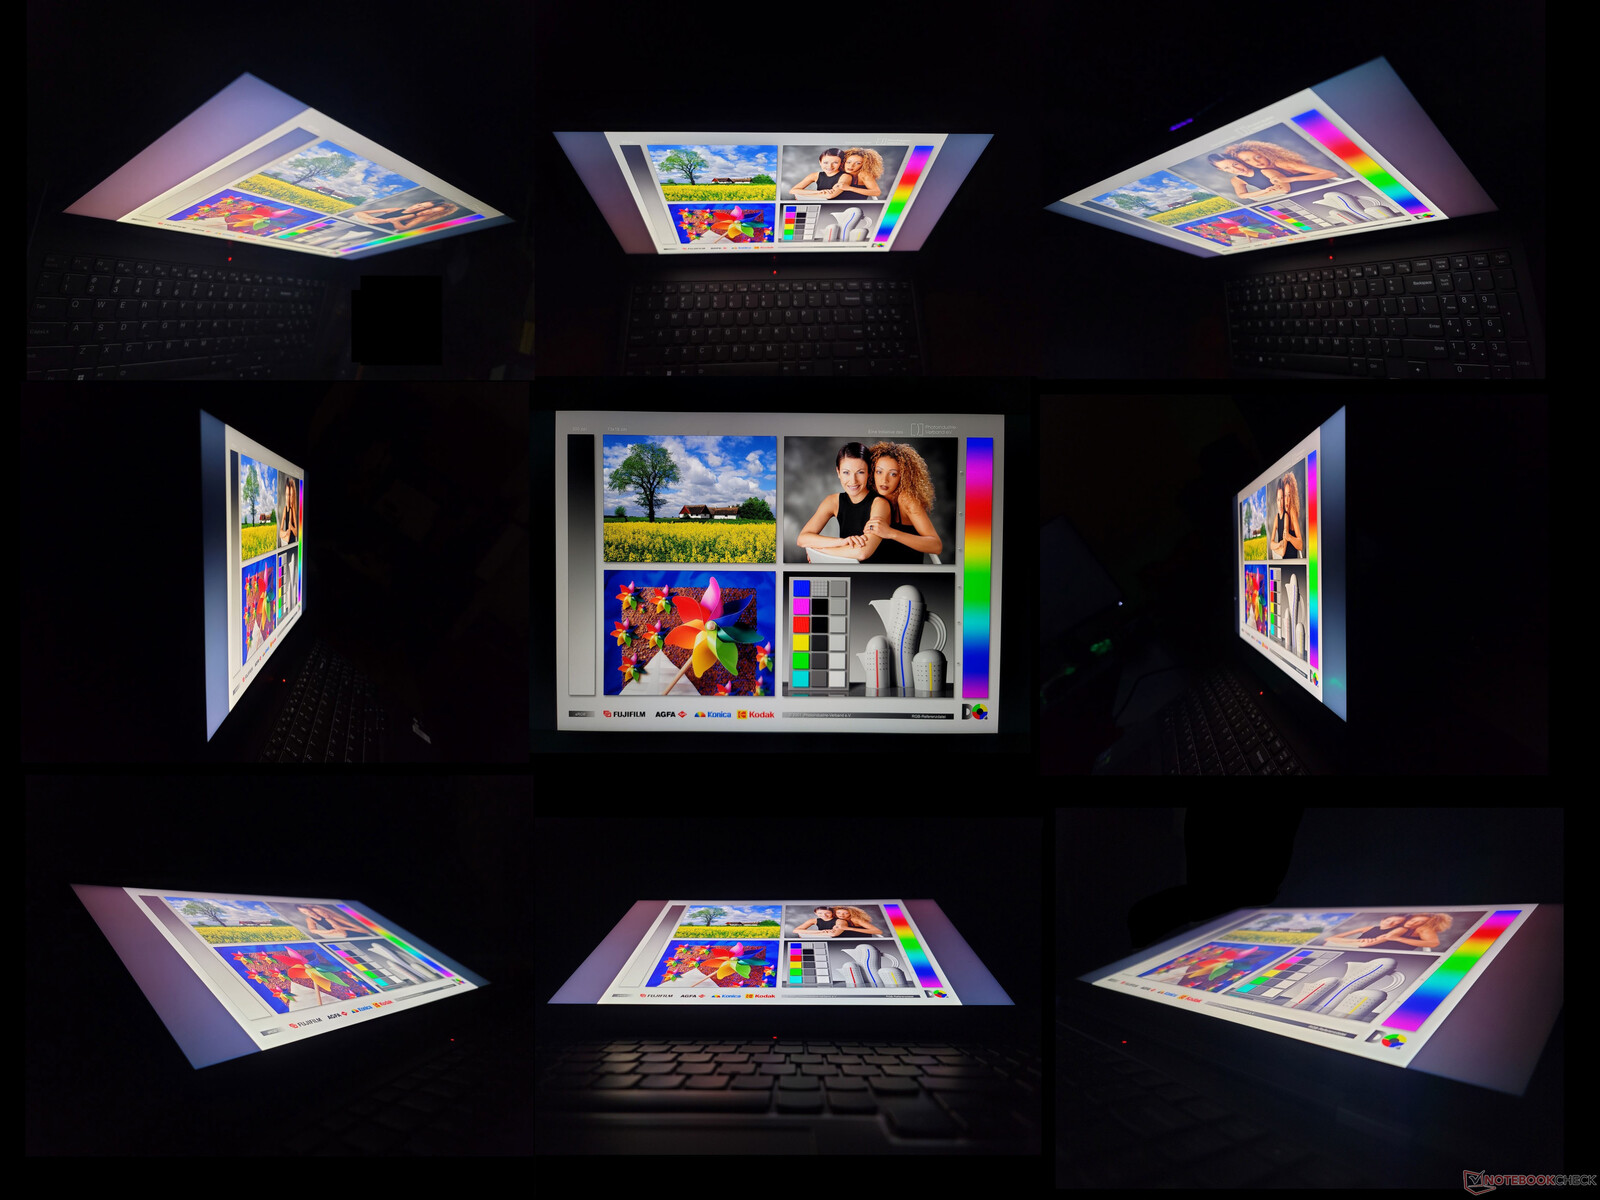
Visor - 165 Hz, G-Sync, 100% sRGB, IPS
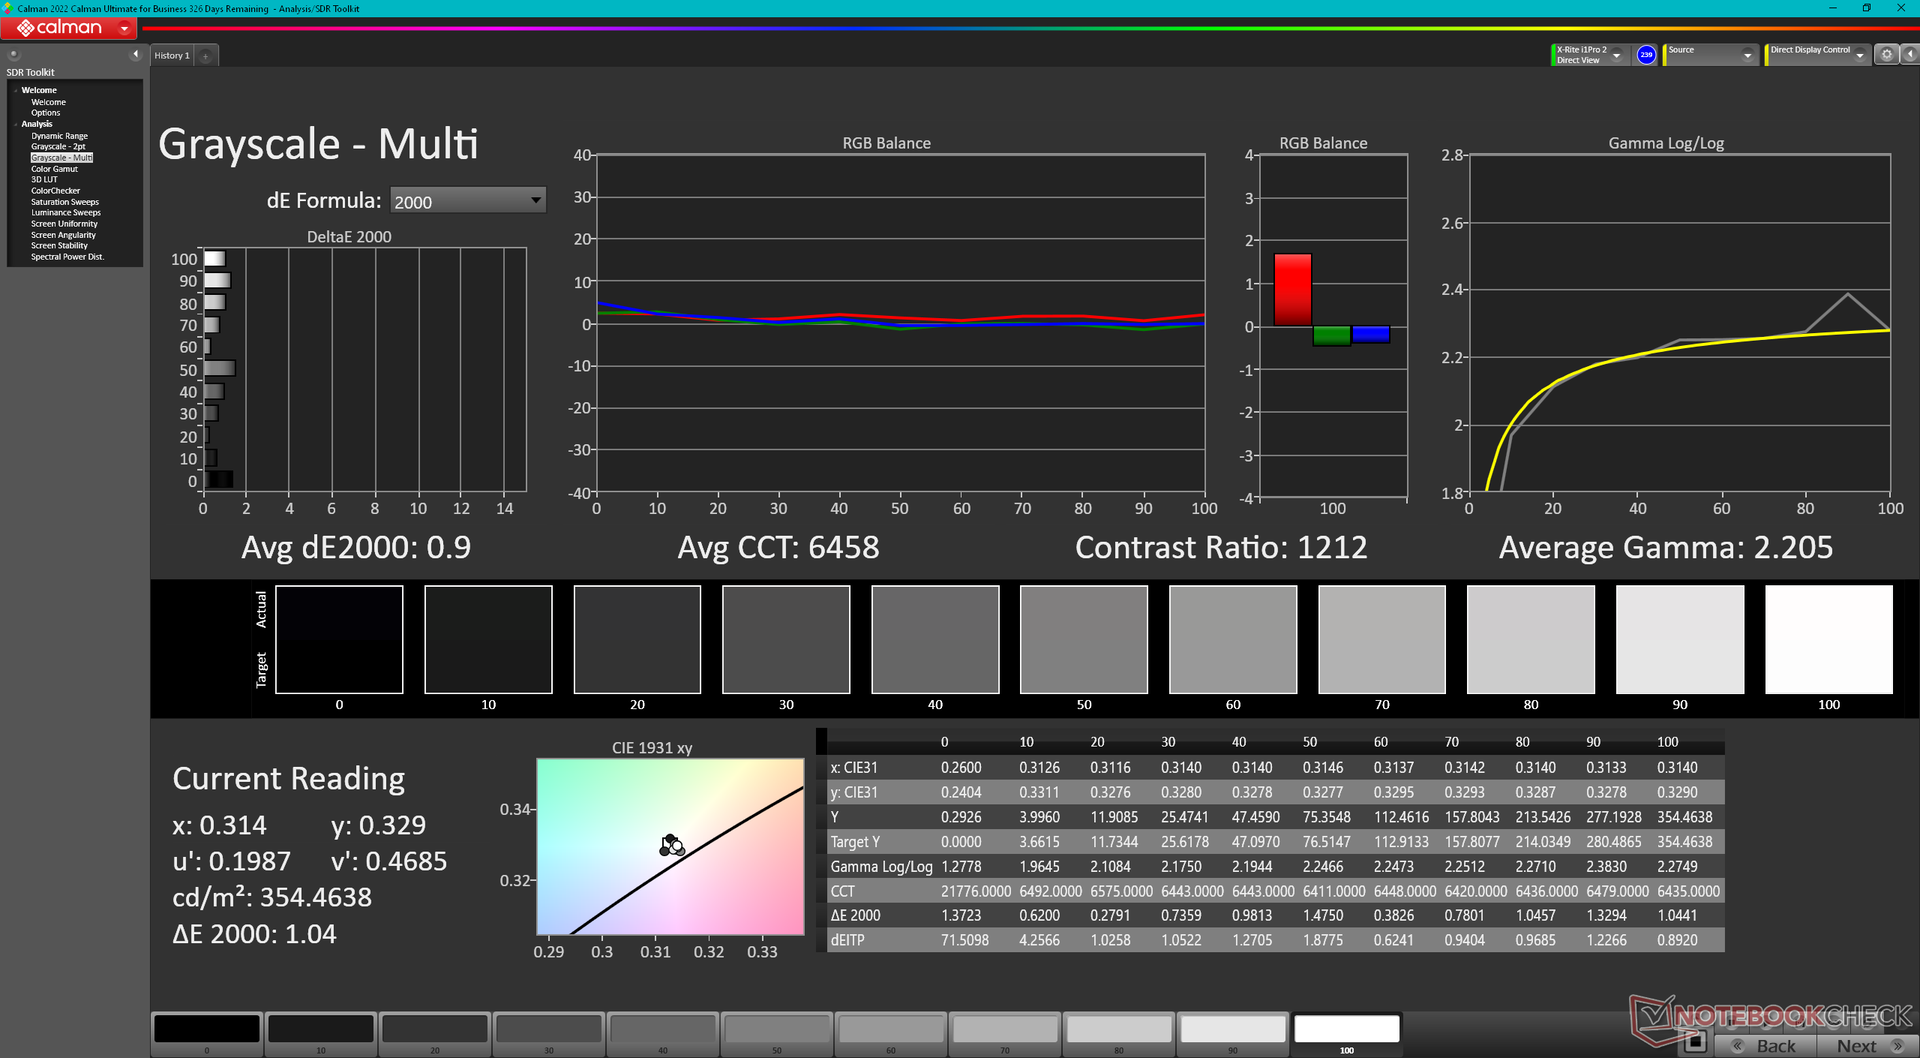
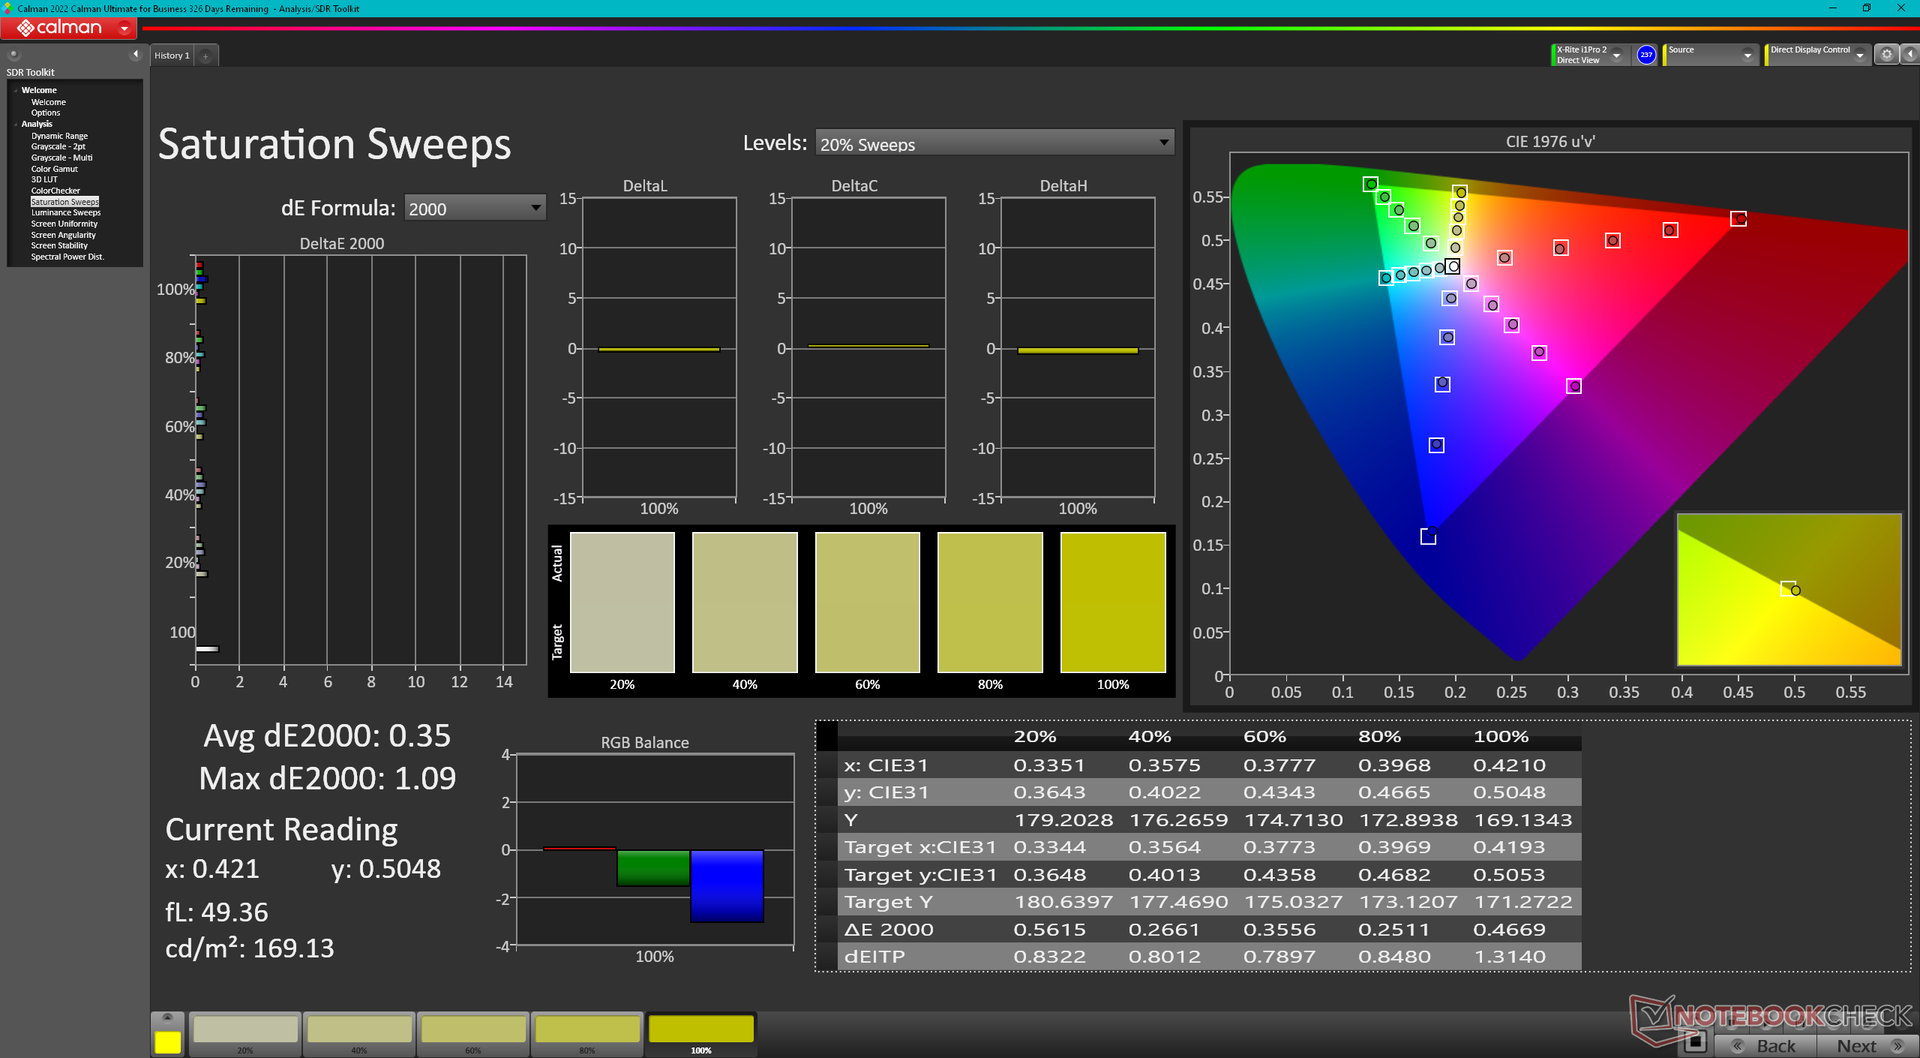
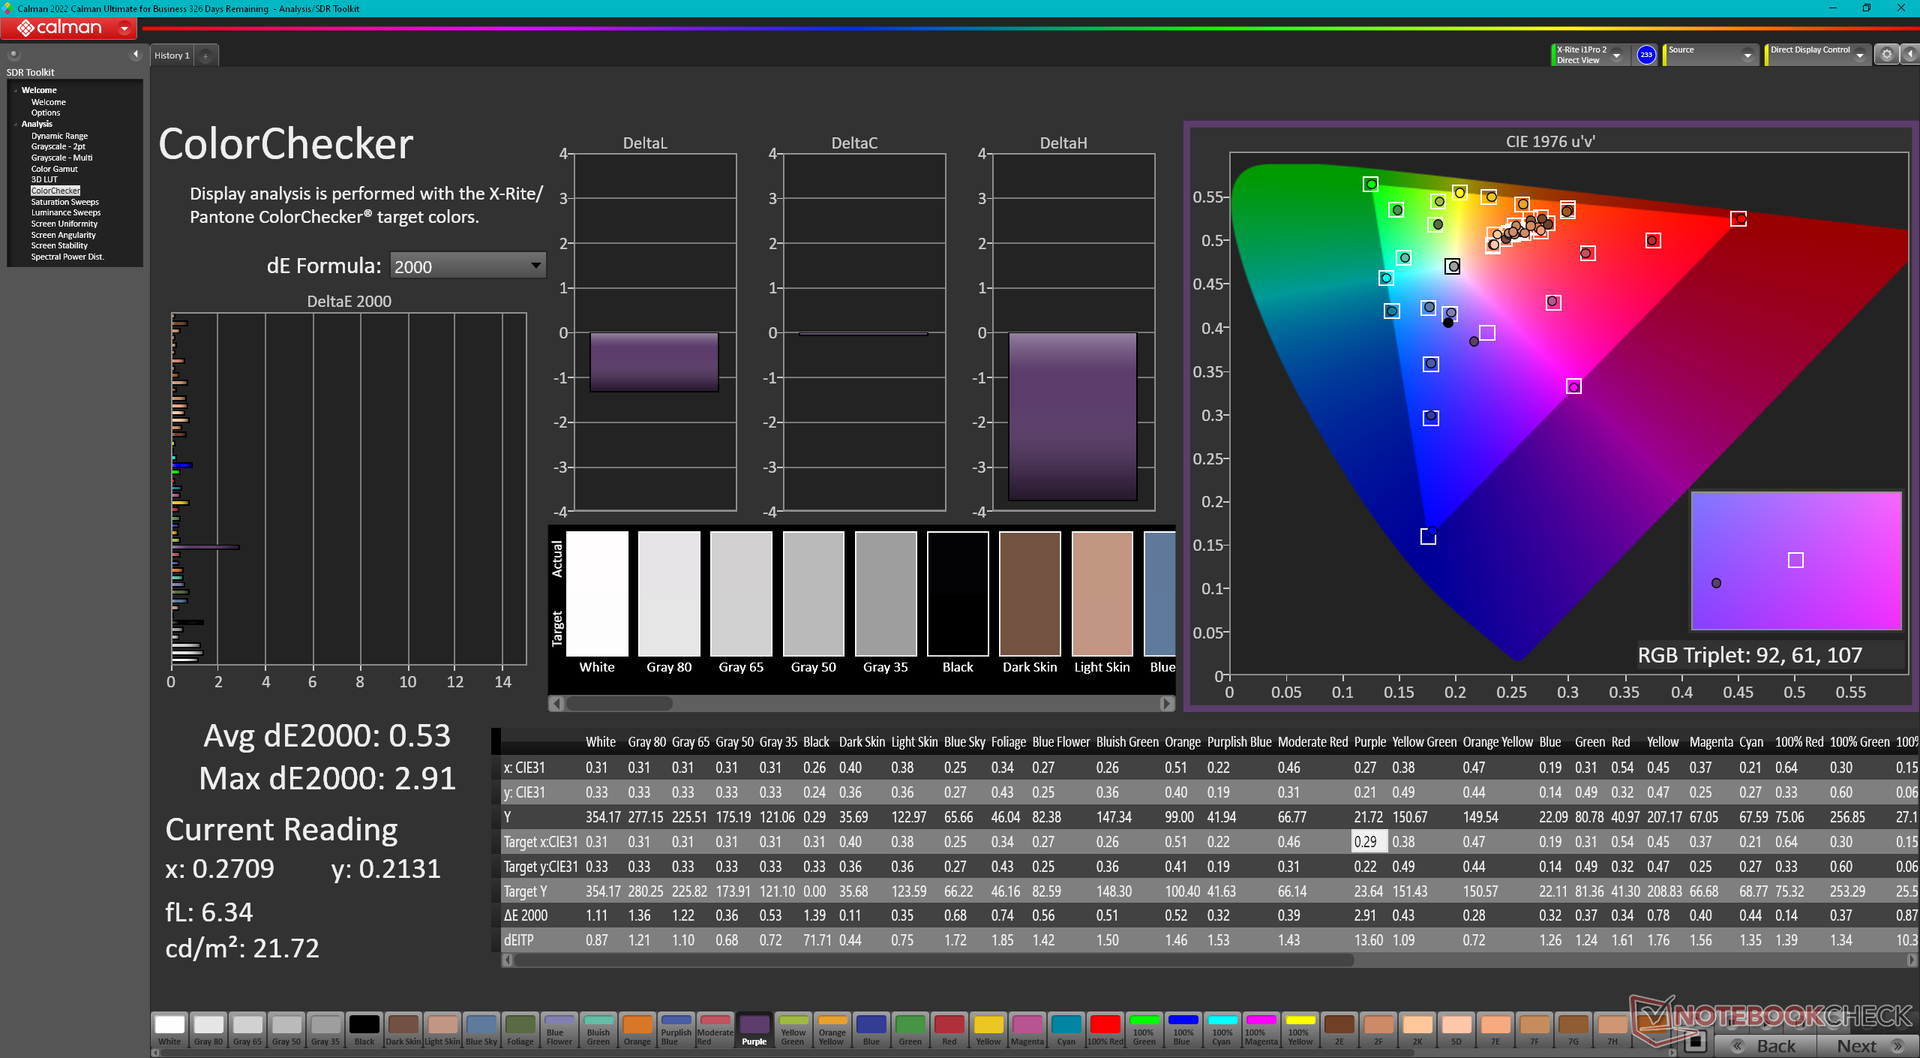
A Lenovo mudou os fornecedores de painéis IPS de AUO para CSOT quando comparado com o modelo do ano passado. No entanto, a maioria dos atributos permanecem quase os mesmos para uma experiência de visualização semelhante. Os usuários ainda estão recebendo G-Sync, 100% de cobertura sRGB, taxa de atualização nativa de 165 Hz, tempos de resposta rápidos, retroiluminação brilhante de 350-nit e uma relação de contraste decente de ~1000:1. Alguns SKUs podem incluir um painel 1080p 144 Hz mais barato que recomendamos evitar devido a seu espaço de cor mais estreito.


| |||||||||||||||||||||||||
iluminação: 89 %
iluminação com acumulador: 363.5 cd/m²
Contraste: 932:1 (Preto: 0.39 cd/m²)
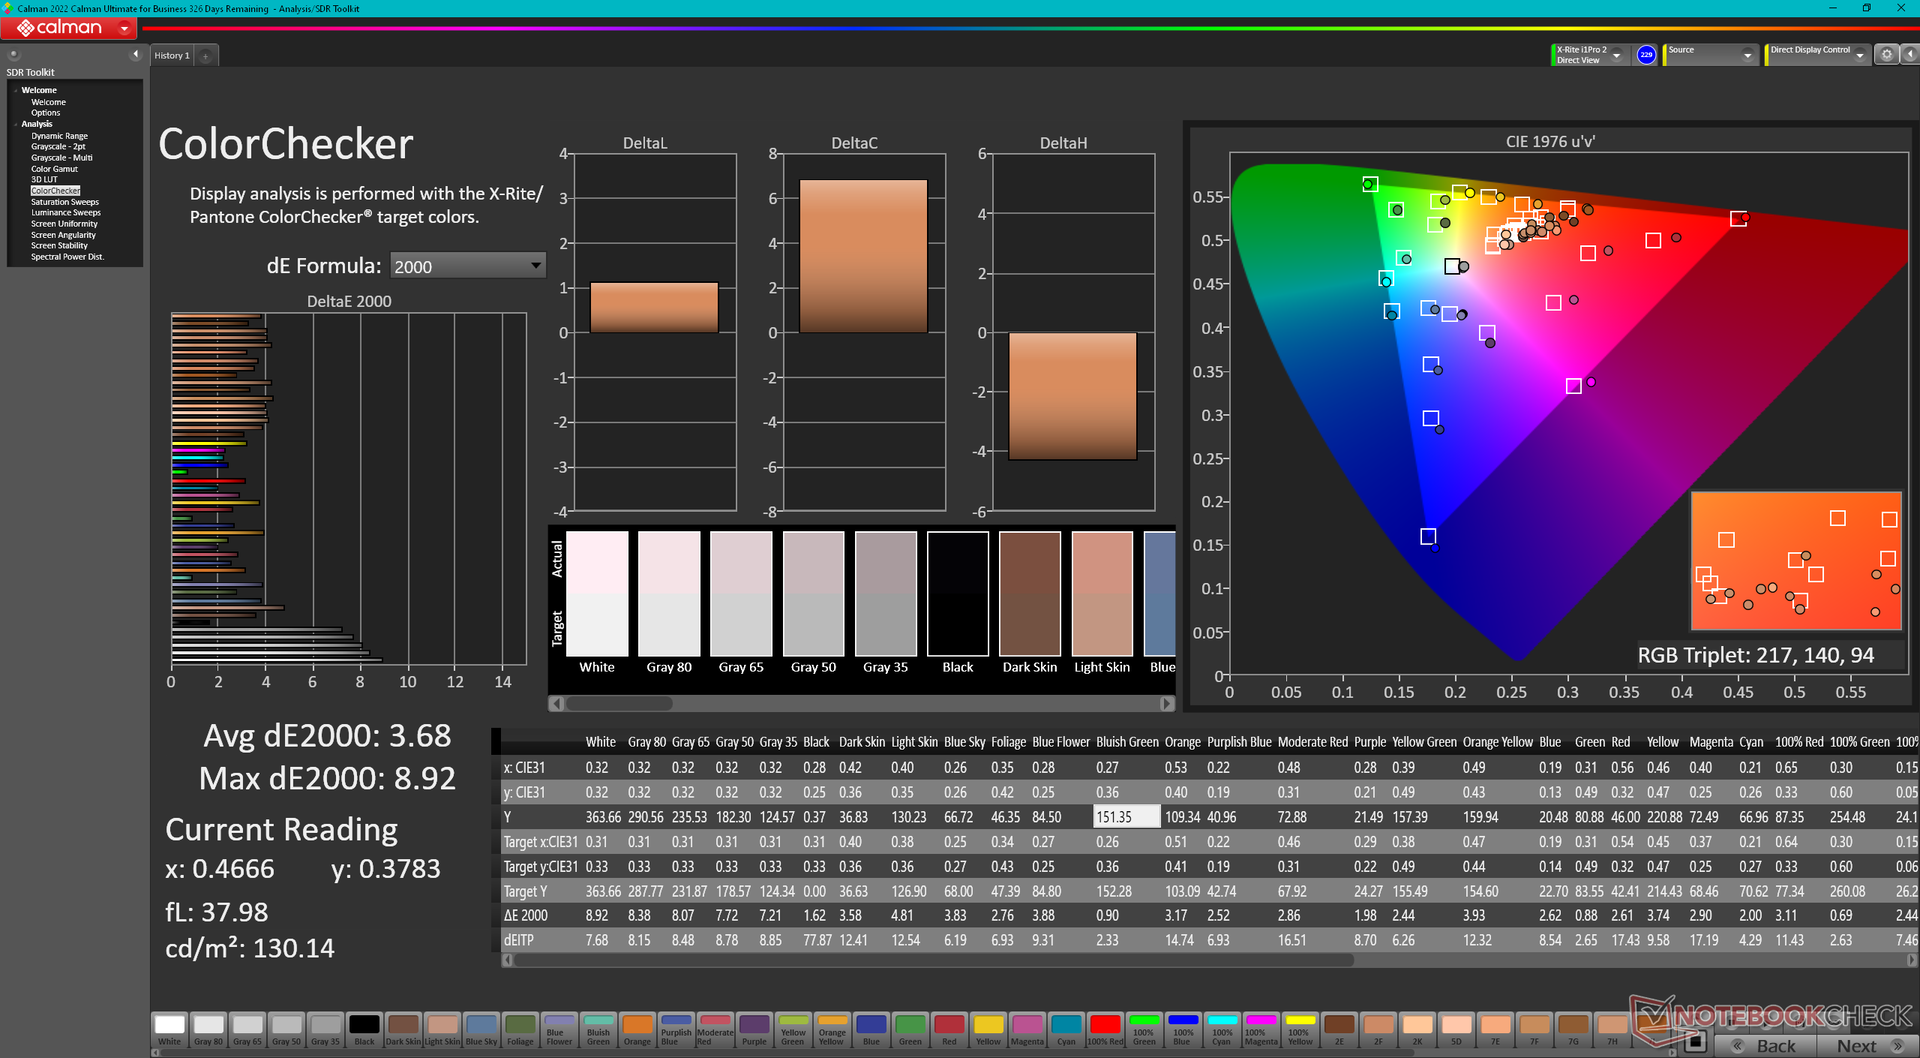
ΔE ColorChecker Calman: 3.68 | ∀{0.5-29.43 Ø4.71}
calibrated: 0.53
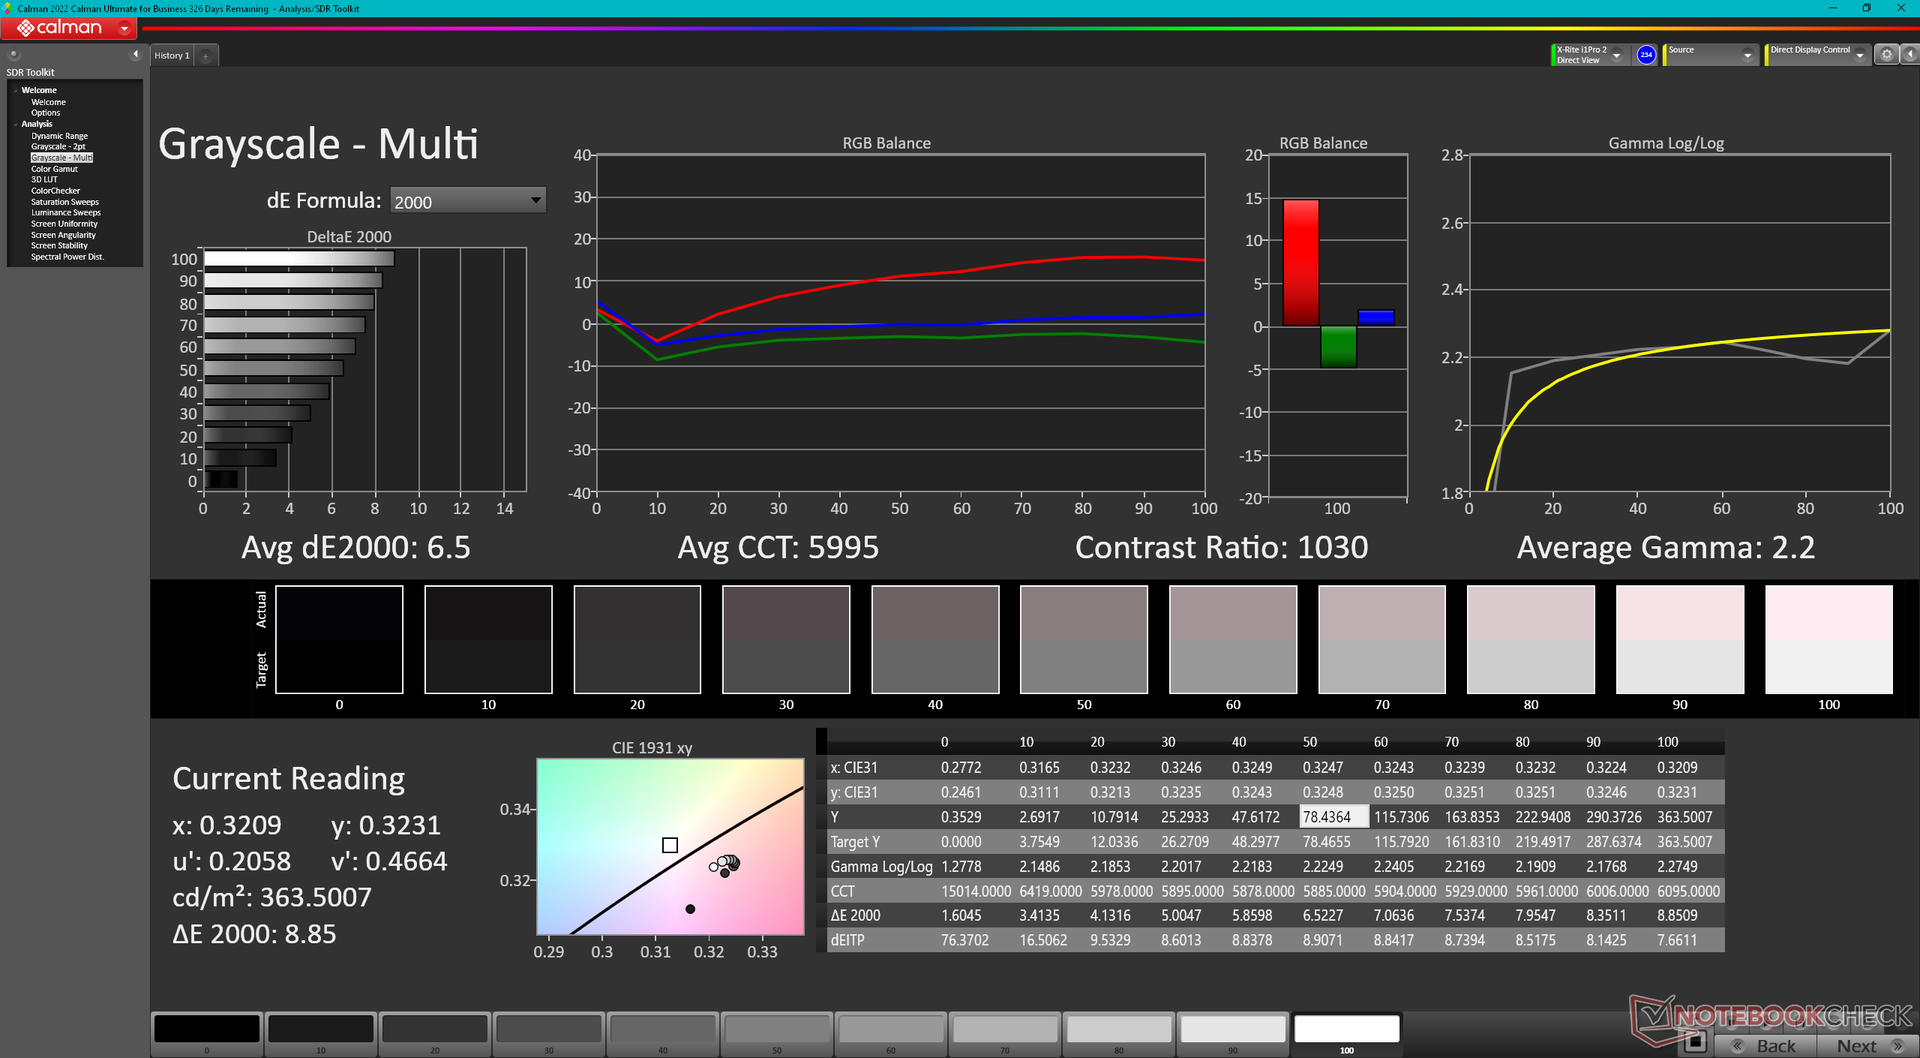
ΔE Greyscale Calman: 6.5 | ∀{0.09-98 Ø4.96}
70% AdobeRGB 1998 (Argyll 3D)
99.5% sRGB (Argyll 3D)
69.1% Display P3 (Argyll 3D)
Gamma: 2.2
CCT: 5995 K
| Lenovo Legion 5 15IAH7H 82RB CSOT MNF601CA1-3, IPS, 1920x1080, 15.6" | Lenovo Legion 5 15ACH-82JU00C6GE-FL B156HAN12.H, , 1920x1080, 15.6" | MSI Bravo 15 B5DD-010US Chi Mei N156HRA-EA1, IPS, 1920x1080, 15.6" | Asus TUF Gaming F15 FX507ZM TL156VDXP0101, IPS, 1920x1080, 15.6" | Acer Aspire Nitro 5 AN515-55-57GF Chi Mei CMN N156HRA-EA1, IPS, 1920x1080, 15.6" | Razer Blade 15 Base Edition 2021, i7-10750H RTX 3060 BOE NV156FHM-N4K, IPS, 1920x1080, 15.6" | |
|---|---|---|---|---|---|---|
| Display | -4% | -38% | -3% | -37% | -7% | |
| Display P3 Coverage (%) | 69.1 | 65.4 -5% | 42.1 -39% | 66.4 -4% | 42.54 -38% | 64.3 -7% |
| sRGB Coverage (%) | 99.5 | 96.3 -3% | 62.8 -37% | 97 -3% | 63.5 -36% | 91.8 -8% |
| AdobeRGB 1998 Coverage (%) | 70 | 67.5 -4% | 43.6 -38% | 68.5 -2% | 44.02 -37% | 65.5 -6% |
| Response Times | 16% | -82% | 28% | -111% | 29% | |
| Response Time Grey 50% / Grey 80% * (ms) | 14.8 ? | 13.6 ? 8% | 25.6 ? -73% | 5.6 ? 62% | 33.8 ? -128% | 8.8 ? 41% |
| Response Time Black / White * (ms) | 12 ? | 9.2 ? 23% | 22.8 ? -90% | 12.8 ? -7% | 23.2 ? -93% | 10 ? 17% |
| PWM Frequency (Hz) | 1000 ? | |||||
| Screen | -15% | -87% | 23% | -53% | -40% | |
| Brightness middle (cd/m²) | 363.5 | 350 -4% | 265.1 -27% | 353.7 -3% | 288 -21% | 317.2 -13% |
| Brightness (cd/m²) | 350 | 350 0% | 245 -30% | 340 -3% | 262 -25% | 306 -13% |
| Brightness Distribution (%) | 89 | 96 8% | 87 -2% | 89 0% | 88 -1% | 89 0% |
| Black Level * (cd/m²) | 0.39 | 0.3 23% | 0.35 10% | 0.34 13% | 0.21 46% | 0.31 21% |
| Contrast (:1) | 932 | 1167 25% | 757 -19% | 1040 12% | 1371 47% | 1023 10% |
| Colorchecker dE 2000 * | 3.68 | 3.9 -6% | 4.68 -27% | 1.74 53% | 3.61 2% | 4.37 -19% |
| Colorchecker dE 2000 max. * | 8.92 | 8.2 8% | 19.96 -124% | 3.63 59% | 18.07 -103% | 6.62 26% |
| Colorchecker dE 2000 calibrated * | 0.53 | 1.6 -202% | 3.7 -598% | 0.5 6% | 3.12 -489% | 2.67 -404% |
| Greyscale dE 2000 * | 6.5 | 5.5 15% | 4.5 31% | 2.1 68% | 2.4 63% | 4.5 31% |
| Gamma | 2.2 100% | 2.15 102% | 2.22 99% | 2.3 96% | 2.216 99% | 2.4 92% |
| CCT | 5995 108% | 7414 88% | 6632 98% | 6257 104% | 6675 97% | 7418 88% |
| Color Space (Percent of AdobeRGB 1998) (%) | 44 | 59.2 | ||||
| Color Space (Percent of sRGB) (%) | 62 | 91.4 | ||||
| Média Total (Programa/Configurações) | -1% /
-8% | -69% /
-76% | 16% /
18% | -67% /
-58% | -6% /
-23% |
* ... menor é melhor
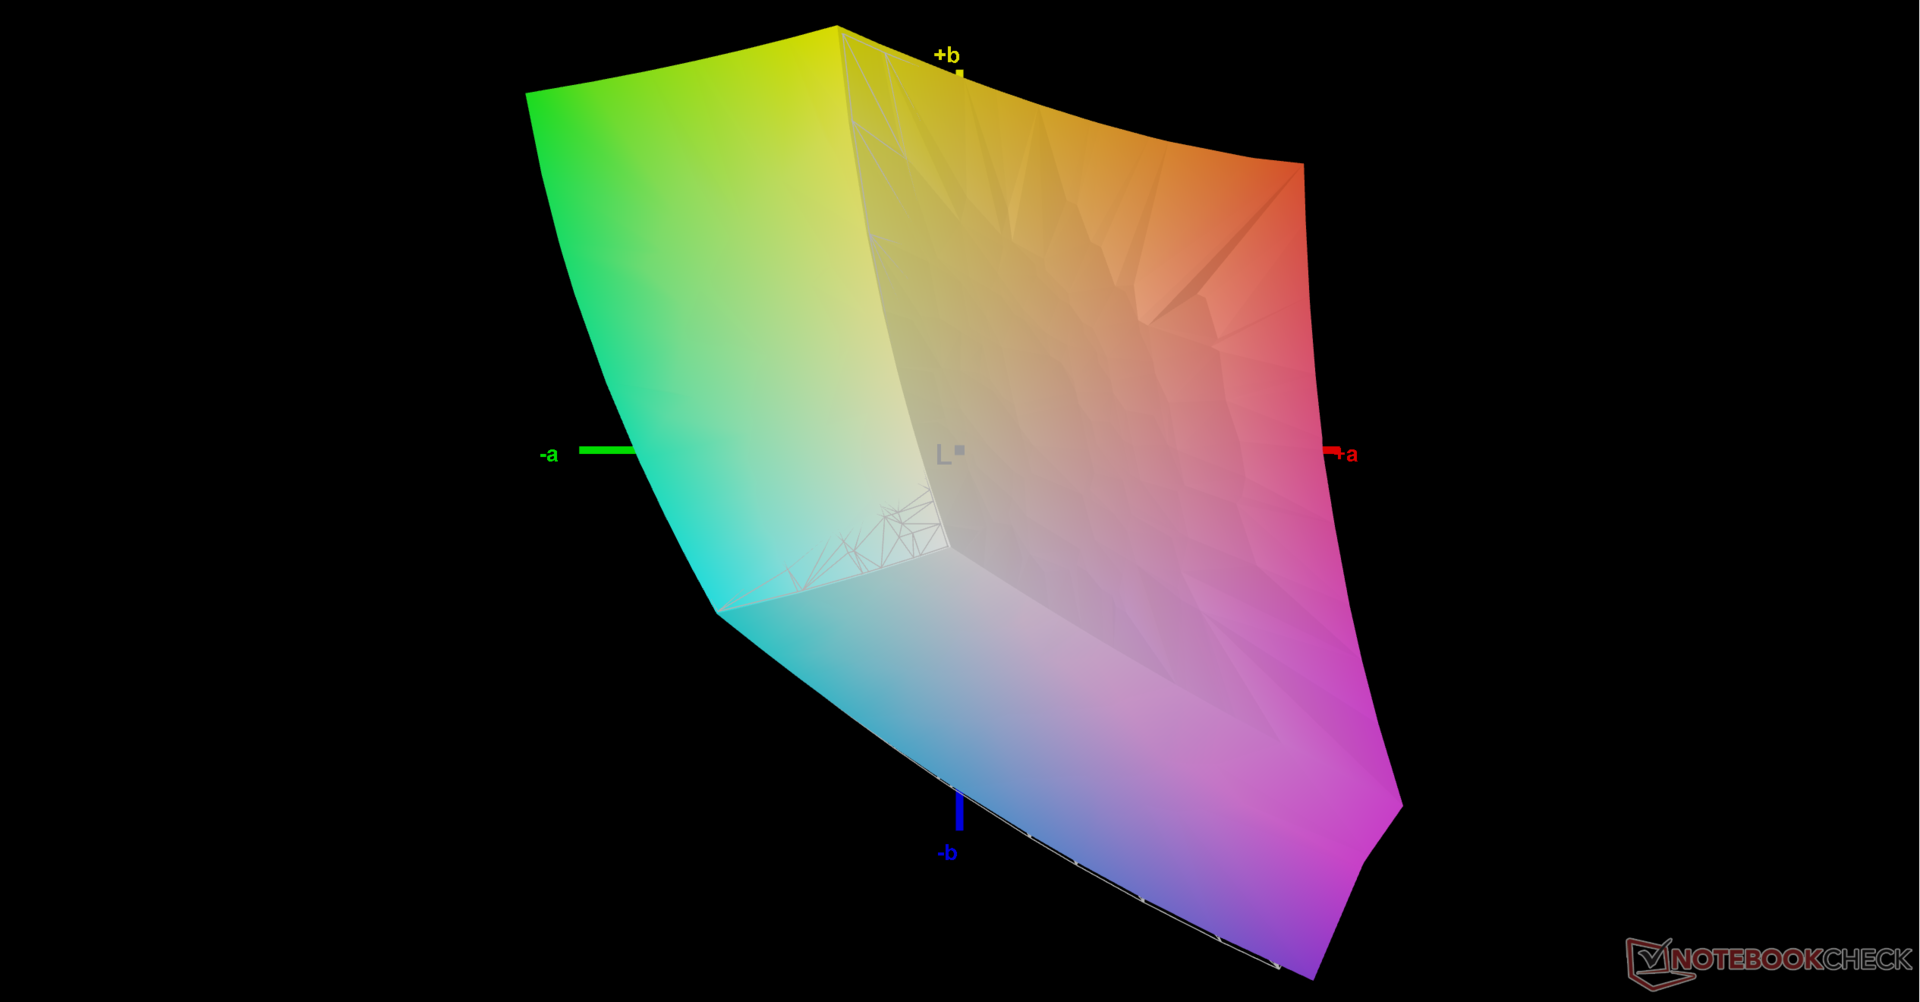
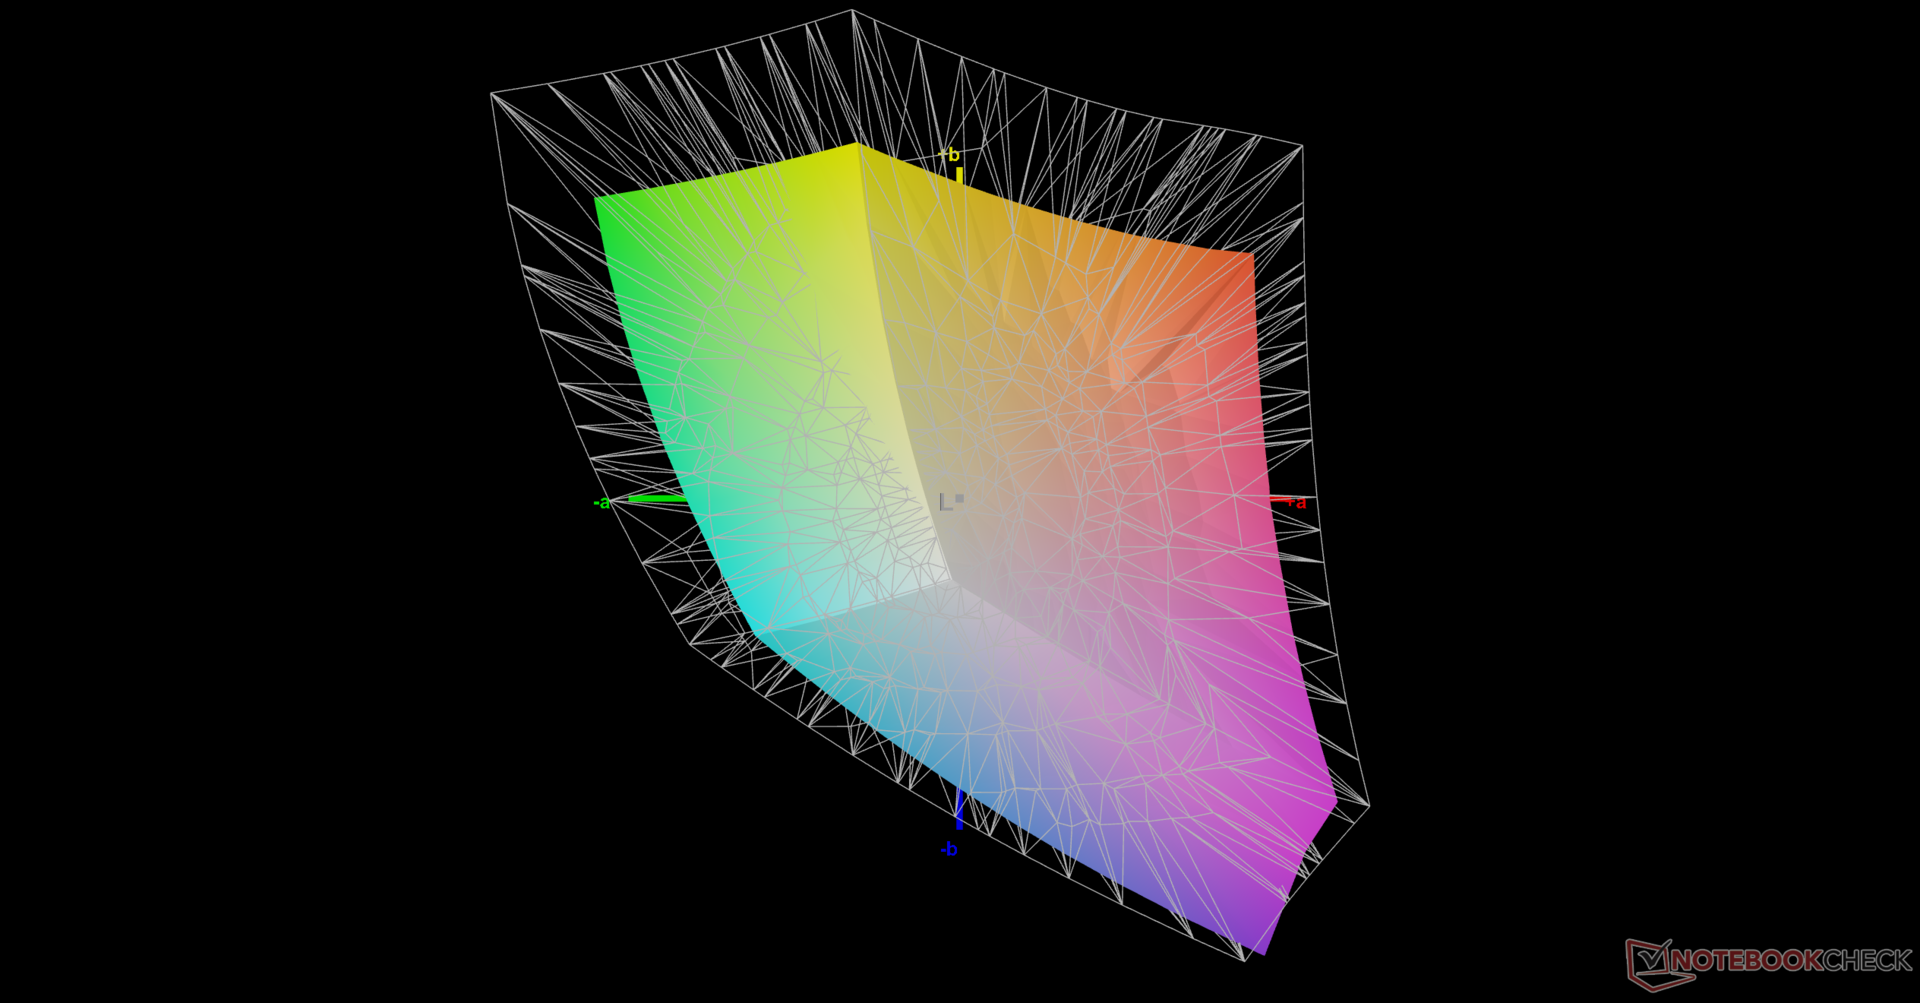
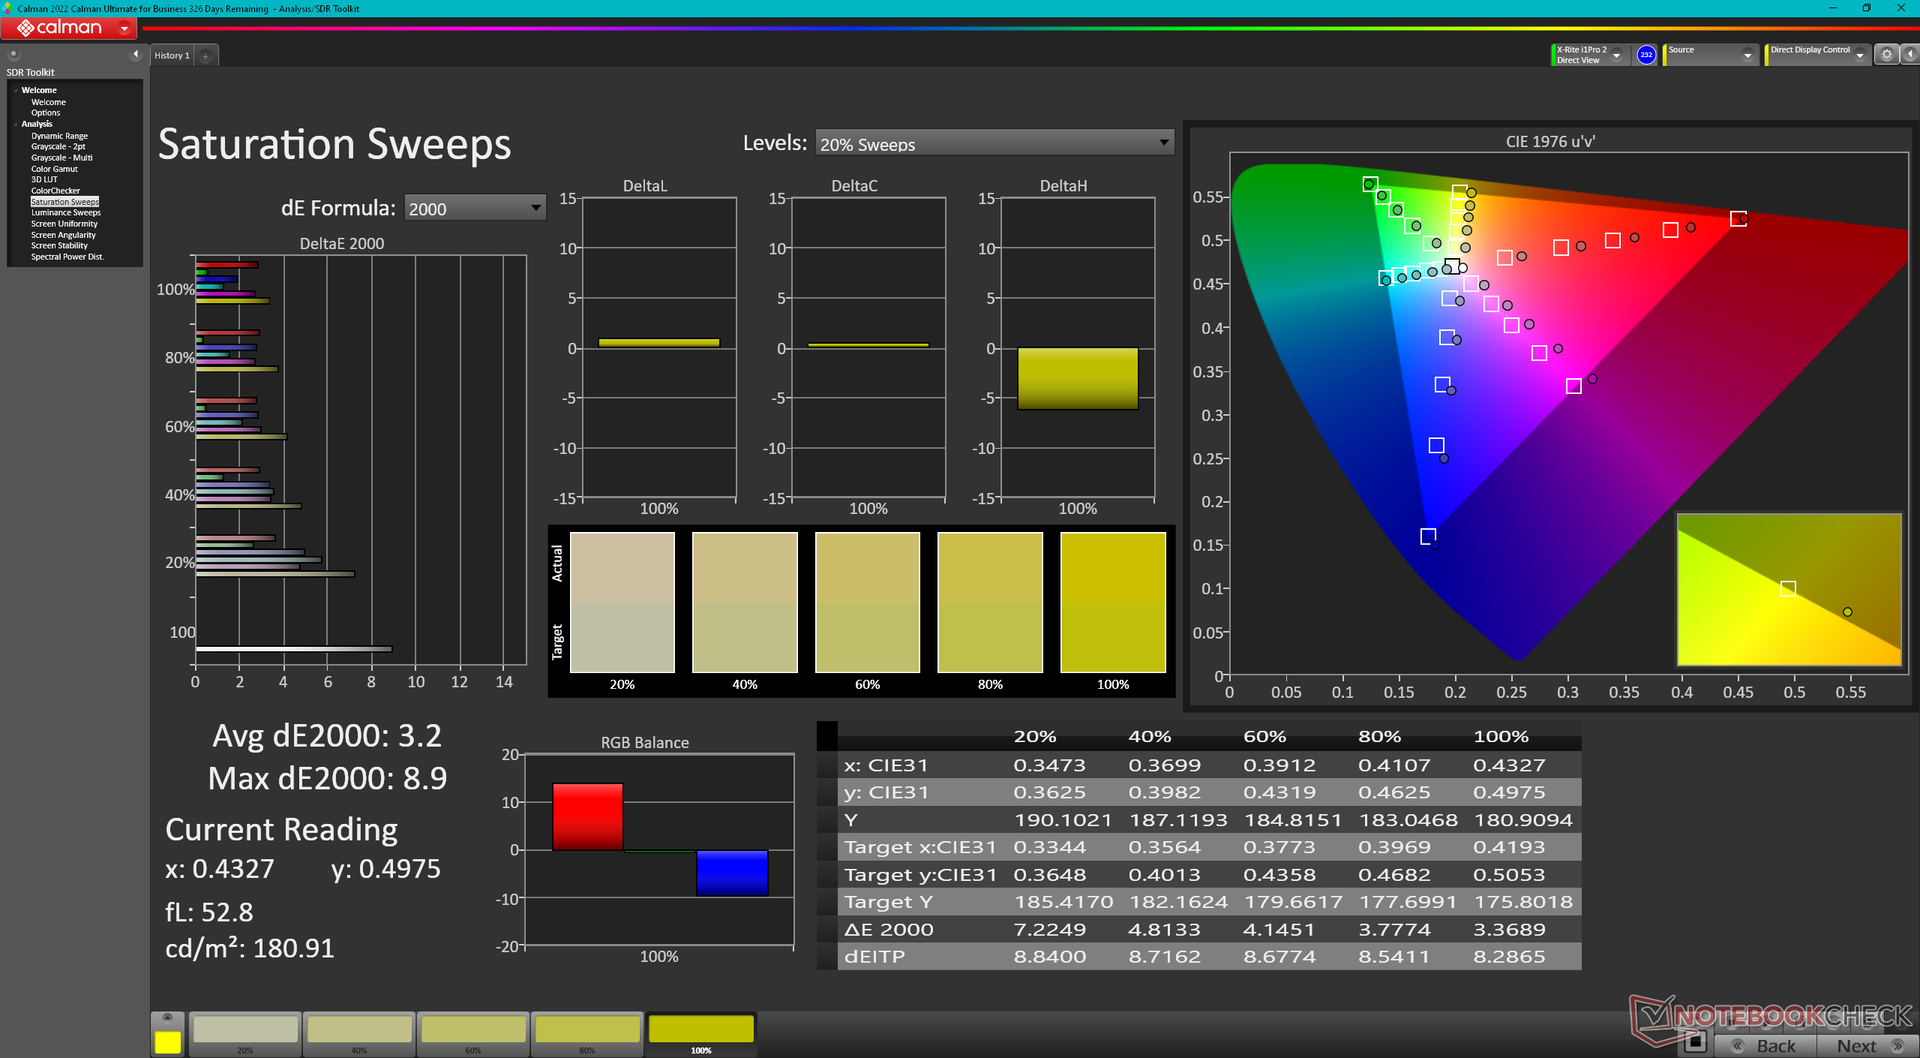
O visor não vem pré-calibrado como demonstrado por nossos resultados do colorímetro X-Rite abaixo onde os valores médios de escala de cinza e deltaE de cor são tão altos quanto 6,5 e 3,68, respectivamente. Uma calibração adequada pode reduzir essas médias para apenas 0,9 e 0,53, respectivamente, uma vez que o painel cobre todo o sRGB. Recomendamos aplicar nosso perfil ICM calibrado acima para melhor explorar as amplas cores sRGB do painel.
Exibir tempos de resposta
| ↔ Tempo de resposta preto para branco | ||
|---|---|---|
| 12 ms ... ascensão ↗ e queda ↘ combinadas | ↗ 6.8 ms ascensão | 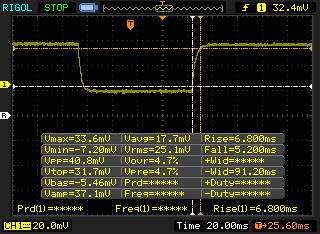 |
| ↘ 5.2 ms queda | ||
| A tela mostra boas taxas de resposta em nossos testes, mas pode ser muito lenta para jogadores competitivos. Em comparação, todos os dispositivos testados variam de 0.1 (mínimo) a 240 (máximo) ms. » 32 % de todos os dispositivos são melhores. Isso significa que o tempo de resposta medido é melhor que a média de todos os dispositivos testados (19.8 ms). | ||
| ↔ Tempo de resposta 50% cinza a 80% cinza | ||
| 14.8 ms ... ascensão ↗ e queda ↘ combinadas | ↗ 8 ms ascensão | 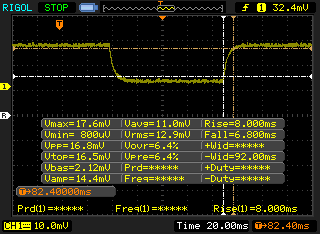 |
| ↘ 6.8 ms queda | ||
| A tela mostra boas taxas de resposta em nossos testes, mas pode ser muito lenta para jogadores competitivos. Em comparação, todos os dispositivos testados variam de 0.165 (mínimo) a 636 (máximo) ms. » 29 % de todos os dispositivos são melhores. Isso significa que o tempo de resposta medido é melhor que a média de todos os dispositivos testados (31 ms). | ||
Cintilação da tela / PWM (modulação por largura de pulso)
| Tela tremeluzindo / PWM não detectado | 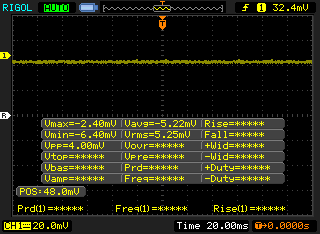 | ||
[pwm_comparison] Em comparação: 52 % de todos os dispositivos testados não usam PWM para escurecer a tela. Se PWM foi detectado, uma média de 7757 (mínimo: 5 - máximo: 343500) Hz foi medida. | |||
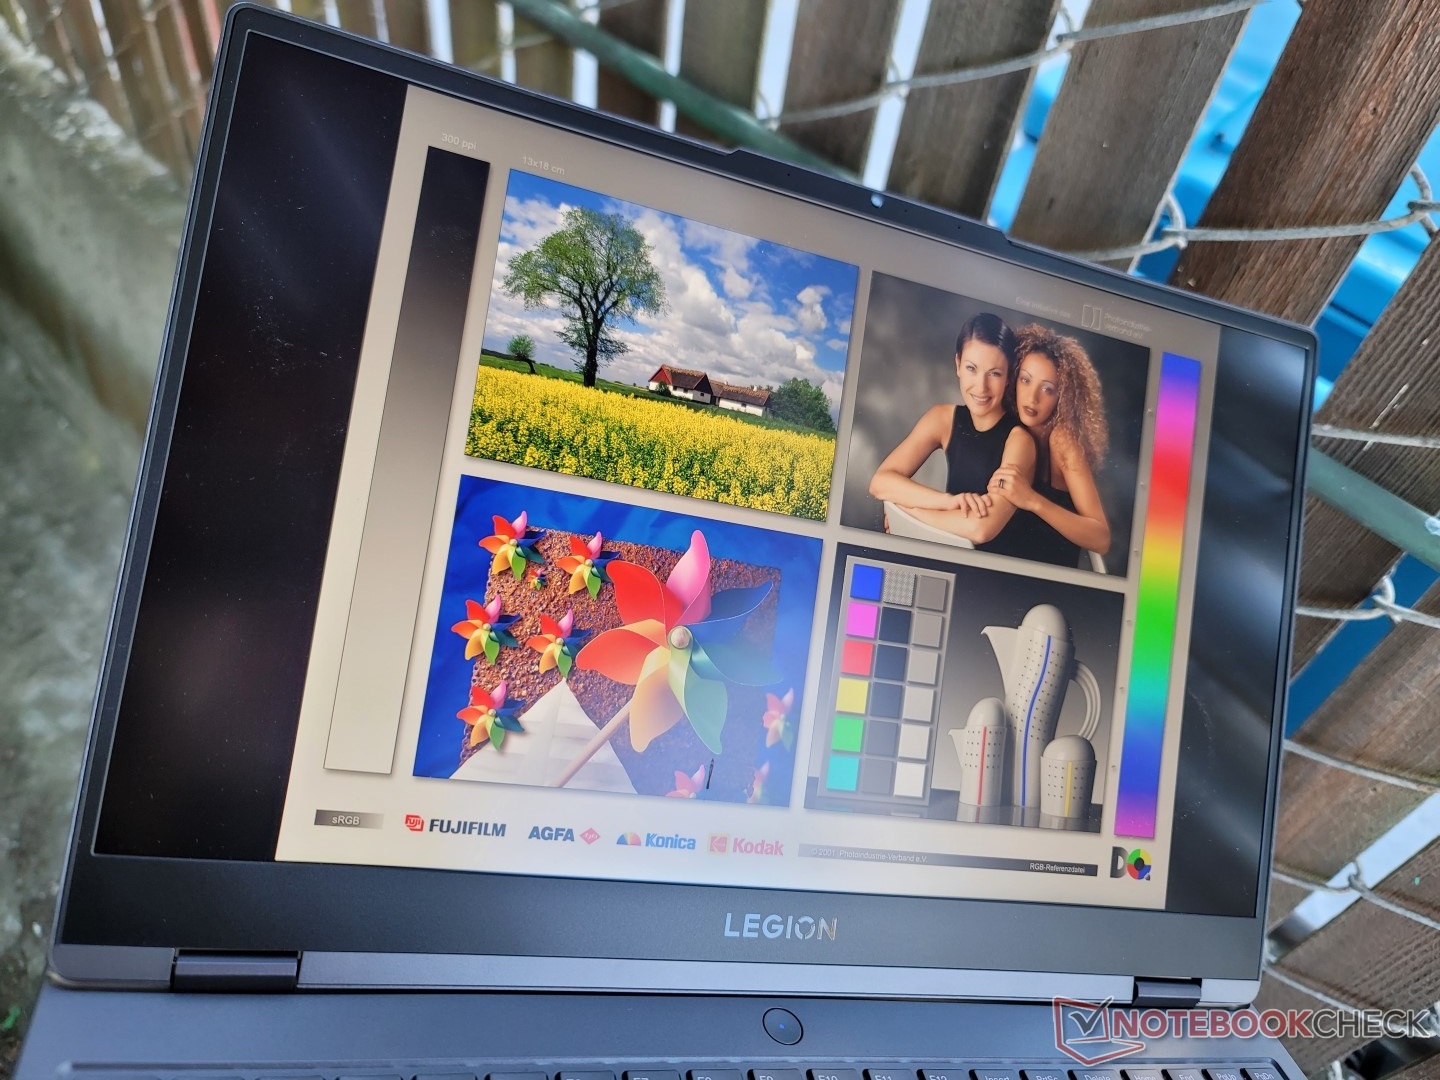
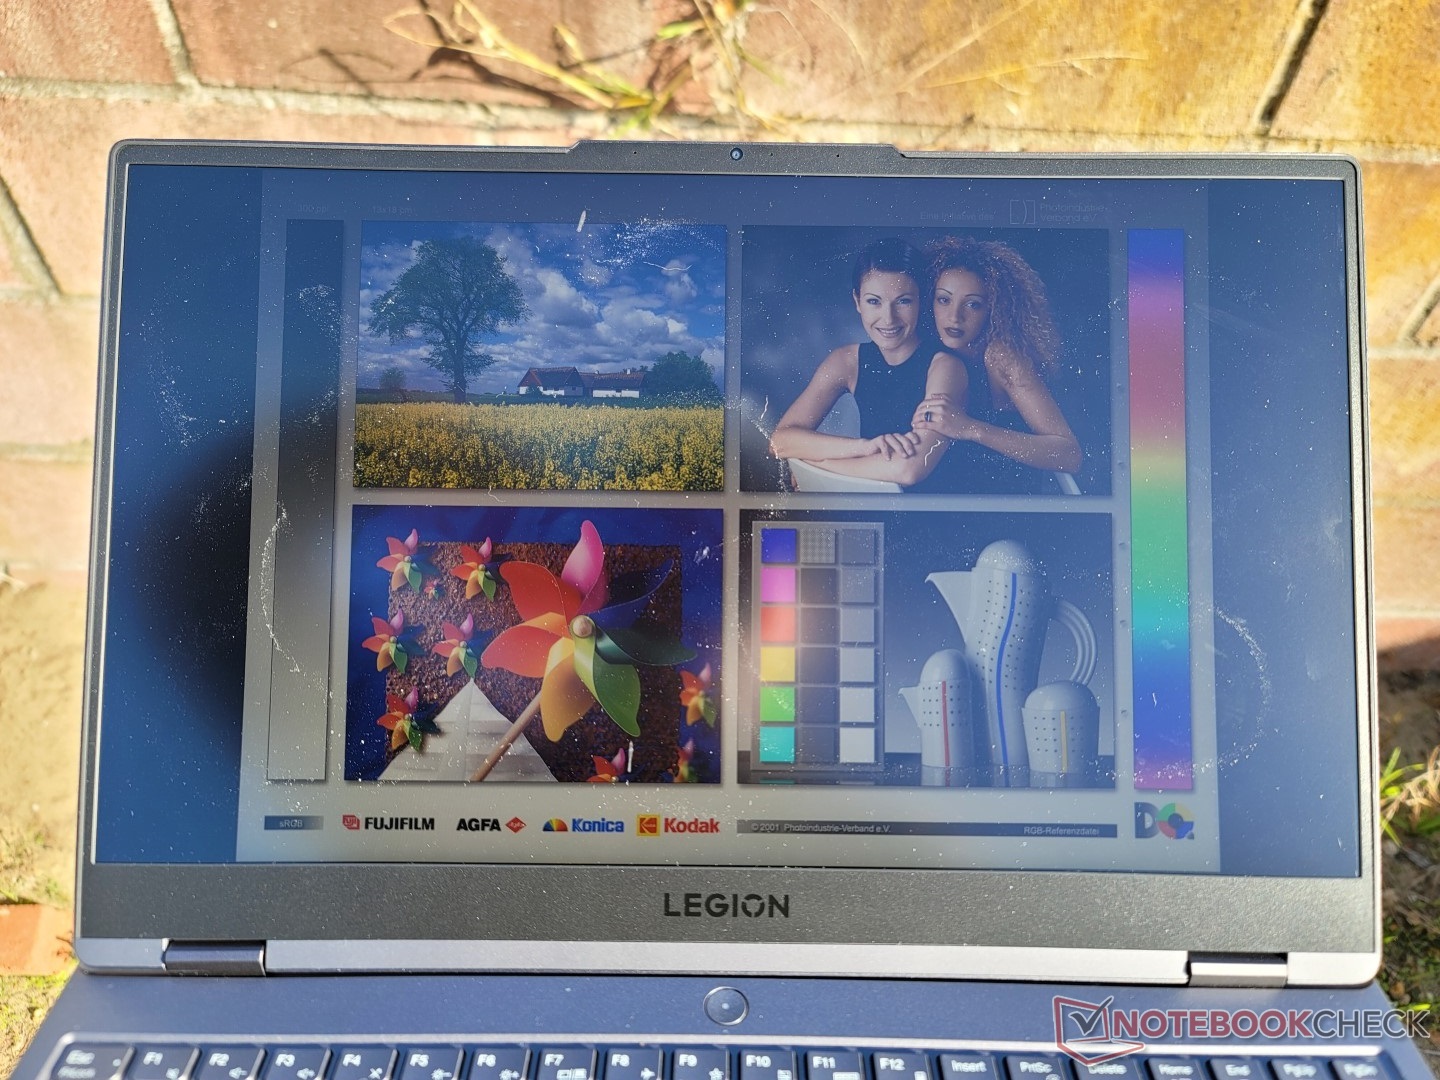
Com 350 lêndeas, a tela é apenas ligeiramente mais brilhante do que a média dos portáteis de jogos, onde 300 lêndeas são comuns. A tela é confortável para visualização ao ar livre sob a sombra e a cobertura mate ajuda a reduzir o brilho, mas tudo se torna lavado se sob condições mais brilhantes.
Desempenho - Suporte MUX
Condições de teste
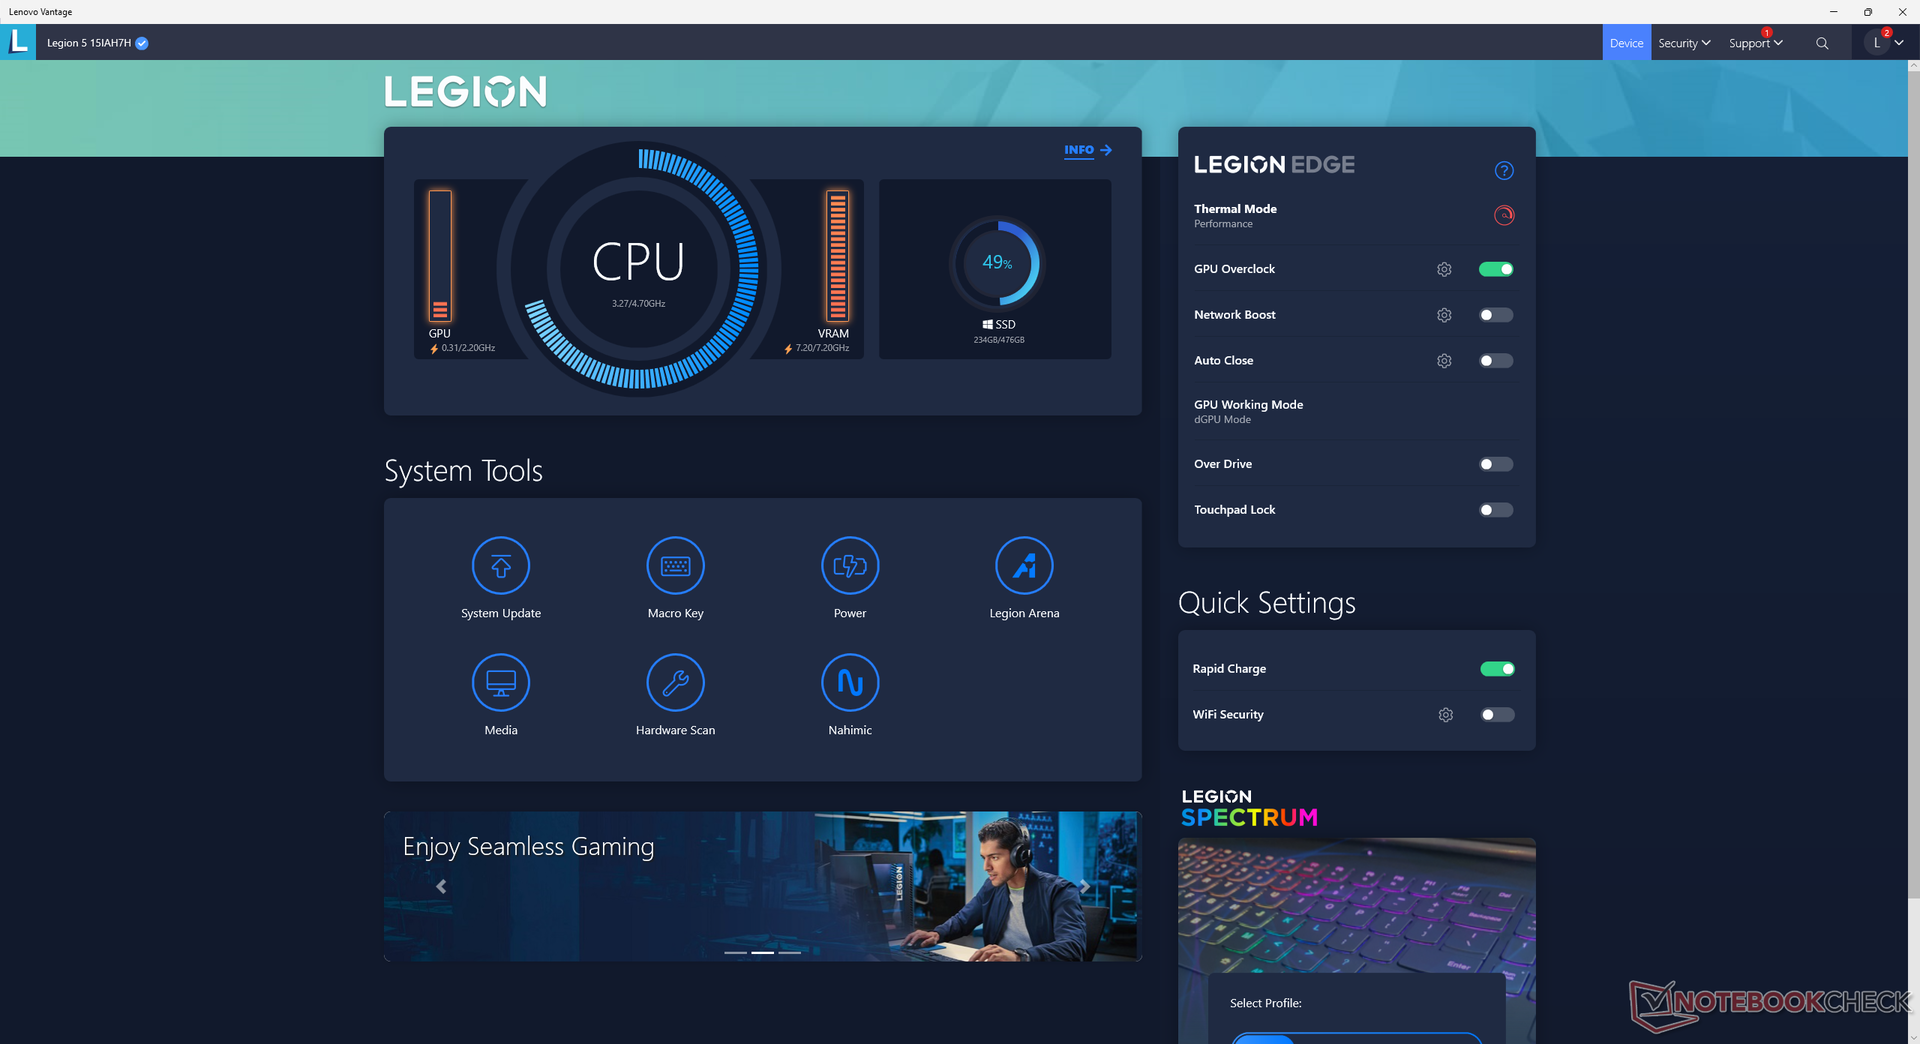
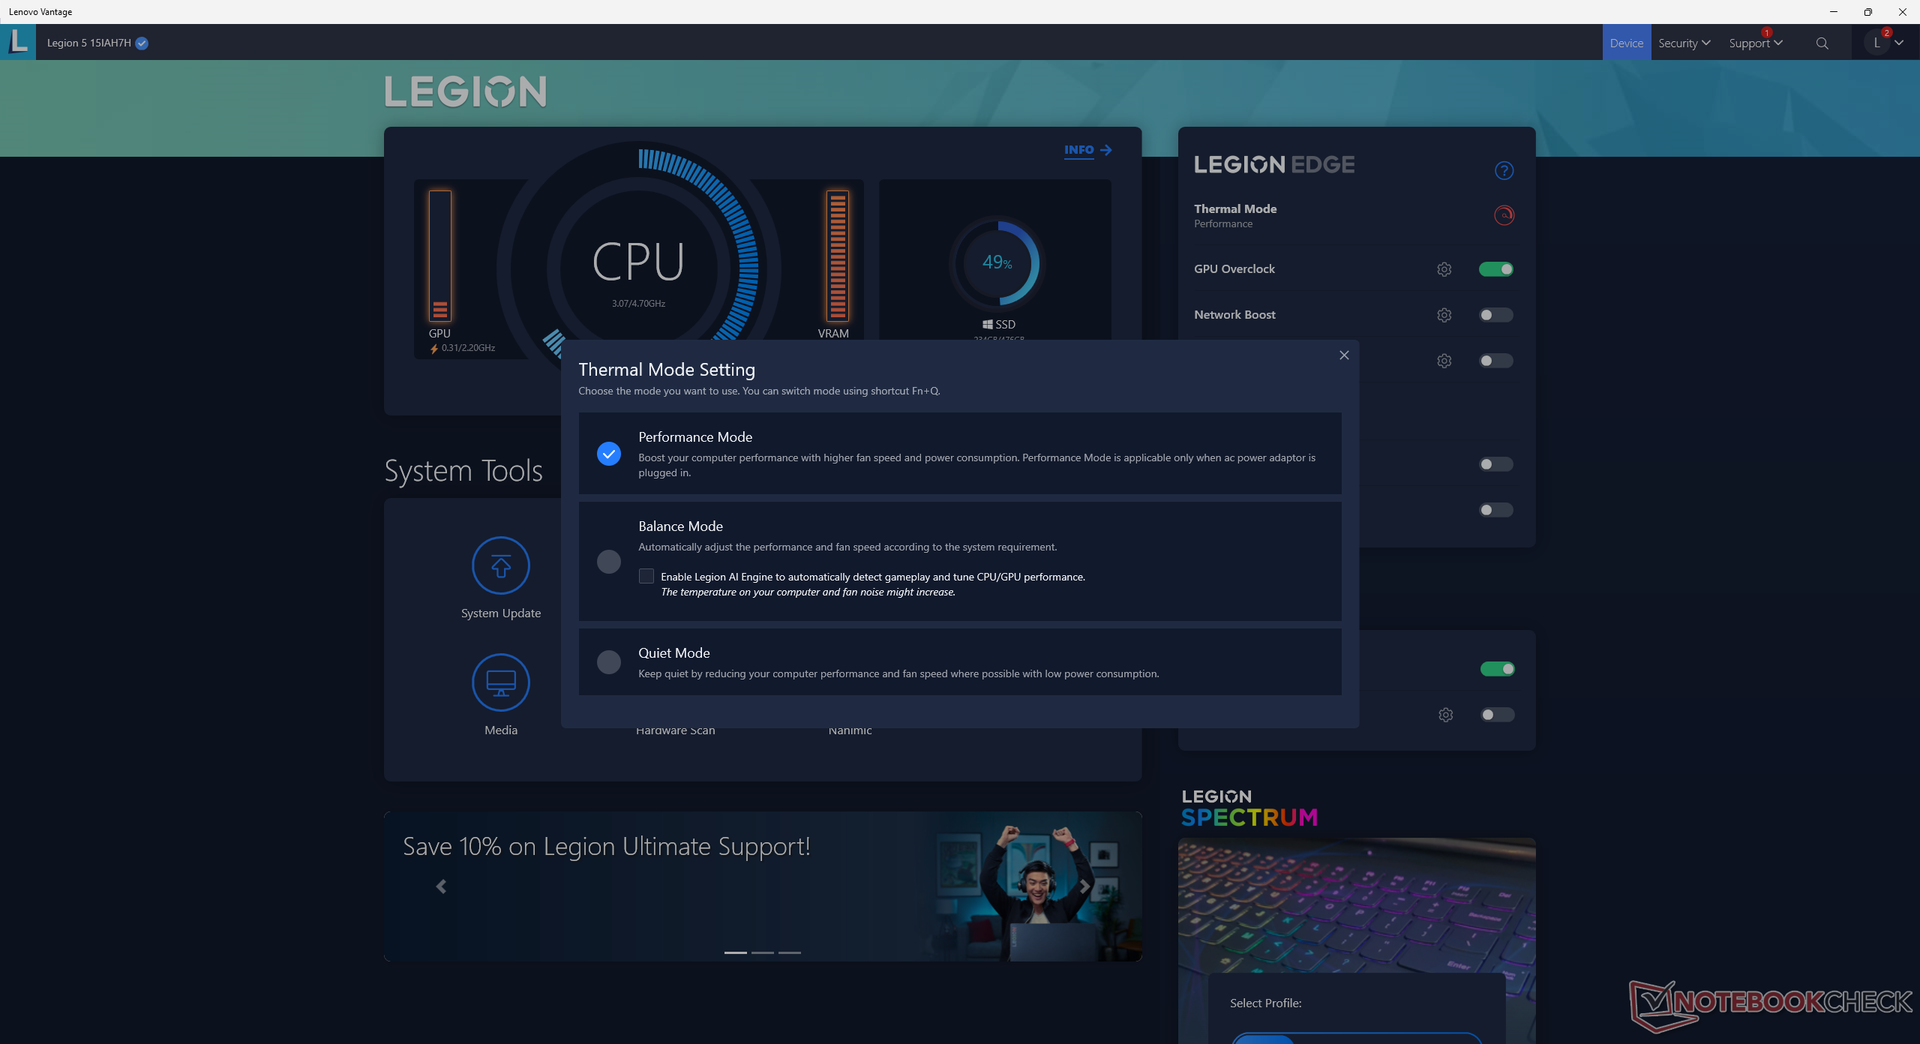
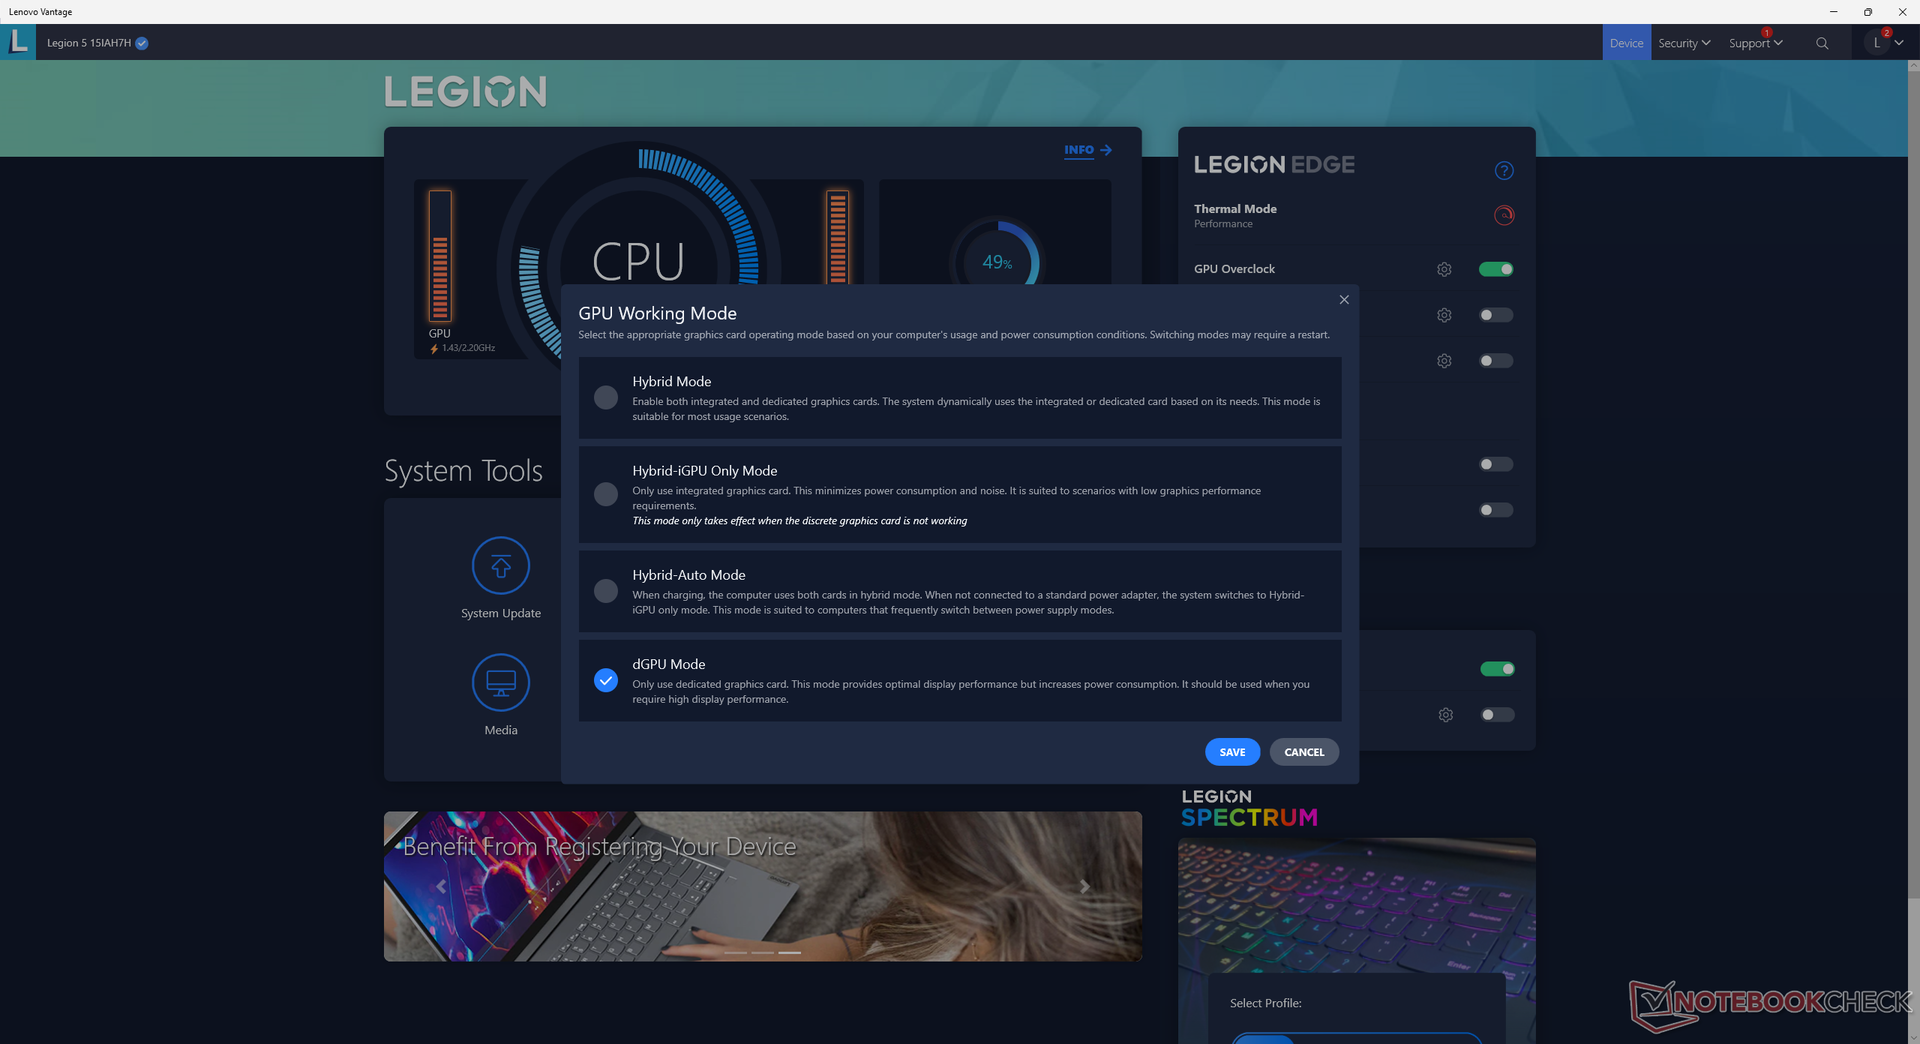
Configuramos nosso sistema para o modo Performance e a GPU para o modo discreto via Lenovo Vantage antes de executar quaisquer benchmarks de performance abaixo. É altamente recomendável que os usuários se familiarizem com o software Vantage pré-instalado, pois ele é o centro para atualizações do sistema, modos gráficos MUX ou híbridos, comportamento de carga e muito mais, como mostrado pelas capturas de tela abaixo.
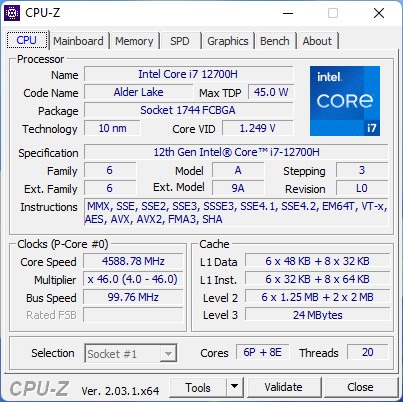
Processador
O desempenho da CPU é mais rápido do que o esperado, com resultados 15% a 25% mais rápidos do que a média dos laptops em nosso banco de dados equipados com o mesmo Núcleo i7-12700H processador. Na verdade, o Legion 5 15 é um dos modelos mais rápidos que você pode obter com o Core i7-12700H. O desempenho bruto supera o Núcleo i7-12800H no mais caro 2022 Lâmina Razer 15 por margens perceptíveis
Despromoção para um Núcleo i5-12500H a configuração implica um mergulho de 5% e 25% no desempenho de rosca única e rosca múltipla, respectivamente.
Cinebench R15 Multi Loop
Cinebench R23: Multi Core | Single Core
Cinebench R15: CPU Multi 64Bit | CPU Single 64Bit
Blender: v2.79 BMW27 CPU
7-Zip 18.03: 7z b 4 | 7z b 4 -mmt1
Geekbench 5.5: Multi-Core | Single-Core
HWBOT x265 Benchmark v2.2: 4k Preset
LibreOffice : 20 Documents To PDF
R Benchmark 2.5: Overall mean
* ... menor é melhor
AIDA64: FP32 Ray-Trace | FPU Julia | CPU SHA3 | CPU Queen | FPU SinJulia | FPU Mandel | CPU AES | CPU ZLib | FP64 Ray-Trace | CPU PhotoWorxx
| Performance rating | |
| Lenovo Legion 5 15IAH7H 82RB | |
| Lenovo Legion 5 15ACH-82JU00C6GE-FL | |
| Média Intel Core i7-12700H | |
| Asus TUF Gaming F15 FX507ZM | |
| MSI Bravo 15 B5DD-010US | |
| Acer Aspire Nitro 5 AN515-55-57GF | |
| AIDA64 / FP32 Ray-Trace | |
| Lenovo Legion 5 15IAH7H 82RB | |
| Lenovo Legion 5 15ACH-82JU00C6GE-FL | |
| Média Intel Core i7-12700H (2585 - 17957, n=64) | |
| MSI Bravo 15 B5DD-010US | |
| Asus TUF Gaming F15 FX507ZM | |
| Acer Aspire Nitro 5 AN515-55-57GF | |
| AIDA64 / FPU Julia | |
| Lenovo Legion 5 15ACH-82JU00C6GE-FL | |
| Lenovo Legion 5 15IAH7H 82RB | |
| MSI Bravo 15 B5DD-010US | |
| Média Intel Core i7-12700H (12439 - 90760, n=64) | |
| Asus TUF Gaming F15 FX507ZM | |
| Acer Aspire Nitro 5 AN515-55-57GF | |
| AIDA64 / CPU SHA3 | |
| Lenovo Legion 5 15IAH7H 82RB | |
| Asus TUF Gaming F15 FX507ZM | |
| Lenovo Legion 5 15ACH-82JU00C6GE-FL | |
| Média Intel Core i7-12700H (833 - 4242, n=64) | |
| MSI Bravo 15 B5DD-010US | |
| Acer Aspire Nitro 5 AN515-55-57GF | |
| AIDA64 / CPU Queen | |
| Lenovo Legion 5 15IAH7H 82RB | |
| Asus TUF Gaming F15 FX507ZM | |
| Média Intel Core i7-12700H (57923 - 103202, n=63) | |
| Lenovo Legion 5 15ACH-82JU00C6GE-FL | |
| MSI Bravo 15 B5DD-010US | |
| Acer Aspire Nitro 5 AN515-55-57GF | |
| AIDA64 / FPU SinJulia | |
| Lenovo Legion 5 15ACH-82JU00C6GE-FL | |
| Lenovo Legion 5 15IAH7H 82RB | |
| Asus TUF Gaming F15 FX507ZM | |
| MSI Bravo 15 B5DD-010US | |
| Média Intel Core i7-12700H (3249 - 9939, n=64) | |
| Acer Aspire Nitro 5 AN515-55-57GF | |
| AIDA64 / FPU Mandel | |
| Lenovo Legion 5 15ACH-82JU00C6GE-FL | |
| Lenovo Legion 5 15IAH7H 82RB | |
| MSI Bravo 15 B5DD-010US | |
| Média Intel Core i7-12700H (7135 - 44760, n=64) | |
| Asus TUF Gaming F15 FX507ZM | |
| Acer Aspire Nitro 5 AN515-55-57GF | |
| AIDA64 / CPU AES | |
| Lenovo Legion 5 15IAH7H 82RB | |
| Lenovo Legion 5 15ACH-82JU00C6GE-FL | |
| MSI Bravo 15 B5DD-010US | |
| Média Intel Core i7-12700H (31839 - 144360, n=64) | |
| Asus TUF Gaming F15 FX507ZM | |
| Acer Aspire Nitro 5 AN515-55-57GF | |
| AIDA64 / CPU ZLib | |
| Asus TUF Gaming F15 FX507ZM | |
| Lenovo Legion 5 15IAH7H 82RB | |
| Média Intel Core i7-12700H (305 - 1171, n=64) | |
| Lenovo Legion 5 15ACH-82JU00C6GE-FL | |
| MSI Bravo 15 B5DD-010US | |
| Acer Aspire Nitro 5 AN515-55-57GF | |
| AIDA64 / FP64 Ray-Trace | |
| Lenovo Legion 5 15IAH7H 82RB | |
| Lenovo Legion 5 15ACH-82JU00C6GE-FL | |
| Média Intel Core i7-12700H (1437 - 9692, n=64) | |
| MSI Bravo 15 B5DD-010US | |
| Asus TUF Gaming F15 FX507ZM | |
| Acer Aspire Nitro 5 AN515-55-57GF | |
| AIDA64 / CPU PhotoWorxx | |
| Lenovo Legion 5 15IAH7H 82RB | |
| Asus TUF Gaming F15 FX507ZM | |
| Média Intel Core i7-12700H (12863 - 52207, n=64) | |
| Acer Aspire Nitro 5 AN515-55-57GF | |
| MSI Bravo 15 B5DD-010US | |
| Lenovo Legion 5 15ACH-82JU00C6GE-FL | |
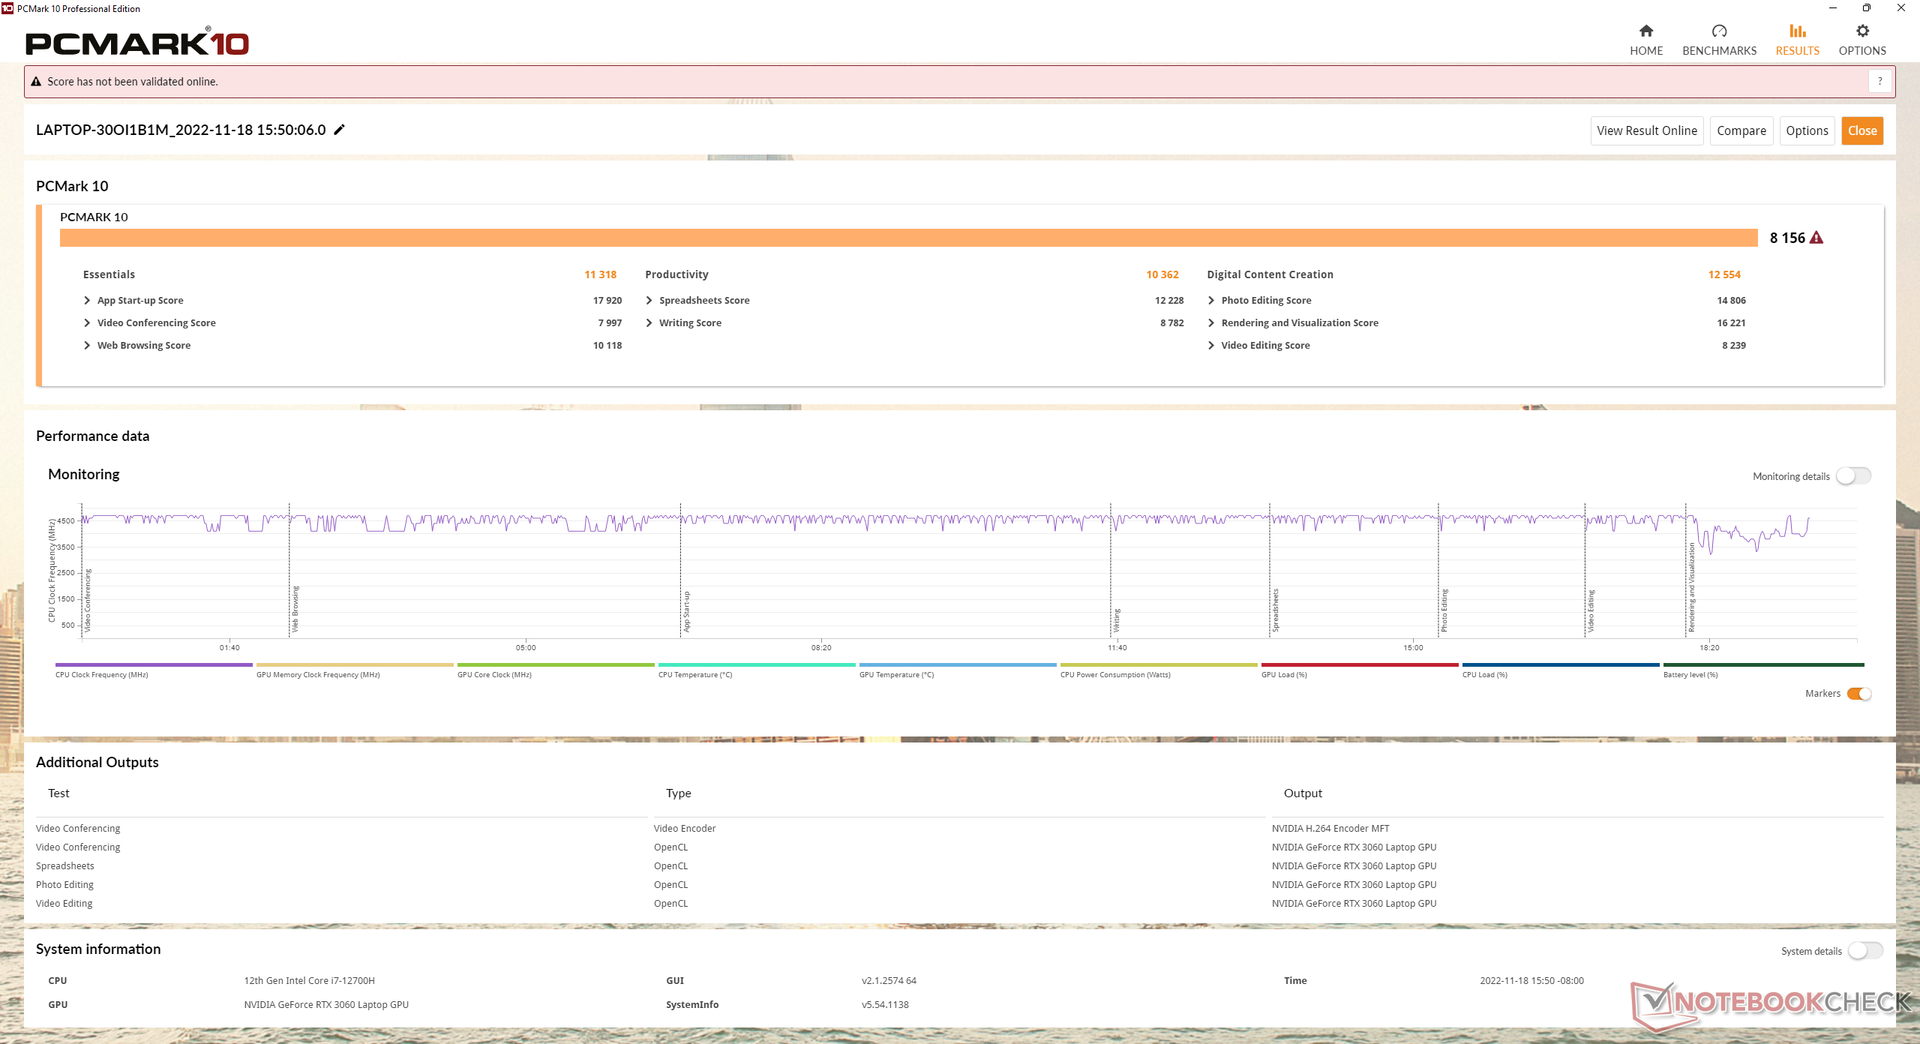
Desempenho do sistema
Os resultados da PCMark são consistentemente superiores aos do modelo do ano passado para ser um dos mais altos de qualquer laptop com a mesma CPU Core i7-12700H e GPU RTX 3060. Isto se alinha com os resultados de desempenho da CPU e da GPU mais rápidos do que a média de nossa unidade de teste.
CrossMark: Overall | Productivity | Creativity | Responsiveness
| PCMark 10 / Score | |
| Lenovo Legion 5 15IAH7H 82RB | |
| Asus TUF Gaming F15 FX507ZM | |
| Média Intel Core i7-12700H, NVIDIA GeForce RTX 3060 Laptop GPU (5986 - 8156, n=12) | |
| Lenovo Legion 5 15ACH-82JU00C6GE-FL | |
| Razer Blade 15 Base Edition 2021, i7-10750H RTX 3060 | |
| MSI Bravo 15 B5DD-010US | |
| Acer Aspire Nitro 5 AN515-55-57GF | |
| PCMark 10 / Essentials | |
| Lenovo Legion 5 15IAH7H 82RB | |
| Média Intel Core i7-12700H, NVIDIA GeForce RTX 3060 Laptop GPU (9289 - 12144, n=12) | |
| Asus TUF Gaming F15 FX507ZM | |
| Lenovo Legion 5 15ACH-82JU00C6GE-FL | |
| Razer Blade 15 Base Edition 2021, i7-10750H RTX 3060 | |
| MSI Bravo 15 B5DD-010US | |
| Acer Aspire Nitro 5 AN515-55-57GF | |
| PCMark 10 / Productivity | |
| Lenovo Legion 5 15IAH7H 82RB | |
| Lenovo Legion 5 15ACH-82JU00C6GE-FL | |
| Média Intel Core i7-12700H, NVIDIA GeForce RTX 3060 Laptop GPU (6161 - 10362, n=12) | |
| Asus TUF Gaming F15 FX507ZM | |
| MSI Bravo 15 B5DD-010US | |
| Razer Blade 15 Base Edition 2021, i7-10750H RTX 3060 | |
| Acer Aspire Nitro 5 AN515-55-57GF | |
| PCMark 10 / Digital Content Creation | |
| Lenovo Legion 5 15IAH7H 82RB | |
| Asus TUF Gaming F15 FX507ZM | |
| Média Intel Core i7-12700H, NVIDIA GeForce RTX 3060 Laptop GPU (8950 - 12554, n=12) | |
| Razer Blade 15 Base Edition 2021, i7-10750H RTX 3060 | |
| Lenovo Legion 5 15ACH-82JU00C6GE-FL | |
| MSI Bravo 15 B5DD-010US | |
| Acer Aspire Nitro 5 AN515-55-57GF | |
| CrossMark / Overall | |
| Lenovo Legion 5 15IAH7H 82RB | |
| Média Intel Core i7-12700H, NVIDIA GeForce RTX 3060 Laptop GPU (1649 - 2017, n=11) | |
| CrossMark / Productivity | |
| Lenovo Legion 5 15IAH7H 82RB | |
| Média Intel Core i7-12700H, NVIDIA GeForce RTX 3060 Laptop GPU (1536 - 1958, n=11) | |
| CrossMark / Creativity | |
| Lenovo Legion 5 15IAH7H 82RB | |
| Média Intel Core i7-12700H, NVIDIA GeForce RTX 3060 Laptop GPU (1816 - 2084, n=11) | |
| CrossMark / Responsiveness | |
| Lenovo Legion 5 15IAH7H 82RB | |
| Média Intel Core i7-12700H, NVIDIA GeForce RTX 3060 Laptop GPU (1210 - 2207, n=11) | |
| PCMark 10 Score | 8156 pontos | |
Ajuda | ||
| AIDA64 / Memory Copy | |
| Média Intel Core i7-12700H (25615 - 80511, n=64) | |
| Asus TUF Gaming F15 FX507ZM | |
| Lenovo Legion 5 15IAH7H 82RB | |
| MSI Bravo 15 B5DD-010US | |
| Lenovo Legion 5 15ACH-82JU00C6GE-FL | |
| Acer Aspire Nitro 5 AN515-55-57GF | |
| AIDA64 / Memory Read | |
| Lenovo Legion 5 15IAH7H 82RB | |
| Asus TUF Gaming F15 FX507ZM | |
| Média Intel Core i7-12700H (25586 - 79442, n=64) | |
| MSI Bravo 15 B5DD-010US | |
| Lenovo Legion 5 15ACH-82JU00C6GE-FL | |
| Acer Aspire Nitro 5 AN515-55-57GF | |
| AIDA64 / Memory Write | |
| Lenovo Legion 5 15IAH7H 82RB | |
| Asus TUF Gaming F15 FX507ZM | |
| Média Intel Core i7-12700H (23679 - 88660, n=64) | |
| Acer Aspire Nitro 5 AN515-55-57GF | |
| MSI Bravo 15 B5DD-010US | |
| Lenovo Legion 5 15ACH-82JU00C6GE-FL | |
| AIDA64 / Memory Latency | |
| Lenovo Legion 5 15IAH7H 82RB | |
| Lenovo Legion 5 15ACH-82JU00C6GE-FL | |
| Média Intel Core i7-12700H (76.2 - 133.9, n=62) | |
| MSI Bravo 15 B5DD-010US | |
| Acer Aspire Nitro 5 AN515-55-57GF | |
| Asus TUF Gaming F15 FX507ZM | |
* ... menor é melhor
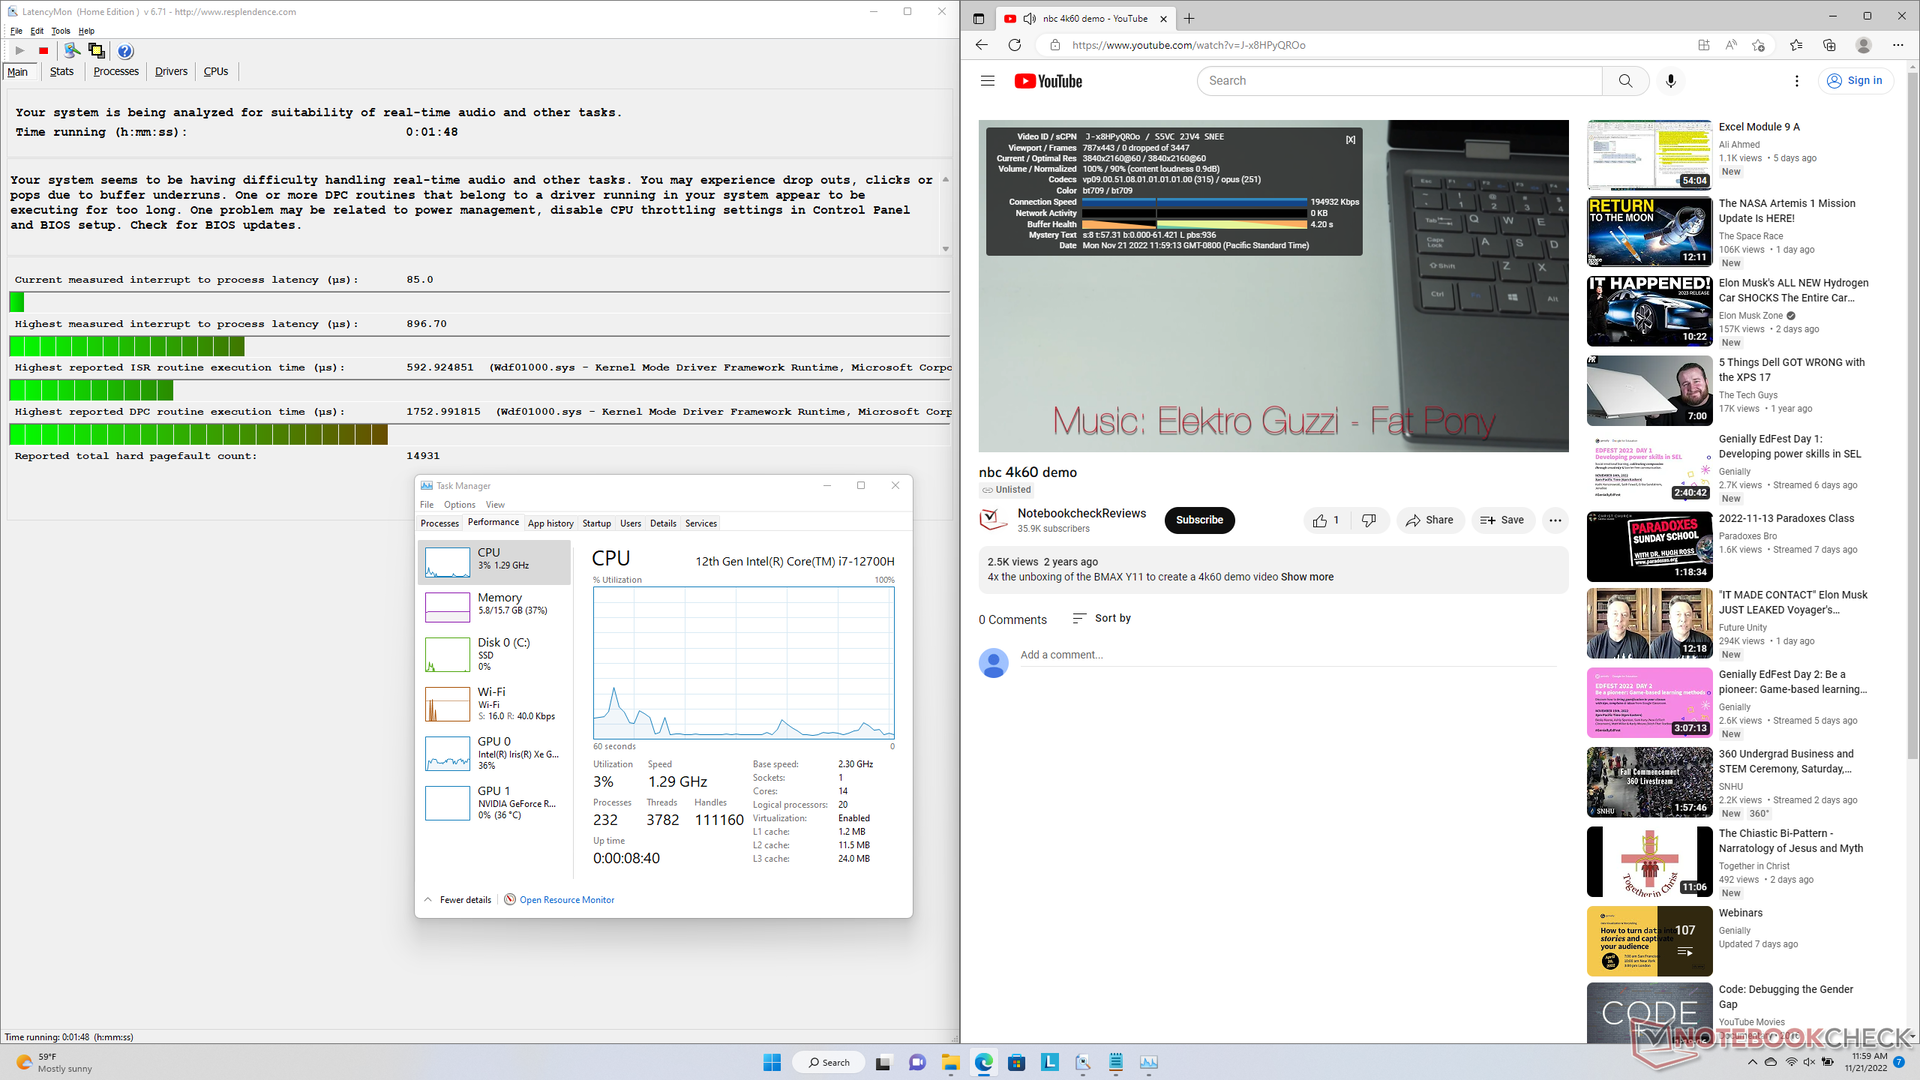
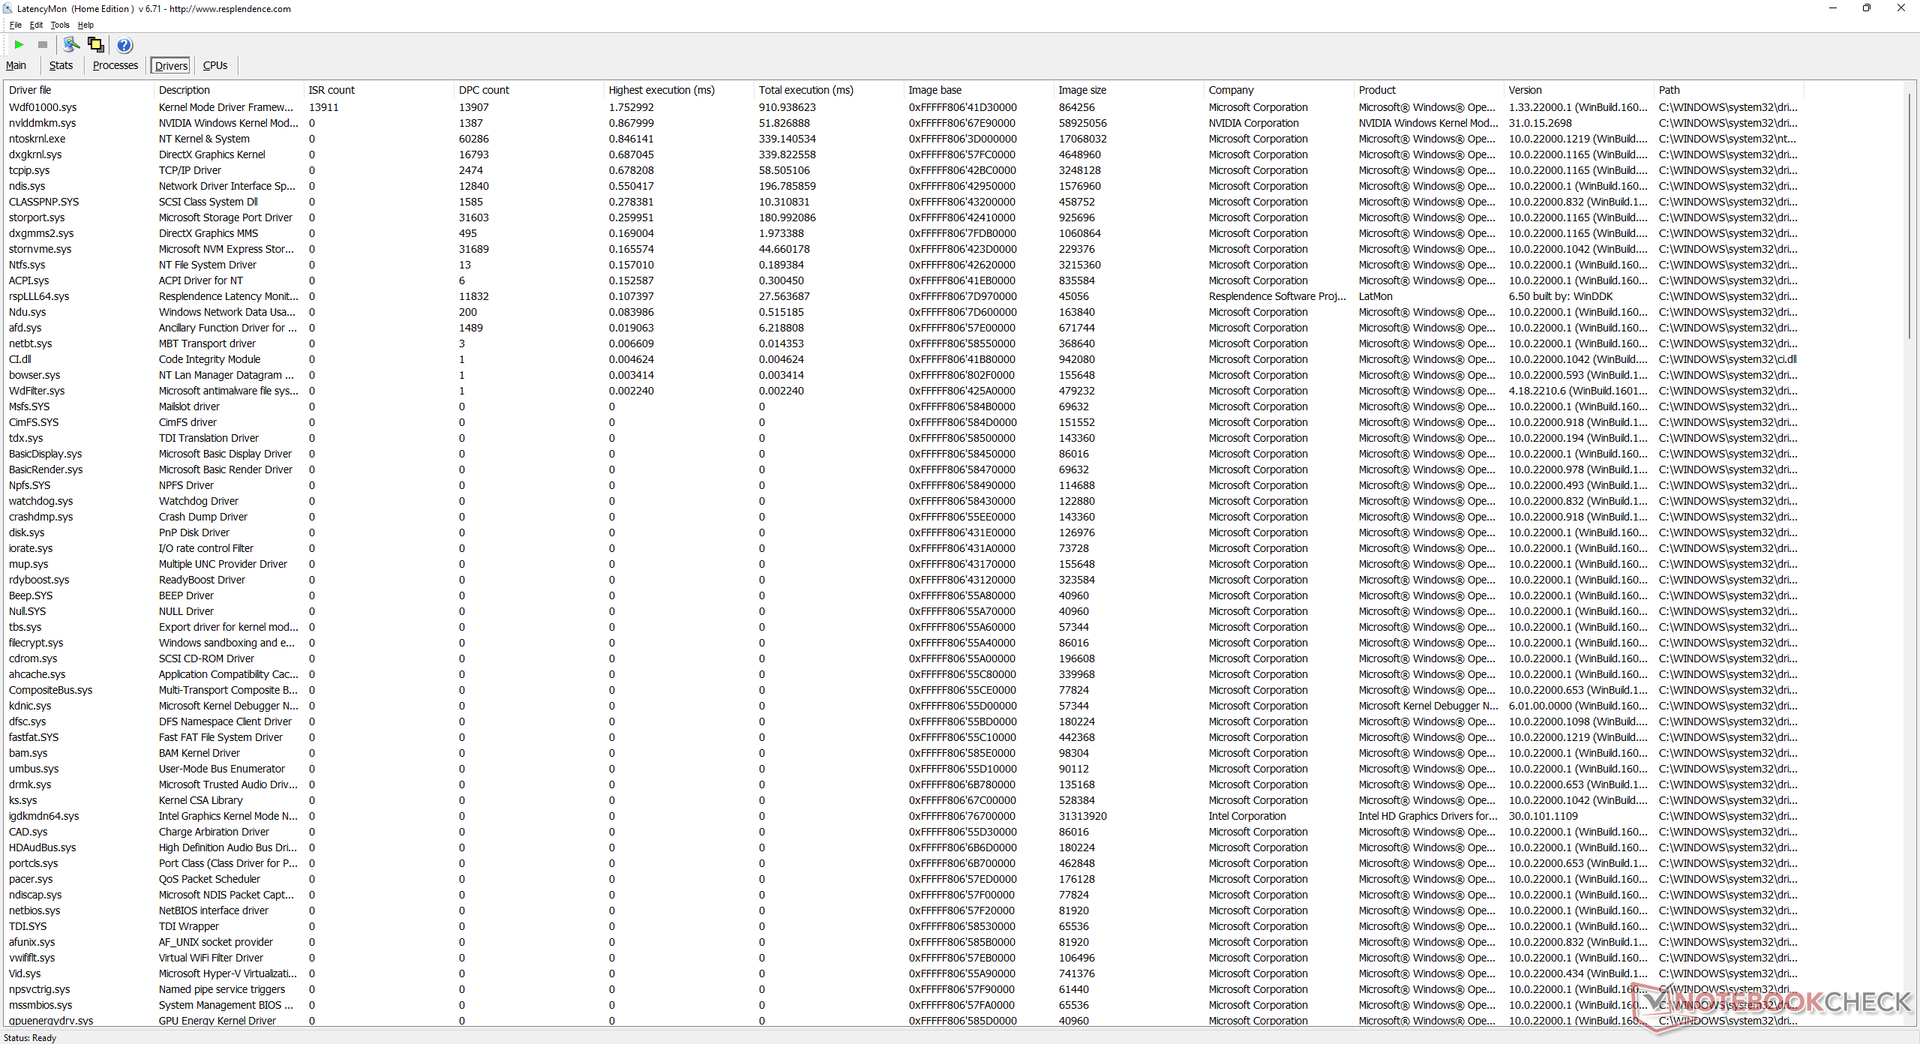
Latência do DPC
LatencyMon revela pequenos problemas de DPC ao abrir várias abas do navegador em nossa página inicial. a reprodução de vídeo de 4K a 60 FPS é perfeita, sem queda de quadros.
| DPC Latencies / LatencyMon - interrupt to process latency (max), Web, Youtube, Prime95 | |
| MSI Bravo 15 B5DD-010US | |
| Lenovo Legion 5 15IAH7H 82RB | |
| Asus TUF Gaming F15 FX507ZM | |
| Lenovo Legion 5 15ACH-82JU00C6GE-FL | |
| Razer Blade 15 Base Edition 2021, i7-10750H RTX 3060 | |
| Acer Aspire Nitro 5 AN515-55-57GF | |
* ... menor é melhor
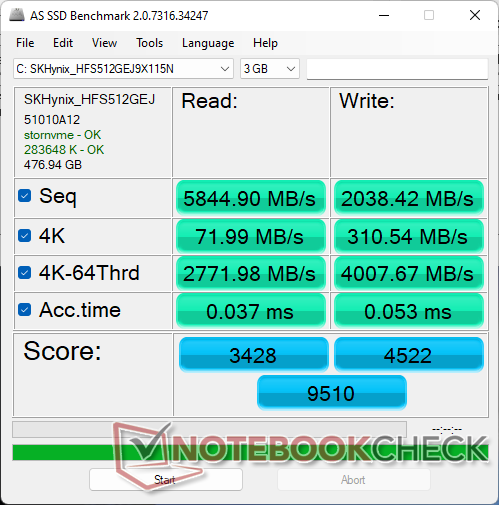
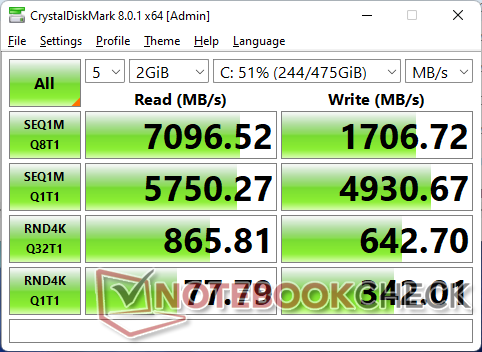
Dispositivos de armazenamento - 2x Suporte PCIe4 x4
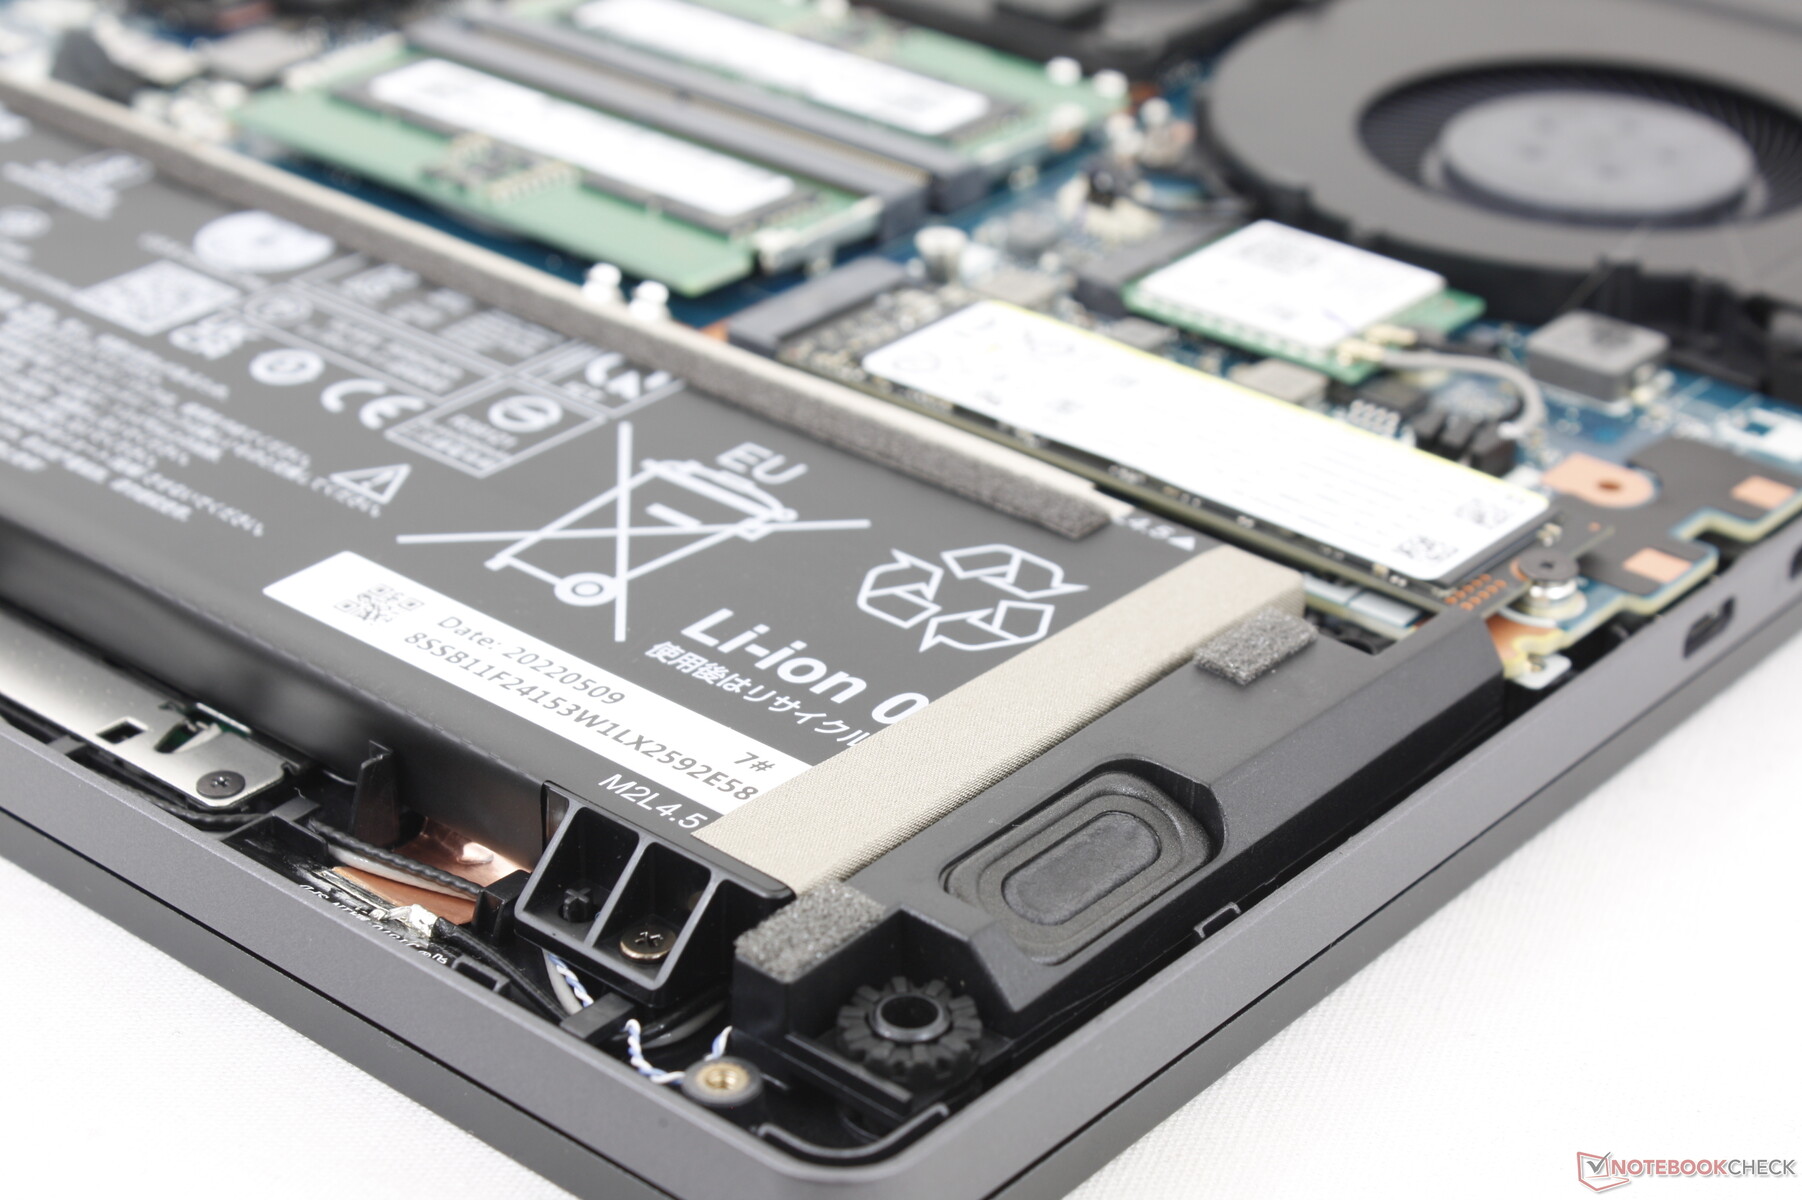
Os usuários podem instalar até dois M.2 2280 SSDs. Cada slot inclui sua própria almofada térmica e espalhador de calor para auxiliar no resfriamento. Os 512 GB Unidade SK Hynix em nossa unidade foi capaz de manter sua taxa máxima de leitura de 7000 MB/s sem qualquer problema de estrangulamento
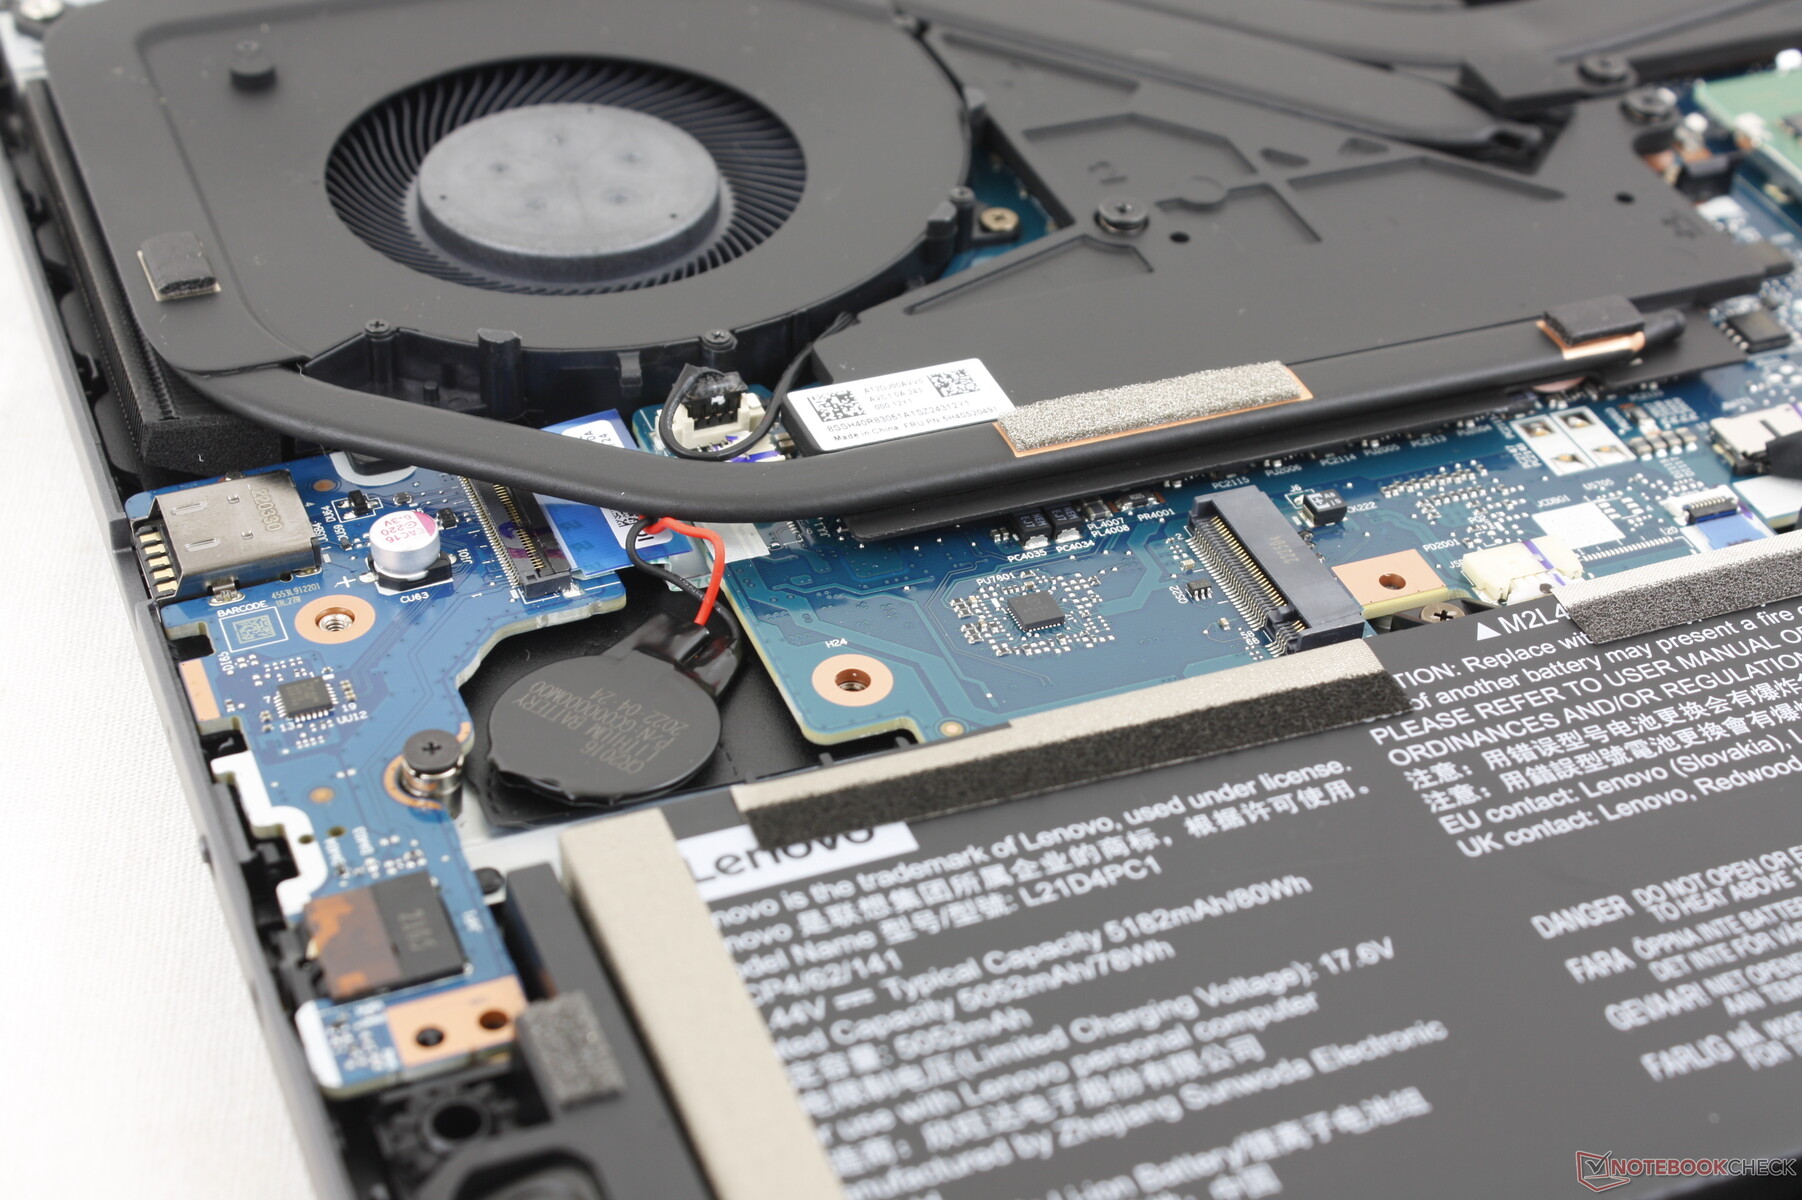
Se instalar um segundo drive, certifique-se de que ele não esteja em frente e verso ou então pode não caber em seu slot. Nossa figura abaixo mostra que a bateria BIOS está ocupando espaço de um potencial M.2 2280 SSD.

* ... menor é melhor
Disk Throttling: DiskSpd Read Loop, Queue Depth 8
GPU Performance - TGP Alto 140 W
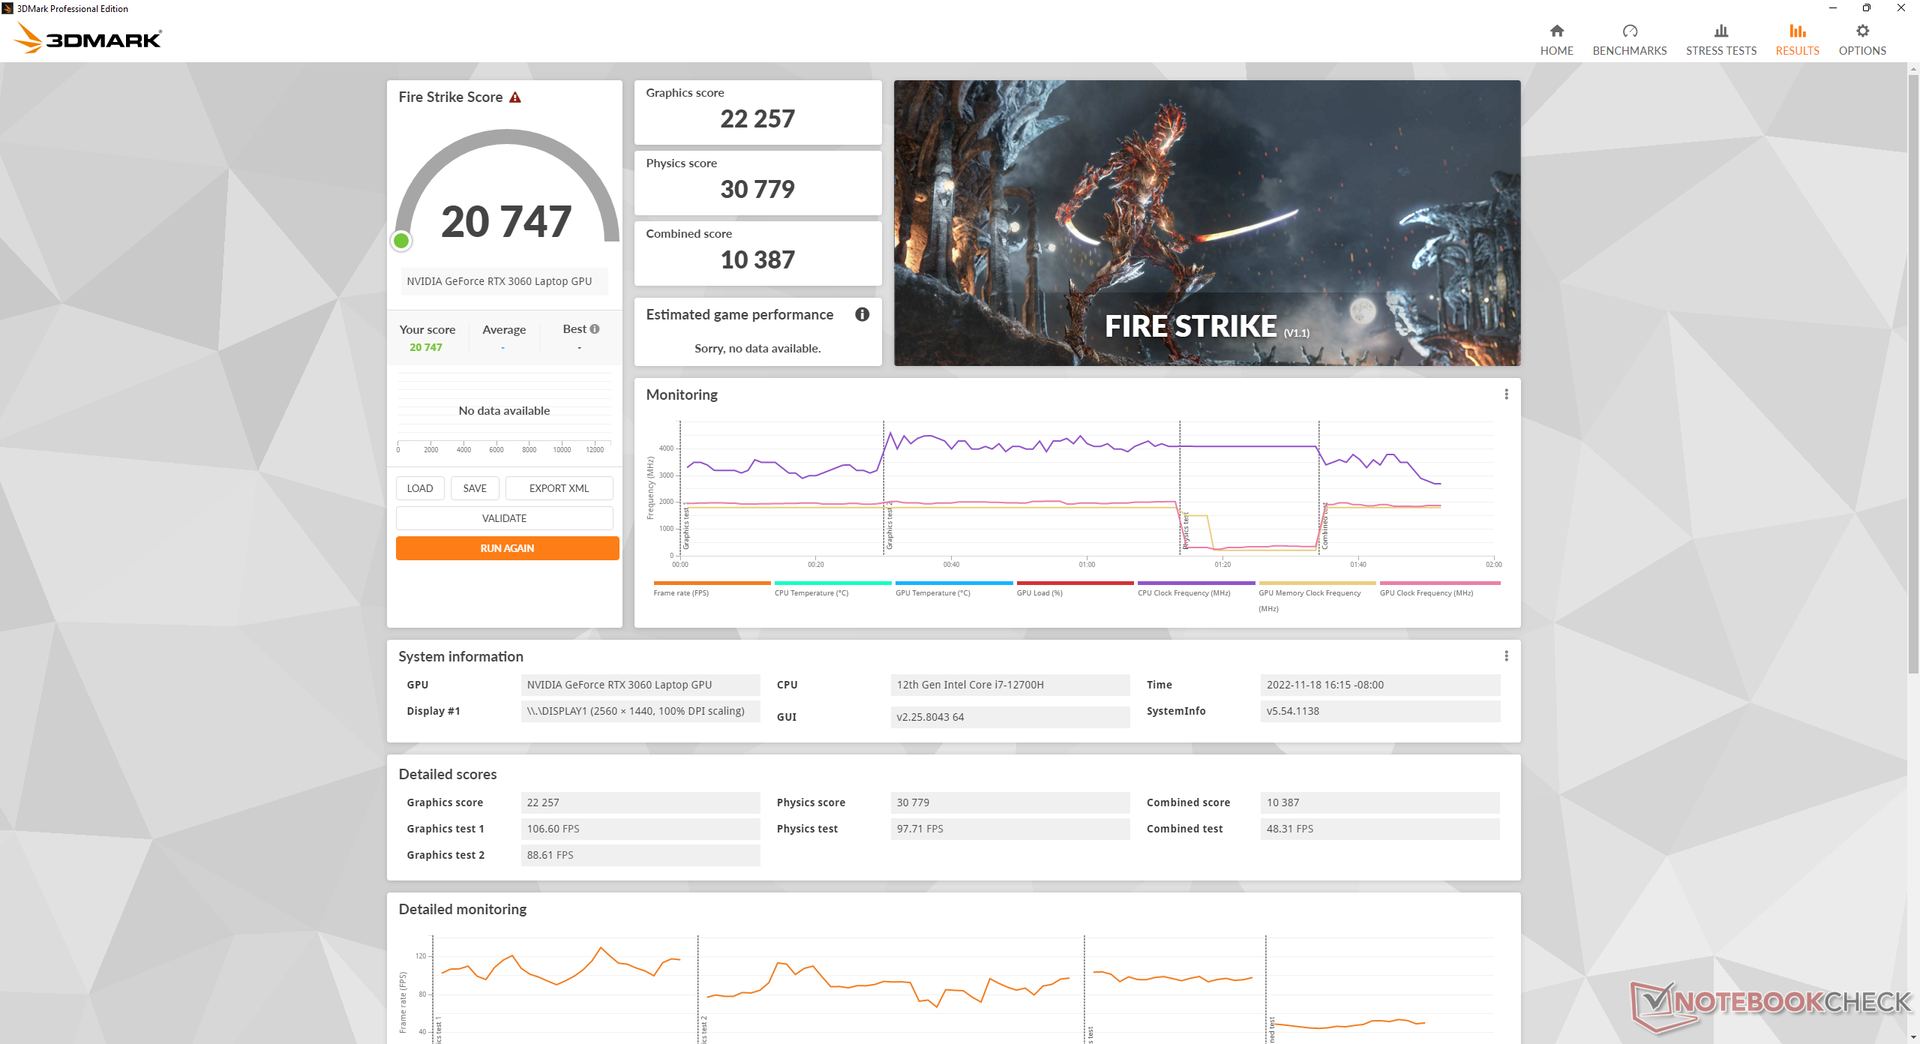
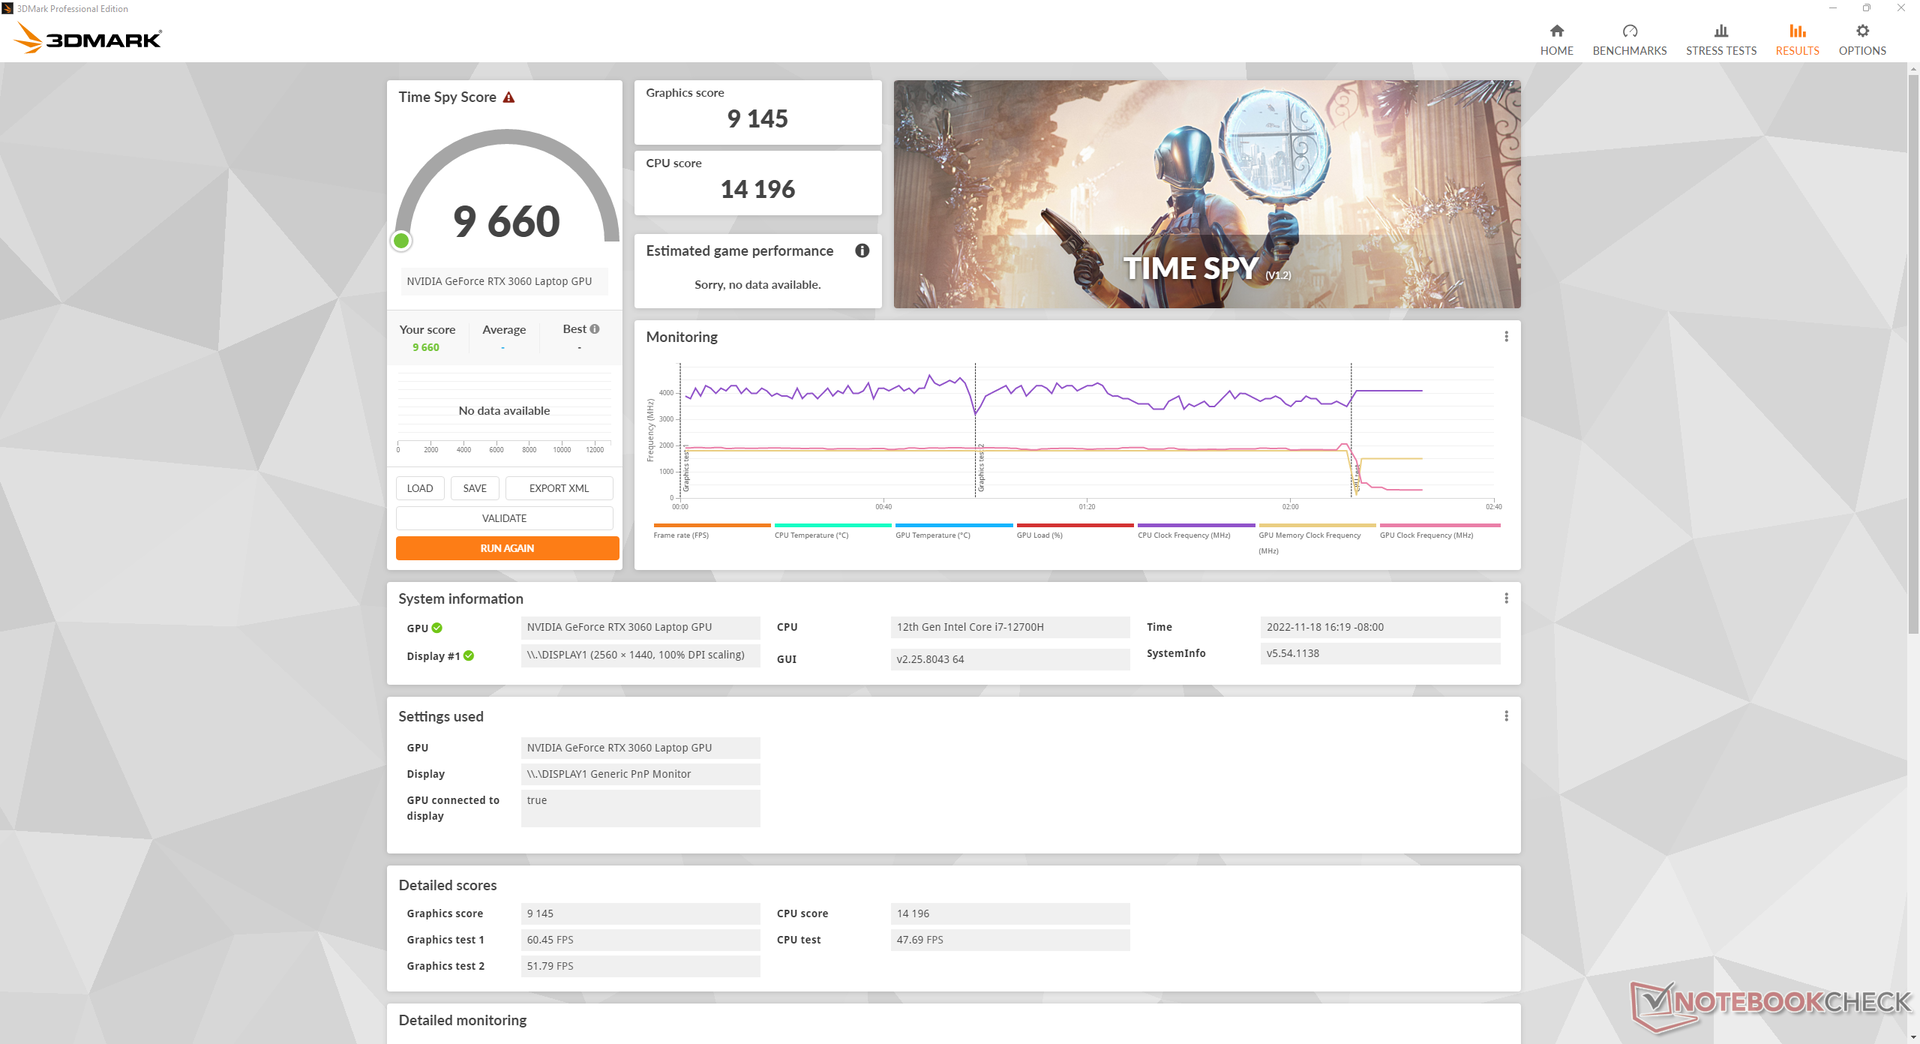
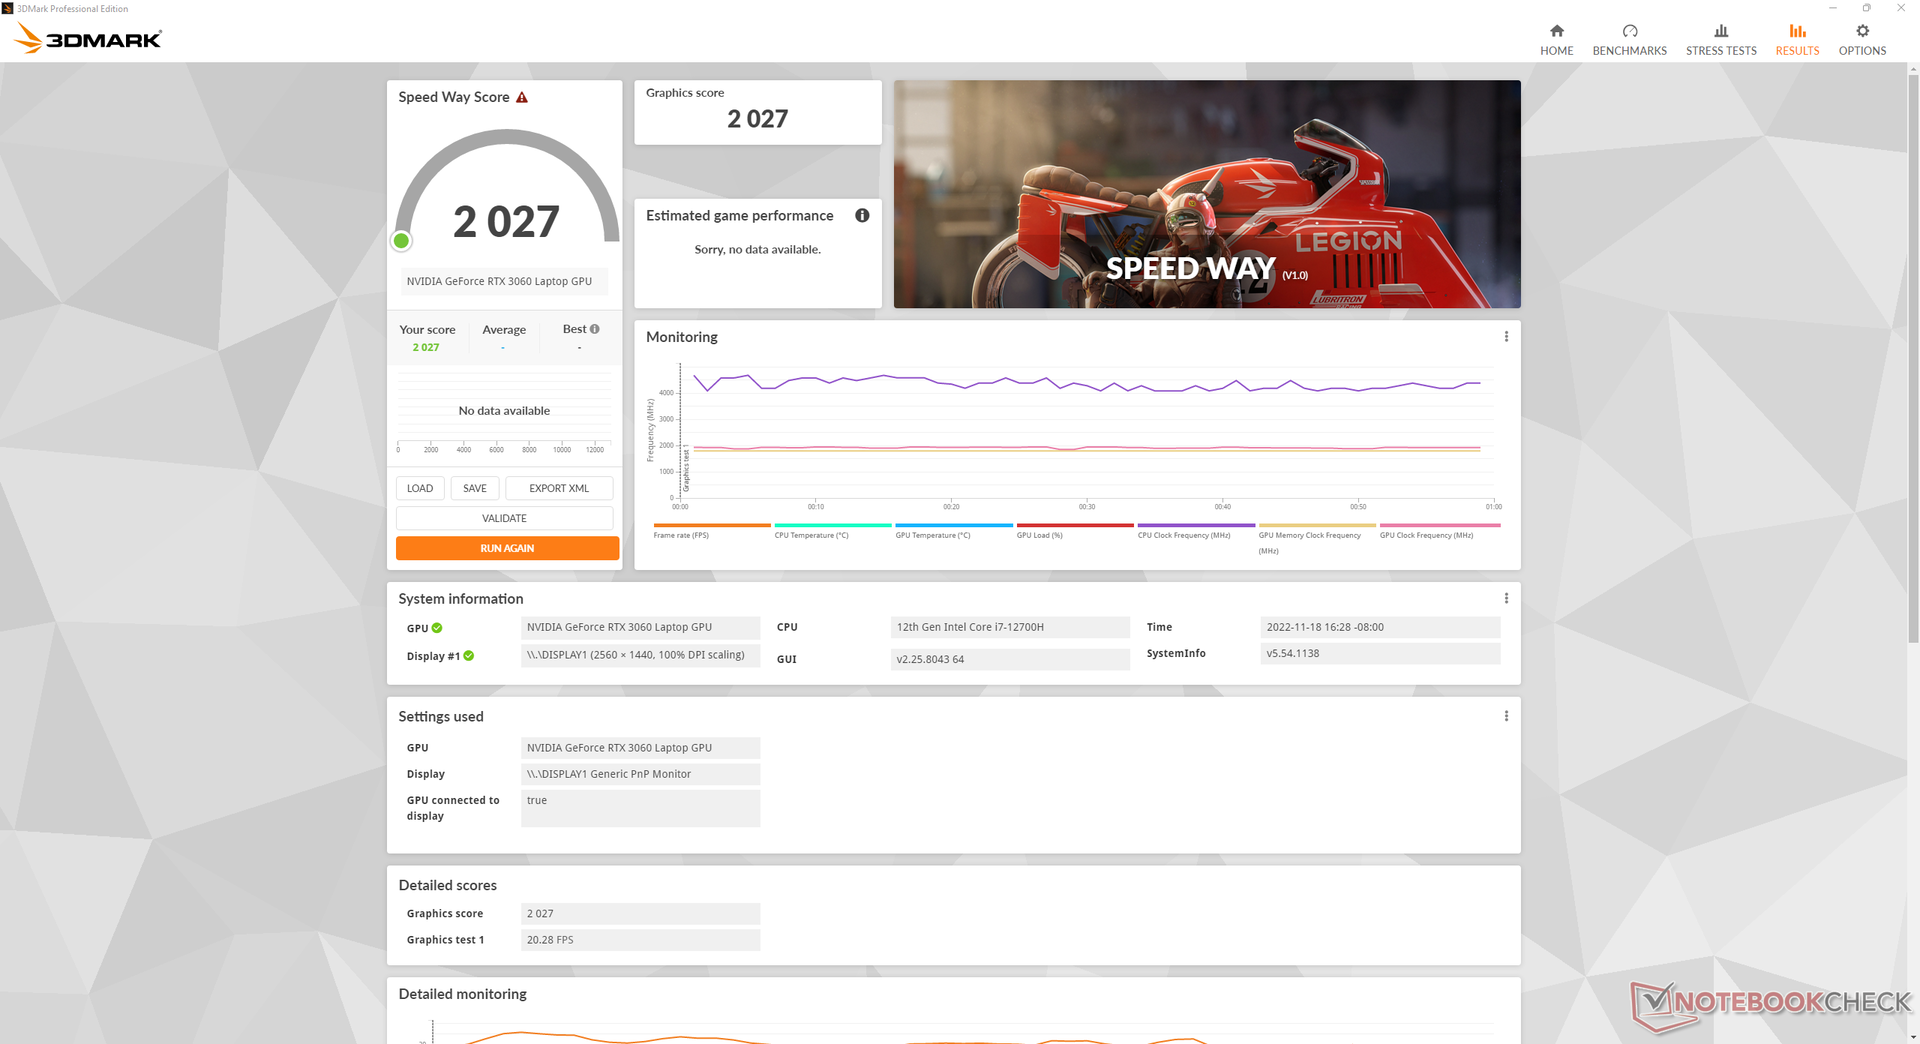
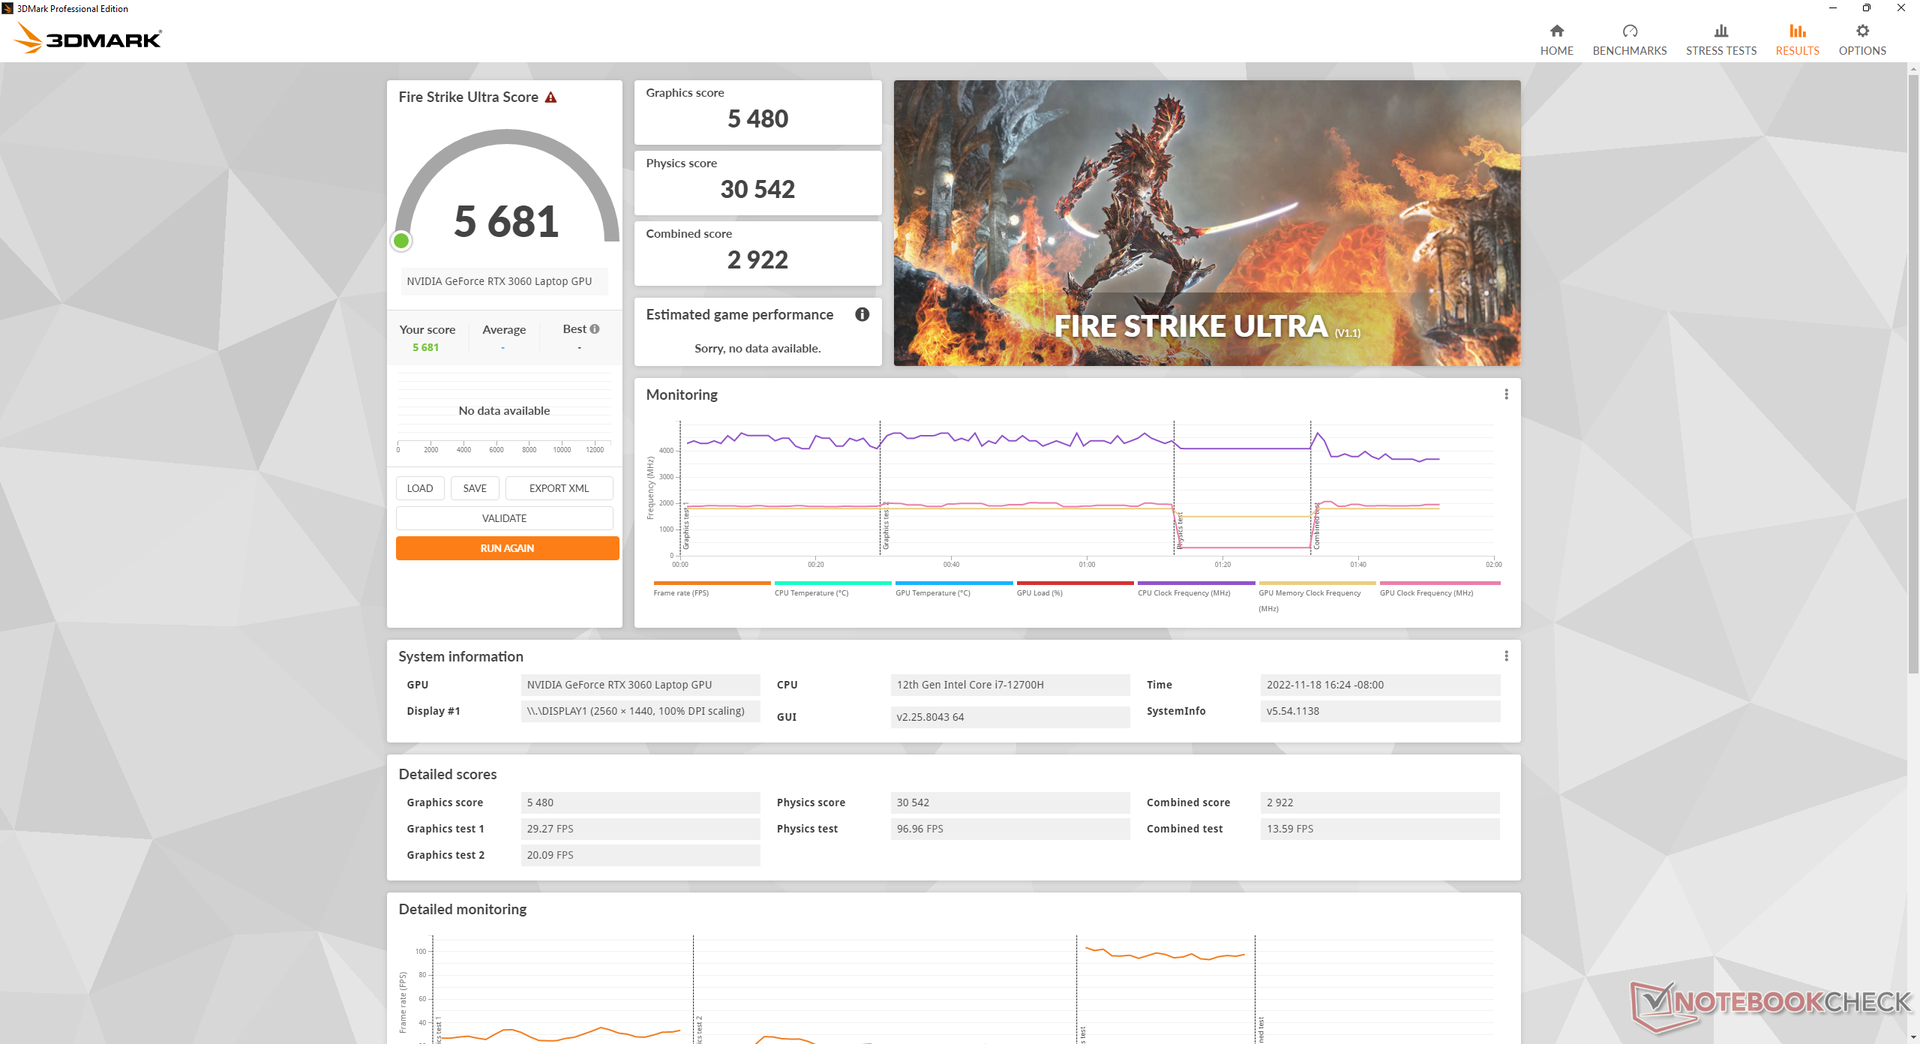
O desempenho gráfico é excelente com resultados 3DMark que são 10 a 15% mais rápidos do que a média do laptop em nosso banco de dados equipado com o mesmo GeForce RTX 3060 GPU. O desempenho superior à média pode ser parcialmente atribuído à meta de 140 W TGP, que é mais alta do que na maioria dos outros laptops de jogos.
O sistema deve ser ajustado para o modo Performance a fim de utilizar plenamente a GPU. Se rodando no modo Balanceado, por exemplo, a performance gráfica cairá em cerca de 10%, como mostra nosso Fire Strike resultados abaixo
.
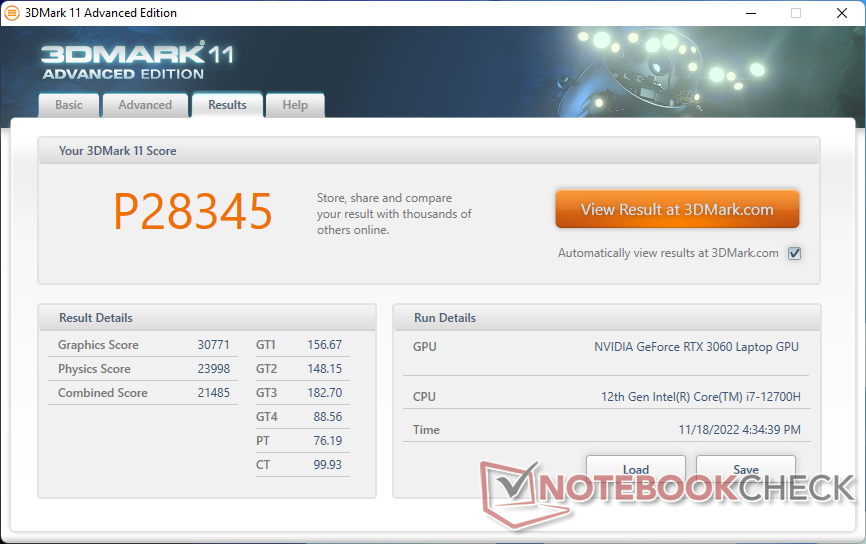

| 3DMark 11 Performance | 28345 pontos | |
| 3DMark Fire Strike Score | 20747 pontos | |
| 3DMark Time Spy Score | 9660 pontos | |
Ajuda | ||
| Blender | |
| v3.3 Classroom OPTIX/RTX | |
| Média NVIDIA GeForce RTX 3060 Laptop GPU (30 - 56, n=15) | |
| Lenovo Legion 5 15IAH7H 82RB | |
| v3.3 Classroom CUDA | |
| Média NVIDIA GeForce RTX 3060 Laptop GPU (51 - 89, n=15) | |
| Lenovo Legion 5 15IAH7H 82RB | |
| v3.3 Classroom CPU | |
| Média NVIDIA GeForce RTX 3060 Laptop GPU (291 - 508, n=15) | |
| Lenovo Legion 5 15IAH7H 82RB | |
* ... menor é melhor
| Performance rating - Percent | |
| Média da turma Gaming | |
| Lenovo Legion 5 15IAH7H 82RB | |
| The Witcher 3 - 1920x1080 Ultra Graphics & Postprocessing (HBAO+) | |
| Média da turma Gaming (104.7 - 240, n=7, últimos 2 anos) | |
| Lenovo Legion 5 15IAH7H 82RB | |
| GTA V - 1920x1080 Highest AA:4xMSAA + FX AF:16x | |
| Média da turma Gaming (48.3 - 186.9, n=94, últimos 2 anos) | |
| Lenovo Legion 5 15IAH7H 82RB | |
| Final Fantasy XV Benchmark - 1920x1080 High Quality | |
| Média da turma Gaming (41 - 215, n=95, últimos 2 anos) | |
| Lenovo Legion 5 15IAH7H 82RB | |
| Strange Brigade - 1920x1080 ultra AA:ultra AF:16 | |
| Média da turma Gaming (76.3 - 458, n=87, últimos 2 anos) | |
| Lenovo Legion 5 15IAH7H 82RB | |
| Dota 2 Reborn - 1920x1080 ultra (3/3) best looking | |
| Lenovo Legion 5 15IAH7H 82RB | |
| Média da turma Gaming (84.8 - 248, n=107, últimos 2 anos) | |
| X-Plane 11.11 - 1920x1080 high (fps_test=3) | |
| Lenovo Legion 5 15IAH7H 82RB | |
| Média da turma Gaming (55.5 - 143.5, n=109, últimos 2 anos) | |
Witcher 3 FPS Chart
| baixo | média | alto | ultra | QHD | |
|---|---|---|---|---|---|
| GTA V (2015) | 186.8 | 183.4 | 179.4 | 109.8 | 83.6 |
| The Witcher 3 (2015) | 448.6 | 295.6 | 181.1 | 89.2 | |
| Dota 2 Reborn (2015) | 180.1 | 168.2 | 161.9 | 154.8 | |
| Final Fantasy XV Benchmark (2018) | 214 | 133.5 | 100.9 | 73.7 | |
| X-Plane 11.11 (2018) | 157.1 | 138.3 | 109.3 | ||
| Strange Brigade (2018) | 471 | 242 | 192.1 | 166.3 | 118.4 |
| Cyberpunk 2077 1.6 (2022) | 135.7 | 113.4 | 87.7 | 73.7 | 45.8 |
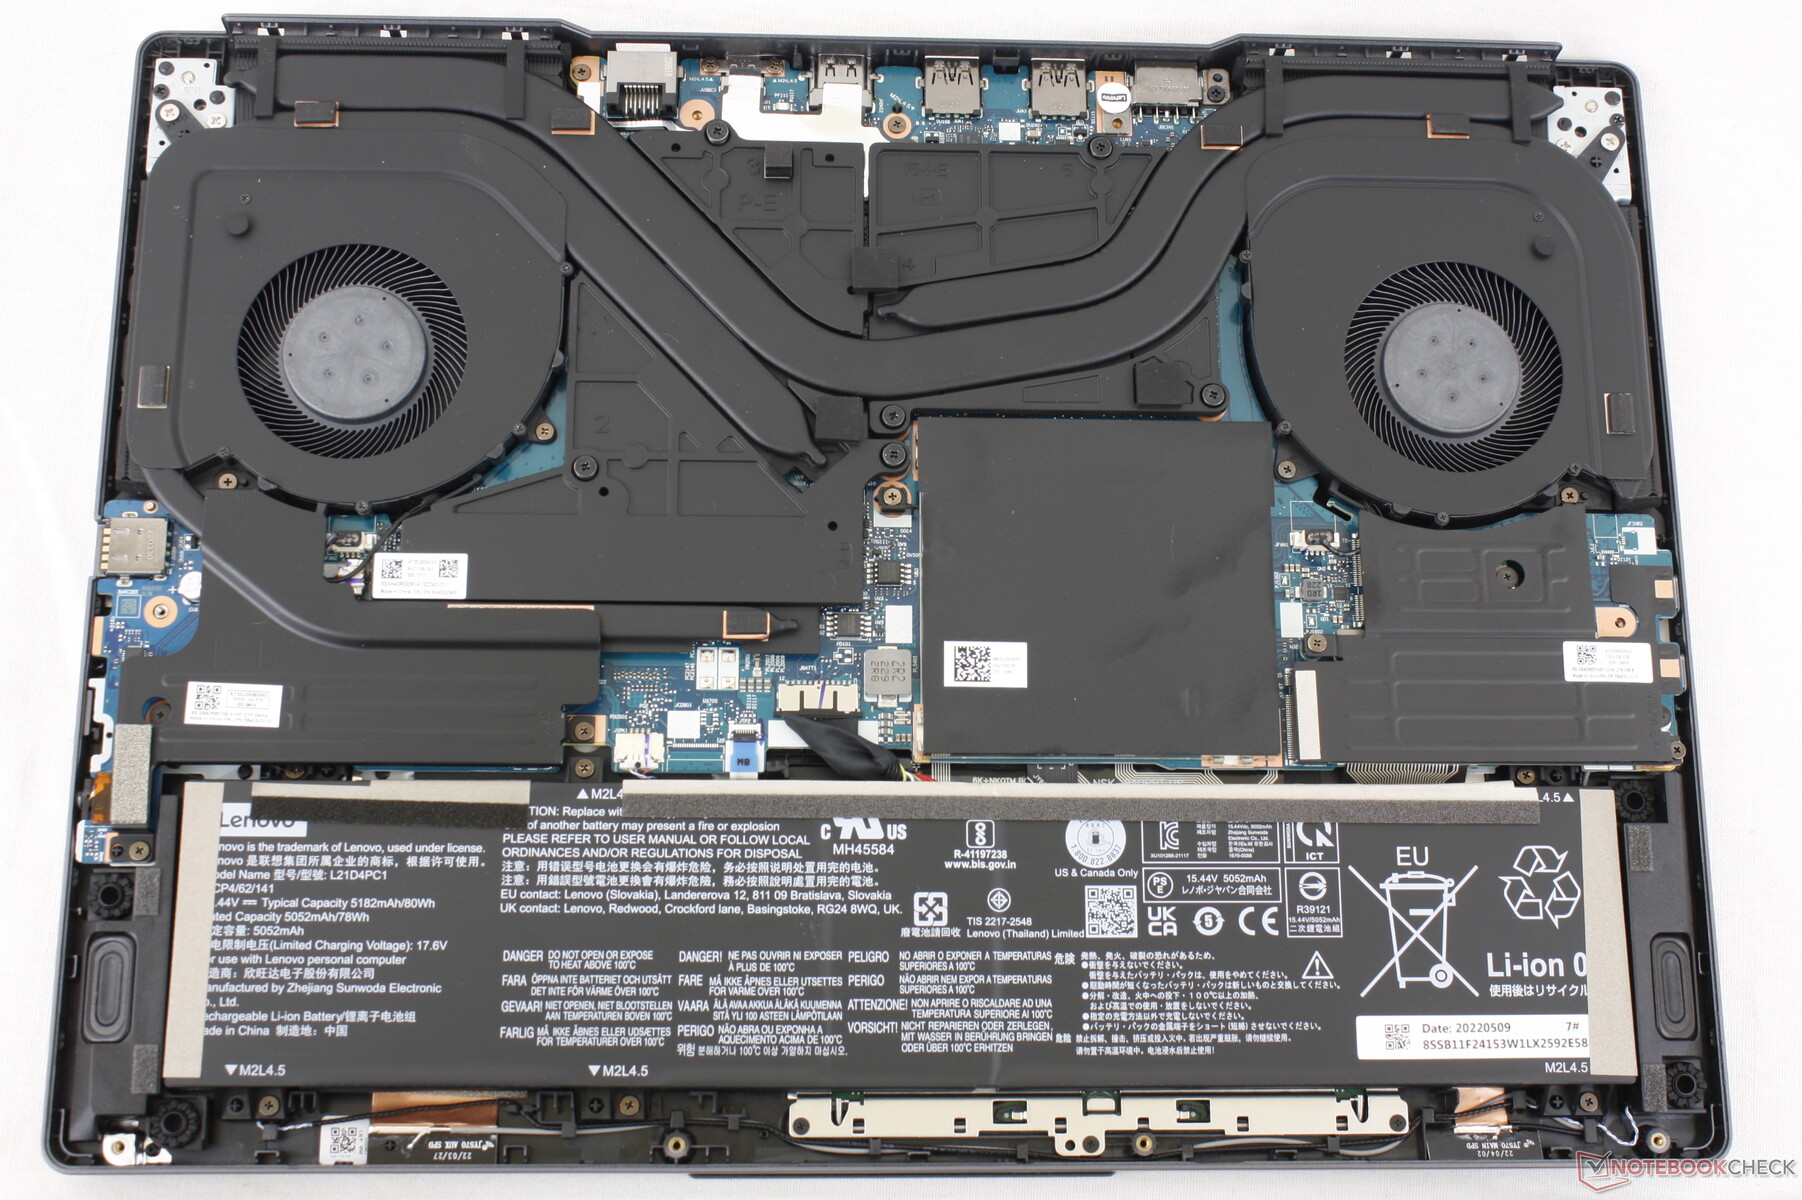
Emissões
Ruído do sistema
Os ventiladores internos permanecem mais silenciosos por mais tempo antes de precisar de aumentar a velocidade quando comparados com os ventiladores do modelo 2021. Ao rodar a primeira cena de referência do 3DMark 06, por exemplo, o ruído dos ventiladores seria de apenas 29,3 dB(A) em comparação com 54 dB(A) no modelo mais antigo. Isto significa que você pode executar cargas baixas a baixas-médias como navegação na web ou streaming de vídeo por períodos mais longos antes que os ventiladores se tornem audíveis.
Rodando Witcher 3 no modo Balanceado resultaria em um nível de ruído do ventilador entre 43 e 48 dB(A) em comparação com um nível plano de 51,4 dB(A) quando funcionando no modo Performance. Assim, os usuários devem suportar ventiladores mais altos se quiserem explorar plenamente a GPU. O ruído geral do ventilador é mais alto do que na Razer Blade 15 Base Edition, mas mais silencioso do que na GPU.Asus TUF Gaming F15 cada um com a mesma GeForce RTX 3060 GPU.
Barulho
| Ocioso |
| 23.5 / 23.5 / 26.8 dB |
| Carga |
| 29.3 / 53 dB |
 | ||
30 dB silencioso 40 dB(A) audível 50 dB(A) ruidosamente alto |
||
min: | ||
| Lenovo Legion 5 15IAH7H 82RB GeForce RTX 3060 Laptop GPU, i7-12700H | Lenovo Legion 5 15ACH-82JU00C6GE-FL GeForce RTX 3060 Laptop GPU, R7 5800H, Micron 2300 512GB MTFDHBA512TDV | MSI Bravo 15 B5DD-010US Radeon RX 5500M, R5 5600H, Kingston OM8PCP3512F-AB | Asus TUF Gaming F15 FX507ZM GeForce RTX 3060 Laptop GPU, i7-12700H, SK Hynix HFM001TD3JX013N | Acer Aspire Nitro 5 AN515-55-57GF GeForce RTX 3060 Laptop GPU, i5-10300H, WDC PC SN530 SDBPNPZ-512G | Razer Blade 15 Base Edition 2021, i7-10750H RTX 3060 GeForce RTX 3060 Laptop GPU, i7-10750H, Samsung SSD PM981a MZVLB512HBJQ | |
|---|---|---|---|---|---|---|
| Noise | -21% | -12% | -5% | -15% | -6% | |
| desligado / ambiente * (dB) | 23.3 | 24.2 -4% | 24.5 -5% | 23.2 -0% | 25 -7% | 25.3 -9% |
| Idle Minimum * (dB) | 23.5 | 29 -23% | 24.5 -4% | 23.6 -0% | 25 -6% | 25.4 -8% |
| Idle Average * (dB) | 23.5 | 29 -23% | 32.8 -40% | 23.6 -0% | 30 -28% | 25.4 -8% |
| Idle Maximum * (dB) | 26.8 | 29 -8% | 32.8 -22% | 25.4 5% | 33 -23% | 25.4 5% |
| Load Average * (dB) | 29.3 | 53.5 -83% | 34.5 -18% | 38 -30% | 46 -57% | 42.5 -45% |
| Witcher 3 ultra * (dB) | 51.4 | 53.5 -4% | 42.5 17% | 54.1 -5% | 47 9% | 42 18% |
| Load Maximum * (dB) | 53 | 53.5 -1% | 58.5 -10% | 57.2 -8% | 50 6% | 52.2 2% |
* ... menor é melhor
Temperatura
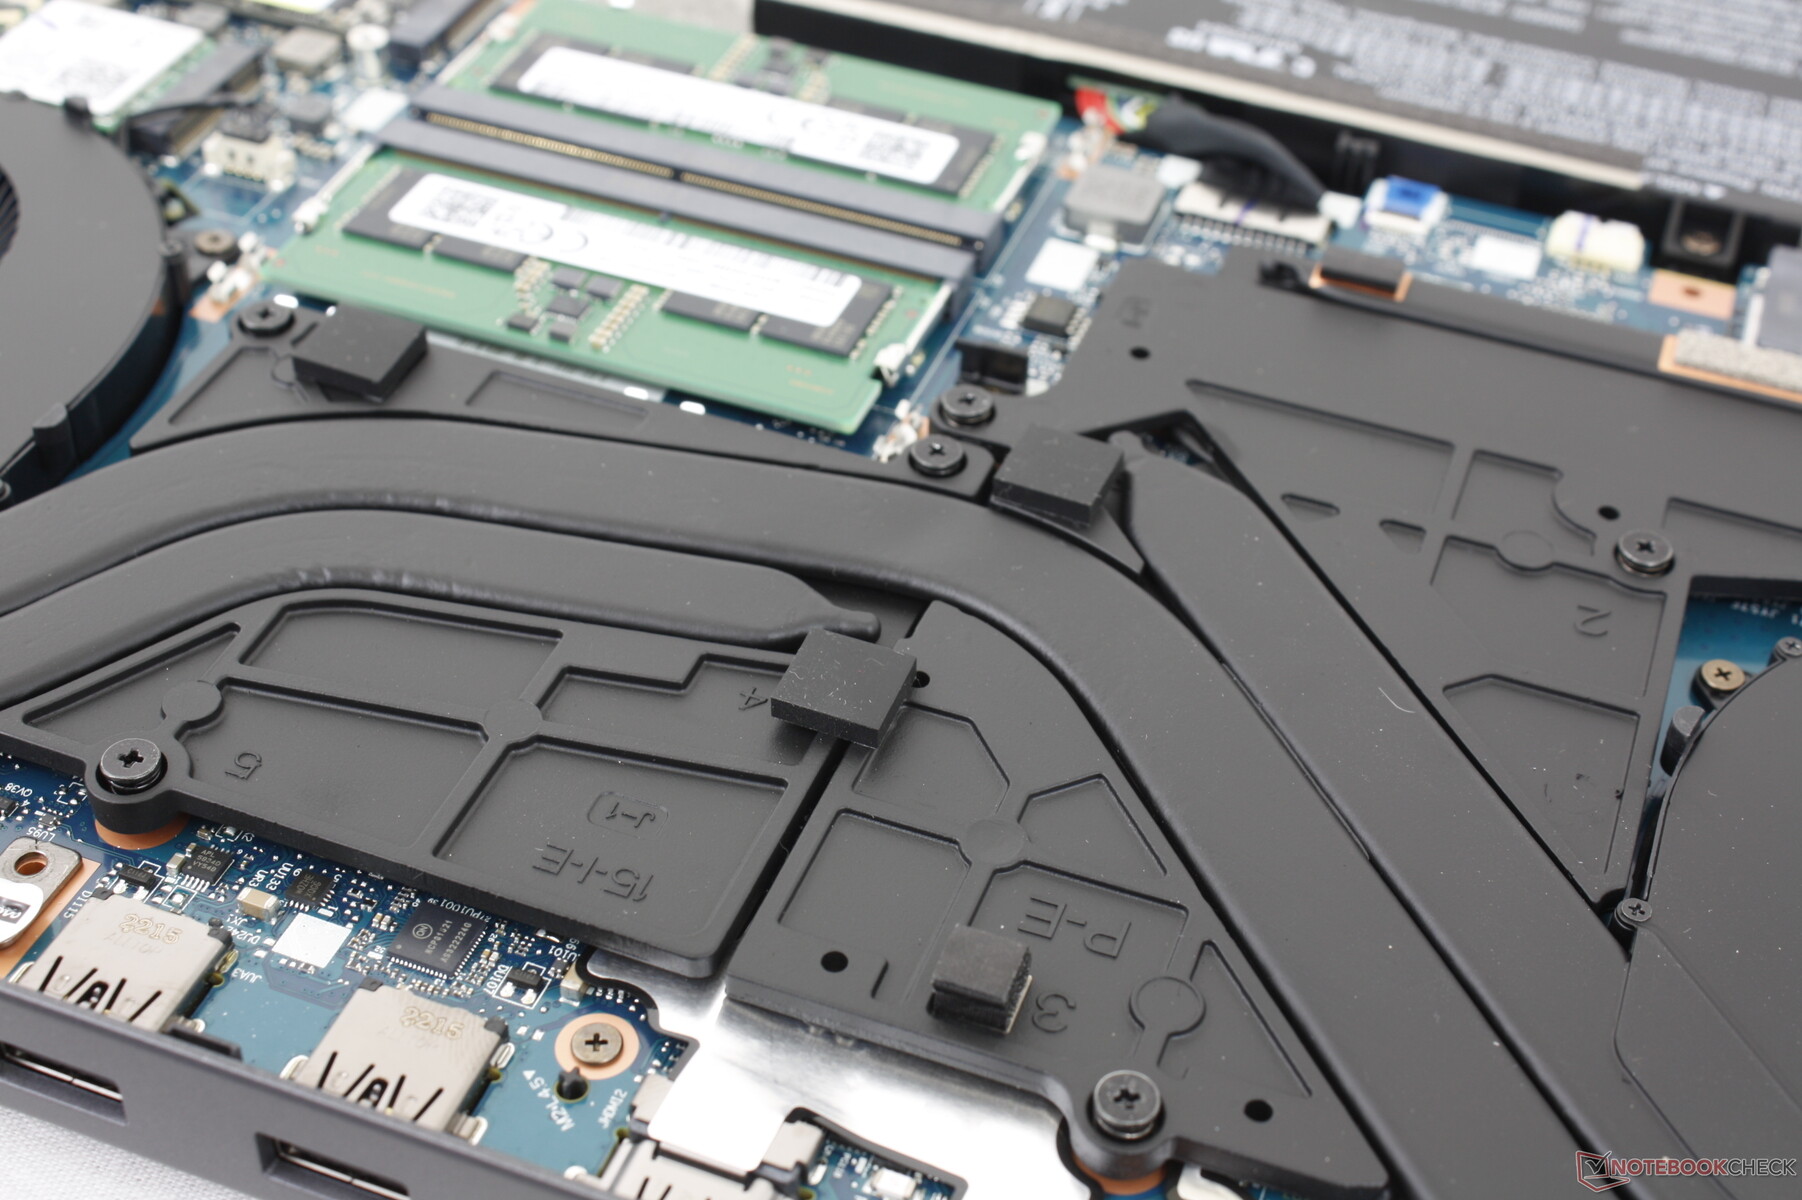
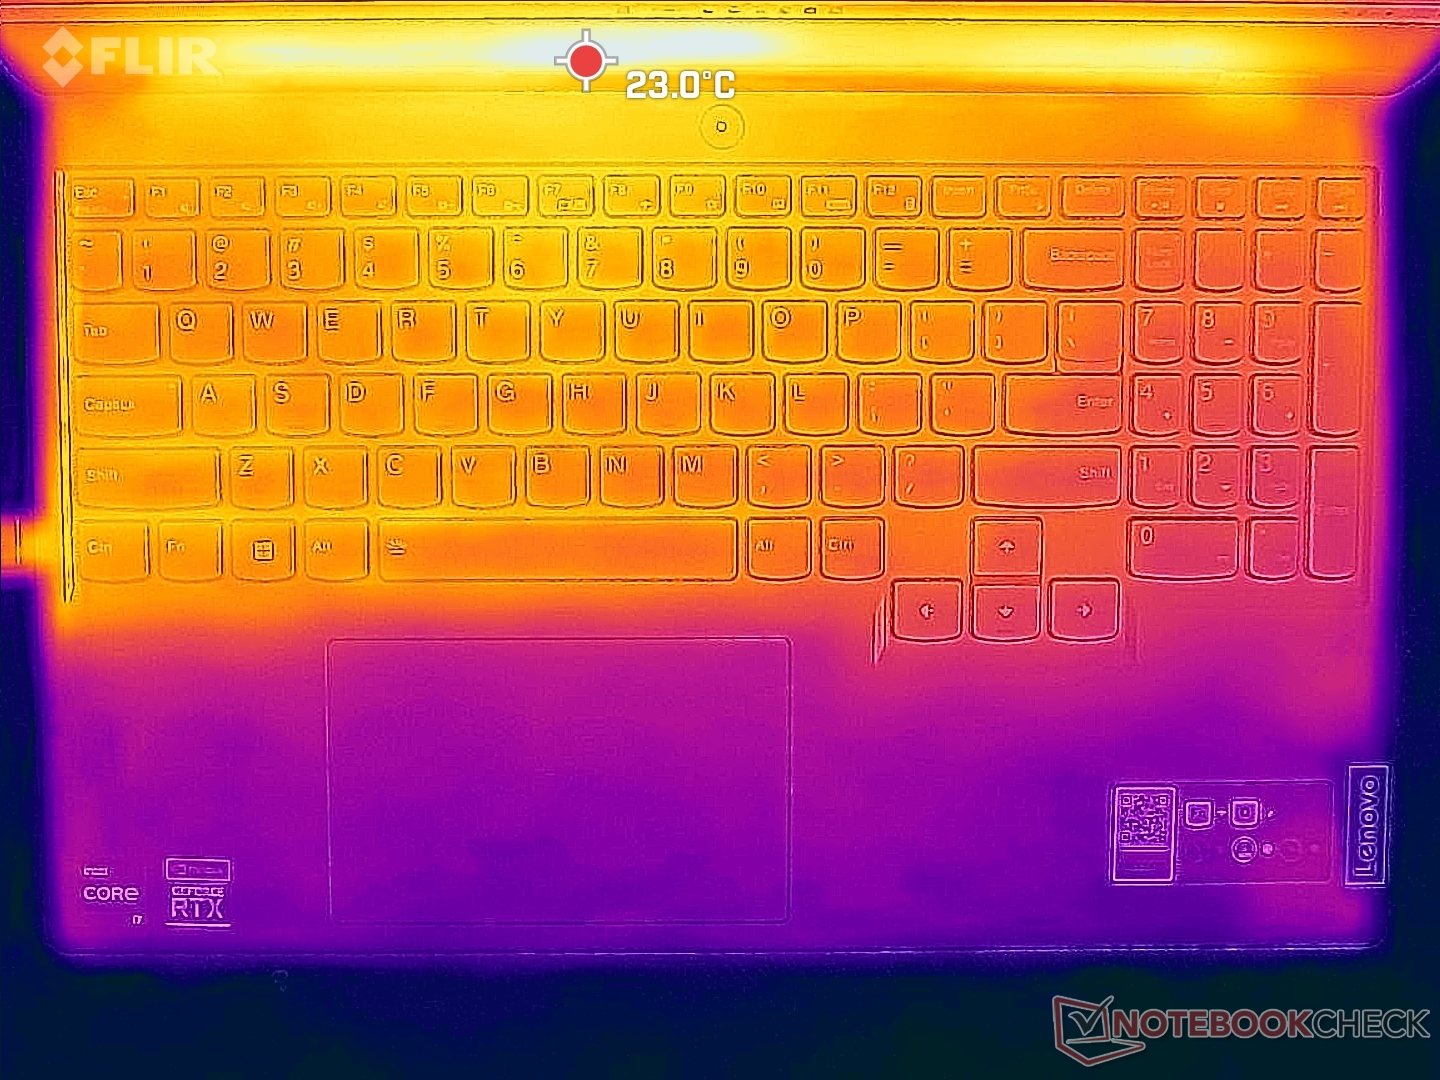
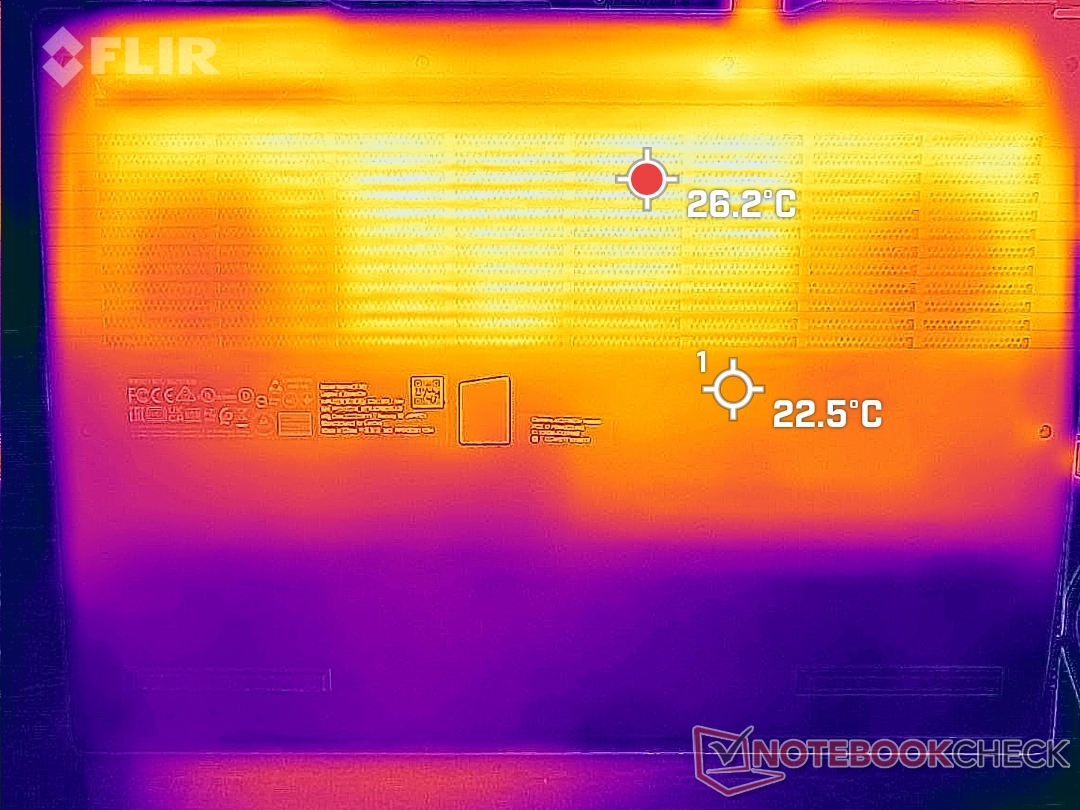
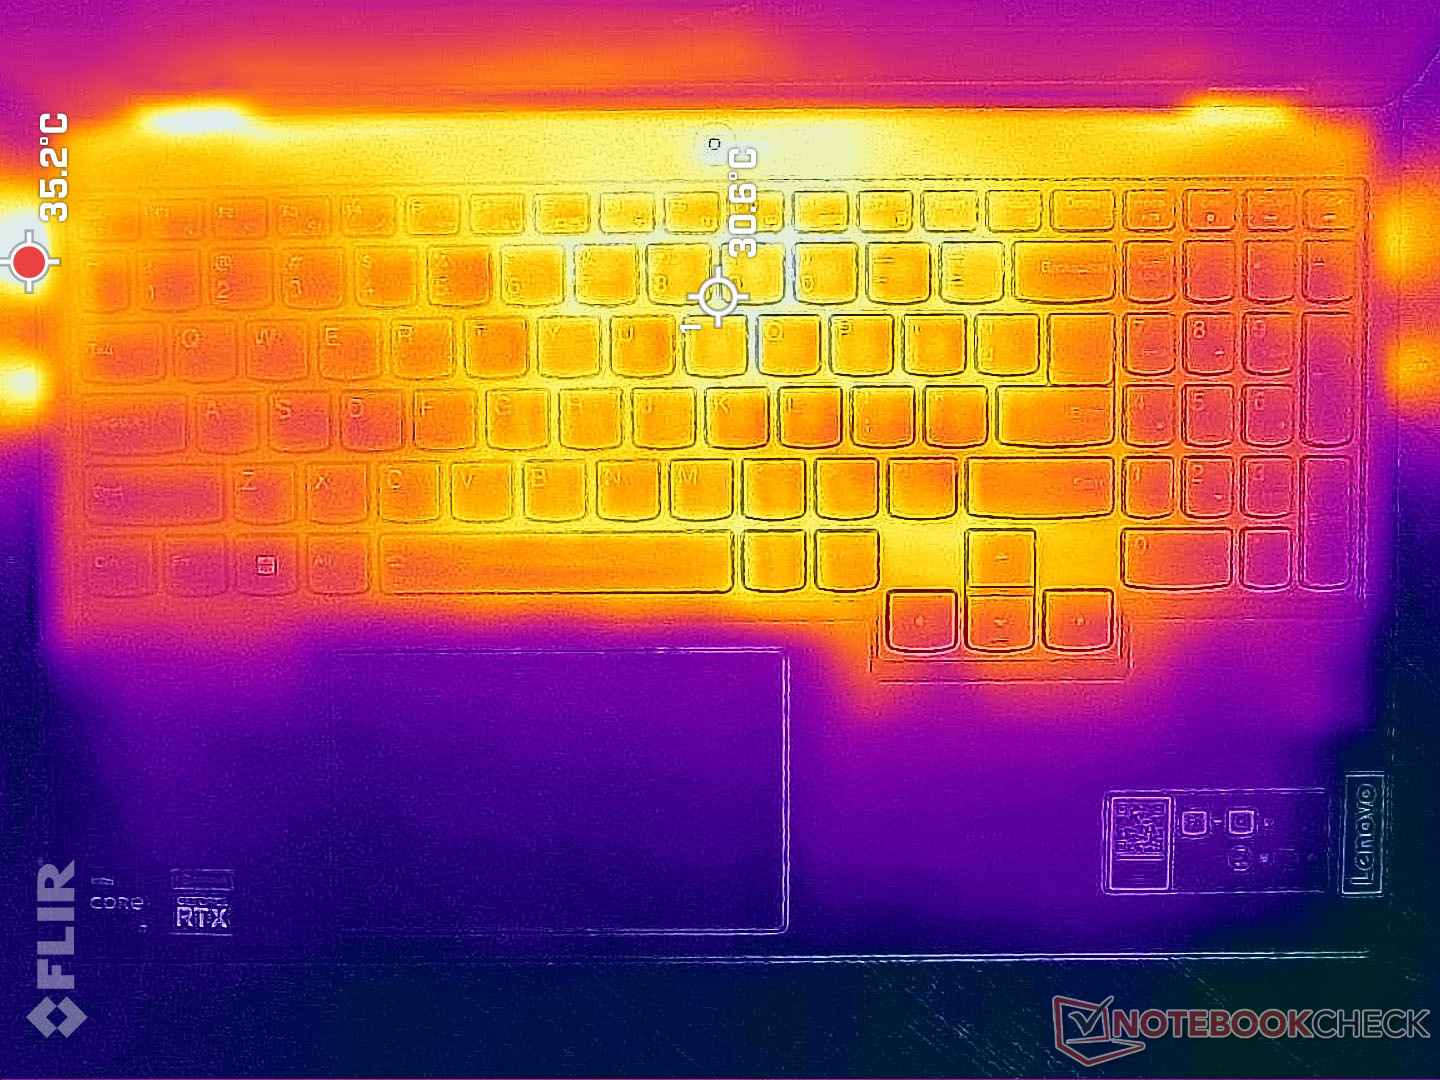
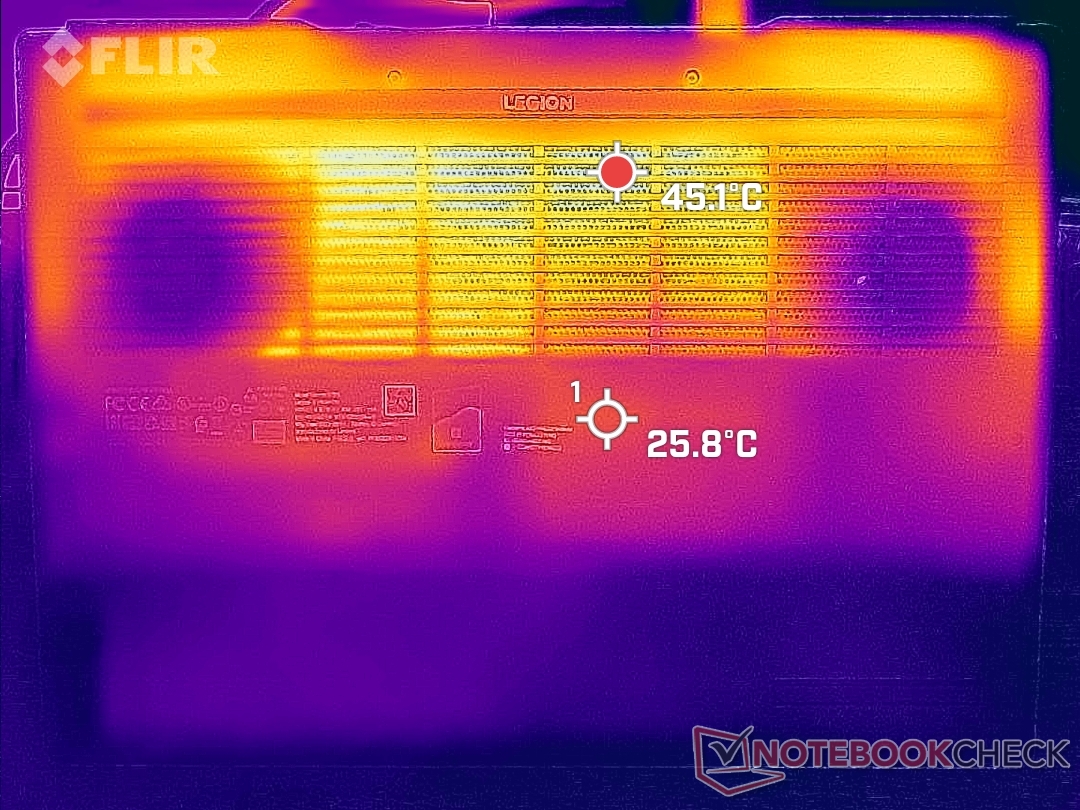
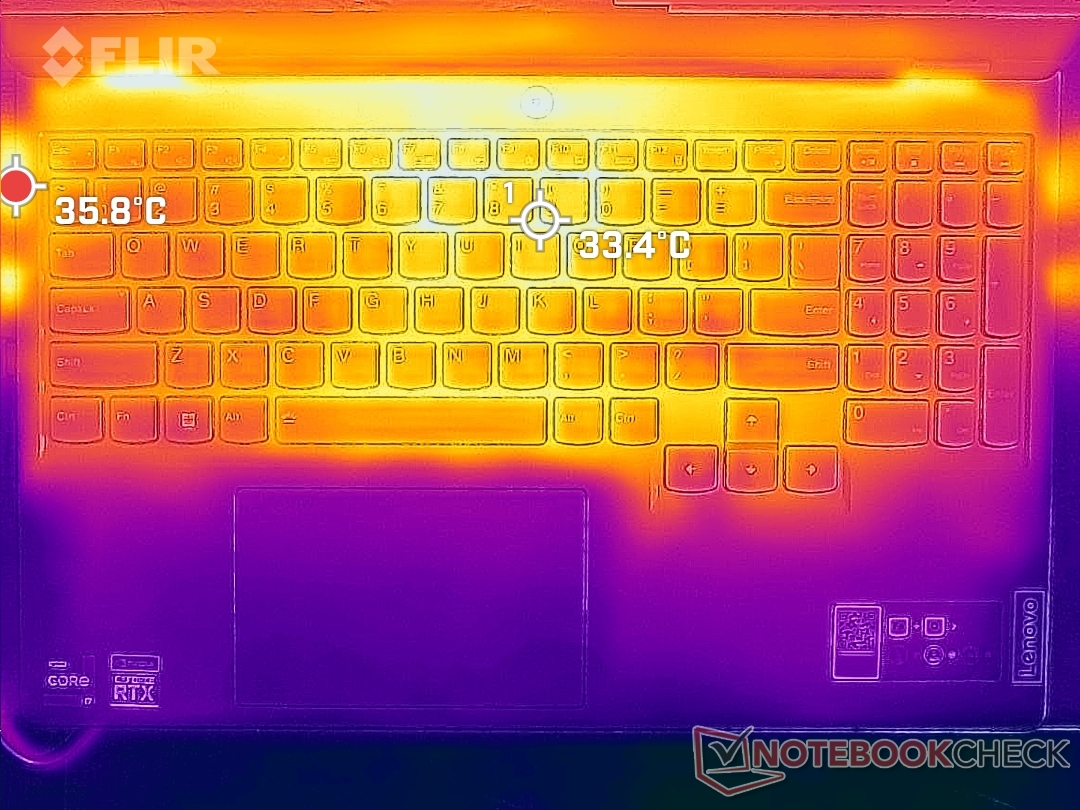
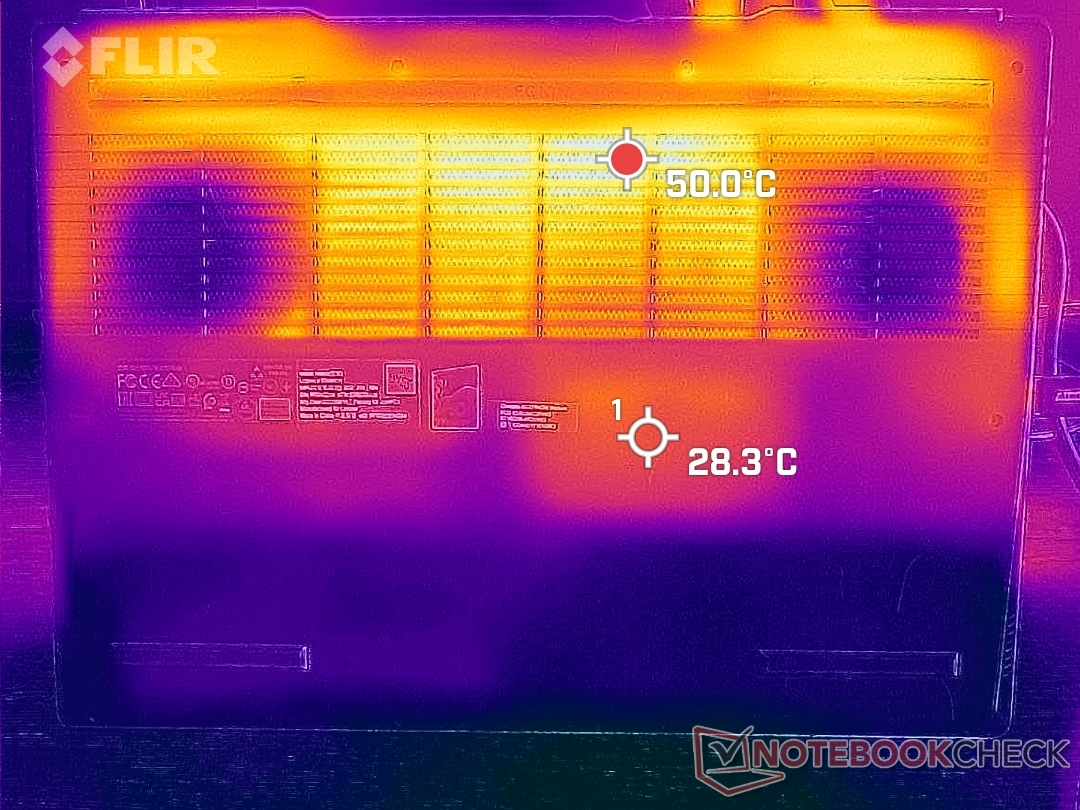
As temperaturas superficiais são muito mais quentes na parte inferior, onde os pontos quentes podem chegar a mais de 50 C, em comparação com apenas 36 C na parte superior, quando a carga é exigente. No entanto, isto é uma melhoria em relação ao modelo do ano passado, onde as temperaturas podem chegar a mais de 40 C na maior parte do teclado quando se joga.
Os pontos quentes estão na direção da borda traseira do chassi, onde o contato com a pele é improvável. Há grelhas de ventilação em quase metade da superfície do chassi e, portanto, os usuários devem ter cuidado para não bloquear nenhum fluxo de ar.
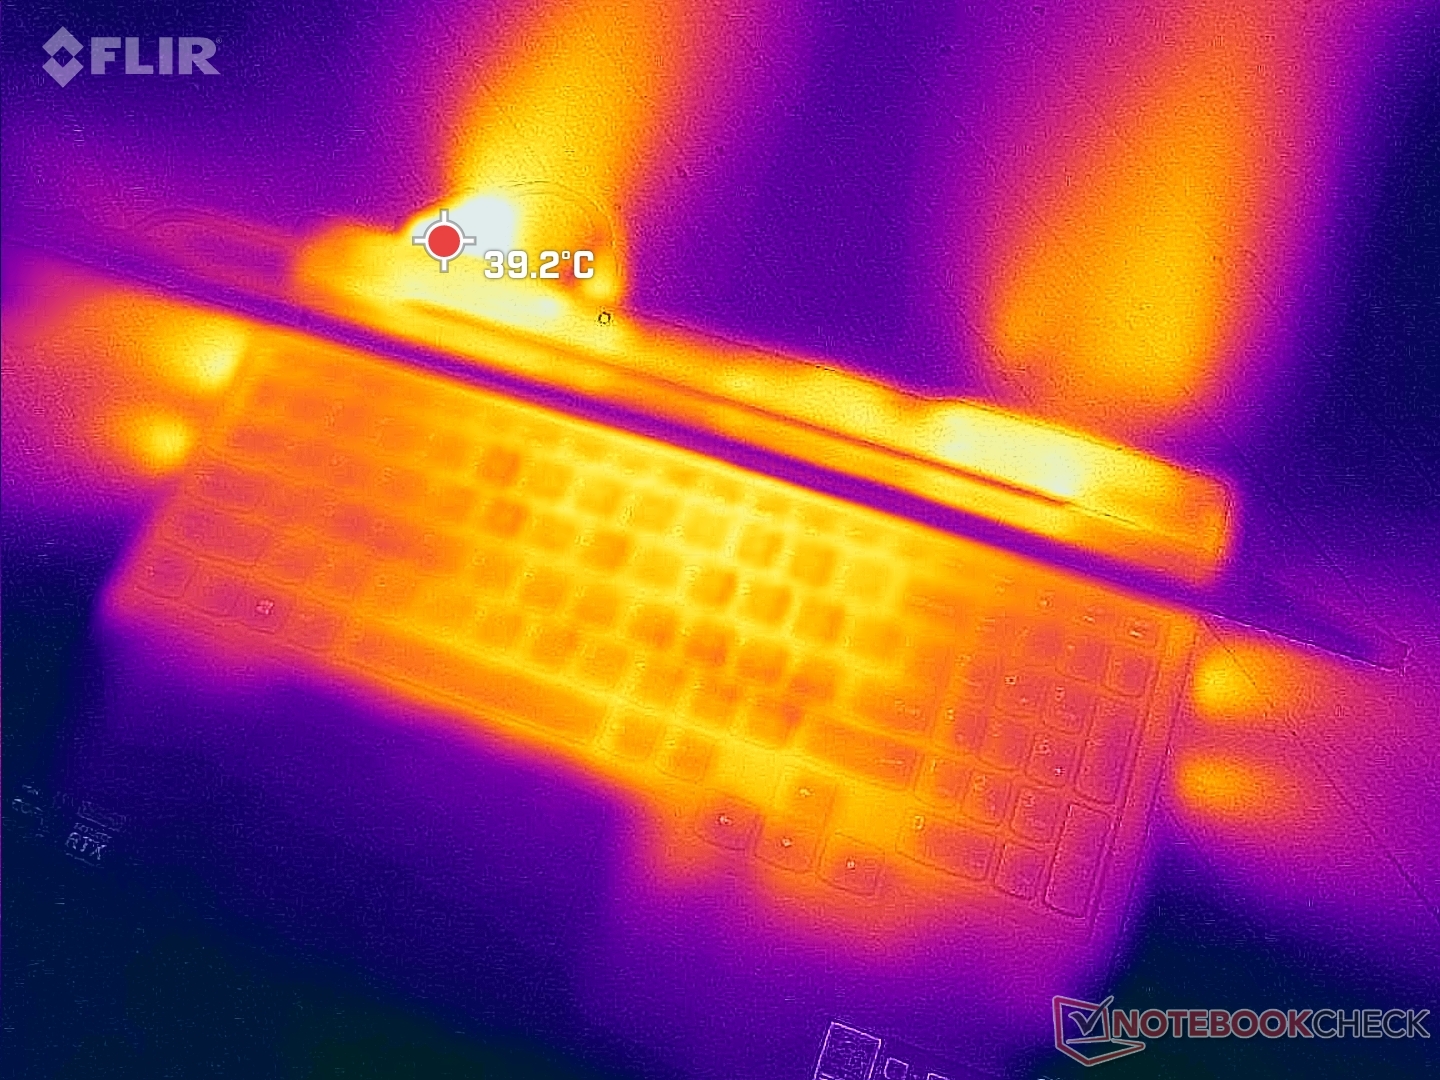
(+) A temperatura máxima no lado superior é 37.8 °C / 100 F, em comparação com a média de 40.4 °C / 105 F , variando de 21.2 a 68.8 °C para a classe Gaming.
(-) A parte inferior aquece até um máximo de 51 °C / 124 F, em comparação com a média de 43.2 °C / 110 F
(+) Em uso inativo, a temperatura média para o lado superior é 23.8 °C / 75 F, em comparação com a média do dispositivo de 33.9 °C / ### class_avg_f### F.
(+) Jogando The Witcher 3, a temperatura média para o lado superior é 27.3 °C / 81 F, em comparação com a média do dispositivo de 33.9 °C / ## #class_avg_f### F.
(+) Os apoios para as mãos e o touchpad são mais frios que a temperatura da pele, com um máximo de 23.8 °C / 74.8 F e, portanto, são frios ao toque.
(+) A temperatura média da área do apoio para as mãos de dispositivos semelhantes foi 28.8 °C / 83.8 F (+5 °C / 9 F).
| Lenovo Legion 5 15IAH7H 82RB Intel Core i7-12700H, NVIDIA GeForce RTX 3060 Laptop GPU | Lenovo Legion 5 15ACH-82JU00C6GE-FL AMD Ryzen 7 5800H, NVIDIA GeForce RTX 3060 Laptop GPU | MSI Bravo 15 B5DD-010US AMD Ryzen 5 5600H, AMD Radeon RX 5500M | Asus TUF Gaming F15 FX507ZM Intel Core i7-12700H, NVIDIA GeForce RTX 3060 Laptop GPU | Acer Aspire Nitro 5 AN515-55-57GF Intel Core i5-10300H, NVIDIA GeForce RTX 3060 Laptop GPU | Razer Blade 15 Base Edition 2021, i7-10750H RTX 3060 Intel Core i7-10750H, NVIDIA GeForce RTX 3060 Laptop GPU | |
|---|---|---|---|---|---|---|
| Heat | 0% | -20% | -25% | -6% | -19% | |
| Maximum Upper Side * (°C) | 37.8 | 42.6 -13% | 52.2 -38% | 44.4 -17% | 49 -30% | 45.2 -20% |
| Maximum Bottom * (°C) | 51 | 52.2 -2% | 48.6 5% | 48.8 4% | 51 -0% | 48 6% |
| Idle Upper Side * (°C) | 25.8 | 24.9 3% | 38 -47% | 37.8 -47% | 26 -1% | 34.4 -33% |
| Idle Bottom * (°C) | 28.8 | 25.3 12% | 28.4 1% | 39.6 -38% | 27 6% | 37.2 -29% |
* ... menor é melhor
Teste de estresse
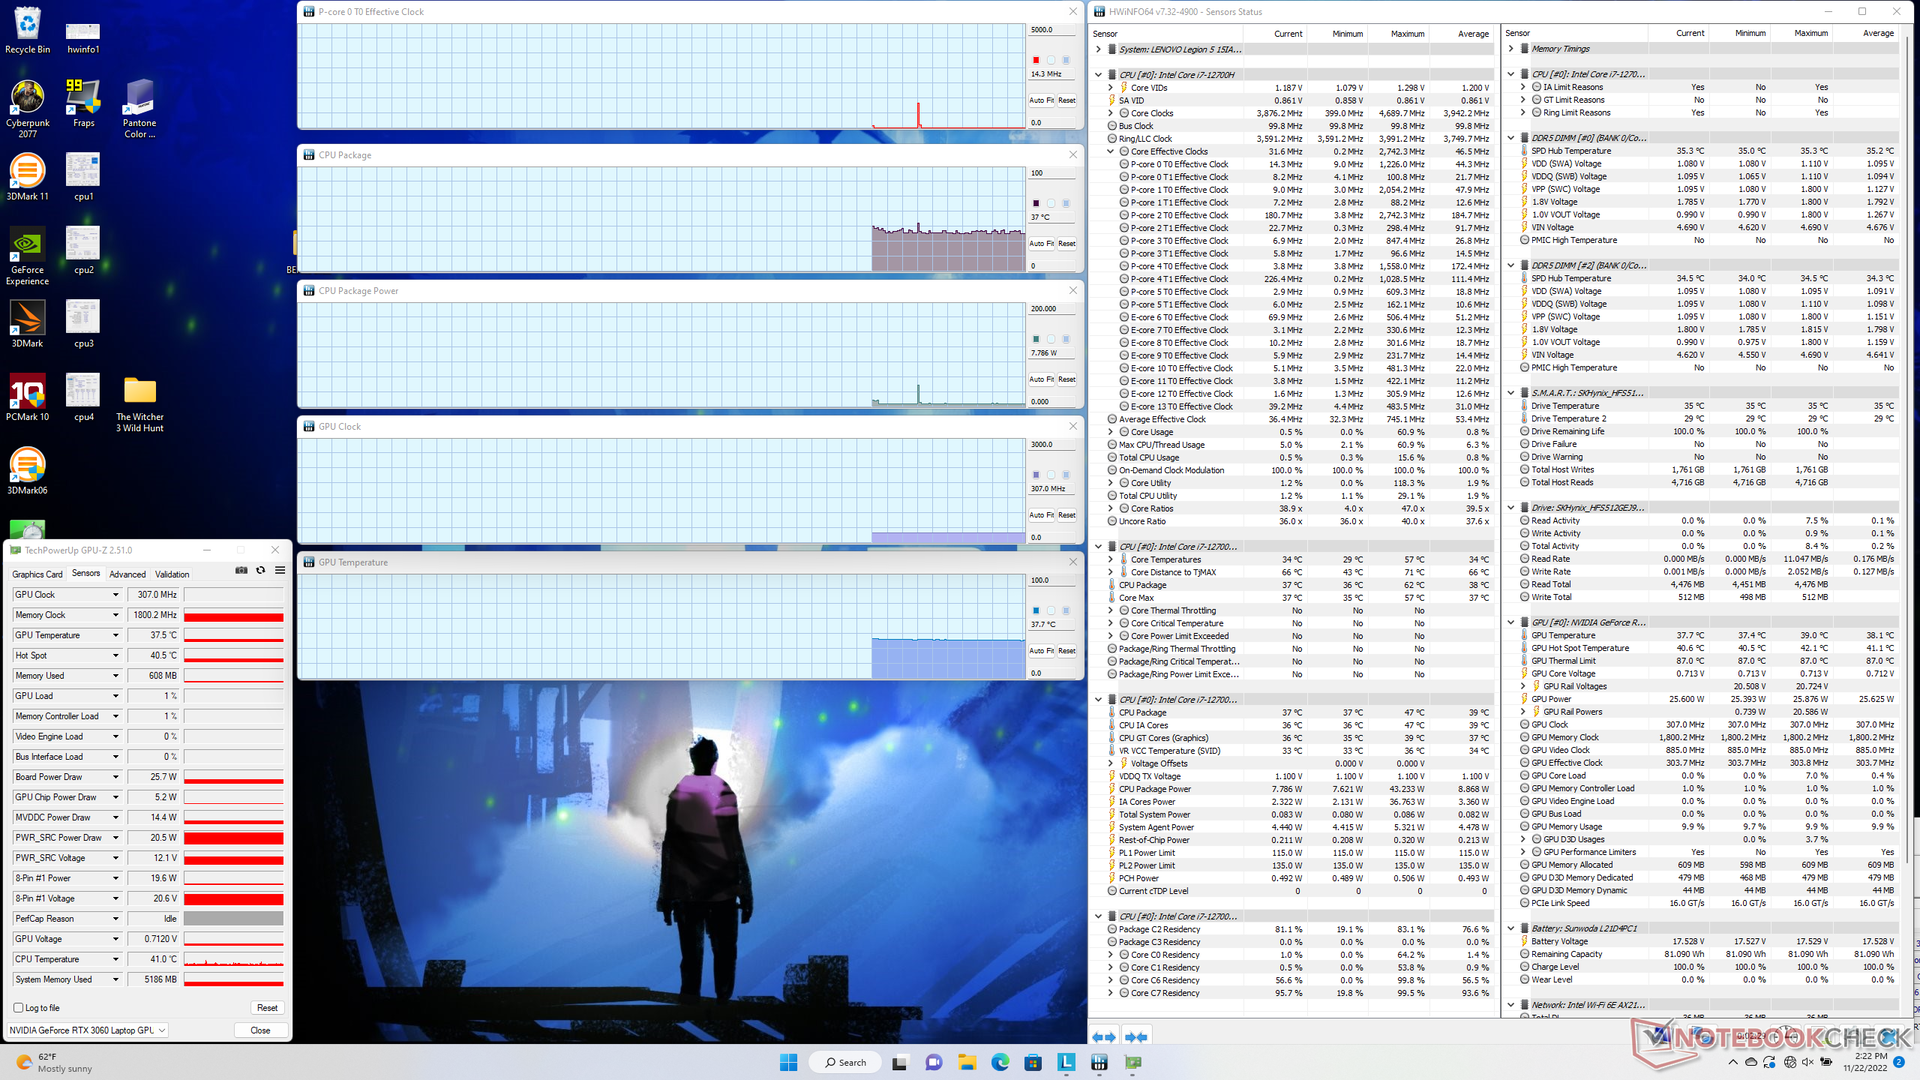
Ao rodar Prime95 para enfatizar a CPU, as taxas de clock e o consumo de energia da placa aumentariam para 4,1 GHz e 110 W, respectivamente, durando cerca de um minuto ou mais. A CPU se estabilizaria então em 3,6 GHz, 101 W, e 97 C depois disso. A temperatura muito quente do núcleo sugere que o processador está empurrando os limites da solução de resfriamento mais do que em outros laptops para apertar o desempenho adicional. O HP Envy 16 com a mesma CPU Core i7-12700H, por exemplo, estabilizaria em apenas 2,1 GHz e 66 C quando sob condições de teste semelhantes em comparação.
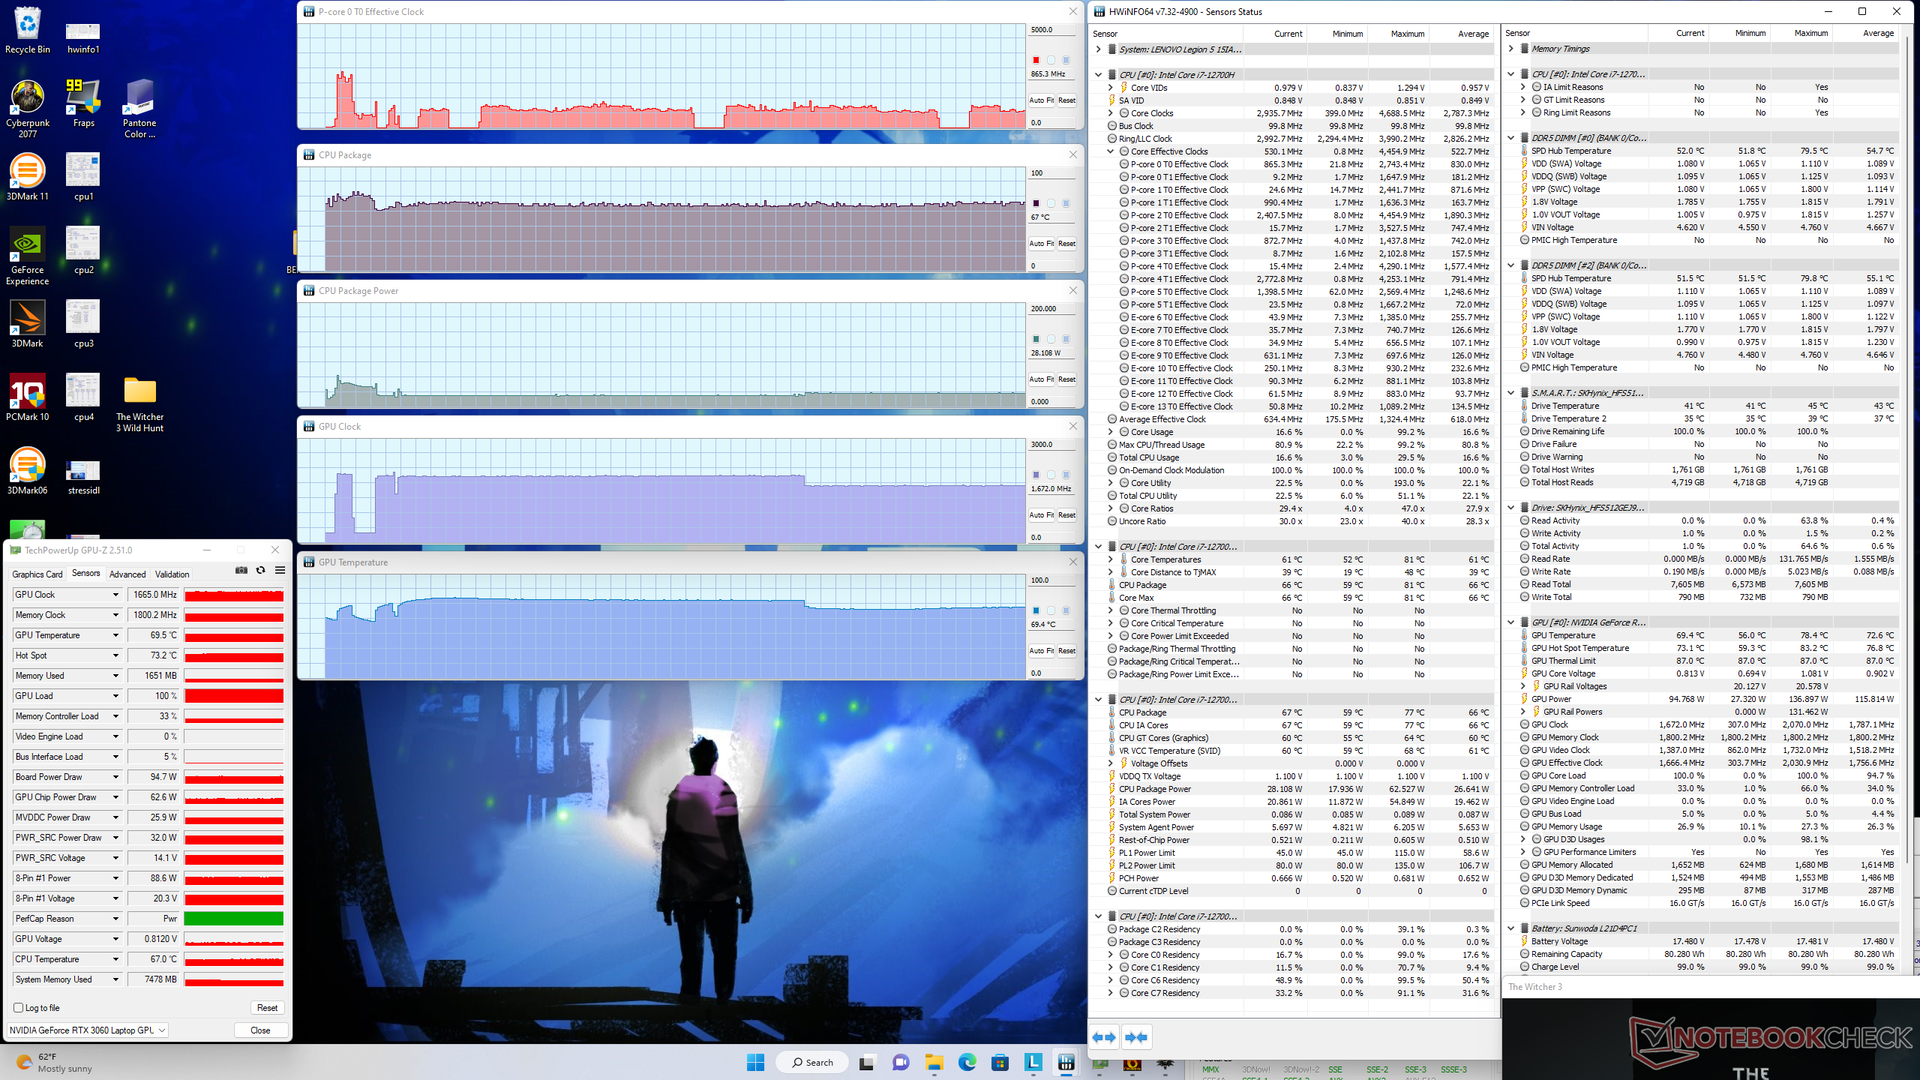
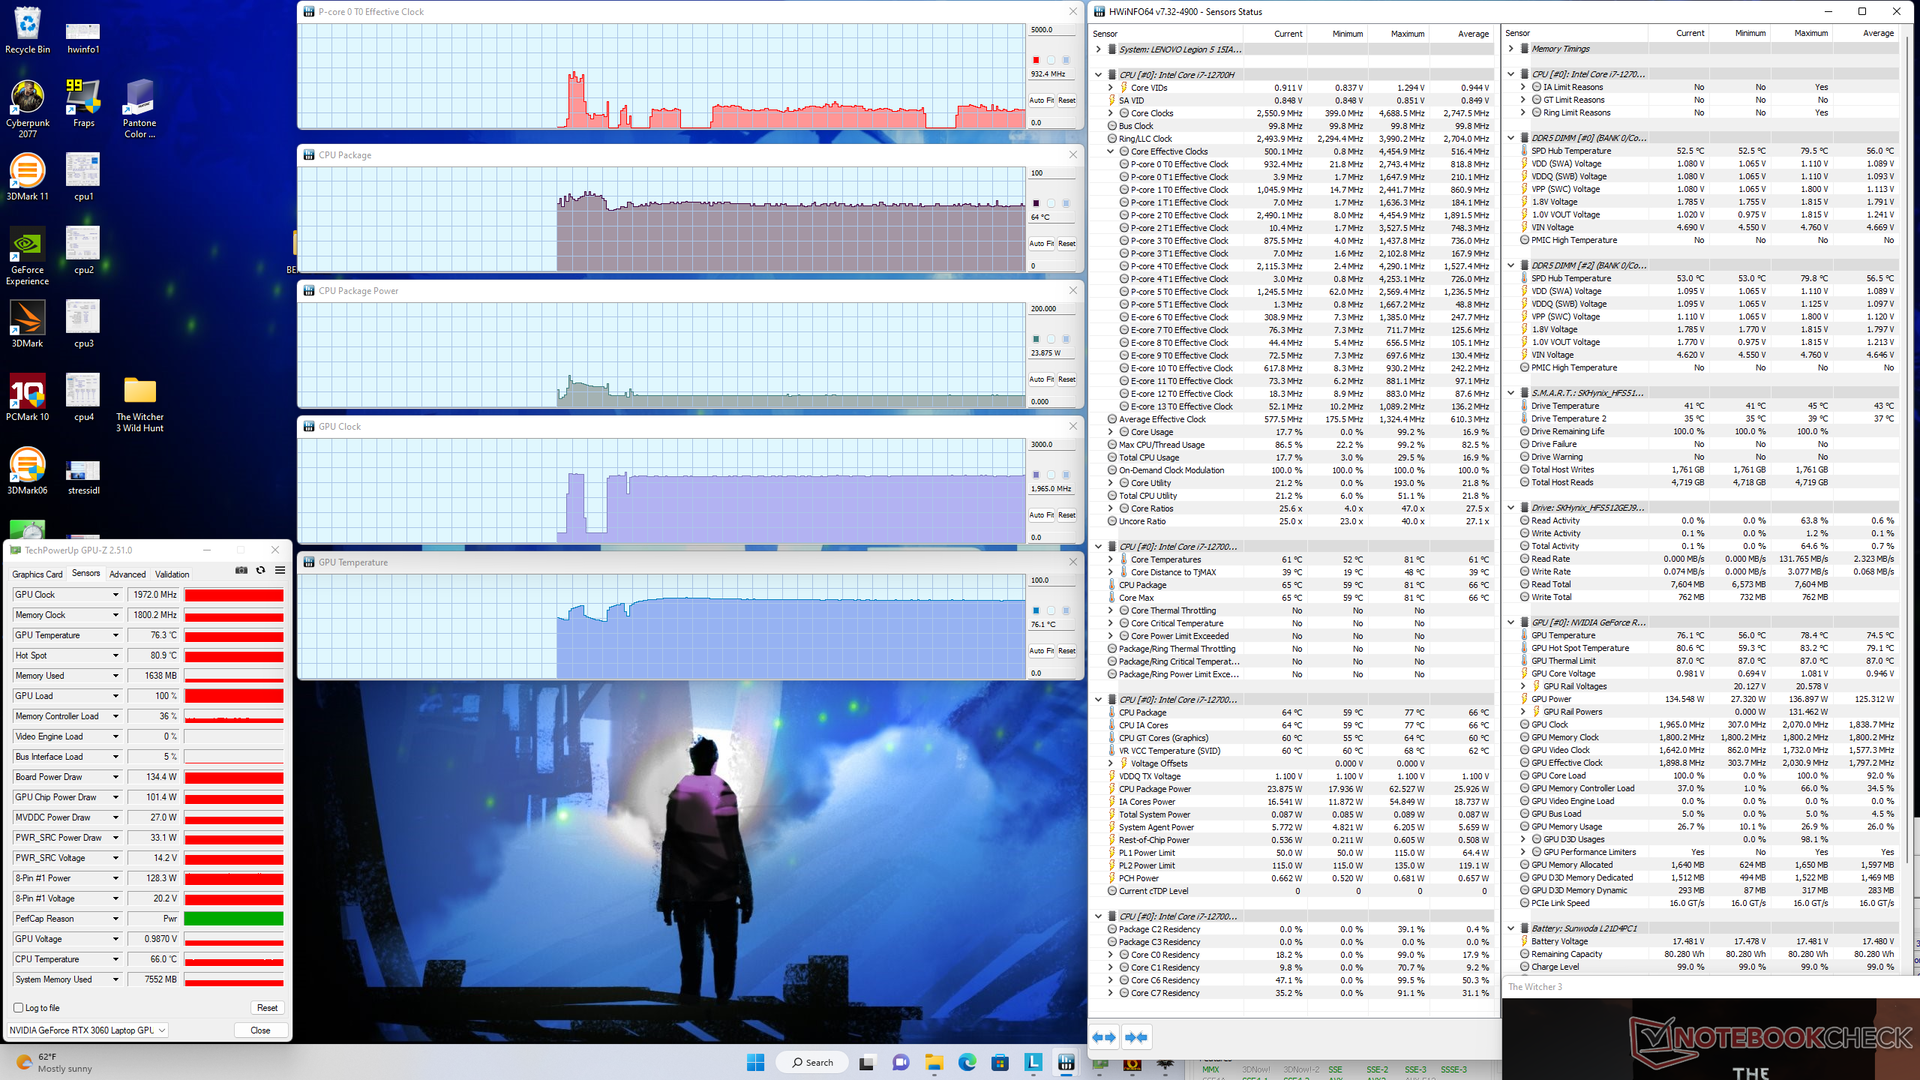
Rodando Witcher 3 no modo Performance para representar cargas típicas de jogos faria com que a GPU Nvidia se estabilizasse em 1972 MHz, 134 W de potência da placa, e 76 C. Se no modo Balanceado, a GPU se estabilizaria em 1665 MHz, 95 W, e 70 C para um déficit de performance de 10% como detalhado em nossa seção de Performance da GPU acima. Portanto, os usuários devem habilitar o modo Performance através do software Vantage se quiserem explorar ao máximo a GPU.
Funcionando com bateria limita o desempenho. Um teste Fire Strike em baterias retornaria pontuações de 23698 e 12906 pontos, respectivamente, em relação a 30779 e 22257 pontos quando em rede elétrica.
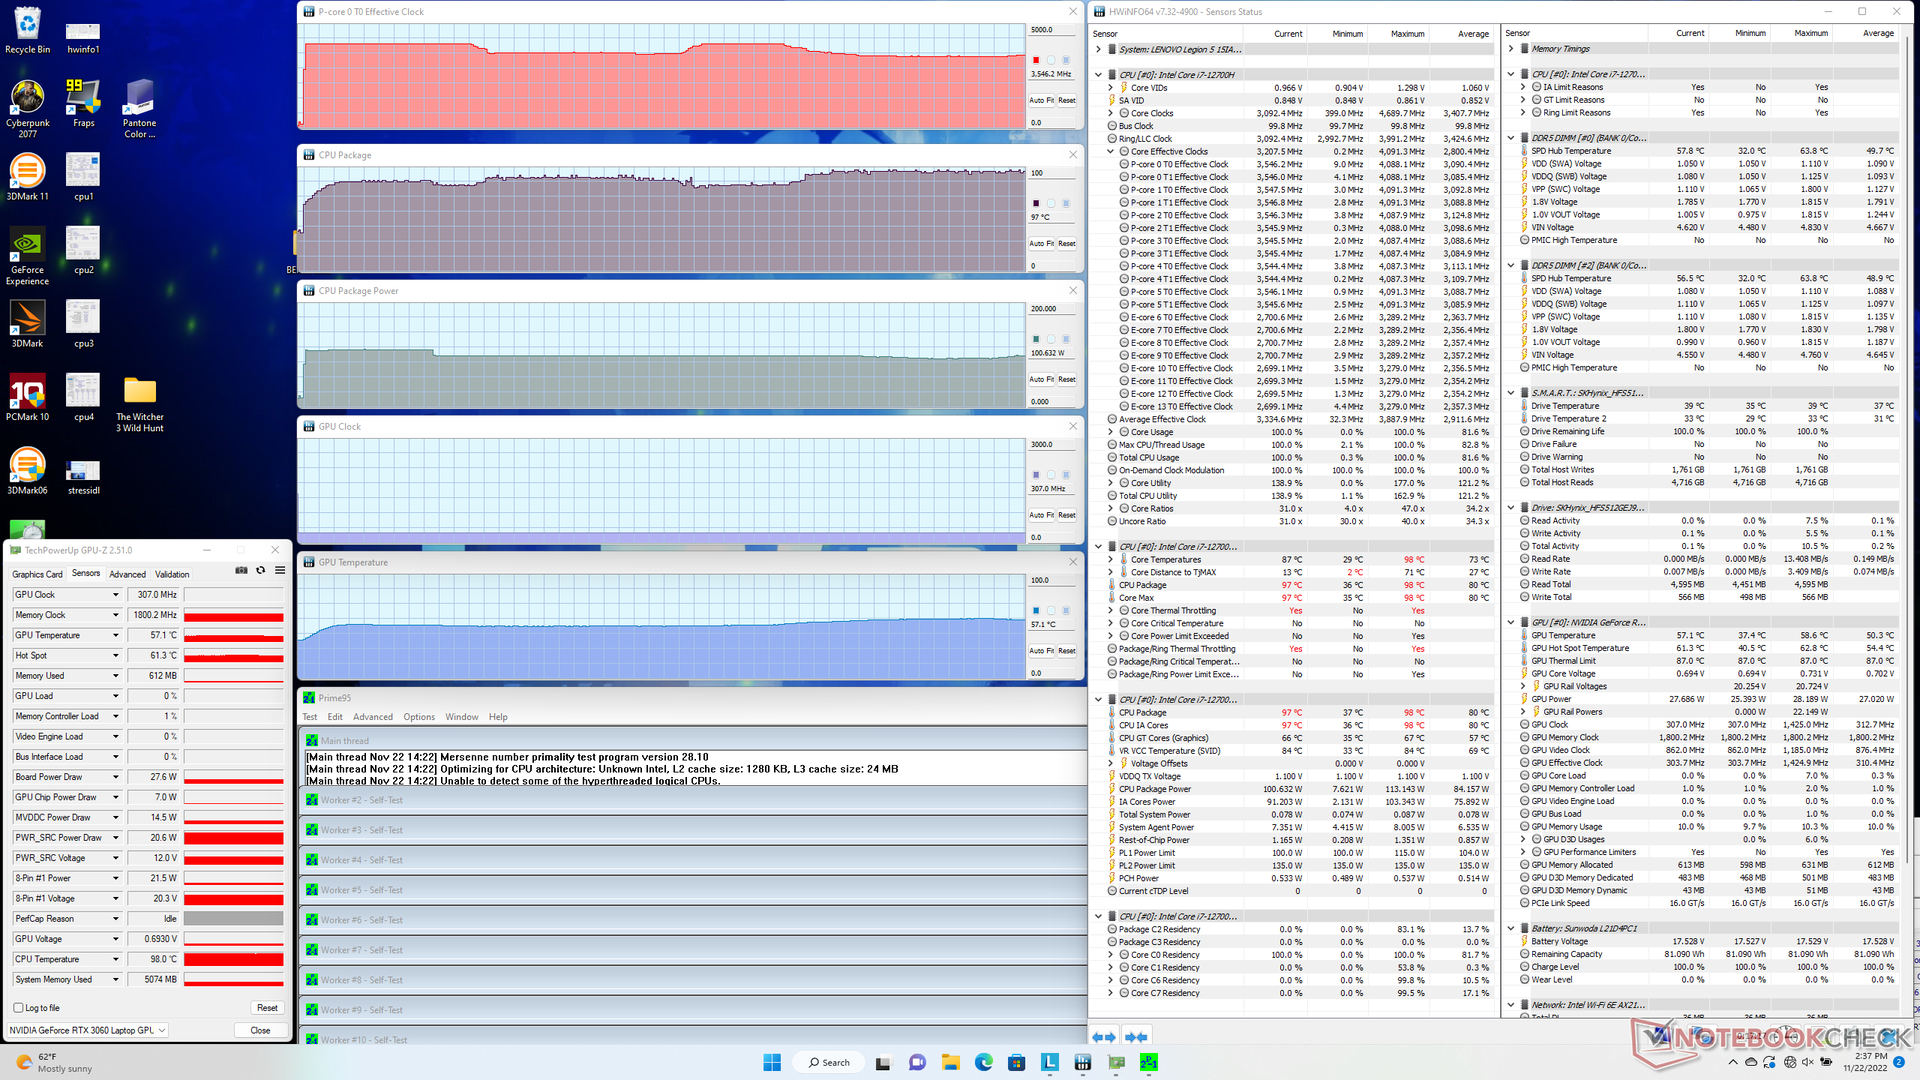
| Relógio CPU (GHz) | Relógio GPU (MHz) | Temperatura média da CPU (°C) | Temperatura média da GPU (°C) | |
| System Idle | -- | -- | 37 | 38 |
| Prime95 Stress | 3.6 - 3.8 | -- | 97 | 57 |
| Prime95 + FurMark Stress | 2.5 | 1597 - 2010 | 77 | 75 |
| Witcher 3 Estresse (modo equilibrado) | ~0.9 | 1665 | 67 | 70 |
| Witcher 3 Estresse (modo de desempenho) | ~0.9 | 1972 | 64 | 76 |
Oradores
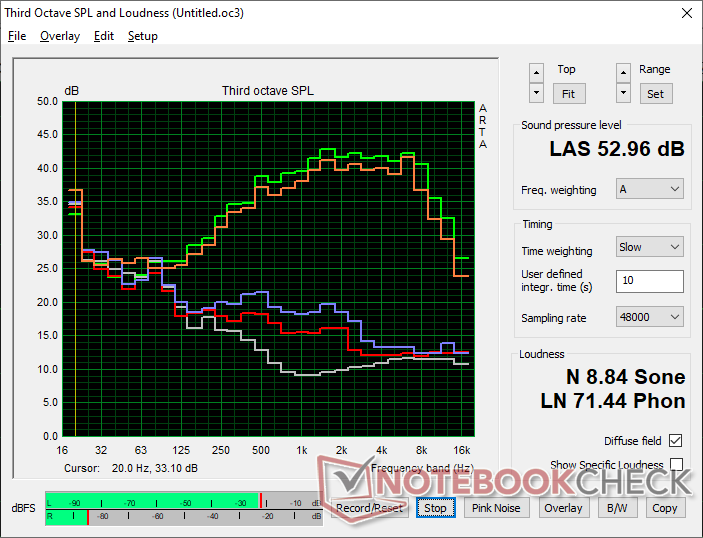
Lenovo Legion 5 15IAH7H 82RB análise de áudio
(+) | os alto-falantes podem tocar relativamente alto (###valor### dB)
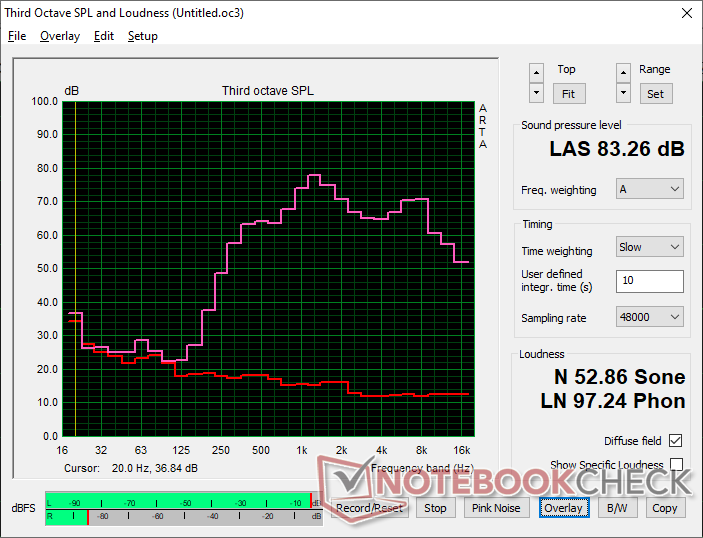
Graves 100 - 315Hz
(-) | quase nenhum baixo - em média 28.2% menor que a mediana
(±) | a linearidade dos graves é média (12.9% delta para a frequência anterior)
Médios 400 - 2.000 Hz
(±) | médios mais altos - em média 5.7% maior que a mediana
(±) | a linearidade dos médios é média (7.4% delta para frequência anterior)
Altos 2 - 16 kHz
(+) | agudos equilibrados - apenas 3.3% longe da mediana
(+) | os máximos são lineares (6.4% delta da frequência anterior)
Geral 100 - 16.000 Hz
(±) | a linearidade do som geral é média (23.6% diferença em relação à mediana)
Comparado com a mesma classe
» 86% de todos os dispositivos testados nesta classe foram melhores, 4% semelhantes, 10% piores
» O melhor teve um delta de 6%, a média foi 18%, o pior foi 132%
Comparado com todos os dispositivos testados
» 71% de todos os dispositivos testados foram melhores, 6% semelhantes, 23% piores
» O melhor teve um delta de 4%, a média foi 23%, o pior foi 134%
Apple MacBook Pro 16 2021 M1 Pro análise de áudio
(+) | os alto-falantes podem tocar relativamente alto (###valor### dB)
Graves 100 - 315Hz
(+) | bons graves - apenas 3.8% longe da mediana
(+) | o baixo é linear (5.2% delta para a frequência anterior)
Médios 400 - 2.000 Hz
(+) | médios equilibrados - apenas 1.3% longe da mediana
(+) | médios são lineares (2.1% delta para frequência anterior)
Altos 2 - 16 kHz
(+) | agudos equilibrados - apenas 1.9% longe da mediana
(+) | os máximos são lineares (2.7% delta da frequência anterior)
Geral 100 - 16.000 Hz
(+) | o som geral é linear (4.6% diferença em relação à mediana)
Comparado com a mesma classe
» 0% de todos os dispositivos testados nesta classe foram melhores, 0% semelhantes, 100% piores
» O melhor teve um delta de 5%, a média foi 17%, o pior foi 45%
Comparado com todos os dispositivos testados
» 0% de todos os dispositivos testados foram melhores, 0% semelhantes, 100% piores
» O melhor teve um delta de 4%, a média foi 23%, o pior foi 134%
Gerenciamento de energia - Demanda sob altas cargas de CPU
Consumo de energia
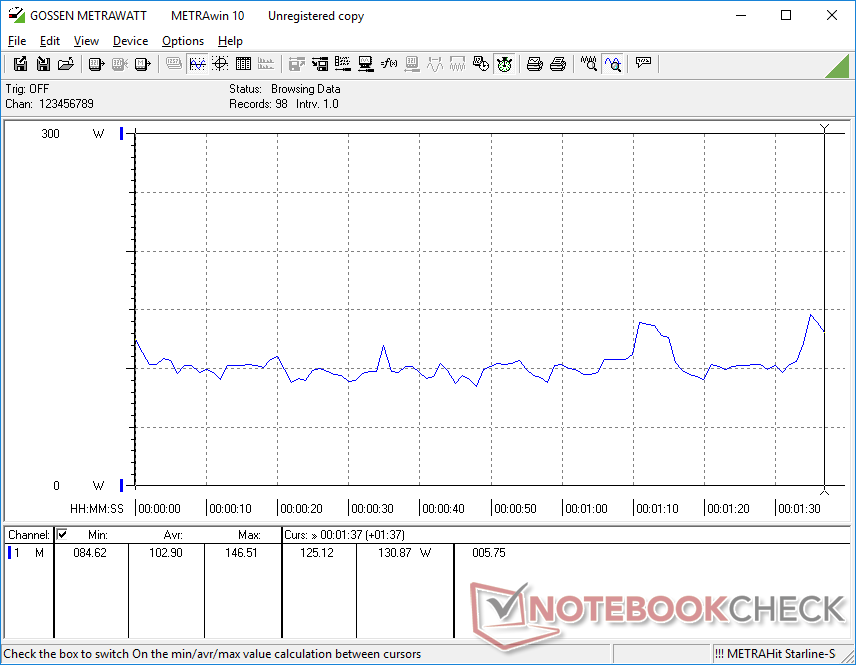
O sistema é excepcionalmente exigente quando ocioso na área de trabalho. O consumo de energia variaria entre 20 W quando na configuração de brilho e perfil de potência mais baixos com gráficos híbridos e 49 W quando na configuração de brilho e perfil de potência mais altos com o dGPU ativo. Em contraste, o modelo 2021 variaria entre 7 W e 16 W.
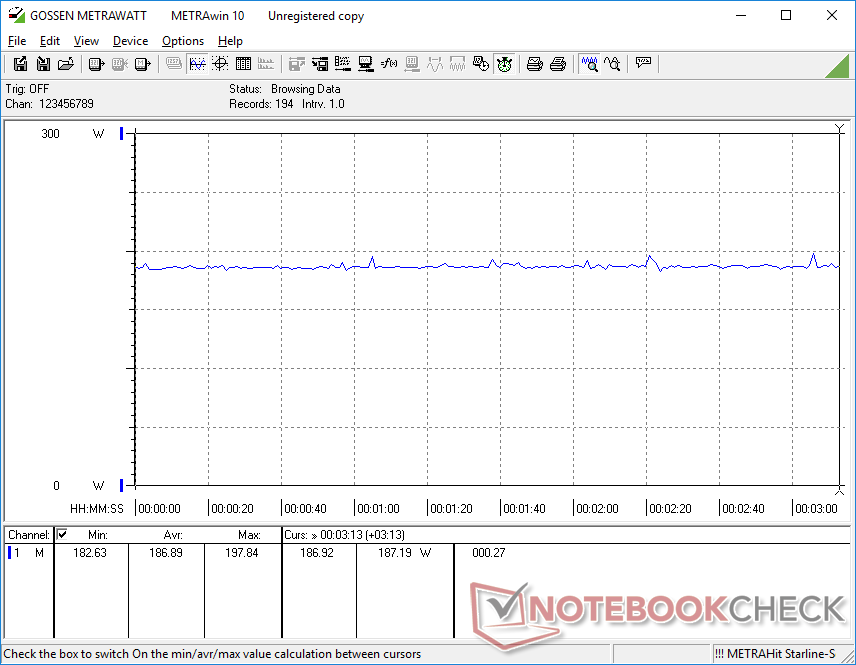
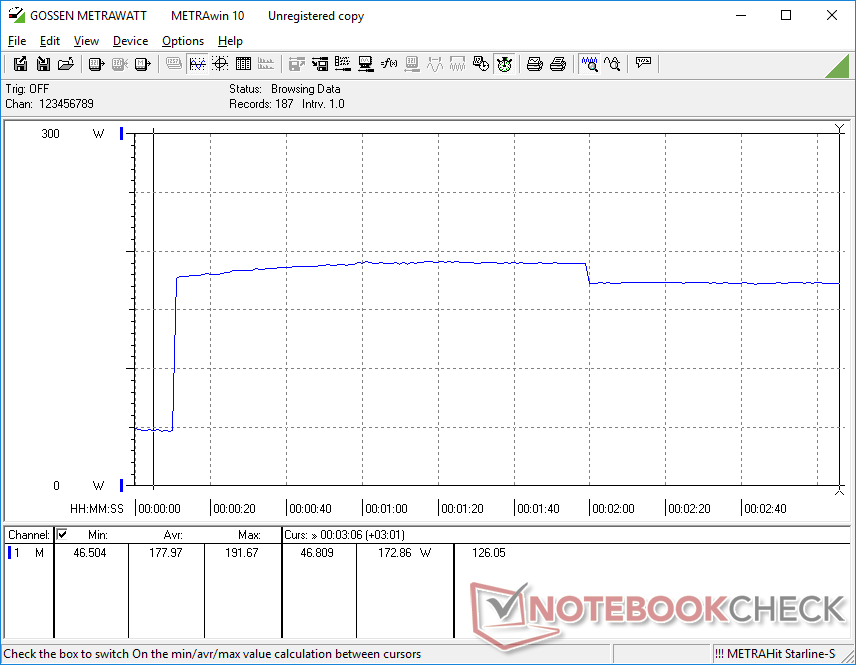
Rodando Witcher 3 exige cerca de 187 W em comparação com 175 W no modelo do ano passado, o que está intimamente correlacionado com a meta de 10 W de TGP mais alta de nosso modelo 2022.
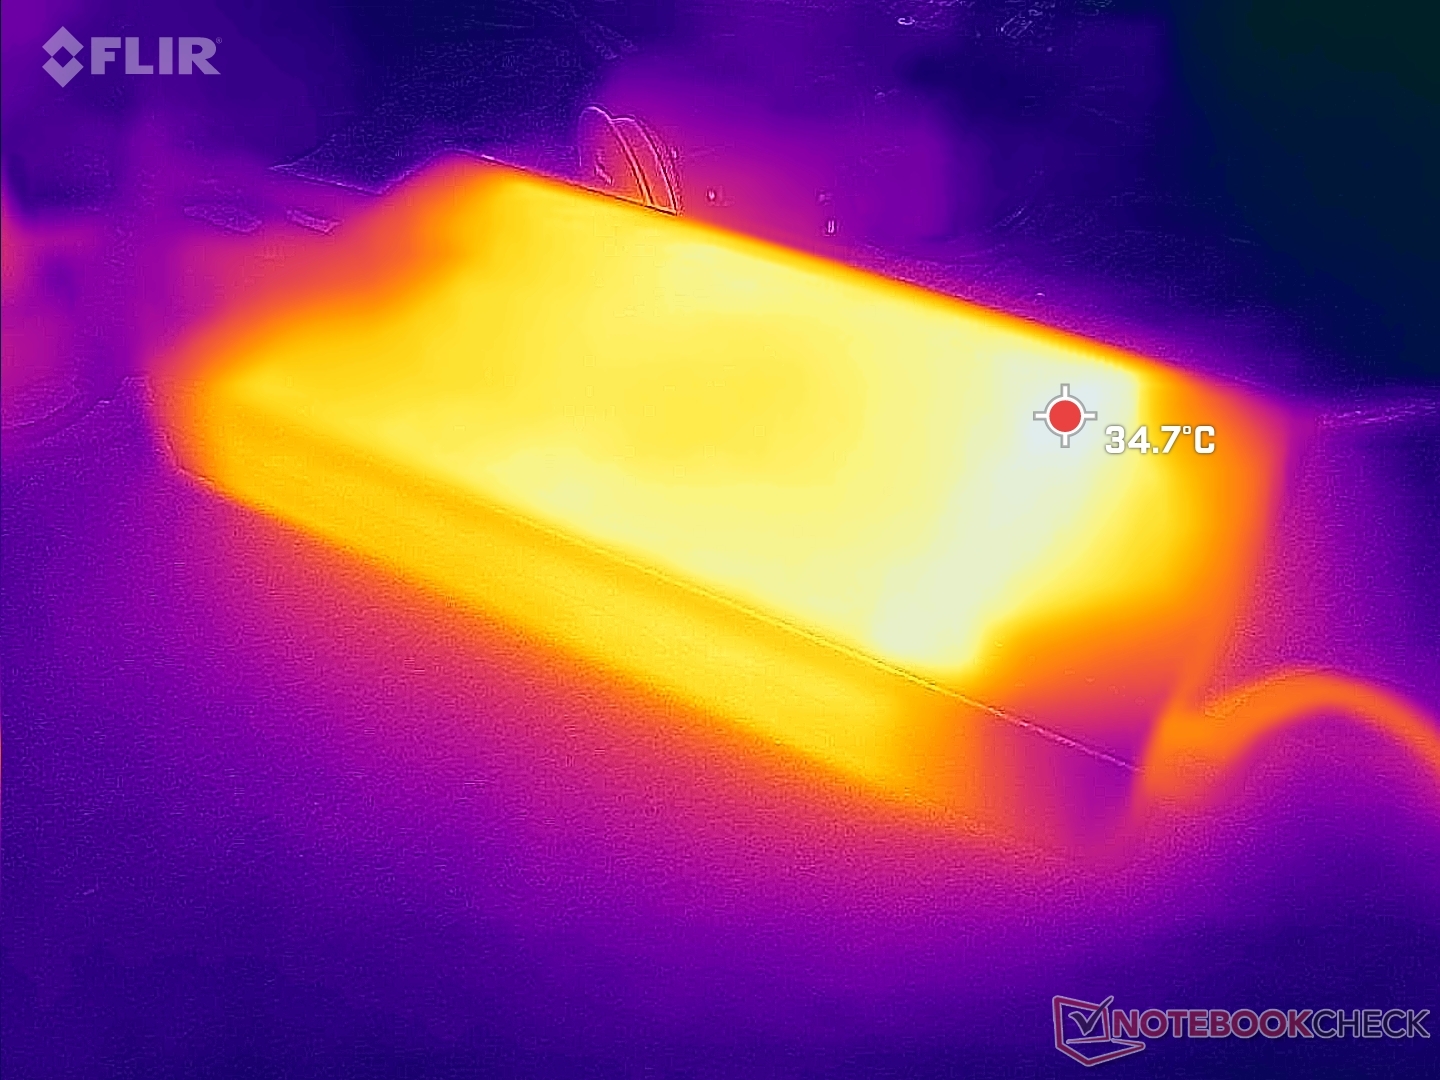
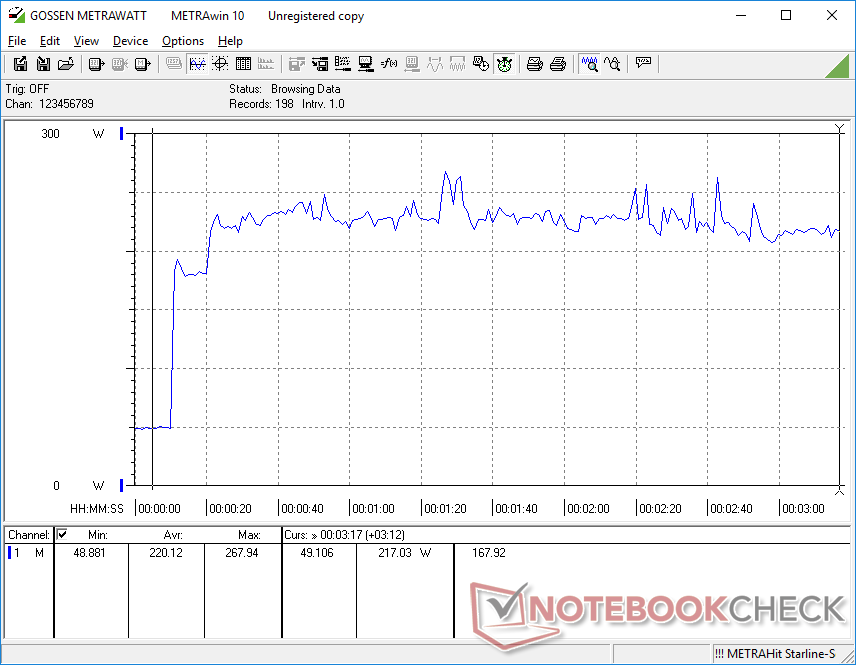
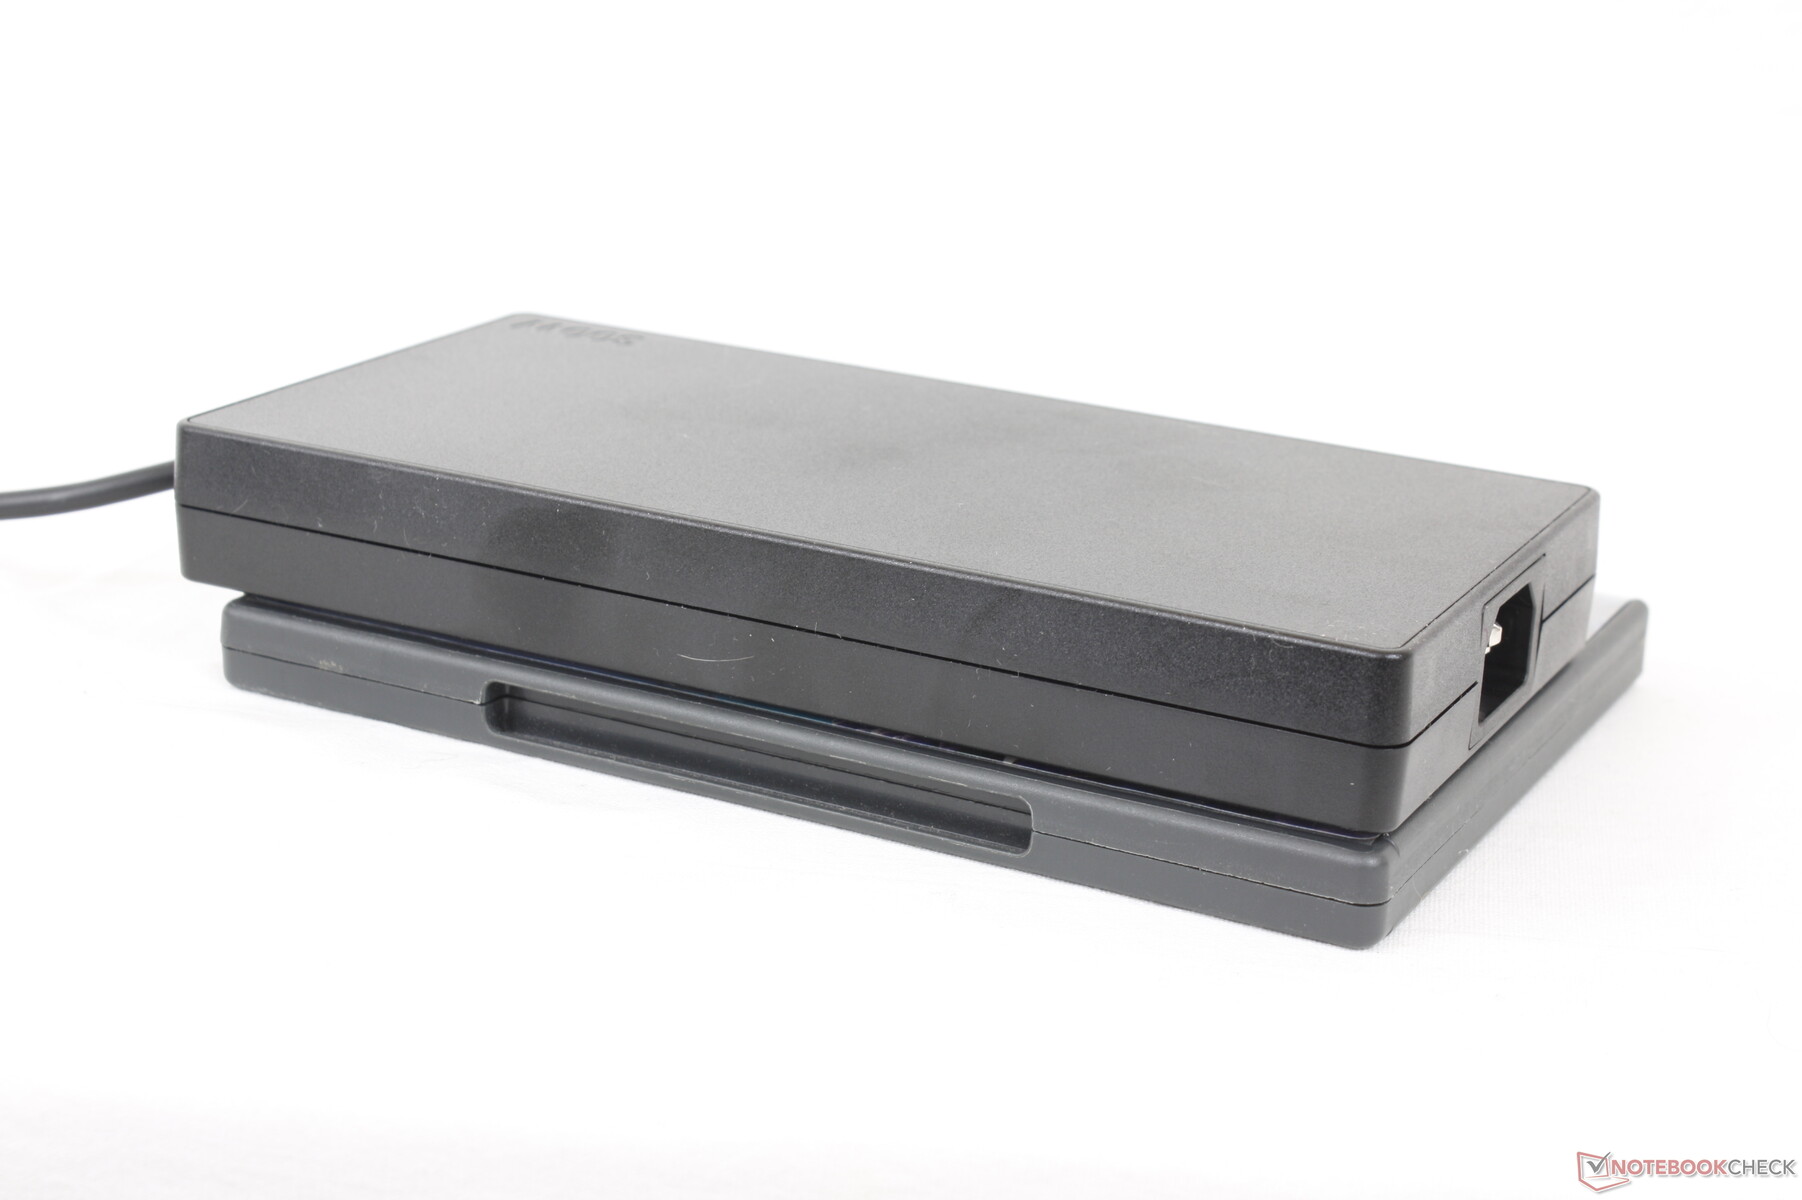
Somos capazes de registrar um consumo máximo de 268 W do grande (~19,8 x 9,8 x 2,5 cm) adaptador CA de 300 W quando tanto a CPU quanto a GPU estão em 100% de utilização. Este máximo é maior do que na maioria dos outros laptops para jogos rodando em plataformas Intel AMD ou 10ª/11ª geração, pois a série Core da 12ª geração é muito mais exigente.
| desligado | |
| Ocioso | |
| Carga |
|
Key:
min: | |
| Lenovo Legion 5 15IAH7H 82RB i7-12700H, GeForce RTX 3060 Laptop GPU, , IPS, 1920x1080, 15.6" | Lenovo Legion 5 15ACH-82JU00C6GE-FL R7 5800H, GeForce RTX 3060 Laptop GPU, Micron 2300 512GB MTFDHBA512TDV, , 1920x1080, 15.6" | MSI Bravo 15 B5DD-010US R5 5600H, Radeon RX 5500M, Kingston OM8PCP3512F-AB, IPS, 1920x1080, 15.6" | Asus TUF Gaming F15 FX507ZM i7-12700H, GeForce RTX 3060 Laptop GPU, SK Hynix HFM001TD3JX013N, IPS, 1920x1080, 15.6" | Acer Aspire Nitro 5 AN515-55-57GF i5-10300H, GeForce RTX 3060 Laptop GPU, WDC PC SN530 SDBPNPZ-512G, IPS, 1920x1080, 15.6" | Razer Blade 15 Base Edition 2021, i7-10750H RTX 3060 i7-10750H, GeForce RTX 3060 Laptop GPU, Samsung SSD PM981a MZVLB512HBJQ, IPS, 1920x1080, 15.6" | |
|---|---|---|---|---|---|---|
| Power Consumption | 34% | 53% | 31% | 49% | 29% | |
| Idle Minimum * (Watt) | 19.8 | 7.3 63% | 6.6 67% | 6.3 68% | 5 75% | 11.7 41% |
| Idle Average * (Watt) | 26.2 | 10.5 60% | 9.8 63% | 9.8 63% | 9 66% | 16 39% |
| Idle Maximum * (Watt) | 48.2 | 15.7 67% | 10.8 78% | 26.5 45% | 13 73% | 29.3 39% |
| Load Average * (Watt) | 102.9 | 108 -5% | 70.5 31% | 103.8 -1% | 84 18% | 95.6 7% |
| Witcher 3 ultra * (Watt) | 186.7 | 175 6% | 103.2 45% | 189 -1% | 125 33% | 141.3 24% |
| Load Maximum * (Watt) | 268 | 228 15% | 175 35% | 241.9 10% | 190 29% | 197 26% |
* ... menor é melhor
Power Consumption Witcher 3 / Stresstest
Power Consumption external Monitor
Vida útil da bateria
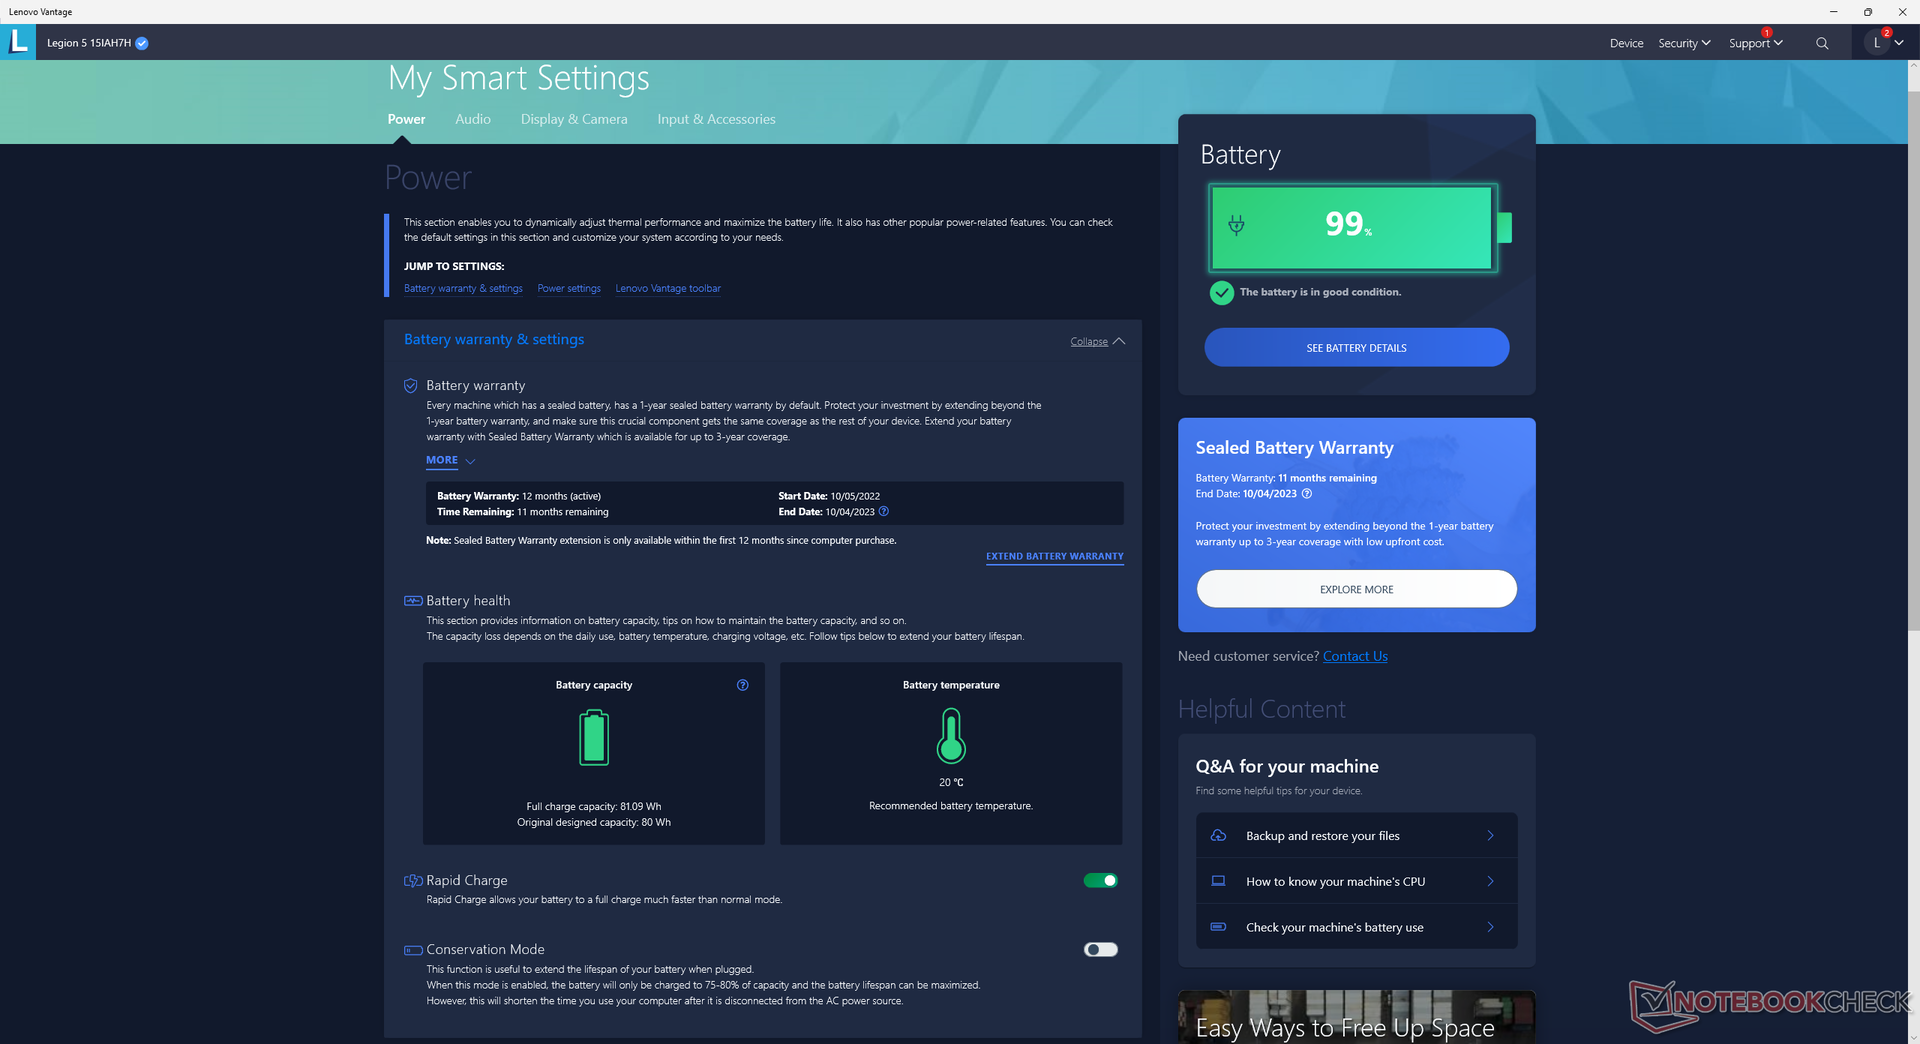
O tempo de funcionamento da WLAN é aproximadamente o mesmo do modelo do ano passado, já que a capacidade da bateria ainda está em 80 Wh. A carga de capacidade vazia a plena leva apenas 35 minutos quando a carga rápida é ligada em comparação com 1,5 a 2 horas na maioria dos outros laptops.
O carregamento USB-C é suportado somente através da porta USB-C traseira. Entretanto, o carregamento só pode ser compatível com o carregador opcional Lenovo USB-C e não com a maioria dos carregadores de terceiros. Tentamos três carregadores USB-C separados (30 W, 100 W e 130 W), mas somente o carregador de 130 W da Lenovo funcionaria.
Alguns SKUs vêm com uma bateria menor de 60 Wh em vez da nossa de 80 Wh.
| Lenovo Legion 5 15IAH7H 82RB i7-12700H, GeForce RTX 3060 Laptop GPU, 80 Wh | Lenovo Legion 5 15ACH-82JU00C6GE-FL R7 5800H, GeForce RTX 3060 Laptop GPU, 80 Wh | MSI Bravo 15 B5DD-010US R5 5600H, Radeon RX 5500M, 53 Wh | Asus TUF Gaming F15 FX507ZM i7-12700H, GeForce RTX 3060 Laptop GPU, 90 Wh | Acer Aspire Nitro 5 AN515-55-57GF i5-10300H, GeForce RTX 3060 Laptop GPU, 57.5 Wh | Razer Blade 15 Base Edition 2021, i7-10750H RTX 3060 i7-10750H, GeForce RTX 3060 Laptop GPU, 65 Wh | |
|---|---|---|---|---|---|---|
| Duração da bateria | 30% | 10% | 30% | 25% | 9% | |
| Reader / Idle (h) | 8.1 | 9.2 14% | 15.8 95% | 7.8 -4% | ||
| WiFi v1.3 (h) | 5 | 4.8 -4% | 6.3 26% | 4.8 -4% | 5.7 14% | 4.8 -4% |
| Load (h) | 1.1 | 1.8 64% | 1 -9% | 1.1 0% | 1.5 36% | 1.5 36% |
| H.264 (h) | 4.3 | 6.2 |
Pro
Contra
Veredicto - Tamanho grande, grande desempenho
O aspecto mais surpreendente do 2022 Legion 5 15 é seu desempenho mais rápido do que a média. Apesar de já termos testado muitos laptops para jogos com o Núcleo i7-12700H CPU e GeForce RTX 3060 GPU, este modelo Lenovo funciona a taxas de relógio visivelmente mais altas para um desempenho superior ao de muitos concorrentes equipados com o mesmo hardware. Se você estiver preocupado em adquirir acidentalmente um laptop com hardware abaixo do tempo, então o Legion 5 15 irá esmagar qualquer preocupação desse tipo.
A Lenovo 2022 Legion 5 15 se destaca por maximizar o desempenho em um chassi quase semi-profissional com o mínimo de luzes RGB. É bastante grande e pesado, no entanto, e alguns aspectos auxiliares poderiam usar algumas melhorias.
O desempenho extra vem ao custo de um chassi mais pesado e maior. A traseira grande saliente é difícil de ignorar e concorrentes como a Asus TUF Gaming F15 FX507ZM ou Razer Blade 15 Base Model são visivelmente mais leves. Se você viajar muito, então o desempenho mais alto pode não valer o peso mais pesado. O adaptador volumoso de 300 W AC também não torna a Lenovo muito amigável para viagens.
Para modelos futuros, gostaríamos de ver melhorias no clickpad esponjoso, qualidade pixelada da webcam, suporte de carga USB-C de terceiros e pequenas dobradiças. Esta última em particular ajudaria a justificar o chassi mais pesado quando comparado com a concorrência.
Preço e Disponibilidade
A Lenovo está agora enviando sua série Legion 5 15 a partir de $1100 a $1900 USD, dependendo da configuração. Nossa configuração de revisão específica é atualmente enviada por $1350.
Lenovo Legion 5 15IAH7H 82RB
- 11/25/2022 v7 (old)
Allen Ngo
Price comparison

