Breve Análise do Portátil Lenovo Legion 5 17IMH: A bateria simplesmente não morrerá
Avaliação | Data | Modelo | Peso | Altura | Size | Resolução | Preço |
|---|---|---|---|---|---|---|---|
| 81.9 % v7 (old) | 10/2020 | Lenovo Legion 5 17IMH05 i5-10300H, GeForce GTX 1650 Mobile | 2.9 kg | 26.2 mm | 17.30" | 1920x1080 | |
| 78.5 % v7 (old) | 05/2020 | MSI GF75 Thin 10SCXR i5-10300H, GeForce GTX 1650 Mobile | 2.2 kg | 23.1 mm | 17.30" | 1920x1080 | |
| 82.9 % v7 (old) | 05/2020 | Asus TUF A17 FA706IU-AS76 R7 4800H, GeForce GTX 1660 Ti Mobile | 2.6 kg | 26 mm | 17.30" | 1920x1080 | |
| 81.6 % v7 (old) | 07/2019 | HP Pavilion Gaming 17-cd0085cl i7-9750H, GeForce GTX 1660 Ti Max-Q | 2.8 kg | 25 mm | 17.30" | 1920x1080 |


| SD Card Reader | |
| average JPG Copy Test (av. of 3 runs) | |
| Média da turma Gaming (20.9 - 210, n=54, últimos 2 anos) | |
| Lenovo Legion 5 17IMH05 (Toshiba Exceria Pro SDXC 64 GB UHS-II) | |
| HP Pavilion Gaming 17-cd0085cl (Toshiba Exceria Pro SDXC 64 GB UHS-II) | |
| maximum AS SSD Seq Read Test (1GB) | |
| Média da turma Gaming (25.5 - 261, n=51, últimos 2 anos) | |
| Lenovo Legion 5 17IMH05 (Toshiba Exceria Pro SDXC 64 GB UHS-II) | |
| HP Pavilion Gaming 17-cd0085cl (Toshiba Exceria Pro SDXC 64 GB UHS-II) | |


| |||||||||||||||||||||||||
iluminação: 89 %
iluminação com acumulador: 326 cd/m²
Contraste: 1304:1 (Preto: 0.25 cd/m²)
ΔE ColorChecker Calman: 4.42 | ∀{0.5-29.43 Ø4.71}
calibrated: 1.53
ΔE Greyscale Calman: 5.8 | ∀{0.09-98 Ø4.96}
93% sRGB (Argyll 1.6.3 3D)
71% AdobeRGB 1998 (Argyll 1.6.3 3D)
71.2% AdobeRGB 1998 (Argyll 3D)
97.1% sRGB (Argyll 3D)
69.4% Display P3 (Argyll 3D)
Gamma: 2.261
CCT: 6822 K
| Lenovo Legion 5 17IMH05 AU Optronics B173HAN04.3, IPS, 1920x1080, 17.3" | MSI GF75 Thin 10SCXR AU Optronics B173HAN04.7, IPS, 1920x1080, 17.3" | Asus TUF A17 FA706IU-AS76 BOE NV173FHM-NX1, IPS, 1920x1080, 17.3" | HP Pavilion Gaming 17-cd0085cl BOE0825, IPS, 1920x1080, 17.3" | |
|---|---|---|---|---|
| Display | -42% | -41% | -9% | |
| Display P3 Coverage (%) | 69.4 | 39.46 -43% | 40.55 -42% | 63.3 -9% |
| sRGB Coverage (%) | 97.1 | 58.4 -40% | 59.7 -39% | 90.2 -7% |
| AdobeRGB 1998 Coverage (%) | 71.2 | 40.77 -43% | 41.89 -41% | 64.3 -10% |
| Response Times | 9% | 37% | 24% | |
| Response Time Grey 50% / Grey 80% * (ms) | 38.4 ? | 34 ? 11% | 22.4 ? 42% | 31.6 ? 18% |
| Response Time Black / White * (ms) | 28 ? | 26.4 ? 6% | 19.2 ? 31% | 19.6 ? 30% |
| PWM Frequency (Hz) | ||||
| Screen | -40% | -37% | -13% | |
| Brightness middle (cd/m²) | 326 | 251.2 -23% | 264.8 -19% | 299.6 -8% |
| Brightness (cd/m²) | 304 | 242 -20% | 253 -17% | 285 -6% |
| Brightness Distribution (%) | 89 | 92 3% | 90 1% | 86 -3% |
| Black Level * (cd/m²) | 0.25 | 0.34 -36% | 0.31 -24% | 0.33 -32% |
| Contrast (:1) | 1304 | 739 -43% | 854 -35% | 908 -30% |
| Colorchecker dE 2000 * | 4.42 | 4.5 -2% | 4.73 -7% | 3.68 17% |
| Colorchecker dE 2000 max. * | 9.44 | 20 -112% | 18.89 -100% | 8.05 15% |
| Colorchecker dE 2000 calibrated * | 1.53 | 3.91 -156% | 4.64 -203% | 3.15 -106% |
| Greyscale dE 2000 * | 5.8 | 4 31% | 1.4 76% | 3.8 34% |
| Gamma | 2.261 97% | 2.25 98% | 2.16 102% | 2.12 104% |
| CCT | 6822 95% | 5882 111% | 6641 98% | 7240 90% |
| Color Space (Percent of AdobeRGB 1998) (%) | 71 | 37.3 -47% | 38.4 -46% | 58.1 -18% |
| Color Space (Percent of sRGB) (%) | 93 | 58.1 -38% | 59.3 -36% | 89.8 -3% |
| Média Total (Programa/Configurações) | -24% /
-35% | -14% /
-29% | 1% /
-7% |
* ... menor é melhor
Exibir tempos de resposta
| ↔ Tempo de resposta preto para branco | ||
|---|---|---|
| 28 ms ... ascensão ↗ e queda ↘ combinadas | ↗ 15.6 ms ascensão | 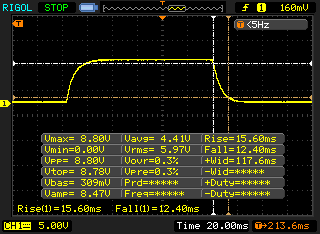 |
| ↘ 12.4 ms queda | ||
| A tela mostra taxas de resposta relativamente lentas em nossos testes e pode ser muito lenta para os jogadores. Em comparação, todos os dispositivos testados variam de 0.1 (mínimo) a 240 (máximo) ms. » 71 % de todos os dispositivos são melhores. Isso significa que o tempo de resposta medido é pior que a média de todos os dispositivos testados (19.8 ms). | ||
| ↔ Tempo de resposta 50% cinza a 80% cinza | ||
| 38.4 ms ... ascensão ↗ e queda ↘ combinadas | ↗ 19.6 ms ascensão | 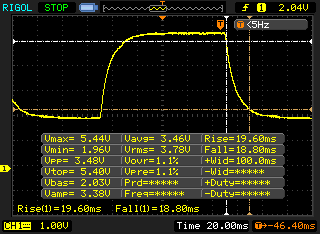 |
| ↘ 18.8 ms queda | ||
| A tela mostra taxas de resposta lentas em nossos testes e será insatisfatória para os jogadores. Em comparação, todos os dispositivos testados variam de 0.165 (mínimo) a 636 (máximo) ms. » 58 % de todos os dispositivos são melhores. Isso significa que o tempo de resposta medido é pior que a média de todos os dispositivos testados (31 ms). | ||
Cintilação da tela / PWM (modulação por largura de pulso)
| Tela tremeluzindo / PWM não detectado | 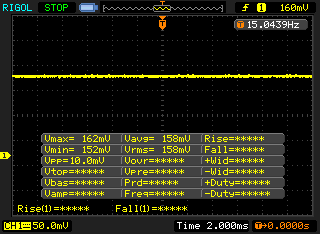 | ||
[pwm_comparison] Em comparação: 52 % de todos os dispositivos testados não usam PWM para escurecer a tela. Se PWM foi detectado, uma média de 7757 (mínimo: 5 - máximo: 343500) Hz foi medida. | |||
| Cinebench R15 | |
| CPU Single 64Bit | |
| Média da turma Gaming (188.8 - 350, n=106, últimos 2 anos) | |
| HP Pavilion Gaming 17-cd0085cl | |
| Asus TUF A17 FA706IU-AS76 | |
| Lenovo Legion 5 17IMH05 (Leistungsmodus) | |
| MSI GF75 Thin 10SCXR | |
| Média Intel Core i5-10300H (108 - 194, n=17) | |
| Lenovo Legion 5 17IMH05 | |
| CPU Multi 64Bit | |
| Média da turma Gaming (1578 - 6330, n=105, últimos 2 anos) | |
| Asus TUF A17 FA706IU-AS76 | |
| HP Pavilion Gaming 17-cd0085cl | |
| Lenovo Legion 5 17IMH05 (Leistungsmodus) | |
| MSI GF75 Thin 10SCXR | |
| Média Intel Core i5-10300H (536 - 921, n=17) | |
| Lenovo Legion 5 17IMH05 | |
| Blender - v2.79 BMW27 CPU | |
| MSI GF75 Thin 10SCXR | |
| Lenovo Legion 5 17IMH05 | |
| Média Intel Core i5-10300H (479 - 555, n=14) | |
| Lenovo Legion 5 17IMH05 (Leistungsmodus) | |
| Asus TUF A17 FA706IU-AS76 | |
| Média da turma Gaming (79 - 330, n=104, últimos 2 anos) | |
| 7-Zip 18.03 | |
| 7z b 4 -mmt1 | |
| Média da turma Gaming (4199 - 7436, n=105, últimos 2 anos) | |
| Lenovo Legion 5 17IMH05 (Leistungsmodus) | |
| Asus TUF A17 FA706IU-AS76 | |
| Média Intel Core i5-10300H (2945 - 4956, n=14) | |
| MSI GF75 Thin 10SCXR | |
| Lenovo Legion 5 17IMH05 | |
| 7z b 4 | |
| Média da turma Gaming (33491 - 148086, n=105, últimos 2 anos) | |
| Asus TUF A17 FA706IU-AS76 | |
| Lenovo Legion 5 17IMH05 (Leistungsmodus) | |
| Média Intel Core i5-10300H (15146 - 24841, n=14) | |
| MSI GF75 Thin 10SCXR | |
| Lenovo Legion 5 17IMH05 | |
| Cinebench R20 | |
| CPU (Single Core) | |
| Média da turma Gaming (442 - 913, n=106, últimos 2 anos) | |
| Asus TUF A17 FA706IU-AS76 | |
| Lenovo Legion 5 17IMH05 (Leistungsmodus) | |
| Média Intel Core i5-10300H (312 - 470, n=15) | |
| MSI GF75 Thin 10SCXR | |
| Lenovo Legion 5 17IMH05 | |
| CPU (Multi Core) | |
| Média da turma Gaming (4029 - 16433, n=106, últimos 2 anos) | |
| Asus TUF A17 FA706IU-AS76 | |
| Lenovo Legion 5 17IMH05 (Leistungsmodus ) | |
| Média Intel Core i5-10300H (1397 - 2240, n=15) | |
| MSI GF75 Thin 10SCXR | |
| Lenovo Legion 5 17IMH05 | |
| Geekbench 5.5 | |
| Single-Core | |
| Média da turma Gaming (986 - 2474, n=105, últimos 2 anos) | |
| Asus TUF A17 FA706IU-AS76 | |
| Lenovo Legion 5 17IMH05 (Leistungsmodus) | |
| Média Intel Core i5-10300H (703 - 1241, n=16) | |
| MSI GF75 Thin 10SCXR | |
| Lenovo Legion 5 17IMH05 | |
| Multi-Core | |
| Média da turma Gaming (6460 - 28263, n=105, últimos 2 anos) | |
| Asus TUF A17 FA706IU-AS76 | |
| Média Intel Core i5-10300H (2783 - 4728, n=16) | |
| Lenovo Legion 5 17IMH05 (Leistungsmodus) | |
| MSI GF75 Thin 10SCXR | |
| Lenovo Legion 5 17IMH05 | |
| HWBOT x265 Benchmark v2.2 - 4k Preset | |
| Média da turma Gaming (11.5 - 44.4, n=105, últimos 2 anos) | |
| Asus TUF A17 FA706IU-AS76 | |
| Lenovo Legion 5 17IMH05 (Leistungsmodus) | |
| Média Intel Core i5-10300H (6.13 - 7.78, n=14) | |
| MSI GF75 Thin 10SCXR | |
| Lenovo Legion 5 17IMH05 | |
| LibreOffice - 20 Documents To PDF | |
| Lenovo Legion 5 17IMH05 | |
| Asus TUF A17 FA706IU-AS76 | |
| MSI GF75 Thin 10SCXR | |
| Média Intel Core i5-10300H (23.9 - 94, n=14) | |
| Média da turma Gaming (33.2 - 88.8, n=105, últimos 2 anos) | |
| Lenovo Legion 5 17IMH05 (Leistungsmodus) | |
| R Benchmark 2.5 - Overall mean | |
| Lenovo Legion 5 17IMH05 | |
| Média Intel Core i5-10300H (0.625 - 1.088, n=14) | |
| MSI GF75 Thin 10SCXR | |
| Lenovo Legion 5 17IMH05 (Leistungsmodus) | |
| Asus TUF A17 FA706IU-AS76 | |
| Média da turma Gaming (0.3439 - 0.759, n=106, últimos 2 anos) | |
* ... menor é melhor
| PCMark 8 Home Score Accelerated v2 | 3181 pontos | |
| PCMark 8 Creative Score Accelerated v2 | 2954 pontos | |
| PCMark 8 Work Score Accelerated v2 | 4265 pontos | |
| PCMark 10 Score | 4077 pontos | |
Ajuda | ||
| PCMark 10 - Score | |
| Média da turma Gaming (5828 - 12414, n=93, últimos 2 anos) | |
| Asus TUF A17 FA706IU-AS76 | |
| HP Pavilion Gaming 17-cd0085cl | |
| MSI GF75 Thin 10SCXR | |
| Média Intel Core i5-10300H, NVIDIA GeForce GTX 1650 Mobile (4077 - 5301, n=5) | |
| Lenovo Legion 5 17IMH05 (Leistungsmodus) | |
| Lenovo Legion 5 17IMH05 | |
| PCMark 8 | |
| Home Score Accelerated v2 | |
| Média da turma Gaming (n=1últimos 2 anos) | |
| Asus TUF A17 FA706IU-AS76 | |
| HP Pavilion Gaming 17-cd0085cl | |
| MSI GF75 Thin 10SCXR | |
| Média Intel Core i5-10300H, NVIDIA GeForce GTX 1650 Mobile (3181 - 3971, n=5) | |
| Lenovo Legion 5 17IMH05 (Leistungsmodus) | |
| Lenovo Legion 5 17IMH05 | |
| Work Score Accelerated v2 | |
| Asus TUF A17 FA706IU-AS76 | |
| MSI GF75 Thin 10SCXR | |
| HP Pavilion Gaming 17-cd0085cl | |
| Lenovo Legion 5 17IMH05 (Leistungsmodus) | |
| Média Intel Core i5-10300H, NVIDIA GeForce GTX 1650 Mobile (4265 - 5276, n=5) | |
| Lenovo Legion 5 17IMH05 | |
| Média da turma Gaming (n=1últimos 2 anos) | |
| DPC Latencies / LatencyMon - interrupt to process latency (max), Web, Youtube, Prime95 | |
| Asus TUF A17 FA706IU-AS76 | |
| MSI GF75 Thin 10SCXR | |
| Lenovo Legion 5 17IMH05 | |
* ... menor é melhor

| Lenovo Legion 5 17IMH05 SK hynix BC511 HFM512GDHTNI-87A0B | MSI GF75 Thin 10SCXR WDC PC SN530 SDBPNPZ-512G | Asus TUF A17 FA706IU-AS76 Intel SSD 660p 1TB SSDPEKNW010T8 | HP Pavilion Gaming 17-cd0085cl Samsung SSD PM981 MZVLB256HAHQ | Média SK hynix BC511 HFM512GDHTNI-87A0B | |
|---|---|---|---|---|---|
| CrystalDiskMark 5.2 / 6 | 13% | 28% | 27% | -4% | |
| Write 4K (MB/s) | 134.7 | 140.7 4% | 189.7 41% | 135.3 0% | 135.9 ? 1% |
| Read 4K (MB/s) | 44.84 | 43.18 -4% | 62.3 39% | 63.7 42% | 45.3 ? 1% |
| Write Seq (MB/s) | 1053 | 1829 74% | 1681 60% | 1337 27% | 1057 ? 0% |
| Read Seq (MB/s) | 1241 | 1095 -12% | 1608 30% | 1617 30% | 1144 ? -8% |
| Write 4K Q32T1 (MB/s) | 499.8 | 431.7 -14% | 468.6 -6% | 568 14% | 458 ? -8% |
| Read 4K Q32T1 (MB/s) | 518 | 527 2% | 541 4% | 645 25% | 425 ? -18% |
| Write Seq Q32T1 (MB/s) | 1022 | 1831 79% | 1770 73% | 1428 40% | 1040 ? 2% |
| Read Seq Q32T1 (MB/s) | 2263 | 1708 -25% | 1898 -16% | 3184 41% | 2274 ? 0% |
| AS SSD | -38% | -7% | 15% | 1% | |
| Seq Read (MB/s) | 1635 | 1007 -38% | 1320 -19% | 1709 5% | 1601 ? -2% |
| Seq Write (MB/s) | 913 | 1755 92% | 1539 69% | 1345 47% | 879 ? -4% |
| 4K Read (MB/s) | 46.18 | 39.88 -14% | 56.3 22% | 49.73 8% | 48.7 ? 5% |
| 4K Write (MB/s) | 101.7 | 111.6 10% | 158.5 56% | 108.2 6% | 114.9 ? 13% |
| 4K-64 Read (MB/s) | 773 | 751 -3% | 586 -24% | 731 -5% | 764 ? -1% |
| 4K-64 Write (MB/s) | 745 | 402.6 -46% | 820 10% | 1233 66% | 754 ? 1% |
| Access Time Read * (ms) | 0.05 | 0.084 -68% | 0.043 14% | 0.073 -46% | 0.0535 ? -7% |
| Access Time Write * (ms) | 0.037 | 0.151 -308% | 0.113 -205% | 0.034 8% | 0.034 ? 8% |
| Score Read (Points) | 983 | 892 -9% | 775 -21% | 951 -3% | 973 ? -1% |
| Score Write (Points) | 938 | 690 -26% | 1132 21% | 1476 57% | 957 ? 2% |
| Score Total (Points) | 2399 | 2085 -13% | 2333 -3% | 2909 21% | 2405 ? 0% |
| Média Total (Programa/Configurações) | -13% /
-17% | 11% /
8% | 21% /
20% | -2% /
-1% |
* ... menor é melhor
Constant Performance Reads: DiskSpd Read Loop, Queue Depth 8
| 3DMark 11 Performance | 11495 pontos | |
| 3DMark Cloud Gate Standard Score | 26934 pontos | |
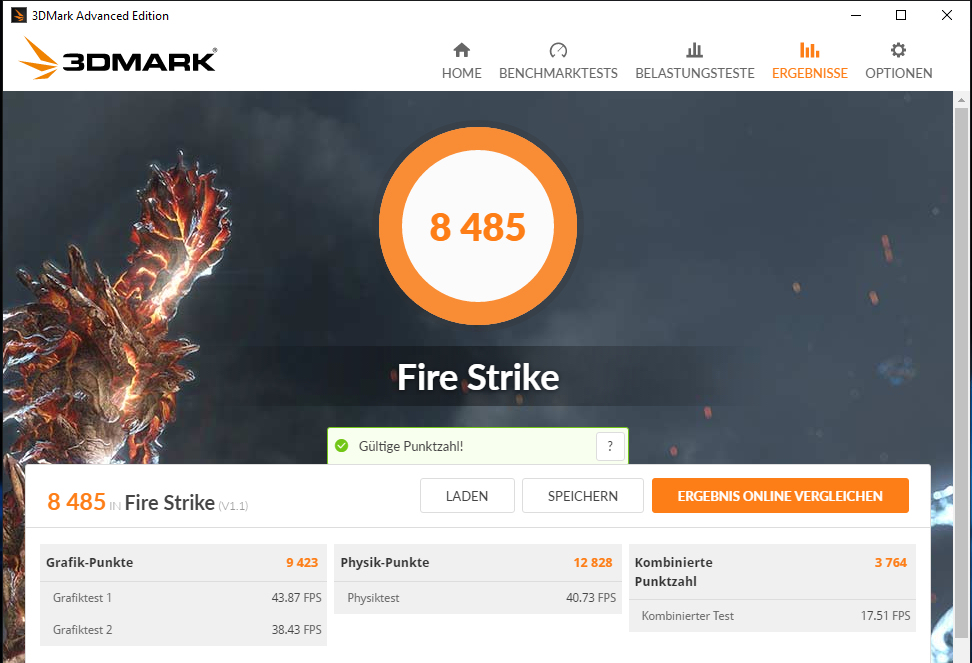
| 3DMark Fire Strike Score | 8485 pontos | |
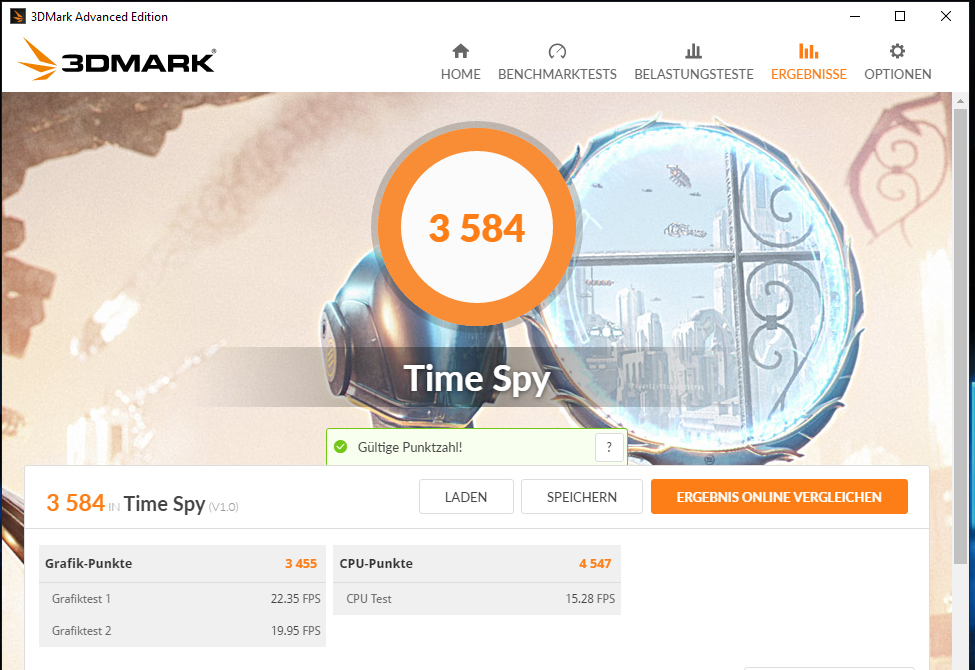
| 3DMark Time Spy Score | 3584 pontos | |
Ajuda | ||
| The Witcher 3 - 1920x1080 Ultra Graphics & Postprocessing (HBAO+) | |
| Média da turma Gaming (104.7 - 240, n=7, últimos 2 anos) | |
| Asus TUF A17 FA706IU-AS76 | |
| HP Pavilion Gaming 17-cd0085cl | |
| Lenovo Legion 5 17IMH05 | |
| Nexoc GH5 515IG | |
| MSI GF75 Thin 10SCXR | |
| Lenovo IdeaPad Gaming 3i 15IMH05 | |
| Média NVIDIA GeForce GTX 1650 Mobile (29.9 - 40.3, n=31) | |
| F1 2020 | |
| 1920x1080 Ultra High Preset AA:T AF:16x | |
| Nexoc GH5 515IG | |
| Lenovo Legion 5 17IMH05 | |
| Média NVIDIA GeForce GTX 1650 Mobile (48.3 - 63, n=5) | |
| 1280x720 Ultra Low Preset | |
| Nexoc GH5 515IG | |
| Média NVIDIA GeForce GTX 1650 Mobile (156 - 208, n=5) | |
| Lenovo Legion 5 17IMH05 | |
| Death Stranding | |
| 1920x1080 Very High Preset | |
| Lenovo Legion 5 17IMH05 | |
| Média NVIDIA GeForce GTX 1650 Mobile (56.5 - 57.8, n=4) | |
| Nexoc GH5 515IG | |
| 1280x720 Low Preset | |
| Média NVIDIA GeForce GTX 1650 Mobile (100.8 - 111, n=4) | |
| Nexoc GH5 515IG | |
| Lenovo Legion 5 17IMH05 | |
| Mafia Definitive Edition | |
| 1920x1080 High Preset | |
| Média NVIDIA GeForce GTX 1650 Mobile (43.3 - 44.9, n=2) | |
| Lenovo Legion 5 17IMH05 | |
| 1280x720 Low Preset | |
| Média NVIDIA GeForce GTX 1650 Mobile (66.2 - 103, n=2) | |
| Lenovo Legion 5 17IMH05 | |
| baixo | média | alto | ultra | |
|---|---|---|---|---|
| BioShock Infinite (2013) | 250.1 | 217.9 | 205.7 | 93.2 |
| The Witcher 3 (2015) | 172.7 | 117.3 | 69.5 | 40.3 |
| Shadow of the Tomb Raider (2018) | 83 | 62 | 52 | 45 |
| Doom Eternal (2020) | 139 | 84.3 | 69.2 | |
| F1 2020 (2020) | 156 | 100 | 80 | 57 |
| Death Stranding (2020) | 100.8 | 64 | 59.5 | 57.6 |
| Flight Simulator 2020 (2020) | 50.4 | 35.9 | 25.5 | 17.5 |
| Serious Sam 4 (2020) | 99.3 | 48.4 | 40.6 | 27.8 |
| Mafia Definitive Edition (2020) | 66.2 | 47.1 | 43.3 | |
| Star Wars Squadrons (2020) | 179.1 | 122.6 | 108.7 | 100 |
| FIFA 21 (2020) | 153.2 | 125.8 | 120.4 | 113.1 |
Barulho
| Ocioso |
| 24 / 25 / 29 dB |
| Carga |
| 43 / 51 dB |
 | ||
30 dB silencioso 40 dB(A) audível 50 dB(A) ruidosamente alto |
||
min: | ||
| Lenovo Legion 5 17IMH05 i5-10300H, GeForce GTX 1650 Mobile | MSI GF75 Thin 10SCXR i5-10300H, GeForce GTX 1650 Mobile | Asus TUF A17 FA706IU-AS76 R7 4800H, GeForce GTX 1660 Ti Mobile | HP Pavilion Gaming 17-cd0085cl i7-9750H, GeForce GTX 1660 Ti Max-Q | Média NVIDIA GeForce GTX 1650 Mobile | Média da turma Gaming | |
|---|---|---|---|---|---|---|
| Noise | -9% | -12% | -1% | -7% | -5% | |
| desligado / ambiente * (dB) | 24 | 28.4 -18% | 28.7 -20% | 28.2 -18% | 27.6 ? -15% | 24.1 ? -0% |
| Idle Minimum * (dB) | 24 | 33 -38% | 28.7 -20% | 30.1 -25% | 28.1 ? -17% | 26 ? -8% |
| Idle Average * (dB) | 25 | 33 -32% | 30.5 -22% | 30.1 -20% | 28.8 ? -15% | 27.4 ? -10% |
| Idle Maximum * (dB) | 29 | 33.1 -14% | 32.5 -12% | 30.1 -4% | 31 ? -7% | 30.1 ? -4% |
| Load Average * (dB) | 43 | 37.7 12% | 42.5 1% | 34.2 20% | 41.7 ? 3% | 43.6 ? -1% |
| Witcher 3 ultra * (dB) | 46 | 39.2 15% | 50.1 -9% | 34.2 26% | ||
| Load Maximum * (dB) | 51 | 46 10% | 53.4 -5% | 43.8 14% | 46.4 ? 9% | 54.2 ? -6% |
* ... menor é melhor
(-) A temperatura máxima no lado superior é 47 °C / 117 F, em comparação com a média de 40.4 °C / 105 F , variando de 21.2 a 68.8 °C para a classe Gaming.
(±) A parte inferior aquece até um máximo de 44 °C / 111 F, em comparação com a média de 43.2 °C / 110 F
(+) Em uso inativo, a temperatura média para o lado superior é 29.7 °C / 85 F, em comparação com a média do dispositivo de 33.9 °C / ### class_avg_f### F.
(±) Jogando The Witcher 3, a temperatura média para o lado superior é 35.3 °C / 96 F, em comparação com a média do dispositivo de 33.9 °C / ## #class_avg_f### F.
(+) Os apoios para as mãos e o touchpad são mais frios que a temperatura da pele, com um máximo de 28 °C / 82.4 F e, portanto, são frios ao toque.
(±) A temperatura média da área do apoio para as mãos de dispositivos semelhantes foi 28.8 °C / 83.8 F (+0.8 °C / 1.4 F).
| Lenovo Legion 5 17IMH05 i5-10300H, GeForce GTX 1650 Mobile | MSI GF75 Thin 10SCXR i5-10300H, GeForce GTX 1650 Mobile | Asus TUF A17 FA706IU-AS76 R7 4800H, GeForce GTX 1660 Ti Mobile | HP Pavilion Gaming 17-cd0085cl i7-9750H, GeForce GTX 1660 Ti Max-Q | Média NVIDIA GeForce GTX 1650 Mobile | Média da turma Gaming | |
|---|---|---|---|---|---|---|
| Heat | -8% | -2% | -8% | 3% | -2% | |
| Maximum Upper Side * (°C) | 47 | 42 11% | 47.6 -1% | 42.6 9% | 46 ? 2% | 45.2 ? 4% |
| Maximum Bottom * (°C) | 44 | 53.4 -21% | 50.8 -15% | 49 -11% | 49.2 ? -12% | 48.1 ? -9% |
| Idle Upper Side * (°C) | 35 | 34.2 2% | 33 6% | 34 3% | 28.3 ? 19% | 31 ? 11% |
| Idle Bottom * (°C) | 30 | 37.4 -25% | 29 3% | 39.4 -31% | 28.9 ? 4% | 34.2 ? -14% |
* ... menor é melhor
Lenovo Legion 5 17IMH05 análise de áudio
(±) | o volume do alto-falante é médio, mas bom (###valor### dB)
Graves 100 - 315Hz
(-) | quase nenhum baixo - em média 19.8% menor que a mediana
(-) | graves não são lineares (15.3% delta para frequência anterior)
Médios 400 - 2.000 Hz
(+) | médios equilibrados - apenas 4.5% longe da mediana
(+) | médios são lineares (2.7% delta para frequência anterior)
Altos 2 - 16 kHz
(+) | agudos equilibrados - apenas 4.7% longe da mediana
(+) | os máximos são lineares (4.3% delta da frequência anterior)
Geral 100 - 16.000 Hz
(±) | a linearidade do som geral é média (18.8% diferença em relação à mediana)
Comparado com a mesma classe
» 62% de todos os dispositivos testados nesta classe foram melhores, 8% semelhantes, 30% piores
» O melhor teve um delta de 6%, a média foi 18%, o pior foi 132%
Comparado com todos os dispositivos testados
» 43% de todos os dispositivos testados foram melhores, 8% semelhantes, 49% piores
» O melhor teve um delta de 4%, a média foi 23%, o pior foi 134%
| desligado | |
| Ocioso | |
| Carga |
|
Key:
min: | |
| Lenovo Legion 5 17IMH05 i5-10300H, GeForce GTX 1650 Mobile | MSI GF75 Thin 10SCXR i5-10300H, GeForce GTX 1650 Mobile | Asus TUF A17 FA706IU-AS76 R7 4800H, GeForce GTX 1660 Ti Mobile | HP Pavilion Gaming 17-cd0085cl i7-9750H, GeForce GTX 1660 Ti Max-Q | Média NVIDIA GeForce GTX 1650 Mobile | Média da turma Gaming | |
|---|---|---|---|---|---|---|
| Power Consumption | -120% | -73% | -41% | -34% | -177% | |
| Idle Minimum * (Watt) | 2 | 13 -550% | 7.4 -270% | 5.4 -170% | 4.96 ? -148% | 13 ? -550% |
| Idle Average * (Watt) | 8 | 15.7 -96% | 10.5 -31% | 9.2 -15% | 8.61 ? -8% | 19 ? -138% |
| Idle Maximum * (Watt) | 16 | 21 -31% | 17 -6% | 13 19% | 14.8 ? 7% | 24.6 ? -54% |
| Load Average * (Watt) | 58 | 87 -50% | 103.7 -79% | 85.9 -48% | 81.7 ? -41% | 110.7 ? -91% |
| Witcher 3 ultra * (Watt) | 89 | 96.4 -8% | 128.1 -44% | 107.9 -21% | ||
| Load Maximum * (Watt) | 169 | 145.8 14% | 183.2 -8% | 182.2 -8% | 131.9 ? 22% | 259 ? -53% |
* ... menor é melhor
| Lenovo Legion 5 17IMH05 i5-10300H, GeForce GTX 1650 Mobile, 80 Wh | MSI GF75 Thin 10SCXR i5-10300H, GeForce GTX 1650 Mobile, 51 Wh | Asus TUF A17 FA706IU-AS76 R7 4800H, GeForce GTX 1660 Ti Mobile, 90 Wh | HP Pavilion Gaming 17-cd0085cl i7-9750H, GeForce GTX 1660 Ti Max-Q, 52.5 Wh | Média da turma Gaming | |
|---|---|---|---|---|---|
| Duração da bateria | -54% | 3% | -47% | -39% | |
| Reader / Idle (h) | 23.3 | 7.7 -67% | 9.1 -61% | 11.6 -50% | 8.27 ? -65% |
| H.264 (h) | 14.3 | 8.32 ? -42% | |||
| WiFi v1.3 (h) | 11.4 | 4.7 -59% | 8.5 -25% | 5.7 -50% | 7.11 ? -38% |
| Load (h) | 1.7 | 1.1 -35% | 3.3 94% | 1 -41% | 1.502 ? -12% |
Pro
Contra
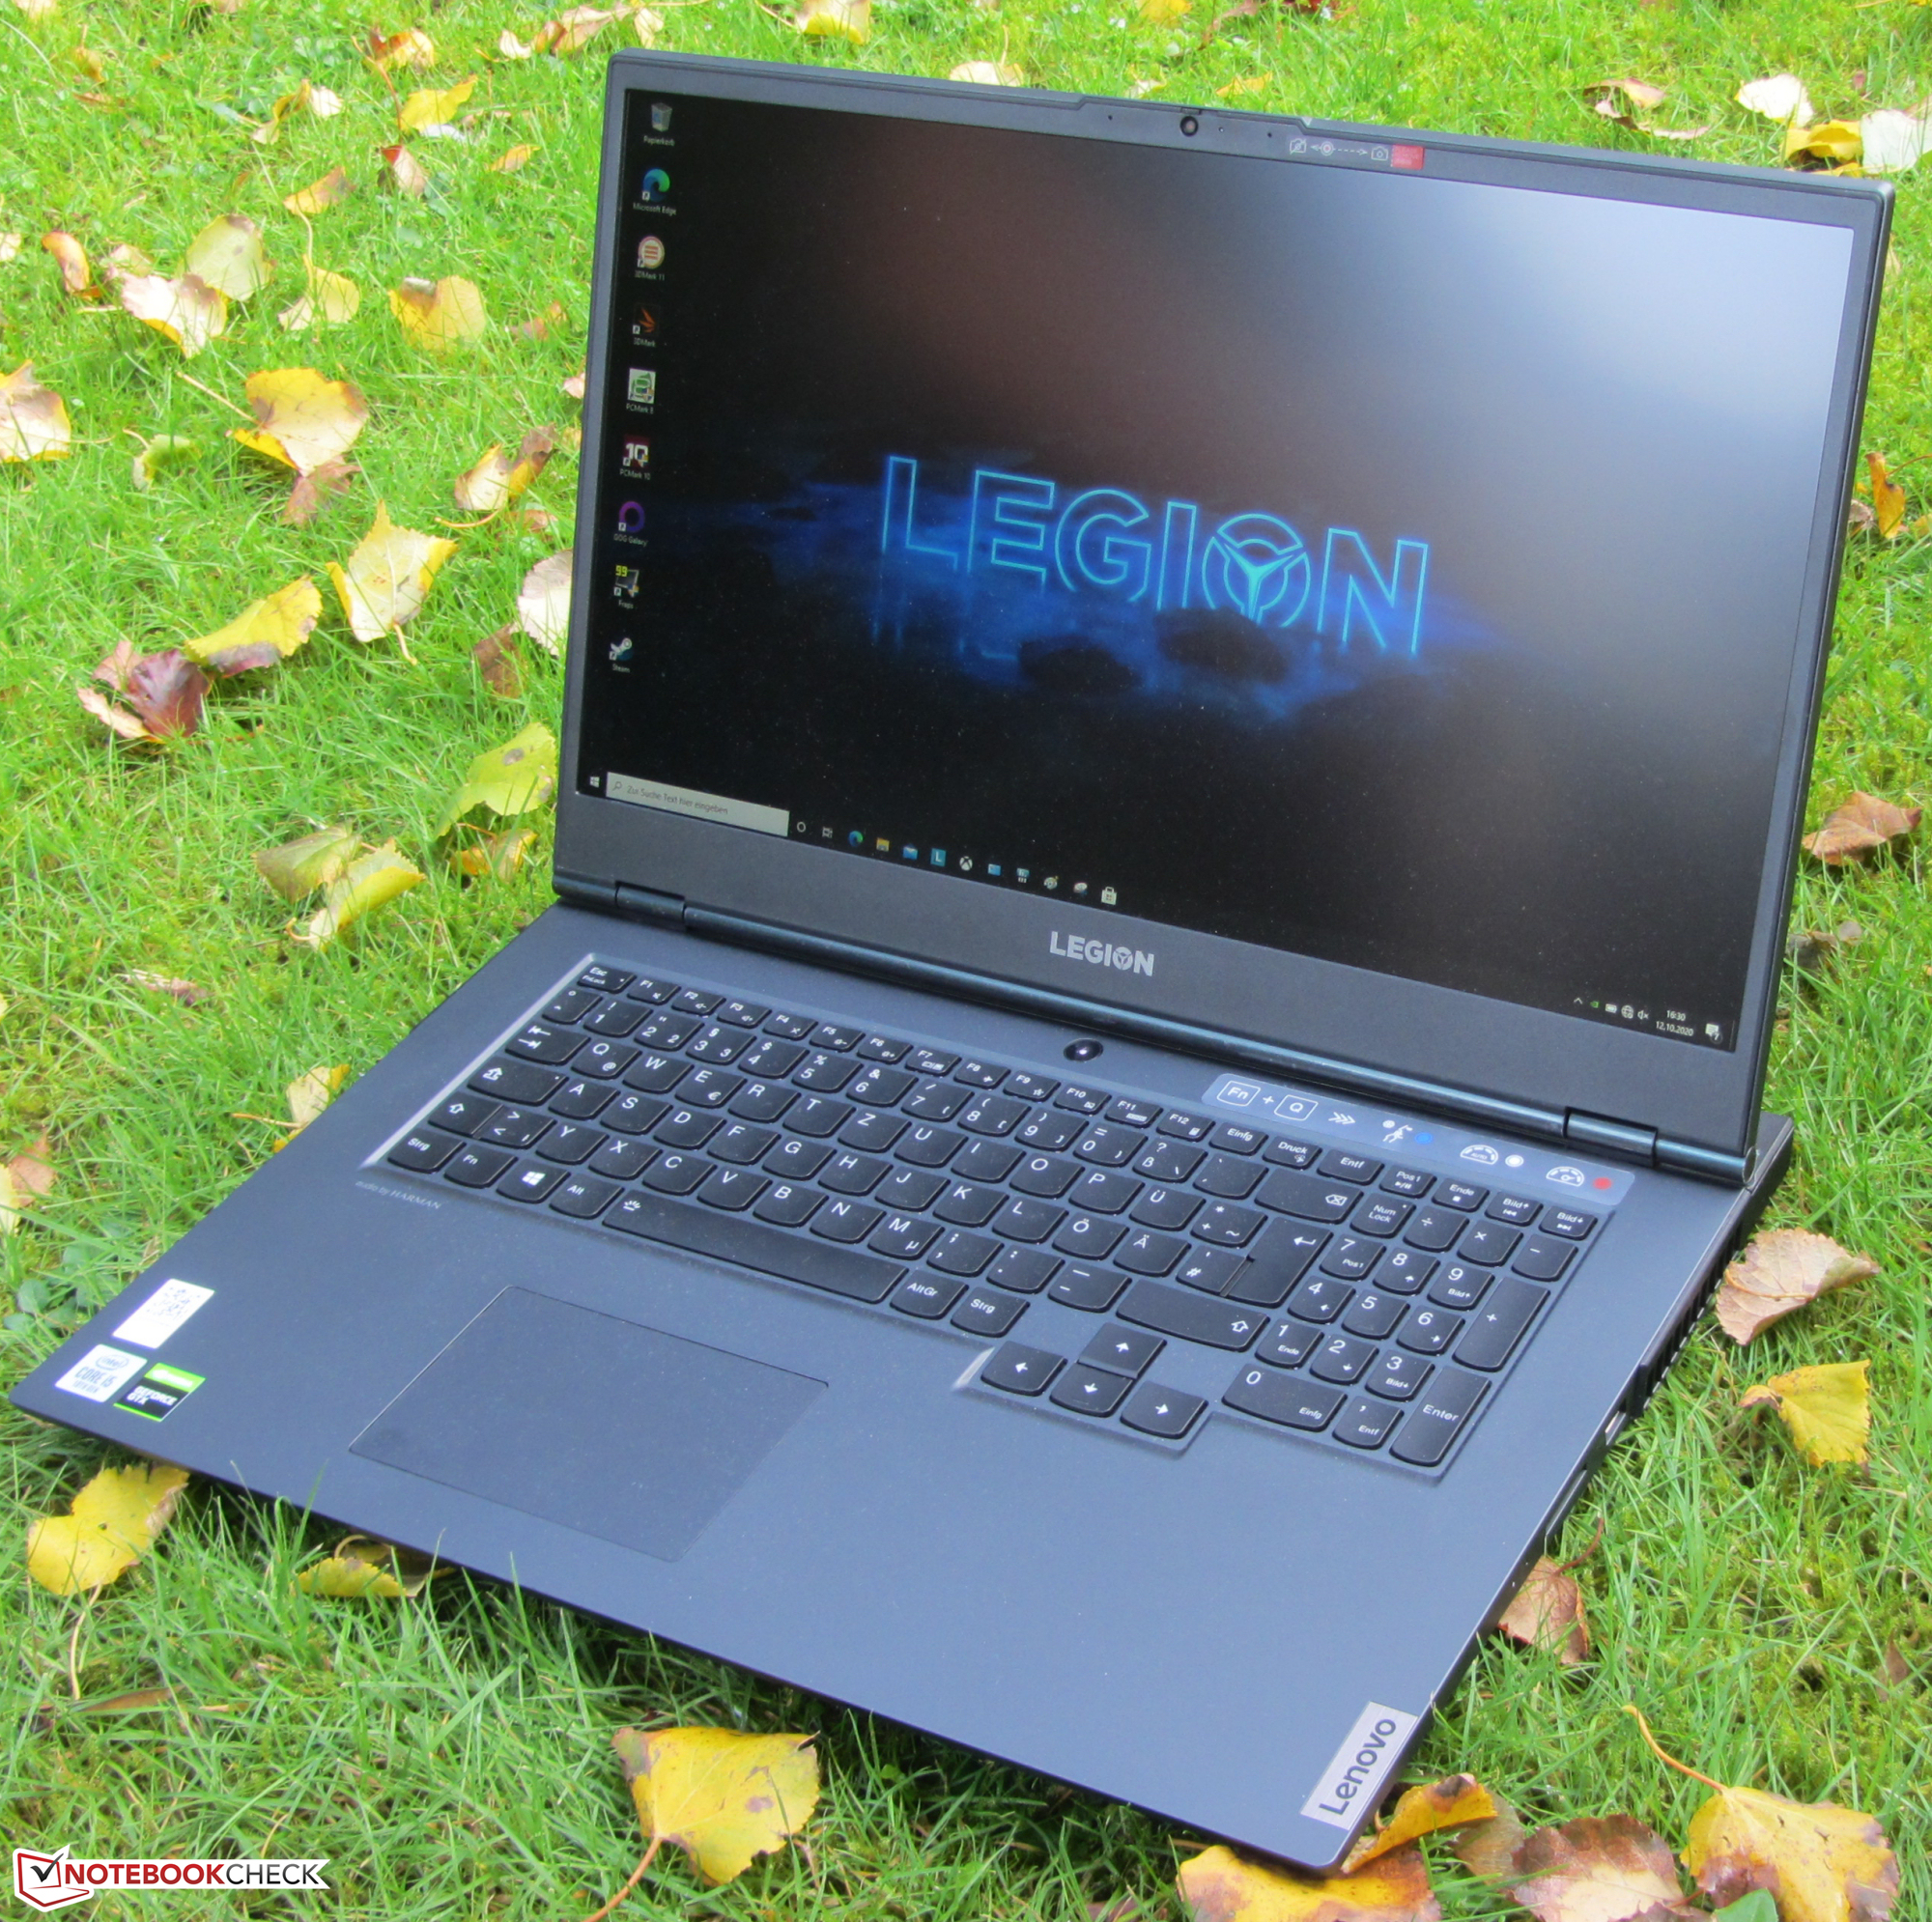
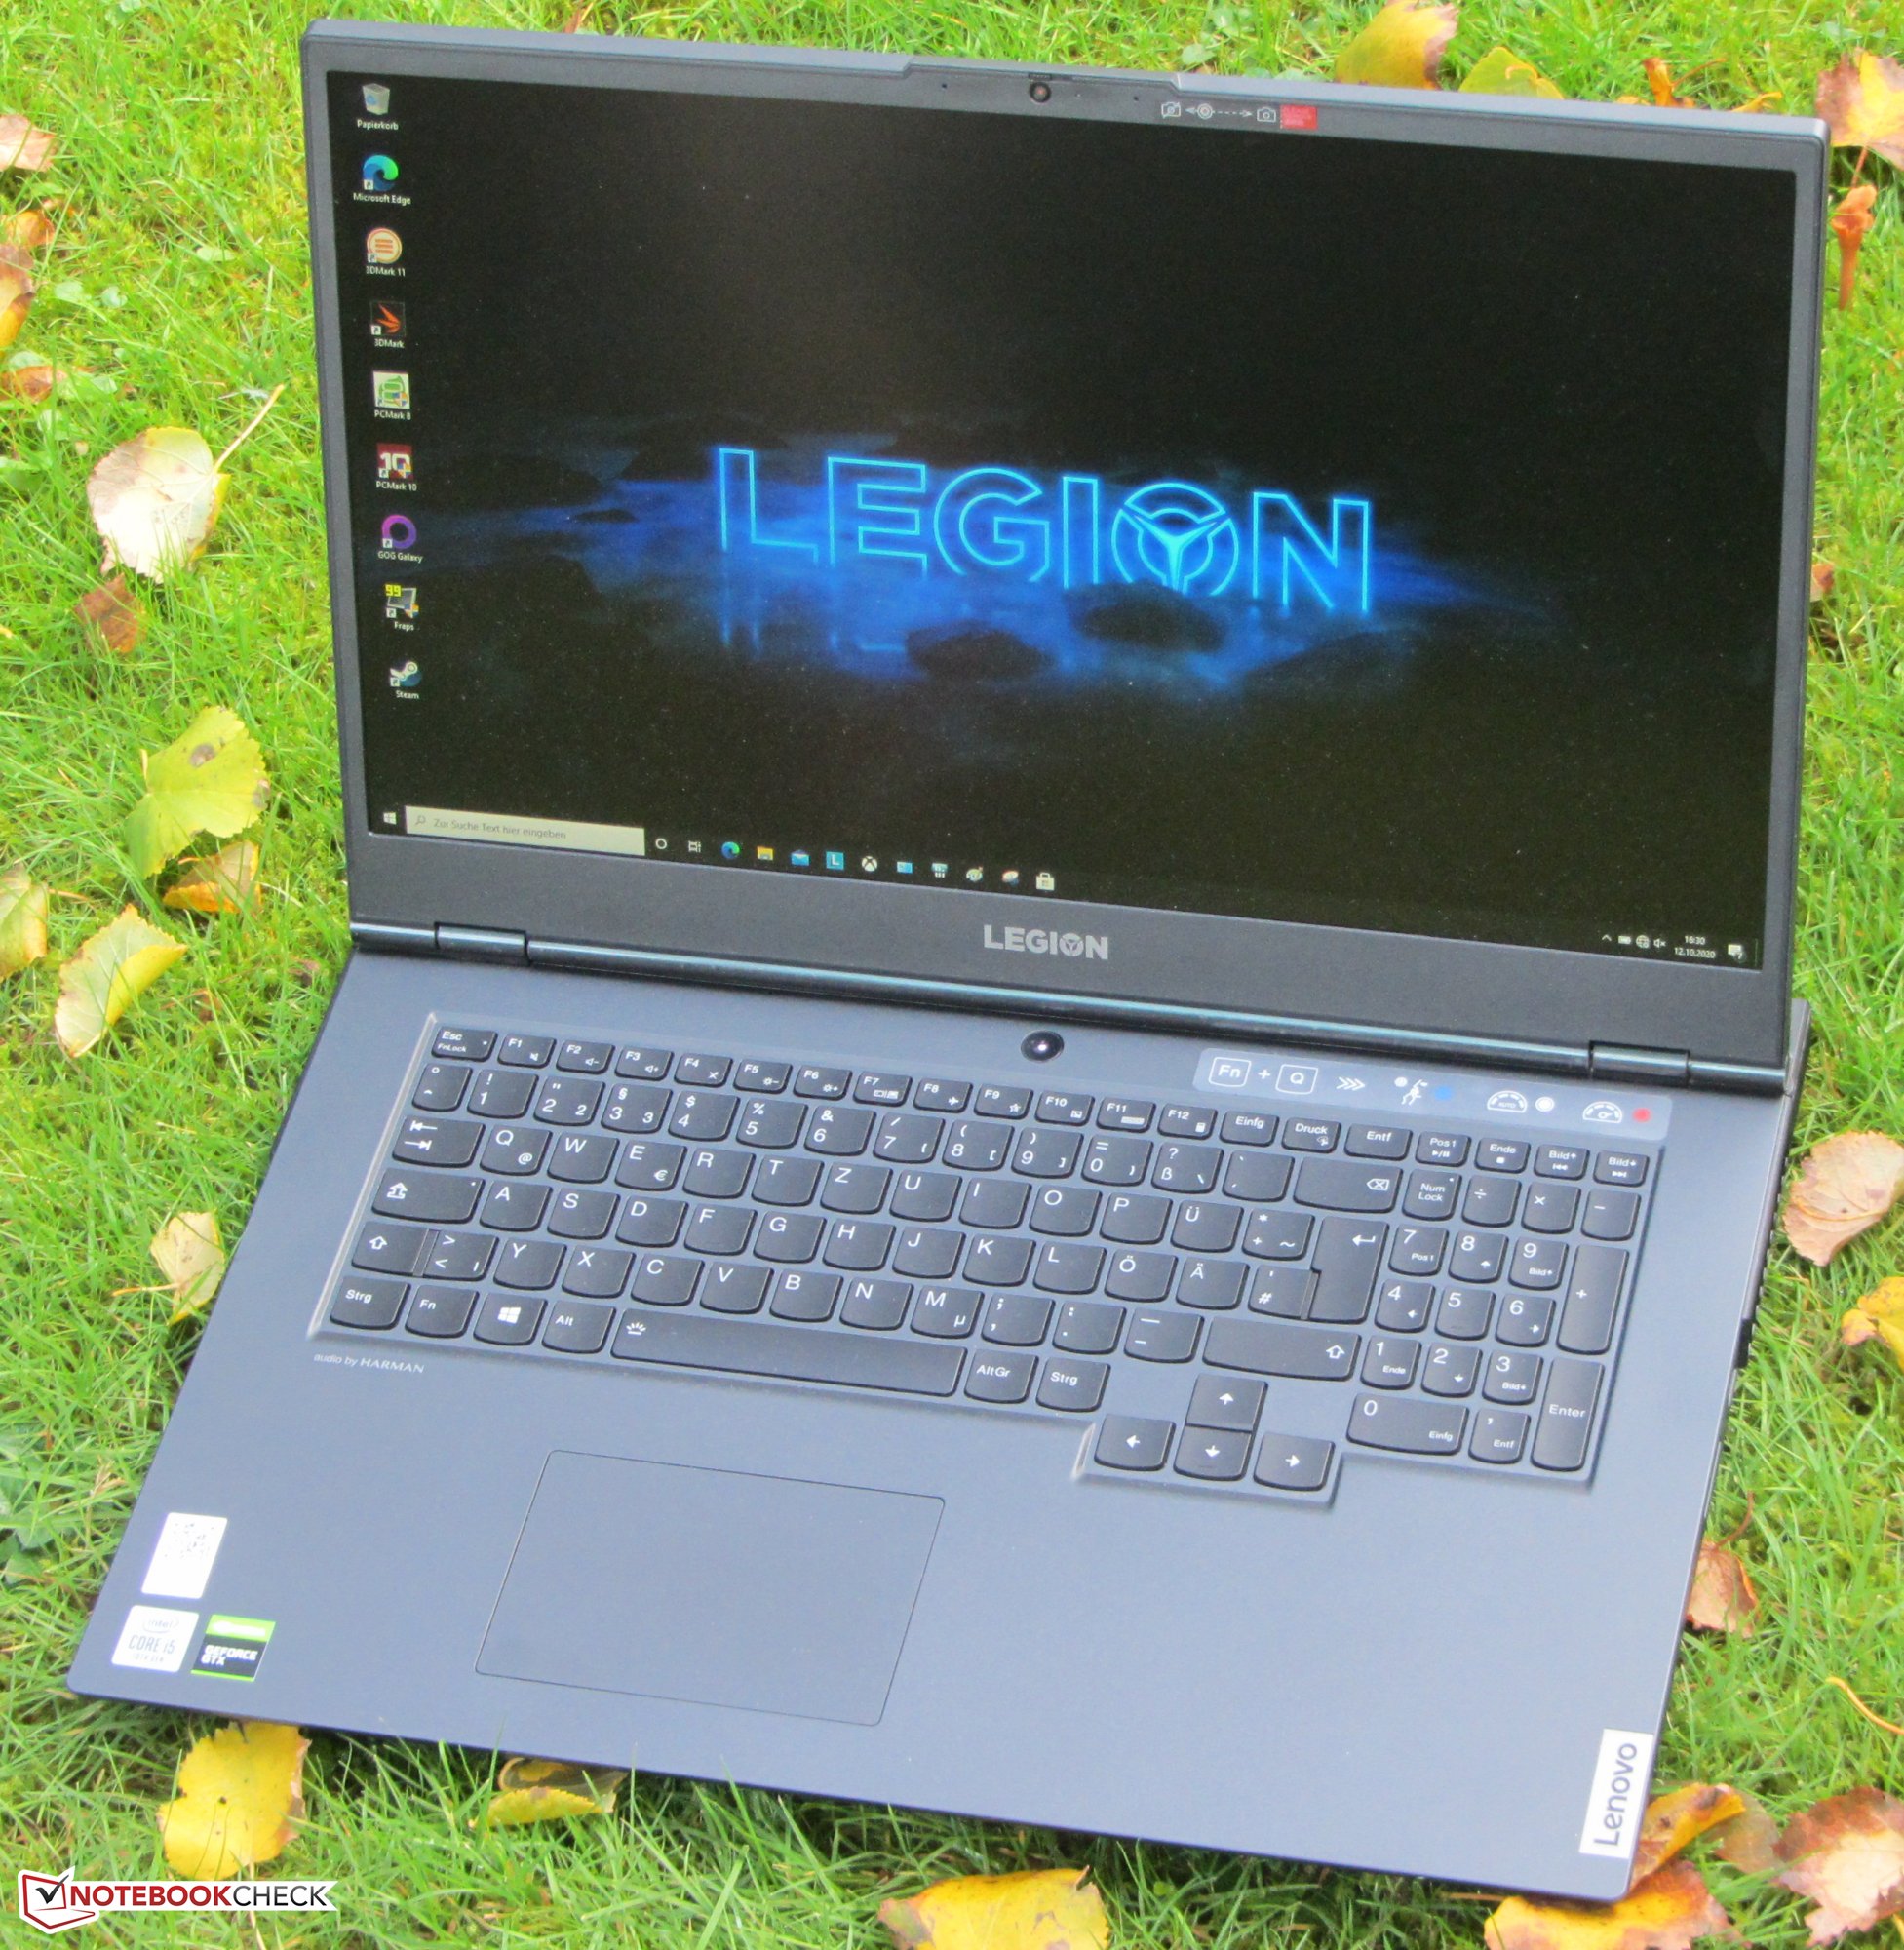
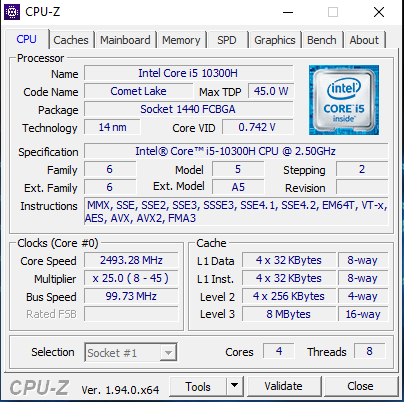
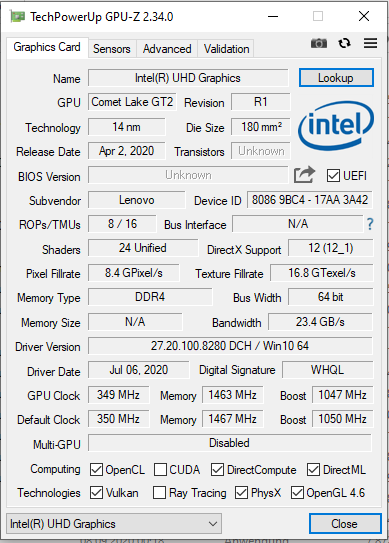
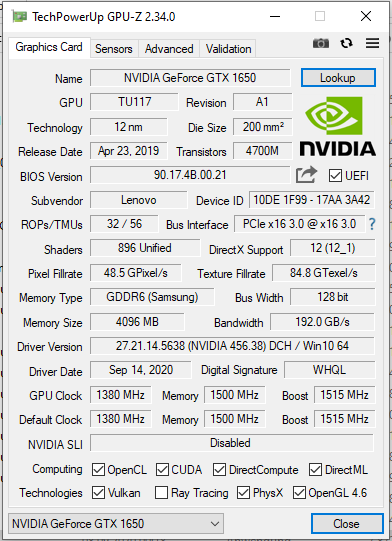
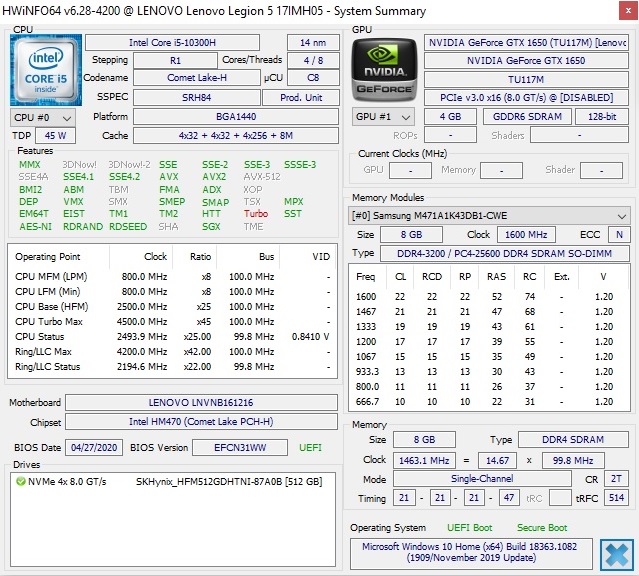
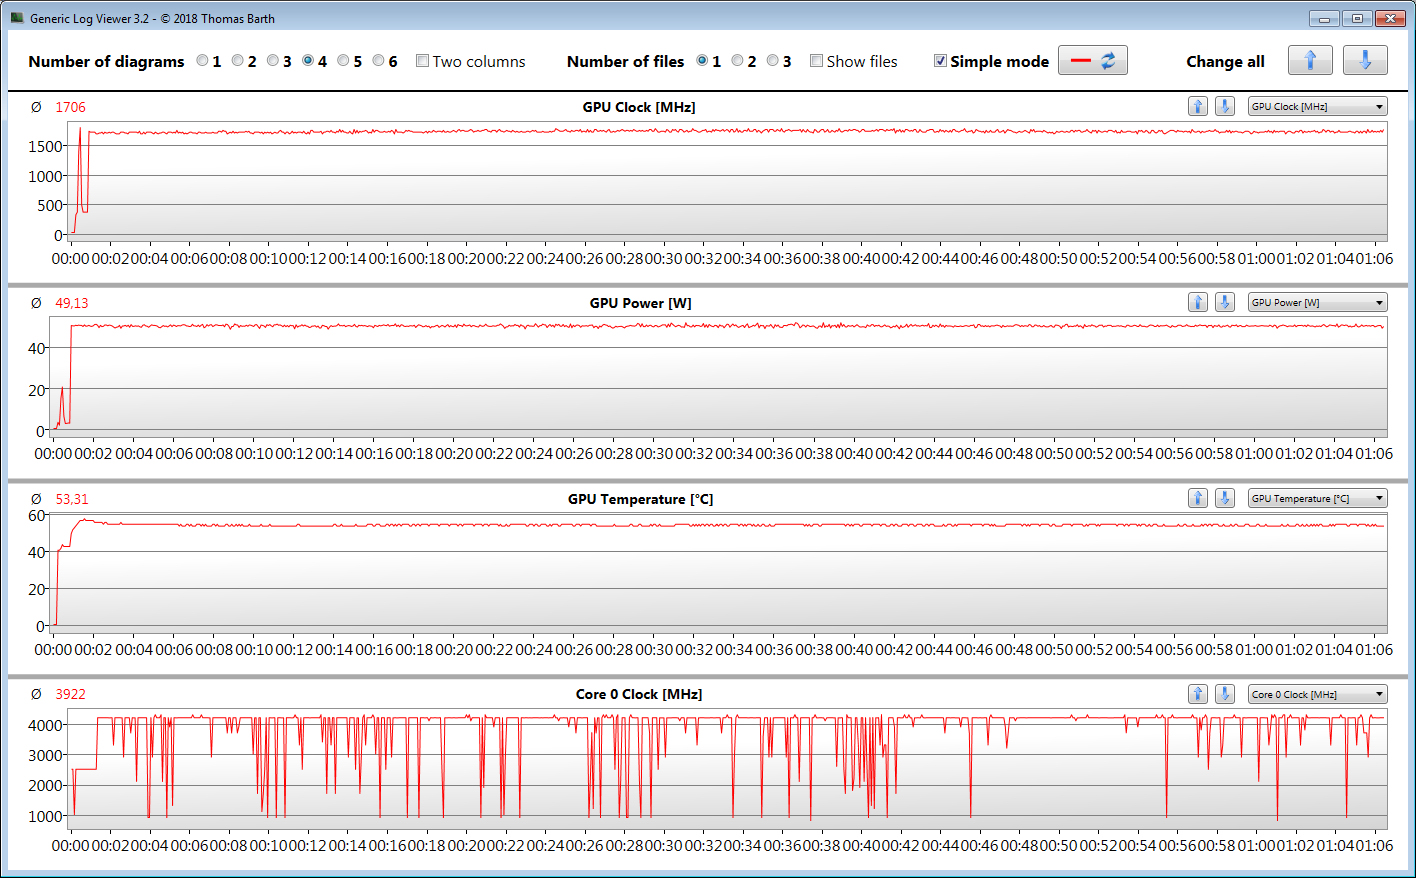
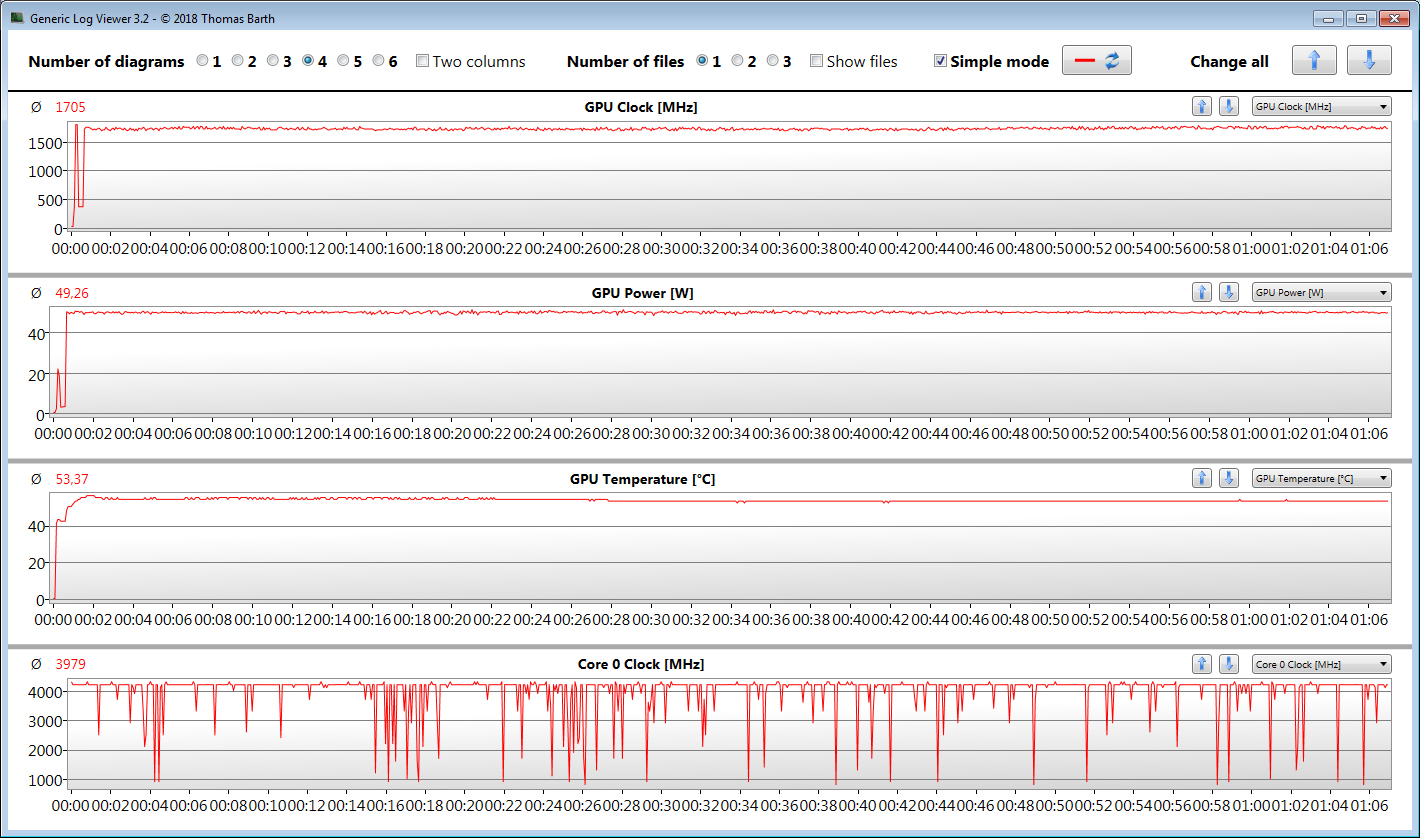
O Legion 5 tem um processador Core i5-10300H (Comet Lake) e núcleo gráfico GeForce GTX-1650 dedicado que em combinação roda todos os jogos de computador atuais fluentemente na tela. As resoluções e configurações de qualidade mais altas são possíveis apenas até certo ponto. O modo Silencioso é capaz de transformar o portátil para jogos em um silencioso cavalo de trabalho que só incomoda o usuário o menos possível com o ruído de ventilador.
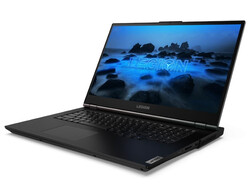
Oficialmente, o Lenovo Legion 5 17IMH05 é considerado um portátil para jogos. No entanto, a variante de equipamento testada aqui pode ser facilmente considerada um polivalente que atinge uma boa figura em vários cenários de uso.
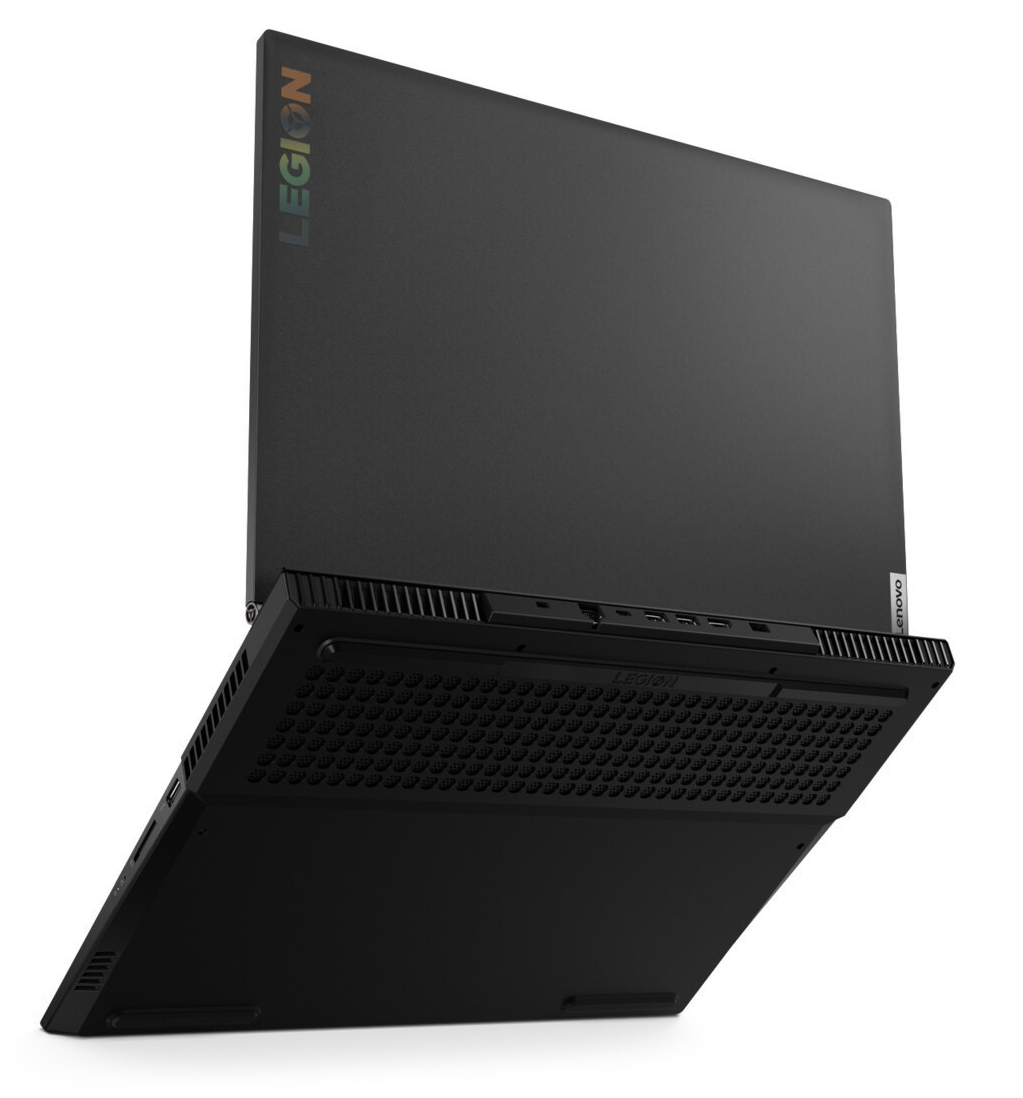
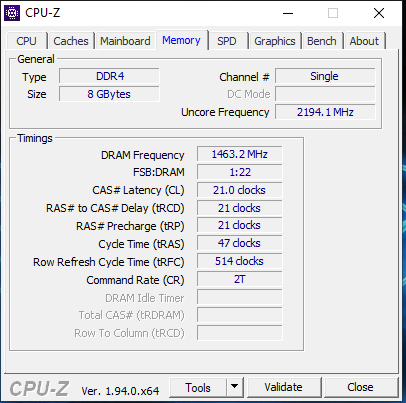
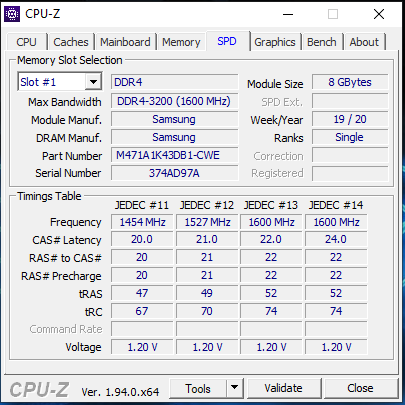
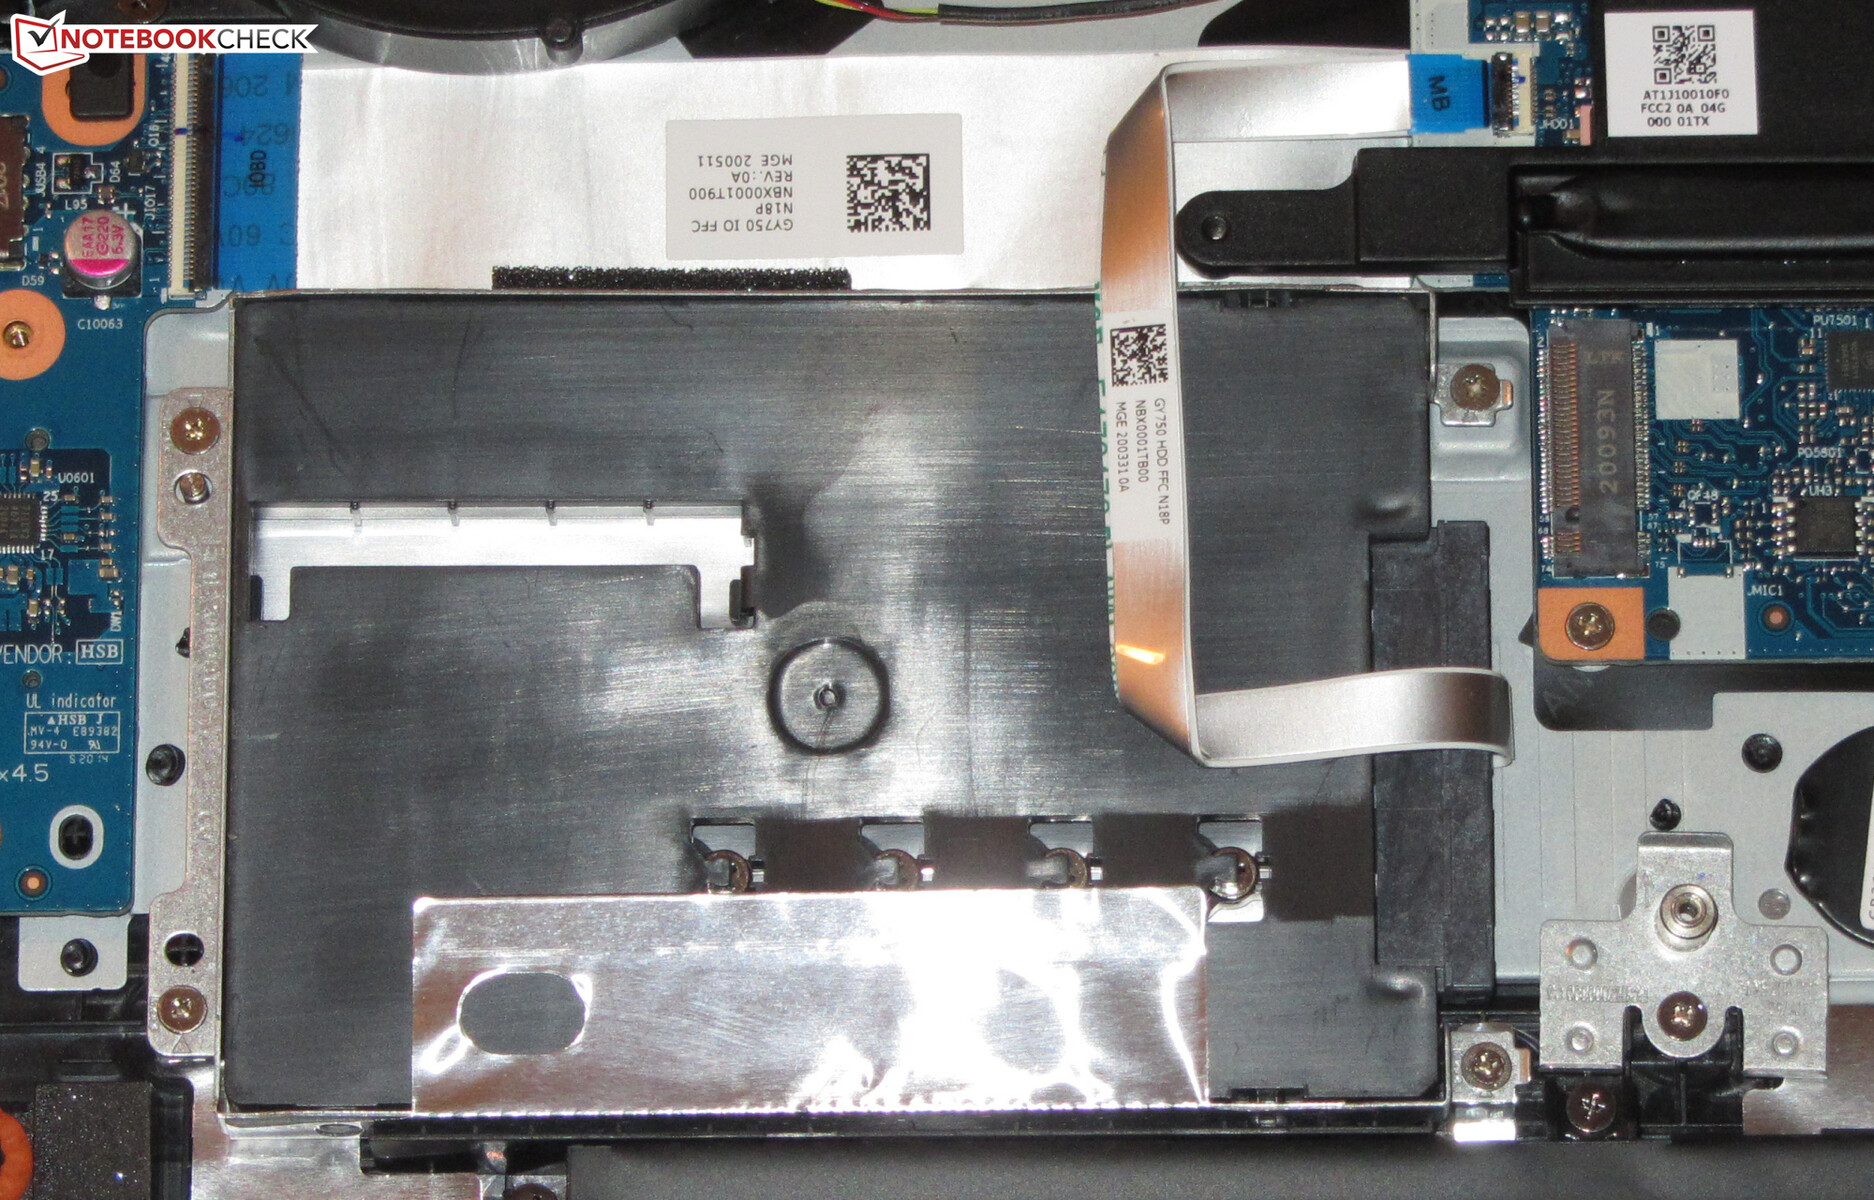
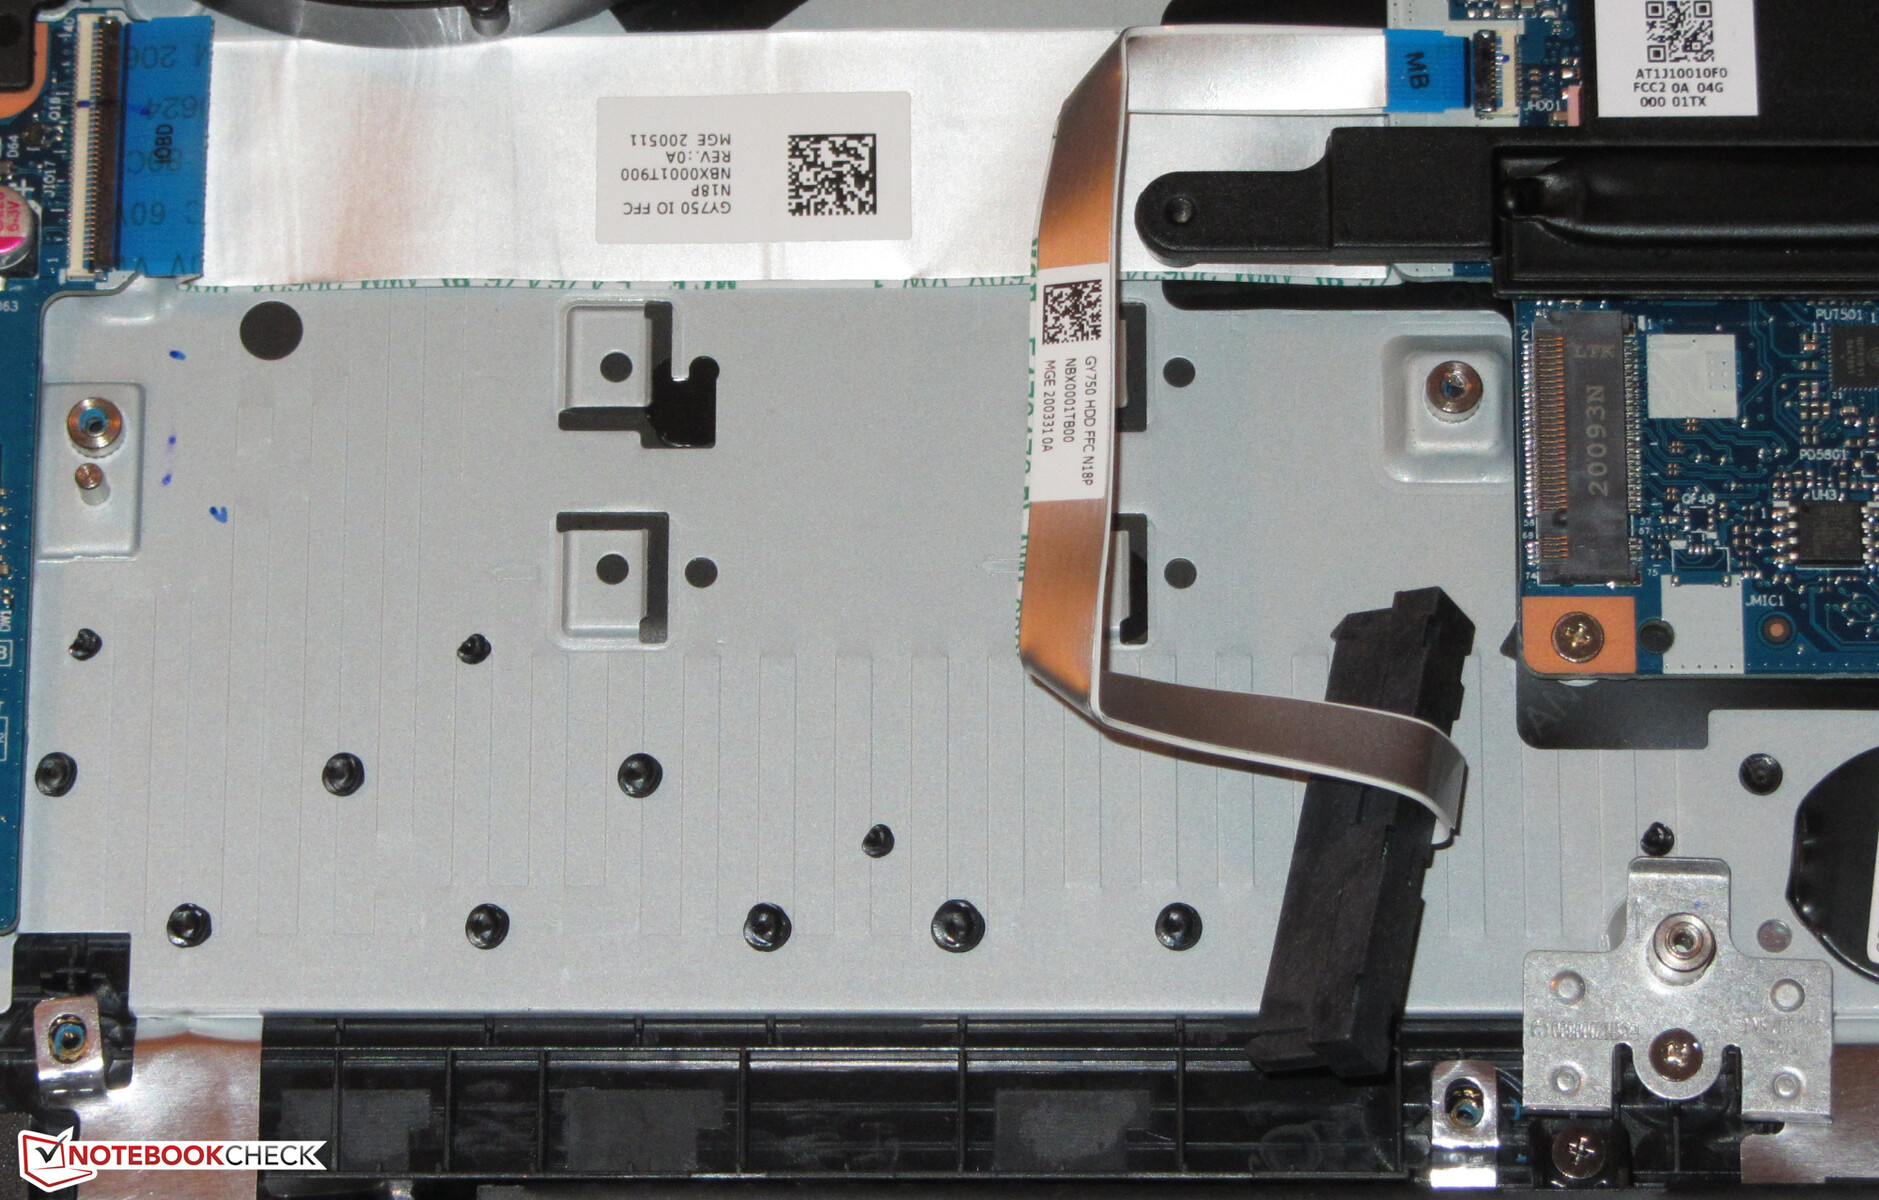
Com 8 GB de memória de trabalho e um SSD NVMe de 512 GB, A quantidade de armazenamento disponível não é muito abundante. No entanto, existem algumas opções de expansão. Por exemplo, você pode ou deveria instalar um segundo módulo de memória funcional para ativar o modo de canal duplo. Além do SSD atualmente presente, também há espaço interno para um drive de 2,5 polegadas ou um segundo SSD NMVe.
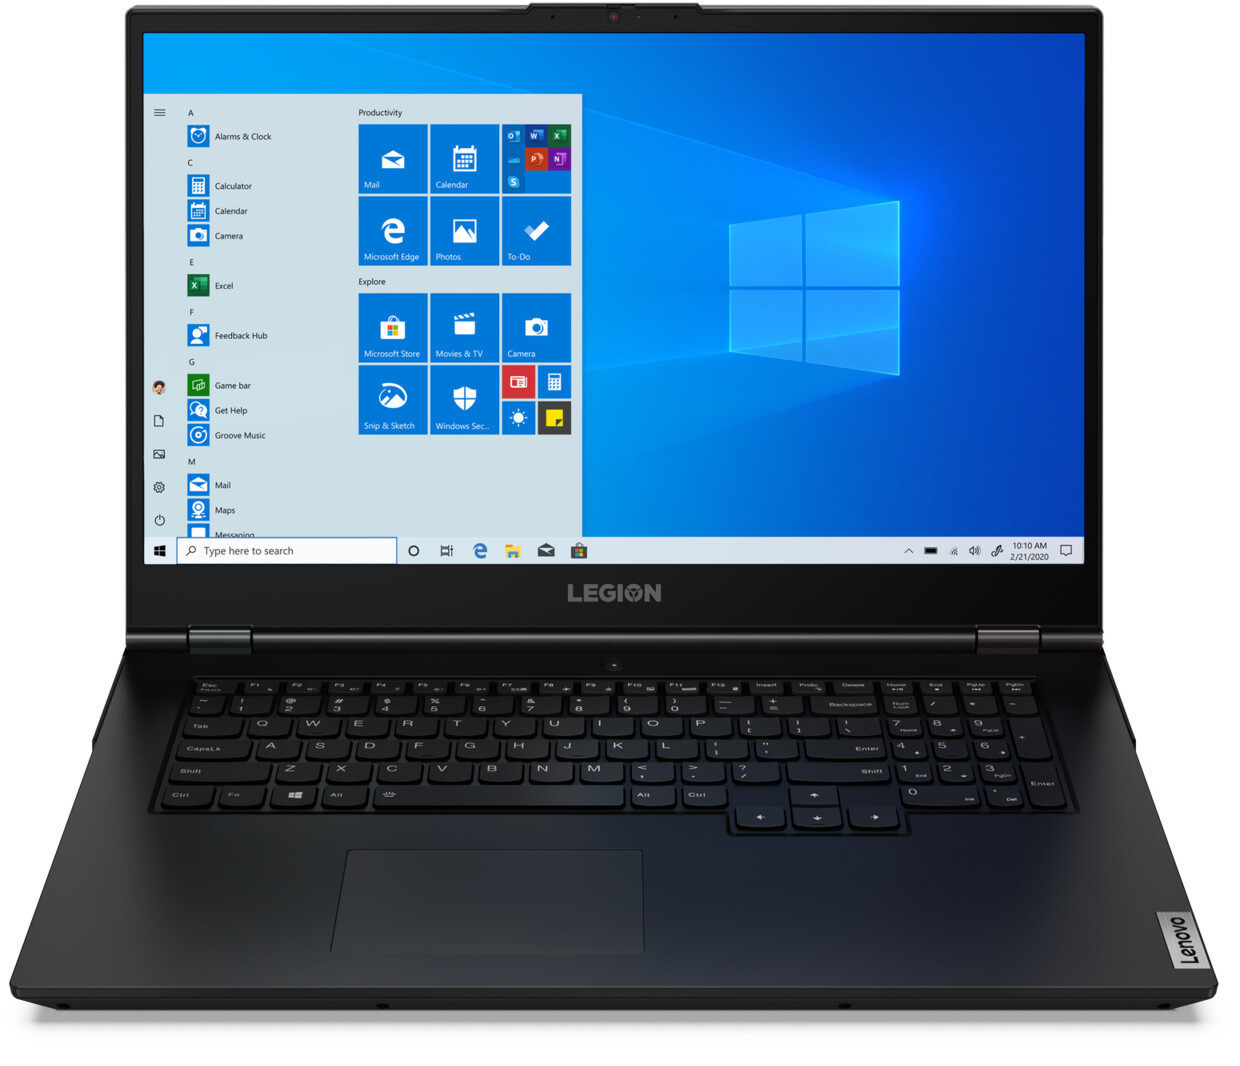
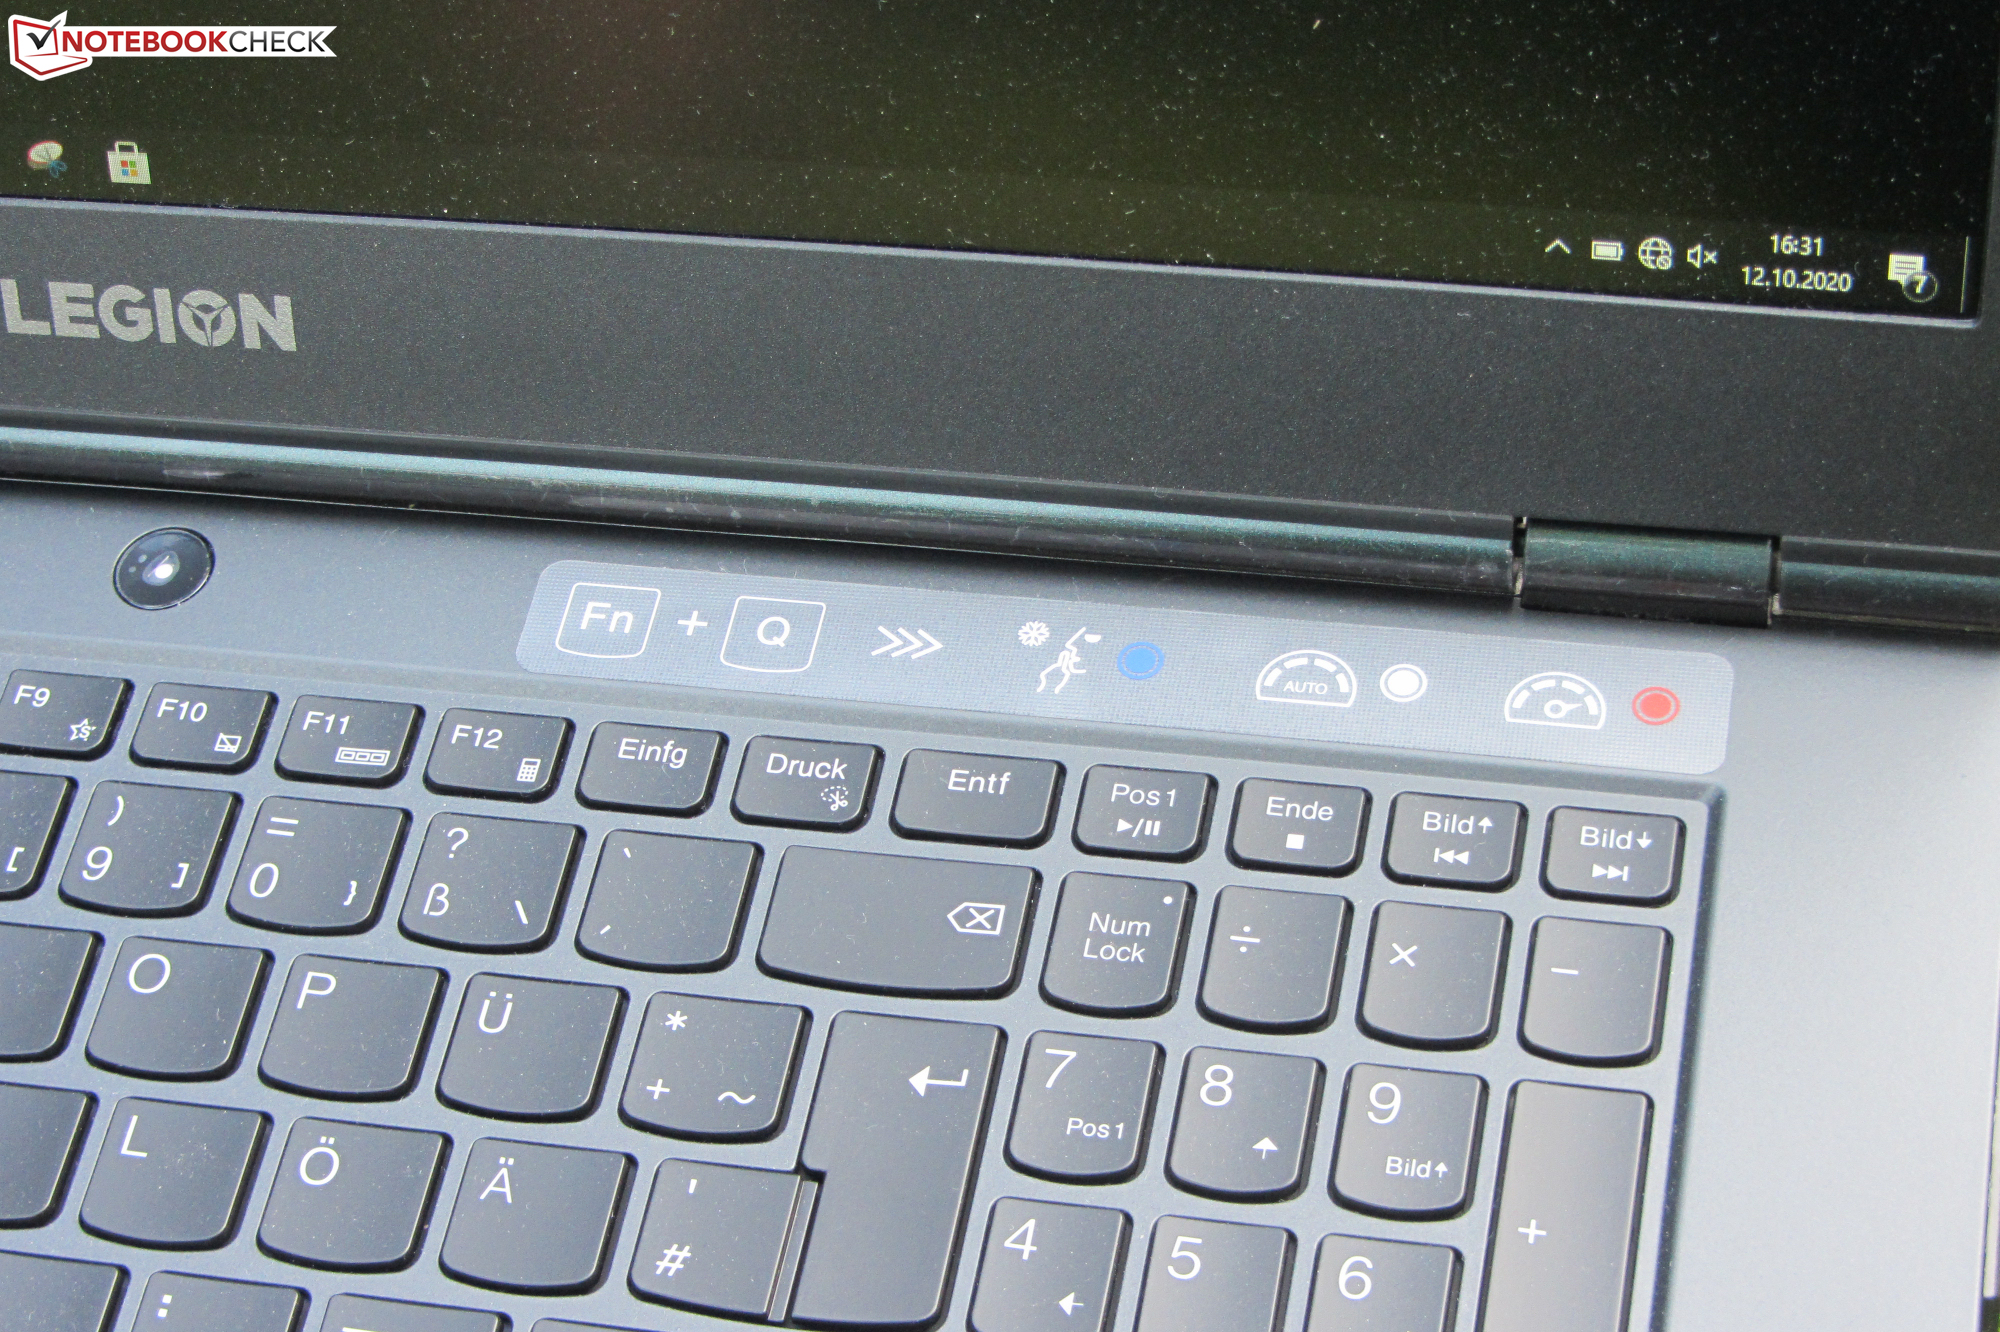
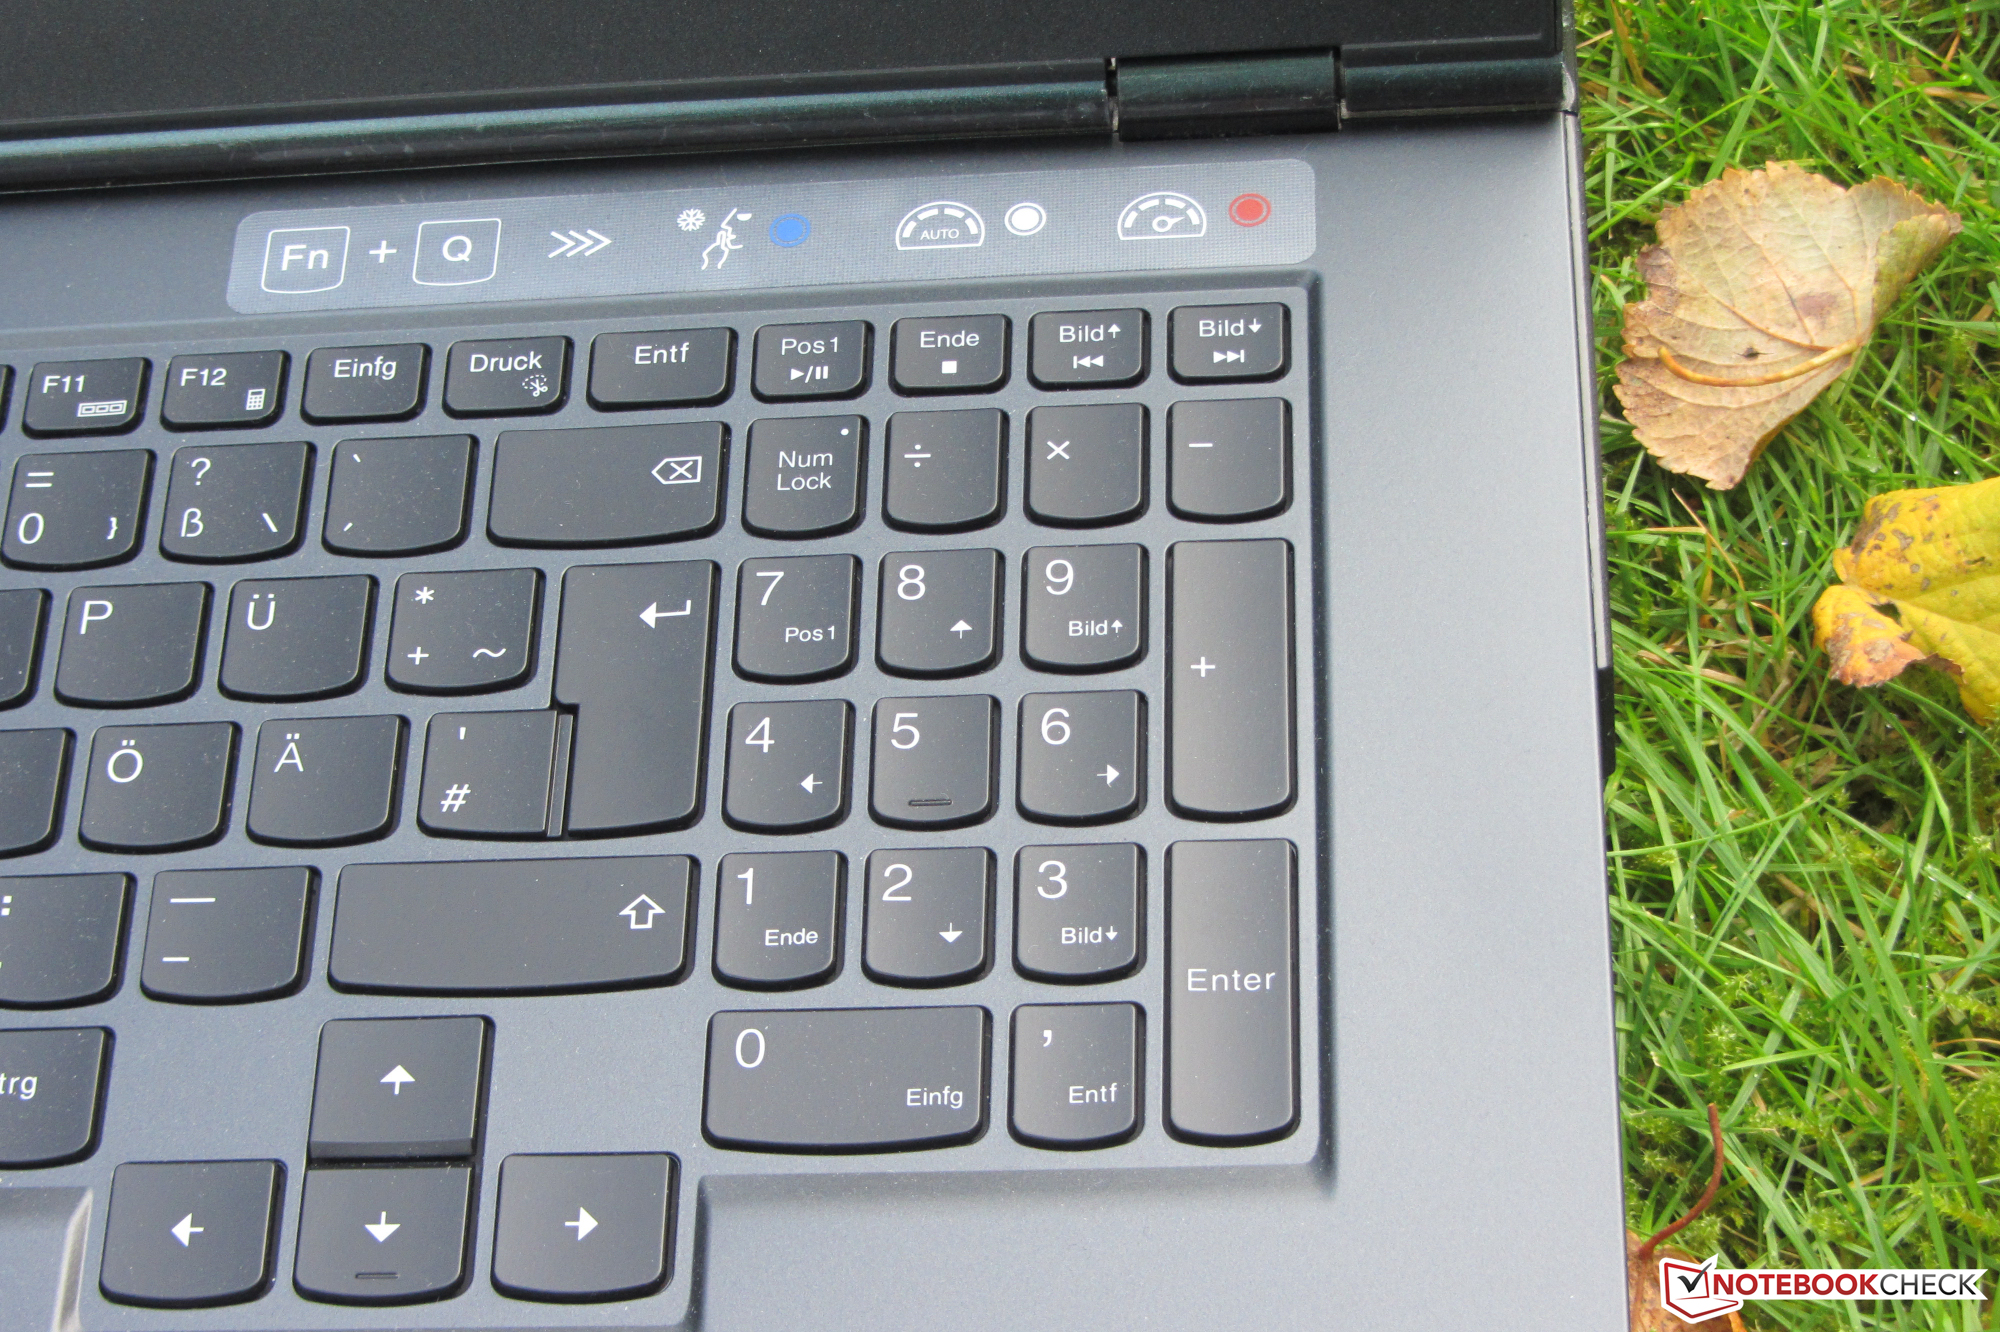
A tela Full-HD IPS oferece ângulos de visão estáveis, uma superfície mate, brilho suficiente e um bom contraste, reprodução de cores aceitável e uma cobertura decente do espaço de cores. O teclado iluminado integrado é adequado para tarefas diárias e a duração da bateria é excelente.
Lenovo Legion 5 17IMH05
- 10/17/2020 v7 (old)
Sascha Mölck
Price comparison
