Acer Swift 3 SF314 em revisão: Nenhum vôo de fantasia para o laptop AMD

O Swift 3 é o laptop de pão e manteiga da Acer - um modelo barato cuja variante de nível básico está disponível por 530 euros (~$530). Assim, testamos muitos modelos Swift no passado, especialmente variantes Intel e soluções high-end como o Swift XcomGTX 1650 Móvel e oSwift 3Xcom umIntel Iris Xe MAX dGPU
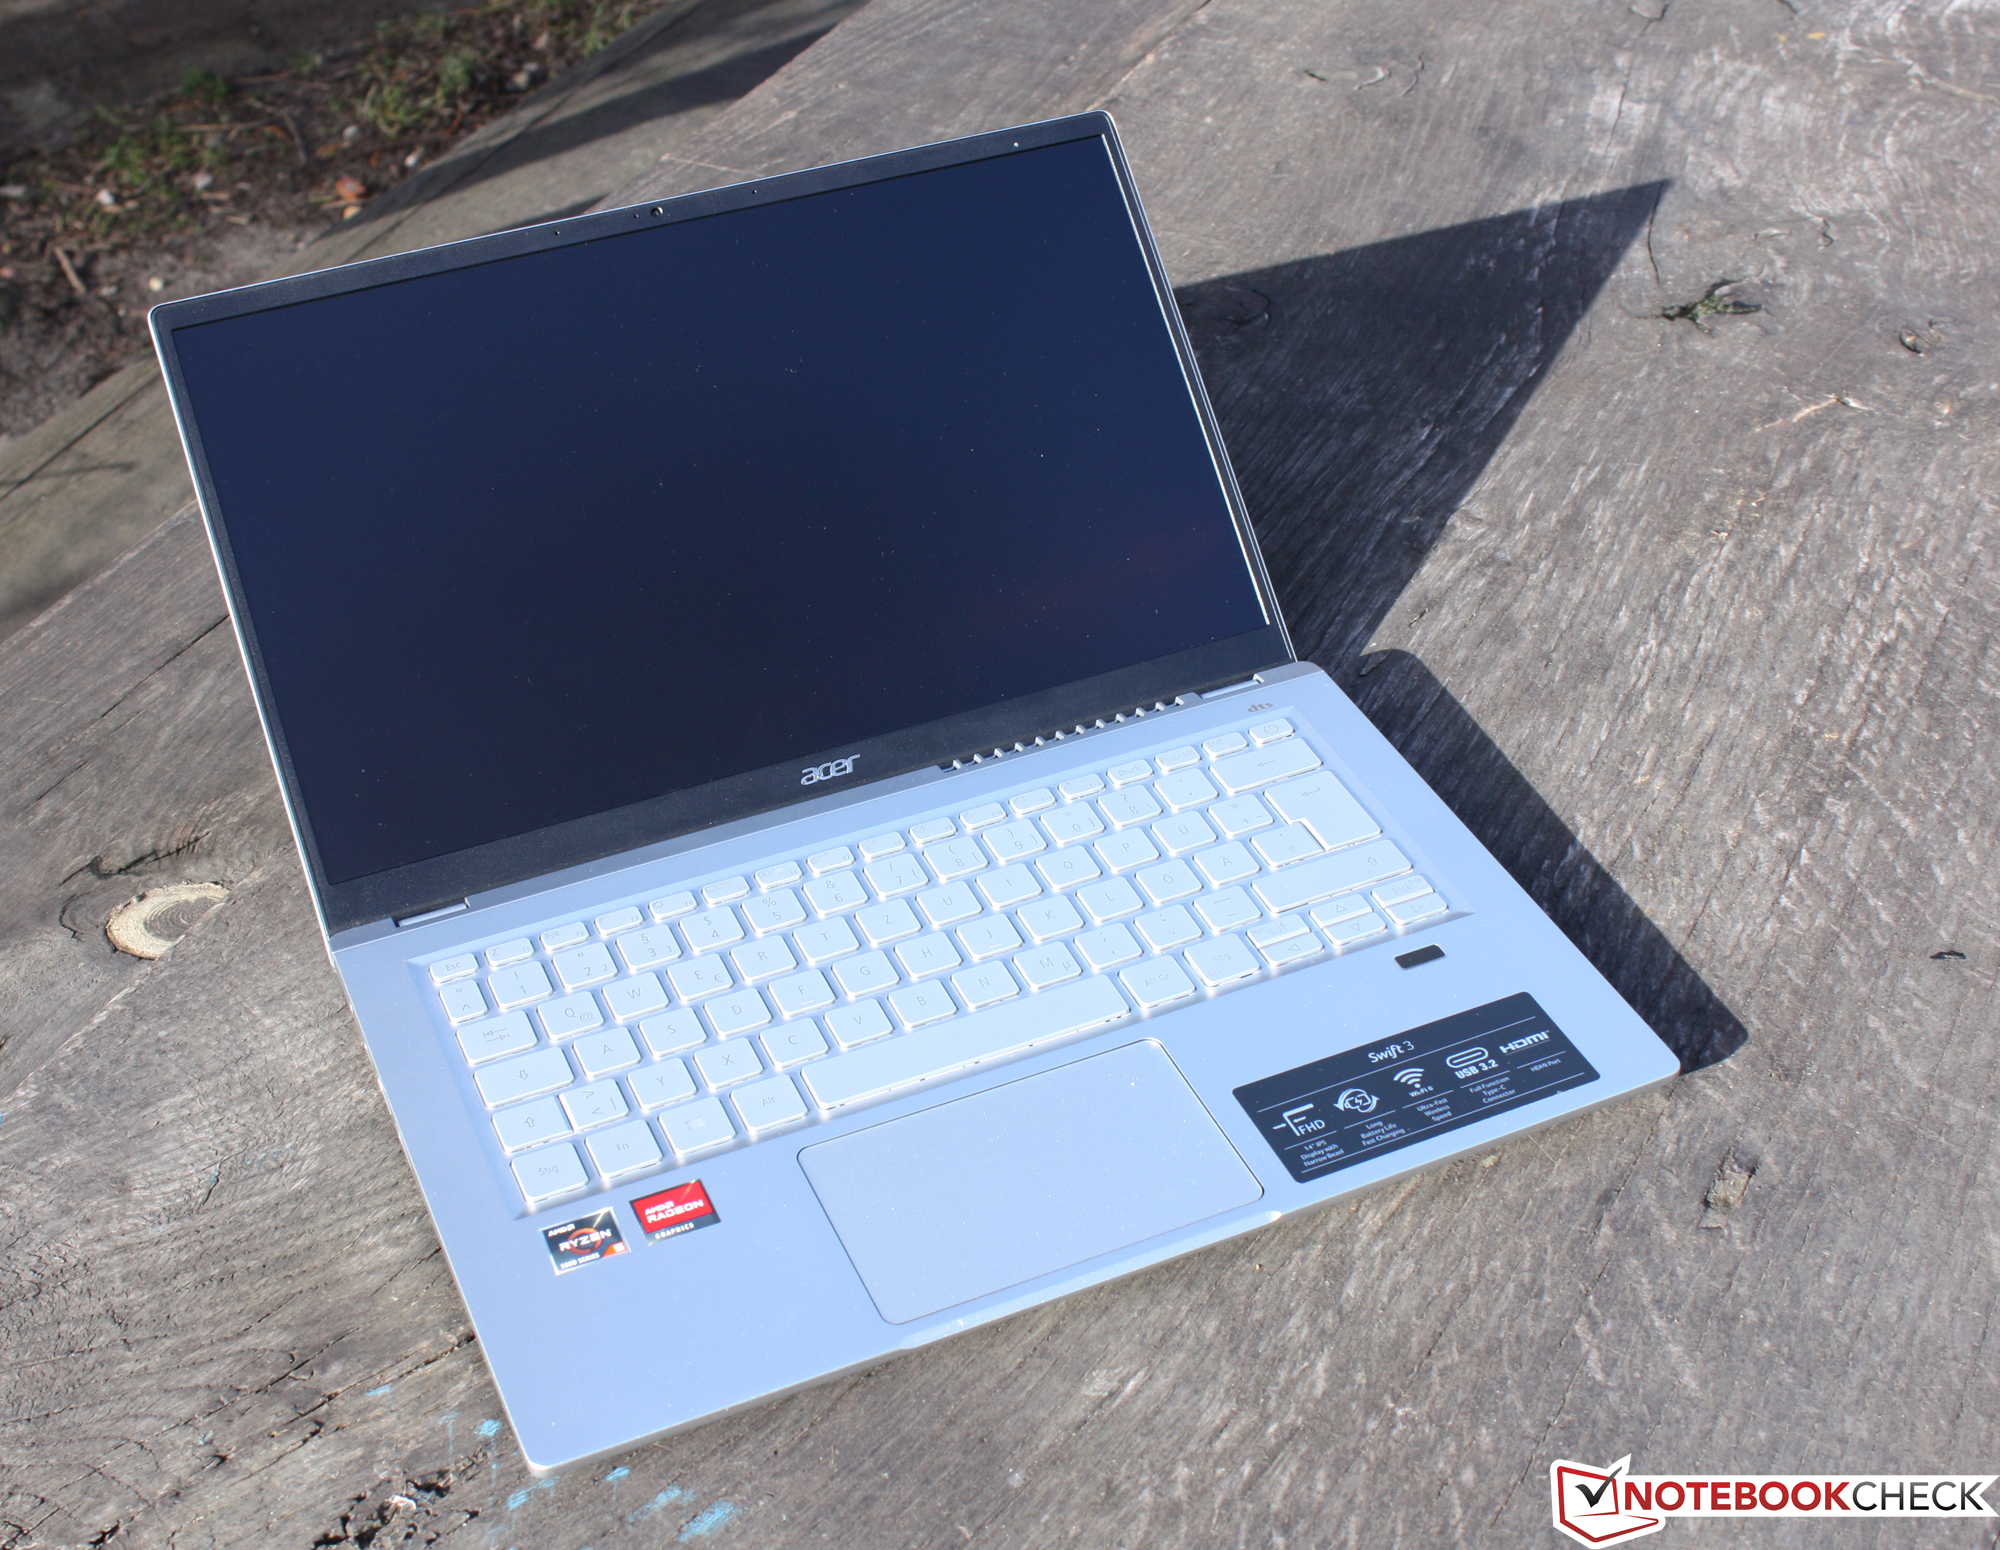
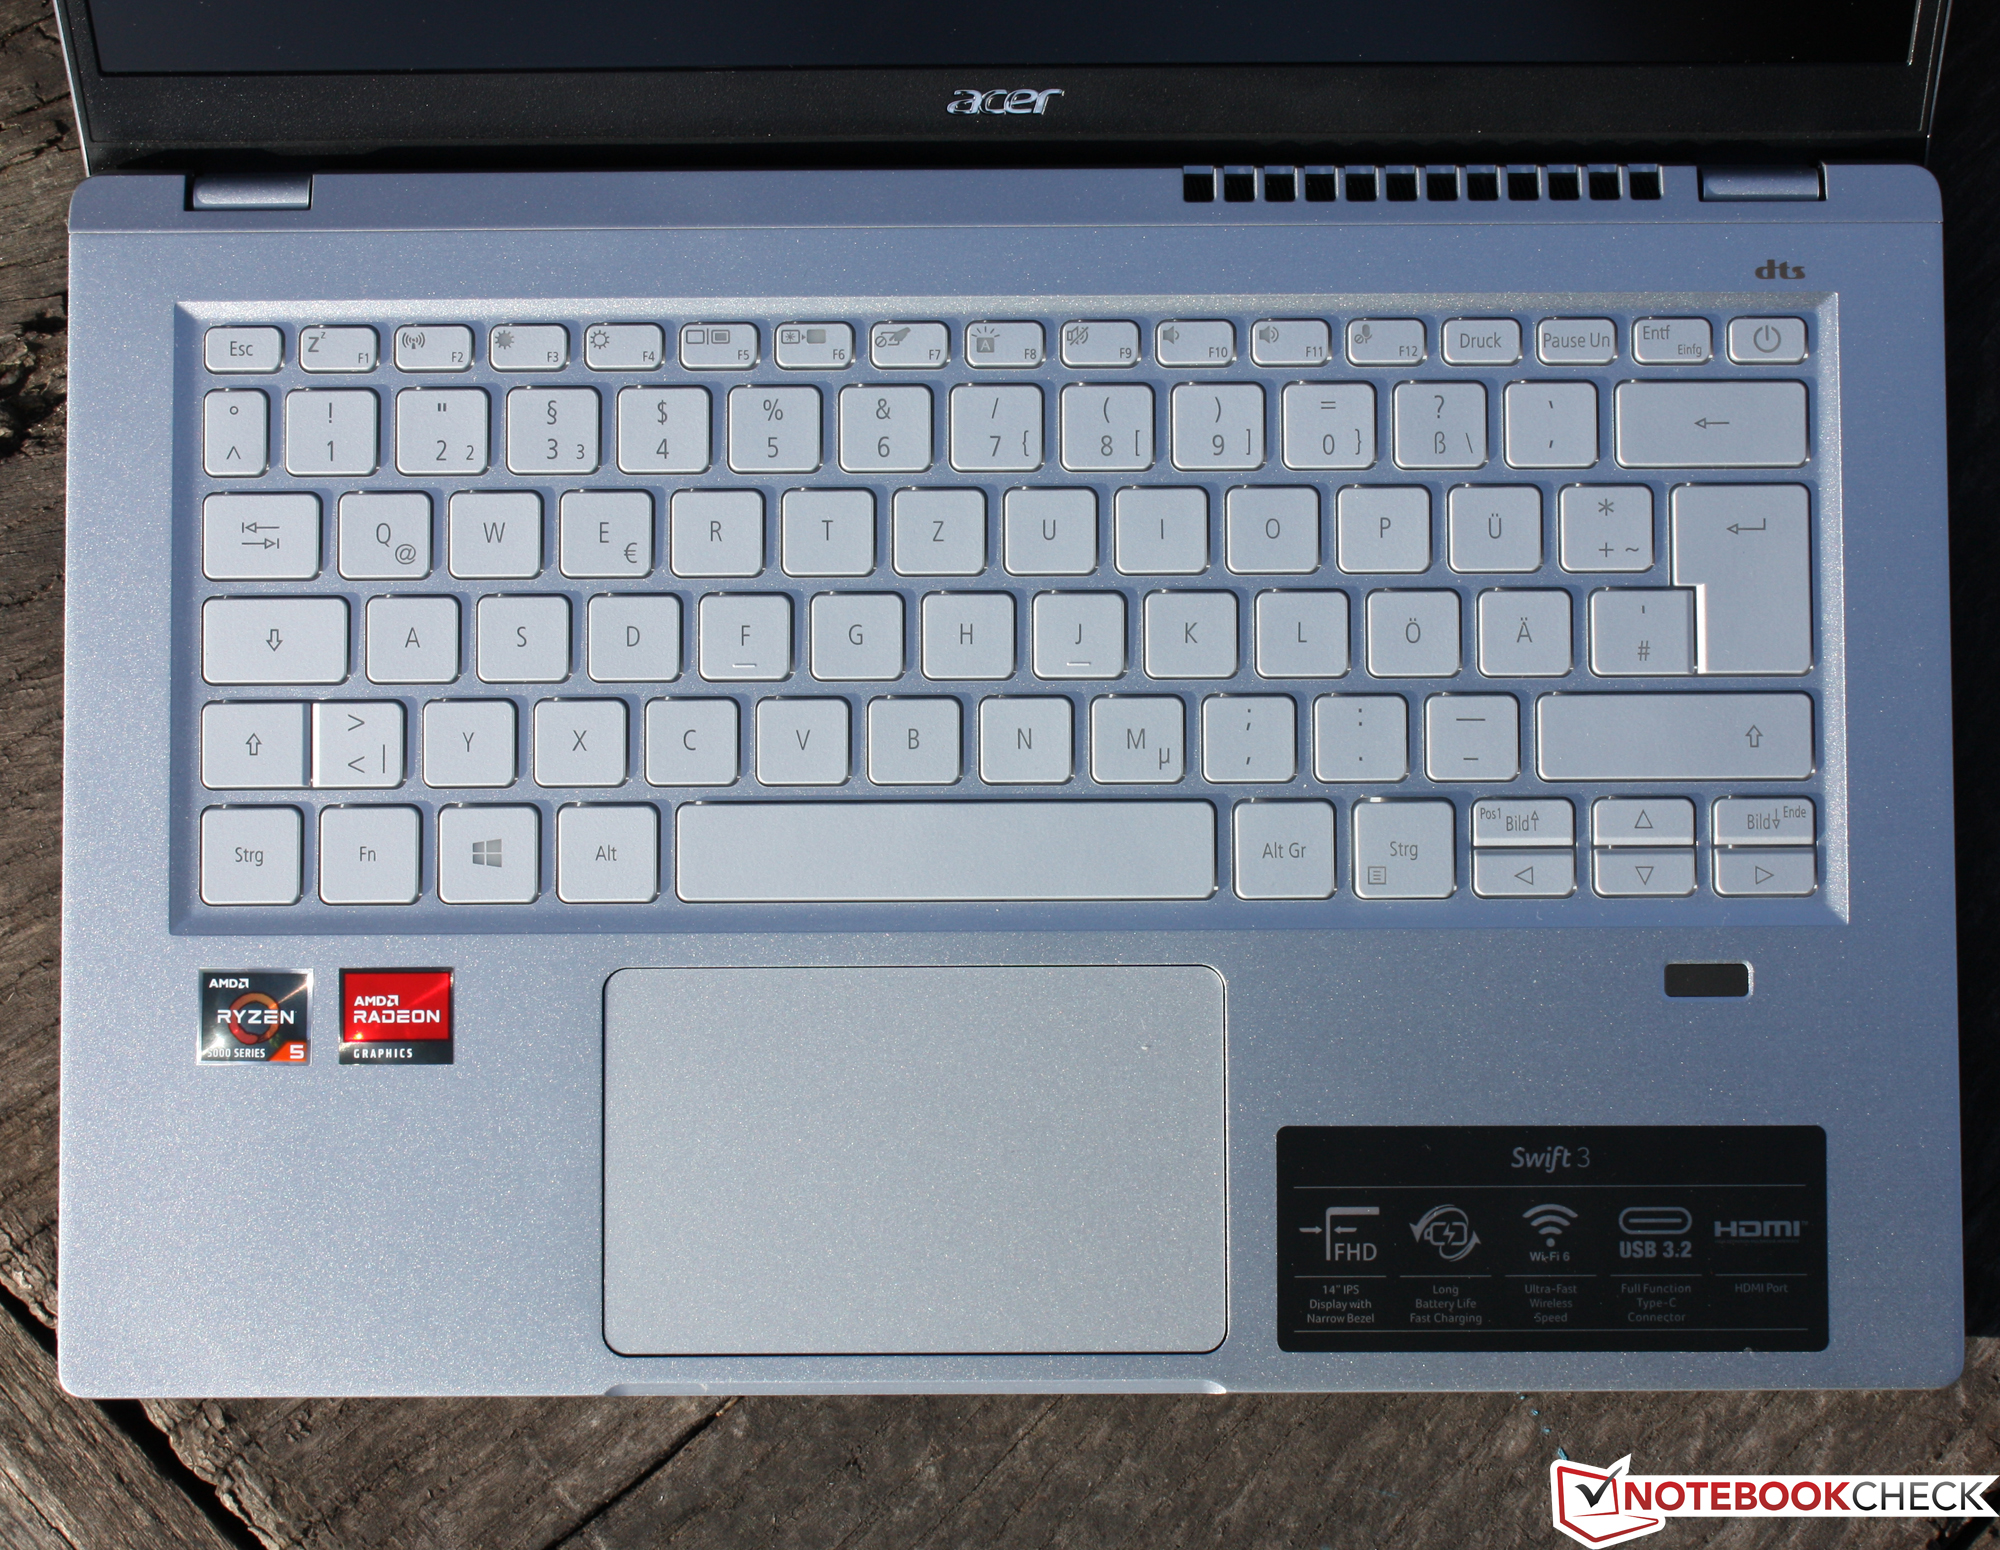
A atualização de hoje é sobre um dos menores notebooks da linha Swift, o SF314-43 com luz de 1,3 kg com um Ryzen 5 5500U16 GB de RAM, e um SSD de 512 GB. Para conseguir o menor preço possível, os varejistas enviam o modelo com Linux (eShell). Instalamos o Windows 11 para o qual uma pequena partição também tinha os drivers necessários.
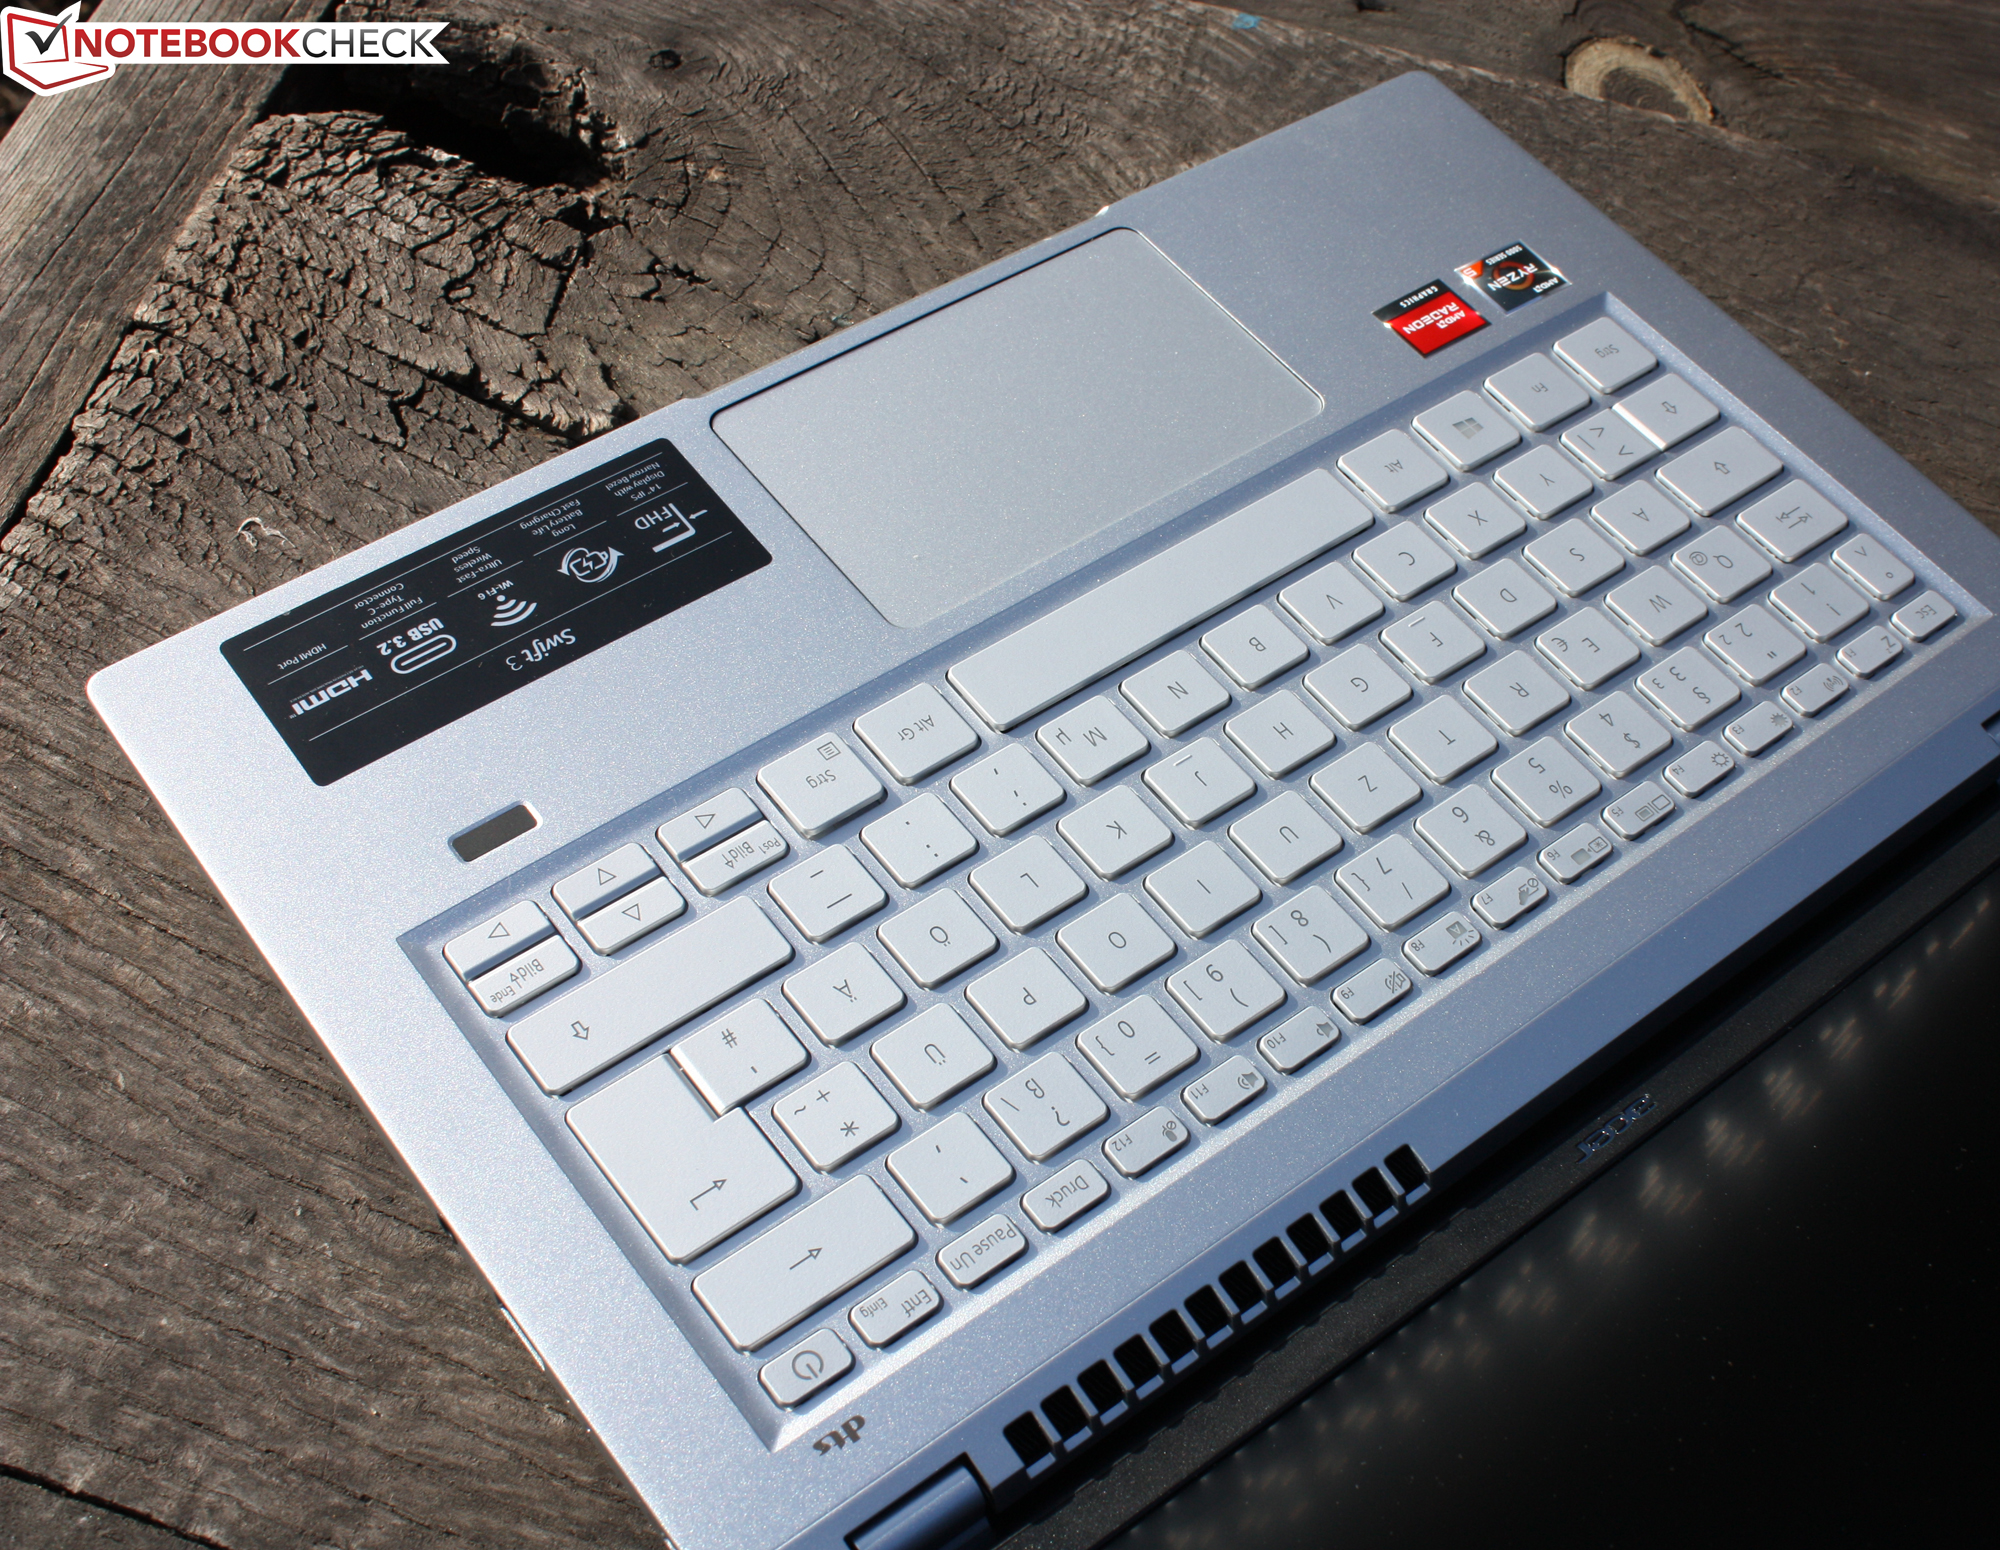
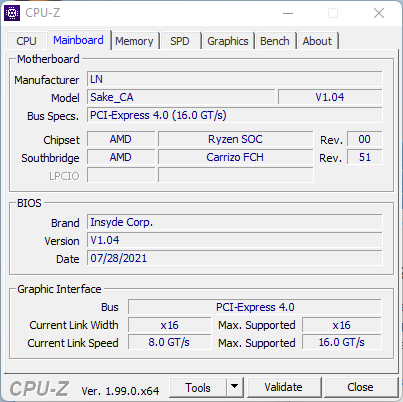
Devido à estratégia da plataforma, onde um chassi é utilizado para variantes tecnicamente diferentes, é tal que já temos o estojo, os dispositivos de entrada e as portas do Swift X SFX14 (GTX 1650) e da contraparte da Intel Swift 3 SF314-511. Portanto, saltaremos estes capítulos e o encaminharemos para as revisões correspondentes.
Outros dispositivos Acer Swift de 14 polegadas em revisão:
- Acer Swift X SFX14-41G-R7F3 (Ryzen 5 5500U, GTX 1650 Móvel)
- Acer Swift 3 SF314-511(i5-1135G7, Iris Xe Graphics G7 80EUs)
- Acer Swift 3X SF314-510G(i7-1165G7, IntelIris Xe MAX)
- Acer Swift 3 SF314-42(Ryzen 7 4700U, Radeon RX) - 6/2020
Possíveis concorrentes em comparação
Avaliação | Data | Modelo | Peso | Altura | Size | Resolução | Preço |
|---|---|---|---|---|---|---|---|
| 86 % v7 (old) | 03/2022 | Acer Swift 3 SF314-43-R8BP R5 5500U, Vega 7 | 1.3 kg | 16.5 mm | 14.00" | 1920x1080 | |
| 88.2 % v7 (old) | 02/2022 | Acer Swift 3 SF314-511-54ZK i5-1135G7, Iris Xe G7 80EUs | 1.2 kg | 16.55 mm | 14.00" | 1920x1080 | |
| 86.7 % v7 (old) | 07/2021 | Lenovo ThinkPad E14 G3-20Y7003SGE R5 5500U, Vega 7 | 1.6 kg | 17.9 mm | 14.00" | 1920x1080 | |
| 84.8 % v7 (old) | 01/2022 | HP Pavilion 14-dv0357ng i5-1135G7, Iris Xe G7 80EUs | 1.4 kg | 19 mm | 14.00" | 1920x1080 | |
| 84.8 % v7 (old) | 01/2022 | Dell Latitude 14 5420-D2G5W i5-1135G7, Iris Xe G7 80EUs | 1.5 kg | 20.9 mm | 14.00" | 1920x1080 | |
| 83.6 % v7 (old) | Lenovo ThinkBook 14 G2 ITL 20VDS02G00 i3-1115G4, UHD Graphics Xe G4 48EUs | 1.5 kg | 17.9 mm | 14.00" | 1920x1080 |
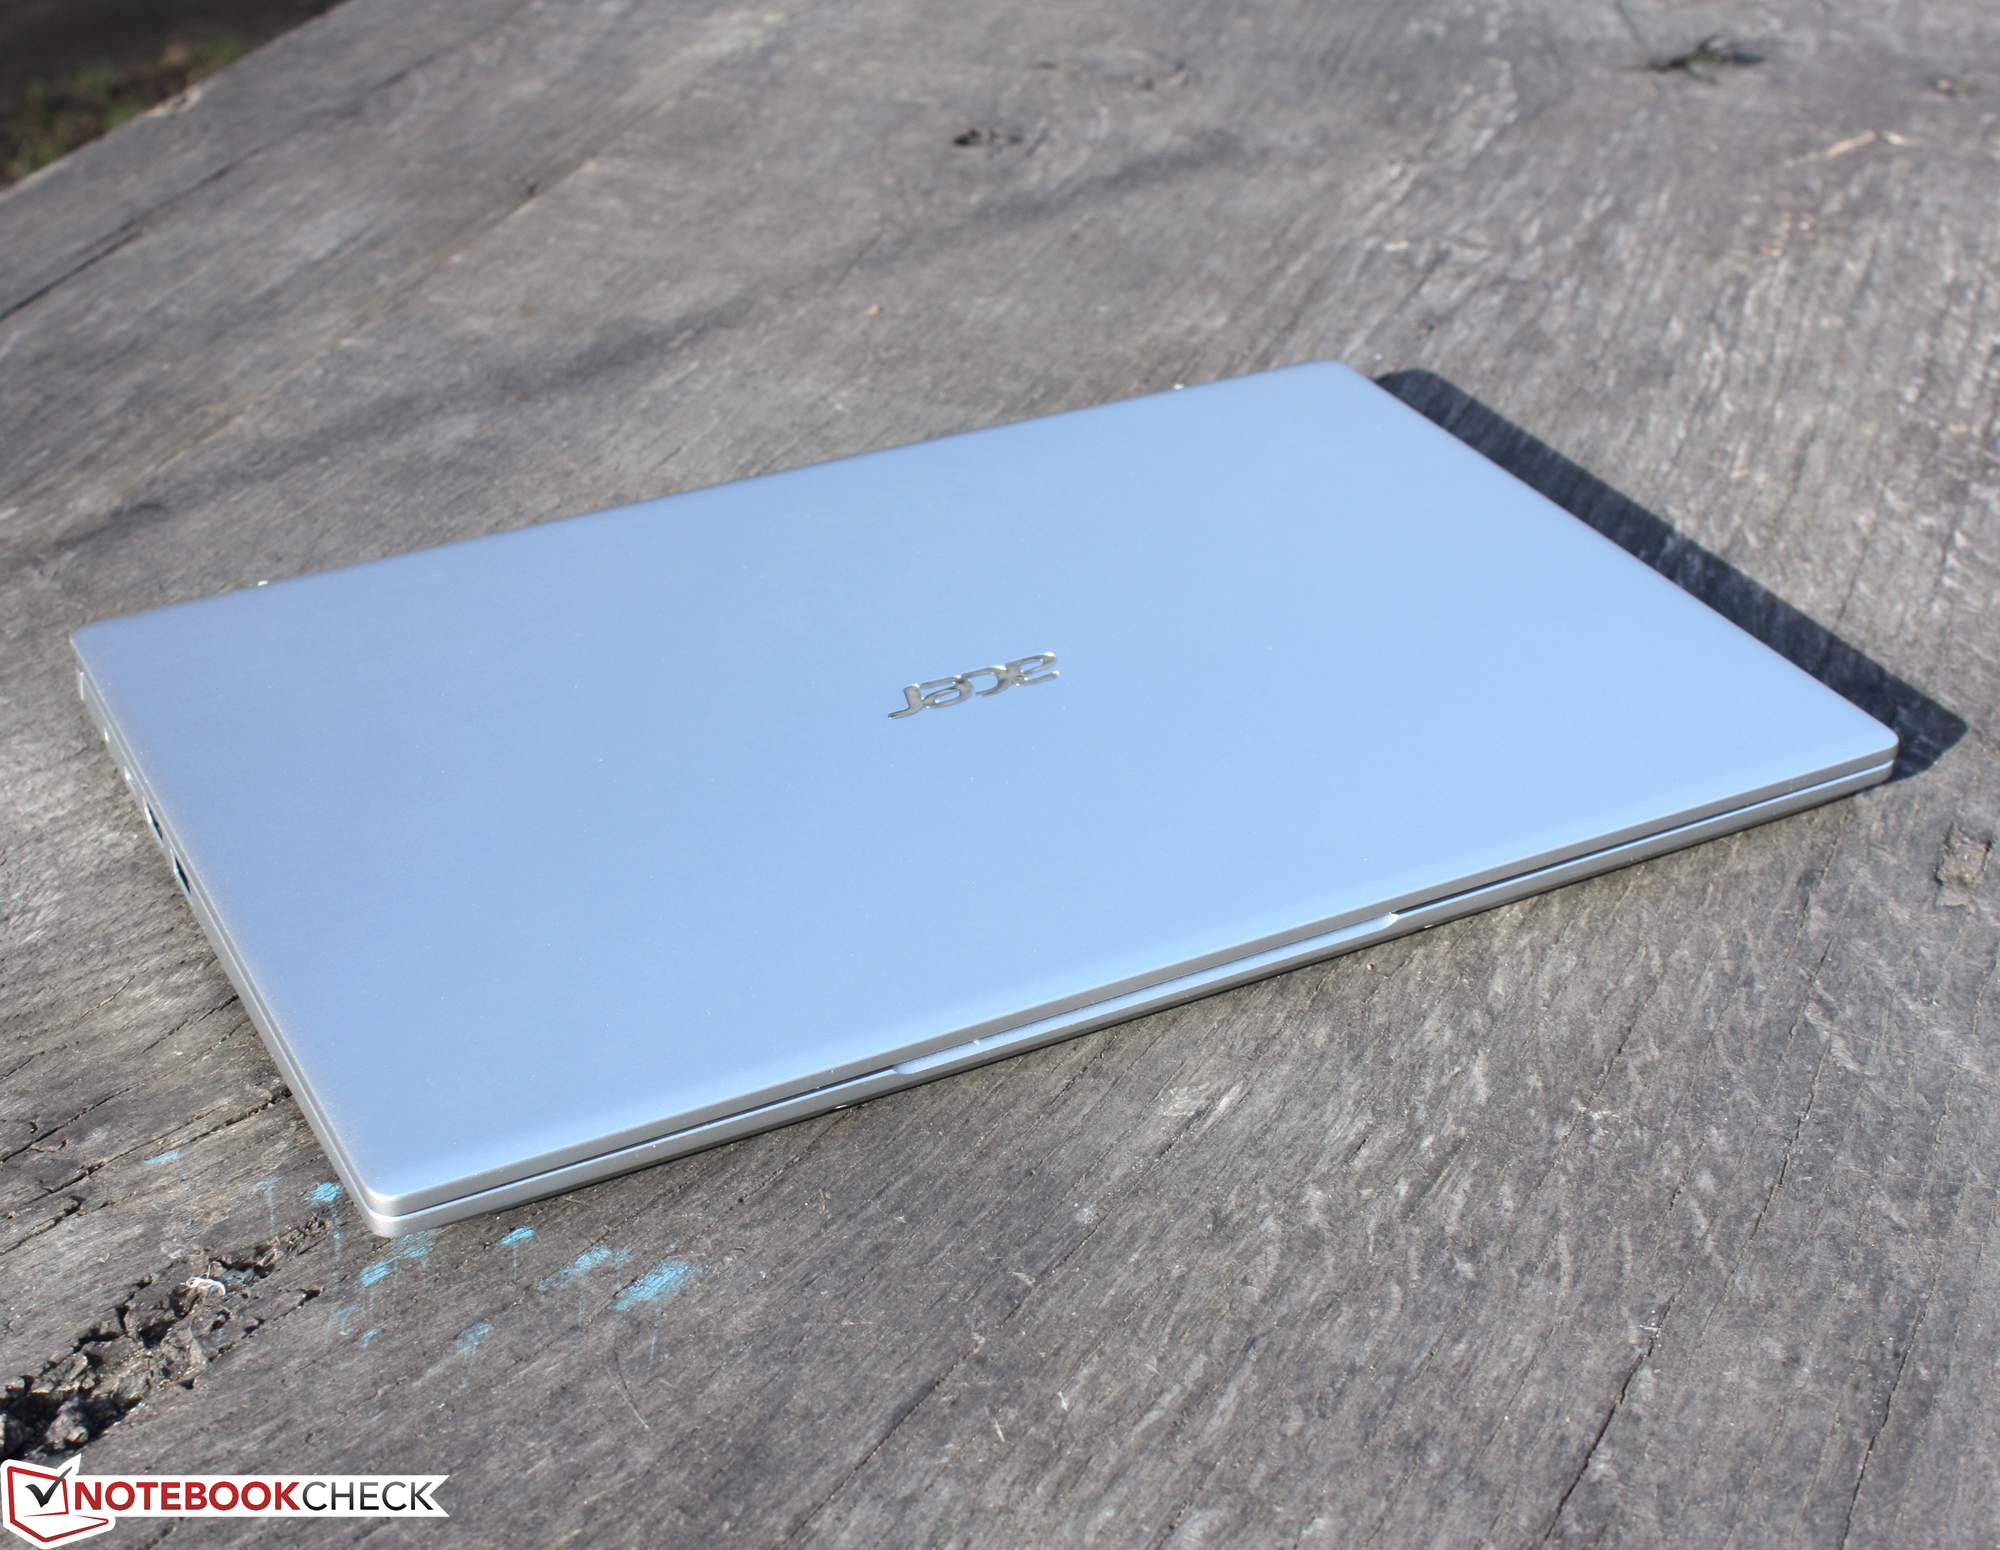
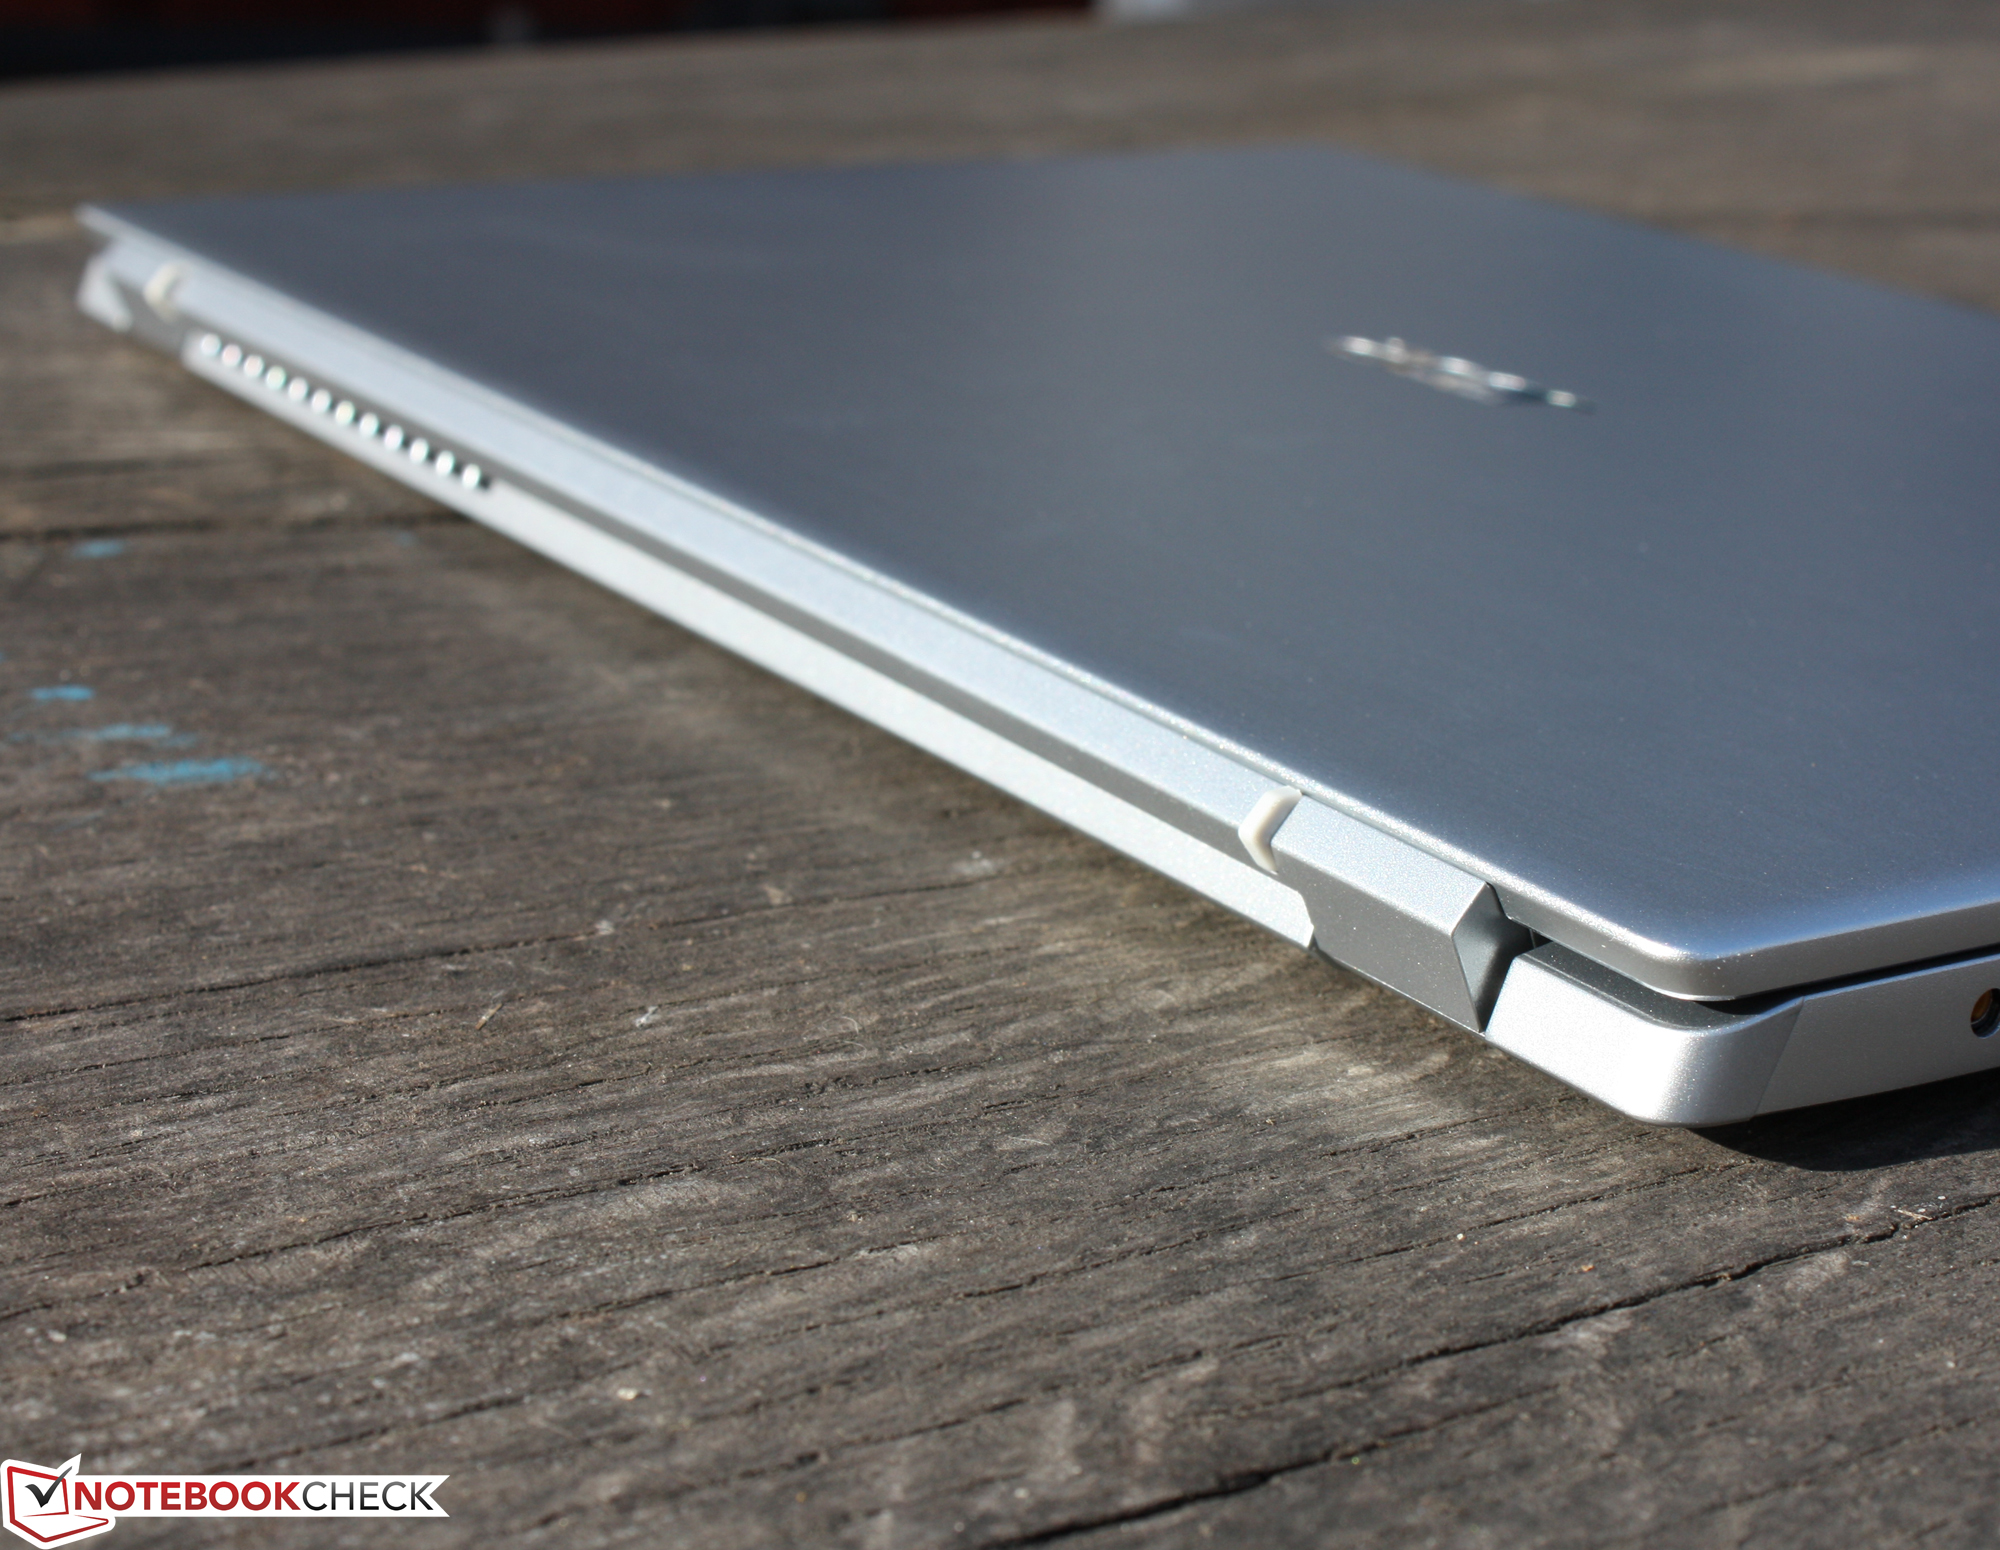
Estojo: Stable Swift 3
Equipamento: O MediaTek Wi-Fi é muito lento
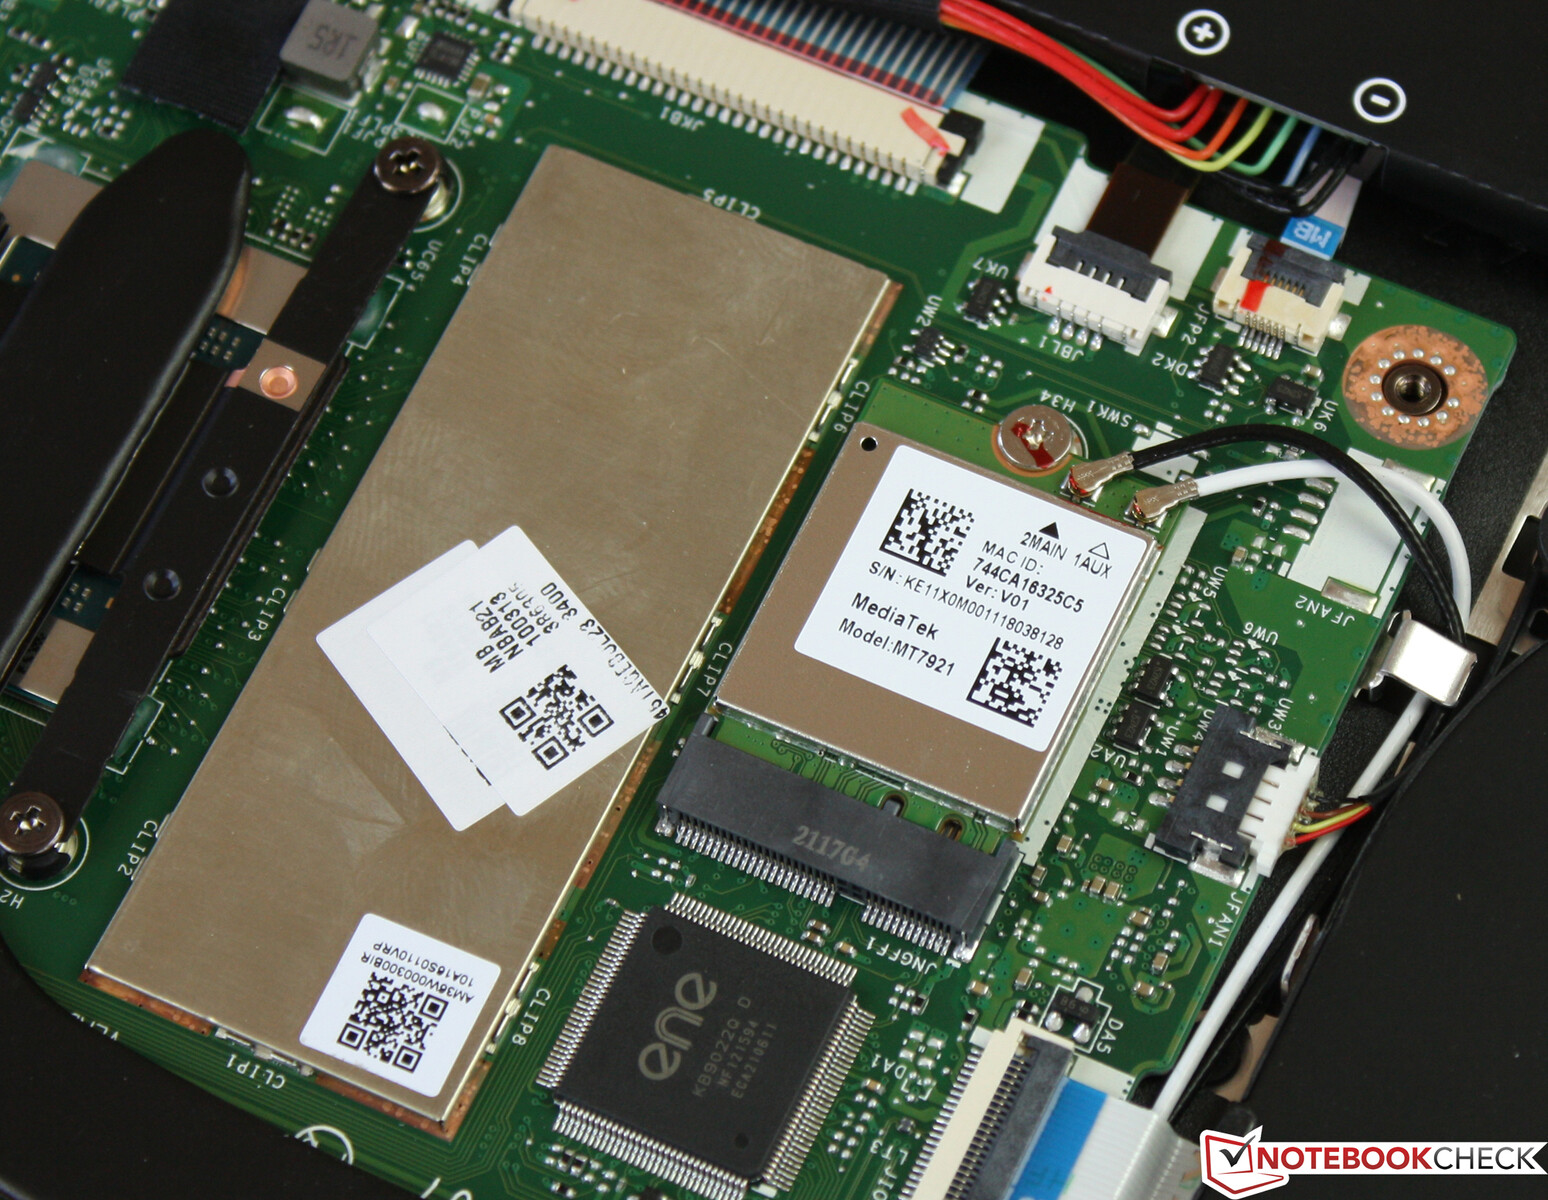
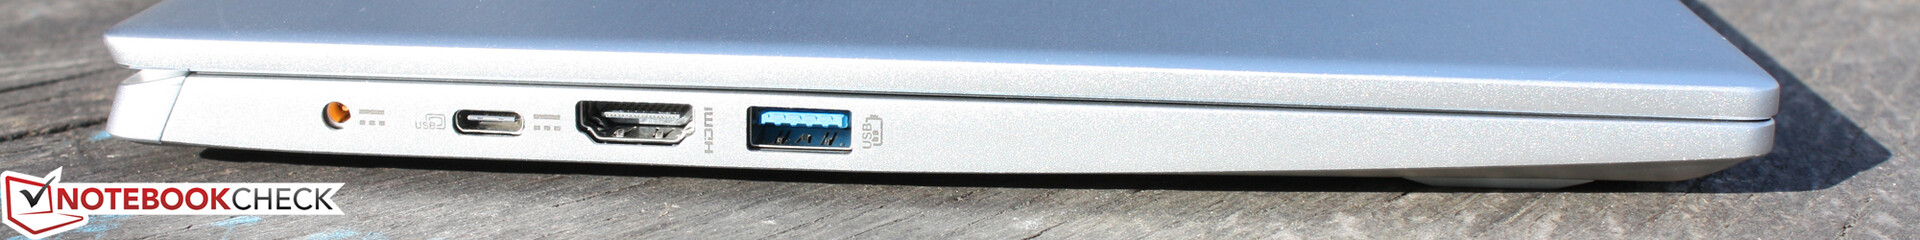
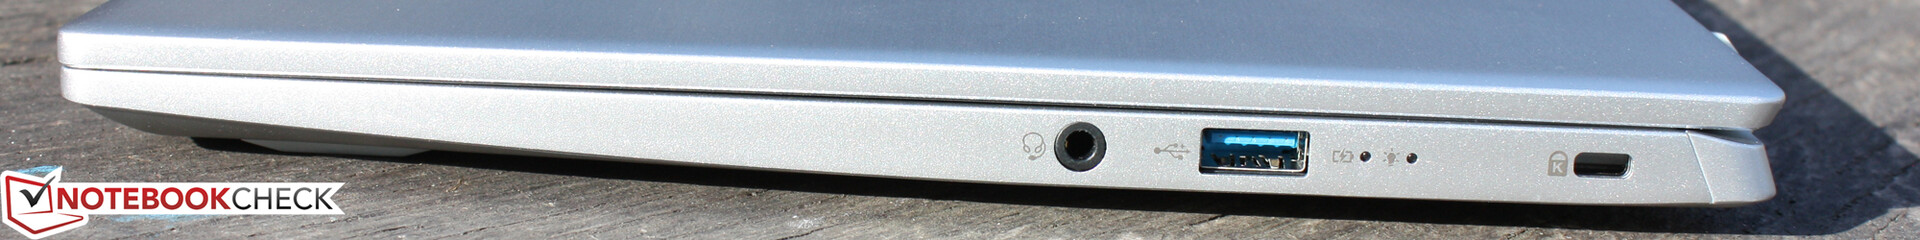
Os portos são idênticos aos do Swift X. Infelizmente, o mau desempenho do Wi-Fi também é idêntico ao do Swift X. A velocidade de download parece um desastre, o que foi o mesmo problema com o Swift Xtambém. As velocidades de transferência determinadas sob condições ótimas (nenhum outro dispositivo WLAN nas proximidades, um metro de distância entre o laptop e o PC do servidor) acabam sendo muito abismais com apenas cerca de 182 MBit/s (várias amostras aleatórias)
Ao transmitir, entretanto, o chip MediaTek Wi-Fi é muito mais rápido, com cerca de 871 MBit/s. Este é um bom resultado, embora não seja realmente entusiasmante. A discrepância entre as velocidades de envio e recebimento indica um problema do motorista, que supomos que possa ser remediado com uma atualização do motorista no futuro
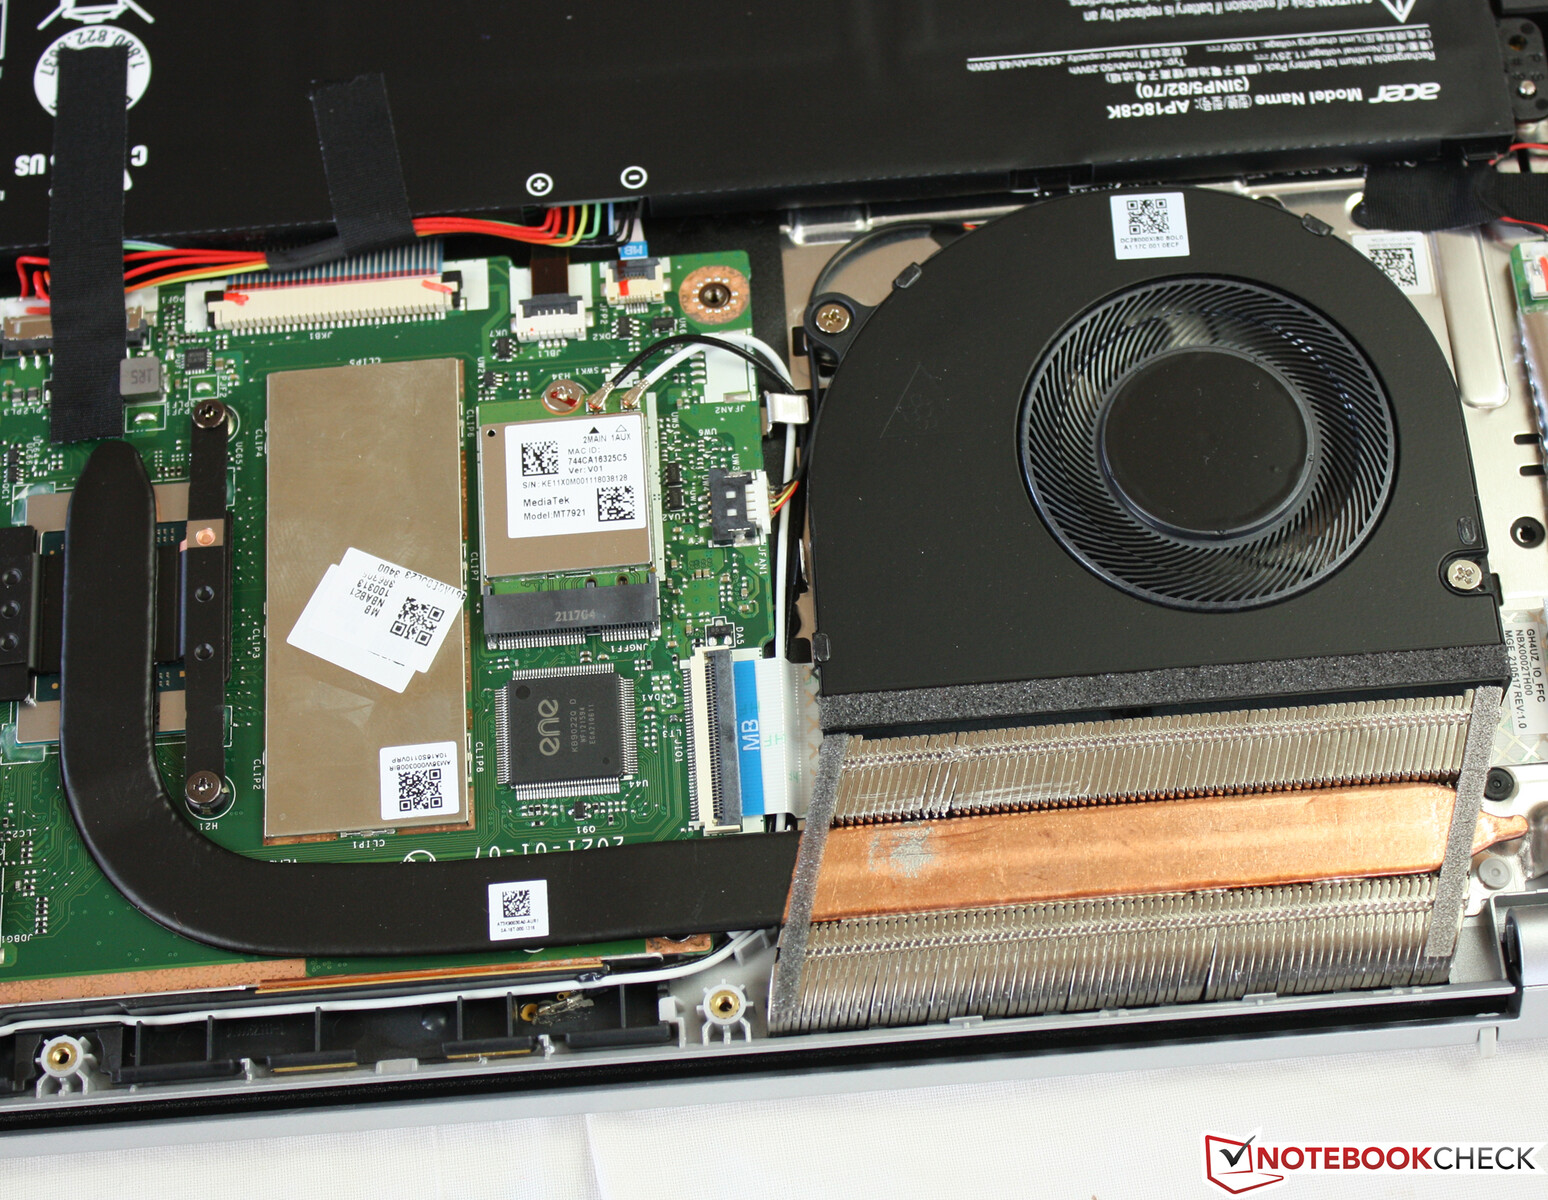
No entanto, a questão surge quanto ao local onde as antenas são instaladas na tampa de alumínio totalmente fechada? Dito isto, esta não pode ser a razão para a má pontuação, pois caso contrário os uploads também seriam identicamente baixos.
| Networking | |
| iperf3 transmit AX12 | |
| Acer Swift 3 SF314-511-54ZK | |
| Acer Swift 3 SF314-43-R8BP | |
| Lenovo ThinkPad E14 G3-20Y7003SGE | |
| Dell Latitude 14 5420-D2G5W | |
| Média MediaTek MT7921 (548 - 985, n=16) | |
| Lenovo ThinkBook 14 G2 ITL 20VDS02G00 | |
| Lenovo ThinkBook 14 G2 ITL 20VDS02G00 | |
| HP Pavilion 14-dv0357ng | |
| iperf3 receive AX12 | |
| Dell Latitude 14 5420-D2G5W | |
| Acer Swift 3 SF314-511-54ZK | |
| Lenovo ThinkPad E14 G3-20Y7003SGE | |
| Lenovo ThinkBook 14 G2 ITL 20VDS02G00 | |
| Lenovo ThinkBook 14 G2 ITL 20VDS02G00 | |
| Média MediaTek MT7921 (90 - 972, n=16) | |
| HP Pavilion 14-dv0357ng | |
| Acer Swift 3 SF314-43-R8BP | |
Webcam


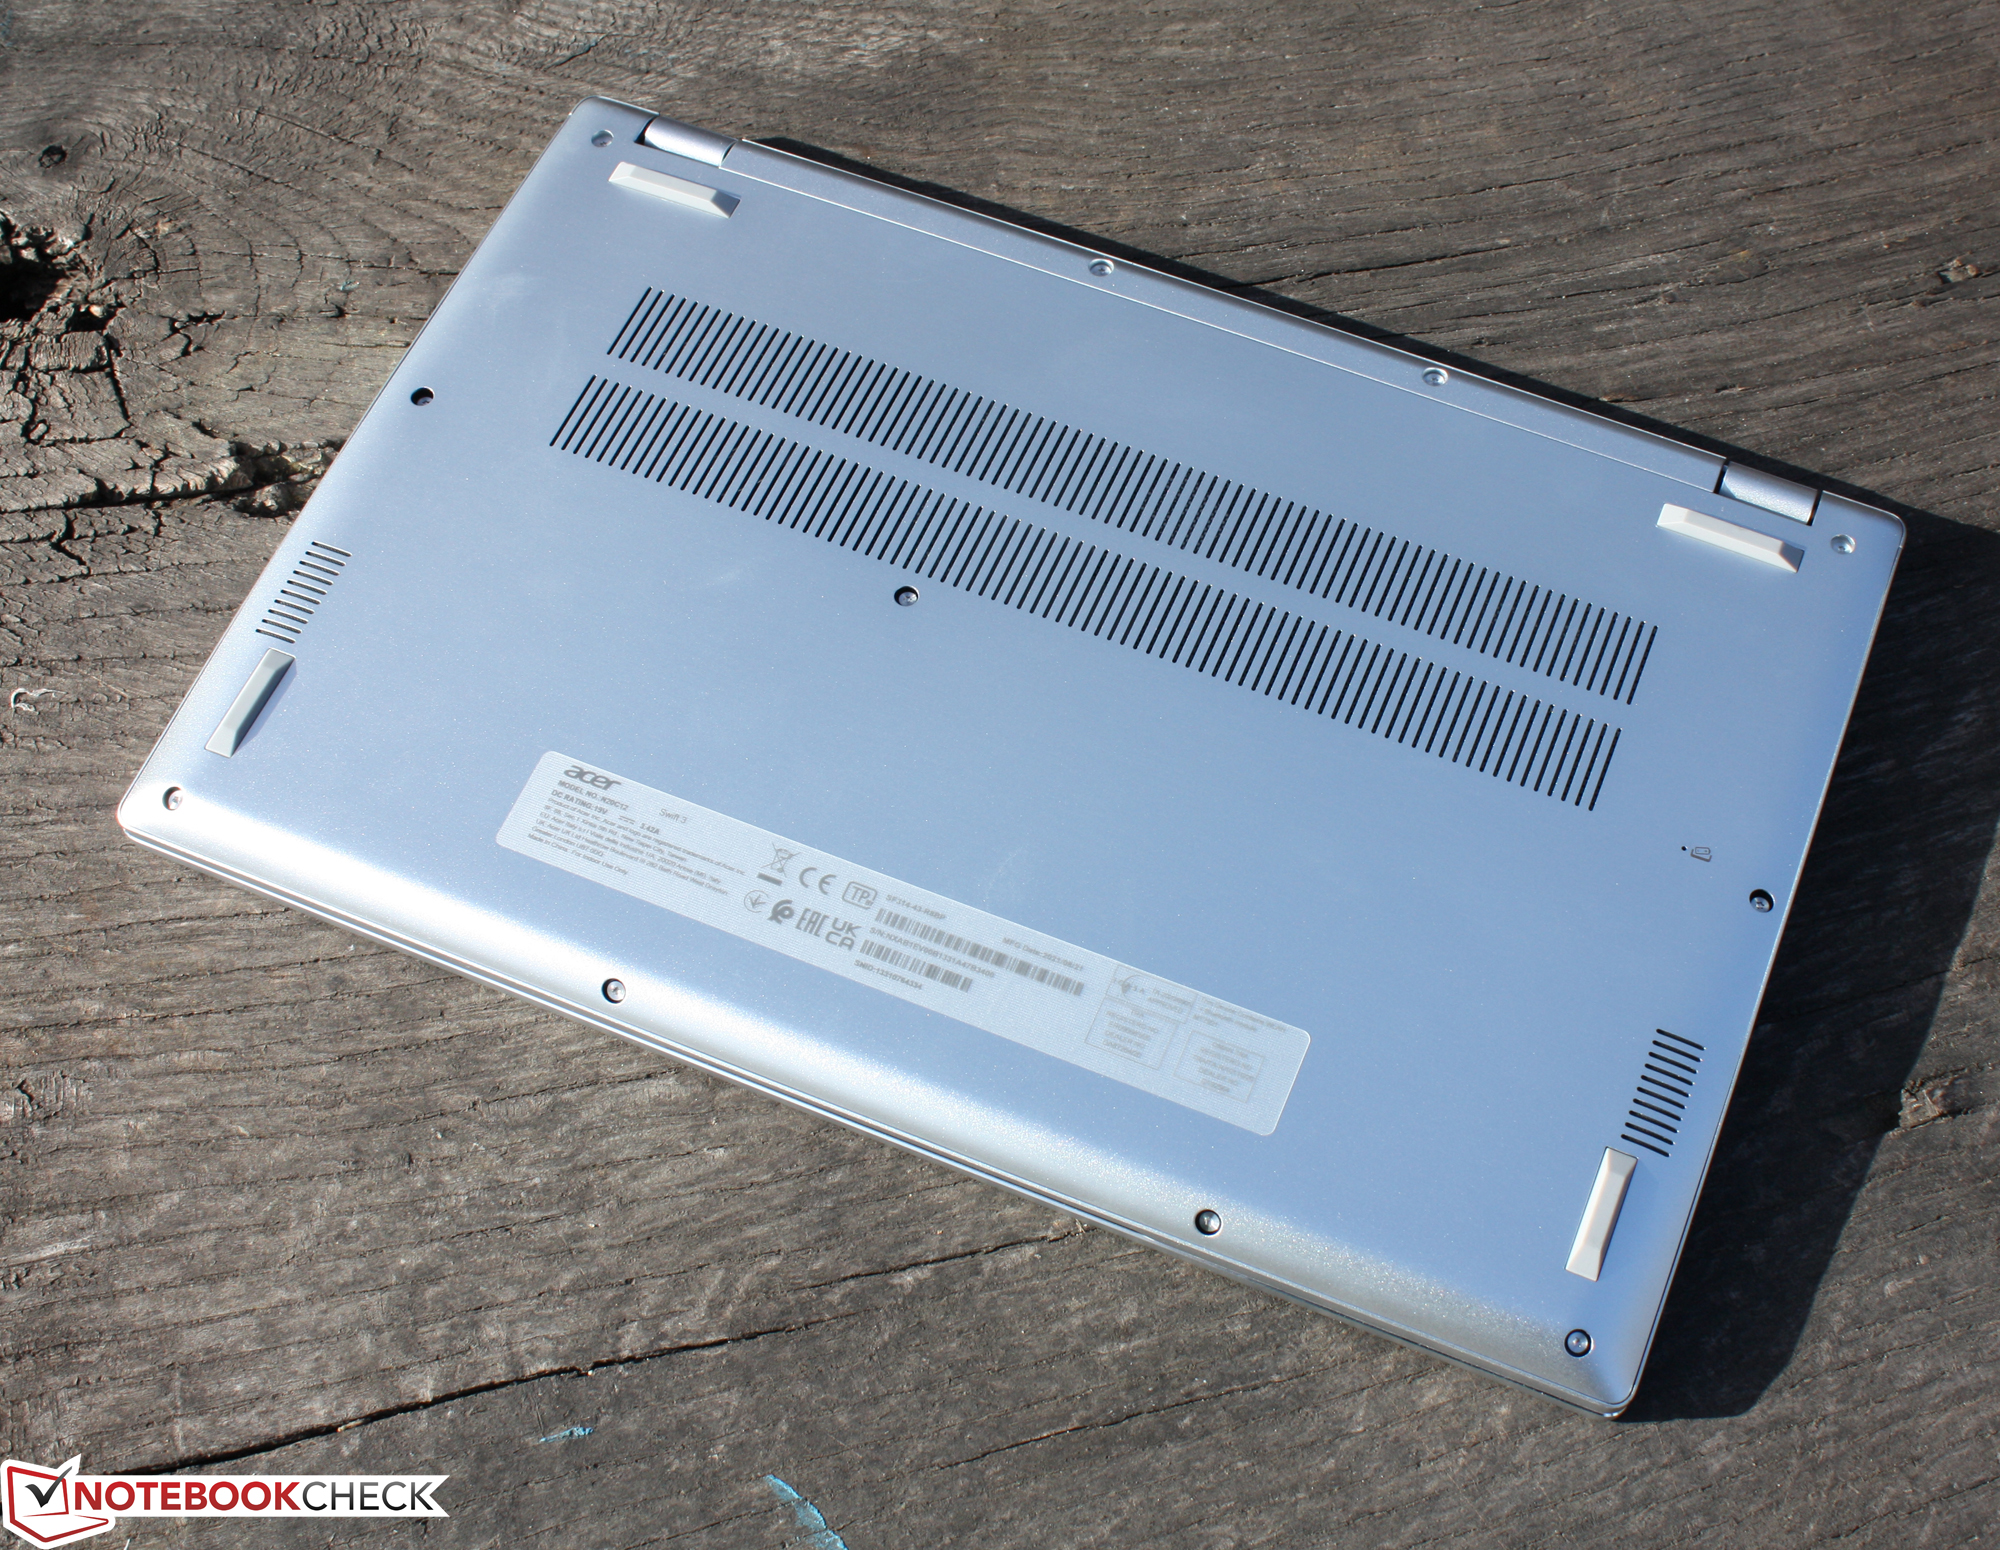
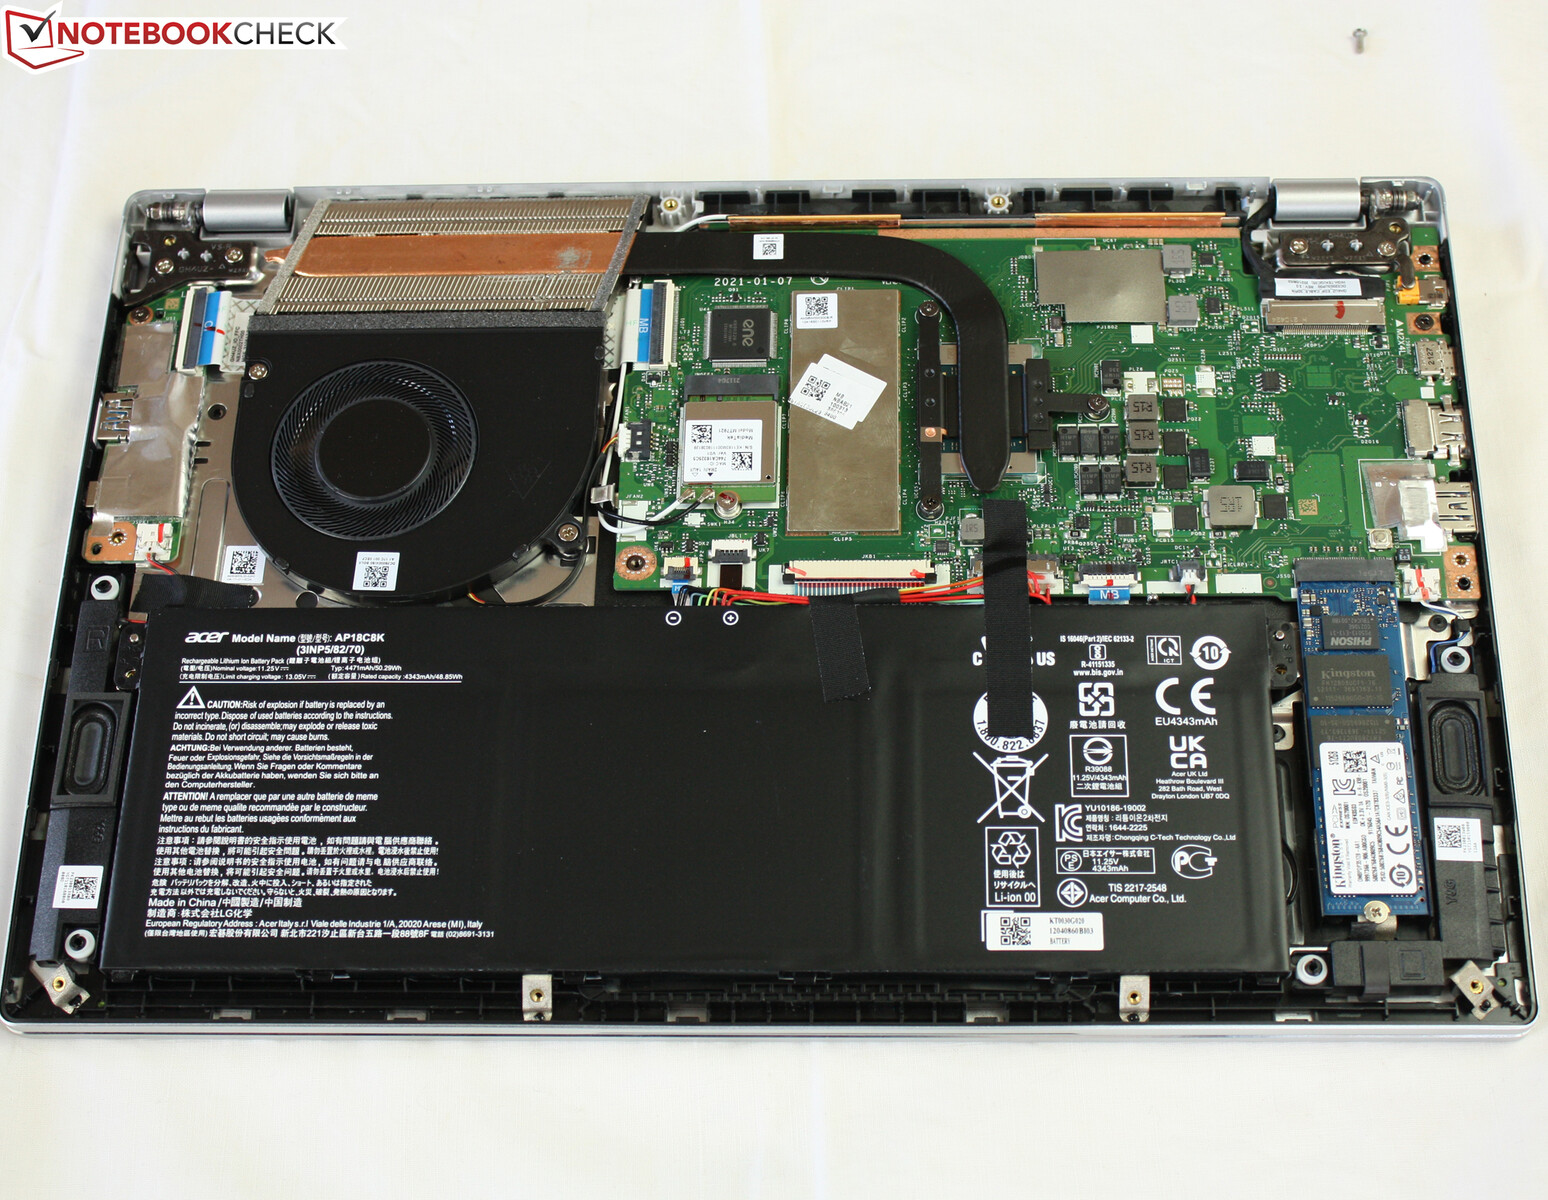
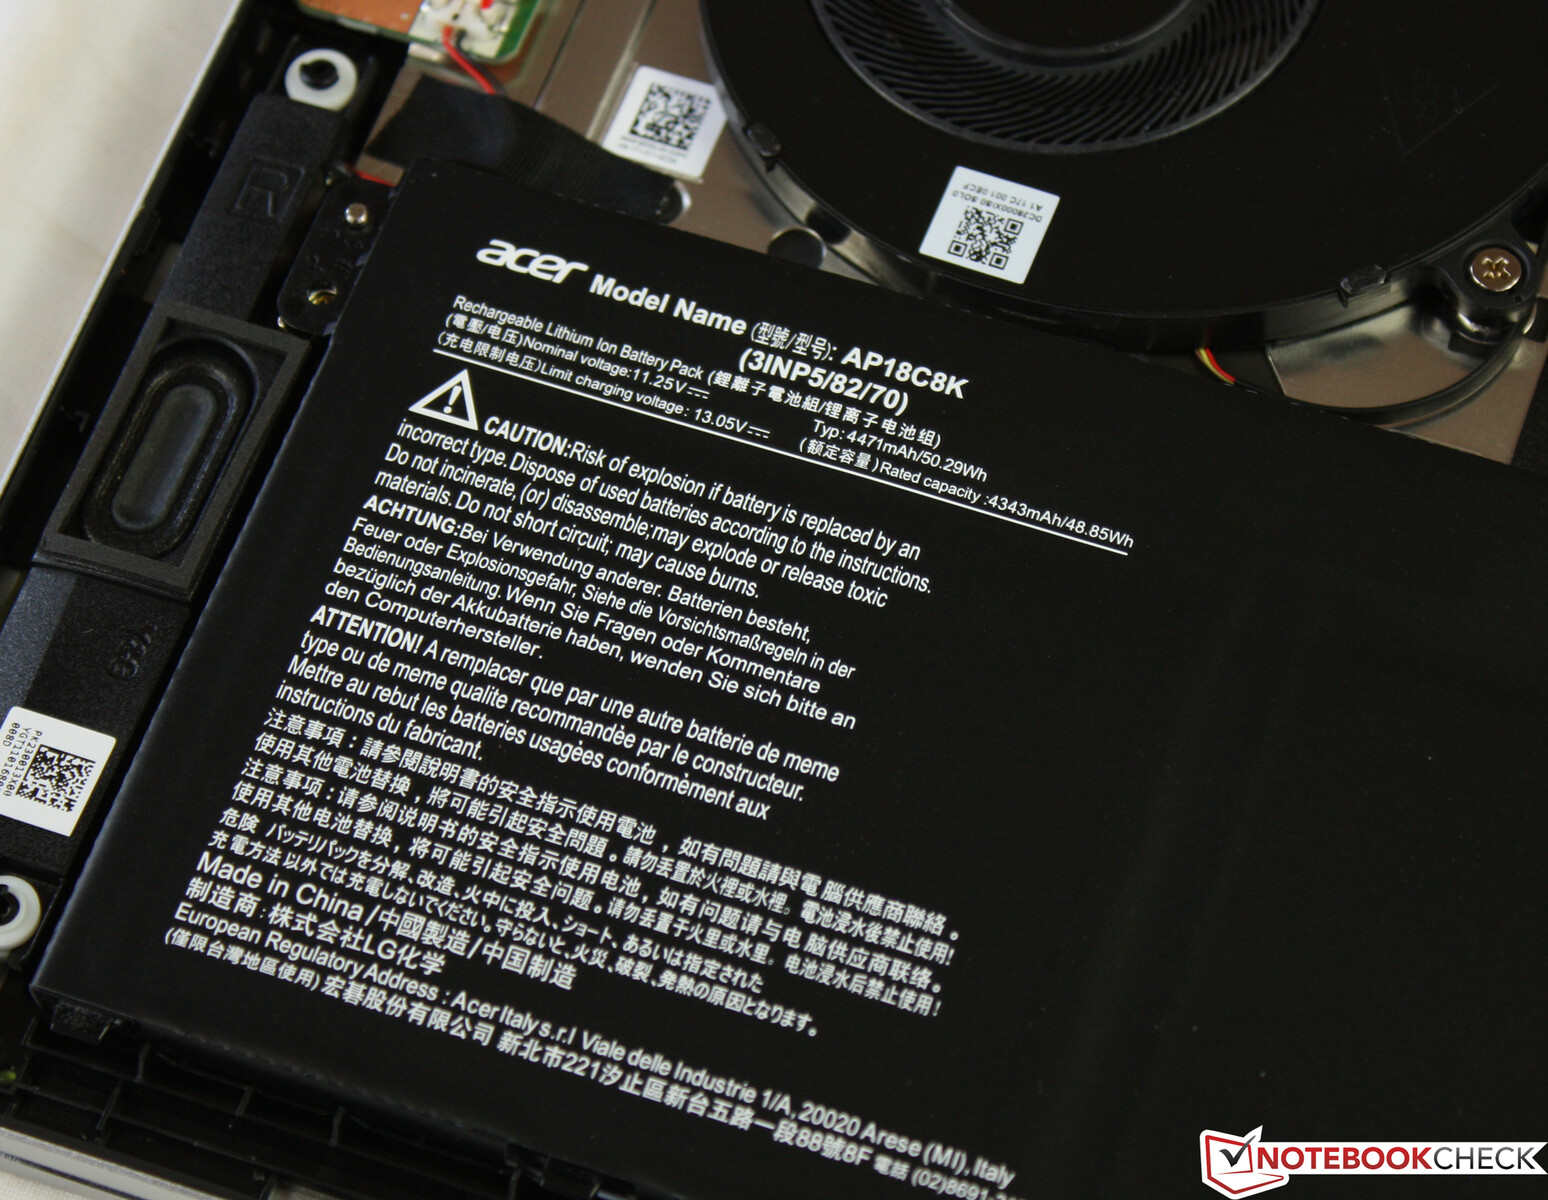
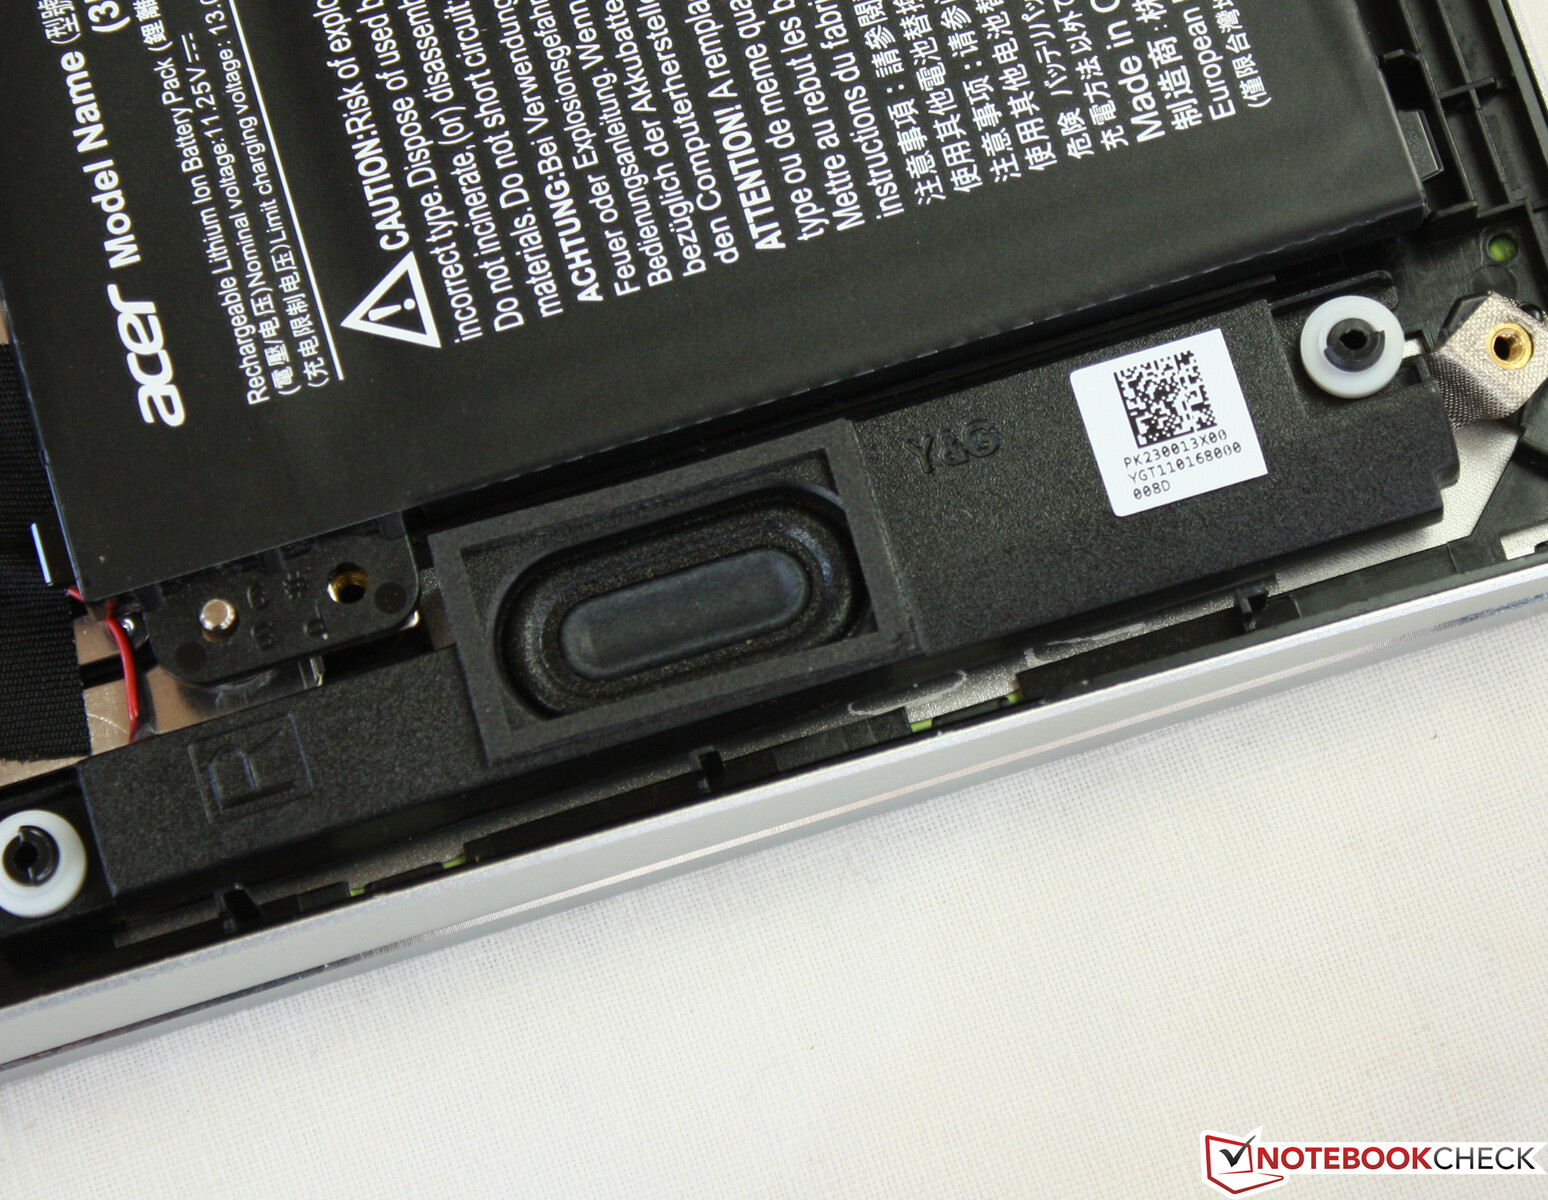
Manutenção
O cartão WLAN da Swift 3 pode ser atualizado. O SSD também pode ser trocado posteriormente por um modelo maior. Não há um segundo slot M.2 como no Swift X. A memória de trabalho é soldada.
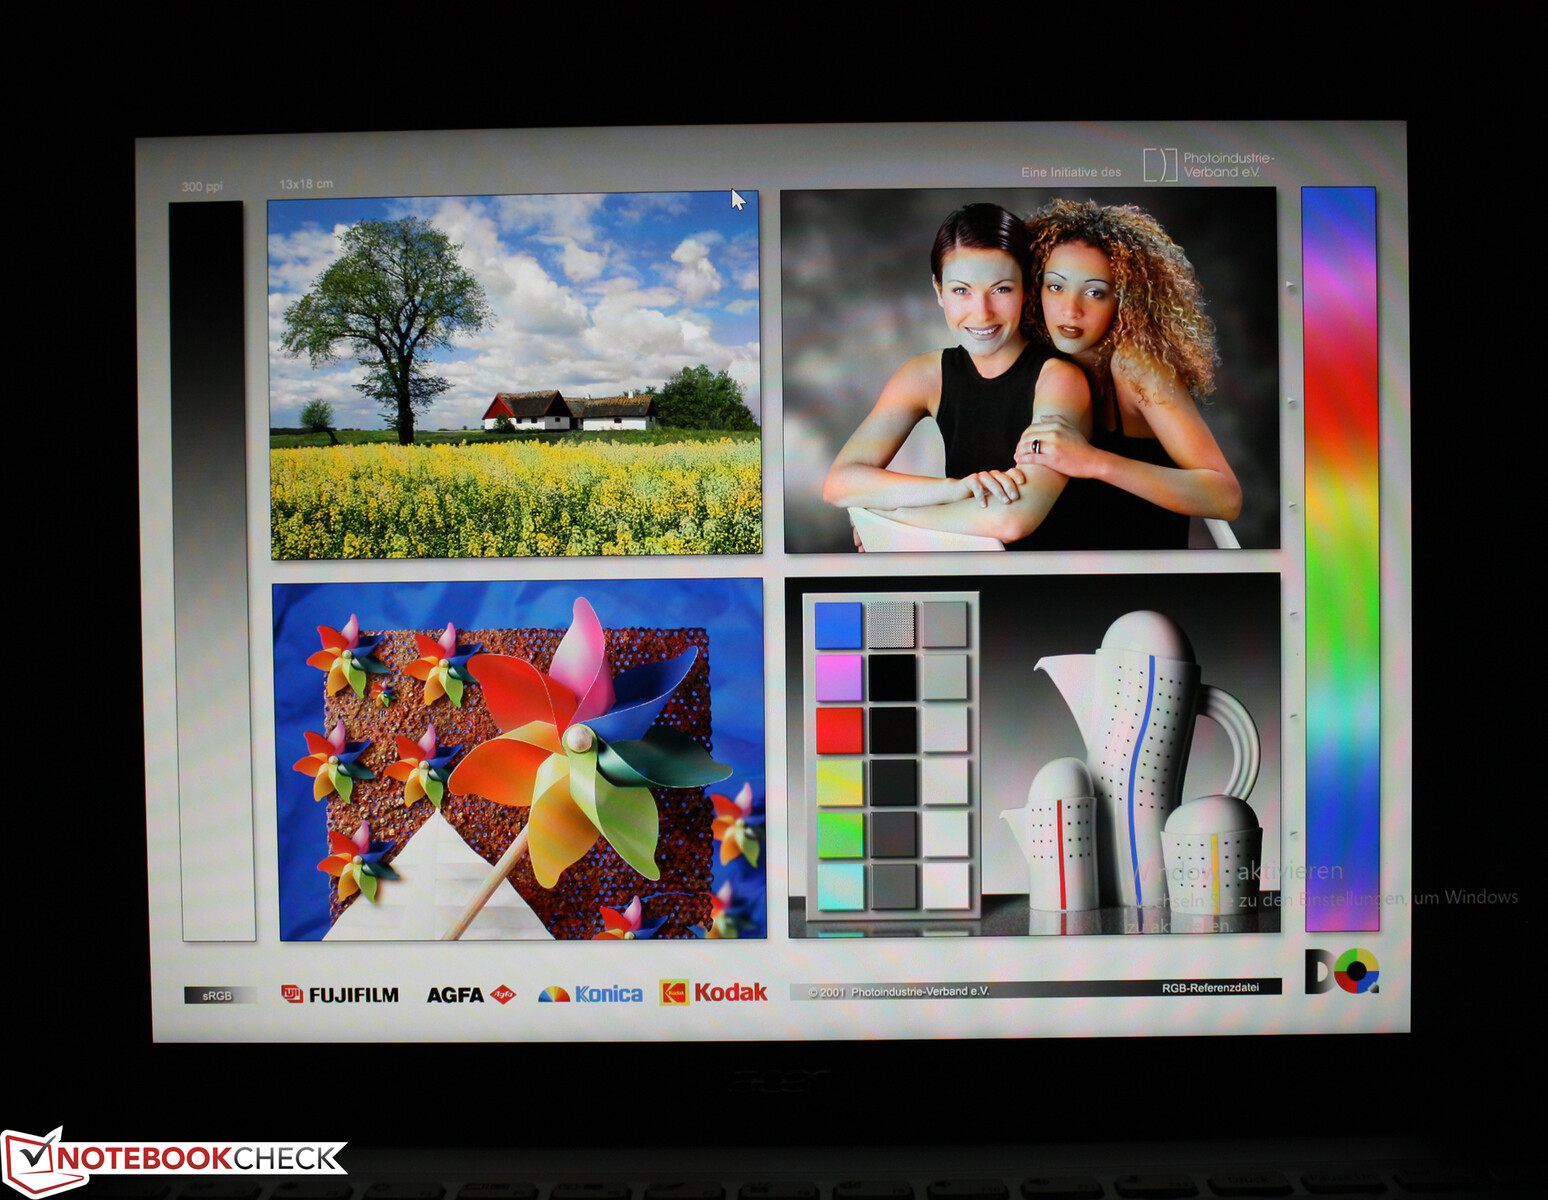
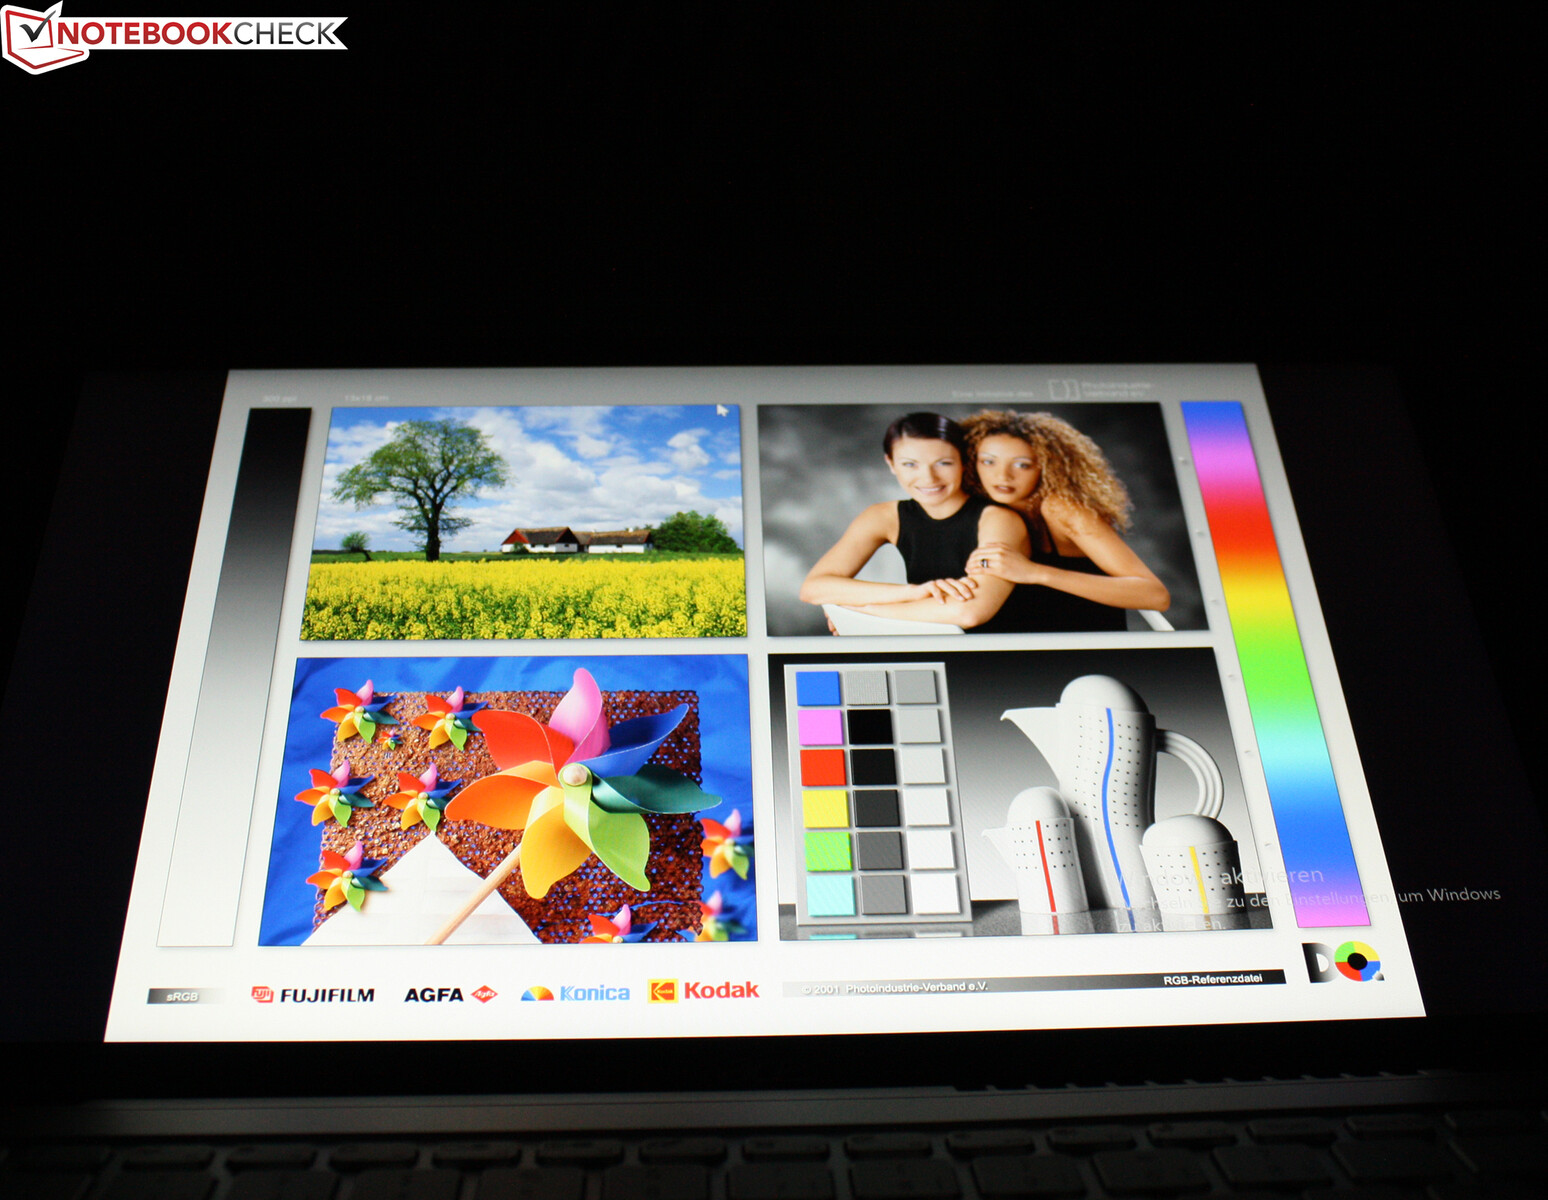
Mostrar: A tela Acer brilha muito fraco
Enquanto oSwift X SFX14-41G e Swift 3 SF314-511 são equipados com painéis AUO (B140HAN06) que proporcionam excelente desempenho em nossos testes, nosso modelo atual conta com uma tela Chi-Mei (N140HCA EAC CMN). Esta parece ser uma escolha pior porque o espaço sRGB não está mais totalmente coberto e o brilho também é menor. No entanto, as diferenças em contraste são insignificantes.
O brilho aumenta visivelmente em direção ao centro da tela, mas não há sangramento visível de luz de fundo. A luminância no modo de bateria permanece inalterada enquanto o AMD Vari Bright estiver desativado nas configurações da Radeon.
Um aspecto negativo aqui é que a tela usa PWM para reduzir o brilho quando o brilho é de 20% e baixo. Dito isto, a alta freqüência de 25.000 Hz não deve sobrecarregar os olhos. Além disso, a maioria dos usuários teria dificuldade de trabalhar na tela com brilho tão baixo, porque 20% é simplesmente muito escuro mesmo em ambientes internos.
| |||||||||||||||||||||||||
iluminação: 78 %
iluminação com acumulador: 259 cd/m²
Contraste: 1079:1 (Preto: 0.24 cd/m²)
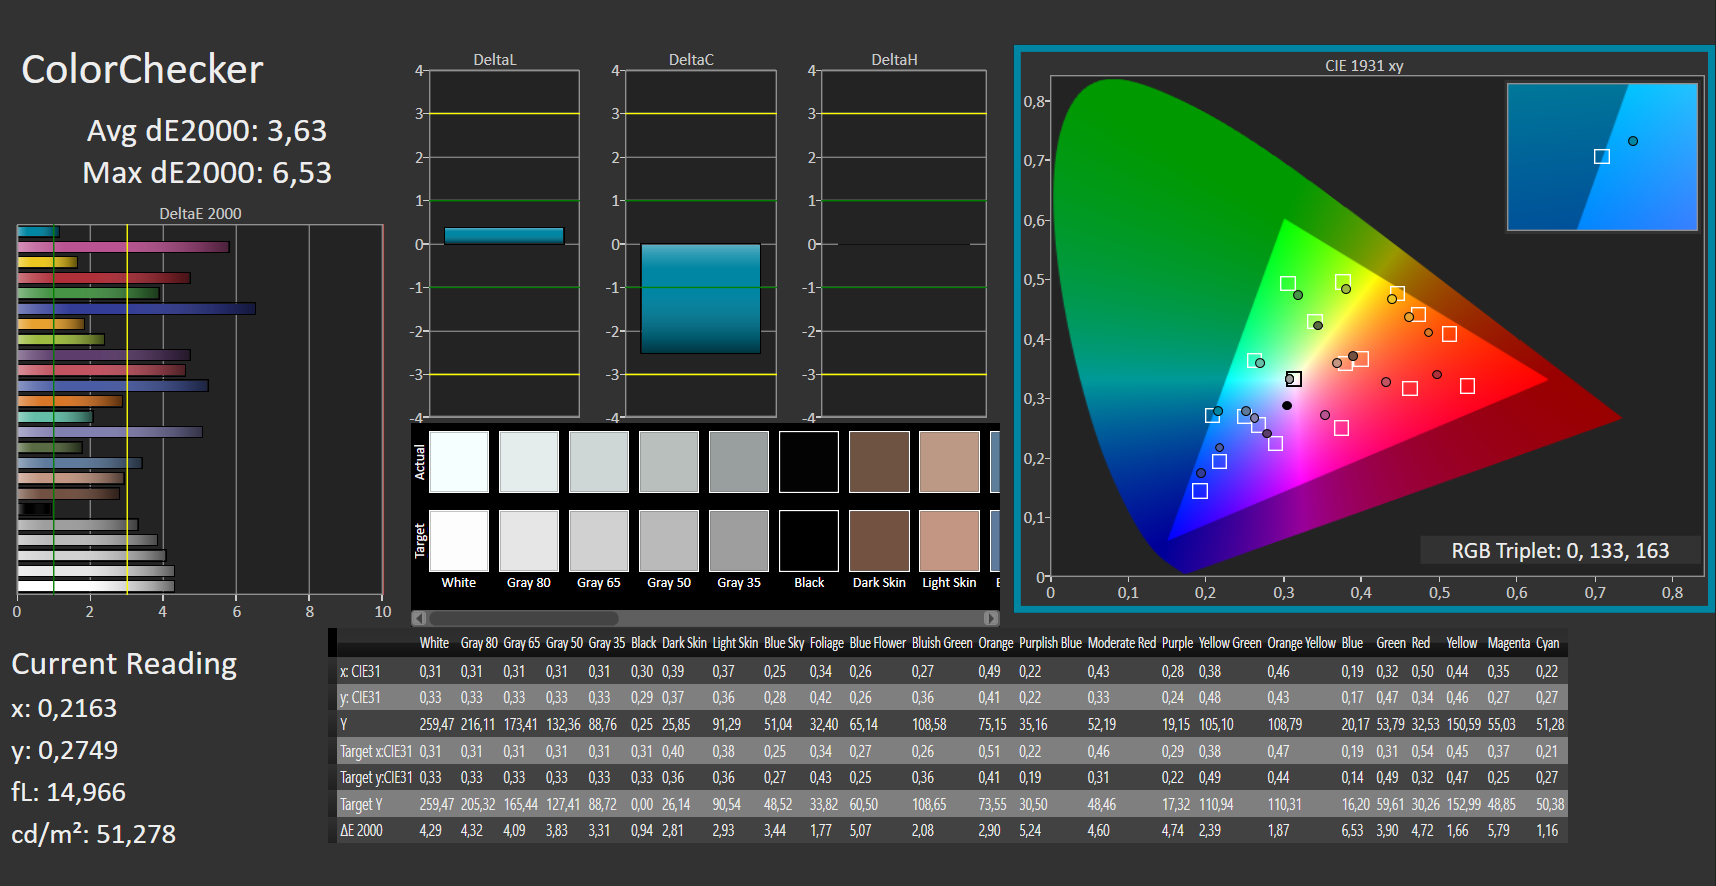
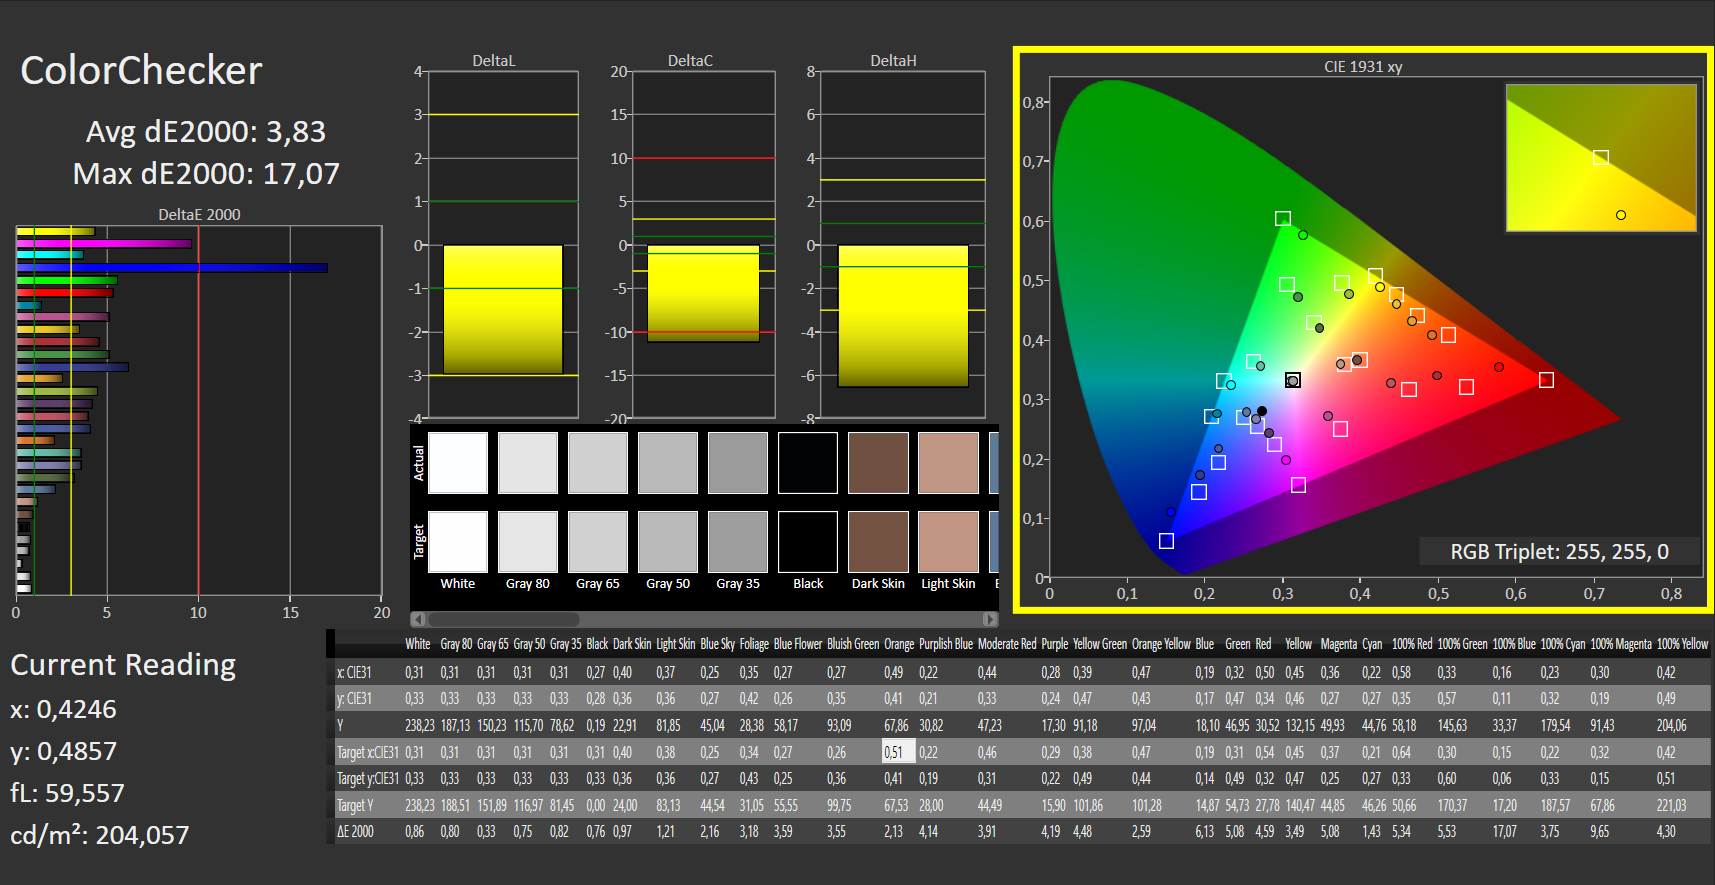
ΔE ColorChecker Calman: 3.63 | ∀{0.5-29.43 Ø4.71}
calibrated: 3.83
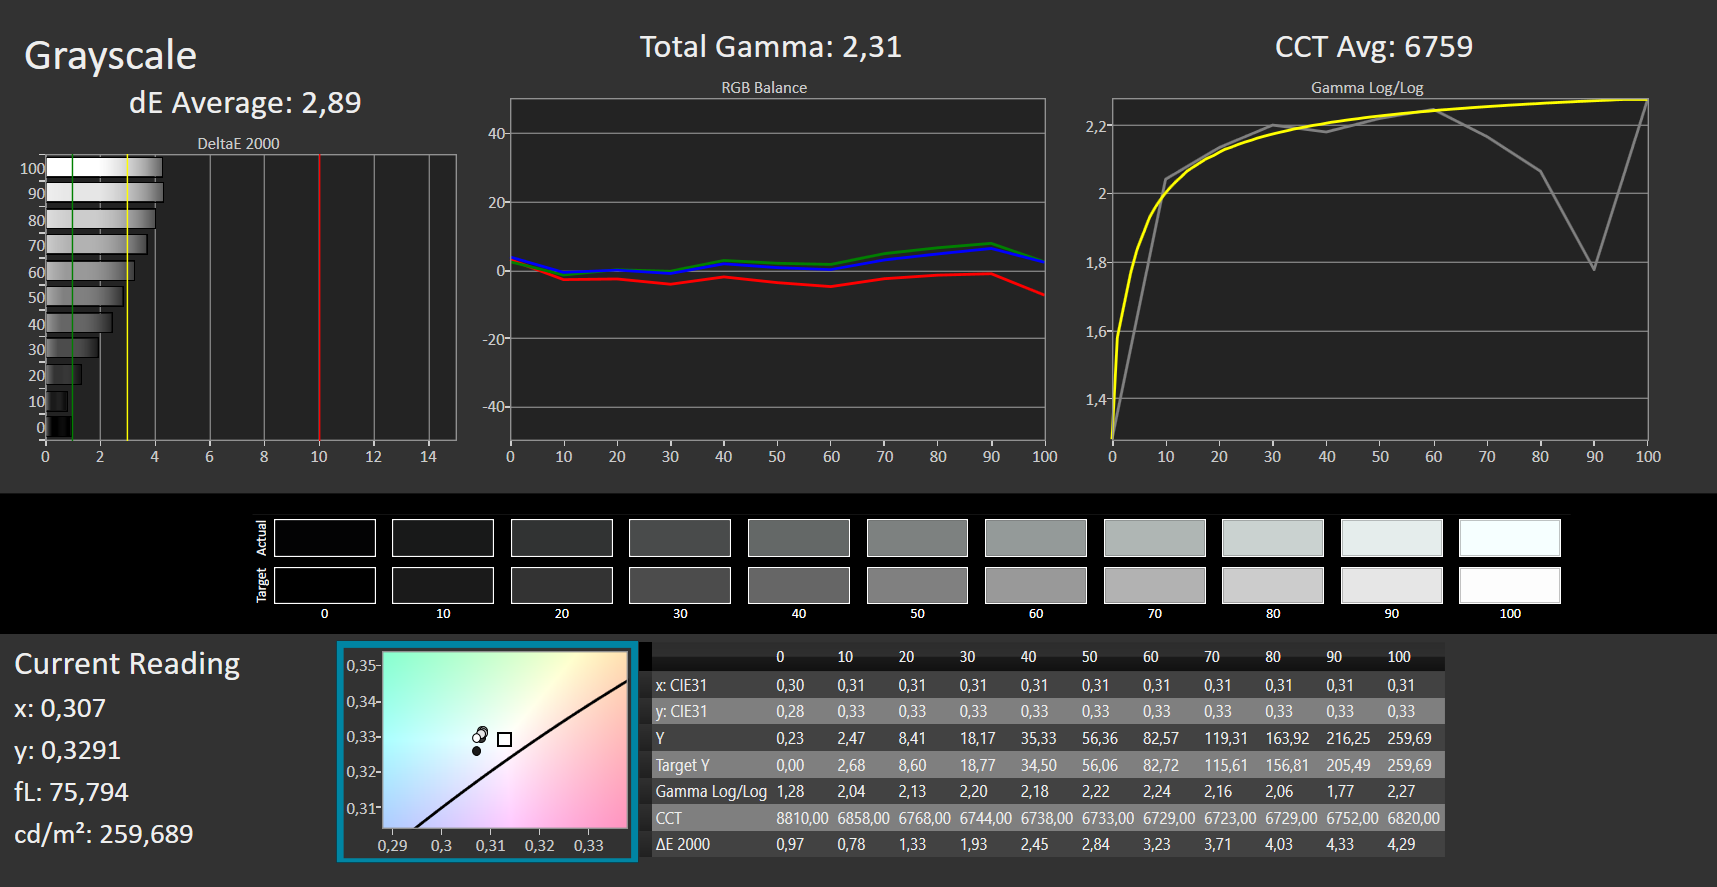
ΔE Greyscale Calman: 2.89 | ∀{0.09-98 Ø4.96}
45% AdobeRGB 1998 (Argyll 3D)
65% sRGB (Argyll 3D)
43% Display P3 (Argyll 3D)
Gamma: 2.31
CCT: 6759 K
| Acer Swift 3 SF314-43-R8BP Chi Mei N140HCA EAC CMN, IPS, 1920x1080, 14" | Acer Swift 3 SF314-511-54ZK AUO B140HAN06, IPS, 1920x1080, 14" | Lenovo ThinkPad E14 G3-20Y7003SGE NVM140FHM-N4V, IPS, 1920x1080, 14" | HP Pavilion 14-dv0357ng LGD0619, IPS, 1920x1080, 14" | Dell Latitude 14 5420-D2G5W AUO5491 / B140HAN, IPS, 1920x1080, 14" | Lenovo ThinkBook 14 G2 ITL 20VDS02G00 AU Optronics B140HAN04.E, a-Si IPS LED, 1920x1080, 14" | |
|---|---|---|---|---|---|---|
| Display | 53% | -7% | 42% | -17% | -14% | |
| Display P3 Coverage (%) | 43 | 67 56% | 40.3 -6% | 62 44% | 36 -16% | 37.2 -13% |
| sRGB Coverage (%) | 65 | 98 51% | 59.5 -8% | 92 42% | 54 -17% | 55.5 -15% |
| AdobeRGB 1998 Coverage (%) | 45 | 69 53% | 41.7 -7% | 63 40% | 37 -18% | 38.4 -15% |
| Response Times | -27% | 11% | 18% | -6% | -18% | |
| Response Time Grey 50% / Grey 80% * (ms) | 37 ? | 52 ? -41% | 35.2 ? 5% | 37 ? -0% | 41 ? -11% | 45.9 ? -24% |
| Response Time Black / White * (ms) | 26 ? | 29 ? -12% | 21.6 ? 17% | 17 ? 35% | 26 ? -0% | 29 ? -12% |
| PWM Frequency (Hz) | 25000 ? | |||||
| Screen | 28% | -10% | -10% | -3% | -27% | |
| Brightness middle (cd/m²) | 259 | 320 24% | 341 32% | 387 49% | 290 12% | 386 49% |
| Brightness (cd/m²) | 229 | 309 35% | 327 43% | 359 57% | 282 23% | 348 52% |
| Brightness Distribution (%) | 78 | 84 8% | 90 15% | 84 8% | 81 4% | 83 6% |
| Black Level * (cd/m²) | 0.24 | 0.25 -4% | 0.26 -8% | 0.55 -129% | 0.26 -8% | 0.29 -21% |
| Contrast (:1) | 1079 | 1280 19% | 1312 22% | 704 -35% | 1115 3% | 1331 23% |
| Colorchecker dE 2000 * | 3.63 | 2.57 29% | 5.1 -40% | 4.04 -11% | 4.65 -28% | 6.3 -74% |
| Colorchecker dE 2000 max. * | 6.53 | 3.5 46% | 17.6 -170% | 8.28 -27% | 7.5 -15% | 18.3 -180% |
| Colorchecker dE 2000 calibrated * | 3.83 | 0.76 80% | 4.4 -15% | 1 74% | 3.98 -4% | 4.1 -7% |
| Greyscale dE 2000 * | 2.89 | 2.46 15% | 2.1 27% | 5 -73% | 3.22 -11% | 5.4 -87% |
| Gamma | 2.31 95% | 2.23 99% | 2.11 104% | 2.62 84% | 2.54 87% | 2.55 86% |
| CCT | 6759 96% | 6311 103% | 6755 96% | 7123 91% | 6169 105% | 5894 110% |
| Média Total (Programa/Configurações) | 18% /
26% | -2% /
-7% | 17% /
5% | -9% /
-6% | -20% /
-23% |
* ... menor é melhor
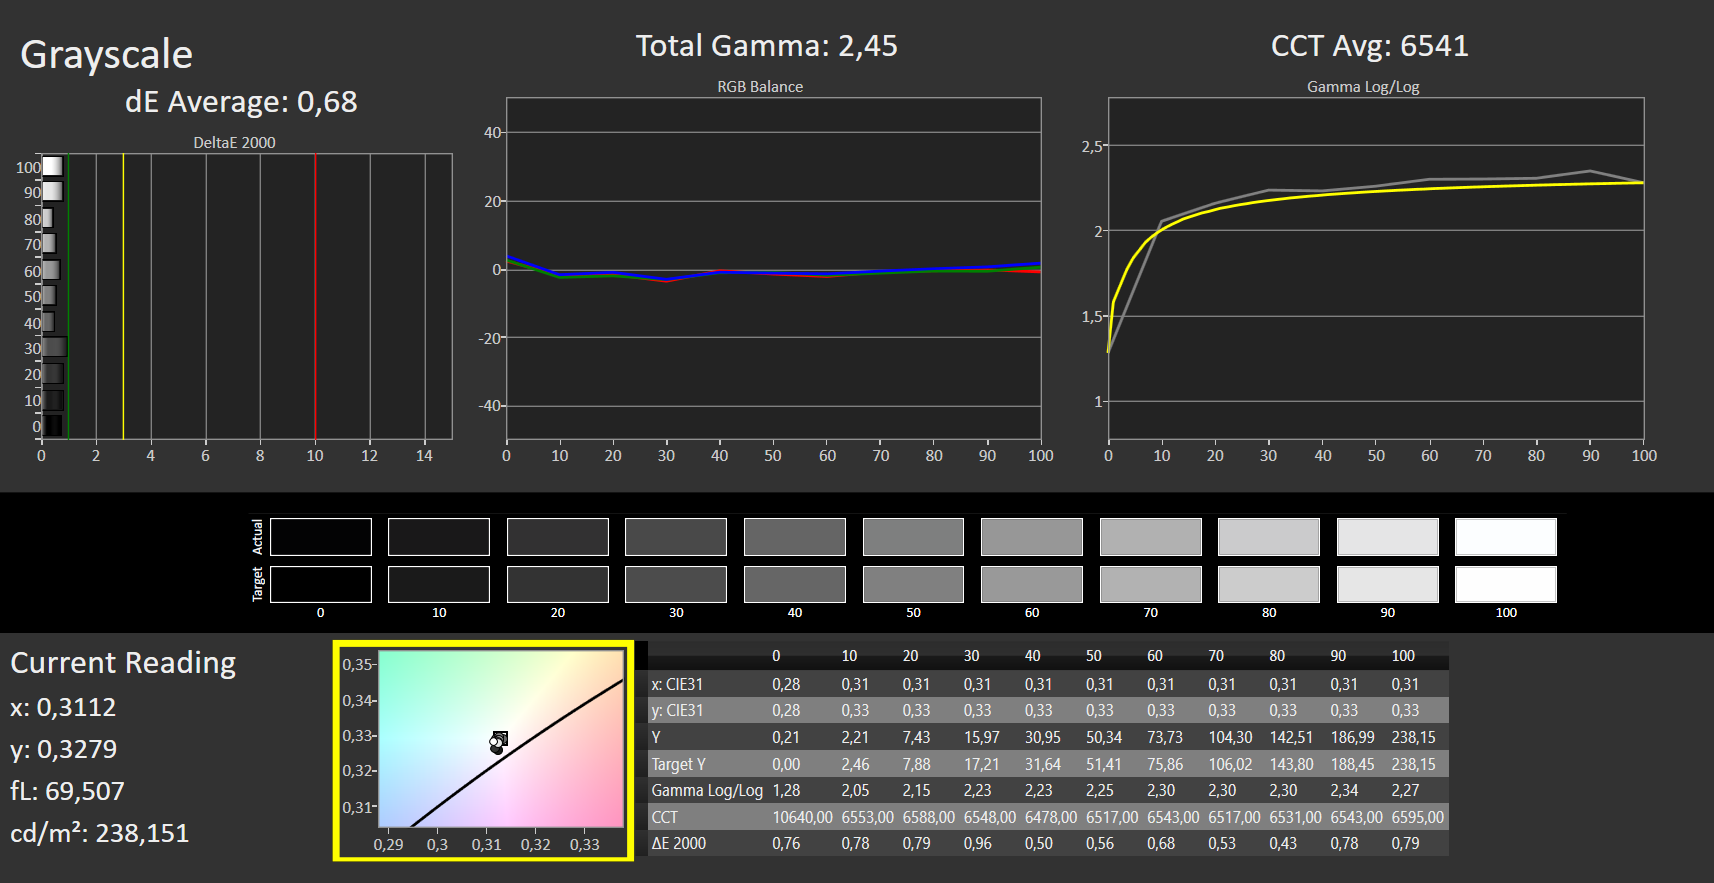
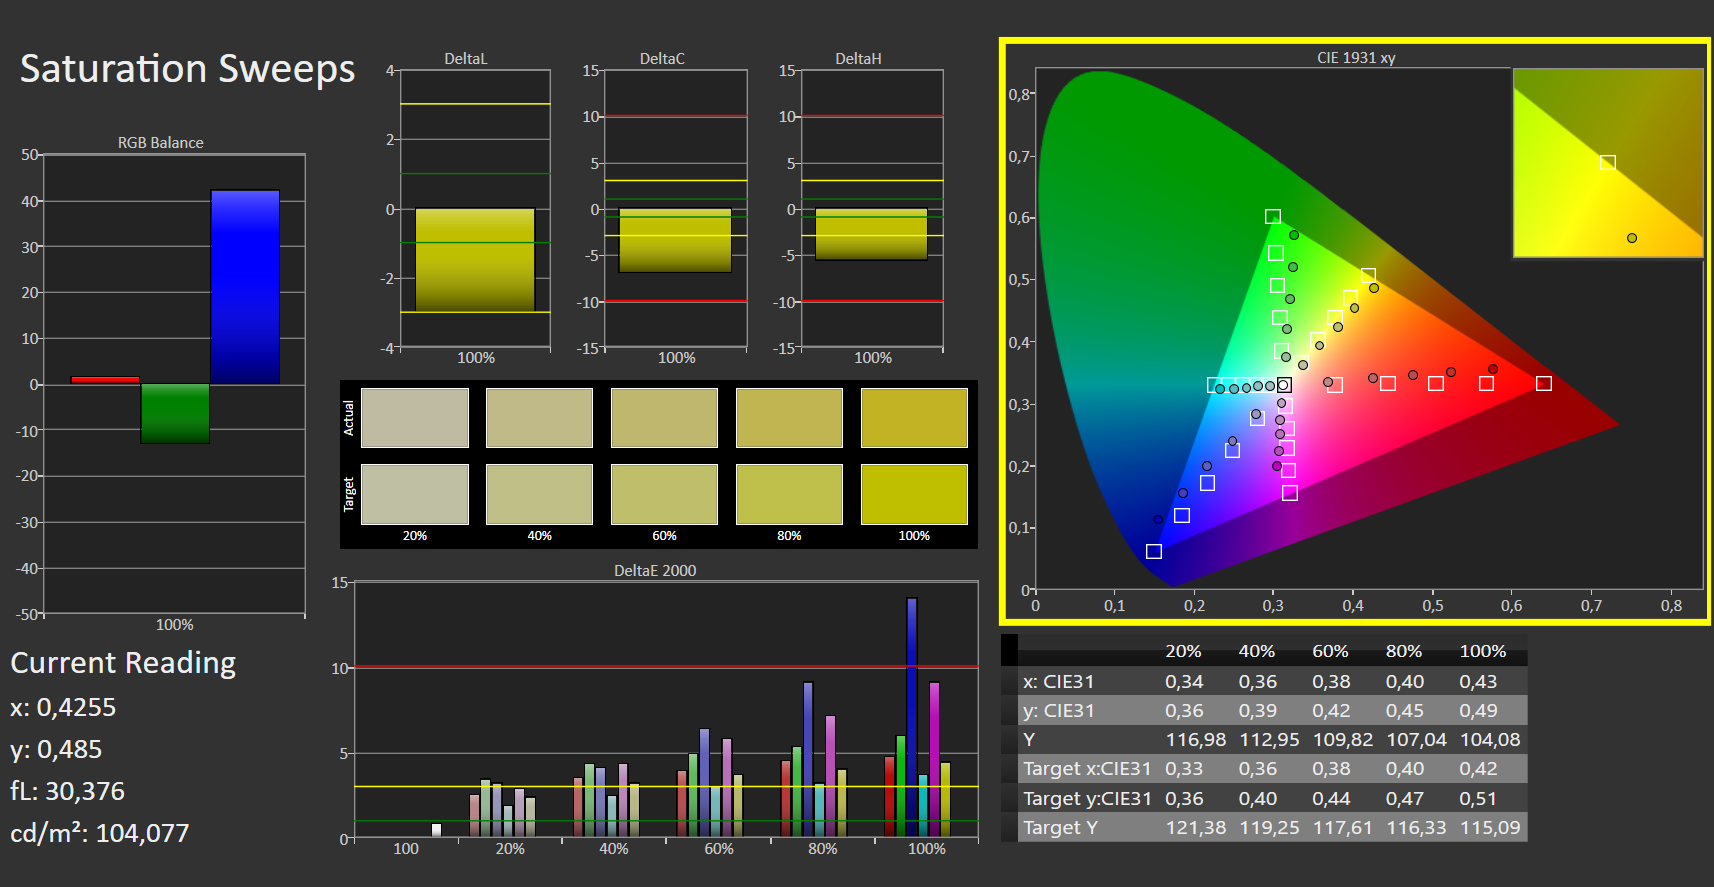
Os espaços de cor AdobeRGB (45%) e sRGB (65%) não são completamente reproduzidos.
A tela mostra uma reprodução de cores bastante decente em seu estado de entrega. Entretanto, com um desvio de cor de Delta E 2000 de 3,6, o alvo (Delta E menos de 3) acaba de ser perdido. A tela não sofre de um elenco azul. A escala de cinza do Delta E é de 2,9. Uma calibração não trouxe uma melhoria - o painel Chi-Mei é aparentemente difícil de calibrar. Os painéis AUO do Swift X (AMD) ou Swift 3 SF314-511 (Intel) poderia melhorar sua reprodução de cores através de calibração.

Exibir tempos de resposta
| ↔ Tempo de resposta preto para branco | ||
|---|---|---|
| 26 ms ... ascensão ↗ e queda ↘ combinadas | ↗ 12 ms ascensão |  |
| ↘ 14 ms queda | ||
| A tela mostra taxas de resposta relativamente lentas em nossos testes e pode ser muito lenta para os jogadores. Em comparação, todos os dispositivos testados variam de 0.1 (mínimo) a 240 (máximo) ms. » 63 % de todos os dispositivos são melhores. Isso significa que o tempo de resposta medido é pior que a média de todos os dispositivos testados (19.8 ms). | ||
| ↔ Tempo de resposta 50% cinza a 80% cinza | ||
| 37 ms ... ascensão ↗ e queda ↘ combinadas | ↗ 18 ms ascensão |  |
| ↘ 19 ms queda | ||
| A tela mostra taxas de resposta lentas em nossos testes e será insatisfatória para os jogadores. Em comparação, todos os dispositivos testados variam de 0.165 (mínimo) a 636 (máximo) ms. » 53 % de todos os dispositivos são melhores. Isso significa que o tempo de resposta medido é pior que a média de todos os dispositivos testados (31 ms). | ||
Cintilação da tela / PWM (modulação por largura de pulso)
| Tela tremeluzindo/PWM detectado | 25000 Hz | ≤ 20 % configuração de brilho |  |
A luz de fundo da tela pisca em 25000 Hz (pior caso, por exemplo, utilizando PWM) Cintilação detectada em uma configuração de brilho de 20 % e abaixo. Não deve haver cintilação ou PWM acima desta configuração de brilho. A frequência de 25000 Hz é bastante alta, então a maioria dos usuários sensíveis ao PWM não deve notar nenhuma oscilação. [pwm_comparison] Em comparação: 52 % de todos os dispositivos testados não usam PWM para escurecer a tela. Se PWM foi detectado, uma média de 7754 (mínimo: 5 - máximo: 343500) Hz foi medida. | |||
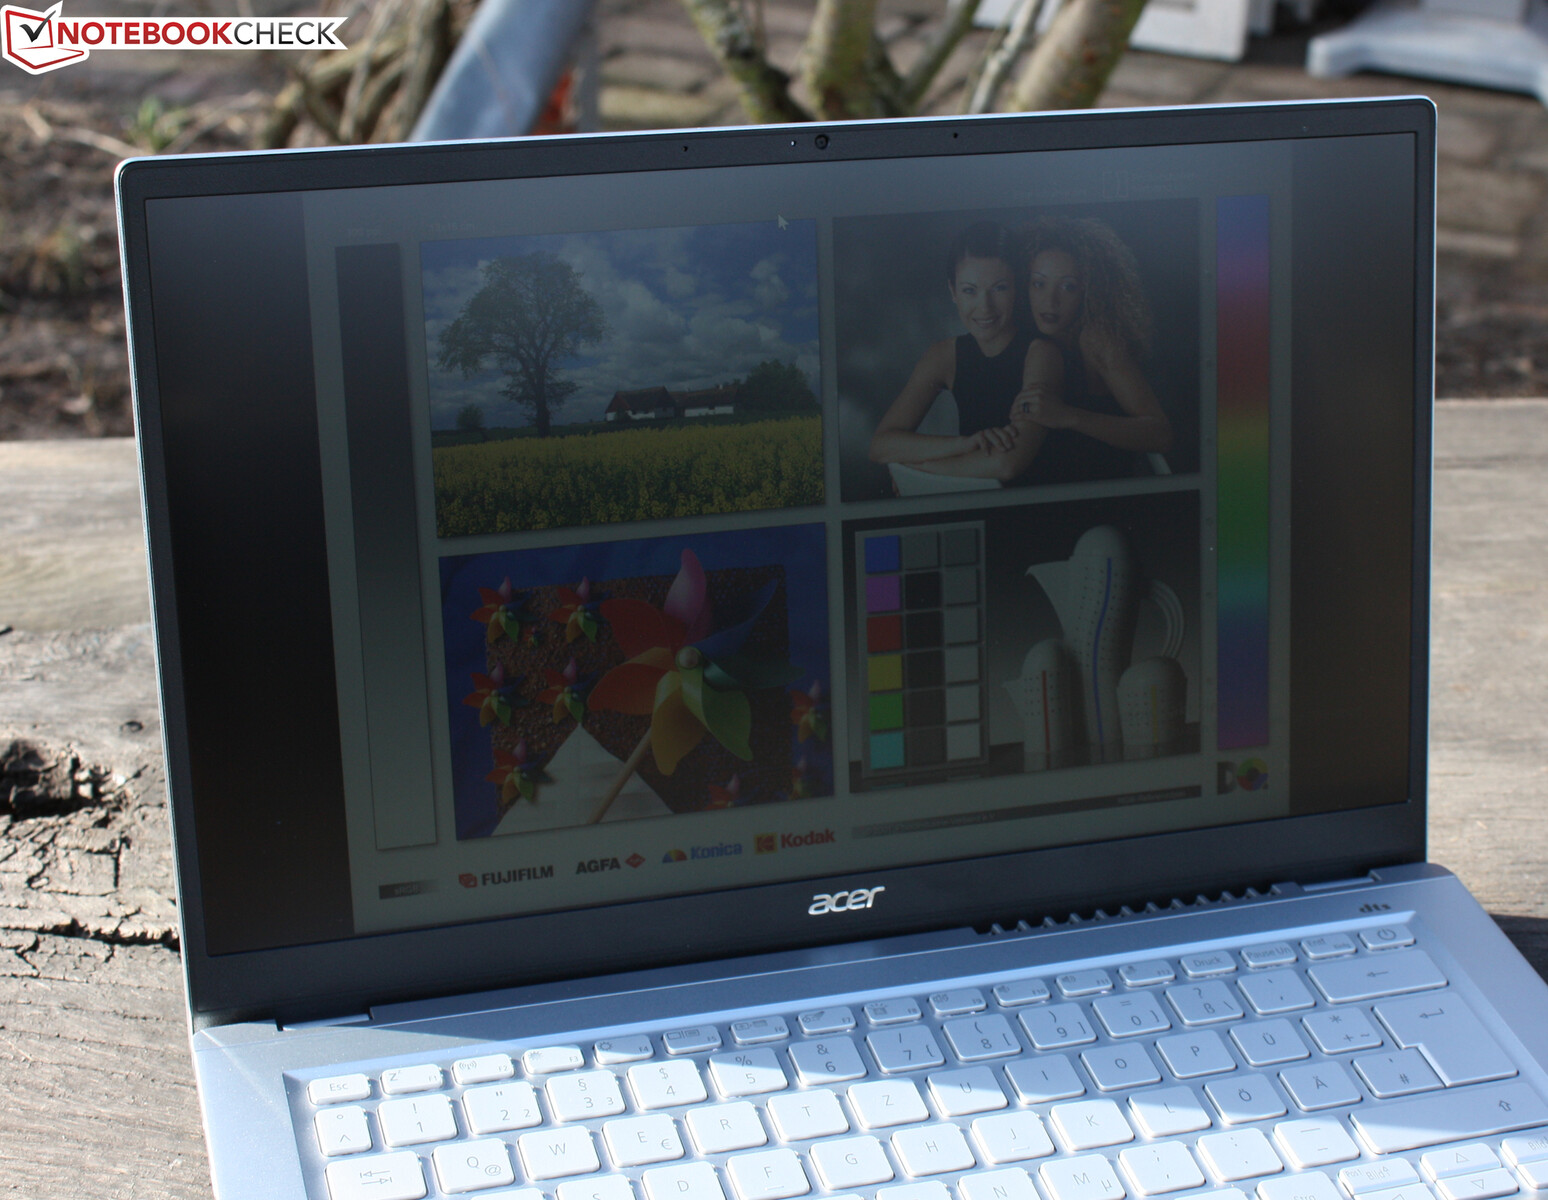
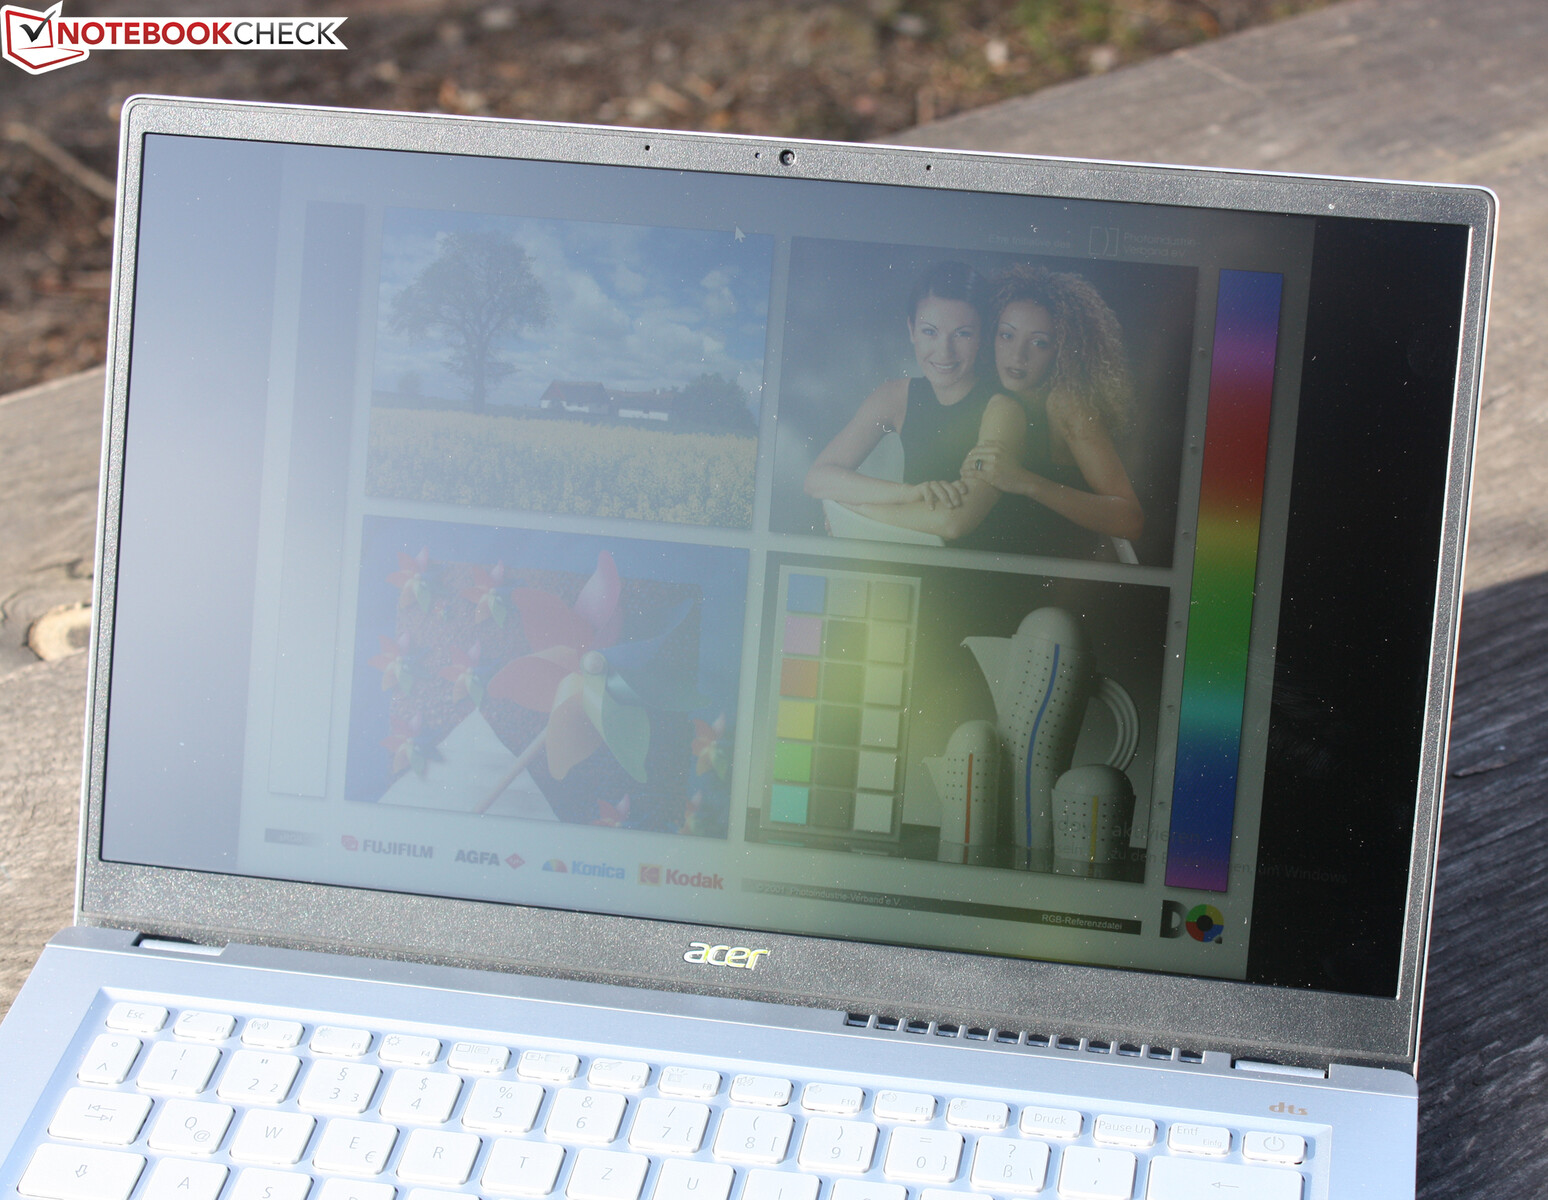
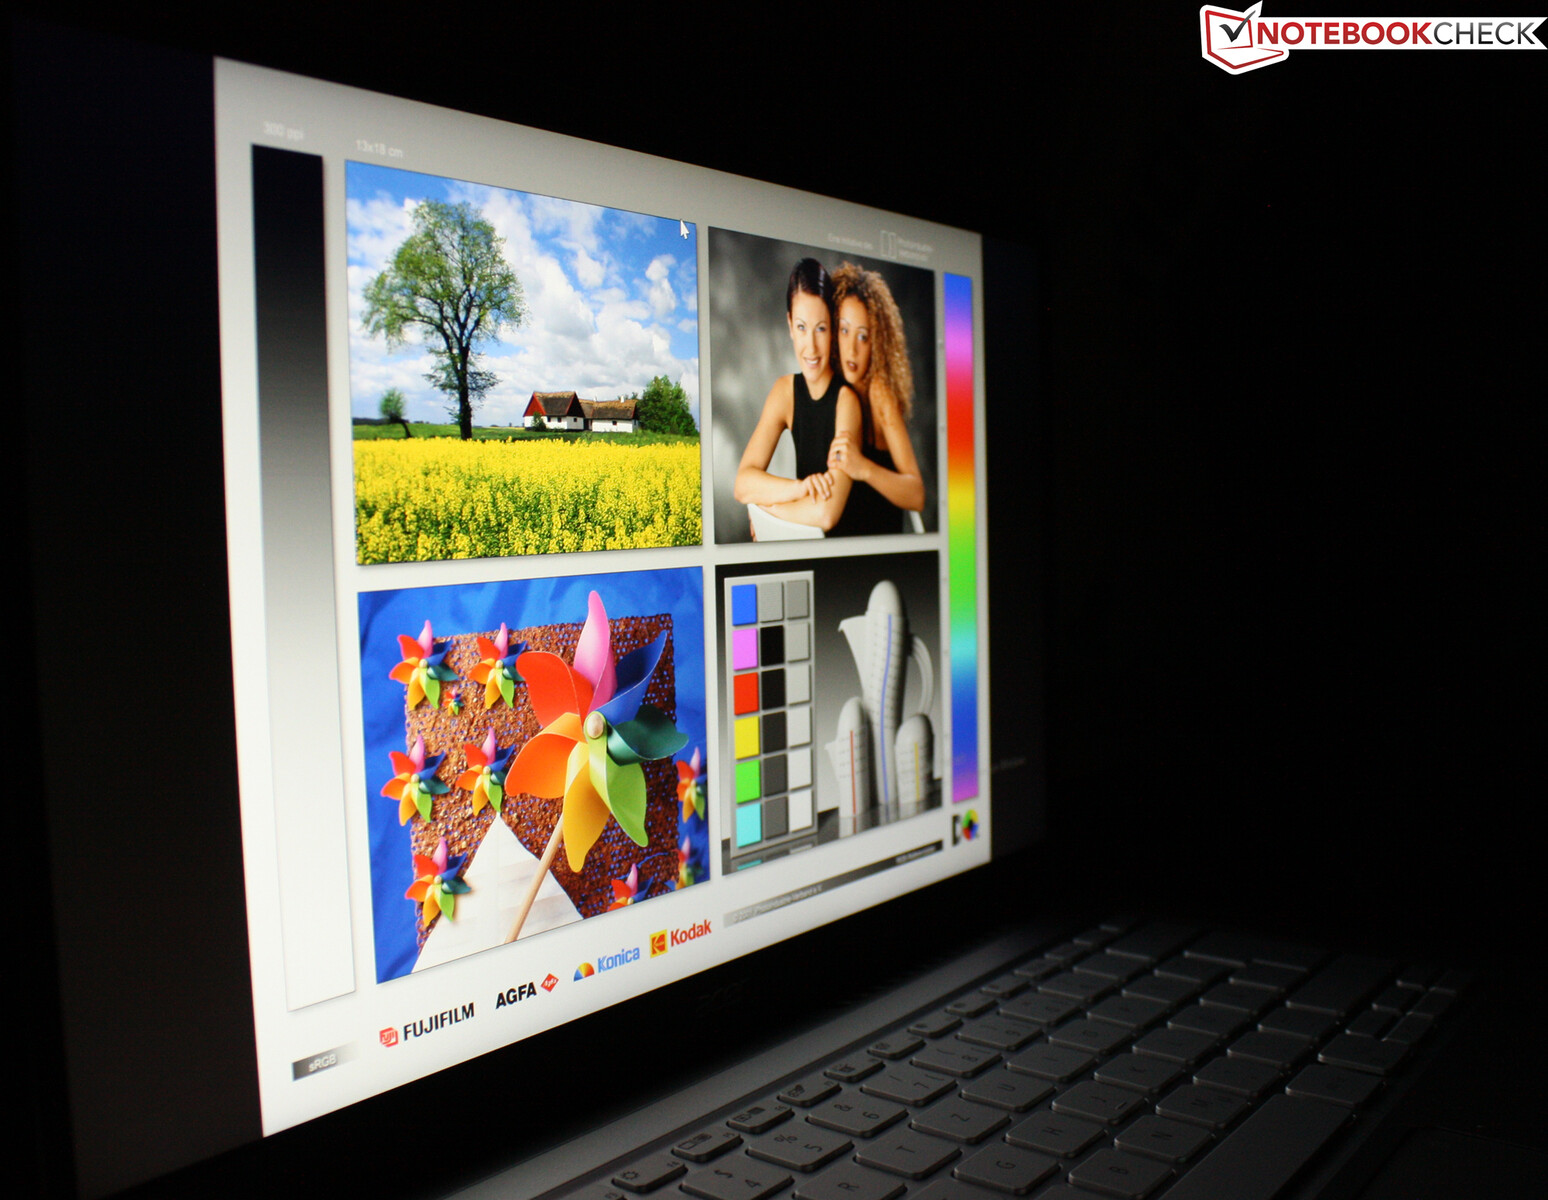
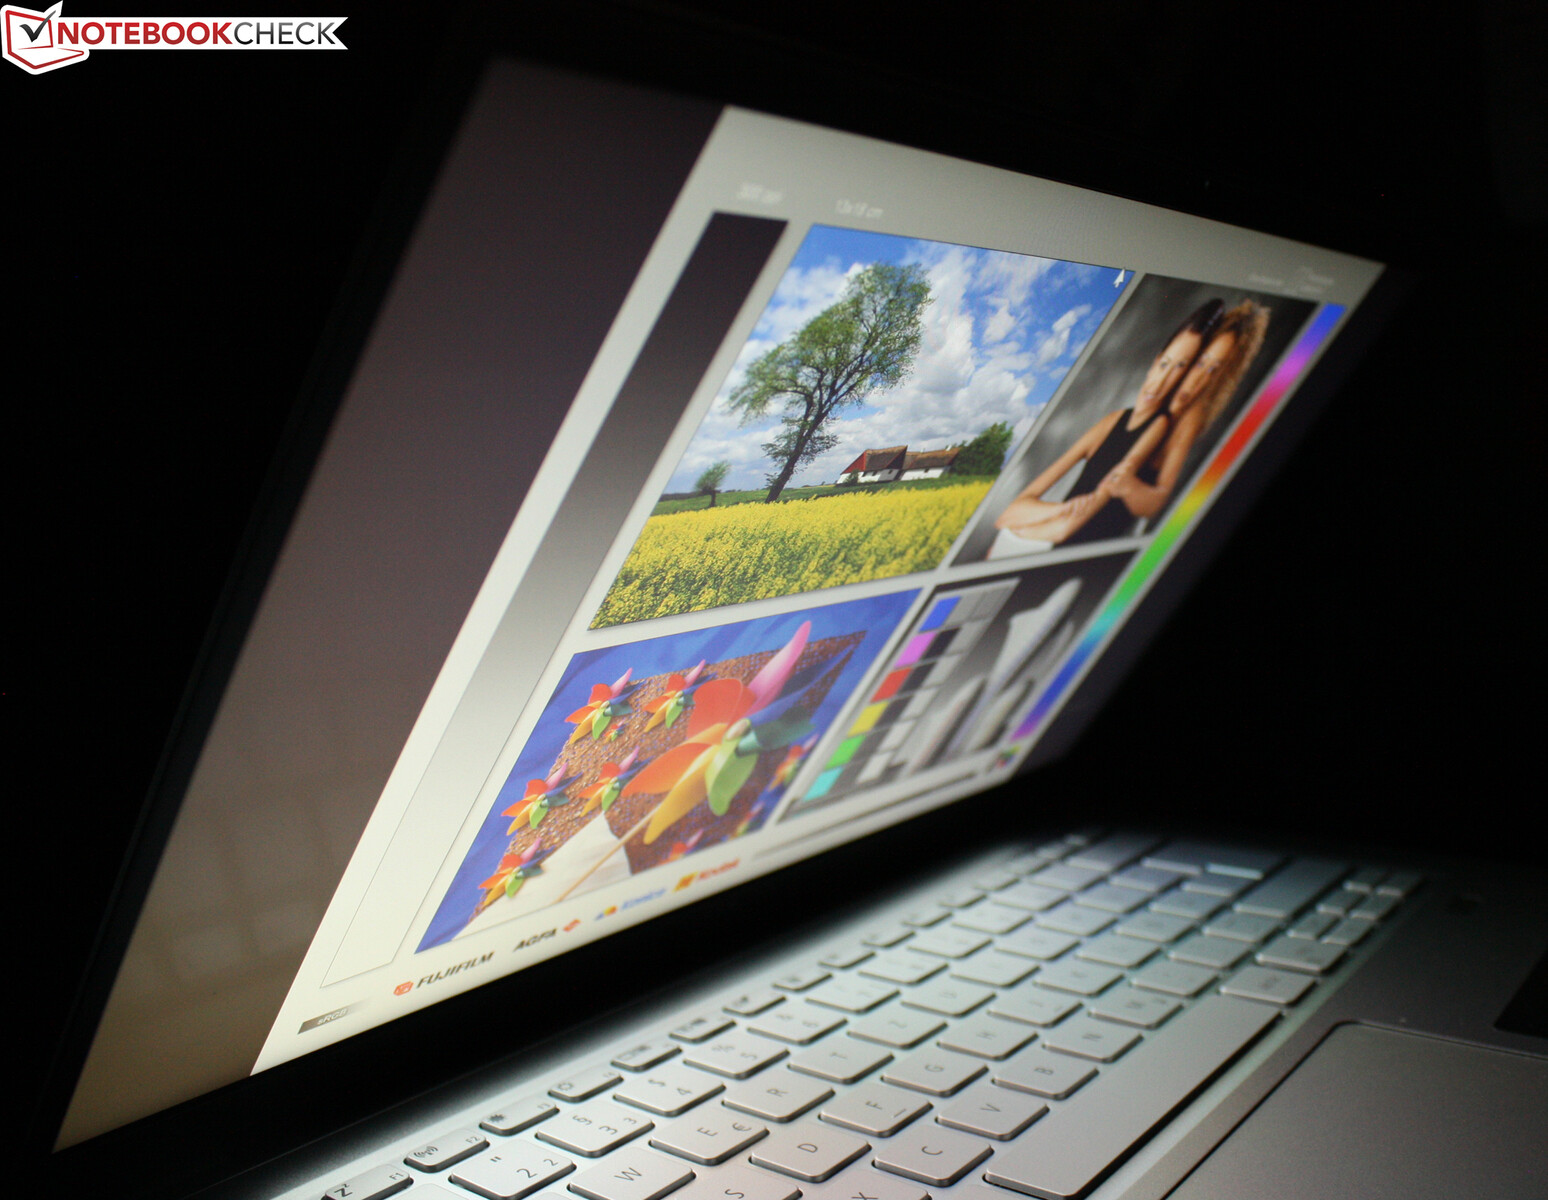
O Swift 3 vem com um painel IPS com ângulos de visão estáveis. Assim, a tela pode ser lida a partir de cada posição. A baixa luminosidade máxima da tela impede em grande parte a leitura ao sol. Se você não desativar o Vari Bright, você perderá uma boa quantidade de luminância. Este aparelho de 14 polegadas é feito principalmente para uso interno. Pelo menos, a superfície fosca garante reflexos mínimos.
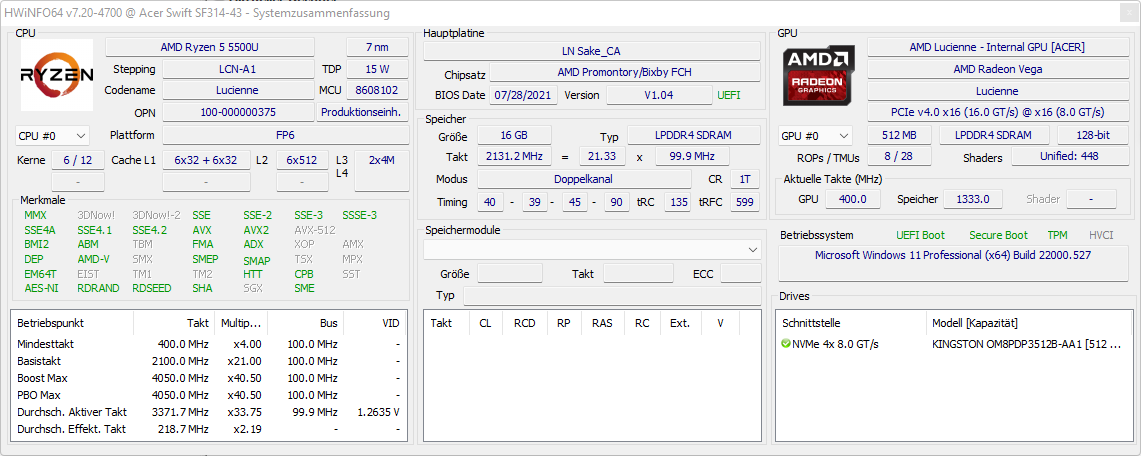
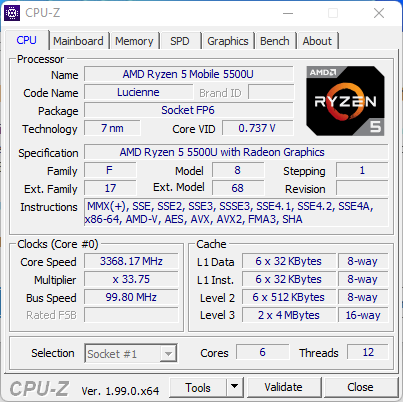
Desempenho: Não há AMD de alto vôo desta vez
As configurações AMD disponíveis para a Swift 3 incluem configurações baseadas noRyzen 5 5500U, 5700U e 5300U. Os modelos AMD são oferecidos com 8 ou 16 GB de RAM. A escolha deve ser considerada cuidadosamente porque a memória de trabalho não pode ser alterada ou atualizada à medida que é soldada. O mesmo se aplica ao SSD, que é oferecido de 256 GB a 1 TB. O disco rígido é plugado, mas um segundo soquete M.2 - como no Swift X- não está disponível.
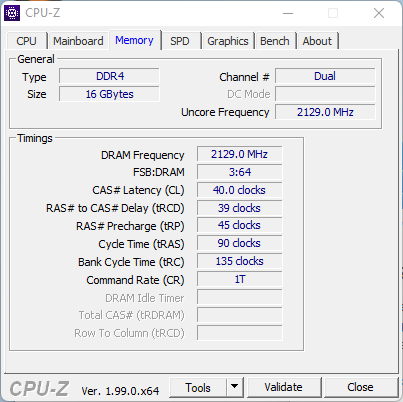
A RAM funciona como um canal duplo, o que faz com que o desempenho seja um pouco maior quando se joga. Sentimos que nossa variante de teste com a Ryzen 5 5500Uo SSD de 512 GB e 16 GB de RAM oferece a melhor relação preço-desempenho.
Condições de teste
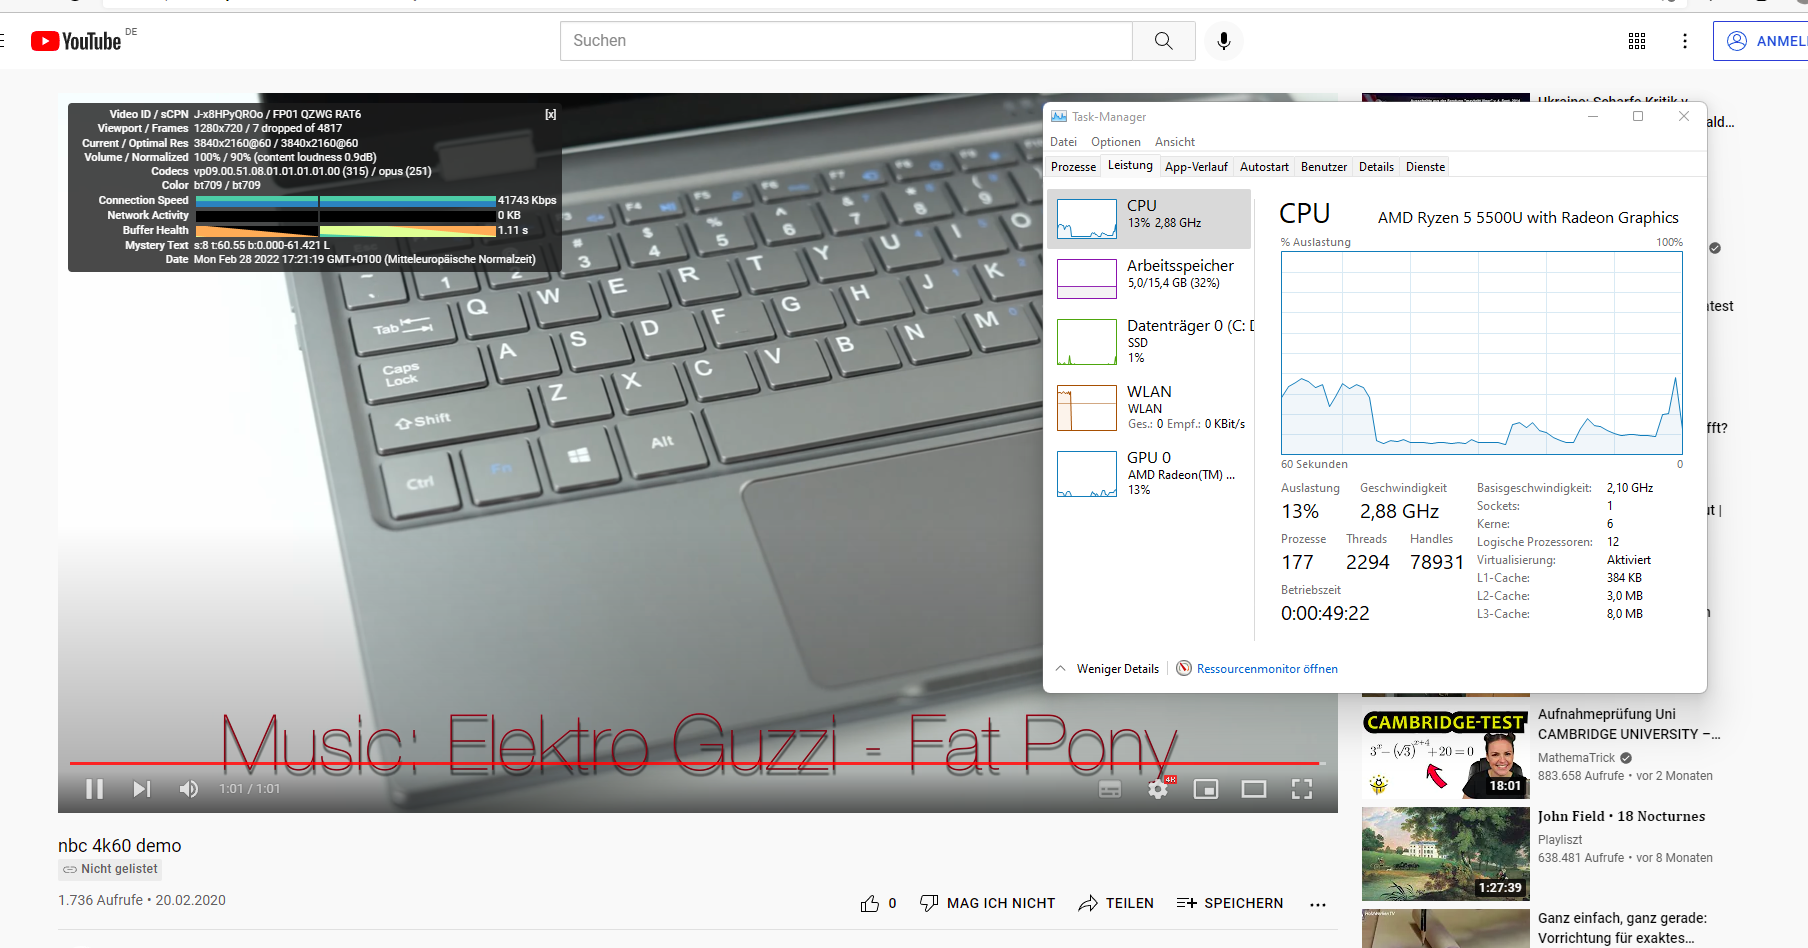
Instalamos o Windows depois de remover o Linux eShell. Assim, somente o gerenciamento de energia do Windows estava disponível. Isto foi definido para "Melhor desempenho" para os testes de desempenho e para "Melhor economia de energia" durante os testes de resistência.
Processador
O Ryzen 5 5500Urelógios de até 3,9 GHz no Swift 3. Este núcleo de seis núcleos desde o início de 2021 tem bom desempenho computacional, mas tem que admitir a derrota para os processadores da 11ª geração da Intel em um único núcleo. Os Ryzen sempre batem os rivais Intel do Core i5 ao Core i7 em multi-core. No entanto, o Ryzen 5 5500U da amostra de revisão está logo abaixo de sua própria média do banco de dados em muitos pontos de referência, embora a diferença de -1% seja marginal.
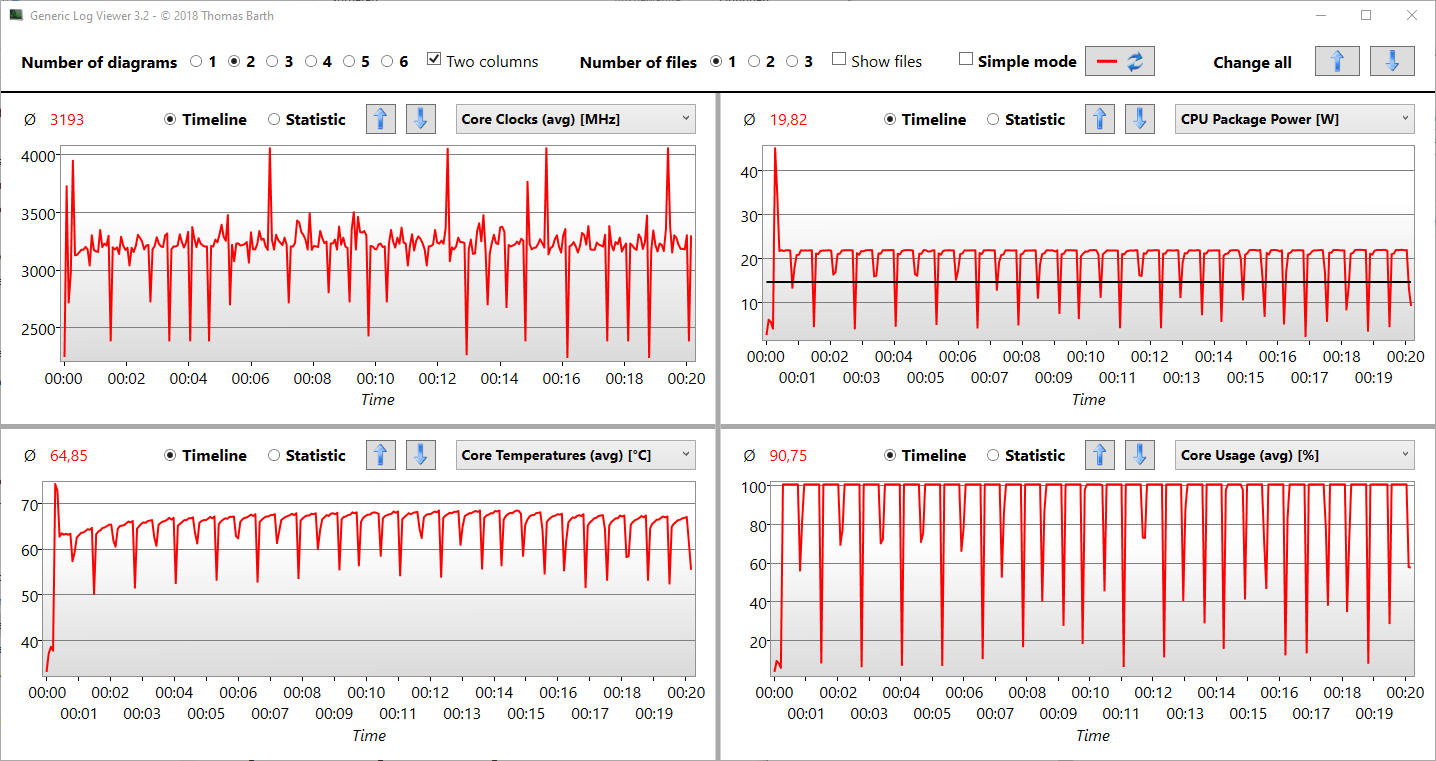
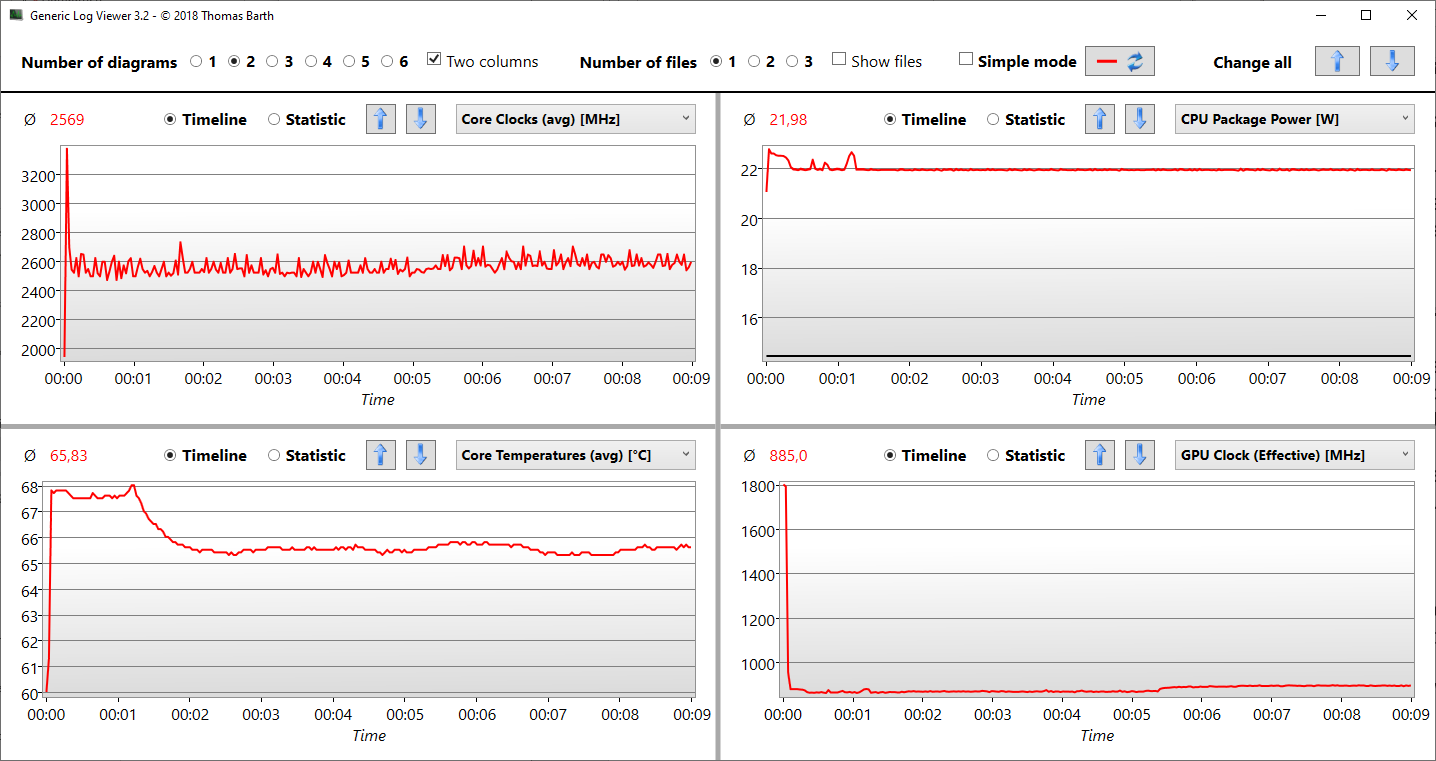
O desempenho da CPU depende do conjunto TDP e do resfriamento. Vemos um máximo de 45 W como potência do pacote da CPU durante as medições do Cinebench, que deve corresponder ao PL2/Short Burst. No entanto, isto só pode ser mantido por alguns segundos, após os quais continua a 22 W (3,2 ao invés de 3,9 GHz). Este nível é então mantido do primeiro ao último loop, com exceção de alguns picos de relógio durante o decorrer do teste. O desempenho não diminui no modo de bateria como é evidente nos últimos 5 minutos do loop R15 executado em energia da bateria.
Devido ao uso extremamente curto do PL2 e à limitação drástica a apenas 22 W, os resultados do loop R15 quase parecem uma linha reta sem desvios. Aqui, a Acer optou por uma abordagem muito conservadora do TDP em favor do calor residual e do baixo ruído, o que não extrai a última grama de desempenho do APU, ao contrário do que vimos com o Lenovo ThinkPad E14 G3. O desempenho da Swift 3 com um tubo de aquecimento duplo é mostrado por sua irmã Swift X SFX14 (R5 5500U), que pode manter um alto desempenho (PL2) para 4 a 5 corridas e é, portanto, 12% mais rápido na primeira corrida.
Cinebench R15 Multi Dauertest
Cinebench R23: Multi Core | Single Core
Cinebench R20: CPU (Multi Core) | CPU (Single Core)
Cinebench R15: CPU Multi 64Bit | CPU Single 64Bit
Blender: v2.79 BMW27 CPU
7-Zip 18.03: 7z b 4 | 7z b 4 -mmt1
Geekbench 5.5: Multi-Core | Single-Core
HWBOT x265 Benchmark v2.2: 4k Preset
LibreOffice : 20 Documents To PDF
R Benchmark 2.5: Overall mean
| CPU Performance rating | |
| Média da turma Subnotebook | |
| Lenovo ThinkPad E14 G3-20Y7003SGE | |
| Média AMD Ryzen 5 5500U | |
| Acer Swift 3 SF314-43-R8BP | |
| Acer Swift 3 SF314-511-54ZK | |
| Dell Latitude 14 5420-D2G5W | |
| HP Pavilion 14-dv0357ng -6! | |
| Lenovo ThinkBook 14 G2 ITL 20VDS02G00 | |
| Cinebench R23 / Multi Core | |
| Média da turma Subnotebook (1555 - 21812, n=59, últimos 2 anos) | |
| Lenovo ThinkPad E14 G3-20Y7003SGE | |
| Média AMD Ryzen 5 5500U (6030 - 8565, n=19) | |
| Acer Swift 3 SF314-43-R8BP | |
| Acer Swift 3 SF314-511-54ZK | |
| Dell Latitude 14 5420-D2G5W | |
| HP Pavilion 14-dv0357ng | |
| Lenovo ThinkBook 14 G2 ITL 20VDS02G00 | |
| Cinebench R23 / Single Core | |
| Média da turma Subnotebook (358 - 2213, n=60, últimos 2 anos) | |
| Dell Latitude 14 5420-D2G5W | |
| Lenovo ThinkBook 14 G2 ITL 20VDS02G00 | |
| HP Pavilion 14-dv0357ng | |
| Acer Swift 3 SF314-511-54ZK | |
| Lenovo ThinkPad E14 G3-20Y7003SGE | |
| Média AMD Ryzen 5 5500U (1149 - 1183, n=18) | |
| Acer Swift 3 SF314-43-R8BP | |
| Cinebench R20 / CPU (Multi Core) | |
| Média da turma Subnotebook (579 - 8541, n=56, últimos 2 anos) | |
| Lenovo ThinkPad E14 G3-20Y7003SGE | |
| Média AMD Ryzen 5 5500U (2223 - 3316, n=20) | |
| Acer Swift 3 SF314-43-R8BP | |
| Dell Latitude 14 5420-D2G5W | |
| Acer Swift 3 SF314-511-54ZK | |
| HP Pavilion 14-dv0357ng | |
| Lenovo ThinkBook 14 G2 ITL 20VDS02G00 | |
| Cinebench R20 / CPU (Single Core) | |
| Média da turma Subnotebook (128 - 832, n=56, últimos 2 anos) | |
| Acer Swift 3 SF314-511-54ZK | |
| Dell Latitude 14 5420-D2G5W | |
| Lenovo ThinkBook 14 G2 ITL 20VDS02G00 | |
| Lenovo ThinkPad E14 G3-20Y7003SGE | |
| Acer Swift 3 SF314-43-R8BP | |
| Média AMD Ryzen 5 5500U (449 - 461, n=19) | |
| HP Pavilion 14-dv0357ng | |
| Cinebench R15 / CPU Multi 64Bit | |
| Média da turma Subnotebook (327 - 3345, n=56, últimos 2 anos) | |
| Lenovo ThinkPad E14 G3-20Y7003SGE | |
| Média AMD Ryzen 5 5500U (995 - 1412, n=20) | |
| Acer Swift 3 SF314-43-R8BP | |
| Acer Swift 3 SF314-511-54ZK | |
| Dell Latitude 14 5420-D2G5W | |
| HP Pavilion 14-dv0357ng | |
| Lenovo ThinkBook 14 G2 ITL 20VDS02G00 | |
| Cinebench R15 / CPU Single 64Bit | |
| Média da turma Subnotebook (72.4 - 322, n=56, últimos 2 anos) | |
| Dell Latitude 14 5420-D2G5W | |
| Acer Swift 3 SF314-511-54ZK | |
| Lenovo ThinkPad E14 G3-20Y7003SGE | |
| Média AMD Ryzen 5 5500U (170 - 179, n=18) | |
| Acer Swift 3 SF314-43-R8BP | |
| Lenovo ThinkBook 14 G2 ITL 20VDS02G00 | |
| Blender / v2.79 BMW27 CPU | |
| Lenovo ThinkBook 14 G2 ITL 20VDS02G00 | |
| HP Pavilion 14-dv0357ng | |
| Acer Swift 3 SF314-511-54ZK | |
| Dell Latitude 14 5420-D2G5W | |
| Média AMD Ryzen 5 5500U (358 - 490, n=18) | |
| Acer Swift 3 SF314-43-R8BP | |
| Lenovo ThinkPad E14 G3-20Y7003SGE | |
| Média da turma Subnotebook (159 - 2271, n=57, últimos 2 anos) | |
| 7-Zip 18.03 / 7z b 4 | |
| Média da turma Subnotebook (11668 - 77867, n=56, últimos 2 anos) | |
| Lenovo ThinkPad E14 G3-20Y7003SGE | |
| Média AMD Ryzen 5 5500U (29585 - 36896, n=18) | |
| Acer Swift 3 SF314-43-R8BP | |
| Acer Swift 3 SF314-511-54ZK | |
| Dell Latitude 14 5420-D2G5W | |
| HP Pavilion 14-dv0357ng | |
| Lenovo ThinkBook 14 G2 ITL 20VDS02G00 | |
| 7-Zip 18.03 / 7z b 4 -mmt1 | |
| Média da turma Subnotebook (2643 - 6699, n=58, últimos 2 anos) | |
| HP Pavilion 14-dv0357ng | |
| Dell Latitude 14 5420-D2G5W | |
| Lenovo ThinkBook 14 G2 ITL 20VDS02G00 | |
| Acer Swift 3 SF314-511-54ZK | |
| Média AMD Ryzen 5 5500U (4174 - 4378, n=19) | |
| Lenovo ThinkPad E14 G3-20Y7003SGE | |
| Acer Swift 3 SF314-43-R8BP | |
| Geekbench 5.5 / Multi-Core | |
| Média da turma Subnotebook (2557 - 17218, n=48, últimos 2 anos) | |
| Acer Swift 3 SF314-43-R8BP | |
| Lenovo ThinkPad E14 G3-20Y7003SGE | |
| Média AMD Ryzen 5 5500U (4063 - 5917, n=20) | |
| Acer Swift 3 SF314-511-54ZK | |
| Dell Latitude 14 5420-D2G5W | |
| Lenovo ThinkBook 14 G2 ITL 20VDS02G00 | |
| Geekbench 5.5 / Single-Core | |
| Média da turma Subnotebook (726 - 2224, n=48, últimos 2 anos) | |
| Acer Swift 3 SF314-511-54ZK | |
| Lenovo ThinkBook 14 G2 ITL 20VDS02G00 | |
| Dell Latitude 14 5420-D2G5W | |
| Lenovo ThinkPad E14 G3-20Y7003SGE | |
| Acer Swift 3 SF314-43-R8BP | |
| Média AMD Ryzen 5 5500U (1070 - 1126, n=20) | |
| HWBOT x265 Benchmark v2.2 / 4k Preset | |
| Média da turma Subnotebook (0.97 - 25.1, n=56, últimos 2 anos) | |
| Acer Swift 3 SF314-43-R8BP | |
| Lenovo ThinkPad E14 G3-20Y7003SGE | |
| Média AMD Ryzen 5 5500U (6.7 - 9.74, n=20) | |
| Acer Swift 3 SF314-511-54ZK | |
| Dell Latitude 14 5420-D2G5W | |
| Lenovo ThinkBook 14 G2 ITL 20VDS02G00 | |
| LibreOffice / 20 Documents To PDF | |
| Acer Swift 3 SF314-43-R8BP | |
| Média AMD Ryzen 5 5500U (60 - 80.7, n=17) | |
| Lenovo ThinkPad E14 G3-20Y7003SGE | |
| Média da turma Subnotebook (39.9 - 220, n=55, últimos 2 anos) | |
| Dell Latitude 14 5420-D2G5W | |
| Acer Swift 3 SF314-511-54ZK | |
| Lenovo ThinkBook 14 G2 ITL 20VDS02G00 | |
| R Benchmark 2.5 / Overall mean | |
| Lenovo ThinkBook 14 G2 ITL 20VDS02G00 | |
| Dell Latitude 14 5420-D2G5W | |
| Acer Swift 3 SF314-511-54ZK | |
| Média AMD Ryzen 5 5500U (0.607 - 0.67, n=19) | |
| Acer Swift 3 SF314-43-R8BP | |
| Lenovo ThinkPad E14 G3-20Y7003SGE | |
| Média da turma Subnotebook (0.4024 - 1.456, n=57, últimos 2 anos) | |
* ... menor é melhor
AIDA64: FP32 Ray-Trace | FPU Julia | CPU SHA3 | CPU Queen | FPU SinJulia | FPU Mandel | CPU AES | CPU ZLib | FP64 Ray-Trace | CPU PhotoWorxx
| Performance rating | |
| Média da turma Subnotebook | |
| Lenovo ThinkPad E14 G3-20Y7003SGE | |
| Média AMD Ryzen 5 5500U | |
| Acer Swift 3 SF314-43-R8BP | |
| Dell Latitude 14 5420-D2G5W | |
| Acer Swift 3 SF314-511-54ZK | |
| Lenovo ThinkBook 14 G2 ITL 20VDS02G00 | |
| AIDA64 / FP32 Ray-Trace | |
| Média da turma Subnotebook (1135 - 32888, n=57, últimos 2 anos) | |
| Lenovo ThinkPad E14 G3-20Y7003SGE | |
| Média AMD Ryzen 5 5500U (7222 - 10680, n=18) | |
| Acer Swift 3 SF314-43-R8BP | |
| Dell Latitude 14 5420-D2G5W | |
| Acer Swift 3 SF314-511-54ZK | |
| Lenovo ThinkBook 14 G2 ITL 20VDS02G00 | |
| AIDA64 / FPU Julia | |
| Média da turma Subnotebook (5218 - 123315, n=57, últimos 2 anos) | |
| Lenovo ThinkPad E14 G3-20Y7003SGE | |
| Média AMD Ryzen 5 5500U (41815 - 58107, n=18) | |
| Acer Swift 3 SF314-43-R8BP | |
| Dell Latitude 14 5420-D2G5W | |
| Acer Swift 3 SF314-511-54ZK | |
| Lenovo ThinkBook 14 G2 ITL 20VDS02G00 | |
| AIDA64 / CPU SHA3 | |
| Média da turma Subnotebook (444 - 5287, n=57, últimos 2 anos) | |
| Dell Latitude 14 5420-D2G5W | |
| Acer Swift 3 SF314-511-54ZK | |
| Lenovo ThinkPad E14 G3-20Y7003SGE | |
| Média AMD Ryzen 5 5500U (1354 - 1907, n=18) | |
| Acer Swift 3 SF314-43-R8BP | |
| Lenovo ThinkBook 14 G2 ITL 20VDS02G00 | |
| AIDA64 / CPU Queen | |
| Acer Swift 3 SF314-43-R8BP | |
| Média AMD Ryzen 5 5500U (68235 - 74033, n=18) | |
| Lenovo ThinkPad E14 G3-20Y7003SGE | |
| Média da turma Subnotebook (10579 - 95002, n=48, últimos 2 anos) | |
| Dell Latitude 14 5420-D2G5W | |
| Acer Swift 3 SF314-511-54ZK | |
| Lenovo ThinkBook 14 G2 ITL 20VDS02G00 | |
| AIDA64 / FPU SinJulia | |
| Lenovo ThinkPad E14 G3-20Y7003SGE | |
| Média AMD Ryzen 5 5500U (9007 - 10446, n=18) | |
| Acer Swift 3 SF314-43-R8BP | |
| Média da turma Subnotebook (744 - 18418, n=57, últimos 2 anos) | |
| Dell Latitude 14 5420-D2G5W | |
| Acer Swift 3 SF314-511-54ZK | |
| Lenovo ThinkBook 14 G2 ITL 20VDS02G00 | |
| AIDA64 / FPU Mandel | |
| Média da turma Subnotebook (3341 - 65433, n=57, últimos 2 anos) | |
| Lenovo ThinkPad E14 G3-20Y7003SGE | |
| Média AMD Ryzen 5 5500U (21894 - 30659, n=18) | |
| Acer Swift 3 SF314-43-R8BP | |
| Dell Latitude 14 5420-D2G5W | |
| Acer Swift 3 SF314-511-54ZK | |
| Lenovo ThinkBook 14 G2 ITL 20VDS02G00 | |
| AIDA64 / CPU AES | |
| Dell Latitude 14 5420-D2G5W | |
| Média da turma Subnotebook (638 - 96917, n=57, últimos 2 anos) | |
| Lenovo ThinkPad E14 G3-20Y7003SGE | |
| Média AMD Ryzen 5 5500U (31792 - 54455, n=18) | |
| Acer Swift 3 SF314-43-R8BP | |
| Acer Swift 3 SF314-511-54ZK | |
| Lenovo ThinkBook 14 G2 ITL 20VDS02G00 | |
| AIDA64 / CPU ZLib | |
| Média da turma Subnotebook (164.9 - 1379, n=57, últimos 2 anos) | |
| Lenovo ThinkPad E14 G3-20Y7003SGE | |
| Média AMD Ryzen 5 5500U (234 - 614, n=18) | |
| Acer Swift 3 SF314-43-R8BP | |
| Dell Latitude 14 5420-D2G5W | |
| Acer Swift 3 SF314-511-54ZK | |
| Lenovo ThinkBook 14 G2 ITL 20VDS02G00 | |
| AIDA64 / FP64 Ray-Trace | |
| Média da turma Subnotebook (610 - 17495, n=57, últimos 2 anos) | |
| Lenovo ThinkPad E14 G3-20Y7003SGE | |
| Média AMD Ryzen 5 5500U (3943 - 5717, n=18) | |
| Acer Swift 3 SF314-43-R8BP | |
| Dell Latitude 14 5420-D2G5W | |
| Acer Swift 3 SF314-511-54ZK | |
| Lenovo ThinkBook 14 G2 ITL 20VDS02G00 | |
| AIDA64 / CPU PhotoWorxx | |
| Média da turma Subnotebook (6569 - 85600, n=57, últimos 2 anos) | |
| Acer Swift 3 SF314-511-54ZK | |
| Acer Swift 3 SF314-43-R8BP | |
| Lenovo ThinkPad E14 G3-20Y7003SGE | |
| Média AMD Ryzen 5 5500U (7765 - 22932, n=18) | |
| Dell Latitude 14 5420-D2G5W | |
| Lenovo ThinkBook 14 G2 ITL 20VDS02G00 | |
Desempenho do sistema
O desempenho da aplicação é, portanto, um pouco pior do que um Lenovo ThinkPad E14 G3por exemplo, que é capaz de extrair mais desempenho do R5 5500U. Os testes de produtividade e Essentials no PCMark 10 sofrem especialmente. Em contraste, o dispositivo de teste está bem à frente na Criação de Conteúdo Digital, o que poderia ser devido à rápida memória de trabalho de dois canais (ver testes AIDA64) e à baixa latência. O SSD da Kingston não tem um efeito positivo aqui; ele é apenas moderadamente rápido.
CrossMark: Overall | Productivity | Creativity | Responsiveness
| PCMark 10 / Score | |
| Média da turma Subnotebook (4920 - 9939, n=45, últimos 2 anos) | |
| Lenovo ThinkPad E14 G3-20Y7003SGE | |
| Média AMD Ryzen 5 5500U, AMD Radeon RX Vega 7 (4626 - 5301, n=13) | |
| Acer Swift 3 SF314-511-54ZK | |
| Acer Swift 3 SF314-43-R8BP | |
| HP Pavilion 14-dv0357ng | |
| Dell Latitude 14 5420-D2G5W | |
| Lenovo ThinkBook 14 G2 ITL 20VDS02G00 | |
| PCMark 10 / Essentials | |
| Média da turma Subnotebook (8552 - 11646, n=45, últimos 2 anos) | |
| HP Pavilion 14-dv0357ng | |
| Acer Swift 3 SF314-511-54ZK | |
| Lenovo ThinkPad E14 G3-20Y7003SGE | |
| Média AMD Ryzen 5 5500U, AMD Radeon RX Vega 7 (8390 - 9789, n=13) | |
| Lenovo ThinkBook 14 G2 ITL 20VDS02G00 | |
| Dell Latitude 14 5420-D2G5W | |
| Acer Swift 3 SF314-43-R8BP | |
| PCMark 10 / Productivity | |
| Média da turma Subnotebook (5435 - 16606, n=45, últimos 2 anos) | |
| Lenovo ThinkPad E14 G3-20Y7003SGE | |
| Média AMD Ryzen 5 5500U, AMD Radeon RX Vega 7 (6262 - 7958, n=13) | |
| HP Pavilion 14-dv0357ng | |
| Lenovo ThinkBook 14 G2 ITL 20VDS02G00 | |
| Acer Swift 3 SF314-511-54ZK | |
| Acer Swift 3 SF314-43-R8BP | |
| Dell Latitude 14 5420-D2G5W | |
| PCMark 10 / Digital Content Creation | |
| Média da turma Subnotebook (5722 - 13779, n=45, últimos 2 anos) | |
| Acer Swift 3 SF314-43-R8BP | |
| Acer Swift 3 SF314-511-54ZK | |
| Média AMD Ryzen 5 5500U, AMD Radeon RX Vega 7 (4513 - 5540, n=13) | |
| Lenovo ThinkPad E14 G3-20Y7003SGE | |
| Dell Latitude 14 5420-D2G5W | |
| HP Pavilion 14-dv0357ng | |
| Lenovo ThinkBook 14 G2 ITL 20VDS02G00 | |
| CrossMark / Overall | |
| Média da turma Subnotebook (365 - 2356, n=59, últimos 2 anos) | |
| Acer Swift 3 SF314-511-54ZK | |
| Dell Latitude 14 5420-D2G5W | |
| Acer Swift 3 SF314-43-R8BP | |
| Média AMD Ryzen 5 5500U, AMD Radeon RX Vega 7 (958 - 1103, n=6) | |
| Lenovo ThinkBook 14 G2 ITL 20VDS02G00 | |
| CrossMark / Productivity | |
| Média da turma Subnotebook (364 - 2277, n=59, últimos 2 anos) | |
| Acer Swift 3 SF314-511-54ZK | |
| Dell Latitude 14 5420-D2G5W | |
| Lenovo ThinkBook 14 G2 ITL 20VDS02G00 | |
| Média AMD Ryzen 5 5500U, AMD Radeon RX Vega 7 (1039 - 1153, n=6) | |
| Acer Swift 3 SF314-43-R8BP | |
| CrossMark / Creativity | |
| Média da turma Subnotebook (372 - 2743, n=59, últimos 2 anos) | |
| Acer Swift 3 SF314-511-54ZK | |
| Acer Swift 3 SF314-43-R8BP | |
| Média AMD Ryzen 5 5500U, AMD Radeon RX Vega 7 (895 - 1054, n=6) | |
| Dell Latitude 14 5420-D2G5W | |
| Lenovo ThinkBook 14 G2 ITL 20VDS02G00 | |
| CrossMark / Responsiveness | |
| Média da turma Subnotebook (312 - 1854, n=59, últimos 2 anos) | |
| Acer Swift 3 SF314-511-54ZK | |
| Lenovo ThinkBook 14 G2 ITL 20VDS02G00 | |
| Média AMD Ryzen 5 5500U, AMD Radeon RX Vega 7 (918 - 1112, n=6) | |
| Dell Latitude 14 5420-D2G5W | |
| Acer Swift 3 SF314-43-R8BP | |
| PCMark 10 Score | 4787 pontos | |
Ajuda | ||
| AIDA64 / Memory Copy | |
| Média da turma Subnotebook (14554 - 131023, n=57, últimos 2 anos) | |
| Acer Swift 3 SF314-43-R8BP | |
| Média AMD Ryzen 5 5500U (19083 - 40547, n=18) | |
| AIDA64 / Memory Read | |
| Média da turma Subnotebook (15948 - 127174, n=57, últimos 2 anos) | |
| Acer Swift 3 SF314-43-R8BP | |
| Média AMD Ryzen 5 5500U (23005 - 47024, n=18) | |
| AIDA64 / Memory Write | |
| Média da turma Subnotebook (15709 - 135141, n=57, últimos 2 anos) | |
| Acer Swift 3 SF314-43-R8BP | |
| Média AMD Ryzen 5 5500U (20150 - 42337, n=18) | |
| AIDA64 / Memory Latency | |
| Acer Swift 3 SF314-43-R8BP | |
| Média AMD Ryzen 5 5500U (87.3 - 119, n=18) | |
| Média da turma Subnotebook (6.1 - 159.9, n=55, últimos 2 anos) | |
* ... menor é melhor
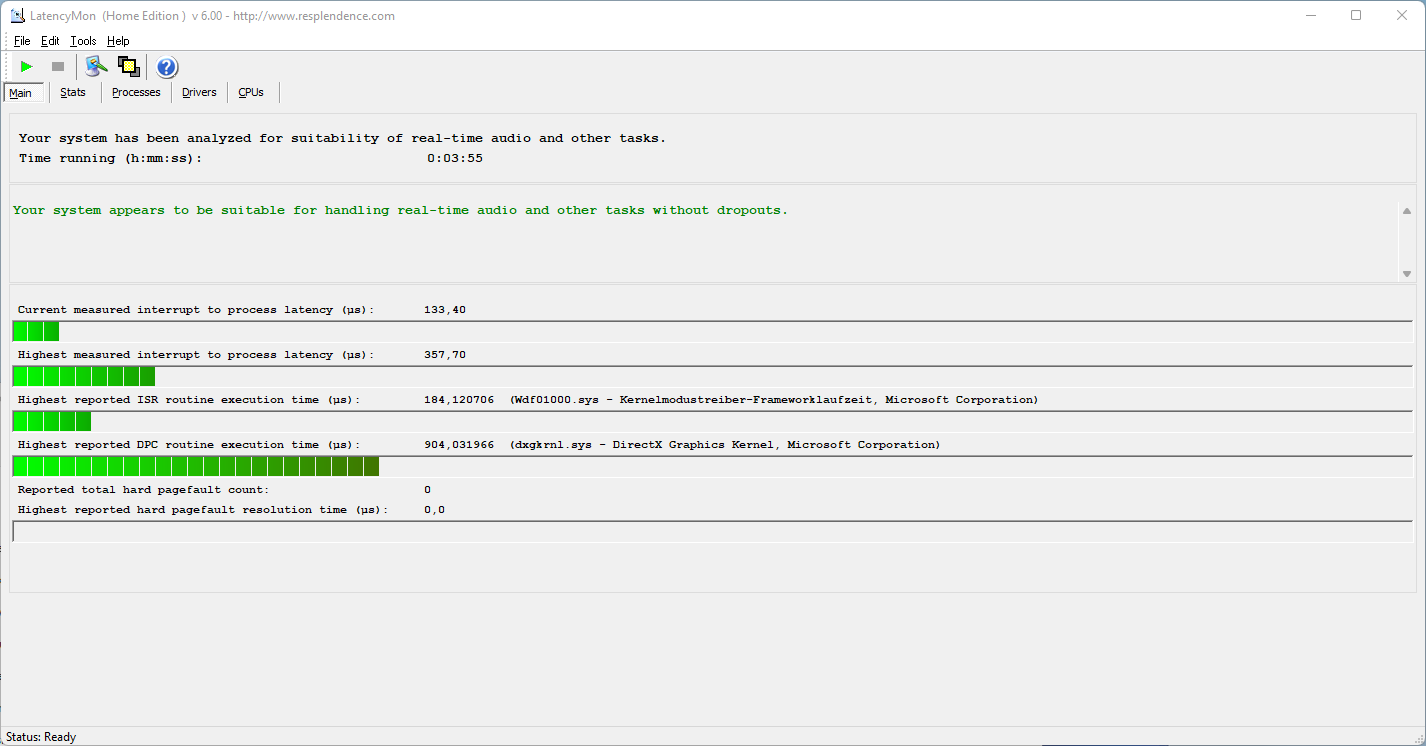
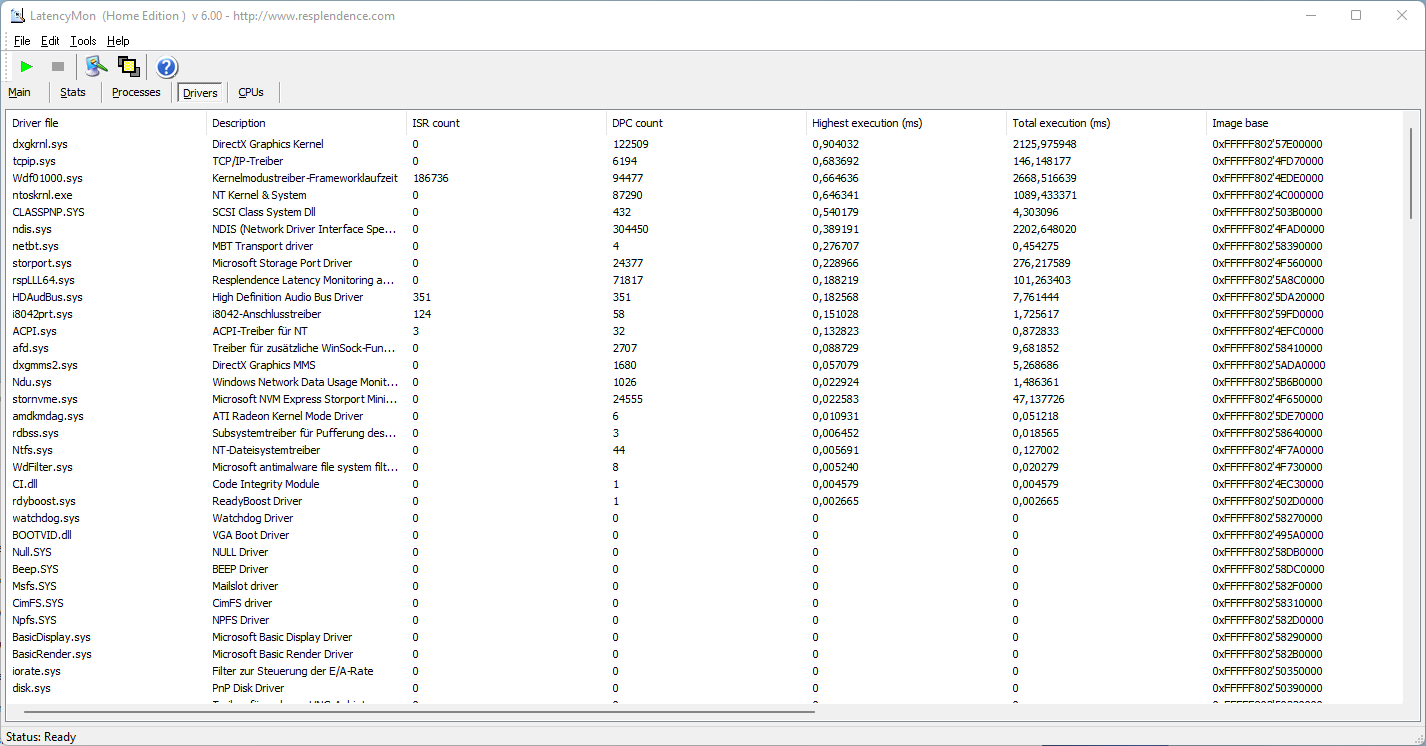
Latência do DPC
No teste com LatencyMon, o Swift 3 quase não mostra nenhum aumento da latência. Portanto, o equipamento de 14 polegadas é bastante adequado para aplicações em tempo real e similares. A medição é baseada na configuração atual do driver.
| DPC Latencies / LatencyMon - interrupt to process latency (max), Web, Youtube, Prime95 | |
| Dell Latitude 14 5420-D2G5W | |
| Lenovo ThinkBook 14 G2 ITL 20VDS02G00 | |
| HP Pavilion 14-dv0357ng | |
| Acer Swift 3 SF314-511-54ZK | |
| Lenovo ThinkPad E14 G3-20Y7003SGE | |
| Acer Swift 3 SF314-43-R8BP | |
* ... menor é melhor
Armazenamento em massa
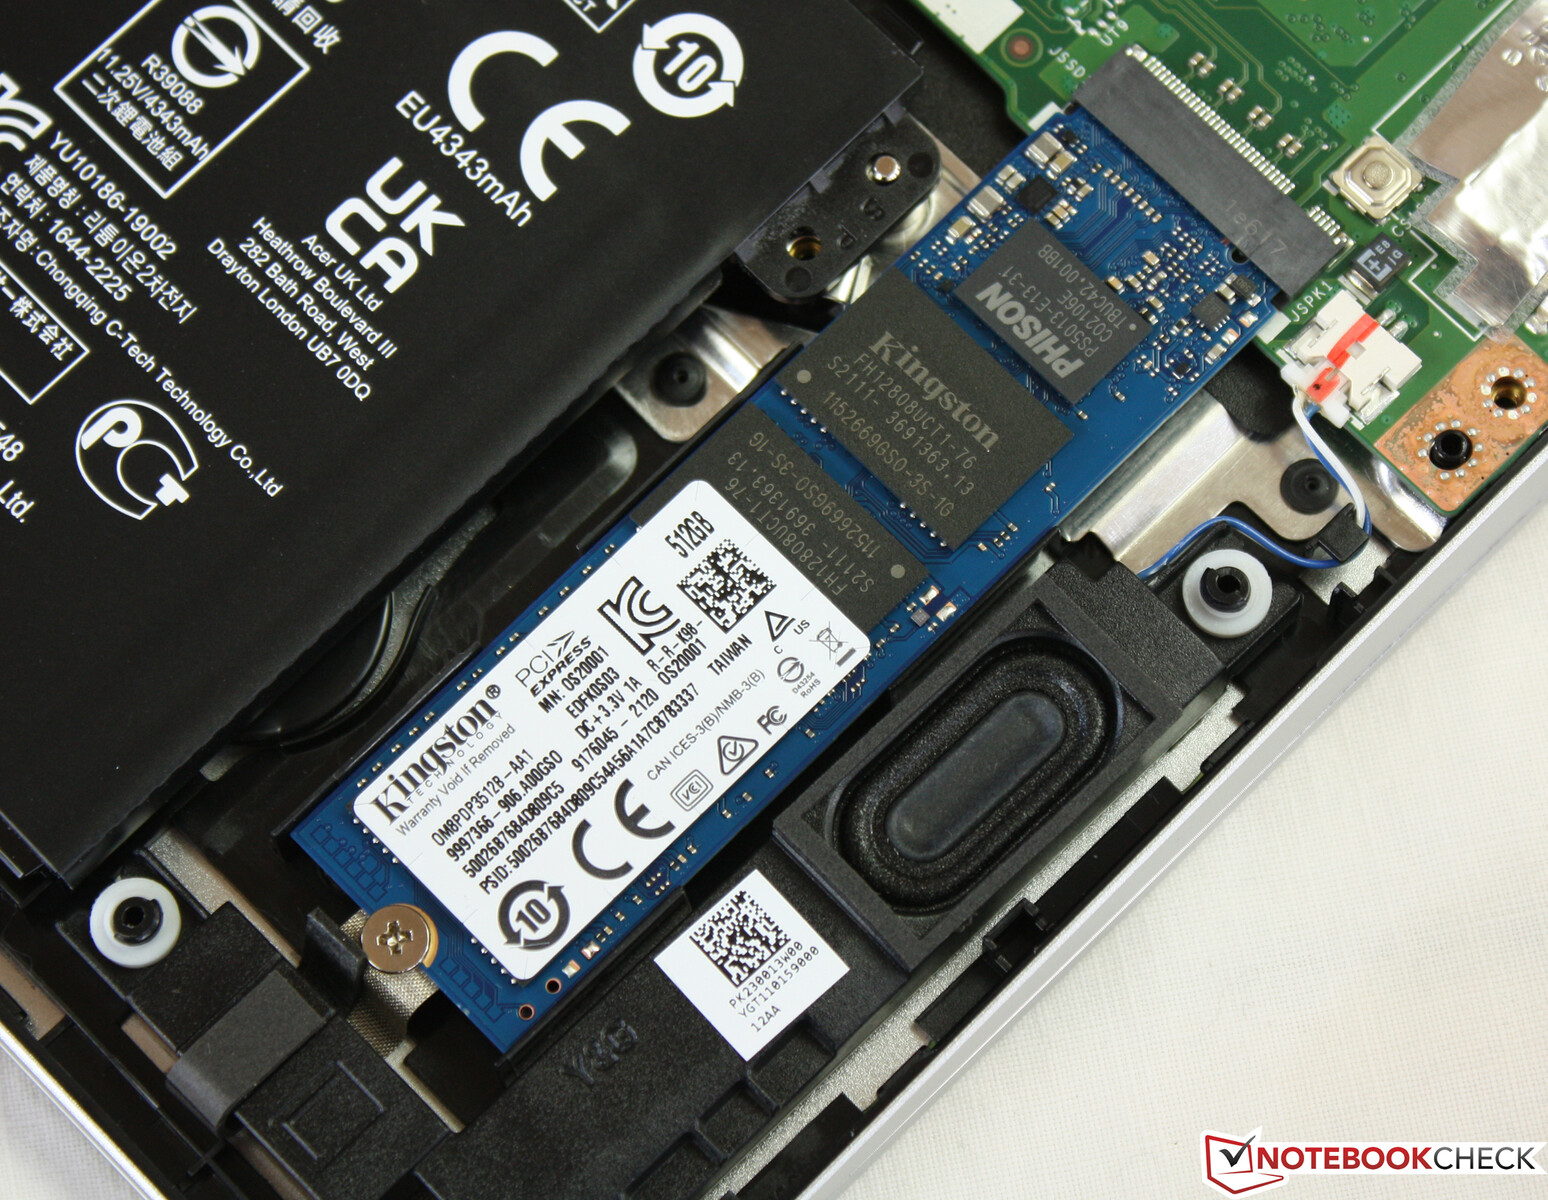
O armazenamento em estado sólido Kingston com uma capacidade bruta de 512 GB é o meio entre as configurações da Acer. Não há um segundo slot M.2 para expansão. O drive Kingston tem dificuldades no meio-campo. Encontramos o Samsung PM9A1 SSD no Swift 3 SF314-511 (Intel, iGPU) para ser muito rápido. Nota: Os fabricantes podem equipar dispositivos do mesmo tipo com SSDs diferentes; não há garantia de que você obterá um WDC, um Micron, um Kingston ou um Samsung.
O desempenho de outros dispositivos de armazenamento em massa em nossos testes pode ser visto em nossoTabelas de referência HDD/SSD.

| Drive Performance rating - Percent | |
| Acer Swift 3 SF314-511-54ZK -1! | |
| Média da turma Subnotebook | |
| Lenovo ThinkPad E14 G3-20Y7003SGE | |
| Lenovo ThinkBook 14 G2 ITL 20VDS02G00 | |
| Acer Swift 3 SF314-43-R8BP | |
| Média Kingston OM8PDP3512B-AI1 | |
| Dell Latitude 14 5420-D2G5W | |
| HP Pavilion 14-dv0357ng -8! | |
* ... menor é melhor
Continuous power read: DiskSpd Read Loop, Queue Depth 8
Placa gráfica
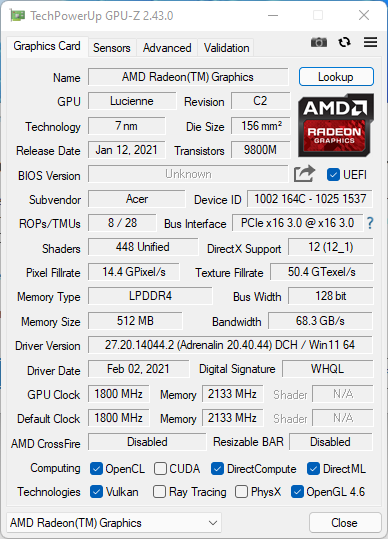
Com o Radeon RX Vega 7os gráficos SoC, o Swift 3 não é projetado para jogos, o que é imediatamente evidente em nossa mesa de jogos: Mesmo títulos antigos são capazes de funcionar sem problemas apenas em configurações mínimas. Se você está pensando seriamente nos jogos atuais, você deve definitivamente procurar uma alternativa. Dentro dos laptops iGPU, o Radeon RX está aproximadamente no mesmo nível que o Intel Iris Xe Graphics G7 80EUs.
A comparação de desempenho com outras GPUs pode ser encontrada em nosso Lista de referência da GPU.
| 3DMark Performance rating - Percent | |
| Média da turma Subnotebook | |
| Acer Swift 3 SF314-511-54ZK | |
| HP Pavilion 14-dv0357ng | |
| Acer Swift 3 SF314-43-R8BP | |
| Lenovo ThinkPad E14 G3-20Y7003SGE | |
| Média AMD Radeon RX Vega 7 | |
| Dell Latitude 14 5420-D2G5W | |
| Lenovo ThinkBook 14 G2 ITL 20VDS02G00 | |
| 3DMark 11 - 1280x720 Performance GPU | |
| Média da turma Subnotebook (995 - 18489, n=54, últimos 2 anos) | |
| Acer Swift 3 SF314-511-54ZK | |
| Acer Swift 3 SF314-43-R8BP | |
| HP Pavilion 14-dv0357ng | |
| Lenovo ThinkPad E14 G3-20Y7003SGE | |
| Média AMD Radeon RX Vega 7 (3353 - 6249, n=62) | |
| Dell Latitude 14 5420-D2G5W | |
| Lenovo ThinkBook 14 G2 ITL 20VDS02G00 | |
| 3DMark | |
| 1920x1080 Fire Strike Graphics | |
| Média da turma Subnotebook (832 - 32931, n=56, últimos 2 anos) | |
| Acer Swift 3 SF314-511-54ZK | |
| HP Pavilion 14-dv0357ng | |
| Acer Swift 3 SF314-43-R8BP | |
| Lenovo ThinkPad E14 G3-20Y7003SGE | |
| Média AMD Radeon RX Vega 7 (1772 - 4037, n=66) | |
| Dell Latitude 14 5420-D2G5W | |
| Lenovo ThinkBook 14 G2 ITL 20VDS02G00 | |
| 2560x1440 Time Spy Graphics | |
| Média da turma Subnotebook (804 - 14477, n=55, últimos 2 anos) | |
| Acer Swift 3 SF314-511-54ZK | |
| HP Pavilion 14-dv0357ng | |
| Acer Swift 3 SF314-43-R8BP | |
| Lenovo ThinkPad E14 G3-20Y7003SGE | |
| Média AMD Radeon RX Vega 7 (496 - 1249, n=61) | |
| Dell Latitude 14 5420-D2G5W | |
| Lenovo ThinkBook 14 G2 ITL 20VDS02G00 | |
| 3DMark 11 Performance | 5686 pontos | |
| 3DMark Fire Strike Score | 3437 pontos | |
| 3DMark Time Spy Score | 1305 pontos | |
Ajuda | ||
Desempenho do jogo
| The Witcher 3 | |
| 1366x768 Medium Graphics & Postprocessing | |
| Média da turma Subnotebook (74.5 - 115, n=7, últimos 2 anos) | |
| Acer Swift 3 SF314-511-54ZK | |
| HP Pavilion 14-dv0357ng | |
| Acer Swift 3 SF314-43-R8BP | |
| Média AMD Radeon RX Vega 7 (9.74 - 81.3, n=39) | |
| Dell Latitude 14 5420-D2G5W | |
| 1920x1080 High Graphics & Postprocessing (Nvidia HairWorks Off) | |
| Média da turma Subnotebook (25.6 - 64, n=12, últimos 2 anos) | |
| HP Pavilion 14-dv0357ng | |
| Acer Swift 3 SF314-511-54ZK | |
| Lenovo ThinkPad E14 G3-20Y7003SGE | |
| Média AMD Radeon RX Vega 7 (8.96 - 26.2, n=52) | |
| Acer Swift 3 SF314-43-R8BP | |
| Dell Latitude 14 5420-D2G5W | |
| Dota 2 Reborn - 1920x1080 ultra (3/3) best looking | |
| Média da turma Subnotebook (13 - 97, n=60, últimos 2 anos) | |
| Acer Swift 3 SF314-511-54ZK | |
| Acer Swift 3 SF314-43-R8BP | |
| Lenovo ThinkPad E14 G3-20Y7003SGE | |
| Média AMD Radeon RX Vega 7 (23.3 - 58.2, n=62) | |
| HP Pavilion 14-dv0357ng | |
| Lenovo ThinkBook 14 G2 ITL 20VDS02G00 | |
| Final Fantasy XV Benchmark | |
| 1920x1080 Standard Quality | |
| Média da turma Subnotebook (15.1 - 75.2, n=53, últimos 2 anos) | |
| Acer Swift 3 SF314-511-54ZK | |
| Acer Swift 3 SF314-43-R8BP | |
| HP Pavilion 14-dv0357ng | |
| Lenovo ThinkPad E14 G3-20Y7003SGE | |
| Média AMD Radeon RX Vega 7 (8.9 - 20.3, n=44) | |
| Dell Latitude 14 5420-D2G5W | |
| 1280x720 Lite Quality | |
| Média da turma Subnotebook (21.4 - 129.8, n=54, últimos 2 anos) | |
| Acer Swift 3 SF314-511-54ZK | |
| Acer Swift 3 SF314-43-R8BP | |
| Lenovo ThinkPad E14 G3-20Y7003SGE | |
| HP Pavilion 14-dv0357ng | |
| Média AMD Radeon RX Vega 7 (17.1 - 41.1, n=44) | |
| Dell Latitude 14 5420-D2G5W | |
| Lenovo ThinkBook 14 G2 ITL 20VDS02G00 | |
| Strange Brigade | |
| 1280x720 lowest AF:1 | |
| Média da turma Subnotebook (85 - 335, n=49, últimos 2 anos) | |
| Acer Swift 3 SF314-511-54ZK | |
| Acer Swift 3 SF314-43-R8BP | |
| HP Pavilion 14-dv0357ng | |
| Lenovo ThinkPad E14 G3-20Y7003SGE | |
| Média AMD Radeon RX Vega 7 (19.4 - 95.3, n=43) | |
| Dell Latitude 14 5420-D2G5W | |
| Lenovo ThinkBook 14 G2 ITL 20VDS02G00 | |
| 1920x1080 medium AA:medium AF:4 | |
| Média da turma Subnotebook (29.8 - 137.5, n=49, últimos 2 anos) | |
| Acer Swift 3 SF314-511-54ZK | |
| Acer Swift 3 SF314-43-R8BP | |
| HP Pavilion 14-dv0357ng | |
| Lenovo ThinkPad E14 G3-20Y7003SGE | |
| Média AMD Radeon RX Vega 7 (13.4 - 36.1, n=43) | |
| Dell Latitude 14 5420-D2G5W | |
| Lenovo ThinkBook 14 G2 ITL 20VDS02G00 | |
| F1 2021 | |
| 1280x720 Ultra Low Preset | |
| Média AMD Radeon RX Vega 7 (71 - 107.9, n=13) | |
| Acer Swift 3 SF314-43-R8BP | |
| 1920x1080 Medium Preset AA:T AF:16x | |
| Média AMD Radeon RX Vega 7 (29 - 45.8, n=12) | |
| Acer Swift 3 SF314-43-R8BP | |
| 1920x1080 Ultra Low Preset | |
| Lenovo ThinkBook 14 G2 ITL 20VDS02G00 | |
Witcher 3 FPS-Diagramm
| baixo | média | alto | ultra | |
|---|---|---|---|---|
| The Witcher 3 (2015) | 34.7 | 17.4 | 13 | |
| Dota 2 Reborn (2015) | 100 | 82.8 | 54 | 50.2 |
| Final Fantasy XV Benchmark (2018) | 35.4 | 18.1 | 12.4 | |
| Far Cry 5 (2018) | 44 | 20 | 19 | |
| Strange Brigade (2018) | 81.4 | 32.1 | 27 | 22.9 |
| F1 2021 (2021) | 71 | 29 |
Emissões: Silencioso 14-incher da Acer
Emissões sonoras
A Swift 3 não produz muito ruído em toda a faixa de carga. Quando ocioso, o ventilador fica parado e reina o silêncio. Sob carga, o ventilador quase não faz marcha lenta. Assim, medimos níveis de pressão sonora de 38 dB(A) no teste de esforço e 34 dB(A) sob carga média. Estas emissões são bastante baixas, o que deveria ser o caso de um sub-portátil móvel. Ninguém quer levar um ventilador de aquecimento para a biblioteca.
Barulho
| Ocioso |
| 26 / 26 / 27.5 dB |
| Carga |
| 34 / 38.2 dB |
 | ||
30 dB silencioso 40 dB(A) audível 50 dB(A) ruidosamente alto |
||
min: | ||
| Acer Swift 3 SF314-43-R8BP Vega 7, R5 5500U, Kingston OM8PDP3512B-AI1 | Acer Swift 3 SF314-511-54ZK Iris Xe G7 80EUs, i5-1135G7, Samsung PM9A1 MZVL2512HCJQ | Lenovo ThinkPad E14 G3-20Y7003SGE Vega 7, R5 5500U, SK Hynix BC711 HFM512GD3HX015N | HP Pavilion 14-dv0357ng Iris Xe G7 80EUs, i5-1135G7, Intel Optane Memory H10 with Solid State Storage 32GB + 1TB HBRPEKNX0203AH(L/H) | Dell Latitude 14 5420-D2G5W Iris Xe G7 80EUs, i5-1135G7, WDC PC SN530 SDBPTPZ-256G | Lenovo ThinkBook 14 G2 ITL 20VDS02G00 UHD Graphics Xe G4 48EUs, i3-1115G4, Samsung PM991A MZALQ256HBJD | |
|---|---|---|---|---|---|---|
| Noise | 1% | 8% | 3% | -4% | -1% | |
| desligado / ambiente * (dB) | 26 | 25 4% | 23.8 8% | 25.4 2% | 25 4% | 24.6 5% |
| Idle Minimum * (dB) | 26 | 25 4% | 23.8 8% | 25.4 2% | 25 4% | 24.6 5% |
| Idle Average * (dB) | 26 | 25 4% | 23.8 8% | 25.4 2% | 25 4% | 24.6 5% |
| Idle Maximum * (dB) | 27.5 | 27.5 -0% | 25 9% | 25.4 8% | 25 9% | 26.7 3% |
| Load Average * (dB) | 34 | 32.9 3% | 32 6% | 35.4 -4% | 36.5 -7% | 38.9 -14% |
| Load Maximum * (dB) | 38.2 | 42 -10% | 34.5 10% | 35.5 7% | 52.4 -37% | 42.8 -12% |
| Witcher 3 ultra * (dB) | 32 |
* ... menor é melhor
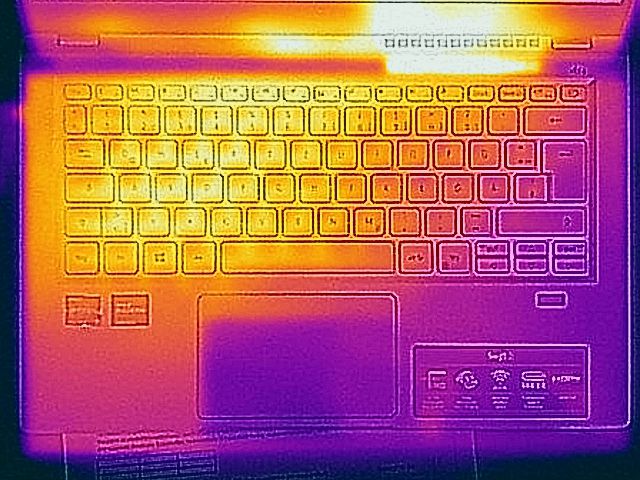
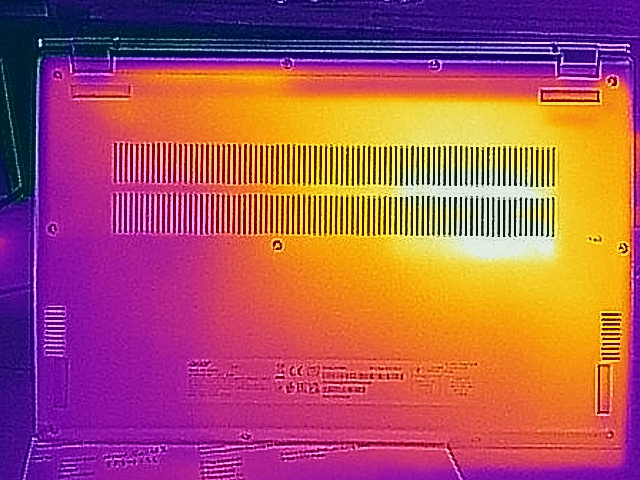
Temperatura
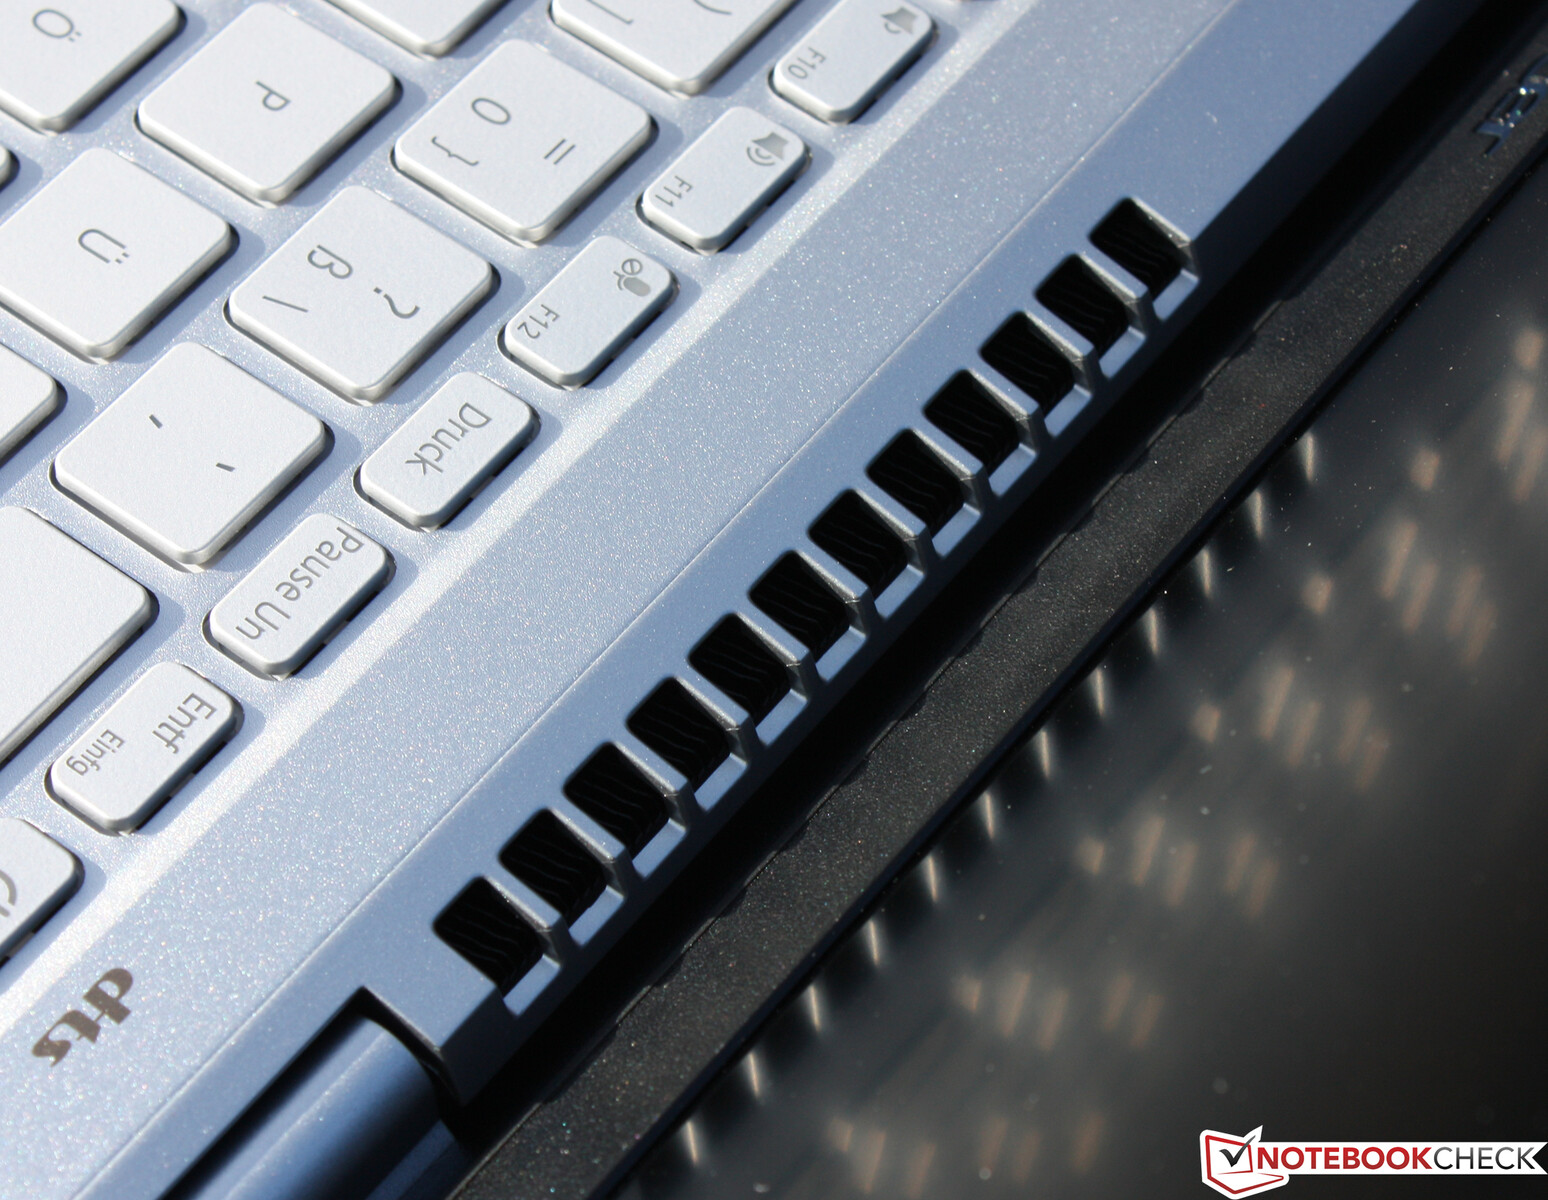
O desempenho é aparado a baixas temperaturas e garante emissões moderadas de calor de 36 ou 38 graus, no máximo. O gráfico de dissipação de calor mostra os resultados após nosso teste de estresse, e o caso permanece relativamente frio durante os jogos.
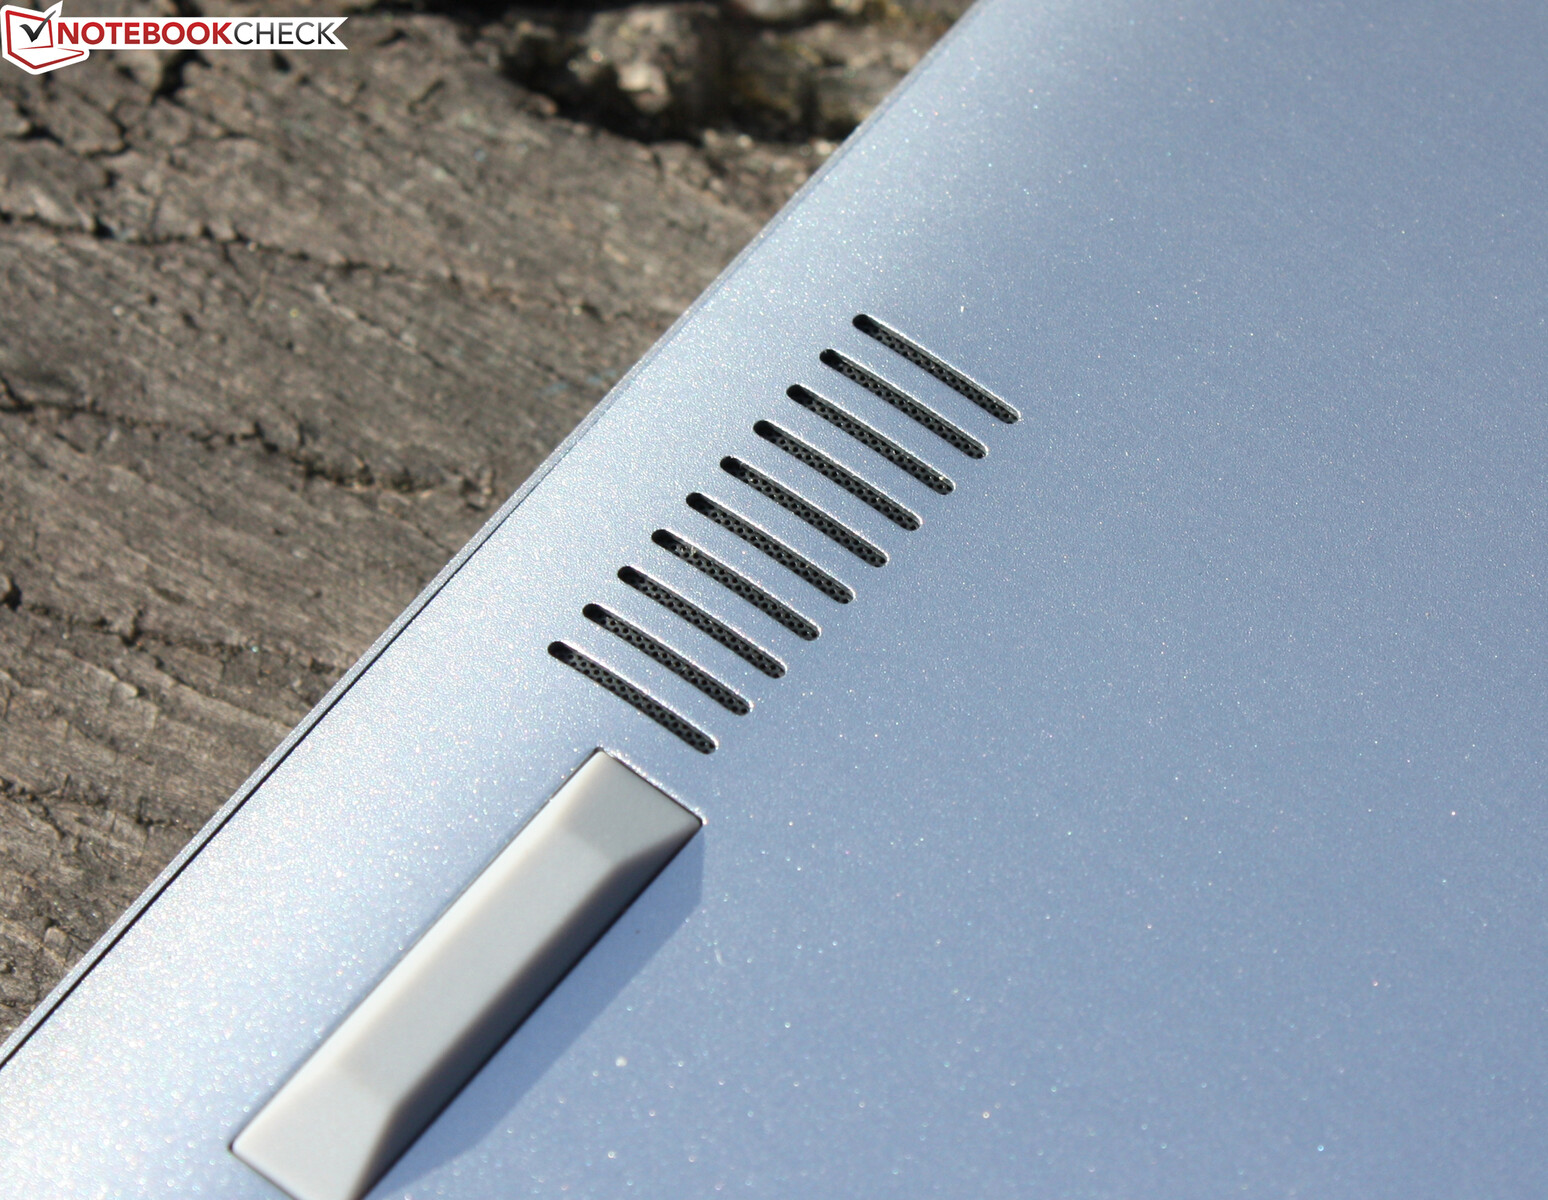
O case só se sente quente durante a carga sustentada e nunca fica muito quente para ser colocado sobre as coxas, por exemplo. Entretanto, não se deve colocar este equipamento de 14 polegadas sobre um cobertor ou tapete, pois isso bloquearia as entradas de ar na parte de baixo. O visor, quando aberto, levanta deliberadamente a base para permitir um melhor suprimento de ar.
A temperatura média de ociosidade é de apenas 23 graus, e a caixa metálica parece morna.
(+) A temperatura máxima no lado superior é 36 °C / 97 F, em comparação com a média de 35.9 °C / 97 F , variando de 21.4 a 59 °C para a classe Subnotebook.
(+) A parte inferior aquece até um máximo de 38 °C / 100 F, em comparação com a média de 39.2 °C / 103 F
(+) Em uso inativo, a temperatura média para o lado superior é 23 °C / 73 F, em comparação com a média do dispositivo de 30.8 °C / ### class_avg_f### F.
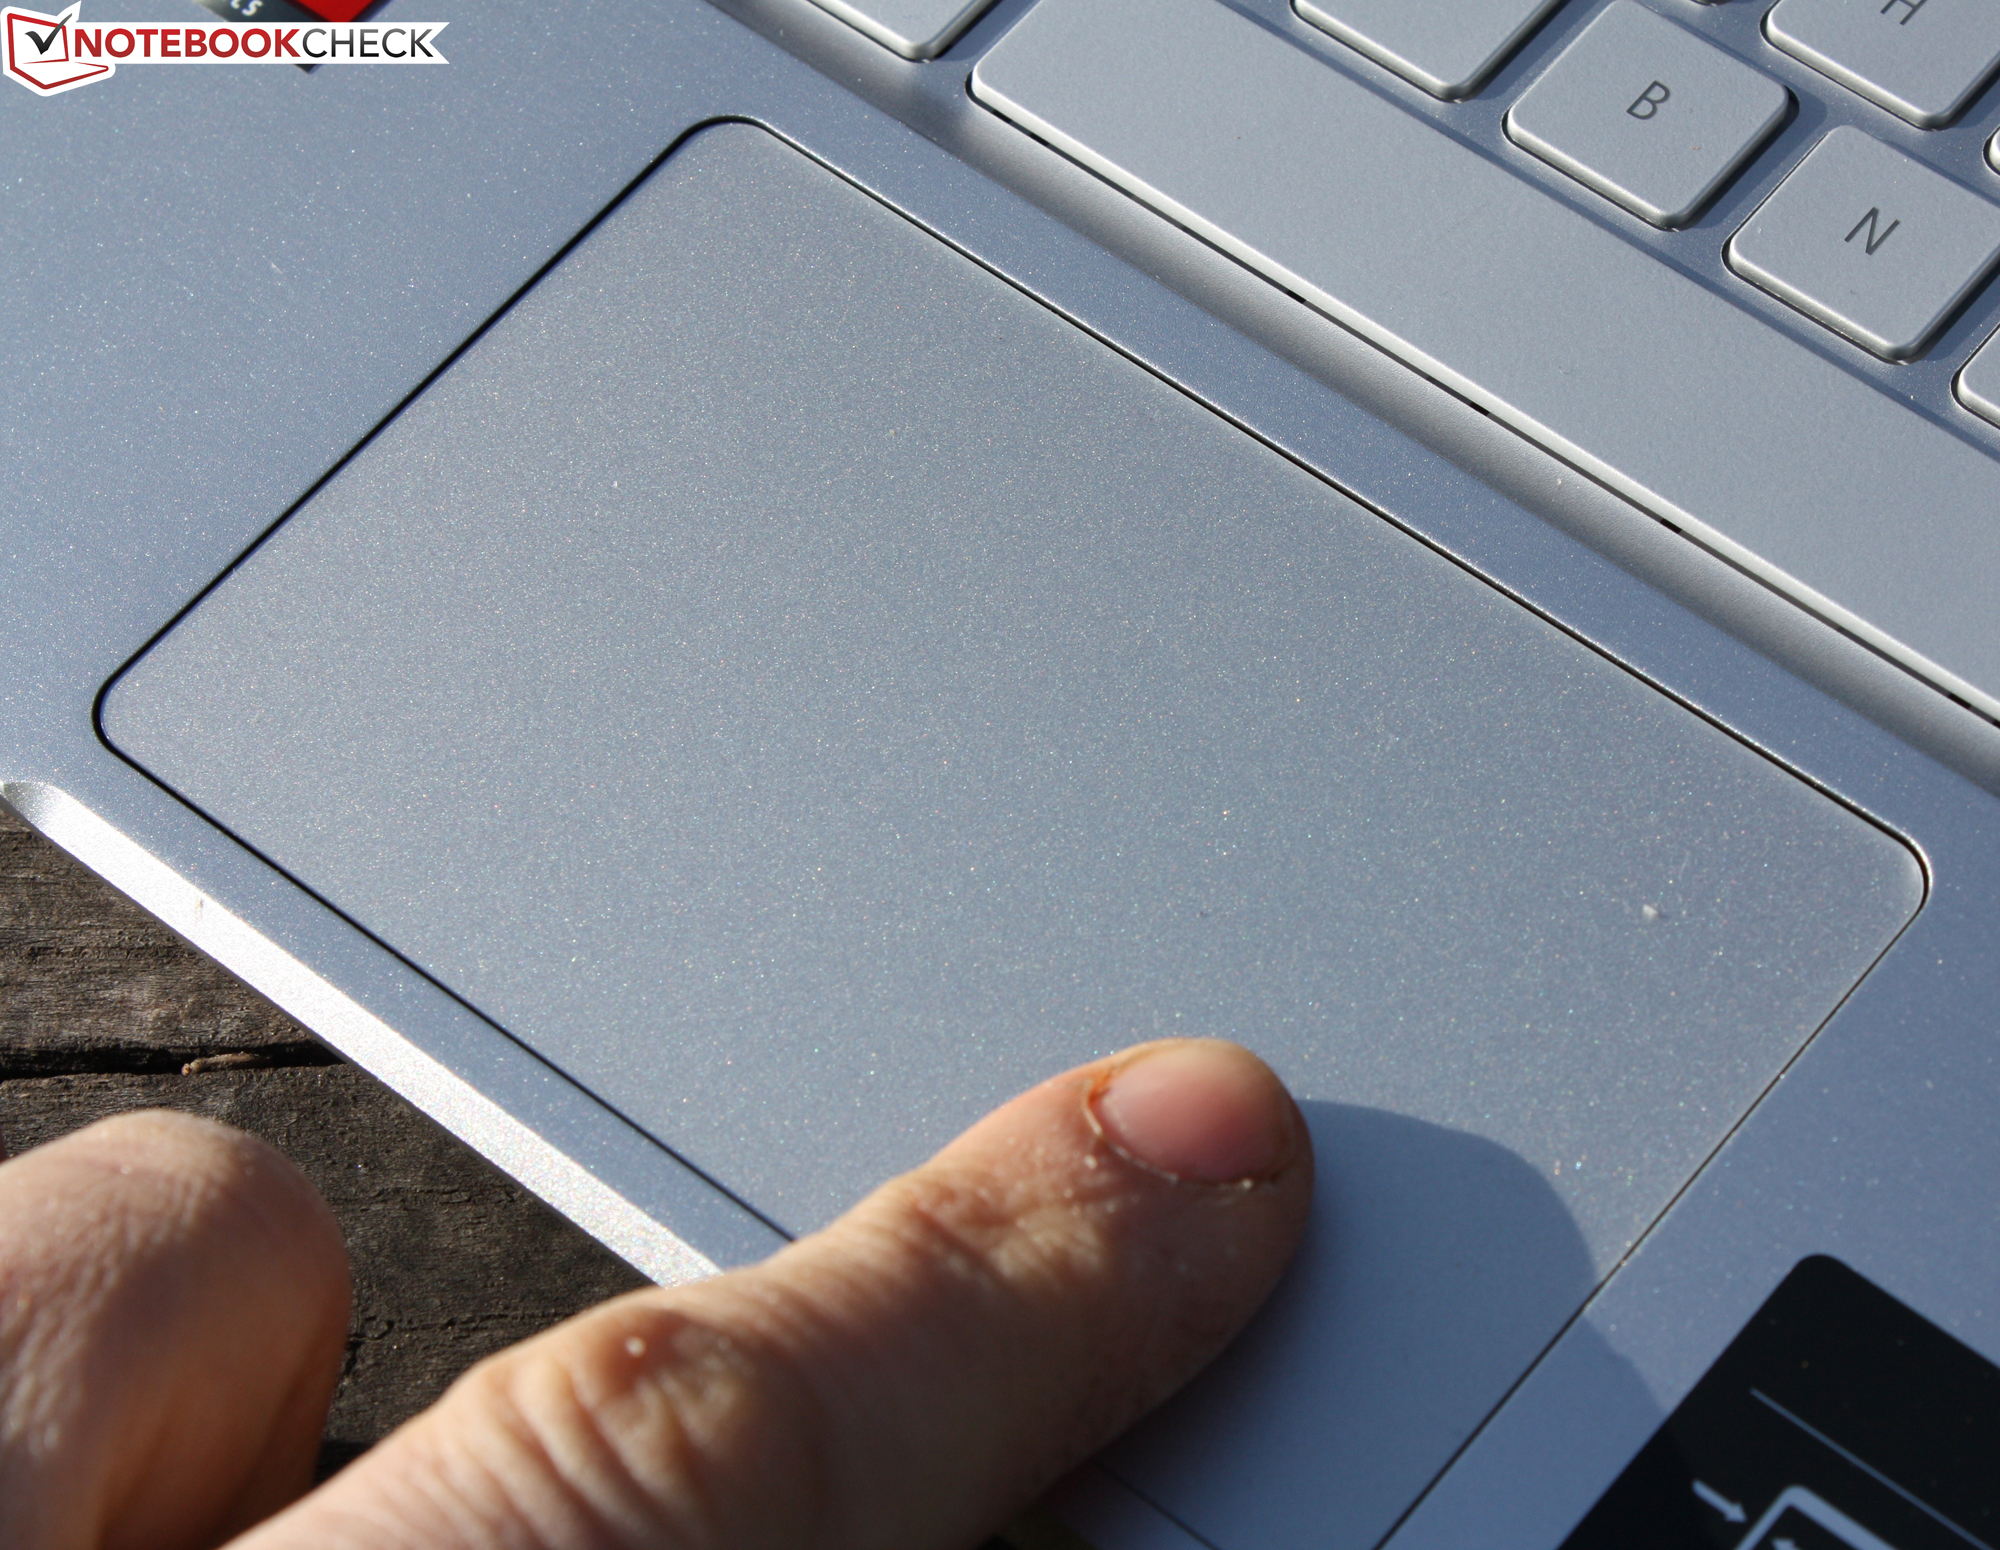
(+) Os apoios para as mãos e o touchpad são mais frios que a temperatura da pele, com um máximo de 28.9 °C / 84 F e, portanto, são frios ao toque.
(±) A temperatura média da área do apoio para as mãos de dispositivos semelhantes foi 28.2 °C / 82.8 F (-0.7 °C / -1.2 F).
| Acer Swift 3 SF314-43-R8BP AMD Ryzen 5 5500U, AMD Radeon RX Vega 7 | Acer Swift 3 SF314-511-54ZK Intel Core i5-1135G7, Intel Iris Xe Graphics G7 80EUs | Lenovo ThinkPad E14 G3-20Y7003SGE AMD Ryzen 5 5500U, AMD Radeon RX Vega 7 | HP Pavilion 14-dv0357ng Intel Core i5-1135G7, Intel Iris Xe Graphics G7 80EUs | Dell Latitude 14 5420-D2G5W Intel Core i5-1135G7, Intel Iris Xe Graphics G7 80EUs | Lenovo ThinkBook 14 G2 ITL 20VDS02G00 Intel Core i3-1115G4, Intel UHD Graphics Xe G4 48EUs | |
|---|---|---|---|---|---|---|
| Heat | -8% | -14% | -17% | -13% | -8% | |
| Maximum Upper Side * (°C) | 36 | 39.6 -10% | 45.1 -25% | 40.5 -13% | 41.7 -16% | 35 3% |
| Maximum Bottom * (°C) | 38 | 43.2 -14% | 49.3 -30% | 39.9 -5% | 35.6 6% | 38 -0% |
| Idle Upper Side * (°C) | 24.1 | 25 -4% | 24.7 -2% | 31.3 -30% | 29.9 -24% | 28 -16% |
| Idle Bottom * (°C) | 25.7 | 26.2 -2% | 25.6 -0% | 31.1 -21% | 29.7 -16% | 30 -17% |
* ... menor é melhor
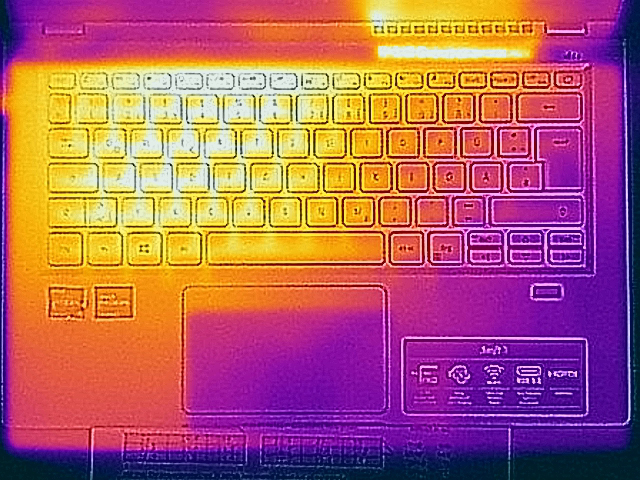
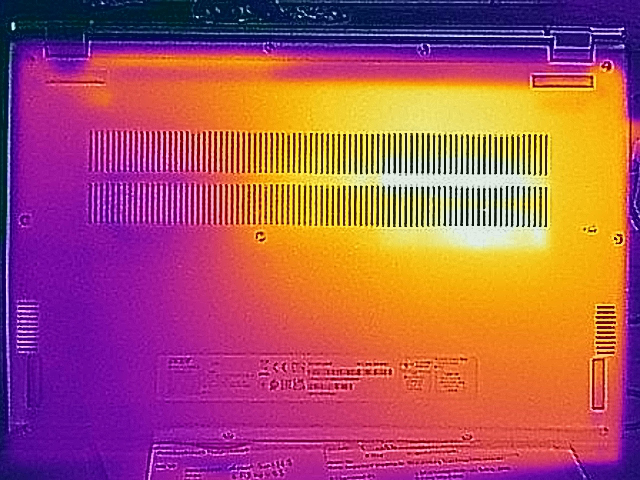
Teste de estresse
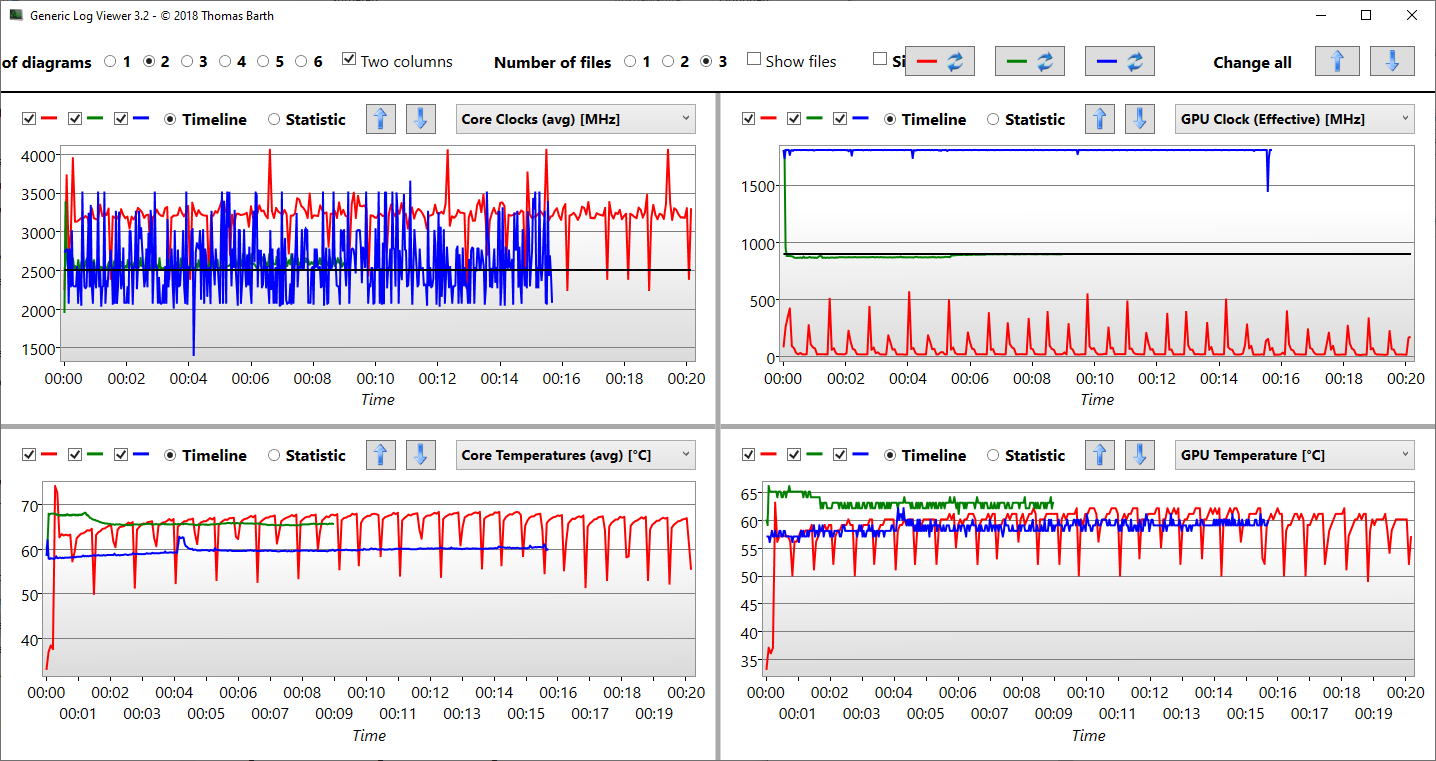
O Acer Swift 3 passa por nossos testes de estresse (Prime95 e Furmark por uma hora) de maneira semelhante tanto no modo de rede quanto no modo de bateria. O processador funciona a 3,4 GHz por alguns segundos, após o que o relógio cai para 2,5 GHz. O relógio do núcleo gráfico cai de um 1.800 MHz inicial para cerca de 800 MHz. Podemos ver aqui também o comportamento do teste Cinebench R15 anterior - o PL2 só pode ser mantido por um tempo muito curto (apenas segundos), após o qual ocorre uma estrangulamento significativo. O estrangulamento é típico dos processadores AMD e Intel, mas raramente vemos uma queda tão grande, especialmente porque também ocorre no loop R15 - ou seja, sob carga única da CPU.
Deve-se notar aqui que o teste de estresse é um cenário extremo que não ocorre no uso diário. Utilizamos este teste para verificar se o sistema também funciona de forma estável sob carga total.
O notebook fino não esquenta excessivamente. Registramos temperaturas de cerca de 35 graus Celsius em três pontos de medição durante o teste de estresse. Os valores estão dentro da zona verde no uso diário. O dispositivo mais silencioso não aquece nem mesmo ao toque.
Alto-falante
Acer Swift 3 SF314-43-R8BP análise de áudio
(-) | alto-falantes não muito altos (###valor### dB)
Graves 100 - 315Hz
(-) | quase nenhum baixo - em média 28.3% menor que a mediana
(±) | a linearidade dos graves é média (12.3% delta para a frequência anterior)
Médios 400 - 2.000 Hz
(±) | médios mais altos - em média 5.9% maior que a mediana
(±) | a linearidade dos médios é média (8.9% delta para frequência anterior)
Altos 2 - 16 kHz
(+) | agudos equilibrados - apenas 4.2% longe da mediana
(+) | os máximos são lineares (4.8% delta da frequência anterior)
Geral 100 - 16.000 Hz
(±) | a linearidade do som geral é média (26% diferença em relação à mediana)
Comparado com a mesma classe
» 87% de todos os dispositivos testados nesta classe foram melhores, 2% semelhantes, 11% piores
» O melhor teve um delta de 5%, a média foi 18%, o pior foi 53%
Comparado com todos os dispositivos testados
» 80% de todos os dispositivos testados foram melhores, 4% semelhantes, 16% piores
» O melhor teve um delta de 4%, a média foi 23%, o pior foi 134%
Lenovo ThinkPad E14 G3-20Y7003SGE análise de áudio
(±) | o volume do alto-falante é médio, mas bom (###valor### dB)
Graves 100 - 315Hz
(±) | graves reduzidos - em média 13.7% menor que a mediana
(±) | a linearidade dos graves é média (13% delta para a frequência anterior)
Médios 400 - 2.000 Hz
(±) | médios mais altos - em média 7% maior que a mediana
(+) | médios são lineares (3.7% delta para frequência anterior)
Altos 2 - 16 kHz
(+) | agudos equilibrados - apenas 3.7% longe da mediana
(+) | os máximos são lineares (4.7% delta da frequência anterior)
Geral 100 - 16.000 Hz
(±) | a linearidade do som geral é média (19.3% diferença em relação à mediana)
Comparado com a mesma classe
» 39% de todos os dispositivos testados nesta classe foram melhores, 7% semelhantes, 54% piores
» O melhor teve um delta de 7%, a média foi 21%, o pior foi 53%
Comparado com todos os dispositivos testados
» 47% de todos os dispositivos testados foram melhores, 8% semelhantes, 46% piores
» O melhor teve um delta de 4%, a média foi 23%, o pior foi 134%
Gerenciamento de energia
Consumo de energia
A Swift 3 não revela nenhuma conspicuidade em termos de consumo de energia. Registramos um consumo máximo de energia de 7,7 W em modo inativo. Durante o teste de estresse (Prime95 e Furmark funcionam por pelo menos uma hora), o valor aumenta até 63 W, mas somente nos primeiros segundos! Depois disso, a Swift acelerada se afunda junto com pouco menos de 40 W.
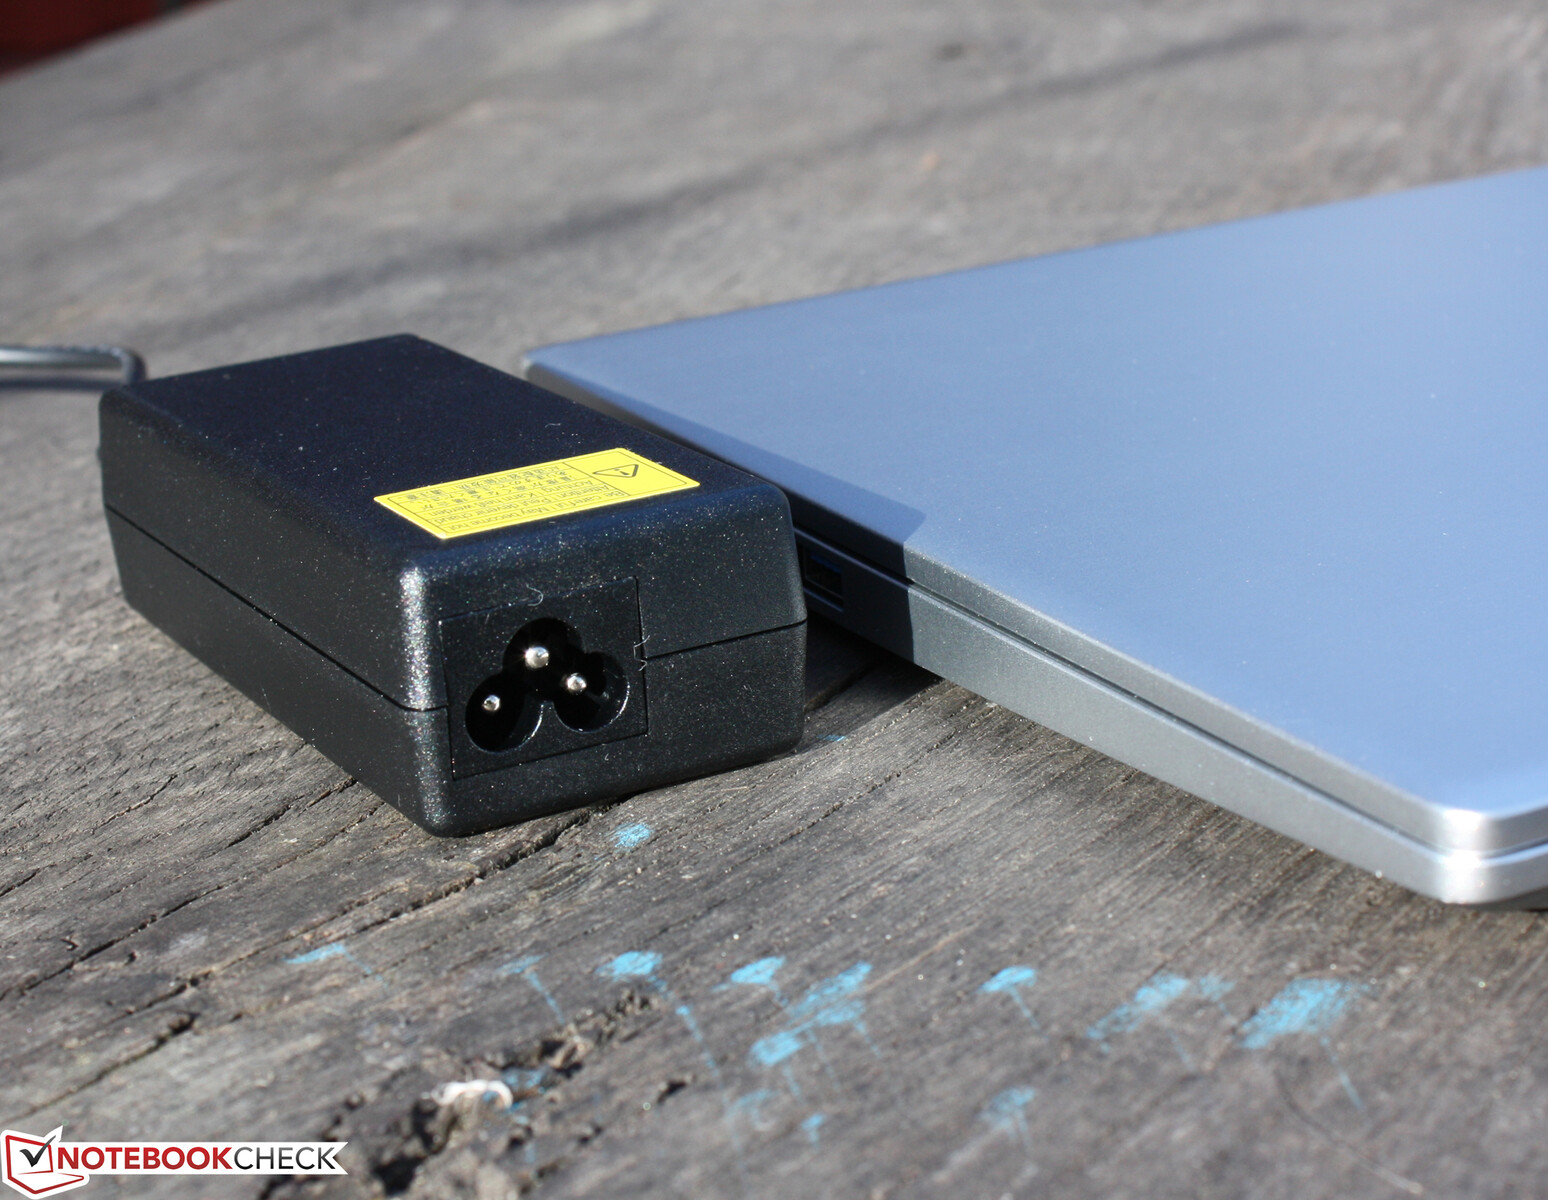
Mais energia - cerca de 44 W - é consumida quando corremos oWitcher 3 teste, mas mesmo isto é apenas nos primeiros 30 segundos. Depois disso, a aceleração do relógio do iGPU garante uma redução constante para 41 W. A potência nominal da fonte de alimentação é de 65 W.
| desligado | |
| Ocioso | |
| Carga |
|
Key:
min: | |
| Acer Swift 3 SF314-43-R8BP R5 5500U, Vega 7, Kingston OM8PDP3512B-AI1, IPS, 1920x1080, 14" | Acer Swift 3 SF314-511-54ZK i5-1135G7, Iris Xe G7 80EUs, Samsung PM9A1 MZVL2512HCJQ, IPS, 1920x1080, 14" | Lenovo ThinkPad E14 G3-20Y7003SGE R5 5500U, Vega 7, SK Hynix BC711 HFM512GD3HX015N, IPS, 1920x1080, 14" | HP Pavilion 14-dv0357ng i5-1135G7, Iris Xe G7 80EUs, Intel Optane Memory H10 with Solid State Storage 32GB + 1TB HBRPEKNX0203AH(L/H), IPS, 1920x1080, 14" | Dell Latitude 14 5420-D2G5W i5-1135G7, Iris Xe G7 80EUs, WDC PC SN530 SDBPTPZ-256G, IPS, 1920x1080, 14" | Lenovo ThinkBook 14 G2 ITL 20VDS02G00 i3-1115G4, UHD Graphics Xe G4 48EUs, Samsung PM991A MZALQ256HBJD, a-Si IPS LED, 1920x1080, 14" | Média AMD Radeon RX Vega 7 | Média da turma Subnotebook | |
|---|---|---|---|---|---|---|---|---|
| Power Consumption | -1% | -4% | -13% | 1% | -28% | -9% | -3% | |
| Idle Minimum * (Watt) | 4.1 | 4.3 -5% | 3.5 15% | 4.8 -17% | 3.4 17% | 6.3 -54% | 4.79 ? -17% | 3.73 ? 9% |
| Idle Average * (Watt) | 5.4 | 6.8 -26% | 7.5 -39% | 8.5 -57% | 7.1 -31% | 9.5 -76% | 7.72 ? -43% | 6.51 ? -21% |
| Idle Maximum * (Watt) | 7.7 | 9 -17% | 8.7 -13% | 12.4 -61% | 8.4 -9% | 10.4 -35% | 9.12 ? -18% | 7.88 ? -2% |
| Load Average * (Watt) | 44 | 33.3 24% | 43.6 1% | 37.7 14% | 35.3 20% | 32.7 26% | 38.4 ? 13% | 42.3 ? 4% |
| Witcher 3 ultra * (Watt) | 41.8 | 33.3 20% | 42.2 -1% | 35.4 15% | 35.4 15% | |||
| Load Maximum * (Watt) | 63 | 65 -3% | 55 13% | 45.3 28% | 67 -6% | 63.3 -0% | 51.7 ? 18% | 64.8 ? -3% |
* ... menor é melhor
Energieaufnahme Witcher 3 / Stresstest
Energieaufnahme mit externem Monitor
Duração da bateria
O caderno Acer Swift 3 atinge um tempo de execução de 8:25 h em nosso prático teste WLAN. Usamos um script para simular a carga ao acessar websites. O brilho do display é ajustado para cerca de 150 cd/m². Isso é menos tempo de execução do que a maioria dos concorrentes, mas nossa unidade Swift 3 tem apenas uma bateria de 48 Wh ao contrário da célula de 56 Wh no Swift 3 SF314-511 (Intel).
| Acer Swift 3 SF314-43-R8BP R5 5500U, Vega 7, 48 Wh | Acer Swift 3 SF314-511-54ZK i5-1135G7, Iris Xe G7 80EUs, 56 Wh | Lenovo ThinkPad E14 G3-20Y7003SGE R5 5500U, Vega 7, 57 Wh | HP Pavilion 14-dv0357ng i5-1135G7, Iris Xe G7 80EUs, 43 Wh | Dell Latitude 14 5420-D2G5W i5-1135G7, Iris Xe G7 80EUs, 63 Wh | Lenovo ThinkBook 14 G2 ITL 20VDS02G00 i3-1115G4, UHD Graphics Xe G4 48EUs, 58 Wh | Média da turma Subnotebook | |
|---|---|---|---|---|---|---|---|
| Duração da bateria | 43% | 3% | -29% | 37% | -8% | 44% | |
| Reader / Idle (h) | 19.3 | 33.6 74% | 22.9 19% | 13.2 -32% | 28.6 ? 48% | ||
| WiFi v1.3 (h) | 8.4 | 12.1 44% | 11.3 35% | 6 -29% | 12.8 52% | 7.6 -10% | 14 ? 67% |
| Load (h) | 1.7 | 1.9 12% | 1.2 -29% | 2.4 41% | 2 18% | 1.998 ? 18% | |
| H.264 (h) | 13.8 | 5.9 | 8.8 | 15.3 ? | |||
| Witcher 3 ultra (h) | 2 |
Pro
Contra
Veredicto: O Swift 3 da Acer não é o mais rápido
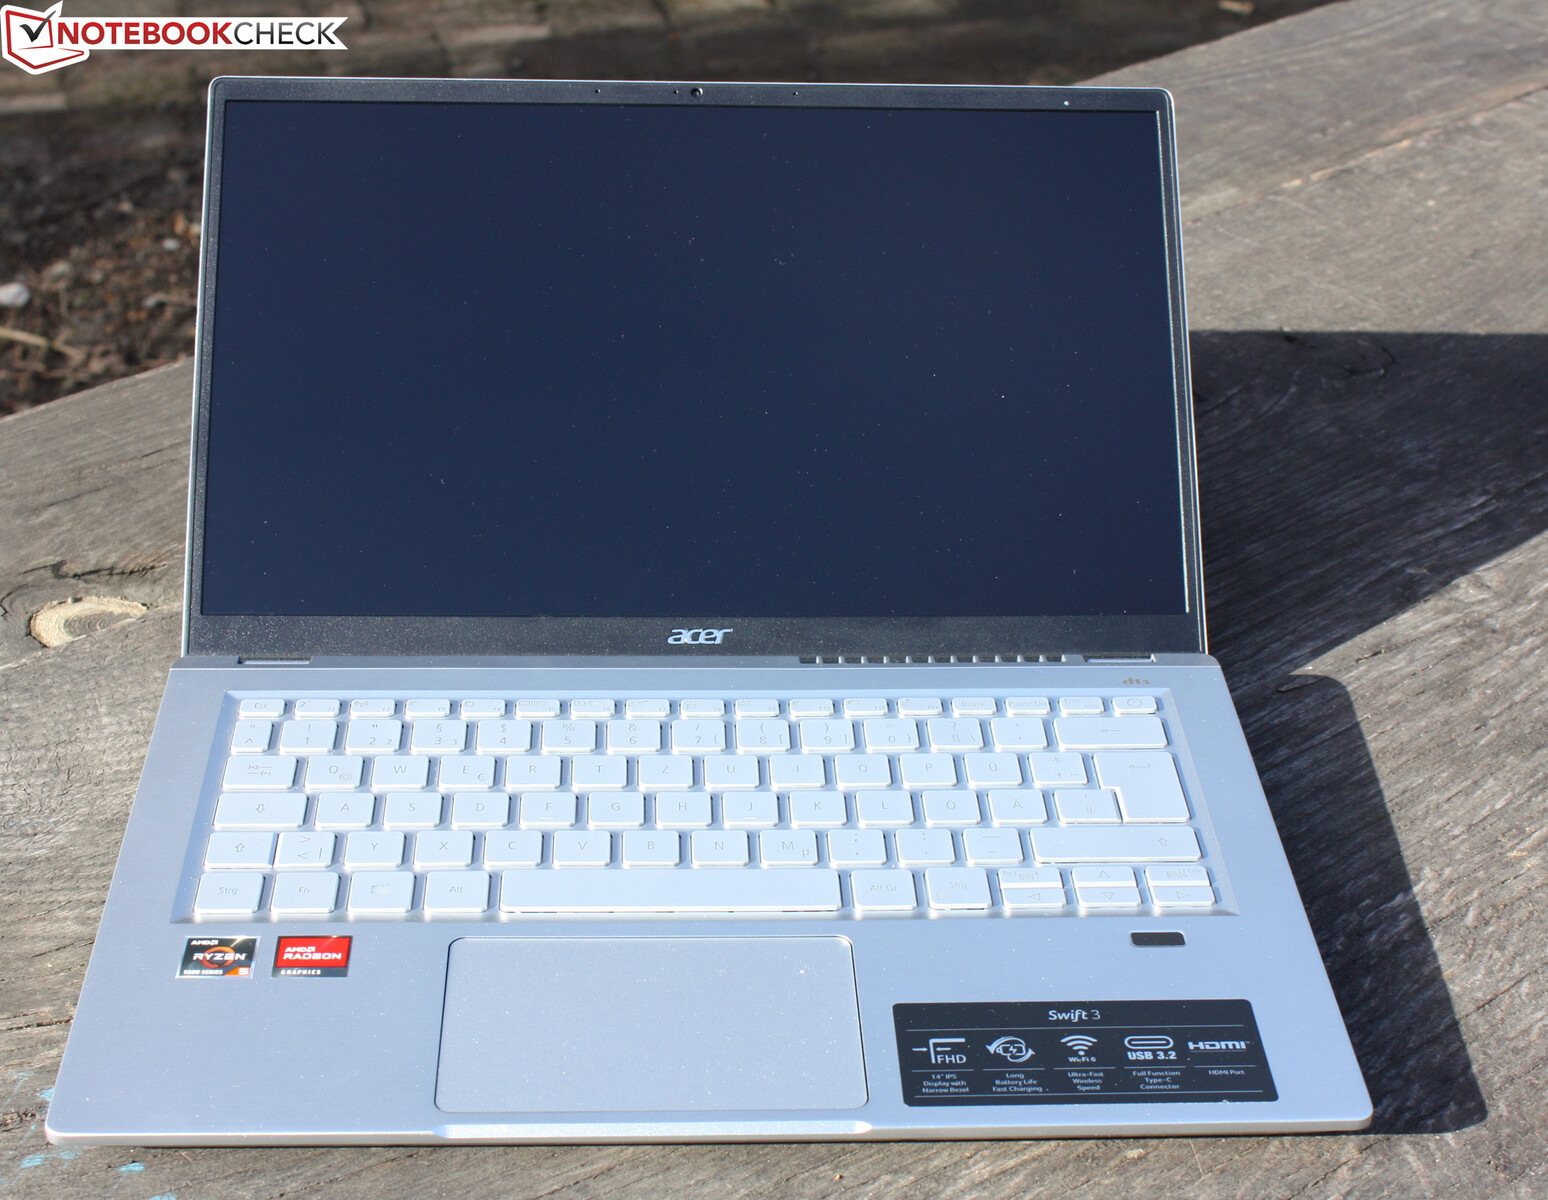

A Acer oferece um notebook de 14 polegadas com um chassi metálico fino no Swift 3 SF314-43. O chassi compacto pesa apenas 1,3 kg, tem 16,5 mm de espessura e oferece excelente estabilidade e háptica para a faixa de preço
A Acer fornece um equipamento móvel de 14 polegadas com o Swift 3 SF314-43, que só é desaproveitado em termos de visualização e Wi-Fi.
A principal crítica à tela é o baixo brilho - uma média de 230 cd/m² é muito baixa, mesmo para uma tela fosca. A cobertura do espaço de cores também não é muito grande, mas isto é pouco relevante para usuários que não gostam de edição de imagens e CAD (e estes usuários certamente não comprarão um Swift 3)
O Ryzen 5 5500U APU, que é conhecido por seu bom desempenho, estrangula mais do que o esperado mesmo durante o loop do Cinebench R15. Entretanto, o Swift 3 SF314-43 ainda supera o desempenho dos laptops Intel, ou pelo menos está ao mesmo nível deles
A tabela conservadora de temperatura faz com que um equipamento de 14 polegadas quase silencioso permaneça frio o tempo todo. Assim, o Swift 3 SF314-43 é um sub-portátil recomendável para compradores de orçamento que não se importam com o desempenho máximo, mas querem estabilidade, ergonomia e mobilidade
Se você quiser permanecer dentro do orçamento - mas concentrar-se no desempenho máximo - você deve dar uma olhada no PensePad E14 G3que é capaz de extrair mais desempenho dos Ryzen 5500U.
Preço e disponibilidade
Nossa configuração de teste do Acer Swift 3 SF314-43-R8BP está atualmente disponível por 679 Euros em notebooksbilliger.
Acer Swift 3 SF314-43-R8BP
- 03/09/2022 v7 (old)
Sebastian Jentsch
Price comparison
