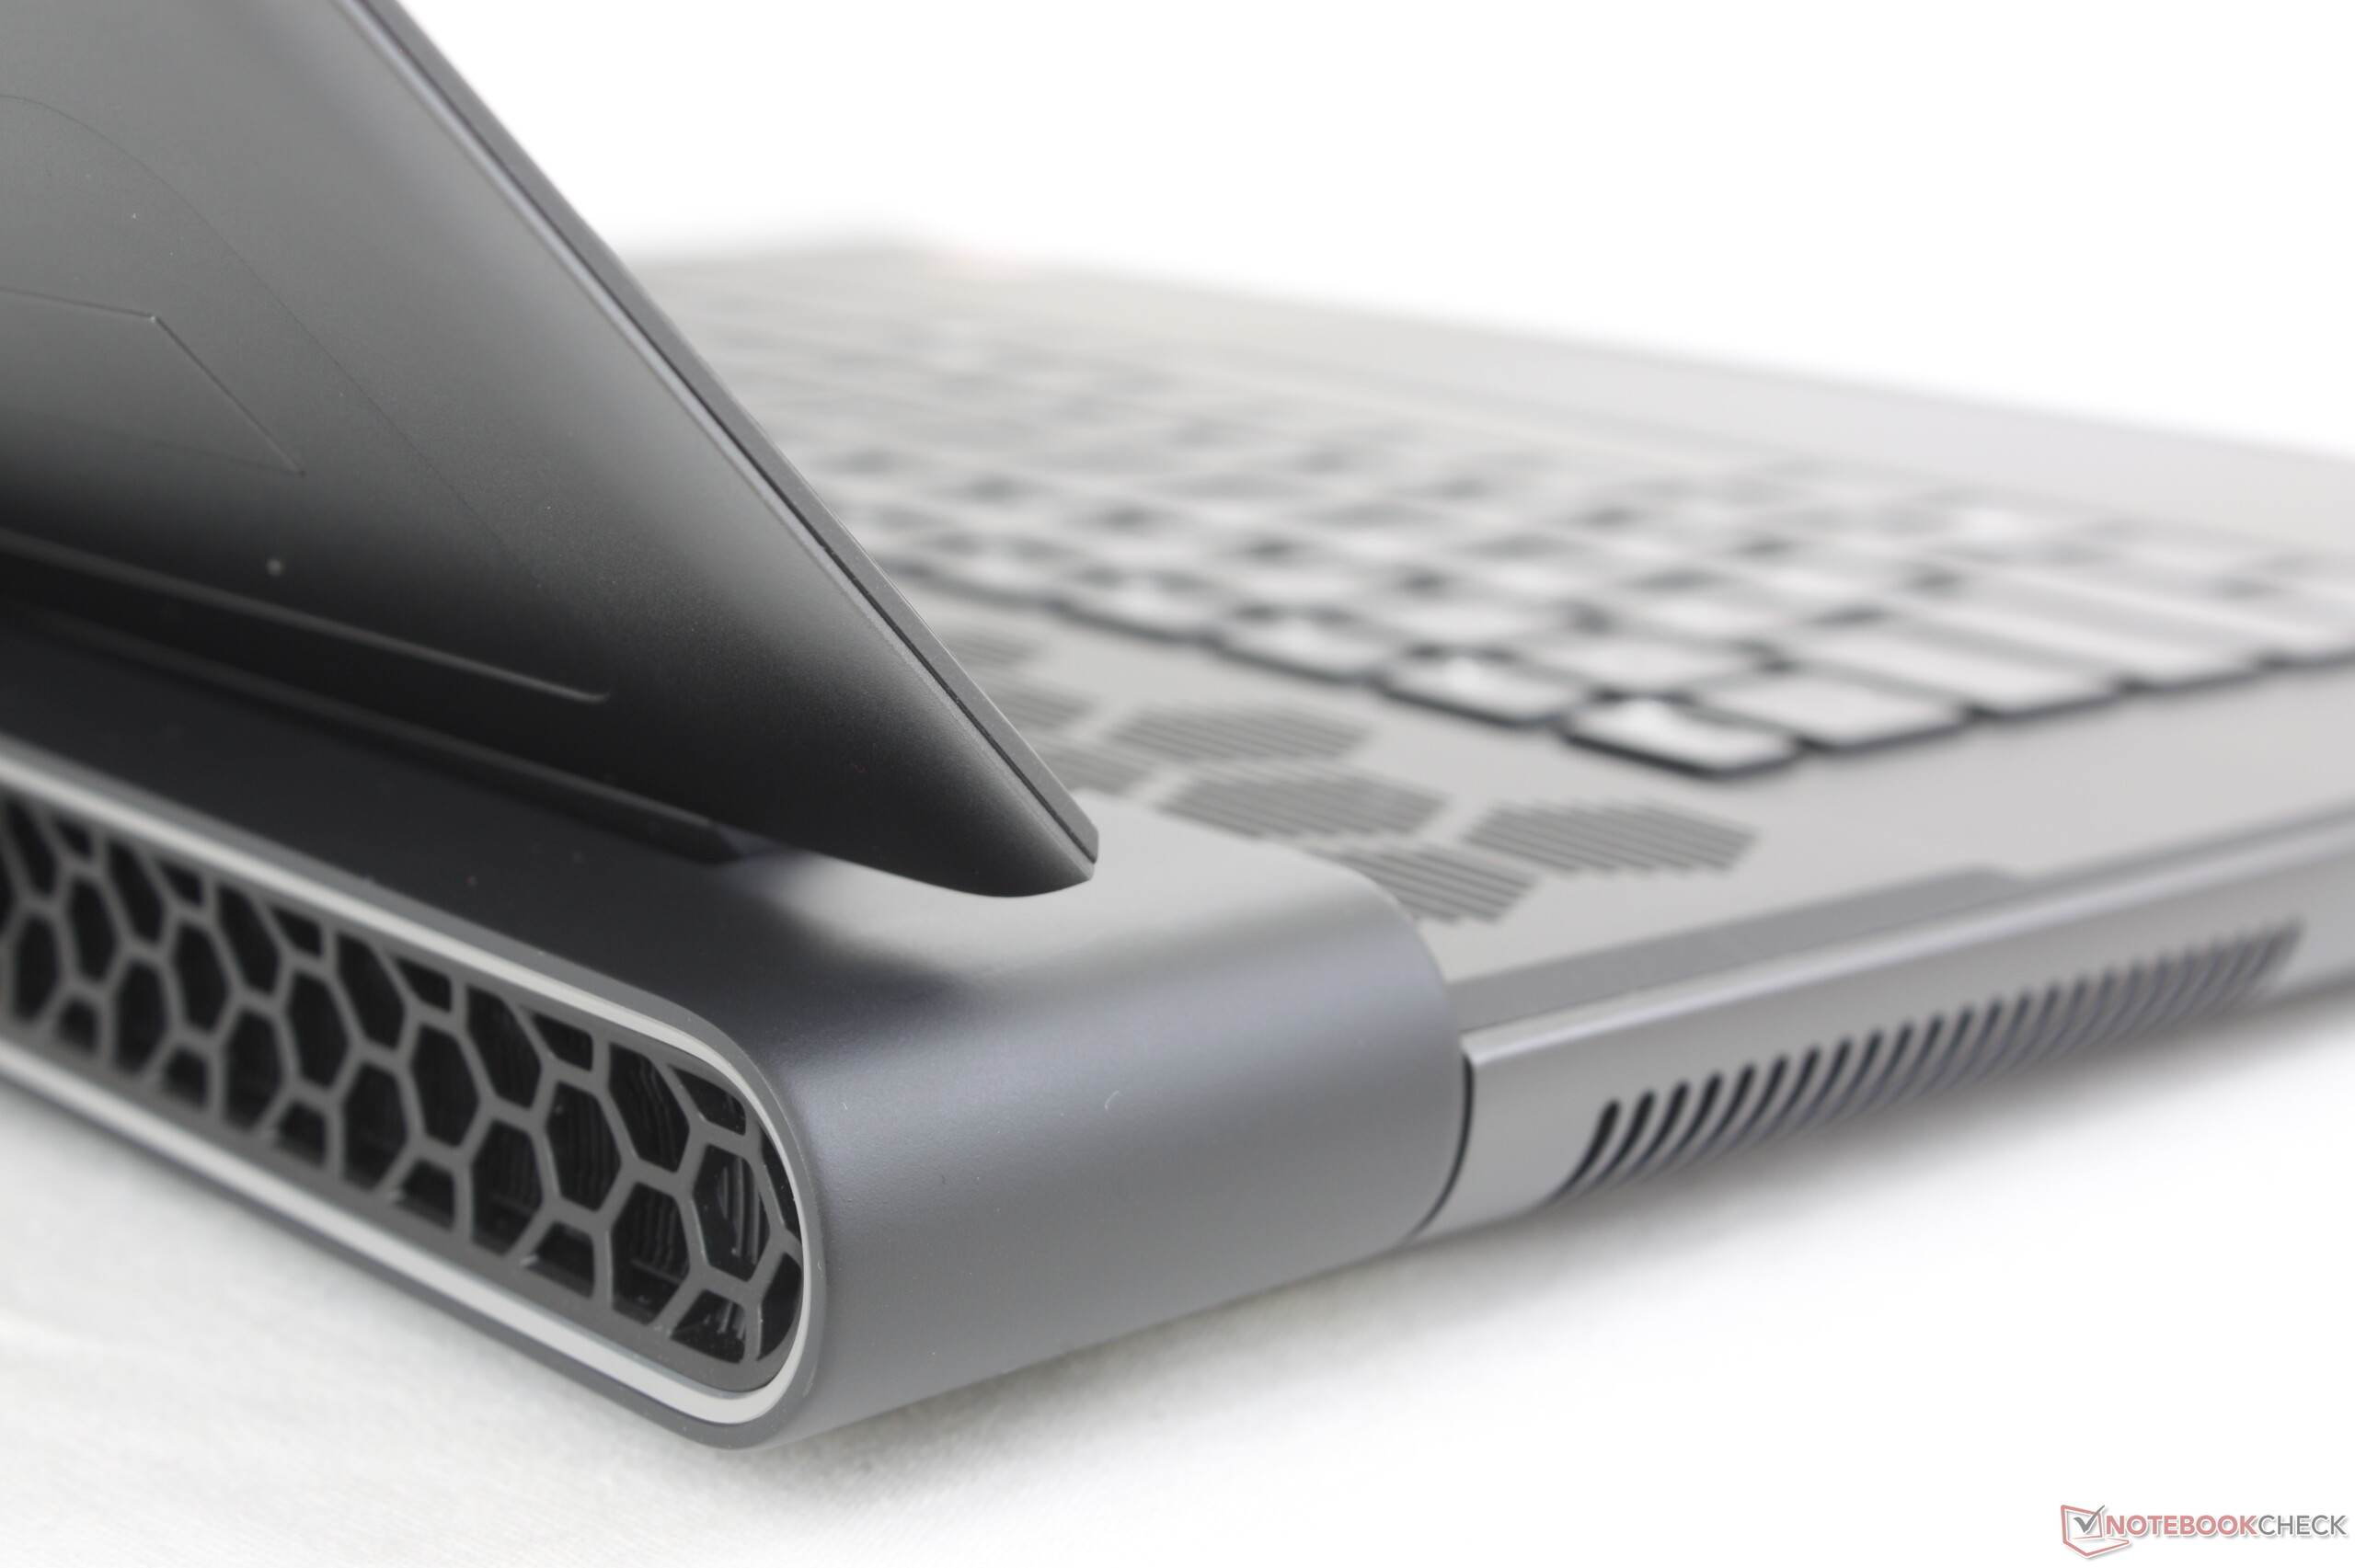
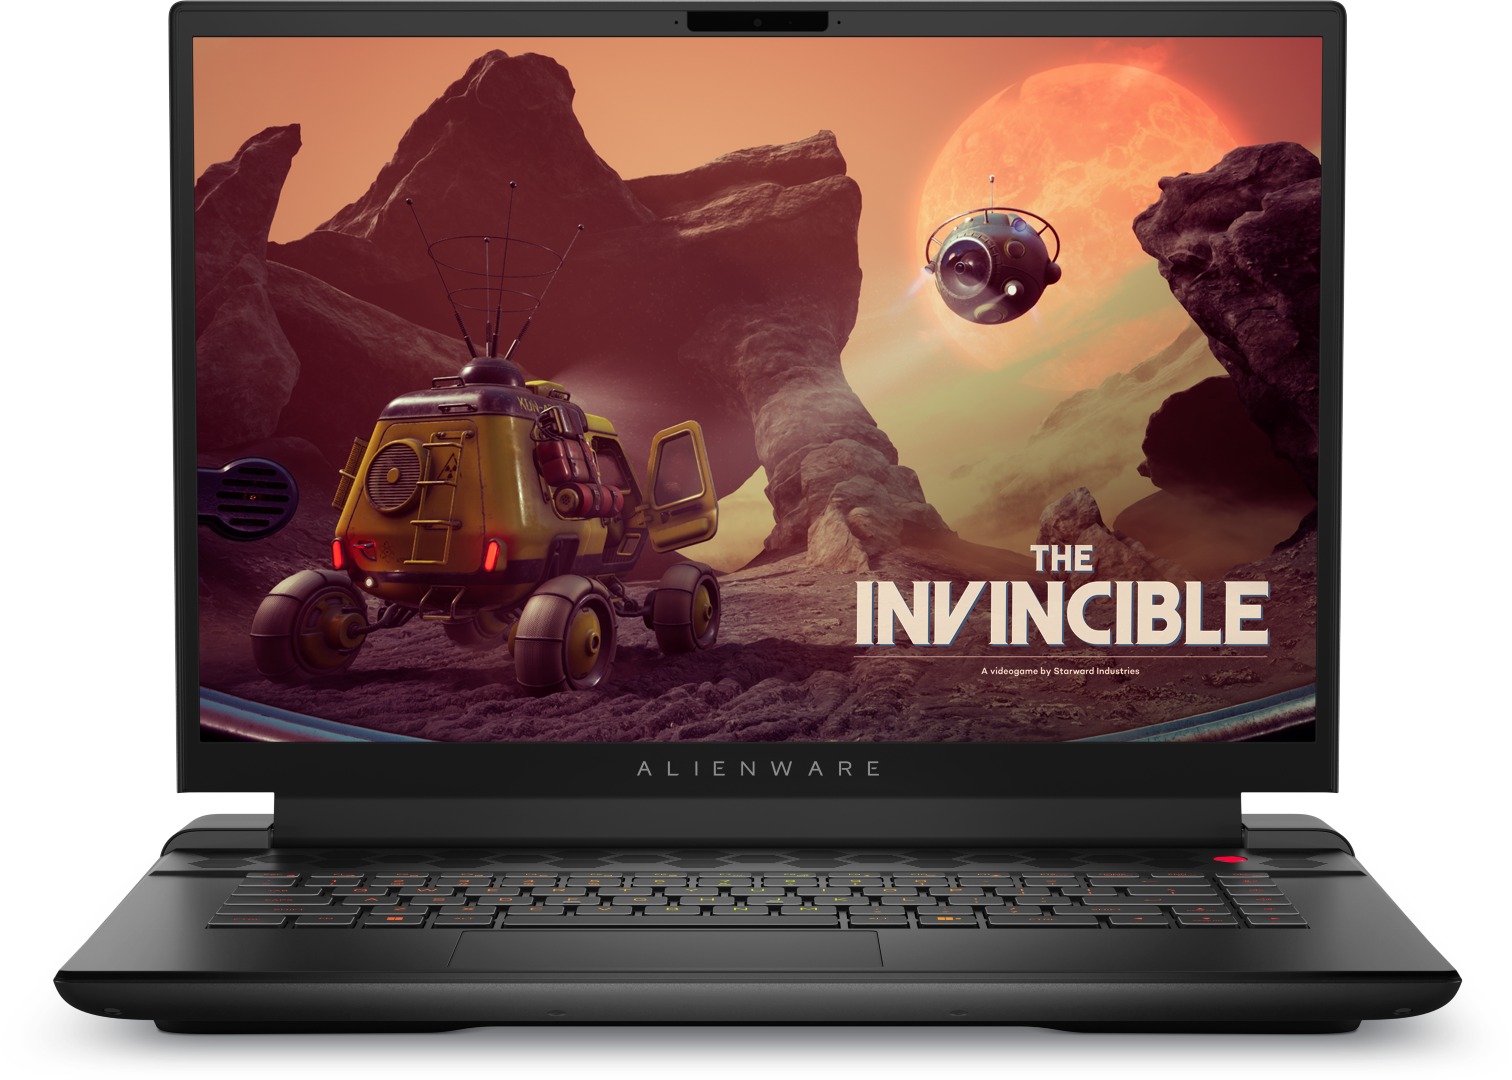
Análise do Alienware m16 R1: Máquina para jogos QHD com RTX 4060 e Thunderbolt 4
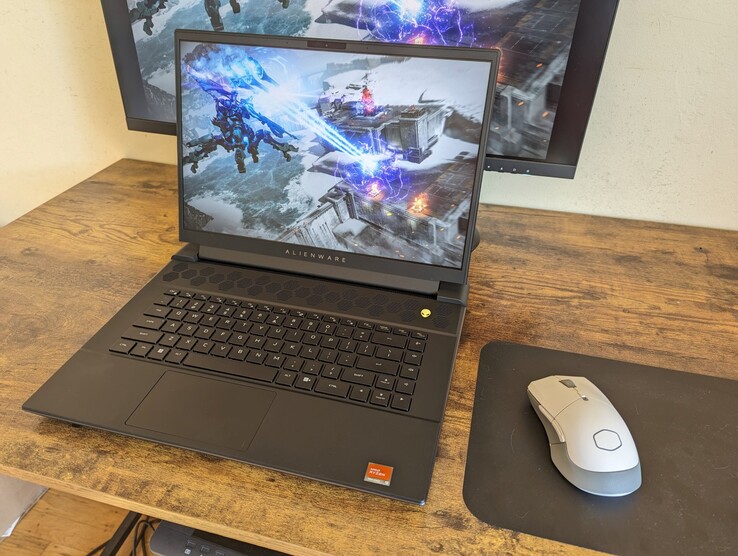
Os jogos, a renderização e a criação de conteúdo provavelmente serão as principais áreas de aplicação do Alienware m16 R1. O Raptor Lake e o Ada Lovelace fornecem o poder de computação necessário. Nossa variante é um modelo de nível básico da série m16-R1; recentemente, tivemos ummodelo irmão da extremidade superior da escala de desempenho. Os dispositivos concorrentes incluem o Acer Predator Helios 16 PH16-71e o Medion Erazer Defender P40, o Lenovo Legion Pro 5 16IRX8, o XMG Pro 15 (E23) e oAorus 15 BSF.
Informações sobre o gabinete, o equipamento e os dispositivos de entrada podem ser encontradas emnossa análise do modelo irmão quase idêntico.
Possíveis concorrentes em comparação
Avaliação | Data | Modelo | Peso | Altura | Size | Resolução | Preço |
|---|---|---|---|---|---|---|---|
| 88.3 % v7 (old) | 09/2023 | Alienware m16 R1 Intel i7-13700HX, GeForce RTX 4060 Laptop GPU | 3 kg | 25.4 mm | 16.00" | 2560x1600 | |
| 89.5 % v7 (old) | 07/2023 | Acer Predator Helios 16 PH16-71-731Q i7-13700HX, GeForce RTX 4060 Laptop GPU | 2.6 kg | 26.9 mm | 16.00" | 2560x1600 | |
| 84.6 % v7 (old) | 05/2023 | Medion Erazer Defender P40 i7-13700HX, GeForce RTX 4060 Laptop GPU | 2.9 kg | 33 mm | 17.30" | 2560x1440 | |
| 87.9 % v7 (old) | 05/2023 | Lenovo Legion Pro 5 16IRX8 i7-13700HX, GeForce RTX 4060 Laptop GPU | 2.5 kg | 26.8 mm | 16.00" | 2560x1600 | |
| 86.2 % v7 (old) | 07/2023 | Schenker XMG Pro 15 (E23) i9-13900HX, GeForce RTX 4060 Laptop GPU | 2.4 kg | 24.9 mm | 15.60" | 2560x1440 | |
| 85.7 % v7 (old) | 08/2023 | Aorus 15 BSF i7-13700H, GeForce RTX 4070 Laptop GPU | 2.4 kg | 20.9 mm | 15.60" | 2560x1440 |
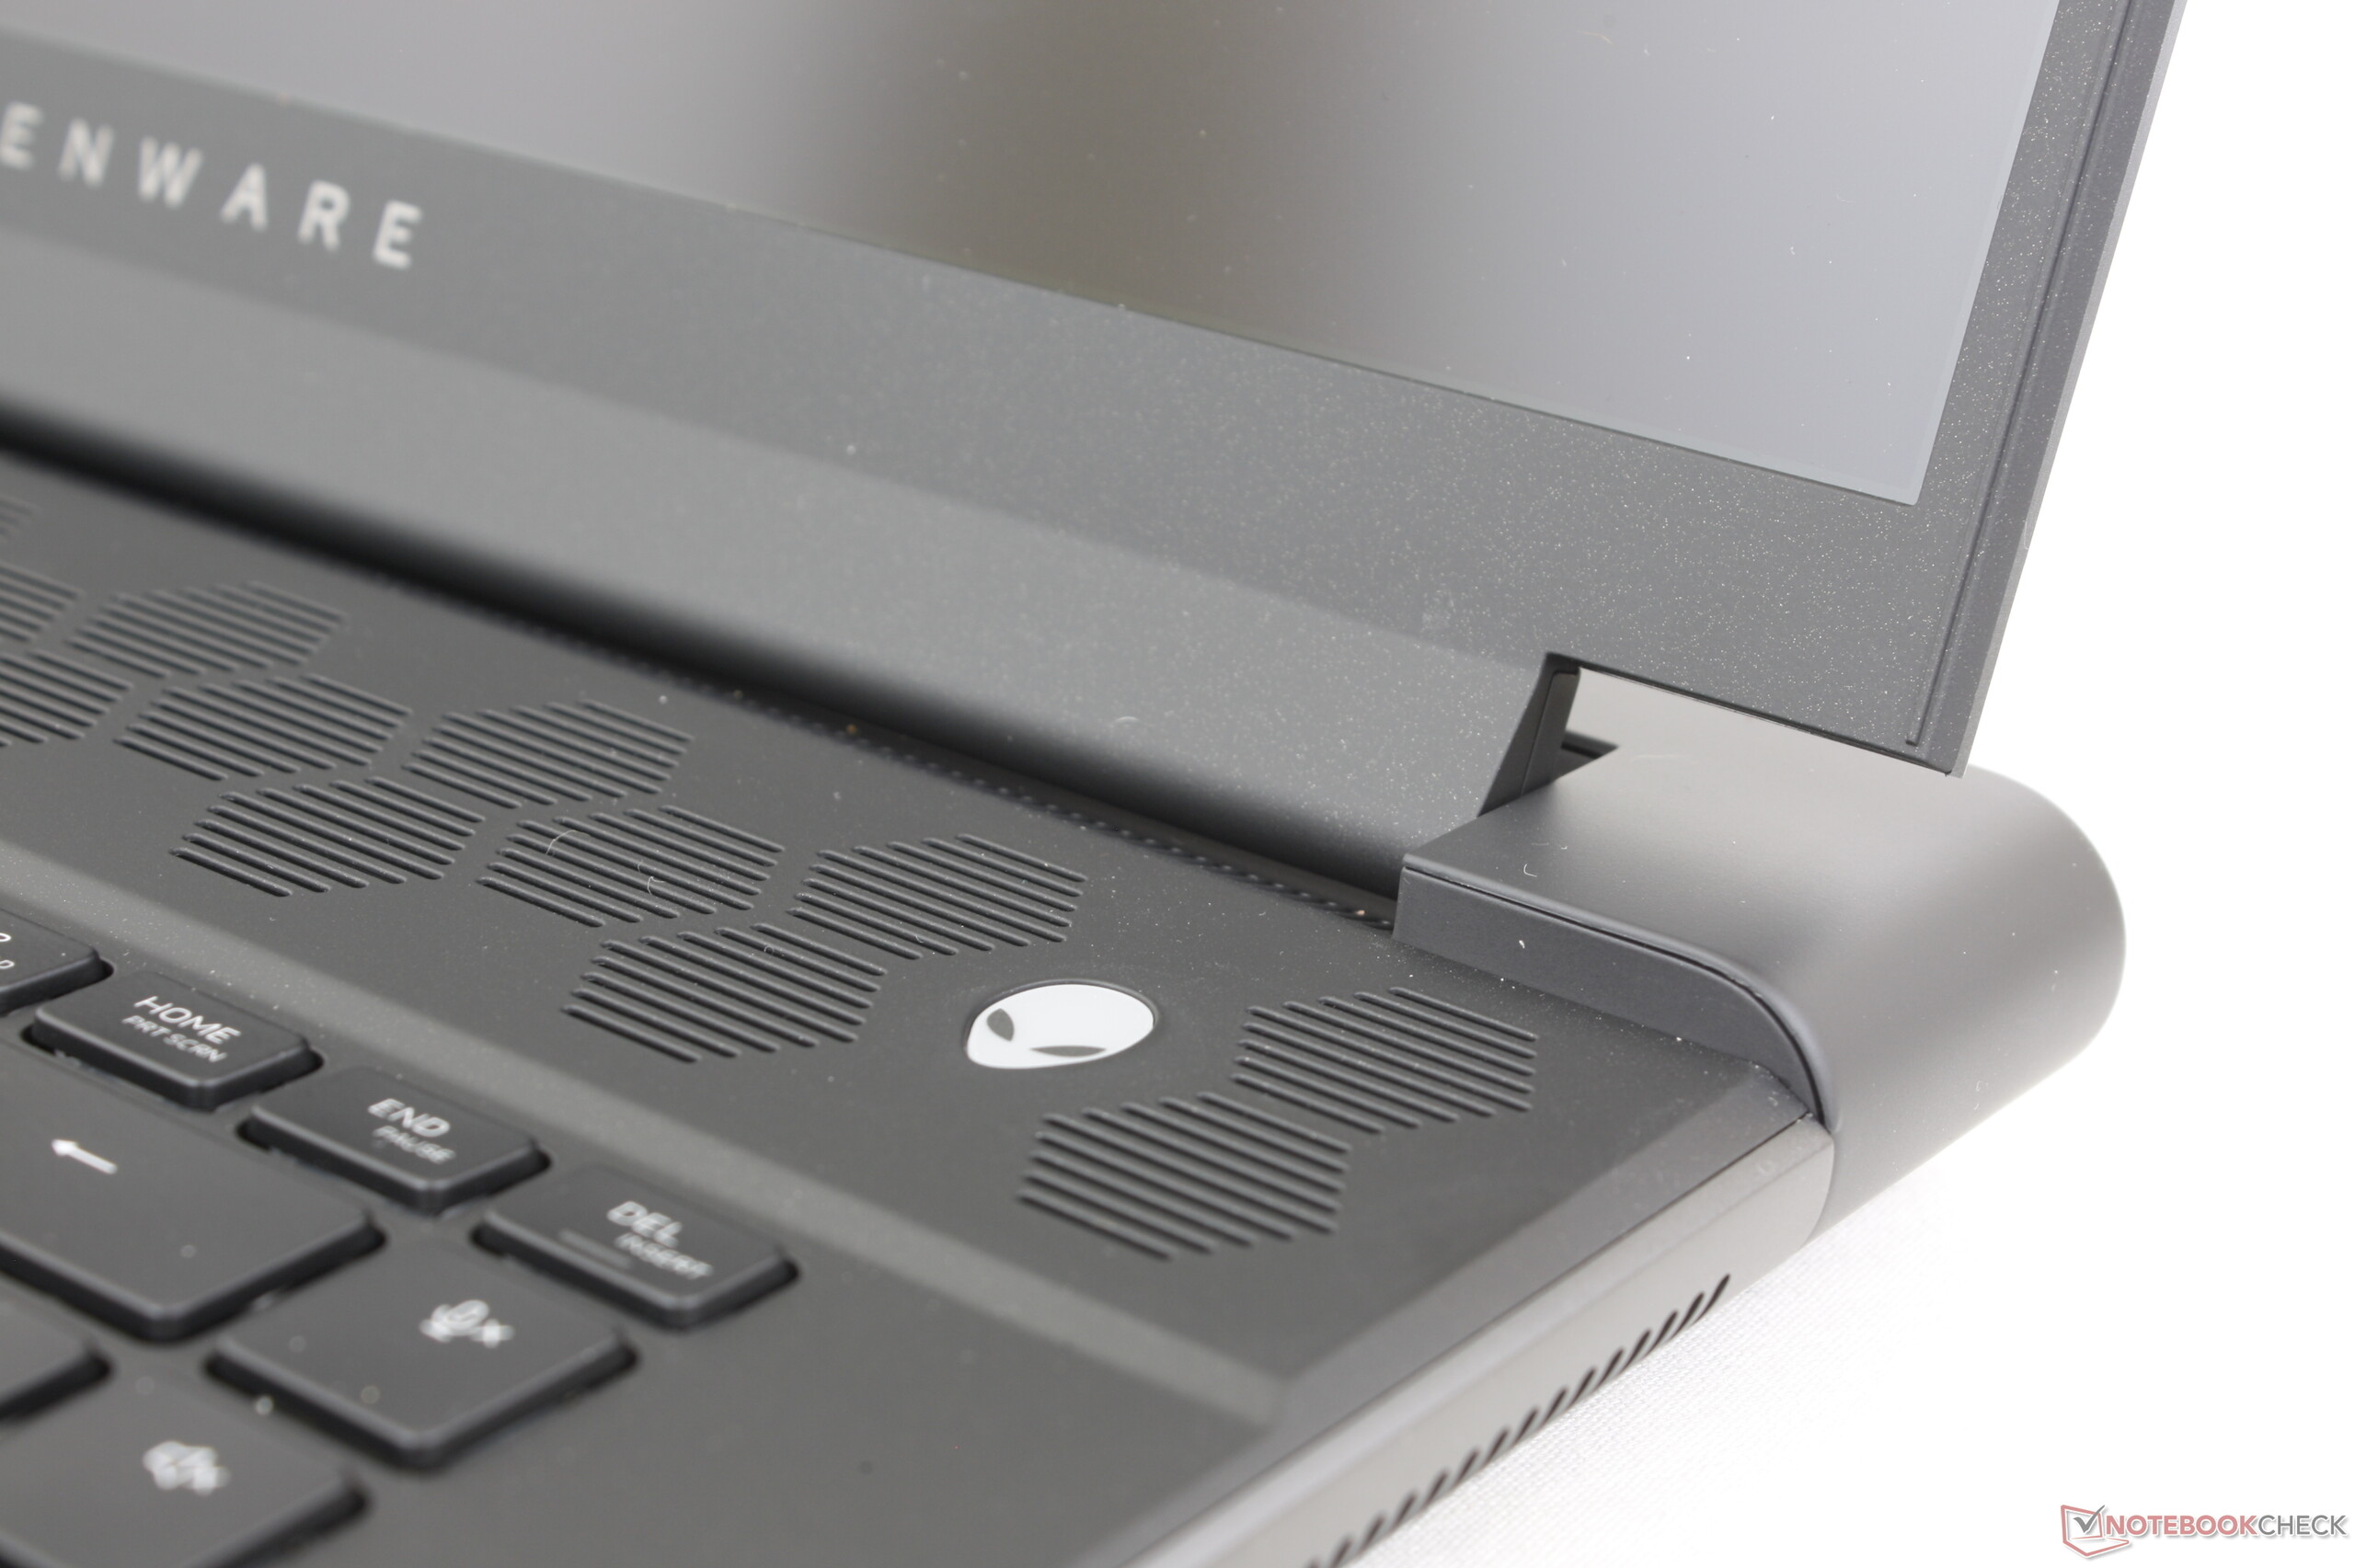
Equipamentos e dispositivos de entrada - Diferenças em relação ao modelo AMD
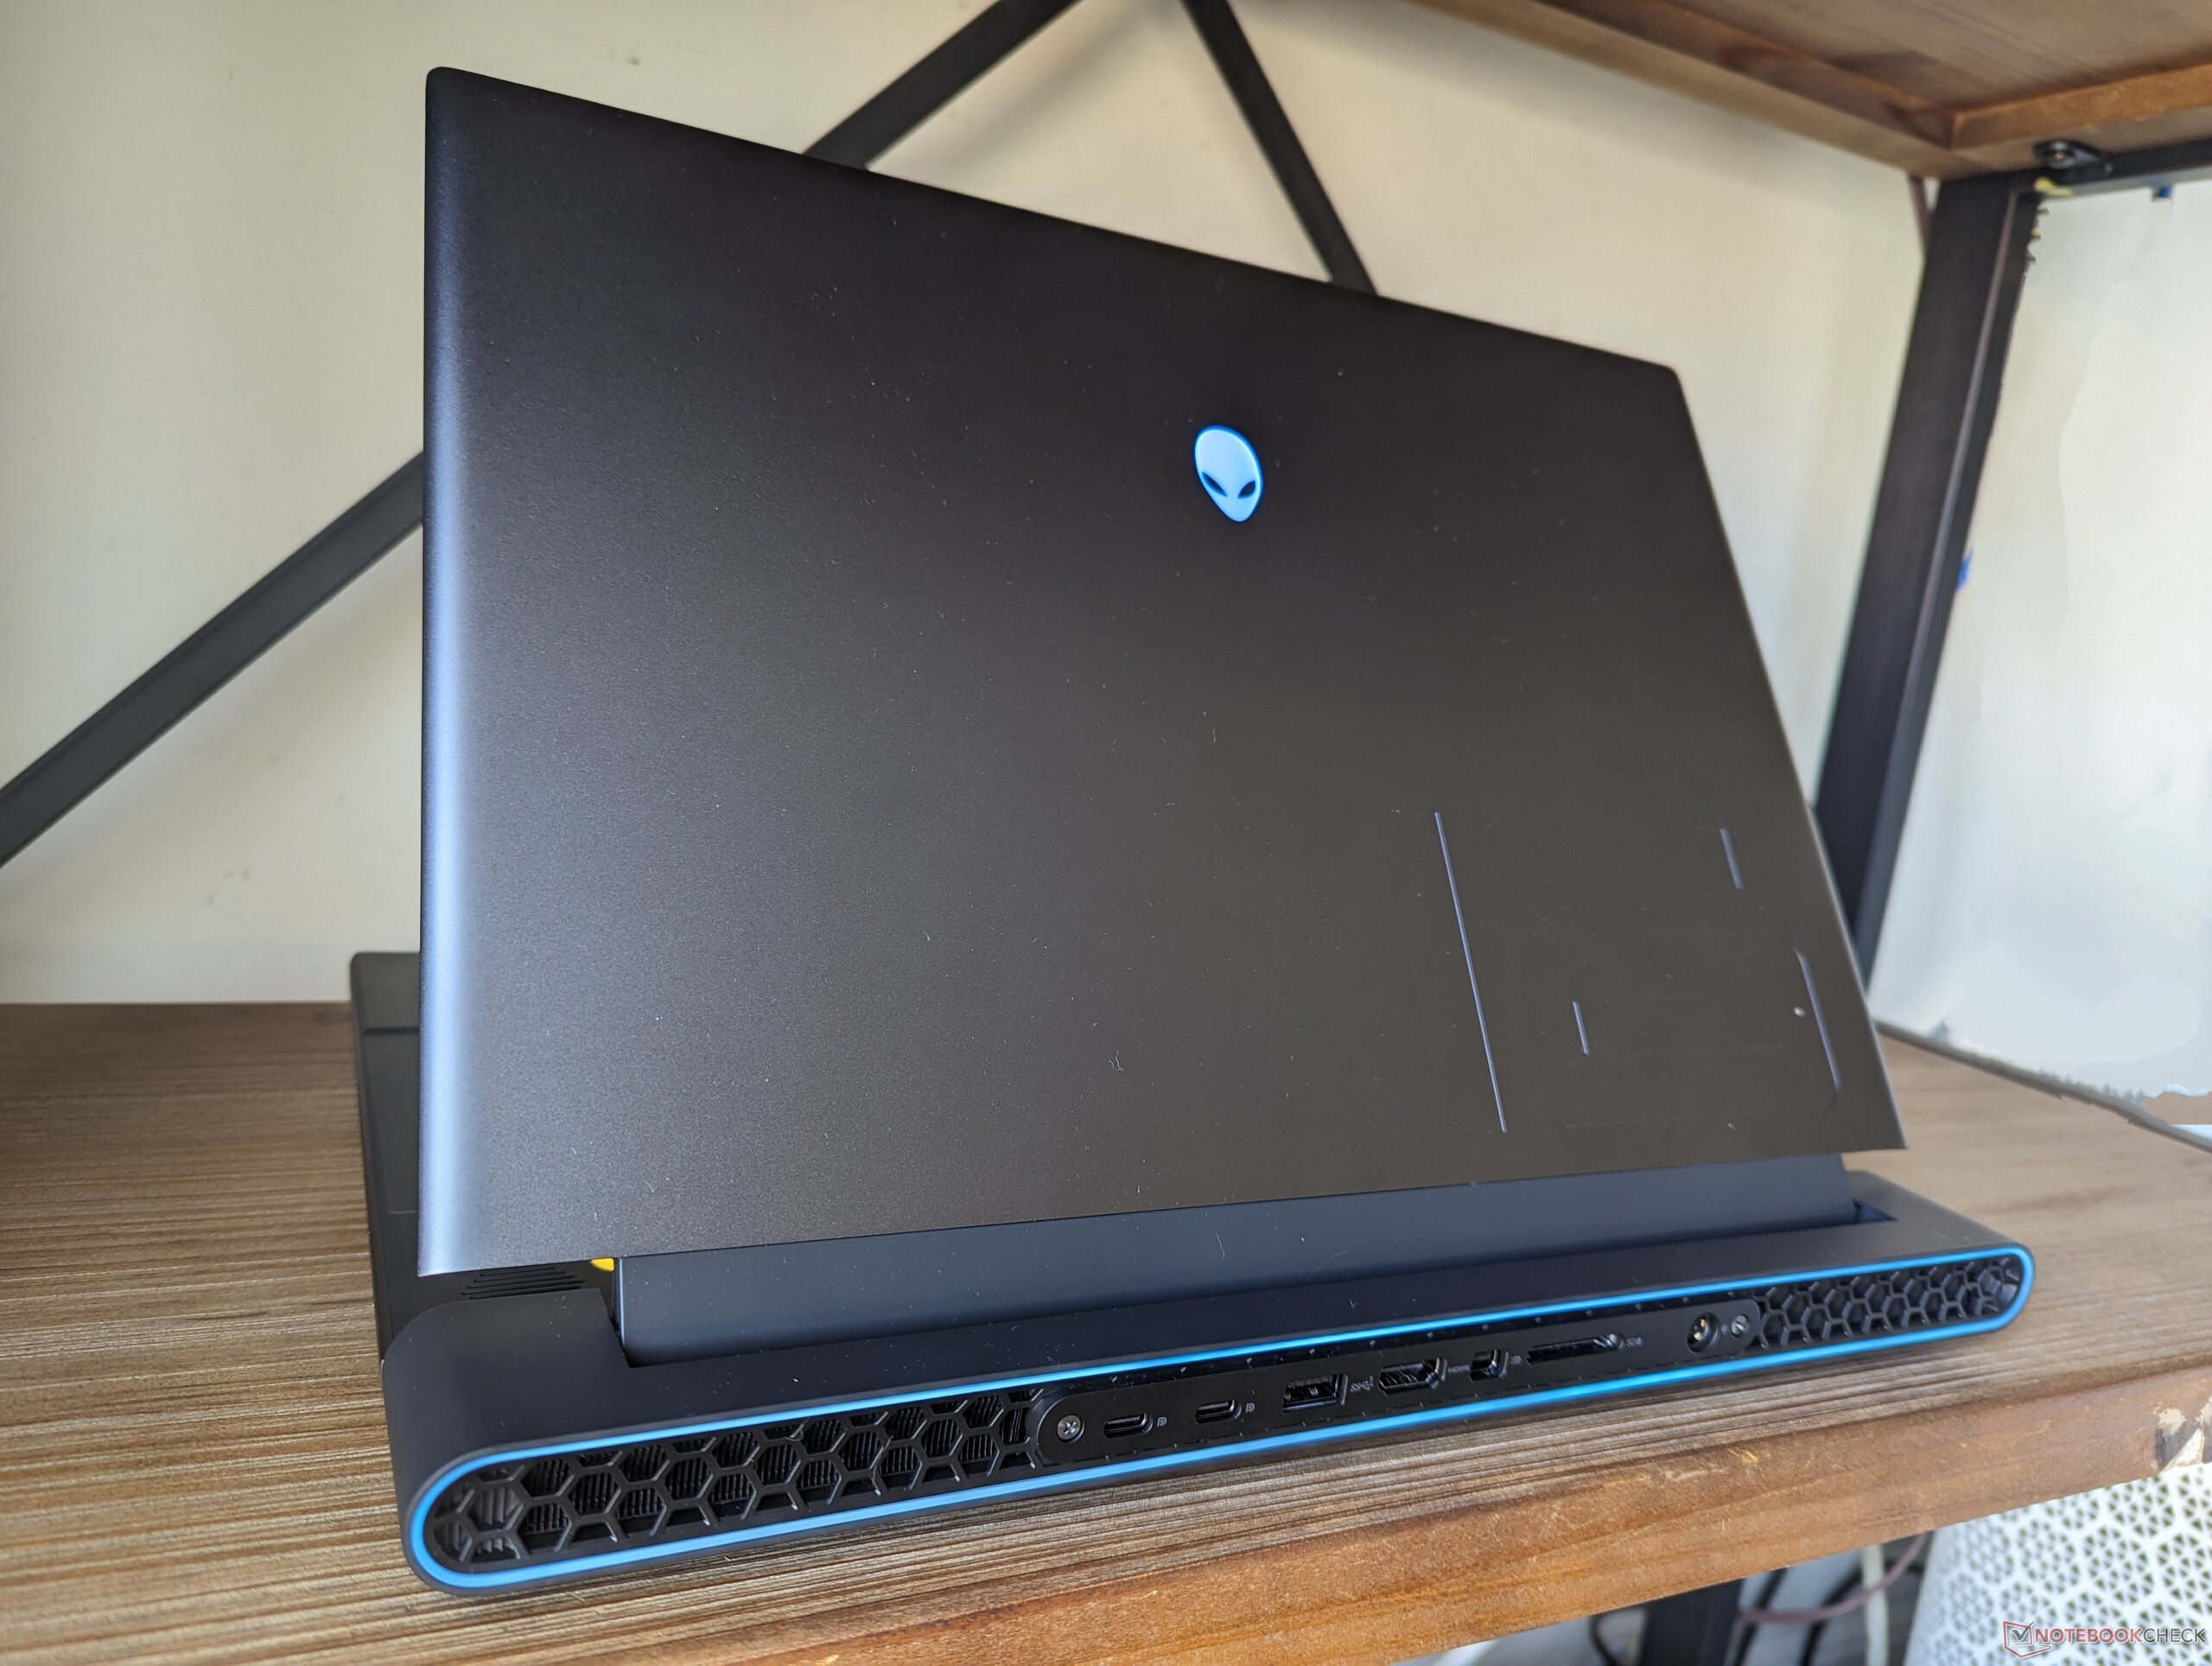
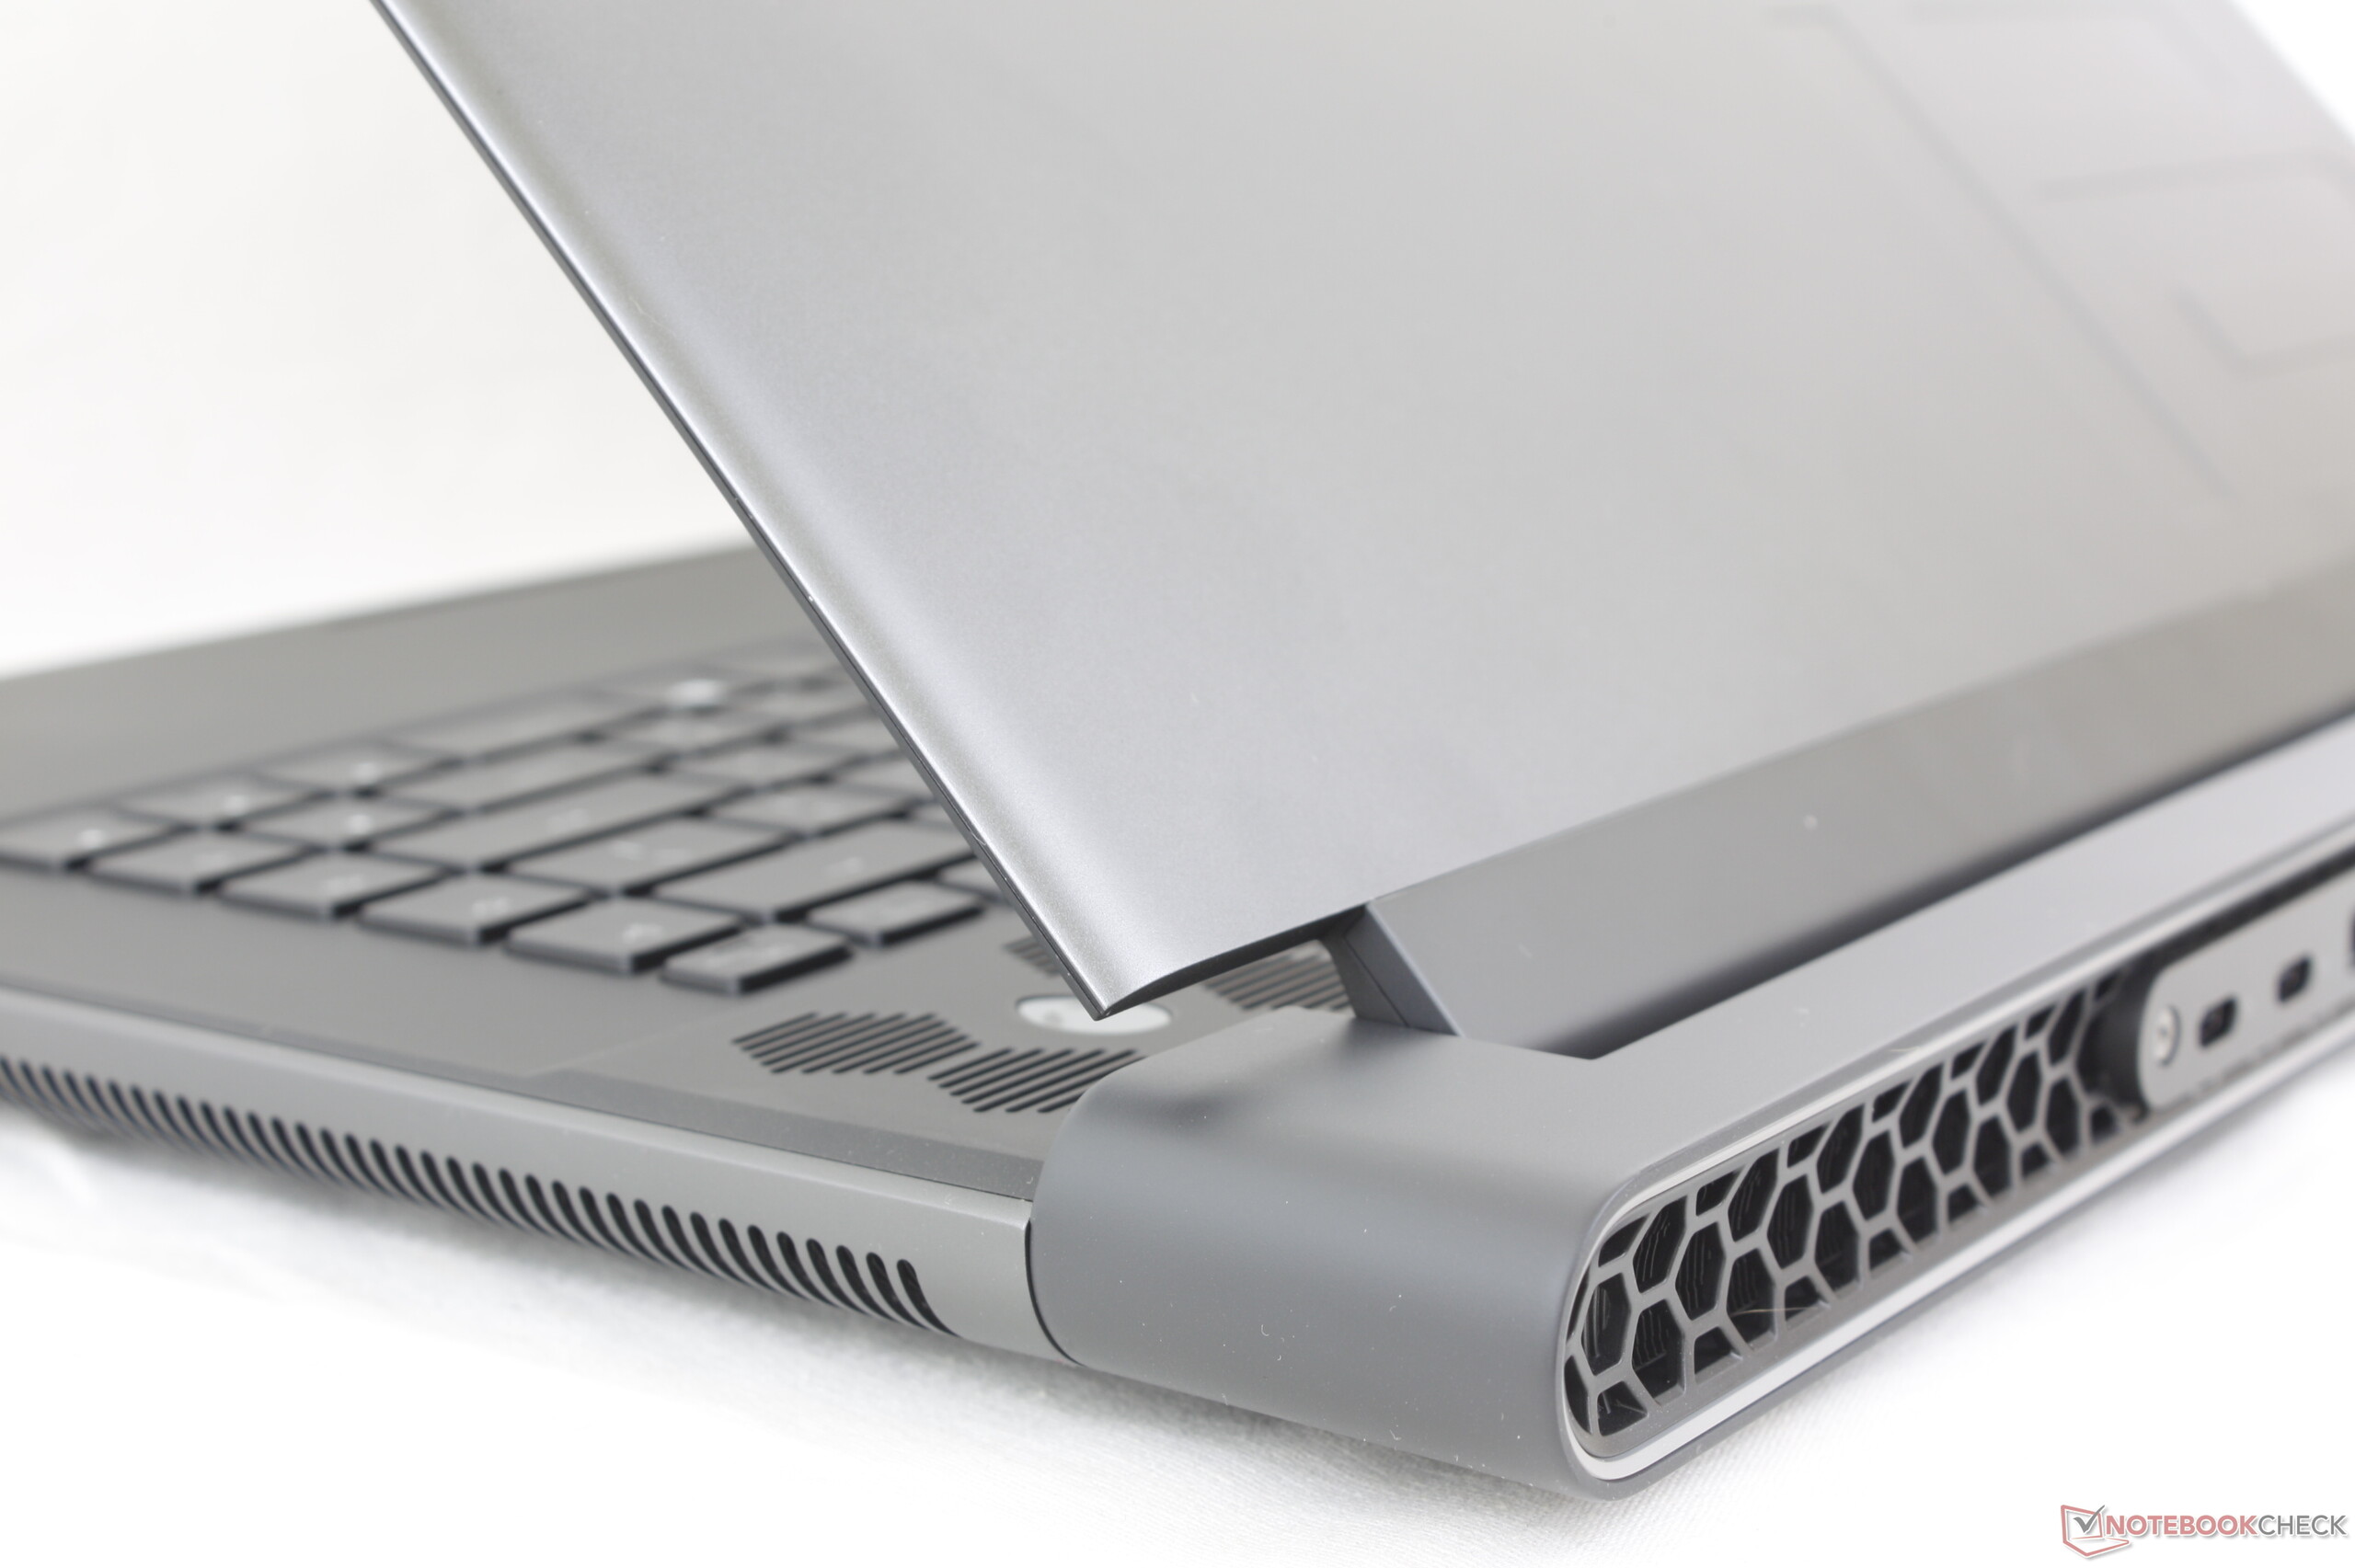
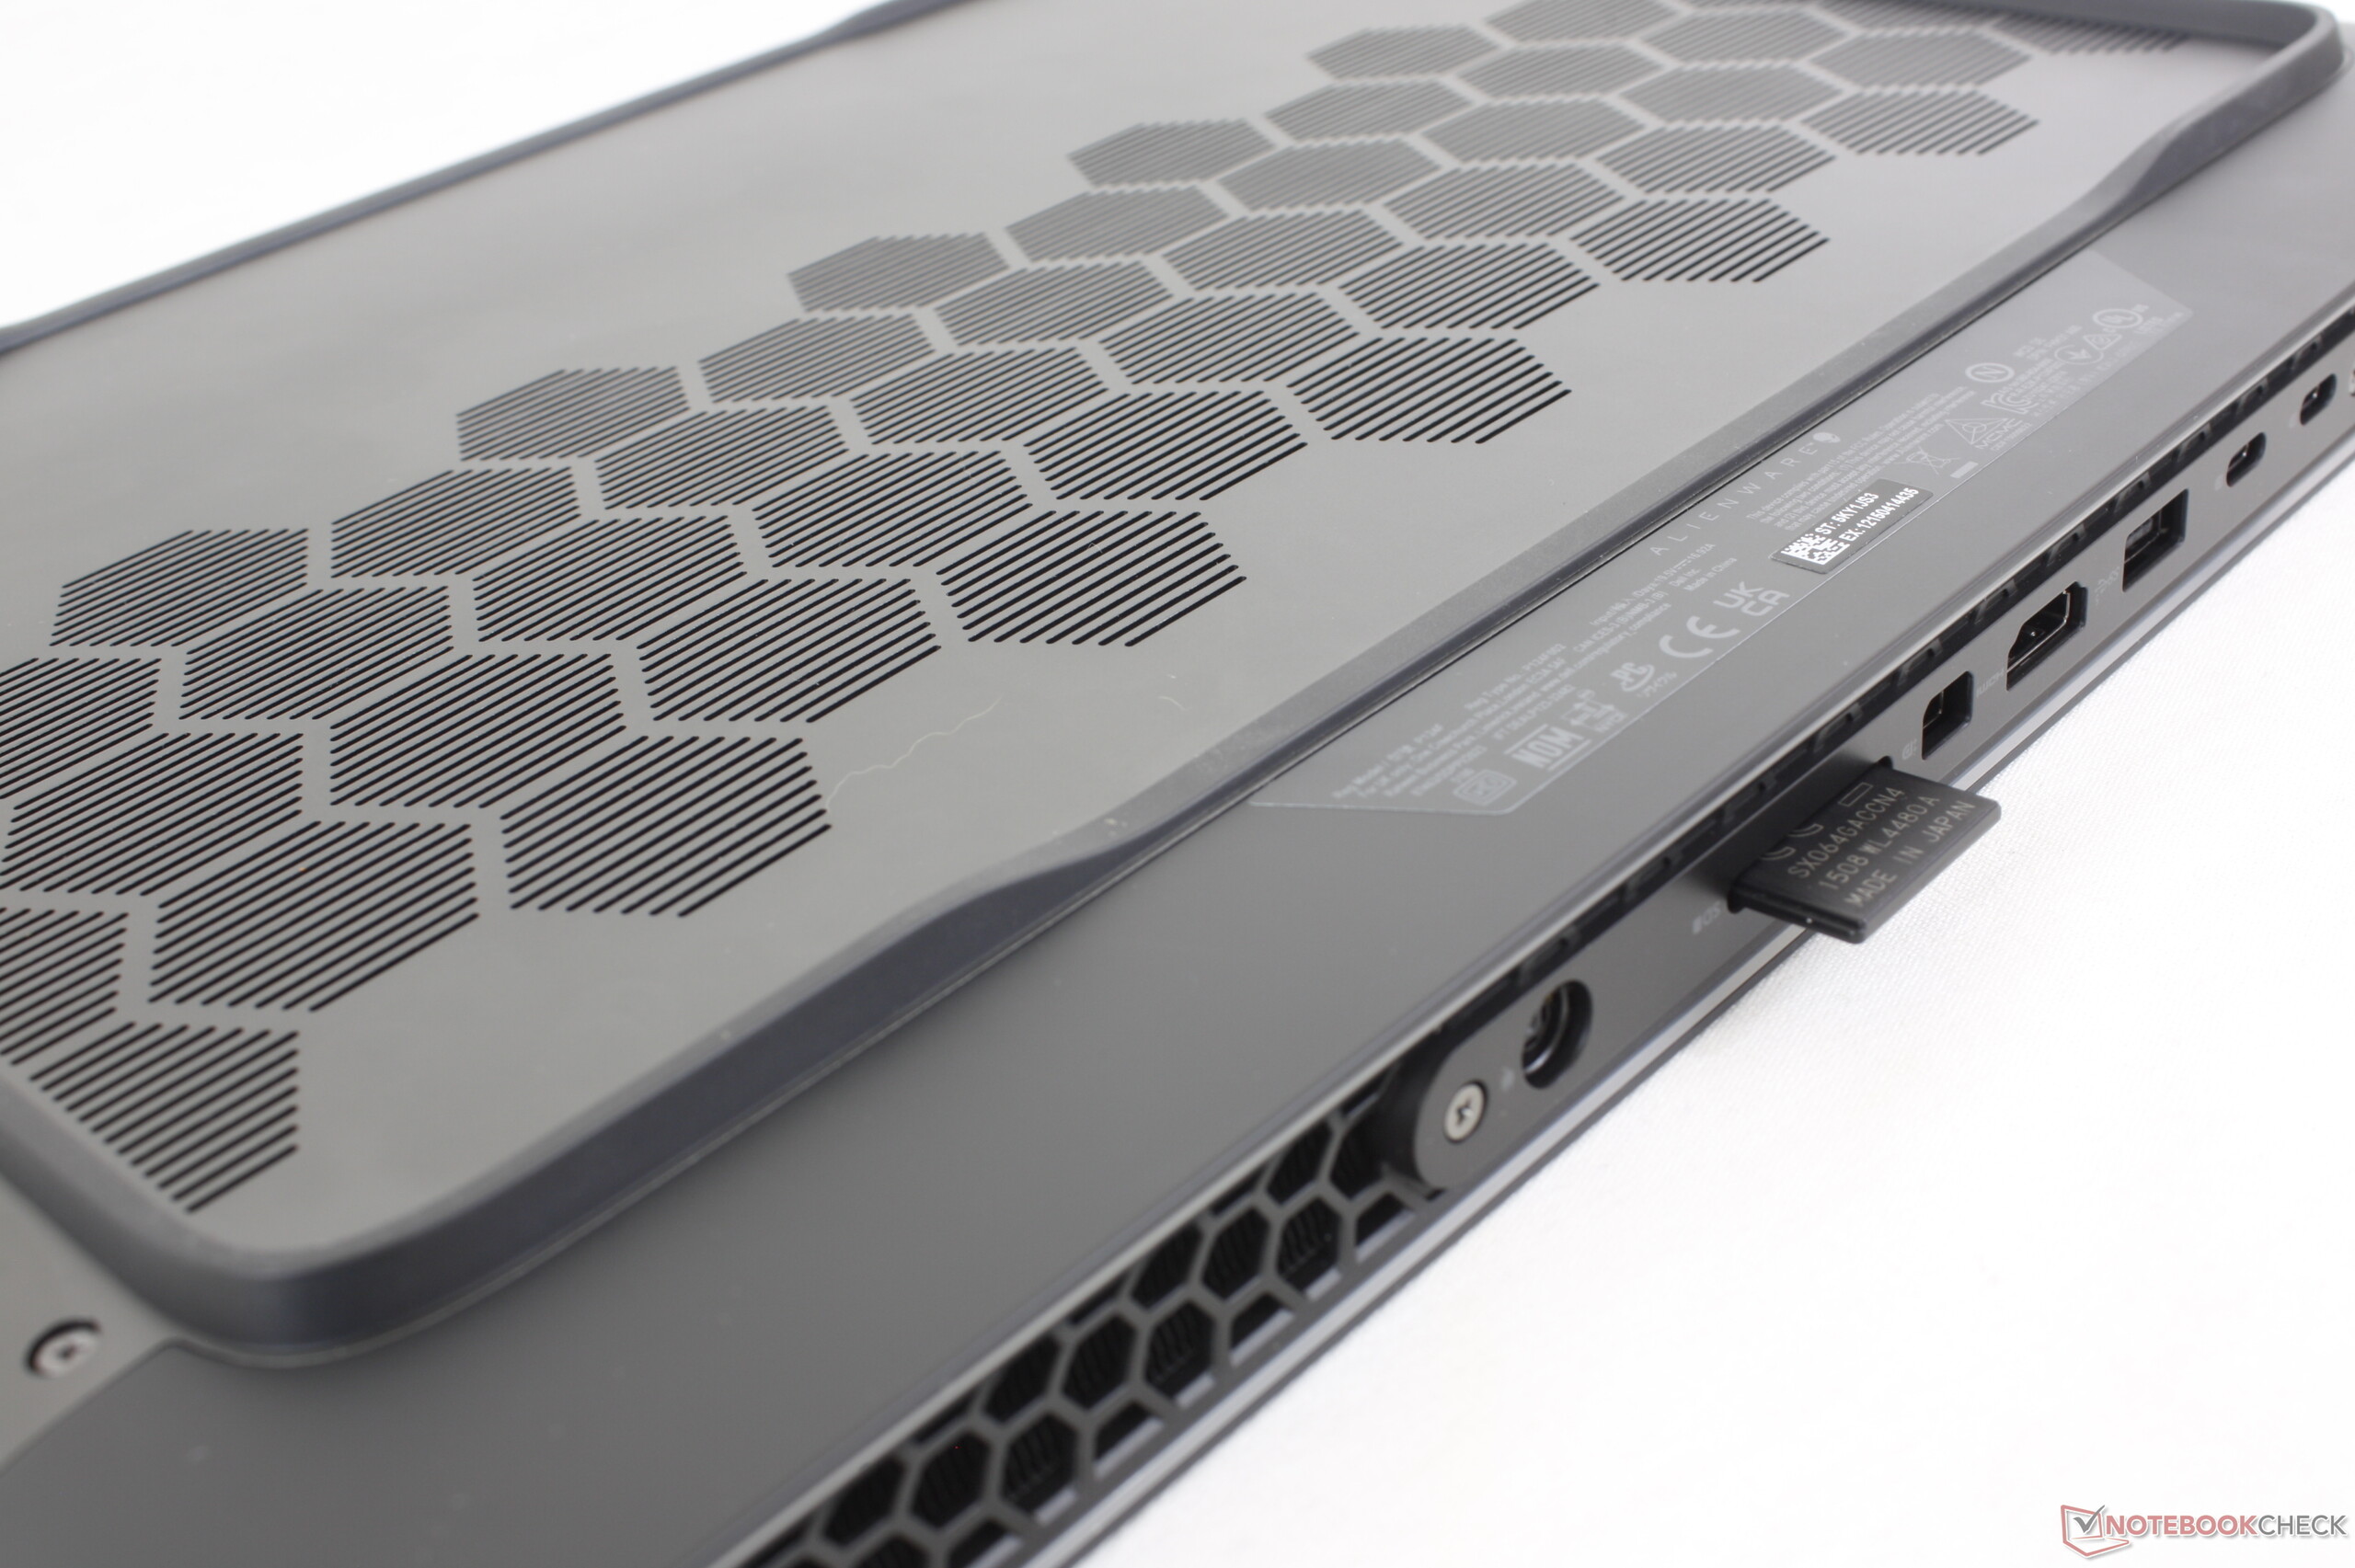
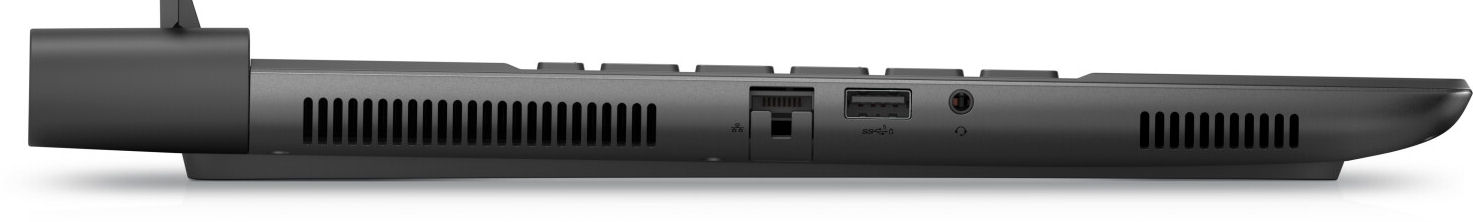
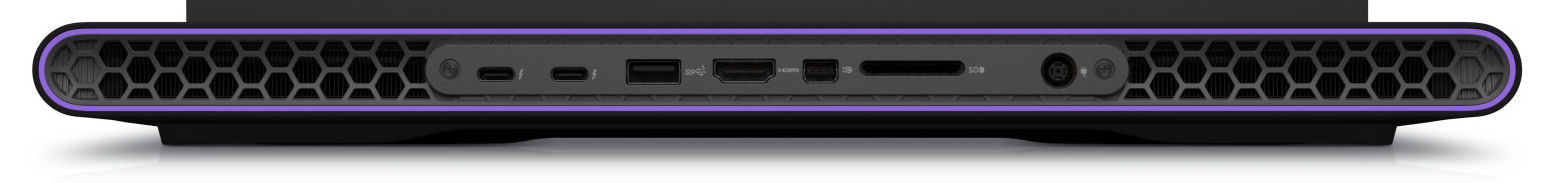
- As duas portas USB-C dos modelos m16 baseados em Intel suportam Thunderbolt 4 (AMD: somente USB 3.2 Gen 2), incluindo DisplayPort e Power Delivery. Mas tenha cuidado: não é possível ligar o notebook ou carregar a bateria via USB-C. As portas USB-C só podem fornecer energia. As portas USB-C só podem fornecer energia.
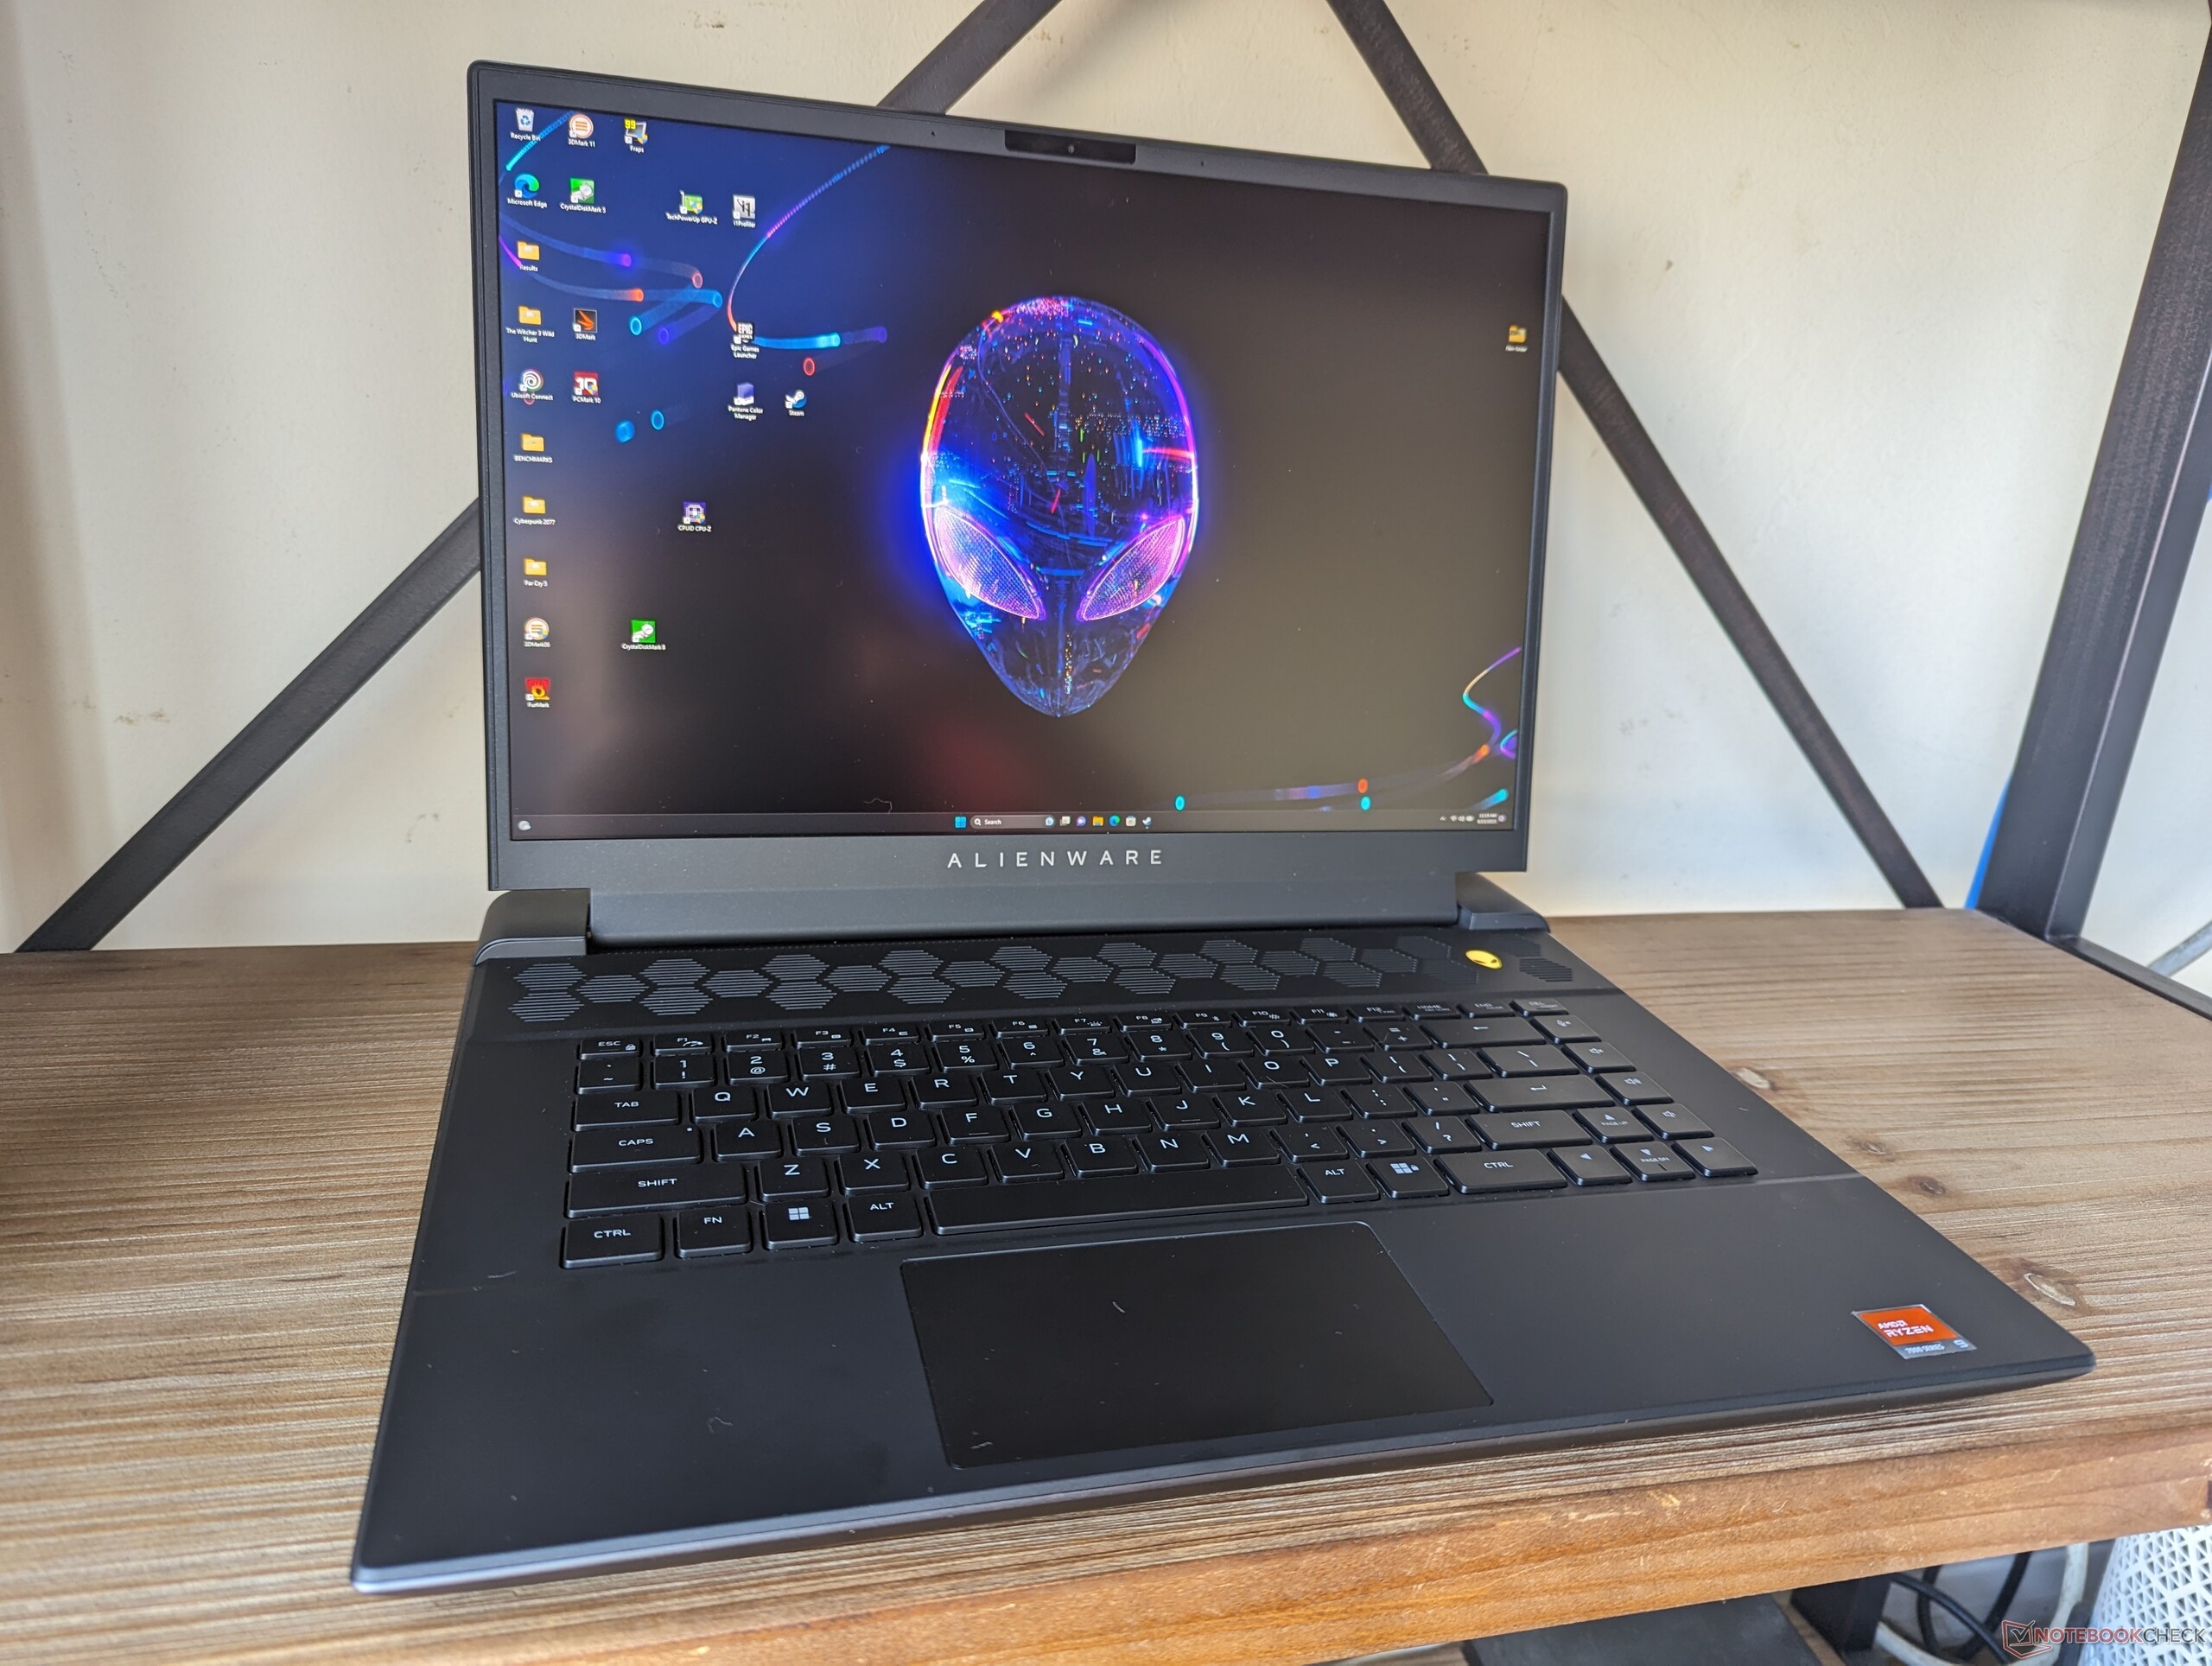
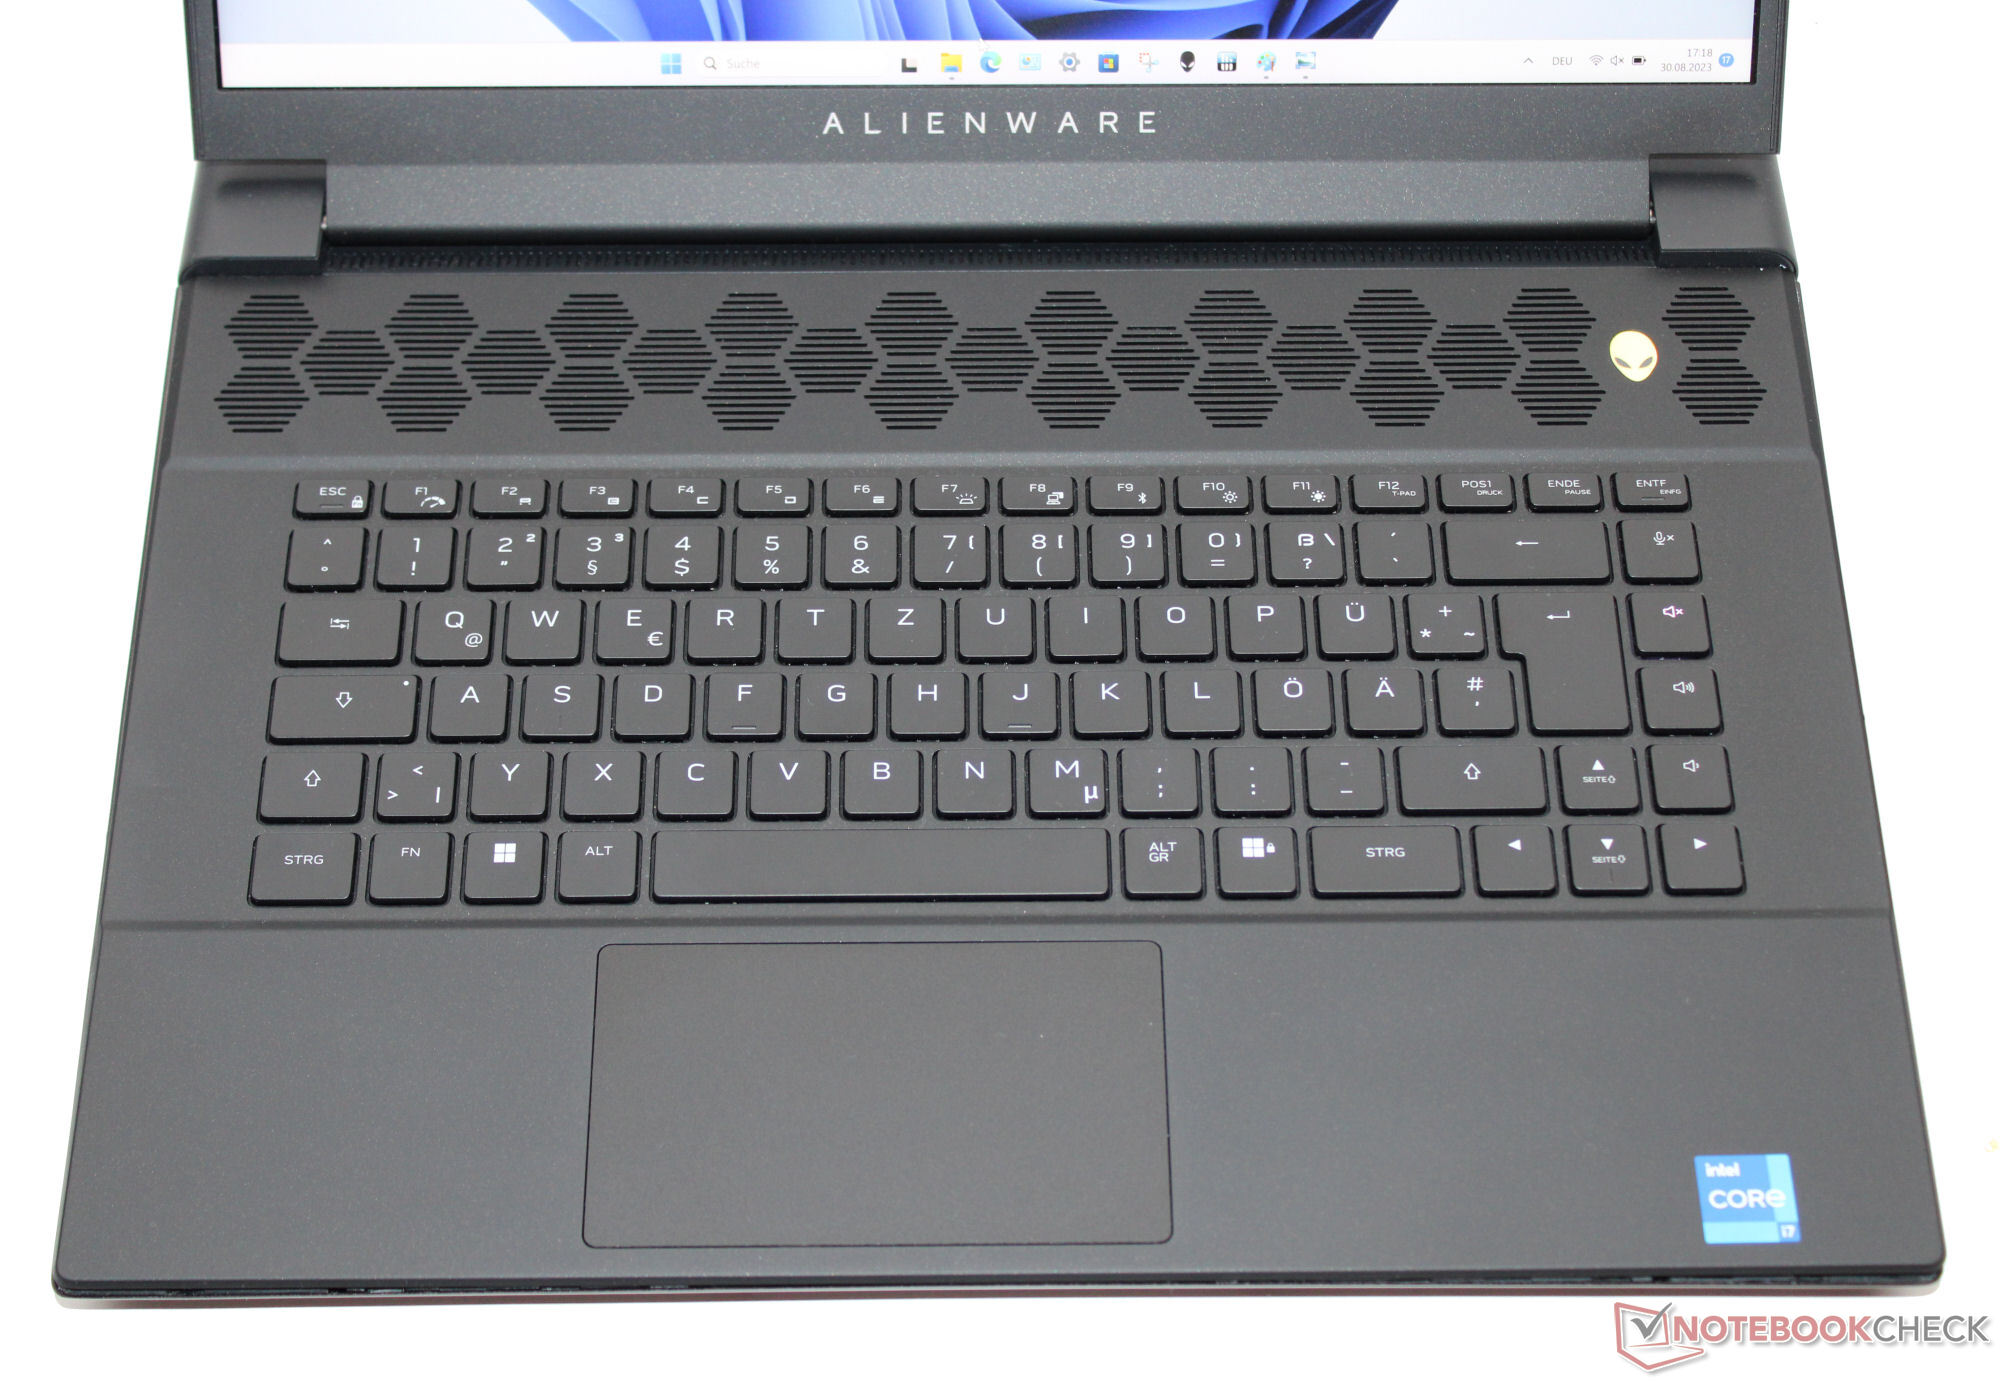
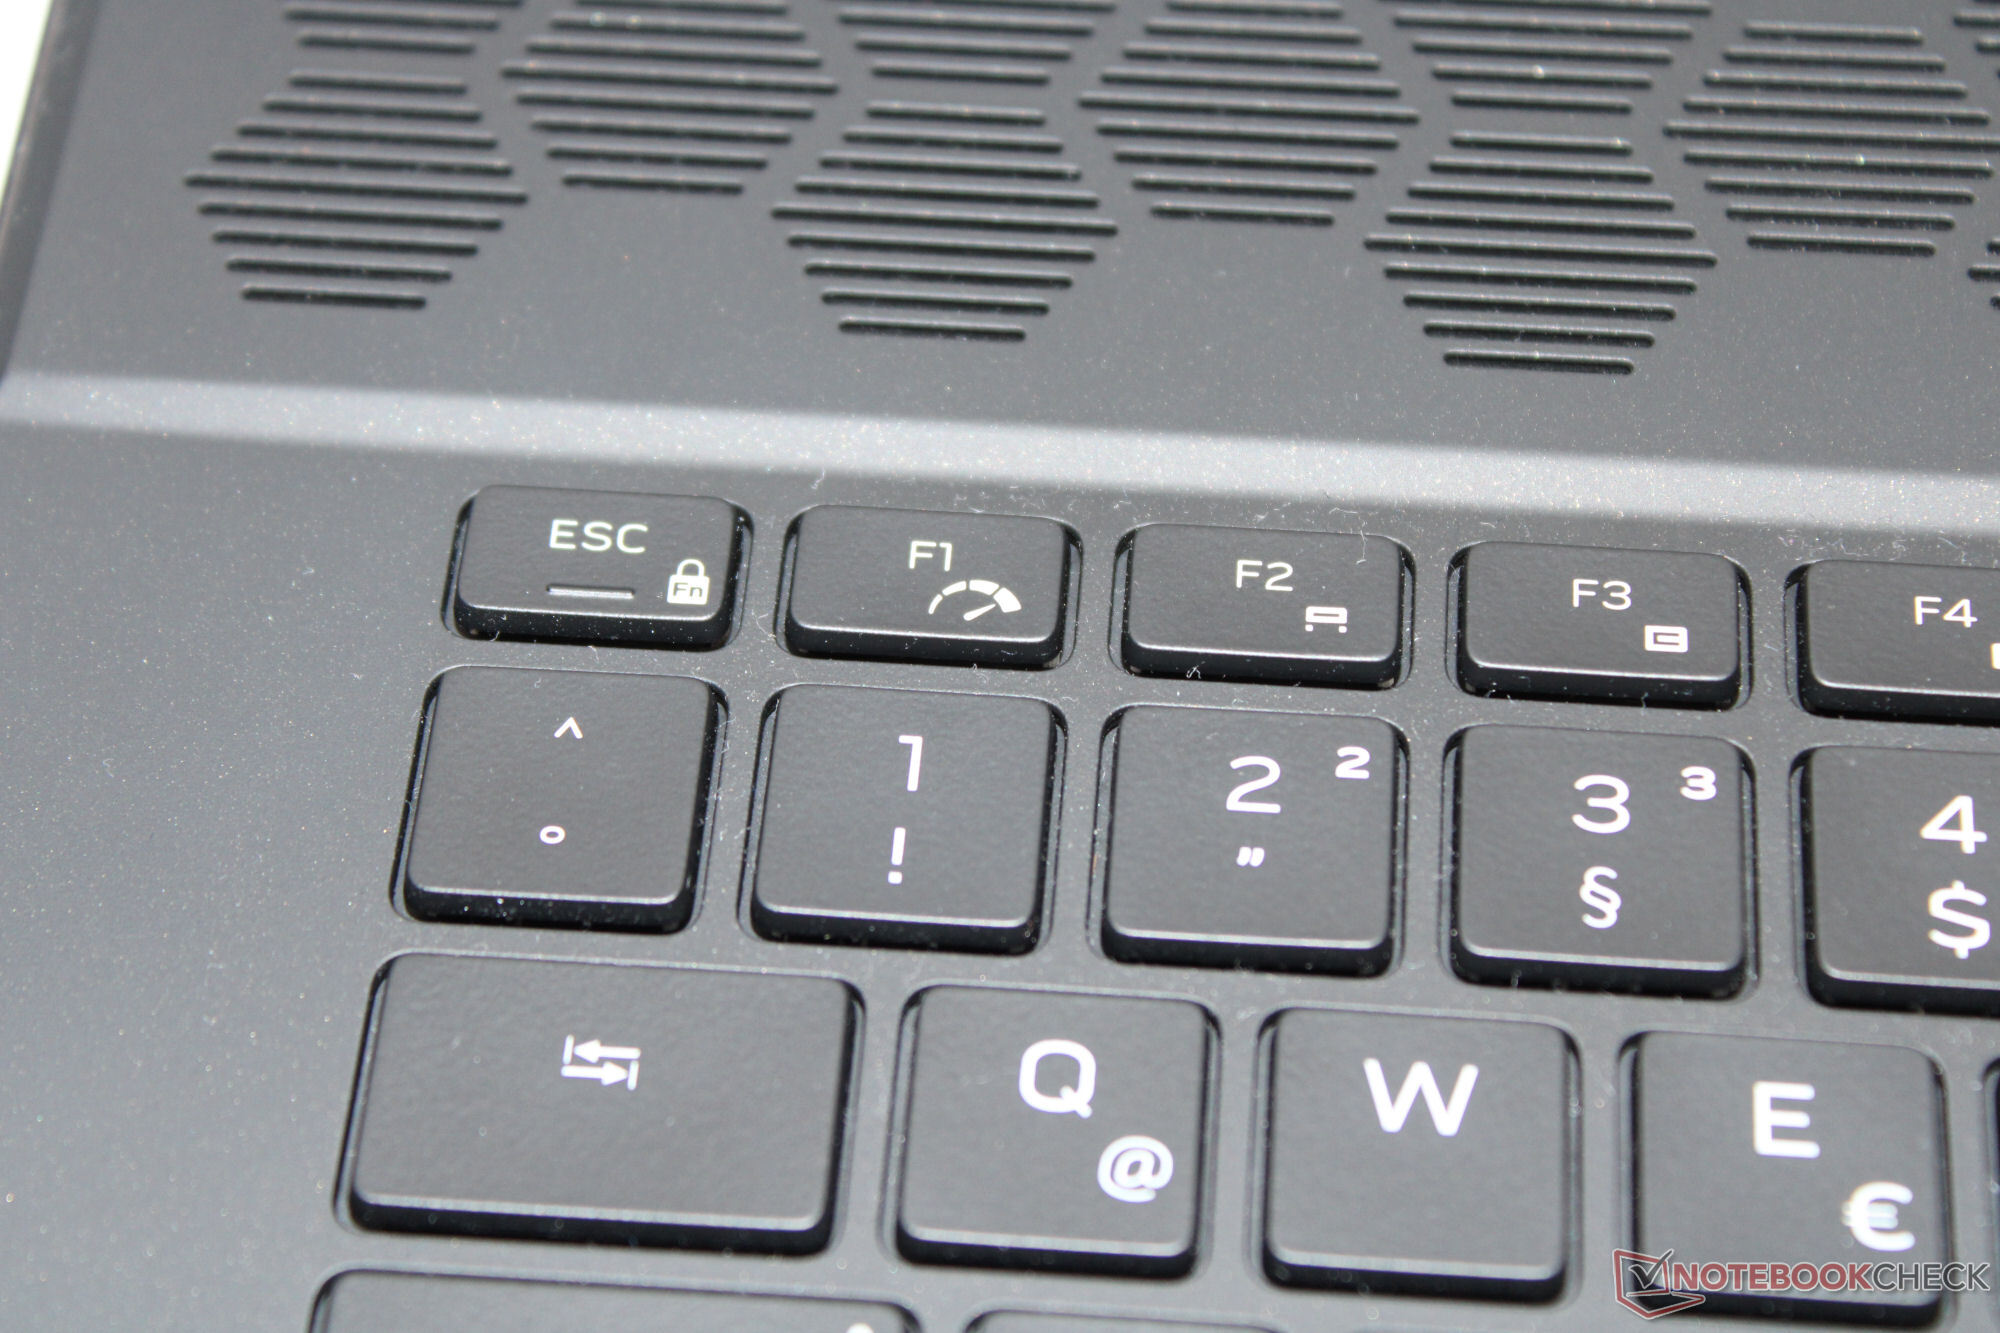
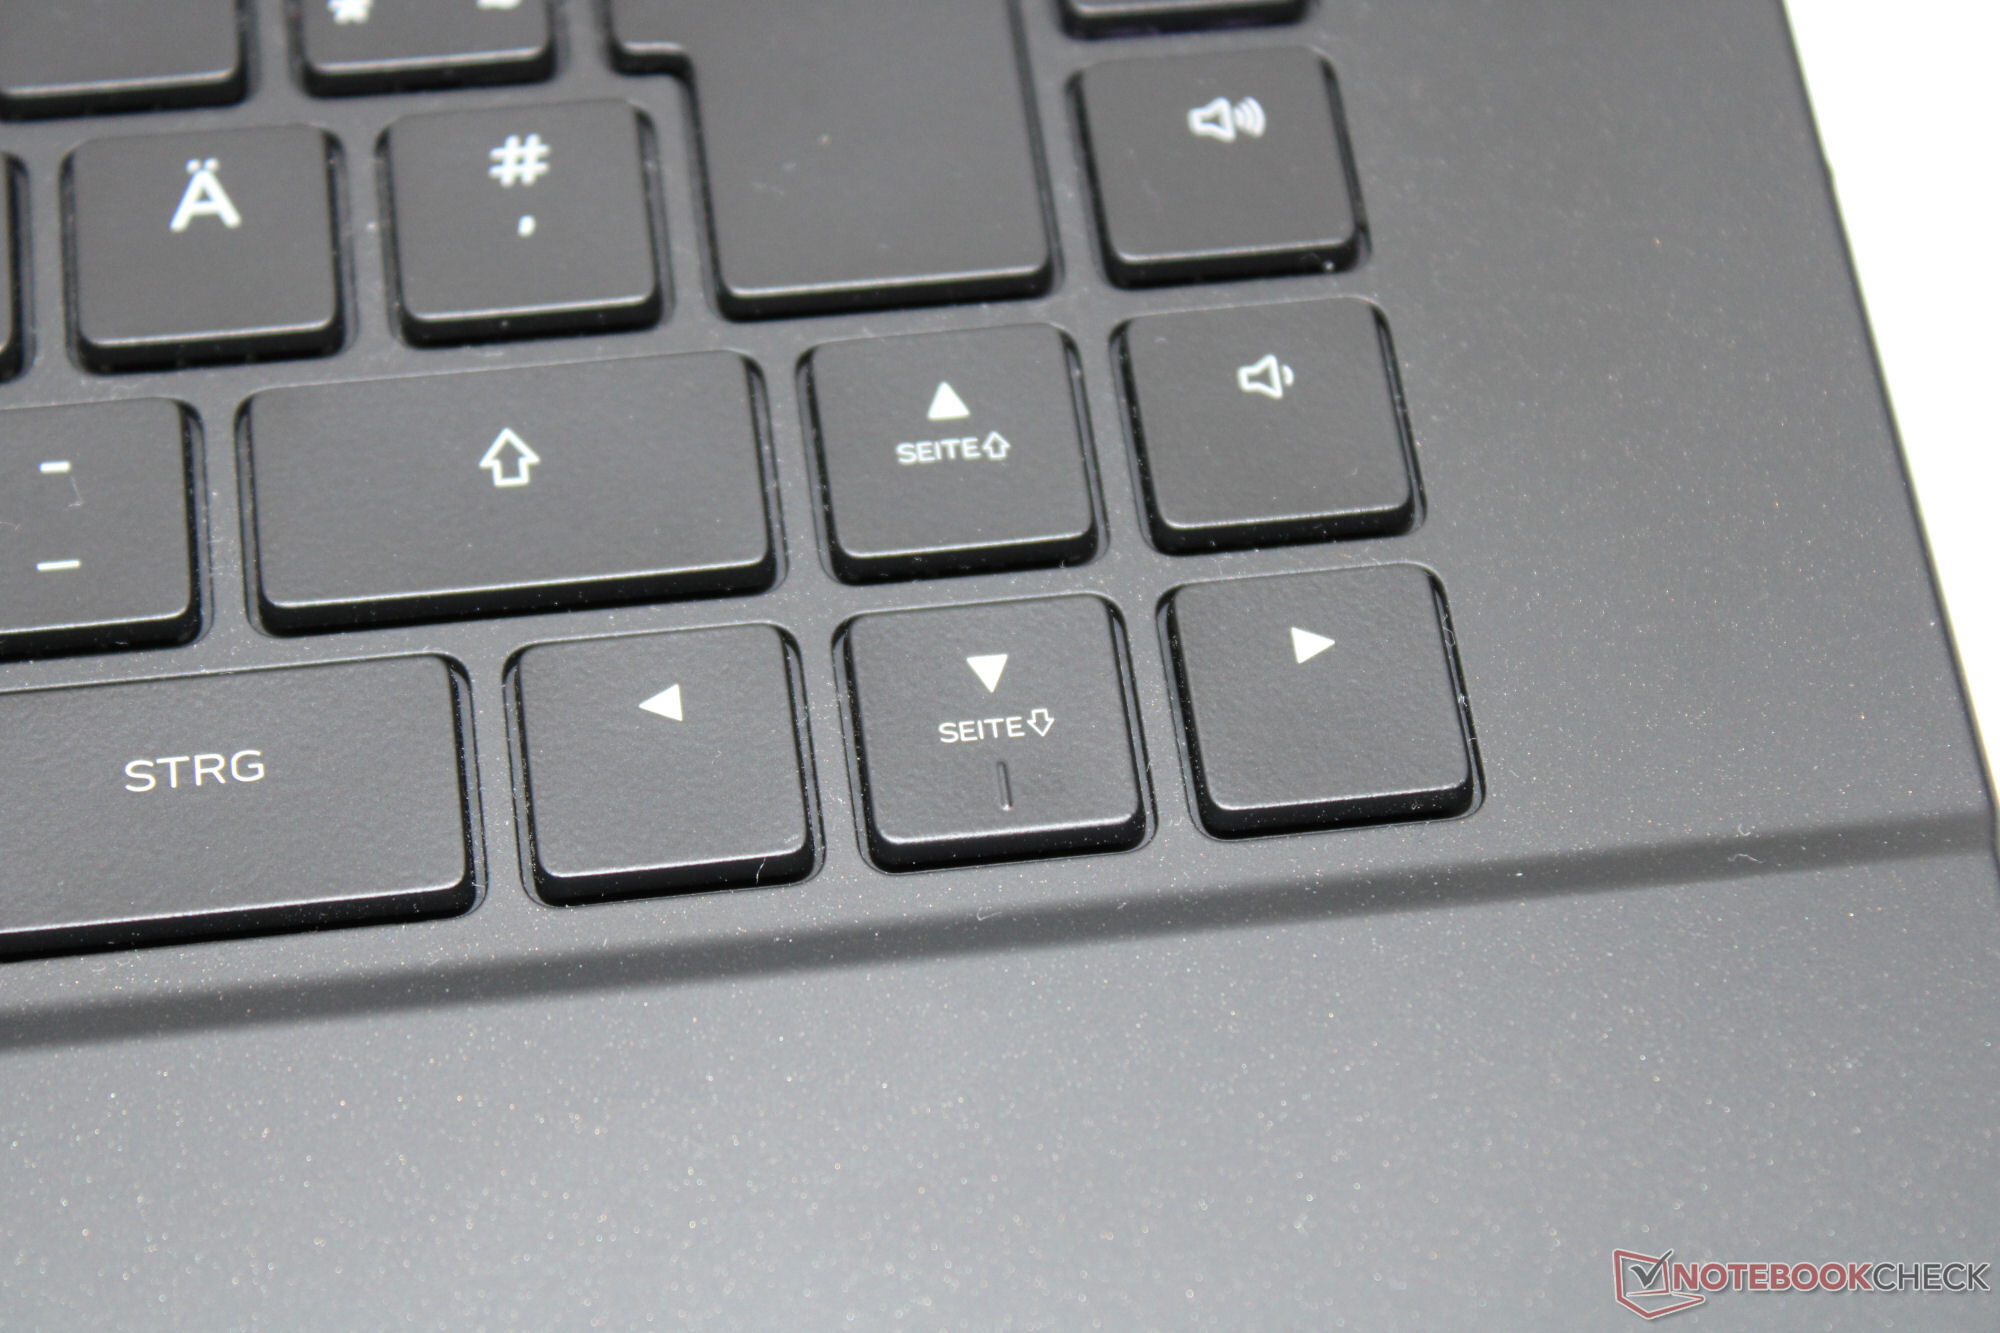
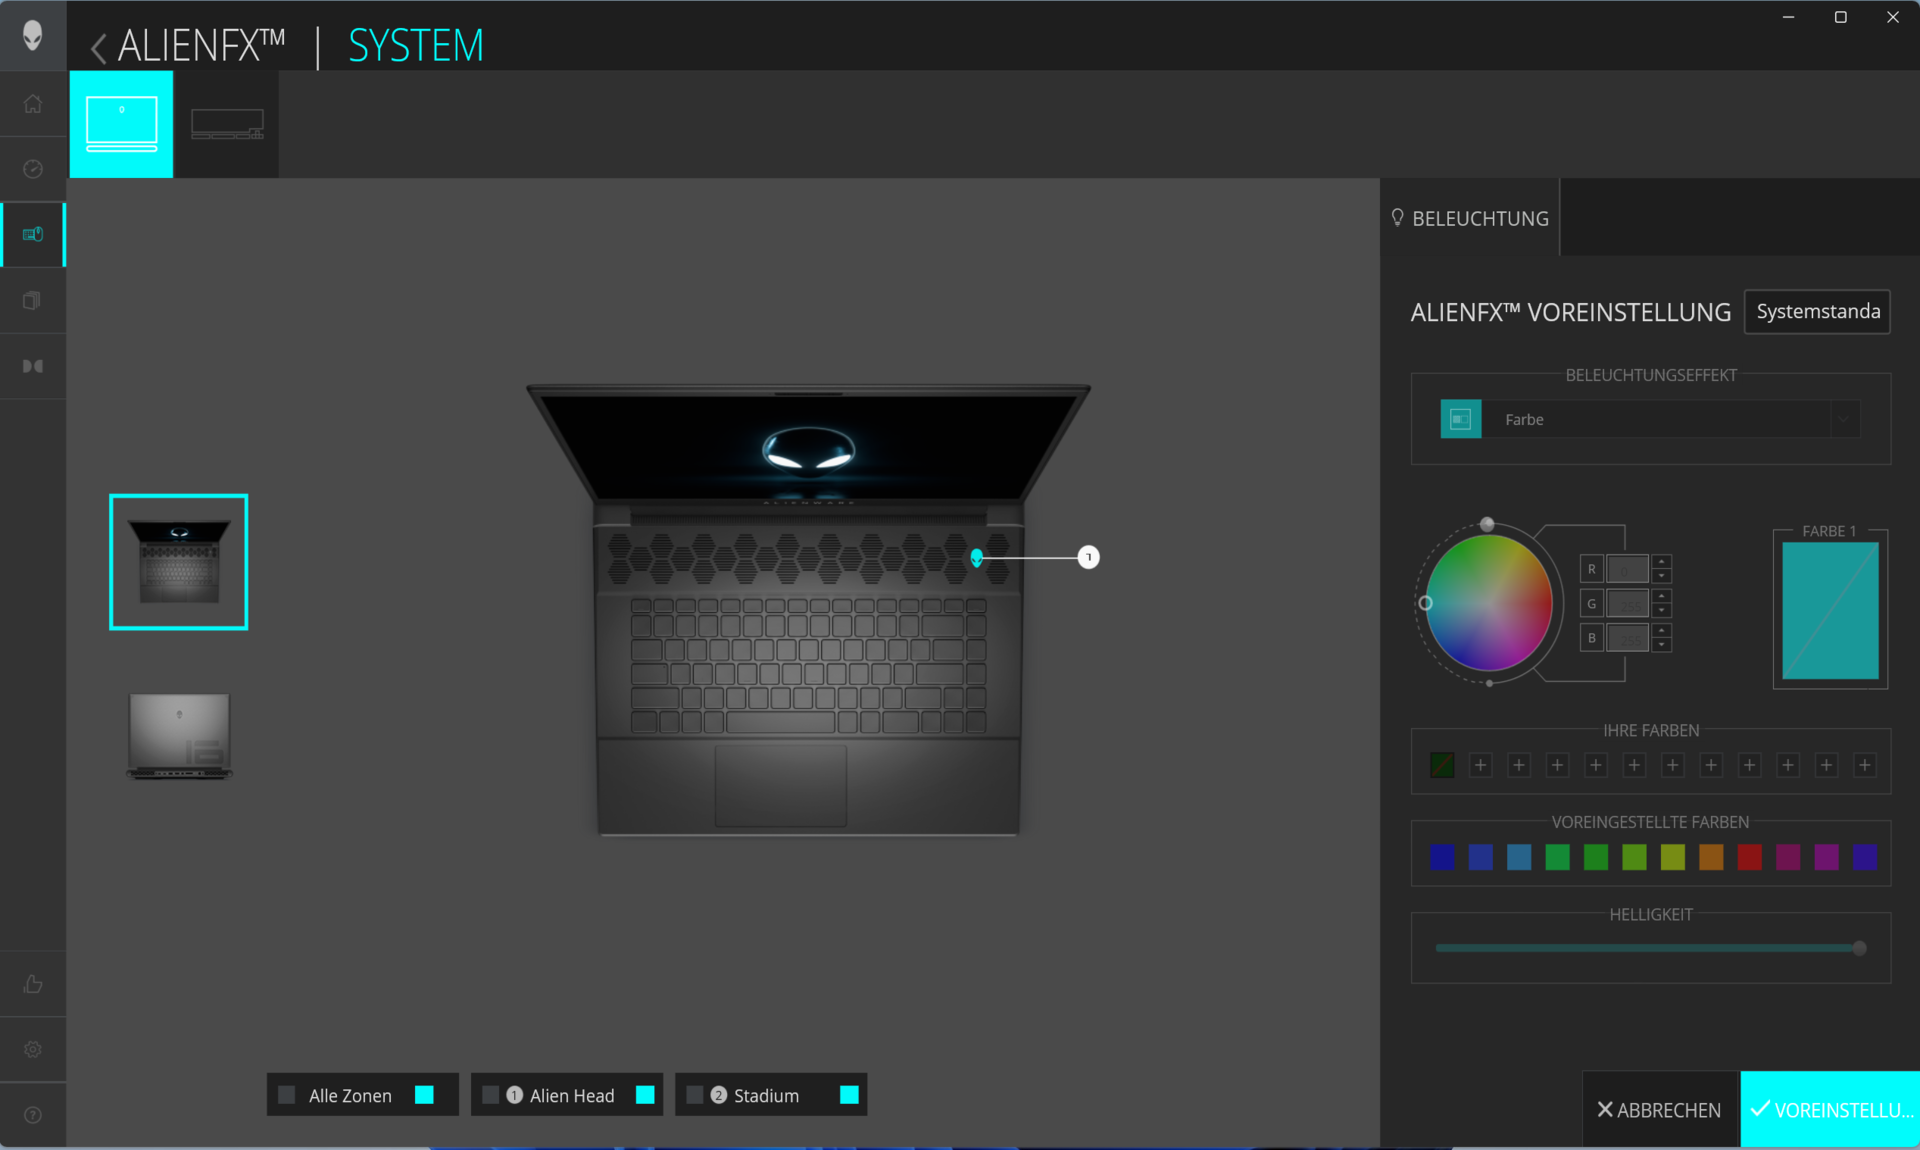
- Em vez do teclado mecânico (CherryMX) do modelomodelo irmãonosso dispositivo de teste tem um teclado de membrana. Suas teclas oferecem deslocamento médio, um ponto de pressão muito claro e resistência muito firme. A iluminação individual das teclas (RGB) também é possível.
| SD Card Reader | |
| average JPG Copy Test (av. of 3 runs) | |
| Alienware m16 R1 AMD (Toshiba Exceria Pro SDXC 64 GB UHS-II) | |
| Alienware m16 R1 Intel (AV PRO microSD 128 GB V60) | |
| Média da turma Gaming (20.9 - 210, n=54, últimos 2 anos) | |
| Medion Erazer Defender P40 (AV PRO microSD 128 GB V60) | |
| Schenker XMG Pro 15 (E23) | |
| Acer Predator Helios 16 PH16-71-731Q | |
| maximum AS SSD Seq Read Test (1GB) | |
| Alienware m16 R1 AMD (Toshiba Exceria Pro SDXC 64 GB UHS-II) | |
| Alienware m16 R1 Intel (AV PRO microSD 128 GB V60) | |
| Média da turma Gaming (25.5 - 261, n=51, últimos 2 anos) | |
| Medion Erazer Defender P40 (AV PRO microSD 128 GB V60) | |
| Schenker XMG Pro 15 (E23) | |
| Acer Predator Helios 16 PH16-71-731Q | |


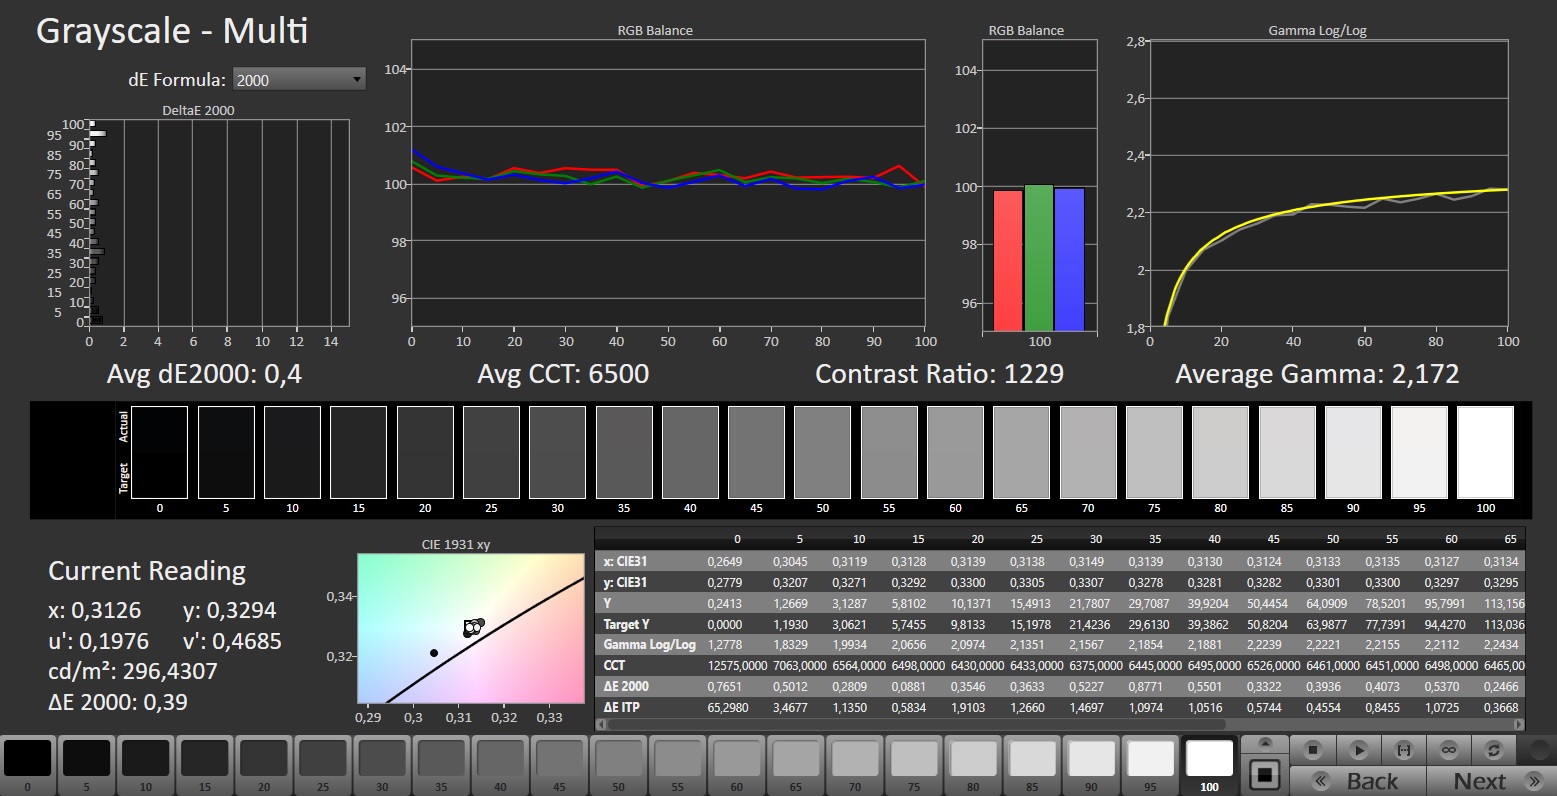
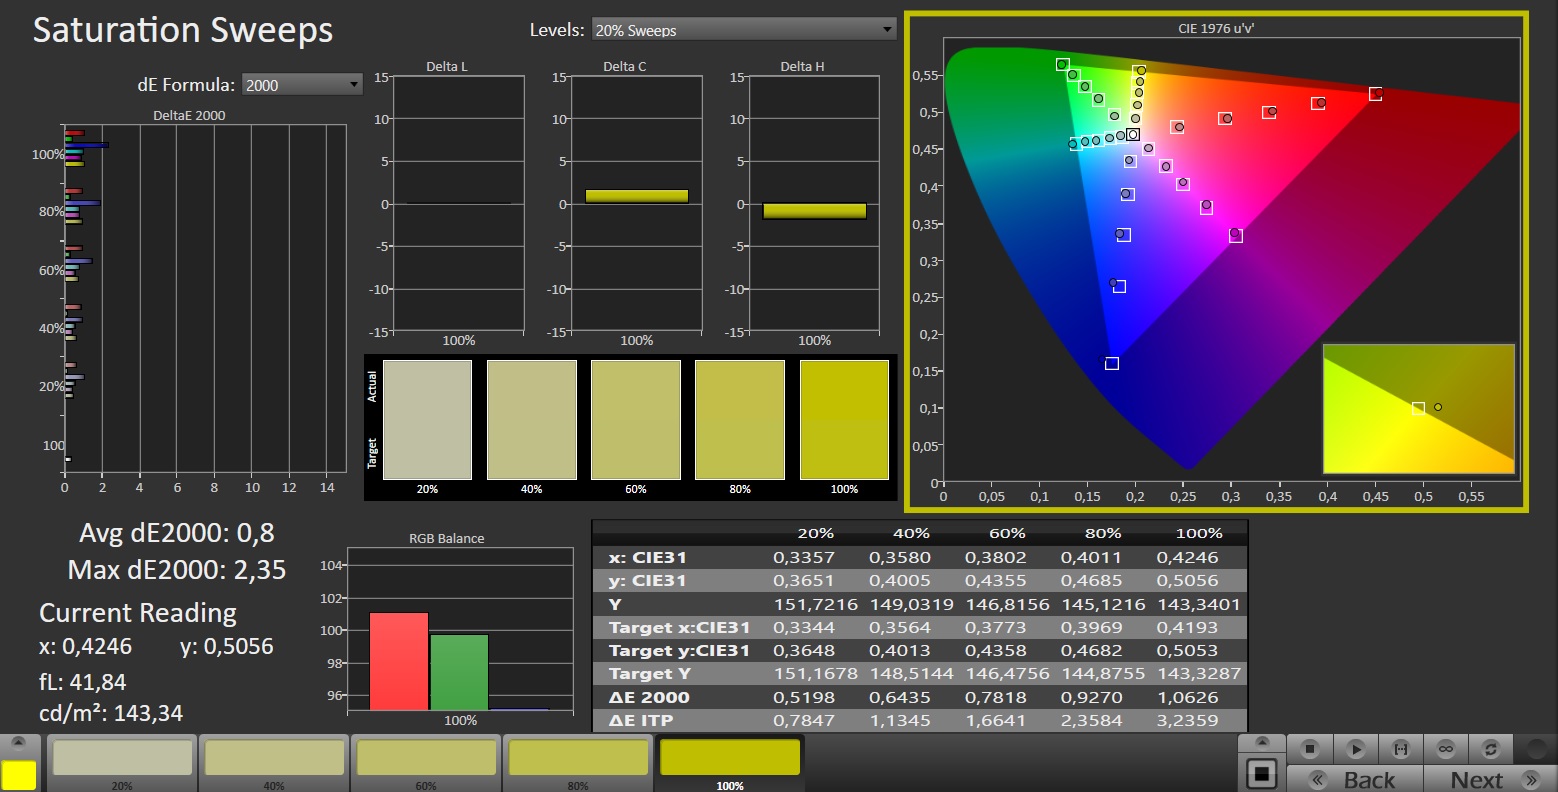
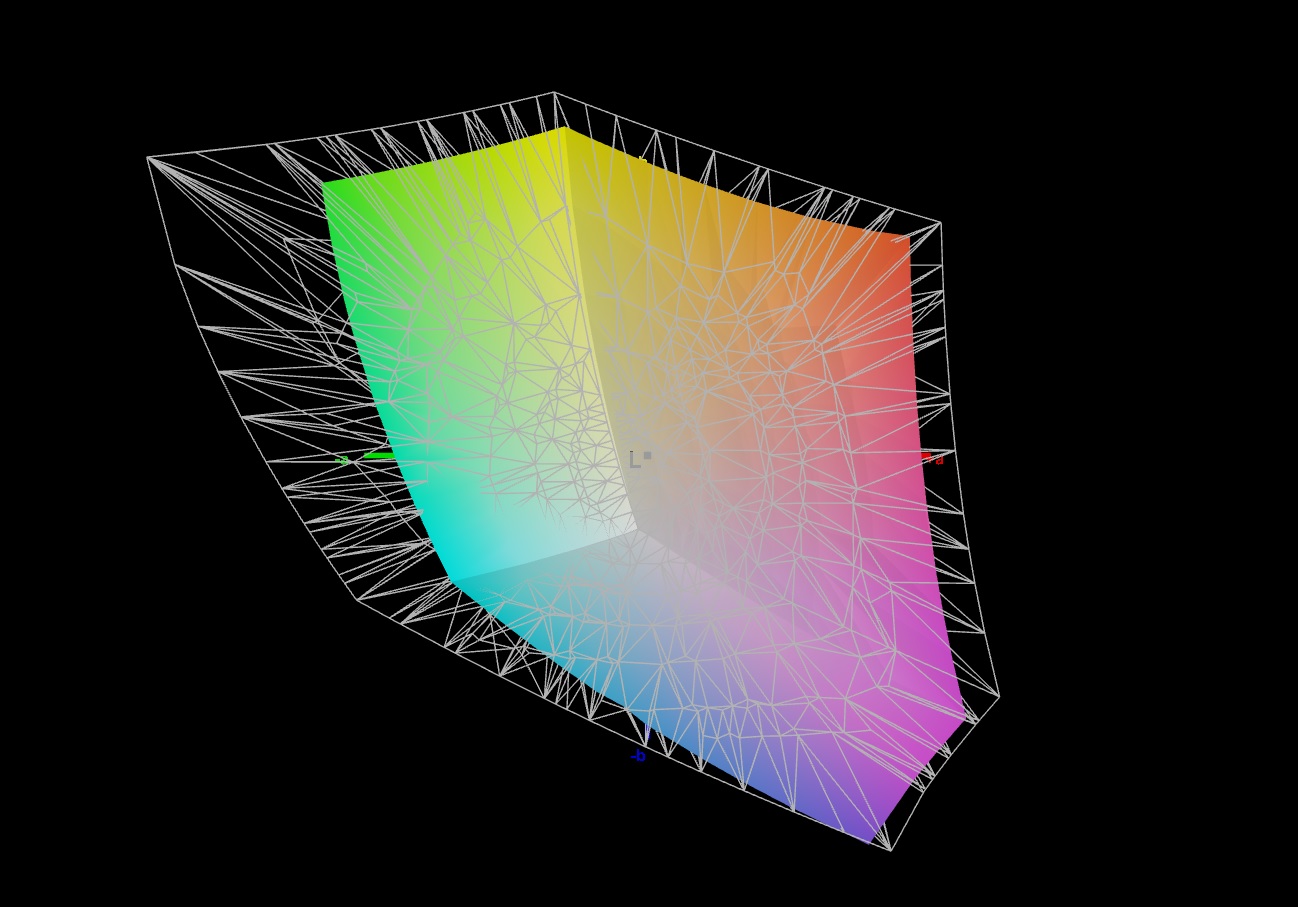
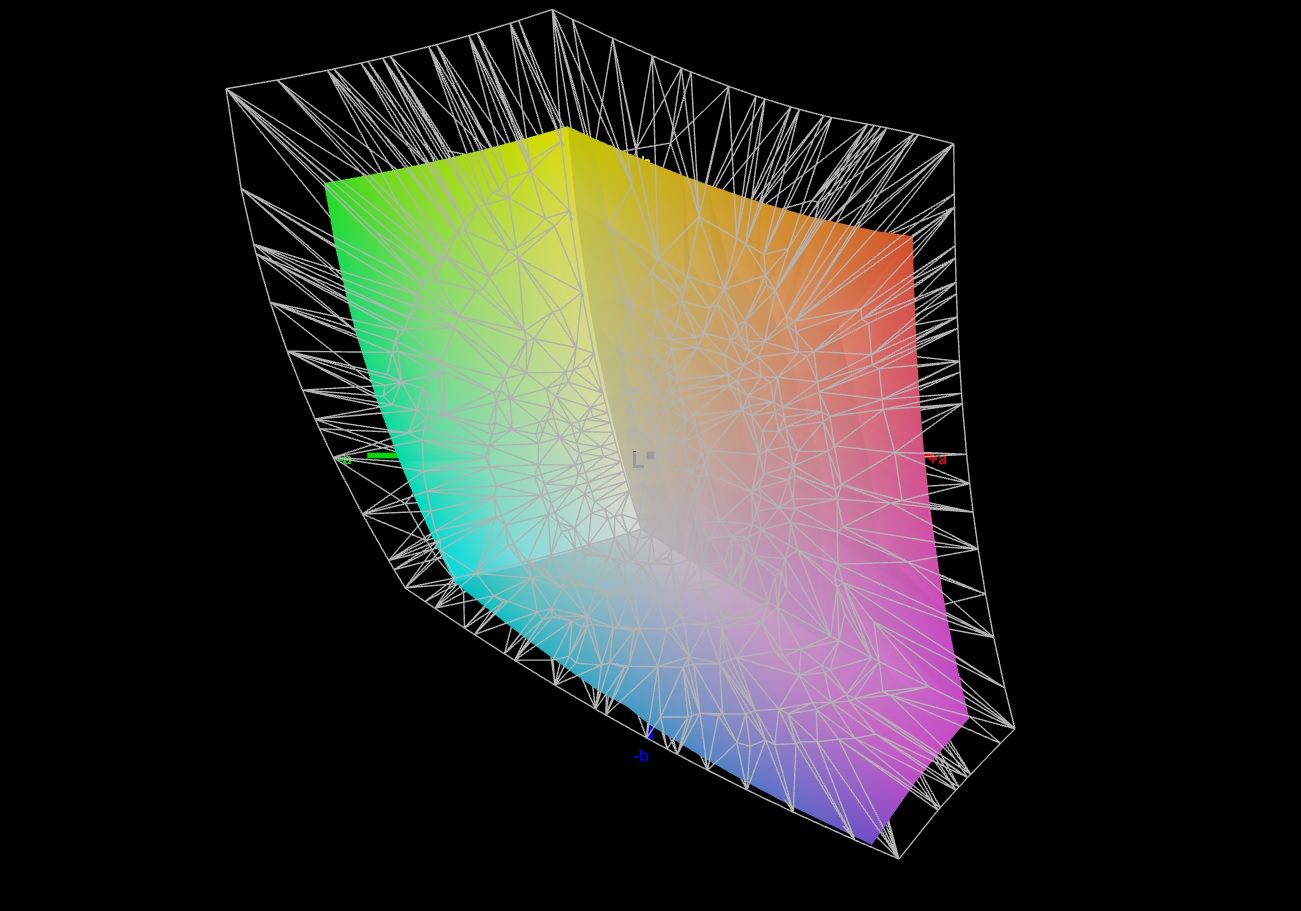
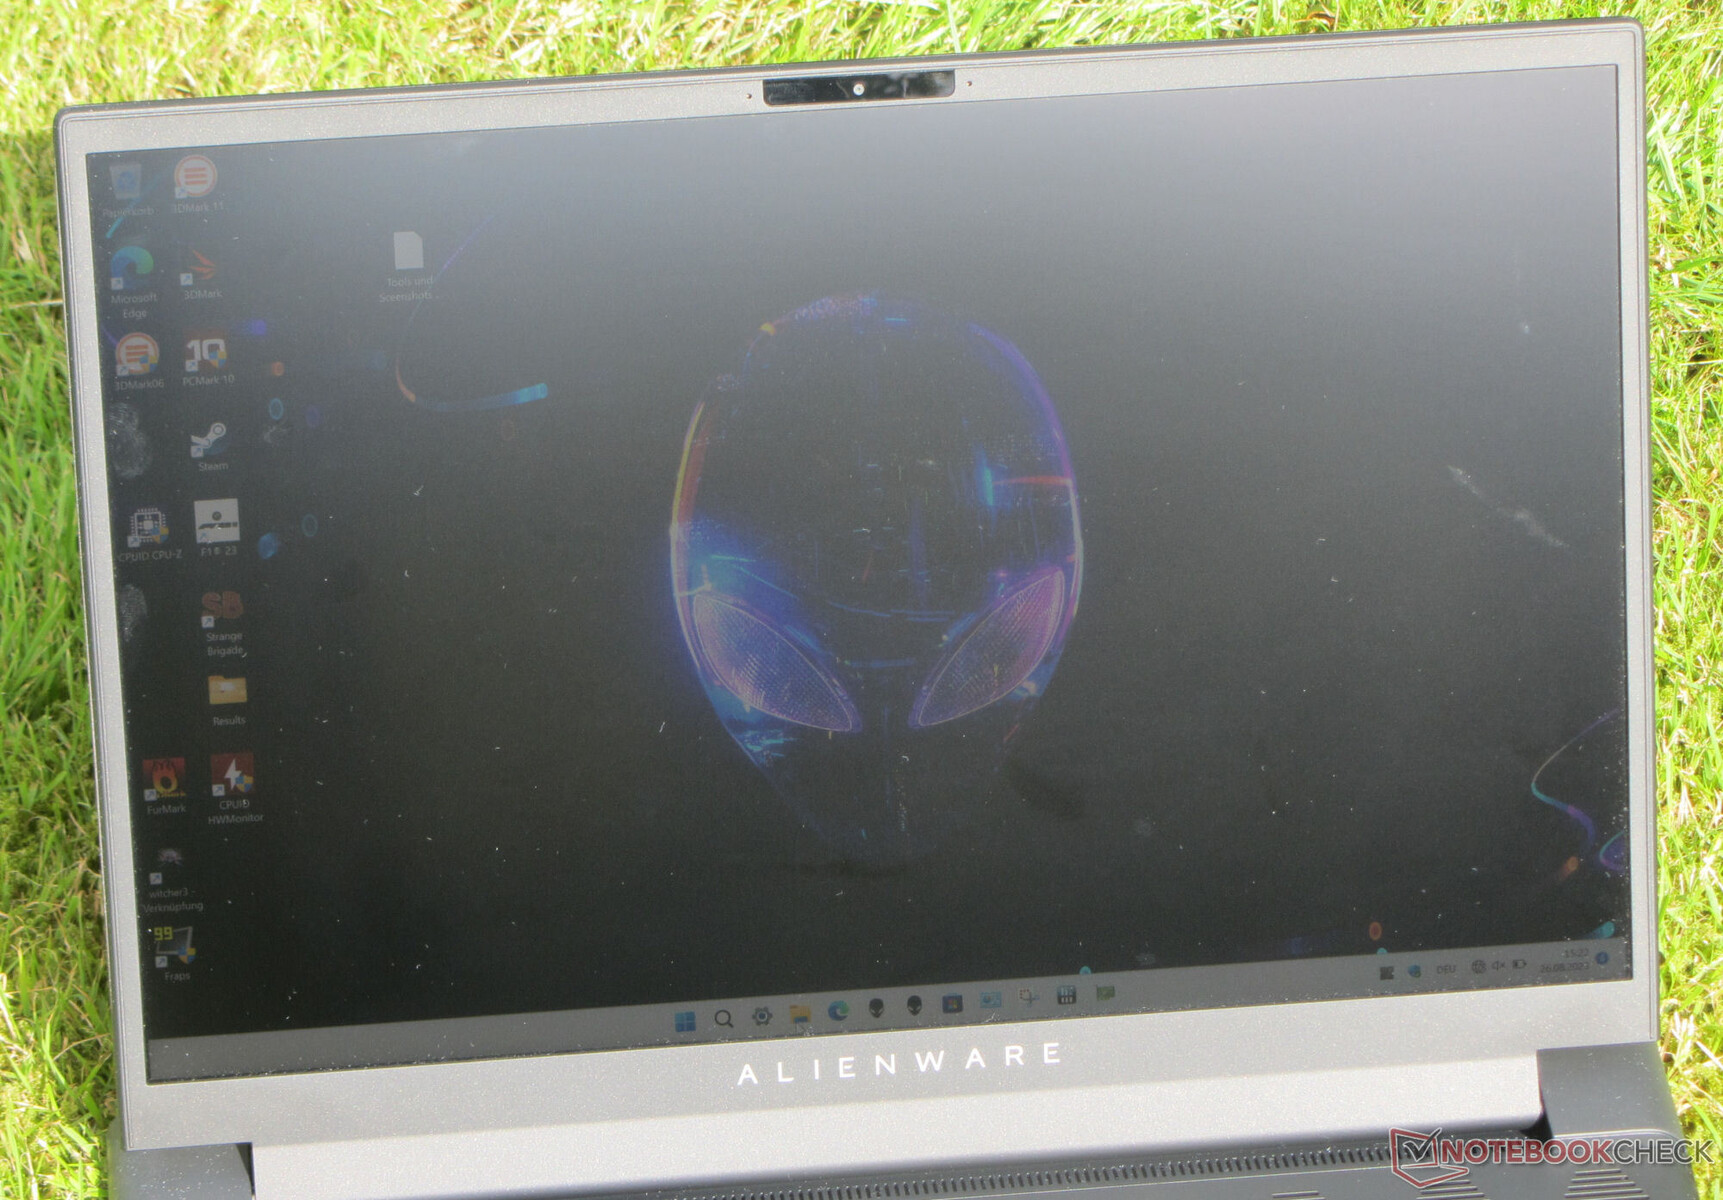
Tela - QHD+ com cobertura sRGB
O lado positivo da tela fosca de 16 polegadas (2560x1600, IPS) no formato 16:10 é a ausência de cintilação PWM, suporte a G-Sync (somente para modelos Intel m16) e tempos de resposta curtos. O brilho e o contraste do painel de 165 Hz atingem a respectiva meta (> 300 cd/m² ou 1000:1).
Como alternativa, há dois outros monitores (1x QHD+, 1x FHD+) que oferecem taxas de atualização mais altas e maior cobertura do espaço de cores. as opções 4k, OLED ou mini-LED não estão disponíveis.
| |||||||||||||||||||||||||
iluminação: 89 %
iluminação com acumulador: 306 cd/m²
Contraste: 1020:1 (Preto: 0.3 cd/m²)
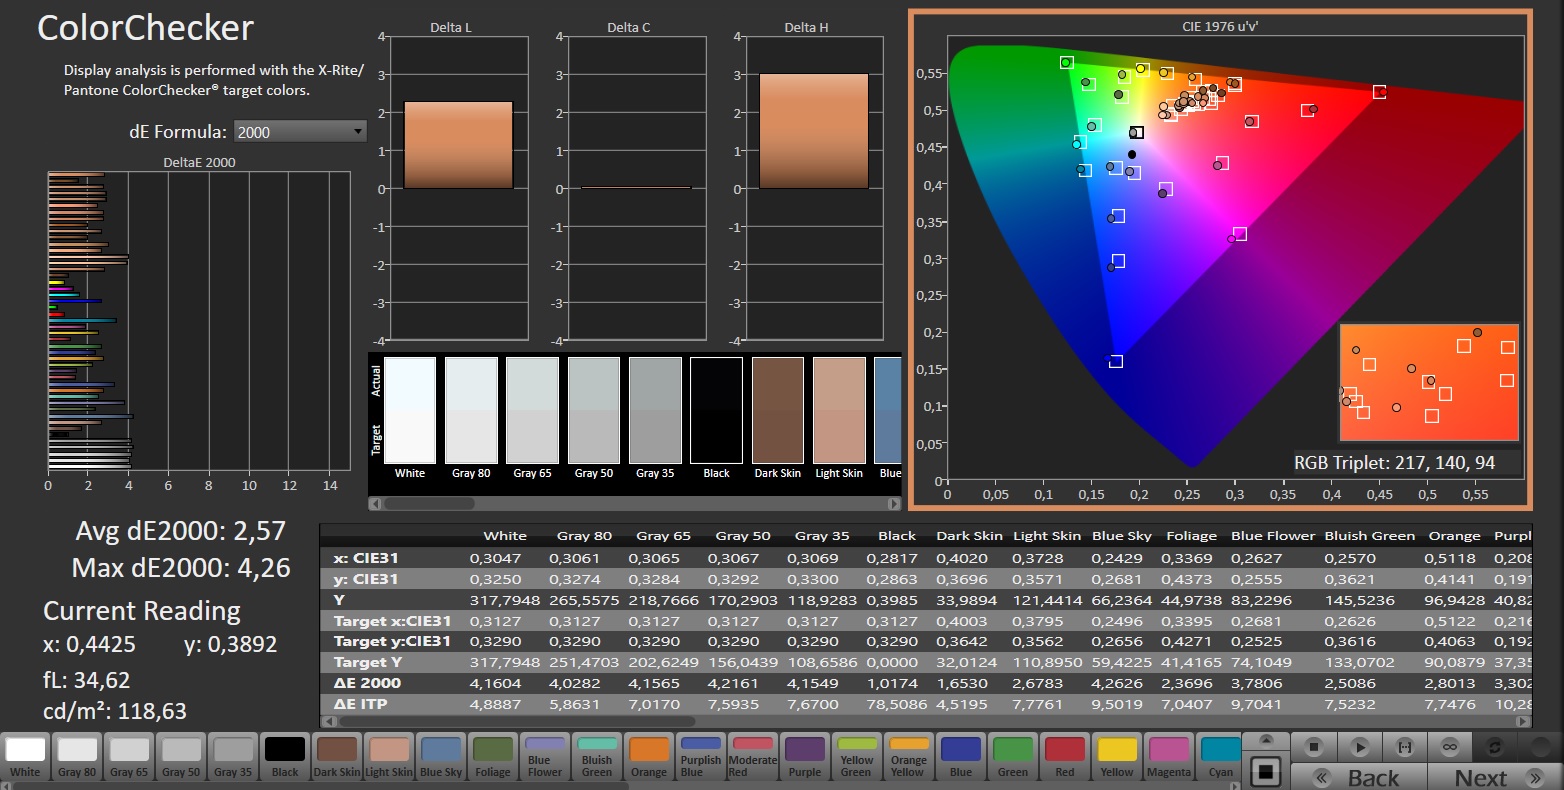
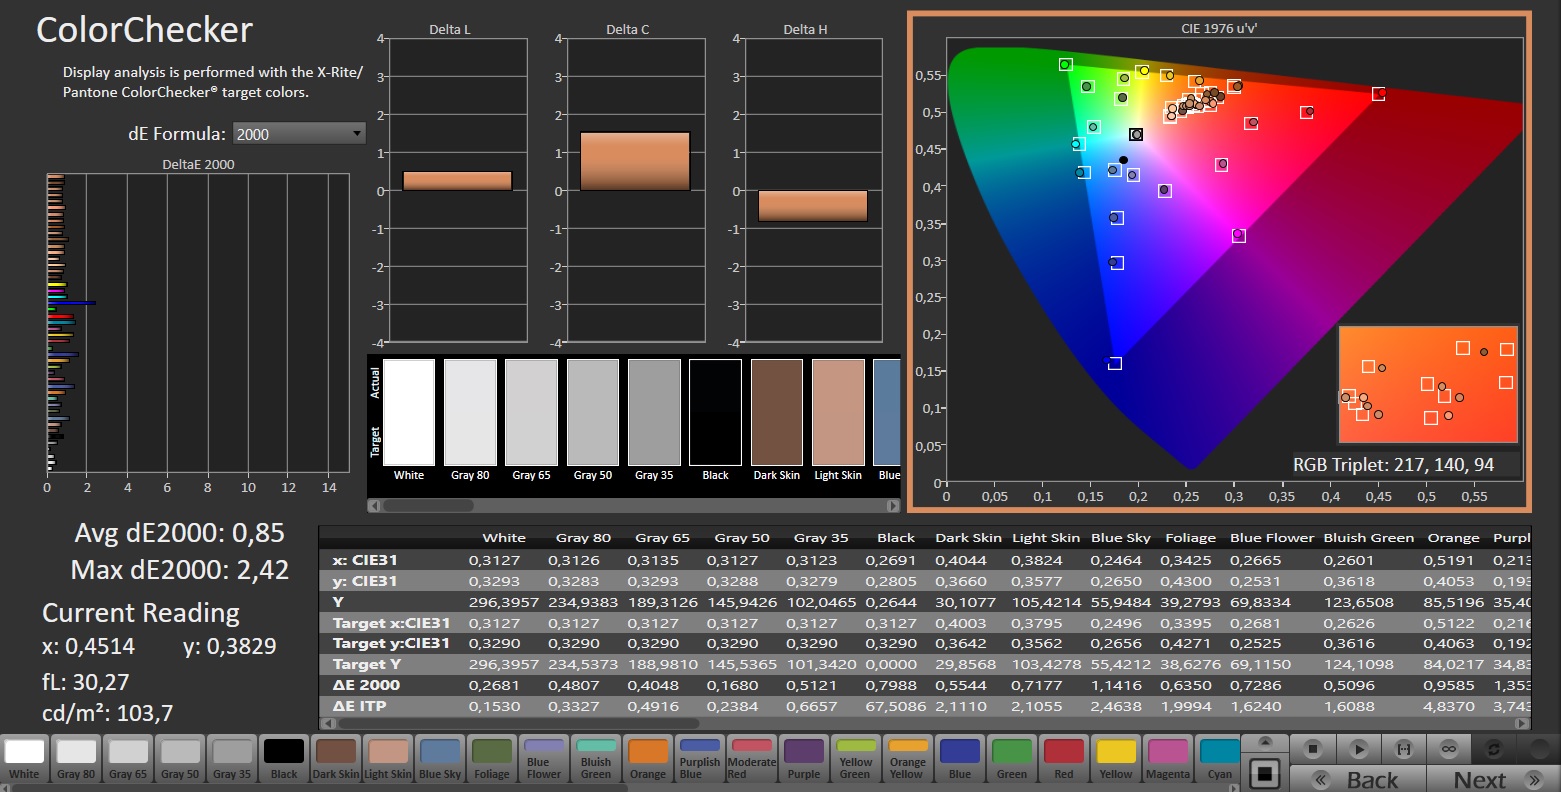
ΔE ColorChecker Calman: 2.57 | ∀{0.5-29.43 Ø4.71}
calibrated: 0.85
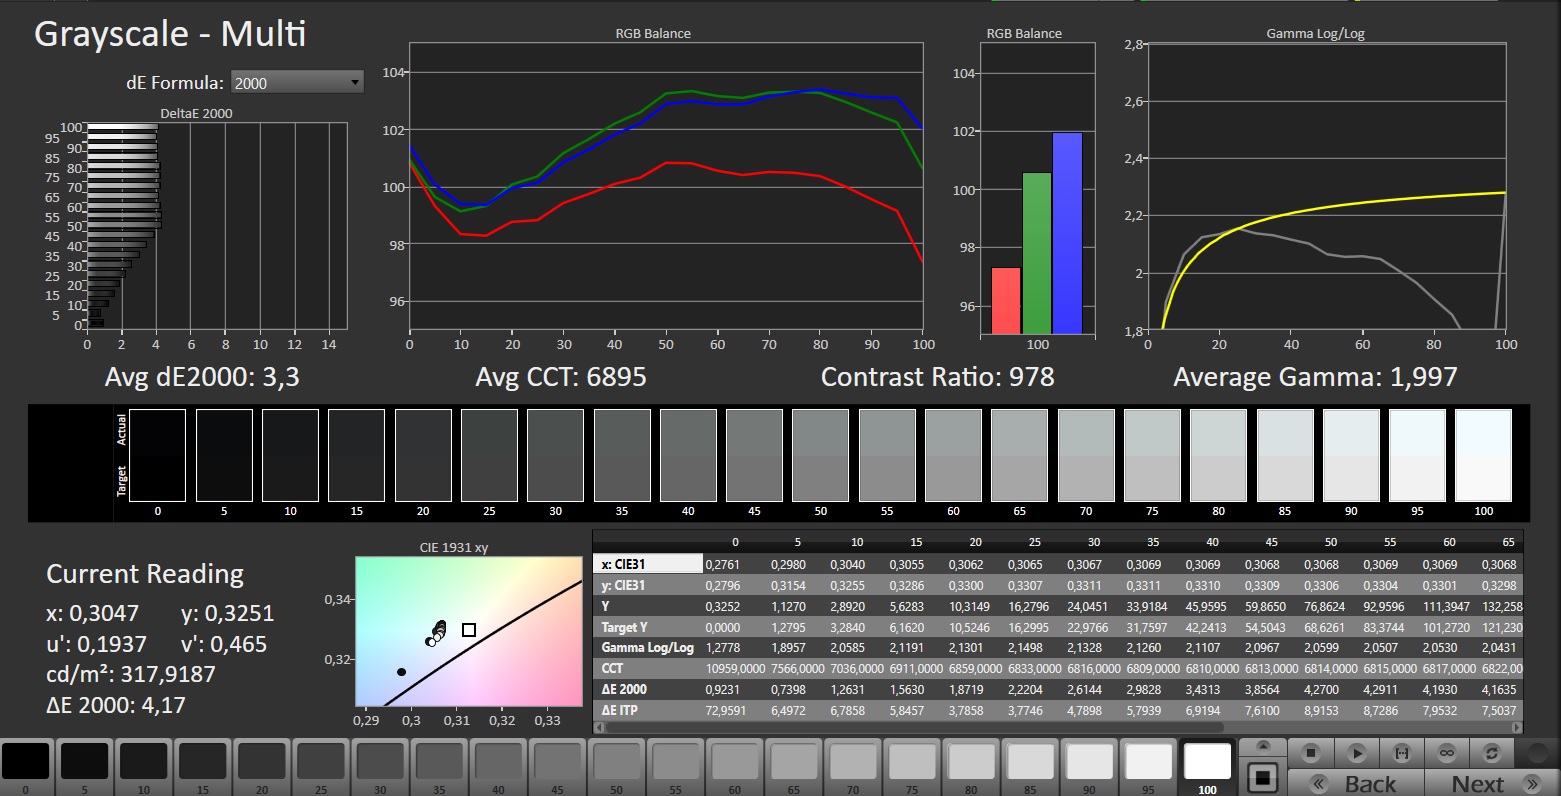
ΔE Greyscale Calman: 3.3 | ∀{0.09-98 Ø4.96}
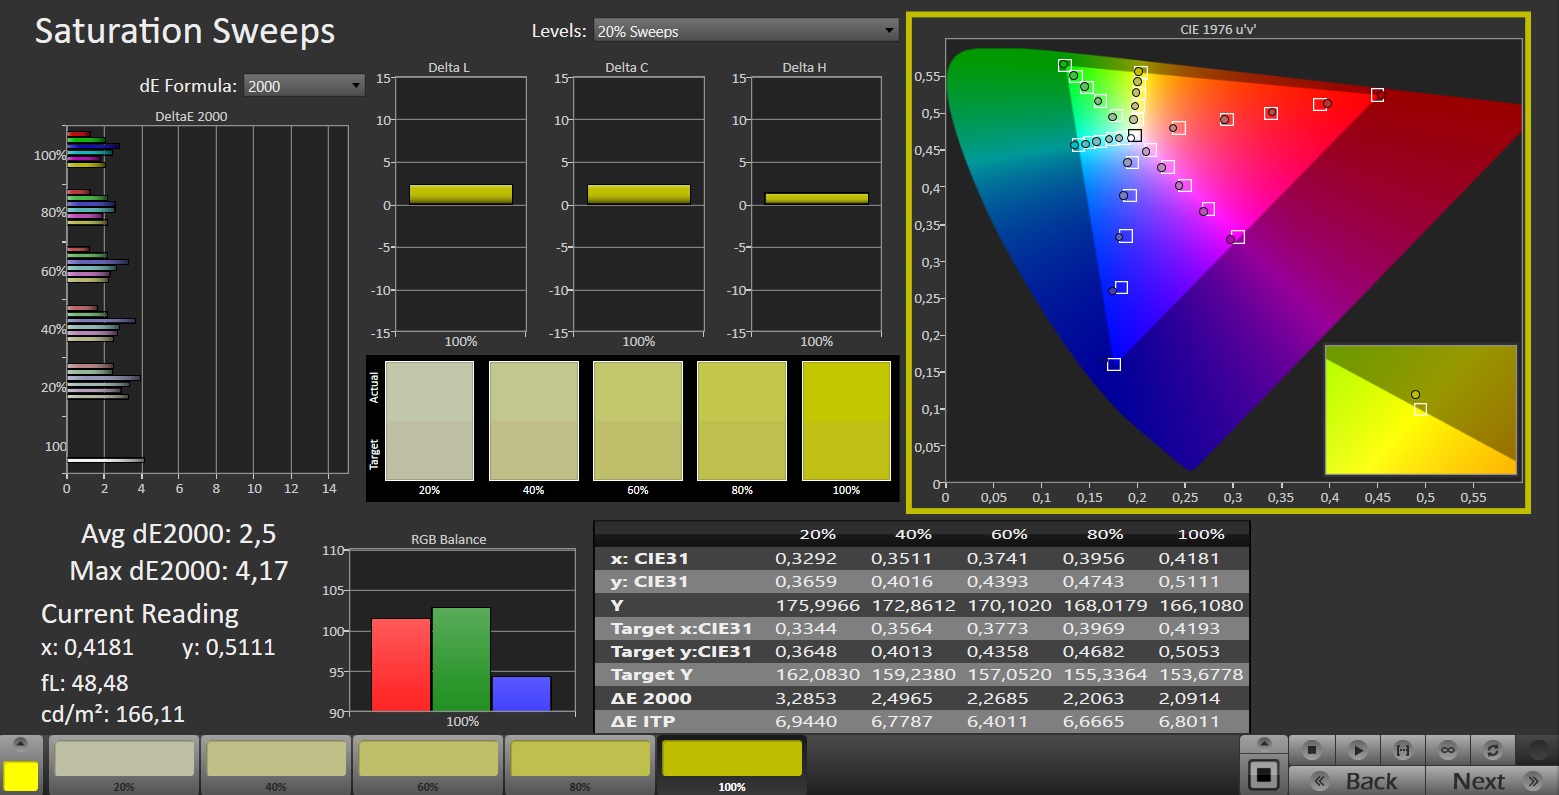
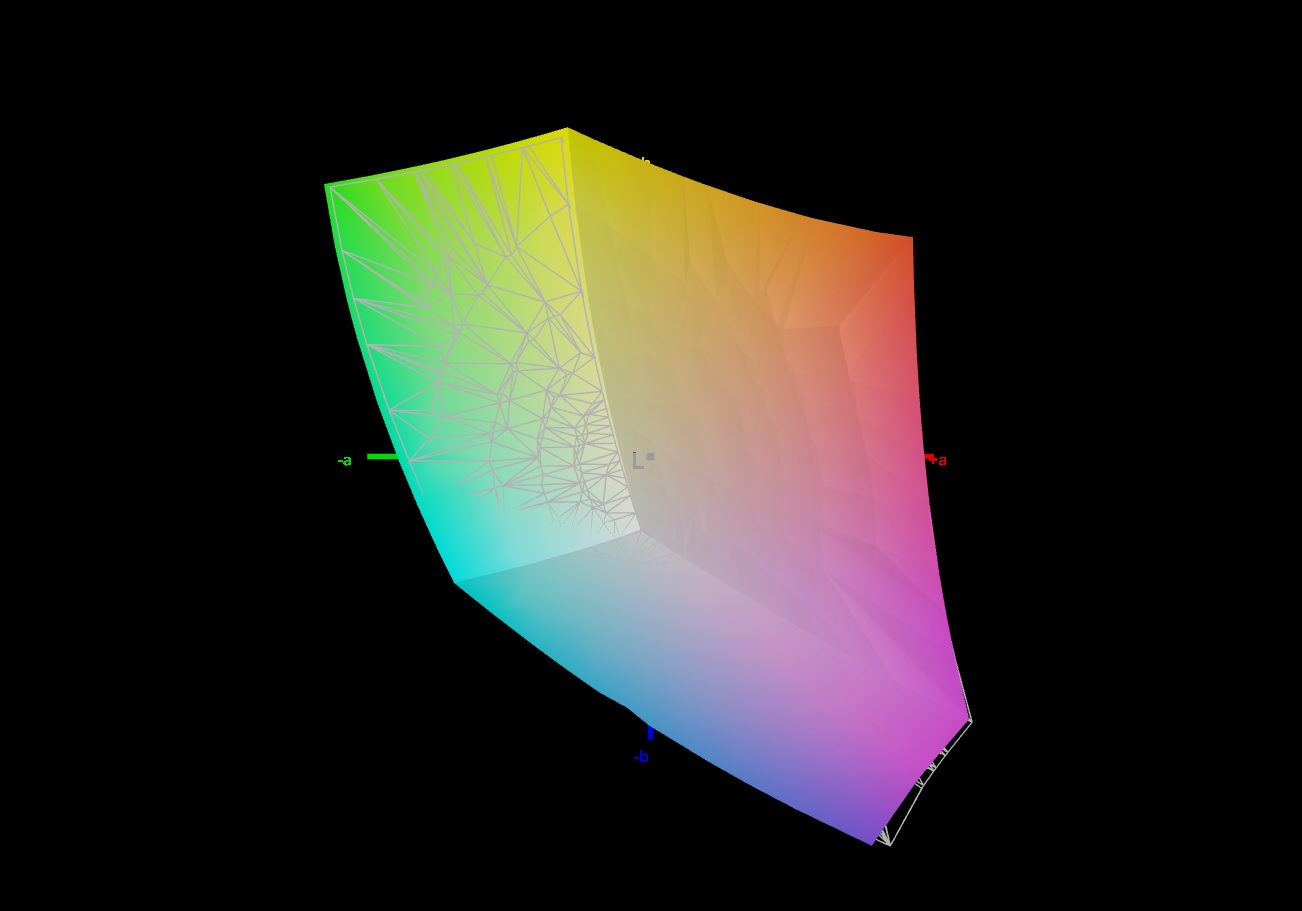
70% AdobeRGB 1998 (Argyll 3D)
97.2% sRGB (Argyll 3D)
67.7% Display P3 (Argyll 3D)
Gamma: 1.997
CCT: 6895 K
| Alienware m16 R1 Intel BOE NE16NYB, IPS, 2560x1600, 16" | Acer Predator Helios 16 PH16-71-731Q BOE NE160QDM-NZ2, IPS-LED, 2560x1600, 16" | Medion Erazer Defender P40 BOE CQ NE173QHM-NZ3, IPS, 2560x1440, 17.3" | Lenovo Legion Pro 5 16IRX8 AU Optronics B160QAN03.1, IPS, 2560x1600, 16" | Schenker XMG Pro 15 (E23) BOE0AD1, IPS, 2560x1440, 15.6" | Aorus 15 BSF Sharp LQ156T1JW05, IPS, 2560x1440, 15.6" | Alienware m16 R1 AMD BOE NE16NZ4, IPS, 2560x1600, 16" | |
|---|---|---|---|---|---|---|---|
| Display | 22% | 1% | 4% | 23% | 23% | 25% | |
| Display P3 Coverage (%) | 67.7 | 97.1 43% | 68.3 1% | 71.2 5% | 97.8 44% | 98.2 45% | 98.6 46% |
| sRGB Coverage (%) | 97.2 | 100 3% | 98.1 1% | 98.8 2% | 99.9 3% | 99.9 3% | 99.9 3% |
| AdobeRGB 1998 Coverage (%) | 70 | 84.7 21% | 69.8 0% | 73.3 5% | 85.4 22% | 85.7 22% | 88.9 27% |
| Response Times | -114% | -142% | -153% | -141% | -90% | -25% | |
| Response Time Grey 50% / Grey 80% * (ms) | 4 ? | 13.6 ? -240% | 14.6 ? -265% | 14.5 ? -263% | 14 ? -250% | 11.3 ? -183% | 5.1 ? -27% |
| Response Time Black / White * (ms) | 7.3 ? | 6.4 ? 12% | 8.7 ? -19% | 10.4 ? -42% | 9.6 ? -32% | 7 ? 4% | 9 ? -23% |
| PWM Frequency (Hz) | |||||||
| Screen | 14% | 18% | 19% | -15% | -24% | -34% | |
| Brightness middle (cd/m²) | 306 | 511 67% | 364 19% | 405.7 33% | 322 5% | 299 -2% | 329 8% |
| Brightness (cd/m²) | 302 | 498 65% | 343 14% | 368 22% | 301 0% | 282 -7% | 317 5% |
| Brightness Distribution (%) | 89 | 94 6% | 86 -3% | 87 -2% | 85 -4% | 82 -8% | 89 0% |
| Black Level * (cd/m²) | 0.3 | 0.36 -20% | 0.28 7% | 0.38 -27% | 0.36 -20% | 0.31 -3% | 0.32 -7% |
| Contrast (:1) | 1020 | 1419 39% | 1300 27% | 1068 5% | 894 -12% | 965 -5% | 1028 1% |
| Colorchecker dE 2000 * | 2.57 | 1.76 32% | 1.67 35% | 1.65 36% | 1.98 23% | 2.24 13% | 3.71 -44% |
| Colorchecker dE 2000 max. * | 4.26 | 3.7 13% | 2.78 35% | 4.2 1% | 5.24 -23% | 4.29 -1% | 7.23 -70% |
| Colorchecker dE 2000 calibrated * | 0.85 | 1.56 -84% | 1.14 -34% | 0.53 38% | 1.98 -133% | 2.62 -208% | 2.82 -232% |
| Greyscale dE 2000 * | 3.3 | 3 9% | 1.4 58% | 1.2 64% | 2.44 26% | 3 9% | 2.2 33% |
| Gamma | 1.997 110% | 2.33 94% | 2.091 105% | 2.3 96% | 2.42 91% | 2.086 105% | 2.3 96% |
| CCT | 6895 94% | 6341 103% | 6568 99% | 6453 101% | 6984 93% | 6289 103% | 6270 104% |
| Média Total (Programa/Configurações) | -26% /
-2% | -41% /
-9% | -43% /
-9% | -44% /
-25% | -30% /
-23% | -11% /
-20% |
* ... menor é melhor
A tela mostra uma boa representação de cores ex works: a meta (DeltaE < 3) é atingida com um desvio de cerca de 2,6. A calibração reduz ainda mais esse desvio para 0,85 e garante níveis de cinza mais equilibrados. O painel é capaz de reproduzir totalmente o espaço de cores sRGB, mas não os espaços de cores AdobeRGB e DCI P3. Por outro lado, o espaço P3 pode ser reproduzido nas telas alternativas.
Exibir tempos de resposta
| ↔ Tempo de resposta preto para branco | ||
|---|---|---|
| 7.3 ms ... ascensão ↗ e queda ↘ combinadas | ↗ 3.6 ms ascensão | 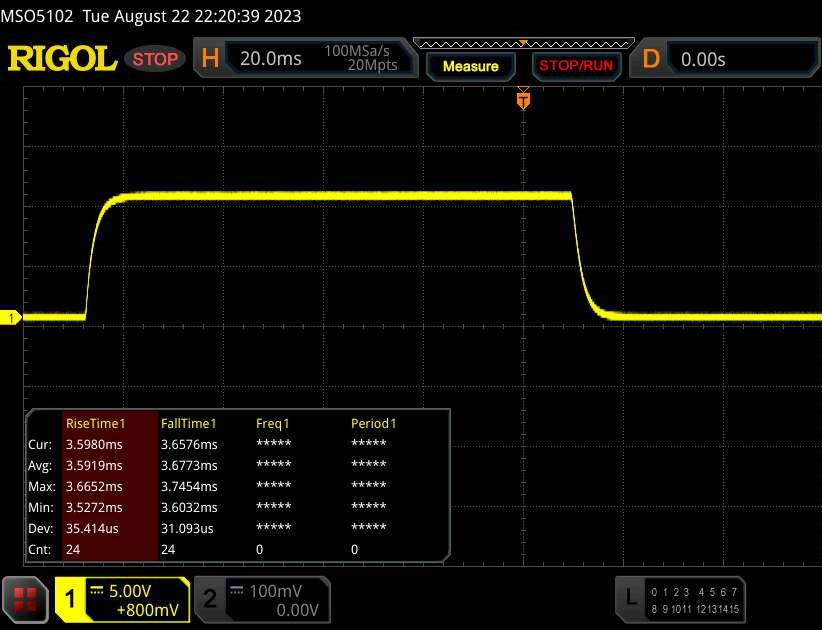 |
| ↘ 3.7 ms queda | ||
| A tela mostra taxas de resposta muito rápidas em nossos testes e deve ser muito adequada para jogos em ritmo acelerado. Em comparação, todos os dispositivos testados variam de 0.1 (mínimo) a 240 (máximo) ms. » 22 % de todos os dispositivos são melhores. Isso significa que o tempo de resposta medido é melhor que a média de todos os dispositivos testados (19.8 ms). | ||
| ↔ Tempo de resposta 50% cinza a 80% cinza | ||
| 4 ms ... ascensão ↗ e queda ↘ combinadas | ↗ 1.7 ms ascensão | 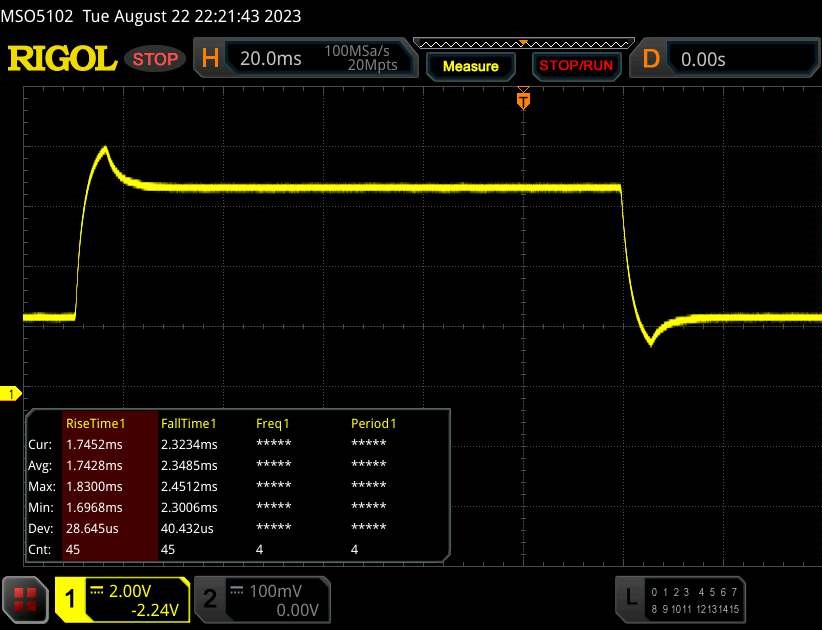 |
| ↘ 2.3 ms queda | ||
| A tela mostra taxas de resposta muito rápidas em nossos testes e deve ser muito adequada para jogos em ritmo acelerado. Em comparação, todos os dispositivos testados variam de 0.165 (mínimo) a 636 (máximo) ms. » 15 % de todos os dispositivos são melhores. Isso significa que o tempo de resposta medido é melhor que a média de todos os dispositivos testados (31 ms). | ||
Cintilação da tela / PWM (modulação por largura de pulso)
| Tela tremeluzindo / PWM não detectado | 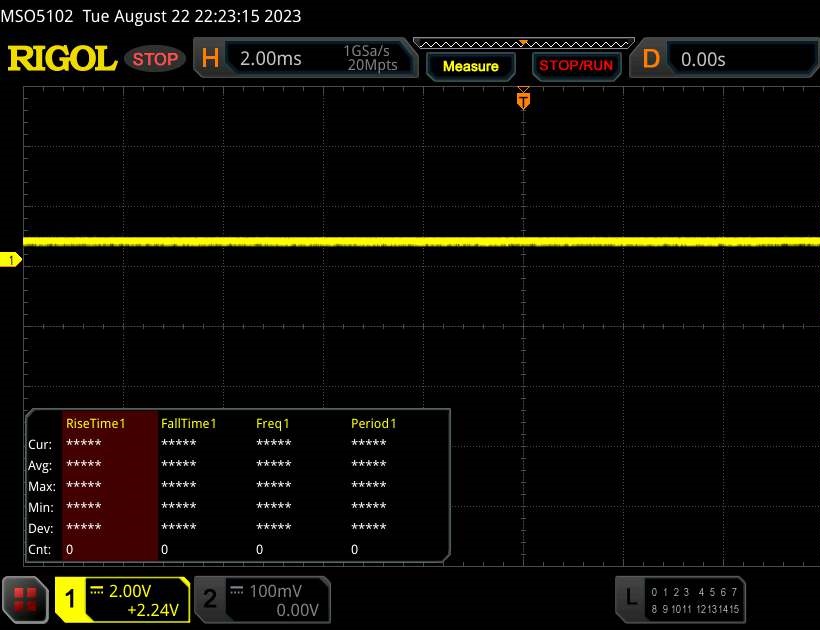 | ||
[pwm_comparison] Em comparação: 52 % de todos os dispositivos testados não usam PWM para escurecer a tela. Se PWM foi detectado, uma média de 7757 (mínimo: 5 - máximo: 343500) Hz foi medida. | |||
O painel IPS estável com ângulo de visão pode ser lido de qualquer posição. Em ambientes externos, a leitura da tela é perfeitamente possível, desde que o sol não esteja brilhando muito forte.

Desempenho - O notebook Alienware oferece alto desempenho do sistema
Na linha Alienware m16 R1, as GPUs Ada Lovelace (RTX 4060, 4070, 4080) são combinados com CPUs da Intel ou da AMD. Há duas exceções: alguns modelos da AMD só podem ser encomendados com uma Radeon RX 7600M XT e determinados modelos da Intel com uma GeForce RTX 4090. Nosso dispositivo m16 baseado em Intel está disponível por cerca de 1.900 euros, o que o torna atualmente um dos representantes mais baratos da série.
Condições de teste
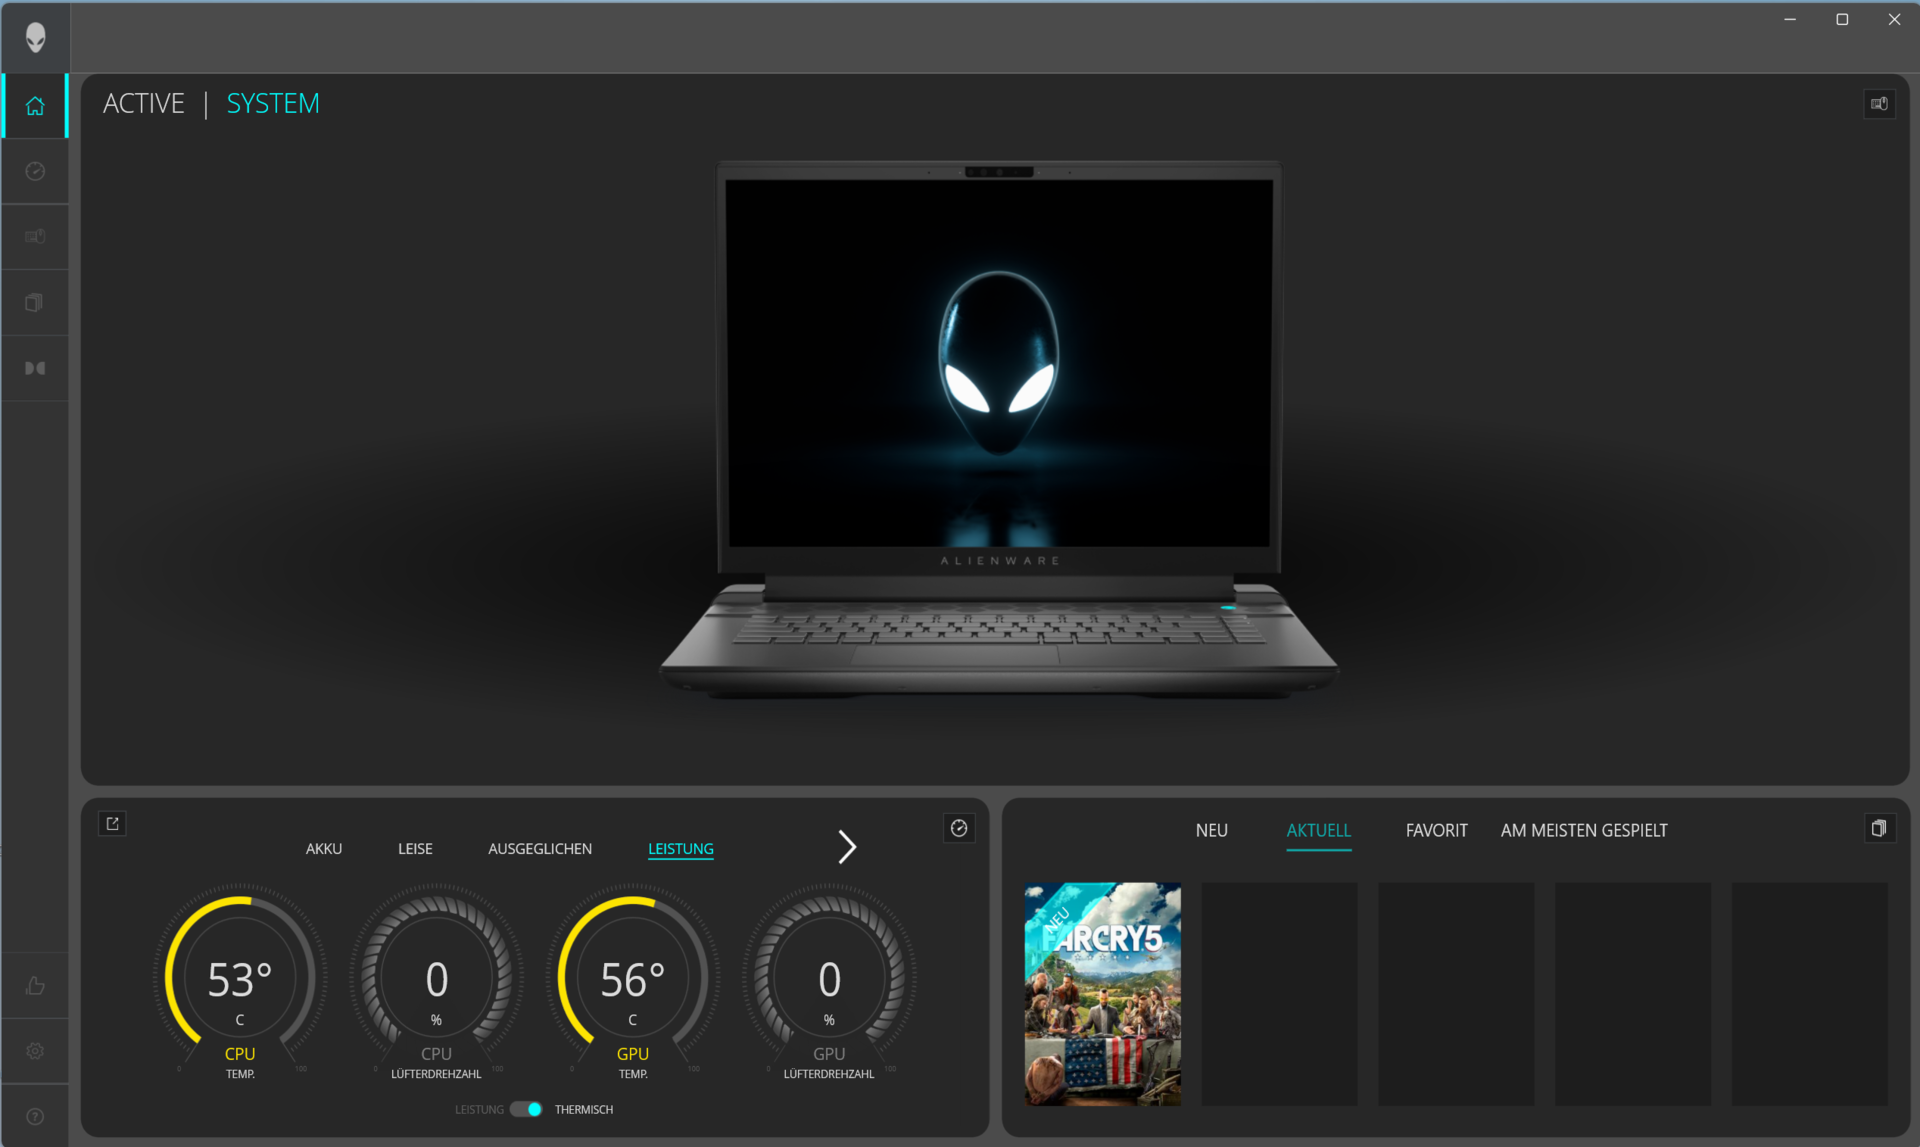
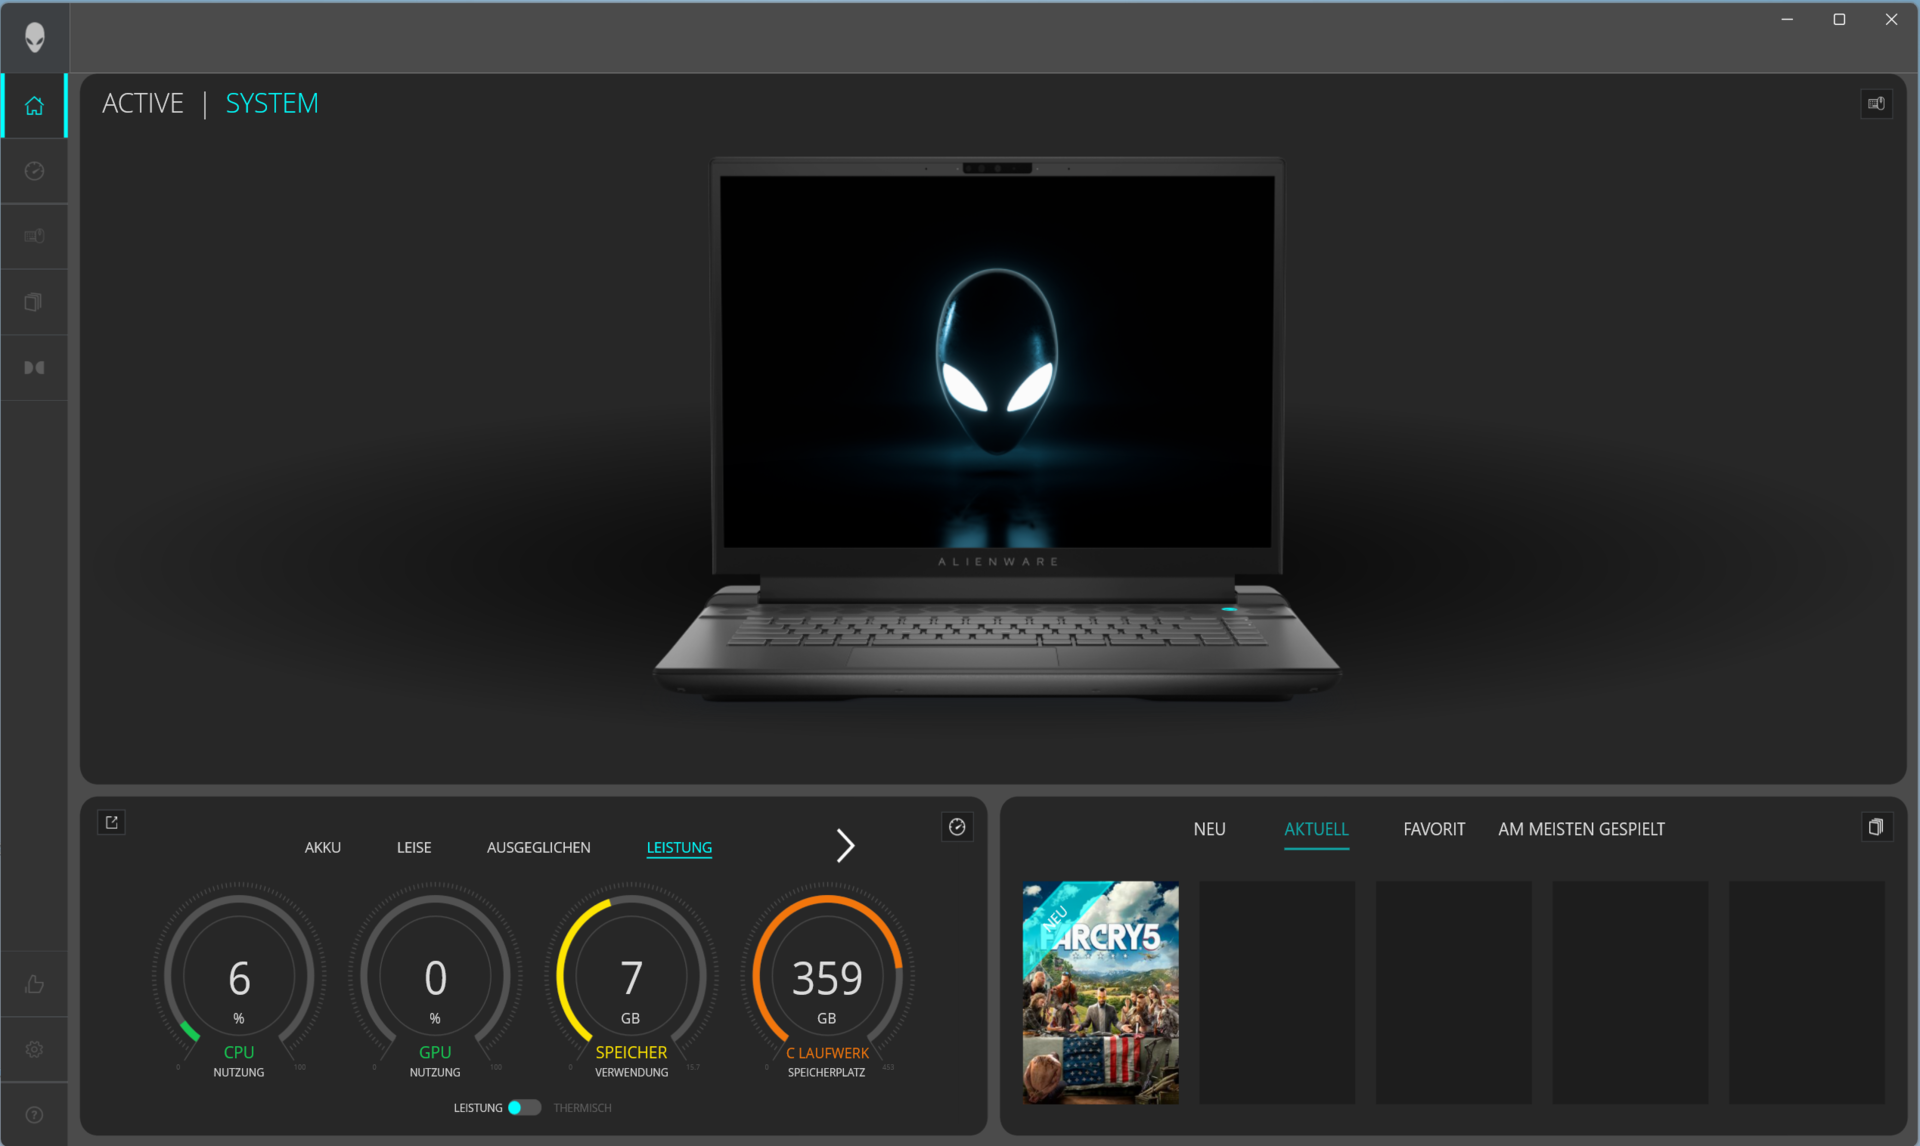
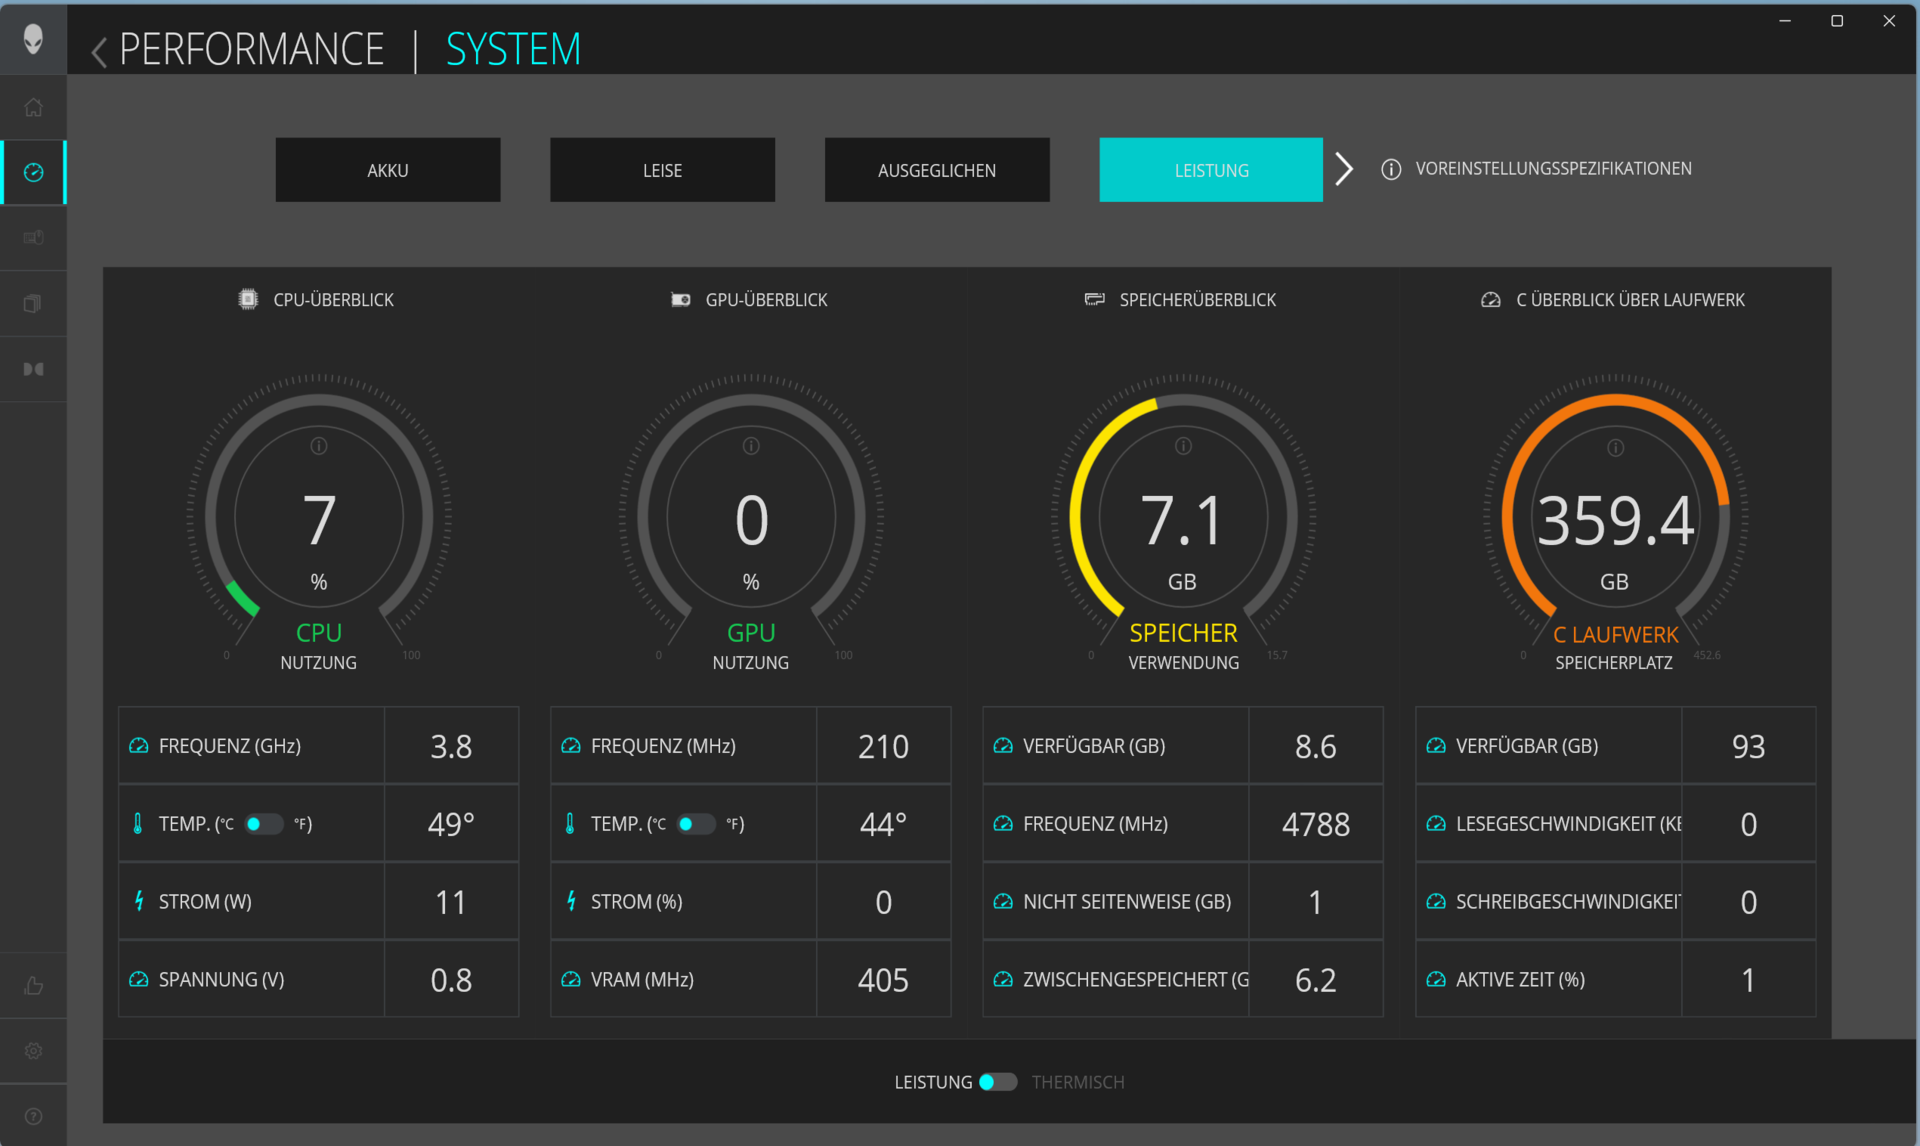
Os usuários podem alternar entre cinco modos de desempenho específicos do fabricante por meio do Alienware Command Center (centro de controle do laptop). Um modo de alto desempenho (desempenho máximo, ventiladores totalmente acionados) pode ser ativado com a tecla "F1". Em nossos testes, foram usados os modos "Performance" (benchmarks) e "Balanced" (testes de bateria).
Observação: O modelo irmão Estreia do desempenho do AMD Ryzen 9 7845HX: Análise do laptop Alienware m16 R1 foi testado com o perfil "Overdrive" e o modo dGPU ativo. Portanto, os resultados de benchmark nem sempre são diretamente comparáveis.
| Desempenho | Overdrive | Balanceado | Silencioso | Bateria | |
|---|---|---|---|---|---|
| Limite de potência 1 (HWInfo) | 157 watts | 165 watts | 157 watts | 50 watts | 55 watts |
| Limite de energia 2 (HWInfo) | 157 watts | 165 watts | 157 watts | 157 watts | 157 watts |
| Desempenho (Witcher 3) | 104fps | 104fps | 103fps | 102fps | 103fps |
| Ruído (Witcher 3) | 51dB(A) | 58dB(A) | 49dB(A) | 43dB(A) | 47dB(A) |

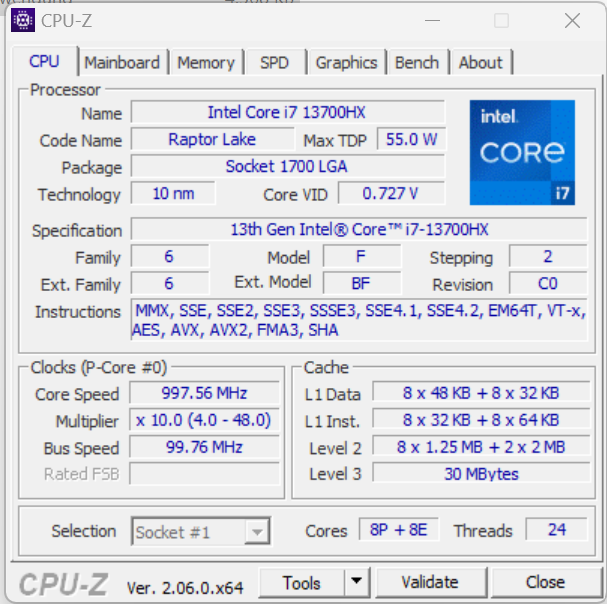
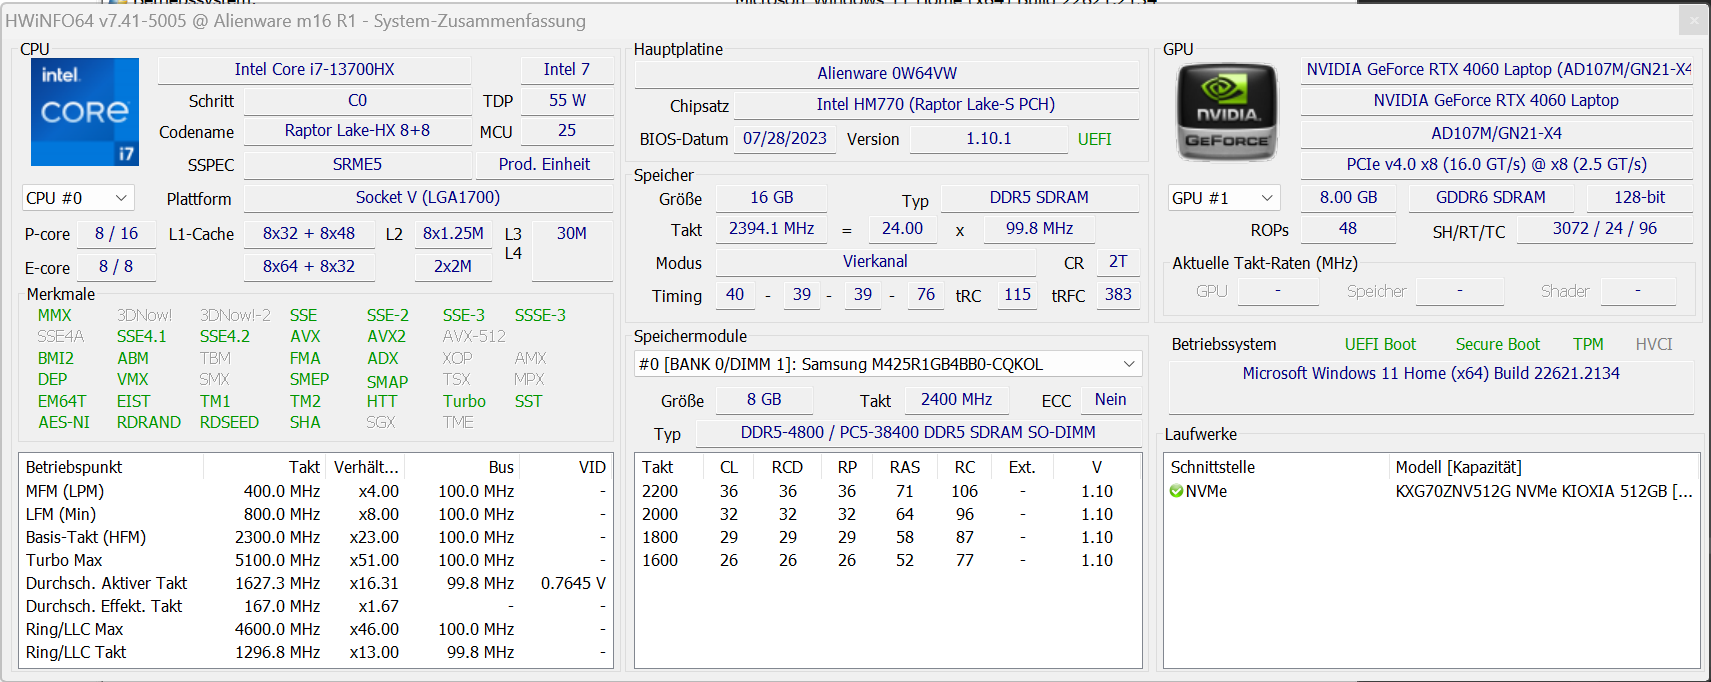
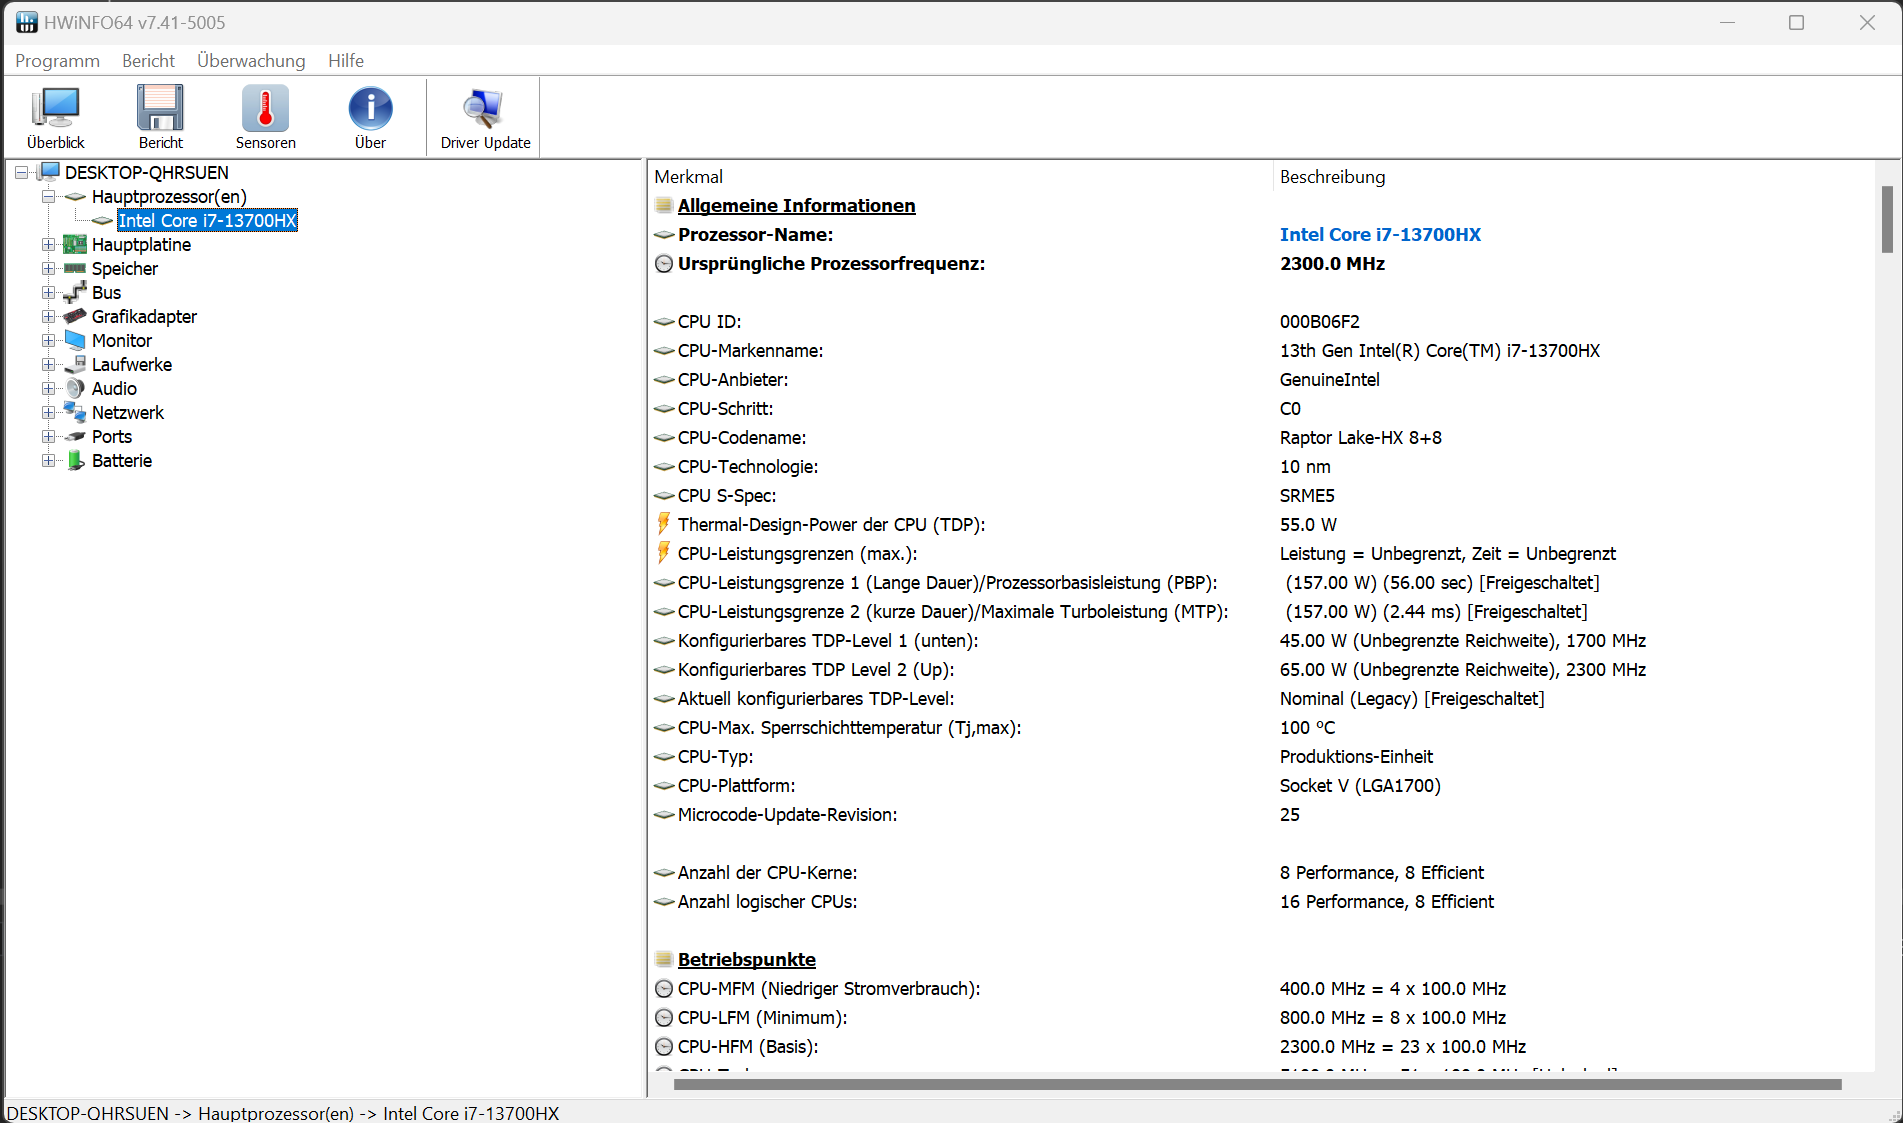
Processador
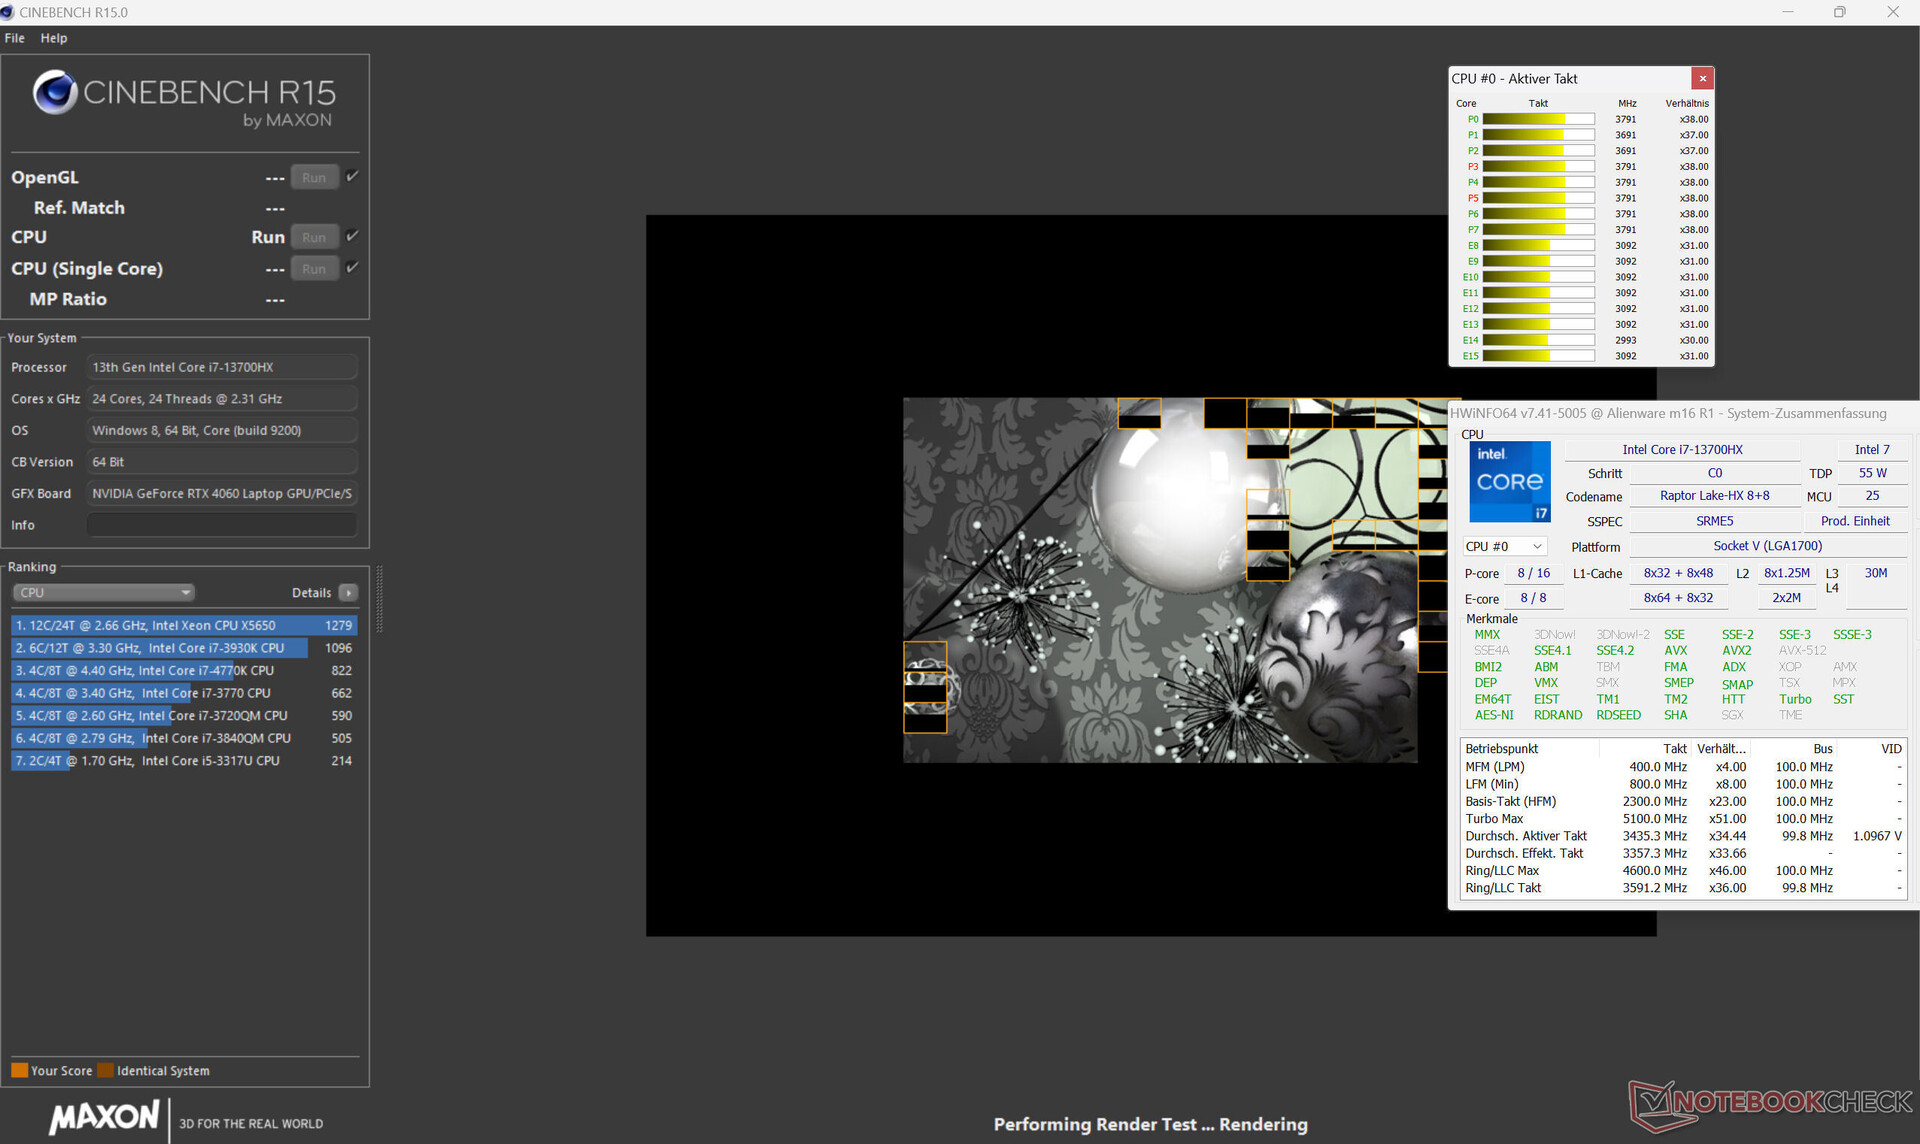
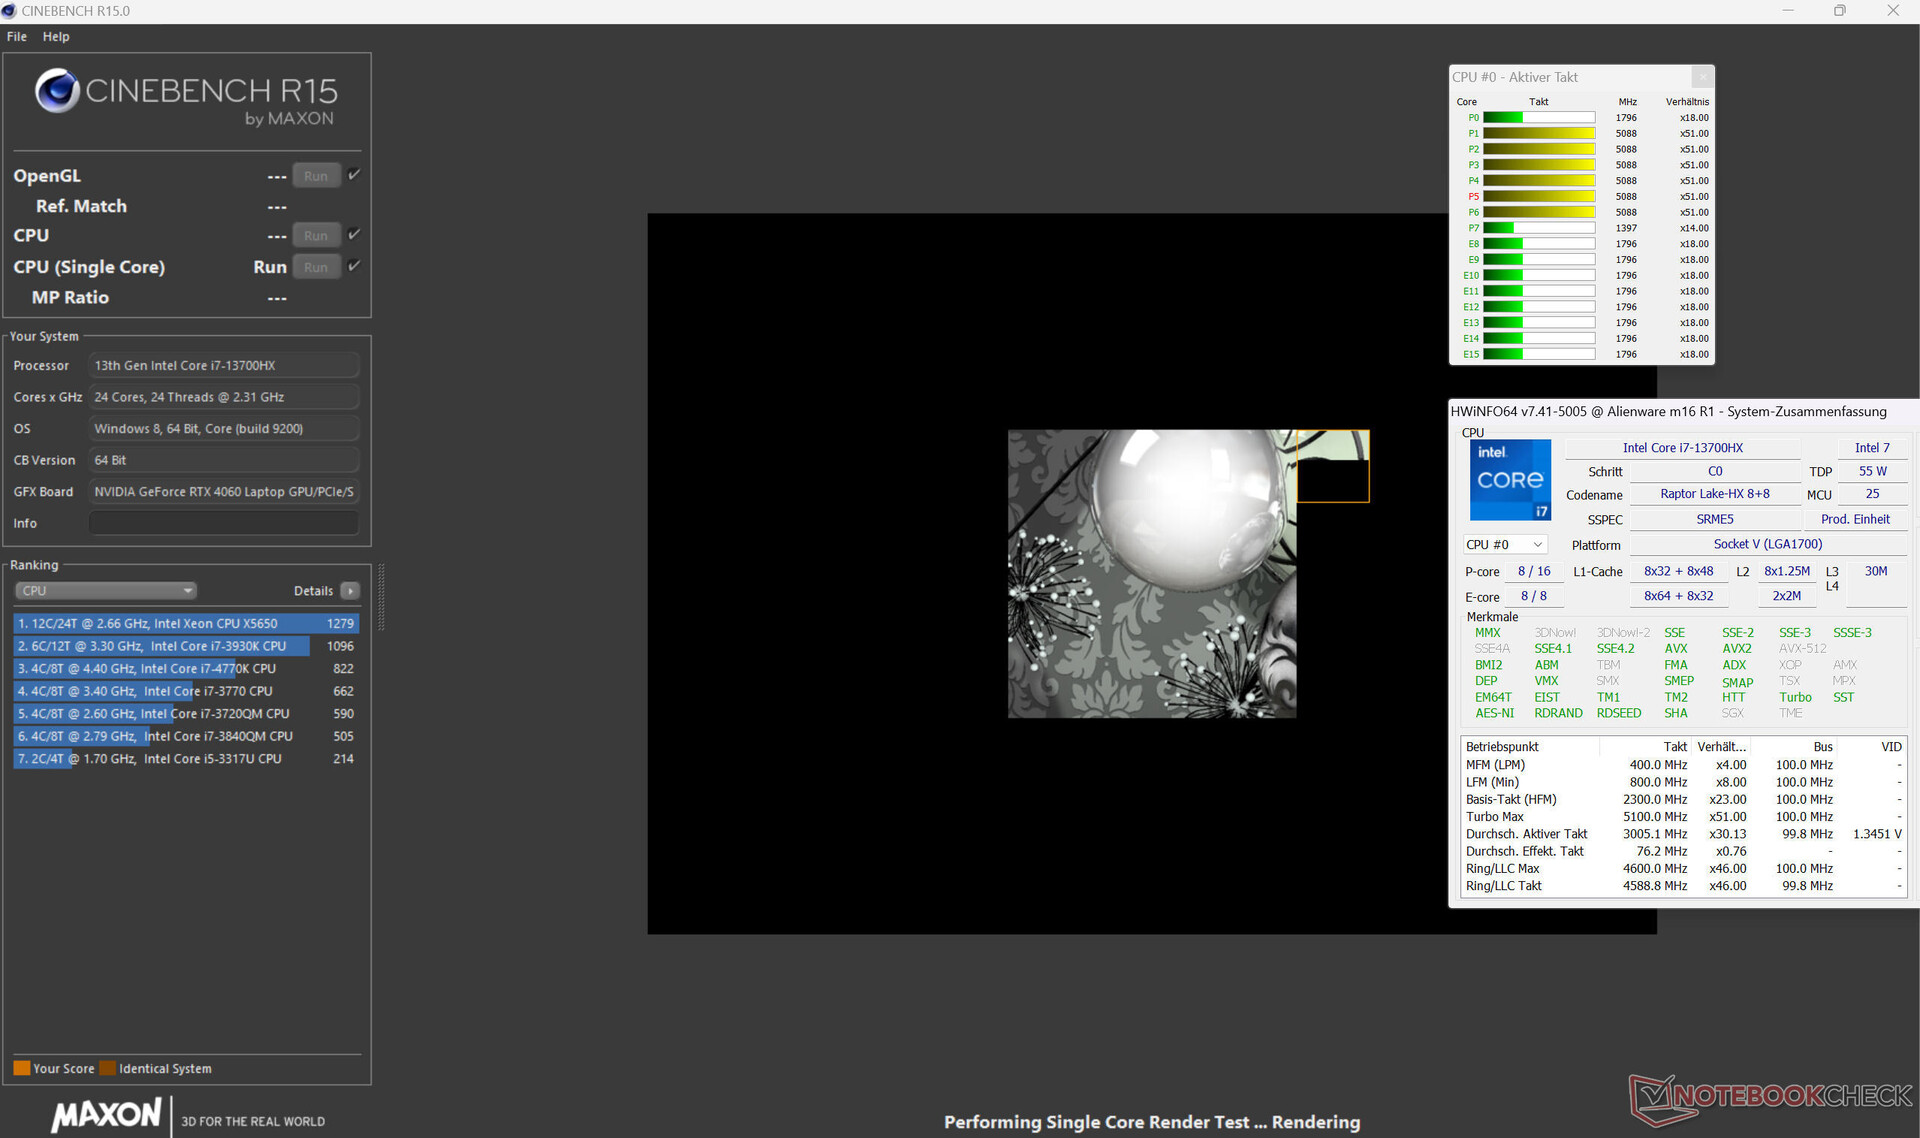
O Core-i7-13700HX (Raptor Lake) consiste em oito núcleos de eficiência (sem hyperthreading, 1,5 a 3,7 GHz) e oito núcleos de desempenho (hyperthreading, 2,1 a 5 GHz). No total, há 24 núcleos lógicos de CPU.
Os resultados do benchmark estão acima da média da CPU na operação da rede elétrica. No modo de bateria, o desempenho single-thread mais relevante (160 pontos) cai de forma semelhante ao desempenho multi-thread (2.134 pontos).
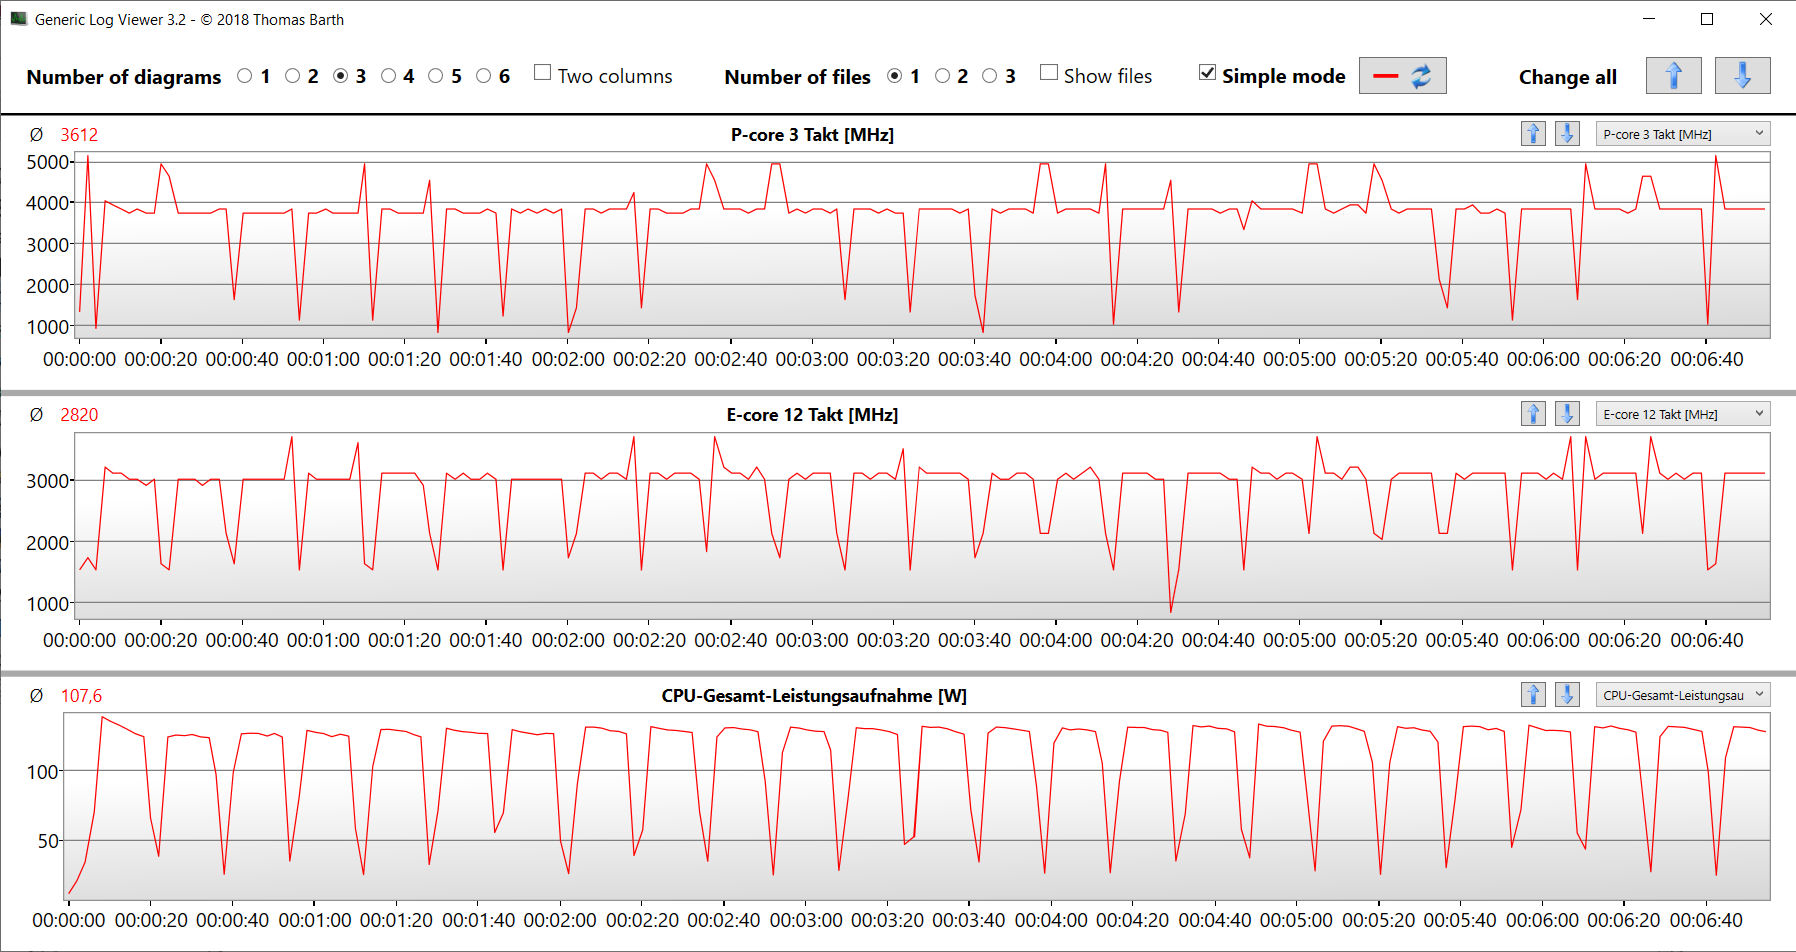
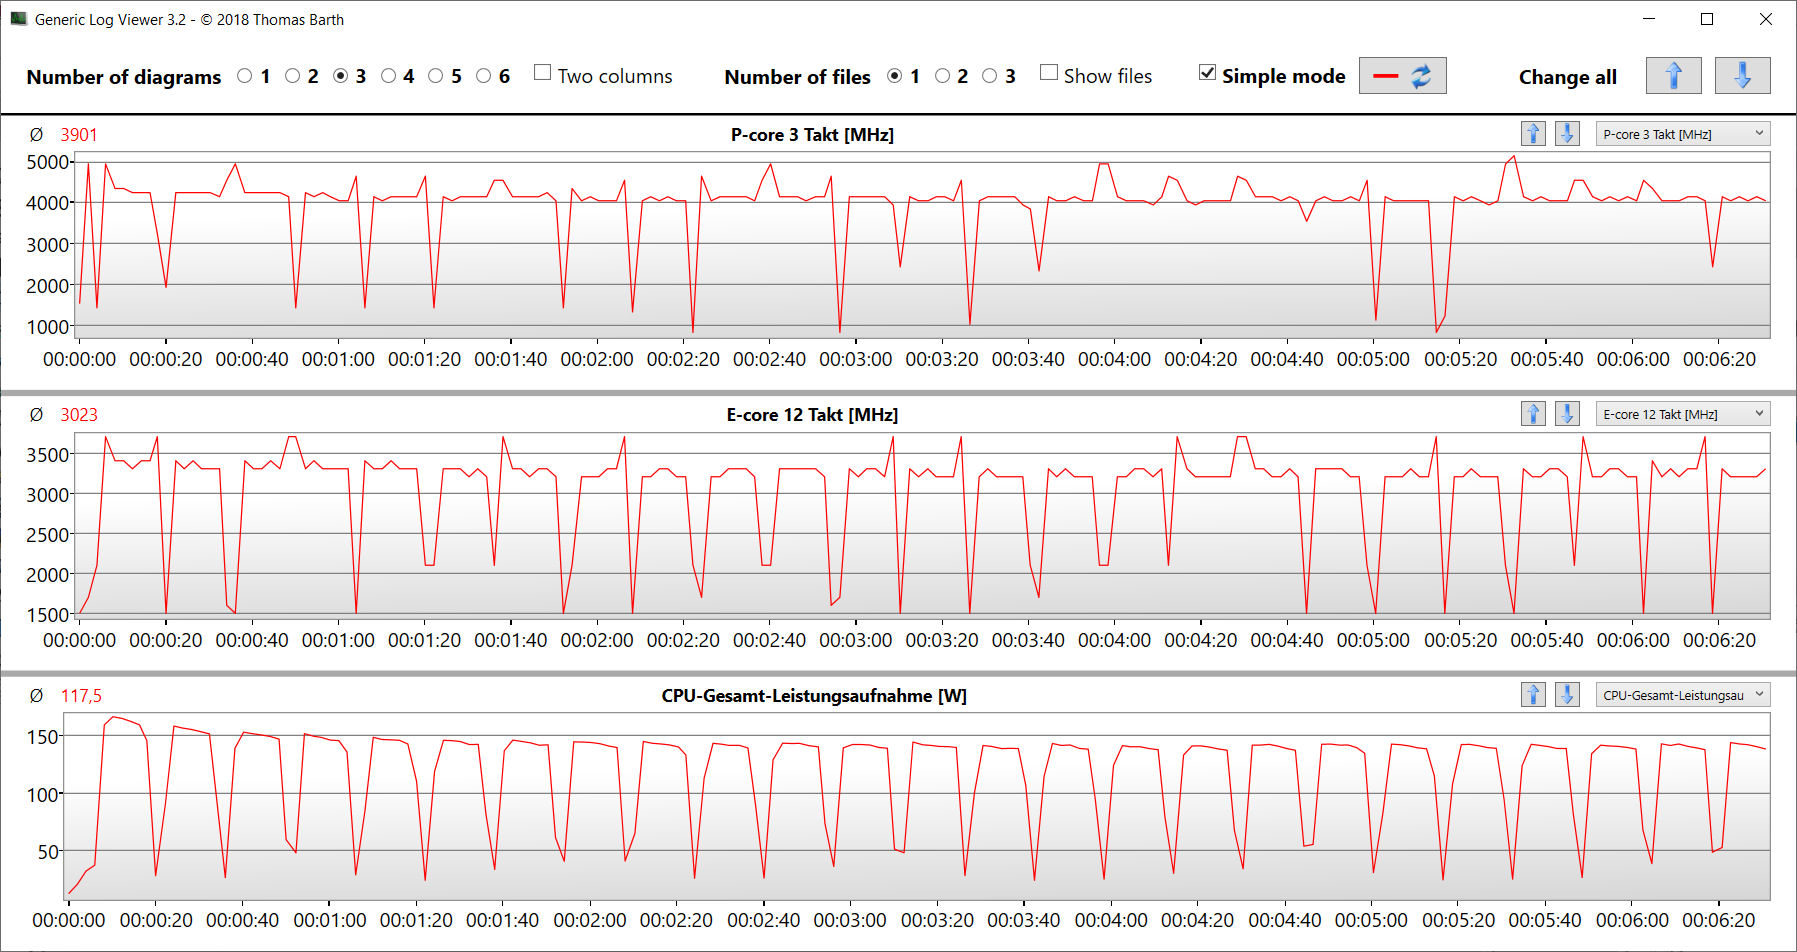
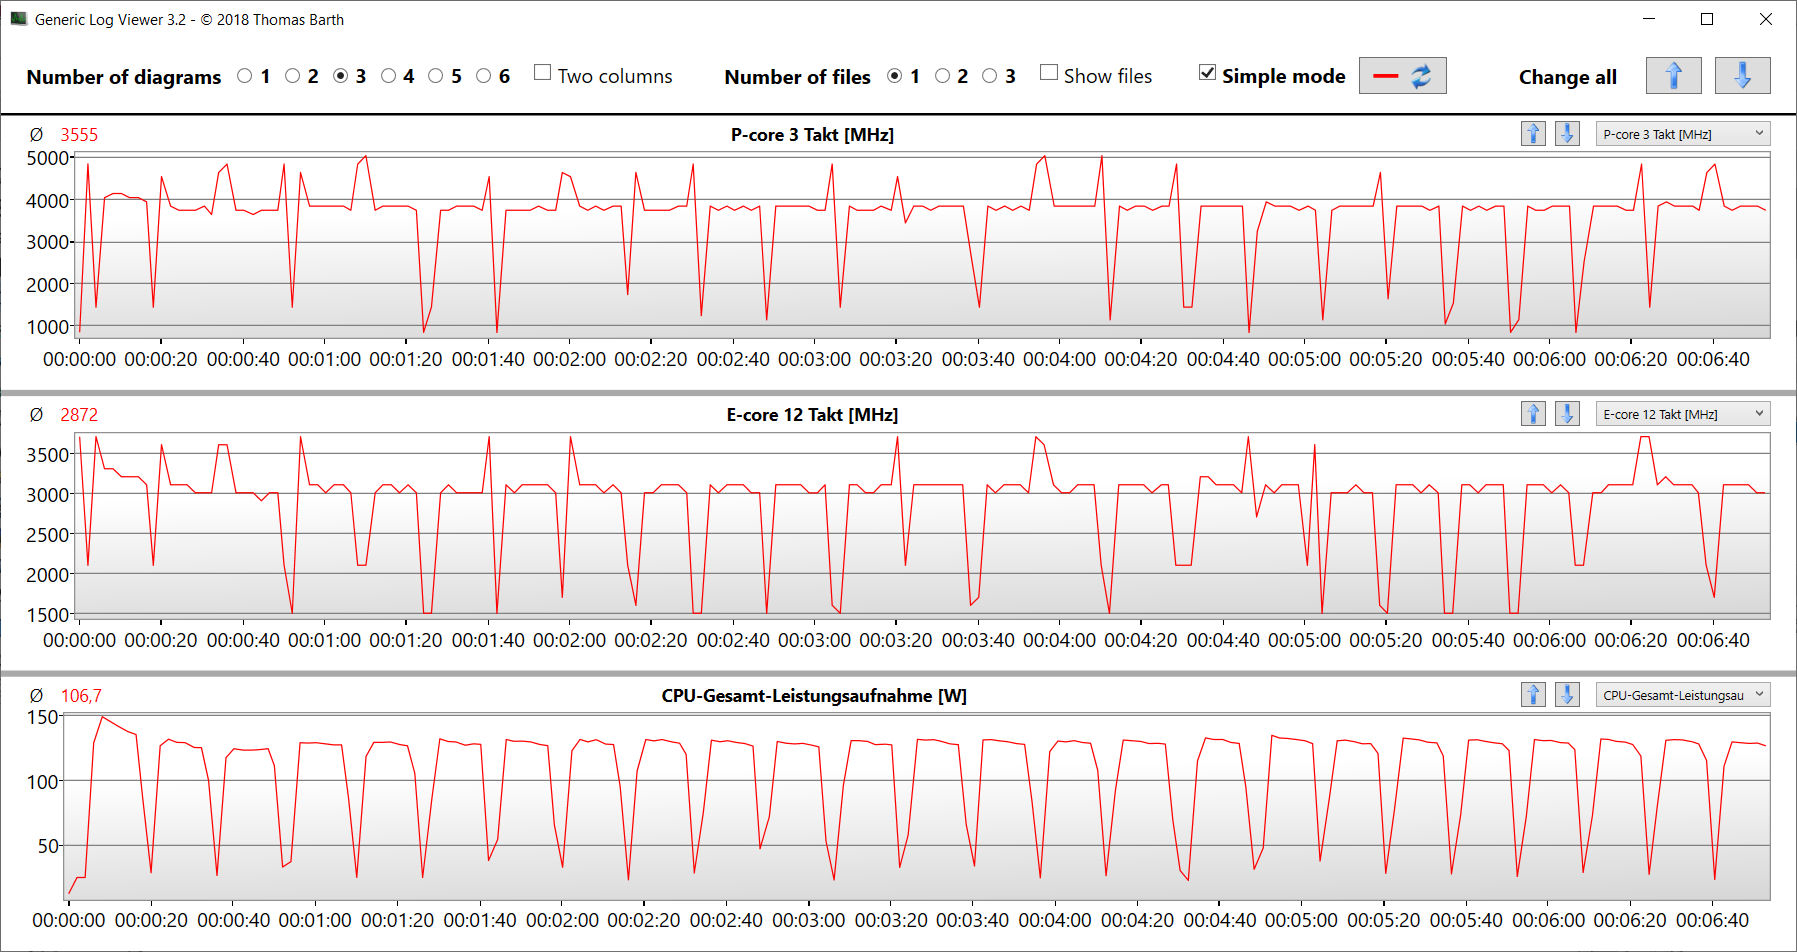
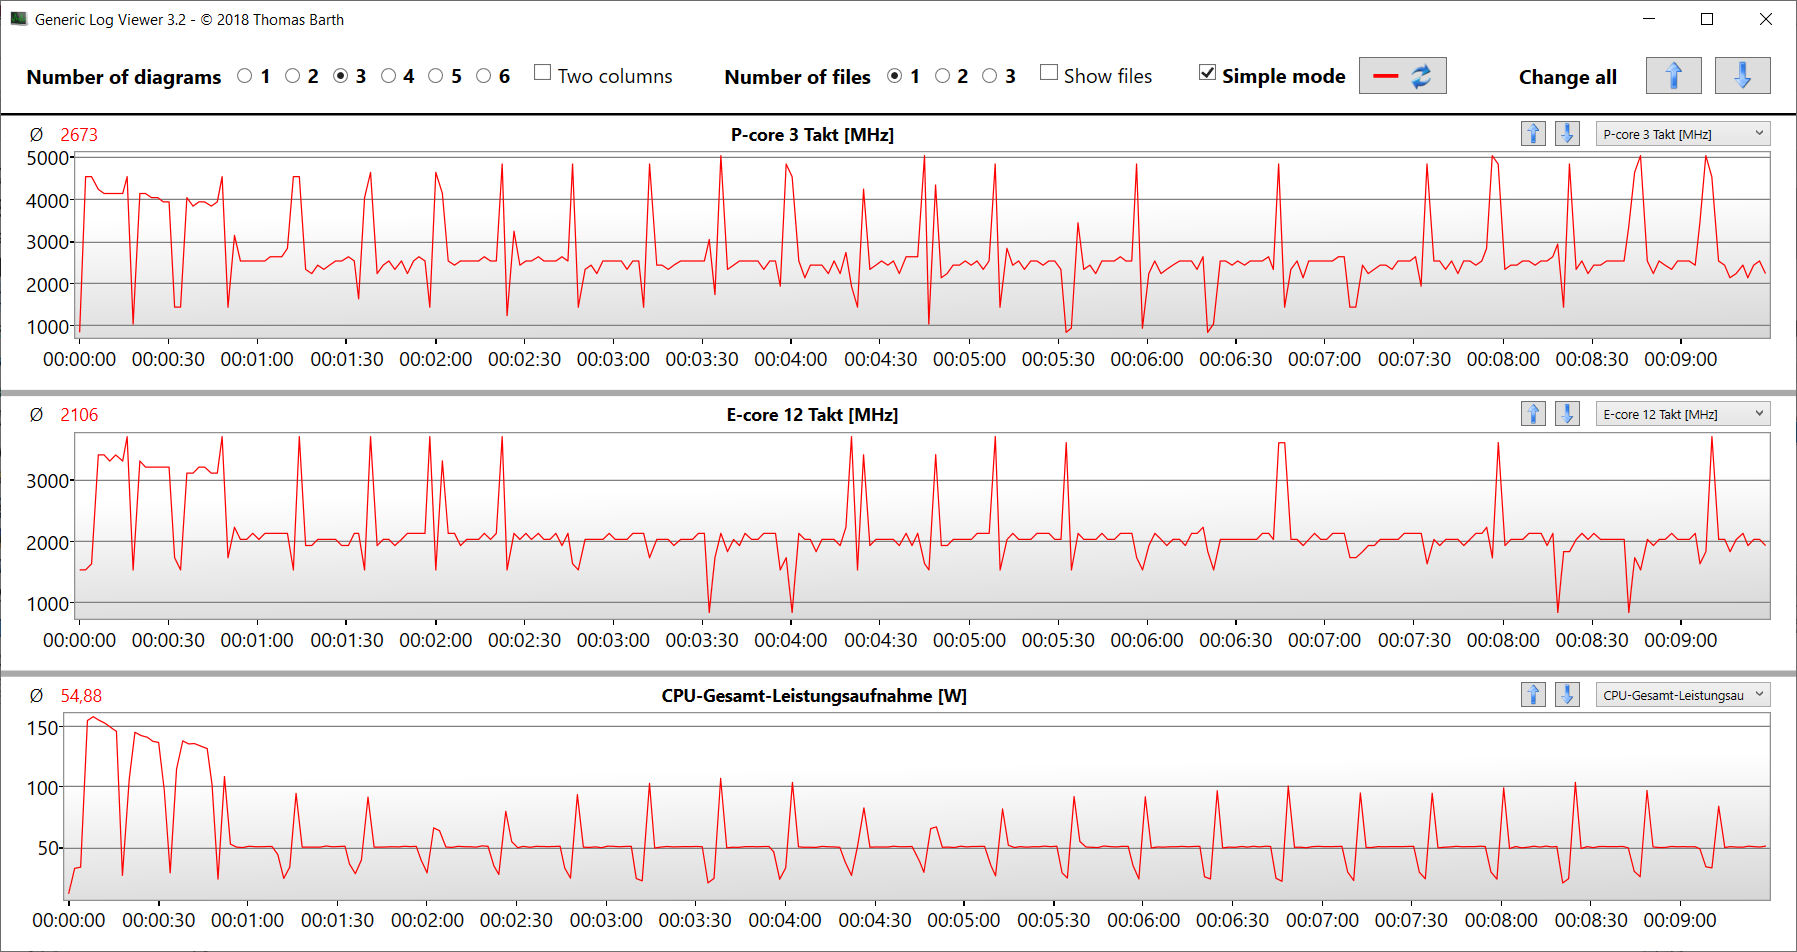
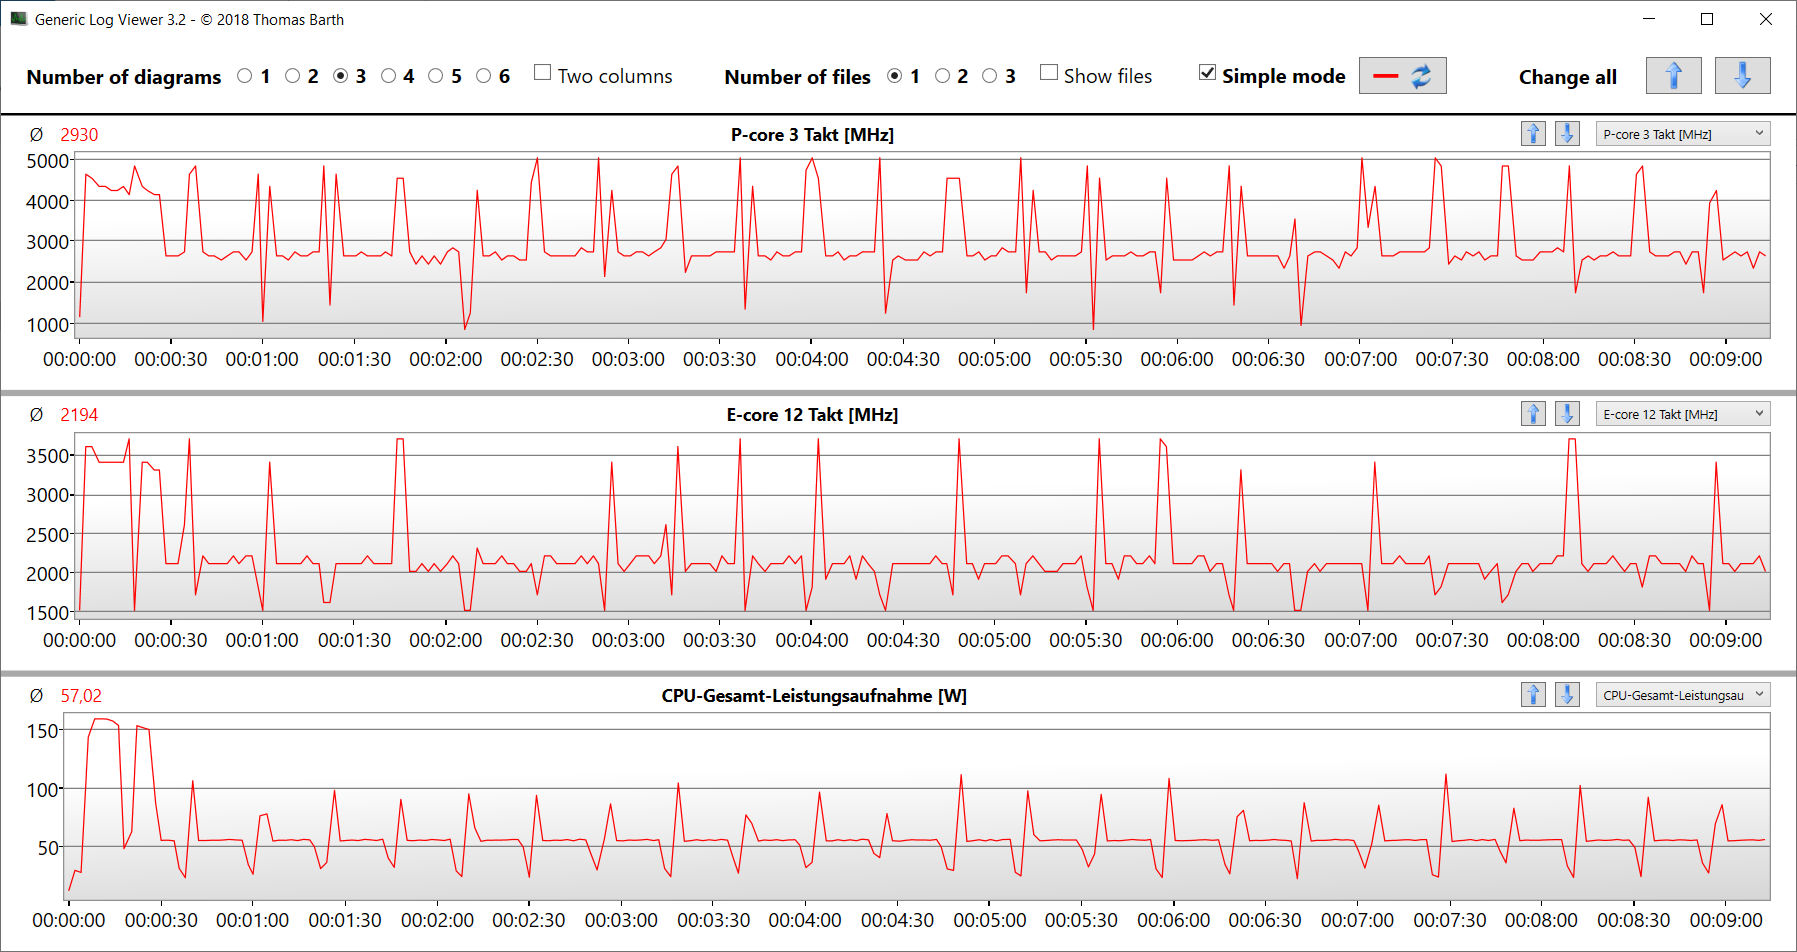
O teste de loop CB15 confirma que o turbo da CPU pode ser mantido permanentemente. No entanto, a taxa de clock cai ligeiramente após a primeira execução, independentemente do perfil usado. o "Overdrive" garante o mais alto nível geral de desempenho.
Cinebench R15 Multi Sustained Load
* ... menor é melhor
AIDA64: FP32 Ray-Trace | FPU Julia | CPU SHA3 | CPU Queen | FPU SinJulia | FPU Mandel | CPU AES | CPU ZLib | FP64 Ray-Trace | CPU PhotoWorxx
| Performance rating | |
| Alienware m16 R1 AMD | |
| Média da turma Gaming | |
| Alienware m16 R1 Intel | |
| Acer Predator Helios 16 PH16-71-731Q | |
| Schenker XMG Pro 15 (E23) | |
| Lenovo Legion Pro 5 16IRX8 | |
| Média Intel Core i7-13700HX | |
| Medion Erazer Defender P40 | |
| Aorus 15 BSF | |
| AIDA64 / FP32 Ray-Trace | |
| Alienware m16 R1 AMD | |
| Média da turma Gaming (10227 - 85542, n=105, últimos 2 anos) | |
| Lenovo Legion Pro 5 16IRX8 | |
| Alienware m16 R1 Intel | |
| Acer Predator Helios 16 PH16-71-731Q | |
| Média Intel Core i7-13700HX (14261 - 21999, n=11) | |
| Schenker XMG Pro 15 (E23) | |
| Medion Erazer Defender P40 | |
| Aorus 15 BSF | |
| AIDA64 / FPU Julia | |
| Alienware m16 R1 AMD | |
| Média da turma Gaming (51376 - 238426, n=105, últimos 2 anos) | |
| Lenovo Legion Pro 5 16IRX8 | |
| Alienware m16 R1 Intel | |
| Acer Predator Helios 16 PH16-71-731Q | |
| Média Intel Core i7-13700HX (74636 - 109364, n=11) | |
| Schenker XMG Pro 15 (E23) | |
| Medion Erazer Defender P40 | |
| Aorus 15 BSF | |
| AIDA64 / CPU SHA3 | |
| Alienware m16 R1 AMD | |
| Média da turma Gaming (2180 - 10115, n=105, últimos 2 anos) | |
| Alienware m16 R1 Intel | |
| Schenker XMG Pro 15 (E23) | |
| Lenovo Legion Pro 5 16IRX8 | |
| Acer Predator Helios 16 PH16-71-731Q | |
| Média Intel Core i7-13700HX (3359 - 5053, n=11) | |
| Medion Erazer Defender P40 | |
| Aorus 15 BSF | |
| AIDA64 / CPU Queen | |
| Alienware m16 R1 AMD | |
| Schenker XMG Pro 15 (E23) | |
| Média da turma Gaming (49785 - 173351, n=90, últimos 2 anos) | |
| Alienware m16 R1 Intel | |
| Acer Predator Helios 16 PH16-71-731Q | |
| Lenovo Legion Pro 5 16IRX8 | |
| Medion Erazer Defender P40 | |
| Média Intel Core i7-13700HX (86532 - 114717, n=11) | |
| Aorus 15 BSF | |
| AIDA64 / FPU SinJulia | |
| Alienware m16 R1 AMD | |
| Média da turma Gaming (4424 - 33636, n=105, últimos 2 anos) | |
| Alienware m16 R1 Intel | |
| Lenovo Legion Pro 5 16IRX8 | |
| Acer Predator Helios 16 PH16-71-731Q | |
| Schenker XMG Pro 15 (E23) | |
| Média Intel Core i7-13700HX (9290 - 13519, n=11) | |
| Medion Erazer Defender P40 | |
| Aorus 15 BSF | |
| AIDA64 / FPU Mandel | |
| Alienware m16 R1 AMD | |
| Média da turma Gaming (25115 - 128721, n=105, últimos 2 anos) | |
| Lenovo Legion Pro 5 16IRX8 | |
| Alienware m16 R1 Intel | |
| Acer Predator Helios 16 PH16-71-731Q | |
| Média Intel Core i7-13700HX (35751 - 53484, n=11) | |
| Schenker XMG Pro 15 (E23) | |
| Medion Erazer Defender P40 | |
| Aorus 15 BSF | |
| AIDA64 / CPU AES | |
| Alienware m16 R1 Intel | |
| Acer Predator Helios 16 PH16-71-731Q | |
| Aorus 15 BSF | |
| Média Intel Core i7-13700HX (67846 - 182575, n=11) | |
| Alienware m16 R1 AMD | |
| Média da turma Gaming (39258 - 247074, n=105, últimos 2 anos) | |
| Lenovo Legion Pro 5 16IRX8 | |
| Schenker XMG Pro 15 (E23) | |
| Medion Erazer Defender P40 | |
| AIDA64 / CPU ZLib | |
| Alienware m16 R1 AMD | |
| Média da turma Gaming (574 - 2531, n=105, últimos 2 anos) | |
| Acer Predator Helios 16 PH16-71-731Q | |
| Schenker XMG Pro 15 (E23) | |
| Alienware m16 R1 Intel | |
| Lenovo Legion Pro 5 16IRX8 | |
| Média Intel Core i7-13700HX (981 - 1451, n=11) | |
| Medion Erazer Defender P40 | |
| Aorus 15 BSF | |
| AIDA64 / FP64 Ray-Trace | |
| Alienware m16 R1 AMD | |
| Média da turma Gaming (5509 - 45446, n=105, últimos 2 anos) | |
| Lenovo Legion Pro 5 16IRX8 | |
| Alienware m16 R1 Intel | |
| Acer Predator Helios 16 PH16-71-731Q | |
| Média Intel Core i7-13700HX (7728 - 11837, n=11) | |
| Schenker XMG Pro 15 (E23) | |
| Medion Erazer Defender P40 | |
| Aorus 15 BSF | |
| AIDA64 / CPU PhotoWorxx | |
| Schenker XMG Pro 15 (E23) | |
| Média da turma Gaming (12271 - 89891, n=105, últimos 2 anos) | |
| Aorus 15 BSF | |
| Lenovo Legion Pro 5 16IRX8 | |
| Medion Erazer Defender P40 | |
| Alienware m16 R1 Intel | |
| Acer Predator Helios 16 PH16-71-731Q | |
| Média Intel Core i7-13700HX (19678 - 42415, n=11) | |
| Alienware m16 R1 AMD | |
Desempenho do sistema
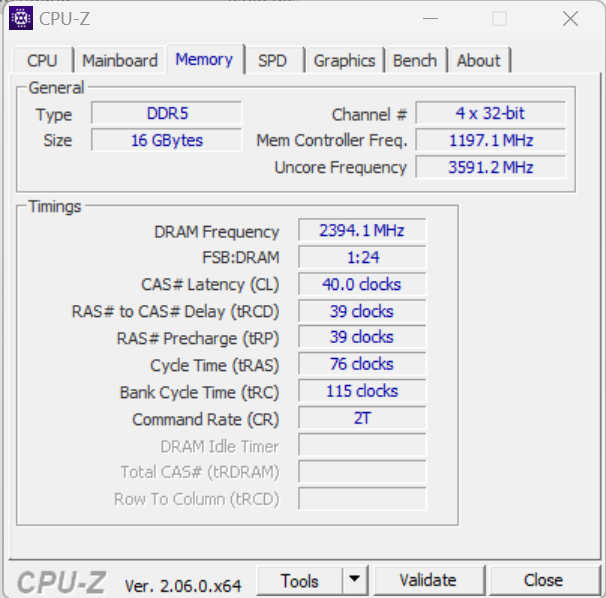
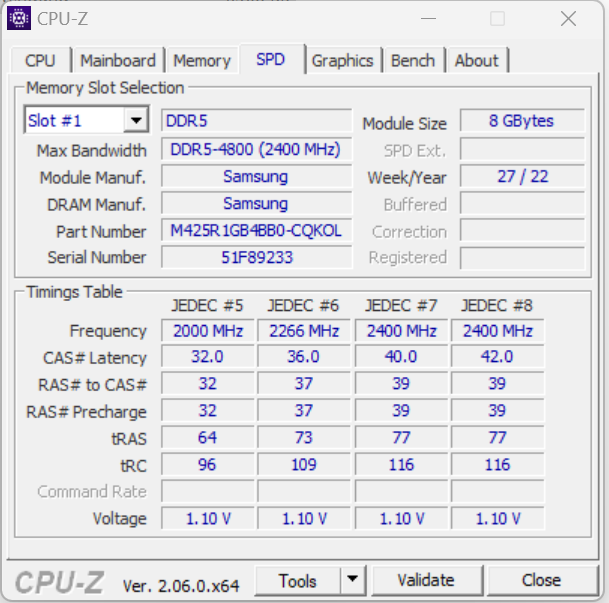
O sistema de funcionamento suave não mostra falta de potência de computação. O laptop lida com renderização, edição de vídeo e jogos sem problemas. As taxas de transferência da RAM estão em um nível normal para a memória DDR5-4800.
CrossMark: Overall | Productivity | Creativity | Responsiveness
| PCMark 10 / Score | |
| Alienware m16 R1 AMD | |
| Média da turma Gaming (5828 - 12414, n=93, últimos 2 anos) | |
| Acer Predator Helios 16 PH16-71-731Q | |
| Lenovo Legion Pro 5 16IRX8 | |
| Schenker XMG Pro 15 (E23) | |
| Média Intel Core i7-13700HX, NVIDIA GeForce RTX 4060 Laptop GPU (6909 - 7743, n=5) | |
| Aorus 15 BSF | |
| Alienware m16 R1 Intel | |
| Medion Erazer Defender P40 | |
| PCMark 10 / Essentials | |
| Alienware m16 R1 AMD | |
| Schenker XMG Pro 15 (E23) | |
| Acer Predator Helios 16 PH16-71-731Q | |
| Lenovo Legion Pro 5 16IRX8 | |
| Aorus 15 BSF | |
| Alienware m16 R1 Intel | |
| Média da turma Gaming (8810 - 11935, n=97, últimos 2 anos) | |
| Média Intel Core i7-13700HX, NVIDIA GeForce RTX 4060 Laptop GPU (9760 - 11313, n=5) | |
| Medion Erazer Defender P40 | |
| PCMark 10 / Productivity | |
| Média da turma Gaming (6845 - 25323, n=95, últimos 2 anos) | |
| Acer Predator Helios 16 PH16-71-731Q | |
| Schenker XMG Pro 15 (E23) | |
| Alienware m16 R1 AMD | |
| Medion Erazer Defender P40 | |
| Média Intel Core i7-13700HX, NVIDIA GeForce RTX 4060 Laptop GPU (9131 - 11018, n=5) | |
| Alienware m16 R1 Intel | |
| Lenovo Legion Pro 5 16IRX8 | |
| Aorus 15 BSF | |
| PCMark 10 / Digital Content Creation | |
| Alienware m16 R1 AMD | |
| Média da turma Gaming (7602 - 19954, n=95, últimos 2 anos) | |
| Lenovo Legion Pro 5 16IRX8 | |
| Média Intel Core i7-13700HX, NVIDIA GeForce RTX 4060 Laptop GPU (9393 - 12434, n=5) | |
| Aorus 15 BSF | |
| Acer Predator Helios 16 PH16-71-731Q | |
| Alienware m16 R1 Intel | |
| Schenker XMG Pro 15 (E23) | |
| Medion Erazer Defender P40 | |
| CrossMark / Overall | |
| Acer Predator Helios 16 PH16-71-731Q | |
| Aorus 15 BSF | |
| Alienware m16 R1 Intel | |
| Alienware m16 R1 AMD | |
| Média da turma Gaming (1366 - 2409, n=94, últimos 2 anos) | |
| Schenker XMG Pro 15 (E23) | |
| Média Intel Core i7-13700HX, NVIDIA GeForce RTX 4060 Laptop GPU (1663 - 2105, n=5) | |
| Medion Erazer Defender P40 | |
| Lenovo Legion Pro 5 16IRX8 | |
| CrossMark / Productivity | |
| Aorus 15 BSF | |
| Acer Predator Helios 16 PH16-71-731Q | |
| Alienware m16 R1 Intel | |
| Alienware m16 R1 AMD | |
| Média da turma Gaming (1386 - 2254, n=94, últimos 2 anos) | |
| Schenker XMG Pro 15 (E23) | |
| Média Intel Core i7-13700HX, NVIDIA GeForce RTX 4060 Laptop GPU (1618 - 1989, n=5) | |
| Medion Erazer Defender P40 | |
| Lenovo Legion Pro 5 16IRX8 | |
| CrossMark / Creativity | |
| Acer Predator Helios 16 PH16-71-731Q | |
| Média da turma Gaming (1343 - 2786, n=94, últimos 2 anos) | |
| Alienware m16 R1 Intel | |
| Schenker XMG Pro 15 (E23) | |
| Alienware m16 R1 AMD | |
| Aorus 15 BSF | |
| Média Intel Core i7-13700HX, NVIDIA GeForce RTX 4060 Laptop GPU (1710 - 2274, n=5) | |
| Medion Erazer Defender P40 | |
| Lenovo Legion Pro 5 16IRX8 | |
| CrossMark / Responsiveness | |
| Aorus 15 BSF | |
| Acer Predator Helios 16 PH16-71-731Q | |
| Alienware m16 R1 Intel | |
| Schenker XMG Pro 15 (E23) | |
| Alienware m16 R1 AMD | |
| Média da turma Gaming (1226 - 2334, n=94, últimos 2 anos) | |
| Média Intel Core i7-13700HX, NVIDIA GeForce RTX 4060 Laptop GPU (1269 - 1983, n=5) | |
| Lenovo Legion Pro 5 16IRX8 | |
| Medion Erazer Defender P40 | |
| PCMark 10 Score | 7224 pontos | |
Ajuda | ||
| AIDA64 / Memory Copy | |
| Schenker XMG Pro 15 (E23) | |
| Média da turma Gaming (21750 - 129946, n=105, últimos 2 anos) | |
| Aorus 15 BSF | |
| Lenovo Legion Pro 5 16IRX8 | |
| Medion Erazer Defender P40 | |
| Alienware m16 R1 Intel | |
| Acer Predator Helios 16 PH16-71-731Q | |
| Média Intel Core i7-13700HX (36125 - 63990, n=11) | |
| Alienware m16 R1 AMD | |
| AIDA64 / Memory Read | |
| Schenker XMG Pro 15 (E23) | |
| Média da turma Gaming (22956 - 118858, n=105, últimos 2 anos) | |
| Aorus 15 BSF | |
| Lenovo Legion Pro 5 16IRX8 | |
| Medion Erazer Defender P40 | |
| Alienware m16 R1 Intel | |
| Acer Predator Helios 16 PH16-71-731Q | |
| Média Intel Core i7-13700HX (36510 - 69729, n=11) | |
| Alienware m16 R1 AMD | |
| AIDA64 / Memory Write | |
| Aorus 15 BSF | |
| Acer Predator Helios 16 PH16-71-731Q | |
| Média da turma Gaming (22297 - 135096, n=105, últimos 2 anos) | |
| Schenker XMG Pro 15 (E23) | |
| Lenovo Legion Pro 5 16IRX8 | |
| Média Intel Core i7-13700HX (33598 - 85675, n=11) | |
| Alienware m16 R1 Intel | |
| Medion Erazer Defender P40 | |
| Alienware m16 R1 AMD | |
| AIDA64 / Memory Latency | |
| Média da turma Gaming (75.3 - 259, n=105, últimos 2 anos) | |
| Medion Erazer Defender P40 | |
| Aorus 15 BSF | |
| Alienware m16 R1 AMD | |
| Alienware m16 R1 Intel | |
| Média Intel Core i7-13700HX (81.5 - 97.9, n=11) | |
| Acer Predator Helios 16 PH16-71-731Q | |
| Schenker XMG Pro 15 (E23) | |
| Lenovo Legion Pro 5 16IRX8 | |
* ... menor é melhor
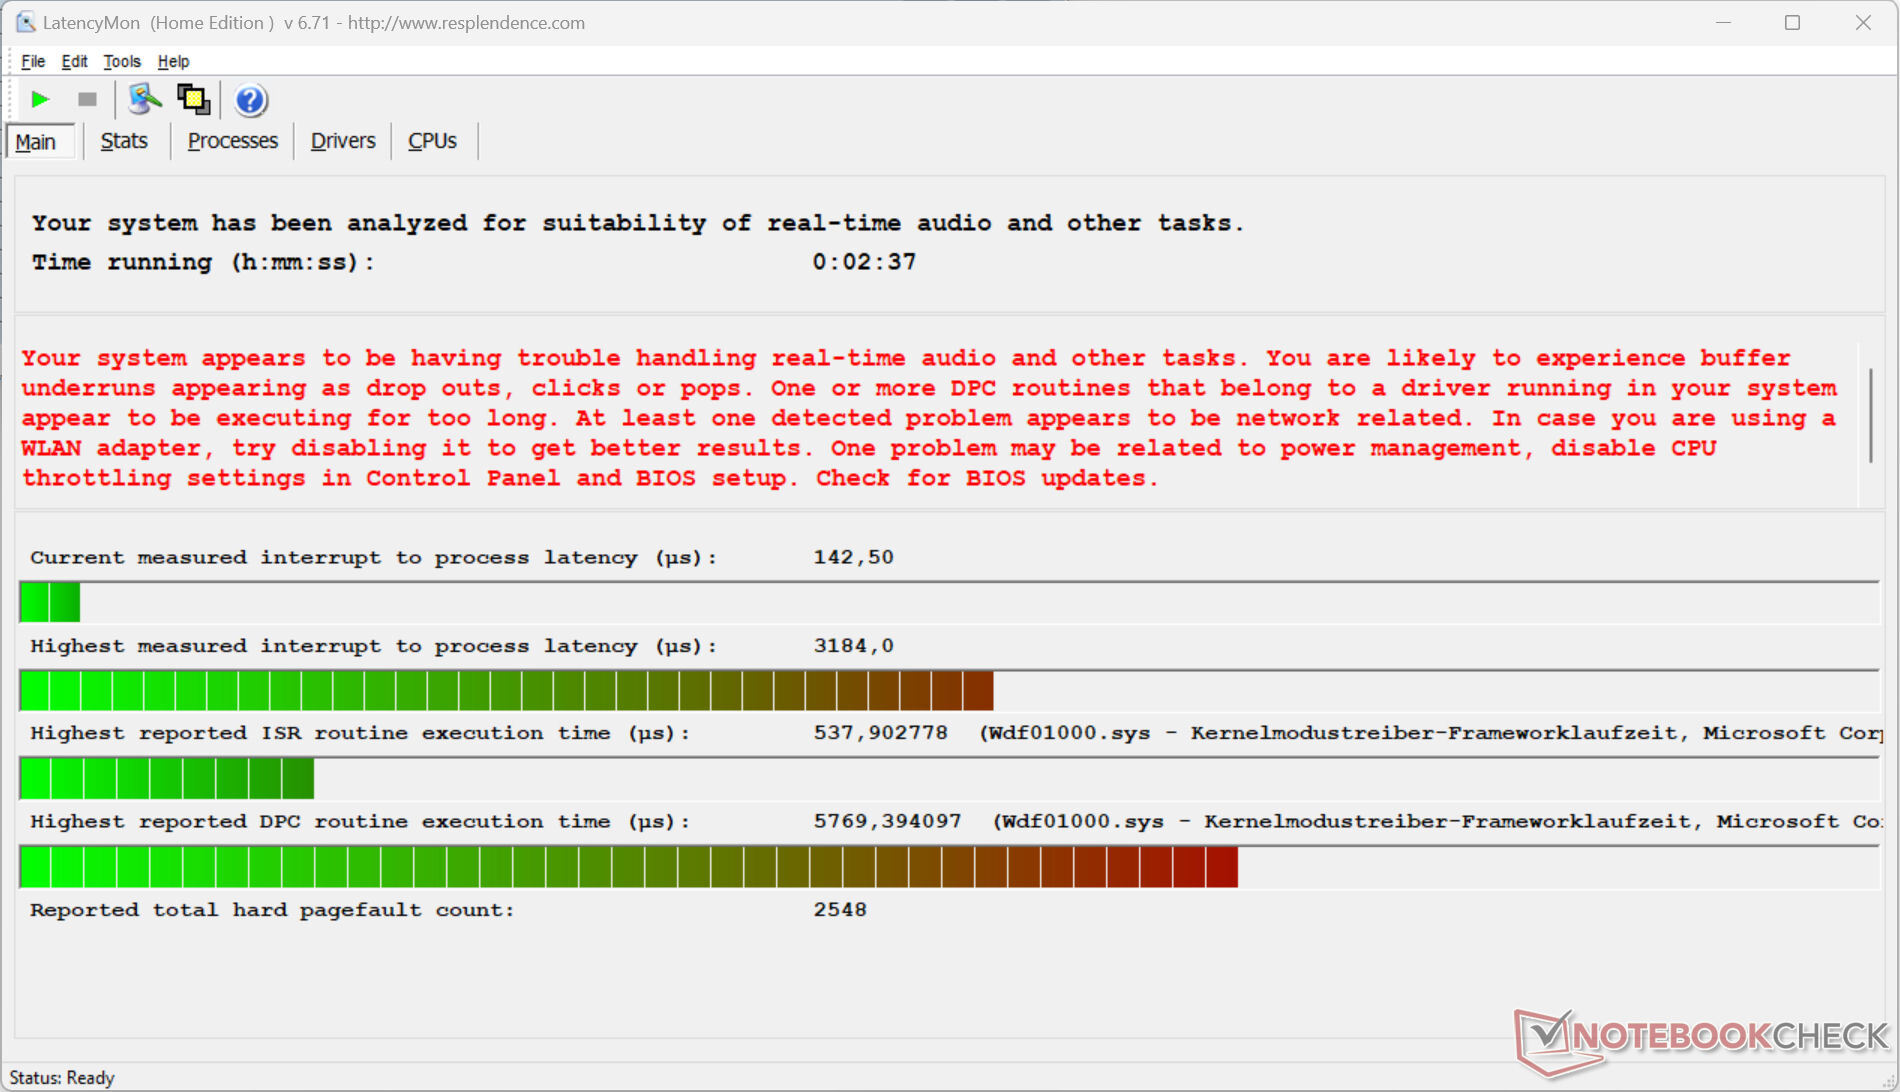
Latência DPC
O teste padronizado do monitor de latência (navegação na Web, reprodução de vídeo 4k, alta carga do Prime95) revelou anomalias. O sistema não parece ser adequado para edição de vídeo e áudio em tempo real. Futuras atualizações de software podem resultar em melhorias ou maior degradação.
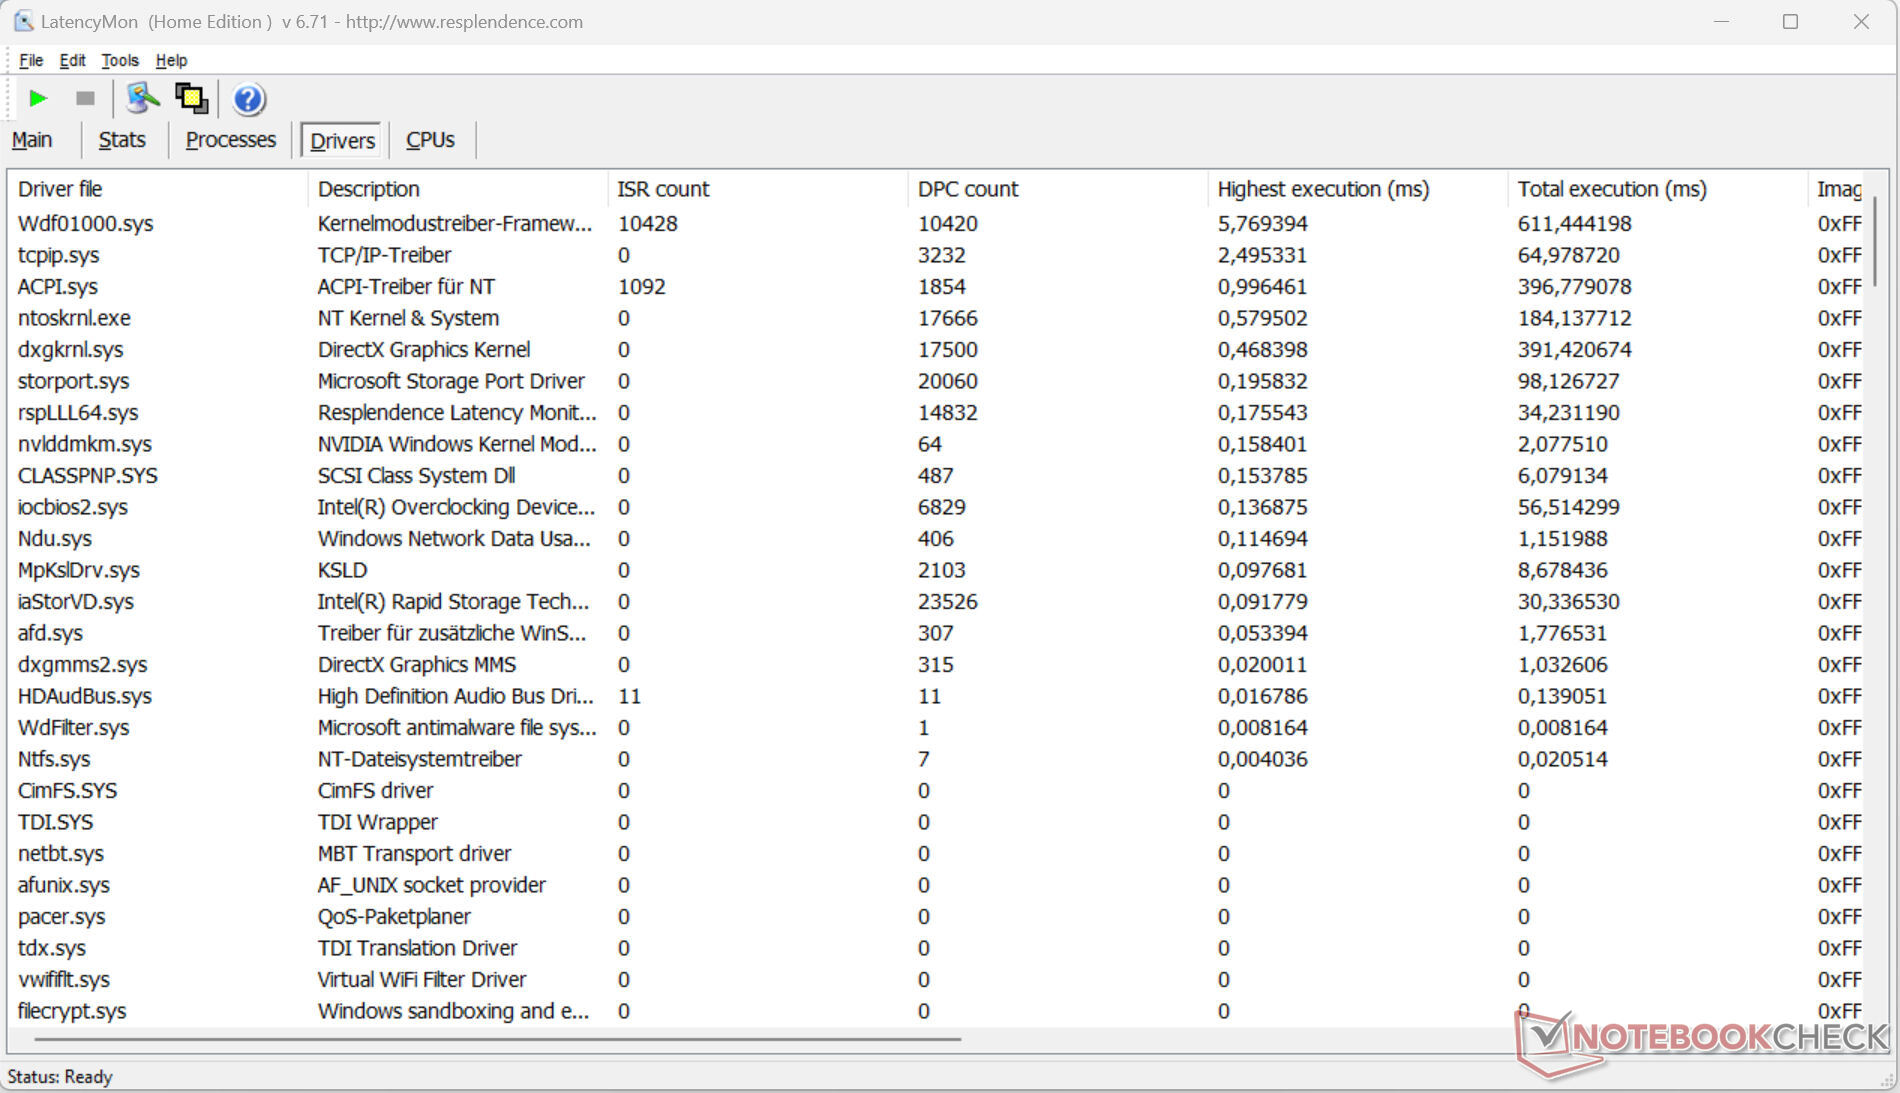
| DPC Latencies / LatencyMon - interrupt to process latency (max), Web, Youtube, Prime95 | |
| Medion Erazer Defender P40 | |
| Alienware m16 R1 Intel | |
| Alienware m16 R1 AMD | |
| Aorus 15 BSF | |
| Acer Predator Helios 16 PH16-71-731Q | |
| Schenker XMG Pro 15 (E23) | |
| Lenovo Legion Pro 5 16IRX8 | |
* ... menor é melhor
Dispositivos de armazenamento
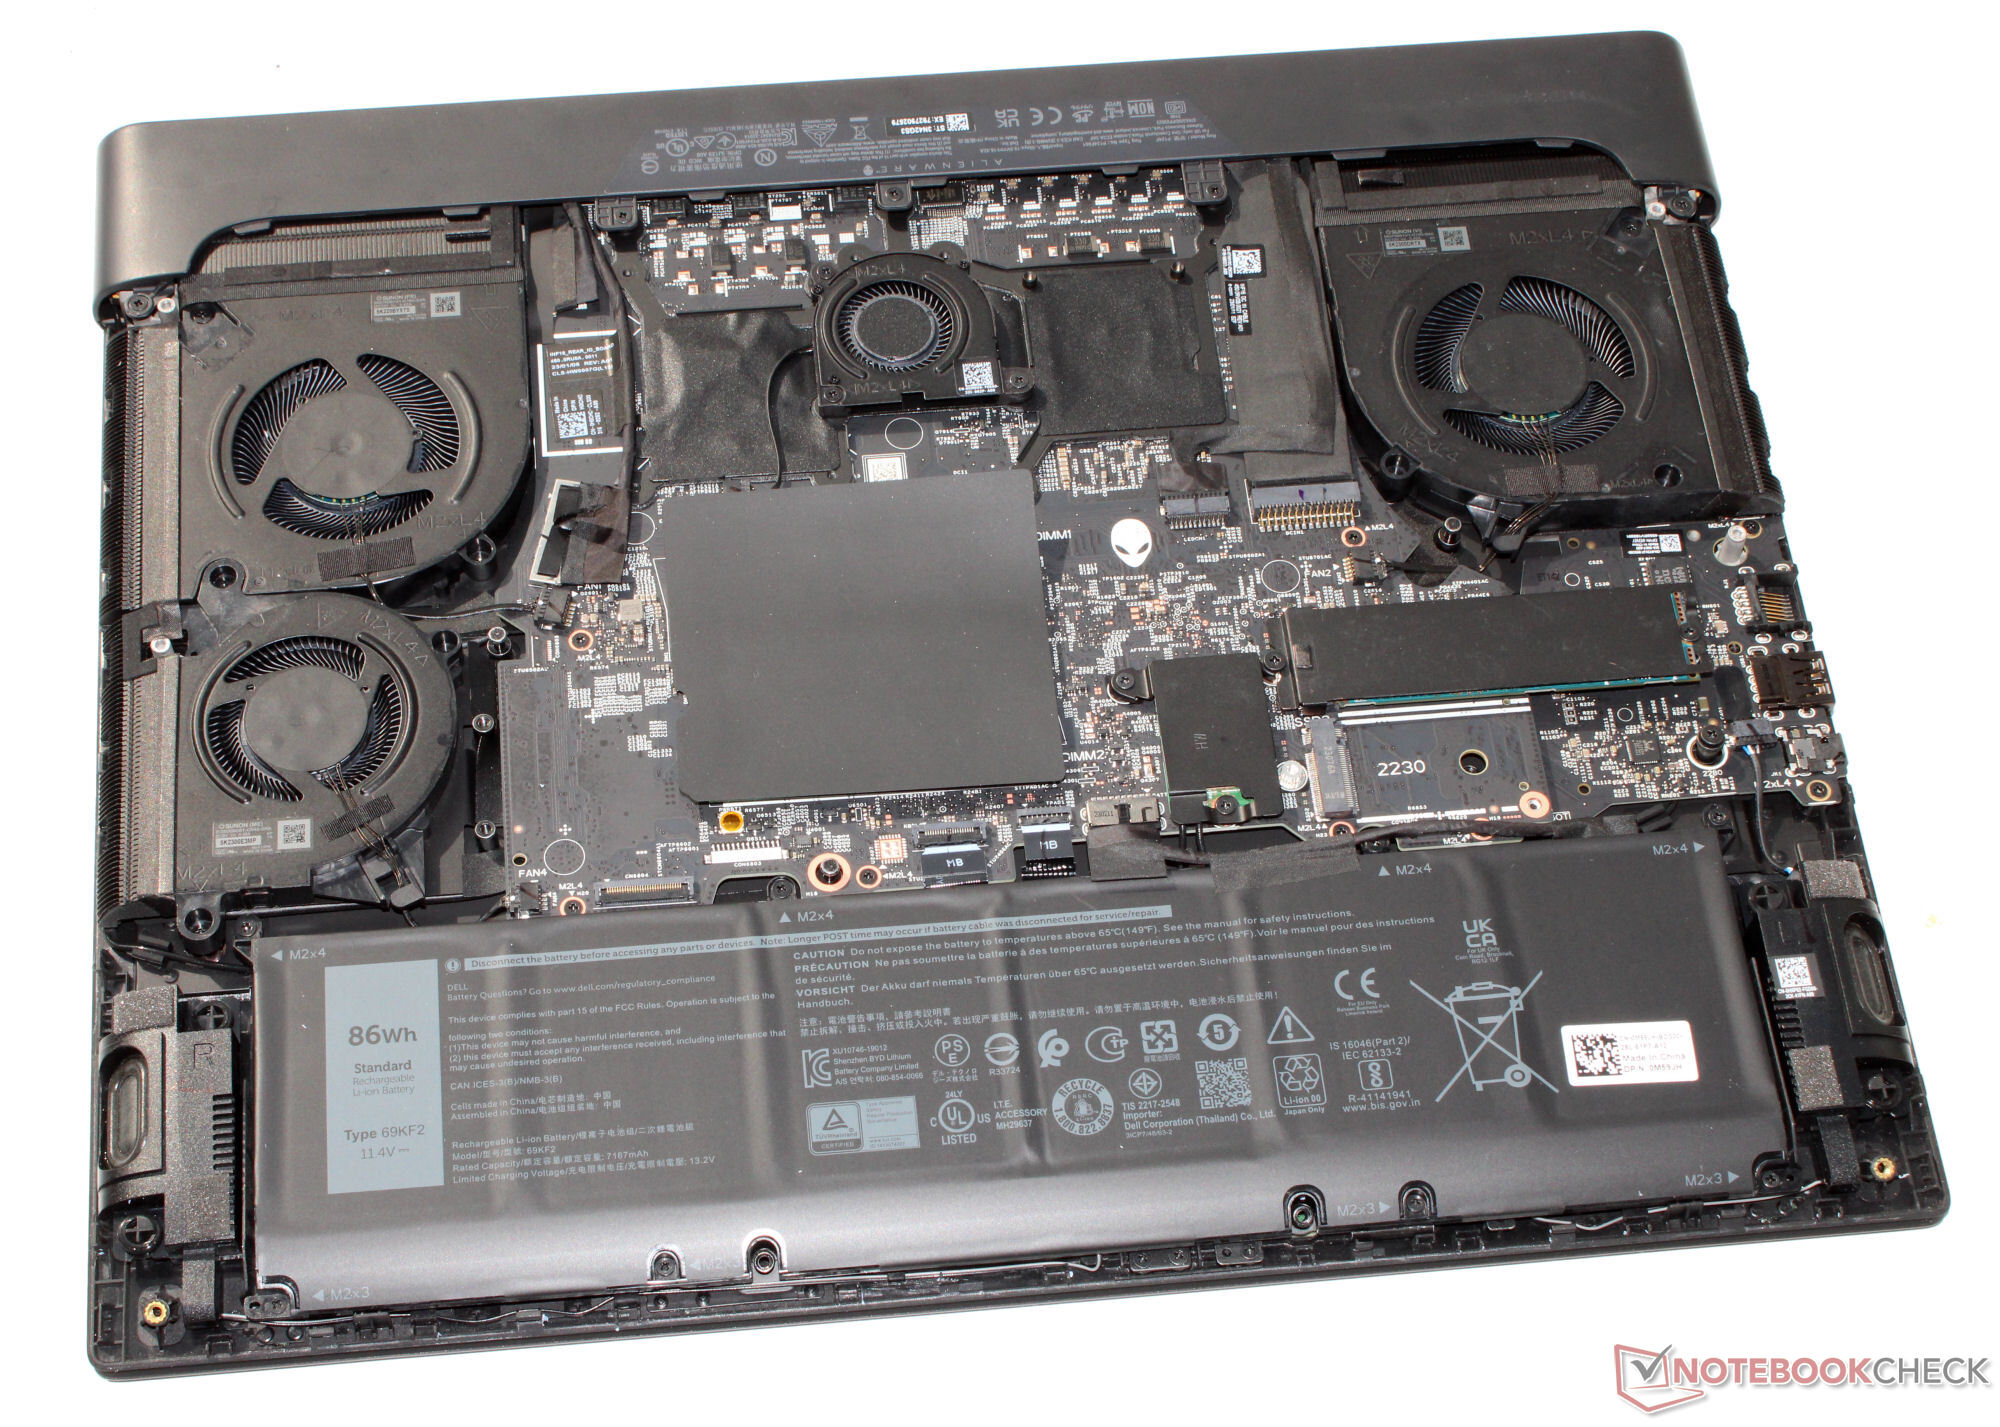
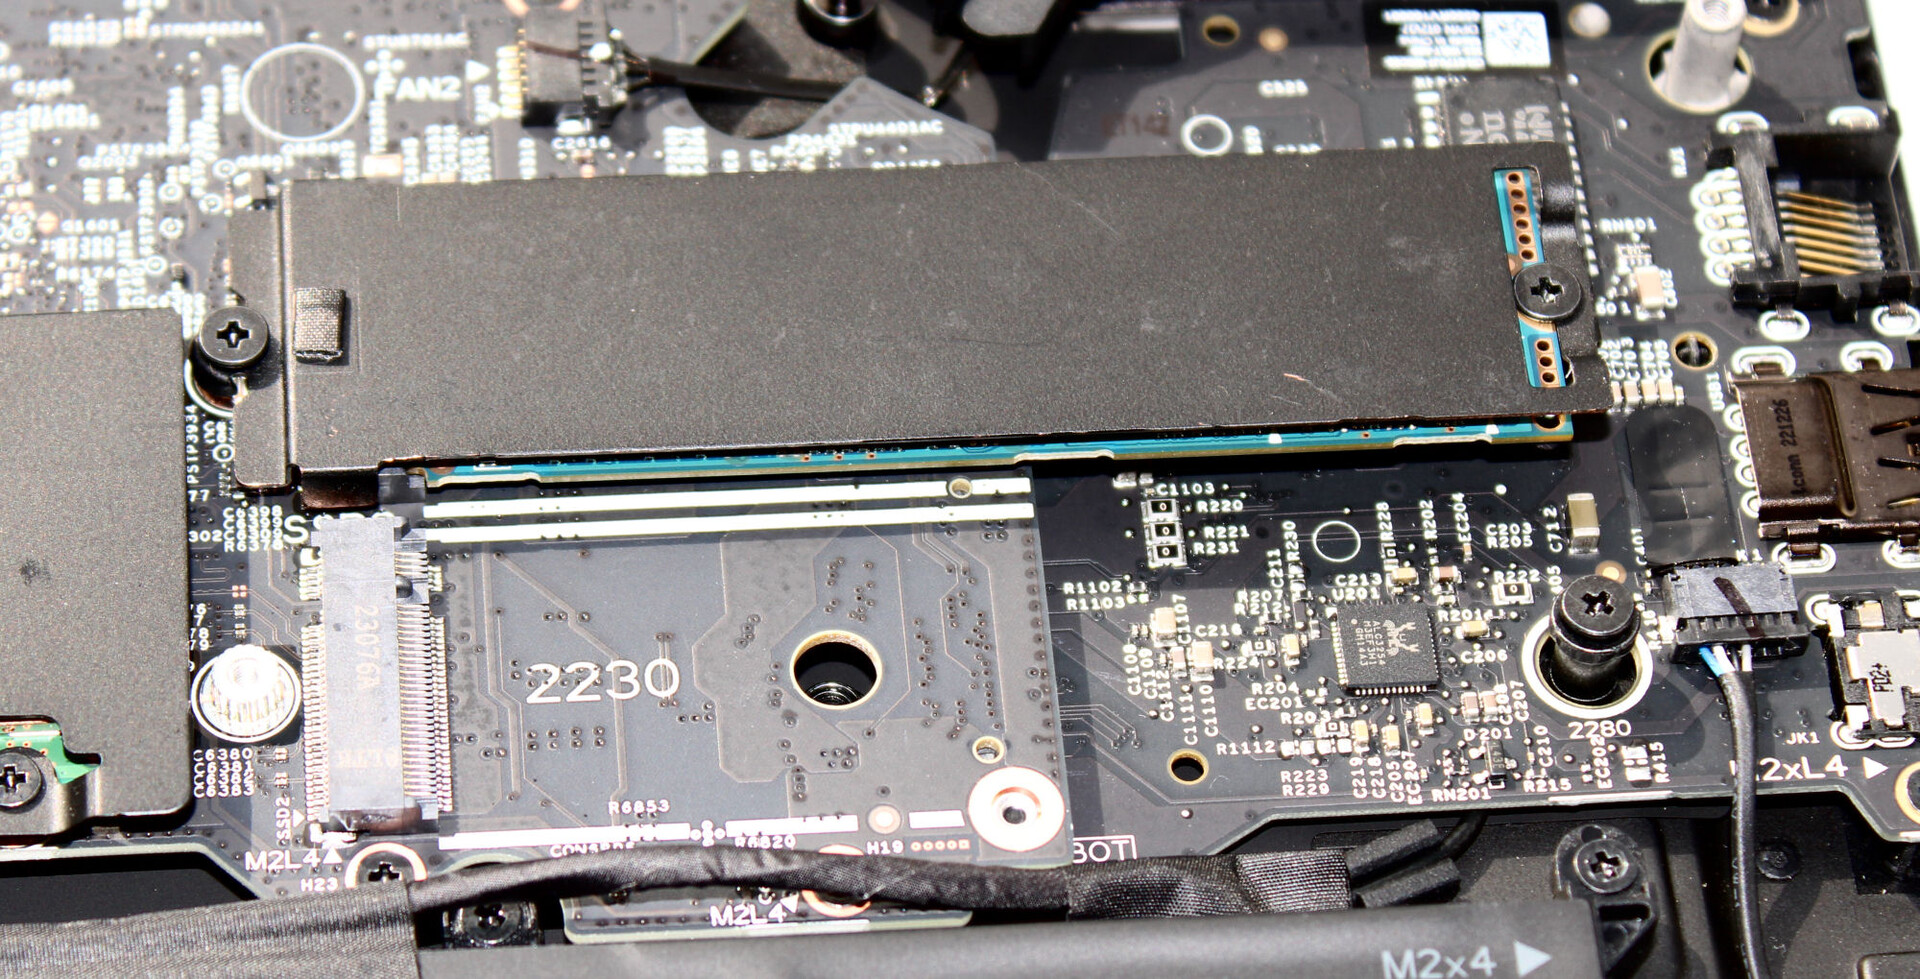
Um SSD de 512 GB (PCIe 4, M.2 2280) da Kioxia serve como unidade do sistema. Ele oferece boas taxas de dados, mas não é um dos principais modelos de SSD. Não houve estrangulamento induzido termicamente. O notebook tem espaço para outro SSD PCIe-4 (M.2 2230 ou M.2 2280). Outras configurações do m16 podem acomodar até quatro SSDs.

* ... menor é melhor
Sustained Read Performance: DiskSpd Read Loop, Queue Depth 8
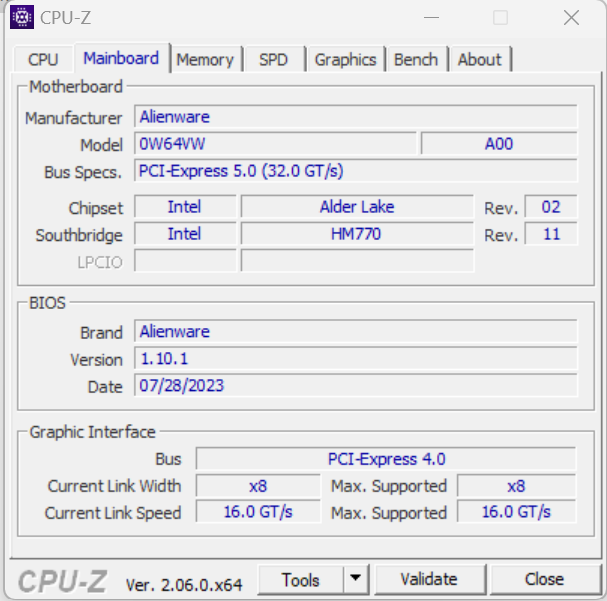
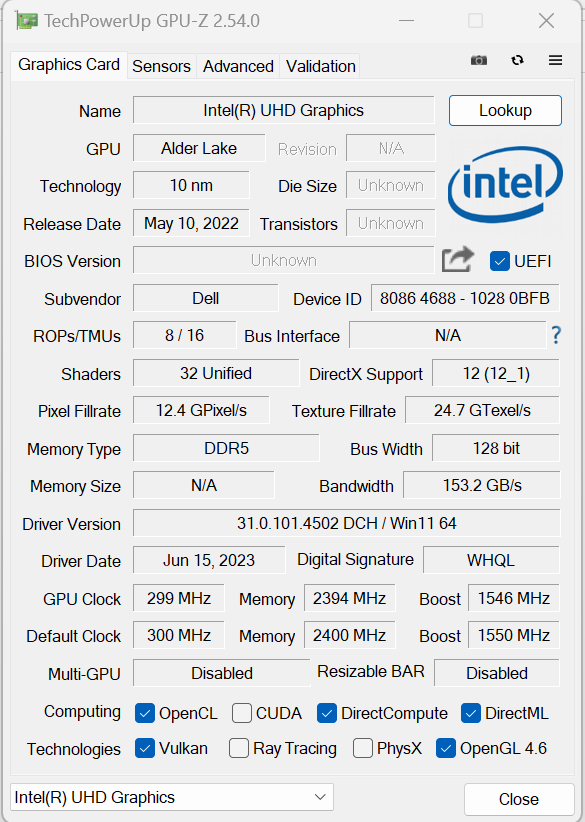
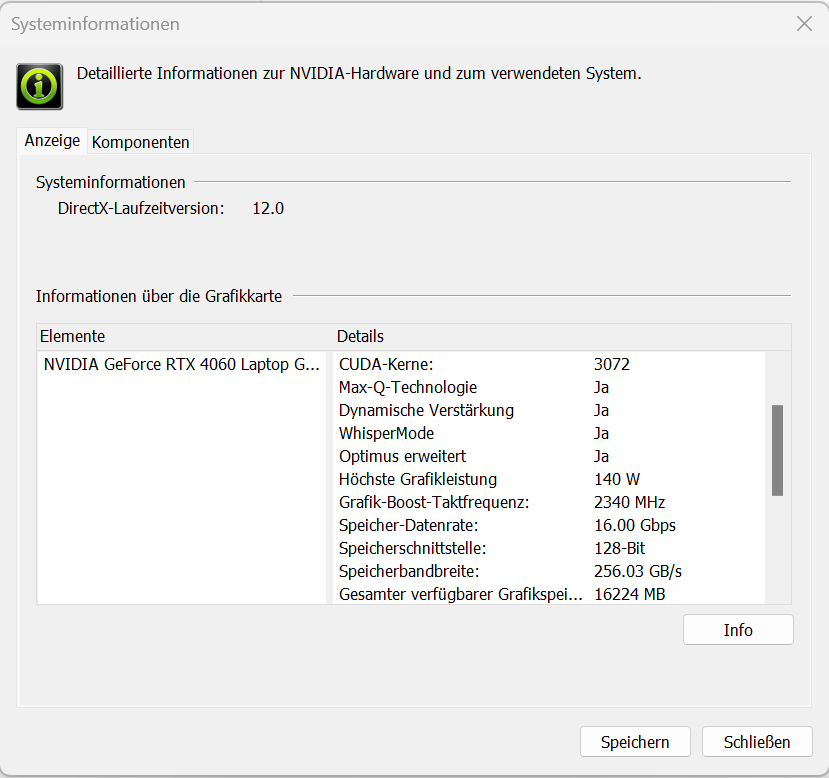
Placa gráfica
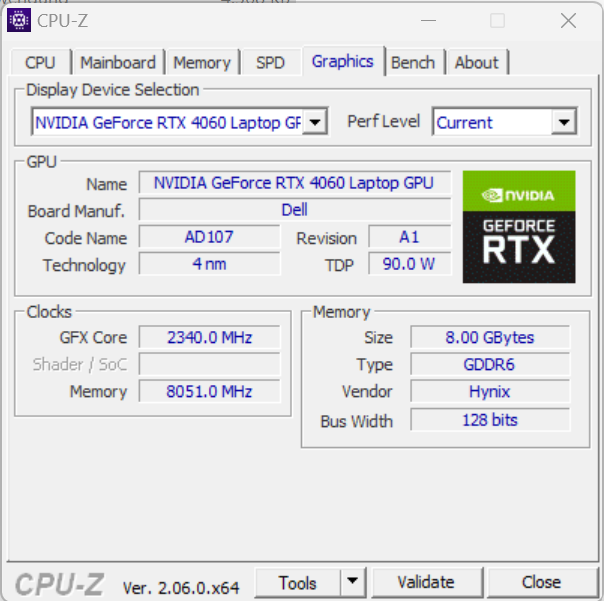
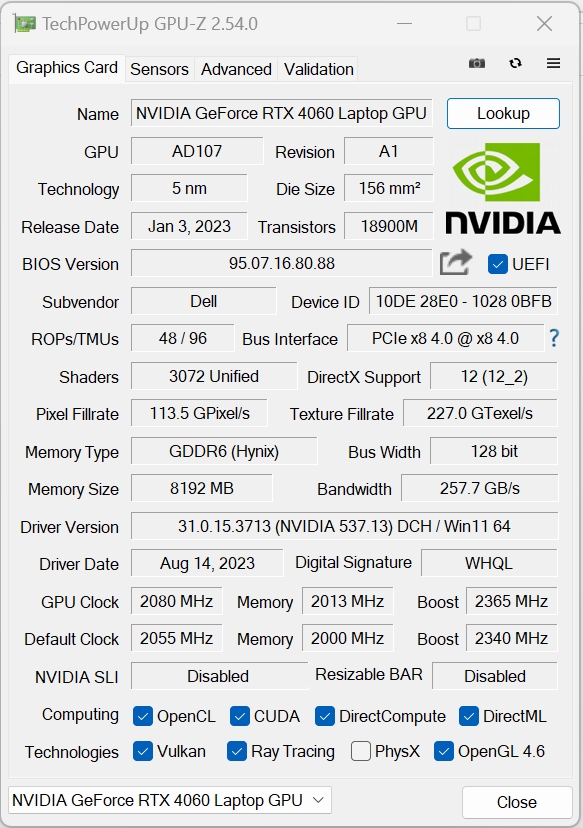
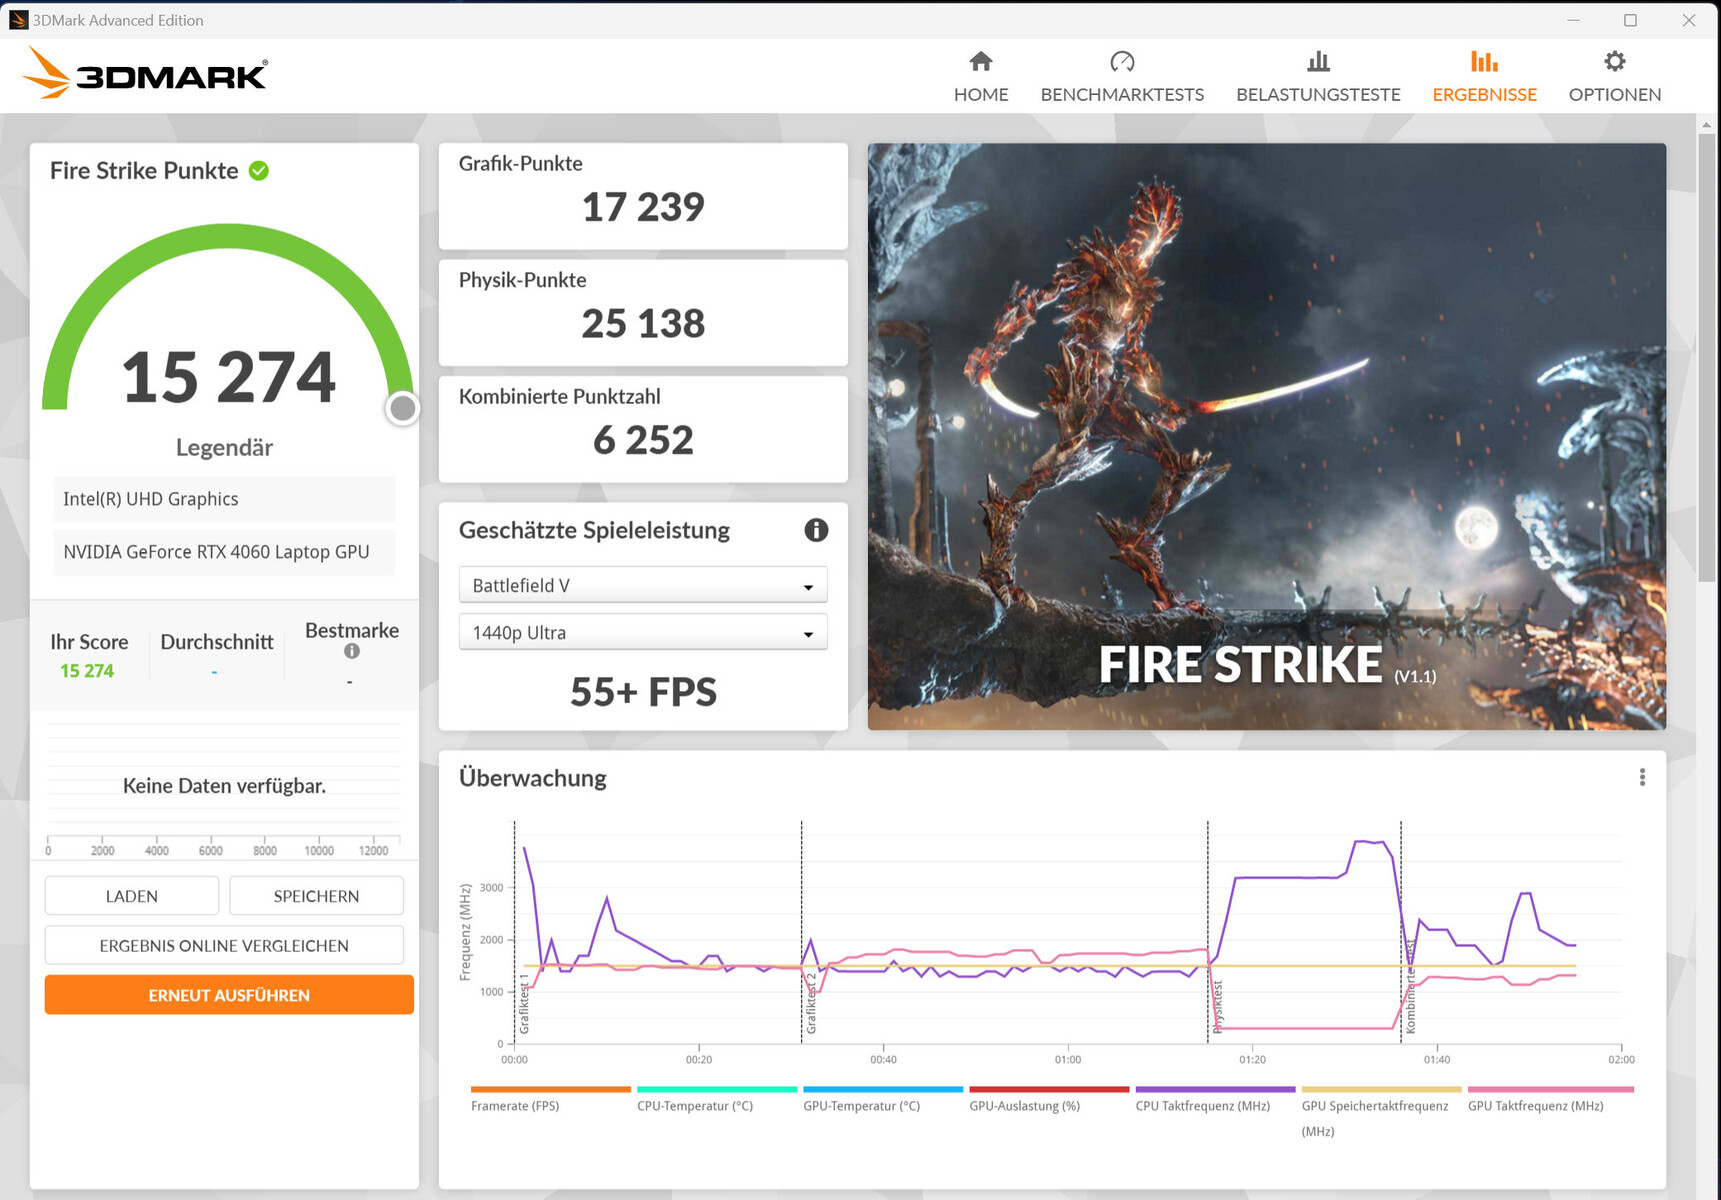
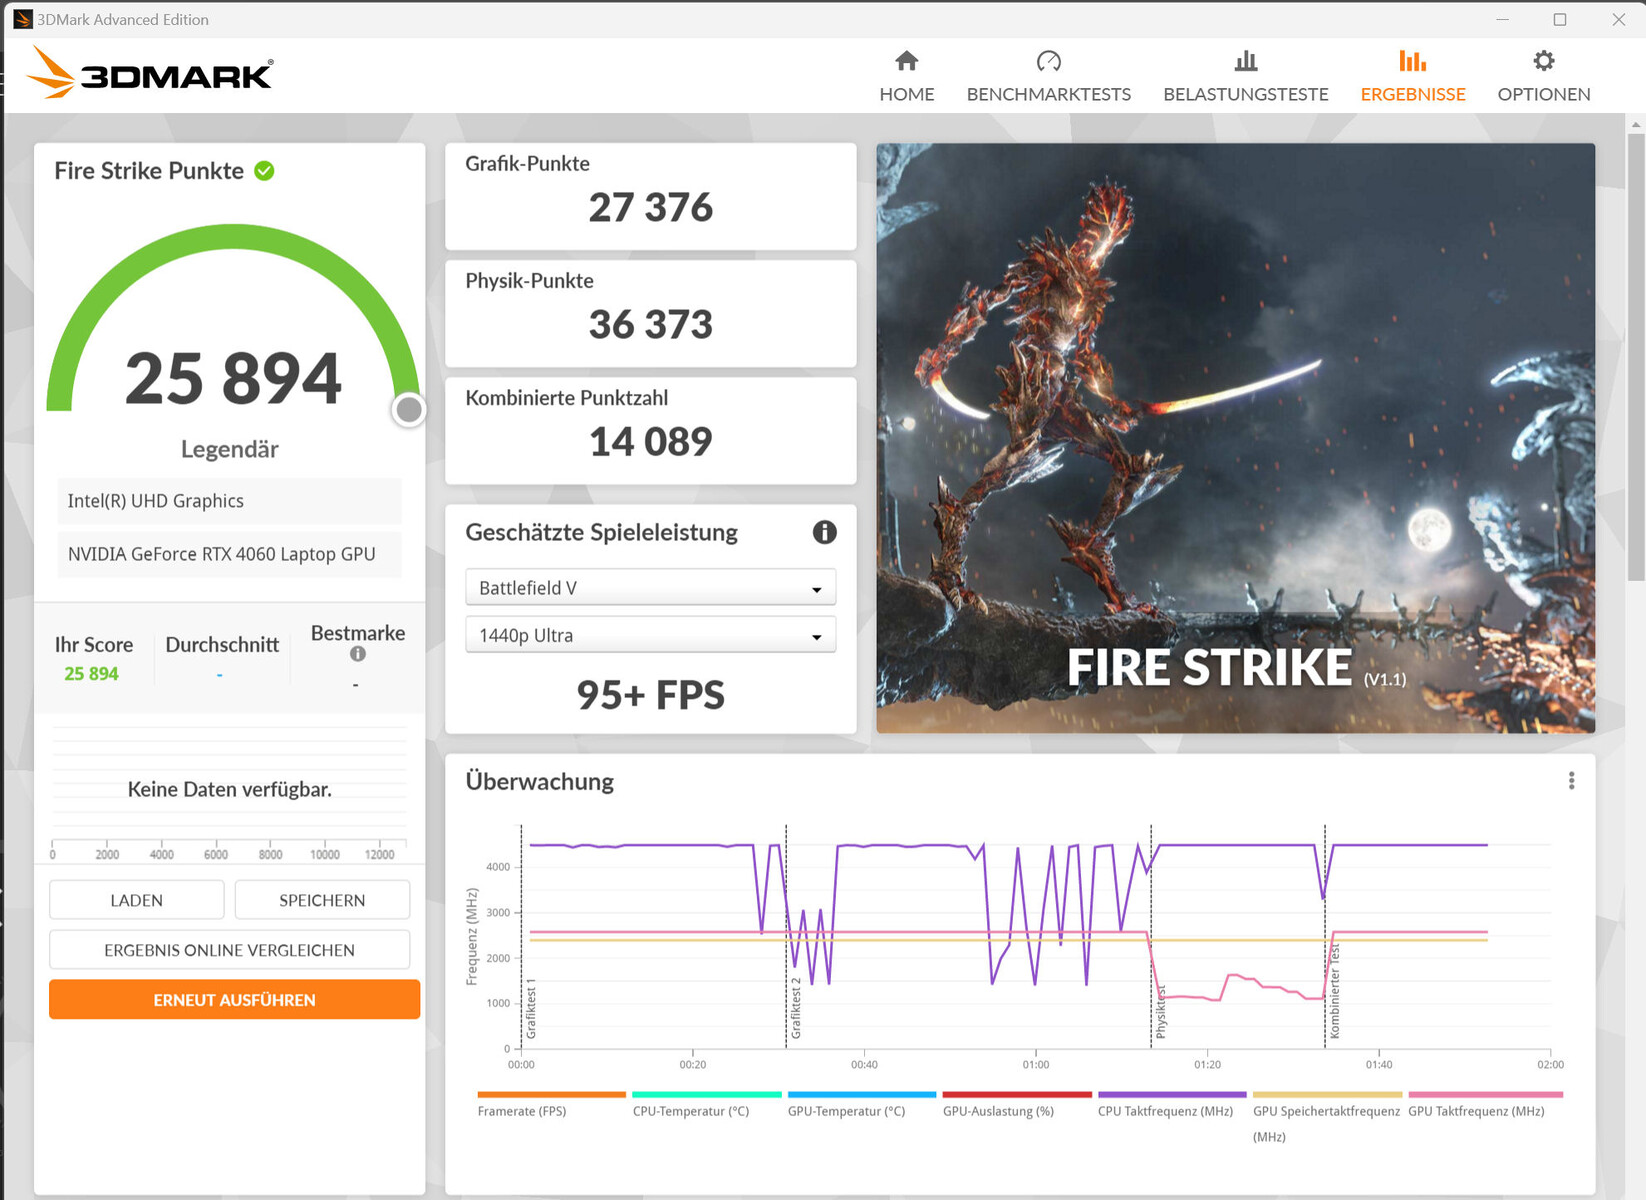
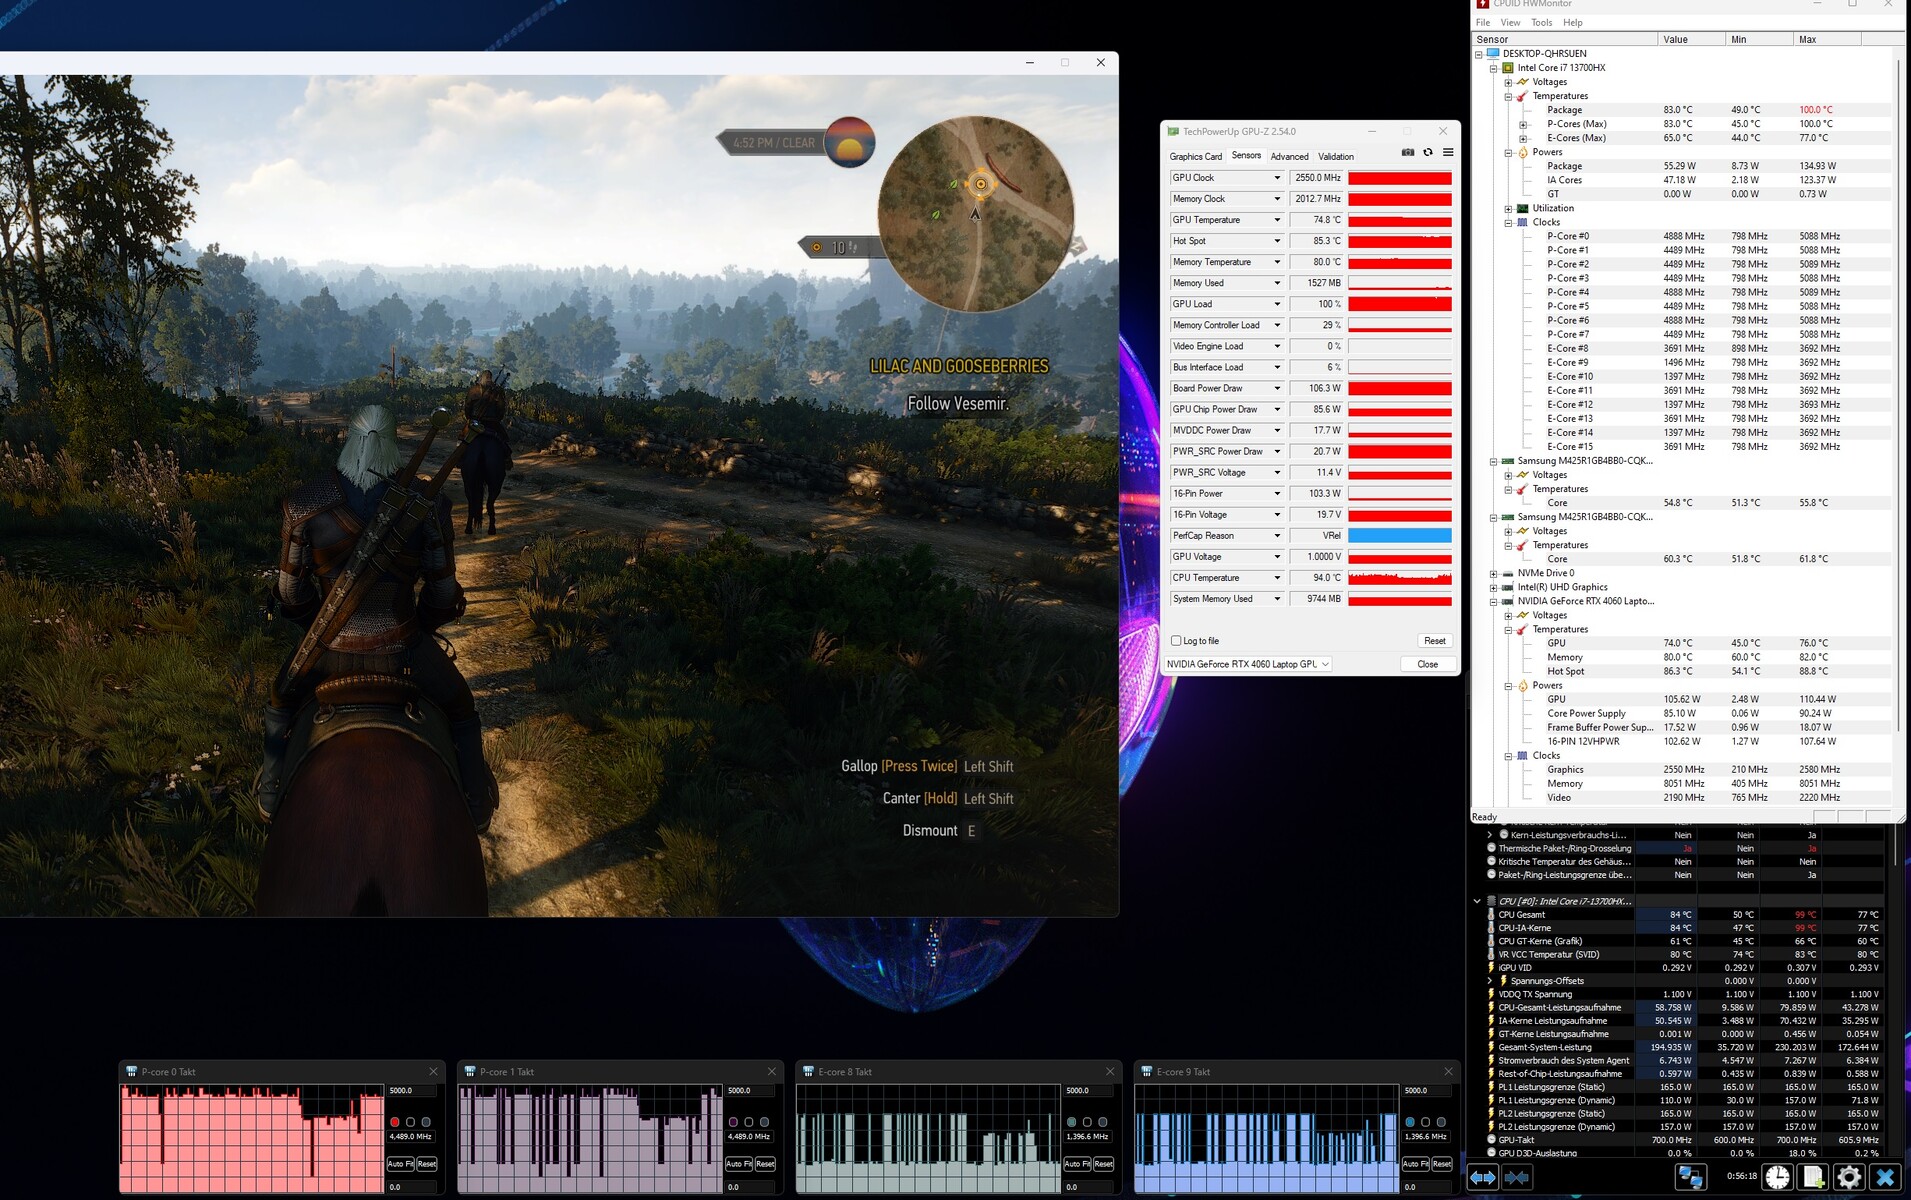
A GeForce RTX 4060oferece 3072 shaders, um barramento de 128 bits de largura e memória GDDR6 rápida (8.192 MB). A Dell permite um TGP máximo de 140 watts (115 watts + 25 watts de Dynamic Boost) - mais do que isso não é possível. De acordo com o teste Witcher 3, o TGP não está sendo totalmente utilizado. Os resultados do benchmark estão acima da média anterior da RTX 4060 e estão entre os melhores valores registrados com essa GPU até o momento. A alternância entre dGPU e Optimus não requer uma reinicialização - o Optimus avançado é compatível.

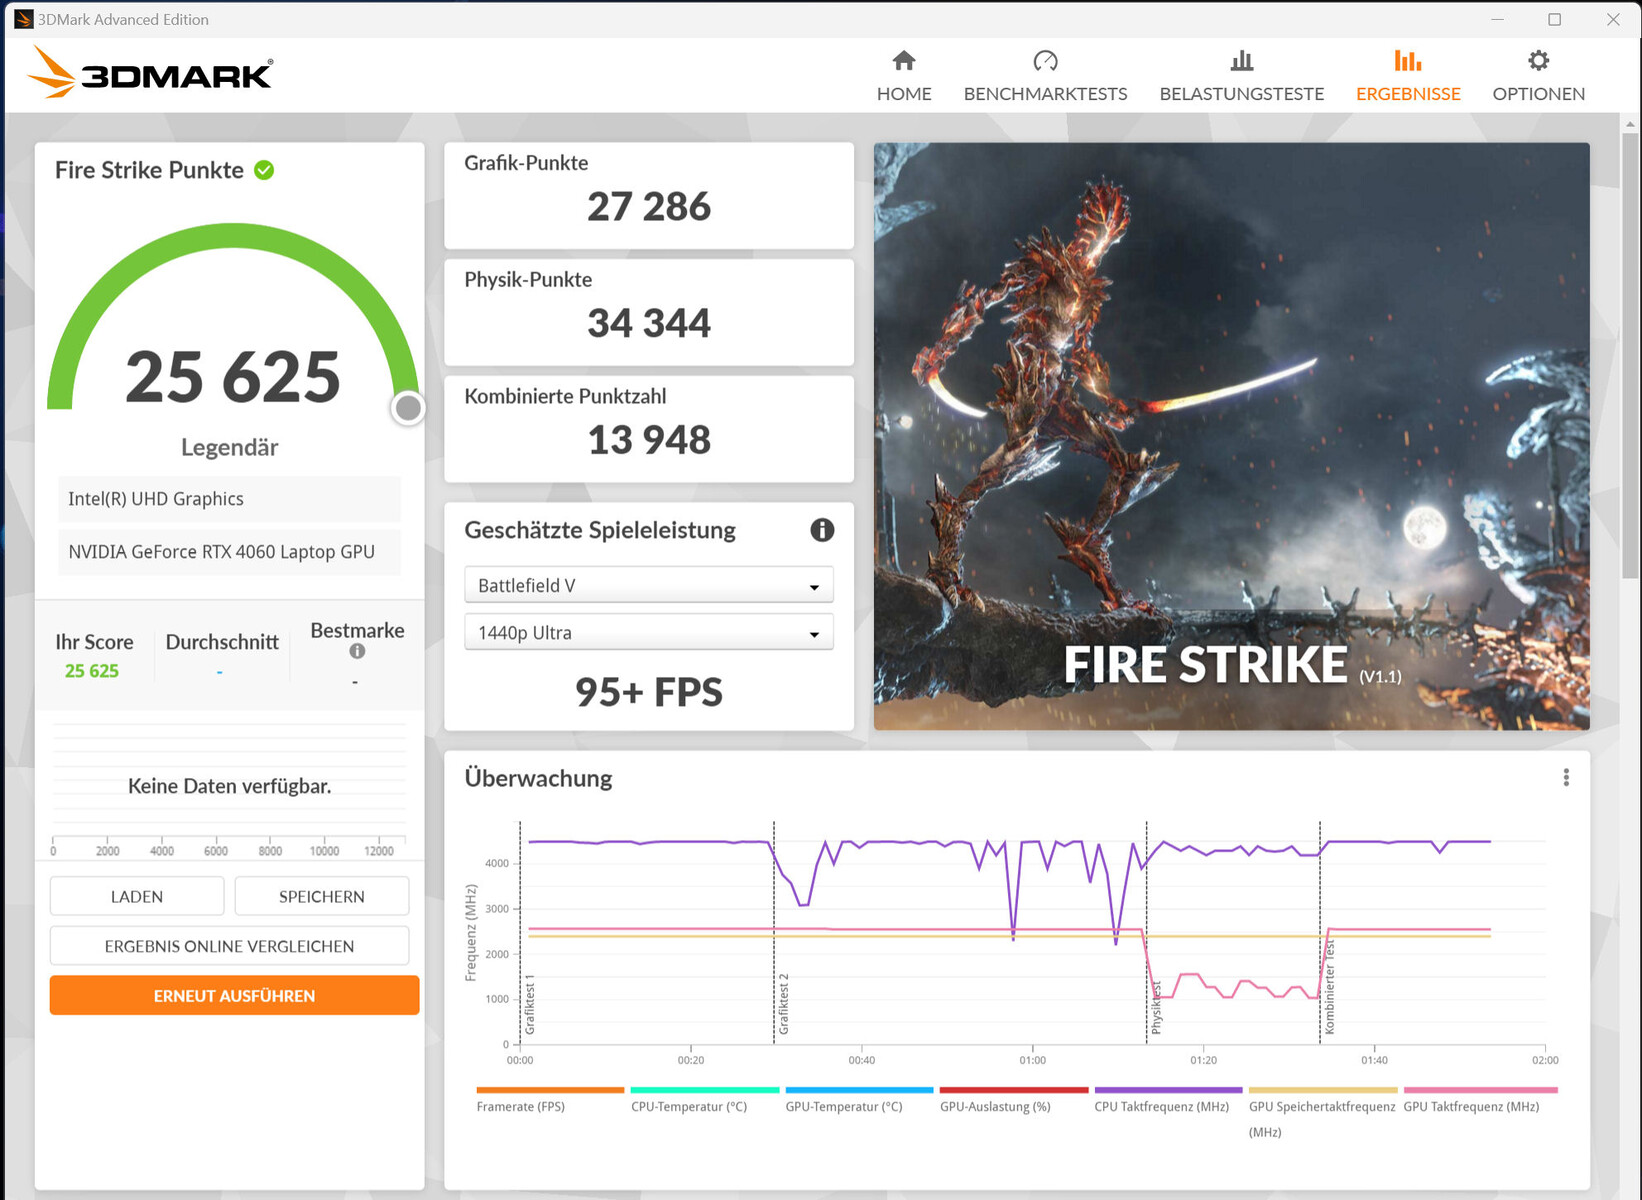
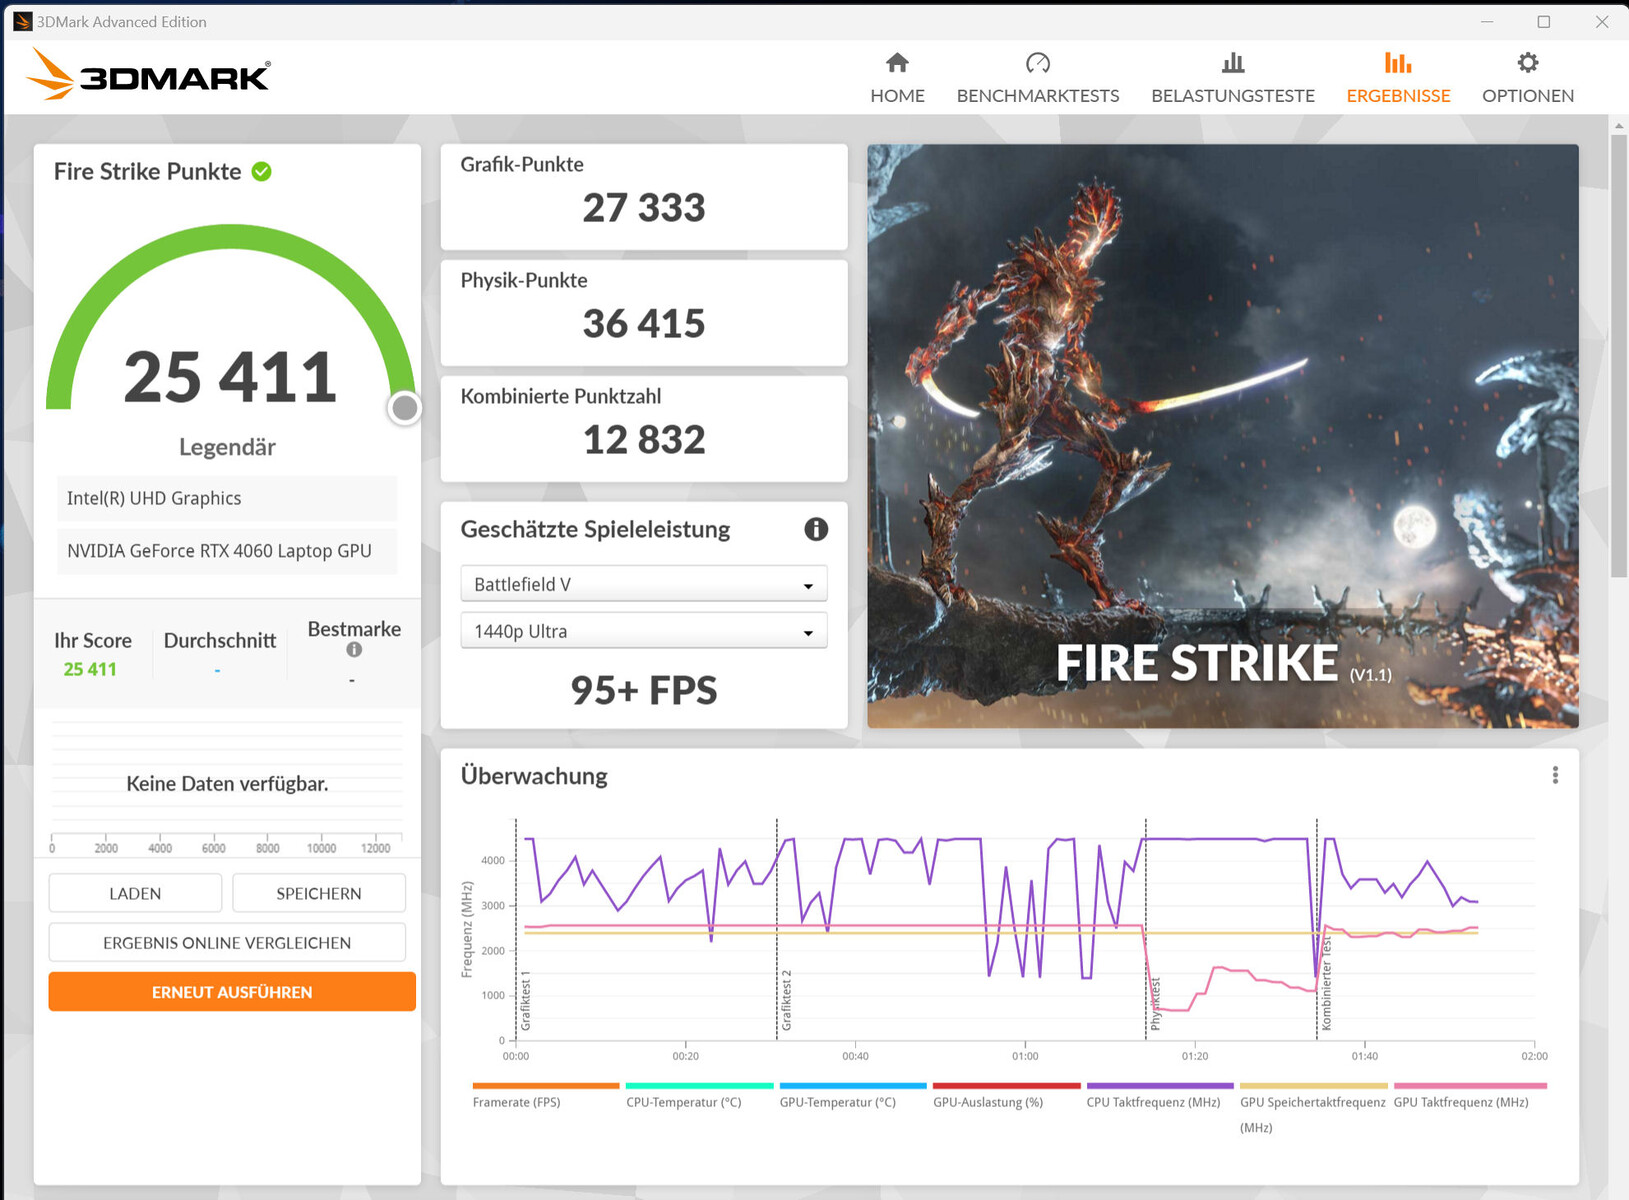
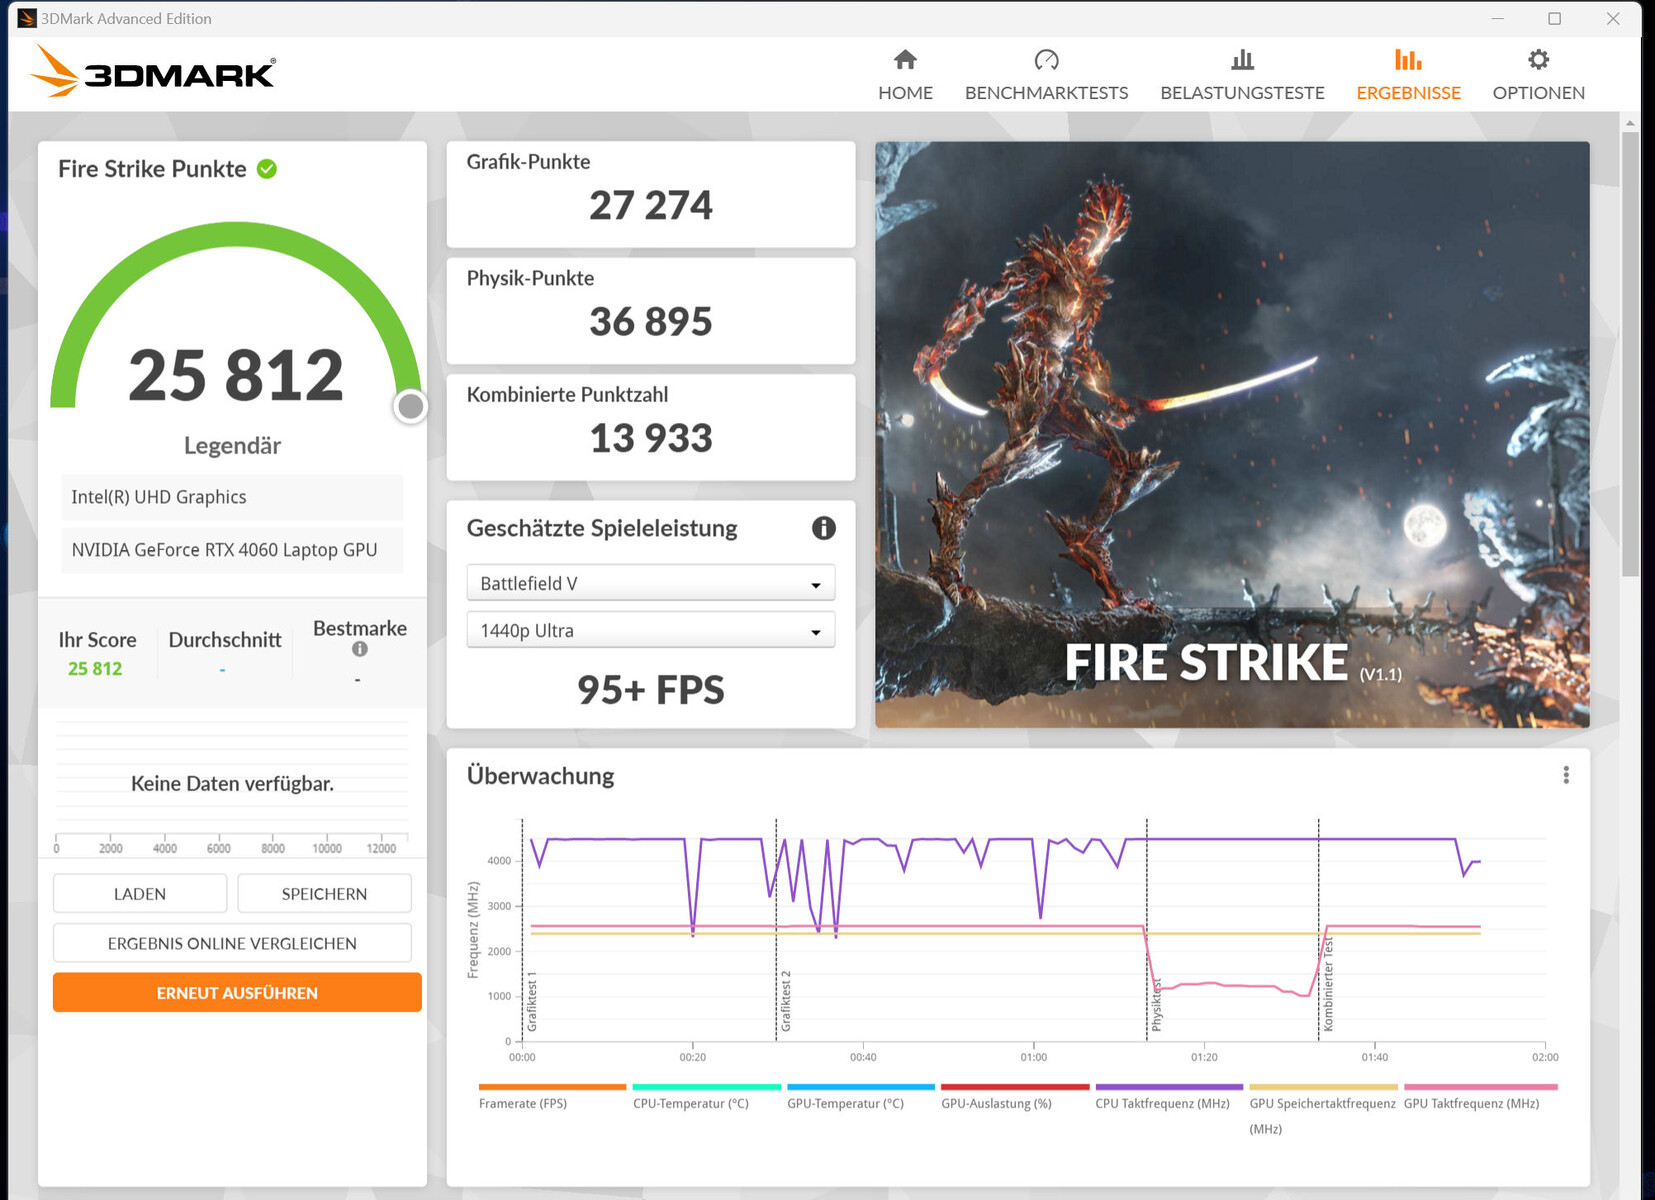
| 3DMark 06 Standard Score | 55811 pontos | |
| 3DMark 11 Performance | 33427 pontos | |
| 3DMark Cloud Gate Standard Score | 67224 pontos | |
| 3DMark Fire Strike Score | 25869 pontos | |
| 3DMark Time Spy Score | 11090 pontos | |
Ajuda | ||
* ... menor é melhor
Desempenho em jogos
O m16 foi projetado para jogos QHD+ em configurações altas ou máximas. Resoluções mais altas são possíveis se uma tela correspondente estiver conectada - com configurações parcialmente reduzidas. São alcançadas taxas de quadros acima da média da RTX 4060.
| The Witcher 3 - 1920x1080 Ultra Graphics & Postprocessing (HBAO+) | |
| Média da turma Gaming (104.7 - 240, n=7, últimos 2 anos) | |
| Alienware m16 R1 AMD | |
| Schenker XMG Pro 15 (E23) | |
| Aorus 15 BSF | |
| Lenovo Legion Pro 5 16IRX8 | |
| Alienware m16 R1 Intel | |
| Medion Erazer Defender P40 | |
| Acer Predator Helios 16 PH16-71-731Q | |
| Média NVIDIA GeForce RTX 4060 Laptop GPU (77 - 159.7, n=42) | |
| Atlas Fallen - 1920x1080 Very High Preset | |
| Alienware m16 R1 Intel | |
| Média NVIDIA GeForce RTX 4060 Laptop GPU (88.2 - 114.4, n=3) | |
| Ratchet & Clank Rift Apart | |
| 1920x1080 Very High Preset AA:T | |
| Aorus 15 BSF | |
| Alienware m16 R1 Intel | |
| Média NVIDIA GeForce RTX 4060 Laptop GPU (51.6 - 54.8, n=4) | |
| 1920x1080 Very High Preset + Very High Raytracing AA:T | |
| Aorus 15 BSF | |
| Alienware m16 R1 Intel | |
| Média NVIDIA GeForce RTX 4060 Laptop GPU (39.1 - 44.5, n=3) | |
| Immortals of Aveum - 1920x1080 Ultra AF:16x | |
| Alienware m16 R1 Intel | |
| Média NVIDIA GeForce RTX 4060 Laptop GPU (33 - 48.9, n=4) | |
| The Callisto Protocol | |
| 1920x1080 Ultra Preset (without FSR Upscaling) | |
| Aorus 15 BSF | |
| Alienware m16 R1 Intel | |
| Média NVIDIA GeForce RTX 4060 Laptop GPU (54.4 - 81.1, n=3) | |
| 1920x1080 Ultra Preset (without FSR Upscaling) + Full Ray-Tracing | |
| Aorus 15 BSF | |
| Alienware m16 R1 Intel | |
| Média NVIDIA GeForce RTX 4060 Laptop GPU (38.6 - 69.8, n=2) | |
| Star Wars Jedi Survivor | |
| 1920x1080 Epic Preset | |
| Alienware m16 R1 Intel | |
| Medion Erazer Defender P40 | |
| Média NVIDIA GeForce RTX 4060 Laptop GPU (45.5 - 66.7, n=10) | |
| 1920x1080 Epic Preset + Ray Tracing | |
| Alienware m16 R1 Intel | |
| Média NVIDIA GeForce RTX 4060 Laptop GPU (47 - 52.8, n=4) | |
| Medion Erazer Defender P40 | |
Para verificar se a taxa de quadros permanece praticamente constante por longos períodos, o "The Witcher 3" é executado por cerca de 60 minutos em resolução Full HD e com as configurações de qualidade máxima. O personagem do jogo não é movido. Não foi observada uma queda na taxa de quadros.
Witcher 3 FPS-Diagramm
| baixo | média | alto | ultra | QHD | |
|---|---|---|---|---|---|
| The Witcher 3 (2015) | 497 | 340.9 | 206.2 | 106.5 | 78.8 |
| Dota 2 Reborn (2015) | 189.5 | 169.6 | 165.8 | 153.2 | |
| Final Fantasy XV Benchmark (2018) | 232 | 150.8 | 104.7 | 77.1 | |
| X-Plane 11.11 (2018) | 170.4 | 156.7 | 120.4 | ||
| Far Cry 5 (2018) | 199 | 163 | 155 | 146 | 107 |
| Strange Brigade (2018) | 580 | 283 | 223 | 190.3 | 128.5 |
| Cyberpunk 2077 1.6 (2022) | 134.6 | 104.5 | 89.3 | 82.1 | 49.9 |
| The Callisto Protocol (2022) | 165.4 | 135.4 | 128 | 81.1 | 62.8 |
| Star Wars Jedi Survivor (2023) | 86 | 75.8 | 70.9 | 66.7 | 41.7 |
| F1 23 (2023) | 291 | 272 | 187.6 | 119.9 | 38.9 |
| Ratchet & Clank Rift Apart (2023) | 86 | 74.7 | 60.6 | 54.8 | 46.6 |
| Atlas Fallen (2023) | 145.9 | 137.5 | 132.1 | 114.4 | 79.2 |
| Immortals of Aveum (2023) | 61.6 | 54.6 | 48.9 | 32.8 |
Emissões - O laptop Dell pode produzir muito ruído
Ruído
O nível de pressão sonora pode subir até 58 dB(A) ("Overdrive") no modo de jogo. o modo "Performance" tem um desempenho melhor, com 51 dB(A). O favorito entre os modos é o perfil "Silencioso": um nível de 43 dB(A) é obtido ao custo de um desempenho ligeiramente reduzido em jogos.
Quando ocioso e em uso diário (escritório, Internet), os quatro ventiladores geralmente ficam parados e o silêncio reina.
Barulho
| Ocioso |
| 25 / 26 / 27 dB |
| Carga |
| 52 / 53 dB |
 | ||
30 dB silencioso 40 dB(A) audível 50 dB(A) ruidosamente alto |
||
min: | ||
| Alienware m16 R1 Intel GeForce RTX 4060 Laptop GPU, i7-13700HX, Kioxia KXG70ZNV512G | Acer Predator Helios 16 PH16-71-731Q GeForce RTX 4060 Laptop GPU, i7-13700HX, Micron 3400 1TB MTFDKBA1T0TFH | Medion Erazer Defender P40 GeForce RTX 4060 Laptop GPU, i7-13700HX, Phison PS5021-E21 1TB | Lenovo Legion Pro 5 16IRX8 GeForce RTX 4060 Laptop GPU, i7-13700HX, SK hynix PC801 HFS512GEJ9X115N | Schenker XMG Pro 15 (E23) GeForce RTX 4060 Laptop GPU, i9-13900HX, Crucial P5 Plus 1TB CT1000P5PSSD8 | Aorus 15 BSF GeForce RTX 4070 Laptop GPU, i7-13700H, Gigabyte AG470S1TB-SI B10 | Alienware m16 R1 AMD GeForce RTX 4080 Laptop GPU, R9 7845HX, Kioxia XG8 KXG80ZNV1T02 | |
|---|---|---|---|---|---|---|---|
| Noise | 5% | -9% | 9% | 3% | -10% | 4% | |
| desligado / ambiente * (dB) | 25 | 24 4% | 25 -0% | 23 8% | 24 4% | 24 4% | 22.9 8% |
| Idle Minimum * (dB) | 25 | 24 4% | 26 -4% | 23.1 8% | 24 4% | 25 -0% | 22.9 8% |
| Idle Average * (dB) | 26 | 24 8% | 27 -4% | 23.1 11% | 24 8% | 31 -19% | 29.7 -14% |
| Idle Maximum * (dB) | 27 | 32.32 -20% | 32 -19% | 26.6 1% | 24 11% | 37 -37% | 29.7 -10% |
| Load Average * (dB) | 52 | 36.66 29% | 53 -2% | 34.7 33% | 53.65 -3% | 51 2% | 29.8 43% |
| Witcher 3 ultra * (dB) | 51 | 49.06 4% | 56 -10% | 47.6 7% | 53.53 -5% | 54.7 -7% | |
| Load Maximum * (dB) | 53 | 49.49 7% | 64 -21% | 54.8 -3% | 53.65 -1% | 57 -8% | 54.7 -3% |
* ... menor é melhor
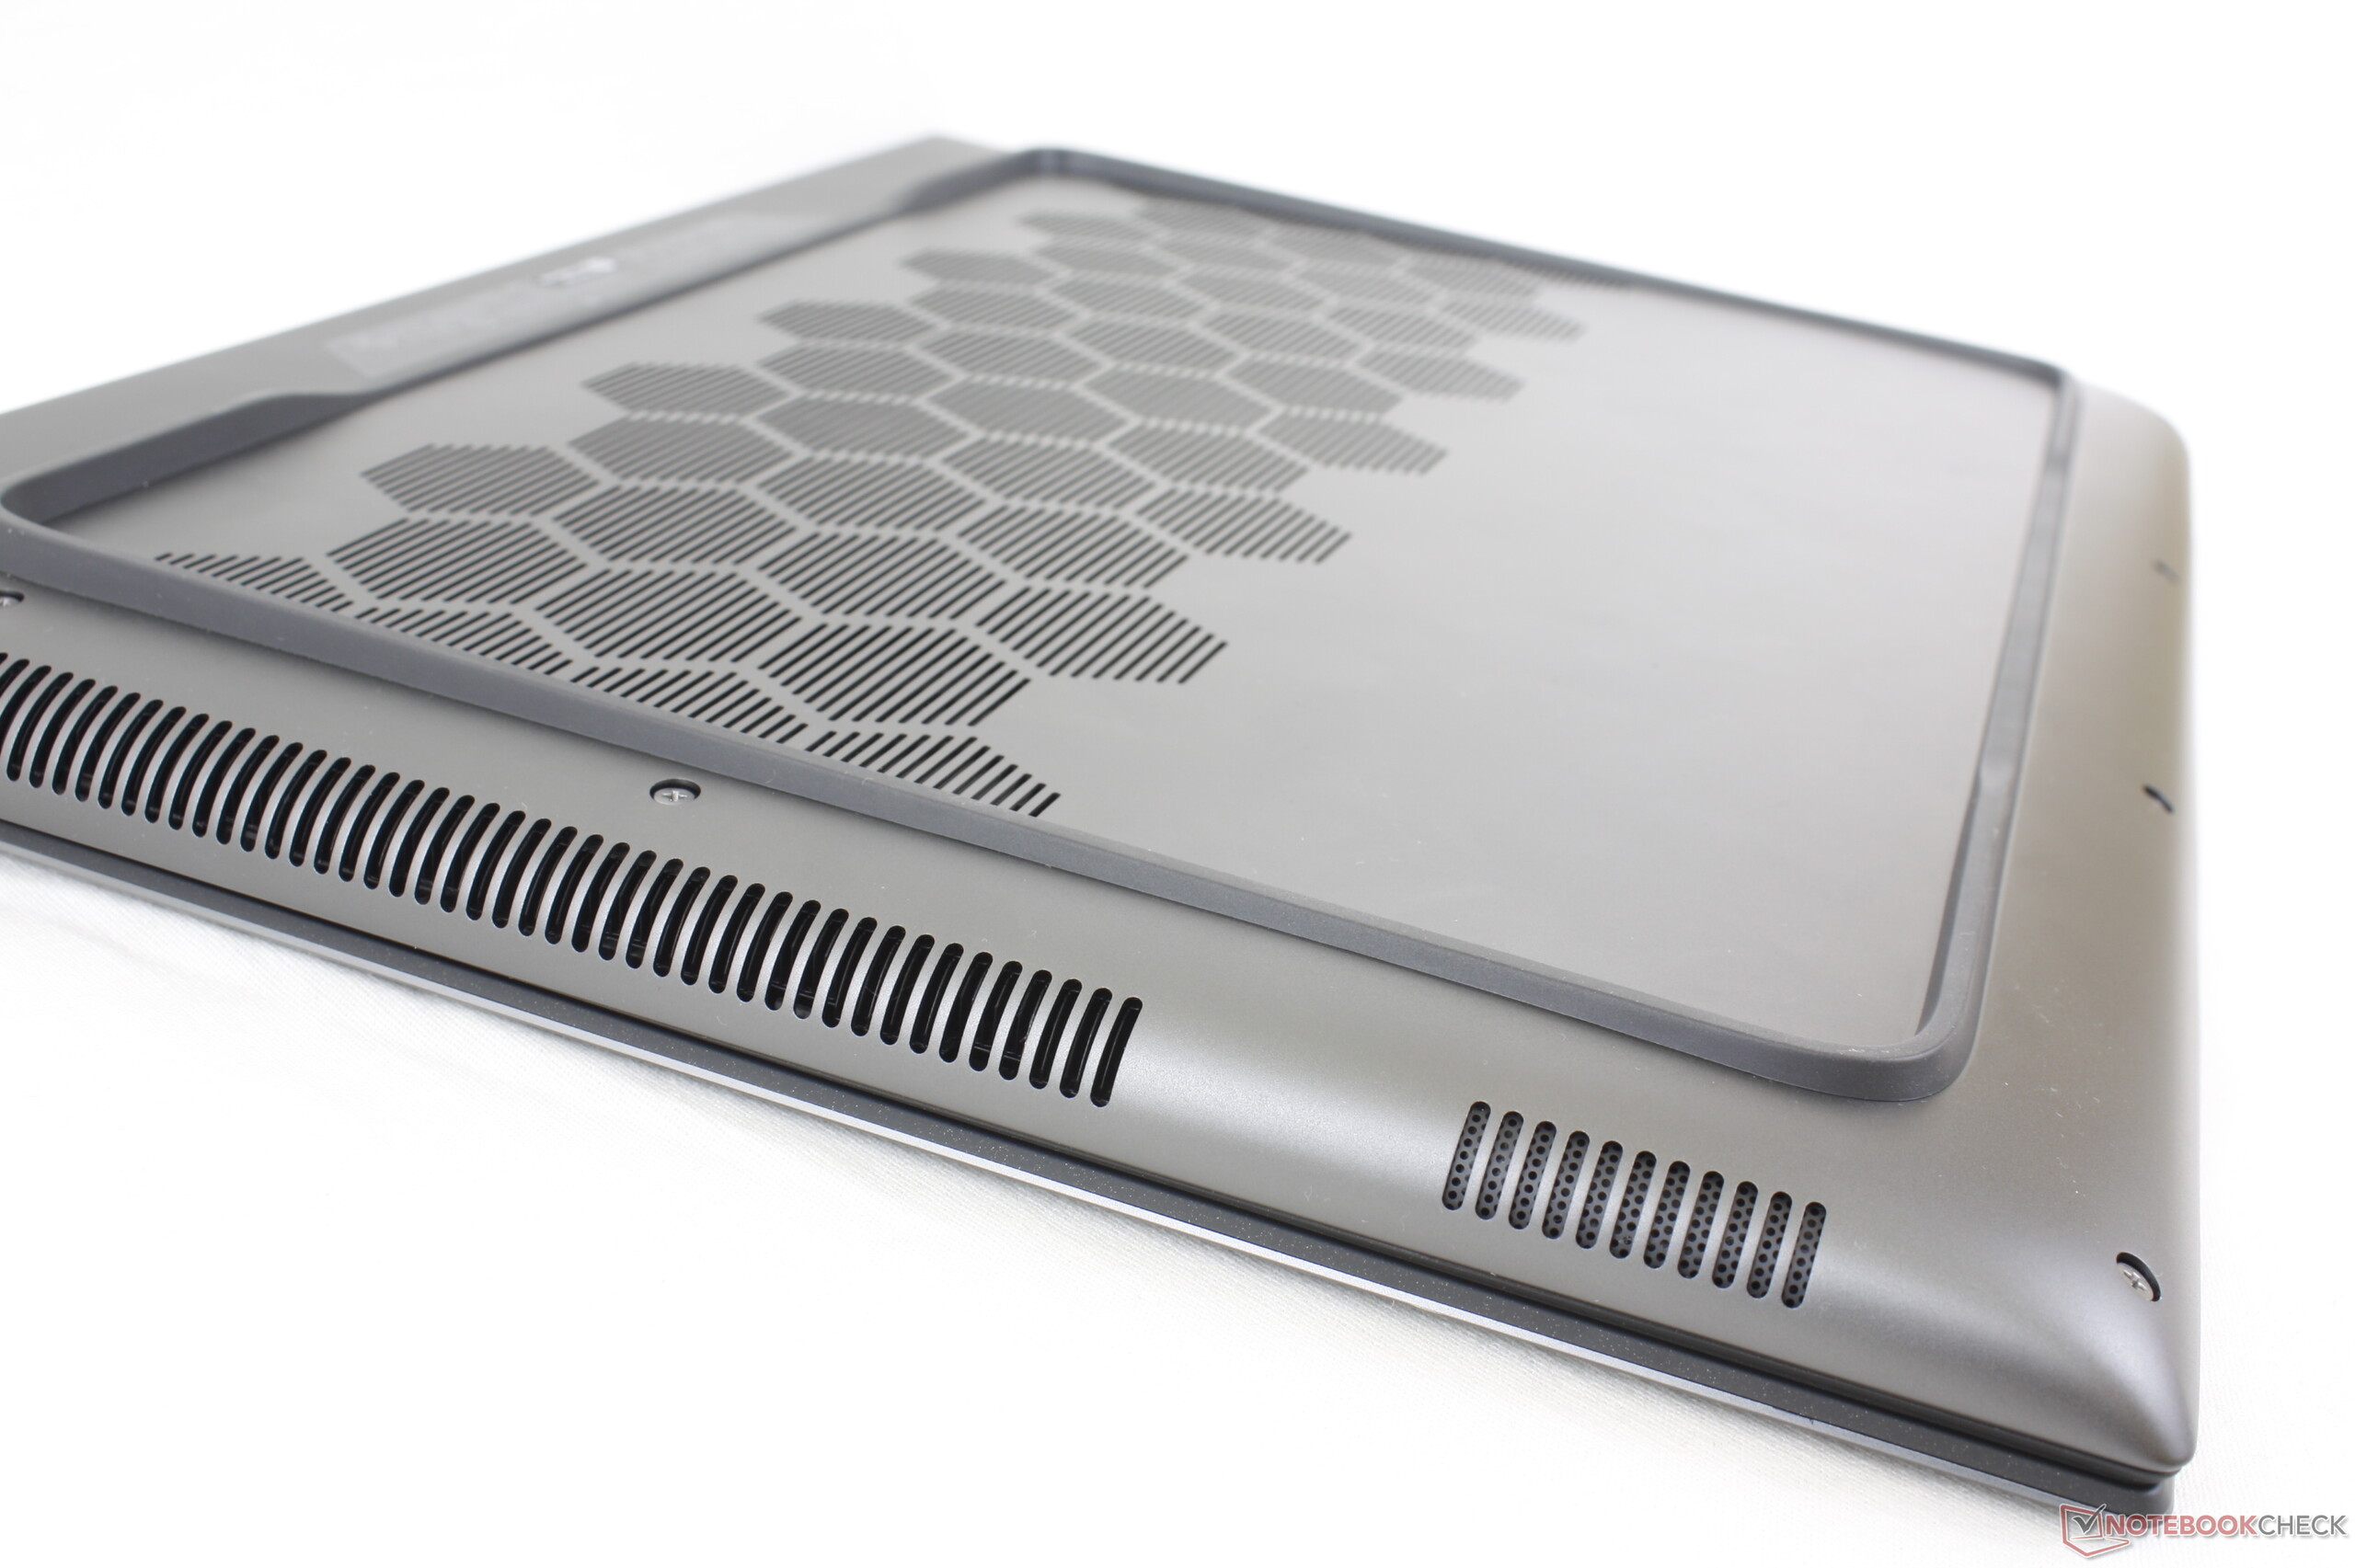
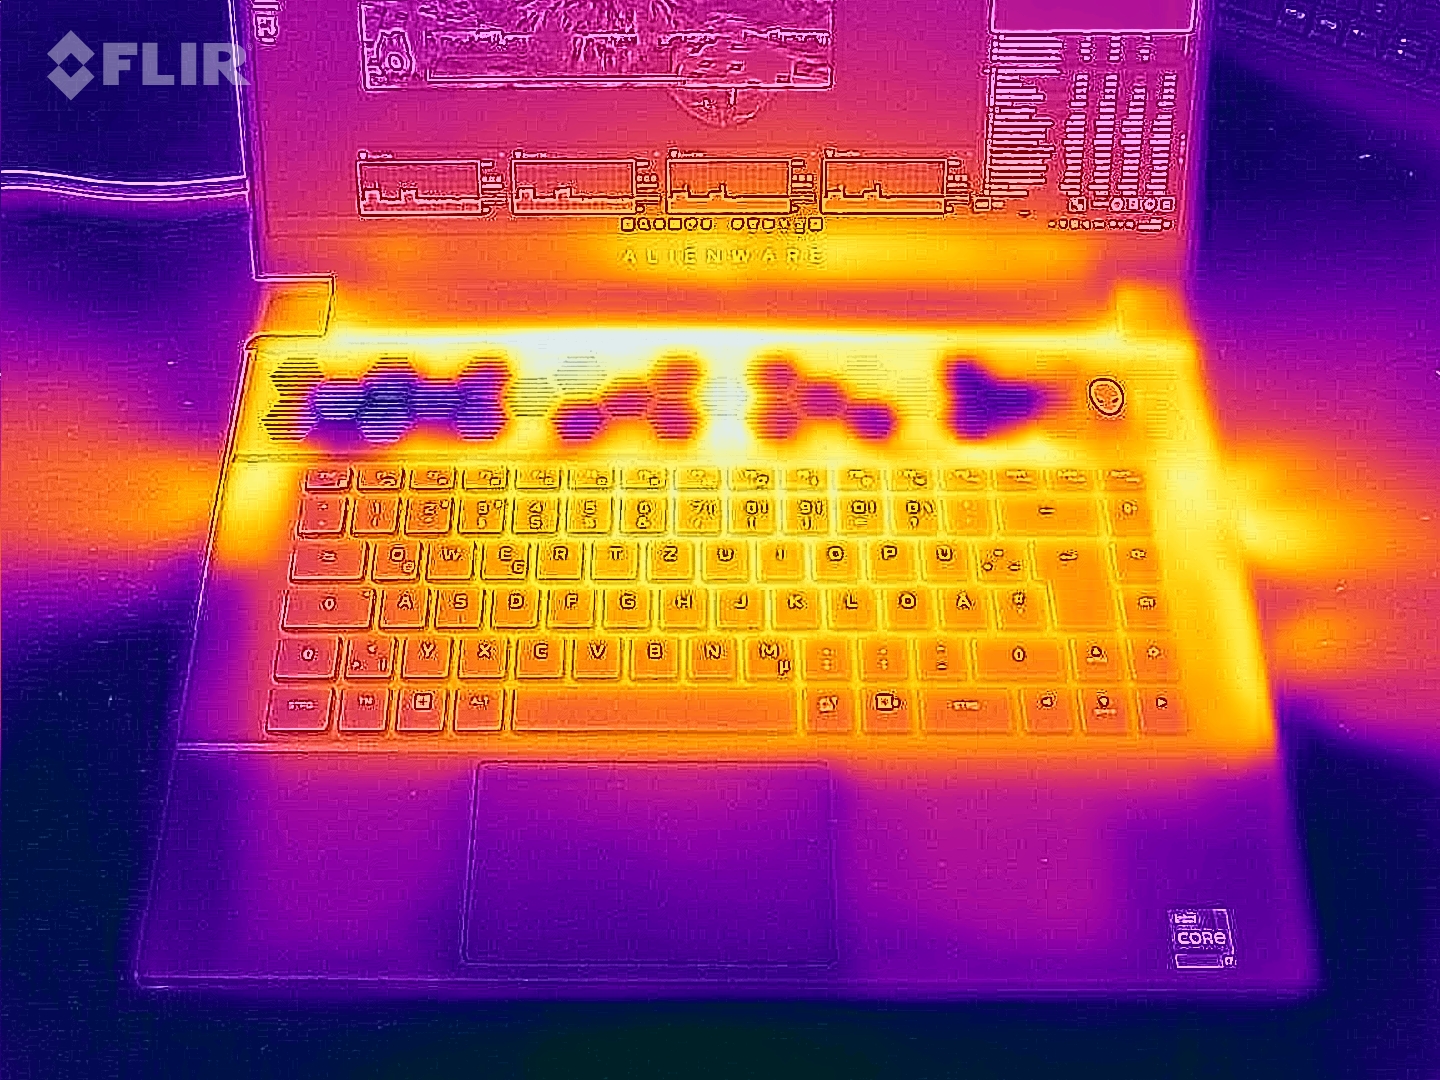
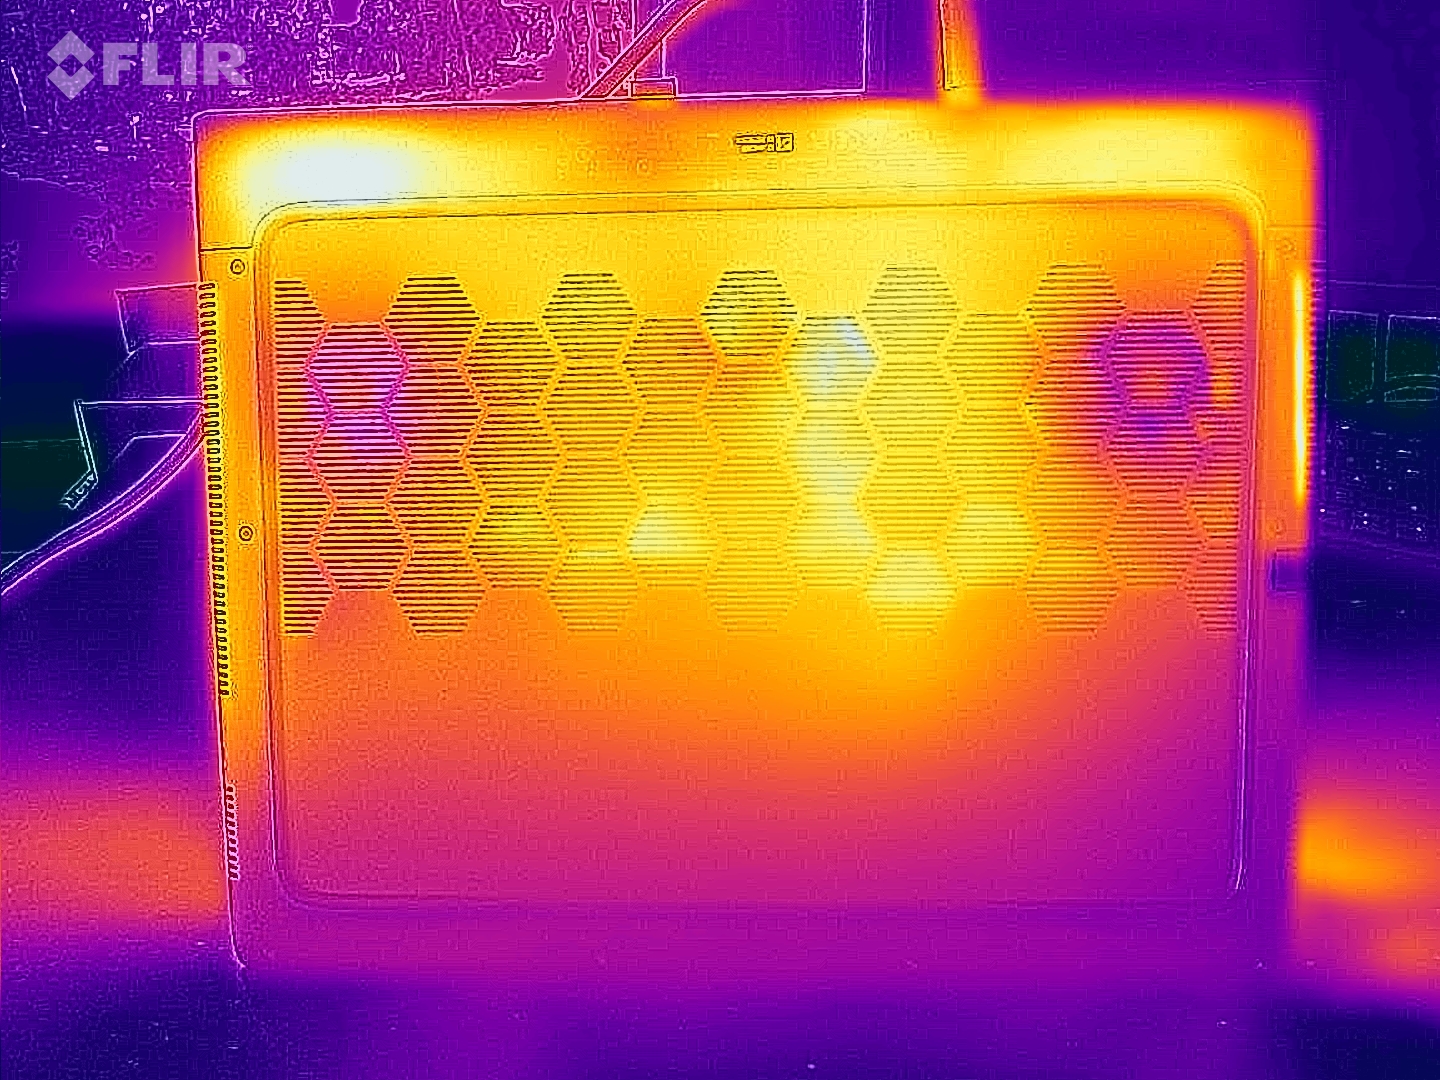
Temperatura
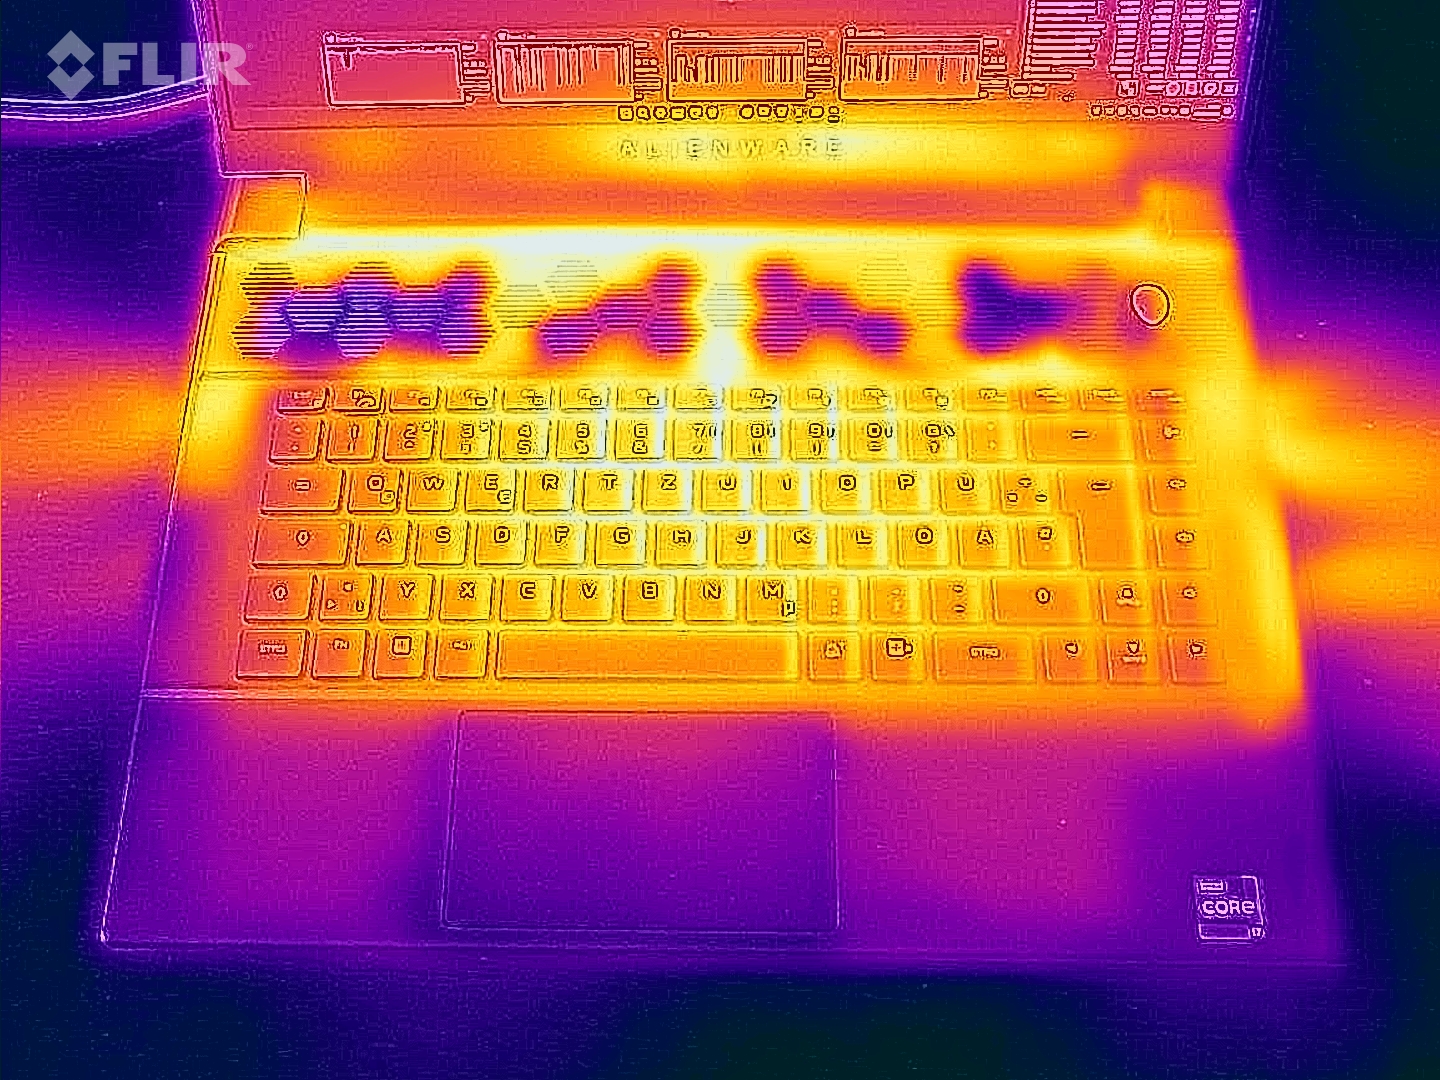
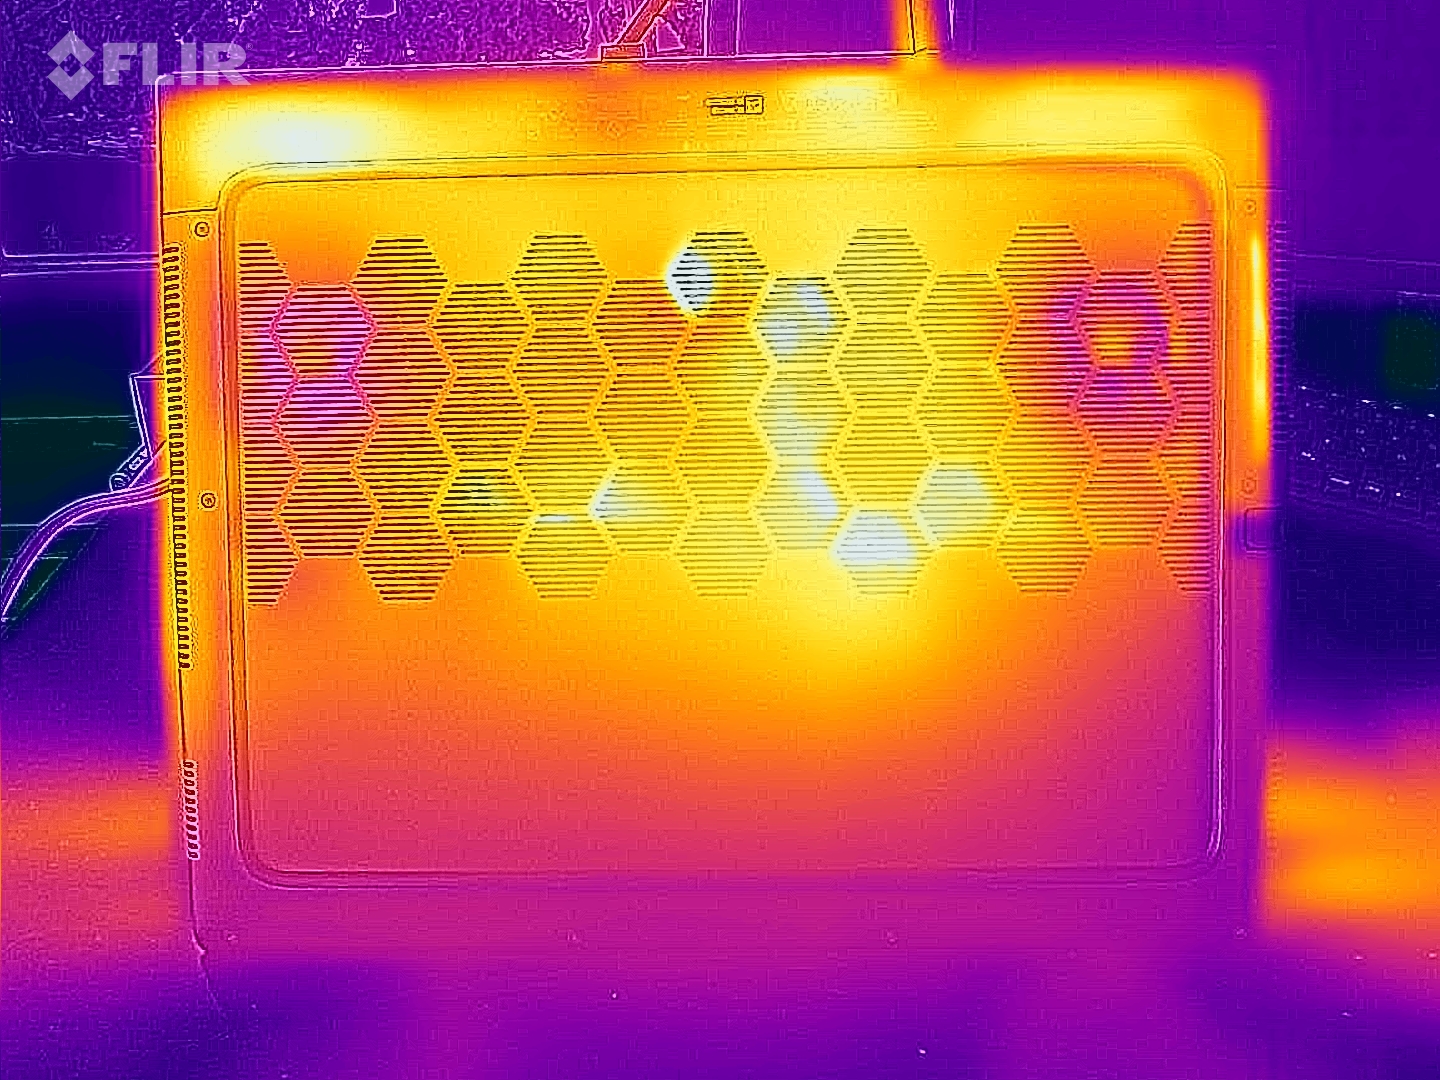
Os testes de estresse e o site Witcher 3 causam um aquecimento perceptível do notebook, mas tudo permanece dentro dos limites aceitáveis. No uso diário (escritório, Internet), as temperaturas do gabinete permanecem basicamente na zona verde, mas estão em um nível muito alto em comparação com laptops comparáveis.
O notebook aquece mais sob carga do que seu equivalente da AMD Estreia do desempenho do AMD Ryzen 9 7845HX: Análise do laptop Alienware m16 R1 equipado com hardware mais potente. Este último se beneficia da APU mais econômica.
(-) A temperatura máxima no lado superior é 49 °C / 120 F, em comparação com a média de 40.4 °C / 105 F , variando de 21.2 a 68.8 °C para a classe Gaming.
(-) A parte inferior aquece até um máximo de 48 °C / 118 F, em comparação com a média de 43.2 °C / 110 F
(±) Em uso inativo, a temperatura média para o lado superior é 37 °C / 99 F, em comparação com a média do dispositivo de 33.9 °C / ### class_avg_f### F.
(-) Jogando The Witcher 3, a temperatura média para o lado superior é 46 °C / 115 F, em comparação com a média do dispositivo de 33.9 °C / ## #class_avg_f### F.
(-) Os apoios para as mãos e o touchpad podem ficar muito quentes ao toque, com um máximo de 44 °C / 111.2 F.
(-) A temperatura média da área do apoio para as mãos de dispositivos semelhantes foi 28.8 °C / 83.8 F (-15.2 °C / -27.4 F).
| Alienware m16 R1 Intel Intel Core i7-13700HX, NVIDIA GeForce RTX 4060 Laptop GPU | Acer Predator Helios 16 PH16-71-731Q Intel Core i7-13700HX, NVIDIA GeForce RTX 4060 Laptop GPU | Medion Erazer Defender P40 Intel Core i7-13700HX, NVIDIA GeForce RTX 4060 Laptop GPU | Lenovo Legion Pro 5 16IRX8 Intel Core i7-13700HX, NVIDIA GeForce RTX 4060 Laptop GPU | Schenker XMG Pro 15 (E23) Intel Core i9-13900HX, NVIDIA GeForce RTX 4060 Laptop GPU | Aorus 15 BSF Intel Core i7-13700H, NVIDIA GeForce RTX 4070 Laptop GPU | Alienware m16 R1 AMD AMD Ryzen 9 7845HX, NVIDIA GeForce RTX 4080 Laptop GPU | |
|---|---|---|---|---|---|---|---|
| Heat | -2% | 18% | 12% | 7% | 4% | 9% | |
| Maximum Upper Side * (°C) | 49 | 41 16% | 42 14% | 42.8 13% | 50 -2% | 48 2% | 48 2% |
| Maximum Bottom * (°C) | 48 | 66 -38% | 45 6% | 50 -4% | 50 -4% | 47 2% | 39 19% |
| Idle Upper Side * (°C) | 40 | 36 10% | 28 30% | 29.6 26% | 33 17% | 39 2% | 37 7% |
| Idle Bottom * (°C) | 39 | 37 5% | 30 23% | 34 13% | 32 18% | 35 10% | 36.2 7% |
* ... menor é melhor
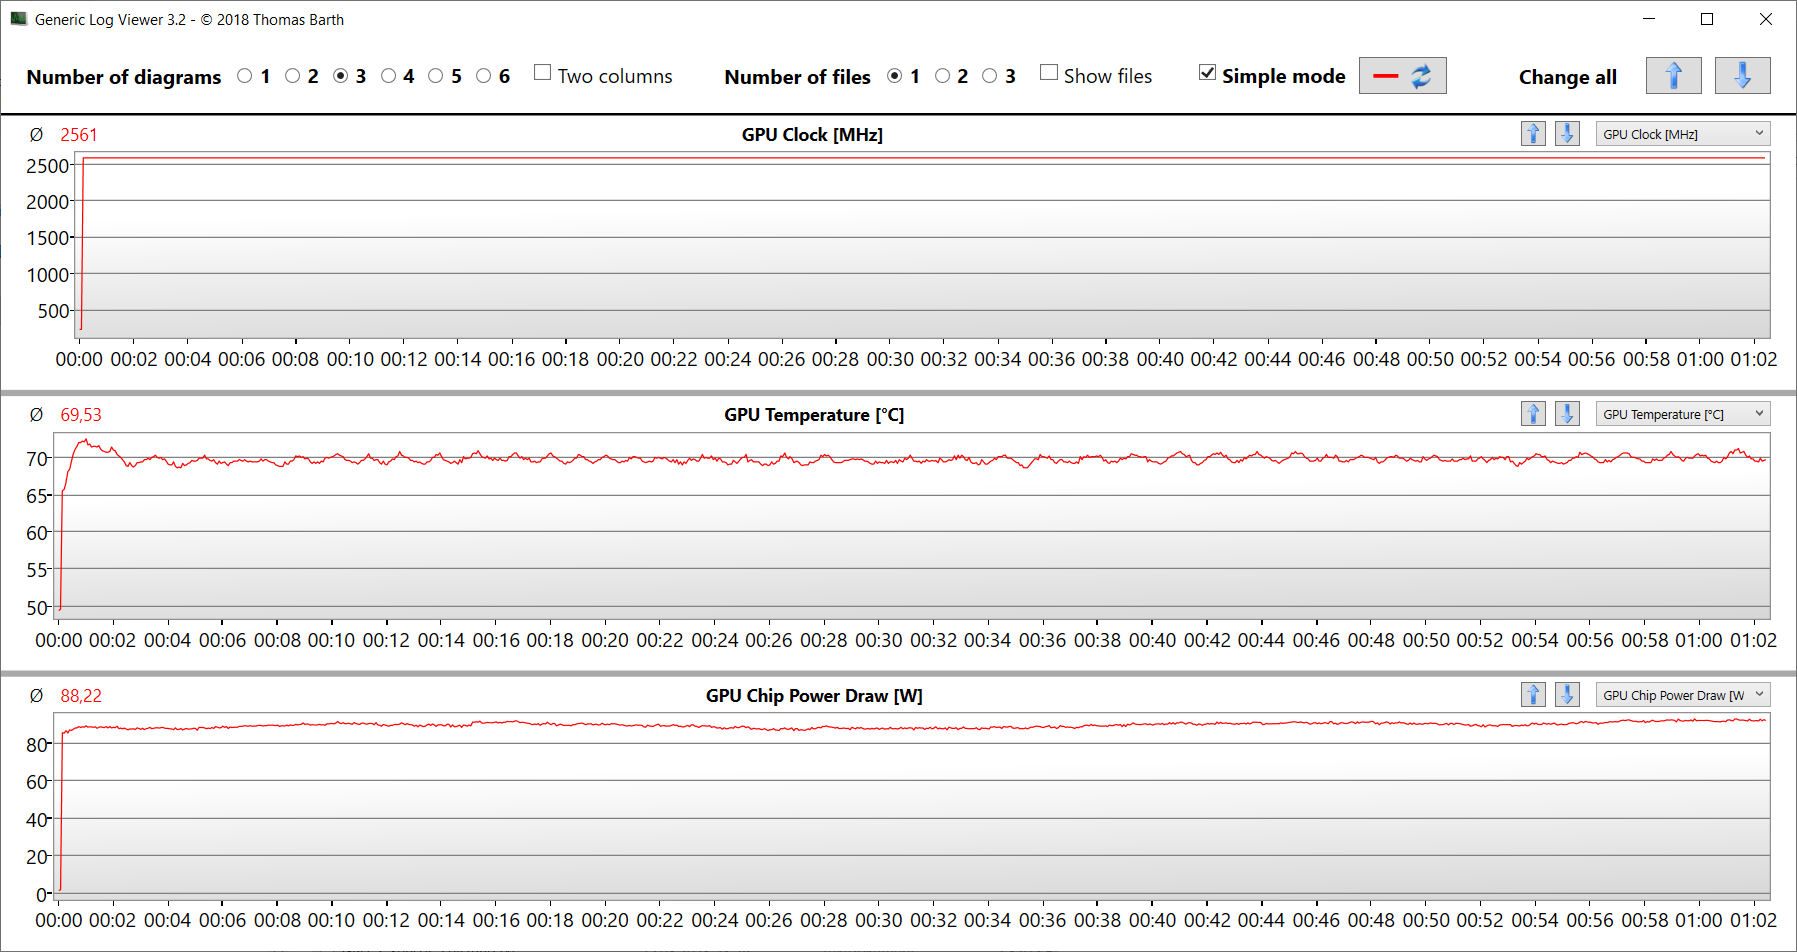
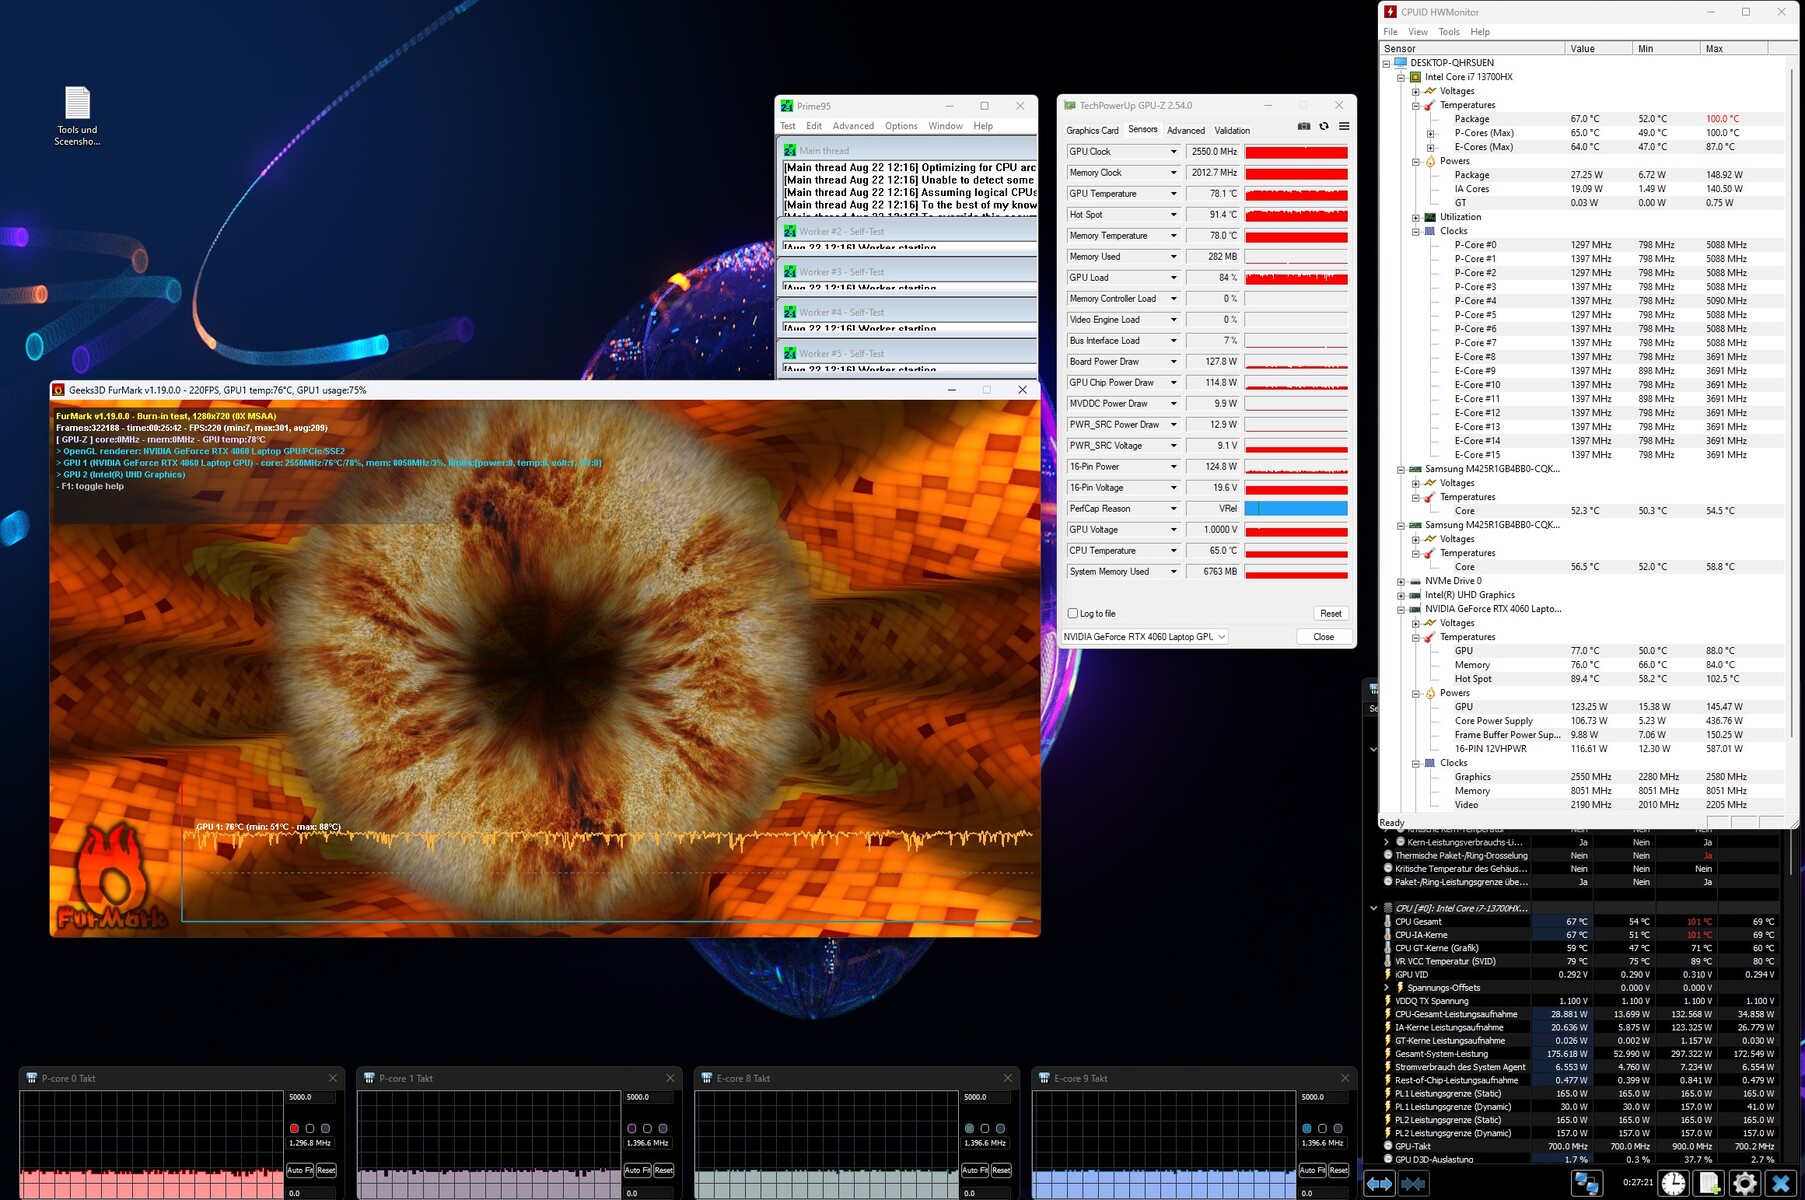
Teste de estresse
O teste de estresse (Prime95 e Furmark em operação contínua) representa um cenário extremo para verificar a estabilidade do sistema sob carga total. A CPU (P: 4,2 GHz, E: 3,4 GHz) inicia o teste com altas taxas de clock. À medida que o teste avança, o clock diminui ligeiramente até cair repentinamente para valores abaixo do clock base após cerca de 30 minutos. A GPU trabalha constantemente com potência máxima.
Alto-falantes
Os alto-falantes estéreo produzem um som decente, mas quase não há graves. Recomenda-se o uso de fones de ouvido ou alto-falantes externos para uma melhor experiência sonora.
Alienware m16 R1 Intel análise de áudio
(+) | os alto-falantes podem tocar relativamente alto (###valor### dB)
Graves 100 - 315Hz
(-) | quase nenhum baixo - em média 24% menor que a mediana
(±) | a linearidade dos graves é média (13.5% delta para a frequência anterior)
Médios 400 - 2.000 Hz
(+) | médios equilibrados - apenas 1.4% longe da mediana
(+) | médios são lineares (3.3% delta para frequência anterior)
Altos 2 - 16 kHz
(+) | agudos equilibrados - apenas 3.5% longe da mediana
(+) | os máximos são lineares (4.6% delta da frequência anterior)
Geral 100 - 16.000 Hz
(+) | o som geral é linear (13.4% diferença em relação à mediana)
Comparado com a mesma classe
» 19% de todos os dispositivos testados nesta classe foram melhores, 7% semelhantes, 74% piores
» O melhor teve um delta de 6%, a média foi 18%, o pior foi 132%
Comparado com todos os dispositivos testados
» 14% de todos os dispositivos testados foram melhores, 4% semelhantes, 82% piores
» O melhor teve um delta de 4%, a média foi 23%, o pior foi 134%
Acer Predator Helios 16 PH16-71-731Q análise de áudio
(±) | o volume do alto-falante é médio, mas bom (###valor### dB)
Graves 100 - 315Hz
(-) | quase nenhum baixo - em média 15% menor que a mediana
(-) | graves não são lineares (15% delta para frequência anterior)
Médios 400 - 2.000 Hz
(+) | médios equilibrados - apenas 2.5% longe da mediana
(+) | médios são lineares (5.9% delta para frequência anterior)
Altos 2 - 16 kHz
(+) | agudos equilibrados - apenas 2.9% longe da mediana
(±) | a linearidade dos máximos é média (8.4% delta para frequência anterior)
Geral 100 - 16.000 Hz
(+) | o som geral é linear (13.6% diferença em relação à mediana)
Comparado com a mesma classe
» 20% de todos os dispositivos testados nesta classe foram melhores, 7% semelhantes, 73% piores
» O melhor teve um delta de 6%, a média foi 18%, o pior foi 132%
Comparado com todos os dispositivos testados
» 15% de todos os dispositivos testados foram melhores, 4% semelhantes, 82% piores
» O melhor teve um delta de 4%, a média foi 23%, o pior foi 134%
Gerenciamento de energia - O m16 oferece tempos de execução reduzidos
Consumo de energia
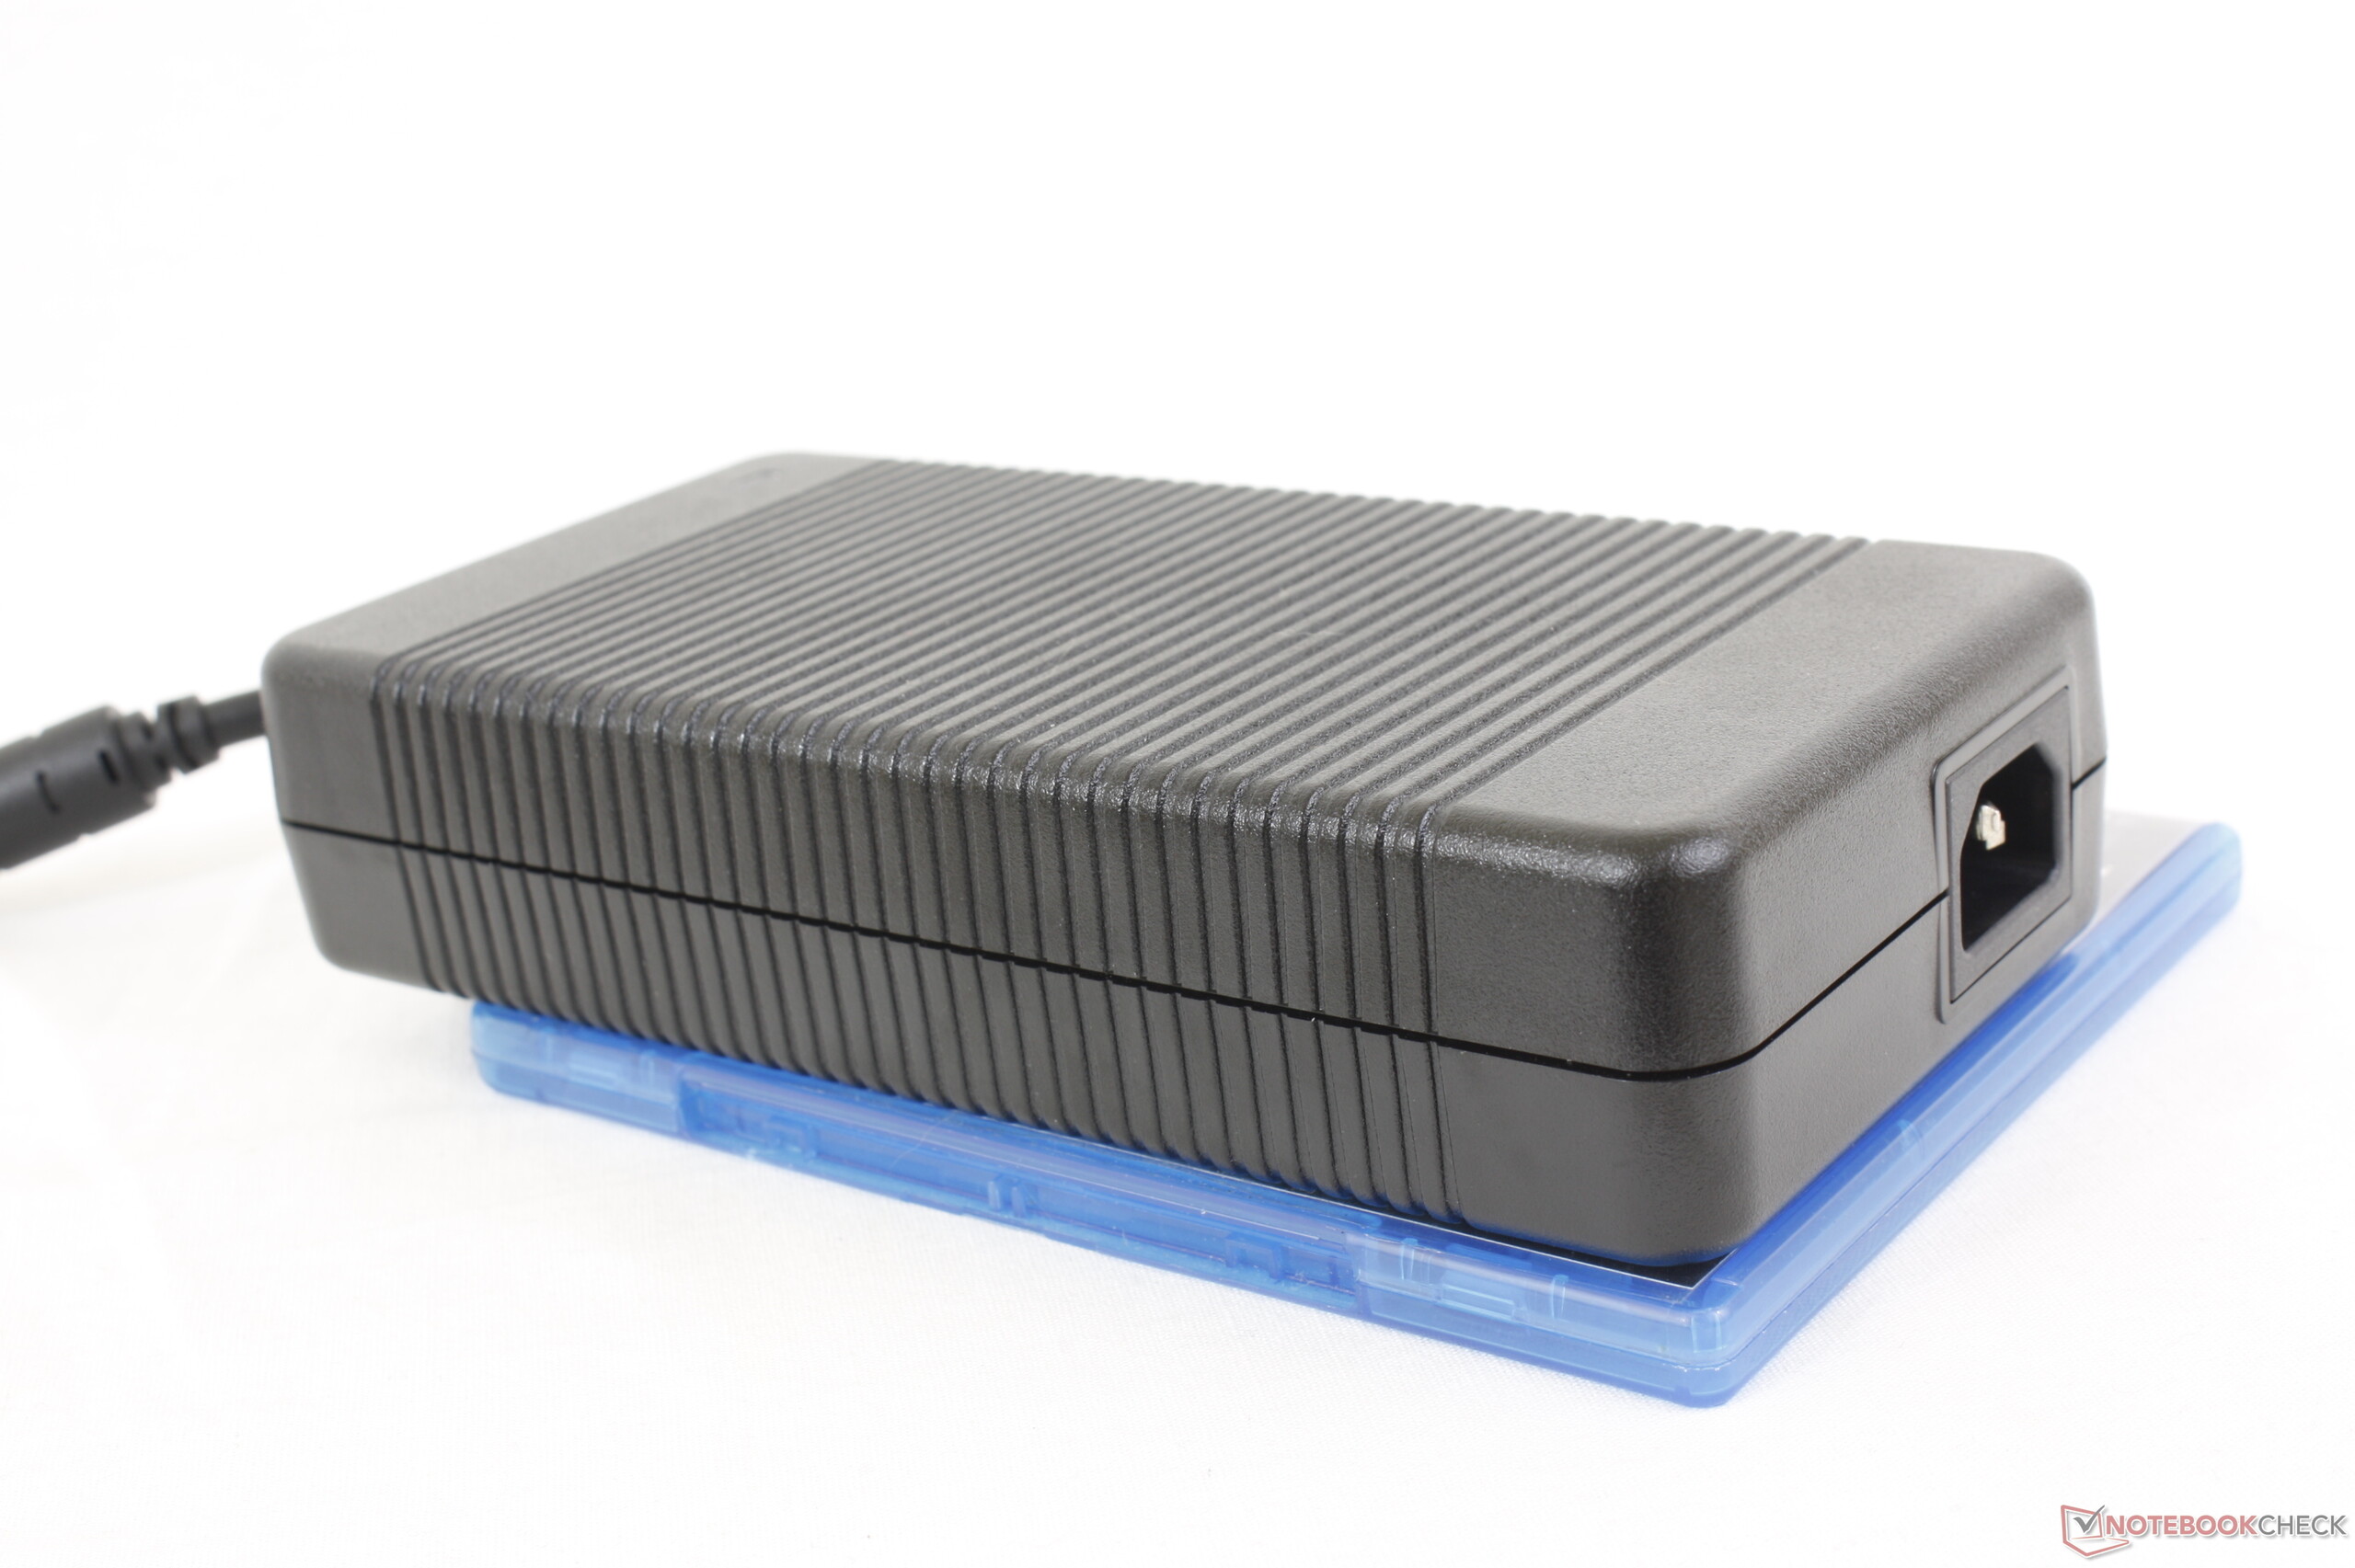
O m16 não apresenta nenhuma anormalidade em termos de consumo de energia: os valores estão em um nível normal para o hardware instalado. O teste Witcher 3 é executado com consumo de energia constante. Durante o teste de estresse, a demanda diminui significativamente ao longo do tempo. Portanto, a fonte de alimentação (330 watts) está suficientemente dimensionada.
| desligado | |
| Ocioso | |
| Carga |
|
Key:
min: | |
| Alienware m16 R1 Intel i7-13700HX, GeForce RTX 4060 Laptop GPU | Acer Predator Helios 16 PH16-71-731Q i7-13700HX, GeForce RTX 4060 Laptop GPU | Medion Erazer Defender P40 i7-13700HX, GeForce RTX 4060 Laptop GPU | Lenovo Legion Pro 5 16IRX8 i7-13700HX, GeForce RTX 4060 Laptop GPU | Schenker XMG Pro 15 (E23) i9-13900HX, GeForce RTX 4060 Laptop GPU | Aorus 15 BSF i7-13700H, GeForce RTX 4070 Laptop GPU | Alienware m16 R1 AMD R9 7845HX, GeForce RTX 4080 Laptop GPU | Média NVIDIA GeForce RTX 4060 Laptop GPU | Média da turma Gaming | |
|---|---|---|---|---|---|---|---|---|---|
| Power Consumption | -12% | 13% | -46% | -62% | 17% | -133% | 6% | -11% | |
| Idle Minimum * (Watt) | 10 | 15.9 -59% | 8 20% | 24.5 -145% | 21.6 -116% | 7 30% | 39 -290% | 11.5 ? -15% | 13 ? -30% |
| Idle Average * (Watt) | 14 | 20.5 -46% | 12 14% | 29.2 -109% | 29 -107% | 12 14% | 44.6 -219% | 16 ? -14% | 19 ? -36% |
| Idle Maximum * (Watt) | 21 | 20.9 -0% | 18 14% | 34.3 -63% | 42.7 -103% | 20 5% | 68.1 -224% | 20.3 ? 3% | 24.6 ? -17% |
| Load Average * (Watt) | 119 | 106 11% | 101 15% | 98.7 17% | 190 -60% | 94 21% | 129.8 -9% | 92.9 ? 22% | 110.7 ? 7% |
| Witcher 3 ultra * (Watt) | 186.7 | 175 6% | 180.8 3% | 178.6 4% | 189 -1% | 175.8 6% | 285 -53% | ||
| Load Maximum * (Watt) | 323 | 276 15% | 284 12% | 249.6 23% | 269 17% | 247 24% | 327.3 -1% | 210 ? 35% | 259 ? 20% |
* ... menor é melhor
Power consumption Witcher 3 / Stress test
Power consumption with an external monitor
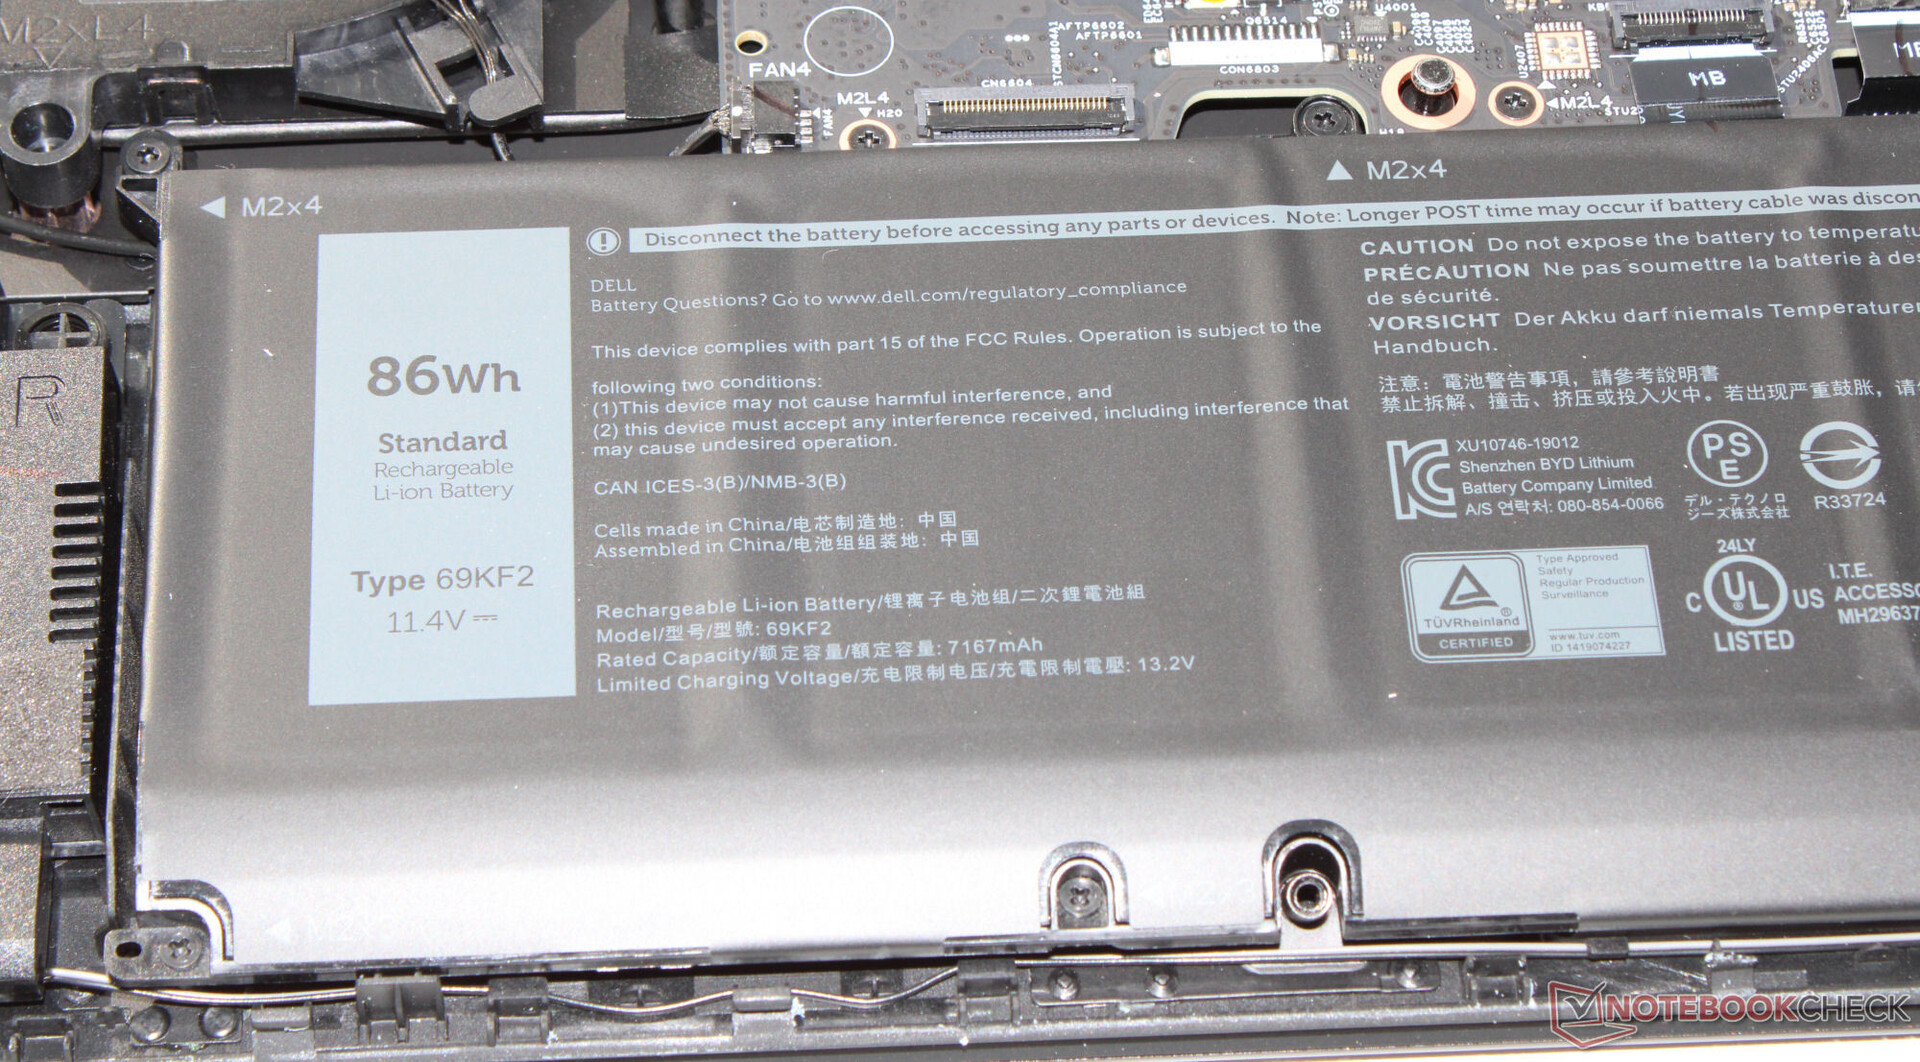
Duração da bateria
O notebook de 16 polegadas atinge tempos de execução de 4:46 h e 5:36 h no teste de WLAN (carregamento de sites por meio de um script) e no teste de vídeo (curta-metragem Big Buck Bunny, codificação H.264, FHD, em um loop), respectivamente. Durante os dois testes, as funções de economia de energia do notebook foram desativadas e o brilho da tela foi ajustado para cerca de 150 cd/m². Os módulos sem fio também foram desativados para o teste de vídeo.
De modo geral, o m16 oferece tempos de execução reduzidos. Alguns concorrentes oferecem taxas muito melhores aqui. A vantagem sobre oModelo irmão da AMDda AMD provavelmente se deve ao modo dGPU ativo do último.
| Alienware m16 R1 Intel i7-13700HX, GeForce RTX 4060 Laptop GPU, 86 Wh | Acer Predator Helios 16 PH16-71-731Q i7-13700HX, GeForce RTX 4060 Laptop GPU, 90 Wh | Medion Erazer Defender P40 i7-13700HX, GeForce RTX 4060 Laptop GPU, 73 Wh | Lenovo Legion Pro 5 16IRX8 i7-13700HX, GeForce RTX 4060 Laptop GPU, 80 Wh | Schenker XMG Pro 15 (E23) i9-13900HX, GeForce RTX 4060 Laptop GPU, 80 Wh | Aorus 15 BSF i7-13700H, GeForce RTX 4070 Laptop GPU, 99 Wh | Alienware m16 R1 AMD R9 7845HX, GeForce RTX 4080 Laptop GPU, 86 Wh | Média da turma Gaming | |
|---|---|---|---|---|---|---|---|---|
| Duração da bateria | 18% | 25% | -18% | 55% | 92% | -27% | 44% | |
| Reader / Idle (h) | 6.4 | 8.8 38% | 6.7 5% | 10.9 70% | 4 -37% | 8.27 ? 29% | ||
| H.264 (h) | 5.6 | 4.8 -14% | 5.7 2% | 9 61% | 8.32 ? 49% | |||
| WiFi v1.3 (h) | 4.8 | 5.6 17% | 6.2 29% | 3.4 -29% | 5.7 19% | 10.3 115% | 3.7 -23% | 7.11 ? 48% |
| Load (h) | 1 | 1.5 50% | 1.3 30% | 0.7 -30% | 1.9 90% | 2.2 120% | 0.8 -20% | 1.502 ? 50% |
| Witcher 3 ultra (h) | 1.5 |
Pro
Contra
Veredicto - Máquina de jogos poderosa
Nossa variante do Alienware m16 R1 - o modelo de nível básico da série - foi projetada para jogos e renderização em QHD+. O processador Core i7-13700HX e a GeForce RTX 4060 fornecem a potência necessária. Ambos os componentes funcionam principalmente em altas velocidades de clock e é possível obter um compromisso aceitável entre desempenho e ruído.
A Dell oferece um poderoso notebook para jogos QHD+ no Alienware m16 R1. Apenas características secundárias merecem críticas.
O painel IPS (16 polegadas, 2560x1600, sRGB, G-Sync) causou uma boa impressão geral. Como alternativa, dois outros painéis com taxas de atualização mais altas e maior cobertura de espaço de cores (DCI-P3) podem ser escolhidos. A oferta de disco rígido (512 GB) é bastante pequena; 1 TB ou 2 TB seriam mais adequados para o preço de 1900 euros. A duração da bateria também é bastante medíocre.
Duas portas Thunderbolt 4 (Power Delivery, Displayport) garantem muitas opções de expansão (GPU externa, docking). A fonte de alimentação do notebook via USB C não é possível; as portas USB C apenas fornecem energia.
Uma alternativa é o Acer Predator Helios 16 PH16-71. Ele oferece praticamente a mesma configuração de hardware, mas mais espaço no disco rígido (1 TB). Além disso, ele tem uma tela mais brilhante.
Preço e disponibilidade
Uma configuração semelhante à nossa variante do Alienware m16 R1, mas com um disco rígido de 1 TB, está disponível nos EUA na Best Buy a um preço de US$ 1.999,99.
Os preços são de 05.09.2023 e estão sujeitos a alterações.
Alienware m16 R1 Intel
- 09/04/2023 v7 (old)
Sascha Mölck
Transparência
A seleção dos dispositivos a serem analisados é feita pela nossa equipe editorial. A amostra de teste foi fornecida ao autor como empréstimo pelo fabricante ou varejista para fins desta revisão. O credor não teve influência nesta revisão, nem o fabricante recebeu uma cópia desta revisão antes da publicação. Não houve obrigação de publicar esta revisão. Como empresa de mídia independente, a Notebookcheck não está sujeita à autoridade de fabricantes, varejistas ou editores.
É assim que o Notebookcheck está testando
Todos os anos, o Notebookcheck analisa de forma independente centenas de laptops e smartphones usando procedimentos padronizados para garantir que todos os resultados sejam comparáveis. Desenvolvemos continuamente nossos métodos de teste há cerca de 20 anos e definimos padrões da indústria no processo. Em nossos laboratórios de teste, equipamentos de medição de alta qualidade são utilizados por técnicos e editores experientes. Esses testes envolvem um processo de validação em vários estágios. Nosso complexo sistema de classificação é baseado em centenas de medições e benchmarks bem fundamentados, o que mantém a objetividade.Price comparison

