Análise do laptop Acer Predator Helios 16: Um laptop para jogos silencioso com muitos pontos fortes
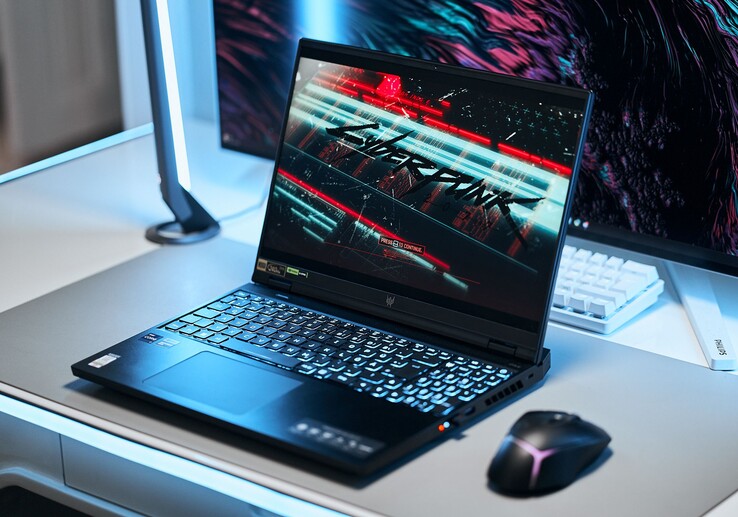
Como sucessor do Predator Helios 300o Predator Helios 16 é o mais recente laptop para jogos de alto nível da Acer com elementos de médio porte. Nosso modelo de análise optou por umaRTX 4060uma GPU de nível médio, e custa cerca de US$ 1.700, com SKUs de até umaRTX 4080também disponíveis. A gama média pura da Acer é representada peloHelios Neo 16e a sérieSérie Nitrocom a última servindo para cobrir o segmento de nível básico. Por outro lado, oTriton 16é o laptop para jogos ultrafino da Acer.
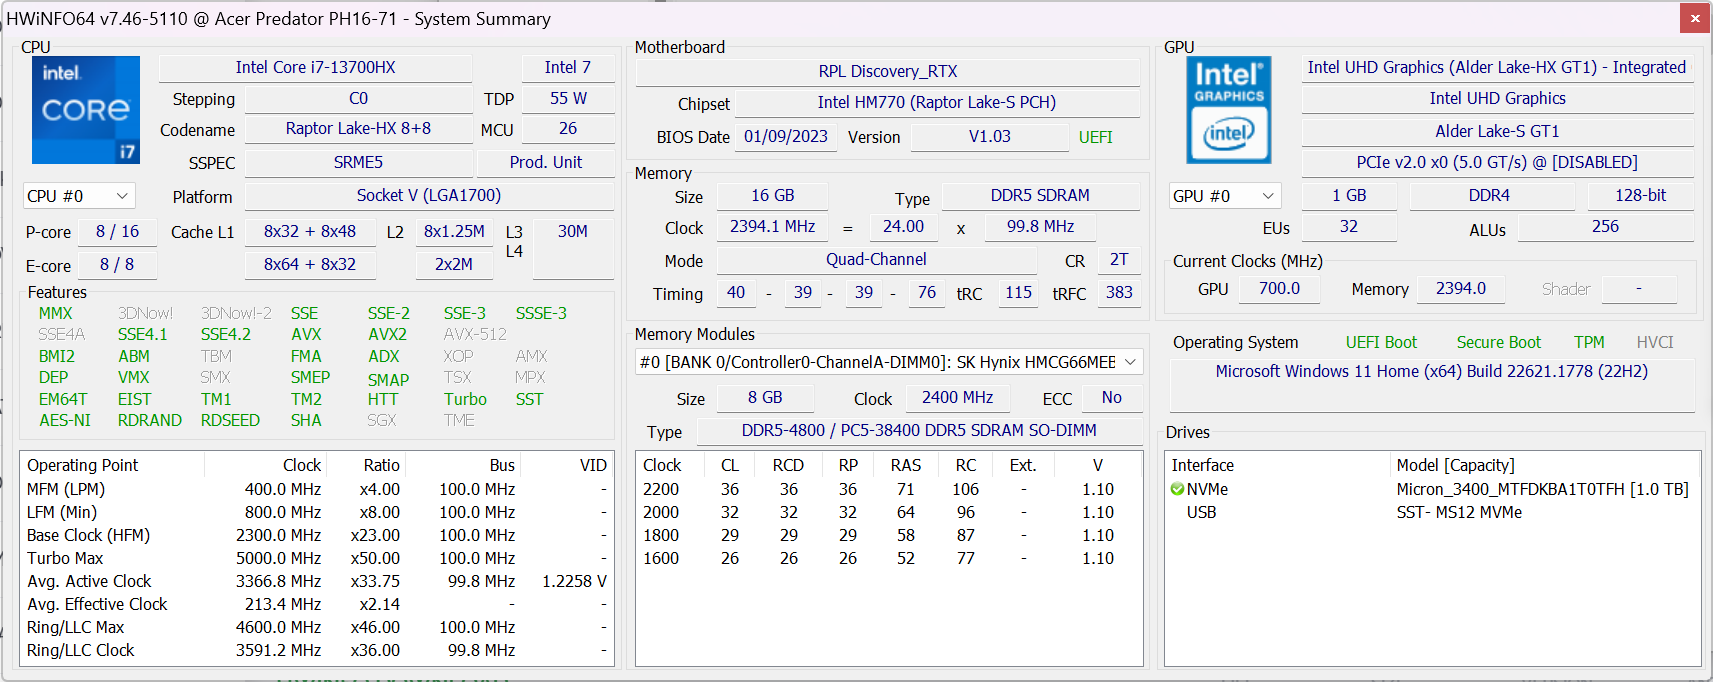
Além disso, um processador Intel Core i7-13700HX (TDP de 55 watts), 16 GB de RAM DDR5 (dois bancos de RAM) e um SSD de 1 TB (PCIe 4.0) também são colocados em ação. Embora uma tela mini-LED também esteja disponível, o nosso modelo vem com um painel IPS retroiluminado por LED comum que, inesperadamente, optou por um conjunto de recursos de ponta, como mostra a nossa análise.
A concorrência vem principalmente na forma do Lenovo Legion Pro 5 da Lenovo, mas o Asus TUF Gaming A16da Gigabyte, o Aorus 15Xe o Dell G15 da Dell também estão disputando o título de melhor laptop para jogos de médio porte.
Possíveis concorrentes em comparação
Avaliação | Data | Modelo | Peso | Altura | Size | Resolução | Preço |
|---|---|---|---|---|---|---|---|
| 89.5 % v7 (old) | 07/2023 | Acer Predator Helios 16 PH16-71-731Q i7-13700HX, GeForce RTX 4060 Laptop GPU | 2.6 kg | 26.9 mm | 16.00" | 2560x1600 | |
| 88.1 % v7 (old) | 06/2023 | Acer Nitro 16 AN16-41 R7 7735HS, GeForce RTX 4070 Laptop GPU | 2.7 kg | 27.9 mm | 16.00" | 2560x1600 | |
| 87.9 % v7 (old) | 05/2023 | Lenovo Legion Pro 5 16IRX8 i7-13700HX, GeForce RTX 4060 Laptop GPU | 2.5 kg | 26.8 mm | 16.00" | 2560x1600 | |
| 86.2 % v7 (old) | 04/2023 | Aorus 15X ASF i7-13700HX, GeForce RTX 4070 Laptop GPU | 2.3 kg | 19.7 mm | 15.60" | 2560x1440 | |
| 86.2 % v7 (old) | 02/2023 | Asus TUF Gaming A16 FA617 R7 7735HS, Radeon RX 7600S | 2.2 kg | 27 mm | 16.00" | 1920x1200 | |
| 84.2 % v7 (old) | 06/2023 | Dell G15 5530 i7-13650HX, GeForce RTX 4060 Laptop GPU | 3 kg | 26.95 mm | 15.60" | 1920x1080 |
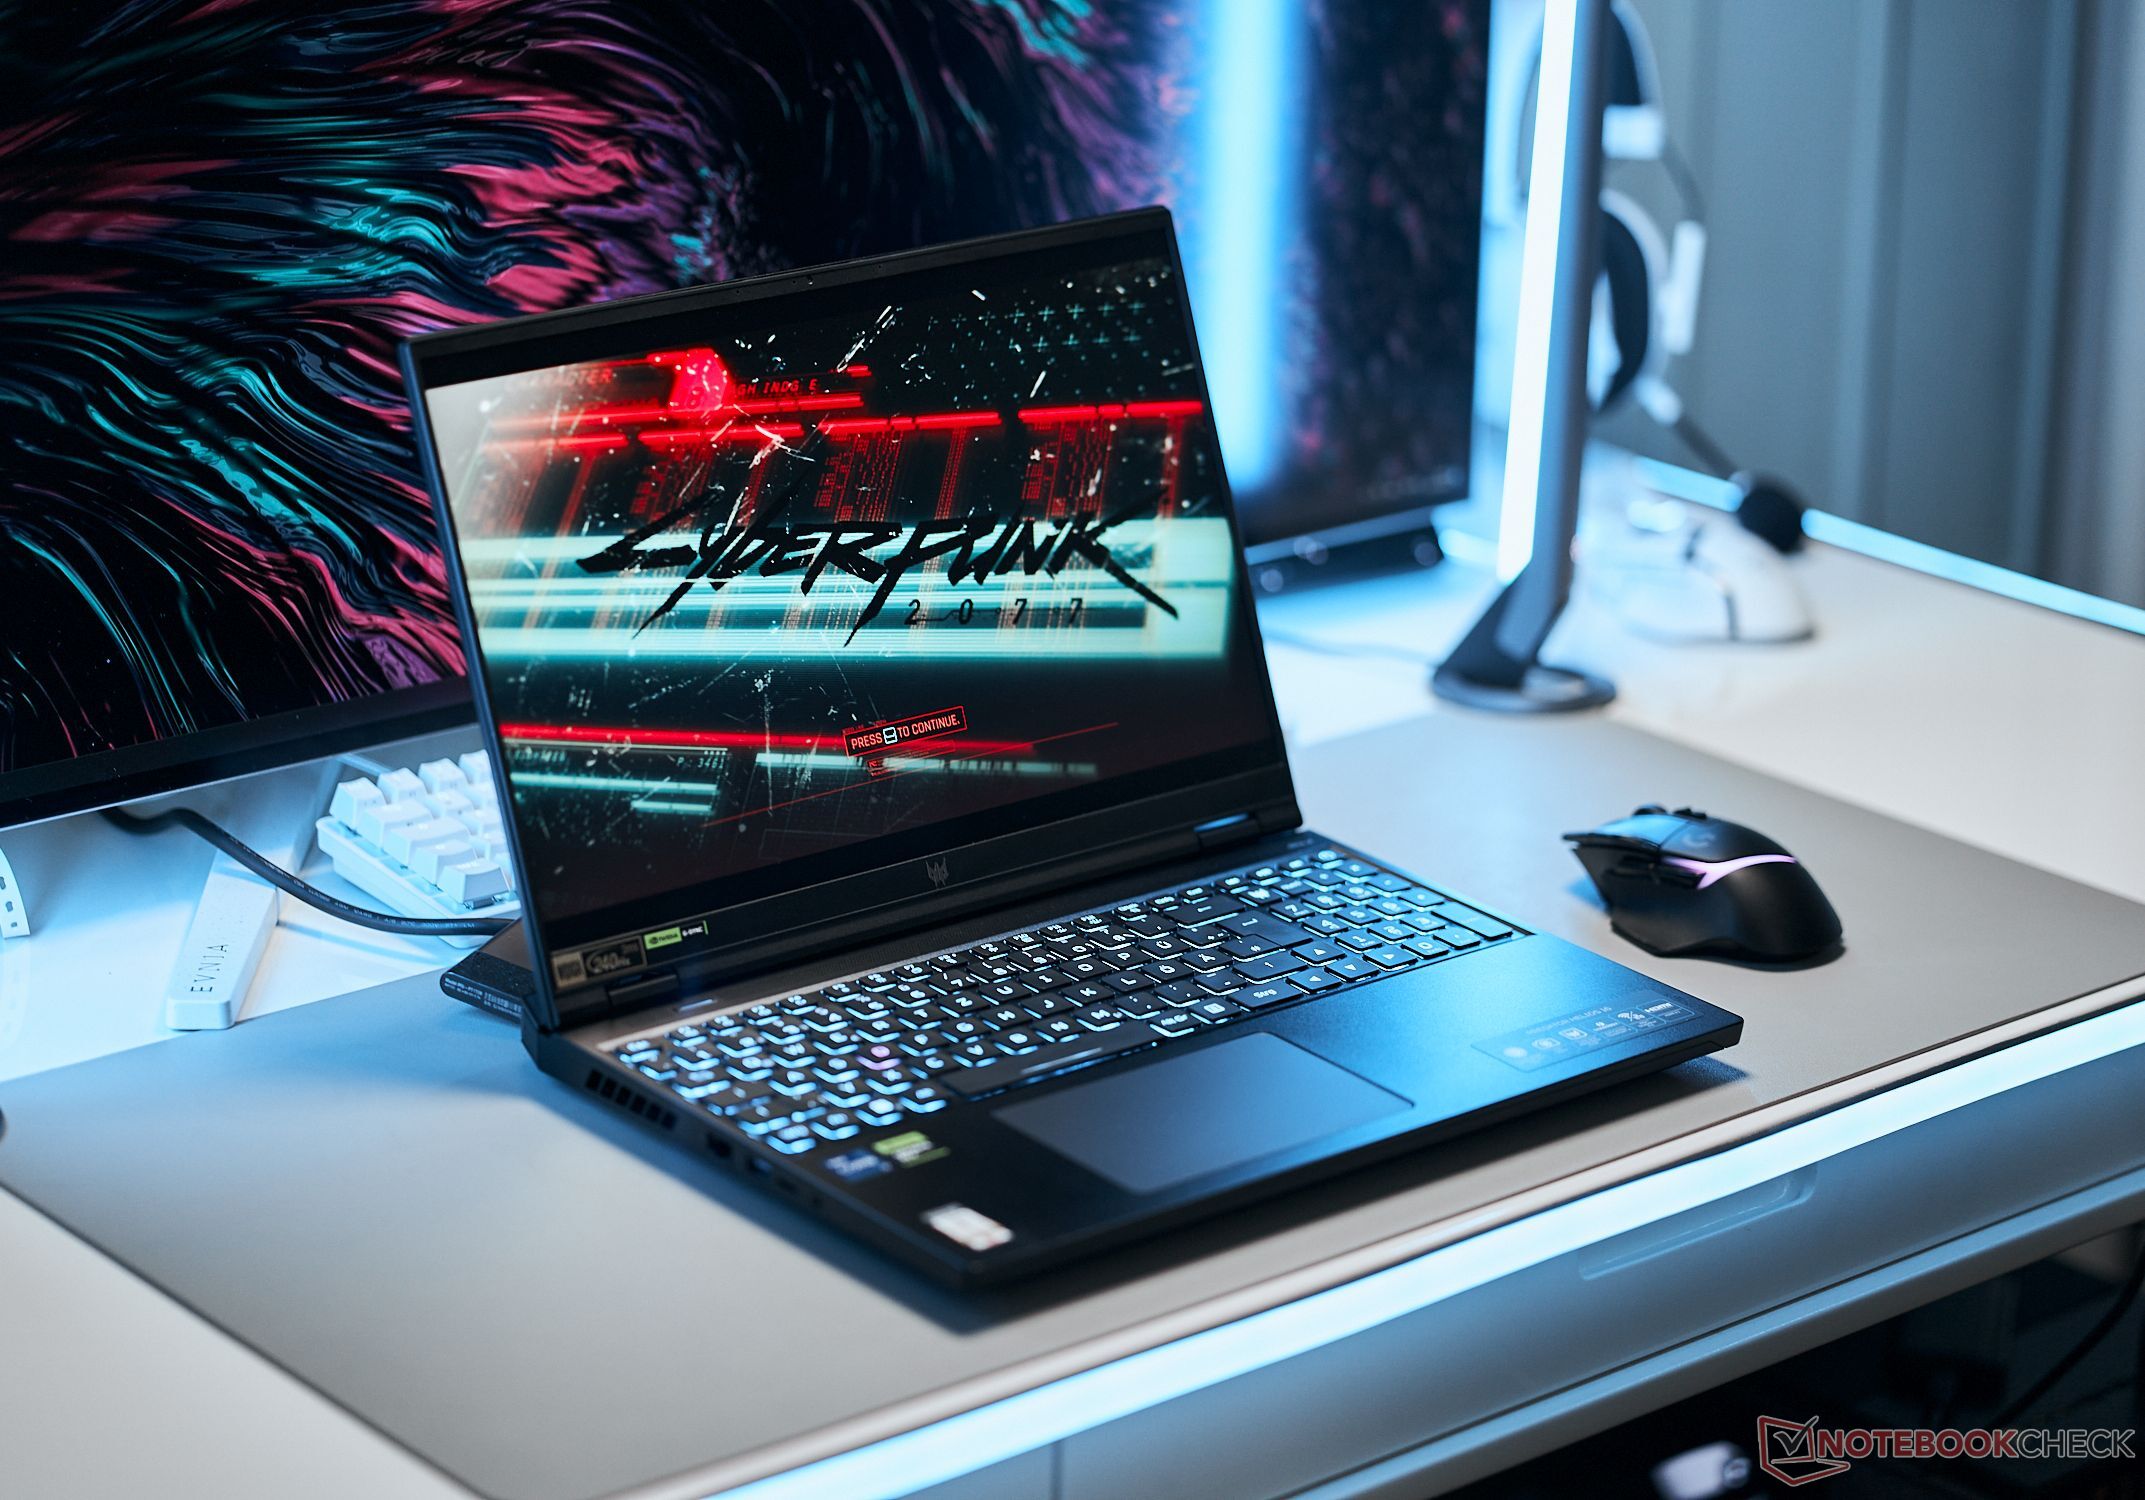
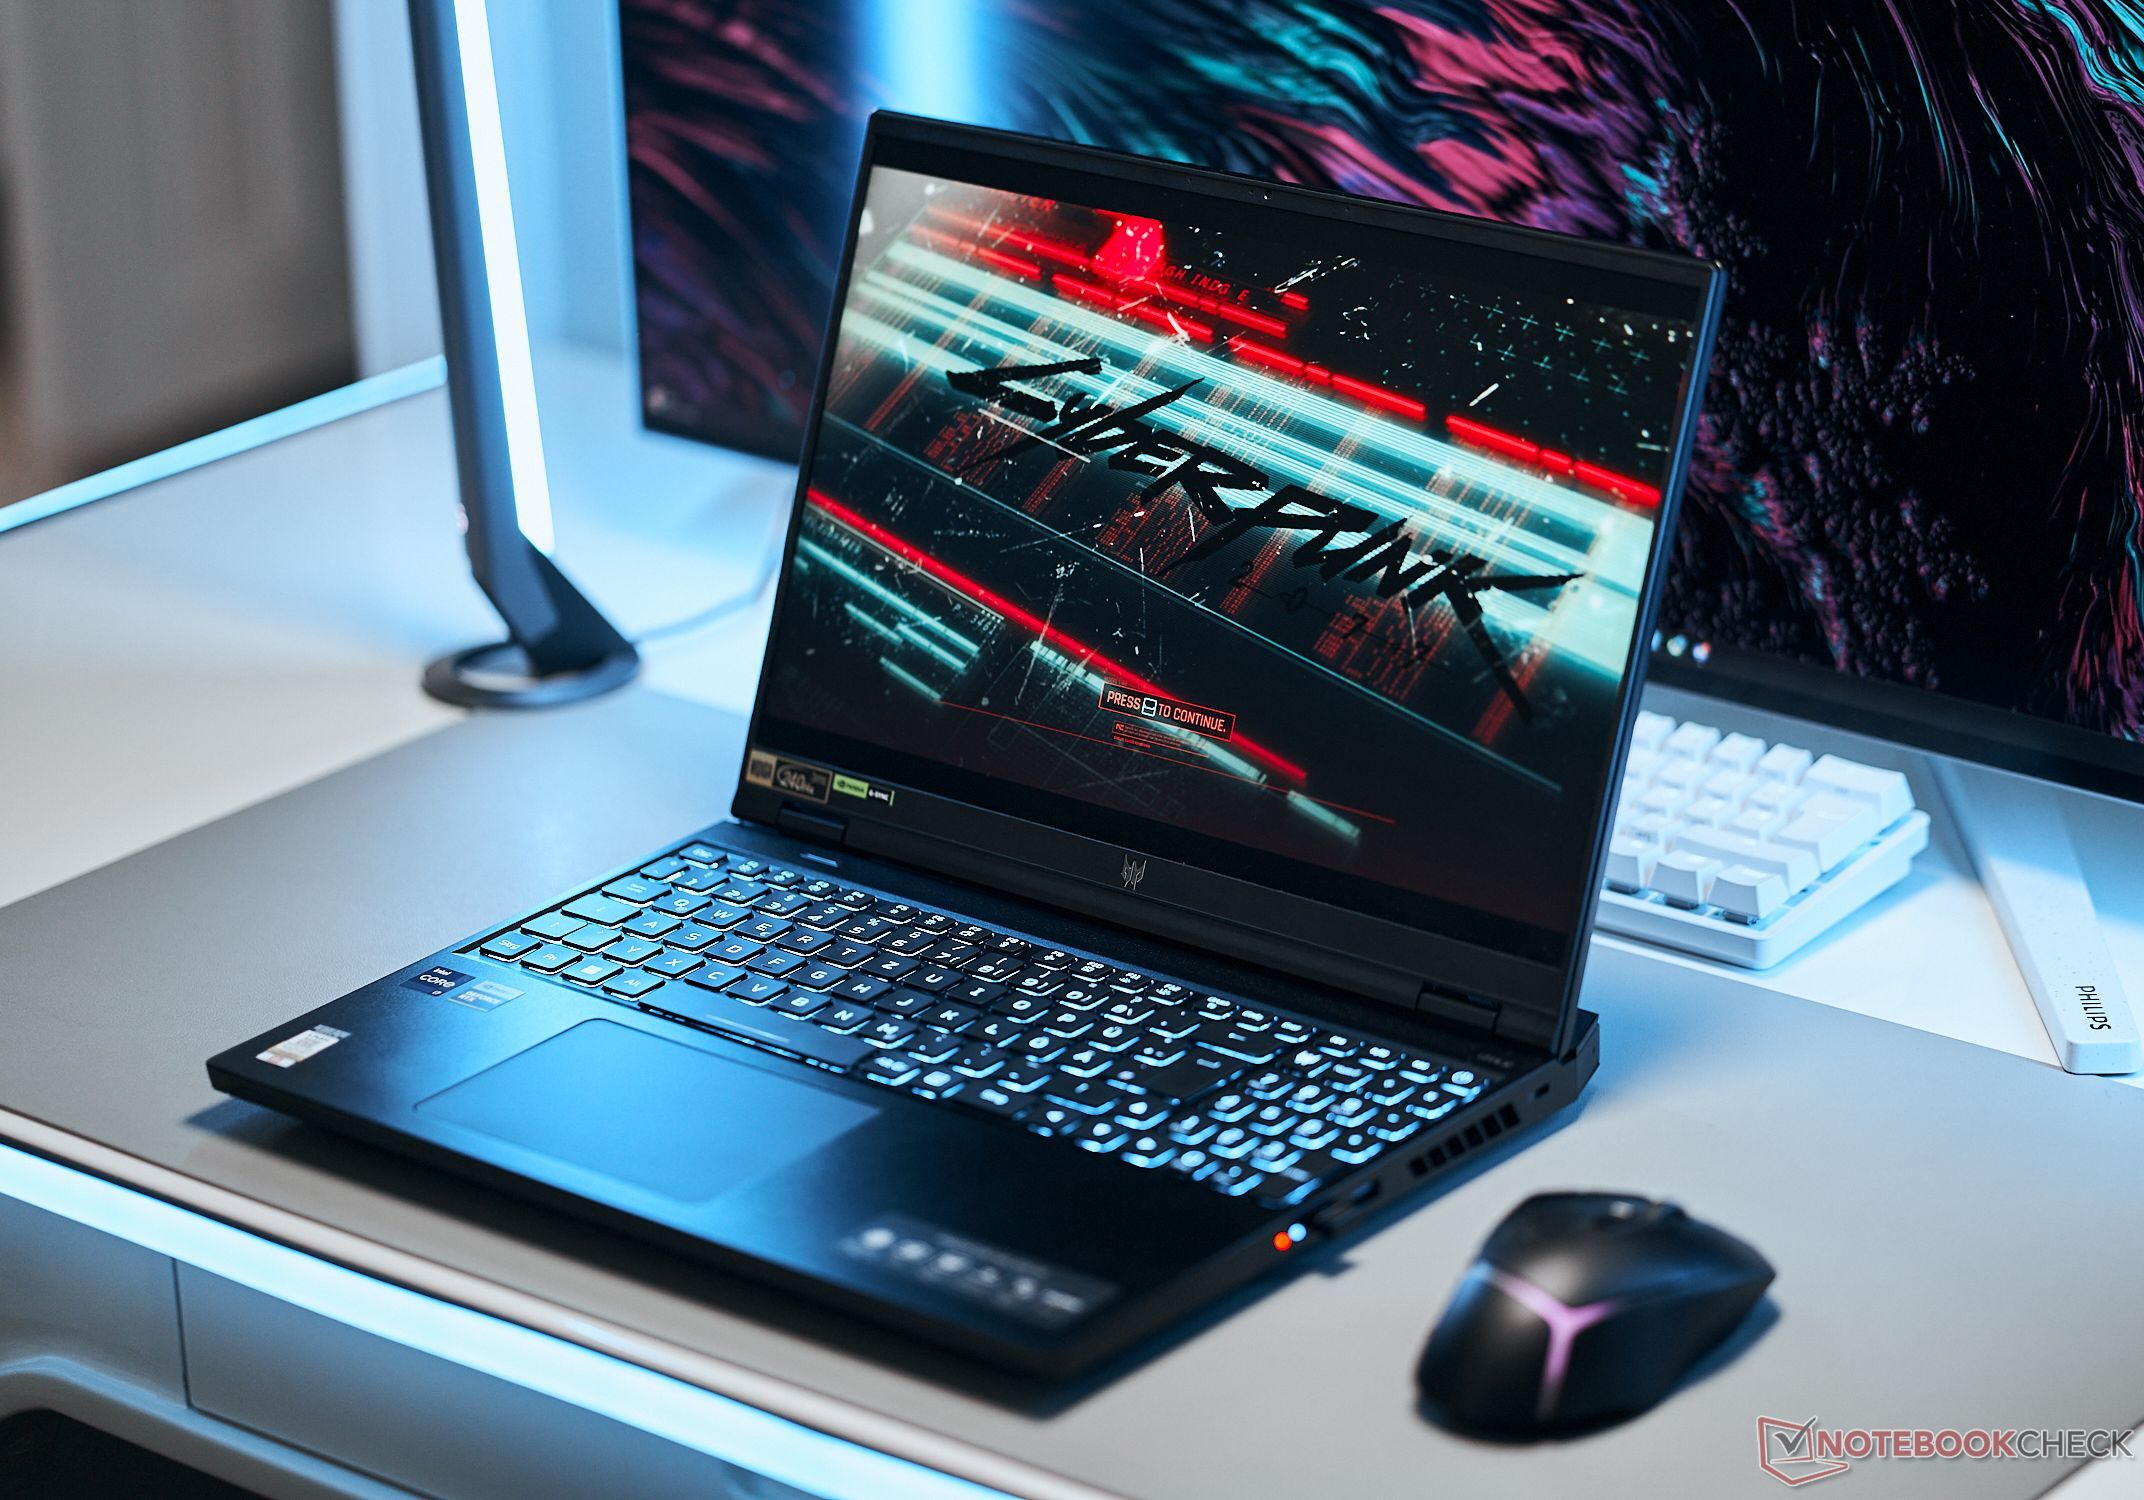
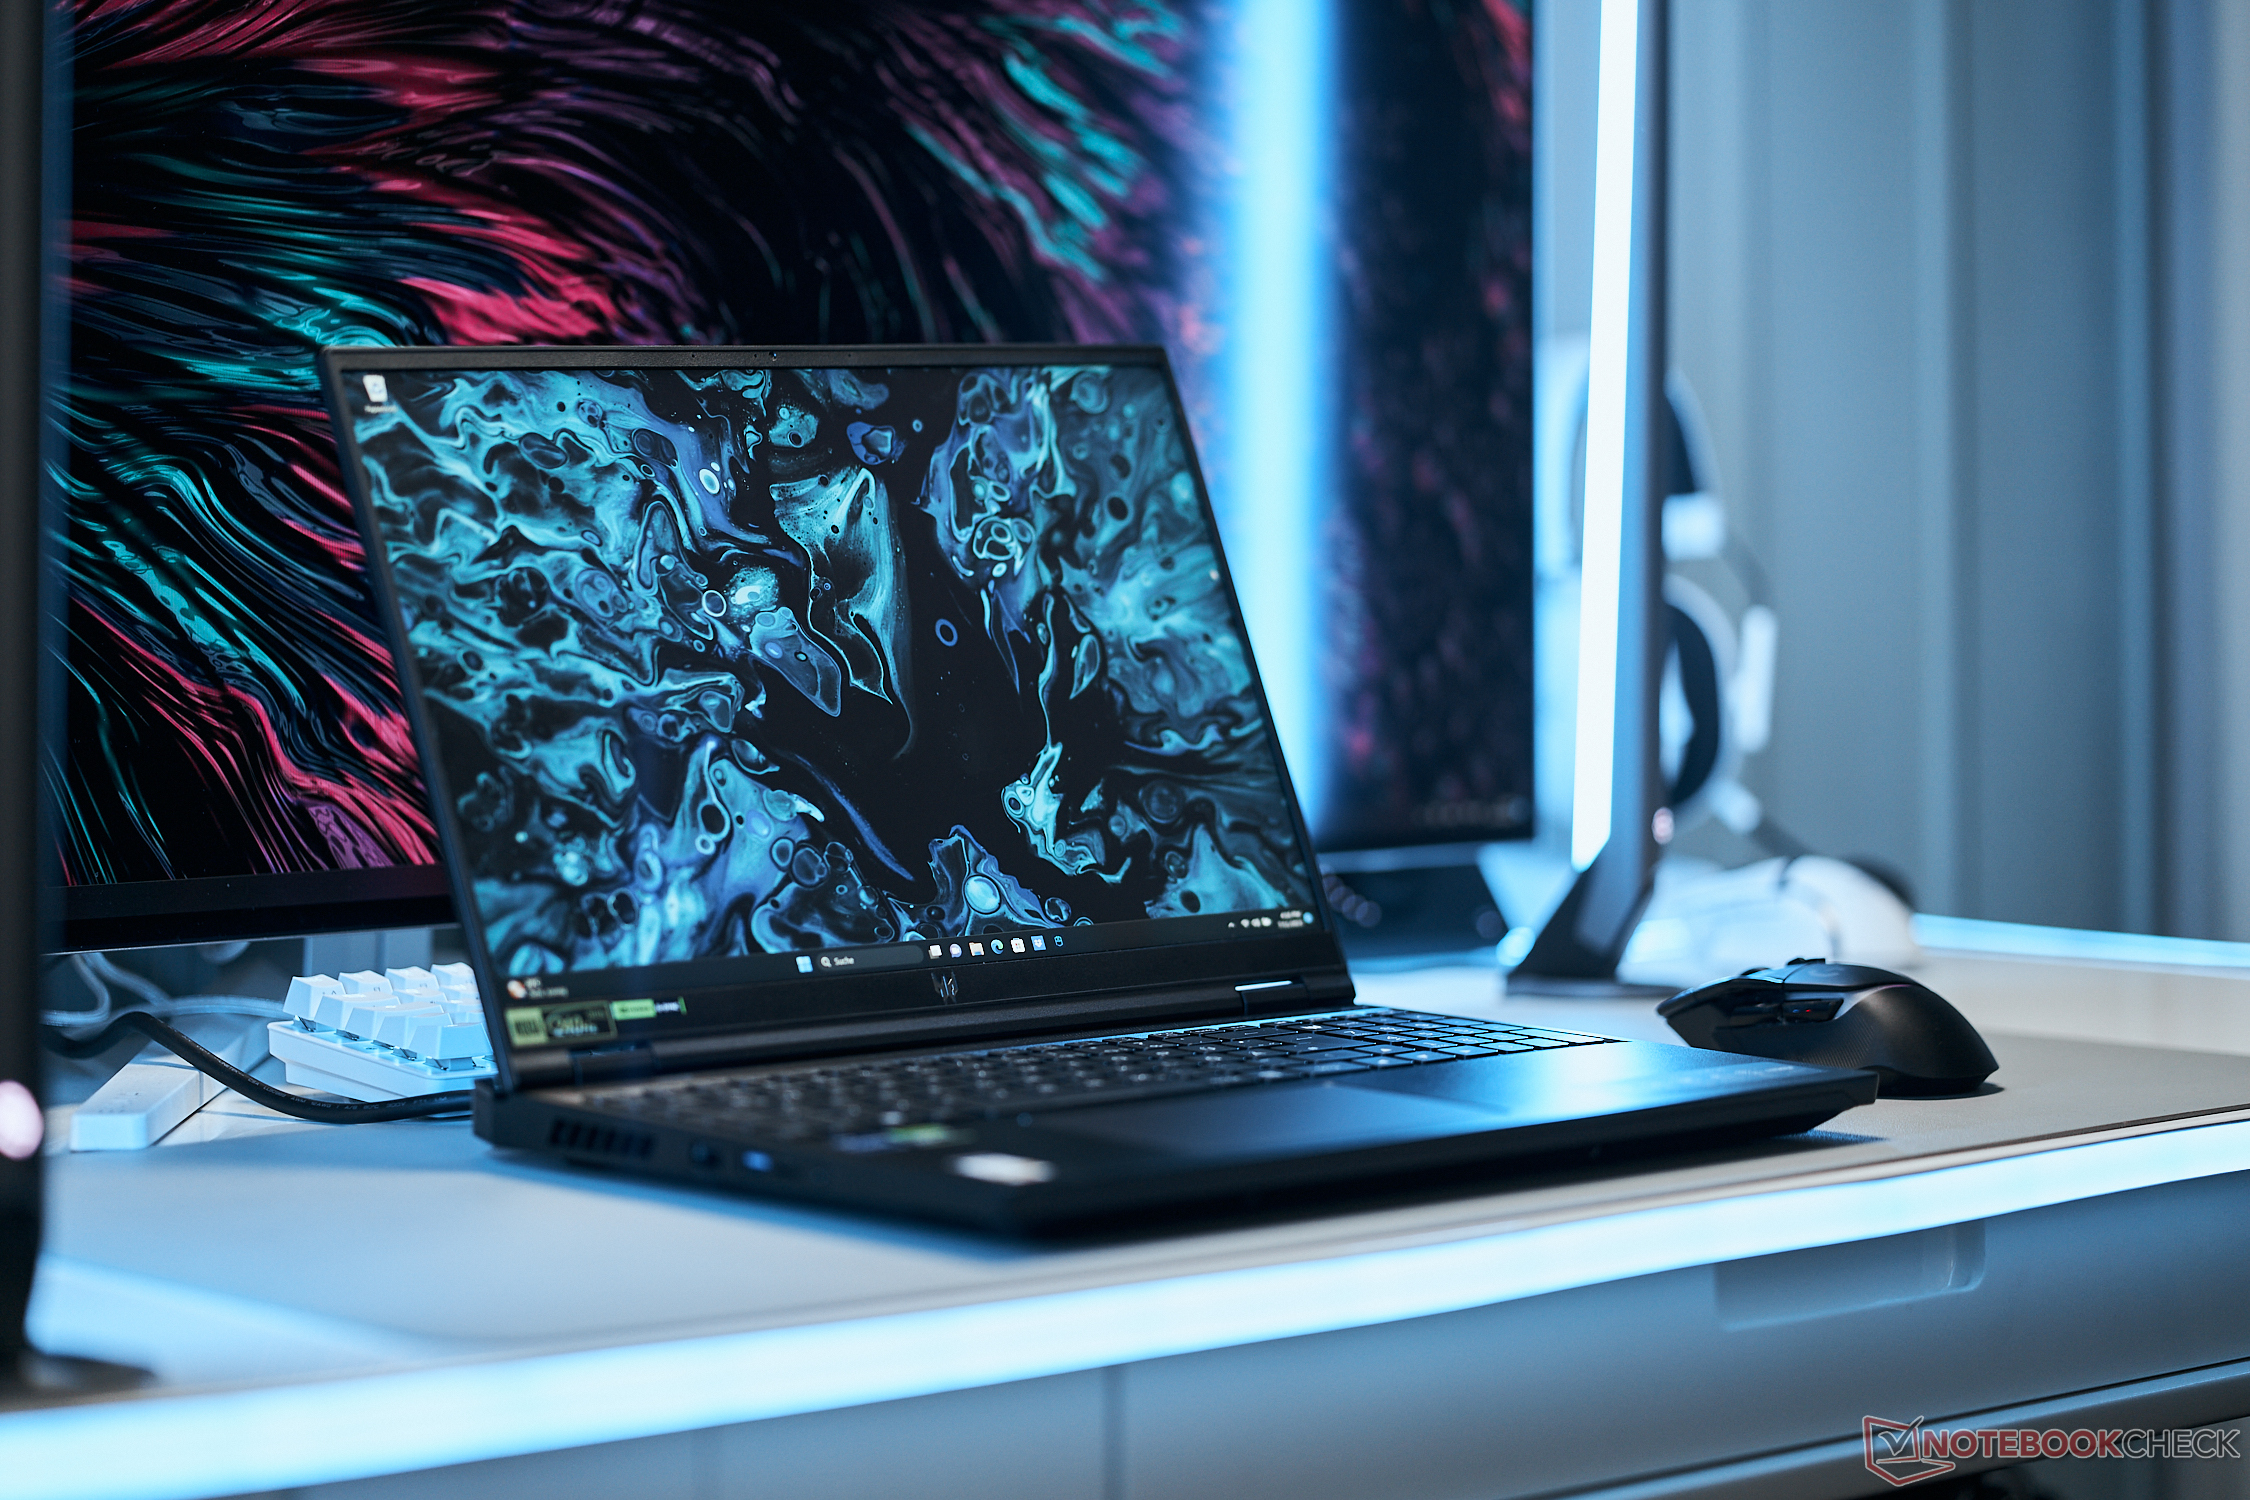
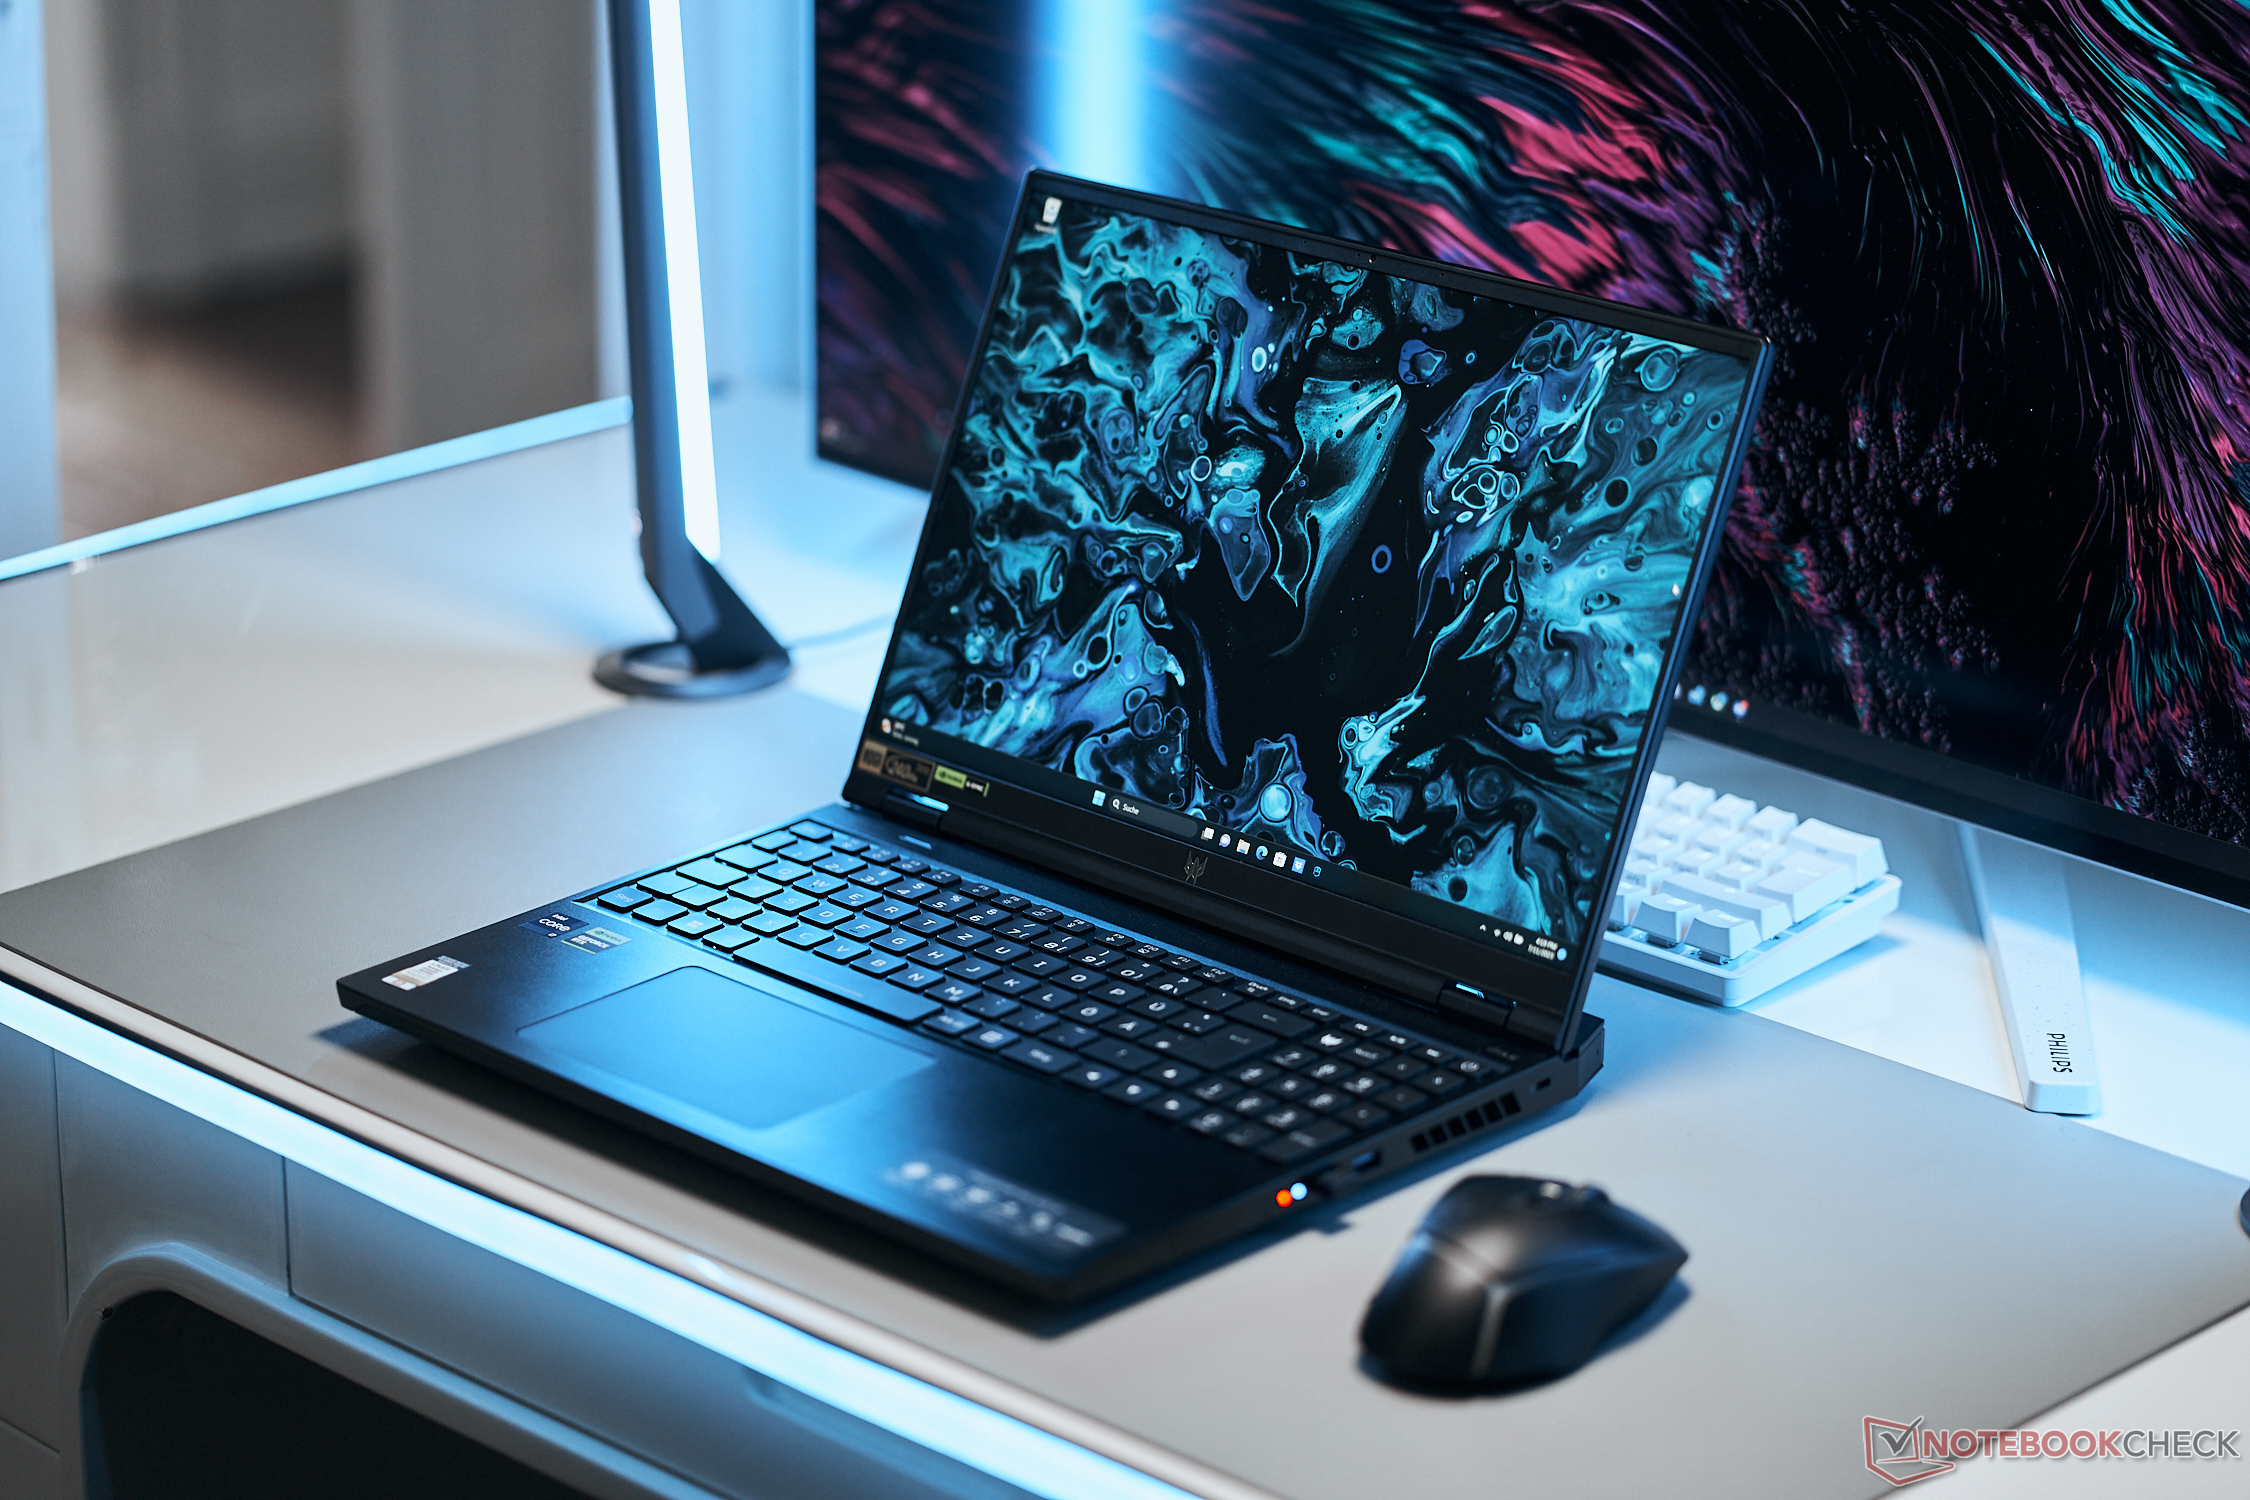
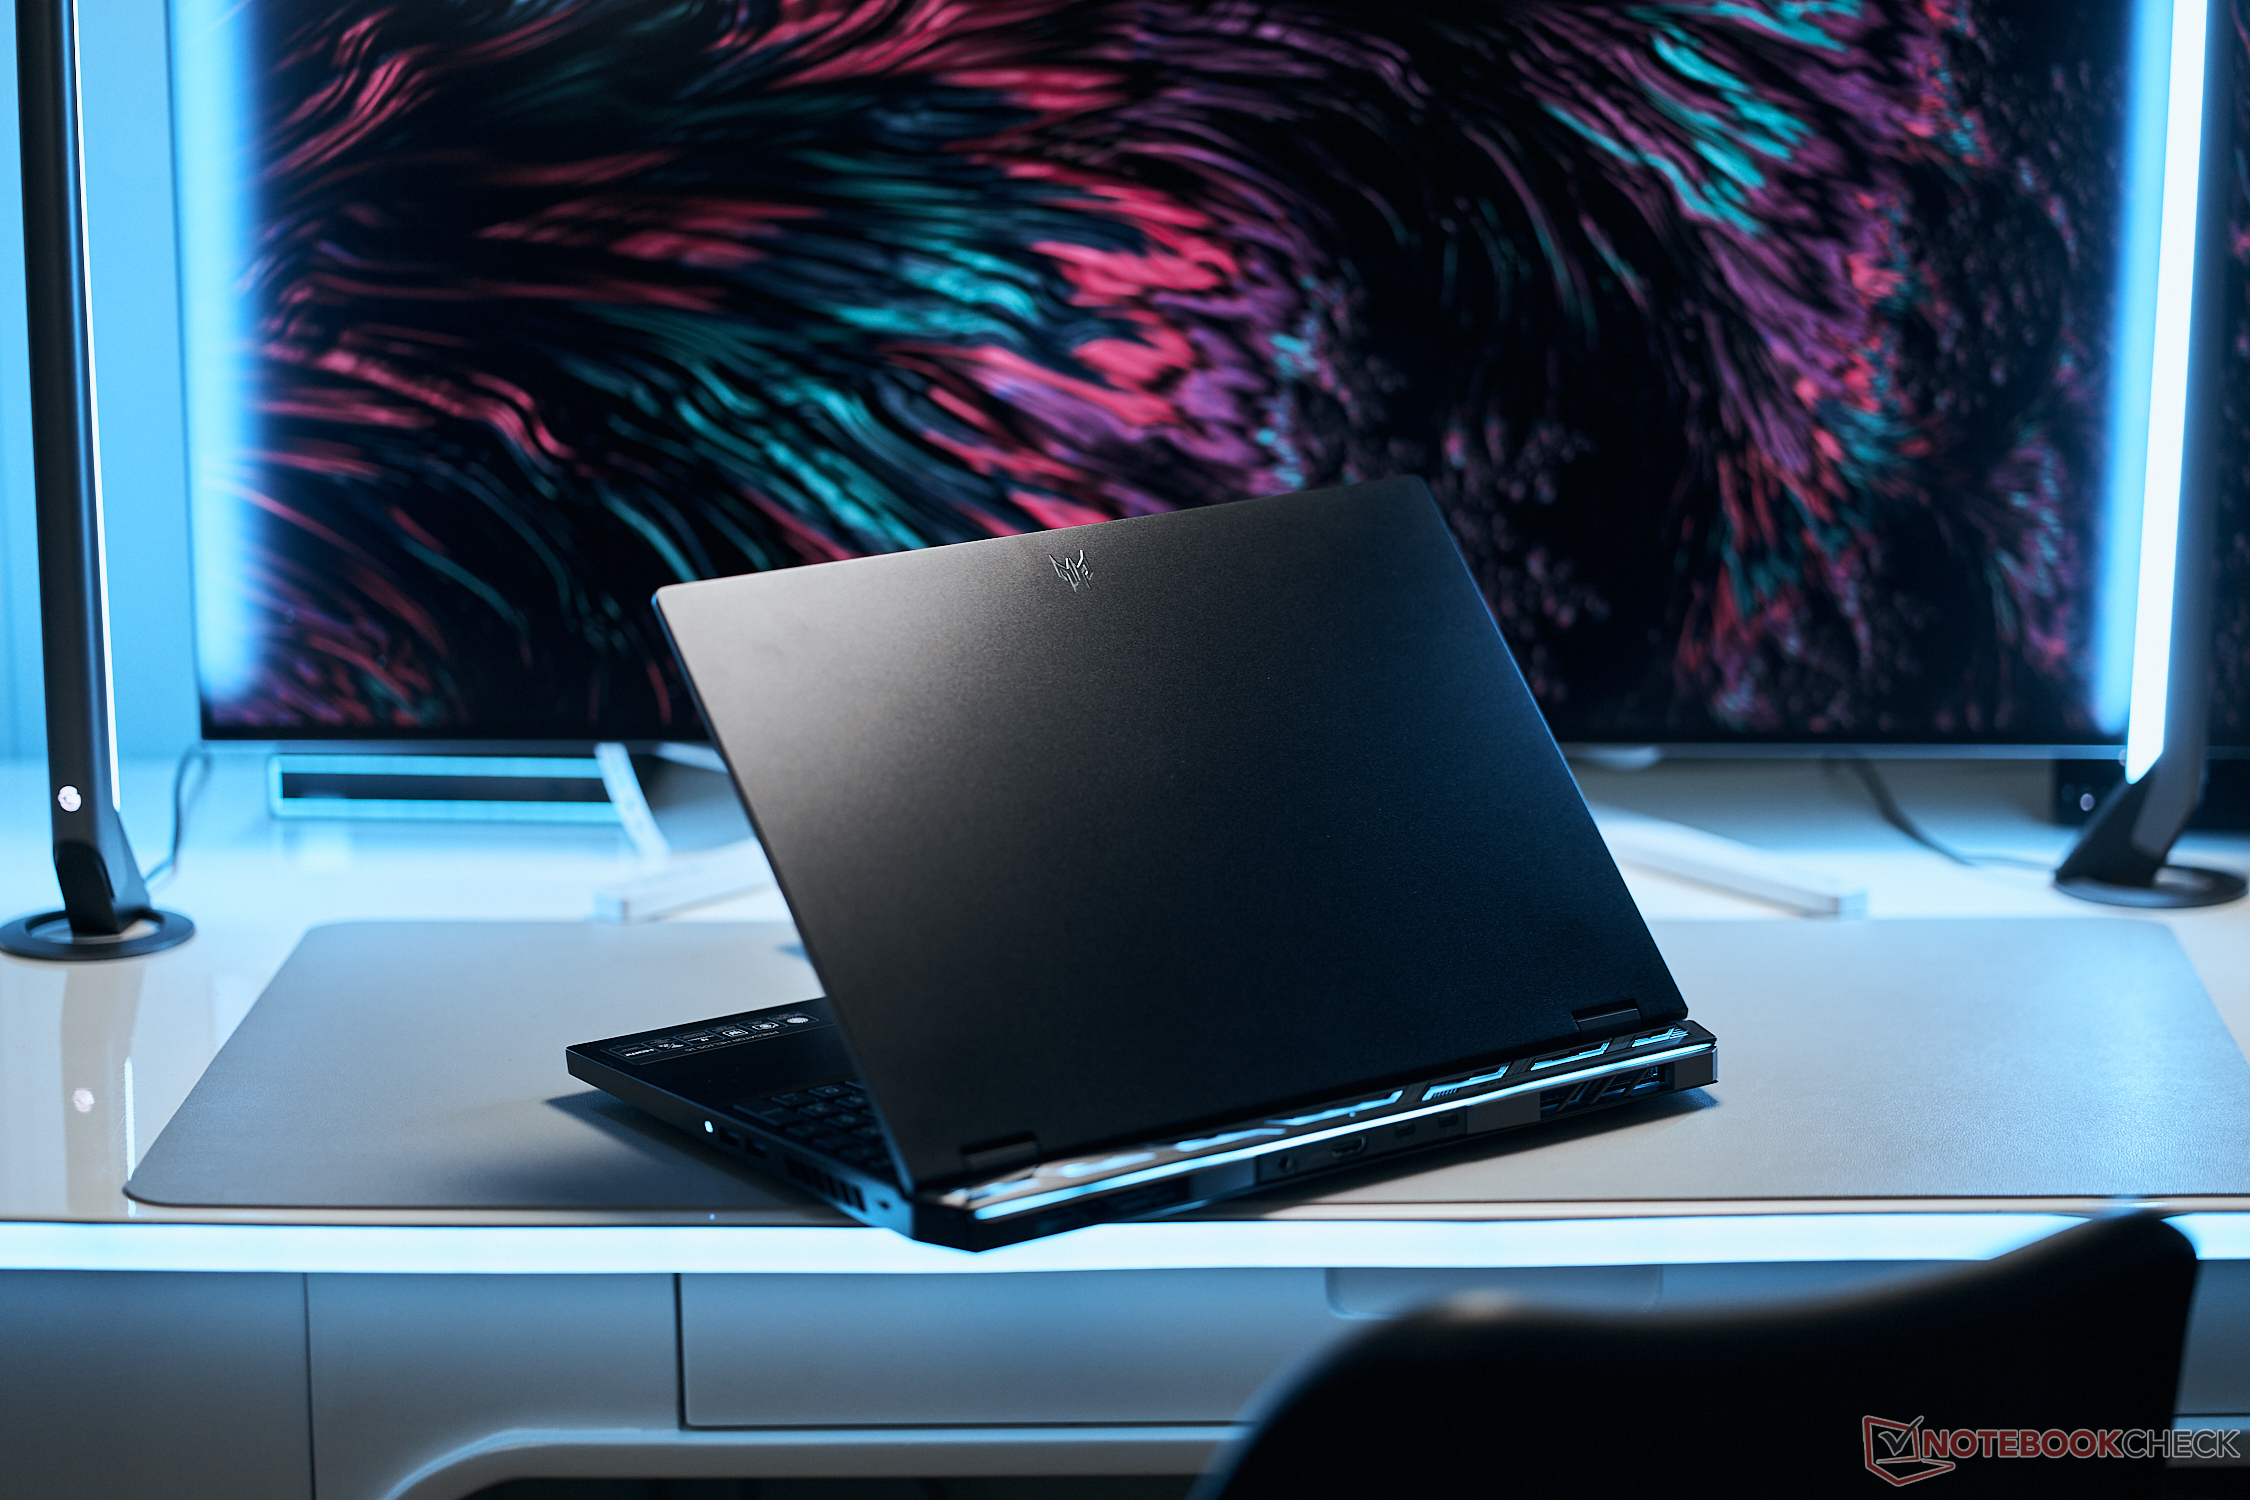
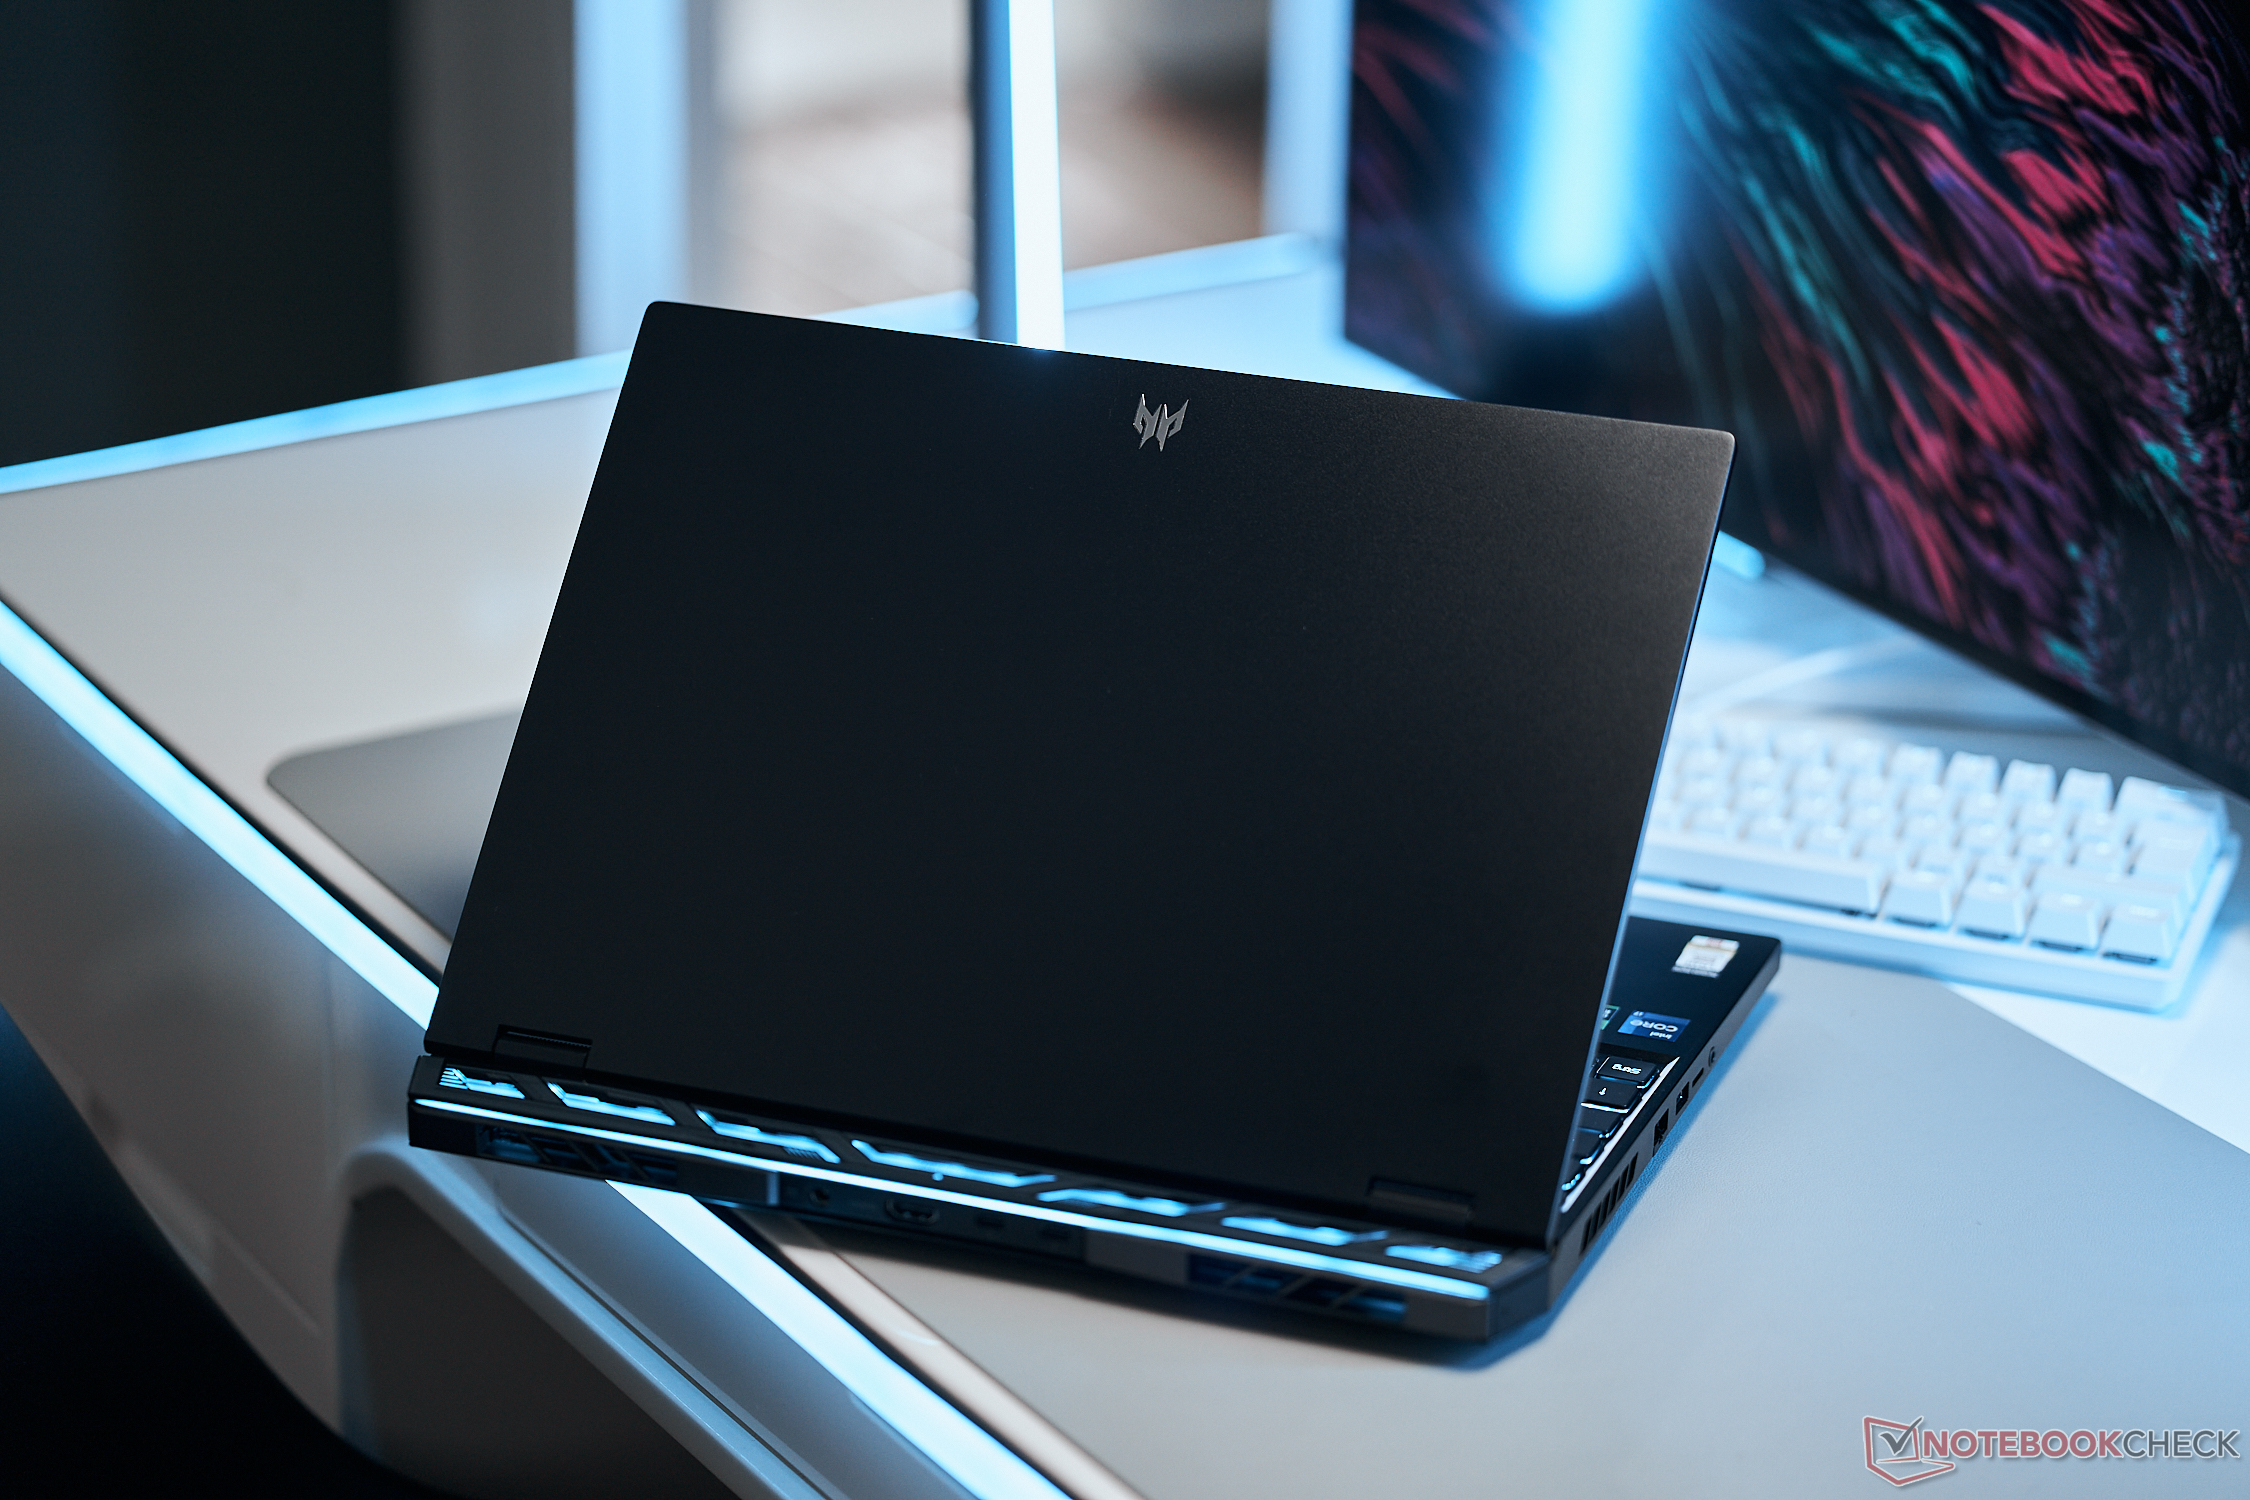
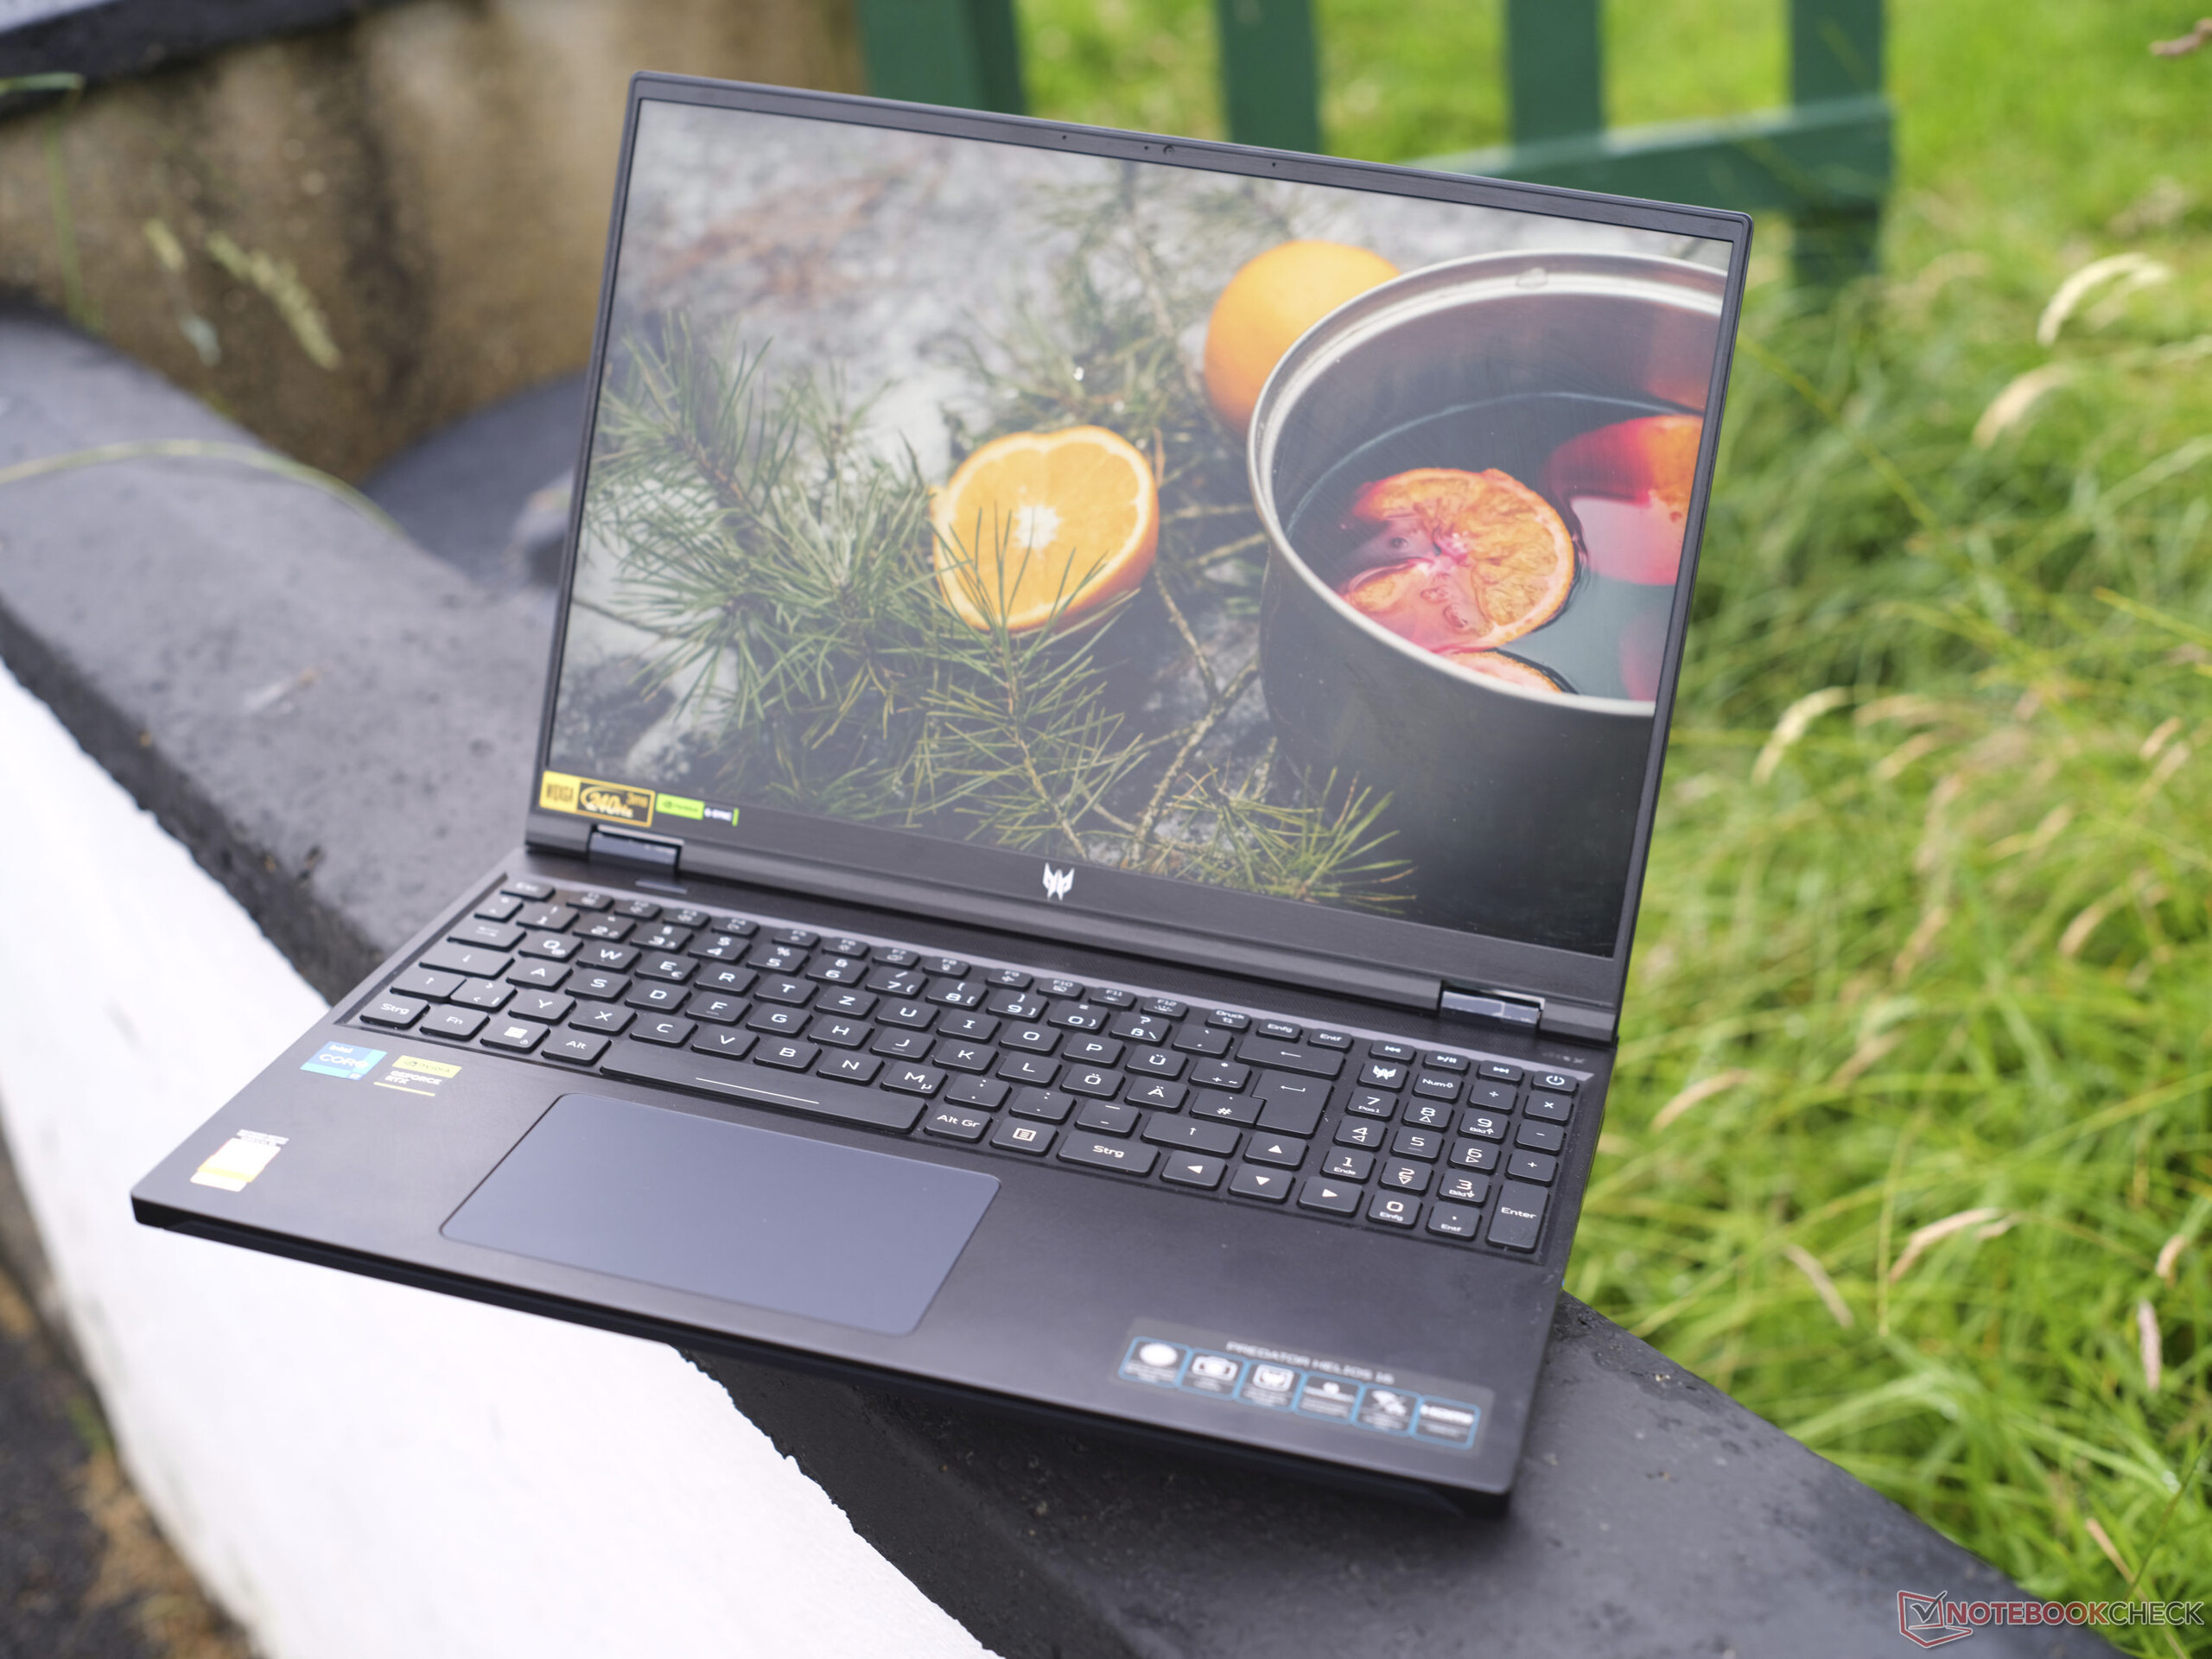
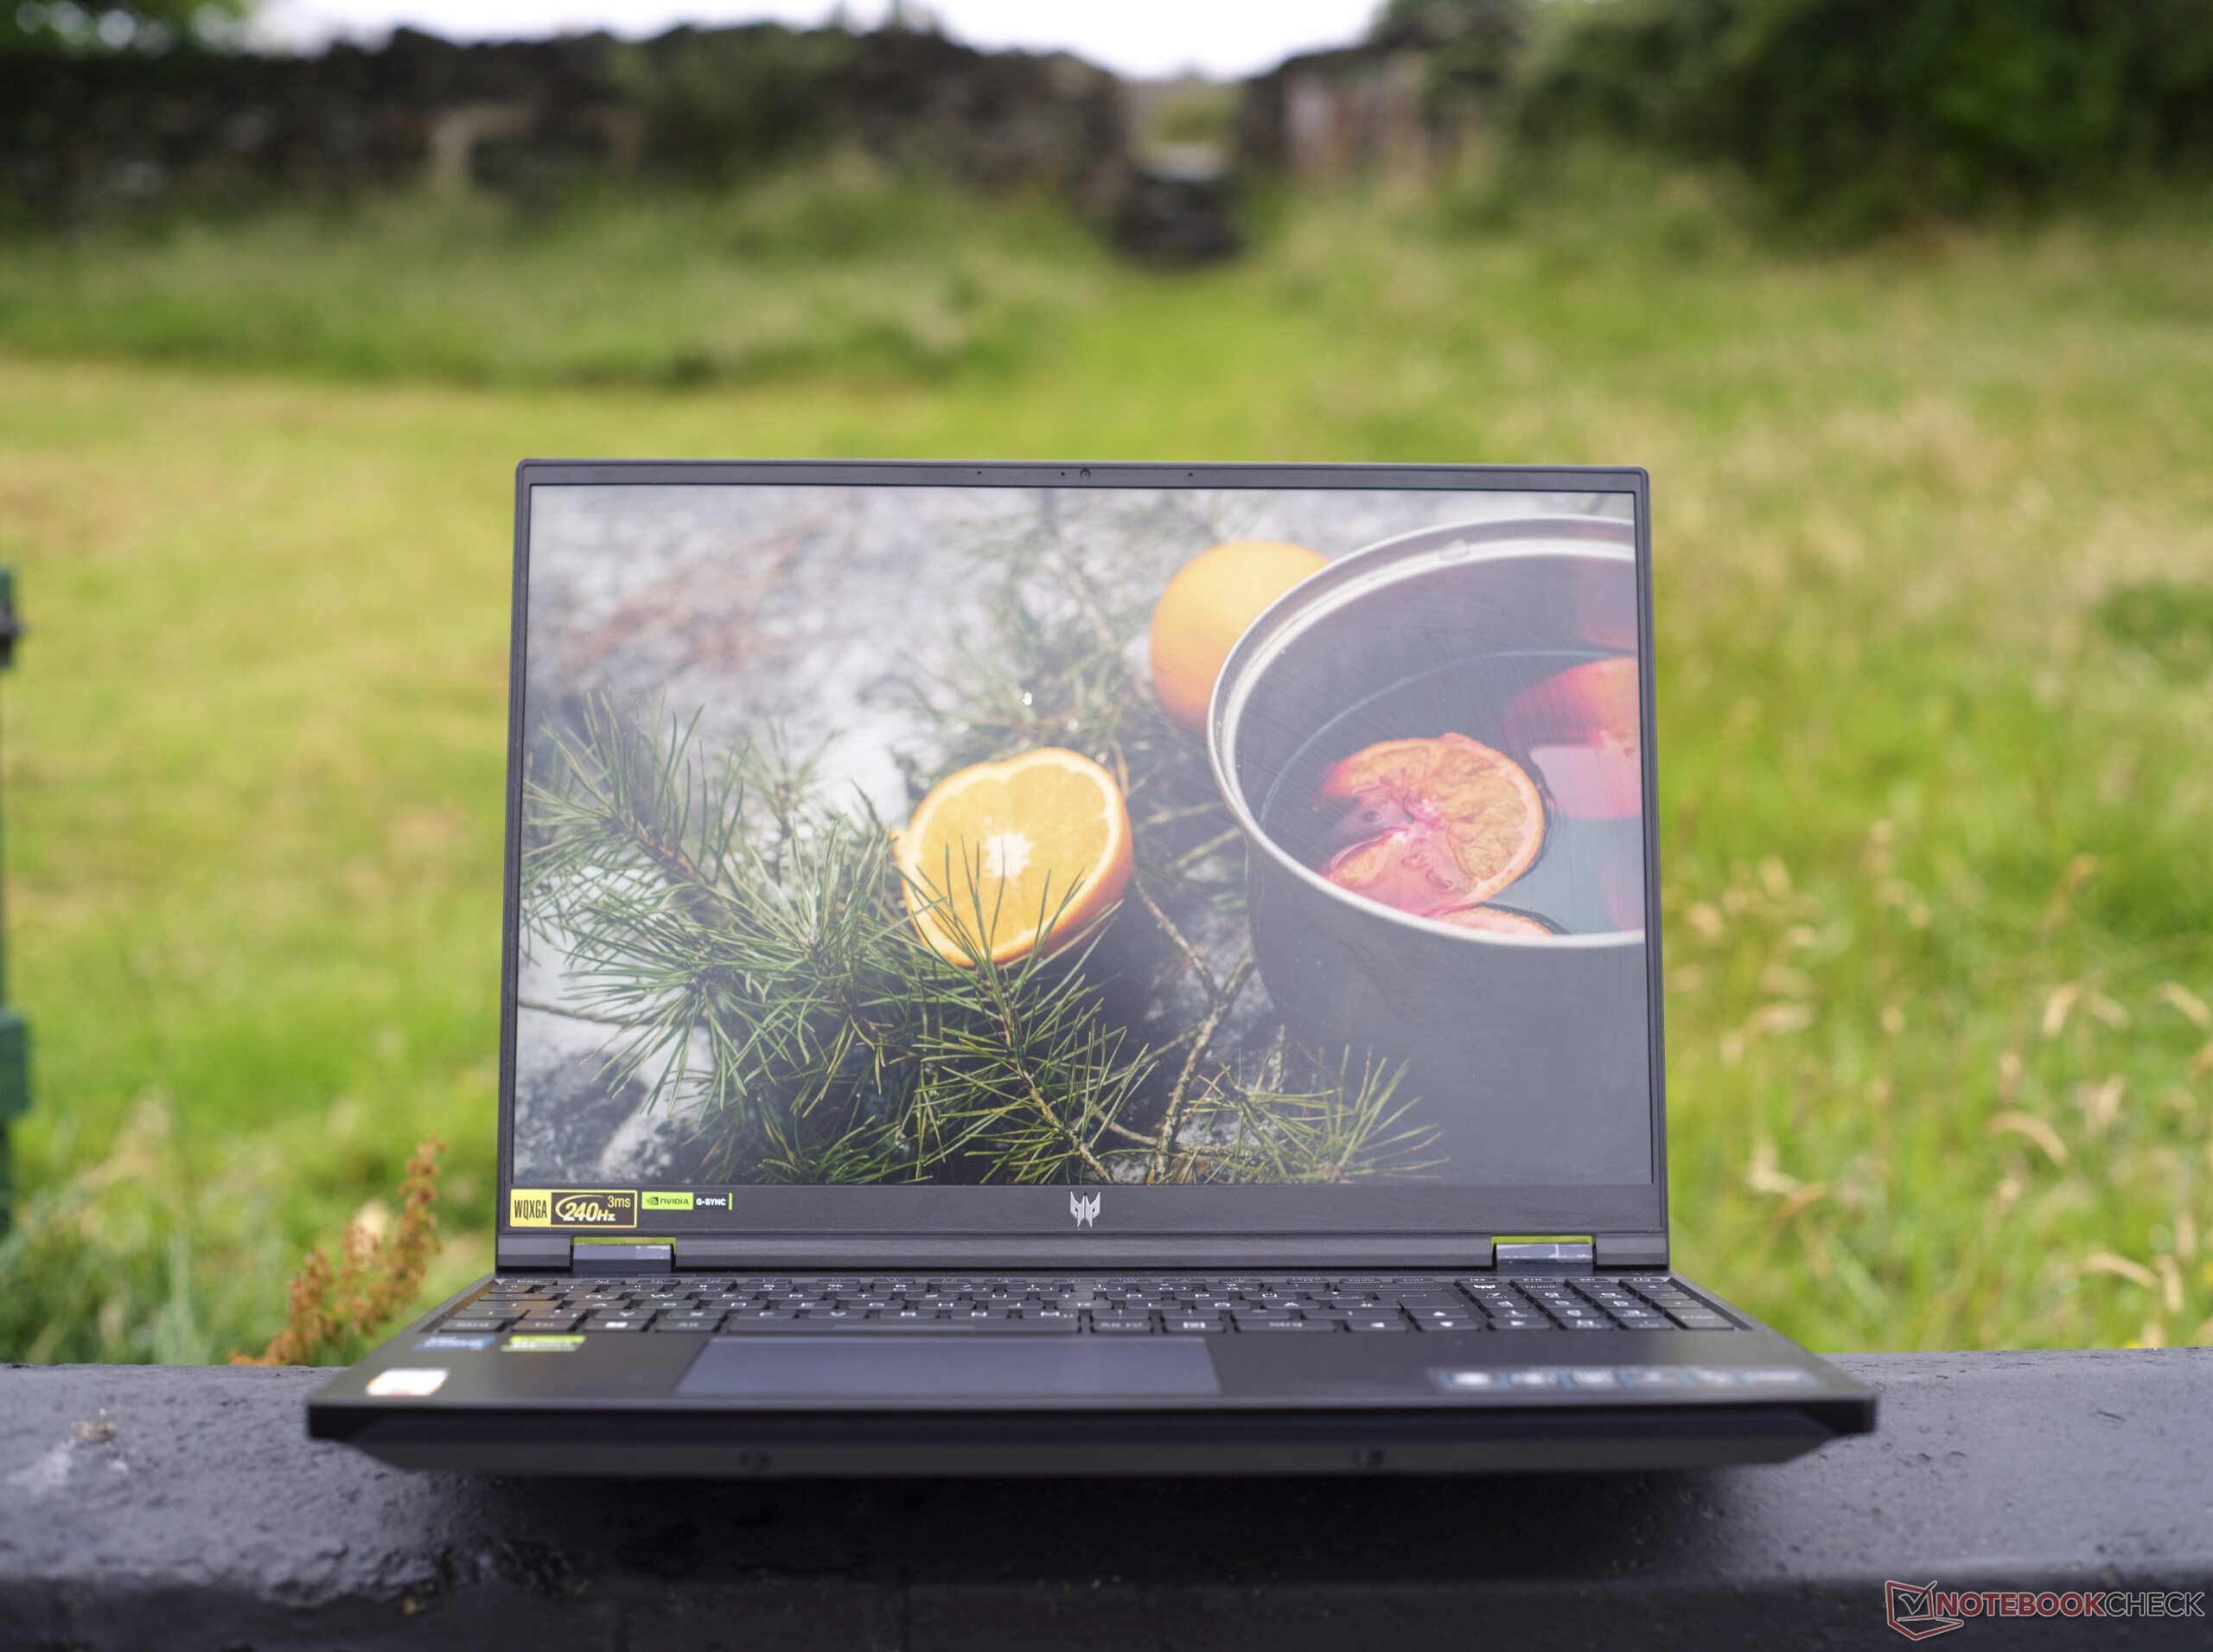
O caso: Um laptop para jogos Acer robusto e quase discreto
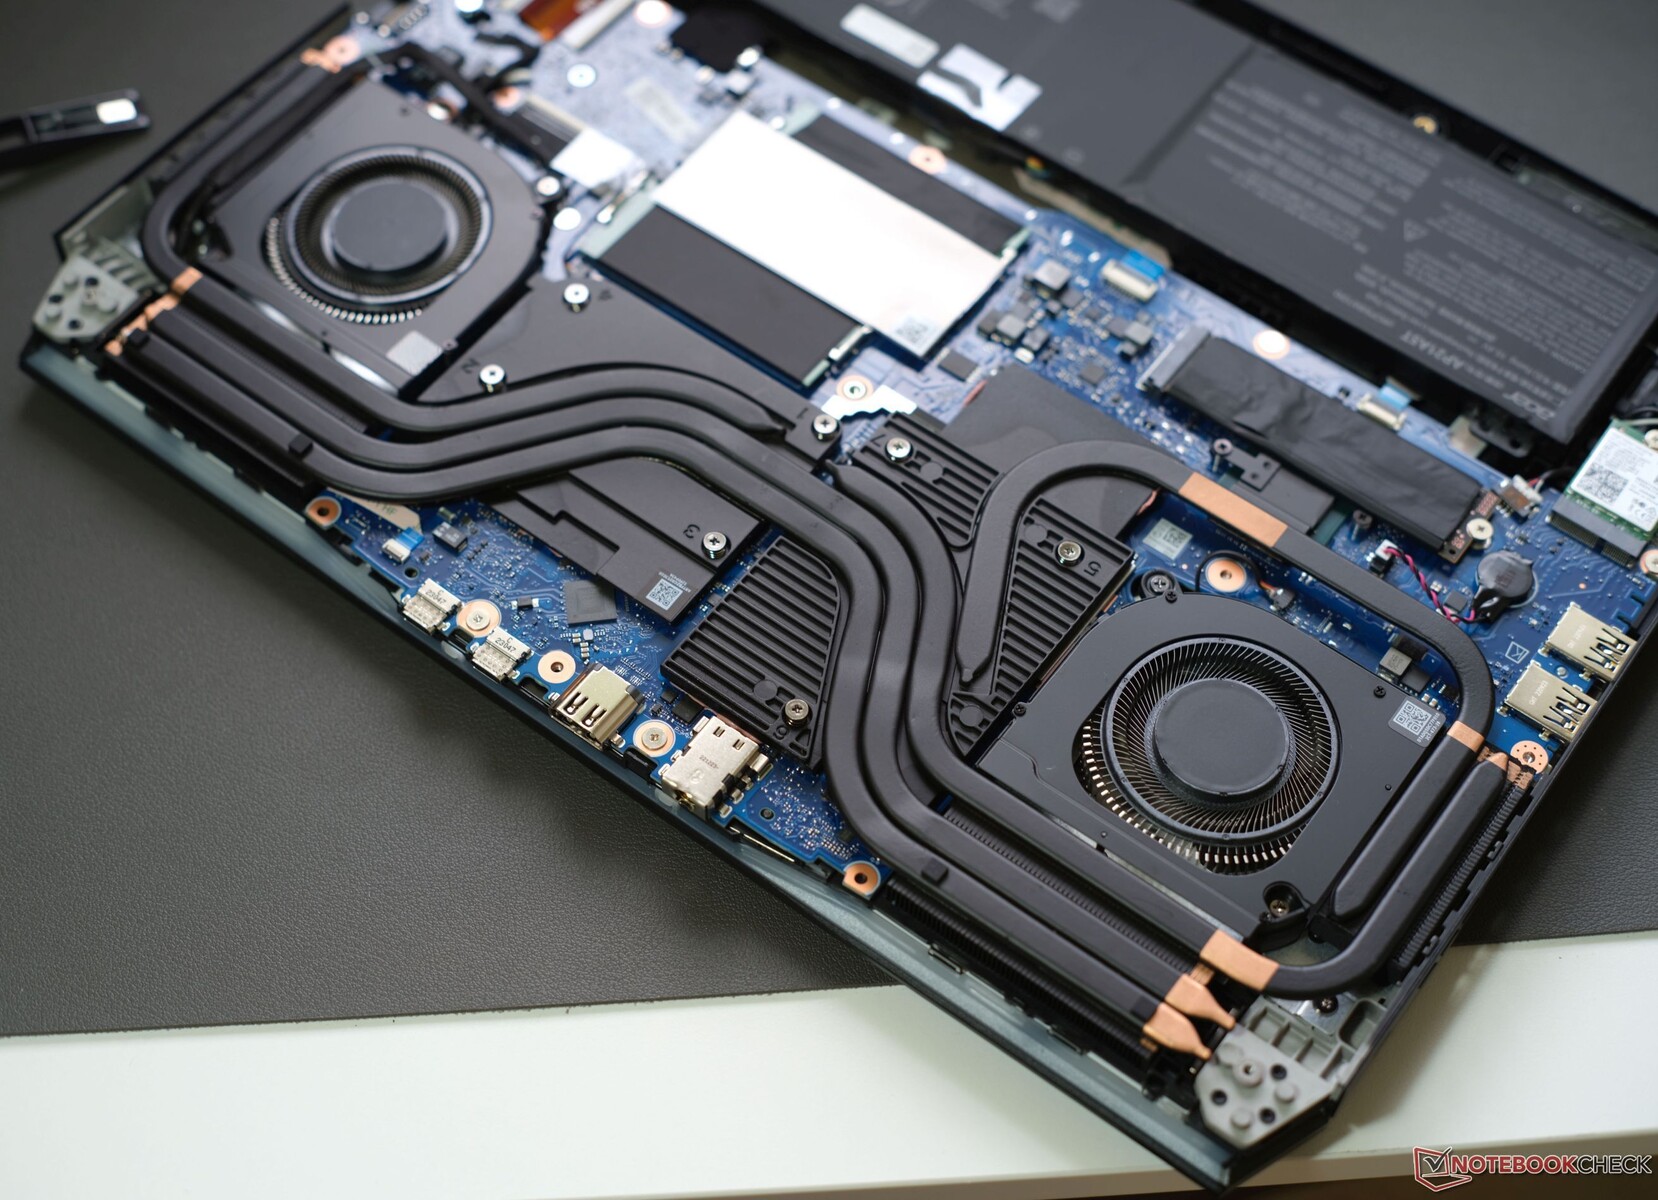
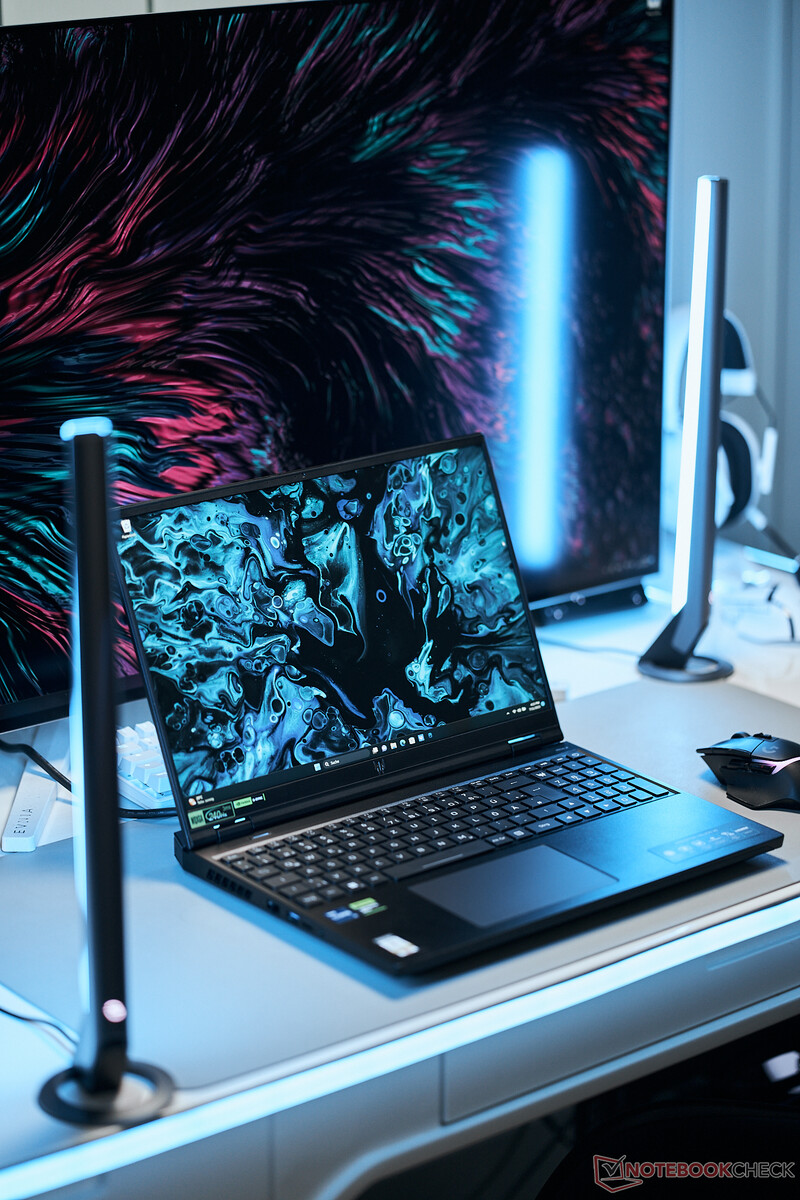
Assim como seu antecessoro Helios 16 vem em preto fosco e é feito principalmente de liga de alumínio escovado, sendo que apenas a unidade de base e a borda da tela são feitas de plástico para evitar as desvantagens associadas aos materiais condutores de calor.
Os destaques, em um exterior de aparência discreta, vêm na forma do elegante logotipo do Predator na tampa da tela e na moldura inferior, bem como em um sistema de resfriamento retroiluminado por LEDs. As superfícies lisas fazem um bom trabalho ao atrair impressões digitais, enquanto o ajuste e o acabamento são perfeitos, sem rangidos.
A unidade de base é muito estável, enquanto a tampa pode ser levemente torcida, mas não conseguimos produzir distorções de imagem, mesmo depois de aplicar uma pressão específica. As dobradiças são fixadas com muita firmeza, a tampa quase não balança e pode ser aberta com uma mão em um ângulo de até ~145°. Em geral, o Predator Helios causa uma impressão muito sólida.

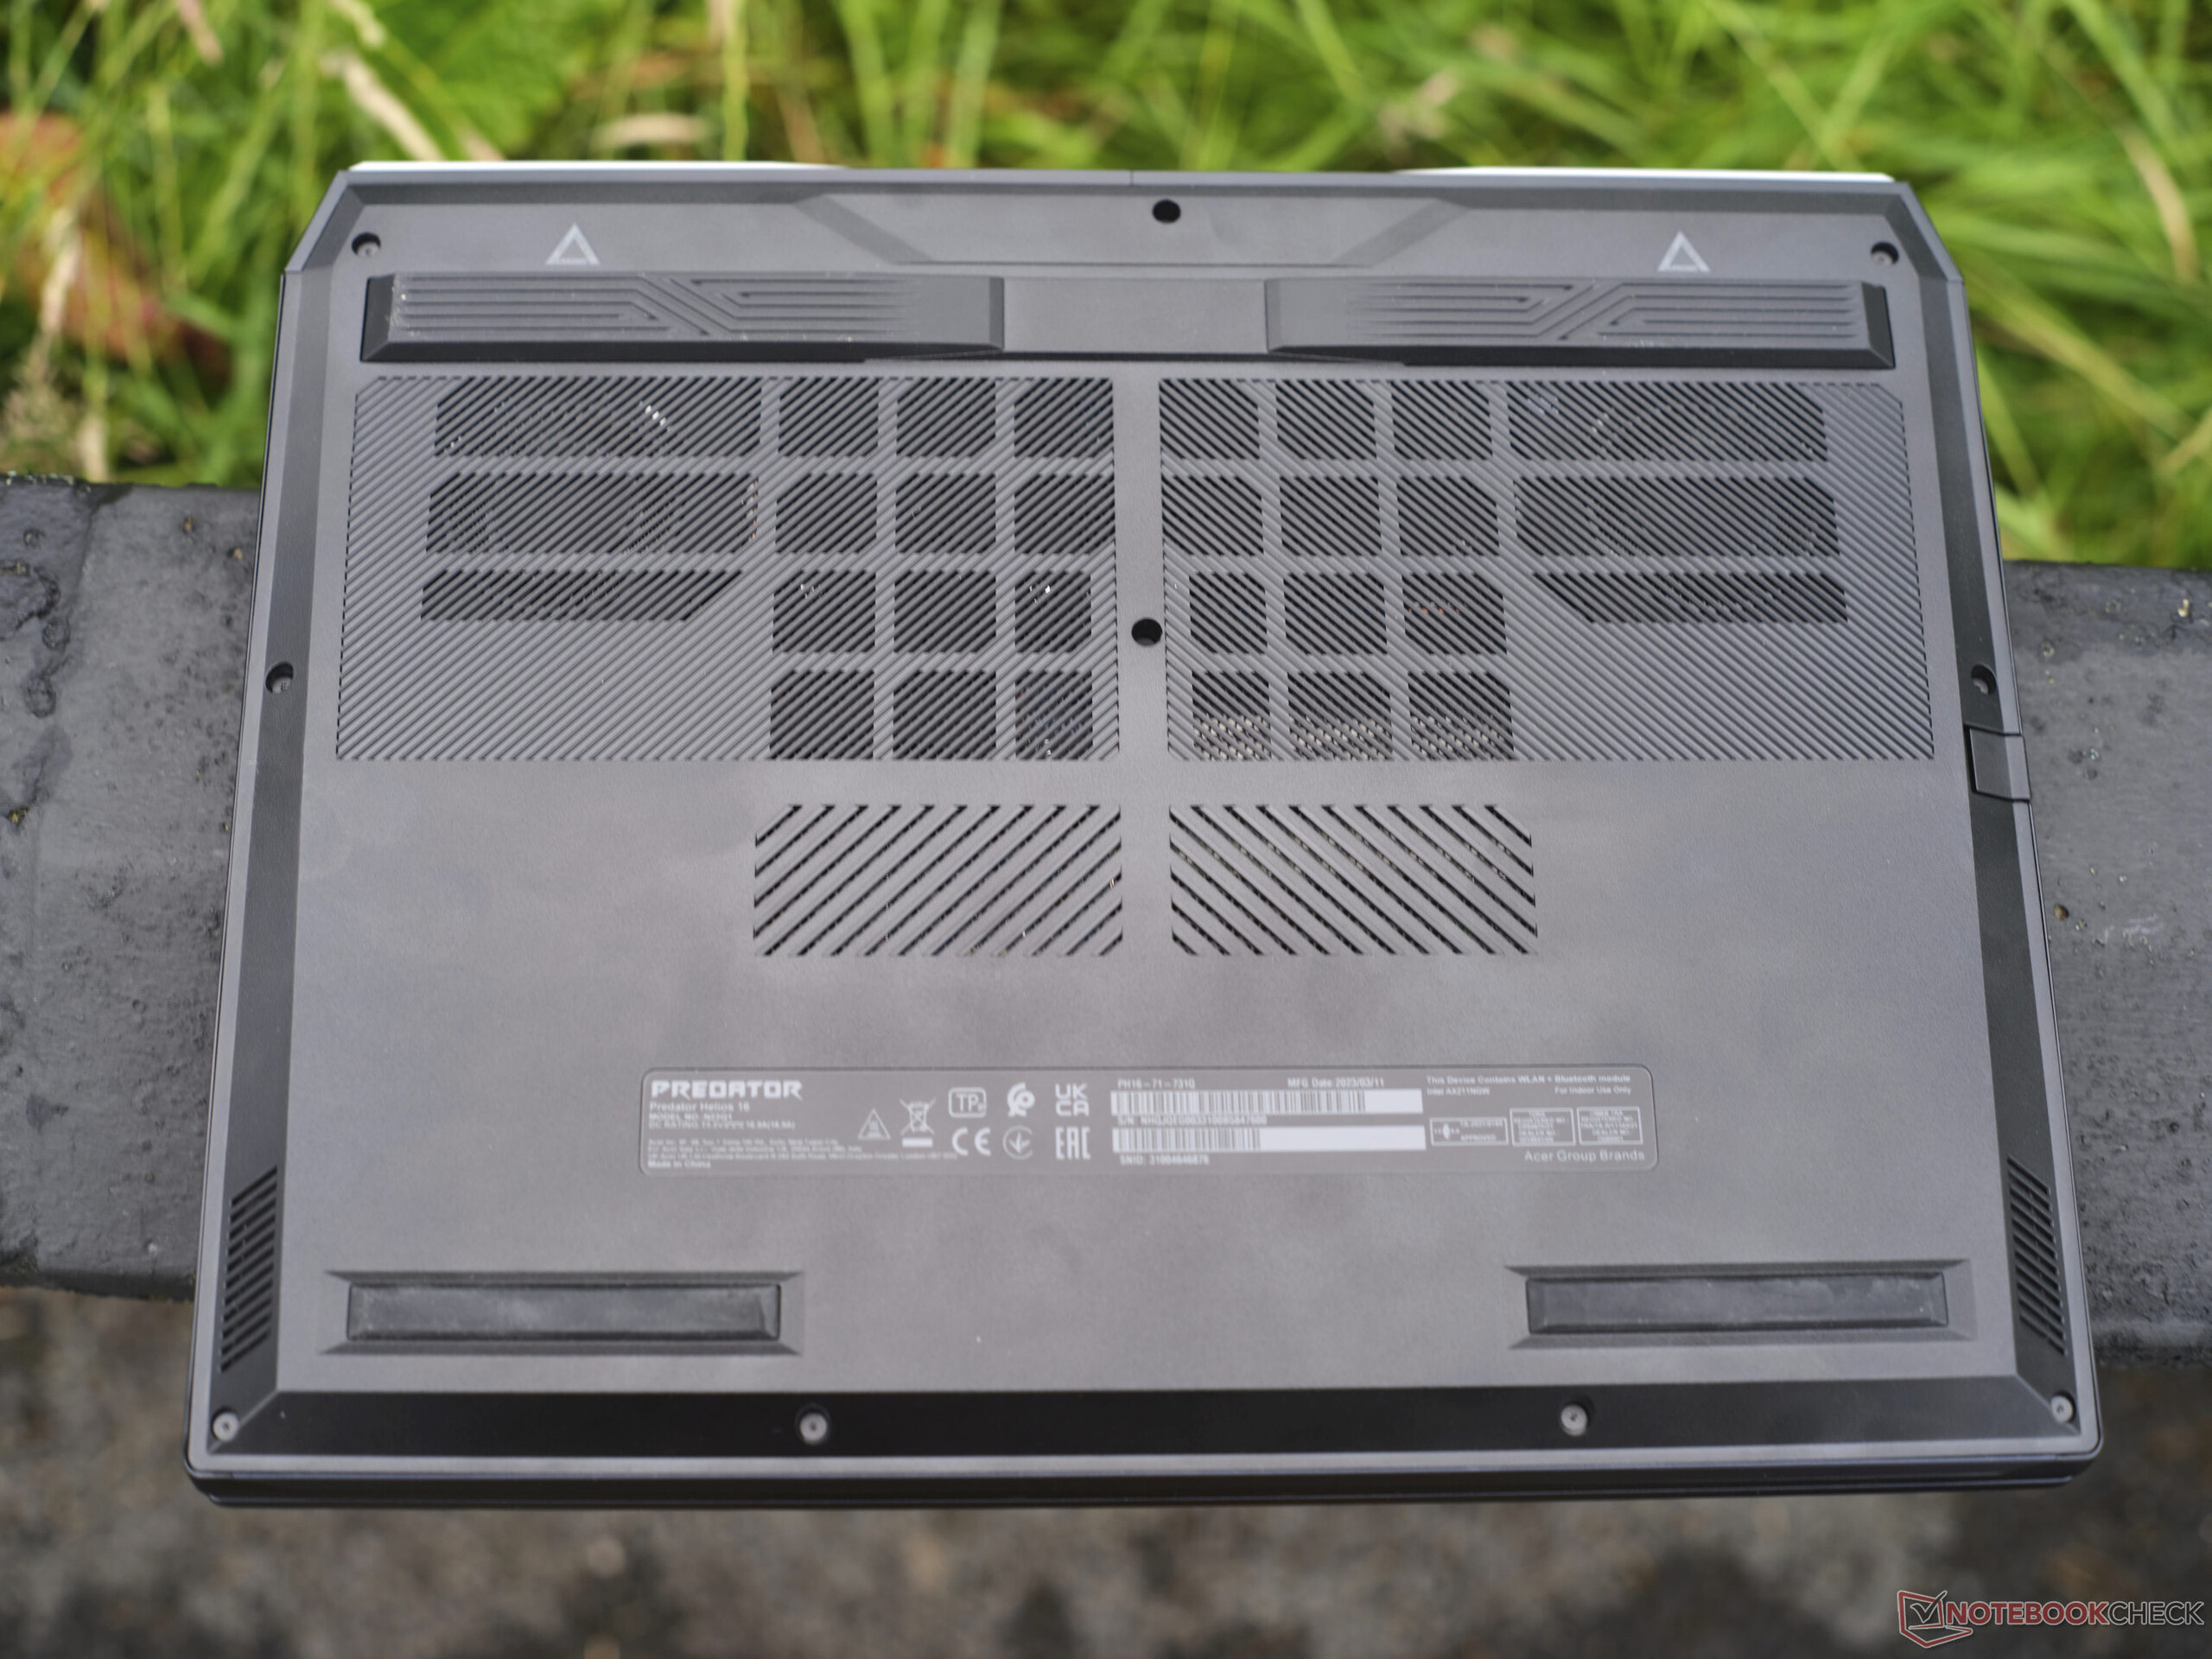
O Acer Predator Helios tem cerca de 27 mm de espessura e pesa pouco menos de 2,6 kg. Essas estatísticas vitais podem ser consideradas médias para uma máquina de jogos com um sistema de resfriamento tão potente. Entretanto, apesar de ter a mesma altura, com 2,2 kg, oAsus TUF Gaming A16é significativamente mais leve, enquanto o Gigabyte Aorus 15X, com 19,7 mm de espessuraGigabyte Aorus 15Xde 19,7 mm de espessura, é consideravelmente mais fino, apesar de ter o mesmo TGP.
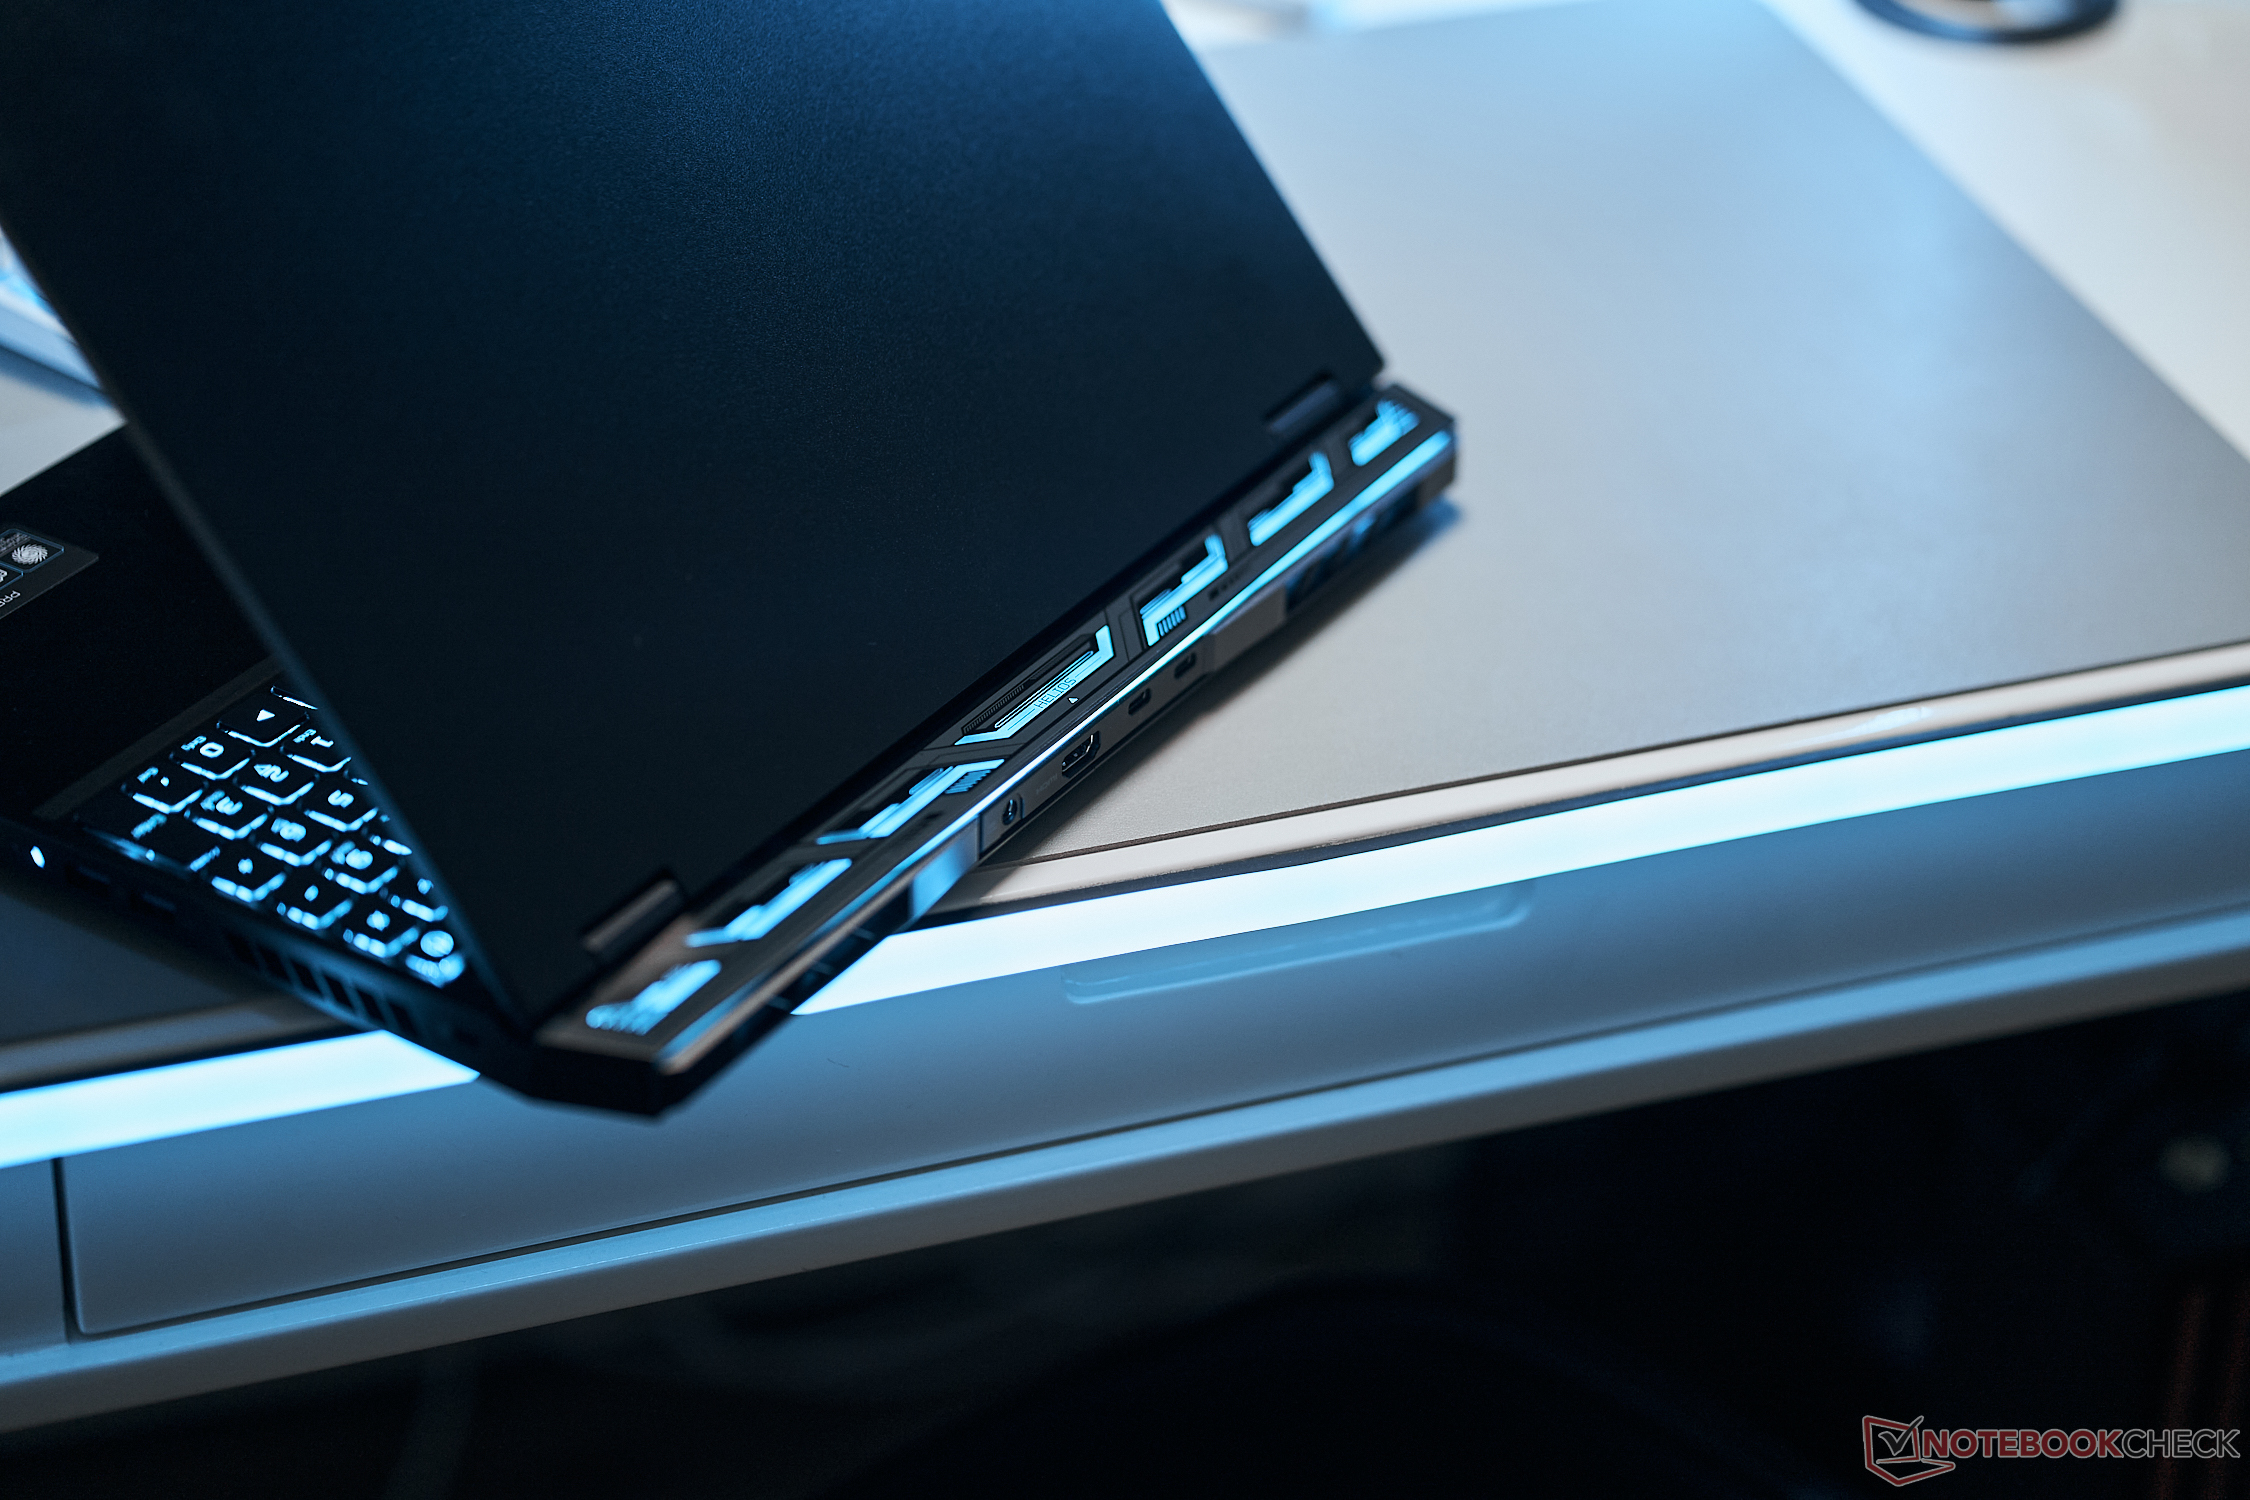
Características: O Helios 16 oferece uma seleção generosa de portas e Wi-Fi Killer rápido
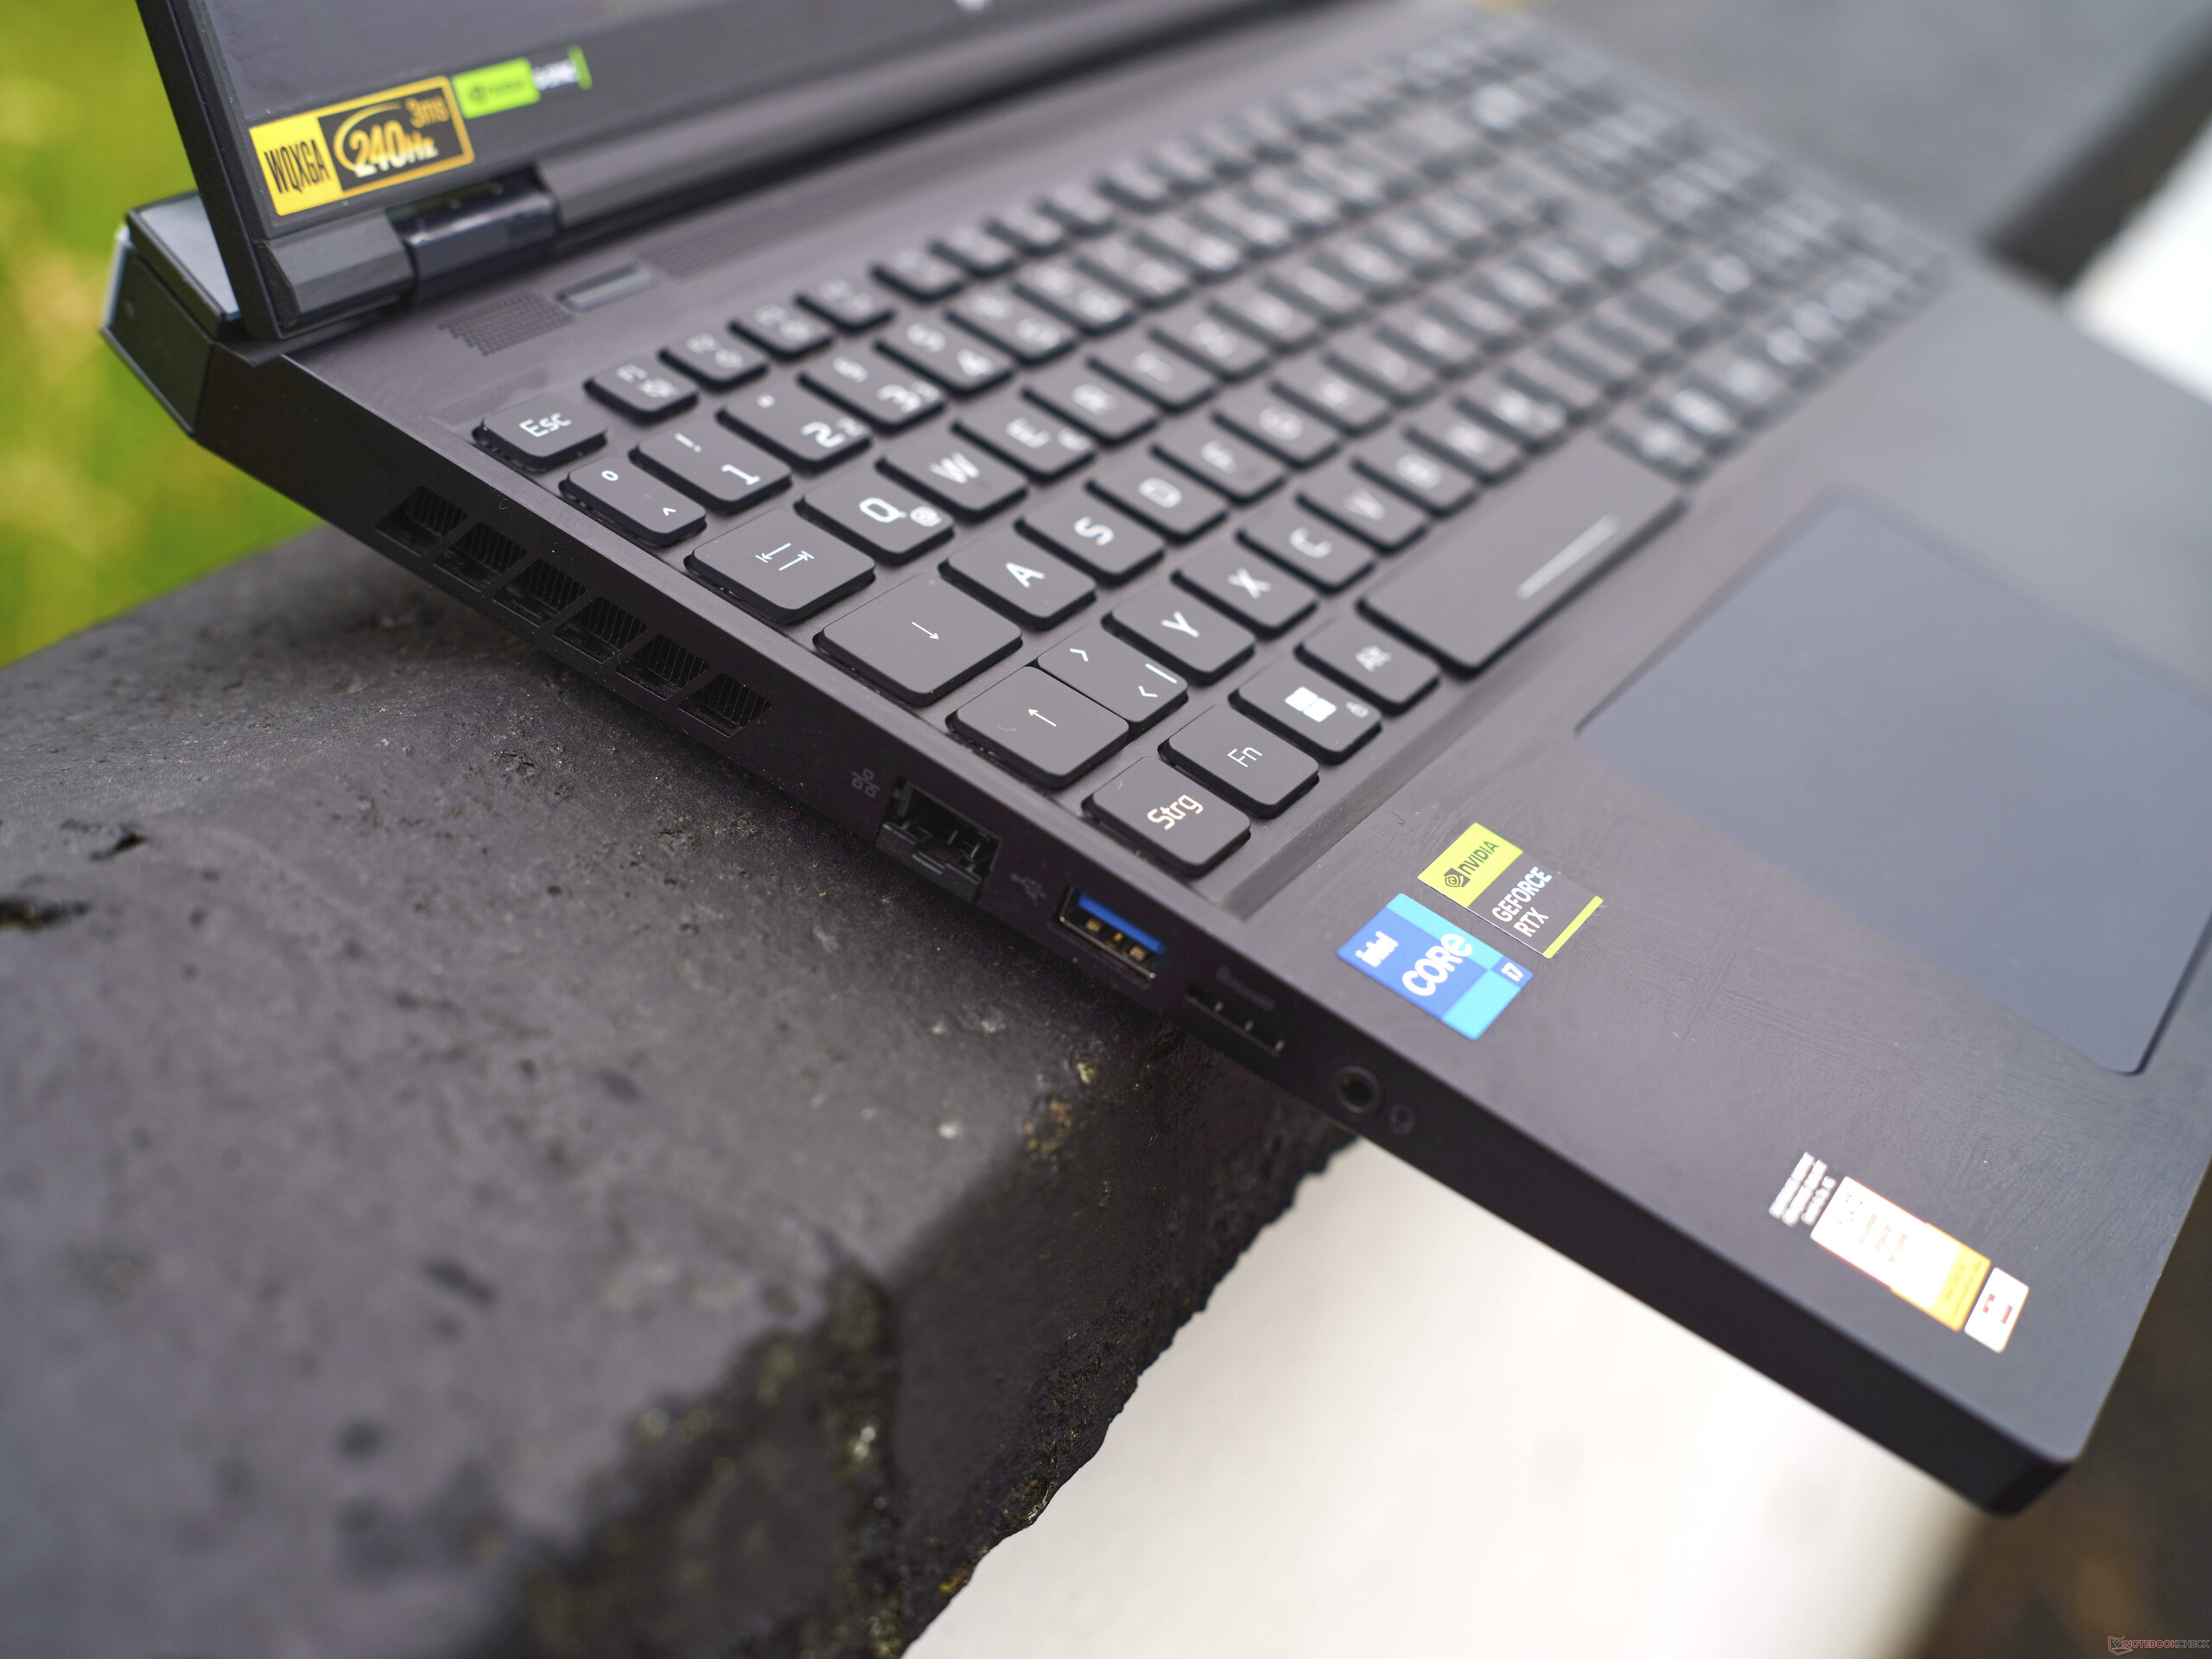
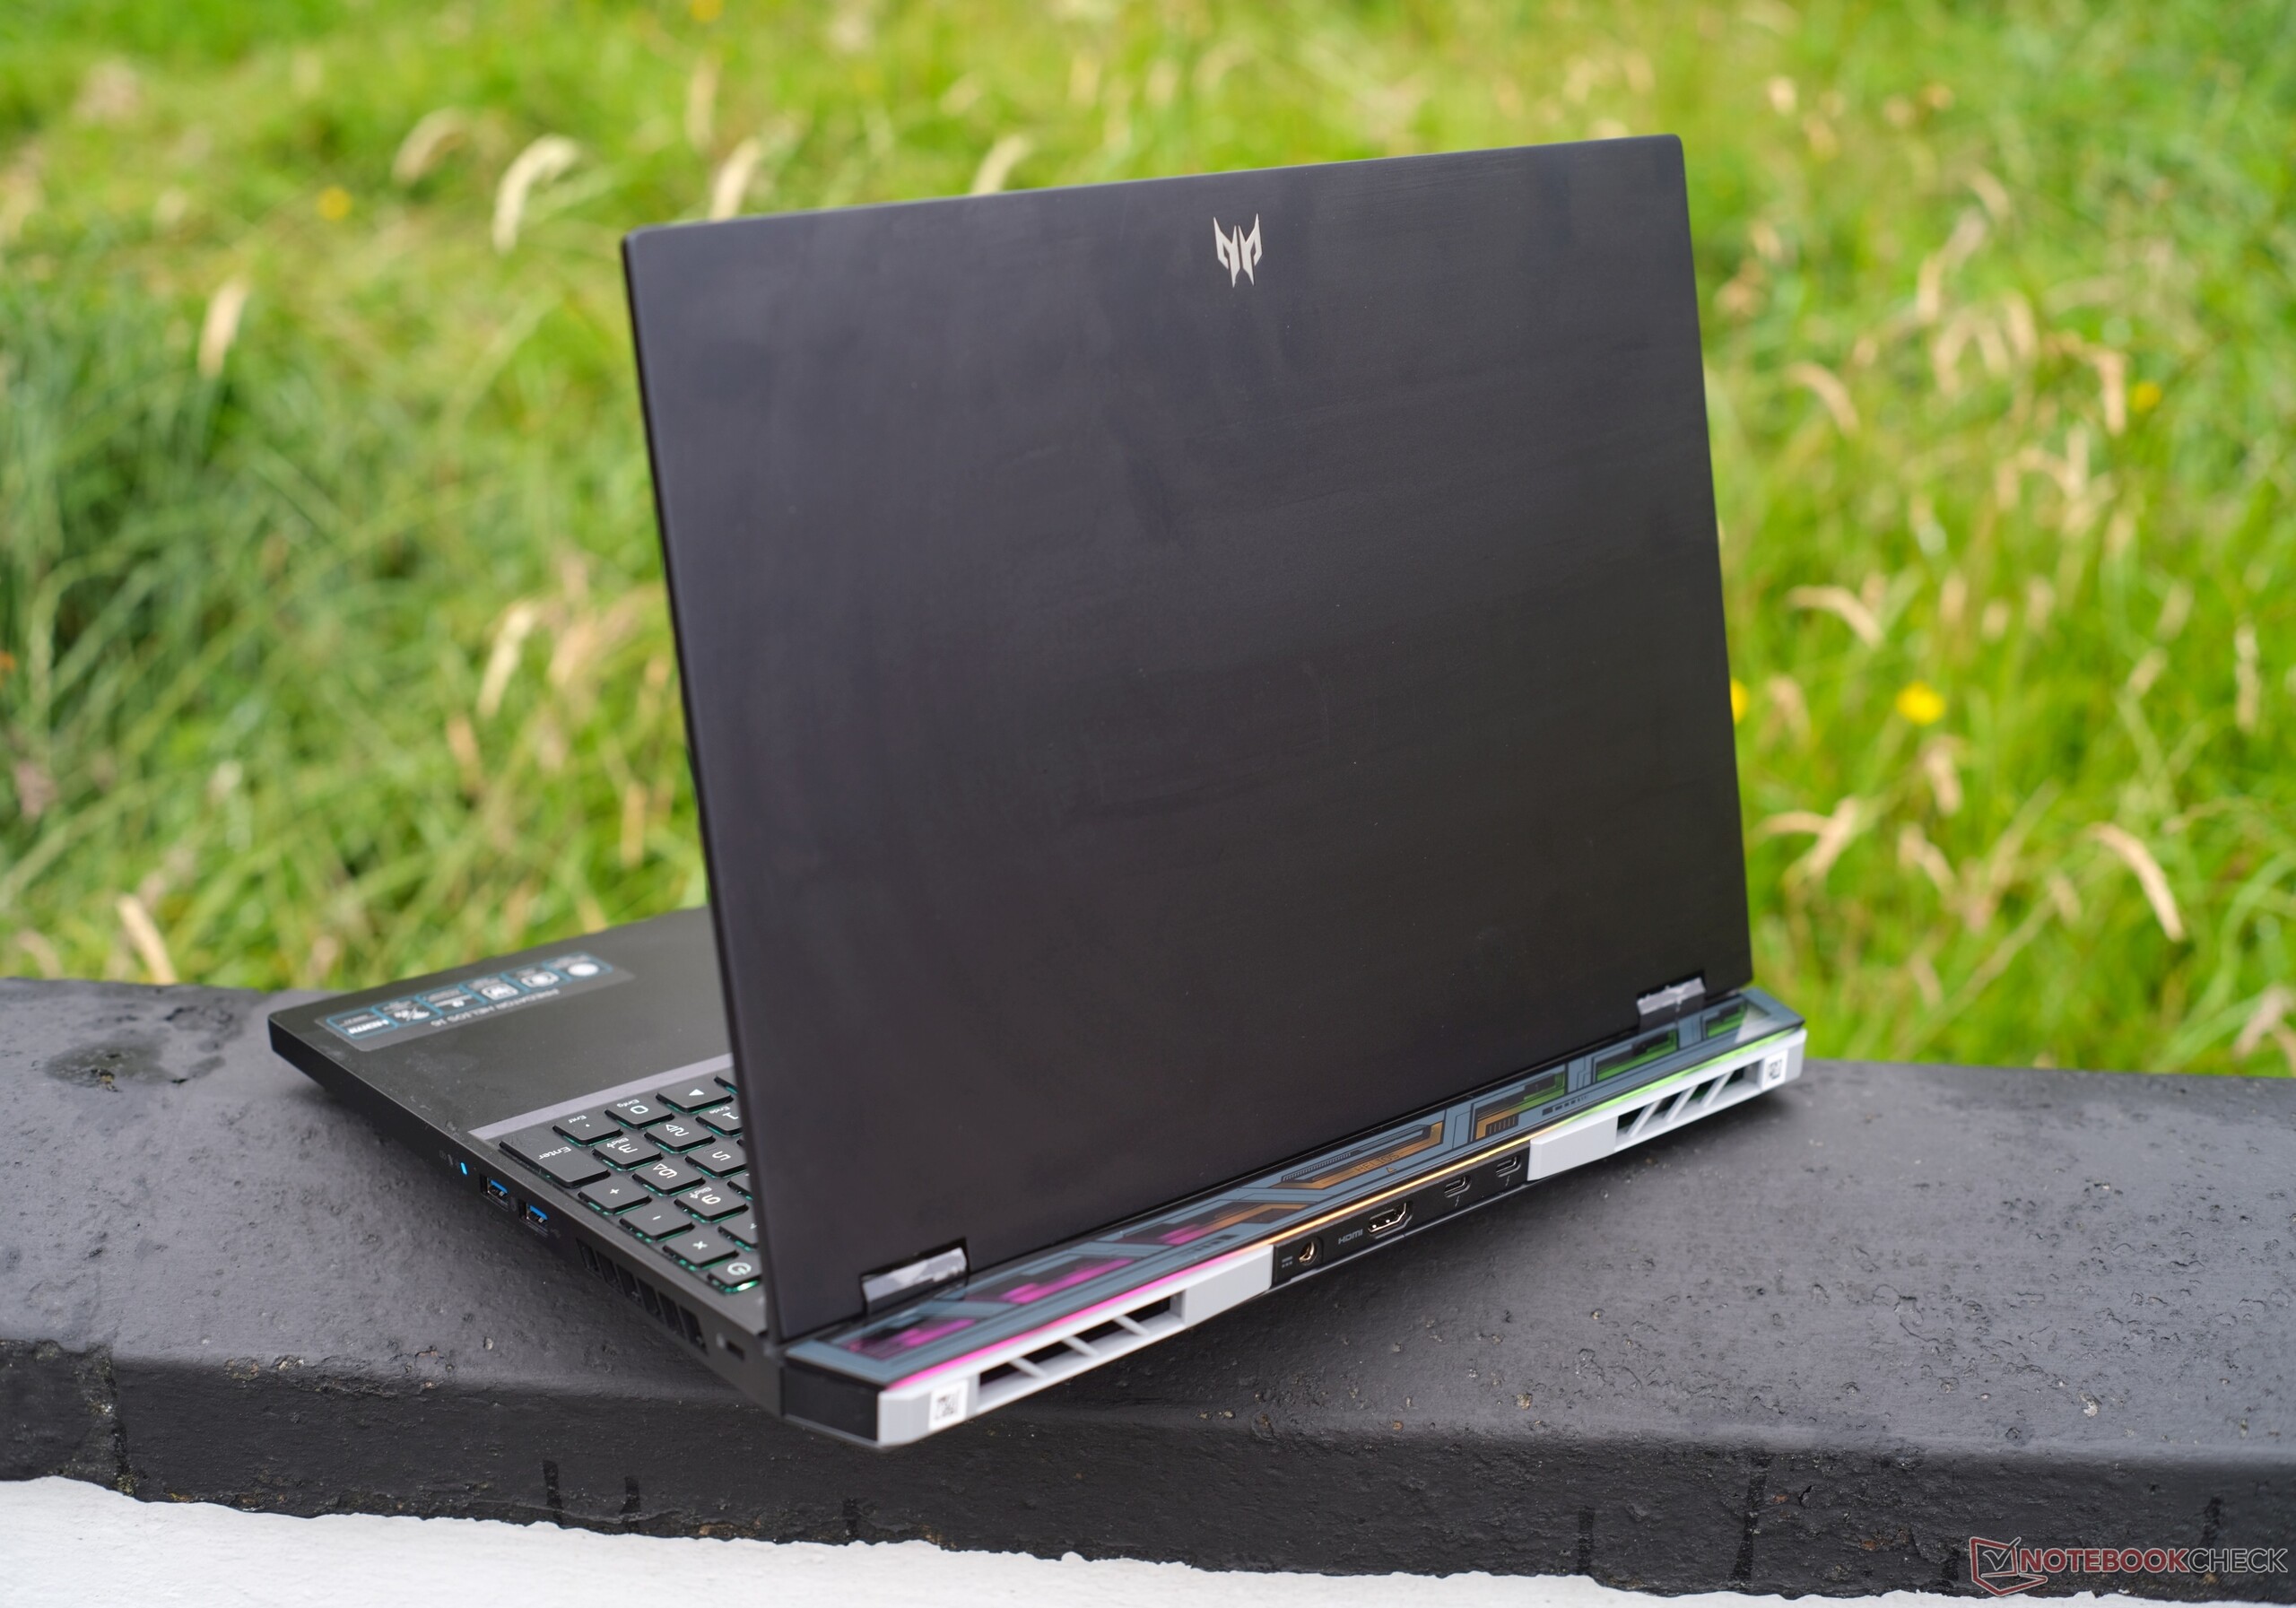
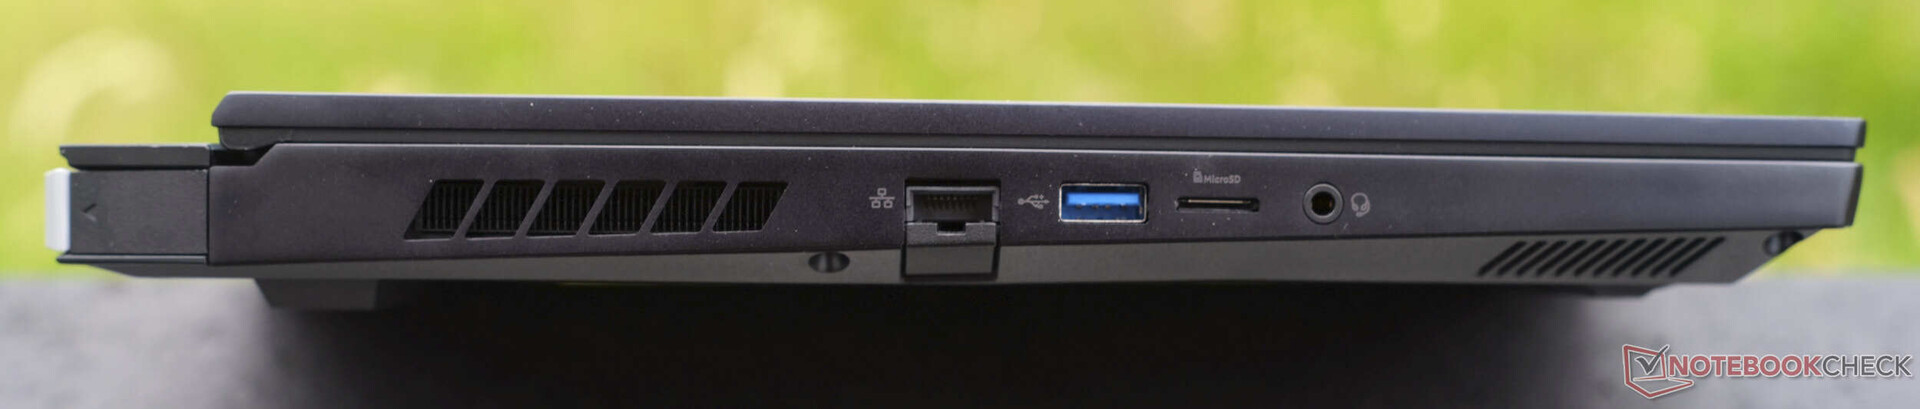
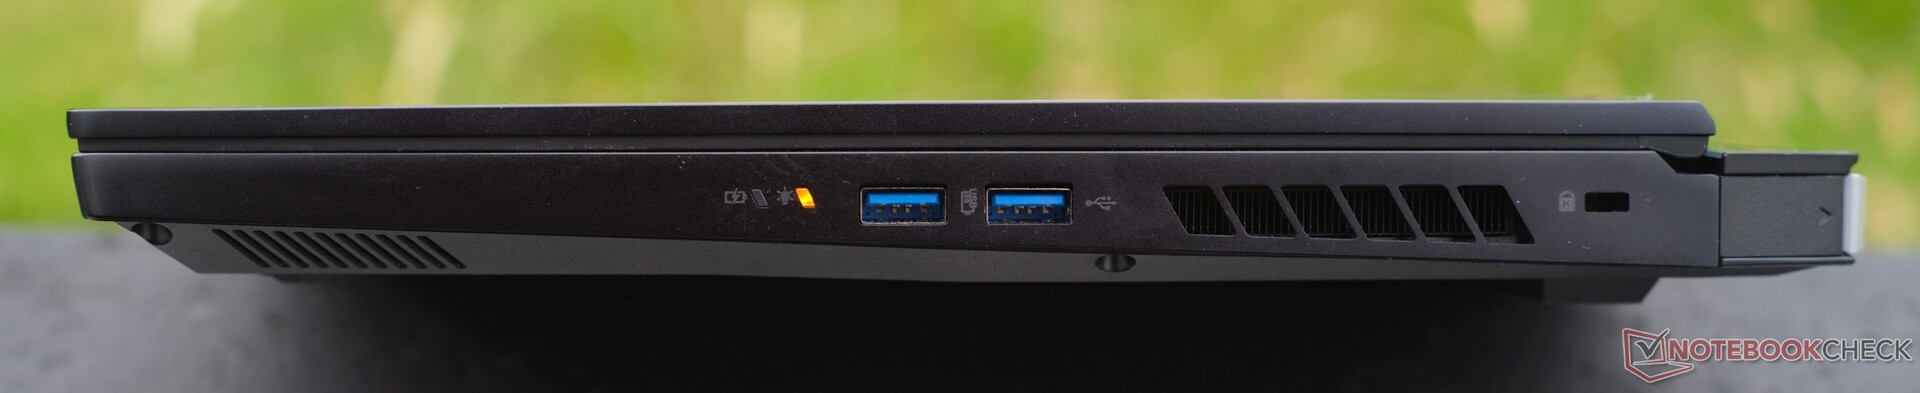
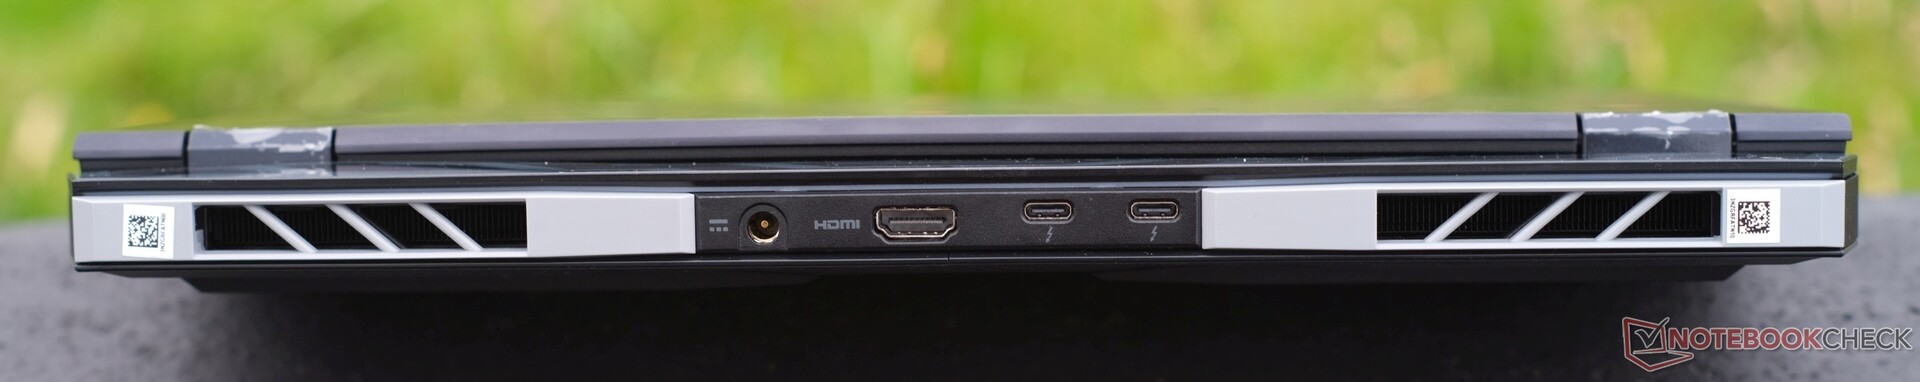
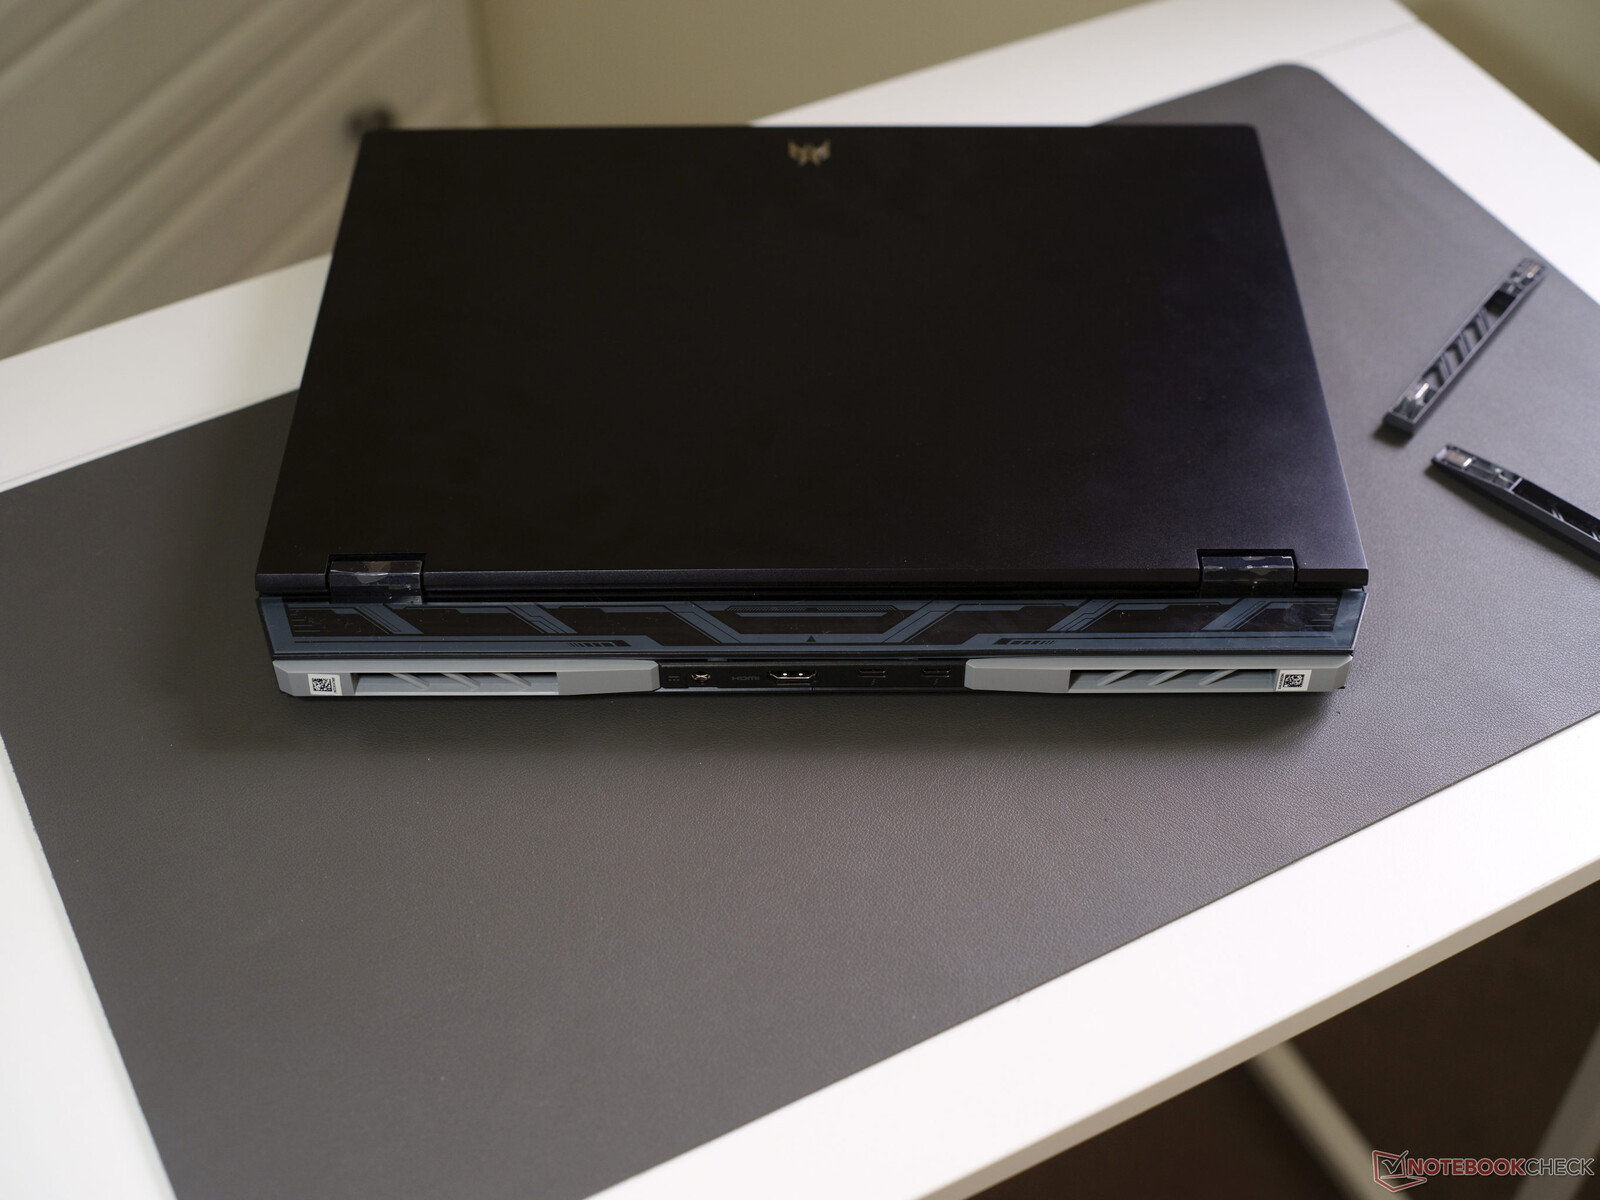
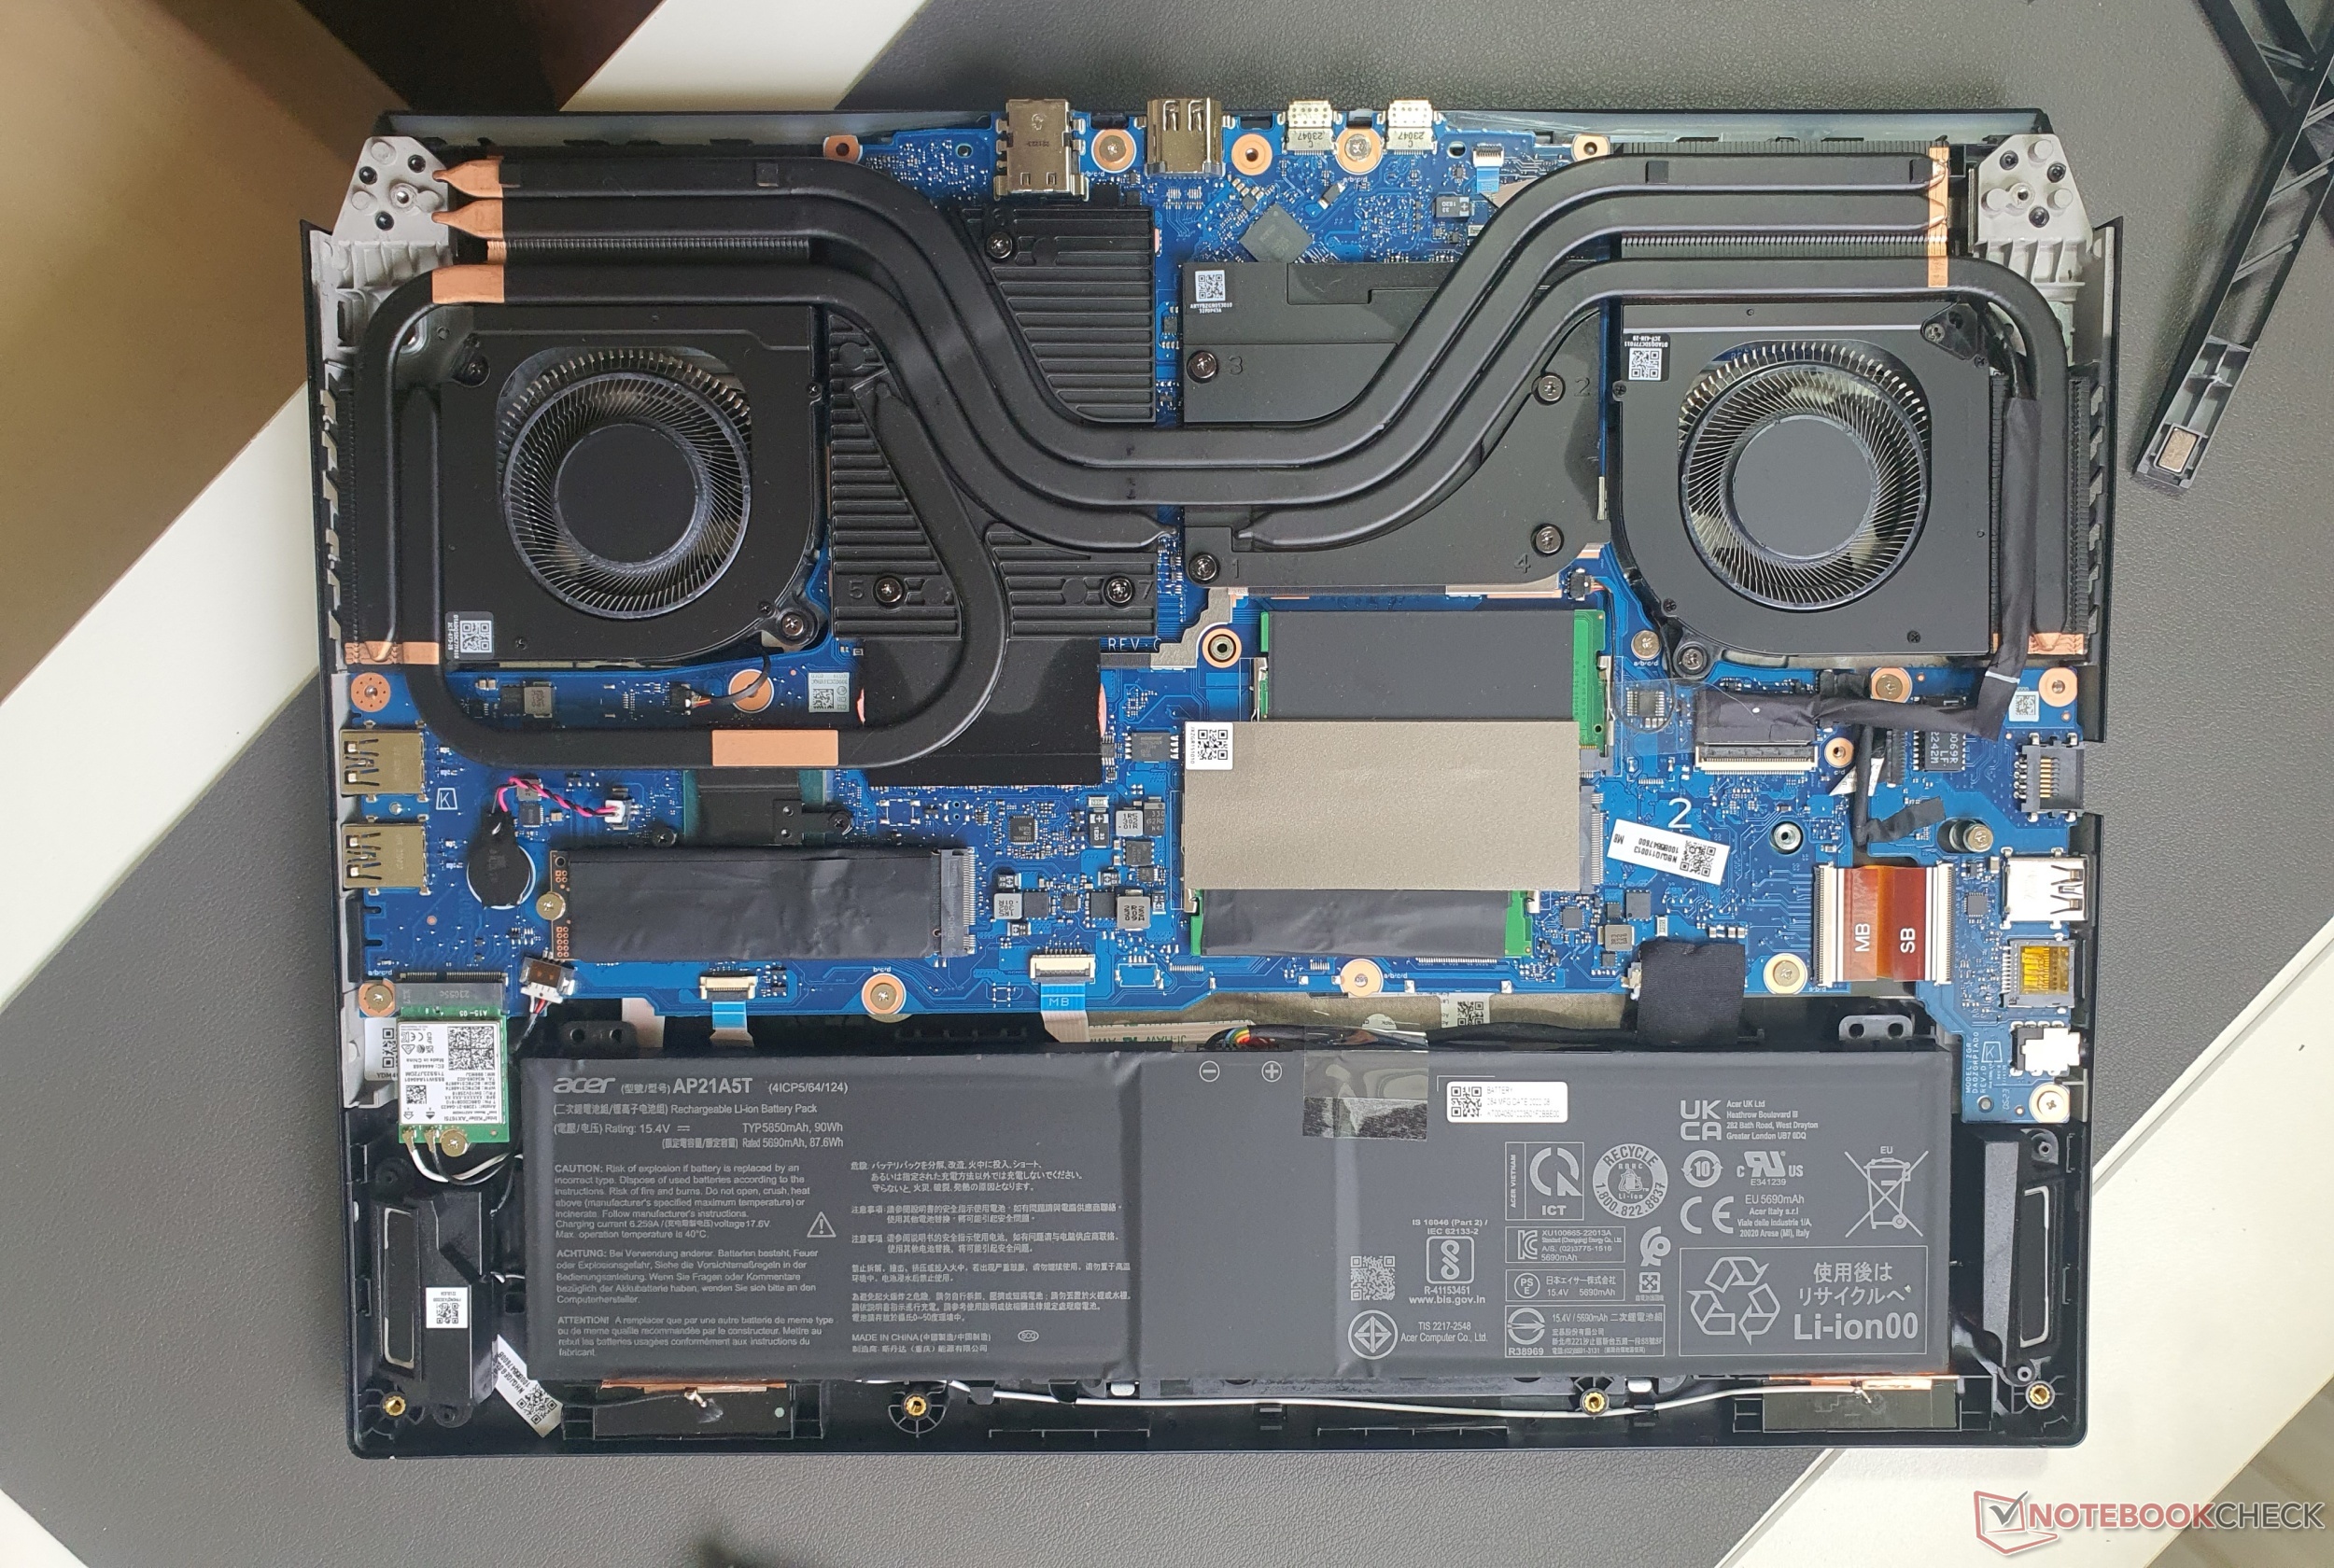
O laptop para jogos da Acer tem várias portas, incluindo 5x USB. À esquerda, há 1x USB-A 3.1 (5 GBit/s), à direita, 2x USB-A 3.2 (10 GBit/s), bem como 2x Thunderbolt 4 na parte traseira, que inclui DisplayPort 1.4 e Power Delivery (100 watts). O laptop também possui Gigabit ethernet, um leitor de cartão microSD, um conector de áudio de 3,5 mm, uma trava Kensington, HDMI 2.1 e o conector de carregamento.
Leitor de cartão SD
Emparelhado com nosso cartão de referência AV PRO microSD 128 GB V60, o leitor de cartão microSD não é necessariamente lento, mas também não é muito rápido, o que é uma pena, considerando o preço do Helios 16. Entretanto, os dispositivos em nosso campo de concorrentes (pelo menos os equipados com um leitor de cartão) leem e copiam dados com a mesma rapidez.
| SD Card Reader | |
| average JPG Copy Test (av. of 3 runs) | |
| Média da turma Gaming (20.9 - 210, n=55, últimos 2 anos) | |
| Lenovo Legion S7 16ARHA7 (AV PRO microSD 128 GB V60) | |
| Medion Erazer Defender P40 (AV PRO microSD 128 GB V60) | |
| Acer Nitro 16 AN16-41 (AV Pro SD microSD 128 GB V60) | |
| HP Omen 17-ck2097ng (AV PRO microSD 128 GB V60) | |
| Acer Predator Helios 16 PH16-71-731Q | |
| maximum AS SSD Seq Read Test (1GB) | |
| Média da turma Gaming (25.5 - 261, n=52, últimos 2 anos) | |
| Medion Erazer Defender P40 (AV PRO microSD 128 GB V60) | |
| Lenovo Legion S7 16ARHA7 (AV PRO microSD 128 GB V60) | |
| Acer Predator Helios 16 PH16-71-731Q | |
| Acer Nitro 16 AN16-41 (AV Pro SD microSD 128 GB V60) | |
| HP Omen 17-ck2097ng (AV PRO microSD 128 GB V60) | |
Comunicação
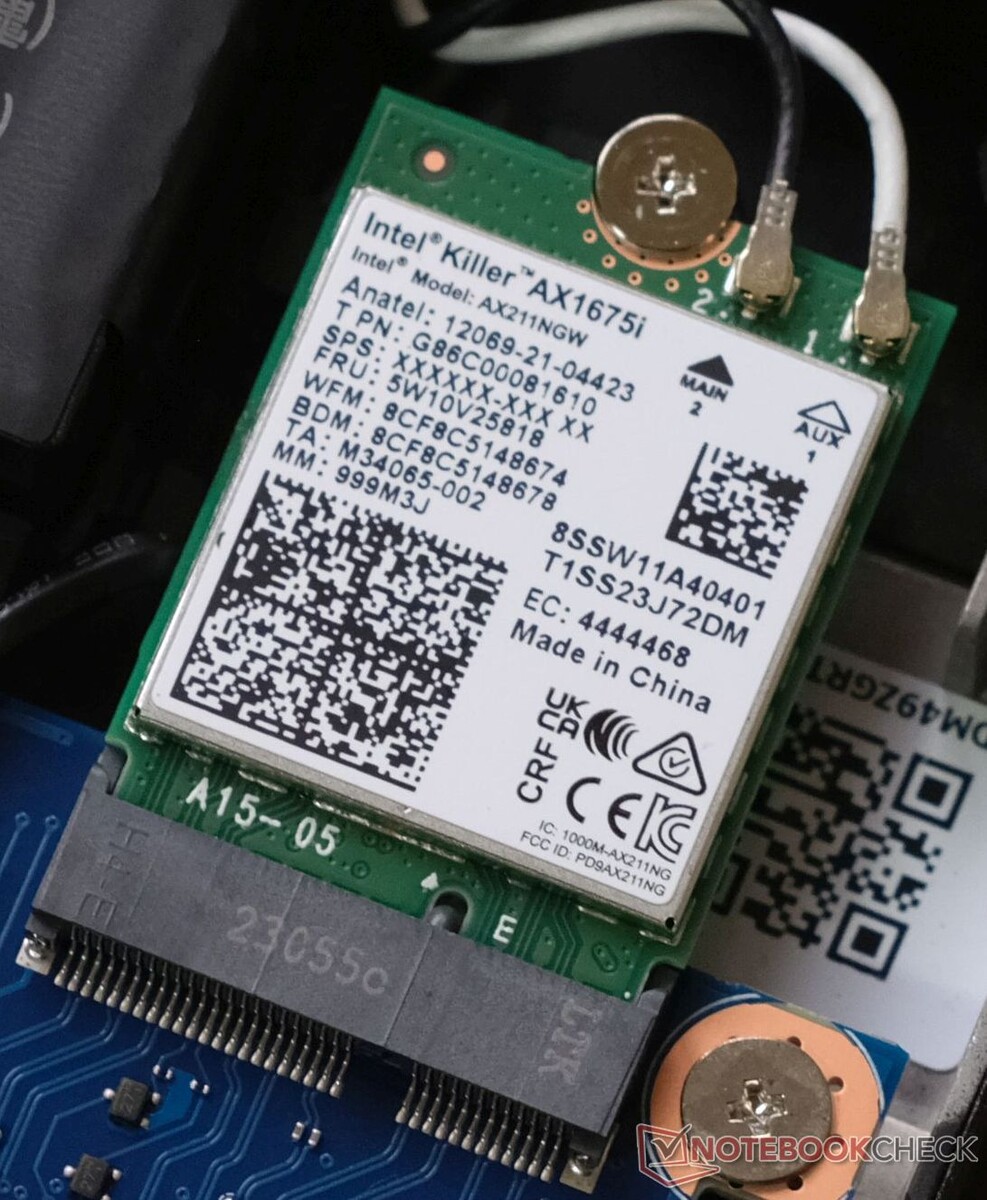
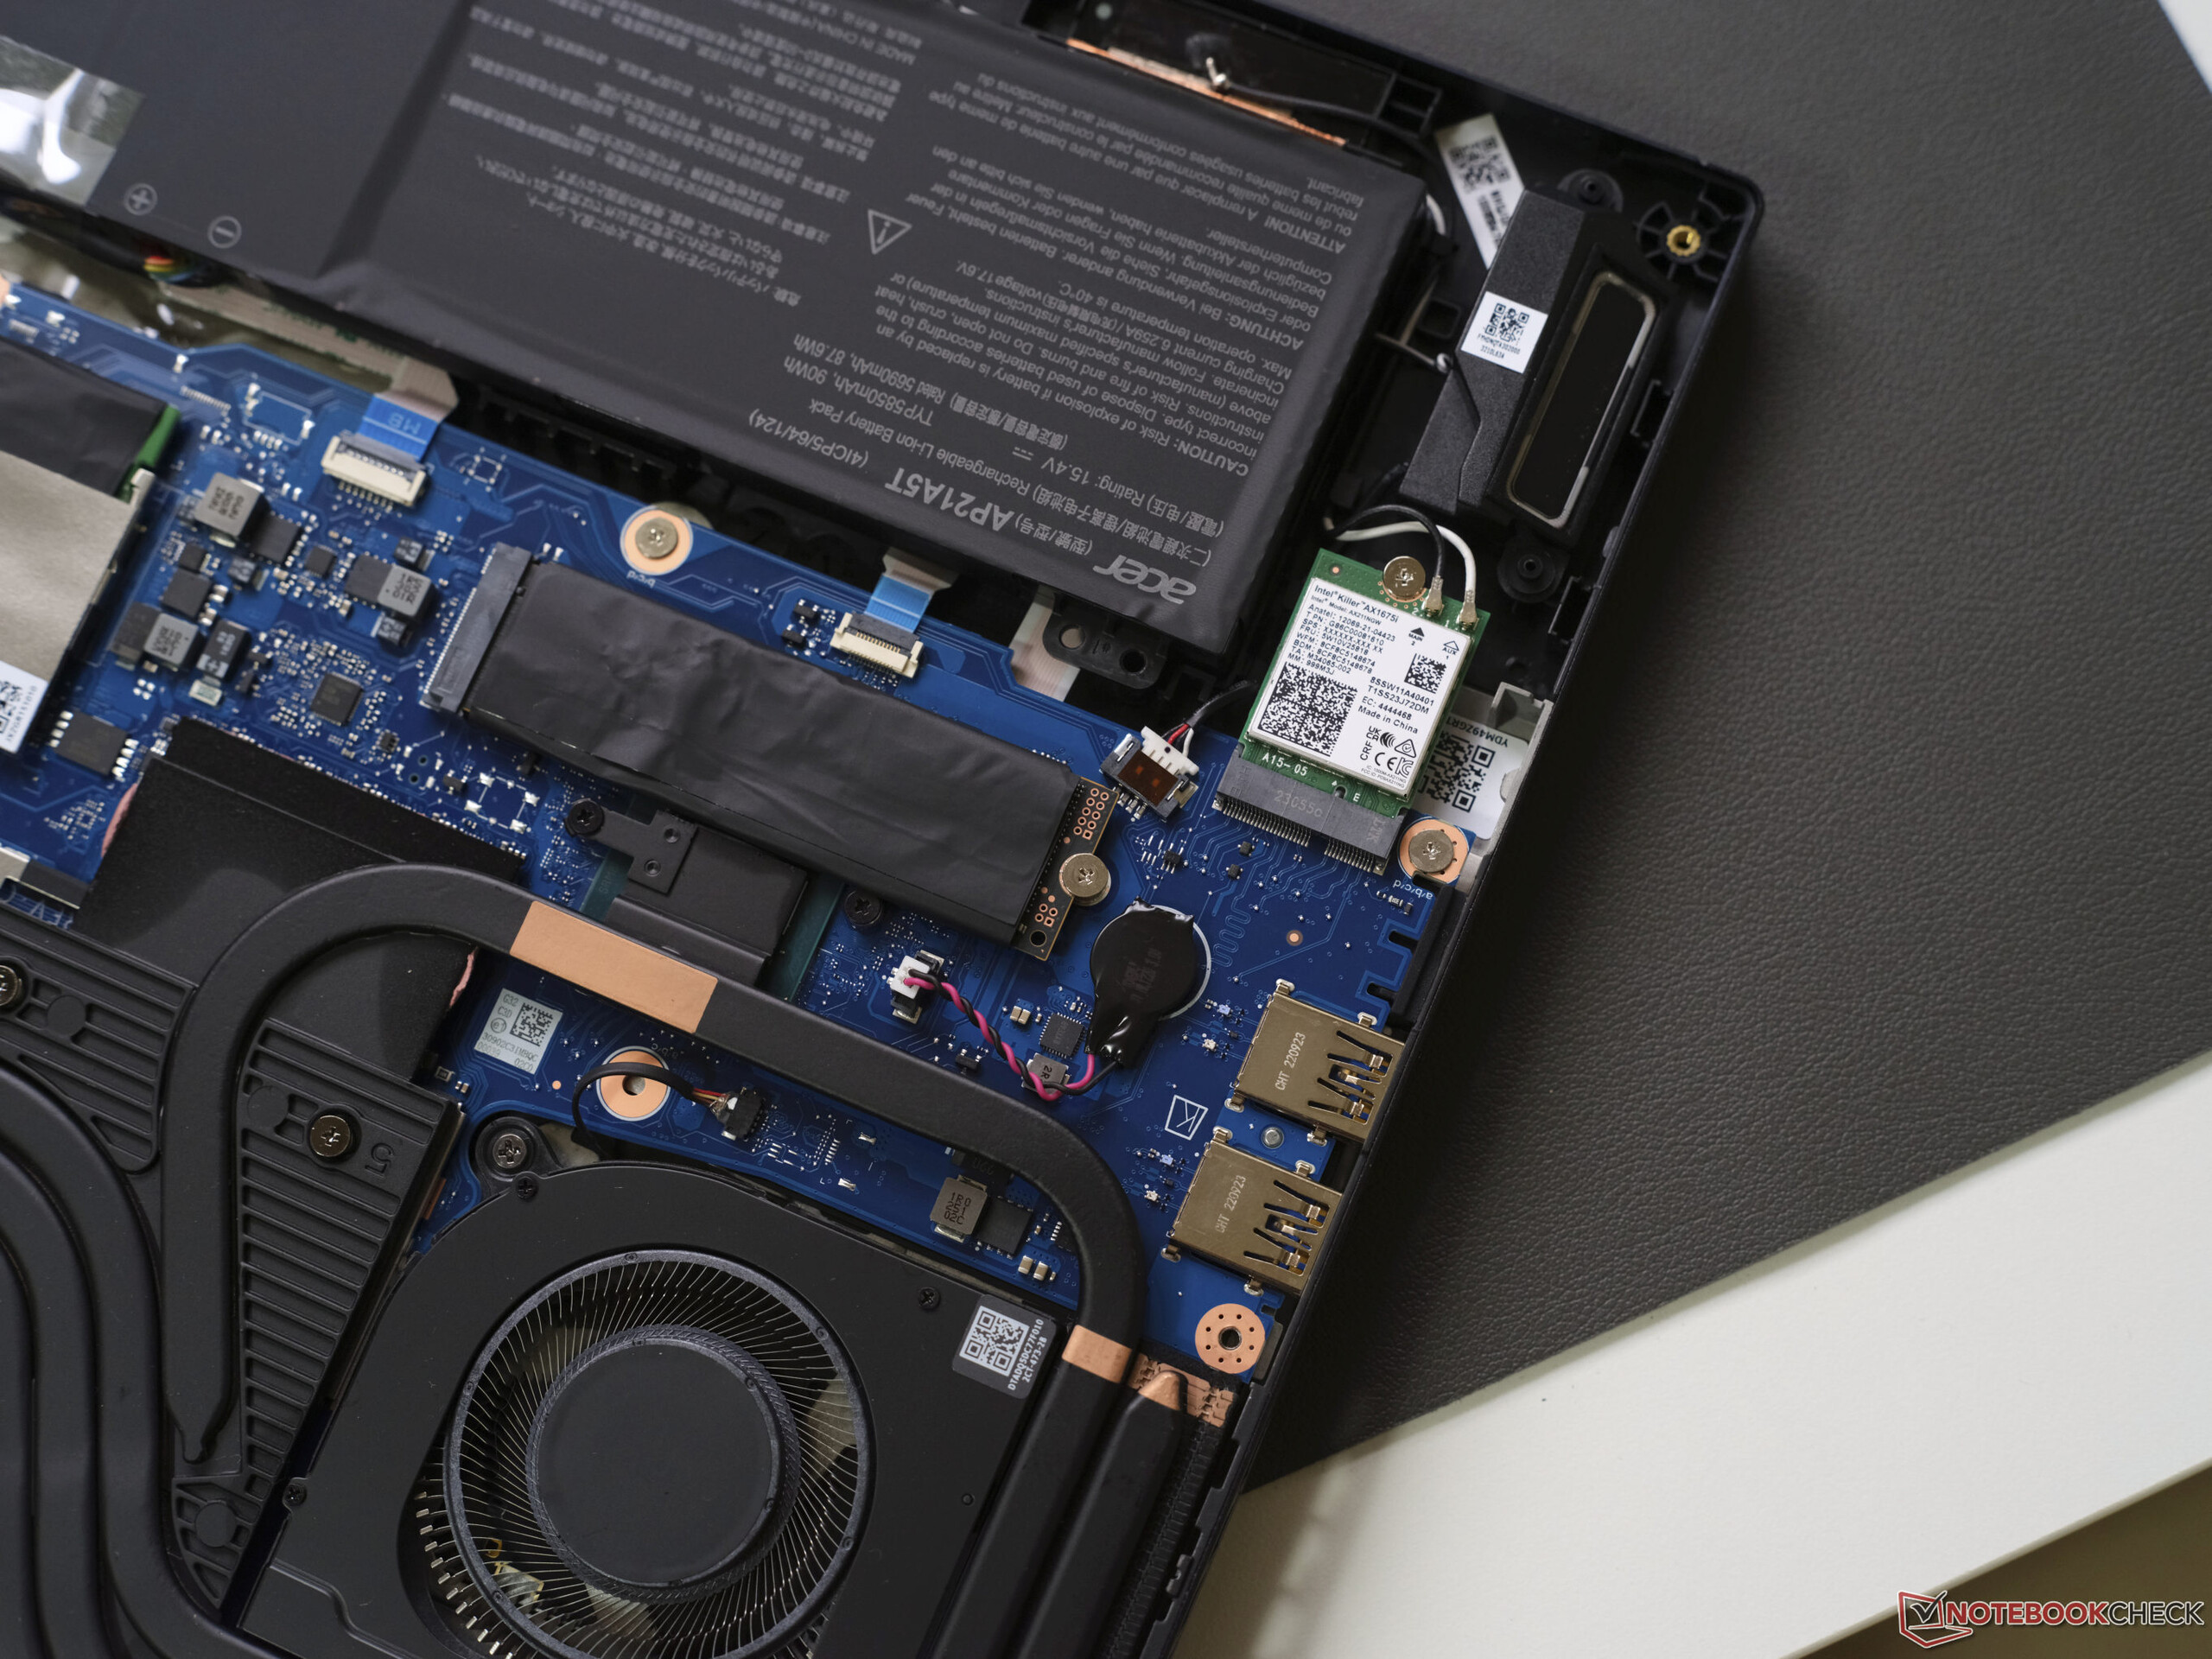
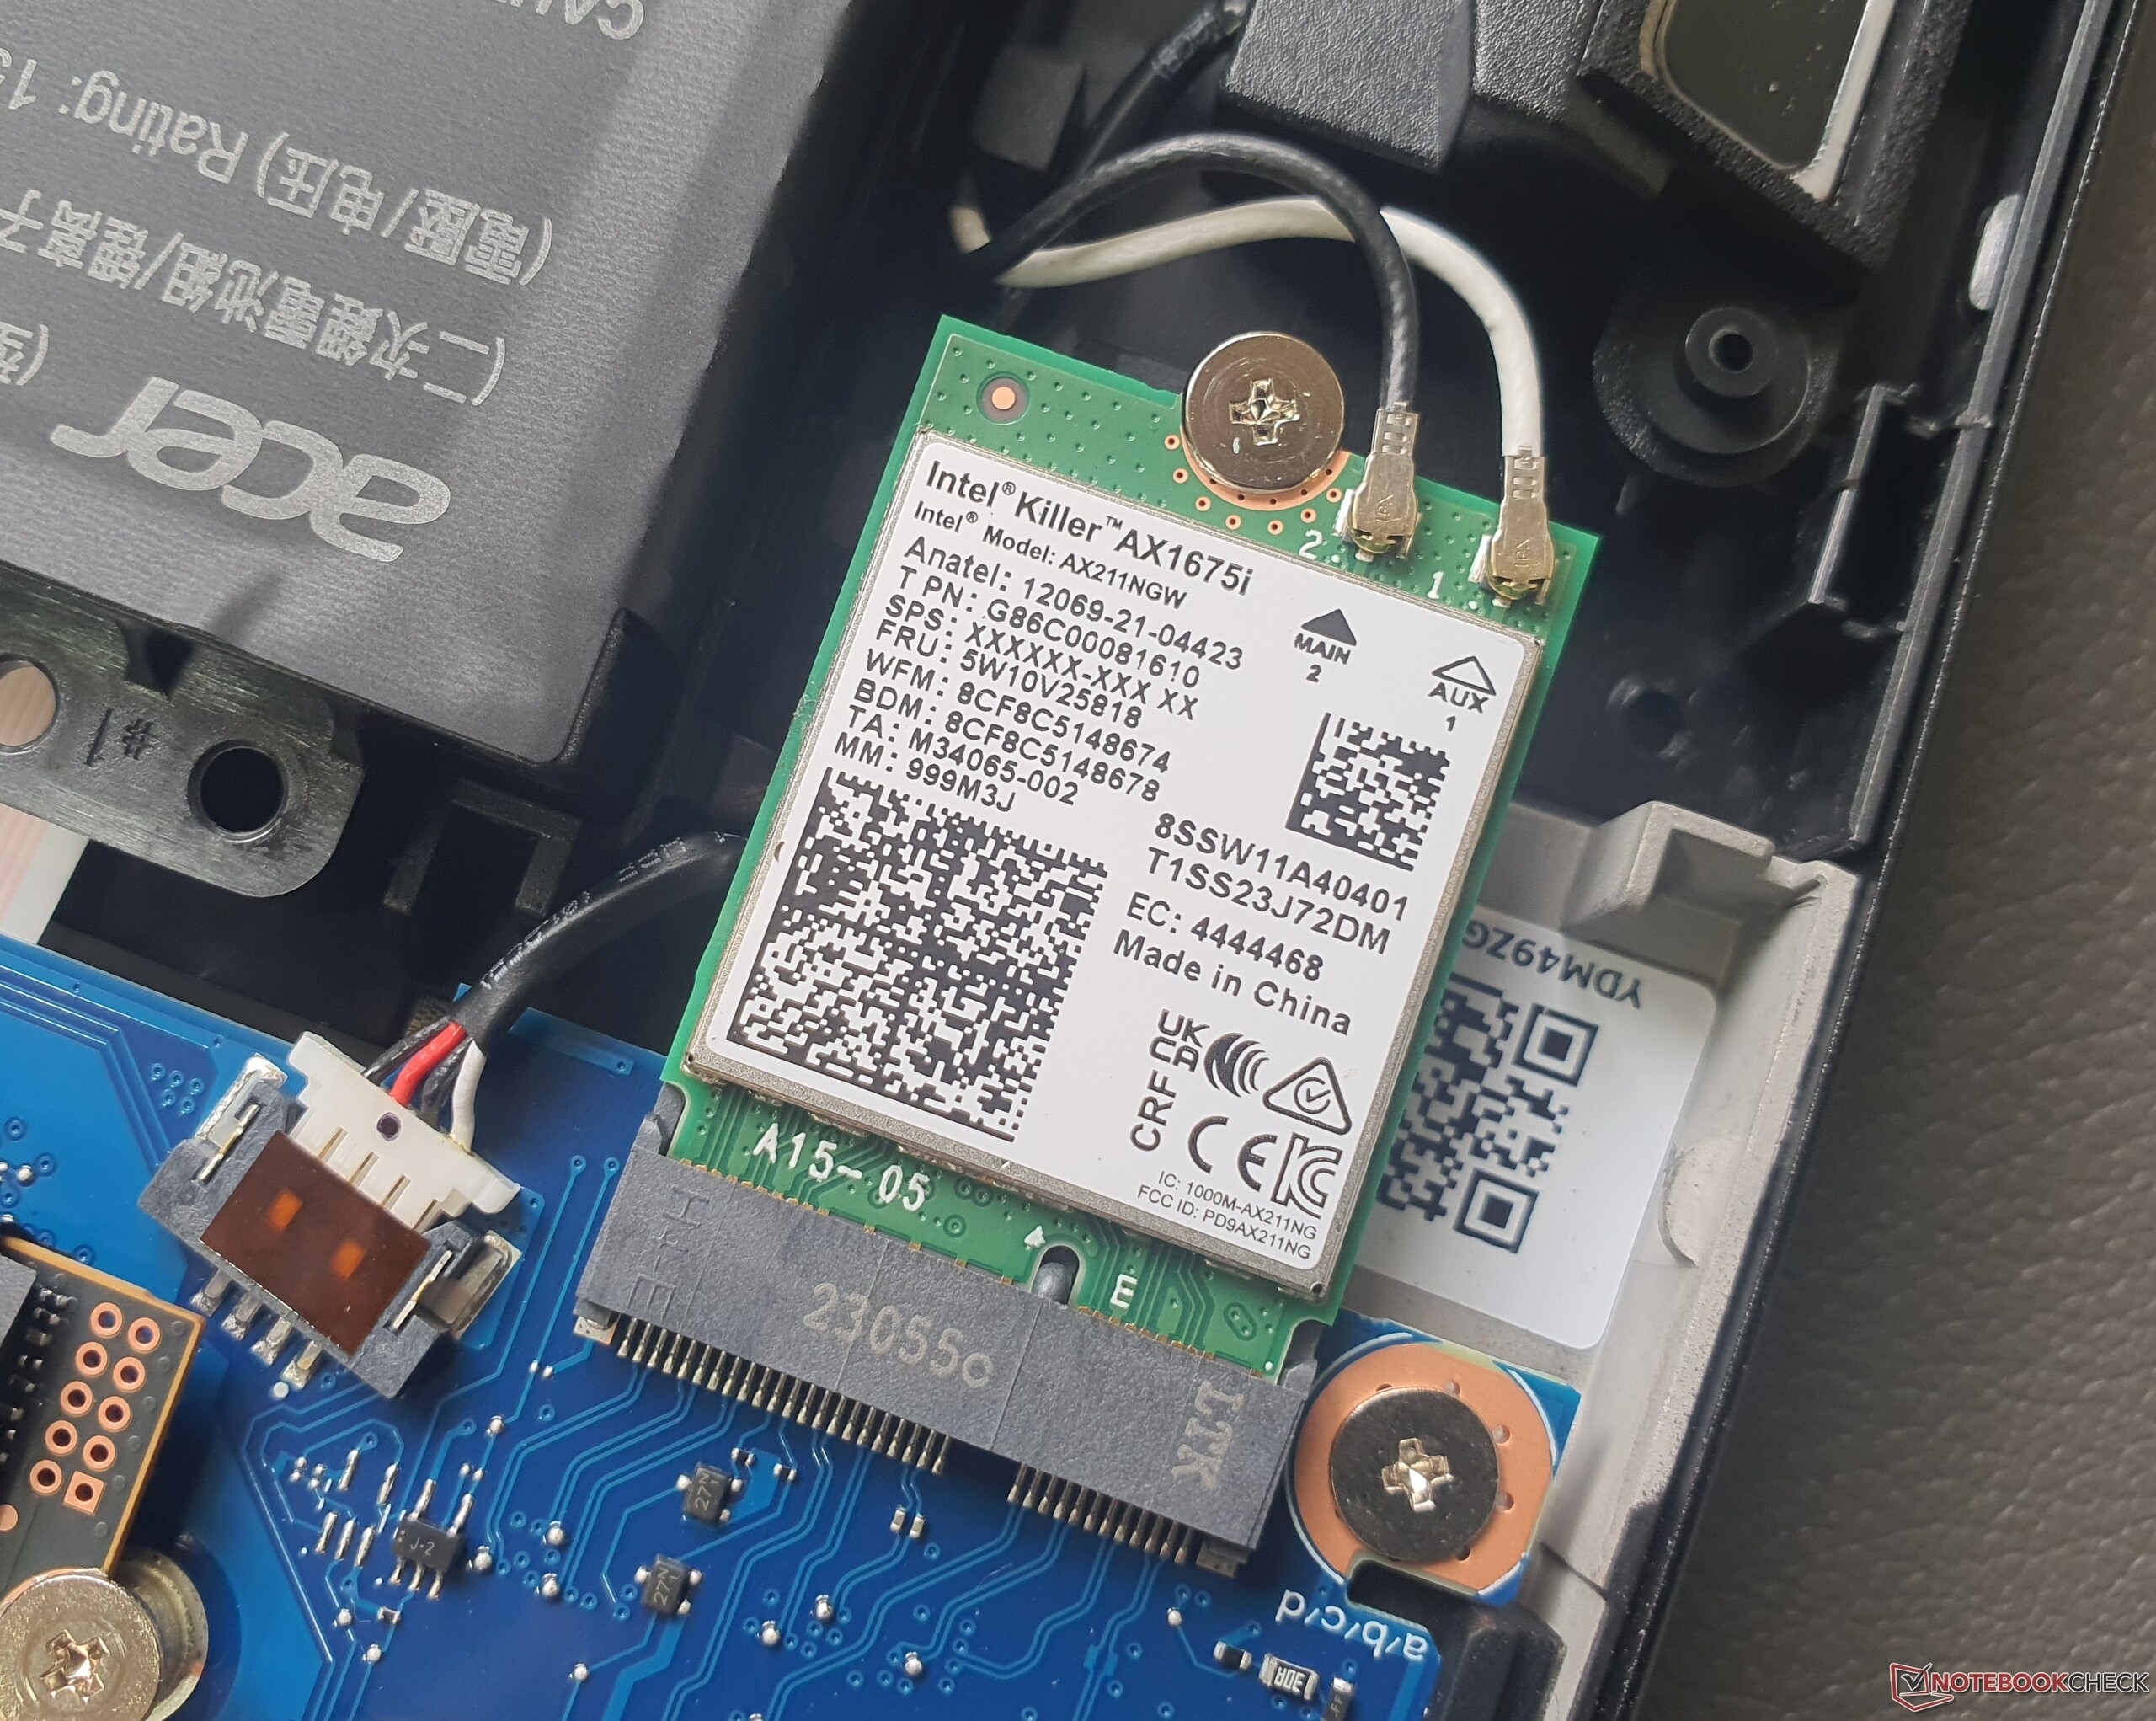
O chip Intel Killer AX1675i Wi-Fi 6E é responsável pela transmissão da rede sem fio, operando em uma velocidade de primeira classe de até 1,6 GBit/s e é mais rápido do que a porta Gigabit RJ45 instalada (Killer 2600) permite, pois não suporta 2,5 GBit/s. Em particular, oLegion Pro 5 16e oTUF Gaming A16ficam um pouco atrás do Helios 16. O Bluetooth 5.2 está integrado.
Webcam
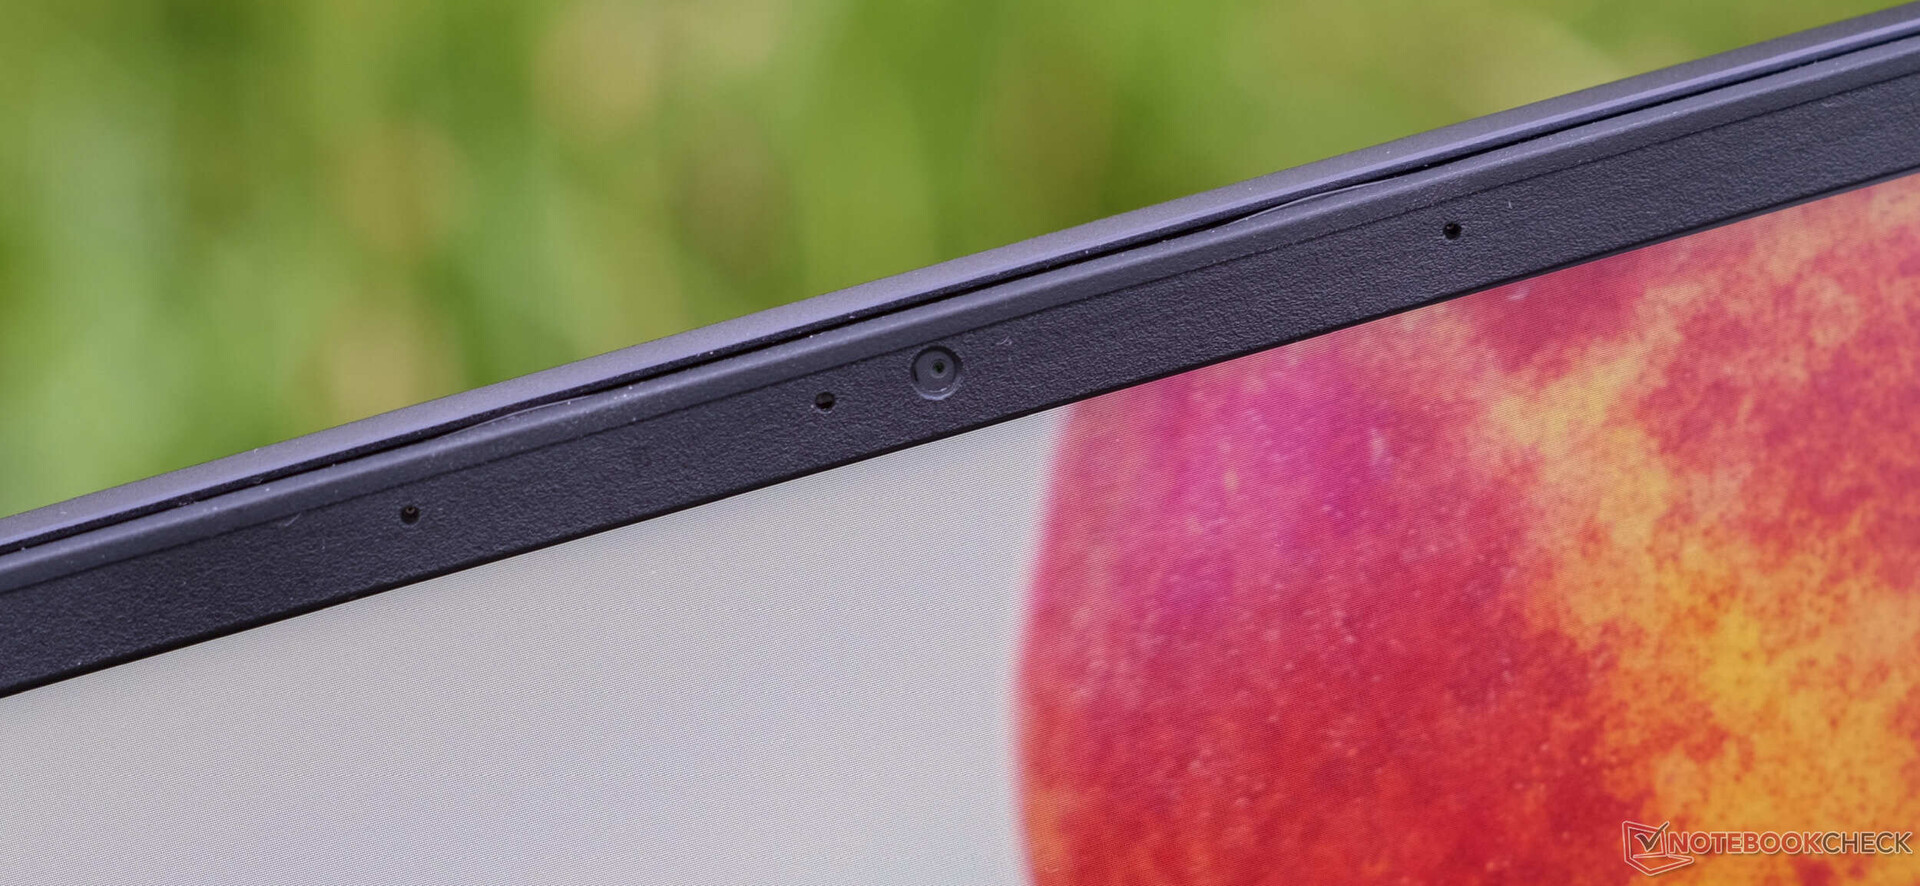
Sob boas condições de iluminação, a webcam de 1080p oferece imagens muito boas. Quando confrontada com uma luz de fundo (neste caso, proveniente de uma janela lateral sem fontes de luz adicionais), há uma redução drástica na qualidade. O Windows Hello é compatível, mas não há um obturador físico da câmera.


Acessórios

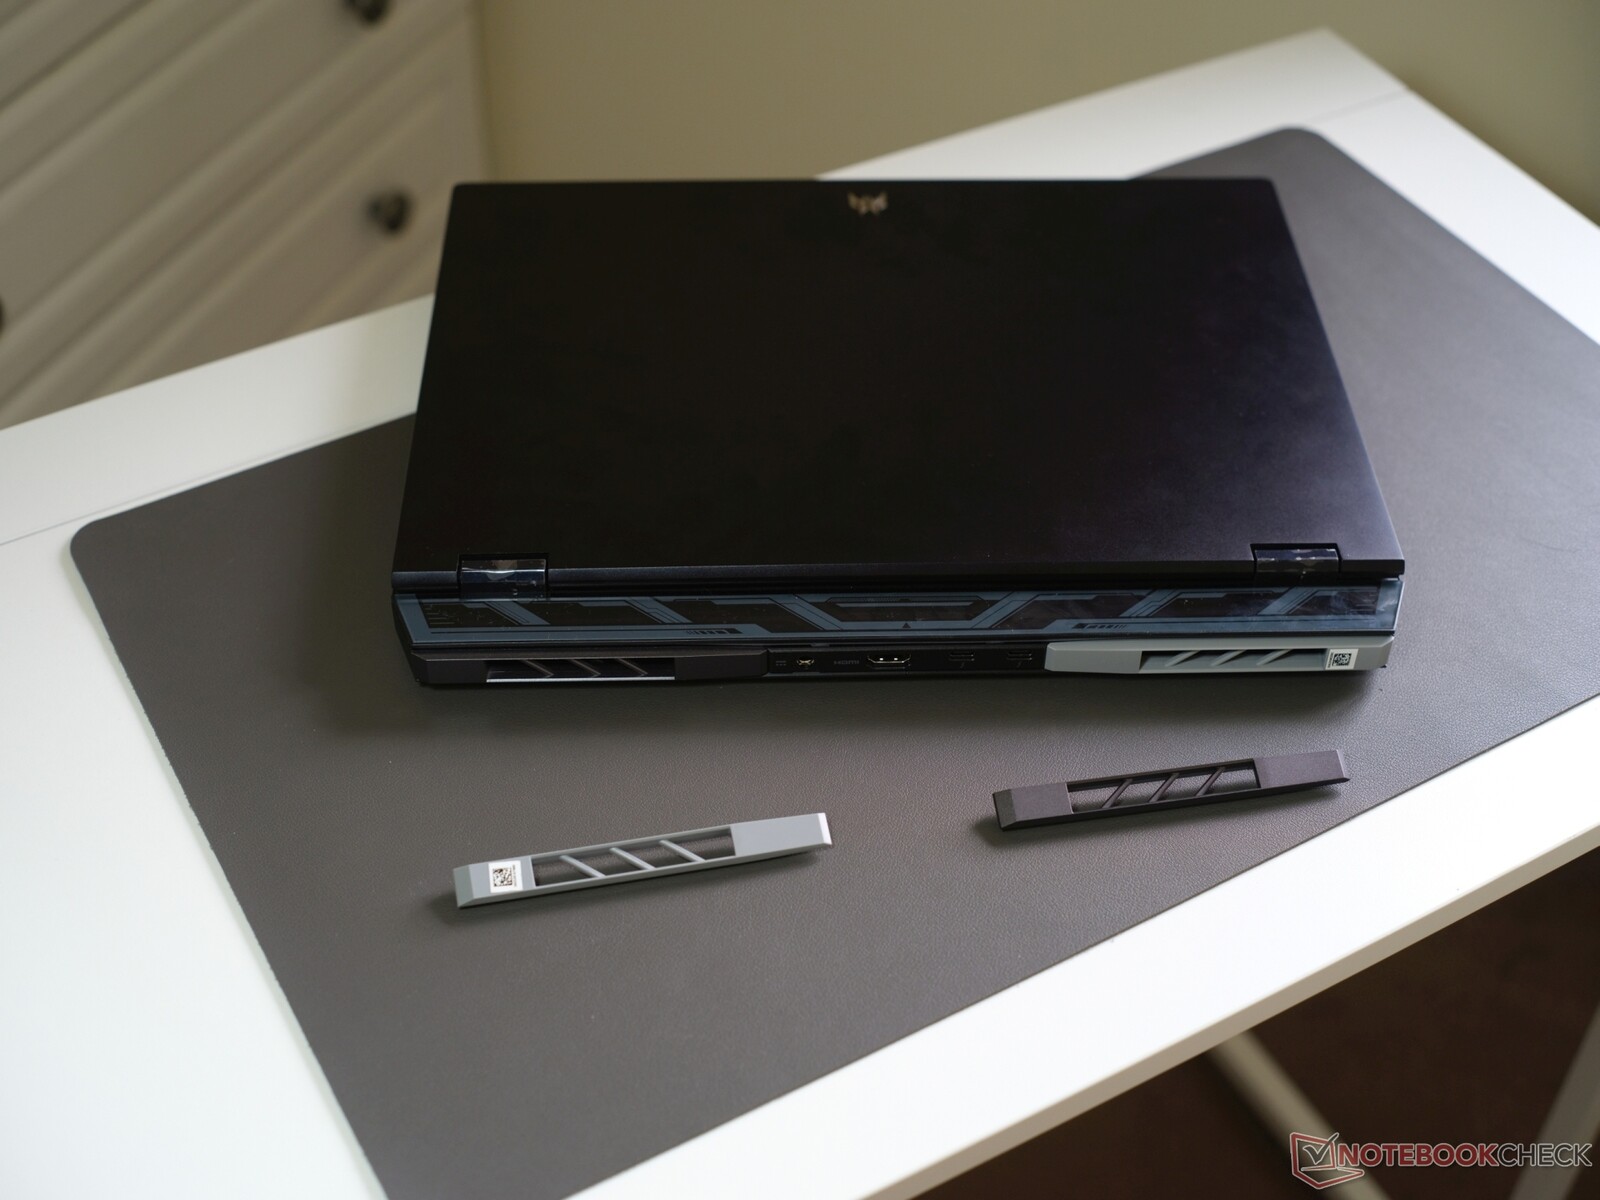
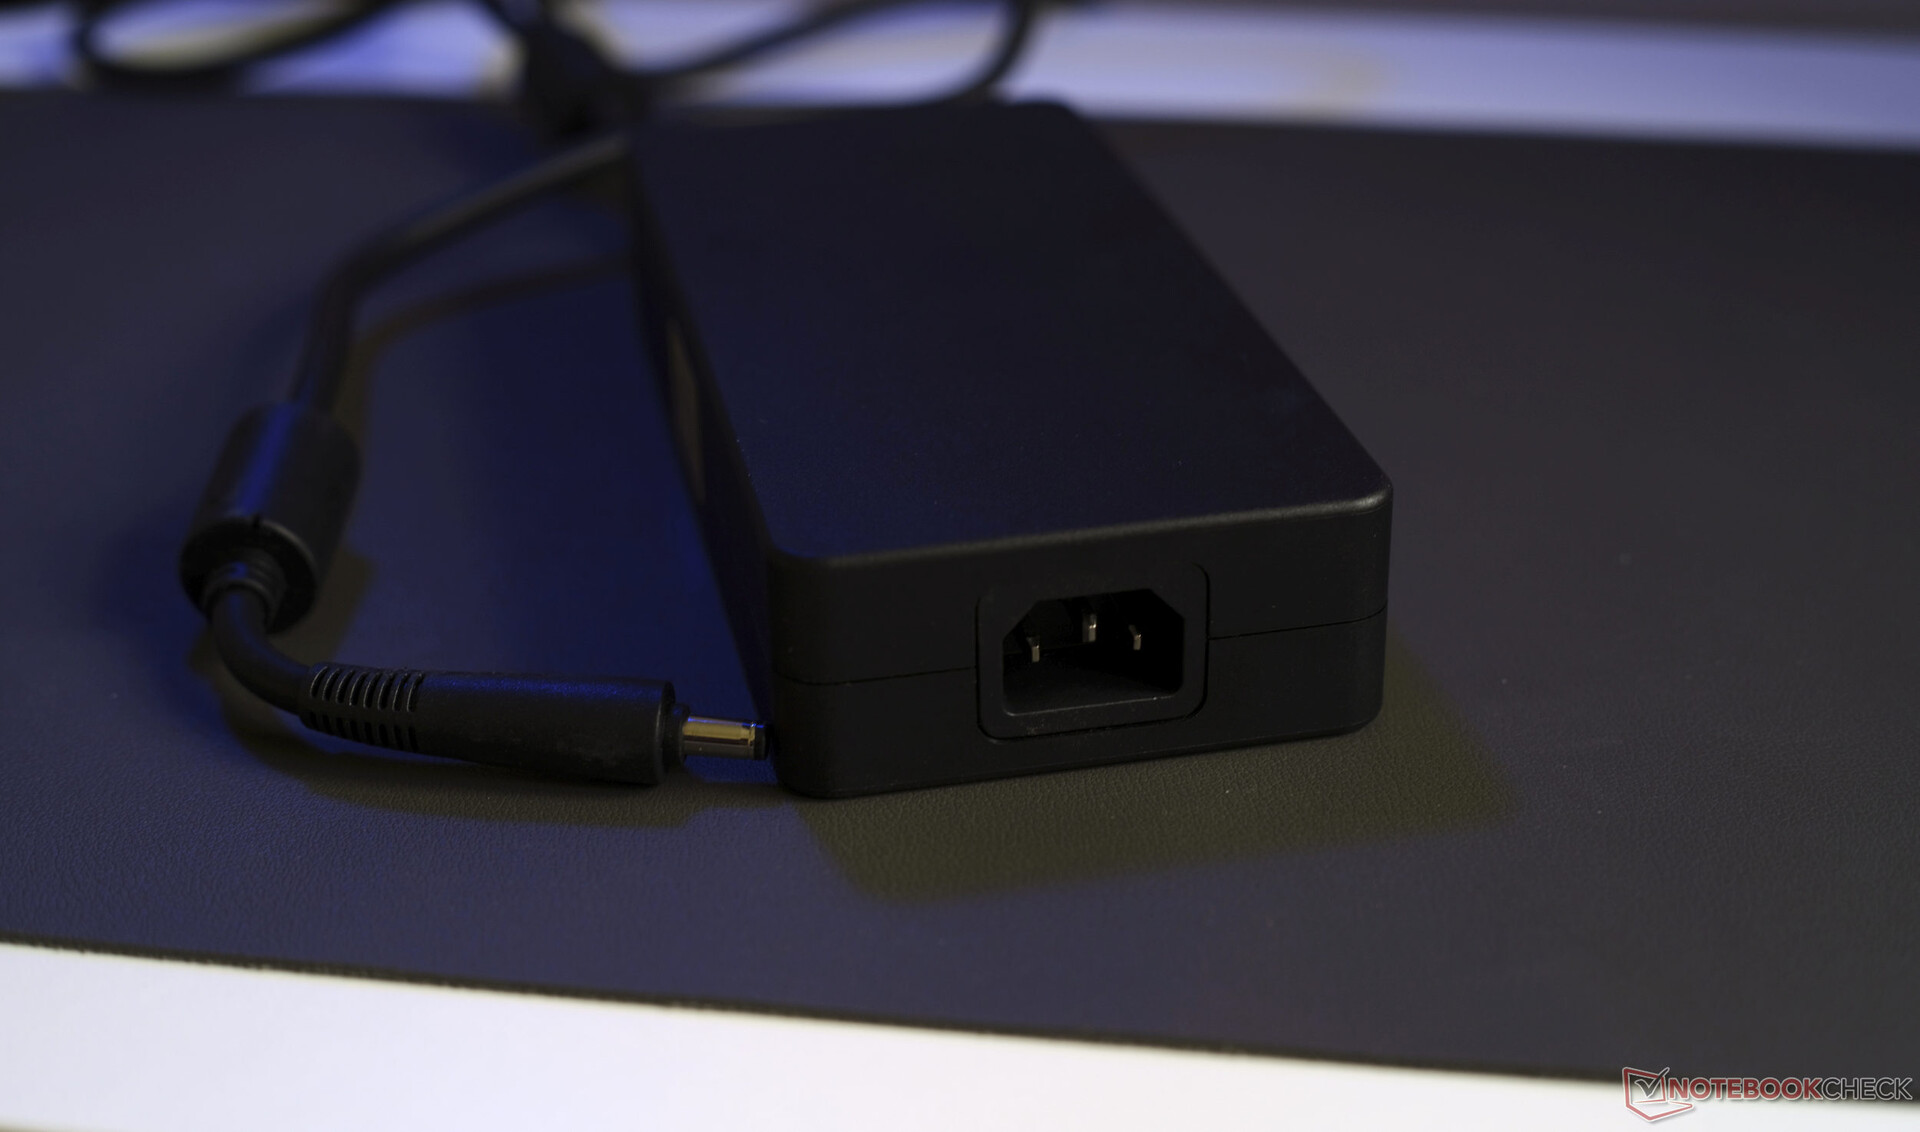
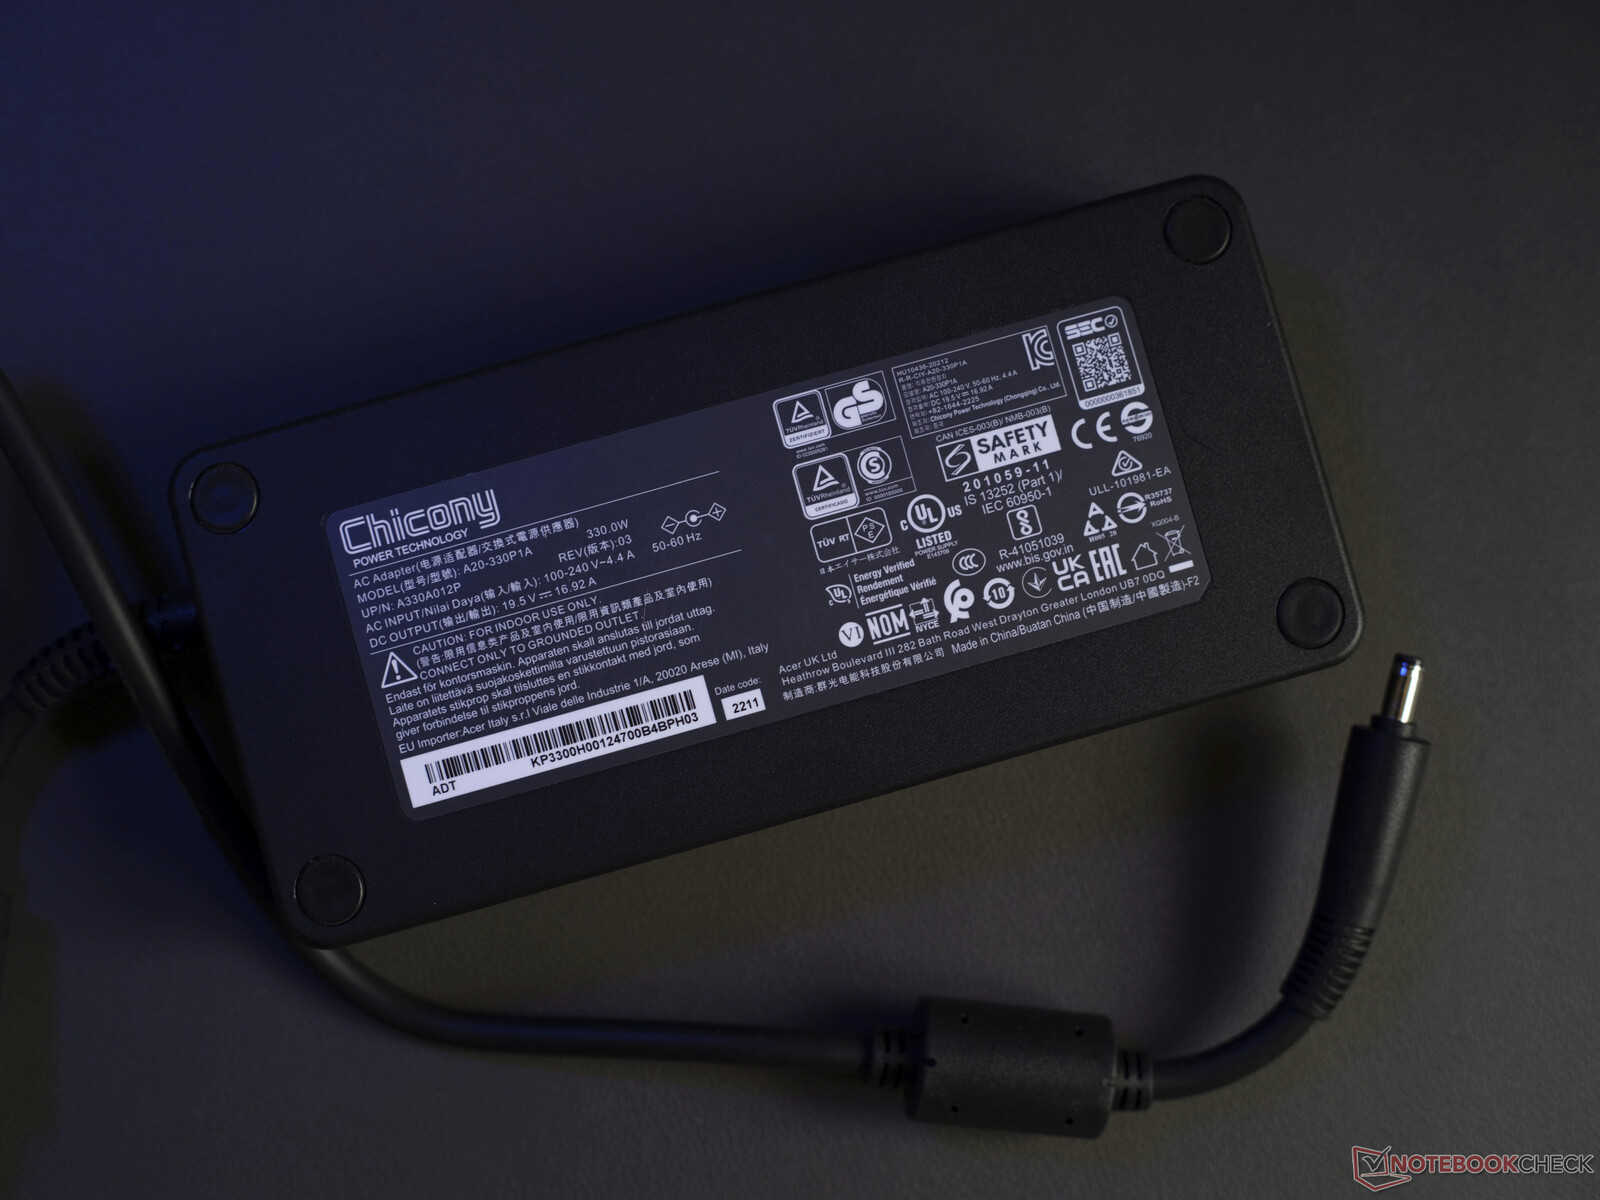
A Acer incluiu duas grades magnéticas adicionais em cinza claro para substituir as grades em cinza escuro pré-instaladas. Teria sido divertido usar cores mais ousadas. Além disso, há apenas a PSU de 330 watts. O fabricante não optou por uma embalagem ecologicamente correta.
As fotos à direita se aplicam ao pacote para jogos Predator atualmente disponível na loja alemã da Acer.
Manutenção
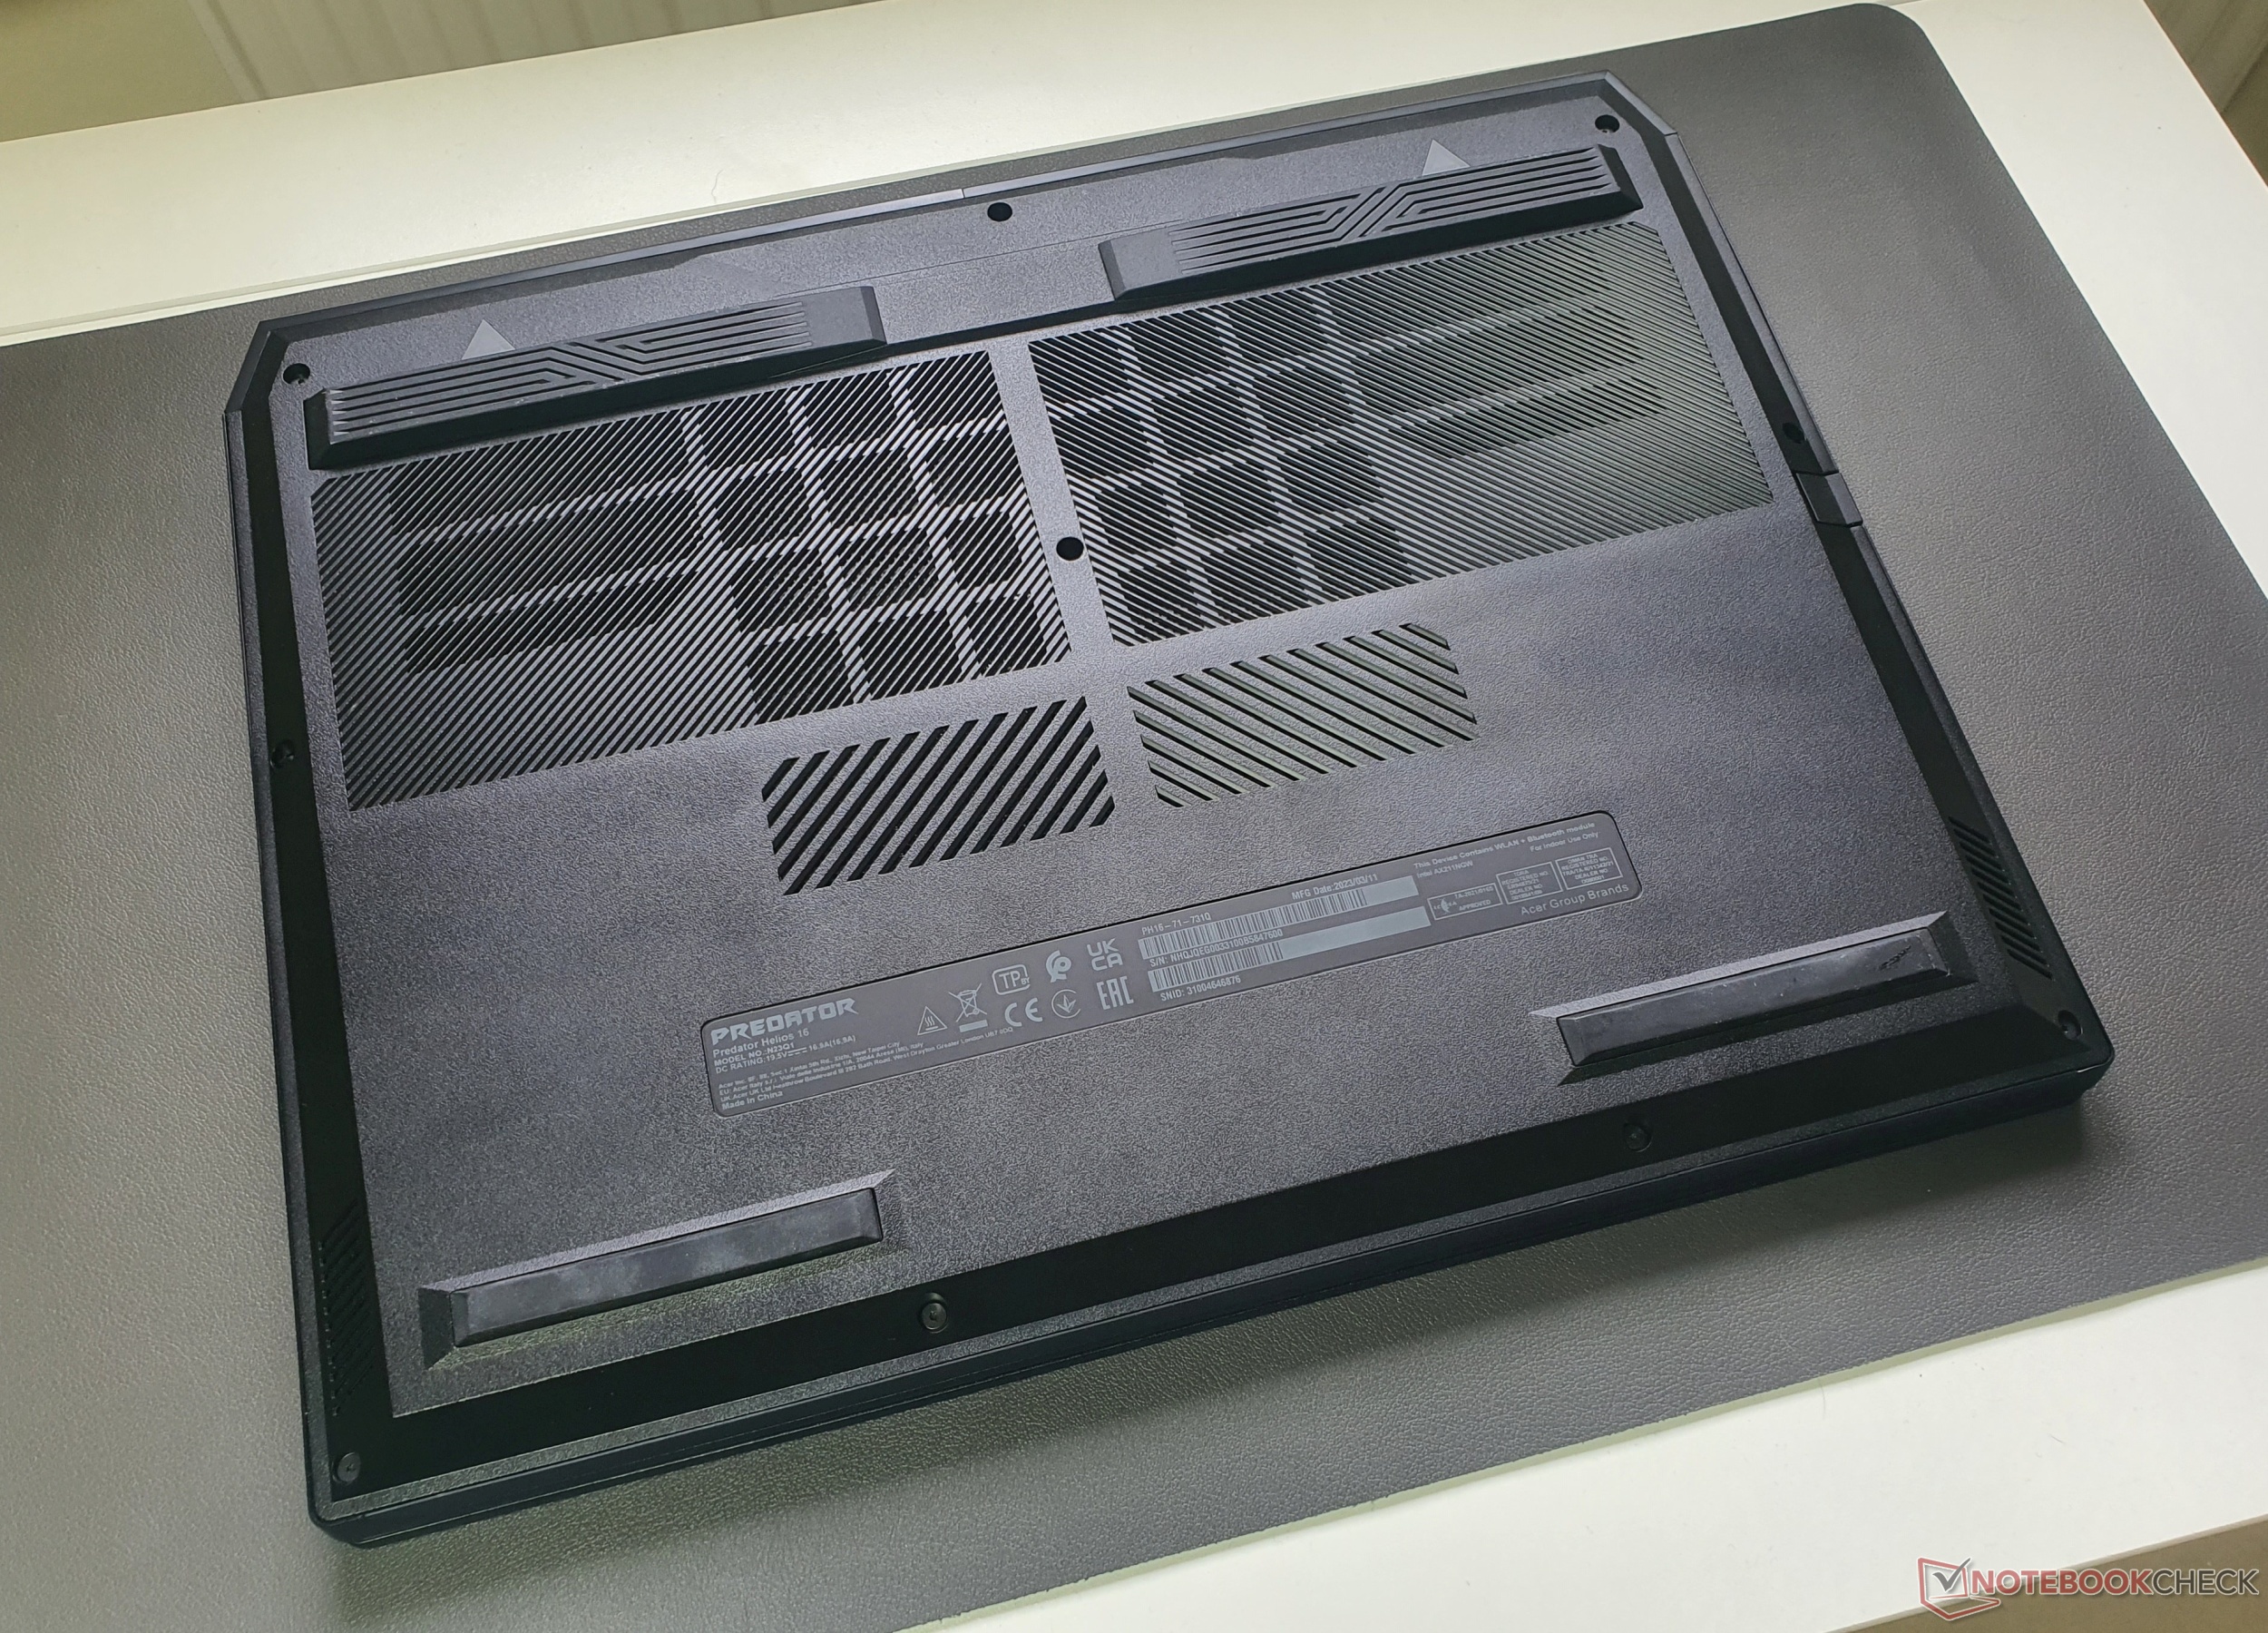
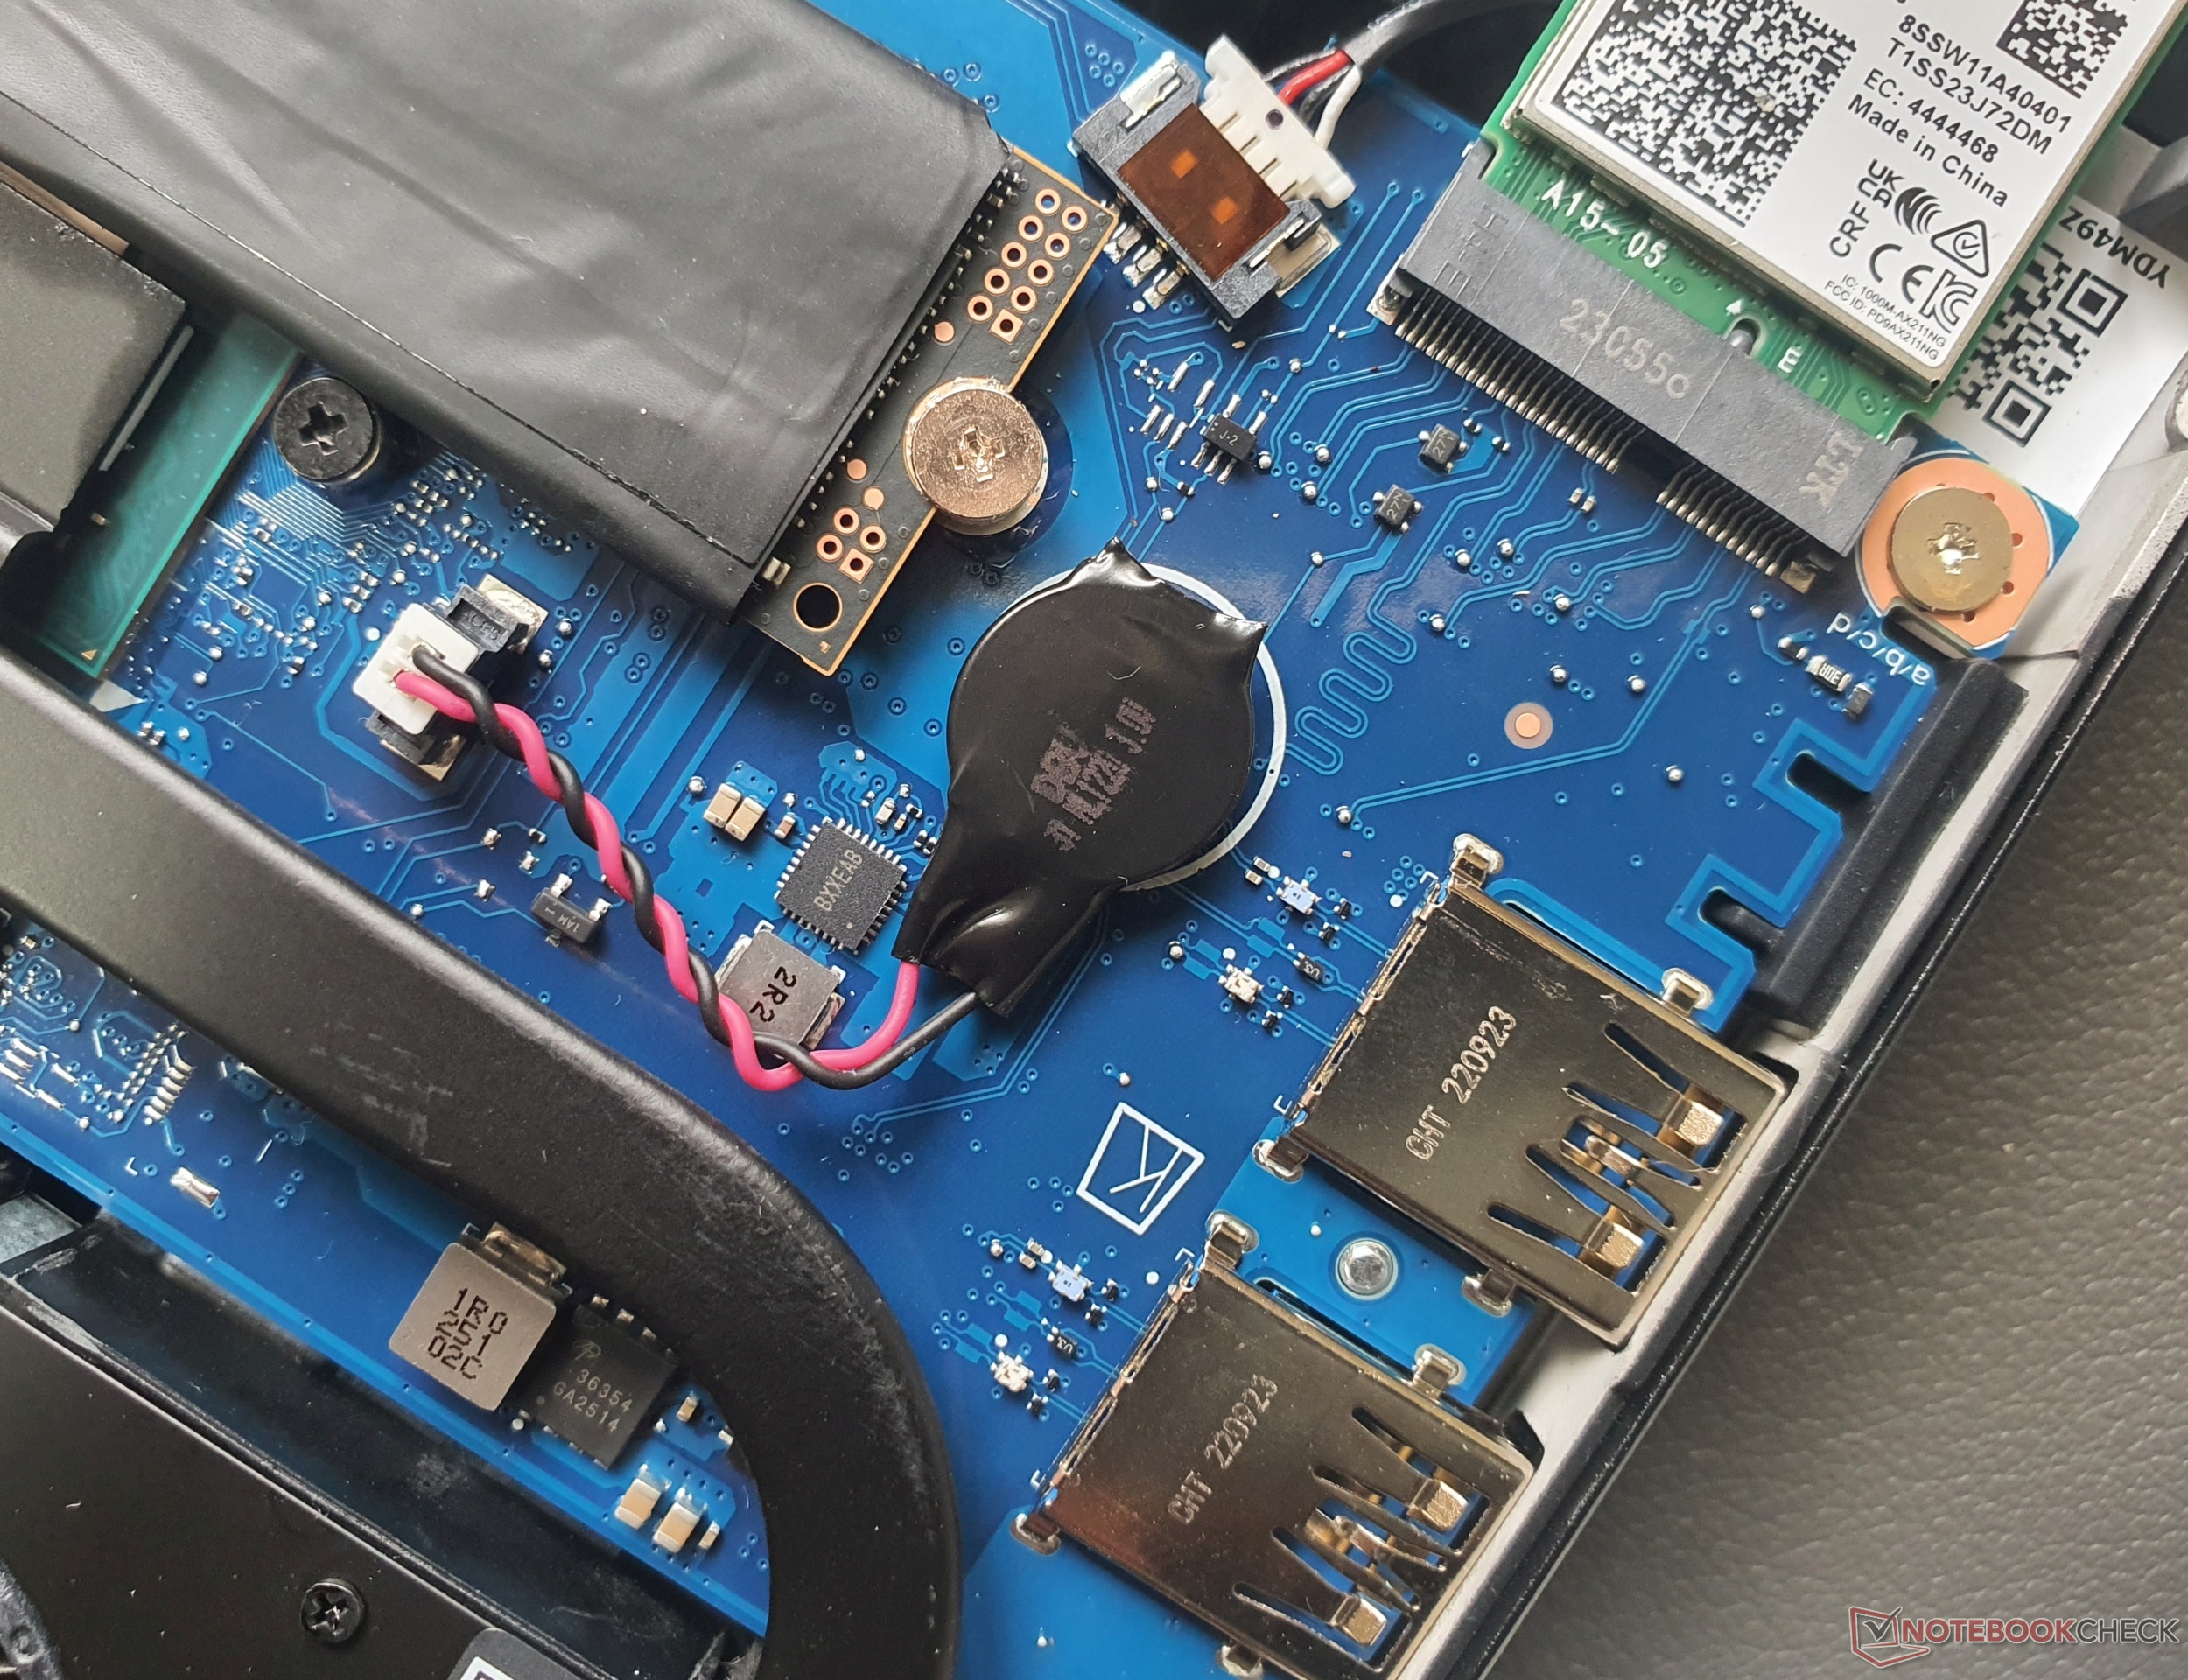
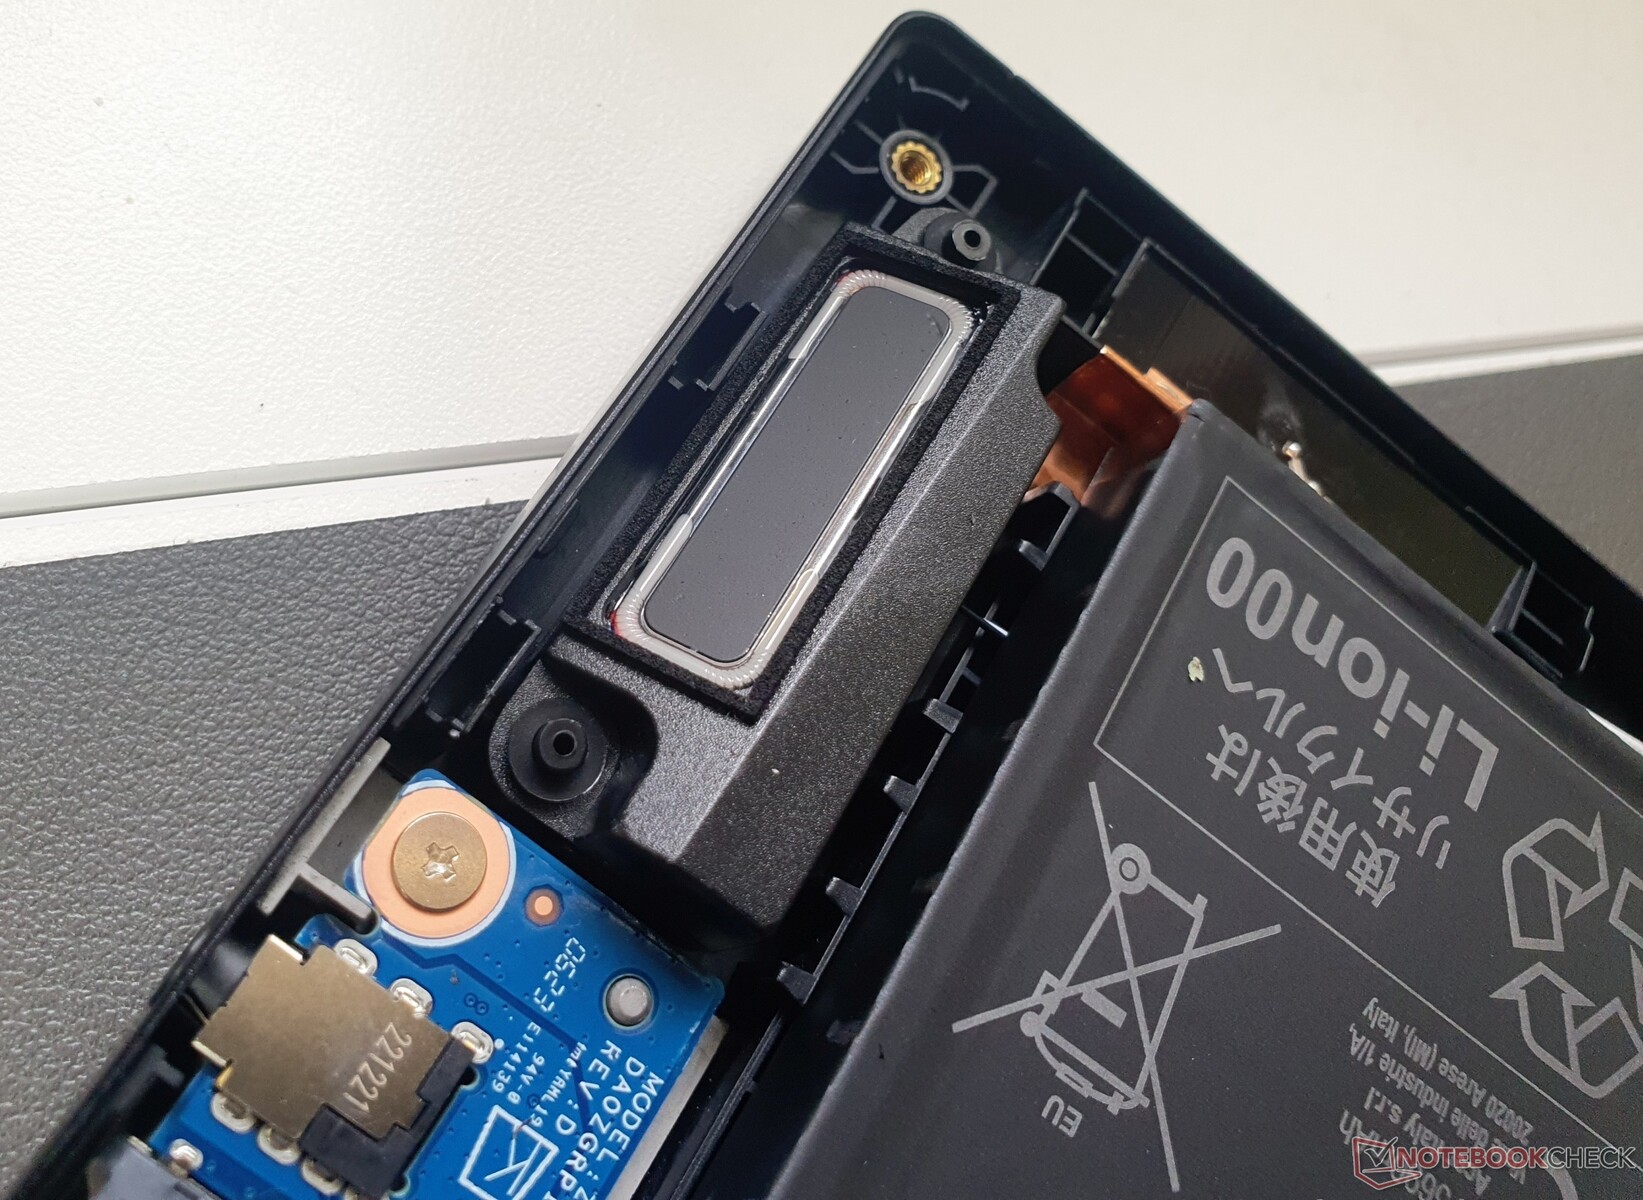
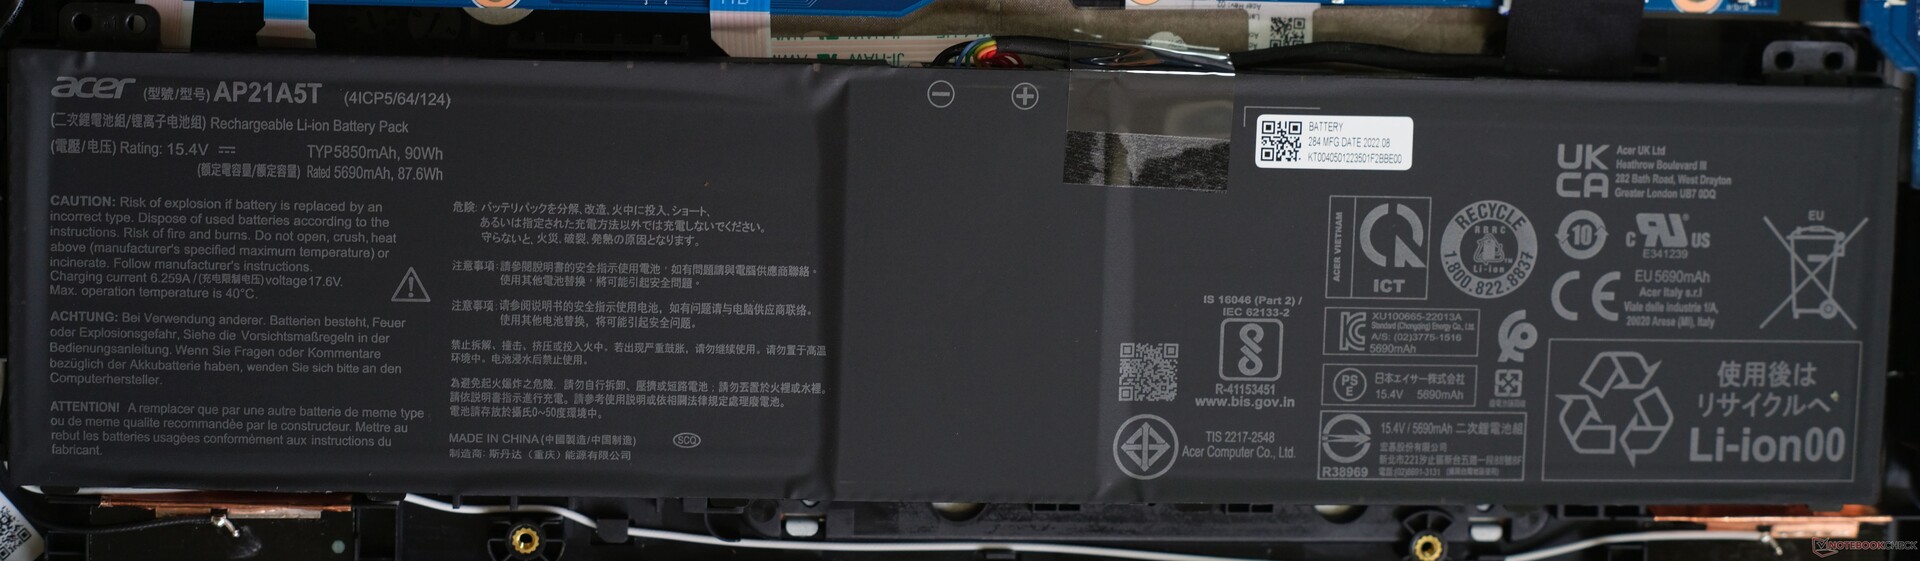
É bastante fácil acessar os componentes internos do gabinete depois de soltar dez parafusos Torx T5. As peças que podem ser trocadas incluem a RAM (dois bancos), o SSD M.2 2280 e o chip Wi-Fi. Entretanto, a bateria parafusada e a bateria do BIOS também podem ser facilmente substituídas.


Garantia
Na Alemanha, a Acer oferece uma garantia de 24 meses. Com o Acer Care Plus, ela pode ser estendida por até cinco anos.
Dispositivos de entrada: O Predator Helios tem iluminação mini-LED
Teclado
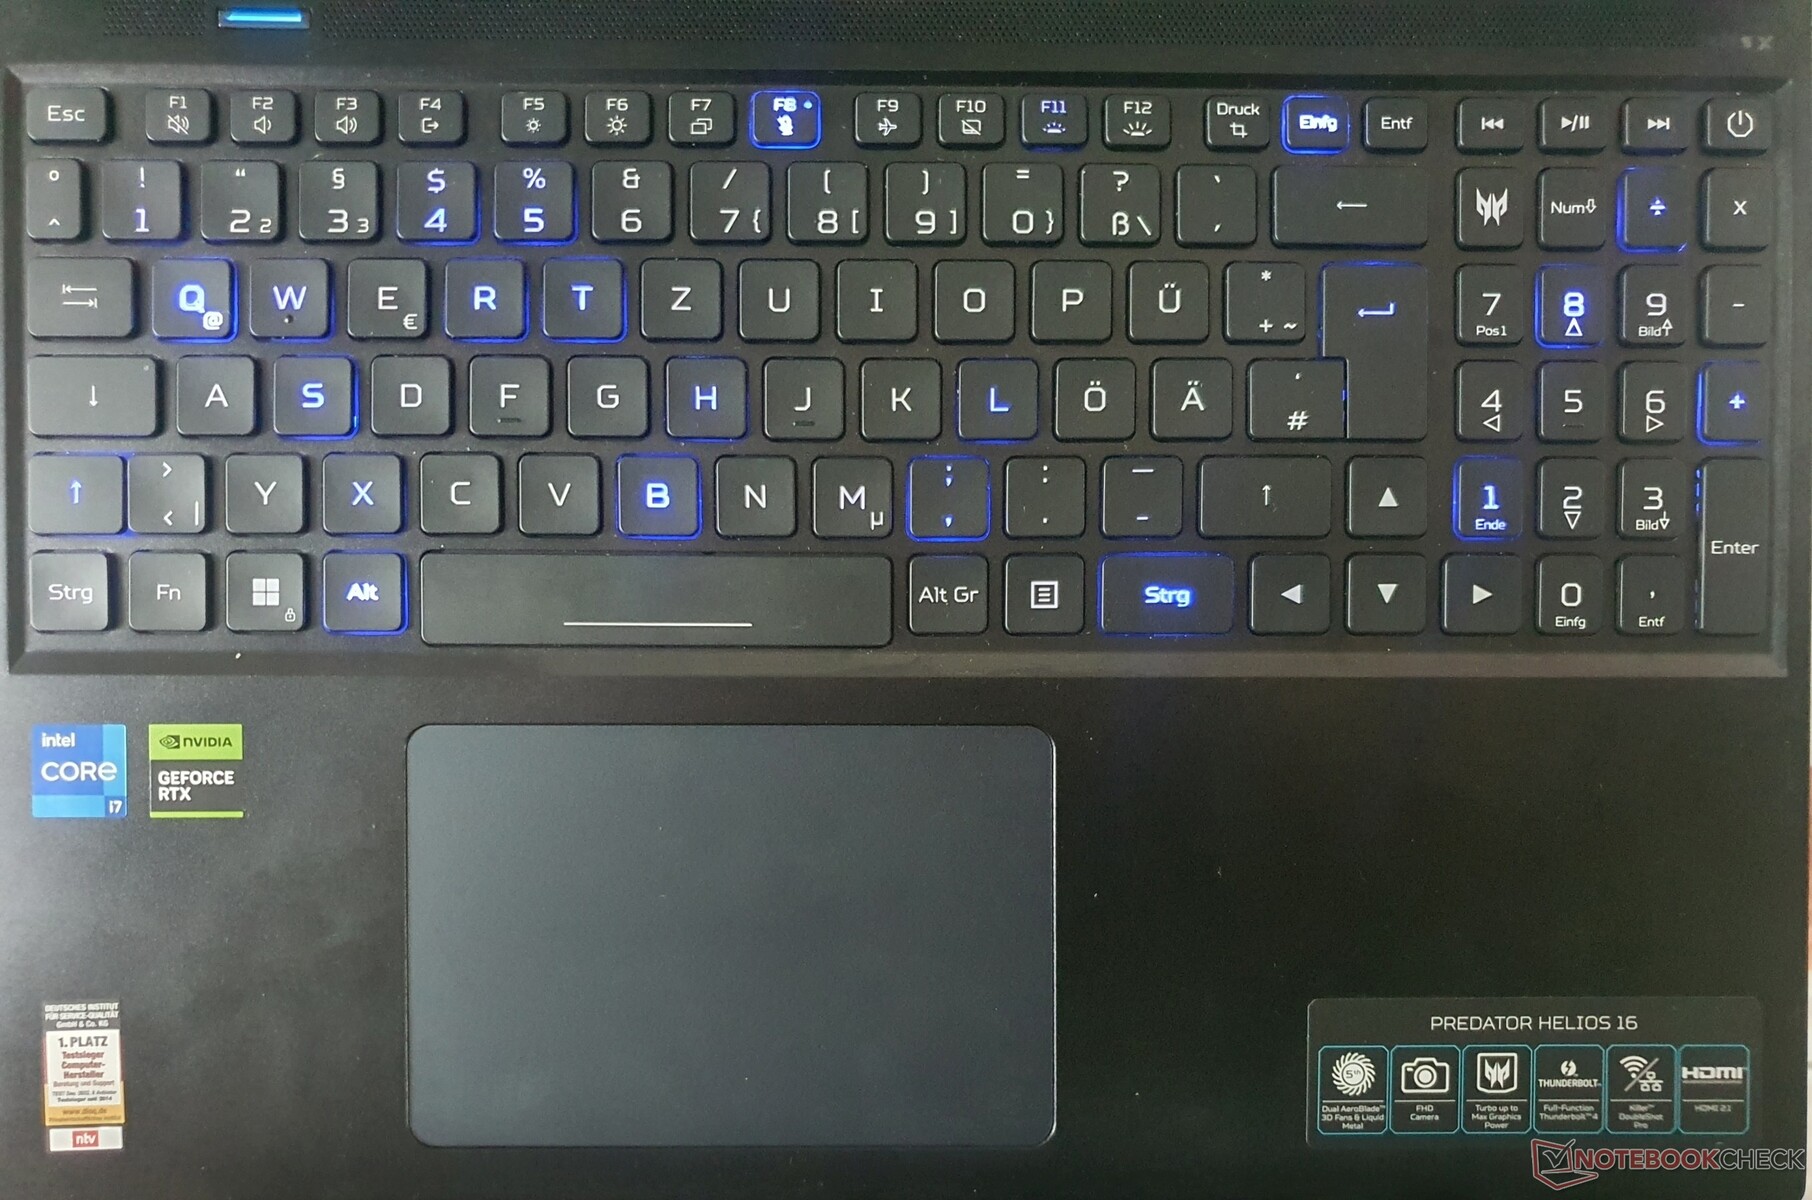
A Acer tem usado o mesmo teclado chiclet de 6 linhas com teclas de 15 x 15 mm desde o modelomodelo 2020. Apesar do curso generoso das teclas, o feedback não atinge seu potencial: O ponto de pressão é tangível e poderia ser um pouco mais definido, mas o ruído da digitação é discreto. No meio e no lado direito, o teclado flexiona significativamente, mas não incomoda ao digitar, desde que você não bata nas teclas.
A luz de fundo mini-LED é nova e oferece configurações principais diferentes. O RGB de teclas individuais tem quatro configurações disponíveis e pode ficar muito brilhante. As transições são particularmente suaves e limpas, enquanto os mini-LEDs também são mais eficientes em termos de energia.
Gostamos do layout e, em particular, das teclas de seta de tamanho normal ao custo de um shift menor. Embora o botão do logotipo inicialize o aplicativo Predator Sense, é possível alternar entre os modos de desempenho usando o botão do lado esquerdo acima do teclado.


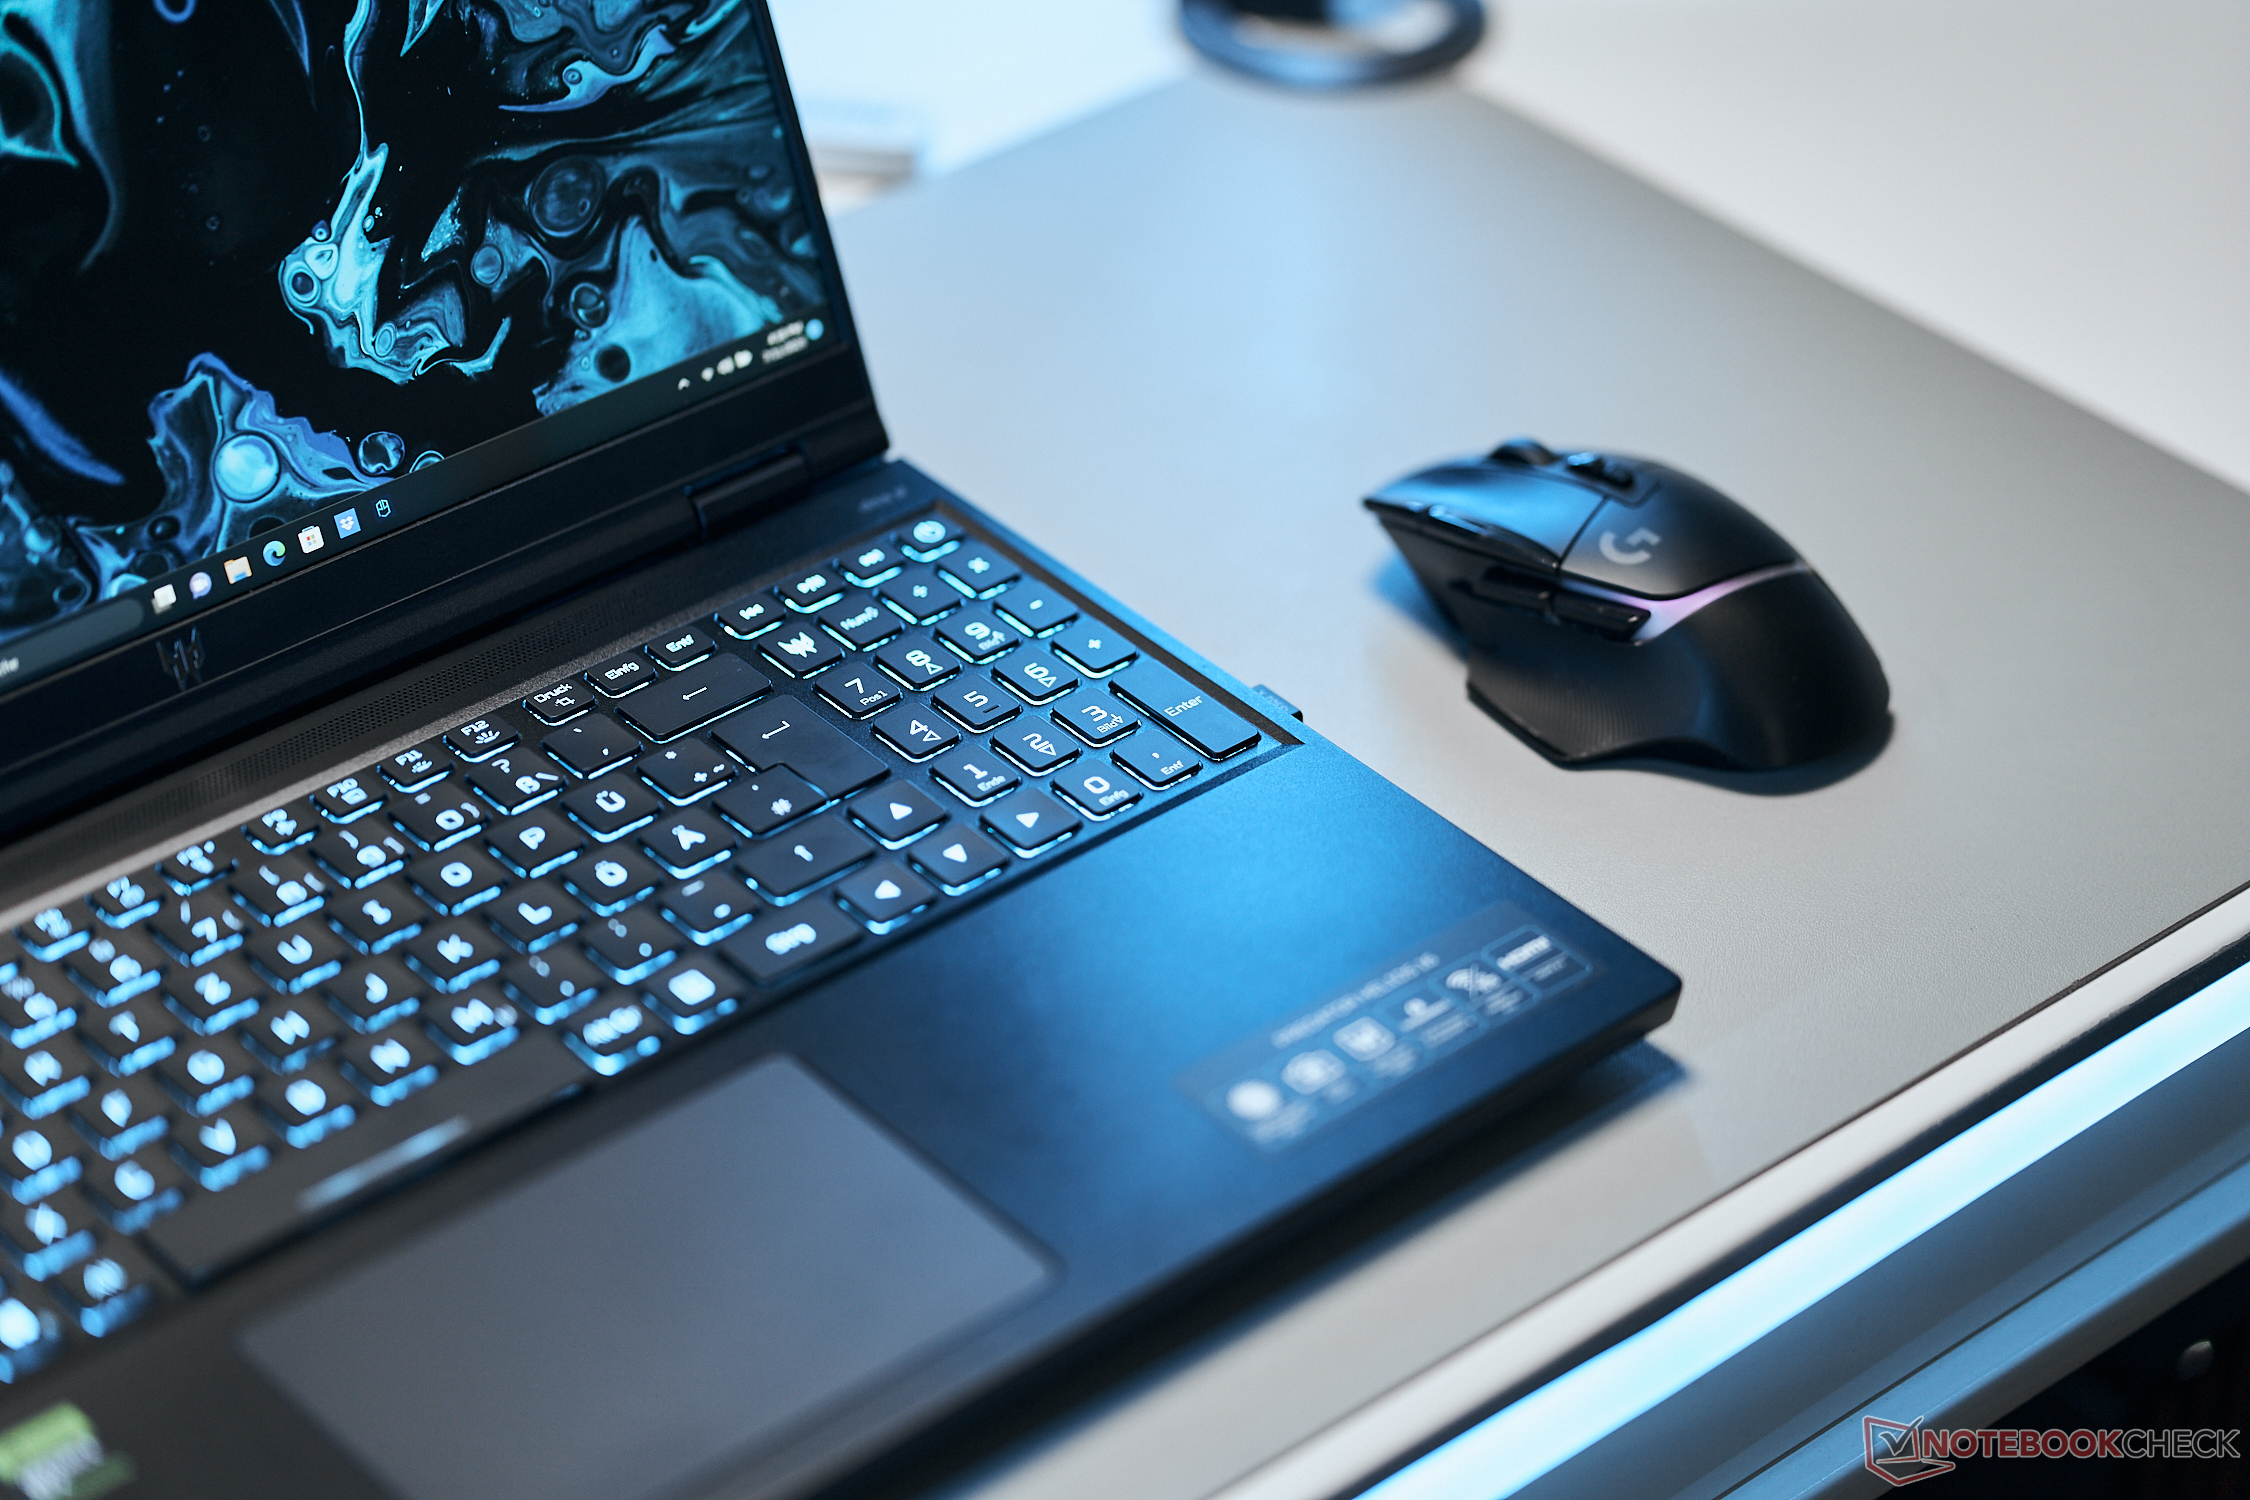
Touchpad
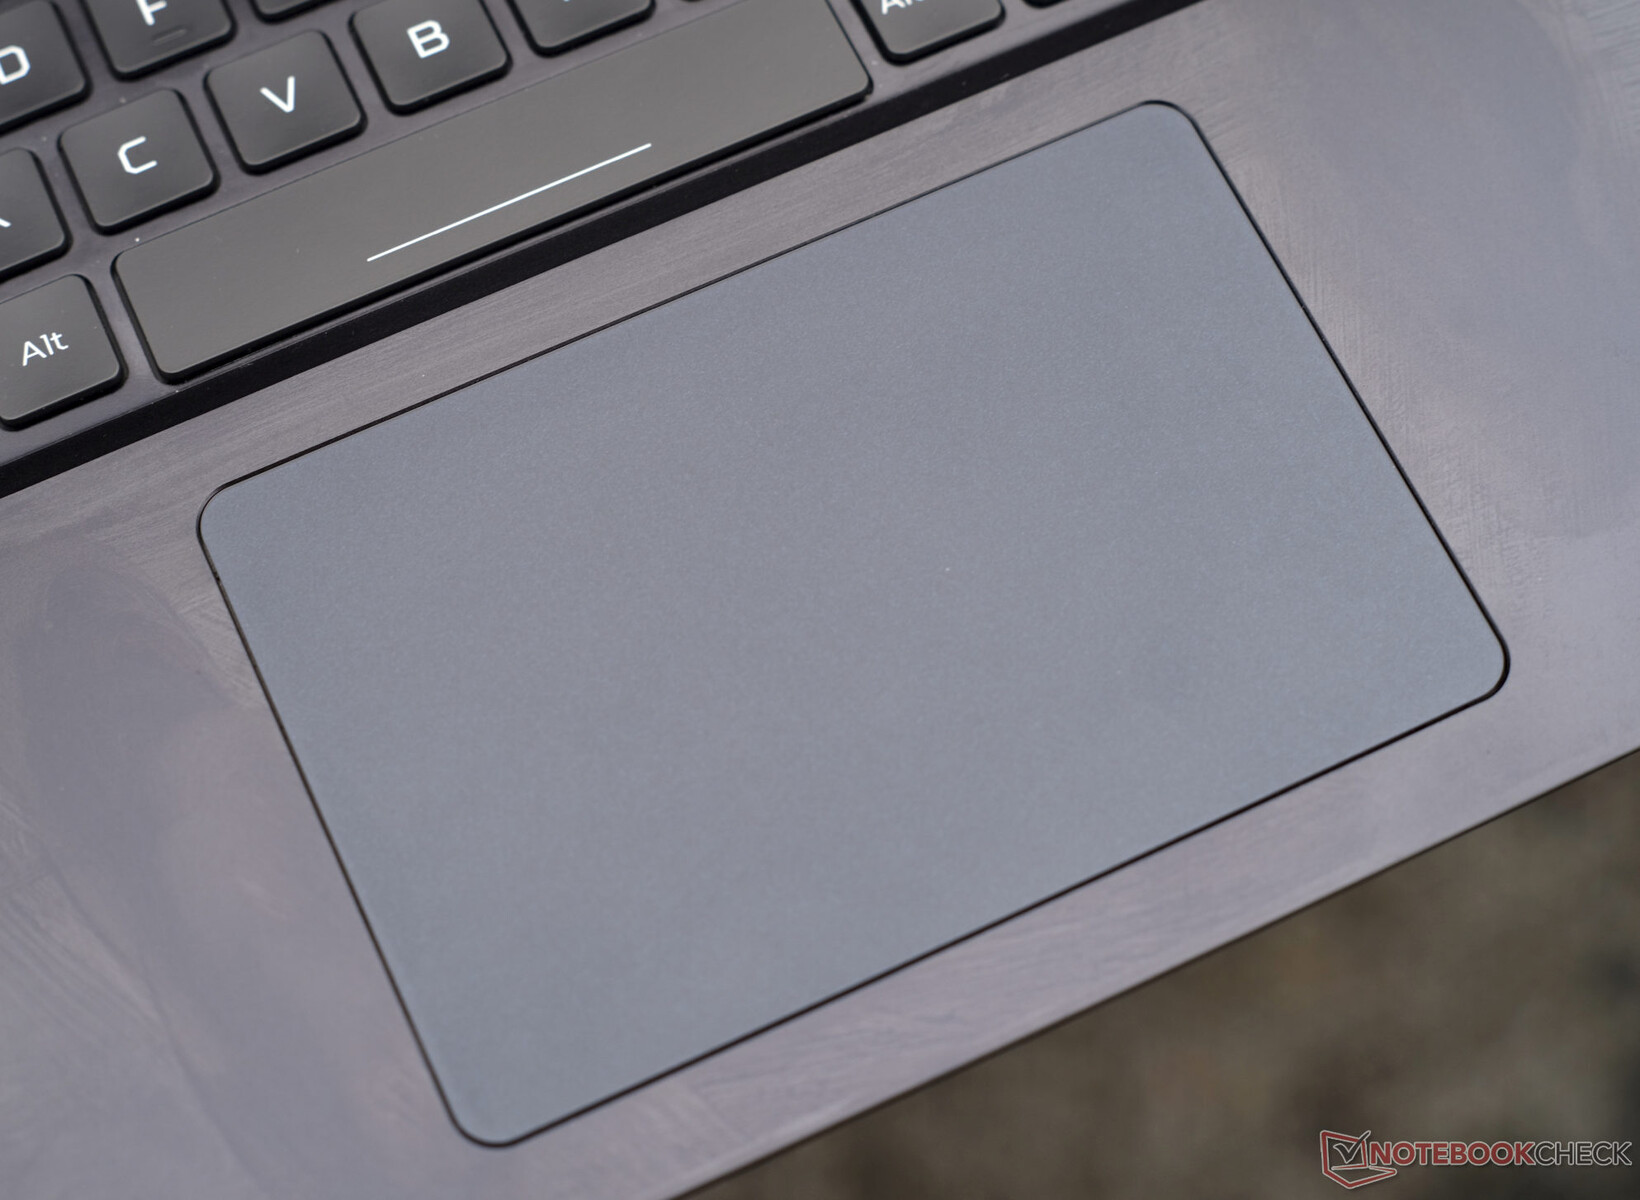
Os dedos deslizam lindamente e com um feedback muito preciso sobre o touchpad de 12,6 x 8,3 mm, graças ao revestimento de Gorilla Glass. Dessa forma, os gestos multitoque e a rolagem são feitos sem esforço. Os botões de clique integrados têm deslocamento médio e feedback satisfatório.
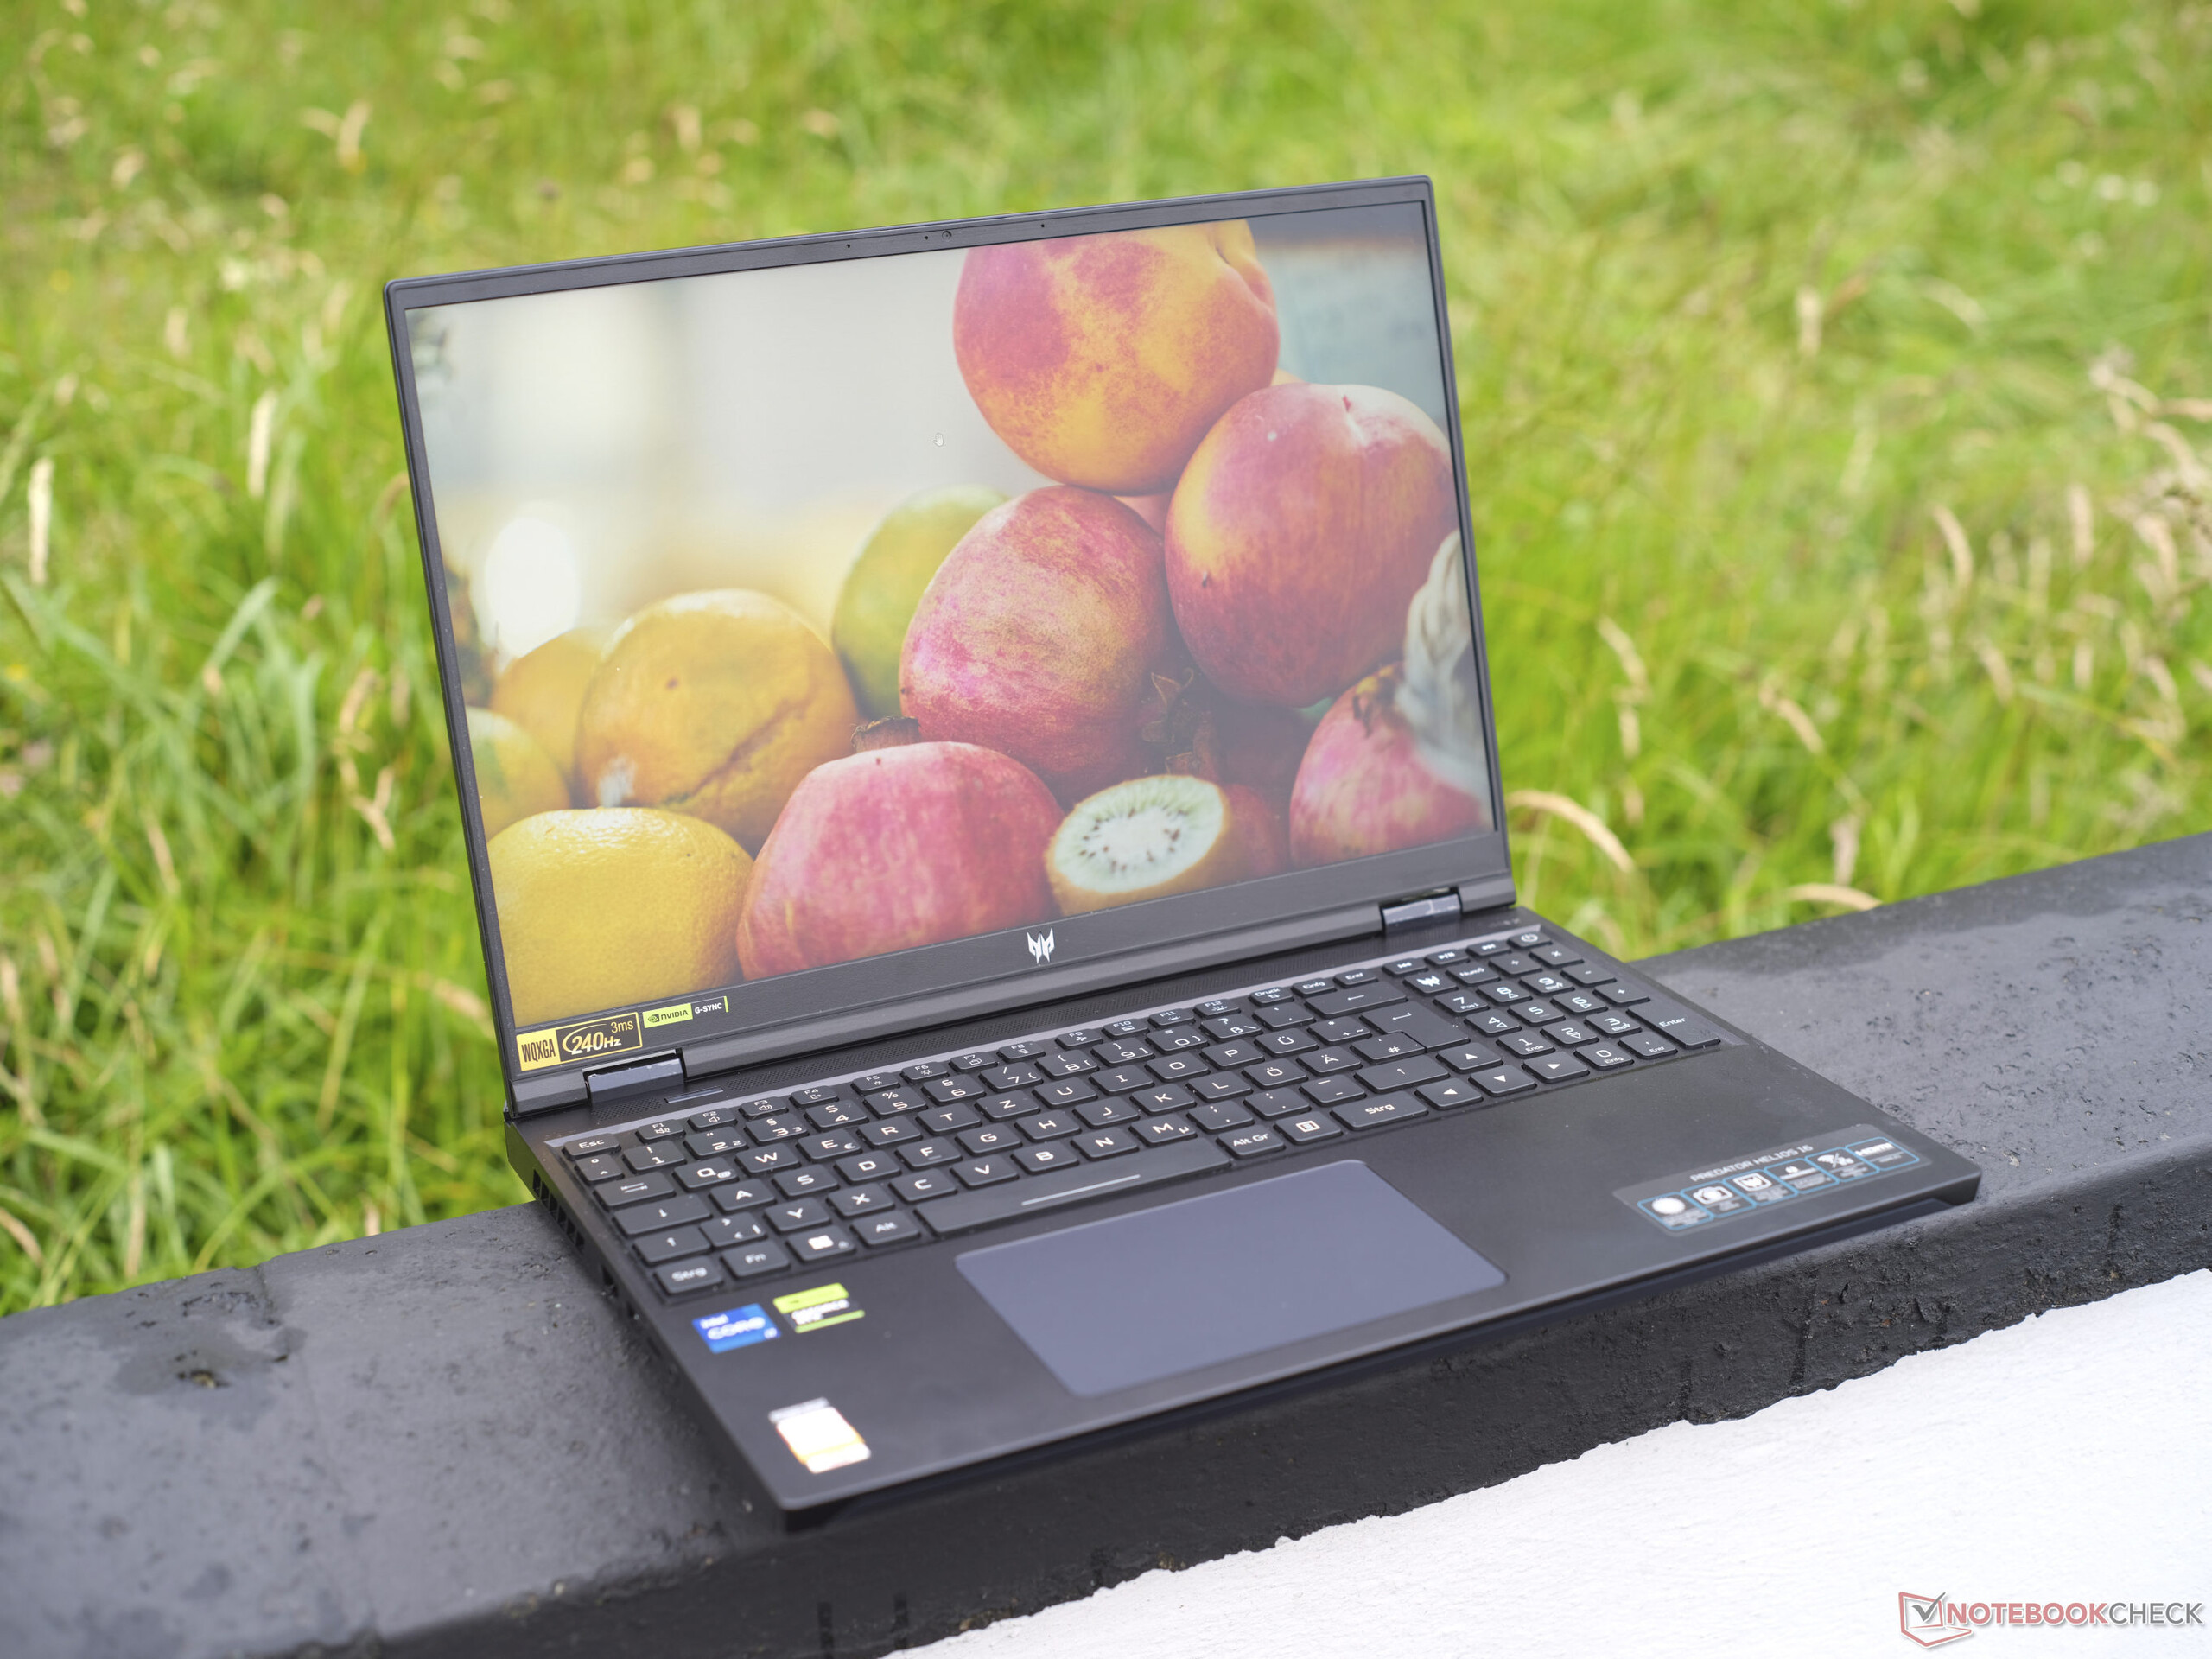
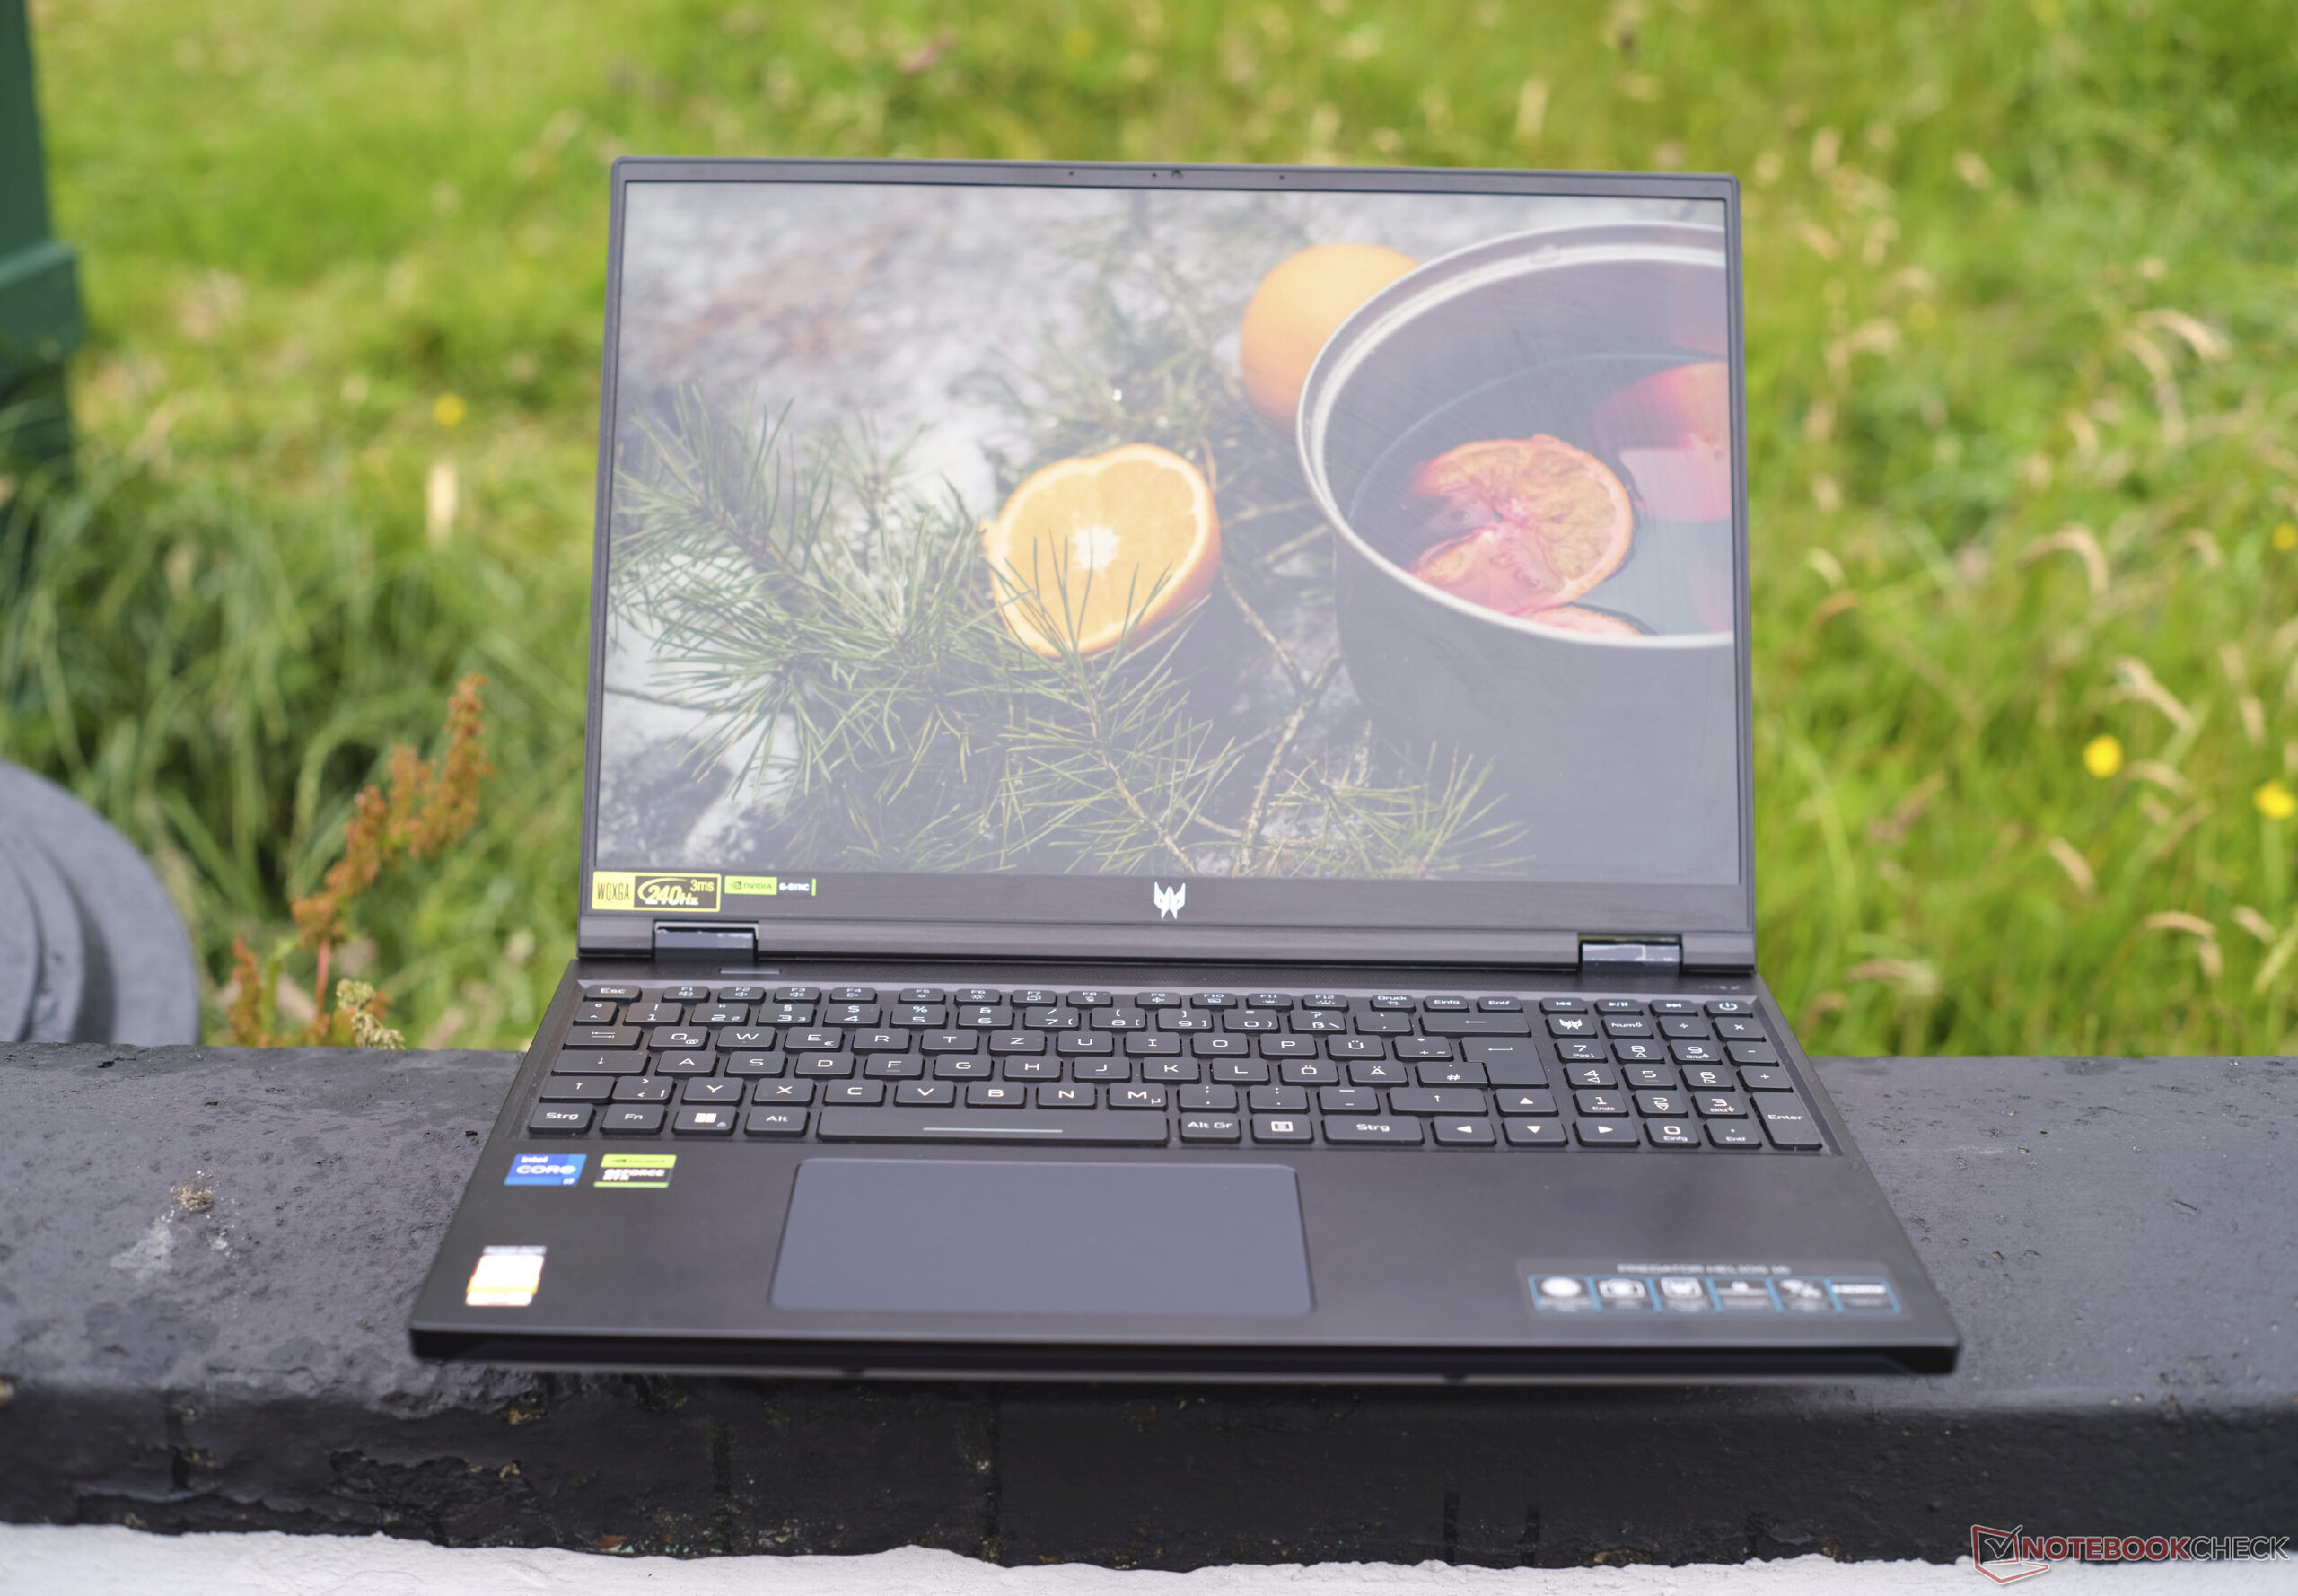
Tela: Uma máquina de jogos com 97% de DCI P3, 500 cd/m² e 240 Hz
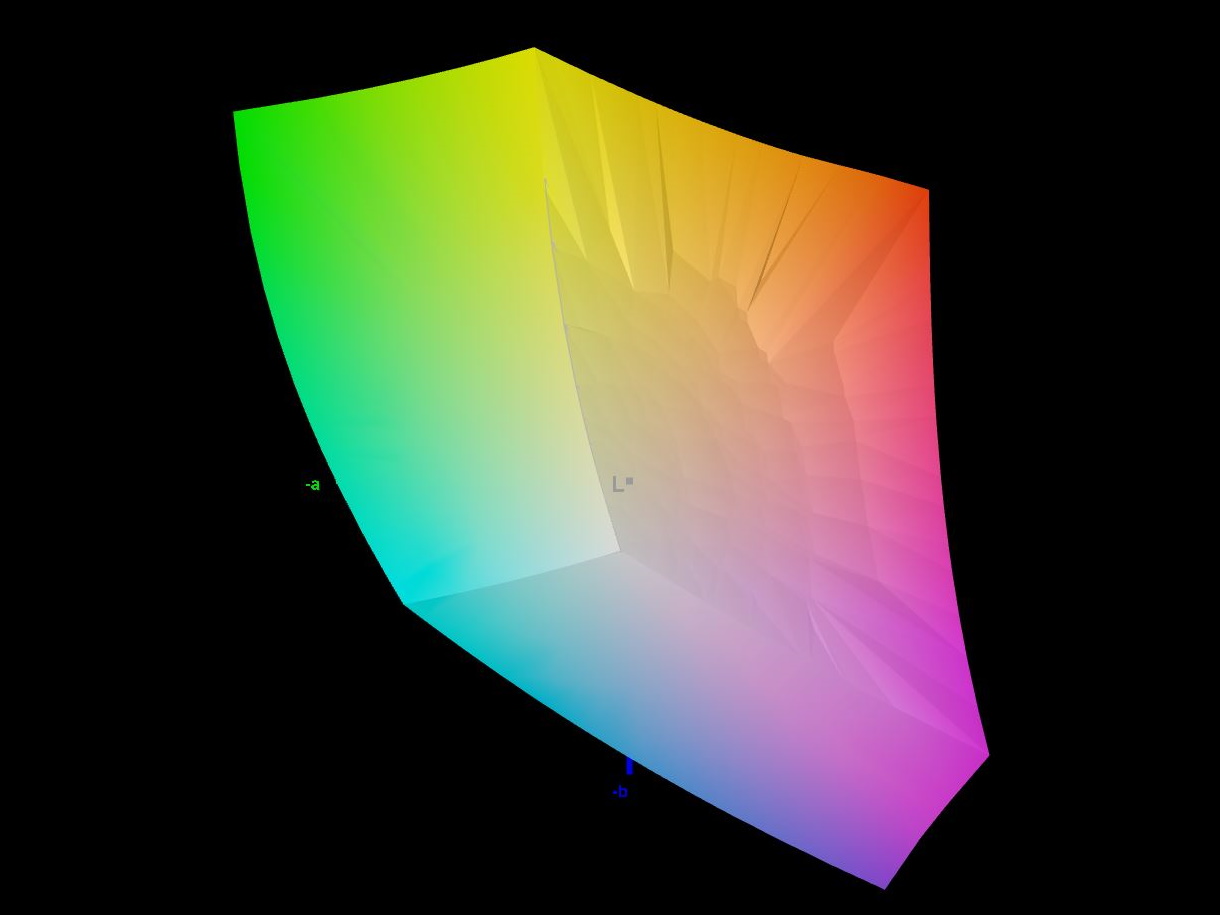
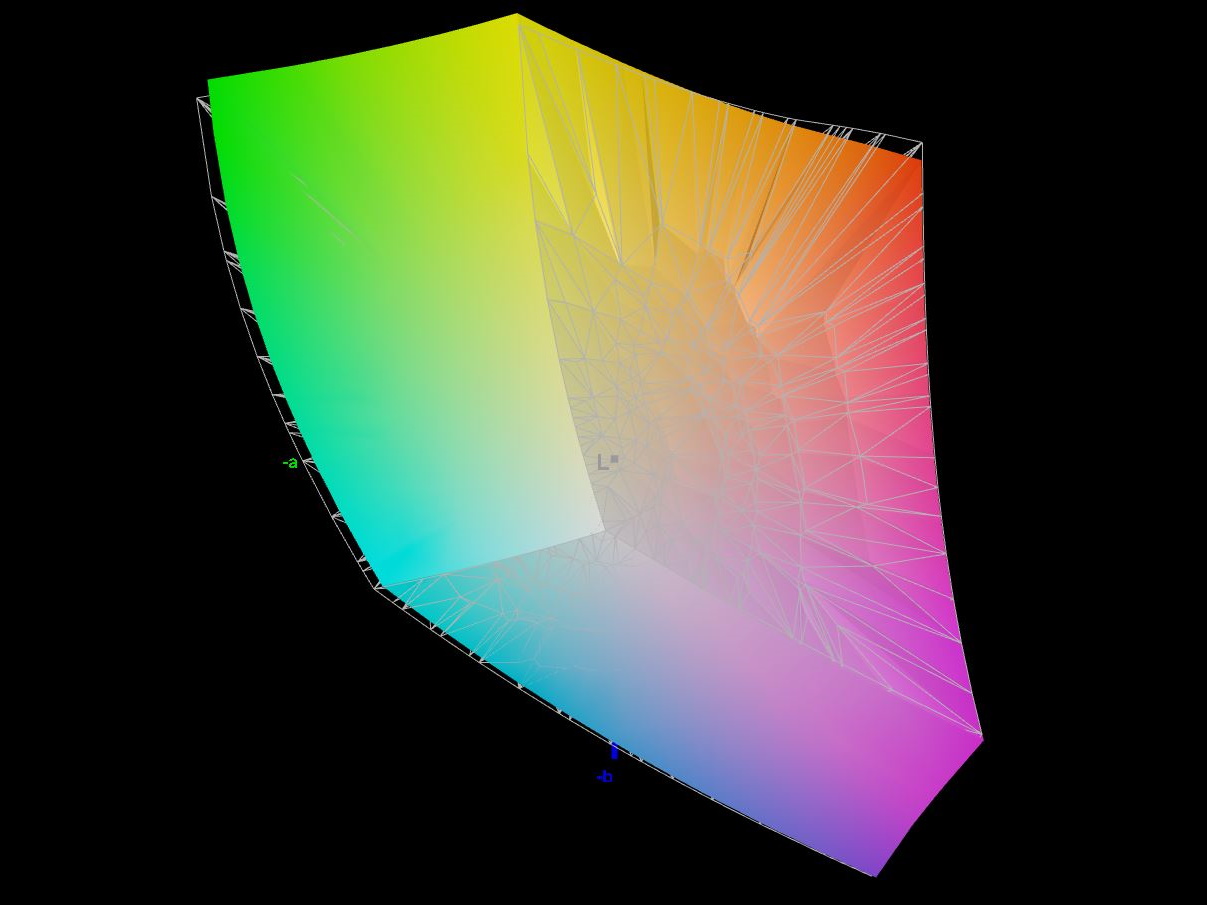
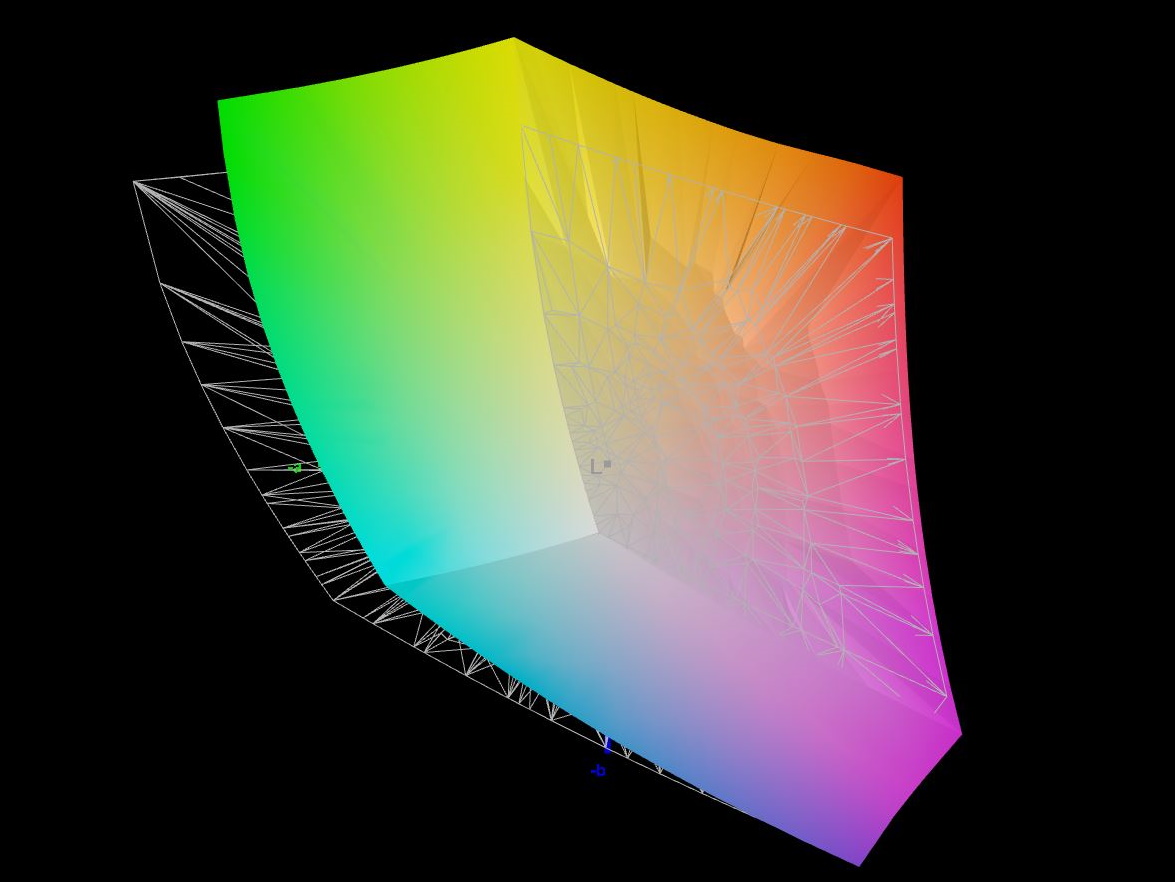
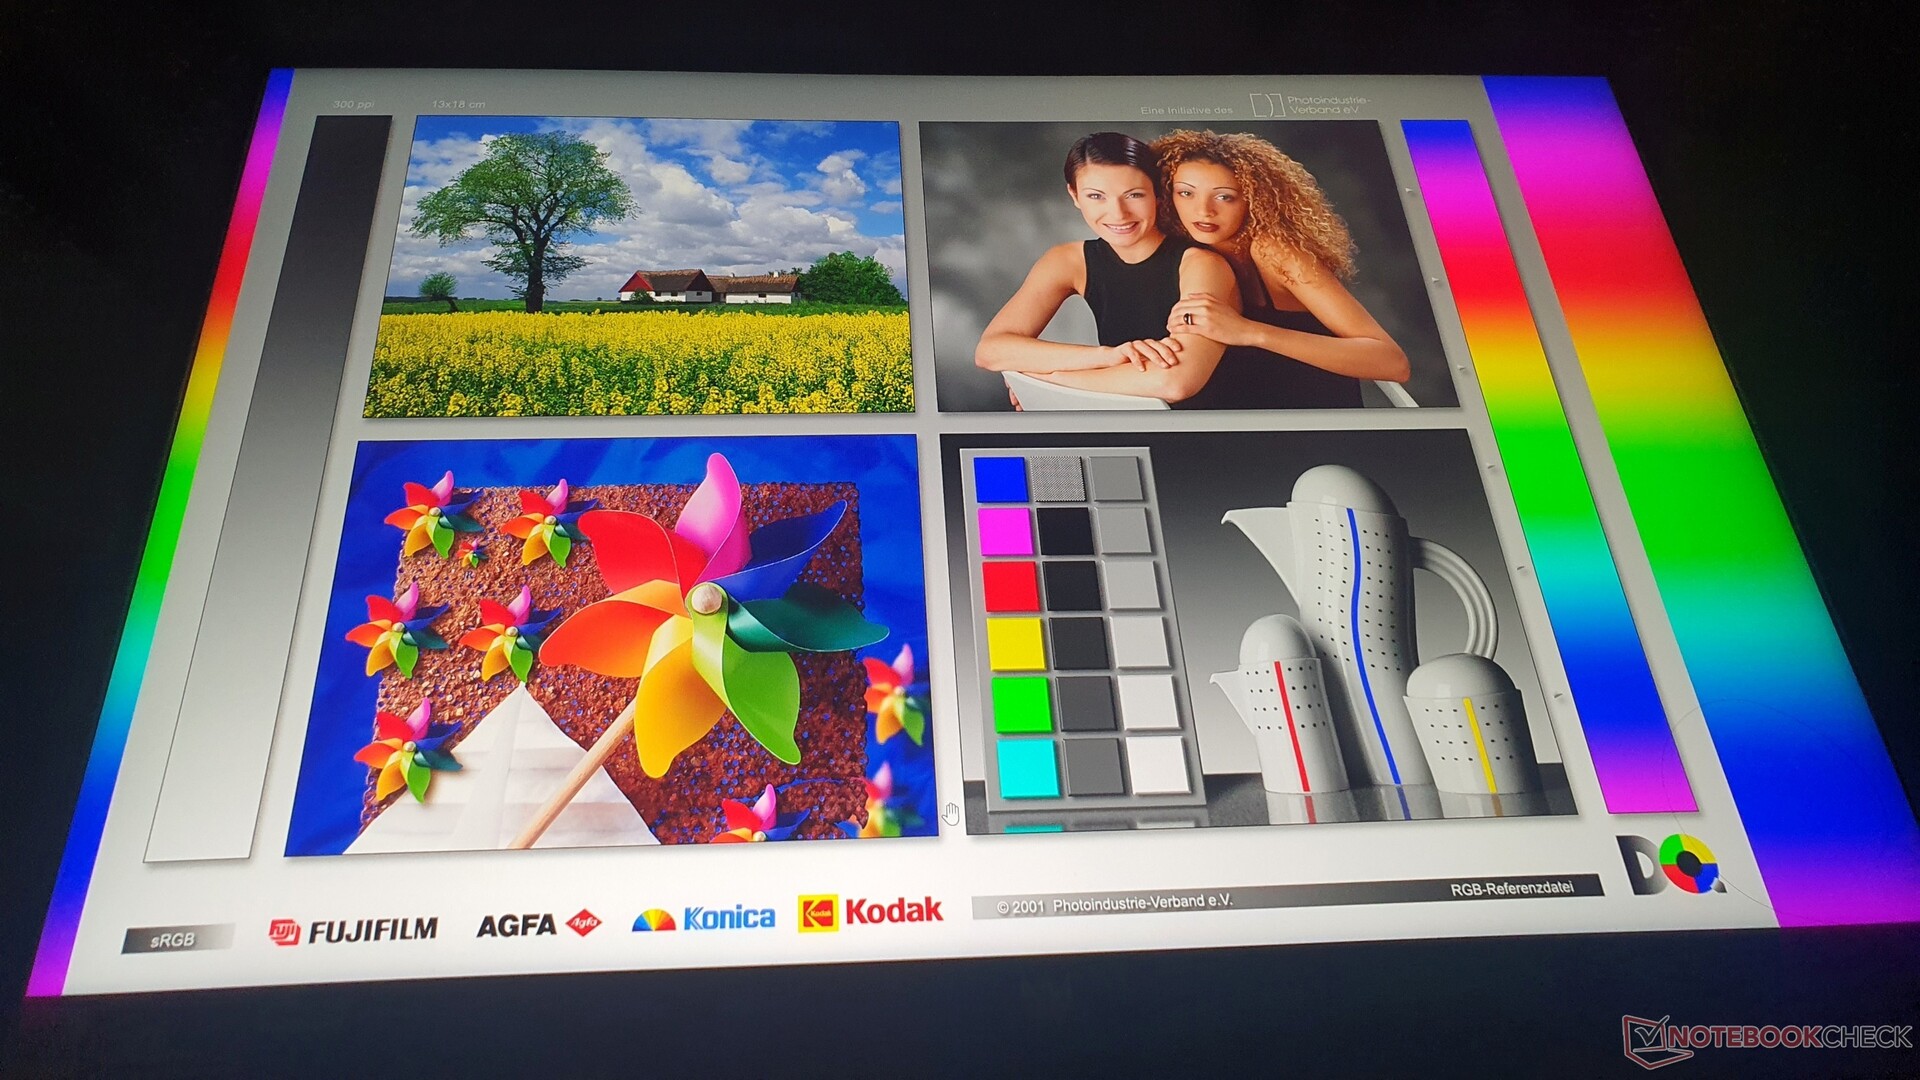
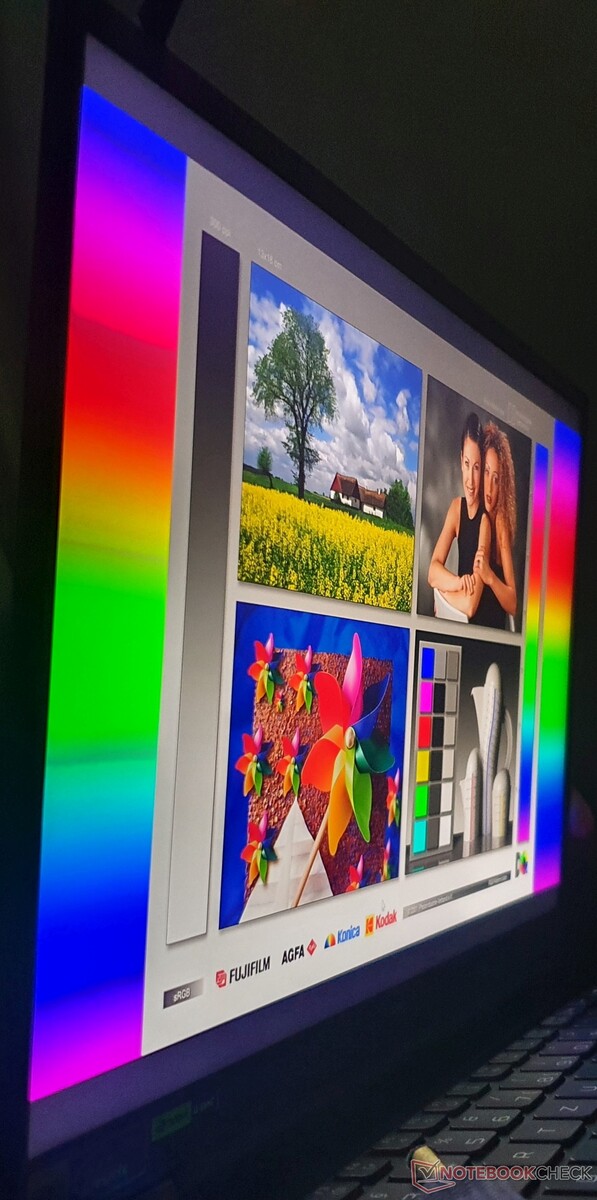
O dispositivo analisado com o número de modelo PH16-71-731Q não vem com a tela mini-LED disponível como opcional e suas 1.024 zonas de escurecimento. No entanto, ficamos surpresos com o fato de que o painel rápido, de 240 Hz, IPS fosco, com resolução de 2.560 x 1.600 pixels (16:10) cobre orgulhosamente 97% do espaço de cores DCI P3. Isso significa que as imagens, em jogos, entre outras coisas, parecem ainda mais vivas.
Todos os outros dados importantes também parecem bons: Brilho de pouco menos de 500 cd/m², alto contraste de 1:419:1 e iluminação uniforme de 94%. Além disso, o PWM, que pode causar cansaço visual ou dores de cabeça, não é usado. O Acer Nitro 16 é o único concorrente em nossa lista de dispositivos concorrentes que consegue um brilho significativamente acima de ~300 cd/m².
Os bons tempos de resposta de cinza para cinza de 13,6 ms e de preto para branco de 6,4 ms são semelhantes aos de seus concorrentes, sendo que o Dell G15 5530 está na frente com um tempo de cinza para cinza de apenas 3,4 ms. Além disso, o Nvidia G-Sync e o Dolby Vision também são compatíveis.
| |||||||||||||||||||||||||
iluminação: 94 %
iluminação com acumulador: 511 cd/m²
Contraste: 1419:1 (Preto: 0.36 cd/m²)
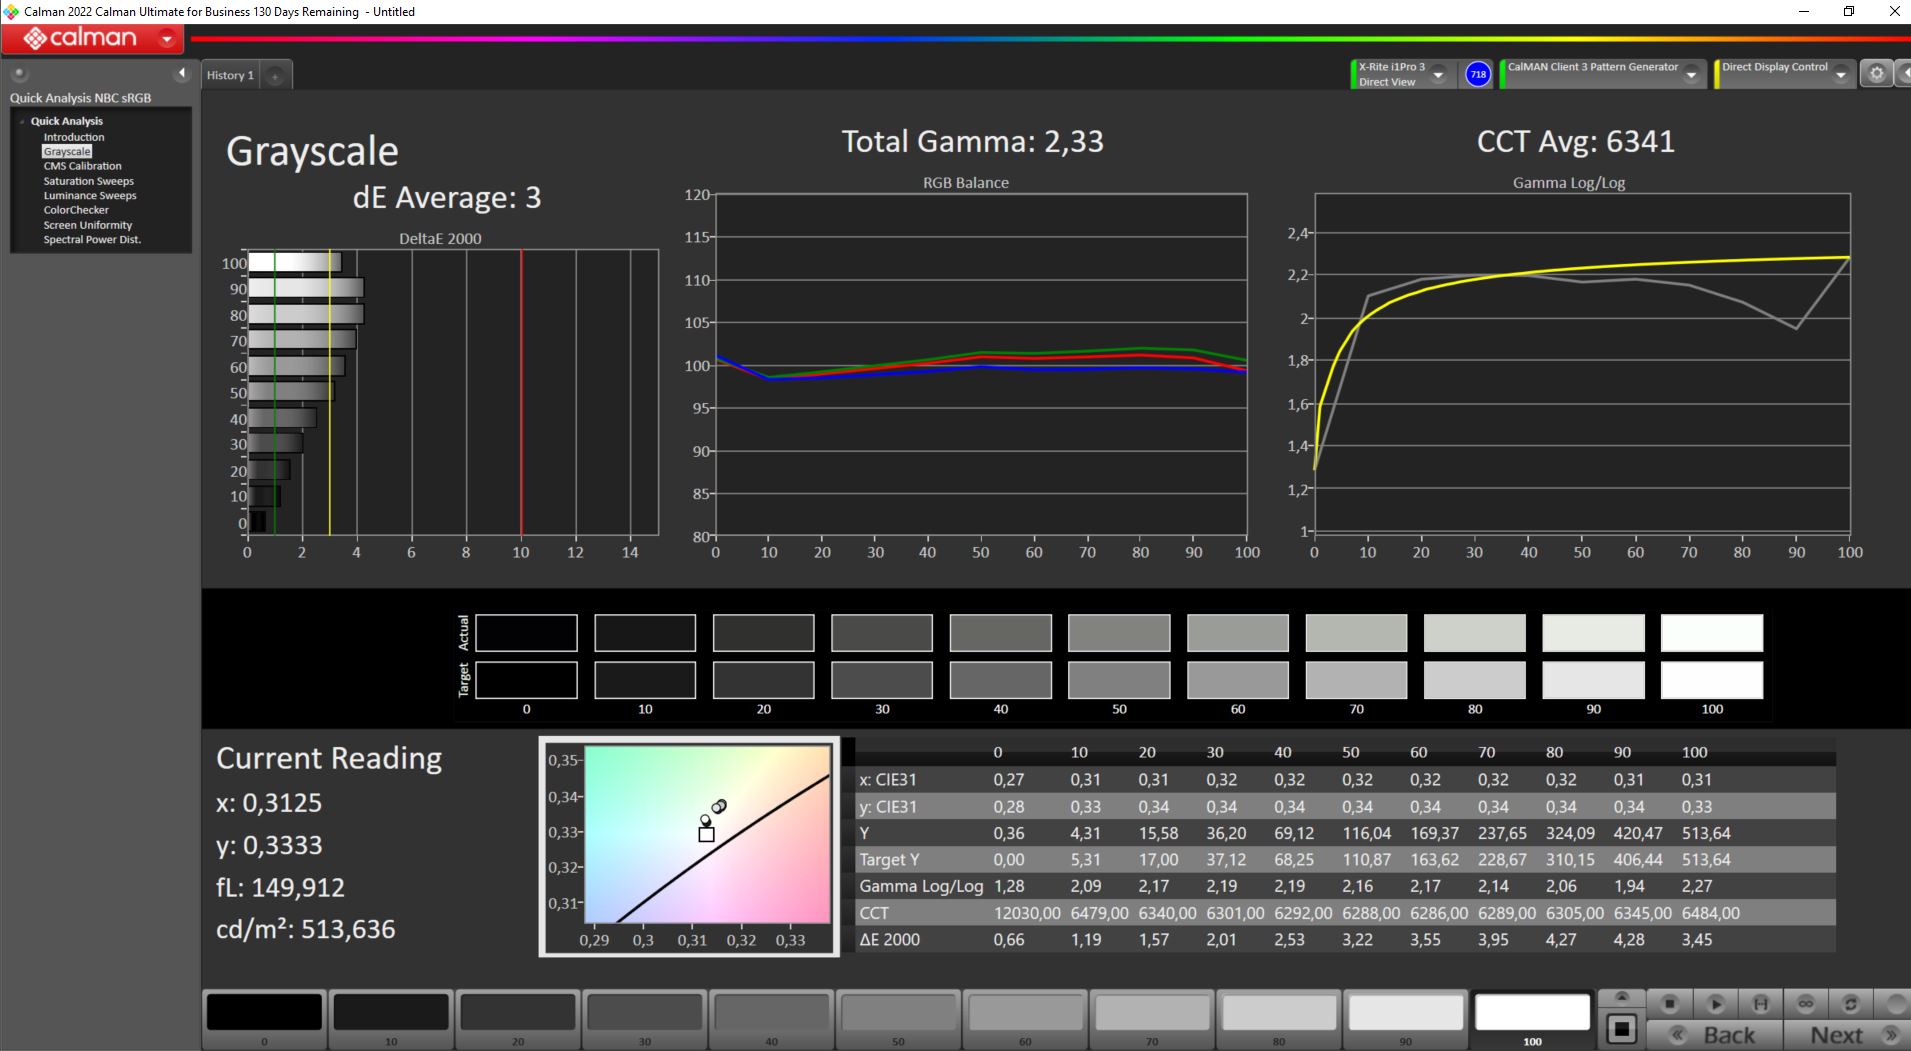
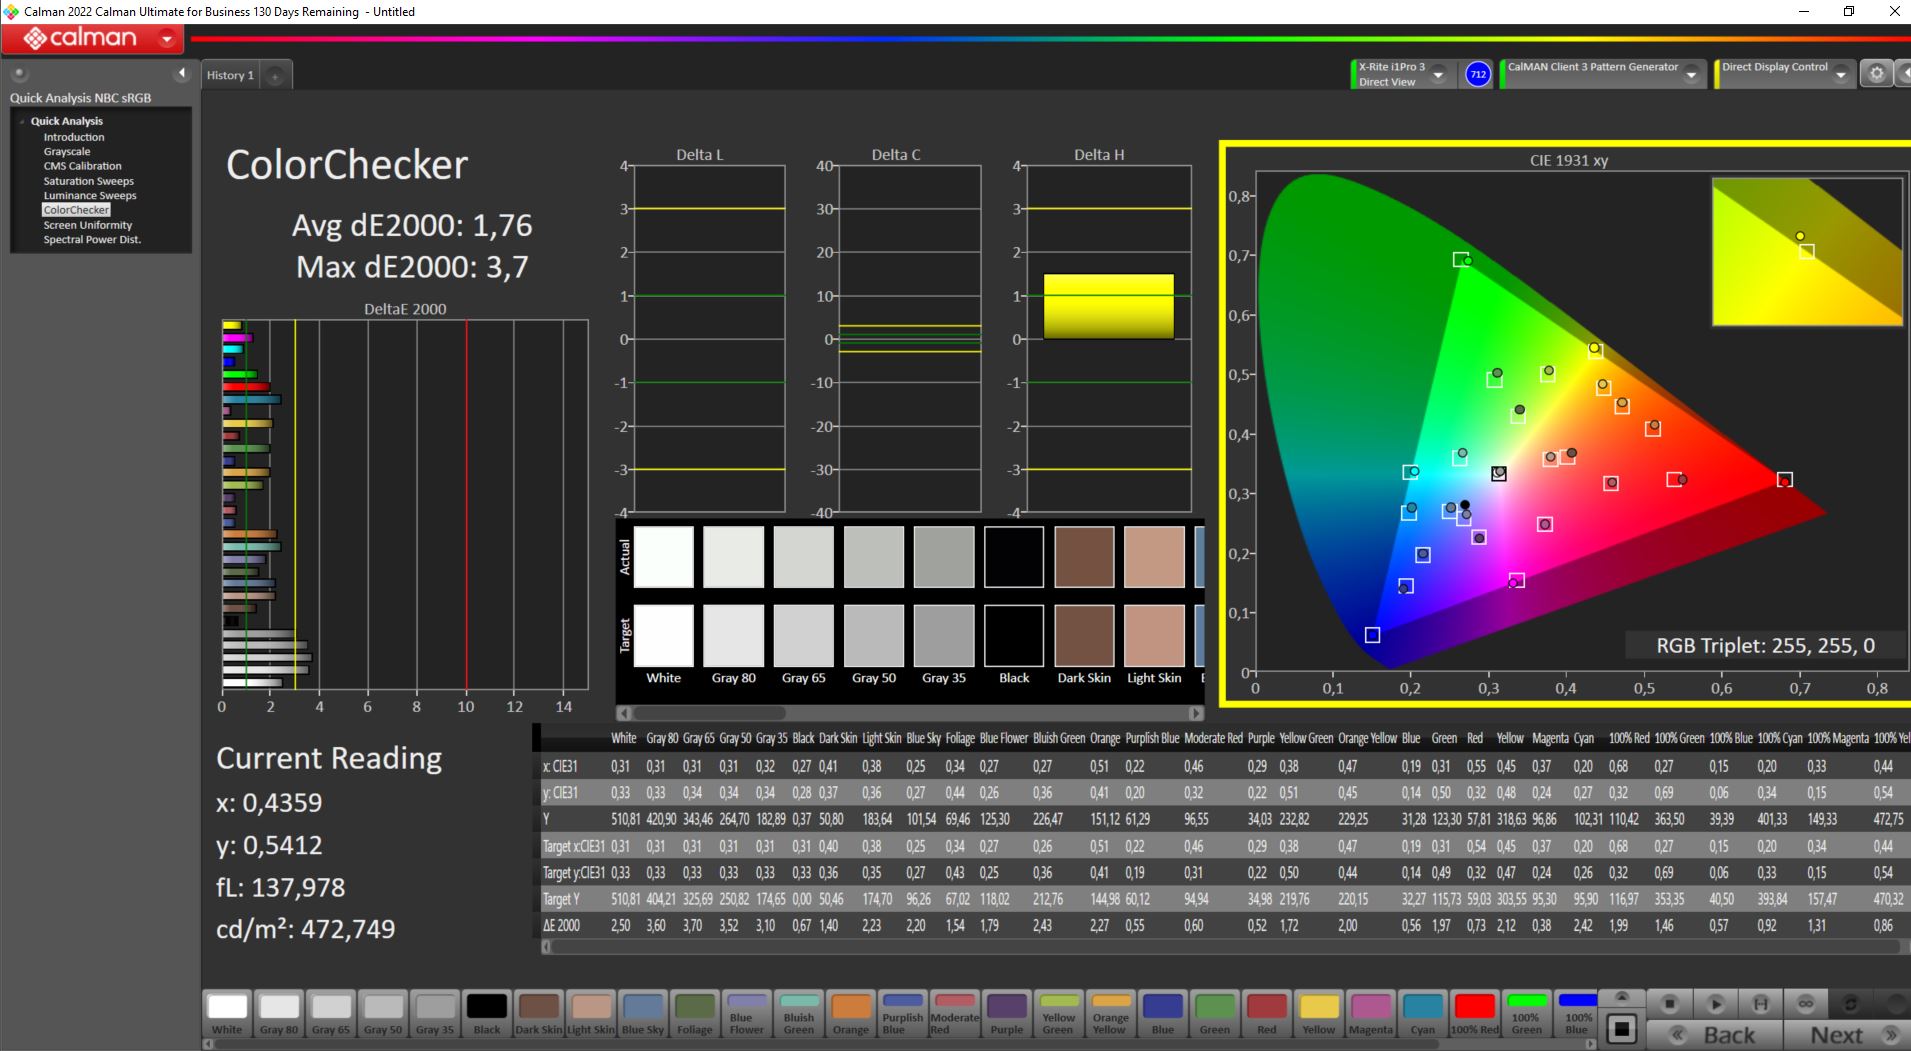
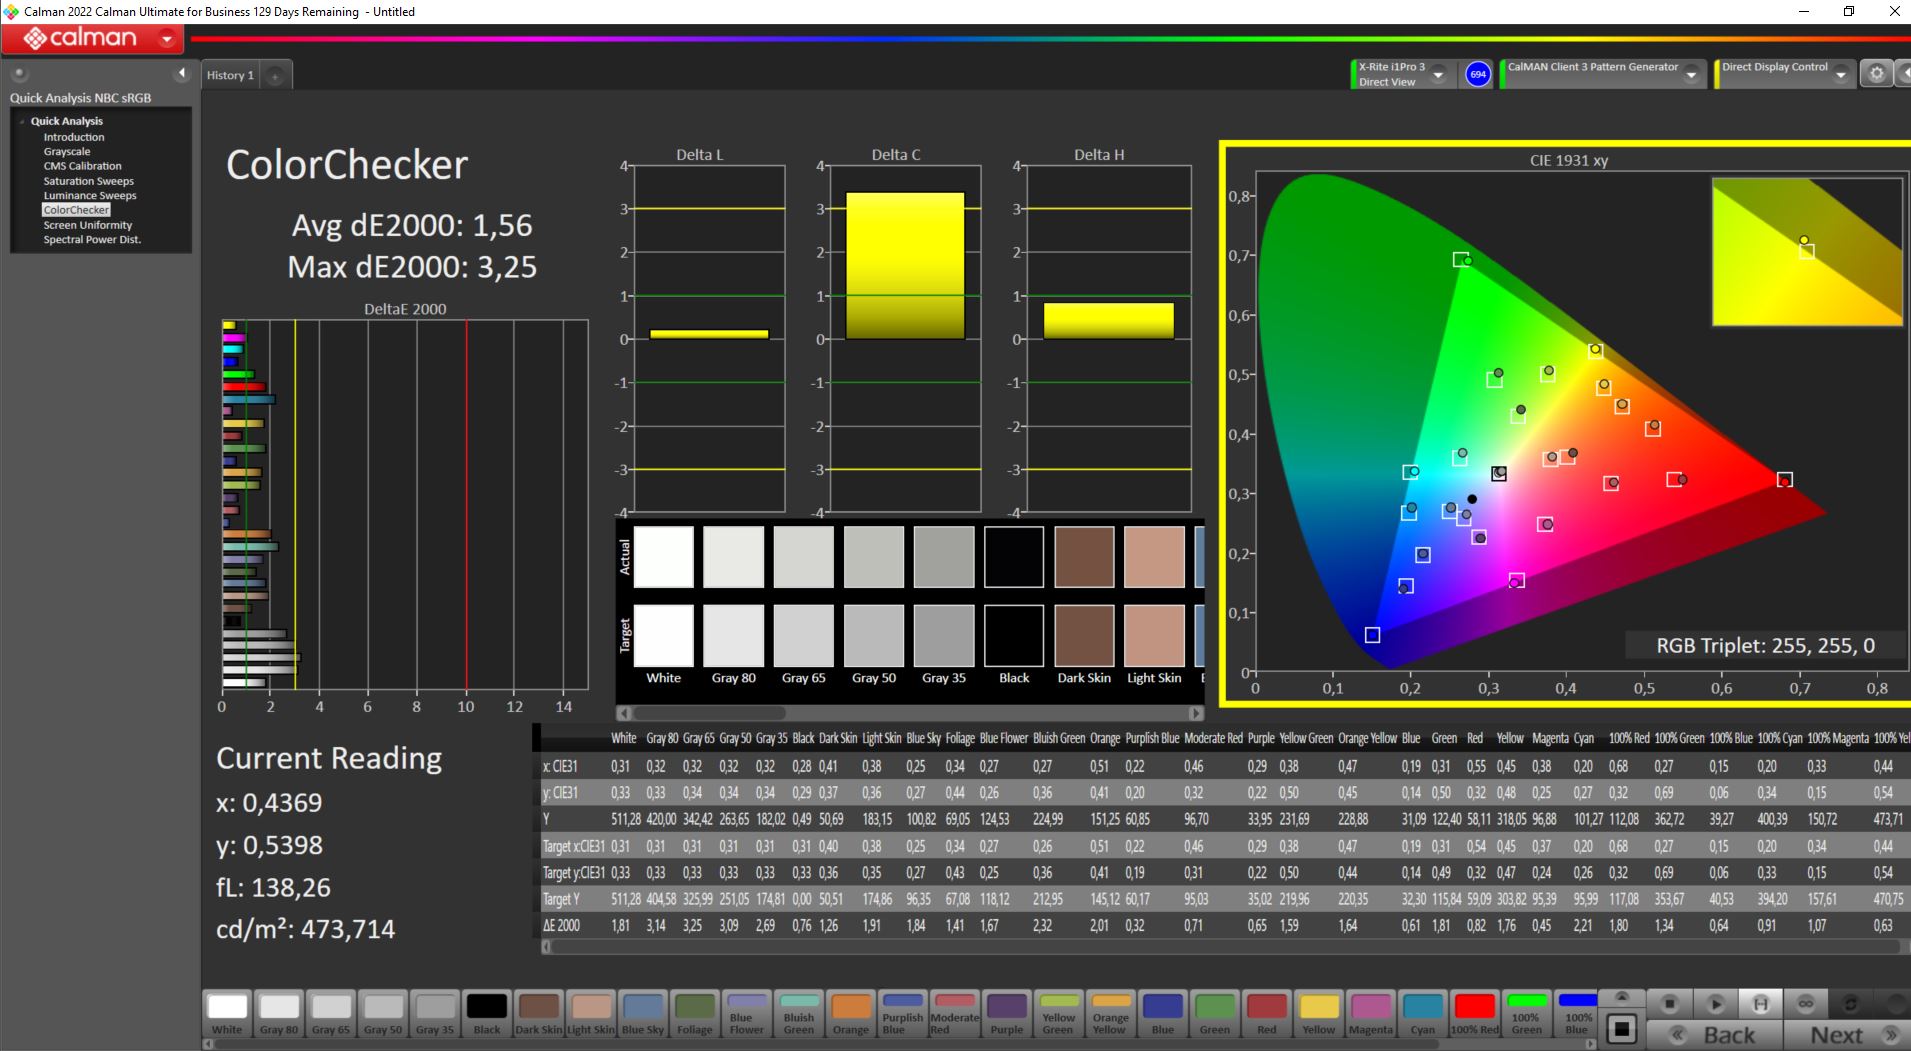
ΔE ColorChecker Calman: 1.76 | ∀{0.5-29.43 Ø4.71}
calibrated: 1.56
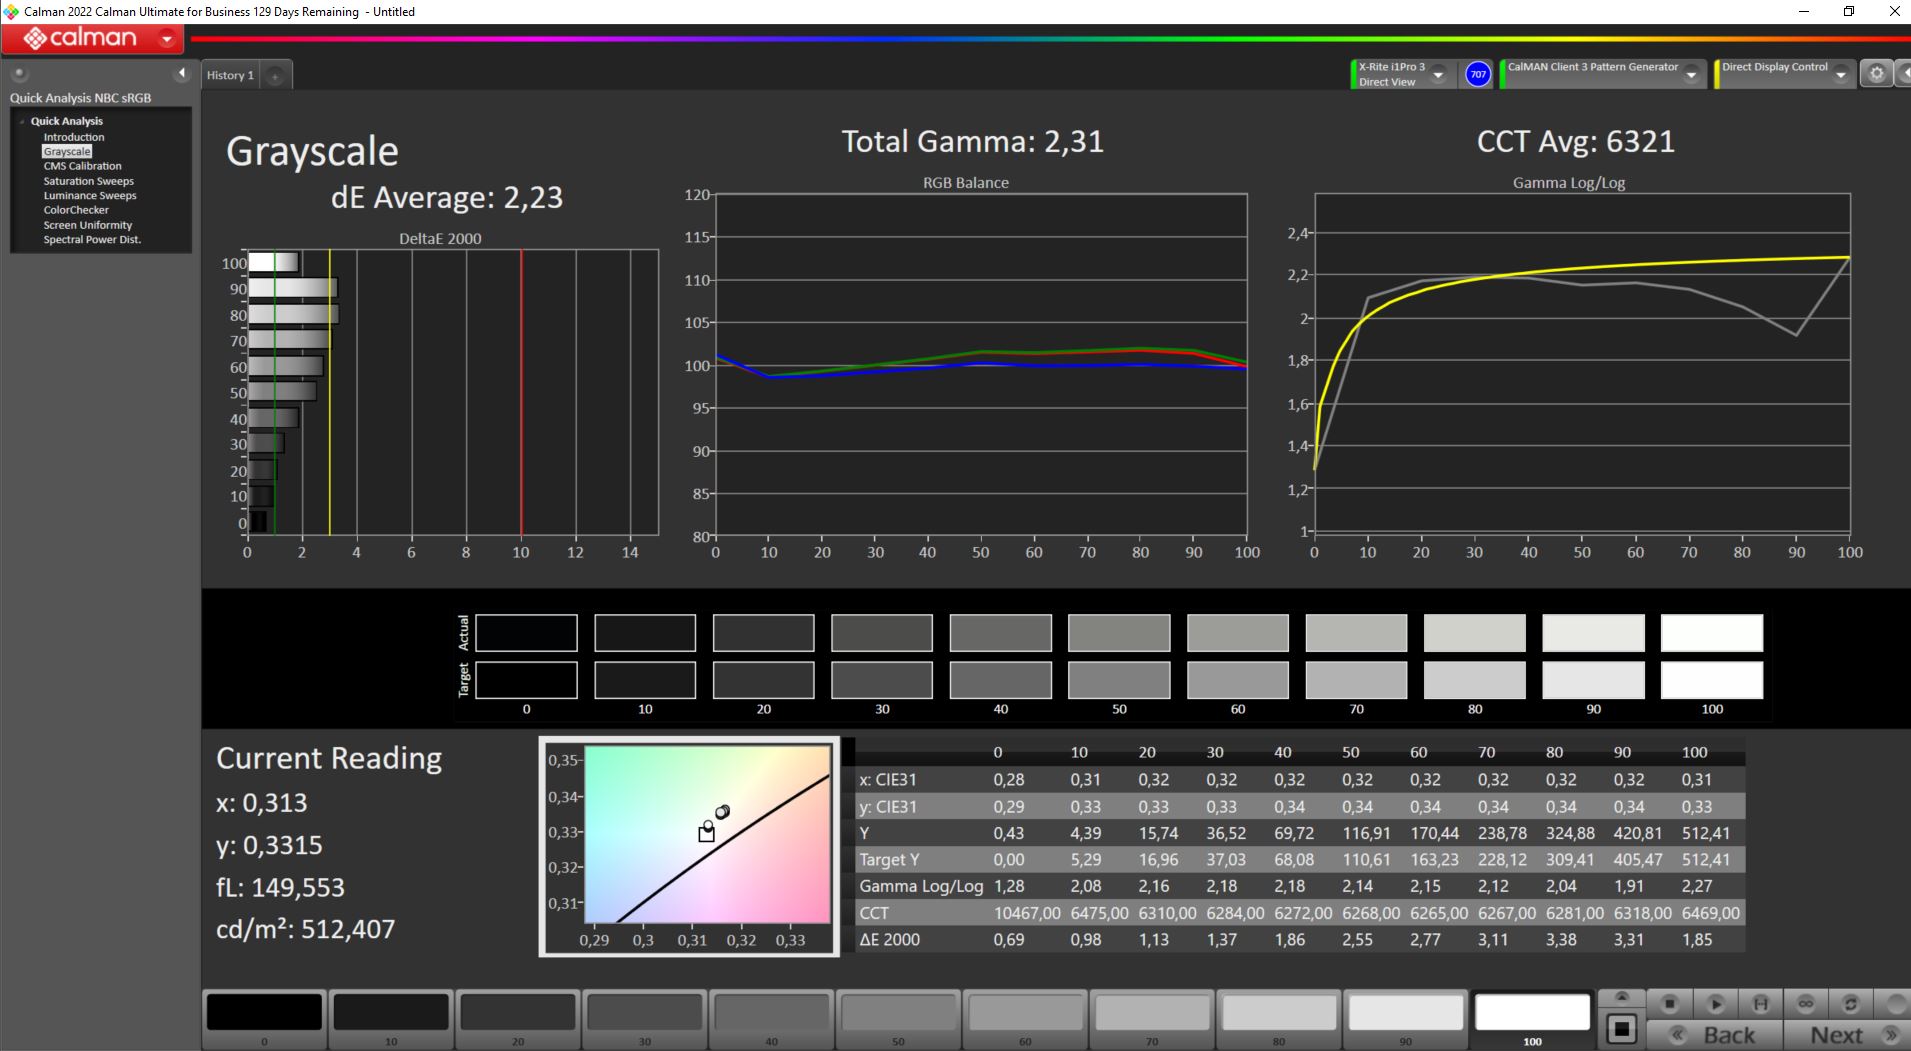
ΔE Greyscale Calman: 3 | ∀{0.09-98 Ø4.96}
84.7% AdobeRGB 1998 (Argyll 3D)
100% sRGB (Argyll 3D)
97.1% Display P3 (Argyll 3D)
Gamma: 2.33
CCT: 6341 K
| Acer Predator Helios 16 PH16-71-731Q BOE NE160QDM-NZ2, IPS-LED, 2560x1600, 16" | Acer Nitro 16 AN16-41 BOE CQ NE16QDM-NY1, IPS, 2560x1600, 16" | Lenovo Legion Pro 5 16IRX8 AU Optronics B160QAN03.1, IPS, 2560x1600, 16" | Aorus 15X ASF BOE CQ NE156QHM-NZ1, IPS, 2560x1440, 15.6" | Asus TUF Gaming A16 FA617 NE160WUM-NX2 (BOE0B33), IPS-Level, 1920x1200, 16" | Dell G15 5530 AUO B156HAN, IPS, 1920x1080, 15.6" | |
|---|---|---|---|---|---|---|
| Display | -16% | -14% | -16% | -16% | -13% | |
| Display P3 Coverage (%) | 97.1 | 67.9 -30% | 71.2 -27% | 69.3 -29% | 69.4 -29% | 73.1 -25% |
| sRGB Coverage (%) | 100 | 99.1 -1% | 98.8 -1% | 98.2 -2% | 97.8 -2% | 98.4 -2% |
| AdobeRGB 1998 Coverage (%) | 84.7 | 69.9 -17% | 73.3 -13% | 70.5 -17% | 70.9 -16% | 74.4 -12% |
| Response Times | 21% | -35% | -19% | -42% | 46% | |
| Response Time Grey 50% / Grey 80% * (ms) | 13.6 ? | 11 ? 19% | 14.5 ? -7% | 12.4 ? 9% | 17 ? -25% | 3.39 ? 75% |
| Response Time Black / White * (ms) | 6.4 ? | 5 ? 22% | 10.4 ? -63% | 9.4 ? -47% | 10.1 ? -58% | 5.35 ? 16% |
| PWM Frequency (Hz) | 21620 ? | |||||
| Screen | -3% | 4% | 5% | 5% | -50% | |
| Brightness middle (cd/m²) | 511 | 520 2% | 405.7 -21% | 316 -38% | 308 -40% | 320 -37% |
| Brightness (cd/m²) | 498 | 494 -1% | 368 -26% | 301 -40% | 293 -41% | 316 -37% |
| Brightness Distribution (%) | 94 | 91 -3% | 87 -7% | 90 -4% | 90 -4% | 94 0% |
| Black Level * (cd/m²) | 0.36 | 0.39 -8% | 0.38 -6% | 0.28 22% | 0.23 36% | 0.21 42% |
| Contrast (:1) | 1419 | 1333 -6% | 1068 -25% | 1129 -20% | 1339 -6% | 1524 7% |
| Colorchecker dE 2000 * | 1.76 | 1.94 -10% | 1.65 6% | 1.54 12% | 1.47 16% | 4.55 -159% |
| Colorchecker dE 2000 max. * | 3.7 | 5.62 -52% | 4.2 -14% | 2.46 34% | 2.98 19% | 9.83 -166% |
| Colorchecker dE 2000 calibrated * | 1.56 | 0.74 53% | 0.53 66% | 1.21 22% | 1.02 35% | 1.51 3% |
| Greyscale dE 2000 * | 3 | 2.94 2% | 1.2 60% | 1.3 57% | 2.2 27% | 6.2 -107% |
| Gamma | 2.33 94% | 2.37 93% | 2.3 96% | 2.307 95% | 2.228 99% | 2.07 106% |
| CCT | 6341 103% | 6443 101% | 6453 101% | 6456 101% | 6228 104% | 6479 100% |
| Média Total (Programa/Configurações) | 1% /
-2% | -15% /
-6% | -10% /
-3% | -18% /
-6% | -6% /
-29% |
* ... menor é melhor
Como 100% do sRGB, 97,1% do DCI P3 e 84,7% do AdobeRGB são cobertos, nada impede a edição de fotos e vídeos, que dependem de cores precisas. Nenhum laptop para jogos em nosso campo de comparação pode sequer chegar perto desses números, com exceção do espaço de cores sRGB.
Quando saem da caixa, as cores e as escalas de cinza já estão calibradas e, portanto, não excedem o limite DeltaE 3, até o qual o olho humano pode detectar desvios de cor. Nossa calibração conseguiu melhorar ainda mais esses valores, sem nenhuma projeção de cor visível. Nosso perfil de cor calibrado pode ser baixado aqui https://notebookcheck.com/uploads/tx_nbc2/helios16_kal.icm.

Exibir tempos de resposta
| ↔ Tempo de resposta preto para branco | ||
|---|---|---|
| 6.4 ms ... ascensão ↗ e queda ↘ combinadas | ↗ 2.2 ms ascensão | 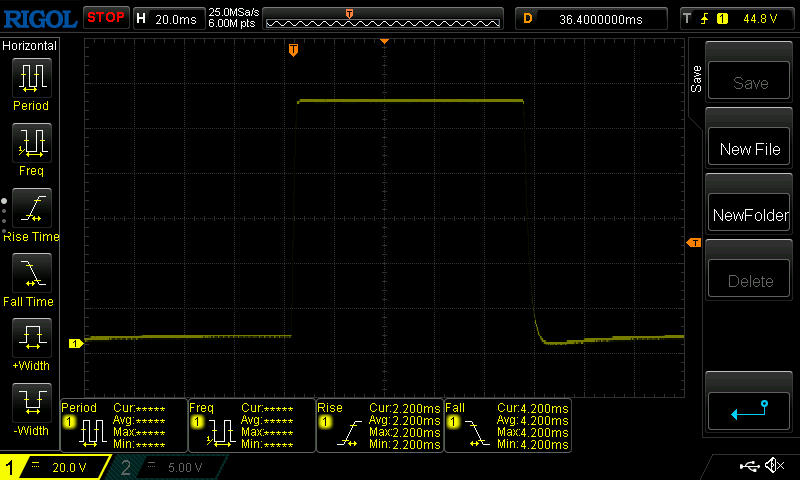 |
| ↘ 4.2 ms queda | ||
| A tela mostra taxas de resposta muito rápidas em nossos testes e deve ser muito adequada para jogos em ritmo acelerado. Em comparação, todos os dispositivos testados variam de 0.1 (mínimo) a 240 (máximo) ms. » 20 % de todos os dispositivos são melhores. Isso significa que o tempo de resposta medido é melhor que a média de todos os dispositivos testados (19.8 ms). | ||
| ↔ Tempo de resposta 50% cinza a 80% cinza | ||
| 13.6 ms ... ascensão ↗ e queda ↘ combinadas | ↗ 6.2 ms ascensão | 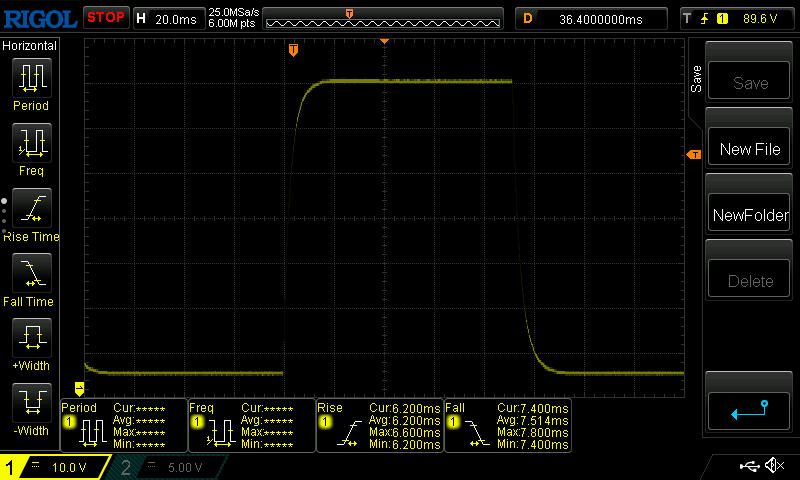 |
| ↘ 7.4 ms queda | ||
| A tela mostra boas taxas de resposta em nossos testes, mas pode ser muito lenta para jogadores competitivos. Em comparação, todos os dispositivos testados variam de 0.165 (mínimo) a 636 (máximo) ms. » 27 % de todos os dispositivos são melhores. Isso significa que o tempo de resposta medido é melhor que a média de todos os dispositivos testados (30.9 ms). | ||
Cintilação da tela / PWM (modulação por largura de pulso)
| Tela tremeluzindo / PWM não detectado | 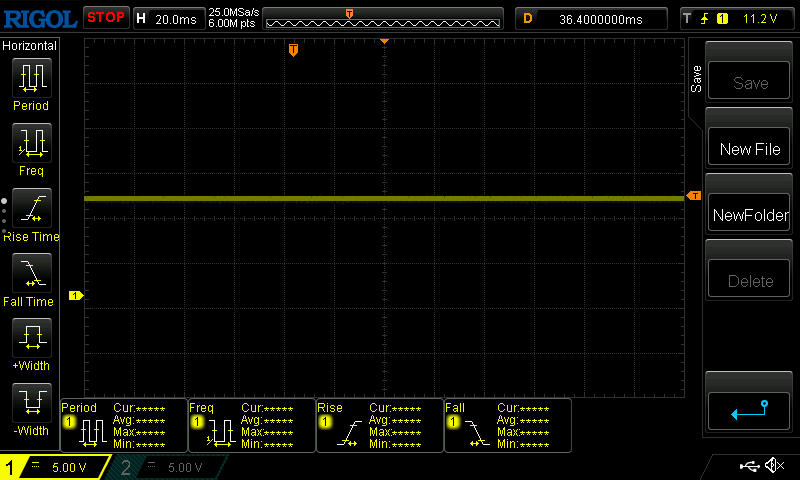 | ||
[pwm_comparison] Em comparação: 52 % de todos os dispositivos testados não usam PWM para escurecer a tela. Se PWM foi detectado, uma média de 7748 (mínimo: 5 - máximo: 343500) Hz foi medida. | |||
Em ambientes externos, a tela é legível tanto na sombra quanto em áreas semi-sombreadas. Sob luz solar direta, mesmo uma tela fosca e 500 cd/m² nem sempre ajudam.


Como é típico de um painel IPS, os ângulos de visão são estáveis, de cima, de baixo e também de lado.
Desempenho: A RTX 4060 já atinge sua velocidade máxima de clock a 100 watts
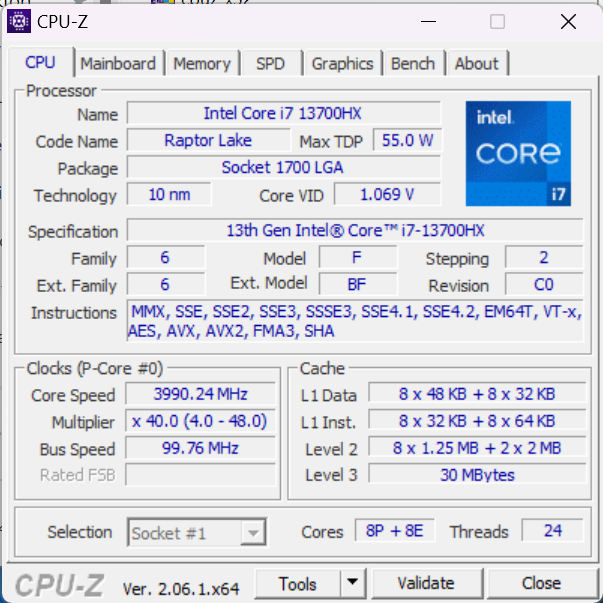
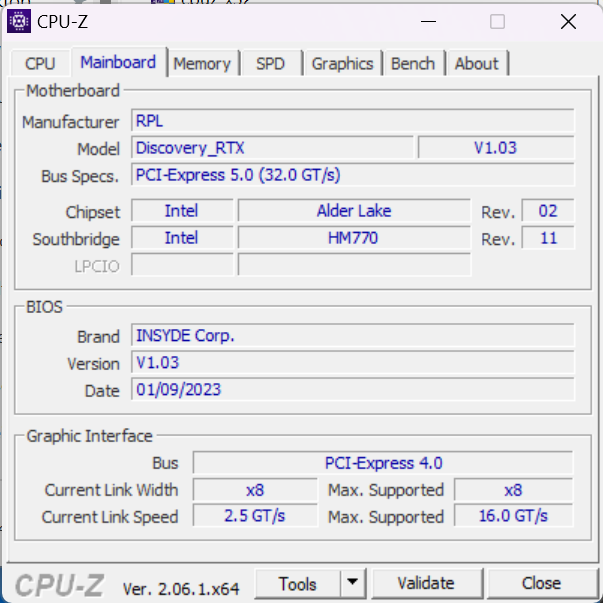
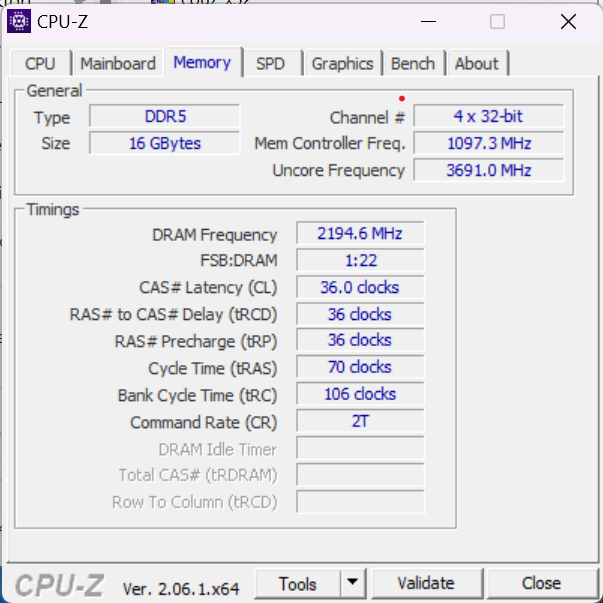
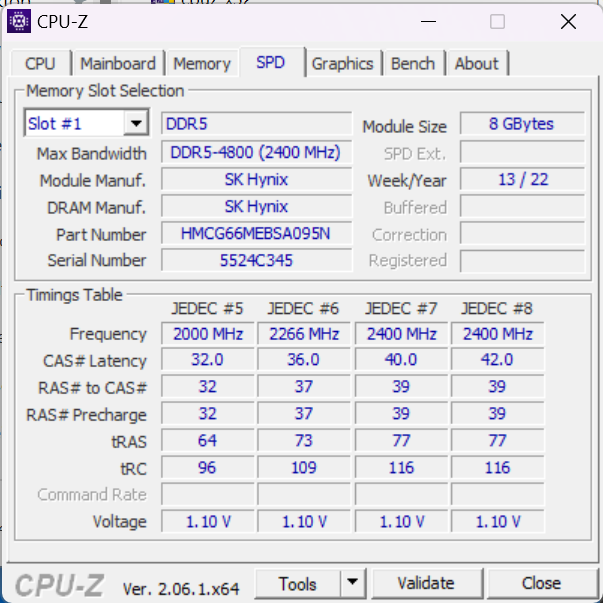
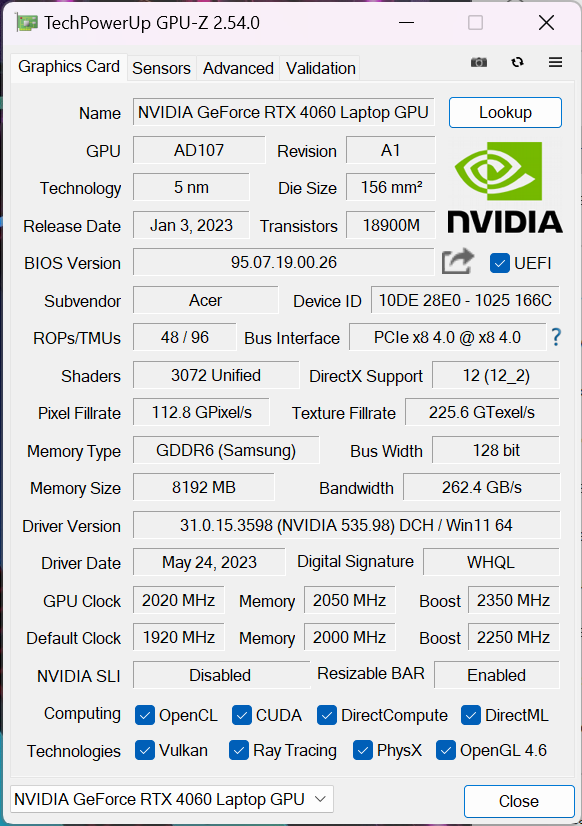
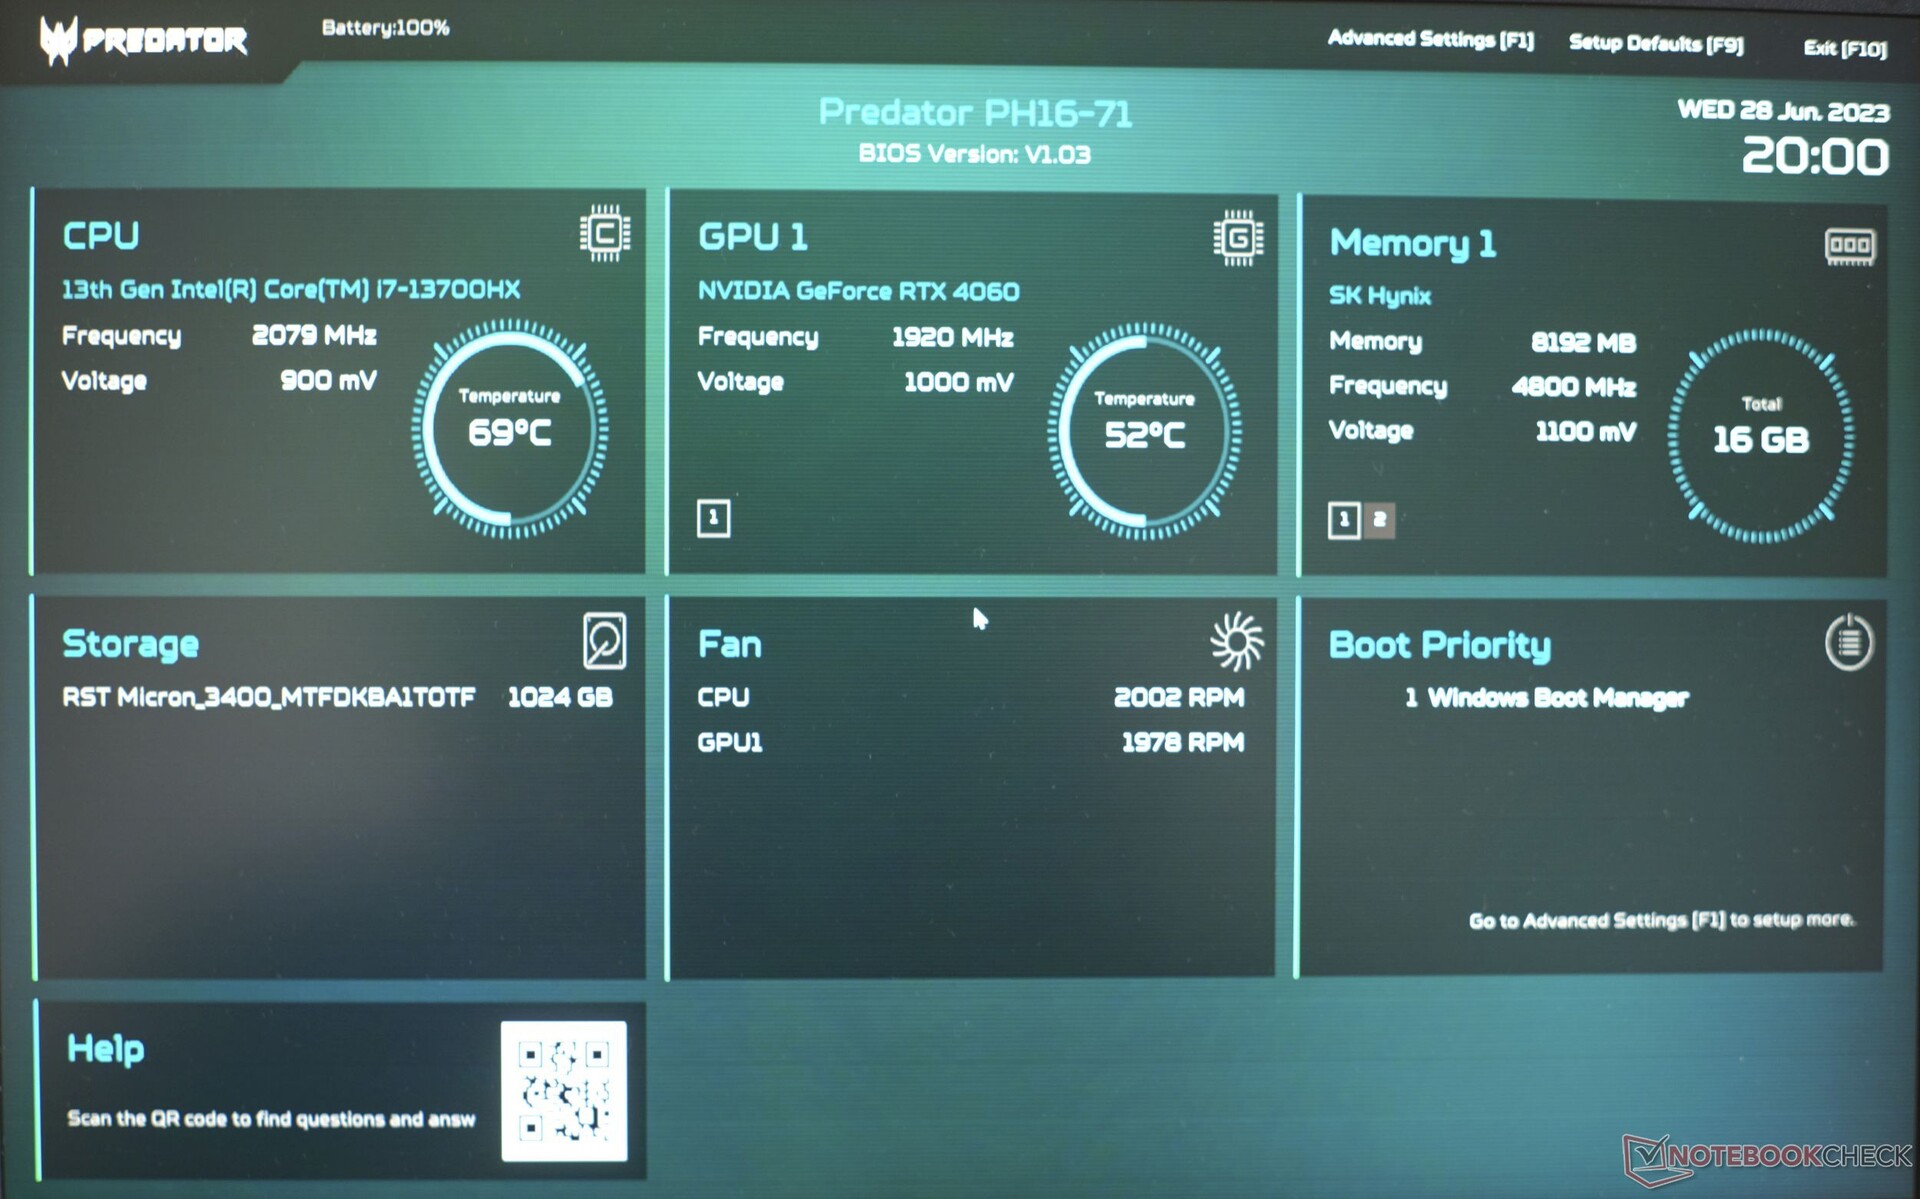
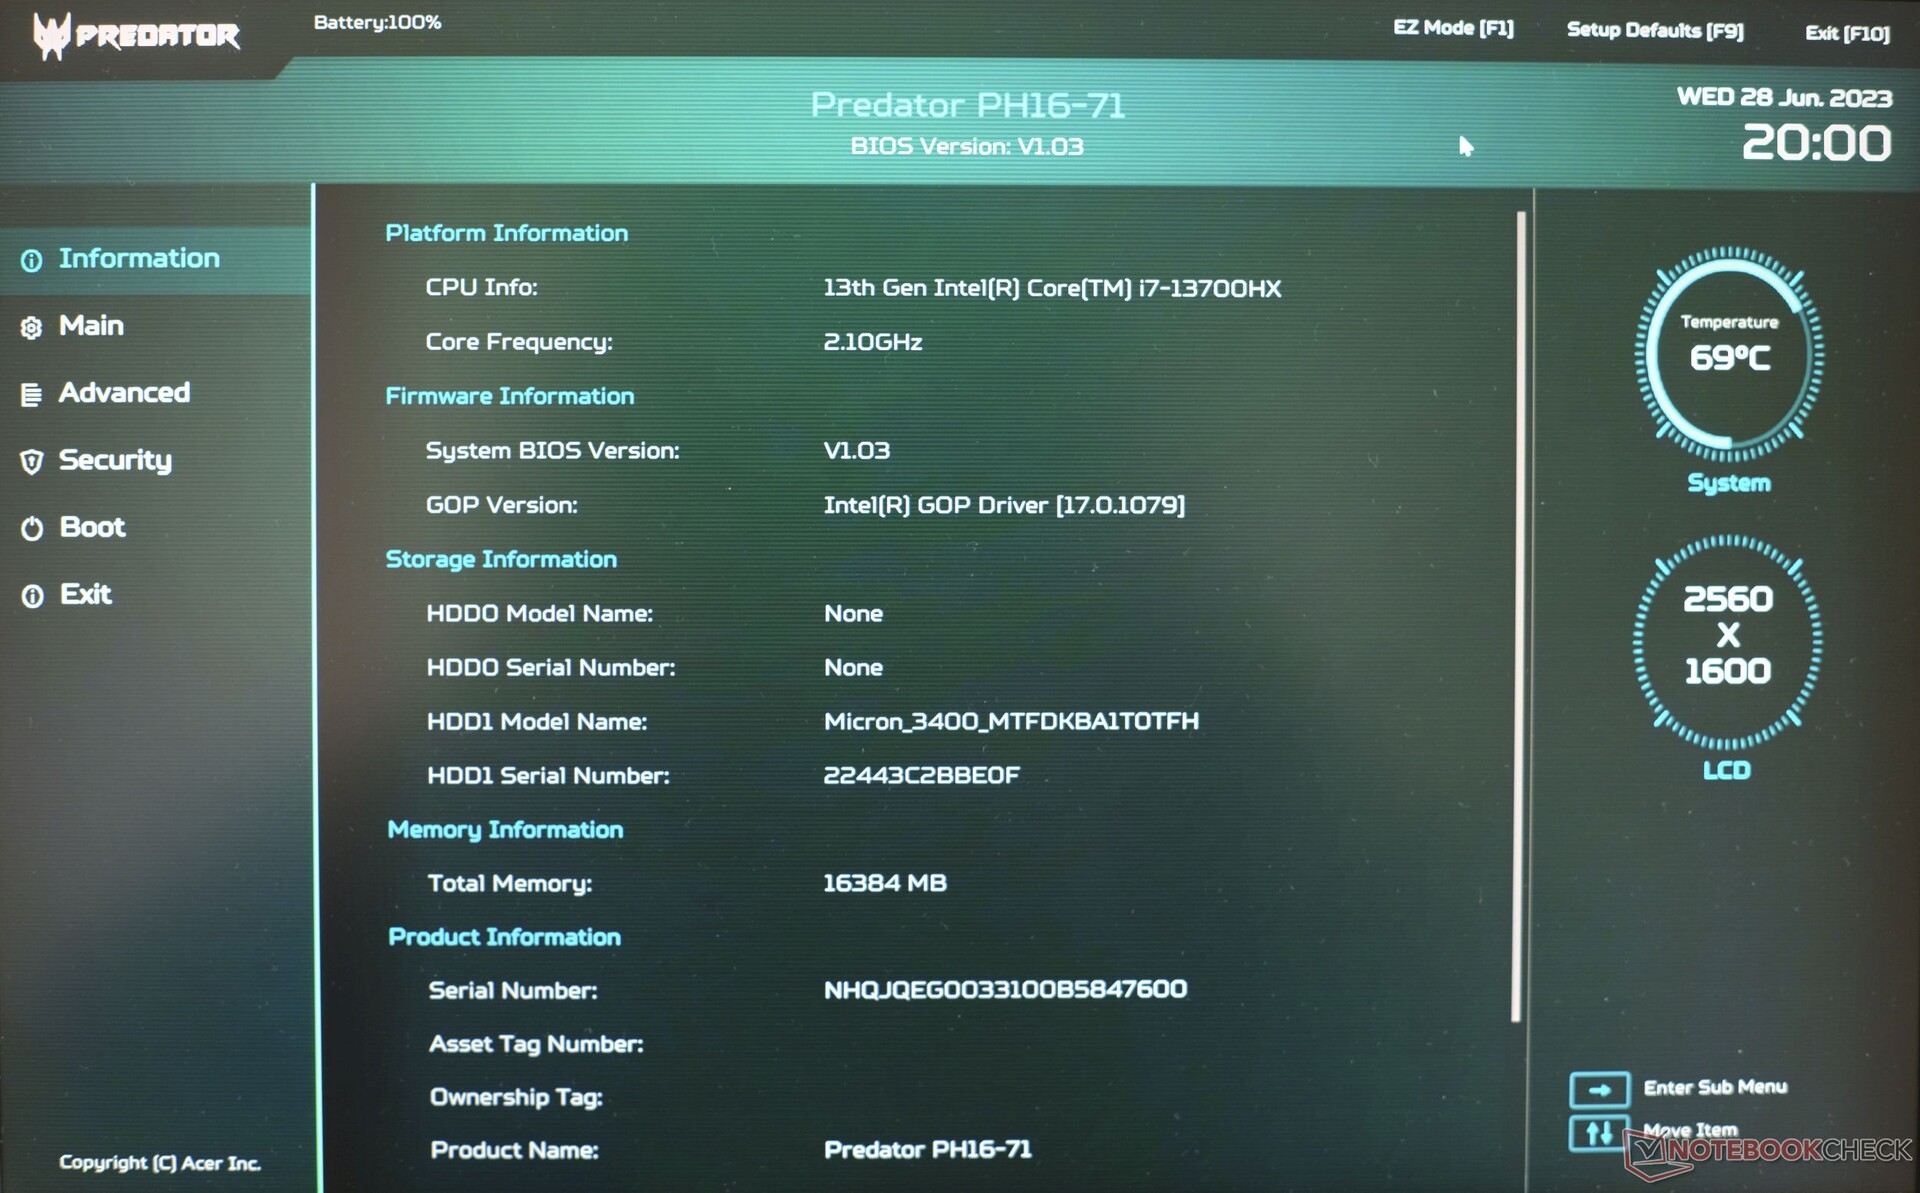
Nossa configuração de análise do Acer Predator Helios 16 tem um processador Intel Core i7-13700HX(8 núcleos P + 8 núcleos E), 16 GB de RAM DDR5 4800, uma unidade SSD de 1 TB (PCIe 4.0) e uma placa de vídeo Nvidia GeForce RTX 4060com TGP máximo (140 watts). Outras SKUs estão disponíveis com um Core i9-13900HX(8 núcleos P + 16 núcleos E), umaRTX 4070 ou RTX 4080.
O mercado-alvo do modelo de análise são os gamers que não precisam jogar os jogos atuais nas taxas de quadros mais altas ou na resolução QHD nativa do dispositivo. Outros aplicativos gráficos, como edição de vídeo 4K ou renderização 3D, podem ser facilmente realizados com esse modelo.
Condições de teste
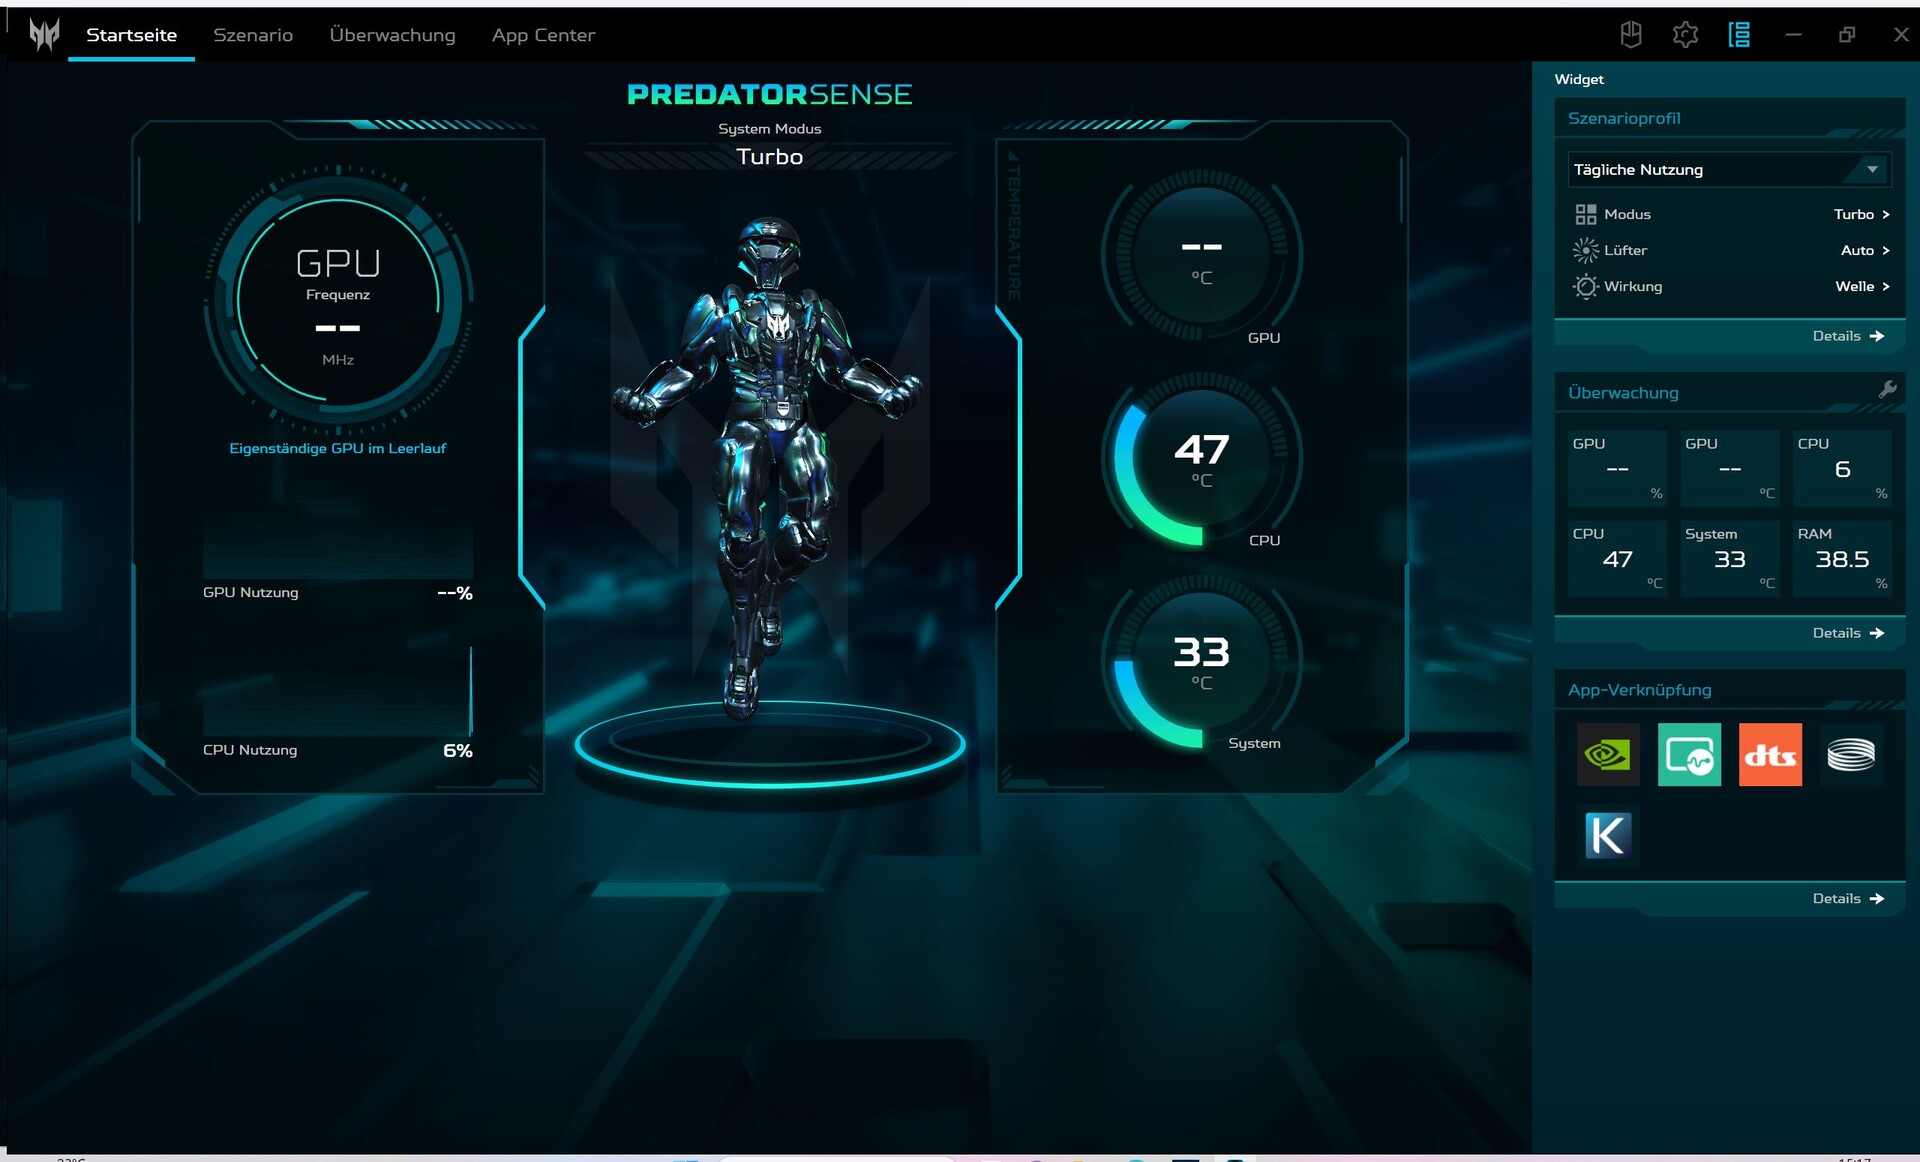


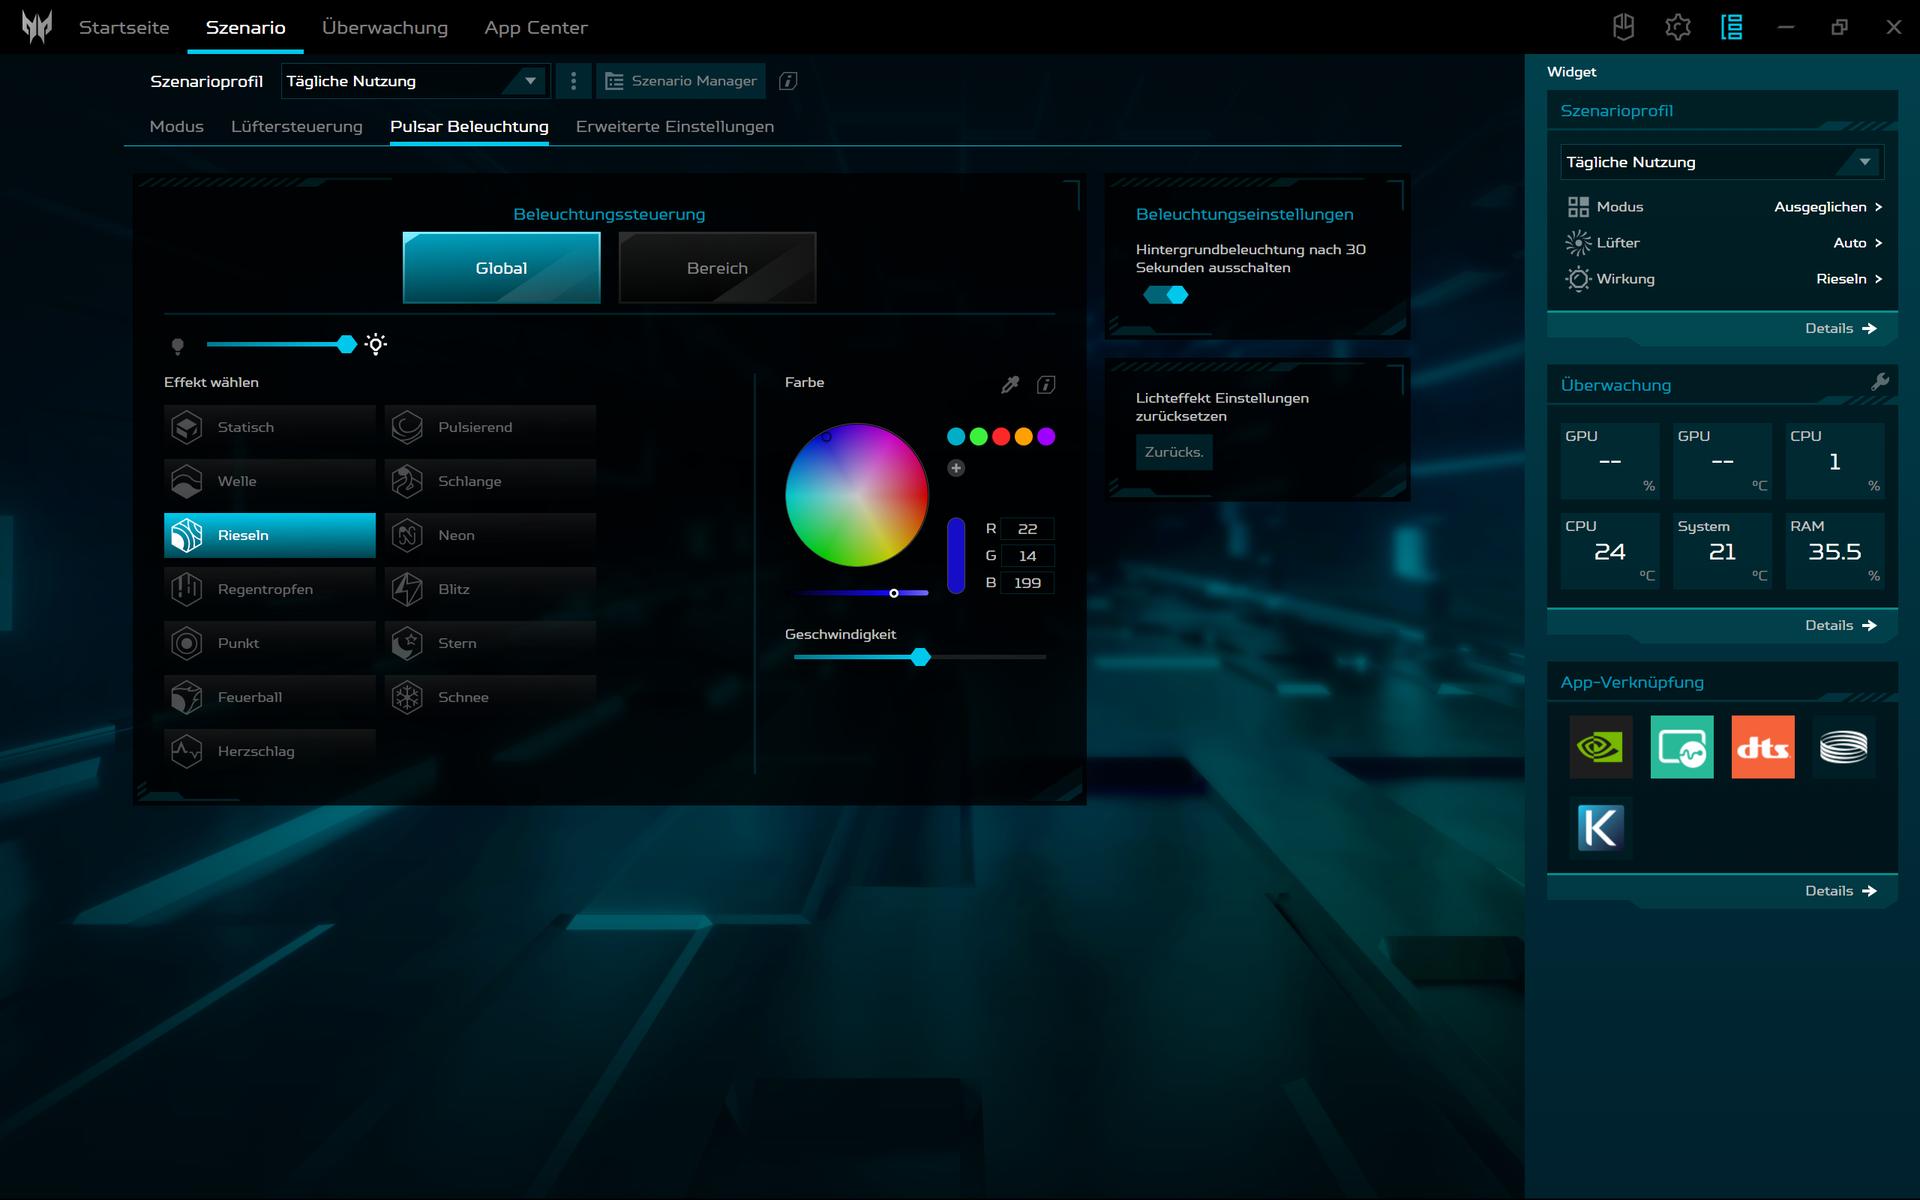
No software do Centro de Controle da Acer, o "PredatorSense", estão disponíveis quatro modos de desempenho que podem ser selecionados alternativamente por meio do botão no lado esquerdo, acima do teclado. Realizamos nossos benchmarks baseados em desempenho usando o modo "Desempenho". Quando desconectado da rede elétrica, ele foi automaticamente alterado para o modo "Balanced". O modo "Eco", que também está disponível aqui, reduz o brilho da tela e todas as formas de iluminação LED são desativadas. O Helios 16 precisa ser carregado a pelo menos 40% para controlar os modos de desempenho.
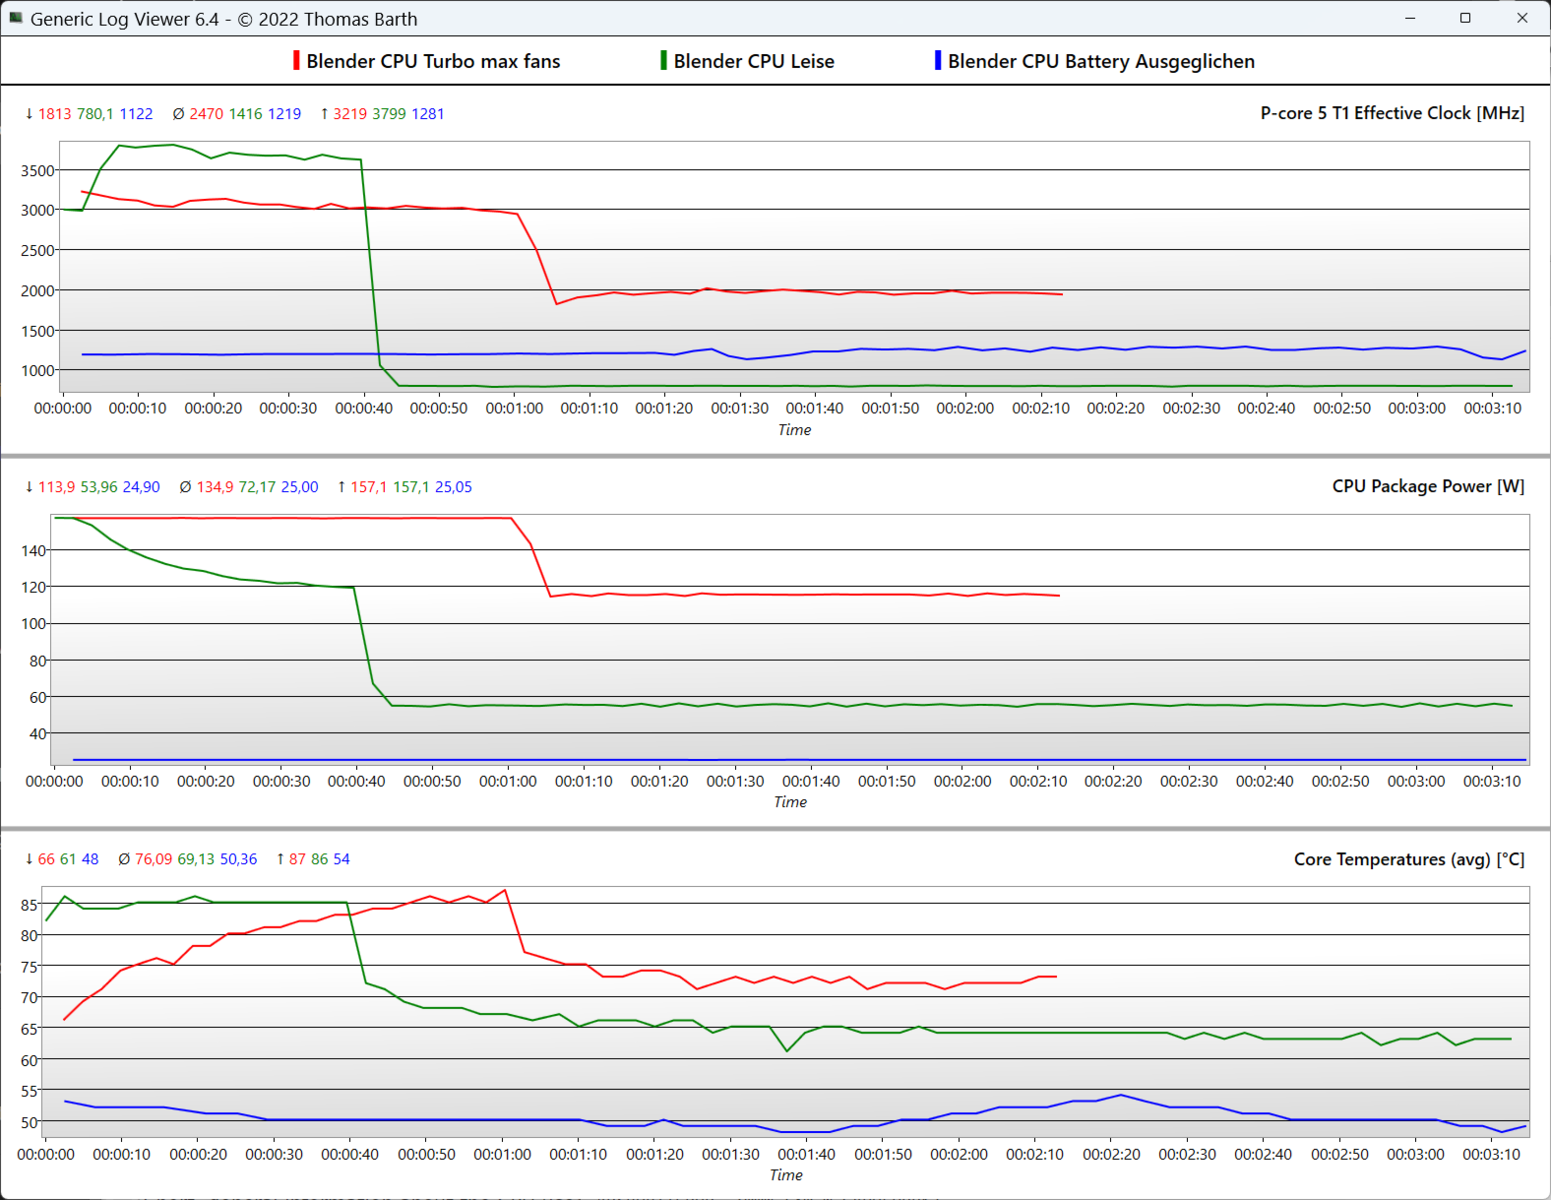
A tabela abaixo destaca que muito pouca energia é perdida no modo "Balanced", com as ventoinhas permanecendo consideravelmente mais silenciosas, de fato, quase agradavelmente silenciosas. Por outro lado, o modo "Turbo" é insuportavelmente barulhento e, portanto, só é útil para renderização de vídeos longos ou algo semelhante.
| Cenário | Turbo + Max fans | Turbo | Desempenho | Balanceado | Silencioso | Bateria |
|---|---|---|---|---|---|---|
| CPU PL2 | 157 W (1:05 min) | 157 W > 150 W (1 min) | 157 W > 140 W (~55 seg) | 157 W > 135 W (~55 seg) | 157 W > 120 W (~40 seg) | 25 W |
| CPU PL1 | 118 W | 115 W | 95 W | 85 W | 55 W | 25 W |
| GPU @Cyberpunk 2077 1.6 | 103 W | 100 W | 100 W | 90 W | 55 W | 37 W |
| GPU @FurMark | 138 W | 137 W | 130 W | 100 W | 60 W | 40 W |
| Desempenho (Cyperpunk 2077 1.6 @FHD/Ultra) | 96.2fps | 95.5fps | 93.2fps | 87.4fps | 65.8fps | 30fps |
Processador
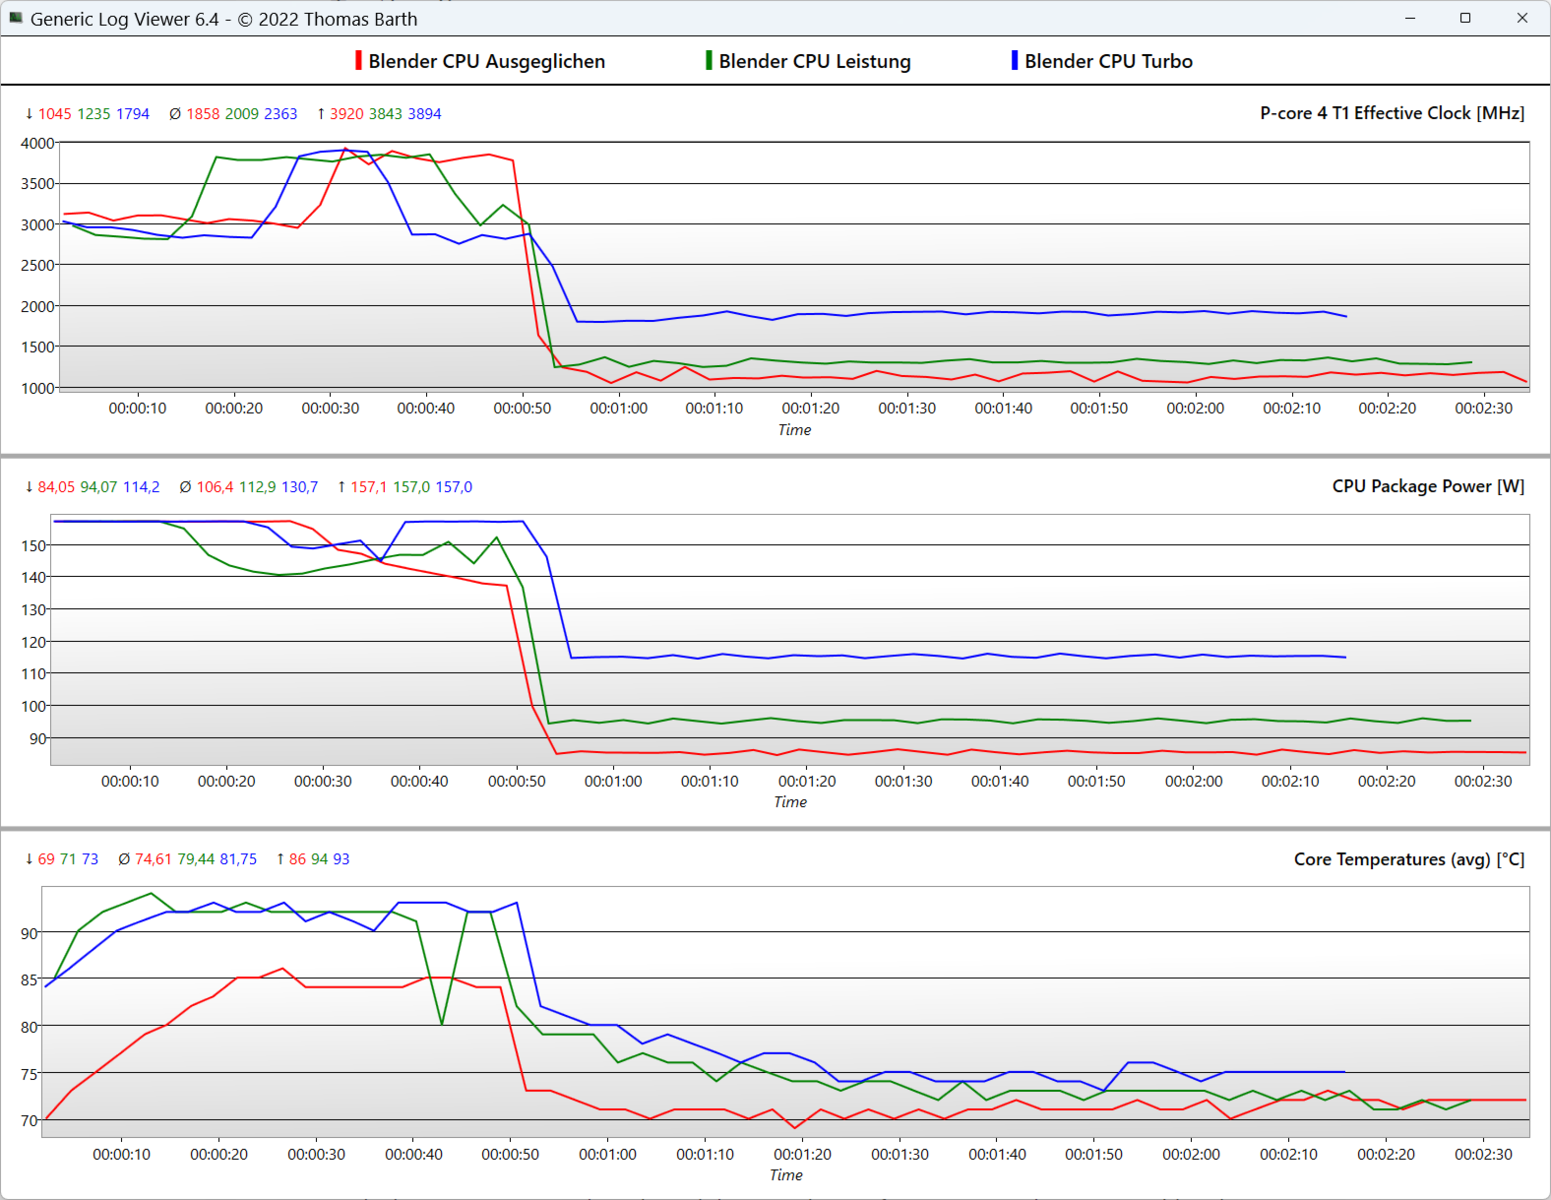
O Intel Core i7-13700HXpossui 16 núcleos e 24 threads (8 núcleos P + 8 núcleos E), além de um TDP de 55 watts. O turbo de 4,5 GHz não é totalmente utilizado e, no primeiro minuto, os núcleos P ficam entre 3 GHz e 3,9 GHz e depois caem para 1,9 GHz (modo Turbo) e 1,3 GHz (modo Desempenho), respectivamente.
O desempenho de vários núcleos corresponde ao de seus concorrentes com a mesma CPU. O AMD de 8 núcleos Ryzen 7 7735HS encontrado no Acer Nitro 16 e no Asus TUF Gaming A16 é claramente superado. A partir da quinta execução do Cinebench R15, o estrangulamento ficou em cerca de 15% e pode ser quase totalmente evitado com a ativação do modo "Turbo". O Core i9-13900HX, disponível opcionalmente, possui o dobro do número de núcleos E e é normalmente cerca de 33% mais rápido em tarefas com vários núcleos. No modo de bateria, as coisas parecem sombrias, pois o mísero limite de TDP de 25 watts significa uma queda no desempenho de quase 65%.
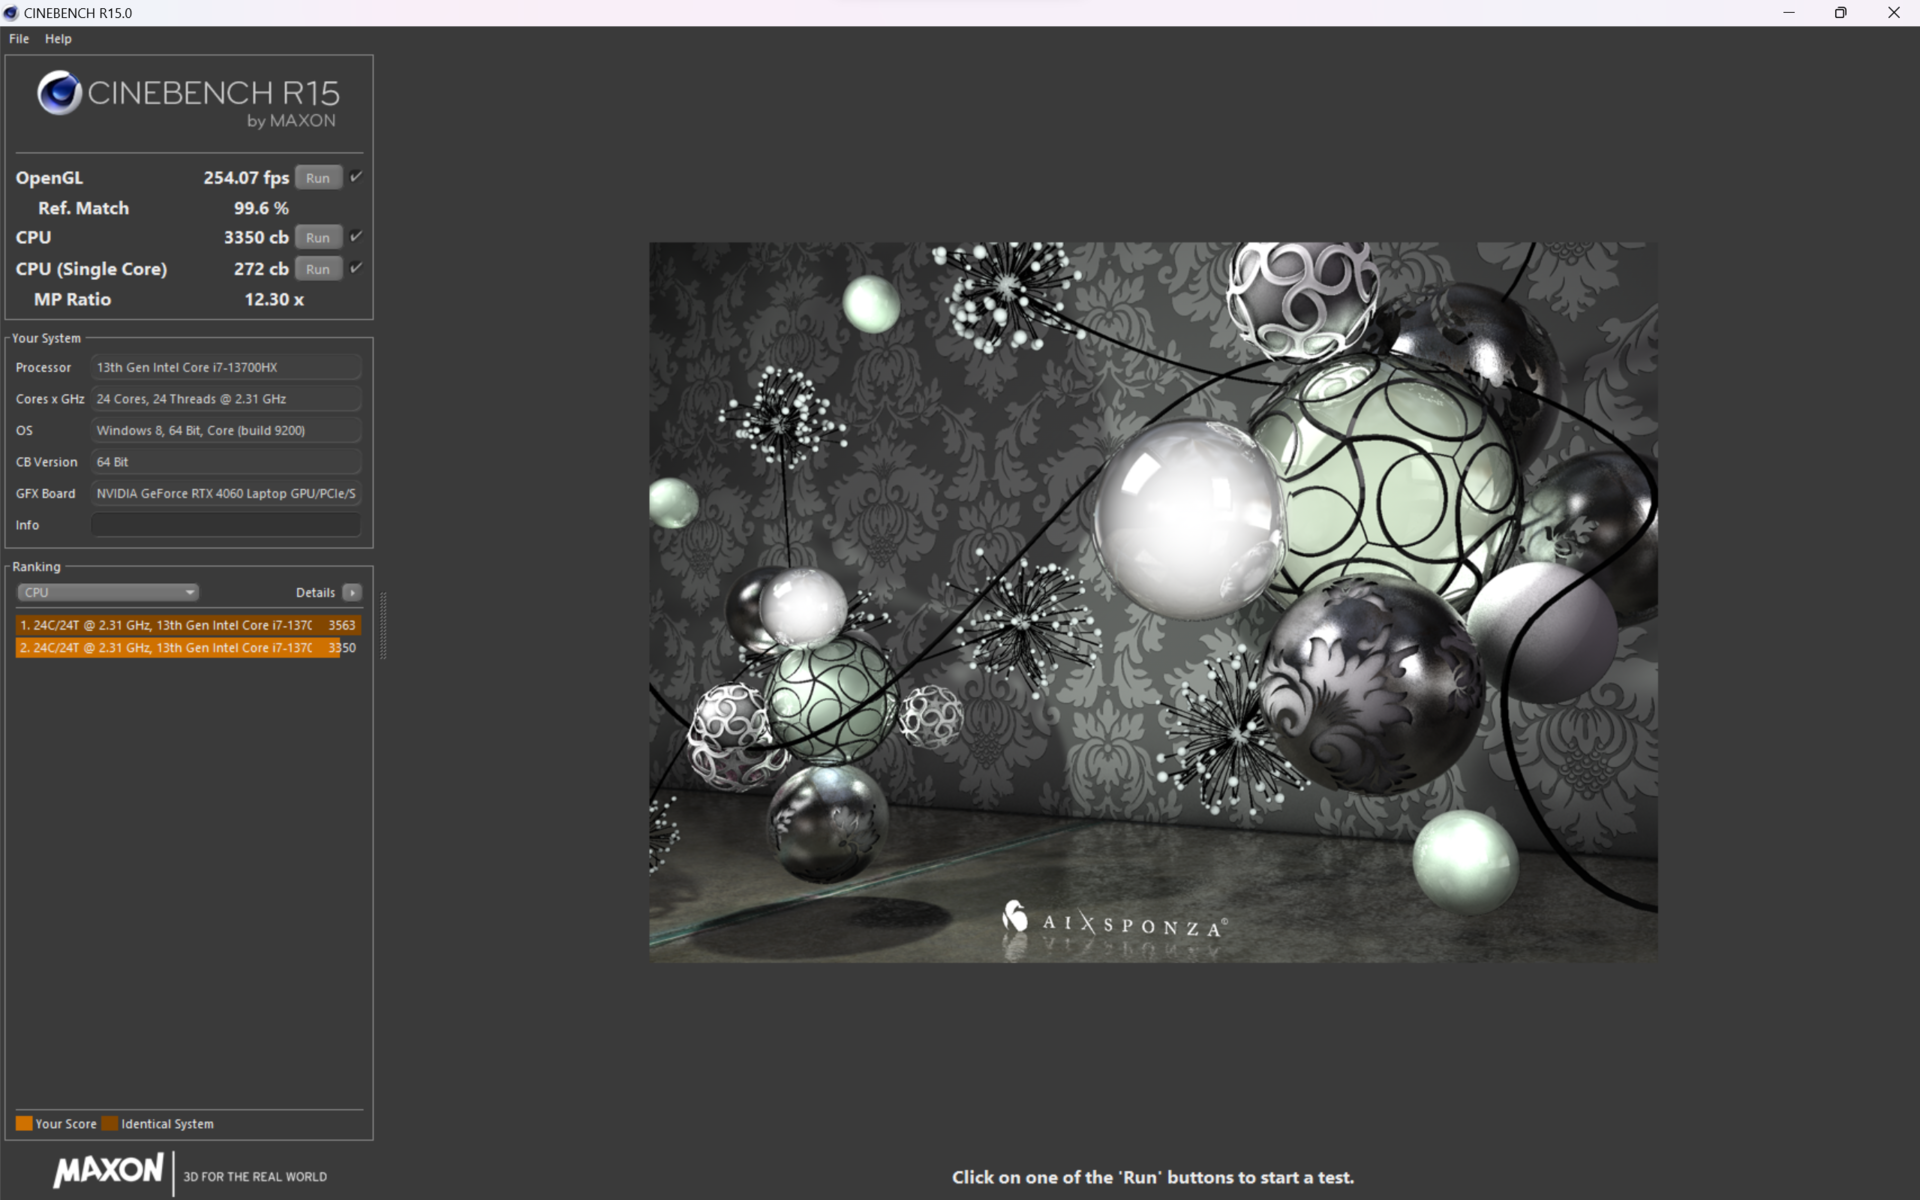


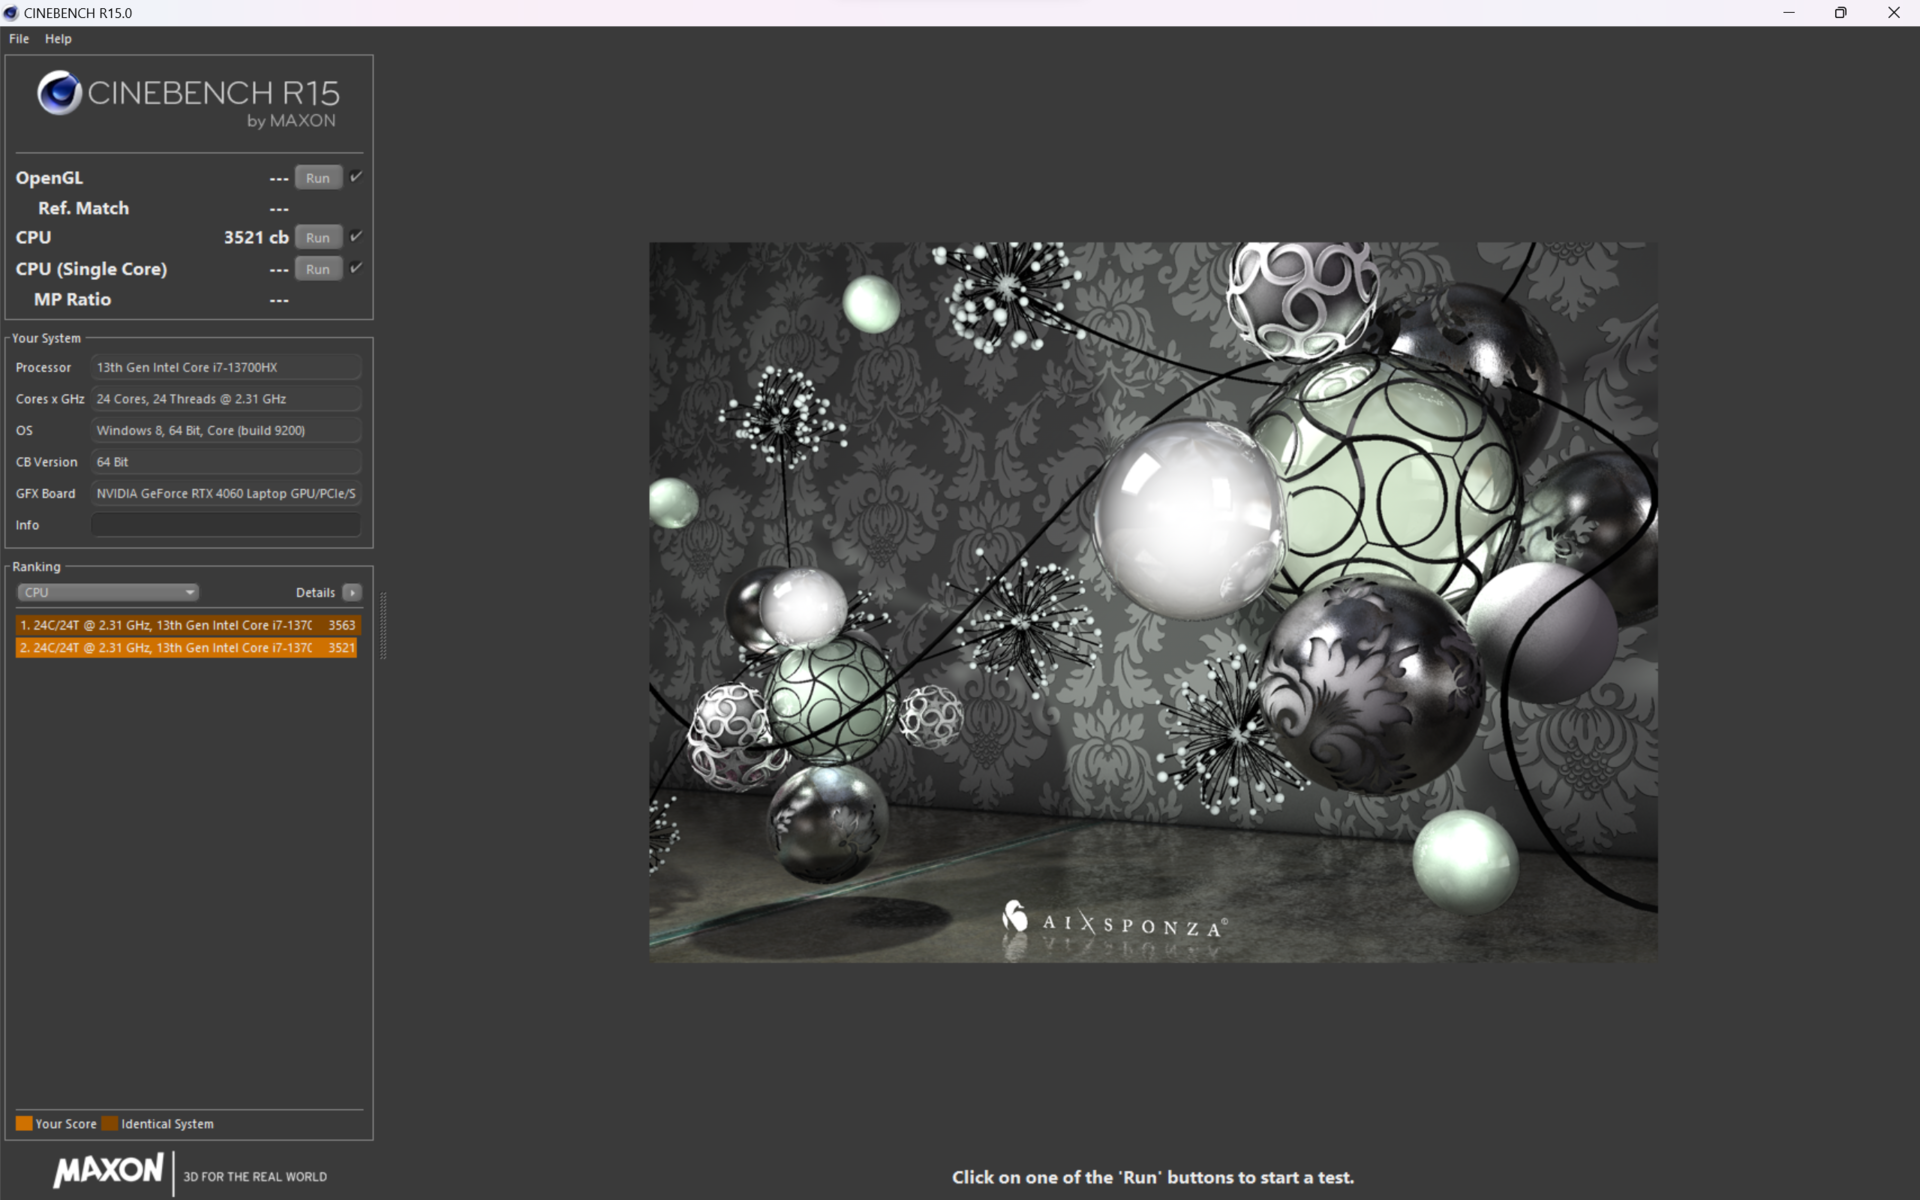
Cinebench R15 Multi Continuous Test
Cinebench R23: Multi Core | Single Core
Cinebench R20: CPU (Multi Core) | CPU (Single Core)
Cinebench R15: CPU Multi 64Bit | CPU Single 64Bit
Blender: v2.79 BMW27 CPU
7-Zip 18.03: 7z b 4 | 7z b 4 -mmt1
Geekbench 5.5: Multi-Core | Single-Core
HWBOT x265 Benchmark v2.2: 4k Preset
LibreOffice : 20 Documents To PDF
R Benchmark 2.5: Overall mean
| CPU Performance rating | |
| Média da turma Gaming | |
| Acer Predator Helios 16 PH16-71-731Q | |
| Asus ROG Zephyrus M16 GU604VY-NM042X | |
| Aorus 15X ASF | |
| Dell G15 5530 | |
| Média Intel Core i7-13700HX | |
| Lenovo Legion Pro 5 16IRX8 | |
| Acer Predator Helios 300 (i7-12700H, RTX 3070 Ti) | |
| Acer Nitro 16 AN16-41 | |
| Asus TUF Gaming A16 FA617 | |
| Cinebench R23 / Multi Core | |
| Média da turma Gaming (10488 - 42661, n=108, últimos 2 anos) | |
| Acer Predator Helios 16 PH16-71-731Q | |
| Dell G15 5530 | |
| Média Intel Core i7-13700HX (15558 - 22598, n=11) | |
| Aorus 15X ASF | |
| Lenovo Legion Pro 5 16IRX8 | |
| Asus ROG Zephyrus M16 GU604VY-NM042X | |
| Acer Predator Helios 300 (i7-12700H, RTX 3070 Ti) | |
| Acer Nitro 16 AN16-41 | |
| Asus TUF Gaming A16 FA617 | |
| Cinebench R23 / Single Core | |
| Média da turma Gaming (1166 - 2415, n=108, últimos 2 anos) | |
| Asus ROG Zephyrus M16 GU604VY-NM042X | |
| Acer Predator Helios 16 PH16-71-731Q | |
| Aorus 15X ASF | |
| Dell G15 5530 | |
| Média Intel Core i7-13700HX (1666 - 1933, n=11) | |
| Acer Predator Helios 300 (i7-12700H, RTX 3070 Ti) | |
| Lenovo Legion Pro 5 16IRX8 | |
| Asus TUF Gaming A16 FA617 | |
| Acer Nitro 16 AN16-41 | |
| Cinebench R20 / CPU (Multi Core) | |
| Média da turma Gaming (4029 - 16433, n=107, últimos 2 anos) | |
| Acer Predator Helios 16 PH16-71-731Q | |
| Dell G15 5530 | |
| Aorus 15X ASF | |
| Média Intel Core i7-13700HX (6160 - 8610, n=11) | |
| Asus ROG Zephyrus M16 GU604VY-NM042X | |
| Lenovo Legion Pro 5 16IRX8 | |
| Acer Predator Helios 300 (i7-12700H, RTX 3070 Ti) | |
| Acer Nitro 16 AN16-41 | |
| Asus TUF Gaming A16 FA617 | |
| Cinebench R20 / CPU (Single Core) | |
| Média da turma Gaming (442 - 913, n=107, últimos 2 anos) | |
| Asus ROG Zephyrus M16 GU604VY-NM042X | |
| Acer Predator Helios 16 PH16-71-731Q | |
| Aorus 15X ASF | |
| Dell G15 5530 | |
| Média Intel Core i7-13700HX (644 - 740, n=11) | |
| Acer Predator Helios 300 (i7-12700H, RTX 3070 Ti) | |
| Lenovo Legion Pro 5 16IRX8 | |
| Asus TUF Gaming A16 FA617 | |
| Acer Nitro 16 AN16-41 | |
| Cinebench R15 / CPU Multi 64Bit | |
| Média da turma Gaming (1578 - 6330, n=106, últimos 2 anos) | |
| Aorus 15X ASF | |
| Acer Predator Helios 16 PH16-71-731Q | |
| Acer Predator Helios 16 PH16-71-731Q | |
| Lenovo Legion Pro 5 16IRX8 | |
| Média Intel Core i7-13700HX (2548 - 3482, n=12) | |
| Dell G15 5530 | |
| Asus ROG Zephyrus M16 GU604VY-NM042X | |
| Acer Predator Helios 300 (i7-12700H, RTX 3070 Ti) | |
| Acer Nitro 16 AN16-41 | |
| Asus TUF Gaming A16 FA617 | |
| Cinebench R15 / CPU Single 64Bit | |
| Média da turma Gaming (188.8 - 350, n=107, últimos 2 anos) | |
| Asus ROG Zephyrus M16 GU604VY-NM042X | |
| Aorus 15X ASF | |
| Dell G15 5530 | |
| Acer Predator Helios 16 PH16-71-731Q | |
| Média Intel Core i7-13700HX (243 - 279, n=11) | |
| Lenovo Legion Pro 5 16IRX8 | |
| Acer Predator Helios 300 (i7-12700H, RTX 3070 Ti) | |
| Asus TUF Gaming A16 FA617 | |
| Acer Nitro 16 AN16-41 | |
| Blender / v2.79 BMW27 CPU | |
| Asus TUF Gaming A16 FA617 | |
| Acer Nitro 16 AN16-41 | |
| Acer Predator Helios 300 (i7-12700H, RTX 3070 Ti) | |
| Aorus 15X ASF | |
| Asus ROG Zephyrus M16 GU604VY-NM042X | |
| Média Intel Core i7-13700HX (138 - 207, n=10) | |
| Dell G15 5530 | |
| Acer Predator Helios 16 PH16-71-731Q | |
| Lenovo Legion Pro 5 16IRX8 | |
| Média da turma Gaming (79 - 330, n=105, últimos 2 anos) | |
| 7-Zip 18.03 / 7z b 4 | |
| Média da turma Gaming (33491 - 148086, n=106, últimos 2 anos) | |
| Acer Predator Helios 16 PH16-71-731Q | |
| Asus ROG Zephyrus M16 GU604VY-NM042X | |
| Lenovo Legion Pro 5 16IRX8 | |
| Dell G15 5530 | |
| Média Intel Core i7-13700HX (58912 - 89294, n=11) | |
| Aorus 15X ASF | |
| Acer Predator Helios 300 (i7-12700H, RTX 3070 Ti) | |
| Asus TUF Gaming A16 FA617 | |
| Acer Nitro 16 AN16-41 | |
| 7-Zip 18.03 / 7z b 4 -mmt1 | |
| Média da turma Gaming (4199 - 7436, n=106, últimos 2 anos) | |
| Aorus 15X ASF | |
| Asus ROG Zephyrus M16 GU604VY-NM042X | |
| Acer Predator Helios 16 PH16-71-731Q | |
| Média Intel Core i7-13700HX (5552 - 6409, n=11) | |
| Dell G15 5530 | |
| Asus TUF Gaming A16 FA617 | |
| Acer Predator Helios 300 (i7-12700H, RTX 3070 Ti) | |
| Lenovo Legion Pro 5 16IRX8 | |
| Acer Nitro 16 AN16-41 | |
| Geekbench 5.5 / Multi-Core | |
| Média da turma Gaming (6460 - 28263, n=106, últimos 2 anos) | |
| Acer Predator Helios 16 PH16-71-731Q | |
| Asus ROG Zephyrus M16 GU604VY-NM042X | |
| Aorus 15X ASF | |
| Lenovo Legion Pro 5 16IRX8 | |
| Dell G15 5530 | |
| Média Intel Core i7-13700HX (10156 - 15850, n=12) | |
| Acer Predator Helios 300 (i7-12700H, RTX 3070 Ti) | |
| Asus TUF Gaming A16 FA617 | |
| Acer Nitro 16 AN16-41 | |
| Geekbench 5.5 / Single-Core | |
| Média da turma Gaming (986 - 2474, n=106, últimos 2 anos) | |
| Asus ROG Zephyrus M16 GU604VY-NM042X | |
| Acer Predator Helios 16 PH16-71-731Q | |
| Aorus 15X ASF | |
| Dell G15 5530 | |
| Média Intel Core i7-13700HX (1666 - 1899, n=12) | |
| Lenovo Legion Pro 5 16IRX8 | |
| Acer Predator Helios 300 (i7-12700H, RTX 3070 Ti) | |
| Asus TUF Gaming A16 FA617 | |
| Acer Nitro 16 AN16-41 | |
| HWBOT x265 Benchmark v2.2 / 4k Preset | |
| Média da turma Gaming (11.5 - 44.4, n=106, últimos 2 anos) | |
| Lenovo Legion Pro 5 16IRX8 | |
| Acer Predator Helios 16 PH16-71-731Q | |
| Dell G15 5530 | |
| Média Intel Core i7-13700HX (17.1 - 25.5, n=11) | |
| Asus ROG Zephyrus M16 GU604VY-NM042X | |
| Aorus 15X ASF | |
| Asus TUF Gaming A16 FA617 | |
| Acer Nitro 16 AN16-41 | |
| Acer Predator Helios 300 (i7-12700H, RTX 3070 Ti) | |
| LibreOffice / 20 Documents To PDF | |
| Acer Predator Helios 300 (i7-12700H, RTX 3070 Ti) | |
| Asus TUF Gaming A16 FA617 | |
| Acer Nitro 16 AN16-41 | |
| Asus ROG Zephyrus M16 GU604VY-NM042X | |
| Média da turma Gaming (33.2 - 88.8, n=106, últimos 2 anos) | |
| Dell G15 5530 | |
| Média Intel Core i7-13700HX (36.5 - 52.9, n=11) | |
| Aorus 15X ASF | |
| Acer Predator Helios 16 PH16-71-731Q | |
| Lenovo Legion Pro 5 16IRX8 | |
| R Benchmark 2.5 / Overall mean | |
| Asus TUF Gaming A16 FA617 | |
| Acer Nitro 16 AN16-41 | |
| Lenovo Legion Pro 5 16IRX8 | |
| Média Intel Core i7-13700HX (0.4274 - 0.513, n=11) | |
| Acer Predator Helios 300 (i7-12700H, RTX 3070 Ti) | |
| Aorus 15X ASF | |
| Média da turma Gaming (0.3439 - 0.759, n=107, últimos 2 anos) | |
| Acer Predator Helios 16 PH16-71-731Q | |
| Dell G15 5530 | |
| Asus ROG Zephyrus M16 GU604VY-NM042X | |
* ... menor é melhor
AIDA64: FP32 Ray-Trace | FPU Julia | CPU SHA3 | CPU Queen | FPU SinJulia | FPU Mandel | CPU AES | CPU ZLib | FP64 Ray-Trace | CPU PhotoWorxx
| Performance rating | |
| Média da turma Gaming | |
| Acer Predator Helios 16 PH16-71-731Q | |
| Lenovo Legion Pro 5 16IRX8 | |
| Média Intel Core i7-13700HX | |
| Aorus 15X ASF | |
| Dell G15 5530 | |
| Acer Nitro 16 AN16-41 | |
| Asus TUF Gaming A16 FA617 | |
| AIDA64 / FP32 Ray-Trace | |
| Média da turma Gaming (10227 - 85542, n=106, últimos 2 anos) | |
| Lenovo Legion Pro 5 16IRX8 | |
| Acer Predator Helios 16 PH16-71-731Q | |
| Média Intel Core i7-13700HX (14261 - 21999, n=11) | |
| Dell G15 5530 | |
| Aorus 15X ASF | |
| Acer Nitro 16 AN16-41 | |
| Asus TUF Gaming A16 FA617 | |
| AIDA64 / FPU Julia | |
| Média da turma Gaming (51376 - 372155, n=106, últimos 2 anos) | |
| Acer Nitro 16 AN16-41 | |
| Lenovo Legion Pro 5 16IRX8 | |
| Asus TUF Gaming A16 FA617 | |
| Acer Predator Helios 16 PH16-71-731Q | |
| Média Intel Core i7-13700HX (74636 - 109364, n=11) | |
| Dell G15 5530 | |
| Aorus 15X ASF | |
| AIDA64 / CPU SHA3 | |
| Média da turma Gaming (2180 - 10115, n=106, últimos 2 anos) | |
| Lenovo Legion Pro 5 16IRX8 | |
| Acer Predator Helios 16 PH16-71-731Q | |
| Dell G15 5530 | |
| Média Intel Core i7-13700HX (3359 - 5053, n=11) | |
| Aorus 15X ASF | |
| Asus TUF Gaming A16 FA617 | |
| Acer Nitro 16 AN16-41 | |
| AIDA64 / CPU Queen | |
| Média da turma Gaming (49785 - 173351, n=90, últimos 2 anos) | |
| Acer Predator Helios 16 PH16-71-731Q | |
| Lenovo Legion Pro 5 16IRX8 | |
| Aorus 15X ASF | |
| Média Intel Core i7-13700HX (86532 - 114717, n=11) | |
| Acer Nitro 16 AN16-41 | |
| Dell G15 5530 | |
| Asus TUF Gaming A16 FA617 | |
| AIDA64 / FPU SinJulia | |
| Média da turma Gaming (4424 - 33636, n=106, últimos 2 anos) | |
| Lenovo Legion Pro 5 16IRX8 | |
| Acer Nitro 16 AN16-41 | |
| Acer Predator Helios 16 PH16-71-731Q | |
| Asus TUF Gaming A16 FA617 | |
| Média Intel Core i7-13700HX (9290 - 13519, n=11) | |
| Aorus 15X ASF | |
| Dell G15 5530 | |
| AIDA64 / FPU Mandel | |
| Média da turma Gaming (25115 - 196829, n=106, últimos 2 anos) | |
| Acer Nitro 16 AN16-41 | |
| Asus TUF Gaming A16 FA617 | |
| Lenovo Legion Pro 5 16IRX8 | |
| Acer Predator Helios 16 PH16-71-731Q | |
| Média Intel Core i7-13700HX (35751 - 53484, n=11) | |
| Dell G15 5530 | |
| Aorus 15X ASF | |
| AIDA64 / CPU AES | |
| Acer Predator Helios 16 PH16-71-731Q | |
| Aorus 15X ASF | |
| Média Intel Core i7-13700HX (67846 - 182575, n=11) | |
| Média da turma Gaming (39258 - 247074, n=106, últimos 2 anos) | |
| Lenovo Legion Pro 5 16IRX8 | |
| Dell G15 5530 | |
| Asus TUF Gaming A16 FA617 | |
| Acer Nitro 16 AN16-41 | |
| AIDA64 / CPU ZLib | |
| Média da turma Gaming (574 - 2531, n=106, últimos 2 anos) | |
| Acer Predator Helios 16 PH16-71-731Q | |
| Lenovo Legion Pro 5 16IRX8 | |
| Dell G15 5530 | |
| Média Intel Core i7-13700HX (981 - 1451, n=11) | |
| Aorus 15X ASF | |
| Acer Nitro 16 AN16-41 | |
| Asus TUF Gaming A16 FA617 | |
| AIDA64 / FP64 Ray-Trace | |
| Média da turma Gaming (5509 - 45446, n=106, últimos 2 anos) | |
| Lenovo Legion Pro 5 16IRX8 | |
| Acer Predator Helios 16 PH16-71-731Q | |
| Média Intel Core i7-13700HX (7728 - 11837, n=11) | |
| Dell G15 5530 | |
| Aorus 15X ASF | |
| Acer Nitro 16 AN16-41 | |
| Asus TUF Gaming A16 FA617 | |
| AIDA64 / CPU PhotoWorxx | |
| Média da turma Gaming (12271 - 89891, n=106, últimos 2 anos) | |
| Dell G15 5530 | |
| Lenovo Legion Pro 5 16IRX8 | |
| Acer Predator Helios 16 PH16-71-731Q | |
| Aorus 15X ASF | |
| Média Intel Core i7-13700HX (19678 - 42415, n=11) | |
| Asus TUF Gaming A16 FA617 | |
| Acer Nitro 16 AN16-41 | |
Desempenho do sistema
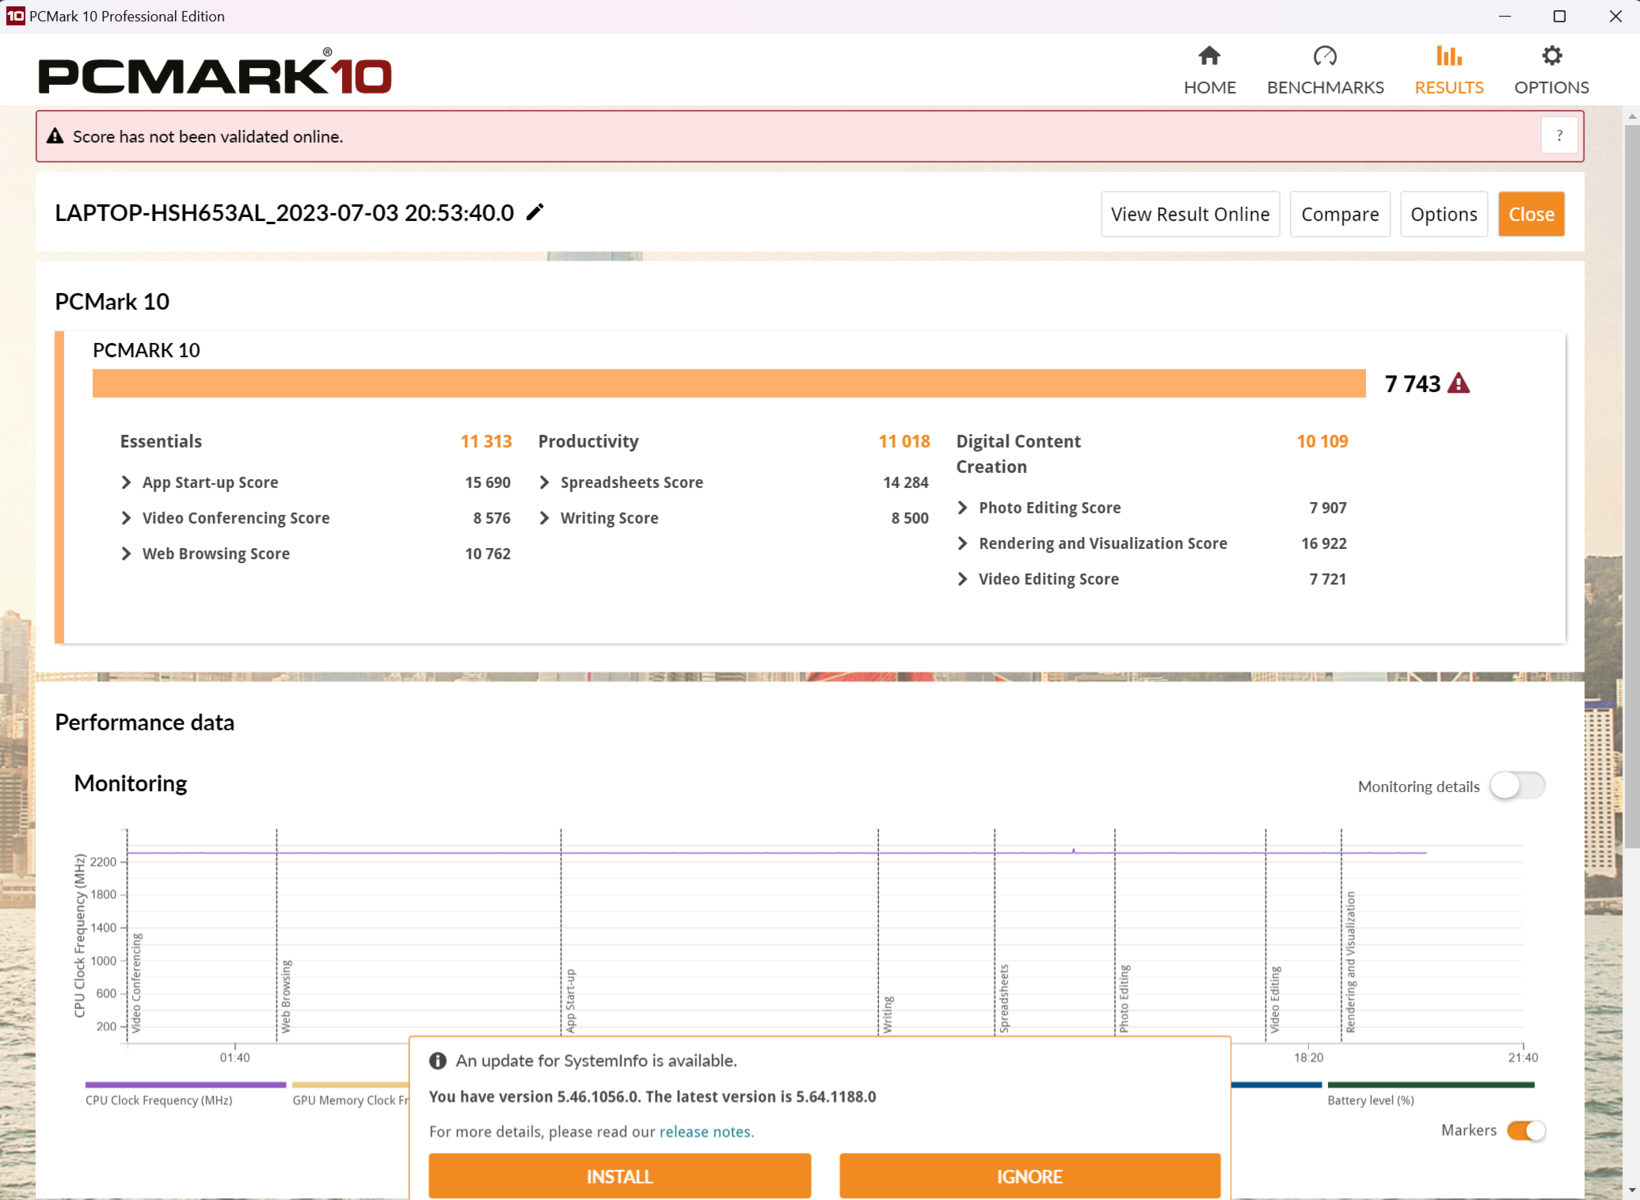
Nas tarefas diárias, o laptop Acer é excepcionalmente ágil. Navegar na Internet enquanto reproduz um vídeo 4K do YouTube não faz o sistema Intel-HX suar. Isso significa que, no benchmark PCMark 10, o Predator Helios fica em primeiro lugar, seguido de perto peloLenovo Legion Pro 5 16.
Da mesma forma, o desempenho de navegação na Web, conforme ilustrado pelo Mozilla Kraken 1.1 e WebXPRT, também está em um nível muito alto graças ao forte desempenho de núcleo único.
CrossMark: Overall | Productivity | Creativity | Responsiveness
Mozilla Kraken 1.1: Total
Speedometer 2.0: Result 2.0
Octane V2: Total Score
Jetstream 2: 2.0 Total
WebXPRT 3: Overall
WebXPRT 4: Overall
| PCMark 10 / Score | |
| Média da turma Gaming (5828 - 12414, n=94, últimos 2 anos) | |
| Acer Predator Helios 16 PH16-71-731Q | |
| Lenovo Legion Pro 5 16IRX8 | |
| Média Intel Core i7-13700HX, NVIDIA GeForce RTX 4060 Laptop GPU (6909 - 7743, n=5) | |
| Asus TUF Gaming A16 FA617 | |
| Acer Nitro 16 AN16-41 | |
| Aorus 15X ASF | |
| Dell G15 5530 | |
| PCMark 10 / Essentials | |
| Acer Predator Helios 16 PH16-71-731Q | |
| Dell G15 5530 | |
| Lenovo Legion Pro 5 16IRX8 | |
| Aorus 15X ASF | |
| Média da turma Gaming (8810 - 11935, n=98, últimos 2 anos) | |
| Média Intel Core i7-13700HX, NVIDIA GeForce RTX 4060 Laptop GPU (9760 - 11313, n=5) | |
| Asus TUF Gaming A16 FA617 | |
| Acer Nitro 16 AN16-41 | |
| PCMark 10 / Productivity | |
| Média da turma Gaming (6845 - 25323, n=96, últimos 2 anos) | |
| Acer Predator Helios 16 PH16-71-731Q | |
| Dell G15 5530 | |
| Média Intel Core i7-13700HX, NVIDIA GeForce RTX 4060 Laptop GPU (9131 - 11018, n=5) | |
| Aorus 15X ASF | |
| Asus TUF Gaming A16 FA617 | |
| Acer Nitro 16 AN16-41 | |
| Lenovo Legion Pro 5 16IRX8 | |
| PCMark 10 / Digital Content Creation | |
| Média da turma Gaming (7602 - 19954, n=96, últimos 2 anos) | |
| Lenovo Legion Pro 5 16IRX8 | |
| Média Intel Core i7-13700HX, NVIDIA GeForce RTX 4060 Laptop GPU (9393 - 12434, n=5) | |
| Asus TUF Gaming A16 FA617 | |
| Acer Nitro 16 AN16-41 | |
| Acer Predator Helios 16 PH16-71-731Q | |
| Aorus 15X ASF | |
| Dell G15 5530 | |
| CrossMark / Overall | |
| Acer Predator Helios 16 PH16-71-731Q | |
| Aorus 15X ASF | |
| Média da turma Gaming (1366 - 2409, n=95, últimos 2 anos) | |
| Média Intel Core i7-13700HX, NVIDIA GeForce RTX 4060 Laptop GPU (1663 - 2105, n=5) | |
| Dell G15 5530 | |
| Lenovo Legion Pro 5 16IRX8 | |
| Acer Nitro 16 AN16-41 | |
| CrossMark / Productivity | |
| Acer Predator Helios 16 PH16-71-731Q | |
| Aorus 15X ASF | |
| Média da turma Gaming (1386 - 2254, n=95, últimos 2 anos) | |
| Média Intel Core i7-13700HX, NVIDIA GeForce RTX 4060 Laptop GPU (1618 - 1989, n=5) | |
| Dell G15 5530 | |
| Lenovo Legion Pro 5 16IRX8 | |
| Acer Nitro 16 AN16-41 | |
| CrossMark / Creativity | |
| Acer Predator Helios 16 PH16-71-731Q | |
| Média da turma Gaming (1343 - 2786, n=95, últimos 2 anos) | |
| Aorus 15X ASF | |
| Dell G15 5530 | |
| Média Intel Core i7-13700HX, NVIDIA GeForce RTX 4060 Laptop GPU (1710 - 2274, n=5) | |
| Lenovo Legion Pro 5 16IRX8 | |
| Acer Nitro 16 AN16-41 | |
| CrossMark / Responsiveness | |
| Aorus 15X ASF | |
| Acer Predator Helios 16 PH16-71-731Q | |
| Média da turma Gaming (1226 - 2334, n=95, últimos 2 anos) | |
| Média Intel Core i7-13700HX, NVIDIA GeForce RTX 4060 Laptop GPU (1269 - 1983, n=5) | |
| Lenovo Legion Pro 5 16IRX8 | |
| Dell G15 5530 | |
| Acer Nitro 16 AN16-41 | |
| Mozilla Kraken 1.1 / Total | |
| Asus TUF Gaming A16 FA617 | |
| Asus TUF Gaming A16 FA617 | |
| Acer Nitro 16 AN16-41 | |
| Lenovo Legion Pro 5 16IRX8 | |
| Média Intel Core i7-13700HX, NVIDIA GeForce RTX 4060 Laptop GPU (495 - 538, n=5) | |
| Dell G15 5530 | |
| Acer Predator Helios 16 PH16-71-731Q | |
| Aorus 15X ASF | |
| Média da turma Gaming (391 - 590, n=101, últimos 2 anos) | |
| Speedometer 2.0 / Result 2.0 | |
| Média da turma Gaming (29 - 736, n=27, últimos 2 anos) | |
| Acer Predator Helios 16 PH16-71-731Q | |
| Média Intel Core i7-13700HX, NVIDIA GeForce RTX 4060 Laptop GPU (300 - 343, n=3) | |
| Aorus 15X ASF | |
| Acer Nitro 16 AN16-41 | |
| Octane V2 / Total Score | |
| Média da turma Gaming (93292 - 139447, n=27, últimos 2 anos) | |
| Aorus 15X ASF | |
| Acer Predator Helios 16 PH16-71-731Q | |
| Média Intel Core i7-13700HX, NVIDIA GeForce RTX 4060 Laptop GPU (86875 - 96413, n=3) | |
| Acer Nitro 16 AN16-41 | |
| Jetstream 2 / 2.0 Total | |
| Média da turma Gaming (334 - 516, n=27, últimos 2 anos) | |
| Lenovo Legion Pro 5 16IRX8 | |
| Acer Predator Helios 16 PH16-71-731Q | |
| Aorus 15X ASF | |
| Média Intel Core i7-13700HX, NVIDIA GeForce RTX 4060 Laptop GPU (263 - 305, n=4) | |
| Acer Nitro 16 AN16-41 | |
| WebXPRT 3 / Overall | |
| Acer Predator Helios 16 PH16-71-731Q | |
| Aorus 15X ASF | |
| Média da turma Gaming (220 - 532, n=99, últimos 2 anos) | |
| Asus TUF Gaming A16 FA617 | |
| Asus TUF Gaming A16 FA617 | |
| Dell G15 5530 | |
| Média Intel Core i7-13700HX, NVIDIA GeForce RTX 4060 Laptop GPU (238 - 336, n=4) | |
| Acer Nitro 16 AN16-41 | |
| Lenovo Legion Pro 5 16IRX8 | |
| WebXPRT 4 / Overall | |
| Média da turma Gaming (165 - 354, n=99, últimos 2 anos) | |
| Acer Predator Helios 16 PH16-71-731Q | |
| Dell G15 5530 | |
| Aorus 15X ASF | |
| Média Intel Core i7-13700HX, NVIDIA GeForce RTX 4060 Laptop GPU (247 - 283, n=5) | |
| Lenovo Legion Pro 5 16IRX8 | |
| Asus TUF Gaming A16 FA617 | |
| Asus TUF Gaming A16 FA617 | |
| Acer Nitro 16 AN16-41 | |
* ... menor é melhor
| PCMark 10 Score | 7743 pontos | |
Ajuda | ||
| AIDA64 / Memory Copy | |
| Média da turma Gaming (21750 - 129946, n=106, últimos 2 anos) | |
| Dell G15 5530 | |
| Lenovo Legion Pro 5 16IRX8 | |
| Aorus 15X ASF | |
| Acer Predator Helios 16 PH16-71-731Q | |
| Média Intel Core i7-13700HX (36125 - 63990, n=11) | |
| Asus TUF Gaming A16 FA617 | |
| Acer Nitro 16 AN16-41 | |
| AIDA64 / Memory Read | |
| Média da turma Gaming (22956 - 118858, n=106, últimos 2 anos) | |
| Dell G15 5530 | |
| Lenovo Legion Pro 5 16IRX8 | |
| Acer Predator Helios 16 PH16-71-731Q | |
| Aorus 15X ASF | |
| Média Intel Core i7-13700HX (36510 - 69729, n=11) | |
| Asus TUF Gaming A16 FA617 | |
| Acer Nitro 16 AN16-41 | |
| AIDA64 / Memory Write | |
| Acer Predator Helios 16 PH16-71-731Q | |
| Média da turma Gaming (22297 - 135096, n=106, últimos 2 anos) | |
| Lenovo Legion Pro 5 16IRX8 | |
| Dell G15 5530 | |
| Média Intel Core i7-13700HX (33598 - 85675, n=11) | |
| Aorus 15X ASF | |
| Asus TUF Gaming A16 FA617 | |
| Acer Nitro 16 AN16-41 | |
| AIDA64 / Memory Latency | |
| Média da turma Gaming (75.3 - 259, n=106, últimos 2 anos) | |
| Acer Nitro 16 AN16-41 | |
| Dell G15 5530 | |
| Média Intel Core i7-13700HX (81.5 - 97.9, n=11) | |
| Aorus 15X ASF | |
| Acer Predator Helios 16 PH16-71-731Q | |
| Asus TUF Gaming A16 FA617 | |
| Lenovo Legion Pro 5 16IRX8 | |
* ... menor é melhor
Latências de DPC
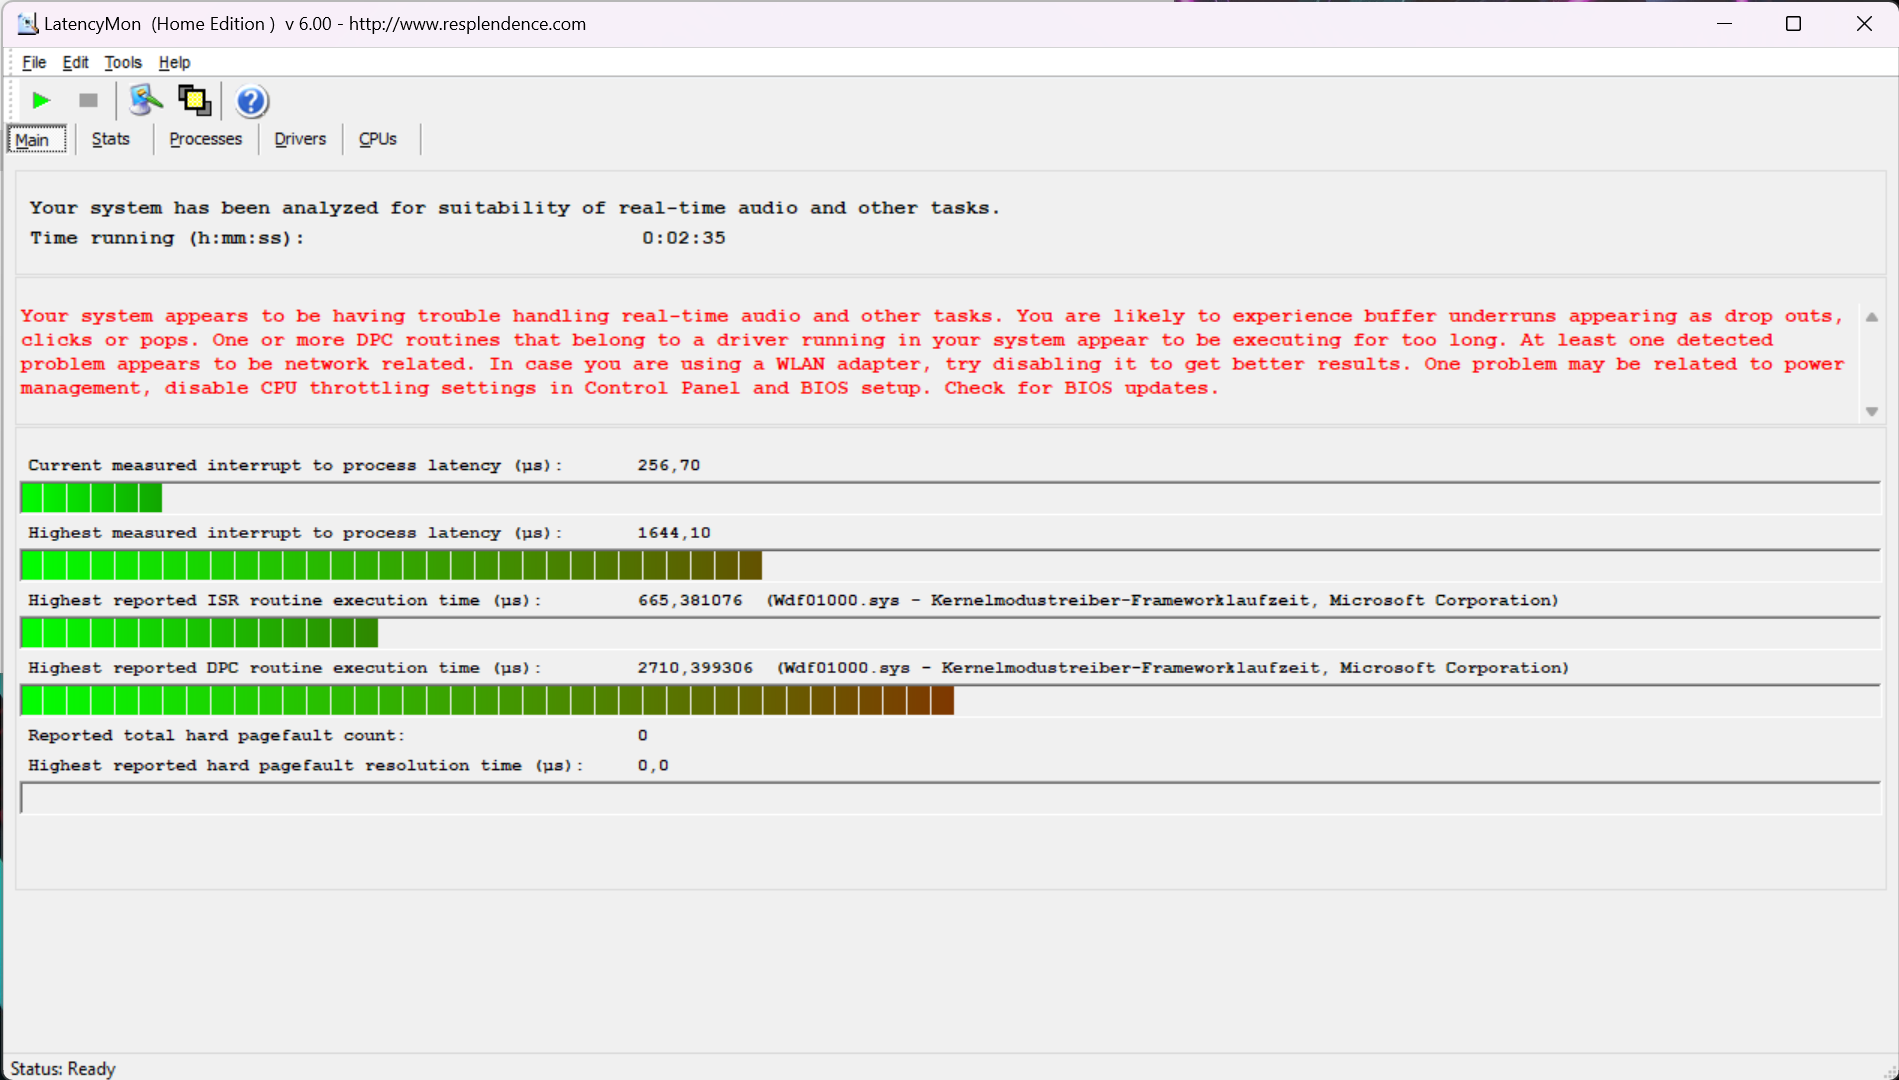
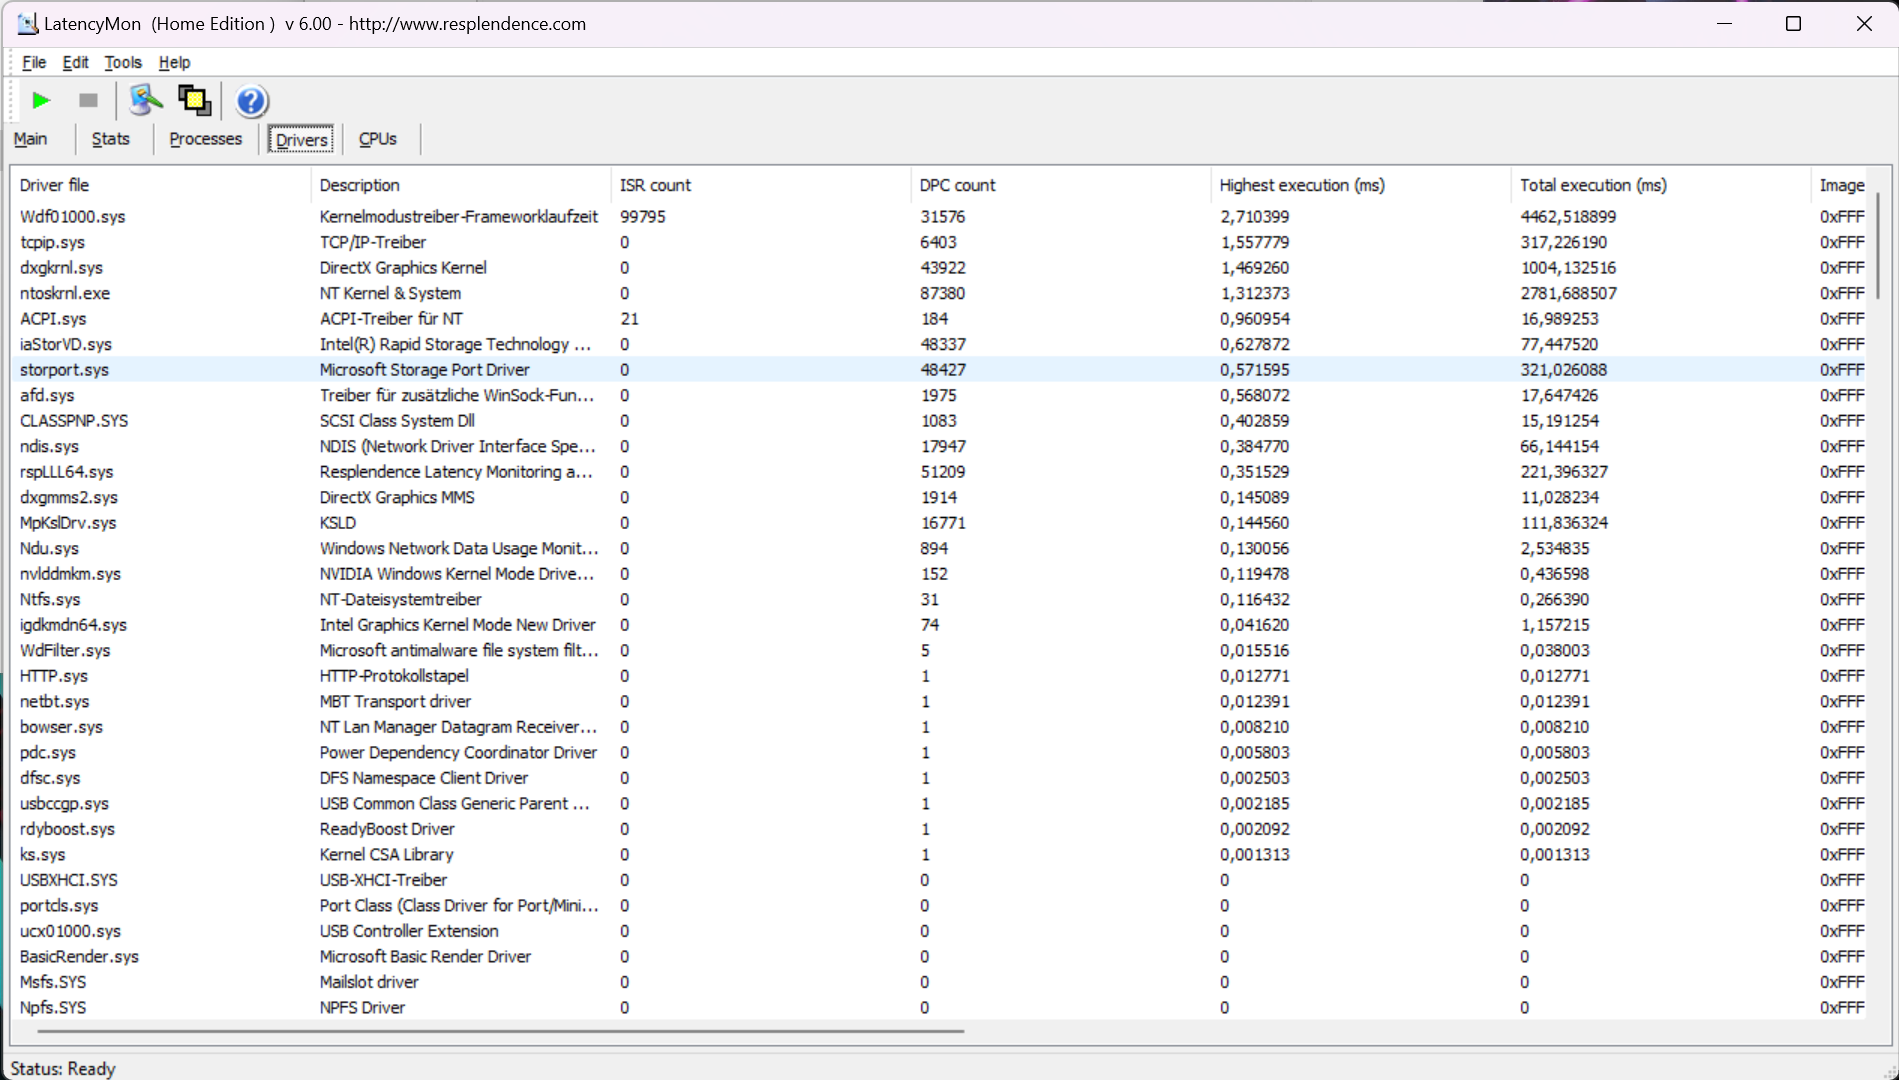
| DPC Latencies / LatencyMon - interrupt to process latency (max), Web, Youtube, Prime95 | |
| Dell G15 5530 | |
| Aorus 15X ASF | |
| Acer Predator Helios 16 PH16-71-731Q | |
| Acer Nitro 16 AN16-41 | |
| Lenovo Legion Pro 5 16IRX8 | |
| Asus TUF Gaming A16 FA617 | |
* ... menor é melhor
Armazenamento em massa
O SSD Micron 3400 PCIe 4.0 instalado tem capacidade para 1 TB. As taxas de transferência de leitura sequencial de até 6.100 MB/s estão acima da média. No entanto, após um curto período de tempo, o estrangulamento drástico relacionado à temperatura entra em ação, reduzindo a velocidade a um terço de sua capacidade. A limitação não está presente no Micron 3400 encontrado noAsus ROG Flow X16ou noLenovo Legion 7mas o mesmo problema foi relatado no HP ZBook Fury 16e no ZBook Firefly 14.
O SK Hynix PC801 noLegion Pro 5 16também pode sustentar transferências de até ~6000 MB/s, enquanto o pequeno SSD M.2 2242 encontrado noDell G15 5530está claramente na parte inferior do pacote.
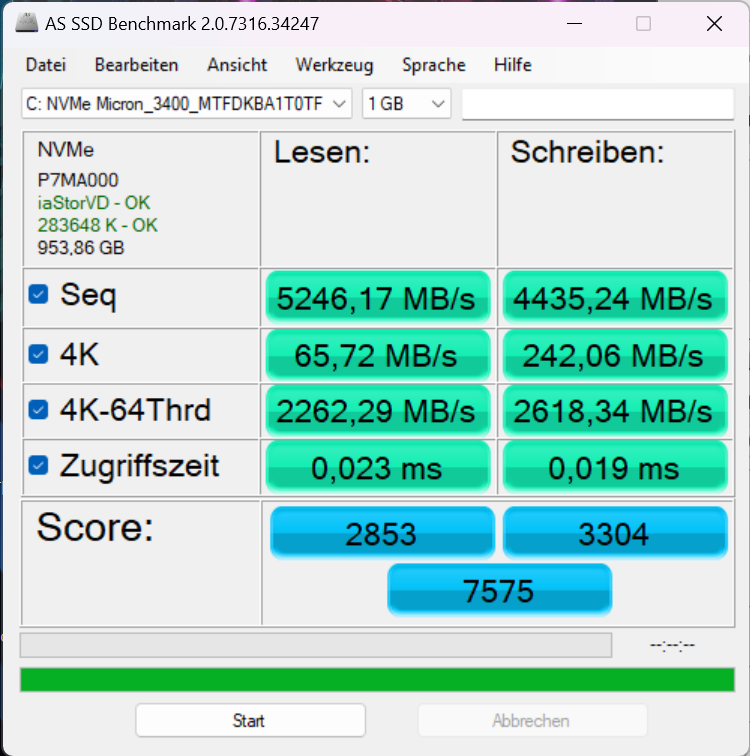
| Acer Predator Helios 16 PH16-71-731Q Micron 3400 1TB MTFDKBA1T0TFH | Acer Nitro 16 AN16-41 Samsung PM9A1 MZVL21T0HCLR | Lenovo Legion Pro 5 16IRX8 SK hynix PC801 HFS512GEJ9X115N | Aorus 15X ASF Gigabyte AG470S1TB-SI B10 | Asus TUF Gaming A16 FA617 Micron 2400 MTFDKBA1T0QFM | Dell G15 5530 SSTC CL4-3D512-Q11 | |
|---|---|---|---|---|---|---|
| AS SSD | -25% | -15% | -15% | -72% | -144% | |
| Seq Read (MB/s) | 5246.2 | 5185.49 -1% | 5856.12 12% | 4649.46 -11% | 3976.53 -24% | 2603.73 -50% |
| Seq Write (MB/s) | 4435.2 | 3900.46 -12% | 4750.28 7% | 3810.26 -14% | 3020.8 -32% | 494.63 -89% |
| 4K Read (MB/s) | 65.7 | 62.76 -4% | 77.12 17% | 100.75 53% | 49.25 -25% | 36.37 -45% |
| 4K Write (MB/s) | 242.1 | 137.9 -43% | 276.66 14% | 308.92 28% | 152.75 -37% | 188.64 -22% |
| 4K-64 Read (MB/s) | 2262.3 | 2593.07 15% | 2572.63 14% | 2964.13 31% | 1901.41 -16% | 932.26 -59% |
| 4K-64 Write (MB/s) | 2618.3 | 3195.33 22% | 3536.78 35% | 3103.89 19% | 1949.13 -26% | 276.64 -89% |
| Access Time Read * (ms) | 0.023 | 0.079 -243% | 0.044 -91% | 0.068 -196% | 0.05 -117% | 0.103 -348% |
| Access Time Write * (ms) | 0.019 | 0.029 -53% | 0.053 -179% | 0.012 37% | 0.105 -453% | 0.182 -858% |
| Score Read (Points) | 2853 | 3174 11% | 3235 13% | 3530 24% | 2348 -18% | 1229 -57% |
| Score Write (Points) | 3304 | 3723 13% | 4288 30% | 3794 15% | 2404 -27% | 515 -84% |
| Score Total (Points) | 7575 | 8452 12% | 9125 20% | 9097 20% | 5903 -22% | 2271 -70% |
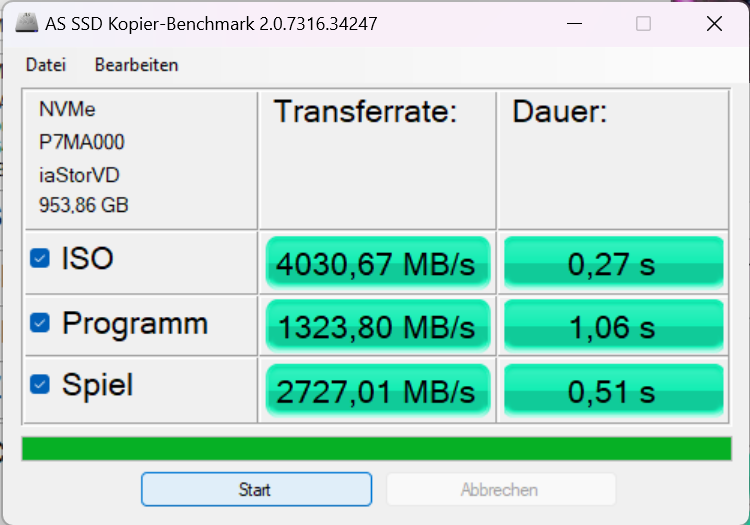
| Copy ISO MB/s (MB/s) | 4030.7 | 3037.59 -25% | 566.62 -86% | 1039.04 -74% | 488.98 -88% | |
| Copy Program MB/s (MB/s) | 1323.8 | 968.9 -27% | 1098.38 -17% | 439.84 -67% | 296.26 -78% | |
| Copy Game MB/s (MB/s) | 2727 | 2239.37 -18% | 2670.4 -2% | 721.09 -74% | 452.22 -83% | |
| DiskSpd | -22% | -3% | 9% | -31% | -57% | |
| seq read (MB/s) | 3587 | 3520 -2% | 5346 49% | 3419 -5% | 2460 -31% | 2726 -24% |
| seq write (MB/s) | 4634 | 2220 -52% | 1495 -68% | 3270 -29% | 2991 -35% | 535 -88% |
| seq q8 t1 read (MB/s) | 6521 | 6661 2% | 7127 9% | 7018 8% | 4633 -29% | 2985 -54% |
| seq q8 t1 write (MB/s) | 4962 | 2216 -55% | 4903 -1% | 4398 -11% | 3415 -31% | 539 -89% |
| 4k q1 t1 read (MB/s) | 68.3 | 48.4 -29% | 65.9 -4% | 73.5 8% | 35.5 -48% | 34 -50% |
| 4k q1 t1 write (MB/s) | 249 | 159.6 -36% | 328 32% | 346 39% | 181.3 -27% | 224 -10% |
| 4k q32 t16 read (MB/s) | 2848 | 3311 16% | 2889 1% | 3552 25% | 2025 -29% | 1054 -63% |
| 4k q32 t16 write (MB/s) | 2670 | 2193 -18% | 1457 -45% | 3610 35% | 2291 -14% | 507 -81% |
| Média Total (Programa/Configurações) | -24% /
-24% | -9% /
-11% | -3% /
-6% | -52% /
-55% | -101% /
-113% |
* ... menor é melhor
* ... menor é melhor
Continuous Performance Read: DiskSpd Read Loop, Queue Depth 8
Placa de vídeo
A Nvidia GeForce RTX 4060 é um chip de médio porte com 8 GB de VRAM que tem um TGP máximo de 140 watts (115 watts + 25 watts de Dynamic Boost). No entanto, a velocidade máxima de clock de 2.570 MHz já é alcançada com 100 watts. Somente o teste de estresse FurMark foi capaz de extrair ~140 watts da GPU. Por outro lado, durante os jogos, uma GPU de laptop RTX 4060 nunca consome mais de 100 W.
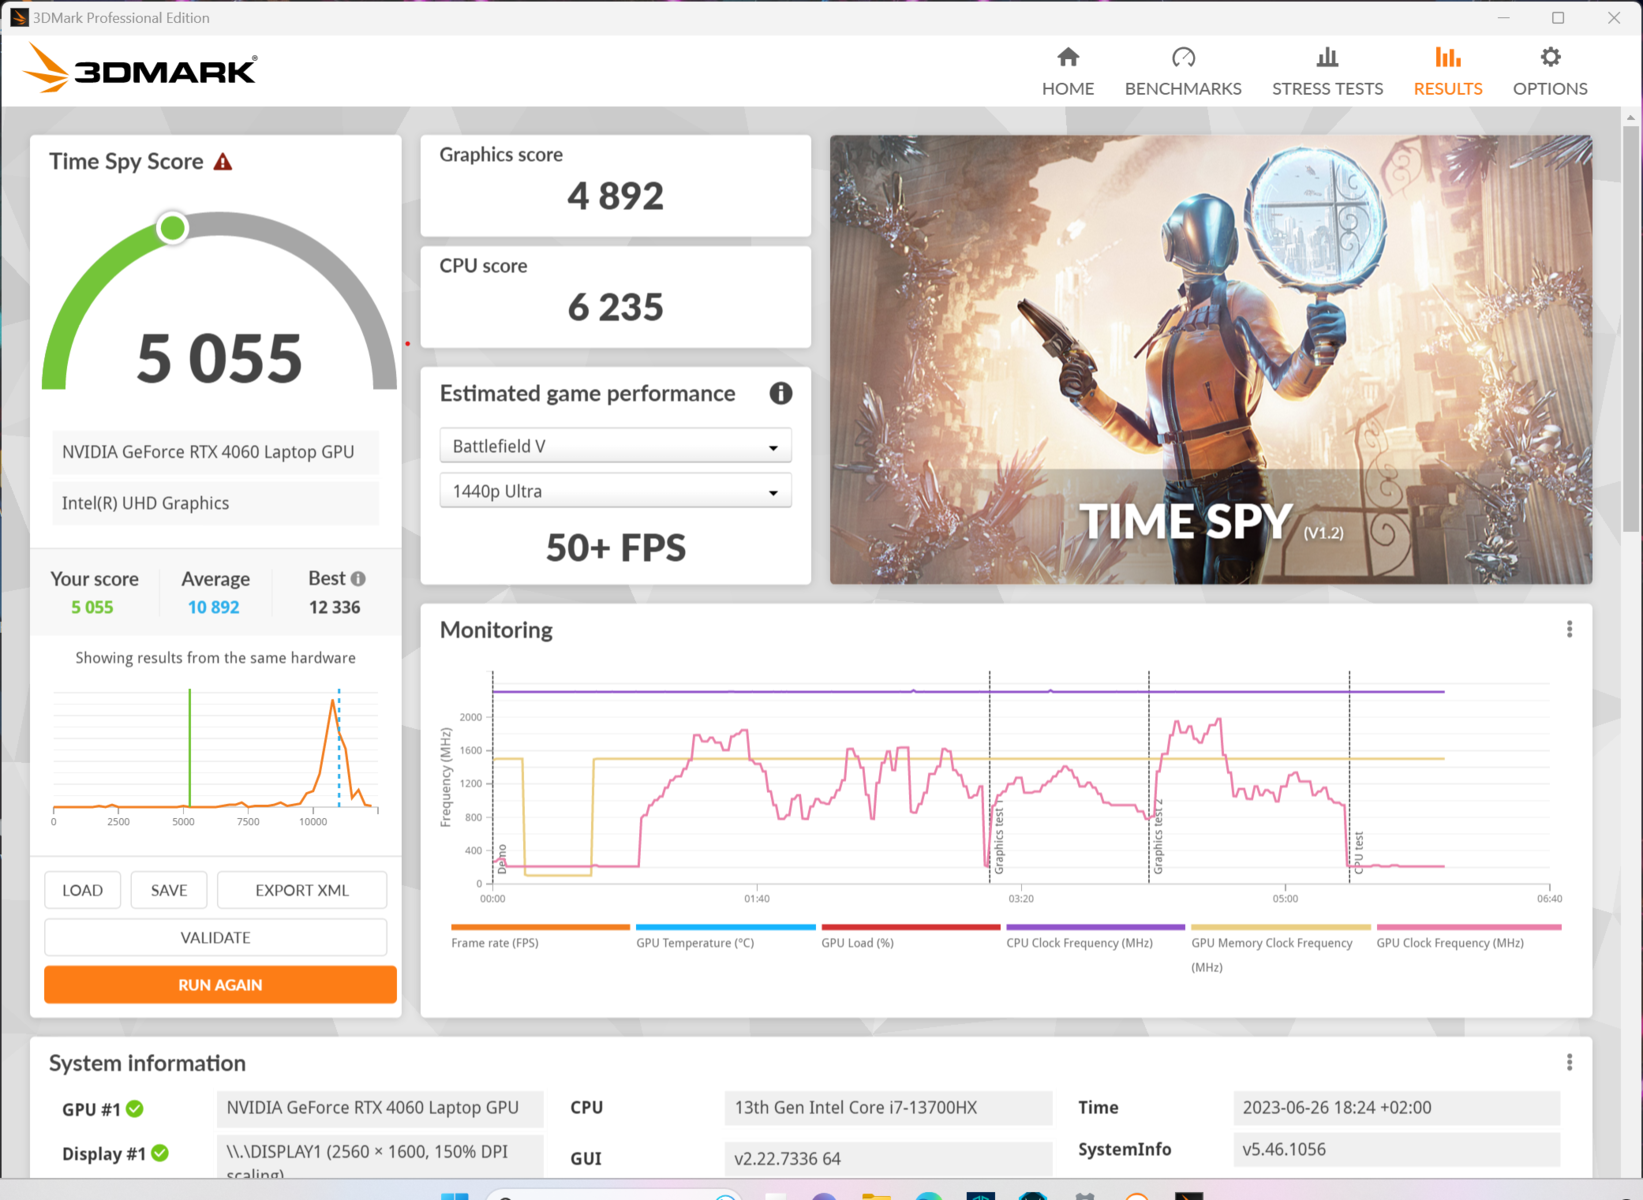
O desempenho é correspondentemente semelhante ao de outros notebooks para jogos com uma RTX 4060, como oLegion Pro 5 16e o Dell G15 5530. O RTX 4070naAorus 15X também não está muito longe. Os resultados sintéticos de benchmark são reduzidos pela metade no modo de bateria.
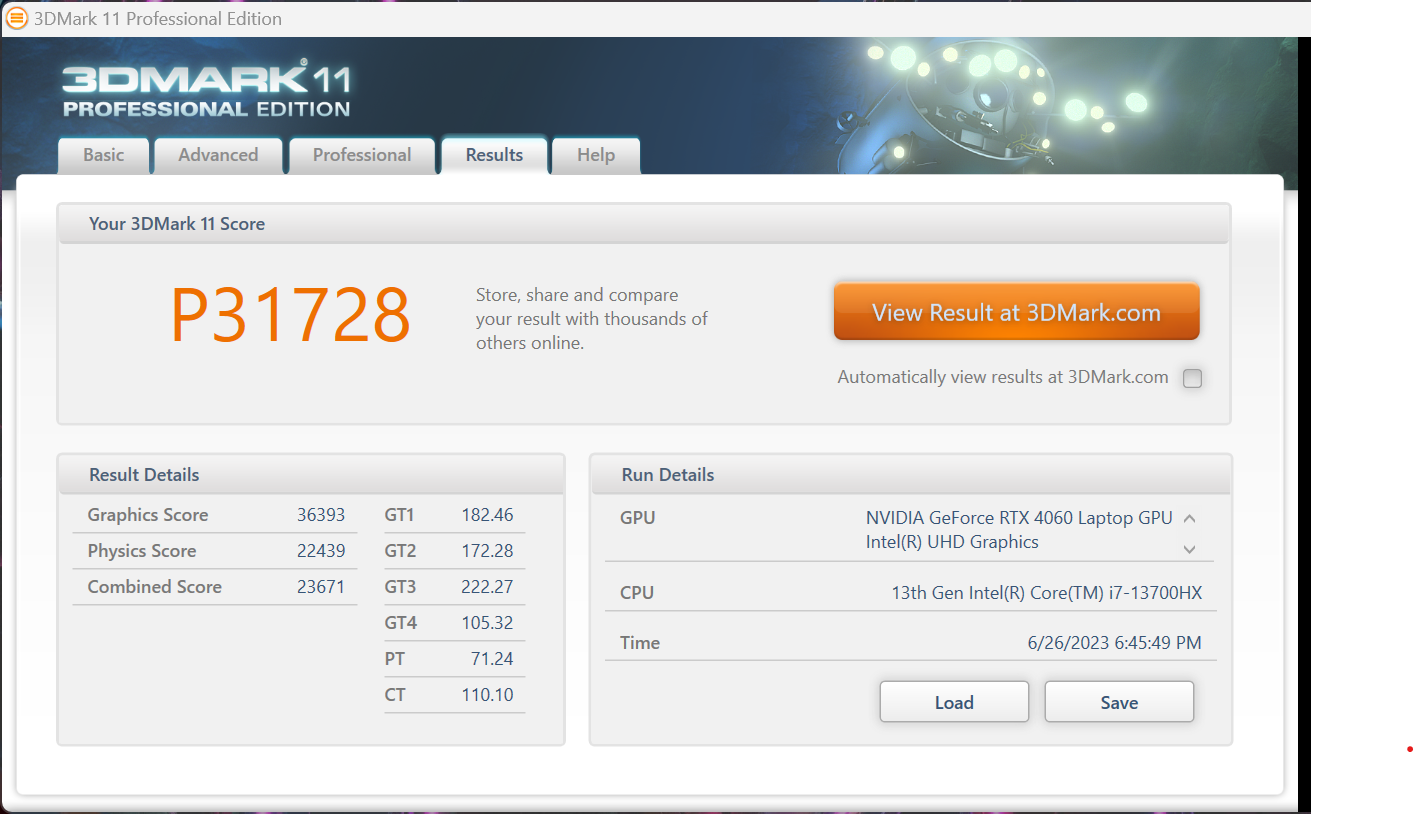


| 3DMark 11 Performance | 31728 pontos | |
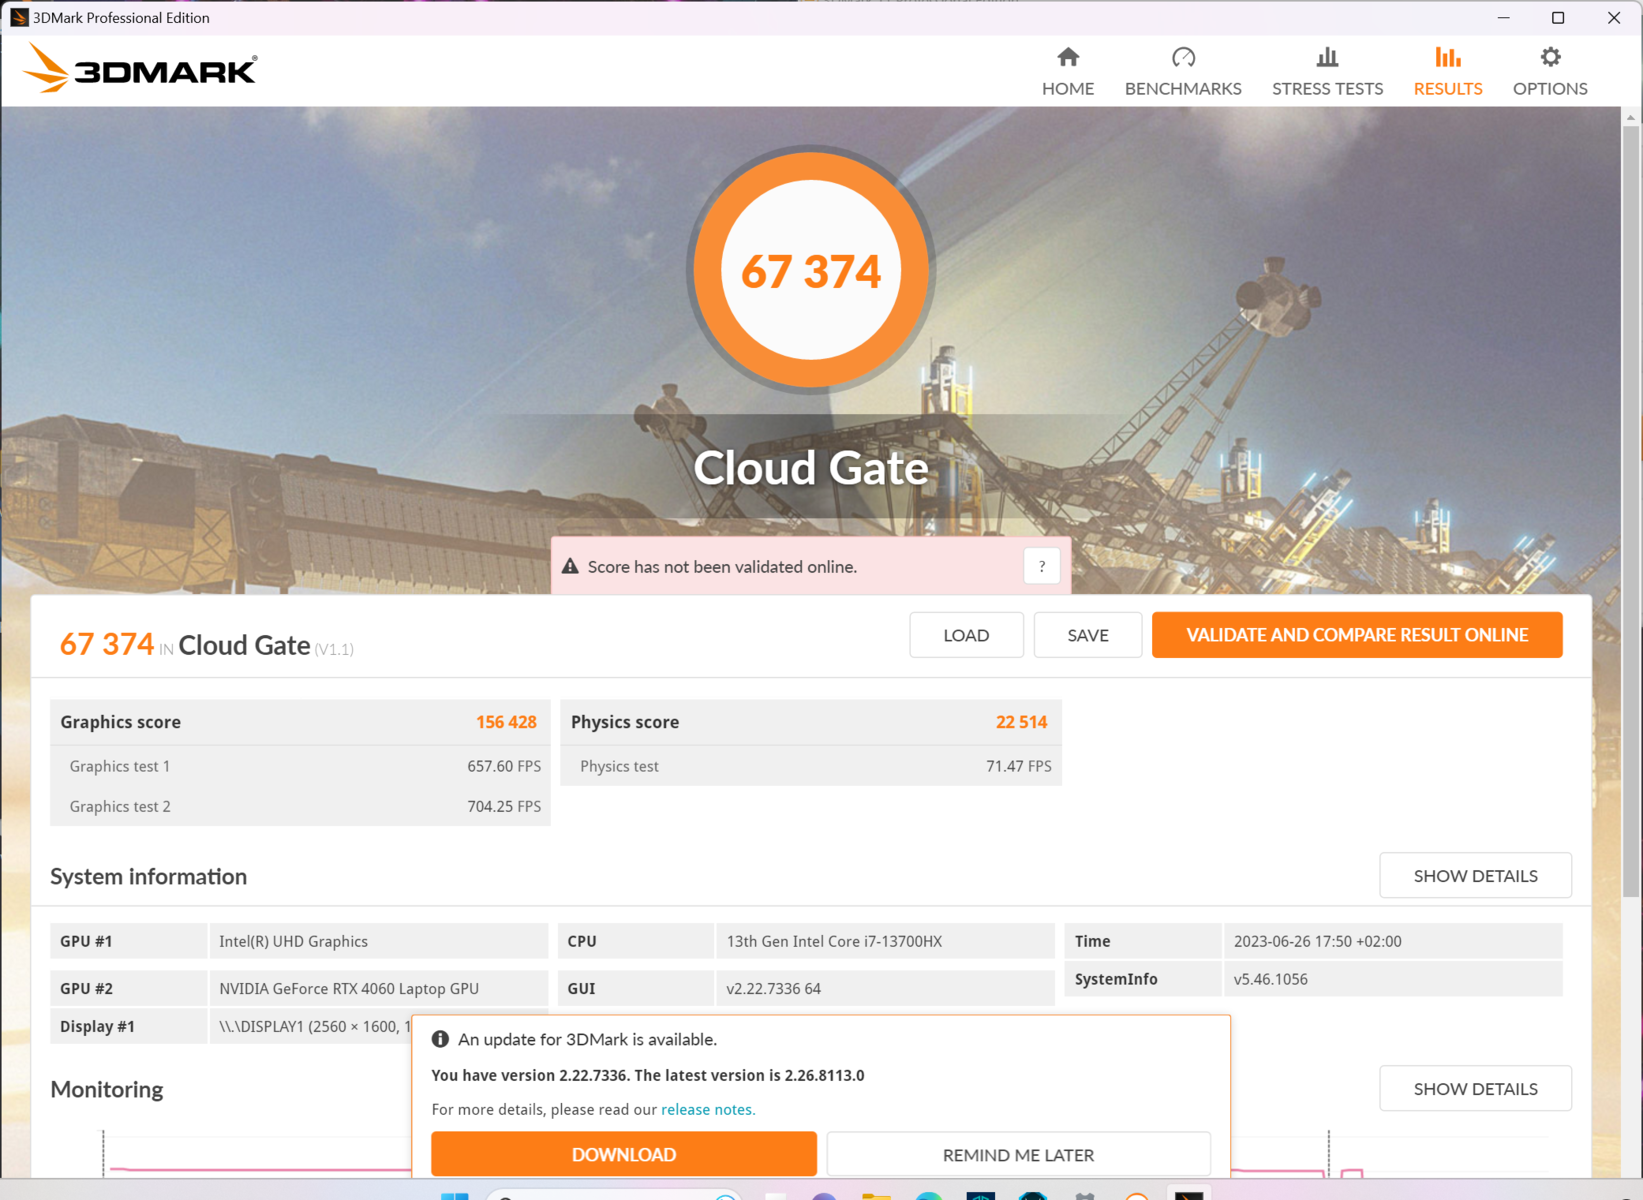
| 3DMark Cloud Gate Standard Score | 67374 pontos | |
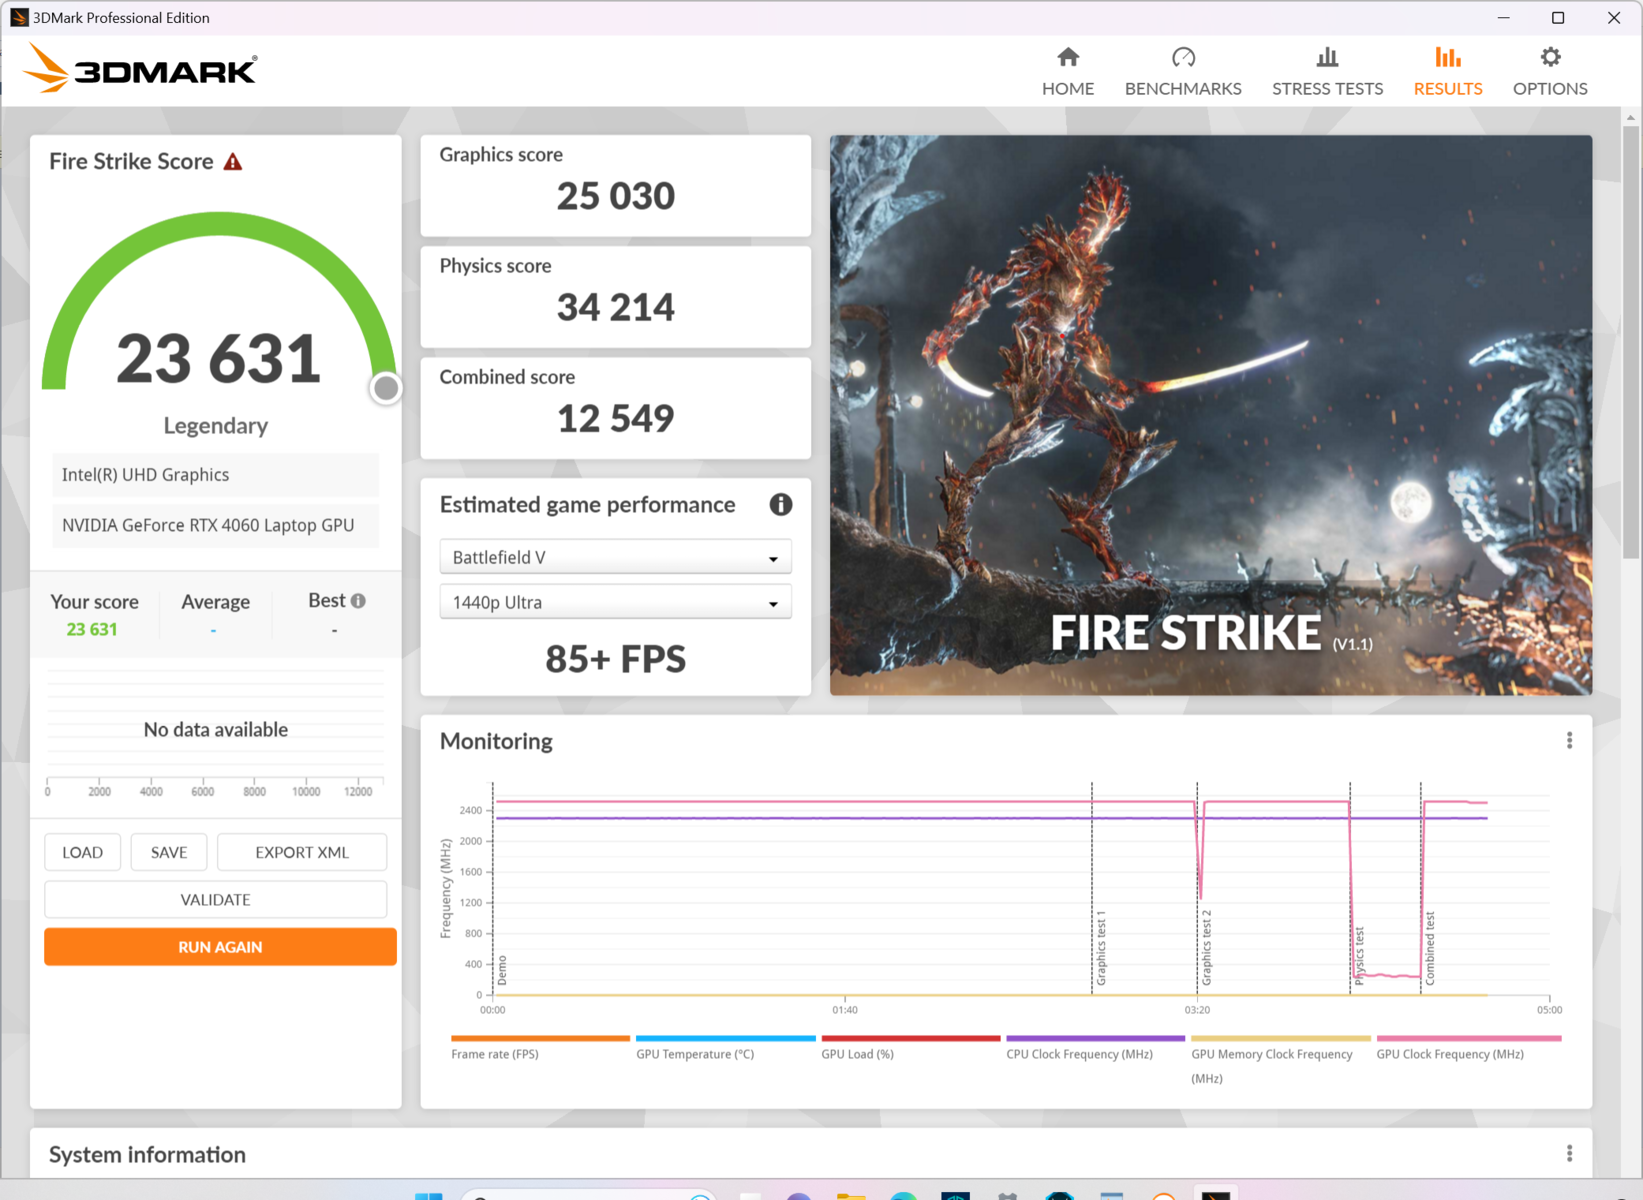
| 3DMark Fire Strike Score | 23631 pontos | |
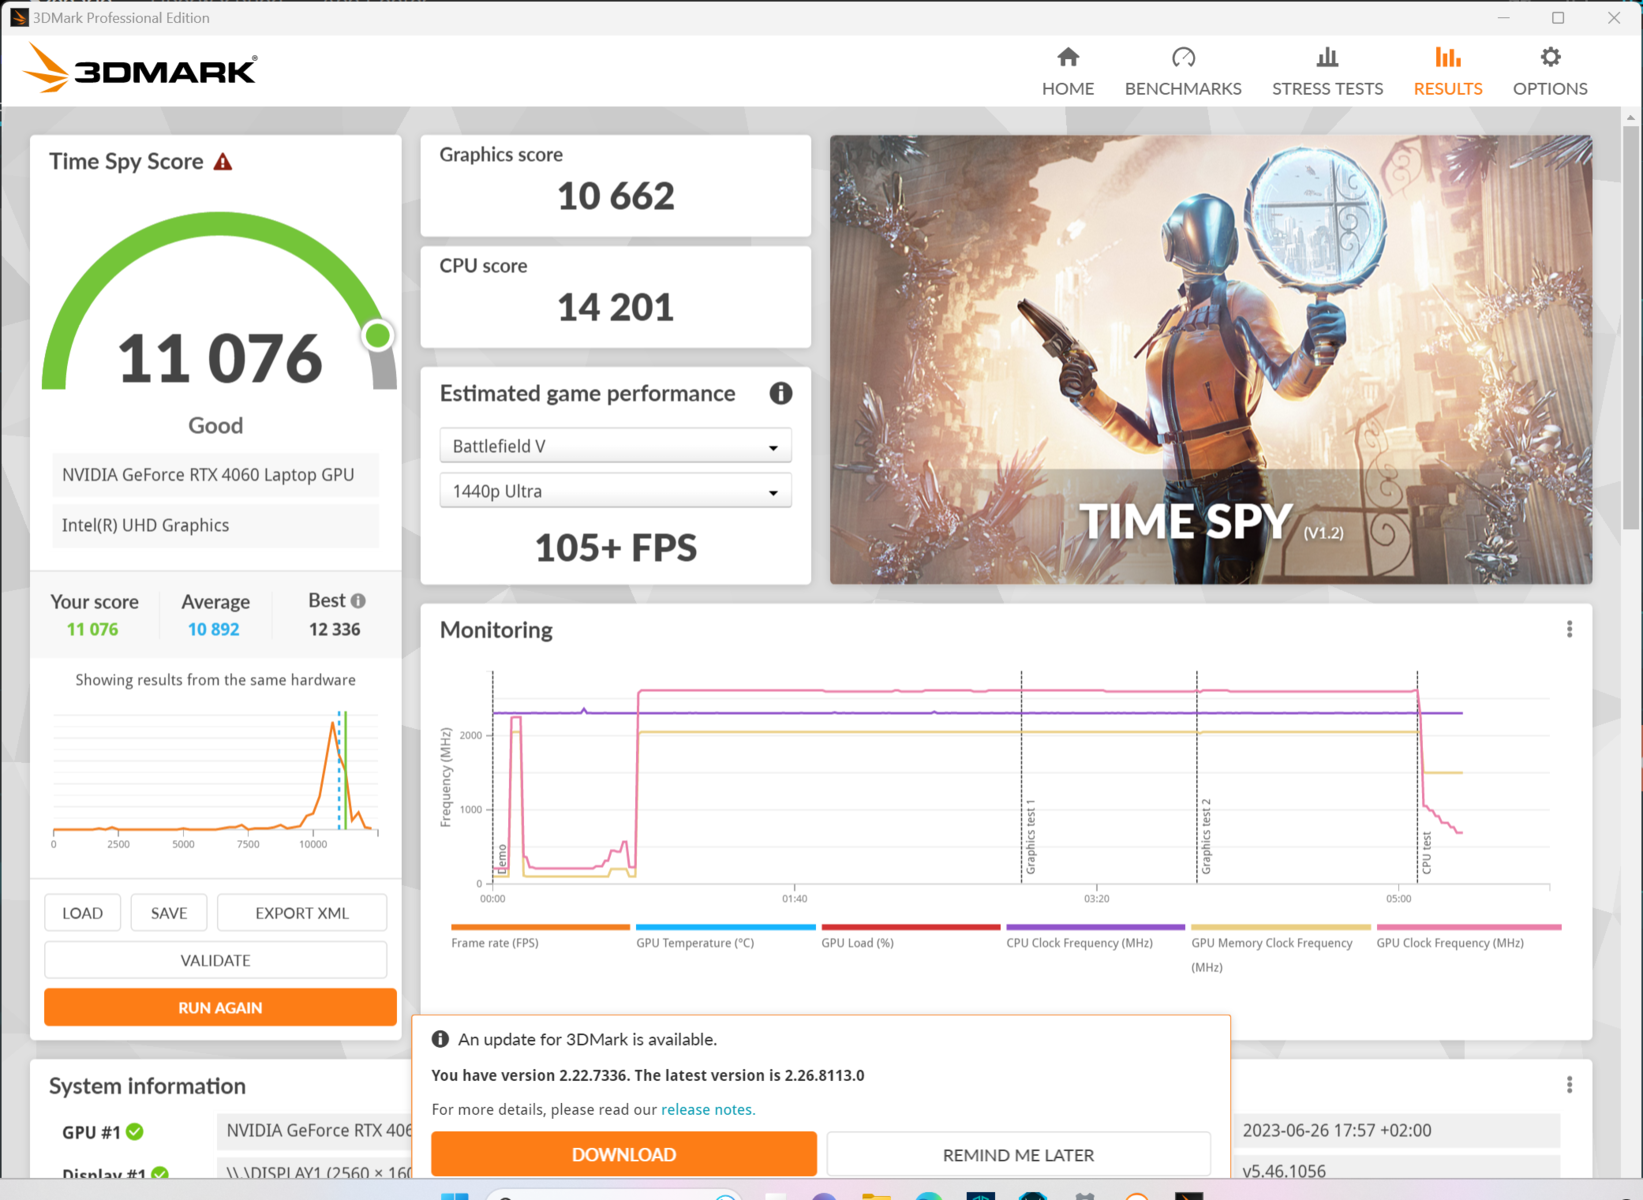
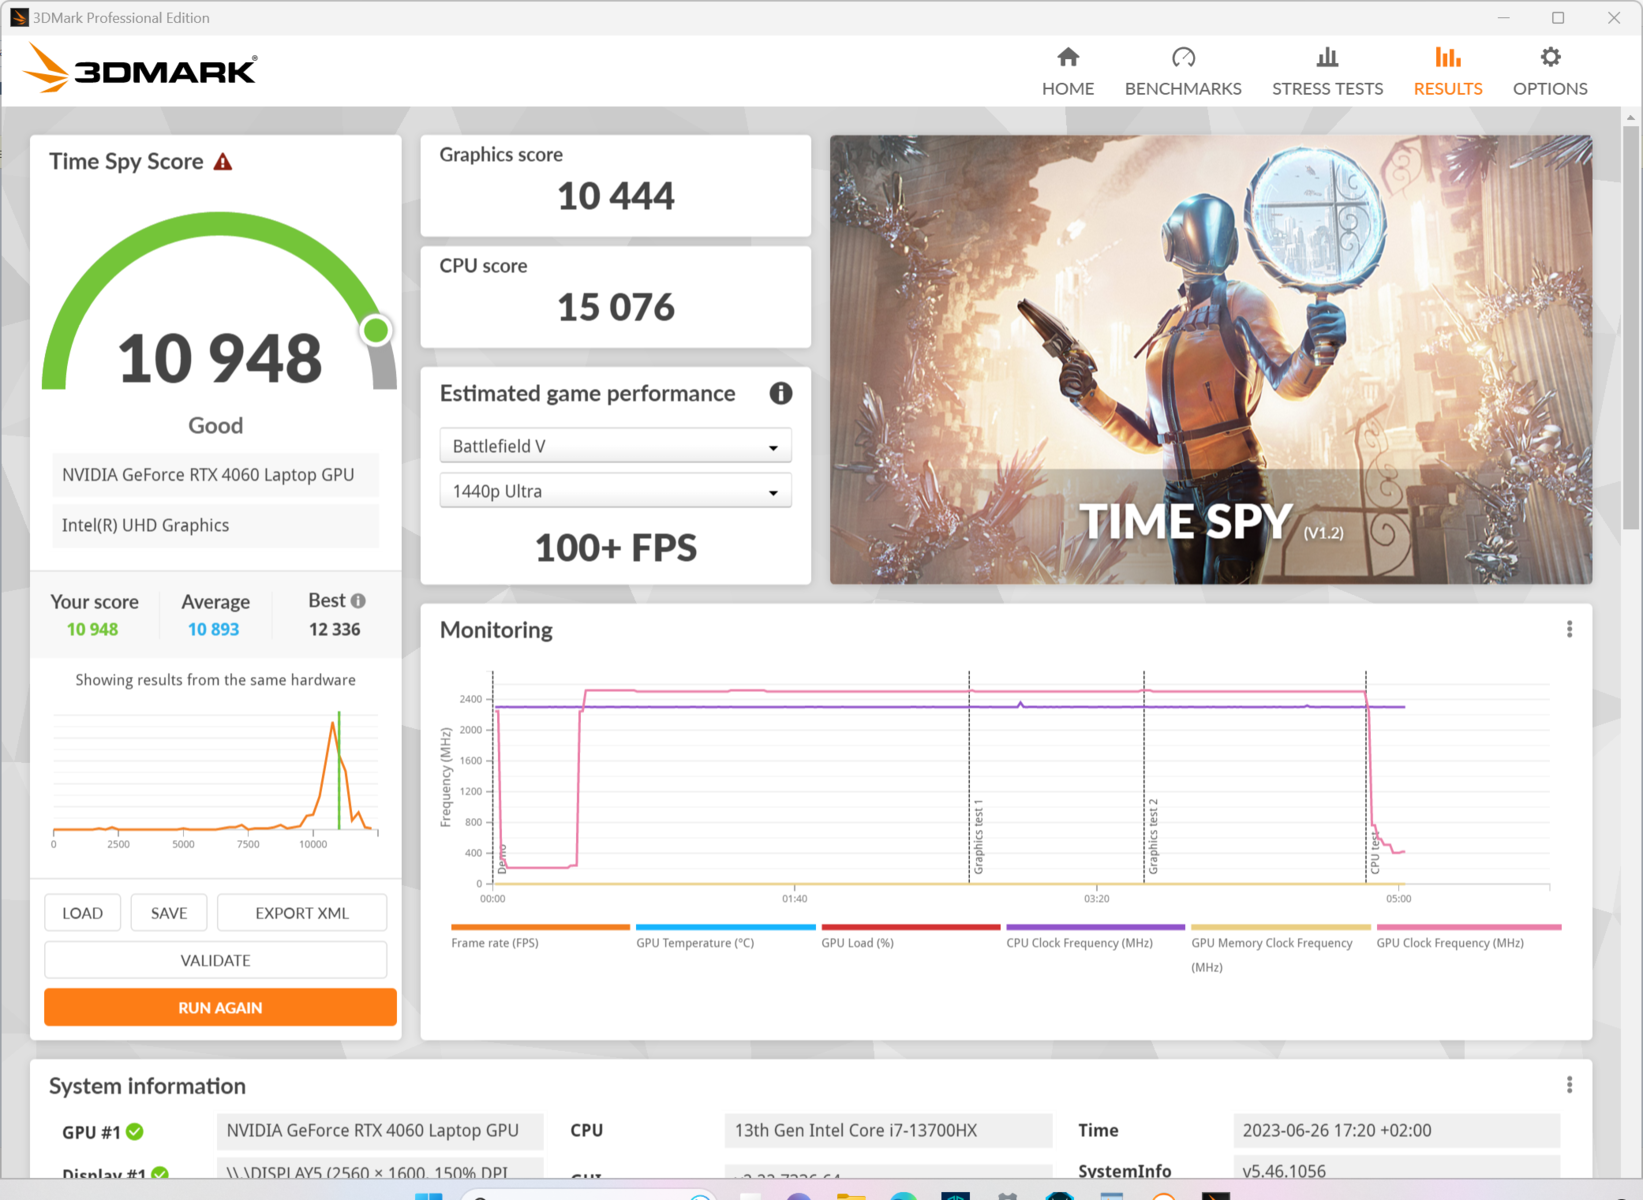
| 3DMark Time Spy Score | 10948 pontos | |
Ajuda | ||
| Geekbench 6.0 - GPU OpenCL 6.0 | |
| Aorus 15X ASF | |
| Acer Nitro 16 AN16-41 | |
| Acer Predator Helios 16 PH16-71-731Q | |
| Dell G15 5530 | |
* ... menor é melhor
Desempenho em jogos
No Cyberpunk 2077 @QHD/Ultra, o Acer Predator Helios 16 foi capaz de correr para a frente de nosso campo de concorrentes, até mesmo um pouco à frente do Legion Pro 5 16'sRTX 4070. No entanto, em nossa classificação de desempenho, os dispositivos concorrentes estão todos agrupados com a RadeonRX 7600Sencontrada no TUF Gaming A16enfraquecendo um pouco.
A mudança para o modo somente dGPU resulta em um ganho de desempenho de apenas 3%. Se isso for combinado com o modo turbo, esse aumento será de 6%. Com o ray tracing ativado, você ainda obtém 60 fps no Cyberpunk 2077 1.6 Ultra/FHD em vez de 93,2 fps. Com o DLSS ativado (balanceado) - nesse caso, sem ray tracing -, são 134,2 fps.
O modo de desempenho balanceado reduz a taxa de quadros para 87,4, o que é mais do que aceitável, considerando os ventiladores significativamente mais silenciosos. No modo de bateria, a taxa de quadros cai em quase 70% para 30 fps. Com o "DLSS Max Performance", é possível dobrar as taxas de quadros mais uma vez para que alguns jogos novos sejam reproduzidos (e permaneçam) de forma relativamente suave no modo de bateria.
Witcher 3 FPS diagram
| baixo | média | alto | ultra | QHD | |
|---|---|---|---|---|---|
| GTA V (2015) | 182.8 | 181.3 | 172.5 | 112.8 | 88.3 |
| The Witcher 3 (2015) | 466 | 331 | 181.3 | 102.1 | |
| Dota 2 Reborn (2015) | 189.6 | 171.8 | 159.2 | 153 | |
| Final Fantasy XV Benchmark (2018) | 226 | 150.3 | 100.1 | 72.4 | |
| X-Plane 11.11 (2018) | 136.2 | 123.2 | 95.4 | ||
| Strange Brigade (2018) | 434 | 272 | 215 | 185.2 | 123.5 |
| Shadow of the Tomb Raider (2018) | 141 | 93 | |||
| God of War (2022) | 134.4 | 112.3 | 89.4 | 64.6 | 53.3 |
| Cyberpunk 2077 1.6 (2022) | 132.5 | 126 | 114.9 | 93.2 | 58.6 |
| Tiny Tina's Wonderlands (2022) | 219 | 175.1 | 114.7 | 87.9 | 60 |
| F1 22 (2022) | 256 | 244 | 196.5 | 65.2 | 38 |
| Call of Duty Modern Warfare 2 2022 (2022) | 88 | 60 | |||
| Returnal (2023) | 84.4 | 77.9 | 72.6 | 67 | 59.4 |
Emissões: O Acer Predator Helios 16 tem um poderoso sistema de resfriamento
Emissões de ruído
Em uso ocioso, ao navegar na Internet e realizar tarefas simples de escritório, o Predator Helios 16 é quase sempre agradavelmente silencioso e, nem é preciso dizer, no modo silencioso ou em operação com bateria.
Em termos de carga pura da CPU, foram atingidos 36,6 dB(A), mas também não foi muito incômodo. Ao jogar, o modo de desempenho fica muito alto, com 49 dB(A), que é a média dos laptops para jogos. No modo turbo, ele fica insuportavelmente alto sem nenhum valor agregado real. Por outro lado, o modo balanceado atinge um ruído de fundo quase agradável, enquanto se perde muito pouco desempenho. Por fim, o modo silencioso é agradável para os ouvidos, com quedas de cerca de 30% em aplicativos 3D.
No entanto, o carregamento do nosso modelo de análise resultou em um ruído de choro claramente audível.
Barulho
| Ocioso |
| 24 / 24 / 32.32 dB |
| Carga |
| 36.66 / 49.49 dB |
 | ||
30 dB silencioso 40 dB(A) audível 50 dB(A) ruidosamente alto |
||
min: | ||
| Acer Predator Helios 16 PH16-71-731Q GeForce RTX 4060 Laptop GPU, i7-13700HX, Micron 3400 1TB MTFDKBA1T0TFH | Acer Nitro 16 AN16-41 GeForce RTX 4070 Laptop GPU, R7 7735HS, Samsung PM9A1 MZVL21T0HCLR | Lenovo Legion Pro 5 16IRX8 GeForce RTX 4060 Laptop GPU, i7-13700HX, SK hynix PC801 HFS512GEJ9X115N | Aorus 15X ASF GeForce RTX 4070 Laptop GPU, i7-13700HX, Gigabyte AG470S1TB-SI B10 | Asus TUF Gaming A16 FA617 Radeon RX 7600S, R7 7735HS, Micron 2400 MTFDKBA1T0QFM | Dell G15 5530 GeForce RTX 4060 Laptop GPU, i7-13650HX, SSTC CL4-3D512-Q11 | |
|---|---|---|---|---|---|---|
| Noise | -3% | 4% | -17% | -1% | 5% | |
| desligado / ambiente * (dB) | 24 | 25.7 -7% | 23 4% | 25 -4% | 24 -0% | 20.41 15% |
| Idle Minimum * (dB) | 24 | 25.7 -7% | 23.1 4% | 28 -17% | 24 -0% | 26.85 -12% |
| Idle Average * (dB) | 24 | 25.7 -7% | 23.1 4% | 29 -21% | 25 -4% | 26.85 -12% |
| Idle Maximum * (dB) | 32.32 | 26.3 19% | 26.6 18% | 36 -11% | 28 13% | 26.85 17% |
| Load Average * (dB) | 36.66 | 33.9 8% | 34.7 5% | 50 -36% | 42 -15% | 27.65 25% |
| Witcher 3 ultra * (dB) | 49.06 | 47.6 3% | 54 -10% | 50 -2% | 47.9 2% | |
| Load Maximum * (dB) | 49.49 | 62 -25% | 54.8 -11% | 58 -17% | 50 -1% | 47.86 3% |
* ... menor é melhor
Temperatura
O laptop para jogos da Acer permanece surpreendentemente frio e, durante as sessões de jogos, a maioria das superfícies não chega nem a 40 °C. O calor está concentrado apenas no sistema de resfriamento saliente na parte traseira, onde os pontos quentes podem chegar a 55 °C durante os jogos. Somente no teste de estresse combinado, medimos um ponto quente de 66 °C, embora isso não ocorra durante o uso diário. Na maioria das vezes, os usuários nunca entrarão em contato com a barra traseira, mas, quando colocada no colo, o contato ocasional com o dispositivo será desagradável durante os jogos.
(±) A temperatura máxima no lado superior é 41 °C / 106 F, em comparação com a média de 40.4 °C / 105 F , variando de 21.2 a 68.8 °C para a classe Gaming.
(-) A parte inferior aquece até um máximo de 66 °C / 151 F, em comparação com a média de 43.2 °C / 110 F
(±) Em uso inativo, a temperatura média para o lado superior é 32.4 °C / 90 F, em comparação com a média do dispositivo de 33.9 °C / ### class_avg_f### F.
(±) Jogando The Witcher 3, a temperatura média para o lado superior é 33.1 °C / 92 F, em comparação com a média do dispositivo de 33.9 °C / ## #class_avg_f### F.
(+) Os apoios para as mãos e o touchpad estão atingindo a temperatura máxima da pele (32 °C / 89.6 F) e, portanto, não estão quentes.
(-) A temperatura média da área do apoio para as mãos de dispositivos semelhantes foi 28.8 °C / 83.8 F (-3.2 °C / -5.8 F).
| Acer Predator Helios 16 PH16-71-731Q Intel Core i7-13700HX, NVIDIA GeForce RTX 4060 Laptop GPU | Acer Nitro 16 AN16-41 AMD Ryzen 7 7735HS, NVIDIA GeForce RTX 4070 Laptop GPU | Lenovo Legion Pro 5 16IRX8 Intel Core i7-13700HX, NVIDIA GeForce RTX 4060 Laptop GPU | Aorus 15X ASF Intel Core i7-13700HX, NVIDIA GeForce RTX 4070 Laptop GPU | Asus TUF Gaming A16 FA617 AMD Ryzen 7 7735HS, AMD Radeon RX 7600S | Dell G15 5530 Intel Core i7-13650HX, NVIDIA GeForce RTX 4060 Laptop GPU | |
|---|---|---|---|---|---|---|
| Heat | 10% | 12% | 19% | -6% | -2% | |
| Maximum Upper Side * (°C) | 41 | 41.5 -1% | 42.8 -4% | 42 -2% | 54 -32% | 54 -32% |
| Maximum Bottom * (°C) | 66 | 51.8 22% | 50 24% | 51 23% | 47 29% | 62.2 6% |
| Idle Upper Side * (°C) | 36 | 31.6 12% | 29.6 18% | 27 25% | 40 -11% | 33.4 7% |
| Idle Bottom * (°C) | 37 | 34.5 7% | 34 8% | 26 30% | 40 -8% | 33.4 10% |
* ... menor é melhor
Teste de estresse
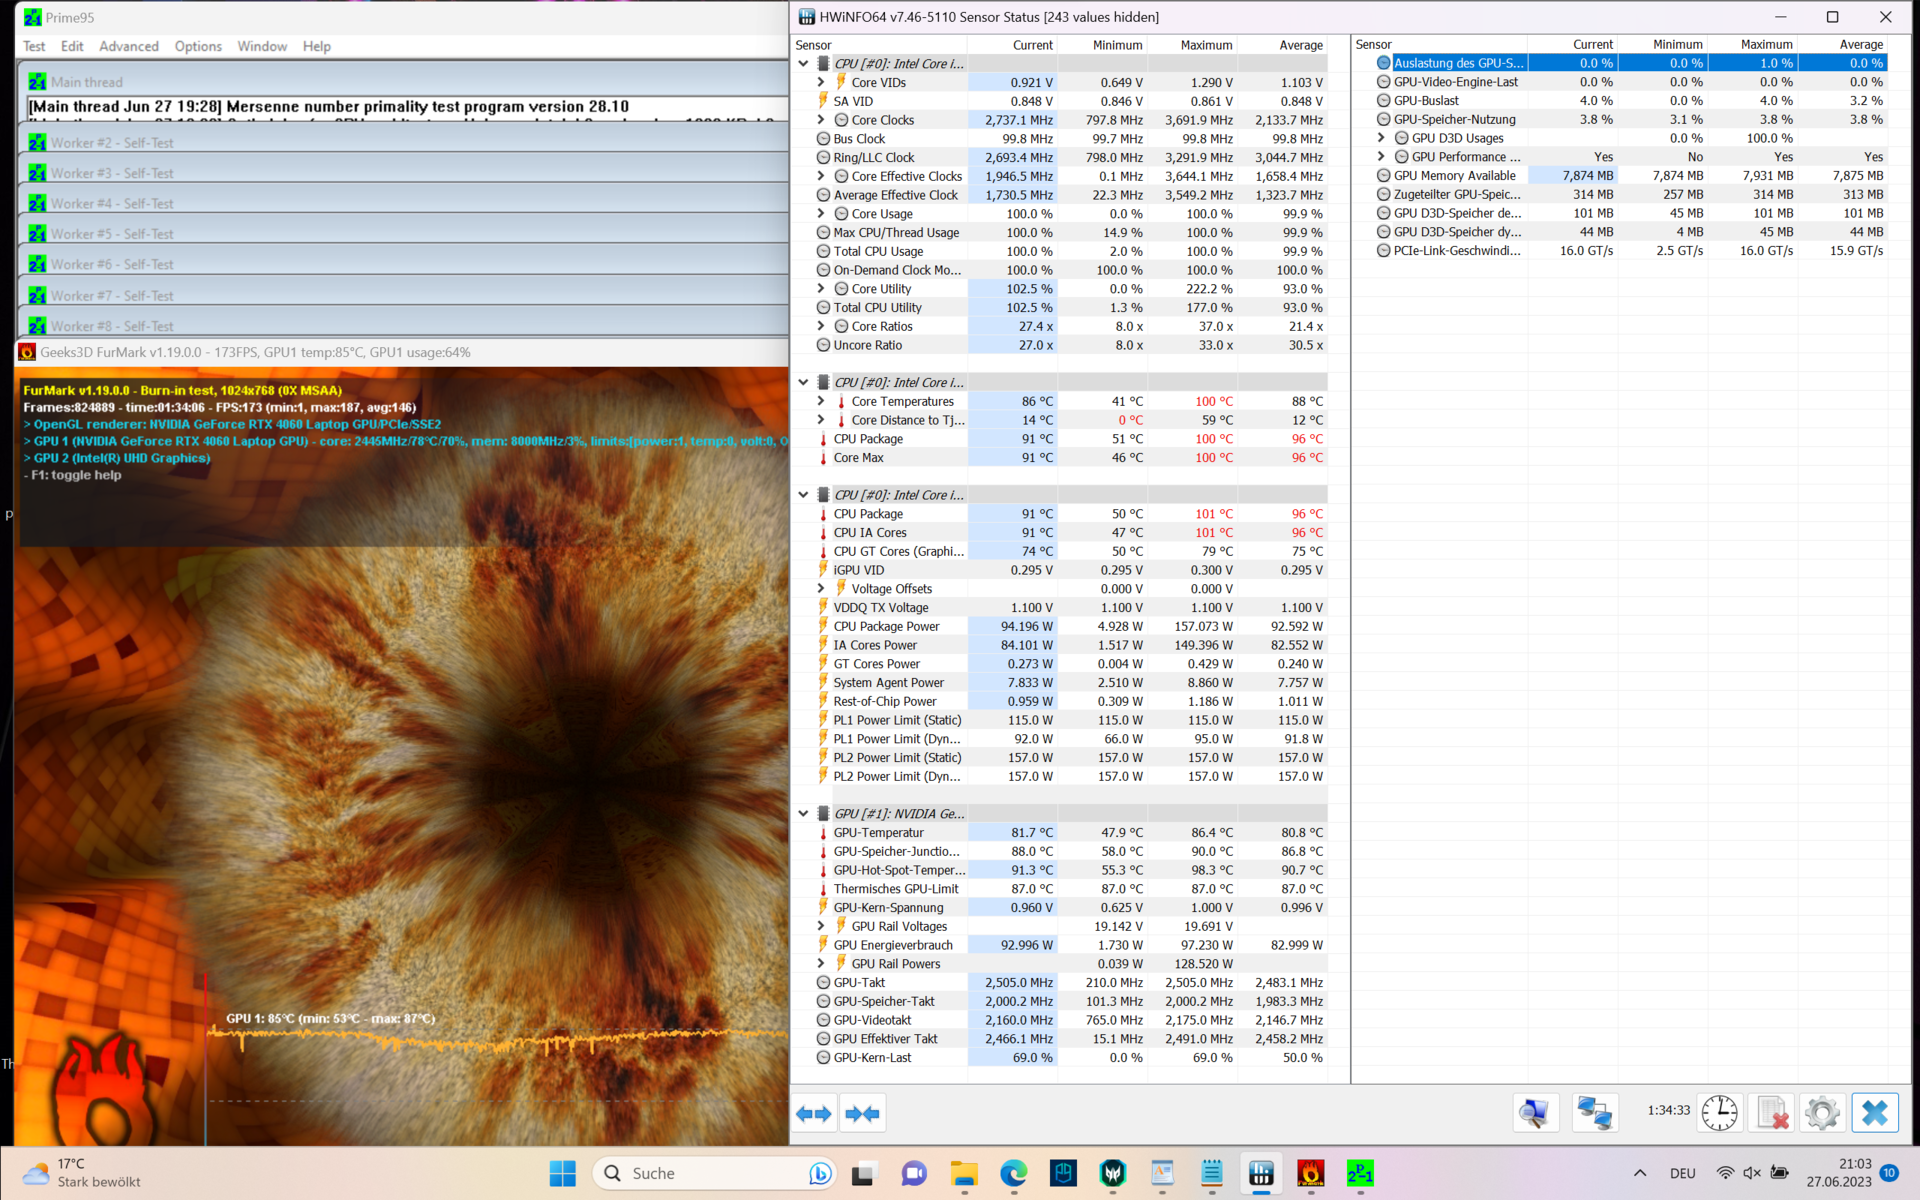
No teste de estresse (FurMark + Prime95), após um minuto, a taxa de clock dos núcleos P caiu de 3,6 GHz para apenas 0,85 GHz, significativamente abaixo da taxa de clock base de 2,1 GHz. Ao ativar o modo turbo e "ventiladores máximos", a taxa de clock só caiu depois de 3 minutos (para ~1,1 GHz). A CPU aquece até 86 °C (e 83 °C, respectivamente) e consome 100 watts continuamente.
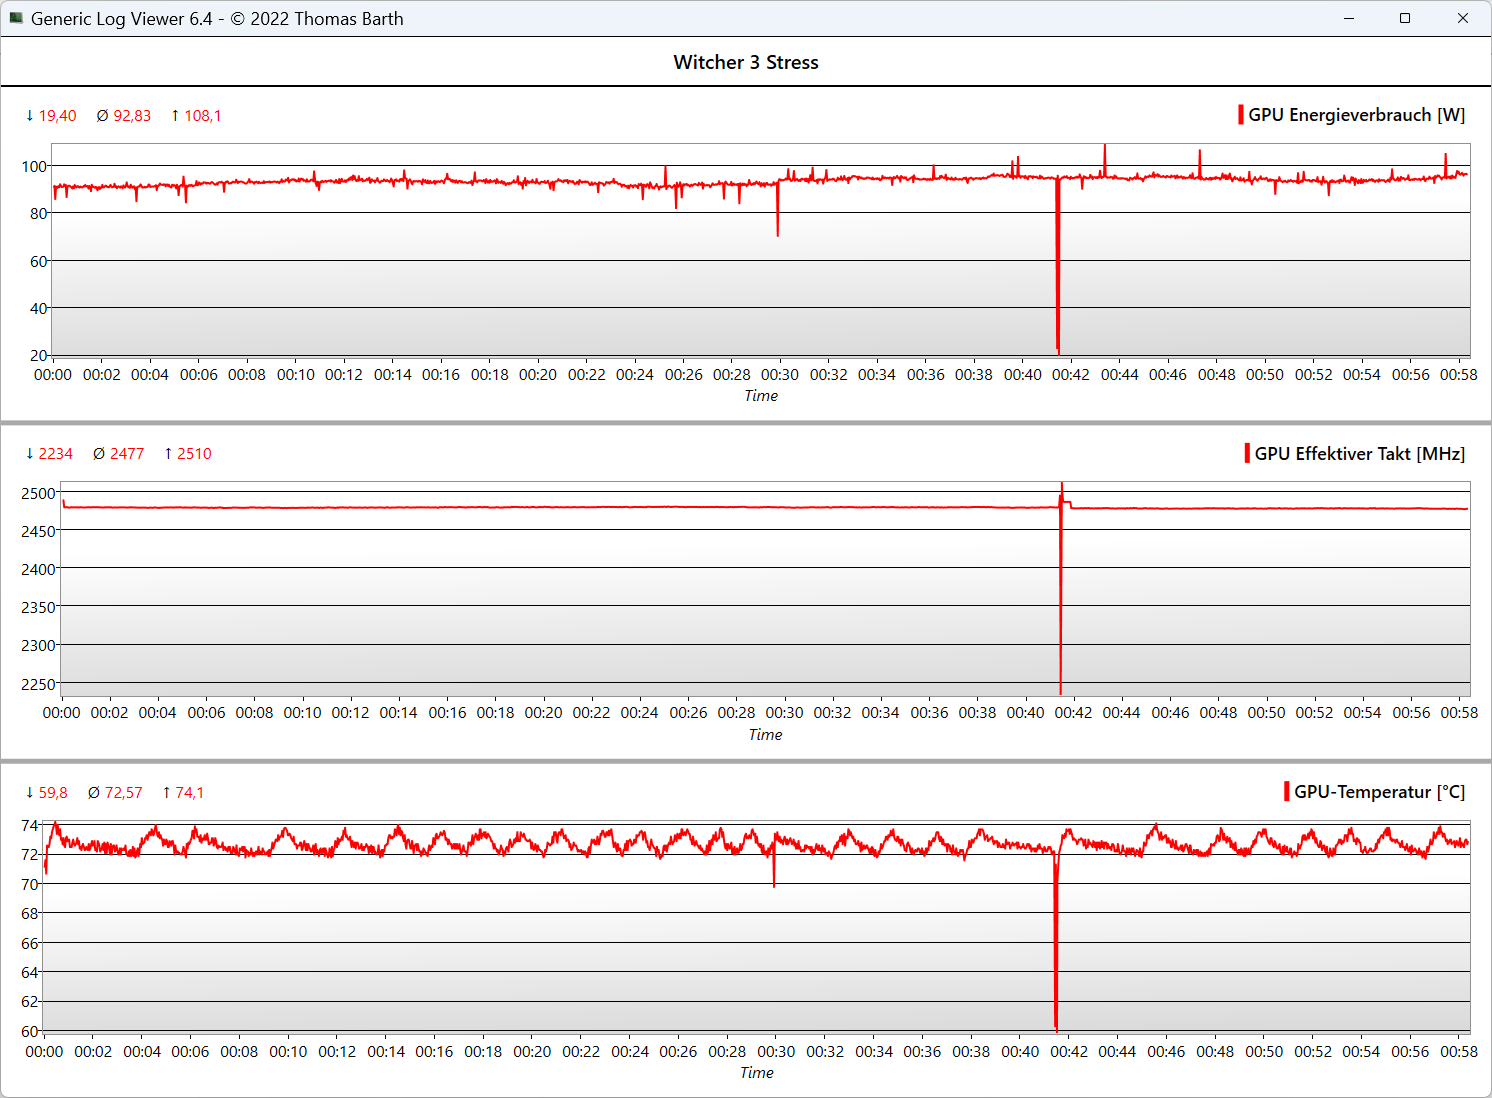
A GPU mantém mais ou menos sua velocidade de clock em 2.500 a 2.600 MHz, não esquenta muito (81 °C) e consome 115 watts. No teste de estresse Witcher 3 e em quase todos os jogos, aRTX 4060 requer apenas 100 watts para atingir sua velocidade máxima de clock. No entanto, em modelos com uma placaRTX 4080isso deve ser diferente.
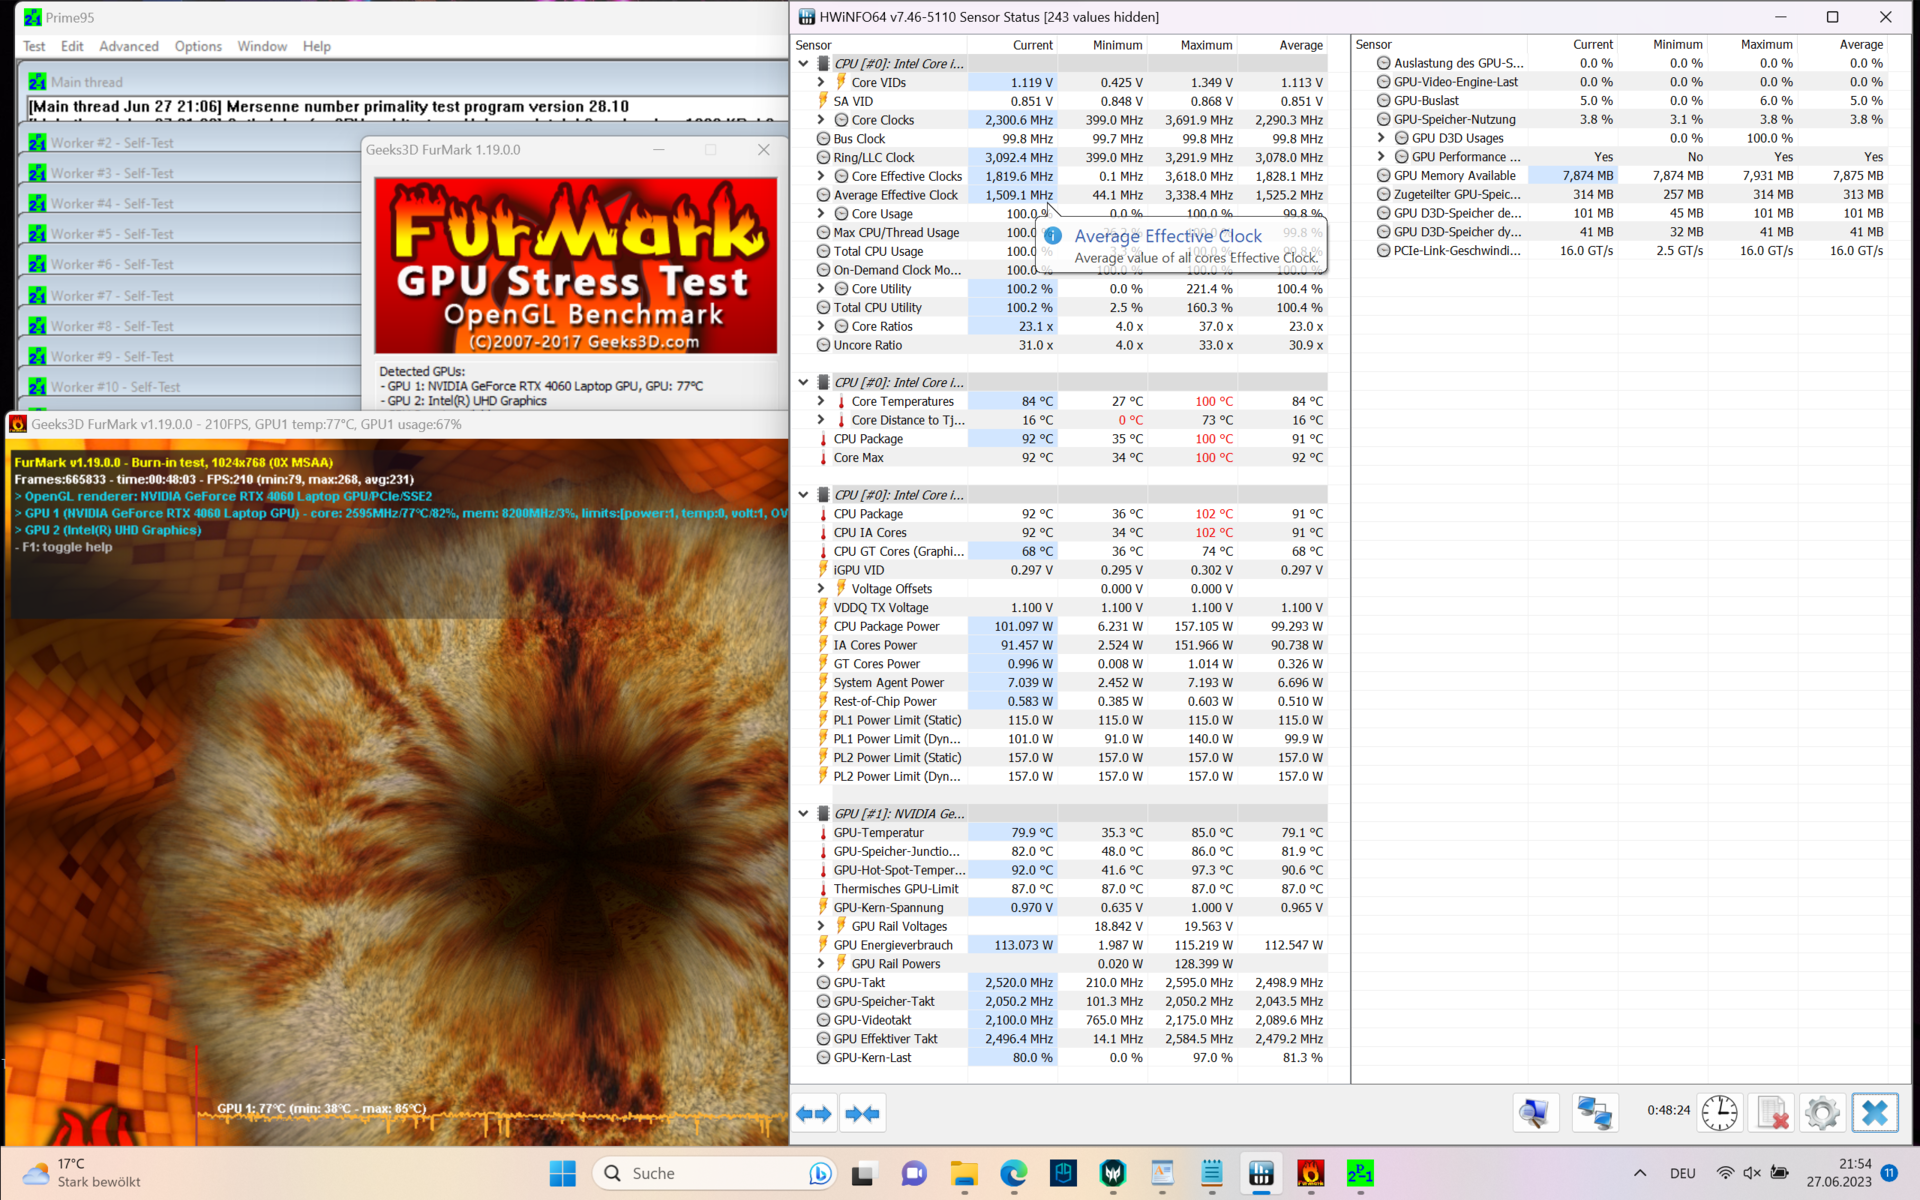
No teste de estresse puro da GPU (FurMark), a GPU continuou a quase atingir a velocidade máxima de clock de cerca de 2.430 MHz, consumindo 129 watts e aquecendo até 76 °C. No modo turbo + ventiladores máximos, atinge-se até 2.625 MHz (leve overclocking), consumindo 136 watts (um pico de 139 watts), enquanto a GPU permanece relativamente fria a 71,5 °C.
Mesmo durante o estresse puro da CPU, após um minuto, os núcleos P atingem apenas 0,92 GHz, pois estão limitados a 100 watts, embora a CPU atinja apenas 70 °C. O sistema de resfriamento poderia claramente gerenciar mais. Se o modo turbo + ventiladores máximos estiverem ativados, o clock ainda será de 1,45 GHz a 115 watts e 73 °C. A capacidade de selecionar os limites de PL teria sido sensata, especialmente ao escolher uma SKU com um Core i9-13900HX.
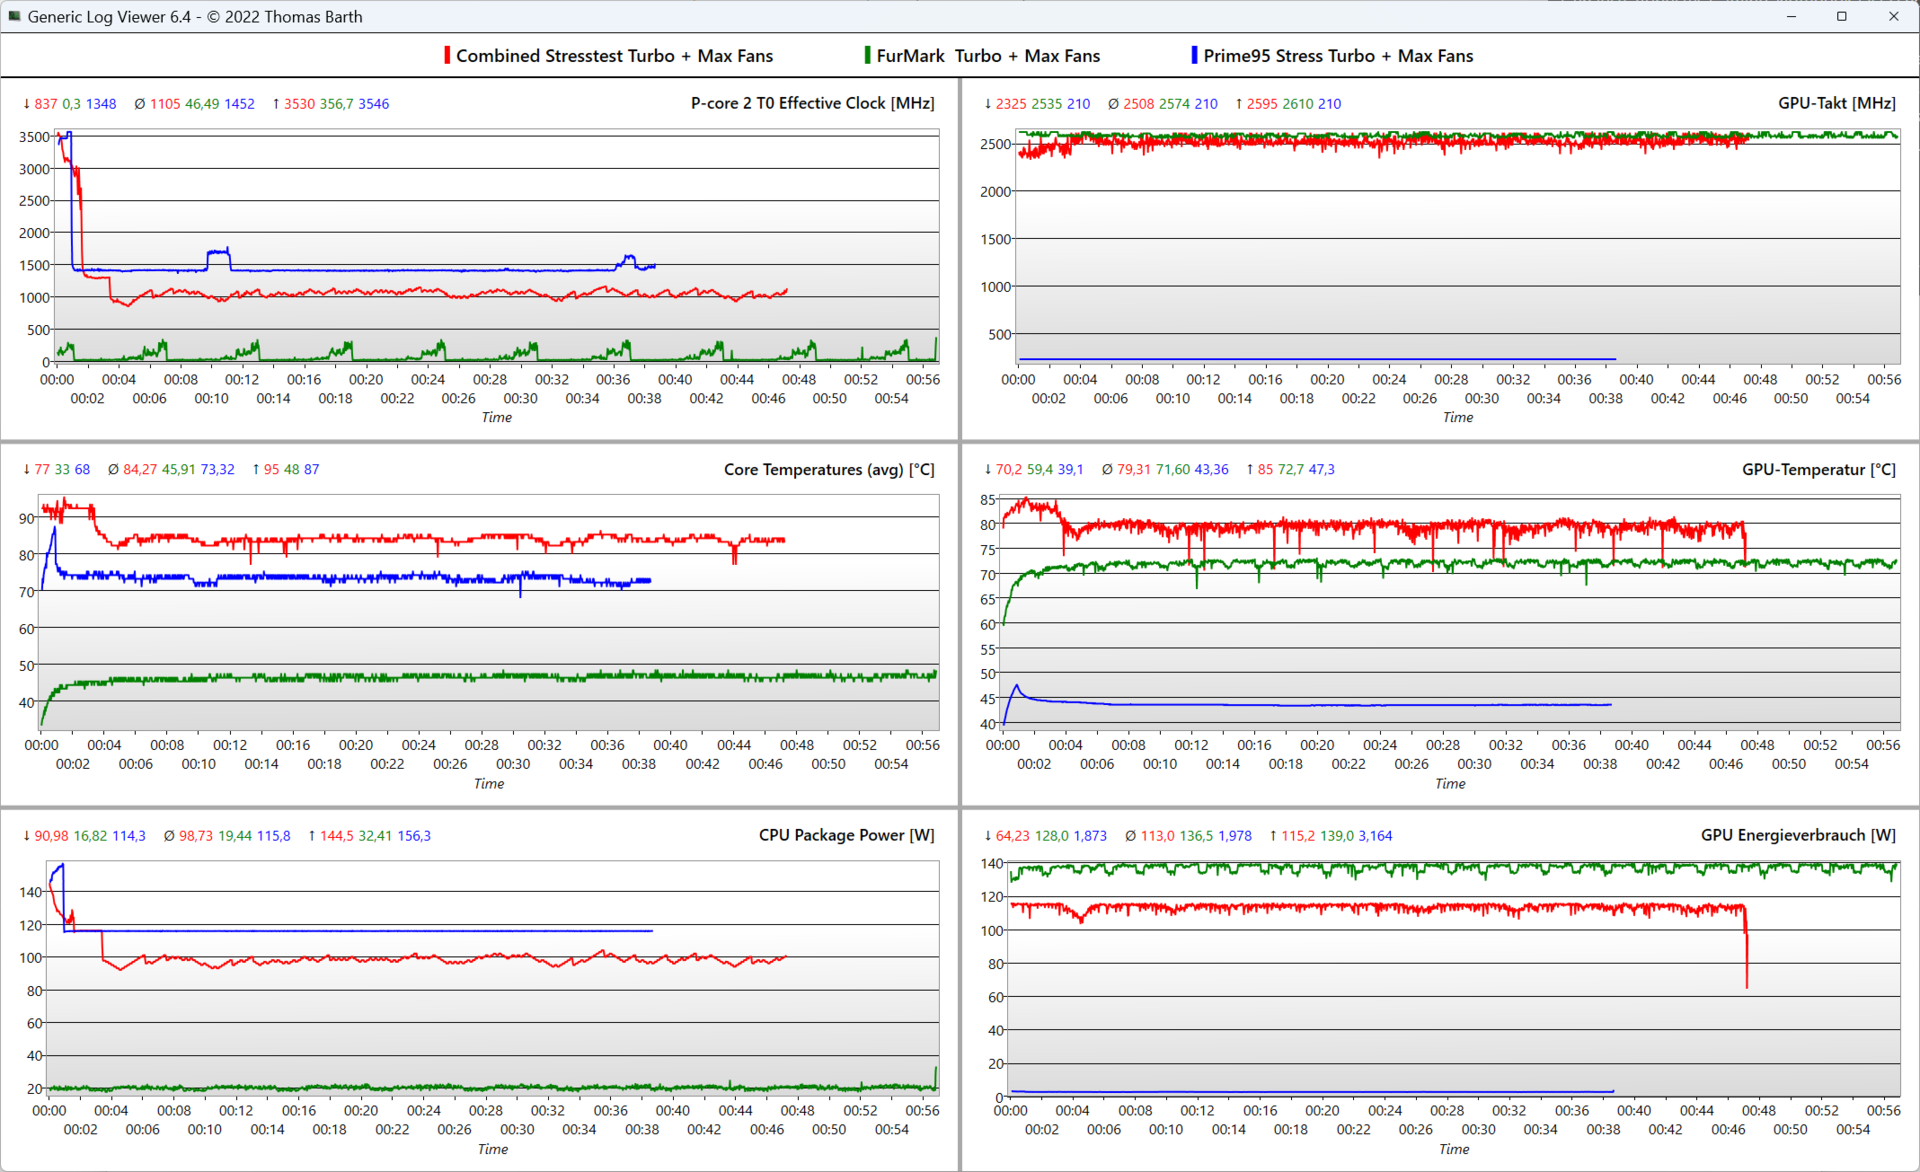
| modo @Performance | Relógio dos núcleos P/ núcleos E (GHz) | Relógio da GPU (MHz) | Temperatura média da CPU (°C) | Temperatura média da GPU (°C) |
| Sistema ocioso | 0,07 / 0,07 | - | 33 | 37 |
| Estresse do Prime95 | 0,95 / 3,5 | 10 | 71 | 49 |
| Prime95 + FurMark | 0,85 / 3,4 | 2.500 | 86 | 81 |
| FurMark Stress | 0,55 / 0,02 | 2.450 | 54 | 76 |
| Witcher 3 Estresse | 1,6 / 0,02 | 2.475 | 61 | 73 |
Alto-falantes
Os alto-falantes estéreo de 2 watts com disparo para baixo produzem médios e agudos equilibrados, mas os graves estão quase completamente ausentes, enquanto o volume máximo de 76,1 dB(A) é bastante mediano. Os laptops para jogos em nosso campo de comparação não se saem melhor.
Como alternativa, oAsus ROG Strix G16da Lenovo Legion Pro 7da Lenovo, oferece melhor som ou você pode usar um fone de ouvido ou sistema de som por meio do conector de áudio ou Bluetooth.
Acer Predator Helios 16 PH16-71-731Q análise de áudio
(±) | o volume do alto-falante é médio, mas bom (###valor### dB)
Graves 100 - 315Hz
(-) | quase nenhum baixo - em média 15% menor que a mediana
(-) | graves não são lineares (15% delta para frequência anterior)
Médios 400 - 2.000 Hz
(+) | médios equilibrados - apenas 2.5% longe da mediana
(+) | médios são lineares (5.9% delta para frequência anterior)
Altos 2 - 16 kHz
(+) | agudos equilibrados - apenas 2.9% longe da mediana
(±) | a linearidade dos máximos é média (8.4% delta para frequência anterior)
Geral 100 - 16.000 Hz
(+) | o som geral é linear (13.6% diferença em relação à mediana)
Comparado com a mesma classe
» 20% de todos os dispositivos testados nesta classe foram melhores, 7% semelhantes, 73% piores
» O melhor teve um delta de 6%, a média foi 18%, o pior foi 132%
Comparado com todos os dispositivos testados
» 15% de todos os dispositivos testados foram melhores, 4% semelhantes, 81% piores
» O melhor teve um delta de 4%, a média foi 23%, o pior foi 134%
Lenovo Legion Pro 5 16IRX8 análise de áudio
(±) | o volume do alto-falante é médio, mas bom (###valor### dB)
Graves 100 - 315Hz
(-) | quase nenhum baixo - em média 23.7% menor que a mediana
(±) | a linearidade dos graves é média (10.7% delta para a frequência anterior)
Médios 400 - 2.000 Hz
(+) | médios equilibrados - apenas 3.8% longe da mediana
(±) | a linearidade dos médios é média (7.1% delta para frequência anterior)
Altos 2 - 16 kHz
(+) | agudos equilibrados - apenas 3.7% longe da mediana
(+) | os máximos são lineares (6.7% delta da frequência anterior)
Geral 100 - 16.000 Hz
(±) | a linearidade do som geral é média (21.9% diferença em relação à mediana)
Comparado com a mesma classe
» 79% de todos os dispositivos testados nesta classe foram melhores, 6% semelhantes, 16% piores
» O melhor teve um delta de 6%, a média foi 18%, o pior foi 132%
Comparado com todos os dispositivos testados
» 63% de todos os dispositivos testados foram melhores, 7% semelhantes, 30% piores
» O melhor teve um delta de 4%, a média foi 23%, o pior foi 134%
Gerenciamento de energia: Alto consumo em modo inativo, menor duração da bateria
Consumo de energia
Com 20 watts, o consumo de energia ocioso é muito alto, mesmo para um sistema Intel HX, enquanto os sistemas AMD HS oferecem os melhores resultados entre os concorrentes da Acer.
175 watts em jogos é relativamente baixo, no entanto, quase todos os notebooks RTX 4060 registram esse valor, pois a GPU atinge sua velocidade máxima de clock a 100 watts. 240 watts a 276 watts são atingidos apenas no teste de estresse diário (e não típico), sendo facilmente absorvidos pela PSU de 330 watts.
| desligado | |
| Ocioso | |
| Carga |
|
Key:
min: | |
| Acer Predator Helios 16 PH16-71-731Q i7-13700HX, GeForce RTX 4060 Laptop GPU, Micron 3400 1TB MTFDKBA1T0TFH, IPS-LED, 2560x1600, 16" | Acer Nitro 16 AN16-41 R7 7735HS, GeForce RTX 4070 Laptop GPU, Samsung PM9A1 MZVL21T0HCLR, IPS, 2560x1600, 16" | Lenovo Legion Pro 5 16IRX8 i7-13700HX, GeForce RTX 4060 Laptop GPU, SK hynix PC801 HFS512GEJ9X115N, IPS, 2560x1600, 16" | Aorus 15X ASF i7-13700HX, GeForce RTX 4070 Laptop GPU, Gigabyte AG470S1TB-SI B10, IPS, 2560x1440, 15.6" | Asus TUF Gaming A16 FA617 R7 7735HS, Radeon RX 7600S, Micron 2400 MTFDKBA1T0QFM, IPS-Level, 1920x1200, 16" | Dell G15 5530 i7-13650HX, GeForce RTX 4060 Laptop GPU, SSTC CL4-3D512-Q11, IPS, 1920x1080, 15.6" | Média NVIDIA GeForce RTX 4060 Laptop GPU | Média da turma Gaming | |
|---|---|---|---|---|---|---|---|---|
| Power Consumption | 11% | -24% | 6% | 29% | 18% | 18% | 2% | |
| Idle Minimum * (Watt) | 15.9 | 11.6 27% | 24.5 -54% | 11 31% | 8 50% | 8.4 47% | 11.5 ? 28% | 13 ? 18% |
| Idle Average * (Watt) | 20.5 | 15.6 24% | 29.2 -42% | 16 22% | 11 46% | 14.98 27% | 16 ? 22% | 19 ? 7% |
| Idle Maximum * (Watt) | 20.9 | 16.5 21% | 34.3 -64% | 24 -15% | 16 23% | 15.56 26% | 20.3 ? 3% | 24.5 ? -17% |
| Load Average * (Watt) | 106 | 155 -46% | 98.7 7% | 104 2% | 97 8% | 96.8 9% | 92.9 ? 12% | 111.1 ? -5% |
| Witcher 3 ultra * (Watt) | 175 | 154.8 12% | 178.6 -2% | 185.4 -6% | 161.5 8% | 186 -6% | ||
| Load Maximum * (Watt) | 276 | 205 26% | 249.6 10% | 272 1% | 168 39% | 271.42 2% | 210 ? 24% | 260 ? 6% |
* ... menor é melhor
Power consumption Witcher 3 / stress test
Power consumption with an external monitor
Duração da bateria
Com um brilho de 150 cd/m² durante a navegação na Internet e uma taxa de atualização variável de 120 a 240 Hz, a duração da bateria do Helios 16 mede um pouco mais de 5,5 horas e é aproximadamente a média dos laptops para jogos. Os sistemas AMD, oAcer Nitro 16eAsus TUF Gaming A16têm uma autonomia muito maior, com 9 e 12 horas, respectivamente. Com apenas 3,5 horas, oLegion Pro 5 16 fica em último lugar.
Depois de meia hora, a bateria é carregada mais uma vez até 50%, e 100% leva cerca de 1,15 horas. Também é possível carregar o laptop via USB-C, porém, isso é mais lento.
| Acer Predator Helios 16 PH16-71-731Q i7-13700HX, GeForce RTX 4060 Laptop GPU, 90 Wh | Acer Nitro 16 AN16-41 R7 7735HS, GeForce RTX 4070 Laptop GPU, 90 Wh | Lenovo Legion Pro 5 16IRX8 i7-13700HX, GeForce RTX 4060 Laptop GPU, 80 Wh | Aorus 15X ASF i7-13700HX, GeForce RTX 4070 Laptop GPU, 99 Wh | Asus TUF Gaming A16 FA617 R7 7735HS, Radeon RX 7600S, 90 Wh | Dell G15 5530 i7-13650HX, GeForce RTX 4060 Laptop GPU, 86 Wh | Média da turma Gaming | |
|---|---|---|---|---|---|---|---|
| Duração da bateria | 65% | -46% | 48% | 58% | -9% | 33% | |
| H.264 (h) | 4.8 | 10.2 113% | 7.9 65% | 6.8 42% | 8.32 ? 73% | ||
| WiFi v1.3 (h) | 5.6 | 9 61% | 3.4 -39% | 8.2 46% | 12.1 116% | 6.5 16% | 7.11 ? 27% |
| Witcher 3 ultra (h) | 1.5 | 0.8 -47% | |||||
| Load (h) | 1.5 | 1.8 20% | 0.7 -53% | 2 33% | 1.5 0% | 0.8 -47% | 1.502 ? 0% |
| Reader / Idle (h) | 12.2 | 6.7 | 11.3 | 20.2 | 8.27 ? |
Pro
Contra
Veredicto: O sólido laptop para jogos RTX 4060 também pode ser silencioso
O laptop para jogos Acer Predator Helios 16 tem muitos pontos fortes, mas também algumas pequenas desvantagens. Ficamos positivamente surpresos com a tela QHD de 240 Hz, rápida e de cores vivas, com 97% de DCI P3 e Dolby Vision, o que significa que nada impede o trabalho criativo.
Emparelhado com a potência da CPU Intel HX e uma tela igualmente muito potenteRTX 4060você obtém um laptop para jogos de médio porte com muitos elementos de ponta.
Também ficamos impressionados com a caixa de metal, apesar de o teclado flexionar um pouco. As teclas em si poderiam ter mais feedback, mas, por outro lado, gostamos da iluminação das teclas em mini-LED com cores particularmente vivas e que economiza energia. No entanto, a duração da bateria é medíocre e provavelmente será ainda mais curta ao usar a tela mini-LED disponível como opcional, especialmente quando combinada com a SKU mais potente (Core i9-13900HX + RTX 4080).
Desempenho de alto nível, uma tela QHD vívida de 240 Hz e paz e tranquilidade ao jogar parecem ser a receita ideal para um laptop para jogos e uma estação de trabalho criativa. No entanto, temos que aceitar algumas compensações.
O potente sistema de resfriamento ajuda a manter as temperaturas internas baixas, garantindo um desempenho silencioso e estável, principalmente nos modos balanceado ou silencioso. O que sentimos falta foi dos limites de potência personalizáveis individualmente para levar o sistema de resfriamento ao limite. O estrangulamento da SSD relacionado à temperatura parece ser uma mancha em um quadro geral positivo, com uma limitação aparentemente excessiva de 25 watts da CPU no modo de bateria.
Com sua variante de análise SKU, o laptop custa atualmente US$ 1.900 e US$ 1.750, respectivamente, mas ocasionalmente também é possível comprar um modelo mais barato por cerca de US$ 1.450 com uma tela de 165 Hz um pouco menos colorida. No entanto, muitas vezes é possível encontrar seu principal concorrente, o Lenovo Legion Pro 5 16 por cerca de US$ 1.400, com o dispositivo oferecendo praticamente os mesmos benefícios. As diferenças só podem ser vistas nos detalhes, como a ausência do Advanced Optimus, um teclado melhor e uma tela QHD de 165 Hz sem cobertura DCI P3.
Além disso, o Asus ROG Strix G16 é uma opção interessante, vem com uma RTX 4060 e também custa cerca de US$ 1.800. Esse investimento também lhe proporcionará melhores alto-falantes, maior duração da bateria, um teclado com feedback mais pronunciado e tempos de resposta de tela mais rápidos.
Preço e disponibilidade
O Acer Predator Helios 16 com o número de modelo PH16-71-74UU (Core i7-13700HX, RTX 4060 e uma tela de 165 Hz) custa atualmente US$ 1.650 na Amazon. O modelo mini-LED, combinado com um Core i9-13900HX e o RTX 4080, está atualmente fora de estoque.
Acer Predator Helios 16 PH16-71-731Q
- 07/05/2023 v7 (old)
Marvin Gollor
Transparência
A seleção dos dispositivos a serem analisados é feita pela nossa equipe editorial. A amostra de teste foi fornecida ao autor como empréstimo pelo fabricante ou varejista para fins desta revisão. O credor não teve influência nesta revisão, nem o fabricante recebeu uma cópia desta revisão antes da publicação. Não houve obrigação de publicar esta revisão. Como empresa de mídia independente, a Notebookcheck não está sujeita à autoridade de fabricantes, varejistas ou editores.
É assim que o Notebookcheck está testando
Todos os anos, o Notebookcheck analisa de forma independente centenas de laptops e smartphones usando procedimentos padronizados para garantir que todos os resultados sejam comparáveis. Desenvolvemos continuamente nossos métodos de teste há cerca de 20 anos e definimos padrões da indústria no processo. Em nossos laboratórios de teste, equipamentos de medição de alta qualidade são utilizados por técnicos e editores experientes. Esses testes envolvem um processo de validação em vários estágios. Nosso complexo sistema de classificação é baseado em centenas de medições e benchmarks bem fundamentados, o que mantém a objetividade.Price comparison

