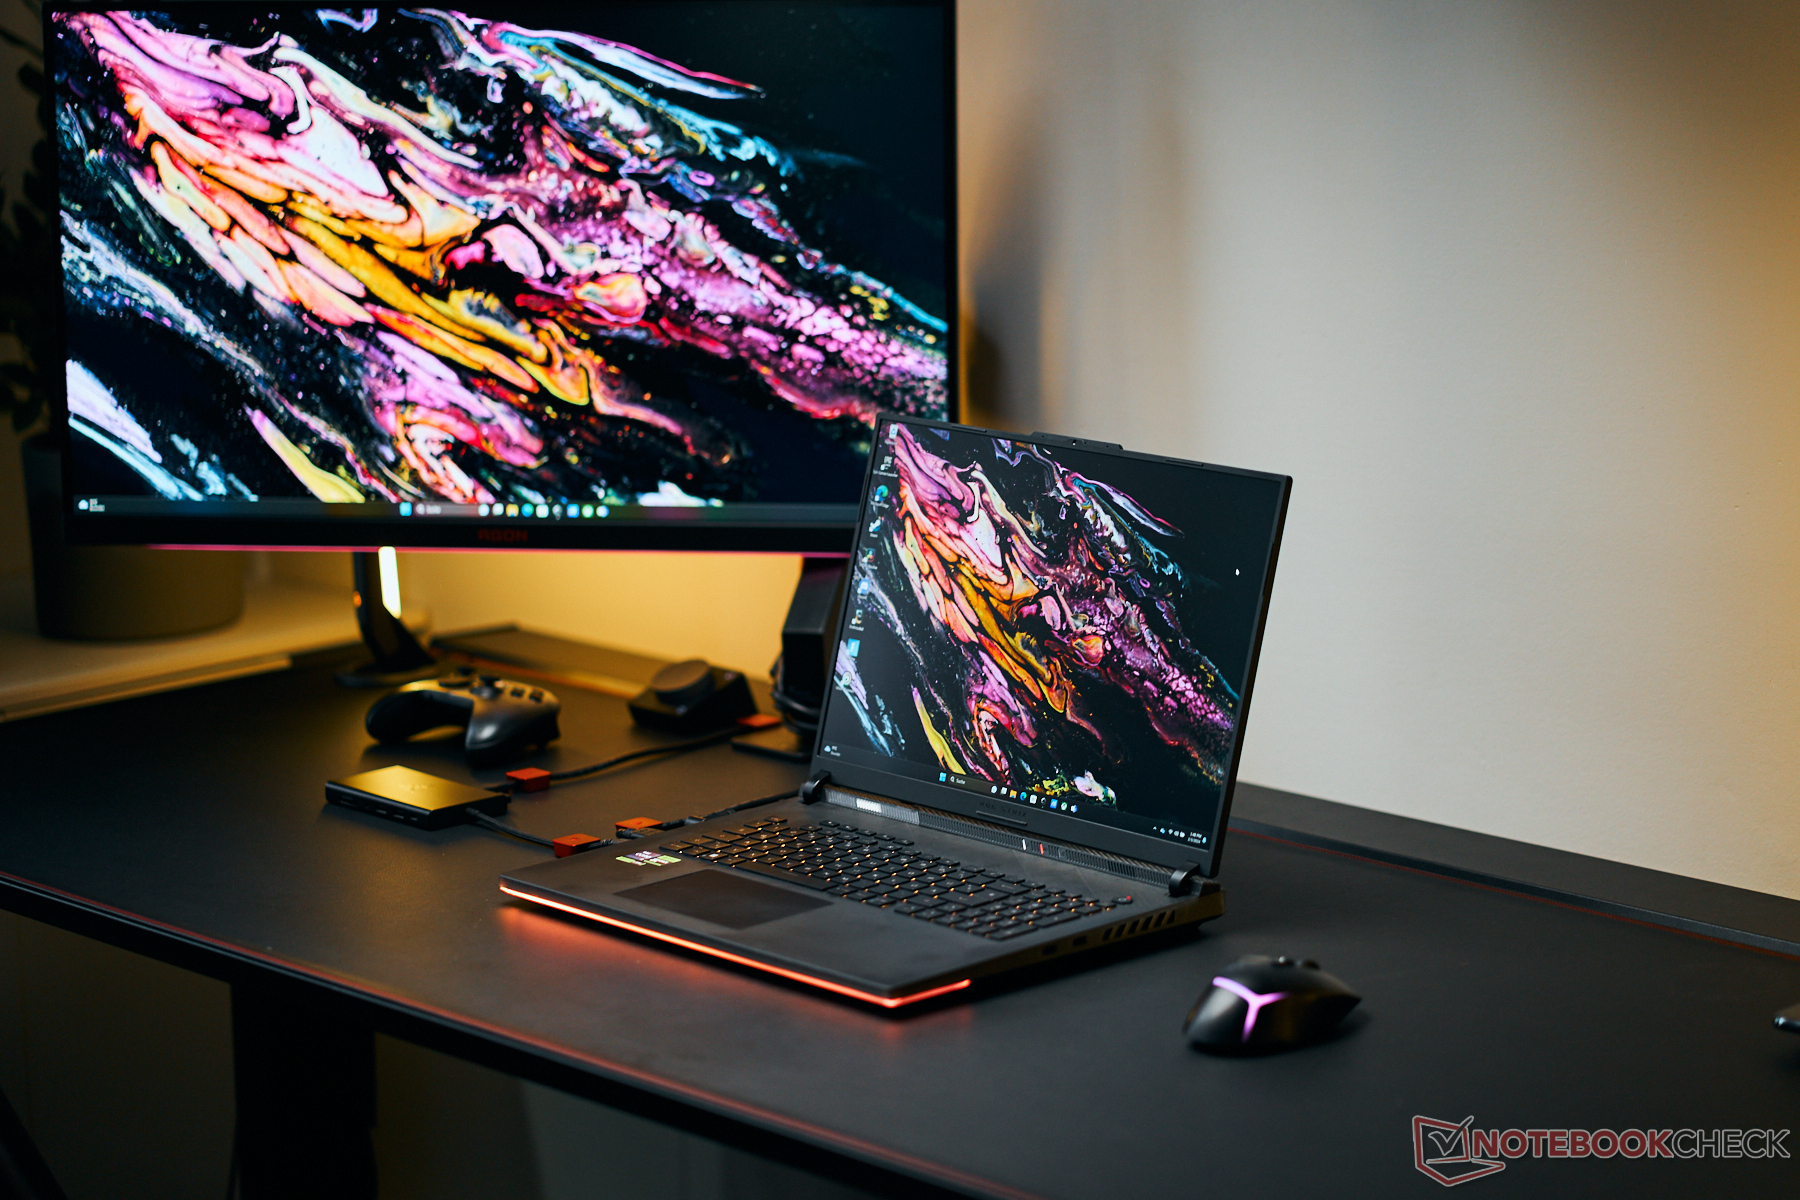
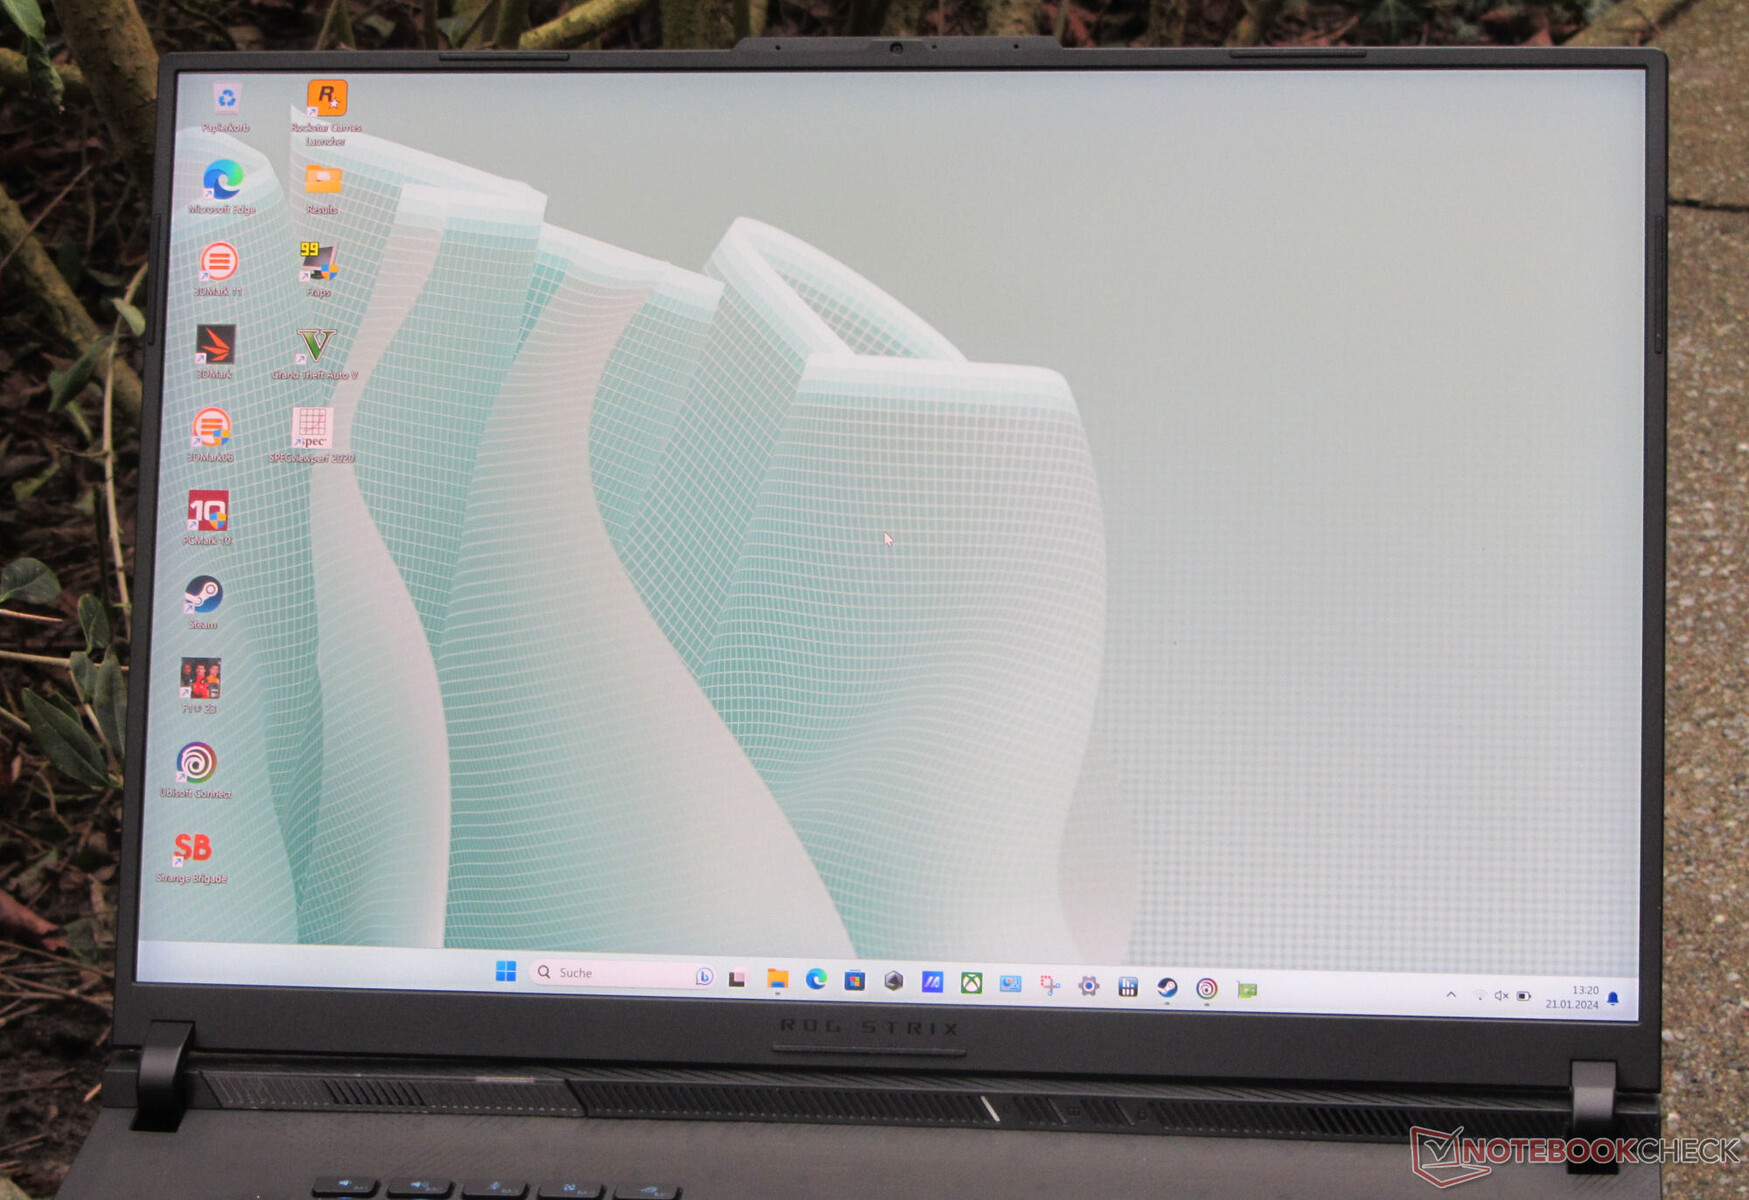
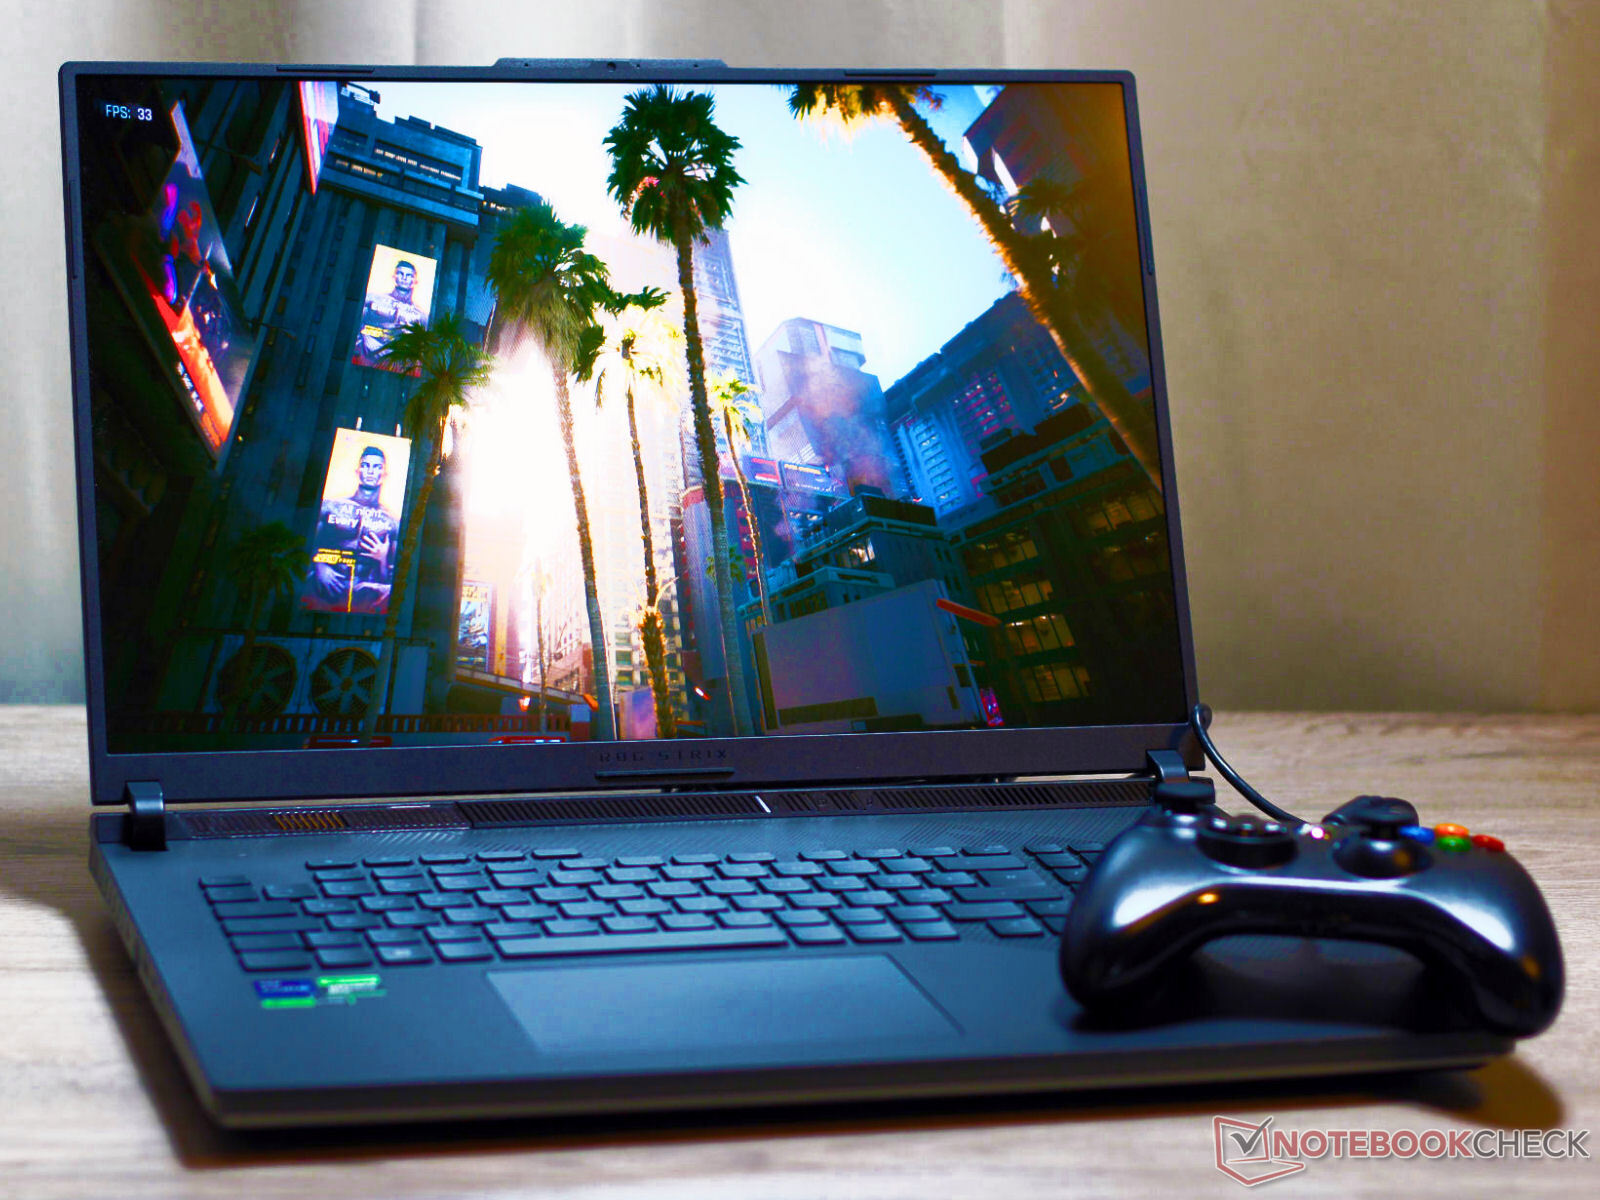
Análise do Asus ROG Strix Scar 18 (2024): Laptop para jogos com RTX 4090 e painel mini-LED
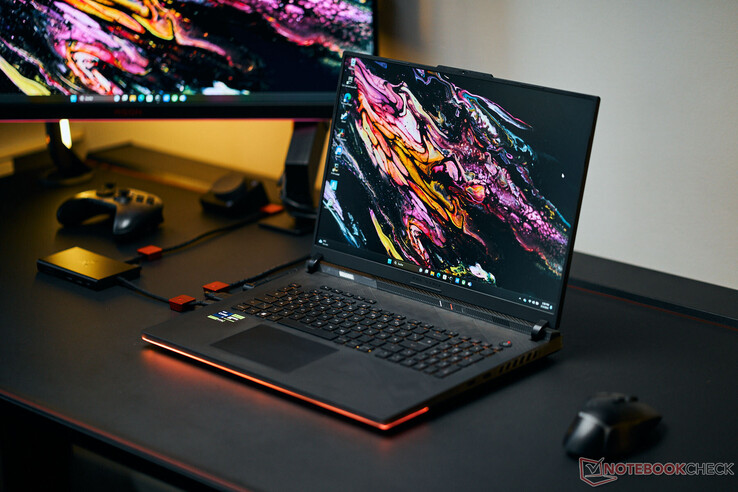
Com o ROG Strix Scar 18, a ASUS tem como alvo gamers e criadores que não carecem dos recursos necessários: Nossa configuração de teste do campeão de alto nível está disponível a partir de cerca de 4.500 euros (~$4.848). O preço chega a essas alturas devido ao hardware poderoso e à tela mini-LED muito brilhante no formato 16:10 com cores precisas e uma diagonal de 18 polegadas. Os concorrentes incluem dispositivos como o Alienware m18 R1e o Acer Predator Helios 18, o Razer Blade 18e o MSI Titan 18 HX A14VIG.
O laptop é o irmão do Scar 18 que testamos no ano passado e compartilha uma construção idêntica. Além da tela, a geração da CPU representa a única mudança, com o Raptor Lake Refresh substituindo o Raptor Lake.
Possíveis concorrentes em comparação
Avaliação | Data | Modelo | Peso | Altura | Size | Resolução | Preço |
|---|---|---|---|---|---|---|---|
| 88.3 % v7 (old) | 02/2024 | Asus ROG Strix Scar 18 G834JYR (2024) i9-14900HX, GeForce RTX 4090 Laptop GPU | 3.1 kg | 30.8 mm | 18.00" | 2560x1600 | |
| 89.2 % v7 (old) | 11/2023 | Alienware m18 R1 AMD R9 7945HX, Radeon RX 7900M | 3.9 kg | 26.7 mm | 18.00" | 1920x1200 | |
| 90.7 % v7 (old) | 04/2023 | Alienware m18 R1 i9-13980HX, GeForce RTX 4090 Laptop GPU | 3.9 kg | 26.7 mm | 18.00" | 1920x1200 | |
| 88.3 % v7 (old) | 10/2023 | Acer Predator Helios 18 N23Q2 i9-13900HX, GeForce RTX 4080 Laptop GPU | 3.2 kg | 29.15 mm | 18.00" | 2560x1600 | |
| 91.4 % v7 (old) | 02/2023 | Razer Blade 18 RTX 4070 i9-13950HX, GeForce RTX 4070 Laptop GPU | 3 kg | 21.9 mm | 18.00" | 2560x1600 | |
| 88.8 % v7 (old) | 01/2024 | MSI Titan 18 HX A14VIG i9-14900HX, GeForce RTX 4090 Laptop GPU | 3.6 kg | 32.1 mm | 18.00" | 3840x2400 |
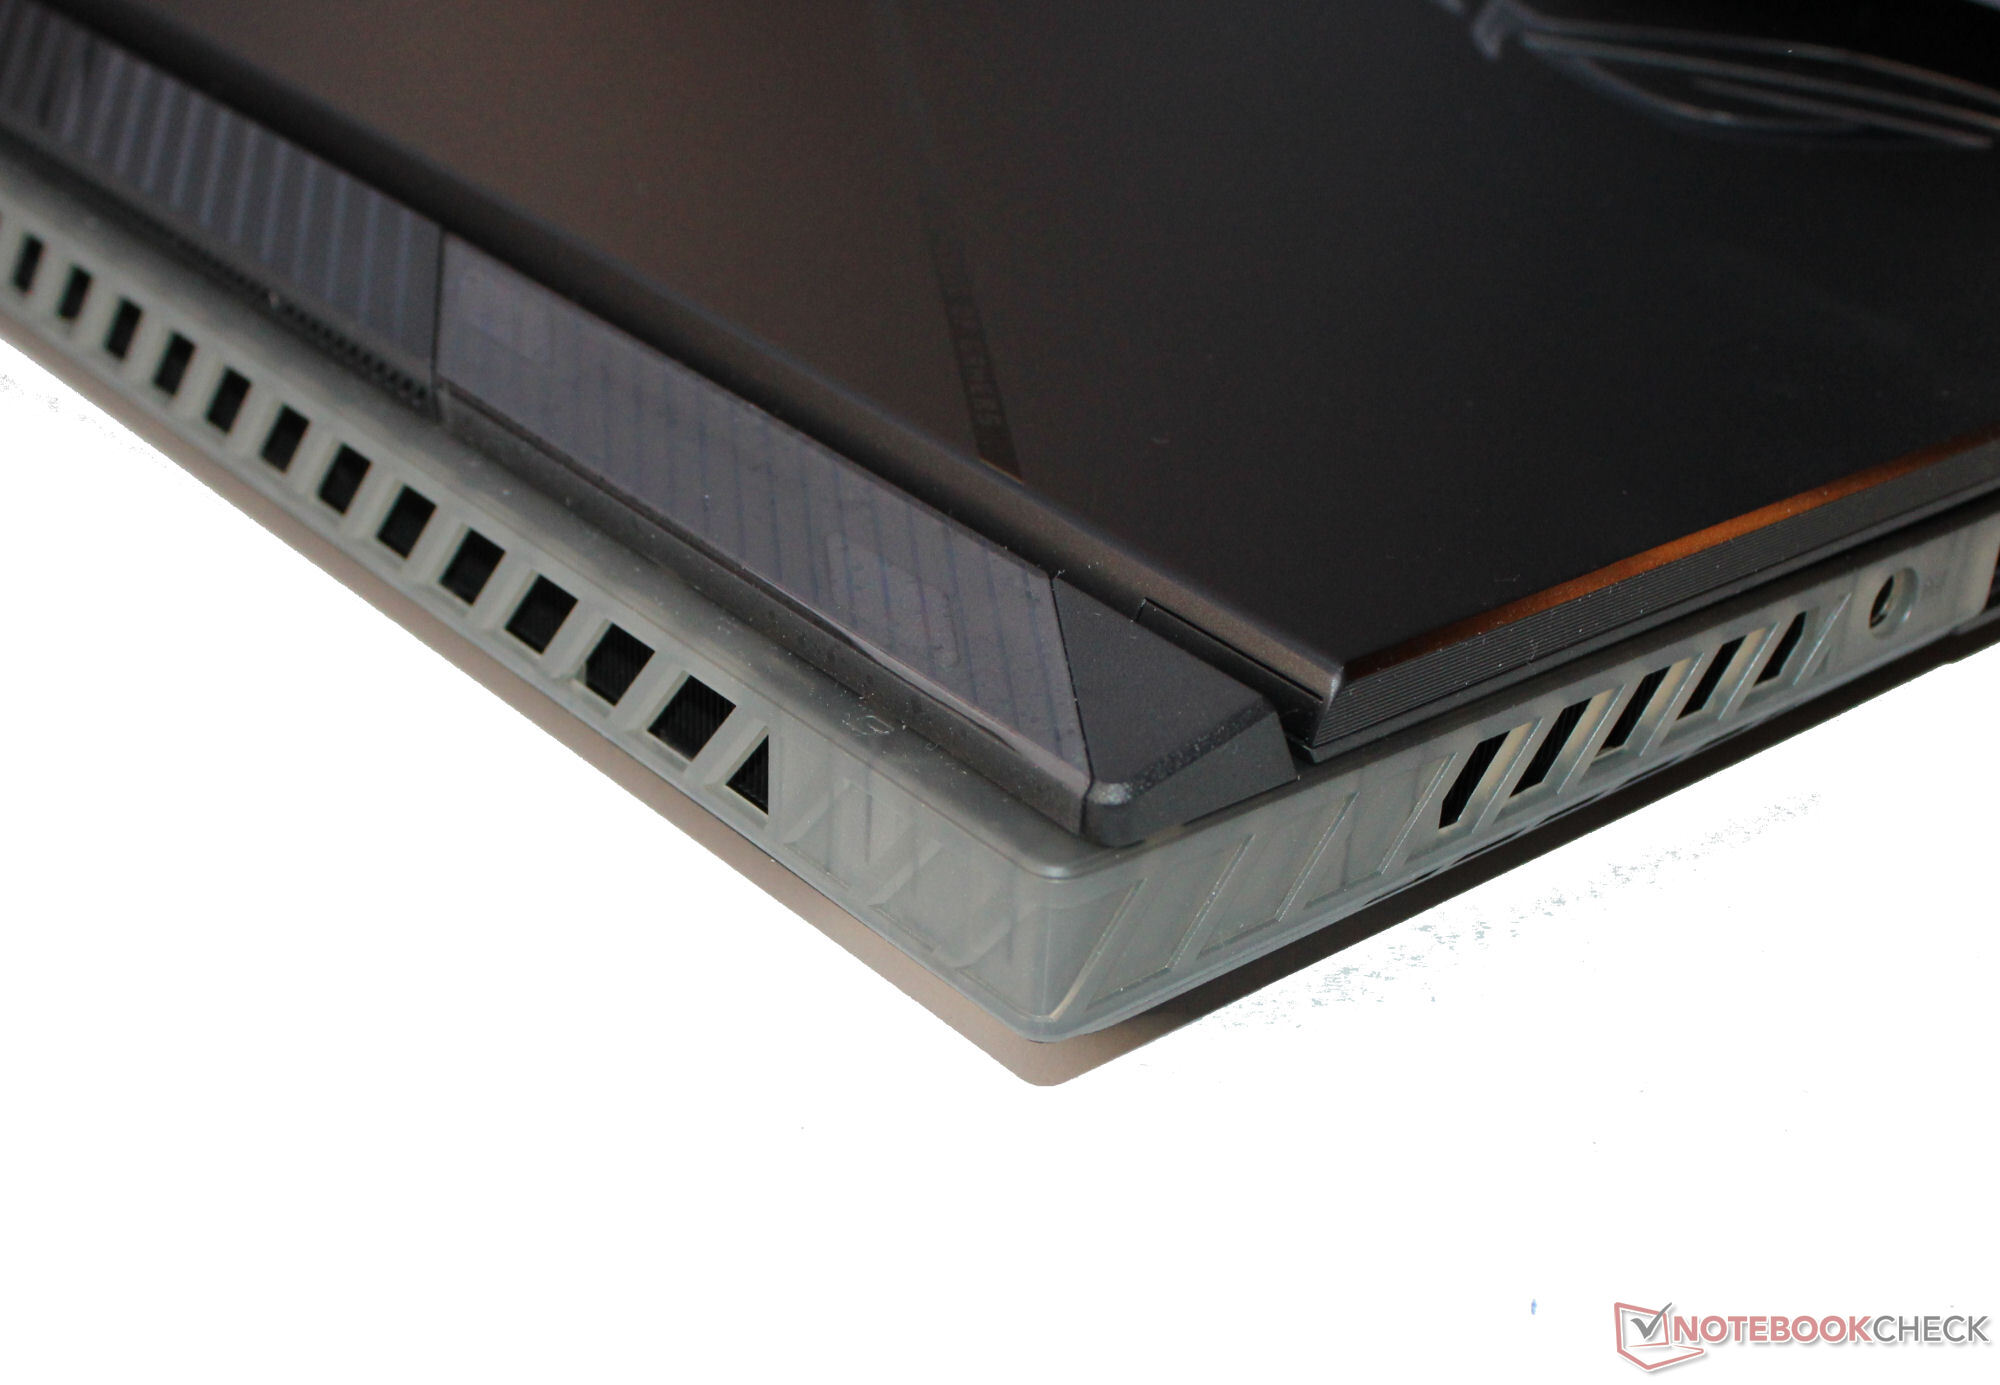
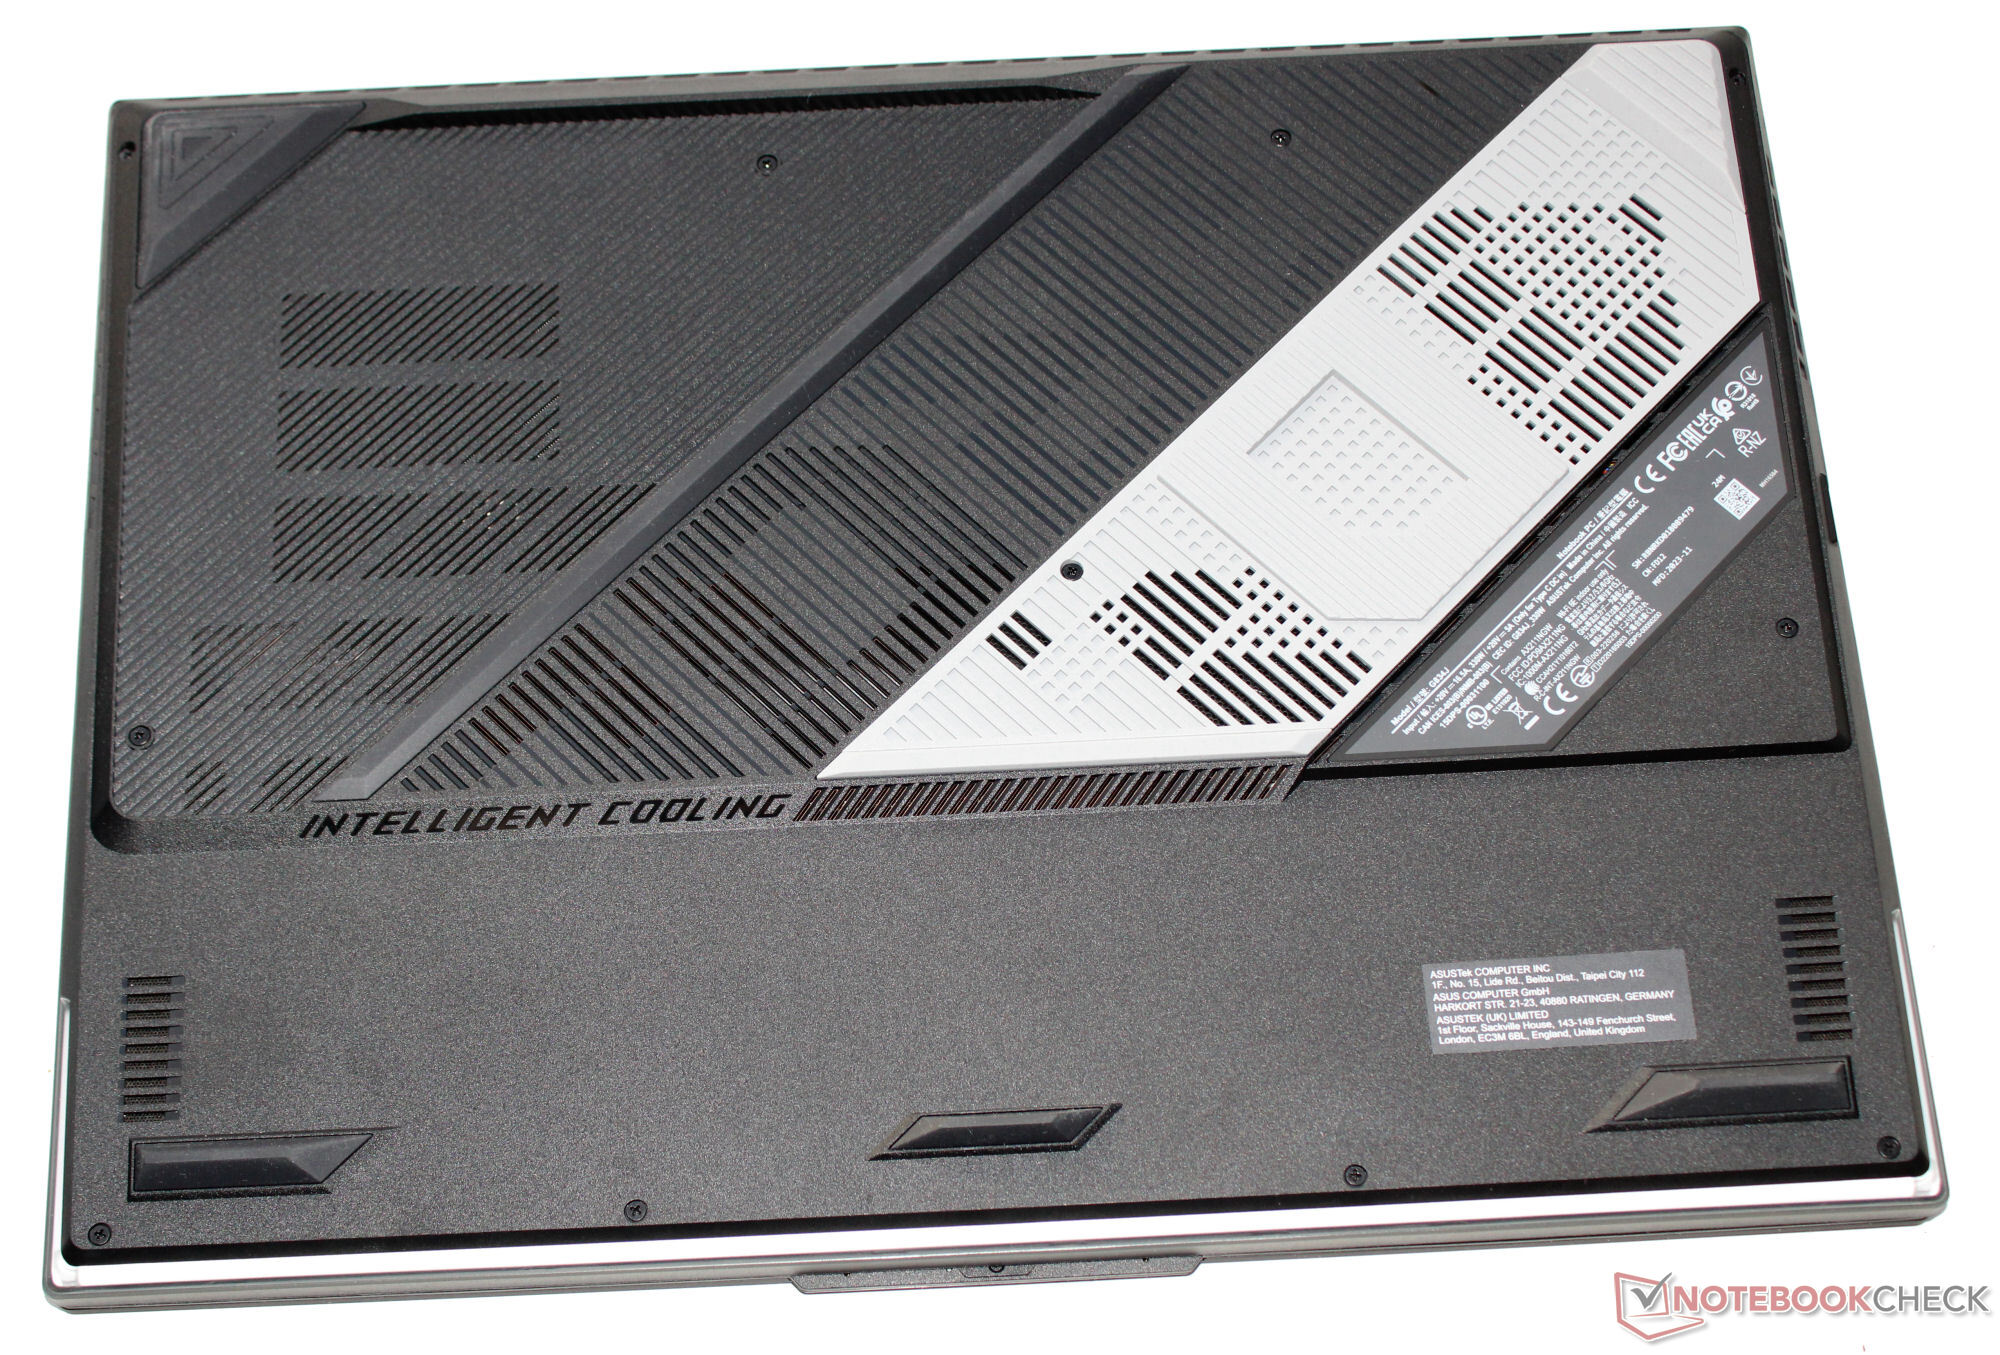
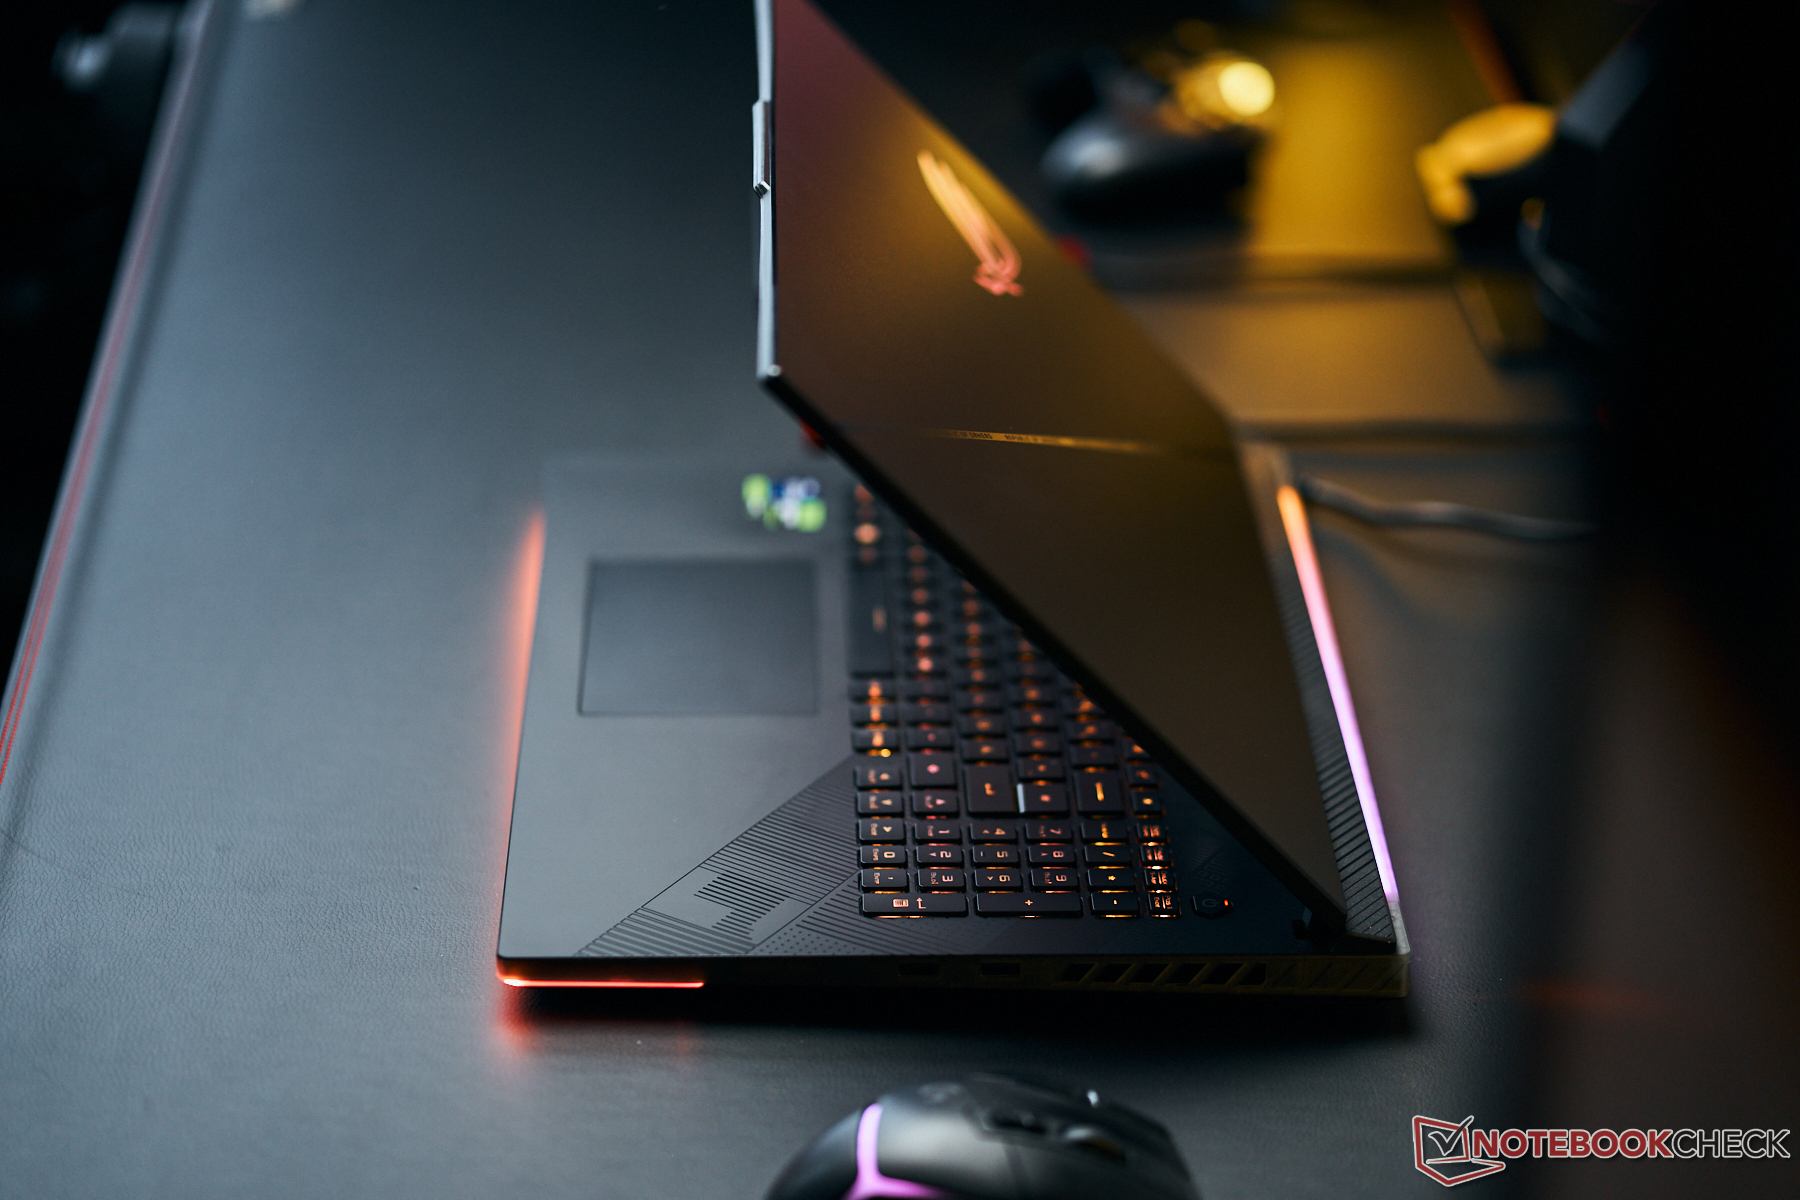
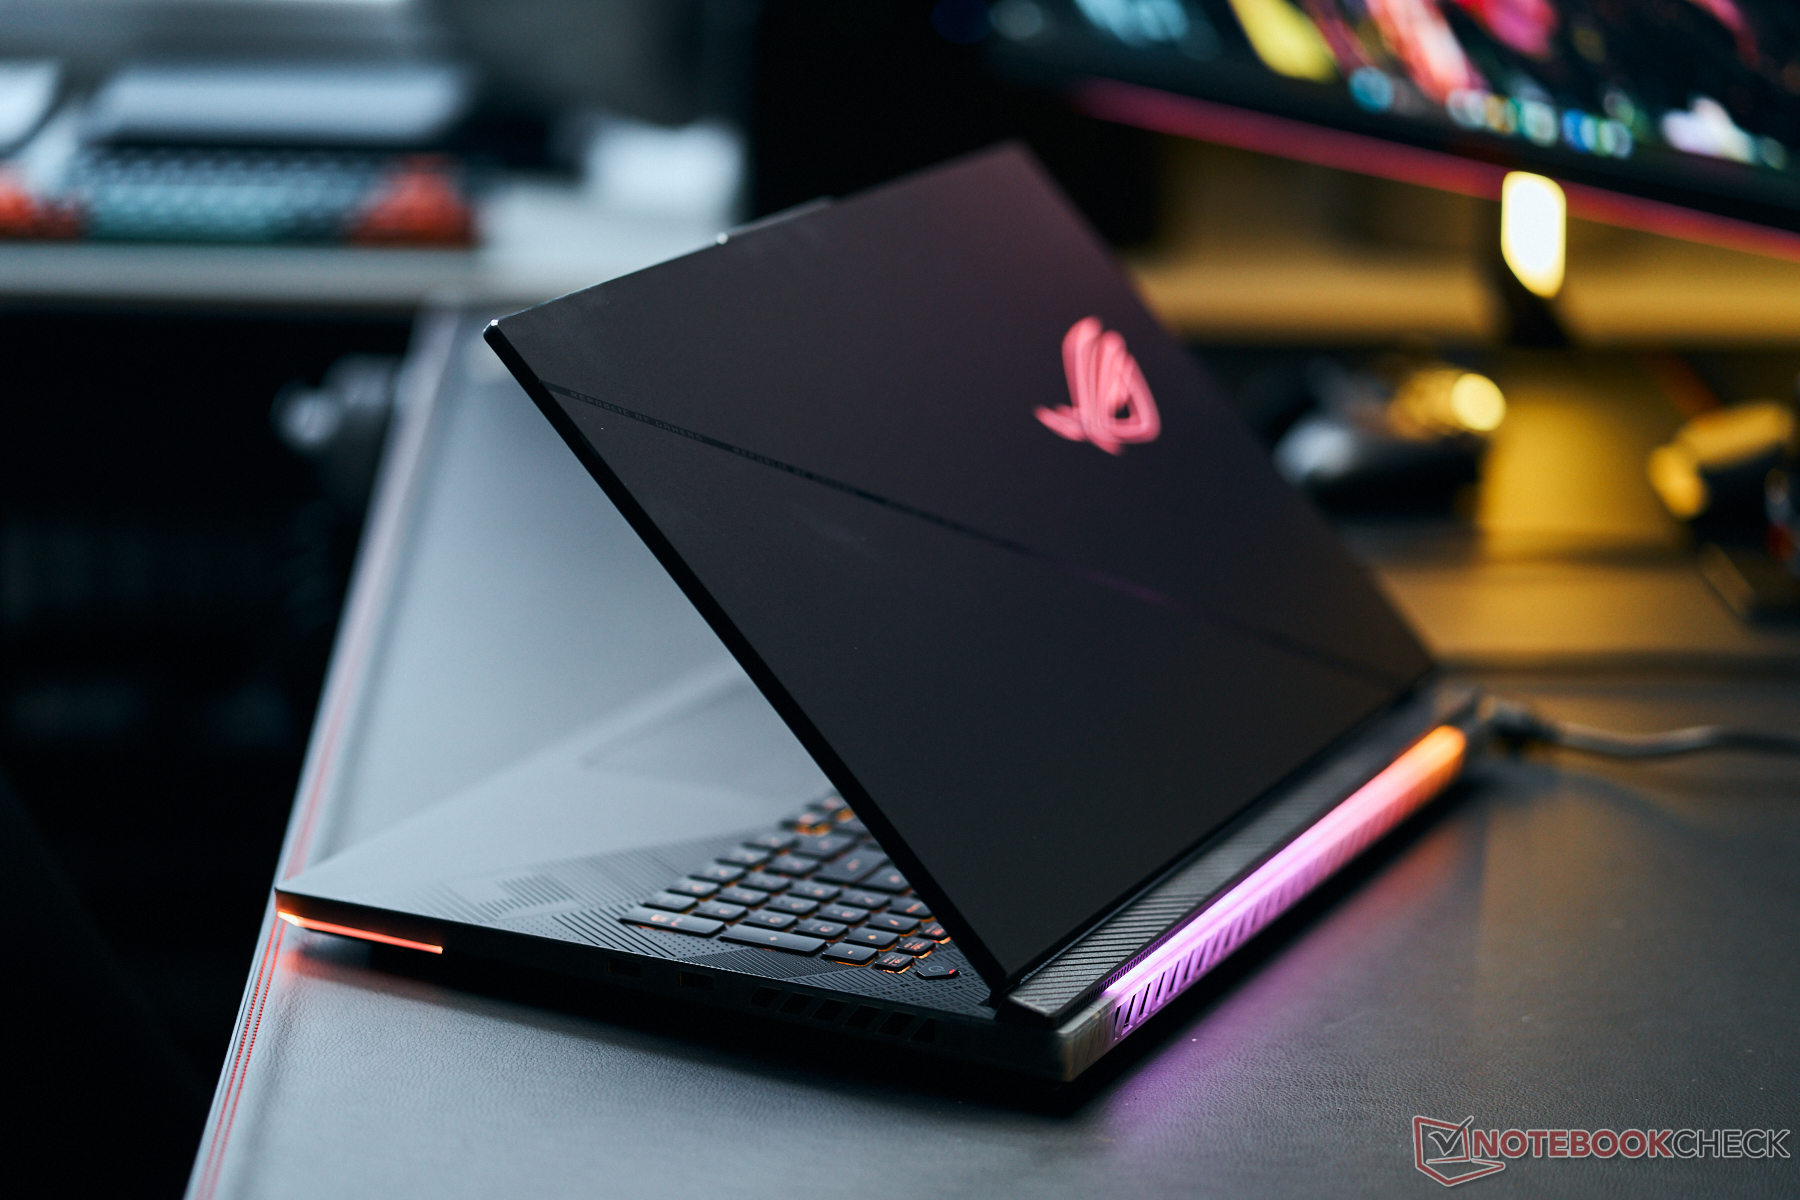
Case - Muito plástico e pouco alumínio
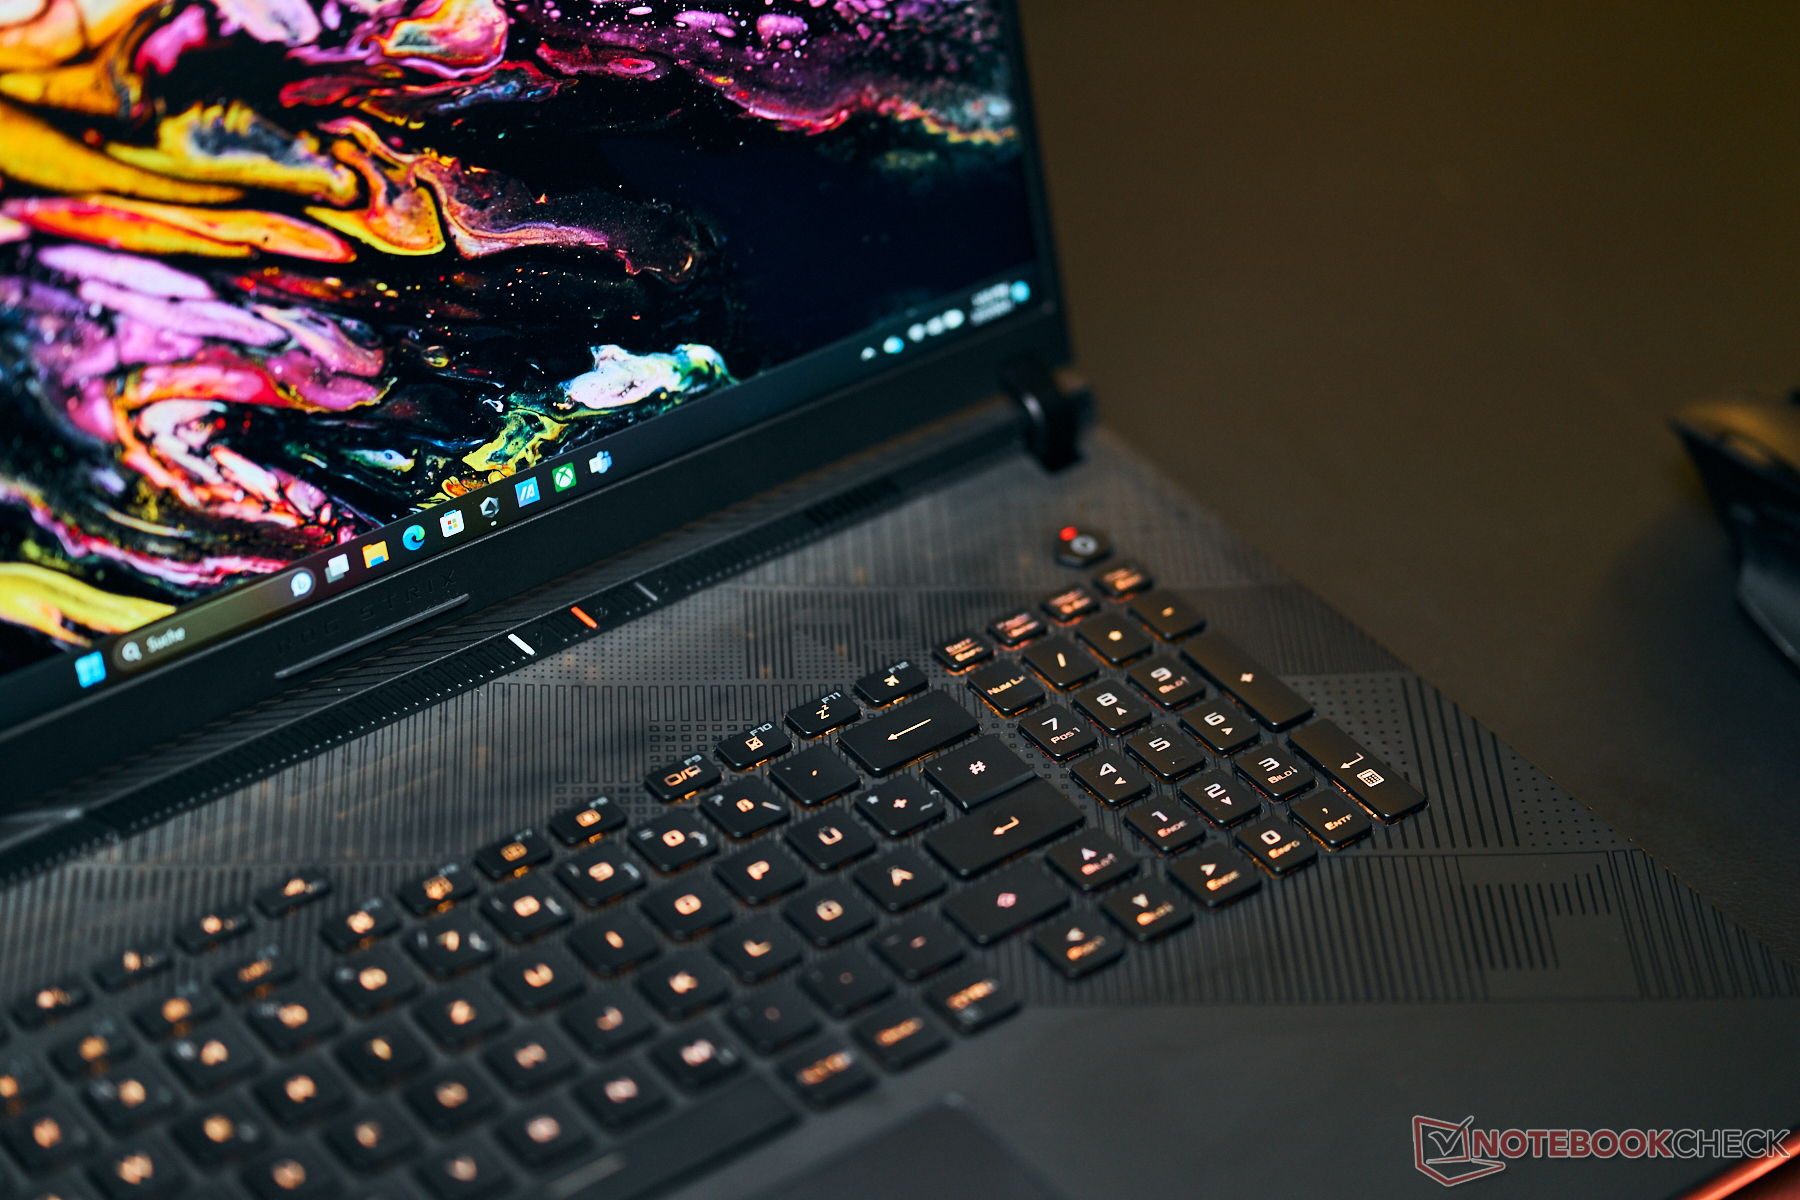
Apesar de seu alto nível de preço, o uso de materiais de alta qualidade permanece limitado, com apenas a parte traseira da tampa da tela do Scar feita de alumínio e o restante dos componentes feitos de plástico. Algumas partes do plástico (acima do teclado e nas laterais curtas) deixam passar alguma luz. Faixas de LED na parte frontal e traseira e um logotipo iluminado na tampa da tela dão um pouco de vida ao gabinete preto.
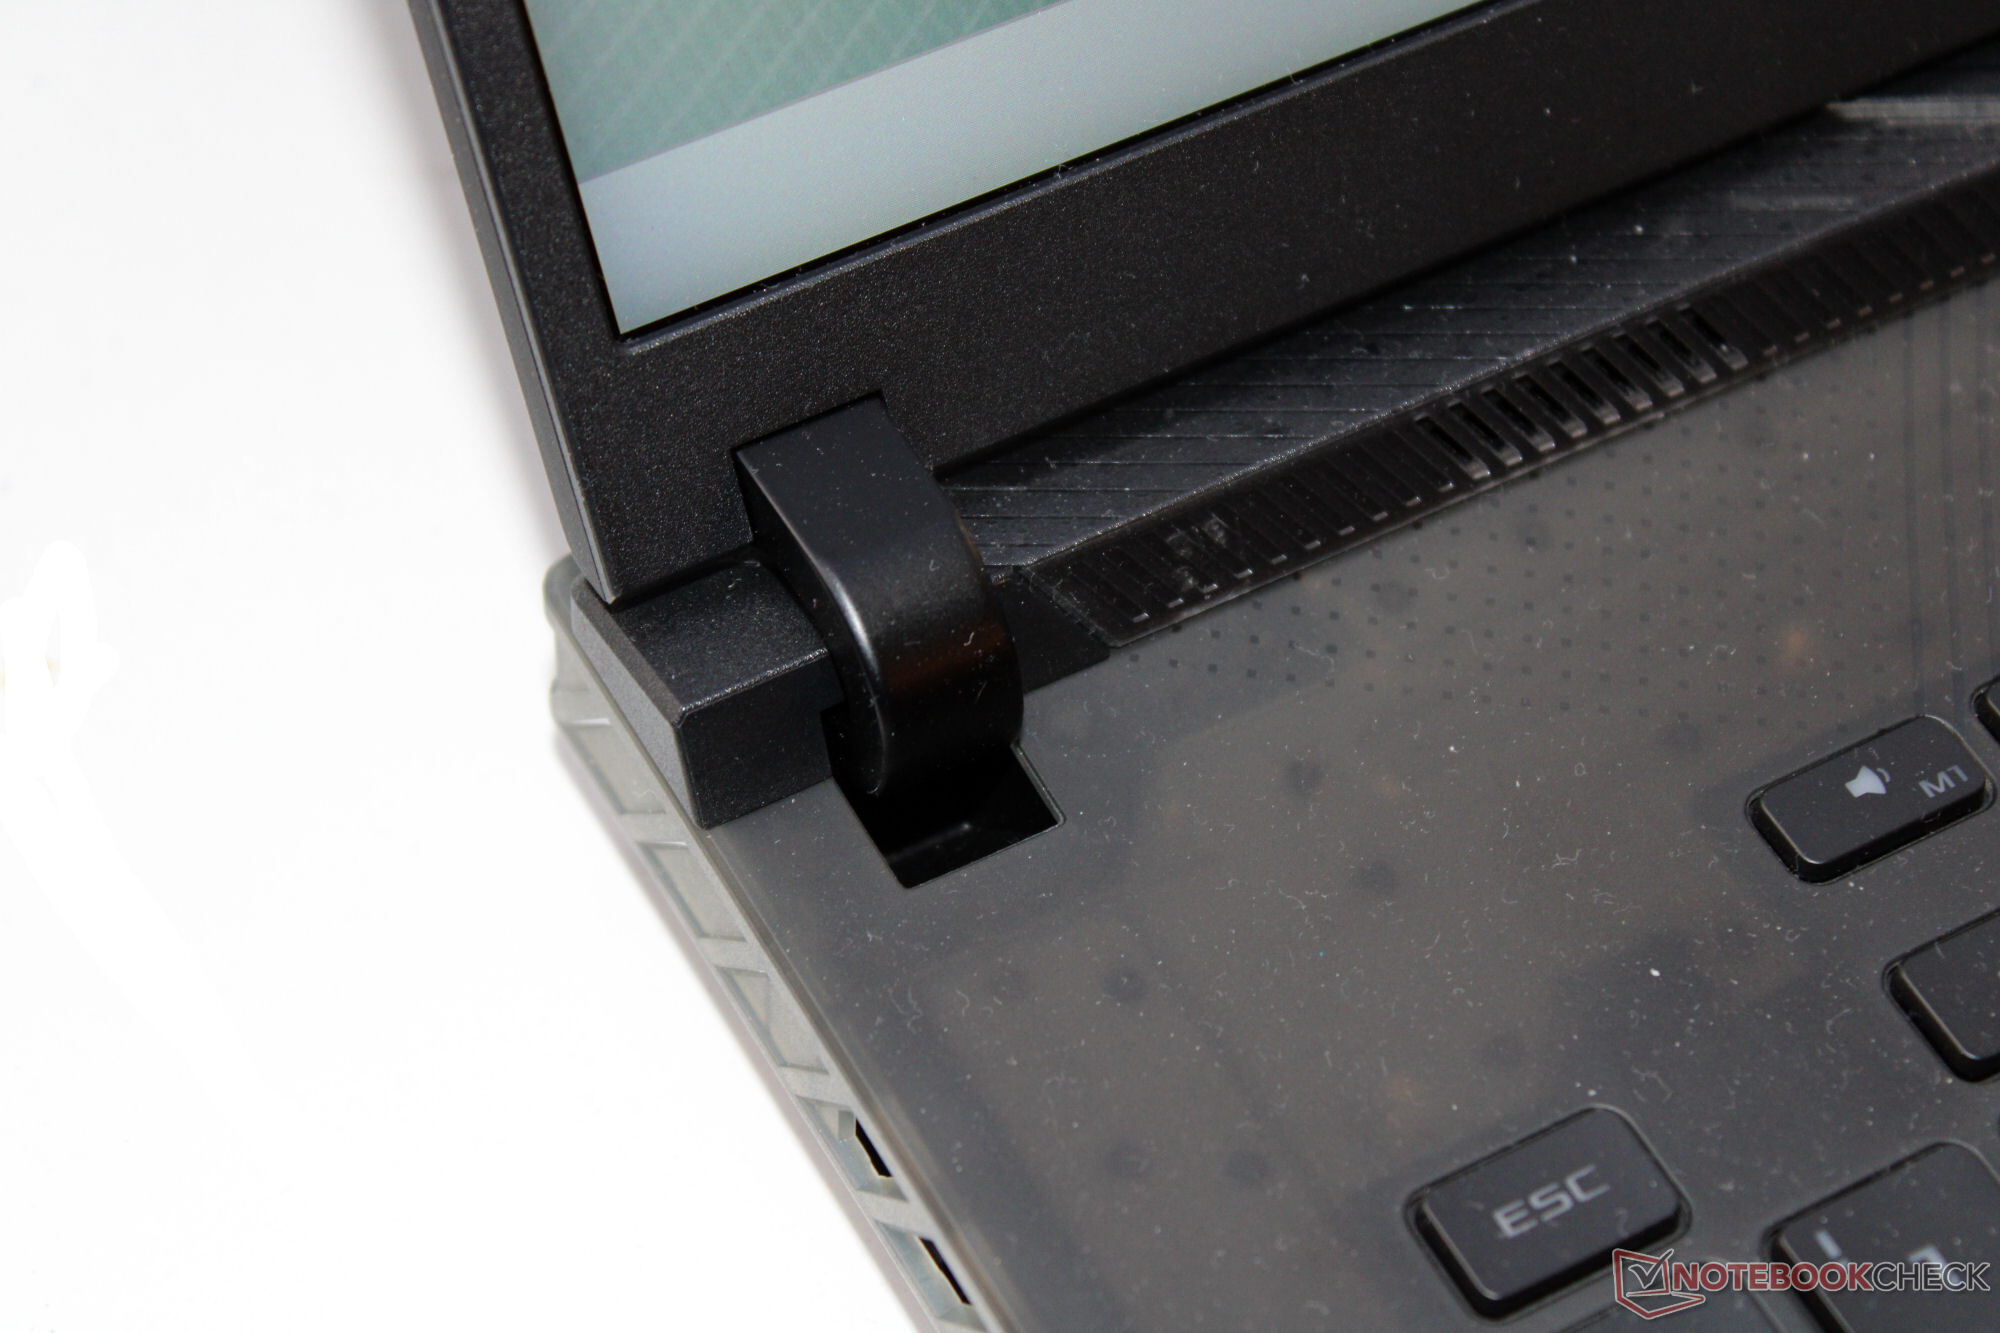
Não observamos nenhuma falha no acabamento e os espaços entre os materiais são pequenos e uniformes. Embora a tampa só possa ser ligeiramente torcida, a resposta da unidade base é mais pronunciada. Um laptop caro que custa vários milhares de euros deveria se sair melhor aqui. A pressão sobre a tampa da tela não causa nenhum artefato de imagem. As dobradiças mantêm a tampa no lugar com firmeza, mas a tela ainda oscila um pouco quando o laptop é movido. O ângulo máximo de abertura é de 130 graus e pode ser aberto com uma única mão.
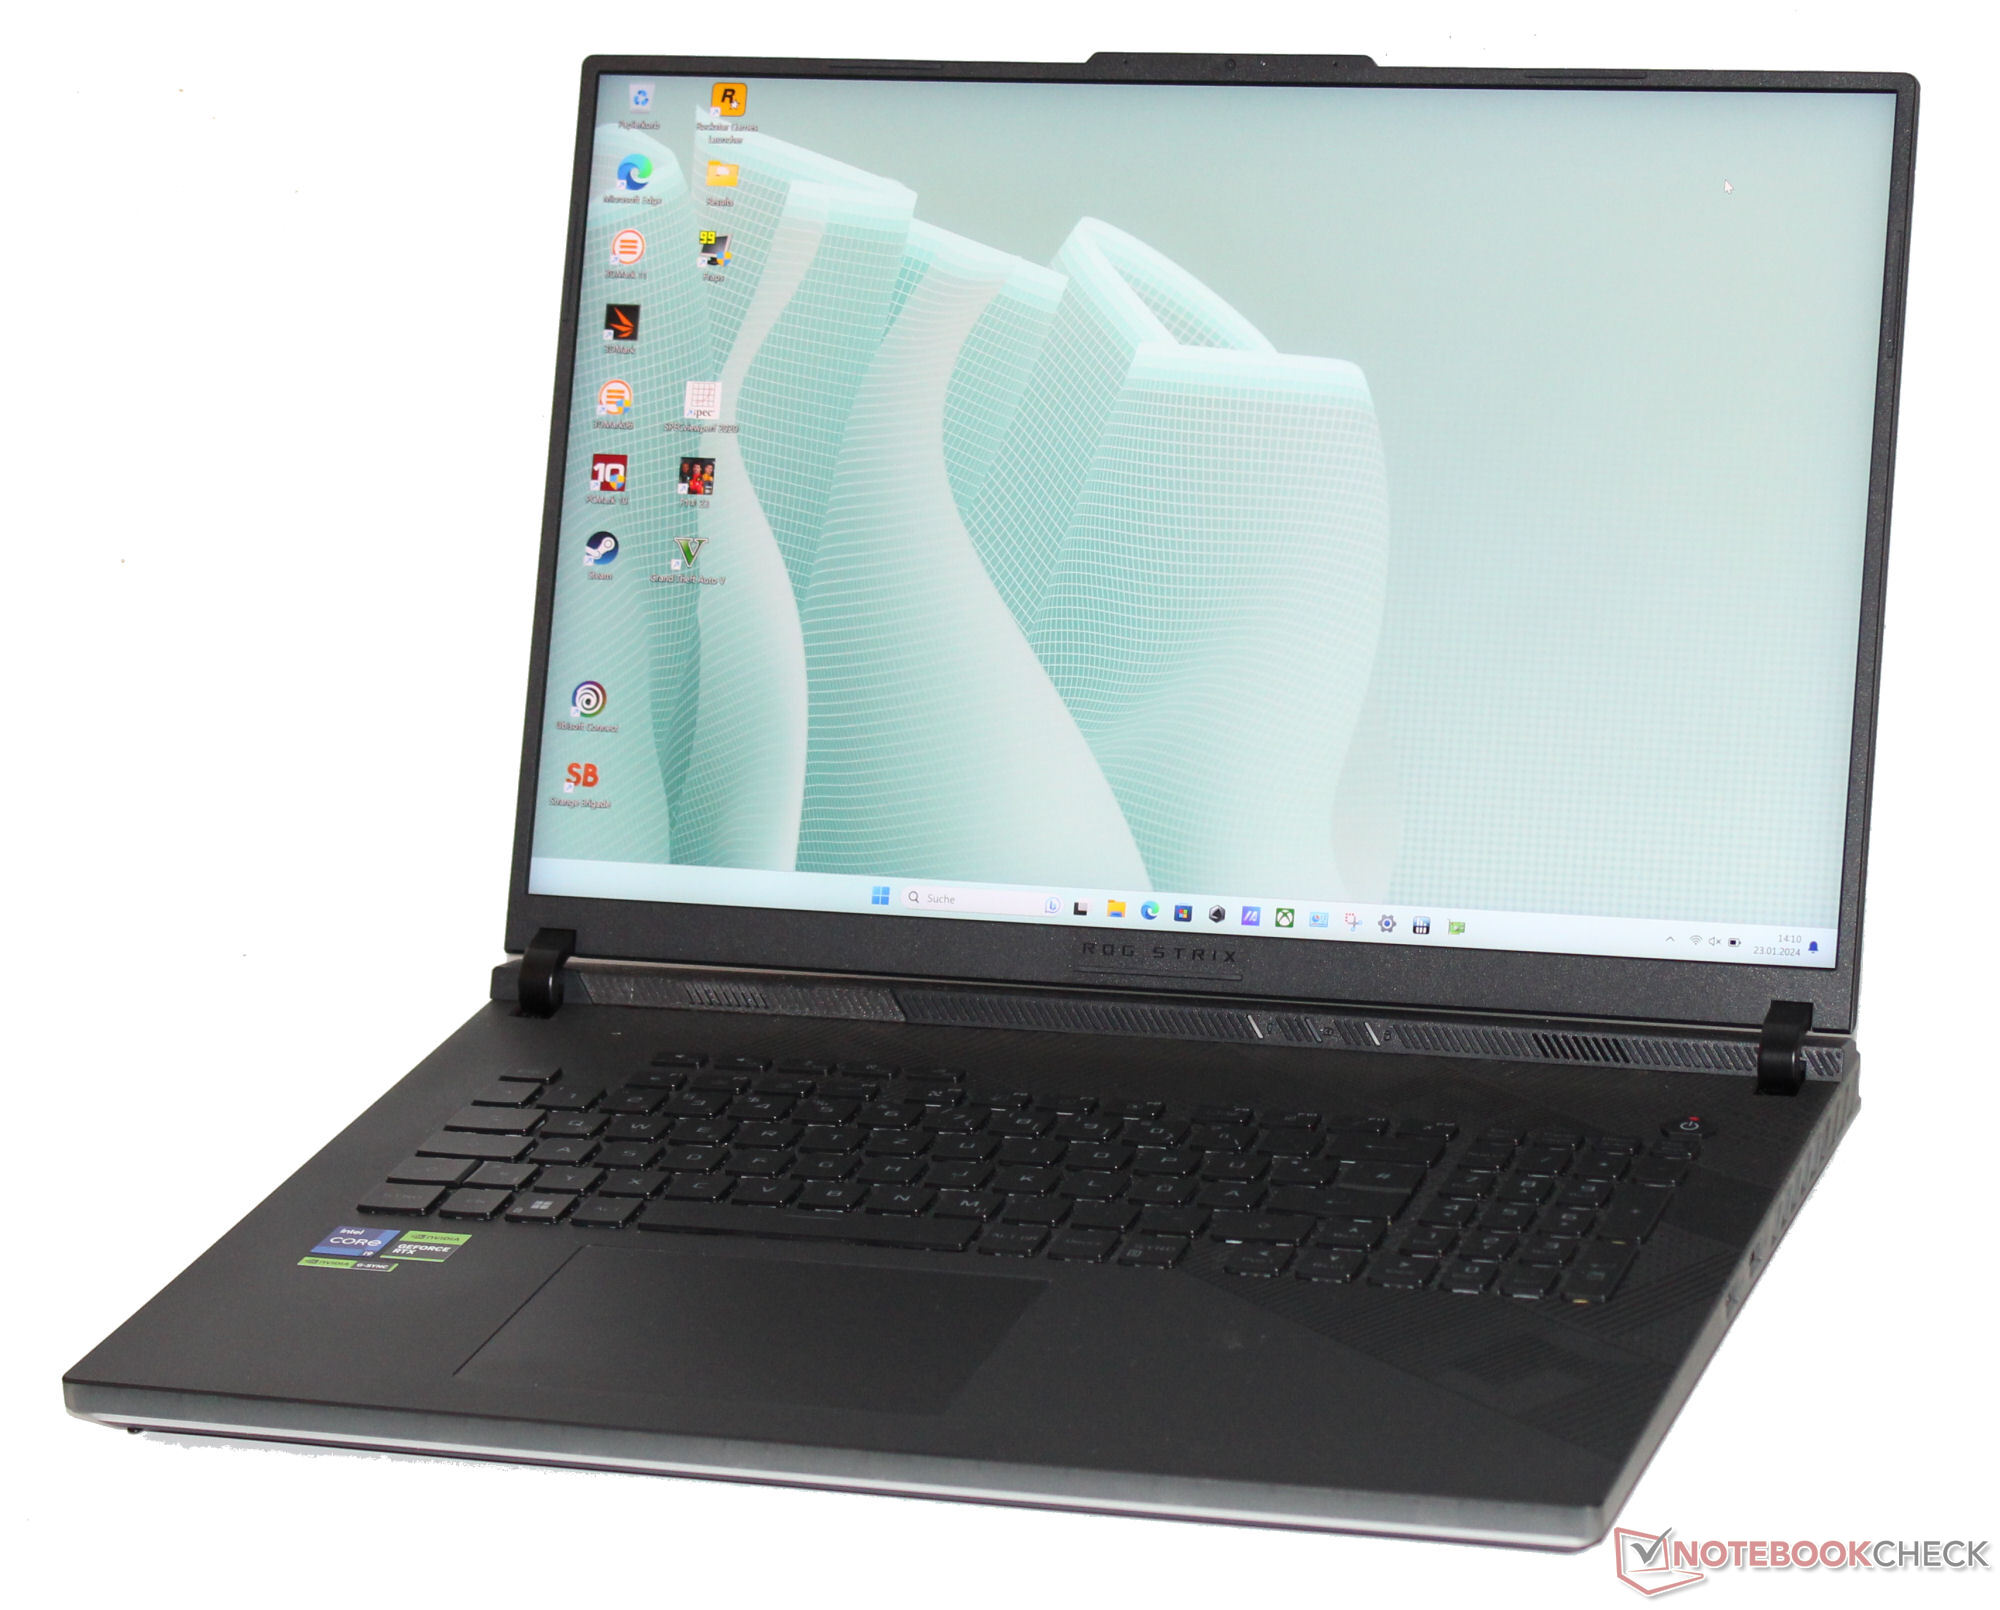


O Scar 18 é um dos dispositivos mais compactos e leves em nosso campo de comparação e só é superado pelo Blade 18 nesses quesitos.
Equipamentos - Asus Strix oferece Thunderbolt 4
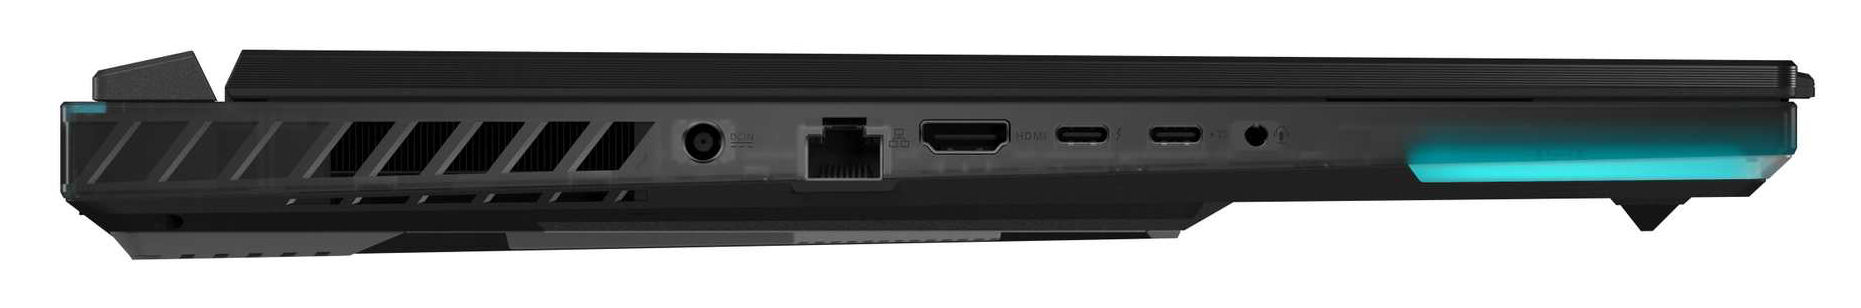
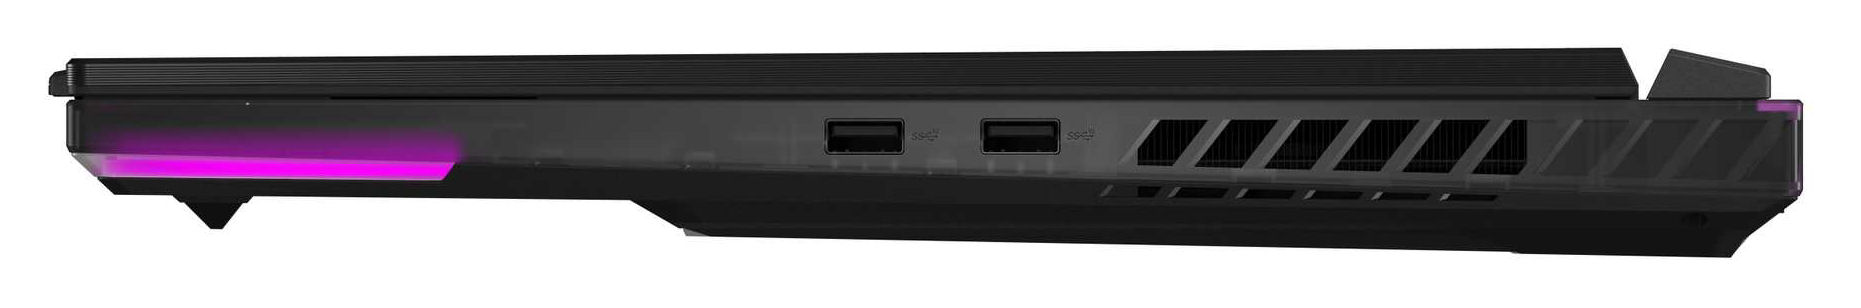
O laptop Asus oferece duas portas USB-A (USB 3.2 Gen 2) e duas portas USB-C (1x Thunderbolt 4, 1x USB 3.2 Gen 2). Ambas as portas USB-C são capazes de emitir um sinal DisplayPort, e a porta USB 3.2 Gen 2 também suporta Power Delivery. As conexões são complementadas por uma porta HDMI, uma porta de áudio e uma porta Gigabit Ethernet. O laptop não inclui um leitor de cartão de armazenamento.
Não há portas na parte traseira do laptop, e todas as portas estão posicionadas nos lados esquerdo e direito do gabinete. Os cabos que correm em direção à parte traseira bloqueariam algumas das aberturas das ventoinhas nas laterais do laptop. Esse é o caso, por exemplo, do cabo de alimentação (plugue de alimentação inclinado). Os usuários destros podem ficar incomodados apenas com as portas USB-A que estão posicionadas somente no lado direito.
Comunicação
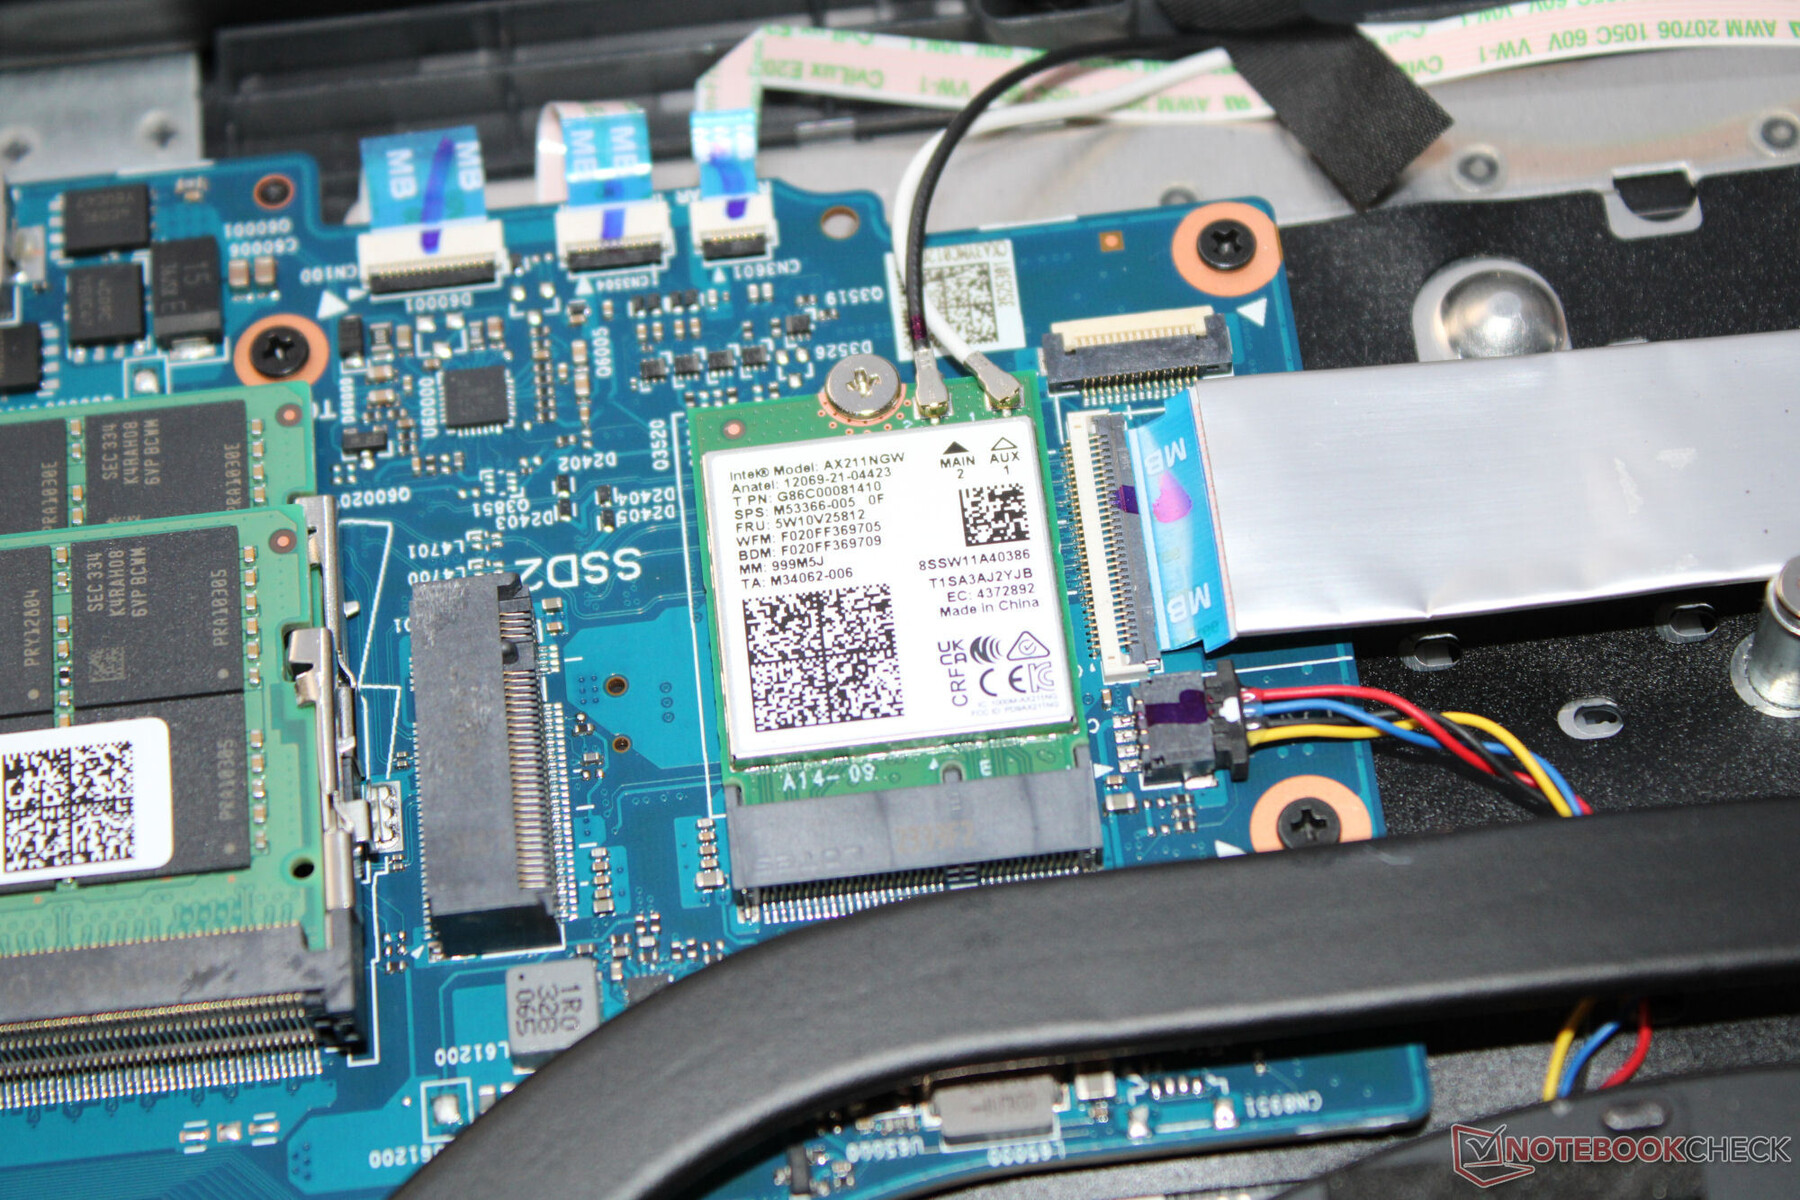
Em condições ideais (sem outros dispositivos Wi-Fi nas proximidades, distância curta entre o laptop e o PC servidor), o laptop atinge taxas de transferência Wi-Fi de boas a muito boas. O Strix usa um chip Wi-Fi 6E (Intel AX211), e as conexões com fio são gerenciadas por um controlador Realtek (RTL8125; 2,5 Gbit/s).
Webcam
Embora a Asus use principalmente hardware de alta qualidade, a webcam é uma exceção, com apenas um modelo de 0,9 MP (máx. 1280x720 pixels) sendo usado aqui. A qualidade da imagem não é convincente, mas um desvio de cor de cerca de 8 (DeltaE alvo < 3) ainda é aceitável. A câmera não inclui um obturador manual.

 GeForce RTX 4090 Laptop GPU, i9-14900HX, Samsung PM9A1a MZVL22T0HDLB")
 GeForce RTX 4090 Laptop GPU, i9-14900HX, Samsung PM9A1a MZVL22T0HDLB")
Acessórios
O laptop não inclui nenhum acessório adicional além dos documentos habituais.
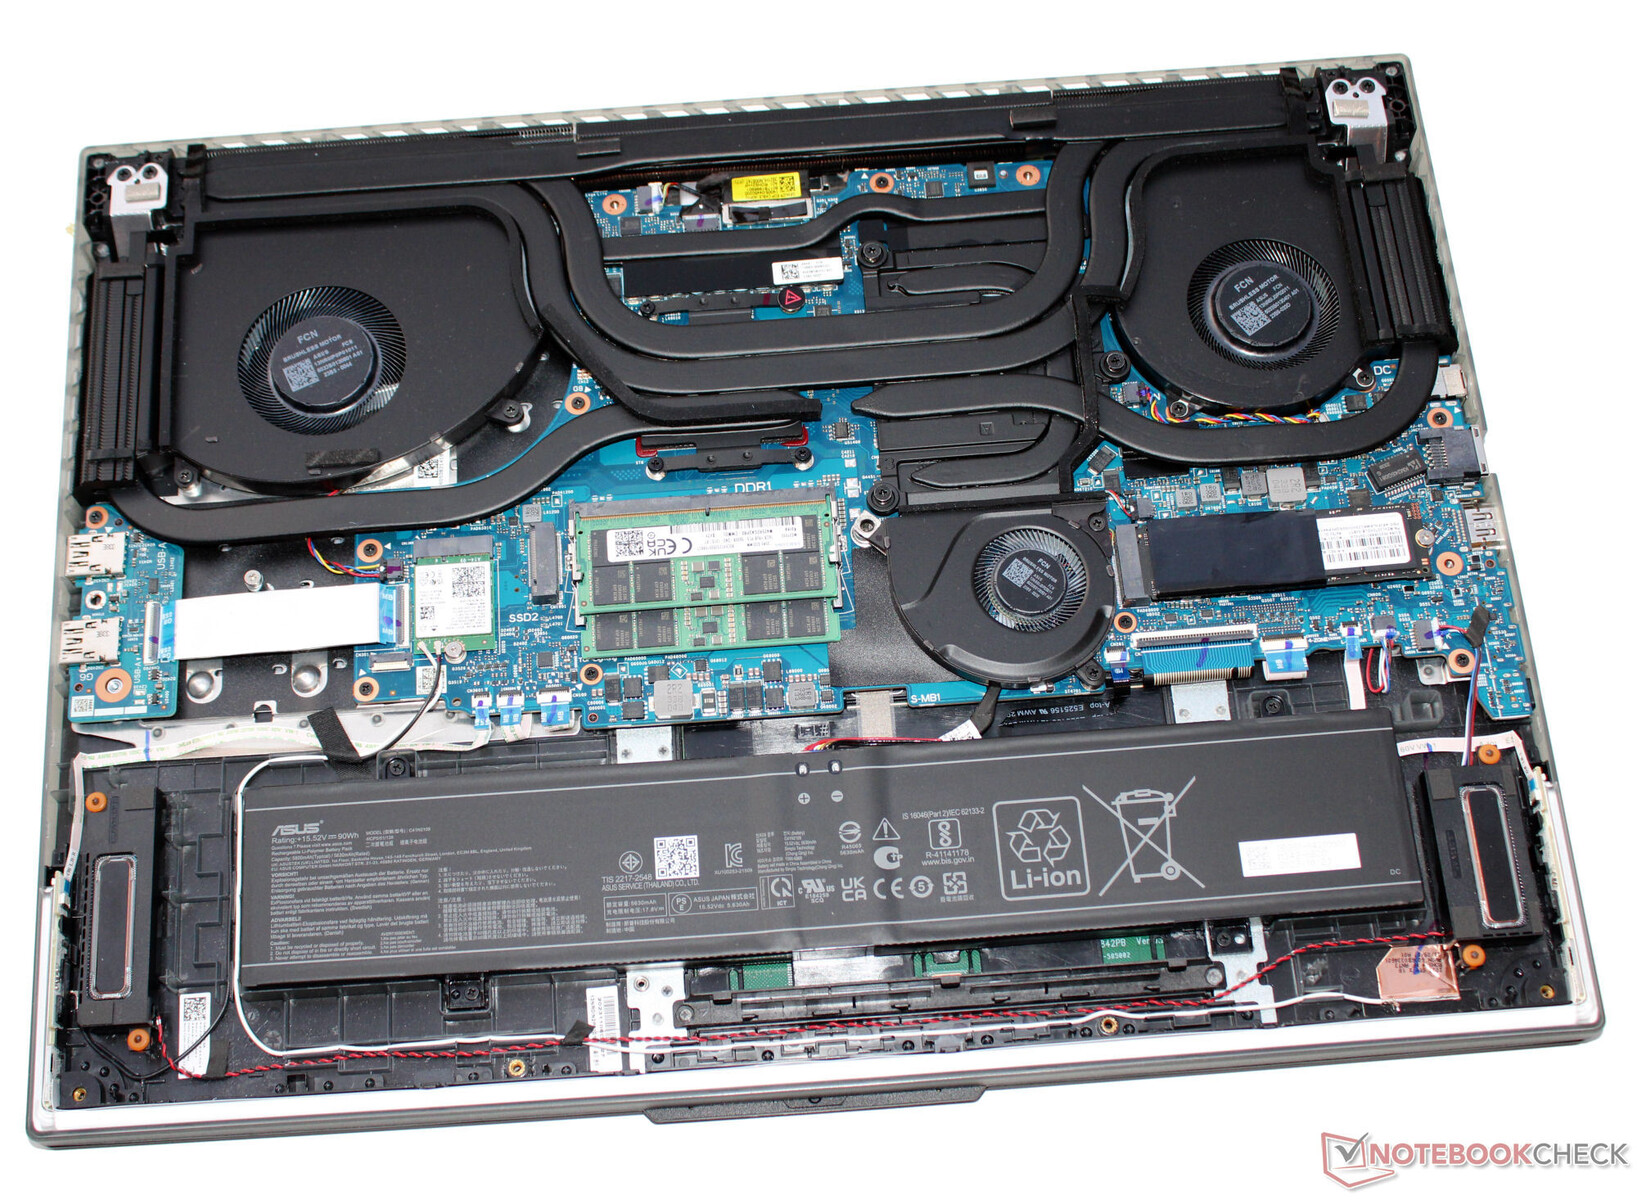
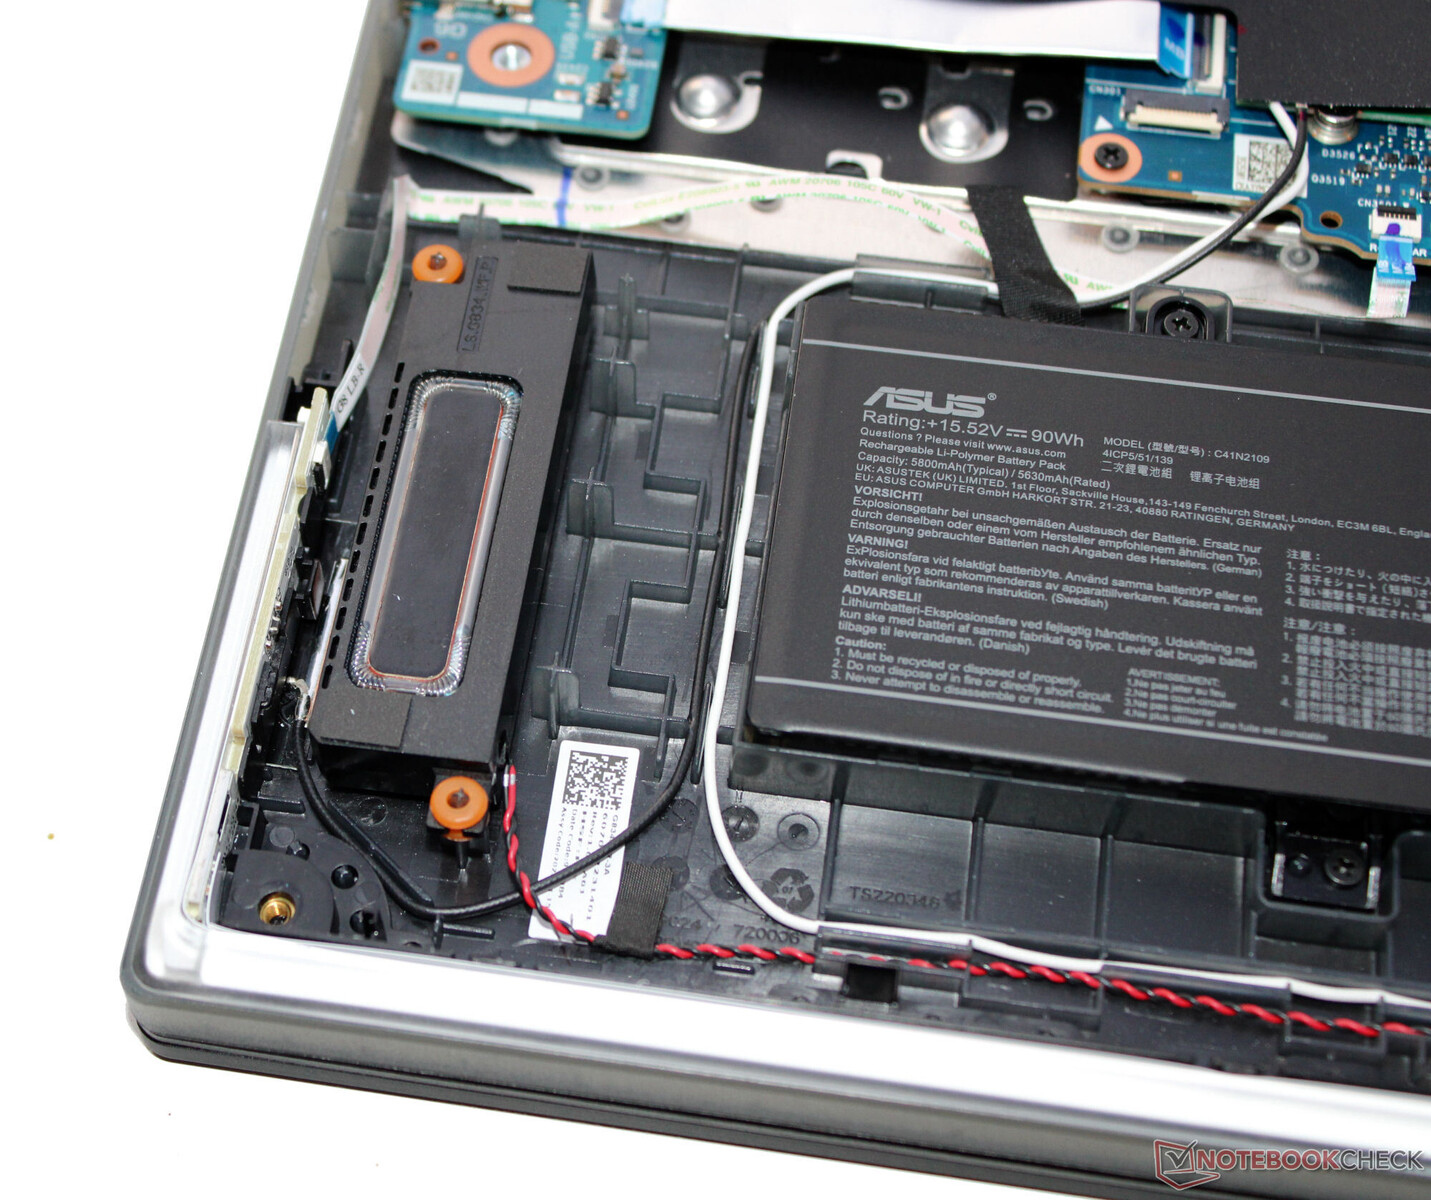
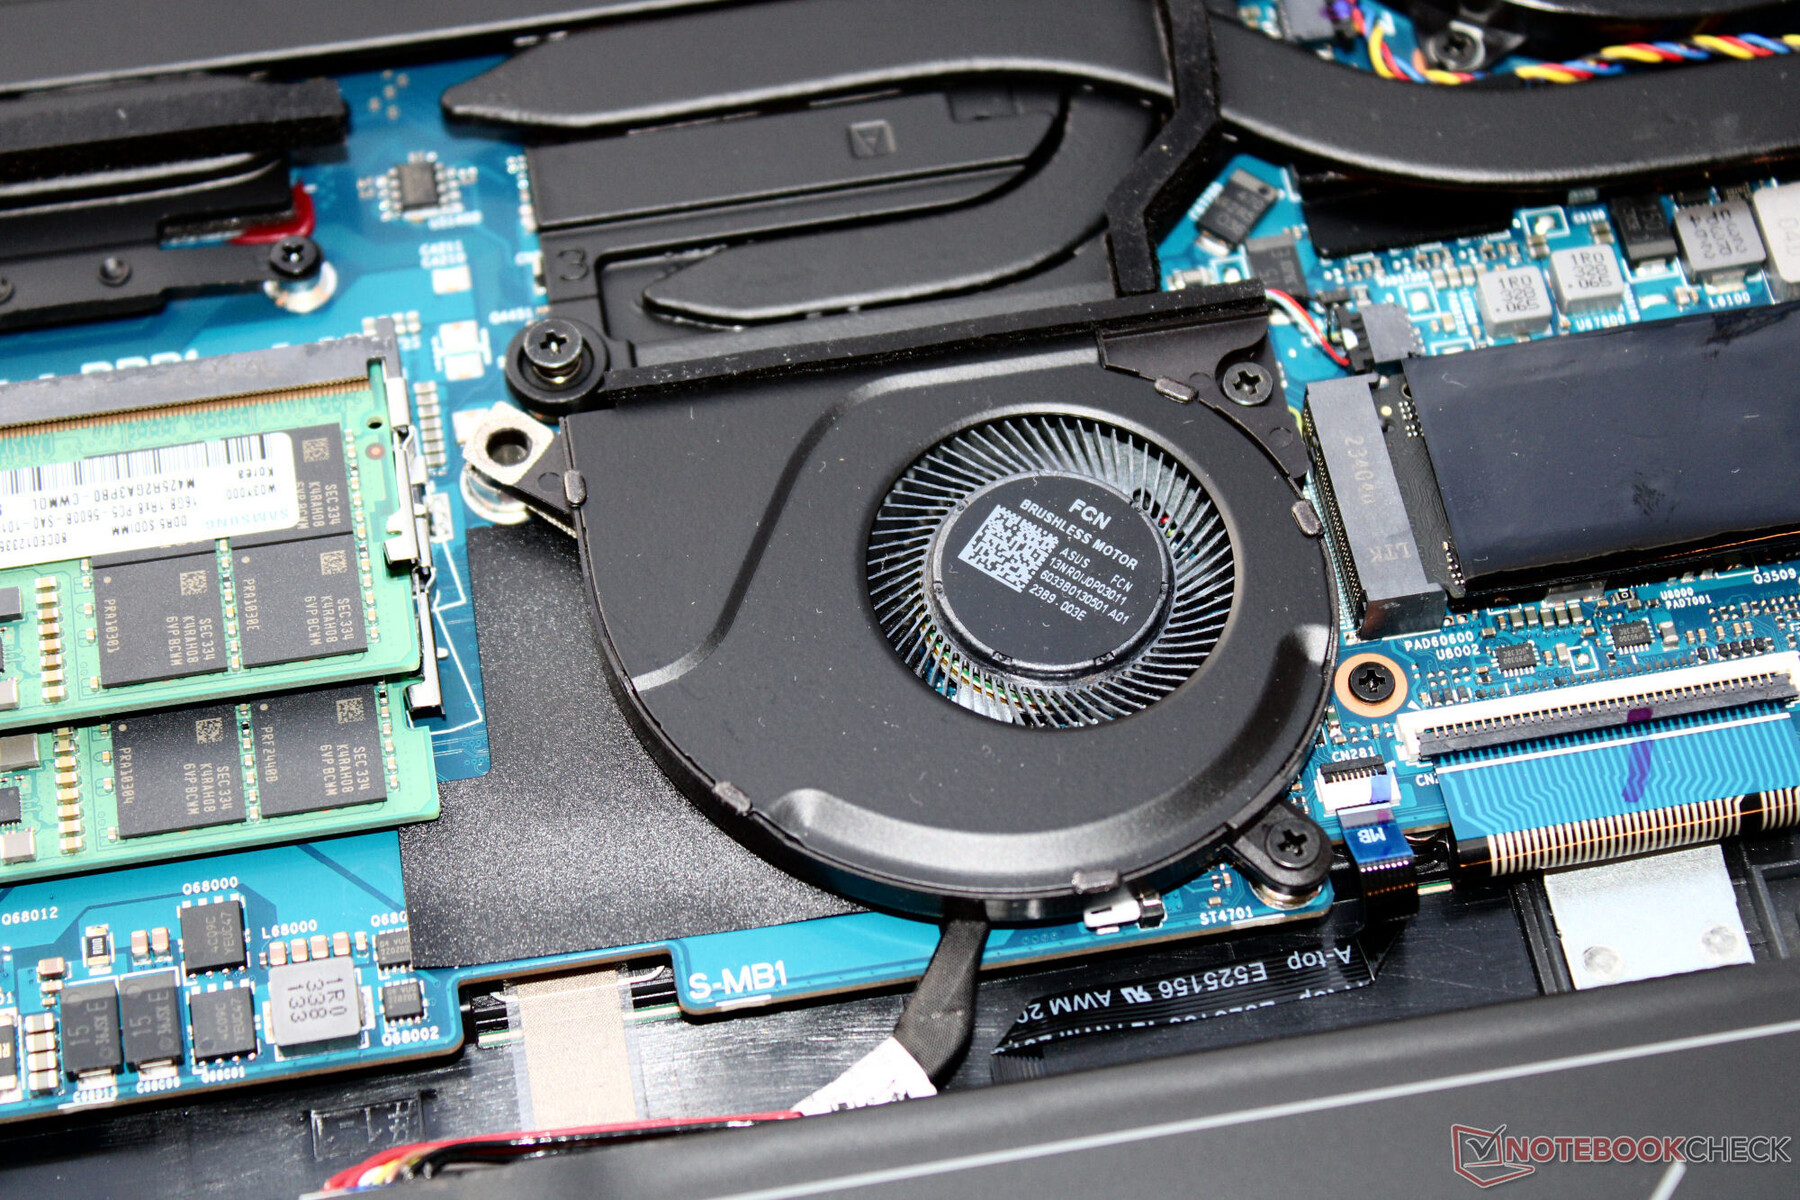
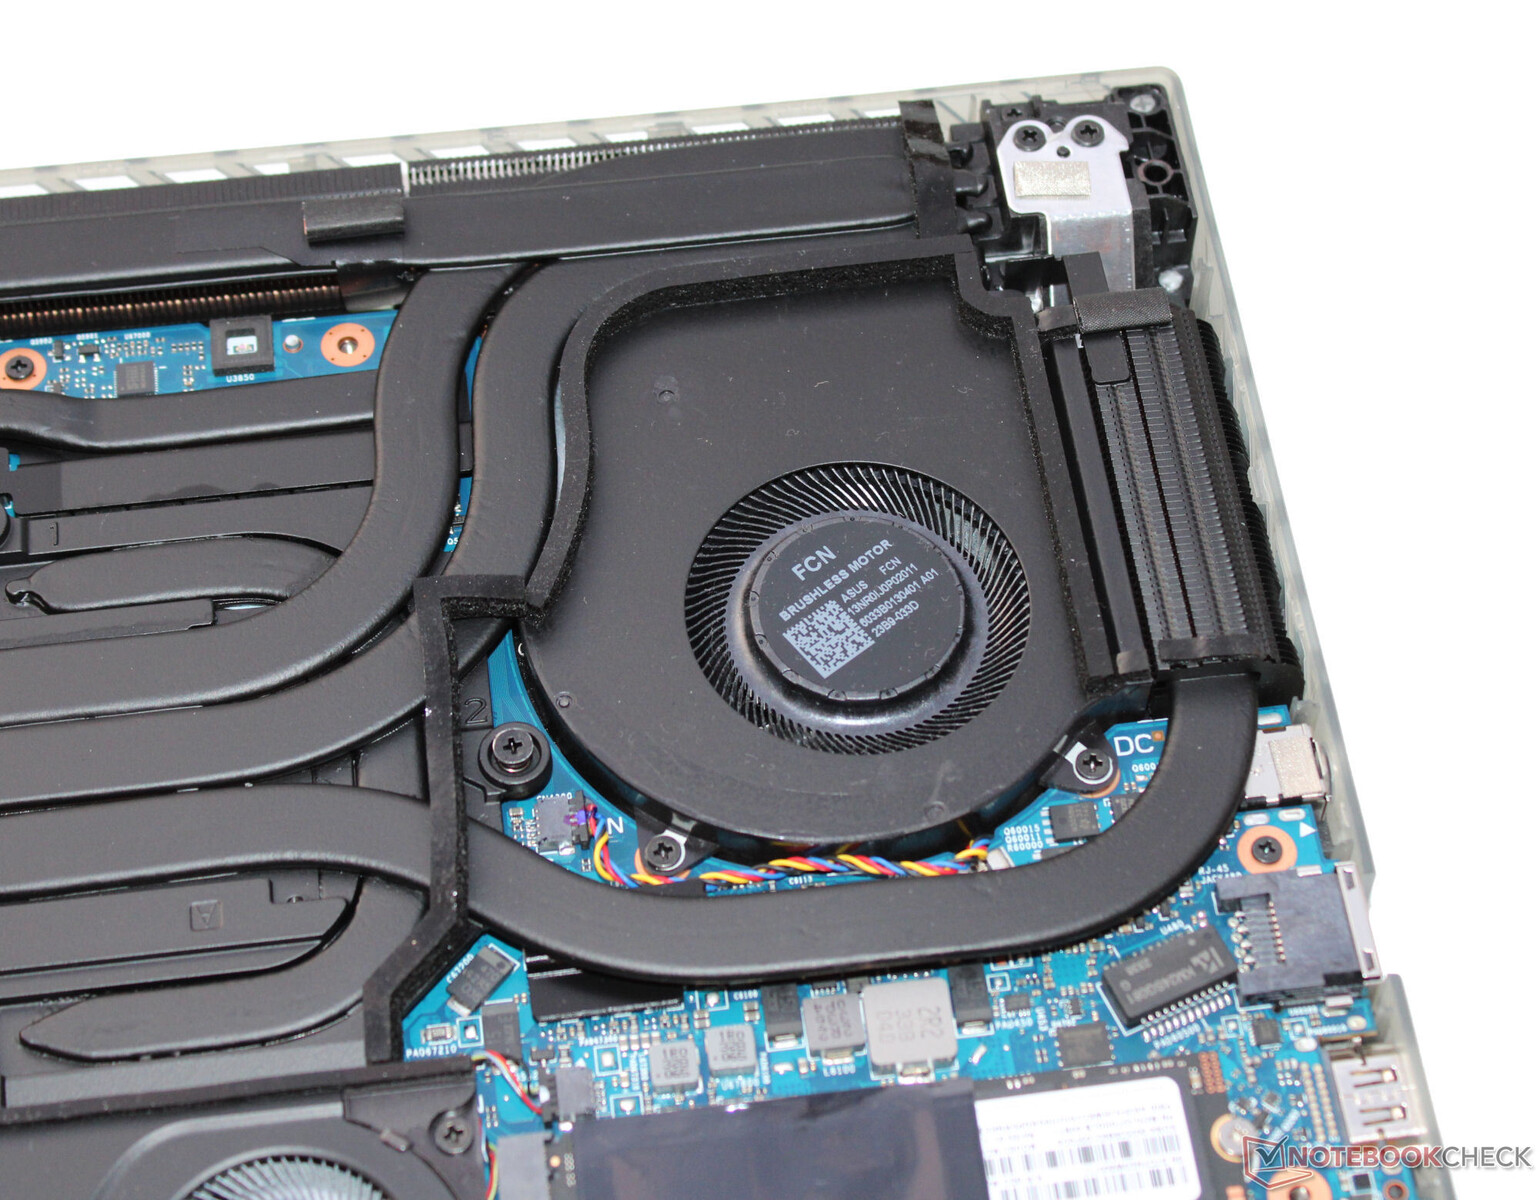
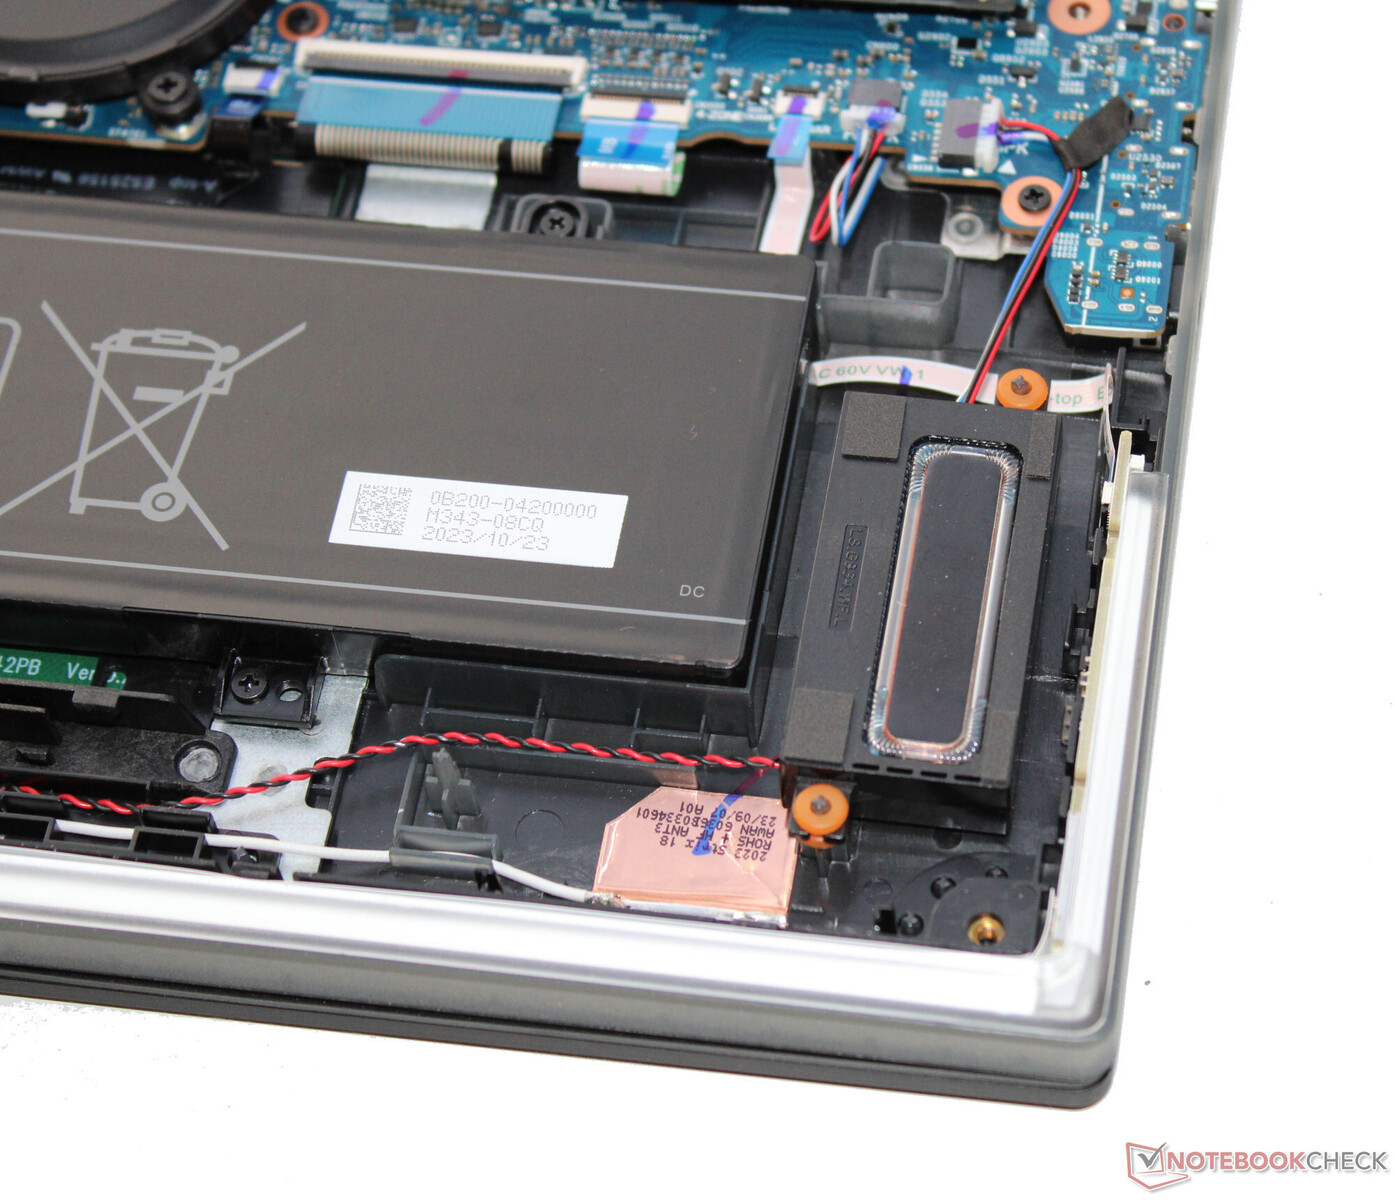
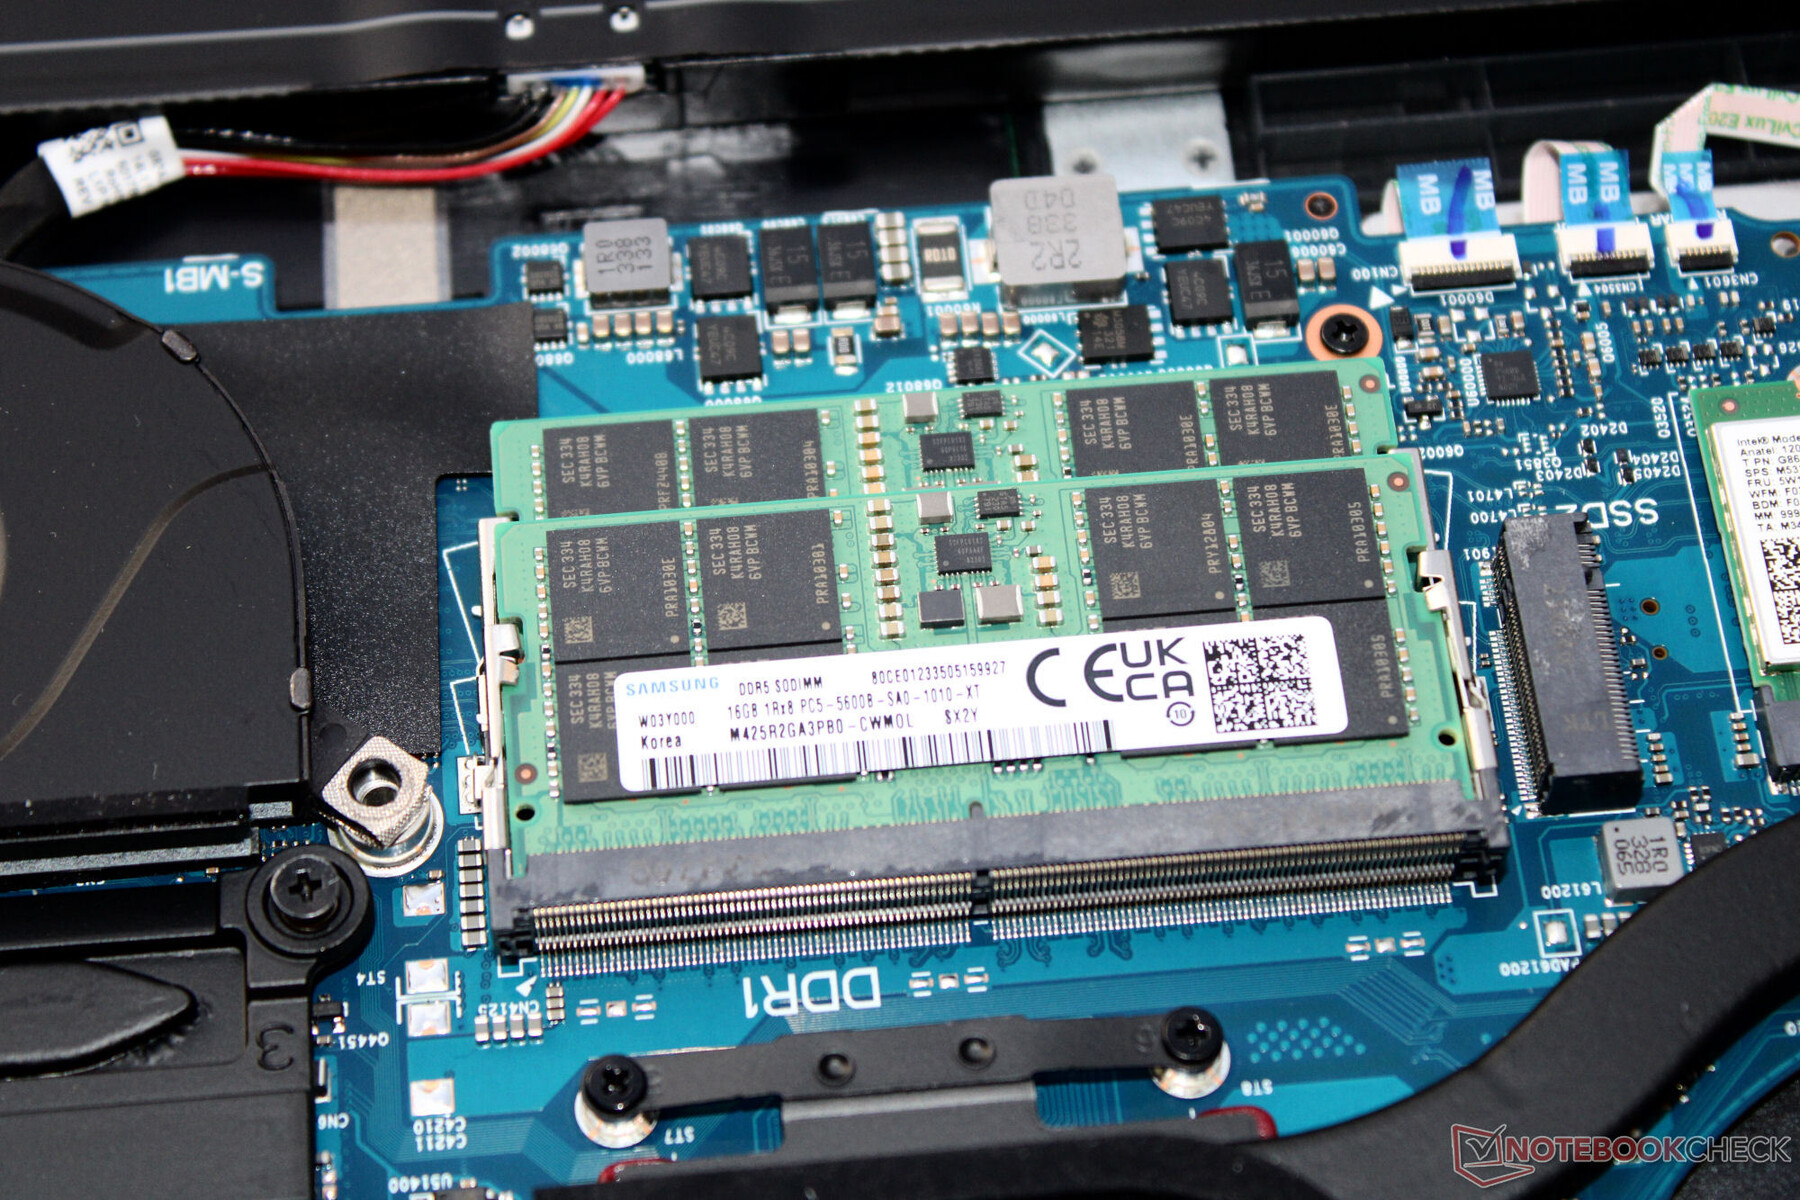
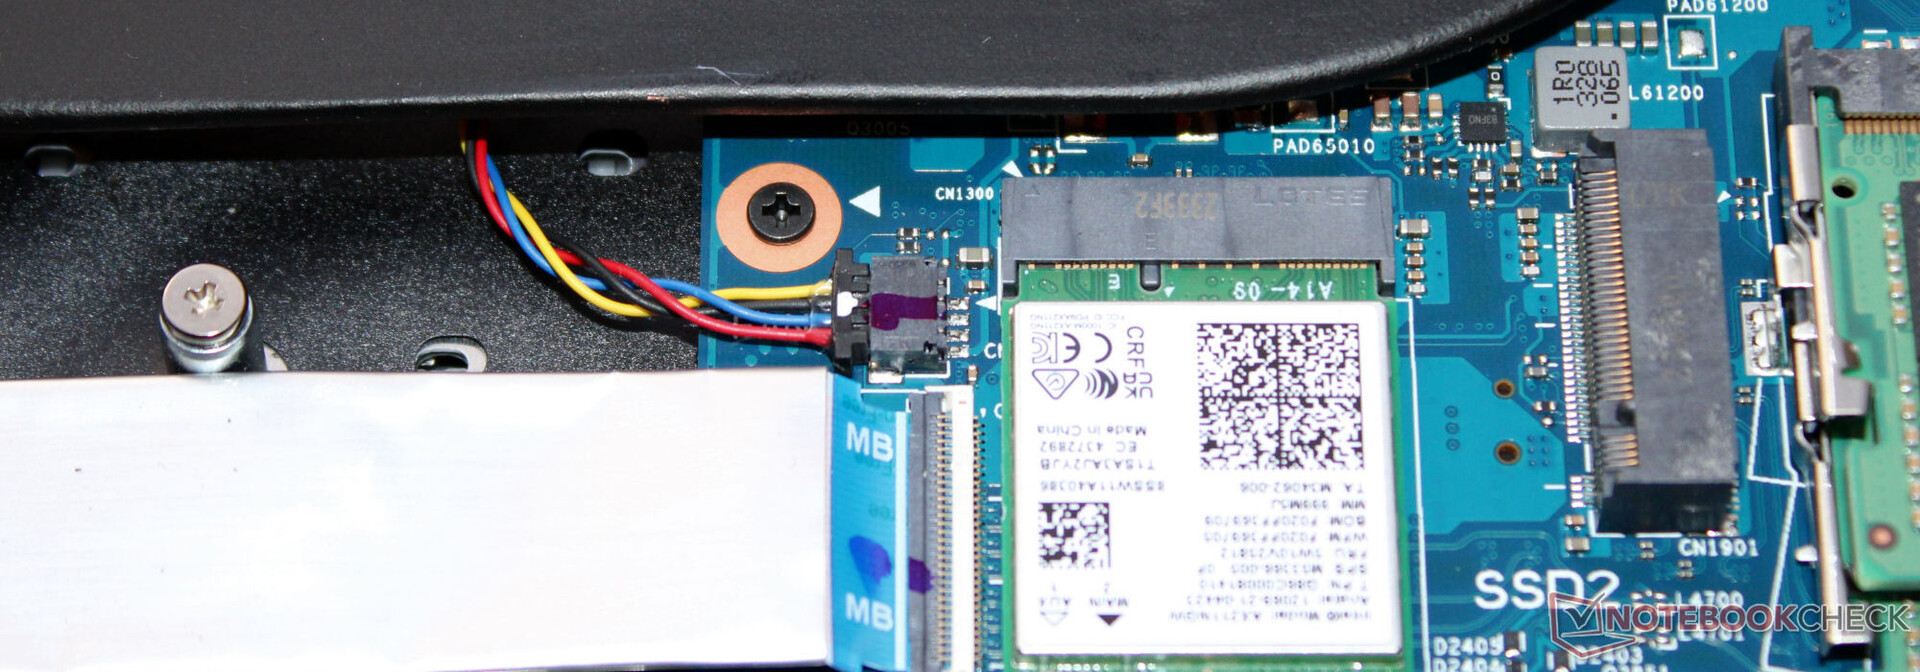
Manutenção
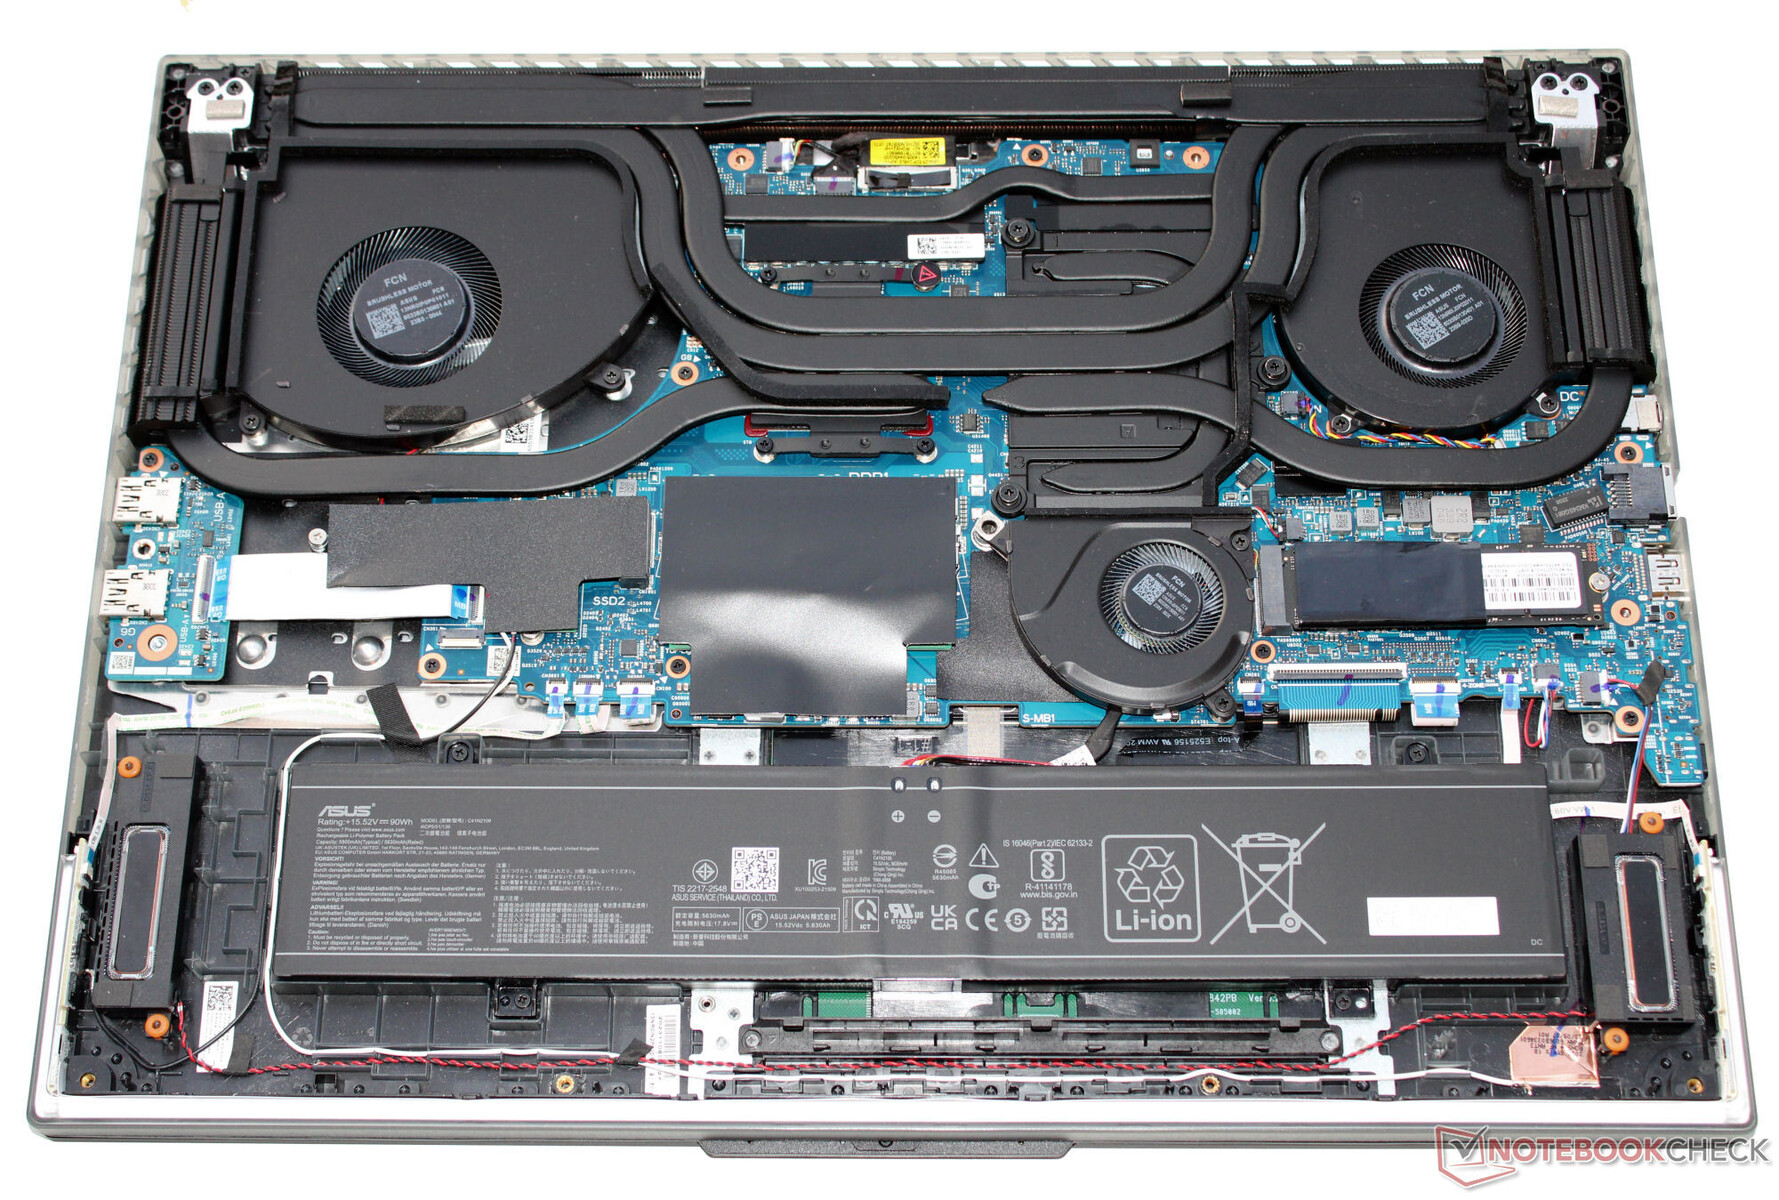
Para abrir o laptop, é necessário remover todos os parafusos da parte inferior do gabinete. Em seguida, o senhor pode levantar a placa do gabinete usando uma ferramenta de alavanca. Após remover a placa do gabinete, o senhor tem acesso aos bancos de armazenamento (ocupados), ao SSD (PCIe 4, M.2-2280), ao segundo slot de SSD (PCIe 4, M.2-2280), ao módulo WLAN, à bateria do BIOS, às ventoinhas e à bateria (parafusada, não colada).
O teclado não pode ser substituído facilmente. Para fazer isso, o senhor teria que substituir toda a parte superior da base, o que exigiria desmontar completamente o laptop.
Garantia
A Asus oferece uma garantia de dois anos para o laptop de 18 polegadas na Alemanha. Uma extensão da garantia para três anos custaria cerca de 200 euros (~$215).
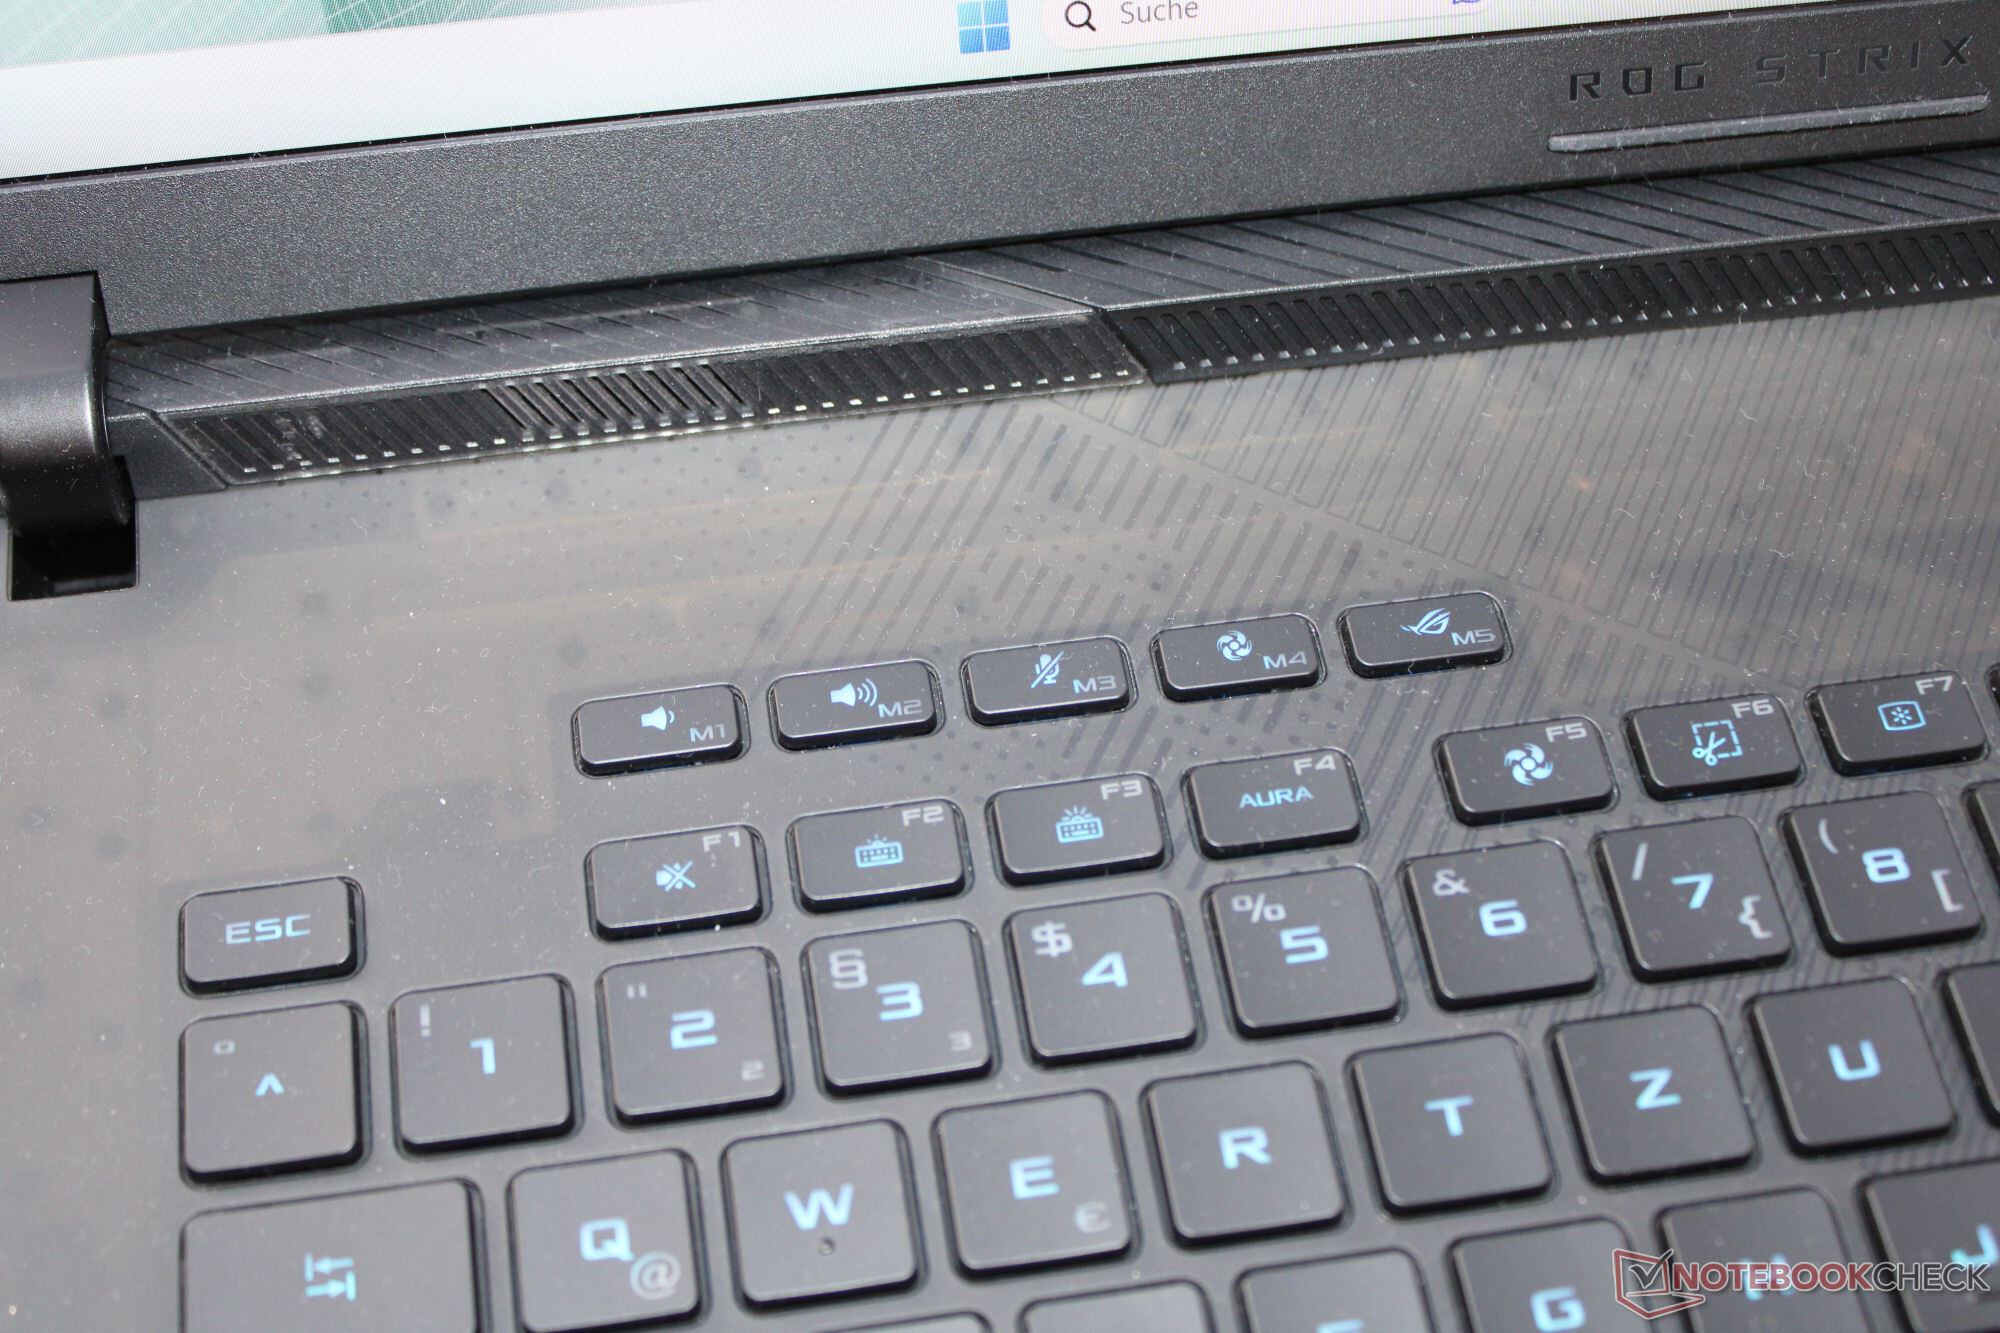
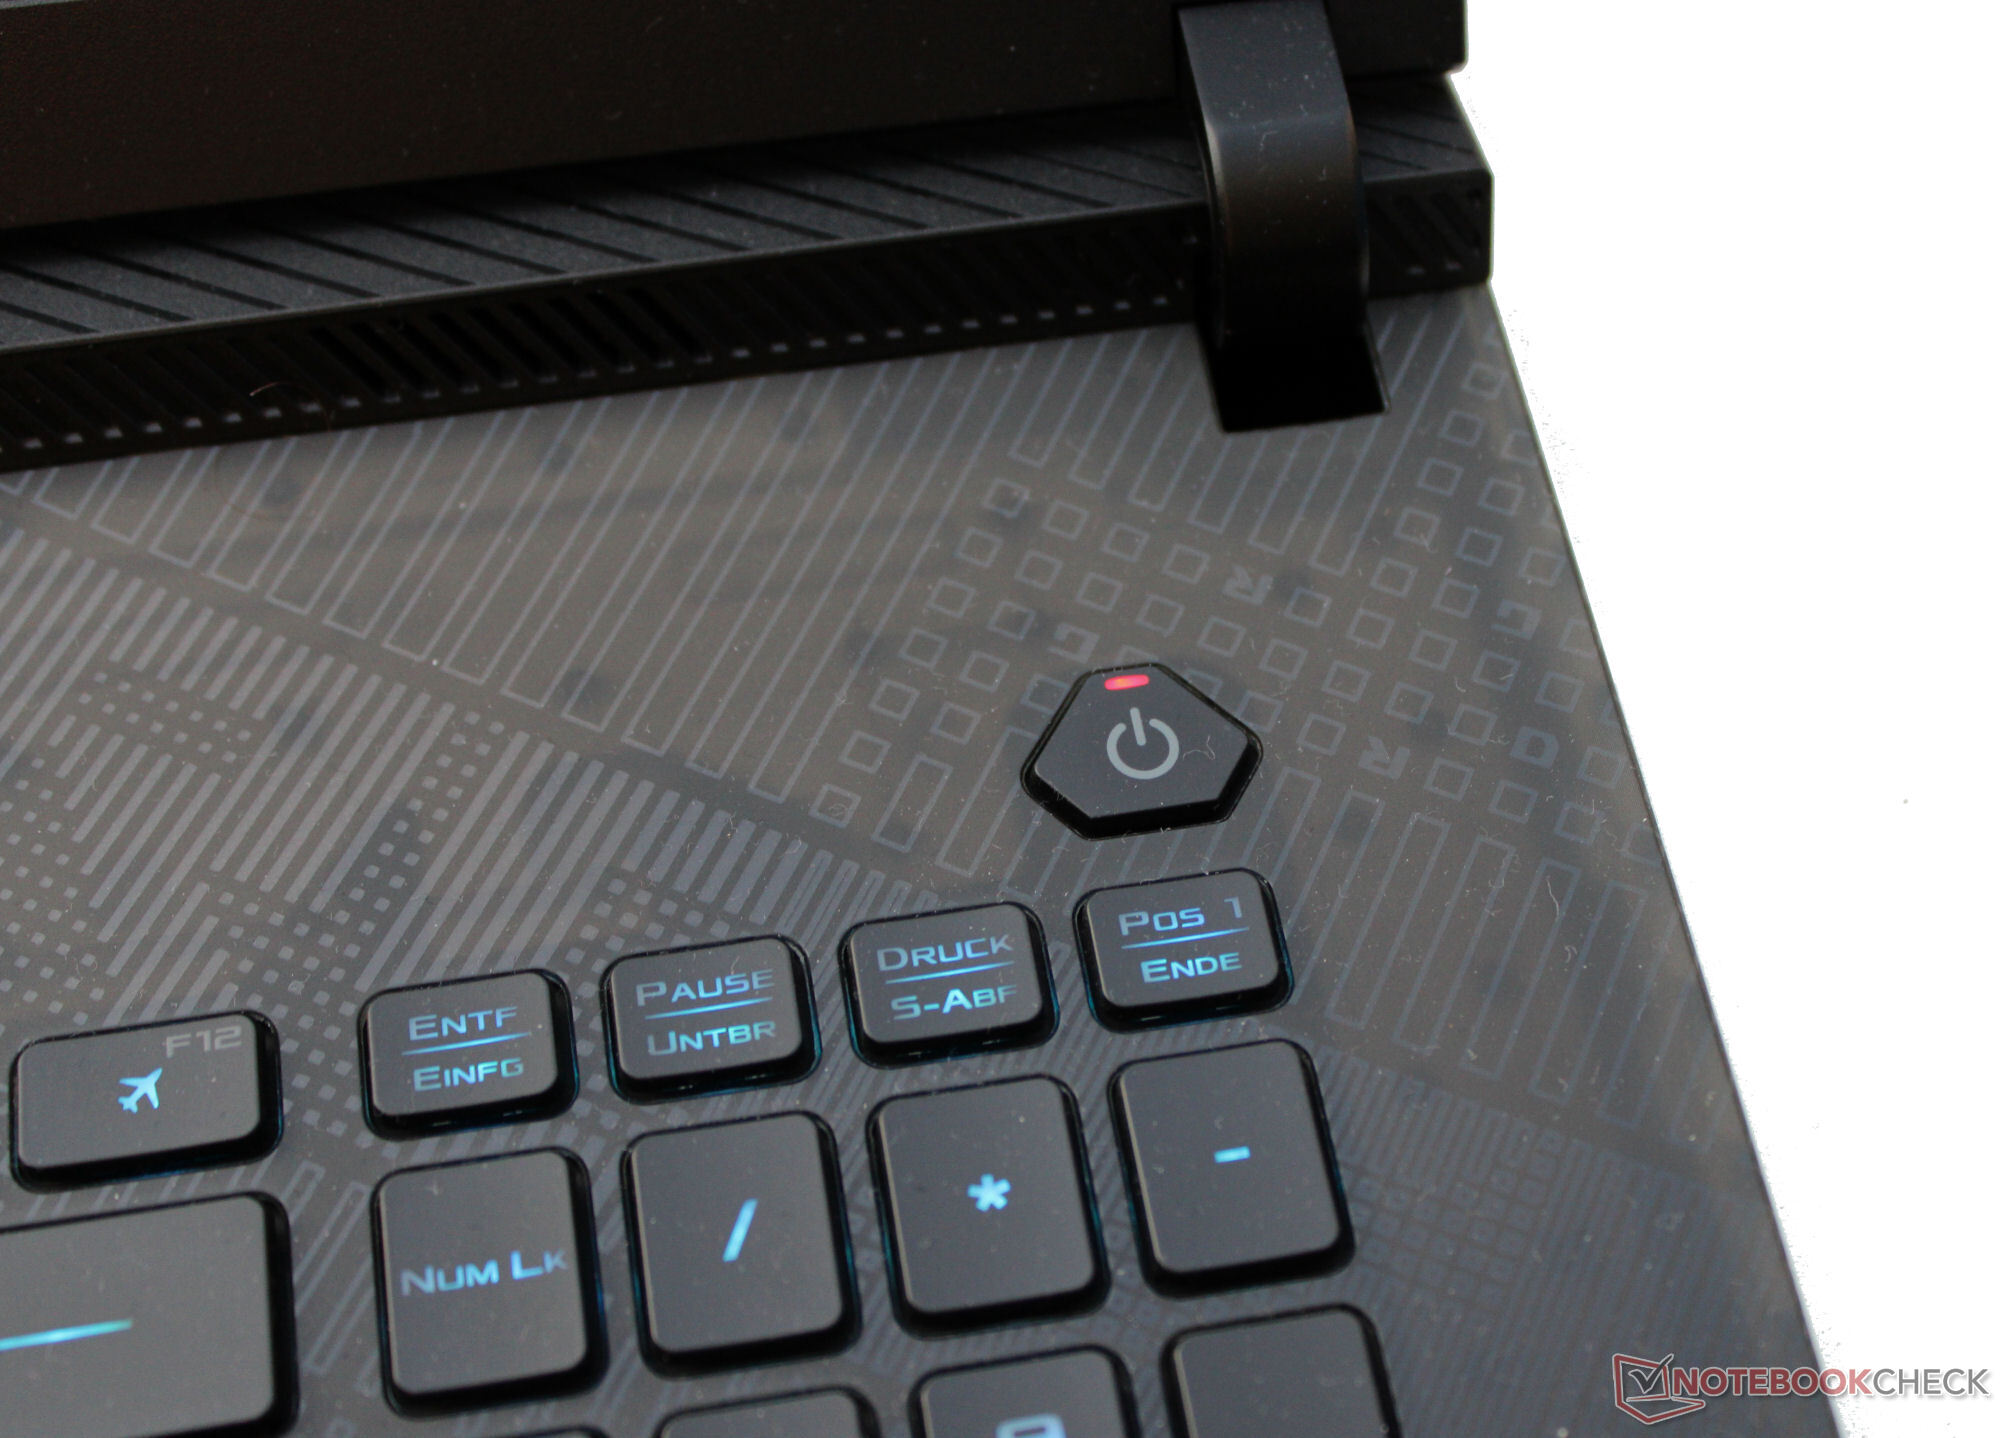
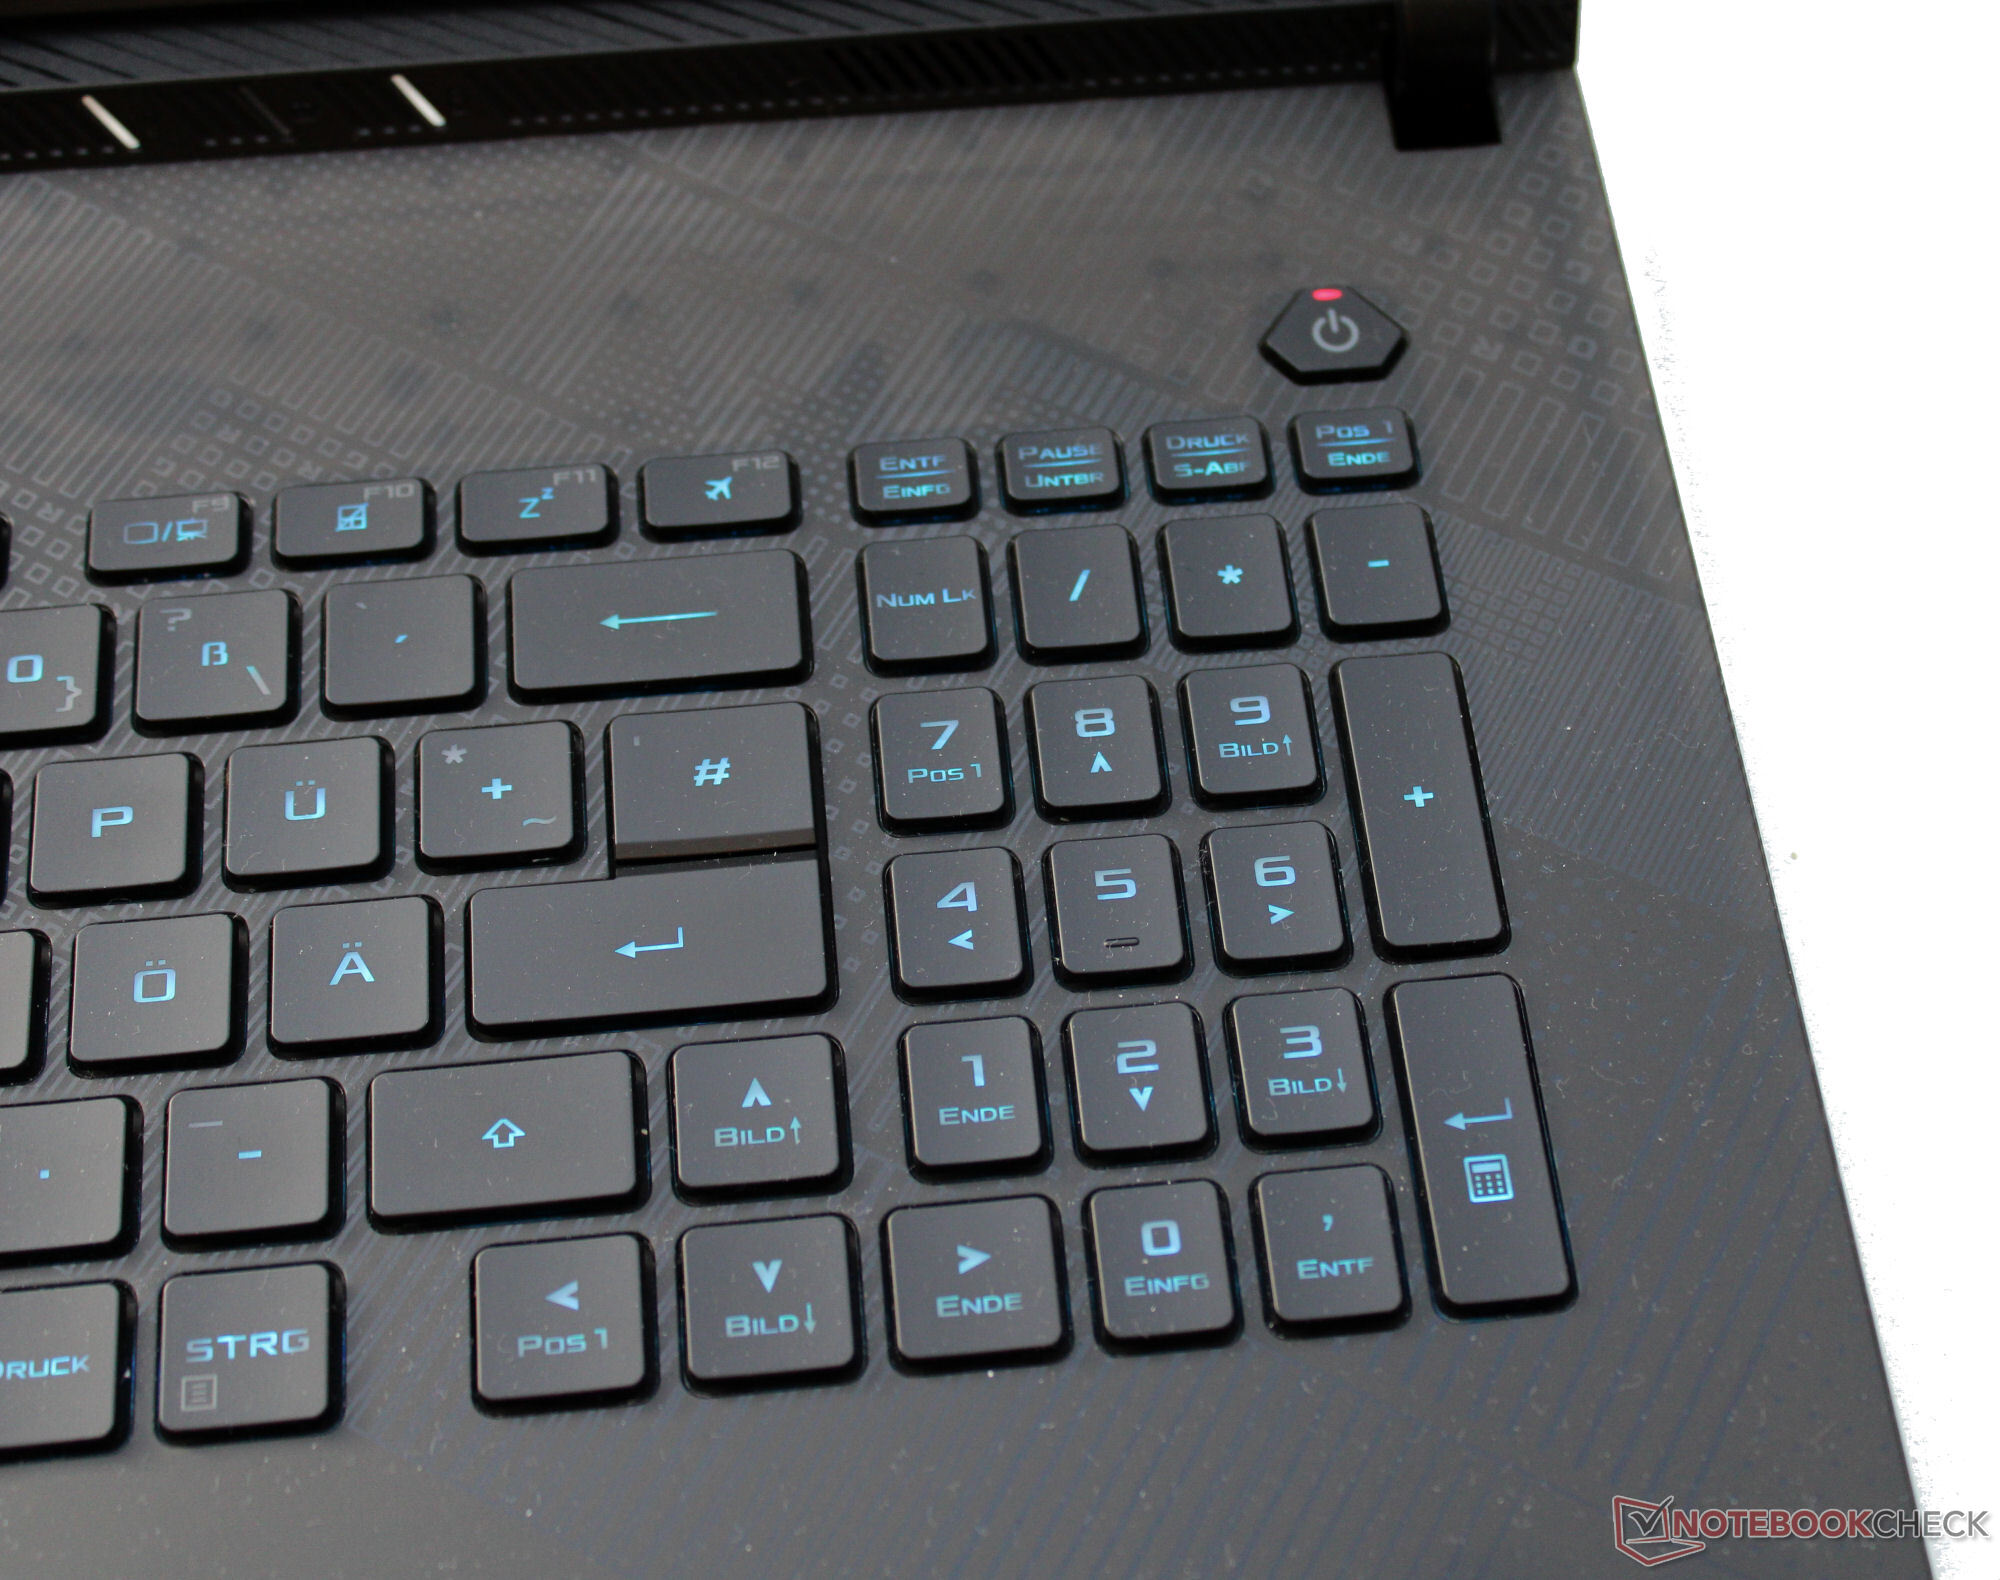
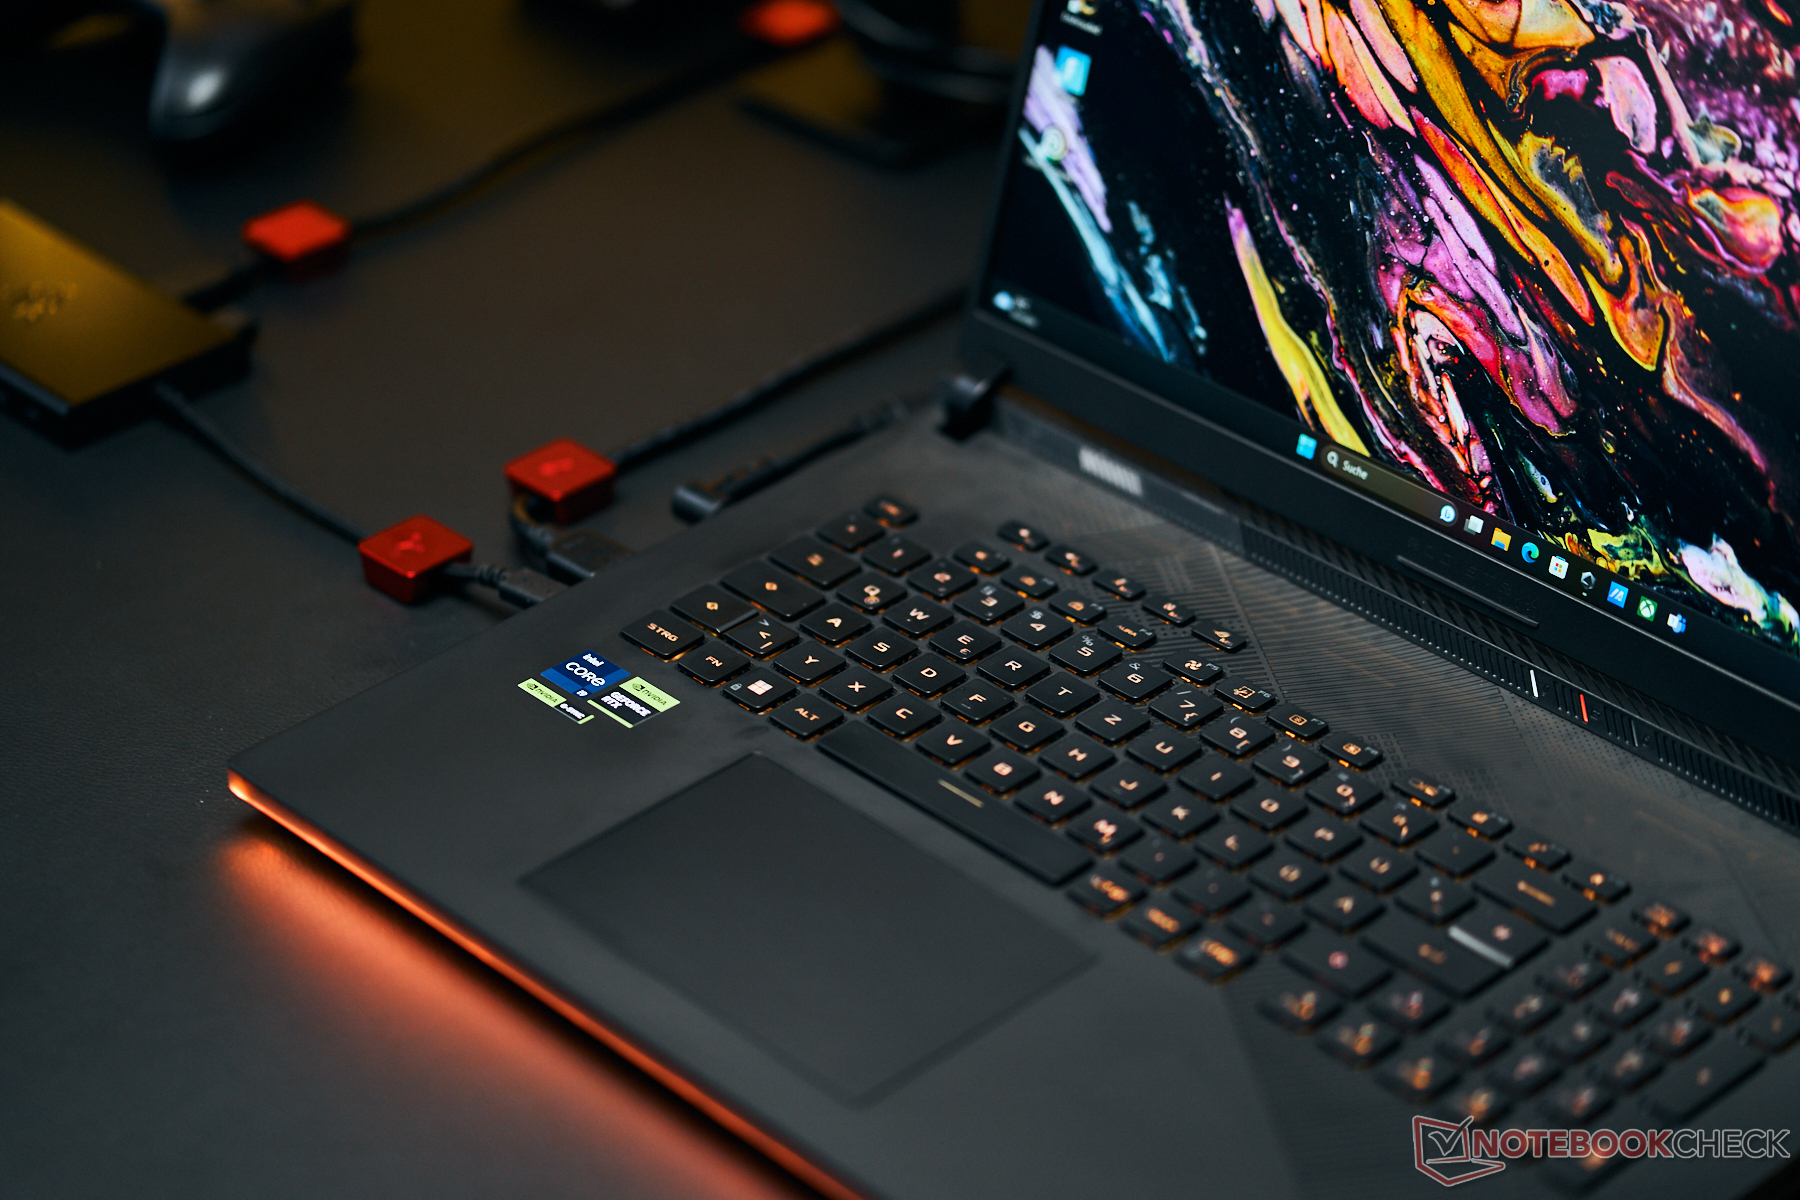
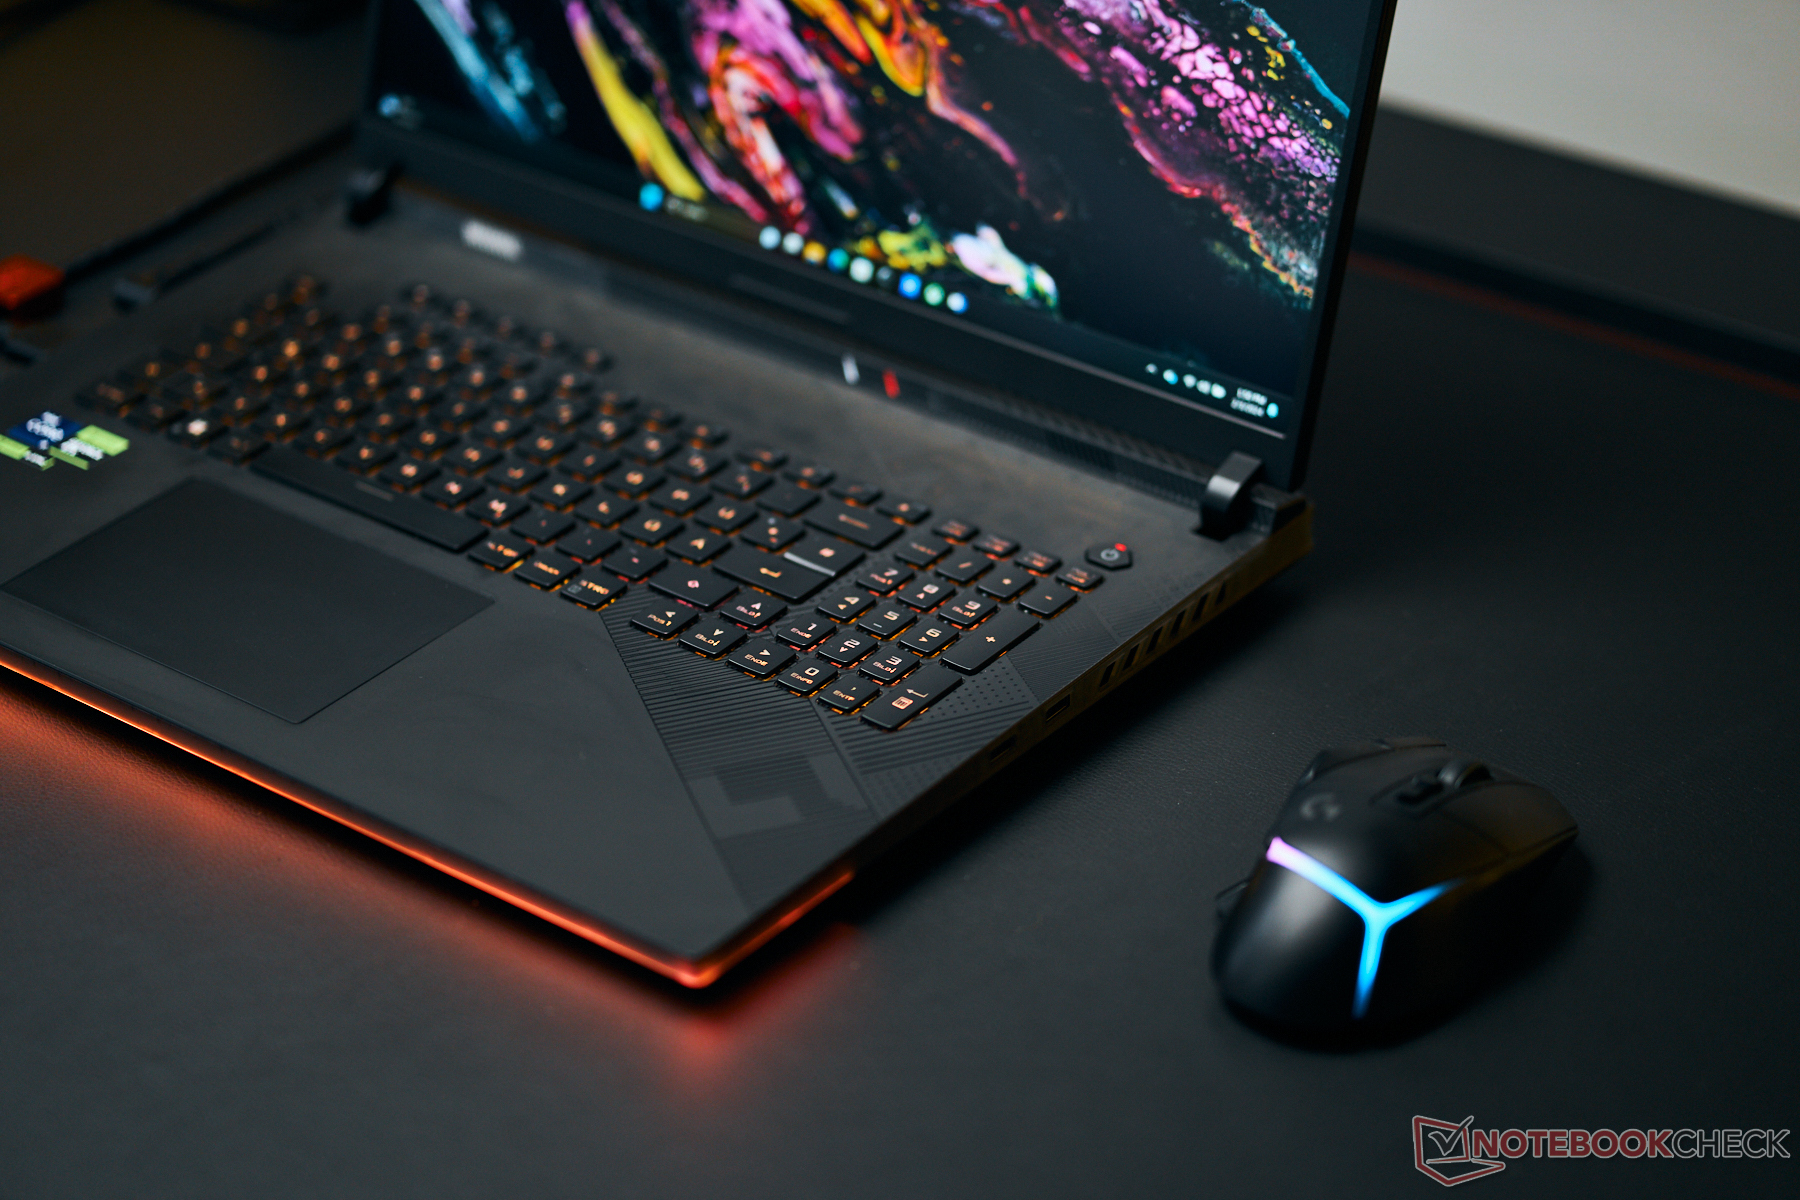
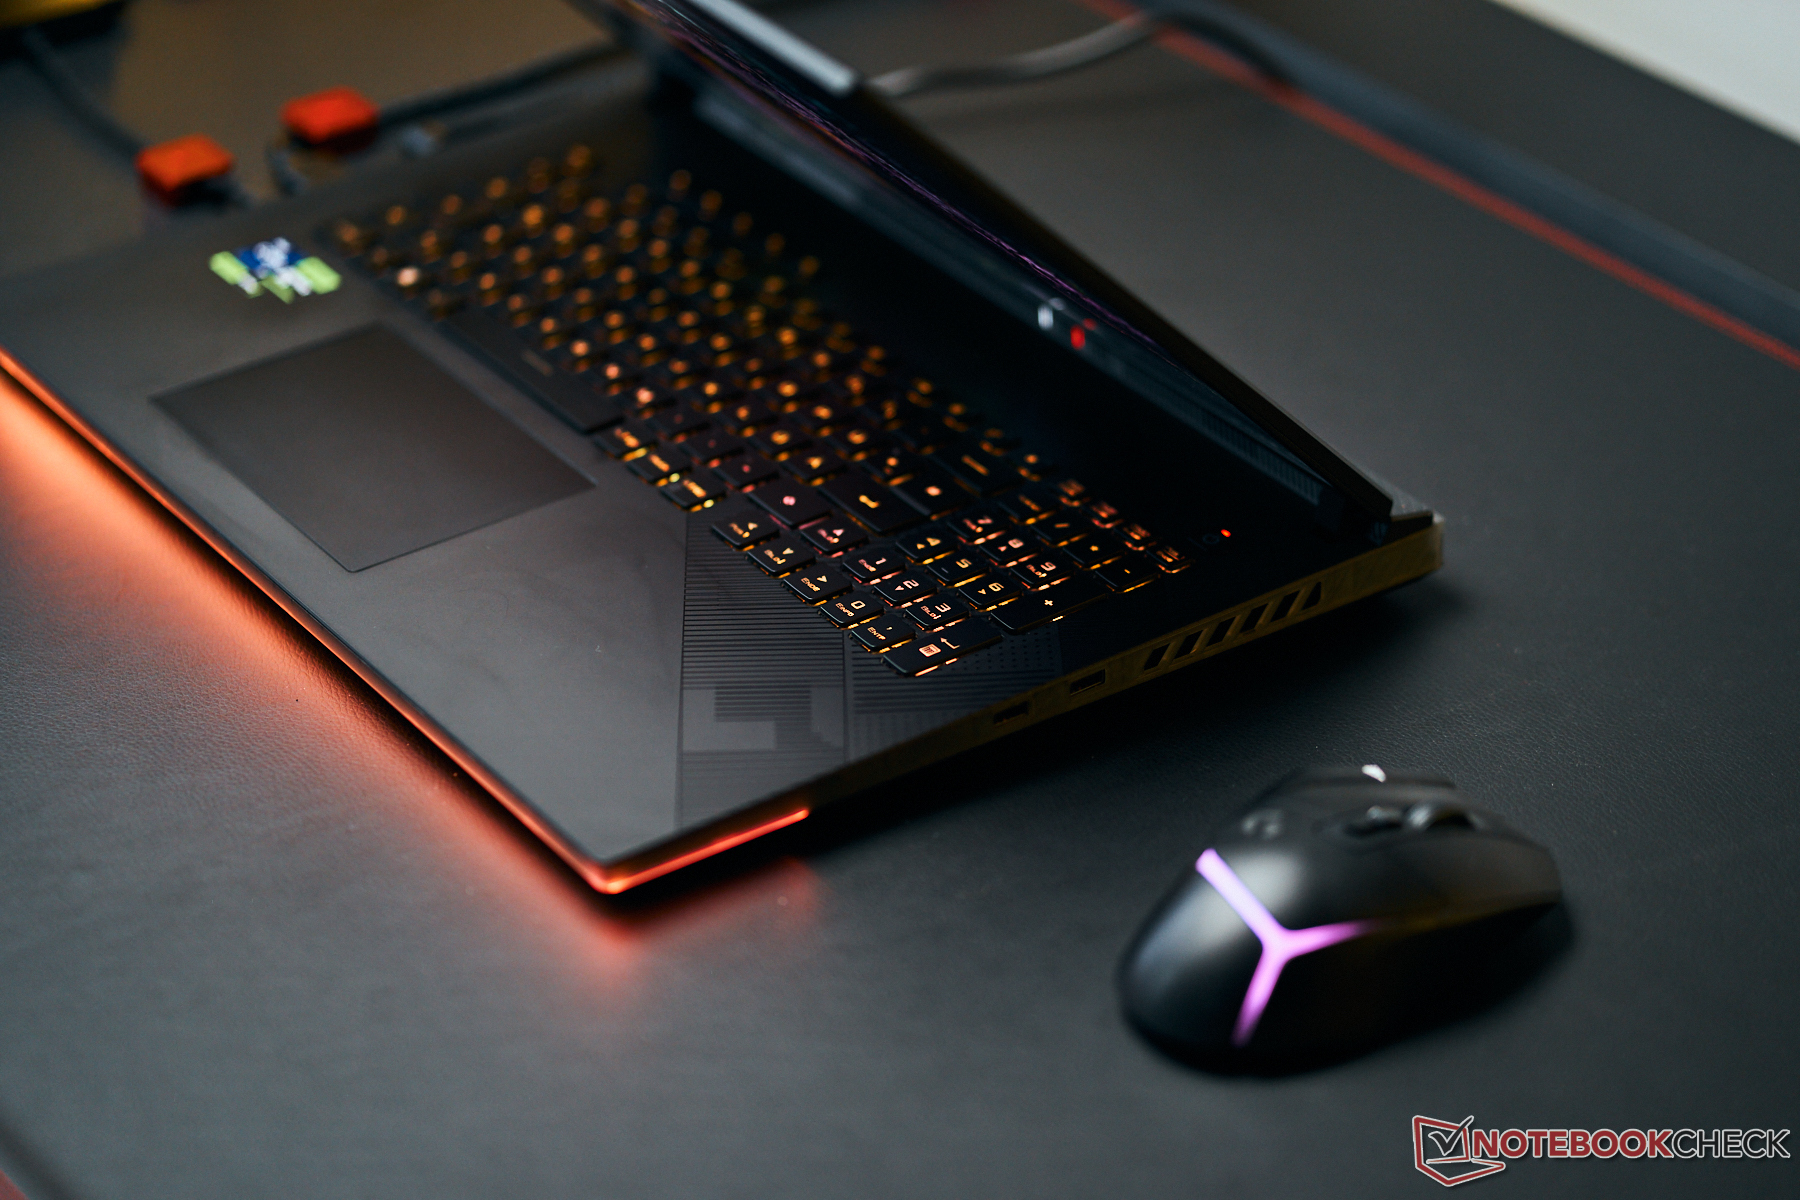
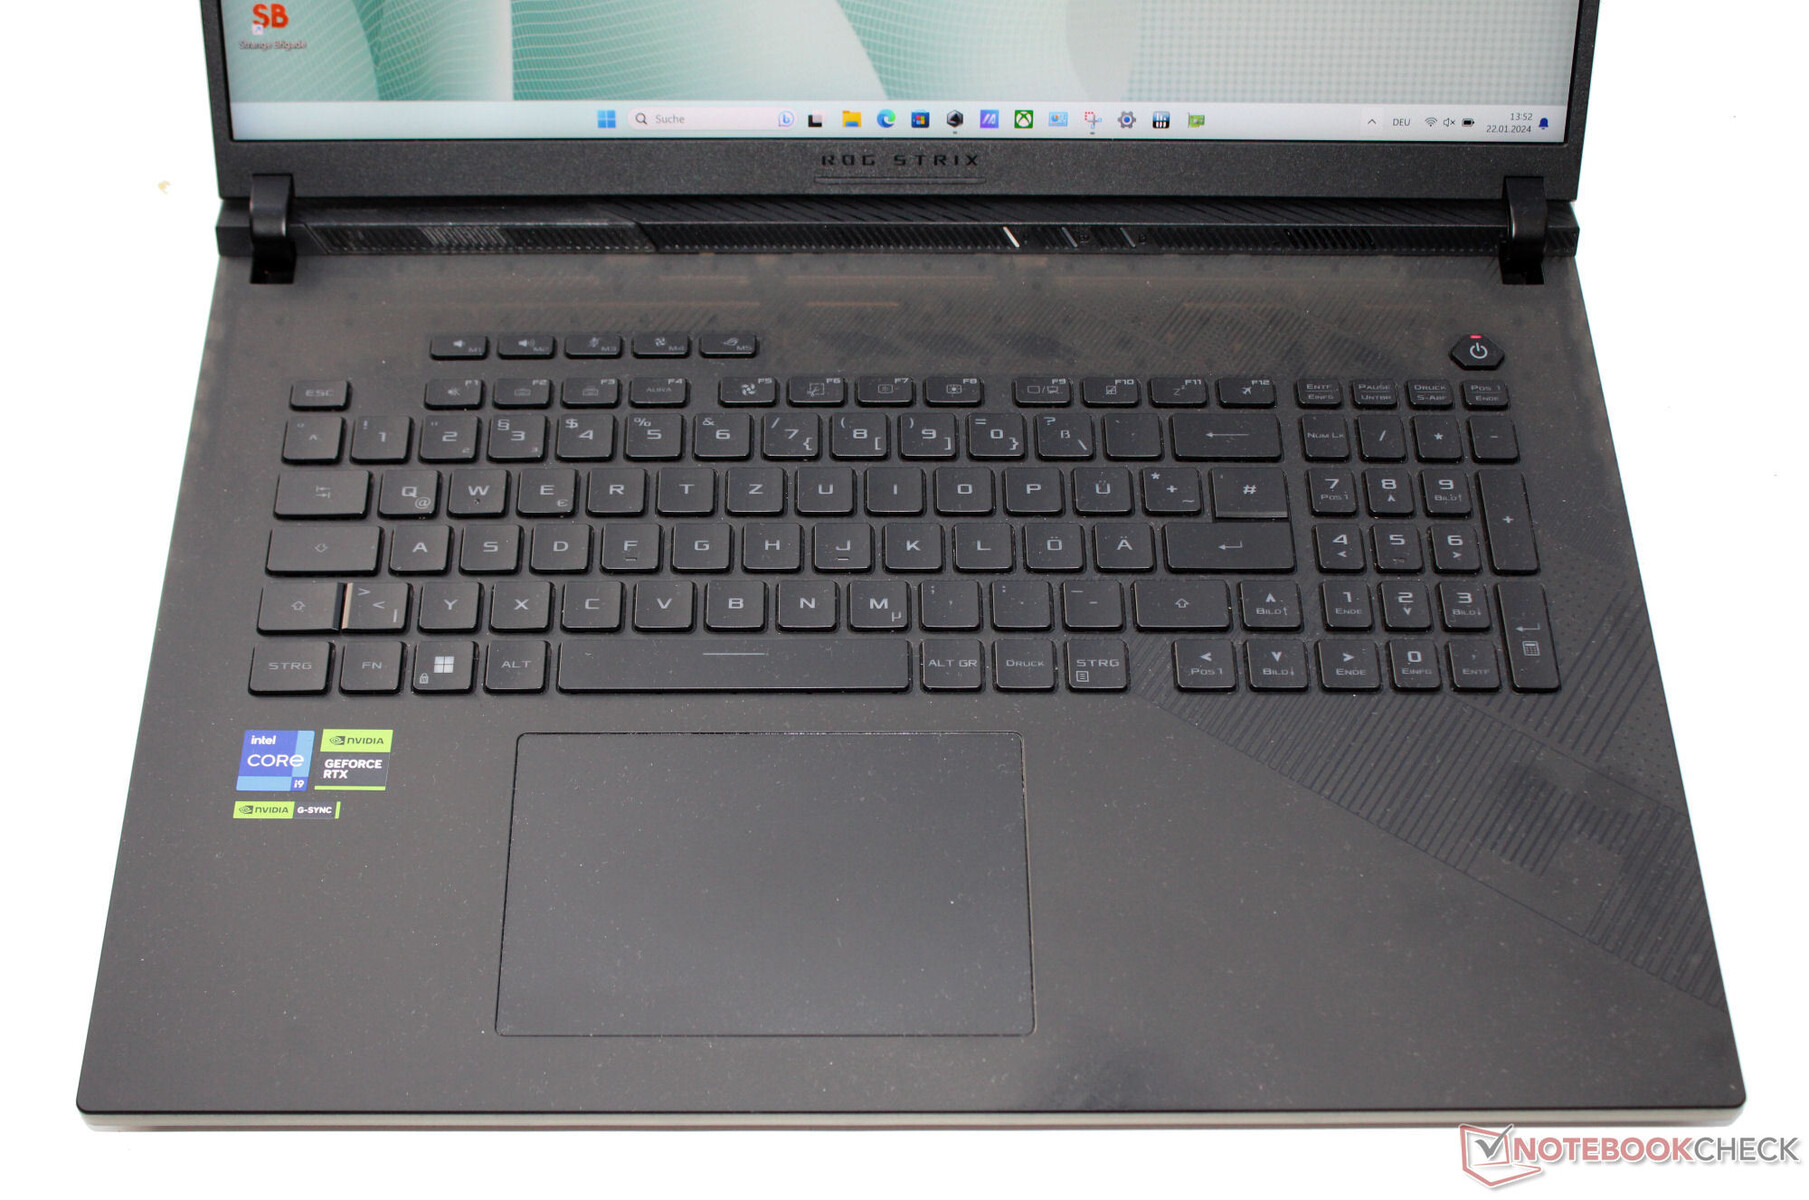
Dispositivos de entrada - Computador Asus com iluminação RGB de tecla única
Teclado
As teclas côncavas do teclado chiclet iluminado oferecem um curso médio e um ponto de pressão claro. A resistência das teclas é basicamente boa, mas, subjetivamente, poderia ter sido um pouco mais nítida. Durante a digitação, a metade direita do teclado tem um pouco de elasticidade, que é mínima, na melhor das hipóteses. Entretanto, isso não chegou a ser um obstáculo. Um aspecto positivo é que todas as quatro teclas de seta têm o tamanho normal. No geral, a Asus oferece um teclado adequado para as tarefas diárias.
Touchpad
Um ClickPad (~13 x 8,5 cm, ~5,1 x 3,35 pol.) cuja superfície lisa facilita o deslizamento dos dedos serve como substituto do mouse. Ele oferece um curso curto e um ponto de pressão claro.
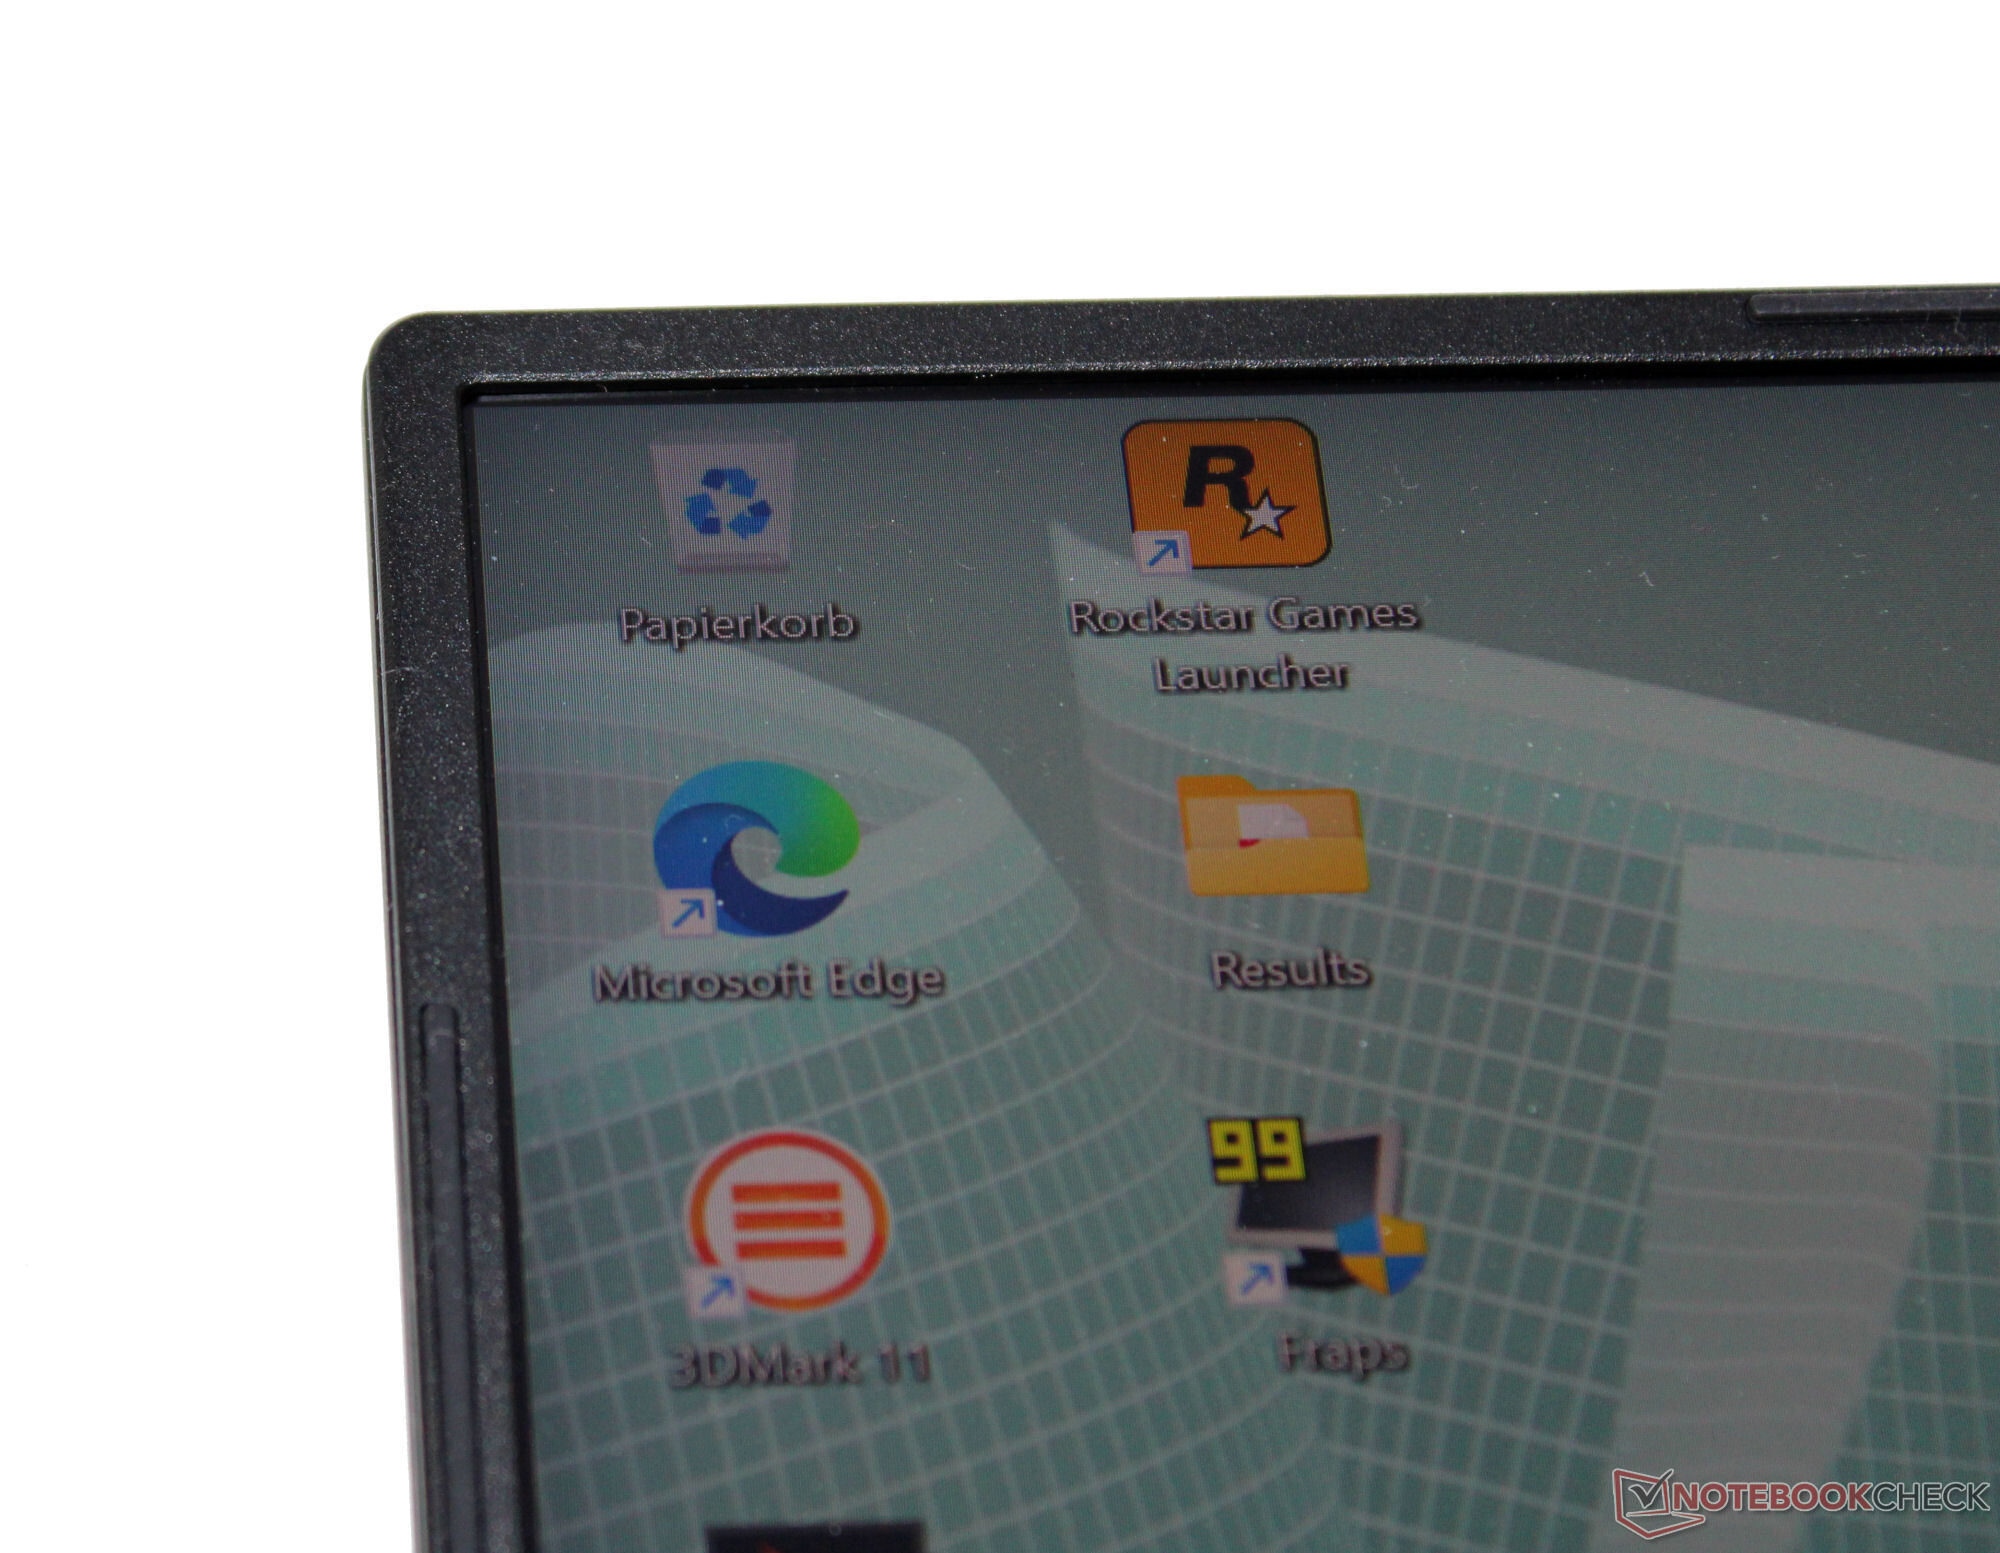
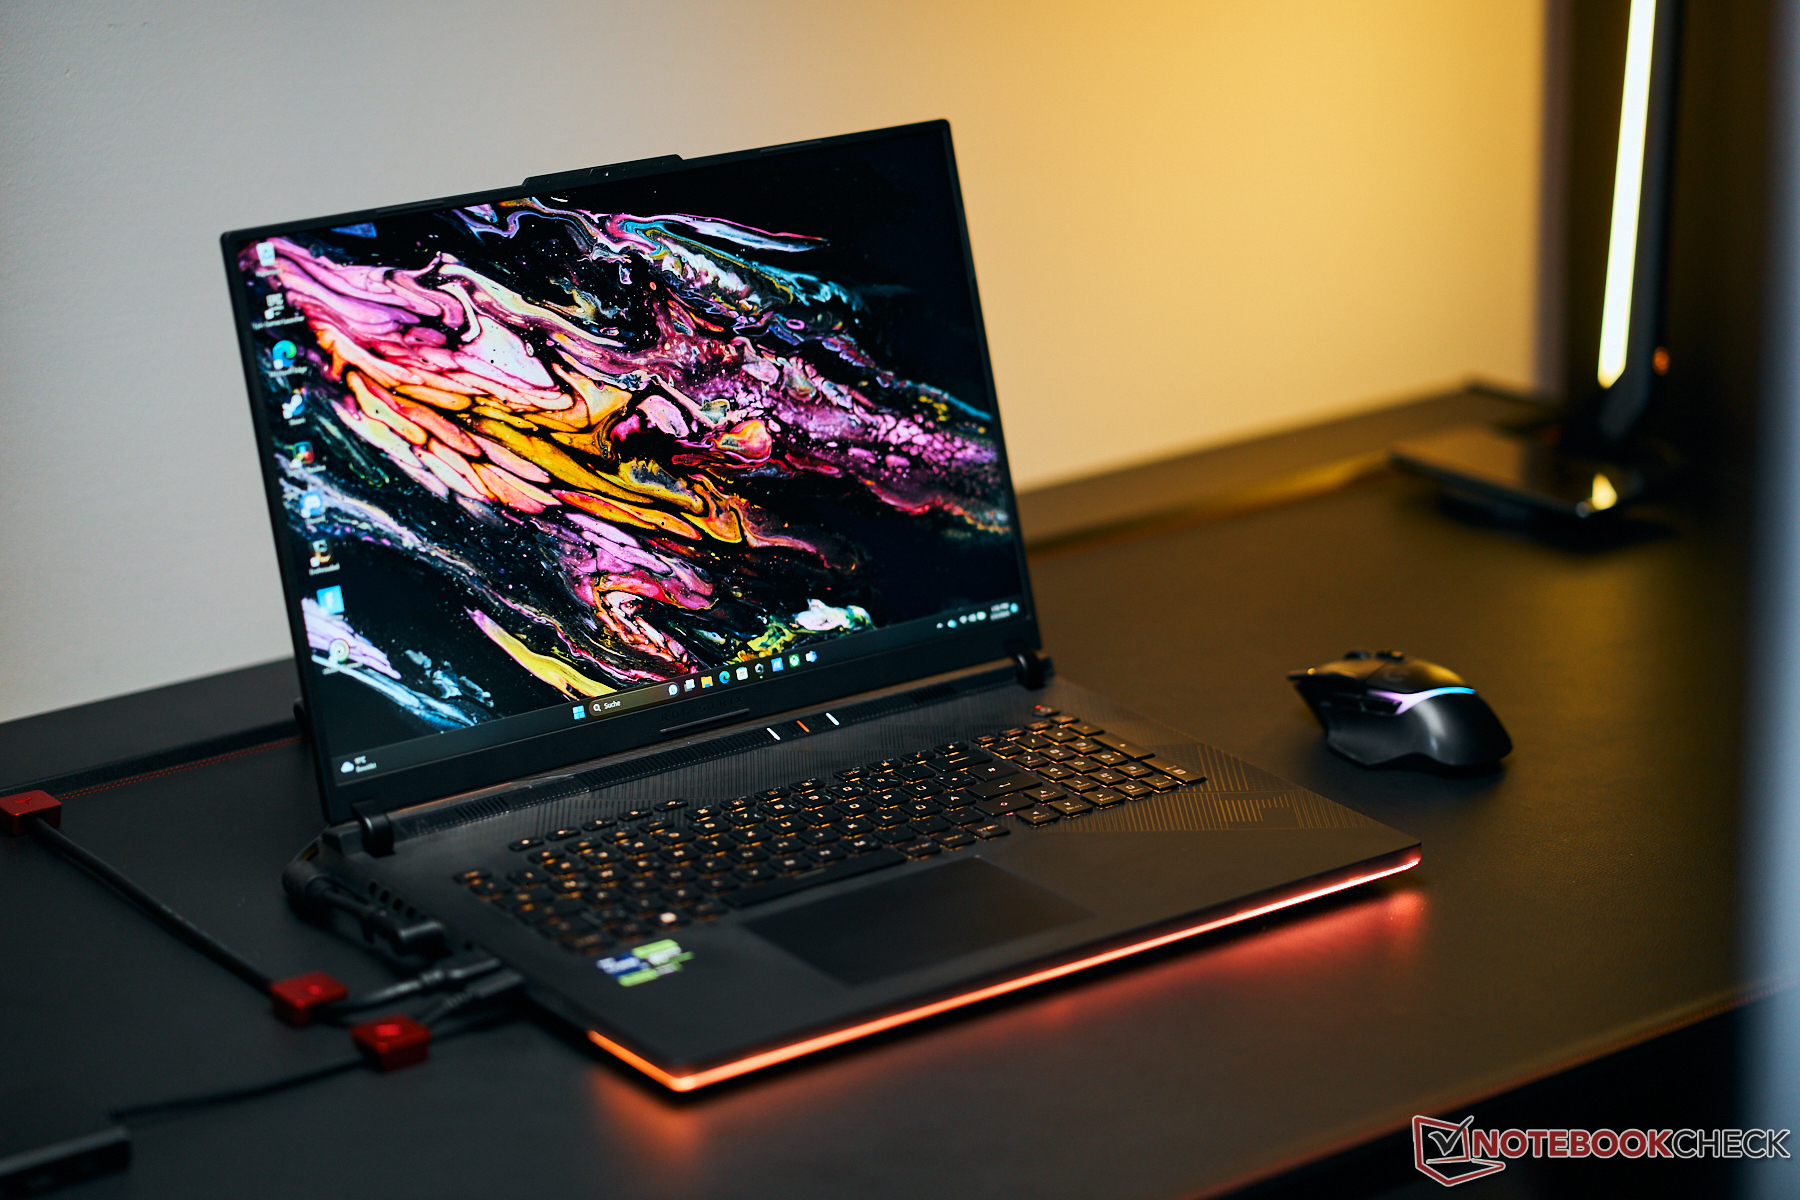
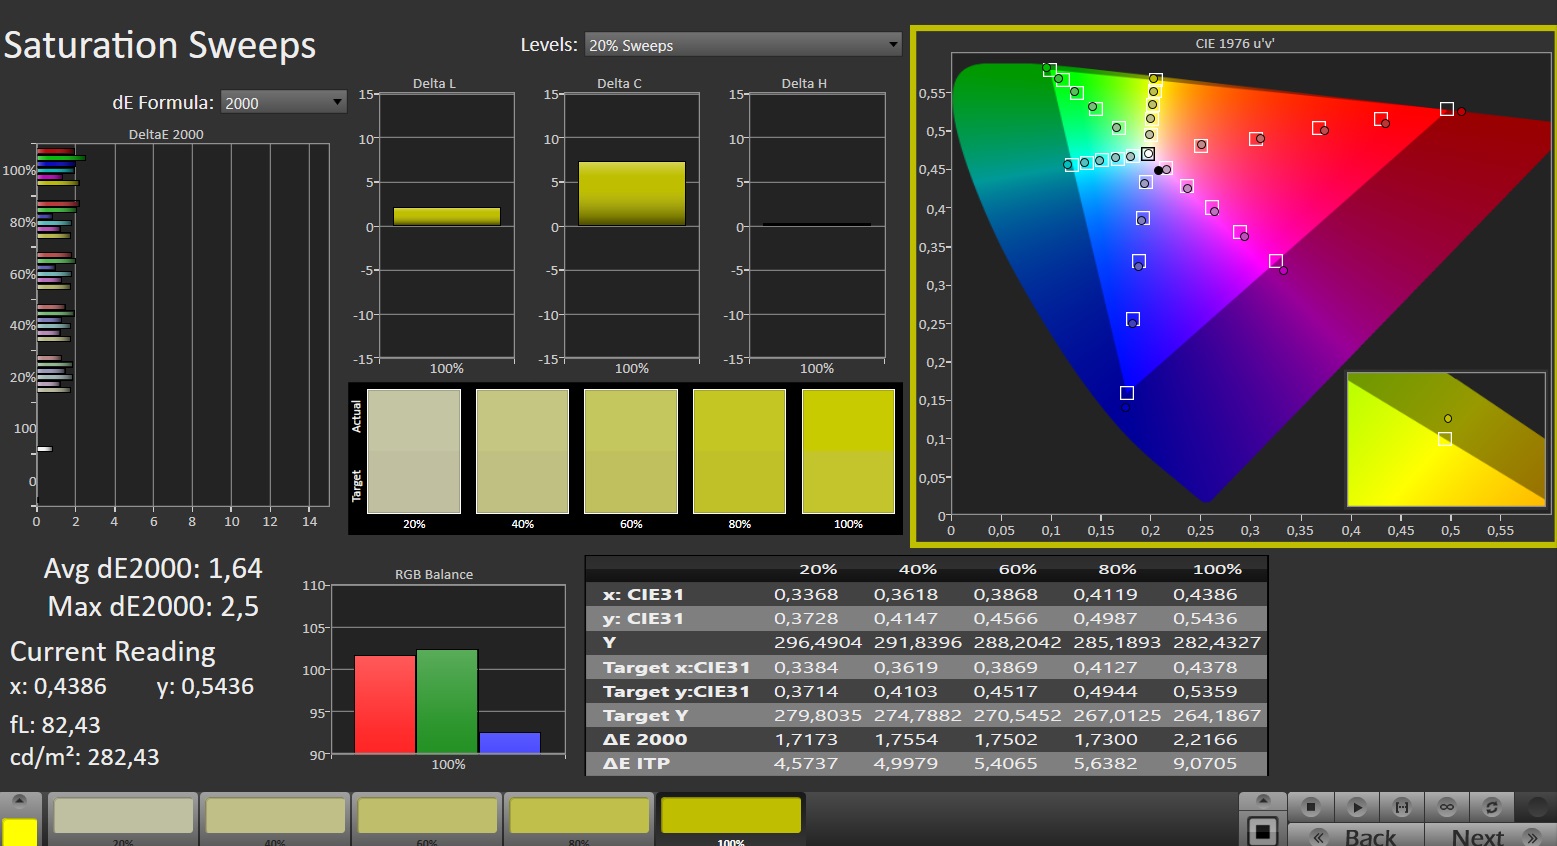
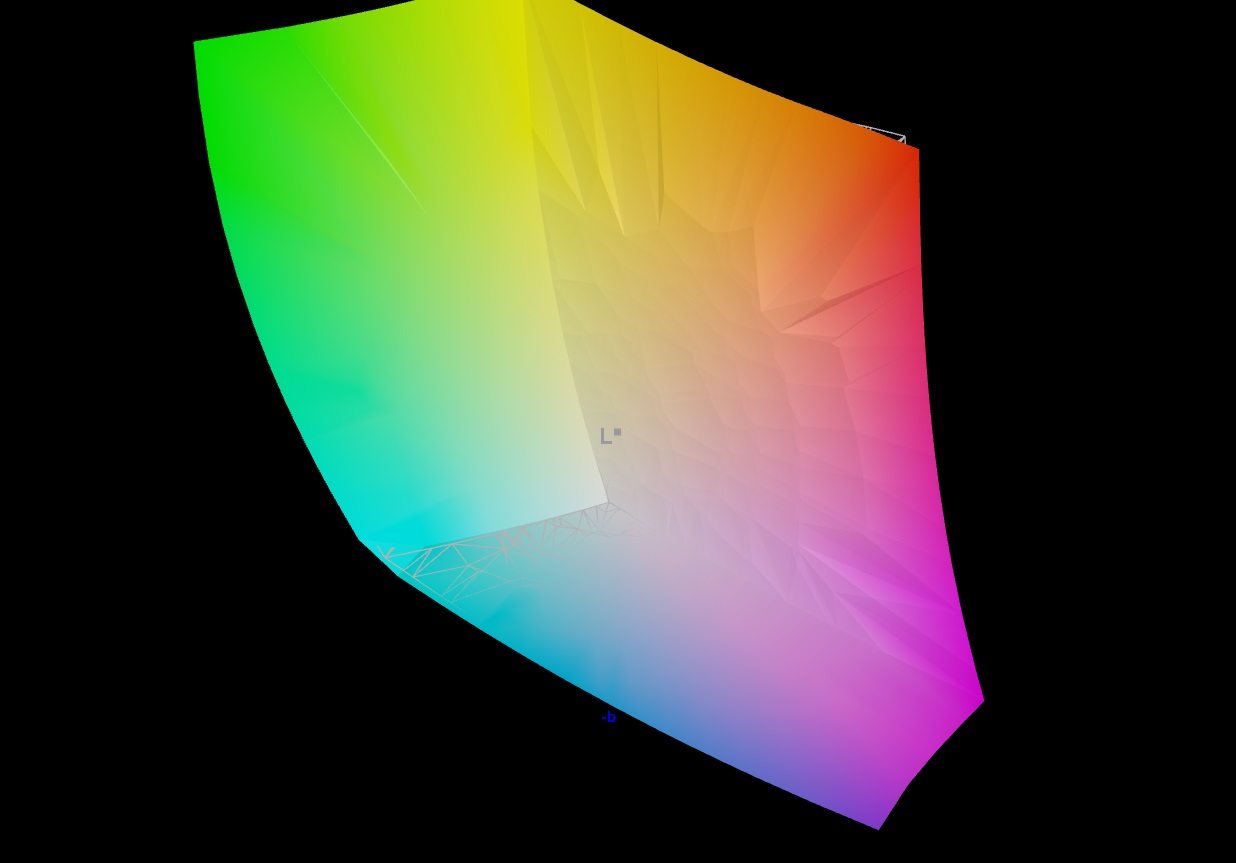
Tela - Mini-LED com cobertura do espaço de cores DCI-P3
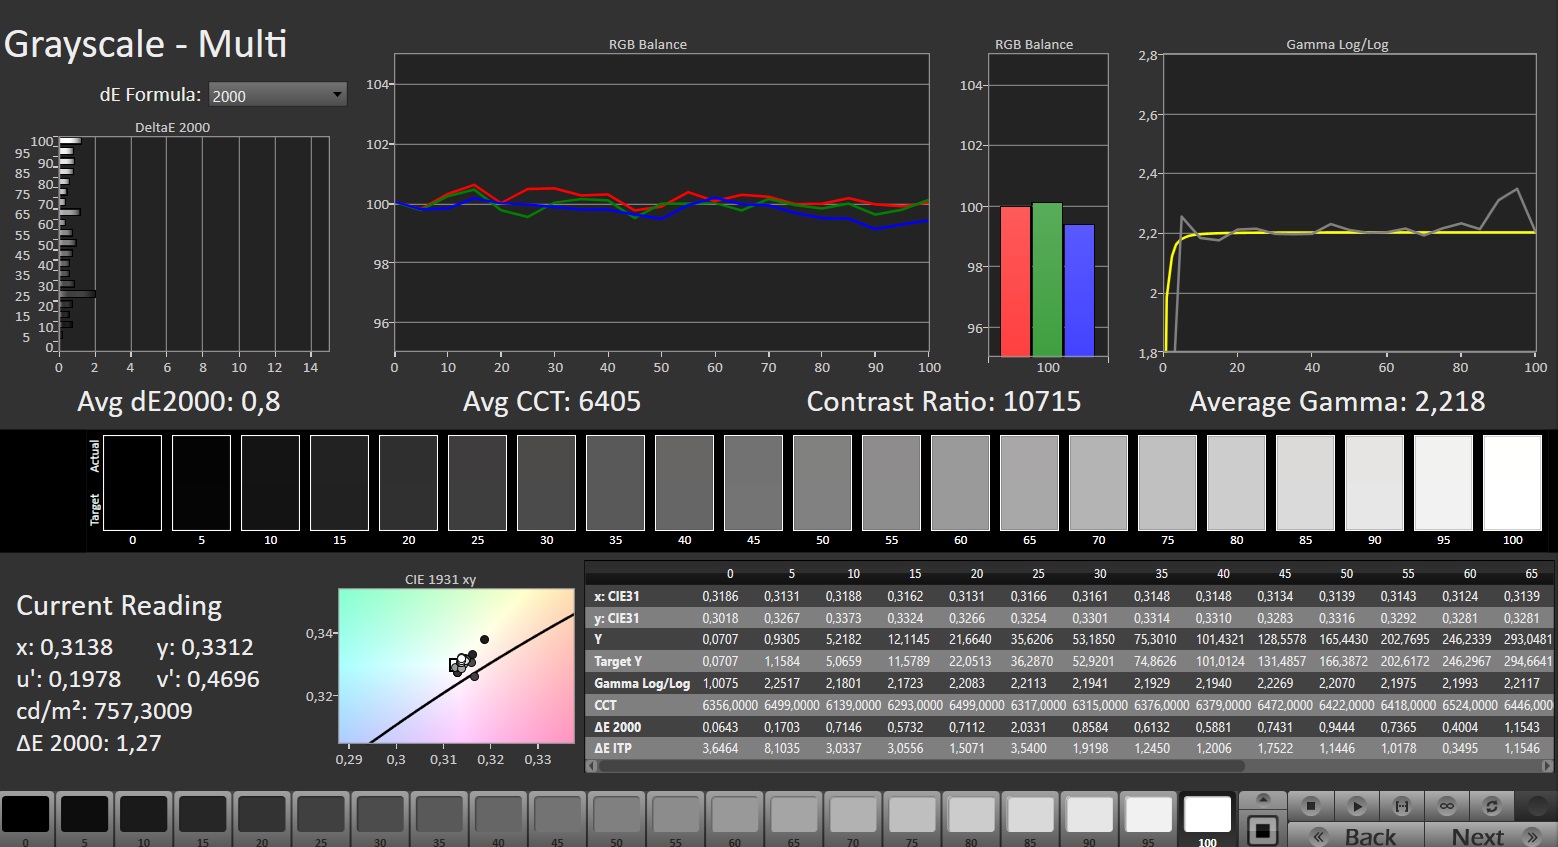
O Scar 18 oferece uma tela mini-LED de 18 polegadas (2560x1600 pixels) no formato 16:10. Seus aspectos positivos incluem o alto brilho, excelente contraste e valor de preto, além da superfície fosca. O painel rápido de 240 Hz também suporta HDR e G-Sync.
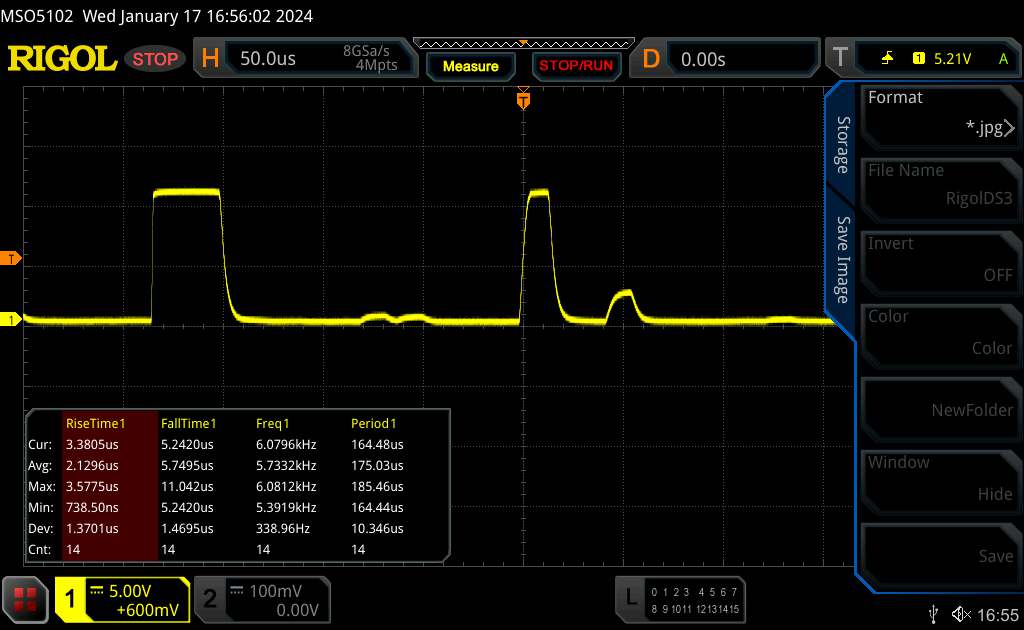
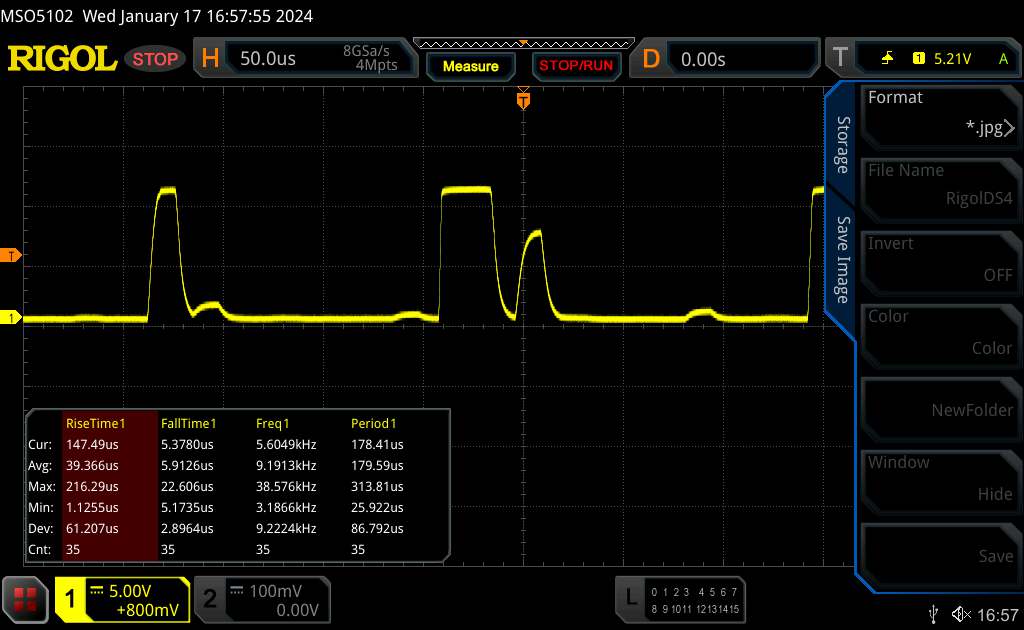
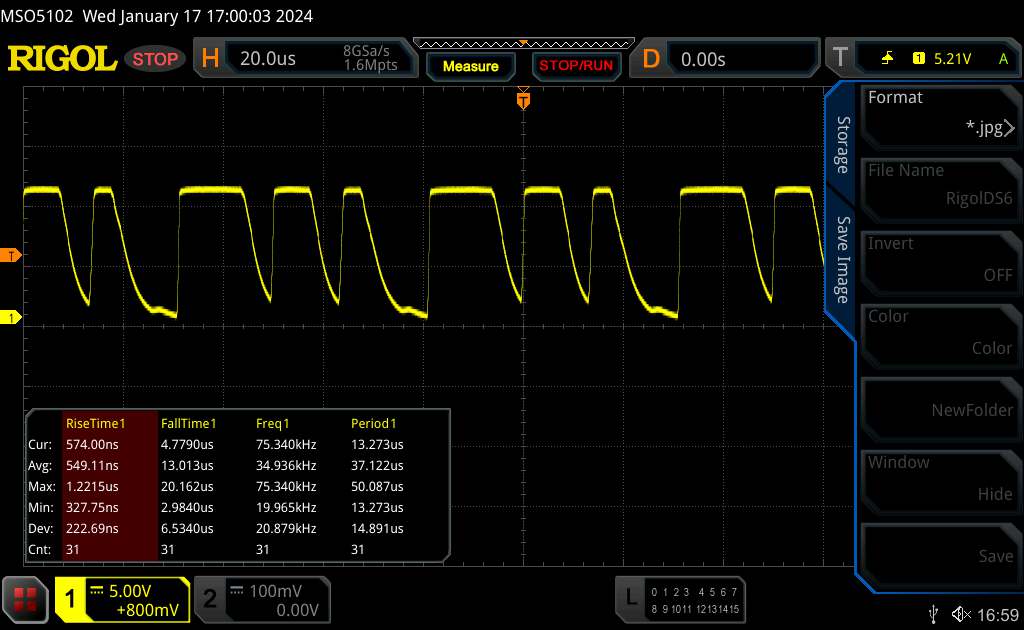
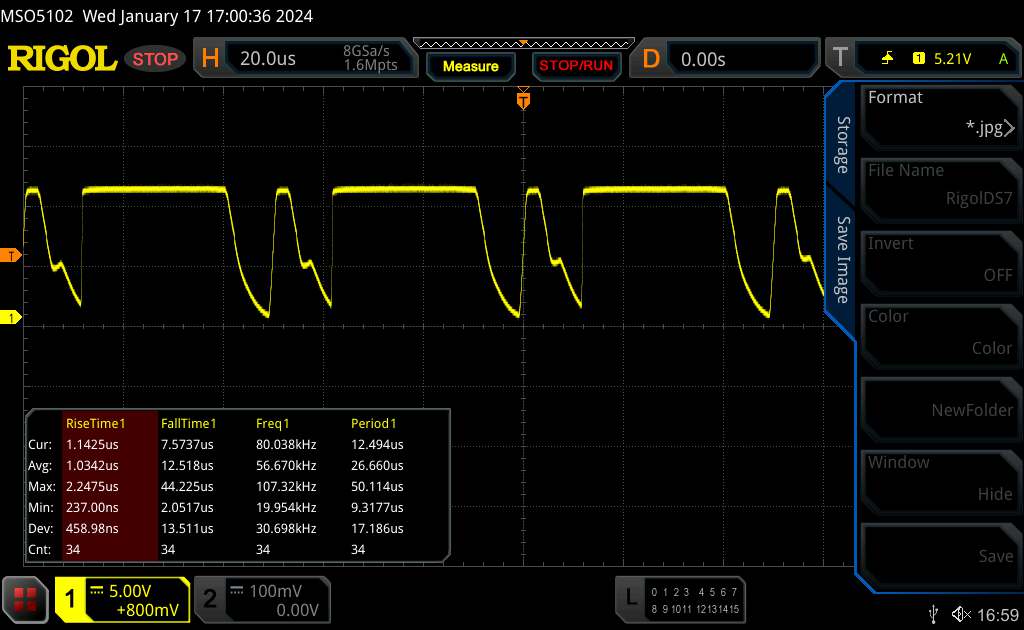
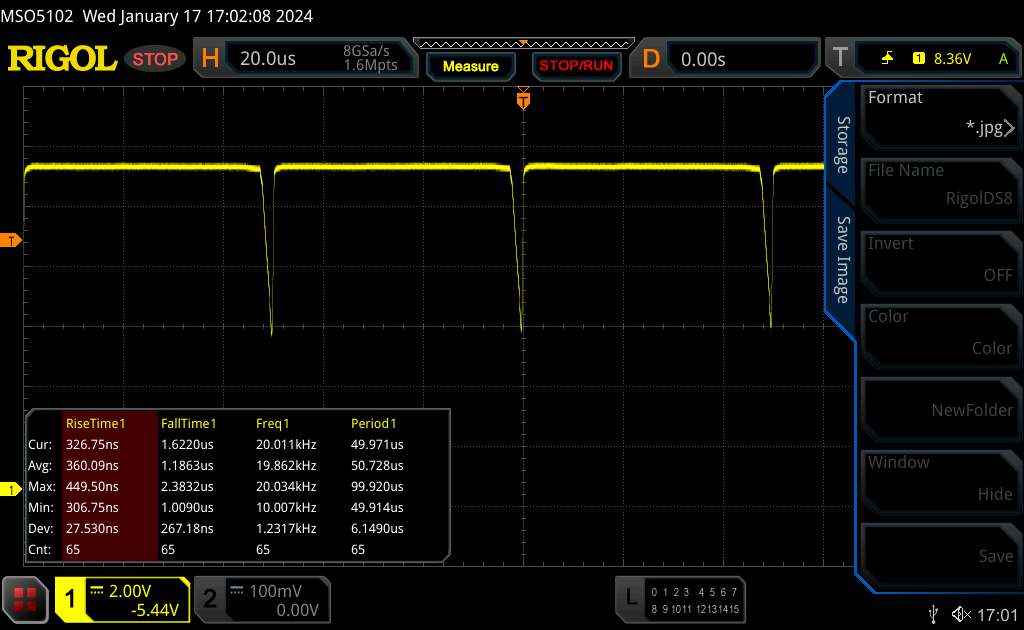
Por outro lado, a tela não está totalmente livre de oscilações de PWM, embora isso não deva ser muito importante na operação diária: Medimos uma oscilação de alta frequência (5.733 Hz) em valores de brilho menores que 94 cd/m².
| |||||||||||||||||||||||||
iluminação: 89 %
iluminação com acumulador: 937 cd/m²
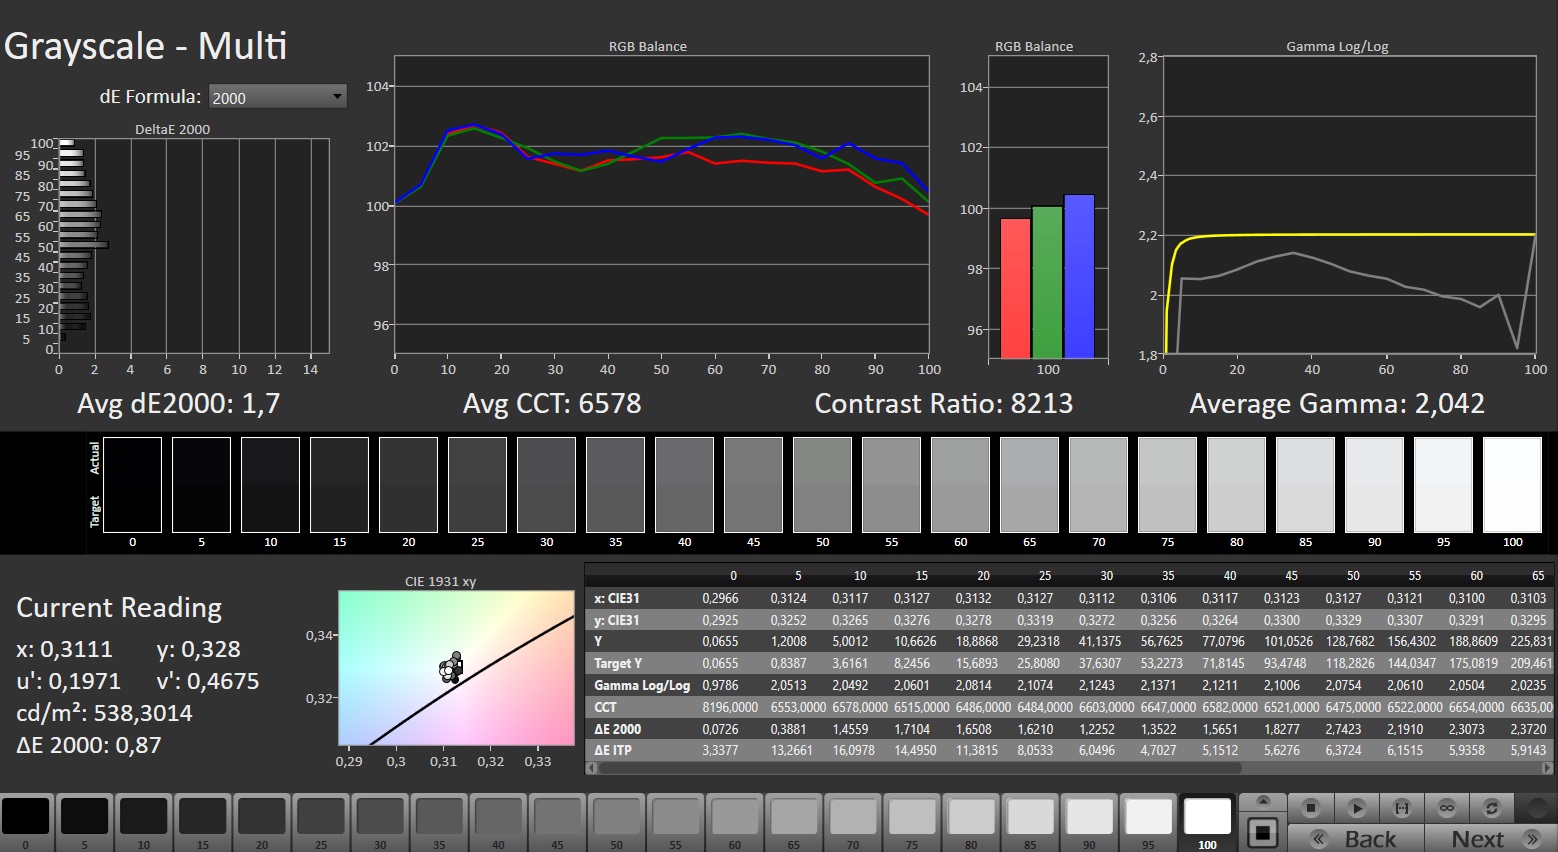
Contraste: 14197:1 (Preto: 0.066 cd/m²)
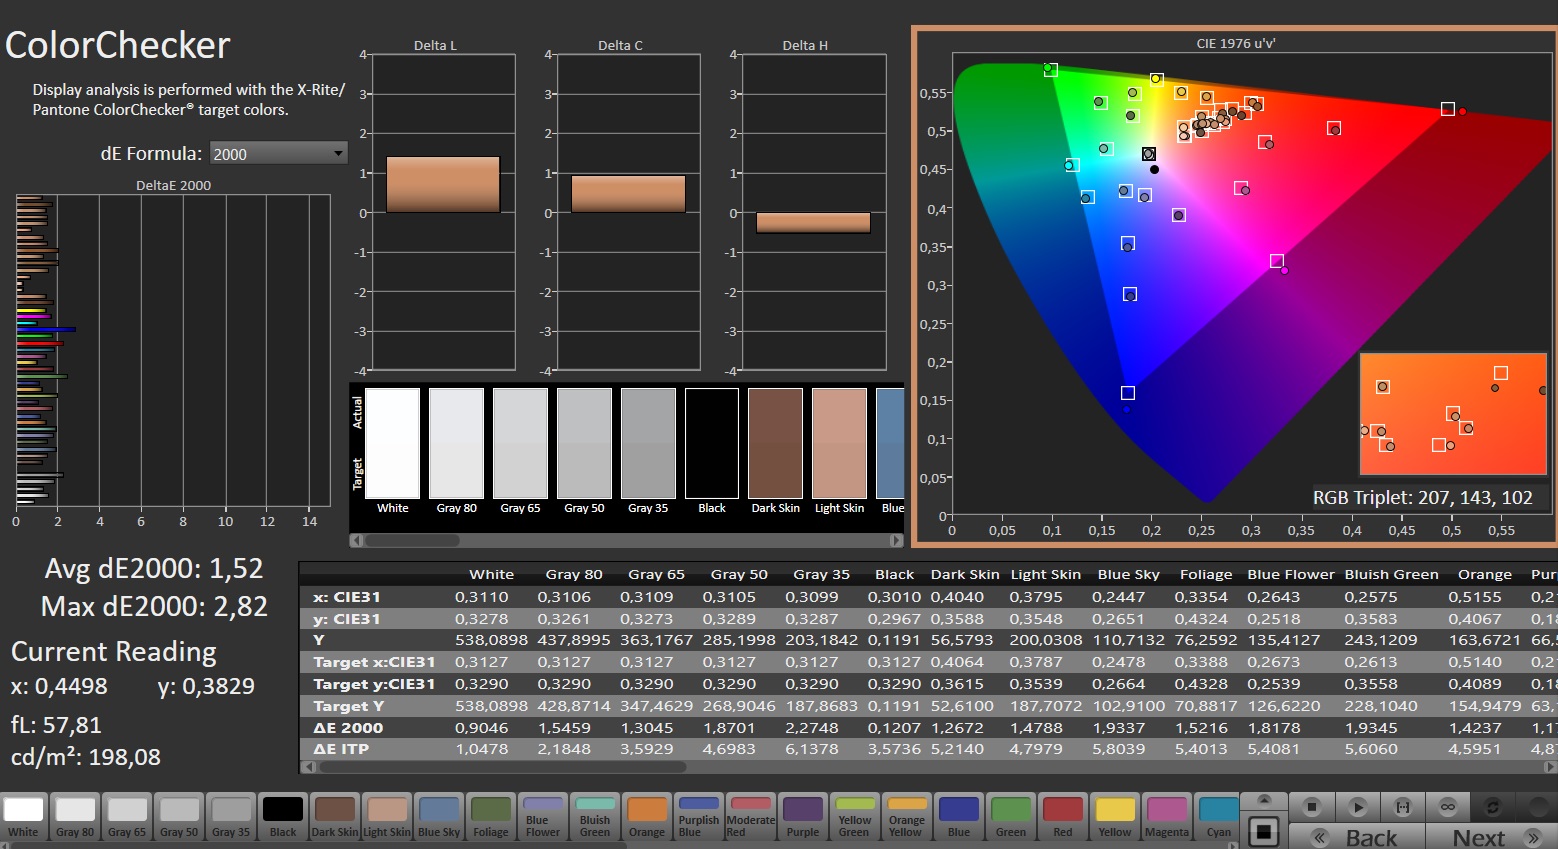
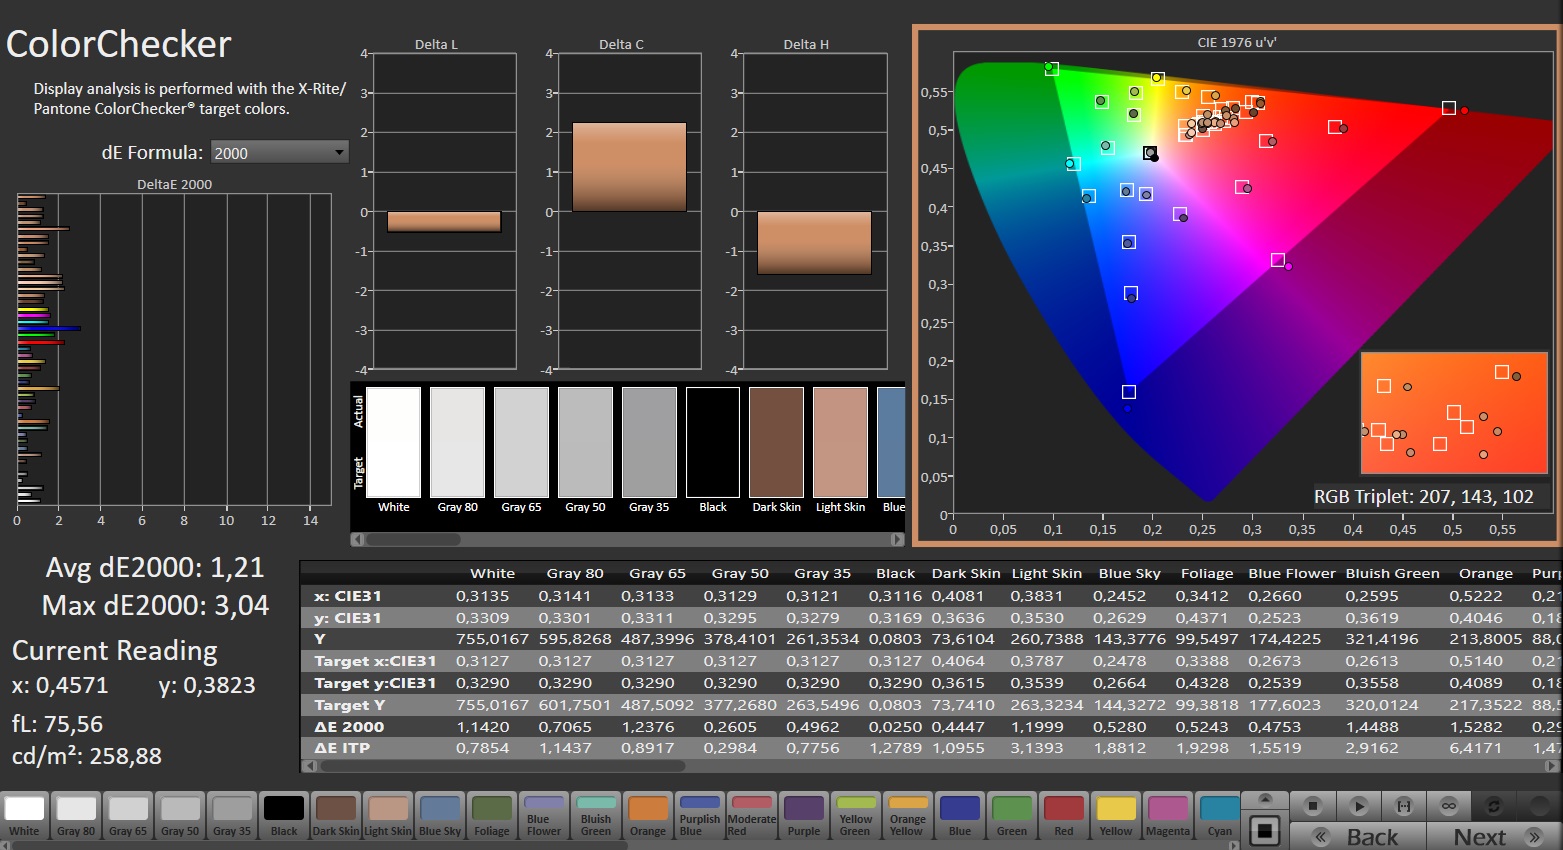
ΔE ColorChecker Calman: 1.52 | ∀{0.5-29.43 Ø4.71}
calibrated: 1.21
ΔE Greyscale Calman: 1.7 | ∀{0.09-98 Ø4.96}
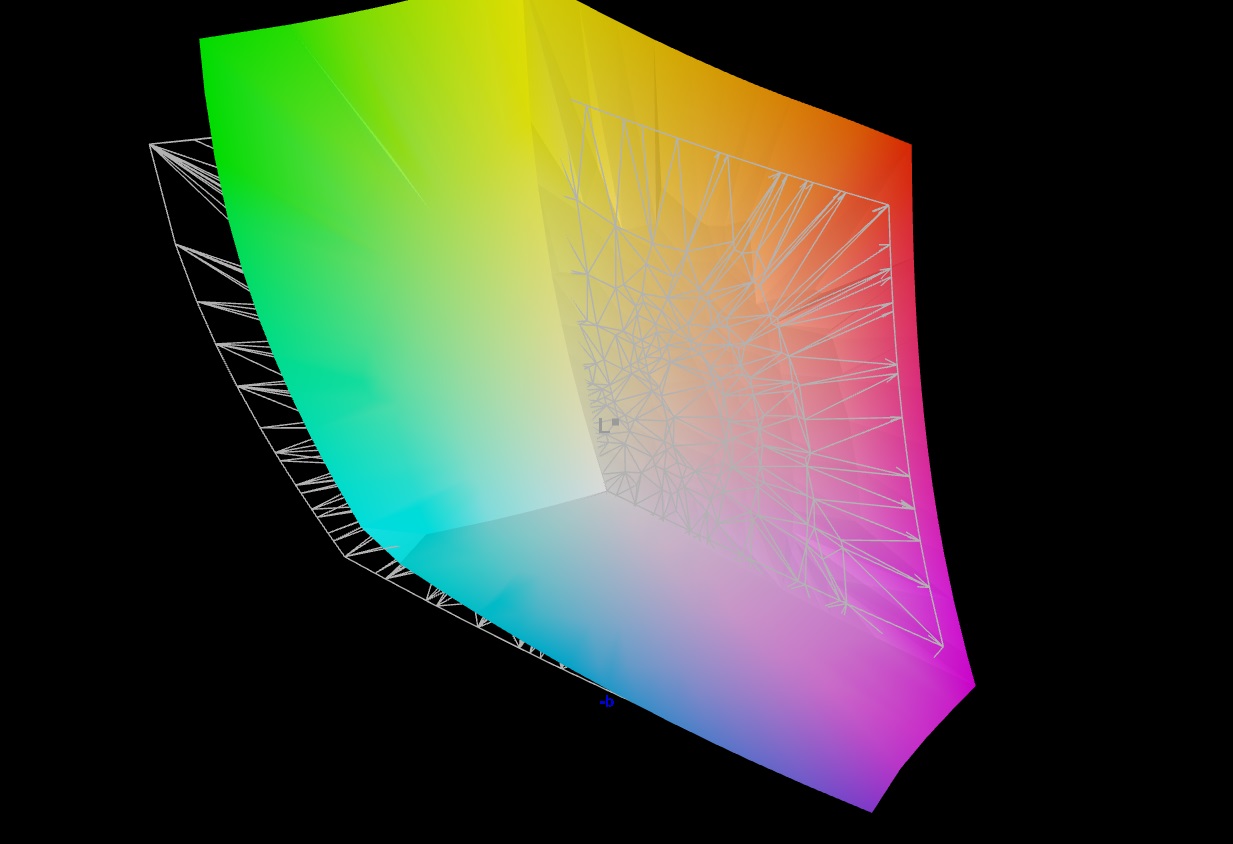
90% AdobeRGB 1998 (Argyll 3D)
100% sRGB (Argyll 3D)
99.9% Display P3 (Argyll 3D)
Gamma: 2.042
CCT: 6578 K
| Asus ROG Strix Scar 18 G834JYR (2024) BOE NE180QDM-NM1, Mini LED, 2560x1600, 18" | Alienware m18 R1 AMD BOE NE18NZ1, IPS, 1920x1200, 18" | Alienware m18 R1 Chi Mei 180JME, IPS, 1920x1200, 18" | Acer Predator Helios 18 N23Q2 AUO45A8 (B180QAN01.2), IPS, 2560x1600, 18" | Razer Blade 18 RTX 4070 AU Optronics B180QAN01.0, IPS, 2560x1600, 18" | MSI Titan 18 HX A14VIG AU Optronics B180ZAN01.0, Mini-LED, 3840x2400, 18" | Asus ROG Strix Scar 18 2023 G834JY-N6005W NE180QDM-NZ2, IPS, 2560x1600, 18" | |
|---|---|---|---|---|---|---|---|
| Display | -1% | -1% | 1% | -3% | -2% | -3% | |
| Display P3 Coverage (%) | 99.9 | 98.5 -1% | 97.7 -2% | 99.8 0% | 96.9 -3% | 98.1 -2% | 97.2 -3% |
| sRGB Coverage (%) | 100 | 99.7 0% | 100 0% | 100 0% | 99.8 0% | 99.8 0% | 99.9 0% |
| AdobeRGB 1998 Coverage (%) | 90 | 88.7 -1% | 89.8 0% | 91.8 2% | 85.3 -5% | 86.2 -4% | 84.9 -6% |
| Response Times | 44% | 41% | -15% | 45% | -318% | 37% | |
| Response Time Grey 50% / Grey 80% * (ms) | 12 ? | 2.8 ? 77% | 3 ? 75% | 7.6 ? 37% | 4.2 ? 65% | 8.6 ? 28% | 5.41 ? 55% |
| Response Time Black / White * (ms) | 10.7 ? | 9.6 ? 10% | 9.9 ? 7% | 17.8 ? -66% | 8 ? 25% | 81.8 ? -664% | 8.62 ? 19% |
| PWM Frequency (Hz) | 5733 ? | 2509 | 2592 ? | ||||
| Screen | -42% | -64% | -114% | -142% | -85% | -211% | |
| Brightness middle (cd/m²) | 937 | 319.6 -66% | 372.8 -60% | 360 -62% | 549.6 -41% | 467.5 -50% | 490 -48% |
| Brightness (cd/m²) | 934 | 304 -67% | 367 -61% | 355 -62% | 524 -44% | 459 -51% | 468 -50% |
| Brightness Distribution (%) | 89 | 87 -2% | 97 9% | 92 3% | 89 0% | 90 1% | 86 -3% |
| Black Level * (cd/m²) | 0.066 | 0.25 -279% | 0.32 -385% | 0.21 -218% | 0.53 -703% | 0.54 -718% | |
| Contrast (:1) | 14197 | 1278 -91% | 1165 -92% | 1714 -88% | 1037 -93% | 907 -94% | |
| Colorchecker dE 2000 * | 1.52 | 1.22 20% | 1.92 -26% | 3.82 -151% | 3.32 -118% | 3.77 -148% | 4.97 -227% |
| Colorchecker dE 2000 max. * | 2.82 | 3.1 -10% | 3.65 -29% | 7.38 -162% | 6.63 -135% | 6.12 -117% | 11.02 -291% |
| Colorchecker dE 2000 calibrated * | 1.21 | 0.47 61% | 0.51 58% | 2.24 -85% | 2.7 -123% | 2.94 -143% | 2.97 -145% |
| Greyscale dE 2000 * | 1.7 | 0.8 53% | 1.5 12% | 5.06 -198% | 2 -18% | 3.2 -88% | 7.2 -324% |
| Gamma | 2.042 108% | 2.23 99% | 2.34 94% | 2.52 87% | 2.29 96% | 2.43 91% | 2.161 102% |
| CCT | 6578 99% | 6471 100% | 6607 98% | 5657 115% | 6319 103% | 6478 100% | 6515 100% |
| Média Total (Programa/Configurações) | 0% /
-21% | -8% /
-35% | -43% /
-75% | -33% /
-85% | -135% /
-103% | -59% /
-131% |
* ... menor é melhor
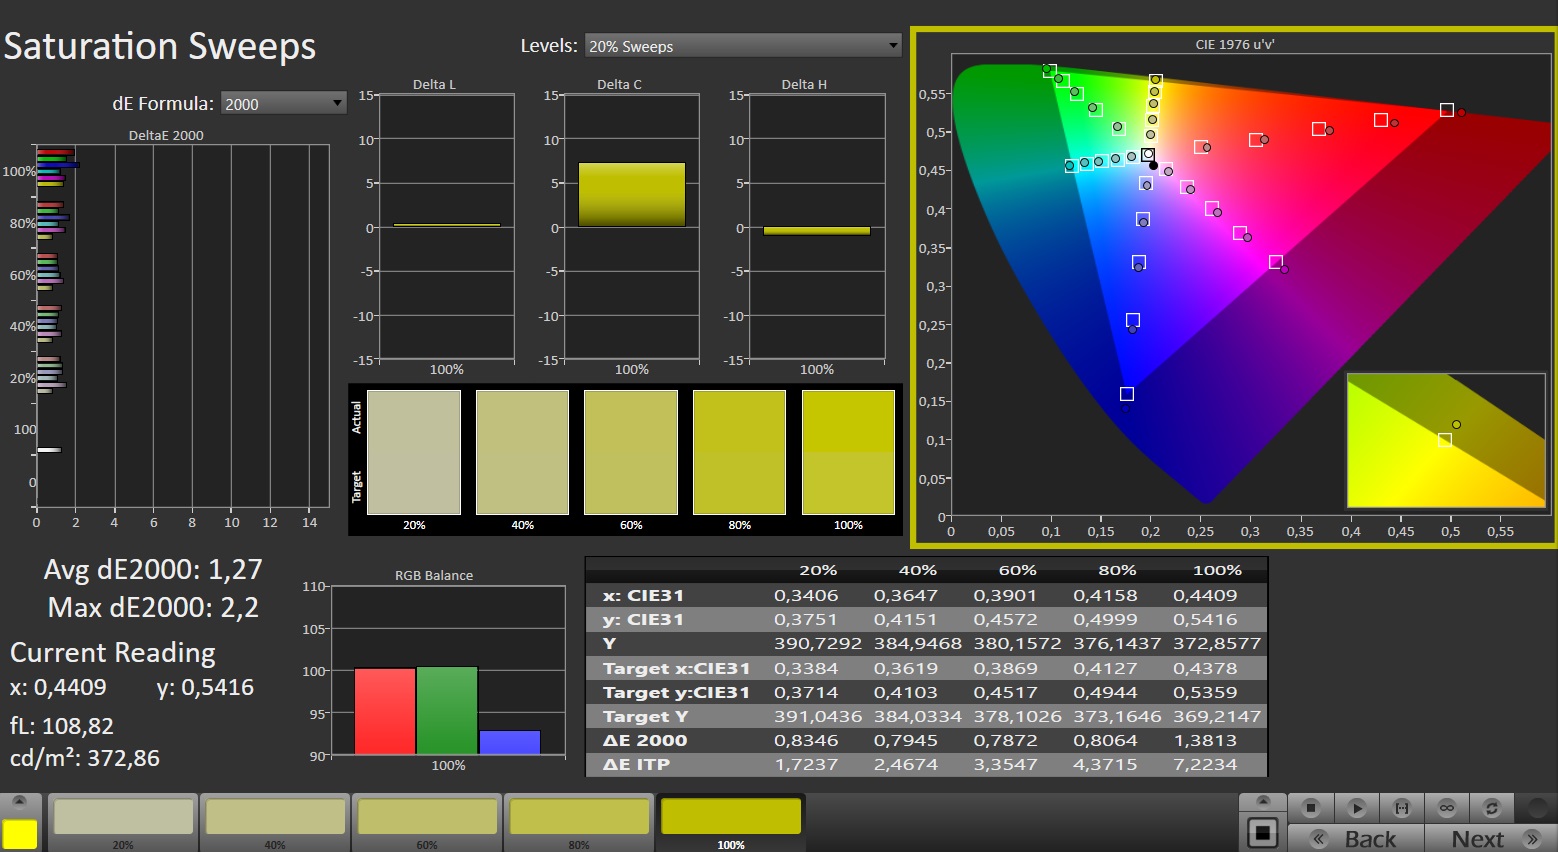
A precisão das cores é um dado adquirido, com os espaços de cores sRGB e DCI-P3 totalmente cobertos e o espaço de cores Adobe RGB com 90%. Graças à certificação Pantone, a reprodução de cores já é muito boa no estado de entrega e, com um desvio de 1,52, a meta de DeltaE < 3 é atingida. Embora uma calibração adicional ainda consiga uma ligeira melhoria, isso se refere principalmente a uma escala de cinza mais equilibrada.

Exibir tempos de resposta
| ↔ Tempo de resposta preto para branco | ||
|---|---|---|
| 10.7 ms ... ascensão ↗ e queda ↘ combinadas | ↗ 7.6 ms ascensão | 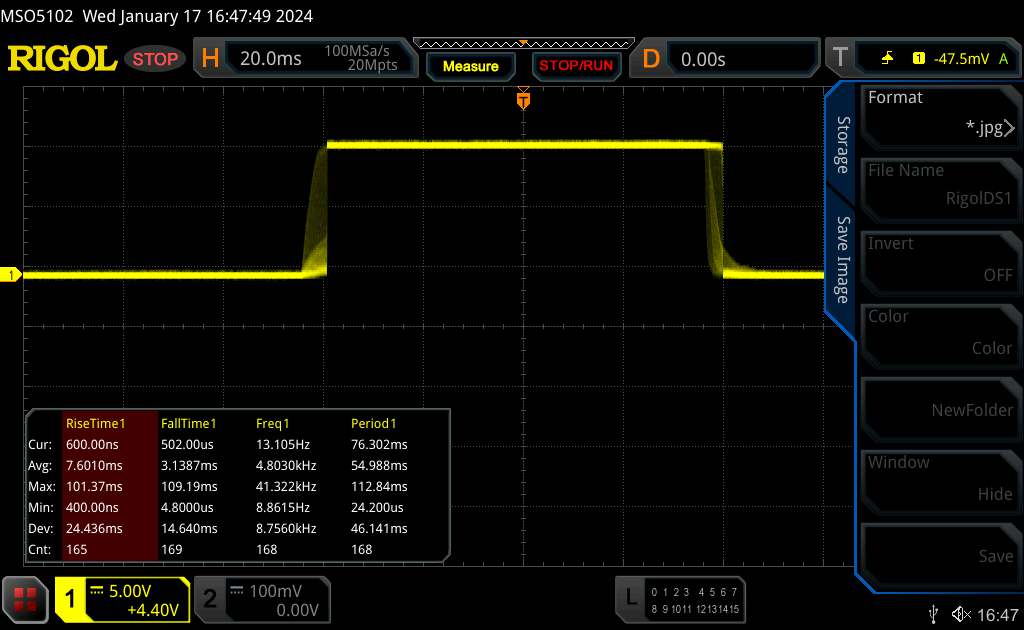 |
| ↘ 3.1 ms queda | ||
| A tela mostra boas taxas de resposta em nossos testes, mas pode ser muito lenta para jogadores competitivos. Em comparação, todos os dispositivos testados variam de 0.1 (mínimo) a 240 (máximo) ms. » 29 % de todos os dispositivos são melhores. Isso significa que o tempo de resposta medido é melhor que a média de todos os dispositivos testados (19.8 ms). | ||
| ↔ Tempo de resposta 50% cinza a 80% cinza | ||
| 12 ms ... ascensão ↗ e queda ↘ combinadas | ↗ 8 ms ascensão | |
| ↘ 4 ms queda | ||
| A tela mostra boas taxas de resposta em nossos testes, mas pode ser muito lenta para jogadores competitivos. Em comparação, todos os dispositivos testados variam de 0.165 (mínimo) a 636 (máximo) ms. » 25 % de todos os dispositivos são melhores. Isso significa que o tempo de resposta medido é melhor que a média de todos os dispositivos testados (31 ms). | ||
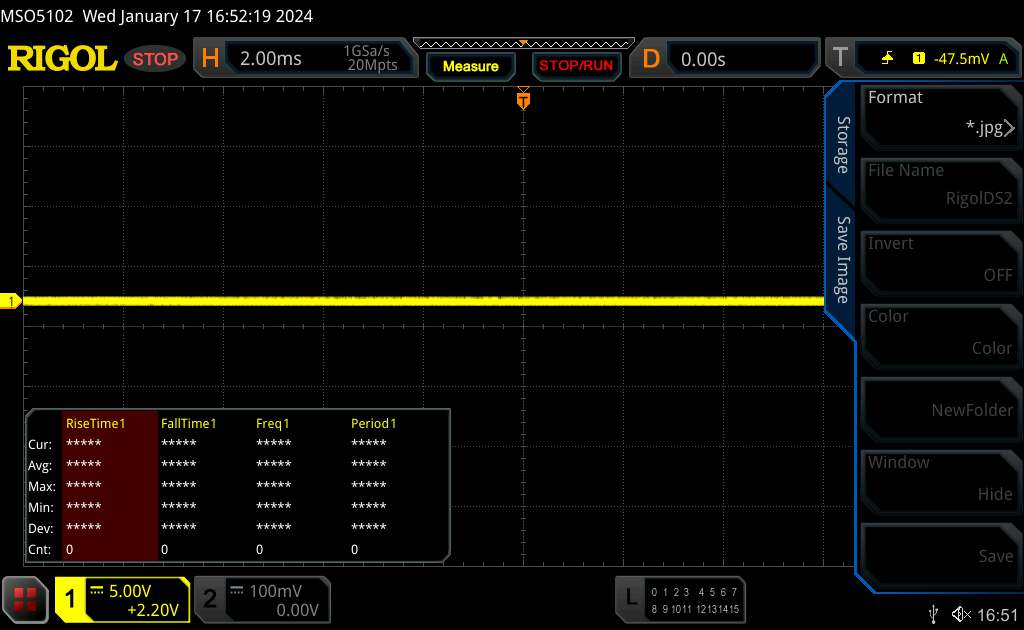
Cintilação da tela / PWM (modulação por largura de pulso)
| Tela tremeluzindo/PWM detectado | 5733 Hz | |
| ≤ 94 brilho cd/m² | ||
A luz de fundo da tela pisca em 5733 Hz (pior caso, por exemplo, utilizando PWM) Cintilação detectada em uma configuração de brilho de 94 cd/m² e abaixo. Não deve haver cintilação ou PWM acima desta configuração de brilho. A frequência de 5733 Hz é bastante alta, então a maioria dos usuários sensíveis ao PWM não deve notar nenhuma oscilação. A cintilação ocorre em configurações de brilho relativamente baixas, portanto, o uso prolongado nesta configuração de brilho ou inferior pode causar fadiga ocular. [pwm_comparison] Em comparação: 52 % de todos os dispositivos testados não usam PWM para escurecer a tela. Se PWM foi detectado, uma média de 7757 (mínimo: 5 - máximo: 343500) Hz foi medida. | ||
O painel IPS tem ângulos de visão estáveis e pode ser lido de praticamente qualquer ângulo. O alto brilho máximo também permite a leitura do conteúdo da tela em ambientes externos.

Desempenho - O Scar 18 oferece hardware de ponta
O Asus ROG Strix Scar 18 é um laptop de ponta no formato de 18 polegadas. O desempenho de computação necessário é fornecido pelo Raptor Lake Refresh e pelo hardware Ada Lovelace. Os preços começam em 3.600 euros (~$3.878), e nossa unidade de teste atual está disponível por cerca de 4.500 euros (~$4.848).
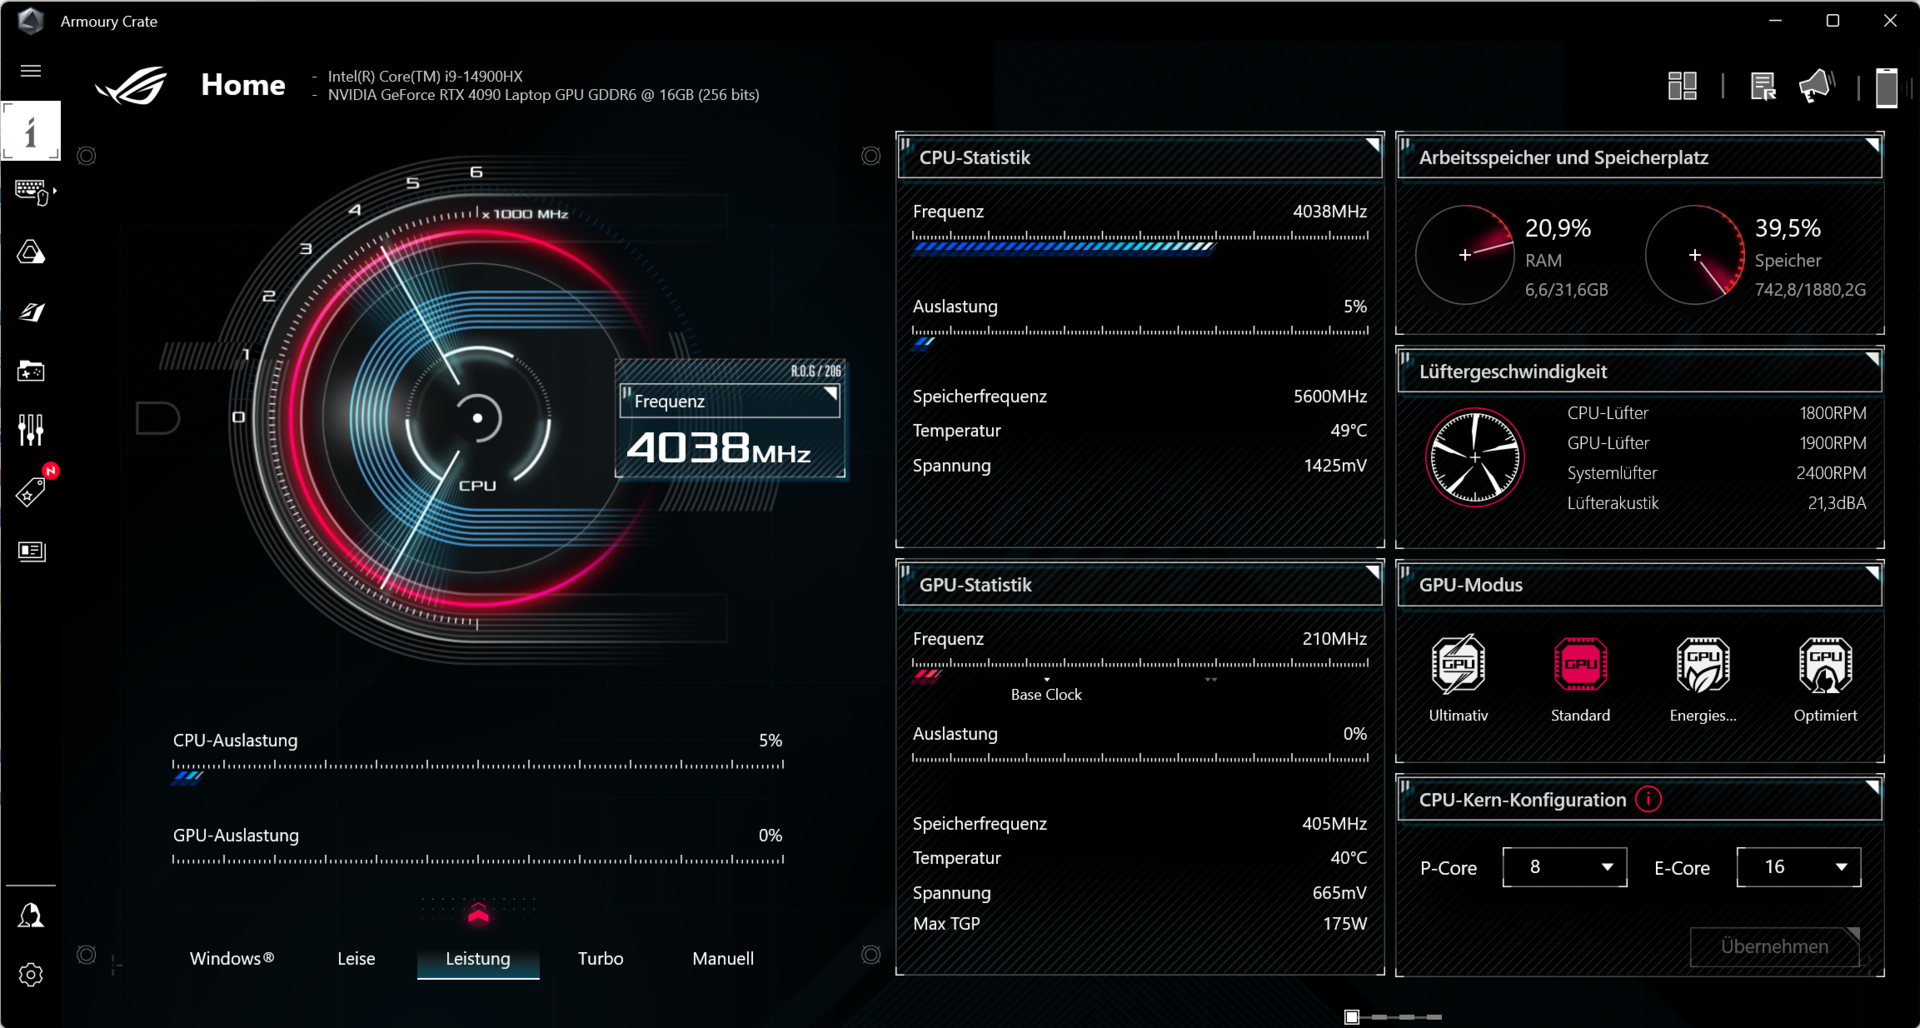
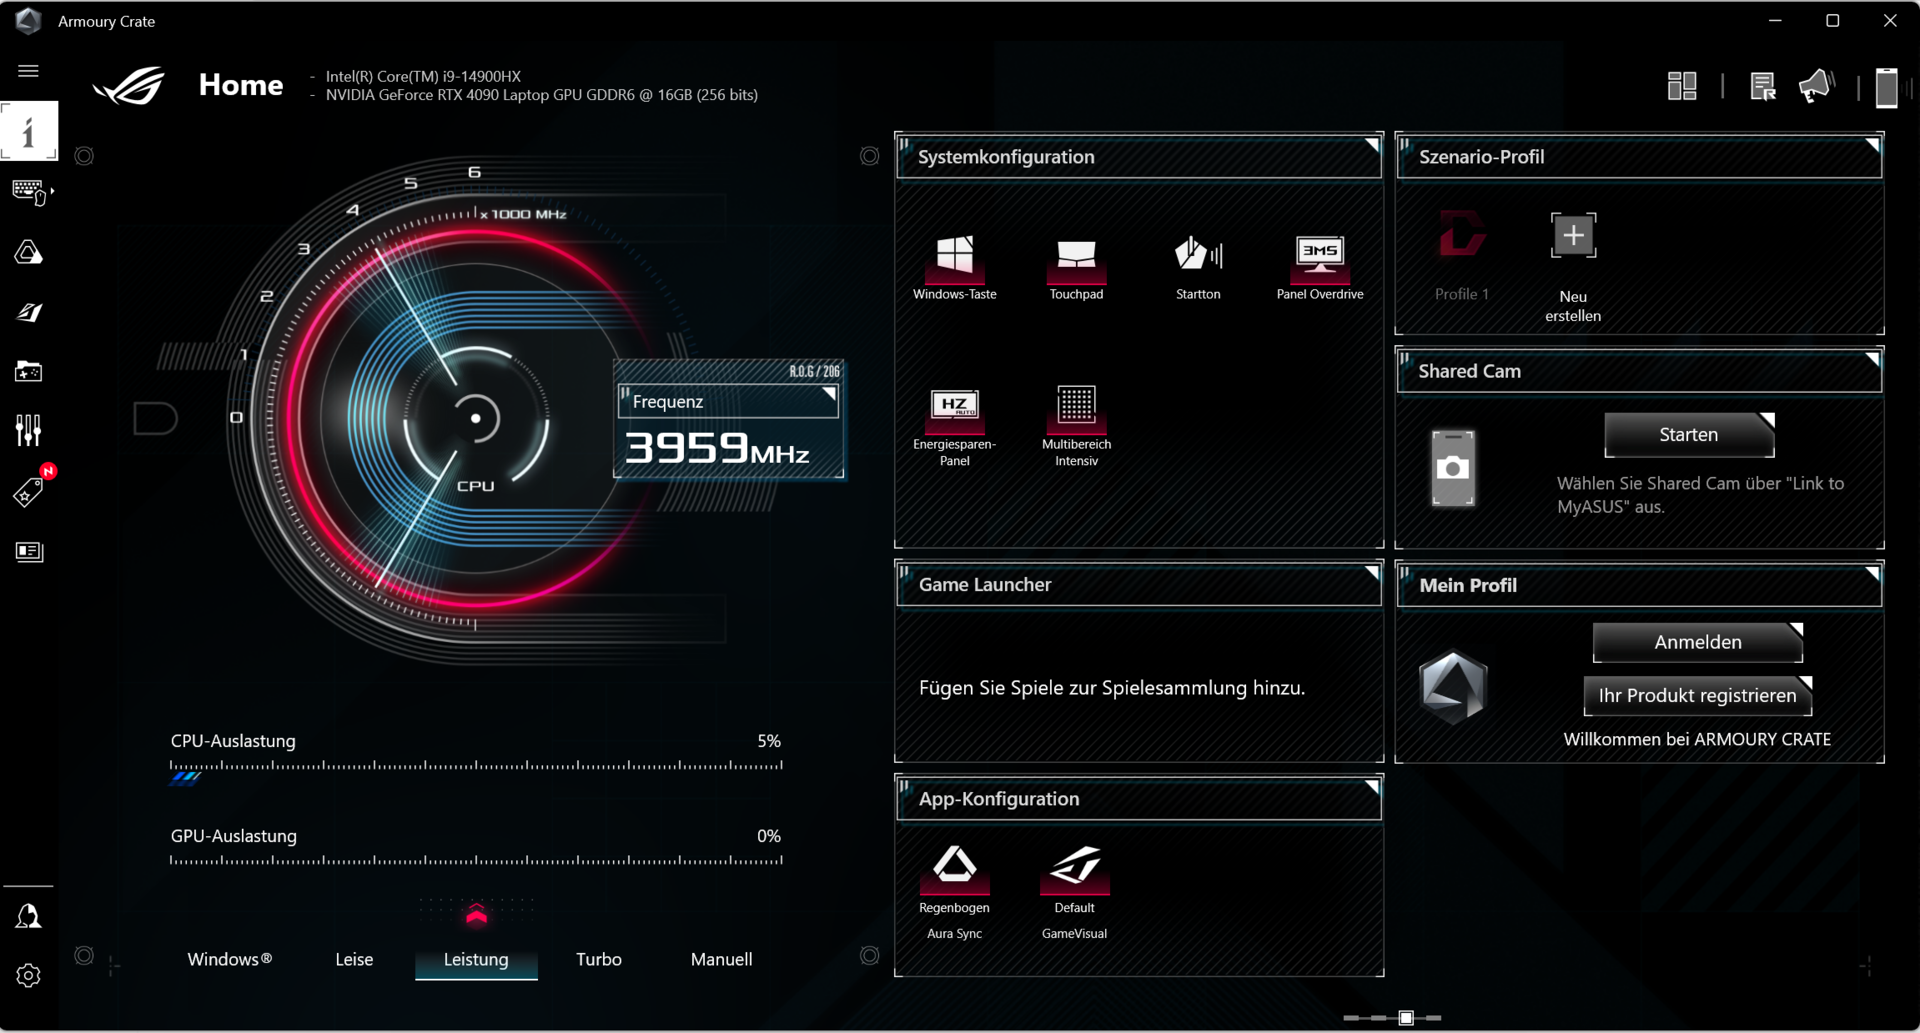
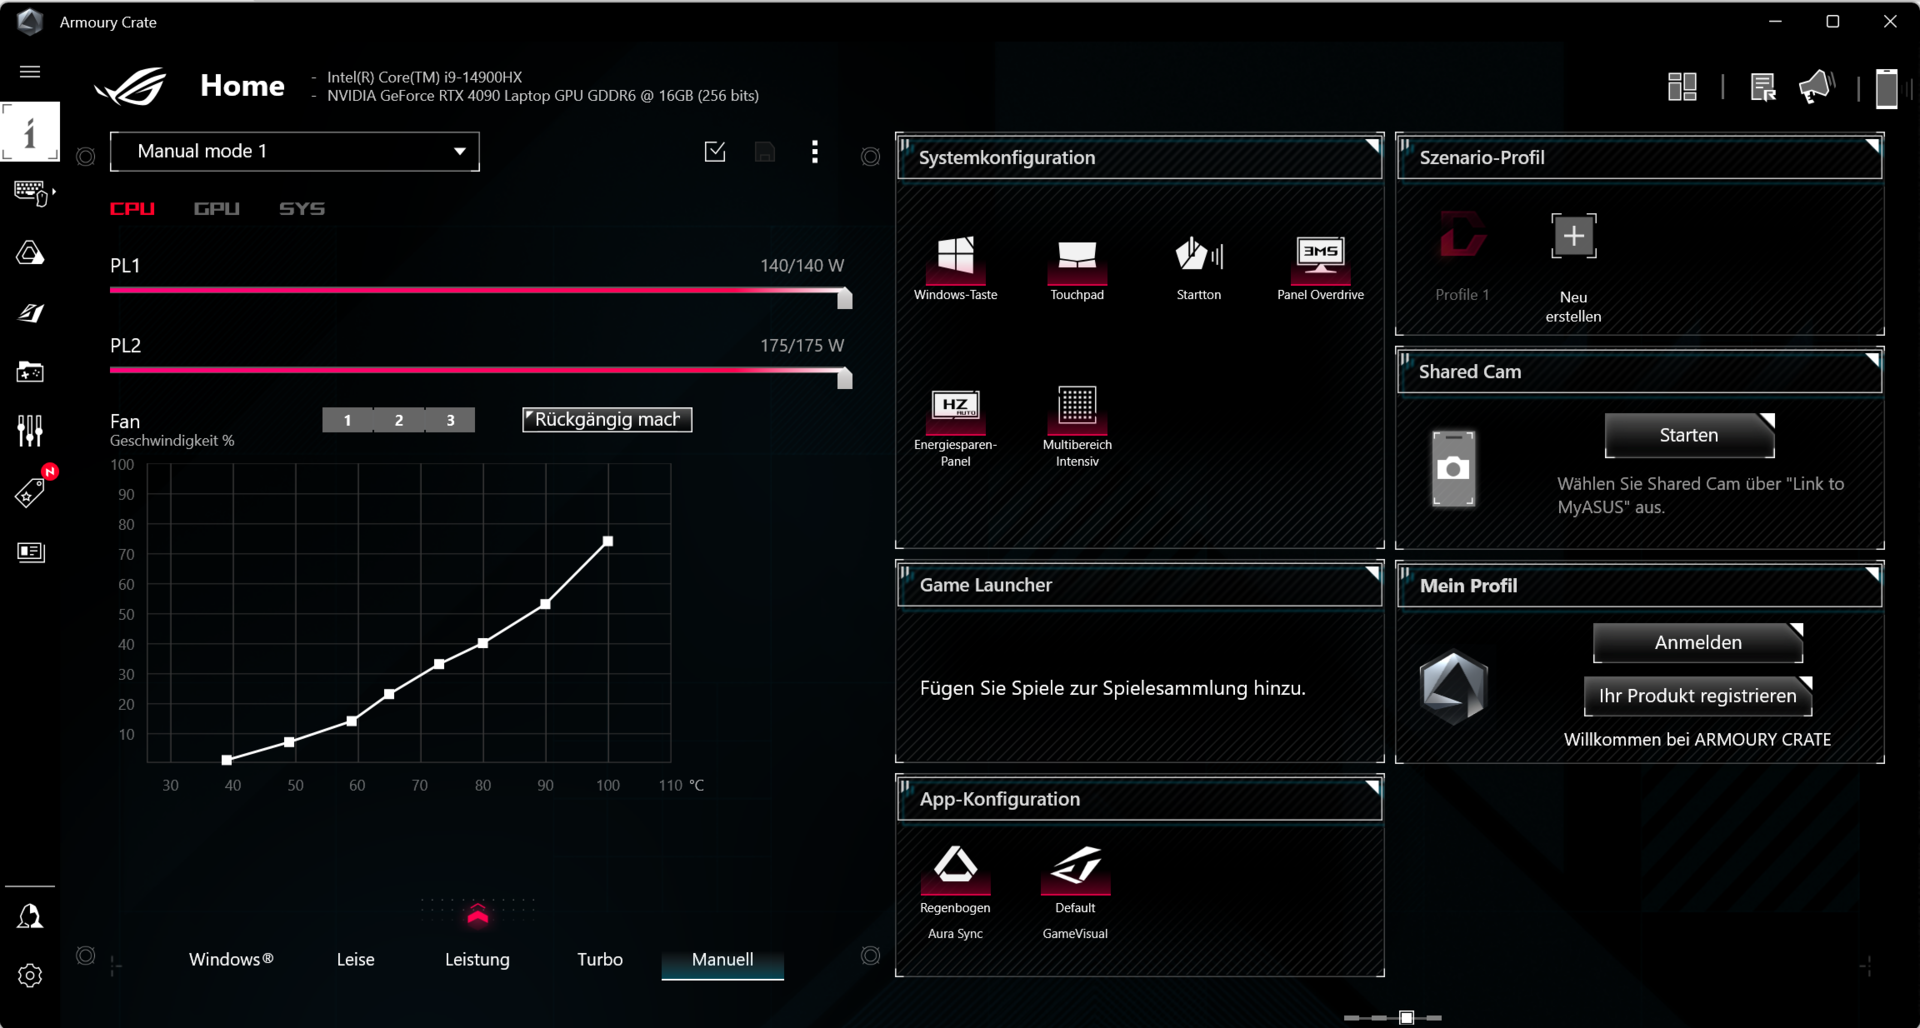
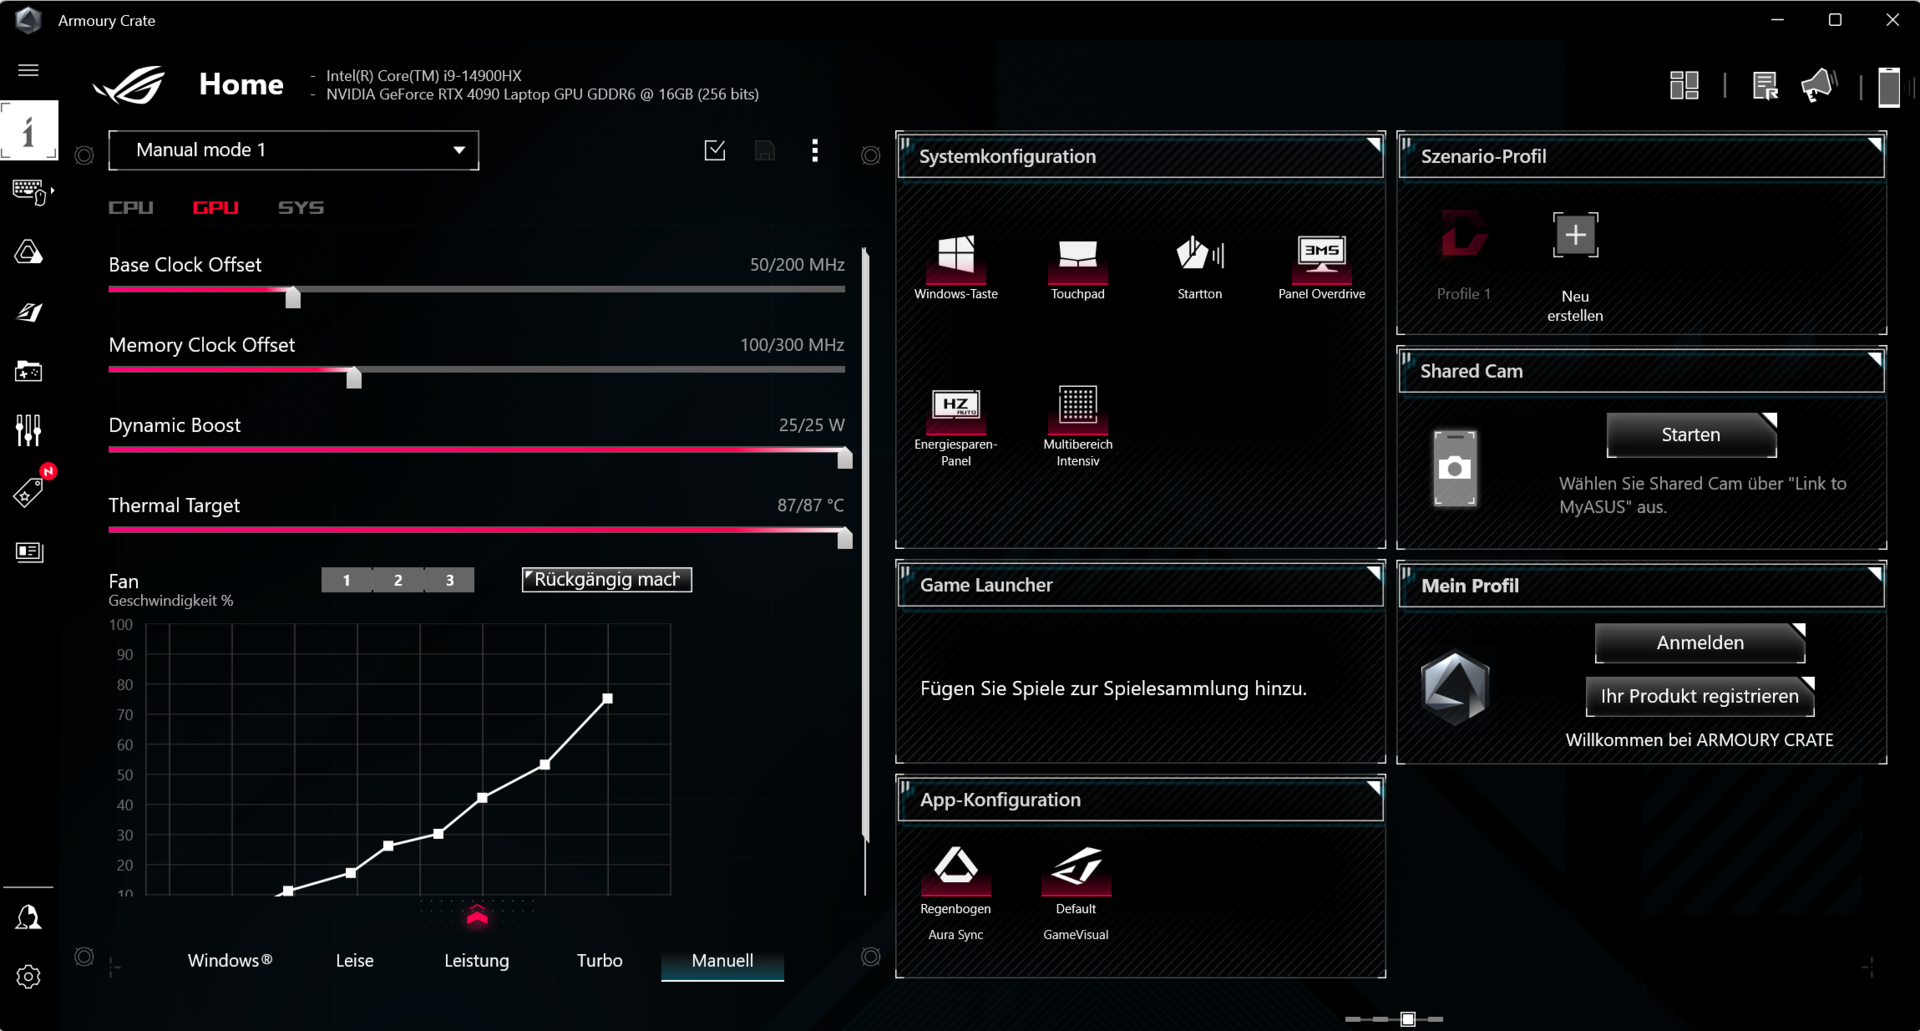
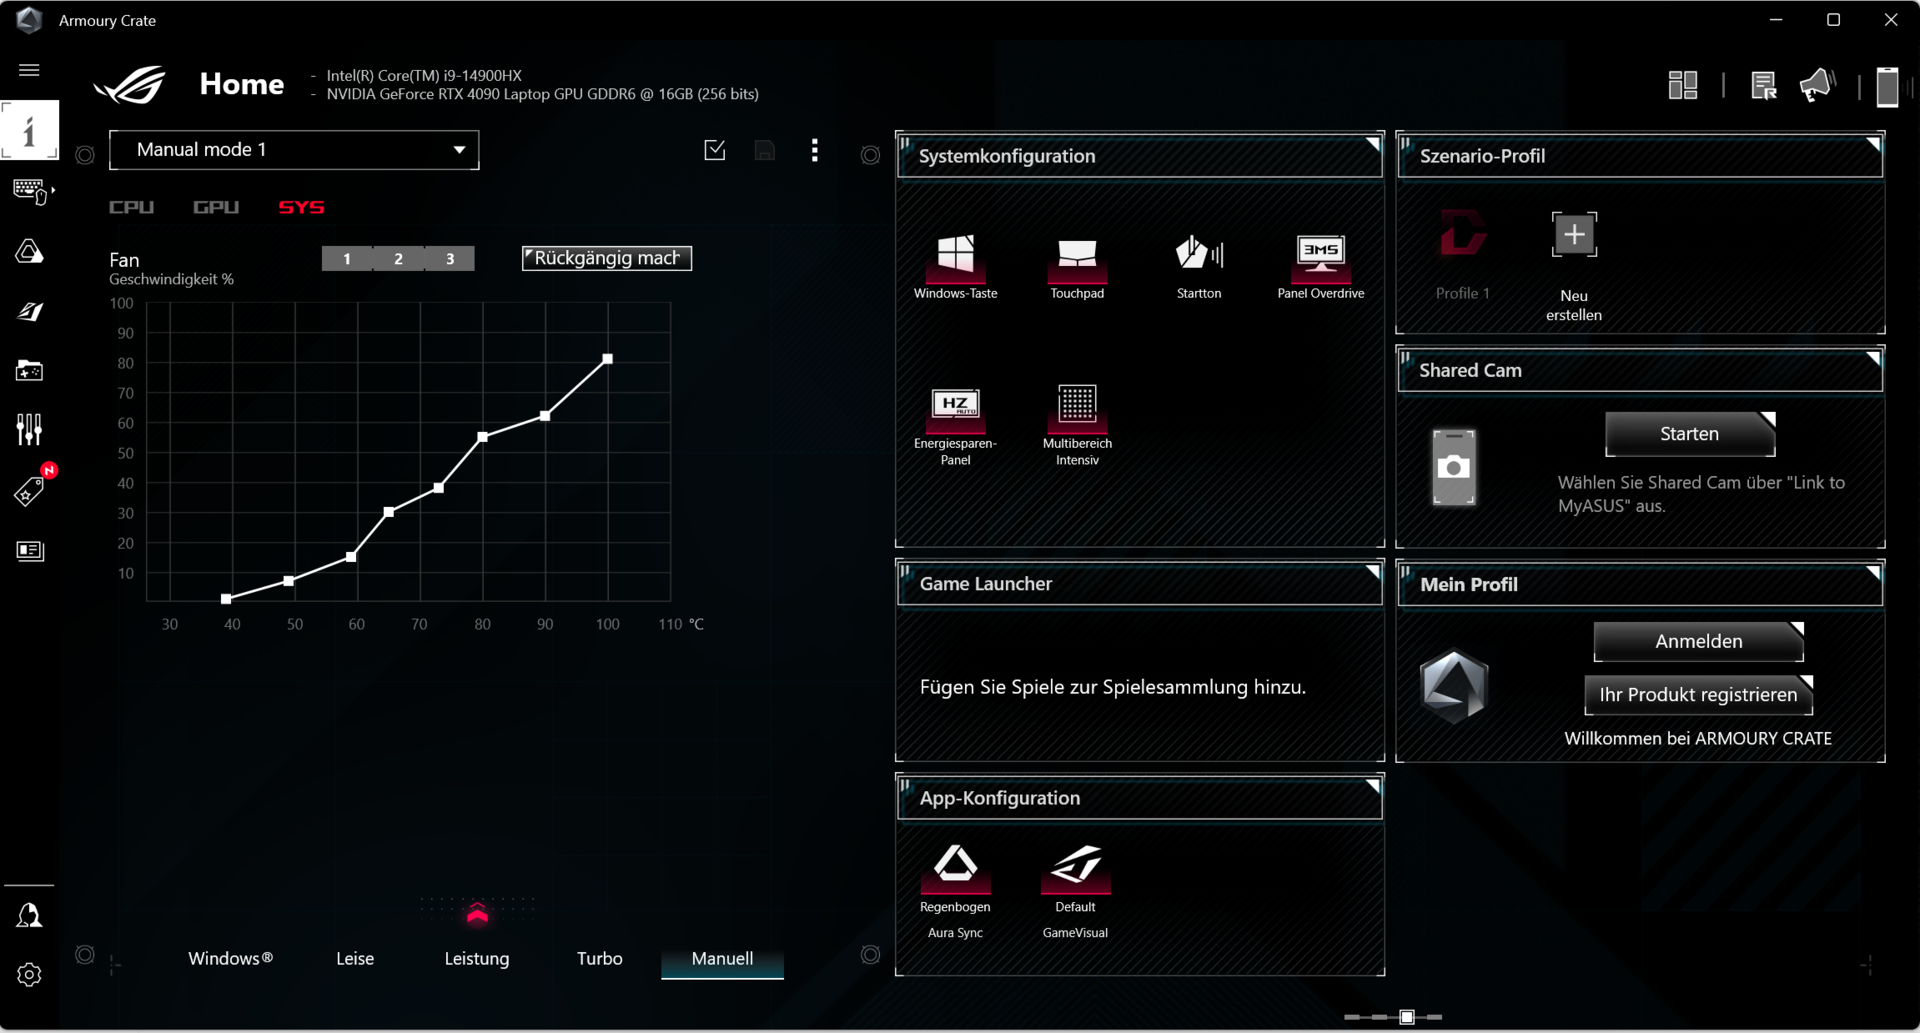
Condições de teste
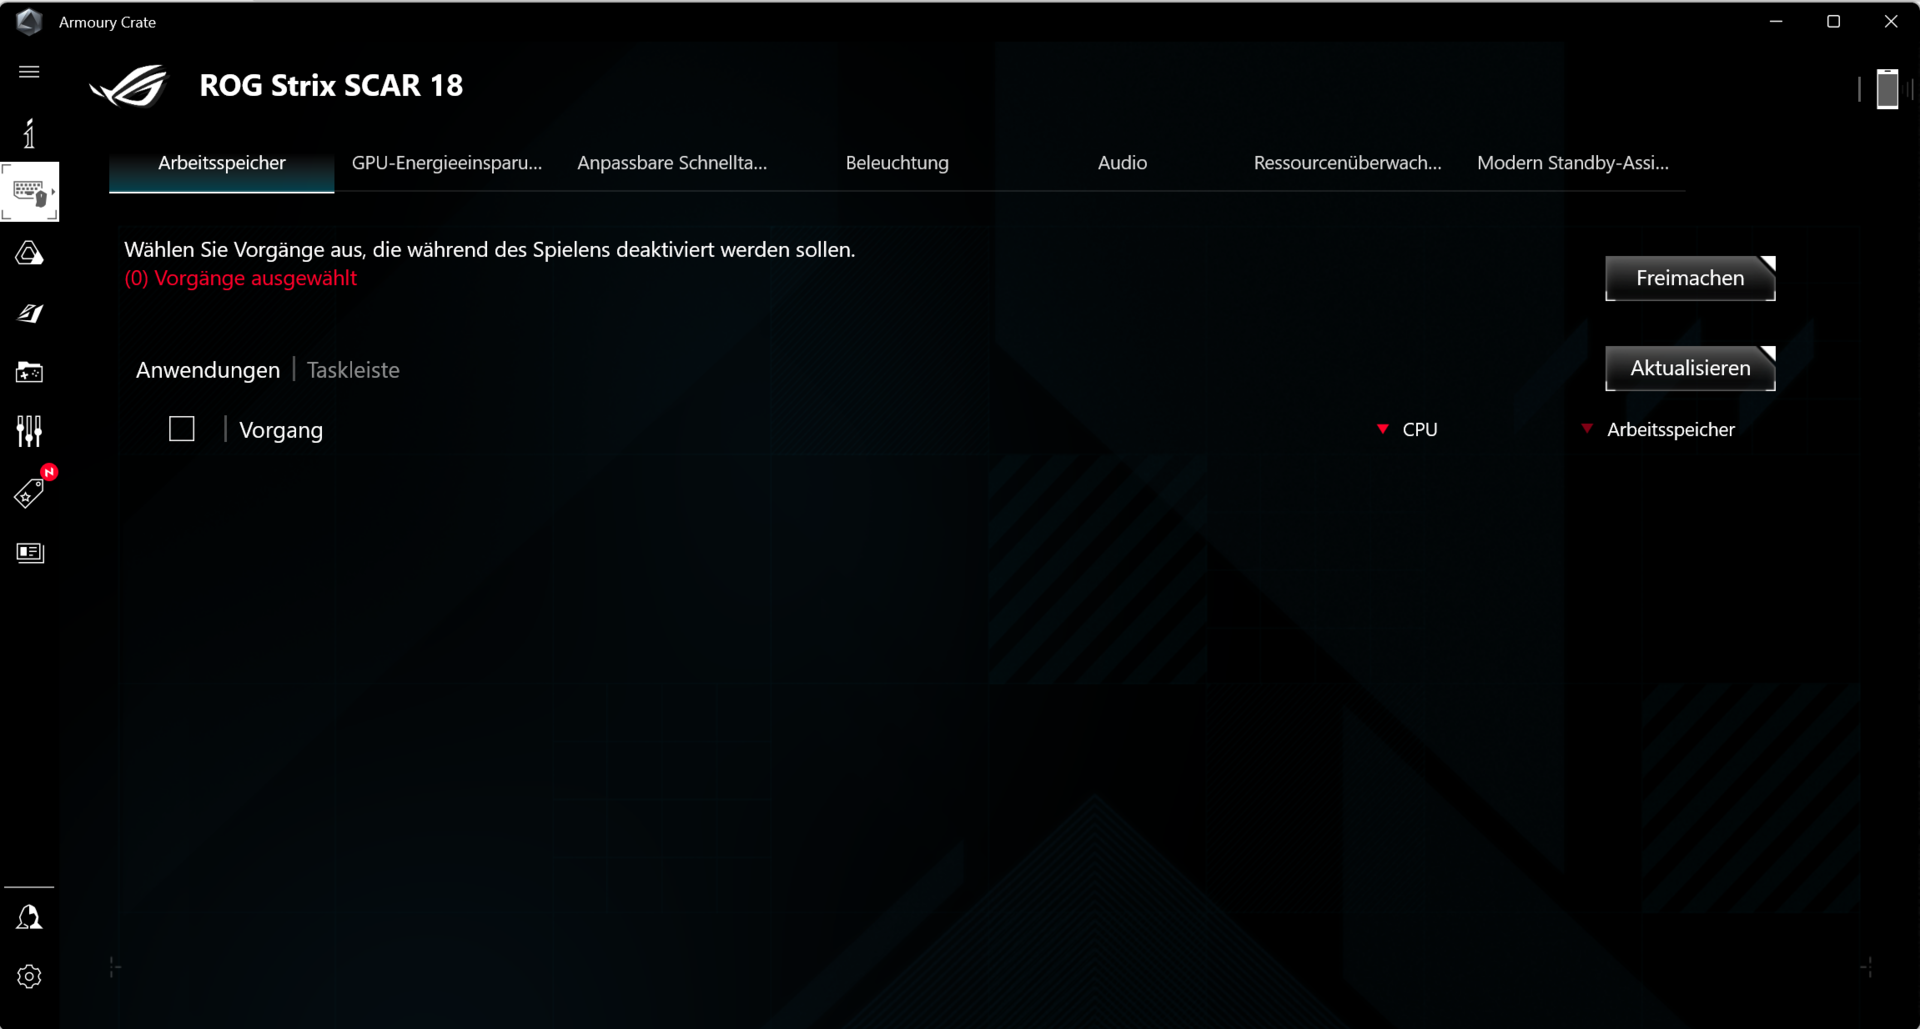
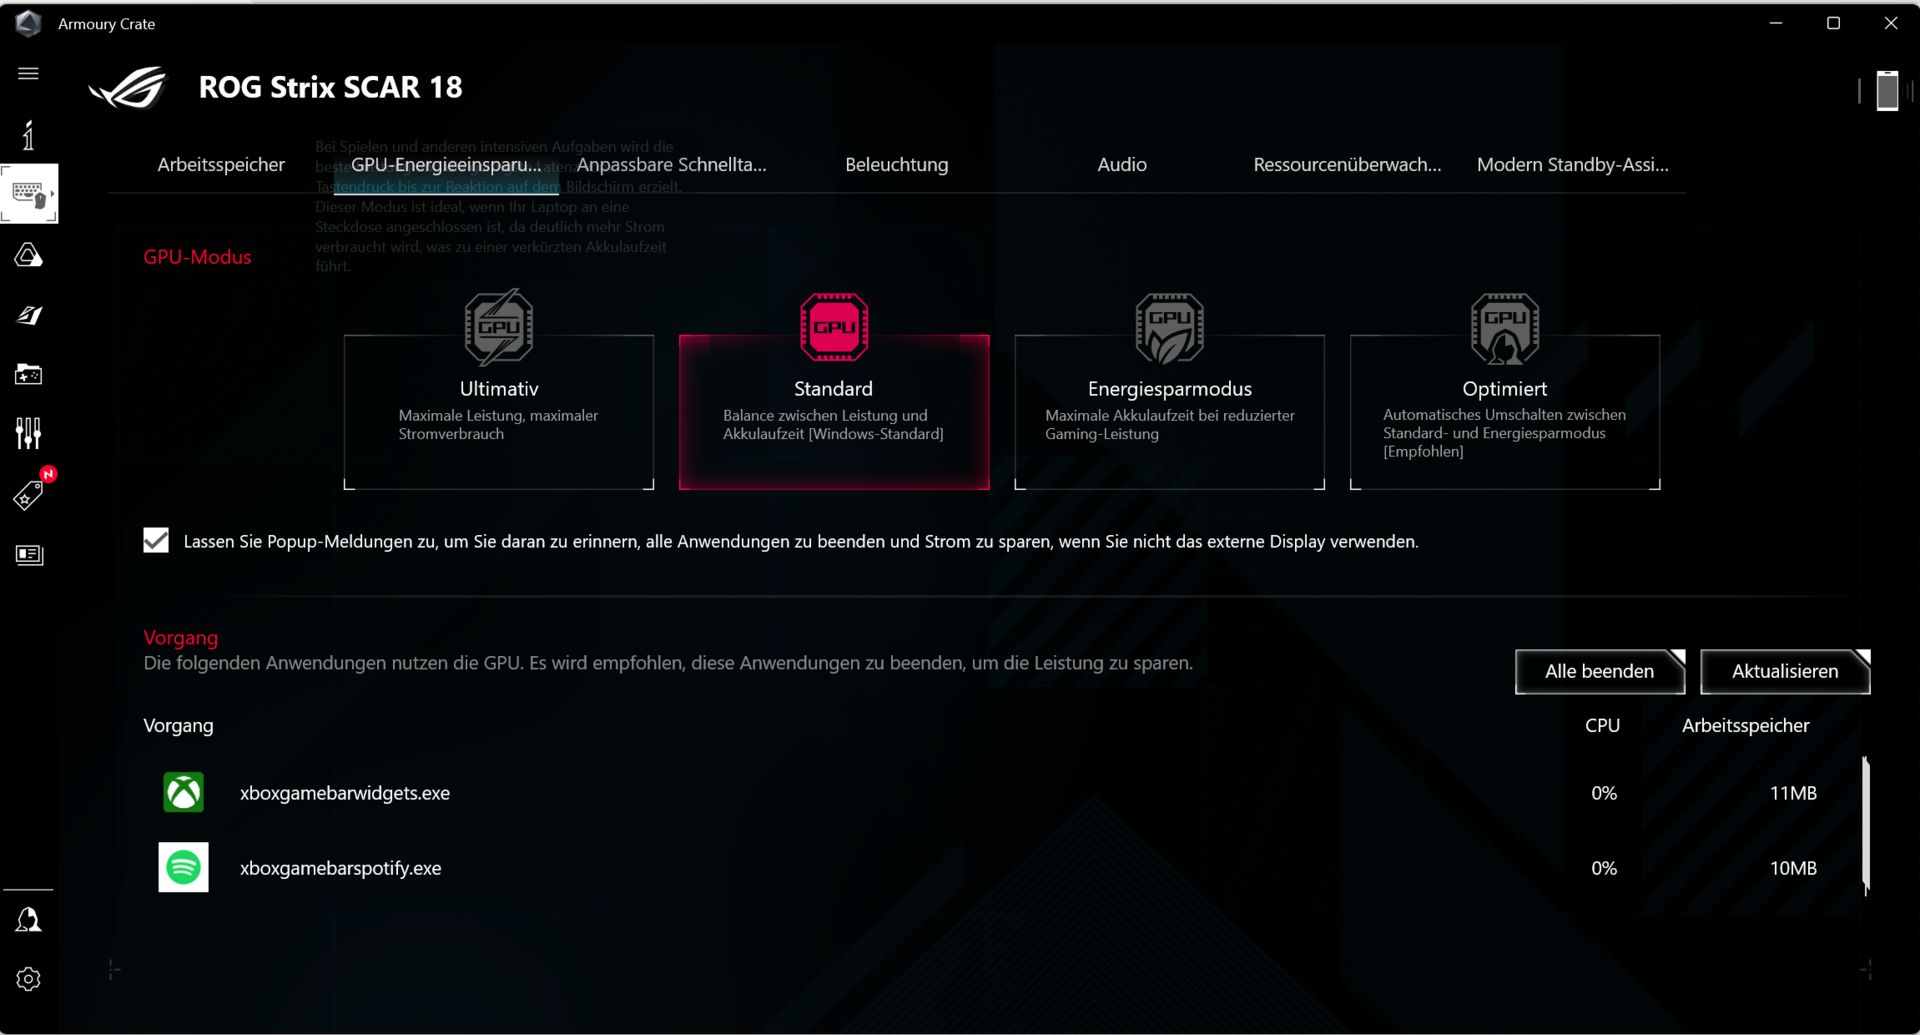
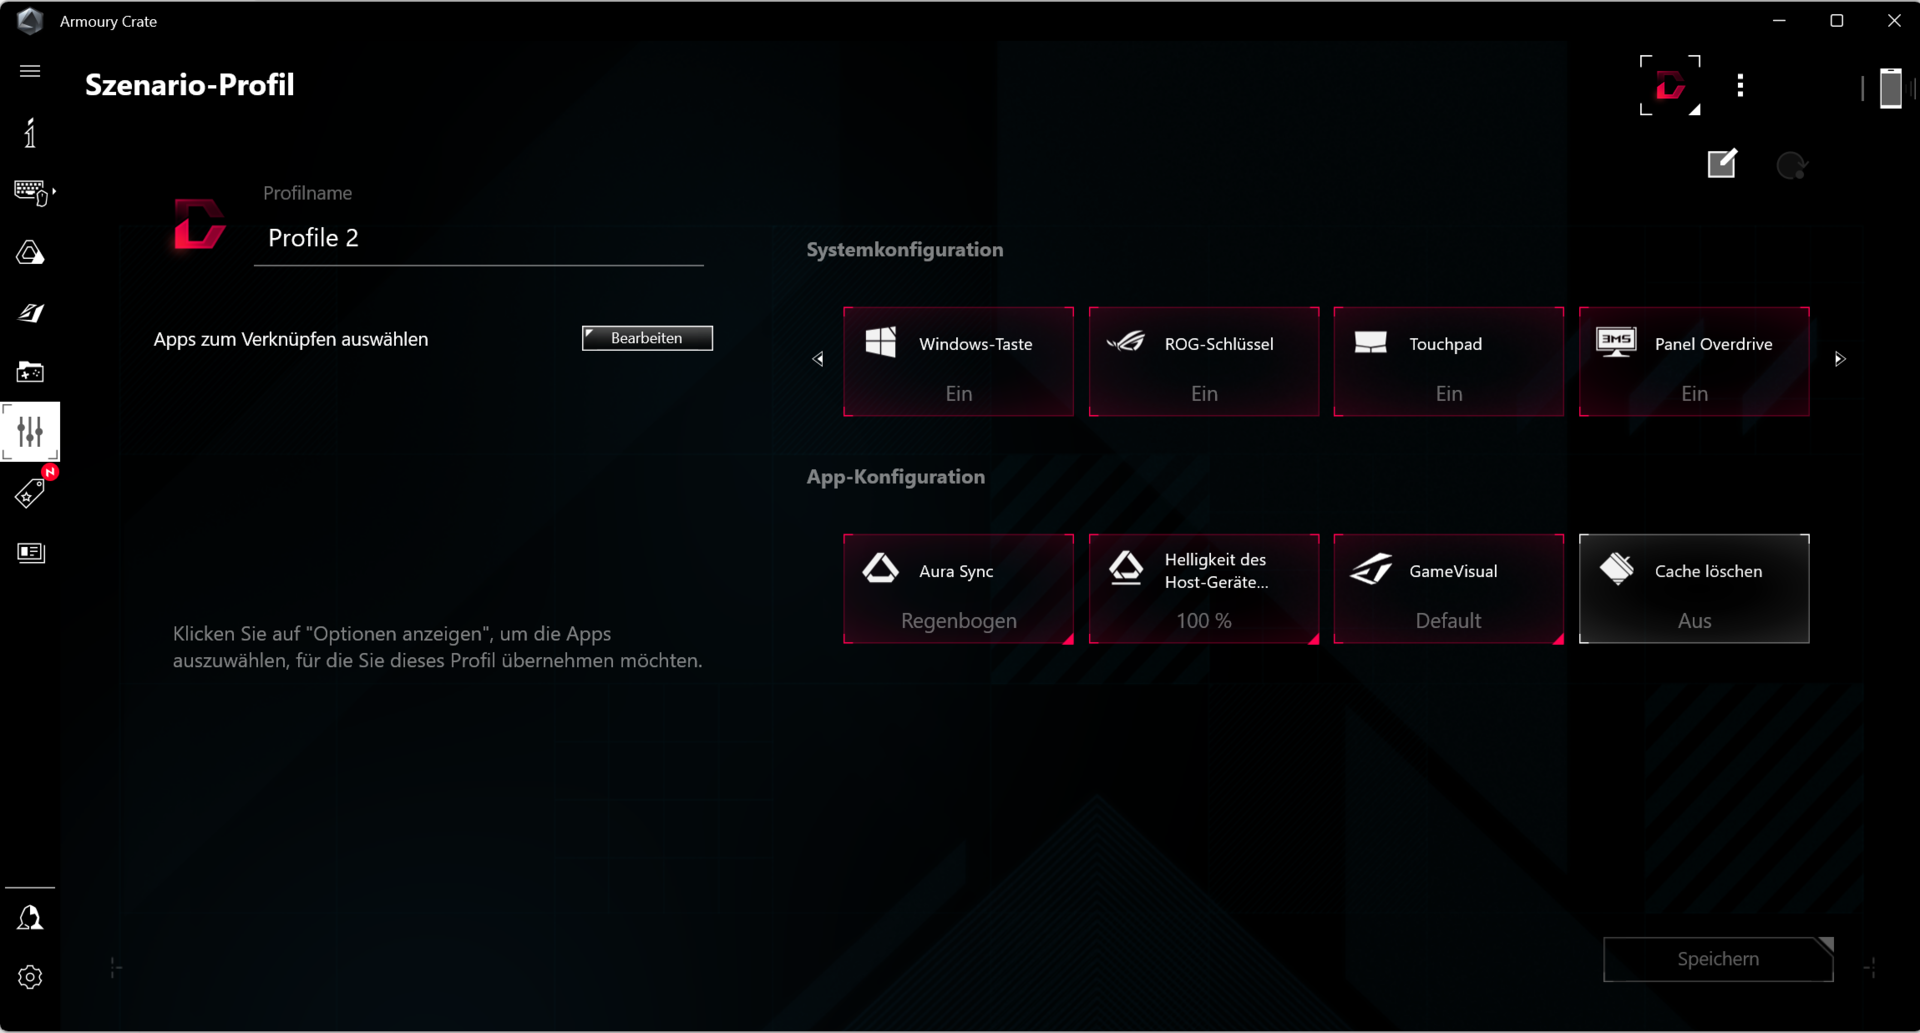
Estão disponíveis três modos de energia pré-configurados pela Asus (consulte a tabela) e o usuário pode alternar entre eles usando a combinação de teclas Fn + F5. Usamos "Performance" para nossos benchmarks e "Silent" para nossos testes de bateria. O modo GPU está definido como "Standard". O centro de controle ("Armory Crate") do laptop permite a criação de perfis individuais ("Manual"), incluindo a configuração dos limites de energia, do Dynamic Boost e das curvas da ventoinha.
| Desempenho | Turbo | Silencioso | |
|---|---|---|---|
| Limite de potência 1 (HWInfo) | 110 Watt | 175 Watt | 65 Watt |
| Limite de potência 2 (HWInfo) | 120 Watt | 175 Watt | 100 Watt |
| Ruído (o Witcher 3) | 50 dB(A) | 56 dB(A) | 35 dB(A) |
| Desempenho ( Witcher 3) | ~188 fps | ~183 fps | ~68 fps |
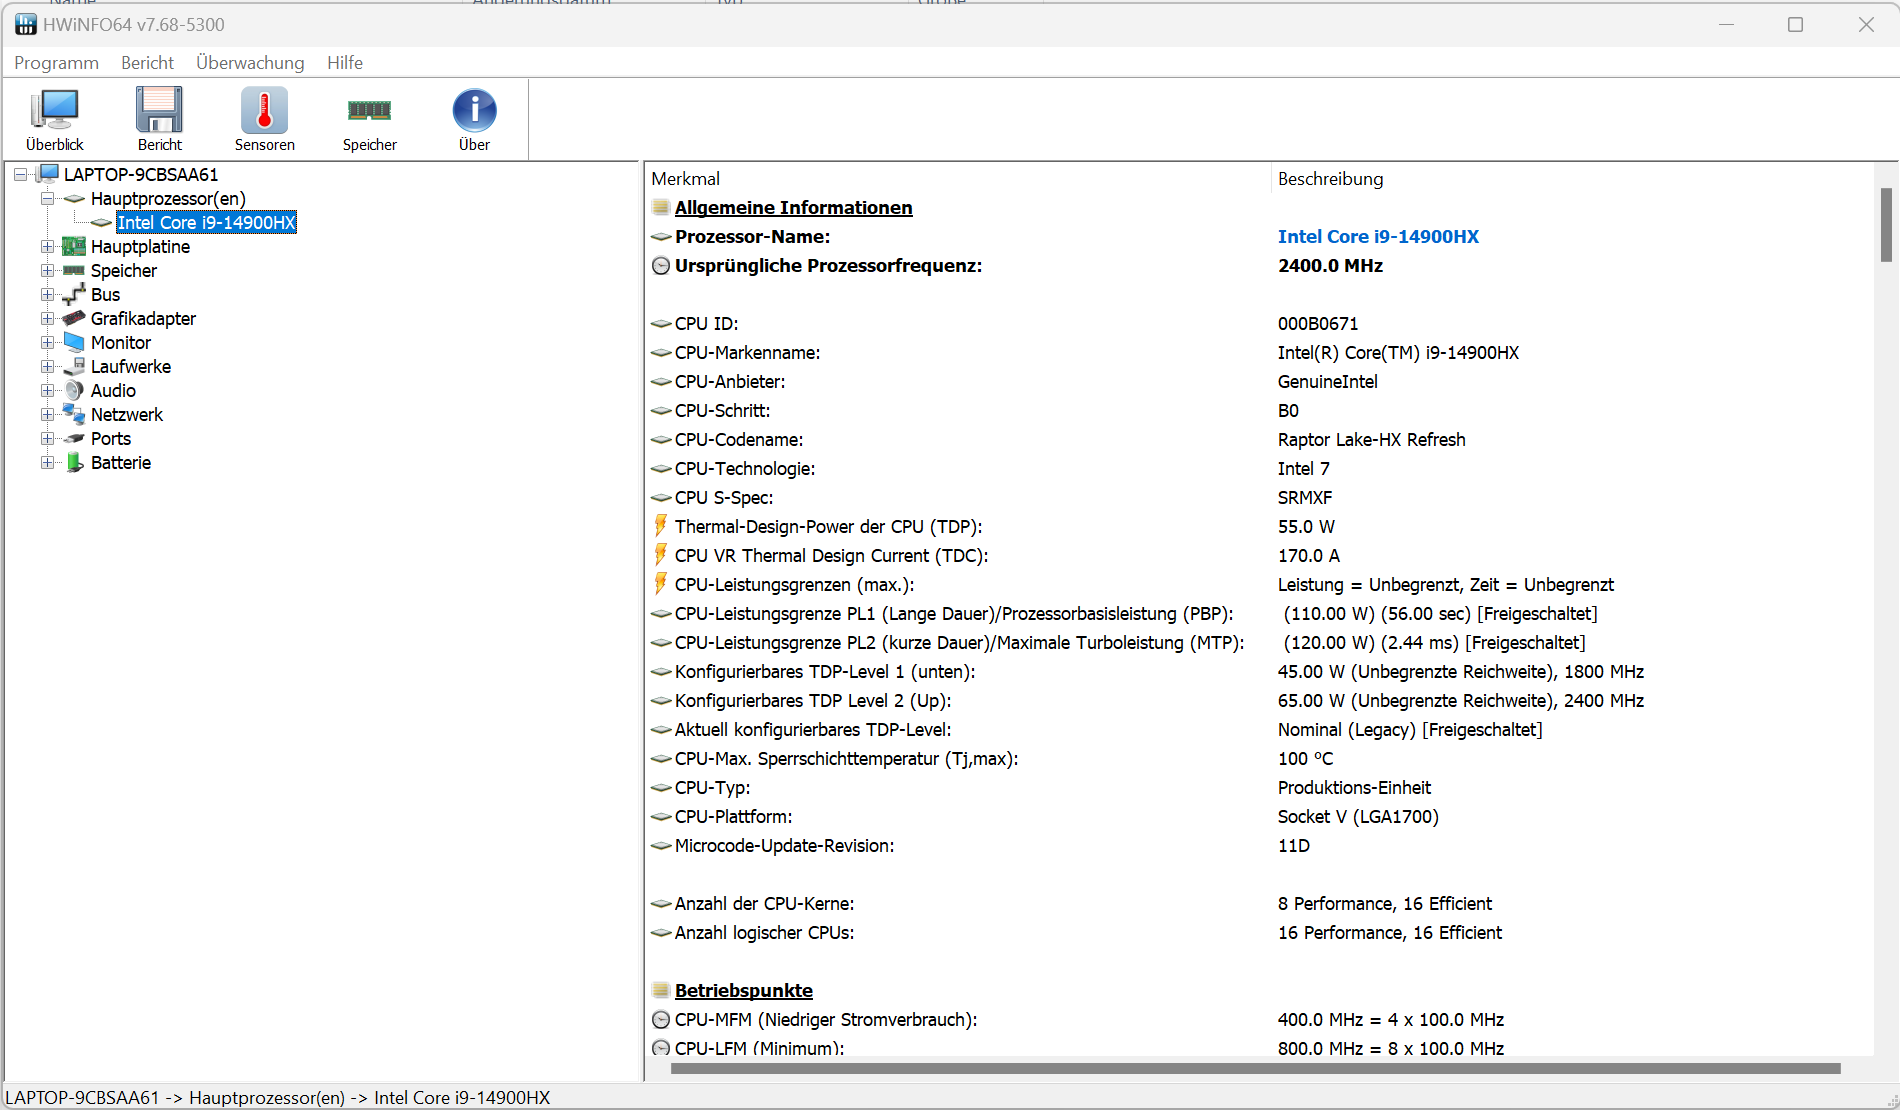
Processador
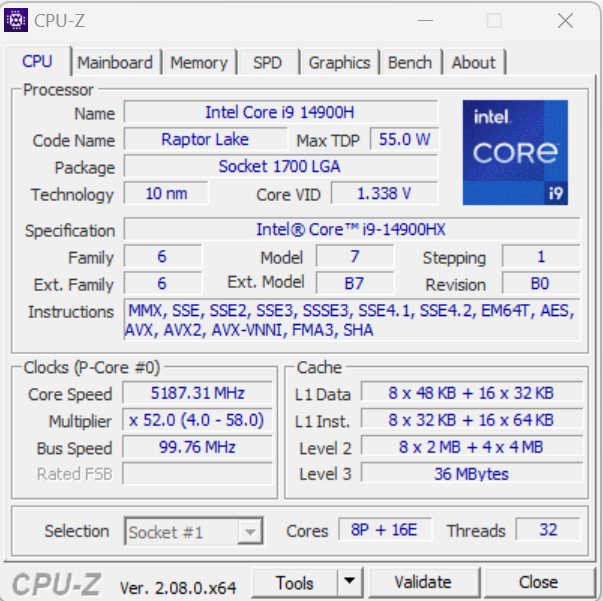
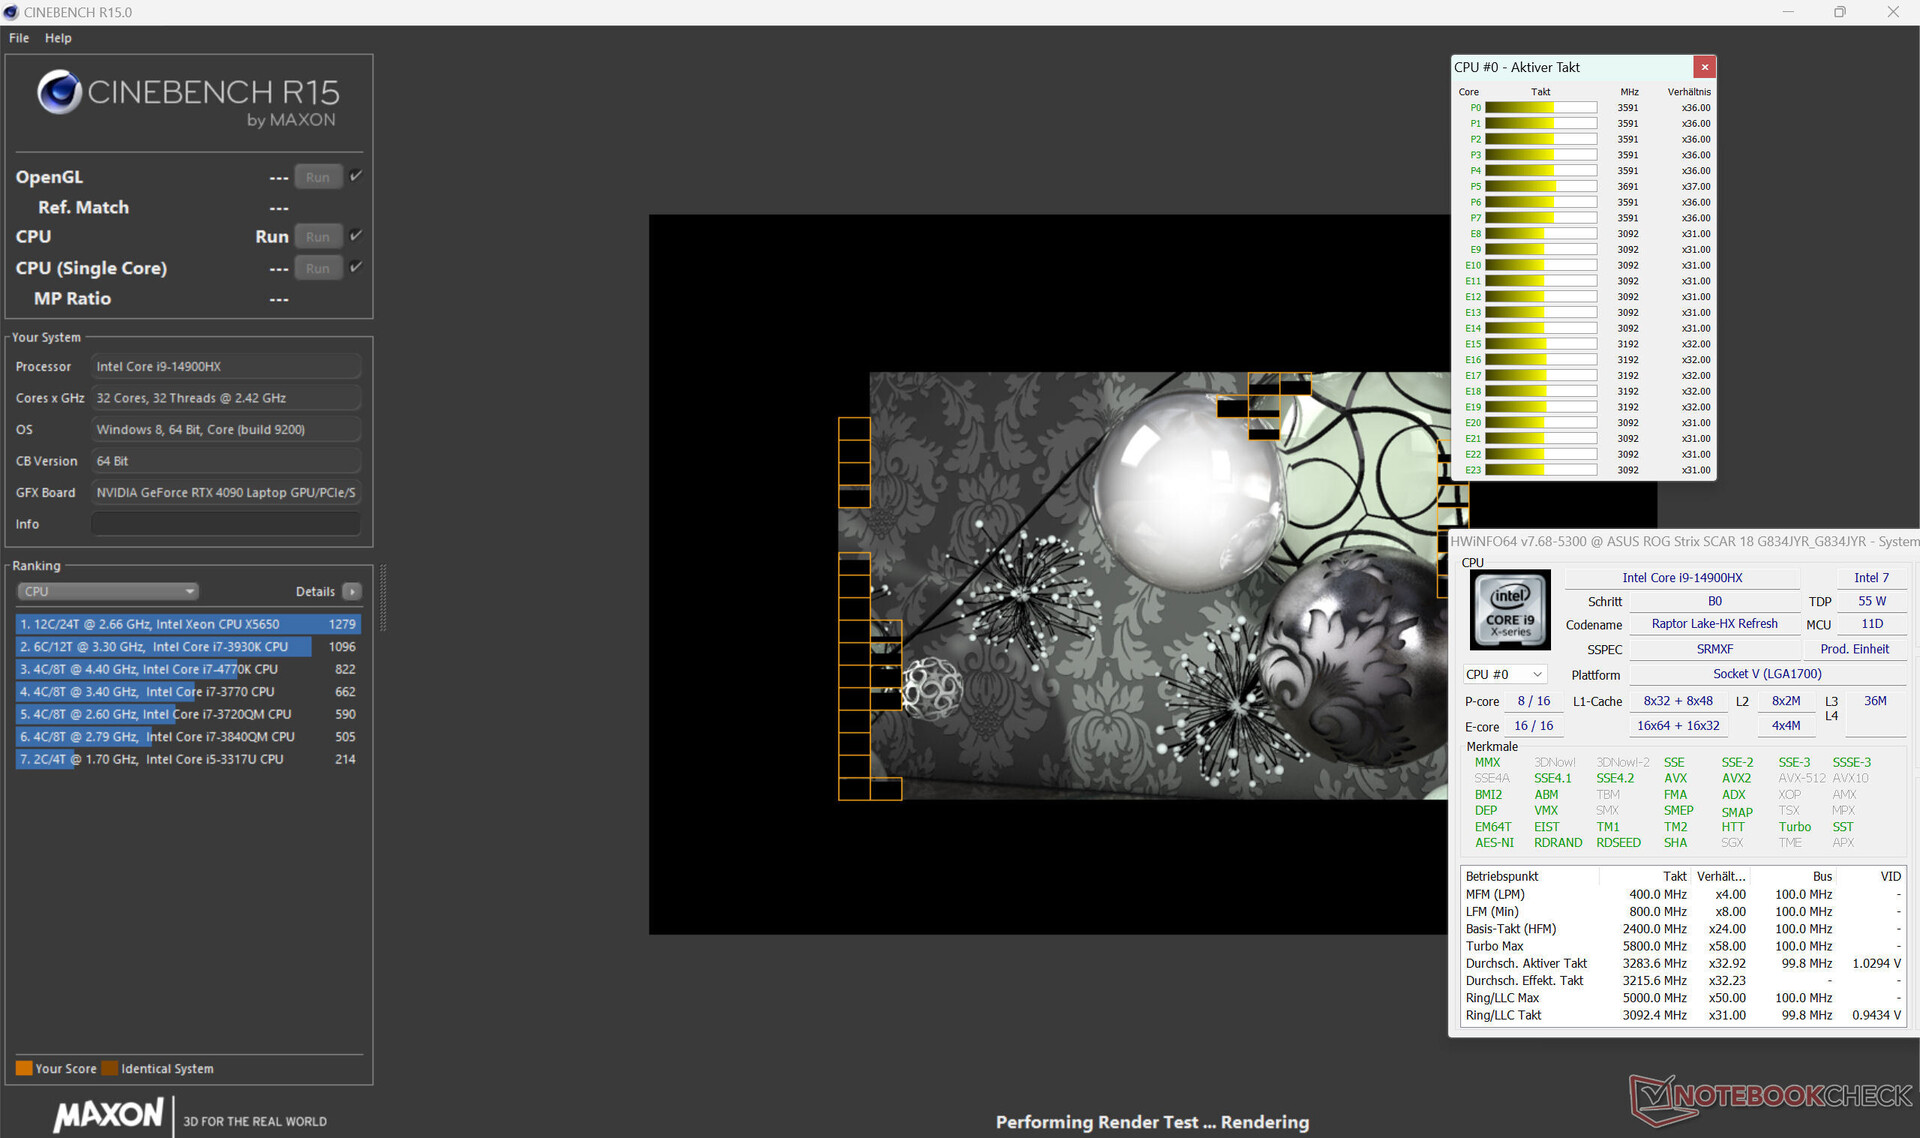
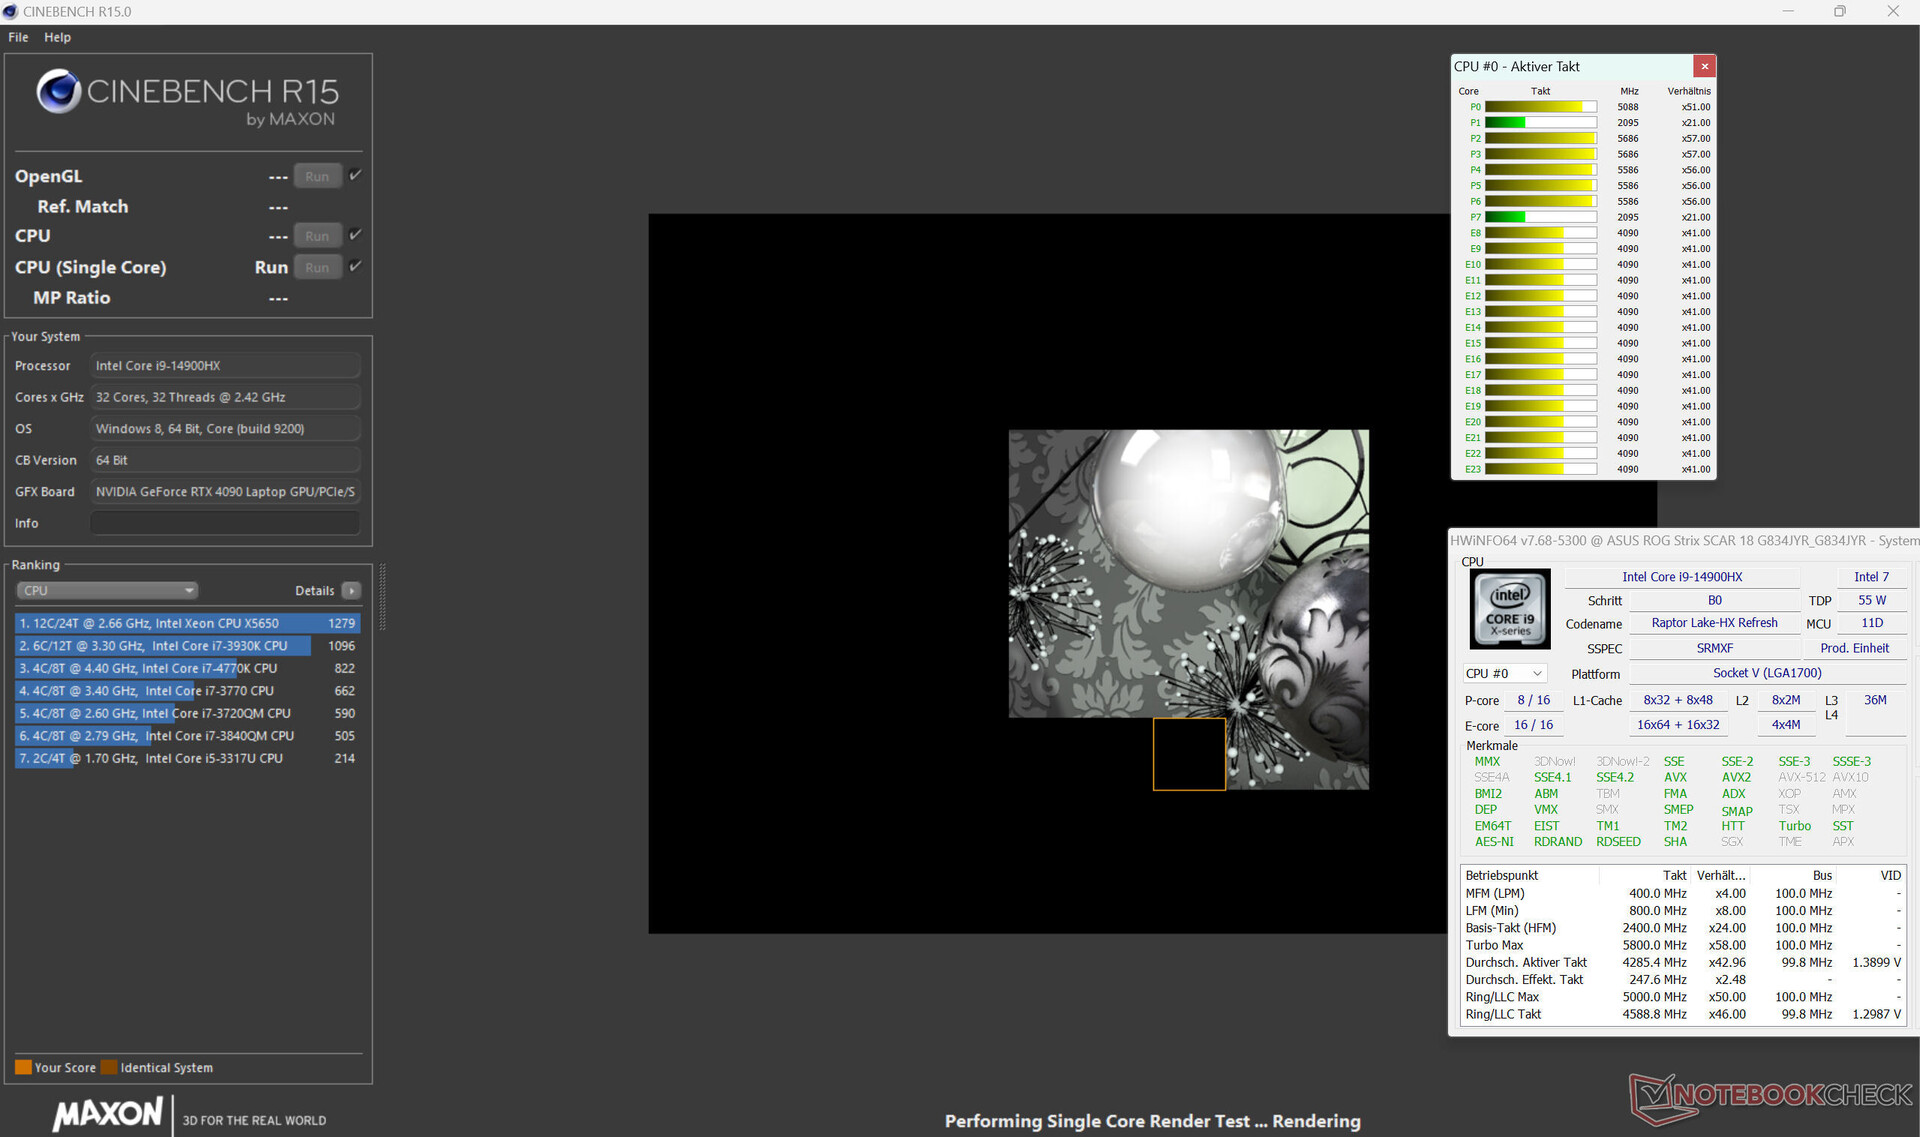
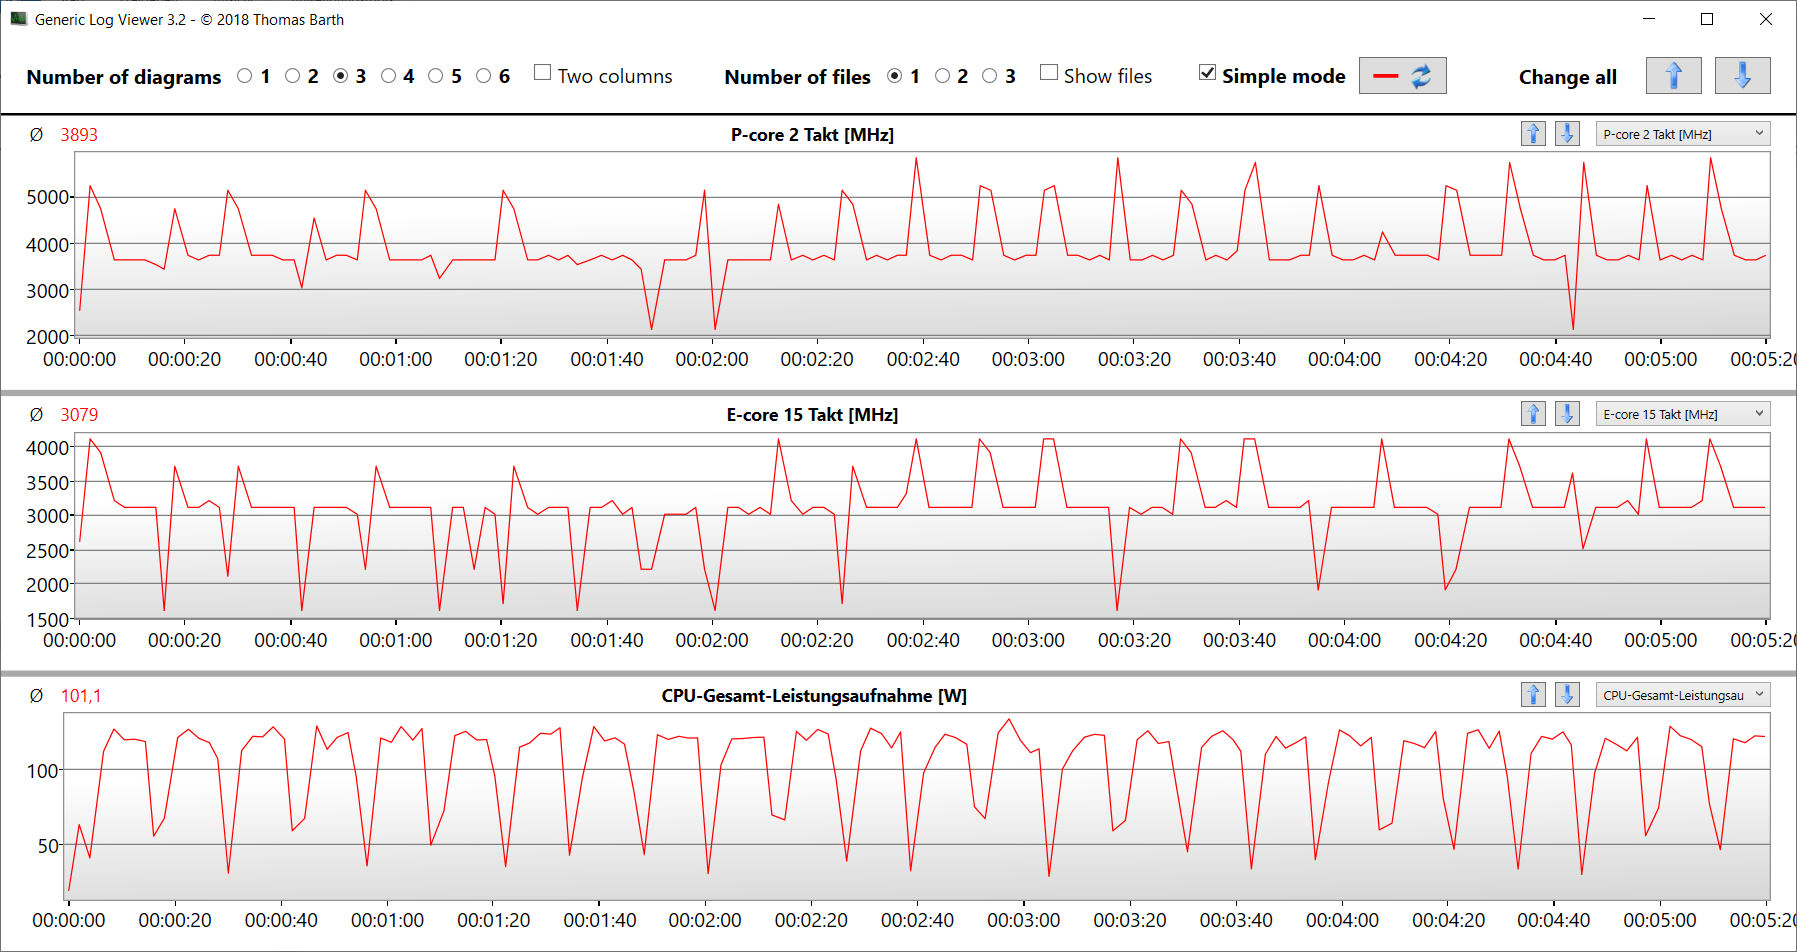
Os 24 núcleos de CPU (8P + 16E = 32 threads) do Core i9-14900HX (Raptor Lake) atingem velocidades máximas de clock de 5,8 GHz (núcleos P) e 4,1 GHz (núcleos E). A CPU responde à carga constante de vários threads (CB15 Loop) com uma velocidade Turbo que permanece constantemente alta. O senhor pode encontrar mais informações sobre o Core i9 em nossa análise.
A seleção do perfil de energia influencia apenas o desempenho de thread único em um sentido limitado, mas tem mais influência sobre o desempenho de multithread. A seleção de "Performance" resulta em valores de benchmark que estão abaixo da média da CPU determinada até agora, enquanto "Turbo" aumenta os resultados ligeiramente acima da média. O desempenho single-thread, que é mais relevante na operação cotidiana, varia no mesmo nível na rede elétrica e na operação com bateria, mas o desempenho multithread cai significativamente na operação com bateria.
Cinebench R15 Multi Constant Load Test
| CPU Performance rating - Percent | |
| Alienware m18 R1 AMD | |
| Asus ROG Strix Scar 18 G834JYR (2024) | |
| Asus ROG Strix Scar 18 2023 G834JY-N6005W -2! | |
| Alienware m18 R1 -2! | |
| MSI Titan 18 HX A14VIG | |
| Acer Predator Helios 18 N23Q2 | |
| Asus ROG Strix Scar 18 G834JYR (2024) | |
| Média Intel Core i9-14900HX | |
| Razer Blade 18 RTX 4070 -2! | |
| Média da turma Gaming | |
| Cinebench R20 | |
| CPU (Multi Core) | |
| Alienware m18 R1 AMD | |
| Alienware m18 R1 | |
| Asus ROG Strix Scar 18 G834JYR (2024) (Turbo) | |
| MSI Titan 18 HX A14VIG | |
| Asus ROG Strix Scar 18 2023 G834JY-N6005W | |
| Acer Predator Helios 18 N23Q2 | |
| Média Intel Core i9-14900HX (6579 - 13832, n=37) | |
| Razer Blade 18 RTX 4070 | |
| Asus ROG Strix Scar 18 G834JYR (2024) | |
| Média da turma Gaming (4029 - 16433, n=106, últimos 2 anos) | |
| CPU (Single Core) | |
| Asus ROG Strix Scar 18 G834JYR (2024) (Turbo) | |
| Asus ROG Strix Scar 18 G834JYR (2024) | |
| Asus ROG Strix Scar 18 2023 G834JY-N6005W | |
| Média Intel Core i9-14900HX (657 - 859, n=37) | |
| MSI Titan 18 HX A14VIG | |
| Alienware m18 R1 | |
| Acer Predator Helios 18 N23Q2 | |
| Razer Blade 18 RTX 4070 | |
| Média da turma Gaming (442 - 913, n=106, últimos 2 anos) | |
| Alienware m18 R1 AMD | |
| Cinebench R15 | |
| CPU Multi 64Bit | |
| Alienware m18 R1 AMD | |
| Alienware m18 R1 | |
| MSI Titan 18 HX A14VIG | |
| Asus ROG Strix Scar 18 2023 G834JY-N6005W | |
| Asus ROG Strix Scar 18 G834JYR (2024) (Turbo) | |
| Acer Predator Helios 18 N23Q2 | |
| Razer Blade 18 RTX 4070 | |
| Média Intel Core i9-14900HX (3263 - 5589, n=38) | |
| Asus ROG Strix Scar 18 G834JYR (2024) | |
| Média da turma Gaming (1578 - 6330, n=105, últimos 2 anos) | |
| CPU Single 64Bit | |
| Asus ROG Strix Scar 18 2023 G834JY-N6005W | |
| Alienware m18 R1 AMD | |
| Asus ROG Strix Scar 18 G834JYR (2024) (Turbo) | |
| Média Intel Core i9-14900HX (247 - 323, n=37) | |
| Alienware m18 R1 | |
| Asus ROG Strix Scar 18 G834JYR (2024) | |
| MSI Titan 18 HX A14VIG | |
| Razer Blade 18 RTX 4070 | |
| Média da turma Gaming (188.8 - 350, n=106, últimos 2 anos) | |
| Acer Predator Helios 18 N23Q2 | |
| Blender - v2.79 BMW27 CPU | |
| Média da turma Gaming (79 - 330, n=104, últimos 2 anos) | |
| Média Intel Core i9-14900HX (91 - 206, n=37) | |
| Asus ROG Strix Scar 18 G834JYR (2024) | |
| Razer Blade 18 RTX 4070 | |
| Asus ROG Strix Scar 18 G834JYR (2024) (Turbo) | |
| Acer Predator Helios 18 N23Q2 | |
| MSI Titan 18 HX A14VIG | |
| Asus ROG Strix Scar 18 2023 G834JY-N6005W | |
| Alienware m18 R1 | |
| Alienware m18 R1 AMD | |
| Geekbench 6.7 | |
| Multi-Core | |
| Asus ROG Strix Scar 18 G834JYR (2024) (6.2.1, Turbo) | |
| Acer Predator Helios 18 N23Q2 | |
| Asus ROG Strix Scar 18 G834JYR (2024) (6.2.1) | |
| Média Intel Core i9-14900HX (13158 - 19665, n=37) | |
| MSI Titan 18 HX A14VIG (6.2.1) | |
| Alienware m18 R1 AMD | |
| Média da turma Gaming (6625 - 22850, n=106, últimos 2 anos) | |
| Single-Core | |
| Asus ROG Strix Scar 18 G834JYR (2024) (6.2.1, Turbo) | |
| Asus ROG Strix Scar 18 G834JYR (2024) (6.2.1) | |
| Média Intel Core i9-14900HX (2419 - 3129, n=37) | |
| Acer Predator Helios 18 N23Q2 | |
| Alienware m18 R1 AMD | |
| Média da turma Gaming (1490 - 3259, n=106, últimos 2 anos) | |
| MSI Titan 18 HX A14VIG (6.2.1) | |
| HWBOT x265 Benchmark v2.2 - 4k Preset | |
| Alienware m18 R1 AMD | |
| Asus ROG Strix Scar 18 2023 G834JY-N6005W | |
| Alienware m18 R1 | |
| Asus ROG Strix Scar 18 G834JYR (2024) (Turbo) | |
| Razer Blade 18 RTX 4070 | |
| MSI Titan 18 HX A14VIG | |
| Acer Predator Helios 18 N23Q2 | |
| Média Intel Core i9-14900HX (16.8 - 38.9, n=37) | |
| Asus ROG Strix Scar 18 G834JYR (2024) | |
| Média da turma Gaming (11.5 - 44.4, n=105, últimos 2 anos) | |
| LibreOffice - 20 Documents To PDF | |
| Média da turma Gaming (33.2 - 88.8, n=105, últimos 2 anos) | |
| Acer Predator Helios 18 N23Q2 | |
| Alienware m18 R1 | |
| MSI Titan 18 HX A14VIG (6.3.4.2) | |
| Asus ROG Strix Scar 18 G834JYR (2024) (6.3.4.2) | |
| Razer Blade 18 RTX 4070 | |
| Média Intel Core i9-14900HX (19 - 85.1, n=37) | |
| Alienware m18 R1 AMD (6.3.4.2) | |
| Asus ROG Strix Scar 18 G834JYR (2024) (6.3.4.2, Turbo) | |
| Asus ROG Strix Scar 18 2023 G834JY-N6005W | |
| R Benchmark 2.5 - Overall mean | |
| Média da turma Gaming (0.3439 - 0.759, n=106, últimos 2 anos) | |
| Alienware m18 R1 AMD | |
| Acer Predator Helios 18 N23Q2 | |
| Razer Blade 18 RTX 4070 | |
| Asus ROG Strix Scar 18 G834JYR (2024) | |
| Alienware m18 R1 | |
| MSI Titan 18 HX A14VIG | |
| Média Intel Core i9-14900HX (0.3604 - 0.4859, n=37) | |
| Asus ROG Strix Scar 18 2023 G834JY-N6005W | |
| Asus ROG Strix Scar 18 G834JYR (2024) (Turbo) | |
* ... menor é melhor
AIDA64: FP32 Ray-Trace | FPU Julia | CPU SHA3 | CPU Queen | FPU SinJulia | FPU Mandel | CPU AES | CPU ZLib | FP64 Ray-Trace | CPU PhotoWorxx
| Performance rating | |
| Alienware m18 R1 AMD | |
| Acer Predator Helios 18 N23Q2 | |
| Alienware m18 R1 | |
| MSI Titan 18 HX A14VIG | |
| Asus ROG Strix Scar 18 2023 G834JY-N6005W | |
| Asus ROG Strix Scar 18 G834JYR (2024) | |
| Razer Blade 18 RTX 4070 | |
| Asus ROG Strix Scar 18 G834JYR (2024) | |
| Média da turma Gaming | |
| Média Intel Core i9-14900HX | |
| AIDA64 / FP32 Ray-Trace | |
| Alienware m18 R1 AMD (v6.85.6300) | |
| Média da turma Gaming (10227 - 85542, n=105, últimos 2 anos) | |
| Alienware m18 R1 (v6.85.6300) | |
| MSI Titan 18 HX A14VIG (v6.92.6600) | |
| Asus ROG Strix Scar 18 2023 G834JY-N6005W (v6.85.6300) | |
| Acer Predator Helios 18 N23Q2 (v6.85.6300) | |
| Asus ROG Strix Scar 18 G834JYR (2024) (v6.92.6600, Turbo) | |
| Razer Blade 18 RTX 4070 (v6.85.6300) | |
| Asus ROG Strix Scar 18 G834JYR (2024) (v6.92.6600) | |
| Média Intel Core i9-14900HX (13098 - 33474, n=36) | |
| AIDA64 / FPU Julia | |
| Alienware m18 R1 AMD (v6.85.6300) | |
| MSI Titan 18 HX A14VIG (v6.92.6600) | |
| Alienware m18 R1 (v6.85.6300) | |
| Média da turma Gaming (51376 - 238426, n=105, últimos 2 anos) | |
| Asus ROG Strix Scar 18 2023 G834JY-N6005W (v6.85.6300) | |
| Asus ROG Strix Scar 18 G834JYR (2024) (v6.92.6600, Turbo) | |
| Acer Predator Helios 18 N23Q2 (v6.85.6300) | |
| Razer Blade 18 RTX 4070 (v6.85.6300) | |
| Asus ROG Strix Scar 18 G834JYR (2024) (v6.92.6600) | |
| Média Intel Core i9-14900HX (67573 - 166040, n=36) | |
| AIDA64 / CPU SHA3 | |
| Alienware m18 R1 AMD (v6.85.6300) | |
| MSI Titan 18 HX A14VIG (v6.92.6600) | |
| Alienware m18 R1 (v6.85.6300) | |
| Asus ROG Strix Scar 18 2023 G834JY-N6005W (v6.85.6300) | |
| Acer Predator Helios 18 N23Q2 (v6.85.6300) | |
| Asus ROG Strix Scar 18 G834JYR (2024) (v6.92.6600, Turbo) | |
| Média da turma Gaming (2180 - 10115, n=105, últimos 2 anos) | |
| Razer Blade 18 RTX 4070 (v6.85.6300) | |
| Asus ROG Strix Scar 18 G834JYR (2024) (v6.92.6600) | |
| Média Intel Core i9-14900HX (3589 - 7979, n=36) | |
| AIDA64 / CPU Queen | |
| Alienware m18 R1 AMD (v6.85.6300) | |
| MSI Titan 18 HX A14VIG (v6.92.6600) | |
| Alienware m18 R1 (v6.85.6300) | |
| Asus ROG Strix Scar 18 G834JYR (2024) (v6.92.6600) | |
| Asus ROG Strix Scar 18 G834JYR (2024) (v6.92.6600, Turbo) | |
| Asus ROG Strix Scar 18 2023 G834JY-N6005W (v6.85.6300) | |
| Média Intel Core i9-14900HX (118405 - 148966, n=36) | |
| Razer Blade 18 RTX 4070 (v6.85.6300) | |
| Acer Predator Helios 18 N23Q2 (v6.85.6300) | |
| Média da turma Gaming (49785 - 173351, n=90, últimos 2 anos) | |
| AIDA64 / FPU SinJulia | |
| Alienware m18 R1 AMD (v6.85.6300) | |
| MSI Titan 18 HX A14VIG (v6.92.6600) | |
| Asus ROG Strix Scar 18 2023 G834JY-N6005W (v6.85.6300) | |
| Alienware m18 R1 (v6.85.6300) | |
| Asus ROG Strix Scar 18 G834JYR (2024) (v6.92.6600, Turbo) | |
| Asus ROG Strix Scar 18 G834JYR (2024) (v6.92.6600) | |
| Razer Blade 18 RTX 4070 (v6.85.6300) | |
| Acer Predator Helios 18 N23Q2 (v6.85.6300) | |
| Média Intel Core i9-14900HX (10475 - 18517, n=36) | |
| Média da turma Gaming (4424 - 33636, n=105, últimos 2 anos) | |
| AIDA64 / FPU Mandel | |
| Alienware m18 R1 AMD (v6.85.6300) | |
| Alienware m18 R1 (v6.85.6300) | |
| Média da turma Gaming (25115 - 128721, n=105, últimos 2 anos) | |
| MSI Titan 18 HX A14VIG (v6.92.6600) | |
| Asus ROG Strix Scar 18 2023 G834JY-N6005W (v6.85.6300) | |
| Acer Predator Helios 18 N23Q2 (v6.85.6300) | |
| Asus ROG Strix Scar 18 G834JYR (2024) (v6.92.6600, Turbo) | |
| Razer Blade 18 RTX 4070 (v6.85.6300) | |
| Asus ROG Strix Scar 18 G834JYR (2024) (v6.92.6600) | |
| Média Intel Core i9-14900HX (32543 - 83662, n=36) | |
| AIDA64 / CPU AES | |
| Acer Predator Helios 18 N23Q2 (v6.85.6300) | |
| Alienware m18 R1 AMD (v6.85.6300) | |
| Média Intel Core i9-14900HX (86964 - 241777, n=36) | |
| MSI Titan 18 HX A14VIG (v6.92.6600) | |
| Alienware m18 R1 (v6.85.6300) | |
| Asus ROG Strix Scar 18 2023 G834JY-N6005W (v6.85.6300) | |
| Asus ROG Strix Scar 18 G834JYR (2024) (v6.92.6600, Turbo) | |
| Asus ROG Strix Scar 18 G834JYR (2024) (v6.92.6600) | |
| Razer Blade 18 RTX 4070 (v6.85.6300) | |
| Média da turma Gaming (39258 - 247074, n=105, últimos 2 anos) | |
| AIDA64 / CPU ZLib | |
| Alienware m18 R1 AMD (v6.85.6300) | |
| MSI Titan 18 HX A14VIG (v6.92.6600) | |
| Asus ROG Strix Scar 18 2023 G834JY-N6005W (v6.85.6300) | |
| Alienware m18 R1 (v6.85.6300) | |
| Acer Predator Helios 18 N23Q2 (v6.85.6300) | |
| Asus ROG Strix Scar 18 G834JYR (2024) (v6.92.6600, Turbo) | |
| Razer Blade 18 RTX 4070 (v6.85.6300) | |
| Média Intel Core i9-14900HX (1054 - 2292, n=36) | |
| Asus ROG Strix Scar 18 G834JYR (2024) | |
| Média da turma Gaming (574 - 2531, n=105, últimos 2 anos) | |
| AIDA64 / FP64 Ray-Trace | |
| Alienware m18 R1 AMD (v6.85.6300) | |
| Média da turma Gaming (5509 - 45446, n=105, últimos 2 anos) | |
| Alienware m18 R1 (v6.85.6300) | |
| MSI Titan 18 HX A14VIG (v6.92.6600) | |
| Asus ROG Strix Scar 18 2023 G834JY-N6005W (v6.85.6300) | |
| Acer Predator Helios 18 N23Q2 (v6.85.6300) | |
| Asus ROG Strix Scar 18 G834JYR (2024) (v6.92.6600, Turbo) | |
| Razer Blade 18 RTX 4070 (v6.85.6300) | |
| Asus ROG Strix Scar 18 G834JYR (2024) (v6.92.6600) | |
| Média Intel Core i9-14900HX (6809 - 18349, n=36) | |
| AIDA64 / CPU PhotoWorxx | |
| Alienware m18 R1 (v6.85.6300) | |
| Acer Predator Helios 18 N23Q2 (v6.85.6300) | |
| Asus ROG Strix Scar 18 G834JYR (2024) (v6.92.6600) | |
| Asus ROG Strix Scar 18 G834JYR (2024) (v6.92.6600, Turbo) | |
| Razer Blade 18 RTX 4070 (v6.85.6300) | |
| Média Intel Core i9-14900HX (23903 - 54702, n=36) | |
| Média da turma Gaming (12271 - 89891, n=105, últimos 2 anos) | |
| Asus ROG Strix Scar 18 2023 G834JY-N6005W (v6.85.6300) | |
| Alienware m18 R1 AMD (v6.85.6300) | |
| MSI Titan 18 HX A14VIG (v6.92.6600) | |
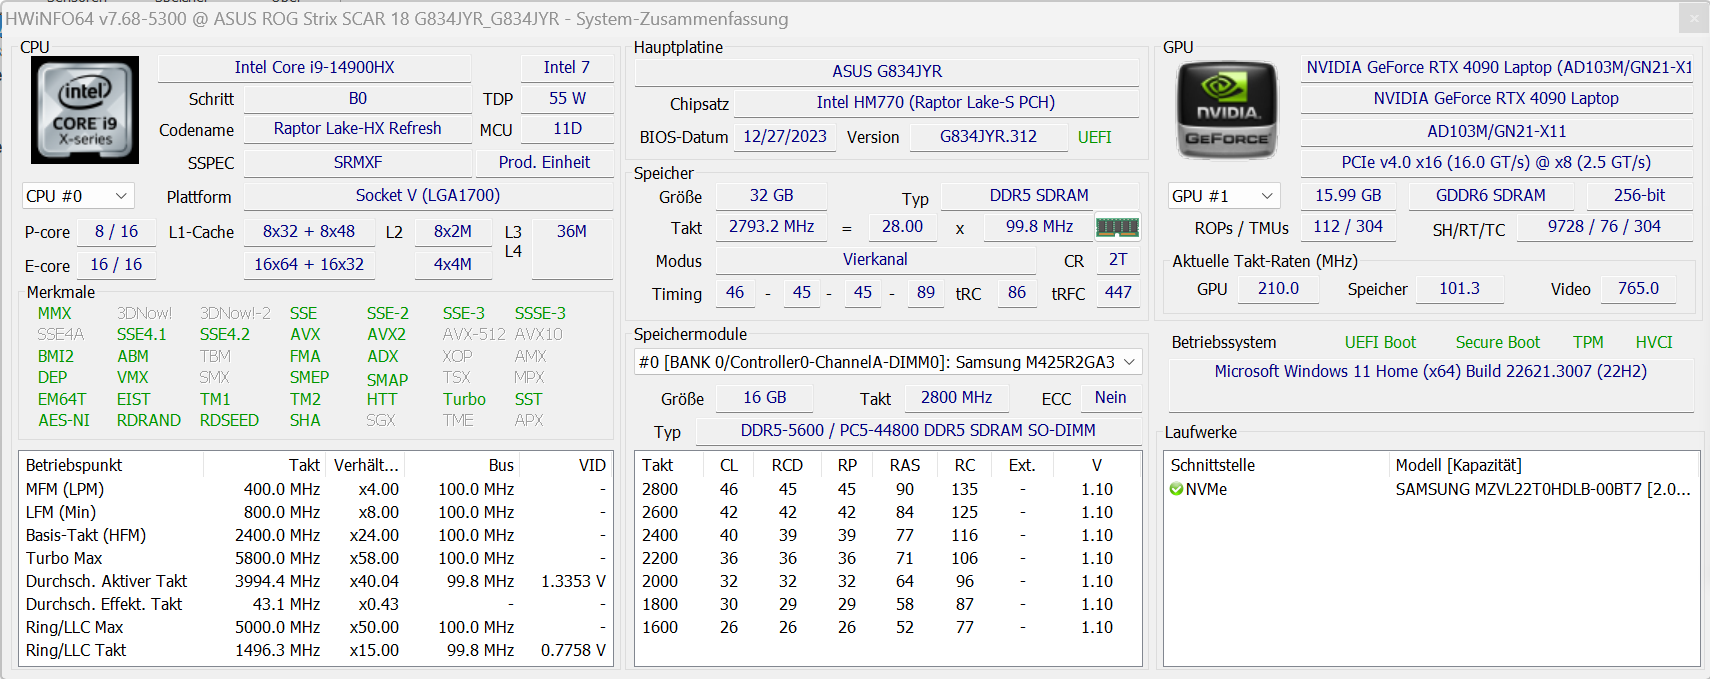
Desempenho do sistema
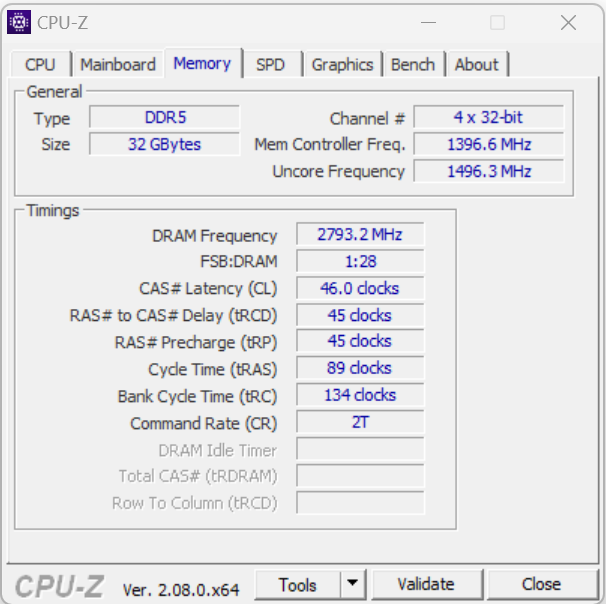
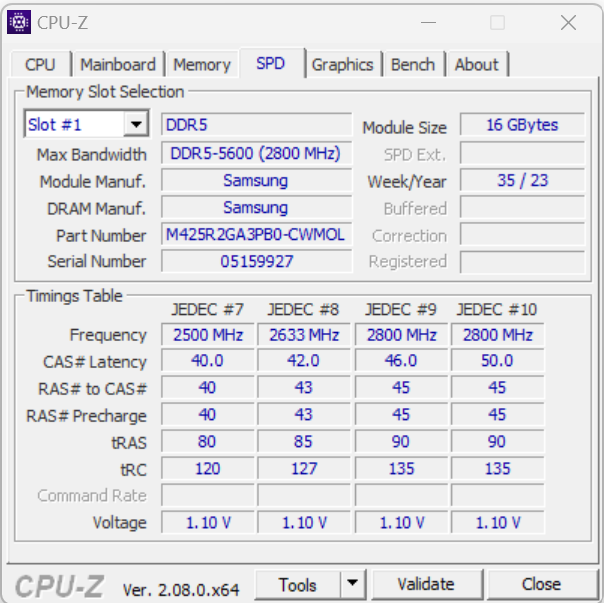
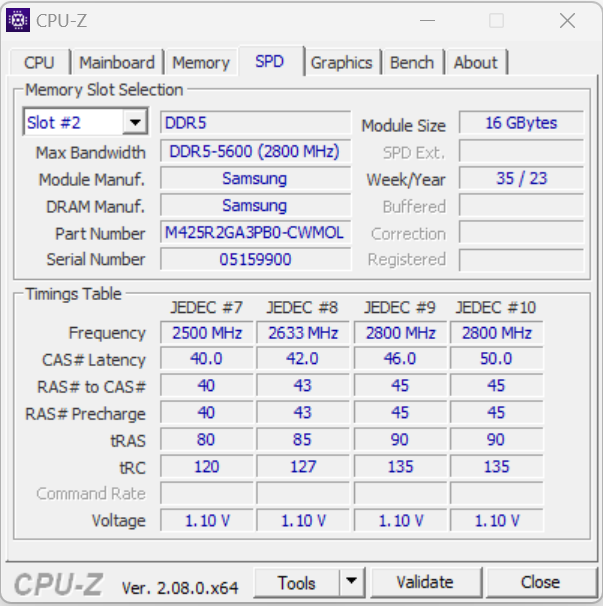
O sistema de funcionamento suave não mostra nenhuma falta de desempenho de computação e o laptop lida com jogos, renderização e outras tarefas sem falhas. As taxas de transferência da memória de trabalho estão em um nível normal para a RAM DDR5-5600.
CrossMark: Overall | Productivity | Creativity | Responsiveness
WebXPRT 3: Overall
WebXPRT 4: Overall
Mozilla Kraken 1.1: Total
| PCMark 10 / Score | |
| Alienware m18 R1 AMD | |
| MSI Titan 18 HX A14VIG | |
| Asus ROG Strix Scar 18 G834JYR (2024) | |
| Asus ROG Strix Scar 18 2023 G834JY-N6005W | |
| Alienware m18 R1 | |
| Média Intel Core i9-14900HX, NVIDIA GeForce RTX 4090 Laptop GPU (8230 - 9234, n=13) | |
| Acer Predator Helios 18 N23Q2 | |
| Média da turma Gaming (5828 - 12414, n=93, últimos 2 anos) | |
| Razer Blade 18 RTX 4070 | |
| PCMark 10 / Essentials | |
| Alienware m18 R1 AMD | |
| Razer Blade 18 RTX 4070 | |
| MSI Titan 18 HX A14VIG | |
| Asus ROG Strix Scar 18 G834JYR (2024) | |
| Alienware m18 R1 | |
| Média Intel Core i9-14900HX, NVIDIA GeForce RTX 4090 Laptop GPU (10778 - 11628, n=13) | |
| Acer Predator Helios 18 N23Q2 | |
| Média da turma Gaming (8810 - 11935, n=97, últimos 2 anos) | |
| PCMark 10 / Productivity | |
| Alienware m18 R1 AMD | |
| Média da turma Gaming (6845 - 25323, n=95, últimos 2 anos) | |
| Média Intel Core i9-14900HX, NVIDIA GeForce RTX 4090 Laptop GPU (9458 - 11759, n=13) | |
| Asus ROG Strix Scar 18 G834JYR (2024) | |
| Acer Predator Helios 18 N23Q2 | |
| MSI Titan 18 HX A14VIG | |
| Alienware m18 R1 | |
| Razer Blade 18 RTX 4070 | |
| PCMark 10 / Digital Content Creation | |
| Alienware m18 R1 AMD | |
| MSI Titan 18 HX A14VIG | |
| Alienware m18 R1 | |
| Asus ROG Strix Scar 18 G834JYR (2024) | |
| Média Intel Core i9-14900HX, NVIDIA GeForce RTX 4090 Laptop GPU (13219 - 16462, n=13) | |
| Acer Predator Helios 18 N23Q2 | |
| Média da turma Gaming (7602 - 19954, n=95, últimos 2 anos) | |
| Razer Blade 18 RTX 4070 | |
| CrossMark / Overall | |
| Asus ROG Strix Scar 18 G834JYR (2024) | |
| Acer Predator Helios 18 N23Q2 | |
| Alienware m18 R1 | |
| Razer Blade 18 RTX 4070 | |
| Média Intel Core i9-14900HX, NVIDIA GeForce RTX 4090 Laptop GPU (1877 - 2344, n=10) | |
| Asus ROG Strix Scar 18 2023 G834JY-N6005W | |
| Média da turma Gaming (1366 - 2409, n=94, últimos 2 anos) | |
| Alienware m18 R1 AMD | |
| MSI Titan 18 HX A14VIG | |
| CrossMark / Productivity | |
| Acer Predator Helios 18 N23Q2 | |
| Asus ROG Strix Scar 18 G834JYR (2024) | |
| Alienware m18 R1 | |
| Razer Blade 18 RTX 4070 | |
| Média Intel Core i9-14900HX, NVIDIA GeForce RTX 4090 Laptop GPU (1738 - 2162, n=10) | |
| Asus ROG Strix Scar 18 2023 G834JY-N6005W | |
| Média da turma Gaming (1386 - 2254, n=94, últimos 2 anos) | |
| Alienware m18 R1 AMD | |
| MSI Titan 18 HX A14VIG | |
| CrossMark / Creativity | |
| Asus ROG Strix Scar 18 G834JYR (2024) | |
| Alienware m18 R1 | |
| Asus ROG Strix Scar 18 2023 G834JY-N6005W | |
| Acer Predator Helios 18 N23Q2 | |
| Razer Blade 18 RTX 4070 | |
| Média Intel Core i9-14900HX, NVIDIA GeForce RTX 4090 Laptop GPU (2195 - 2660, n=10) | |
| Média da turma Gaming (1343 - 2786, n=94, últimos 2 anos) | |
| Alienware m18 R1 AMD | |
| MSI Titan 18 HX A14VIG | |
| CrossMark / Responsiveness | |
| Acer Predator Helios 18 N23Q2 | |
| Asus ROG Strix Scar 18 G834JYR (2024) | |
| Alienware m18 R1 | |
| Razer Blade 18 RTX 4070 | |
| Média Intel Core i9-14900HX, NVIDIA GeForce RTX 4090 Laptop GPU (1478 - 2327, n=10) | |
| Média da turma Gaming (1226 - 2334, n=94, últimos 2 anos) | |
| Asus ROG Strix Scar 18 2023 G834JY-N6005W | |
| Alienware m18 R1 AMD | |
| MSI Titan 18 HX A14VIG | |
| WebXPRT 3 / Overall | |
| Alienware m18 R1 AMD | |
| Razer Blade 18 RTX 4070 | |
| Alienware m18 R1 | |
| Asus ROG Strix Scar 18 2023 G834JY-N6005W | |
| MSI Titan 18 HX A14VIG | |
| Média Intel Core i9-14900HX, NVIDIA GeForce RTX 4090 Laptop GPU (279 - 339, n=10) | |
| Asus ROG Strix Scar 18 G834JYR (2024) | |
| Acer Predator Helios 18 N23Q2 | |
| Média da turma Gaming (220 - 532, n=98, últimos 2 anos) | |
| WebXPRT 4 / Overall | |
| Asus ROG Strix Scar 18 2023 G834JY-N6005W | |
| Alienware m18 R1 | |
| Asus ROG Strix Scar 18 G834JYR (2024) | |
| Razer Blade 18 RTX 4070 | |
| Alienware m18 R1 AMD | |
| Média Intel Core i9-14900HX, NVIDIA GeForce RTX 4090 Laptop GPU (246 - 309, n=8) | |
| MSI Titan 18 HX A14VIG | |
| Média da turma Gaming (165 - 354, n=98, últimos 2 anos) | |
| Mozilla Kraken 1.1 / Total | |
| Razer Blade 18 RTX 4070 | |
| Alienware m18 R1 AMD | |
| Média da turma Gaming (391 - 590, n=100, últimos 2 anos) | |
| Alienware m18 R1 | |
| Acer Predator Helios 18 N23Q2 | |
| Média Intel Core i9-14900HX, NVIDIA GeForce RTX 4090 Laptop GPU (428 - 535, n=11) | |
| MSI Titan 18 HX A14VIG | |
| Asus ROG Strix Scar 18 G834JYR (2024) | |
| Asus ROG Strix Scar 18 2023 G834JY-N6005W | |
* ... menor é melhor
| PCMark 10 Score | 8801 pontos | |
Ajuda | ||
| AIDA64 / Memory Copy | |
| Asus ROG Strix Scar 18 G834JYR (2024) | |
| Alienware m18 R1 | |
| Acer Predator Helios 18 N23Q2 | |
| Razer Blade 18 RTX 4070 | |
| Média Intel Core i9-14900HX (38028 - 83392, n=36) | |
| Média da turma Gaming (21750 - 129946, n=105, últimos 2 anos) | |
| Asus ROG Strix Scar 18 2023 G834JY-N6005W | |
| MSI Titan 18 HX A14VIG | |
| Alienware m18 R1 AMD | |
| AIDA64 / Memory Read | |
| Alienware m18 R1 | |
| Asus ROG Strix Scar 18 G834JYR (2024) | |
| Acer Predator Helios 18 N23Q2 | |
| Razer Blade 18 RTX 4070 | |
| Média Intel Core i9-14900HX (43306 - 87568, n=36) | |
| Asus ROG Strix Scar 18 2023 G834JY-N6005W | |
| Média da turma Gaming (22956 - 118858, n=105, últimos 2 anos) | |
| Alienware m18 R1 AMD | |
| MSI Titan 18 HX A14VIG | |
| AIDA64 / Memory Write | |
| Alienware m18 R1 | |
| Asus ROG Strix Scar 18 G834JYR (2024) | |
| Média da turma Gaming (22297 - 135096, n=105, últimos 2 anos) | |
| Razer Blade 18 RTX 4070 | |
| Acer Predator Helios 18 N23Q2 | |
| Média Intel Core i9-14900HX (37146 - 80589, n=36) | |
| Asus ROG Strix Scar 18 2023 G834JY-N6005W | |
| Alienware m18 R1 AMD | |
| MSI Titan 18 HX A14VIG | |
| AIDA64 / Memory Latency | |
| Média da turma Gaming (75.3 - 259, n=105, últimos 2 anos) | |
| MSI Titan 18 HX A14VIG | |
| Alienware m18 R1 AMD | |
| Asus ROG Strix Scar 18 2023 G834JY-N6005W | |
| Média Intel Core i9-14900HX (76.1 - 105, n=36) | |
| Razer Blade 18 RTX 4070 | |
| Acer Predator Helios 18 N23Q2 | |
| Asus ROG Strix Scar 18 G834JYR (2024) | |
| Alienware m18 R1 | |
* ... menor é melhor
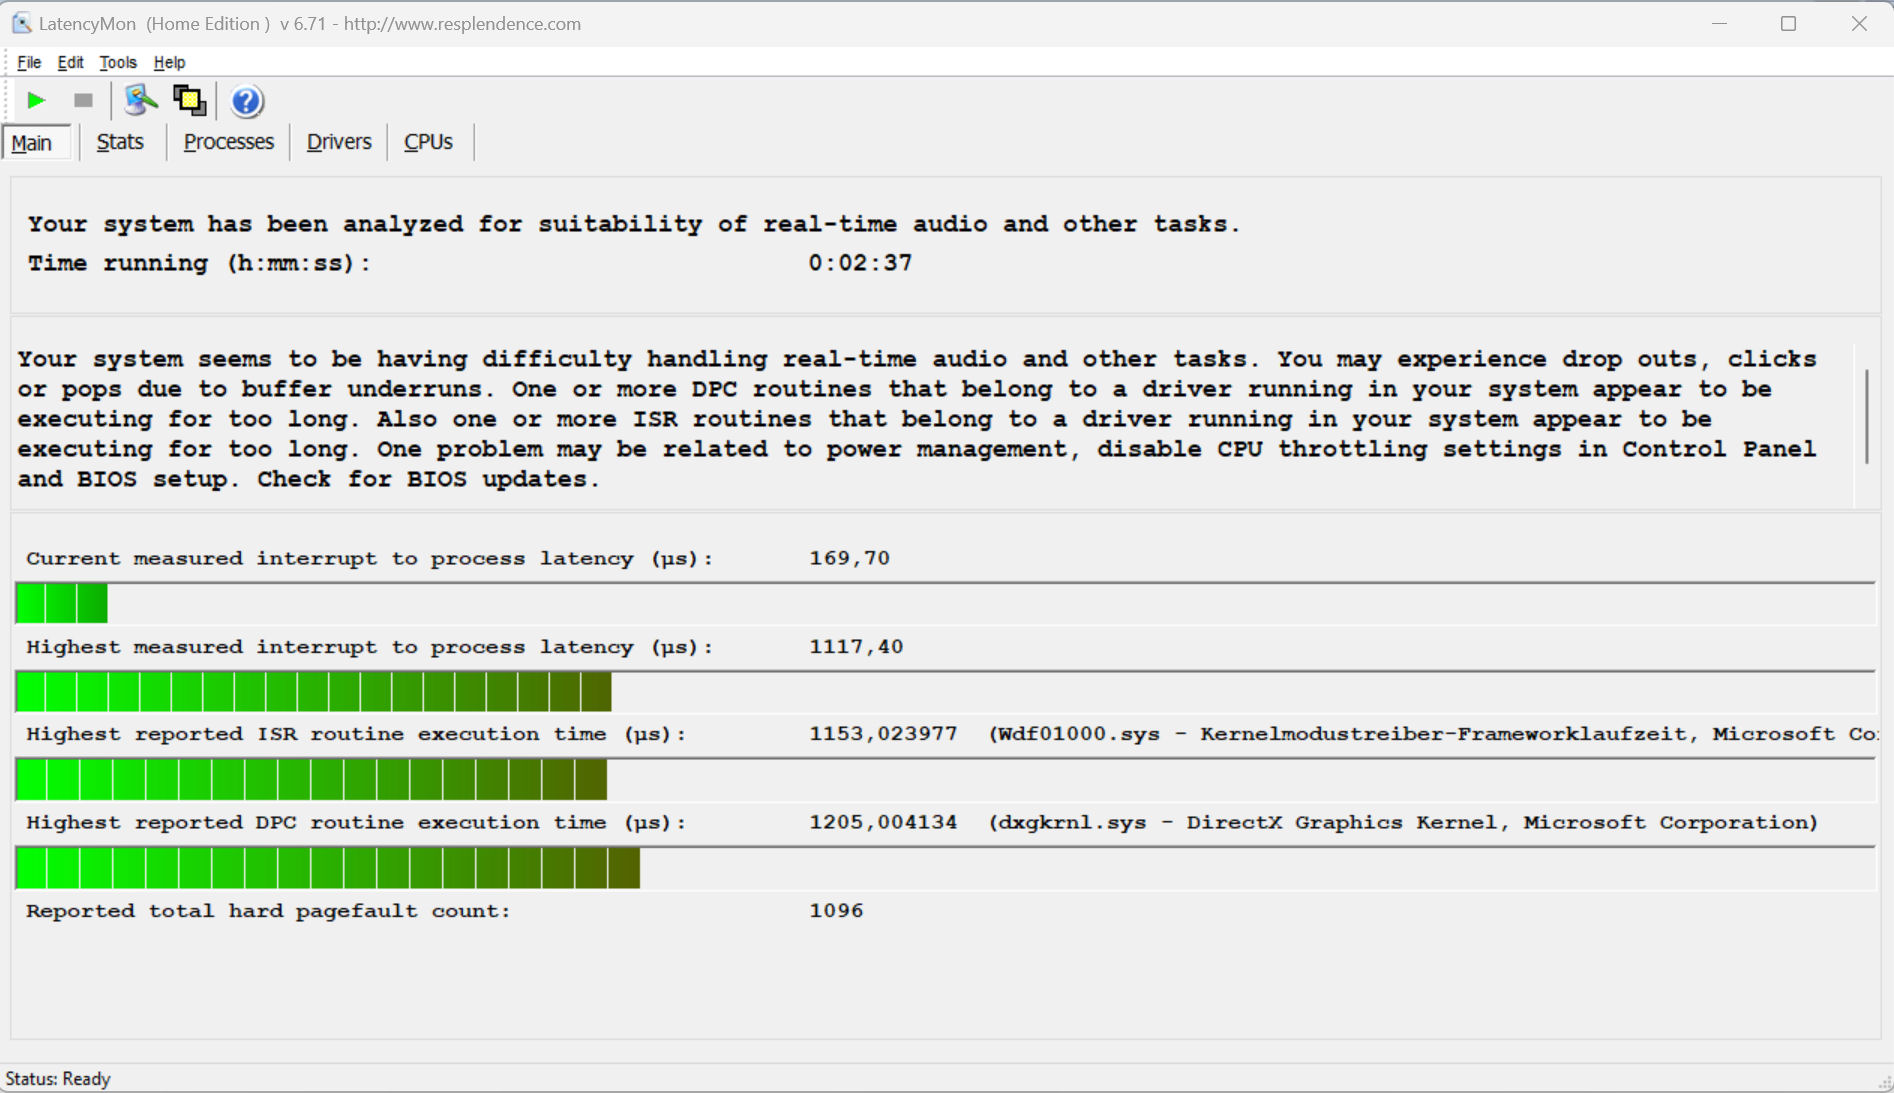
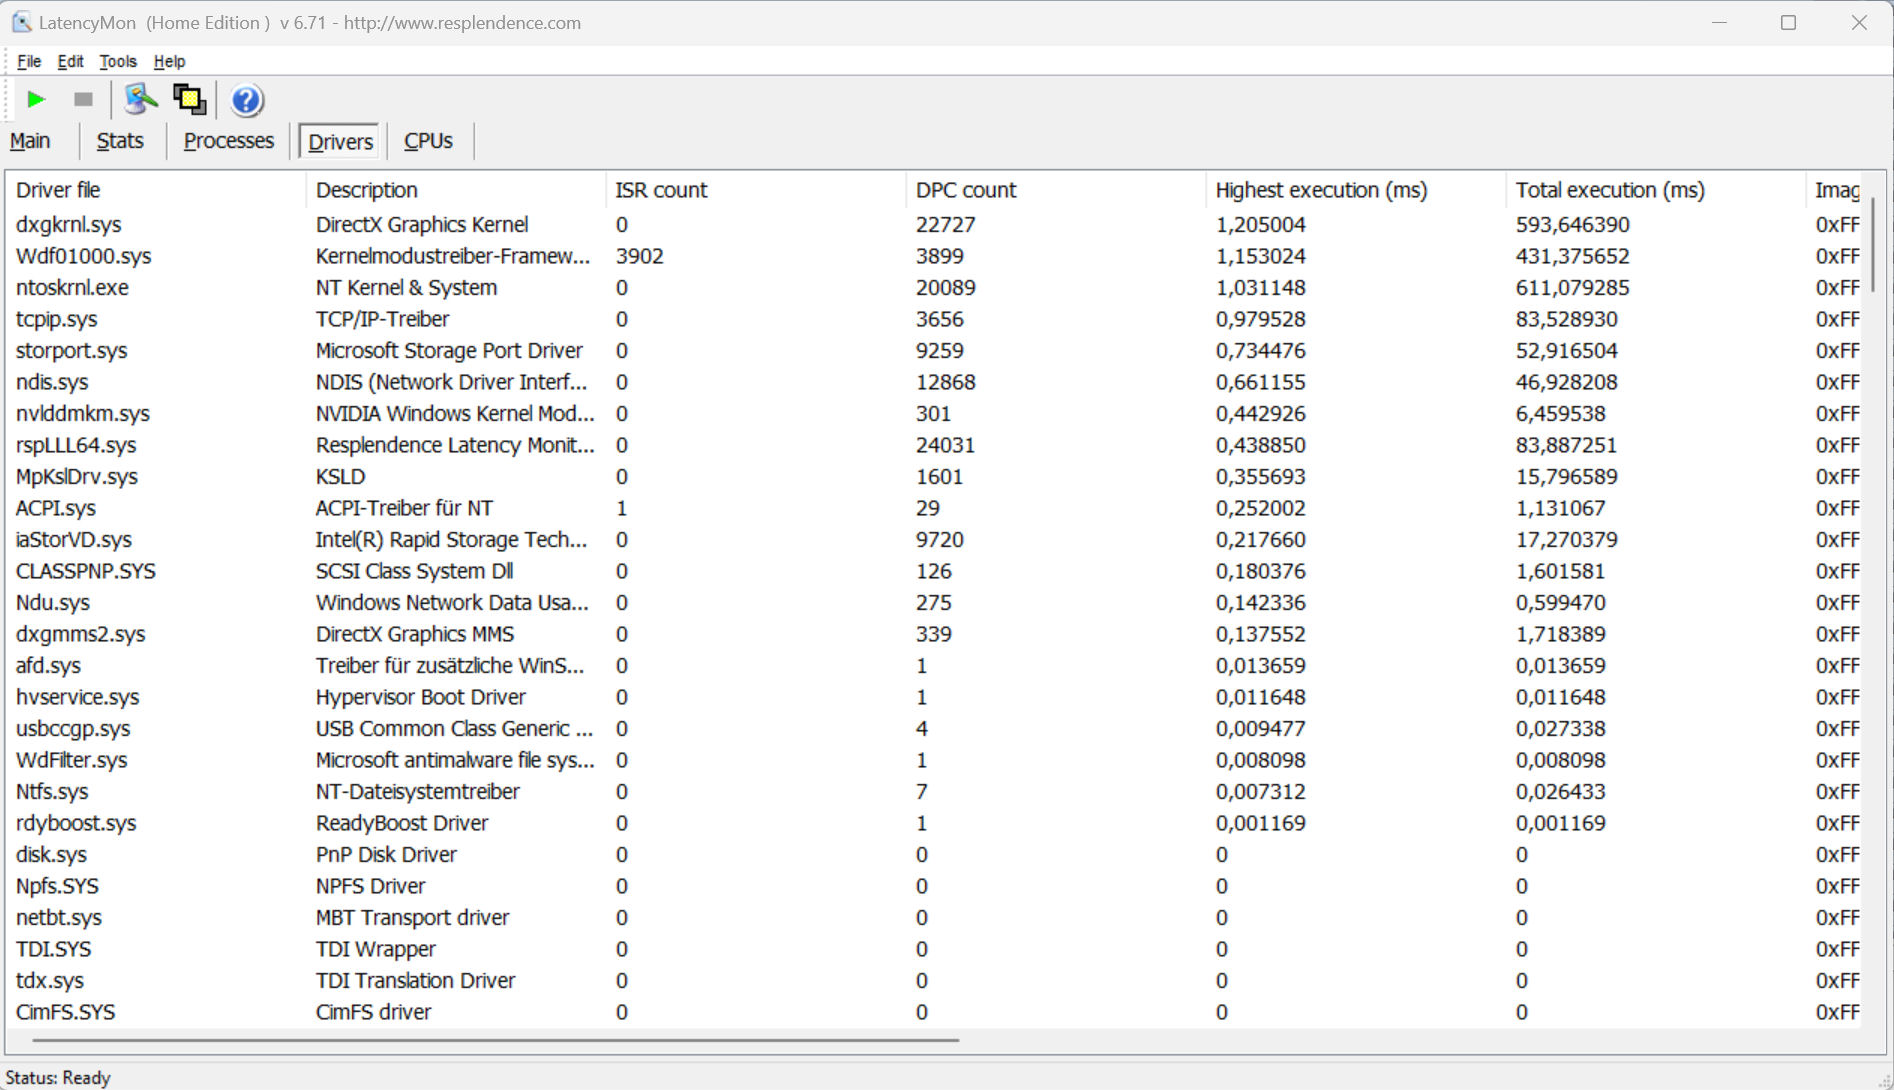
Latências DPC
O teste padronizado do Latency Monitor (com navegação na Web, reprodução de vídeo 4k e alta carga do Prime95) revela um comportamento evidente, e o sistema não parece ser adequado para o processamento de vídeo e áudio em tempo real. Futuras atualizações de software poderão trazer algumas melhorias ou até mesmo piorar a situação.
| DPC Latencies / LatencyMon - interrupt to process latency (max), Web, Youtube, Prime95 | |
| Acer Predator Helios 18 N23Q2 | |
| Alienware m18 R1 | |
| MSI Titan 18 HX A14VIG | |
| Razer Blade 18 RTX 4070 | |
| Alienware m18 R1 AMD | |
| Asus ROG Strix Scar 18 G834JYR (2024) | |
| Asus ROG Strix Scar 18 2023 G834JY-N6005W | |
* ... menor é melhor
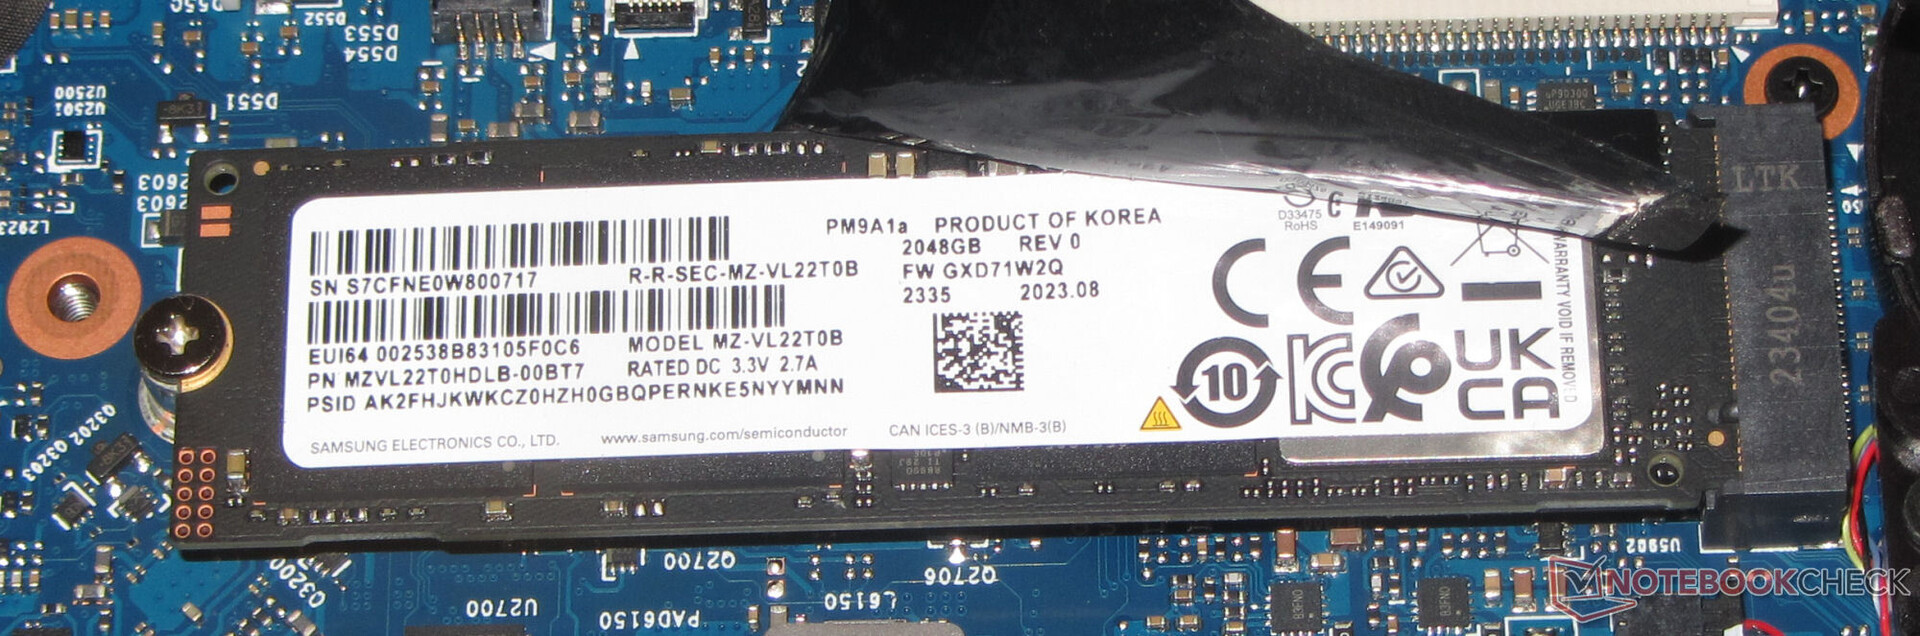
Solução de armazenamento
O Scar 18 pode aceitar um total de dois SSDs PCIe 4 no formato M.2-2280, com suporte também para RAID-0. O SSD Samsung de 2 TB da nossa unidade de teste oferece excelentes taxas de dados. Outro aspecto positivo é a ausência de qualquer estrangulamento causado pelo calor.

* ... menor é melhor
Disk Throttling: DiskSpd Read Loop, Queue Depth 8
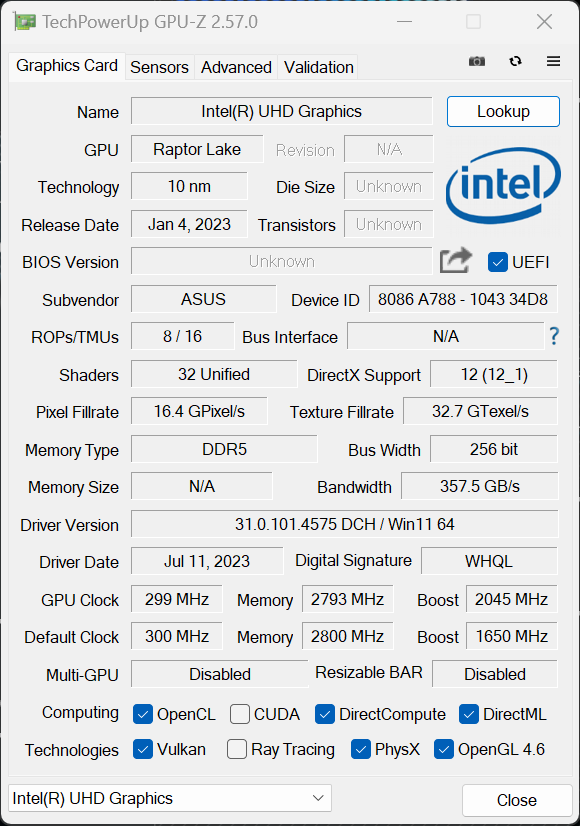
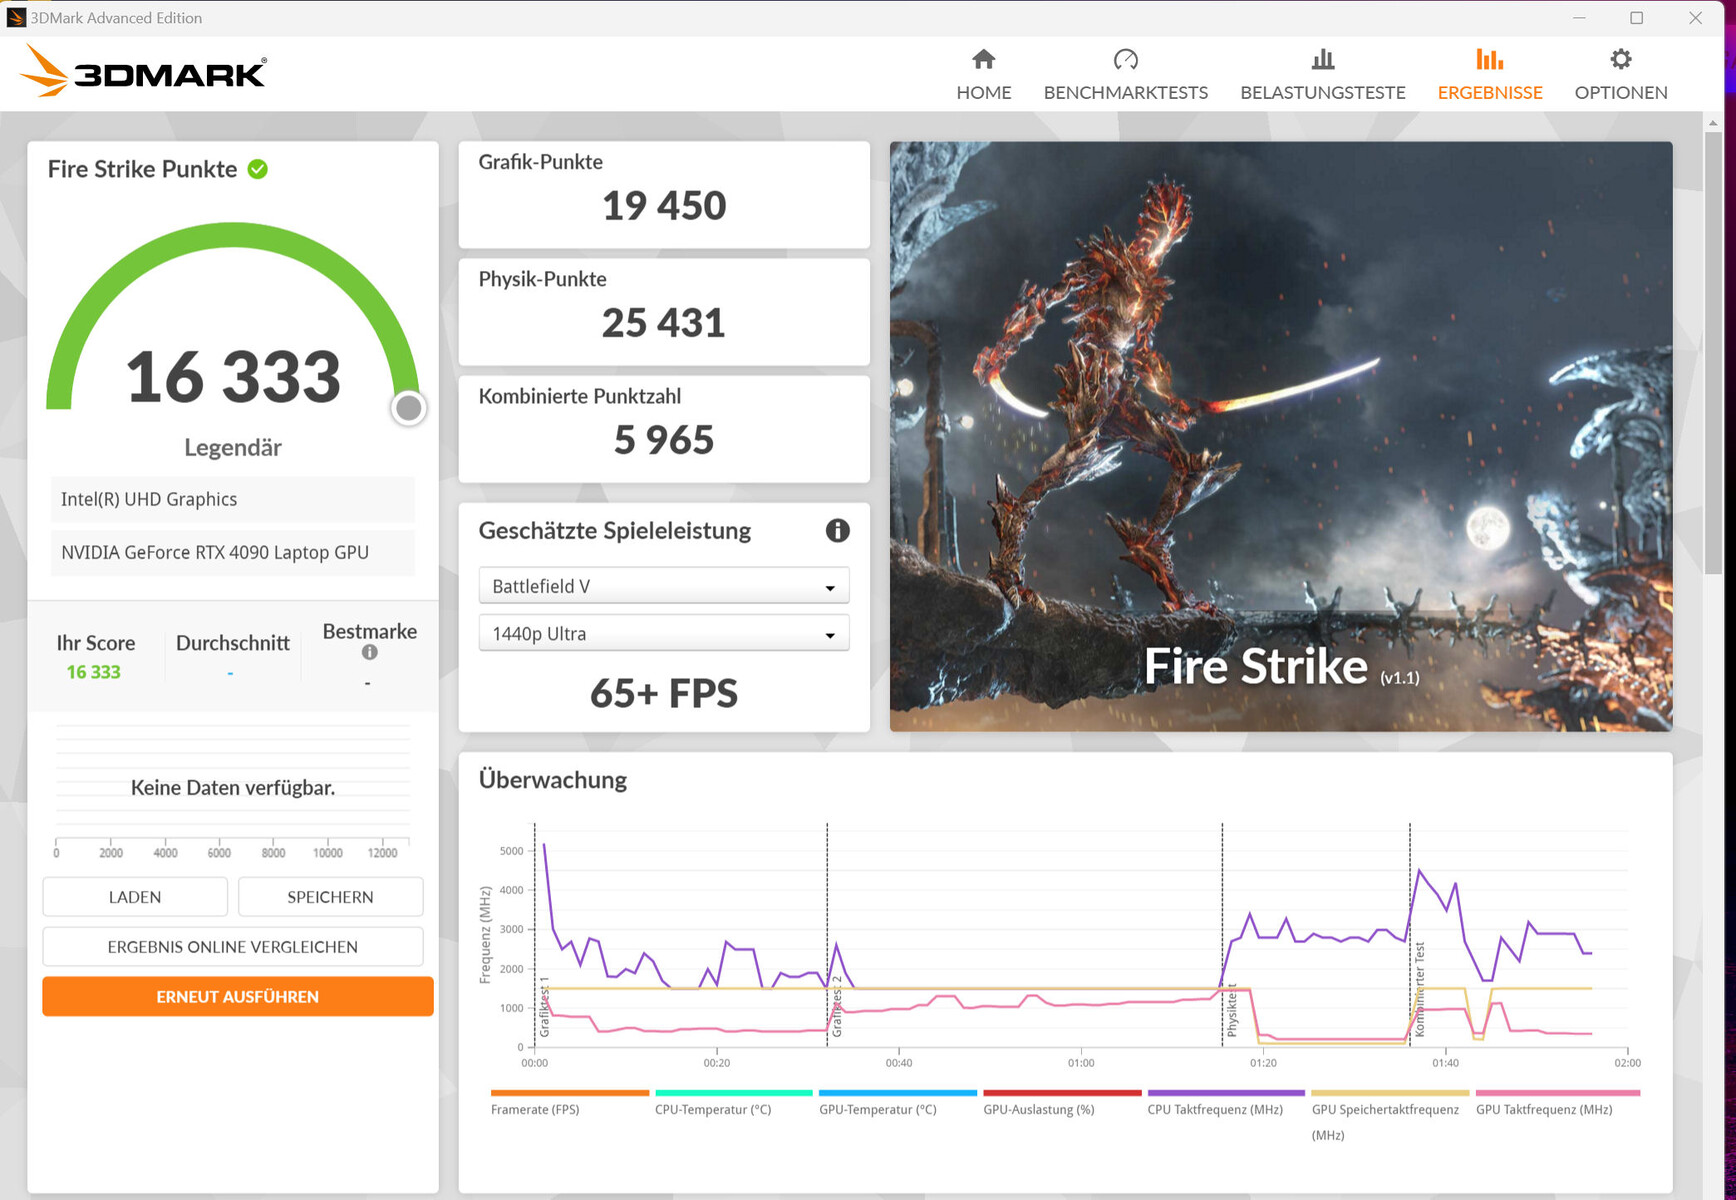
Placa de vídeo
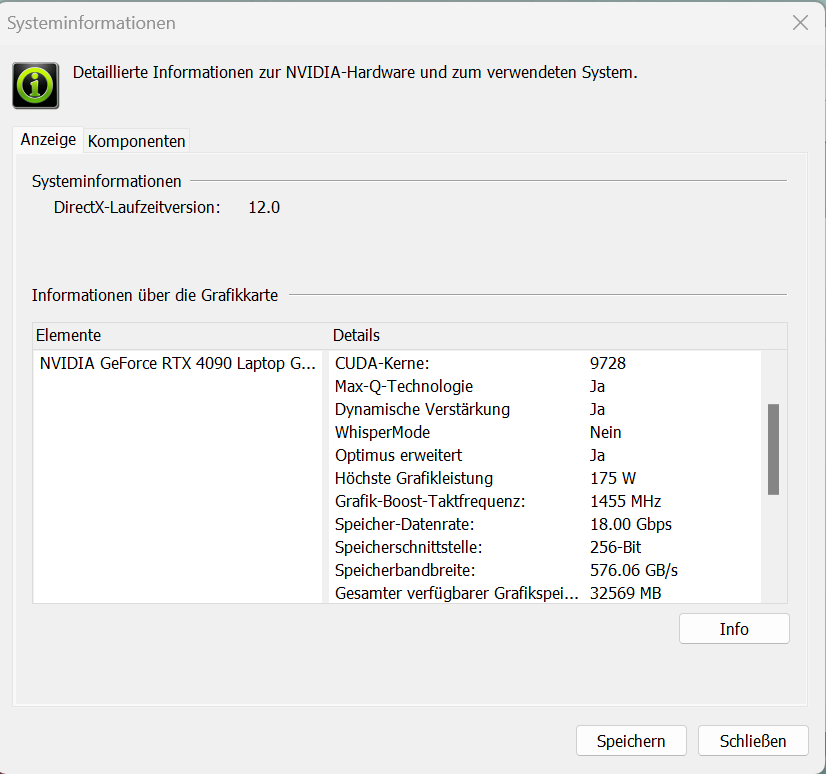
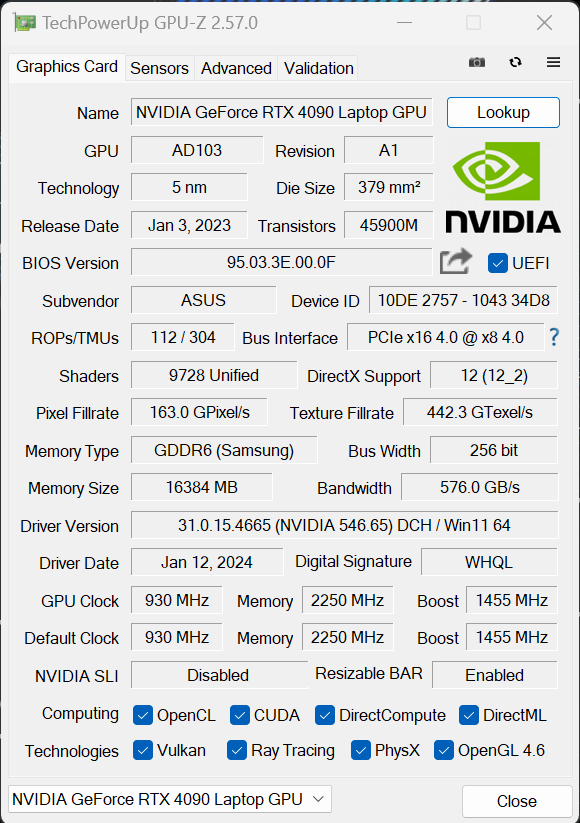
Com a GeForce RTX 4090a Asus usa o modelo top atual da Nvidia entre as GPUs móveis. Ela oferece 9.728 unidades de sombreamento, um barramento de armazenamento de 256 bits e também pode usar armazenamento GDDR6 rápido (16.384 MB). A RTX 4090 recebe um TGP máximo de 175 watts (150 W + 25 W Dynamic Boost) - não é possível fazer mais.
No modo "Performance", os resultados do benchmark estão abaixo da média determinada para o RTX 4090 até o momento, enquanto o "Turbo" resulta em valores no mesmo nível da média. O Optimus avançado é suportado, e a alternância entre a dGPU e o Optimus não exige uma reinicialização.


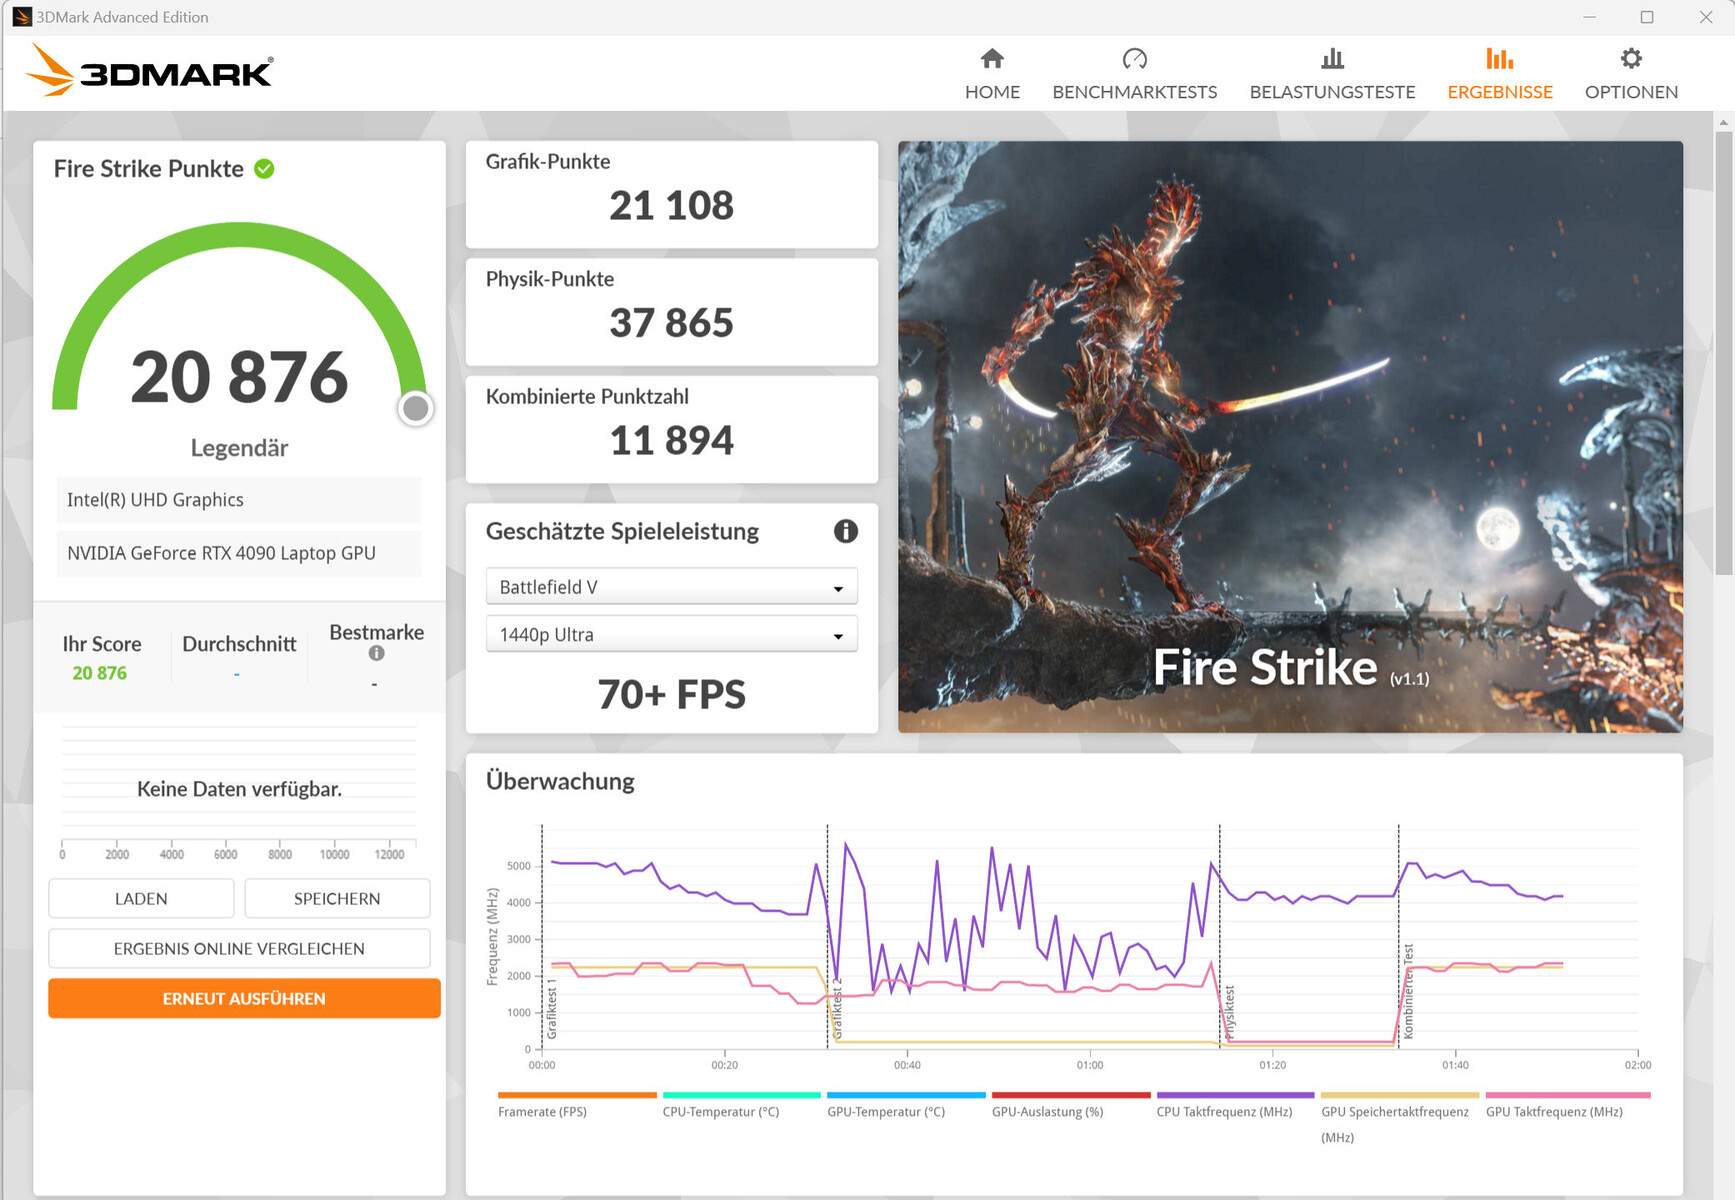
| 3DMark 11 Performance | 42985 pontos | |
| 3DMark Cloud Gate Standard Score | 65110 pontos | |
| 3DMark Fire Strike Score | 33620 pontos | |
| 3DMark Time Spy Score | 19507 pontos | |
Ajuda | ||
| V-Ray Benchmark Next 4.10 | |
| GPU | |
| Asus ROG Strix Scar 18 2023 G834JY-N6005W (v4.10.07 ) | |
| Média NVIDIA GeForce RTX 4090 Laptop GPU (873 - 1334, n=30) | |
| Asus ROG Strix Scar 18 G834JYR (2024) (v4.10.07 ) | |
| Acer Predator Helios 18 N23Q2 (v4.10.07 ) | |
| Média da turma Gaming (427 - 1627, n=99, últimos 2 anos) | |
| CPU | |
| Asus ROG Strix Scar 18 2023 G834JY-N6005W (v4.10.07 ) | |
| Acer Predator Helios 18 N23Q2 (v4.10.07 ) | |
| Média NVIDIA GeForce RTX 4090 Laptop GPU (18206 - 37629, n=30) | |
| Asus ROG Strix Scar 18 G834JYR (2024) (v4.10.07 ) | |
| Média da turma Gaming (10048 - 45327, n=97, últimos 2 anos) | |
* ... menor é melhor
Desempenho em jogos
A Scar 18 permite jogos em QHD+ com as configurações máximas. Resoluções mais altas podem ser usadas se o senhor conectar o monitor correspondente. Os jogos com suporte para DLSS 3 e Frame Generation permitem configurações máximas e efeitos adicionais de raytracing em resolução 4k.
No modo "Performance", as taxas de quadros dos nossos jogos testados estão abaixo da média da RTX 4090 determinada até o momento. A seleção de "Turbo" pode resultar em um ligeiro aumento, e o mesmo vale para o modo de GPU "Ultimate".
| The Witcher 3 - 1920x1080 Ultra Graphics & Postprocessing (HBAO+) | |
| Alienware m18 R1 | |
| MSI Titan 18 HX A14VIG | |
| Média NVIDIA GeForce RTX 4090 Laptop GPU (139.2 - 216, n=35) | |
| Média da turma Gaming (104.7 - 240, n=7, últimos 2 anos) | |
| Asus ROG Strix Scar 18 G834JYR (2024) | |
| Acer Predator Helios 18 N23Q2 | |
| Alienware m18 R1 AMD | |
| Razer Blade 18 RTX 4070 | |
| Call of Duty Modern Warfare 3 2023 | |
| 1920x1080 Extreme Preset | |
| Média NVIDIA GeForce RTX 4090 Laptop GPU (148 - 205, n=7) | |
| Asus ROG Strix Scar 18 G834JYR (2024) | |
| Média da turma Gaming (27 - 95, n=2, últimos 2 anos) | |
| 2560x1440 Extreme Preset | |
| Asus ROG Strix Scar 18 G834JYR (2024) | |
| Média NVIDIA GeForce RTX 4090 Laptop GPU (113 - 162, n=7) | |
| Média da turma Gaming (n=1últimos 2 anos) | |
| The Finals | |
| 1920x1080 Epic Preset | |
| Asus ROG Strix Scar 18 G834JYR (2024) | |
| Média NVIDIA GeForce RTX 4090 Laptop GPU (174.1 - 211, n=2) | |
| Média da turma Gaming (n=1últimos 2 anos) | |
| 2560x1440 Epic Preset | |
| Asus ROG Strix Scar 18 G834JYR (2024) | |
| Média NVIDIA GeForce RTX 4090 Laptop GPU (137.2 - 147.4, n=2) | |
| Média da turma Gaming (n=1últimos 2 anos) | |
| 1920x1080 Epic Preset + Epic RTX Global Illumination | |
| Asus ROG Strix Scar 18 G834JYR (2024) | |
| Média NVIDIA GeForce RTX 4090 Laptop GPU (159.8 - 190.8, n=2) | |
| Palworld | |
| 1920x1080 Epic Preset AA:TSR | |
| Asus ROG Strix Scar 18 G834JYR (2024) | |
| Média NVIDIA GeForce RTX 4090 Laptop GPU (138.8 - 150.9, n=2) | |
| Média da turma Gaming (n=1últimos 2 anos) | |
| 2560x1440 Epic Preset AA:TSR | |
| Asus ROG Strix Scar 18 G834JYR (2024) | |
| Média NVIDIA GeForce RTX 4090 Laptop GPU (110.5 - 119.8, n=2) | |
| Enshrouded | |
| 1920x1080 Max. Quality AA:FX | |
| Média NVIDIA GeForce RTX 4090 Laptop GPU (79 - 101.5, n=3) | |
| Asus ROG Strix Scar 18 G834JYR (2024) | |
| Média da turma Gaming (n=1últimos 2 anos) | |
| 2560x1440 Max. Quality AA:FX | |
| Asus ROG Strix Scar 18 G834JYR (2024) | |
| Média NVIDIA GeForce RTX 4090 Laptop GPU (61.8 - 76, n=3) | |
Para avaliar se as taxas de quadros permanecem relativamente constantes em um período de tempo mais longo, executamos o jogo "The Witcher 3" por cerca de 60 minutos em resolução Full-HD com as configurações de qualidade máxima. O personagem do jogo não é movido. Não observamos nenhuma queda nas taxas de quadros.
The Witcher 3 FPS Chart
| baixo | média | alto | ultra | QHD | |
|---|---|---|---|---|---|
| GTA V (2015) | 187.5 | 187.1 | 181.2 | 136 | 129.6 |
| The Witcher 3 (2015) | 579.6 | 501.7 | 342.8 | 189.4 | 151.5 |
| Dota 2 Reborn (2015) | 219 | 194.5 | 173.9 | 161.3 | |
| Final Fantasy XV Benchmark (2018) | 221 | 198.1 | 166.1 | 143.6 | |
| X-Plane 11.11 (2018) | 197.9 | 172.4 | 136.8 | ||
| Far Cry 5 (2018) | 176 | 163 | 156 | 145 | 145 |
| Strange Brigade (2018) | 429 | 350 | 341 | 331 | 279 |
| Starfield (2023) | 112.7 | 100 | 84.2 | 78.4 | 66 |
| Cyberpunk 2077 (2023) | 134.8 | 121.5 | 117.7 | 112.1 | 83.8 |
| Call of Duty Modern Warfare 3 2023 (2023) | 229 | 210 | 169 | 162 | 162 |
| The Finals (2023) | 228 | 216 | 214 | 211 | 147.4 |
| Palworld (2024) | 211 | 180.9 | 151.3 | 150.9 | 119.8 |
| Enshrouded (2024) | 135.2 | 120.1 | 100.8 | 87.6 | 68.9 |
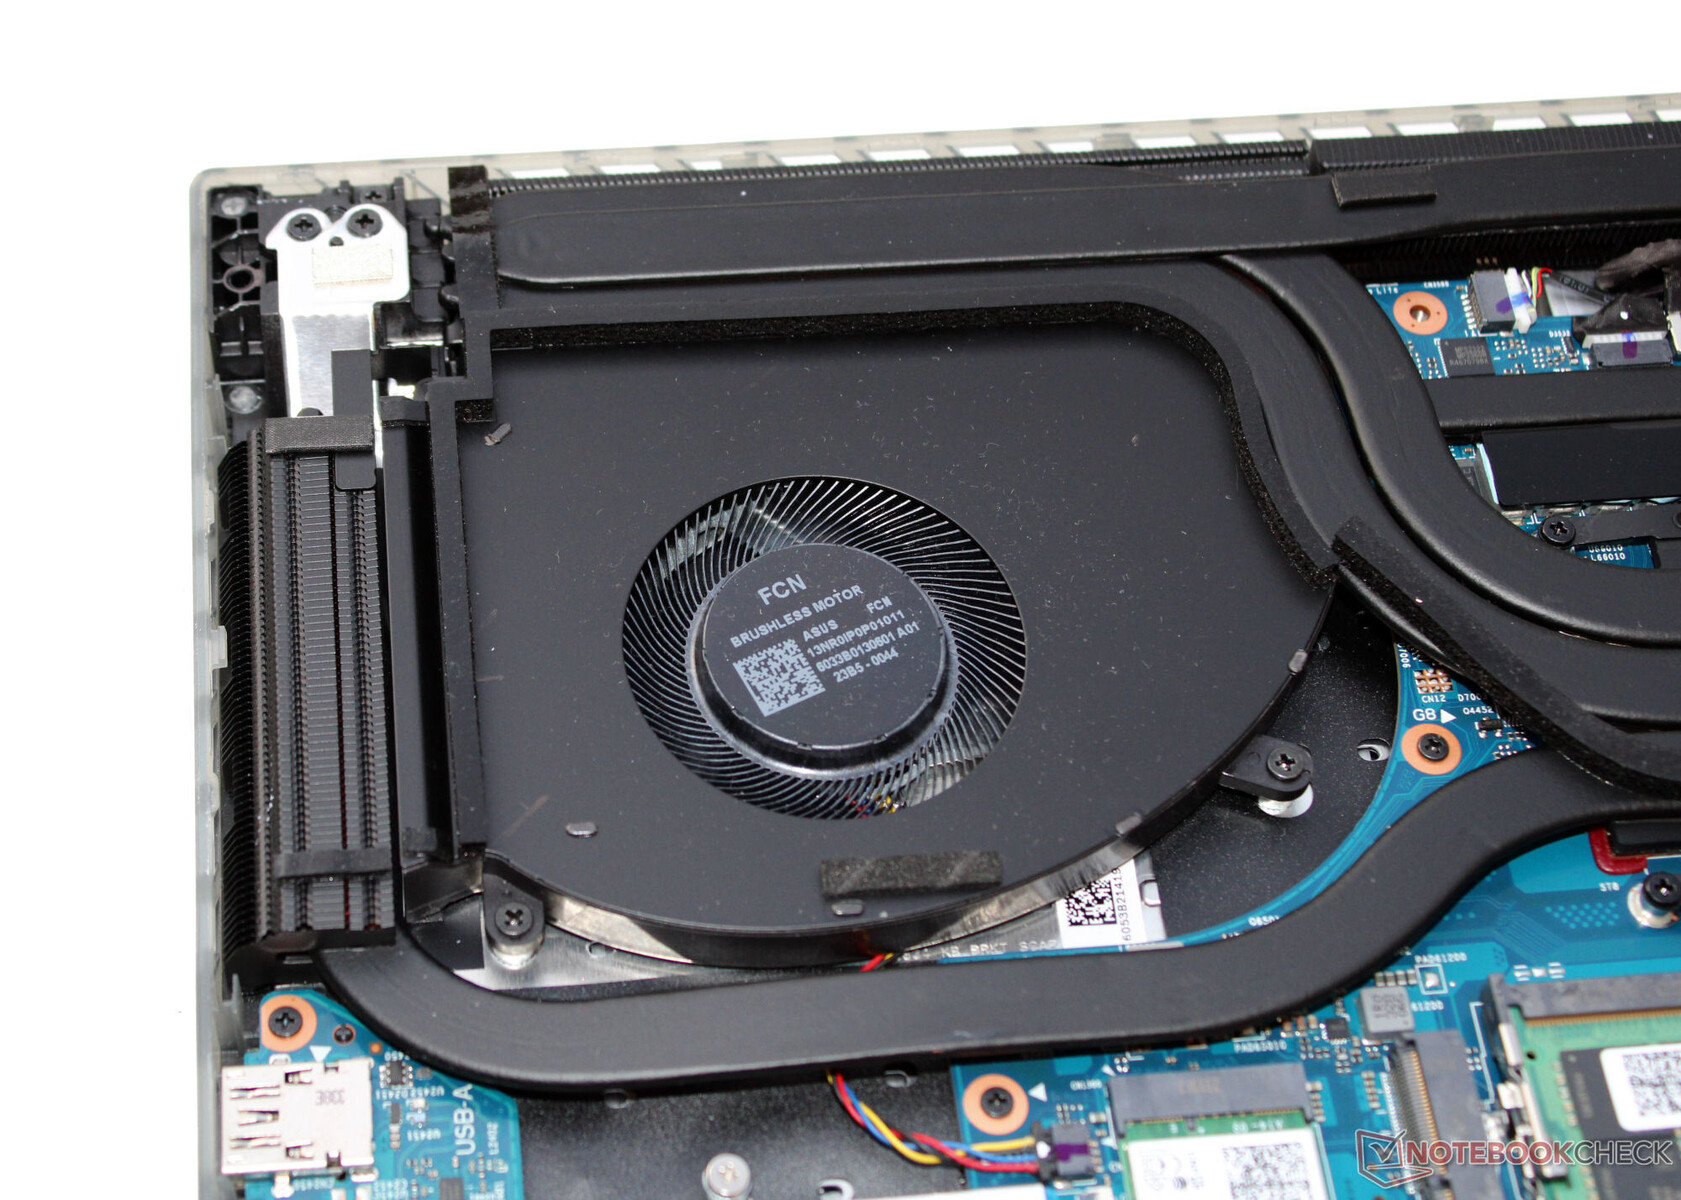
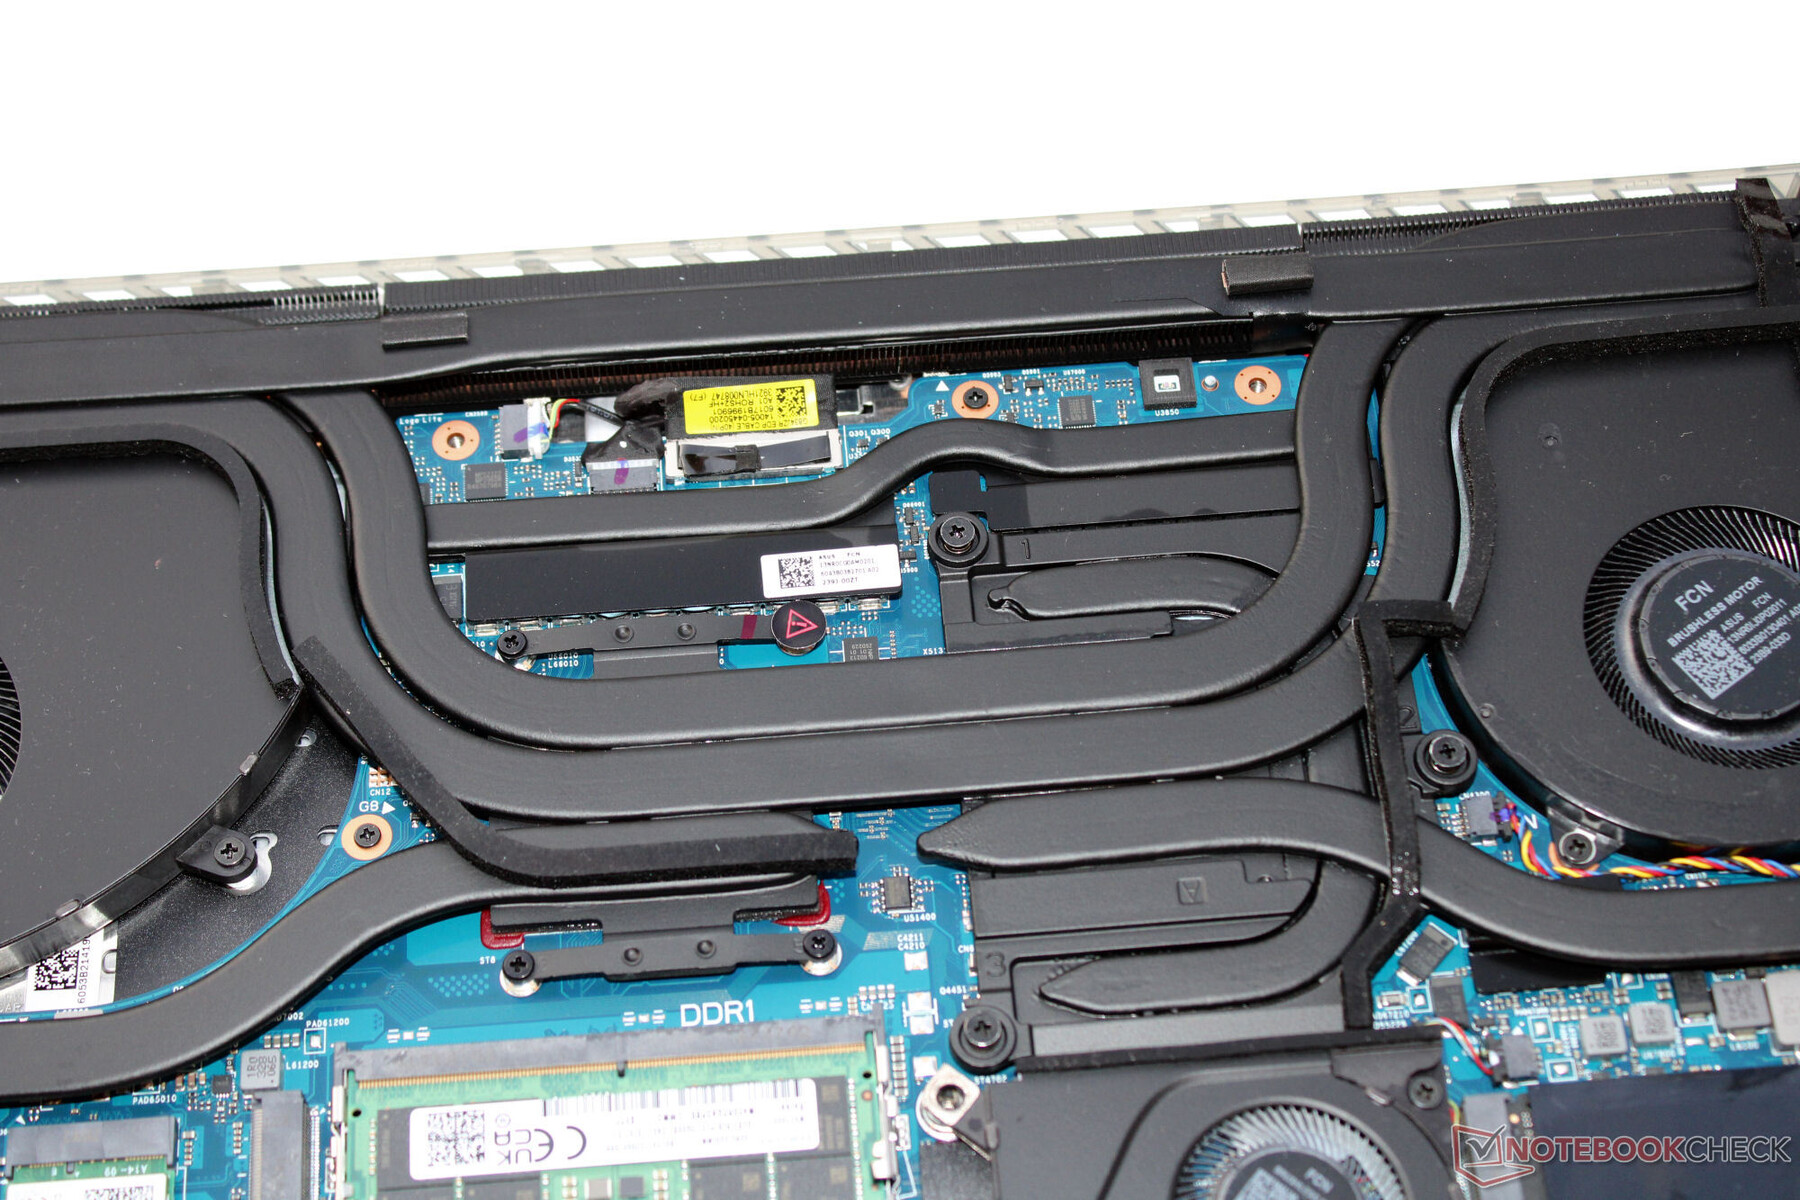
Emissões - O G834JYR pode funcionar silenciosamente
Emissões de ruído
Sob carga total, o nível de ruído aumenta até 52 dB(A) no modo "Performance". Com o "Turbo", o valor aumenta ainda mais, e uma comparação com o Cicatriz 18 de 2023 mostra o mesmo. Sua operação também pode ser mais silenciosa em geral: se o senhor abrir mão do desempenho selecionando o modo "Silent", o nível de ruído diminui para 35 dB(A). Durante a inatividade ou na operação cotidiana (escritório, Internet), muitas vezes apenas uma das duas ventoinhas está funcionando e, ocasionalmente, ambas permanecem silenciosas, especialmente ao usar o perfil "Silent".
Barulho
| Ocioso |
| 27 / 28 / 32 dB |
| Carga |
| 50 / 52 dB |
 | ||
30 dB silencioso 40 dB(A) audível 50 dB(A) ruidosamente alto |
||
min: | ||
| Asus ROG Strix Scar 18 G834JYR (2024) i9-14900HX, GeForce RTX 4090 Laptop GPU | Alienware m18 R1 AMD R9 7945HX, Radeon RX 7900M | Alienware m18 R1 i9-13980HX, GeForce RTX 4090 Laptop GPU | Acer Predator Helios 18 N23Q2 i9-13900HX, GeForce RTX 4080 Laptop GPU | Razer Blade 18 RTX 4070 i9-13950HX, GeForce RTX 4070 Laptop GPU | MSI Titan 18 HX A14VIG i9-14900HX, GeForce RTX 4090 Laptop GPU | Asus ROG Strix Scar 18 2023 G834JY-N6005W i9-13980HX, GeForce RTX 4090 Laptop GPU | |
|---|---|---|---|---|---|---|---|
| Noise | 8% | 12% | 6% | 10% | 5% | 2% | |
| desligado / ambiente * (dB) | 24 | 22.4 7% | 22.8 5% | 23 4% | 23.5 2% | 22.8 5% | 23.9 -0% |
| Idle Minimum * (dB) | 27 | 23 15% | 23 15% | 23 15% | 23.8 12% | 23.8 12% | 23.9 11% |
| Idle Average * (dB) | 28 | 23.4 16% | 23 18% | 23 18% | 23.8 15% | 23.8 15% | 32.6 -16% |
| Idle Maximum * (dB) | 32 | 33.5 -5% | 23 28% | 23 28% | 26.8 16% | 28 12% | 32.6 -2% |
| Load Average * (dB) | 50 | 33.5 33% | 35.6 29% | 45.26 9% | 37.3 25% | 38 24% | 35.9 28% |
| Witcher 3 ultra * (dB) | 50 | 53.6 -7% | 51.3 -3% | 59.82 -20% | 48 4% | 57.3 -15% | |
| Load Maximum * (dB) | 52 | 53.6 -3% | 56.7 -9% | 59.94 -15% | 53.5 -3% | 62.8 -21% | 55.8 -7% |
* ... menor é melhor
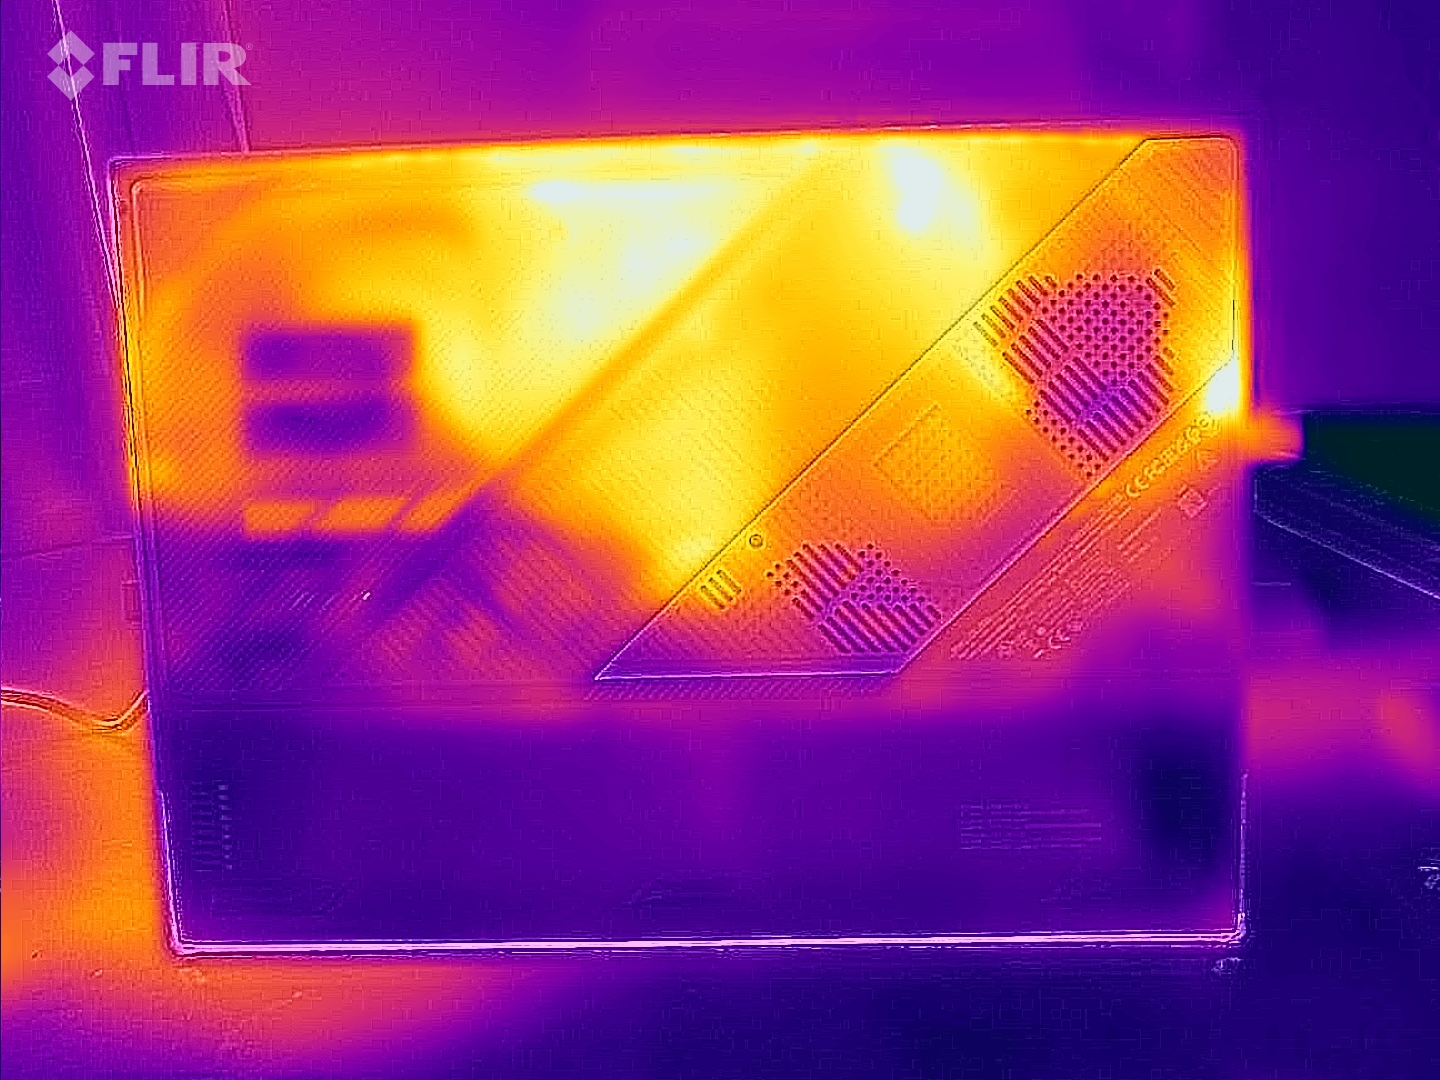
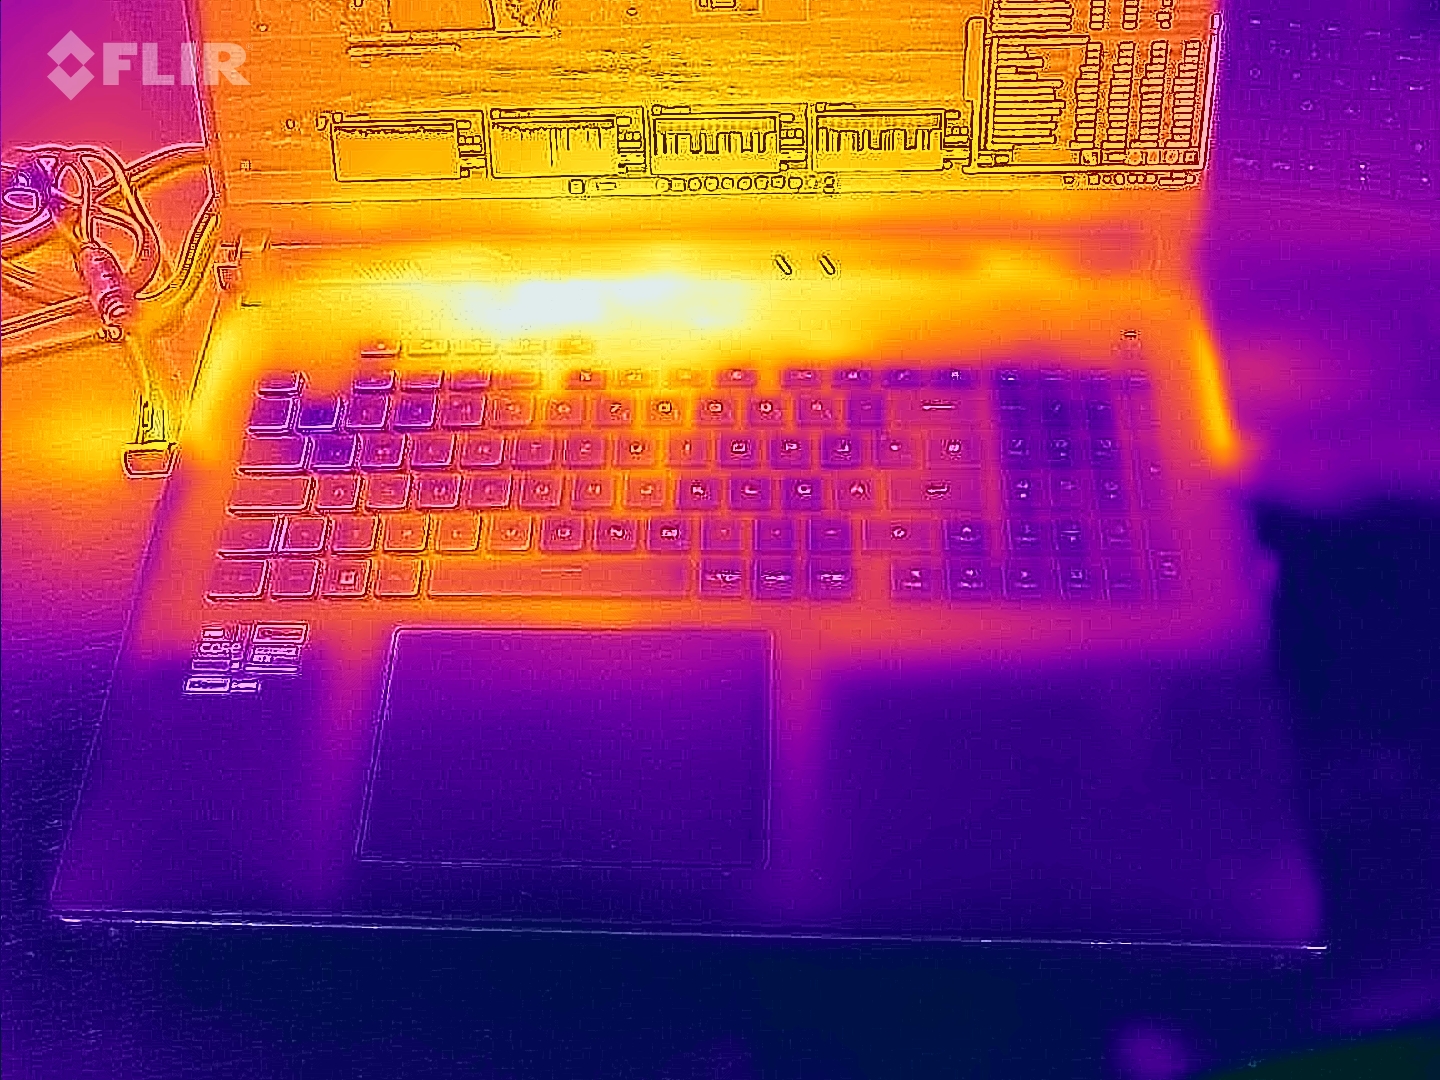
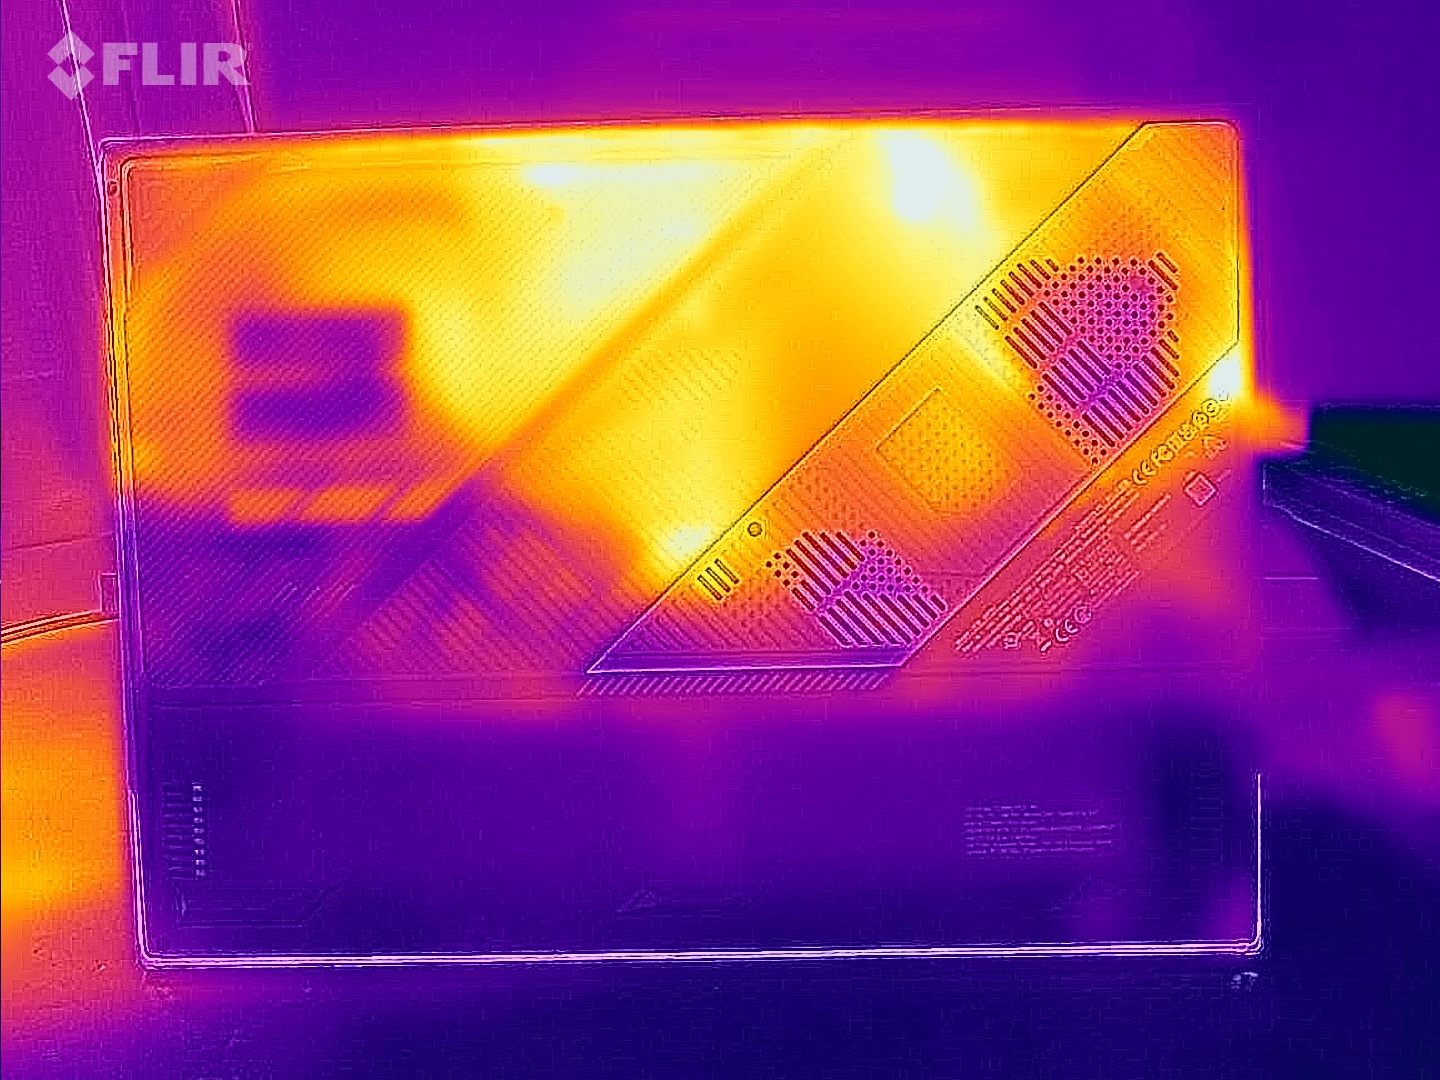
Temperaturas
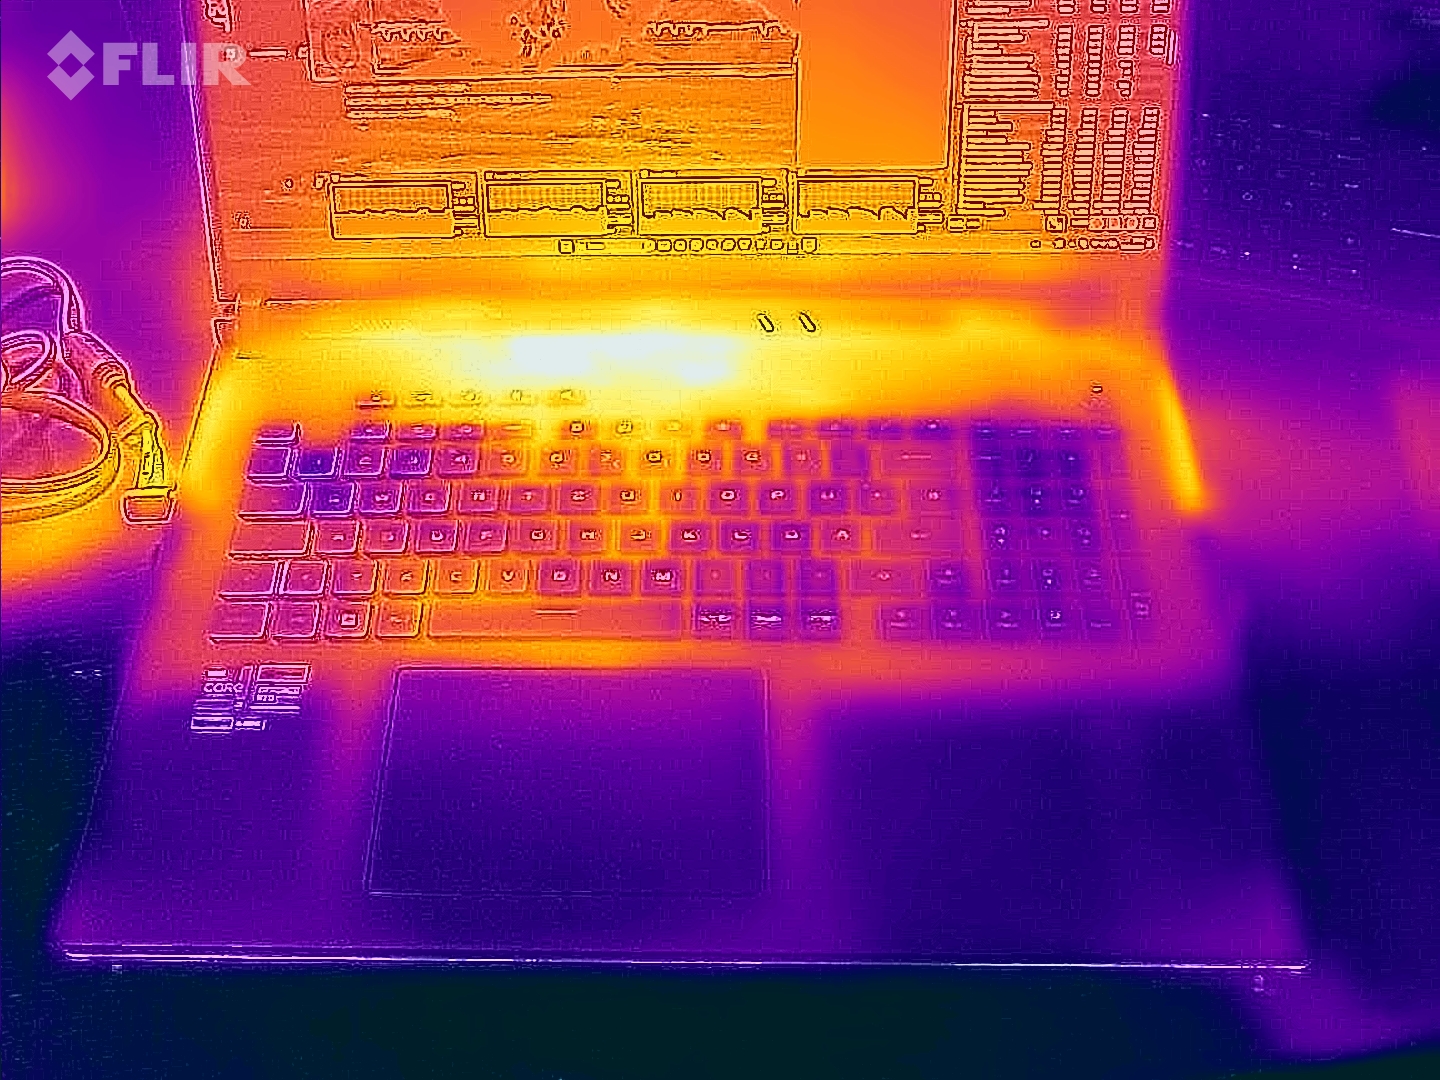
O teste de estresse e o teste Witcher 3 resultam em um aquecimento perceptível, mas não excessivo, do laptop. Em alguns pontos, são atingidos valores acima de 50 ºC (122 ºF). Entretanto, durante a operação diária (escritório, Internet), as temperaturas permanecem dentro da faixa verde.
(-) A temperatura máxima no lado superior é 49 °C / 120 F, em comparação com a média de 40.4 °C / 105 F , variando de 21.2 a 68.8 °C para a classe Gaming.
(-) A parte inferior aquece até um máximo de 47 °C / 117 F, em comparação com a média de 43.2 °C / 110 F
(+) Em uso inativo, a temperatura média para o lado superior é 27.3 °C / 81 F, em comparação com a média do dispositivo de 33.9 °C / ### class_avg_f### F.
(-) Jogando The Witcher 3, a temperatura média para o lado superior é 39.1 °C / 102 F, em comparação com a média do dispositivo de 33.9 °C / ## #class_avg_f### F.
(+) Os apoios para as mãos e o touchpad estão atingindo a temperatura máxima da pele (35 °C / 95 F) e, portanto, não estão quentes.
(-) A temperatura média da área do apoio para as mãos de dispositivos semelhantes foi 28.8 °C / 83.8 F (-6.2 °C / -11.2 F).
| Asus ROG Strix Scar 18 G834JYR (2024) Intel Core i9-14900HX, NVIDIA GeForce RTX 4090 Laptop GPU | Alienware m18 R1 AMD AMD Ryzen 9 7945HX, AMD Radeon RX 7900M | Alienware m18 R1 Intel Core i9-13980HX, NVIDIA GeForce RTX 4090 Laptop GPU | Acer Predator Helios 18 N23Q2 Intel Core i9-13900HX, NVIDIA GeForce RTX 4080 Laptop GPU | Razer Blade 18 RTX 4070 Intel Core i9-13950HX, NVIDIA GeForce RTX 4070 Laptop GPU | MSI Titan 18 HX A14VIG Intel Core i9-14900HX, NVIDIA GeForce RTX 4090 Laptop GPU | Asus ROG Strix Scar 18 2023 G834JY-N6005W Intel Core i9-13980HX, NVIDIA GeForce RTX 4090 Laptop GPU | |
|---|---|---|---|---|---|---|---|
| Heat | 8% | 13% | -8% | 7% | 2% | -3% | |
| Maximum Upper Side * (°C) | 49 | 40.2 18% | 39 20% | 35 29% | 39.2 20% | 37.8 23% | 54 -10% |
| Maximum Bottom * (°C) | 47 | 37.4 20% | 36.4 23% | 56 -19% | 35.6 24% | 37.6 20% | 46 2% |
| Idle Upper Side * (°C) | 29 | 31.6 -9% | 29.2 -1% | 34 -17% | 31.8 -10% | 34.8 -20% | 30 -3% |
| Idle Bottom * (°C) | 31 | 30.6 1% | 27.8 10% | 39 -26% | 33.2 -7% | 36 -16% | 31 -0% |
* ... menor é melhor
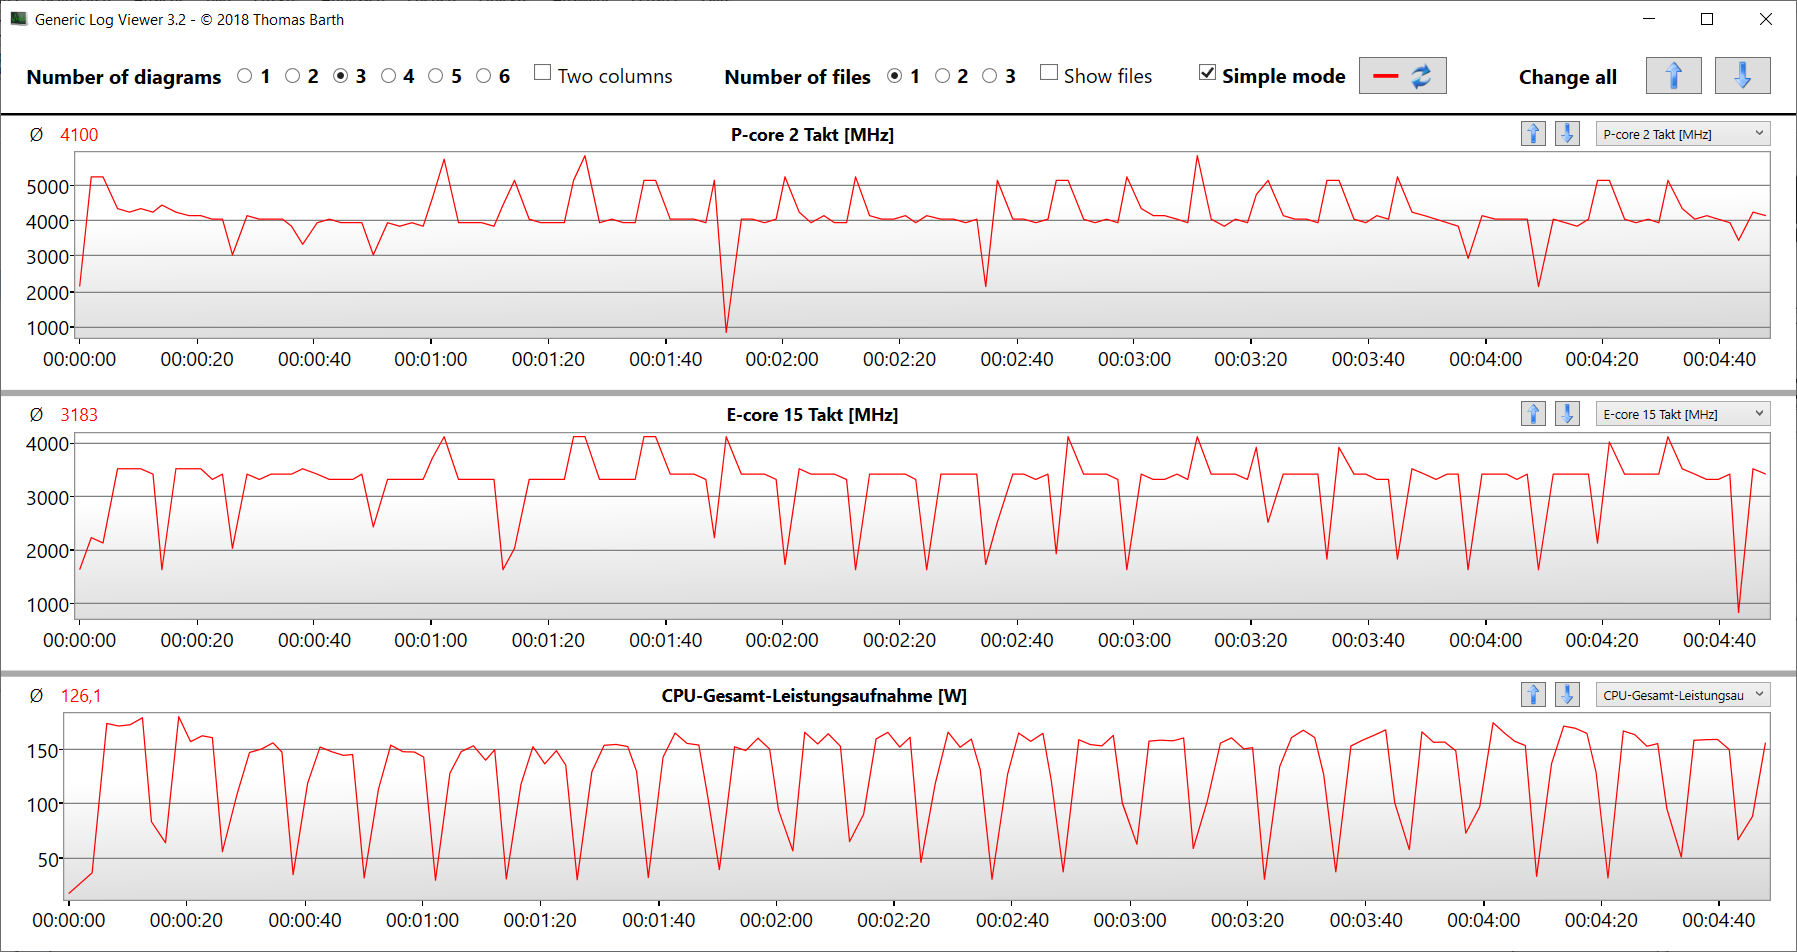
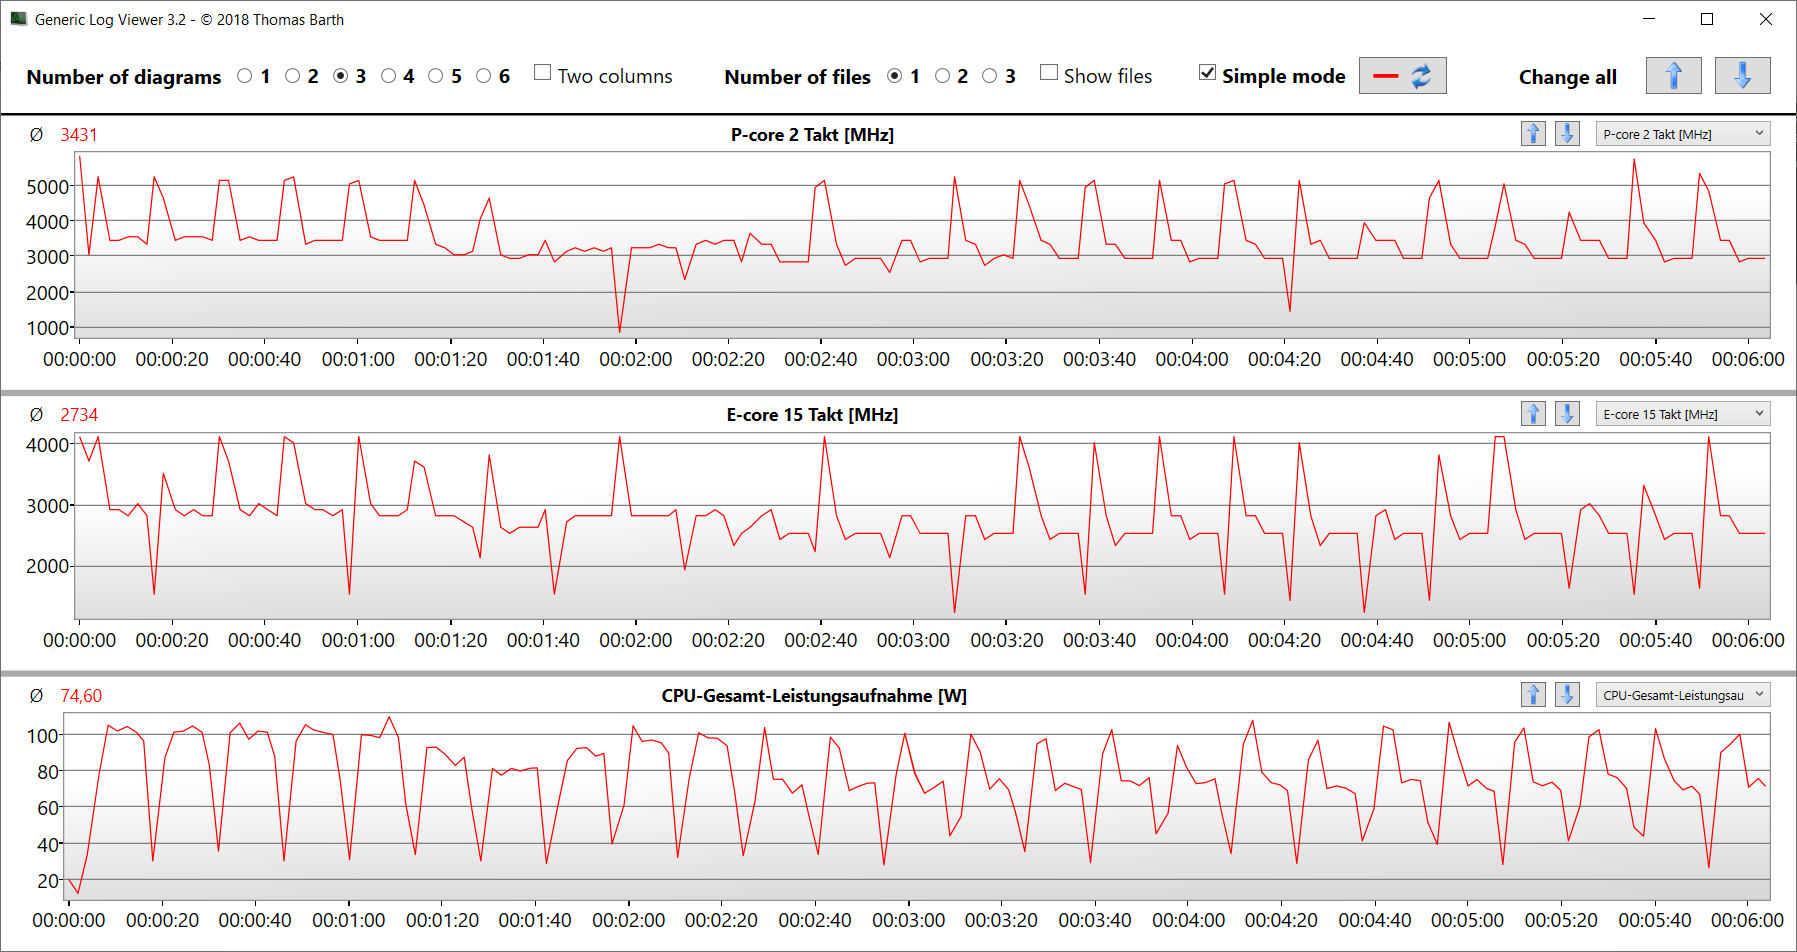
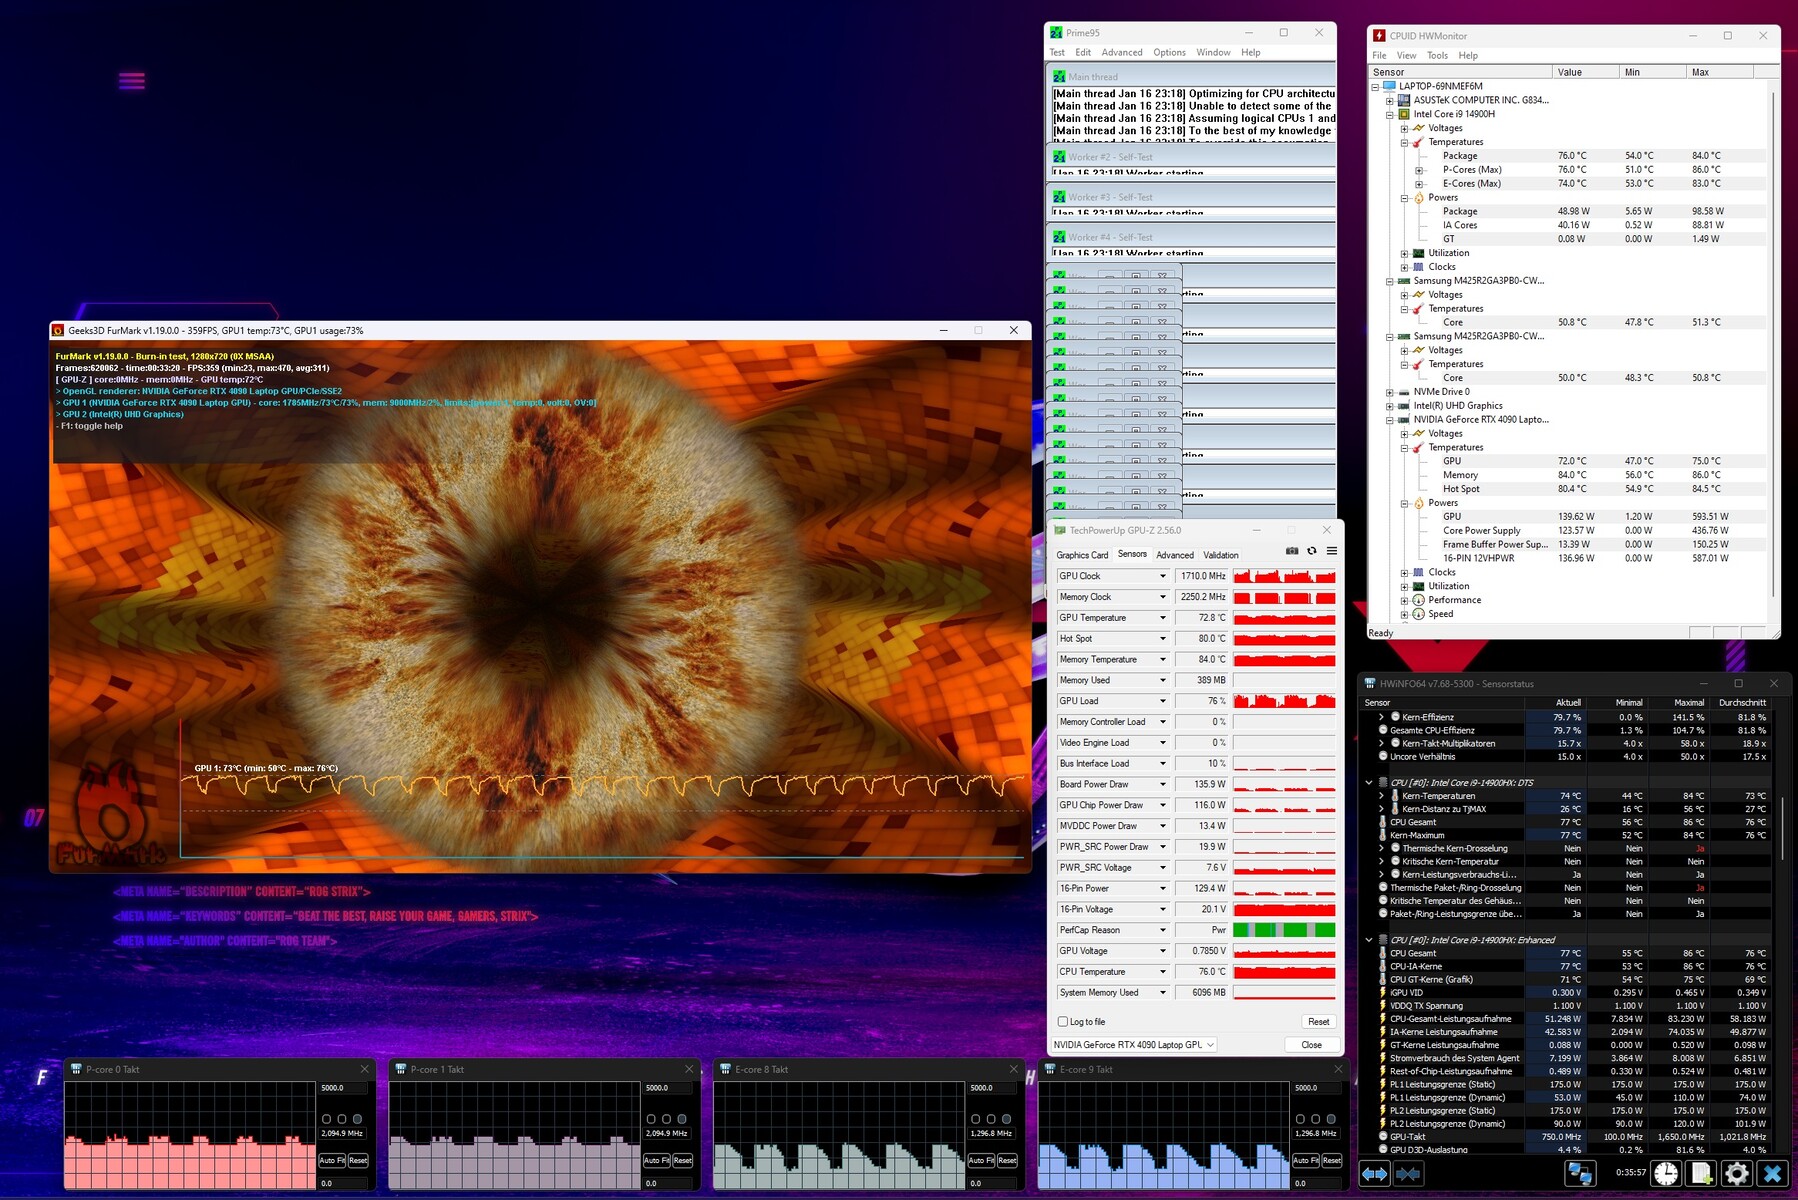
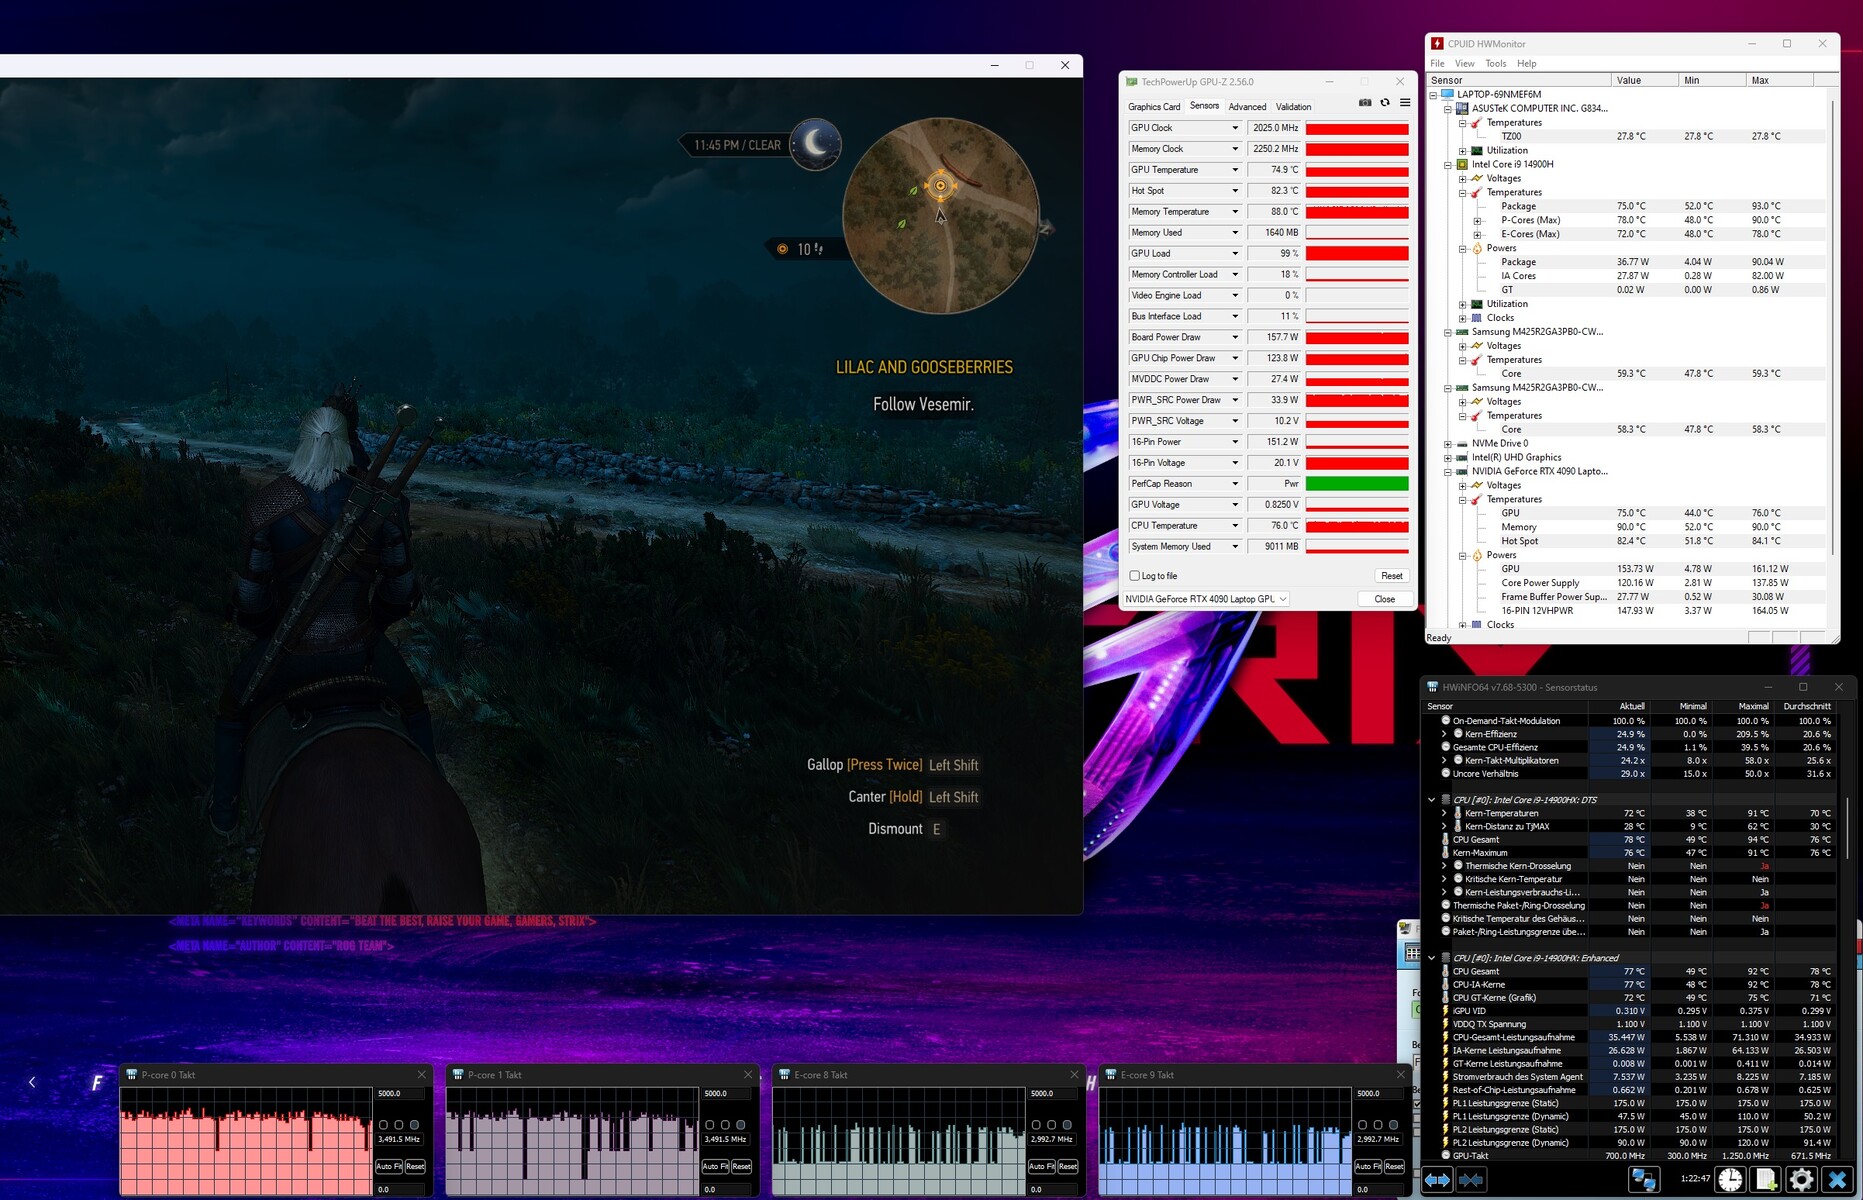
Teste de estresse
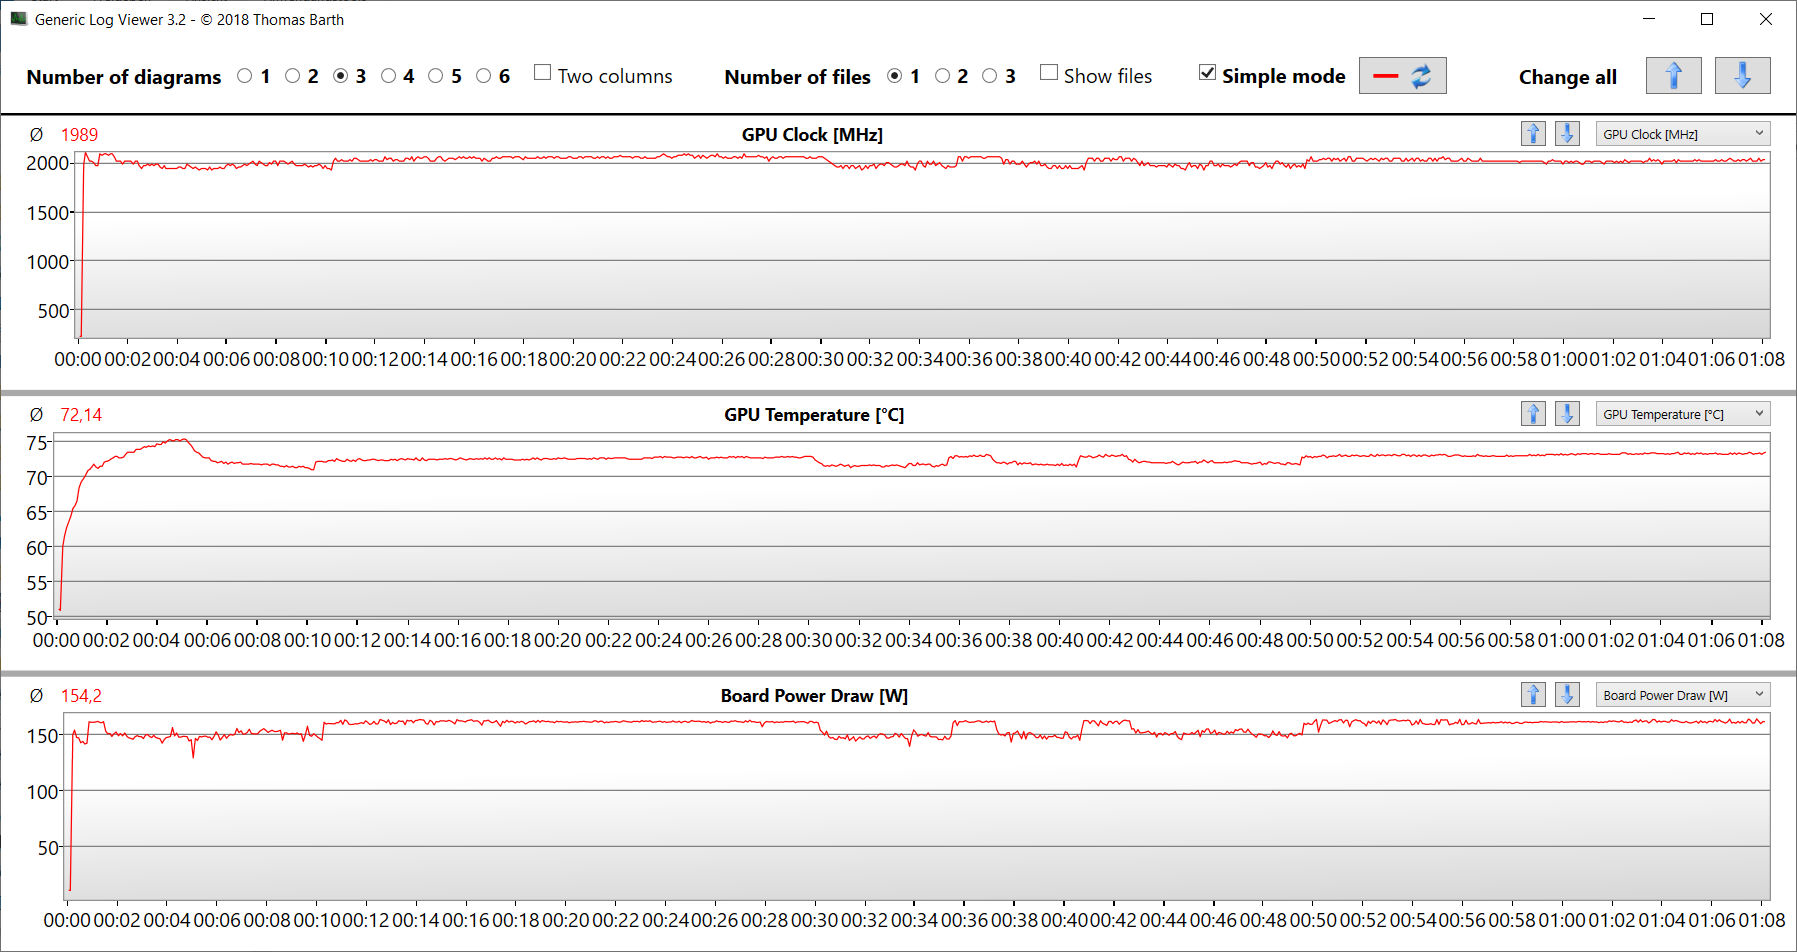
O teste de estresse (com o Prime95 e o Furmark em execução constante) representa um cenário extremo para avaliar a estabilidade do sistema sob carga total. A CPU atinge velocidades máximas de 2,5 a 2,6 GHz (núcleos P) e 2,2 a 2,3 GHz (núcleos E). A GPU (1,9 a 2 GHz) começa o teste com velocidade quase total e a velocidade cai ligeiramente à medida que o teste continua. Além disso, a GPU é regularmente acelerada de forma significativa.
Alto-falantes
Os quatro alto-falantes produzem um som bastante decente juntos. Para obter uma experiência sonora ainda melhor, é possível usar um fone de ouvido ou alto-falantes externos.
Asus ROG Strix Scar 18 G834JYR (2024) análise de áudio
(+) | os alto-falantes podem tocar relativamente alto (###valor### dB)
Graves 100 - 315Hz
(±) | graves reduzidos - em média 5.6% menor que a mediana
(+) | o baixo é linear (6.8% delta para a frequência anterior)
Médios 400 - 2.000 Hz
(±) | médios mais altos - em média 5.7% maior que a mediana
(+) | médios são lineares (2.8% delta para frequência anterior)
Altos 2 - 16 kHz
(±) | máximos reduzidos - em média 7.2% menor que a mediana
(±) | a linearidade dos máximos é média (7.2% delta para frequência anterior)
Geral 100 - 16.000 Hz
(+) | o som geral é linear (13% diferença em relação à mediana)
Comparado com a mesma classe
» 18% de todos os dispositivos testados nesta classe foram melhores, 3% semelhantes, 79% piores
» O melhor teve um delta de 6%, a média foi 18%, o pior foi 132%
Comparado com todos os dispositivos testados
» 13% de todos os dispositivos testados foram melhores, 3% semelhantes, 85% piores
» O melhor teve um delta de 4%, a média foi 23%, o pior foi 134%
MSI Titan 18 HX A14VIG análise de áudio
(+) | os alto-falantes podem tocar relativamente alto (###valor### dB)
Graves 100 - 315Hz
(-) | quase nenhum baixo - em média 17.6% menor que a mediana
(±) | a linearidade dos graves é média (8% delta para a frequência anterior)
Médios 400 - 2.000 Hz
(+) | médios equilibrados - apenas 1.8% longe da mediana
(+) | médios são lineares (3.7% delta para frequência anterior)
Altos 2 - 16 kHz
(+) | agudos equilibrados - apenas 1.2% longe da mediana
(+) | os máximos são lineares (2% delta da frequência anterior)
Geral 100 - 16.000 Hz
(+) | o som geral é linear (9.9% diferença em relação à mediana)
Comparado com a mesma classe
» 5% de todos os dispositivos testados nesta classe foram melhores, 2% semelhantes, 94% piores
» O melhor teve um delta de 6%, a média foi 18%, o pior foi 132%
Comparado com todos os dispositivos testados
» 4% de todos os dispositivos testados foram melhores, 1% semelhantes, 95% piores
» O melhor teve um delta de 4%, a média foi 23%, o pior foi 134%
Gerenciamento de energia - O Asus ROG tem uma duração de bateria razoavelmente boa
Consumo de energia
Durante o teste Witcher 3, o consumo de energia permanece constante em um nível esperado e, durante o teste de estresse, o consumo varia. Essa variação pode ser atribuída a uma redução significativa da velocidade da GPU que ocorre regularmente. O carregador de 330 watts fornece uma quantidade suficiente de energia.
| desligado | |
| Ocioso | |
| Carga |
|
Key:
min: | |
| Asus ROG Strix Scar 18 G834JYR (2024) i9-14900HX, GeForce RTX 4090 Laptop GPU | Alienware m18 R1 AMD R9 7945HX, Radeon RX 7900M | Alienware m18 R1 i9-13980HX, GeForce RTX 4090 Laptop GPU | Acer Predator Helios 18 N23Q2 i9-13900HX, GeForce RTX 4080 Laptop GPU | Razer Blade 18 RTX 4070 i9-13950HX, GeForce RTX 4070 Laptop GPU | MSI Titan 18 HX A14VIG i9-14900HX, GeForce RTX 4090 Laptop GPU | Asus ROG Strix Scar 18 2023 G834JY-N6005W i9-13980HX, GeForce RTX 4090 Laptop GPU | Média da turma Gaming | |
|---|---|---|---|---|---|---|---|---|
| Power Consumption | -112% | -48% | -4% | -40% | -40% | -35% | 6% | |
| Idle Minimum * (Watt) | 14 | 30.3 -116% | 21.6 -54% | 16 -14% | 24.5 -75% | 13.2 6% | 17.3 -24% | 13 ? 7% |
| Idle Average * (Watt) | 17 | 55.6 -227% | 25.2 -48% | 19 -12% | 34.1 -101% | 25.4 -49% | 27 -59% | 19 ? -12% |
| Idle Maximum * (Watt) | 24 | 101.1 -321% | 56.7 -136% | 21.3 11% | 47.7 -99% | 53.5 -123% | 46 -92% | 24.6 ? -3% |
| Load Average * (Watt) | 143 | 160.3 -12% | 164.1 -15% | 124 13% | 140 2% | 151.4 -6% | 133 7% | 110.7 ? 23% |
| Witcher 3 ultra * (Watt) | 251 | 216 14% | 311 -24% | 289 -15% | 202 20% | 336 -34% | ||
| Load Maximum * (Watt) | 302 | 332.1 -10% | 338.9 -12% | 319 -6% | 261 14% | 395.2 -31% | 329 -9% | 259 ? 14% |
* ... menor é melhor
Power Consumption The Witcher 3 / Stress Test
Power Consumption With External Monitor
Duração da bateria
Em nosso teste de WLAN carregando sites da Web por meio de script e ou teste de vídeo reproduzindo o curta-metragem Big Buck Bunny (codificação H.264, FHD) em um loop constante, o laptop de 18 polegadas atinge tempos de execução de 7:41 h e 7:27 h, respectivamente. Portanto, o Scar 18 oferece valores muito bons em geral e é capaz de superar os concorrentes por margens significativas, apesar de suas capacidades de bateria serem maiores em partes.
| Asus ROG Strix Scar 18 G834JYR (2024) i9-14900HX, GeForce RTX 4090 Laptop GPU, 90 Wh | Alienware m18 R1 AMD R9 7945HX, Radeon RX 7900M, 97 Wh | Alienware m18 R1 i9-13980HX, GeForce RTX 4090 Laptop GPU, 97 Wh | Acer Predator Helios 18 N23Q2 i9-13900HX, GeForce RTX 4080 Laptop GPU, 90 Wh | Razer Blade 18 RTX 4070 i9-13950HX, GeForce RTX 4070 Laptop GPU, 91.7 Wh | MSI Titan 18 HX A14VIG i9-14900HX, GeForce RTX 4090 Laptop GPU, 99.9 Wh | Asus ROG Strix Scar 18 2023 G834JY-N6005W i9-13980HX, GeForce RTX 4090 Laptop GPU, 90 Wh | Média da turma Gaming | |
|---|---|---|---|---|---|---|---|---|
| Duração da bateria | -61% | -45% | -16% | -26% | -32% | -15% | 0% | |
| Reader / Idle (h) | 10.2 | 4.5 -56% | 5.6 -45% | 7 -31% | 5.9 -42% | 8.27 ? -19% | ||
| H.264 (h) | 7.5 | 4.8 -36% | 7 -7% | 8.32 ? 11% | ||||
| WiFi v1.3 (h) | 7.7 | 1.4 -82% | 4.3 -44% | 4.4 -43% | 4 -48% | 4.2 -45% | 7.1 -8% | 7.11 ? -8% |
| Load (h) | 1.3 | 0.7 -46% | 0.7 -46% | 1.7 31% | 1.3 0% | 1.2 -8% | 0.9 -31% | 1.502 ? 16% |
| Witcher 3 ultra (h) | 0.9 |
Pro
Contra
Veredicto - Há espaço para melhorias
O processamento de vídeo e imagem, o streaming, a renderização e os jogos estão incluídos nos principais cenários de uso do laptop. Enquanto a GeForce RTX 4090 e o Core i9-14900HX ofereçam o desempenho necessário, eles não atingem nenhum novo recorde. As emissões variam nos níveis altos que são comuns para essa classe de dispositivo.
Com o ROG Strix Scar 18 (2024), a Asus oferece um poderoso laptop de ponta a um preço elevado.
O destaque do laptop é sua tela mini-LED (2560x1600 pixels, DCI-P3, Dolby Vision, 240 Hz) com uma diagonal de 18 polegadas no formato 16:10. Seus aspectos positivos incluem um brilho máximo de quase 1.000 cd/m², um valor de preto muito bom e uma alta precisão de cores.
As portas USB-C (1x USB 3.2 Gen 2, 1x Thunderbolt 4) facilitam sua integração às configurações existentes no local de trabalho e abrem algumas opções de expansão, como uma GPU externa ou uma estação de acoplamento. Ambas as portas USB-C podem ser usadas para saída de sinal DisplayPort, e a porta USB 3.2 Gen 2 também suporta Power Delivery. Tudo isso é acompanhado por uma bateria de excelente duração.
Uma alternativa pode ser o MSI Titan 18 HX A14VIGque consegue obter um desempenho um pouco mais alto com a mesma combinação CPU/GPU, oferece uma tela mini-LED 4k e conta com duas portas TB4. No entanto, o laptop MSI não chega perto de alcançar a duração da bateria do Strix.
Preço e disponibilidade
A Asus ROG Strix Scar 18 (2024) está disponível por cerca de $3.000 na loja da Asus e pelo mesmo preço também na Amazon, por exemplo. Uma configuração semelhante à nossa unidade de teste está disponível por ~$3.900 na Amazon.
Asus ROG Strix Scar 18 G834JYR (2024)
- 02/07/2024 v7 (old)
Sascha Mölck
Transparência
A seleção dos dispositivos a serem analisados é feita pela nossa equipe editorial. A amostra de teste foi fornecida ao autor como empréstimo pelo fabricante ou varejista para fins desta revisão. O credor não teve influência nesta revisão, nem o fabricante recebeu uma cópia desta revisão antes da publicação. Não houve obrigação de publicar esta revisão. Como empresa de mídia independente, a Notebookcheck não está sujeita à autoridade de fabricantes, varejistas ou editores.
É assim que o Notebookcheck está testando
Todos os anos, o Notebookcheck analisa de forma independente centenas de laptops e smartphones usando procedimentos padronizados para garantir que todos os resultados sejam comparáveis. Desenvolvemos continuamente nossos métodos de teste há cerca de 20 anos e definimos padrões da indústria no processo. Em nossos laboratórios de teste, equipamentos de medição de alta qualidade são utilizados por técnicos e editores experientes. Esses testes envolvem um processo de validação em vários estágios. Nosso complexo sistema de classificação é baseado em centenas de medições e benchmarks bem fundamentados, o que mantém a objetividade.Price comparison

