Asus ROG Strix Scar 18 2023 G834JY revisão - Laptop de jogos com RTX 4090
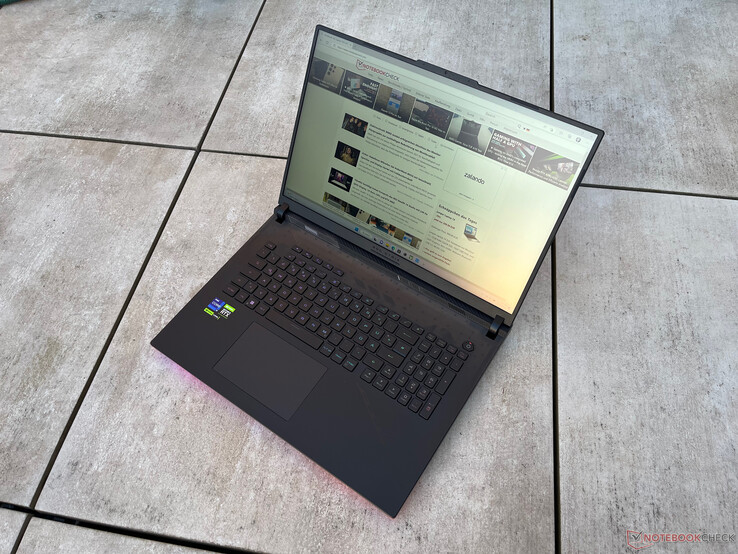
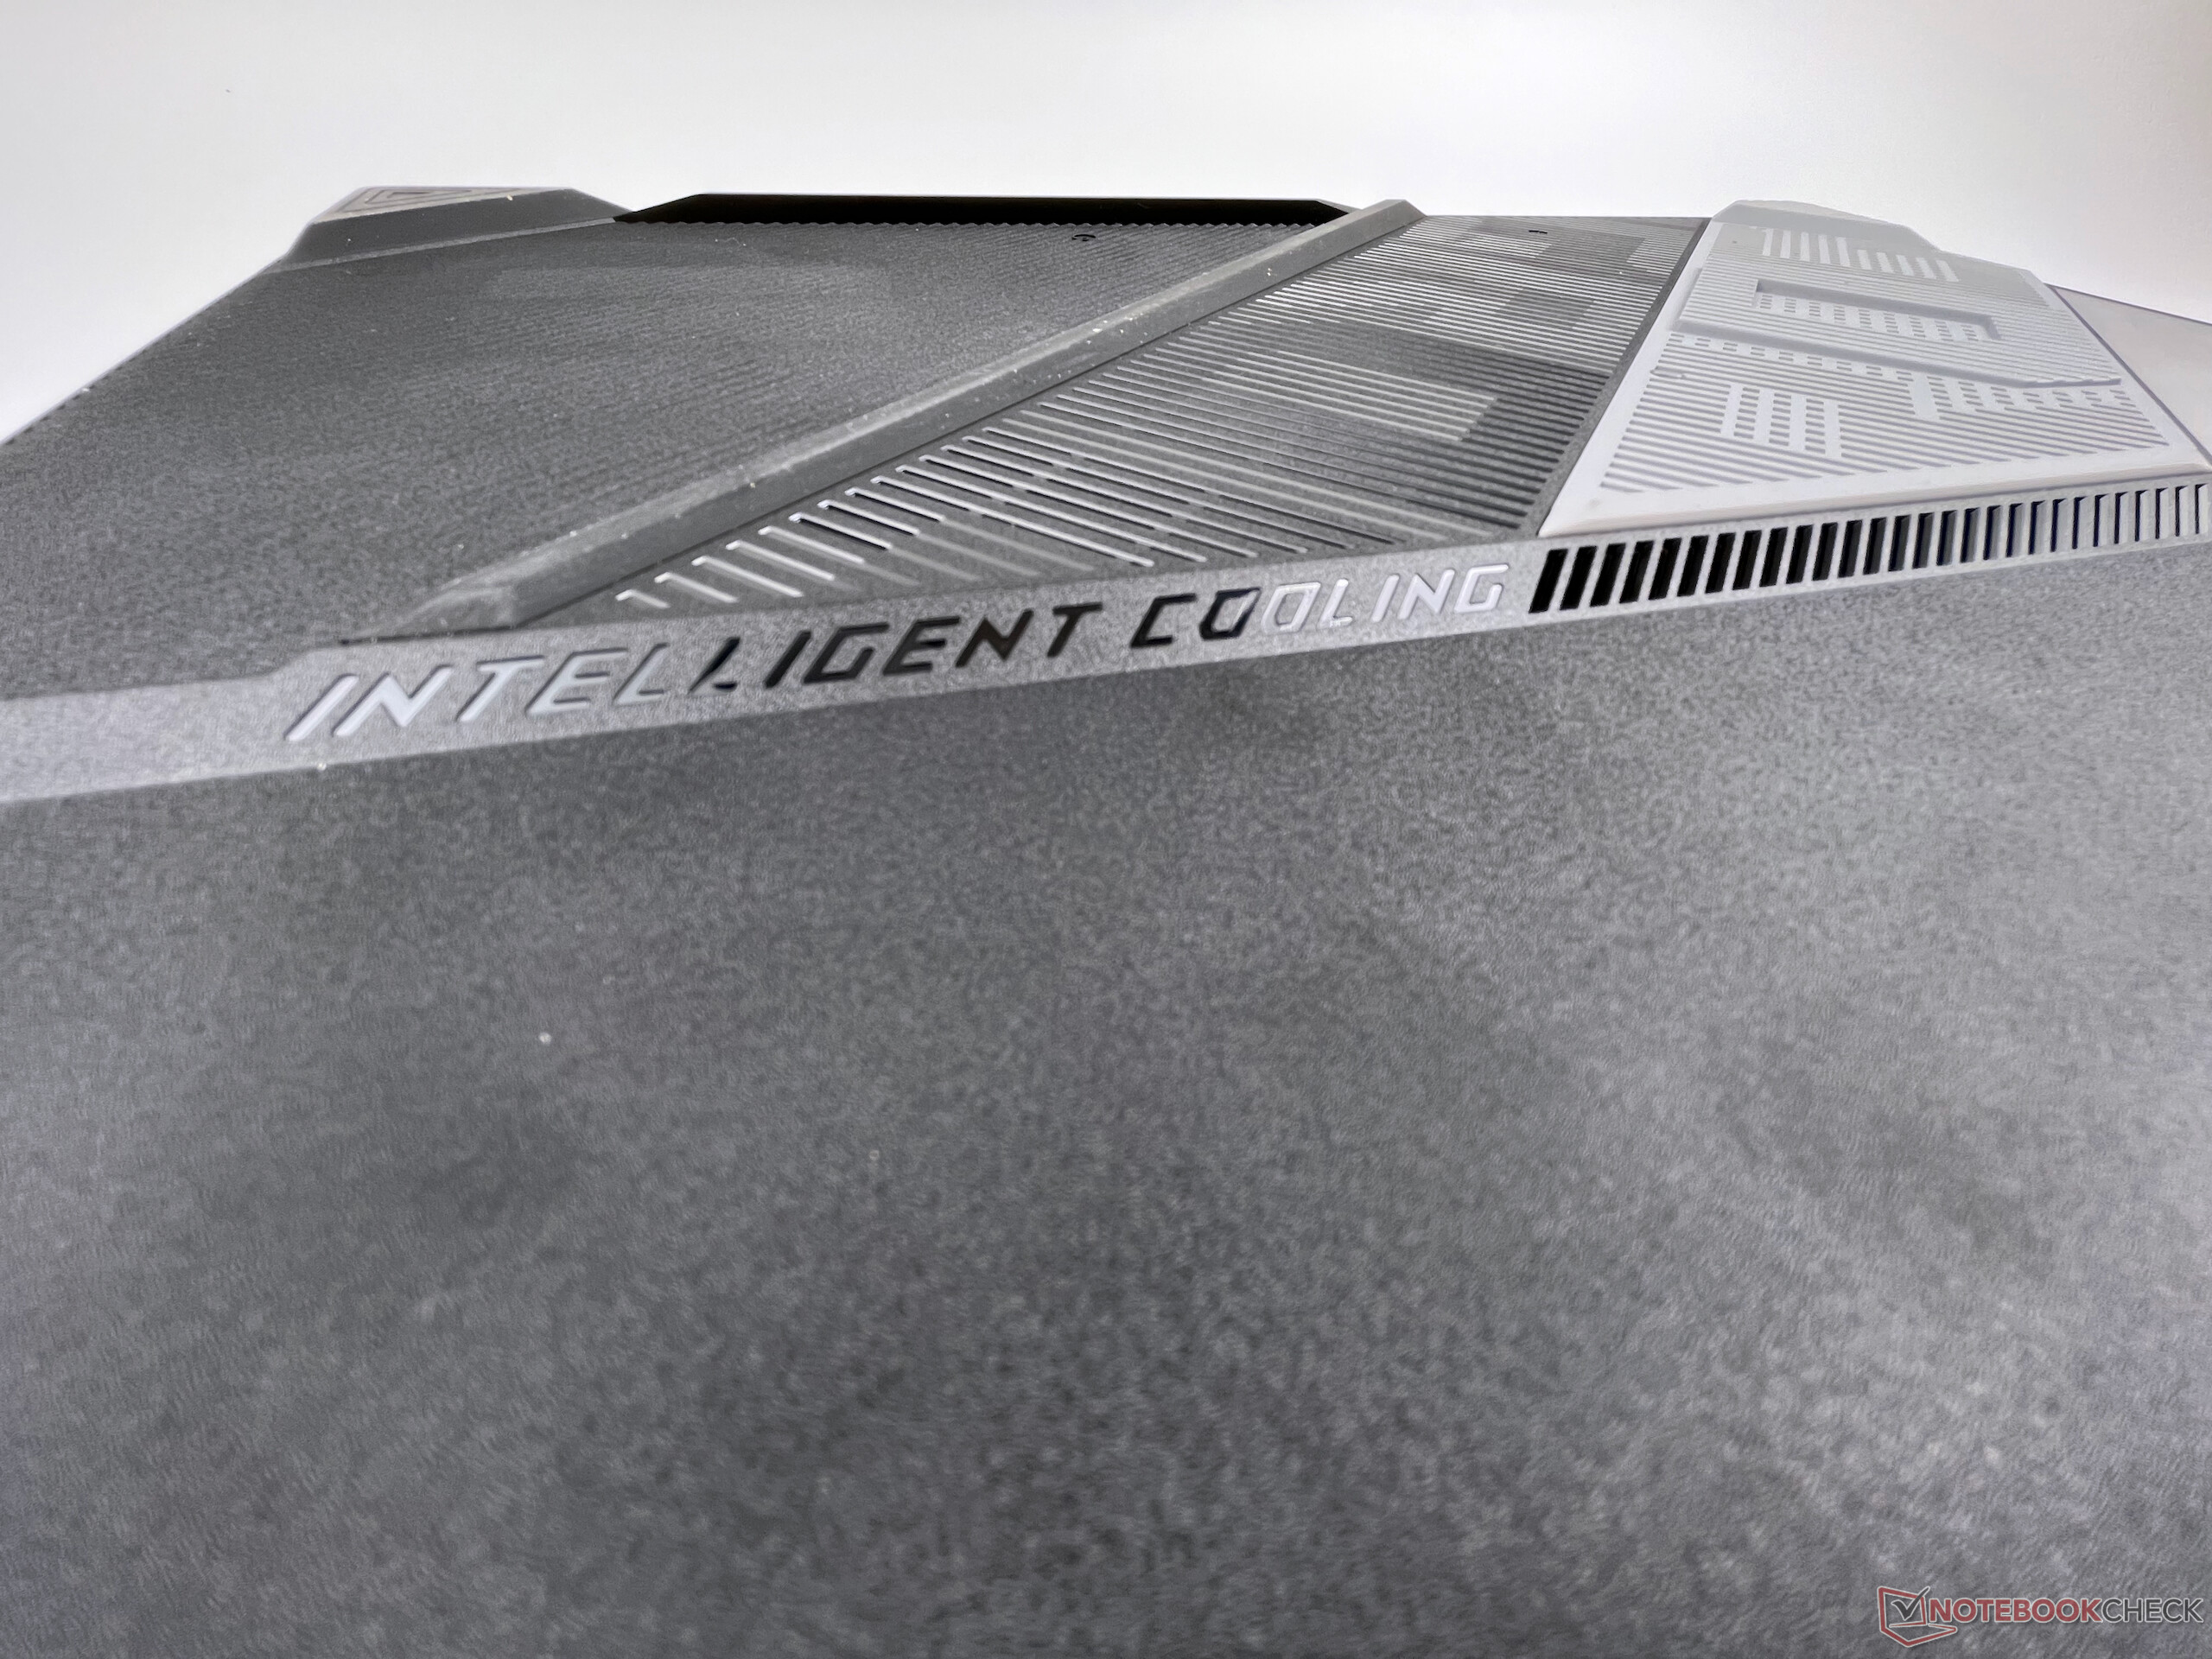
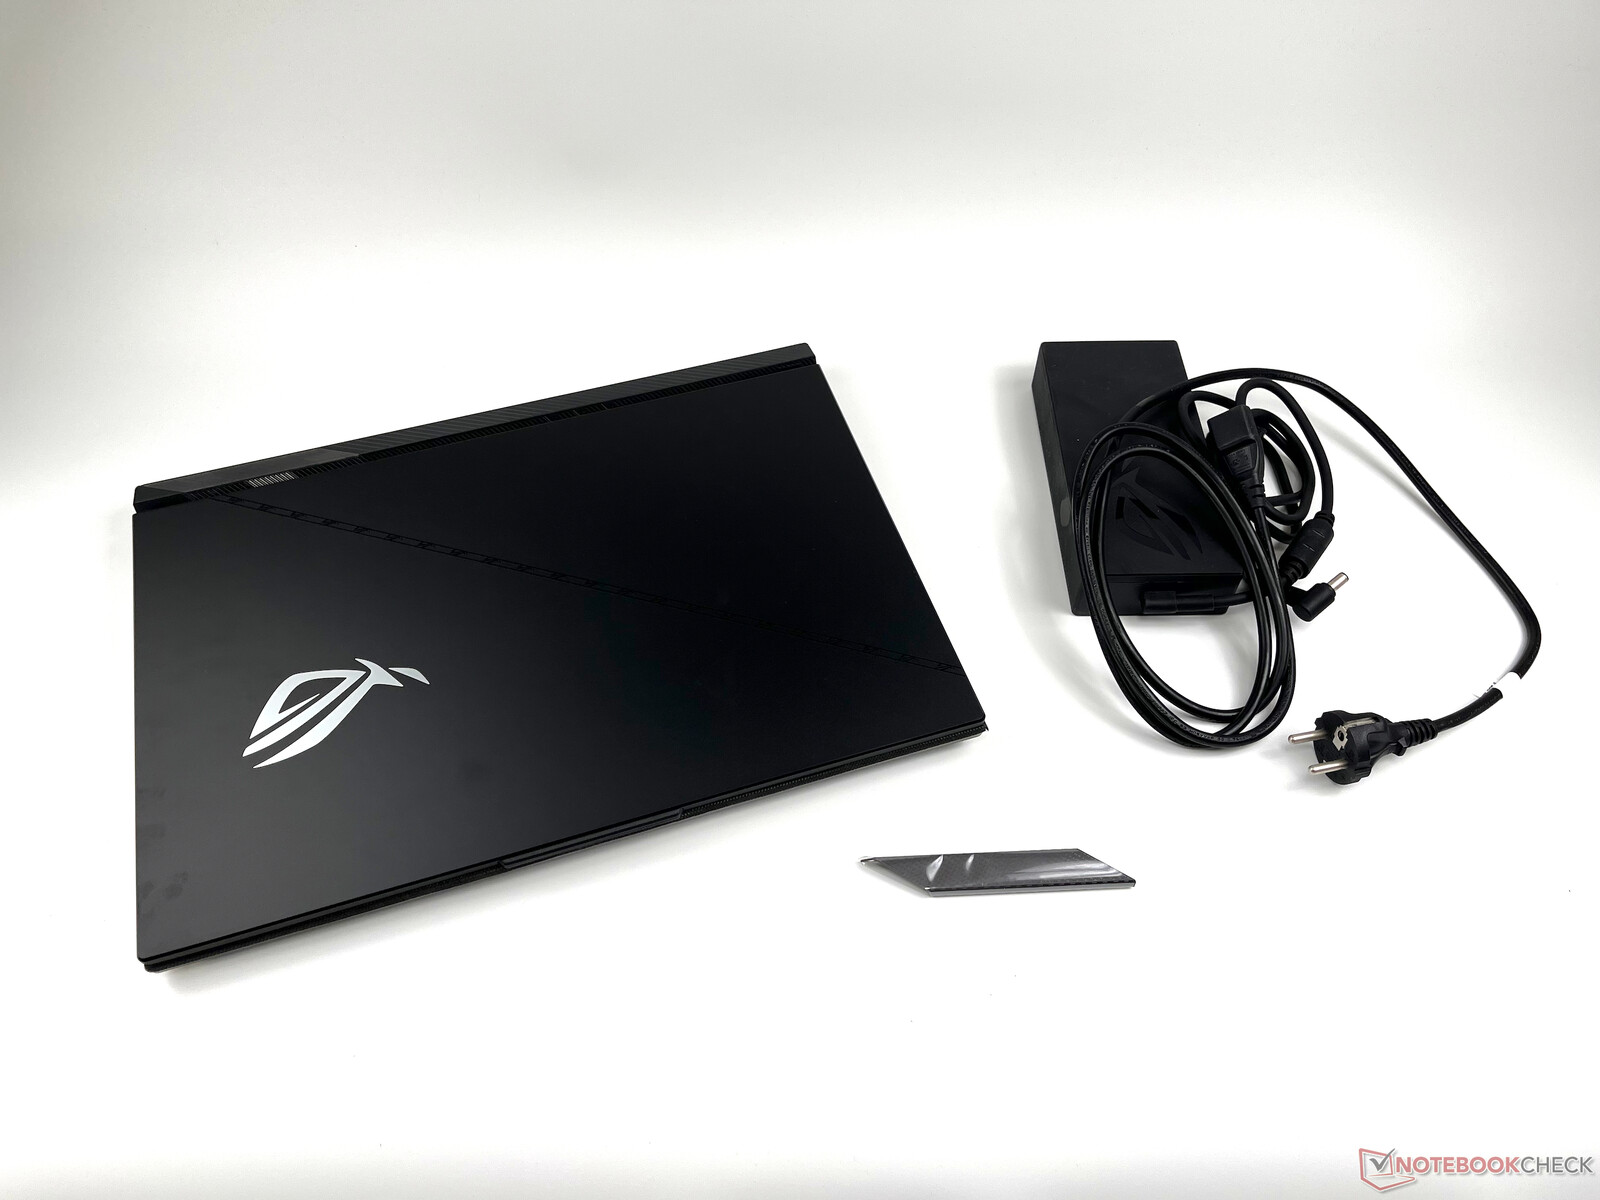
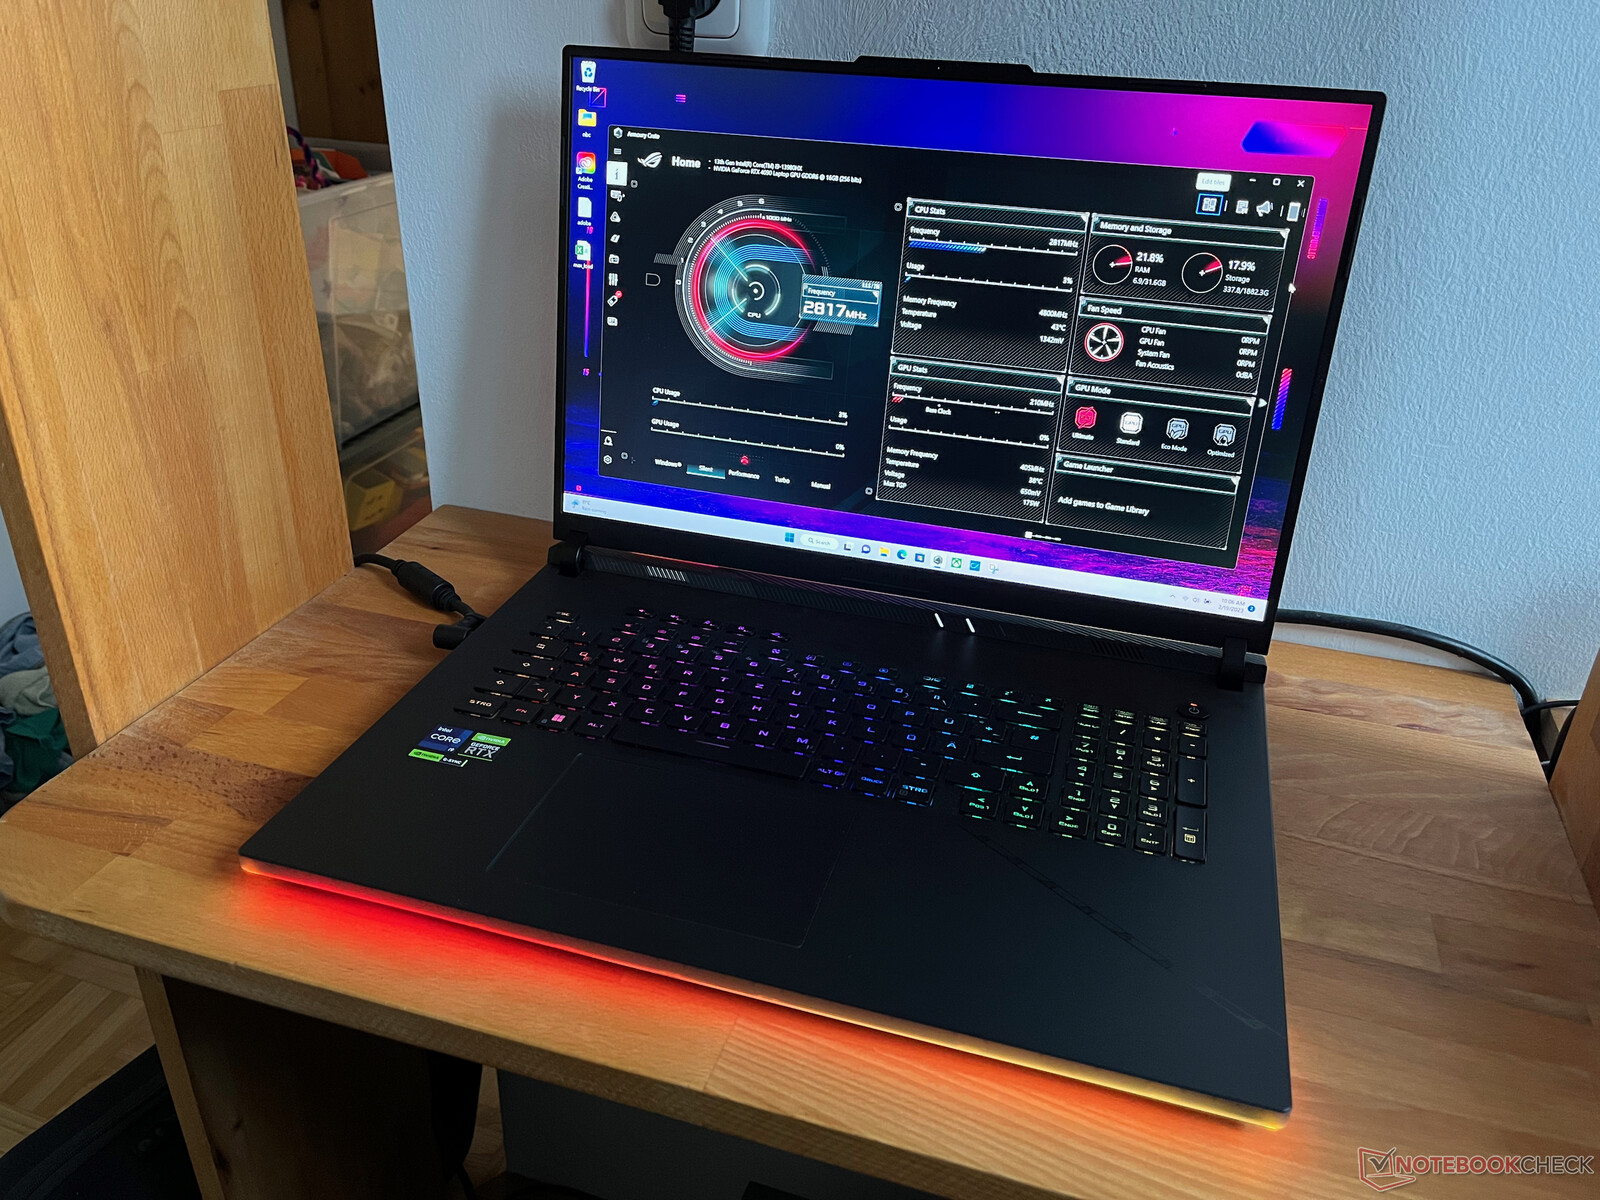
Com o ROG Strix Scar 18, o Asus também se junta à tendência do renascimento dos monstros do jogo de 18 polegadas. Para o lançamento, há um novo caso com o RTX 4080e GPU para notebook RTX 4090usado por nossa unidade de teste. Em termos de CPUs, a Asus utiliza a nova série HX, o que significa que você obtém os componentes de laptop mais rápidos atualmente disponíveis no mercado. Não só a caixa grande é totalmente utilizada pelo display QHD+ de 18 polegadas, mas também abriga um novo sistema de resfriamento com três ventiladores, que supostamente mantém os componentes famintos de energia sob controle. No teste a seguir, damos uma olhada detalhada no G834JY-N6005W com RTX 4090, 32 GB de RAM GDDR5, e 2x SSD de 1 TB que está atualmente disponível na Inglaterra.
Possíveis concorrentes em comparação
Avaliação | Data | Modelo | Peso | Altura | Size | Resolução | Preço |
|---|---|---|---|---|---|---|---|
| 86.6 % v7 (old) | 02/2023 | Asus ROG Strix Scar 18 2023 G834JY-N6005W i9-13980HX, GeForce RTX 4090 Laptop GPU | 3.1 kg | 30.8 mm | 18.00" | 2560x1600 | |
| 89 % v7 (old) | 02/2023 | MSI Titan GT77 HX 13VI i9-13950HX, GeForce RTX 4090 Laptop GPU | 3.5 kg | 23 mm | 17.30" | 3840x2160 | |
| 89.4 % v7 (old) | 02/2023 | Lenovo Legion Pro 7 16IRX8H i9-13900HX, GeForce RTX 4080 Laptop GPU | 2.7 kg | 26 mm | 16.00" | 2560x1600 | |
| 91.2 % v7 (old) | 02/2023 | Razer Blade 16 Early 2023 i9-13950HX, GeForce RTX 4080 Laptop GPU | 2.4 kg | 21.99 mm | 16.00" | 2560x1600 | |
| 86.9 % v7 (old) | 11/2022 | Asus ROG Strix Scar 17 SE G733CX-LL014W i9-12950HX, GeForce RTX 3080 Ti Laptop GPU | 2.9 kg | 28.3 mm | 17.30" | 2560x1440 | |
| 88.3 % v7 (old) | 08/2022 | MSI Titan GT77 12UHS i9-12900HX, GeForce RTX 3080 Ti Laptop GPU | 3.3 kg | 23 mm | 17.30" | 1920x1080 | |
| 85.4 % v7 (old) | 03/2023 | HP Omen 17-ck2097ng i9-13900HX, GeForce RTX 4080 Laptop GPU | 2.8 kg | 27 mm | 17.30" | 2560x1440 |
Caso
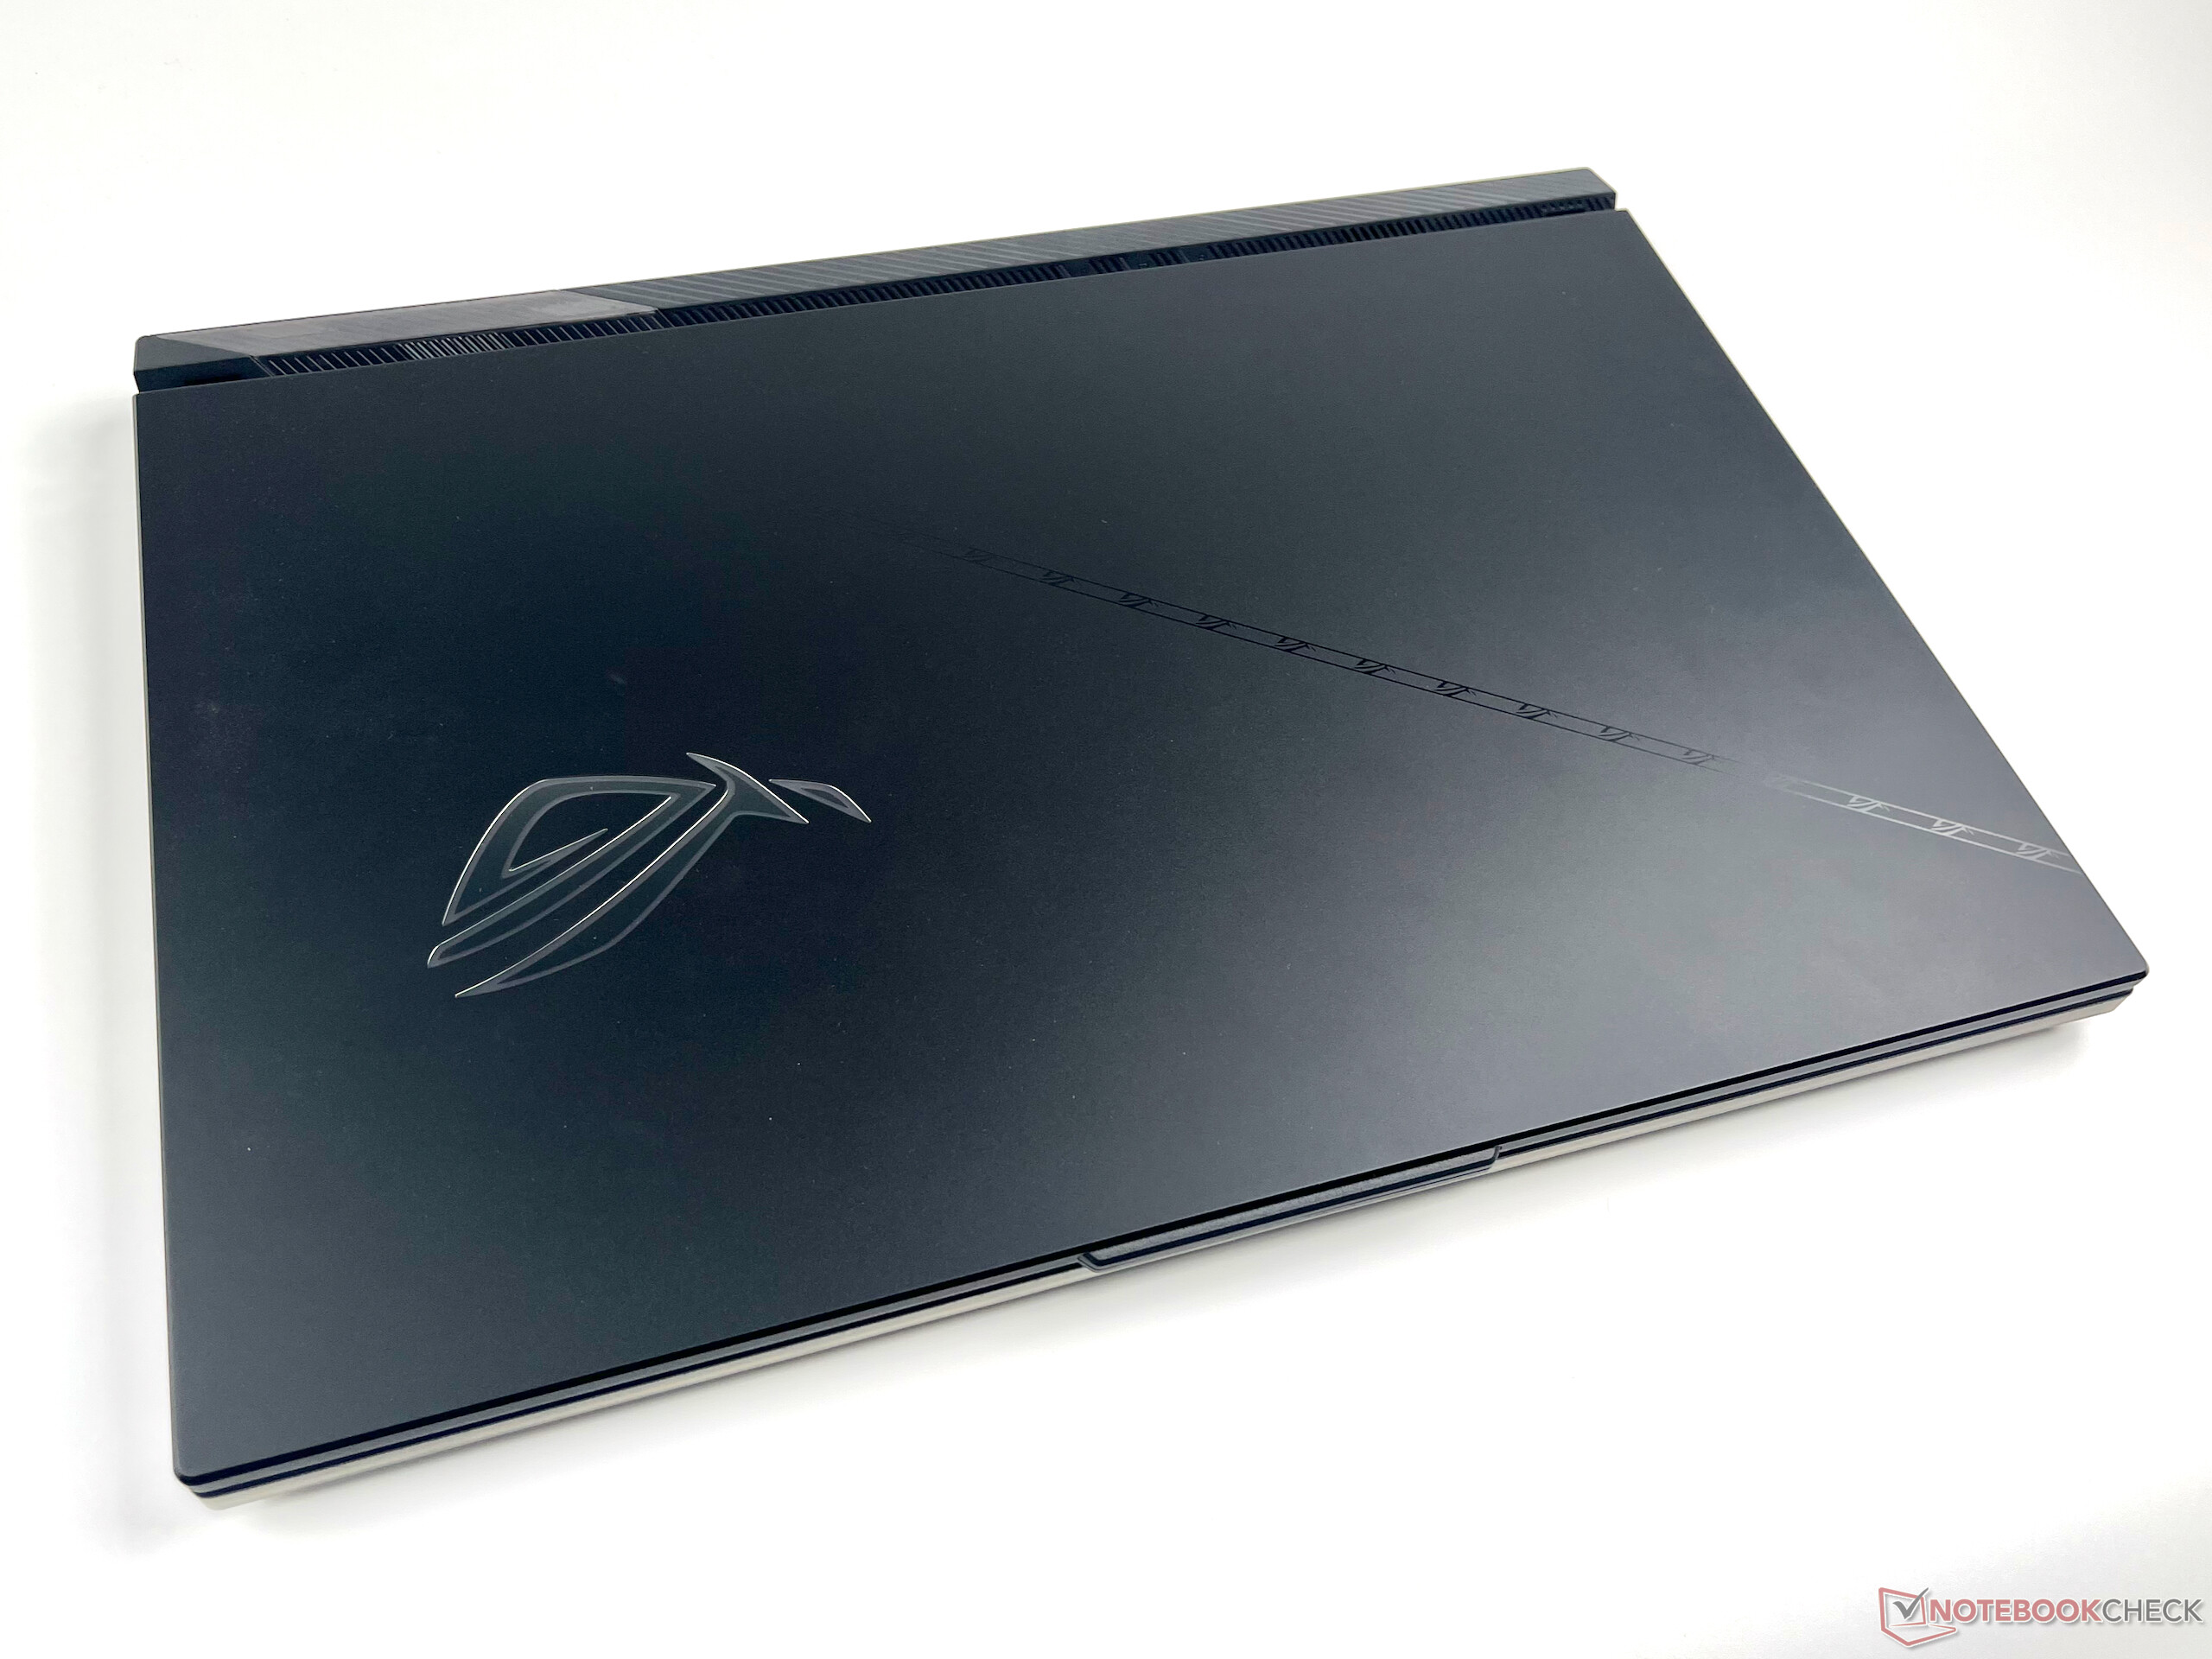
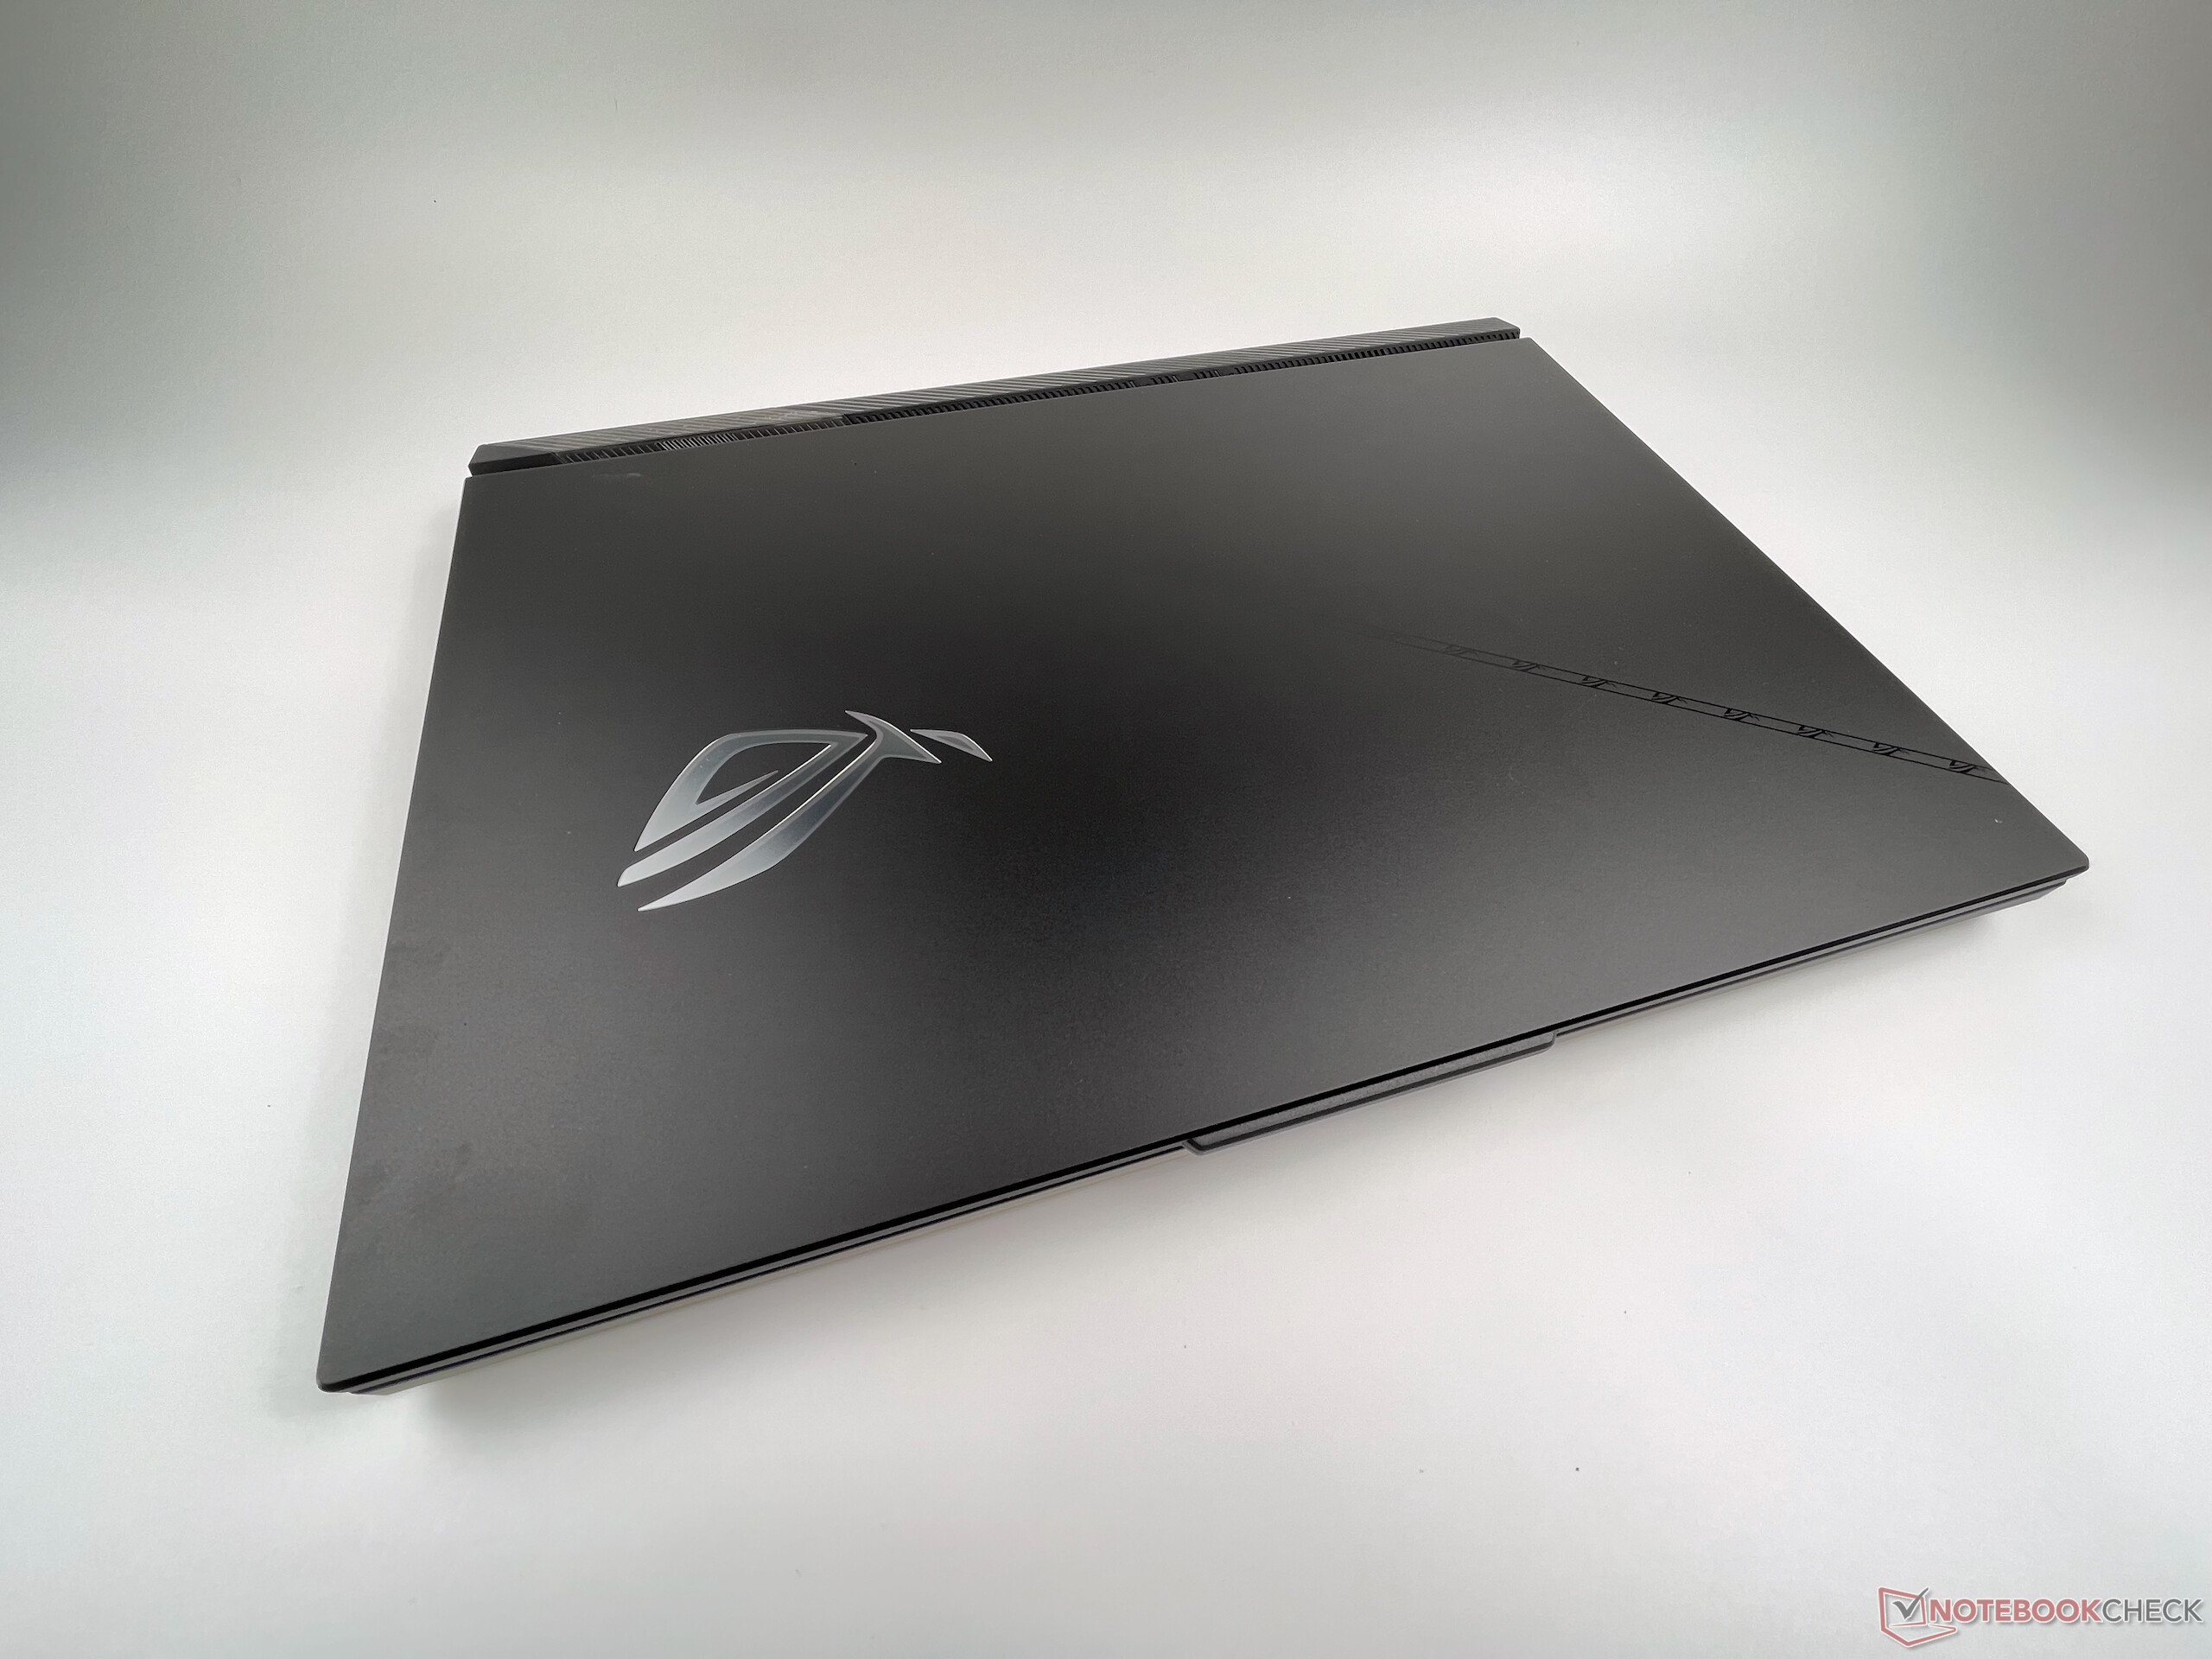
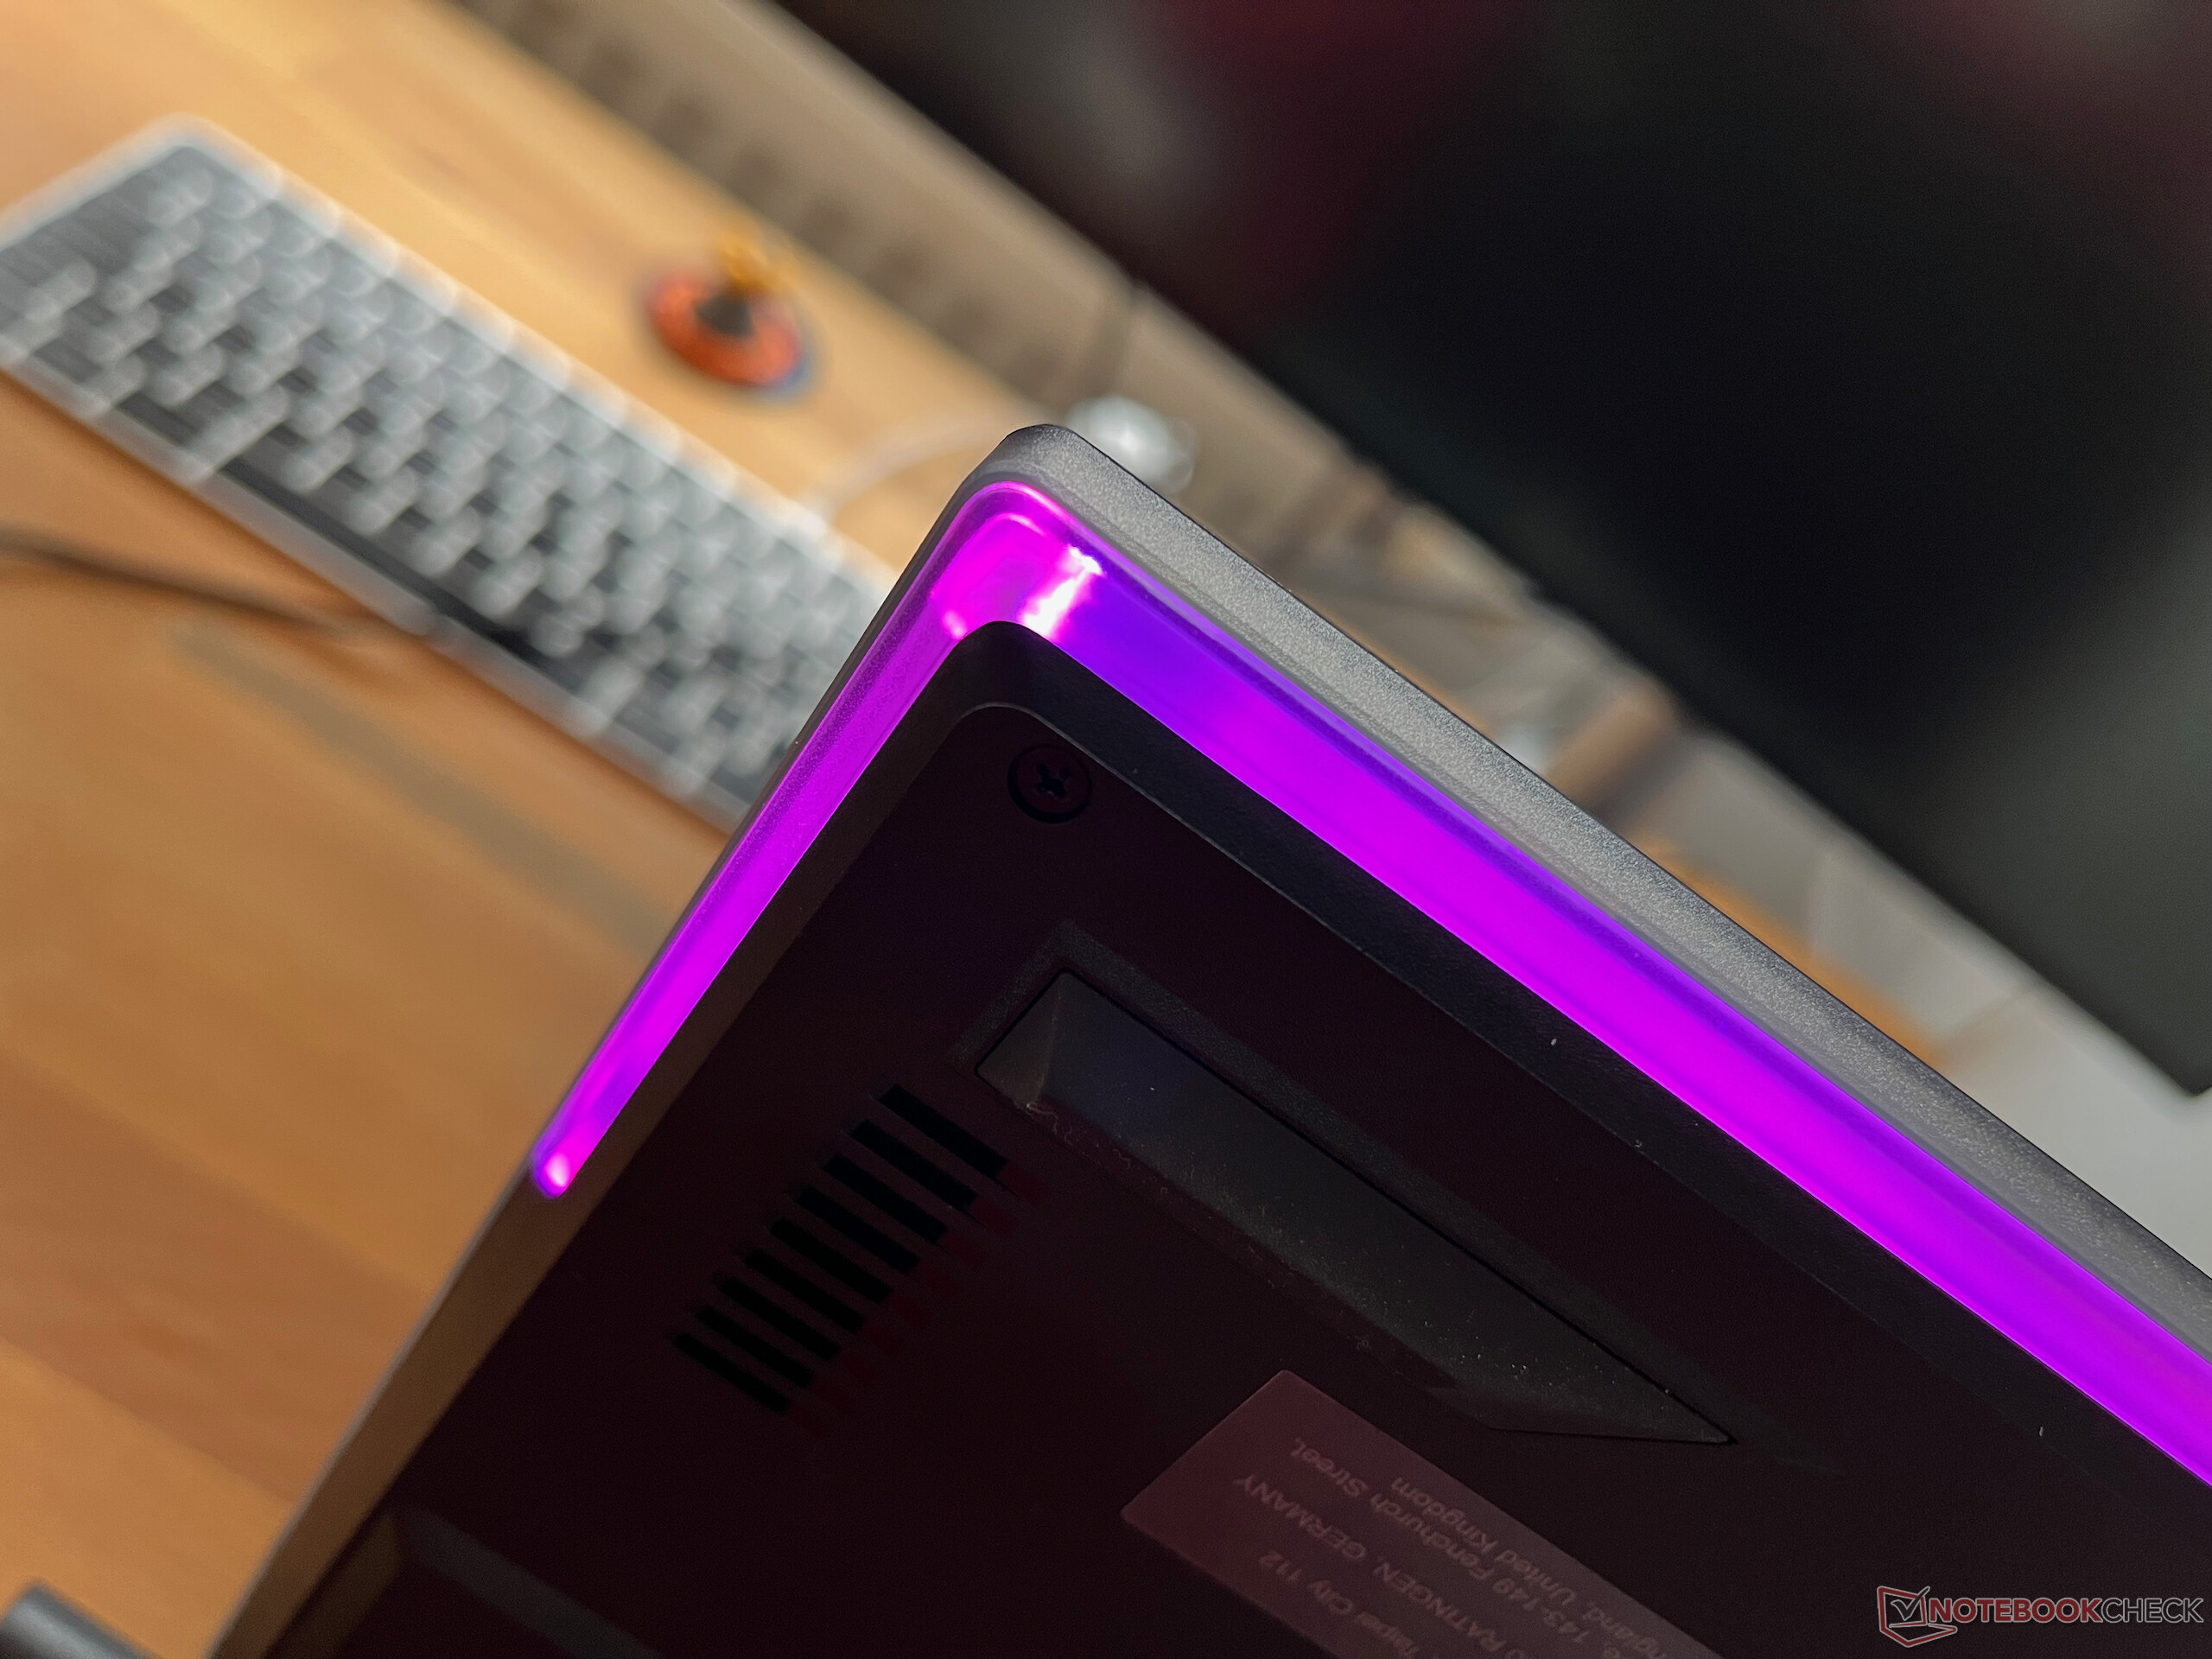
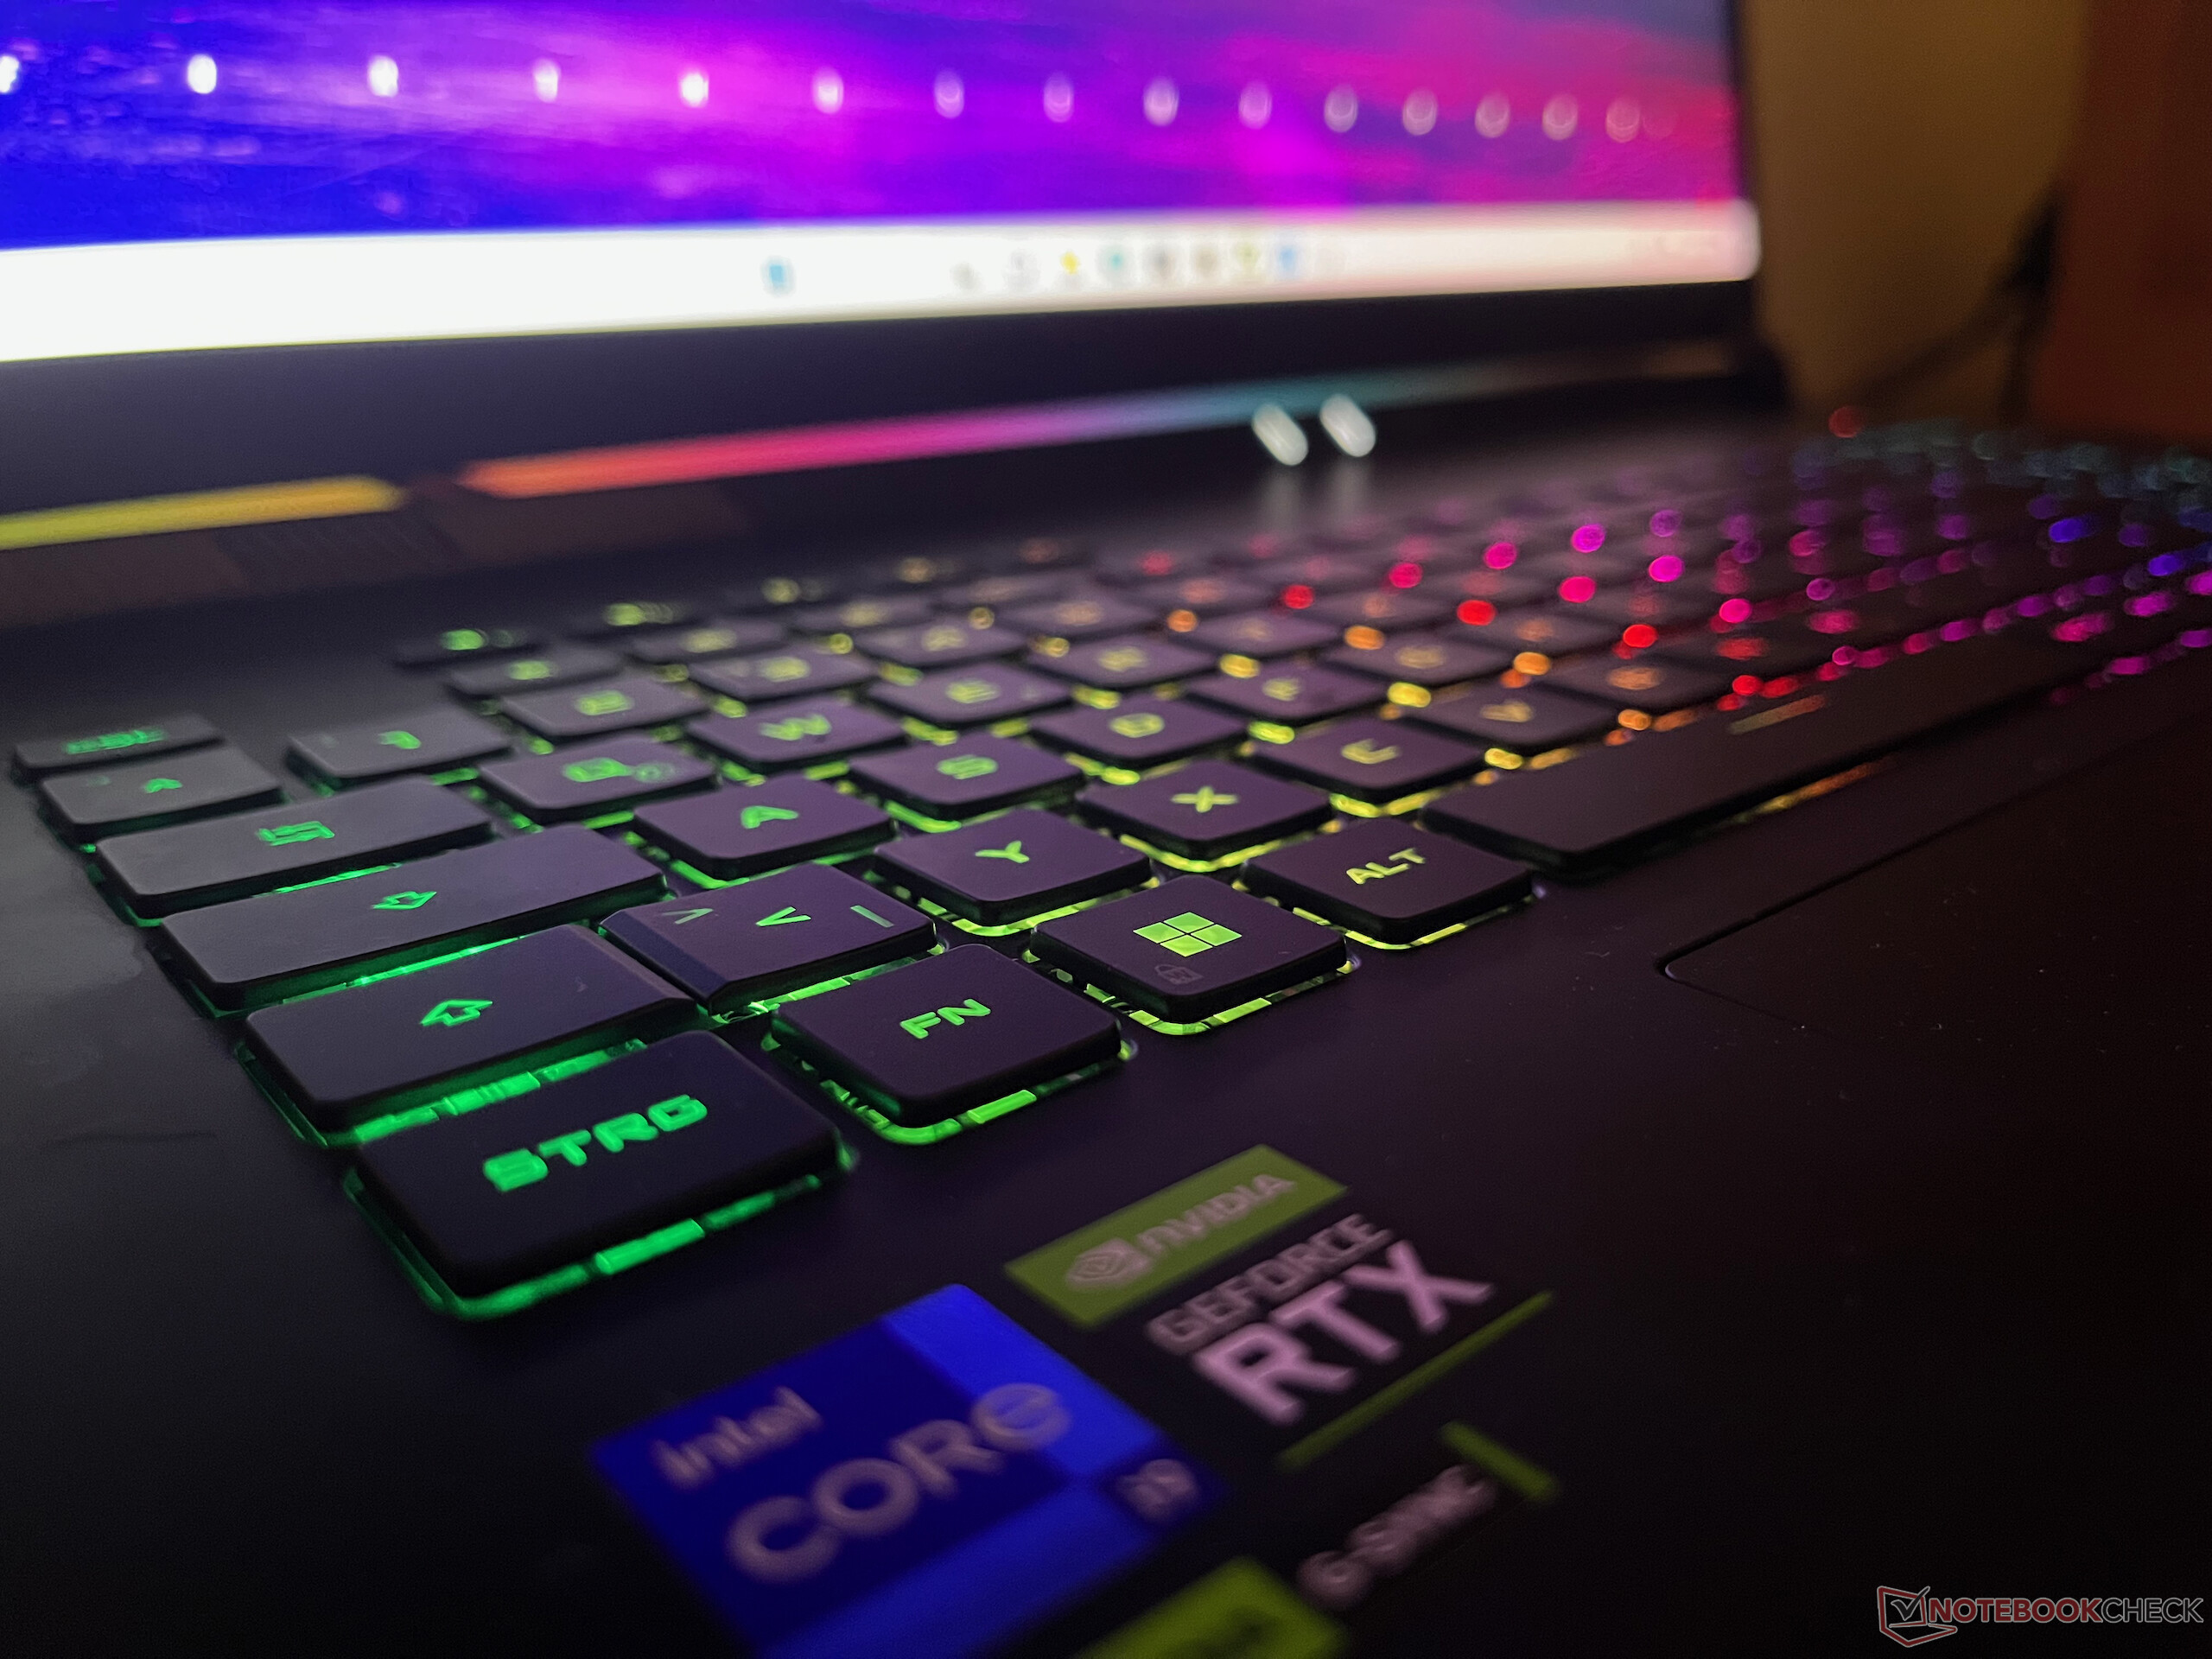
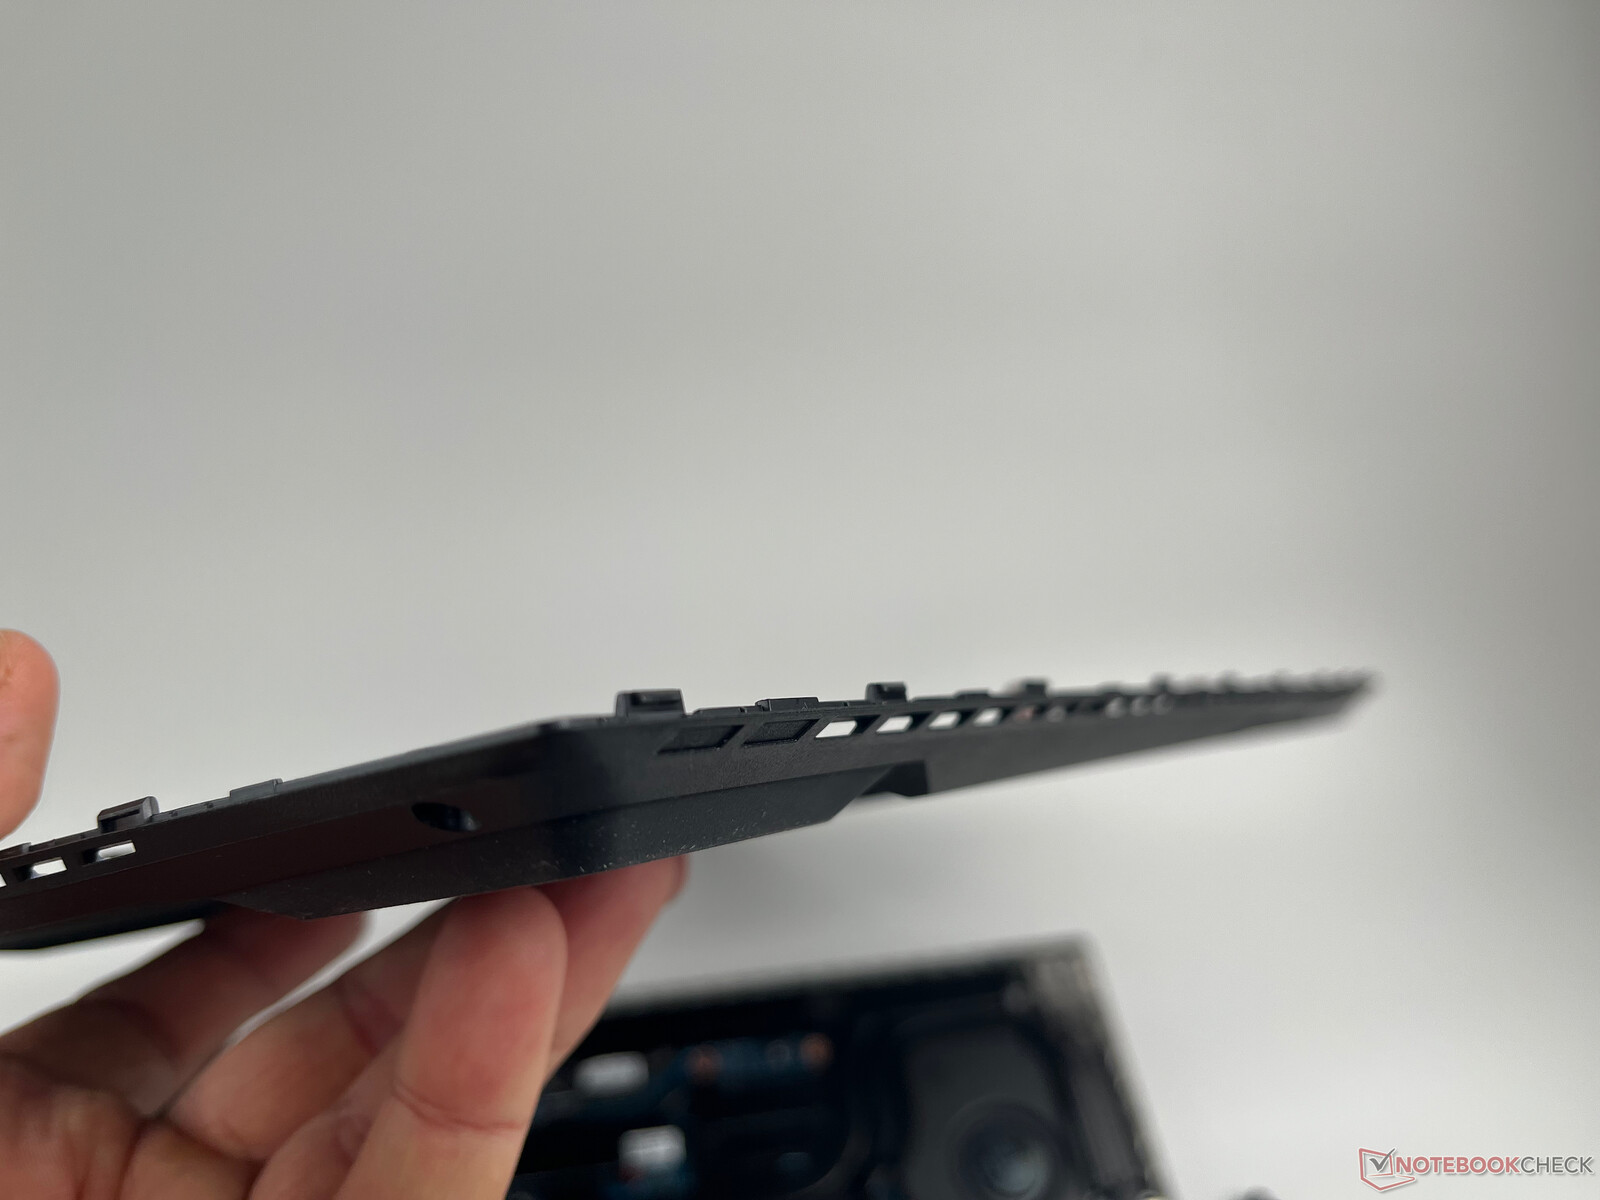
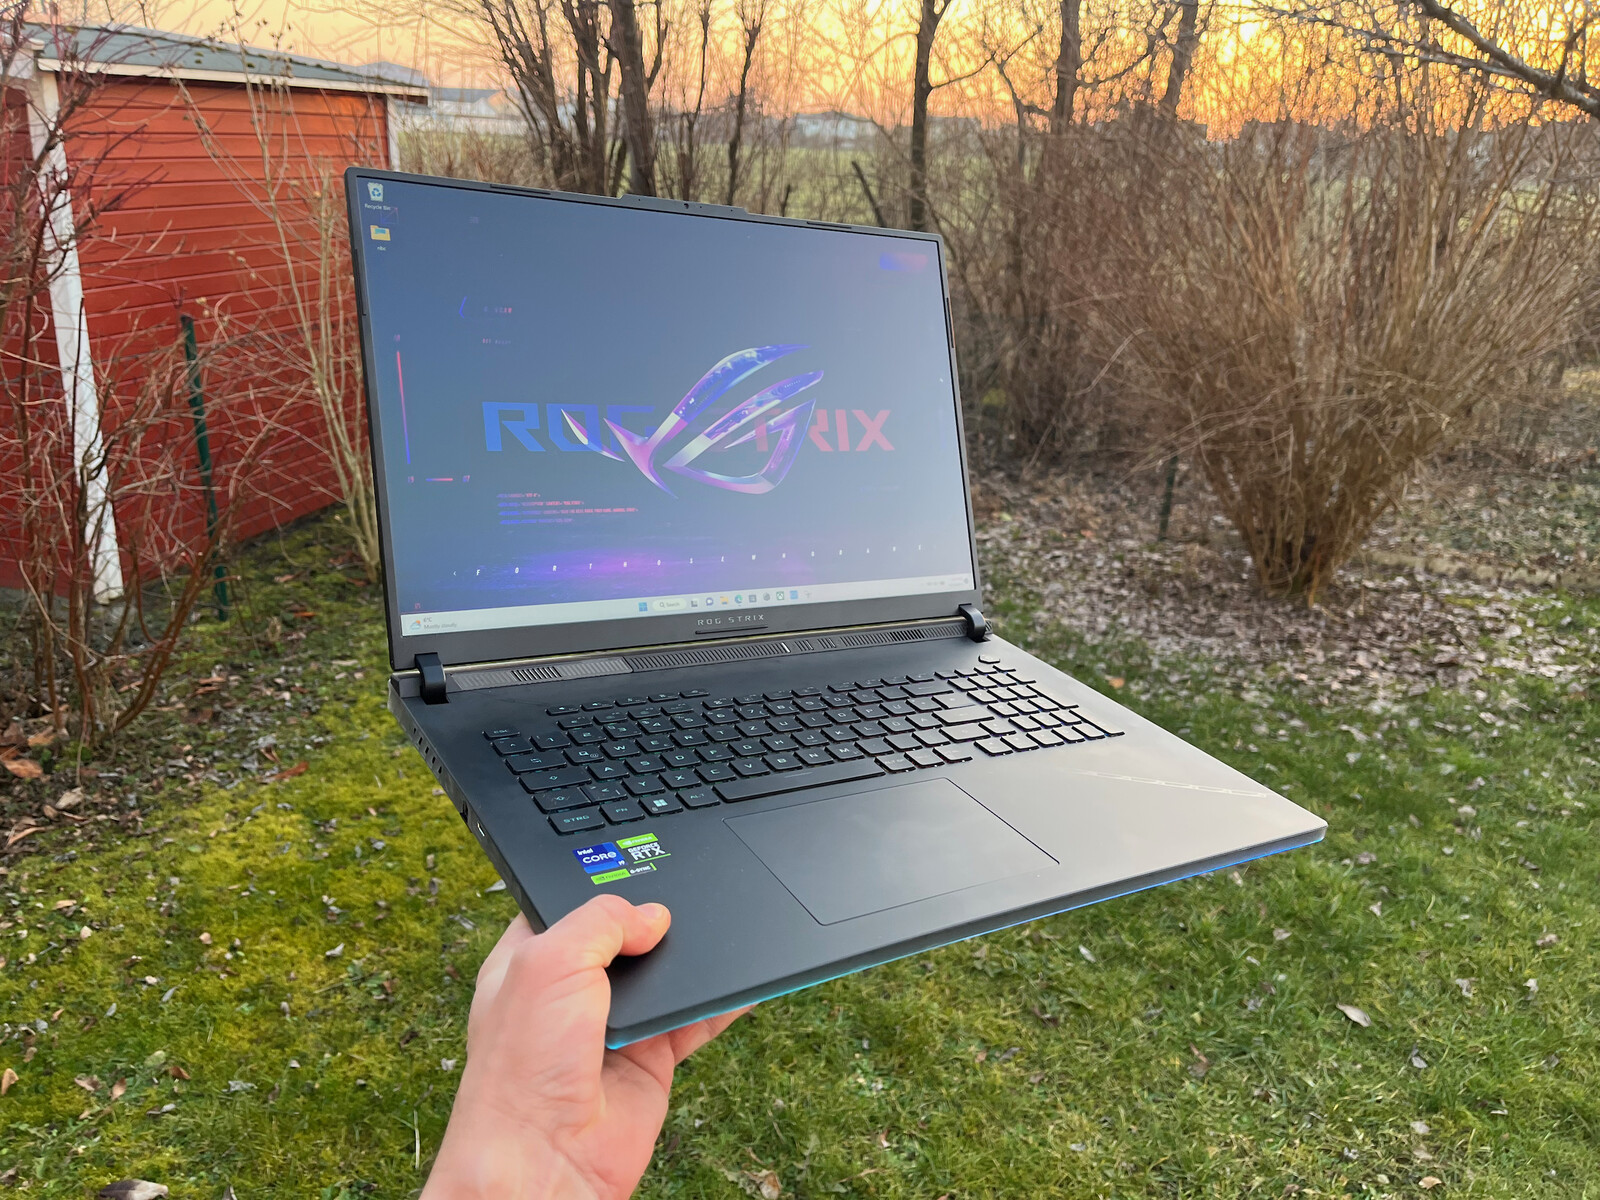
O case deve ser marcado com o uso massivo de LEDs RGB e elementos transparentes do case. Ao mesmo tempo, o design básico é relativamente discreto e bastante atraente. Apenas as superfícies transparentes nas laterais parecem um pouco baratas. A unidade base em si é feita de plástico e não dá muita sensação de alta qualidade. Ela também empena levemente ao ser erguida. Por outro lado, a tampa do display de alumínio é significativamente mais estável, dando também proteção suficiente ao display.
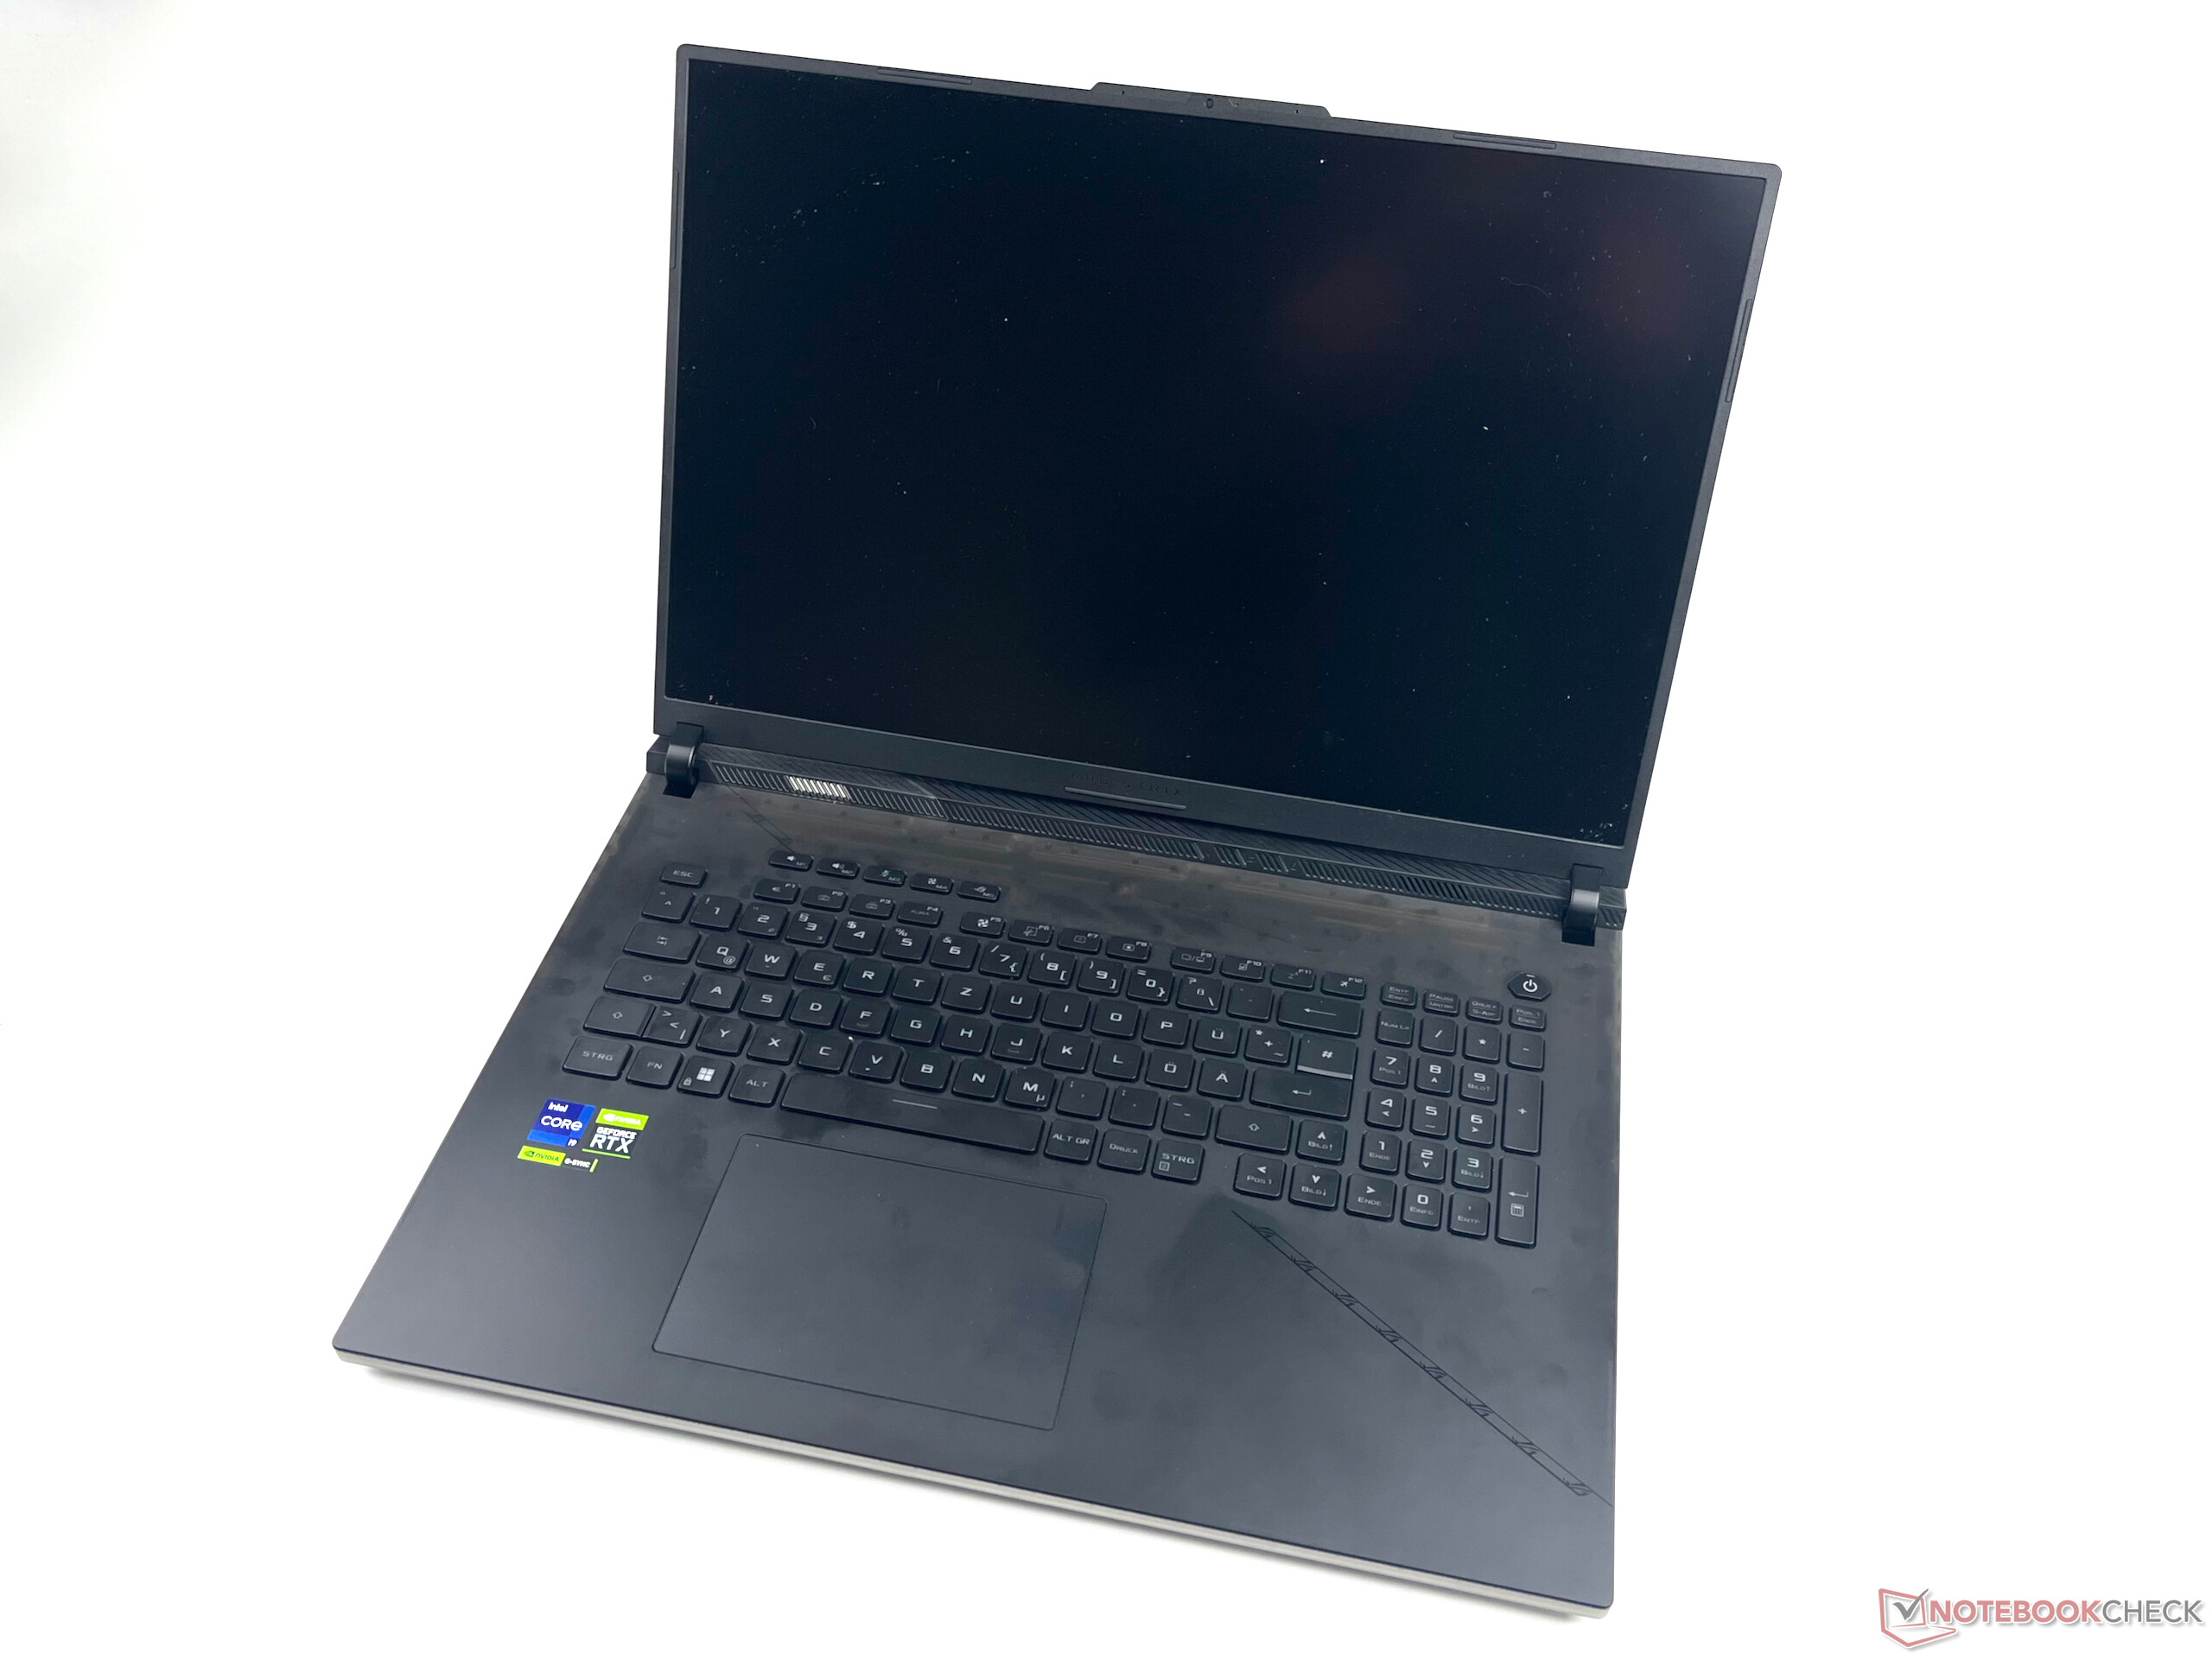
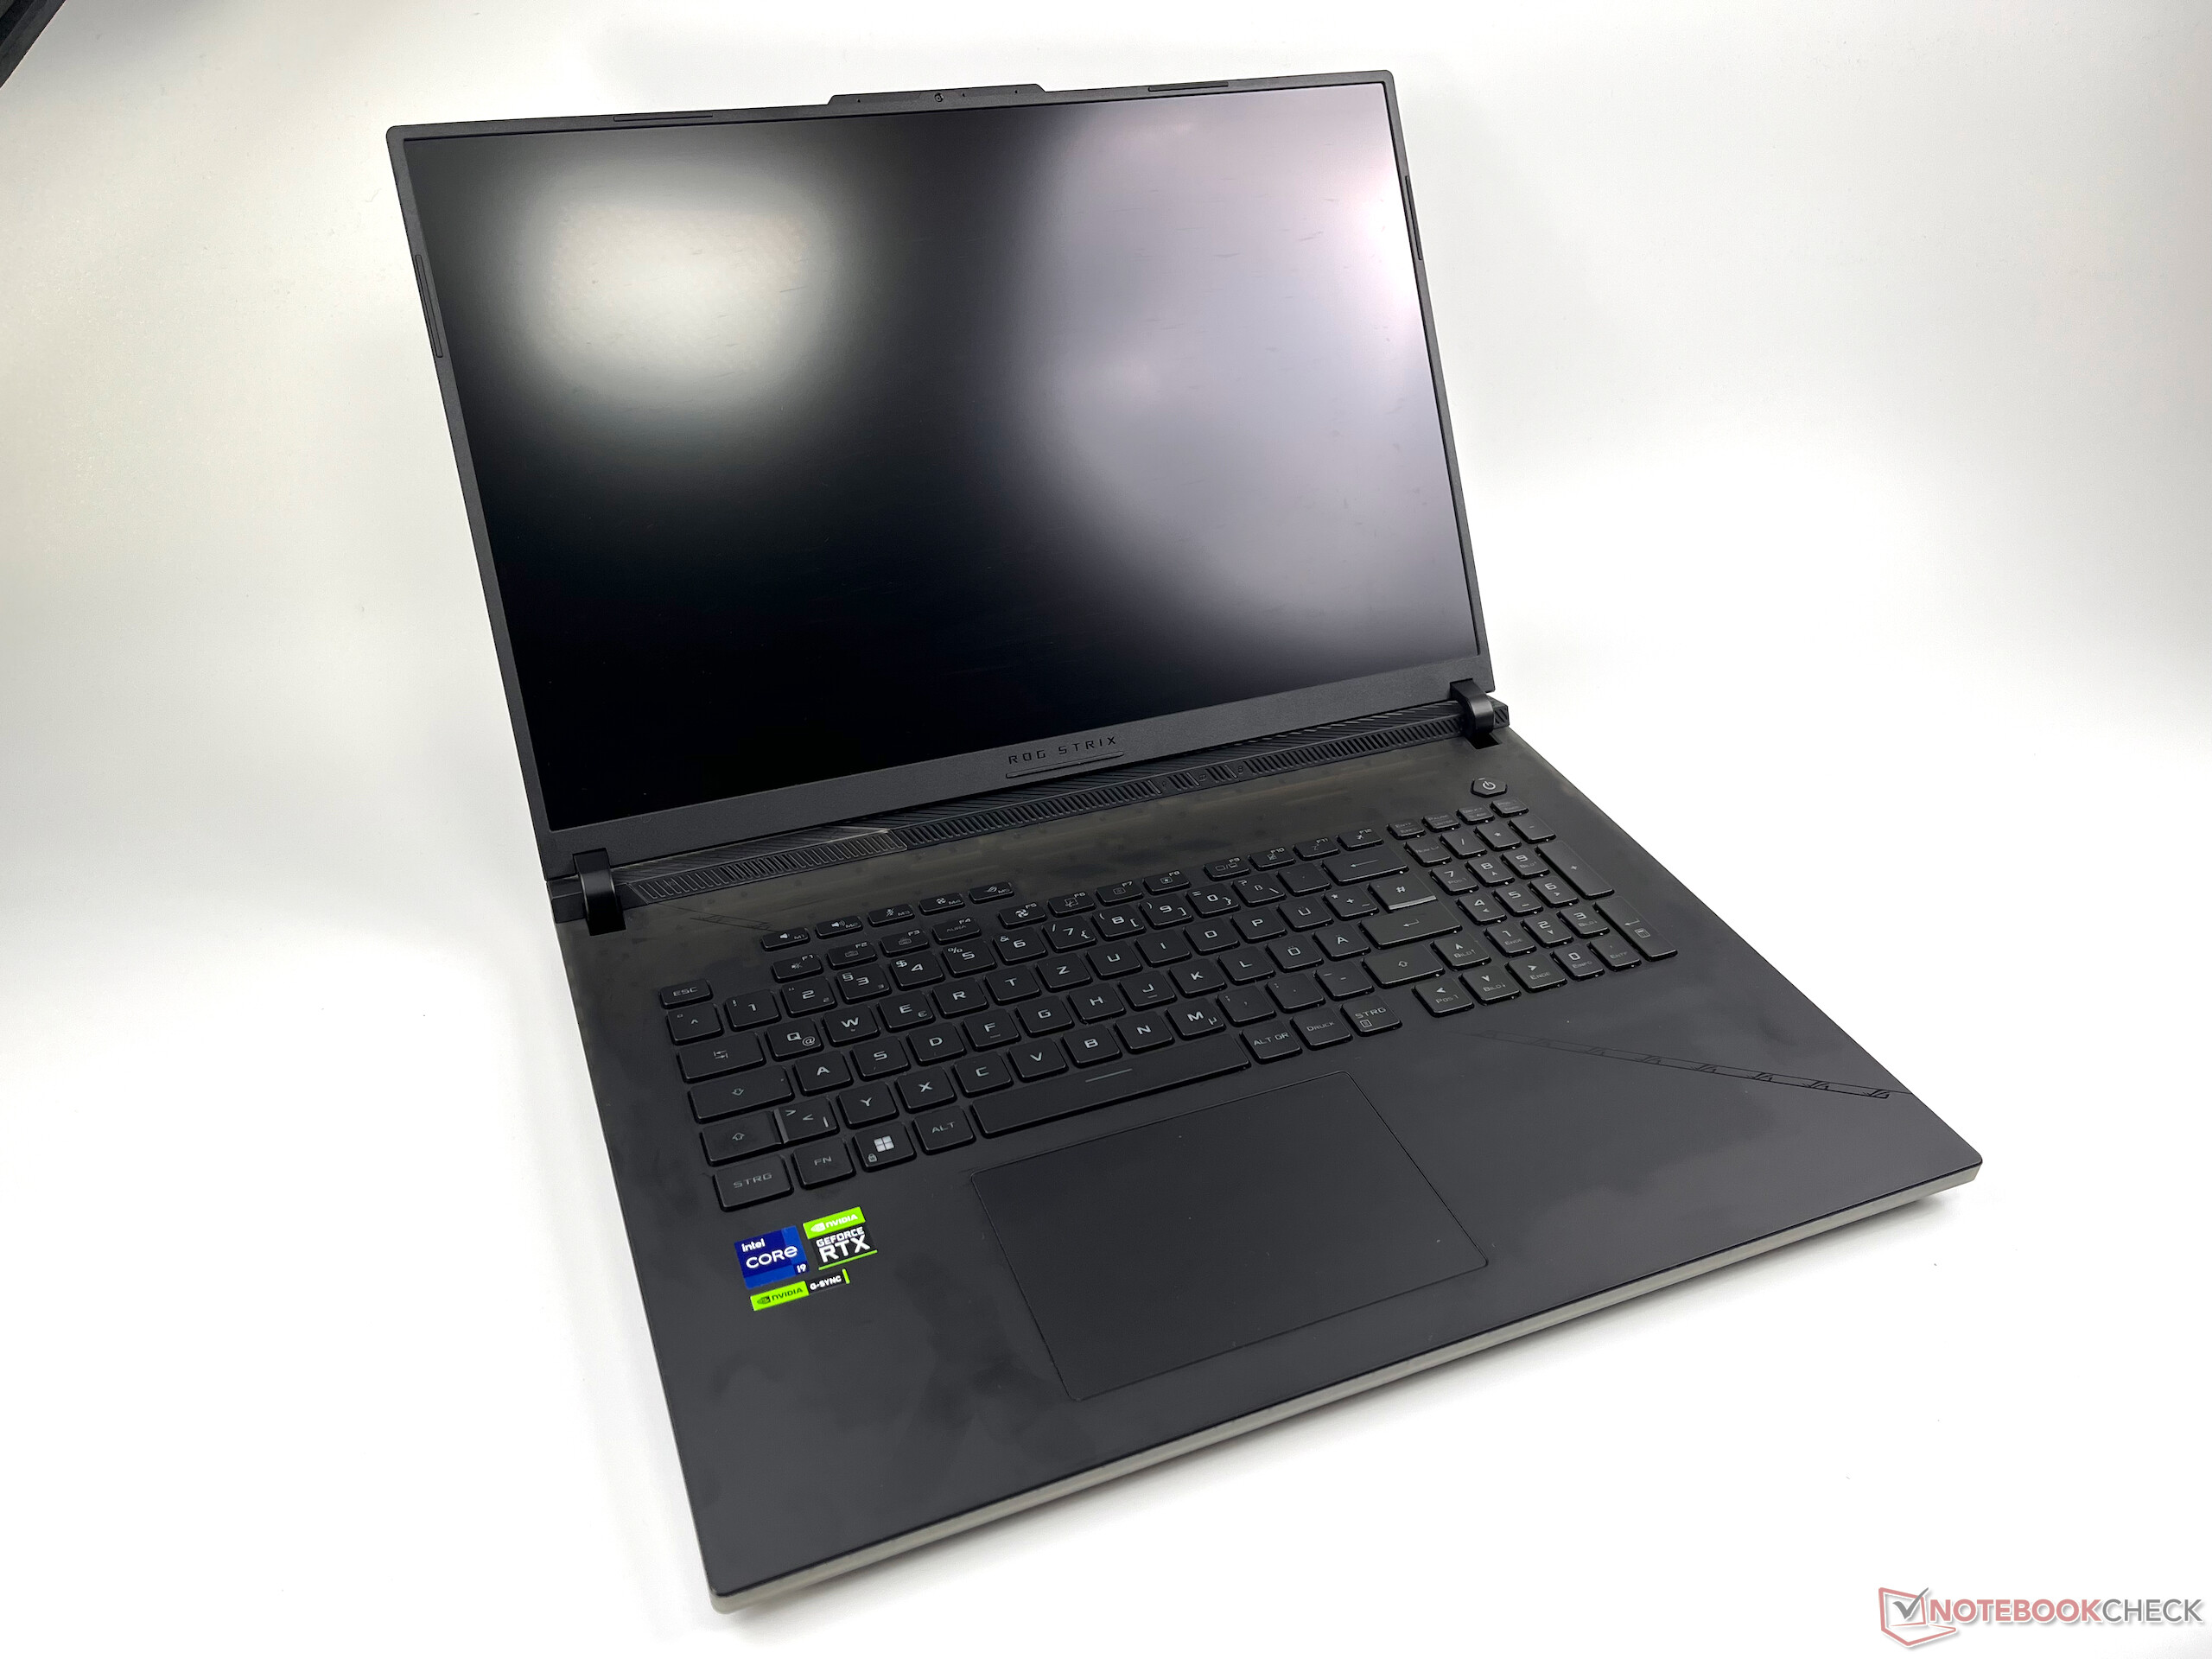

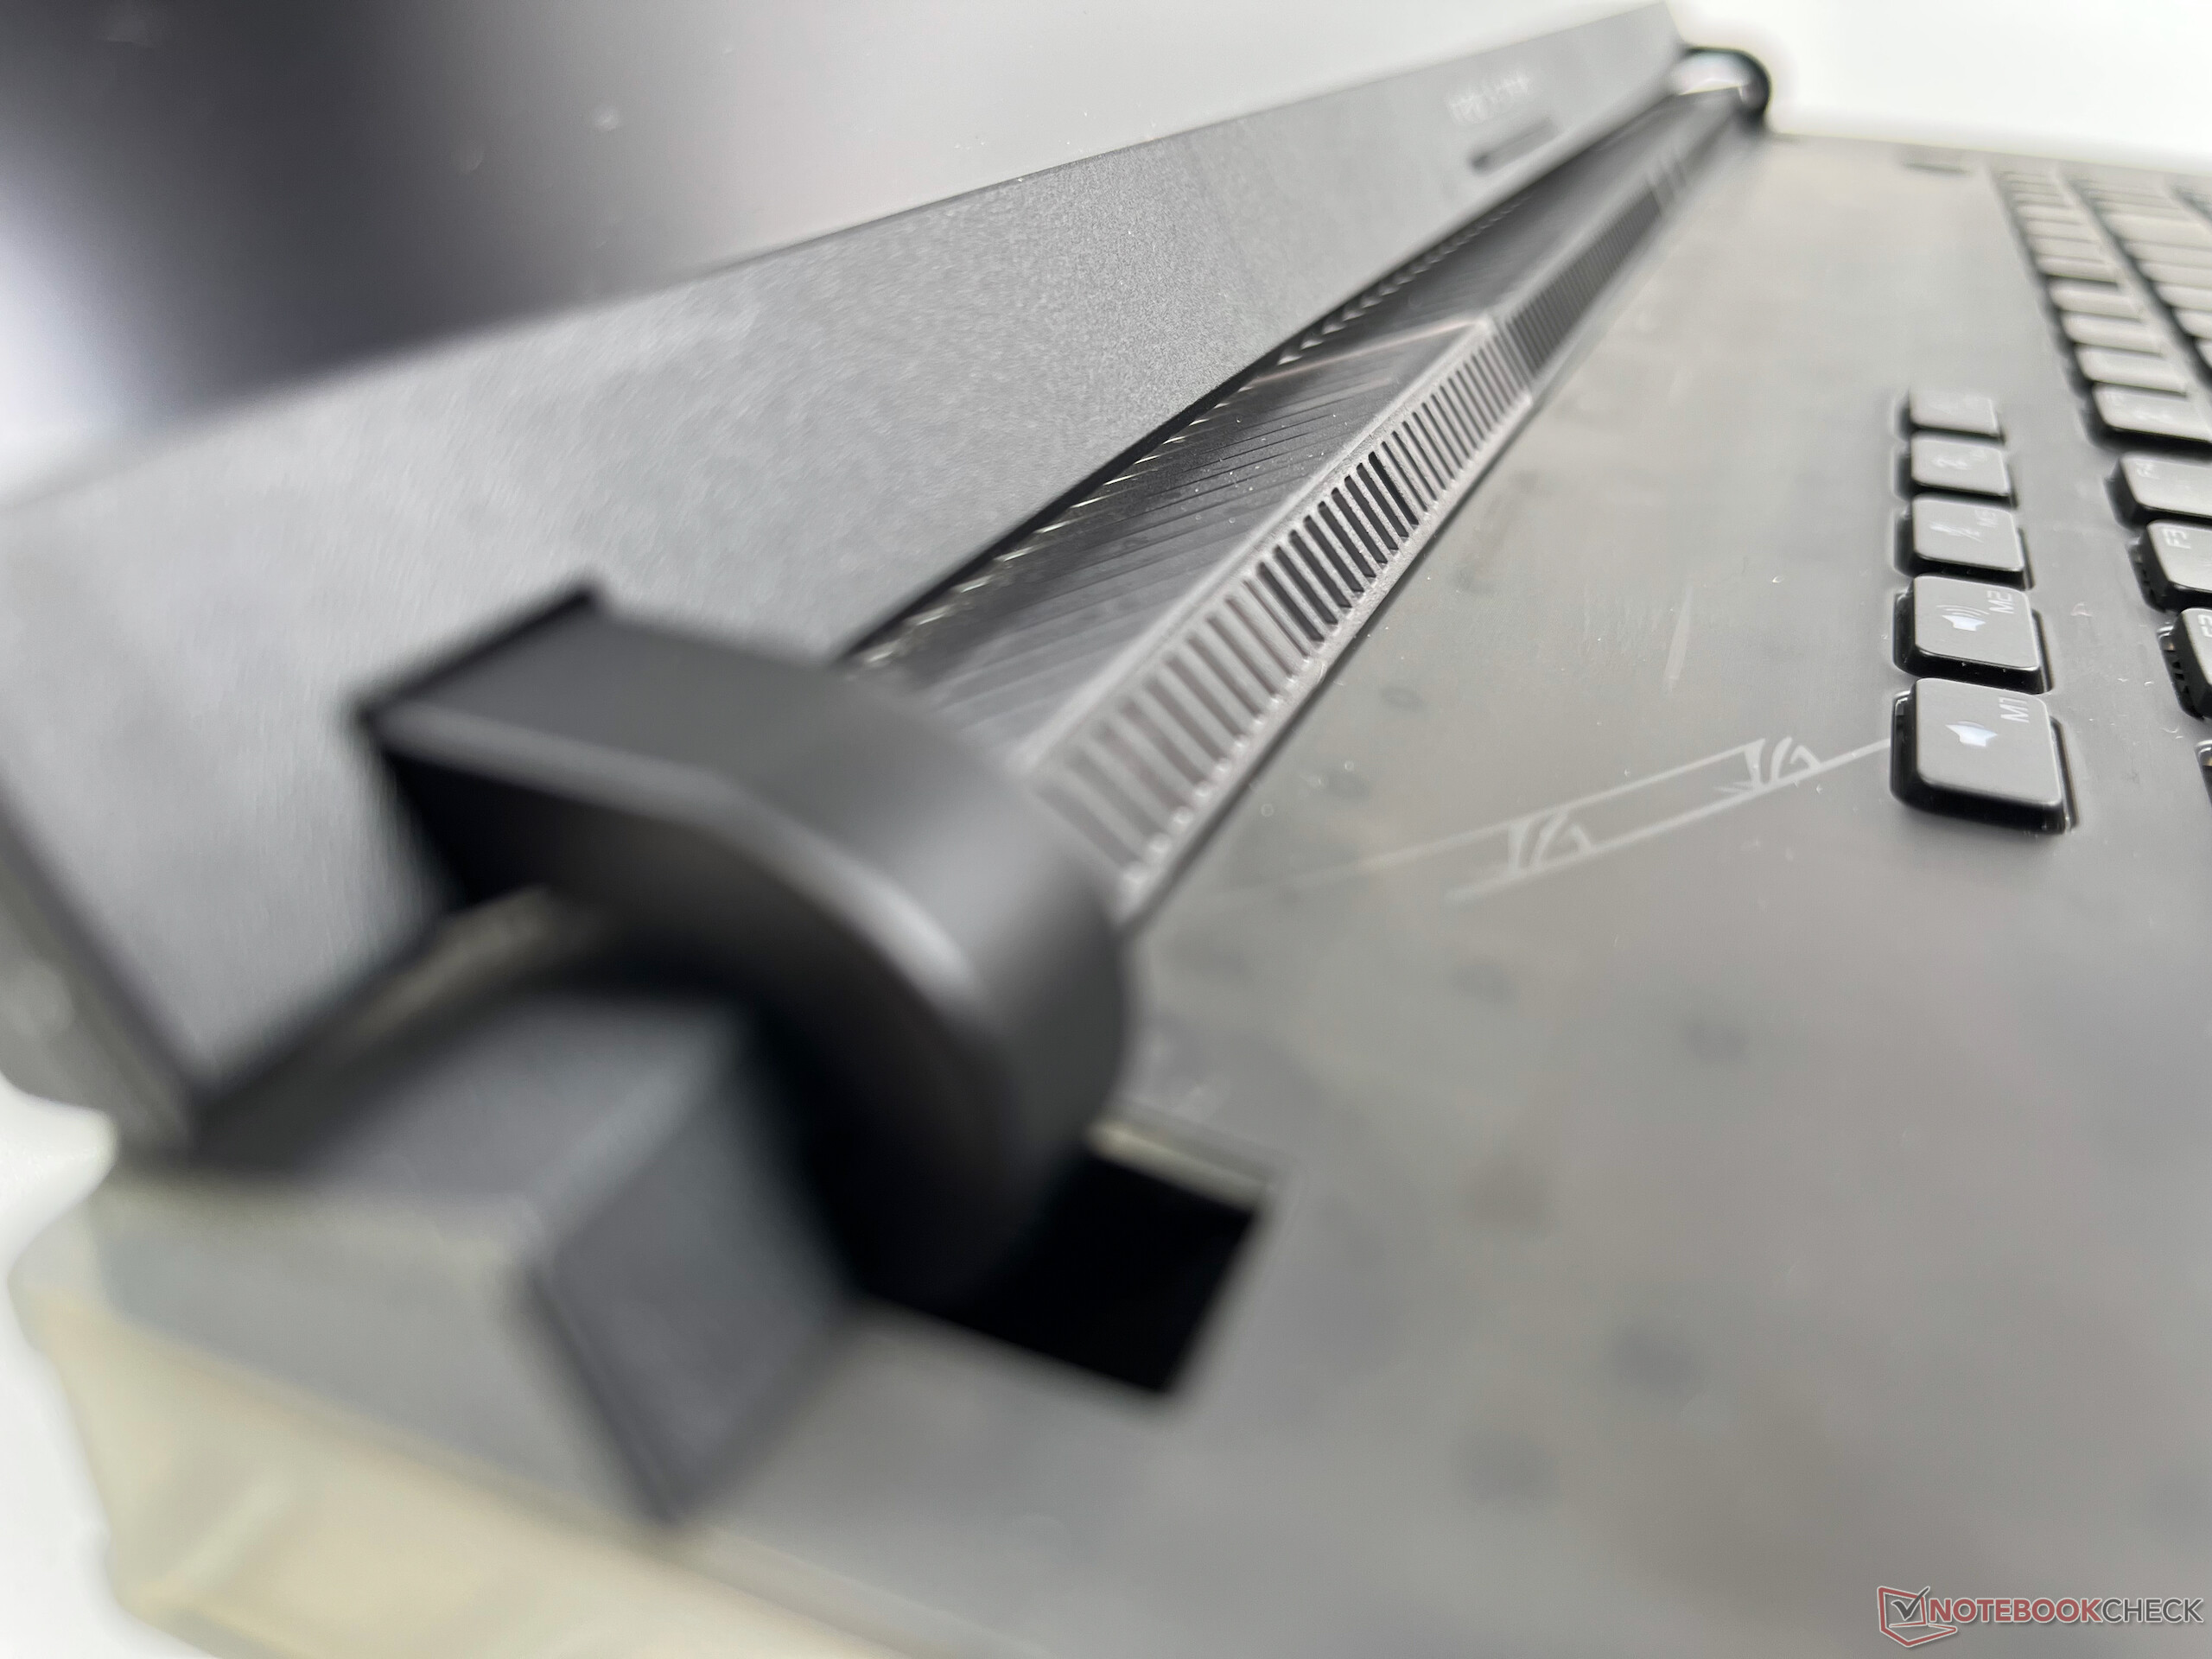
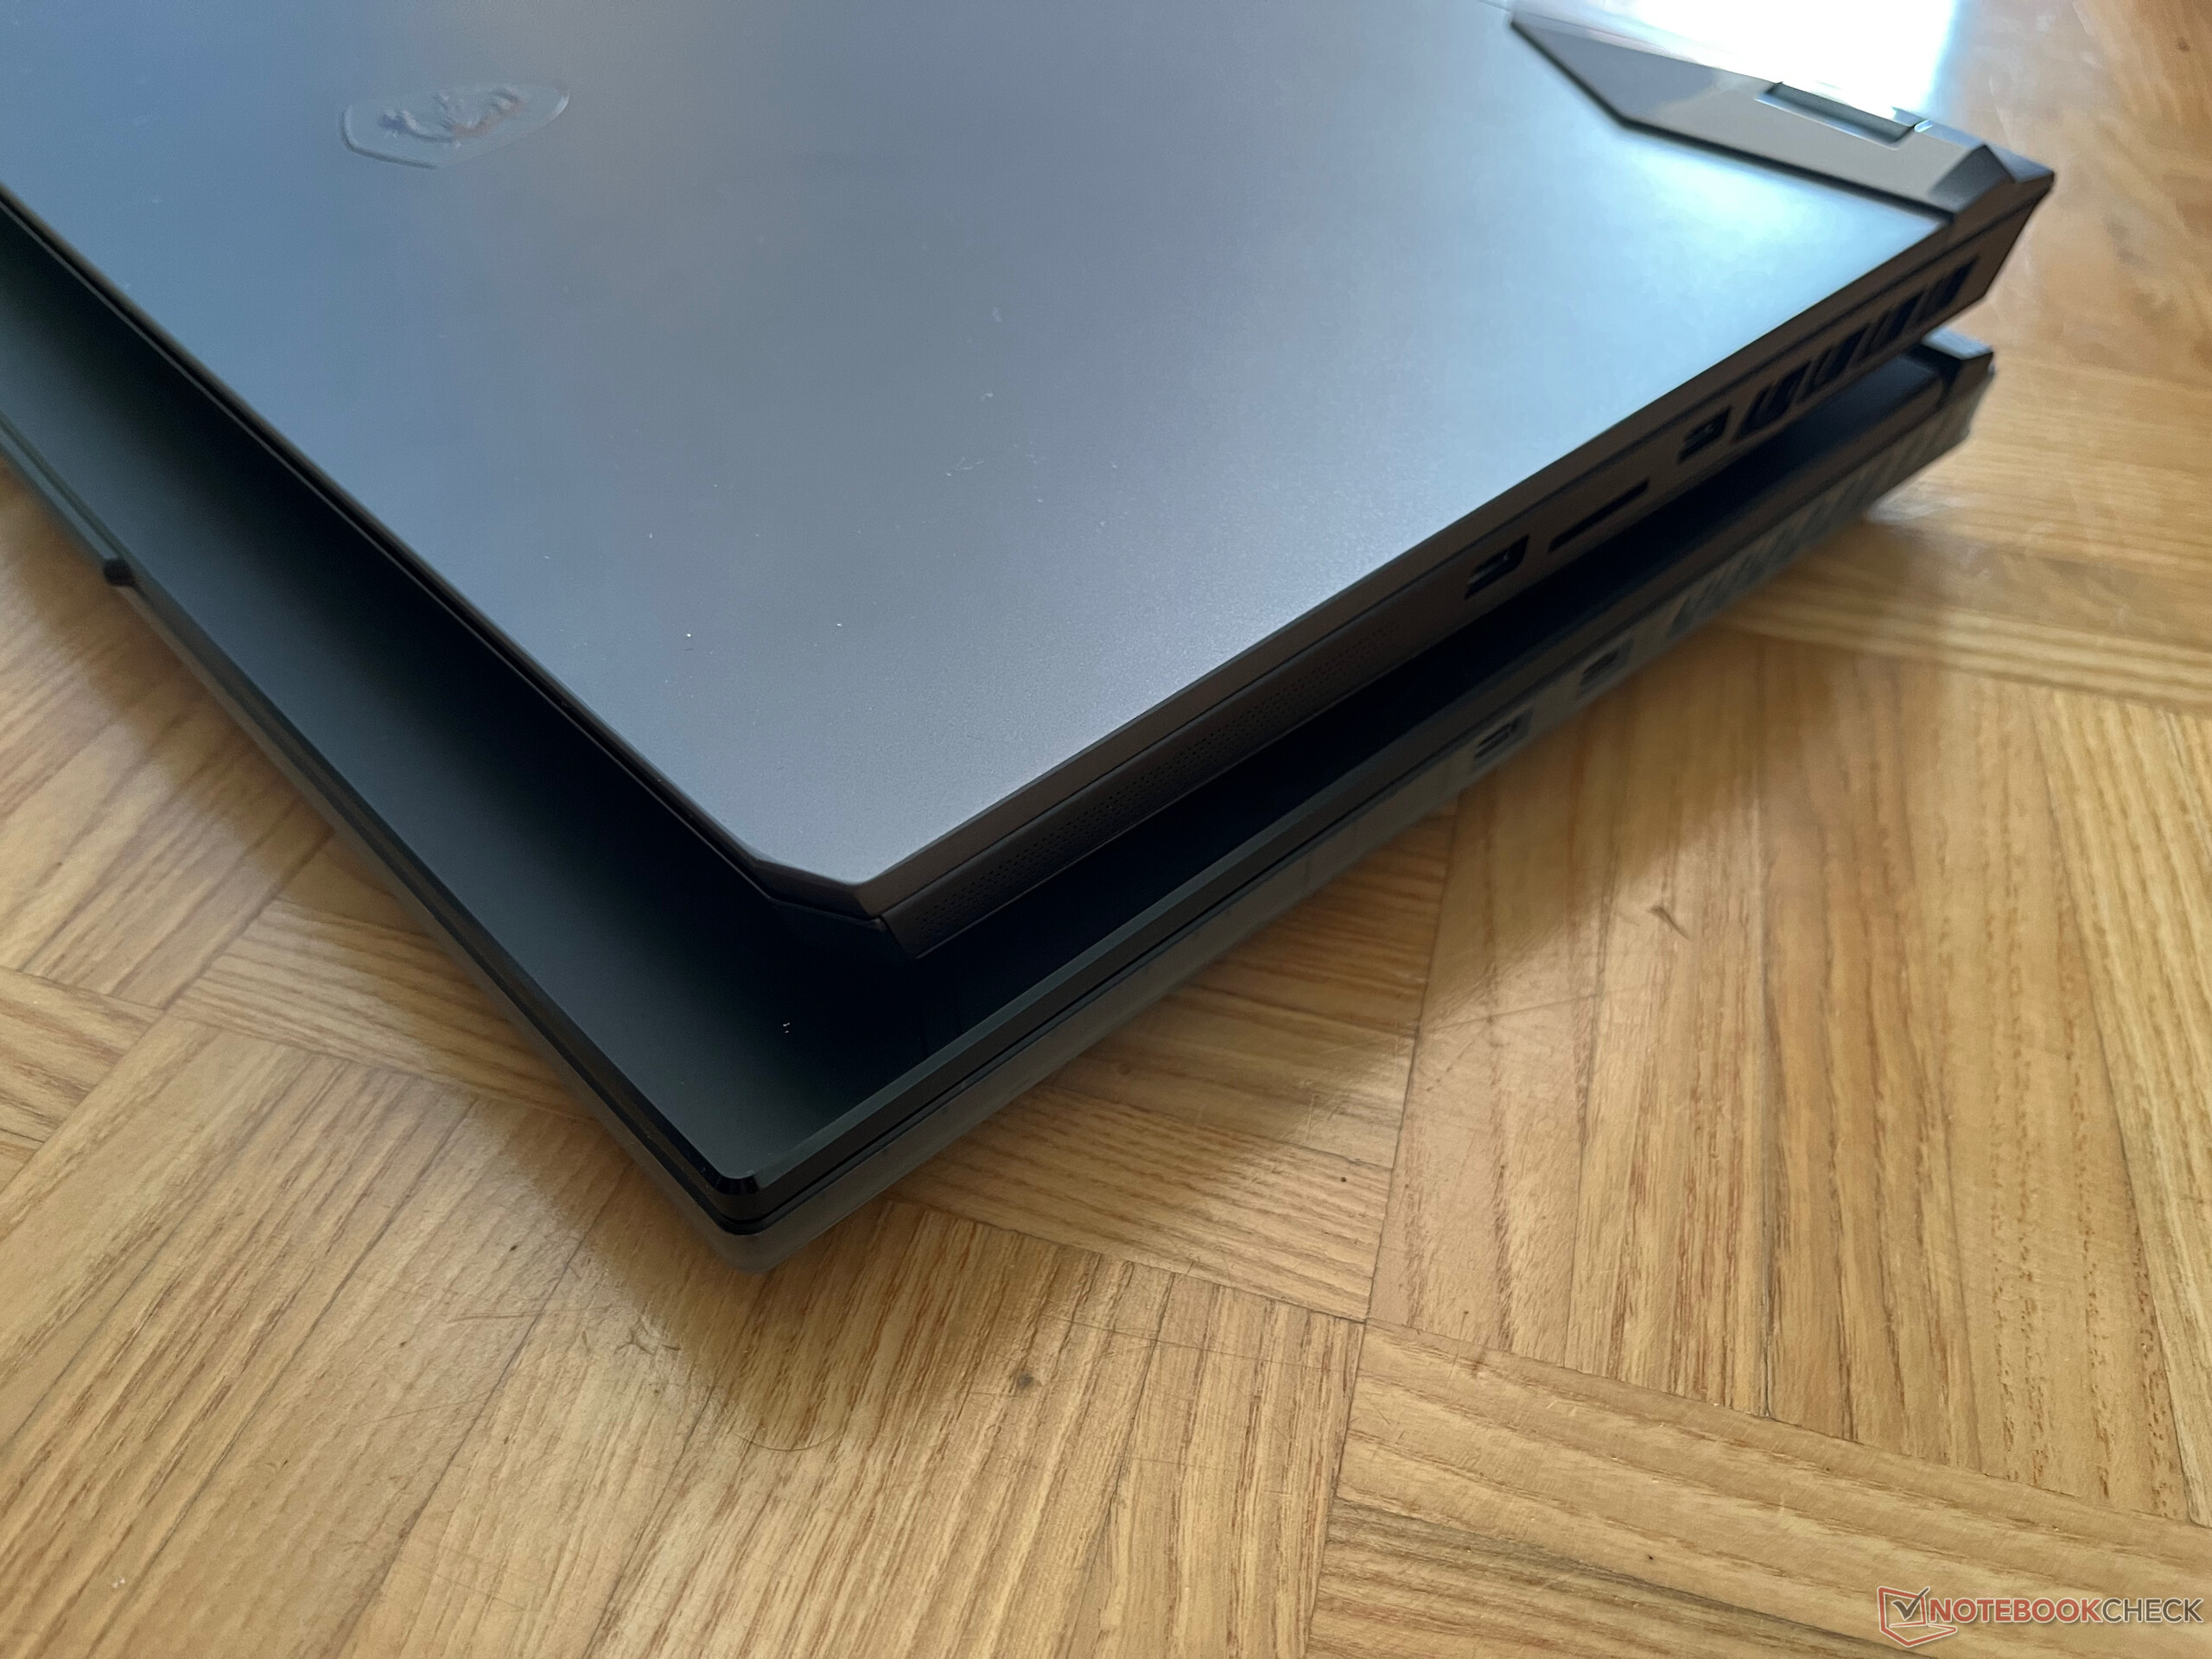
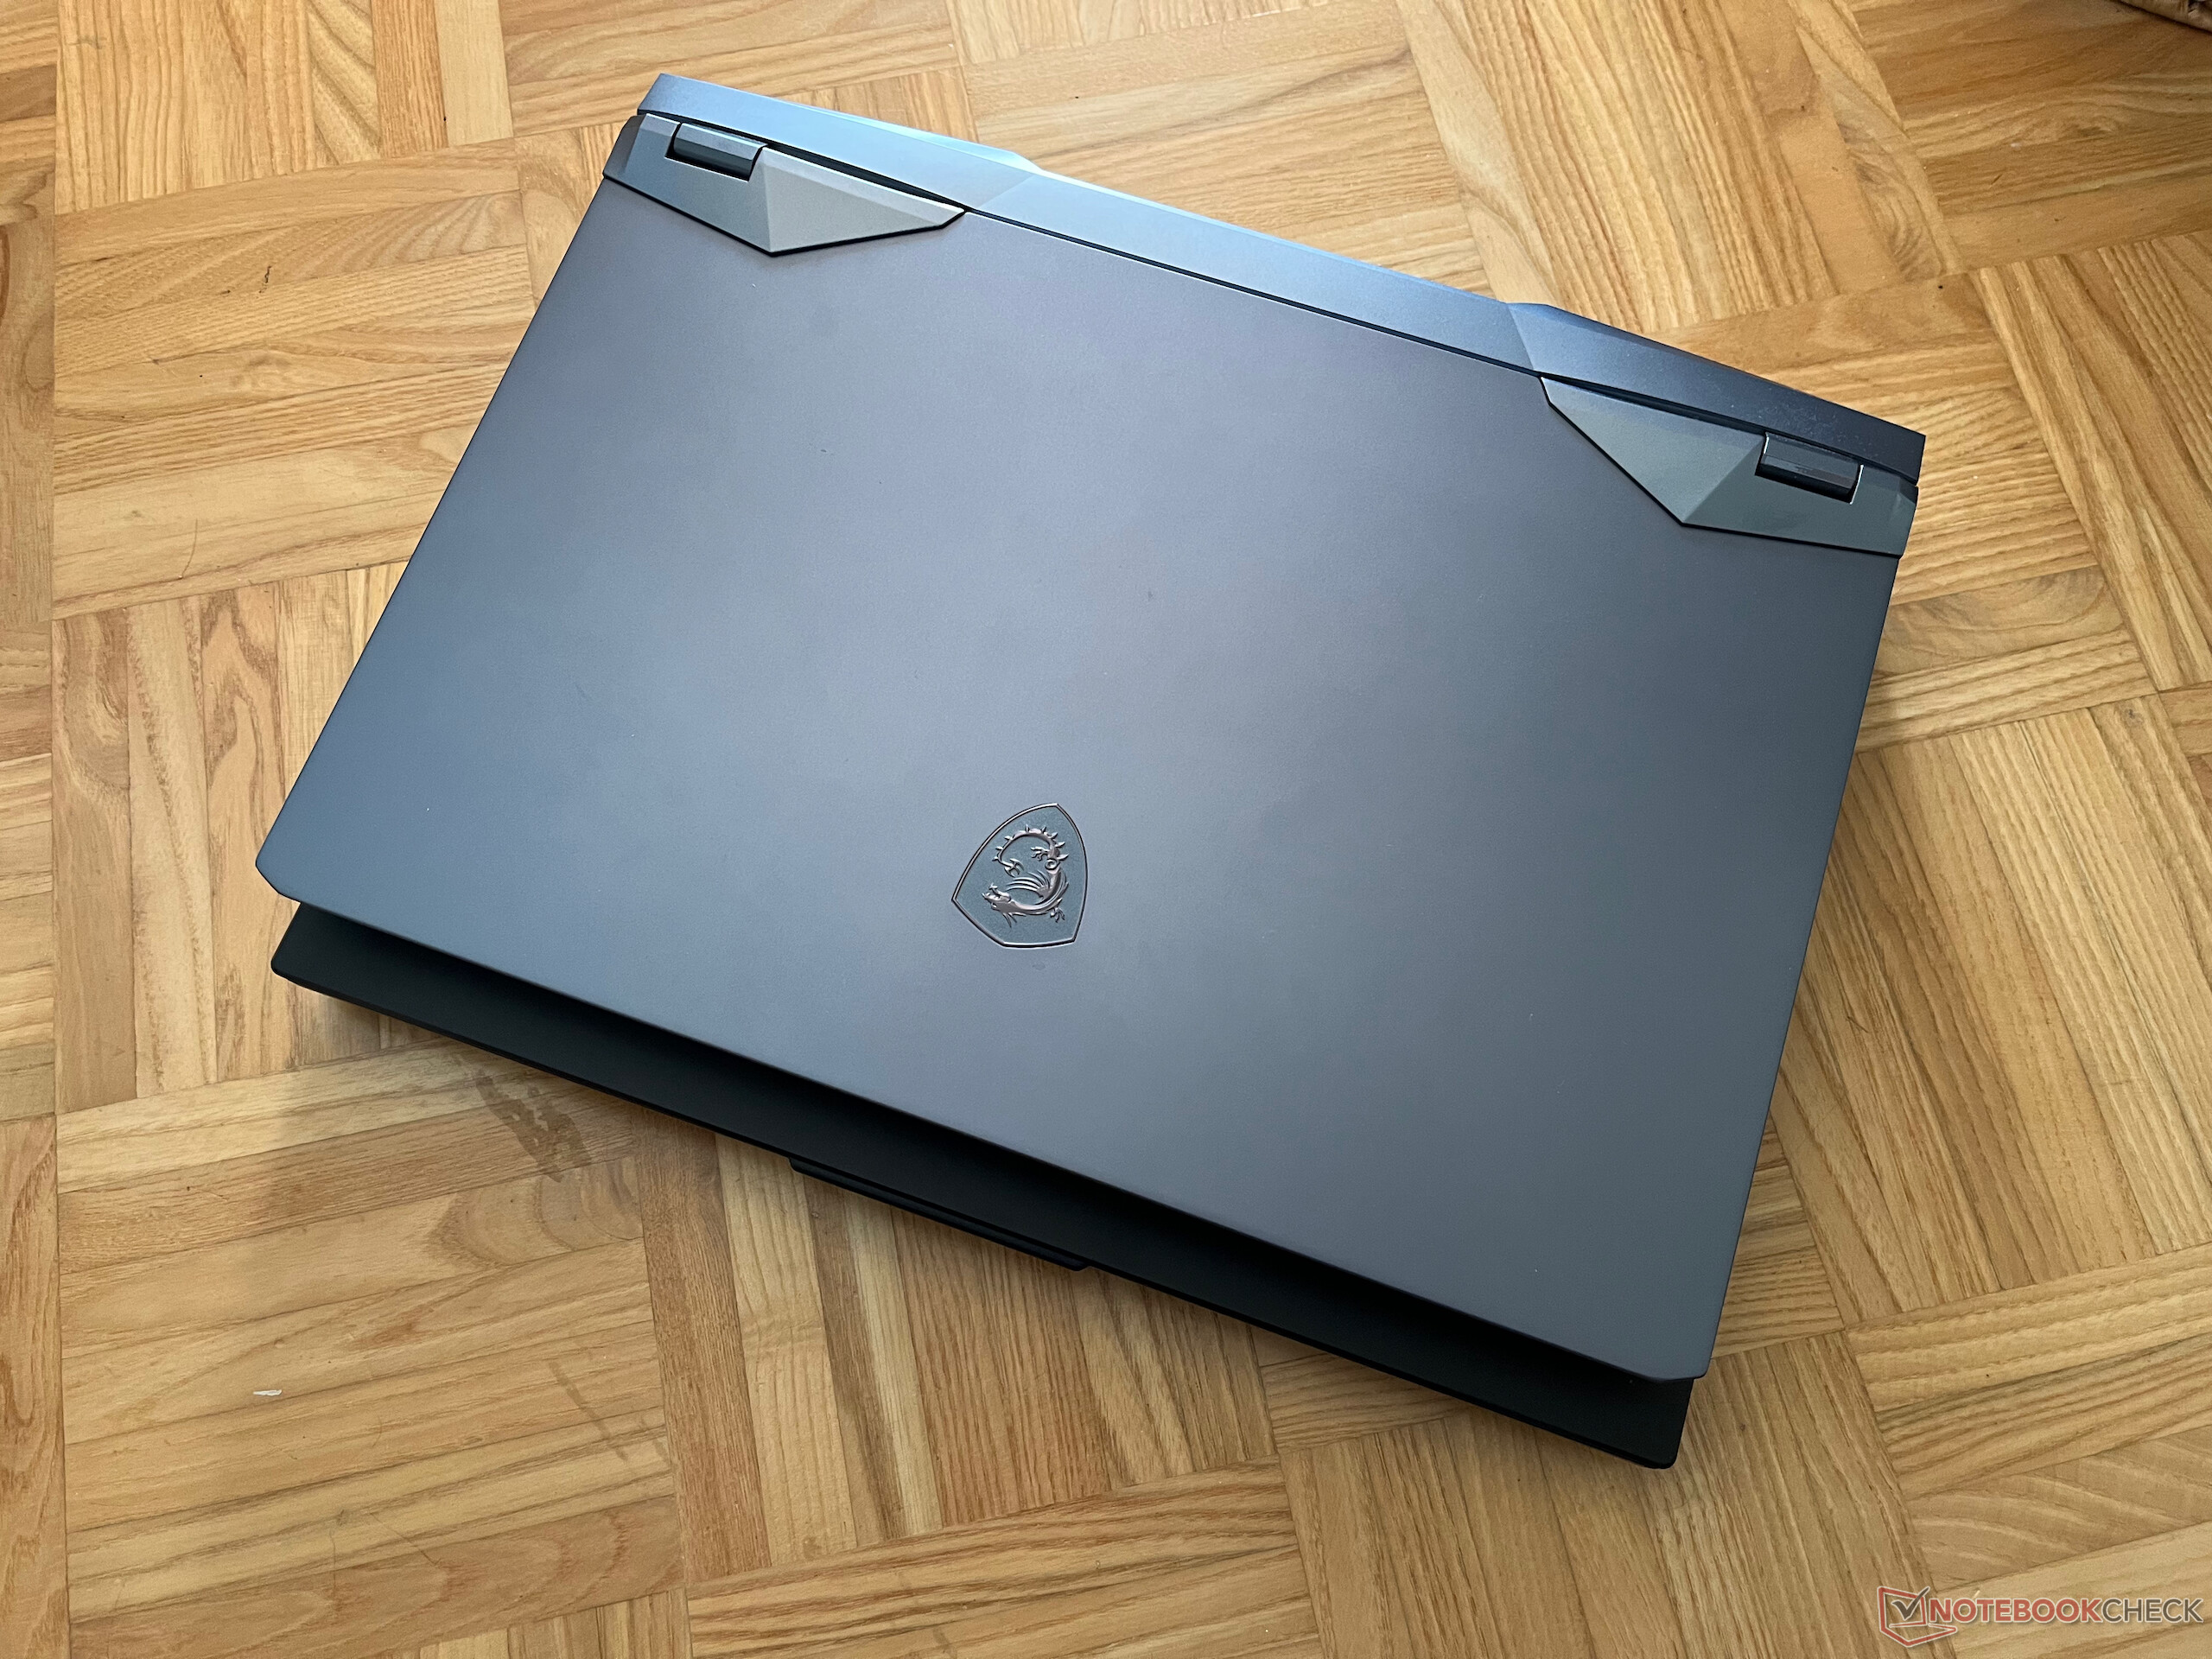
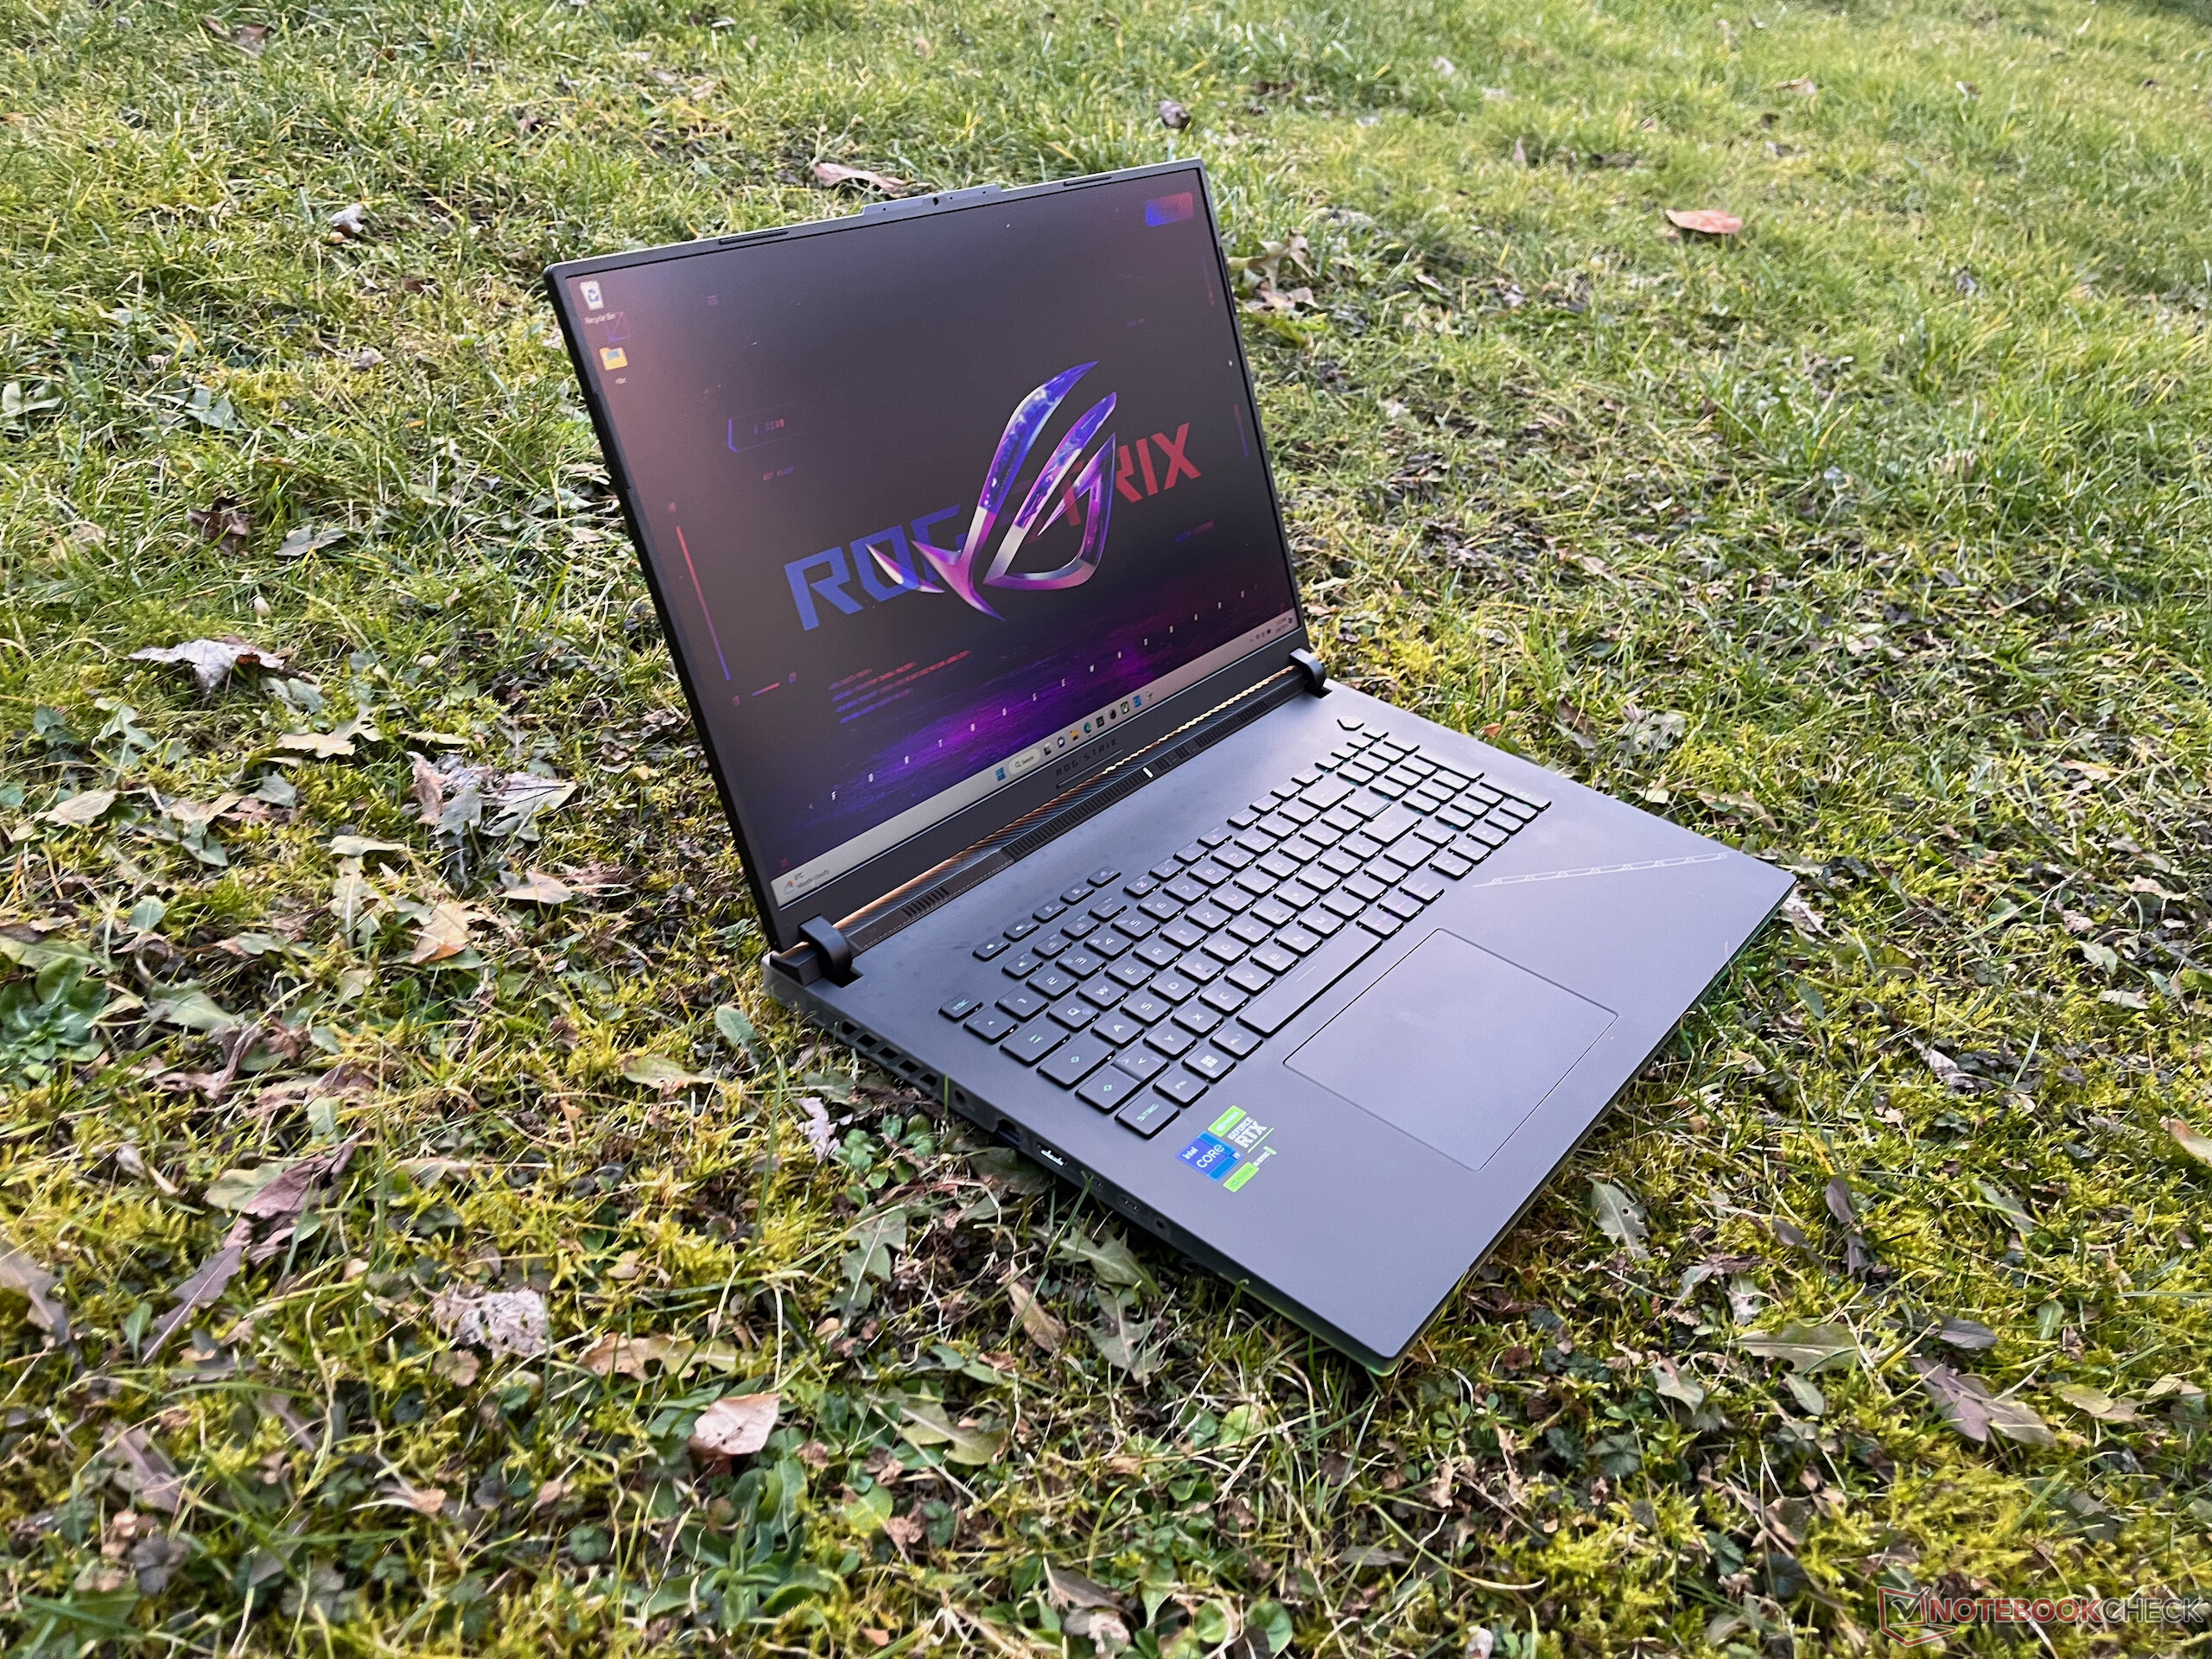
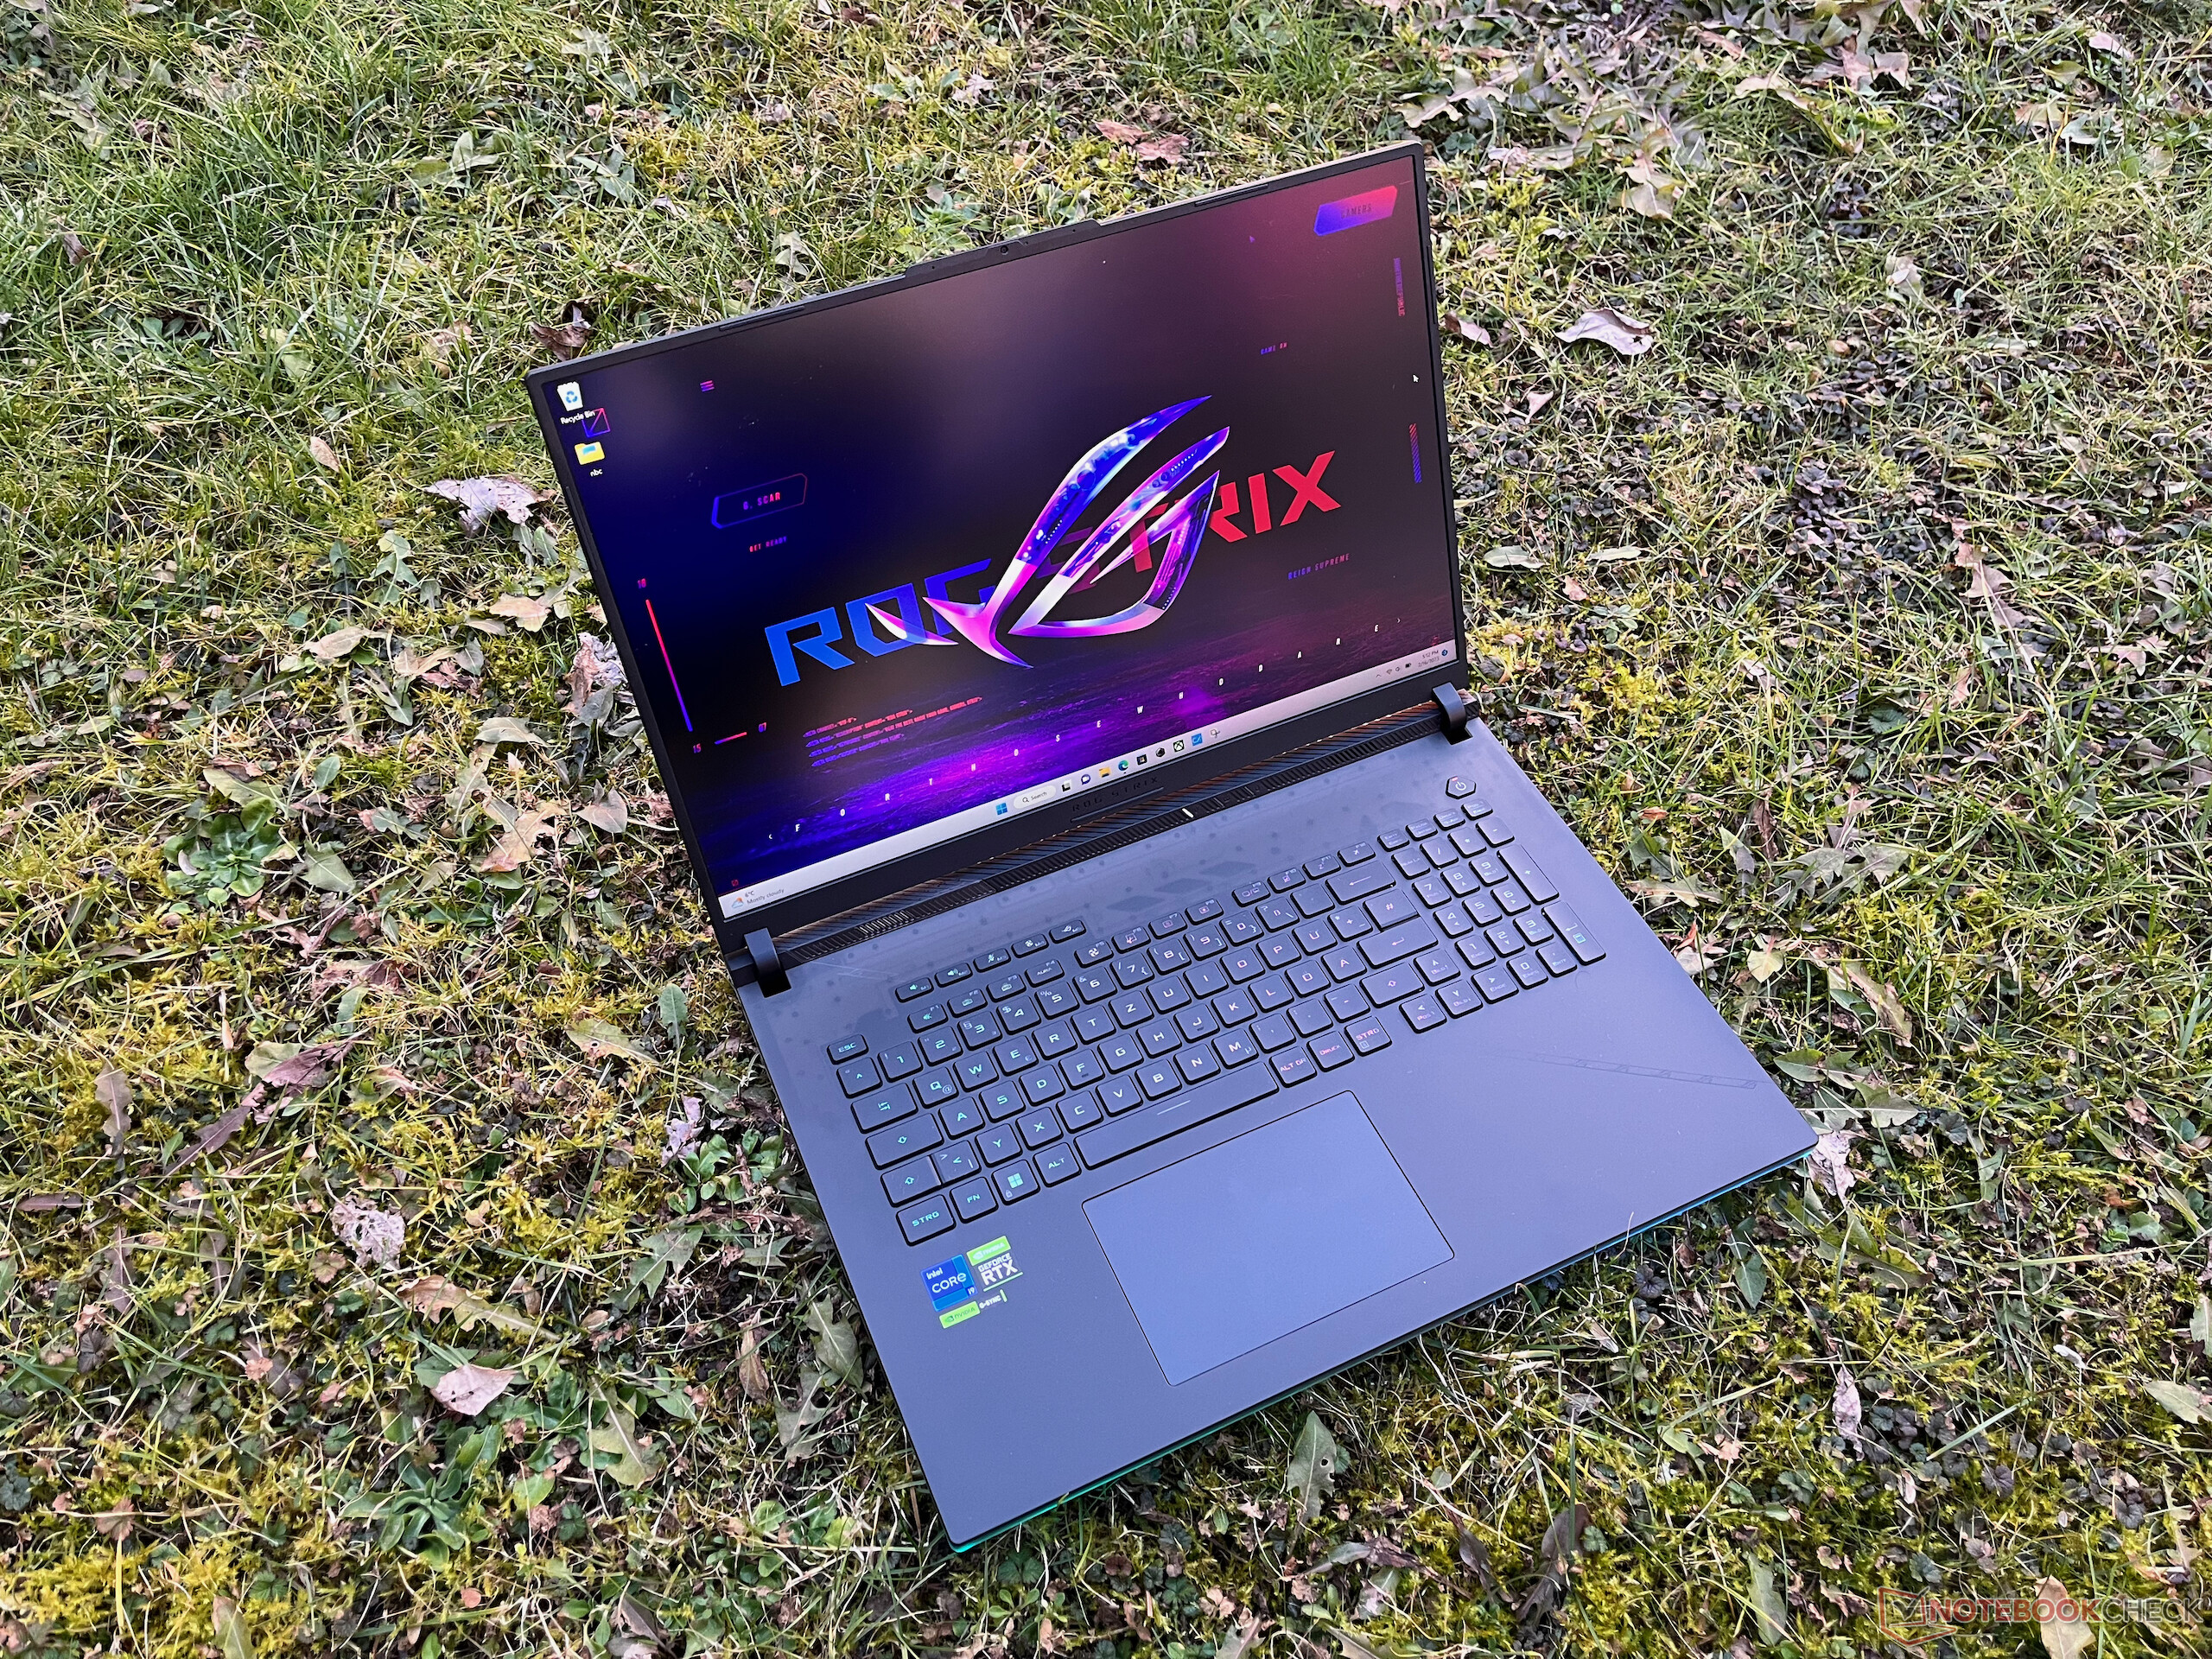
O tamanho da caixa é determinado pelo display gigante de 18 polegadas, excedendo significativamente a maioria dos laptops de 17 polegadas. Por outro lado, a unidade base não é tão maciça, fazendo com que o laptop pareça um pouco menor do que realmente é.
Equipamento
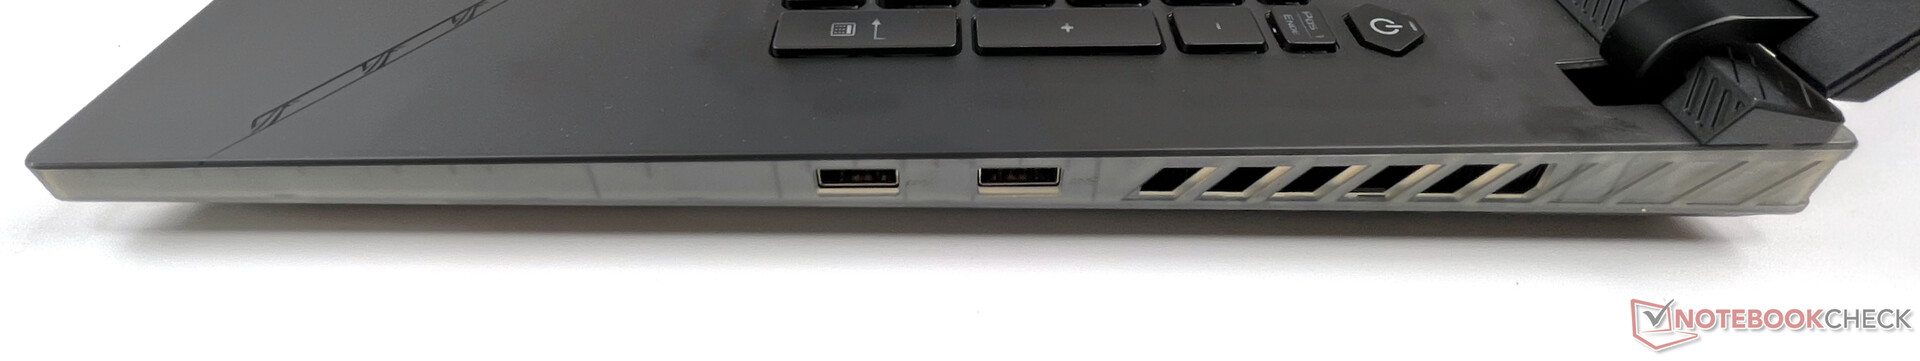
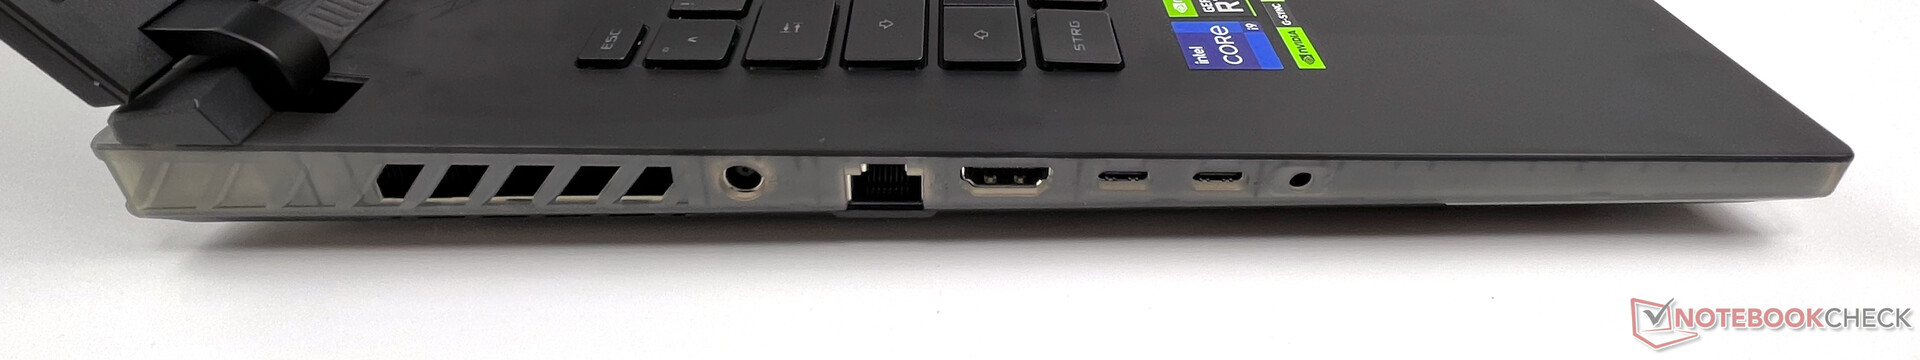
Todos os portos estão do lado esquerdo e direito da caixa. Infelizmente, isto é menos do que o ideal na operação de desktop, já que é sempre possível ver os cabos. Além disso, ambas as conexões USB-A são colocadas do lado direito em direção ao centro, tornando a posição do cabo menos do que ideal para usuários de mouse com a mão direita. Para os usuários canhotos, o cabo de rede estaria no caminho.
Também temos algumas reclamações sobre o equipamento de conexão. Apenas uma das duas portas USB-C suporta o Thunderbolt, e a outra suporta o Power Delivery com algumas limitações. Em nosso teste, o carregador MacBook Air M1 foi capaz de carregar o laptop a 30 watts, mas sem a notificação no Windows. O Anker Nano 2 de 45 watts não carregou o laptop de forma alguma. No lado positivo, também queremos mencionar a conexão de rede de 2,5 Gbit.
Comunicação
Em termos de opções de comunicação, a Asus oferece uma placa rápida Intel Wi-Fi 6E AX211 no formato M.2 para conexões sem fio e um chip Realtek RTL8125 para conexões LAN com fio de 2,5 Gbit. Ambos funcionaram sem nenhuma interrupção em nosso teste, mas a placa AX211 não encontrou a rede de 6-GHz de nosso roteador Asus ROG Rapture GT-AX11000. Infelizmente, o Wi-Fi 6E ainda é um hit-and-miss em nosso teste ao encontrar a rede.
Por outro lado, as taxas de dados na rede Wi-Fi 6 são excelentes e sem nenhuma queda.
Webcam
A webcam HD 720p embutida infelizmente atende apenas as menores exigências em telefonia de vídeo. Boas condições de luz são importantes aqui, já que os resultados que obtemos com a retroiluminação ou no escuro são dificilmente utilizáveis.


")
")
Acessórios
A caixa inclui apenas uma "Armor Cap" adicional, que pode ser substituída à esquerda, abaixo do mostrador. A tampa é fixada magneticamente e pode ser destinada a dar-lhe uma opção para personalizar o dispositivo.
Manutenção
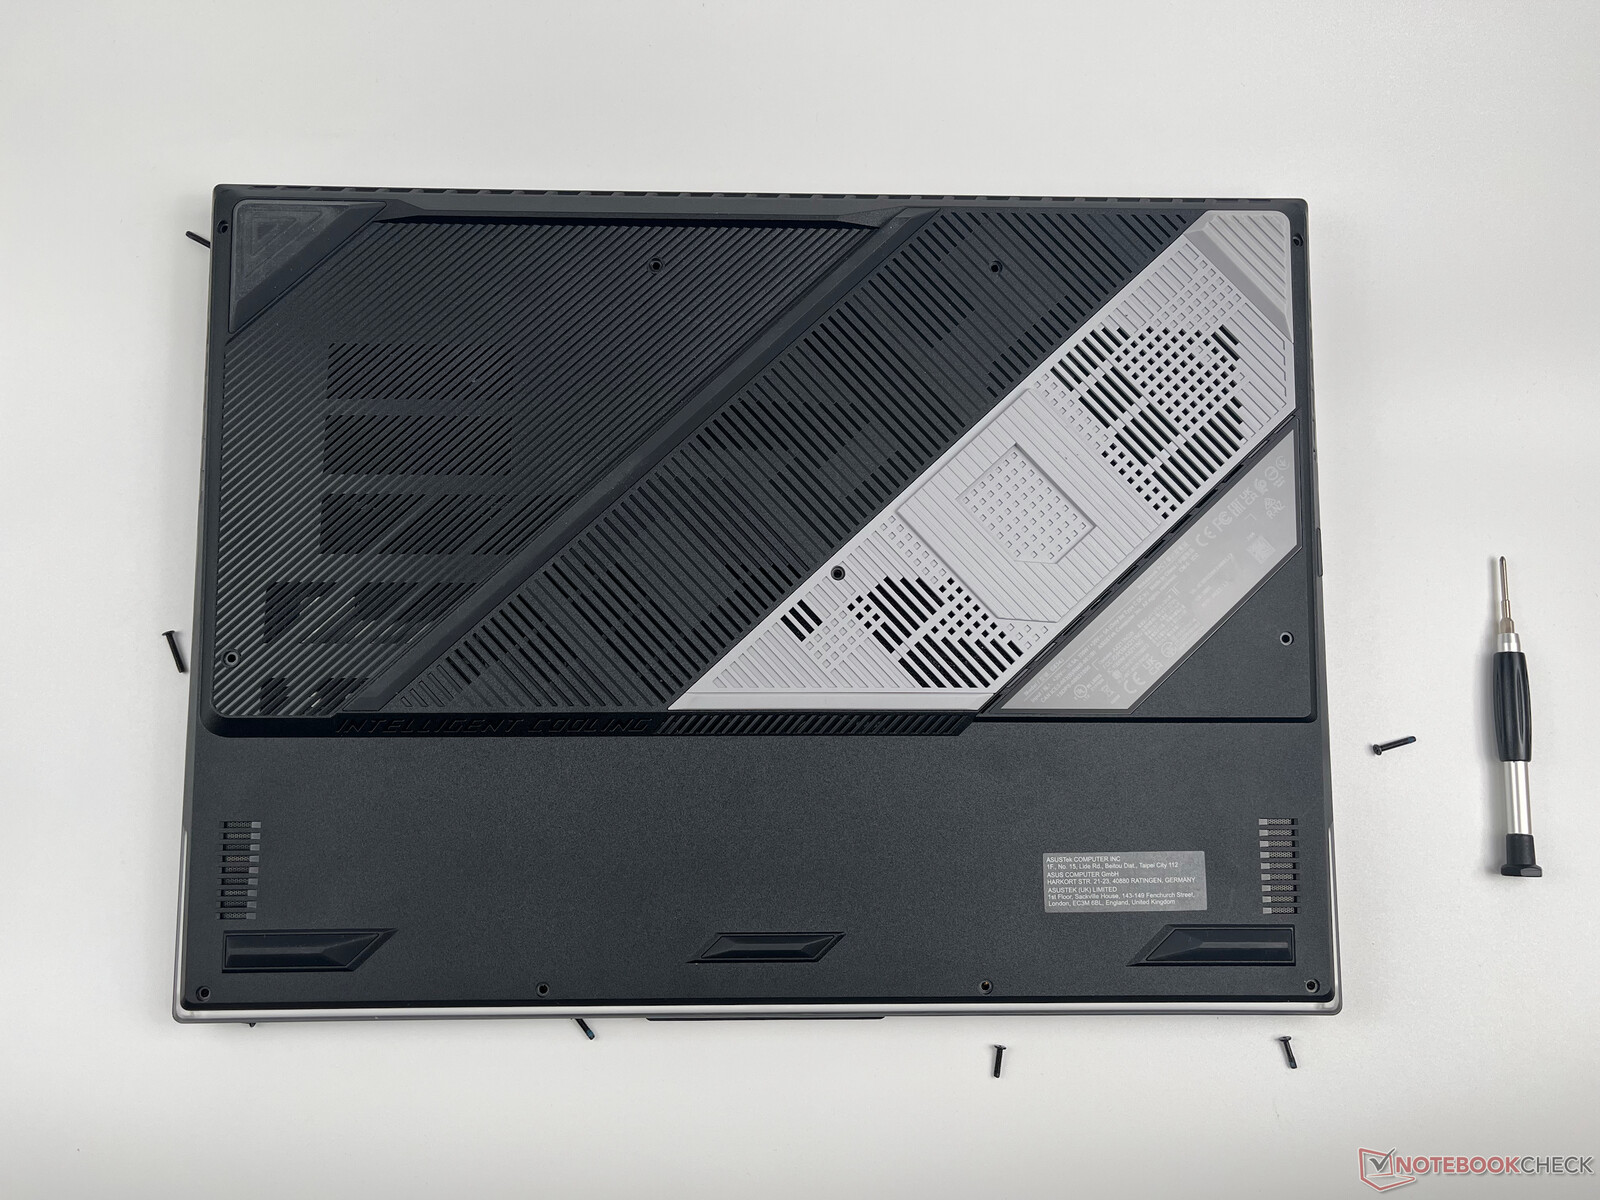
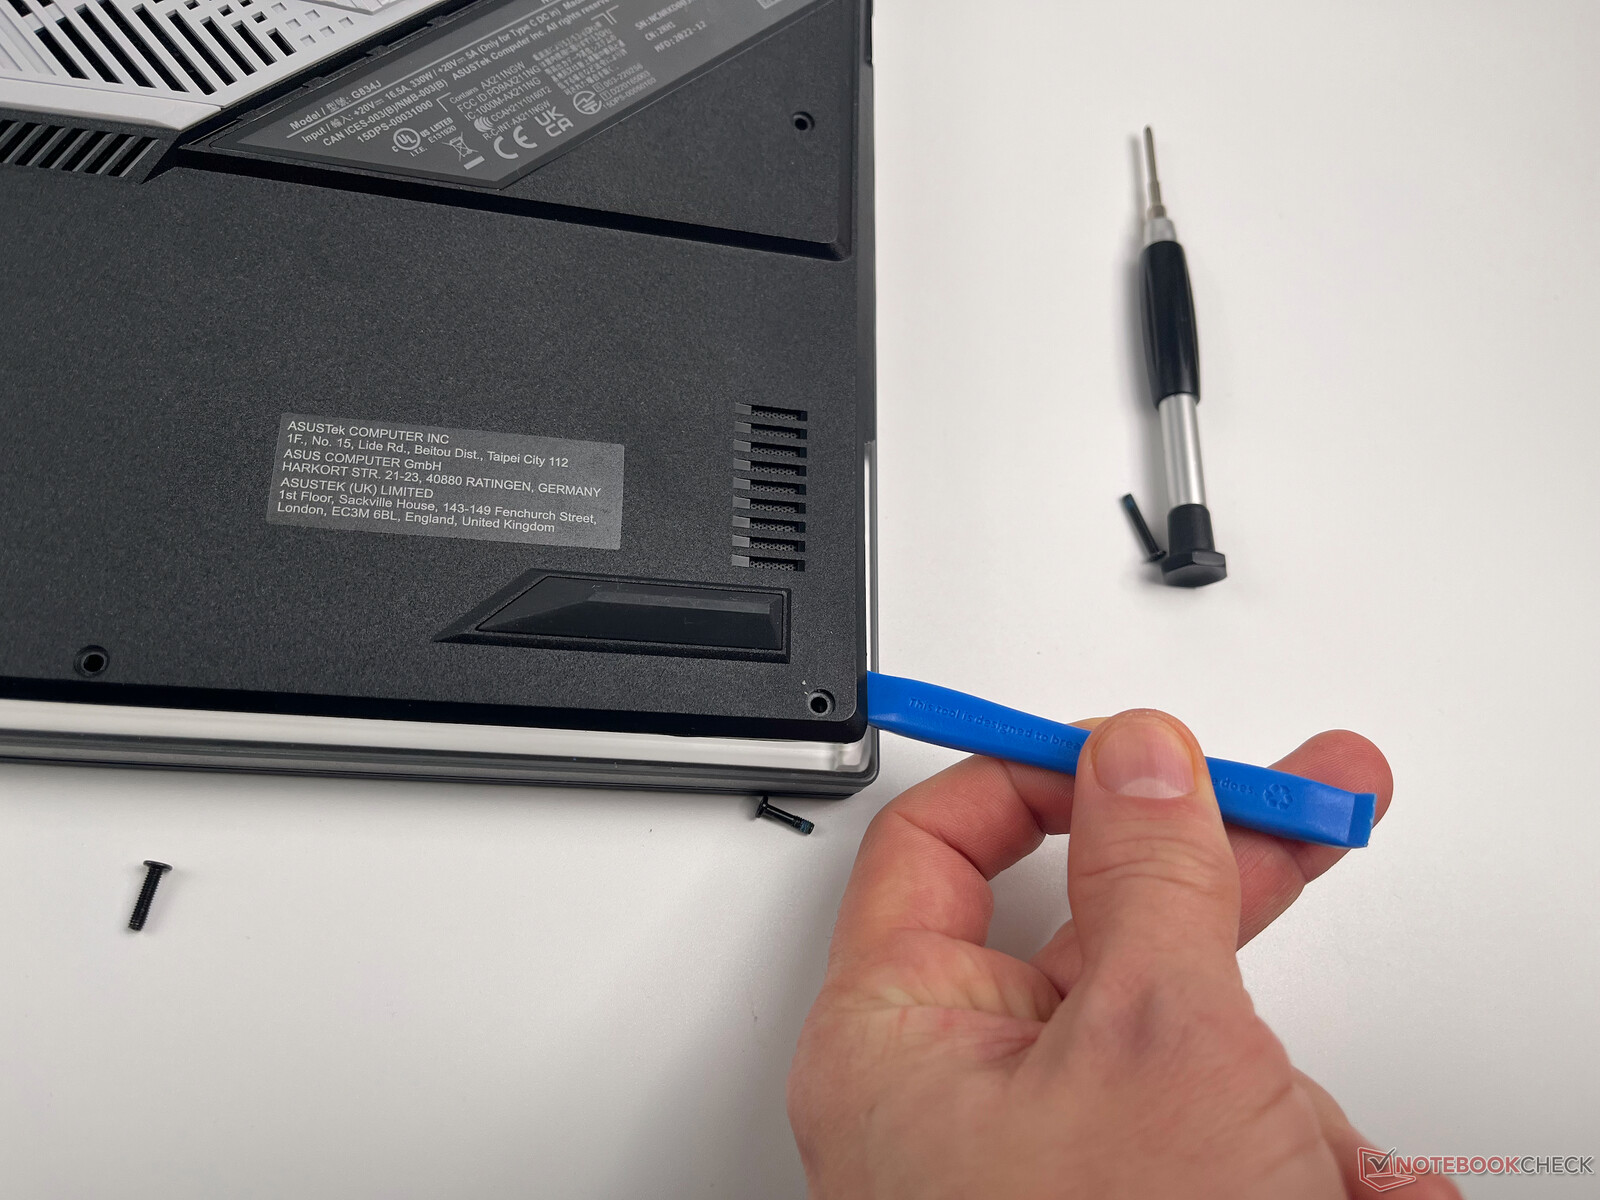
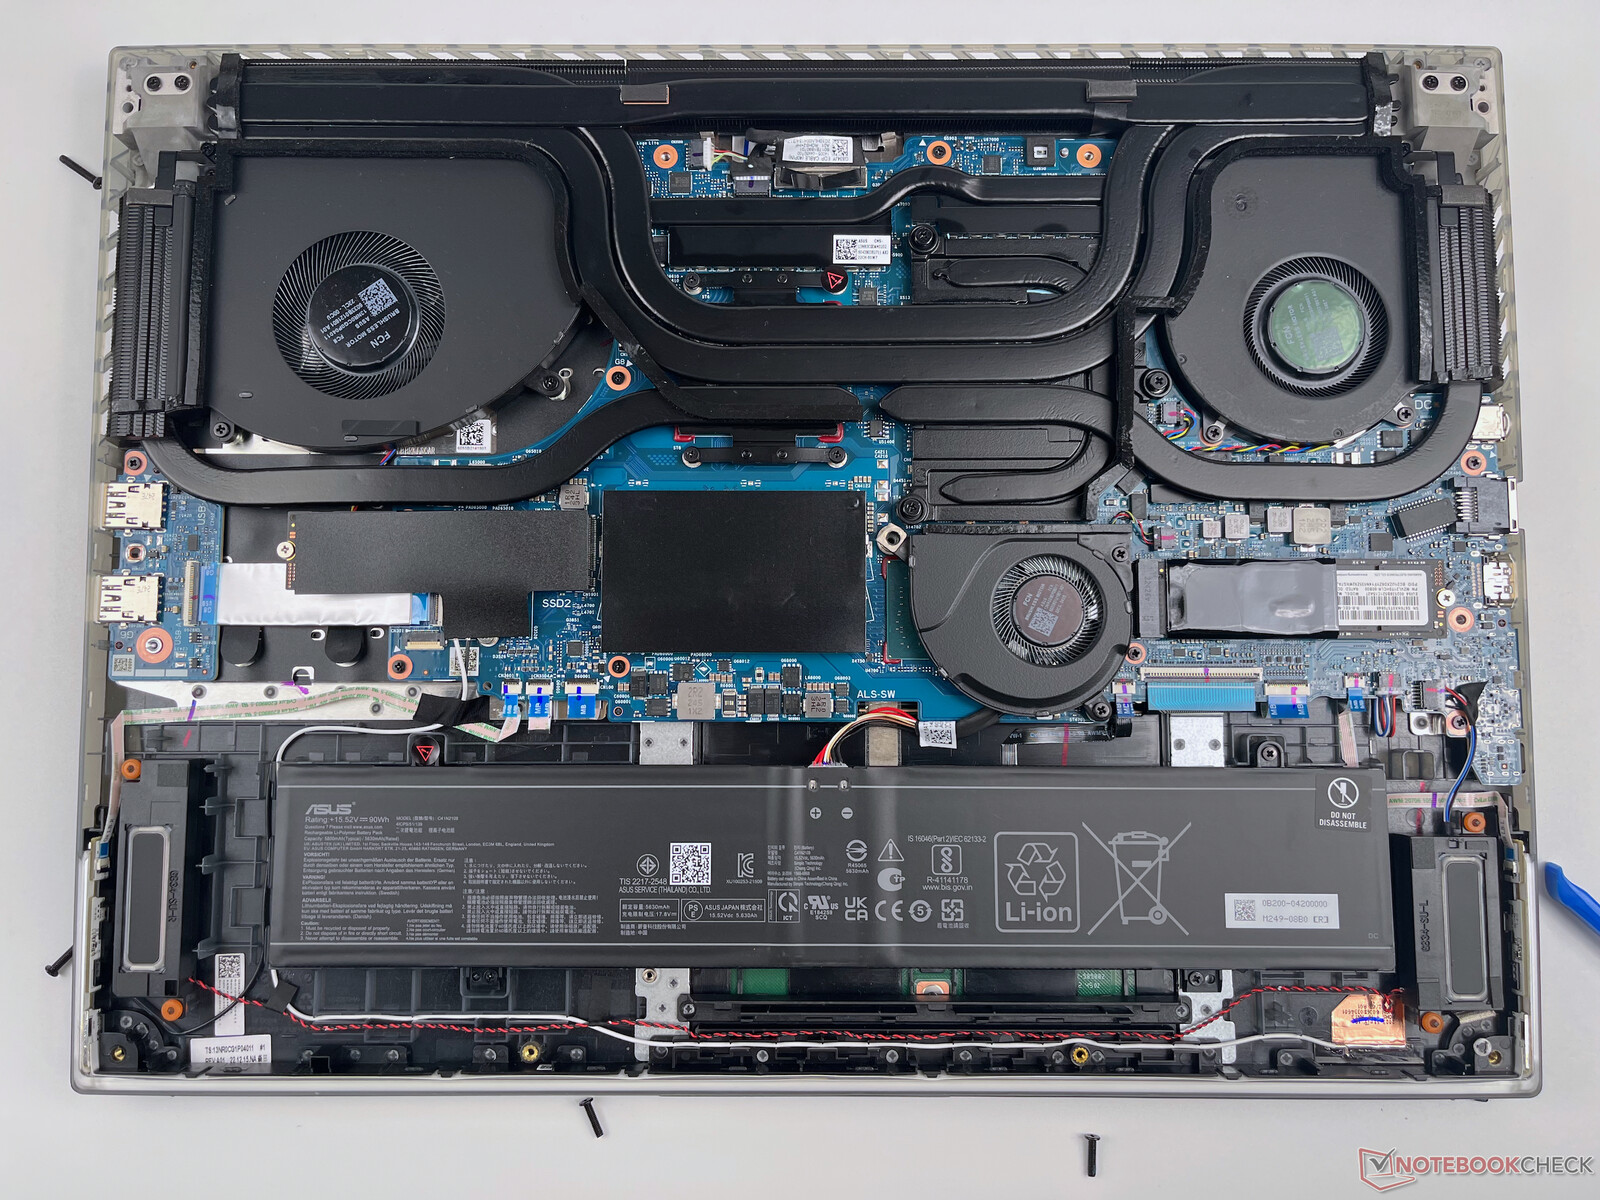
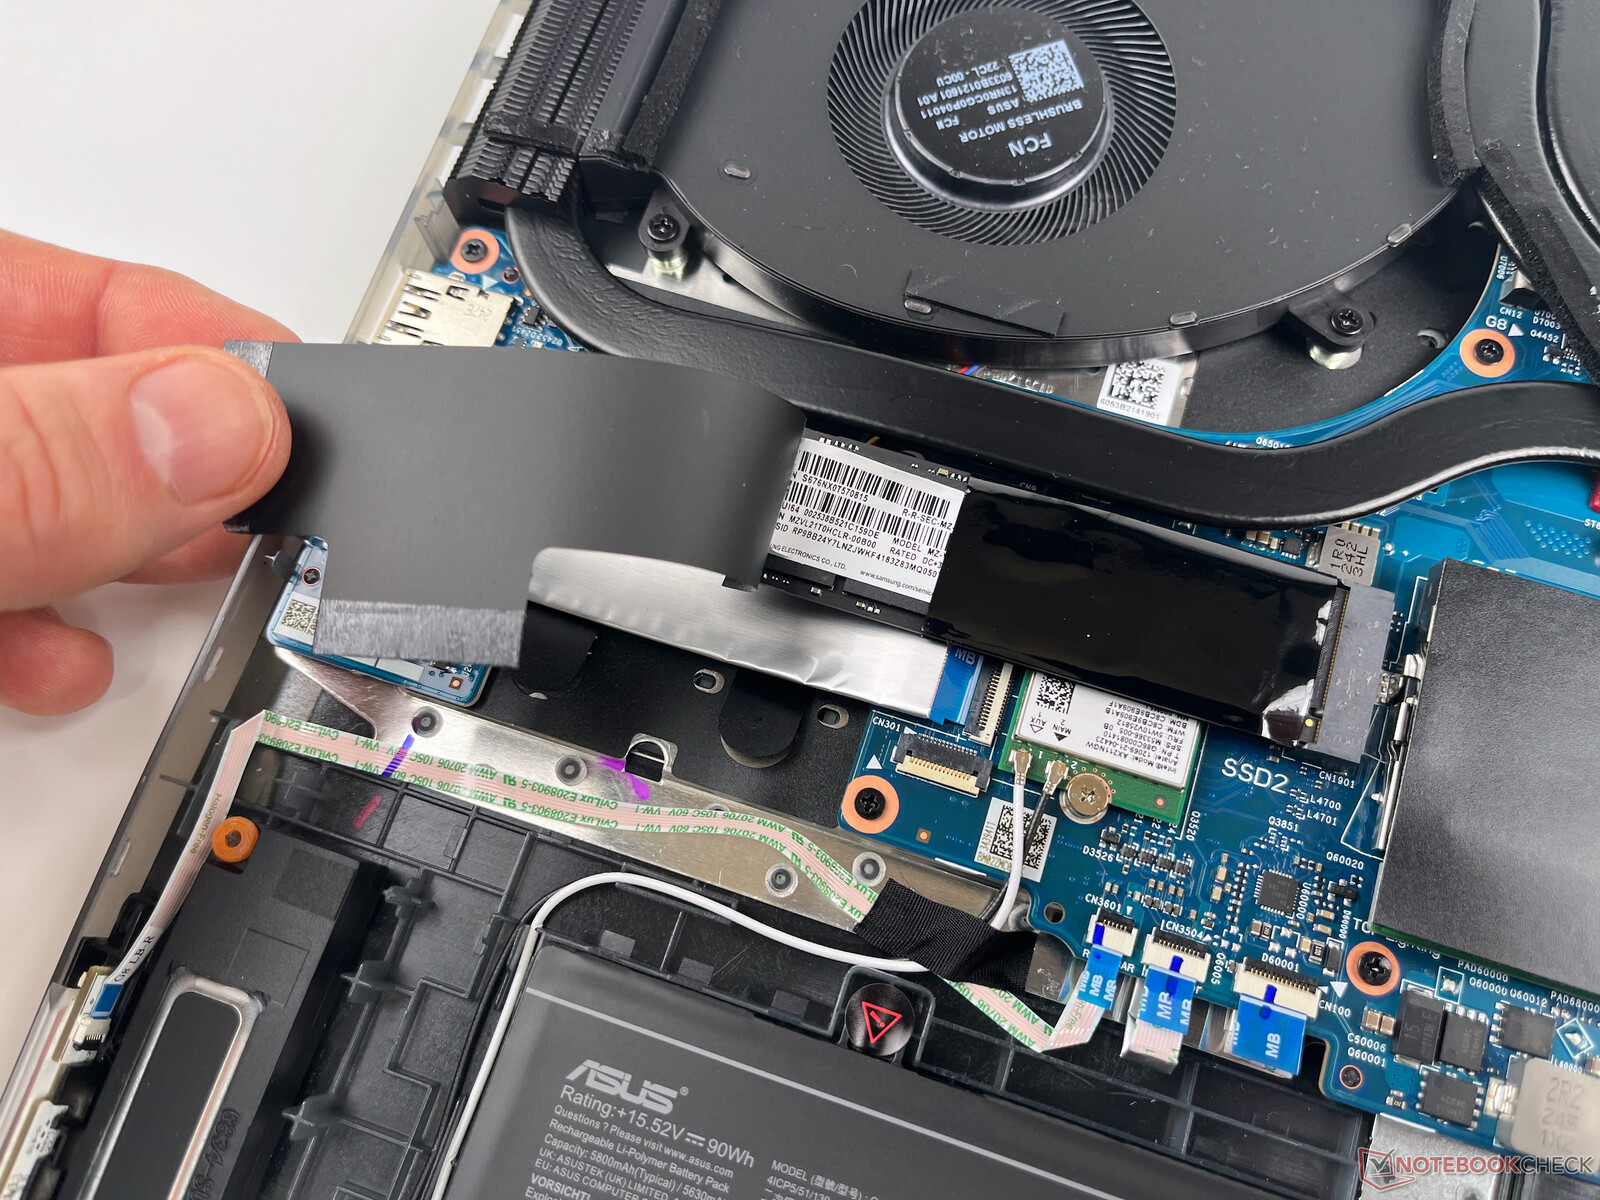
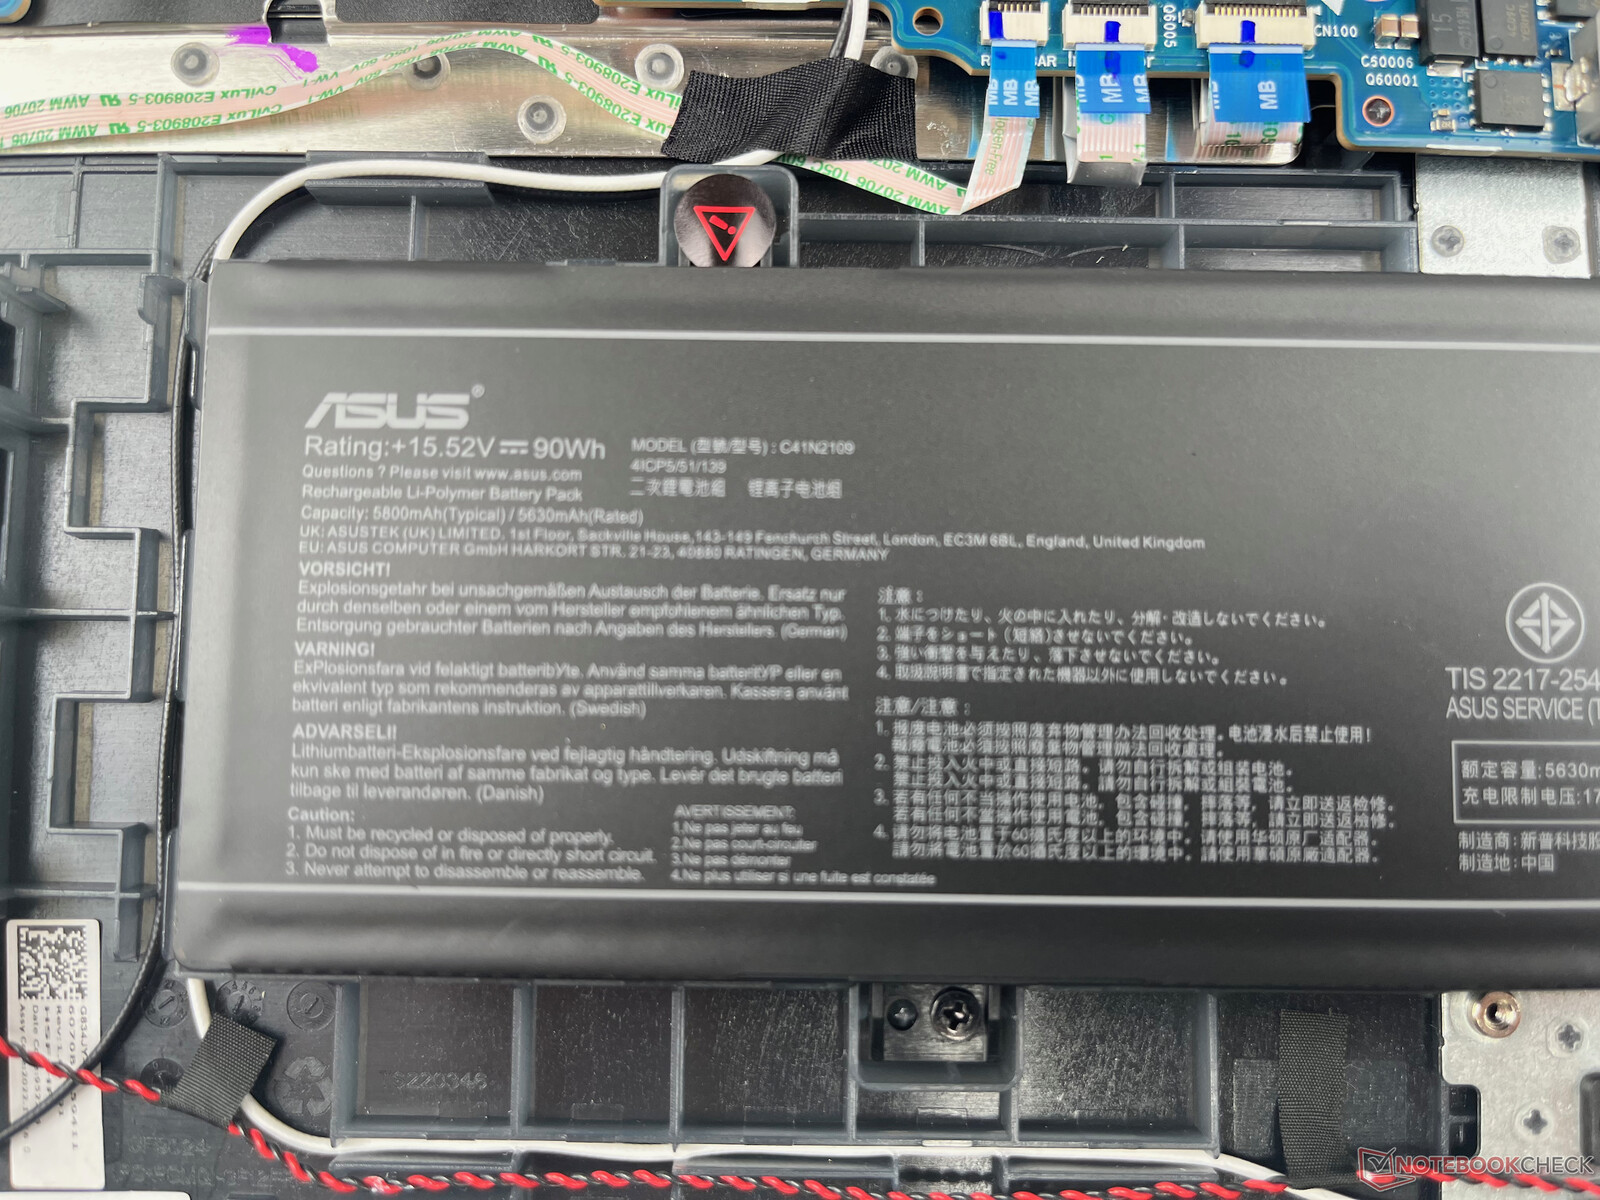
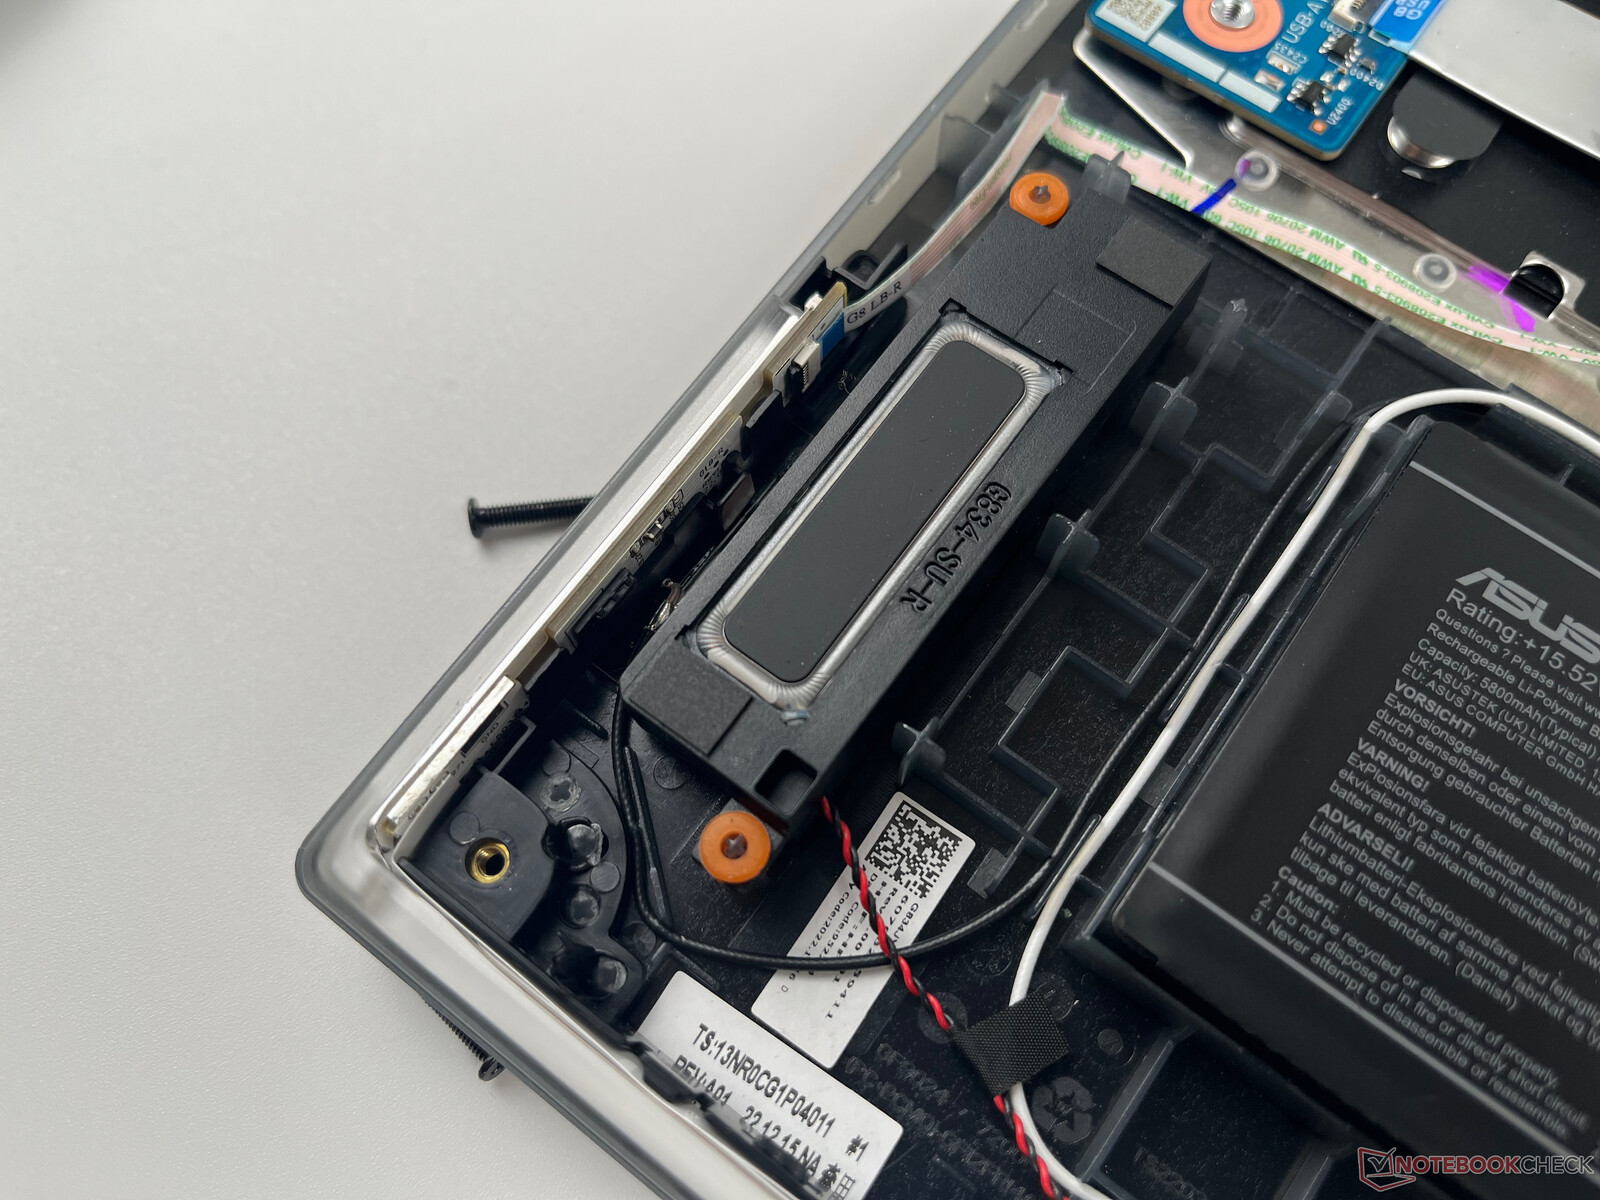
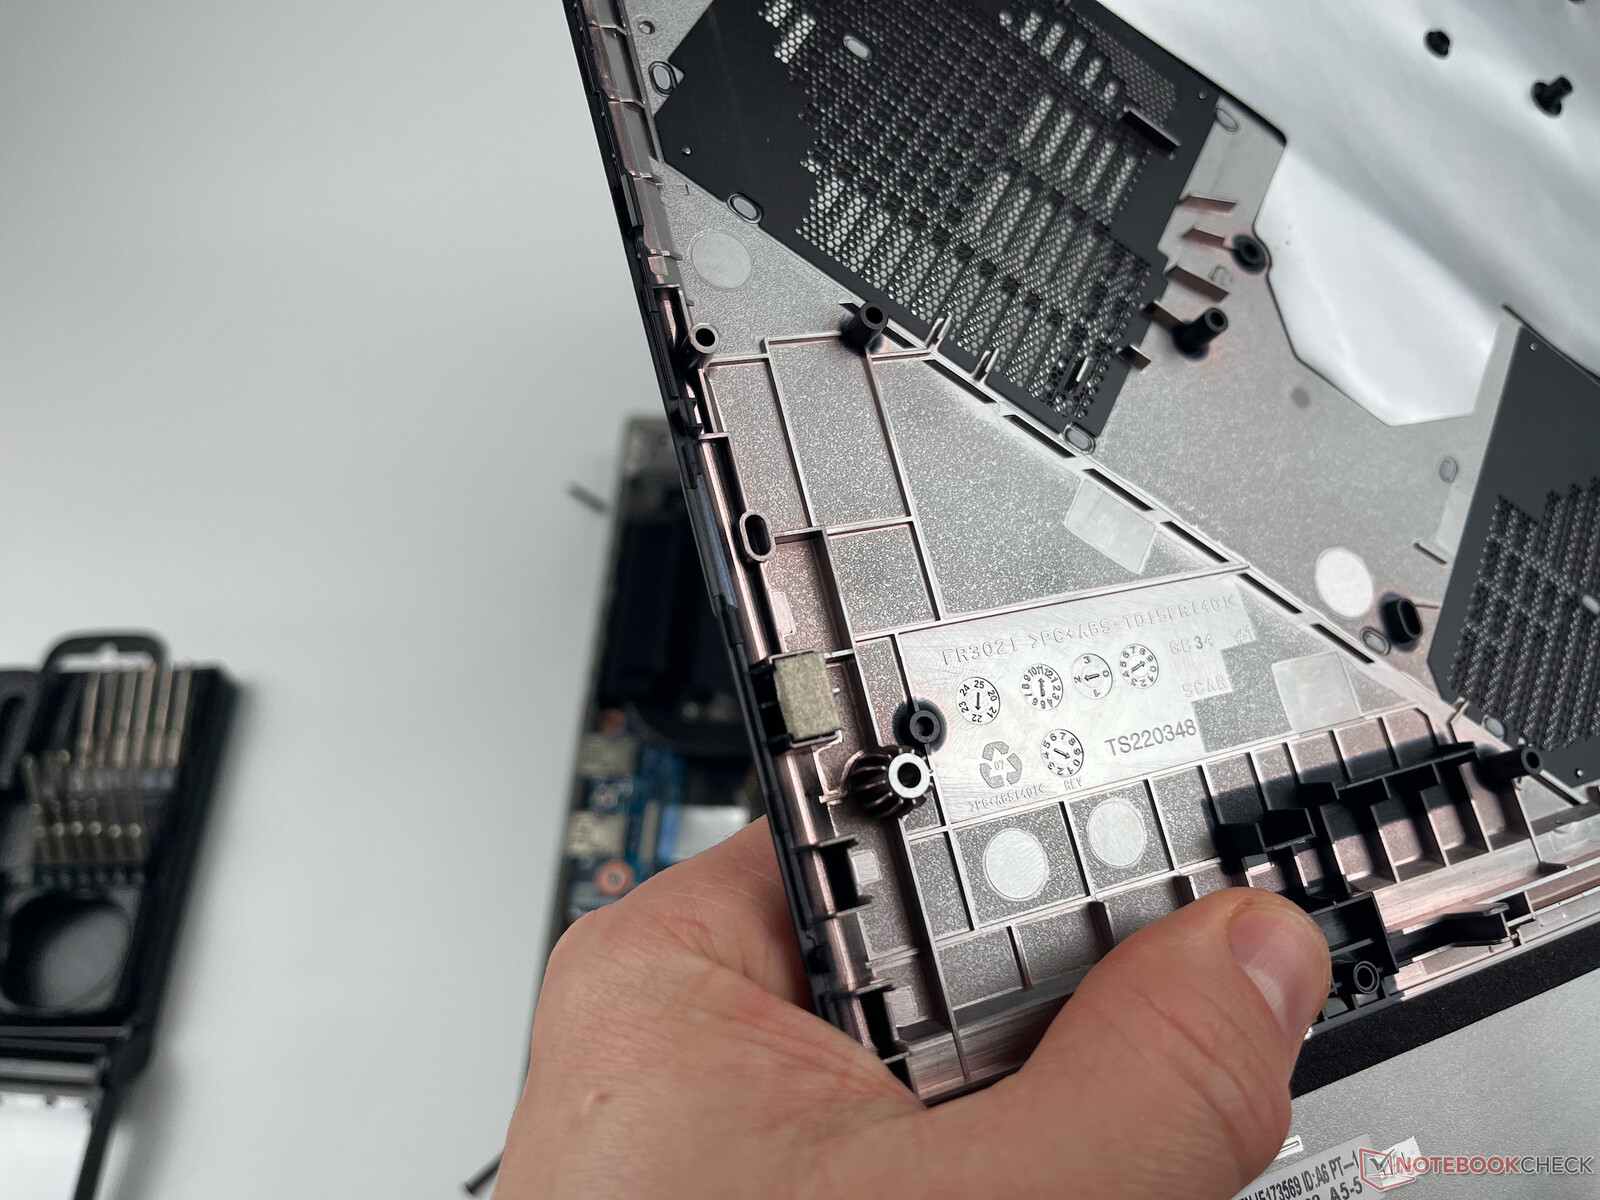
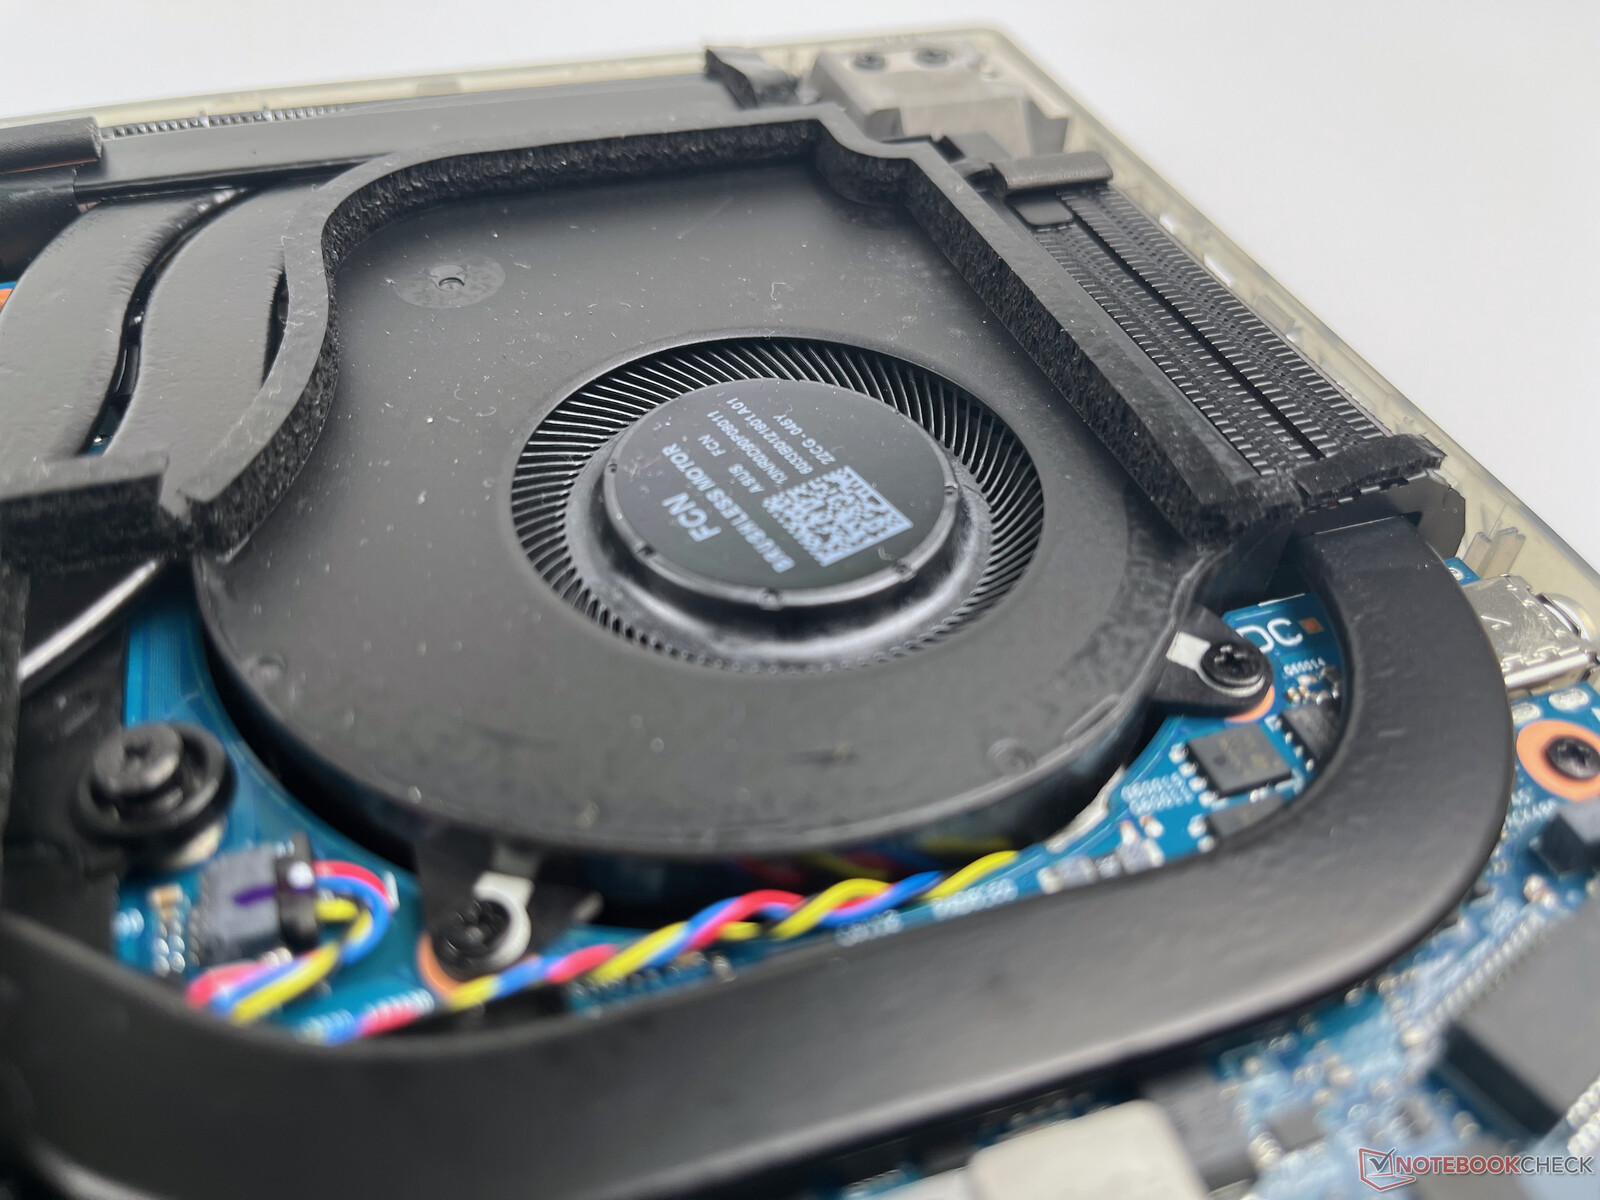
Os interiores da série ROG Strix G18 são relativamente de fácil acesso a partir do fundo da caixa. Primeiro é preciso remover os numerosos parafusos Philips e depois soltar os clipes plásticos nas bordas com uma ferramenta de biselar. Isto foi relativamente fácil de fazer com nossa unidade de teste (começando pelos cantos dianteiros) e, felizmente, nenhum dos grampos plásticos quebrou ao abrir o estojo.
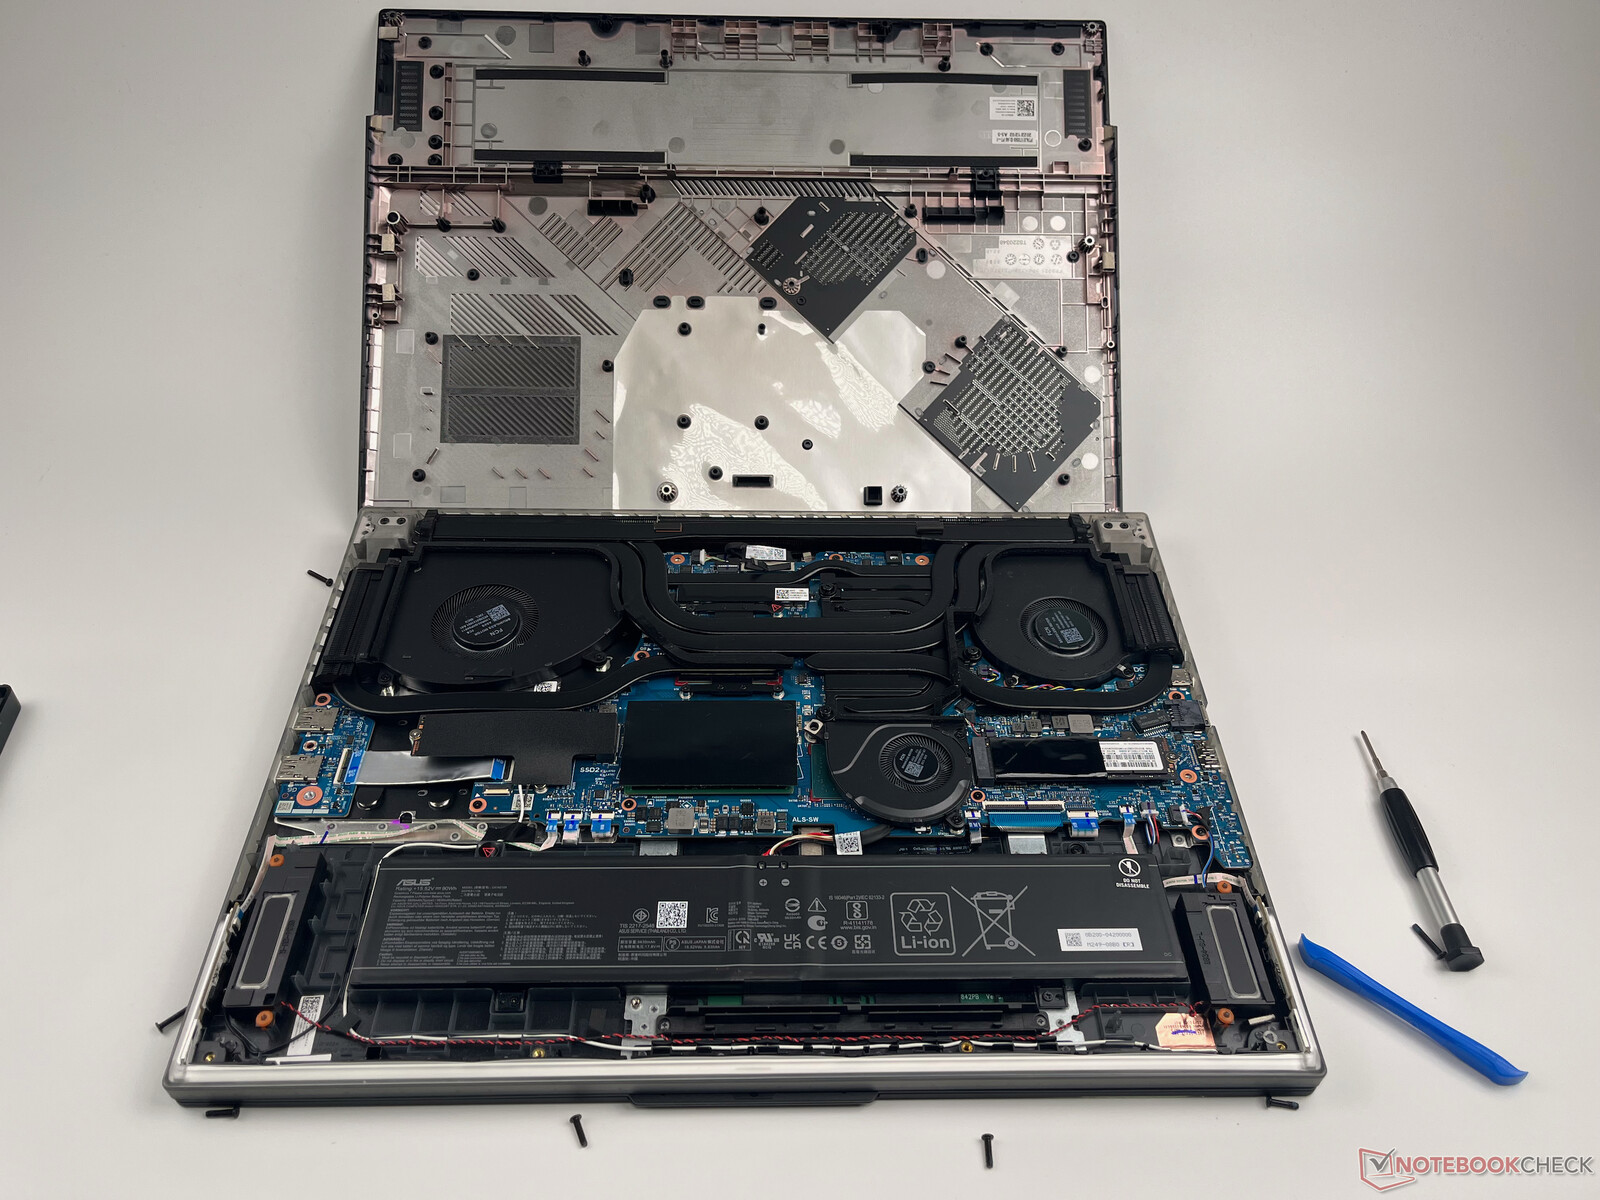
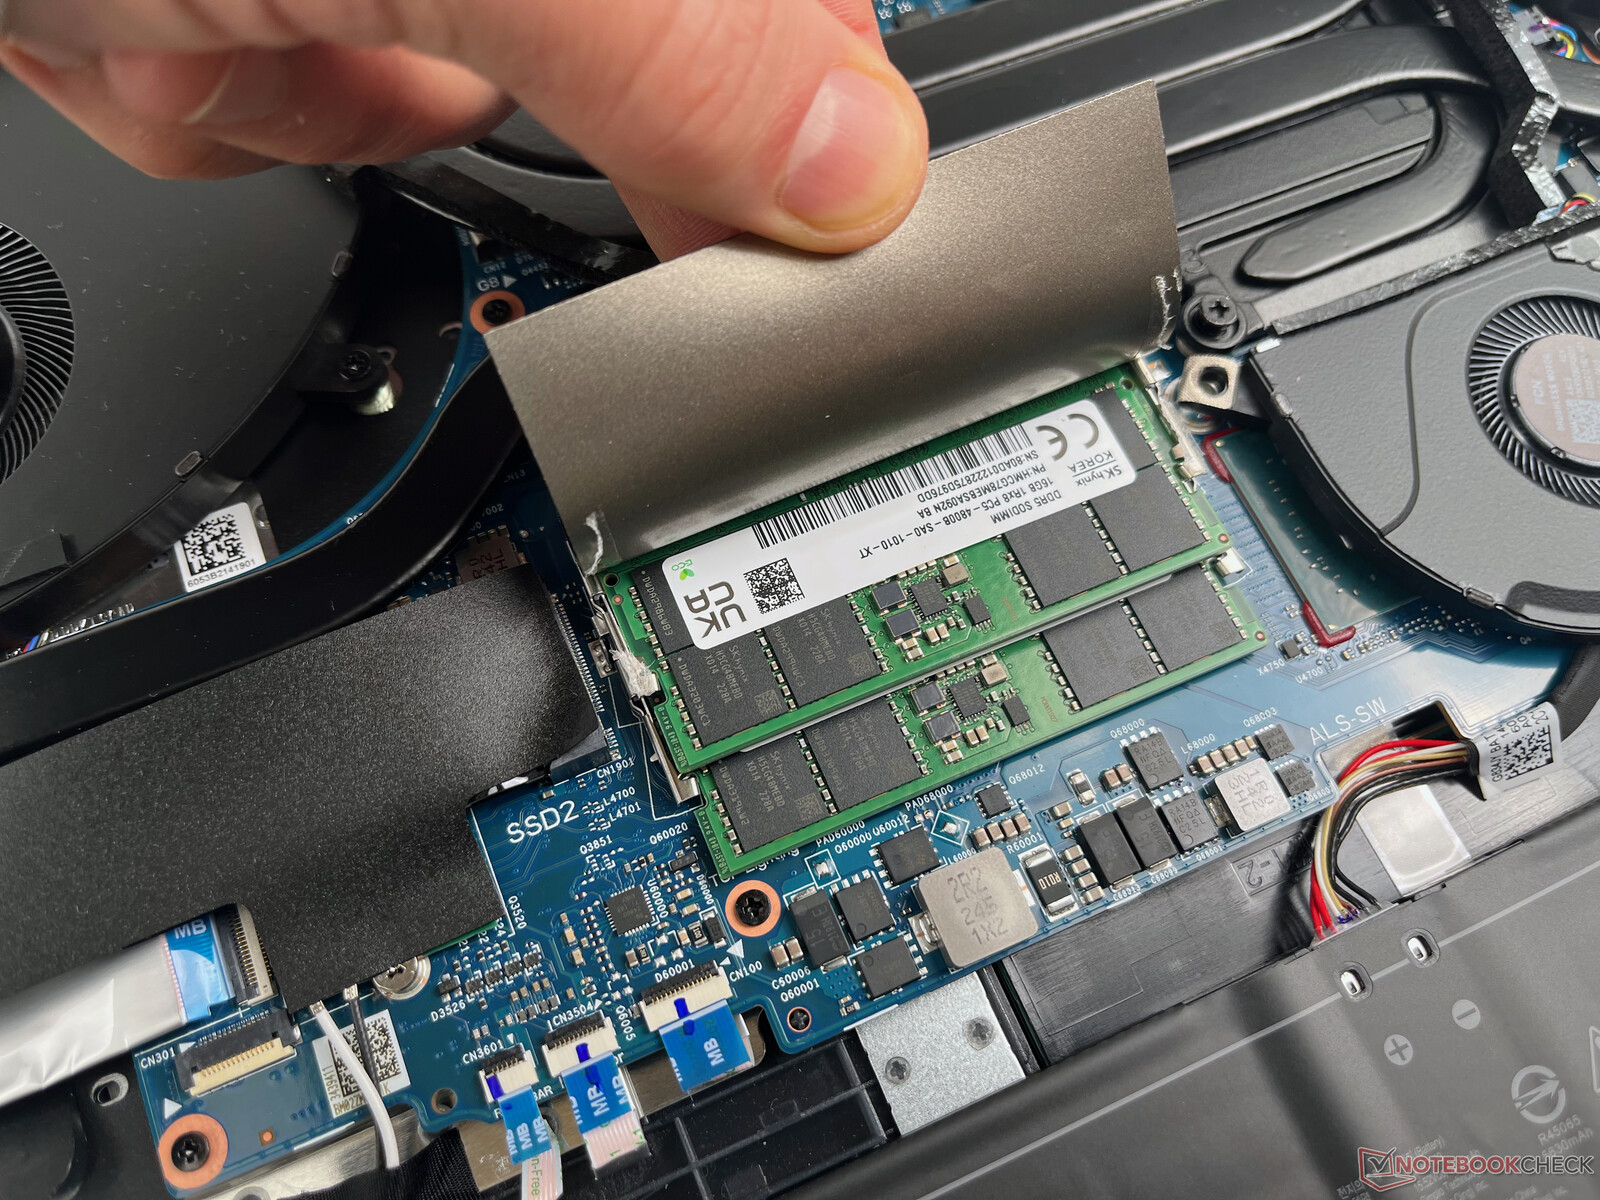
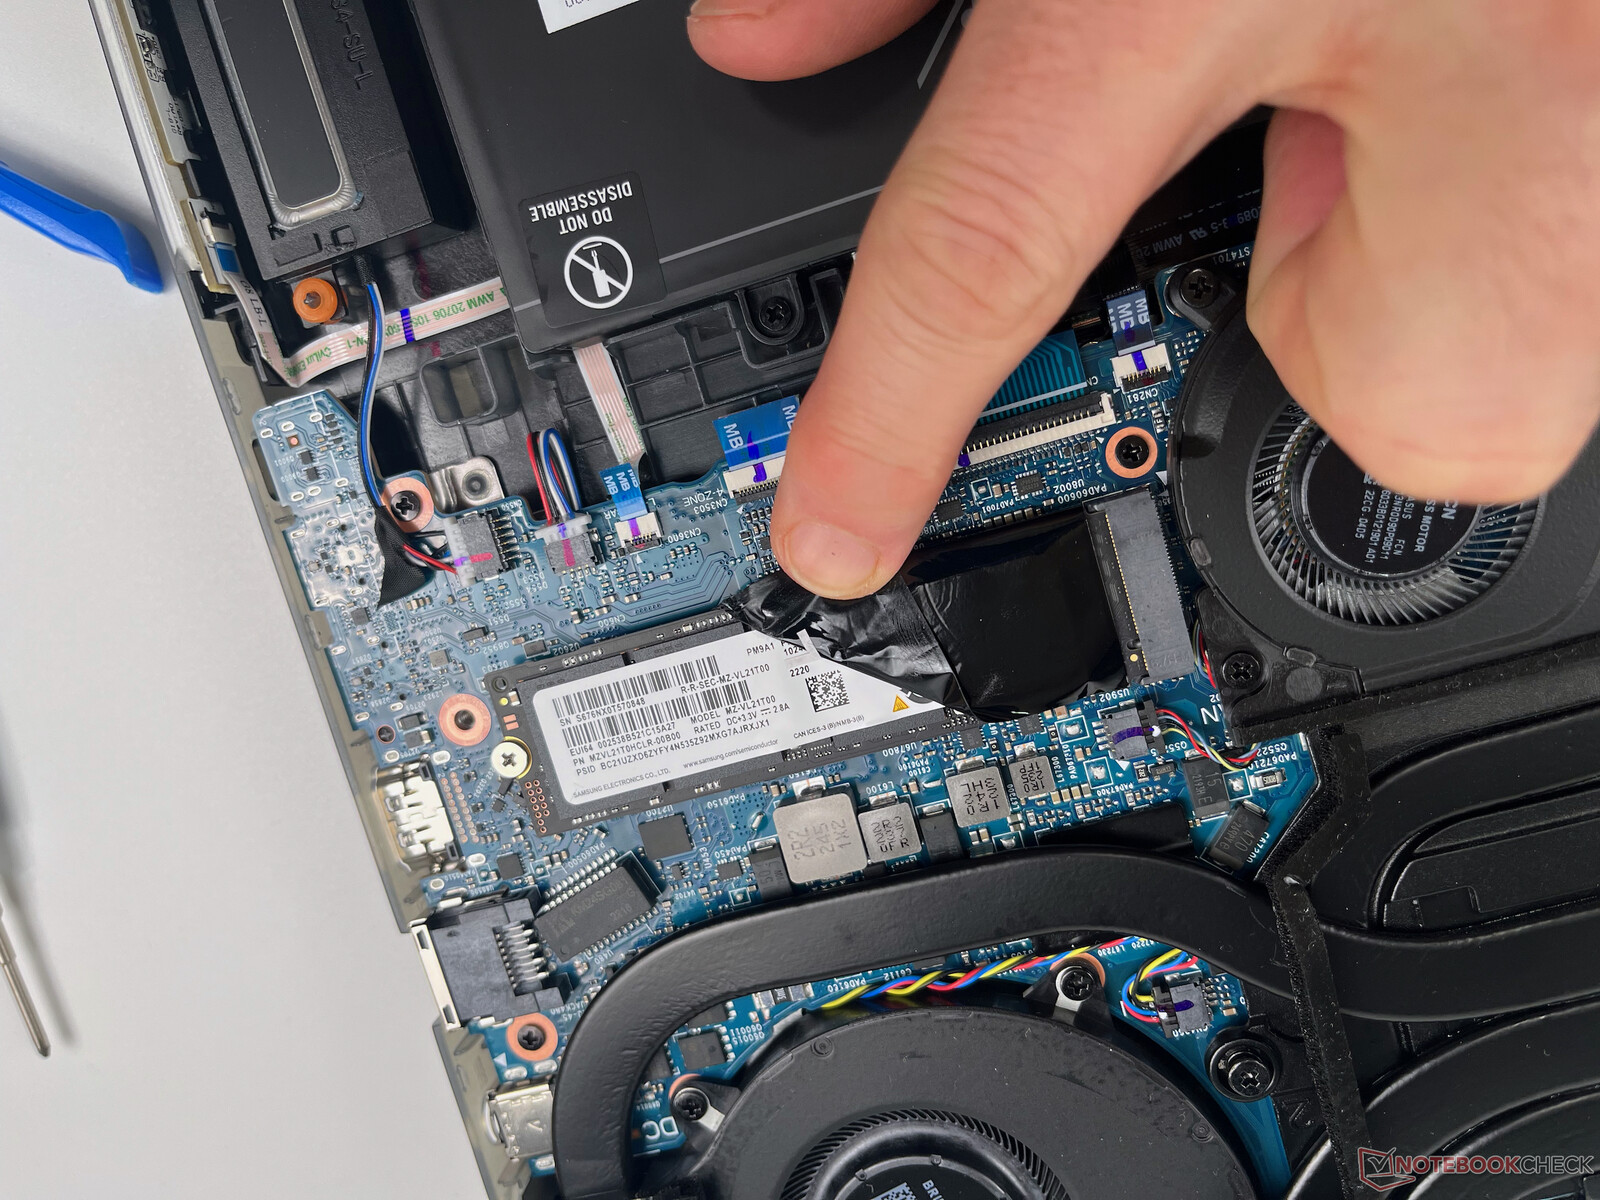
Dentro do laptop, vemos dois slots M.2-2280 para SSDs PCIe (ambos ocupados para o sistema RAID-0), um slot M.2 para a placa WLAN, e dois slots de memória (ambos também ocupados) para um máximo de 64 GB de RAM GDDR5. Todos os ventiladores também são acessíveis e podem ser limpos facilmente. A bateria é aparafusada na caixa, portanto, também deve ser relativamente fácil de substituir.
Garantia
A Asus oferece apenas a garantia habitual de um ano (dois anos para os modelos oferecidos na Alemanha). Não é mencionada uma garantia para peças de reposição ou algo semelhante.
Input Devices
Teclado
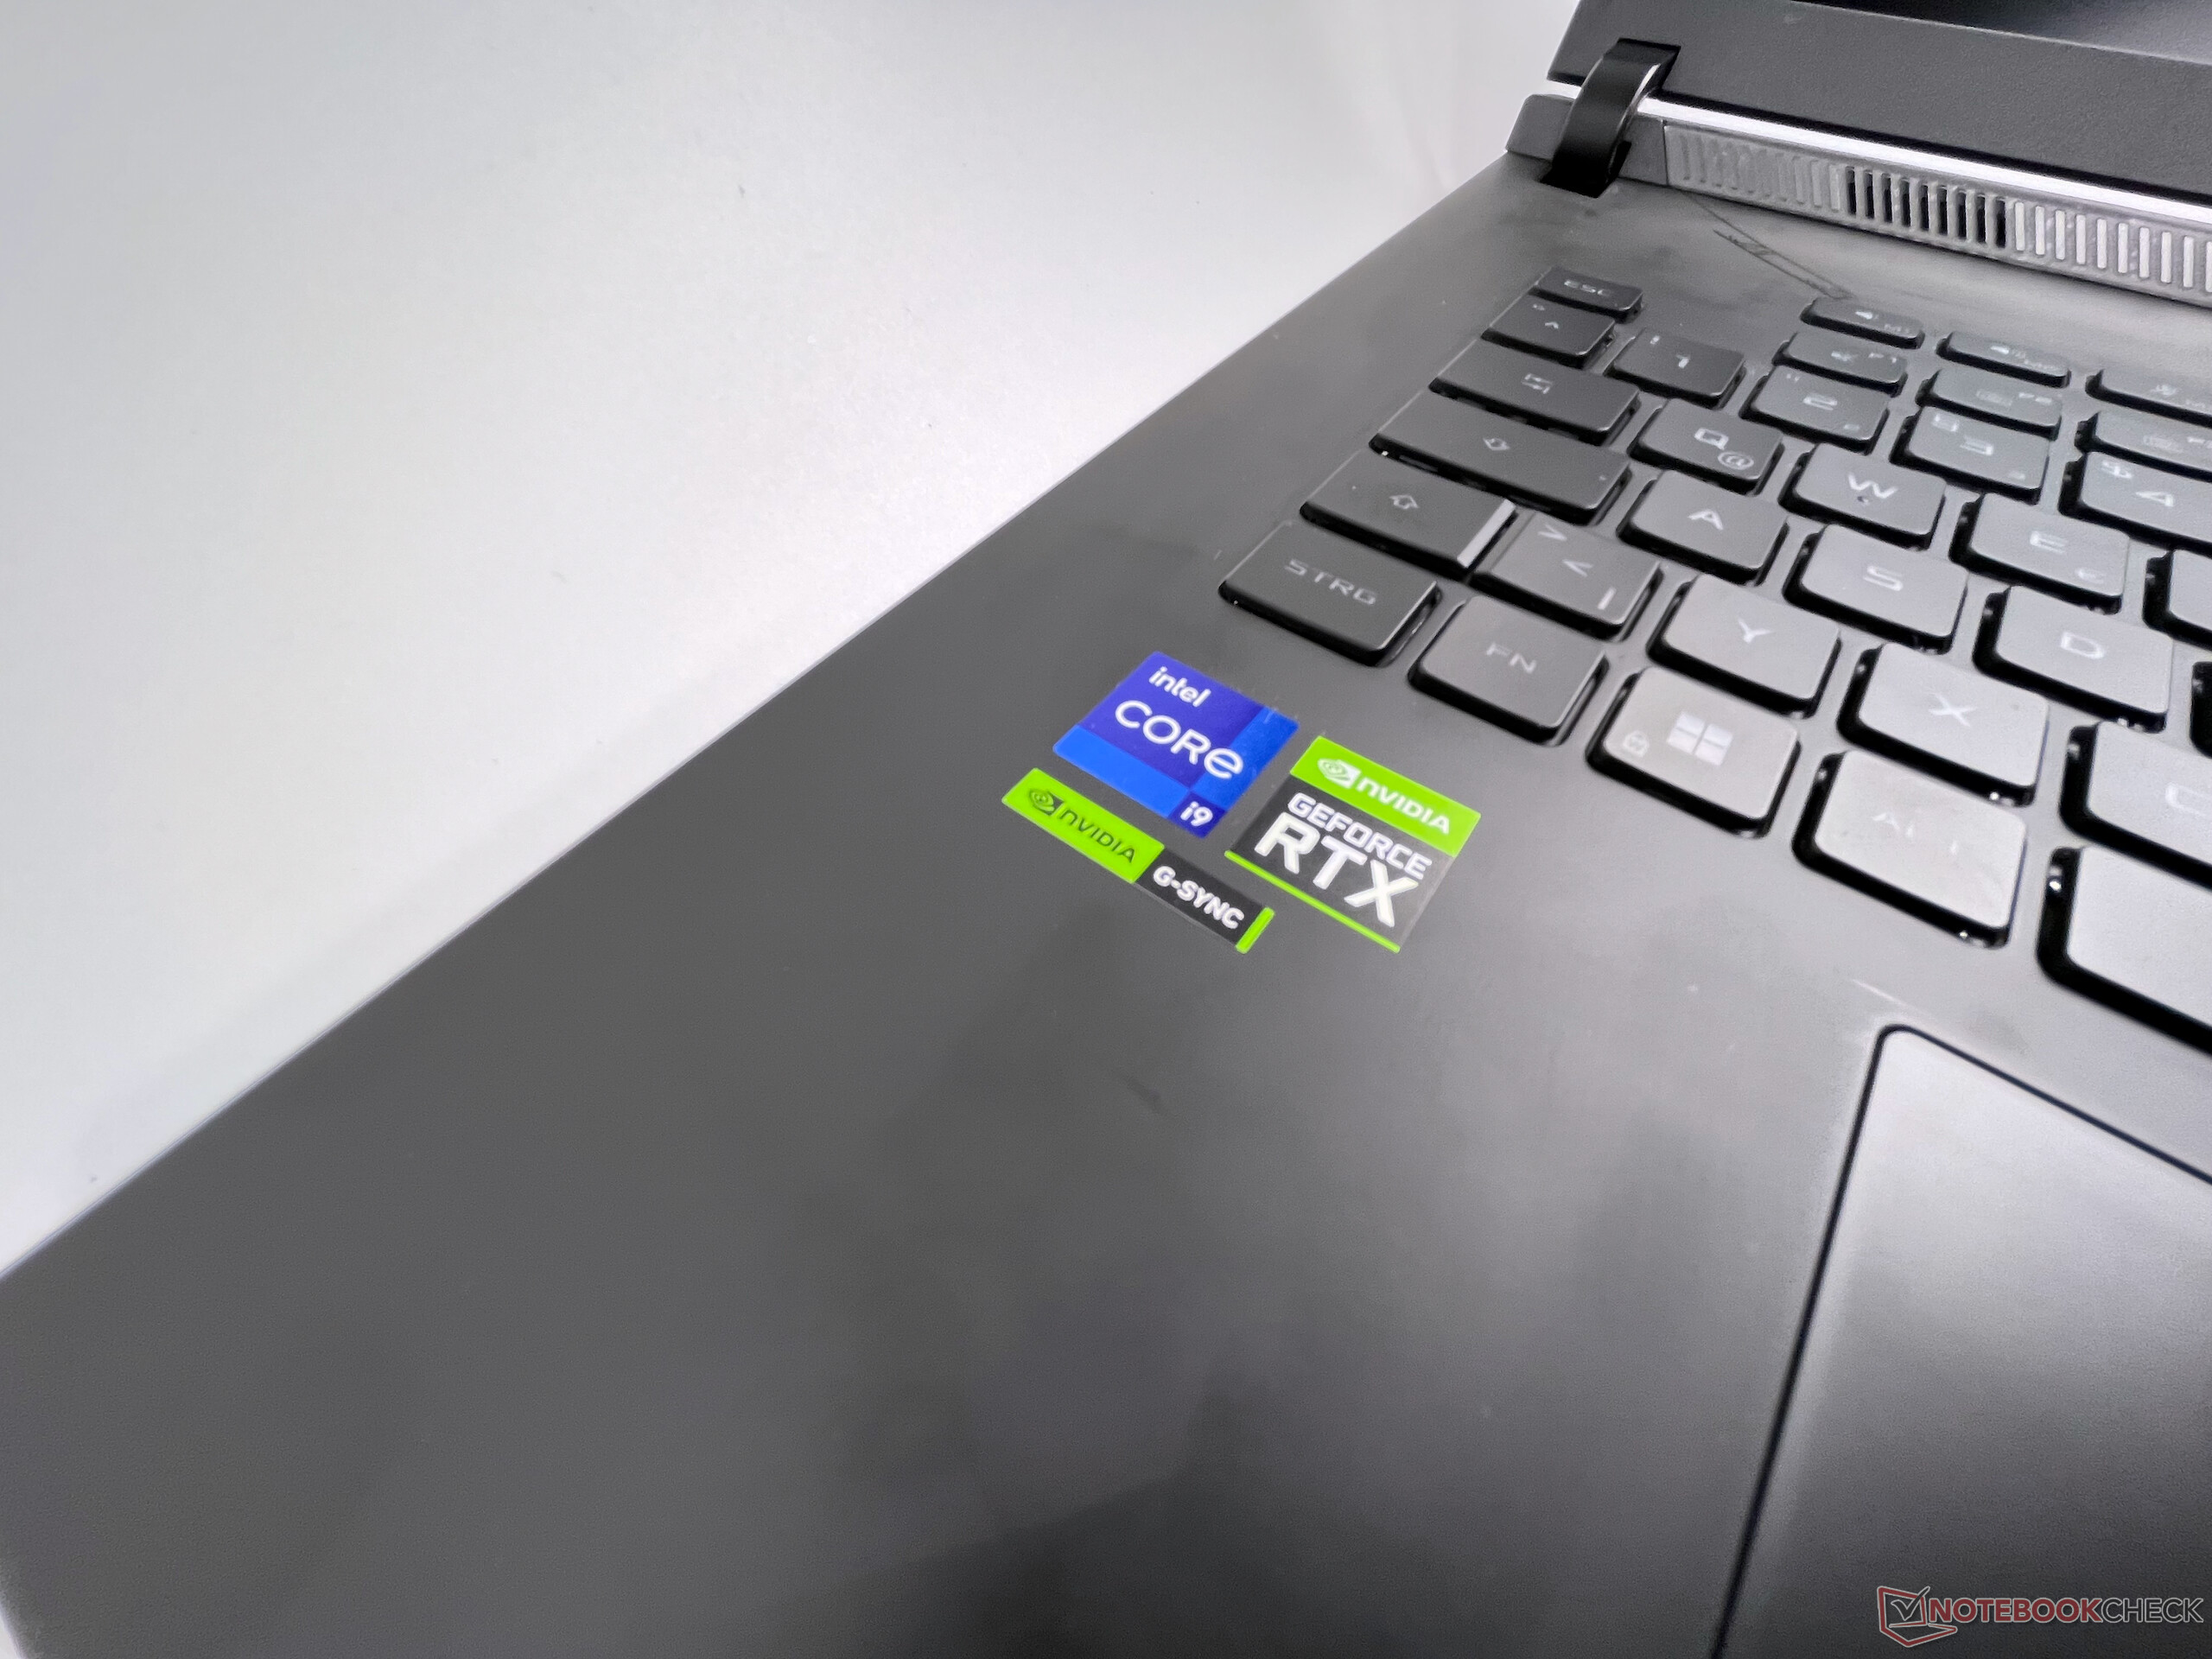
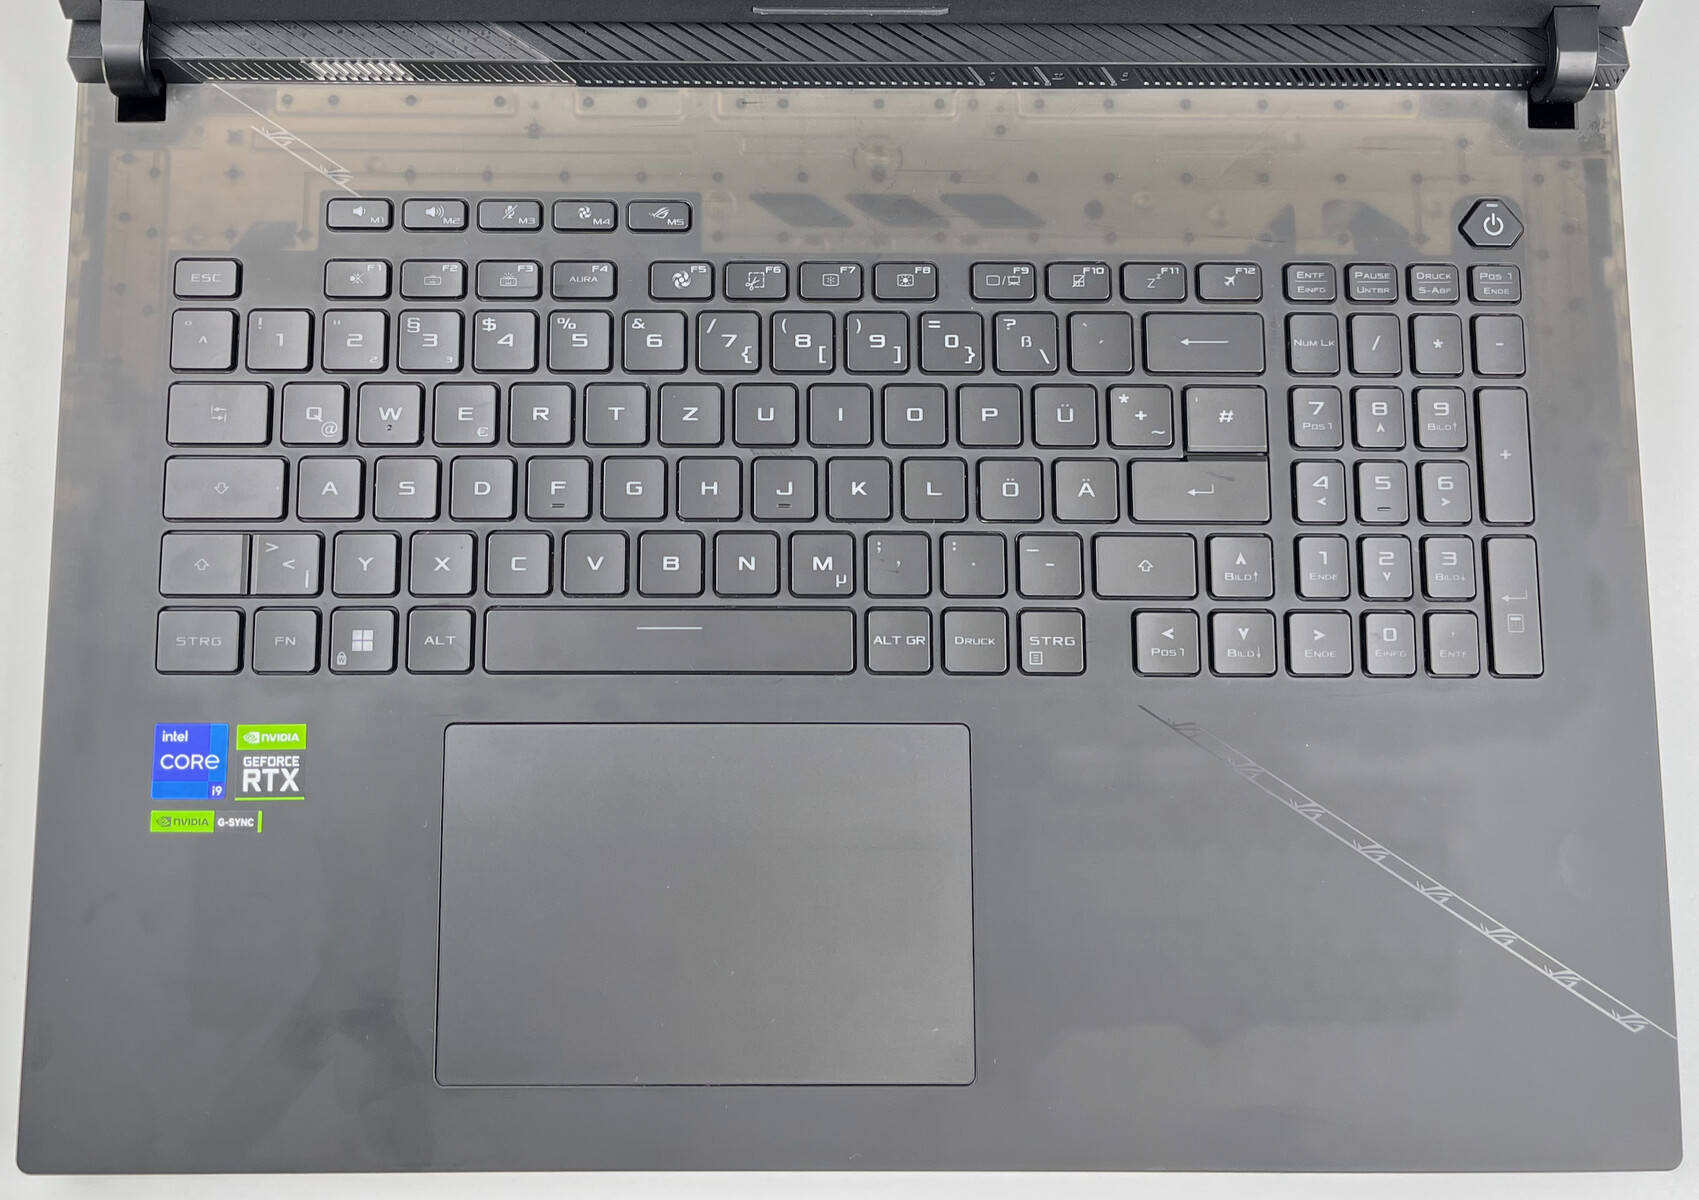
Além do bloco de números, o teclado de tamanho completo usado aqui também inclui cinco teclas especiais acima da linha de dupla utilização F1-F12. As teclas de pintinho oferecem um curso de chave suficiente e um curso silencioso. Durante o primeiro teste de digitação, o autor alcançou umas boas 85 palavras por minuto com 96% de precisão. A retroiluminação RGB integrada das chaves separadas pode ser personalizada com numerosas animações. No teste de capotagem n-key, não vemos nenhuma limitação (24 teclas simultâneas, no máximo, atingidas).
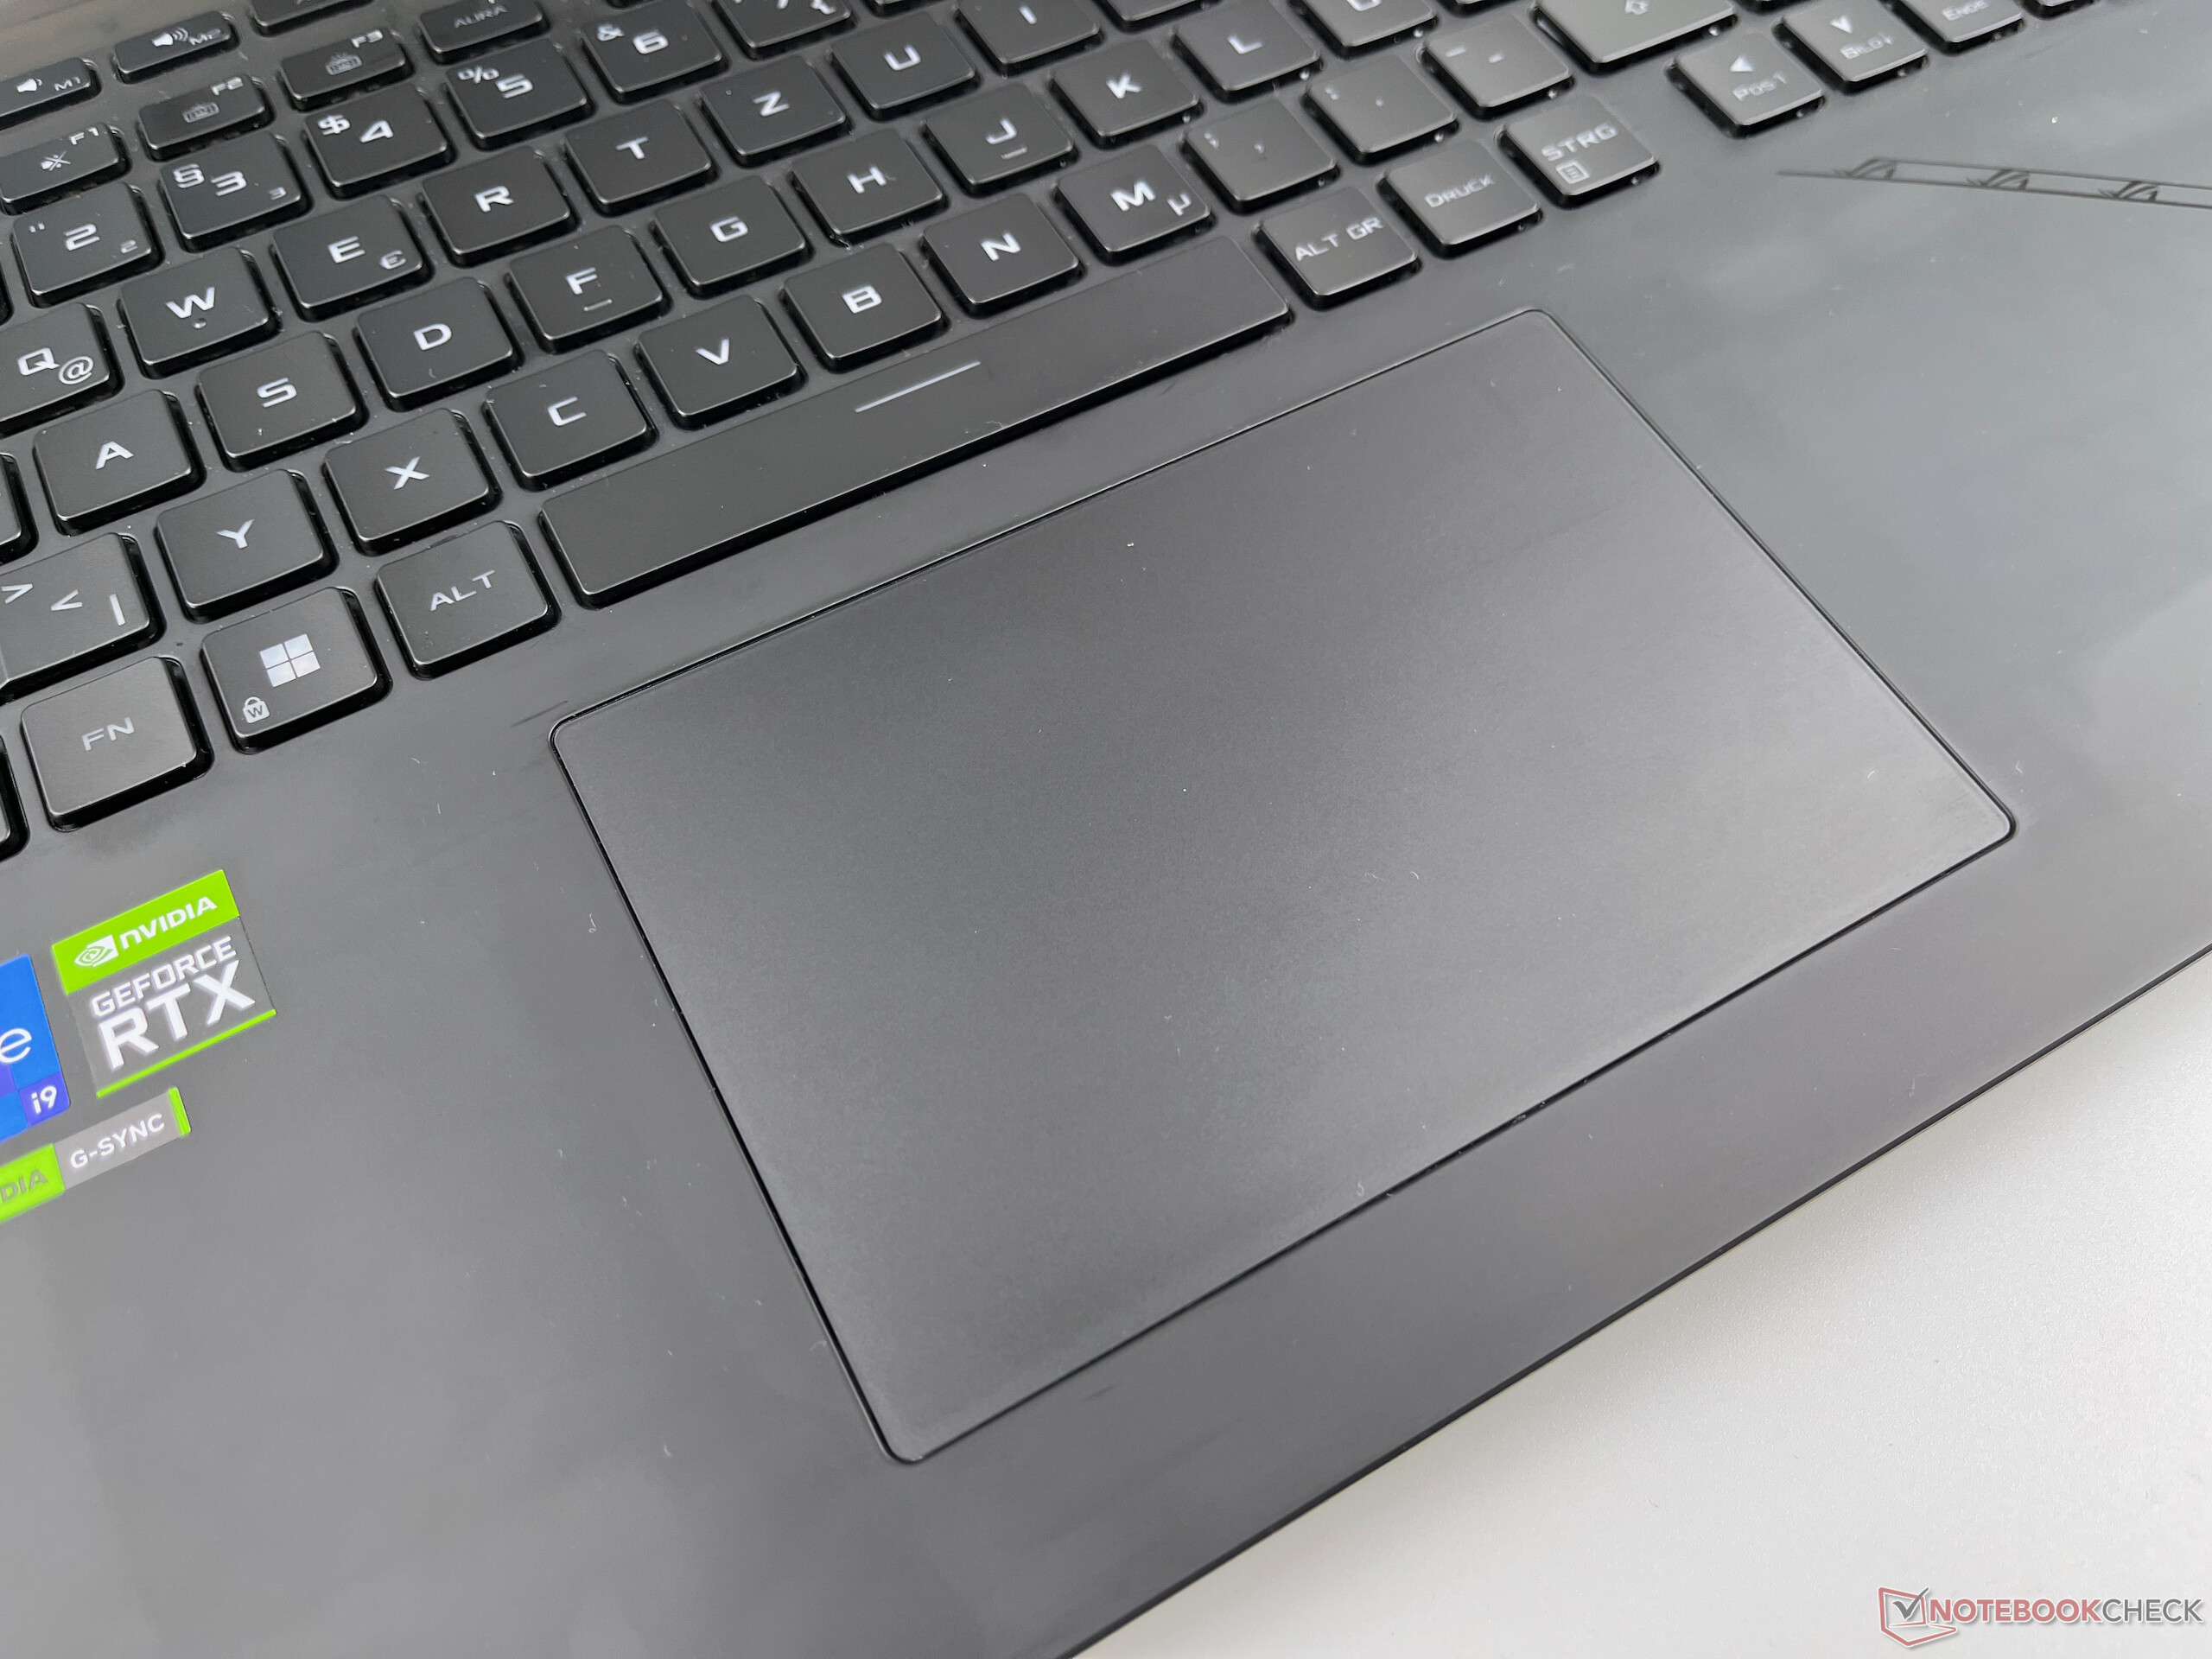
Touchpad
O grande touchpad oferece uma superfície de vidro e excelentes características de deslizamento. Multitouch funcionou sem falhas em nosso teste, e os 4/5 inferiores da área também podem ser clicados confortavelmente. No entanto, um clique no canto inferior direito é muitas vezes reconhecido como um botão direito do mouse, levando a algumas entradas erradas.
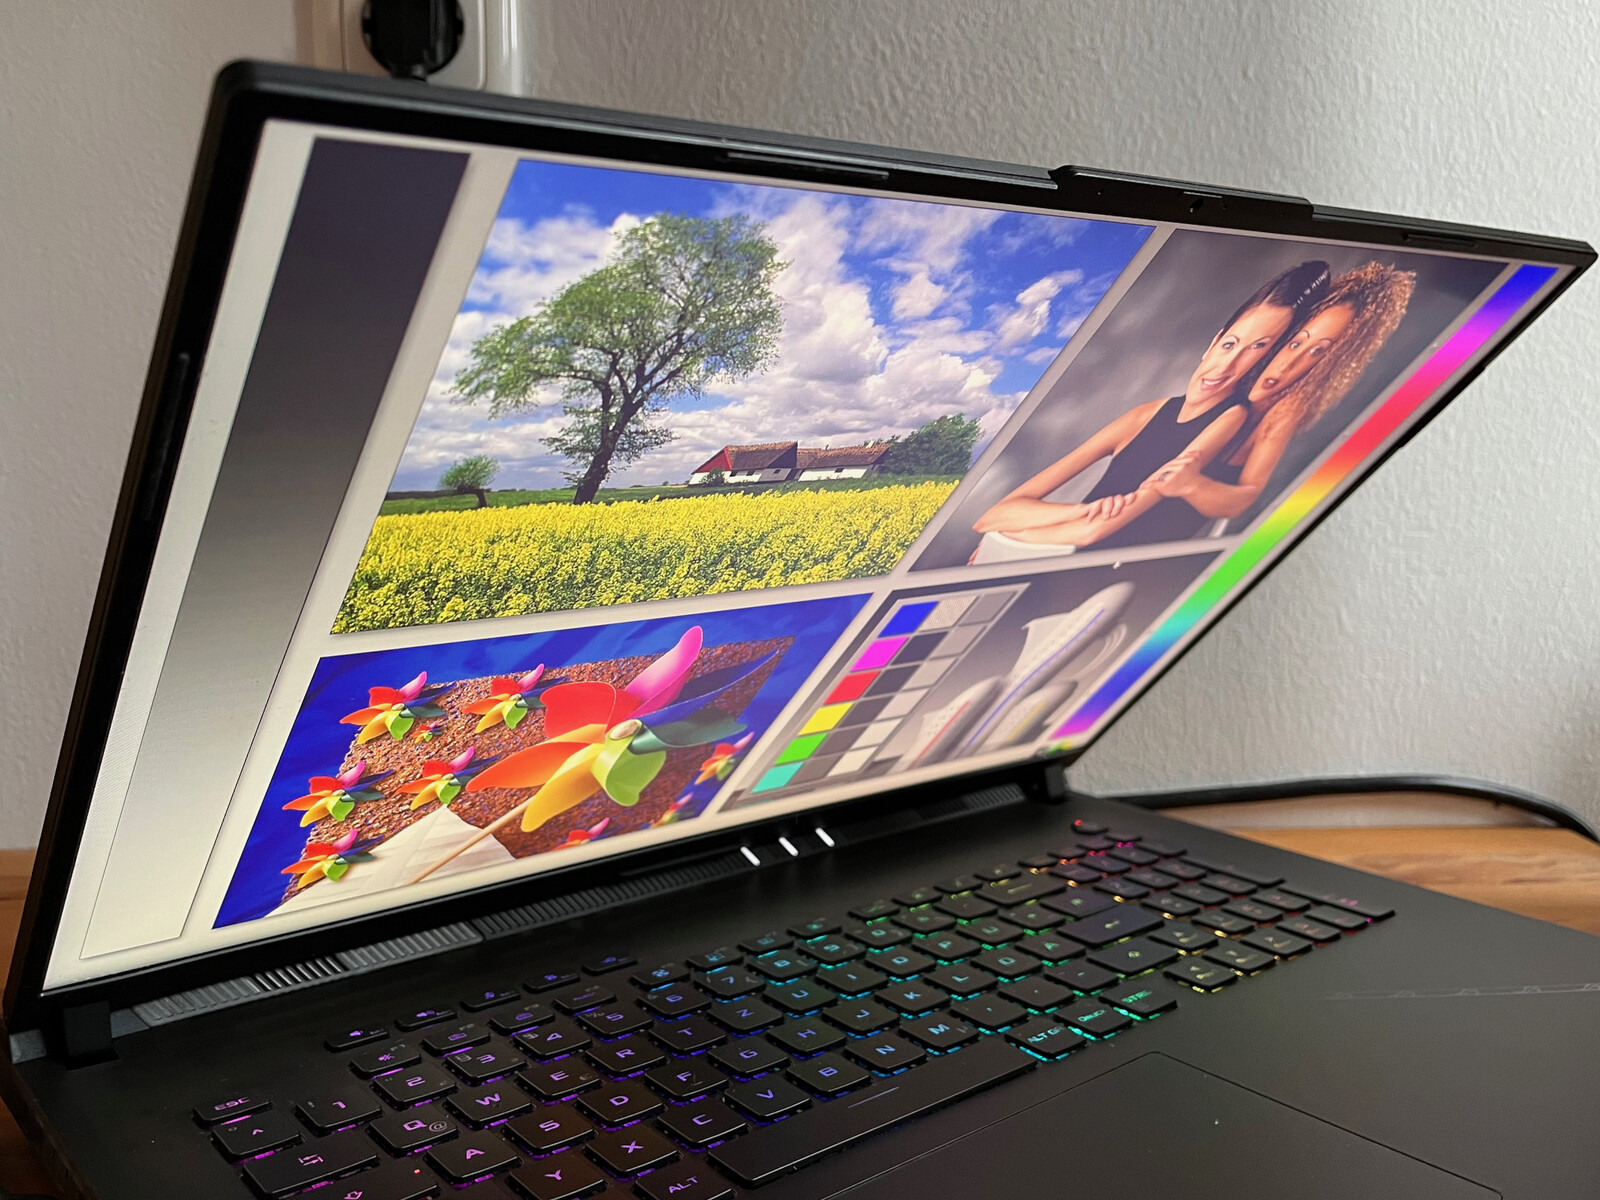
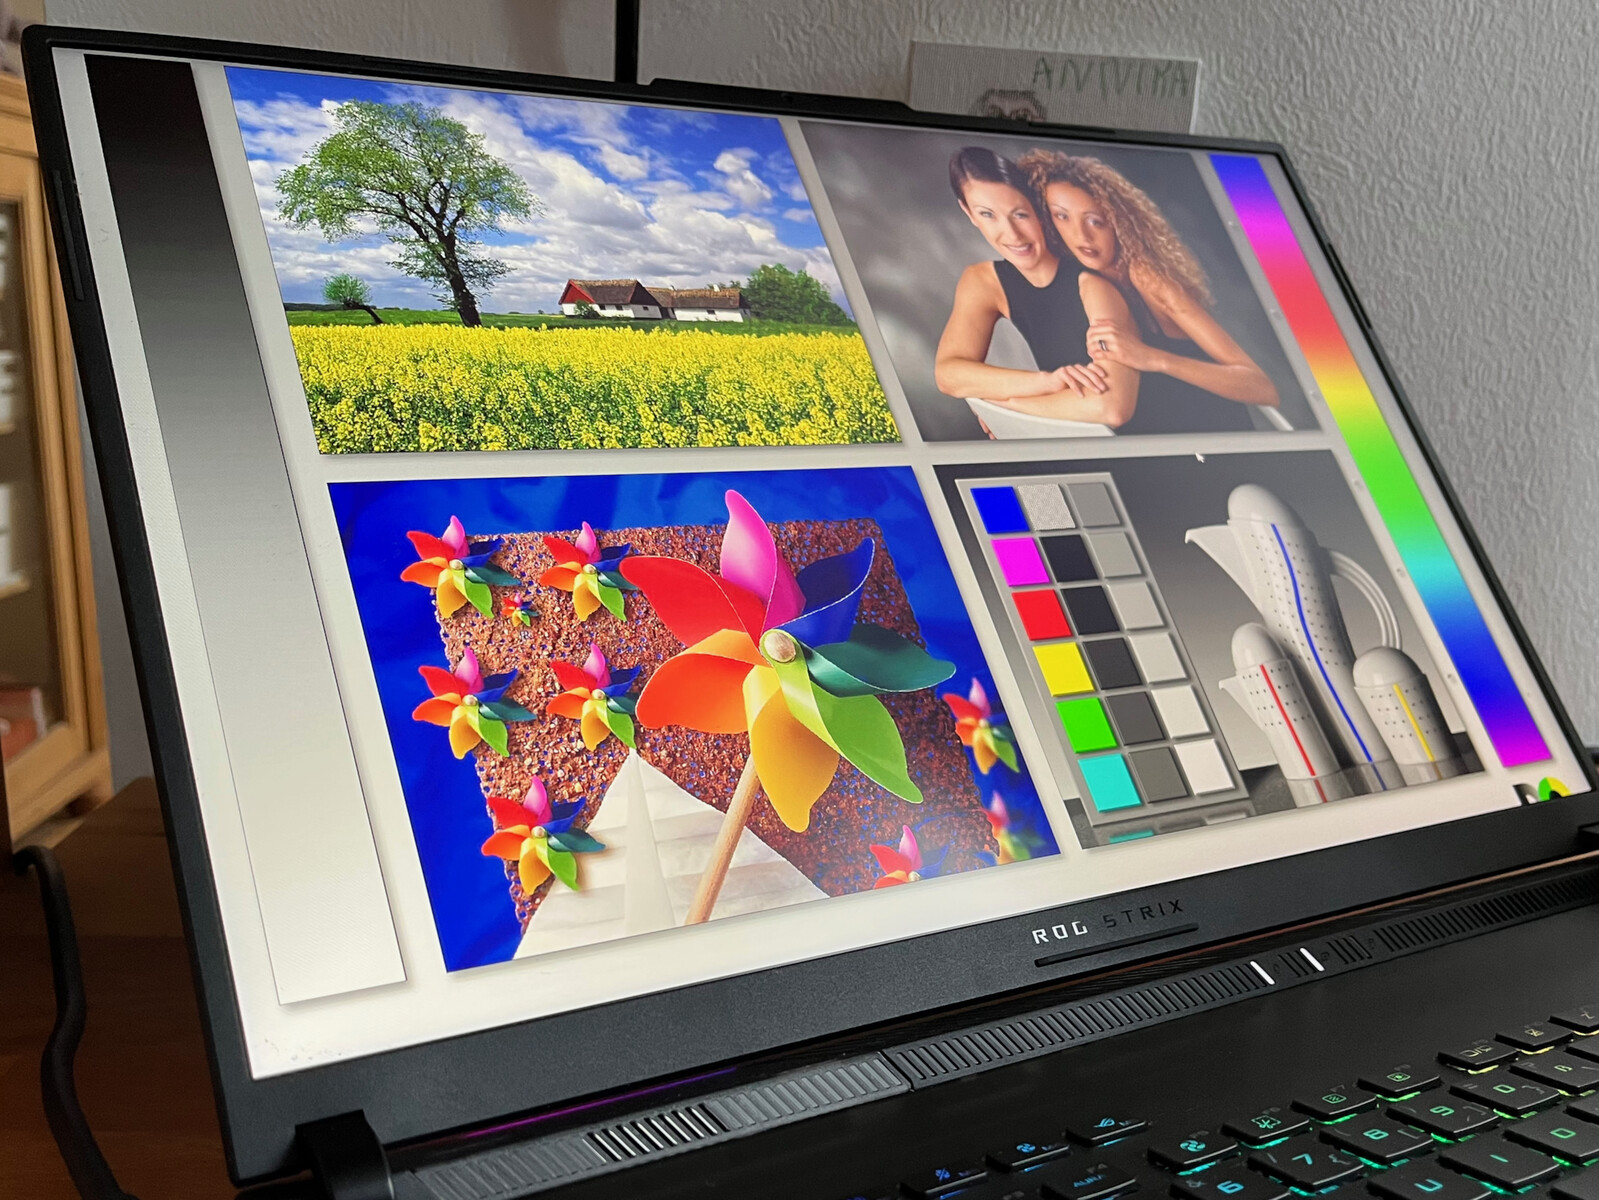
Mostrar
O novo visor de 18 polegadas pontua com inúmeros recursos como G-Sync, 240 Hz, QHD+, tempos de resposta rápidos de 3 ms e cobertura de espaço colorido DCI-P3 de acordo com a folha de especificações. Em termos de brilho, o grande visor de 18 polegadas não atinge exatamente as 500 lêndeas prometidas. Entretanto, o brilho é definitivamente sempre suficiente em ambientes internos, e a distribuição de brilho também é boa, com 86%. Nossa unidade de teste não mostra nenhum sangramento visível de luz de fundo.
| |||||||||||||||||||||||||
iluminação: 86 %
iluminação com acumulador: 490 cd/m²
Contraste: 907:1 (Preto: 0.54 cd/m²)
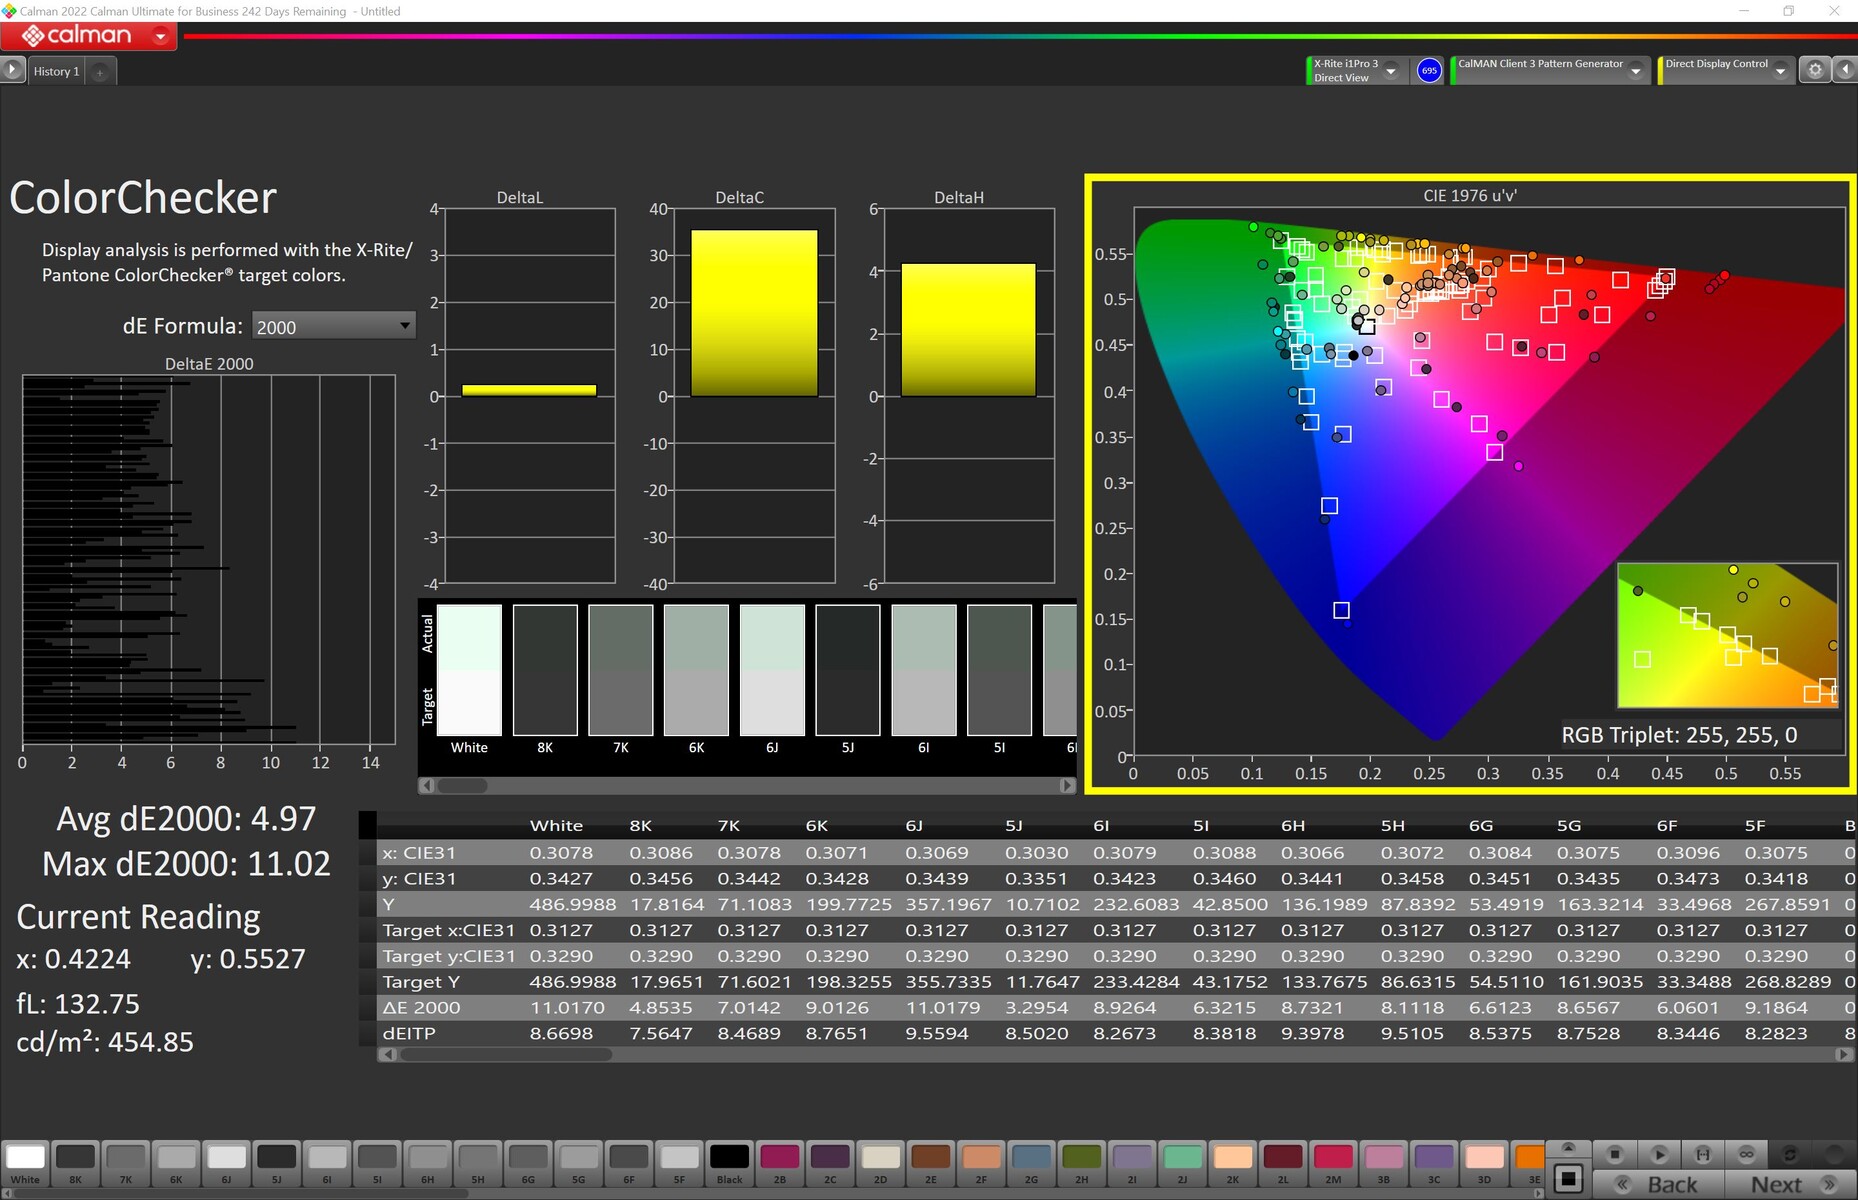
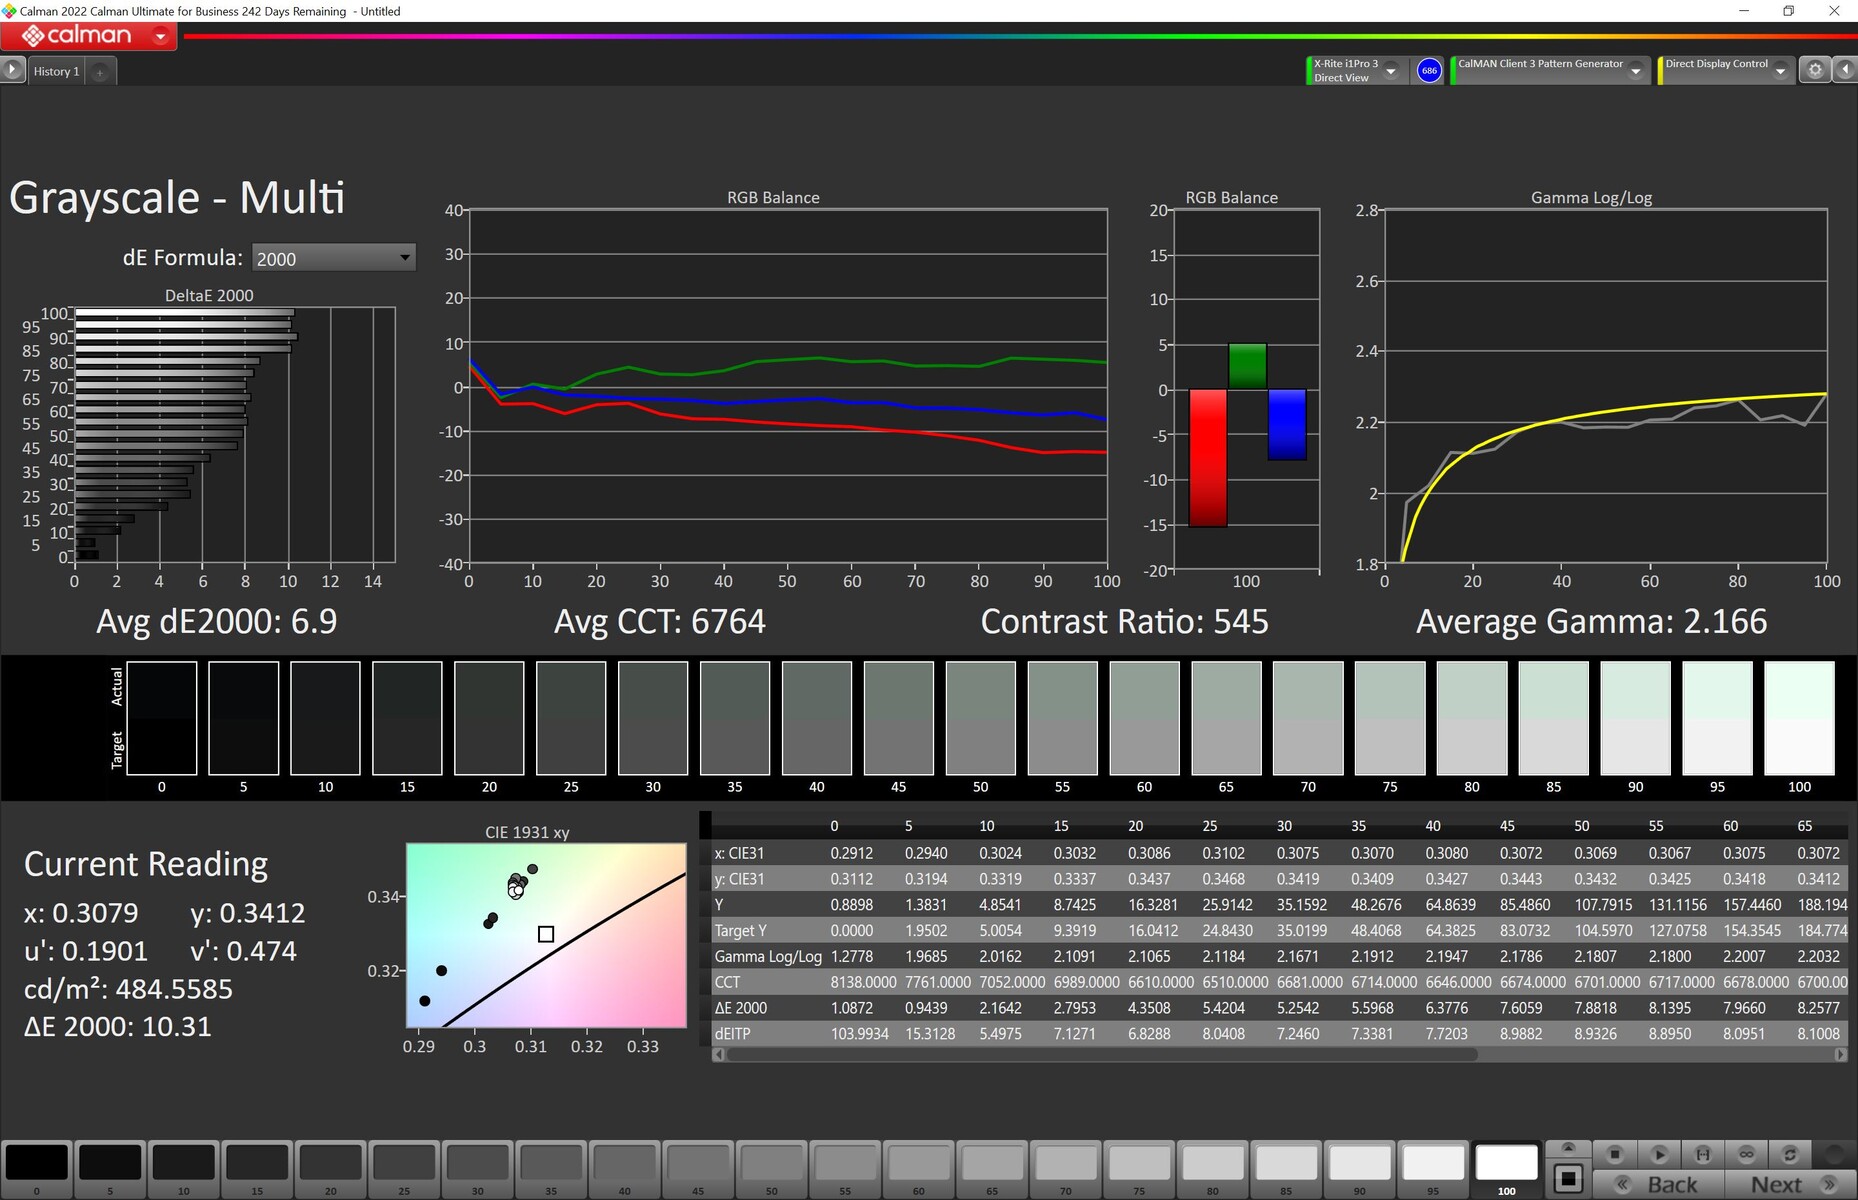
ΔE ColorChecker Calman: 4.97 | ∀{0.5-29.43 Ø4.71}
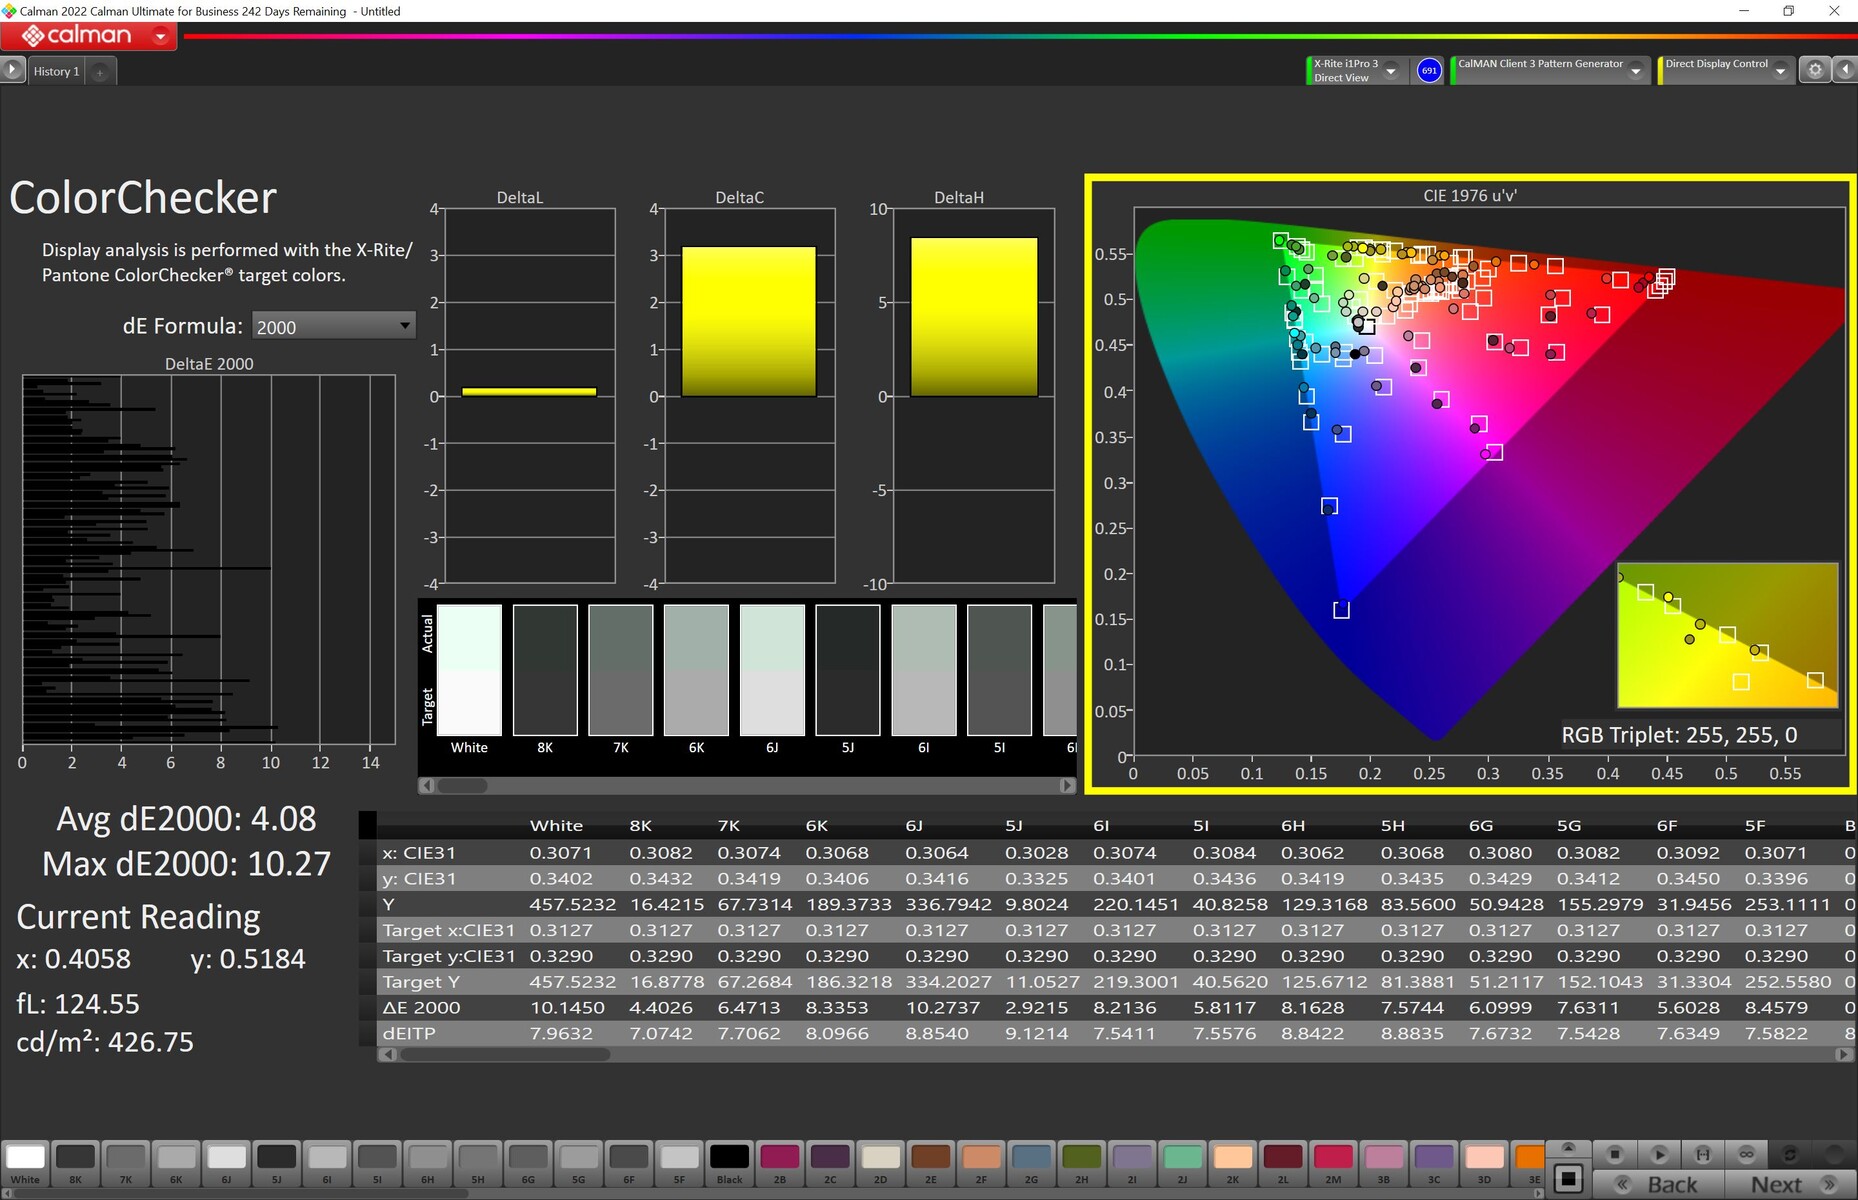
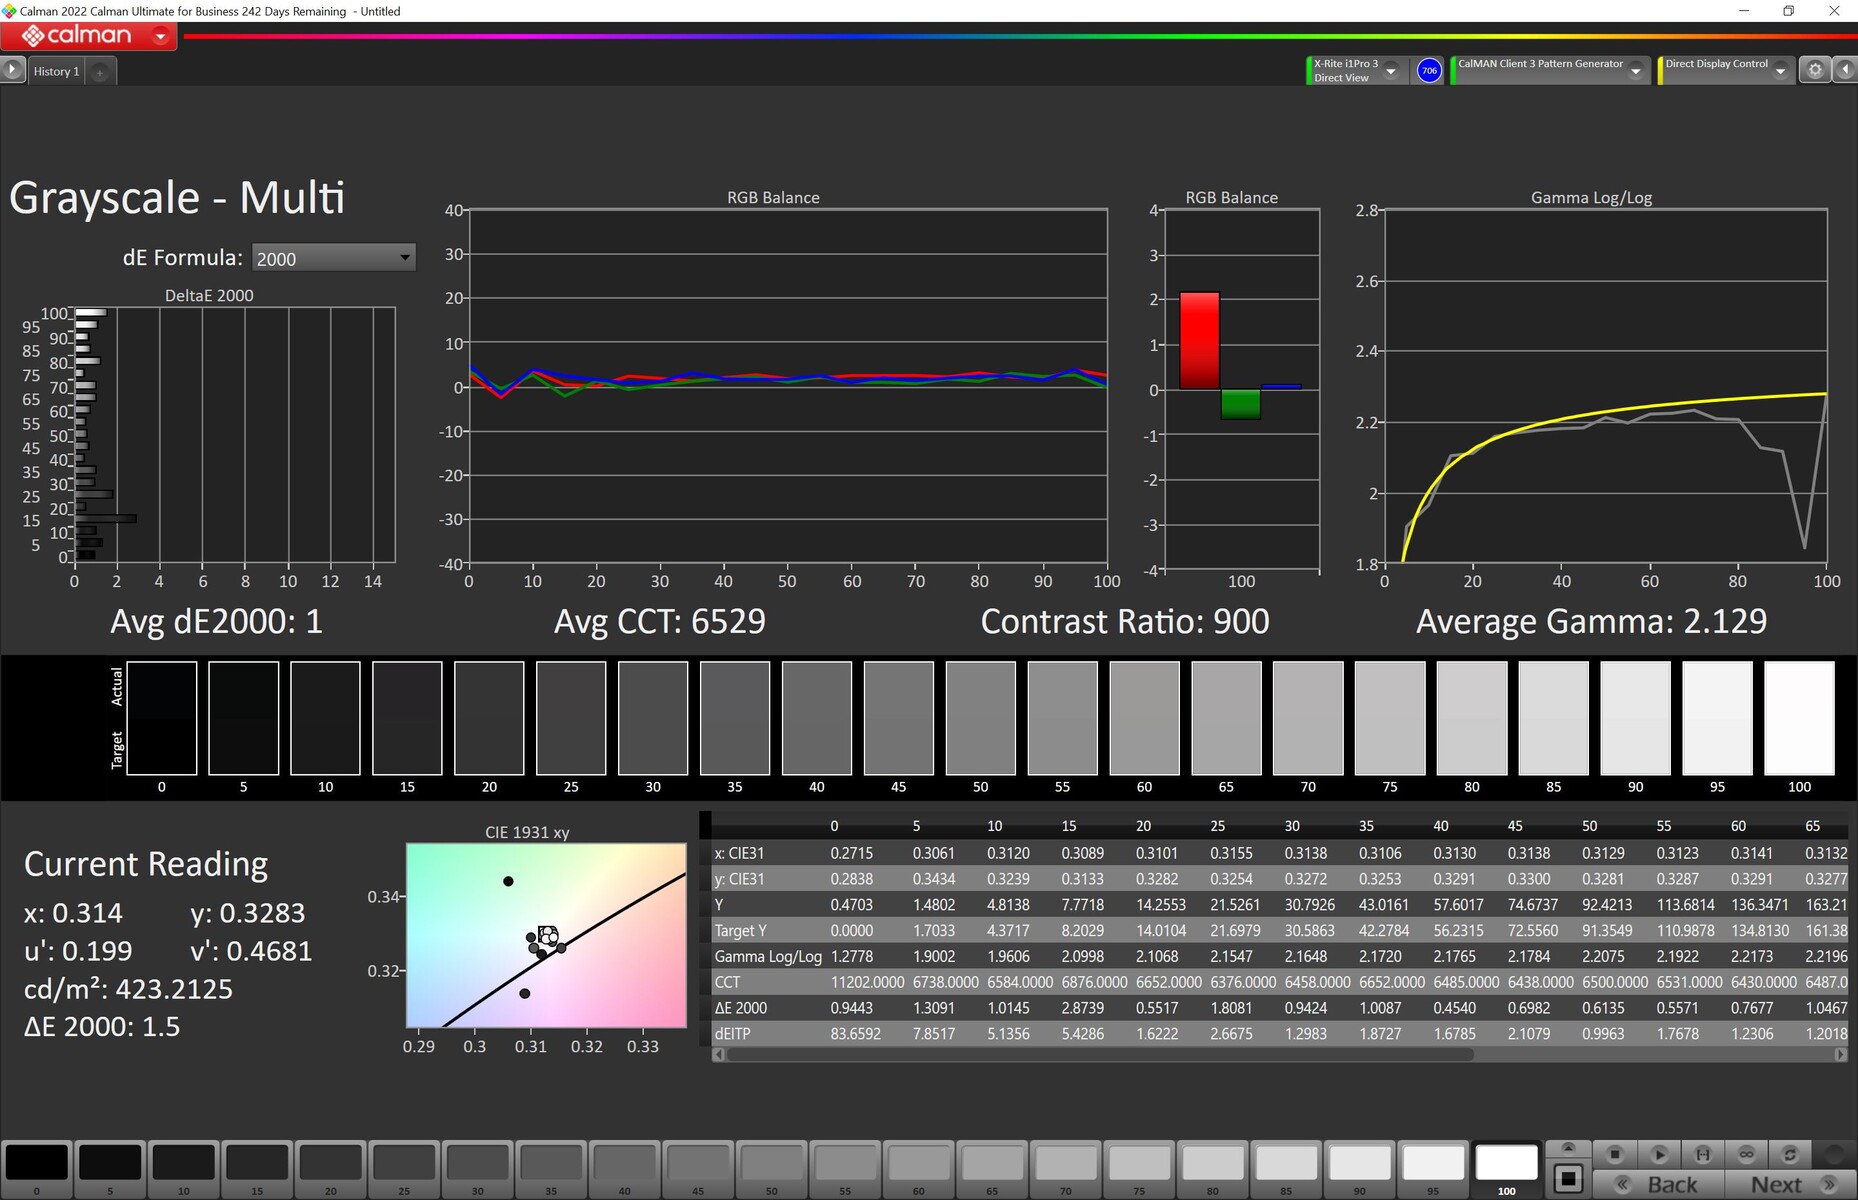
calibrated: 2.97
ΔE Greyscale Calman: 7.2 | ∀{0.09-98 Ø4.96}
100% sRGB (Calman 2D)
84.9% AdobeRGB 1998 (Argyll 3D)
99.9% sRGB (Argyll 3D)
97.2% Display P3 (Argyll 3D)
Gamma: 2.161
CCT: 6515 K
| Asus ROG Strix Scar 18 2023 G834JY-N6005W NE180QDM-NZ2, IPS, 2560x1600, 18" | Razer Blade 18 RTX 4070 AU Optronics B180QAN01.0, IPS, 2560x1600, 18" | MSI Titan GT77 HX 13VI B173ZAN06.C, Mini-LED, 3840x2160, 17.3" | Asus ROG Strix Scar 17 SE G733CX-LL014W NE173QHM-NZ2, IPS, 2560x1440, 17.3" | |
|---|---|---|---|---|
| Display | 0% | 2% | 0% | |
| Display P3 Coverage (%) | 97.2 | 96.9 0% | 94.9 -2% | 97.1 0% |
| sRGB Coverage (%) | 99.9 | 99.8 0% | 99.9 0% | 99.9 0% |
| AdobeRGB 1998 Coverage (%) | 84.9 | 85.3 0% | 92.4 9% | 84.8 0% |
| Response Times | 15% | -410% | -11% | |
| Response Time Grey 50% / Grey 80% * (ms) | 5.41 ? | 4.2 ? 22% | 38.4 ? -610% | 5.7 ? -5% |
| Response Time Black / White * (ms) | 8.62 ? | 8 ? 7% | 26.6 ? -209% | 10.1 ? -17% |
| PWM Frequency (Hz) | 2380 ? | |||
| Screen | 22% | 74253% | 29% | |
| Brightness middle (cd/m²) | 490 | 549.6 12% | 606 24% | 320 -35% |
| Brightness (cd/m²) | 468 | 524 12% | 602 29% | 303 -35% |
| Brightness Distribution (%) | 86 | 89 3% | 93 8% | 87 1% |
| Black Level * (cd/m²) | 0.54 | 0.53 2% | 0.0001 100% | 0.3 44% |
| Contrast (:1) | 907 | 1037 14% | 6060000 668037% | 1067 18% |
| Colorchecker dE 2000 * | 4.97 | 3.32 33% | 4.8 3% | 1.1 78% |
| Colorchecker dE 2000 max. * | 11.02 | 6.63 40% | 8.2 26% | 2.7 75% |
| Colorchecker dE 2000 calibrated * | 2.97 | 2.7 9% | 1.8 39% | |
| Greyscale dE 2000 * | 7.2 | 2 72% | 6.5 10% | 1.1 85% |
| Gamma | 2.161 102% | 2.29 96% | 2.63 84% | 2.13 103% |
| CCT | 6515 100% | 6319 103% | 6596 99% | 6599 98% |
| Média Total (Programa/Configurações) | 12% /
16% | 24615% /
47676% | 6% /
16% |
* ... menor é melhor
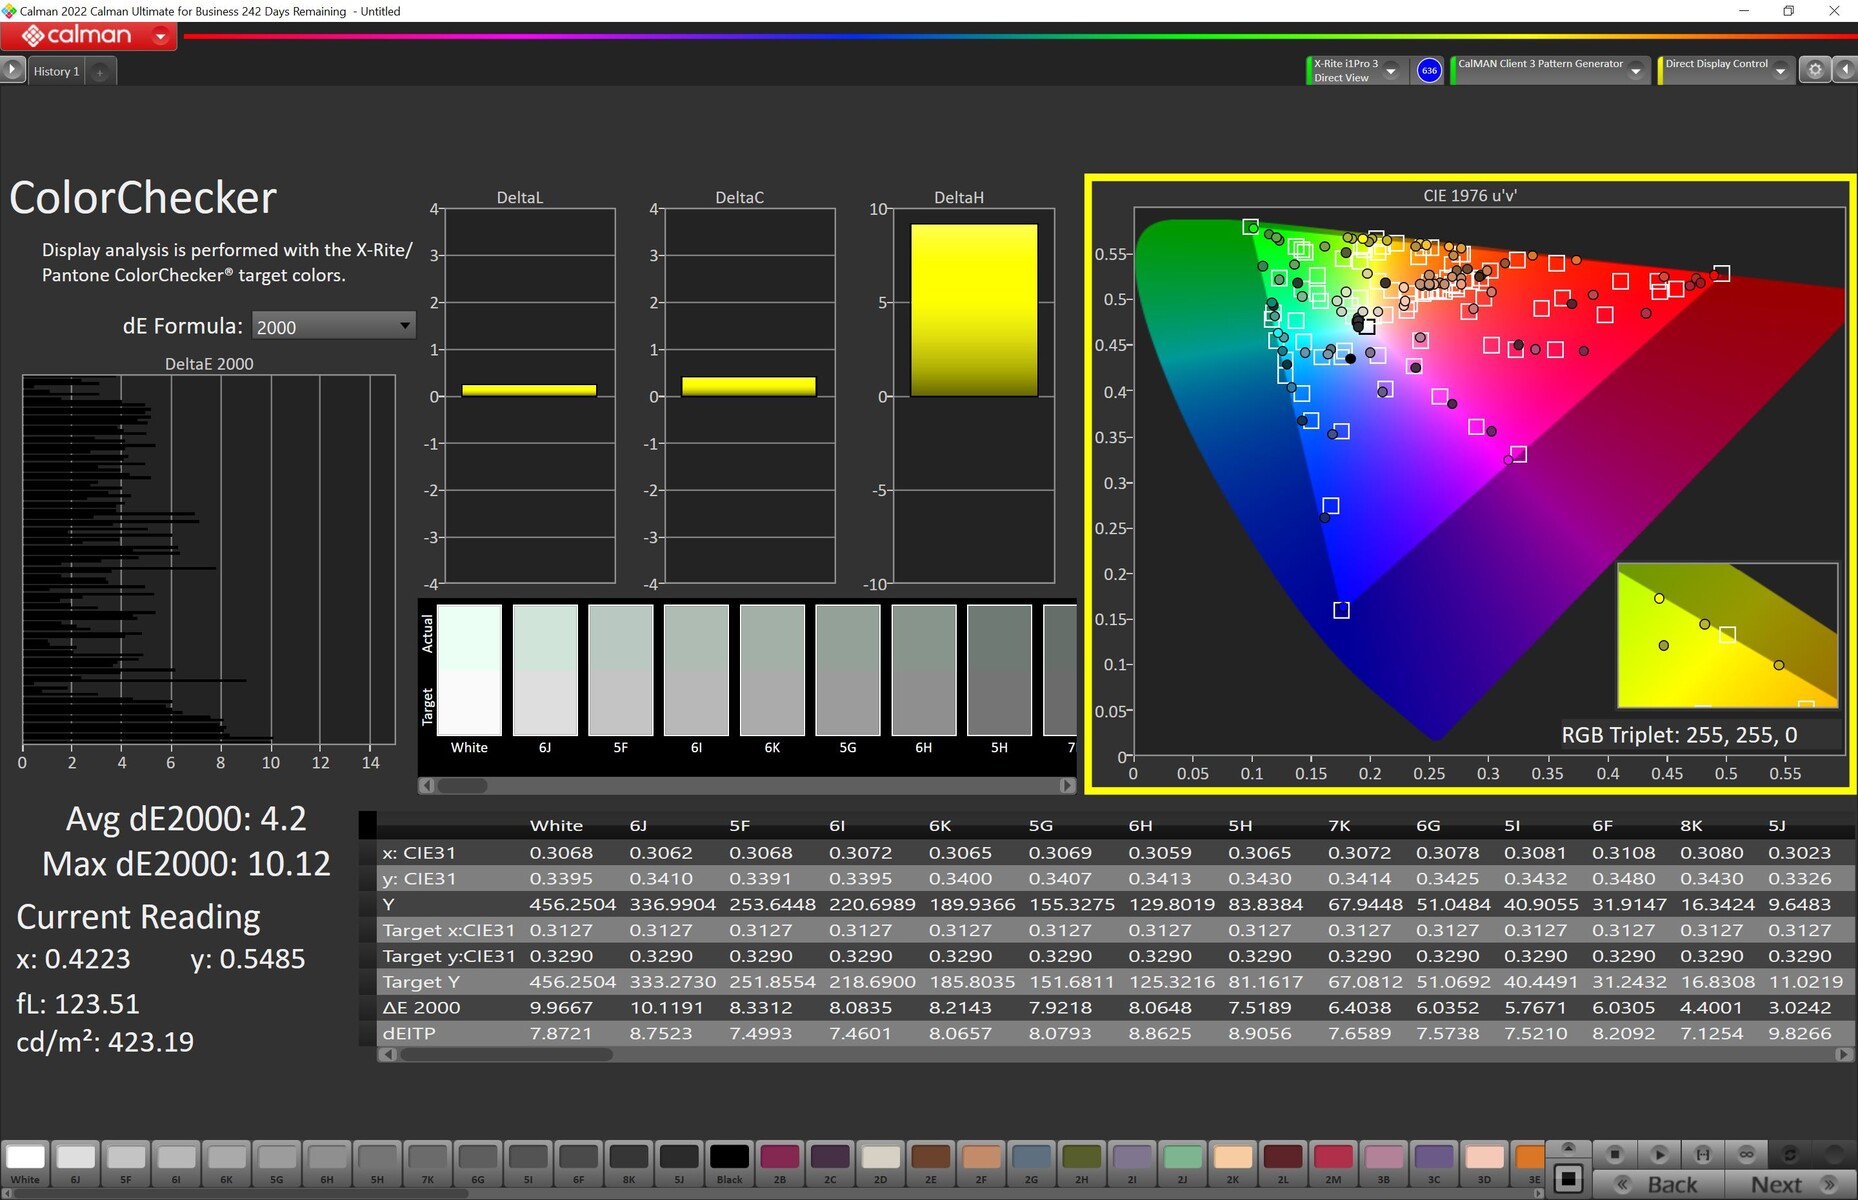
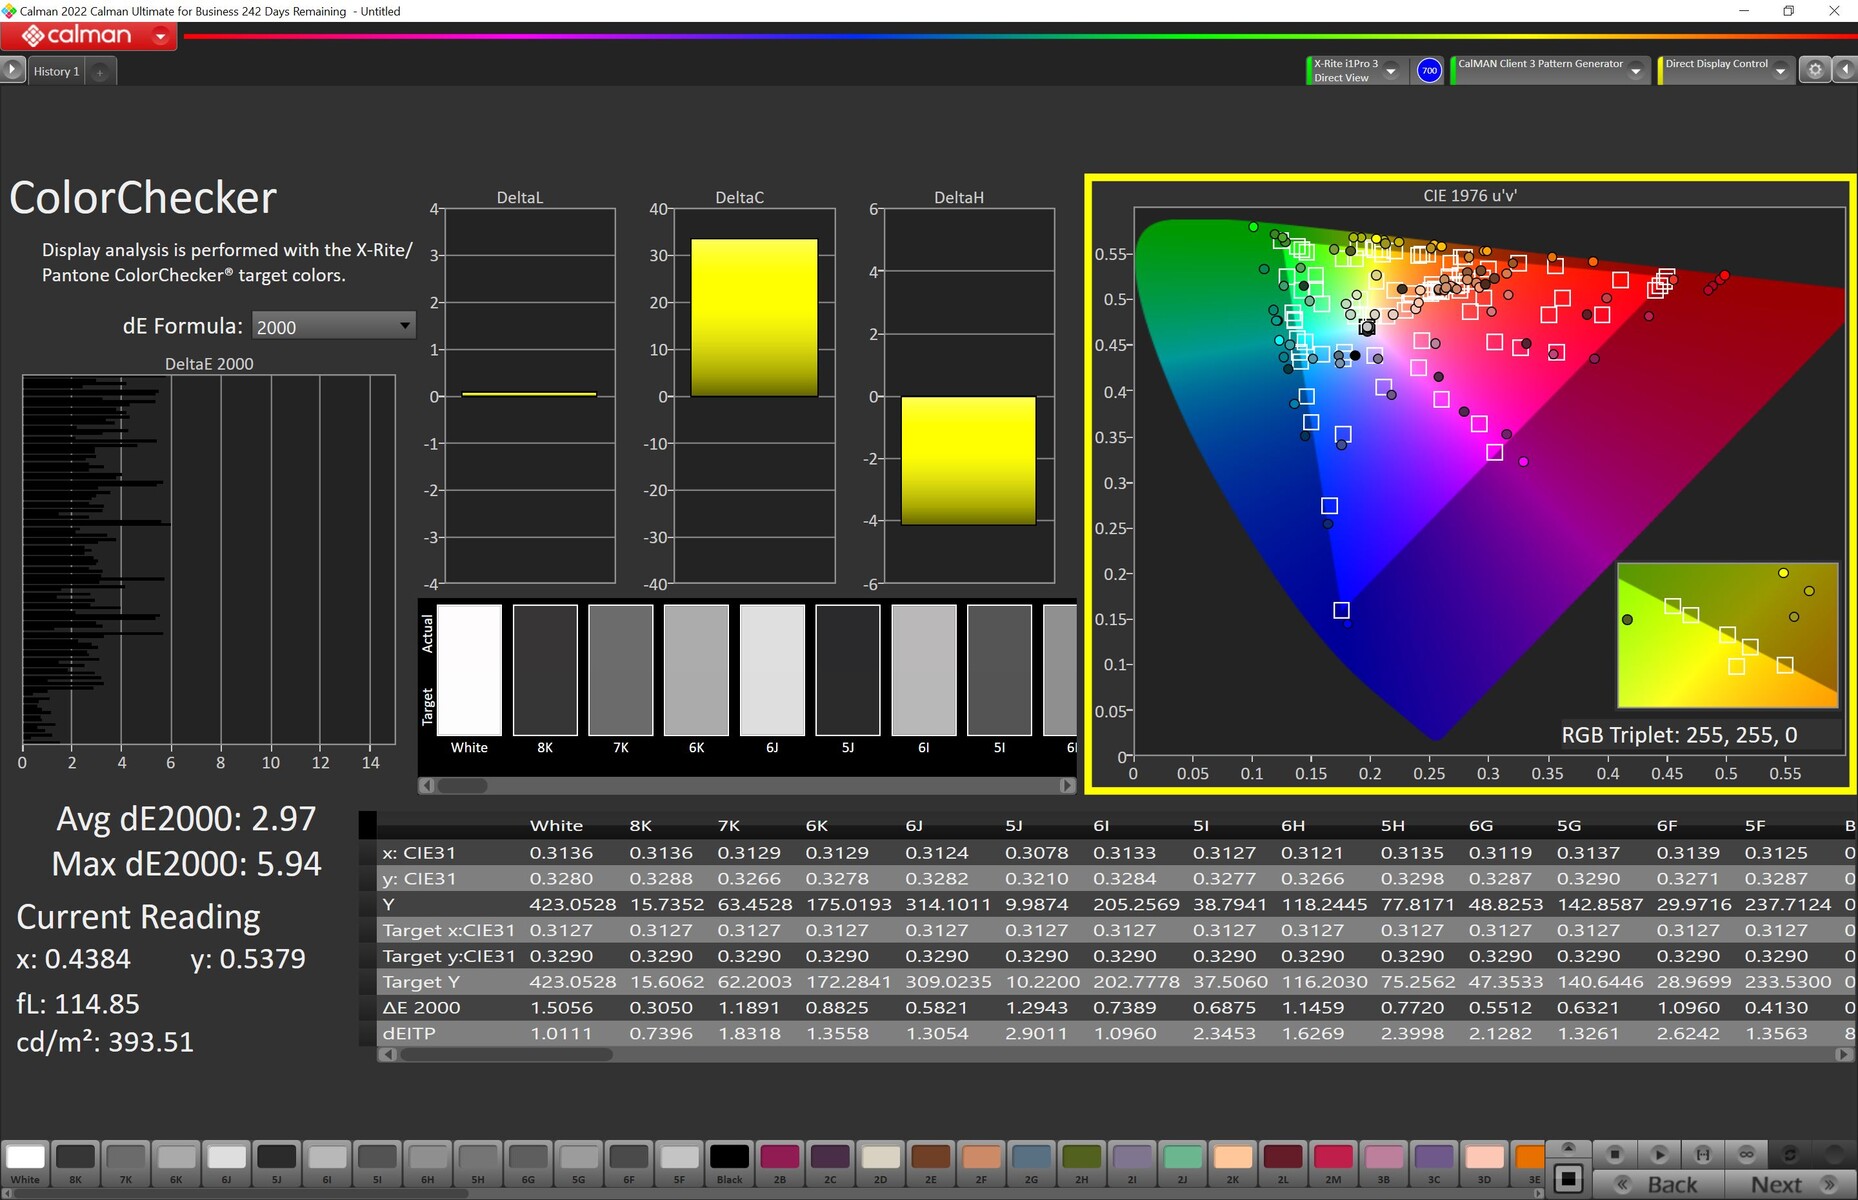
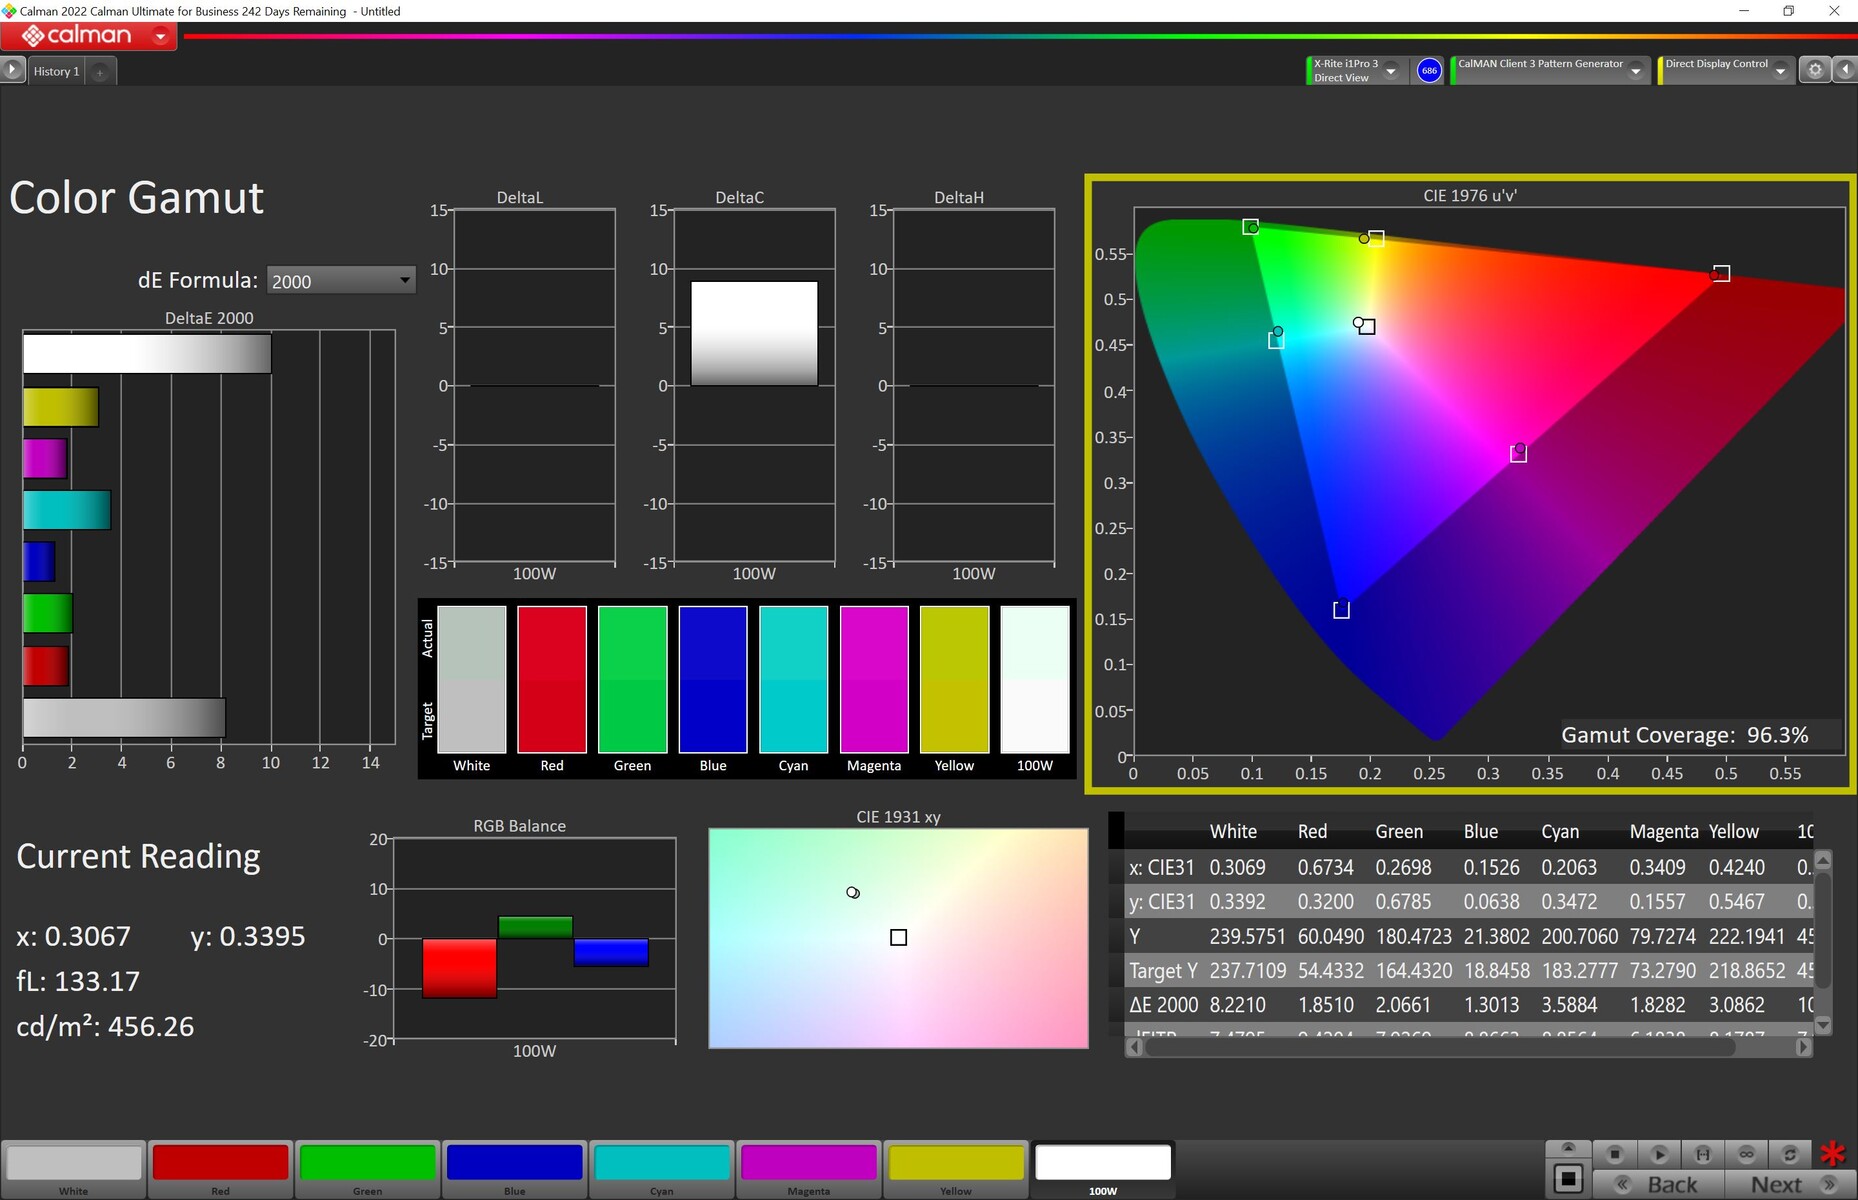
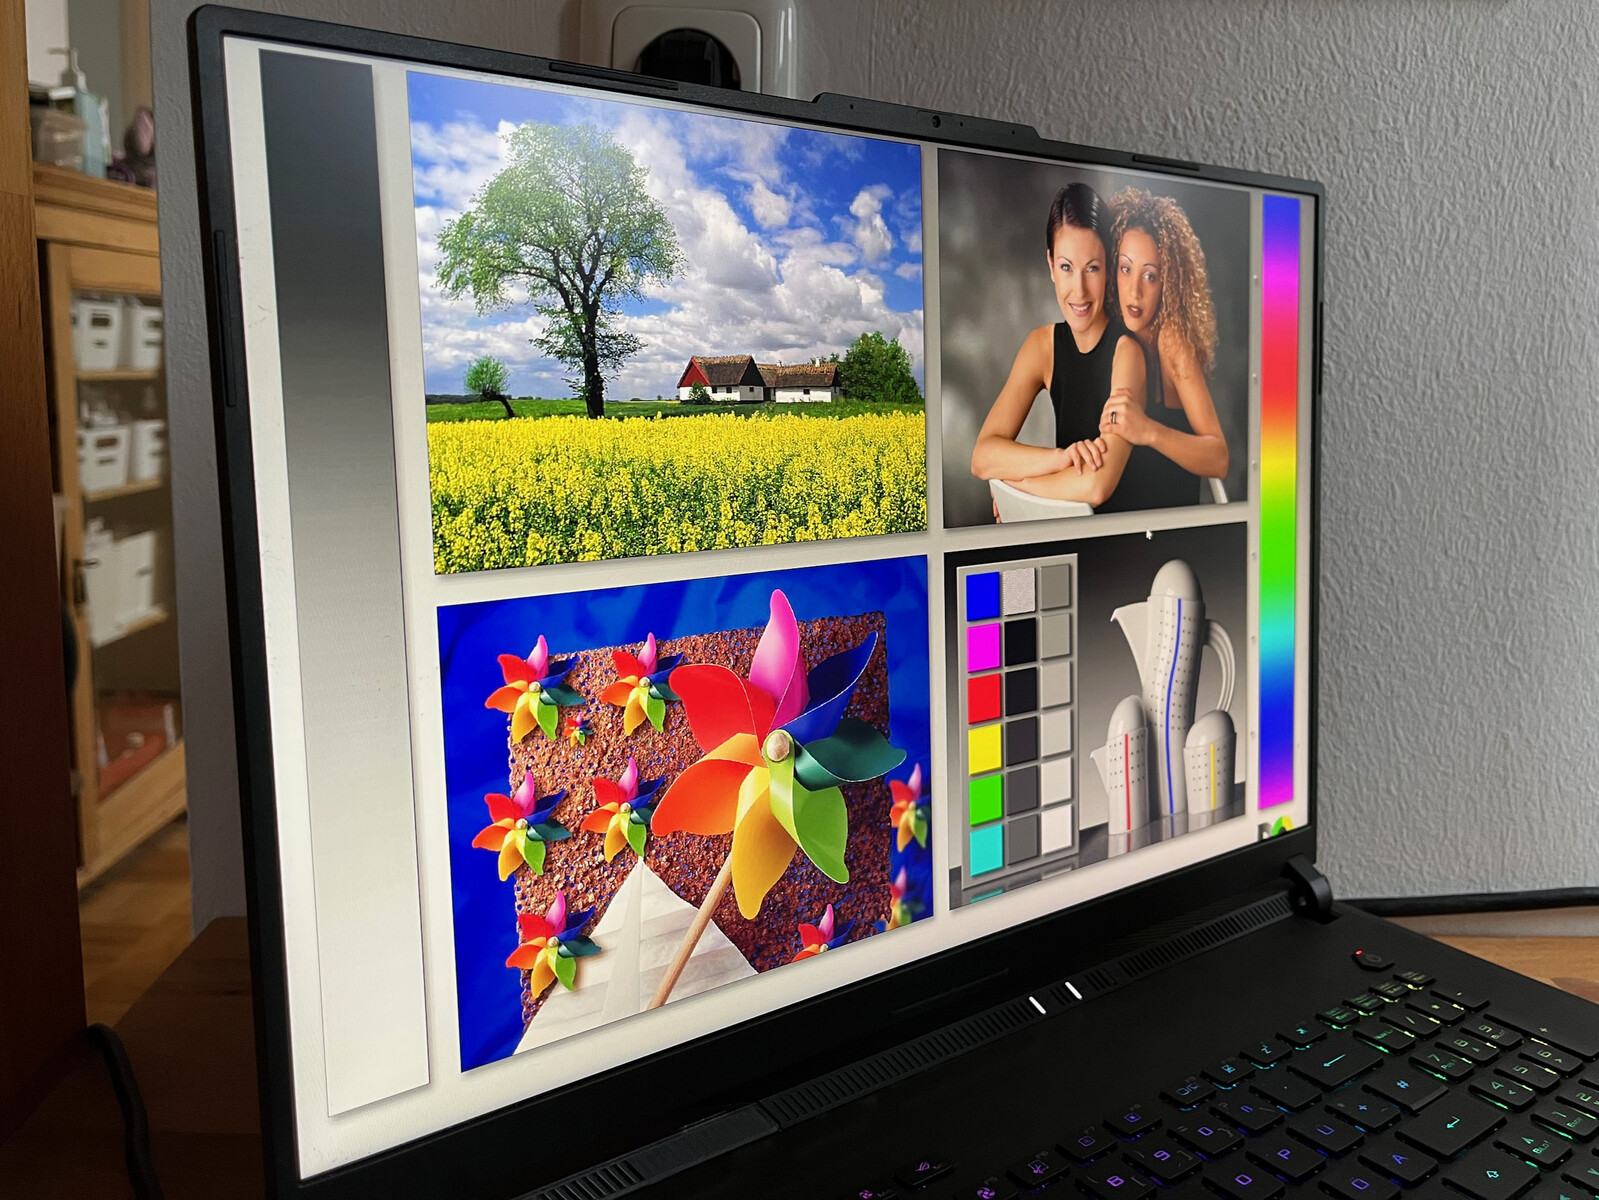
O espaço de cor medido cobre o espaço de cor Display-P3 até 97% e, portanto, também é adequado para tarefas exigentes (após uma calibração). Em termos de precisão de cor, o resultado depende da pré-seleção utilizada. Na ferramenta Armory Crate, a Asus oferece quatro modos diferentes no GameVisual: Native, sRGB, DCI-P3, e Display P3. No modo Nativo, a exibição de nossa unidade de teste tinha uma coloração azul facilmente perceptível e mensurável que também se manifestava como um valor ΔE de quase 5. Após a calibração com nossa i1Pro 3, alcançamos um resultado significativamente melhorado - particularmente também nos valores extremos. Após a calibração, o visor também é adequado para o processamento de imagens.

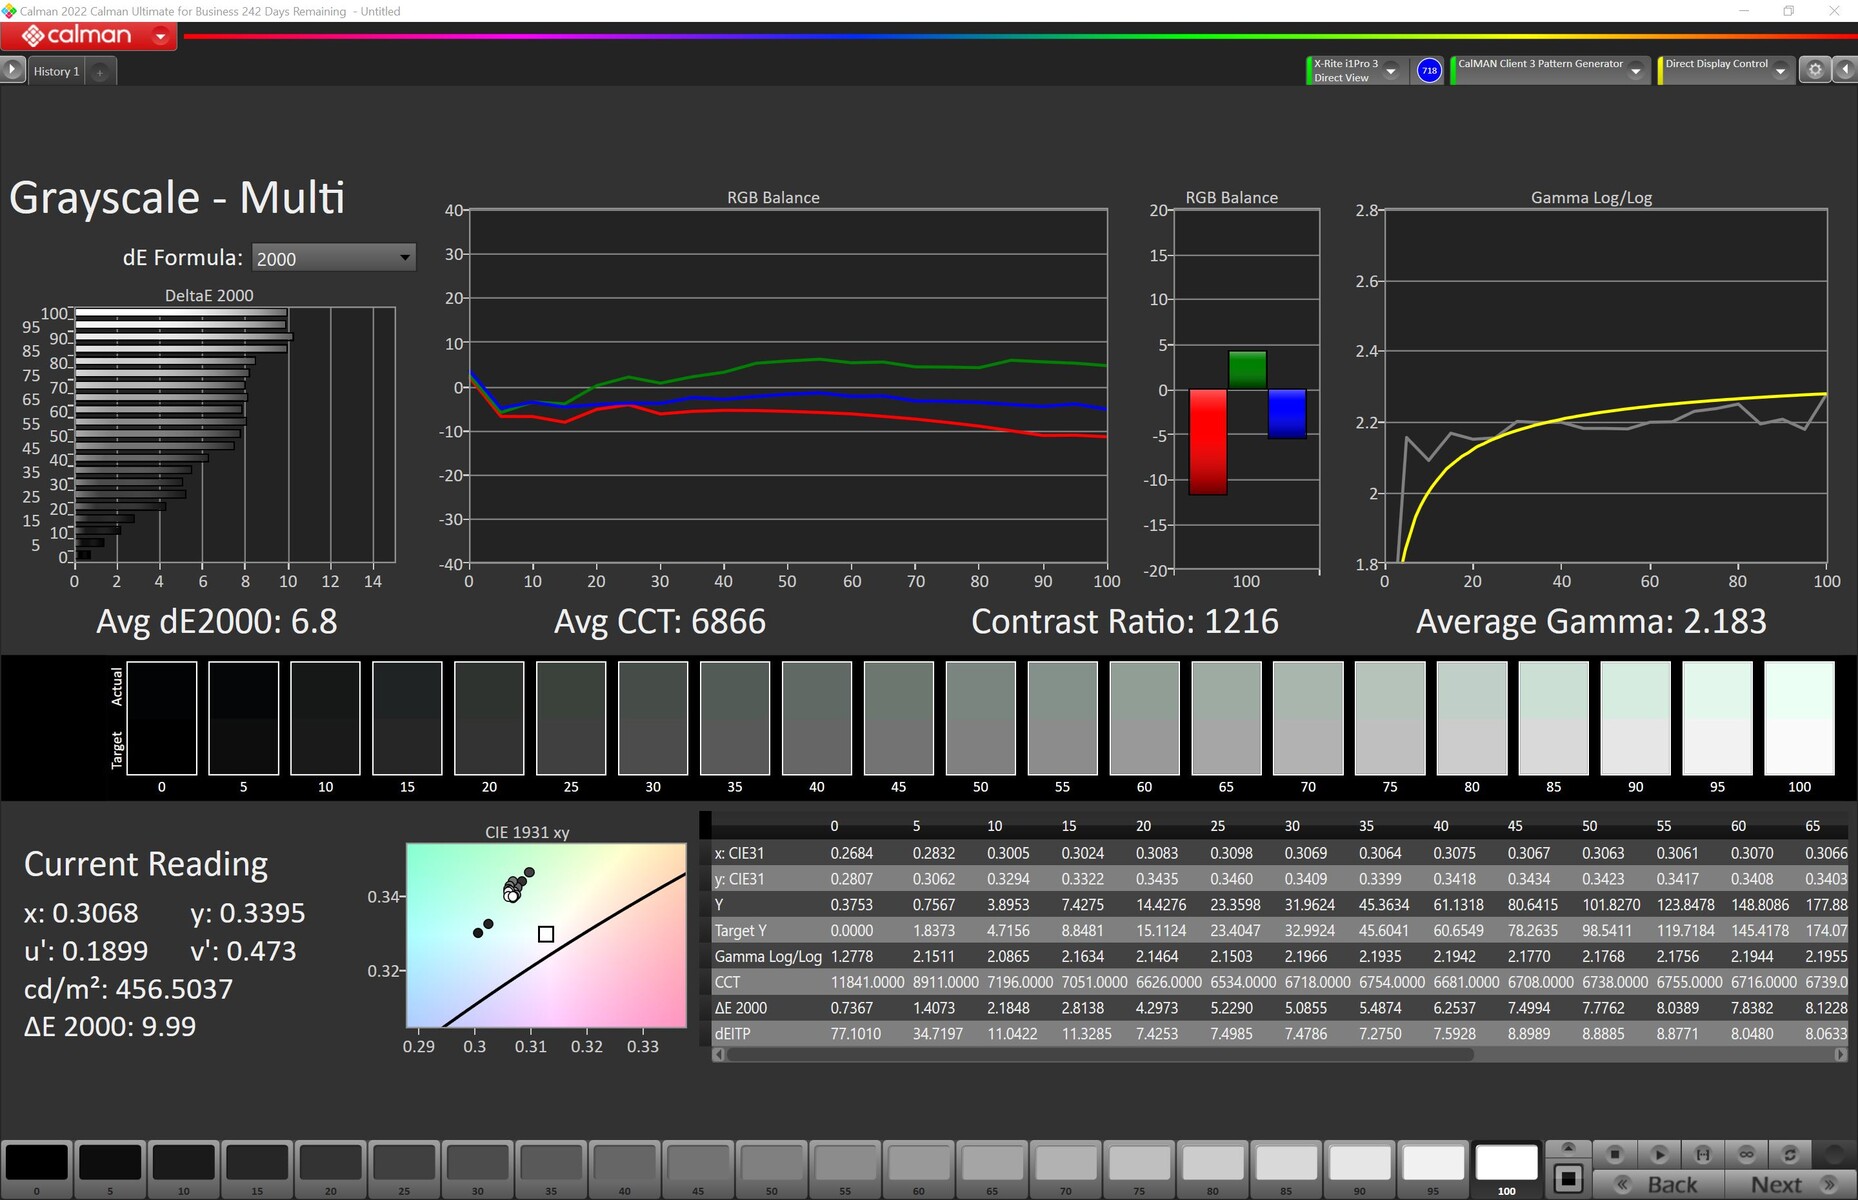
No painel NE180QDM-NZ2 usado aqui, o brilho do visor não é controlado via PWM, e não notamos nenhuma cintilação com nosso dispositivo de medição (em todos os níveis de brilho). Conseguimos confirmar o prometido tempo de resposta de 3 ms durante as mudanças de cinza. Para conseguir isto, o Asus usa um overdrive mínimo, mas não notamos nenhum efeito negativo. Em combinação com a taxa de atualização de 240-Hz, a tela é, portanto, ideal para jogos.
Exibir tempos de resposta
| ↔ Tempo de resposta preto para branco | ||
|---|---|---|
| 8.62 ms ... ascensão ↗ e queda ↘ combinadas | ↗ 3.68 ms ascensão | 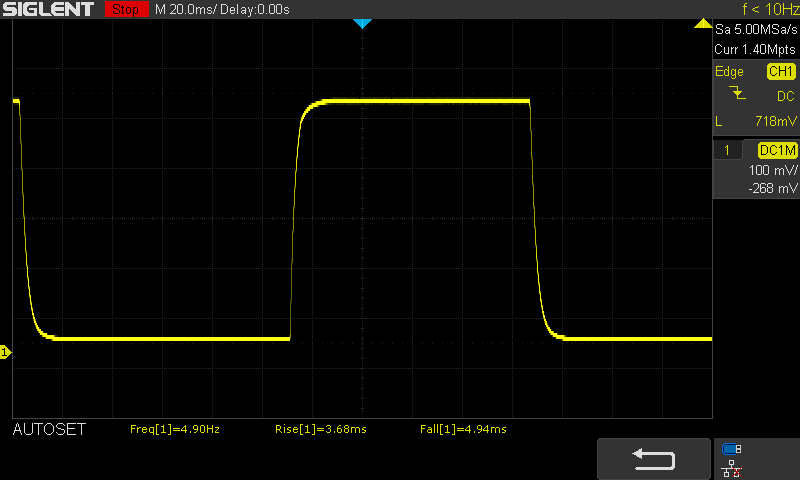 |
| ↘ 4.94 ms queda | ||
| A tela mostra taxas de resposta rápidas em nossos testes e deve ser adequada para jogos. Em comparação, todos os dispositivos testados variam de 0.1 (mínimo) a 240 (máximo) ms. » 24 % de todos os dispositivos são melhores. Isso significa que o tempo de resposta medido é melhor que a média de todos os dispositivos testados (19.8 ms). | ||
| ↔ Tempo de resposta 50% cinza a 80% cinza | ||
| 5.41 ms ... ascensão ↗ e queda ↘ combinadas | ↗ 2.57 ms ascensão | 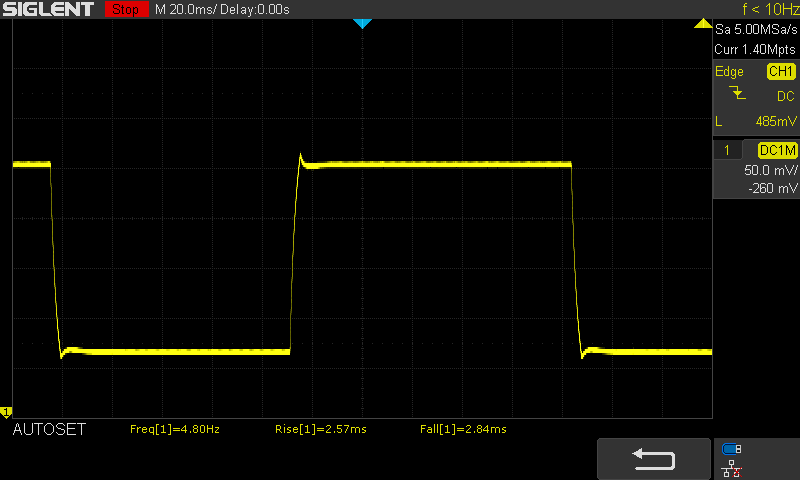 |
| ↘ 2.84 ms queda | ||
| A tela mostra taxas de resposta muito rápidas em nossos testes e deve ser muito adequada para jogos em ritmo acelerado. Em comparação, todos os dispositivos testados variam de 0.165 (mínimo) a 636 (máximo) ms. » 18 % de todos os dispositivos são melhores. Isso significa que o tempo de resposta medido é melhor que a média de todos os dispositivos testados (31 ms). | ||
Cintilação da tela / PWM (modulação por largura de pulso)
| Tela tremeluzindo / PWM não detectado |  | ||
[pwm_comparison] Em comparação: 52 % de todos os dispositivos testados não usam PWM para escurecer a tela. Se PWM foi detectado, uma média de 7754 (mínimo: 5 - máximo: 343500) Hz foi medida. | |||
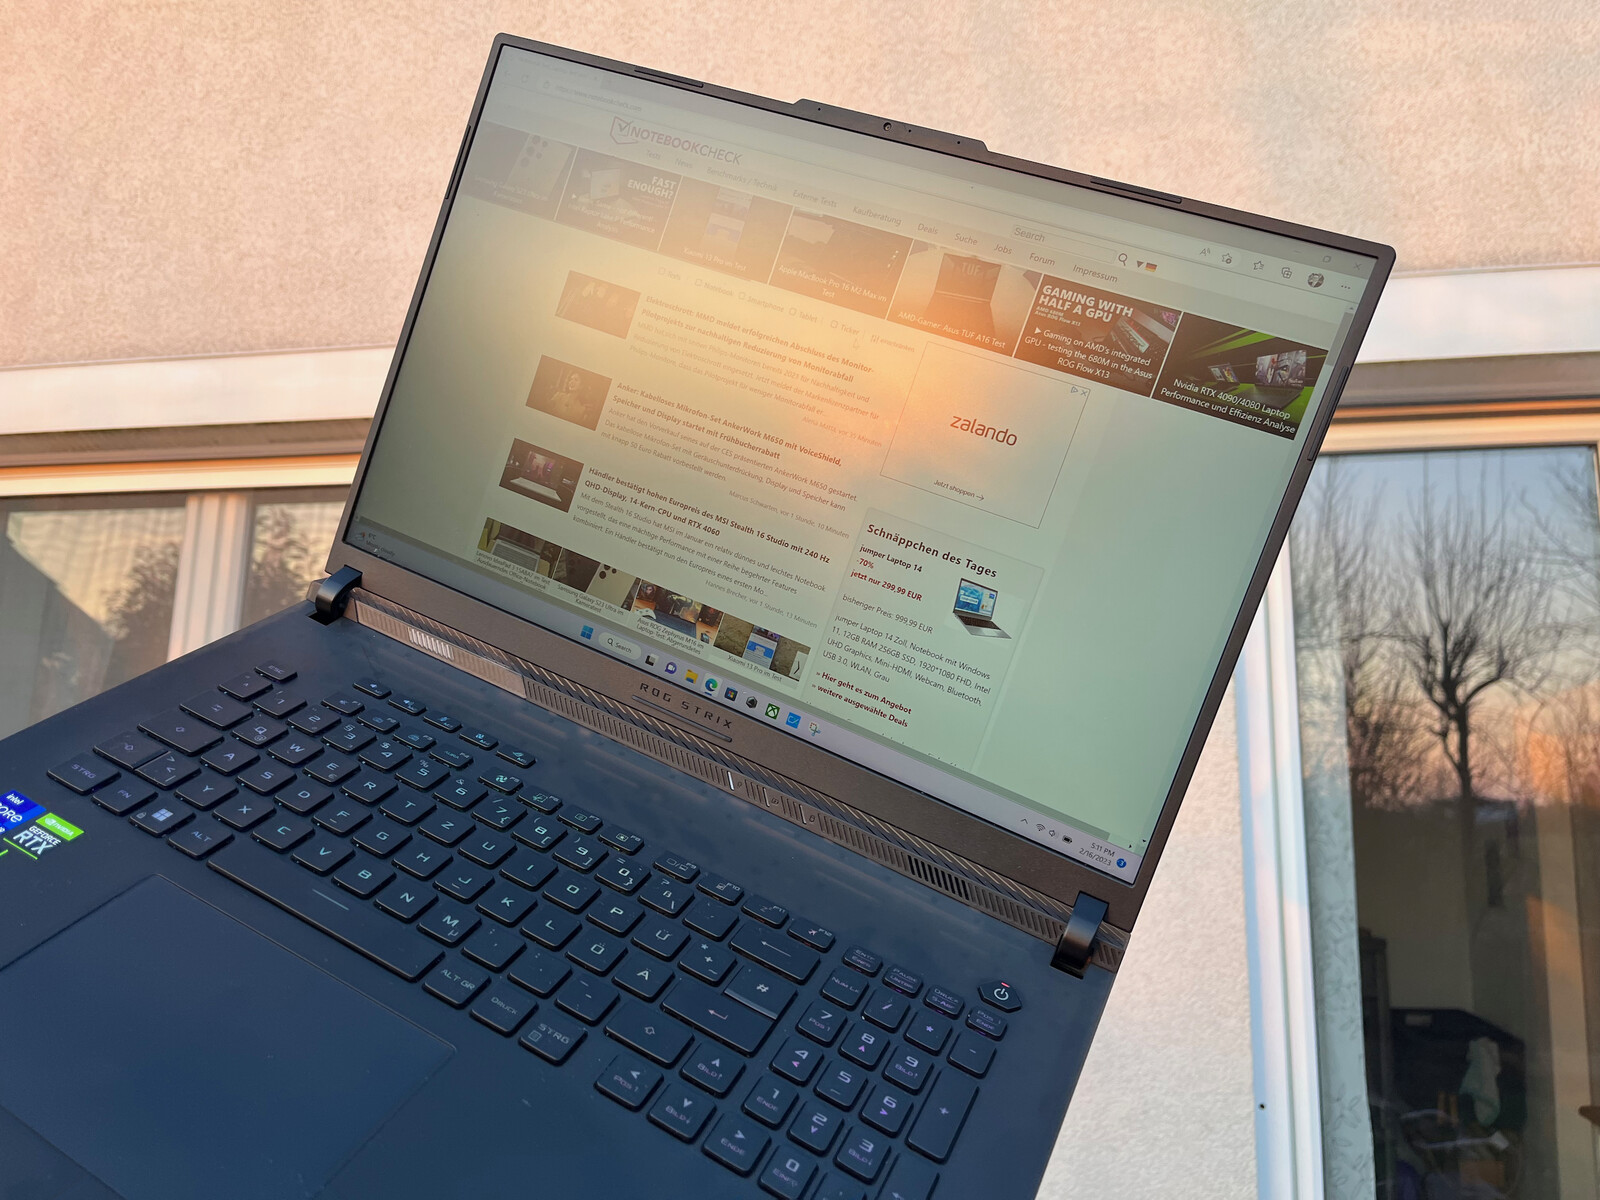
Graças à superfície da tela mate e ao bom brilho máximo, o ROG Strix Scar 18 pode, teoricamente, também ser facilmente utilizado ao ar livre. Embora quase 500 lêndeas sejam insuficientes para o sol brilhante do verão, elas são bastante suficientes na sombra ou no sol da noite, como em nossa imagem.
Graças ao painel de nível IPS, os ângulos de visão são excelentes. A perda de brilho dos ângulos de visão íngreme permanece dentro dos limites, e as distorções de cor não são perceptíveis subjetivamente.

Desempenho
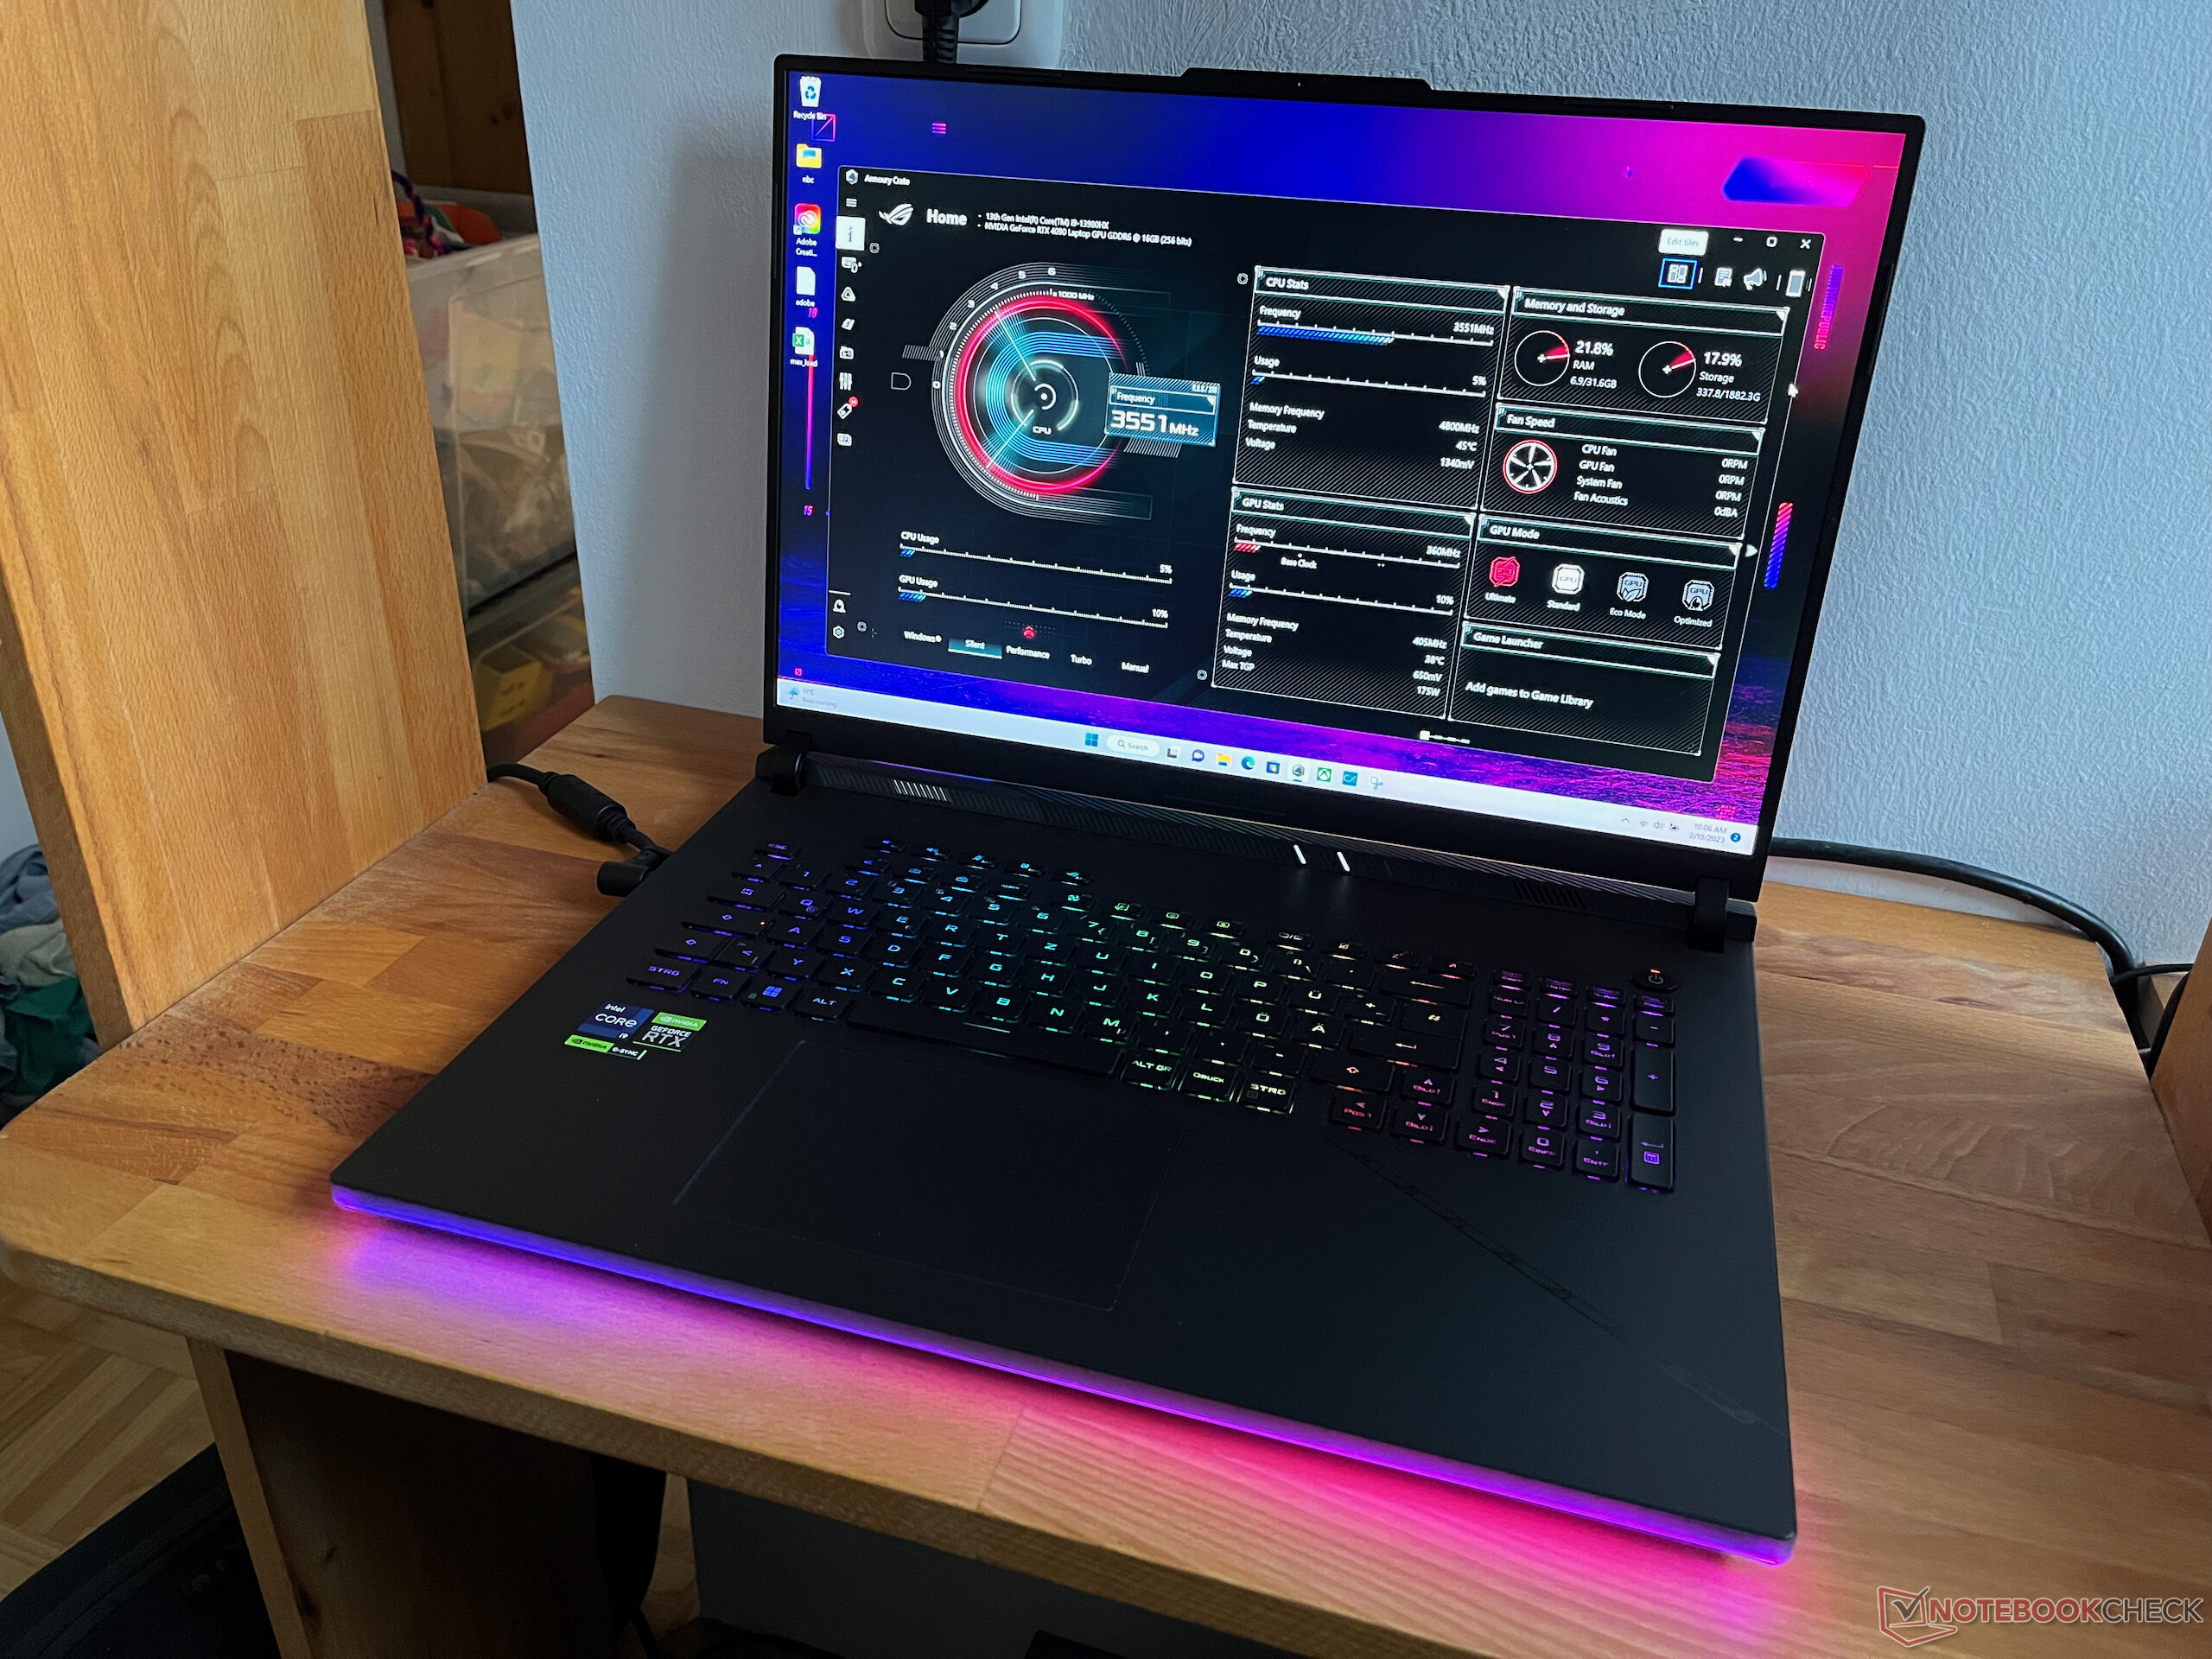
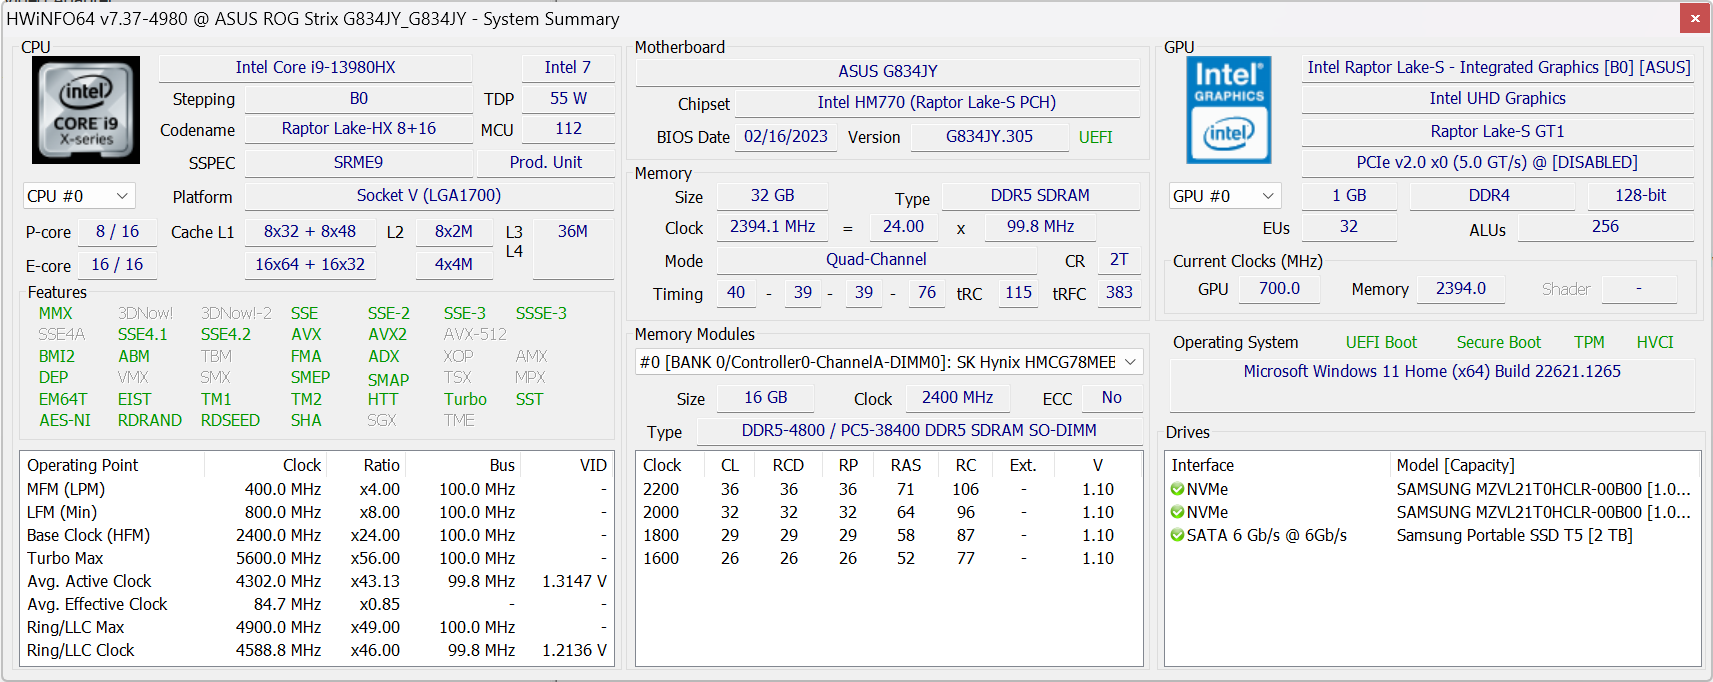
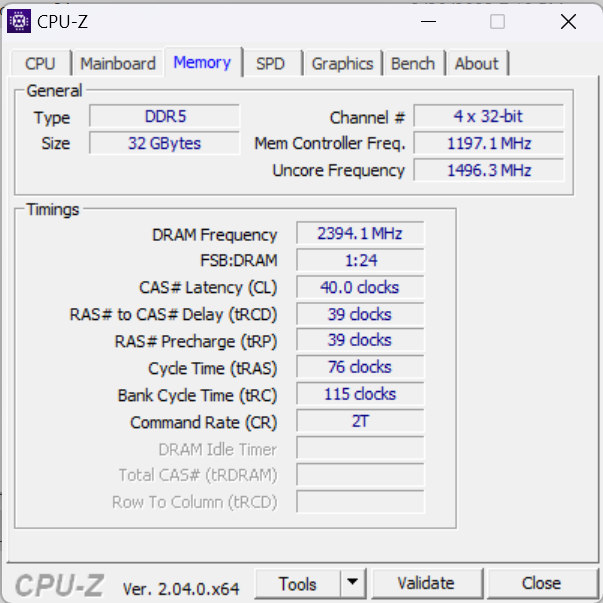
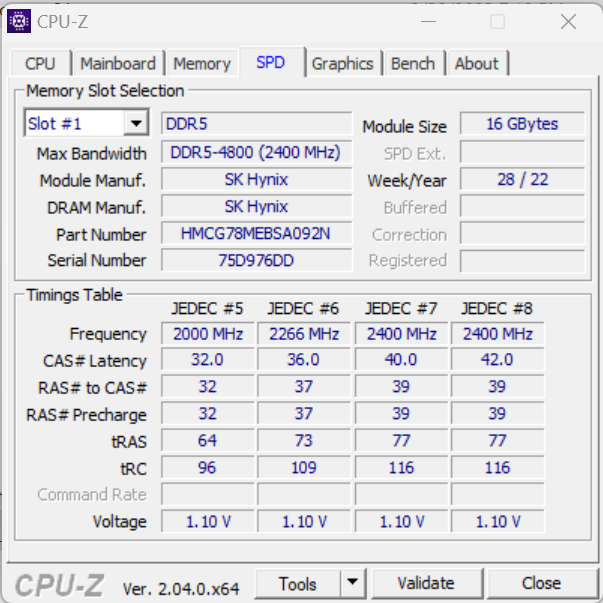
Nossa unidade de teste do Scar 18 é capaz de pontuar várias vezes nas medidas de desempenho. A Asus usa a placa gráfica móvel atualmente mais rápida, a GeForce RTX 4090, permitindo também o consumo máximo de energia de 175 watts. O Asus também não cortou os cantos com o processador, usando o modelo top móvel da Intel. O é o modelo de topo móvel da Intel.Intel Core i9-13980HXé baseado na nova série Raptor Lake, oferecendo 24 núcleos e um impulso máximo de 5,6 GHz considerável. A quantidade de armazenamento também é considerável com 32 GB de RAM DDR5. Entretanto, com 4800 MB/s a velocidade de armazenamento é ligeiramente menor do que em alguns modelos dos concorrentes. E finalmente, há também dois SSDs de 1 TB em um sistema RAID-0.
Condições de teste
Executamos nossos testes de desempenho no modo Turbo e no modo Ultimate GPU. Usando isto, a conexão RTX 4090 é fixada via MUX e overclocked minimamente em 50 MHz. Além disso, também testamos o modo Performance (padrão no estado de entrega) e o modo GPU Standard (comutação MSHybrid Optimus).
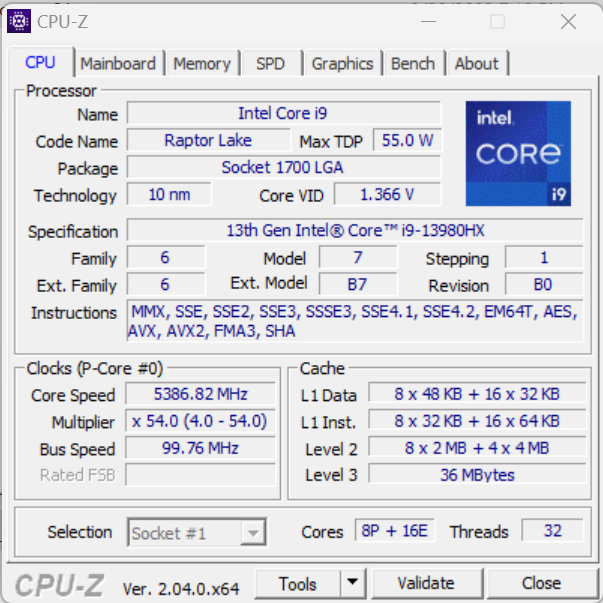
Processador
OIntel Core i9-13980HX é o atual top model da Intel para laptops. Ele é baseado na nova série Raptor Lake e é tecnicamente comparável com o Processador central i9-13900K para desktop. A CPU contém 8 núcleos Raptor Cove Performance com Hyper-Threading e uma velocidade de relógio de até 5,6 GHz. Os núcleos menores Gracemont Efficiency não oferecem Hyper-Threading e têm uma velocidade de relógio de até 4 GHz. Ao todo, a CPU é capaz de usar 32 MB de cache Nível 2 e é especificada pela Intel a 157 watts (PL2) e 55 watts (PL1) TDP. O Asus especifica que a CPU funciona a 65 watts (PL1), mas os valores PL1 e PL2 no HWInfo64 mostram 175 watts. Nos valores de referência, a CPU começa a 175 watts e depois corre para o limite térmico a 96 °C (205 °F), após o que o TDP é baixado para 135 watts. No modo silencioso, o TDP é baixado para 100W / 65W, levando também a um desempenho significativamente reduzido.
Em nossos benchmarks de processador, a i9-13980HX na ROG Strix 18 também é capaz de se colocar um pouco à frente das CPUs 13900HX e 13950HX dos concorrentes. No entanto, este é apenas o caso do modo Turbo, e no modo Performance, o Strix Scar 18 só se coloca no meio do campo das novas CPUs 13000HX. Mas mesmo assim, os dispositivos mais antigos com processadores i9-12950HX ainda são claramente ultrapassados.
Cinebench R15 Multi Constant Load Test
Cinebench R23: Multi Core | Single Core
Cinebench R20: CPU (Multi Core) | CPU (Single Core)
Cinebench R15: CPU Multi 64Bit | CPU Single 64Bit
Blender: v2.79 BMW27 CPU
7-Zip 18.03: 7z b 4 | 7z b 4 -mmt1
Geekbench 5.5: Multi-Core | Single-Core
HWBOT x265 Benchmark v2.2: 4k Preset
LibreOffice : 20 Documents To PDF
R Benchmark 2.5: Overall mean
| CPU Performance rating | |
| Intel Core i9-13900K @253W | |
| Intel NUC13 Raptor Canyon | |
| Asus ROG Strix Scar 18 2023 G834JY-N6005W | |
| MSI Titan GT77 HX 13VI | |
| Lenovo Legion Pro 7 16IRX8H | |
| Média Intel Core i9-13980HX | |
| Schenker XMG Neo 16 Raptor Lake | |
| Razer Blade 18 RTX 4070 | |
| Asus ROG Strix Scar 18 2023 G834JY-N6005W | |
| Razer Blade 16 Early 2023 | |
| Média da turma Gaming | |
| MSI Raider GE77 HX 12UHS | |
| Asus ROG Strix Scar 17 SE G733CX-LL014W | |
| Dell Precision 7000 7670 Performance | |
| Cinebench R23 / Multi Core | |
| Intel Core i9-13900K @253W | |
| MSI Titan GT77 HX 13VI | |
| Intel NUC13 Raptor Canyon | |
| Asus ROG Strix Scar 18 2023 G834JY-N6005W | |
| Média Intel Core i9-13980HX (28301 - 33052, n=11) | |
| Lenovo Legion Pro 7 16IRX8H | |
| Schenker XMG Neo 16 Raptor Lake | |
| Schenker XMG Neo 16 Raptor Lake | |
| Schenker XMG Neo 16 Raptor Lake | |
| Razer Blade 18 RTX 4070 | |
| Asus ROG Strix Scar 18 2023 G834JY-N6005W | |
| Razer Blade 16 Early 2023 | |
| Média da turma Gaming (10488 - 42661, n=107, últimos 2 anos) | |
| MSI Raider GE77 HX 12UHS | |
| Asus ROG Strix Scar 17 SE G733CX-LL014W | |
| Dell Precision 7000 7670 Performance | |
| Cinebench R23 / Single Core | |
| Intel Core i9-13900K @253W | |
| Intel NUC13 Raptor Canyon | |
| Asus ROG Strix Scar 18 2023 G834JY-N6005W | |
| MSI Titan GT77 HX 13VI | |
| Asus ROG Strix Scar 18 2023 G834JY-N6005W | |
| Média Intel Core i9-13980HX (1825 - 2169, n=9) | |
| Razer Blade 18 RTX 4070 | |
| Schenker XMG Neo 16 Raptor Lake | |
| Lenovo Legion Pro 7 16IRX8H | |
| Razer Blade 16 Early 2023 | |
| Média da turma Gaming (1166 - 2415, n=107, últimos 2 anos) | |
| MSI Raider GE77 HX 12UHS | |
| Asus ROG Strix Scar 17 SE G733CX-LL014W | |
| Dell Precision 7000 7670 Performance | |
| Cinebench R20 / CPU (Multi Core) | |
| Intel Core i9-13900K @253W | |
| Intel NUC13 Raptor Canyon | |
| MSI Titan GT77 HX 13VI | |
| Asus ROG Strix Scar 18 2023 G834JY-N6005W | |
| Média Intel Core i9-13980HX (10353 - 12437, n=10) | |
| Lenovo Legion Pro 7 16IRX8H | |
| Schenker XMG Neo 16 Raptor Lake | |
| Razer Blade 18 RTX 4070 | |
| Asus ROG Strix Scar 18 2023 G834JY-N6005W | |
| Média da turma Gaming (4029 - 16433, n=106, últimos 2 anos) | |
| MSI Raider GE77 HX 12UHS | |
| Razer Blade 16 Early 2023 | |
| Asus ROG Strix Scar 17 SE G733CX-LL014W | |
| Dell Precision 7000 7670 Performance | |
| Cinebench R20 / CPU (Single Core) | |
| Intel Core i9-13900K @253W | |
| Intel NUC13 Raptor Canyon | |
| Asus ROG Strix Scar 18 2023 G834JY-N6005W | |
| MSI Titan GT77 HX 13VI | |
| Asus ROG Strix Scar 18 2023 G834JY-N6005W | |
| Razer Blade 18 RTX 4070 | |
| Média Intel Core i9-13980HX (717 - 825, n=10) | |
| Lenovo Legion Pro 7 16IRX8H | |
| Média da turma Gaming (442 - 913, n=106, últimos 2 anos) | |
| Schenker XMG Neo 16 Raptor Lake | |
| MSI Raider GE77 HX 12UHS | |
| Razer Blade 16 Early 2023 | |
| Asus ROG Strix Scar 17 SE G733CX-LL014W | |
| Dell Precision 7000 7670 Performance | |
| Cinebench R15 / CPU Multi 64Bit | |
| Intel Core i9-13900K @253W | |
| Intel NUC13 Raptor Canyon | |
| MSI Titan GT77 HX 13VI | |
| Schenker XMG Neo 16 Raptor Lake | |
| Schenker XMG Neo 16 Raptor Lake | |
| Lenovo Legion Pro 7 16IRX8H | |
| Asus ROG Strix Scar 18 2023 G834JY-N6005W | |
| Média Intel Core i9-13980HX (4358 - 5172, n=11) | |
| Razer Blade 16 Early 2023 | |
| Razer Blade 18 RTX 4070 | |
| Asus ROG Strix Scar 18 2023 G834JY-N6005W | |
| Média da turma Gaming (1578 - 6330, n=105, últimos 2 anos) | |
| MSI Raider GE77 HX 12UHS | |
| Asus ROG Strix Scar 17 SE G733CX-LL014W | |
| Dell Precision 7000 7670 Performance | |
| Cinebench R15 / CPU Single 64Bit | |
| Intel Core i9-13900K @253W | |
| Intel NUC13 Raptor Canyon | |
| Asus ROG Strix Scar 18 2023 G834JY-N6005W | |
| Asus ROG Strix Scar 18 2023 G834JY-N6005W | |
| Média Intel Core i9-13980HX (289 - 312, n=11) | |
| Lenovo Legion Pro 7 16IRX8H | |
| MSI Titan GT77 HX 13VI | |
| Razer Blade 18 RTX 4070 | |
| Média da turma Gaming (188.8 - 350, n=106, últimos 2 anos) | |
| Schenker XMG Neo 16 Raptor Lake | |
| Schenker XMG Neo 16 Raptor Lake | |
| MSI Raider GE77 HX 12UHS | |
| Asus ROG Strix Scar 17 SE G733CX-LL014W | |
| Razer Blade 16 Early 2023 | |
| Dell Precision 7000 7670 Performance | |
| Blender / v2.79 BMW27 CPU | |
| Dell Precision 7000 7670 Performance | |
| Asus ROG Strix Scar 17 SE G733CX-LL014W | |
| MSI Raider GE77 HX 12UHS | |
| Média da turma Gaming (79 - 330, n=104, últimos 2 anos) | |
| Razer Blade 16 Early 2023 | |
| Asus ROG Strix Scar 18 2023 G834JY-N6005W | |
| Schenker XMG Neo 16 Raptor Lake | |
| Razer Blade 18 RTX 4070 | |
| Média Intel Core i9-13980HX (97 - 136, n=10) | |
| Lenovo Legion Pro 7 16IRX8H | |
| Asus ROG Strix Scar 18 2023 G834JY-N6005W | |
| Intel NUC13 Raptor Canyon | |
| MSI Titan GT77 HX 13VI | |
| Intel Core i9-13900K @253W | |
| 7-Zip 18.03 / 7z b 4 | |
| Intel Core i9-13900K @253W | |
| MSI Titan GT77 HX 13VI | |
| Intel NUC13 Raptor Canyon | |
| Asus ROG Strix Scar 18 2023 G834JY-N6005W | |
| Lenovo Legion Pro 7 16IRX8H | |
| Schenker XMG Neo 16 Raptor Lake | |
| Média Intel Core i9-13980HX (104616 - 129804, n=10) | |
| Razer Blade 18 RTX 4070 | |
| Asus ROG Strix Scar 18 2023 G834JY-N6005W | |
| Razer Blade 16 Early 2023 | |
| Média da turma Gaming (33491 - 148086, n=105, últimos 2 anos) | |
| MSI Raider GE77 HX 12UHS | |
| Asus ROG Strix Scar 17 SE G733CX-LL014W | |
| Dell Precision 7000 7670 Performance | |
| 7-Zip 18.03 / 7z b 4 -mmt1 | |
| Intel Core i9-13900K @253W | |
| Intel NUC13 Raptor Canyon | |
| Asus ROG Strix Scar 18 2023 G834JY-N6005W | |
| Lenovo Legion Pro 7 16IRX8H | |
| Asus ROG Strix Scar 18 2023 G834JY-N6005W | |
| Média Intel Core i9-13980HX (6230 - 7163, n=10) | |
| MSI Titan GT77 HX 13VI | |
| Razer Blade 18 RTX 4070 | |
| Schenker XMG Neo 16 Raptor Lake | |
| Razer Blade 16 Early 2023 | |
| Média da turma Gaming (4199 - 7436, n=105, últimos 2 anos) | |
| MSI Raider GE77 HX 12UHS | |
| Asus ROG Strix Scar 17 SE G733CX-LL014W | |
| Dell Precision 7000 7670 Performance | |
| Geekbench 5.5 / Multi-Core | |
| Intel Core i9-13900K @253W | |
| Intel NUC13 Raptor Canyon | |
| Lenovo Legion Pro 7 16IRX8H | |
| Asus ROG Strix Scar 18 2023 G834JY-N6005W | |
| Schenker XMG Neo 16 Raptor Lake | |
| MSI Titan GT77 HX 13VI | |
| Média Intel Core i9-13980HX (18475 - 22200, n=10) | |
| Razer Blade 18 RTX 4070 | |
| Asus ROG Strix Scar 18 2023 G834JY-N6005W | |
| Razer Blade 16 Early 2023 | |
| Média da turma Gaming (6460 - 28263, n=105, últimos 2 anos) | |
| MSI Raider GE77 HX 12UHS | |
| Asus ROG Strix Scar 17 SE G733CX-LL014W | |
| Dell Precision 7000 7670 Performance | |
| Geekbench 5.5 / Single-Core | |
| Intel Core i9-13900K @253W | |
| Asus ROG Strix Scar 18 2023 G834JY-N6005W | |
| Intel NUC13 Raptor Canyon | |
| Asus ROG Strix Scar 18 2023 G834JY-N6005W | |
| Média da turma Gaming (986 - 2474, n=105, últimos 2 anos) | |
| Média Intel Core i9-13980HX (1796 - 2139, n=10) | |
| MSI Titan GT77 HX 13VI | |
| Razer Blade 18 RTX 4070 | |
| Lenovo Legion Pro 7 16IRX8H | |
| Schenker XMG Neo 16 Raptor Lake | |
| MSI Raider GE77 HX 12UHS | |
| Dell Precision 7000 7670 Performance | |
| Asus ROG Strix Scar 17 SE G733CX-LL014W | |
| Razer Blade 16 Early 2023 | |
| HWBOT x265 Benchmark v2.2 / 4k Preset | |
| Intel Core i9-13900K @253W | |
| Intel NUC13 Raptor Canyon | |
| Asus ROG Strix Scar 18 2023 G834JY-N6005W | |
| MSI Titan GT77 HX 13VI | |
| Lenovo Legion Pro 7 16IRX8H | |
| Média Intel Core i9-13980HX (27 - 33.4, n=9) | |
| Razer Blade 18 RTX 4070 | |
| Schenker XMG Neo 16 Raptor Lake | |
| Asus ROG Strix Scar 18 2023 G834JY-N6005W | |
| Média da turma Gaming (11.5 - 44.4, n=105, últimos 2 anos) | |
| Razer Blade 16 Early 2023 | |
| MSI Raider GE77 HX 12UHS | |
| Asus ROG Strix Scar 17 SE G733CX-LL014W | |
| Dell Precision 7000 7670 Performance | |
| LibreOffice / 20 Documents To PDF | |
| Média da turma Gaming (33.2 - 88.8, n=105, últimos 2 anos) | |
| Razer Blade 16 Early 2023 | |
| MSI Titan GT77 HX 13VI | |
| Schenker XMG Neo 16 Raptor Lake | |
| Lenovo Legion Pro 7 16IRX8H | |
| Dell Precision 7000 7670 Performance | |
| Razer Blade 18 RTX 4070 | |
| Média Intel Core i9-13980HX (35 - 51.4, n=10) | |
| MSI Raider GE77 HX 12UHS | |
| Intel NUC13 Raptor Canyon | |
| Asus ROG Strix Scar 18 2023 G834JY-N6005W | |
| Asus ROG Strix Scar 18 2023 G834JY-N6005W | |
| Asus ROG Strix Scar 17 SE G733CX-LL014W | |
| Intel Core i9-13900K @253W | |
| R Benchmark 2.5 / Overall mean | |
| Dell Precision 7000 7670 Performance | |
| Média da turma Gaming (0.3439 - 0.759, n=106, últimos 2 anos) | |
| Asus ROG Strix Scar 17 SE G733CX-LL014W | |
| MSI Raider GE77 HX 12UHS | |
| Razer Blade 16 Early 2023 | |
| MSI Titan GT77 HX 13VI | |
| Lenovo Legion Pro 7 16IRX8H | |
| Média Intel Core i9-13980HX (0.3793 - 0.4462, n=10) | |
| Razer Blade 18 RTX 4070 | |
| Asus ROG Strix Scar 18 2023 G834JY-N6005W | |
| Intel NUC13 Raptor Canyon | |
| Schenker XMG Neo 16 Raptor Lake | |
| Asus ROG Strix Scar 18 2023 G834JY-N6005W | |
| Intel Core i9-13900K @253W | |
Cinebench R23: Multi Core | Single Core
Cinebench R20: CPU (Multi Core) | CPU (Single Core)
Cinebench R15: CPU Multi 64Bit | CPU Single 64Bit
Blender: v2.79 BMW27 CPU
7-Zip 18.03: 7z b 4 | 7z b 4 -mmt1
Geekbench 5.5: Multi-Core | Single-Core
HWBOT x265 Benchmark v2.2: 4k Preset
LibreOffice : 20 Documents To PDF
R Benchmark 2.5: Overall mean
* ... menor é melhor
AIDA64: FP32 Ray-Trace | FPU Julia | CPU SHA3 | CPU Queen | FPU SinJulia | FPU Mandel | CPU AES | CPU ZLib | FP64 Ray-Trace | CPU PhotoWorxx
| Performance rating | |
| Intel Core i9-13900K @253W | |
| Intel NUC13 Raptor Canyon | |
| Asus ROG Strix Scar 18 2023 G834JY-N6005W | |
| MSI Titan GT77 HX 13VI | |
| Lenovo Legion Pro 7 16IRX8H | |
| Média Intel Core i9-13980HX | |
| Média da turma Gaming | |
| Schenker XMG Neo 16 Raptor Lake | |
| Razer Blade 18 RTX 4070 | |
| Asus ROG Strix Scar 18 2023 G834JY-N6005W | |
| Razer Blade 16 Early 2023 | |
| MSI Raider GE77 HX 12UHS | |
| Asus ROG Strix Scar 17 SE G733CX-LL014W | |
| Dell Precision 7000 7670 Performance | |
| AIDA64 / FP32 Ray-Trace | |
| Intel Core i9-13900K @253W | |
| Média da turma Gaming (10227 - 85542, n=105, últimos 2 anos) | |
| MSI Titan GT77 HX 13VI | |
| Asus ROG Strix Scar 18 2023 G834JY-N6005W | |
| Intel NUC13 Raptor Canyon | |
| Schenker XMG Neo 16 Raptor Lake | |
| Lenovo Legion Pro 7 16IRX8H | |
| Média Intel Core i9-13980HX (21332 - 29553, n=9) | |
| Razer Blade 18 RTX 4070 | |
| Razer Blade 16 Early 2023 | |
| Razer Blade 16 Early 2023 | |
| Razer Blade 16 Early 2023 | |
| Asus ROG Strix Scar 18 2023 G834JY-N6005W | |
| MSI Raider GE77 HX 12UHS | |
| Asus ROG Strix Scar 17 SE G733CX-LL014W | |
| Dell Precision 7000 7670 Performance | |
| AIDA64 / FPU Julia | |
| Intel Core i9-13900K @253W | |
| MSI Titan GT77 HX 13VI | |
| Intel NUC13 Raptor Canyon | |
| Média da turma Gaming (51376 - 238426, n=105, últimos 2 anos) | |
| Asus ROG Strix Scar 18 2023 G834JY-N6005W | |
| Lenovo Legion Pro 7 16IRX8H | |
| Média Intel Core i9-13980HX (108001 - 148168, n=9) | |
| Razer Blade 18 RTX 4070 | |
| Schenker XMG Neo 16 Raptor Lake | |
| Asus ROG Strix Scar 18 2023 G834JY-N6005W | |
| Razer Blade 16 Early 2023 | |
| Razer Blade 16 Early 2023 | |
| Razer Blade 16 Early 2023 | |
| MSI Raider GE77 HX 12UHS | |
| Asus ROG Strix Scar 17 SE G733CX-LL014W | |
| Dell Precision 7000 7670 Performance | |
| AIDA64 / CPU SHA3 | |
| Intel Core i9-13900K @253W | |
| MSI Titan GT77 HX 13VI | |
| Asus ROG Strix Scar 18 2023 G834JY-N6005W | |
| Intel NUC13 Raptor Canyon | |
| Lenovo Legion Pro 7 16IRX8H | |
| Schenker XMG Neo 16 Raptor Lake | |
| Média Intel Core i9-13980HX (5264 - 7142, n=9) | |
| Média da turma Gaming (2180 - 10115, n=105, últimos 2 anos) | |
| Razer Blade 16 Early 2023 | |
| Razer Blade 16 Early 2023 | |
| Razer Blade 16 Early 2023 | |
| Razer Blade 18 RTX 4070 | |
| Asus ROG Strix Scar 18 2023 G834JY-N6005W | |
| MSI Raider GE77 HX 12UHS | |
| Asus ROG Strix Scar 17 SE G733CX-LL014W | |
| Dell Precision 7000 7670 Performance | |
| AIDA64 / CPU Queen | |
| Intel Core i9-13900K @253W | |
| Intel NUC13 Raptor Canyon | |
| Asus ROG Strix Scar 18 2023 G834JY-N6005W | |
| Asus ROG Strix Scar 18 2023 G834JY-N6005W | |
| MSI Titan GT77 HX 13VI | |
| Média Intel Core i9-13980HX (126758 - 143409, n=9) | |
| Razer Blade 18 RTX 4070 | |
| Schenker XMG Neo 16 Raptor Lake | |
| Razer Blade 16 Early 2023 | |
| Razer Blade 16 Early 2023 | |
| Lenovo Legion Pro 7 16IRX8H | |
| Média da turma Gaming (49785 - 173351, n=90, últimos 2 anos) | |
| Asus ROG Strix Scar 17 SE G733CX-LL014W | |
| Dell Precision 7000 7670 Performance | |
| MSI Raider GE77 HX 12UHS | |
| AIDA64 / FPU SinJulia | |
| Intel Core i9-13900K @253W | |
| Intel NUC13 Raptor Canyon | |
| Asus ROG Strix Scar 18 2023 G834JY-N6005W | |
| MSI Titan GT77 HX 13VI | |
| Schenker XMG Neo 16 Raptor Lake | |
| Média Intel Core i9-13980HX (13785 - 17117, n=9) | |
| Razer Blade 18 RTX 4070 | |
| Asus ROG Strix Scar 18 2023 G834JY-N6005W | |
| Razer Blade 16 Early 2023 | |
| Razer Blade 16 Early 2023 | |
| Razer Blade 16 Early 2023 | |
| Lenovo Legion Pro 7 16IRX8H | |
| Média da turma Gaming (4424 - 33636, n=105, últimos 2 anos) | |
| MSI Raider GE77 HX 12UHS | |
| Asus ROG Strix Scar 17 SE G733CX-LL014W | |
| Dell Precision 7000 7670 Performance | |
| AIDA64 / FPU Mandel | |
| Intel Core i9-13900K @253W | |
| Média da turma Gaming (25115 - 128721, n=105, últimos 2 anos) | |
| MSI Titan GT77 HX 13VI | |
| Asus ROG Strix Scar 18 2023 G834JY-N6005W | |
| Intel NUC13 Raptor Canyon | |
| Lenovo Legion Pro 7 16IRX8H | |
| Média Intel Core i9-13980HX (53398 - 73758, n=9) | |
| Schenker XMG Neo 16 Raptor Lake | |
| Razer Blade 18 RTX 4070 | |
| Asus ROG Strix Scar 18 2023 G834JY-N6005W | |
| Razer Blade 16 Early 2023 | |
| Razer Blade 16 Early 2023 | |
| Razer Blade 16 Early 2023 | |
| MSI Raider GE77 HX 12UHS | |
| Asus ROG Strix Scar 17 SE G733CX-LL014W | |
| Dell Precision 7000 7670 Performance | |
| AIDA64 / CPU AES | |
| Intel Core i9-13900K @253W | |
| MSI Raider GE77 HX 12UHS | |
| Asus ROG Strix Scar 17 SE G733CX-LL014W | |
| Razer Blade 16 Early 2023 | |
| Razer Blade 16 Early 2023 | |
| Razer Blade 16 Early 2023 | |
| MSI Titan GT77 HX 13VI | |
| Asus ROG Strix Scar 18 2023 G834JY-N6005W | |
| Intel NUC13 Raptor Canyon | |
| Lenovo Legion Pro 7 16IRX8H | |
| Média Intel Core i9-13980HX (105169 - 136520, n=9) | |
| Schenker XMG Neo 16 Raptor Lake | |
| Razer Blade 18 RTX 4070 | |
| Asus ROG Strix Scar 18 2023 G834JY-N6005W | |
| Média da turma Gaming (39258 - 247074, n=105, últimos 2 anos) | |
| Dell Precision 7000 7670 Performance | |
| AIDA64 / CPU ZLib | |
| Intel Core i9-13900K @253W | |
| MSI Titan GT77 HX 13VI | |
| Asus ROG Strix Scar 18 2023 G834JY-N6005W | |
| Intel NUC13 Raptor Canyon | |
| Lenovo Legion Pro 7 16IRX8H | |
| Média Intel Core i9-13980HX (1513 - 2039, n=9) | |
| Schenker XMG Neo 16 Raptor Lake | |
| Razer Blade 16 Early 2023 | |
| Razer Blade 16 Early 2023 | |
| Razer Blade 16 Early 2023 | |
| Razer Blade 18 RTX 4070 | |
| Asus ROG Strix Scar 18 2023 G834JY-N6005W | |
| Média da turma Gaming (574 - 2531, n=105, últimos 2 anos) | |
| MSI Raider GE77 HX 12UHS | |
| Asus ROG Strix Scar 17 SE G733CX-LL014W | |
| Dell Precision 7000 7670 Performance | |
| AIDA64 / FP64 Ray-Trace | |
| Intel Core i9-13900K @253W | |
| Média da turma Gaming (5509 - 45446, n=105, últimos 2 anos) | |
| MSI Titan GT77 HX 13VI | |
| Asus ROG Strix Scar 18 2023 G834JY-N6005W | |
| Intel NUC13 Raptor Canyon | |
| Lenovo Legion Pro 7 16IRX8H | |
| Média Intel Core i9-13980HX (11431 - 16325, n=9) | |
| Schenker XMG Neo 16 Raptor Lake | |
| Razer Blade 18 RTX 4070 | |
| Razer Blade 16 Early 2023 | |
| Razer Blade 16 Early 2023 | |
| Razer Blade 16 Early 2023 | |
| Asus ROG Strix Scar 18 2023 G834JY-N6005W | |
| MSI Raider GE77 HX 12UHS | |
| Asus ROG Strix Scar 17 SE G733CX-LL014W | |
| Dell Precision 7000 7670 Performance | |
| AIDA64 / CPU PhotoWorxx | |
| Razer Blade 16 Early 2023 | |
| Razer Blade 16 Early 2023 | |
| Razer Blade 16 Early 2023 | |
| Razer Blade 18 RTX 4070 | |
| Intel Core i9-13900K @253W | |
| Lenovo Legion Pro 7 16IRX8H | |
| MSI Raider GE77 HX 12UHS | |
| Média Intel Core i9-13980HX (37069 - 52949, n=9) | |
| Intel NUC13 Raptor Canyon | |
| Média da turma Gaming (12271 - 89891, n=105, últimos 2 anos) | |
| Schenker XMG Neo 16 Raptor Lake | |
| Asus ROG Strix Scar 18 2023 G834JY-N6005W | |
| Asus ROG Strix Scar 18 2023 G834JY-N6005W | |
| Dell Precision 7000 7670 Performance | |
| Asus ROG Strix Scar 17 SE G733CX-LL014W | |
| MSI Titan GT77 HX 13VI | |
AIDA64: FP32 Ray-Trace | FPU Julia | CPU SHA3 | CPU Queen | FPU SinJulia | FPU Mandel | CPU AES | CPU ZLib | FP64 Ray-Trace | CPU PhotoWorxx
Desempenho do sistema
O poderoso hardware também é capaz de pontuar no desempenho geral do sistema. No PCMark 10, o Scar 18 atinge uma posição superior que atualmente é apenas pouco ultrapassada pelos poderosos desktops e o MSI Titan GT77 HX 13VI. No CrossMark, o resultado também está na classe superior. Mesmo que alguns laptops sejam capazes de se posicionar à frente do Strix Scar 18, a distância é muito pequena a um máximo de 4% (com o MSI Titan GT77 12UHS atualmente como o laptop mais rápido, e o desktop mais rápido alcançando um resultado 24% maior).
Na referência de armazenamento, você pode ver facilmente o impacto do armazenamento DDR5-4800. Os sistemas com a memória principal mais rápida DDR5-5600 como o Razer Blade 16 ainda são capazes de alcançar uma vantagem significativa. Esta é uma das poucas áreas onde o Asus não usa os componentes mais rápidos disponíveis, mas o impacto é relativamente baixo na prática.
CrossMark: Overall | Productivity | Creativity | Responsiveness
| PCMark 10 / Score | |
| Intel NUC13 Raptor Canyon | |
| MSI Titan GT77 HX 13VI | |
| Média Intel Core i9-13980HX, NVIDIA GeForce RTX 4090 Laptop GPU (8650 - 9068, n=4) | |
| Asus ROG Strix Scar 18 2023 G834JY-N6005W | |
| Média da turma Gaming (5828 - 12414, n=93, últimos 2 anos) | |
| Razer Blade 16 Early 2023 | |
| Lenovo Legion Pro 7 16IRX8H | |
| Razer Blade 18 RTX 4070 | |
| Asus ROG Strix Scar 17 SE G733CX-LL014W | |
| MSI Raider GE77 HX 12UHS | |
| Dell Precision 7000 7670 Performance | |
| PCMark 10 / Essentials | |
| MSI Titan GT77 HX 13VI | |
| Lenovo Legion Pro 7 16IRX8H | |
| Razer Blade 18 RTX 4070 | |
| Intel NUC13 Raptor Canyon | |
| Dell Precision 7000 7670 Performance | |
| Média Intel Core i9-13980HX, NVIDIA GeForce RTX 4090 Laptop GPU (11215 - 11644, n=3) | |
| Razer Blade 16 Early 2023 | |
| Média da turma Gaming (8810 - 11935, n=97, últimos 2 anos) | |
| Asus ROG Strix Scar 17 SE G733CX-LL014W | |
| MSI Raider GE77 HX 12UHS | |
| PCMark 10 / Productivity | |
| Média da turma Gaming (6845 - 25323, n=95, últimos 2 anos) | |
| Intel NUC13 Raptor Canyon | |
| Lenovo Legion Pro 7 16IRX8H | |
| Média Intel Core i9-13980HX, NVIDIA GeForce RTX 4090 Laptop GPU (10125 - 11067, n=3) | |
| Asus ROG Strix Scar 17 SE G733CX-LL014W | |
| MSI Titan GT77 HX 13VI | |
| MSI Raider GE77 HX 12UHS | |
| Razer Blade 18 RTX 4070 | |
| Razer Blade 16 Early 2023 | |
| Dell Precision 7000 7670 Performance | |
| PCMark 10 / Digital Content Creation | |
| MSI Titan GT77 HX 13VI | |
| Intel NUC13 Raptor Canyon | |
| Média Intel Core i9-13980HX, NVIDIA GeForce RTX 4090 Laptop GPU (15052 - 16012, n=3) | |
| Razer Blade 16 Early 2023 | |
| Média da turma Gaming (7602 - 19954, n=95, últimos 2 anos) | |
| Razer Blade 18 RTX 4070 | |
| Lenovo Legion Pro 7 16IRX8H | |
| Asus ROG Strix Scar 17 SE G733CX-LL014W | |
| MSI Raider GE77 HX 12UHS | |
| Dell Precision 7000 7670 Performance | |
| CrossMark / Overall | |
| Intel Core i9-13900K @253W | |
| Intel NUC13 Raptor Canyon | |
| MSI Raider GE77 HX 12UHS | |
| MSI Titan GT77 HX 13VI | |
| Razer Blade 18 RTX 4070 | |
| Asus ROG Strix Scar 17 SE G733CX-LL014W | |
| Asus ROG Strix Scar 18 2023 G834JY-N6005W | |
| Média Intel Core i9-13980HX, NVIDIA GeForce RTX 4090 Laptop GPU (1935 - 2176, n=4) | |
| Asus ROG Strix Scar 18 2023 G834JY-N6005W | |
| Schenker XMG Neo 16 Raptor Lake | |
| Média da turma Gaming (1366 - 2409, n=94, últimos 2 anos) | |
| Dell Precision 7000 7670 Performance | |
| Razer Blade 16 Early 2023 | |
| CrossMark / Productivity | |
| Intel Core i9-13900K @253W | |
| Intel NUC13 Raptor Canyon | |
| MSI Raider GE77 HX 12UHS | |
| MSI Titan GT77 HX 13VI | |
| Razer Blade 18 RTX 4070 | |
| Asus ROG Strix Scar 17 SE G733CX-LL014W | |
| Asus ROG Strix Scar 18 2023 G834JY-N6005W | |
| Média Intel Core i9-13980HX, NVIDIA GeForce RTX 4090 Laptop GPU (1764 - 2005, n=4) | |
| Asus ROG Strix Scar 18 2023 G834JY-N6005W | |
| Média da turma Gaming (1386 - 2254, n=94, últimos 2 anos) | |
| Schenker XMG Neo 16 Raptor Lake | |
| Dell Precision 7000 7670 Performance | |
| Razer Blade 16 Early 2023 | |
| CrossMark / Creativity | |
| Intel Core i9-13900K @253W | |
| Intel NUC13 Raptor Canyon | |
| Asus ROG Strix Scar 18 2023 G834JY-N6005W | |
| MSI Titan GT77 HX 13VI | |
| Média Intel Core i9-13980HX, NVIDIA GeForce RTX 4090 Laptop GPU (2267 - 2469, n=4) | |
| Razer Blade 18 RTX 4070 | |
| Asus ROG Strix Scar 18 2023 G834JY-N6005W | |
| Schenker XMG Neo 16 Raptor Lake | |
| Asus ROG Strix Scar 17 SE G733CX-LL014W | |
| MSI Raider GE77 HX 12UHS | |
| Média da turma Gaming (1343 - 2786, n=94, últimos 2 anos) | |
| Dell Precision 7000 7670 Performance | |
| Razer Blade 16 Early 2023 | |
| CrossMark / Responsiveness | |
| Intel Core i9-13900K @253W | |
| MSI Raider GE77 HX 12UHS | |
| Asus ROG Strix Scar 17 SE G733CX-LL014W | |
| Intel NUC13 Raptor Canyon | |
| Razer Blade 18 RTX 4070 | |
| MSI Titan GT77 HX 13VI | |
| Média da turma Gaming (1226 - 2334, n=94, últimos 2 anos) | |
| Média Intel Core i9-13980HX, NVIDIA GeForce RTX 4090 Laptop GPU (1556 - 1904, n=4) | |
| Asus ROG Strix Scar 18 2023 G834JY-N6005W | |
| Asus ROG Strix Scar 18 2023 G834JY-N6005W | |
| Schenker XMG Neo 16 Raptor Lake | |
| Dell Precision 7000 7670 Performance | |
| Razer Blade 16 Early 2023 | |
CrossMark: Overall | Productivity | Creativity | Responsiveness
| PCMark 10 Score | 8764 pontos | |
Ajuda | ||
| AIDA64 / Memory Copy | |
| Razer Blade 16 Early 2023 | |
| Razer Blade 16 Early 2023 | |
| Razer Blade 16 Early 2023 | |
| Lenovo Legion Pro 7 16IRX8H | |
| Razer Blade 18 RTX 4070 | |
| Intel Core i9-13900K @253W | |
| Média da turma Gaming (21750 - 129946, n=105, últimos 2 anos) | |
| Média Intel Core i9-13980HX (62189 - 80776, n=9) | |
| MSI Raider GE77 HX 12UHS | |
| Intel NUC13 Raptor Canyon | |
| Asus ROG Strix Scar 18 2023 G834JY-N6005W | |
| Schenker XMG Neo 16 Raptor Lake | |
| Asus ROG Strix Scar 18 2023 G834JY-N6005W | |
| Dell Precision 7000 7670 Performance | |
| MSI Titan GT77 HX 13VI | |
| Asus ROG Strix Scar 17 SE G733CX-LL014W | |
| AIDA64 / Memory Read | |
| Razer Blade 16 Early 2023 | |
| Razer Blade 16 Early 2023 | |
| Razer Blade 16 Early 2023 | |
| Razer Blade 18 RTX 4070 | |
| Lenovo Legion Pro 7 16IRX8H | |
| Intel Core i9-13900K @253W | |
| Média Intel Core i9-13980HX (62624 - 89096, n=9) | |
| Schenker XMG Neo 16 Raptor Lake | |
| Asus ROG Strix Scar 18 2023 G834JY-N6005W | |
| Asus ROG Strix Scar 18 2023 G834JY-N6005W | |
| Média da turma Gaming (22956 - 118858, n=105, últimos 2 anos) | |
| Intel NUC13 Raptor Canyon | |
| MSI Raider GE77 HX 12UHS | |
| Asus ROG Strix Scar 17 SE G733CX-LL014W | |
| Dell Precision 7000 7670 Performance | |
| MSI Titan GT77 HX 13VI | |
| AIDA64 / Memory Write | |
| Razer Blade 16 Early 2023 | |
| Razer Blade 16 Early 2023 | |
| Razer Blade 16 Early 2023 | |
| Média da turma Gaming (22297 - 135096, n=105, últimos 2 anos) | |
| Razer Blade 18 RTX 4070 | |
| Intel Core i9-13900K @253W | |
| Lenovo Legion Pro 7 16IRX8H | |
| Média Intel Core i9-13980HX (59912 - 79917, n=9) | |
| Intel NUC13 Raptor Canyon | |
| Schenker XMG Neo 16 Raptor Lake | |
| Asus ROG Strix Scar 18 2023 G834JY-N6005W | |
| MSI Raider GE77 HX 12UHS | |
| Asus ROG Strix Scar 18 2023 G834JY-N6005W | |
| Asus ROG Strix Scar 17 SE G733CX-LL014W | |
| Dell Precision 7000 7670 Performance | |
| MSI Titan GT77 HX 13VI | |
| AIDA64 / Memory Latency | |
| Média da turma Gaming (75.3 - 259, n=105, últimos 2 anos) | |
| Razer Blade 16 Early 2023 | |
| Razer Blade 16 Early 2023 | |
| Razer Blade 16 Early 2023 | |
| Intel NUC13 Raptor Canyon | |
| MSI Titan GT77 HX 13VI | |
| Schenker XMG Neo 16 Raptor Lake | |
| Asus ROG Strix Scar 18 2023 G834JY-N6005W | |
| Asus ROG Strix Scar 18 2023 G834JY-N6005W | |
| Média Intel Core i9-13980HX (79.4 - 93.2, n=9) | |
| Asus ROG Strix Scar 17 SE G733CX-LL014W | |
| Dell Precision 7000 7670 Performance | |
| Razer Blade 18 RTX 4070 | |
| MSI Raider GE77 HX 12UHS | |
| Lenovo Legion Pro 7 16IRX8H | |
| Intel Core i9-13900K @253W | |
* ... menor é melhor
Latências DPC
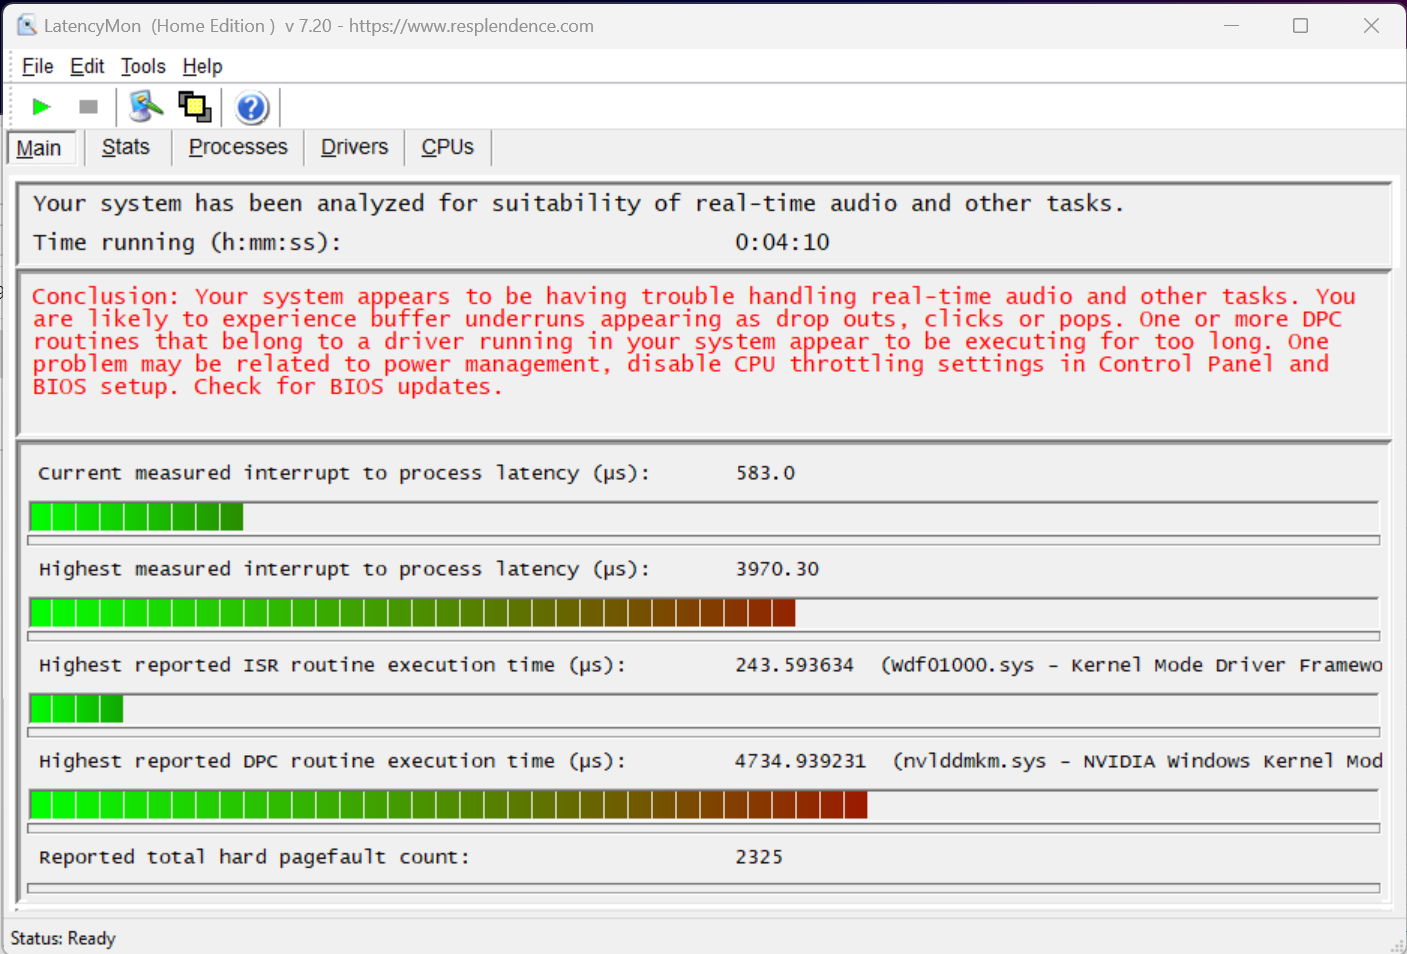
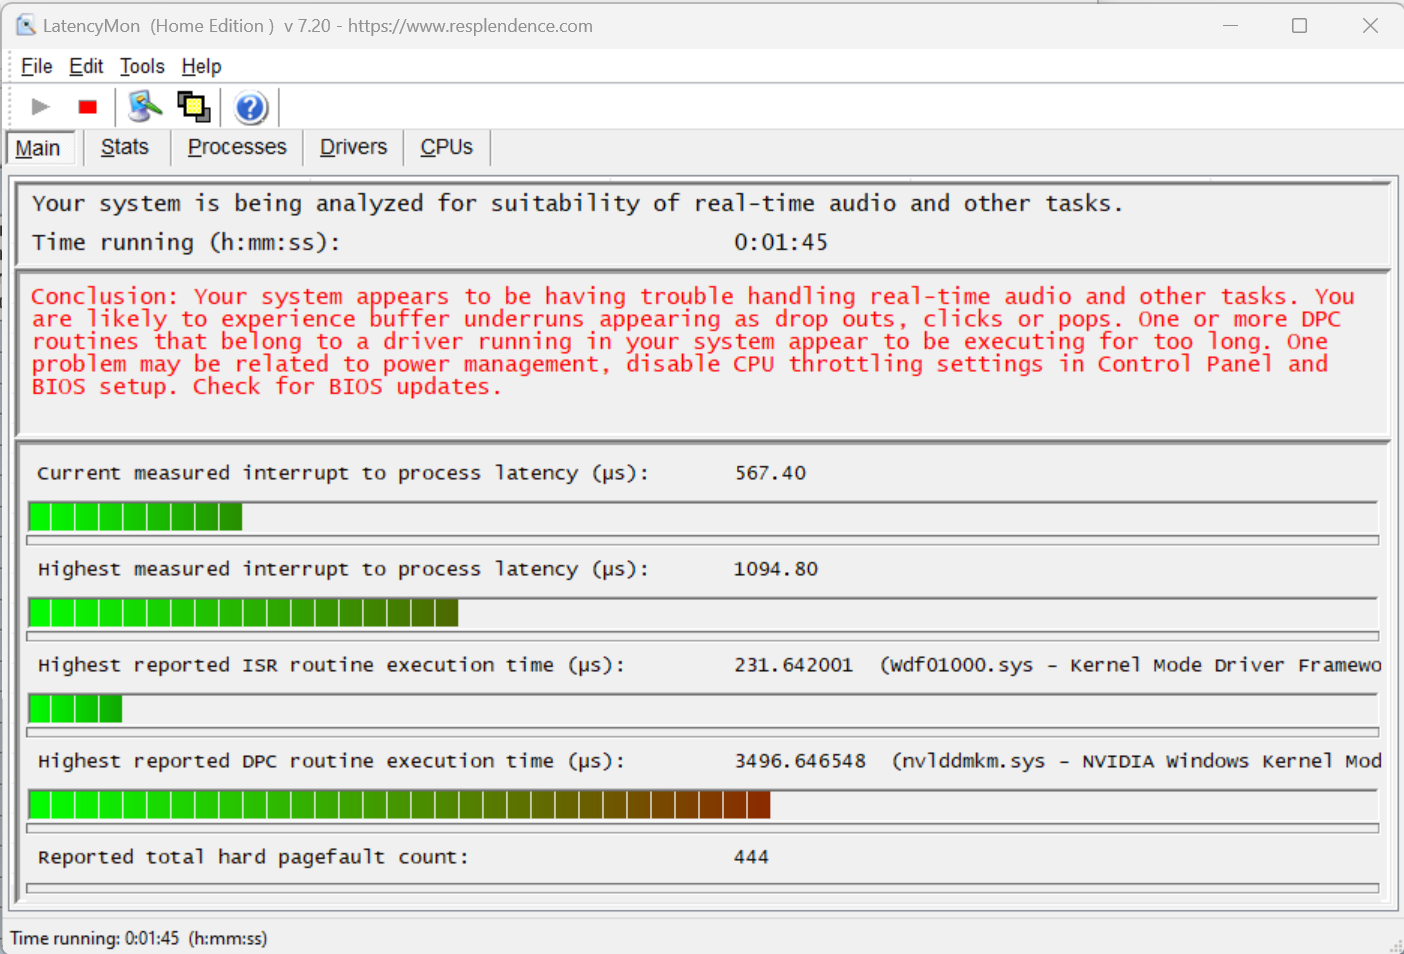
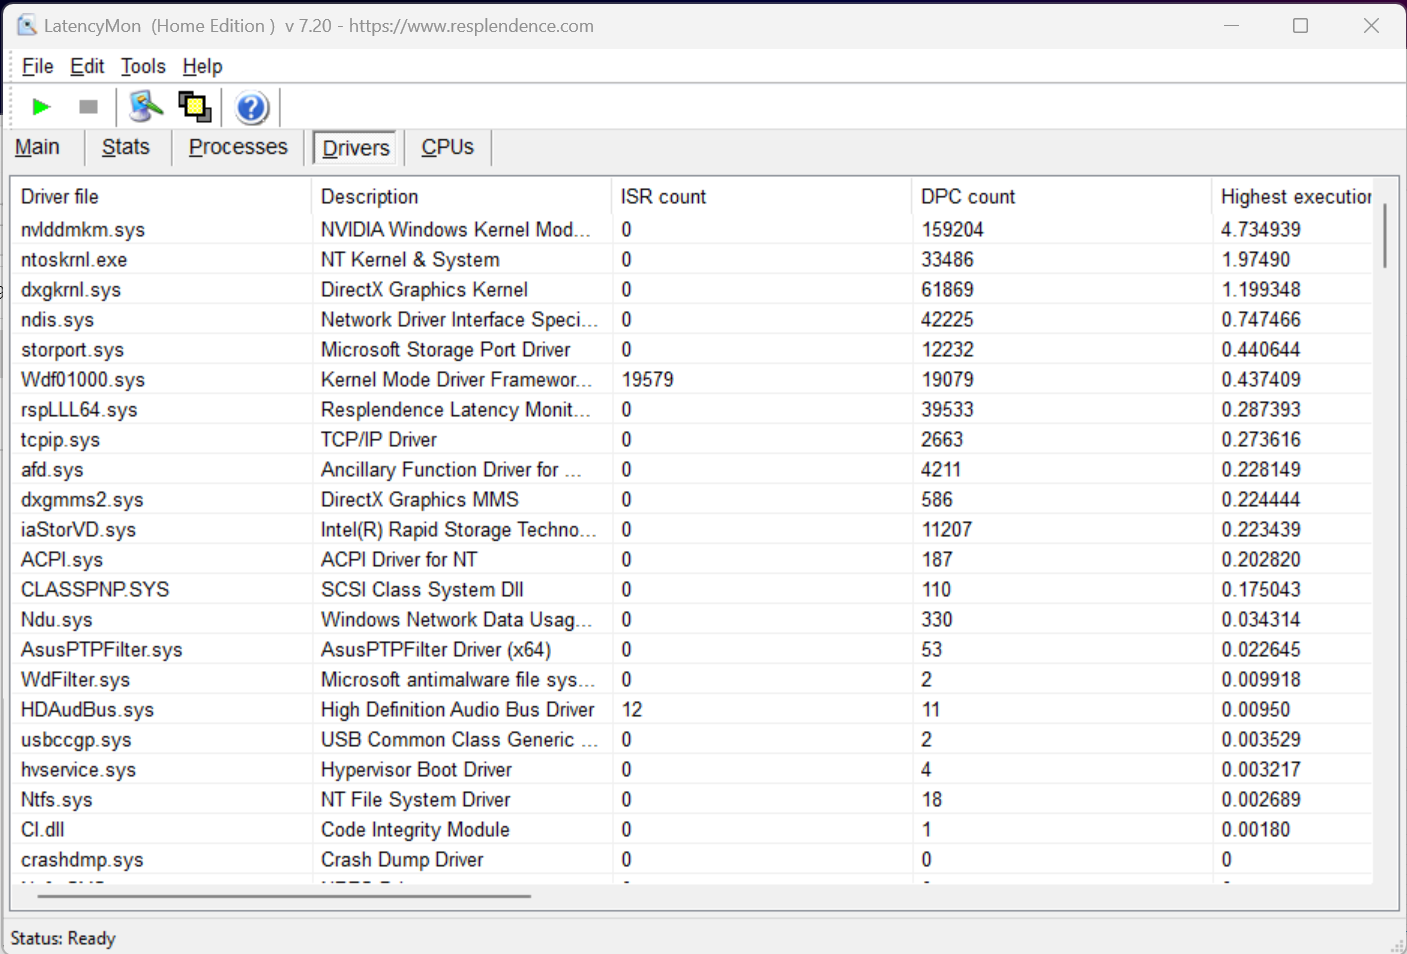
Nas latências do DPC, o laptop Asus só coloca o Asus no meio do campo de todos os laptops testados. De acordo com LatencyMon, o driver Nvidia está em falta aqui, o que pode criar alguns problemas em aplicações em tempo real. Executamos nossos testes em modo Turbo com GPU Ultimate (sem Optimus), que teoricamente é mais adequado do que o modo híbrido ou modo de economia de energia. Infelizmente, o fraco desempenho do DPC não é uma exceção nesta classe de dispositivos.
| DPC Latencies / LatencyMon - interrupt to process latency (max), Web, Youtube, Prime95 | |
| MSI Titan GT77 HX 13VI | |
| Asus ROG Strix Scar 17 SE G733CX-LL014W | |
| Razer Blade 16 Early 2023 | |
| Dell Precision 7000 7670 Performance | |
| MSI Raider GE77 HX 12UHS | |
| Razer Blade 18 RTX 4070 | |
| Asus ROG Strix Scar 18 2023 G834JY-N6005W | |
| Lenovo Legion Pro 7 16IRX8H | |
* ... menor é melhor
Solução de armazenamento
A Asus usa dois SSDs Samsung PM9A1 rápidos, cada um com 1 TB de armazenamento, em um sistema RAID-0 no Scar 18 G834JY-N6005W. Mesmo que a velocidade seja ligeiramente aumentada com isto, a probabilidade de falha e o consumo de energia também aumenta. Entretanto, na comparação com o Legion 5 Pro 16IAH7H com o mesmo sistema RAID, o Asus Scar é ultrapassado - mesmo por uma margem significativa. Mas isto não se deve a problemas térmicos, e o desempenho permanece constante sob carga constante.

* ... menor é melhor
Disk Throttling: DiskSpd Read Loop, Queue Depth 8
Placa Gráfica
A peça de exposição no Asus ROG Strix Scar 18 é claramente o Nvidia GeForce RTX 4090 GPU para notebook. Embora o nome sugira uma semelhança com o GPU de mesa RTX 4090a versão móvel está relacionada com o Desktop RTX 4080 (mesmo chip), e o desempenho permanece inferior ao de um desktop RTX 4070 Ti. Mas, pelo menos, a Asus oferece a versão mais rápida do RTX 4090 Mobile com 175 watts TGP (150 watts + 25 watts Dynamic Boost) e até mesmo overclock a GPU ligeiramente em 50 MHz.
Em comparação com o RTX 4090 noMSI Titan GT77 HX 13VIo Strix G18 ainda mal se posiciona atrás, apesar do overclocking. Os laptops RTX 4080 também são claramente superados, e os laptops com o antigo GPU para laptop RTX 3080 Timodelo superior permanecem muito atrás.
| 3DMark 06 Standard Score | 67702 pontos | |
| 3DMark 11 Performance | 46985 pontos | |
| 3DMark Ice Storm Standard Score | 277937 pontos | |
| 3DMark Cloud Gate Standard Score | 70984 pontos | |
| 3DMark Fire Strike Score | 36408 pontos | |
| 3DMark Fire Strike Extreme Score | 24278 pontos | |
| 3DMark Time Spy Score | 20166 pontos | |
Ajuda | ||
* ... menor é melhor
Desempenho nos jogos
Os benchmarks dos jogos revelam um quadro semelhante ao já existente nos benchmarks sintéticos. Como uma característica especial, a série RTX 4000 agora também oferece suporte para DLSS 3 com geração de quadros. Nos jogos suportados, o RTX 4090 é capaz de dar um impulso significativo nas taxas de quadros aqui. Isto também torna possível efeitos de traçado de raio em 4K com taxas de quadros suaves. Entretanto, os 240 Hz da tela só podem ser totalmente utilizados em jogos menos exigentes na resolução nativa de 2.560 x 1.600 pixels.
| GTA V - 1920x1080 Highest AA:4xMSAA + FX AF:16x | |
| Intel NUC13 Raptor Canyon | |
| Lenovo Legion Pro 7 16IRX8H | |
| Asus ROG Strix Scar 18 2023 G834JY-N6005W | |
| Asus ROG Strix Scar 18 2023 G834JY-N6005W | |
| MSI Titan GT77 HX 13VI | |
| Razer Blade 16 Early 2023 | |
| Schenker XMG Neo 16 Raptor Lake | |
| MSI Raider GE77 HX 12UHS | |
| Média da turma Gaming (48.3 - 186.9, n=94, últimos 2 anos) | |
| Asus ROG Strix Scar 17 SE G733CX-LL014W | |
| Razer Blade 18 RTX 4070 | |
| Dell Precision 7000 7670 Performance | |
| Final Fantasy XV Benchmark - 1920x1080 High Quality | |
| MSI Titan GT77 HX 13VI | |
| Schenker XMG Neo 16 Raptor Lake | |
| Intel NUC13 Raptor Canyon | |
| Asus ROG Strix Scar 18 2023 G834JY-N6005W | |
| Asus ROG Strix Scar 18 2023 G834JY-N6005W | |
| Lenovo Legion Pro 7 16IRX8H | |
| Razer Blade 16 Early 2023 | |
| Média da turma Gaming (41 - 215, n=95, últimos 2 anos) | |
| MSI Raider GE77 HX 12UHS | |
| Asus ROG Strix Scar 17 SE G733CX-LL014W | |
| Razer Blade 18 RTX 4070 | |
| Dell Precision 7000 7670 Performance | |
| Strange Brigade - 1920x1080 ultra AA:ultra AF:16 | |
| MSI Titan GT77 HX 13VI | |
| Asus ROG Strix Scar 18 2023 G834JY-N6005W | |
| Intel NUC13 Raptor Canyon | |
| Schenker XMG Neo 16 Raptor Lake | |
| Asus ROG Strix Scar 18 2023 G834JY-N6005W | |
| Razer Blade 16 Early 2023 | |
| Lenovo Legion Pro 7 16IRX8H | |
| Média da turma Gaming (76.3 - 458, n=87, últimos 2 anos) | |
| Asus ROG Strix Scar 17 SE G733CX-LL014W | |
| MSI Raider GE77 HX 12UHS | |
| Razer Blade 18 RTX 4070 | |
| Dell Precision 7000 7670 Performance | |
| Dota 2 Reborn - 1920x1080 ultra (3/3) best looking | |
| Intel NUC13 Raptor Canyon | |
| Razer Blade 16 Early 2023 | |
| Asus ROG Strix Scar 18 2023 G834JY-N6005W | |
| Asus ROG Strix Scar 18 2023 G834JY-N6005W | |
| MSI Titan GT77 HX 13VI | |
| Lenovo Legion Pro 7 16IRX8H | |
| Razer Blade 18 RTX 4070 | |
| Schenker XMG Neo 16 Raptor Lake | |
| Asus ROG Strix Scar 17 SE G733CX-LL014W | |
| MSI Raider GE77 HX 12UHS | |
| Média da turma Gaming (84.8 - 248, n=107, últimos 2 anos) | |
| Dell Precision 7000 7670 Performance | |
Em nosso teste de carga com o The Witcher 3 e também no teste de estresse 3DMark Time Spy, o Asus G834JY mantém um desempenho estável sem nenhuma queda. As flutuações visíveis no The Witcher 3 são devidas às mudanças entre o dia e a noite.
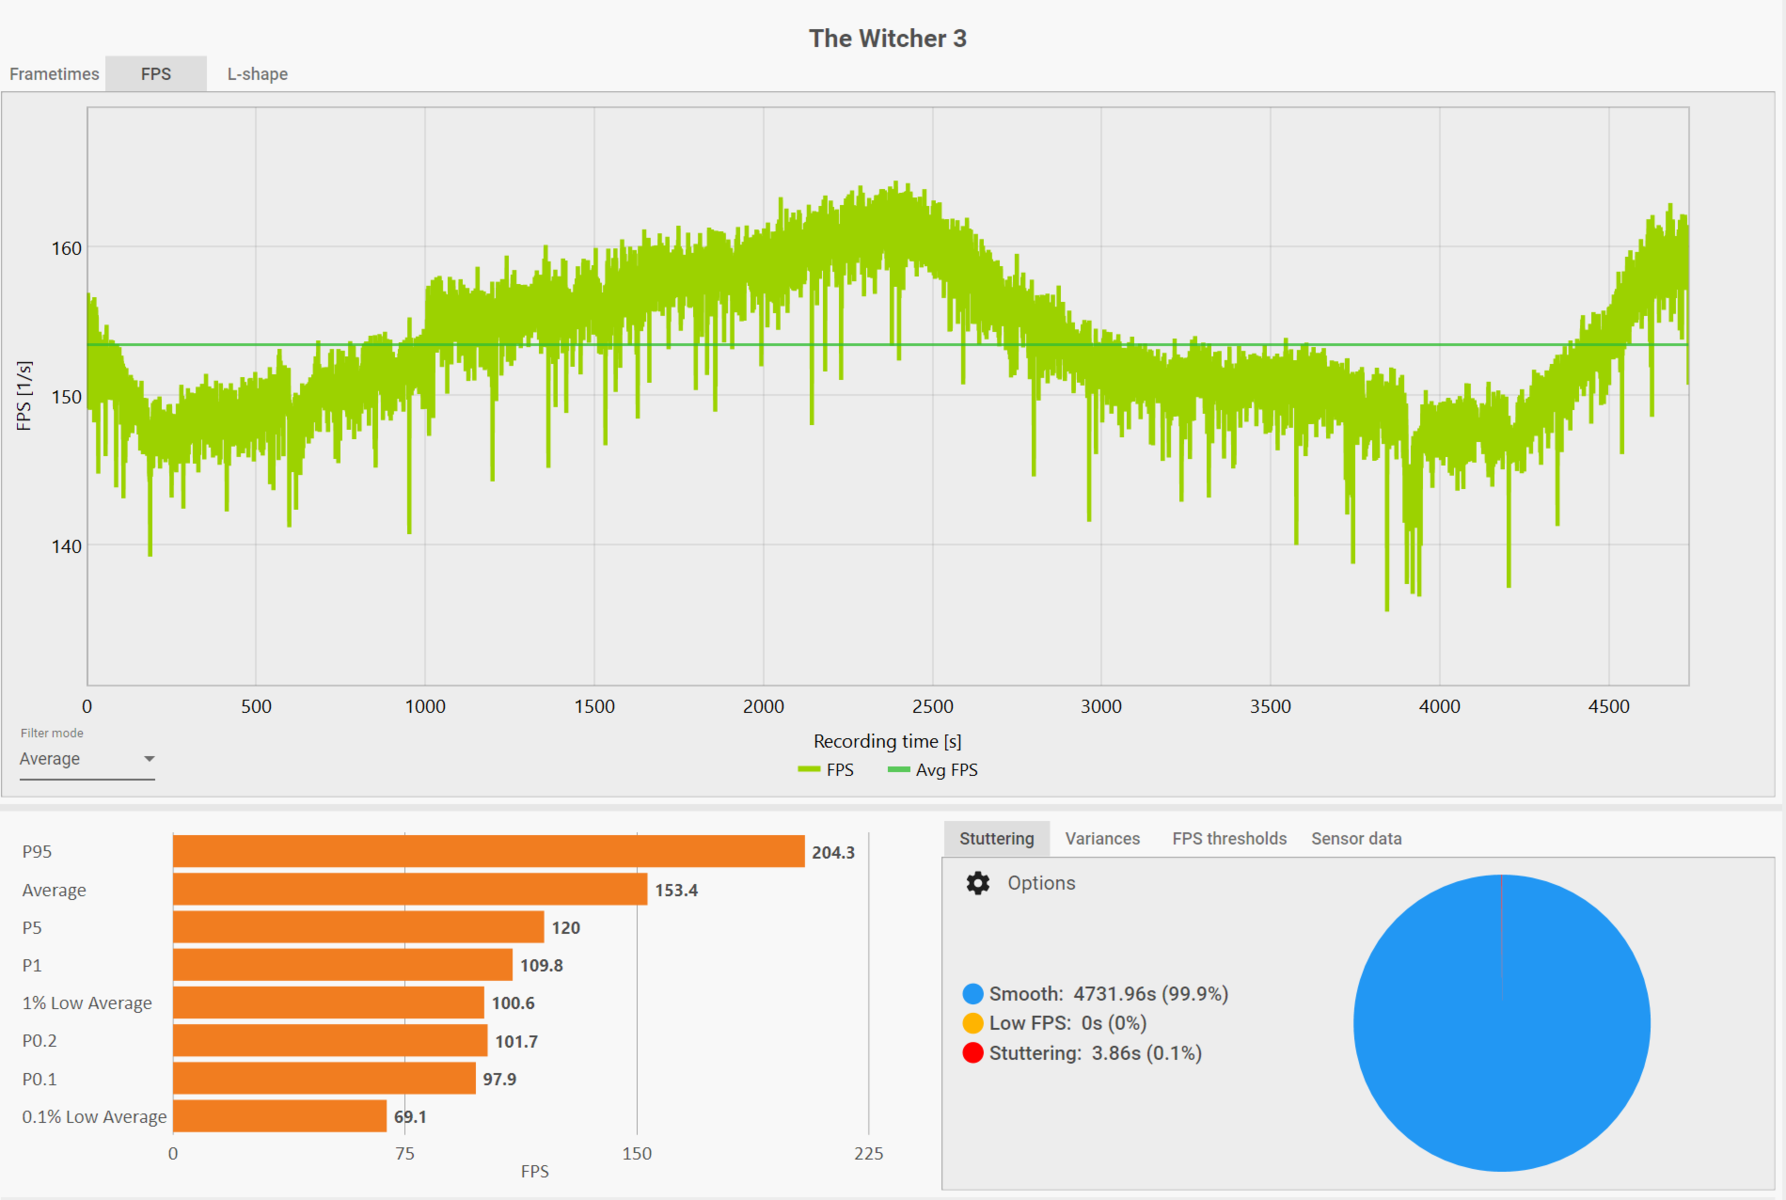
The Witcher 3 FPS Chart
| baixo | média | alto | ultra | QHD | 4K DLSS | 4K | |
|---|---|---|---|---|---|---|---|
| Counter-Strike: GO (2012) | 516 | 314 | |||||
| GTA V (2015) | 187.4 | 185.7 | 184.8 | 141.3 | 139.1 | 175.7 | |
| Dota 2 Reborn (2015) | 237 | 207.7 | 201.75 | 190.2 | 178.6 | ||
| Deus Ex Mankind Divided (2016) | 169 | ||||||
| Final Fantasy XV Benchmark (2018) | 224 | 208 | 177.6 | 146.7 | 90.1 | ||
| X-Plane 11.11 (2018) | 211 | 186.8 | 142.8 | ||||
| Far Cry 5 (2018) | 197 | 181 | 172 | 158 | 153 | 107 | |
| Strange Brigade (2018) | 496 | 403 | 386 | 366 | 292 | 154.7 | |
| Shadow of the Tomb Raider (2018) | 143.7 | 121.2 | 87.3 | ||||
| Control (2019) | 184.4 | 123.2 | 72.6 | ||||
| Horizon Zero Dawn (2020) | 184 | 154 | 145 | 127 | 92 | ||
| Flight Simulator 2020 (2020) | 74 | 74 | 96.8 | 51.2 | |||
| Battlefield 2042 (2021) | 172.6 | 138.9 | 85.4 | ||||
| Halo Infinite (2021) | 128.9 | 77 | 57.3 | ||||
| Elden Ring (2022) | 60 | 60 | 60 | 60 | 60 | 60 | |
| Cyberpunk 2077 1.6 (2022) | 119.7 | 94.5 | |||||
| Vampire Bloodhunt (2022) | 290 | 242 | 138.3 | ||||
| F1 22 (2022) | 319 | 308 | 273 | 124.5 | 75 | 42.4 | |
| FIFA 23 (2022) | 183.7 | 182.6 | 162.4 | ||||
| A Plague Tale Requiem (2022) | 96.8 | 72 | 82.3 | 41 | |||
| Uncharted Legacy of Thieves Collection (2022) | 108.2 | 103.1 | 62.9 | ||||
| Call of Duty Modern Warfare 2 2022 (2022) | 170 | 127 | 112 | 81 | |||
| Spider-Man Miles Morales (2022) | 109.1 | 103.8 | 73.2 | ||||
| Need for Speed Unbound (2022) | 124.2 | 111.8 | 84.3 | ||||
| High On Life (2023) | 180.3 | 120.2 | 52 | ||||
| The Witcher 3 v4 (2023) | 137.6 | 96.6 | 49 |
Emissões
Níveis de ruídos
Sob carga, os três ventiladores embutidos estão lutando audivelmente com os componentes poderosos. Embora as características de ruído permaneçam muito confortáveis, até 55,8 dB (ventiladores a 4900, 5500 e 6400 RPM) ainda é muito barulhento. Durante os jogos, o som dos bons alto-falantes pode ser afogado um pouco, sugerindo que você use fones de ouvido aqui. Se você usar o display de 240 Hz nos jogos e ele atingir altas taxas de quadros, nossa unidade de teste infelizmente produz um lamento de bobina claramente perceptível. Isto é audível a partir de 100 fps e pode se tornar um pouco irritante, dependendo do jogo.
Durante a operação ociosa, os três ventiladores também podem permanecer desligados por longos períodos de tempo, mas somente no modo Silencioso e ao utilizar a GPU integrada. Entretanto, a maior parte do tempo eles não permanecem completamente desligados durante a navegação, mas os níveis mais baixos de ventiladores a 2000 - 3000 RPM são confortavelmente silenciosos a menos de 33 dB(A).
Barulho
| Ocioso |
| 23.9 / 32.6 / 32.6 dB |
| Carga |
| 35.9 / 55.8 dB |
 | ||
30 dB silencioso 40 dB(A) audível 50 dB(A) ruidosamente alto |
||
min: | ||
| Asus ROG Strix Scar 18 2023 G834JY-N6005W GeForce RTX 4090 Laptop GPU, i9-13980HX, 2x Samsung PM9A1 MZVL21T0HCLR (RAID 0) | Razer Blade 18 RTX 4070 GeForce RTX 4070 Laptop GPU, i9-13950HX, SSSTC CA6-8D1024 | Lenovo Legion Pro 7 16IRX8H GeForce RTX 4080 Laptop GPU, i9-13900HX, Samsung PM9A1 MZVL21T0HCLR | Razer Blade 16 Early 2023 GeForce RTX 4080 Laptop GPU, i9-13950HX, SSSTC CA6-8D1024 | MSI Titan GT77 HX 13VI GeForce RTX 4090 Laptop GPU, i9-13950HX, Samsung PM9A1 MZVL22T0HBLB | MSI Raider GE77 HX 12UHS GeForce RTX 3080 Ti Laptop GPU, i9-12900HX, Samsung PM9A1 MZVL22T0HBLB | Asus ROG Strix Scar 17 SE G733CX-LL014W GeForce RTX 3080 Ti Laptop GPU, i9-12950HX, Samsung PM9A1 MZVL22T0HBLB | |
|---|---|---|---|---|---|---|---|
| Noise | 8% | -5% | 11% | -9% | -17% | 13% | |
| desligado / ambiente * (dB) | 23.9 | 23.5 2% | 24 -0% | 23 4% | 24.6 -3% | 26 -9% | 23.9 -0% |
| Idle Minimum * (dB) | 23.9 | 23.8 -0% | 26 -9% | 23 4% | 29.2 -22% | 26 -9% | 23.9 -0% |
| Idle Average * (dB) | 32.6 | 23.8 27% | 28 14% | 23 29% | 29.2 10% | 34 -4% | 23.9 27% |
| Idle Maximum * (dB) | 32.6 | 26.8 18% | 34 -4% | 23.6 28% | 29.2 10% | 46 -41% | 23.9 27% |
| Load Average * (dB) | 35.9 | 37.3 -4% | 47 -31% | 39 -9% | 50.7 -41% | 50 -39% | 34.3 4% |
| Load Maximum * (dB) | 55.8 | 53.5 4% | 56 -0% | 51.3 8% | 61 -9% | 57 -2% | 45.9 18% |
| Witcher 3 ultra * (dB) | 48 | 55 | 51.6 | 53.3 | 55 |
* ... menor é melhor
Temperaturas
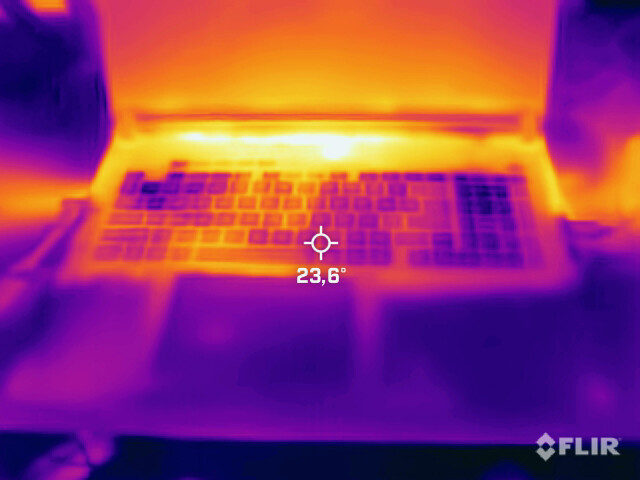
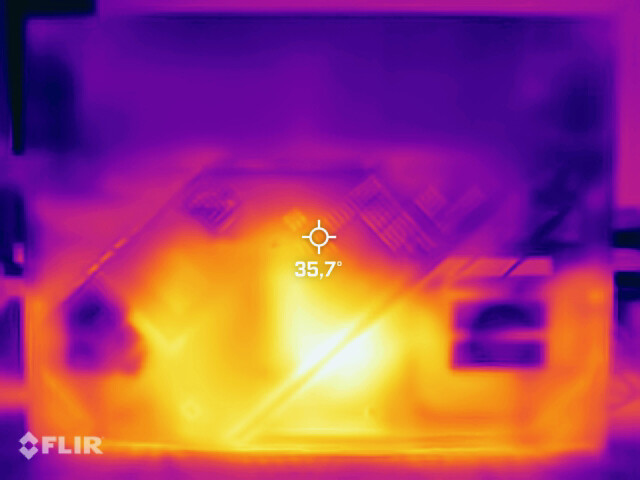
Há resultados mistos nas temperaturas. As áreas relevantes no caso que são tocadas, tais como o descanso da palma e o teclado, permanecem confortavelmente frias, mesmo durante cenários de estresse mais longos. Mas o ponto quente na área superior da caixa fica relativamente quente até 55 °C (131 °F) enquanto se joga.
(-) A temperatura máxima no lado superior é 54 °C / 129 F, em comparação com a média de 40.4 °C / 105 F , variando de 21.2 a 68.8 °C para a classe Gaming.
(-) A parte inferior aquece até um máximo de 46 °C / 115 F, em comparação com a média de 43.2 °C / 110 F
(+) Em uso inativo, a temperatura média para o lado superior é 27.2 °C / 81 F, em comparação com a média do dispositivo de 33.9 °C / ### class_avg_f### F.
(±) Jogando The Witcher 3, a temperatura média para o lado superior é 36 °C / 97 F, em comparação com a média do dispositivo de 33.9 °C / ## #class_avg_f### F.
(+) Os apoios para as mãos e o touchpad são mais frios que a temperatura da pele, com um máximo de 28 °C / 82.4 F e, portanto, são frios ao toque.
(±) A temperatura média da área do apoio para as mãos de dispositivos semelhantes foi 28.8 °C / 83.8 F (+0.8 °C / 1.4 F).
| Asus ROG Strix Scar 18 2023 G834JY-N6005W Intel Core i9-13980HX, NVIDIA GeForce RTX 4090 Laptop GPU | Razer Blade 16 Early 2023 Intel Core i9-13950HX, NVIDIA GeForce RTX 4080 Laptop GPU | MSI Titan GT77 HX 13VI Intel Core i9-13950HX, NVIDIA GeForce RTX 4090 Laptop GPU | MSI Raider GE77 HX 12UHS Intel Core i9-12900HX, NVIDIA GeForce RTX 3080 Ti Laptop GPU | Asus ROG Strix Scar 17 SE G733CX-LL014W Intel Core i9-12950HX, NVIDIA GeForce RTX 3080 Ti Laptop GPU | |
|---|---|---|---|---|---|
| Heat | 9% | 13% | -23% | -4% | |
| Maximum Upper Side * (°C) | 54 | 40 26% | 40.6 25% | 53 2% | 48.8 10% |
| Maximum Bottom * (°C) | 46 | 37.6 18% | 41.1 11% | 58 -26% | 52.4 -14% |
| Idle Upper Side * (°C) | 30 | 32.4 -8% | 26.2 13% | 38 -27% | 30.4 -1% |
| Idle Bottom * (°C) | 31 | 31.4 -1% | 30.3 2% | 43 -39% | 34.1 -10% |
* ... menor é melhor
Teste de estresse
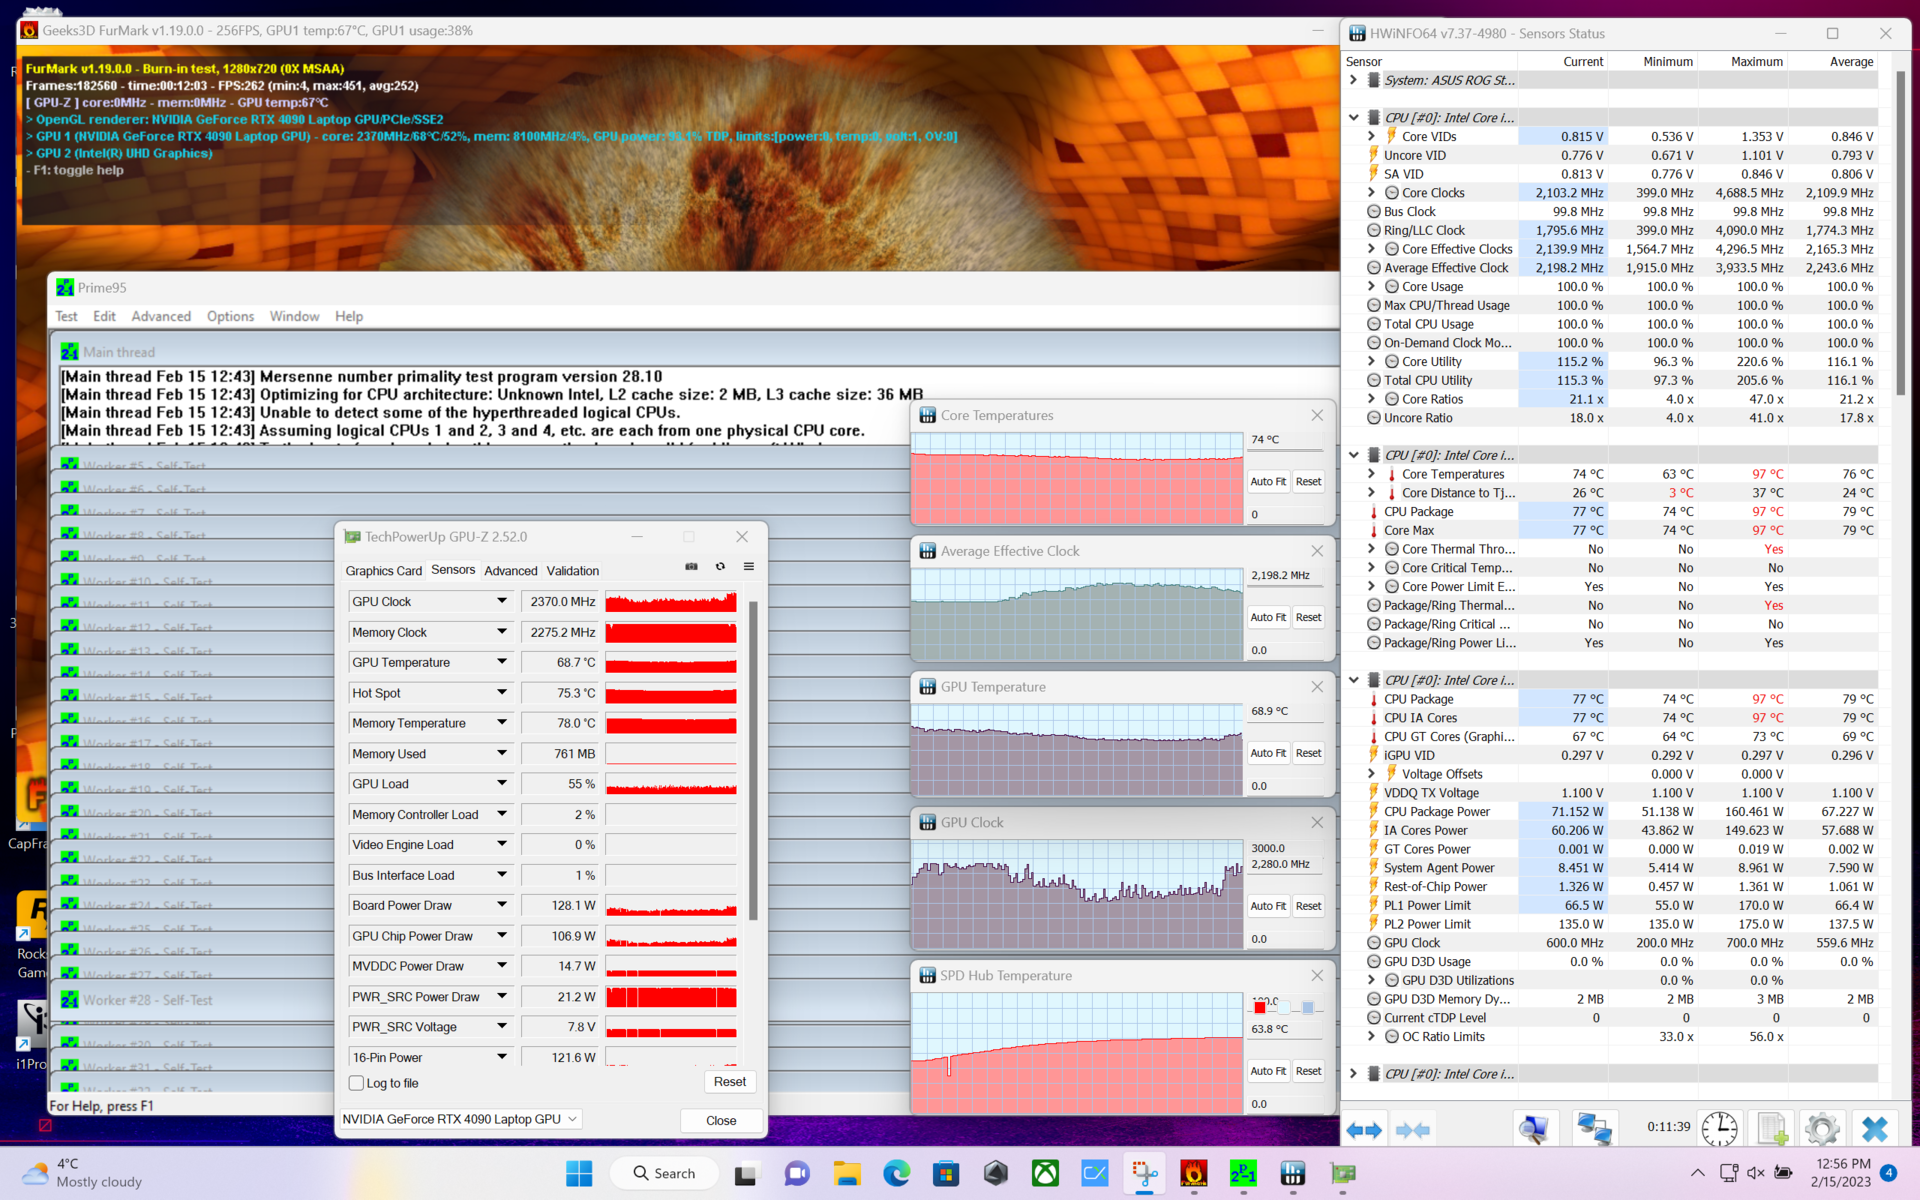
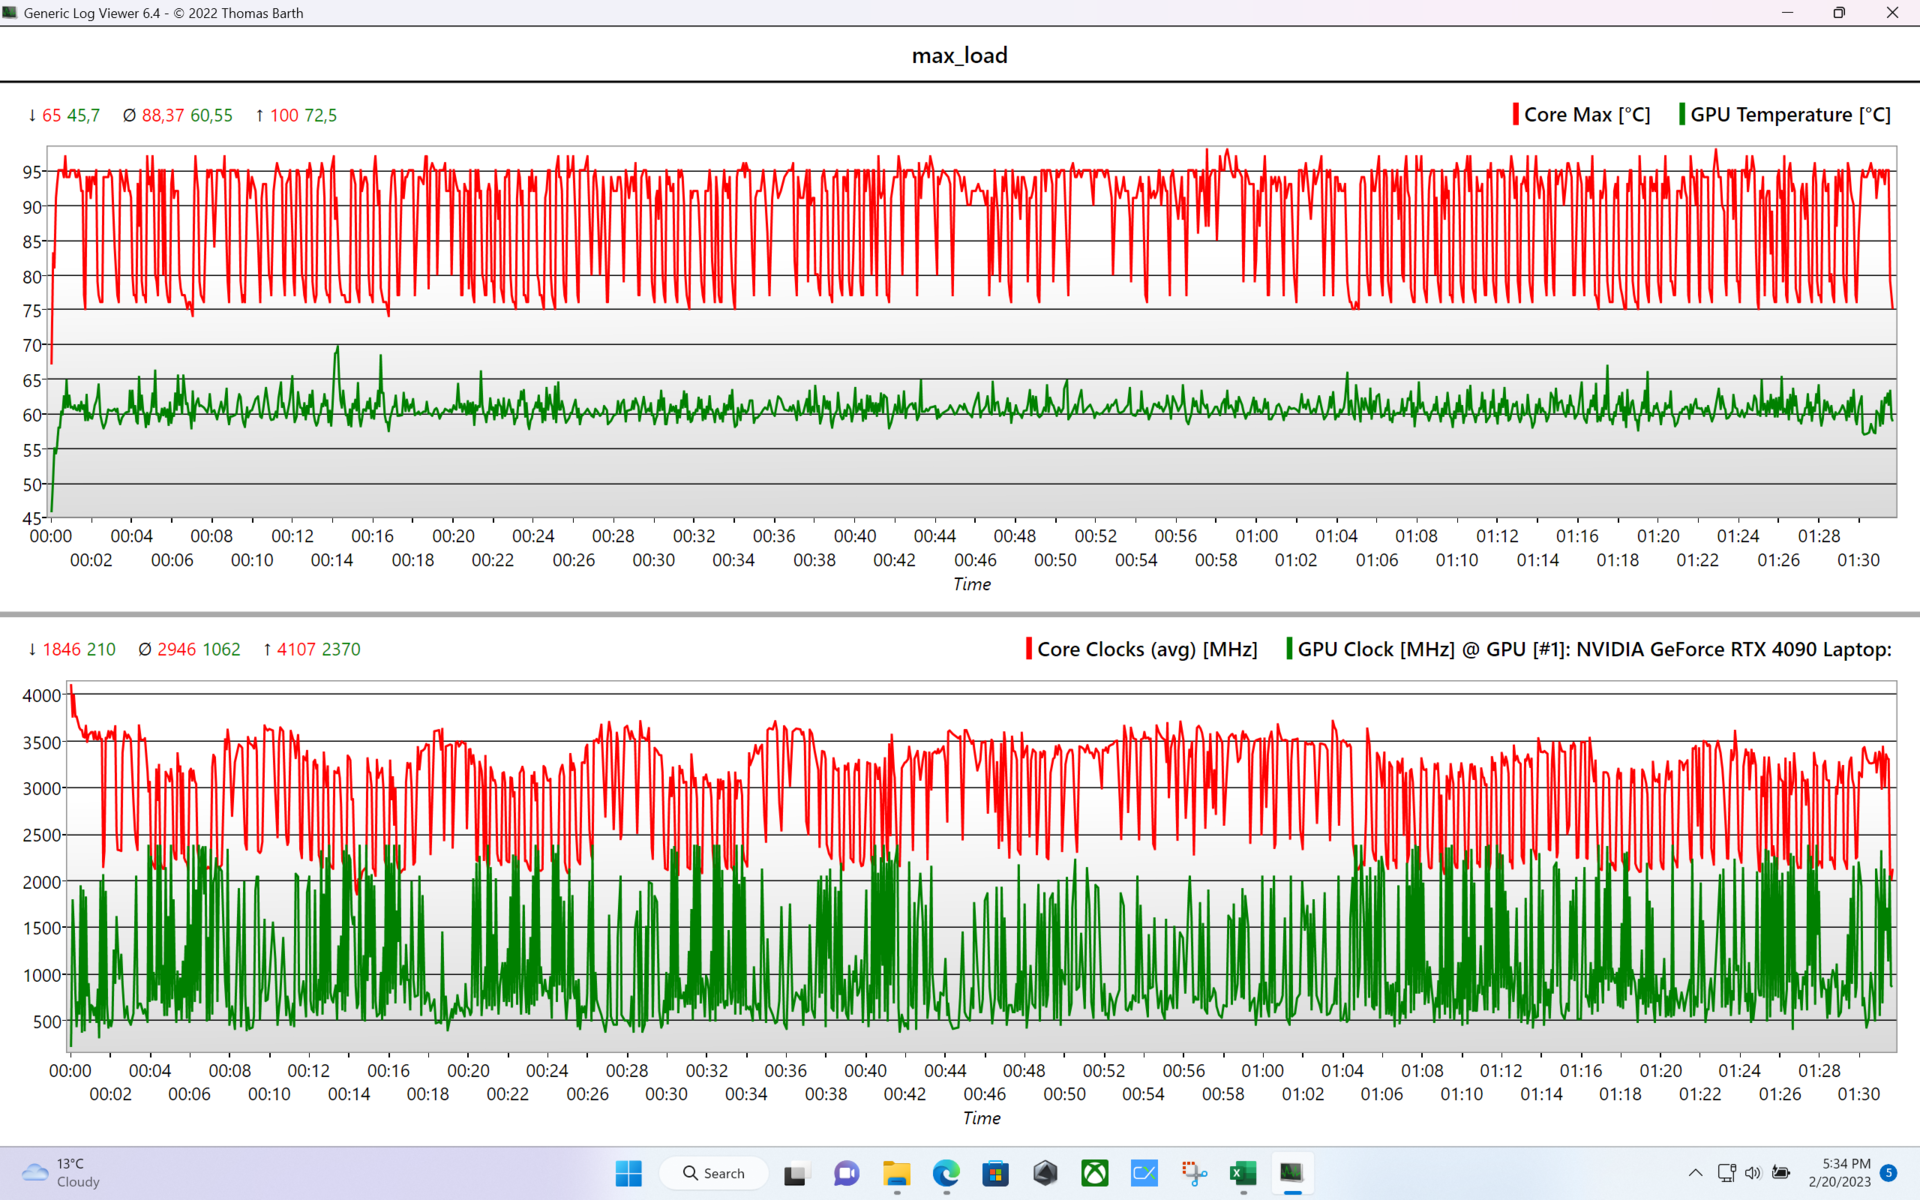
As temperaturas internas da CPU variam fortemente no teste de estresse. Isto pode ser rastreado até as velocidades de relógio constantemente ajustadas que continuam empurrando a CPU para perto da marca de 100-°C (212°F). Na GPU, a situação é consideravelmente menos crítica, e o RTX 4090 só atinge uma temperatura máxima de 70 °C (158 °F).
Enquanto se joga, as temperaturas da CPU permanecem ligeiramente menos extremas. Medimos entre 81 °C (178 °F, Cyberpunk 2077) e 90 °C (194 °F, The Witcher 3). Por outro lado, entre 72 °C (162 °F, Cyberpunk 2077) e 77 °C (171 °F, The Witcher 3), a GPU fica ligeiramente mais quente do que durante o teste de estresse.
| Relógio CPU E-Cores (GHz) | Relógio CPU P-Cores(GHz) | Relógio GPU (MHz) | Temperatura média da CPU (°C) | Temperatura média da GPU (°C) | |
| Sistema ocioso (Silencioso) | 1.4 | 1.8 | 0 | 42 | 0 |
| System Idle (Turbo) | 1.6 | 2.1 | 210 | 44 | 39 |
| Prime95 Stress (Turbo) | 3 | 3.5 | 210 | 92 | 56 |
| Prime95 + FurMark Stress (Turbo) | 1.6 | 2.1 | 2260 | 80 | 73 |
| Witcher 3 Stress | 3.7 | 4.6 | 1995 | 90 | 77 |
Oradores
Os alto-falantes embutidos são relativamente pesados, mas oferecem um desempenho subjetivamente atraente que é adequado para o propósito de jogo do laptop. Em condições diárias, o volume máximo também é suficientemente alto.
Asus ROG Strix Scar 18 2023 G834JY-N6005W análise de áudio
(+) | os alto-falantes podem tocar relativamente alto (###valor### dB)
Graves 100 - 315Hz
(+) | bons graves - apenas 4.8% longe da mediana
(±) | a linearidade dos graves é média (7% delta para a frequência anterior)
Médios 400 - 2.000 Hz
(±) | médios mais altos - em média 9% maior que a mediana
(+) | médios são lineares (5% delta para frequência anterior)
Altos 2 - 16 kHz
(+) | agudos equilibrados - apenas 3.7% longe da mediana
(+) | os máximos são lineares (6.1% delta da frequência anterior)
Geral 100 - 16.000 Hz
(±) | a linearidade do som geral é média (19% diferença em relação à mediana)
Comparado com a mesma classe
» 63% de todos os dispositivos testados nesta classe foram melhores, 8% semelhantes, 28% piores
» O melhor teve um delta de 6%, a média foi 18%, o pior foi 132%
Comparado com todos os dispositivos testados
» 45% de todos os dispositivos testados foram melhores, 7% semelhantes, 47% piores
» O melhor teve um delta de 4%, a média foi 23%, o pior foi 134%
Apple MacBook Pro 16 2021 M1 Pro análise de áudio
(+) | os alto-falantes podem tocar relativamente alto (###valor### dB)
Graves 100 - 315Hz
(+) | bons graves - apenas 3.8% longe da mediana
(+) | o baixo é linear (5.2% delta para a frequência anterior)
Médios 400 - 2.000 Hz
(+) | médios equilibrados - apenas 1.3% longe da mediana
(+) | médios são lineares (2.1% delta para frequência anterior)
Altos 2 - 16 kHz
(+) | agudos equilibrados - apenas 1.9% longe da mediana
(+) | os máximos são lineares (2.7% delta da frequência anterior)
Geral 100 - 16.000 Hz
(+) | o som geral é linear (4.6% diferença em relação à mediana)
Comparado com a mesma classe
» 0% de todos os dispositivos testados nesta classe foram melhores, 0% semelhantes, 100% piores
» O melhor teve um delta de 5%, a média foi 17%, o pior foi 45%
Comparado com todos os dispositivos testados
» 0% de todos os dispositivos testados foram melhores, 0% semelhantes, 100% piores
» O melhor teve um delta de 4%, a média foi 23%, o pior foi 134%
Gerenciamento de energia
Consumo de energia
Devido ao hardware potente, o consumo de energia do sistema é muito alto. O que se destaca é o altíssimo consumo em standby que sempre alterna entre 5 e 10 watts. Em caso de falha também pode ser a iluminação LED com animação mesmo durante o modo de espera.
| desligado | |
| Ocioso | |
| Carga |
|
Key:
min: | |
| Asus ROG Strix Scar 18 2023 G834JY-N6005W i9-13980HX, GeForce RTX 4090 Laptop GPU, 2x Samsung PM9A1 MZVL21T0HCLR (RAID 0), IPS, 2560x1600, 18" | Razer Blade 16 Early 2023 i9-13950HX, GeForce RTX 4080 Laptop GPU, SSSTC CA6-8D1024, IPS, 2560x1600, 16" | MSI Titan GT77 HX 13VI i9-13950HX, GeForce RTX 4090 Laptop GPU, Samsung PM9A1 MZVL22T0HBLB, Mini-LED, 3840x2160, 17.3" | MSI Raider GE77 HX 12UHS i9-12900HX, GeForce RTX 3080 Ti Laptop GPU, Samsung PM9A1 MZVL22T0HBLB, IPS, 3840x2160, 17.3" | Asus ROG Strix Scar 17 SE G733CX-LL014W i9-12950HX, GeForce RTX 3080 Ti Laptop GPU, Samsung PM9A1 MZVL22T0HBLB, IPS, 2560x1440, 17.3" | Média da turma Gaming | |
|---|---|---|---|---|---|---|
| Power Consumption | 9% | 13% | 15% | 6% | 28% | |
| Idle Minimum * (Watt) | 17.3 | 15.2 12% | 14 19% | 13 25% | 19.3 -12% | 13 ? 25% |
| Idle Average * (Watt) | 27 | 22.8 16% | 21.6 20% | 19 30% | 26.5 2% | 19 ? 30% |
| Idle Maximum * (Watt) | 46 | 49.8 -8% | 24.8 46% | 29 37% | 27.1 41% | 24.6 ? 47% |
| Load Average * (Watt) | 133 | 121.2 9% | 122.5 8% | 143 -8% | 141 -6% | 110.7 ? 17% |
| Load Maximum * (Watt) | 329 | 273.7 17% | 418 -27% | 352 -7% | 307.9 6% | 259 ? 21% |
| Witcher 3 ultra * (Watt) | 242 | 265 | 247 | 225 |
* ... menor é melhor
Power Consumption The Witcher 3 / Stress Test
Power Consumption with External Monitor
Vida útil da bateria
Devido aos componentes famintos de energia, a bateria de 90-Wh de capacidade não consegue produzir nenhum valor recorde. No modo Optimus (com GPU desativado), Perfil silencioso, e com o brilho reduzido para 150 cd/m², você ainda pode trabalhar por várias horas fora da rede. Nosso teste WLAN funcionou por pouco mais de 7 horas neste modo. No entanto, se você quiser jogar jogos em operação com bateria, não só tem que se contentar com um desempenho significativamente menor, mas a duração da bateria ainda só durou cerca de uma hora em nosso teste (sem limitação de taxa de quadros) com o The Witcher 3.
A bateria foi completamente recarregada após 1h 40min com o sistema desligado ou 1h 45min em operação ociosa. A fonte de alimentação forneceu um máximo de 117 watts naquele momento.
| Asus ROG Strix Scar 18 2023 G834JY-N6005W i9-13980HX, GeForce RTX 4090 Laptop GPU, 90 Wh | Razer Blade 16 Early 2023 i9-13950HX, GeForce RTX 4080 Laptop GPU, 95.2 Wh | MSI Titan GT77 HX 13VI i9-13950HX, GeForce RTX 4090 Laptop GPU, 99.9 Wh | MSI Raider GE77 HX 12UHS i9-12900HX, GeForce RTX 3080 Ti Laptop GPU, 99.99 Wh | Asus ROG Strix Scar 17 SE G733CX-LL014W i9-12950HX, GeForce RTX 3080 Ti Laptop GPU, 90 Wh | Média da turma Gaming | |
|---|---|---|---|---|---|---|
| Duração da bateria | 21% | 6% | 30% | -41% | 29% | |
| H.264 (h) | 7 | 6 -14% | 6.5 -7% | 8.32 ? 19% | ||
| WiFi v1.3 (h) | 7.1 | 6.1 -14% | 5.3 -25% | 5.4 -24% | 4.2 -41% | 7.11 ? 0% |
| Witcher 3 ultra (h) | 0.9 | |||||
| Load (h) | 0.9 | 1.4 56% | 1.4 56% | 2 122% | 1.502 ? 67% | |
| Reader / Idle (h) | 8.9 | 9.8 | 8.27 ? |
Pro
Contra
Veredicto
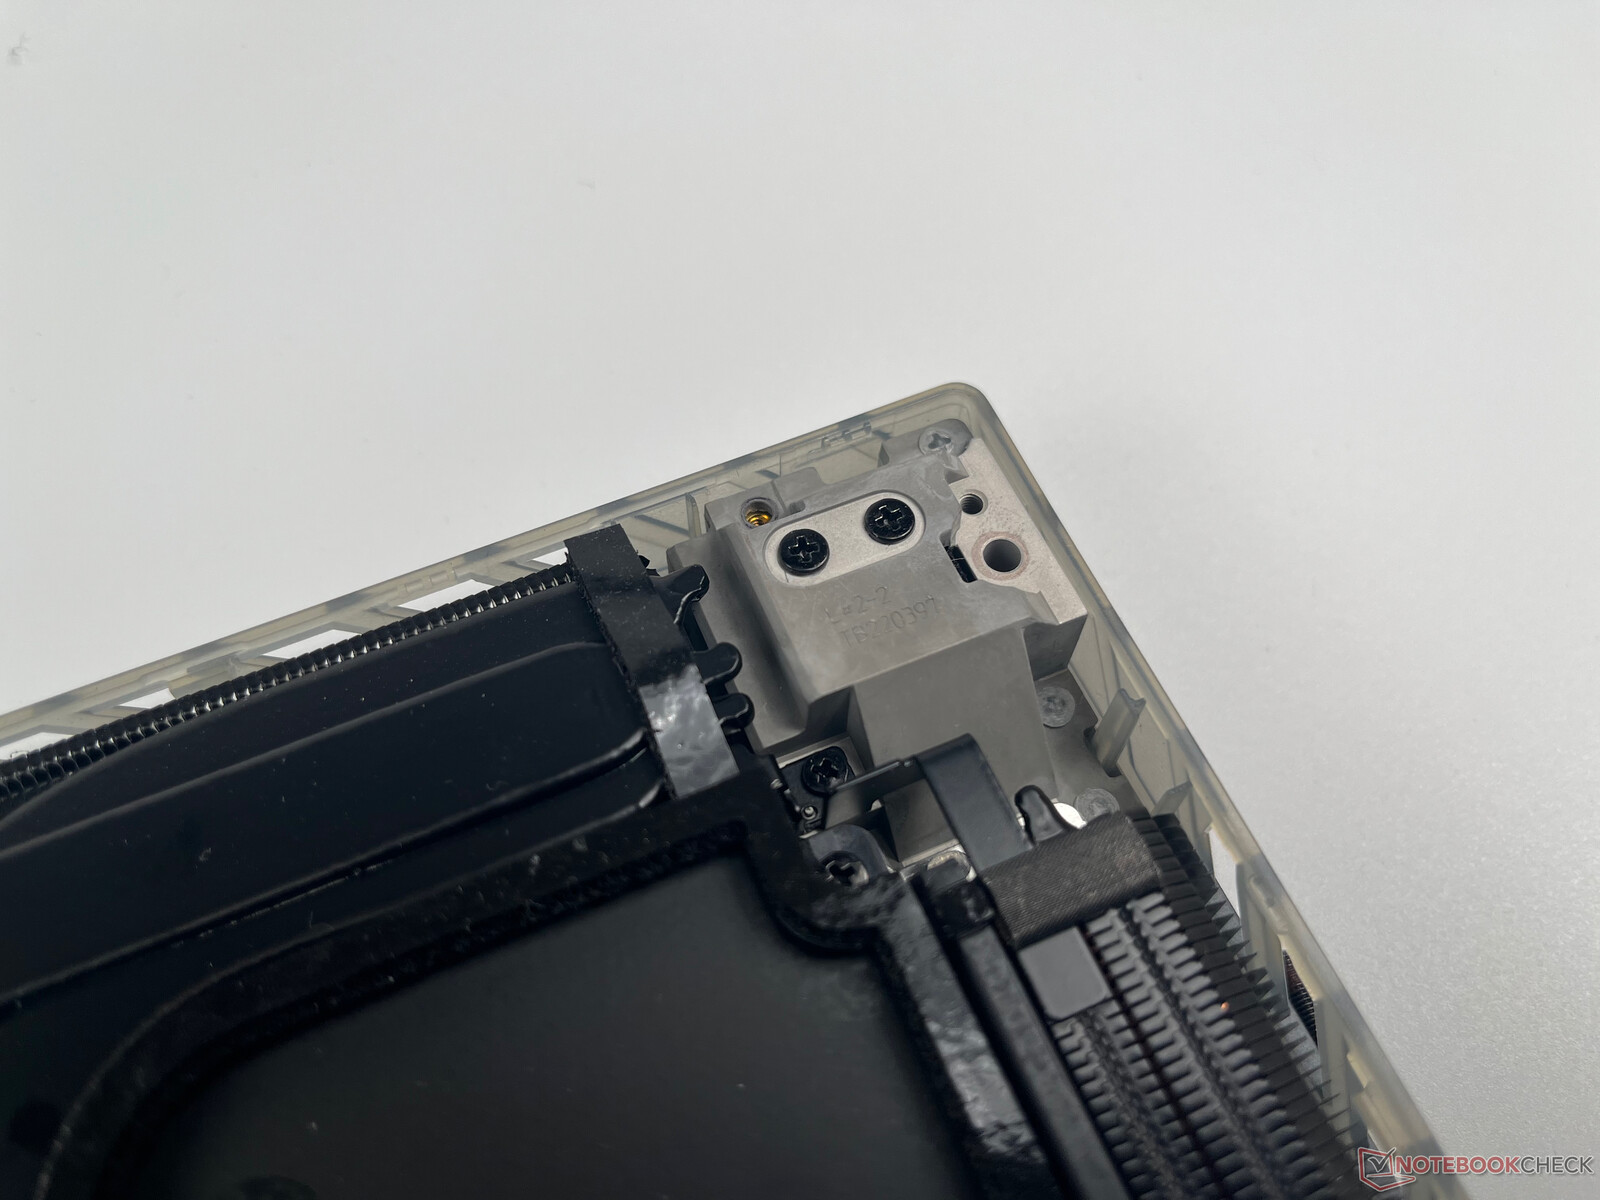
O Asus ROG Strix SCAR 18 (2023) G834JY é um laptop de alto nível para jogos que o Asus equipou com os componentes móveis mais potentes atualmente disponíveis. A caixa grande abriga um visor muito bom de 18 polegadas que fornece aos jogadores tempos de resposta rápidos, G-SYNC, e boa qualidade de imagem. Mas o destaque do G834JY é certamente o poderoso hardware com um Core i9-13980HX, GeForce RTX 4090 GPU para laptop (175 W TGP), e RAID-0 NVMe SSD. Enquanto estes componentes produzem uma enorme quantidade de calor sob carga, o Asus mantém este bem em controle com um sistema de resfriamento por ventilador triplo, tubo de calor da câmara de vapor e pasta de metal líquido.
O ROG Strix SCAR 18 é um pacote global bem completo com valores de desempenho impressionantes a um preço elevado.
Nossos únicos pontos de reclamação são menores, tais como o chorume da bobina de nossa unidade de teste com altas taxas de quadros, a webcam ruim, ou o posicionamento das portas, que pode ser inferior ao ideal em alguns casos.
Como alternativas, você pode obter os modelos de 18 polegadas com GPU RTX 4090 da Alienware (m18 R1) e Razer (Blade 18). A MSI oferece o Titan GT77 HX 13VI minimamente mais rápido, com um display de 17 polegadas. Aqueles que conseguem se contentar com um pouco menos de desempenho podem dar uma olhada nos modelos baseados no RTX 4080, que são significativamente mais acessíveis. A versão G834JZ do Scar 18 também pode representar uma alternativa interessante aqui.
Preço e Disponibilidade
O G834JY-N6000W que testamos está atualmente disponível apenas na Inglaterra por £3999.99 (preço de lista). Algumas lojas americanas oferecem o G834JY-XS97 atualmente por $3899.99(fora de estoque na Asus), e a Amazon oferece o G834JY-XS97 por $5390.
Asus ROG Strix Scar 18 2023 G834JY-N6005W
- 03/07/2023 v7 (old)
Klaus Hinum
Transparência
A seleção dos dispositivos a serem analisados é feita pela nossa equipe editorial. A amostra de teste foi fornecida ao autor como empréstimo pelo fabricante ou varejista para fins desta revisão. O credor não teve influência nesta revisão, nem o fabricante recebeu uma cópia desta revisão antes da publicação. Não houve obrigação de publicar esta revisão. Como empresa de mídia independente, a Notebookcheck não está sujeita à autoridade de fabricantes, varejistas ou editores.
É assim que o Notebookcheck está testando
Todos os anos, o Notebookcheck analisa de forma independente centenas de laptops e smartphones usando procedimentos padronizados para garantir que todos os resultados sejam comparáveis. Desenvolvemos continuamente nossos métodos de teste há cerca de 20 anos e definimos padrões da indústria no processo. Em nossos laboratórios de teste, equipamentos de medição de alta qualidade são utilizados por técnicos e editores experientes. Esses testes envolvem um processo de validação em vários estágios. Nosso complexo sistema de classificação é baseado em centenas de medições e benchmarks bem fundamentados, o que mantém a objetividade.Price comparison

