Análise do laptop MSI Titan 18 HX A14VIG: Ano do dragão

Na CES 2023, questionamos a MSI sobre por que eles não tinham um laptop para jogos de 18 polegadas em desenvolvimento quando a Asus, a Alienware e a Razer estavam lançando suas próprias ofertas de 18 polegadas. Foi somente na CES 2024 que finalmente vimos um modelo MSI de 18 polegadas adequado na forma do Titan 18 HX. Ele pode ter chegado um pouco tarde, mas suas especificações e hardware são igualmente competitivos.
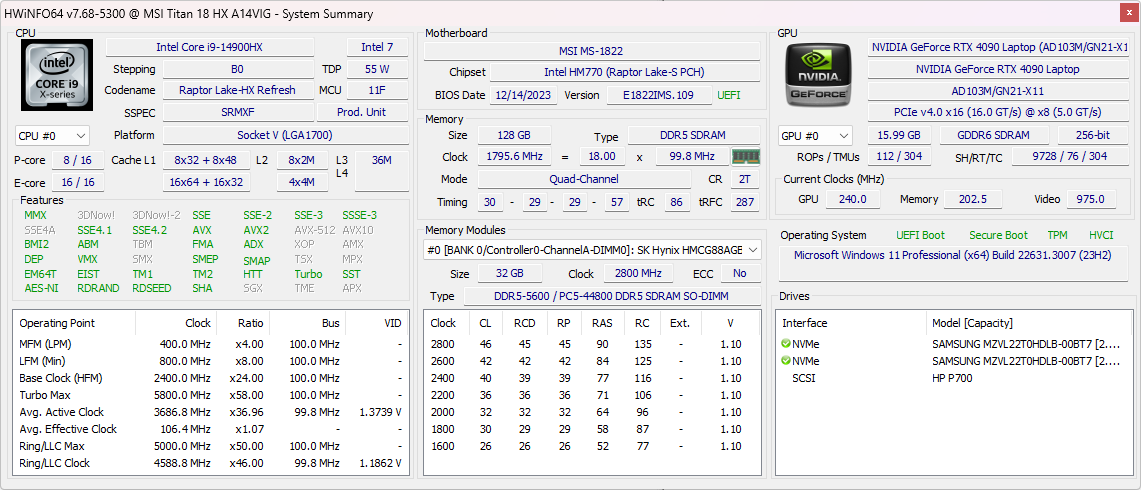
Nossa configuração de análise vem equipada com a nova CPU Intel Raptor Lake Core i9-14900HX de 14ª geração, GPU GeForce RTX 4090 de 175 W e tela Mini-LED 4K (2400p) de 120 Hz por aproximadamente US$ 4.999. Não há configurações menores disponíveis com CPUs, GPUs ou telas diferentes no momento da redação deste texto.
As alternativas ao Titan 18 HX incluem outros notebooks para jogos de 18 polegadas, como o Asus ROG Strix G18, Alienware m18, Razer Blade 18ou o Acer Predator Helios 18.
Mais análises da MSI:
Possíveis concorrentes em comparação
Avaliação | Data | Modelo | Peso | Altura | Size | Resolução | Preço |
|---|---|---|---|---|---|---|---|
| 88.8 % v7 (old) | 01/2024 | MSI Titan 18 HX A14VIG i9-14900HX, GeForce RTX 4090 Laptop GPU | 3.6 kg | 32.1 mm | 18.00" | 3840x2400 | |
| 89 % v7 (old) | 02/2023 | MSI Titan GT77 HX 13VI i9-13950HX, GeForce RTX 4090 Laptop GPU | 3.5 kg | 23 mm | 17.30" | 3840x2160 | |
| 90.7 % v7 (old) | 04/2023 | Alienware m18 R1 i9-13980HX, GeForce RTX 4090 Laptop GPU | 3.9 kg | 26.7 mm | 18.00" | 1920x1200 | |
| 87.4 % v7 (old) | 03/2023 | Asus ROG Strix G18 G814JI i7-13650HX, GeForce RTX 4070 Laptop GPU | 3 kg | 31 mm | 18.00" | 2560x1600 | |
| 88.3 % v7 (old) | 10/2023 | Acer Predator Helios 18 N23Q2 i9-13900HX, GeForce RTX 4080 Laptop GPU | 3.2 kg | 29.15 mm | 18.00" | 2560x1600 | |
| 91.4 % v7 (old) | 02/2023 | Razer Blade 18 RTX 4070 i9-13950HX, GeForce RTX 4070 Laptop GPU | 3 kg | 21.9 mm | 18.00" | 2560x1600 |
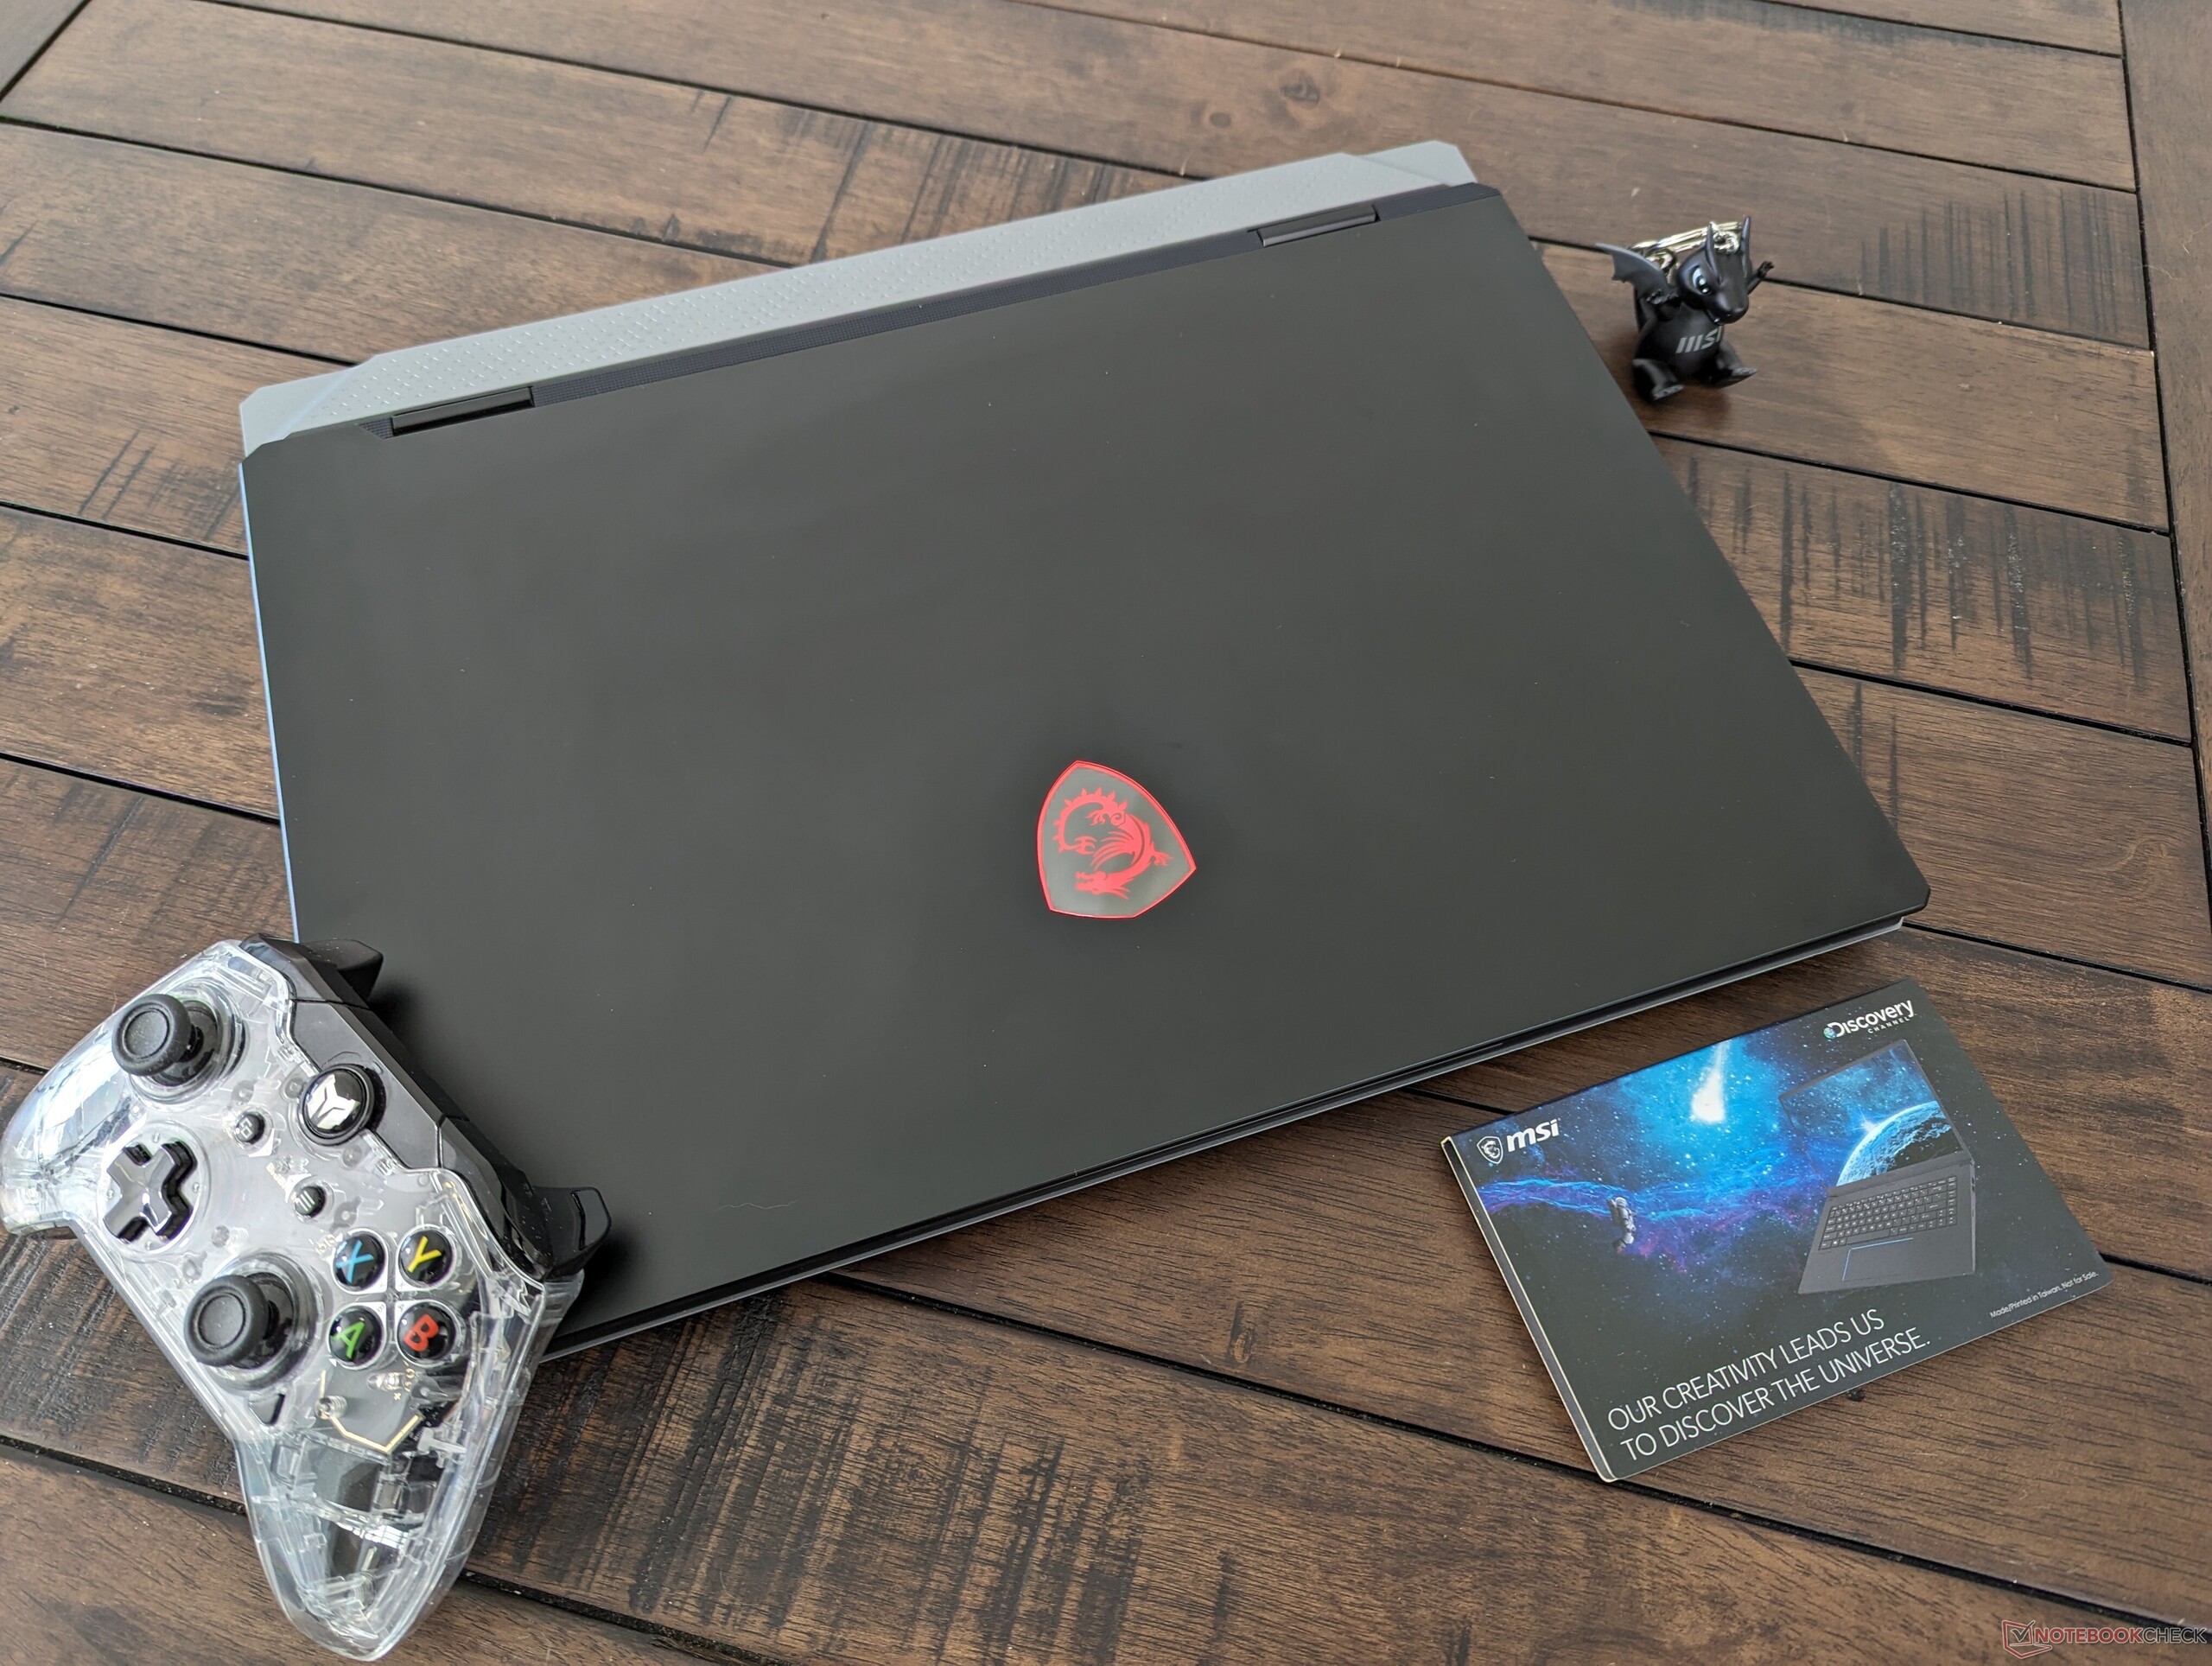
Case - Menos LEDs RGB
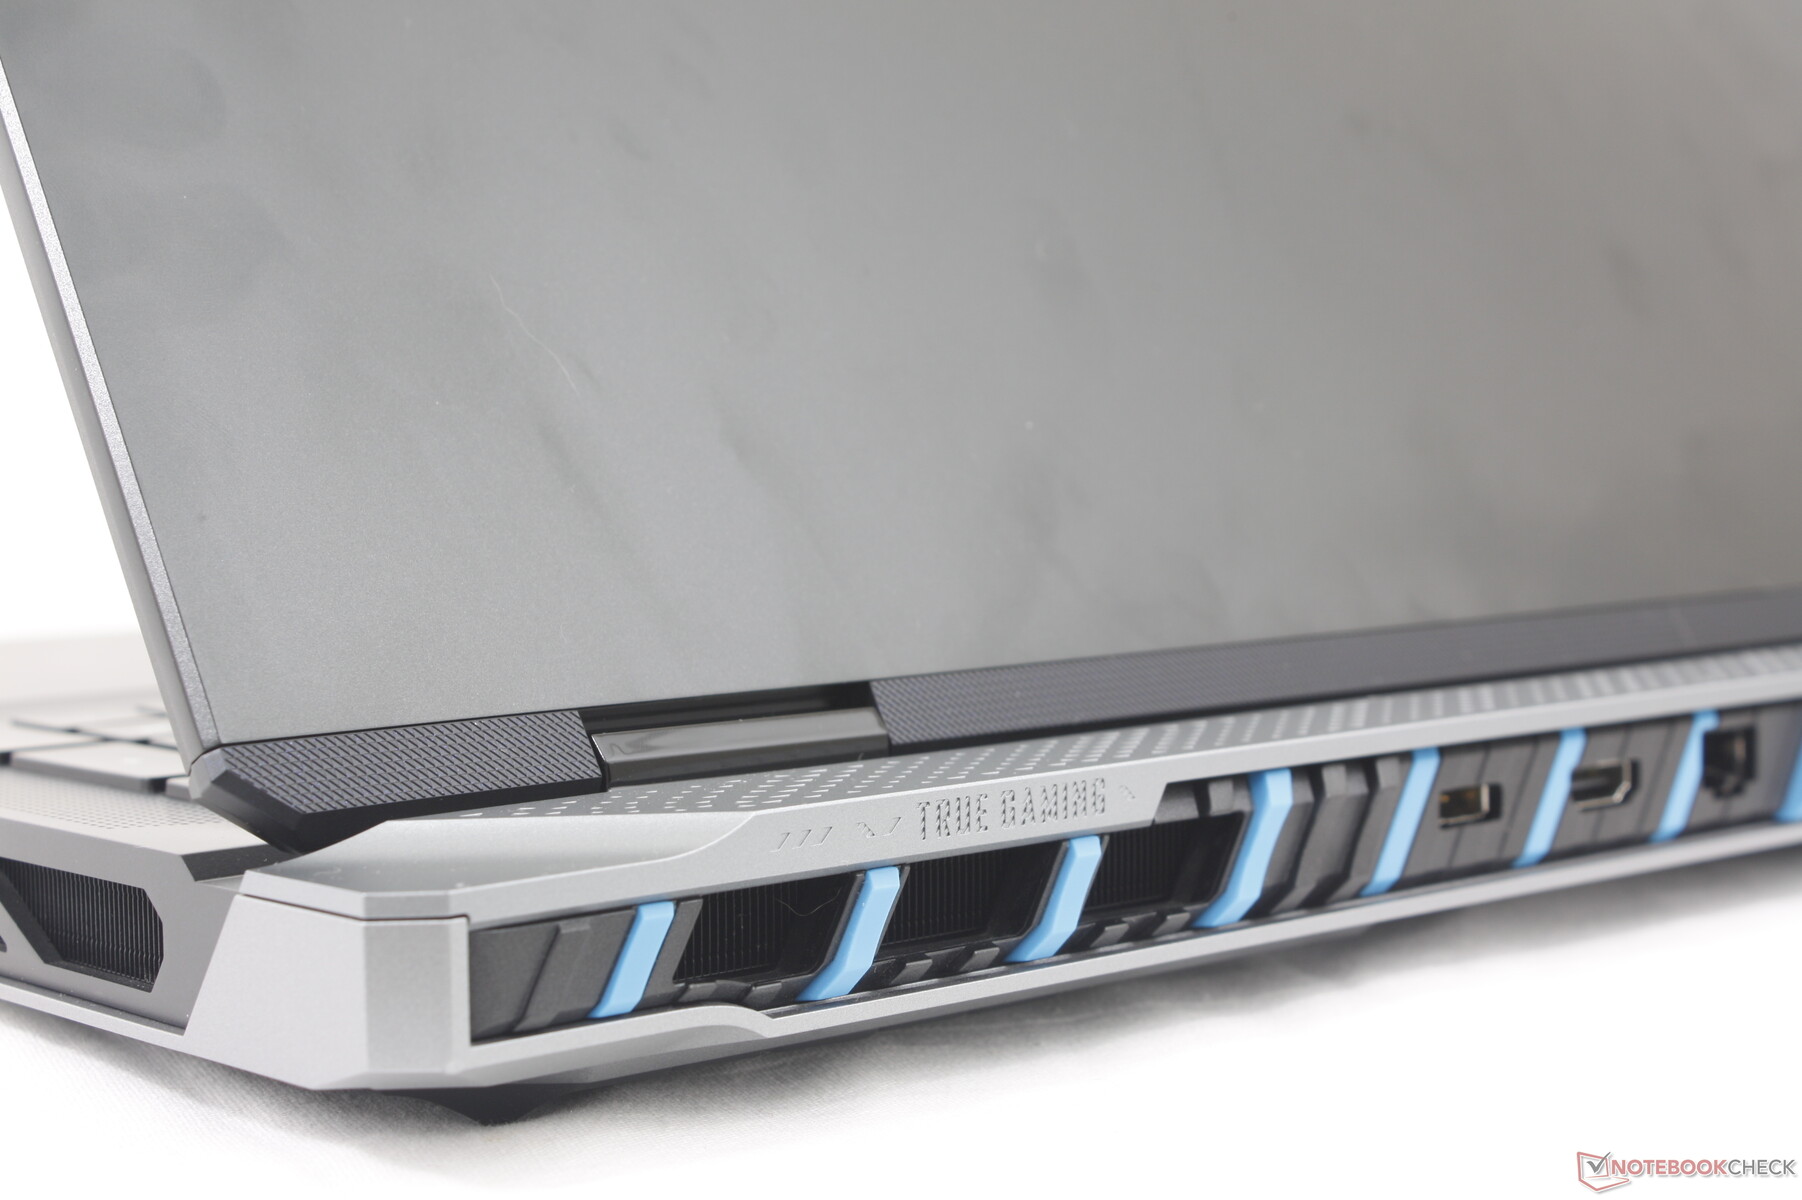
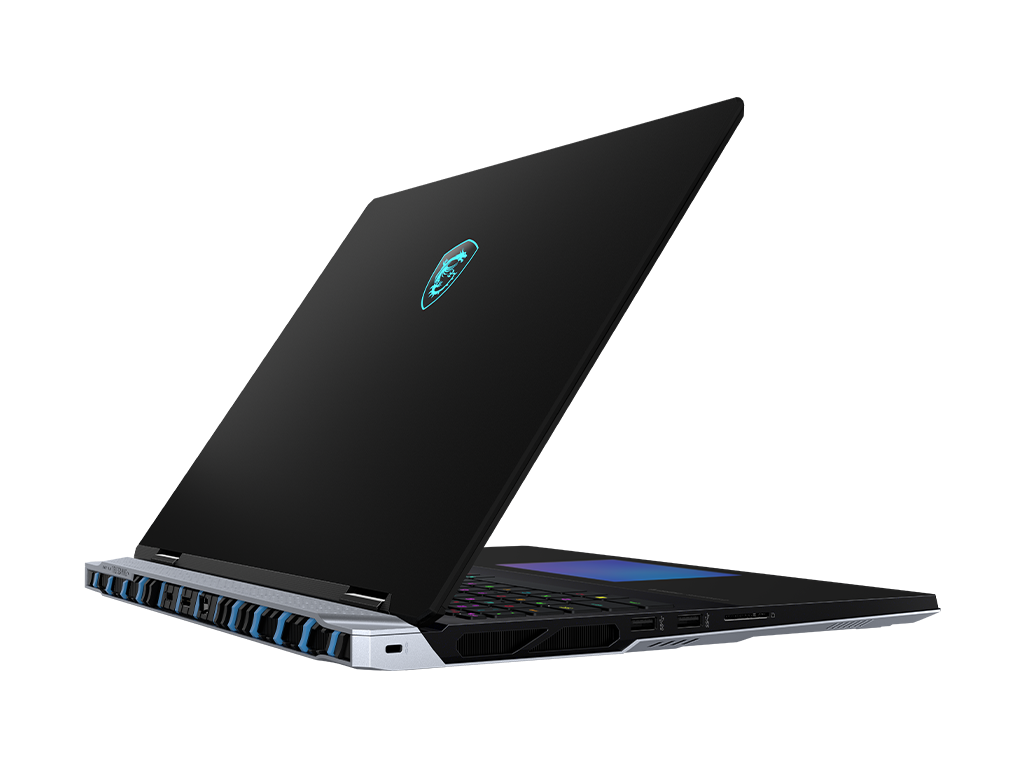
O novo chassi é uma evolução do Titan GT77 em vez do GE78, mais chamativo e de inspiração retrô. Quando comparado com o GT77, o Titan 18 adiciona cores prata e azul de dois tons para complementar o exterior preto. A MSI também está evitando a iluminação RGB "desnecessária", removendo a barra de LEDs na parte traseira.
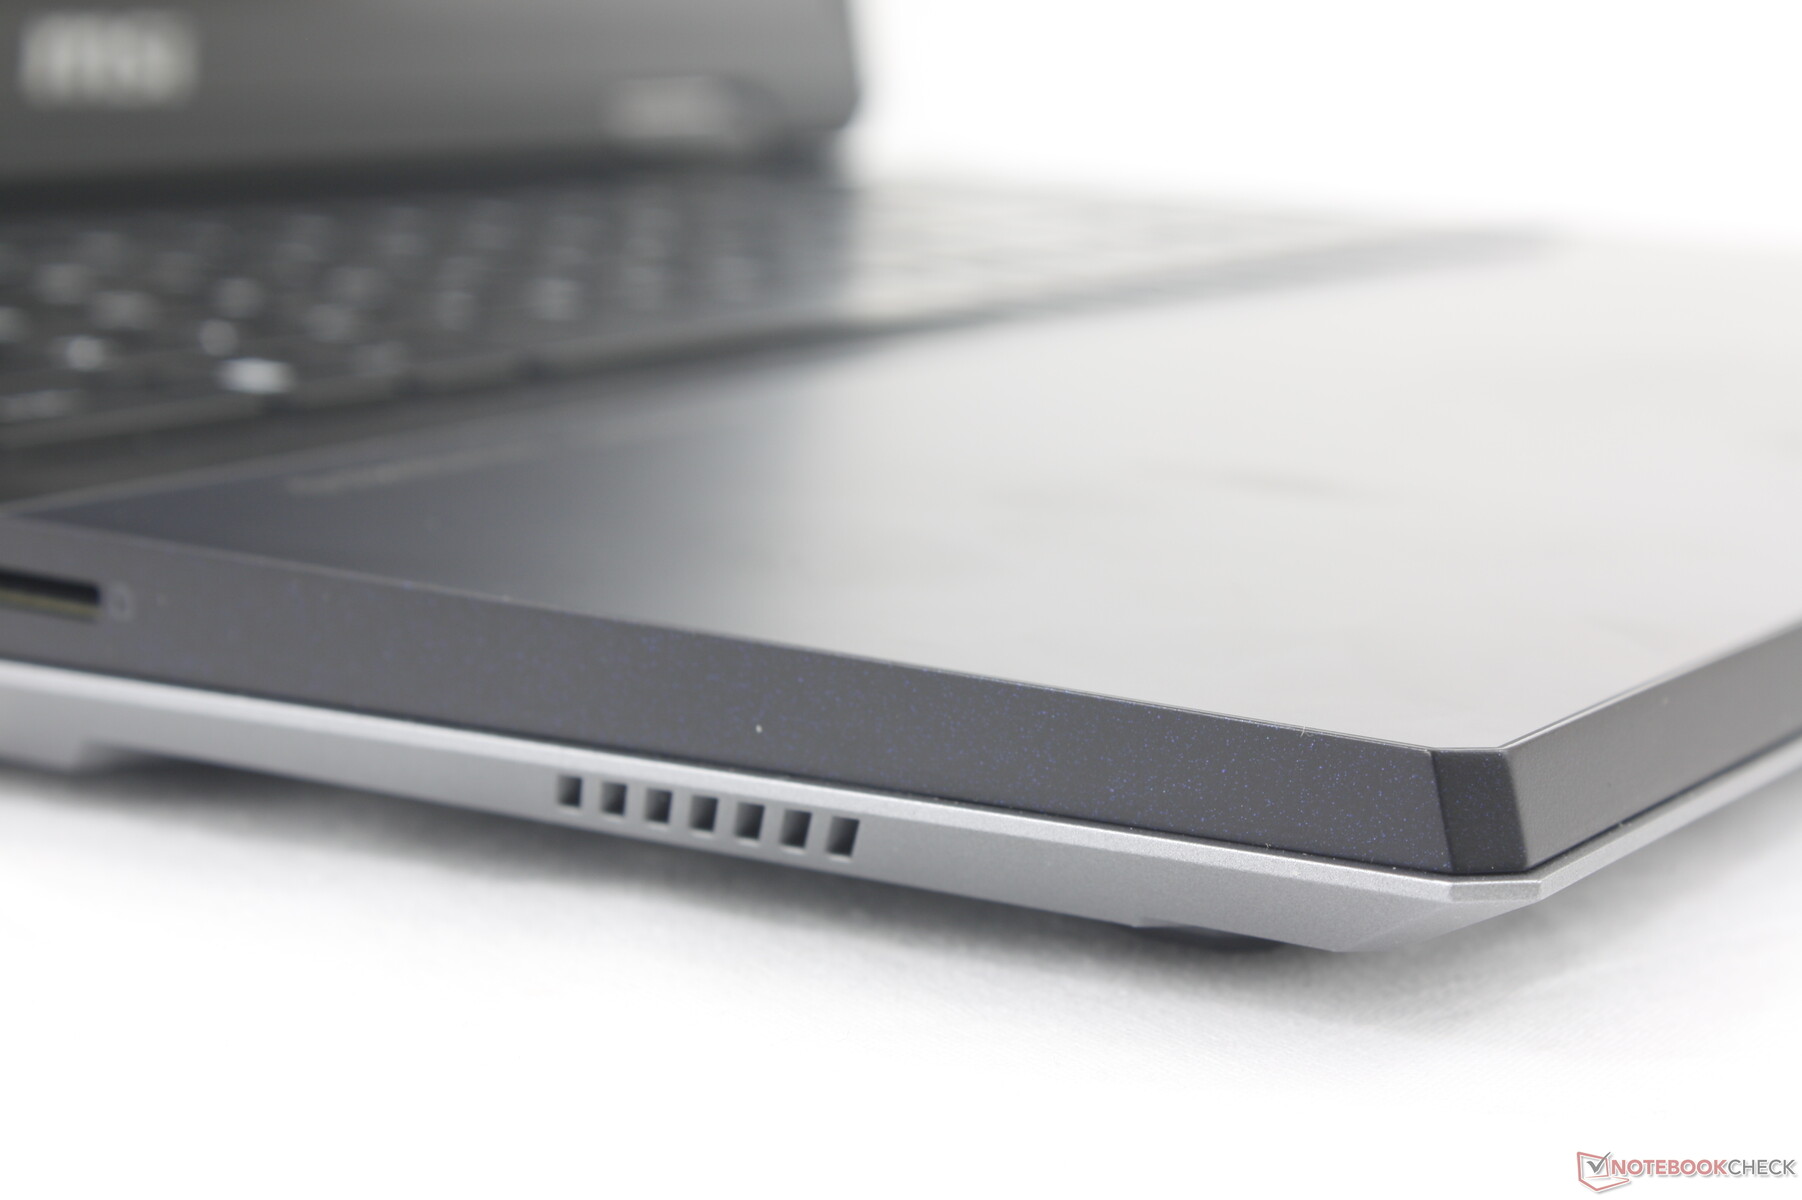
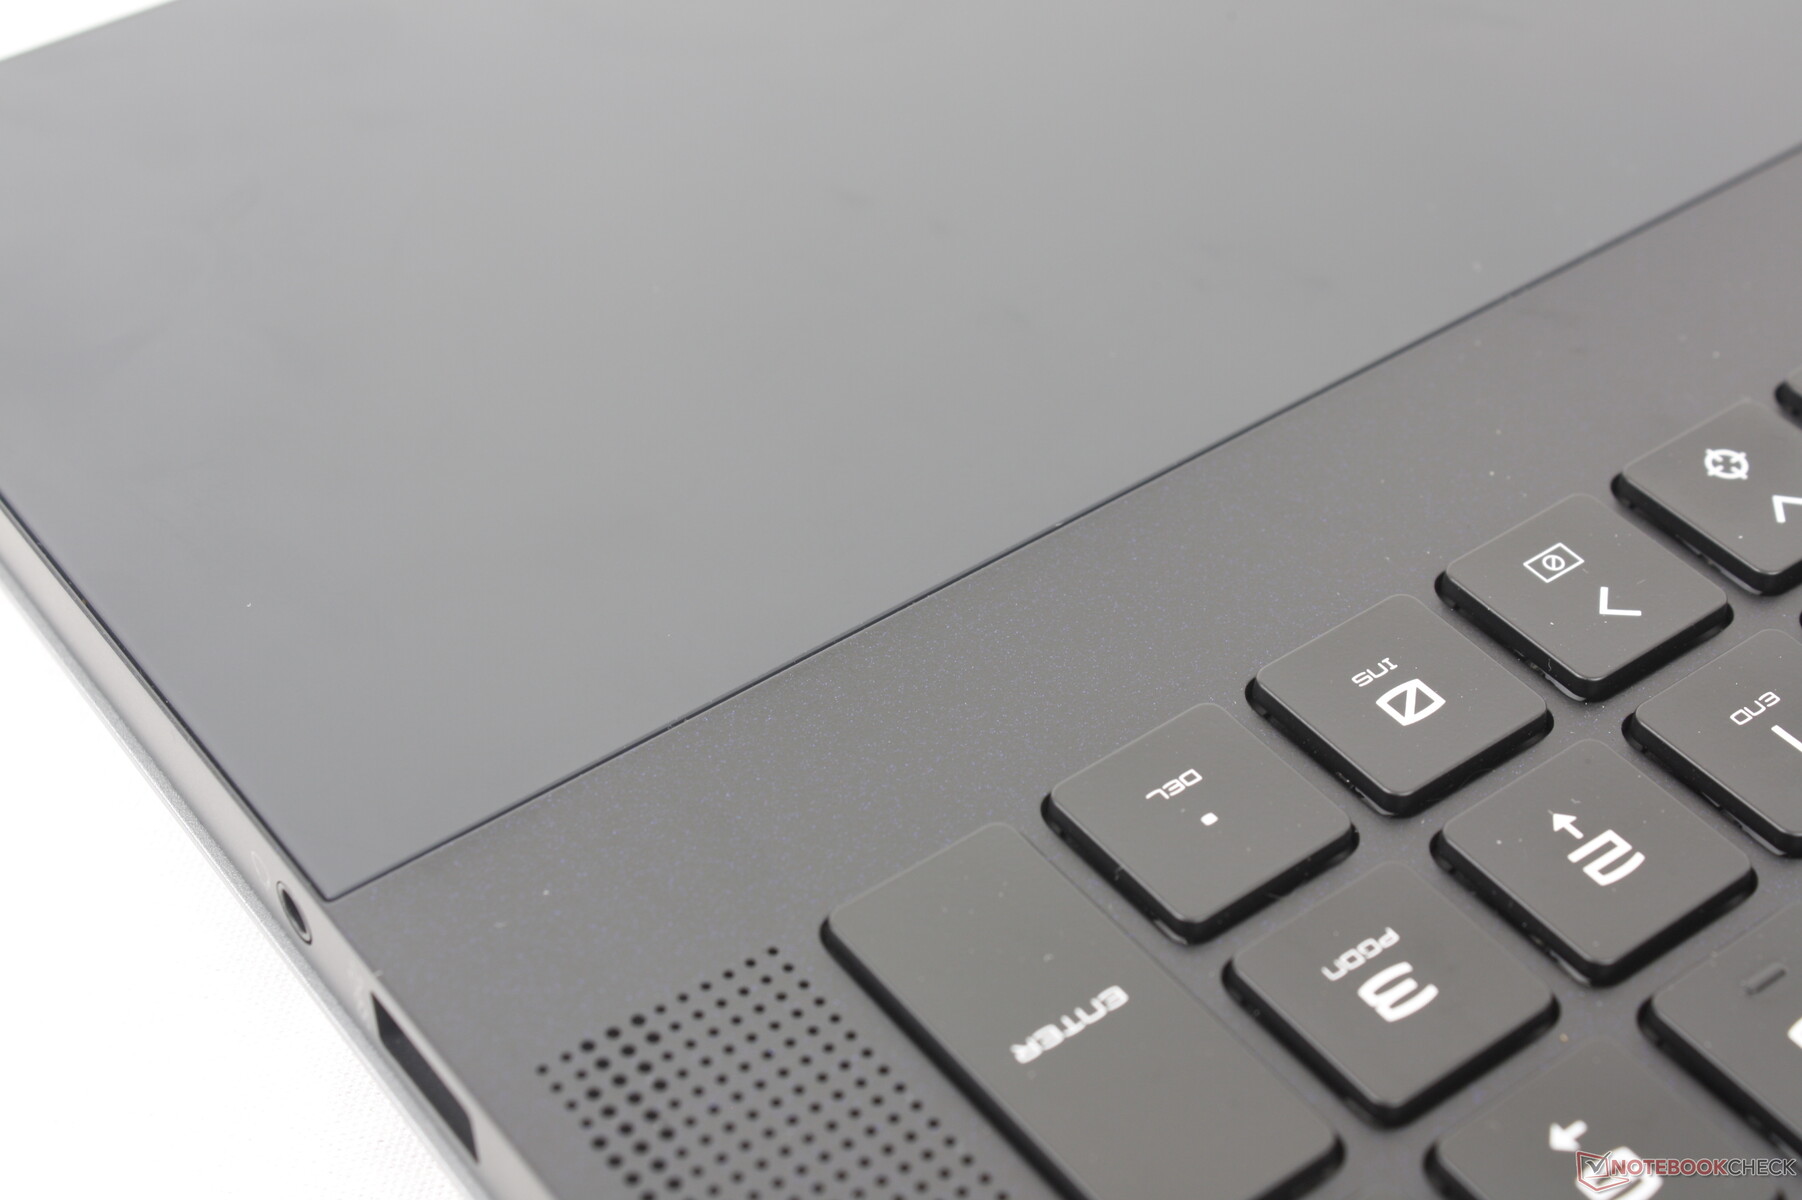
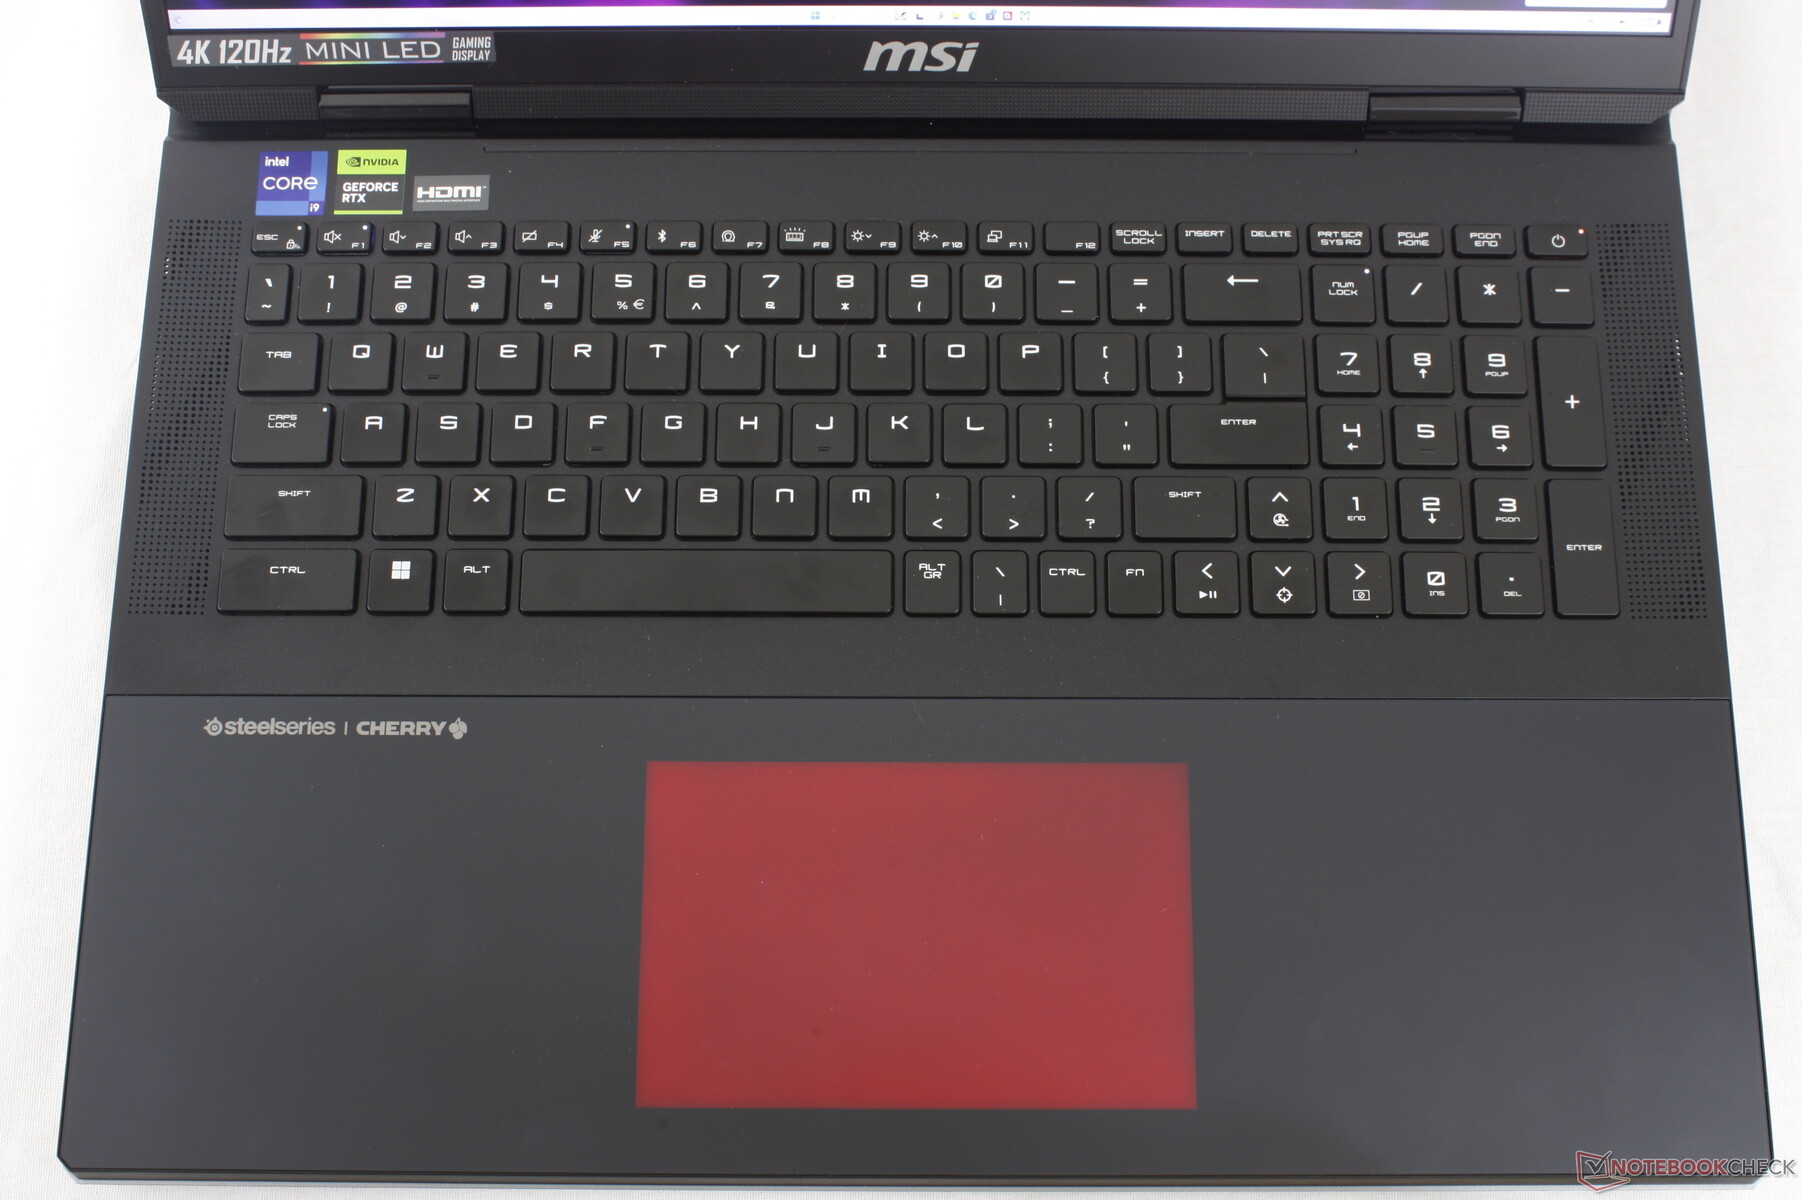
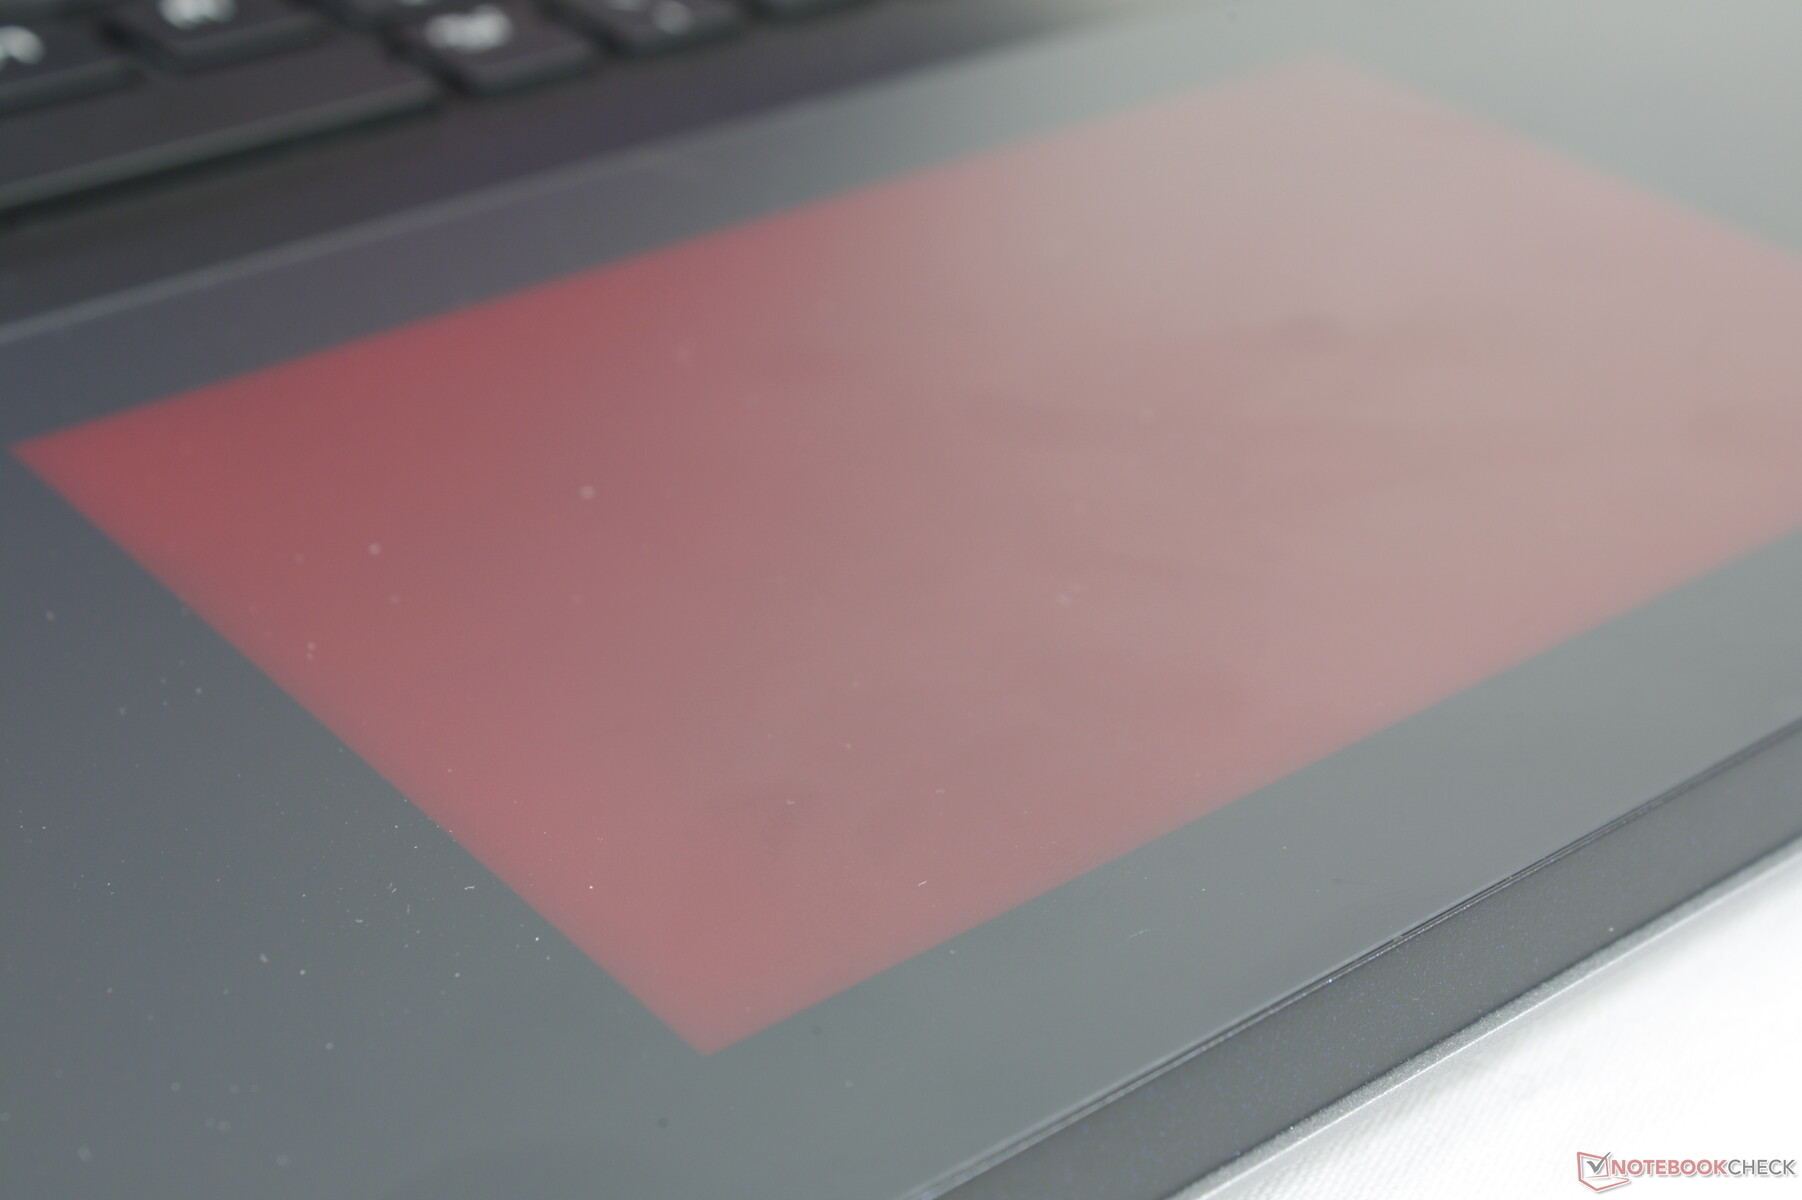
Talvez o aspecto mais reconhecível do Titan 18 seja o vidro plano que se estende sobre os apoios para as mãos e o clickpad. Assim, o clickpad fica nivelado com os apoios para as mãos e é iluminado com efeitos RGB. O resultado final é um design mais elegante e suave, mantendo a estética de jogador de ponta.
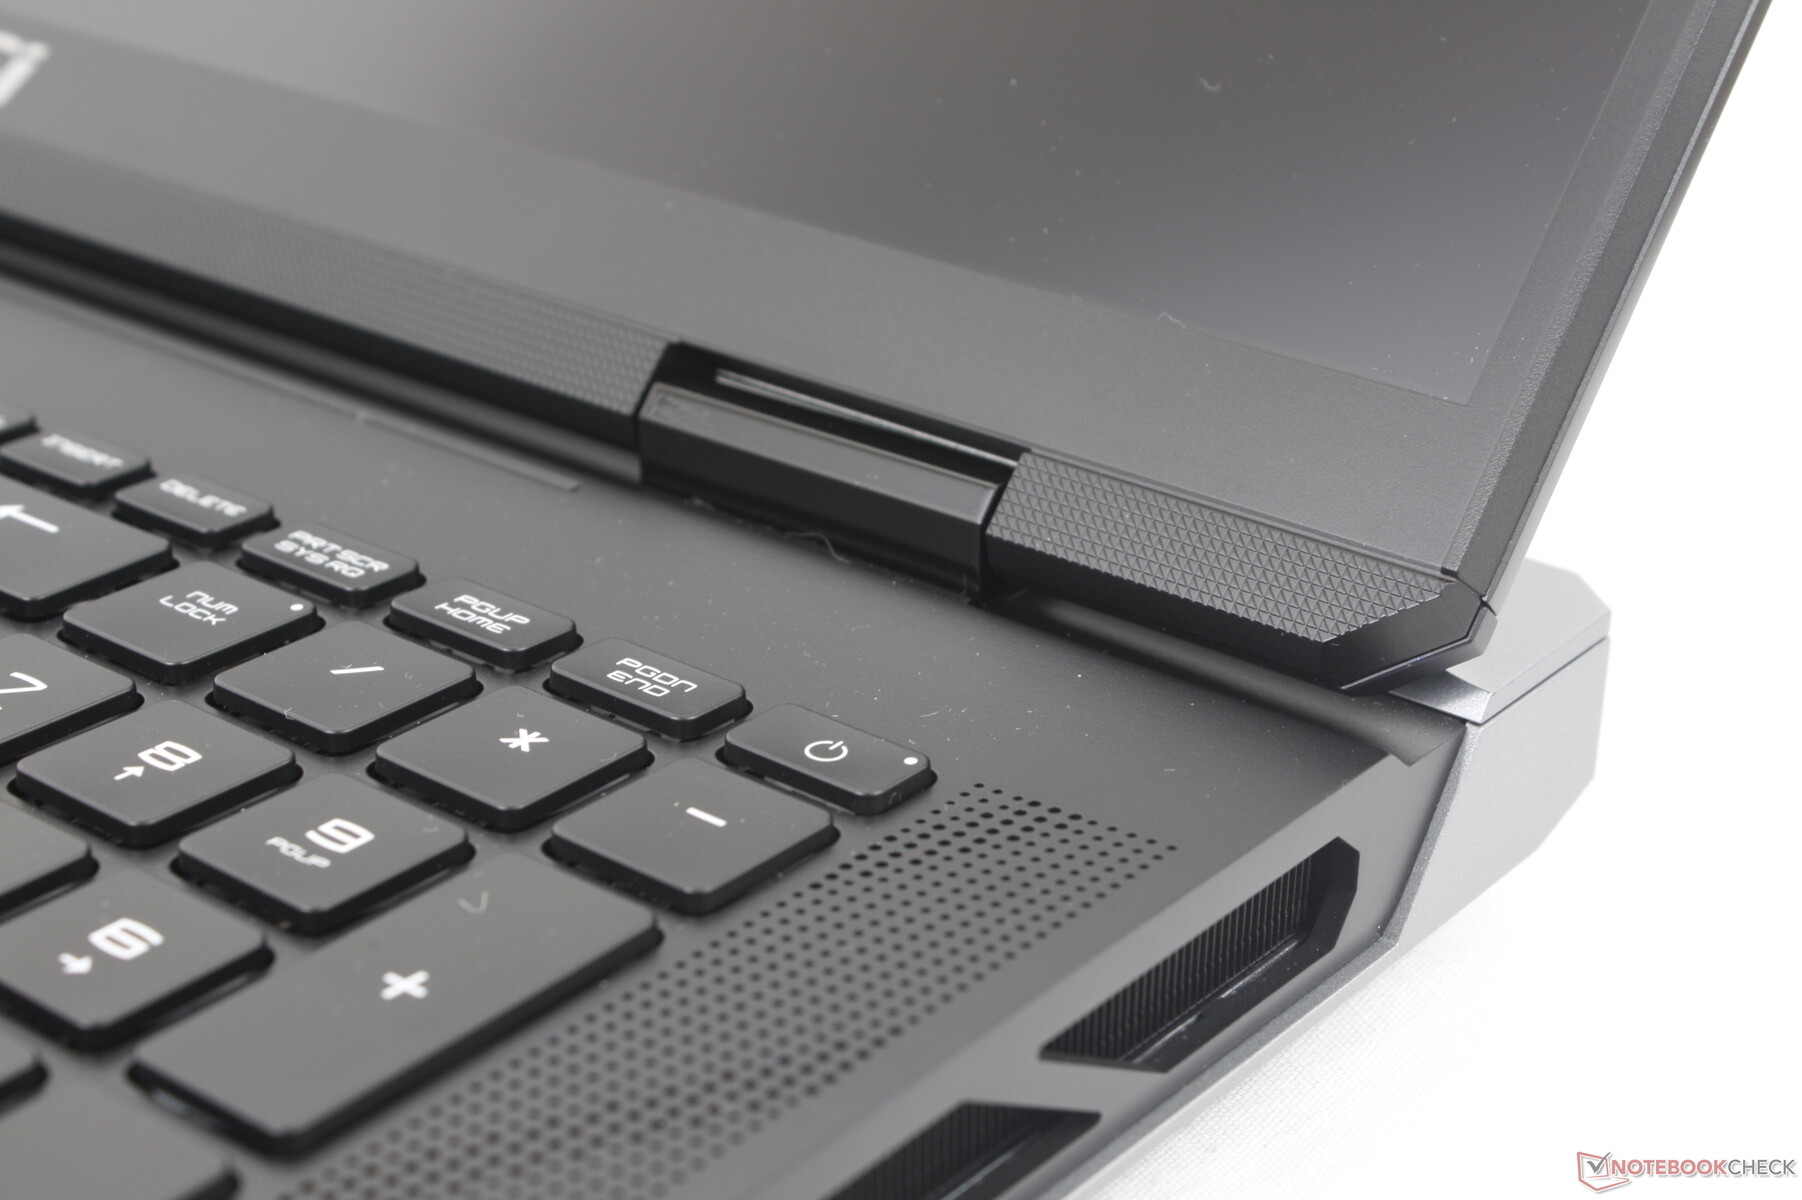
A rigidez do chassi de liga de magnésio e alumínio é excelente, com apenas uma pequena deformação ao pressionar o centro do teclado. Ele certamente parece mais luxuoso do que as superfícies plásticas comuns dos modelos MSI mais baratos, como o Cyborg ou Katana. No entanto, as dobradiças poderiam ser mais firmes para uma melhor sensação de longevidade e todo o sistema é um grande ímã de impressões digitais.
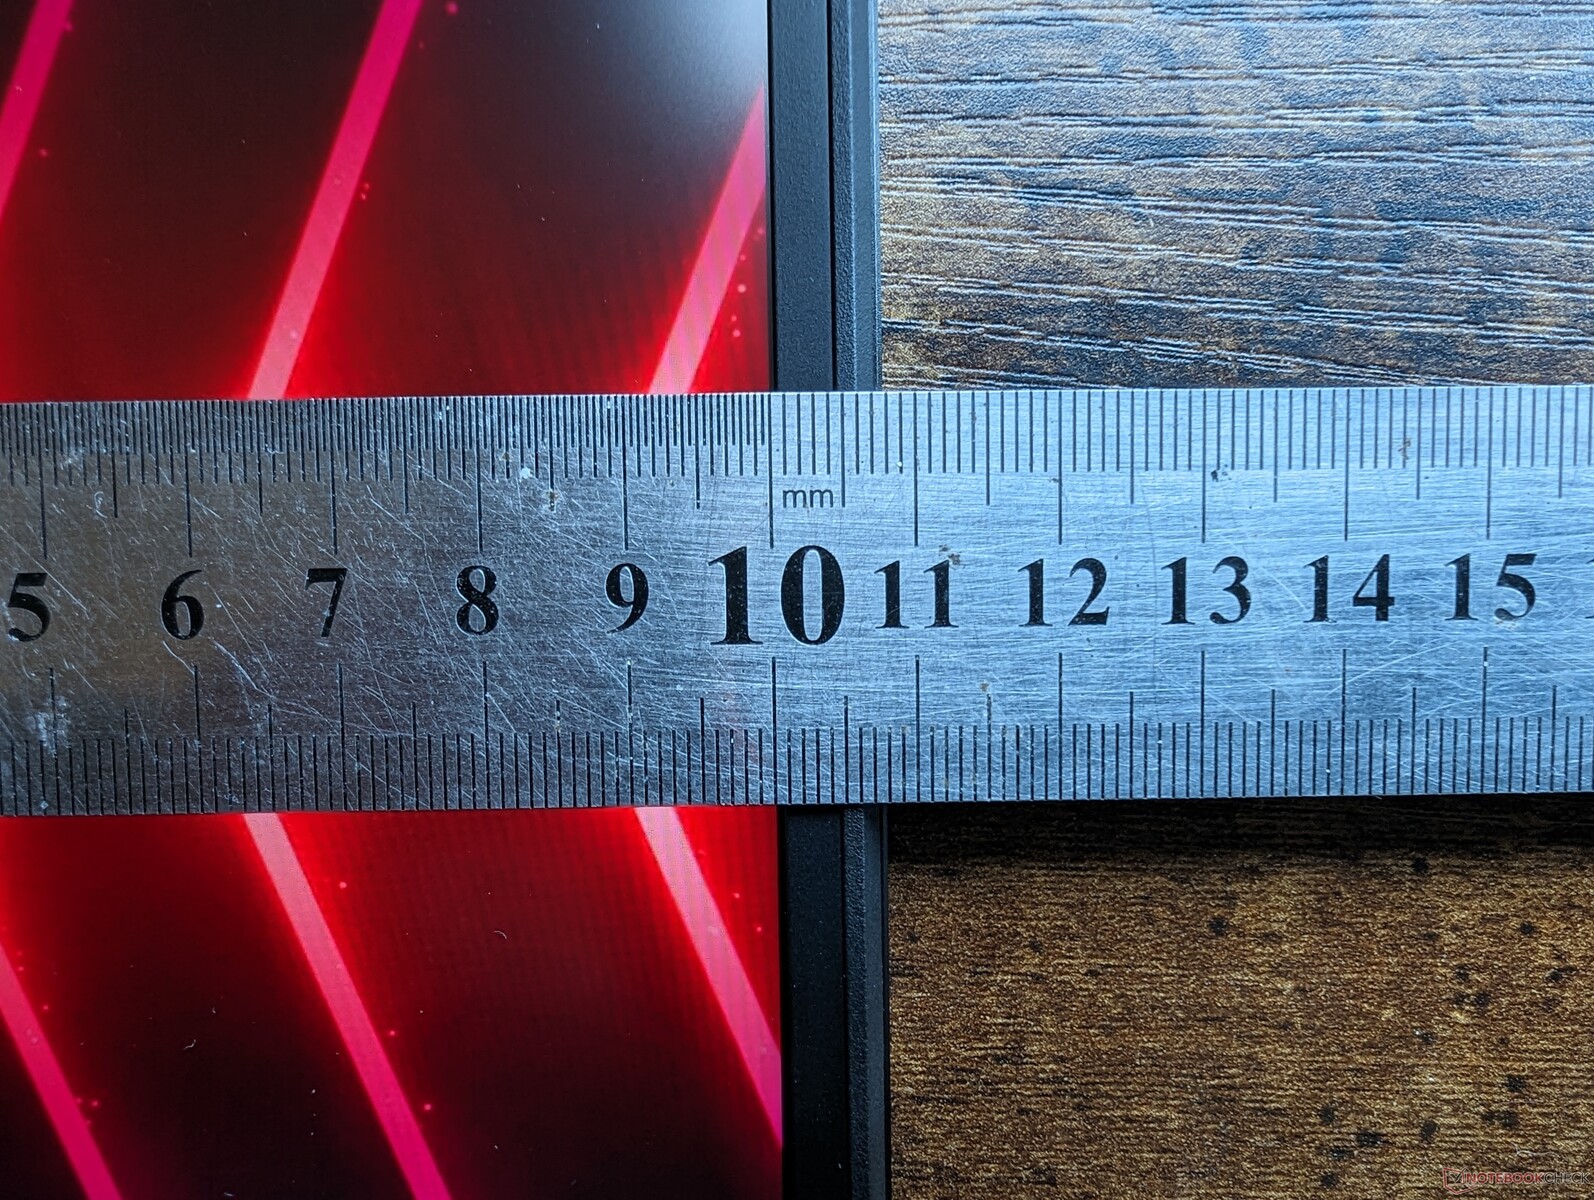
Notavelmente, o Titan 18 HX 16:10 de 18 polegadas ocupa menos espaço do que o Titan 16:9 de 17,3 polegadas Titan GT77 por causa de sua traseira mais curta. Por sua vez, no entanto, o modelo mais novo é visivelmente mais espesso em quase 10 mm, sendo um dos laptops para jogos de 18 polegadas mais espessos disponíveis. Não é necessariamente o mais pesado, pois essa coroa vai para o Alienware m18 R1, mas ainda é visivelmente mais pesado do que o Asus ROG Strix G18 ou o Razer Blade 18, com mais de 500 g cada.
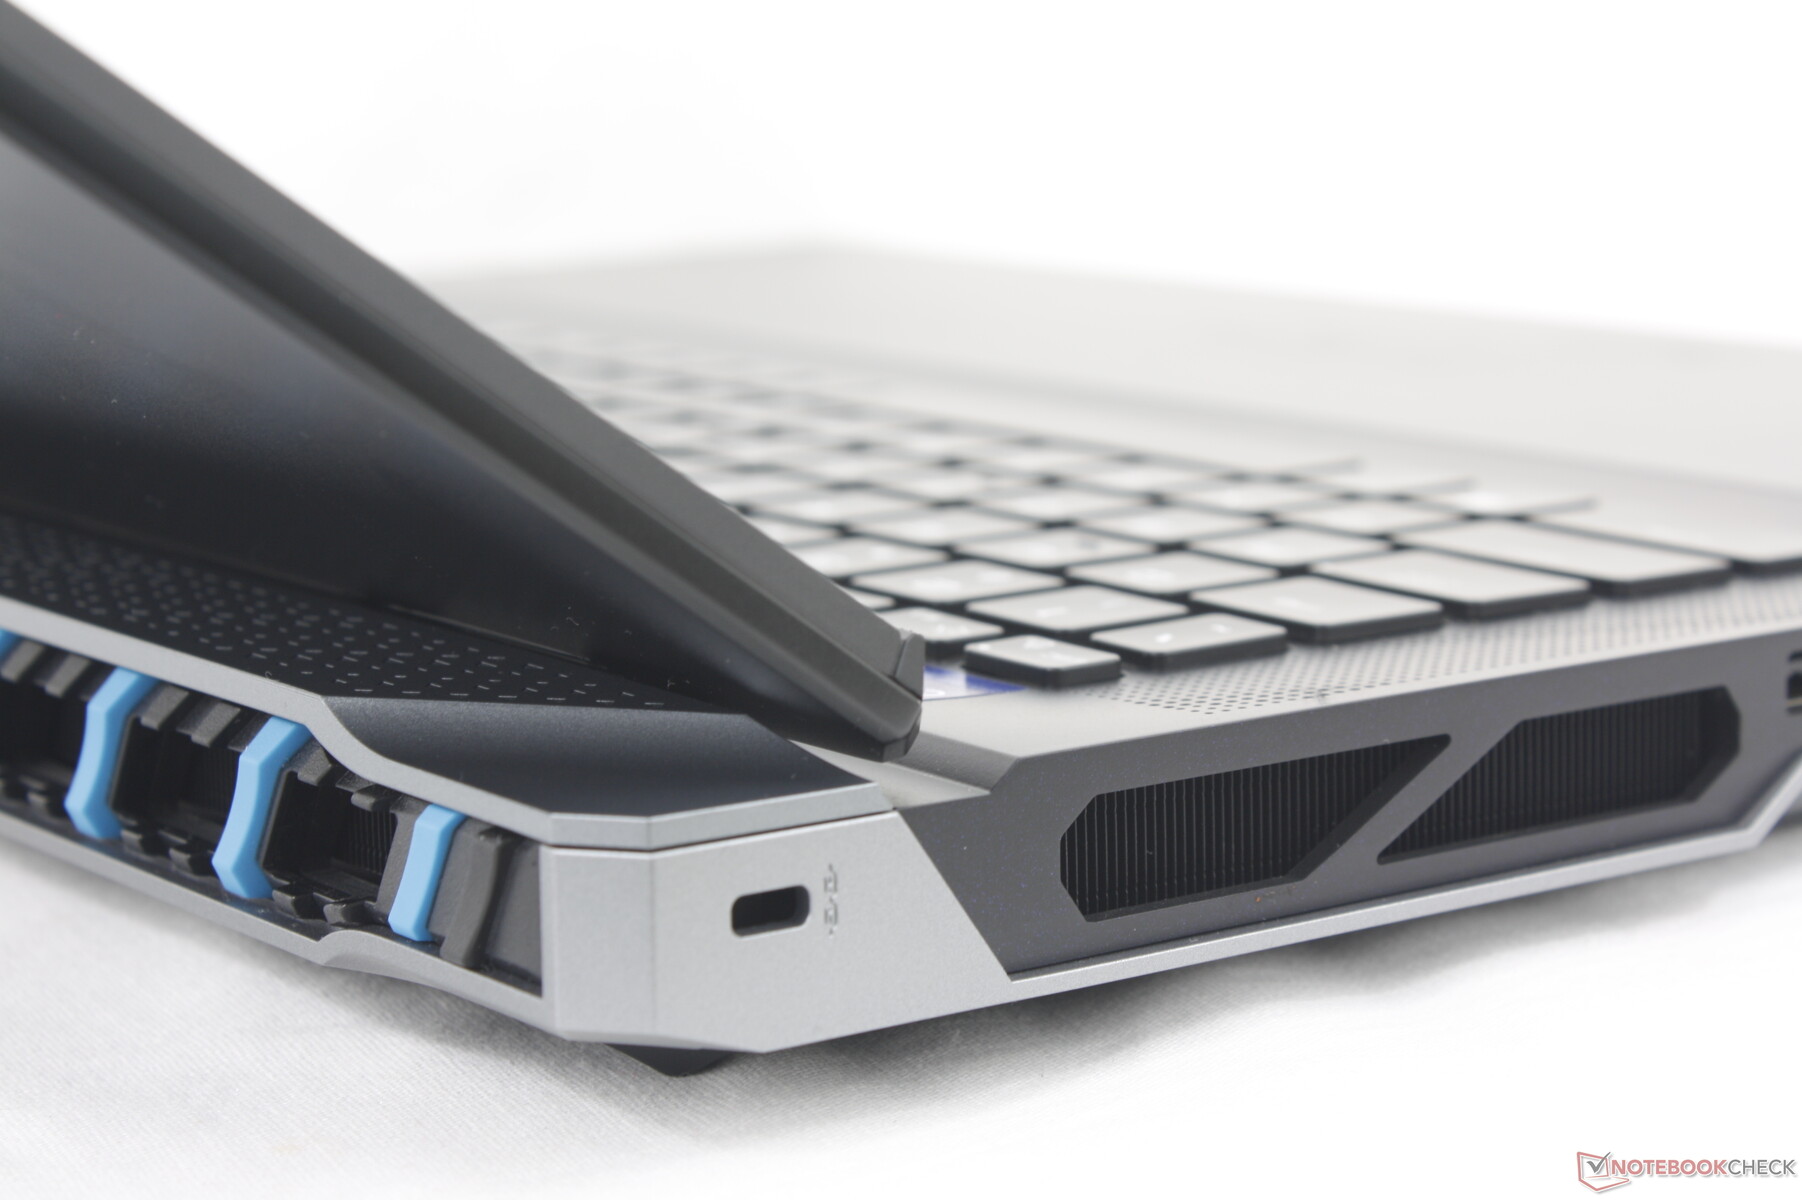
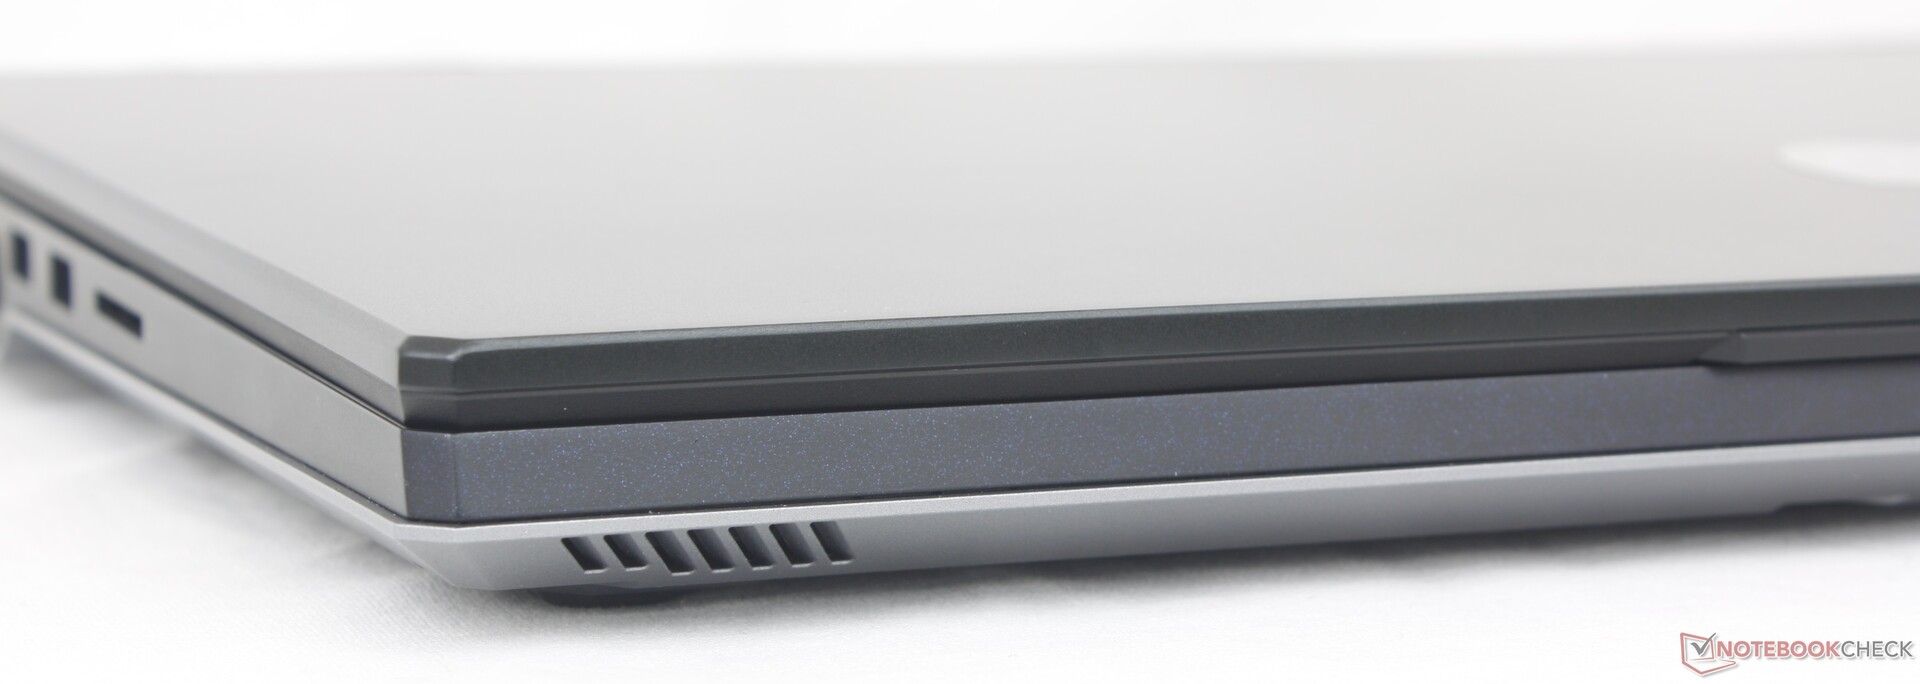
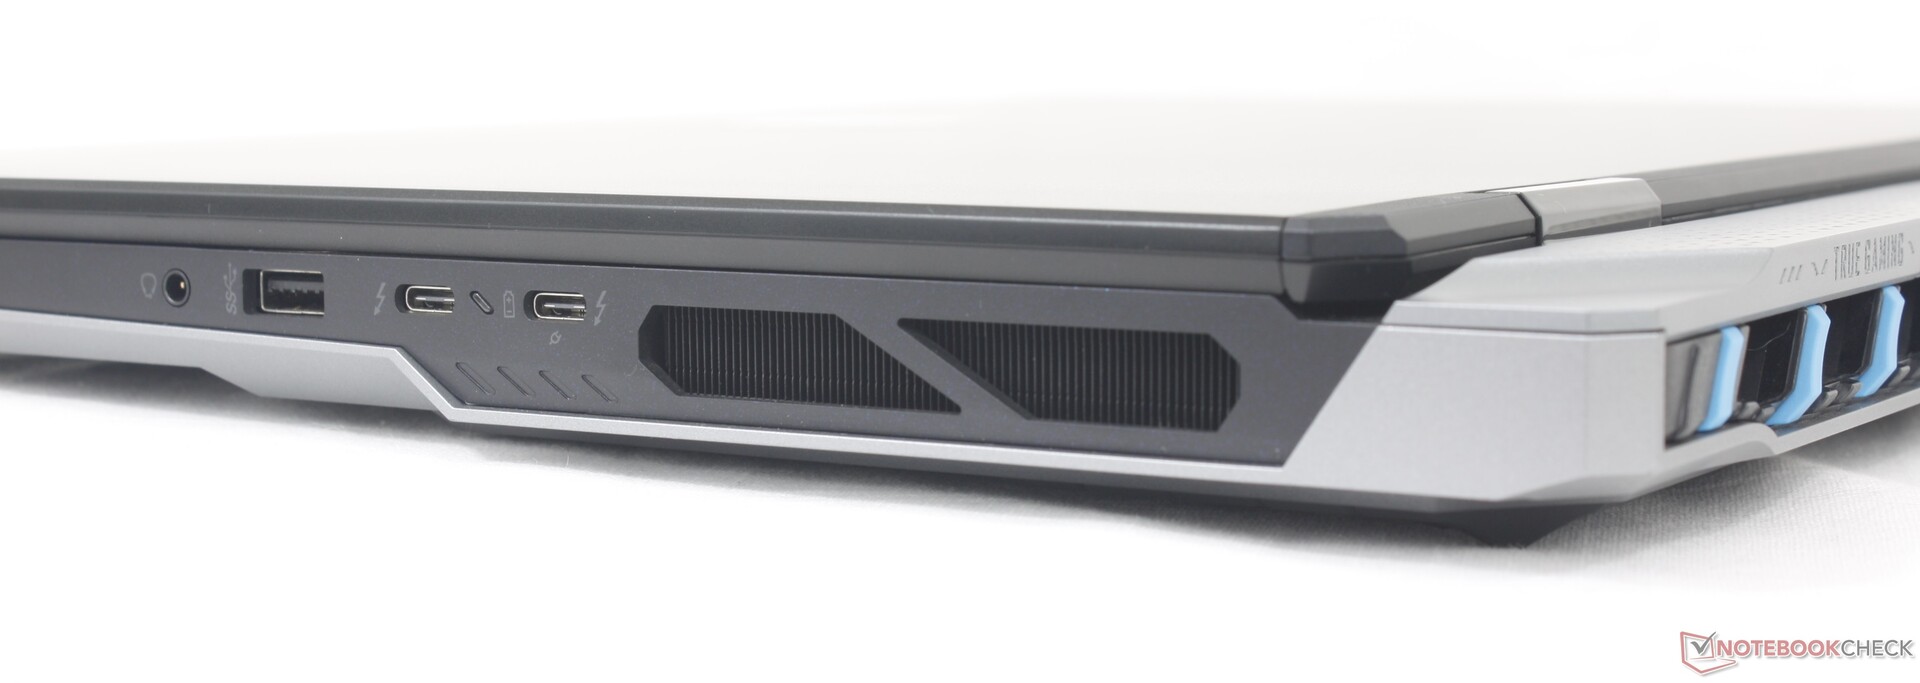
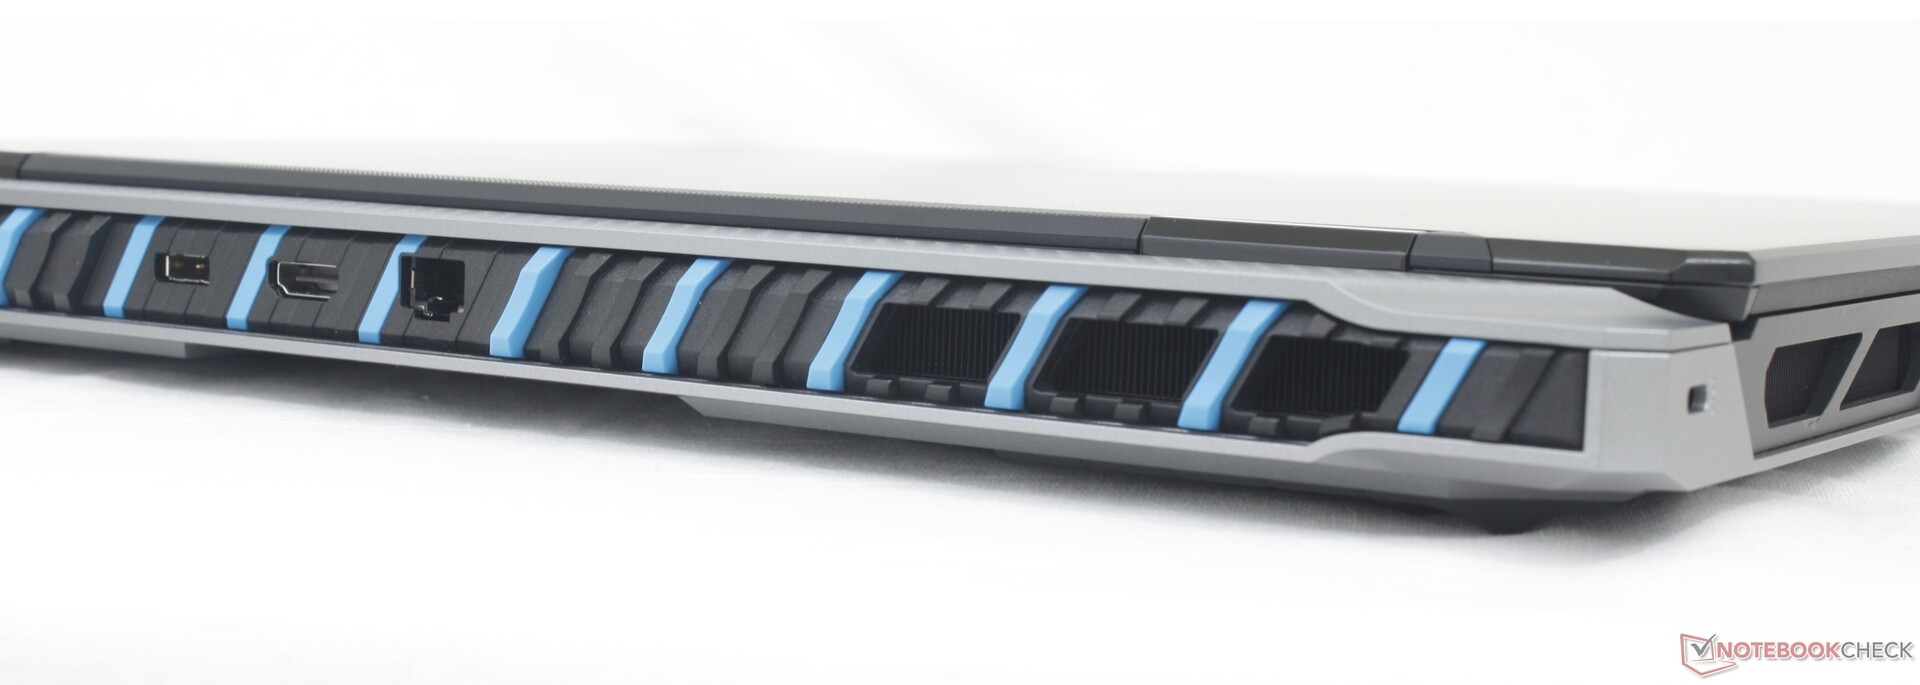
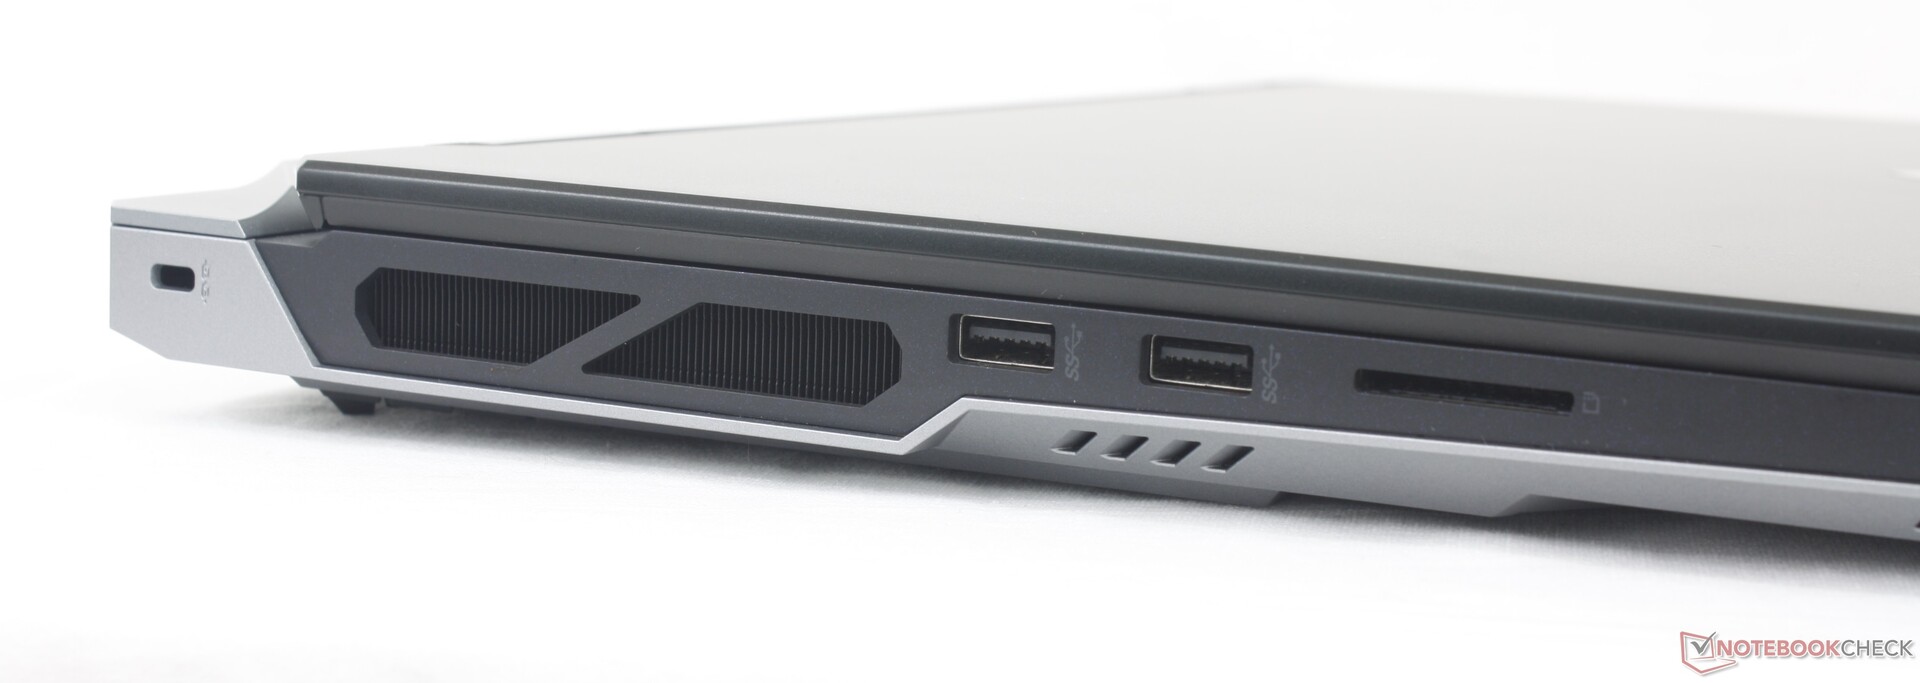
Conectividade
A MSI trouxe de volta todas as portas do GT77 do ano passado, exceto a mini-DisplayPort dedicada. As portas também foram reorganizadas, principalmente na parte traseira, para reduzir a desordem. Em comparação, as portas do GT77 estavam bem compactadas ao longo das bordas esquerda e direita.
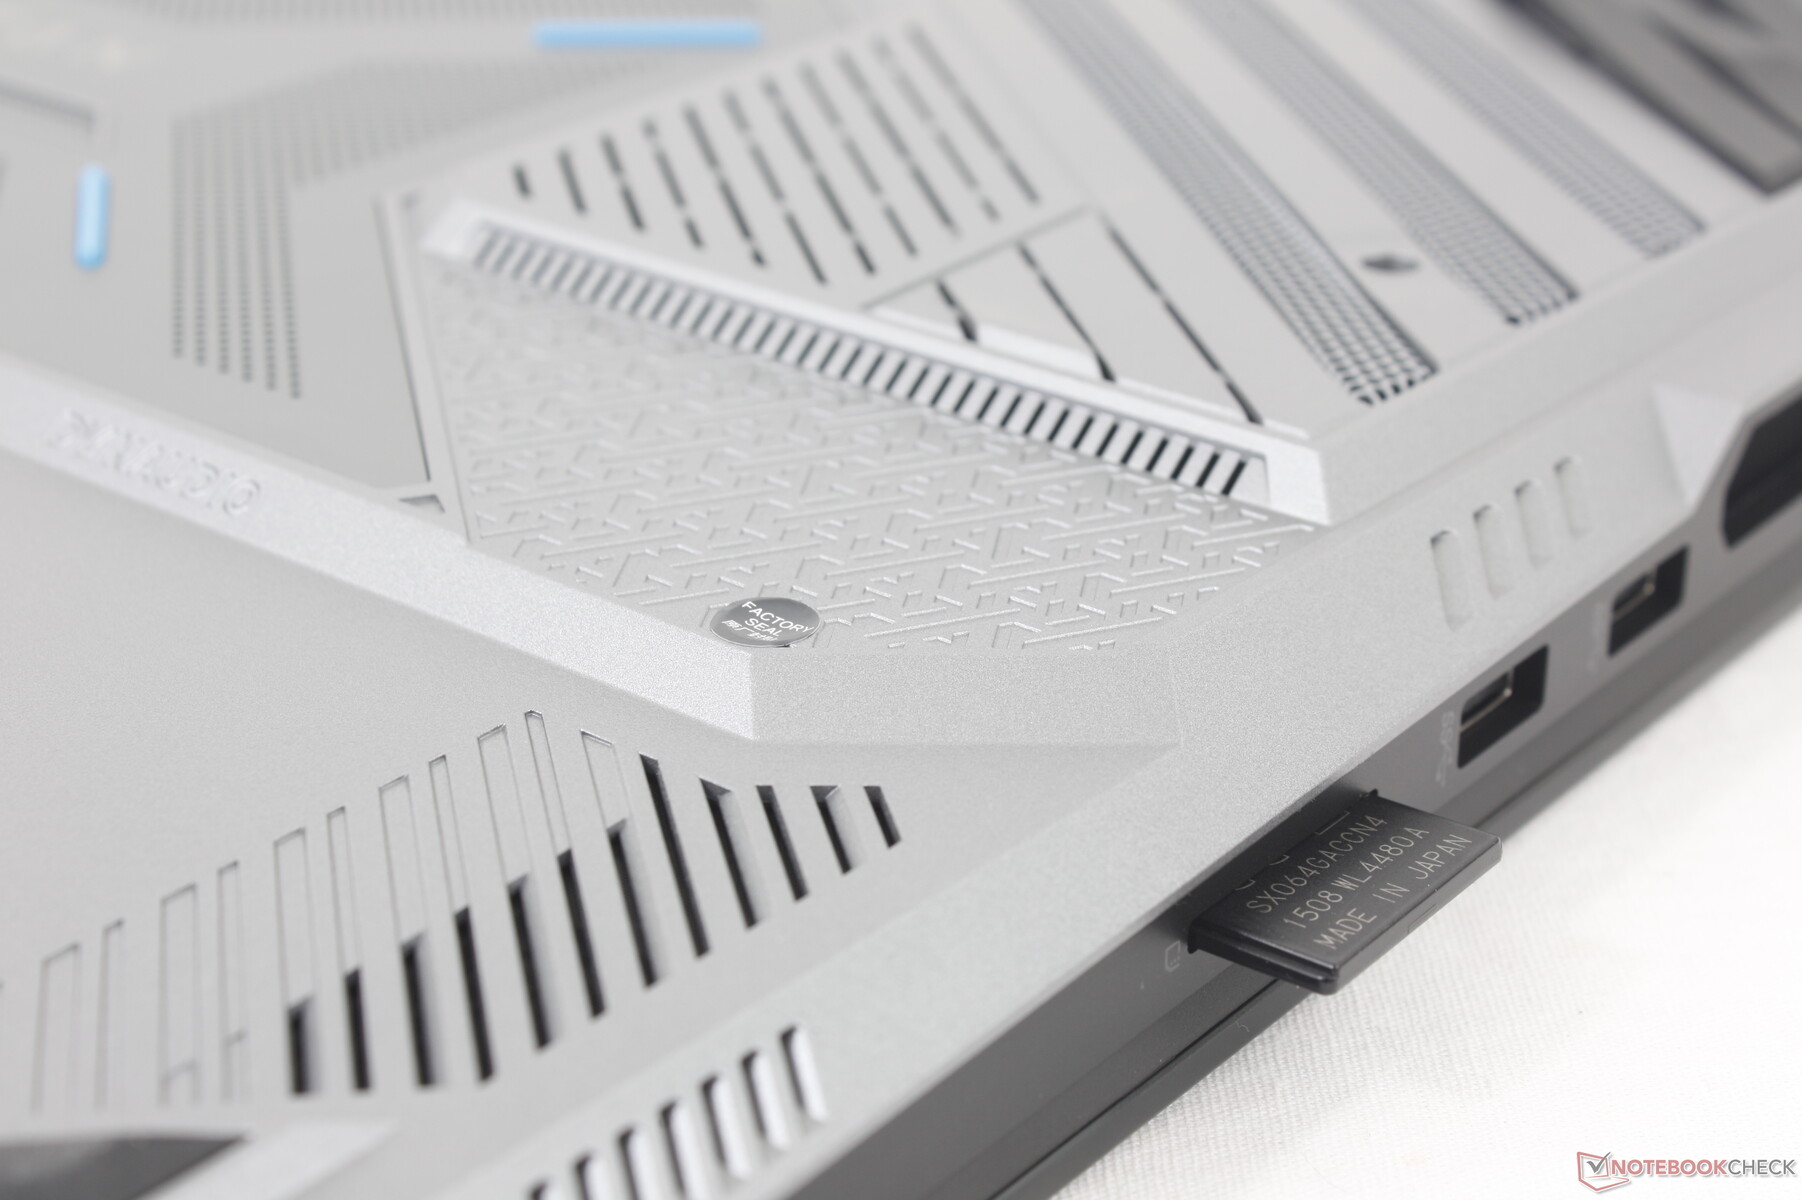
Leitor de cartão SD
Embora o chassi tenha sido renovado, o leitor de cartão lento não foi. Mover 1 GB de imagens do nosso cartão de teste UHS-II para o desktop leva cerca de 12 segundos, sendo duas vezes mais lento do que os leitores de cartão do Razer Blade 18 ou do Alienware m18 R1.
| SD Card Reader | |
| average JPG Copy Test (av. of 3 runs) | |
| Razer Blade 18 RTX 4070 (Angelibird AV Pro V60) | |
| Alienware m18 R1 (Angelibird AV Pro V60) | |
| MSI Titan 18 HX A14VIG (Toshiba Exceria Pro SDXC 64 GB UHS-II) | |
| MSI Titan GT77 HX 13VI (Angelibird AV Pro V60) | |
| Acer Predator Helios 18 N23Q2 | |
| maximum AS SSD Seq Read Test (1GB) | |
| Alienware m18 R1 (Angelibird AV Pro V60) | |
| Razer Blade 18 RTX 4070 (Angelibird AV Pro V60) | |
| MSI Titan 18 HX A14VIG (Toshiba Exceria Pro SDXC 64 GB UHS-II) | |
| MSI Titan GT77 HX 13VI (Angelibird AV Pro V60) | |
| Acer Predator Helios 18 N23Q2 | |
Comunicação
A WLAN é fornecida pelo Killer BE1750x, que é a variante para jogos do BE1750W. O módulo é compatível com o Wi-Fi 7, embora os roteadores Wi-Fi 7 ainda não sejam os mais comuns. Não tivemos problemas de conectividade quando emparelhado com nosso roteador de teste Wi-Fi 6E.
| Networking | |
| iperf3 transmit AXE11000 | |
| Asus ROG Strix G18 G814JI | |
| MSI Titan GT77 HX 13VI | |
| Alienware m18 R1 | |
| Razer Blade 18 RTX 4070 | |
| MSI Titan 18 HX A14VIG | |
| Acer Predator Helios 18 N23Q2 | |
| iperf3 receive AXE11000 | |
| Asus ROG Strix G18 G814JI | |
| MSI Titan GT77 HX 13VI | |
| Razer Blade 18 RTX 4070 | |
| Alienware m18 R1 | |
| MSI Titan 18 HX A14VIG | |
| Acer Predator Helios 18 N23Q2 | |
| iperf3 transmit AXE11000 6GHz | |
| Acer Predator Helios 18 N23Q2 | |
| Alienware m18 R1 | |
| Razer Blade 18 RTX 4070 | |
| MSI Titan 18 HX A14VIG | |
| iperf3 receive AXE11000 6GHz | |
| Razer Blade 18 RTX 4070 | |
| Acer Predator Helios 18 N23Q2 | |
| MSI Titan 18 HX A14VIG | |
| Alienware m18 R1 | |
Webcam
Uma webcam de 2 MP com obturador de privacidade físico e sensor IR é padrão. A câmera pode ter problemas de brilho, como mostra a foto abaixo.

")
")
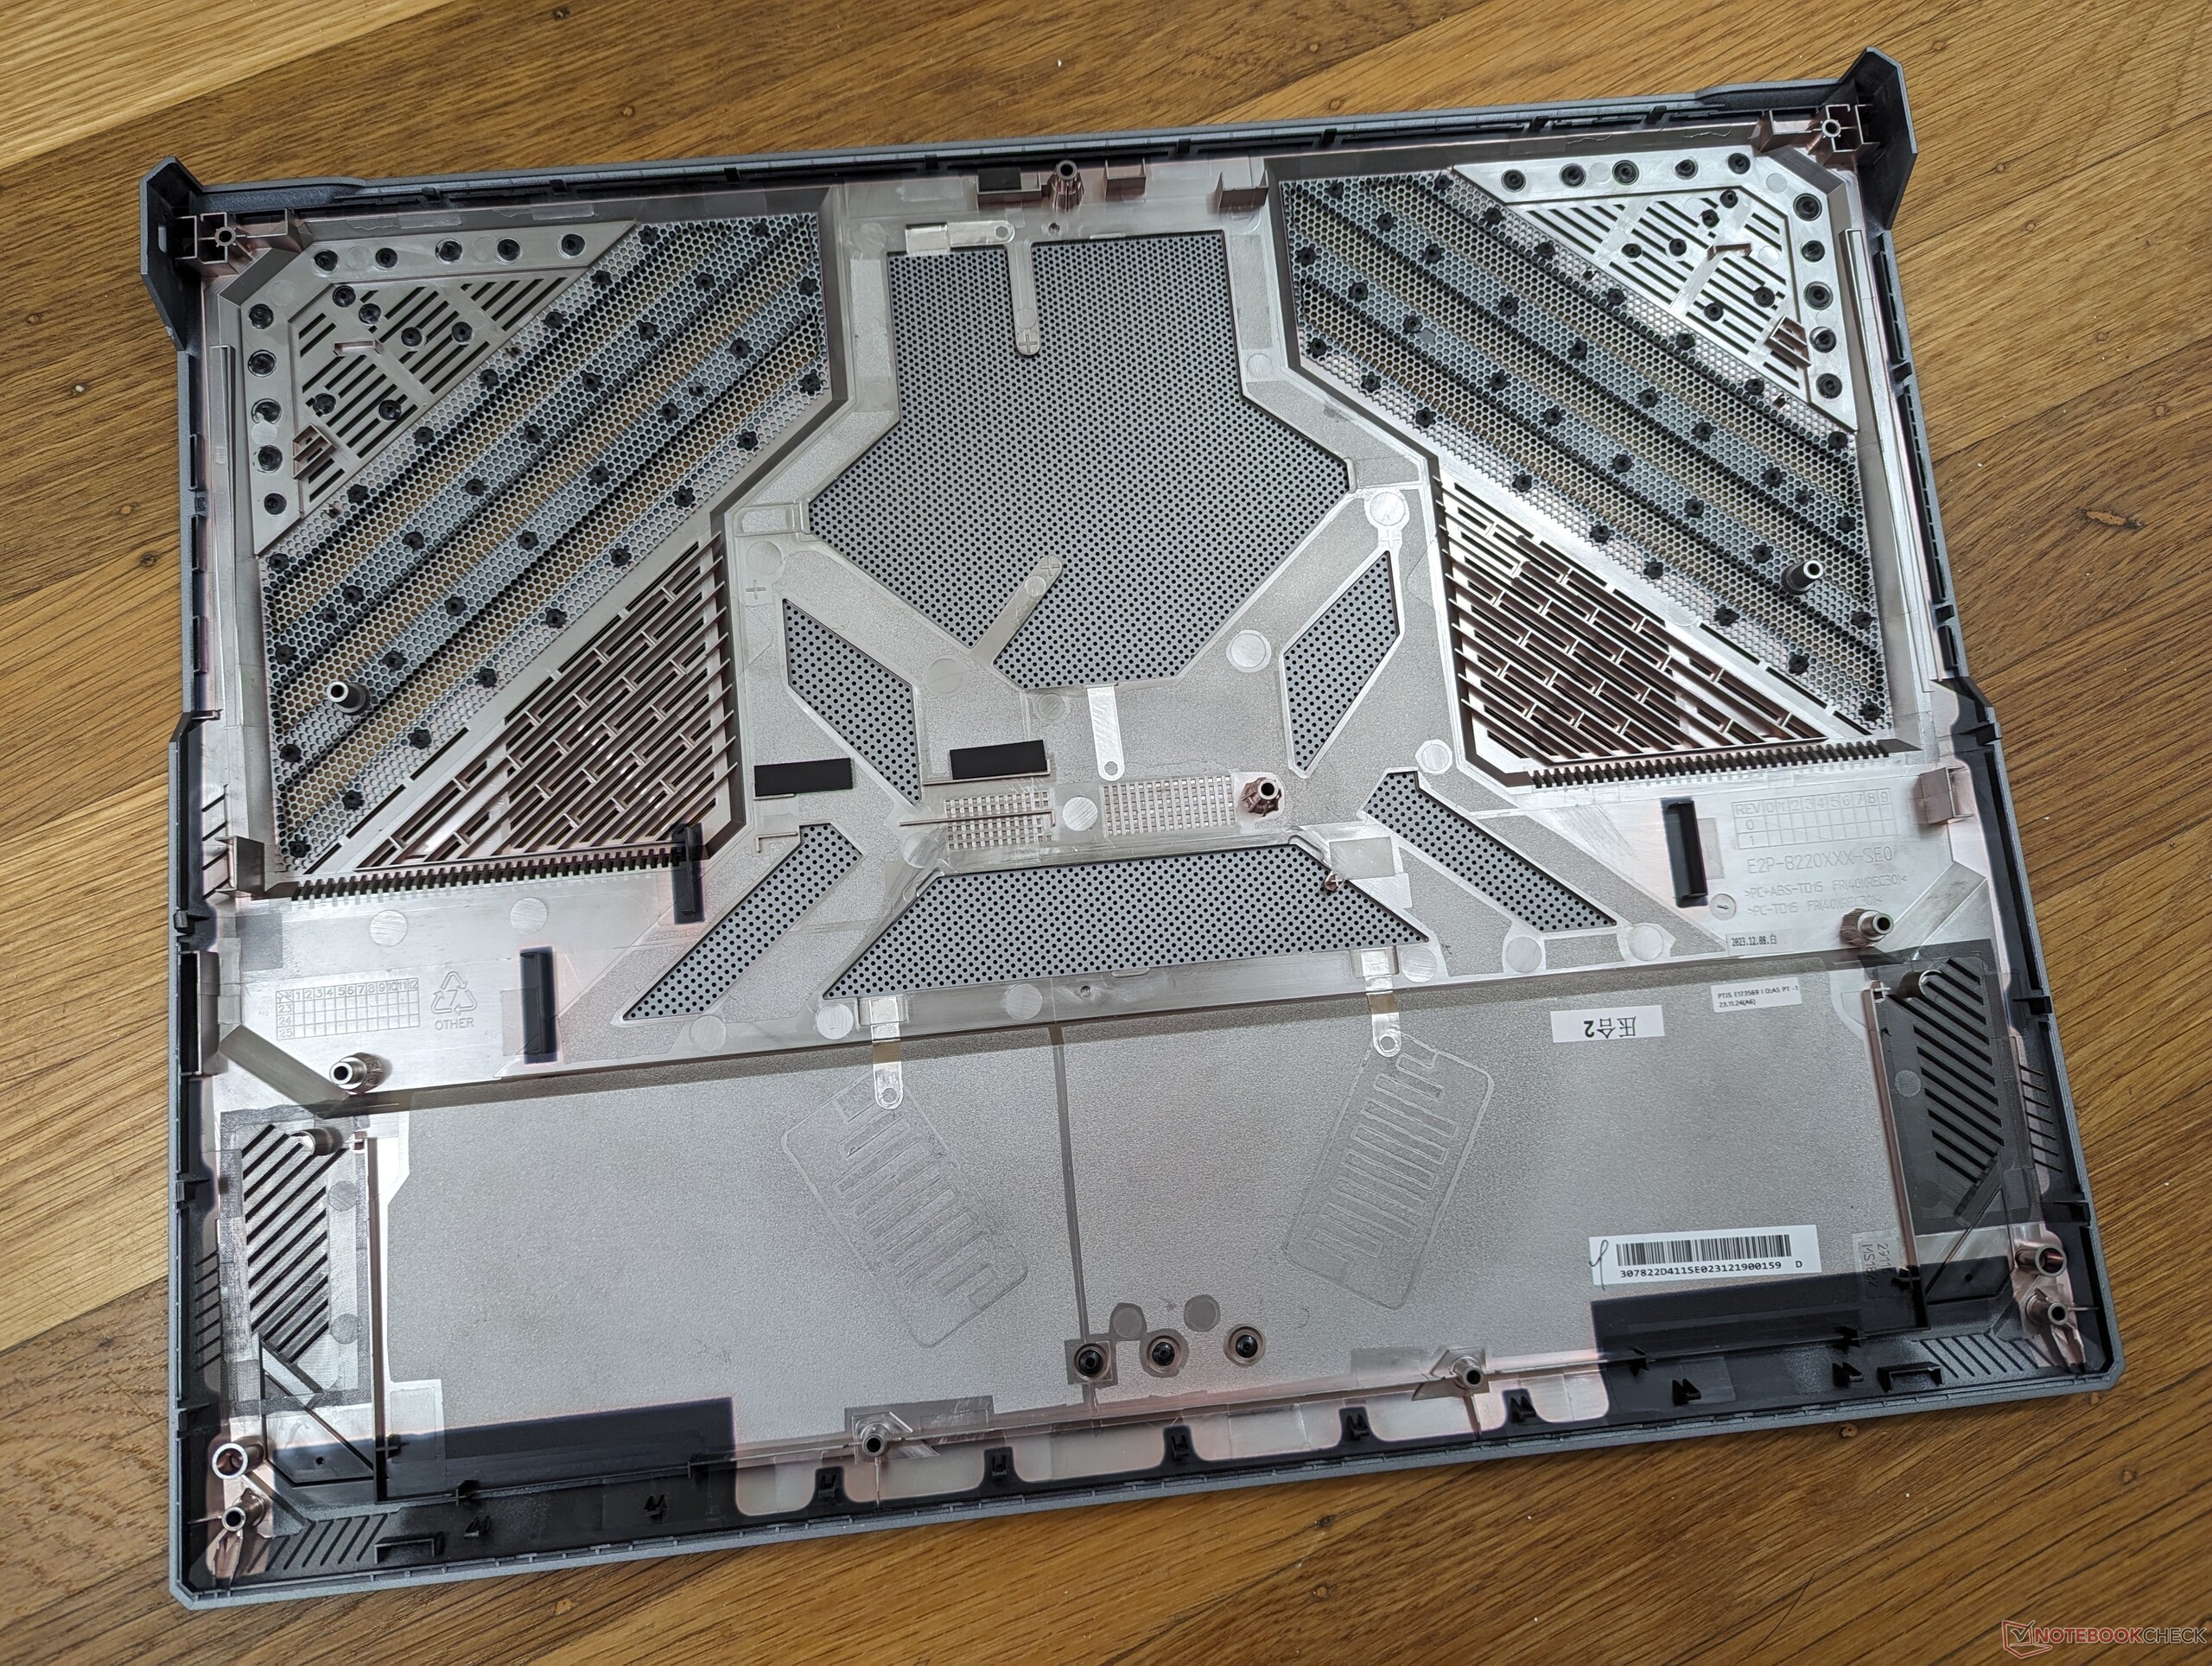
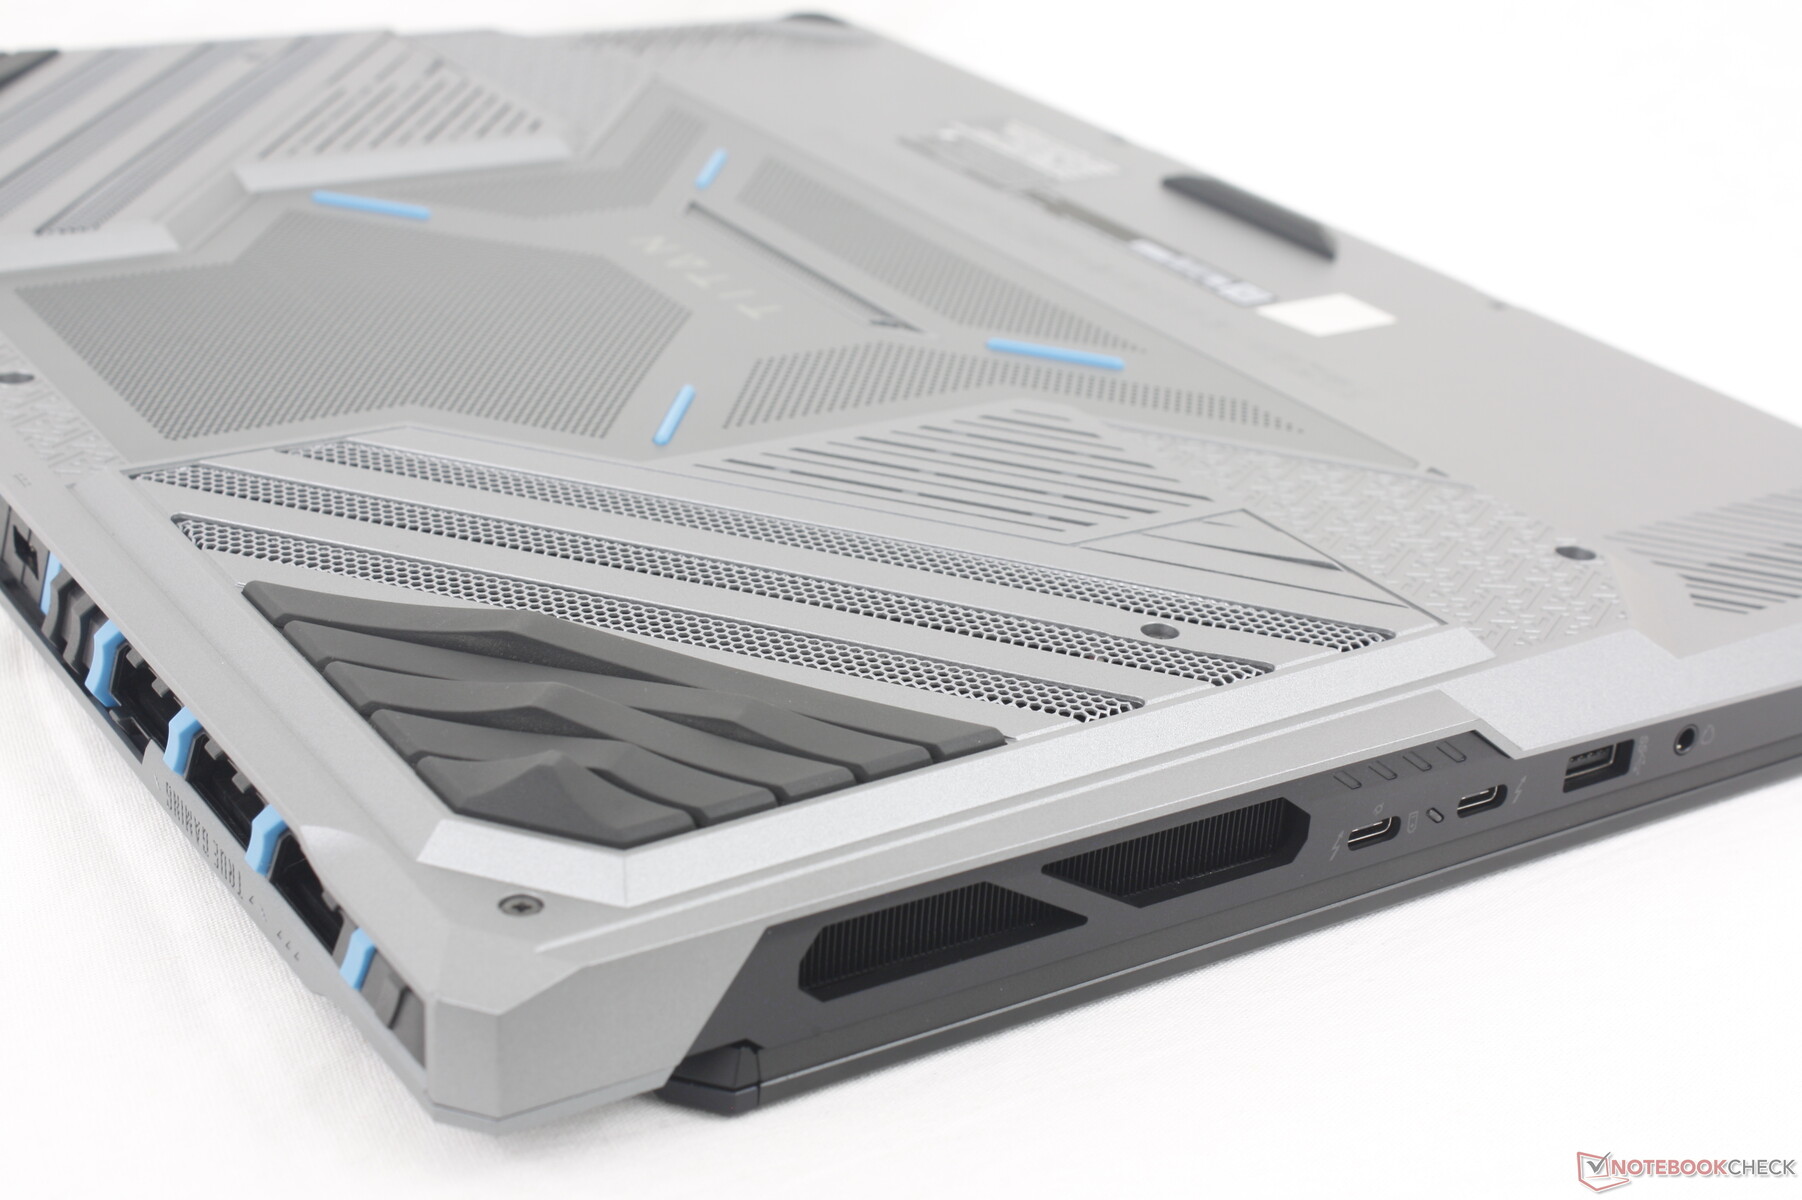
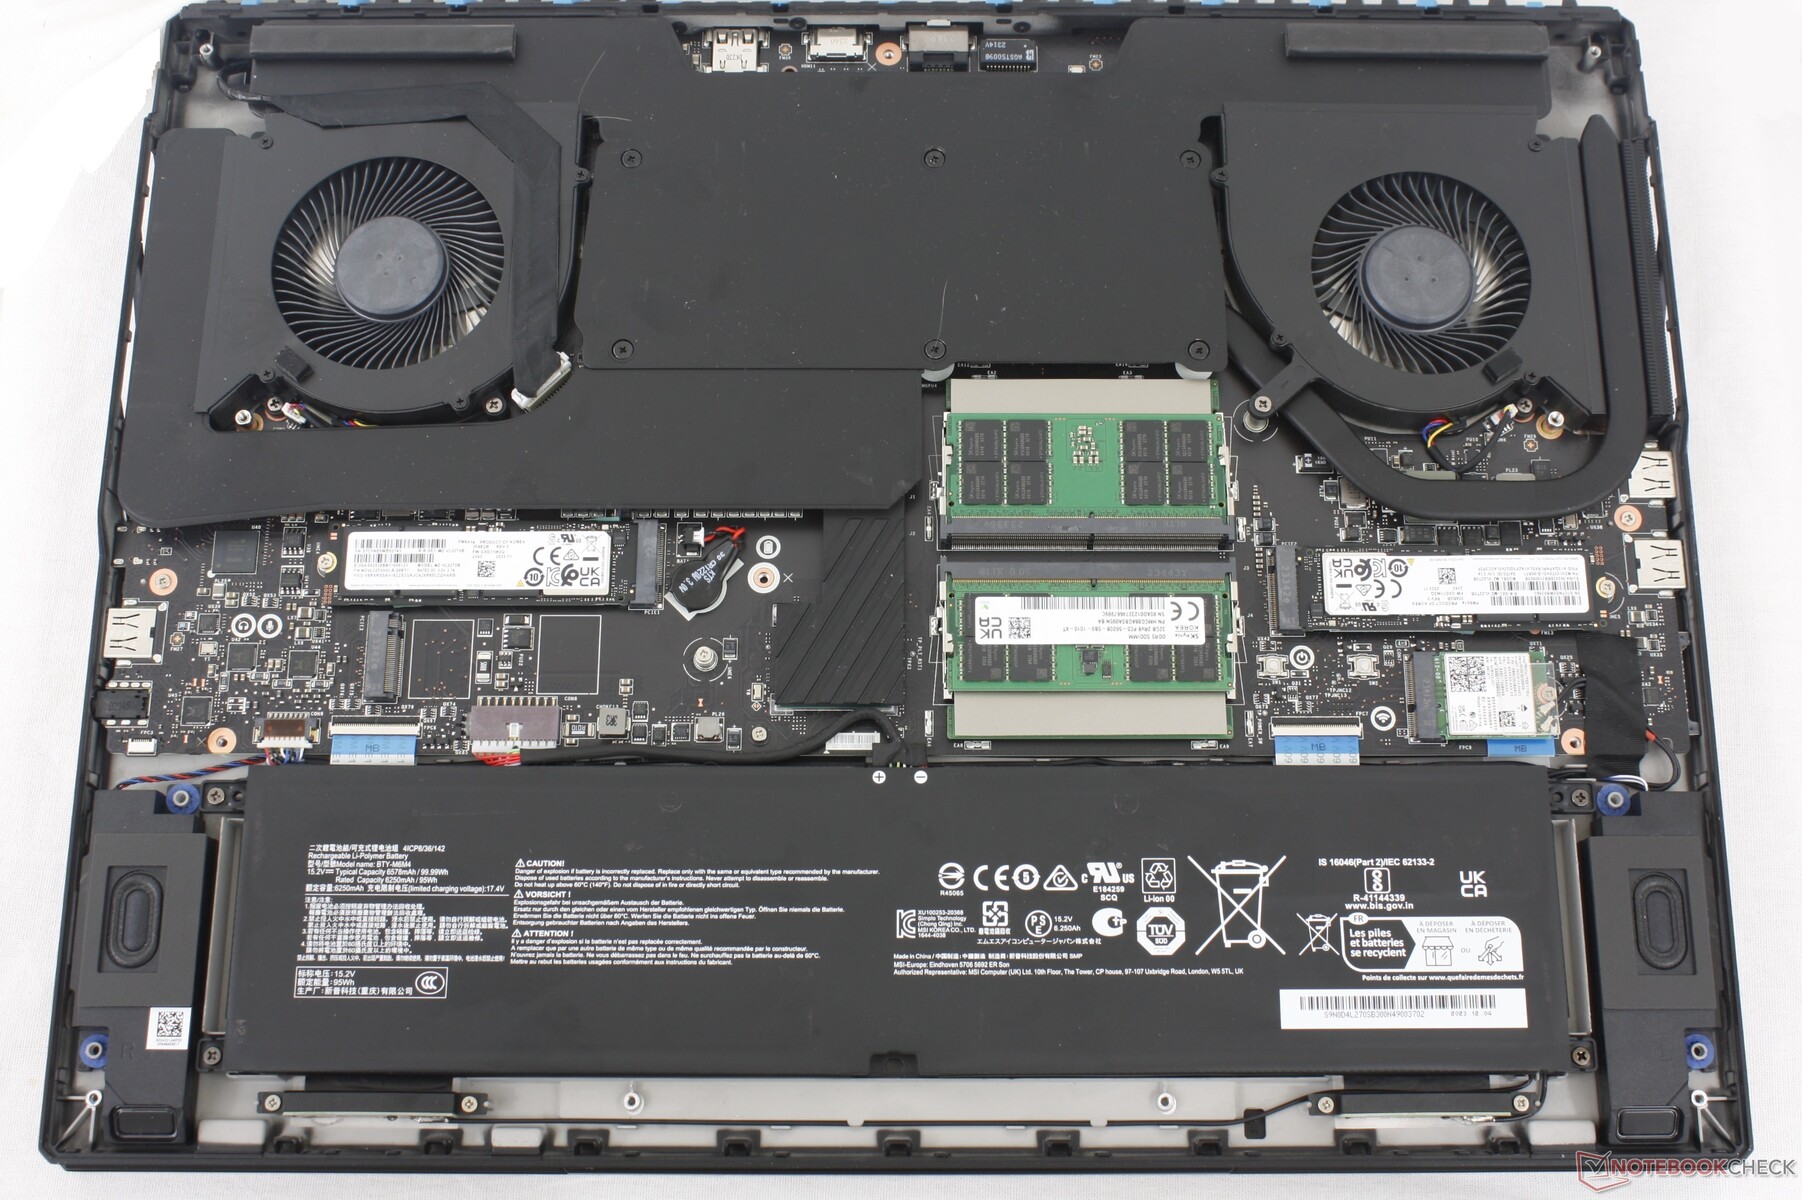
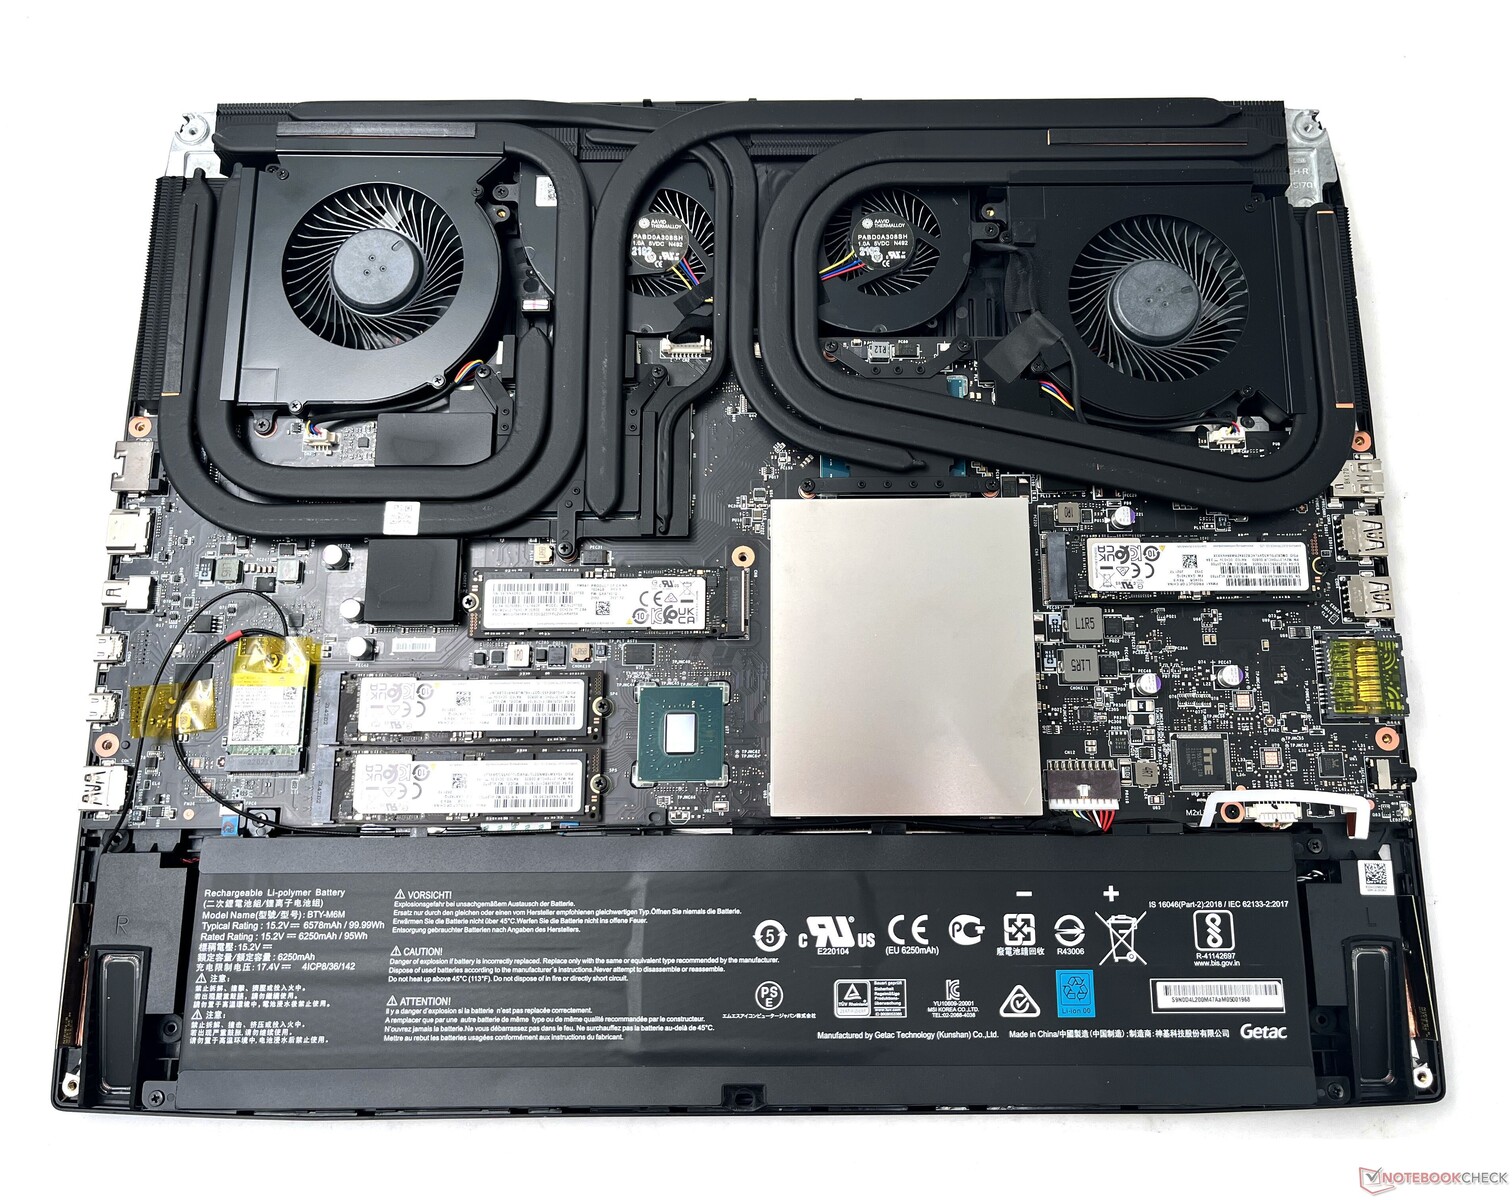
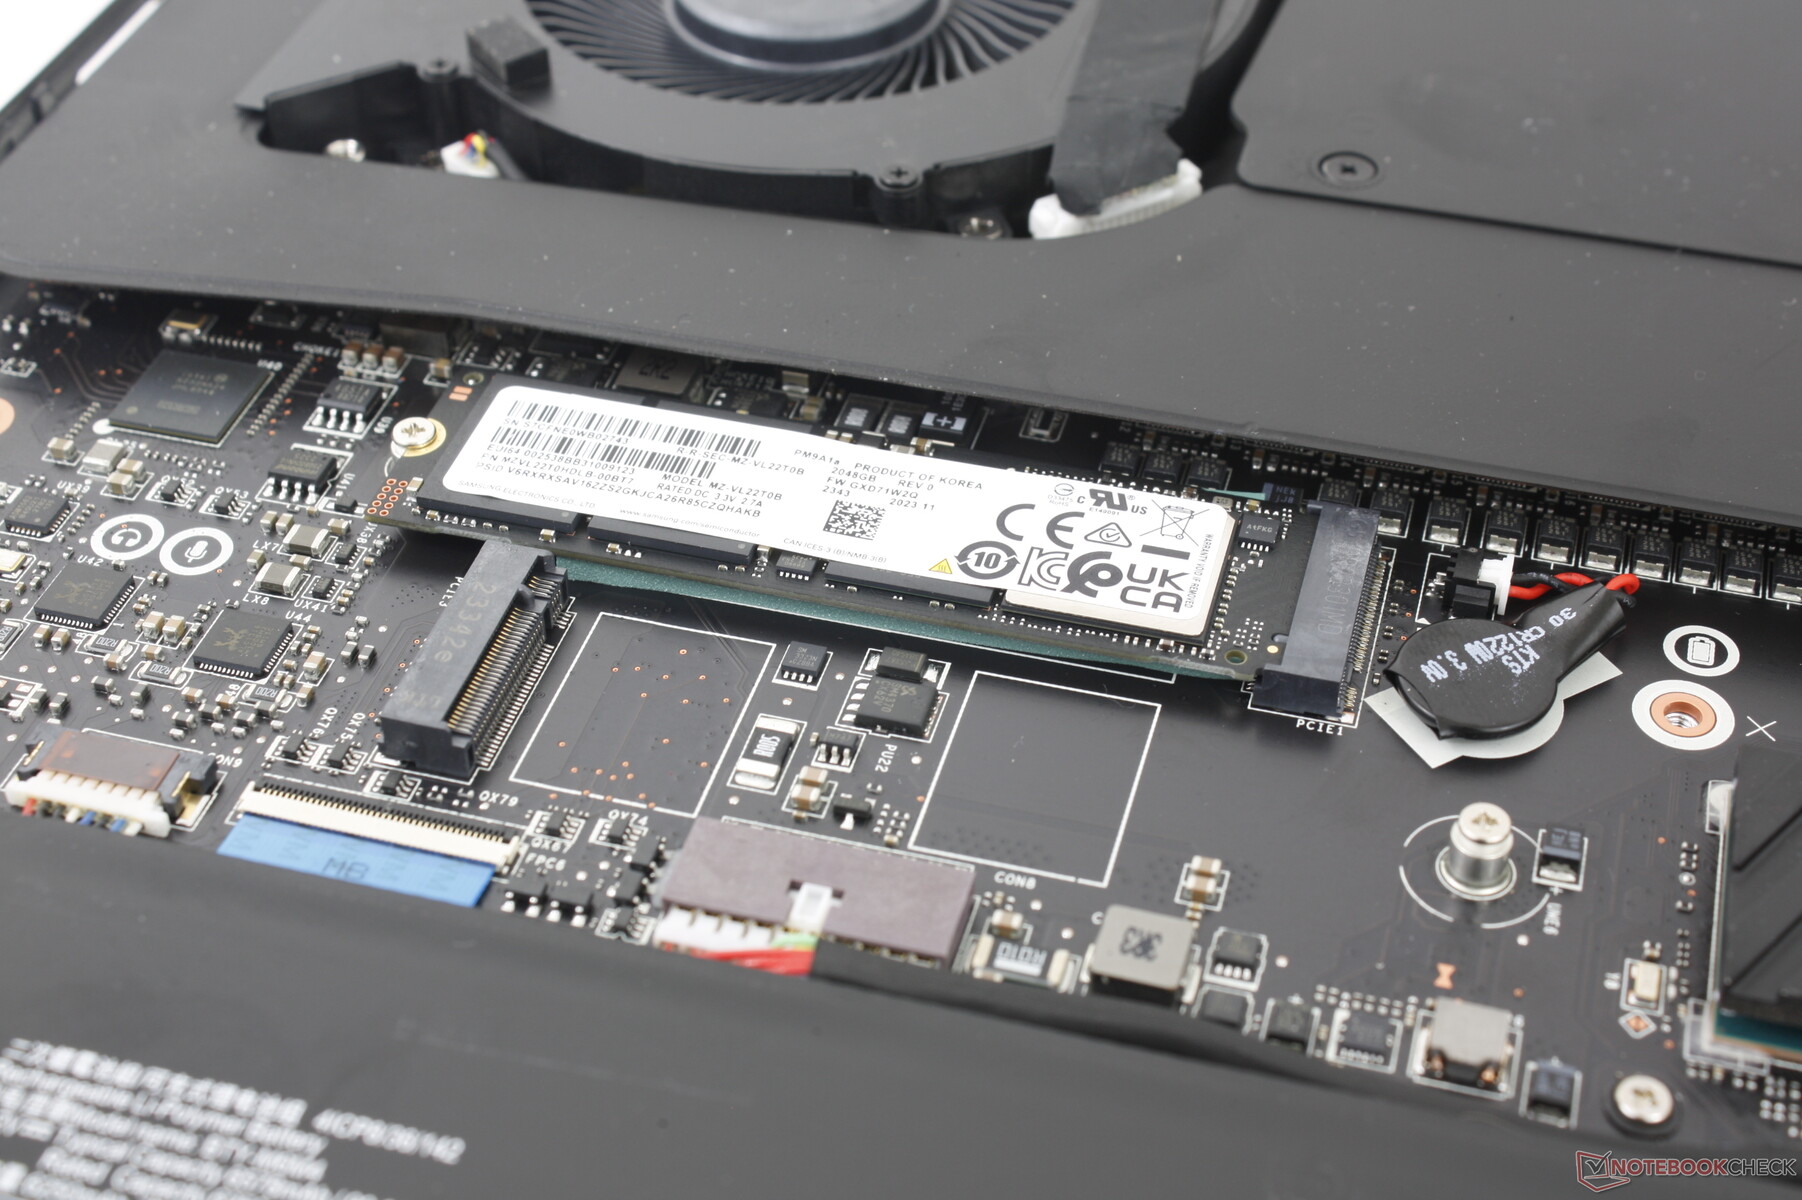
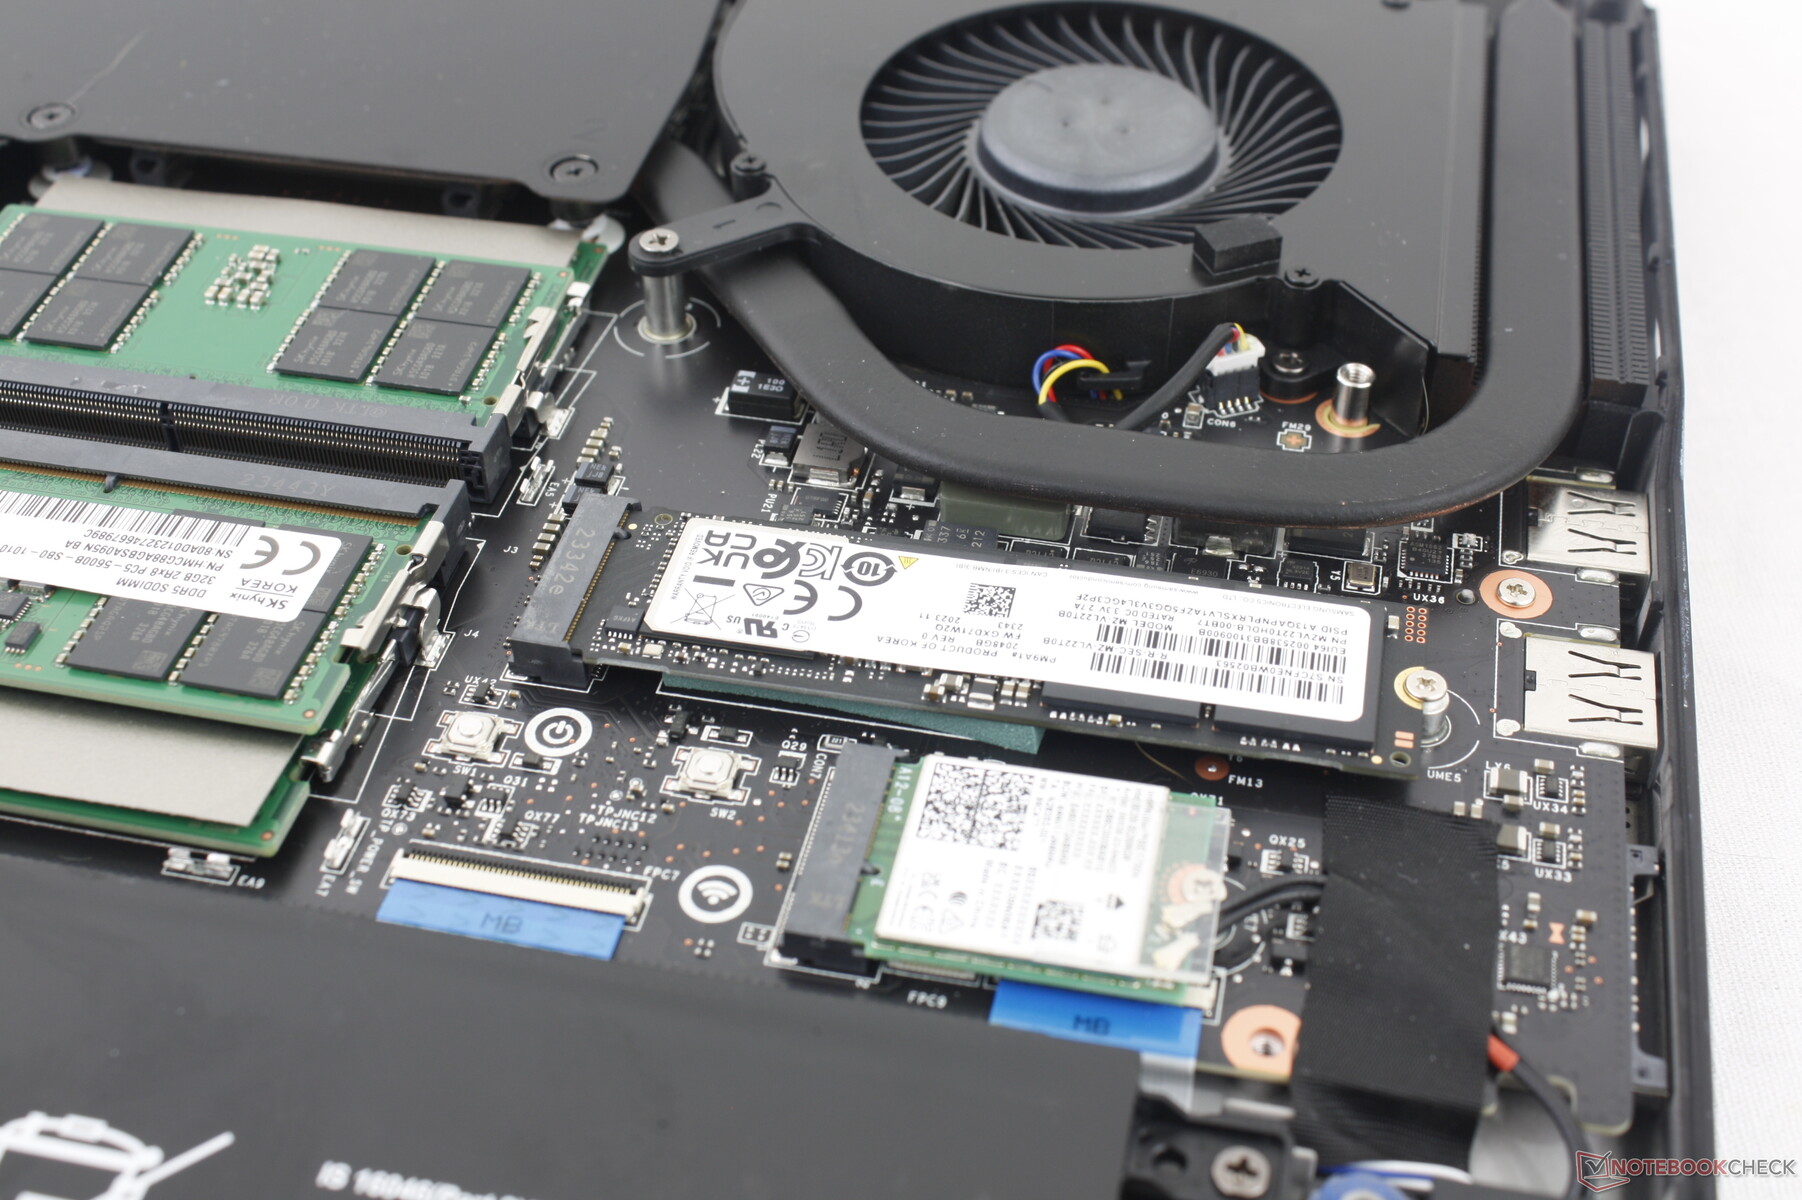
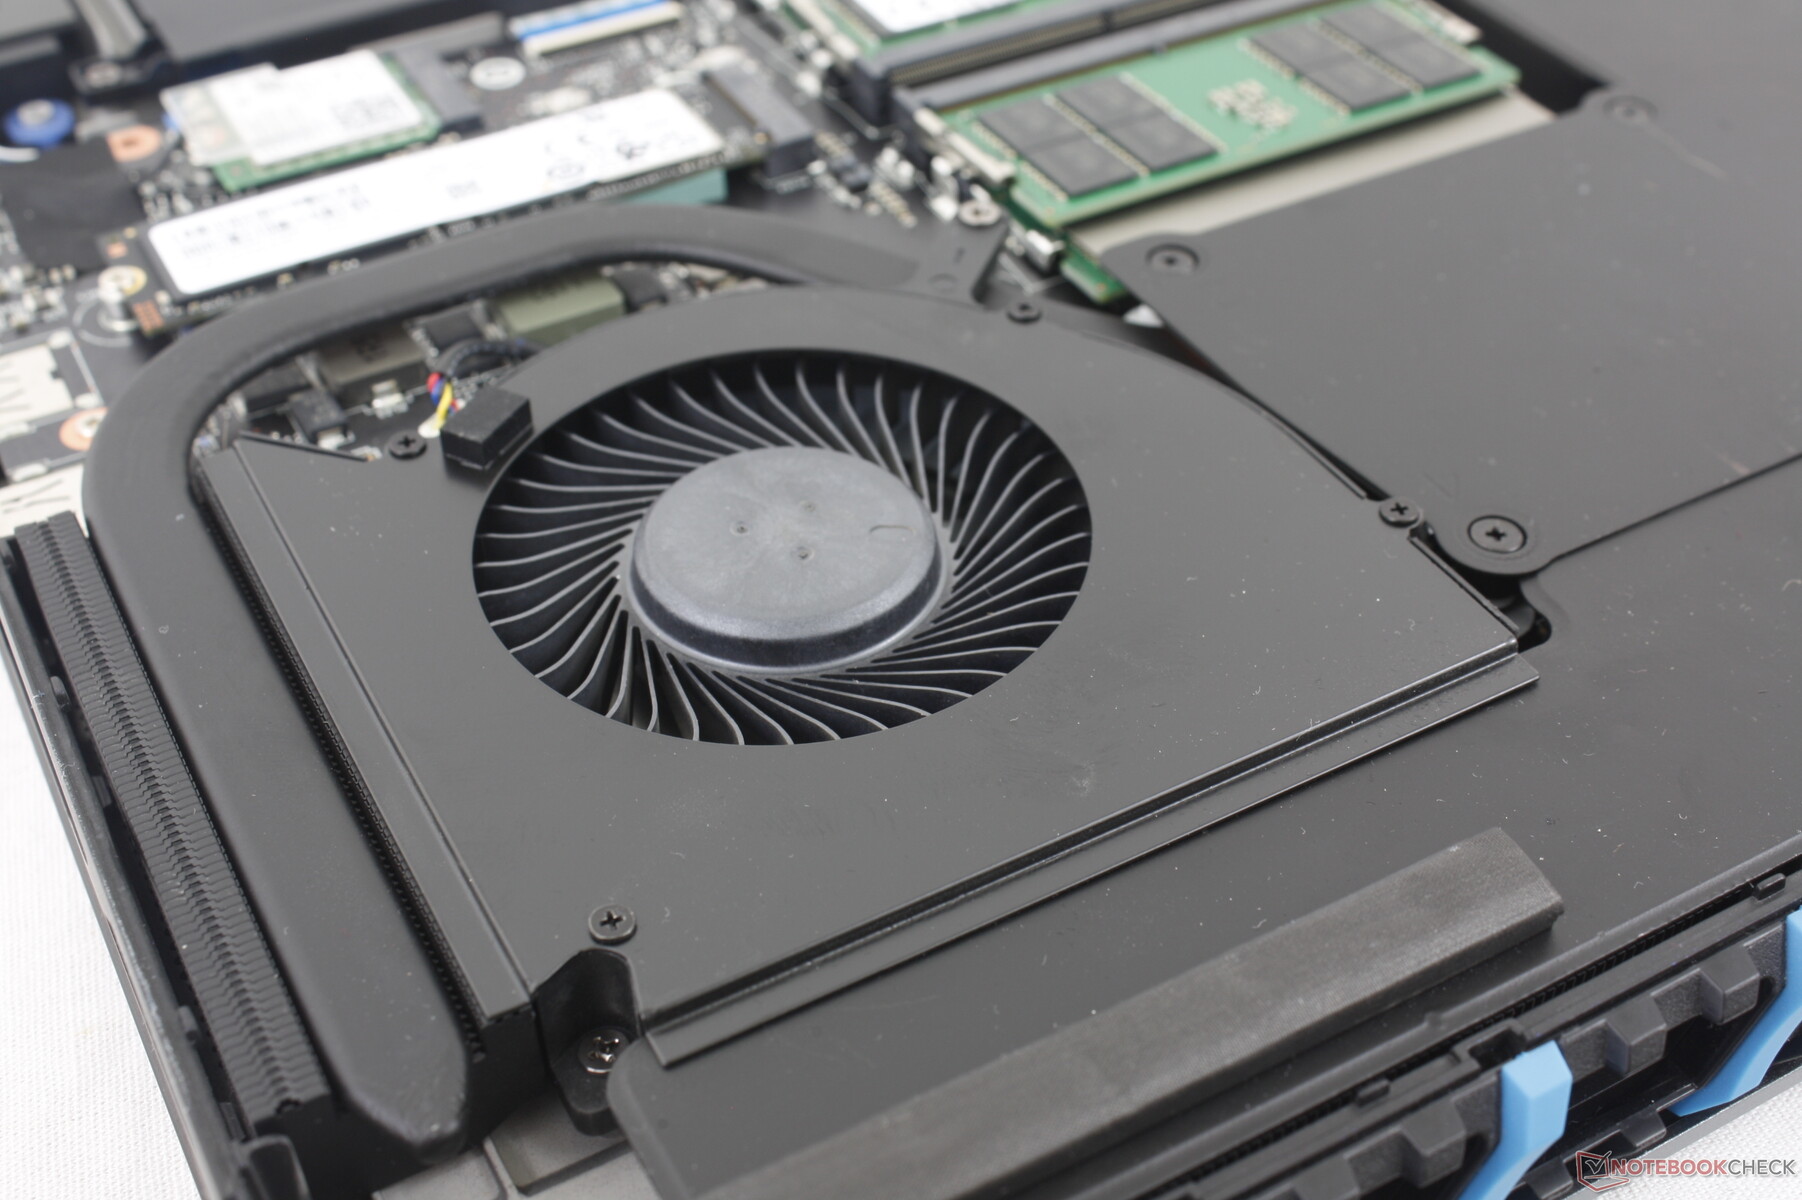
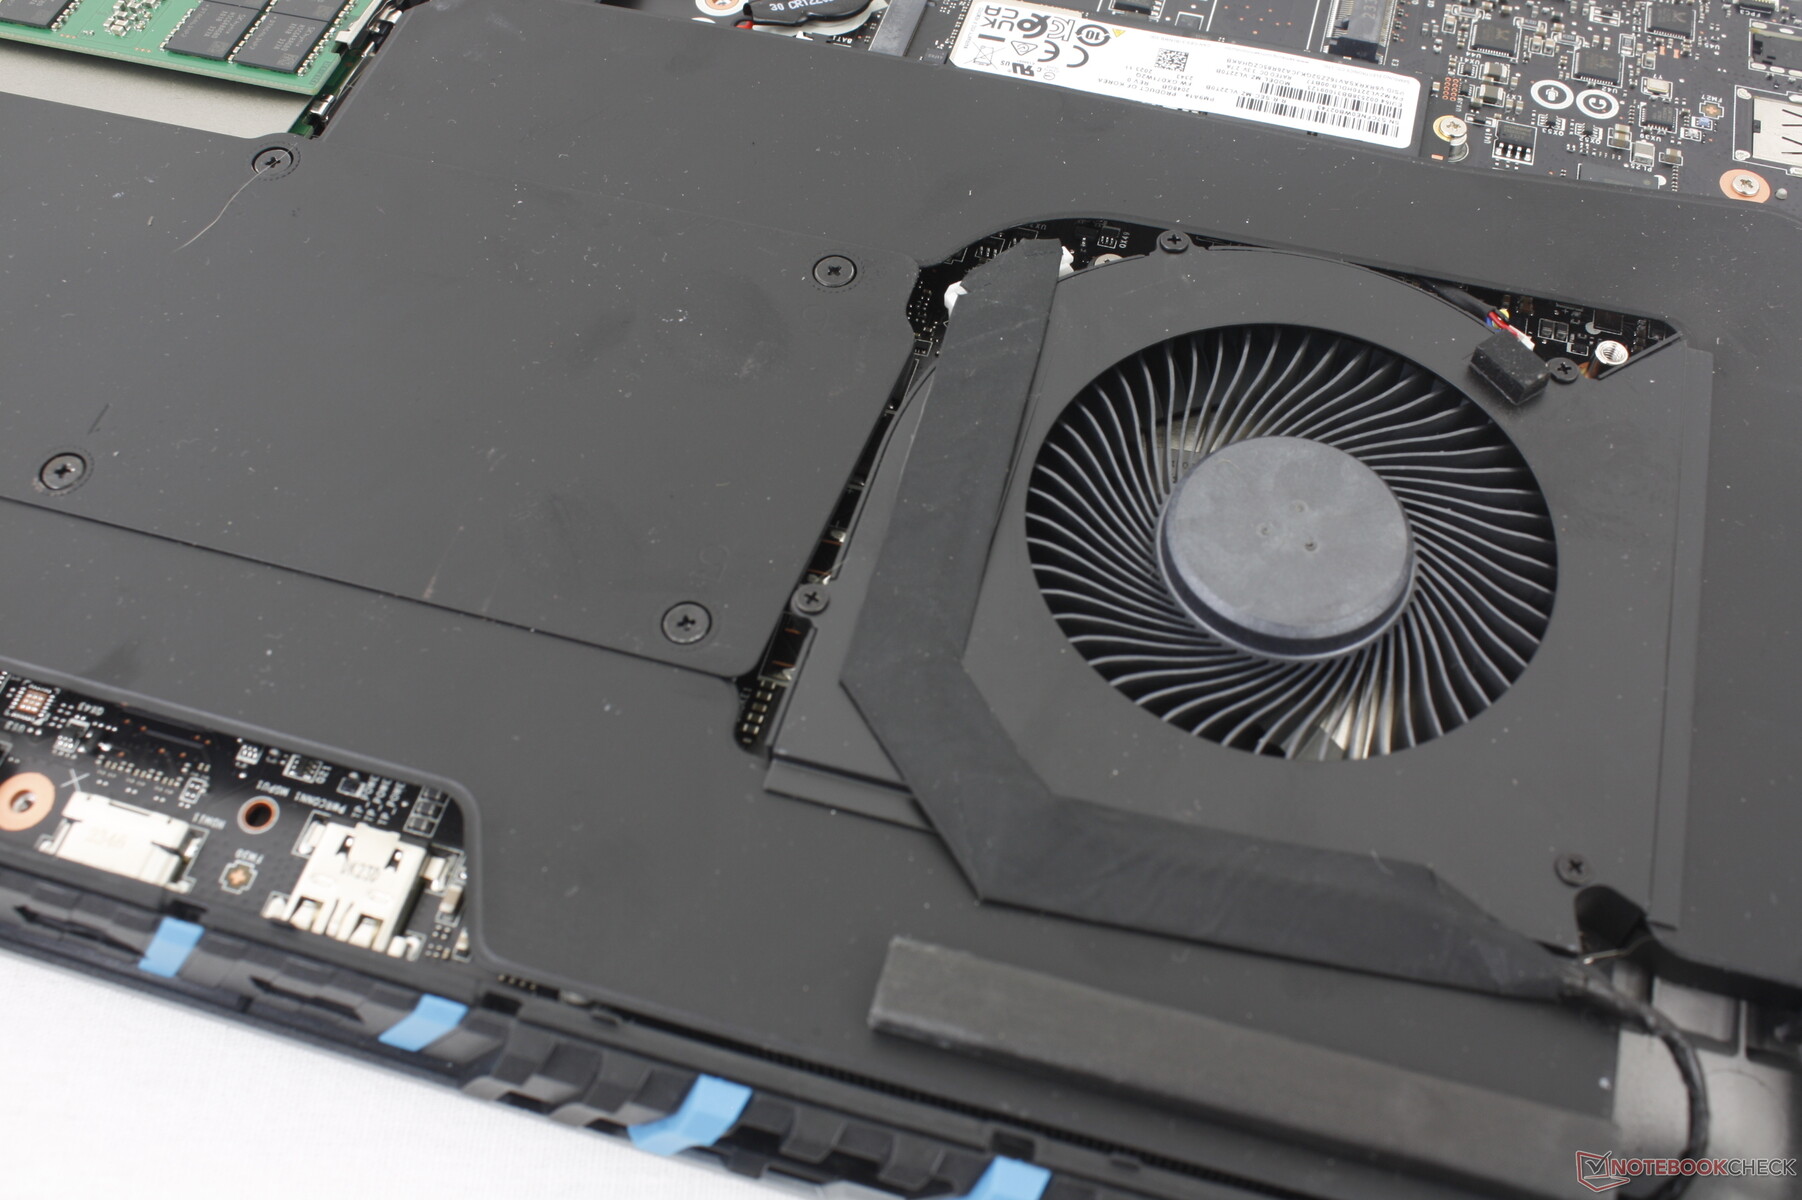
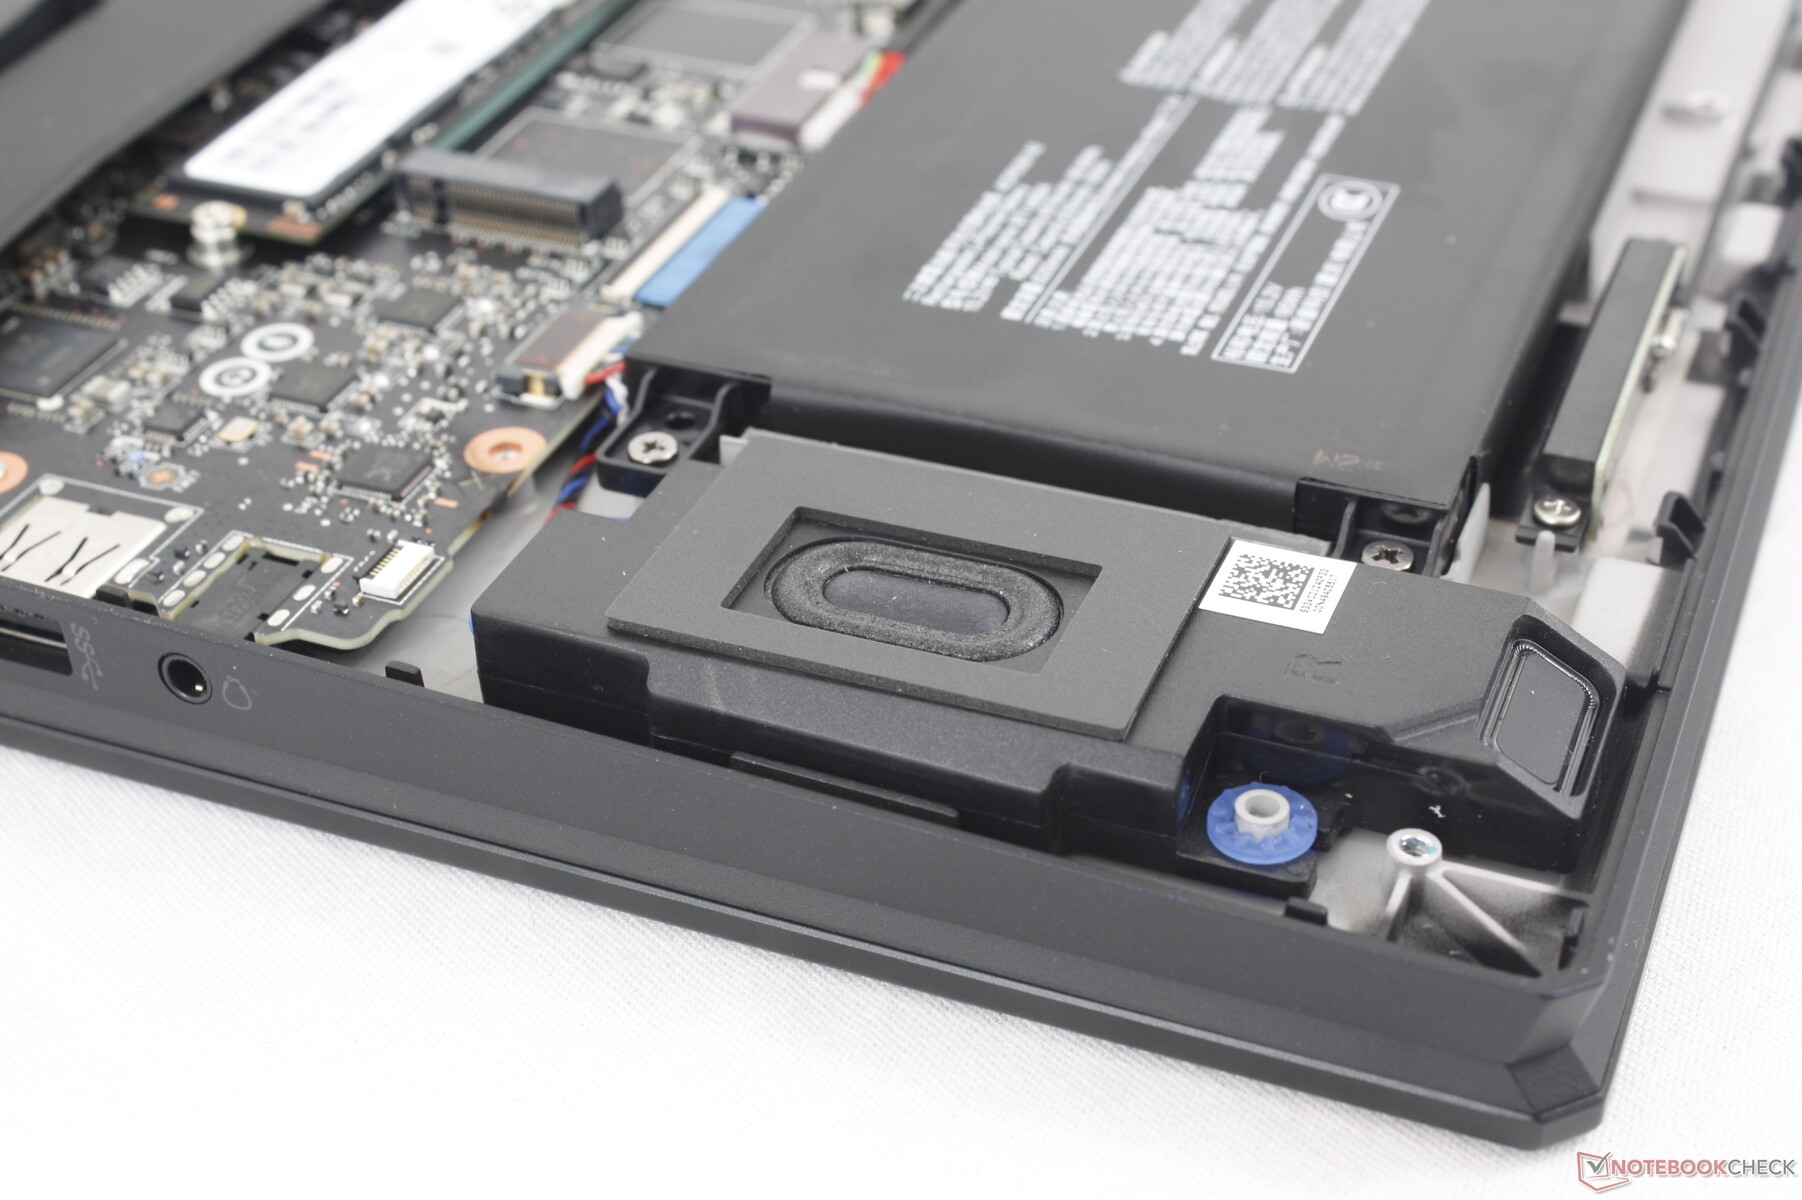
Manutenção
O painel inferior é fixado por 12 parafusos Phillips para facilitar relativamente a manutenção. No entanto, lembre-se de que é necessário quebrar o adesivo de vedação da fábrica para fazer isso.
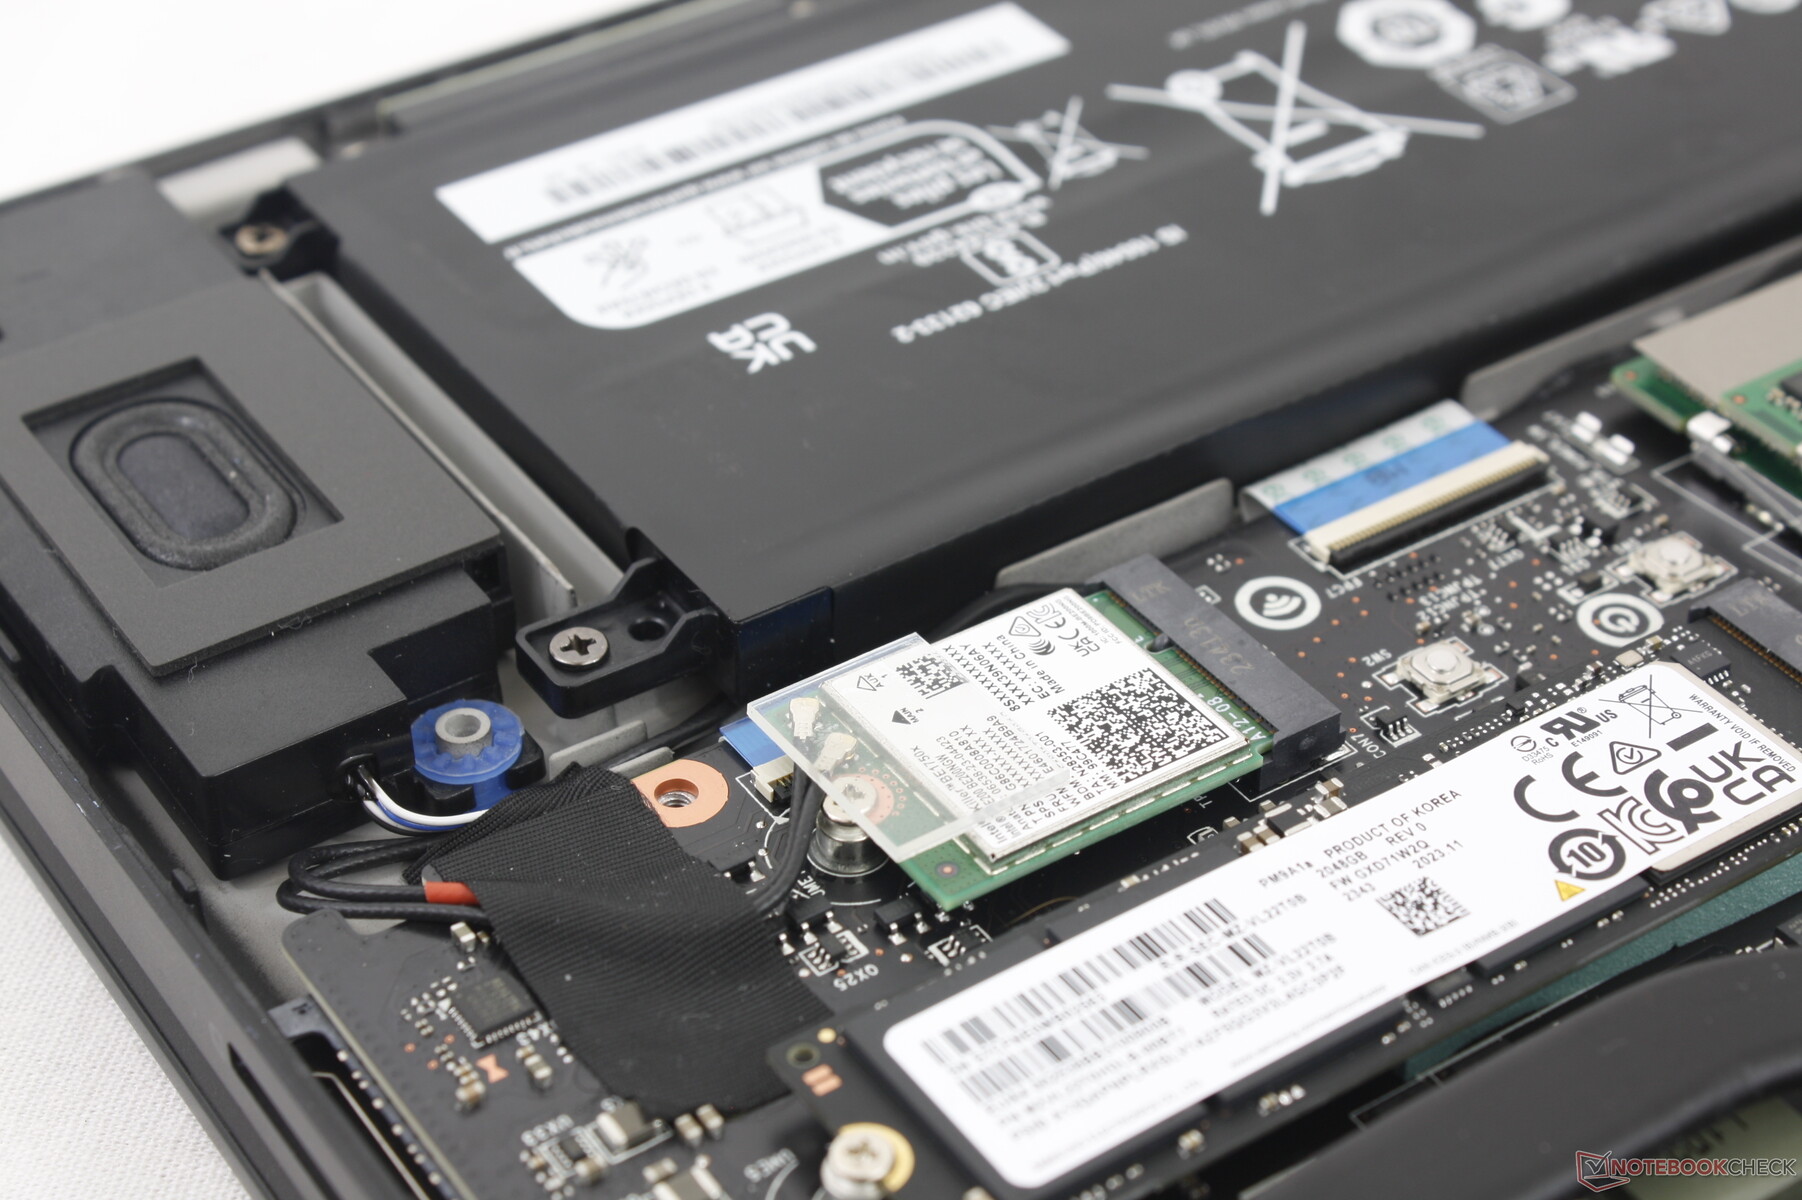
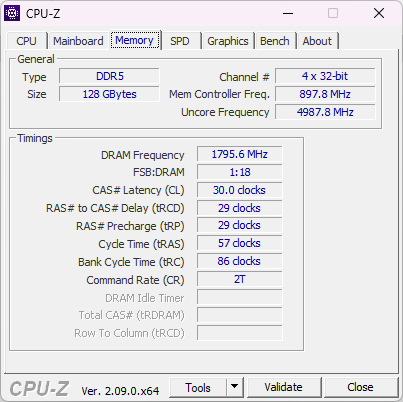
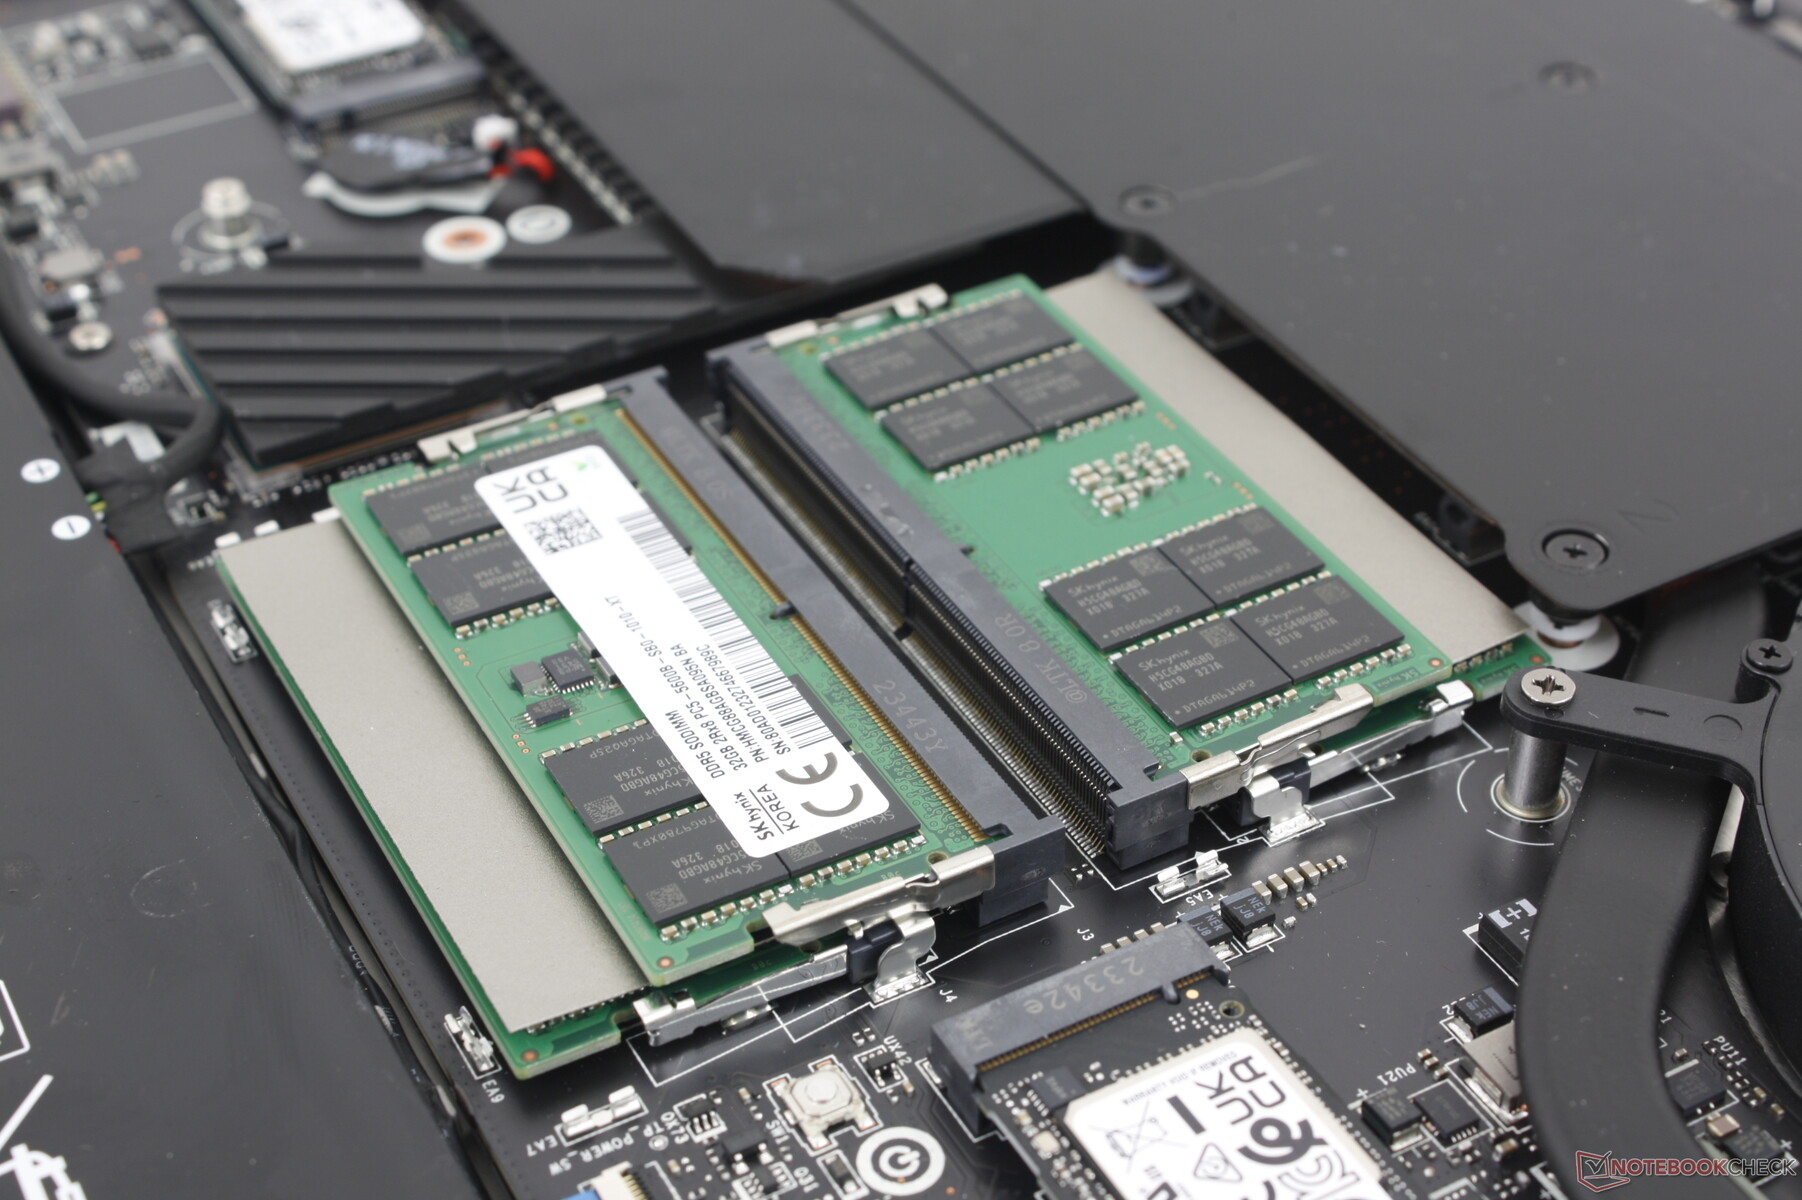
Na parte interna, os usuários têm acesso direto a 4 slots SODIMM, 3 slots SSD M.2 2280 (2x PCIe4 x4, 1x PCIe5 x4) e o módulo WLAN removível. Em comparação, o GT77 do ano passado podia suportar até quatro SSDs e, portanto, as opções de armazenamento são um pouco mais limitadas desta vez.
Acessórios e garantia
A caixa de varejo inclui um mouse USB (M99 Pro), um pano de limpeza de veludo, uma unidade flash USB de 256 GB e um chaveiro Lucky the Dragon. Estranhamente, o chaveiro é preto em vez de vermelho, que é como o mascote geralmente é representado.
A garantia limitada de um ano do fabricante é padrão se o produto for comprado nos EUA.
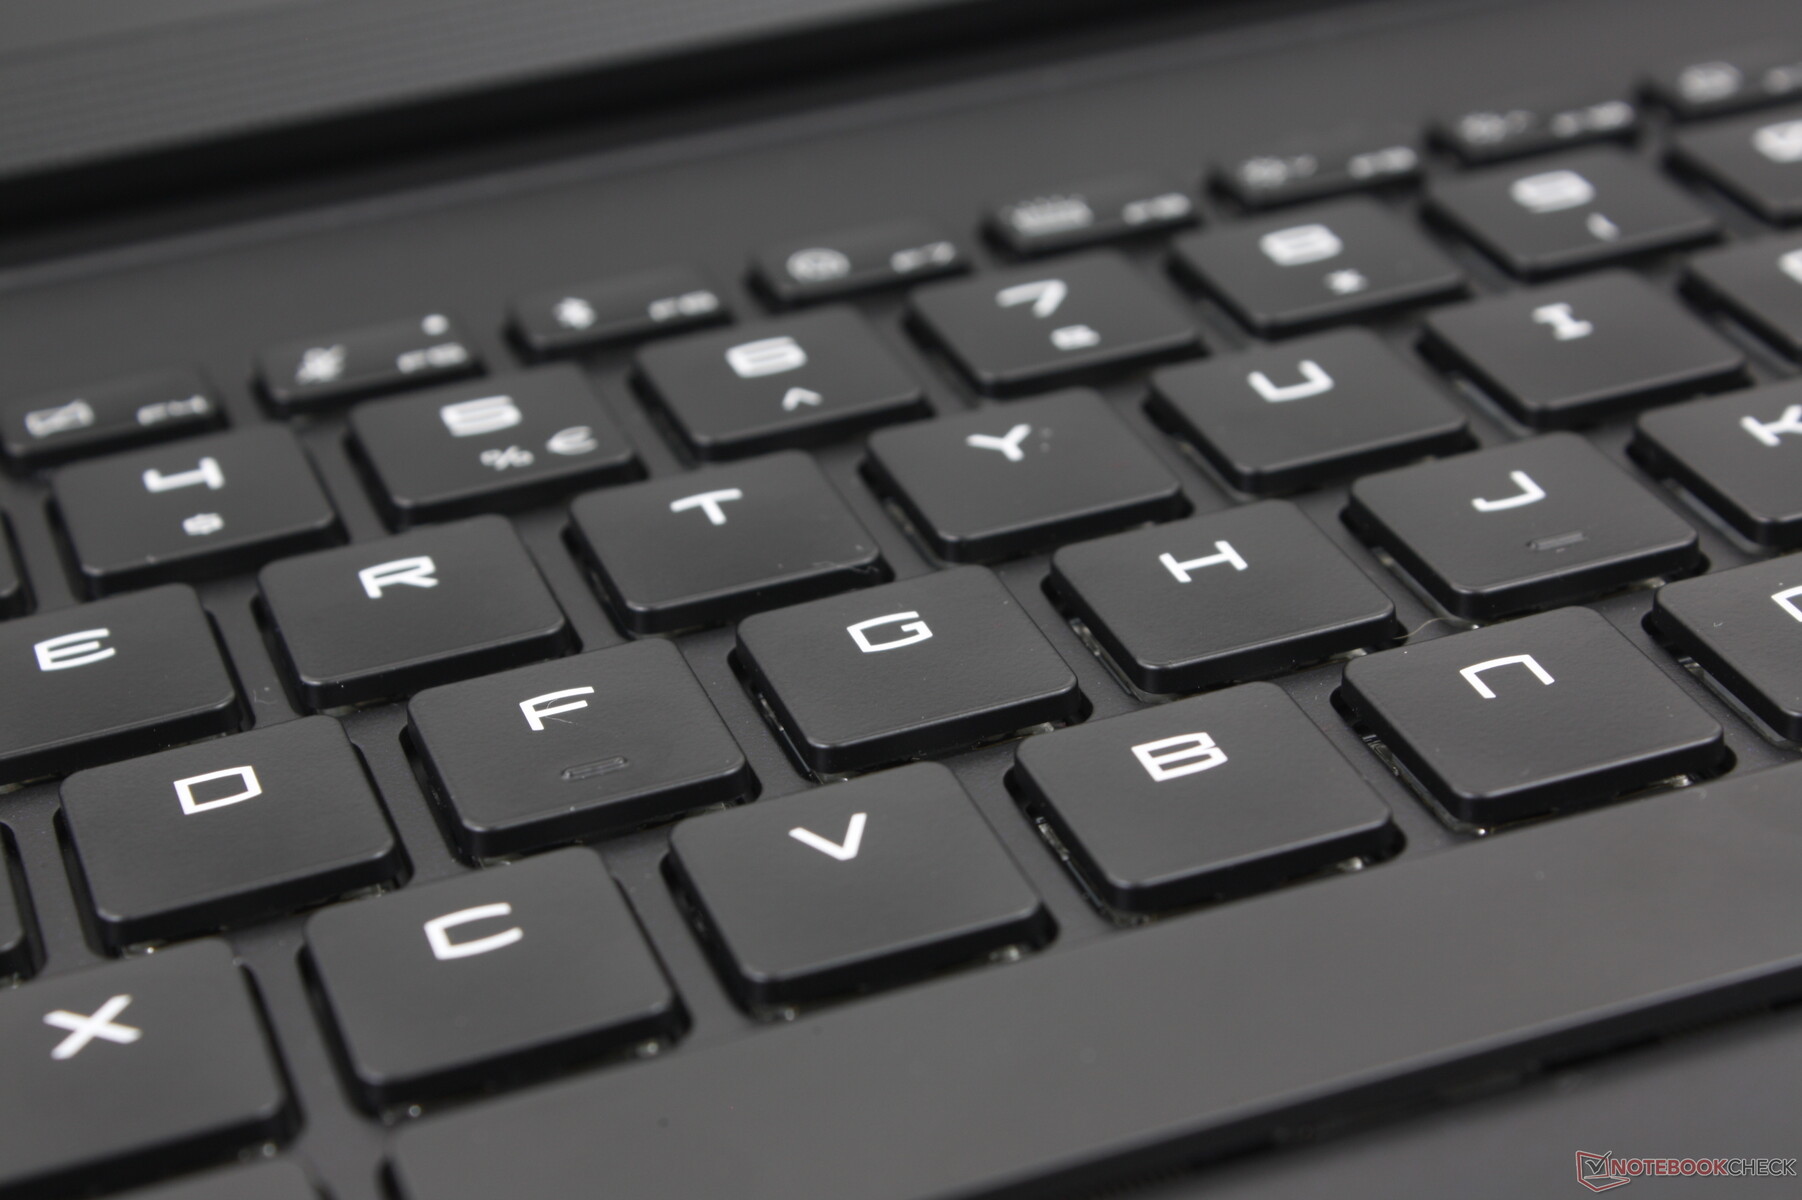
Dispositivos de entrada - teclas confortáveis e fáceis de clicar
Teclado
O teclado mecânico RGB Cherry de perfil ultrabaixo por tecla é padrão em todas as configurações, semelhante ao que está disponível em alguns modelos Alienware. A experiência de digitação é uma das melhores que já tivemos em qualquer laptop em termos de deslocamento e feedback, pois as diferenças são imediatamente perceptíveis quando comparadas às teclas de membrana padrão. A principal desvantagem, obviamente, é o ruído mais alto e agudo, especialmente ao pressionar as teclas Enter e Espaço. Definitivamente, esse não é um teclado que o senhor queira usar em salas de aula ou bibliotecas.
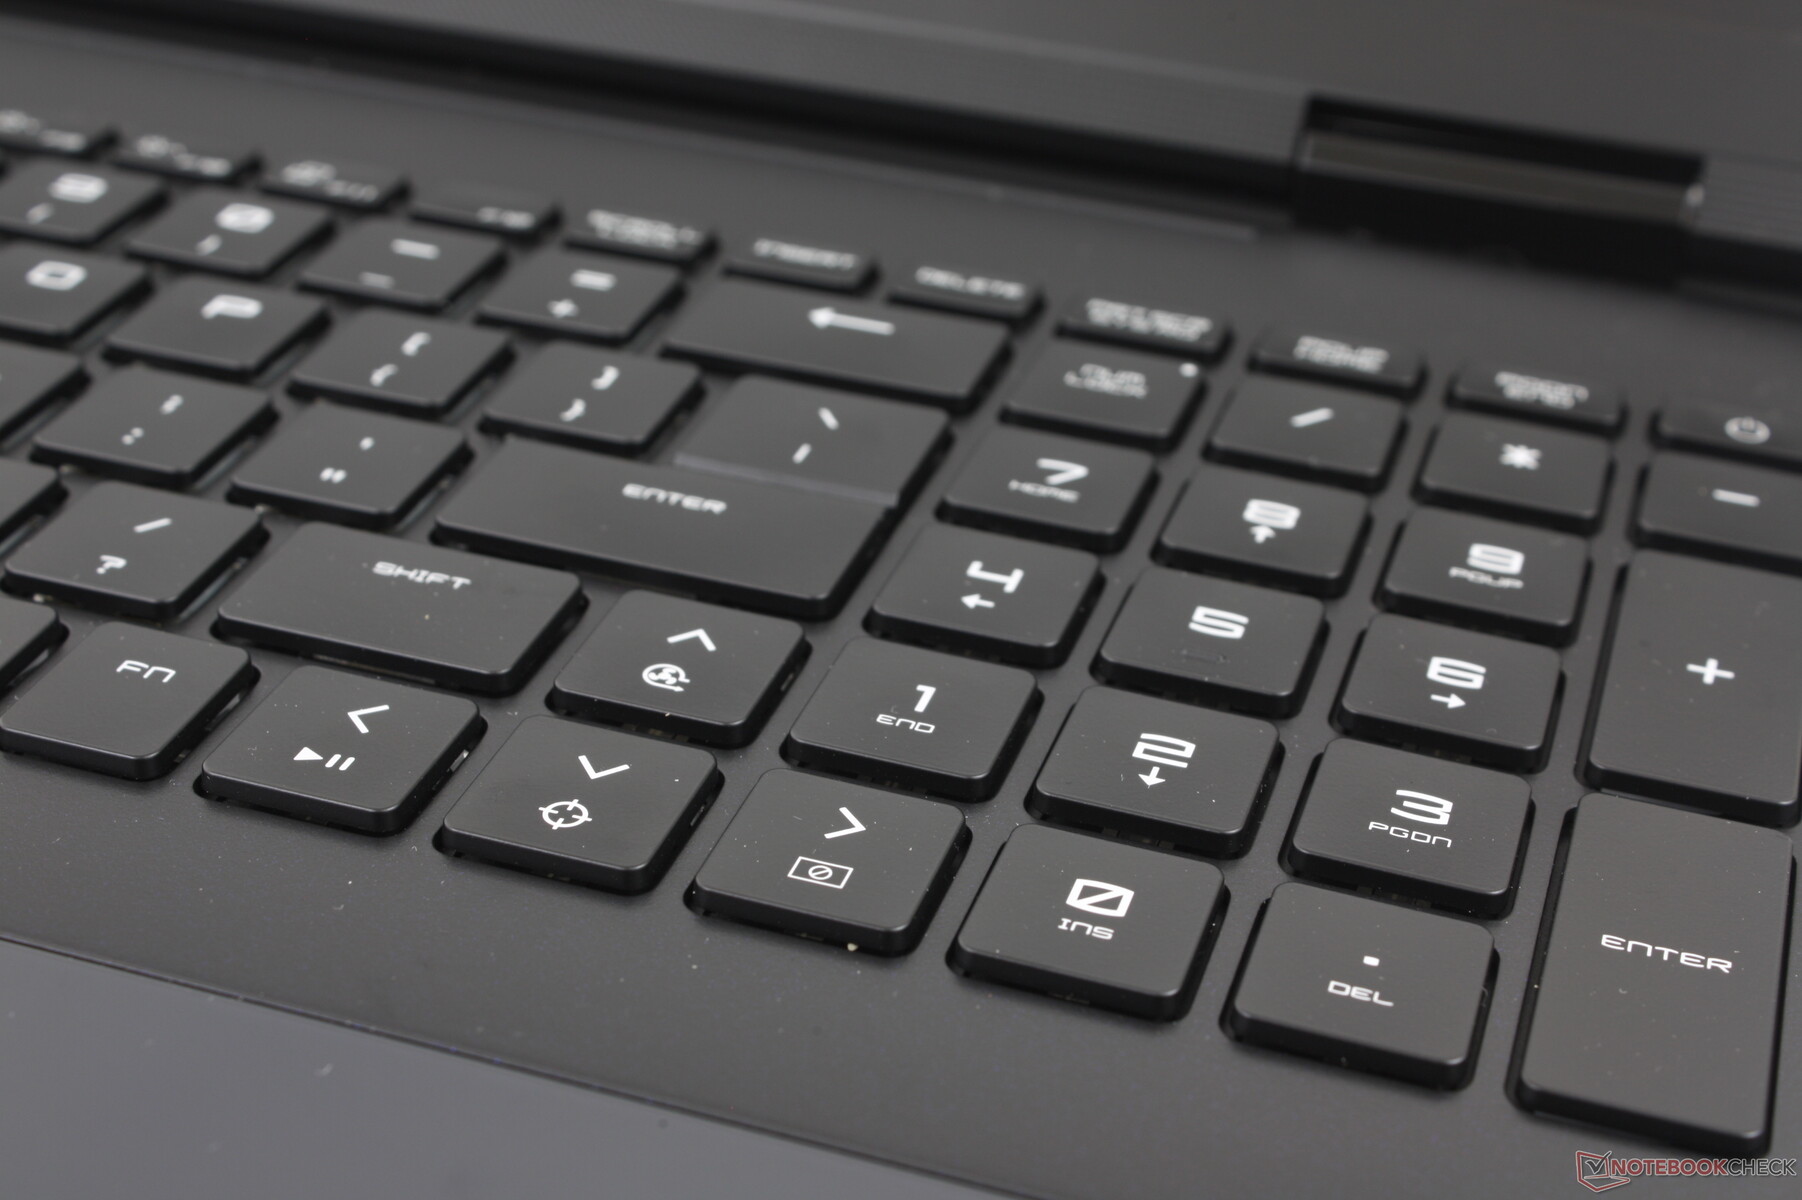
Infelizmente, nem todas as teclas são mecânicas no Titan 18 HX. O teclado numérico e as teclas de seta são baseados em membrana e, portanto, são mais suaves e silenciosos quando pressionados.
Touchpad
O clickpad de 13 x 8,2 cm é iluminado por RGB, assim como em alguns modelos da Alienware. A diferença aqui, no entanto, é que o clickpad da MSI é completamente nivelado com os apoios para as mãos ao redor, proporcionando uma superfície suave e sem transição de ponta a ponta. Essa abordagem é elegante e sexy, mas é menos prática do que um clickpad tradicional com bordas e cantos táteis. Pressionar para baixo para inserir os cliques do mouse também se torna mais difícil e pouco confiável, especialmente para entradas multitoque, como arrastar e soltar. A embalagem padrão inclui um mouse USB gratuito e, portanto, fica claro que a MSI estava se inclinando para a forma em detrimento da função ao projetar o clickpad.
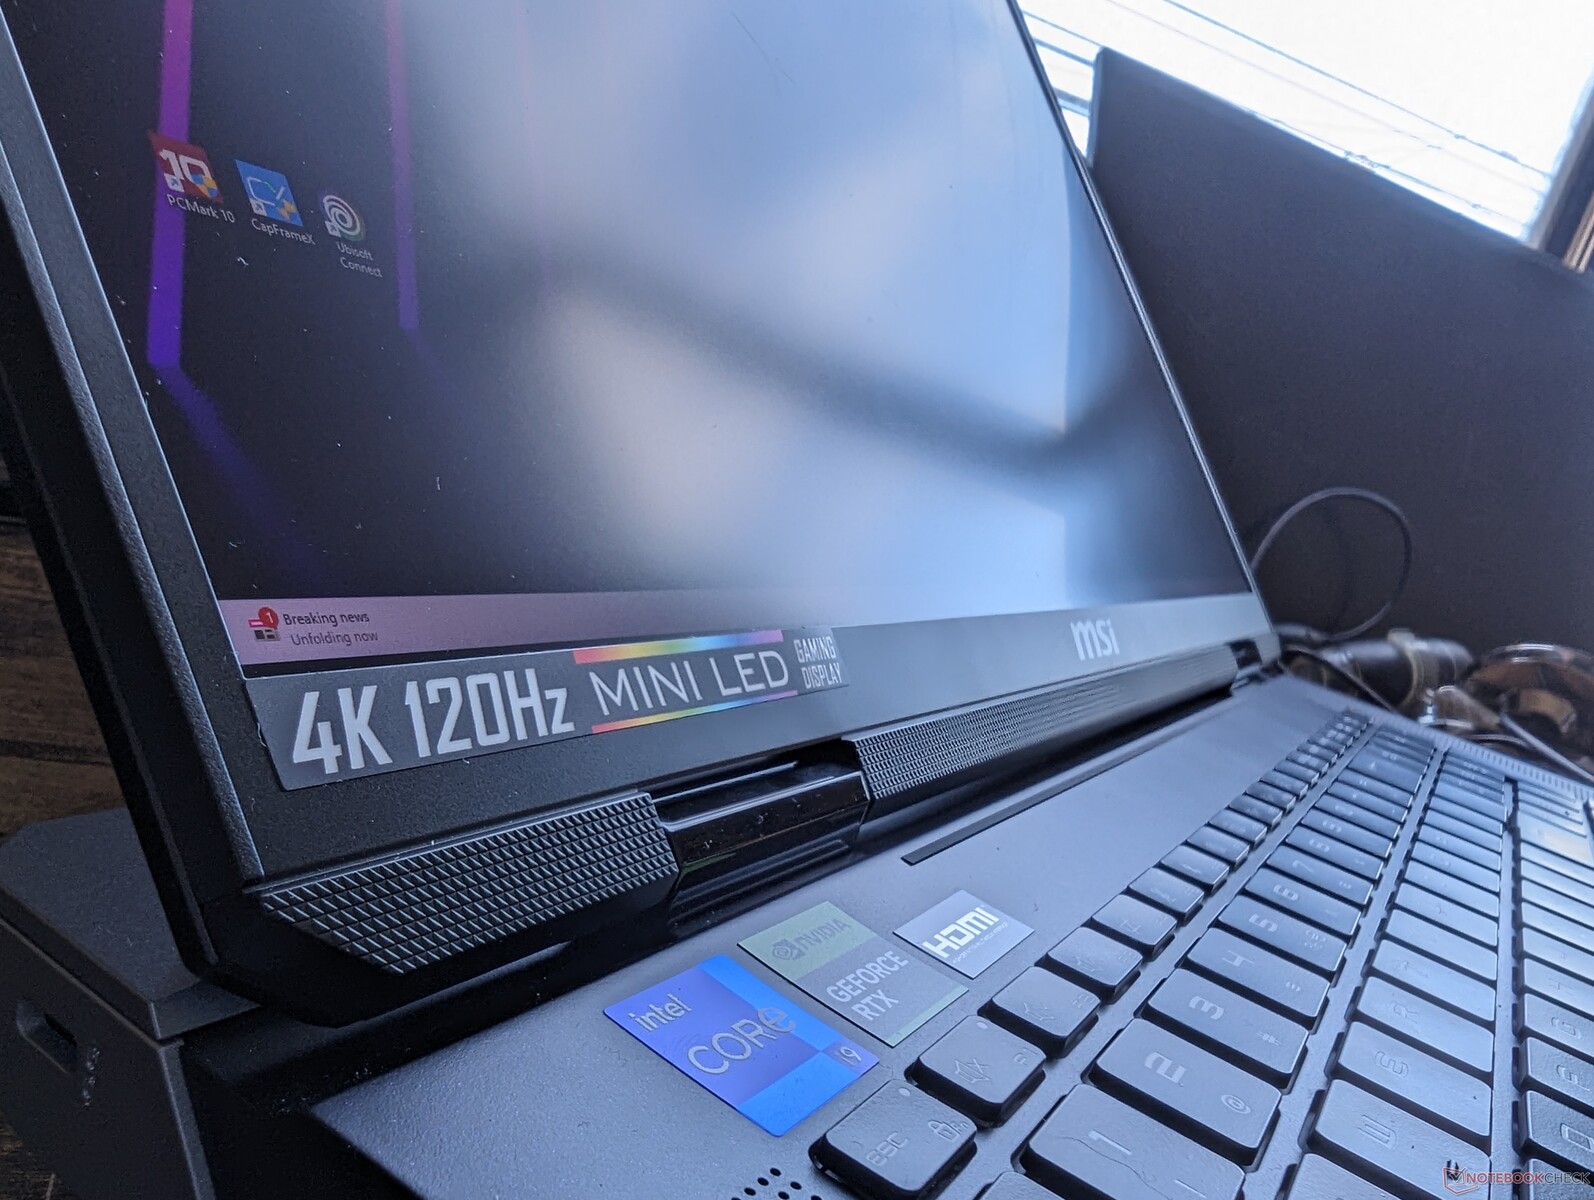
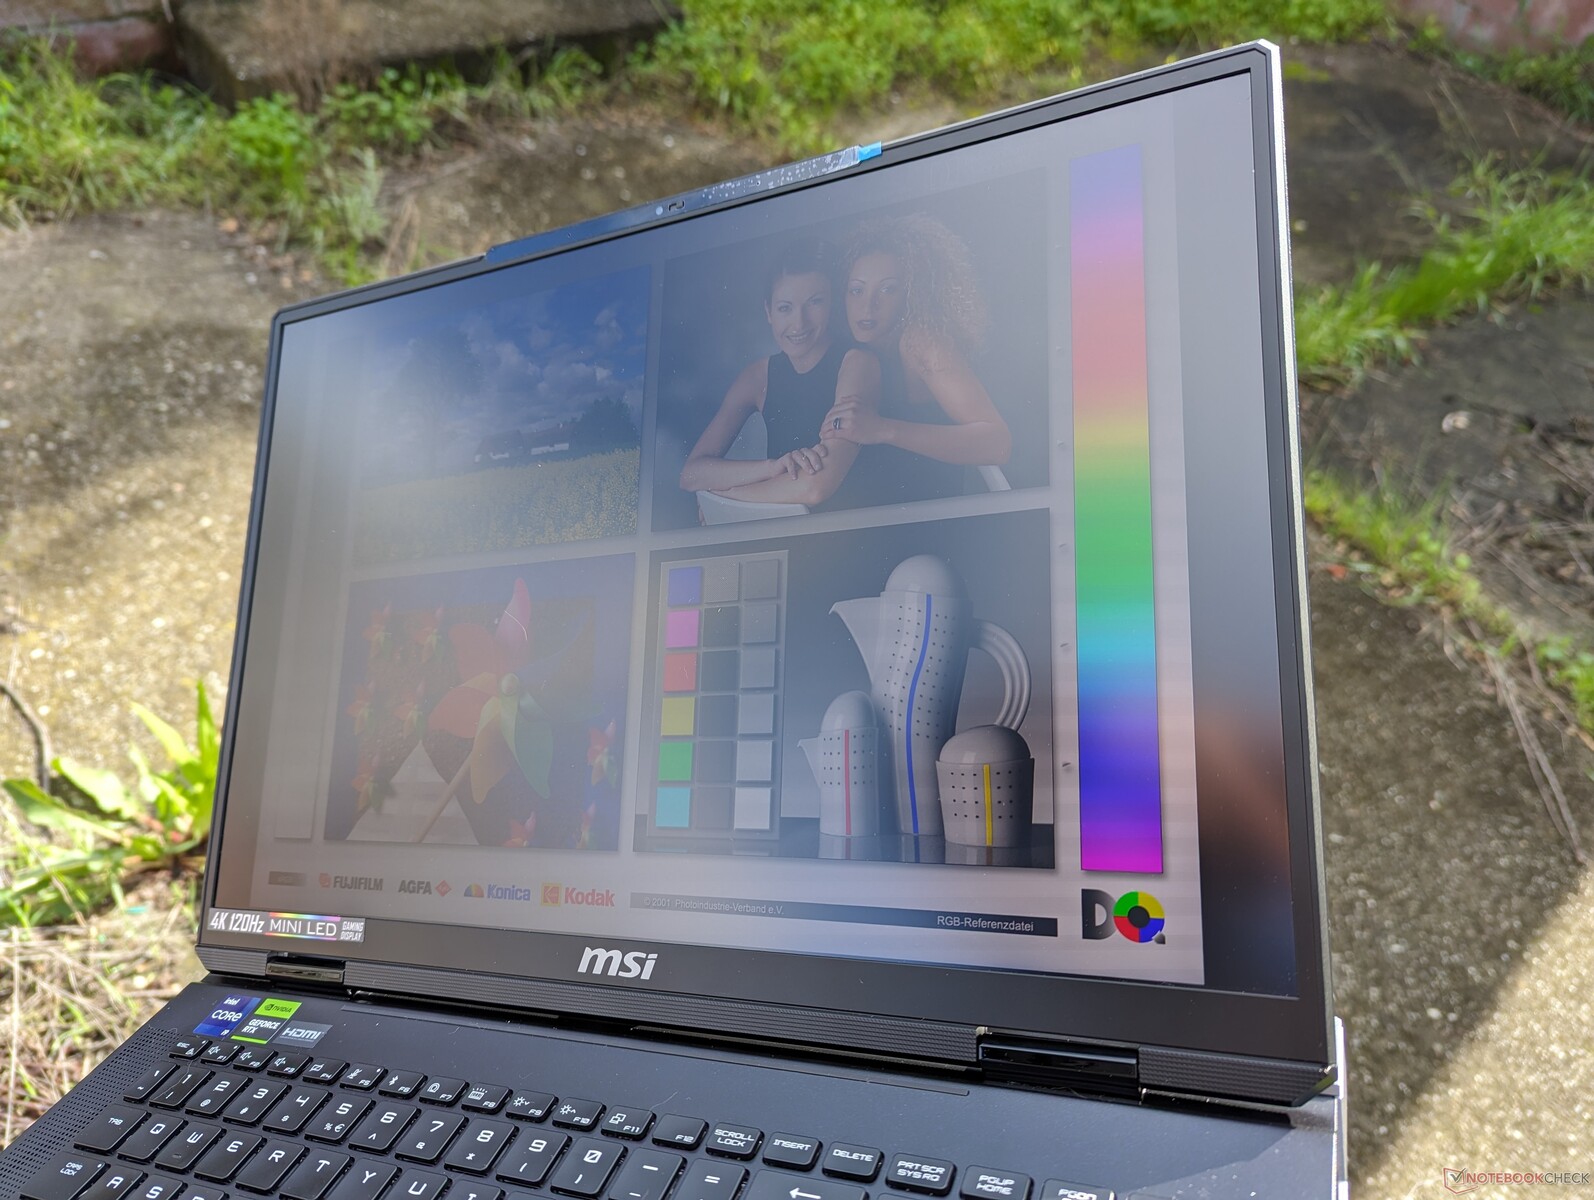
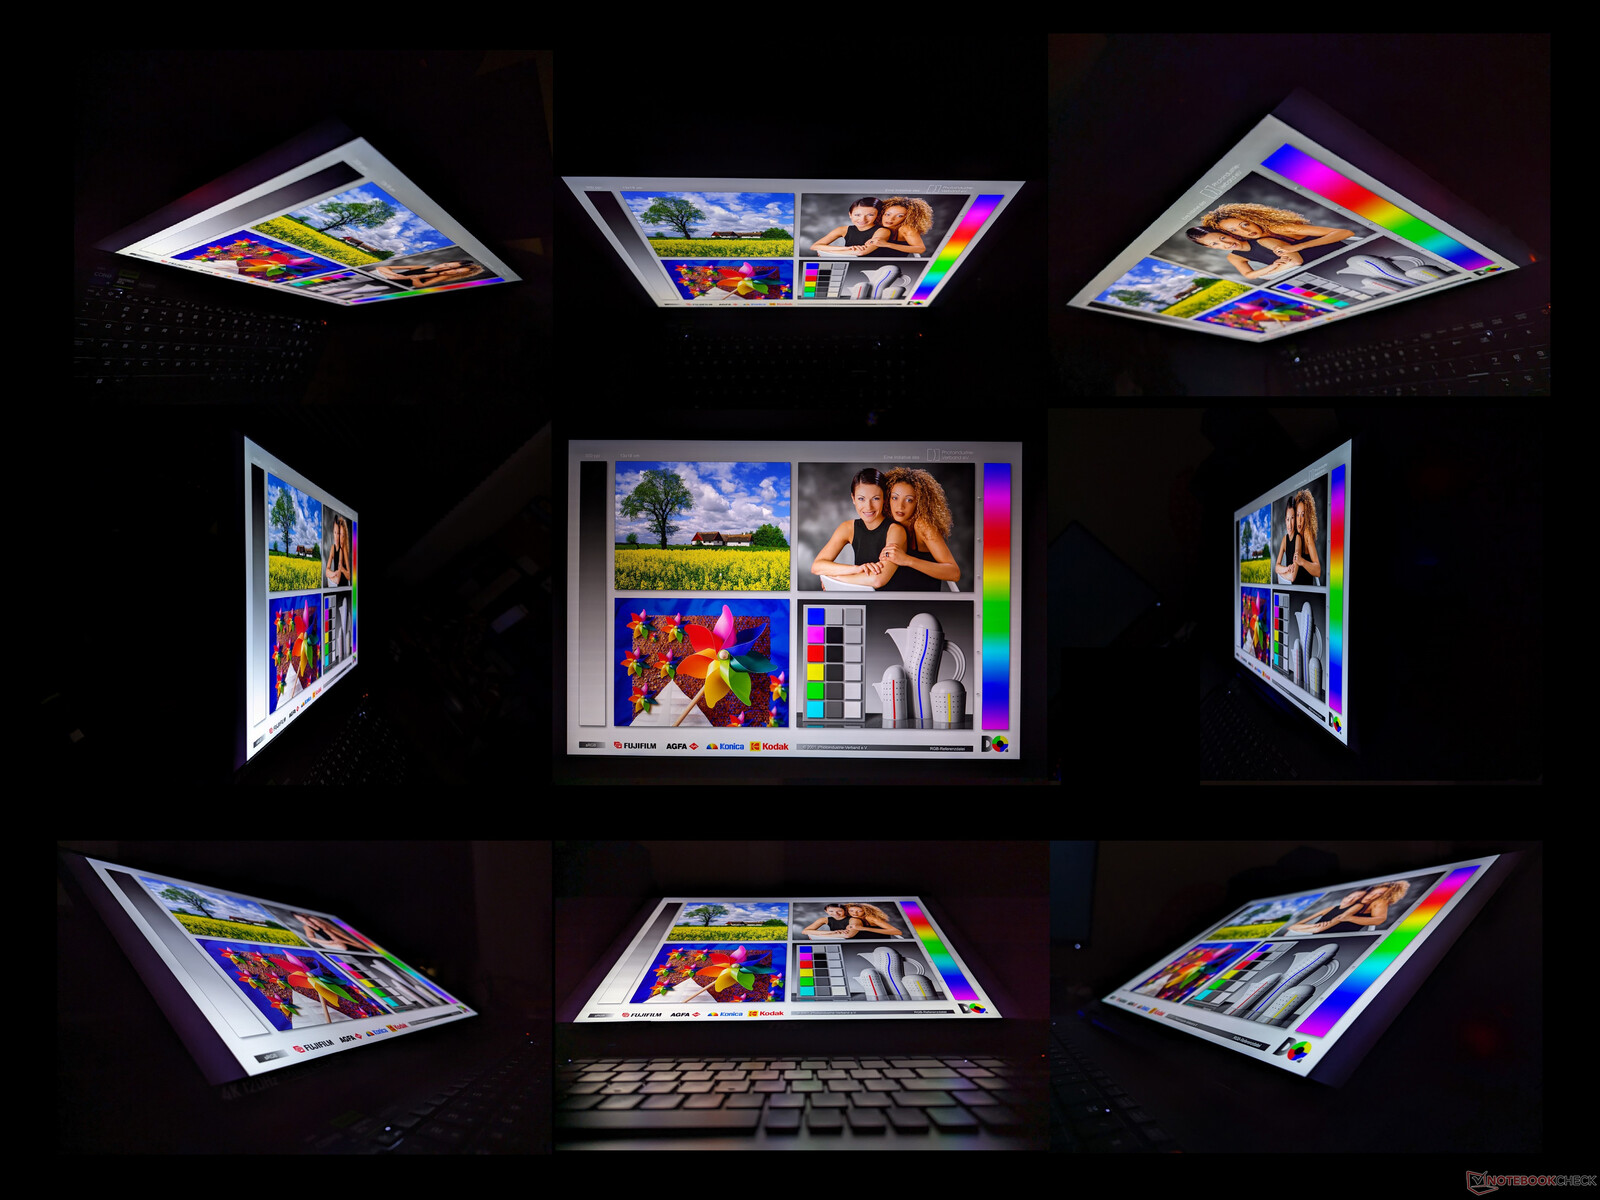
Tela - Facilmente a característica mais marcante da Titan 18 HX
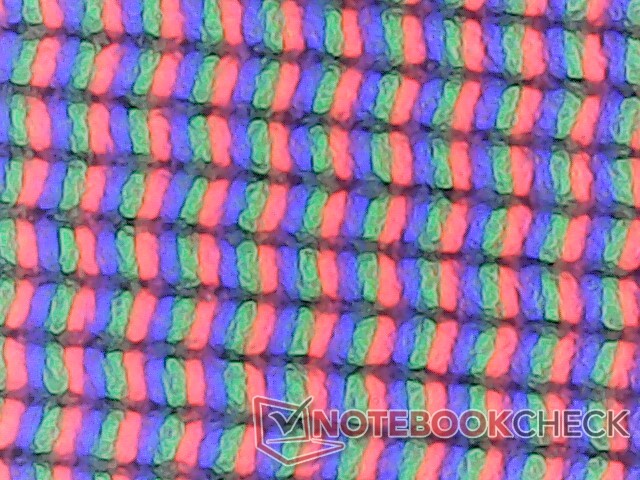
O Titan 18 HX é um dos primeiros notebooks de 18 polegadas a ser lançado este ano com uma tela mini-LED 4K de 120 Hz. Em comparação com IPS e OLED, os painéis mini-LED podem ser muito mais brilhantes e, ao mesmo tempo, oferecer cores DCI-P3 e níveis de preto semelhantes aos do OLED para melhor suporte a HDR. Nesse caso, a tela do Titan 18 HX pode atingir até 1155 nits no modo HDR, de acordo com nosso colorímetro, para suportar a reprodução de HDR1000. Se estiver no modo SDR, a tela fica limitada a cerca de 470 nits, o que é semelhante a muitos painéis IPS.
Lembre-se de que o modo HDR não está disponível se o aparelho estiver funcionando com bateria. O brilho máximo cai para apenas 323 nits quando a bateria está funcionando, mesmo que o recurso de economia de energia da tela esteja desativado. Não temos certeza se esse último é um bug, mas a queda no brilho é certamente perceptível entre a bateria e a rede elétrica.
Infelizmente, a principal desvantagem da tela é que ela não suporta G-Sync ou taxa de atualização variável (VRR). Ele também pode exigir muita energia devido ao seu alto limite de brilho, conforme demonstrado na seção Consumo de energia abaixo. Ainda assim, a tela é uma das melhores que já vimos em qualquer laptop para fins de jogos e multimídia.
| |||||||||||||||||||||||||
iluminação: 90 %
iluminação com acumulador: 323 cd/m²
Contraste: ∞:1 (Preto: 0 cd/m²)
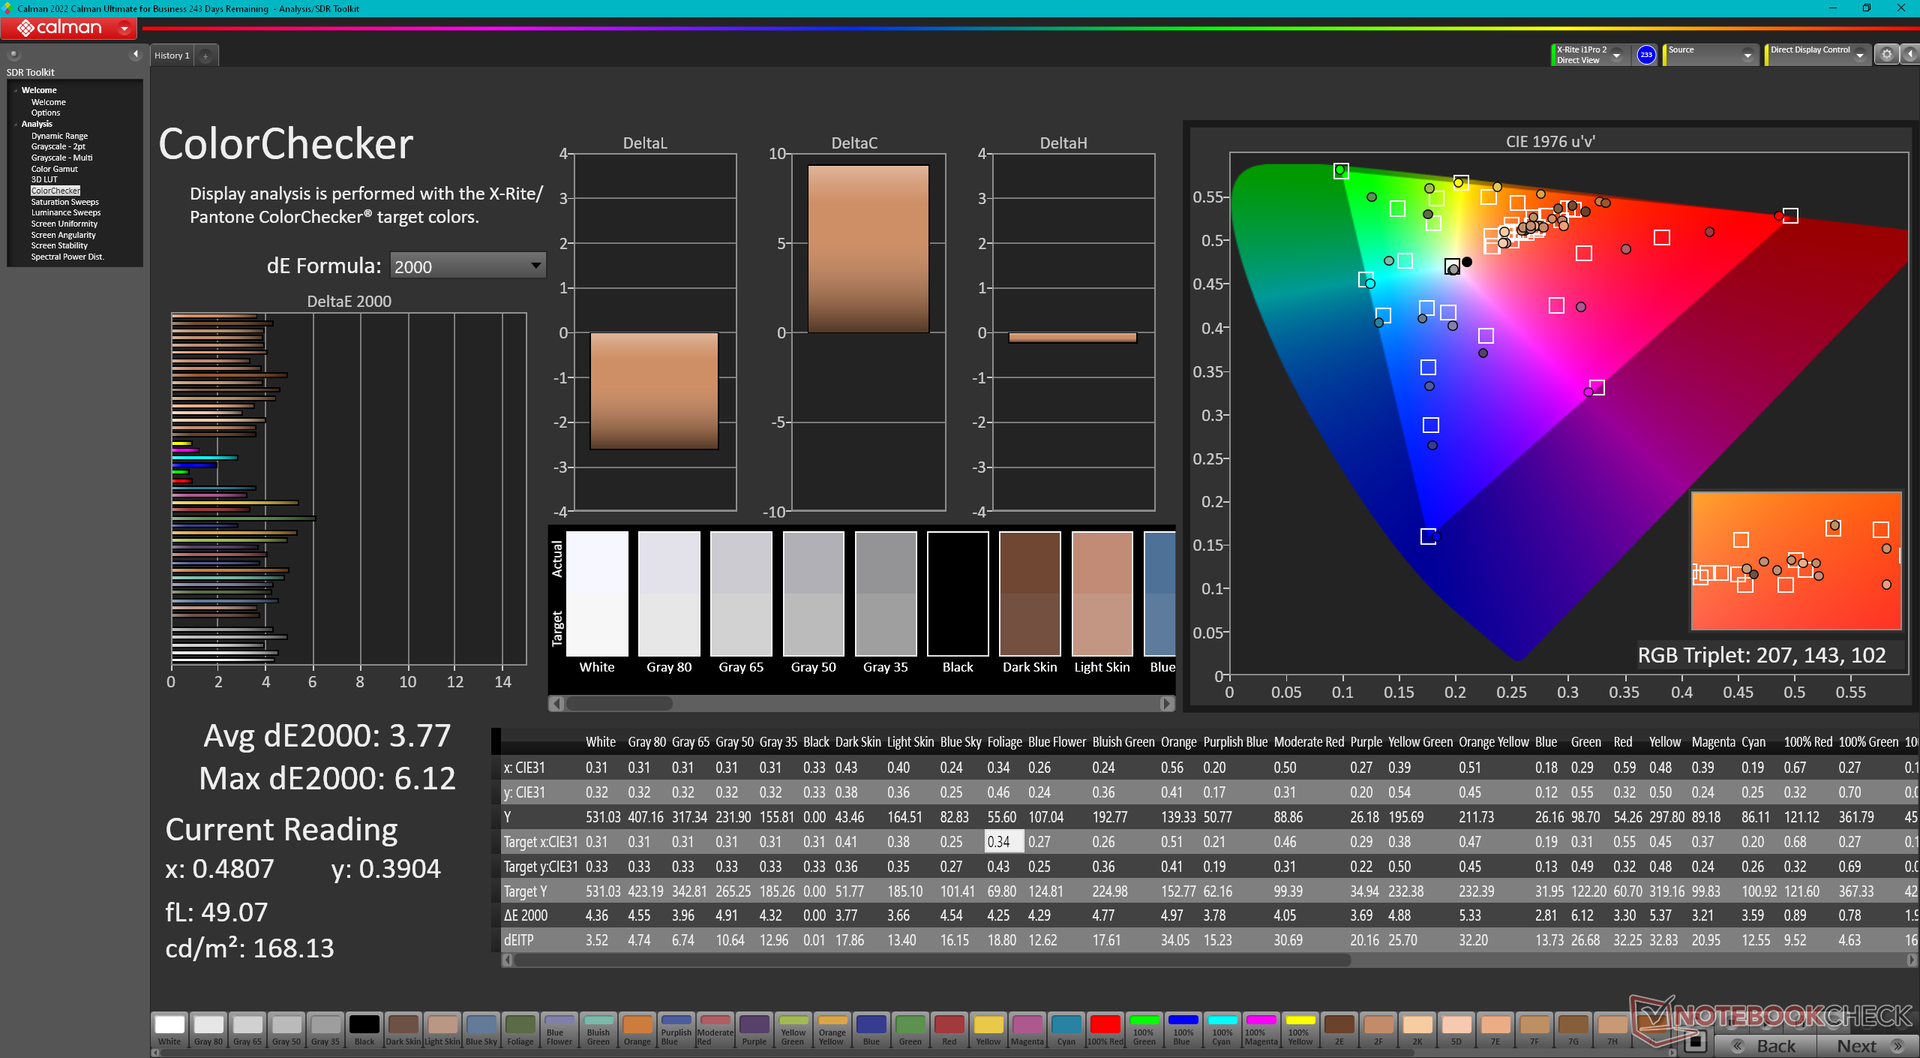
ΔE ColorChecker Calman: 3.77 | ∀{0.5-29.43 Ø4.71}
calibrated: 2.94
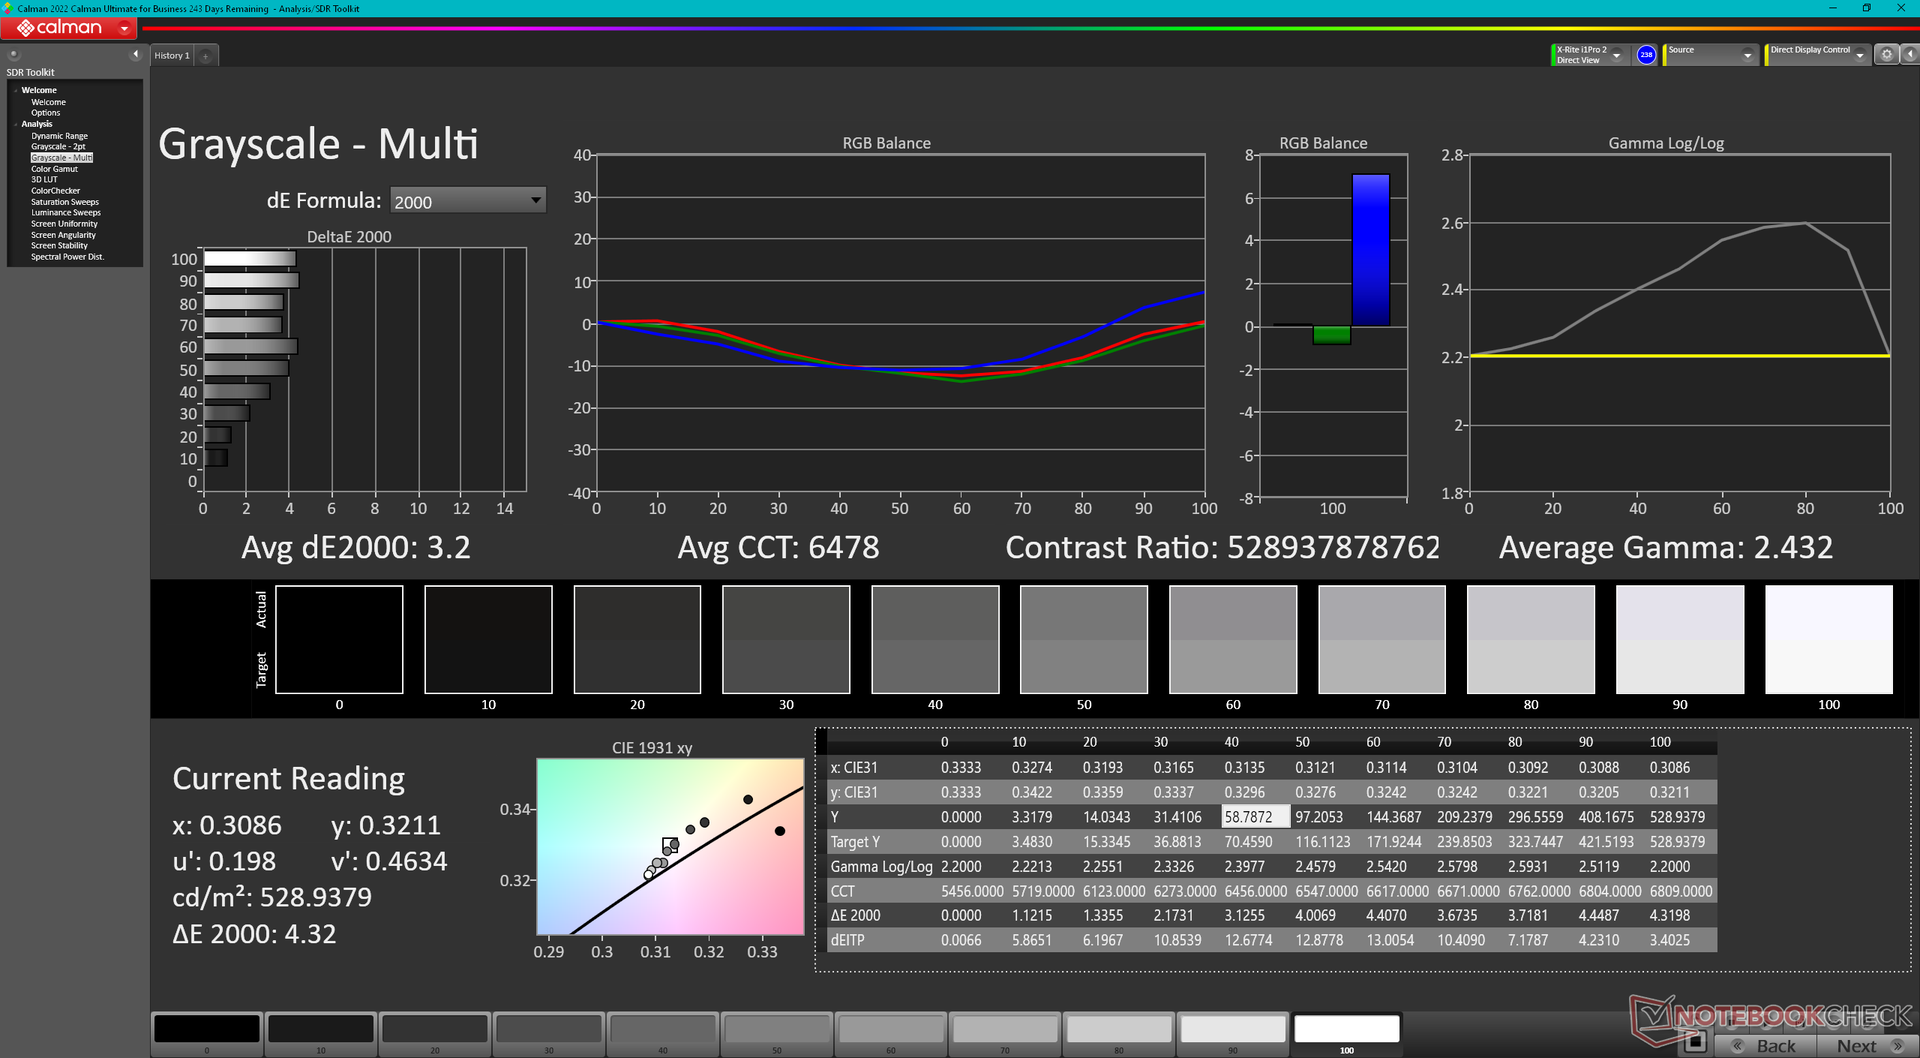
ΔE Greyscale Calman: 3.2 | ∀{0.09-98 Ø4.96}
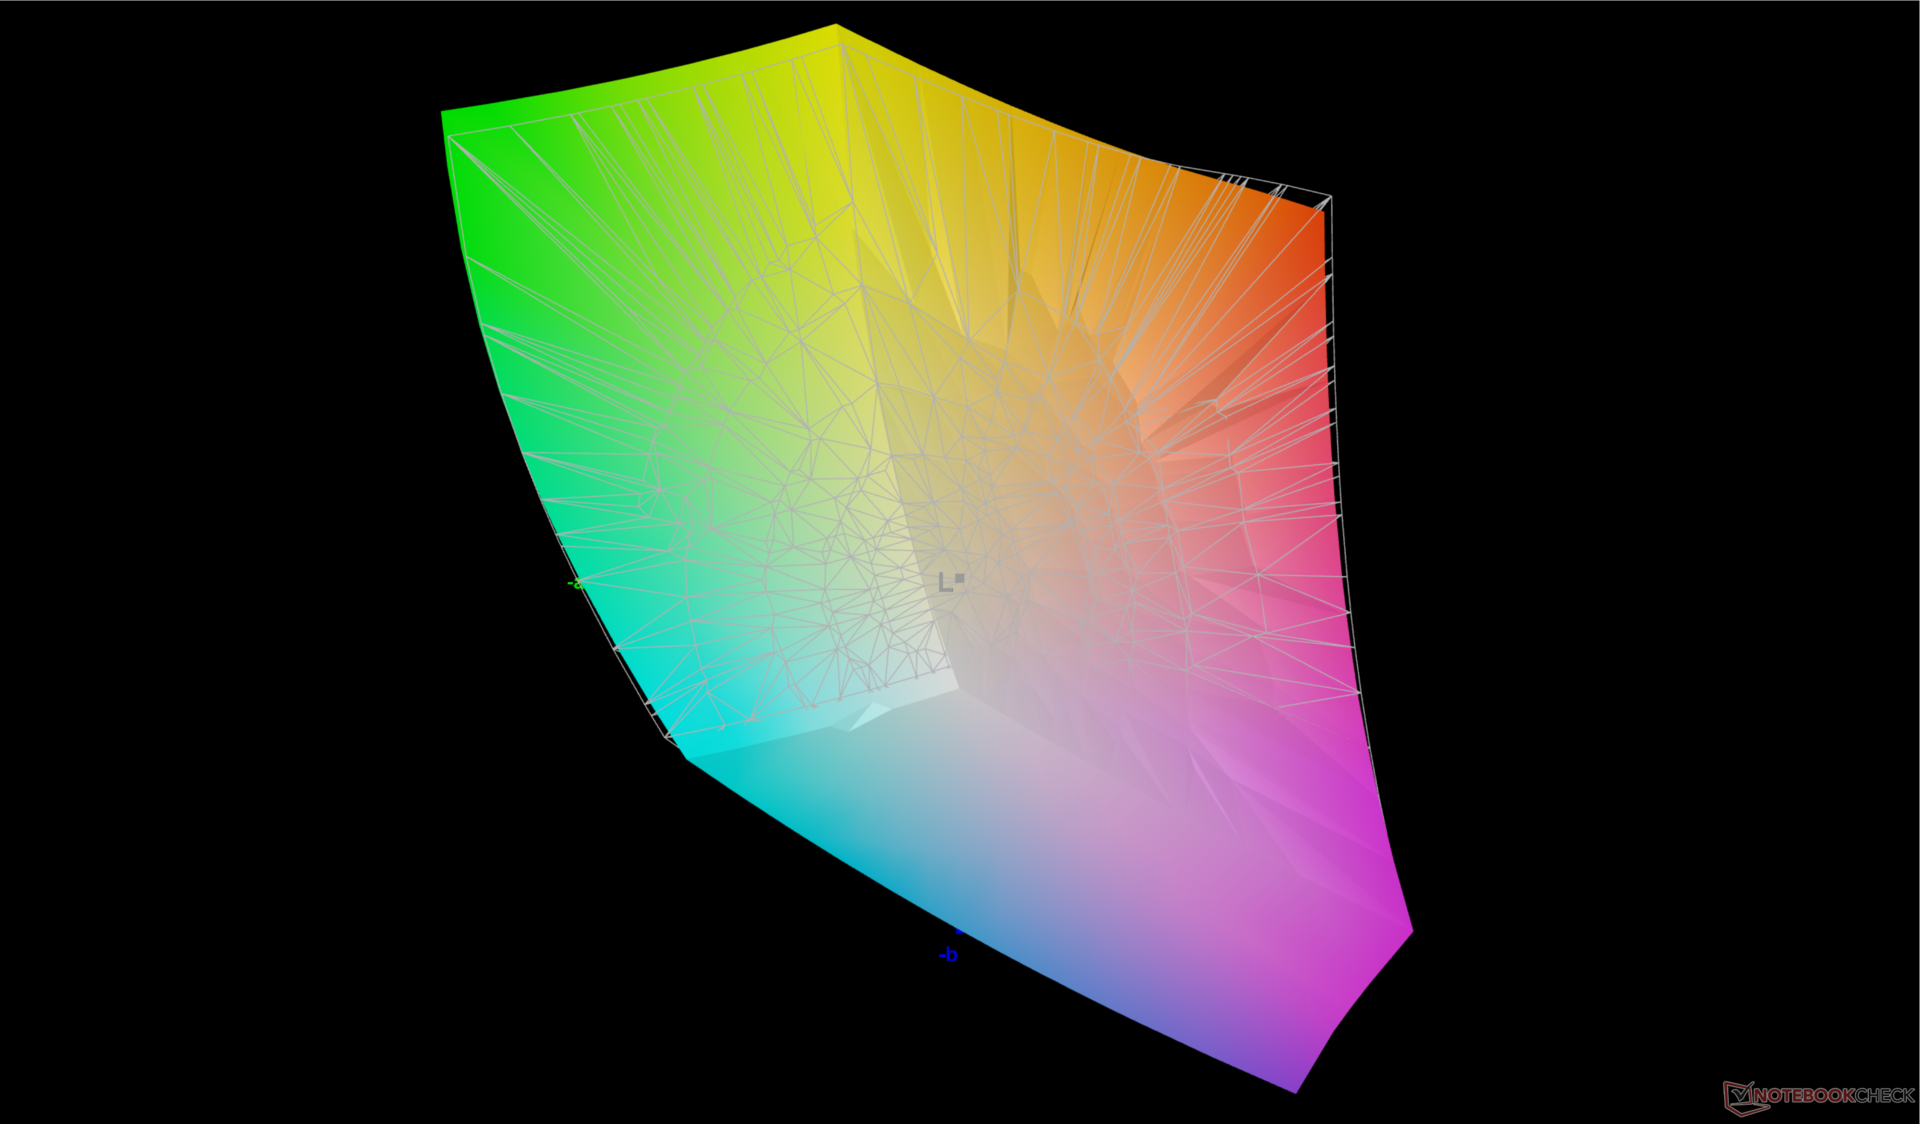
86.2% AdobeRGB 1998 (Argyll 3D)
99.8% sRGB (Argyll 3D)
98.1% Display P3 (Argyll 3D)
Gamma: 2.43
CCT: 6478 K
| MSI Titan 18 HX A14VIG AU Optronics B180ZAN01.0, Mini-LED, 3840x2400, 18" | MSI Titan GT77 HX 13VI B173ZAN06.C, Mini-LED, 3840x2160, 17.3" | Alienware m18 R1 Chi Mei 180JME, IPS, 1920x1200, 18" | Asus ROG Strix G18 G814JI NE180QDM-NZ2 (BOE0B35), IPS, 2560x1600, 18" | Acer Predator Helios 18 N23Q2 AUO45A8 (B180QAN01.2), IPS, 2560x1600, 18" | Razer Blade 18 RTX 4070 AU Optronics B180QAN01.0, IPS, 2560x1600, 18" | |
|---|---|---|---|---|---|---|
| Display | 1% | 1% | -0% | 3% | -1% | |
| Display P3 Coverage (%) | 98.1 | 94.9 -3% | 97.7 0% | 98.1 0% | 99.8 2% | 96.9 -1% |
| sRGB Coverage (%) | 99.8 | 99.9 0% | 100 0% | 99.9 0% | 100 0% | 99.8 0% |
| AdobeRGB 1998 Coverage (%) | 86.2 | 92.4 7% | 89.8 4% | 85.6 -1% | 91.8 6% | 85.3 -1% |
| Response Times | -140% | 77% | 62% | 45% | 71% | |
| Response Time Grey 50% / Grey 80% * (ms) | 8.6 ? | 38.4 ? -347% | 3 ? 65% | 5.6 ? 35% | 7.6 ? 12% | 4.2 ? 51% |
| Response Time Black / White * (ms) | 81.8 ? | 26.6 ? 67% | 9.9 ? 88% | 9 ? 89% | 17.8 ? 78% | 8 ? 90% |
| PWM Frequency (Hz) | 2592 ? | 2380 ? | 2509 | |||
| Screen | -9% | 28% | 21% | -14% | 11% | |
| Brightness middle (cd/m²) | 467.5 | 606 30% | 372.8 -20% | 471 1% | 360 -23% | 549.6 18% |
| Brightness (cd/m²) | 459 | 602 31% | 367 -20% | 422 -8% | 355 -23% | 524 14% |
| Brightness Distribution (%) | 90 | 93 3% | 97 8% | 83 -8% | 92 2% | 89 -1% |
| Black Level * (cd/m²) | 0.0001 | 0.32 | 0.47 | 0.21 | 0.53 | |
| Colorchecker dE 2000 * | 3.77 | 4.8 -27% | 1.92 49% | 2.05 46% | 3.82 -1% | 3.32 12% |
| Colorchecker dE 2000 max. * | 6.12 | 8.2 -34% | 3.65 40% | 4.15 32% | 7.38 -21% | 6.63 -8% |
| Colorchecker dE 2000 calibrated * | 2.94 | 1.8 39% | 0.51 83% | 0.8 73% | 2.24 24% | 2.7 8% |
| Greyscale dE 2000 * | 3.2 | 6.5 -103% | 1.5 53% | 2.8 13% | 5.06 -58% | 2 37% |
| Gamma | 2.43 91% | 2.63 84% | 2.34 94% | 2.204 100% | 2.52 87% | 2.29 96% |
| CCT | 6478 100% | 6596 99% | 6607 98% | 7122 91% | 5657 115% | 6319 103% |
| Contrast (:1) | 6060000 | 1165 | 1002 | 1714 | 1037 | |
| Média Total (Programa/Configurações) | -49% /
-28% | 35% /
29% | 28% /
23% | 11% /
-0% | 27% /
18% |
* ... menor é melhor
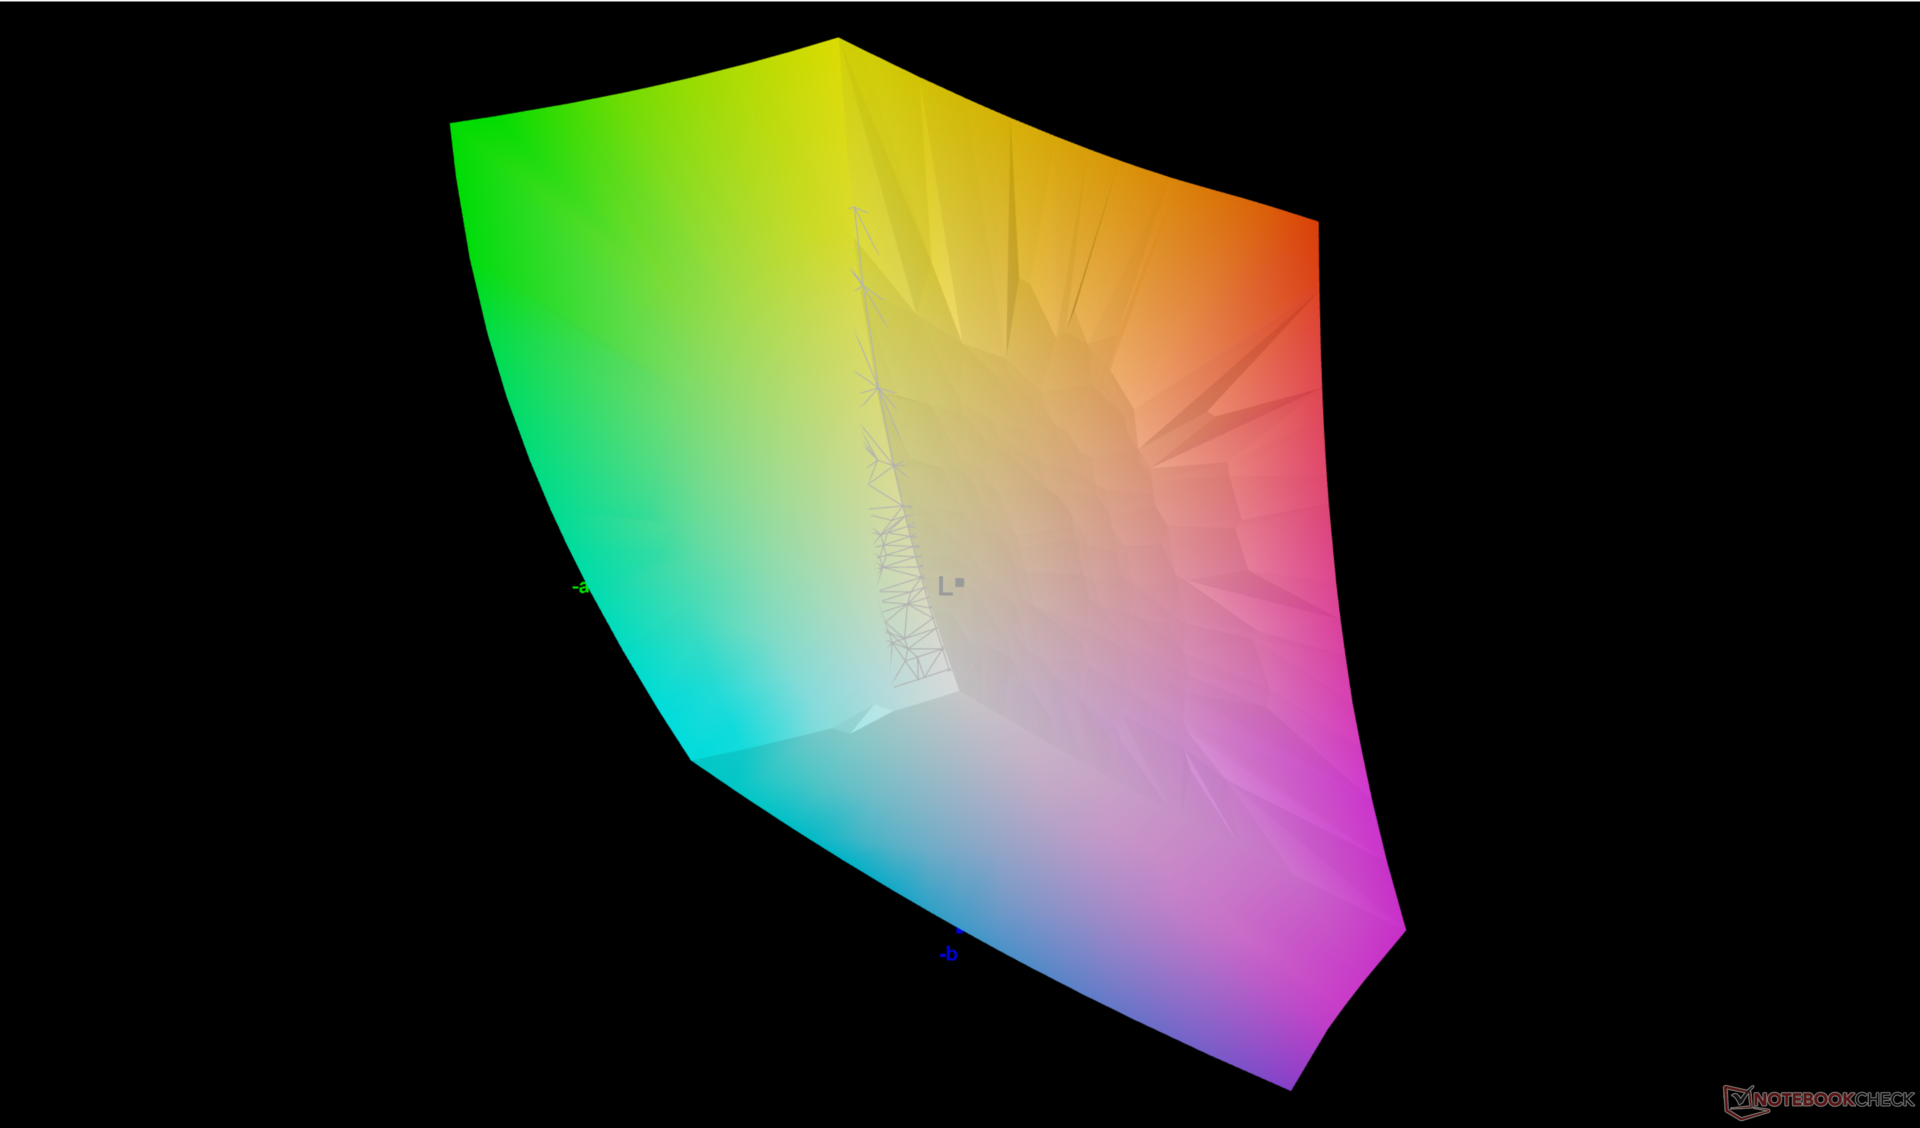
A MSI não anuncia nenhum esforço de calibração Pantone, apesar do alto preço pedido pelo Titan. No entanto, os valores médios de escala de cinza e deltaE de cores ainda são muito bons, com 3,2 e 3,77, respectivamente.
Exibir tempos de resposta
| ↔ Tempo de resposta preto para branco | ||
|---|---|---|
| 81.8 ms ... ascensão ↗ e queda ↘ combinadas | ↗ 76 ms ascensão | 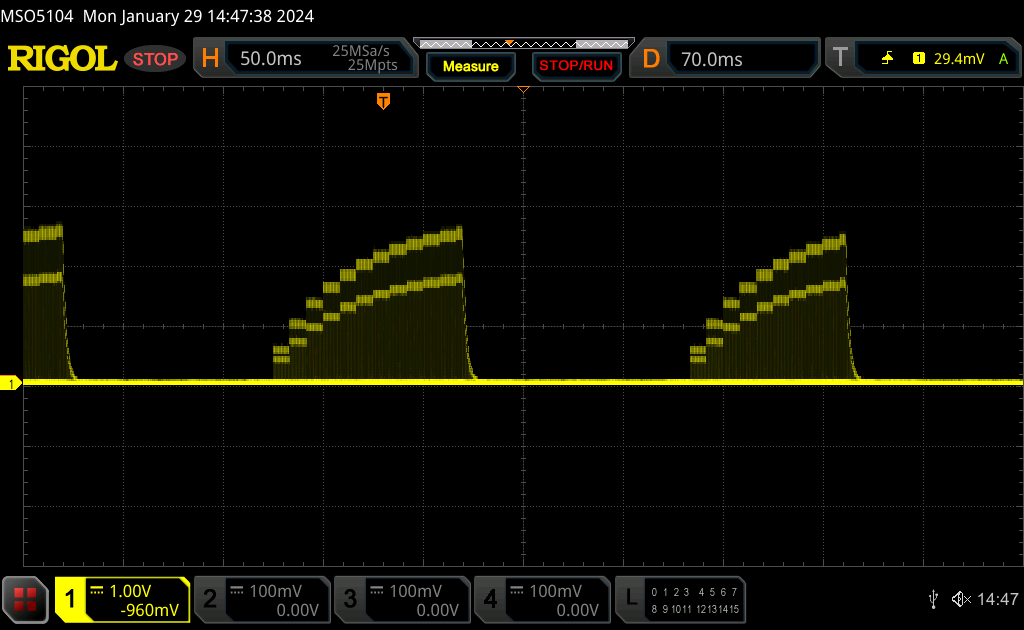 |
| ↘ 5.8 ms queda | ||
| A tela mostra taxas de resposta lentas em nossos testes e será insatisfatória para os jogadores. Em comparação, todos os dispositivos testados variam de 0.1 (mínimo) a 240 (máximo) ms. » 100 % de todos os dispositivos são melhores. Isso significa que o tempo de resposta medido é pior que a média de todos os dispositivos testados (19.8 ms). | ||
| ↔ Tempo de resposta 50% cinza a 80% cinza | ||
| 8.6 ms ... ascensão ↗ e queda ↘ combinadas | ↗ 4.2 ms ascensão | 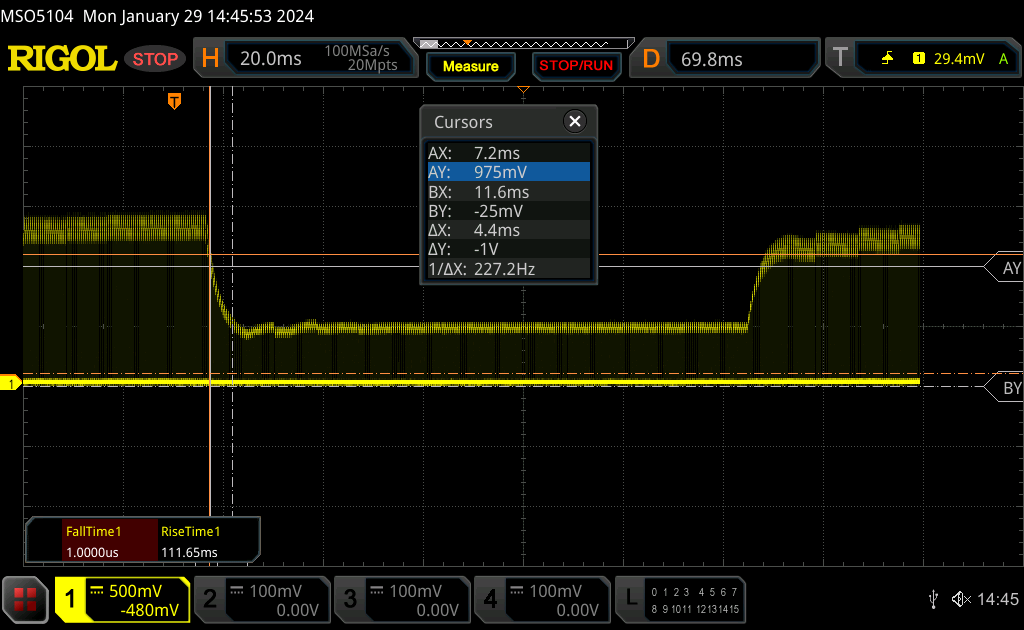 |
| ↘ 4.4 ms queda | ||
| A tela mostra taxas de resposta rápidas em nossos testes e deve ser adequada para jogos. Em comparação, todos os dispositivos testados variam de 0.165 (mínimo) a 636 (máximo) ms. » 22 % de todos os dispositivos são melhores. Isso significa que o tempo de resposta medido é melhor que a média de todos os dispositivos testados (31 ms). | ||
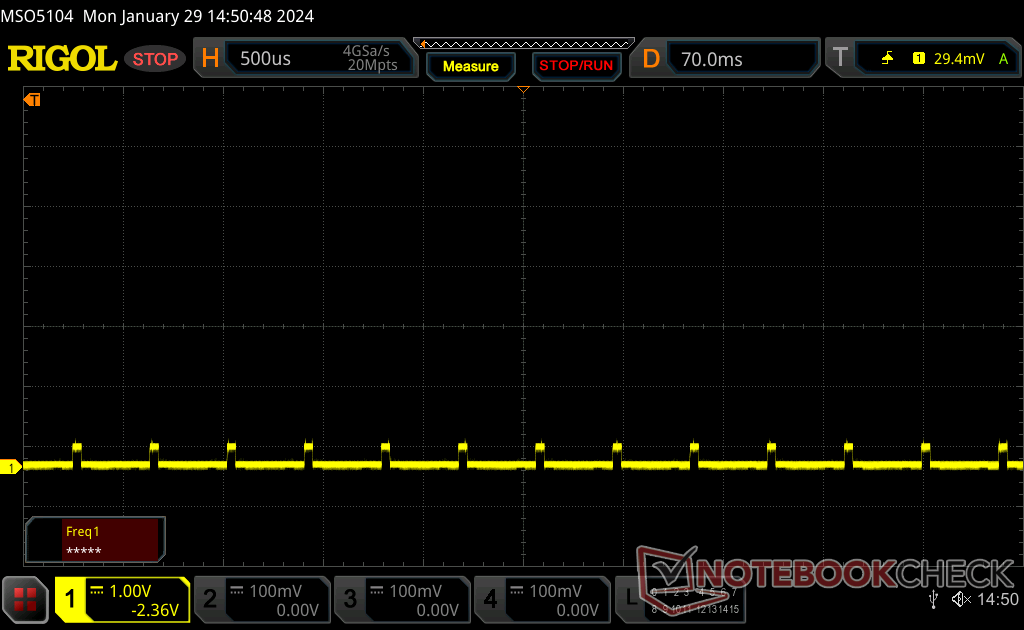
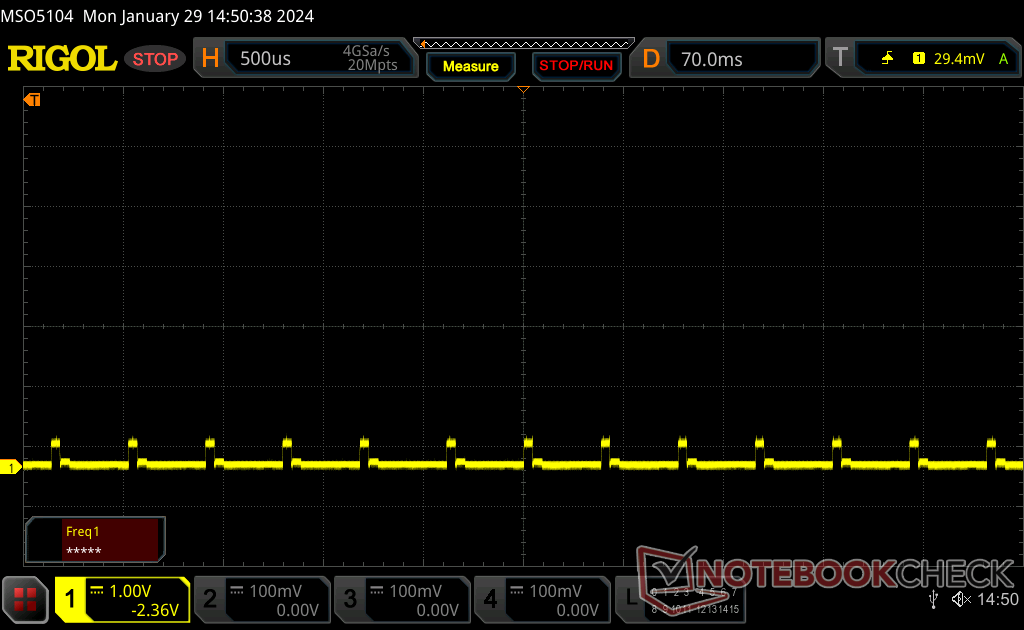
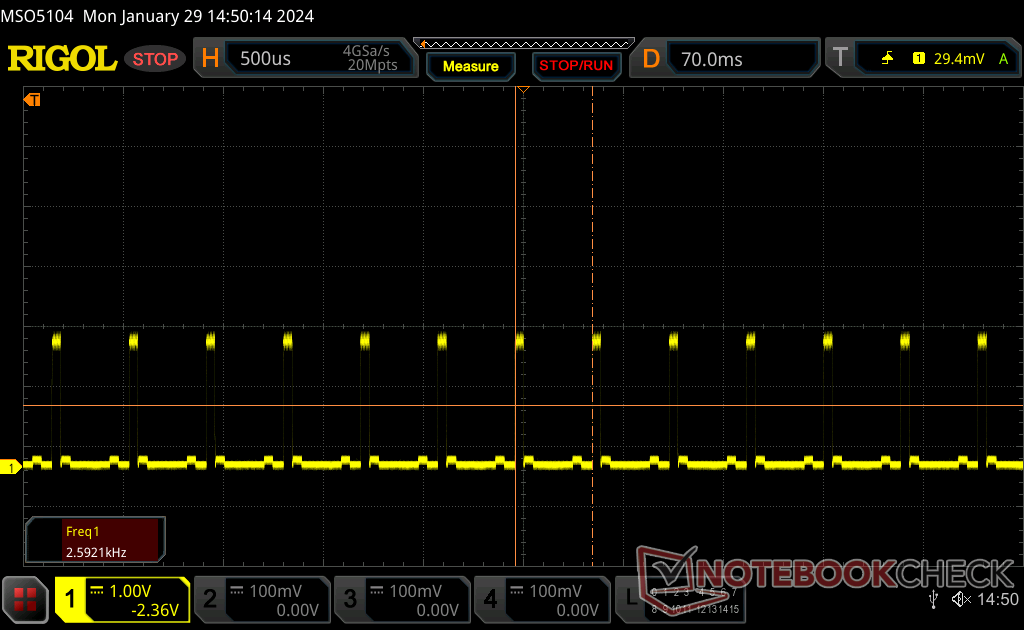
Cintilação da tela / PWM (modulação por largura de pulso)
| Tela tremeluzindo/PWM detectado | 2592 Hz | ≤ 100 % configuração de brilho | 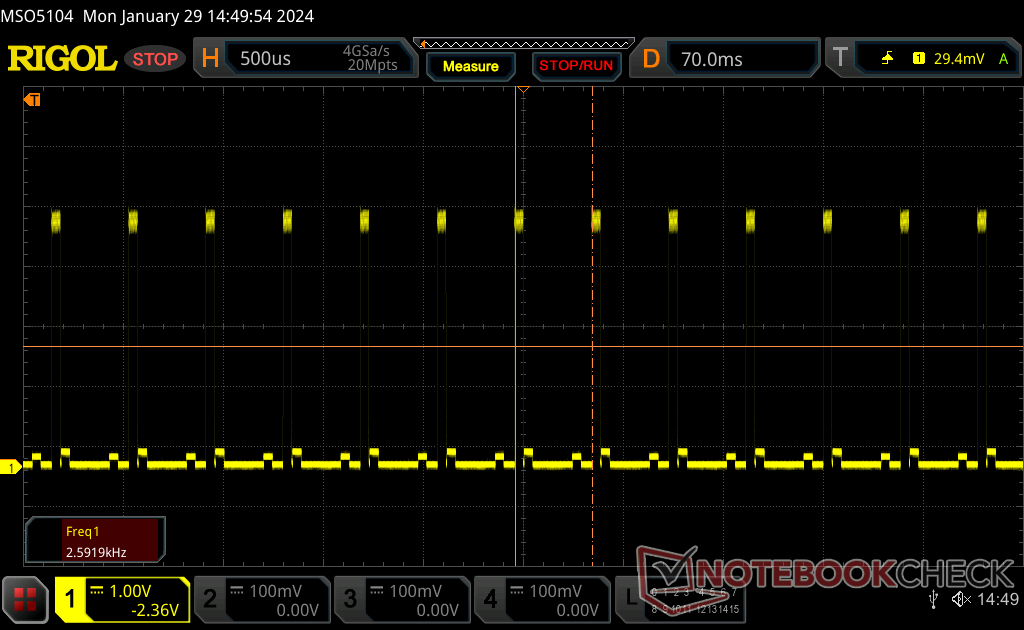 |
A luz de fundo da tela pisca em 2592 Hz (pior caso, por exemplo, utilizando PWM) Cintilação detectada em uma configuração de brilho de 100 % e abaixo. Não deve haver cintilação ou PWM acima desta configuração de brilho. A frequência de 2592 Hz é bastante alta, então a maioria dos usuários sensíveis ao PWM não deve notar nenhuma oscilação. [pwm_comparison] Em comparação: 52 % de todos os dispositivos testados não usam PWM para escurecer a tela. Se PWM foi detectado, uma média de 7757 (mínimo: 5 - máximo: 343500) Hz foi medida. | |||
Os tempos de resposta preto-branco e cinza-cinza do mini-LED são difíceis de medir por meios tradicionais. No entanto, podemos dizer subjetivamente que o efeito fantasma não é um problema nos jogos. Os movimentos rápidos parecem suaves e sem manchas, proporcionando uma experiência mais próxima de uma tela OLED ou IPS com tempos de resposta muito rápidos.
A cintilação está presente em uma frequência constante em todos os níveis de brilho, incluindo o máximo.

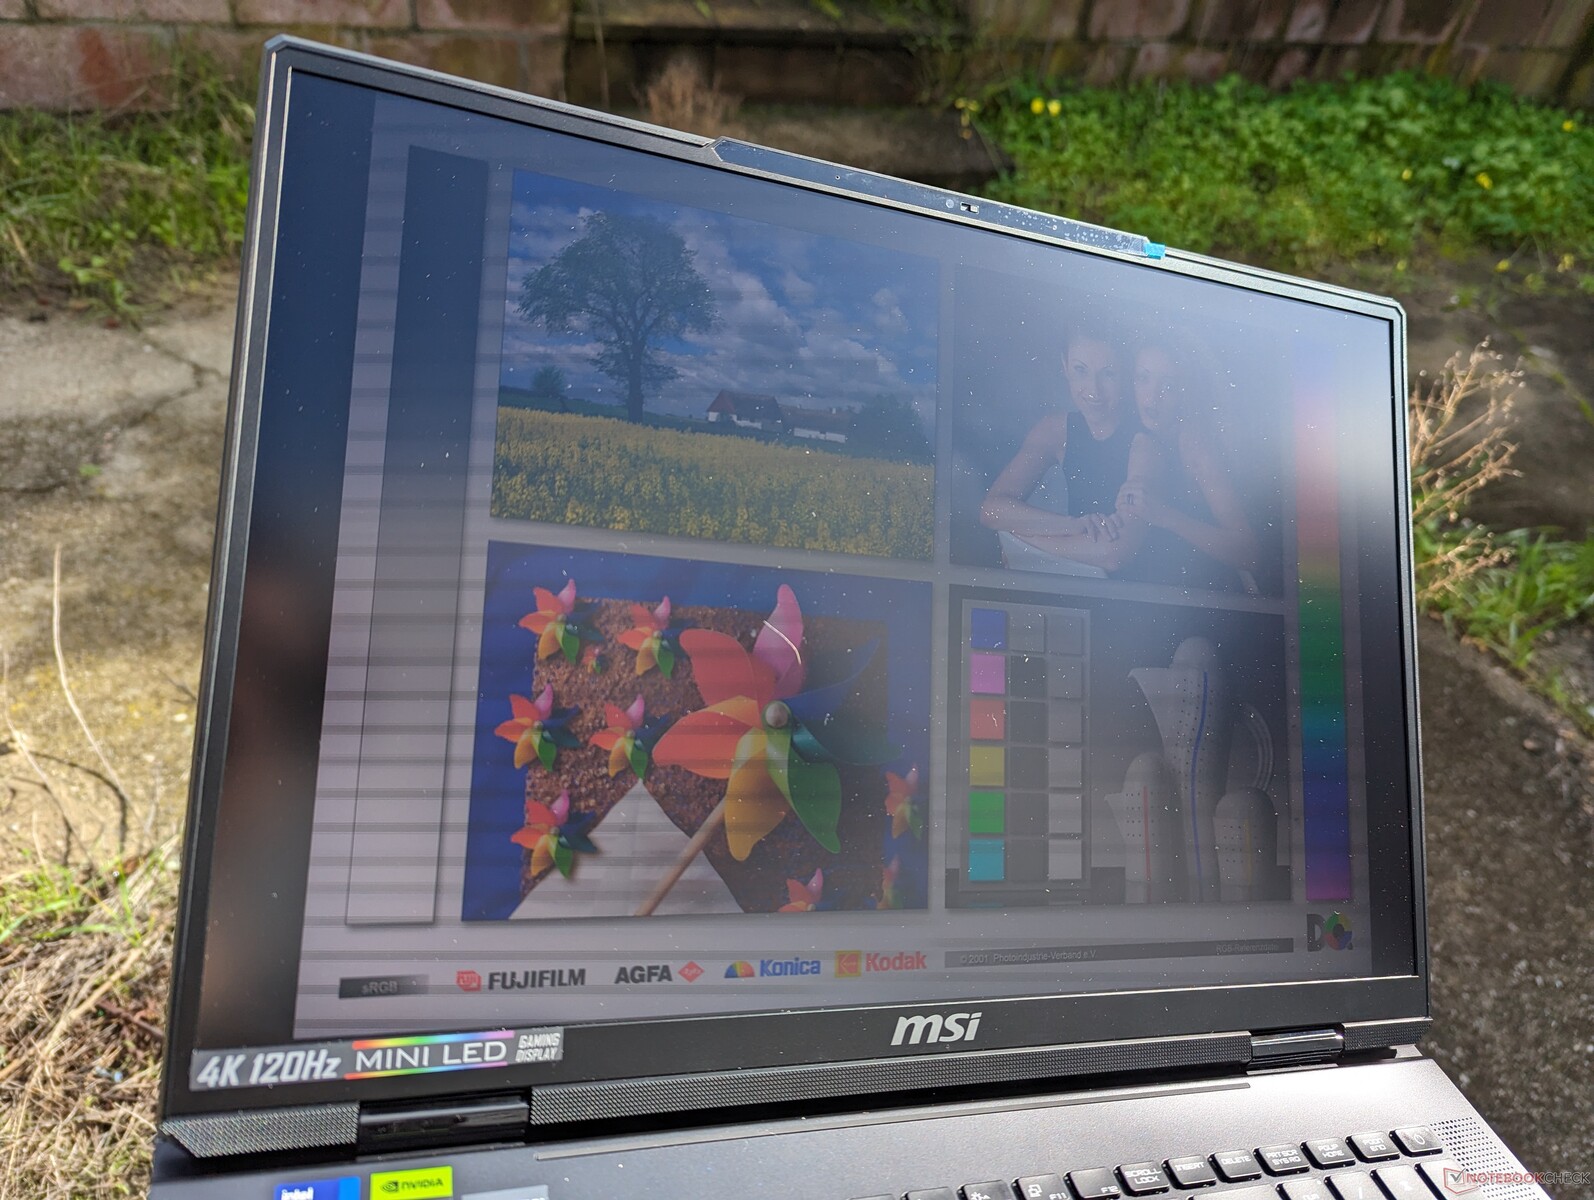
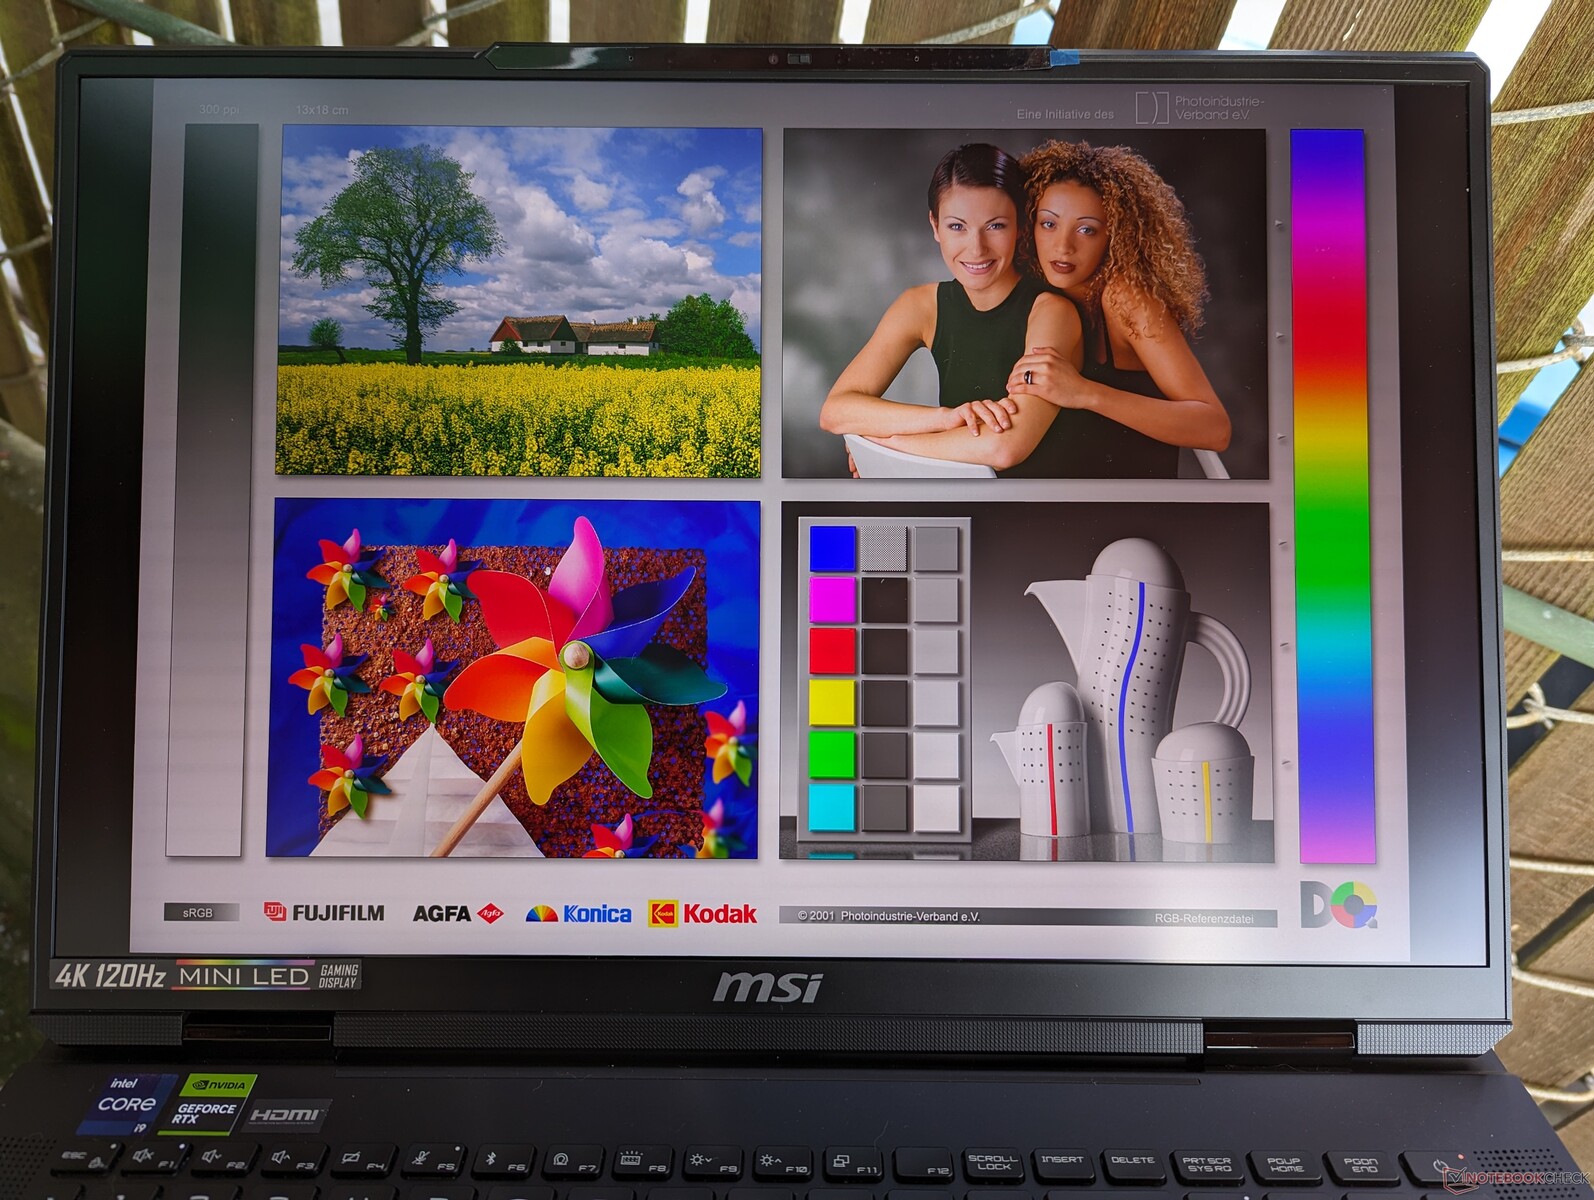
A visibilidade ao ar livre é aceitável se estiver sob a sombra, mas qualquer coisa mais brilhante e a tela fica desbotada. A luz de fundo ultrabrilhante é inatingível se o usuário estiver usando a bateria, conforme mencionado acima.
Desempenho - Raptor Lake-HX de 14ª geração
Condições de teste
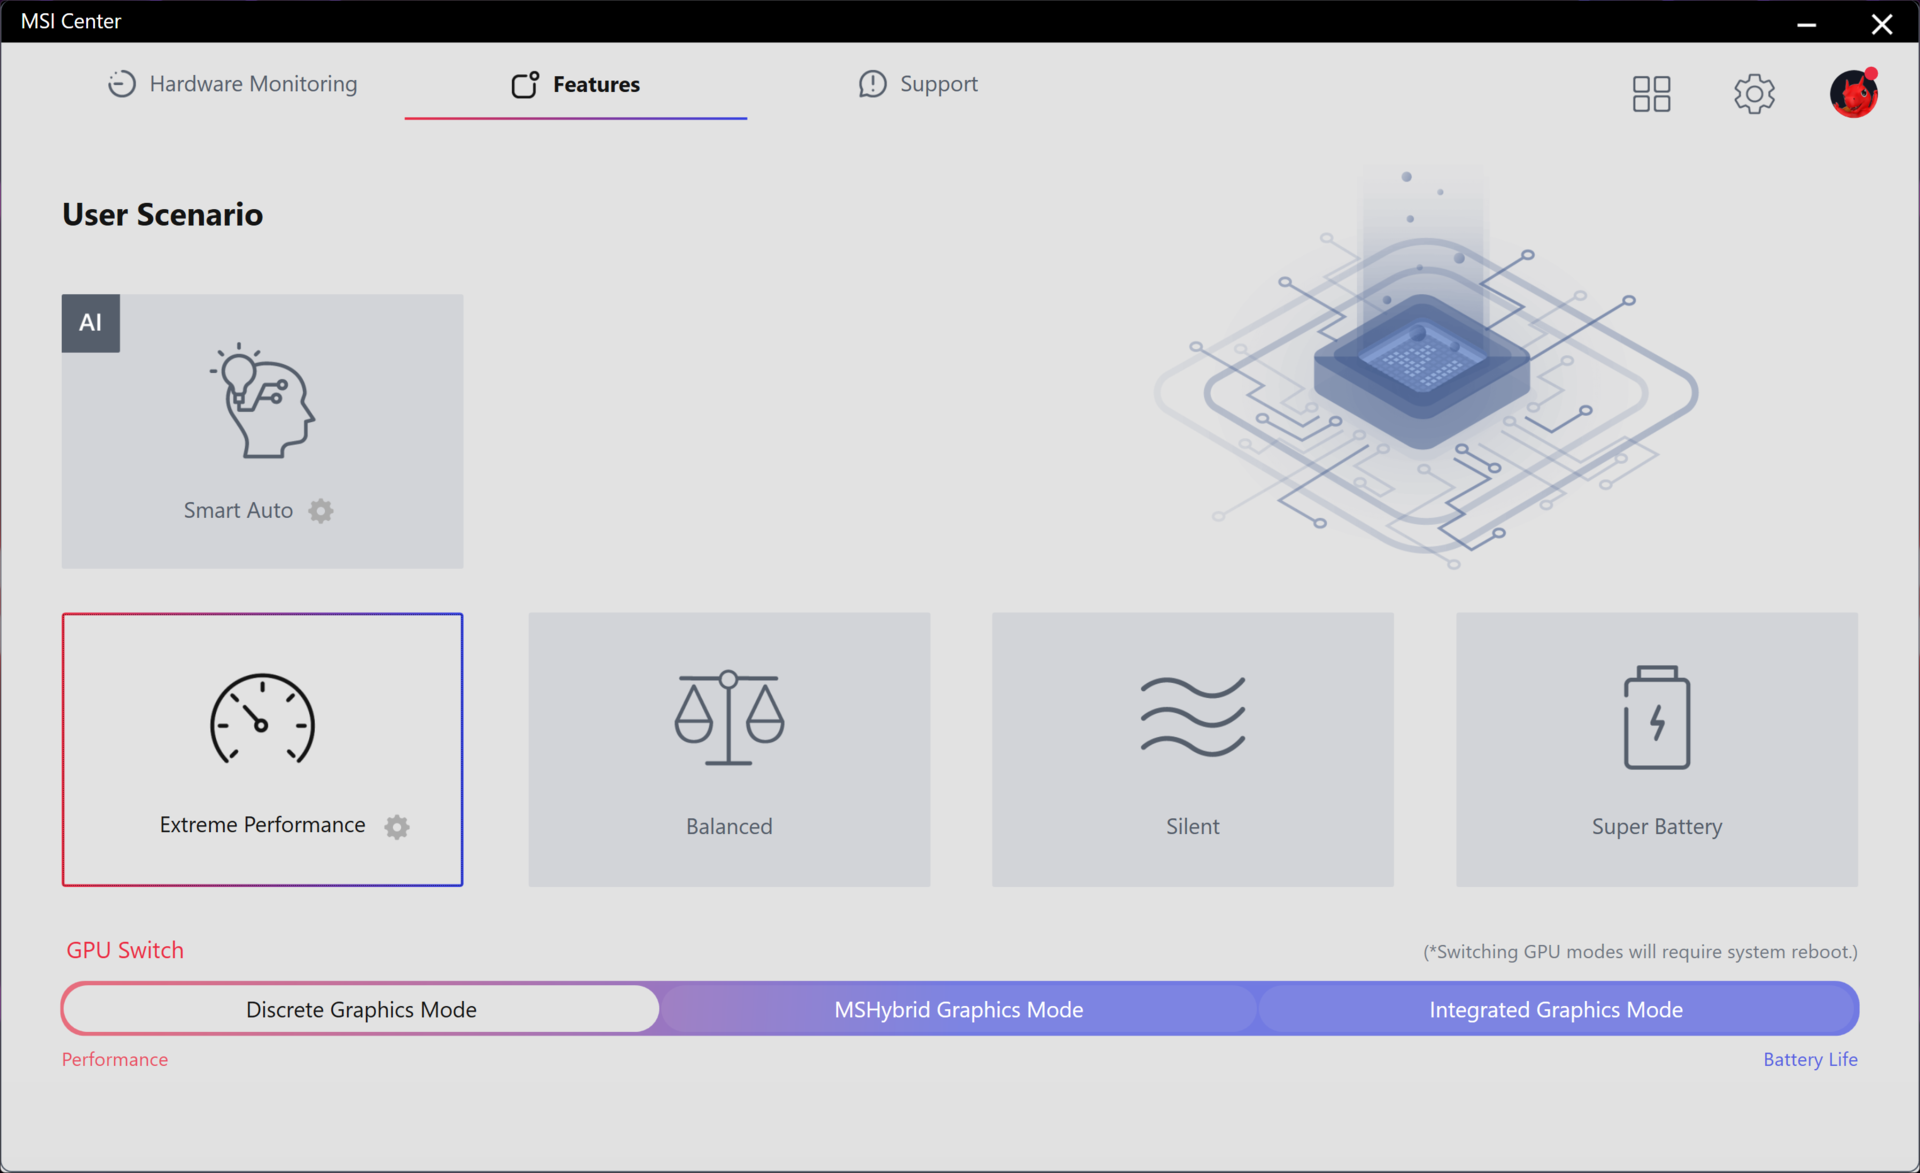
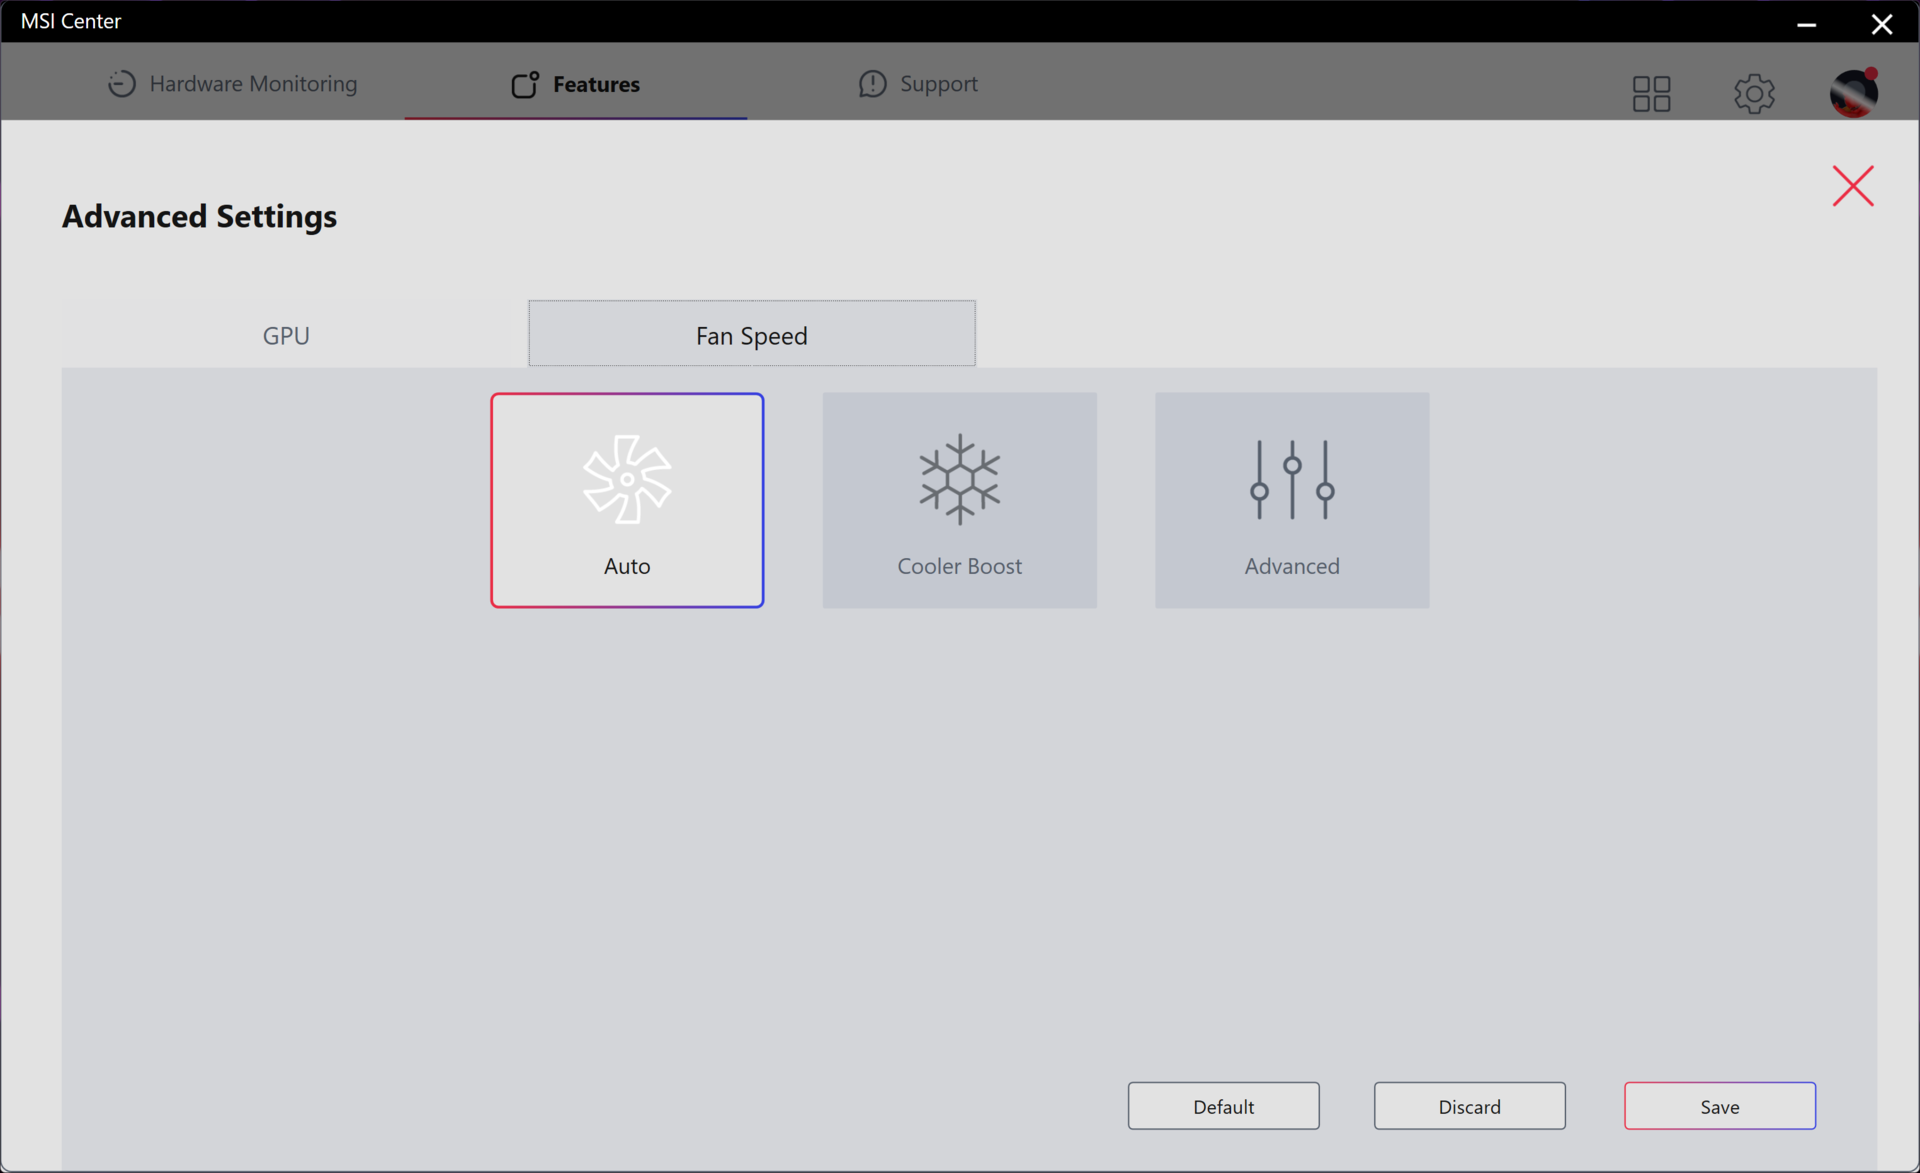
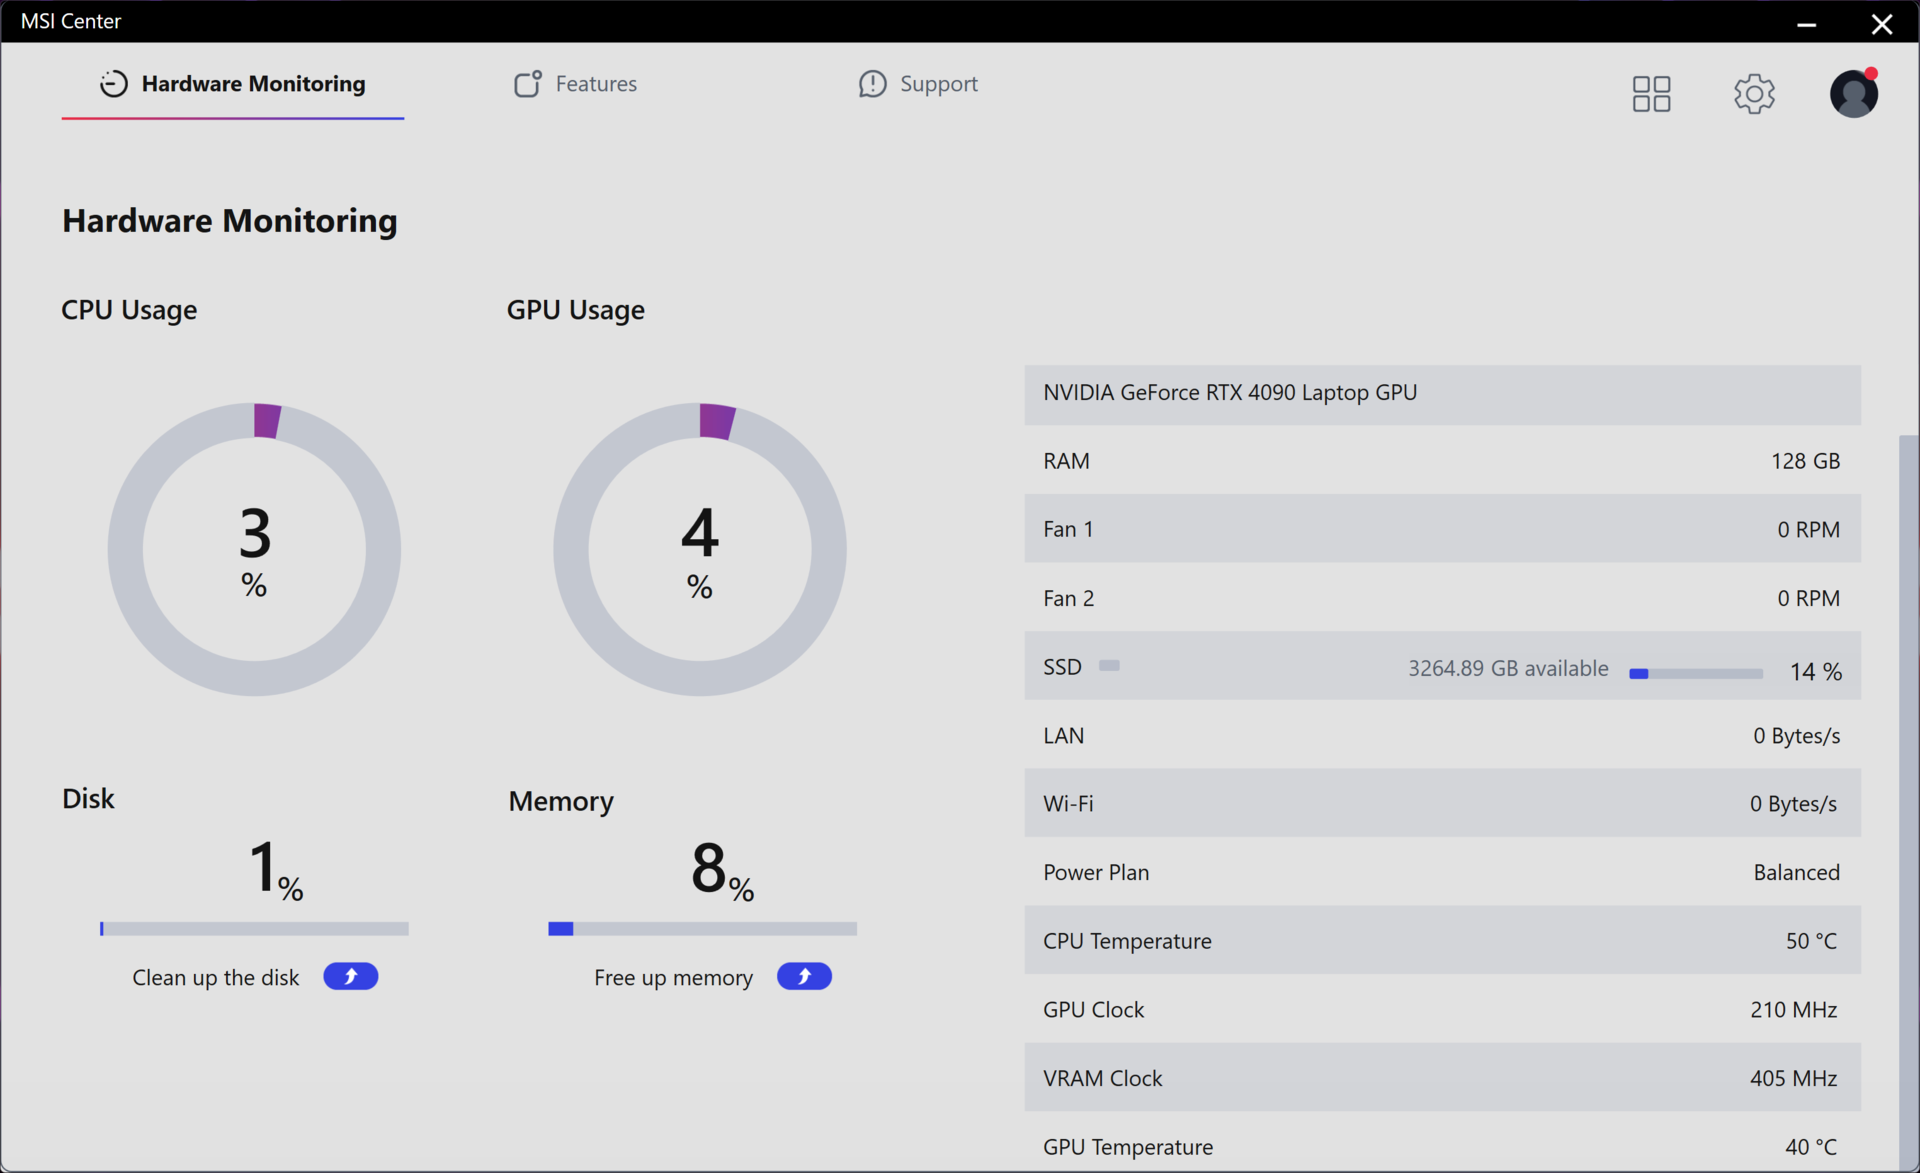
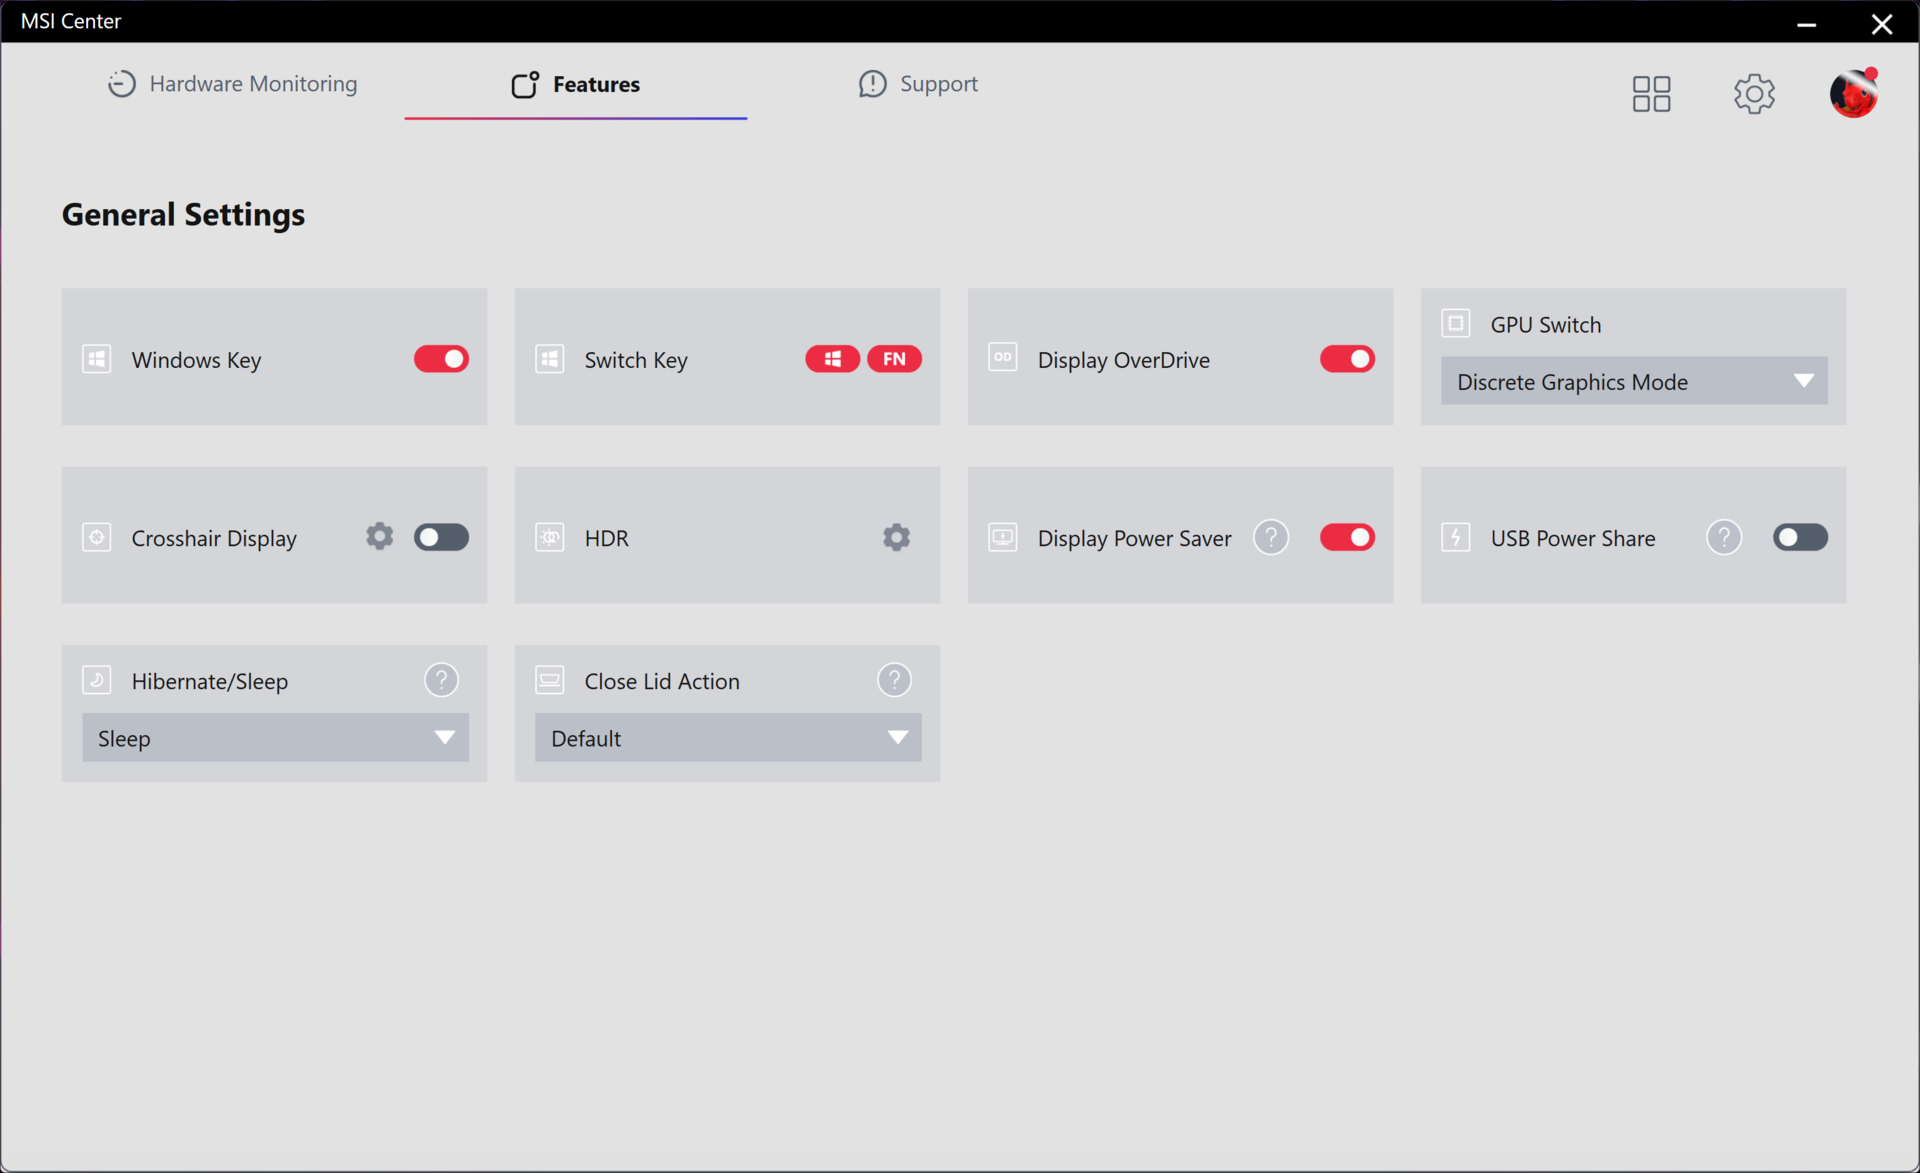
Configuramos o MSI Center para o modo de GPU discreta e o modo de desempenho extremo com o Cooler Boost ativo antes de executar os benchmarks abaixo. Cooler Boost é o nome da marca MSI para o modo de velocidade máxima da ventoinha. Os proprietários devem se familiarizar com o MSI Center, pois ele é o centro de controle para monitorar os sinais vitais do sistema, instalar atualizações específicas da MSI e alternar a maioria dos recursos.
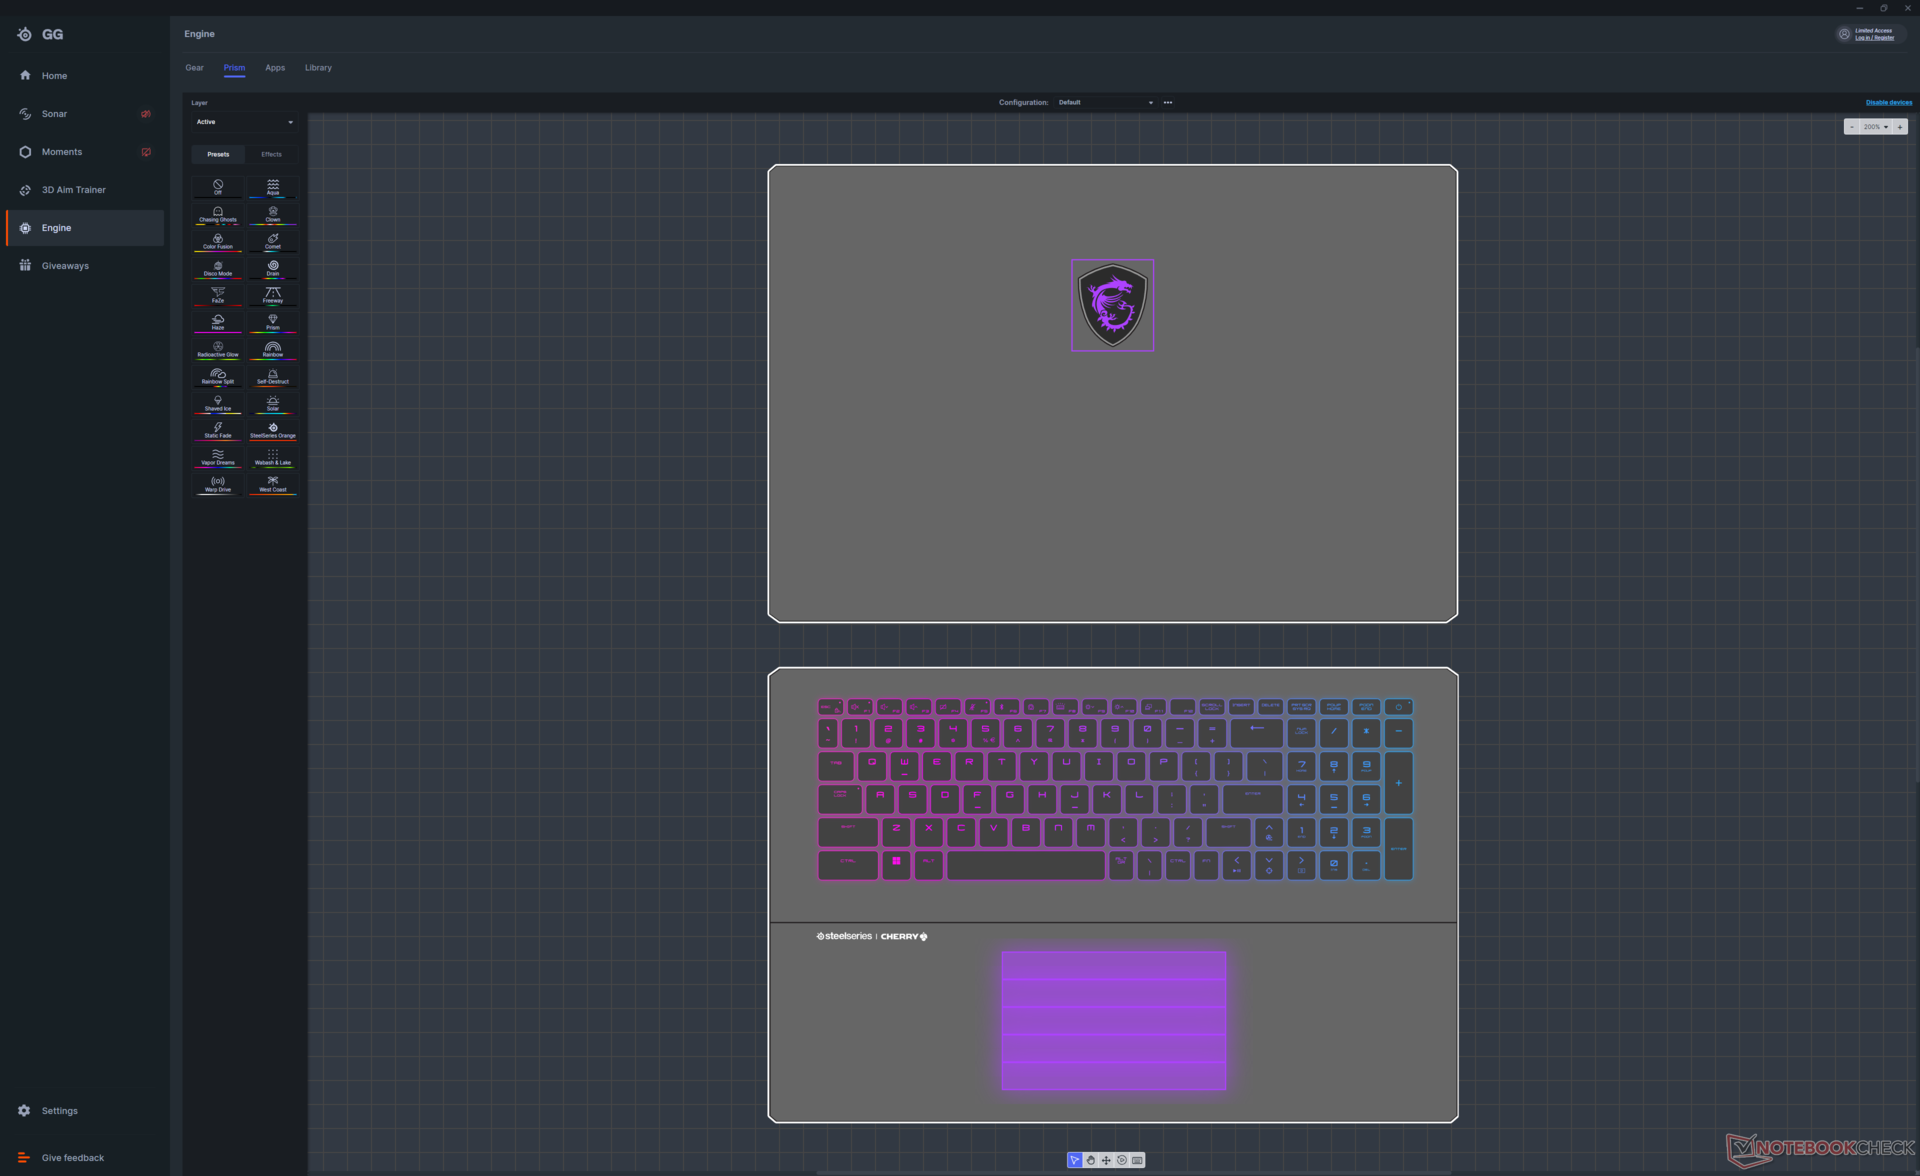
A iluminação do teclado é controlada por um aplicativo separado pré-instalado chamado SteelSeries GG.
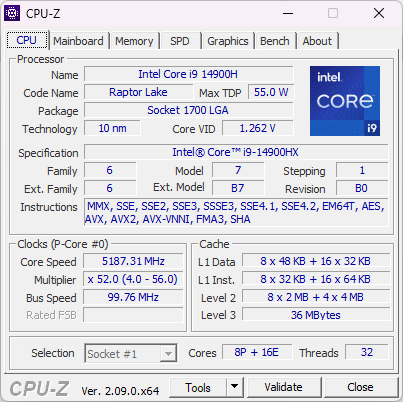
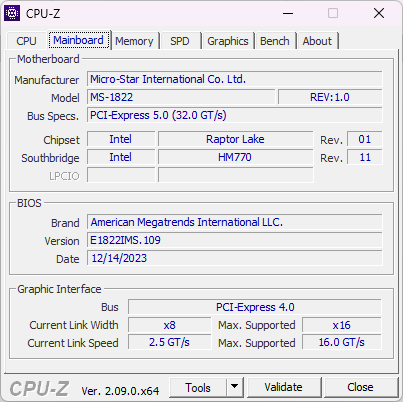
Processador
Desempenho bruto do nosso Core i9-14900HX é essencialmente igual ao do Core i9-13950HX no GT77 do ano passado. Portanto, não espere nenhum ganho de desempenho perceptível ao executar aplicativos tradicionais que exigem muito da CPU. A CPU Raptor Lake-HX de 14ª geração também não tem novos recursos de IA, ao contrário da série Meteor Lake, que integra uma NPU.
A MSI está se preparando para lançar seu aplicativo AI Artist em fevereiro para laptops equipados com CPUs Intel de 14ª geração. O programa aproveita a aceleração de IA da Intel para gerar arte com base em avisos em nível local, em vez de depender de serviços em nuvem para uma experiência de usuário mais rápida. Se o senhor não tiver interesse em aplicativos aprimorados por IA, uma CPU Intel mais antiga, de 13ª geração, poderá atendê-lo da mesma forma.
Cinebench R15 Multi Loop
Cinebench R23: Multi Core | Single Core
Cinebench R20: CPU (Multi Core) | CPU (Single Core)
Cinebench R15: CPU Multi 64Bit | CPU Single 64Bit
Blender: v2.79 BMW27 CPU
7-Zip 18.03: 7z b 4 | 7z b 4 -mmt1
Geekbench 6.7: Multi-Core | Single-Core
Geekbench 5.5: Multi-Core | Single-Core
HWBOT x265 Benchmark v2.2: 4k Preset
LibreOffice : 20 Documents To PDF
R Benchmark 2.5: Overall mean
| CPU Performance rating | |
| Asus ROG Strix Scar 17 G733PYV-LL053X | |
| Asus ROG Strix Scar 17 G733PY-XS96 -2! | |
| Alienware m18 R1 -2! | |
| MSI Titan GT77 HX 13VI -2! | |
| MSI Titan 18 HX A14VIG | |
| Acer Predator Helios 18 N23Q2 | |
| Média Intel Core i9-14900HX | |
| Razer Blade 18 RTX 4070 -2! | |
| Alienware m16 R1 AMD | |
| MSI Raider GE68 HX 13VG, i7-13700HX | |
| NVIDIA GeForce RTX 4070 Super Founders Edition -15! | |
| Asus TUF Gaming A17 FA707XI-NS94 | |
| Asus ROG Strix G18 G814JI -2! | |
| MSI Stealth 16 Studio A13VG -2! | |
| Dell G16 7620 -2! | |
| Alienware m17 R5 (R9 6900HX, RX 6850M XT) -2! | |
| Cinebench R23 / Multi Core | |
| Asus ROG Strix Scar 17 G733PY-XS96 | |
| MSI Titan GT77 HX 13VI | |
| Asus ROG Strix Scar 17 G733PYV-LL053X | |
| Alienware m18 R1 | |
| MSI Titan 18 HX A14VIG | |
| Acer Predator Helios 18 N23Q2 | |
| Média Intel Core i9-14900HX (17078 - 36249, n=37) | |
| Razer Blade 18 RTX 4070 | |
| Alienware m16 R1 AMD | |
| MSI Raider GE68 HX 13VG, i7-13700HX | |
| Asus ROG Strix G18 G814JI | |
| MSI Stealth 16 Studio A13VG | |
| Asus TUF Gaming A17 FA707XI-NS94 | |
| Dell G16 7620 | |
| Alienware m17 R5 (R9 6900HX, RX 6850M XT) | |
| Cinebench R23 / Single Core | |
| Média Intel Core i9-14900HX (1720 - 2245, n=37) | |
| MSI Titan 18 HX A14VIG | |
| Alienware m18 R1 | |
| MSI Titan GT77 HX 13VI | |
| Acer Predator Helios 18 N23Q2 | |
| Razer Blade 18 RTX 4070 | |
| Asus ROG Strix Scar 17 G733PYV-LL053X | |
| Asus ROG Strix G18 G814JI | |
| MSI Raider GE68 HX 13VG, i7-13700HX | |
| Asus ROG Strix Scar 17 G733PY-XS96 | |
| MSI Stealth 16 Studio A13VG | |
| Alienware m16 R1 AMD | |
| Asus TUF Gaming A17 FA707XI-NS94 | |
| Dell G16 7620 | |
| Alienware m17 R5 (R9 6900HX, RX 6850M XT) | |
| Cinebench R20 / CPU (Multi Core) | |
| Asus ROG Strix Scar 17 G733PY-XS96 | |
| Asus ROG Strix Scar 17 G733PYV-LL053X | |
| MSI Titan GT77 HX 13VI | |
| Alienware m18 R1 | |
| MSI Titan 18 HX A14VIG | |
| Acer Predator Helios 18 N23Q2 | |
| Média Intel Core i9-14900HX (6579 - 13832, n=37) | |
| Razer Blade 18 RTX 4070 | |
| Alienware m16 R1 AMD | |
| MSI Raider GE68 HX 13VG, i7-13700HX | |
| Asus ROG Strix G18 G814JI | |
| MSI Stealth 16 Studio A13VG | |
| Asus TUF Gaming A17 FA707XI-NS94 | |
| Dell G16 7620 | |
| Alienware m17 R5 (R9 6900HX, RX 6850M XT) | |
| Cinebench R20 / CPU (Single Core) | |
| Média Intel Core i9-14900HX (657 - 859, n=37) | |
| MSI Titan 18 HX A14VIG | |
| Alienware m18 R1 | |
| Acer Predator Helios 18 N23Q2 | |
| MSI Titan GT77 HX 13VI | |
| Razer Blade 18 RTX 4070 | |
| Asus ROG Strix Scar 17 G733PYV-LL053X | |
| Asus ROG Strix G18 G814JI | |
| MSI Raider GE68 HX 13VG, i7-13700HX | |
| Asus ROG Strix Scar 17 G733PY-XS96 | |
| MSI Stealth 16 Studio A13VG | |
| Alienware m16 R1 AMD | |
| Asus TUF Gaming A17 FA707XI-NS94 | |
| Dell G16 7620 | |
| Alienware m17 R5 (R9 6900HX, RX 6850M XT) | |
| Cinebench R15 / CPU Multi 64Bit | |
| Asus ROG Strix Scar 17 G733PYV-LL053X | |
| Asus ROG Strix Scar 17 G733PY-XS96 | |
| MSI Titan GT77 HX 13VI | |
| Alienware m18 R1 | |
| MSI Titan 18 HX A14VIG | |
| Acer Predator Helios 18 N23Q2 | |
| Razer Blade 18 RTX 4070 | |
| Média Intel Core i9-14900HX (3263 - 5589, n=38) | |
| Alienware m16 R1 AMD | |
| MSI Raider GE68 HX 13VG, i7-13700HX | |
| Asus ROG Strix G18 G814JI | |
| MSI Stealth 16 Studio A13VG | |
| Asus TUF Gaming A17 FA707XI-NS94 | |
| Dell G16 7620 | |
| Alienware m17 R5 (R9 6900HX, RX 6850M XT) | |
| Cinebench R15 / CPU Single 64Bit | |
| Asus ROG Strix Scar 17 G733PYV-LL053X | |
| Asus ROG Strix Scar 17 G733PY-XS96 | |
| Média Intel Core i9-14900HX (247 - 323, n=37) | |
| Alienware m18 R1 | |
| MSI Titan GT77 HX 13VI | |
| MSI Titan 18 HX A14VIG | |
| Razer Blade 18 RTX 4070 | |
| Alienware m16 R1 AMD | |
| Acer Predator Helios 18 N23Q2 | |
| Asus TUF Gaming A17 FA707XI-NS94 | |
| Asus ROG Strix G18 G814JI | |
| MSI Stealth 16 Studio A13VG | |
| MSI Raider GE68 HX 13VG, i7-13700HX | |
| Alienware m17 R5 (R9 6900HX, RX 6850M XT) | |
| Dell G16 7620 | |
| 7-Zip 18.03 / 7z b 4 -mmt1 | |
| Asus ROG Strix Scar 17 G733PY-XS96 | |
| Asus ROG Strix Scar 17 G733PYV-LL053X | |
| Média Intel Core i9-14900HX (5452 - 7545, n=37) | |
| Alienware m16 R1 AMD | |
| Acer Predator Helios 18 N23Q2 | |
| MSI Titan GT77 HX 13VI | |
| Alienware m18 R1 | |
| Razer Blade 18 RTX 4070 | |
| Asus TUF Gaming A17 FA707XI-NS94 | |
| MSI Titan 18 HX A14VIG | |
| MSI Raider GE68 HX 13VG, i7-13700HX | |
| Asus ROG Strix G18 G814JI | |
| MSI Stealth 16 Studio A13VG | |
| Alienware m17 R5 (R9 6900HX, RX 6850M XT) | |
| Dell G16 7620 | |
| Geekbench 6.7 / Multi-Core | |
| Acer Predator Helios 18 N23Q2 | |
| Média Intel Core i9-14900HX (13158 - 19665, n=37) | |
| Asus ROG Strix Scar 17 G733PYV-LL053X | |
| MSI Titan 18 HX A14VIG | |
| MSI Raider GE68 HX 13VG, i7-13700HX | |
| Alienware m16 R1 AMD | |
| Asus TUF Gaming A17 FA707XI-NS94 | |
| Geekbench 6.7 / Single-Core | |
| Média Intel Core i9-14900HX (2419 - 3129, n=37) | |
| Asus ROG Strix Scar 17 G733PYV-LL053X | |
| Acer Predator Helios 18 N23Q2 | |
| MSI Titan 18 HX A14VIG | |
| Asus TUF Gaming A17 FA707XI-NS94 | |
| Alienware m16 R1 AMD | |
| MSI Raider GE68 HX 13VG, i7-13700HX | |
| Geekbench 5.5 / Multi-Core | |
| Alienware m18 R1 | |
| MSI Titan GT77 HX 13VI | |
| Acer Predator Helios 18 N23Q2 | |
| Razer Blade 18 RTX 4070 | |
| Asus ROG Strix Scar 17 G733PYV-LL053X | |
| Média Intel Core i9-14900HX (8618 - 23194, n=37) | |
| Asus ROG Strix Scar 17 G733PY-XS96 | |
| MSI Titan 18 HX A14VIG | |
| MSI Raider GE68 HX 13VG, i7-13700HX | |
| Alienware m16 R1 AMD | |
| Asus ROG Strix G18 G814JI | |
| MSI Stealth 16 Studio A13VG | |
| Dell G16 7620 | |
| Asus TUF Gaming A17 FA707XI-NS94 | |
| Alienware m17 R5 (R9 6900HX, RX 6850M XT) | |
| Geekbench 5.5 / Single-Core | |
| Asus ROG Strix Scar 17 G733PYV-LL053X | |
| MSI Titan 18 HX A14VIG | |
| Média Intel Core i9-14900HX (1669 - 2210, n=37) | |
| Alienware m18 R1 | |
| Acer Predator Helios 18 N23Q2 | |
| Asus ROG Strix Scar 17 G733PY-XS96 | |
| MSI Titan GT77 HX 13VI | |
| Razer Blade 18 RTX 4070 | |
| Asus TUF Gaming A17 FA707XI-NS94 | |
| Alienware m16 R1 AMD | |
| MSI Raider GE68 HX 13VG, i7-13700HX | |
| Asus ROG Strix G18 G814JI | |
| MSI Stealth 16 Studio A13VG | |
| Dell G16 7620 | |
| Alienware m17 R5 (R9 6900HX, RX 6850M XT) | |
| HWBOT x265 Benchmark v2.2 / 4k Preset | |
| Asus ROG Strix Scar 17 G733PY-XS96 | |
| Asus ROG Strix Scar 17 G733PYV-LL053X | |
| Alienware m18 R1 | |
| MSI Titan GT77 HX 13VI | |
| Razer Blade 18 RTX 4070 | |
| MSI Titan 18 HX A14VIG | |
| Acer Predator Helios 18 N23Q2 | |
| Alienware m16 R1 AMD | |
| Média Intel Core i9-14900HX (16.8 - 38.9, n=37) | |
| MSI Raider GE68 HX 13VG, i7-13700HX | |
| Asus ROG Strix G18 G814JI | |
| Asus TUF Gaming A17 FA707XI-NS94 | |
| MSI Stealth 16 Studio A13VG | |
| Dell G16 7620 | |
| Alienware m17 R5 (R9 6900HX, RX 6850M XT) | |
| LibreOffice / 20 Documents To PDF | |
| Asus ROG Strix G18 G814JI | |
| Alienware m17 R5 (R9 6900HX, RX 6850M XT) | |
| MSI Stealth 16 Studio A13VG | |
| Dell G16 7620 | |
| MSI Raider GE68 HX 13VG, i7-13700HX | |
| Acer Predator Helios 18 N23Q2 | |
| Asus TUF Gaming A17 FA707XI-NS94 | |
| Alienware m18 R1 | |
| MSI Titan GT77 HX 13VI | |
| MSI Titan 18 HX A14VIG | |
| Razer Blade 18 RTX 4070 | |
| Média Intel Core i9-14900HX (19 - 85.1, n=37) | |
| Alienware m16 R1 AMD | |
| Asus ROG Strix Scar 17 G733PYV-LL053X | |
| Asus ROG Strix Scar 17 G733PY-XS96 | |
| R Benchmark 2.5 / Overall mean | |
| Dell G16 7620 | |
| Alienware m17 R5 (R9 6900HX, RX 6850M XT) | |
| MSI Stealth 16 Studio A13VG | |
| Asus ROG Strix G18 G814JI | |
| MSI Raider GE68 HX 13VG, i7-13700HX | |
| Asus TUF Gaming A17 FA707XI-NS94 | |
| Alienware m16 R1 AMD | |
| Asus ROG Strix Scar 17 G733PYV-LL053X | |
| Asus ROG Strix Scar 17 G733PY-XS96 | |
| MSI Titan GT77 HX 13VI | |
| Acer Predator Helios 18 N23Q2 | |
| Razer Blade 18 RTX 4070 | |
| Alienware m18 R1 | |
| MSI Titan 18 HX A14VIG | |
| Média Intel Core i9-14900HX (0.3604 - 0.4859, n=37) | |
Cinebench R23: Multi Core | Single Core
Cinebench R20: CPU (Multi Core) | CPU (Single Core)
Cinebench R15: CPU Multi 64Bit | CPU Single 64Bit
Blender: v2.79 BMW27 CPU
7-Zip 18.03: 7z b 4 | 7z b 4 -mmt1
Geekbench 6.7: Multi-Core | Single-Core
Geekbench 5.5: Multi-Core | Single-Core
HWBOT x265 Benchmark v2.2: 4k Preset
LibreOffice : 20 Documents To PDF
R Benchmark 2.5: Overall mean
* ... menor é melhor
AIDA64: FP32 Ray-Trace | FPU Julia | CPU SHA3 | CPU Queen | FPU SinJulia | FPU Mandel | CPU AES | CPU ZLib | FP64 Ray-Trace | CPU PhotoWorxx
| Performance rating | |
| Alienware m18 R1 | |
| Acer Predator Helios 18 N23Q2 | |
| MSI Titan 18 HX A14VIG | |
| MSI Titan GT77 HX 13VI | |
| Razer Blade 18 RTX 4070 | |
| Média Intel Core i9-14900HX | |
| Asus ROG Strix G18 G814JI | |
| AIDA64 / FP32 Ray-Trace | |
| Alienware m18 R1 | |
| MSI Titan 18 HX A14VIG | |
| MSI Titan GT77 HX 13VI | |
| Acer Predator Helios 18 N23Q2 | |
| Razer Blade 18 RTX 4070 | |
| Média Intel Core i9-14900HX (13098 - 33474, n=36) | |
| Asus ROG Strix G18 G814JI | |
| AIDA64 / FPU Julia | |
| MSI Titan 18 HX A14VIG | |
| Alienware m18 R1 | |
| MSI Titan GT77 HX 13VI | |
| Acer Predator Helios 18 N23Q2 | |
| Razer Blade 18 RTX 4070 | |
| Média Intel Core i9-14900HX (67573 - 166040, n=36) | |
| Asus ROG Strix G18 G814JI | |
| AIDA64 / CPU SHA3 | |
| MSI Titan 18 HX A14VIG | |
| Alienware m18 R1 | |
| MSI Titan GT77 HX 13VI | |
| Acer Predator Helios 18 N23Q2 | |
| Razer Blade 18 RTX 4070 | |
| Média Intel Core i9-14900HX (3589 - 7979, n=36) | |
| Asus ROG Strix G18 G814JI | |
| AIDA64 / CPU Queen | |
| MSI Titan 18 HX A14VIG | |
| Alienware m18 R1 | |
| MSI Titan GT77 HX 13VI | |
| Média Intel Core i9-14900HX (118405 - 148966, n=36) | |
| Razer Blade 18 RTX 4070 | |
| Acer Predator Helios 18 N23Q2 | |
| Asus ROG Strix G18 G814JI | |
| AIDA64 / FPU SinJulia | |
| MSI Titan 18 HX A14VIG | |
| MSI Titan GT77 HX 13VI | |
| Alienware m18 R1 | |
| Razer Blade 18 RTX 4070 | |
| Acer Predator Helios 18 N23Q2 | |
| Média Intel Core i9-14900HX (10475 - 18517, n=36) | |
| Asus ROG Strix G18 G814JI | |
| AIDA64 / FPU Mandel | |
| Alienware m18 R1 | |
| MSI Titan 18 HX A14VIG | |
| MSI Titan GT77 HX 13VI | |
| Acer Predator Helios 18 N23Q2 | |
| Razer Blade 18 RTX 4070 | |
| Média Intel Core i9-14900HX (32543 - 83662, n=36) | |
| Asus ROG Strix G18 G814JI | |
| AIDA64 / CPU AES | |
| Acer Predator Helios 18 N23Q2 | |
| Média Intel Core i9-14900HX (86964 - 241777, n=36) | |
| MSI Titan 18 HX A14VIG | |
| MSI Titan GT77 HX 13VI | |
| Alienware m18 R1 | |
| Razer Blade 18 RTX 4070 | |
| Asus ROG Strix G18 G814JI | |
| AIDA64 / CPU ZLib | |
| MSI Titan 18 HX A14VIG | |
| MSI Titan GT77 HX 13VI | |
| Alienware m18 R1 | |
| Acer Predator Helios 18 N23Q2 | |
| Razer Blade 18 RTX 4070 | |
| Média Intel Core i9-14900HX (1054 - 2292, n=36) | |
| Asus ROG Strix G18 G814JI | |
| AIDA64 / FP64 Ray-Trace | |
| Alienware m18 R1 | |
| MSI Titan 18 HX A14VIG | |
| MSI Titan GT77 HX 13VI | |
| Acer Predator Helios 18 N23Q2 | |
| Razer Blade 18 RTX 4070 | |
| Média Intel Core i9-14900HX (6809 - 18349, n=36) | |
| Asus ROG Strix G18 G814JI | |
| AIDA64 / CPU PhotoWorxx | |
| Alienware m18 R1 | |
| Acer Predator Helios 18 N23Q2 | |
| Razer Blade 18 RTX 4070 | |
| Média Intel Core i9-14900HX (23903 - 54702, n=36) | |
| Asus ROG Strix G18 G814JI | |
| MSI Titan GT77 HX 13VI | |
| MSI Titan 18 HX A14VIG | |
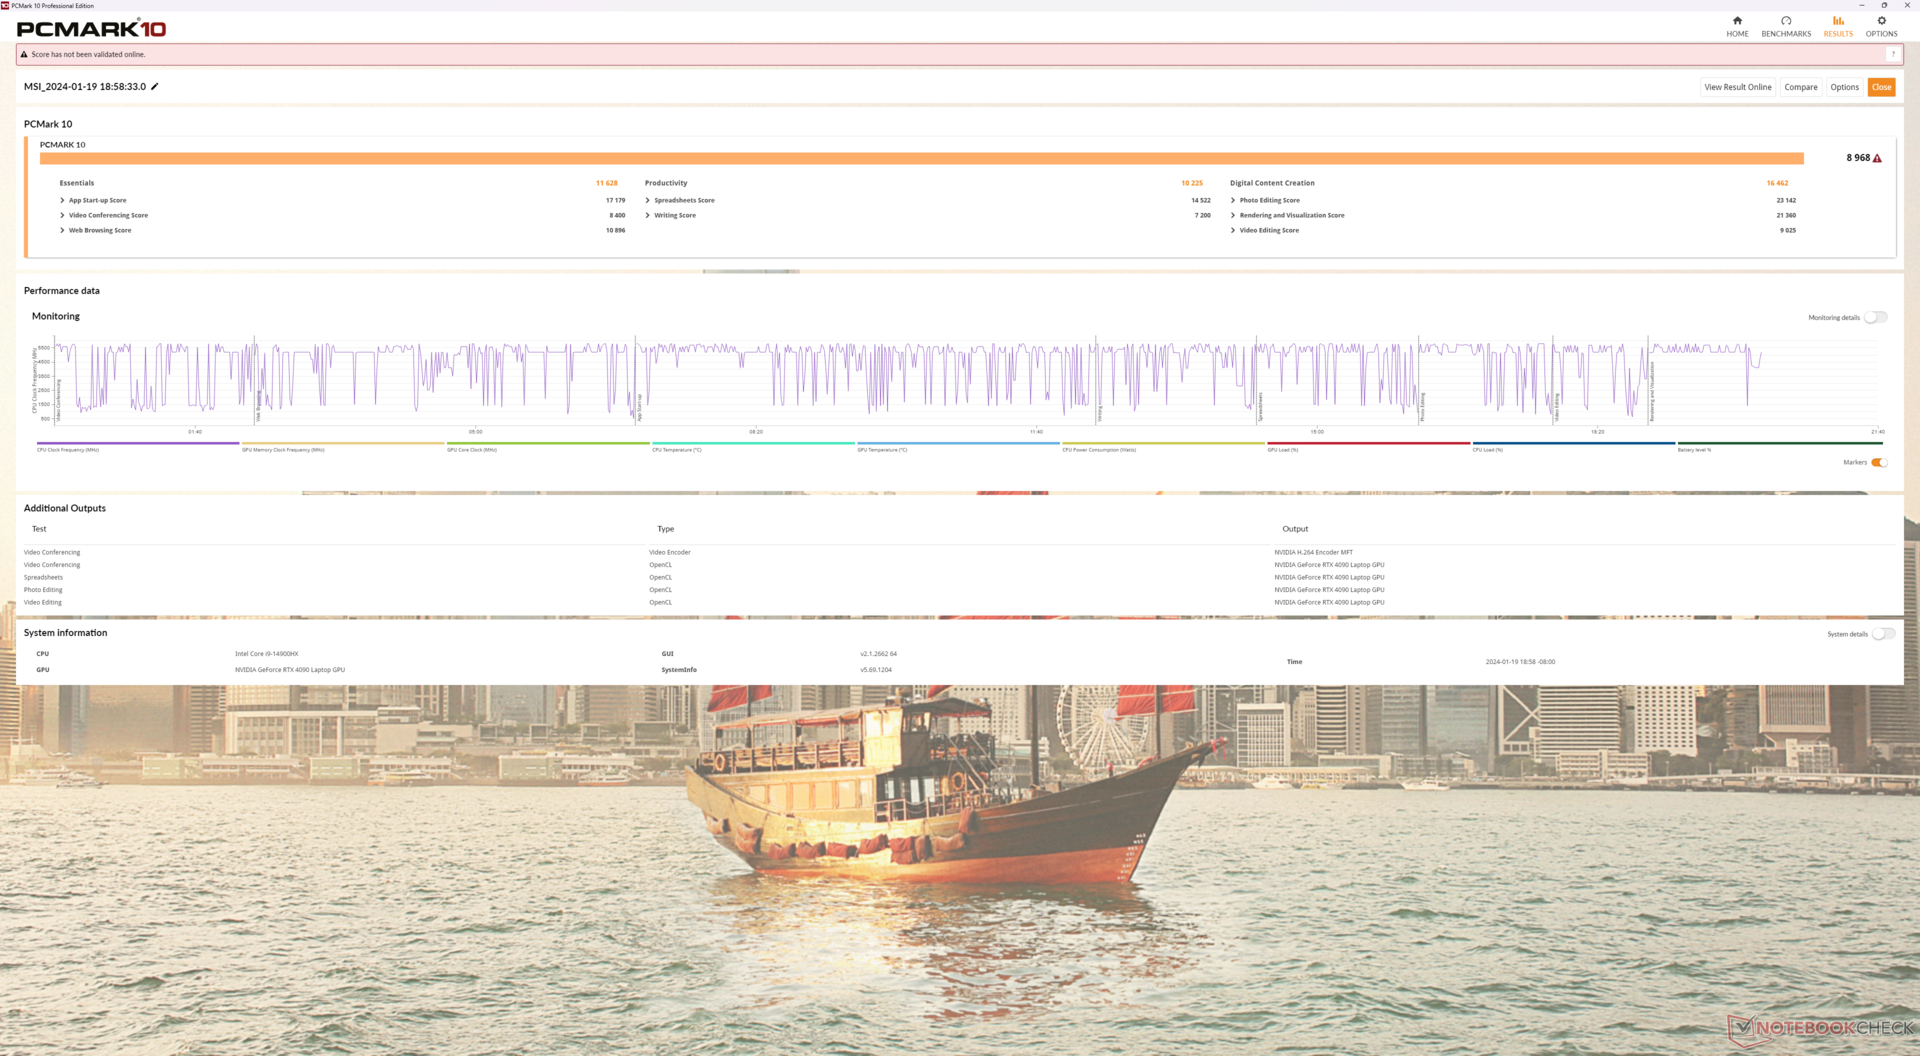
Desempenho do sistema
Os resultados do PCMark estão dentro de apenas alguns pontos percentuais do GT77 do ano passado, o que sugere que não há grandes diferenças de desempenho entre suas CPUs e GPUs ao executar tarefas cotidianas.
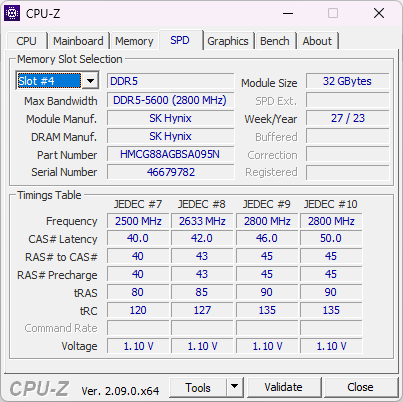
Observe que o desempenho da RAM é mais lento em nossa configuração de 128 GB em até 30 a 40 por cento em comparação com a configuração de 32 GB do Alienware m18 R1. Isso é esperado, pois o desempenho da RAM em capacidades mais altas é limitado pela interface SODIMM antiga.
CrossMark: Overall | Productivity | Creativity | Responsiveness
WebXPRT 3: Overall
WebXPRT 4: Overall
Mozilla Kraken 1.1: Total
| PCMark 10 / Score | |
| MSI Titan 18 HX A14VIG | |
| MSI Titan GT77 HX 13VI | |
| Alienware m18 R1 | |
| Média Intel Core i9-14900HX, NVIDIA GeForce RTX 4090 Laptop GPU (8230 - 9234, n=13) | |
| Acer Predator Helios 18 N23Q2 | |
| Razer Blade 18 RTX 4070 | |
| Asus ROG Strix G18 G814JI | |
| PCMark 10 / Essentials | |
| MSI Titan GT77 HX 13VI | |
| Razer Blade 18 RTX 4070 | |
| MSI Titan 18 HX A14VIG | |
| Alienware m18 R1 | |
| Média Intel Core i9-14900HX, NVIDIA GeForce RTX 4090 Laptop GPU (10778 - 11628, n=13) | |
| Acer Predator Helios 18 N23Q2 | |
| Asus ROG Strix G18 G814JI | |
| PCMark 10 / Productivity | |
| Média Intel Core i9-14900HX, NVIDIA GeForce RTX 4090 Laptop GPU (9458 - 11759, n=13) | |
| Acer Predator Helios 18 N23Q2 | |
| MSI Titan 18 HX A14VIG | |
| Alienware m18 R1 | |
| MSI Titan GT77 HX 13VI | |
| Razer Blade 18 RTX 4070 | |
| Asus ROG Strix G18 G814JI | |
| PCMark 10 / Digital Content Creation | |
| MSI Titan 18 HX A14VIG | |
| MSI Titan GT77 HX 13VI | |
| Alienware m18 R1 | |
| Média Intel Core i9-14900HX, NVIDIA GeForce RTX 4090 Laptop GPU (13219 - 16462, n=13) | |
| Acer Predator Helios 18 N23Q2 | |
| Razer Blade 18 RTX 4070 | |
| Asus ROG Strix G18 G814JI | |
| CrossMark / Overall | |
| Acer Predator Helios 18 N23Q2 | |
| Alienware m18 R1 | |
| MSI Titan GT77 HX 13VI | |
| Razer Blade 18 RTX 4070 | |
| Média Intel Core i9-14900HX, NVIDIA GeForce RTX 4090 Laptop GPU (1877 - 2344, n=10) | |
| MSI Titan 18 HX A14VIG | |
| CrossMark / Productivity | |
| Acer Predator Helios 18 N23Q2 | |
| Alienware m18 R1 | |
| MSI Titan GT77 HX 13VI | |
| Razer Blade 18 RTX 4070 | |
| Média Intel Core i9-14900HX, NVIDIA GeForce RTX 4090 Laptop GPU (1738 - 2162, n=10) | |
| MSI Titan 18 HX A14VIG | |
| CrossMark / Creativity | |
| Alienware m18 R1 | |
| MSI Titan GT77 HX 13VI | |
| Acer Predator Helios 18 N23Q2 | |
| Razer Blade 18 RTX 4070 | |
| Média Intel Core i9-14900HX, NVIDIA GeForce RTX 4090 Laptop GPU (2195 - 2660, n=10) | |
| MSI Titan 18 HX A14VIG | |
| CrossMark / Responsiveness | |
| Acer Predator Helios 18 N23Q2 | |
| Alienware m18 R1 | |
| Razer Blade 18 RTX 4070 | |
| Média Intel Core i9-14900HX, NVIDIA GeForce RTX 4090 Laptop GPU (1478 - 2327, n=10) | |
| MSI Titan GT77 HX 13VI | |
| MSI Titan 18 HX A14VIG | |
| WebXPRT 3 / Overall | |
| Razer Blade 18 RTX 4070 | |
| Alienware m18 R1 | |
| MSI Titan 18 HX A14VIG | |
| Média Intel Core i9-14900HX, NVIDIA GeForce RTX 4090 Laptop GPU (279 - 339, n=10) | |
| MSI Titan GT77 HX 13VI | |
| Acer Predator Helios 18 N23Q2 | |
| Asus ROG Strix G18 G814JI | |
| Asus ROG Strix G18 G814JI | |
| WebXPRT 4 / Overall | |
| Alienware m18 R1 | |
| Razer Blade 18 RTX 4070 | |
| MSI Titan GT77 HX 13VI | |
| Média Intel Core i9-14900HX, NVIDIA GeForce RTX 4090 Laptop GPU (246 - 309, n=8) | |
| MSI Titan 18 HX A14VIG | |
| Asus ROG Strix G18 G814JI | |
| Asus ROG Strix G18 G814JI | |
| Mozilla Kraken 1.1 / Total | |
| Asus ROG Strix G18 G814JI | |
| Asus ROG Strix G18 G814JI | |
| MSI Titan GT77 HX 13VI | |
| Razer Blade 18 RTX 4070 | |
| Alienware m18 R1 | |
| Acer Predator Helios 18 N23Q2 | |
| Média Intel Core i9-14900HX, NVIDIA GeForce RTX 4090 Laptop GPU (428 - 535, n=11) | |
| MSI Titan 18 HX A14VIG | |
* ... menor é melhor
| PCMark 10 Score | 8968 pontos | |
Ajuda | ||
| AIDA64 / Memory Copy | |
| Alienware m18 R1 | |
| Acer Predator Helios 18 N23Q2 | |
| Razer Blade 18 RTX 4070 | |
| Média Intel Core i9-14900HX (38028 - 83392, n=36) | |
| Asus ROG Strix G18 G814JI | |
| MSI Titan GT77 HX 13VI | |
| MSI Titan 18 HX A14VIG | |
| AIDA64 / Memory Read | |
| Alienware m18 R1 | |
| Acer Predator Helios 18 N23Q2 | |
| Razer Blade 18 RTX 4070 | |
| Média Intel Core i9-14900HX (43306 - 87568, n=36) | |
| Asus ROG Strix G18 G814JI | |
| MSI Titan GT77 HX 13VI | |
| MSI Titan 18 HX A14VIG | |
| AIDA64 / Memory Write | |
| Alienware m18 R1 | |
| Razer Blade 18 RTX 4070 | |
| Acer Predator Helios 18 N23Q2 | |
| Média Intel Core i9-14900HX (37146 - 80589, n=36) | |
| MSI Titan GT77 HX 13VI | |
| Asus ROG Strix G18 G814JI | |
| MSI Titan 18 HX A14VIG | |
| AIDA64 / Memory Latency | |
| MSI Titan 18 HX A14VIG | |
| MSI Titan GT77 HX 13VI | |
| Média Intel Core i9-14900HX (76.1 - 105, n=36) | |
| Razer Blade 18 RTX 4070 | |
| Asus ROG Strix G18 G814JI | |
| Acer Predator Helios 18 N23Q2 | |
| Alienware m18 R1 | |
* ... menor é melhor
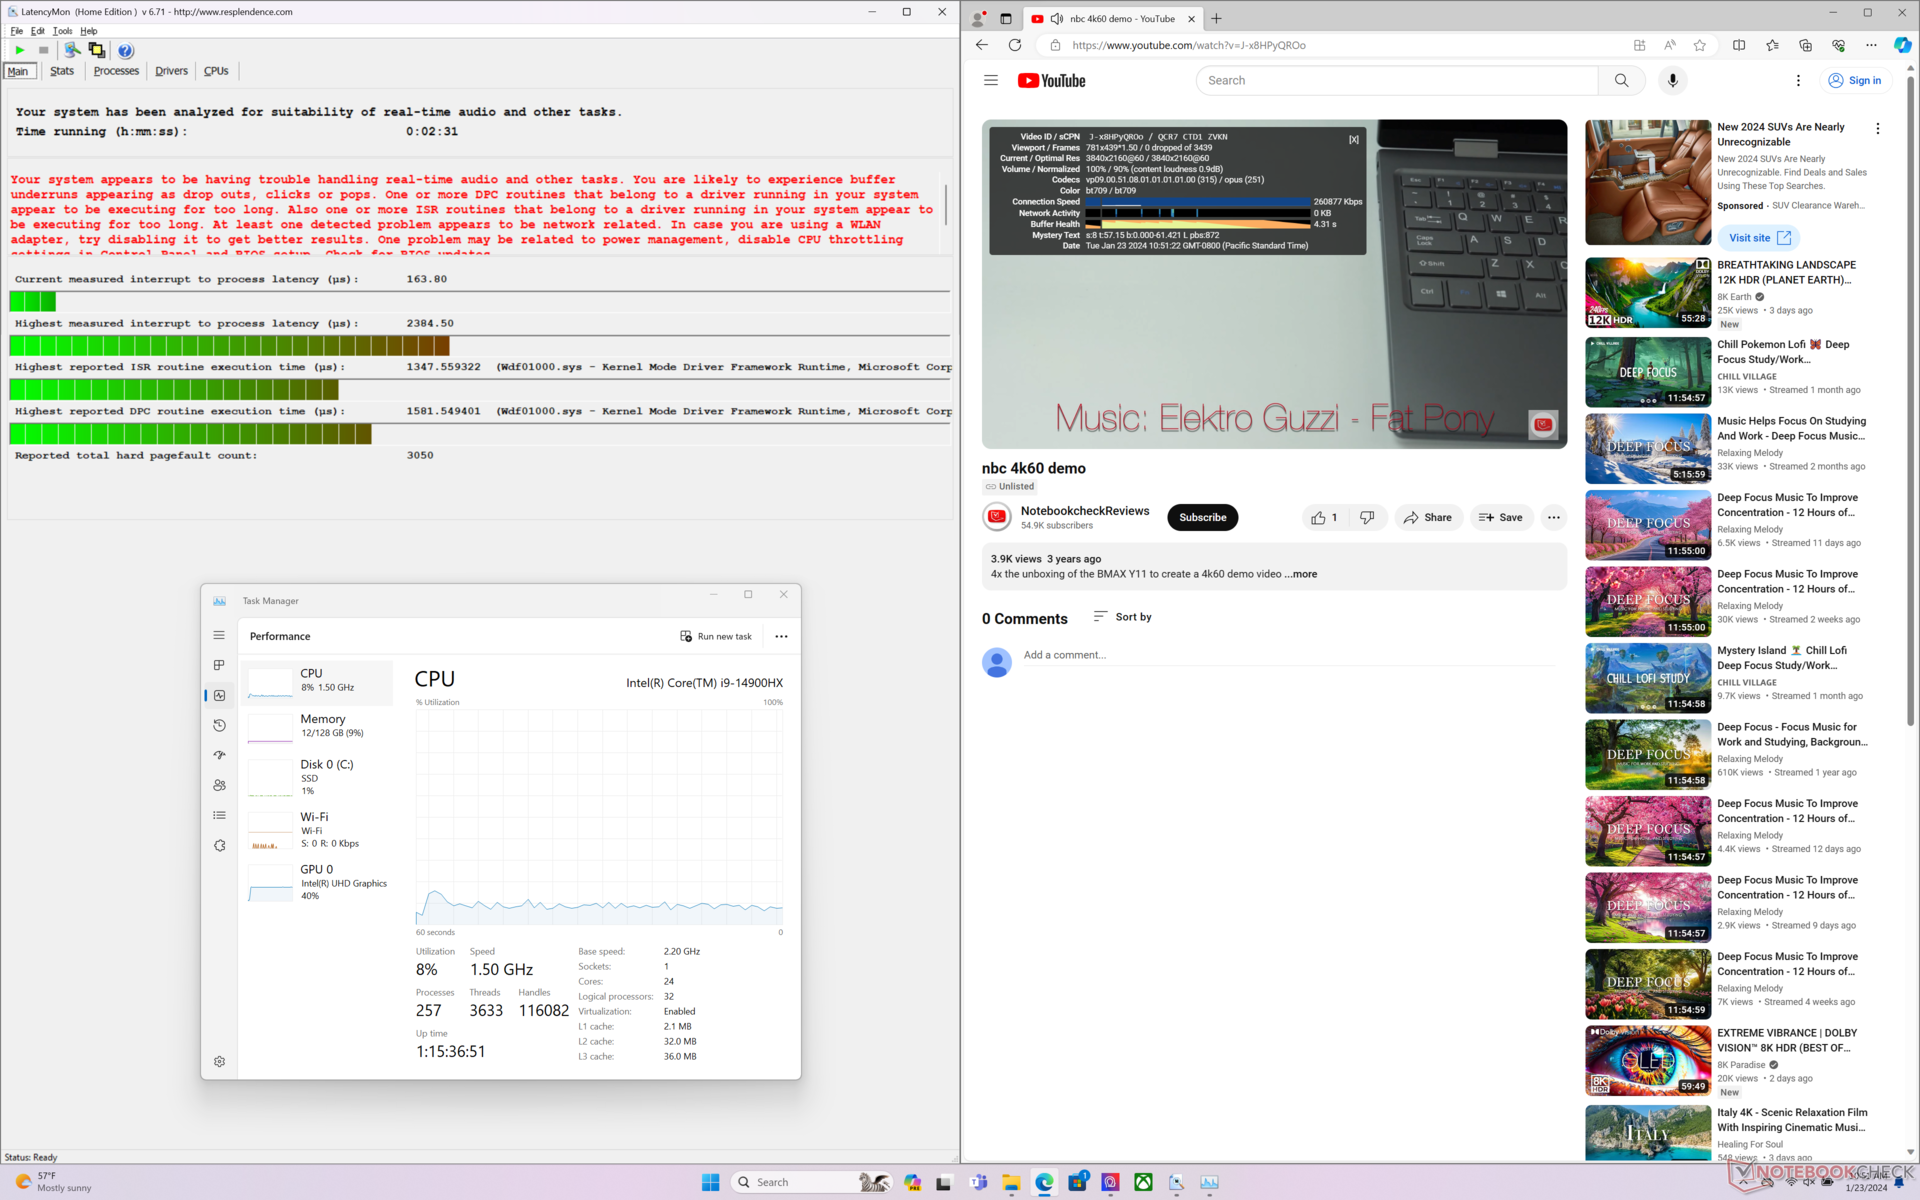
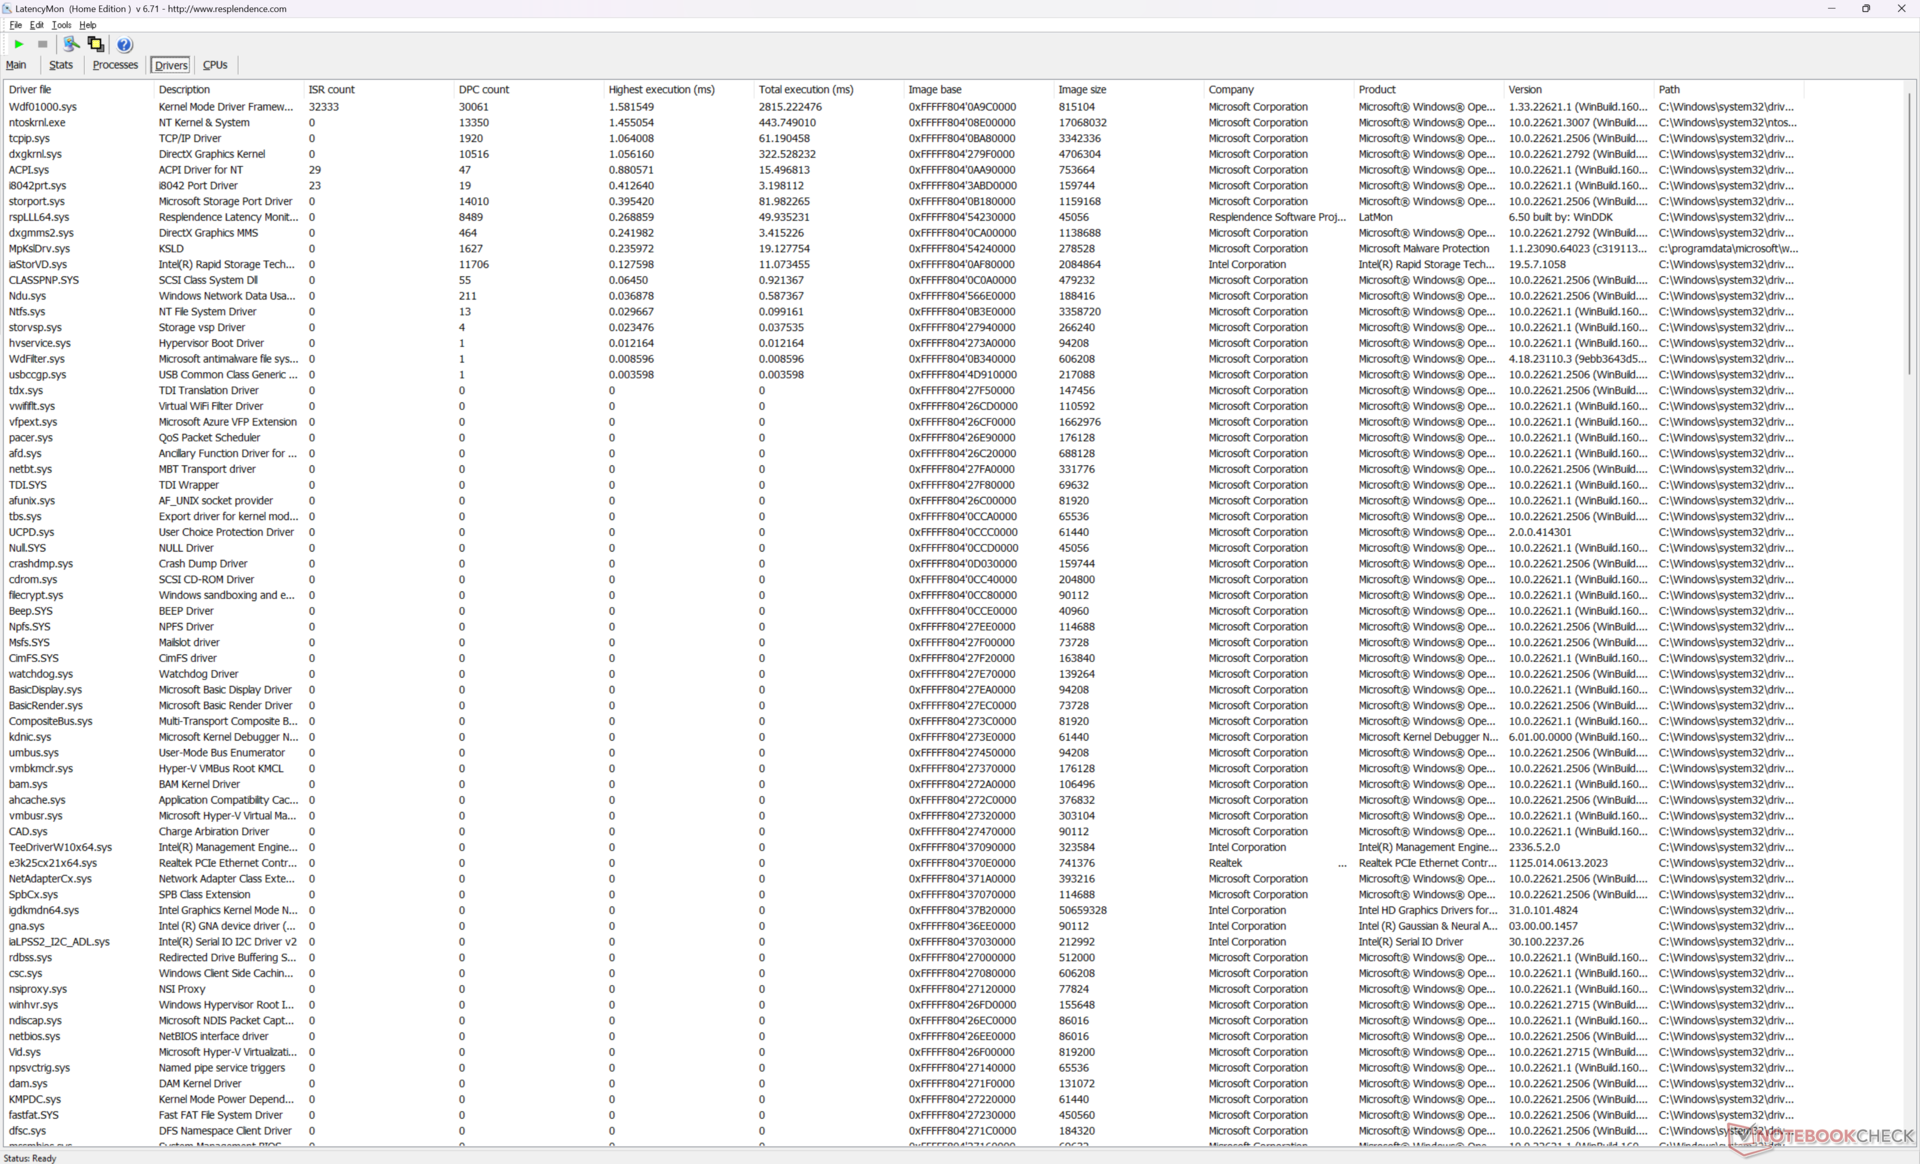
Latência DPC
O LatencyMon mostra problemas de DPC ao abrir várias guias do navegador em nossa página inicial. a reprodução de vídeo 4K a 60 FPS no modo iGPU é perfeita, sem registro de queda de quadros.
| DPC Latencies / LatencyMon - interrupt to process latency (max), Web, Youtube, Prime95 | |
| Acer Predator Helios 18 N23Q2 | |
| MSI Titan GT77 HX 13VI | |
| Alienware m18 R1 | |
| MSI Titan 18 HX A14VIG | |
| Razer Blade 18 RTX 4070 | |
| Asus ROG Strix G18 G814JI | |
* ... menor é melhor
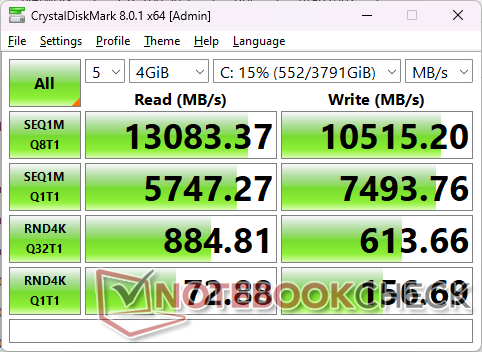
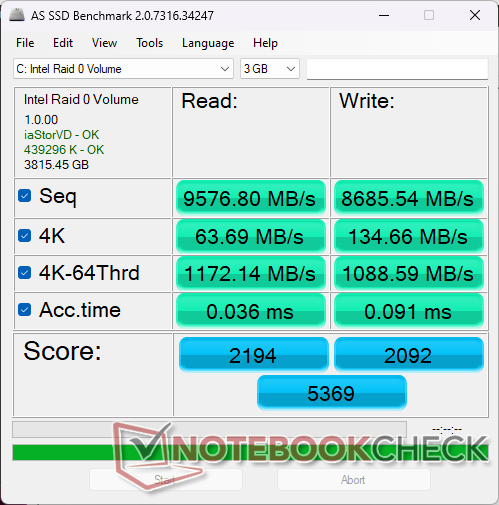
Dispositivos de armazenamento
Nossa unidade vem com dois Samsung MZVL22T0HDLB PM9A1a PCIe4 x4 NVMe SSDs na configuração RAID 0 para taxas de transferência próximas a 13.000 MB/s, em vez dos usuais ~7.000 MB/s da maioria dos SSDs PCIe4 x4 individuais. As unidades não apresentaram problemas de estrangulamento quando submetidas ao DiskSpd por vários minutos.
O Titan 18 HX também pode suportar um único SSD PCIe5 M.2, mas essas unidades continuam com estoque limitado e, portanto, a maioria das configurações no momento é fornecida com unidades PCIe4 x4.

| Drive Performance rating - Percent | |
| Alienware m18 R1 | |
| Acer Predator Helios 18 N23Q2 | |
| Razer Blade 18 RTX 4070 | |
| MSI Titan GT77 HX 13VI | |
| MSI Titan 18 HX A14VIG | |
| Asus ROG Strix G18 G814JI | |
* ... menor é melhor
Disk Throttling: DiskSpd Read Loop, Queue Depth 8
Desempenho da GPU - Gráficos de 175 W + processador de 95 W
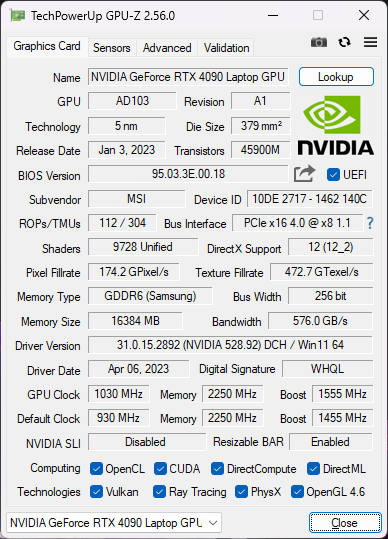
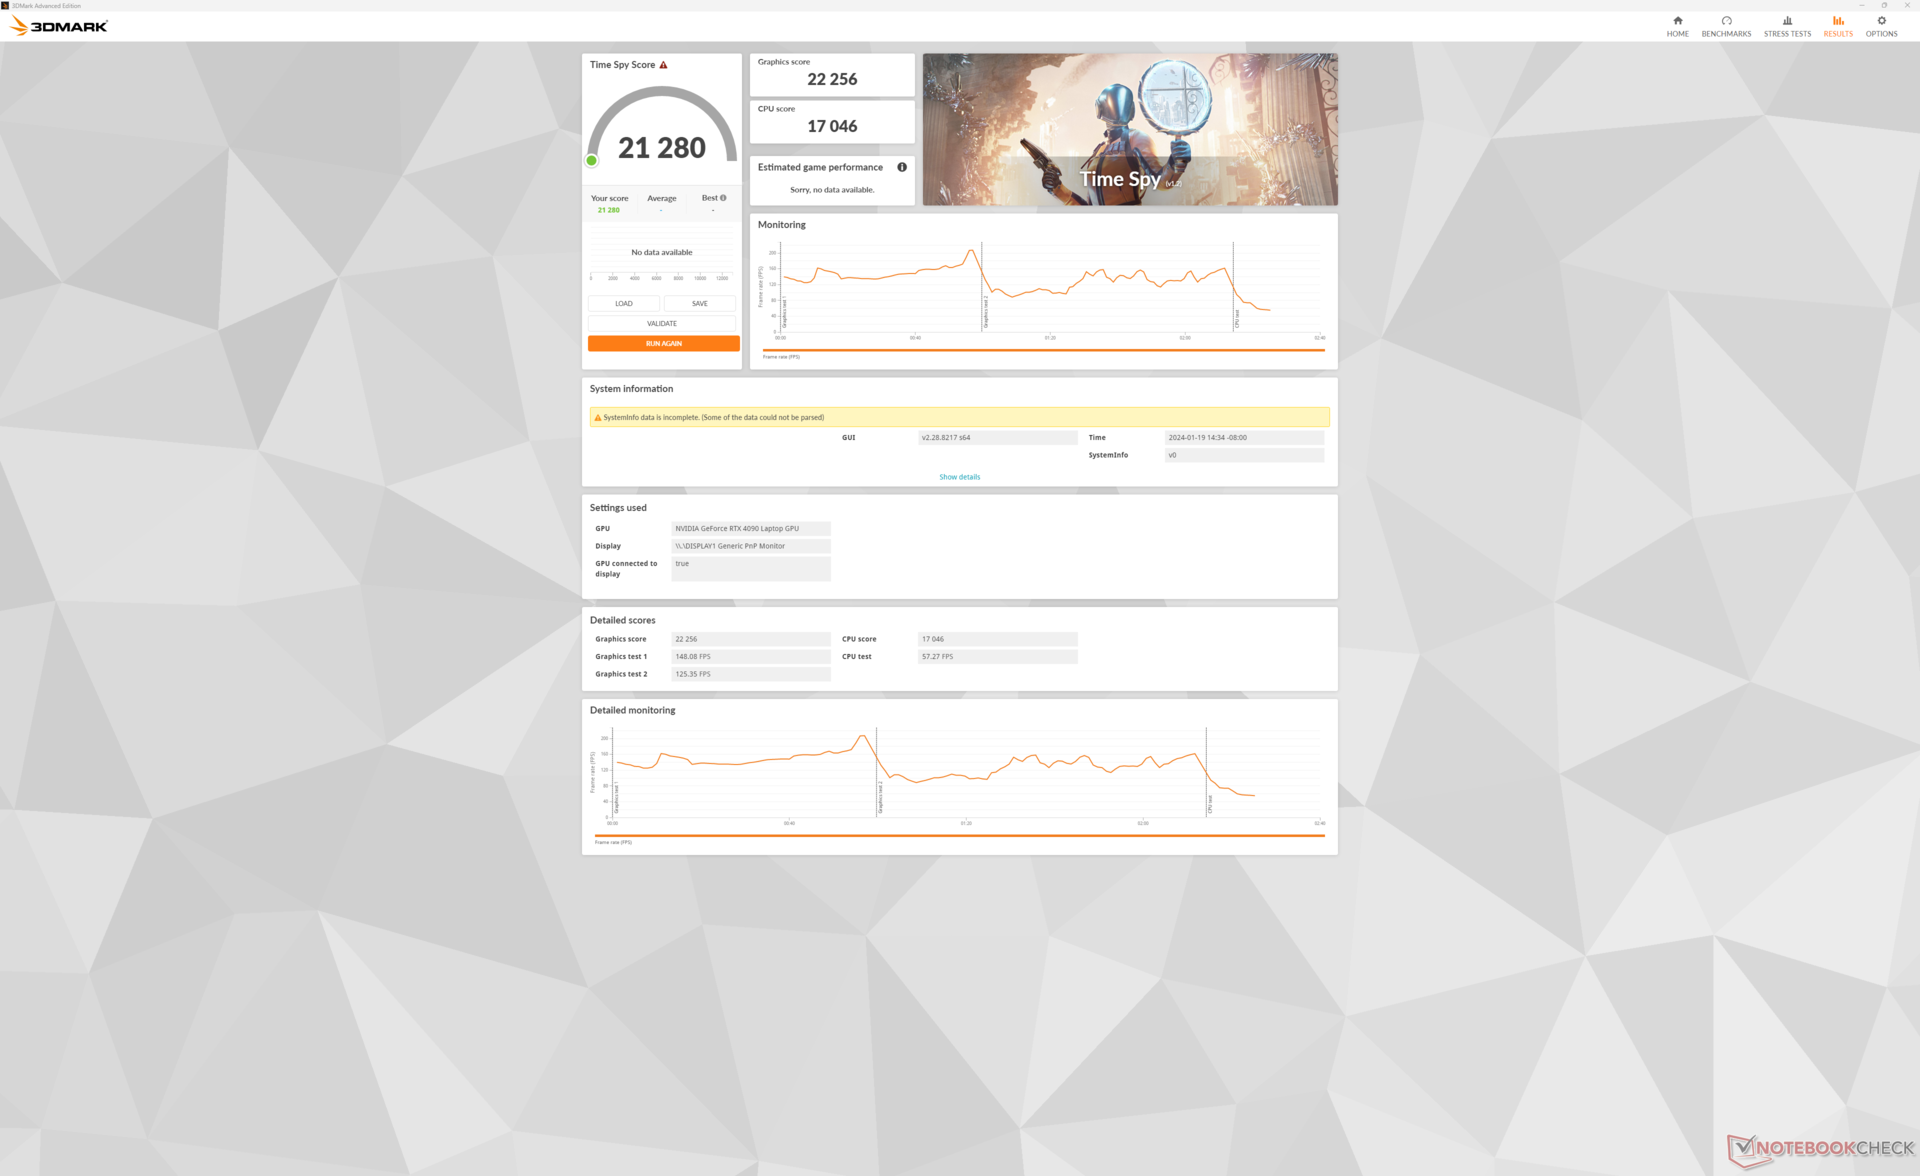
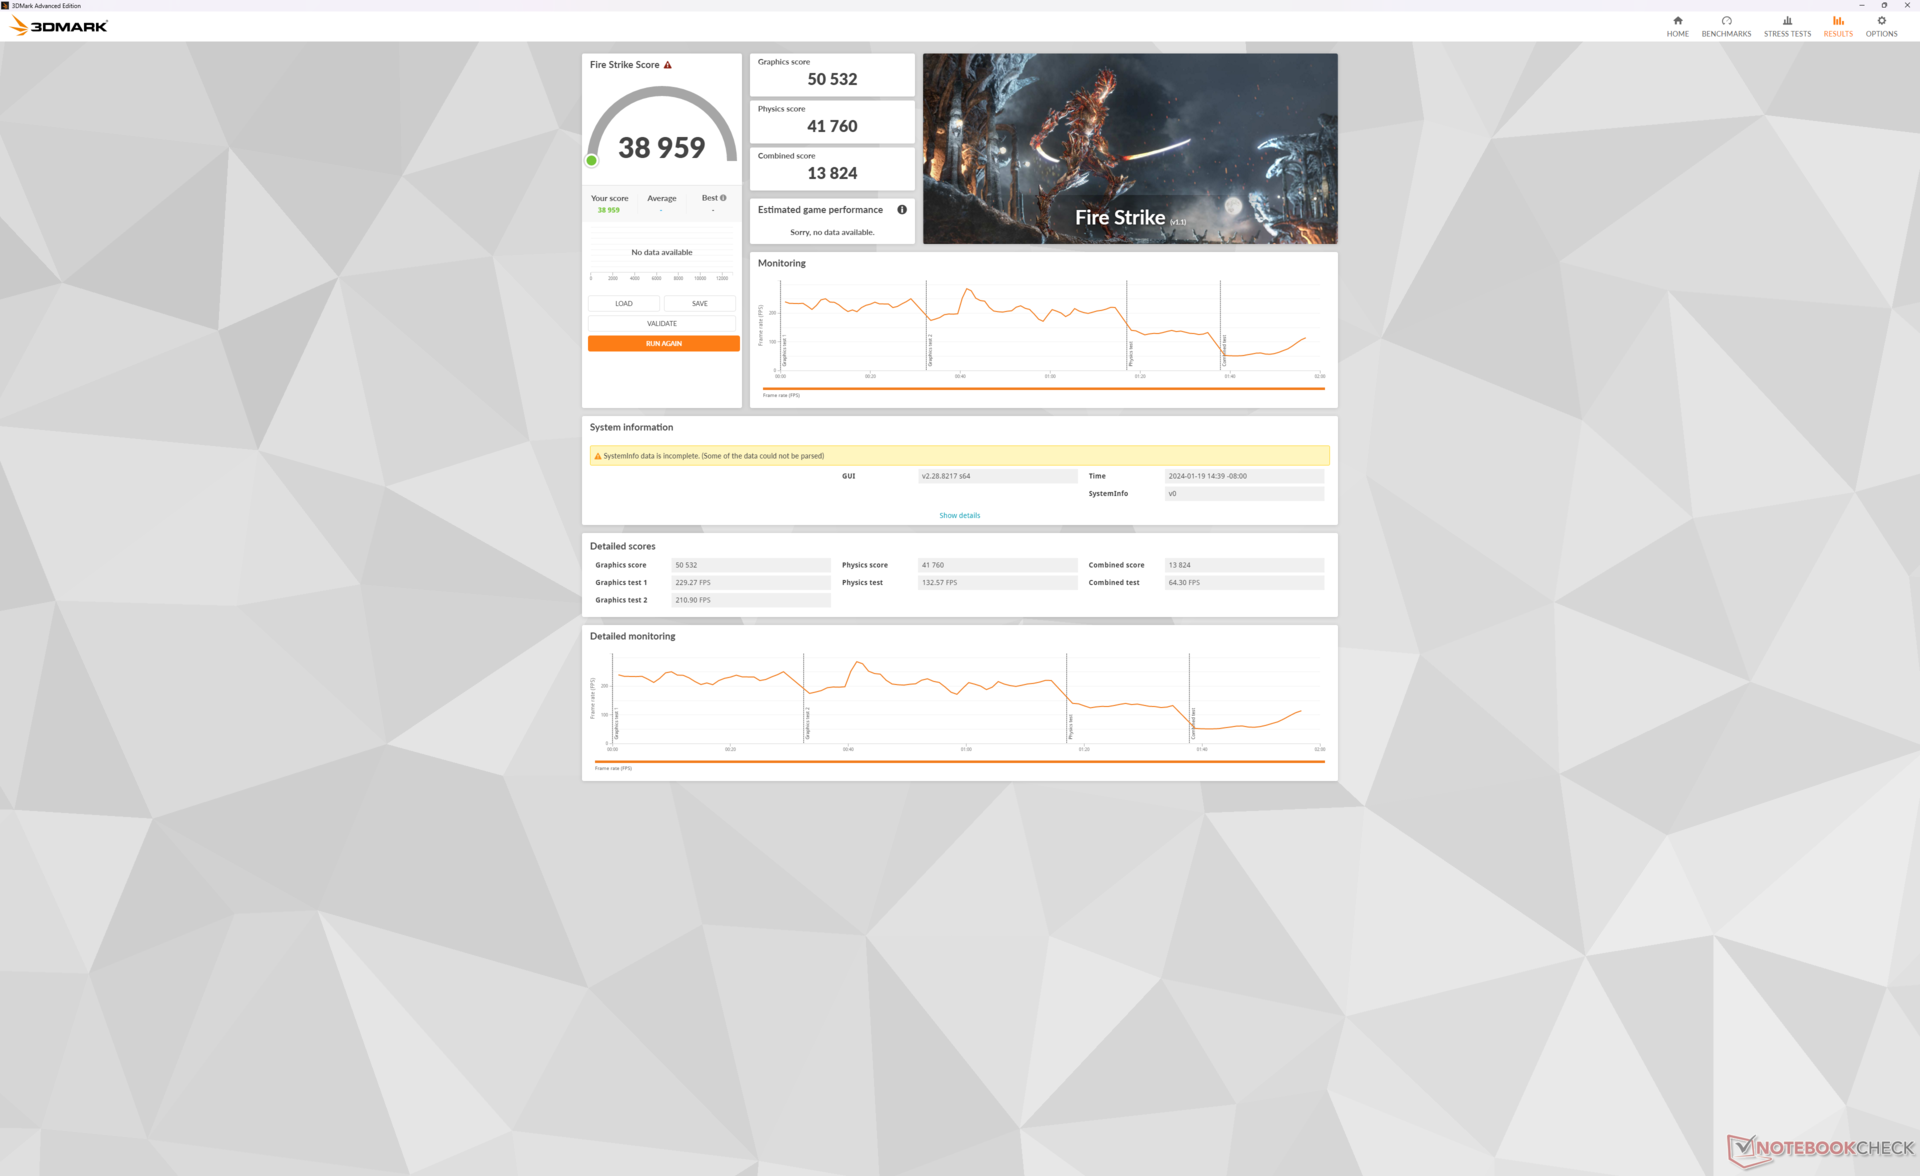
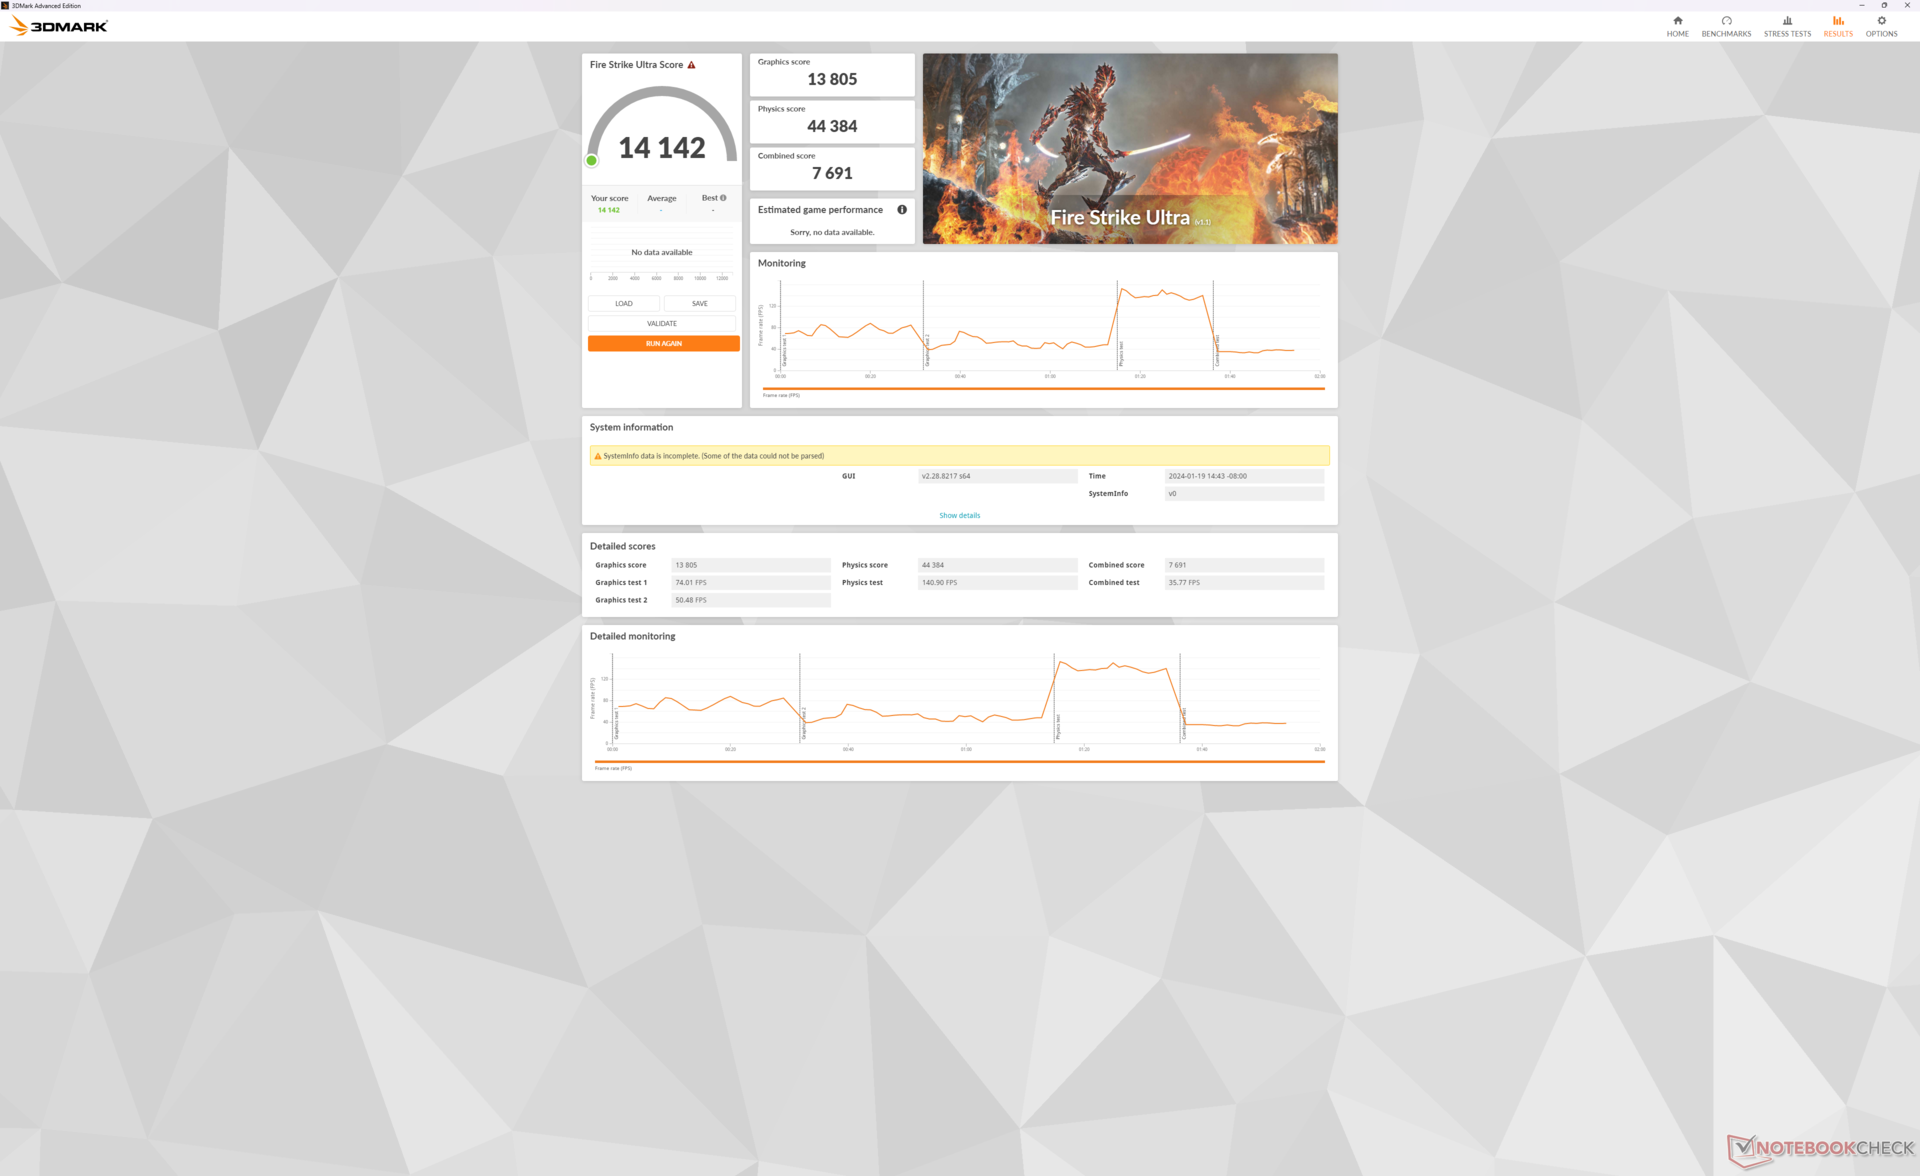
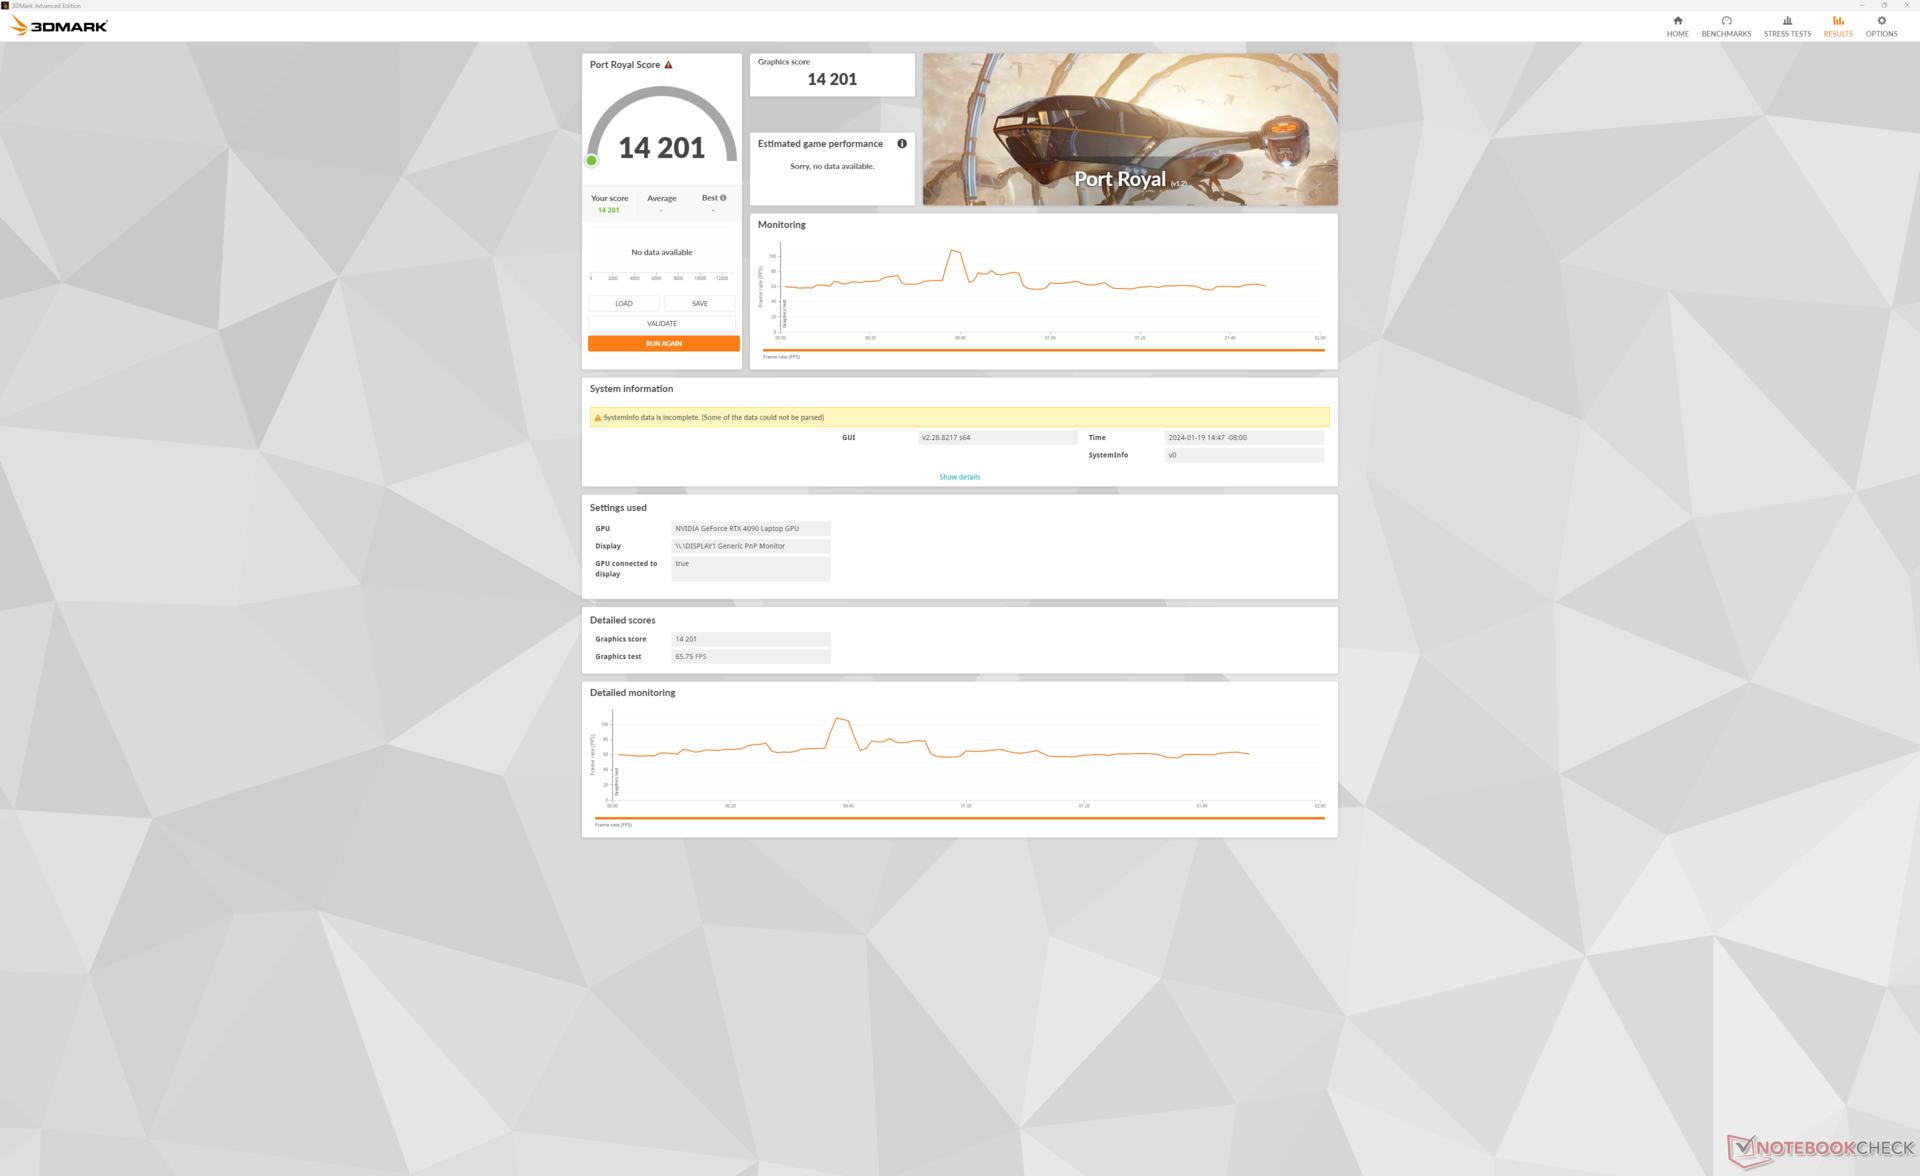
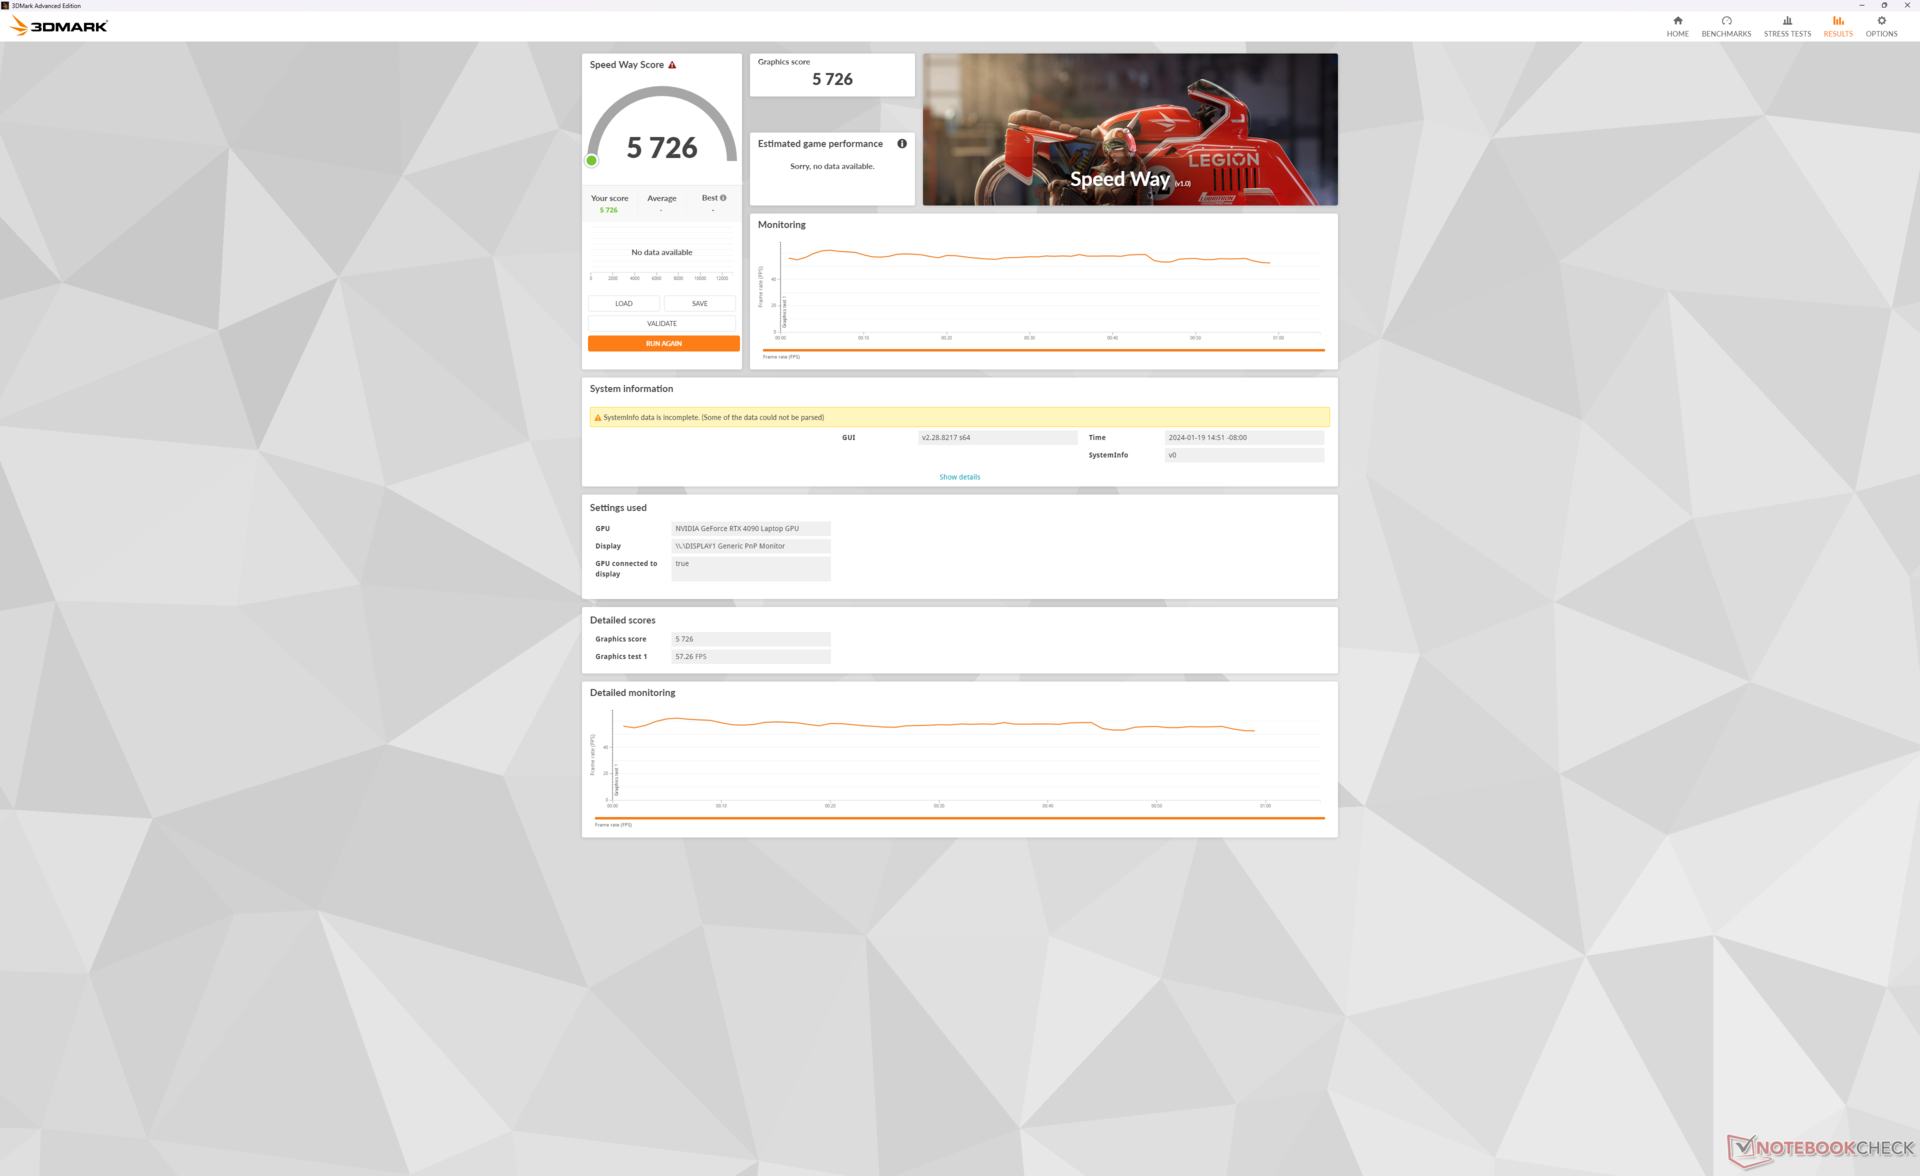
O dispositivo móvel de 175 W GeForce RTX 4090 Em nossa Titan 18 HX retornaria pontuações no 3DMark quase idênticas às da GT77 do ano passado equipada com a mesma GPU. Em outras palavras, não espere que o novo sistema MSI tenha um desempenho mais rápido do que antes, apesar do novo design externo sofisticado. No entanto, é um dos laptops para jogos mais rápidos do mercado, com níveis de desempenho mais semelhantes aos do desktop GeForce RTX 4070 Super.
Ativar ou desativar o Cooler Boost não parece afetar significativamente o desempenho, como mostra a tabela de resultados do site Time Spy abaixo, embora haja diferenças significativas no ruído da ventoinha entre os dois modos. Portanto, o Cooler Boost só é recomendado se as temperaturas do núcleo forem uma preocupação ou durante o overclocking. No entanto, a execução no modo Balanced em vez do modo Extreme Performance reduziria o desempenho gráfico em cerca de 10%.
| Perfil de energia | Pontuação de gráficos | Pontuação da CPU | Pontuação total |
| Desempenho extremo (Cooler Boost ativado) | 22256 | 17046 | 21280 |
| Desempenho extremo (Cooler Boost desligado) | 22097 (-1%) | 16608 (-3%) | 21053 (-1%) |
| Modo equilibrado | 20121 (-10%) | 16532 (-3%) | 19486 (-8%) |
| Energia da bateria | 6480 (-71%) | 6999 (-59%) | 6552 (-69%) |
| 3DMark Performance rating - Percent | |
| AMD Ryzen 9 7900 -2! | |
| MSI Titan GT77 HX 13VI | |
| MSI Titan 18 HX A14VIG | |
| NVIDIA GeForce RTX 4070 Super Founders Edition | |
| Média NVIDIA GeForce RTX 4090 Laptop GPU | |
| Alienware m18 R1 AMD -1! | |
| Acer Predator Helios 18 N23Q2 -1! | |
| Asus ROG Strix Scar 17 SE G733CX-LL014W | |
| Alienware m17 R5 (R9 6900HX, RX 6850M XT) -1! | |
| Razer Blade 18 RTX 4070 | |
| MSI Raider GE68 HX 13VG, i7-13700HX -1! | |
| Asus ROG Strix G18 G814JI -1! | |
| Asus ROG Zephyrus M16 GU603Z -1! | |
| Dell G16 7620 -1! | |
| Lenovo ThinkPad Z16 Gen 2 -1! | |
| 3DMark 11 Performance | 46238 pontos | |
| 3DMark Fire Strike Score | 38959 pontos | |
| 3DMark Time Spy Score | 21280 pontos | |
Ajuda | ||
* ... menor é melhor
Desempenho em jogos
Todos os títulos atuais são executados sem problemas na RTX 4090 móvel, mesmo com a maioria das configurações no máximo. No entanto, a GPU começa a ter um pouco de dificuldade em 4K com F1 22 e Cyberpunk 2077 com média de apenas 44 FPS cada. Nesses cenários, é recomendável ativar o DLSS, especialmente porque a tela não é compatível com o G-Sync. Por exemplo, a execução do Cyberpunk 2077 em configurações nativas de 4K e Ultra RT teria uma média de apenas 21,6 FPS, enquanto a ativação do DLSS Auto e da geração de quadros aumentaria a média para 89 FPS.
| Performance rating - Percent | |
| Alienware m18 R1 | |
| MSI Titan GT77 HX 13VI | |
| MSI Titan 18 HX A14VIG | |
| Acer Predator Helios 18 N23Q2 | |
| Razer Blade 18 RTX 4070 | |
| Asus ROG Strix G18 G814JI | |
| The Witcher 3 - 1920x1080 Ultra Graphics & Postprocessing (HBAO+) | |
| Alienware m18 R1 | |
| MSI Titan 18 HX A14VIG | |
| MSI Titan GT77 HX 13VI | |
| Acer Predator Helios 18 N23Q2 | |
| Asus ROG Strix G18 G814JI | |
| Razer Blade 18 RTX 4070 | |
| GTA V - 1920x1080 Highest AA:4xMSAA + FX AF:16x | |
| Acer Predator Helios 18 N23Q2 | |
| Alienware m18 R1 | |
| MSI Titan GT77 HX 13VI | |
| MSI Titan 18 HX A14VIG | |
| Razer Blade 18 RTX 4070 | |
| Asus ROG Strix G18 G814JI | |
| Final Fantasy XV Benchmark - 1920x1080 High Quality | |
| Alienware m18 R1 | |
| MSI Titan GT77 HX 13VI | |
| MSI Titan 18 HX A14VIG | |
| Acer Predator Helios 18 N23Q2 | |
| Asus ROG Strix G18 G814JI | |
| Razer Blade 18 RTX 4070 | |
| Strange Brigade - 1920x1080 ultra AA:ultra AF:16 | |
| MSI Titan 18 HX A14VIG | |
| MSI Titan GT77 HX 13VI | |
| Alienware m18 R1 | |
| Acer Predator Helios 18 N23Q2 | |
| Asus ROG Strix G18 G814JI | |
| Razer Blade 18 RTX 4070 | |
| Dota 2 Reborn - 1920x1080 ultra (3/3) best looking | |
| Alienware m18 R1 | |
| Acer Predator Helios 18 N23Q2 | |
| MSI Titan GT77 HX 13VI | |
| Razer Blade 18 RTX 4070 | |
| MSI Titan 18 HX A14VIG | |
| Asus ROG Strix G18 G814JI | |
| X-Plane 11.11 - 1920x1080 high (fps_test=3) | |
| Alienware m18 R1 | |
| Acer Predator Helios 18 N23Q2 | |
| Razer Blade 18 RTX 4070 | |
| MSI Titan GT77 HX 13VI | |
| MSI Titan GT77 HX 13VI | |
| MSI Titan 18 HX A14VIG | |
| Asus ROG Strix G18 G814JI | |
| The Witcher 3 | |
| 1920x1080 Ultra Graphics & Postprocessing (HBAO+) | |
| AMD Ryzen 9 7900 | |
| MSI Titan 18 HX A14VIG | |
| MSI Titan GT77 HX 13VI | |
| Média NVIDIA GeForce RTX 4090 Laptop GPU (139.2 - 216, n=35) | |
| NVIDIA GeForce RTX 4070 Super Founders Edition | |
| Acer Predator Helios 18 N23Q2 | |
| Alienware m18 R1 AMD | |
| Alienware m17 R5 (R9 6900HX, RX 6850M XT) | |
| MSI Raider GE68 HX 13VG, i7-13700HX | |
| Asus ROG Strix G18 G814JI | |
| Asus ROG Strix Scar 17 SE G733CX-LL014W | |
| Razer Blade 18 RTX 4070 | |
| Asus ROG Zephyrus M16 GU603Z | |
| Dell G16 7620 | |
| Lenovo ThinkPad Z16 Gen 2 | |
| 3840x2160 High Graphics & Postprocessing (Nvidia HairWorks Off) | |
| AMD Ryzen 9 7900 | |
| MSI Titan 18 HX A14VIG | |
| MSI Titan GT77 HX 13VI | |
| Média NVIDIA GeForce RTX 4090 Laptop GPU (96.3 - 167.6, n=19) | |
| NVIDIA GeForce RTX 4070 Super Founders Edition | |
| Alienware m18 R1 AMD | |
| Razer Blade 18 RTX 4070 | |
| Alienware m17 R5 (R9 6900HX, RX 6850M XT) | |
| Tiny Tina's Wonderlands | |
| 1920x1080 Badass Preset (DX12) | |
| MSI Titan GT77 HX 13VI | |
| MSI Titan 18 HX A14VIG | |
| Média NVIDIA GeForce RTX 4090 Laptop GPU (141.1 - 189.4, n=14) | |
| Alienware m18 R1 AMD | |
| Lenovo ThinkPad Z16 Gen 2 | |
| 2560x1440 Badass Preset (DX12) | |
| MSI Titan GT77 HX 13VI | |
| MSI Titan 18 HX A14VIG | |
| Média NVIDIA GeForce RTX 4090 Laptop GPU (103.4 - 137.8, n=14) | |
| Alienware m18 R1 AMD | |
| Lenovo ThinkPad Z16 Gen 2 | |
| 3840x2160 Badass Preset (DX12) | |
| MSI Titan 18 HX A14VIG | |
| MSI Titan GT77 HX 13VI | |
| Média NVIDIA GeForce RTX 4090 Laptop GPU (53.3 - 73.7, n=12) | |
| Alienware m18 R1 AMD | |
| Cyberpunk 2077 | |
| 1920x1080 Ultra Preset (FSR off) | |
| NVIDIA GeForce RTX 4070 Super Founders Edition | |
| MSI Titan 18 HX A14VIG | |
| Alienware m18 R1 AMD | |
| Acer Predator Helios 18 N23Q2 | |
| Média NVIDIA GeForce RTX 4090 Laptop GPU (93.1 - 158, n=21) | |
| Lenovo ThinkPad Z16 Gen 2 | |
| 2560x1440 Ultra Preset (FSR off) | |
| MSI Titan 18 HX A14VIG | |
| Média NVIDIA GeForce RTX 4090 Laptop GPU (68.1 - 103.9, n=21) | |
| Alienware m18 R1 AMD | |
| NVIDIA GeForce RTX 4070 Super Founders Edition | |
| Acer Predator Helios 18 N23Q2 | |
| Lenovo ThinkPad Z16 Gen 2 | |
| 3840x2160 Ultra Preset (FSR off) | |
| MSI Titan 18 HX A14VIG | |
| Média NVIDIA GeForce RTX 4090 Laptop GPU (31.6 - 50.6, n=11) | |
| NVIDIA GeForce RTX 4070 Super Founders Edition | |
| Alienware m18 R1 AMD | |
| 3840x2160 Ray Tracing Ultra Preset (DLSS off, no Path Tracing) | |
| Média NVIDIA GeForce RTX 4090 Laptop GPU (20.2 - 22.3, n=4) | |
| NVIDIA GeForce RTX 4070 Super Founders Edition | |
| F1 22 | |
| 1920x1080 Ultra High Preset AA:T AF:16x | |
| AMD Ryzen 9 7900 | |
| MSI Titan GT77 HX 13VI | |
| MSI Titan 18 HX A14VIG | |
| NVIDIA GeForce RTX 4070 Super Founders Edition | |
| Média NVIDIA GeForce RTX 4090 Laptop GPU (70.3 - 144.7, n=25) | |
| Alienware m18 R1 AMD | |
| MSI Raider GE68 HX 13VG, i7-13700HX | |
| Asus ROG Strix Scar 17 SE G733CX-LL014W | |
| Lenovo ThinkPad Z16 Gen 2 | |
| 2560x1440 Ultra High Preset AA:T AF:16x | |
| AMD Ryzen 9 7900 | |
| MSI Titan 18 HX A14VIG | |
| MSI Titan GT77 HX 13VI | |
| Média NVIDIA GeForce RTX 4090 Laptop GPU (65.9 - 92.2, n=25) | |
| NVIDIA GeForce RTX 4070 Super Founders Edition | |
| Alienware m18 R1 AMD | |
| Asus ROG Strix Scar 17 SE G733CX-LL014W | |
| MSI Raider GE68 HX 13VG, i7-13700HX | |
| Lenovo ThinkPad Z16 Gen 2 | |
| 3840x2160 Ultra High Preset AA:T AF:16x | |
| AMD Ryzen 9 7900 | |
| MSI Titan GT77 HX 13VI | |
| MSI Titan 18 HX A14VIG | |
| Média NVIDIA GeForce RTX 4090 Laptop GPU (36.8 - 46.1, n=18) | |
| NVIDIA GeForce RTX 4070 Super Founders Edition | |
| Alienware m18 R1 AMD | |
| MSI Raider GE68 HX 13VG, i7-13700HX | |
Witcher 3 FPS Chart
| baixo | média | alto | ultra | QHD | 4K | |
|---|---|---|---|---|---|---|
| GTA V (2015) | 139.2 | |||||
| The Witcher 3 (2015) | 595.3 | 506.6 | 412.2 | 211.2 | 160.7 | |
| Dota 2 Reborn (2015) | 218 | 196.3 | 186.5 | 174.5 | 168.3 | |
| Final Fantasy XV Benchmark (2018) | 229 | 216 | 184 | 158 | 93.6 | |
| X-Plane 11.11 (2018) | 184.9 | 161.8 | 126.1 | 106.5 | ||
| Far Cry 5 (2018) | 191 | 164 | 158 | 155 | 152 | 112 |
| Strange Brigade (2018) | 511 | 423 | 406 | 385 | 307 | 156.1 |
| Tiny Tina's Wonderlands (2022) | 324.7 | 279.8 | 223.7 | 182 | 130.8 | 71 |
| F1 22 (2022) | 307 | 297 | 280 | 132.7 | 90.5 | 44.6 |
| Baldur's Gate 3 (2023) | 246.7 | 226.9 | 208.6 | 207.7 | 155.2 | 80.8 |
| Cyberpunk 2077 (2023) | 155.7 | 145.4 | 135.9 | 129.8 | 94.5 | 43.9 |
| Avatar Frontiers of Pandora (2023) | 103 | 69 | 35 |
Emissões
Ruído do sistema
O ruído e o comportamento da ventoinha estão diretamente ligados aos perfis de energia do MSI Center: Desempenho extremo com o Cooler Boost ativado, Desempenho extremo com o Cooler Boost desativado, Equilibrado e Silencioso. Os jogos com o Cooler Boost ligado podem chegar a 63 dB(A) contra 57,3 dB(A) se o Cooler Boost estiver desligado. No entanto, como as diferenças de desempenho entre os dois modos são muito pequenas, conforme observado acima, é recomendável jogar com o Cooler Boost desligado para evitar que o laptop soe como um secador de cabelo.
O ruído da ventoinha ao jogar no modo Balanced chega a 53 dB(A), sendo visivelmente mais silencioso do que qualquer um dos dois modos Extreme Performance. No entanto, esteja ciente de que o déficit de desempenho é maior se for executado no modo Balanced, conforme mencionado acima. Esteja preparado para um sistema muito barulhento, mesmo quando estiver jogando.
Barulho
| Ocioso |
| 23.8 / 23.8 / 28 dB |
| Carga |
| 38 / 62.8 dB |
 | ||
30 dB silencioso 40 dB(A) audível 50 dB(A) ruidosamente alto |
||
min: | ||
| MSI Titan 18 HX A14VIG GeForce RTX 4090 Laptop GPU, i9-14900HX, 2x Samsung PM9A1a MZVL22T0HDLB (RAID 0) | MSI Titan GT77 HX 13VI GeForce RTX 4090 Laptop GPU, i9-13950HX, Samsung PM9A1 MZVL22T0HBLB | Alienware m18 R1 GeForce RTX 4090 Laptop GPU, i9-13980HX, SK hynix PC801 HFS001TEJ9X101N | Asus ROG Strix G18 G814JI GeForce RTX 4070 Laptop GPU, i7-13650HX, Micron 2400 MTFDKBA1T0QFM | Acer Predator Helios 18 N23Q2 GeForce RTX 4080 Laptop GPU, i9-13900HX, Samsung PM9A1 MZVL22T0HBLB | Razer Blade 18 RTX 4070 GeForce RTX 4070 Laptop GPU, i9-13950HX, SSSTC CA6-8D1024 | |
|---|---|---|---|---|---|---|
| Noise | -12% | 7% | 0% | 1% | 5% | |
| desligado / ambiente * (dB) | 22.8 | 24.6 -8% | 22.8 -0% | 25 -10% | 23 -1% | 23.5 -3% |
| Idle Minimum * (dB) | 23.8 | 29.2 -23% | 23 3% | 26 -9% | 23 3% | 23.8 -0% |
| Idle Average * (dB) | 23.8 | 29.2 -23% | 23 3% | 28 -18% | 23 3% | 23.8 -0% |
| Idle Maximum * (dB) | 28 | 29.2 -4% | 23 18% | 29 -4% | 23 18% | 26.8 4% |
| Load Average * (dB) | 38 | 50.7 -33% | 35.6 6% | 41 -8% | 45.26 -19% | 37.3 2% |
| Witcher 3 ultra * (dB) | 57.3 | 53.3 7% | 51.3 10% | 44 23% | 59.82 -4% | 48 16% |
| Load Maximum * (dB) | 62.8 | 61 3% | 56.7 10% | 46 27% | 59.94 5% | 53.5 15% |
* ... menor é melhor
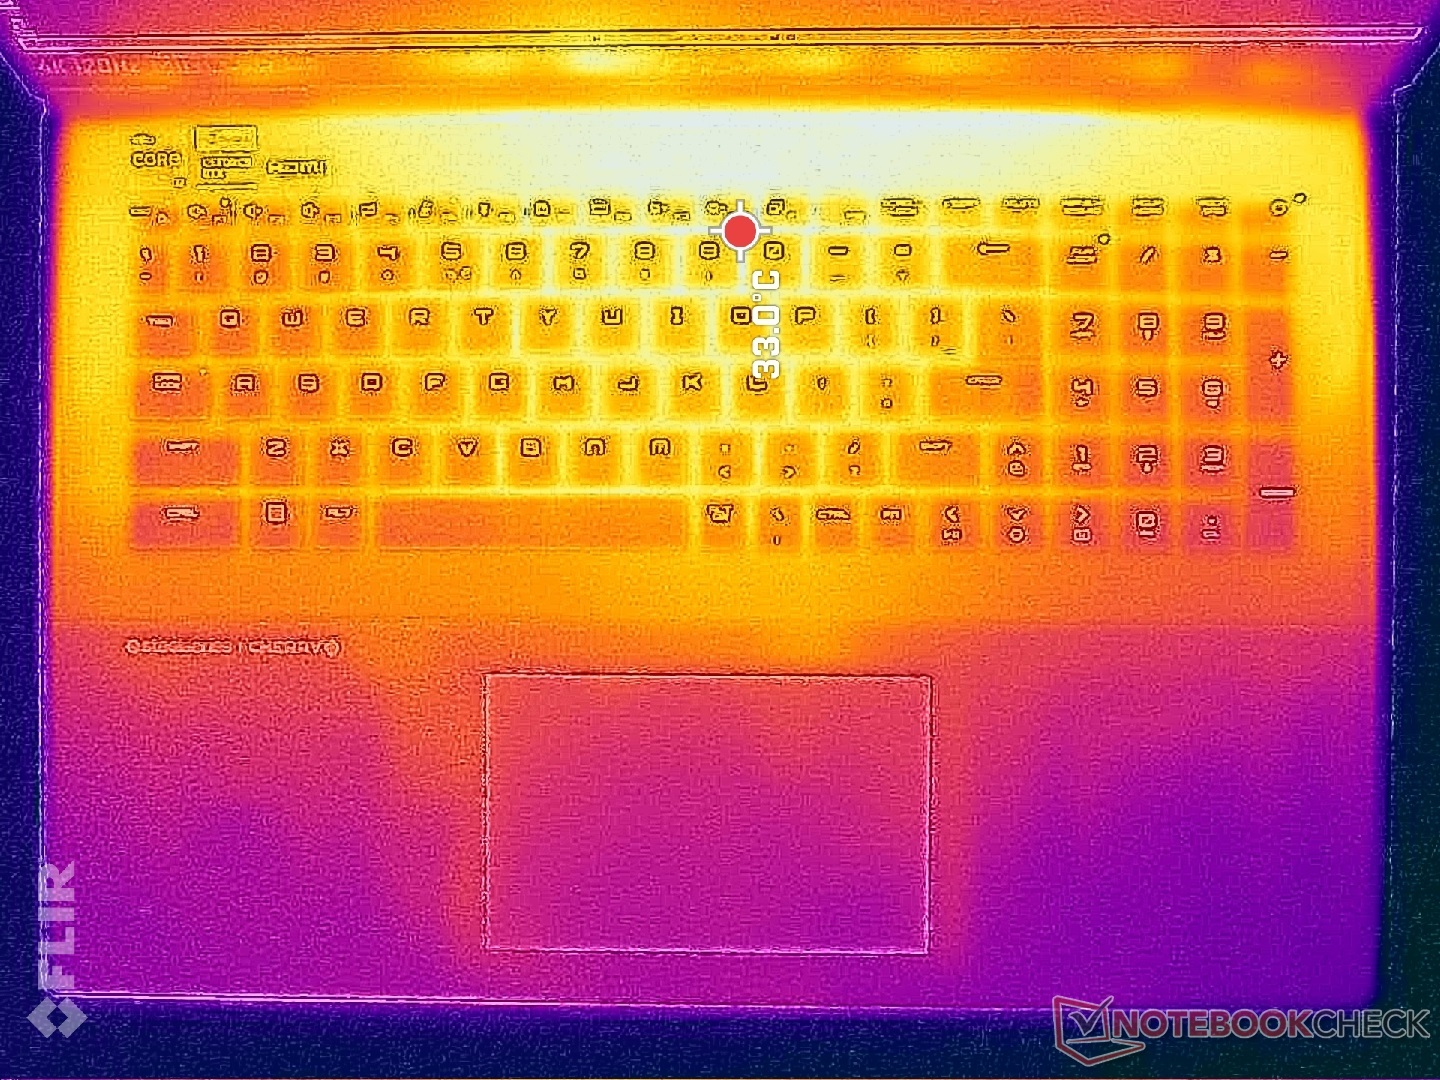
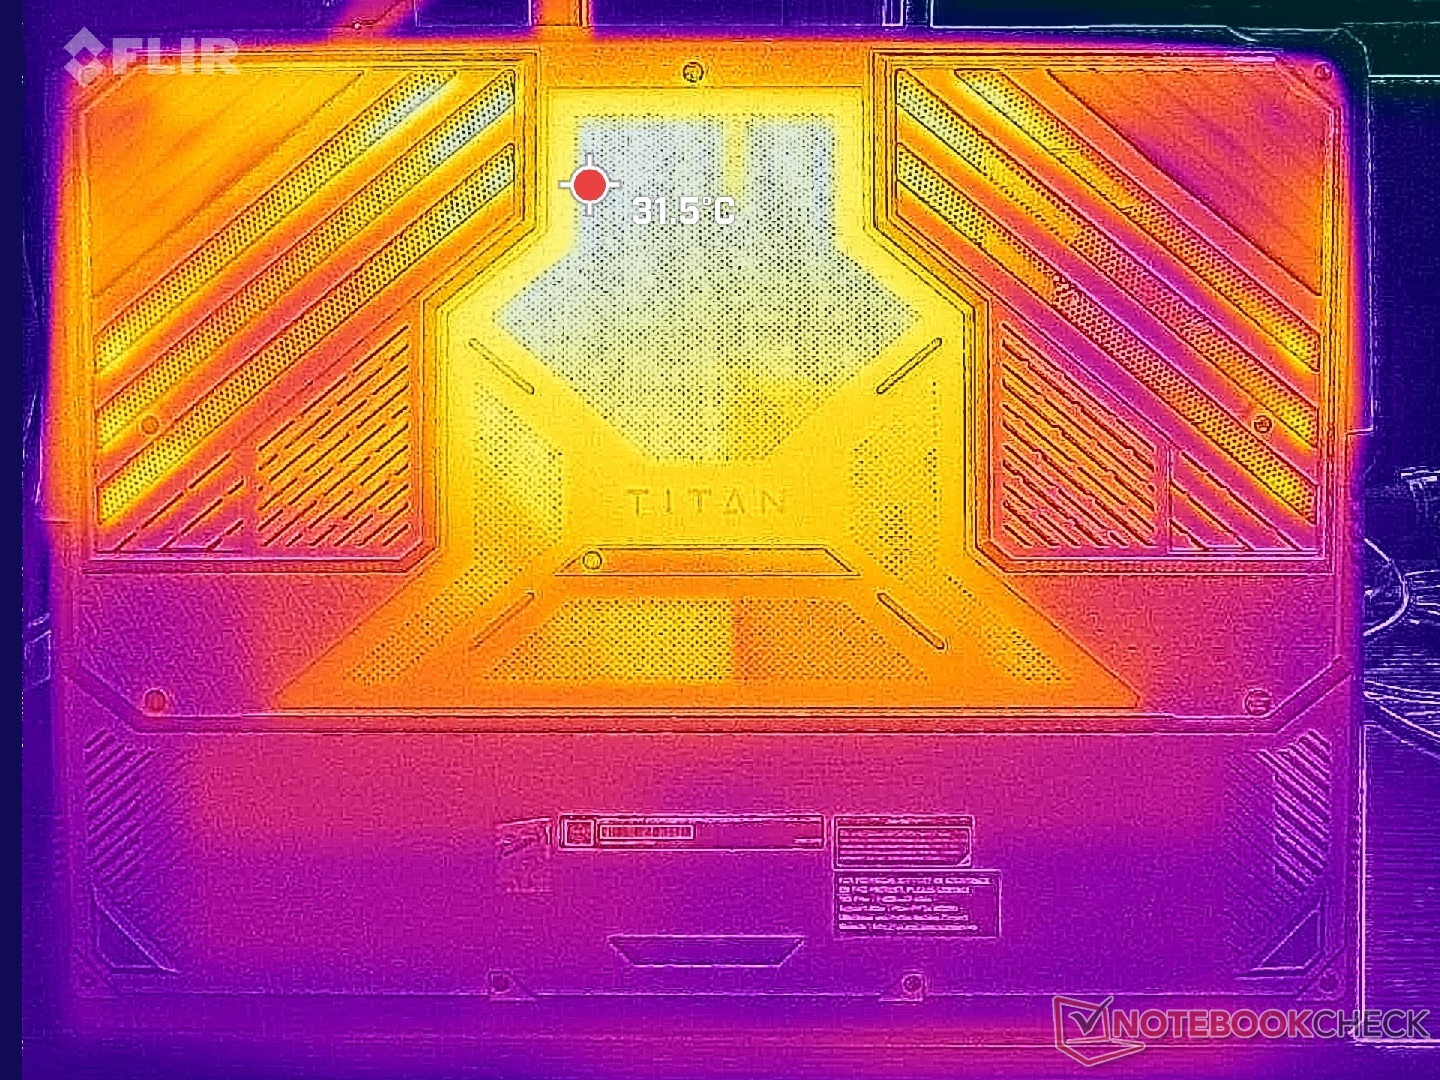
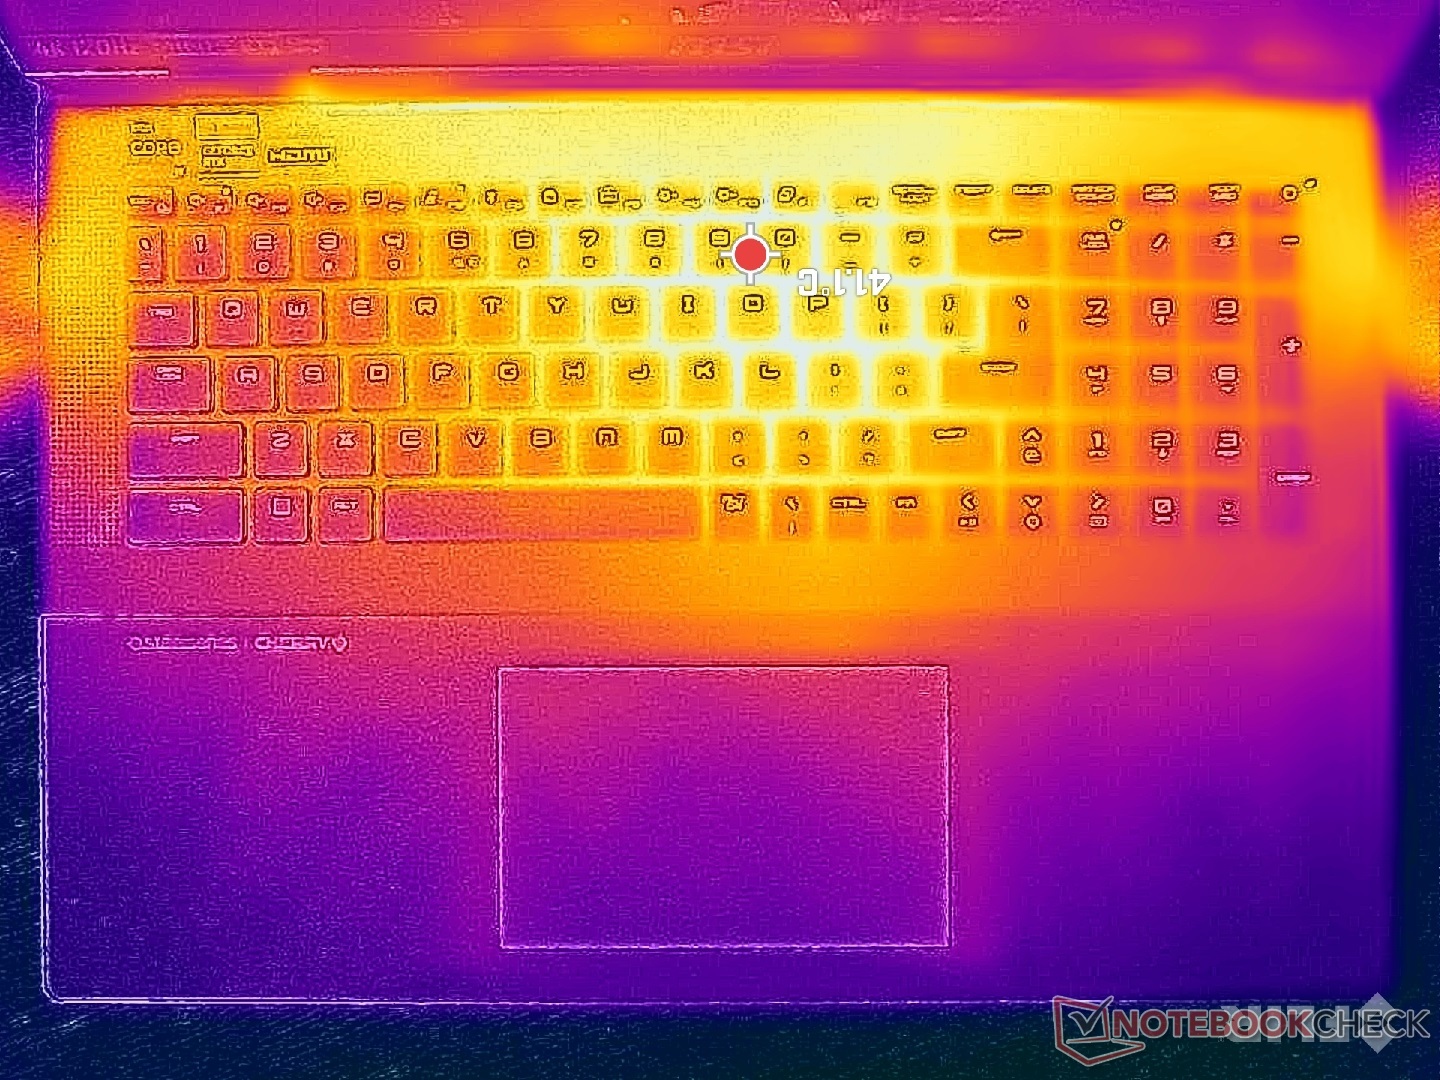
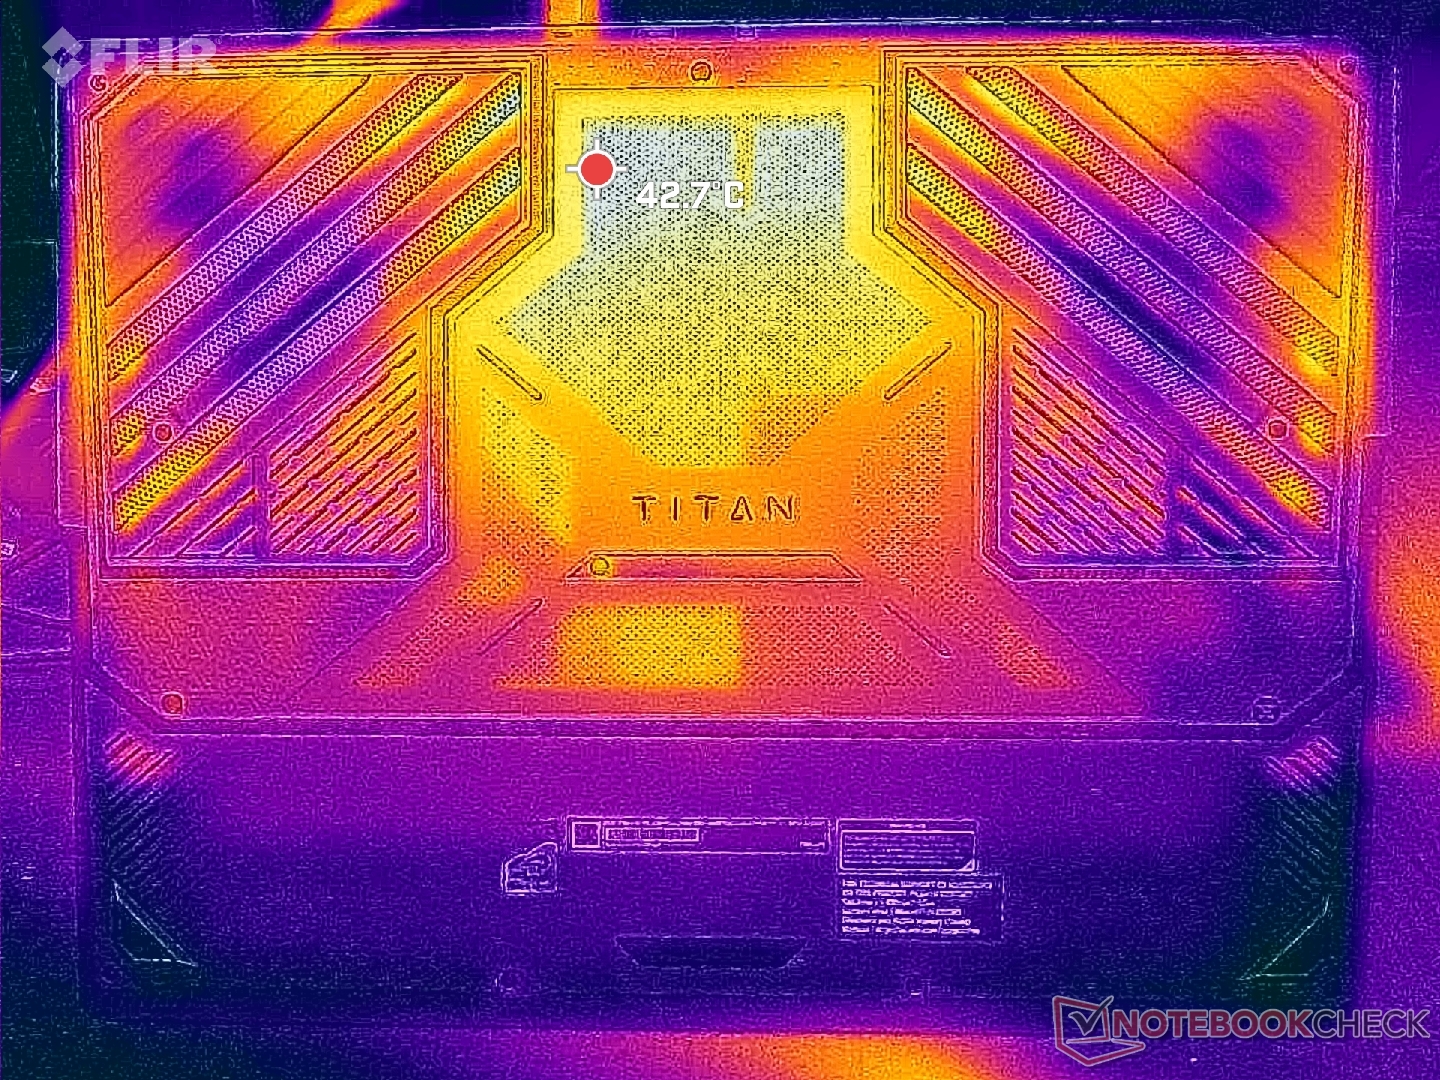
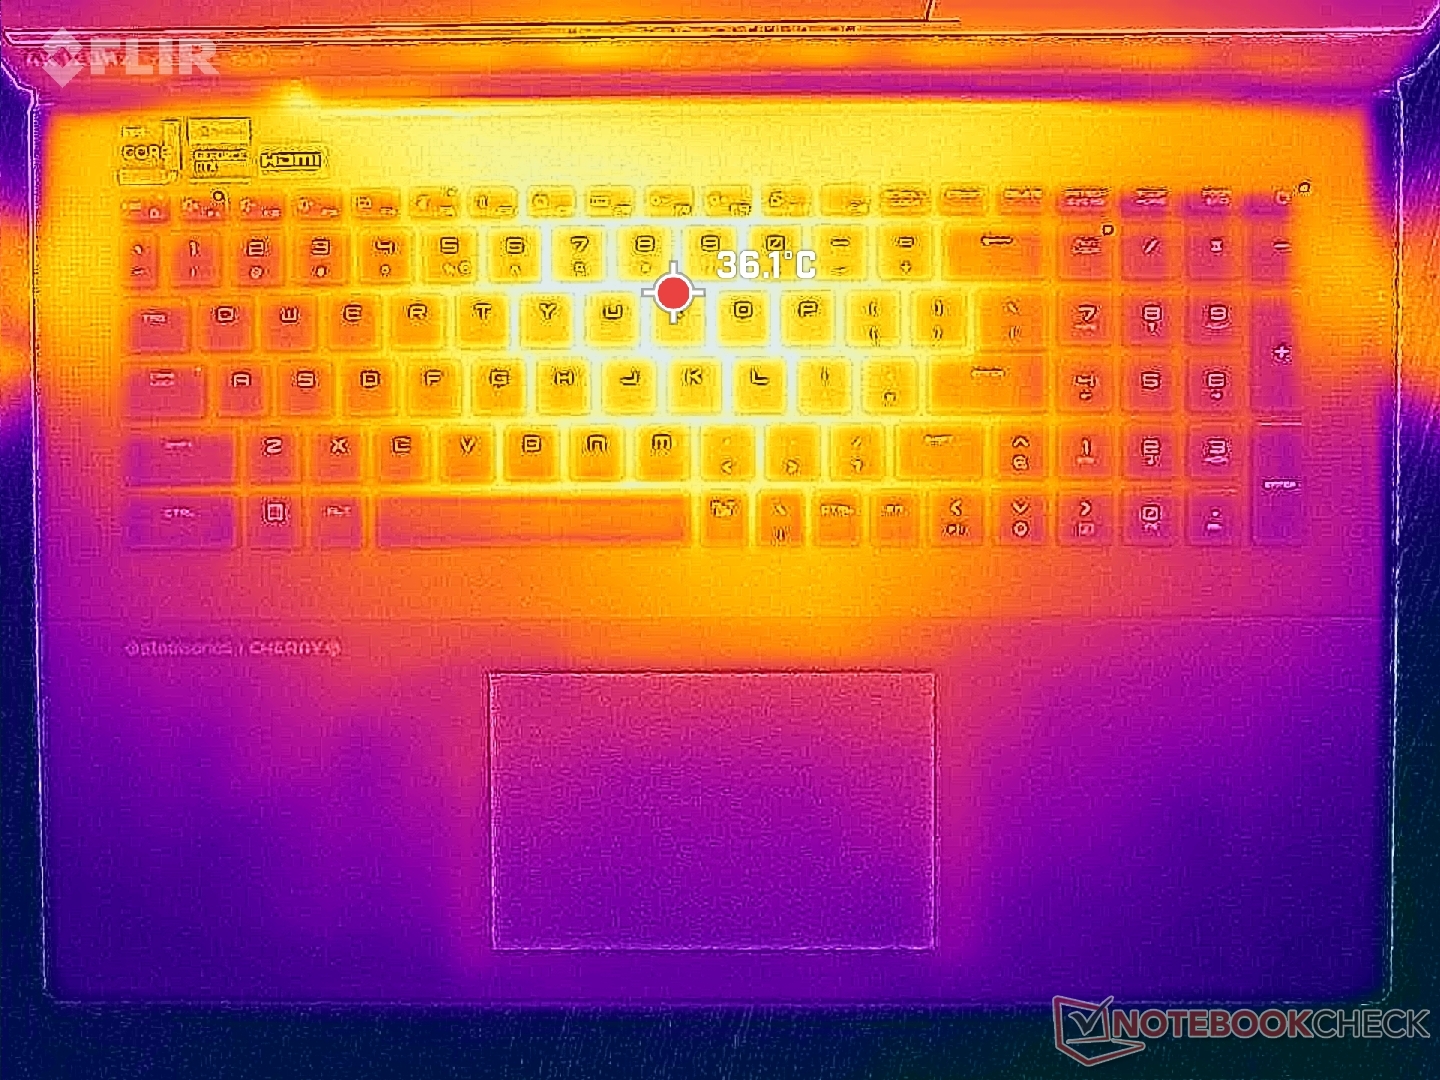
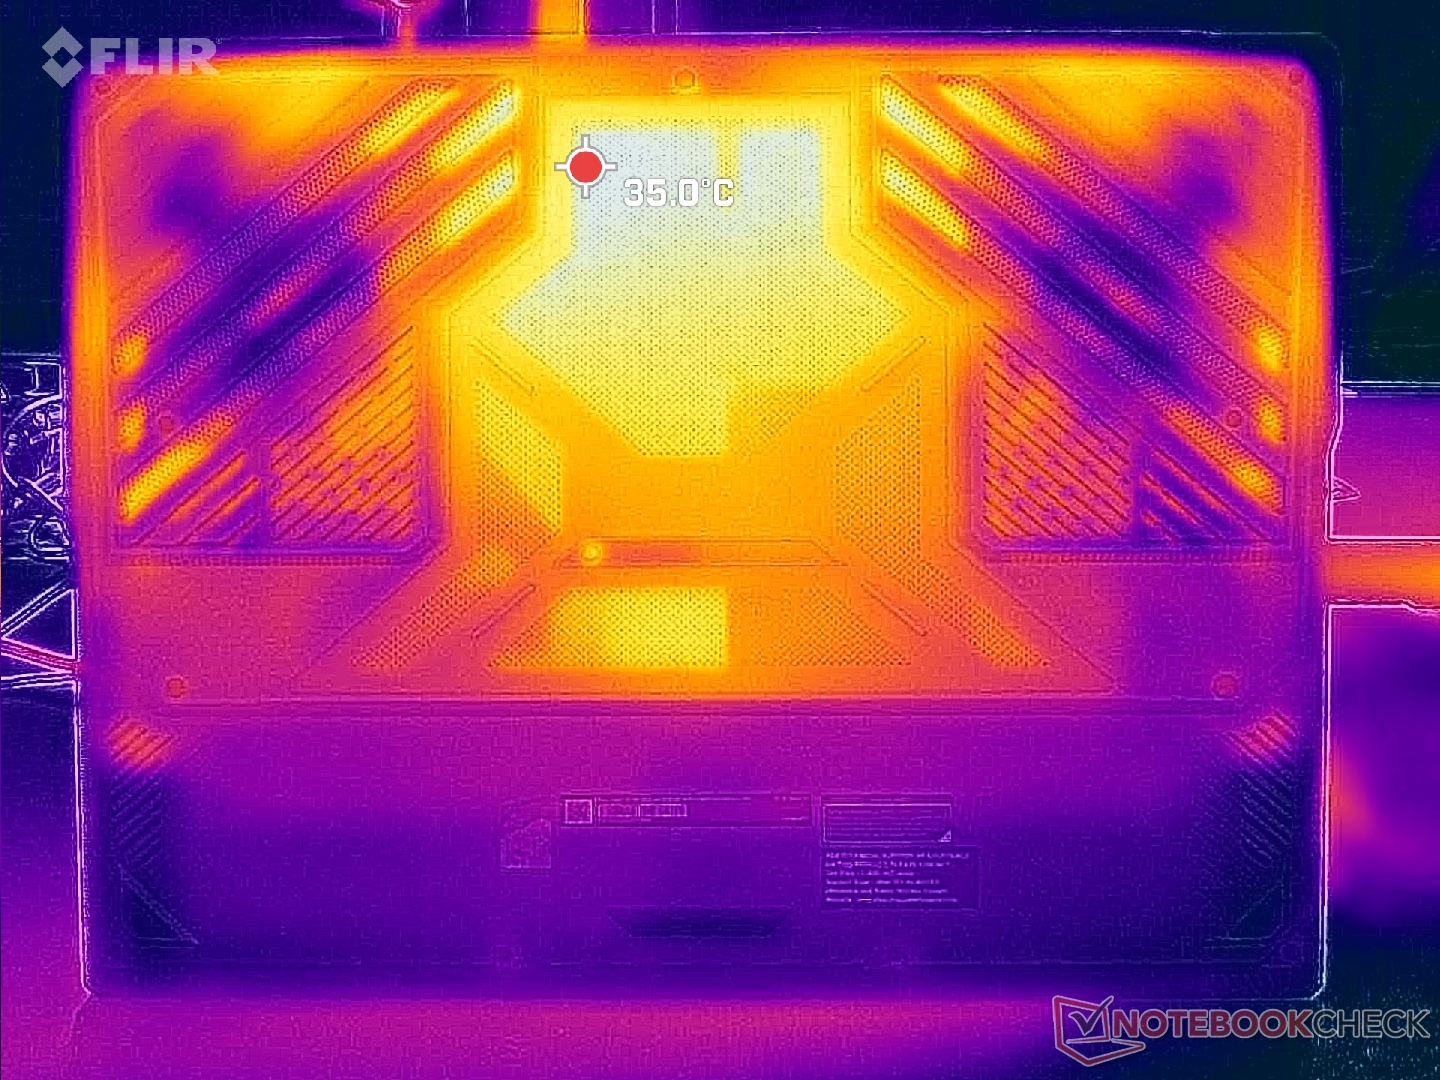
Temperatura
Surpreendentemente, as temperaturas da superfície aqui são ligeiramente mais quentes do que as registradas no monobloco Razer Blade 18 apesar do design mais espesso do MSI. Os pontos quentes atingiriam pouco mais de 41 °C e 37 °C com o Cooler Boost ativo e inativo, respectivamente, em comparação com 35 °C a 40 °C no Razer. Felizmente, os pontos quentes estão na parte traseira do sistema, onde é improvável que as mãos e os dedos toquem. Nunca achamos que os apoios para as mãos ou as teclas estivessem desconfortavelmente quentes durante os jogos.
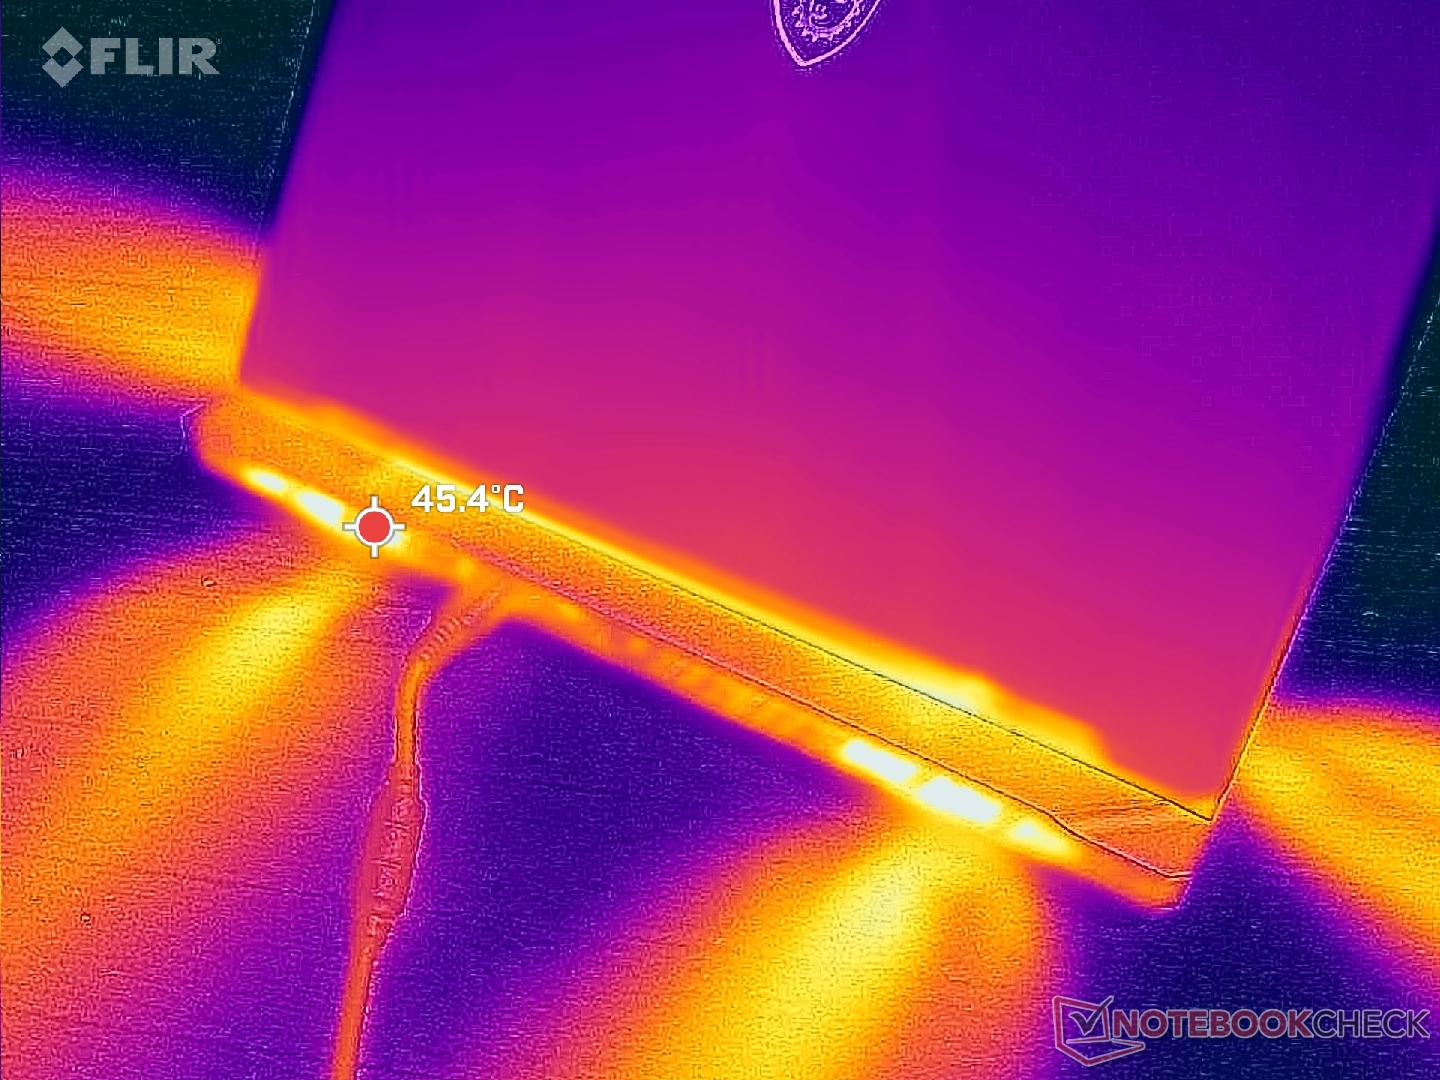

(+) A temperatura máxima no lado superior é 37.8 °C / 100 F, em comparação com a média de 40.4 °C / 105 F , variando de 21.2 a 68.8 °C para a classe Gaming.
(+) A parte inferior aquece até um máximo de 37.6 °C / 100 F, em comparação com a média de 43.2 °C / 110 F
(+) Em uso inativo, a temperatura média para o lado superior é 29.8 °C / 86 F, em comparação com a média do dispositivo de 33.9 °C / ### class_avg_f### F.
(±) Jogando The Witcher 3, a temperatura média para o lado superior é 32.3 °C / 90 F, em comparação com a média do dispositivo de 33.9 °C / ## #class_avg_f### F.
(+) Os apoios para as mãos e o touchpad são mais frios que a temperatura da pele, com um máximo de 25.6 °C / 78.1 F e, portanto, são frios ao toque.
(+) A temperatura média da área do apoio para as mãos de dispositivos semelhantes foi 28.8 °C / 83.8 F (+3.2 °C / 5.7 F).
| MSI Titan 18 HX A14VIG Intel Core i9-14900HX, NVIDIA GeForce RTX 4090 Laptop GPU | MSI Titan GT77 HX 13VI Intel Core i9-13950HX, NVIDIA GeForce RTX 4090 Laptop GPU | Alienware m18 R1 Intel Core i9-13980HX, NVIDIA GeForce RTX 4090 Laptop GPU | Asus ROG Strix G18 G814JI Intel Core i7-13650HX, NVIDIA GeForce RTX 4070 Laptop GPU | Acer Predator Helios 18 N23Q2 Intel Core i9-13900HX, NVIDIA GeForce RTX 4080 Laptop GPU | Razer Blade 18 RTX 4070 Intel Core i9-13950HX, NVIDIA GeForce RTX 4070 Laptop GPU | |
|---|---|---|---|---|---|---|
| Heat | 6% | 10% | -3% | -12% | 5% | |
| Maximum Upper Side * (°C) | 37.8 | 40.6 -7% | 39 -3% | 45 -19% | 35 7% | 39.2 -4% |
| Maximum Bottom * (°C) | 37.6 | 41.1 -9% | 36.4 3% | 47 -25% | 56 -49% | 35.6 5% |
| Idle Upper Side * (°C) | 34.8 | 26.2 25% | 29.2 16% | 28 20% | 34 2% | 31.8 9% |
| Idle Bottom * (°C) | 36 | 30.3 16% | 27.8 23% | 31 14% | 39 -8% | 33.2 8% |
* ... menor é melhor
Teste de estresse
A temperatura da CPU sob carga pode ficar mais quente do que o esperado, mesmo que o Cooler Boost esteja ativado. A execução do site Witcher 3 para representar cargas típicas de jogos, por exemplo, faria com que a CPU se estabilizasse em 97 °C e 90 °C com o Cooler Boost desligado e ligado, respectivamente. Enquanto isso, a GPU se estabilizaria em uma faixa mais razoável de 60 °C. Repetir esse teste no Razer Blade 18 ou no Alienware m18 R1 resultaria em temperaturas de GPU semelhantes, mas temperaturas de CPU mais baixas, na faixa de 80 °C.
Observe que não há grandes diferenças de desempenho entre o Cooler Boost ligado e o Cooler Boost desligado, semelhante ao que observamos na seção Desempenho da GPU acima. As taxas de clock da GPU e o consumo de energia da placa ao executar Witcher 3 permaneceriam relativamente constantes em 2370 MHz e 169 W, respectivamente.
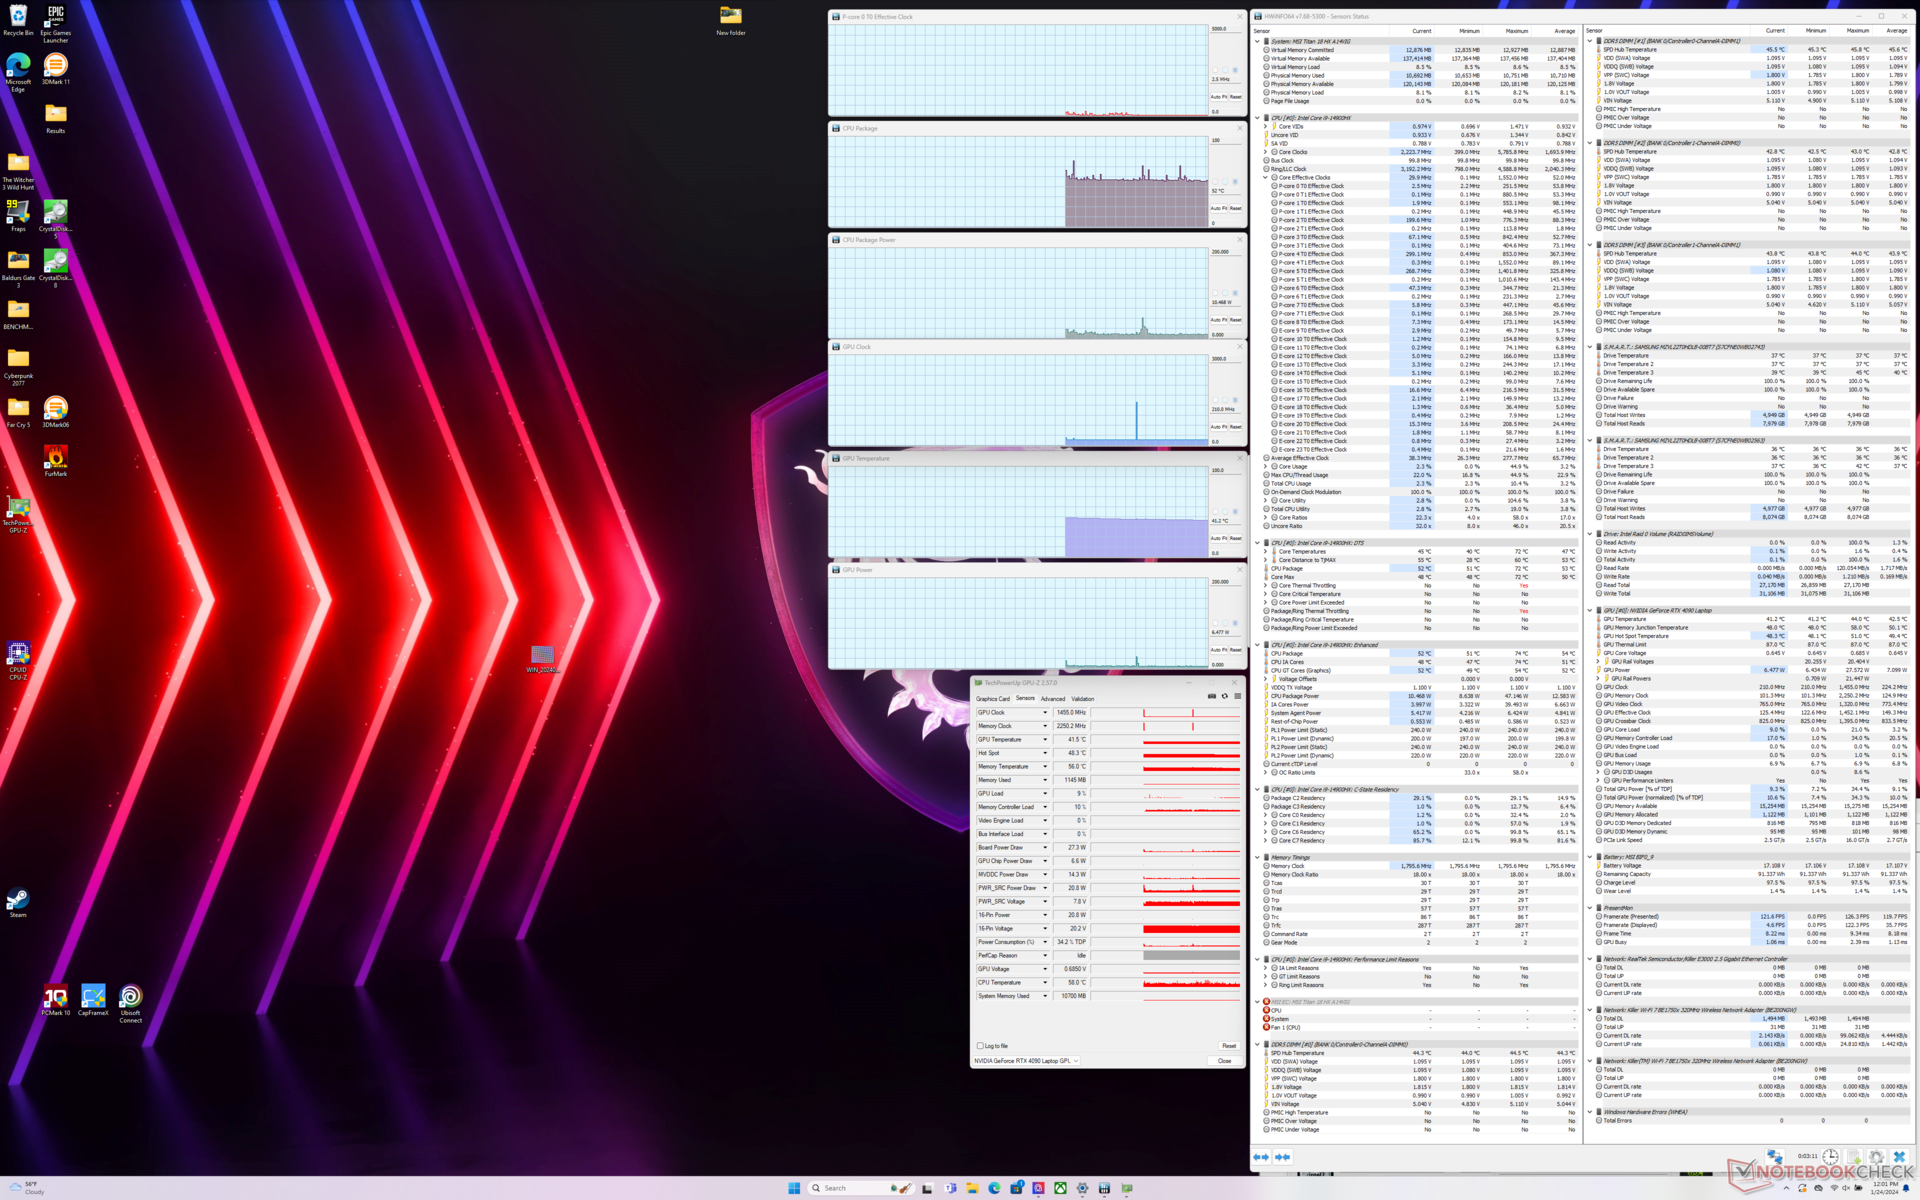
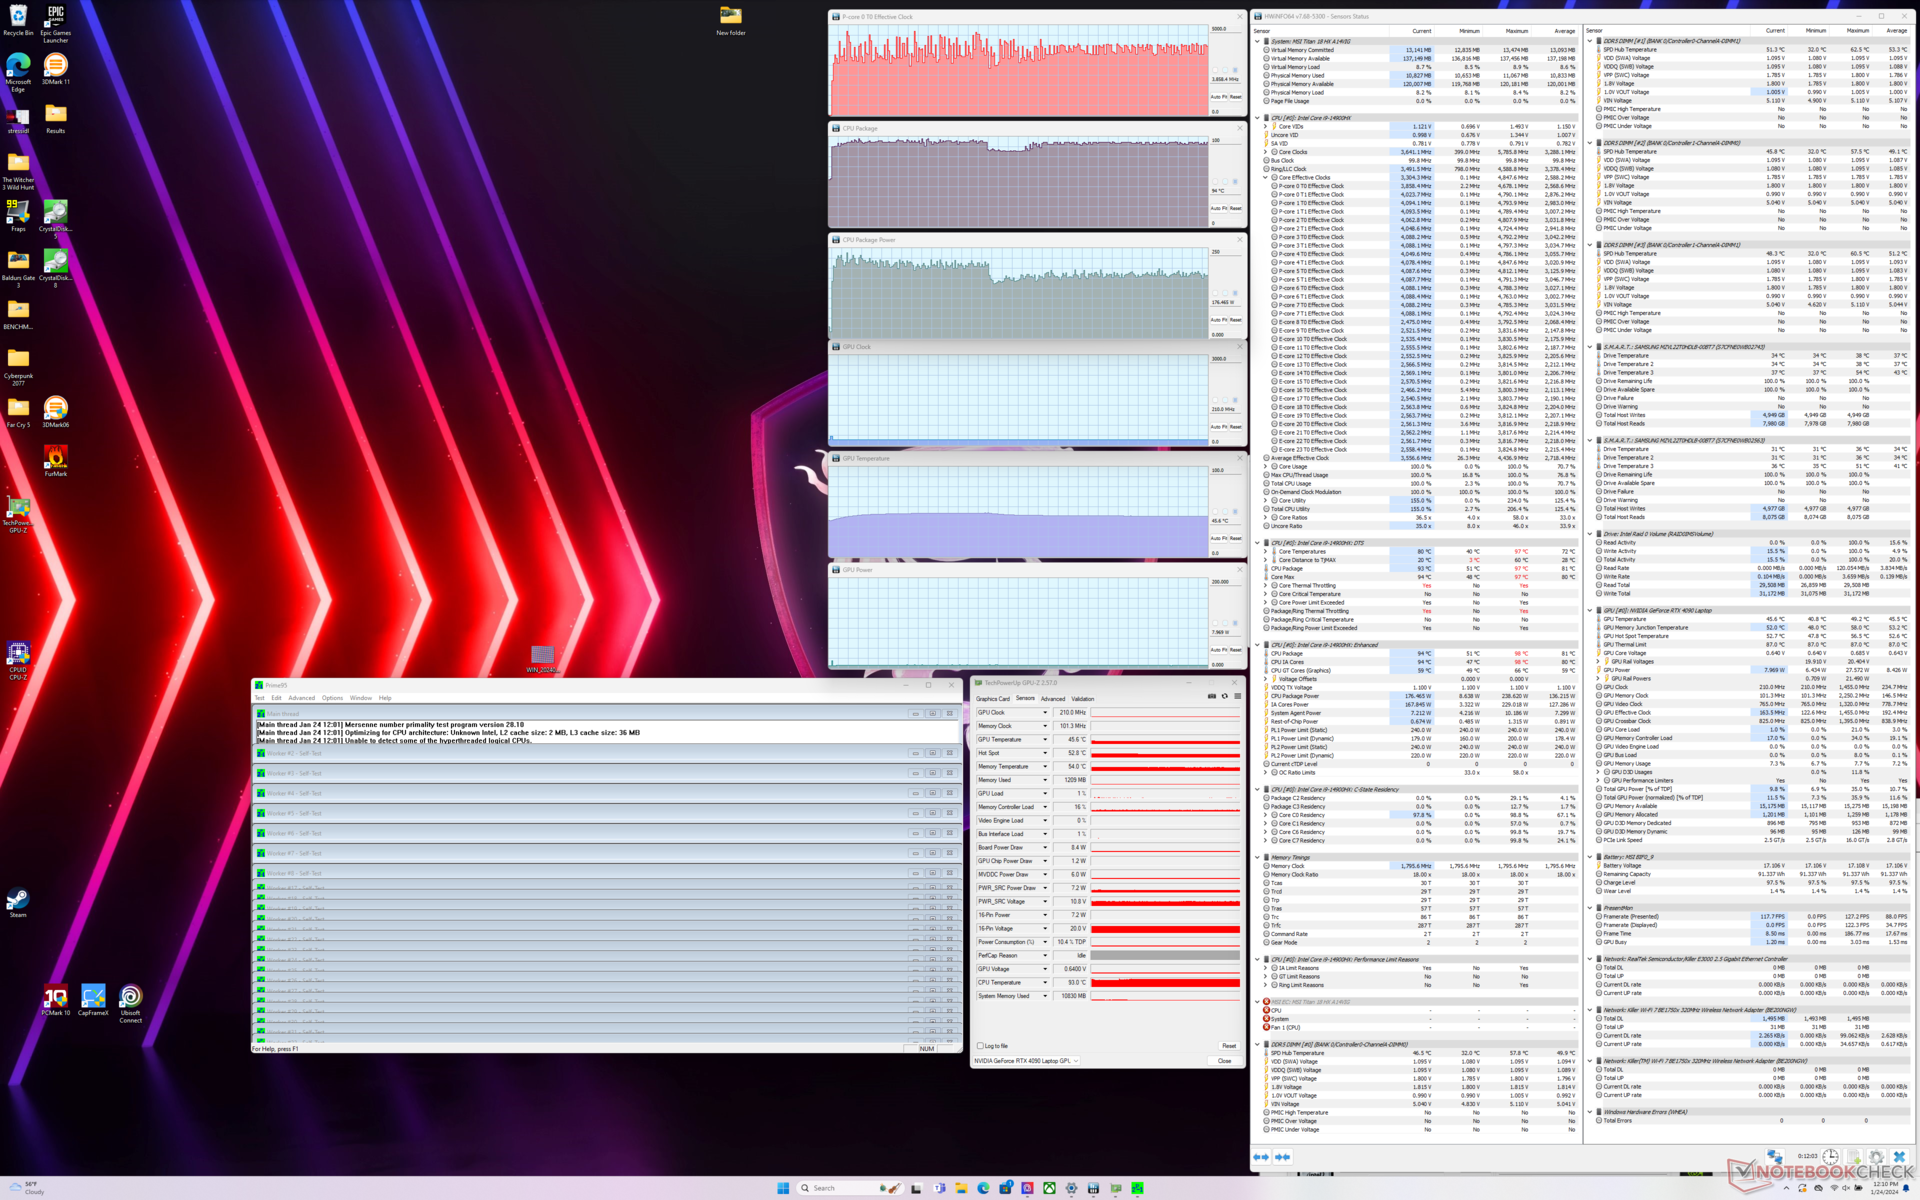
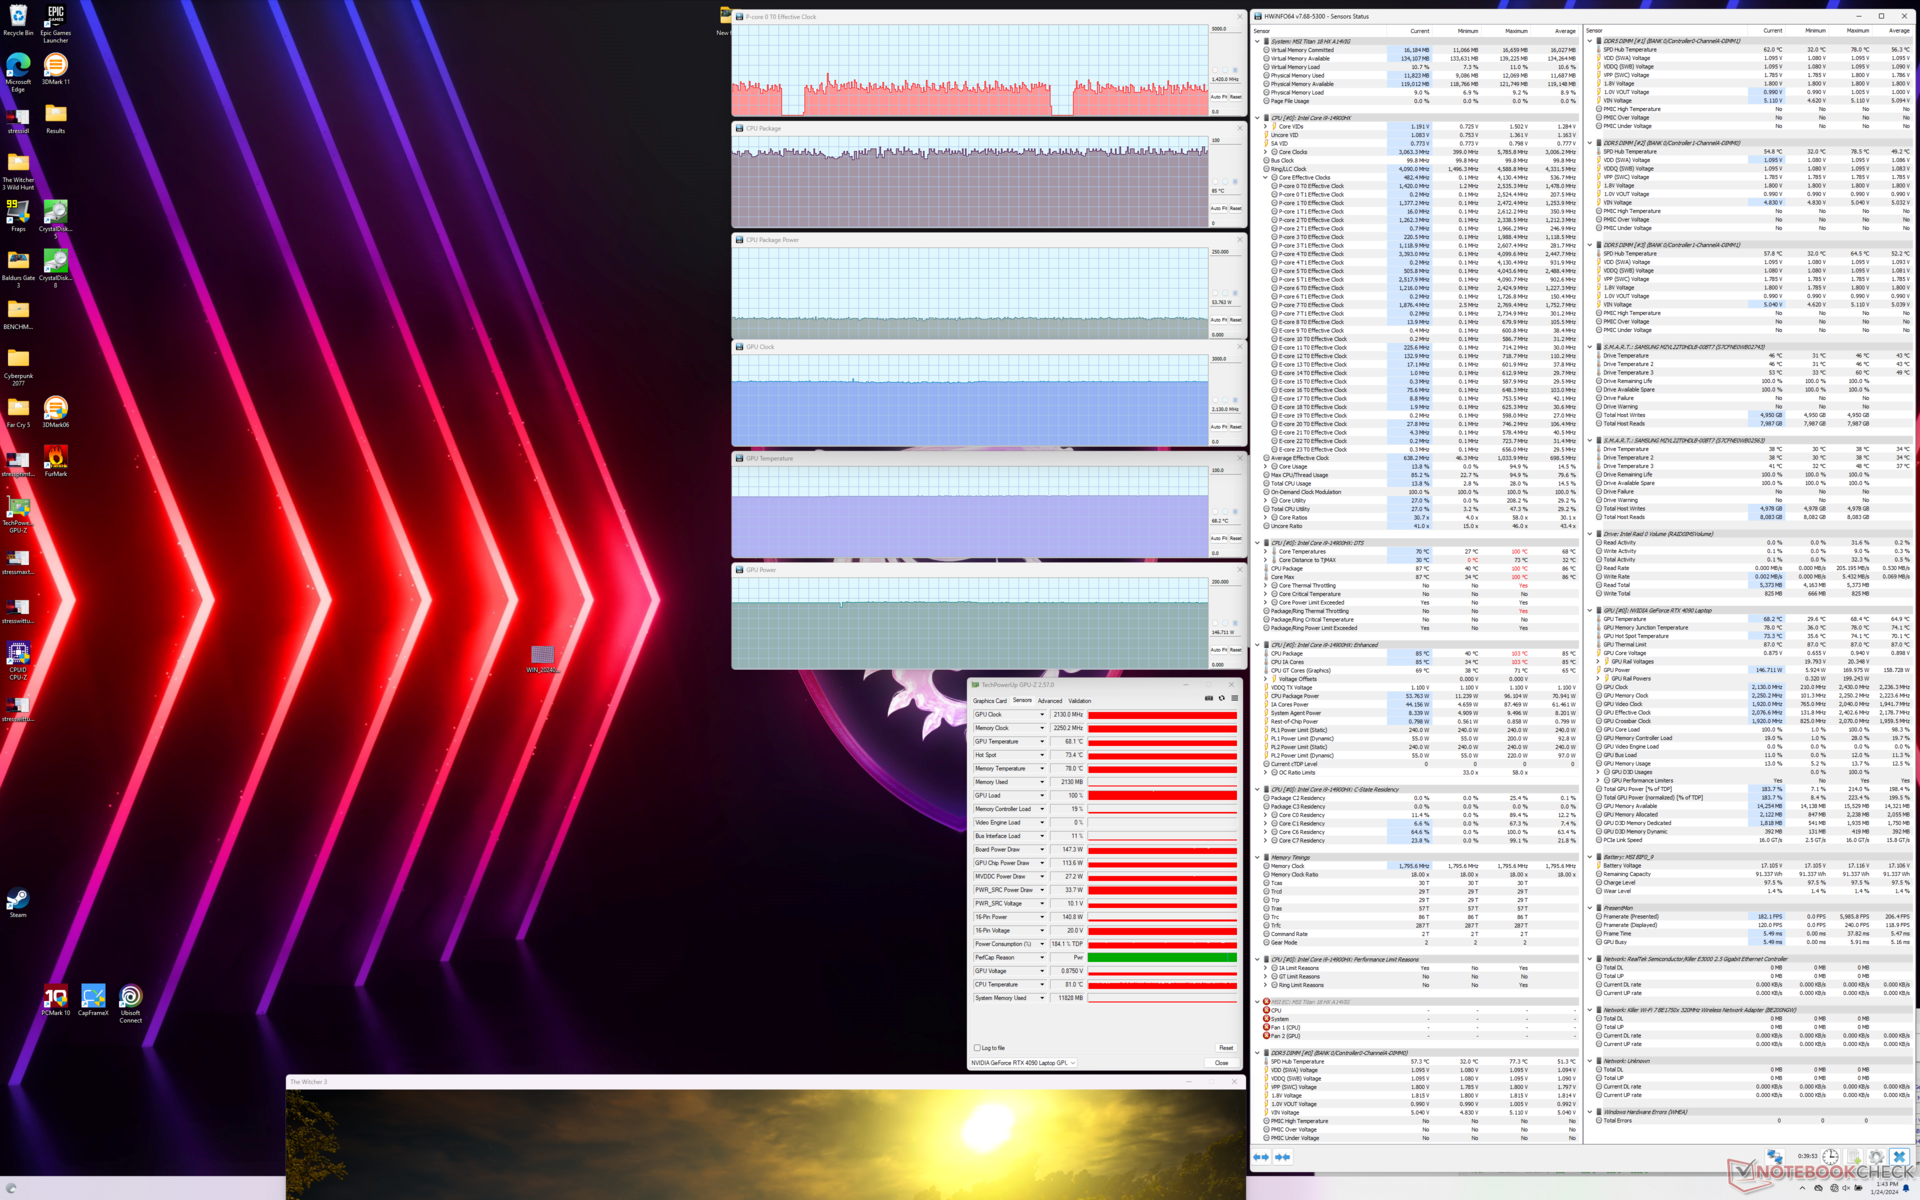
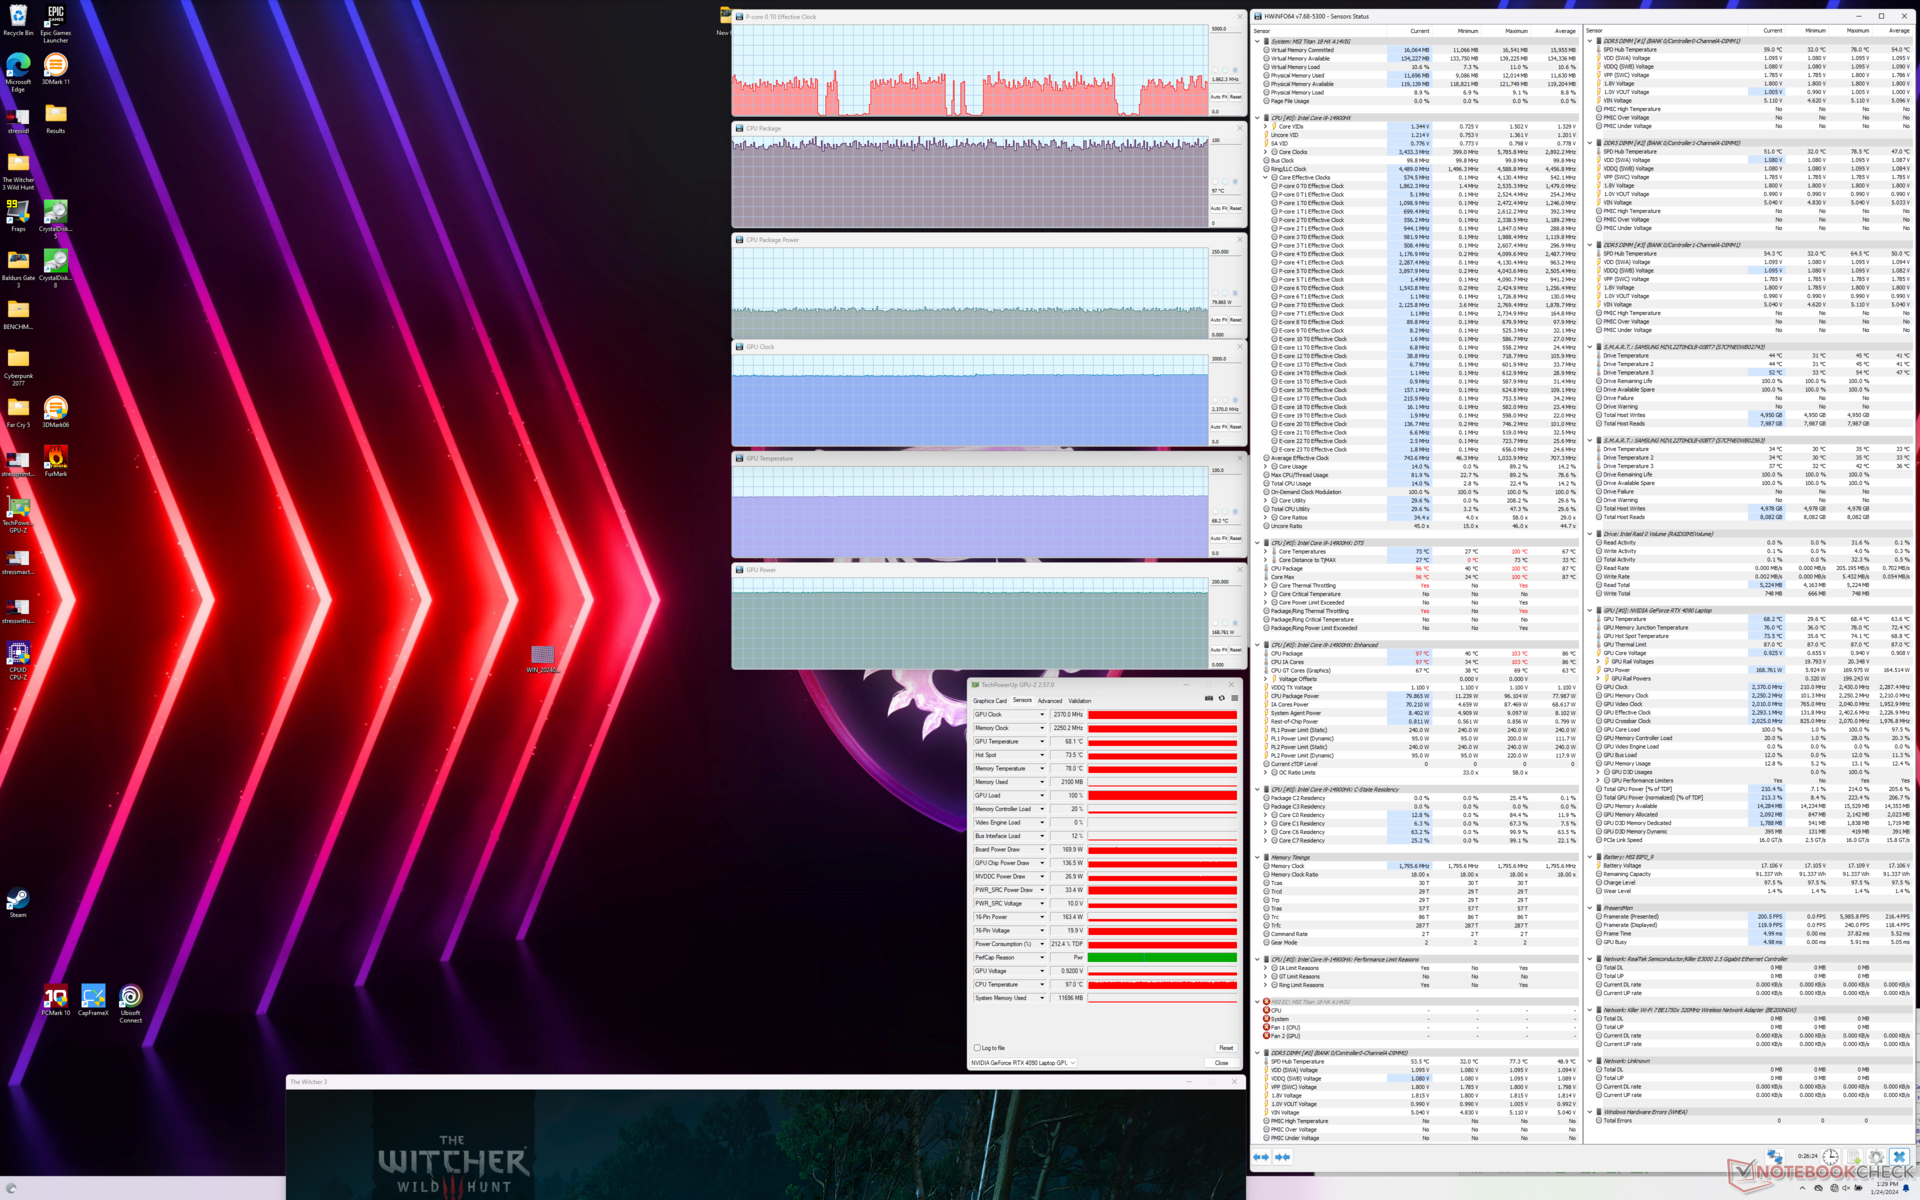
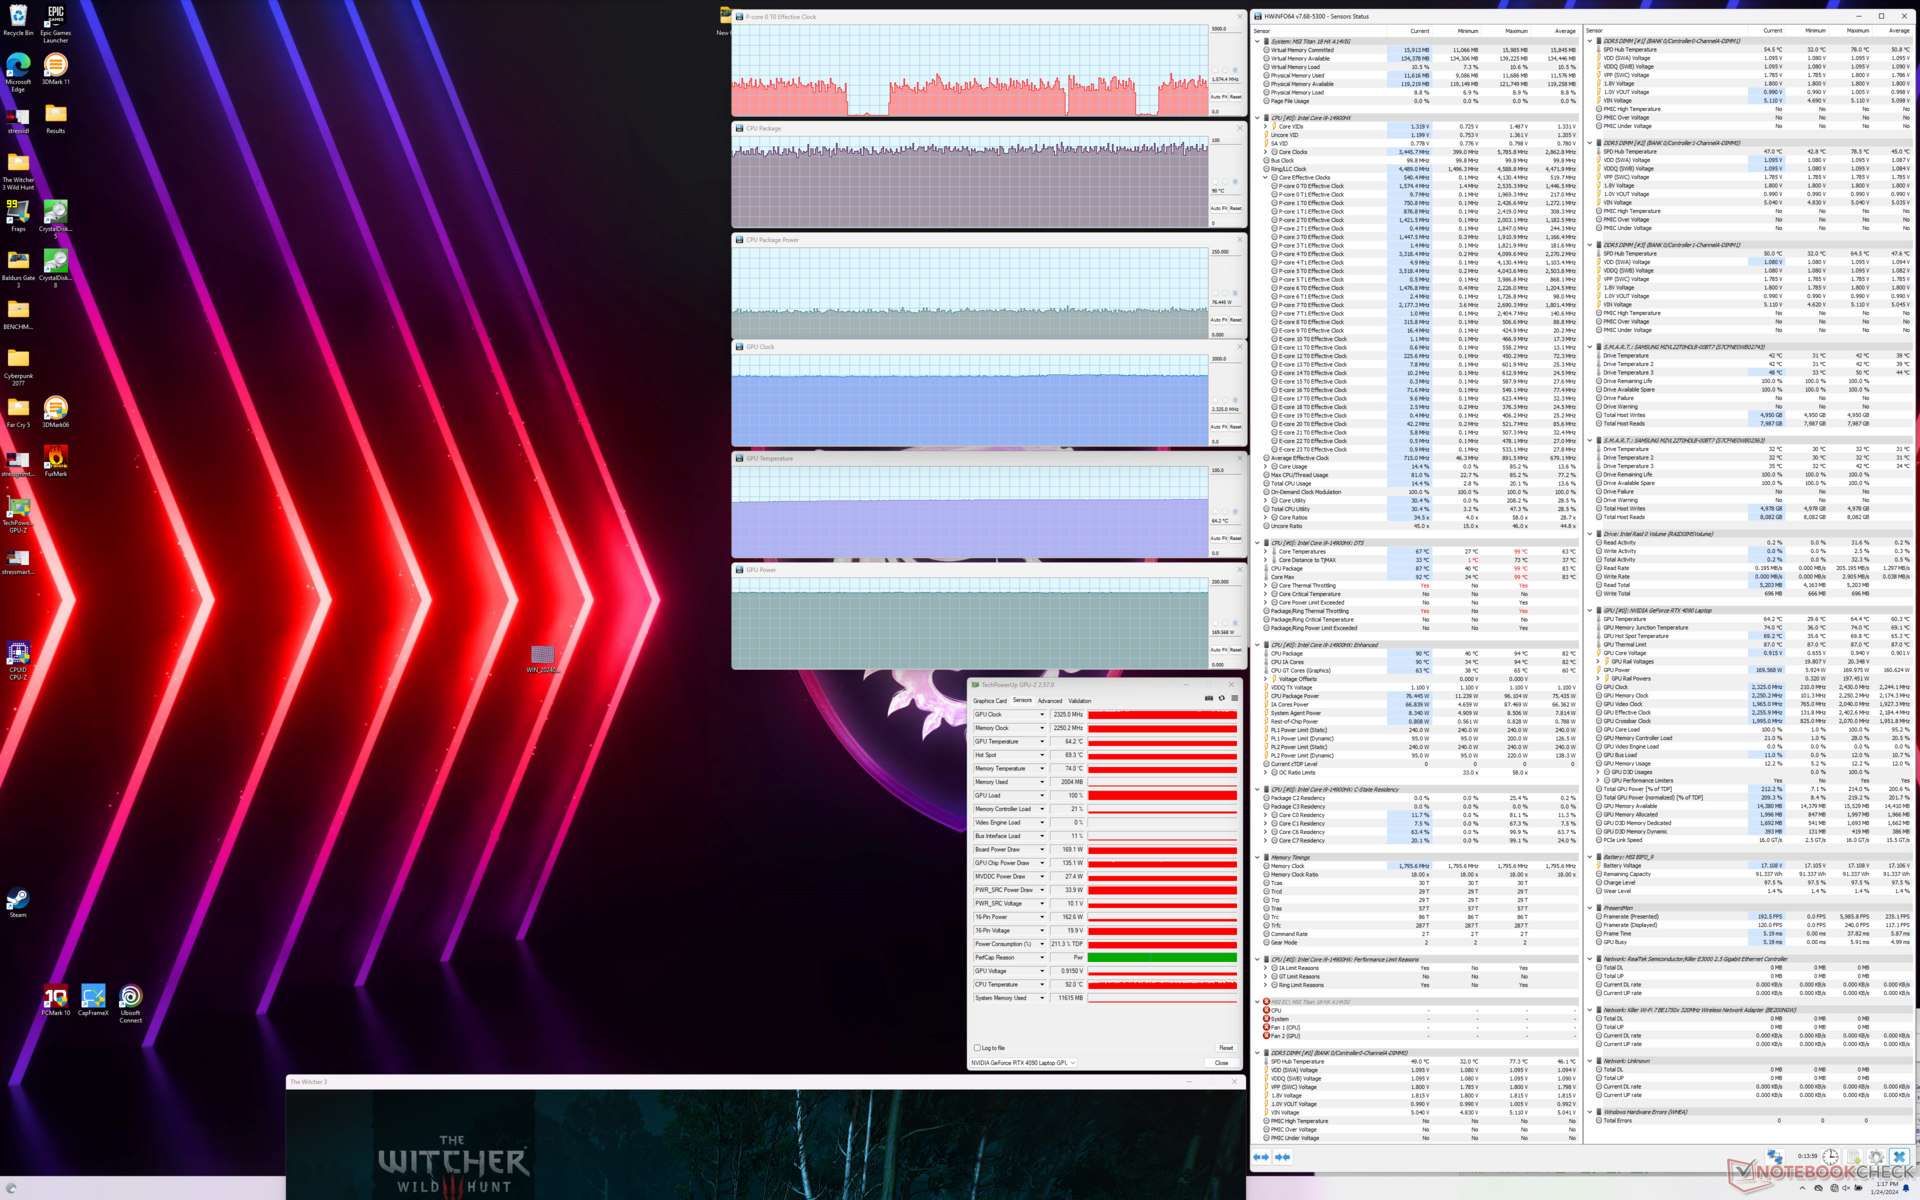
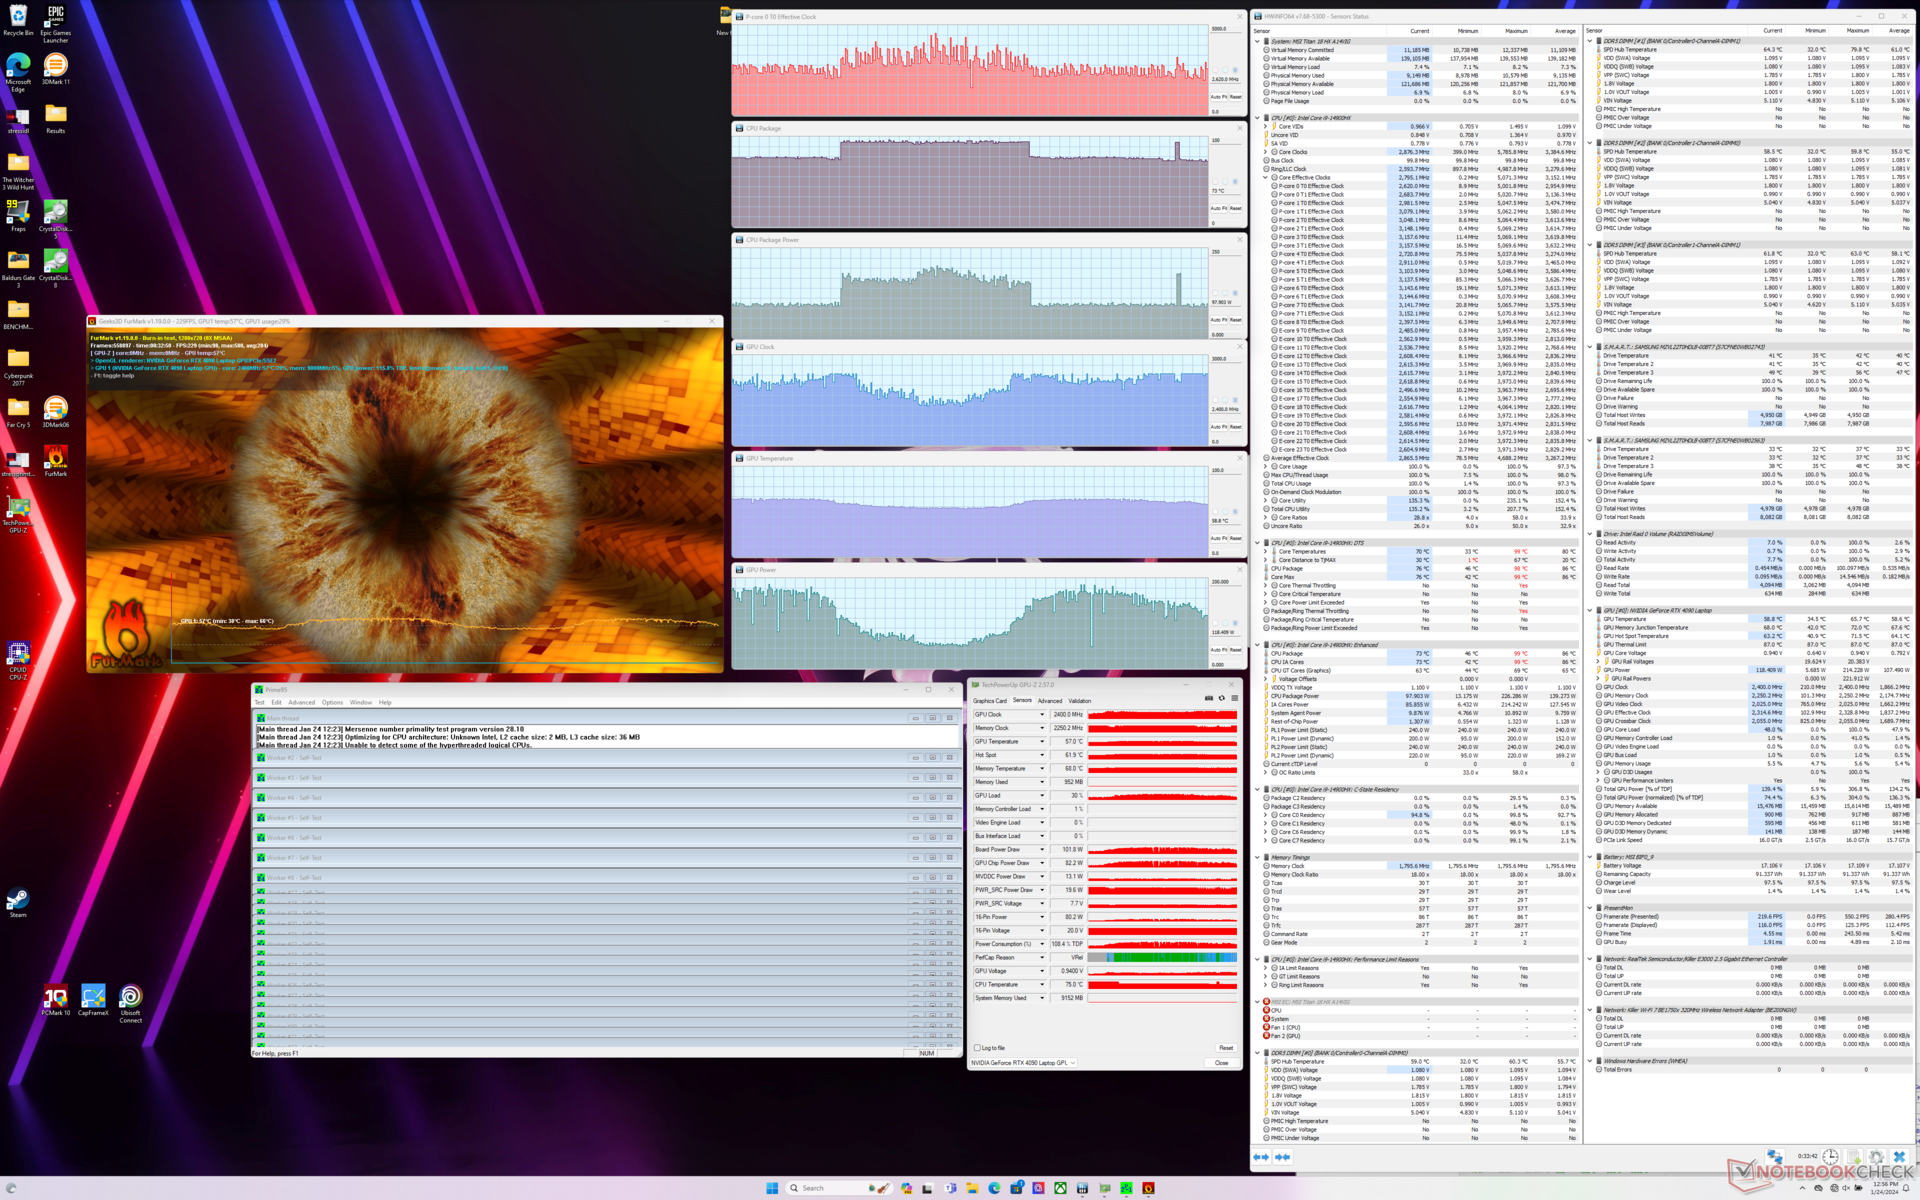
| CPU Clock (GHz) | GPU Clock (MHz) | Temperatura média da CPU (°C) | Temperatura média da GPU (°C) | |
| Sistema ocioso | -- | -- | 52 | 41 |
| Estresse doPrime95 | ~3.8 | -- | 94 | 46 |
| Estresse doPrime95 + FurMark | ~2,6 - ~4,3 | 1300 - 2400 | 73 - 95 | 55 - 65 |
| Witcher 3 Estresse(modo balanceado) | ~1,4 | 2130 | 85 | 68 |
| Witcher 3 Estresse(Extreme Performance Cooler Boost off) | ~1,8 | 2370 | 97 | 68 |
| Witcher 3 Estresse (ExtremePerformance Cooler Boost on) | ~1.8 | 2325 | 90 | 64 |
Alto-falantes
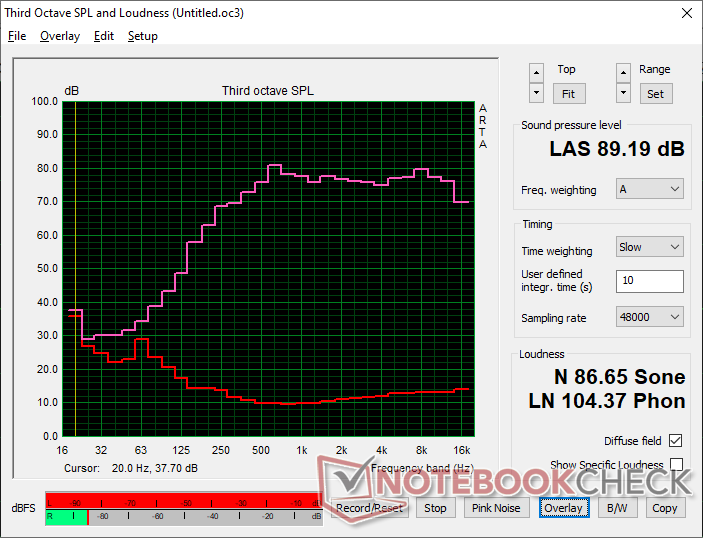
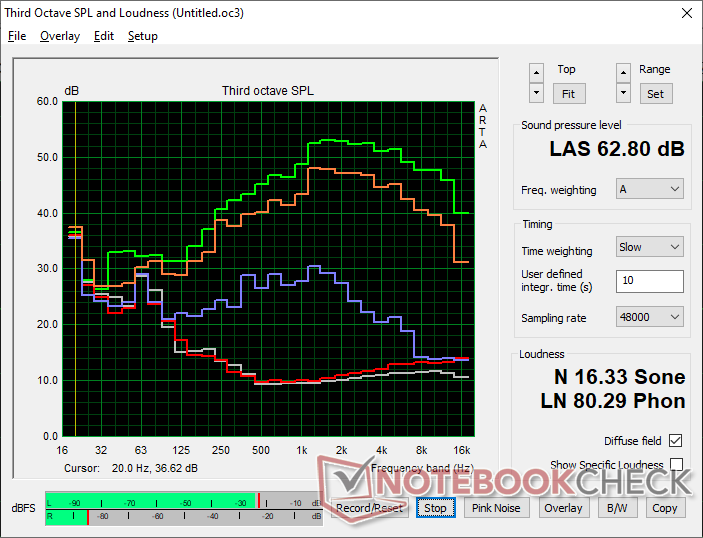
MSI Titan 18 HX A14VIG análise de áudio
(+) | os alto-falantes podem tocar relativamente alto (###valor### dB)
Graves 100 - 315Hz
(-) | quase nenhum baixo - em média 17.6% menor que a mediana
(±) | a linearidade dos graves é média (8% delta para a frequência anterior)
Médios 400 - 2.000 Hz
(+) | médios equilibrados - apenas 1.8% longe da mediana
(+) | médios são lineares (3.7% delta para frequência anterior)
Altos 2 - 16 kHz
(+) | agudos equilibrados - apenas 1.2% longe da mediana
(+) | os máximos são lineares (2% delta da frequência anterior)
Geral 100 - 16.000 Hz
(+) | o som geral é linear (9.9% diferença em relação à mediana)
Comparado com a mesma classe
» 5% de todos os dispositivos testados nesta classe foram melhores, 2% semelhantes, 94% piores
» O melhor teve um delta de 6%, a média foi 18%, o pior foi 132%
Comparado com todos os dispositivos testados
» 4% de todos os dispositivos testados foram melhores, 1% semelhantes, 95% piores
» O melhor teve um delta de 4%, a média foi 23%, o pior foi 134%
Apple MacBook Pro 16 2021 M1 Pro análise de áudio
(+) | os alto-falantes podem tocar relativamente alto (###valor### dB)
Graves 100 - 315Hz
(+) | bons graves - apenas 3.8% longe da mediana
(+) | o baixo é linear (5.2% delta para a frequência anterior)
Médios 400 - 2.000 Hz
(+) | médios equilibrados - apenas 1.3% longe da mediana
(+) | médios são lineares (2.1% delta para frequência anterior)
Altos 2 - 16 kHz
(+) | agudos equilibrados - apenas 1.9% longe da mediana
(+) | os máximos são lineares (2.7% delta da frequência anterior)
Geral 100 - 16.000 Hz
(+) | o som geral é linear (4.6% diferença em relação à mediana)
Comparado com a mesma classe
» 0% de todos os dispositivos testados nesta classe foram melhores, 0% semelhantes, 100% piores
» O melhor teve um delta de 5%, a média foi 17%, o pior foi 45%
Comparado com todos os dispositivos testados
» 0% de todos os dispositivos testados foram melhores, 0% semelhantes, 100% piores
» O melhor teve um delta de 4%, a média foi 23%, o pior foi 134%
Gerenciamento de energia
Consumo de energia
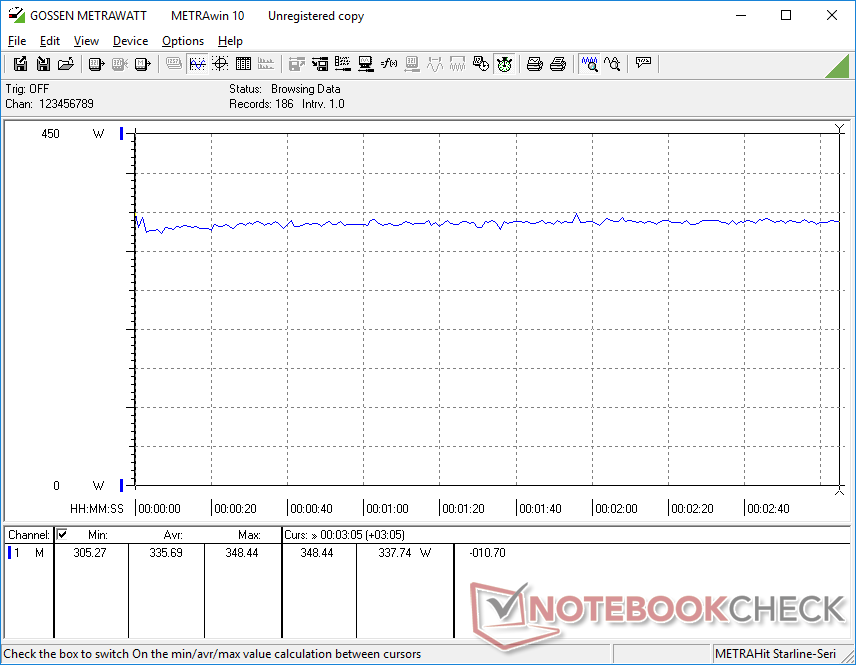
O consumo geral de energia é geralmente maior do que o de outros notebooks para jogos de 18 polegadas devido à exigente CPU de 95 W, à GPU de 175 W e à tela mini-LED 4K 120 Hz ultrabrilhante. A simples inatividade na área de trabalho consumiria entre 13 W e 54 W, dependendo da configuração de brilho e da configuração dGPU/iGPU, que é uma faixa muito mais ampla do que a do Asus ROG Strix G18 ou do Acer Predator Helios 18, cada um com painéis IPS padrão.
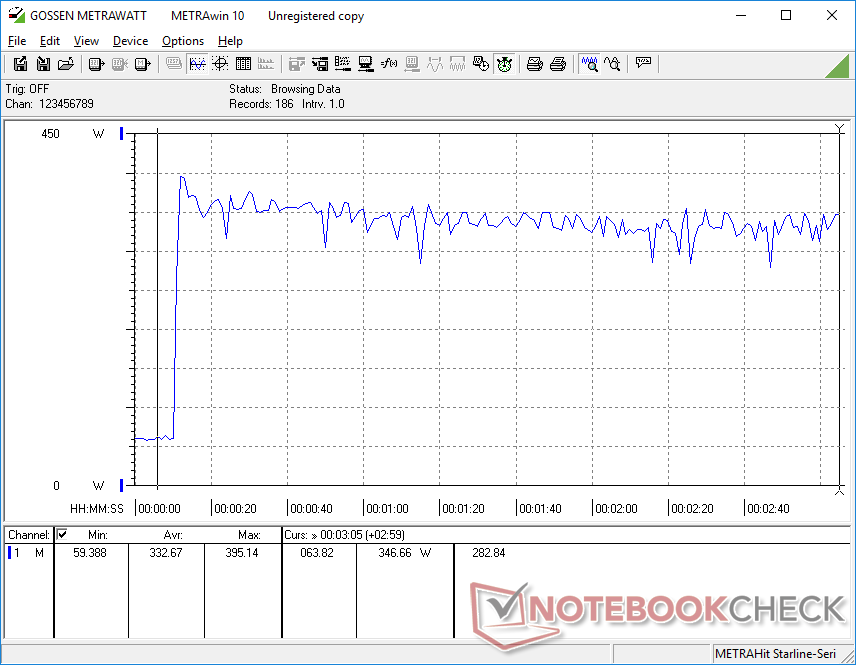
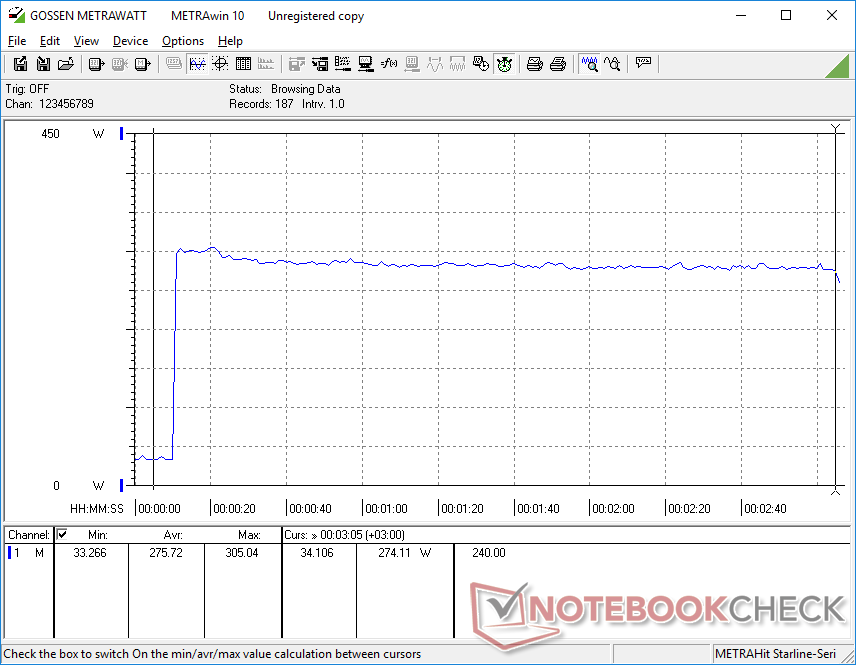
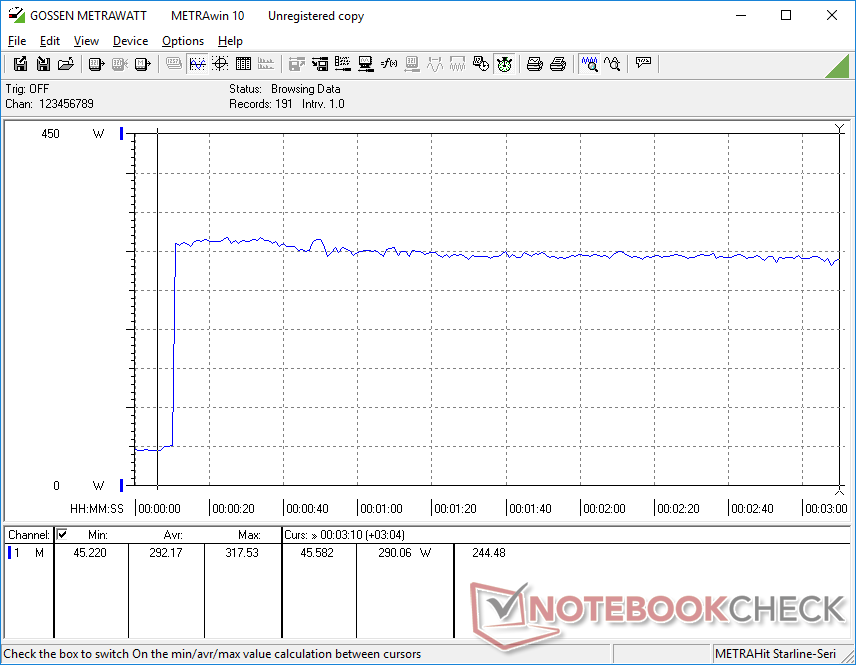
Para jogos, o sistema MSI continua a ser um dos laptops mais exigentes. A execução do Witcher 3 consumiria quase 340 W em comparação com apenas 265 W e 311 W do GT77 ou Alienware m18 R1do ano passado, respectivamente, todos com a mesma GPU RTX 4090.
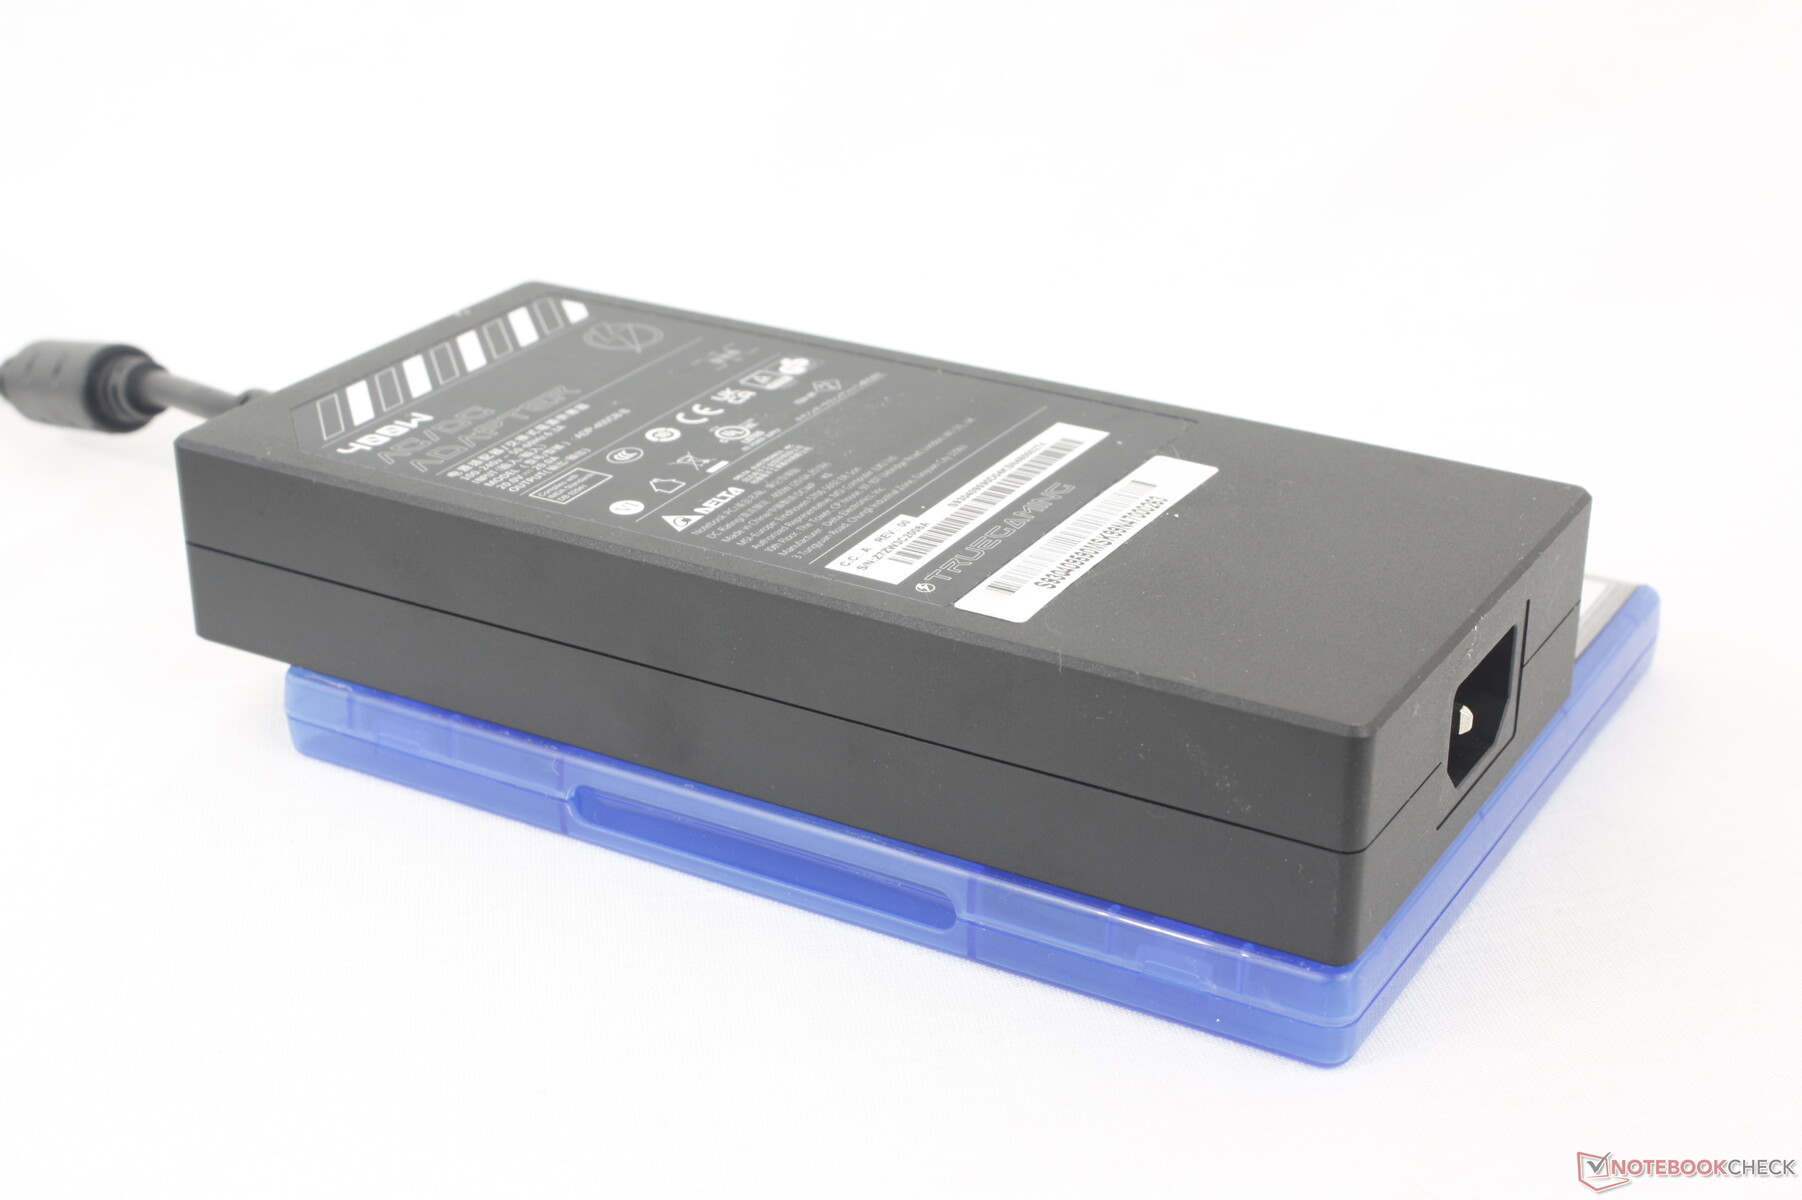
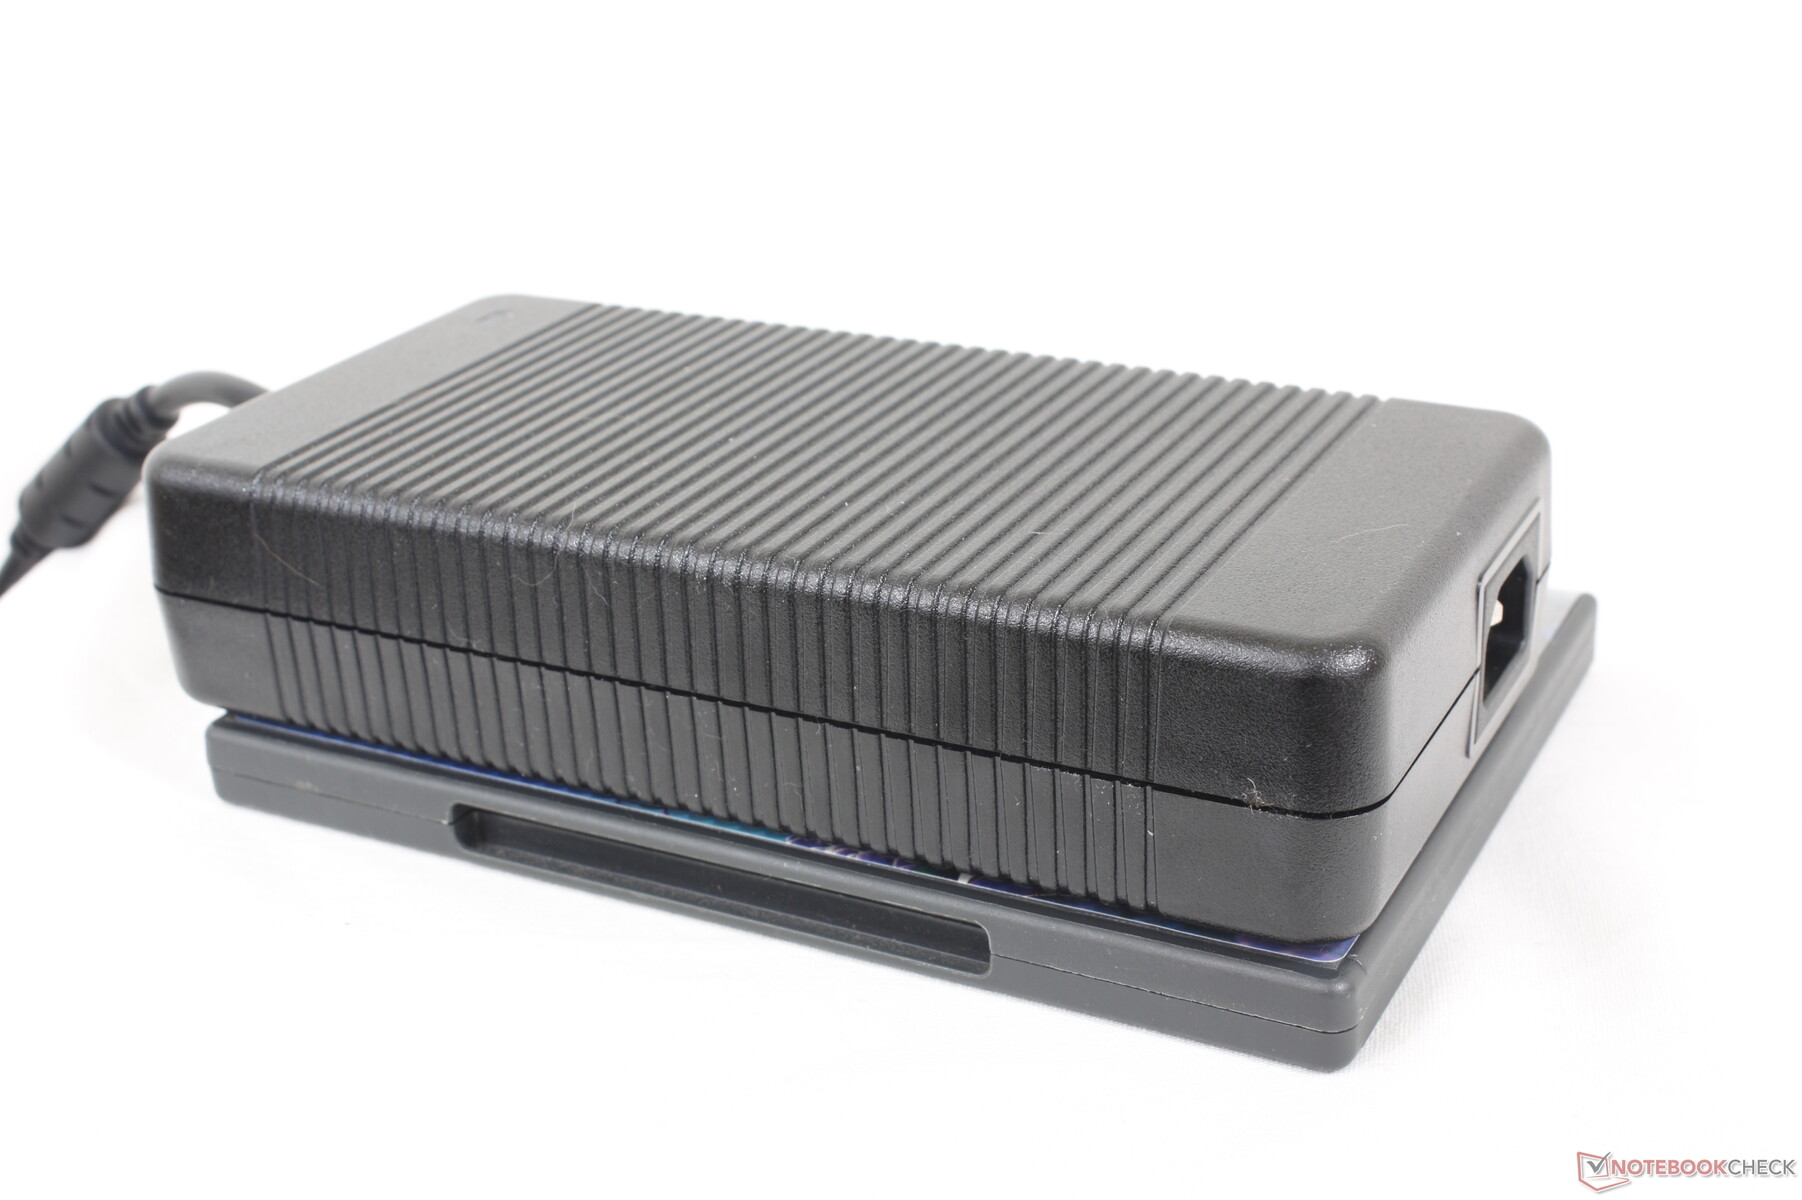
Uma novidade nos notebooks MSI este ano é o adaptador AC redesenhado, que agora é mais fino e mais potente do que antes. Os adaptadores CA anteriores eram bastante grandes, especialmente a versão de 330 W que acompanhava laptops potentes como o Raider GE78. O Titan 16 HX utiliza um adaptador CA de 400 W (~18,8 x 8,8 x 3,2 cm) que é cerca de 35% menor para maior potência por volume. O adaptador de maior capacidade permite um desempenho e taxas de carregamento mais consistentes ao executar cargas exigentes. Em comparação, a maioria dos outros notebooks para jogos de alto desempenho continua a ser fornecida com adaptadores CA de apenas 330 W ou menores.
| desligado | |
| Ocioso | |
| Carga |
|
Key:
min: | |
| MSI Titan 18 HX A14VIG i9-14900HX, GeForce RTX 4090 Laptop GPU, 2x Samsung PM9A1a MZVL22T0HDLB (RAID 0), Mini-LED, 3840x2400, 18" | MSI Titan GT77 HX 13VI i9-13950HX, GeForce RTX 4090 Laptop GPU, Samsung PM9A1 MZVL22T0HBLB, Mini-LED, 3840x2160, 17.3" | Alienware m18 R1 i9-13980HX, GeForce RTX 4090 Laptop GPU, SK hynix PC801 HFS001TEJ9X101N, IPS, 1920x1200, 18" | Asus ROG Strix G18 G814JI i7-13650HX, GeForce RTX 4070 Laptop GPU, Micron 2400 MTFDKBA1T0QFM, IPS, 2560x1600, 18" | Acer Predator Helios 18 N23Q2 i9-13900HX, GeForce RTX 4080 Laptop GPU, Samsung PM9A1 MZVL22T0HBLB, IPS, 2560x1600, 18" | Razer Blade 18 RTX 4070 i9-13950HX, GeForce RTX 4070 Laptop GPU, SSSTC CA6-8D1024, IPS, 2560x1600, 18" | |
|---|---|---|---|---|---|---|
| Power Consumption | 16% | -9% | 41% | 19% | -5% | |
| Idle Minimum * (Watt) | 13.2 | 14 -6% | 21.6 -64% | 8 39% | 16 -21% | 24.5 -86% |
| Idle Average * (Watt) | 25.4 | 21.6 15% | 25.2 1% | 15 41% | 19 25% | 34.1 -34% |
| Idle Maximum * (Watt) | 53.5 | 24.8 54% | 56.7 -6% | 26 51% | 21.3 60% | 47.7 11% |
| Load Average * (Watt) | 151.4 | 122.5 19% | 164.1 -8% | 102 33% | 124 18% | 140 8% |
| Witcher 3 ultra * (Watt) | 336 | 265 21% | 311 7% | 178.6 47% | 289 14% | 202 40% |
| Load Maximum * (Watt) | 395.2 | 418 -6% | 338.9 14% | 267 32% | 319 19% | 261 34% |
* ... menor é melhor
Power Consumption Witcher 3 / Stresstest
Power Consumption external Monitor
Duração da bateria
Conseguimos registrar pouco mais de 4 horas de uso de navegação no mundo real quando configurado no modo balanceado com a dGPU inativa. Não é muito tempo, mas isso é de se esperar de uma potência de 18 polegadas com uma tela mini-LED de 120 Hz. Mesmo no modo Battery Saver da MSI, com a configuração de brilho mais baixa para o melhor cenário, a duração seria de pouco menos de 6 horas. Os resultados do Alienware m18 R1 ou do Razer Blade 18 são semelhantes.
O carregamento da capacidade vazia até a capacidade total com o adaptador CA incluído leva cerca de 2 a 2,5 horas. O sistema também pode ser recarregado com adaptadores USB-C de terceiros, embora muito mais lentamente. Lembre-se de que apenas uma das duas portas USB-C é compatível com o USB-C Power Delivery.
| MSI Titan 18 HX A14VIG i9-14900HX, GeForce RTX 4090 Laptop GPU, 99.9 Wh | MSI Titan GT77 HX 13VI i9-13950HX, GeForce RTX 4090 Laptop GPU, 99.9 Wh | Alienware m18 R1 i9-13980HX, GeForce RTX 4090 Laptop GPU, 97 Wh | Asus ROG Strix G18 G814JI i7-13650HX, GeForce RTX 4070 Laptop GPU, 90 Wh | Acer Predator Helios 18 N23Q2 i9-13900HX, GeForce RTX 4080 Laptop GPU, 90 Wh | Razer Blade 18 RTX 4070 i9-13950HX, GeForce RTX 4070 Laptop GPU, 91.7 Wh | |
|---|---|---|---|---|---|---|
| Duração da bateria | 22% | -15% | 64% | 24% | 7% | |
| Reader / Idle (h) | 5.9 | 5.6 -5% | 11.7 98% | 7 19% | ||
| WiFi v1.3 (h) | 4.2 | 5.3 26% | 4.3 2% | 8.1 93% | 4.4 5% | 4 -5% |
| Load (h) | 1.2 | 1.4 17% | 0.7 -42% | 1.2 0% | 1.7 42% | 1.3 8% |
| H.264 (h) | 6 | 4.8 |
Pro
Contra
Veredicto - Novo design externo, mesmo desempenho interno
Sem nenhuma nova GPU da Nvidia este ano para laptops, a MSI teve que atualizar tudo o que envolve a placa de vídeo para compensar isso. Os usuários estão recebendo um novo design de chassi de 18 polegadas, nova CPU Intel HX de 14ª geração, novo adaptador CA, teclas maiores e uma nova tela 4K mini-LED HDR1000 de 120 Hz para acompanhar o alto preço. A maioria dessas mudanças é um avanço em relação ao GT77do ano passado, mas os usuários estão obtendo o mesmo desempenho em jogos de ambos os modelos.
Os destaques do Titan 18 incluem a tela mini-LED e a CPU Core i9-14900HX. O primeiro é indubitavelmente impressionante e uma das melhores maneiras de assistir a conteúdo HDR em qualquer laptop, mas a falta de suporte ao G-Sync é difícil de ignorar, especialmente em um modelo de jogos de ponta. Enquanto isso, a nova CPU tem um desempenho quase idêntico ao do Core i9-13950HX de 13ª geração encontrado no GT77, o que faz com que pareça nada mais do que uma reformulação da marca. O Titan 18 pode, portanto, ser considerado um grande avanço em relação ao GT77 devido a todas as mudanças externas, mas os componentes internos da Intel e da Nvidia parecem estagnados em comparação.
O MSI Titan 18 HX é um dos laptops para jogos mais rápidos do ano, com uma tela mini-LED 4K igualmente impressionante. No entanto, seu desempenho é quase idêntico ao do GT77 do ano passado.
Se o senhor se sente atraído pela tela mini-LED grande e ultrabrilhante de 18 polegadas, o Titan 18 HX é um dos únicos lugares onde é possível encontrar um no momento em que este artigo foi escrito. Caso contrário, alternativas como o Alienware m18 R1, Asus ROG Strix G18ou Razer Blade 18 todos oferecem G-Sync, taxas de atualização mais rápidas e a mesma opção GeForce RTX 4090 em designs de chassi mais finos e, muitas vezes, mais leves.
Preço e disponibilidade
O Titan 18 HX, conforme analisado, já está sendo vendido na Amazon por US$ 5800. A MSI também está oferecendo o modelo diretamente em seu site oficial a preços iniciais mais baixos.
MSI Titan 18 HX A14VIG
- 01/30/2024 v7 (old)
Allen Ngo
Transparência
A seleção dos dispositivos a serem analisados é feita pela nossa equipe editorial. A amostra de teste foi fornecida ao autor como empréstimo pelo fabricante ou varejista para fins desta revisão. O credor não teve influência nesta revisão, nem o fabricante recebeu uma cópia desta revisão antes da publicação. Não houve obrigação de publicar esta revisão. Como empresa de mídia independente, a Notebookcheck não está sujeita à autoridade de fabricantes, varejistas ou editores.
É assim que o Notebookcheck está testando
Todos os anos, o Notebookcheck analisa de forma independente centenas de laptops e smartphones usando procedimentos padronizados para garantir que todos os resultados sejam comparáveis. Desenvolvemos continuamente nossos métodos de teste há cerca de 20 anos e definimos padrões da indústria no processo. Em nossos laboratórios de teste, equipamentos de medição de alta qualidade são utilizados por técnicos e editores experientes. Esses testes envolvem um processo de validação em vários estágios. Nosso complexo sistema de classificação é baseado em centenas de medições e benchmarks bem fundamentados, o que mantém a objetividade.Price comparison

