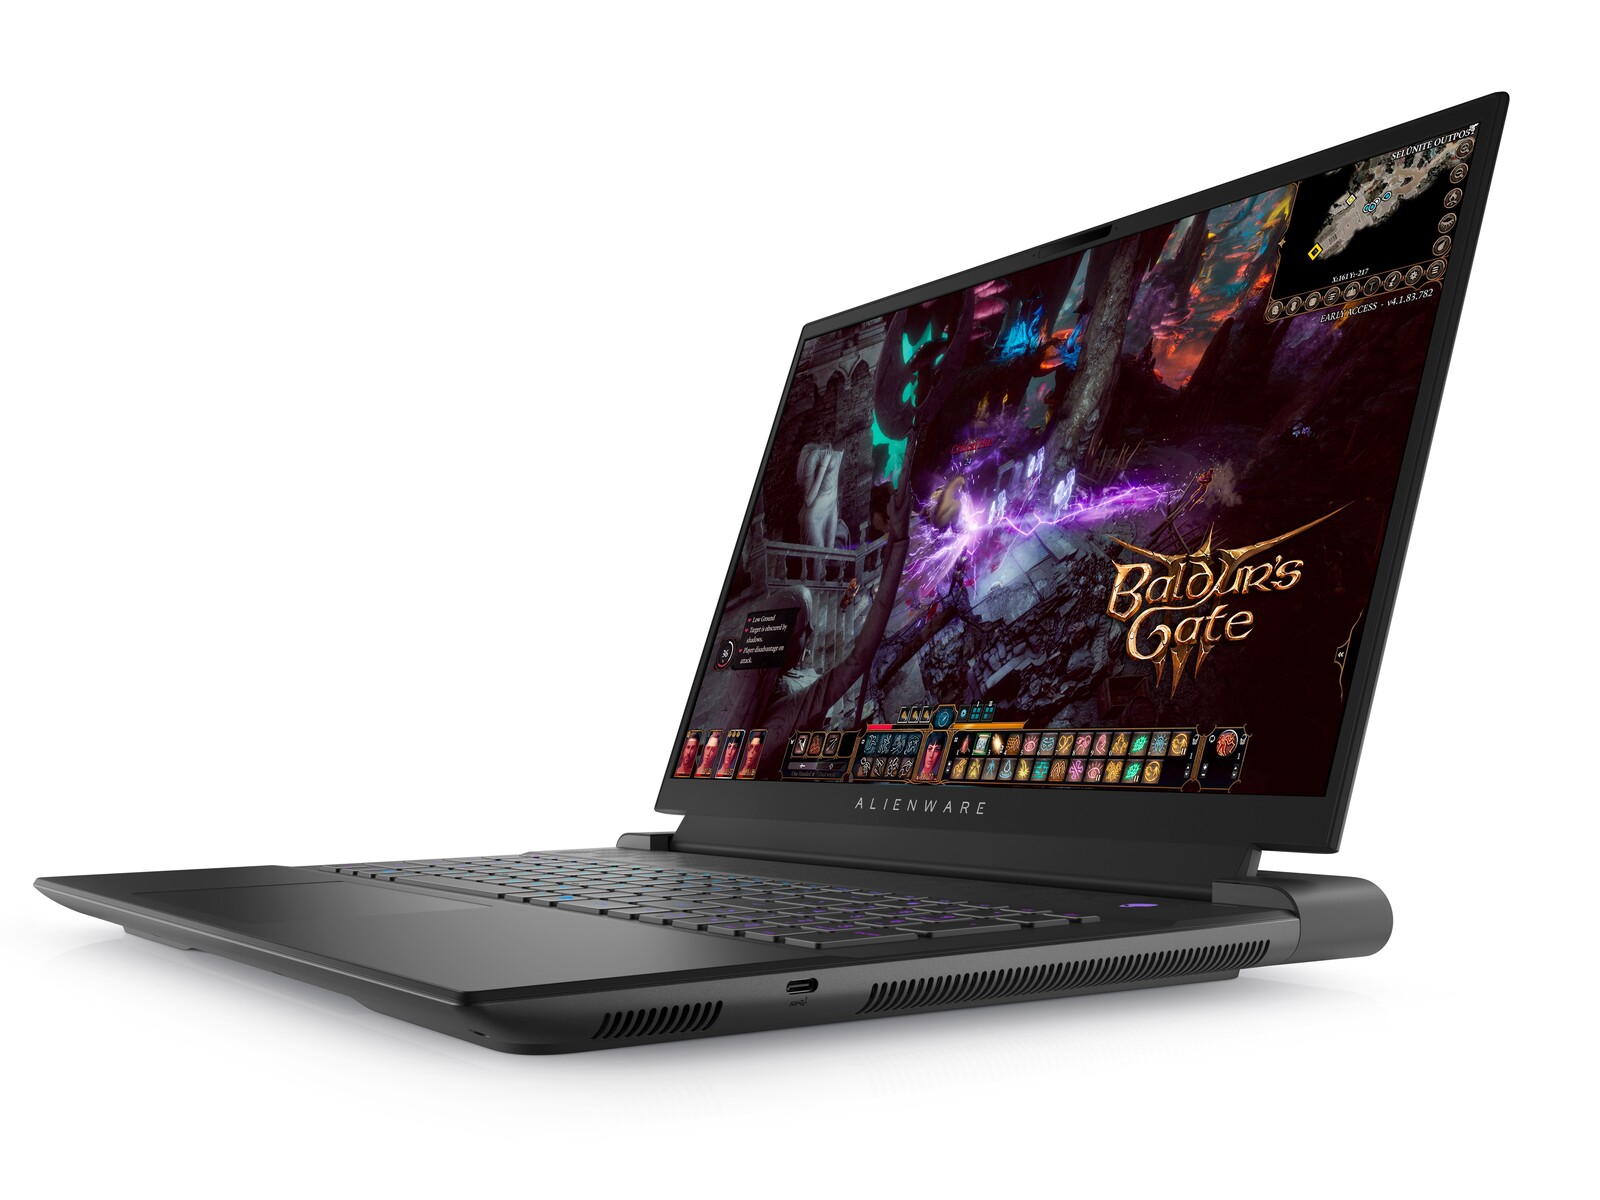
Revisão do laptop Alienware m18 R1: Maior e mais pesado do que o MSI Titan GT77
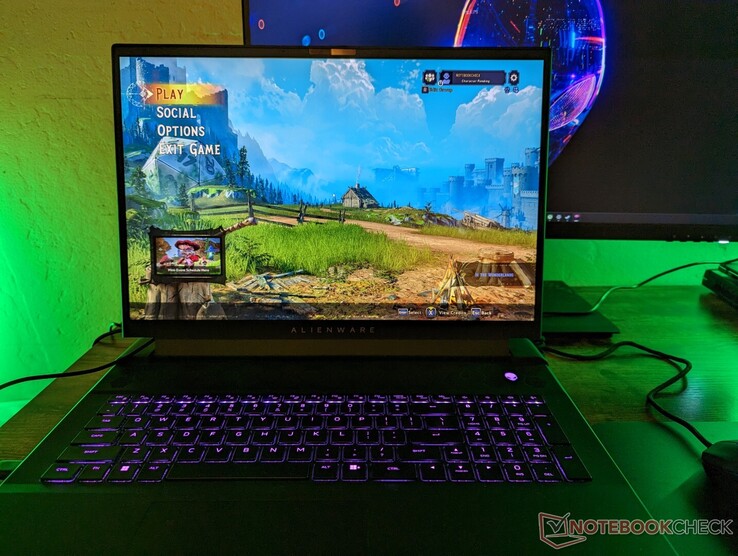
Revelado no início deste ano junto com a série móvel Intel Raptor Lake-H e a série móvel Ada Lovelace GeForce RTX 40, o carro-chefe Alienware m18 R1 é o primeiro modelo de 18 polegadas em sua família desde 2013. É claro que muita coisa mudou desde então, mas os caçadores de desempenho que querem algo maior do que a solução usual de 17 polegadas podem encontrar muito a gostar de um fator de forma de 18 polegadas onde as características e térmicas podem ser maximizadas.
Nossa configuração em revisão é uma especificação superior com a CPU Core i9-13980HX da 13ª geração, 175 W GeForce RTX 4090, teclado RGB baseado em membrana, e tela IPS 1200p 480 Hz por aproximadamente $2900 USD. Outras SKUs estão disponíveis no RTX 4060, Core i7-13700HX e display 1600p 165 Hz com teclado mecânico de ultra baixo perfil CherryMX. Todas as outras configurações suportam as cores G-Sync e DCI-P3 completo.
Os concorrentes diretos incluem outros laptops de 18 polegadas para jogos, como o Lâmina Razer 18 ouAsus ROG Strix Scar 18. A MSI ainda tem que anunciar um novo modelo de 18 polegadas no momento da redação.
Mais análises da Dell:
Possíveis concorrentes em comparação
Avaliação | Data | Modelo | Peso | Altura | Size | Resolução | Preço |
|---|---|---|---|---|---|---|---|
| 90.7 % v7 (old) | 04/2023 | Alienware m18 R1 i9-13980HX, GeForce RTX 4090 Laptop GPU | 3.9 kg | 26.7 mm | 18.00" | 1920x1200 | |
| 91.4 % v7 (old) | 02/2023 | Razer Blade 18 RTX 4070 i9-13950HX, GeForce RTX 4070 Laptop GPU | 3 kg | 21.9 mm | 18.00" | 2560x1600 | |
| 86.6 % v7 (old) | 02/2023 | Asus ROG Strix Scar 18 2023 G834JY-N6005W i9-13980HX, GeForce RTX 4090 Laptop GPU | 3.1 kg | 30.8 mm | 18.00" | 2560x1600 | |
| 88.3 % v7 (old) | 03/2023 | MSI GE78HX 13VH-070US i9-13950HX, GeForce RTX 4080 Laptop GPU | 3 kg | 23 mm | 17.00" | 2560x1600 | |
| 89.9 % v7 (old) | 03/2023 | Eluktronics Mech-17 GP2 i9-13900HX, GeForce RTX 4090 Laptop GPU | 2.9 kg | 27 mm | 17.00" | 2560x1600 | |
| 89 % v7 (old) | 02/2023 | MSI Titan GT77 HX 13VI i9-13950HX, GeForce RTX 4090 Laptop GPU | 3.5 kg | 23 mm | 17.30" | 3840x2160 |
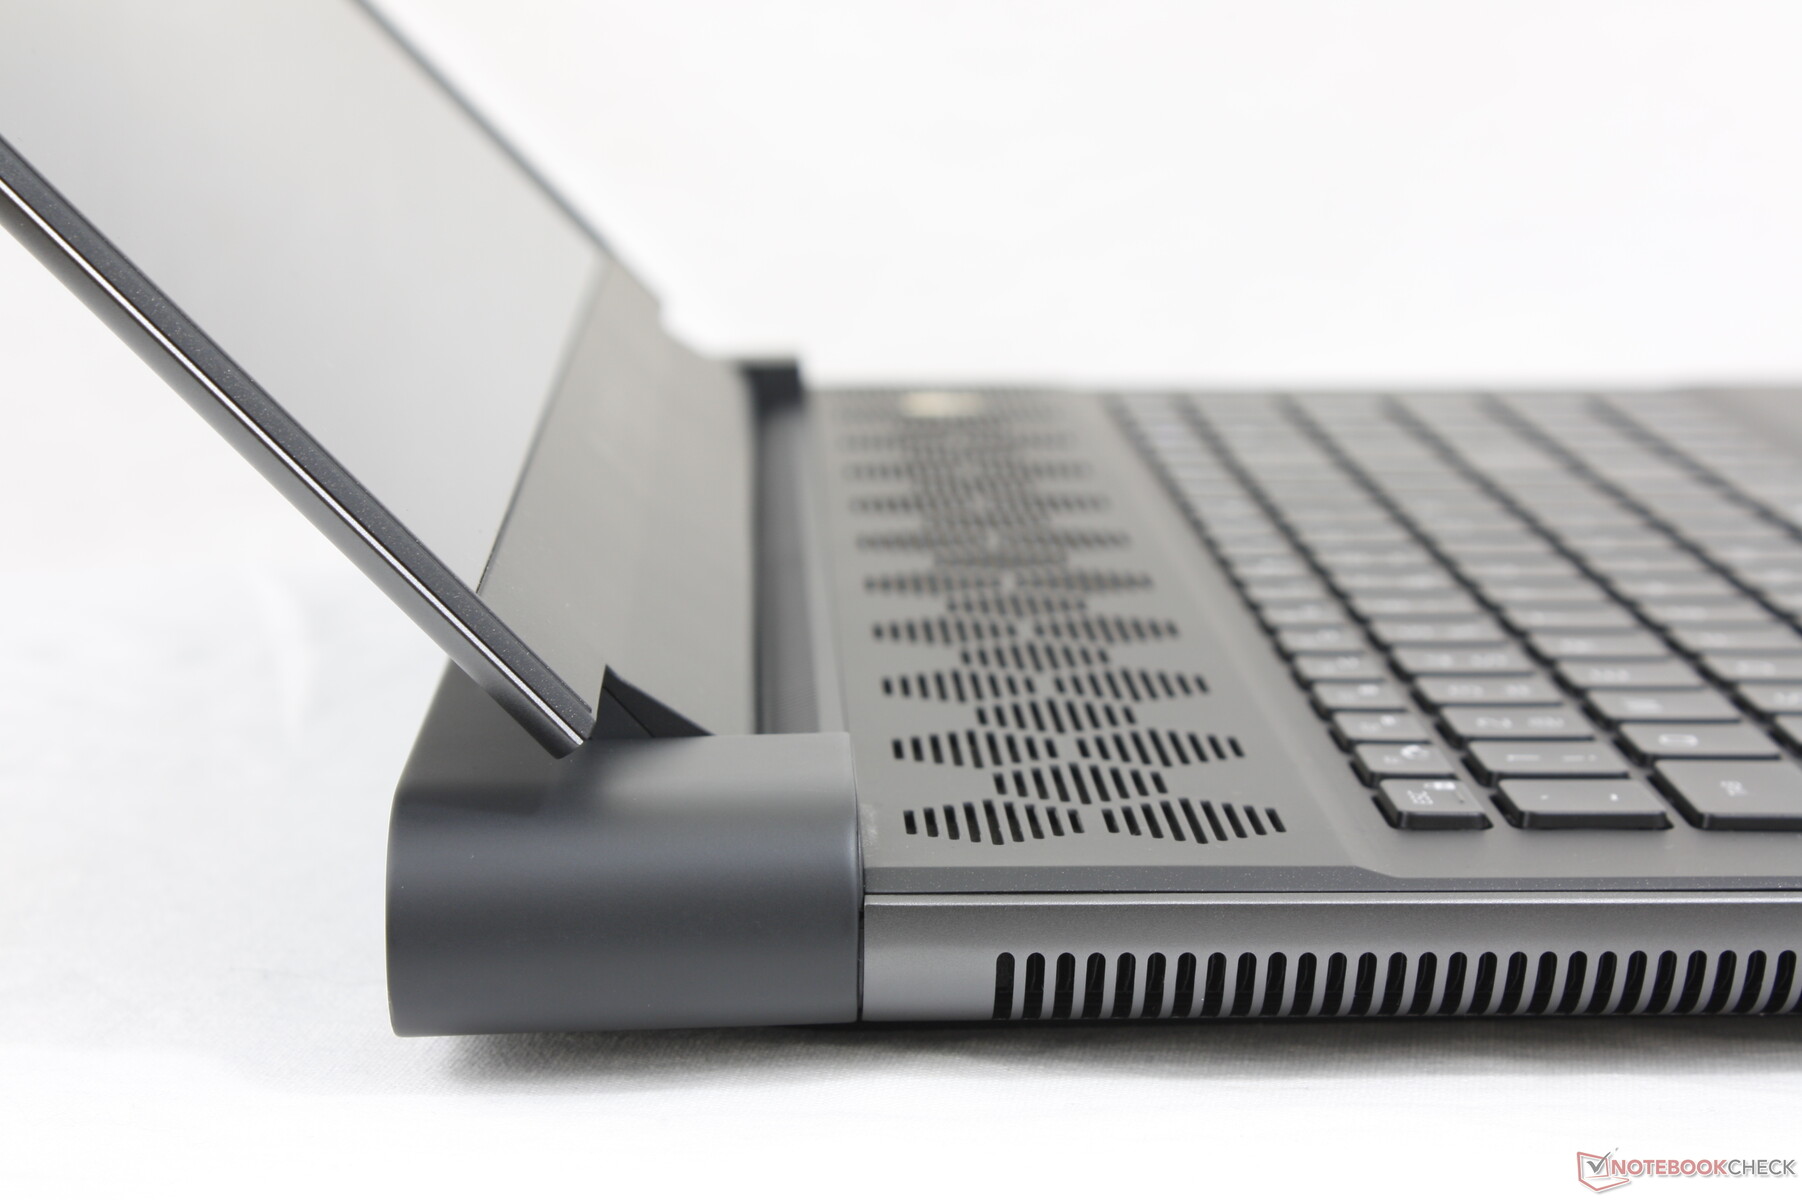
Estojo - Projeto Legenda 3
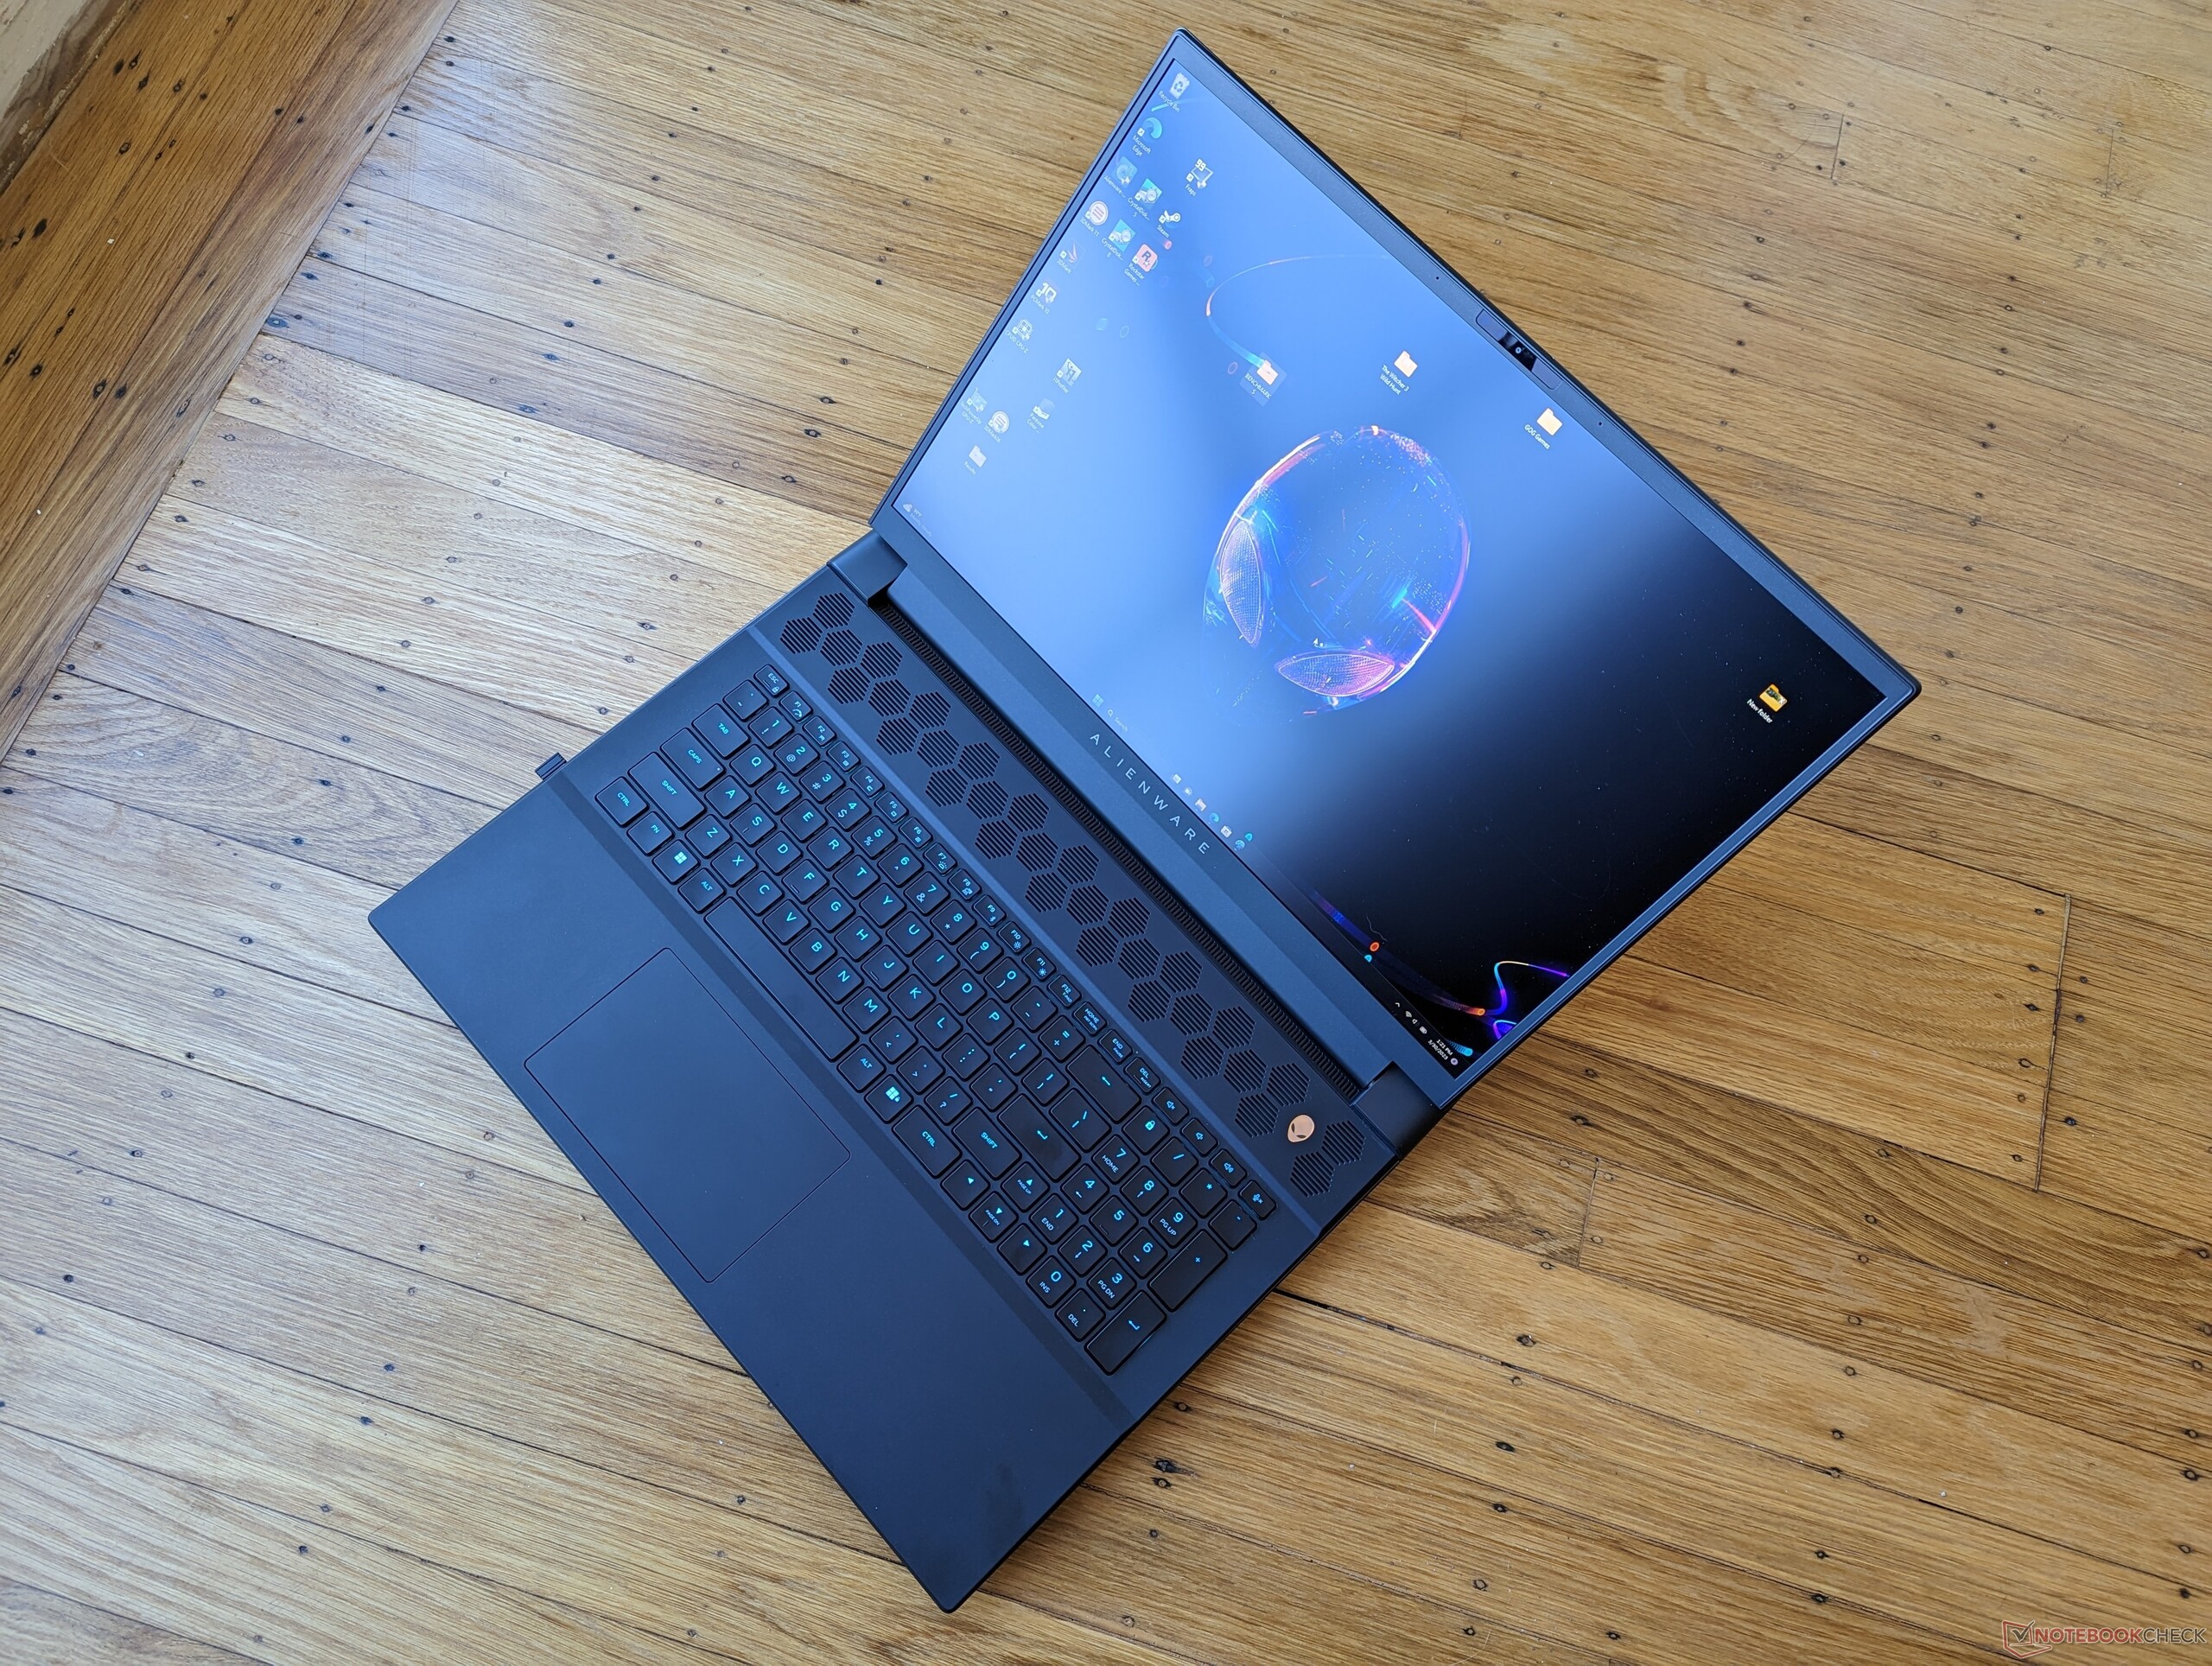
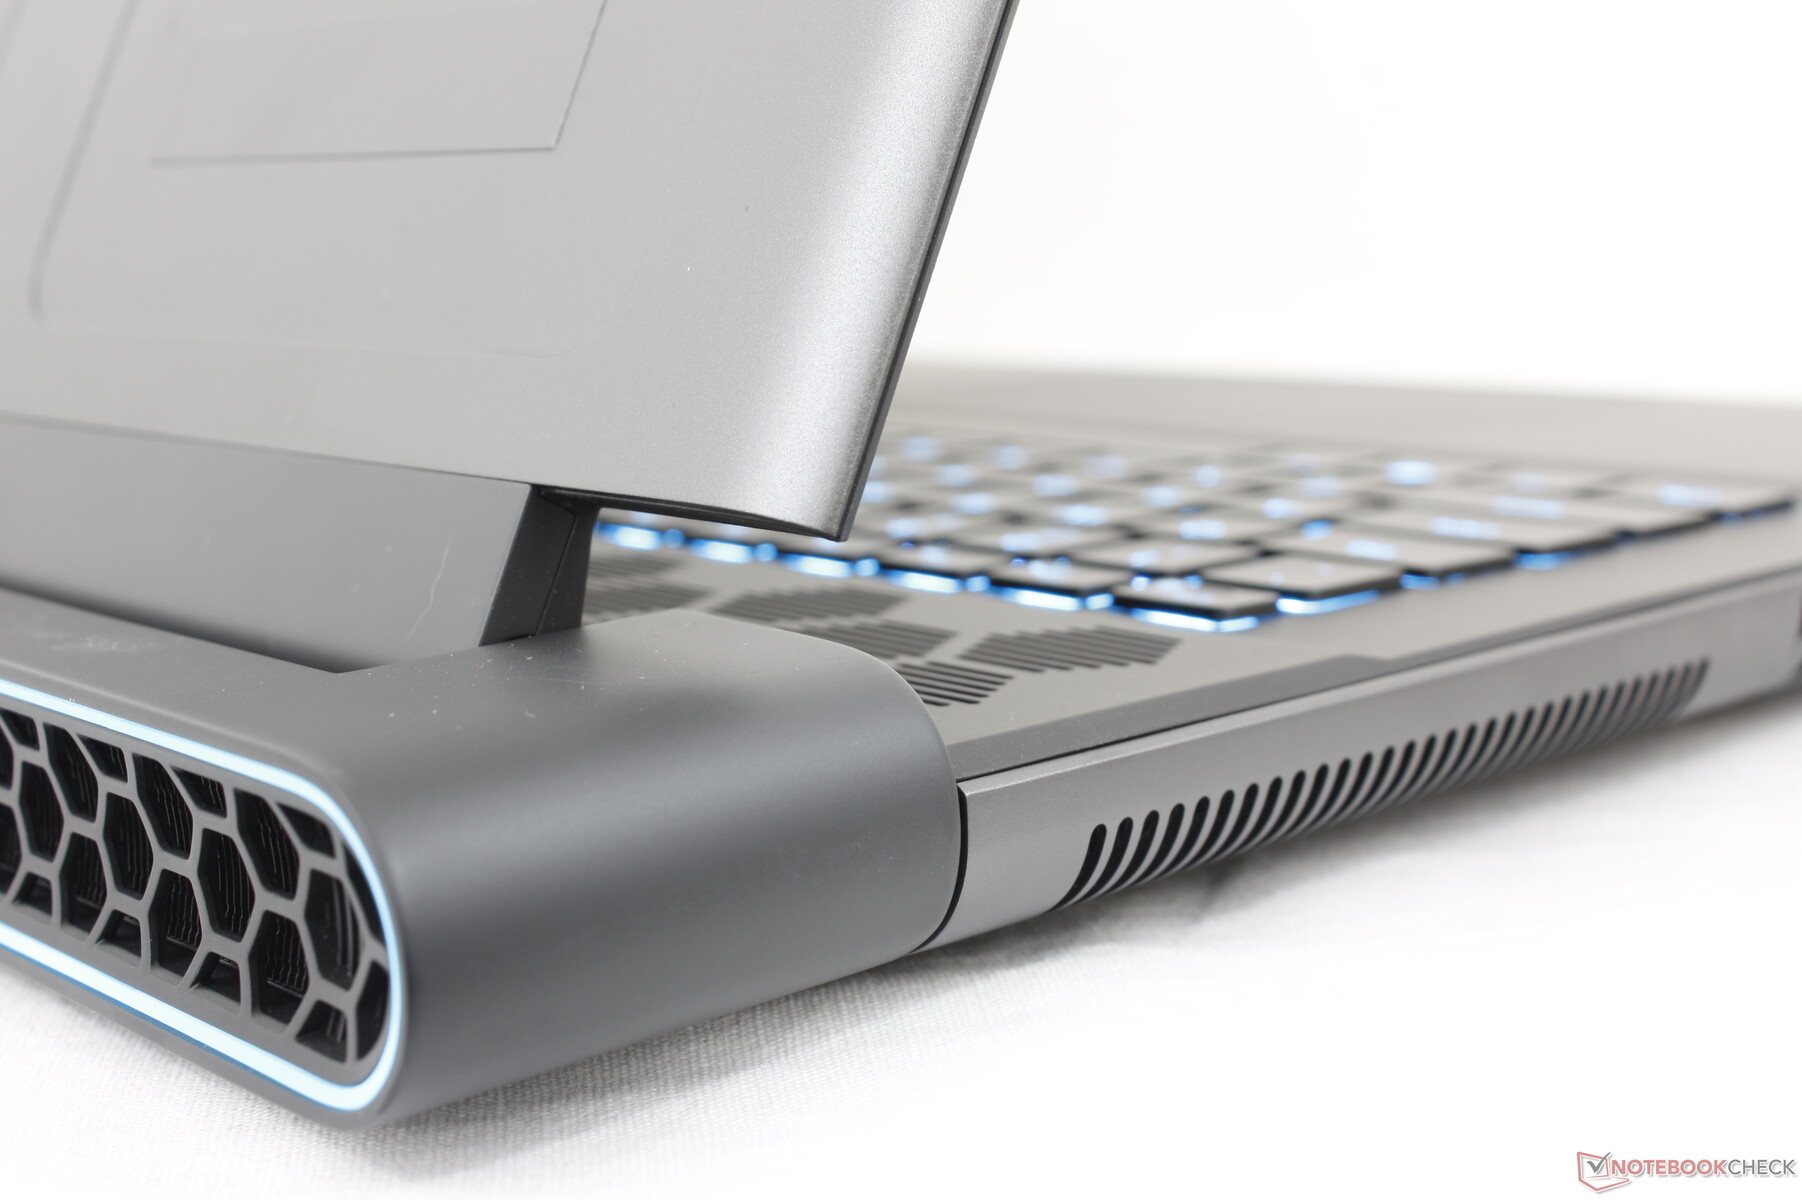
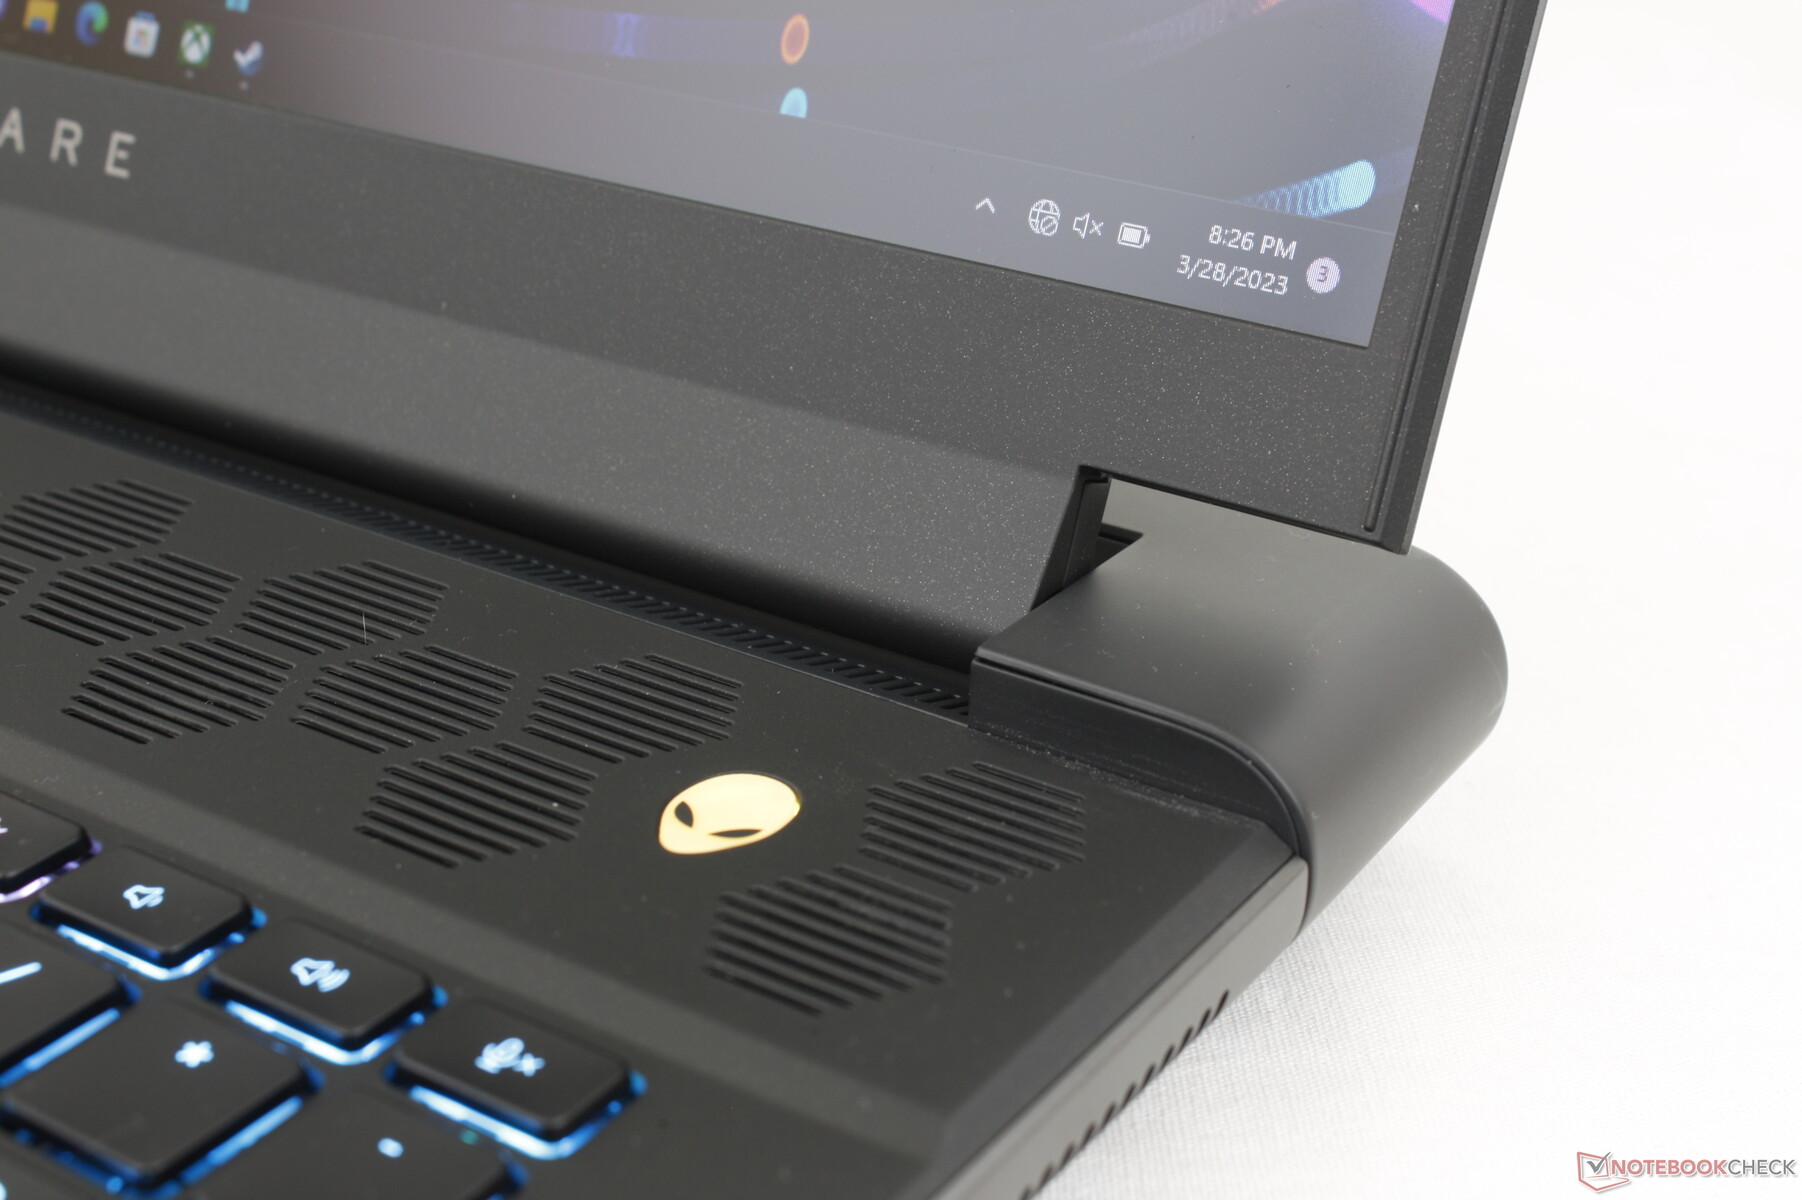
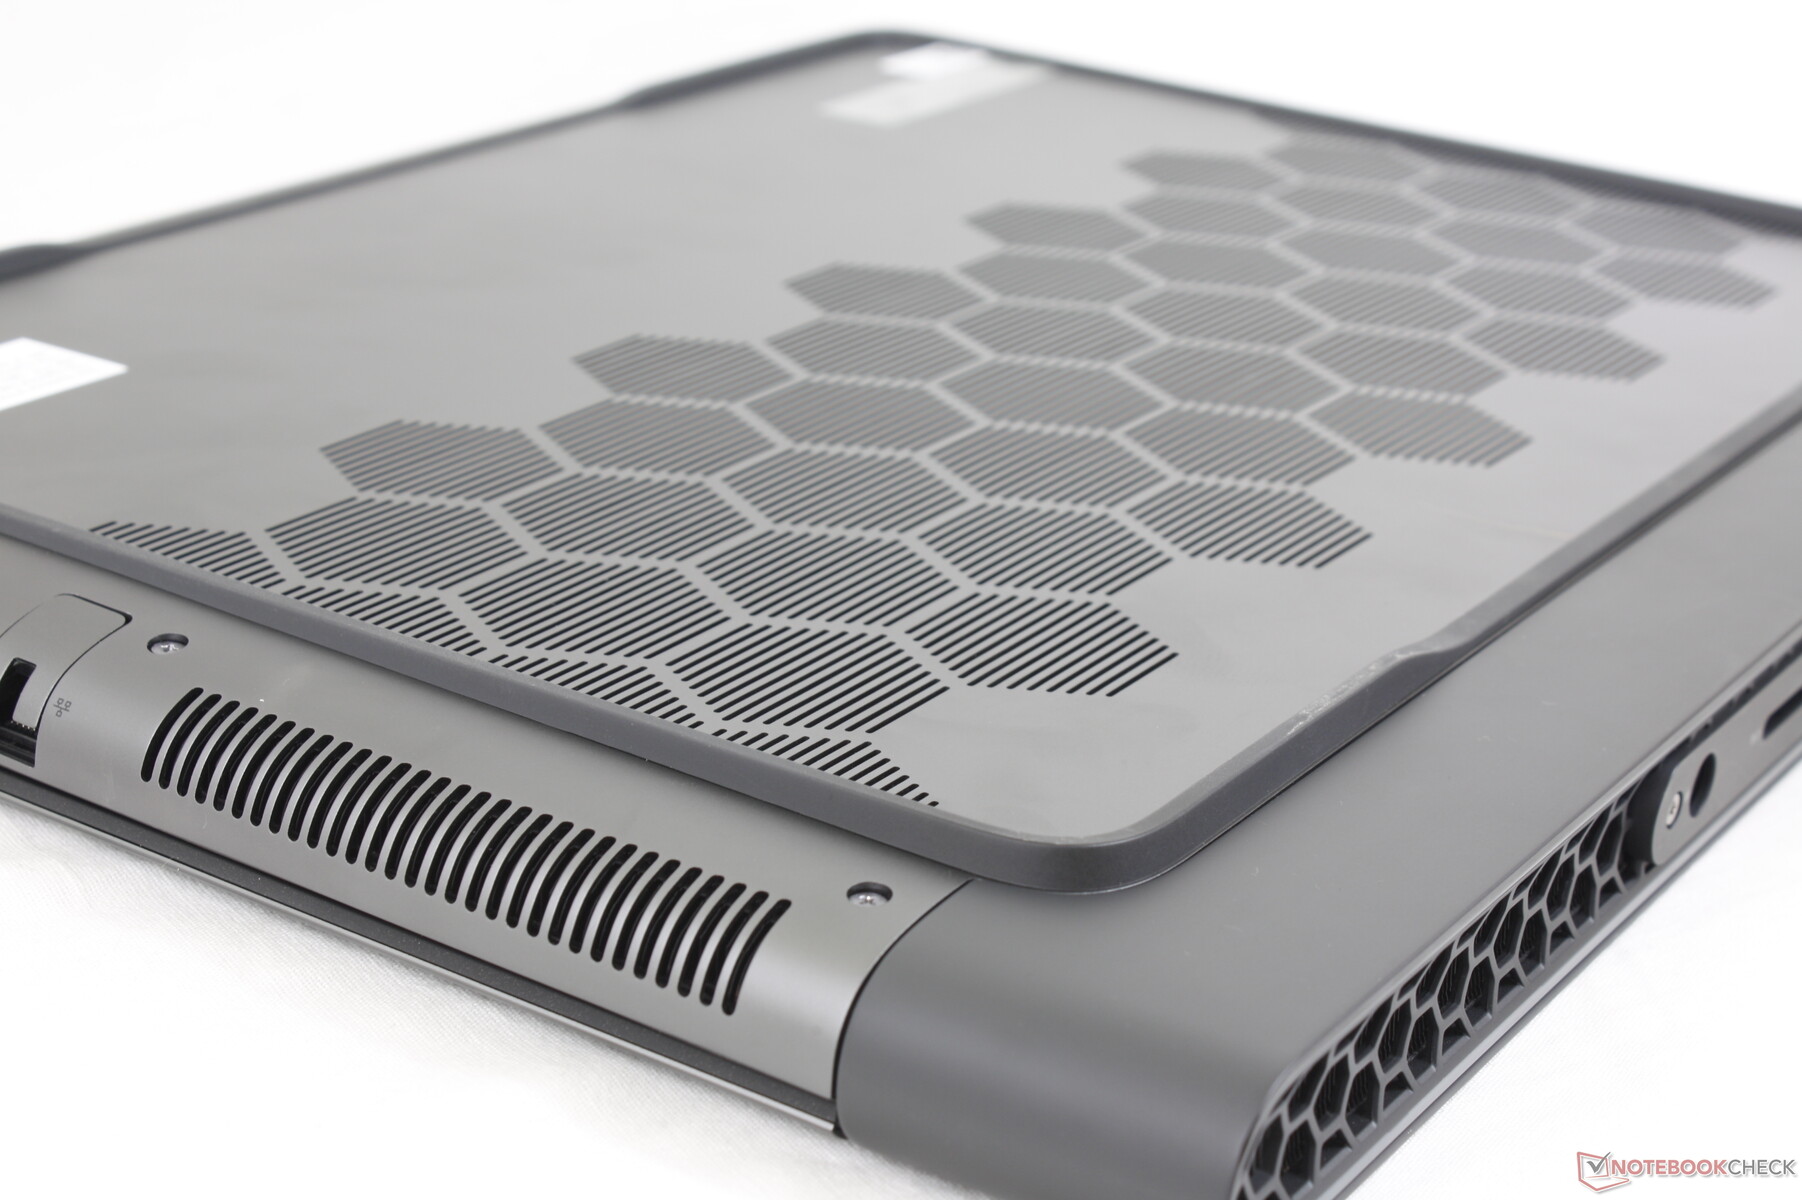
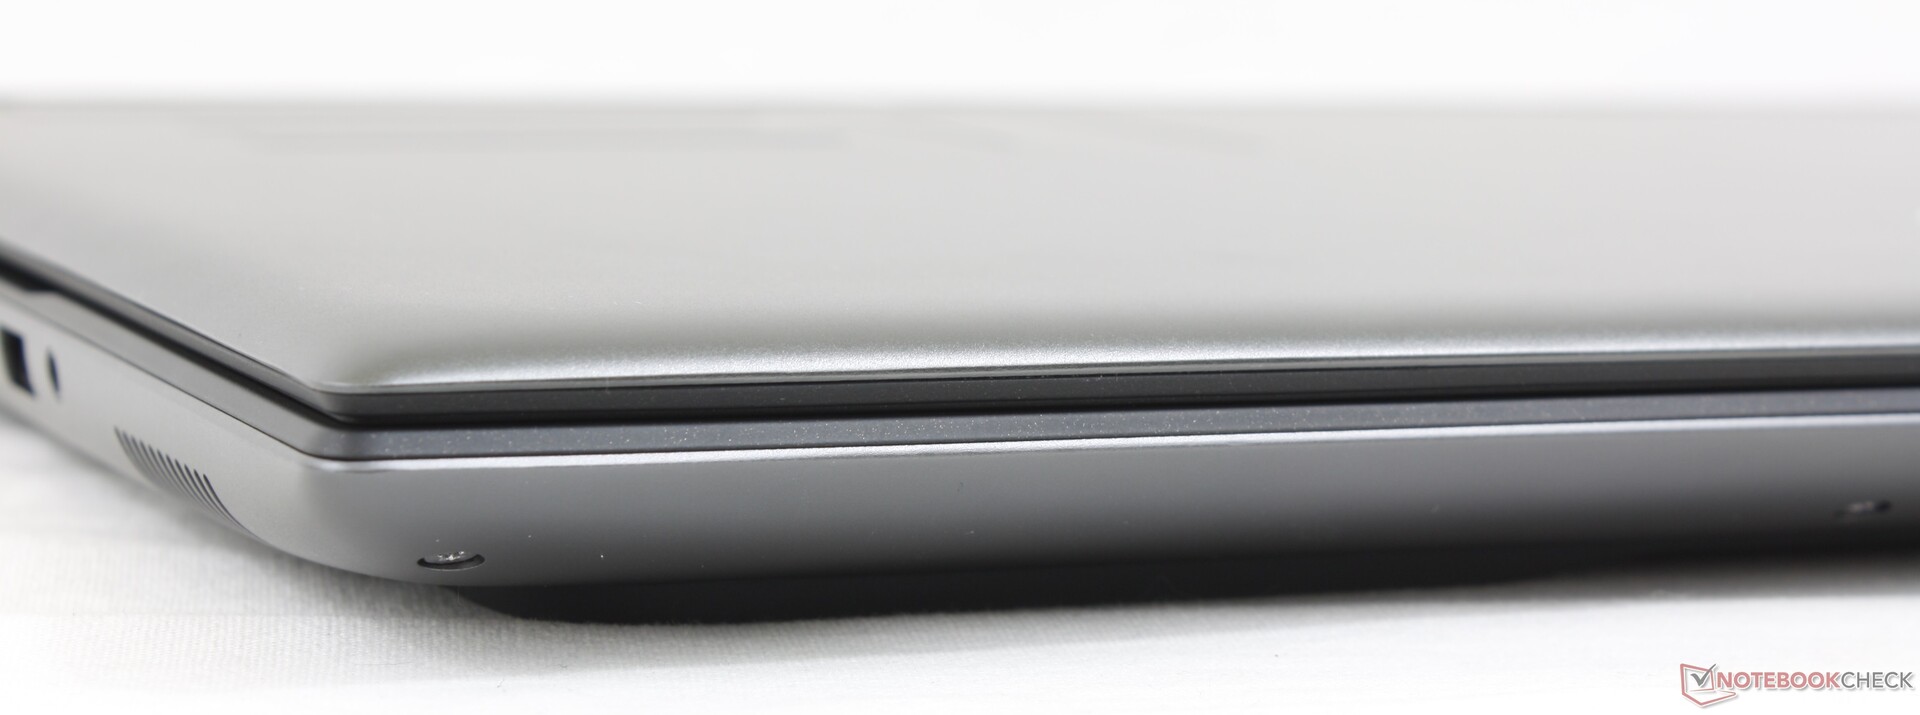
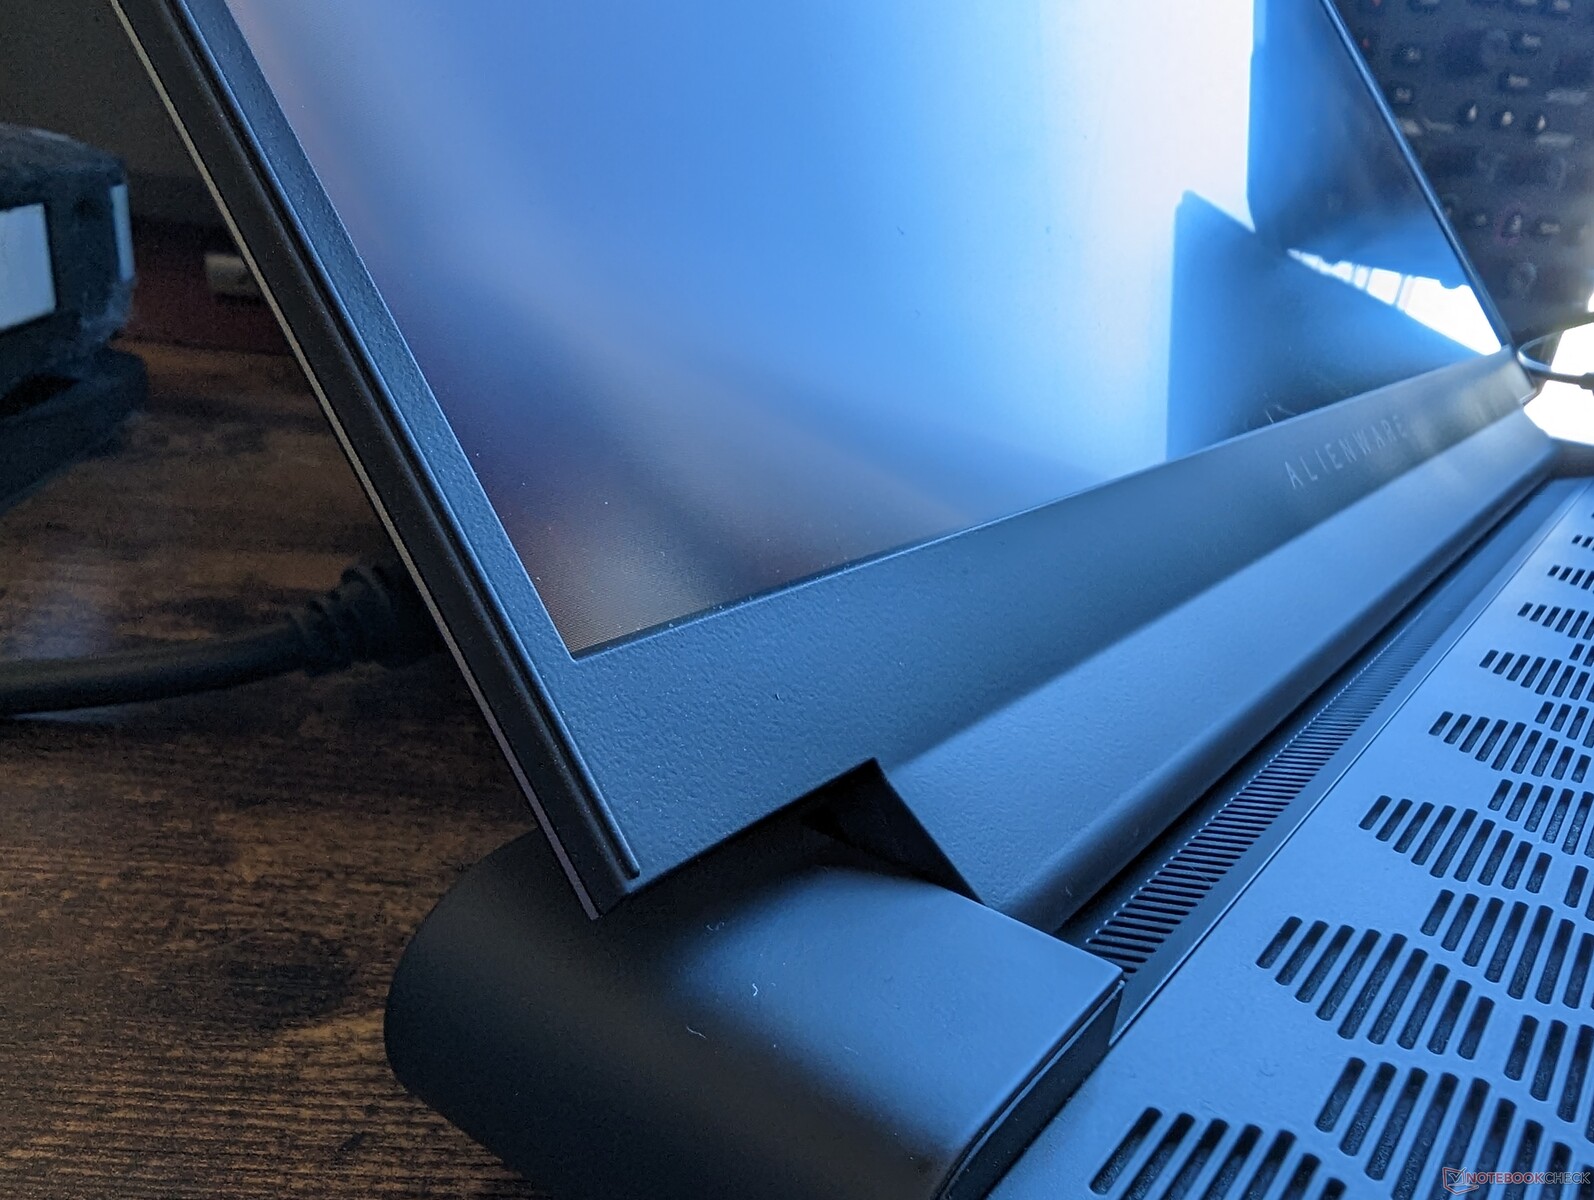
As impressões do chassi são similares às recentes Alienware x17 R2 uma vez que o Alienware m18 R1 usa materiais similares. Sua construção densa e o alinhamento apertado entre os materiais mostram que você não precisa de um design unibody como o Razer Blade 18 para uma sensação de alta qualidade. Tudo desde o centro do teclado até a tampa externa é mais firme e mais resistente a qualquer torção ou depressões do que em muitos outros laptops de jogos, incluindo o MSI GE78.
O teclado de borracha fosca pode ser um saco misto, uma vez que coleta prontamente graxa e impressões digitais desagradáveis ao longo do tempo.
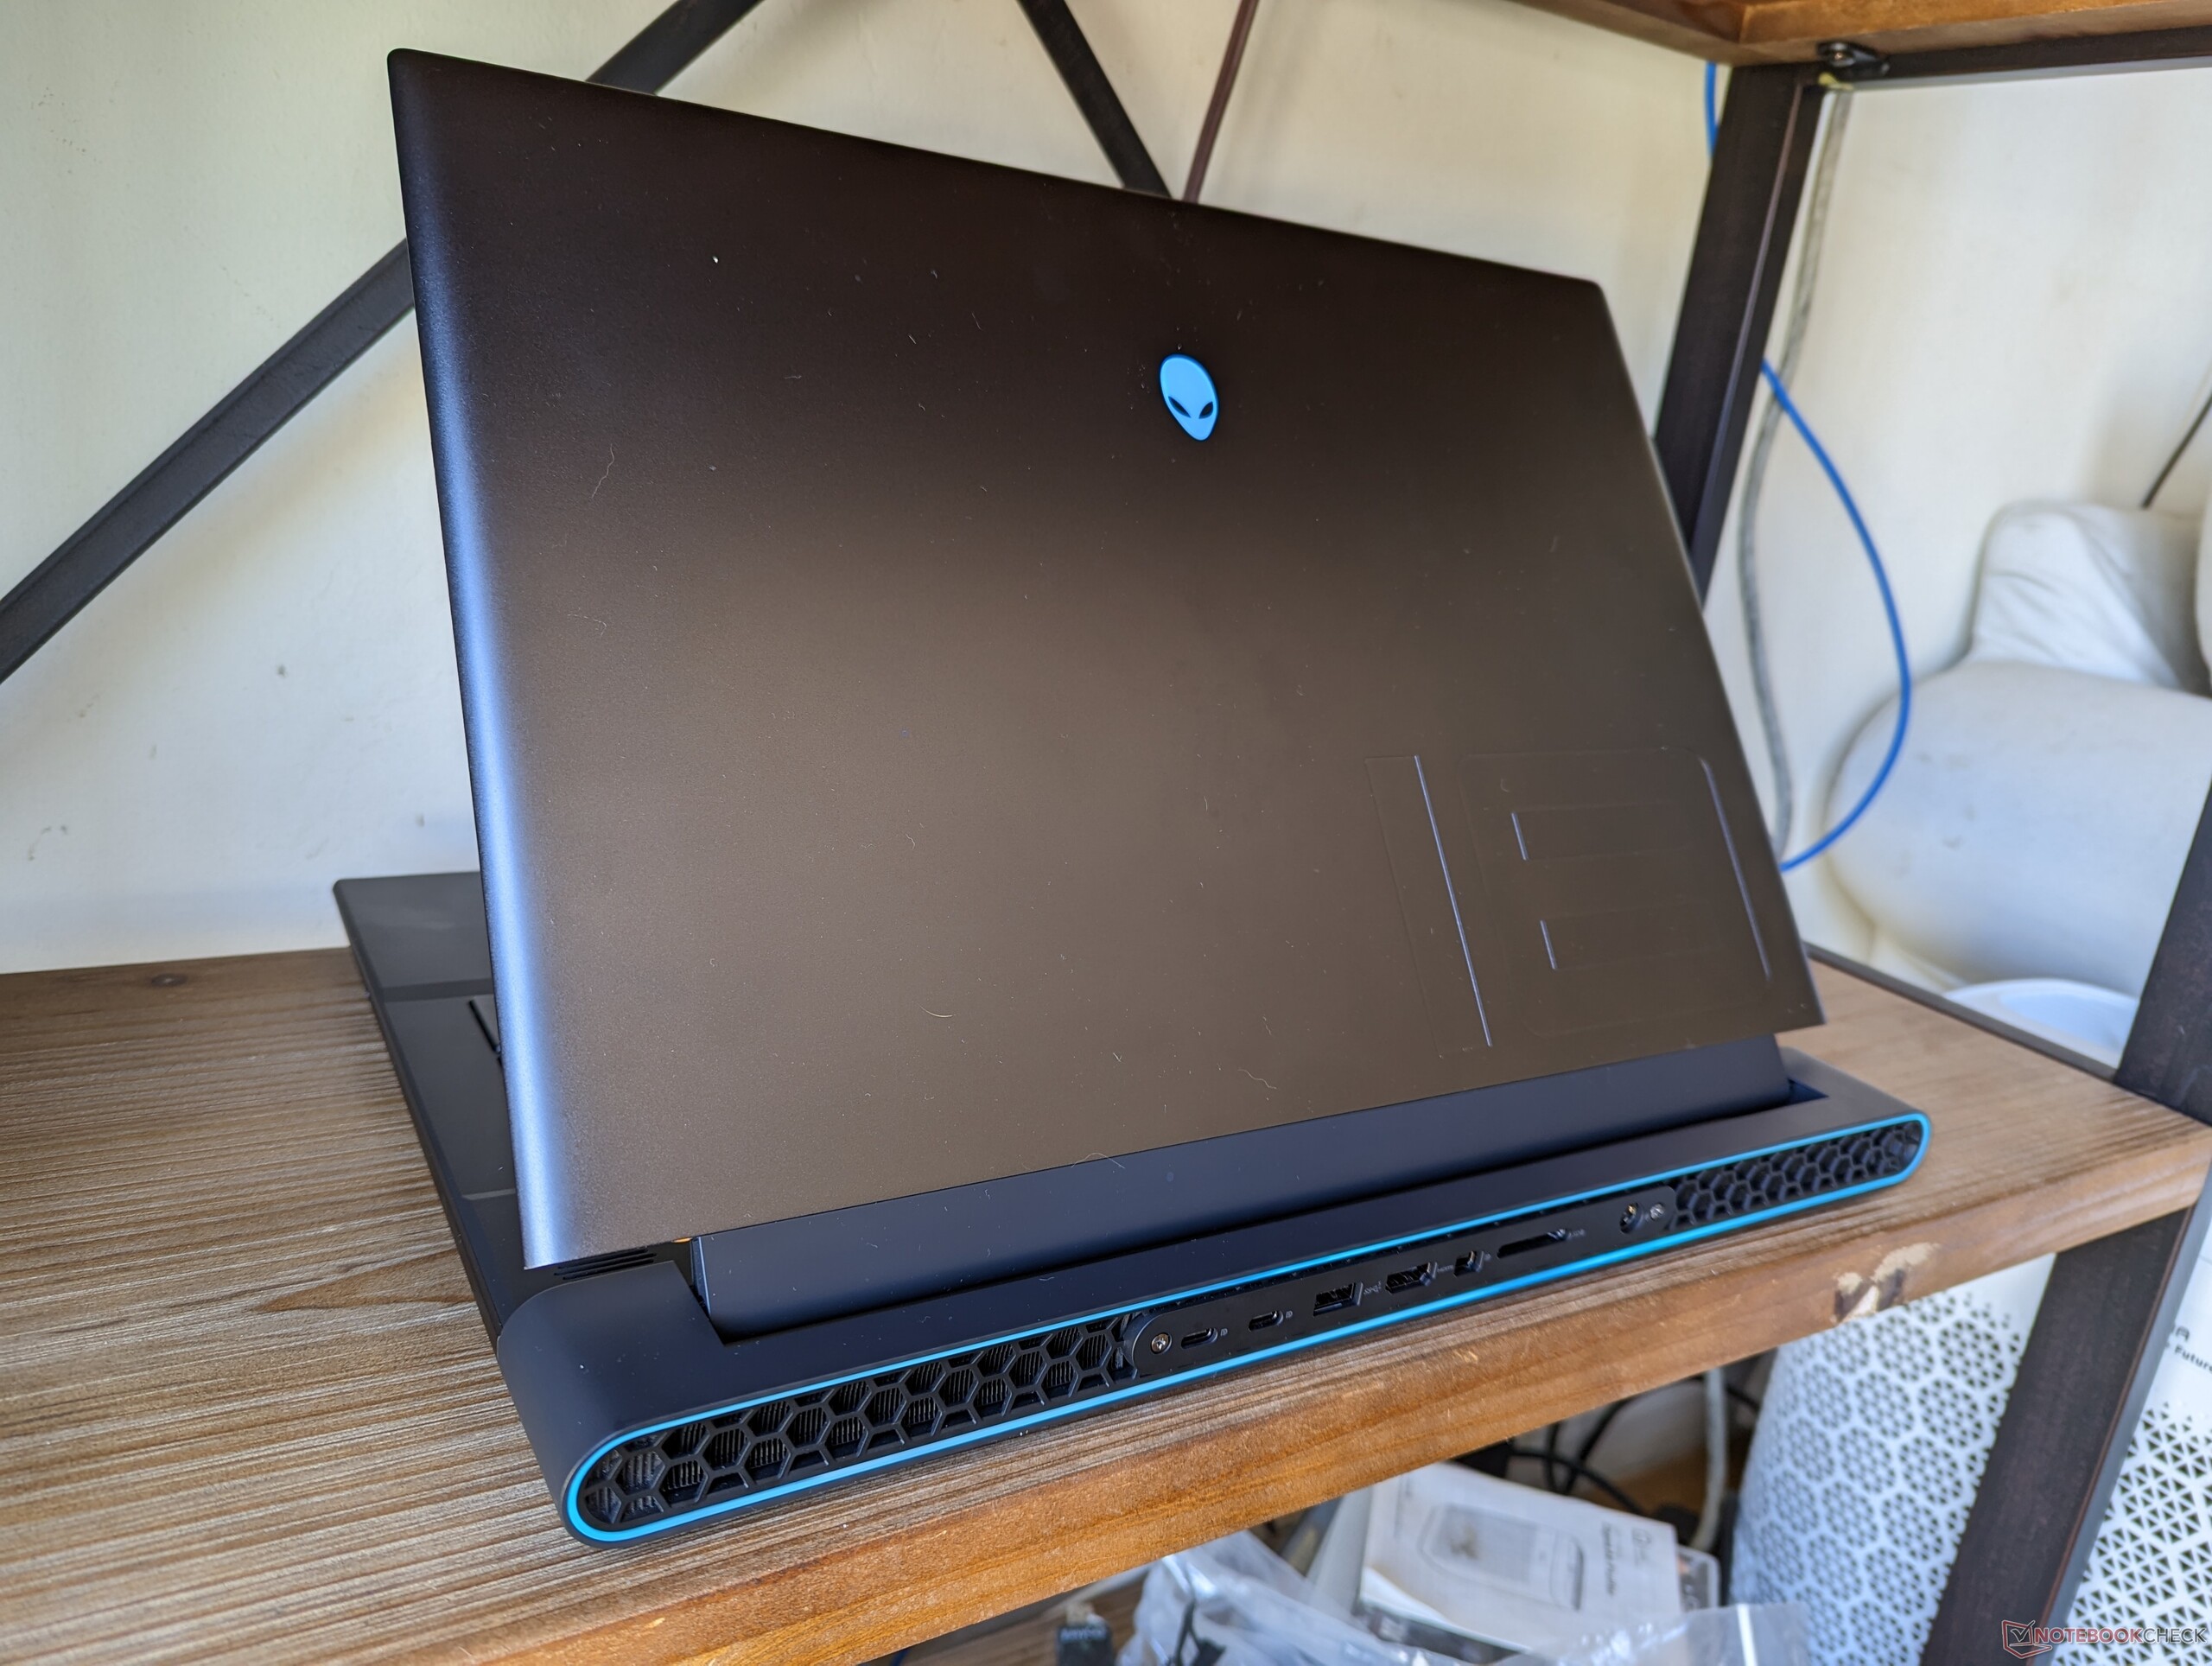
O modelo Alienware é significativamente mais pesado que o Blade 18-inch 18 ouROG Strix Scar 18 por quase um quilograma cada um, para ser um dos laptops mais pesados do ano. De fato, nosso correio de entrega chegou a comentar o peso da caixa de embarque em relação ao seu pequeno tamanho. Muito do peso pode ser atribuído à traseira estendida, ao perfil mais grosso e ao resfriador da câmara de vapor, todos destinados a melhorar o resfriamento. Se você se preocupa com o peso da viagem, então talvez queira considerar o MSI Titan GT77 que, ao invés disso, é mais leve e mais fino do que nossos produtos de informática.
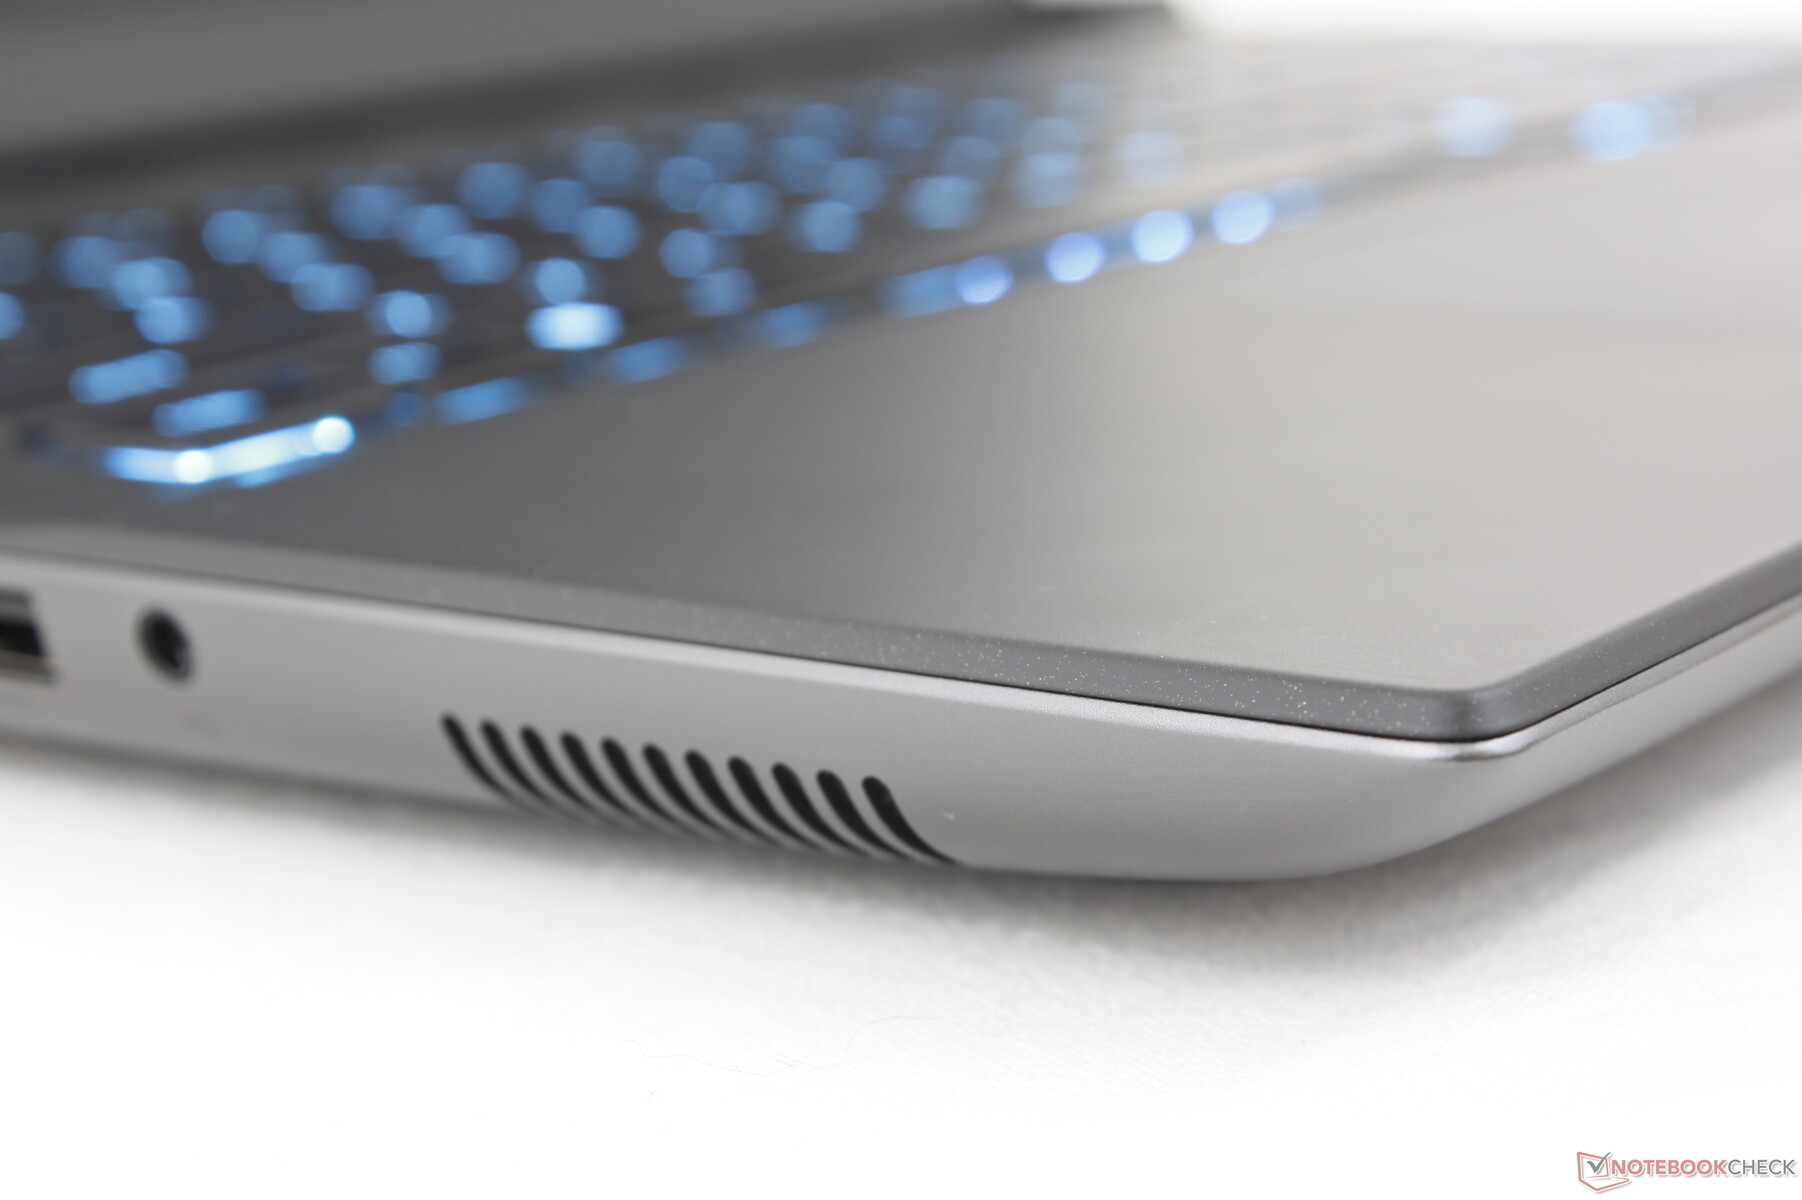
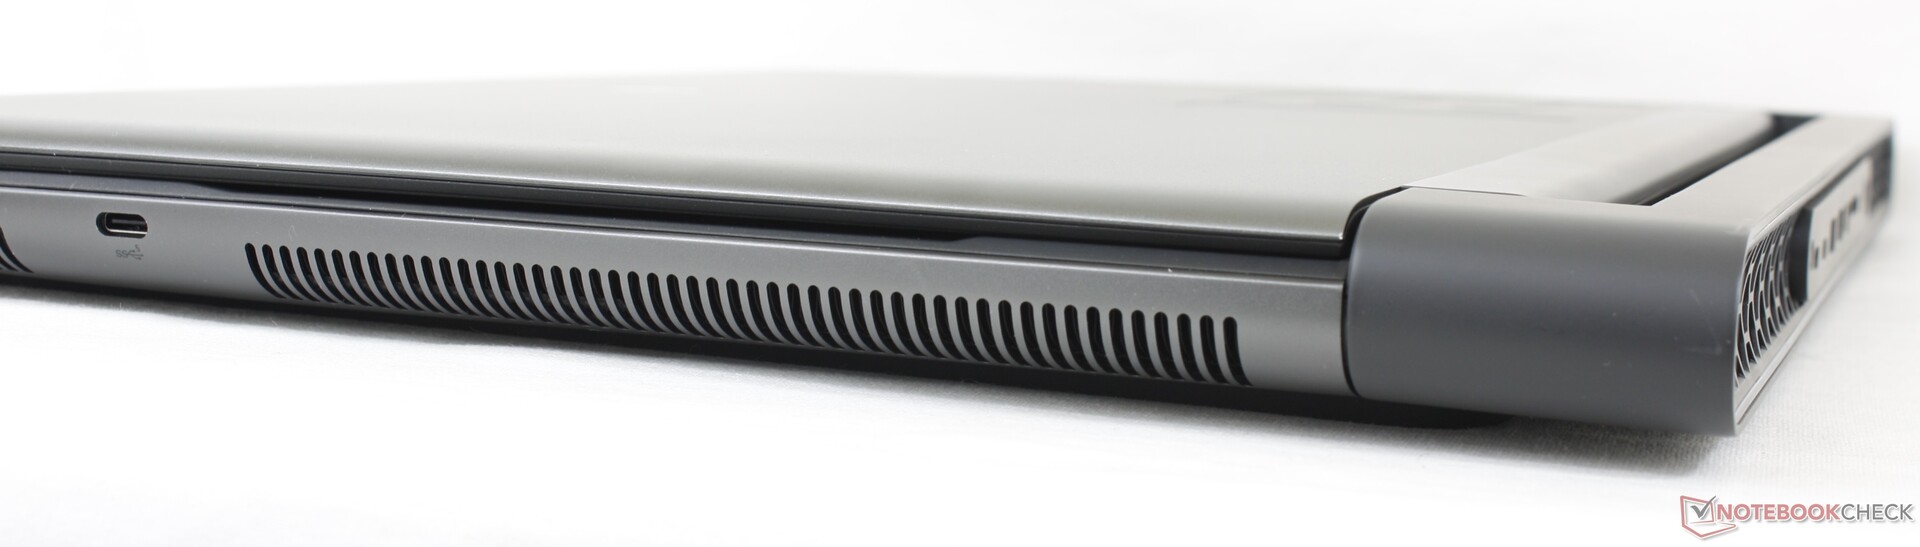
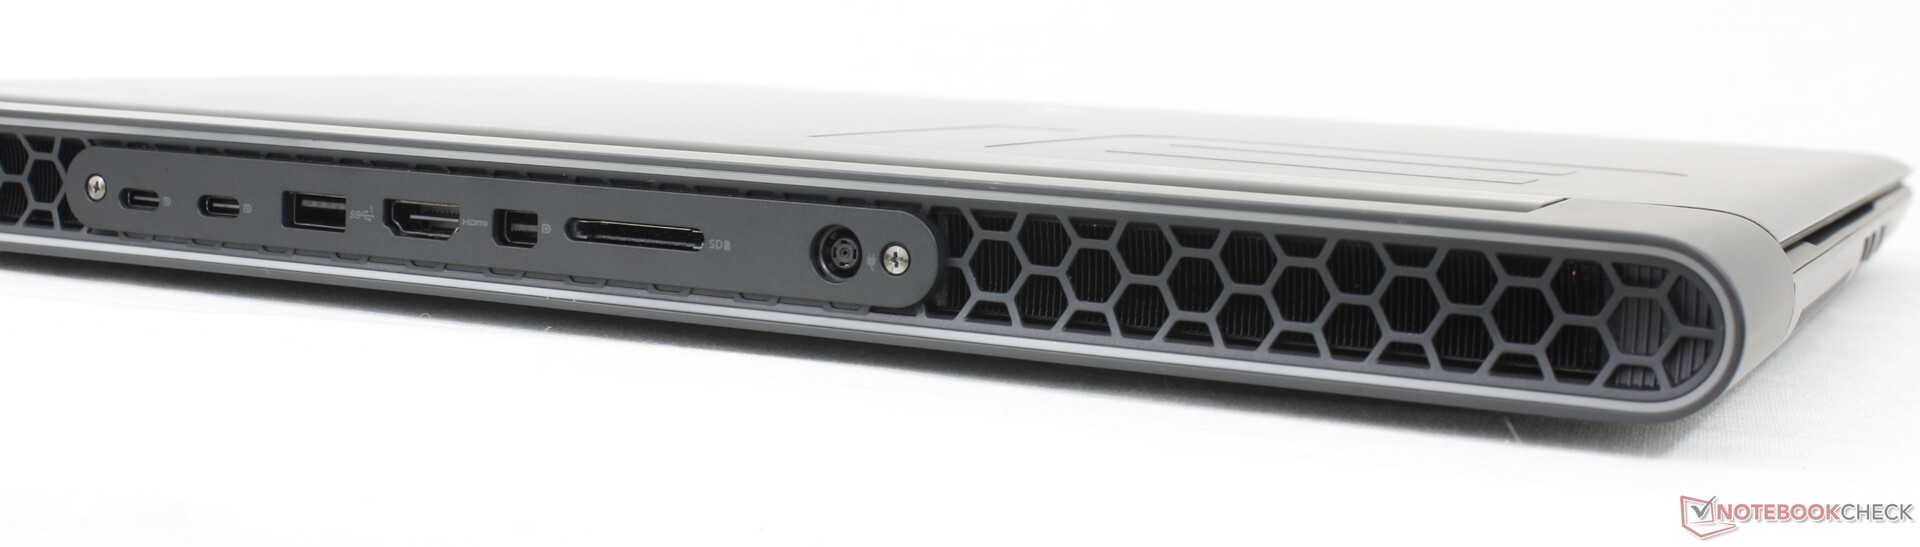
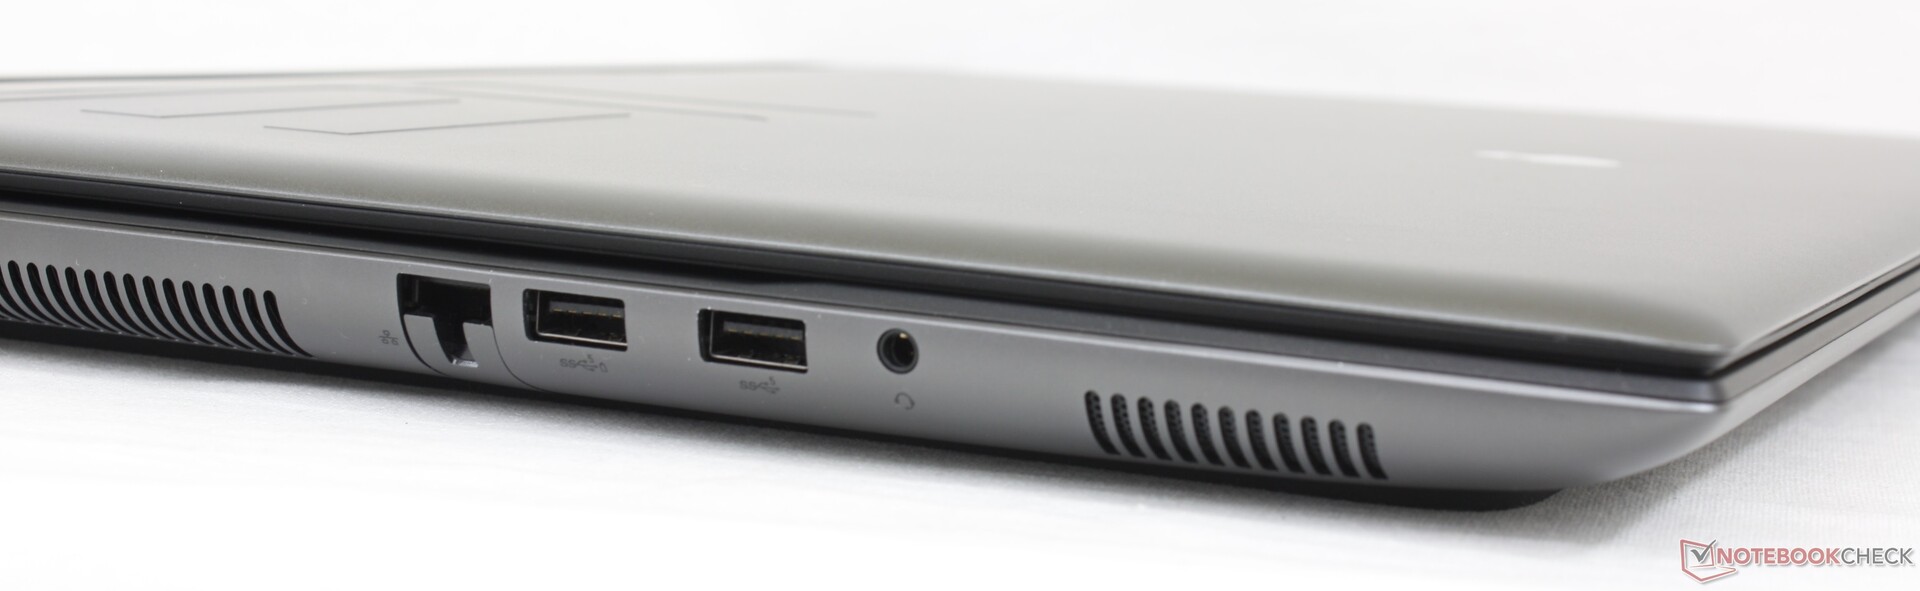
Conectividade - Mais do que o normal
Há mais portos integrados no Alienware do que no concorrente Razer Blade 18 ou Asus ROG Strix Scar 18. O senão, no entanto, é que a maioria dos portos estão bem embalados ao longo da borda traseira, o que os torna um pouco mais difíceis de serem acessados.
Os monitores USB-C só são suportados nas duas portas USB-C traseiras, pois a terceira porta USB-C ao longo da borda direita não suporta saída de vídeo.
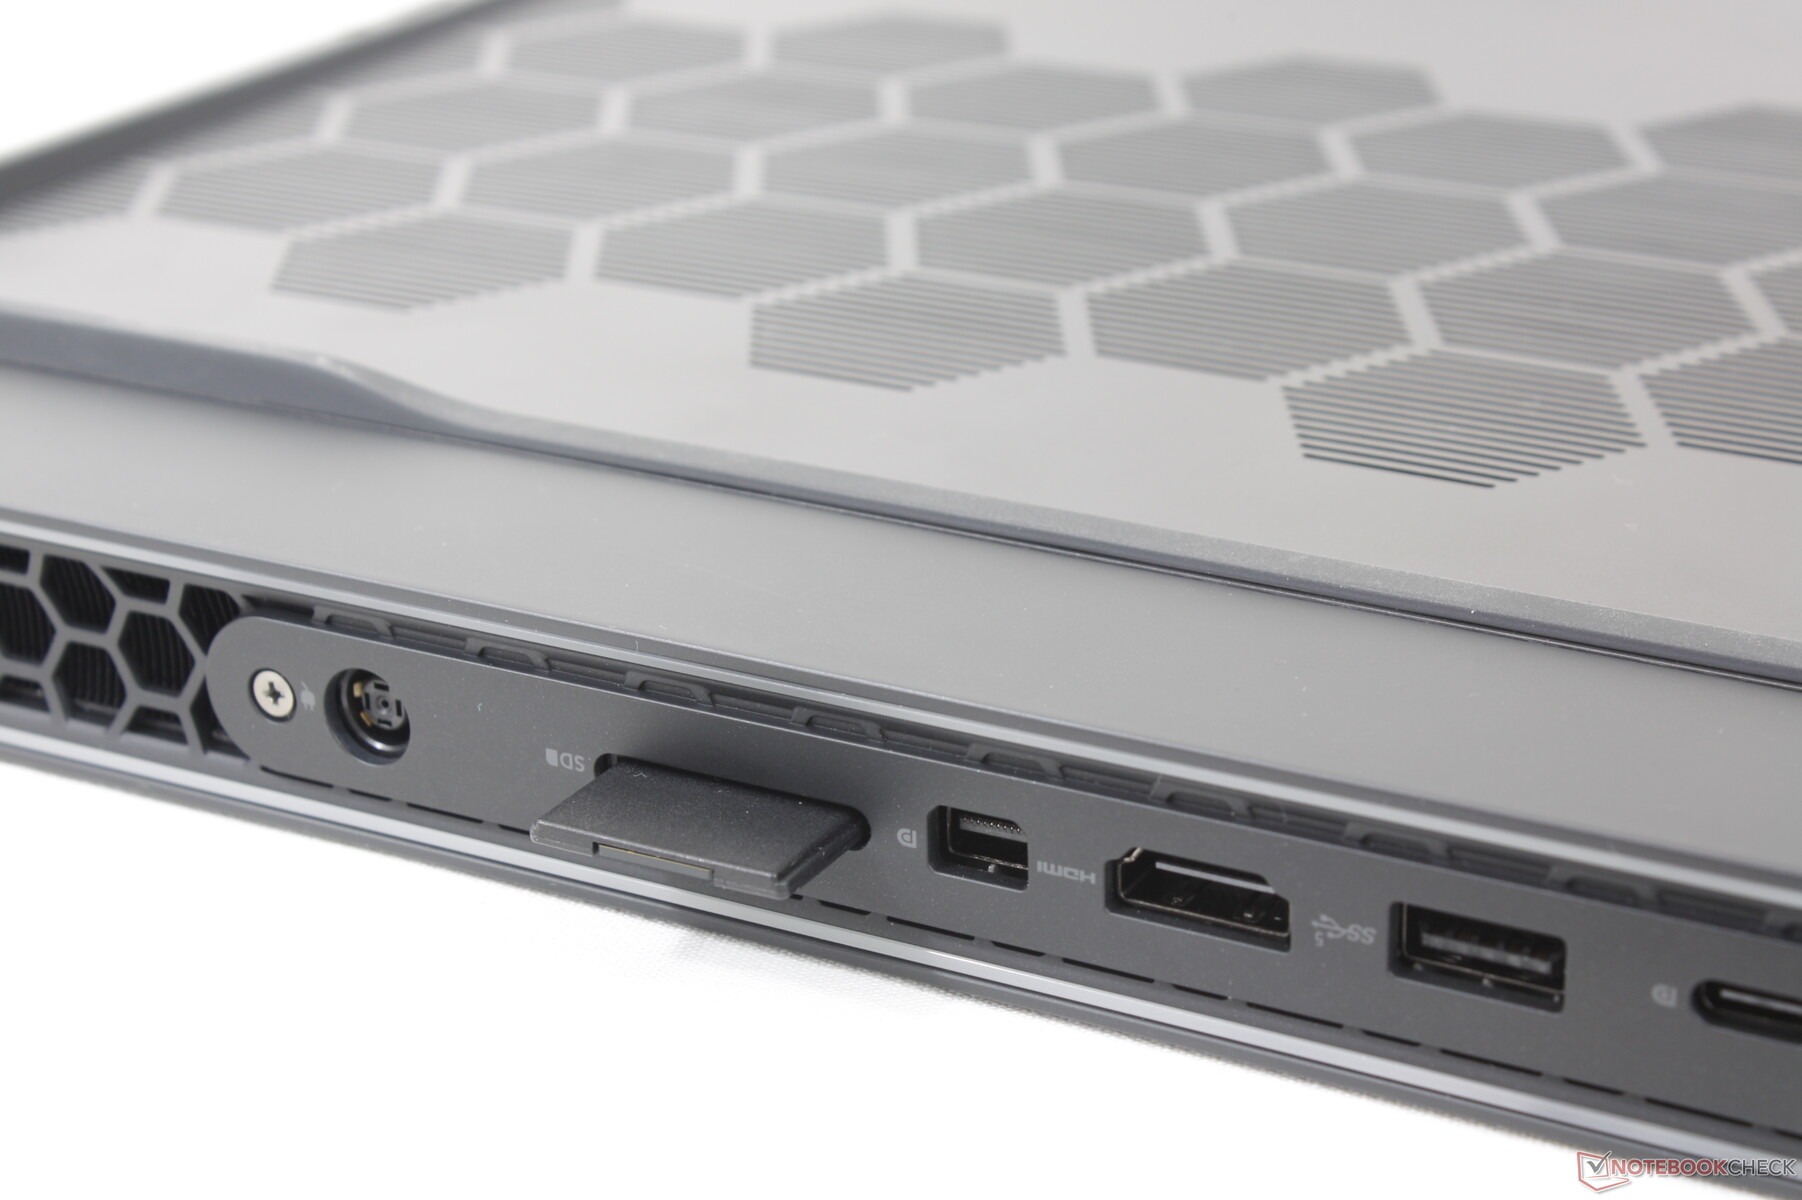
Leitor de cartões SD
O leitor de cartões SD integrado está ao longo da parte traseira da unidade, ao contrário da maioria dos outros laptops. As taxas de transferência são, no entanto, muito rápidas a mais de 2x as velocidades no MSI Titan GT77.
| SD Card Reader | |
| average JPG Copy Test (av. of 3 runs) | |
| Razer Blade 18 RTX 4070 (Angelibird AV Pro V60) | |
| Alienware m18 R1 (Angelibird AV Pro V60) | |
| Alienware x17 R2 P48E (AV Pro V60) | |
| MSI Titan GT77 HX 13VI (Angelibird AV Pro V60) | |
| Eluktronics Mech-17 GP2 (Angelibird AV Pro V60) | |
| maximum AS SSD Seq Read Test (1GB) | |
| Alienware x17 R2 P48E (AV Pro V60) | |
| Alienware m18 R1 (Angelibird AV Pro V60) | |
| Razer Blade 18 RTX 4070 (Angelibird AV Pro V60) | |
| Eluktronics Mech-17 GP2 (Angelibird AV Pro V60) | |
| MSI Titan GT77 HX 13VI (Angelibird AV Pro V60) | |
Comunicação
Um Intel Killer 1675i vem como padrão para compatibilidade com Wi-Fi 6E e Bluetooth 5.2. O Killer é uma sub-marca da Intel otimizada para laptops de jogos e por isso o Killer 1675i é essencialmente um Intel AX211 no coração. O desempenho é excelente e confiável quando comparado ao nosso roteador de teste Asus AXE11000.
| Networking | |
| iperf3 transmit AX12 | |
| Alienware x17 R2 P48E | |
| iperf3 receive AX12 | |
| Alienware x17 R2 P48E | |
| iperf3 transmit AXE11000 | |
| MSI Titan GT77 HX 13VI | |
| Asus ROG Strix Scar 18 2023 G834JY-N6005W | |
| Eluktronics Mech-17 GP2 | |
| Alienware m18 R1 | |
| Razer Blade 18 RTX 4070 | |
| iperf3 receive AXE11000 | |
| Asus ROG Strix Scar 18 2023 G834JY-N6005W | |
| MSI Titan GT77 HX 13VI | |
| Razer Blade 18 RTX 4070 | |
| Eluktronics Mech-17 GP2 | |
| Alienware m18 R1 | |
| iperf3 transmit AXE11000 6GHz | |
| Alienware m18 R1 | |
| Razer Blade 18 RTX 4070 | |
| iperf3 receive AXE11000 6GHz | |
| Razer Blade 18 RTX 4070 | |
| Alienware m18 R1 | |
Webcam
A webcam de 2 MP é típica na maioria dos laptops atualmente, mas estamos ligeiramente desapontados por não ver um sensor de 5 MP dado o tamanho do chassi. O infravermelho vem de série enquanto um obturador de webcam está ausente, ao contrário do Razer Blade 18.


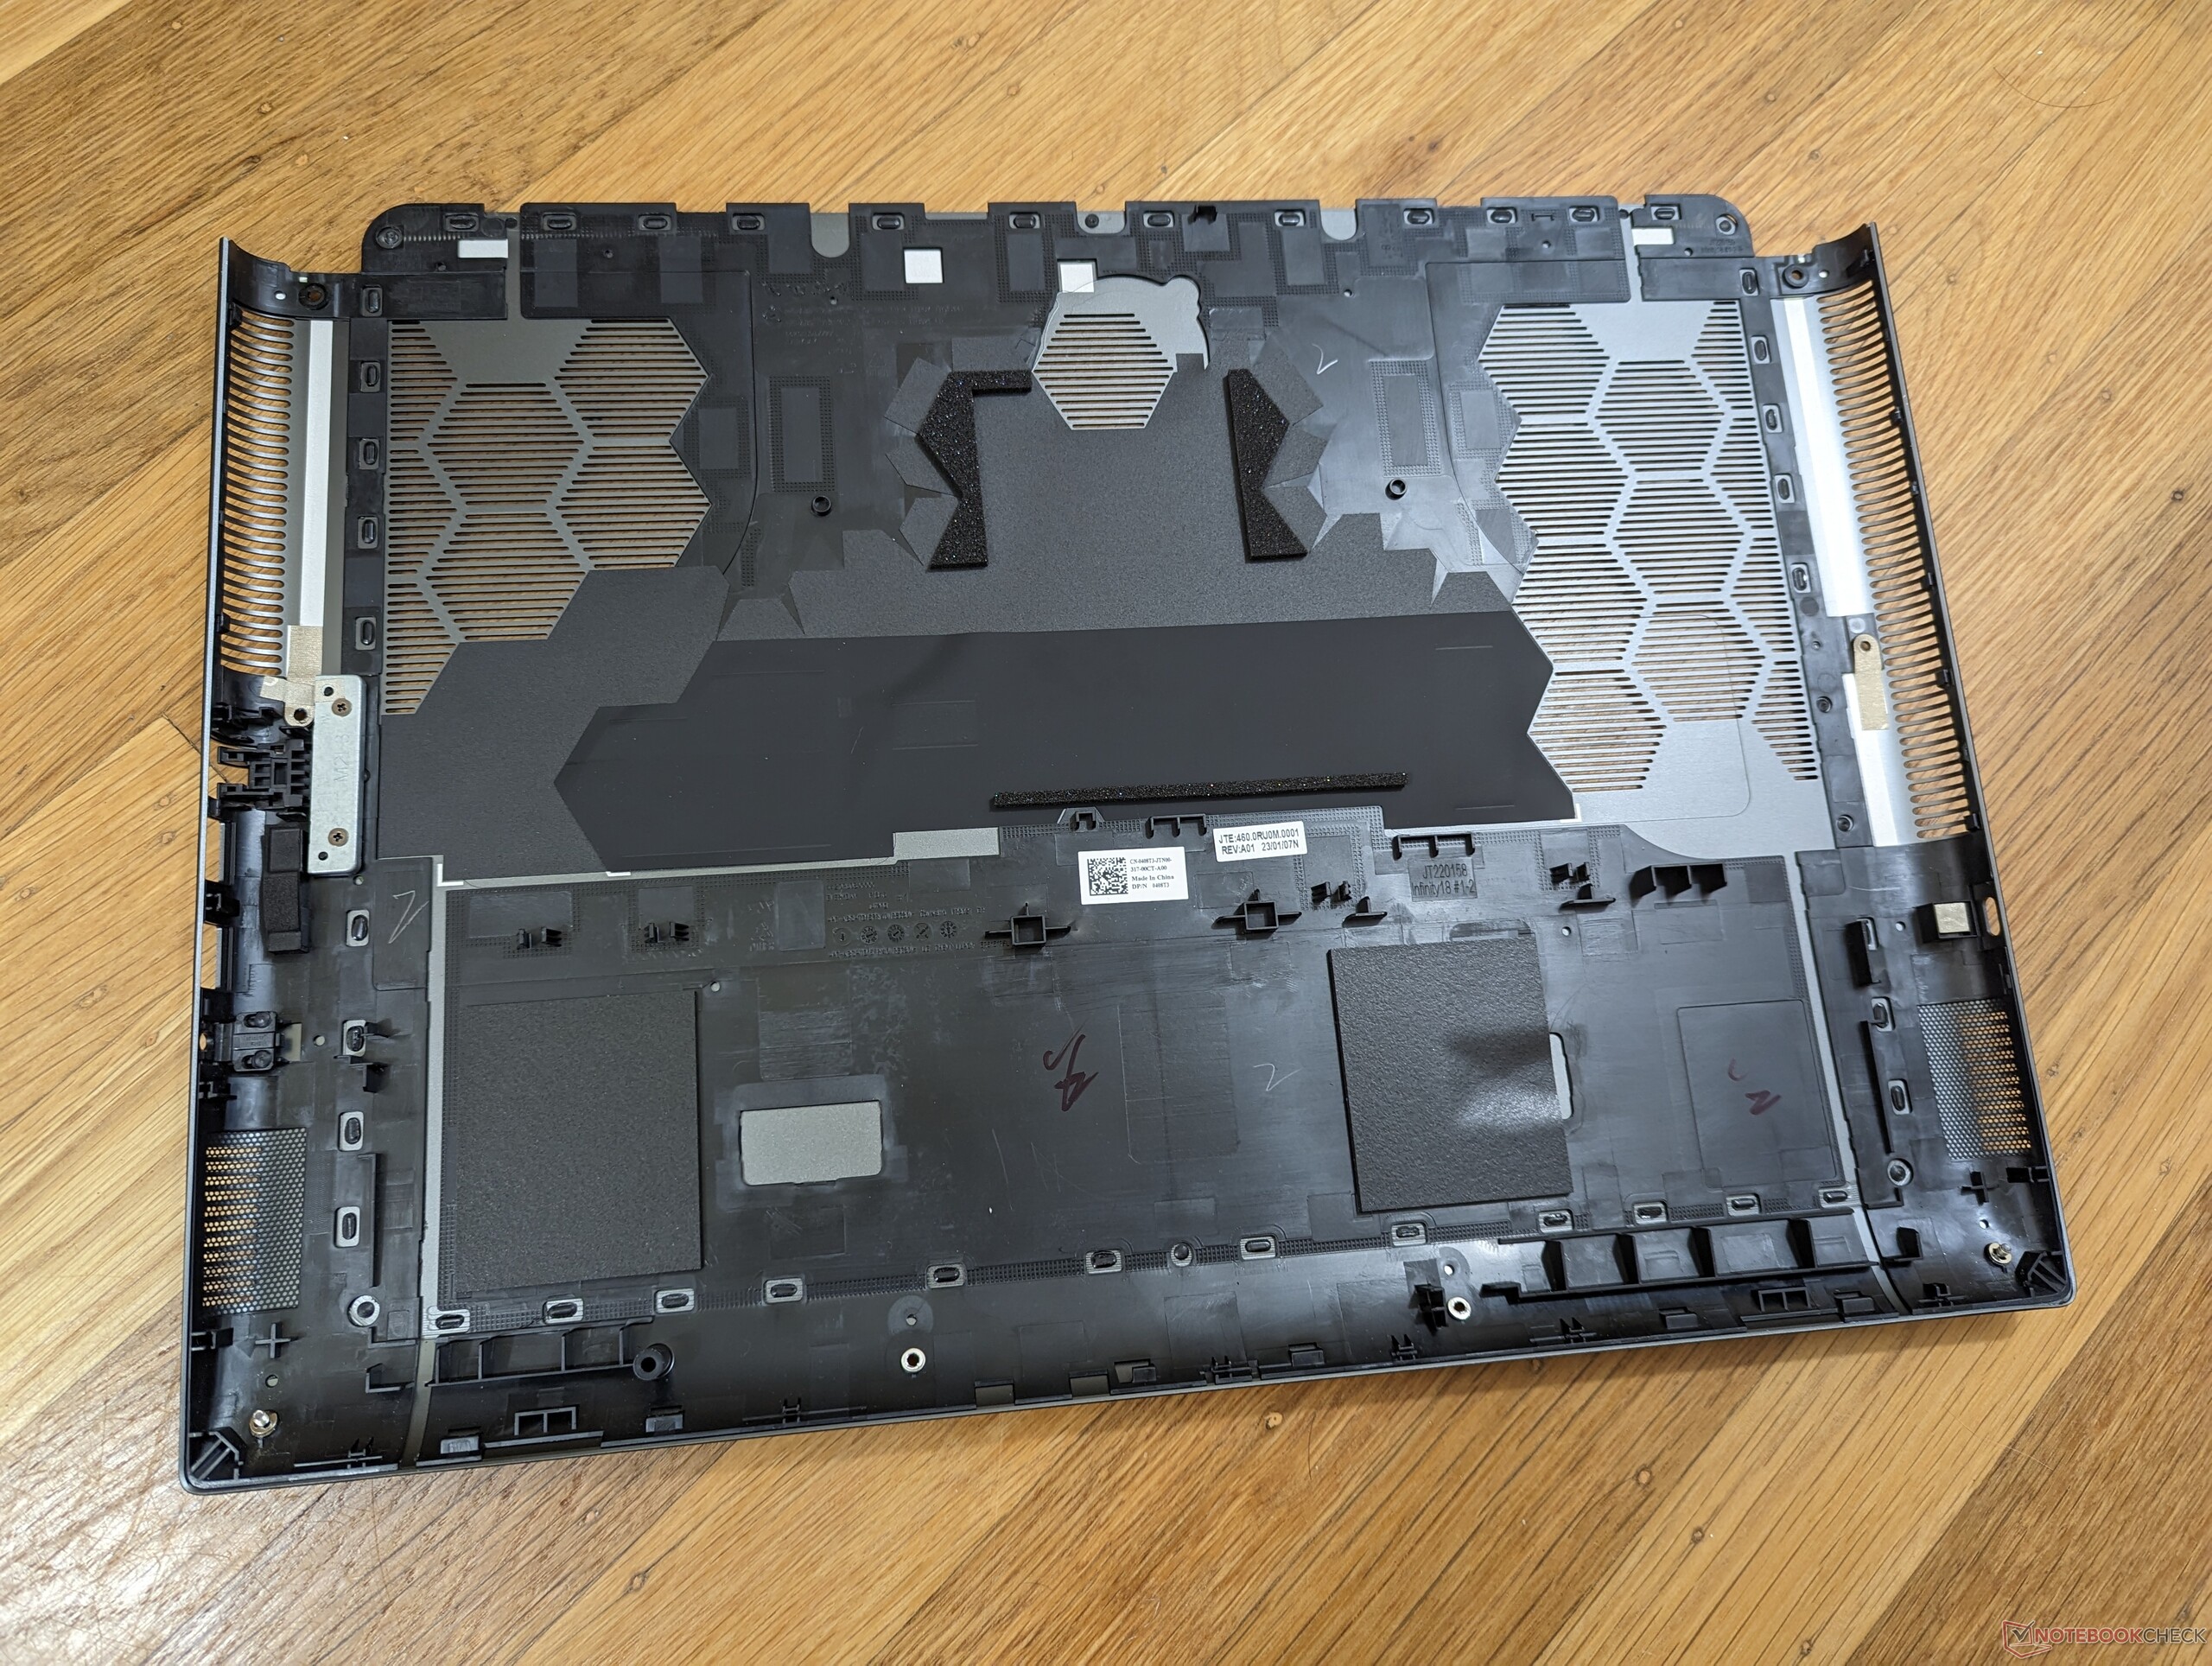
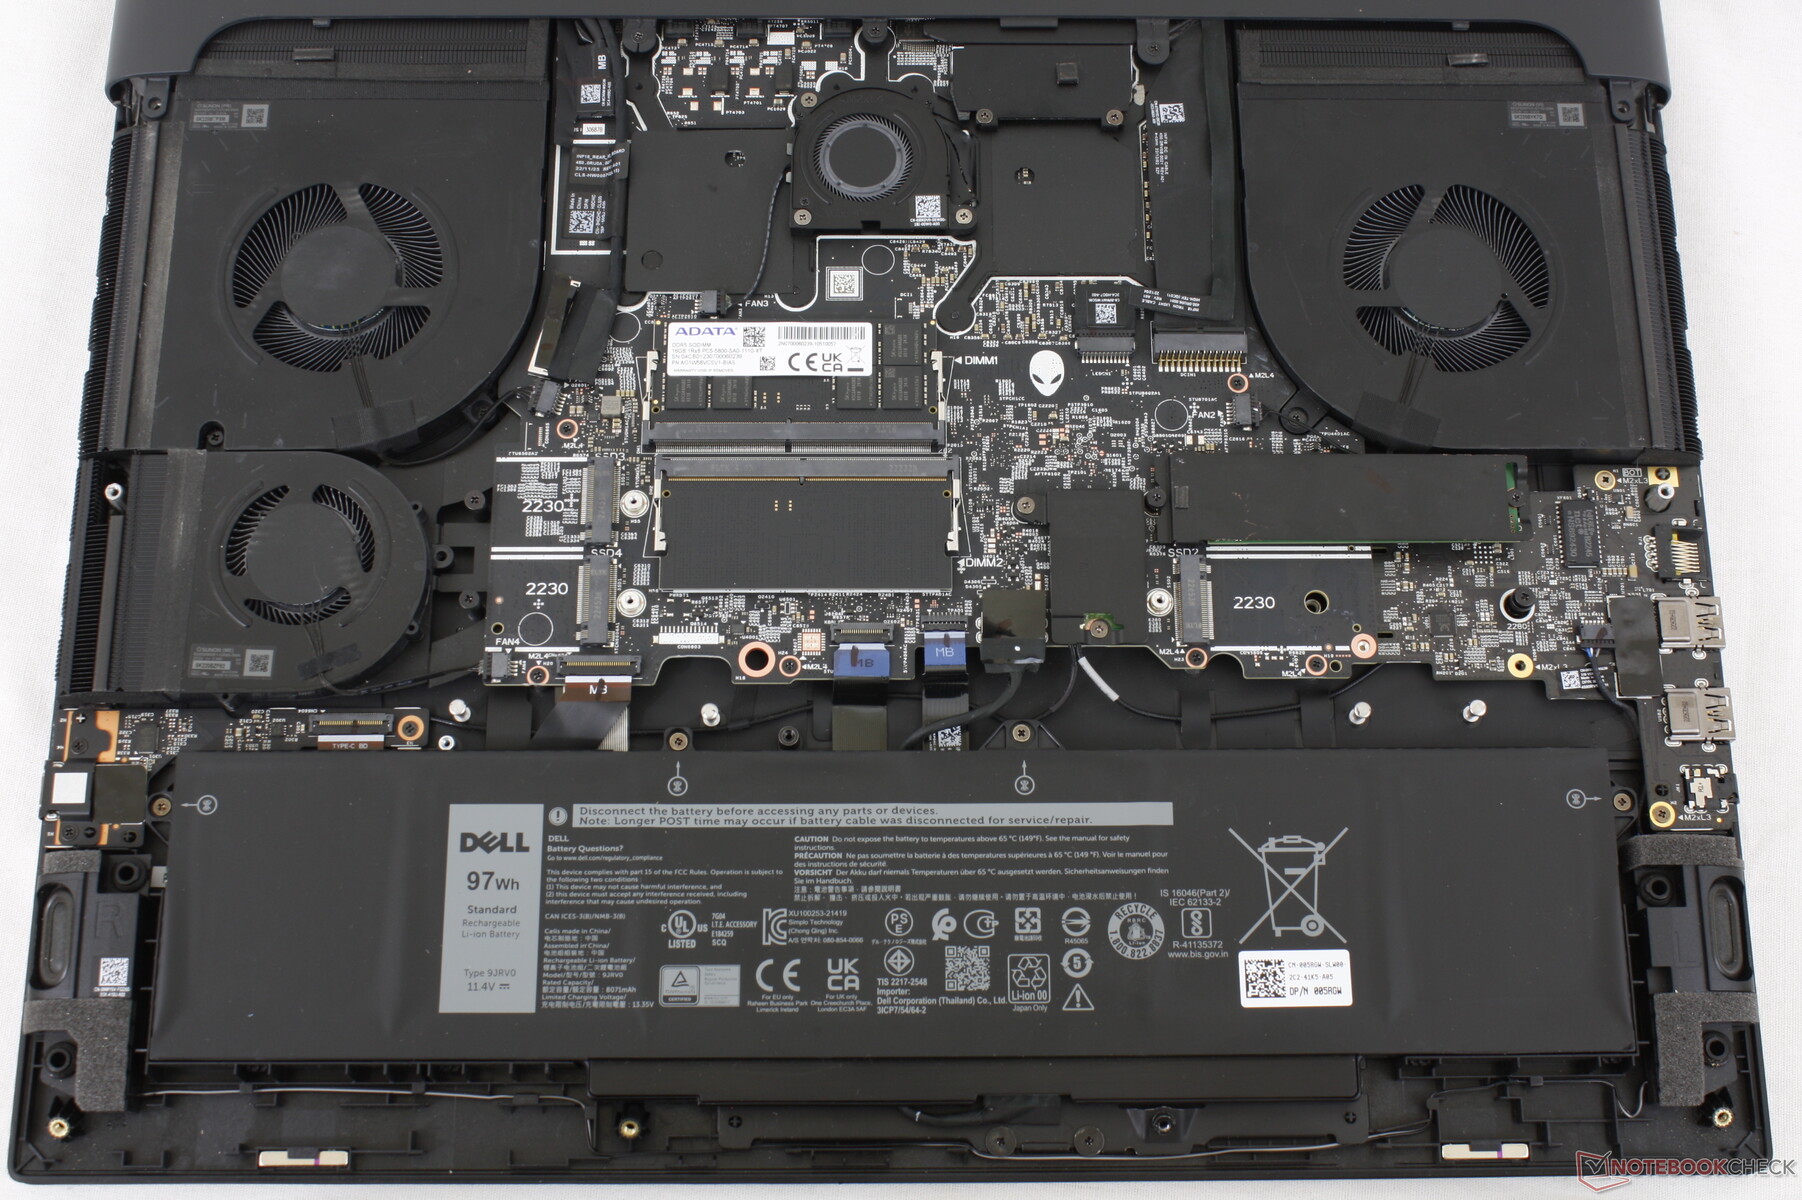
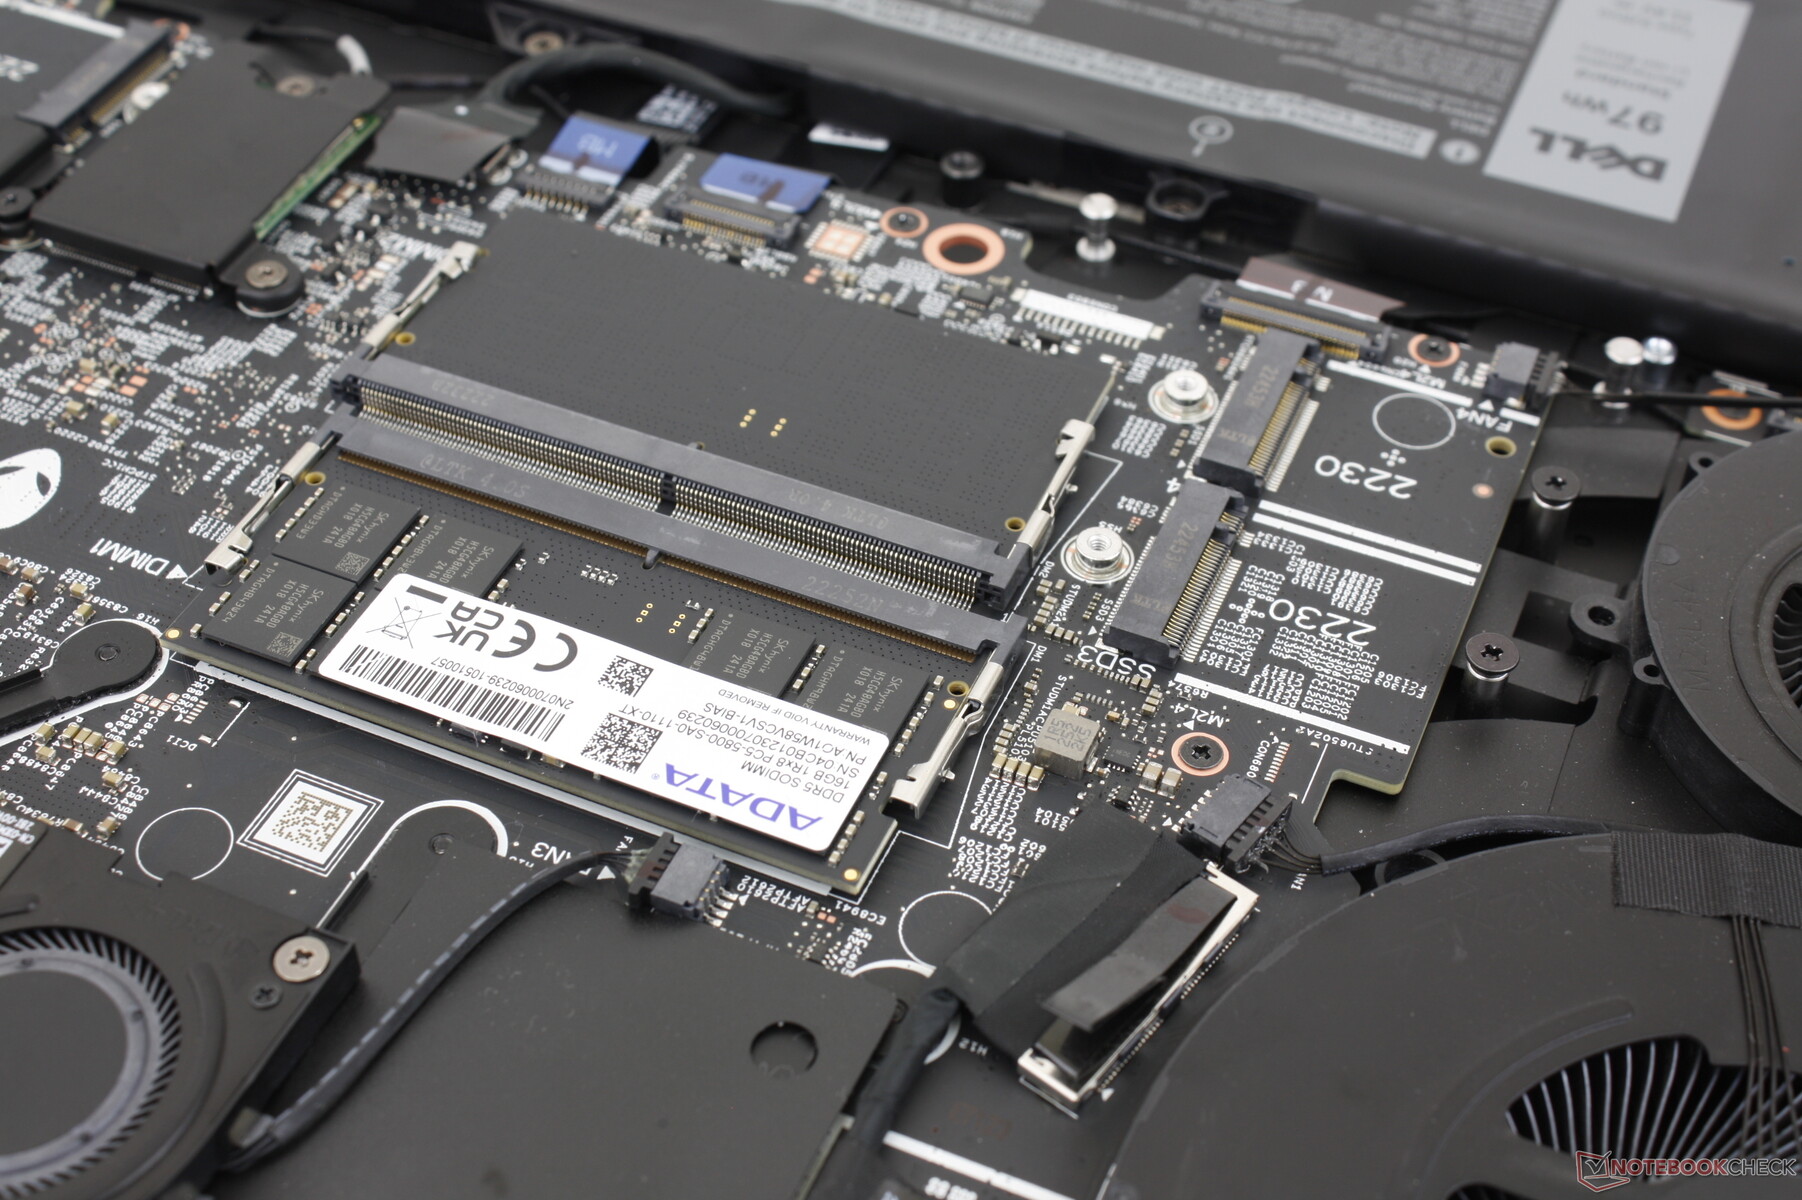
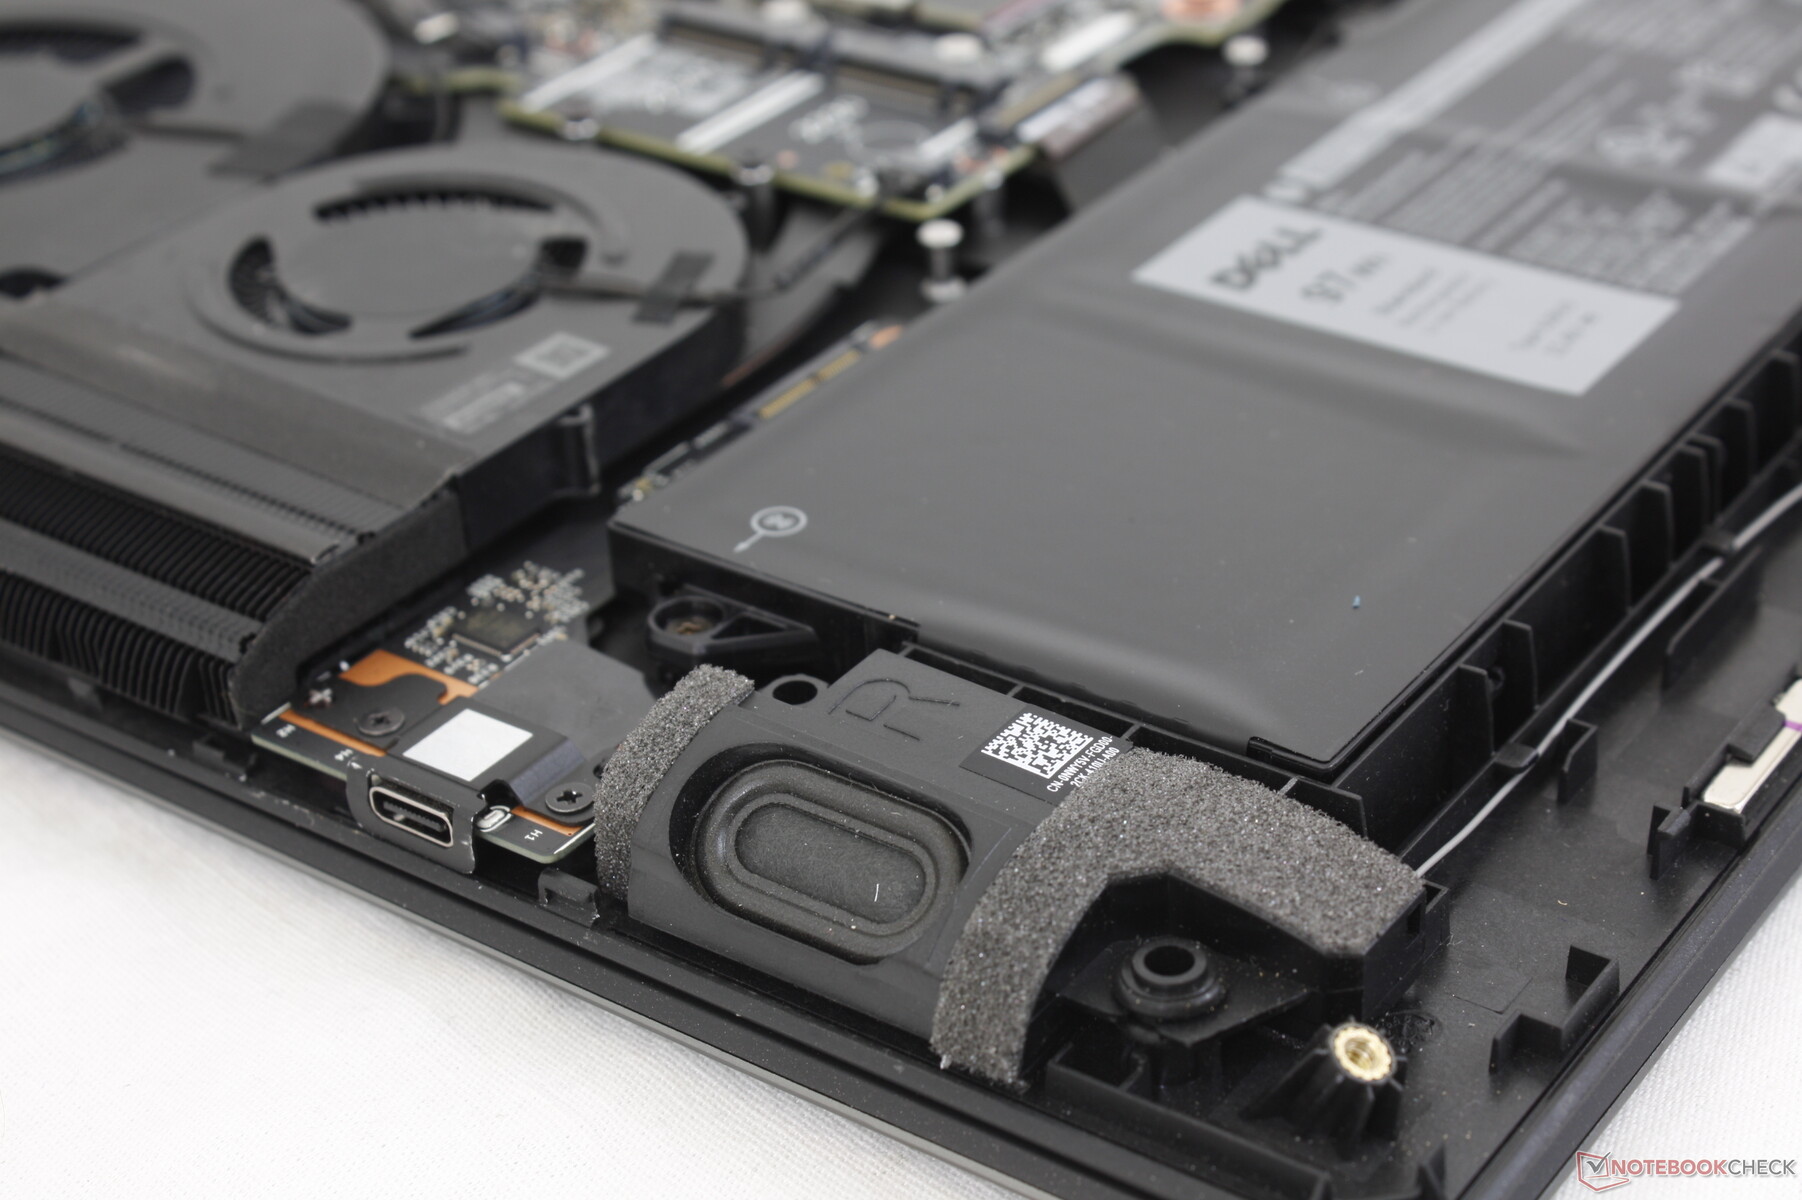
Manutenção
O painel inferior se solta muito facilmente com apenas uma chave de fenda Philips. Em comparação, o painel inferior do novo MSI GE78 requer mais manuseio e rasgamento de um adesivo anti-manipulação.
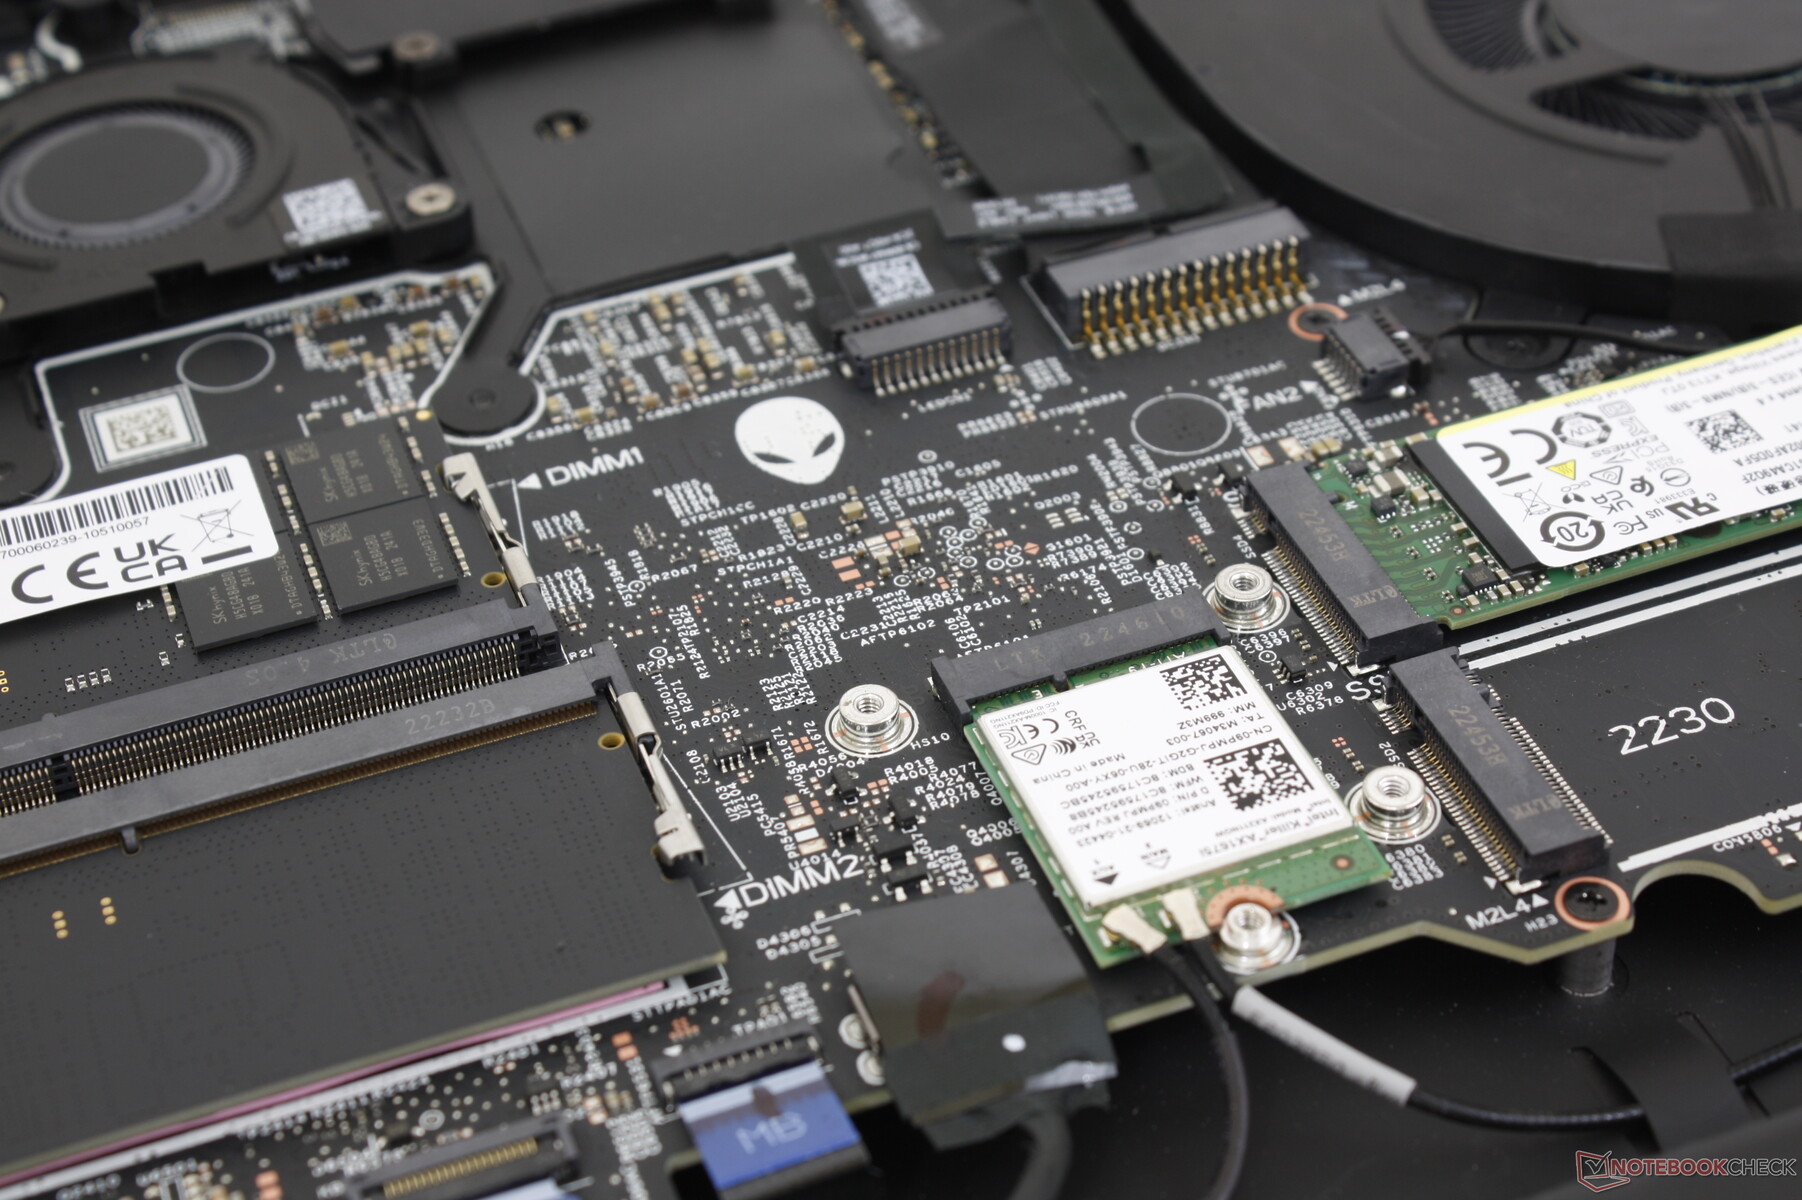
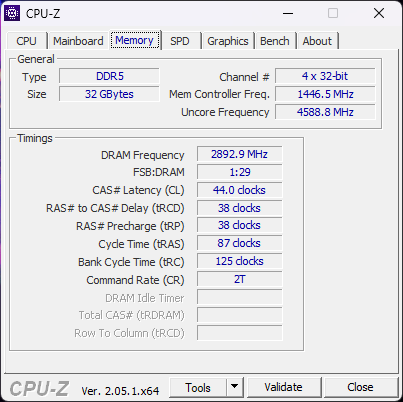
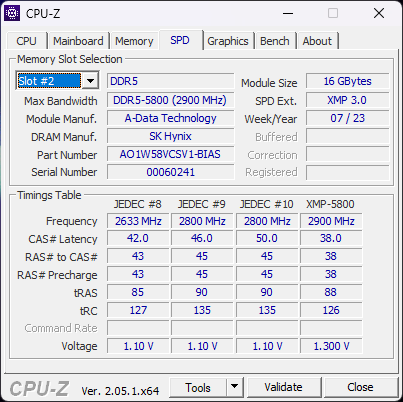
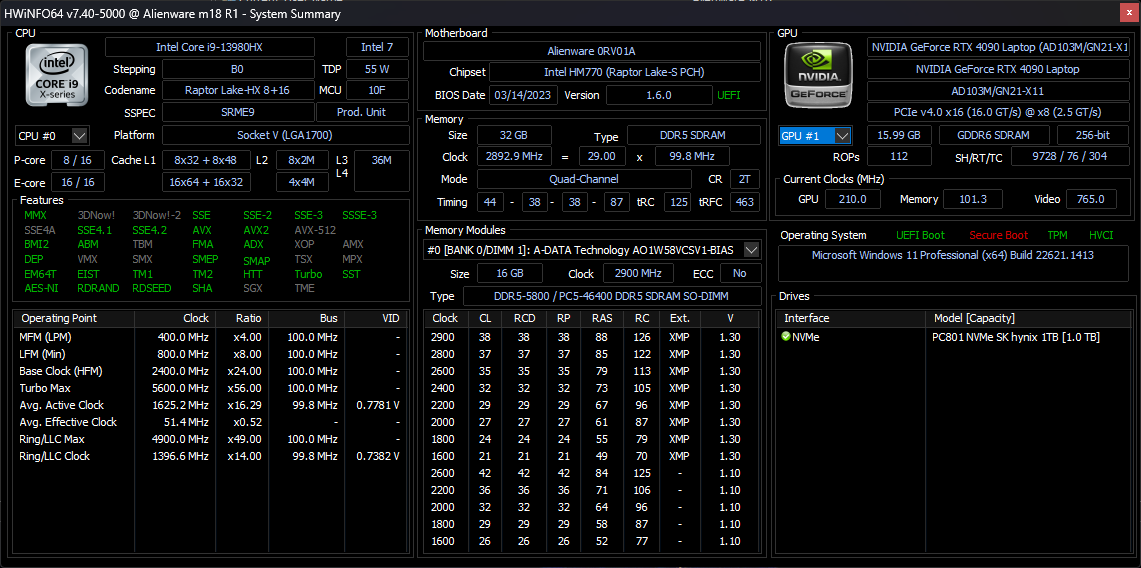
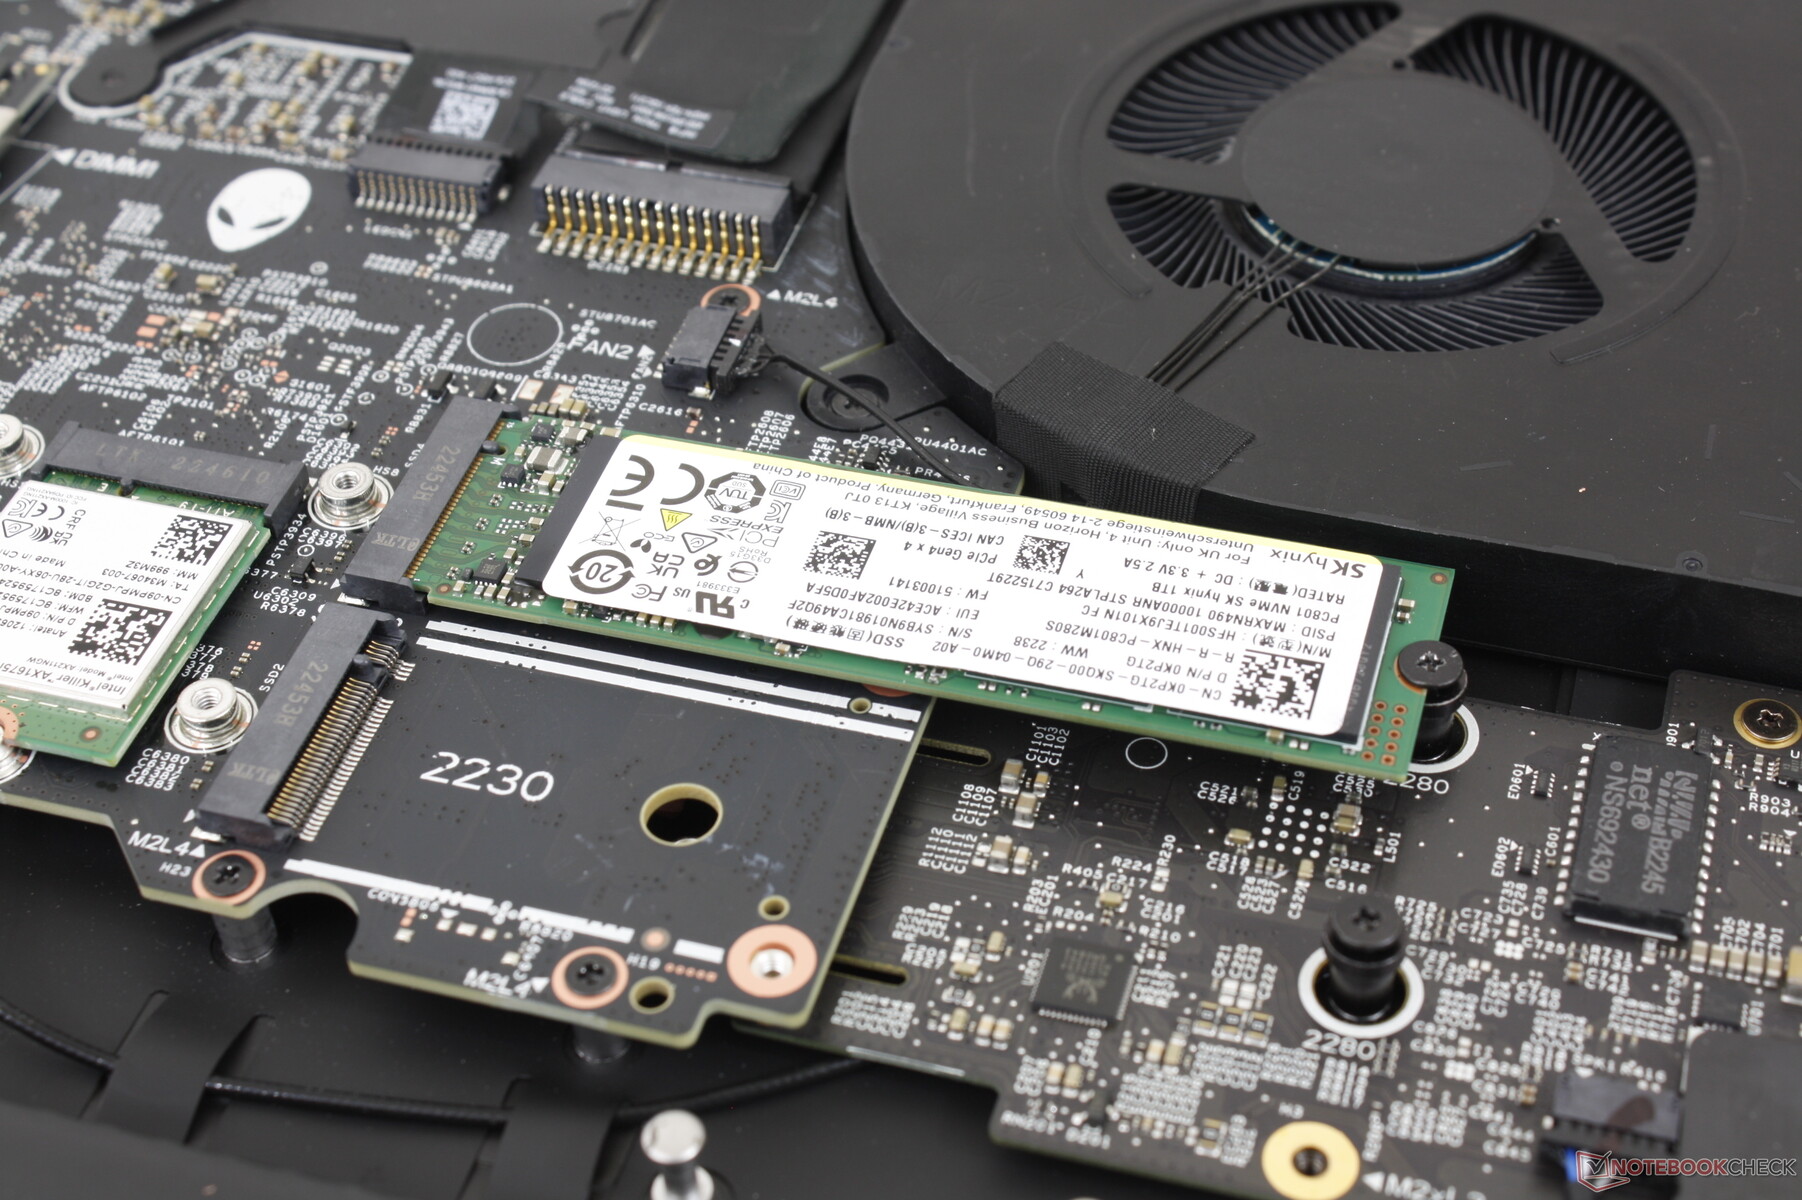
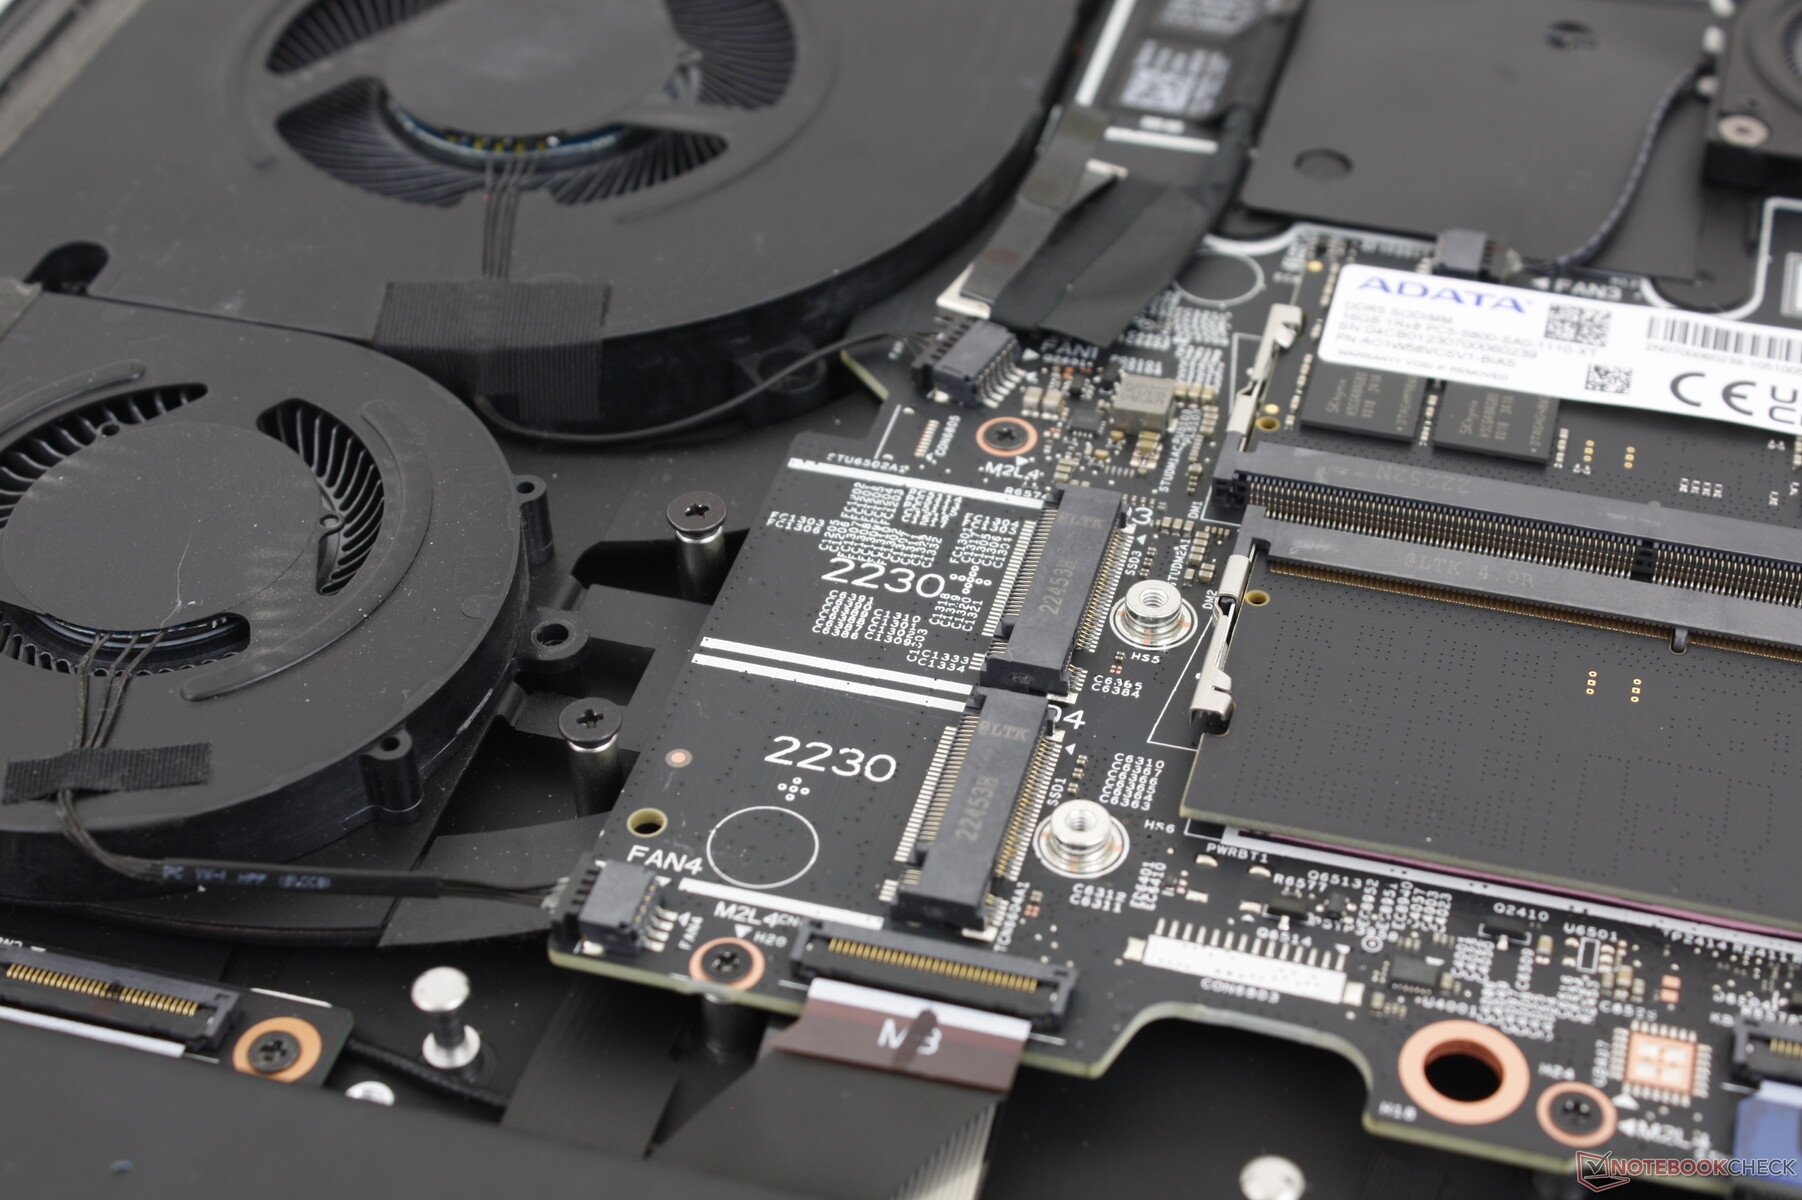
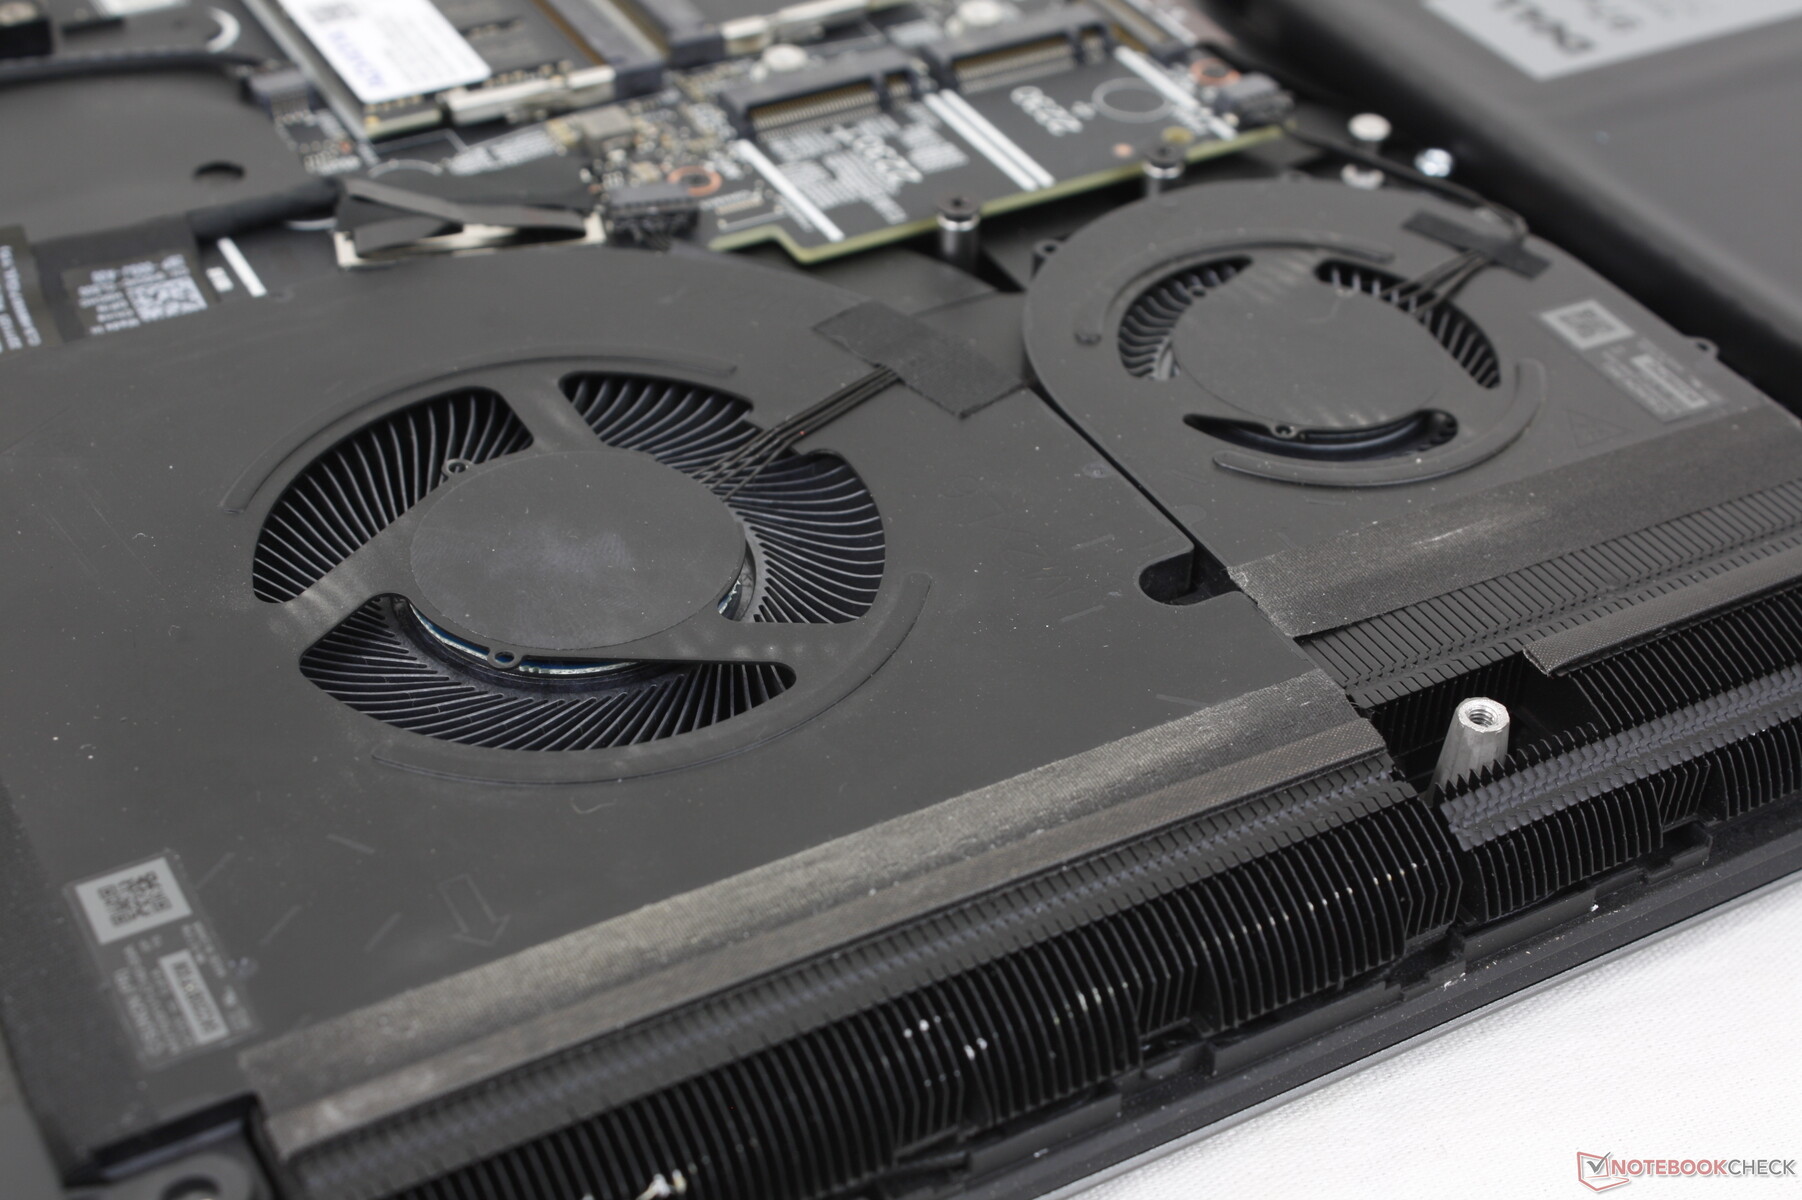
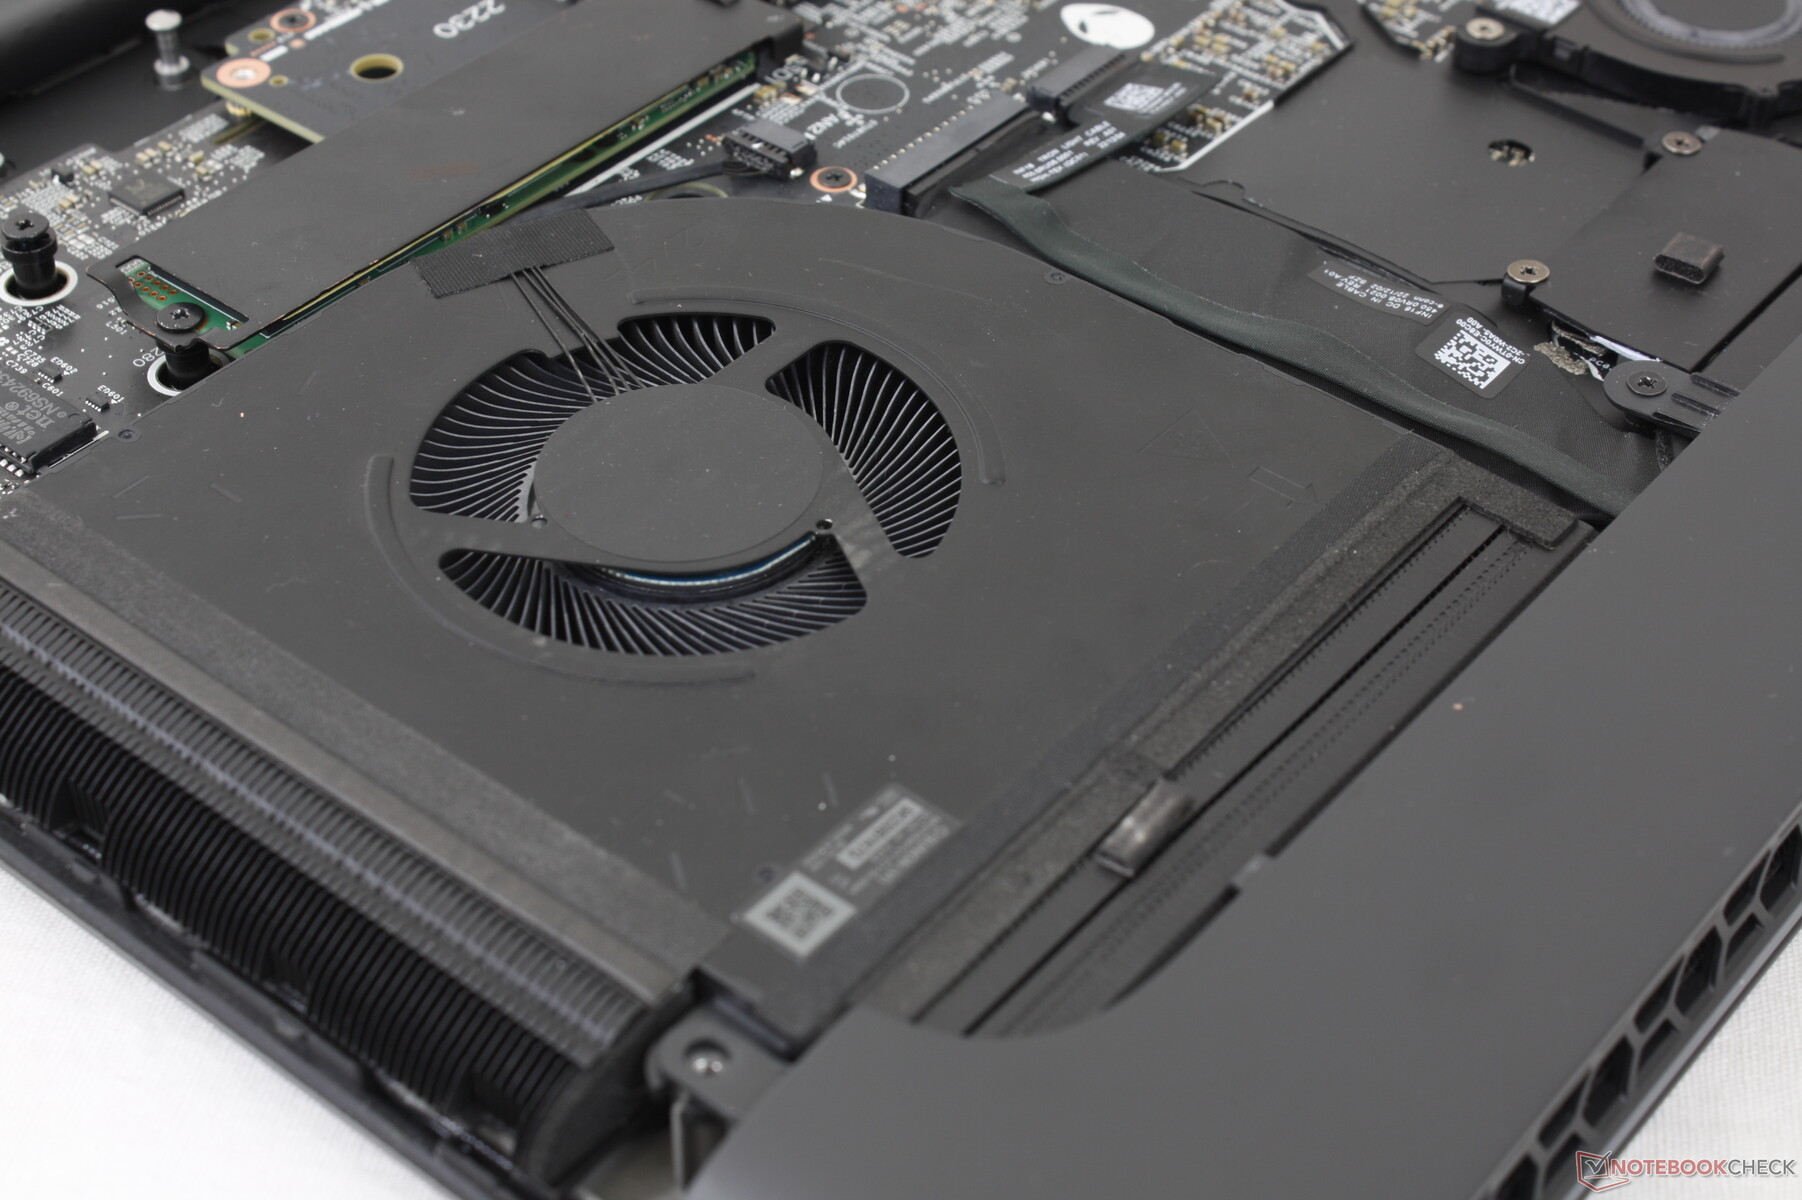
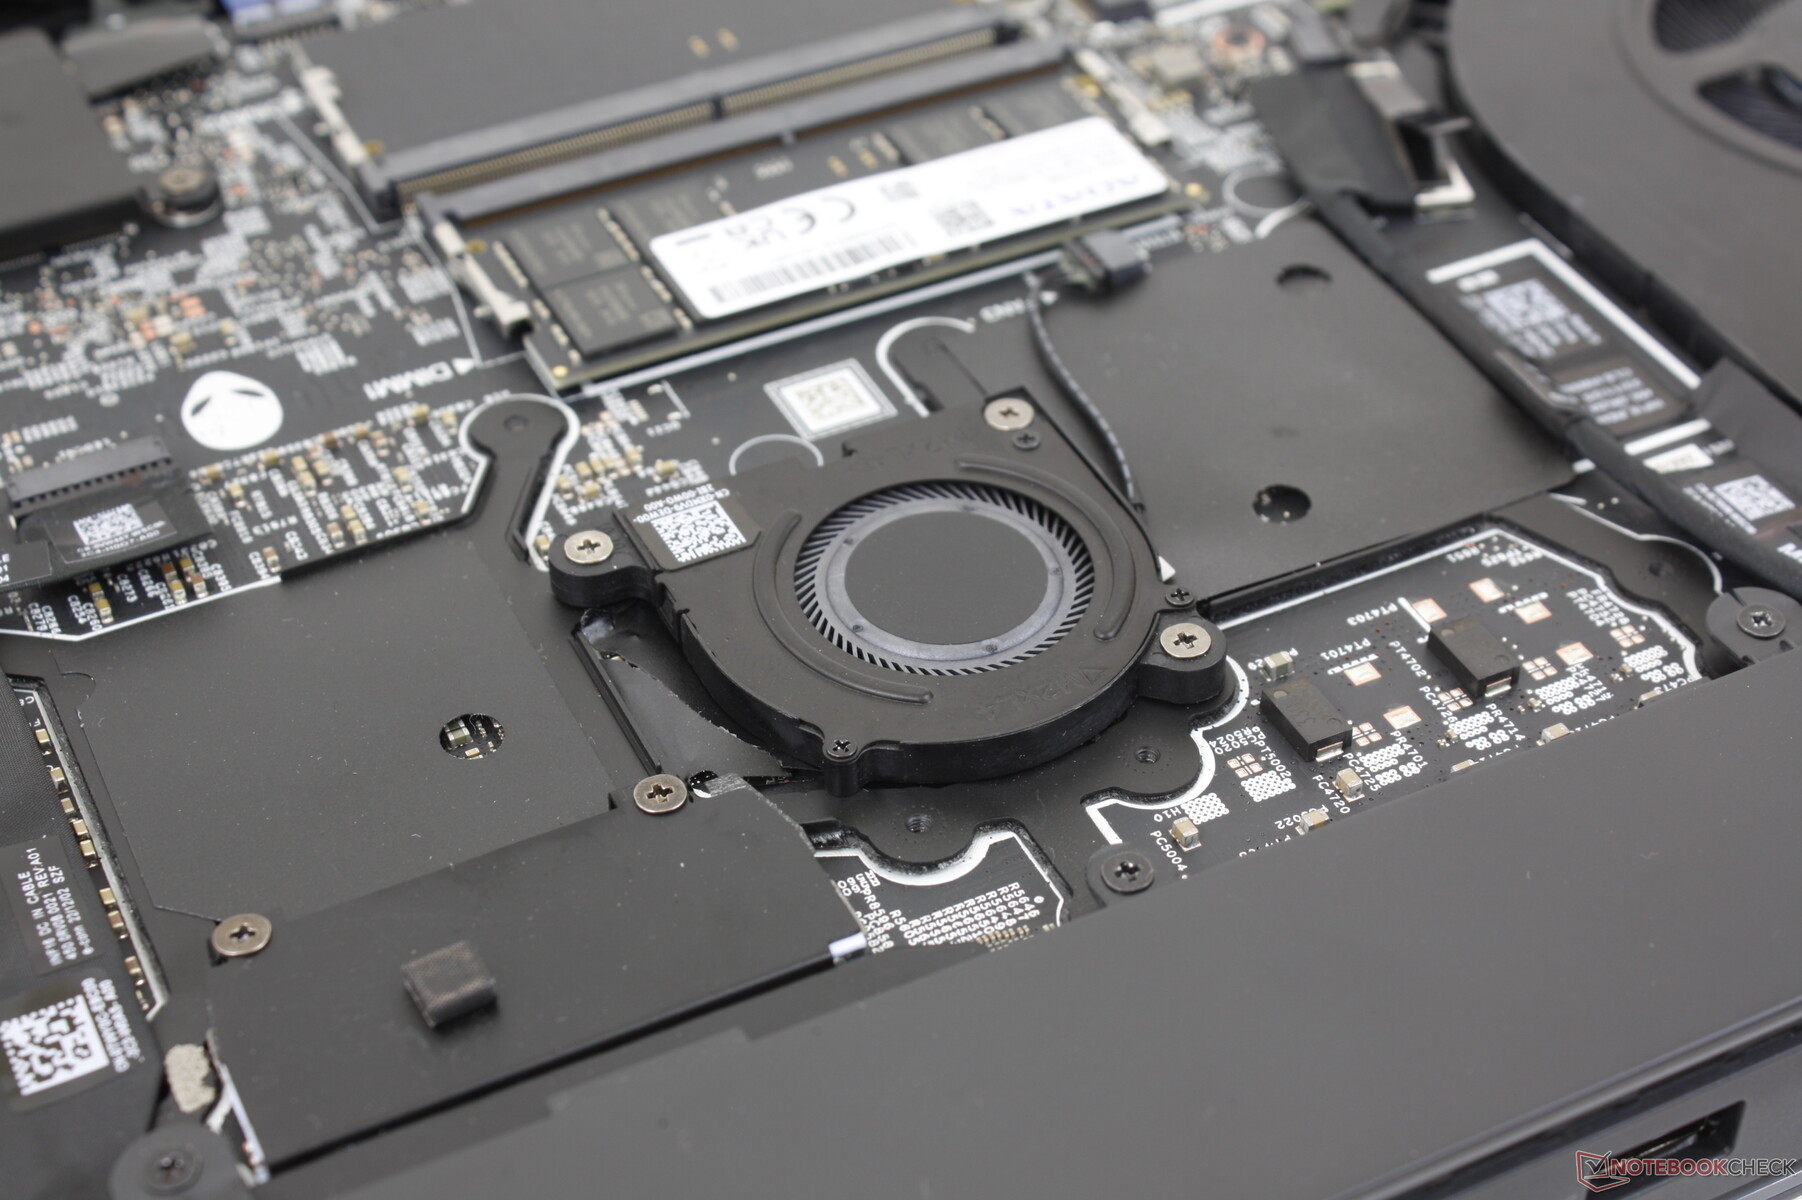
Os usuários têm acesso direto à bateria, módulo WLAN removível, 4x slots M.2 SSD e 2x slots DDR5 SODIMM. Este é um dos poucos laptops com suporte para quatro SSDs NVMe internos (2x M.2 2230 + 2x M.2 2280). Teria sido interessante ver CAMM em vez da SODIMM aqui, especialmente desde que a Dell tem sido campeã da tecnologia RAM mais rápida.
Acessórios e Garantia
Não há extras na caixa além do adaptador AC e da papelada. Note que a Dell abandonou sua porta de ancoragem proprietária Alienware e, portanto, a estação de ancoragem antiga Alienware eGPU não é mais suportada.
A garantia padrão limitada de um ano se aplica se comprada nos EUA.
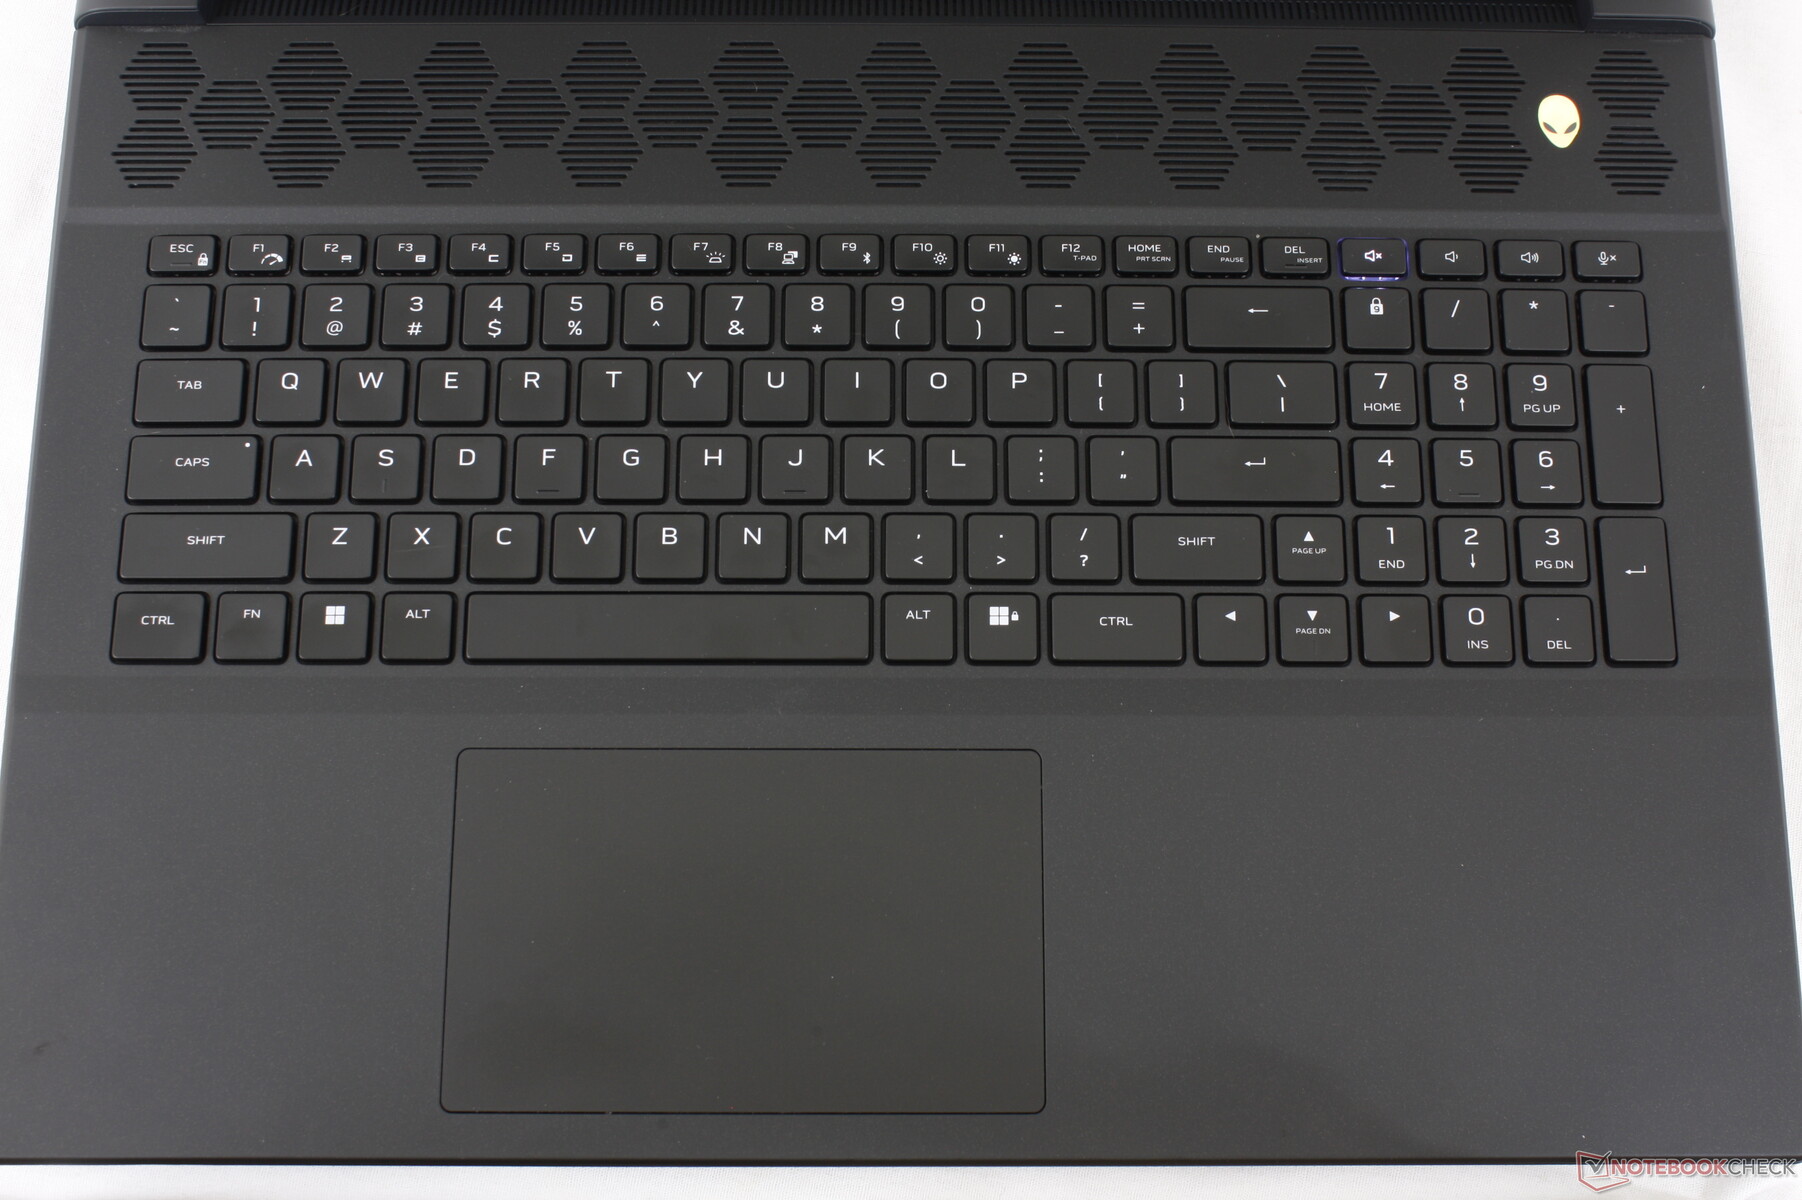
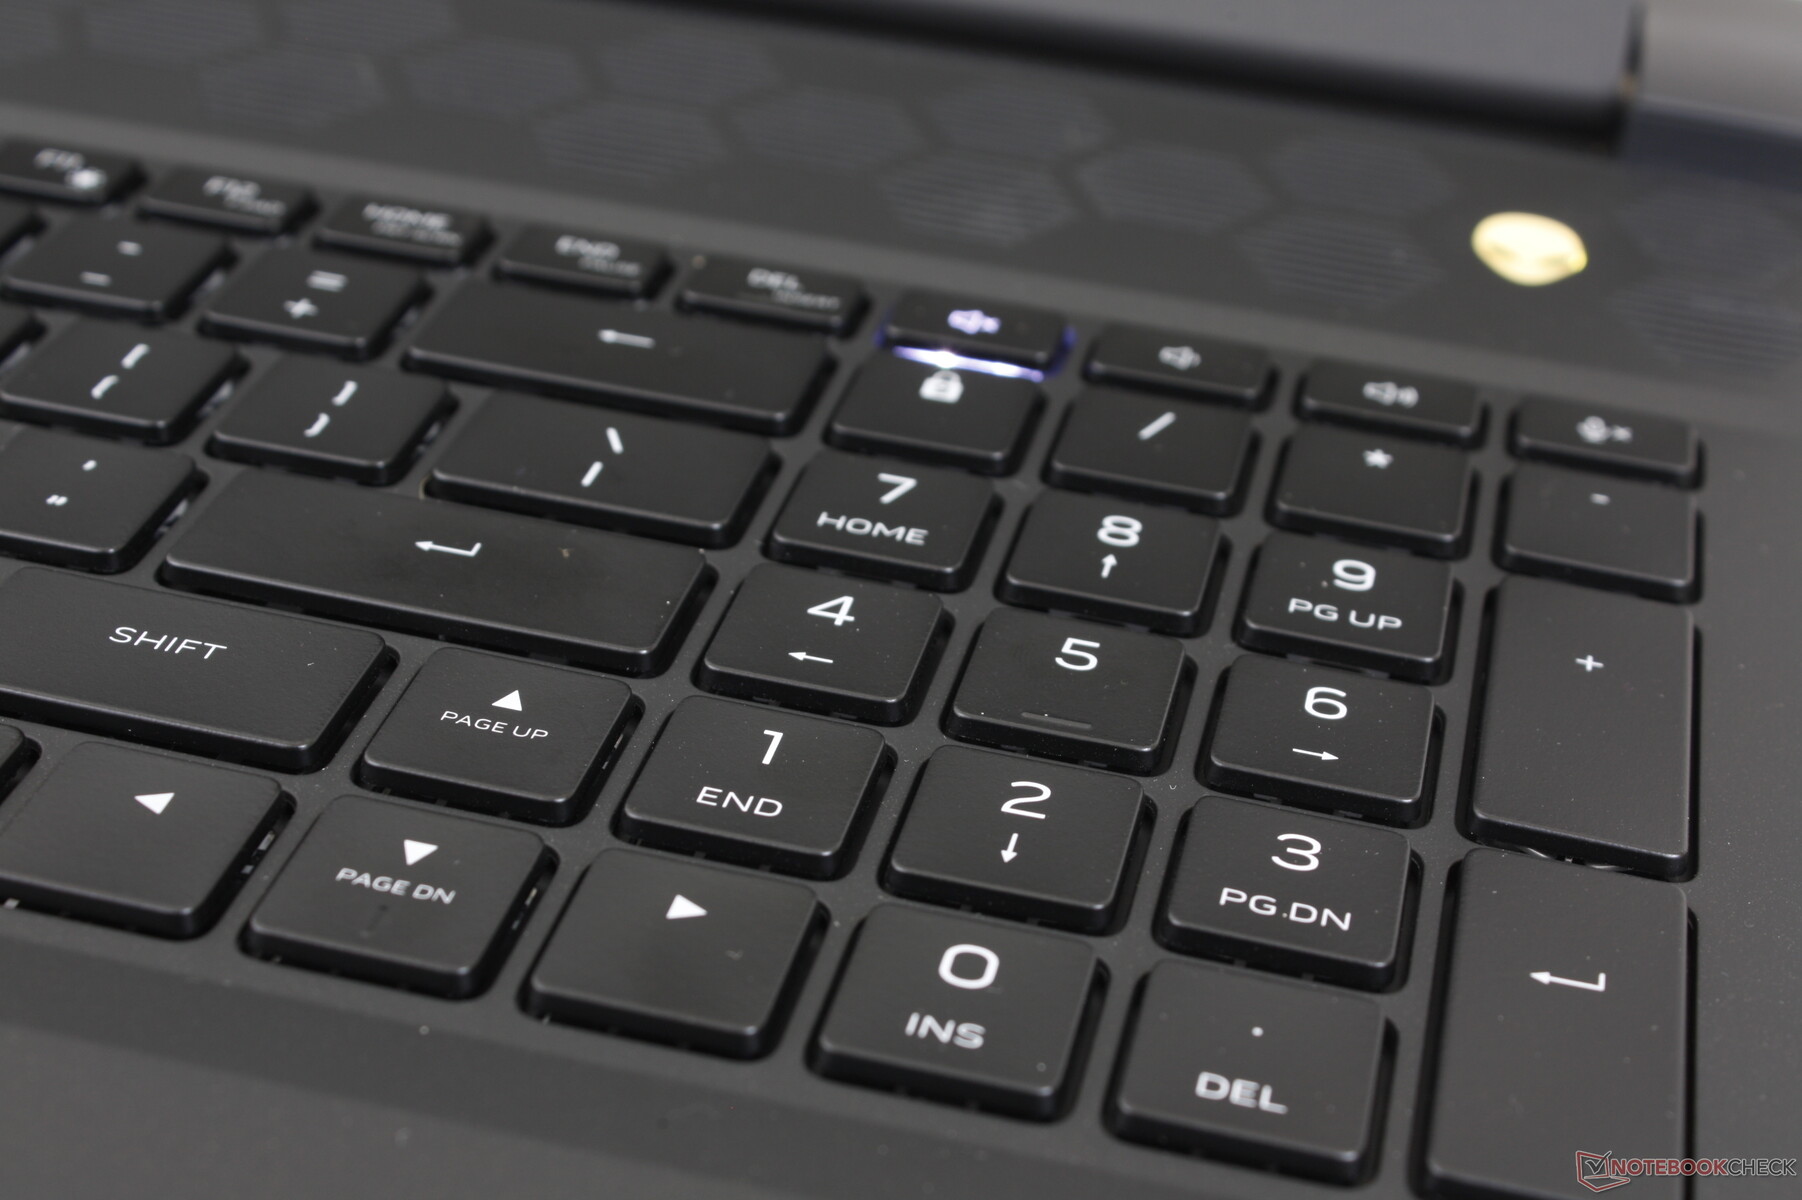
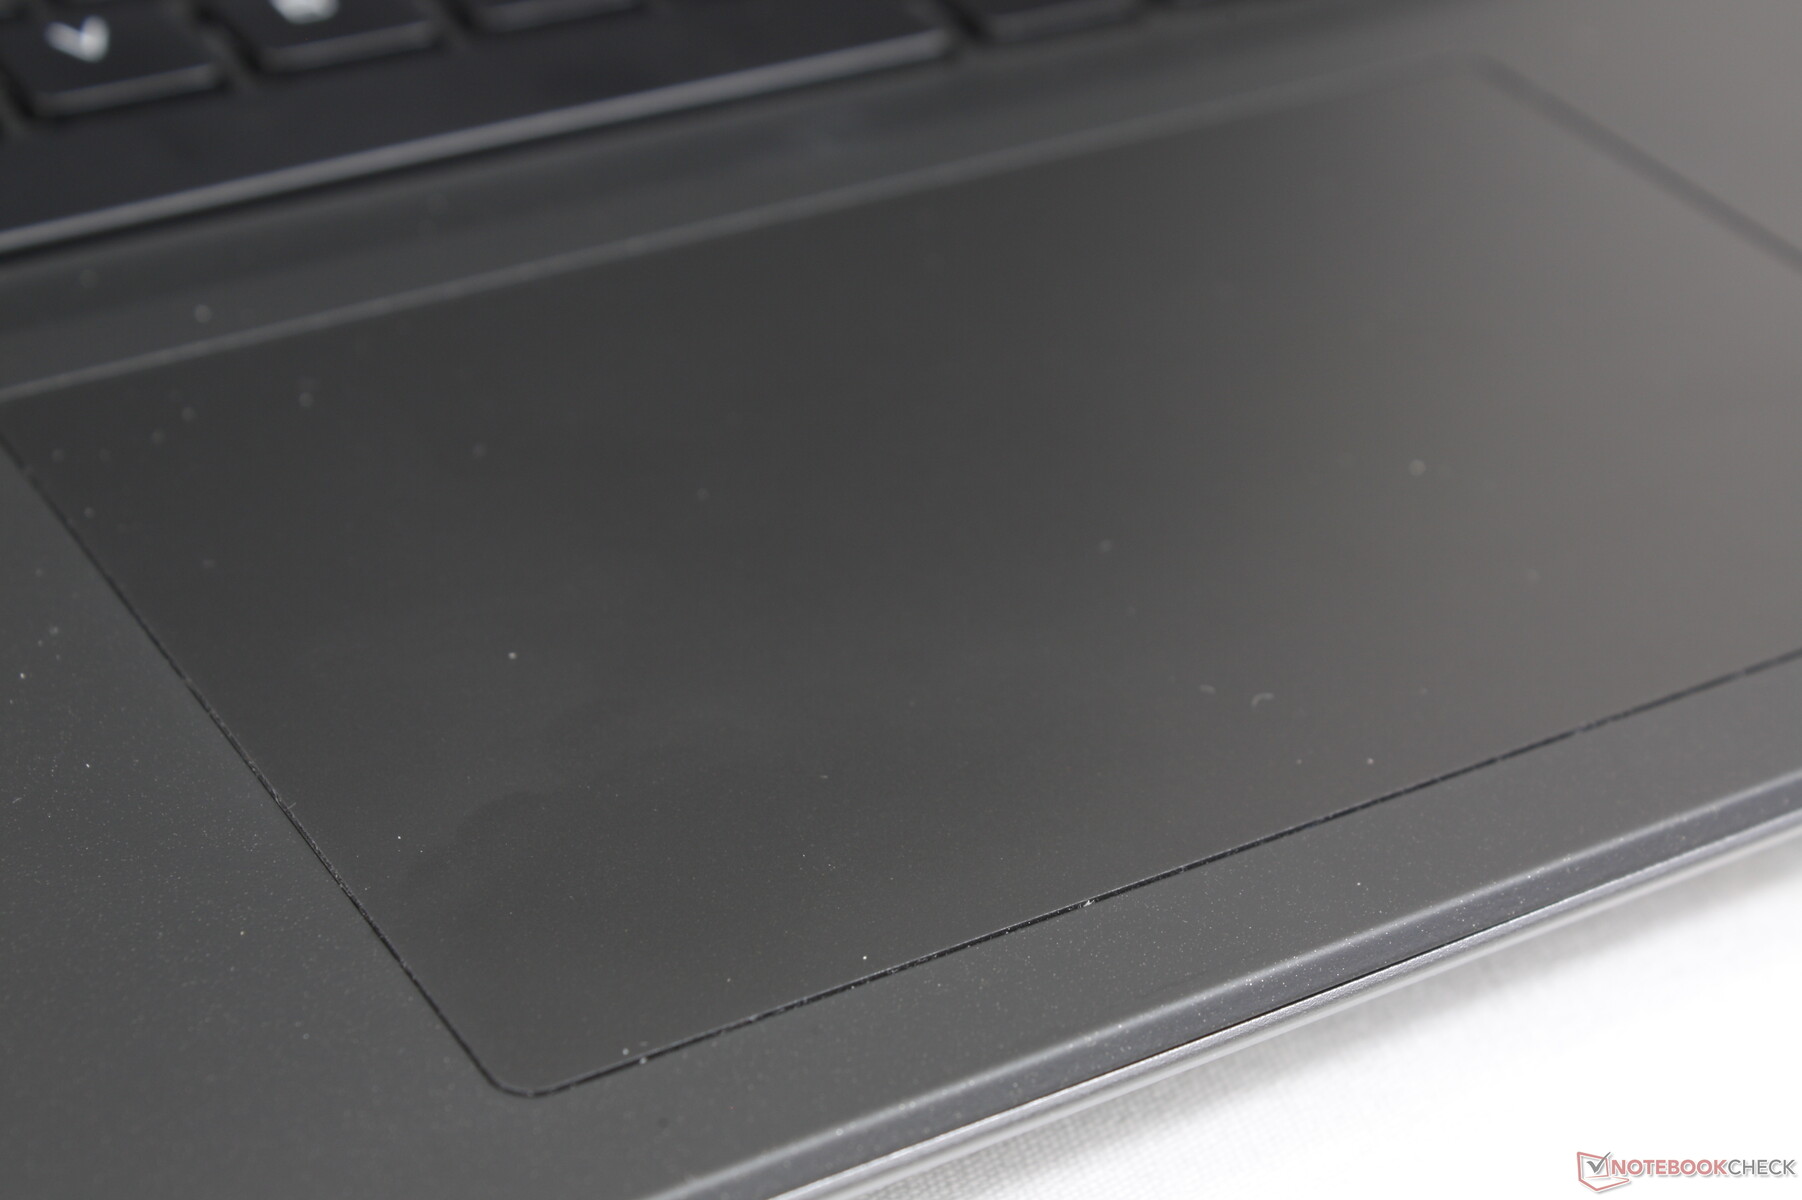
Dispositivos de Entrada - Teclado Confortável, Touchpad Esponja
Teclado
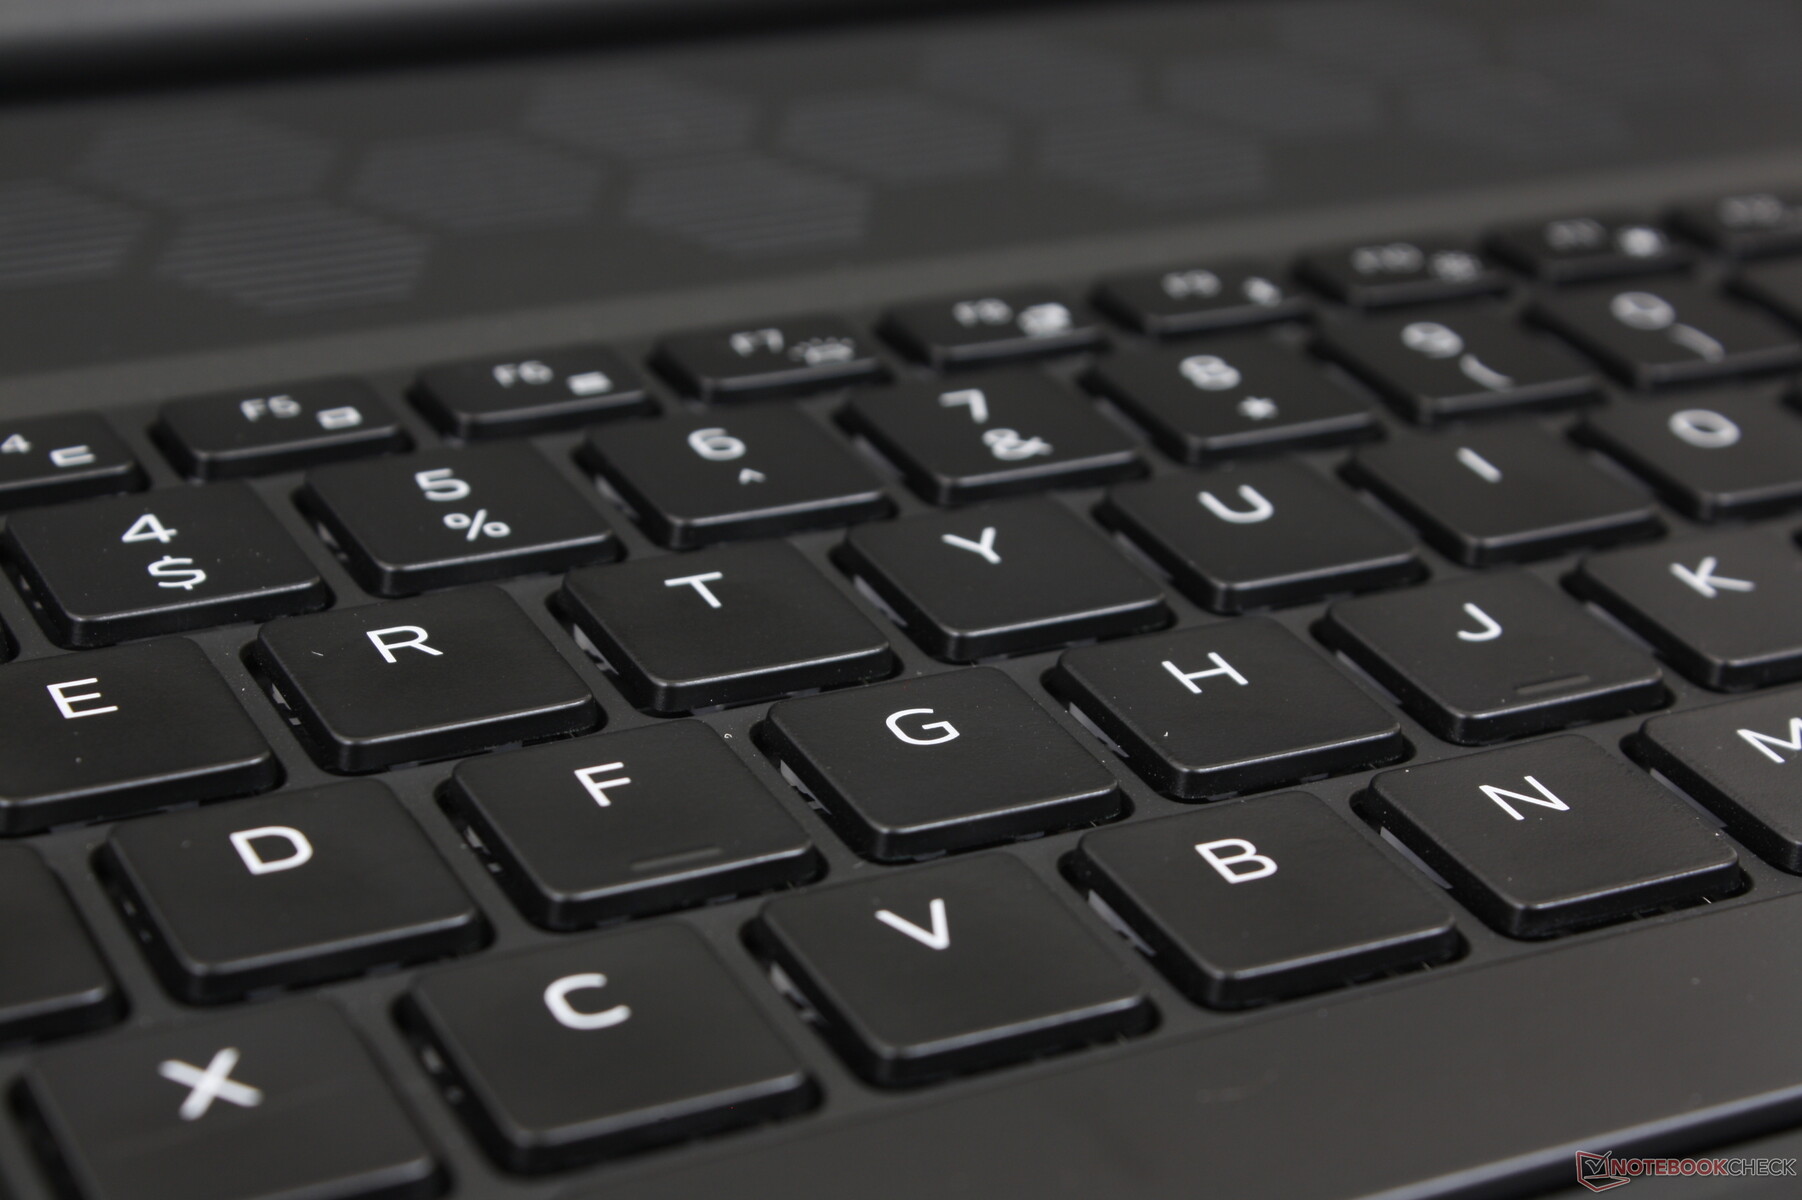
As chaves baseadas em membrana de nossa unidade são provavelmente as melhores que usamos em qualquer laptop para jogos. As viagens são mais profundas e com um feedback mais firme do que as teclas do MSI GE78 ou Razer Blade 18. Há muito pouco a reclamar sobre o teclado aqui em termos de conforto.
Os interruptores mecânicos opcionais CherryMX são provavelmente mais clicáveis, mas muito mais altos. Estes interruptores são provavelmente os mesmos que a Dell oferece para as séries Alienware M15 e M17 existentes.
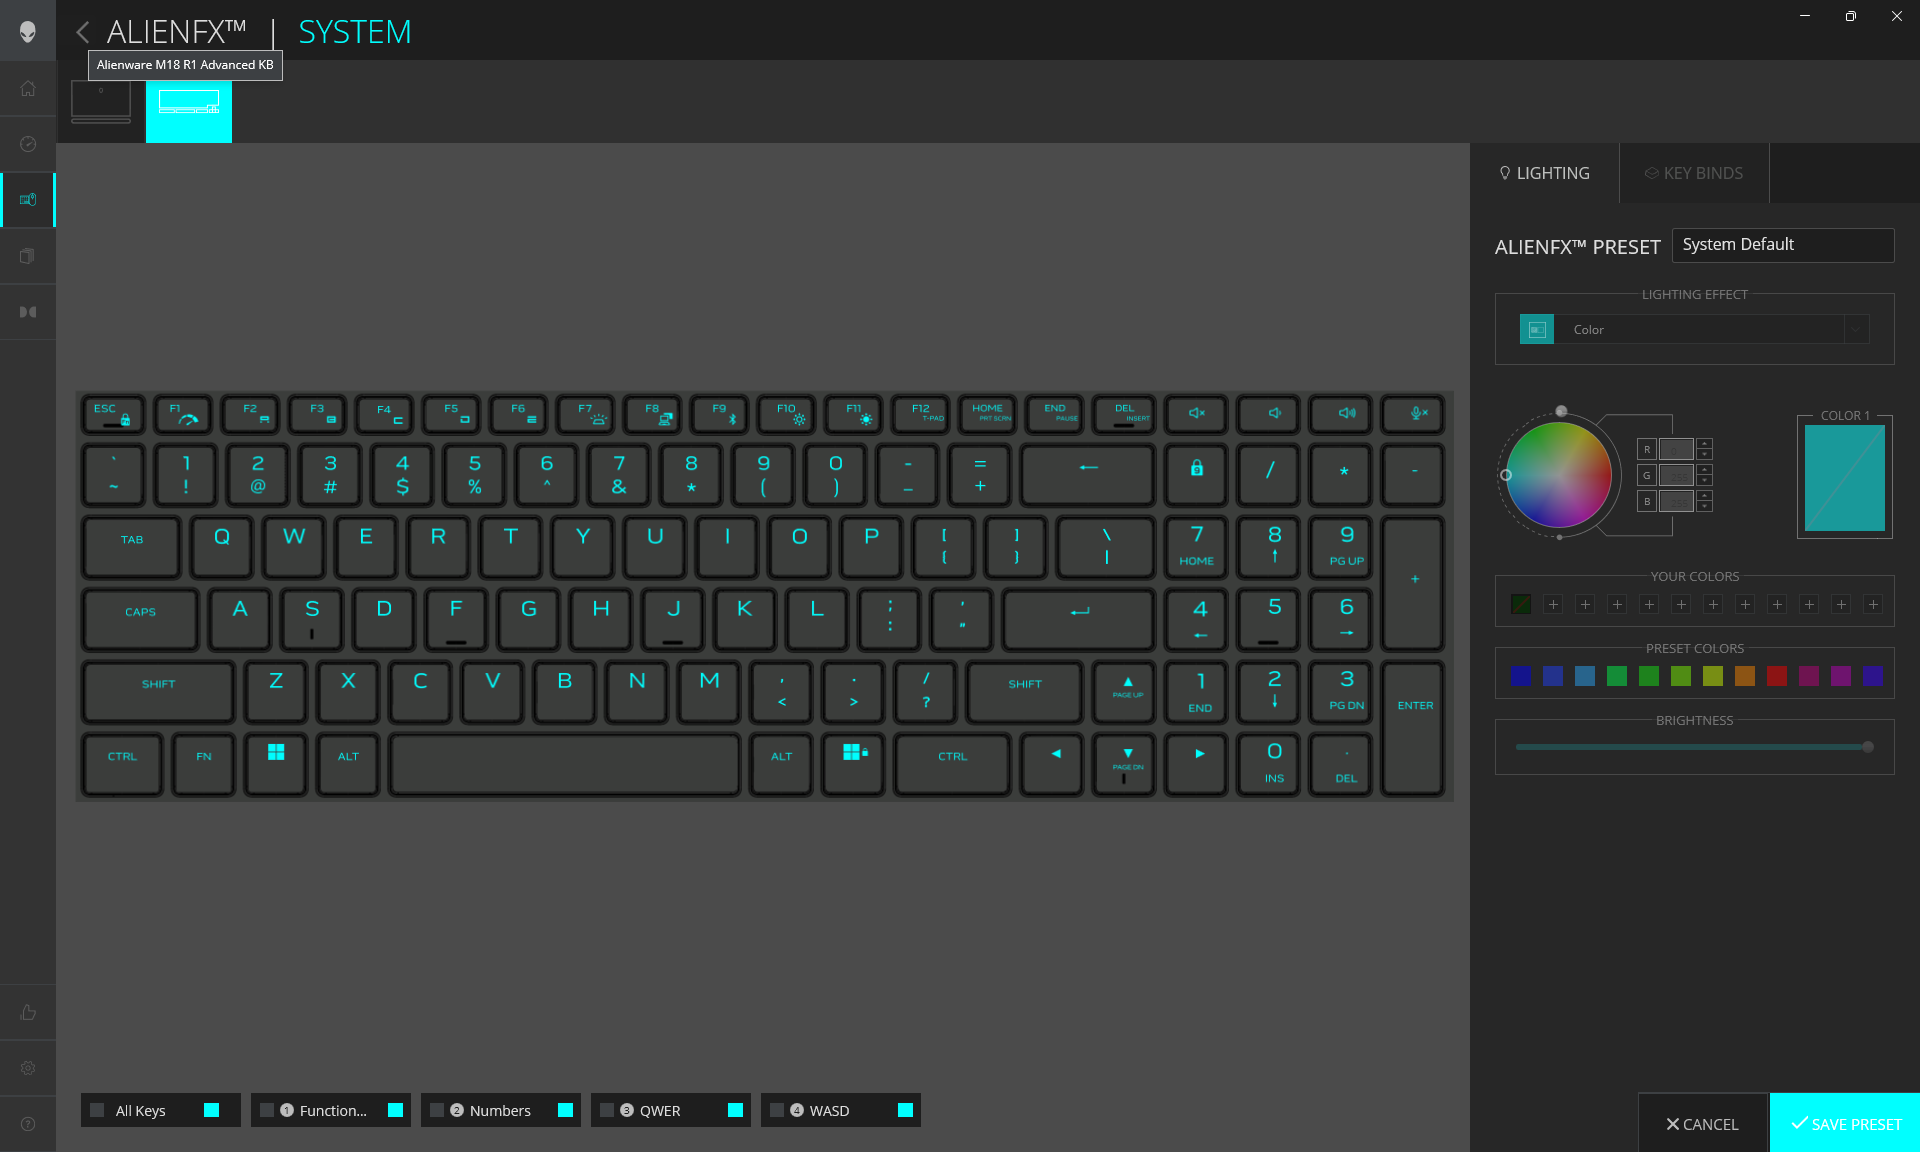
Todos os símbolos chave são iluminados quando a luz de fundo está ativa, ao contrário dos modelos Alienware x15/x17 mais antigos, onde os símbolos secundários não estão iluminados.
Touchpad
A área da superfície é quase idêntica à do clickpad no MSI GE78 (13,2 x 8 cm vs. 13 x 8,2 cm) apesar do maior fator de forma do Alienware de 18 polegadas. Embora a tração seja suave com o mínimo de aderência ao deslizar, o feedback ao clicar está no lado macio, o que torna a experiência insatisfatória. O duplo clique também pode ser cansativo, já que cada clique requer um pouco mais de força do dedo do que na maioria dos outros laptops.
Mostrador - Taxa de atualização extremamente rápida 480 Hz
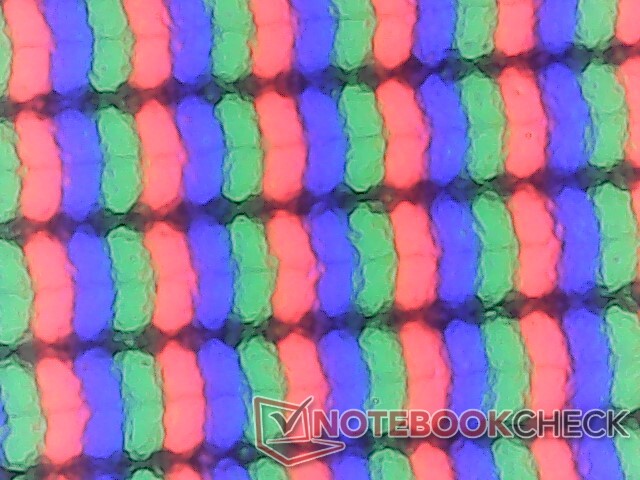
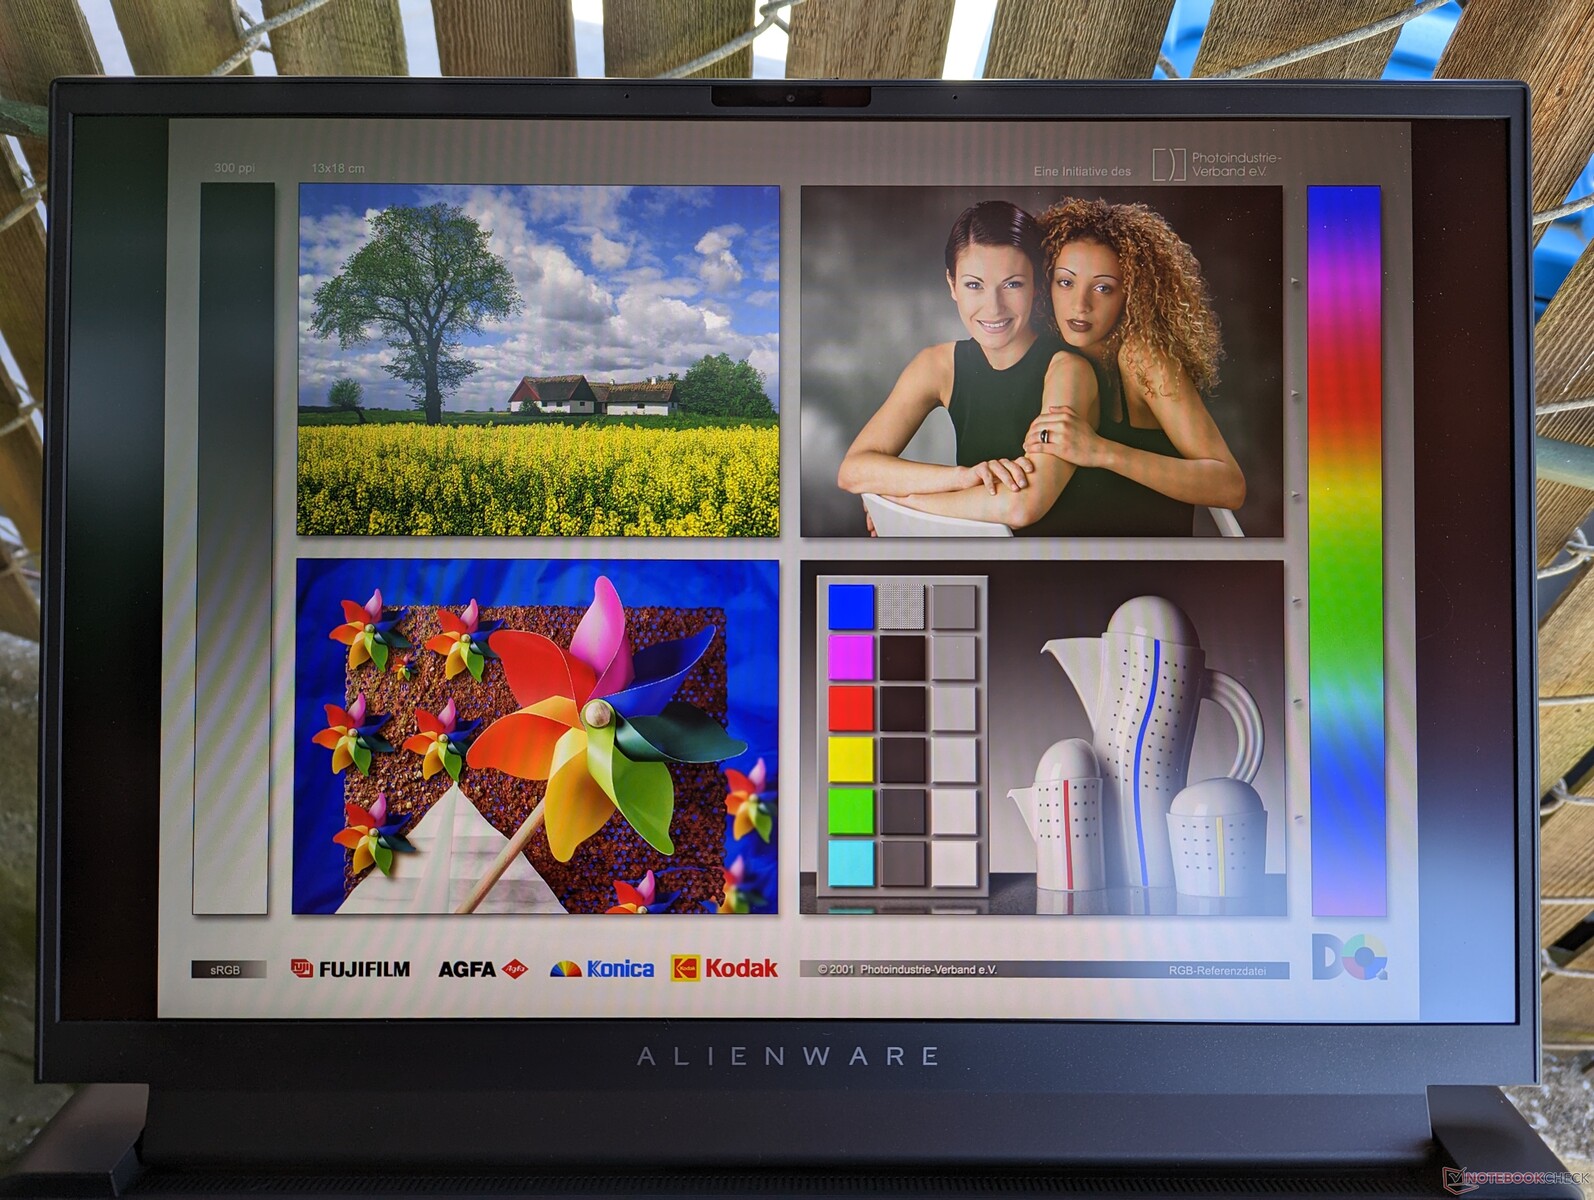
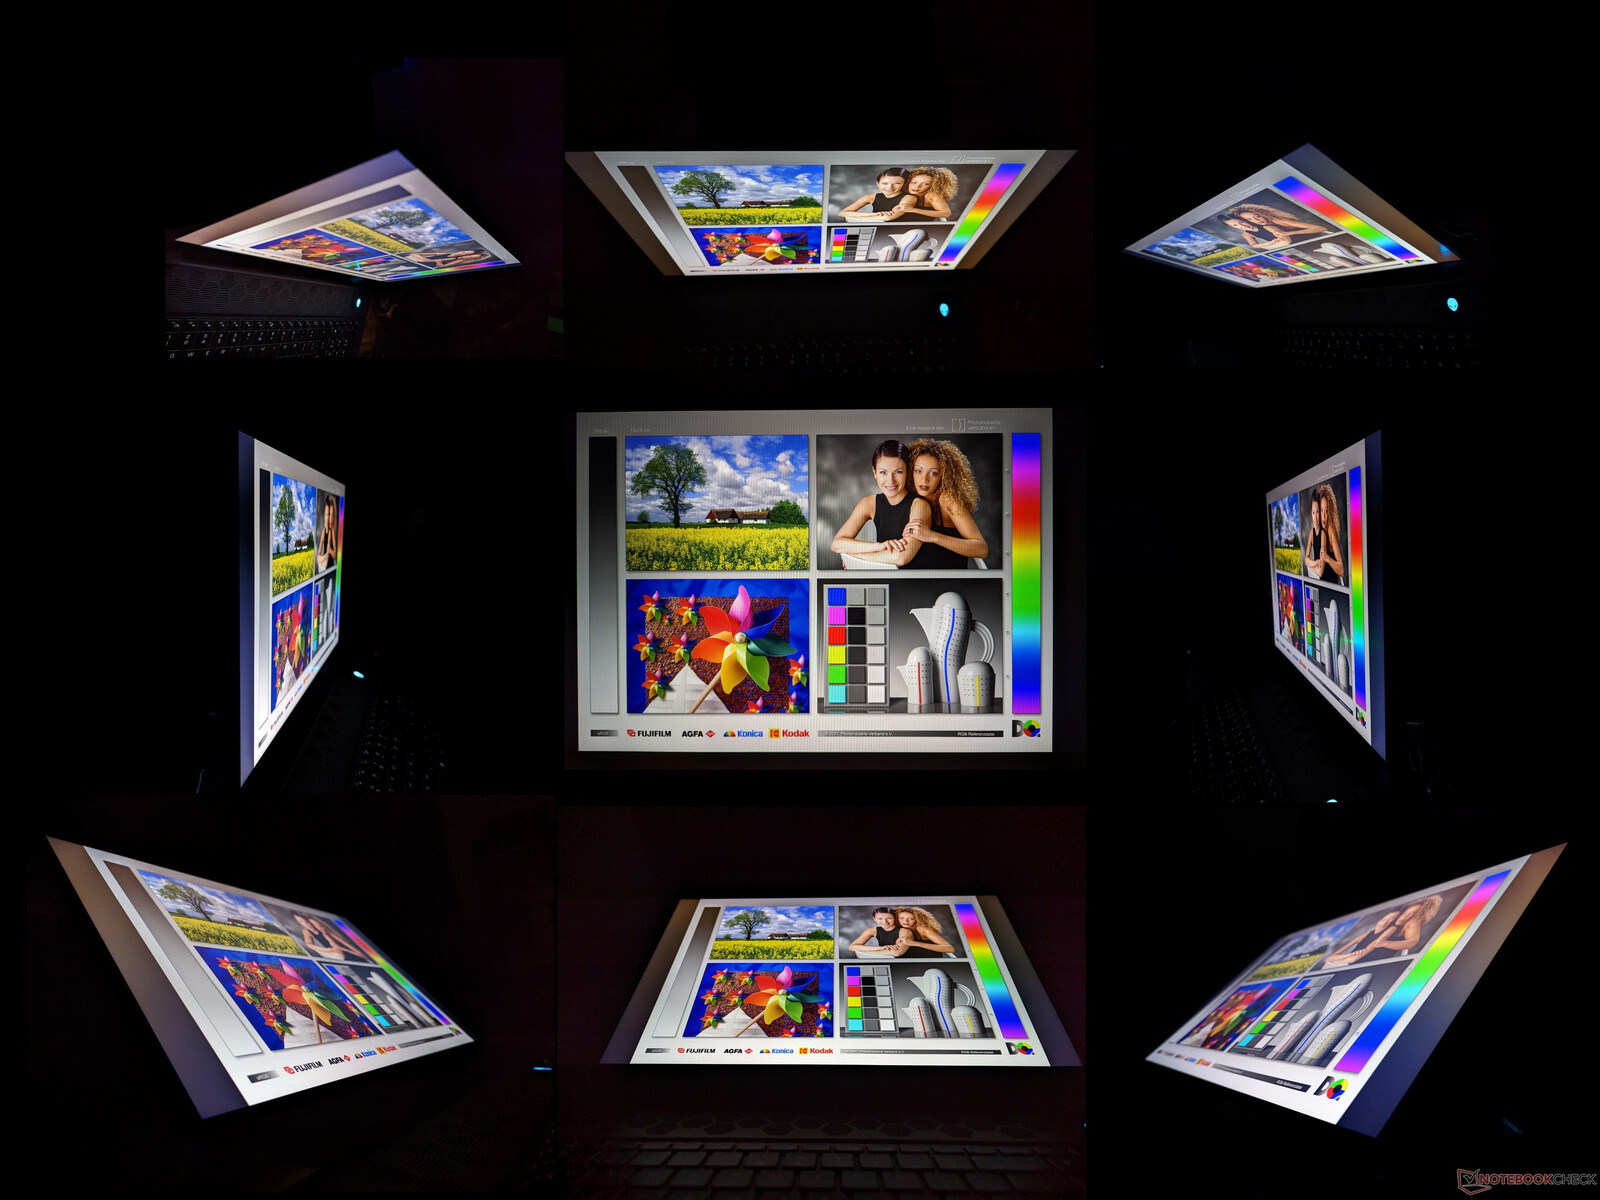
O Alienware é enviado com um painel 1200p Chi Mei 180JME em contraste com os painéis 1600p AU Optronics B180QAN01.0 ou BOE NE180QDM noLâmina Razer 18 e Asus ROG Strix Scar 18, respectivamente. A característica única que separa este painel Chi Mei dos outros dois é sua taxa de atualização nativa 2x mais rápida de 480 Hz, ao invés de 240 Hz. Caso contrário, todos os três painéis compartilham coberturas de cores semelhantes, tempos de resposta de pixels e relações de contraste. As cores P3 completas e a taxa de atualização rápida tornam este modelo particular de Alienware adequado tanto para jogos quanto para edição gráfica.
Uma segunda opção de exibição está disponível com uma resolução nativa de 1600p mais alta, mas menor taxa de atualização de 165 Hz.
| |||||||||||||||||||||||||
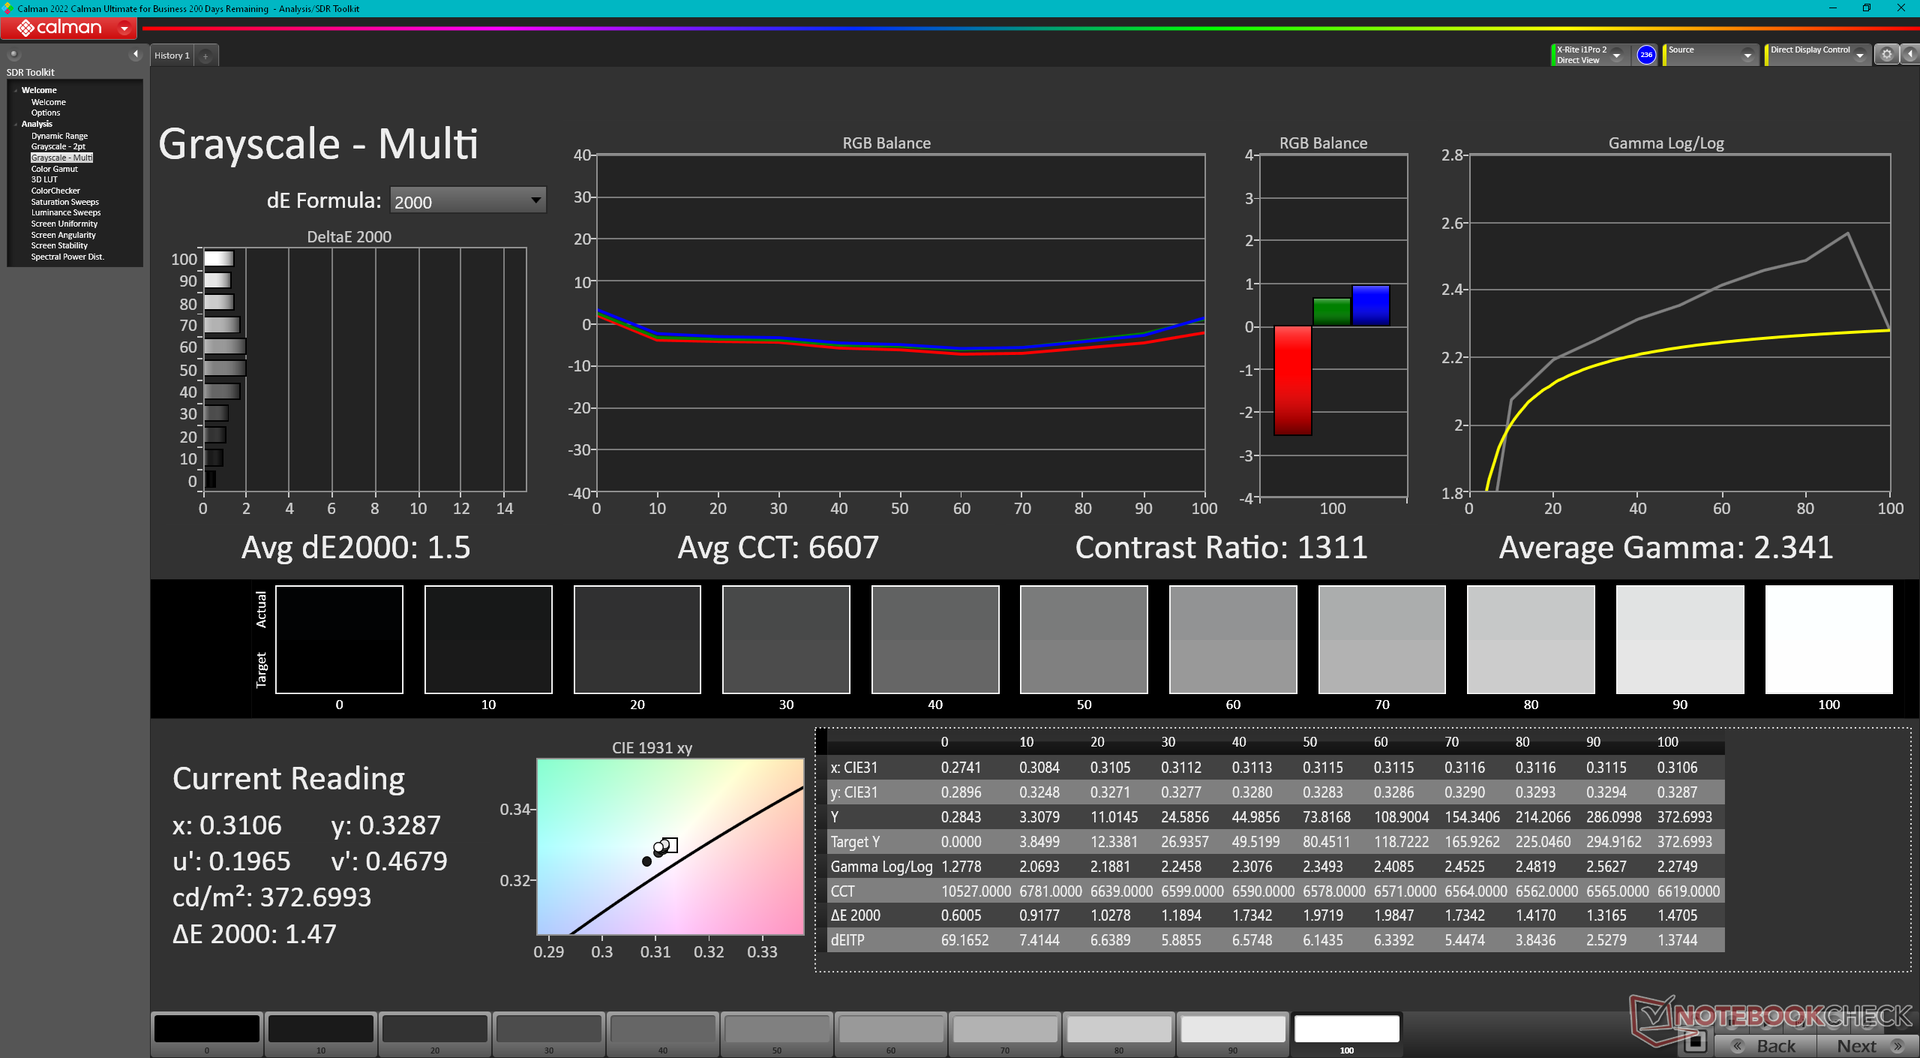
iluminação: 97 %
iluminação com acumulador: 372.8 cd/m²
Contraste: 1165:1 (Preto: 0.32 cd/m²)
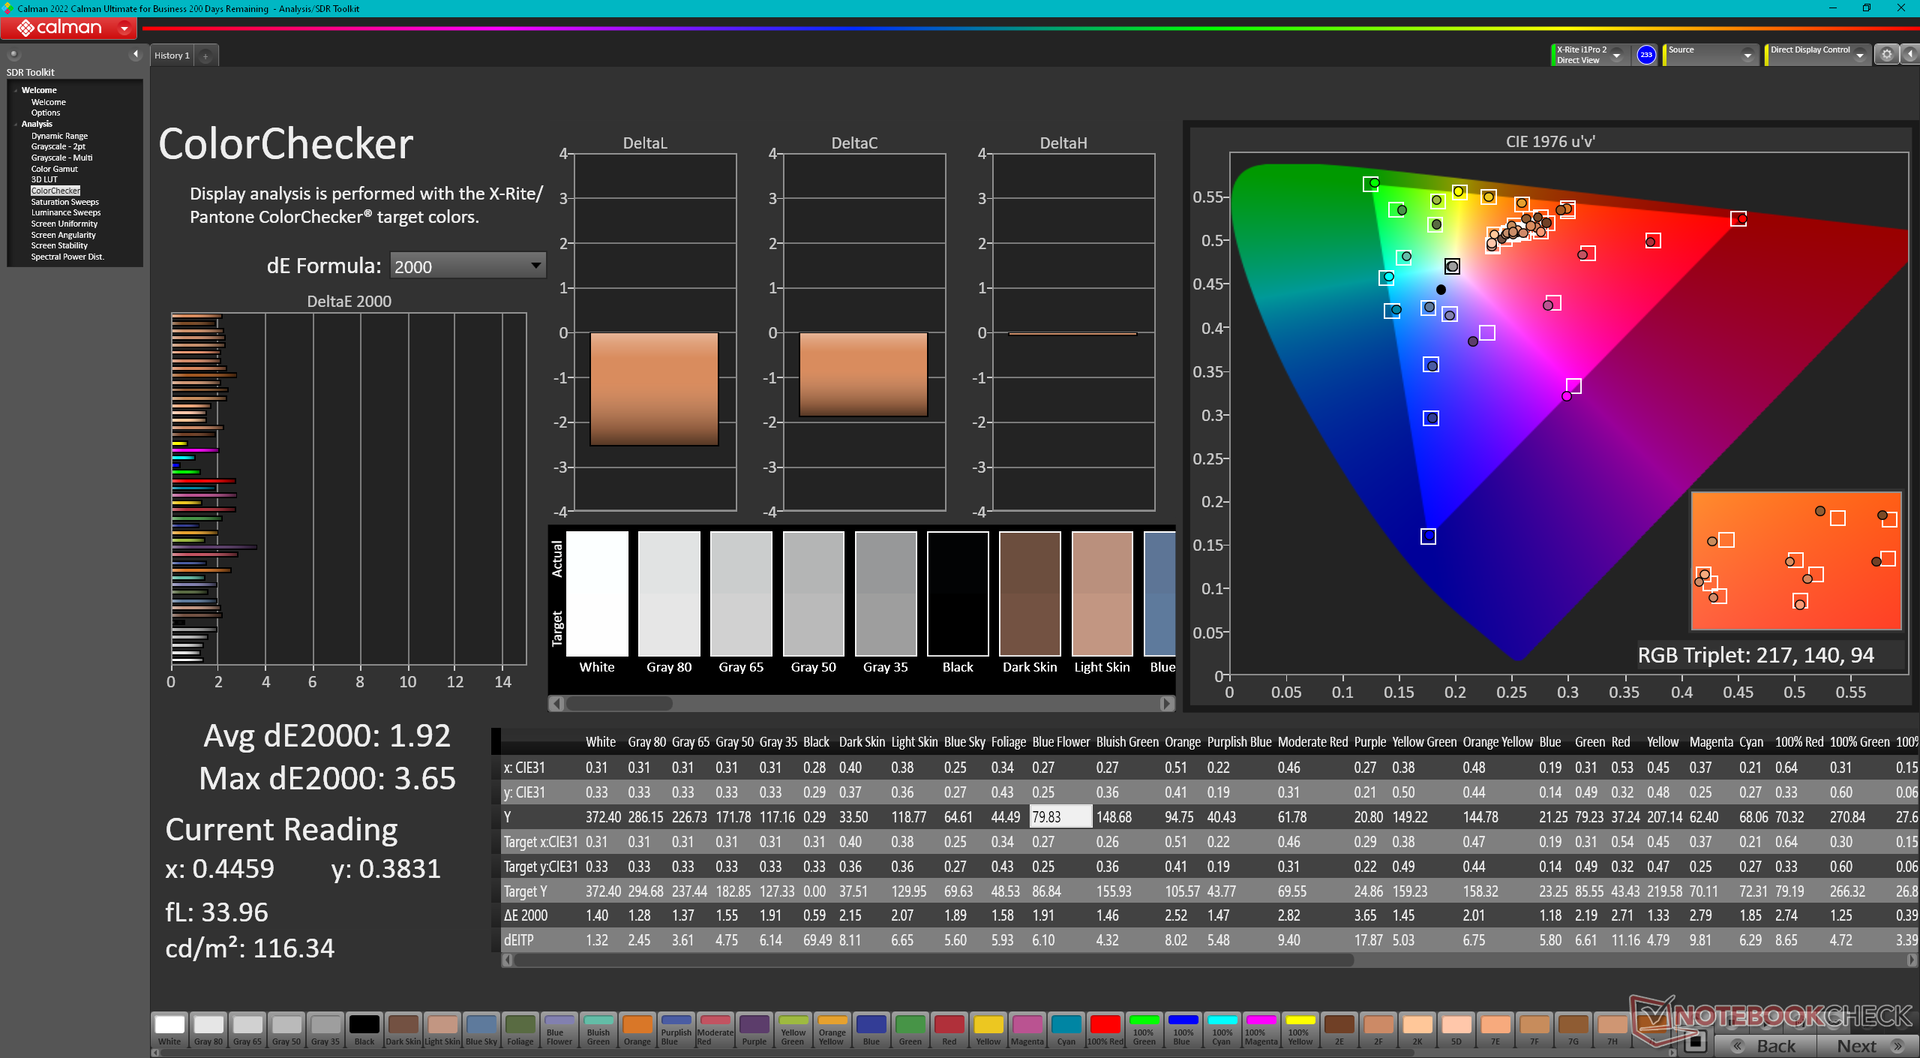
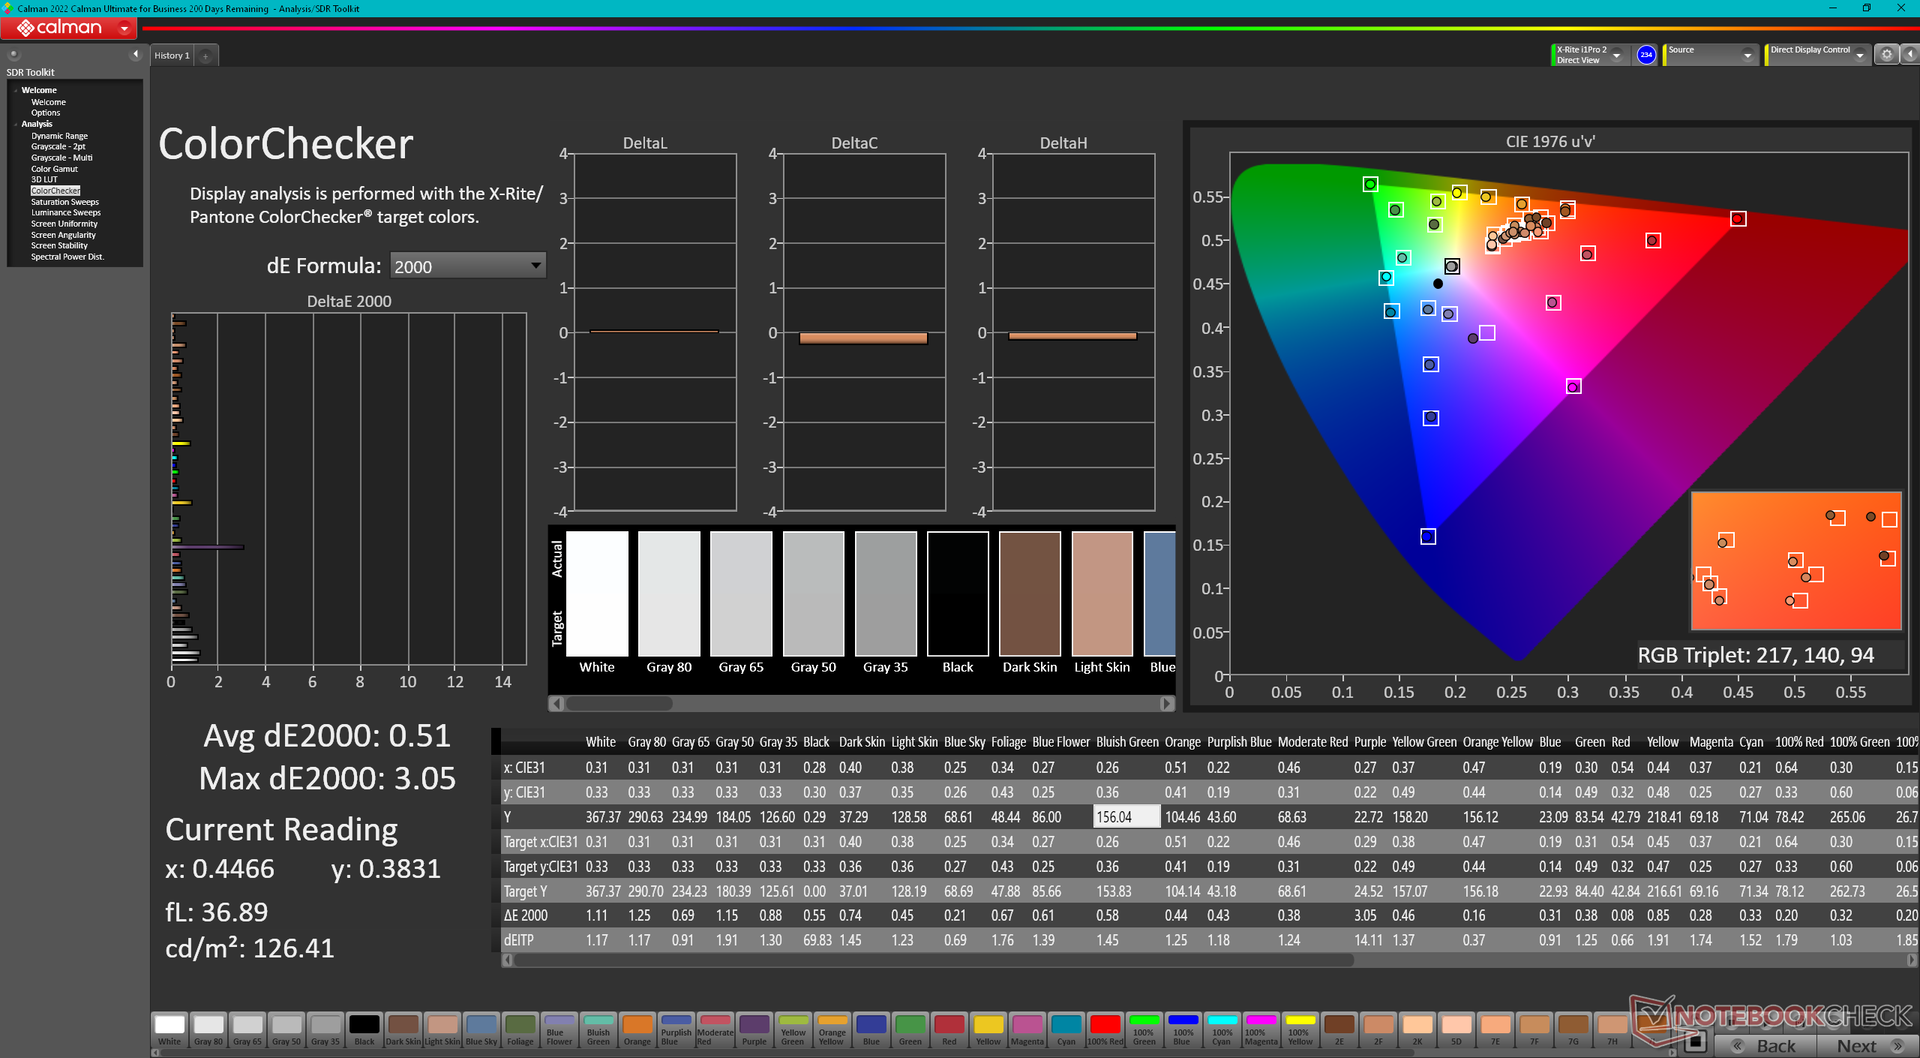
ΔE ColorChecker Calman: 1.92 | ∀{0.5-29.43 Ø4.73}
calibrated: 0.51
ΔE Greyscale Calman: 1.5 | ∀{0.09-98 Ø4.97}
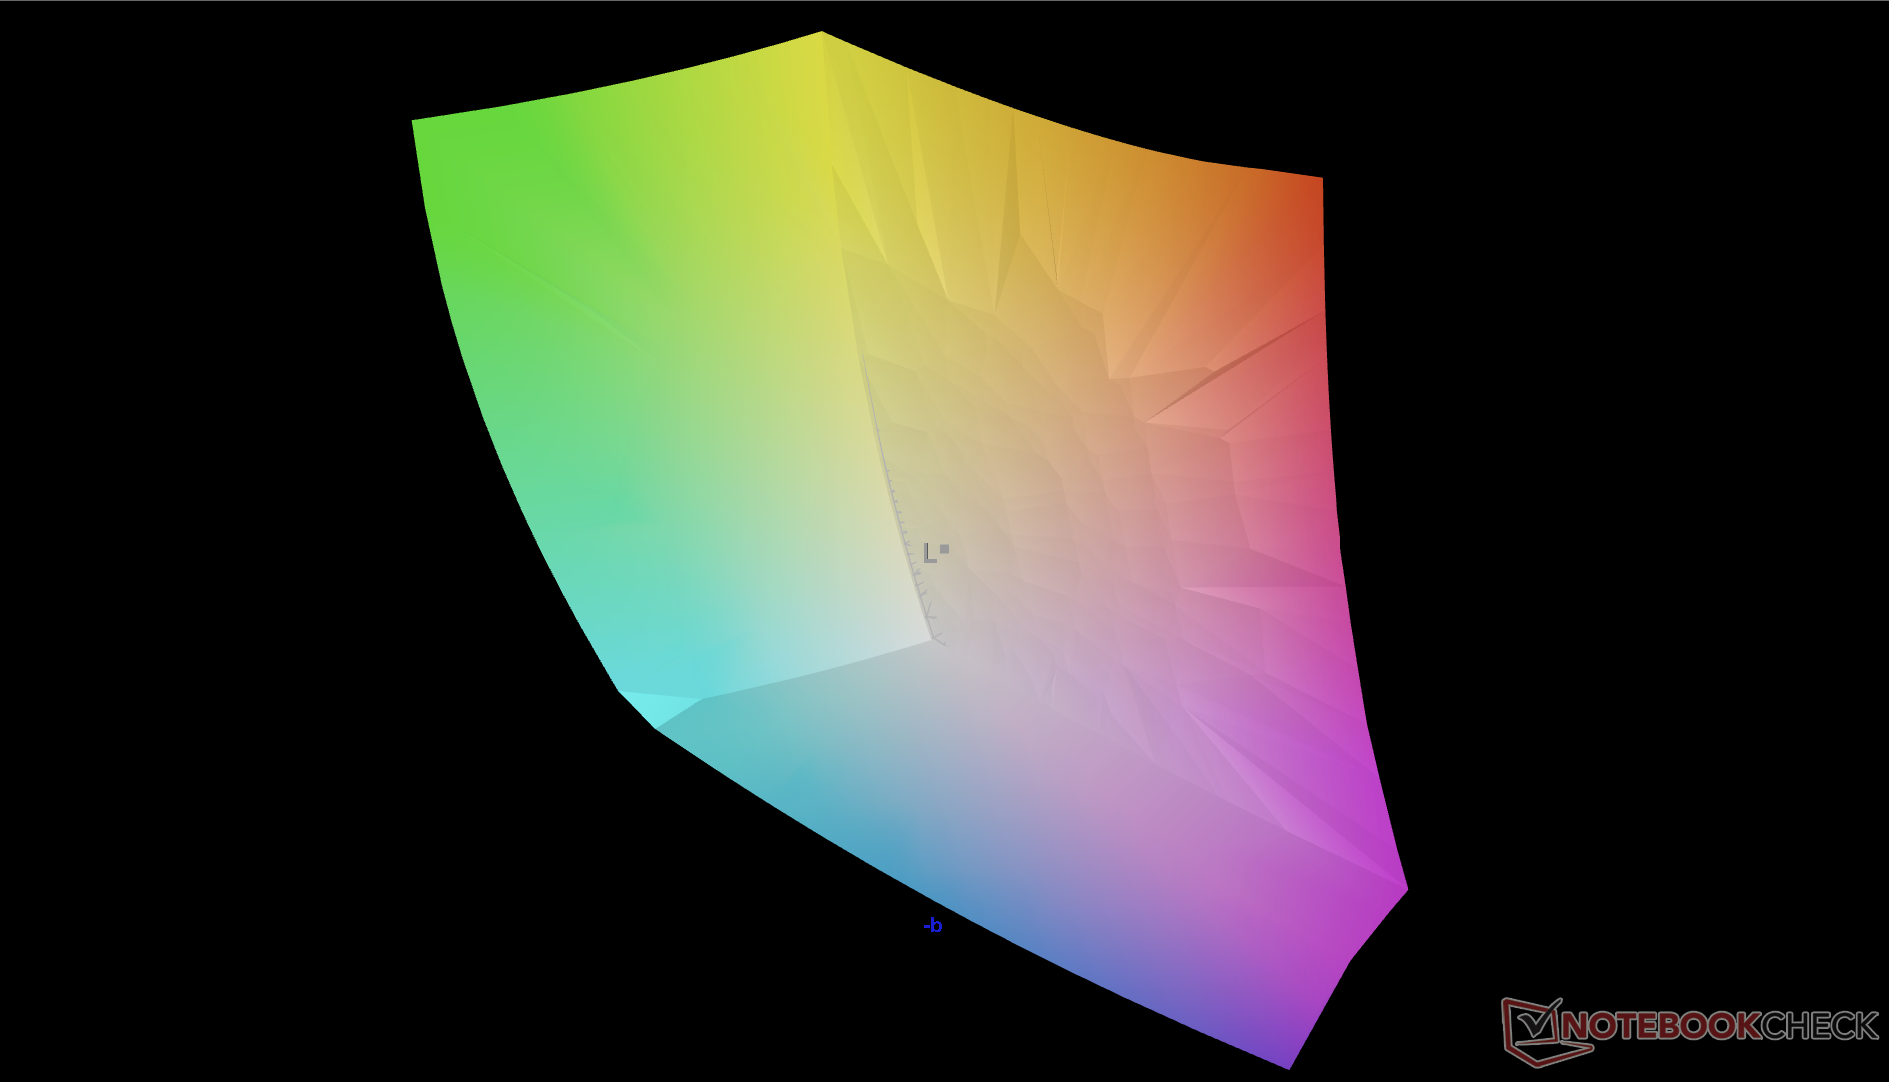
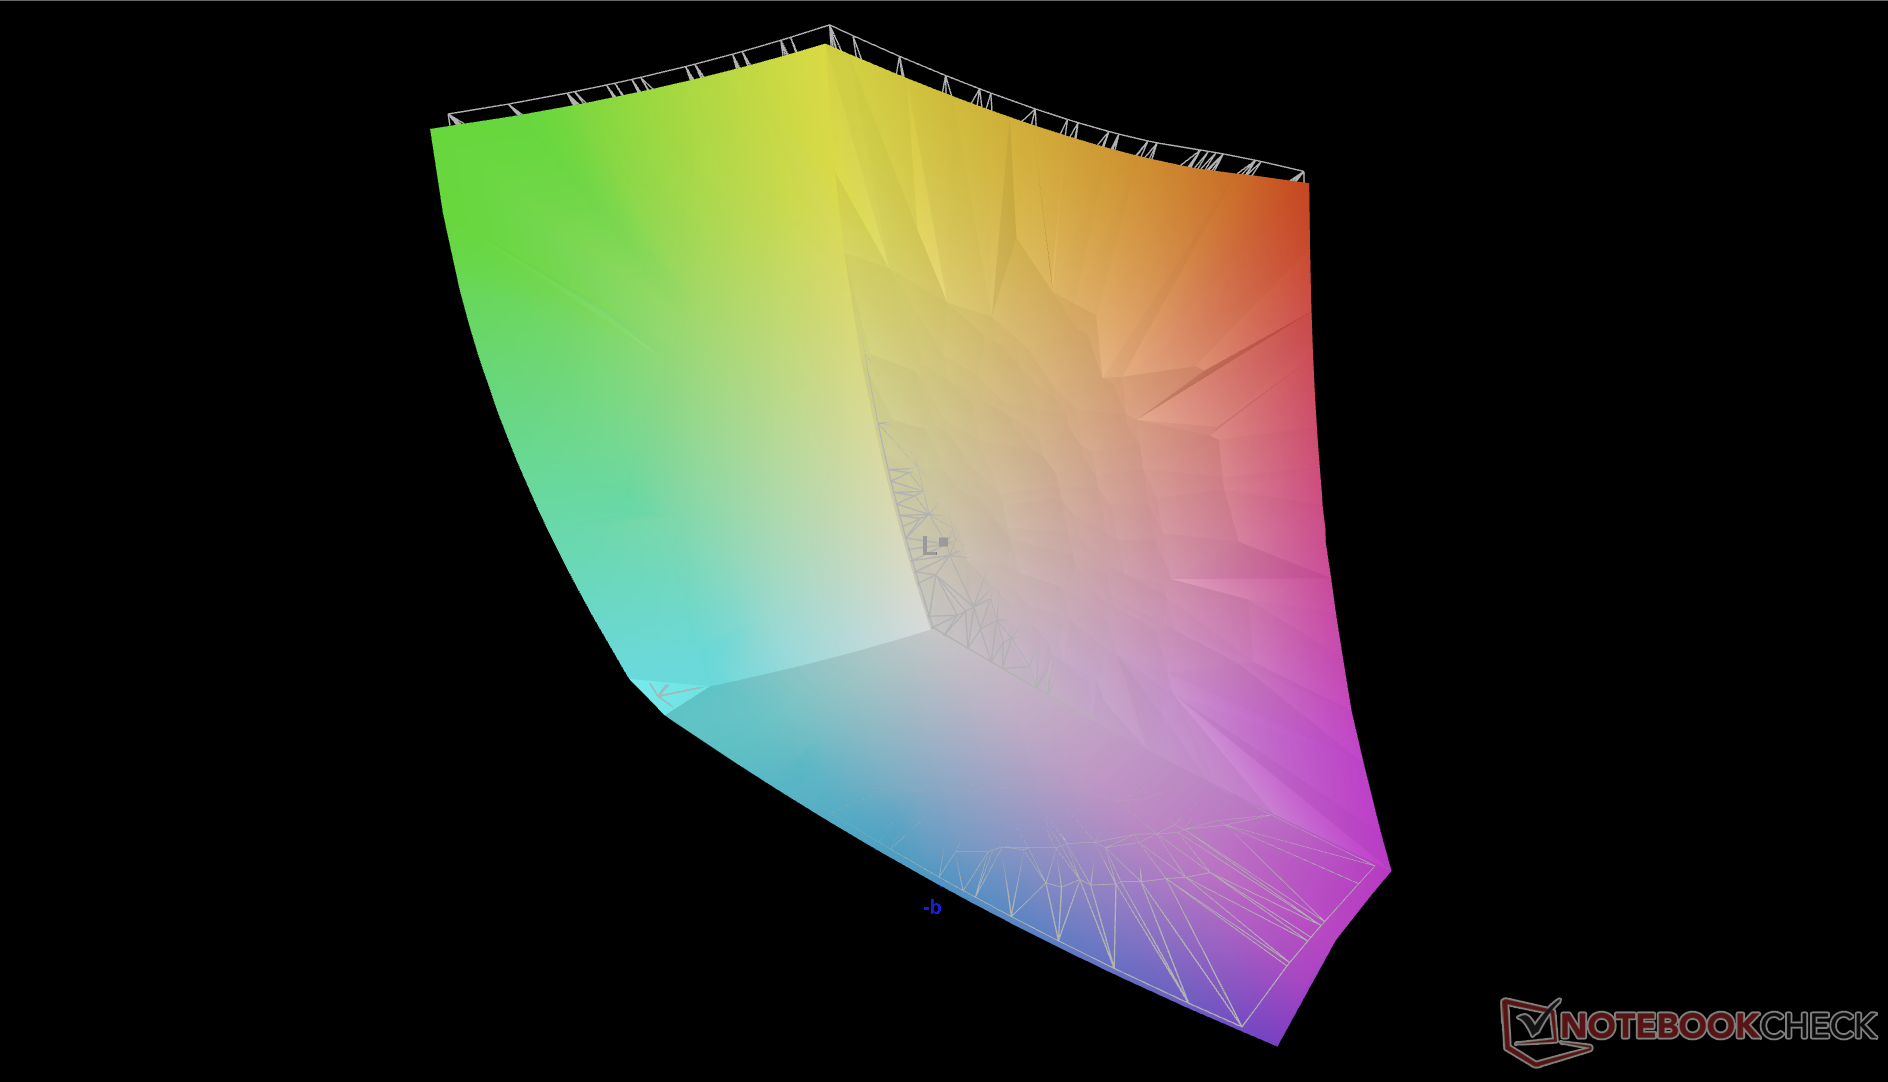
89.8% AdobeRGB 1998 (Argyll 3D)
100% sRGB (Argyll 3D)
97.7% Display P3 (Argyll 3D)
Gamma: 2.34
CCT: 6607 K
| Alienware m18 R1 Chi Mei 180JME, IPS, 1920x1200, 18" | Razer Blade 18 RTX 4070 AU Optronics B180QAN01.0, IPS, 2560x1600, 18" | Asus ROG Strix Scar 18 2023 G834JY-N6005W NE180QDM-NZ2, IPS, 2560x1600, 18" | Eluktronics Mech-17 GP2 BOE NE170QDM-NZ1, IPS, 2560x1600, 17" | MSI Titan GT77 HX 13VI B173ZAN06.C, Mini-LED, 3840x2160, 17.3" | Alienware x17 R2 P48E AU Optronics B173HAN, IPS, 1920x1080, 17.3" | |
|---|---|---|---|---|---|---|
| Display | -2% | -2% | -17% | 0% | -10% | |
| Display P3 Coverage (%) | 97.7 | 96.9 -1% | 97.2 -1% | 69.1 -29% | 94.9 -3% | 79.2 -19% |
| sRGB Coverage (%) | 100 | 99.8 0% | 99.9 0% | 99.7 0% | 99.9 0% | 99.8 0% |
| AdobeRGB 1998 Coverage (%) | 89.8 | 85.3 -5% | 84.9 -5% | 69.8 -22% | 92.4 3% | 79.6 -11% |
| Response Times | -11% | -34% | -148% | -675% | -153% | |
| Response Time Grey 50% / Grey 80% * (ms) | 3 ? | 4.2 ? -40% | 5.41 ? -80% | 12 ? -300% | 38.4 ? -1180% | 12.4 ? -313% |
| Response Time Black / White * (ms) | 9.9 ? | 8 ? 19% | 8.62 ? 13% | 9.4 ? 5% | 26.6 ? -169% | 9.2 ? 7% |
| PWM Frequency (Hz) | 2380 ? | |||||
| Screen | -68% | -141% | -17% | 57715% | -48% | |
| Brightness middle (cd/m²) | 372.8 | 549.6 47% | 490 31% | 417.3 12% | 606 63% | 365.4 -2% |
| Brightness (cd/m²) | 367 | 524 43% | 468 28% | 387 5% | 602 64% | 344 -6% |
| Brightness Distribution (%) | 97 | 89 -8% | 86 -11% | 87 -10% | 93 -4% | 85 -12% |
| Black Level * (cd/m²) | 0.32 | 0.53 -66% | 0.54 -69% | 0.42 -31% | 0.0001 100% | 0.29 9% |
| Contrast (:1) | 1165 | 1037 -11% | 907 -22% | 994 -15% | 6060000 520072% | 1260 8% |
| Colorchecker dE 2000 * | 1.92 | 3.32 -73% | 4.97 -159% | 2.14 -11% | 4.8 -150% | 3.17 -65% |
| Colorchecker dE 2000 max. * | 3.65 | 6.63 -82% | 11.02 -202% | 4.09 -12% | 8.2 -125% | 7.69 -111% |
| Colorchecker dE 2000 calibrated * | 0.51 | 2.7 -429% | 2.97 -482% | 0.42 18% | 1.8 -253% | 0.51 -0% |
| Greyscale dE 2000 * | 1.5 | 2 -33% | 7.2 -380% | 3.1 -107% | 6.5 -333% | 5.3 -253% |
| Gamma | 2.34 94% | 2.29 96% | 2.161 102% | 2.19 100% | 2.63 84% | 2.18 101% |
| CCT | 6607 98% | 6319 103% | 6515 100% | 6040 108% | 6596 99% | 5879 111% |
| Média Total (Programa/Configurações) | -27% /
-46% | -59% /
-96% | -61% /
-36% | 19013% /
37006% | -70% /
-55% |
* ... menor é melhor
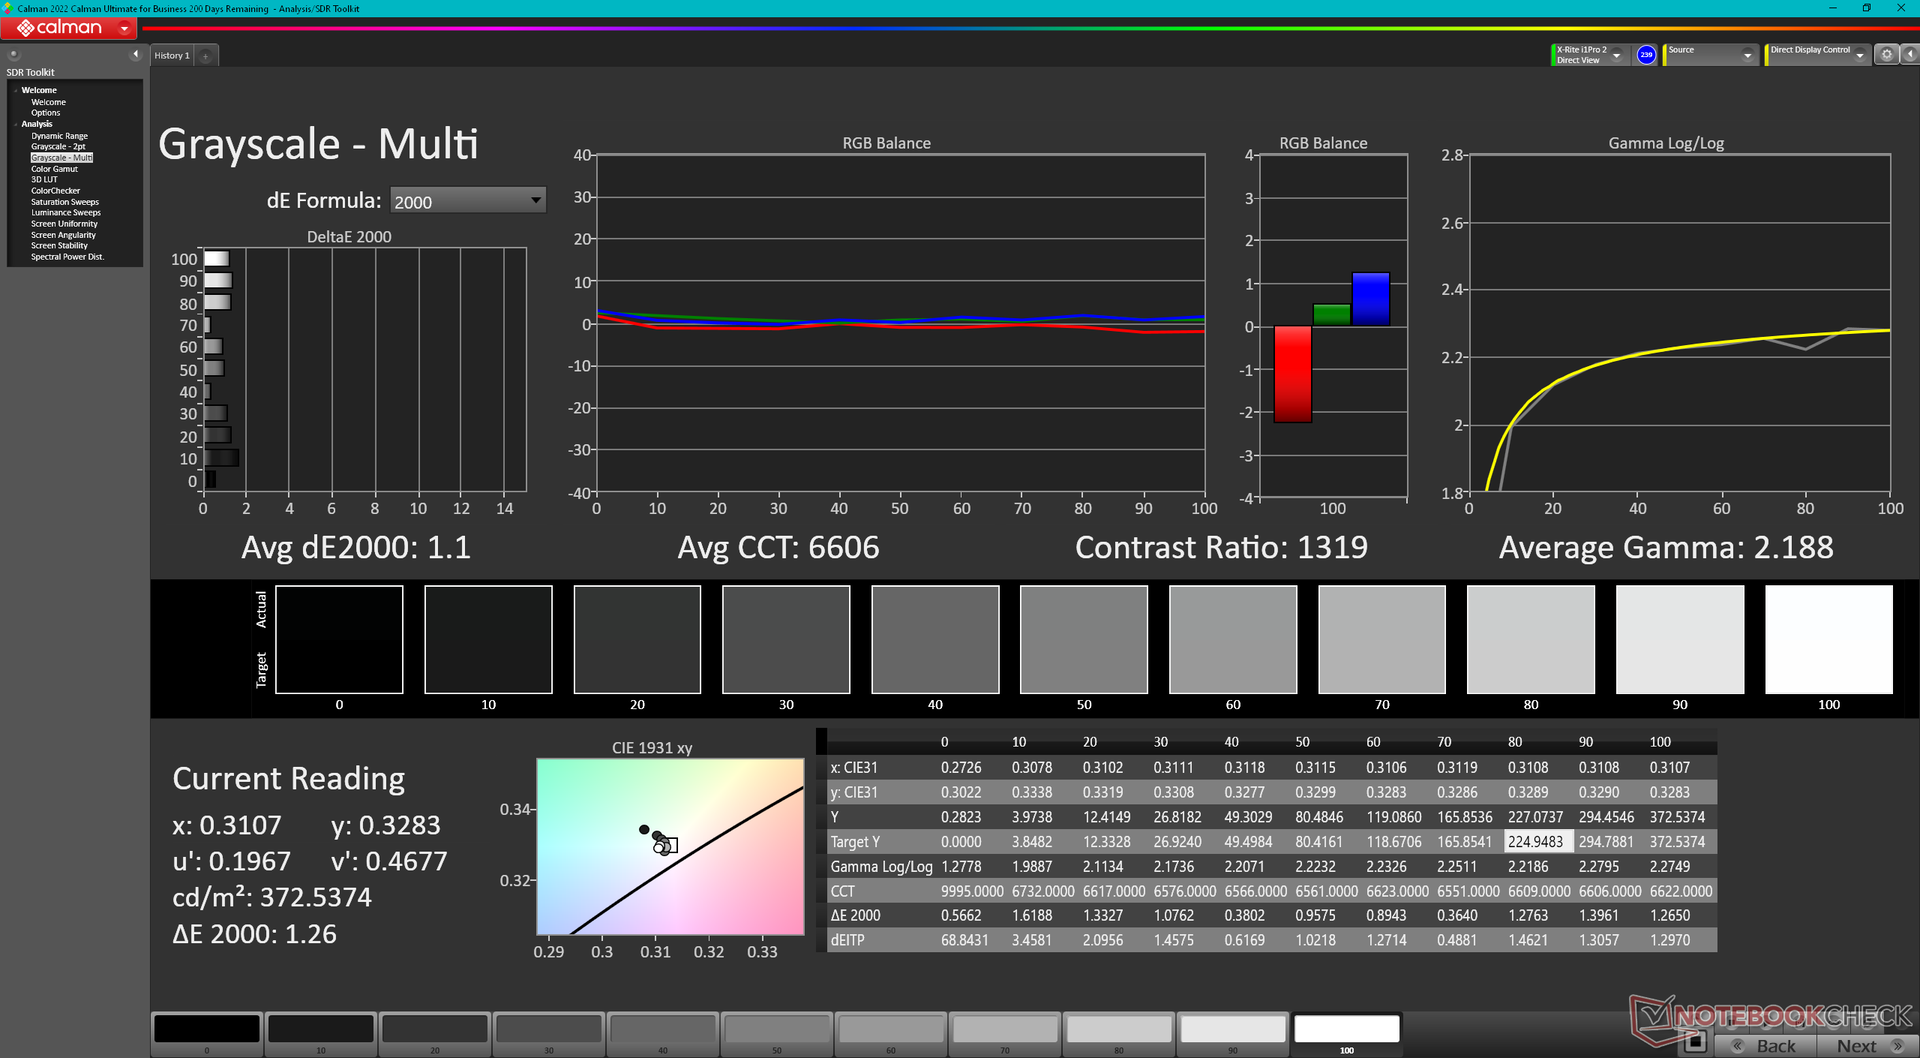
O display vem pré-calibrado para cores precisas e tons de cinza fora da caixa. Calibrar ainda mais o painel não melhoraria significativamente os valores médios do deltaE e, portanto, não é necessária uma calibração pelo usuário final.

Exibir tempos de resposta
| ↔ Tempo de resposta preto para branco | ||
|---|---|---|
| 9.9 ms ... ascensão ↗ e queda ↘ combinadas | ↗ 5.4 ms ascensão | 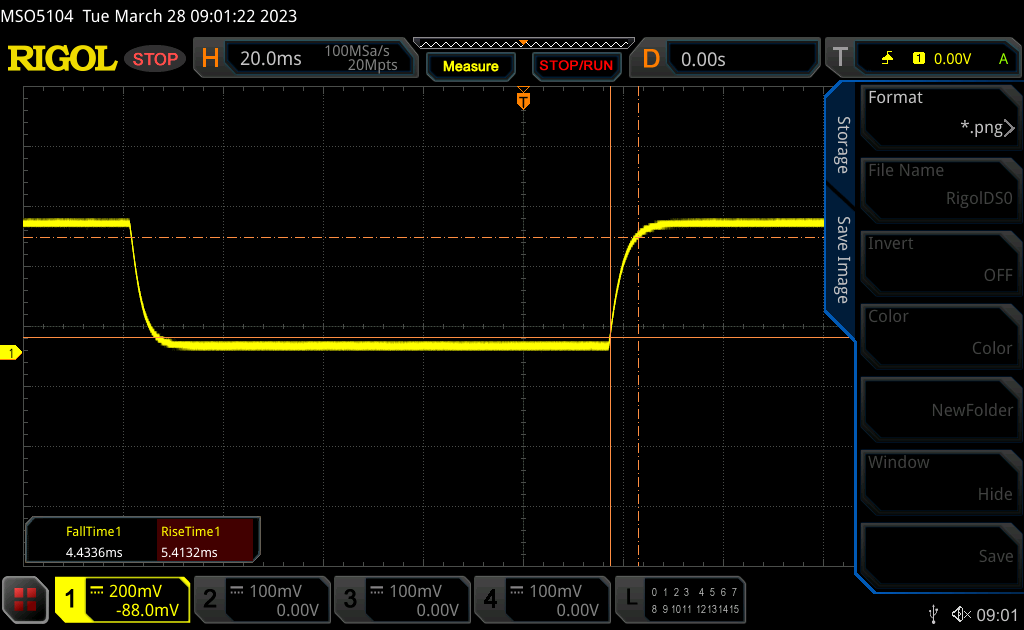 |
| ↘ 4.5 ms queda | ||
| A tela mostra taxas de resposta rápidas em nossos testes e deve ser adequada para jogos. Em comparação, todos os dispositivos testados variam de 0.1 (mínimo) a 240 (máximo) ms. » 27 % de todos os dispositivos são melhores. Isso significa que o tempo de resposta medido é melhor que a média de todos os dispositivos testados (19.9 ms). | ||
| ↔ Tempo de resposta 50% cinza a 80% cinza | ||
| 3 ms ... ascensão ↗ e queda ↘ combinadas | ↗ 1.5 ms ascensão |  |
| ↘ 1.5 ms queda | ||
| A tela mostra taxas de resposta muito rápidas em nossos testes e deve ser muito adequada para jogos em ritmo acelerado. Em comparação, todos os dispositivos testados variam de 0.165 (mínimo) a 636 (máximo) ms. » 13 % de todos os dispositivos são melhores. Isso significa que o tempo de resposta medido é melhor que a média de todos os dispositivos testados (31.1 ms). | ||
Cintilação da tela / PWM (modulação por largura de pulso)
| Tela tremeluzindo / PWM não detectado | 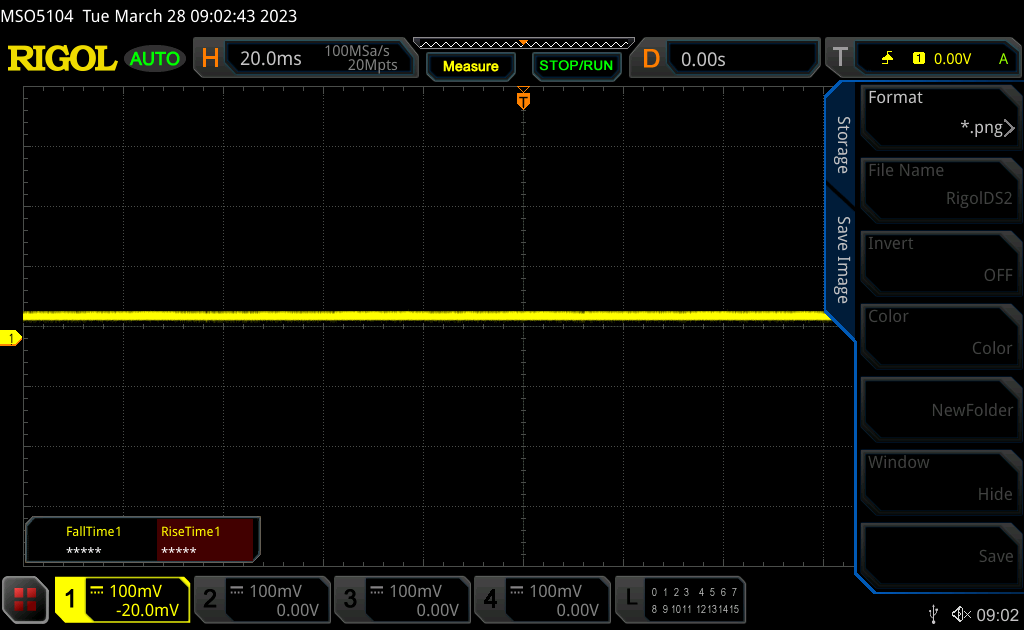 | ||
[pwm_comparison] Em comparação: 52 % de todos os dispositivos testados não usam PWM para escurecer a tela. Se PWM foi detectado, uma média de 7798 (mínimo: 5 - máximo: 343500) Hz foi medida. | |||
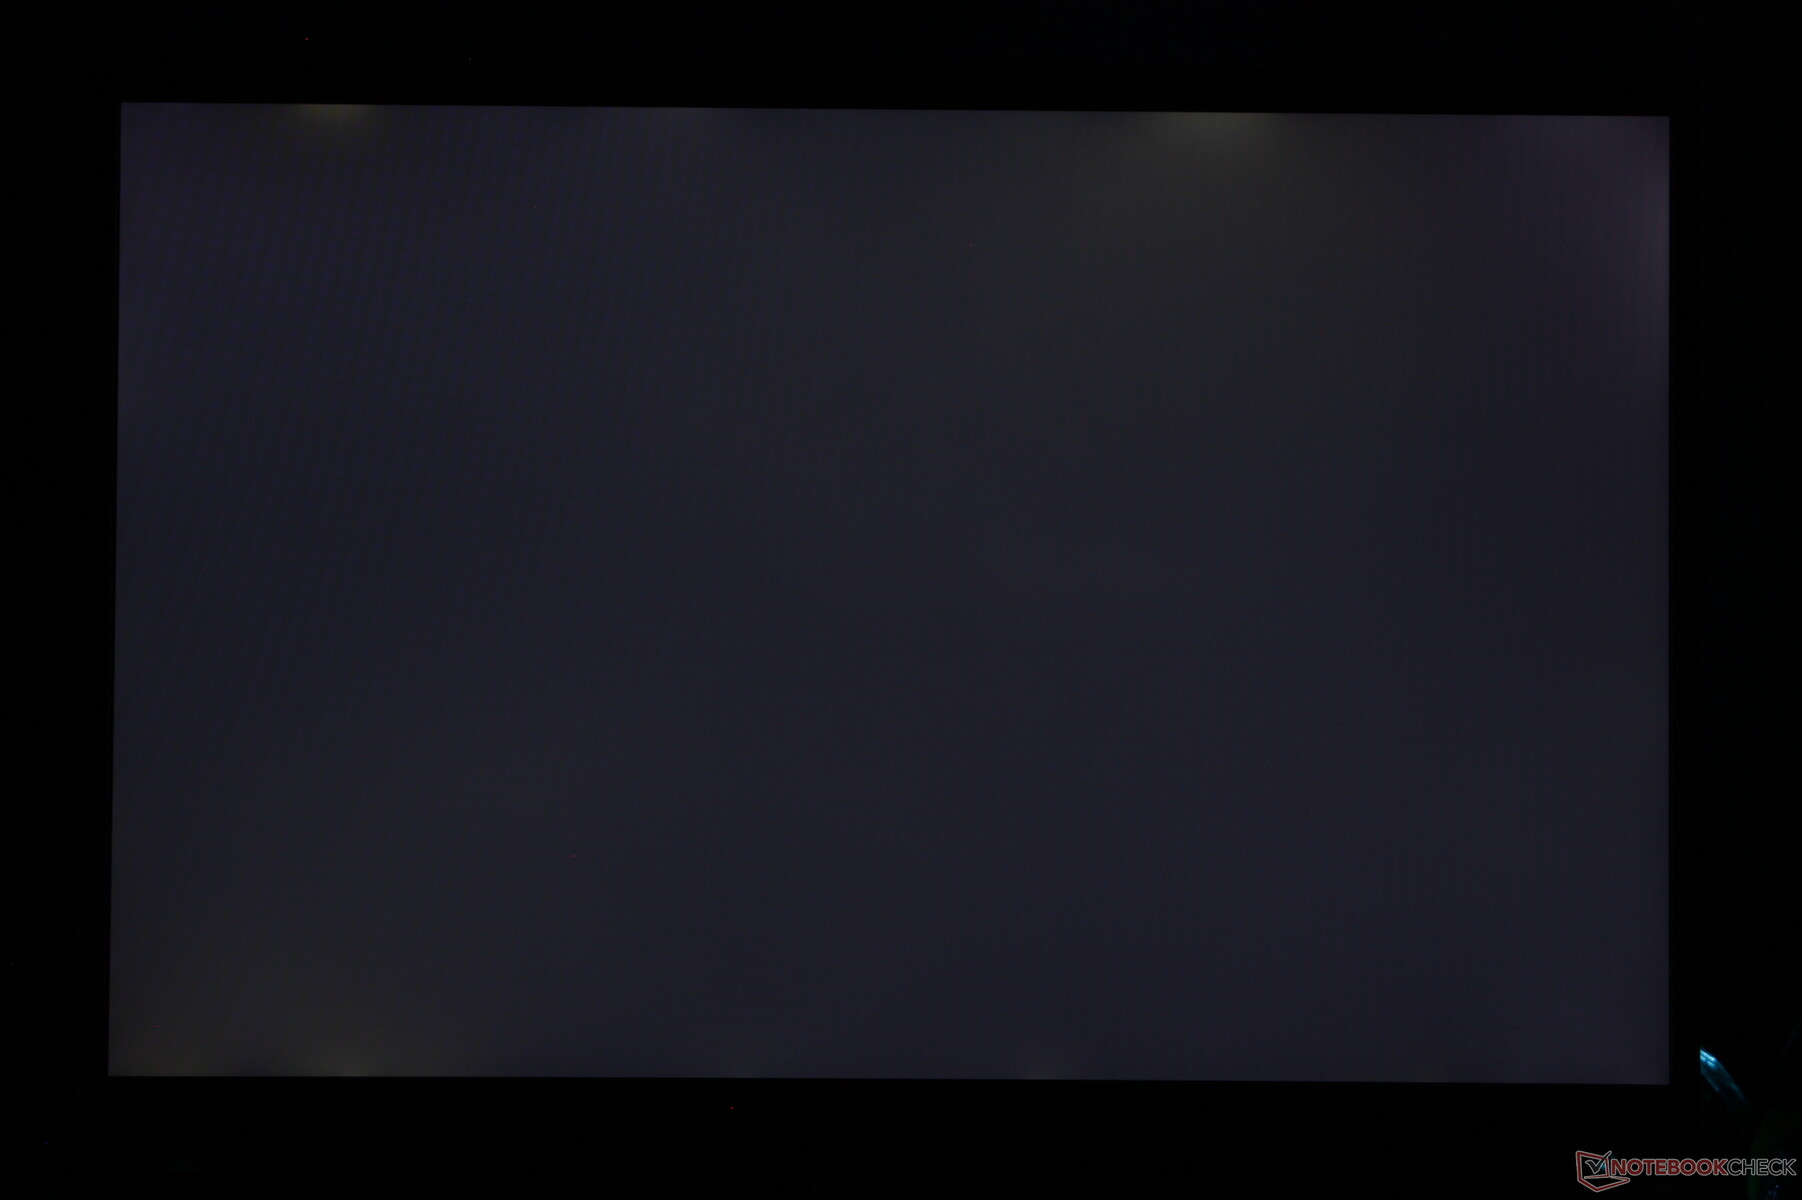
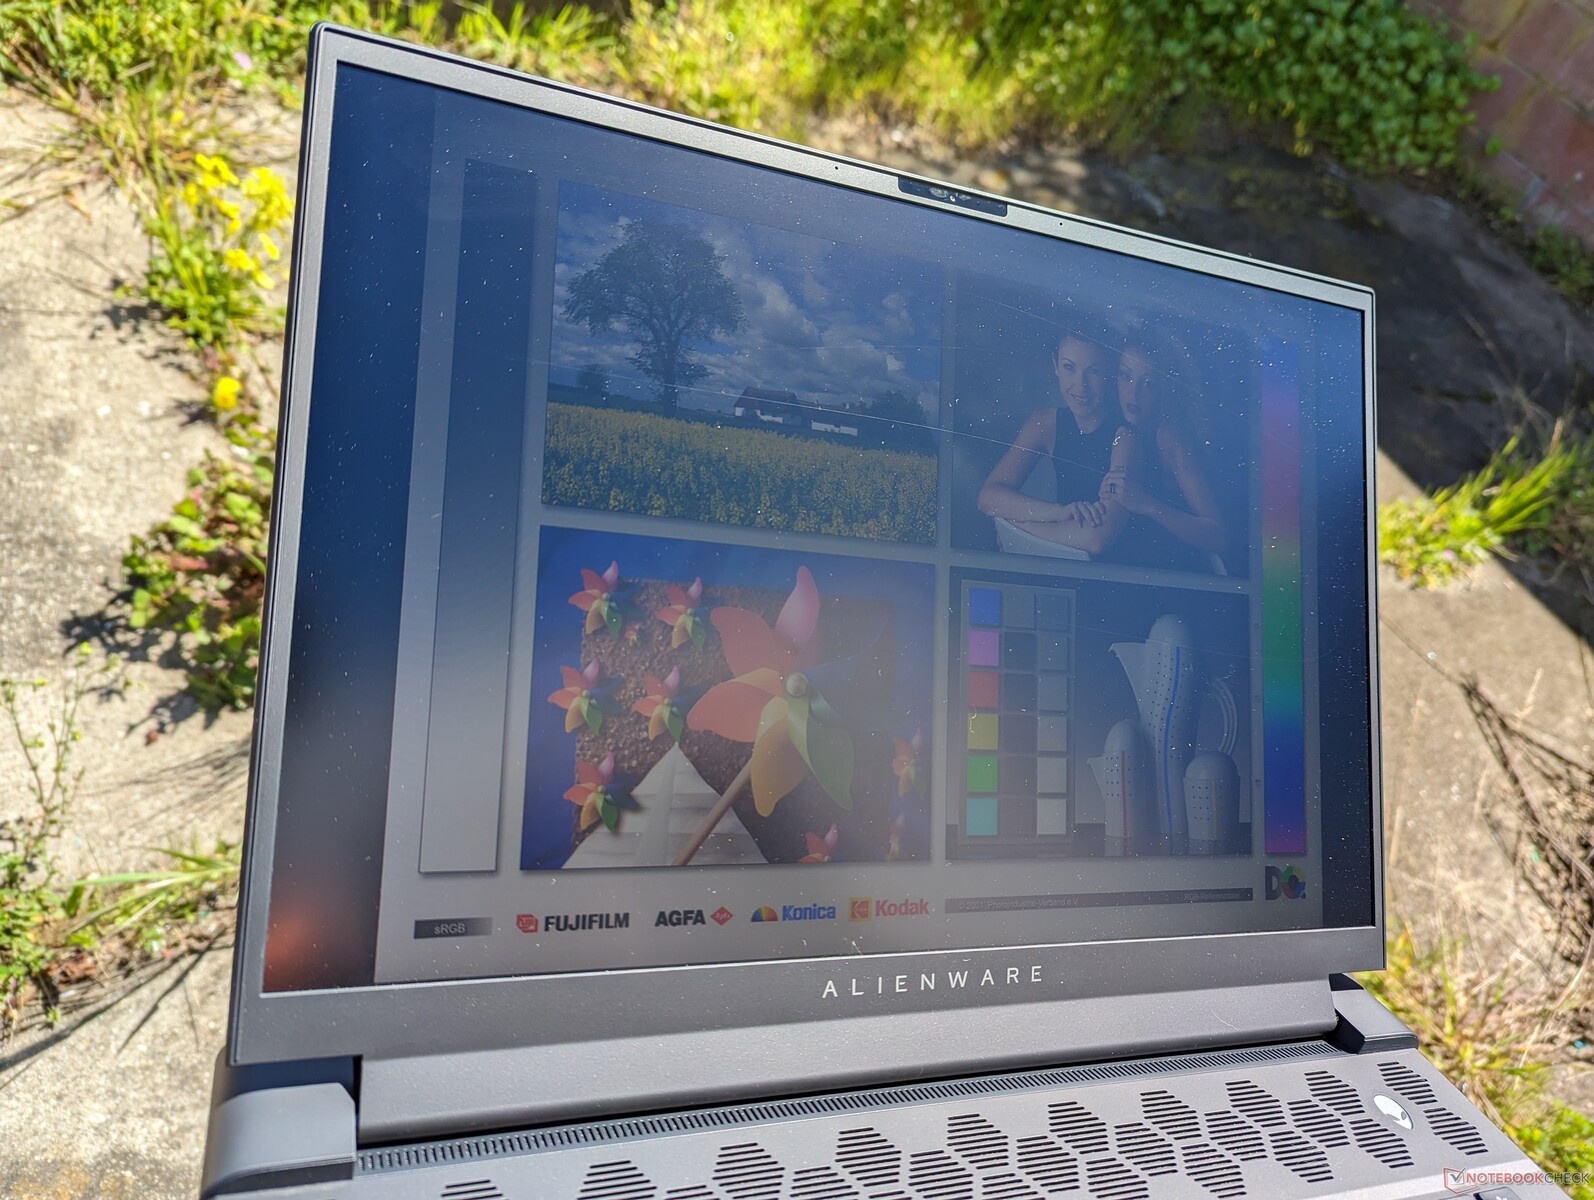
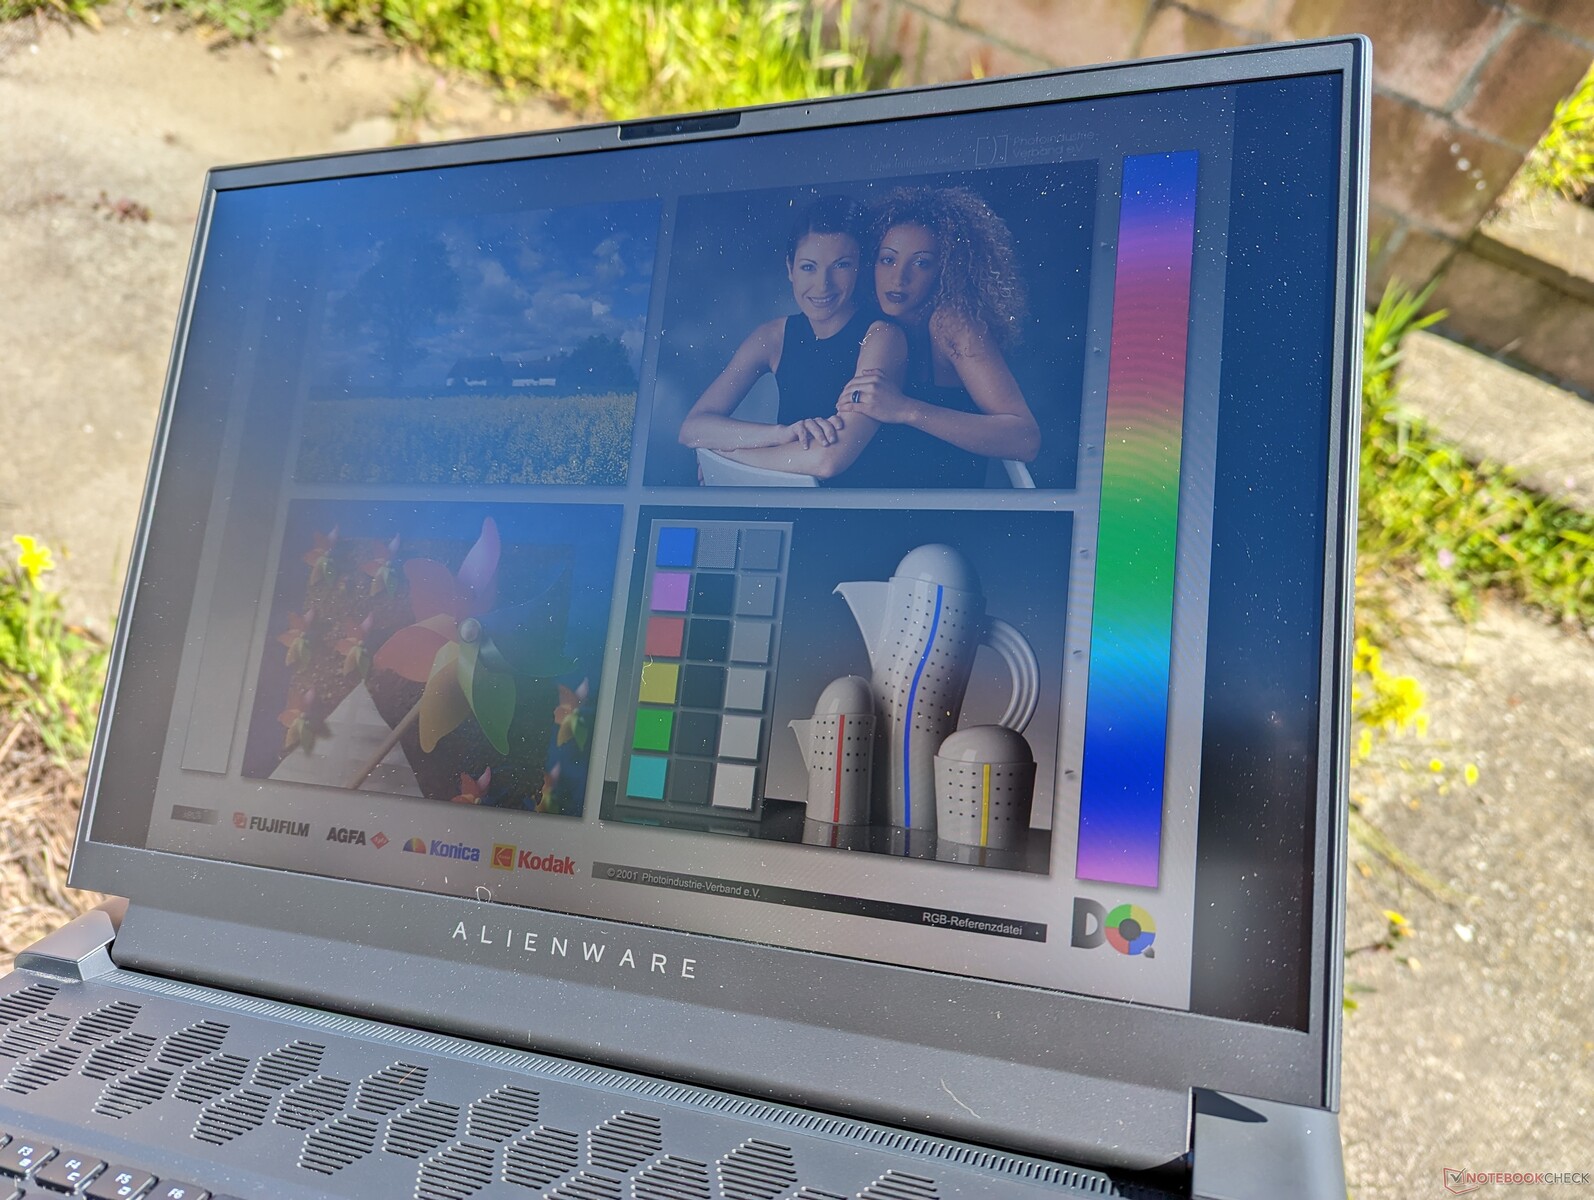
A visibilidade ao ar livre é média para a categoria, já que os displays na maioria dos laptops de jogos normalmente variam entre 300 a 400 lêndeas. Mesmo assim, o imenso peso do Alienware desencoraja o uso ao ar livre. O Blade 18 e o Titan GT77 são mais brilhantes para uma melhor visibilidade ao ar livre.
Desempenho - Intel 13th Gen + Nvidia Ada Lovelace
Condições de teste
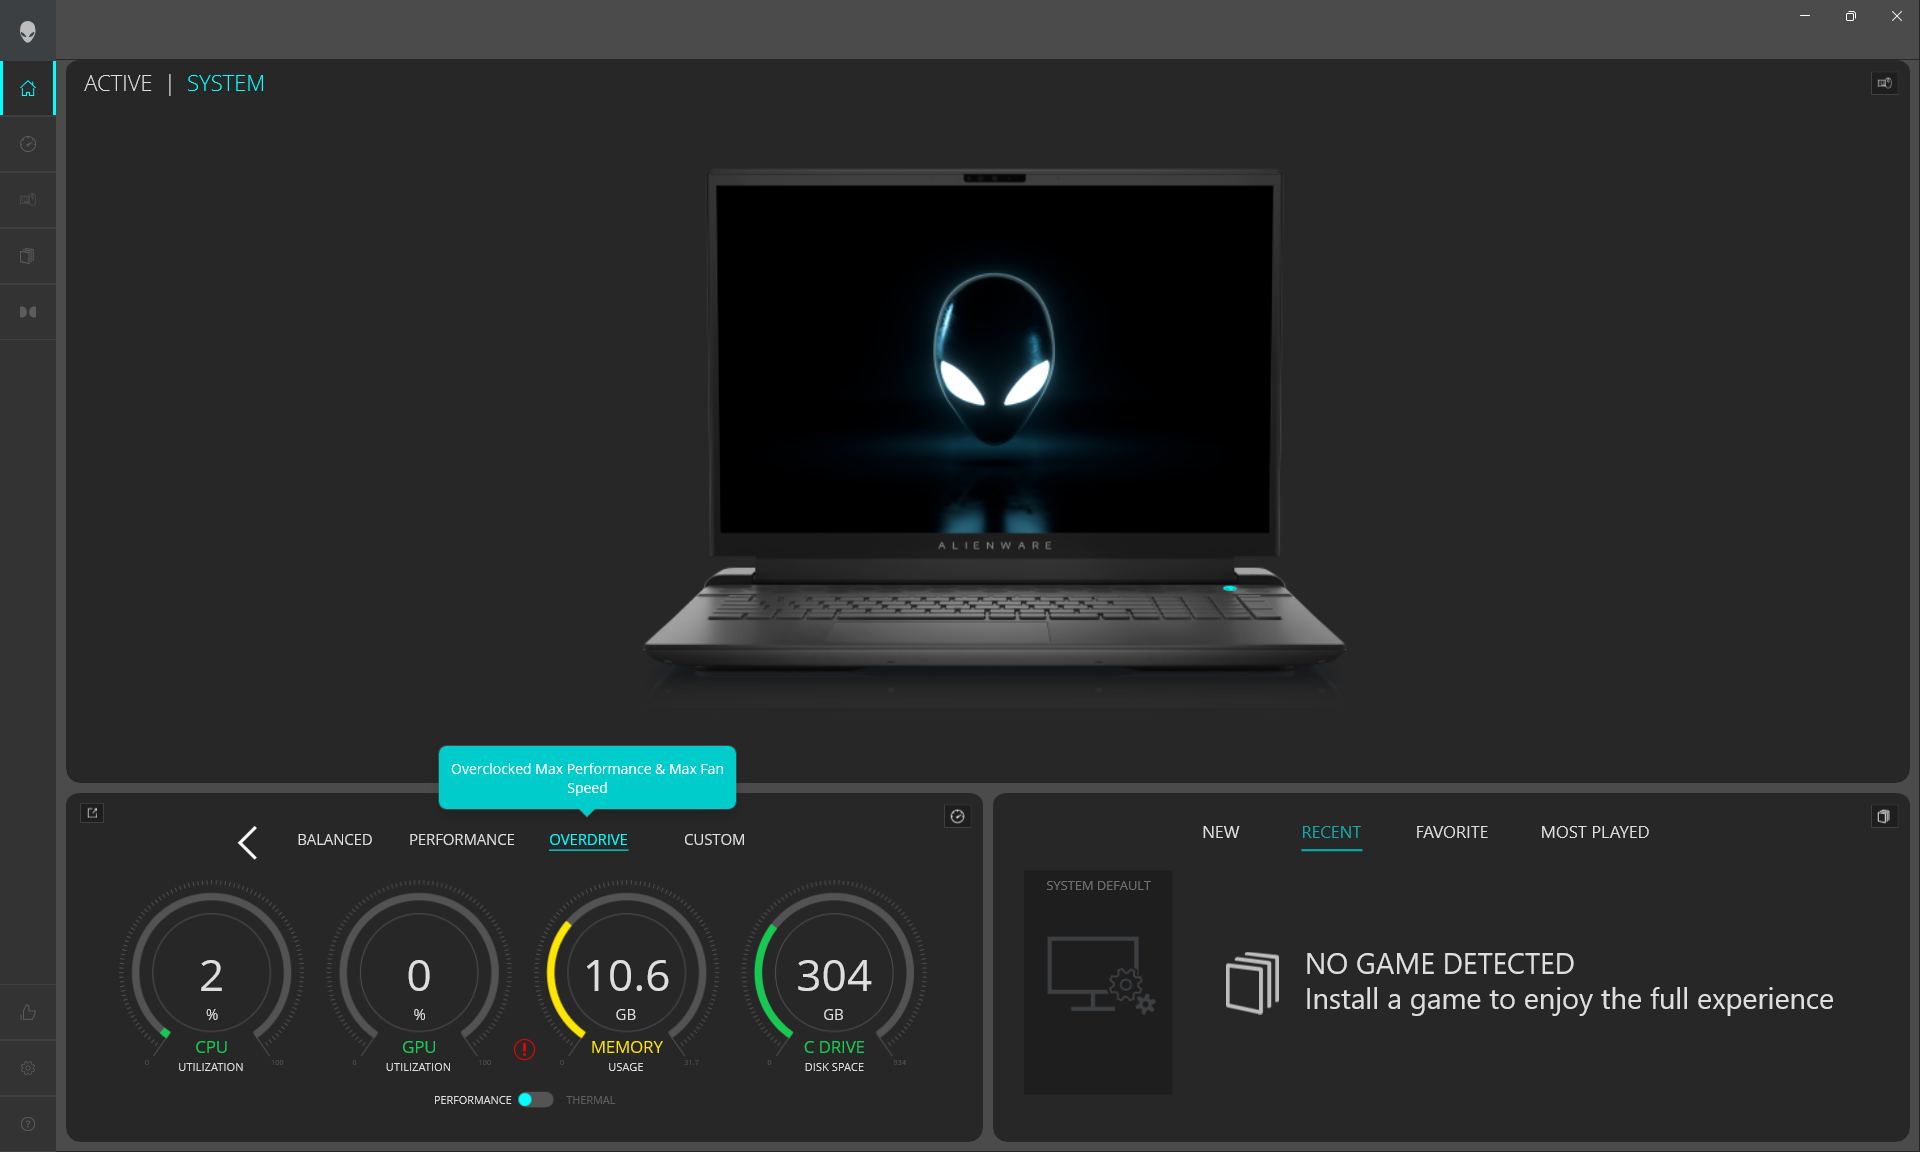
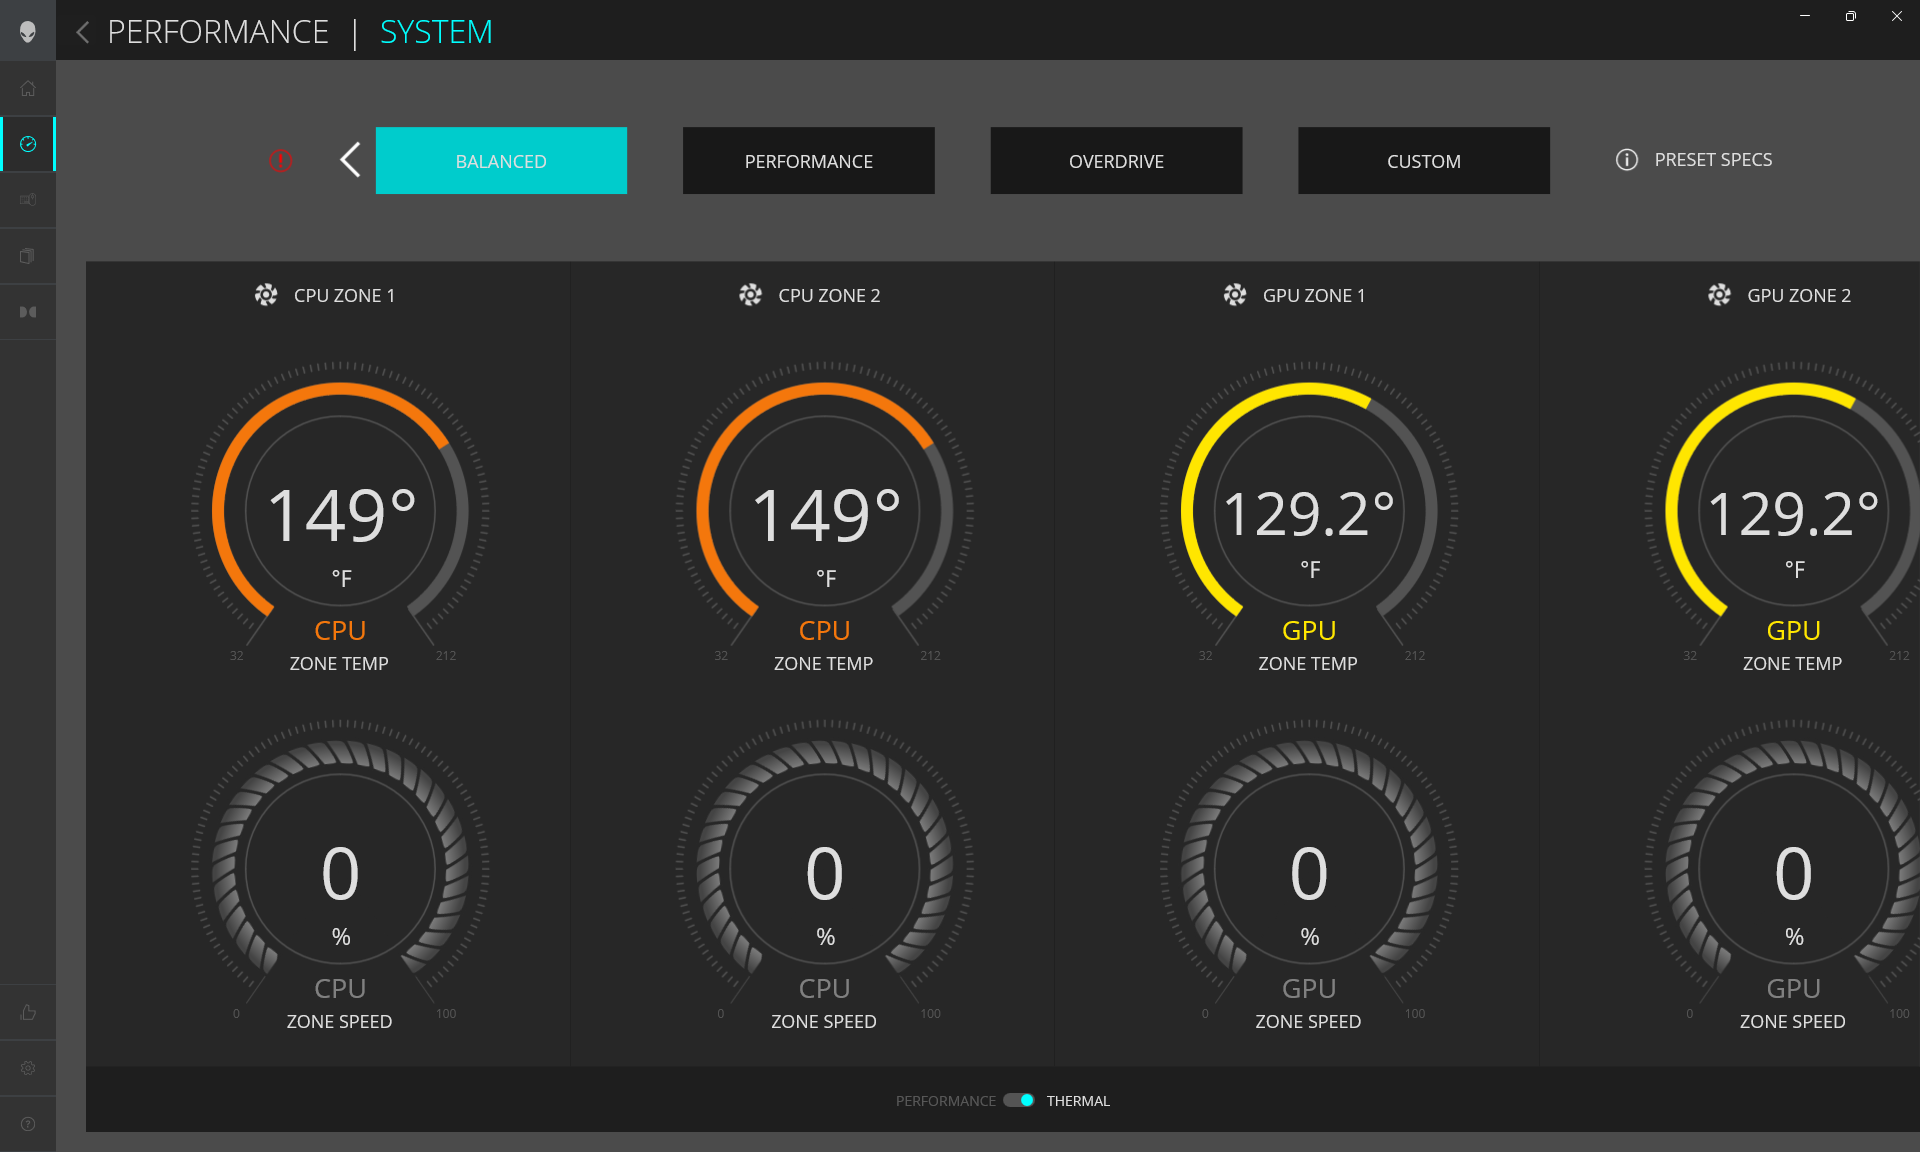
Ajustamos nossa unidade ao modo Performance via Windows, modo GPU discreto via Nvidia Control Panel, e modo Overdrive via Alienware Command Center antes de executar quaisquer benchmarks abaixo. A Dell atualizou completamente o software do Centro de Comando este ano para ser mais fácil de usar e com fontes de tamanho maior do que antes. Contudo, ele ainda carrega muito lentamente, especialmente quando comparado ao mais rápido MSI Center ou ao equivalente do Centro de Controle Schenker.
Experimentamos alguns bugs com o Centro de Comando de Alienware que vale a pena mencionar mesmo após a atualização para a última versão no momento da redação. Primeiramente, o software não consegue carregar se um monitor externo estiver conectado. Em segundo lugar, os ventiladores internos às vezes continuam a funcionar muito alto, mesmo quando o sistema está dormindo ou hibernando nos modos Performance ou Overdrive.
O Advanced Optimus é suportado, o que significa que os usuários podem alternar entre os modos GPU discreto e Optimus via Nvidia Control Panel sem a necessidade de reiniciar. O G-Sync está disponível apenas no modo dGPU enquanto o Optimus se ativa automaticamente se um monitor externo for conectado.
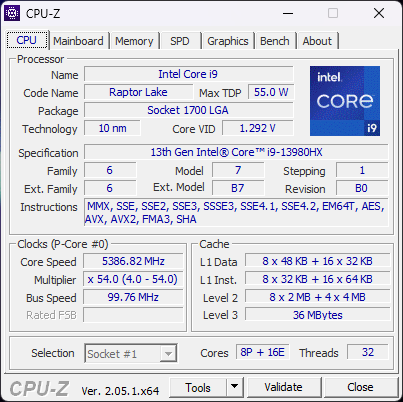
Processador
O desempenho dos processadores é um dos mais rápidos de qualquer CPU móvel atualmente no mercado. Os usuários podem esperar ganhos de uma e múltiplas linhas de cerca de 10% e 75%, respectivamente, sobre a 12ª geração.Núcleo i9-12900HK no antigo Alienware x17 R2. O principal concorrente da AMD Zen 4 é oRyzen 9 7945HX fica aquém das cargas com rosca única em cerca de 10 a 15%.
Apesar do salto maciço de desempenho sobre o Alder Lake-H, as lacunas de desempenho entre oNúcleo i9-13900HX,Núcleo i9-13950HXeNúcleo i9-13980HX são muito menores a menos de 5%. Assim, se for dada a escolha entre as três CPUs, você pode querer economizar alguma massa optando pela i9-13900HX "mais lenta".
A opção de CPU mais baixa disponível é a Núcleo i7-13700HX que é mais lento que nossa i9-13980HX em cerca de 33 por cento.
Cinebench R15 Multi Loop
Cinebench R23: Multi Core | Single Core
Cinebench R20: CPU (Multi Core) | CPU (Single Core)
Cinebench R15: CPU Multi 64Bit | CPU Single 64Bit
Blender: v2.79 BMW27 CPU
7-Zip 18.03: 7z b 4 | 7z b 4 -mmt1
Geekbench 5.5: Multi-Core | Single-Core
HWBOT x265 Benchmark v2.2: 4k Preset
LibreOffice : 20 Documents To PDF
R Benchmark 2.5: Overall mean
* ... menor é melhor
AIDA64: FP32 Ray-Trace | FPU Julia | CPU SHA3 | CPU Queen | FPU SinJulia | FPU Mandel | CPU AES | CPU ZLib | FP64 Ray-Trace | CPU PhotoWorxx
| Performance rating | |
| Alienware m18 R1 | |
| Eluktronics Mech-17 GP2 | |
| MSI Titan GT77 HX 13VI | |
| Asus ROG Strix Scar 18 2023 G834JY-N6005W | |
| Média Intel Core i9-13980HX | |
| Razer Blade 18 RTX 4070 | |
| Alienware x17 R2 P48E | |
| AIDA64 / FP32 Ray-Trace | |
| Alienware m18 R1 | |
| MSI Titan GT77 HX 13VI | |
| Asus ROG Strix Scar 18 2023 G834JY-N6005W | |
| Eluktronics Mech-17 GP2 | |
| Média Intel Core i9-13980HX (21332 - 29553, n=9) | |
| Razer Blade 18 RTX 4070 | |
| Alienware x17 R2 P48E | |
| AIDA64 / FPU Julia | |
| Alienware m18 R1 | |
| MSI Titan GT77 HX 13VI | |
| Asus ROG Strix Scar 18 2023 G834JY-N6005W | |
| Média Intel Core i9-13980HX (108001 - 148168, n=9) | |
| Eluktronics Mech-17 GP2 | |
| Razer Blade 18 RTX 4070 | |
| Alienware x17 R2 P48E | |
| AIDA64 / CPU SHA3 | |
| Alienware m18 R1 | |
| MSI Titan GT77 HX 13VI | |
| Eluktronics Mech-17 GP2 | |
| Asus ROG Strix Scar 18 2023 G834JY-N6005W | |
| Média Intel Core i9-13980HX (5264 - 7142, n=9) | |
| Razer Blade 18 RTX 4070 | |
| Alienware x17 R2 P48E | |
| AIDA64 / CPU Queen | |
| Alienware m18 R1 | |
| Asus ROG Strix Scar 18 2023 G834JY-N6005W | |
| Eluktronics Mech-17 GP2 | |
| MSI Titan GT77 HX 13VI | |
| Média Intel Core i9-13980HX (126758 - 143409, n=9) | |
| Razer Blade 18 RTX 4070 | |
| Alienware x17 R2 P48E | |
| AIDA64 / FPU SinJulia | |
| Eluktronics Mech-17 GP2 | |
| Asus ROG Strix Scar 18 2023 G834JY-N6005W | |
| MSI Titan GT77 HX 13VI | |
| Alienware m18 R1 | |
| Média Intel Core i9-13980HX (13785 - 17117, n=9) | |
| Razer Blade 18 RTX 4070 | |
| Alienware x17 R2 P48E | |
| AIDA64 / FPU Mandel | |
| Alienware m18 R1 | |
| MSI Titan GT77 HX 13VI | |
| Asus ROG Strix Scar 18 2023 G834JY-N6005W | |
| Eluktronics Mech-17 GP2 | |
| Média Intel Core i9-13980HX (53398 - 73758, n=9) | |
| Razer Blade 18 RTX 4070 | |
| Alienware x17 R2 P48E | |
| AIDA64 / CPU AES | |
| Eluktronics Mech-17 GP2 | |
| MSI Titan GT77 HX 13VI | |
| Alienware m18 R1 | |
| Asus ROG Strix Scar 18 2023 G834JY-N6005W | |
| Média Intel Core i9-13980HX (105169 - 136520, n=9) | |
| Razer Blade 18 RTX 4070 | |
| Alienware x17 R2 P48E | |
| AIDA64 / CPU ZLib | |
| MSI Titan GT77 HX 13VI | |
| Asus ROG Strix Scar 18 2023 G834JY-N6005W | |
| Alienware m18 R1 | |
| Eluktronics Mech-17 GP2 | |
| Média Intel Core i9-13980HX (1513 - 2039, n=9) | |
| Razer Blade 18 RTX 4070 | |
| Alienware x17 R2 P48E | |
| AIDA64 / FP64 Ray-Trace | |
| Alienware m18 R1 | |
| MSI Titan GT77 HX 13VI | |
| Asus ROG Strix Scar 18 2023 G834JY-N6005W | |
| Eluktronics Mech-17 GP2 | |
| Média Intel Core i9-13980HX (11431 - 16325, n=9) | |
| Razer Blade 18 RTX 4070 | |
| Alienware x17 R2 P48E | |
| AIDA64 / CPU PhotoWorxx | |
| Alienware m18 R1 | |
| Razer Blade 18 RTX 4070 | |
| Média Intel Core i9-13980HX (37069 - 52949, n=9) | |
| Eluktronics Mech-17 GP2 | |
| Asus ROG Strix Scar 18 2023 G834JY-N6005W | |
| MSI Titan GT77 HX 13VI | |
| Alienware x17 R2 P48E | |
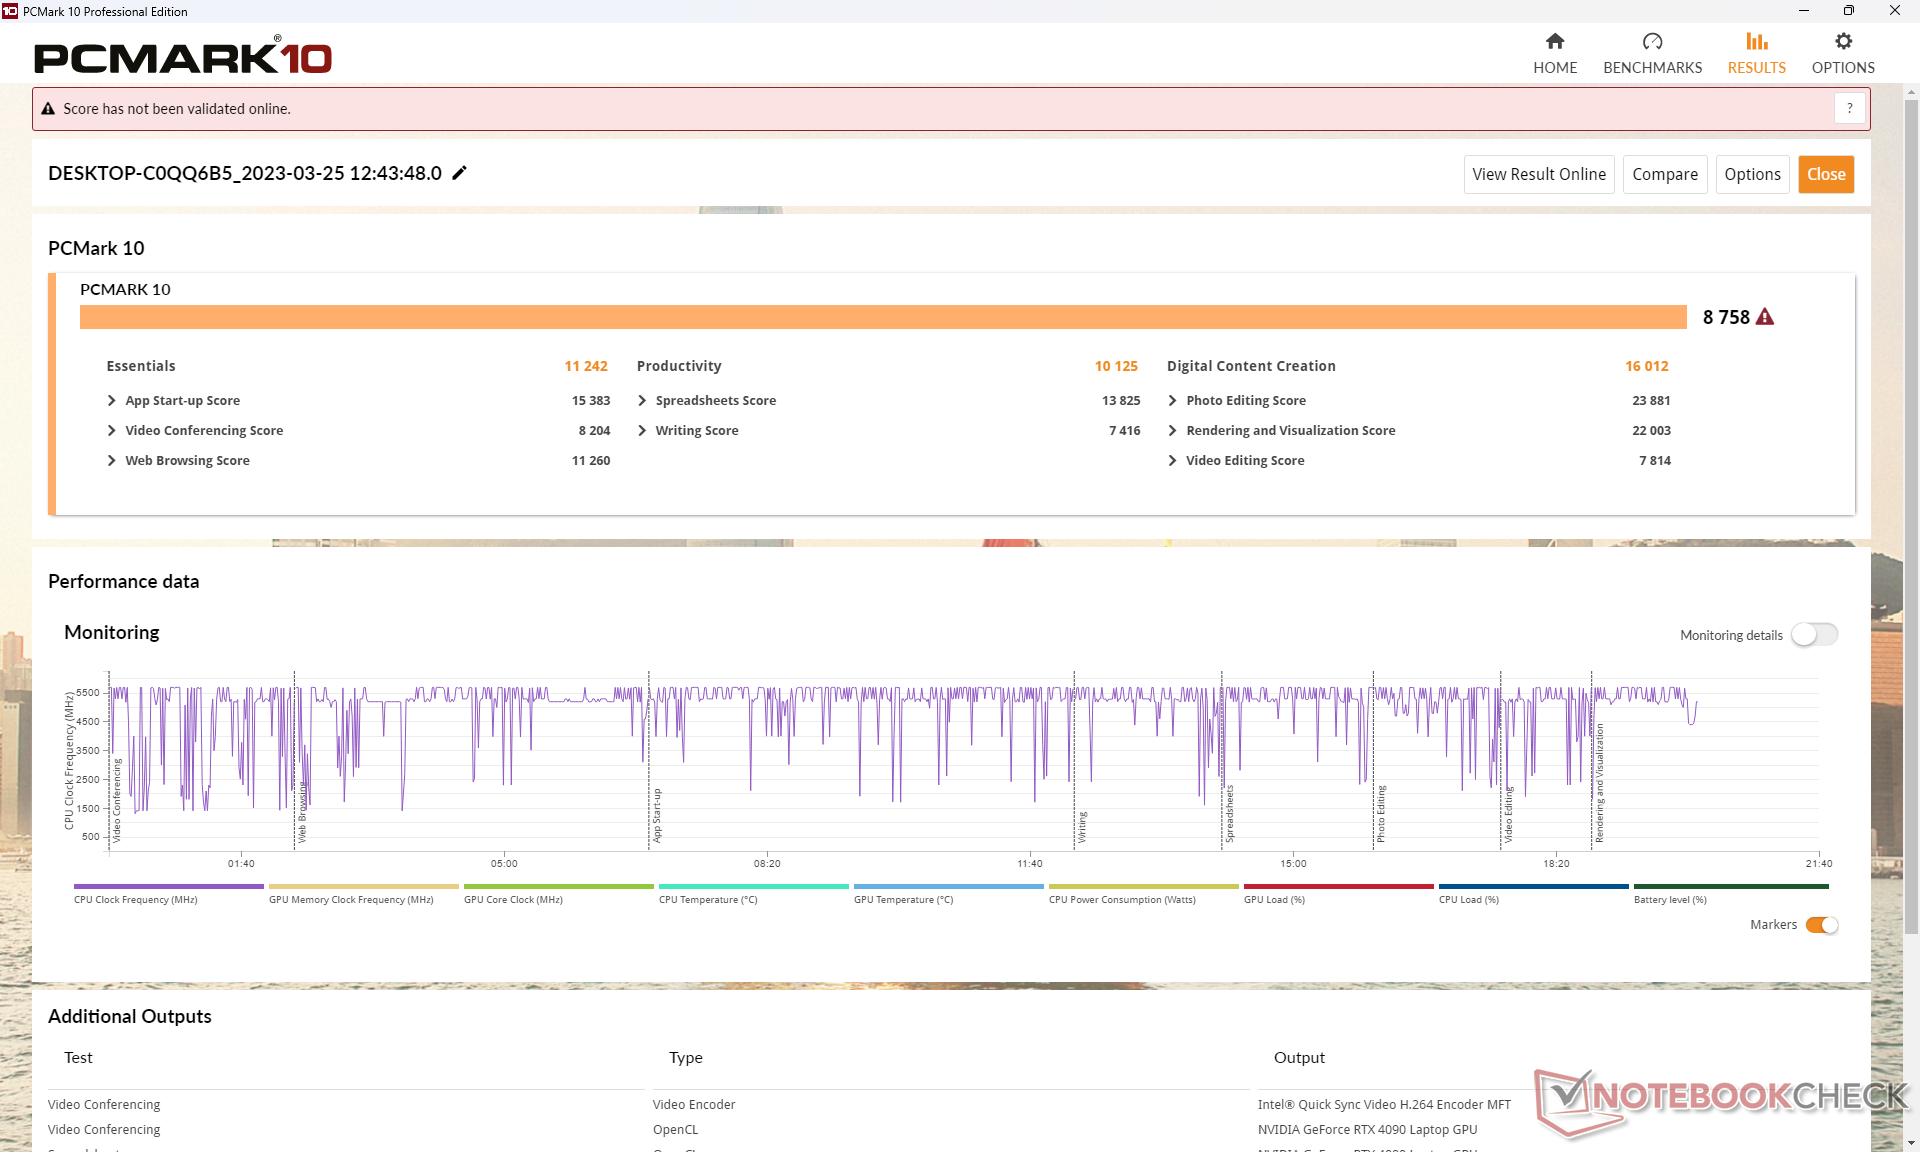
Desempenho do sistema
A pontuação PCMark 10 é comparável a outros laptops com CPUs Intel similares do 13º gênero e GeForce 40 GPUs como oAsus ROG Strix Scar 18 ou MSI Titan GT77 HX. Nosso Alienware também consegue superar o antigo Alienware x17 R2 executado em dois SSDs Samsung PM9A1 em RAID 0.
CrossMark: Overall | Productivity | Creativity | Responsiveness
| PCMark 10 / Score | |
| Eluktronics Mech-17 GP2 | |
| MSI Titan GT77 HX 13VI | |
| Média Intel Core i9-13980HX, NVIDIA GeForce RTX 4090 Laptop GPU (8650 - 9068, n=4) | |
| Asus ROG Strix Scar 18 2023 G834JY-N6005W | |
| Alienware m18 R1 | |
| Alienware x17 R2 P48E | |
| Razer Blade 18 RTX 4070 | |
| PCMark 10 / Essentials | |
| Eluktronics Mech-17 GP2 | |
| MSI Titan GT77 HX 13VI | |
| Razer Blade 18 RTX 4070 | |
| Média Intel Core i9-13980HX, NVIDIA GeForce RTX 4090 Laptop GPU (11215 - 11644, n=3) | |
| Alienware m18 R1 | |
| Alienware x17 R2 P48E | |
| PCMark 10 / Productivity | |
| Eluktronics Mech-17 GP2 | |
| Média Intel Core i9-13980HX, NVIDIA GeForce RTX 4090 Laptop GPU (10125 - 11067, n=3) | |
| Alienware x17 R2 P48E | |
| Alienware m18 R1 | |
| MSI Titan GT77 HX 13VI | |
| Razer Blade 18 RTX 4070 | |
| PCMark 10 / Digital Content Creation | |
| MSI Titan GT77 HX 13VI | |
| Alienware m18 R1 | |
| Média Intel Core i9-13980HX, NVIDIA GeForce RTX 4090 Laptop GPU (15052 - 16012, n=3) | |
| Eluktronics Mech-17 GP2 | |
| Alienware x17 R2 P48E | |
| Razer Blade 18 RTX 4070 | |
| CrossMark / Overall | |
| Eluktronics Mech-17 GP2 | |
| Alienware m18 R1 | |
| MSI Titan GT77 HX 13VI | |
| Razer Blade 18 RTX 4070 | |
| Asus ROG Strix Scar 18 2023 G834JY-N6005W | |
| Média Intel Core i9-13980HX, NVIDIA GeForce RTX 4090 Laptop GPU (1935 - 2176, n=4) | |
| Alienware x17 R2 P48E | |
| CrossMark / Productivity | |
| Eluktronics Mech-17 GP2 | |
| Alienware m18 R1 | |
| MSI Titan GT77 HX 13VI | |
| Razer Blade 18 RTX 4070 | |
| Asus ROG Strix Scar 18 2023 G834JY-N6005W | |
| Média Intel Core i9-13980HX, NVIDIA GeForce RTX 4090 Laptop GPU (1764 - 2005, n=4) | |
| Alienware x17 R2 P48E | |
| CrossMark / Creativity | |
| Eluktronics Mech-17 GP2 | |
| Alienware m18 R1 | |
| Asus ROG Strix Scar 18 2023 G834JY-N6005W | |
| MSI Titan GT77 HX 13VI | |
| Média Intel Core i9-13980HX, NVIDIA GeForce RTX 4090 Laptop GPU (2267 - 2469, n=4) | |
| Razer Blade 18 RTX 4070 | |
| Alienware x17 R2 P48E | |
| CrossMark / Responsiveness | |
| Alienware m18 R1 | |
| Razer Blade 18 RTX 4070 | |
| MSI Titan GT77 HX 13VI | |
| Eluktronics Mech-17 GP2 | |
| Média Intel Core i9-13980HX, NVIDIA GeForce RTX 4090 Laptop GPU (1556 - 1904, n=4) | |
| Alienware x17 R2 P48E | |
| Asus ROG Strix Scar 18 2023 G834JY-N6005W | |
| PCMark 10 Score | 8758 pontos | |
Ajuda | ||
| AIDA64 / Memory Copy | |
| Alienware m18 R1 | |
| Razer Blade 18 RTX 4070 | |
| Média Intel Core i9-13980HX (62189 - 80776, n=9) | |
| Eluktronics Mech-17 GP2 | |
| Asus ROG Strix Scar 18 2023 G834JY-N6005W | |
| MSI Titan GT77 HX 13VI | |
| Alienware x17 R2 P48E | |
| AIDA64 / Memory Read | |
| Alienware m18 R1 | |
| Razer Blade 18 RTX 4070 | |
| Média Intel Core i9-13980HX (62624 - 89096, n=9) | |
| Eluktronics Mech-17 GP2 | |
| Asus ROG Strix Scar 18 2023 G834JY-N6005W | |
| MSI Titan GT77 HX 13VI | |
| Alienware x17 R2 P48E | |
| AIDA64 / Memory Write | |
| Alienware m18 R1 | |
| Razer Blade 18 RTX 4070 | |
| Média Intel Core i9-13980HX (59912 - 79917, n=9) | |
| Eluktronics Mech-17 GP2 | |
| Asus ROG Strix Scar 18 2023 G834JY-N6005W | |
| MSI Titan GT77 HX 13VI | |
| Alienware x17 R2 P48E | |
| AIDA64 / Memory Latency | |
| Alienware x17 R2 P48E | |
| MSI Titan GT77 HX 13VI | |
| Asus ROG Strix Scar 18 2023 G834JY-N6005W | |
| Eluktronics Mech-17 GP2 | |
| Média Intel Core i9-13980HX (79.4 - 93.2, n=9) | |
| Razer Blade 18 RTX 4070 | |
| Alienware m18 R1 | |
* ... menor é melhor
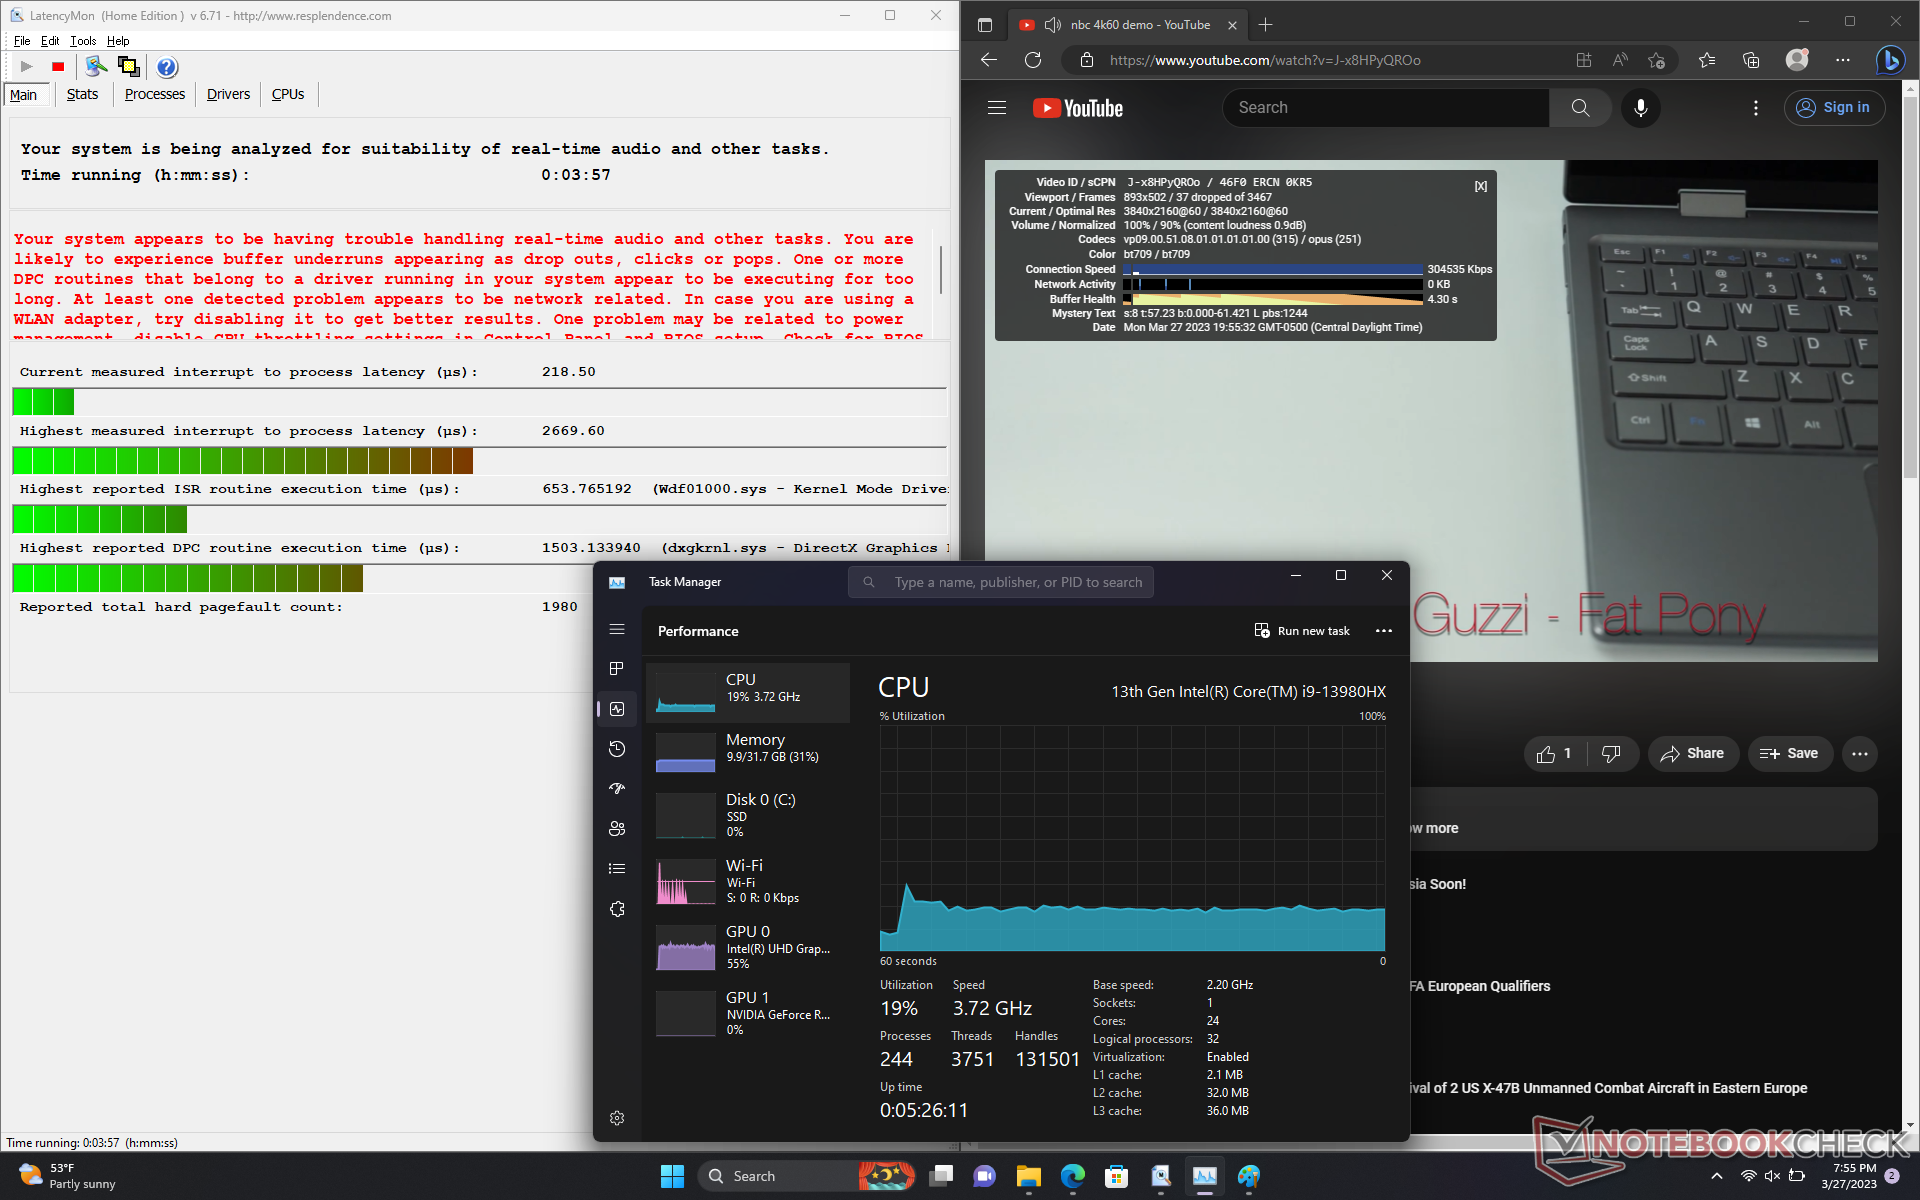
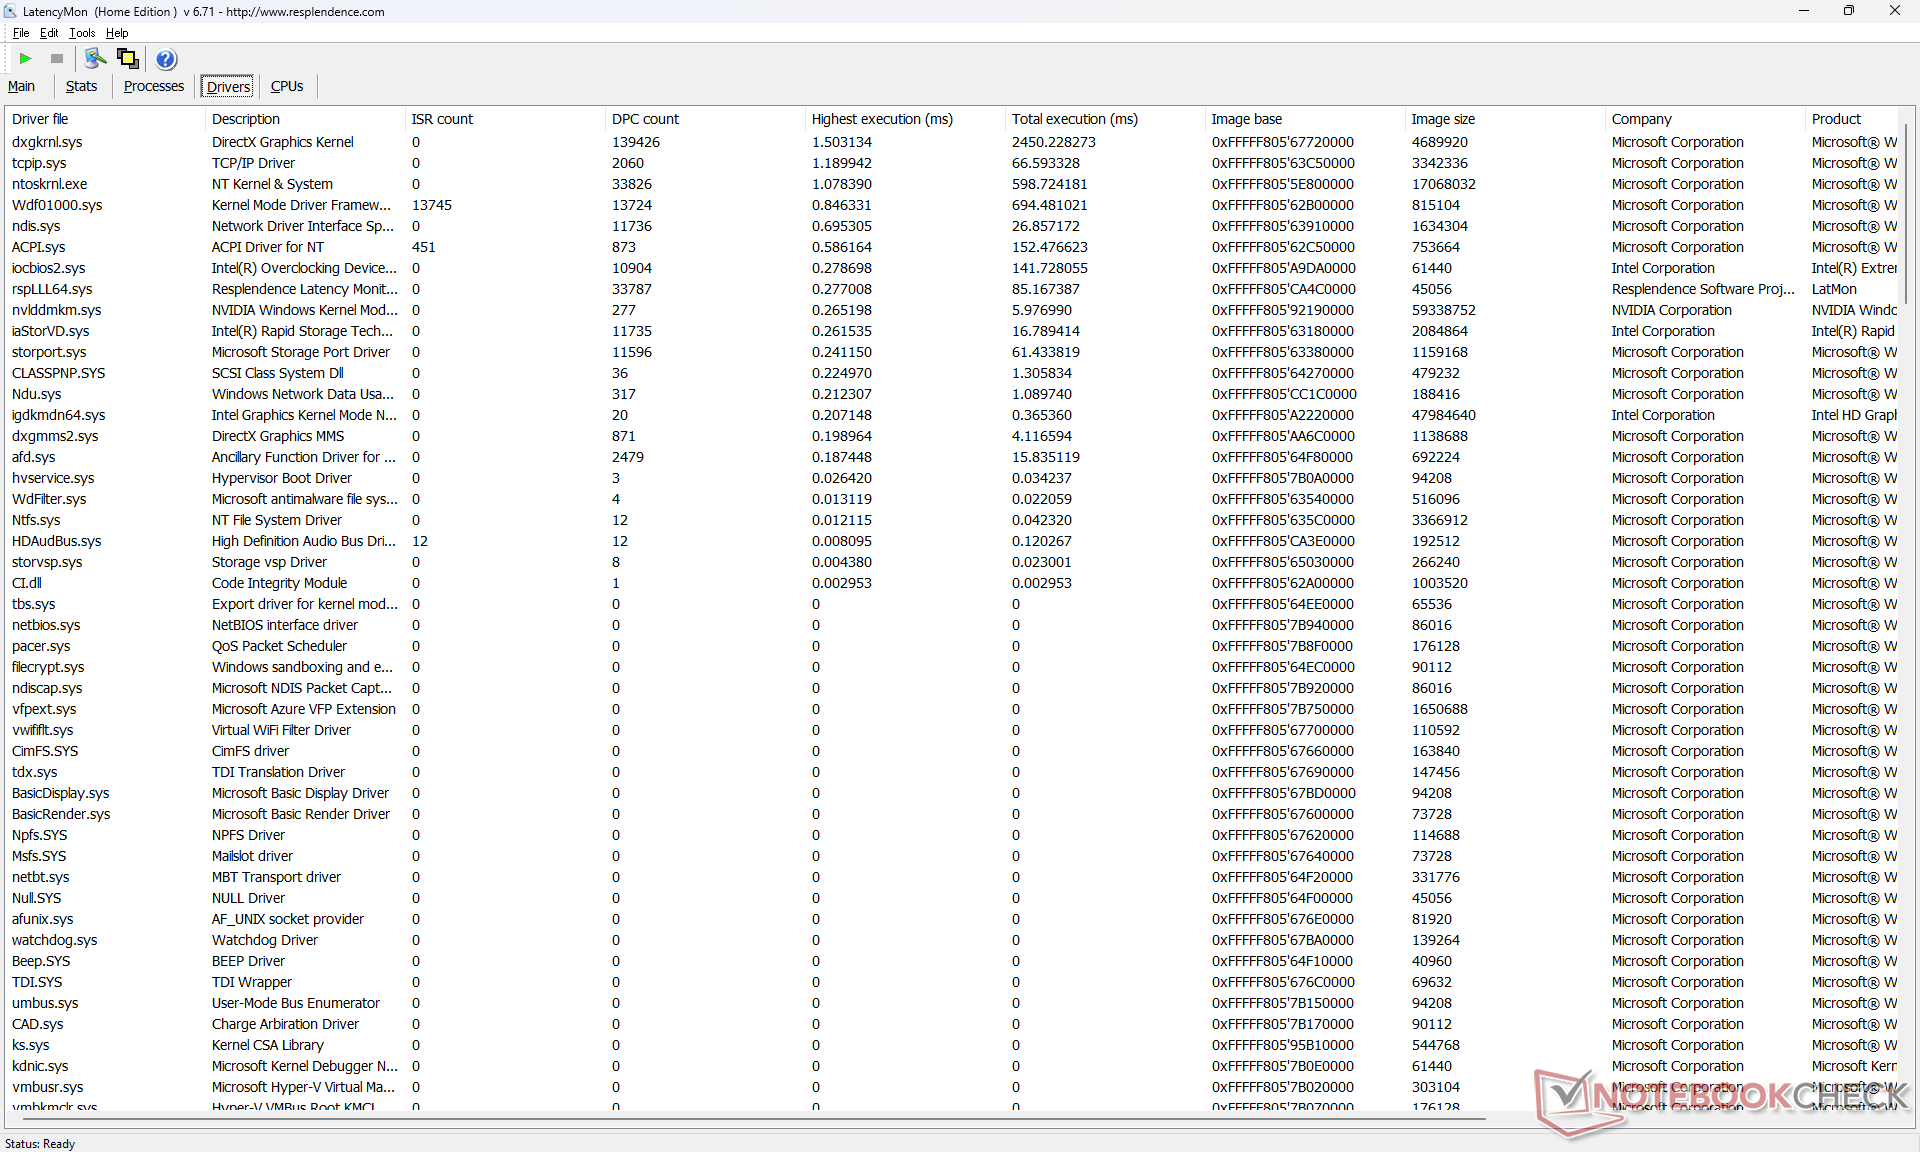
Latência do DPC
LatencyMon revela problemas de DPC ao abrir várias abas do navegador em nossa página inicial. Além disso, o sistema tem problemas para reproduzir o conteúdo de vídeo 4K, uma vez que somos capazes de gravar 37 quadros perdidos durante nosso vídeo de teste de minutos, mesmo depois de repetir os testes. A utilização da CPU e do iGPU é excepcionalmente alta, com 19 e 55 por cento, respectivamente. Estas observações sugerem um manuseio inadequado dos processos de fundo que podem impactar a atividade em foco.
Pelo que vale, Nvidia reconheceu um bug relacionado a um aumento na latência do DPC com o driver gráfico 531,29. Espera-se que uma correção possa vir em breve, de qualquer forma.
| DPC Latencies / LatencyMon - interrupt to process latency (max), Web, Youtube, Prime95 | |
| MSI Titan GT77 HX 13VI | |
| Alienware m18 R1 | |
| Razer Blade 18 RTX 4070 | |
| Alienware x17 R2 P48E | |
| Asus ROG Strix Scar 18 2023 G834JY-N6005W | |
| Eluktronics Mech-17 GP2 | |
* ... menor é melhor
Dispositivos de armazenamento - Quatro acionamentos M.2 Total
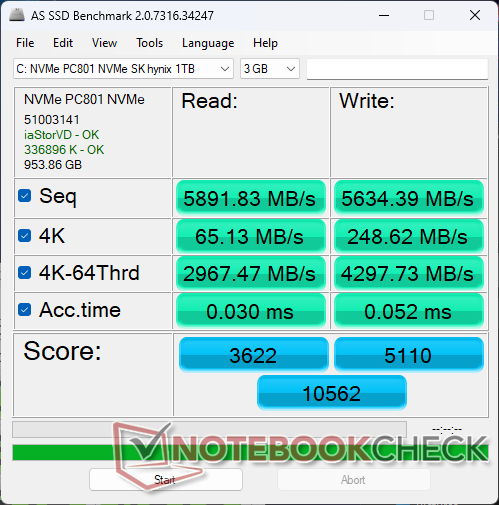
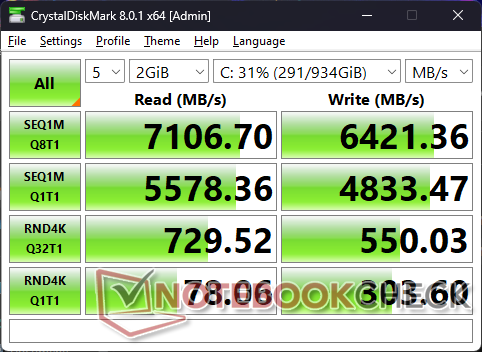
Nossa unidade vem configurada com um SK Hynix PC801 PCIe4 x4 NVMe SSD para taxas de leitura e gravação seqüenciais de até 7000 MB/s e 6500 MB/s, respectivamente. O desempenho é competitivo contra a série Samsung PMA1 e nosso disco não apresenta problemas para manter a velocidade máxima sem estrangulamento.
O Alienware não suporta SSDs PCIe5 NVMe, ao contrário das séries MSI GE78 ou GT77. No entanto, ele suporta mais SSDs internas do que na maioria dos outros laptops.

| Drive Performance rating - Percent | |
| Alienware m18 R1 | |
| MSI Titan GT77 HX 13VI | |
| Razer Blade 18 RTX 4070 | |
| Alienware x17 R2 P48E | |
| Asus ROG Strix Scar 18 2023 G834JY-N6005W | |
| Eluktronics Mech-17 GP2 | |
* ... menor é melhor
Disk Throttling: DiskSpd Read Loop, Queue Depth 8
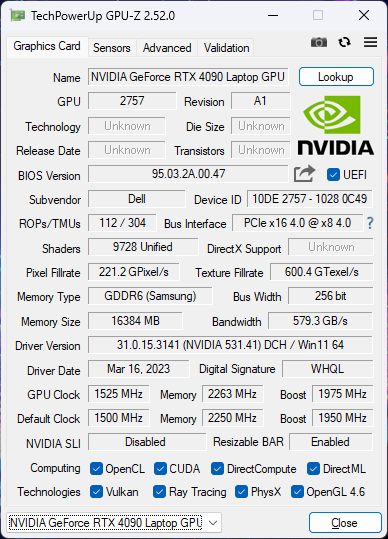
GPU Performance - 175 W GeForce RTX 4090
Desempenho gráfico geral do móvel GeForce RTX 4090 é mais parecido com o desktop GeForce RTX 4070. Ele oferece desempenho suficiente para jogar qualquer jogo atual em 4K Ultra, incluindo F1 22. Se o Ray Tracing estiver habilitado, no entanto, é recomendável habilitar a geração de DLSS ou frame onde houver suporte para manter as taxas de frame a flutuar.
Quando comparado com a última geração móvel RTX 3080 Tio RTX 4090 móvel oferece entre 40 a 70 por cento de desempenho mais rápido, mantendo um envelope de energia semelhante de 175 W.
Rodando Fire Strike no modo Overdrive não apresenta grandes vantagens quando comparado com o modo de desempenho mais silencioso, pois suas pontuações finais seriam quase idênticas. Repetir o teste no modo Balanceado, no entanto, resultaria em uma queda de 5% e 9% no desempenho da GPU e da CPU, respectivamente.
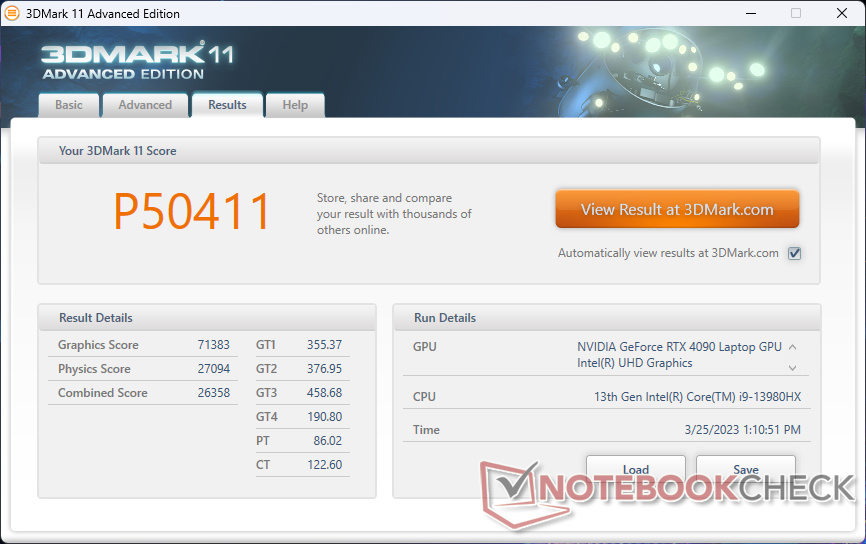
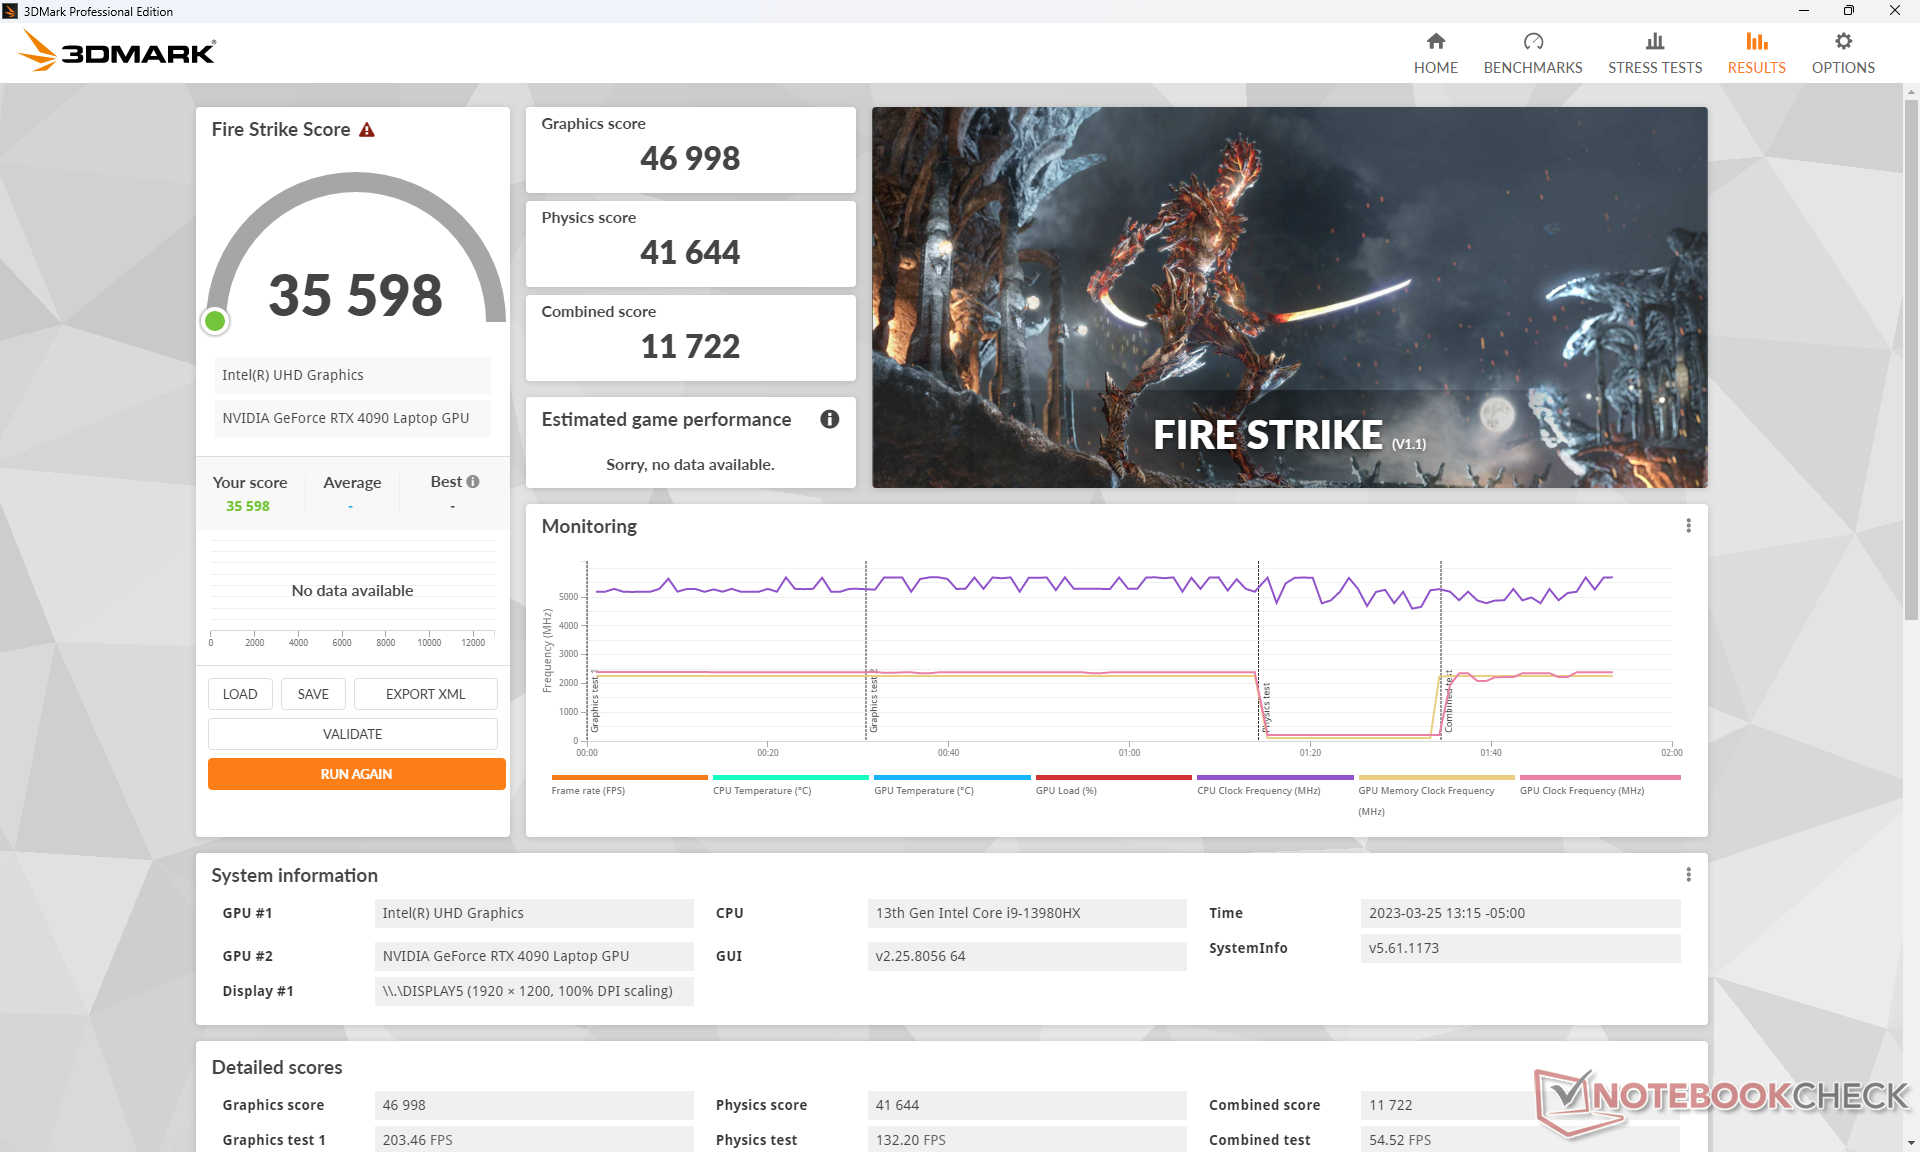
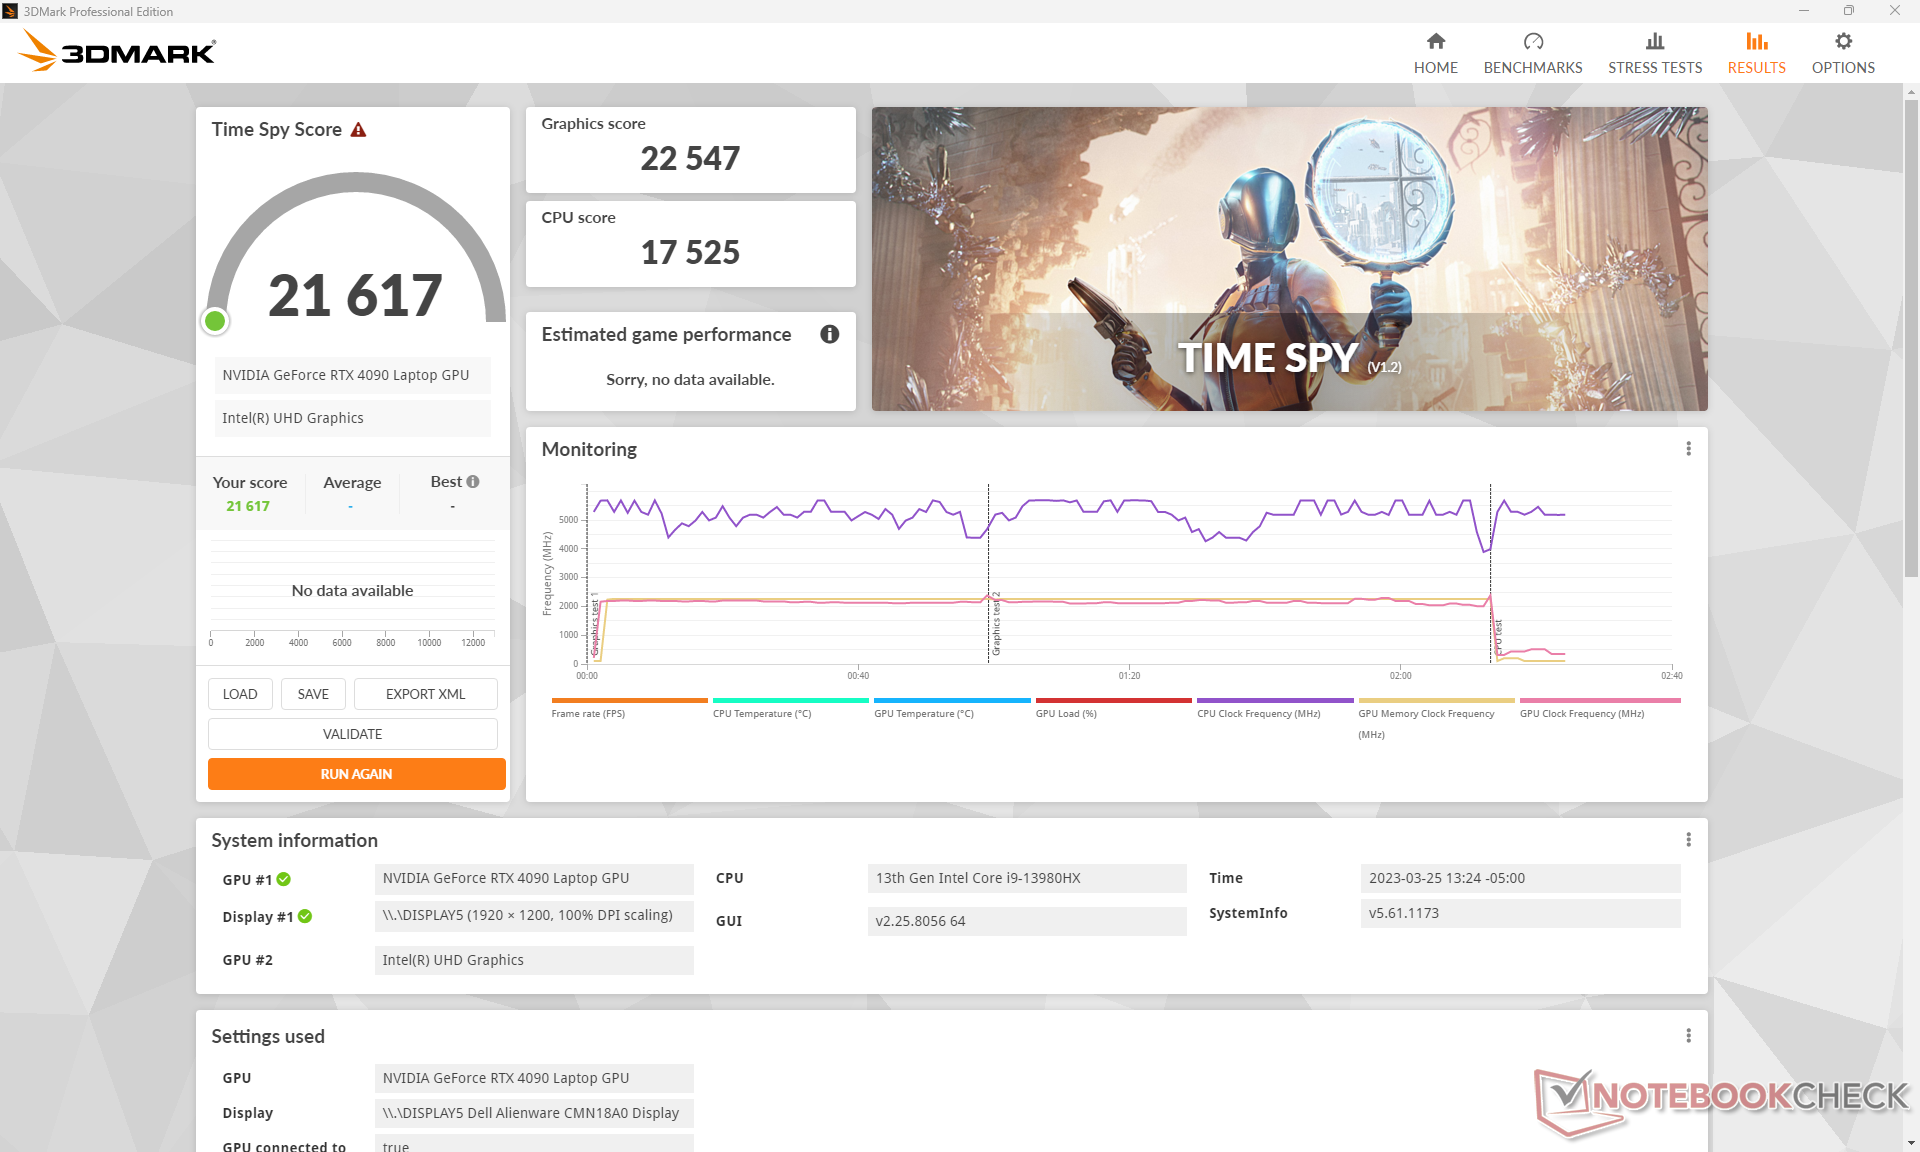
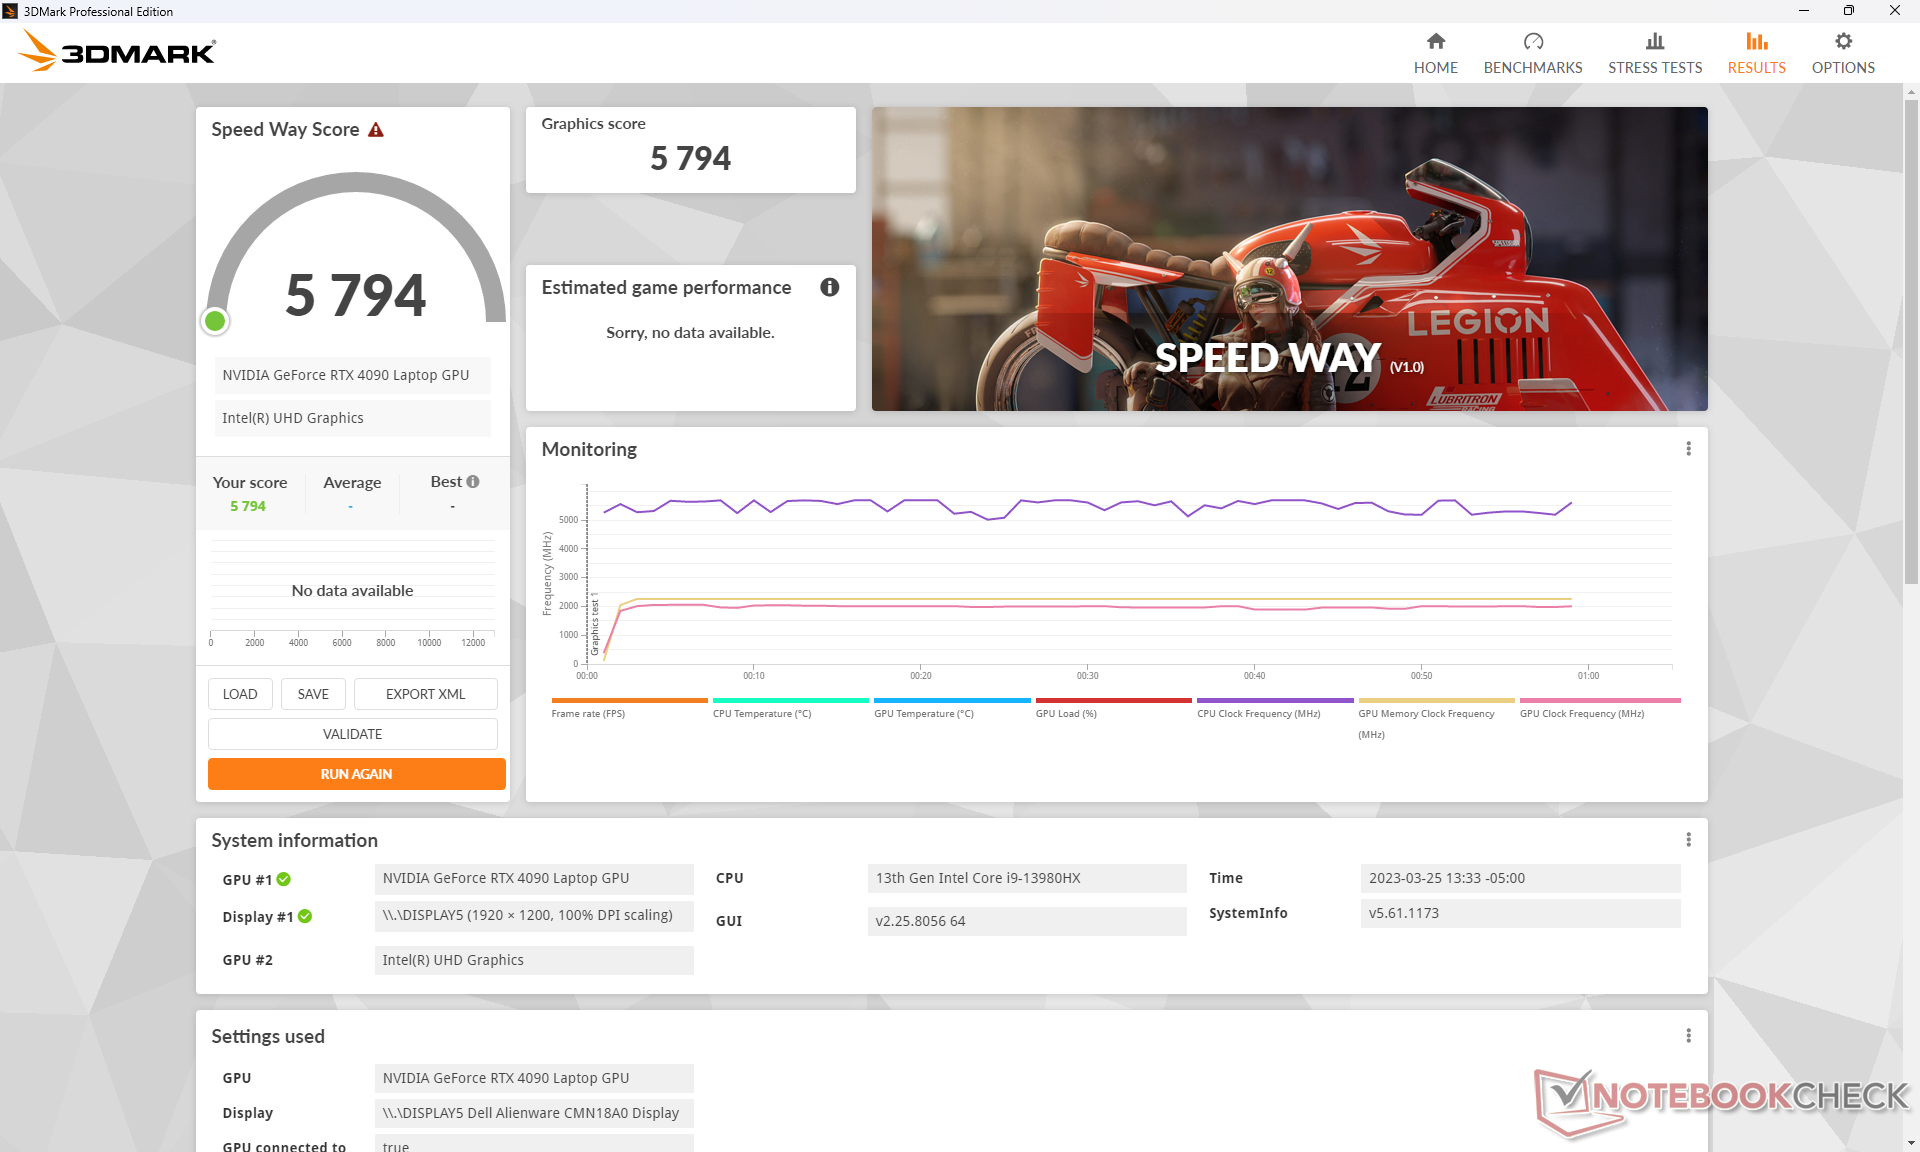
| 3DMark 11 Performance | 50411 pontos | |
| 3DMark Fire Strike Score | 35598 pontos | |
| 3DMark Time Spy Score | 21617 pontos | |
Ajuda | ||
* ... menor é melhor
Witcher 3 FPS Chart
| baixo | média | alto | ultra | QHD | 4K | |
|---|---|---|---|---|---|---|
| GTA V (2015) | 186.7 | 185.3 | 184.5 | 149 | 145.5 | 176.4 |
| The Witcher 3 (2015) | 649.2 | 563.8 | 441.6 | 213.9 | 165.6 | |
| Dota 2 Reborn (2015) | 251 | 220 | 210 | 194.2 | 190.2 | |
| Final Fantasy XV Benchmark (2018) | 231 | 227 | 194.8 | 159.5 | 92.6 | |
| X-Plane 11.11 (2018) | 210 | 187.1 | 143.5 | 124 | ||
| Strange Brigade (2018) | 475 | 388 | 388 | 373 | 308 | 159.8 |
| Cyberpunk 2077 1.6 (2022) | 157.2 | 151.8 | 148.2 | 127.92 | 102.16 | 49.99 |
| Tiny Tina's Wonderlands (2022) | 359.1 | 301.8 | 232.5 | 187.7 | 133.8 | 71.3 |
| F1 22 (2022) | 336 | 320 | 318 | 144.7 | 92.2 | 45.5 |
Emissões - Quatro ventiladores rápidos e furiosos
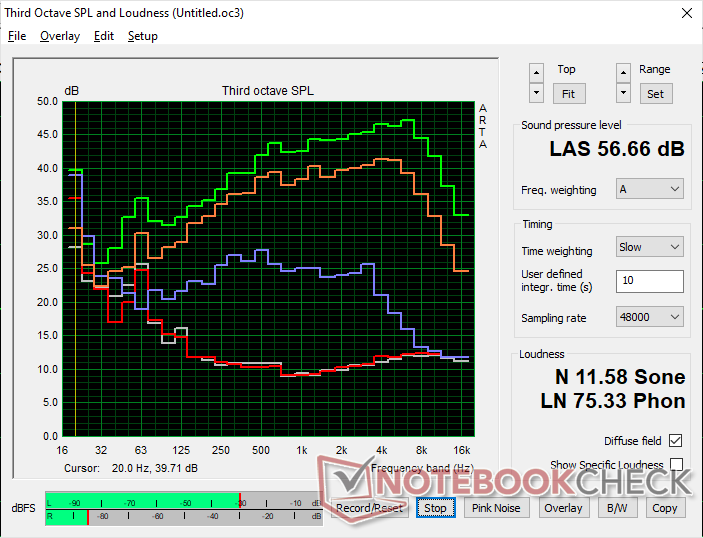
Ruído do sistema
Se você pensasse que um laptop com quatro ventiladores seria barulhento, então você estaria... bem, absolutamente certo. Os jogos no modo Performance induziriam um ruído do ventilador de 51 dB(A), que é semelhante aoEluktronics Mech-17 GP2 mas mais alto que a Lâmina Razer 18. Se os jogos no modo Overdrive, o ruído do ventilador seria ainda mais alto a quase 57 dB(A). Qualquer coisa acima de 50 dB(A) requer um par de bons fones de ouvido para afogar os ventiladores do turbilhão. Tenha em mente que o modo Overdrive não é necessário para a maioria dos jogos, como mostrará nossa seção de Teste de Estresse abaixo.
Felizmente, o sistema é melhor em permanecer silencioso durante cargas mais baixas, já que os ventiladores não pulsam quando em configurações de perfil mais baixo. Assim, você ainda pode navegar pela web ou transmitir conteúdo de vídeo em níveis confortáveis de ruído dos ventiladores.
Barulho
| Ocioso |
| 23 / 23 / 23 dB |
| Carga |
| 35.6 / 56.7 dB |
 | ||
30 dB silencioso 40 dB(A) audível 50 dB(A) ruidosamente alto |
||
min: | ||
| Alienware m18 R1 GeForce RTX 4090 Laptop GPU, i9-13980HX, SK hynix PC801 HFS001TEJ9X101N | Razer Blade 18 RTX 4070 GeForce RTX 4070 Laptop GPU, i9-13950HX, SSSTC CA6-8D1024 | Asus ROG Strix Scar 18 2023 G834JY-N6005W GeForce RTX 4090 Laptop GPU, i9-13980HX, 2x Samsung PM9A1 MZVL21T0HCLR (RAID 0) | Eluktronics Mech-17 GP2 GeForce RTX 4090 Laptop GPU, i9-13900HX, Samsung PM9A1 MZVL21T0HCLR | MSI Titan GT77 HX 13VI GeForce RTX 4090 Laptop GPU, i9-13950HX, Samsung PM9A1 MZVL22T0HBLB | Alienware x17 R2 P48E GeForce RTX 3080 Ti Laptop GPU, i9-12900HK, 2x Samsung PM9A1 1TB (RAID 0) | |
|---|---|---|---|---|---|---|
| Noise | -3% | -15% | -13% | -20% | 2% | |
| desligado / ambiente * (dB) | 22.8 | 23.5 -3% | 23.9 -5% | 25.2 -11% | 24.6 -8% | 22.7 -0% |
| Idle Minimum * (dB) | 23 | 23.8 -3% | 23.9 -4% | 28 -22% | 29.2 -27% | 23.1 -0% |
| Idle Average * (dB) | 23 | 23.8 -3% | 32.6 -42% | 28 -22% | 29.2 -27% | 23.1 -0% |
| Idle Maximum * (dB) | 23 | 26.8 -17% | 32.6 -42% | 30.4 -32% | 29.2 -27% | 23.1 -0% |
| Load Average * (dB) | 35.6 | 37.3 -5% | 35.9 -1% | 41 -15% | 50.7 -42% | 31.9 10% |
| Witcher 3 ultra * (dB) | 51.3 | 48 6% | 50.7 1% | 53.3 -4% | 52.5 -2% | |
| Load Maximum * (dB) | 56.7 | 53.5 6% | 55.8 2% | 52.6 7% | 61 -8% | 52.5 7% |
* ... menor é melhor
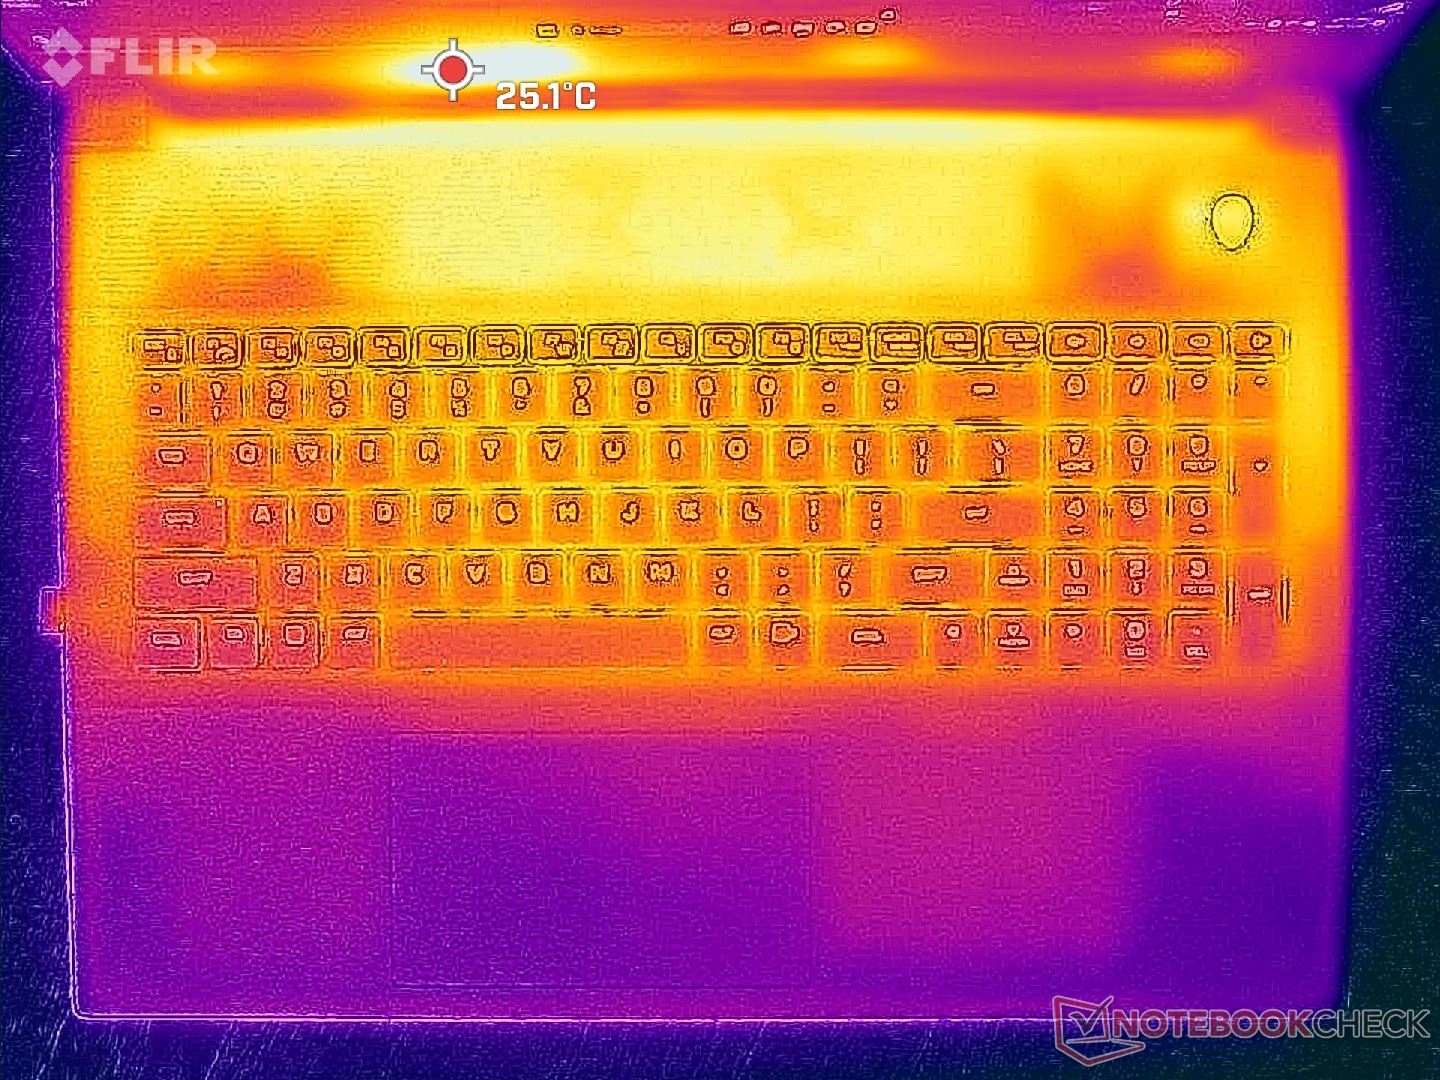
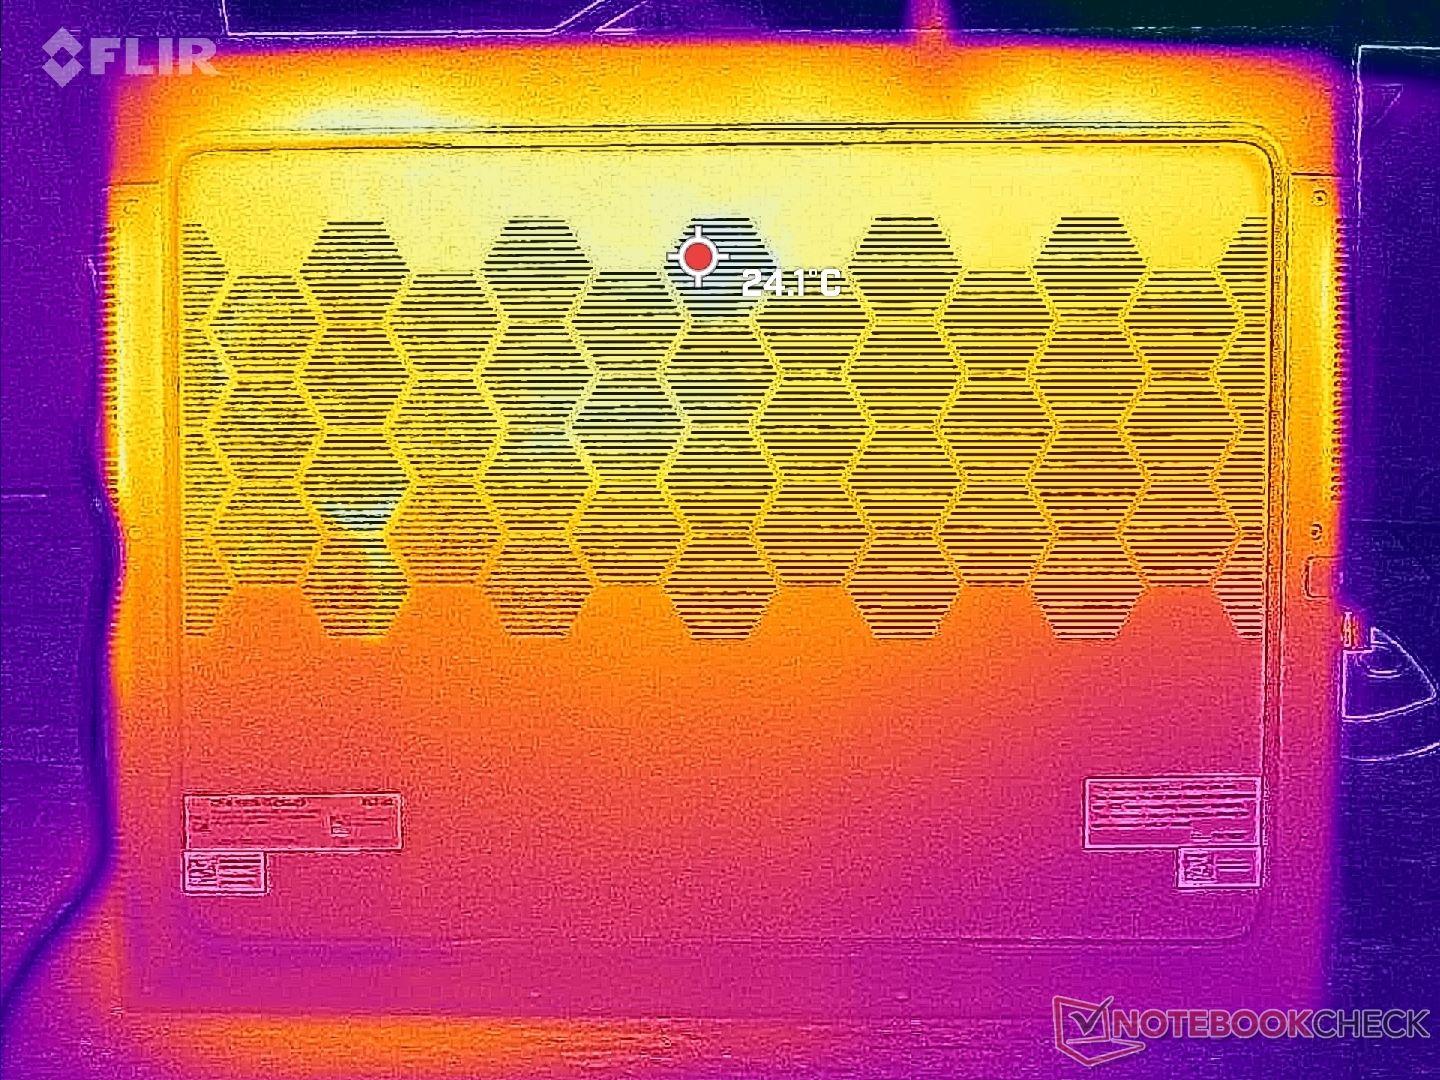
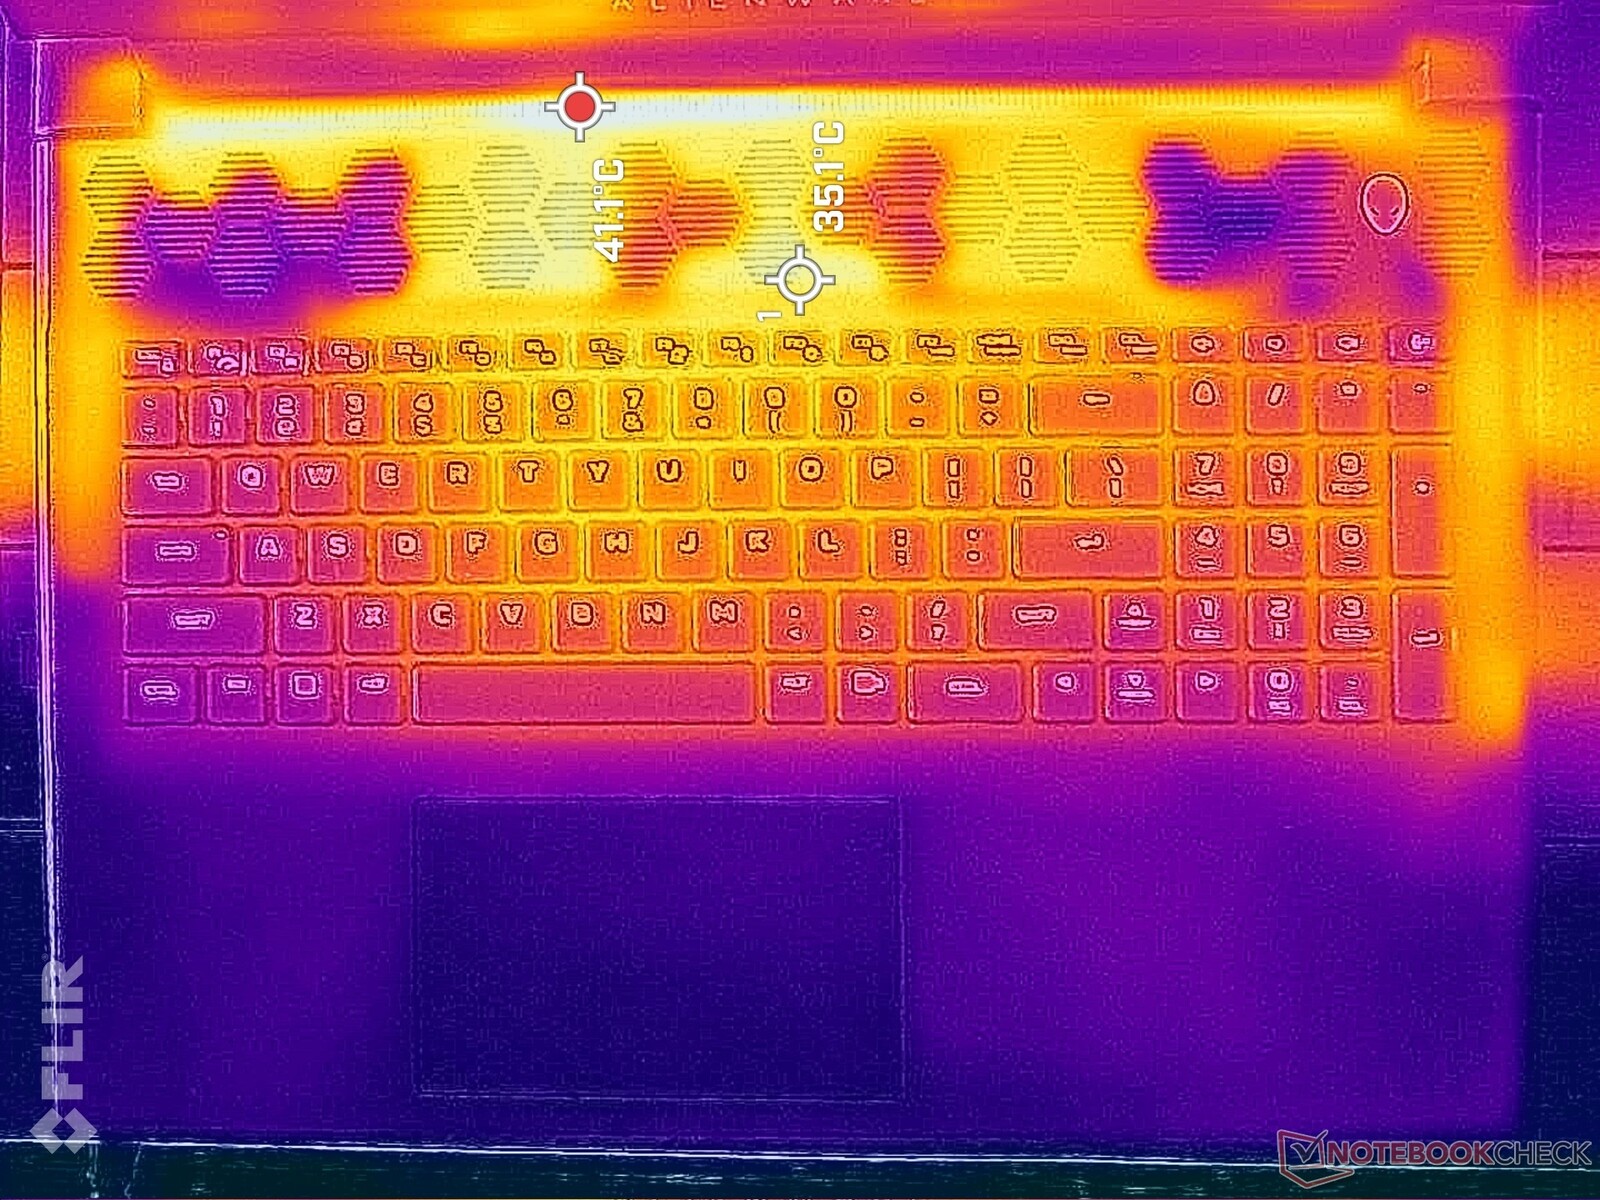
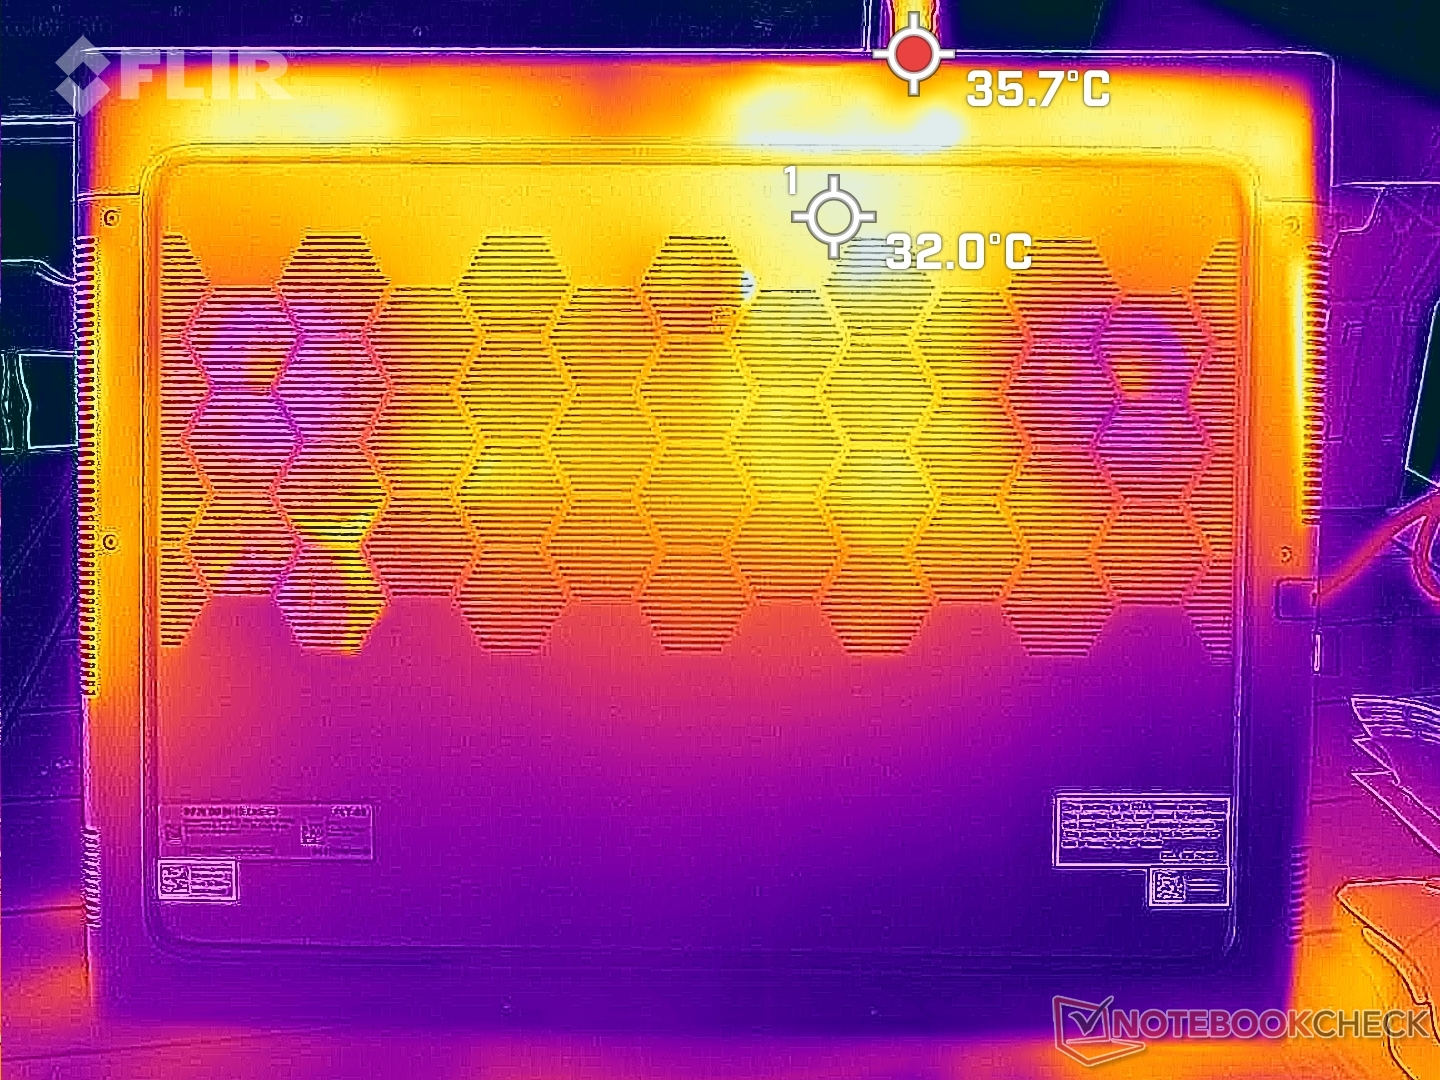
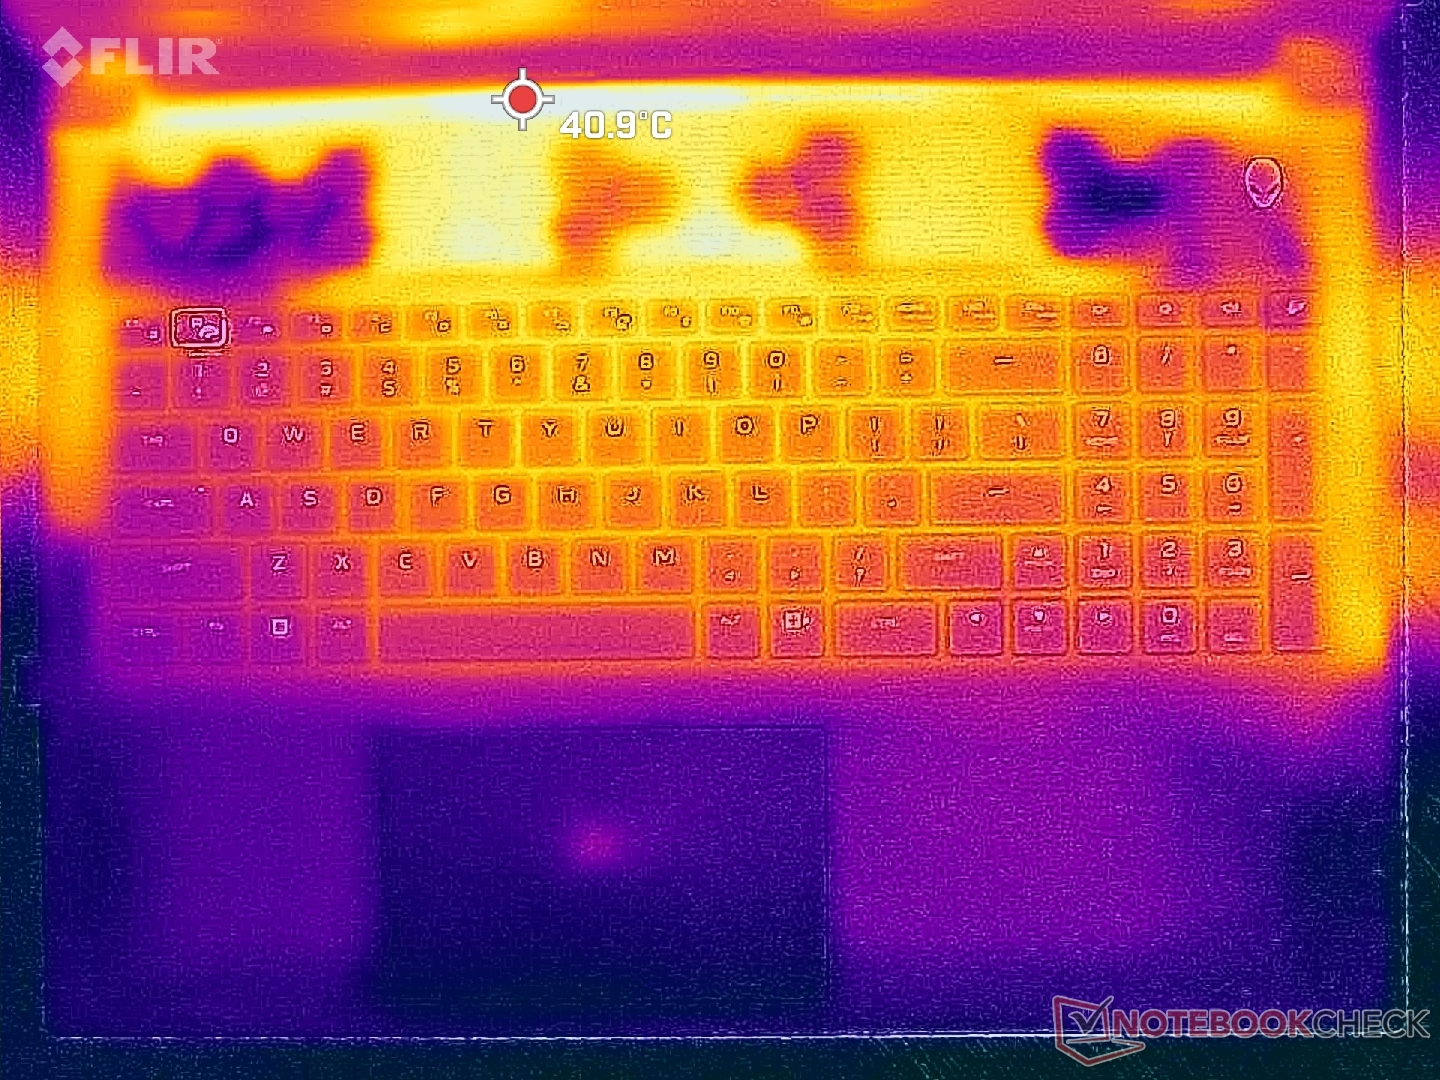
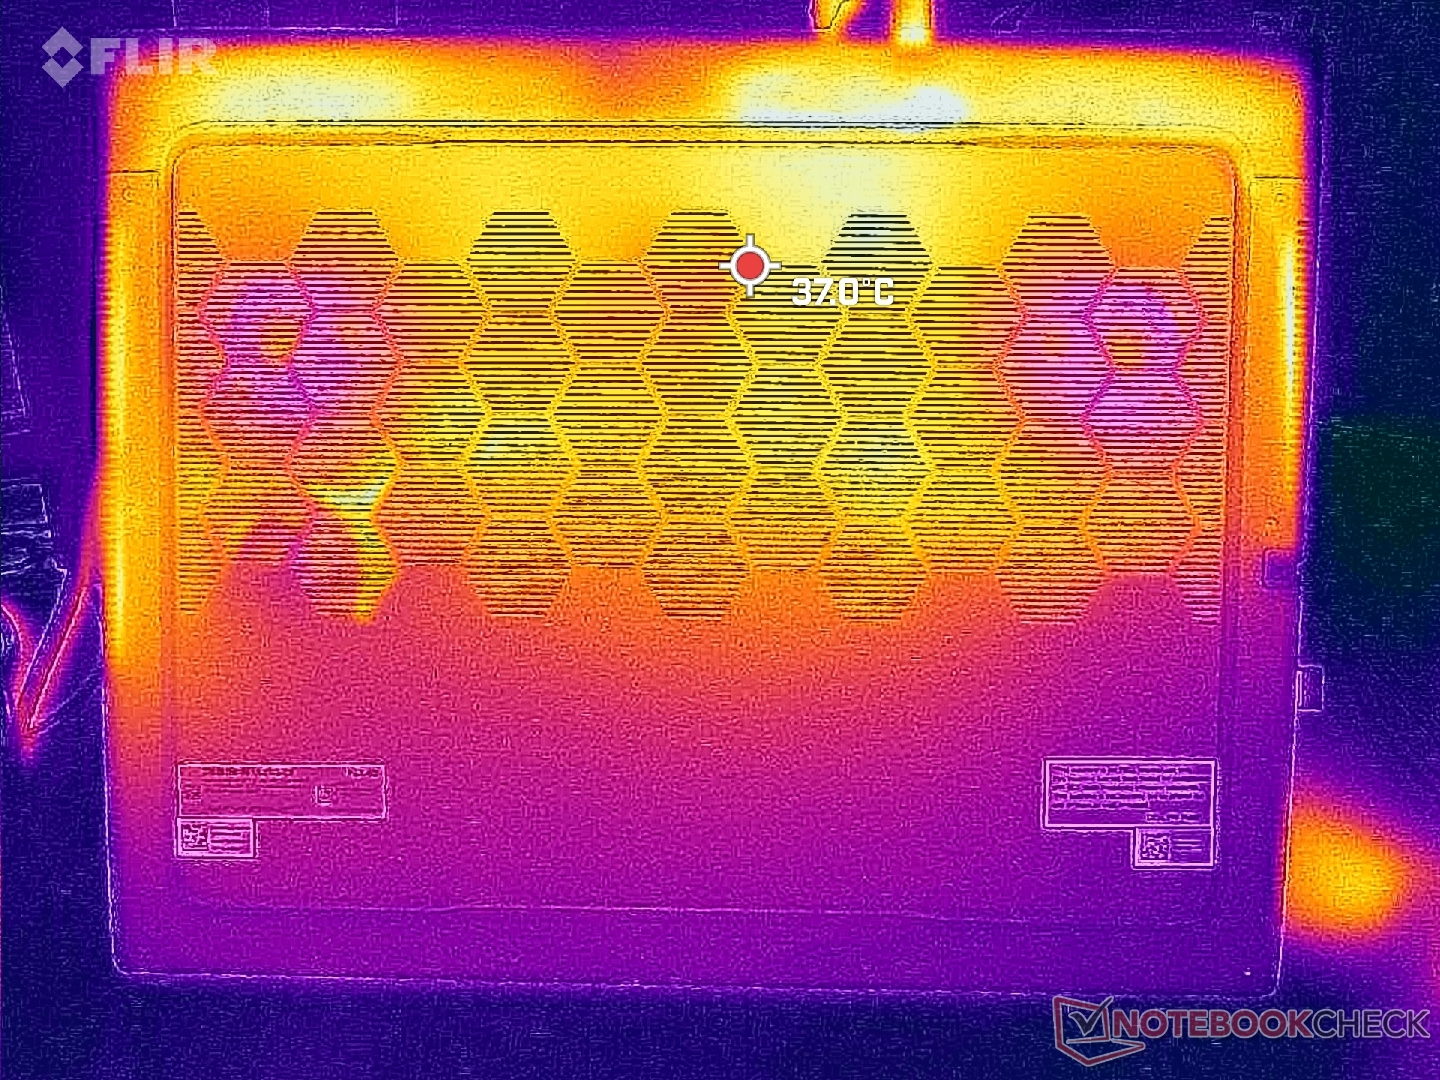
Temperatura
As temperaturas superficiais não são um problema devido em parte às amplas grelhas de ventilação em quase todos os lados do grande chassi. Os pontos mais quentes estão ao longo da traseira, longe das teclas do teclado e dos apoios para as mãos, para manter as mãos confortáveis.
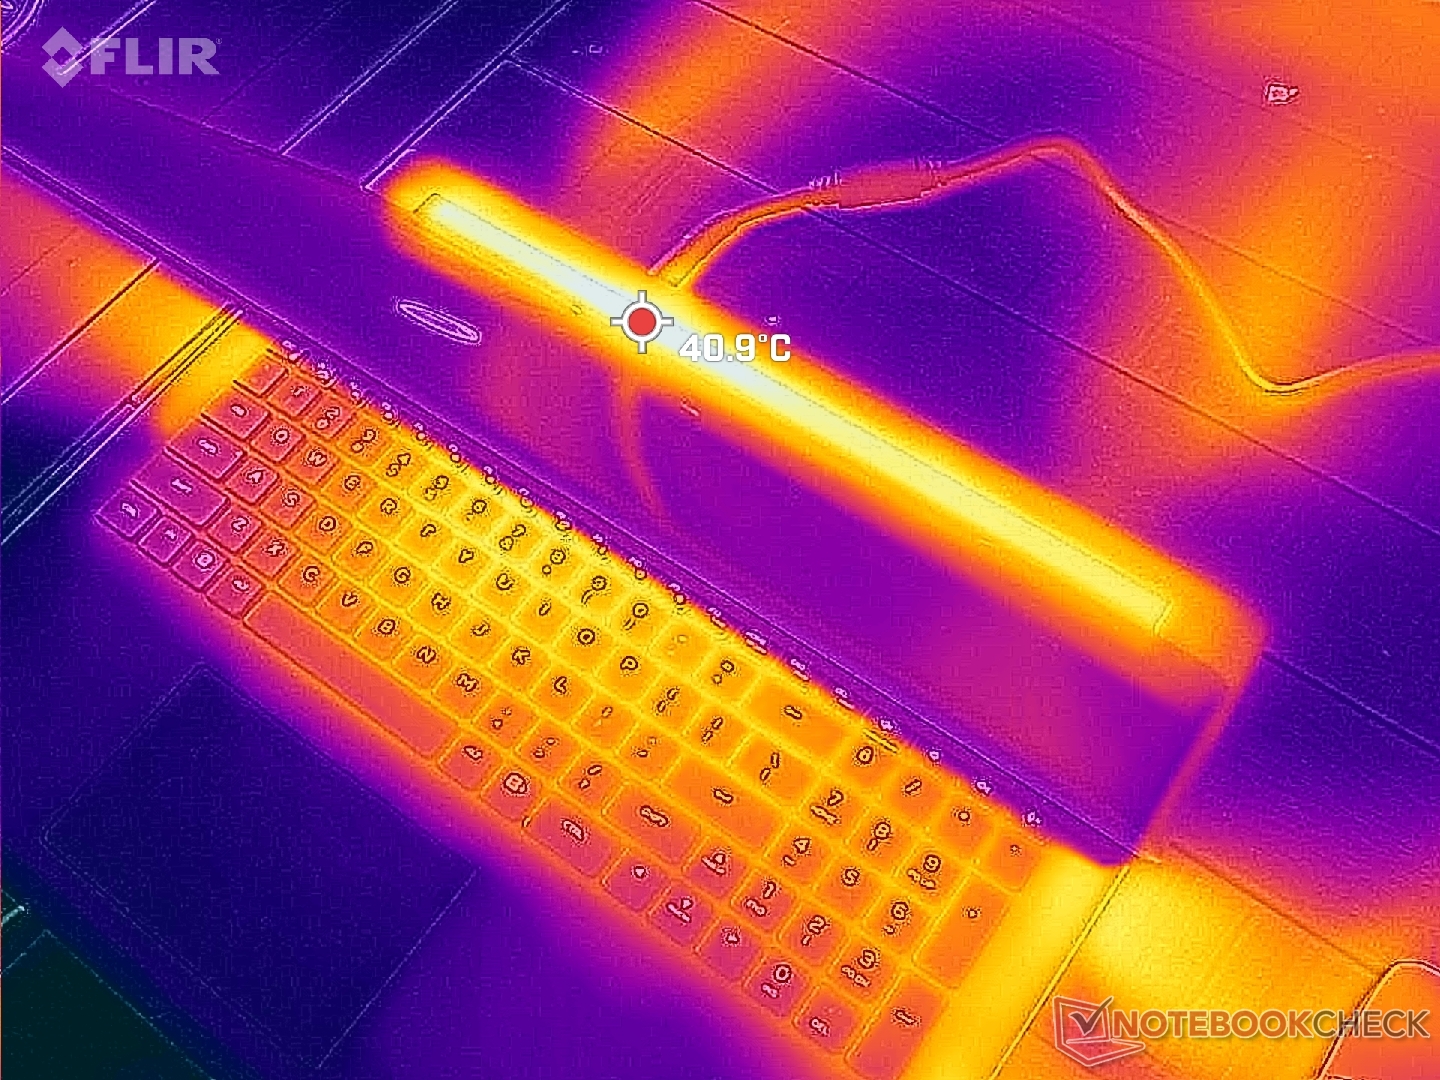
(+) A temperatura máxima no lado superior é 39 °C / 102 F, em comparação com a média de 40.4 °C / 105 F , variando de 21.2 a 68.8 °C para a classe Gaming.
(+) A parte inferior aquece até um máximo de 36.4 °C / 98 F, em comparação com a média de 43.2 °C / 110 F
(+) Em uso inativo, a temperatura média para o lado superior é 25.2 °C / 77 F, em comparação com a média do dispositivo de 33.9 °C / ### class_avg_f### F.
(+) Jogando The Witcher 3, a temperatura média para o lado superior é 29.8 °C / 86 F, em comparação com a média do dispositivo de 33.9 °C / ## #class_avg_f### F.
(+) Os apoios para as mãos e o touchpad são mais frios que a temperatura da pele, com um máximo de 23.8 °C / 74.8 F e, portanto, são frios ao toque.
(+) A temperatura média da área do apoio para as mãos de dispositivos semelhantes foi 28.8 °C / 83.8 F (+5 °C / 9 F).
| Alienware m18 R1 Intel Core i9-13980HX, NVIDIA GeForce RTX 4090 Laptop GPU | Razer Blade 18 RTX 4070 Intel Core i9-13950HX, NVIDIA GeForce RTX 4070 Laptop GPU | Asus ROG Strix Scar 18 2023 G834JY-N6005W Intel Core i9-13980HX, NVIDIA GeForce RTX 4090 Laptop GPU | Eluktronics Mech-17 GP2 Intel Core i9-13900HX, NVIDIA GeForce RTX 4090 Laptop GPU | MSI Titan GT77 HX 13VI Intel Core i9-13950HX, NVIDIA GeForce RTX 4090 Laptop GPU | Alienware x17 R2 P48E Intel Core i9-12900HK, NVIDIA GeForce RTX 3080 Ti Laptop GPU | |
|---|---|---|---|---|---|---|
| Heat | -7% | -20% | -9% | -4% | -15% | |
| Maximum Upper Side * (°C) | 39 | 39.2 -1% | 54 -38% | 39 -0% | 40.6 -4% | 49.6 -27% |
| Maximum Bottom * (°C) | 36.4 | 35.6 2% | 46 -26% | 44 -21% | 41.1 -13% | 42.4 -16% |
| Idle Upper Side * (°C) | 29.2 | 31.8 -9% | 30 -3% | 31 -6% | 26.2 10% | 29.2 -0% |
| Idle Bottom * (°C) | 27.8 | 33.2 -19% | 31 -12% | 29.8 -7% | 30.3 -9% | 32 -15% |
* ... menor é melhor
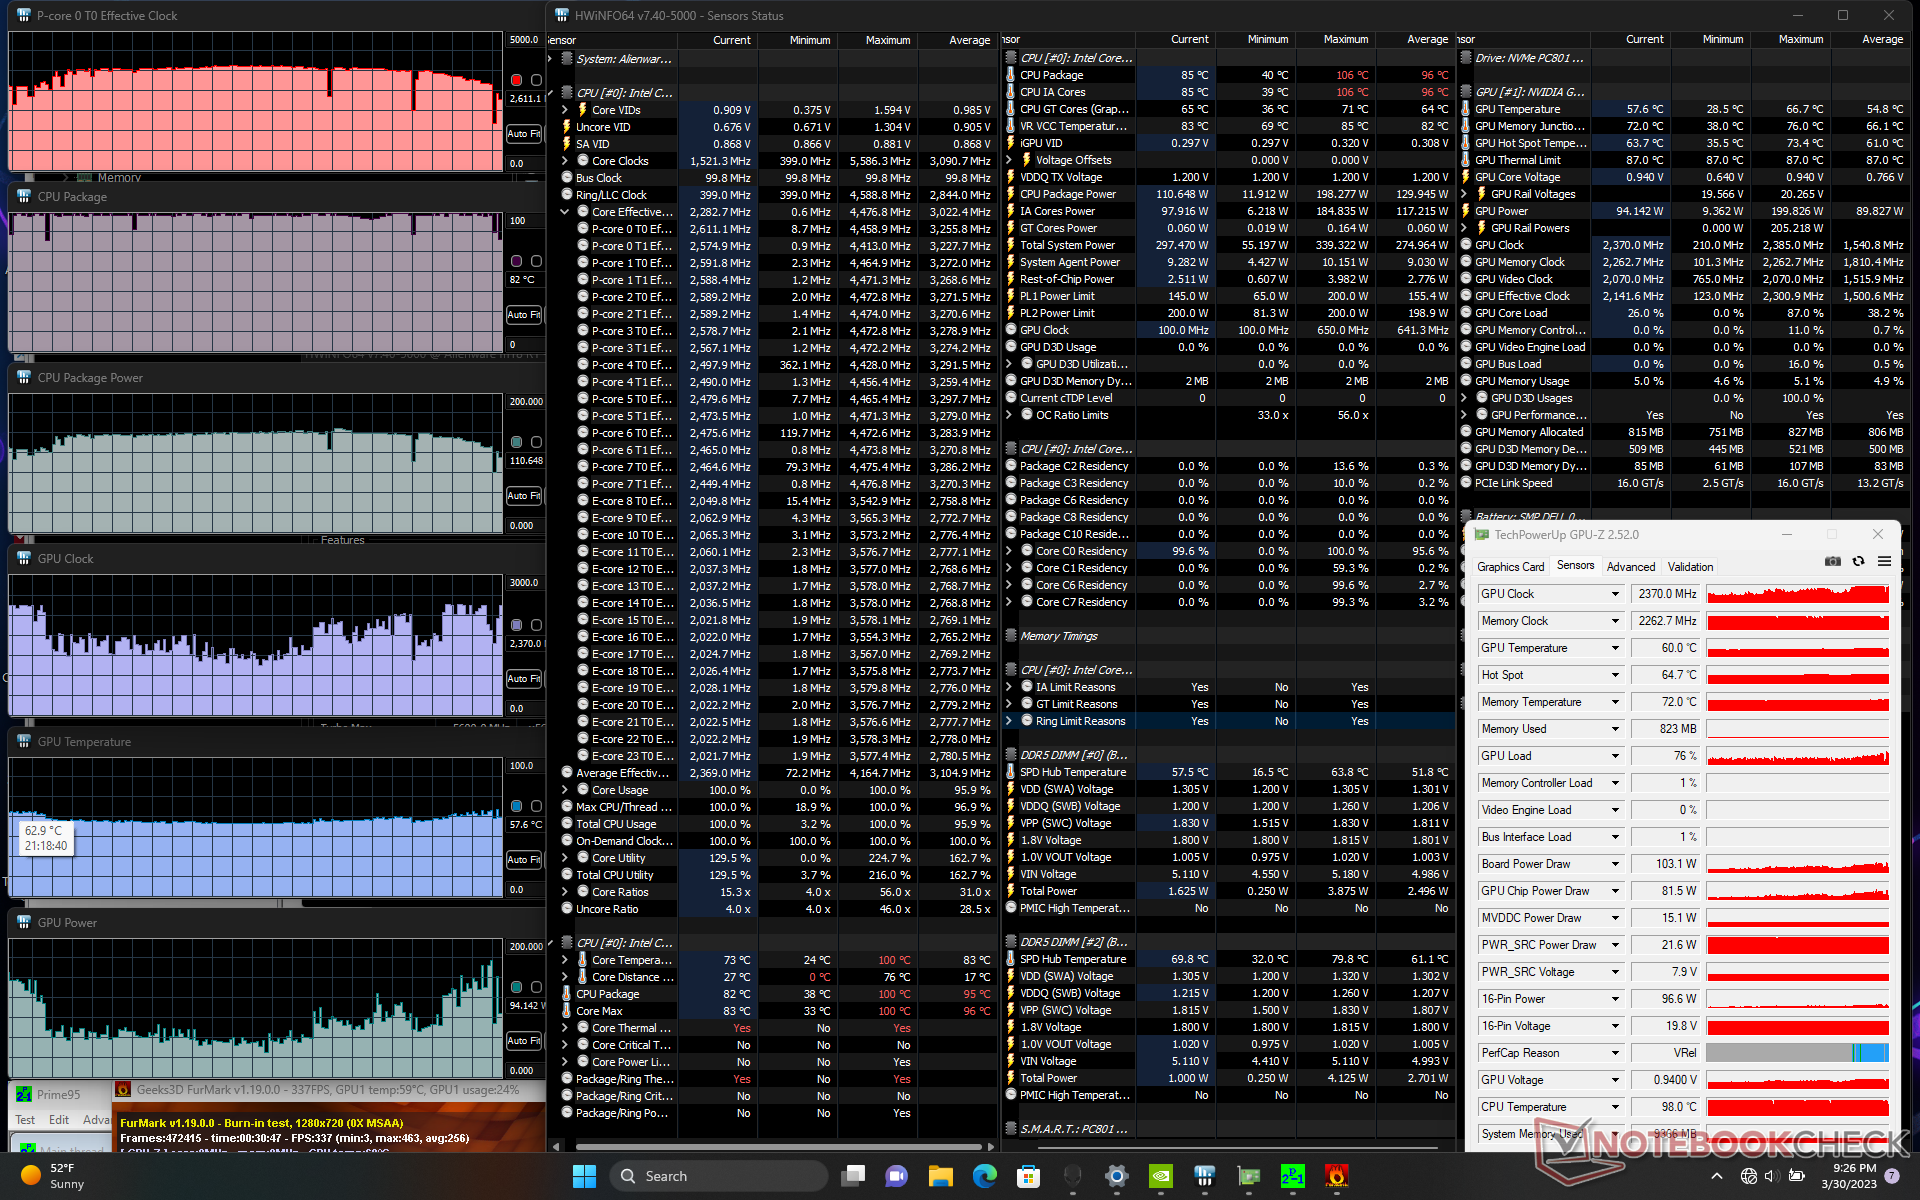
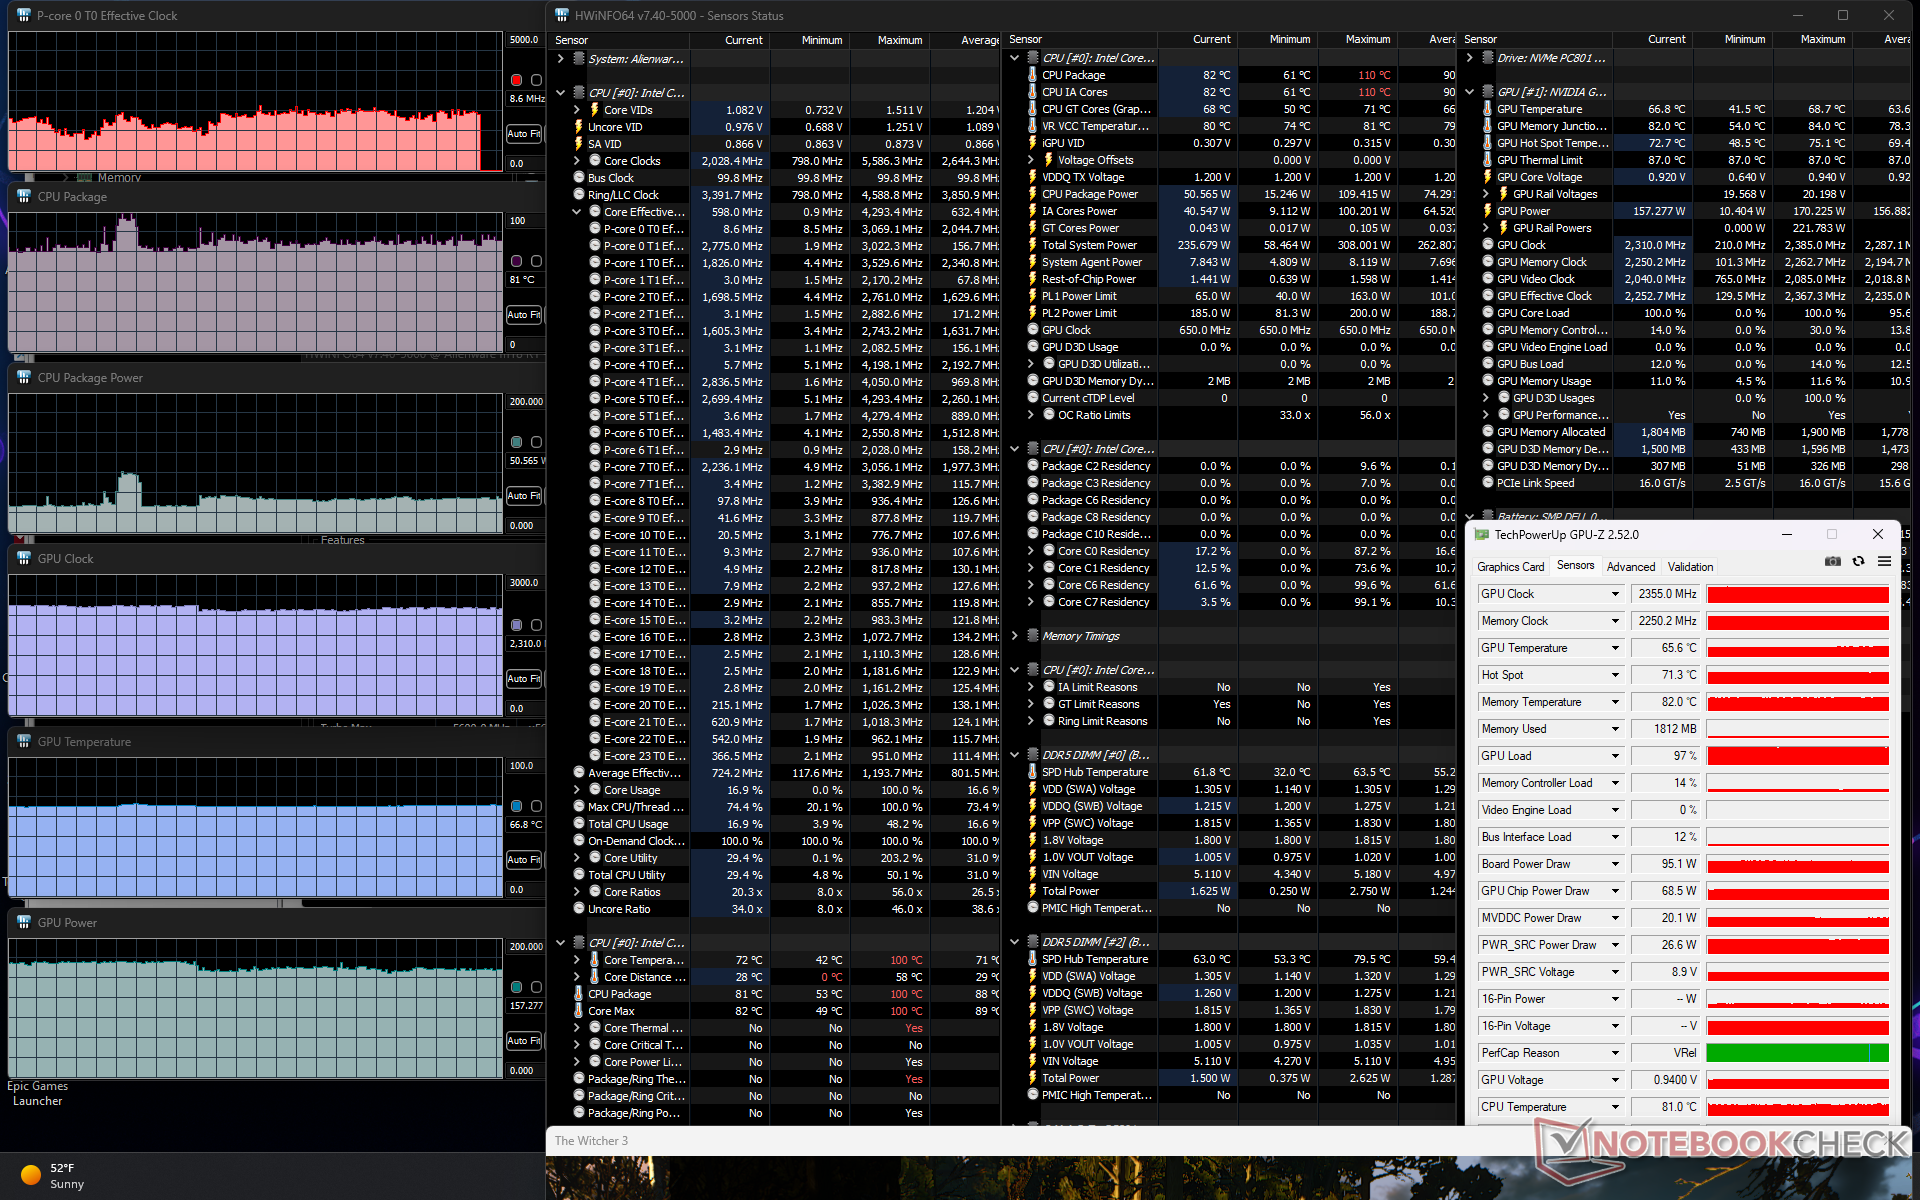
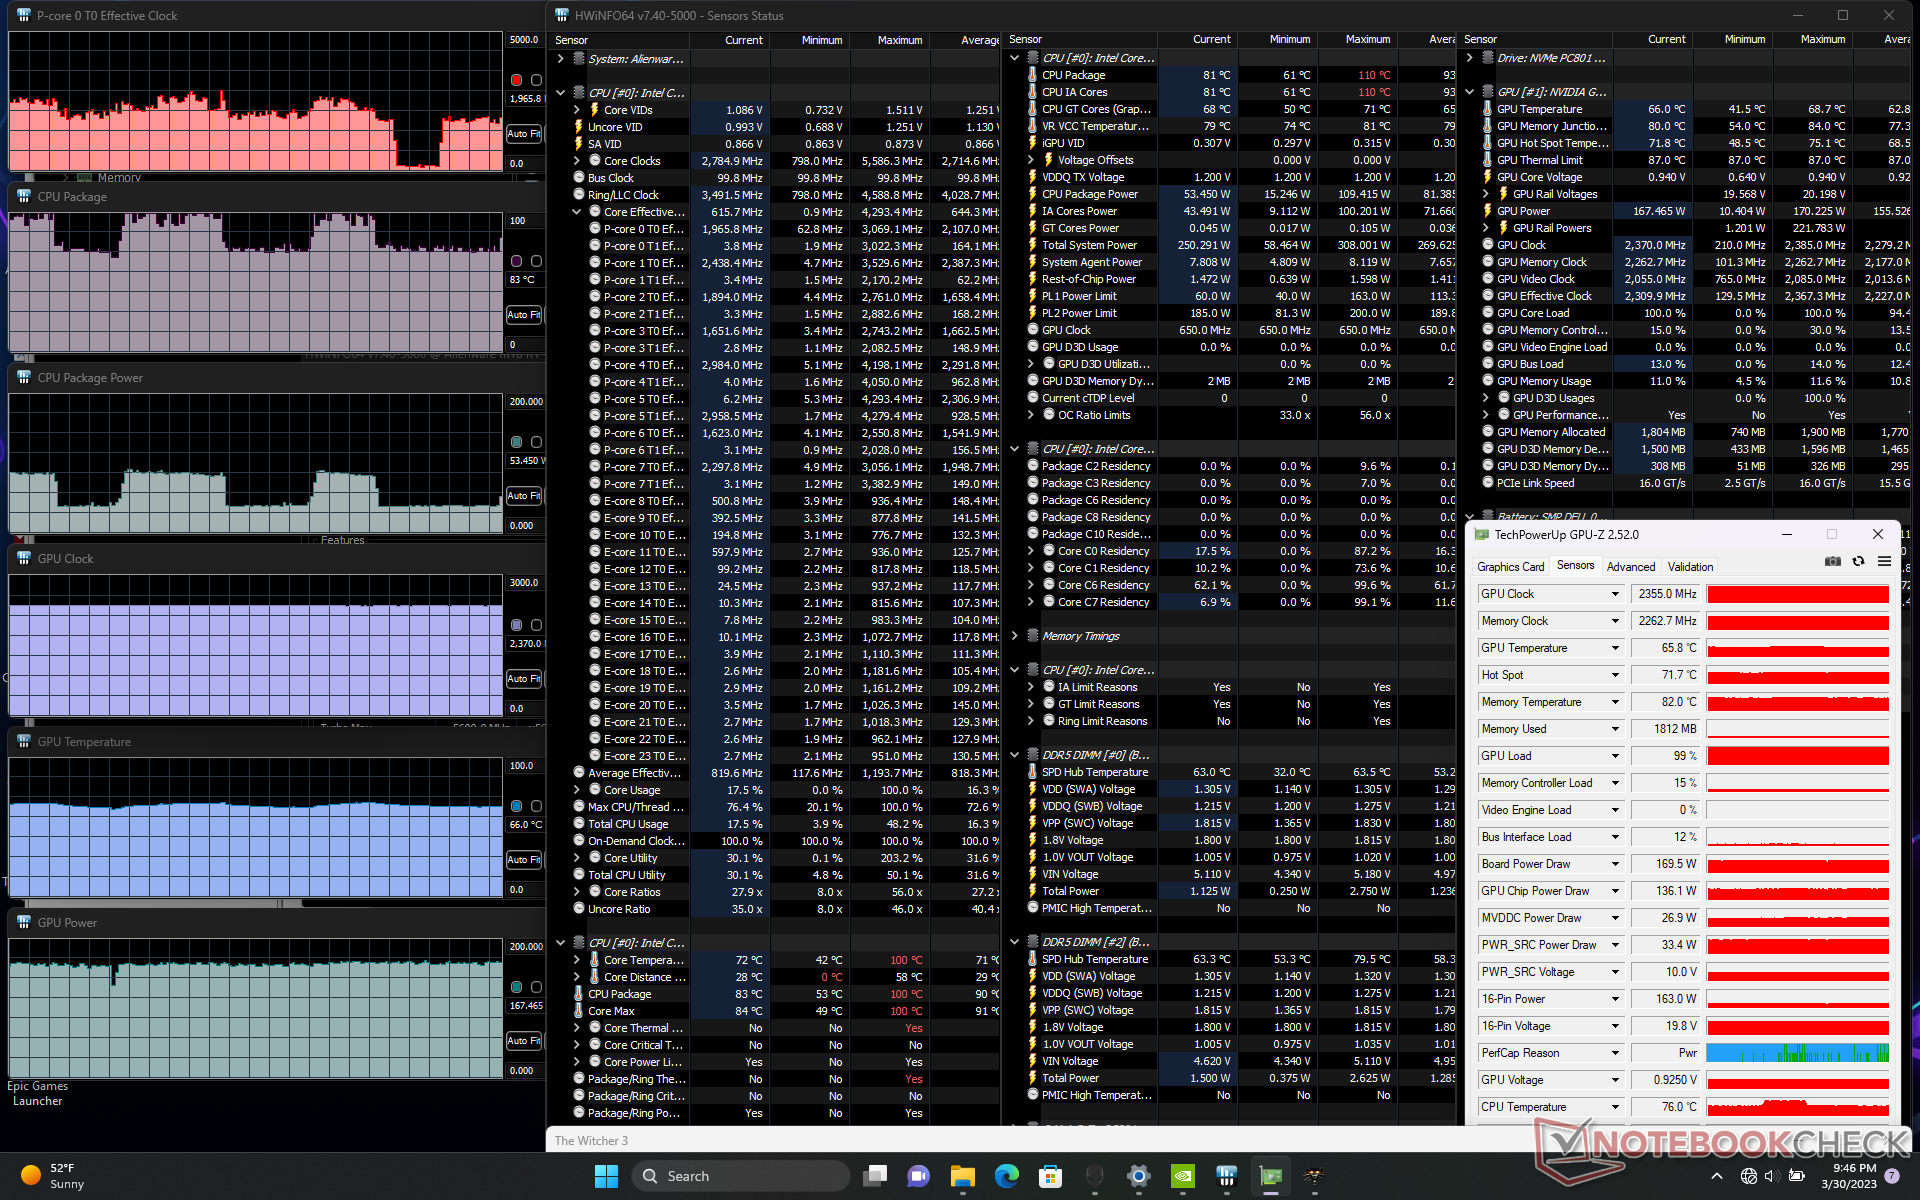
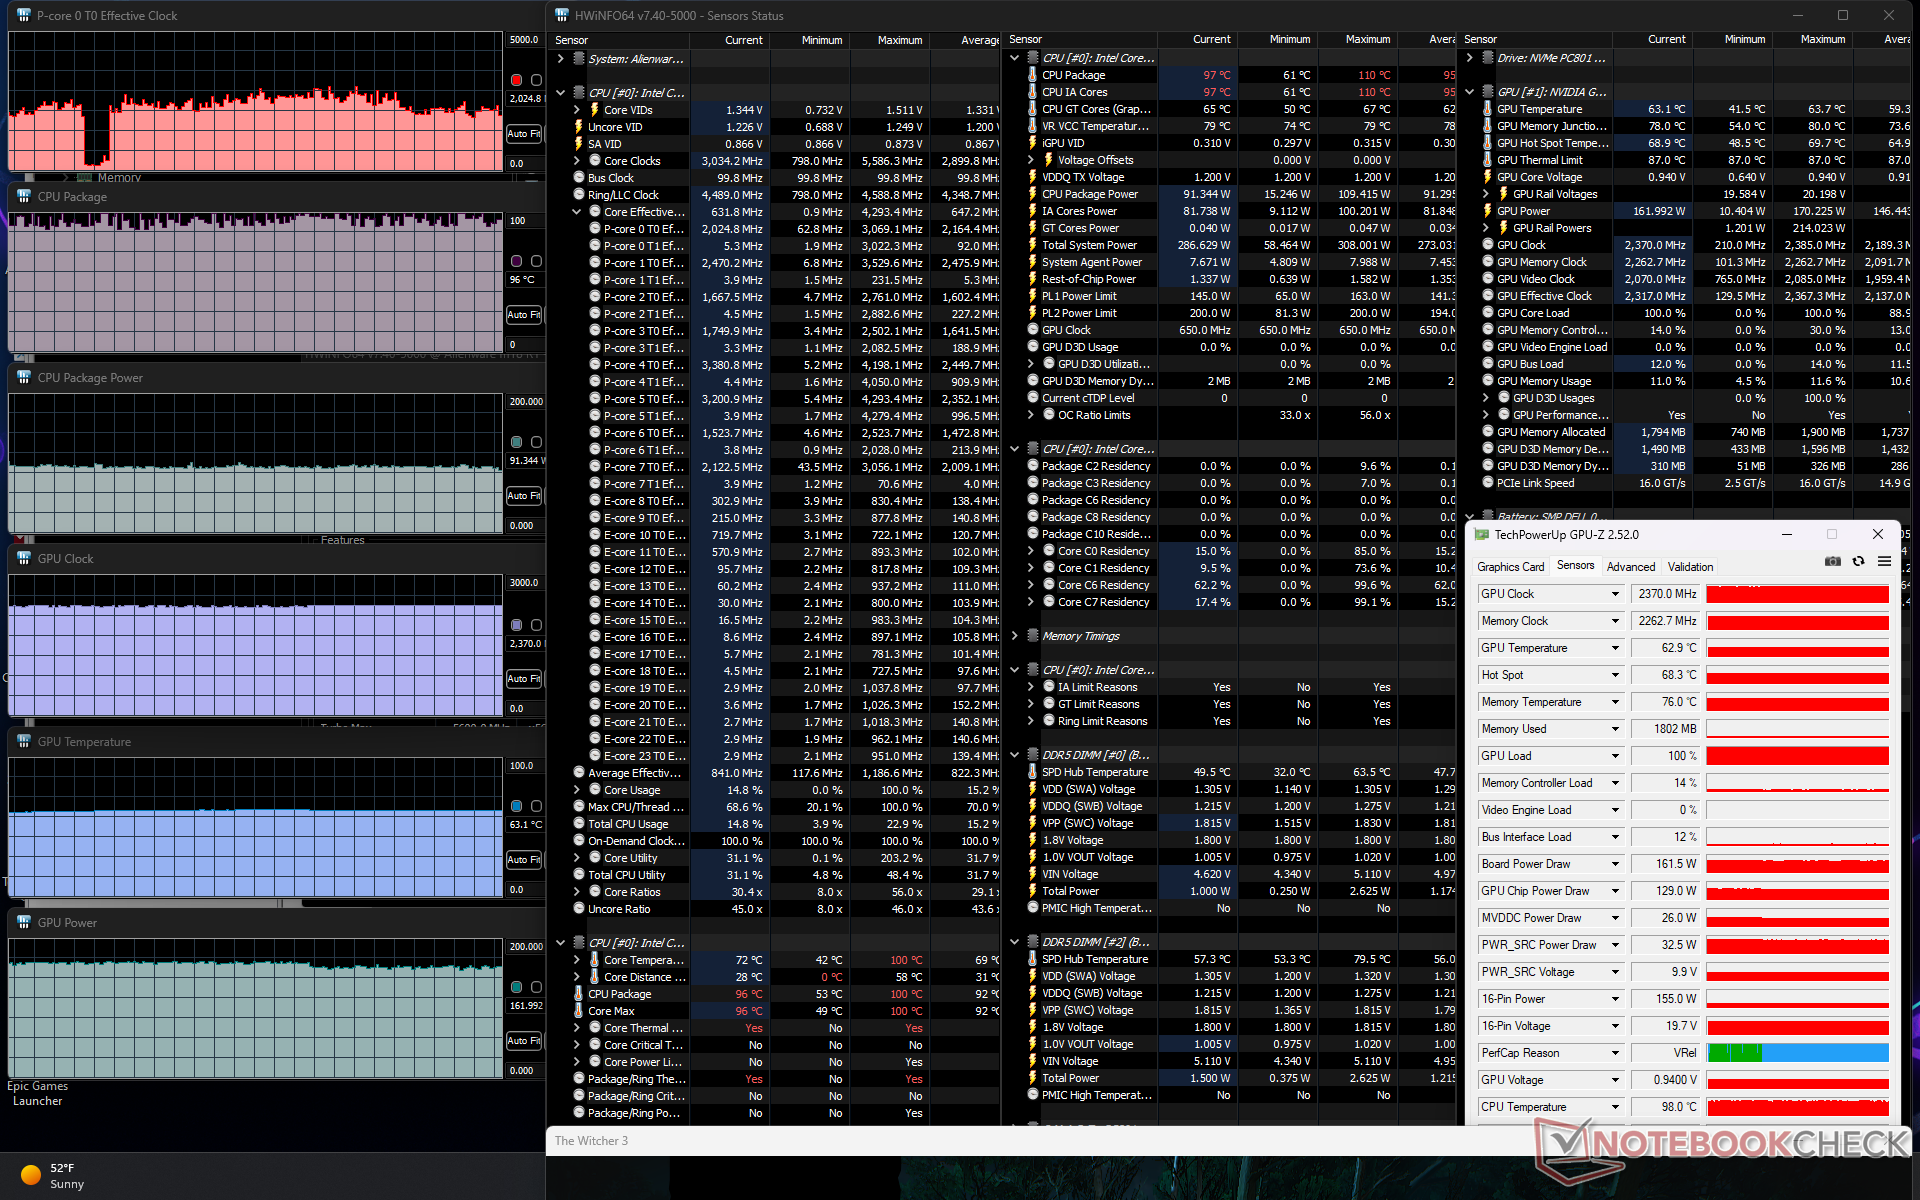
Teste de estresse
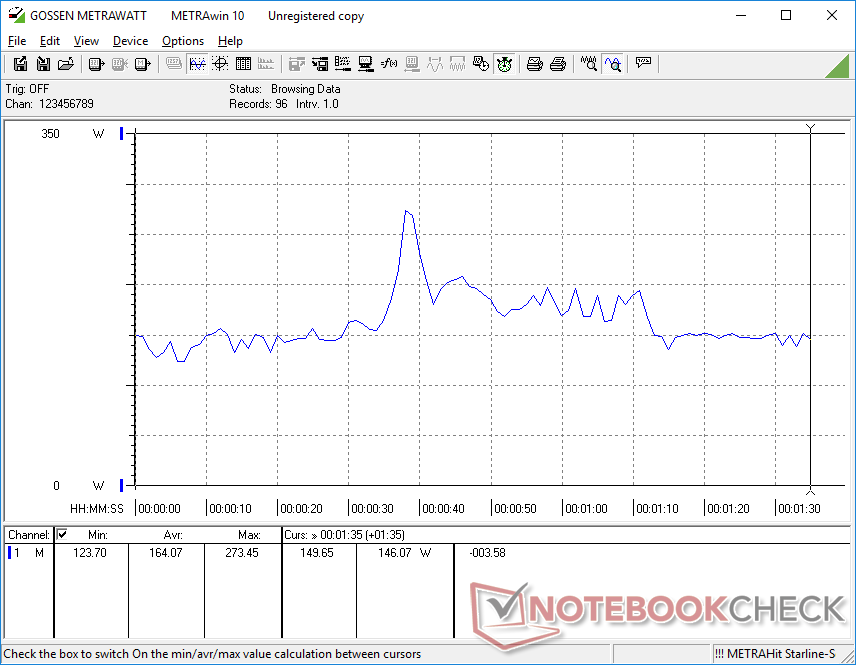
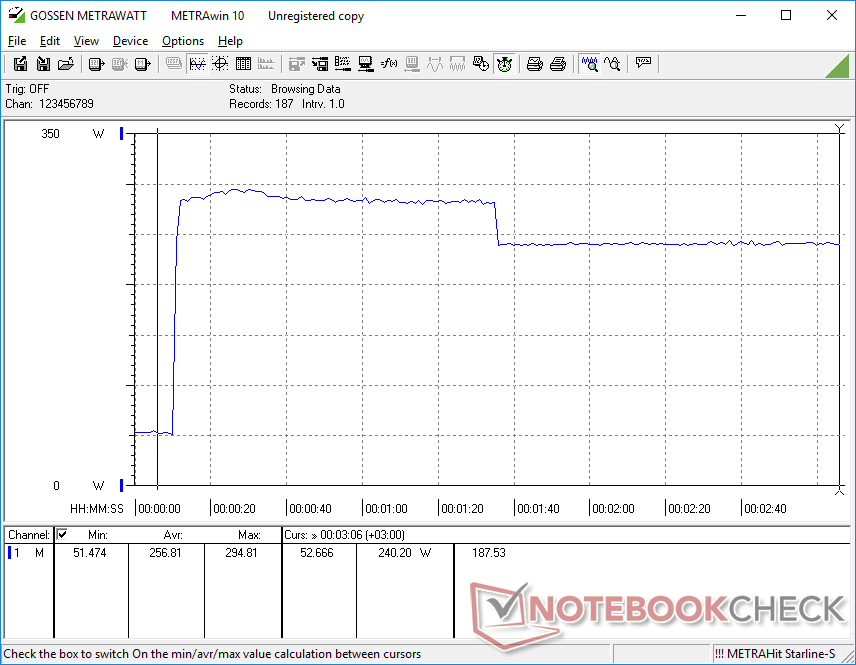
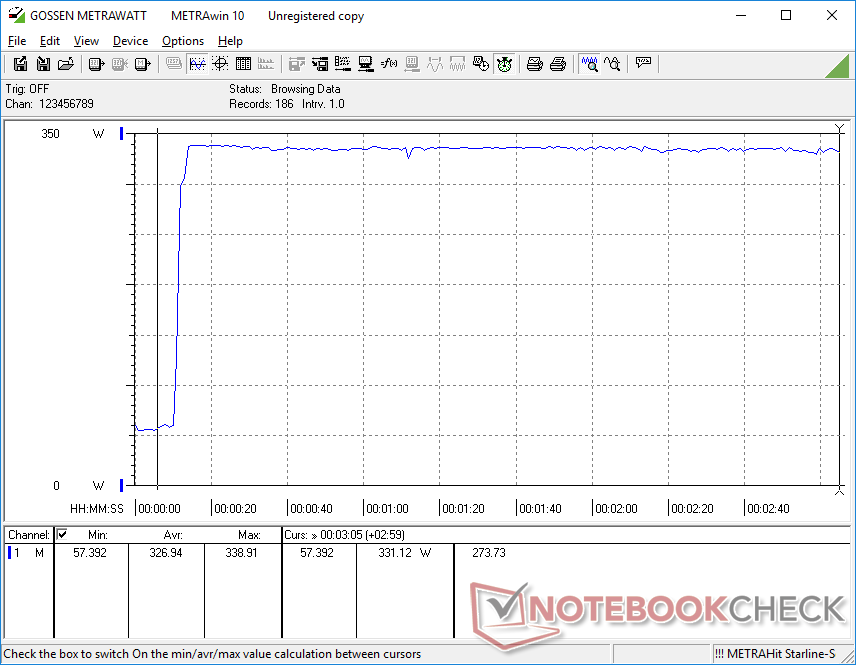
Ao executar Prime95 para enfatizar a CPU, as taxas de clock e o consumo de energia da placa subiriam para 4,5 GHz e 198 W, respectivamente, durando apenas alguns segundos ou até que a temperatura central atingisse 99 C. Depois disso, a CPU cairia para 4,2 GHz e 175 W durante os próximos minutos antes de finalmente se estabilizar em 3,4 GHz, 143 W e 99 C. Portanto, o Turbo Boost máximo não é sustentável, não importa o modo de energia. As temperaturas da CPU também são extremas, mesmo para um laptop para jogos.
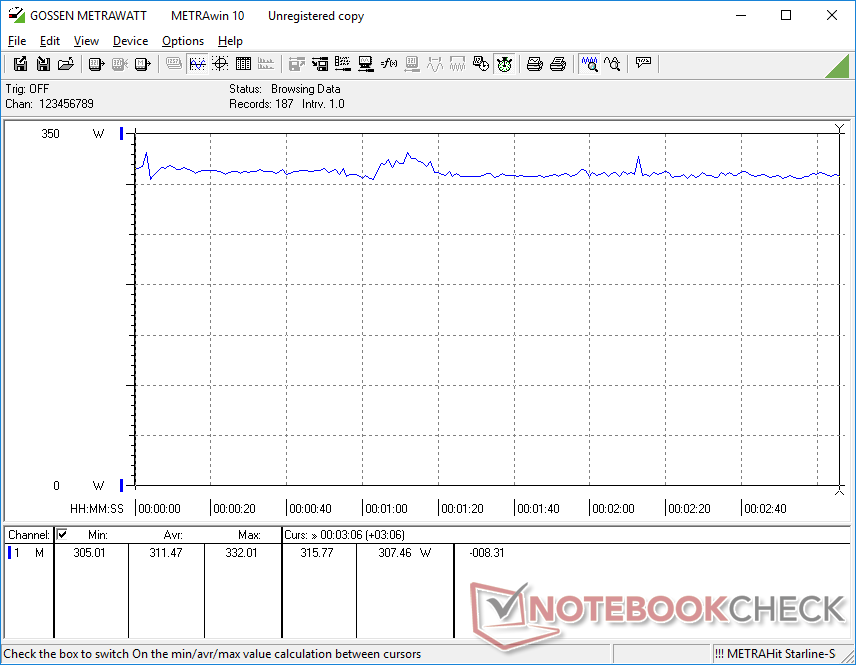
As taxas de relógio da GPU, temperatura e consumo de energia da placa estabilizariam em 2370 MHz, 63 C, e 162 W, respectivamente, quando em funcionamento Witcher 3 no modo Overdrive. Observe que o desempenho da GPU não é afetado quando se corre no modo de desempenho mais silencioso que se alinha com nossas observações Fire Strike de cima. Ao invés disso, é a CPU que sofre um leve impacto na performance. Como a maioria dos jogos são vinculados à GPU, recomendamos jogos em Performance ao invés do modo Overdrive mais alto, se o ruído do ventilador for uma preocupação.
O funcionamento com bateria limita a performance como esperado. Um teste Fire Strike em baterias retornaria pontuações de Física e Gráficos de 25319 e 18778 pontos, respectivamente, em comparação com 41644 e 46998 pontos quando em rede elétrica.
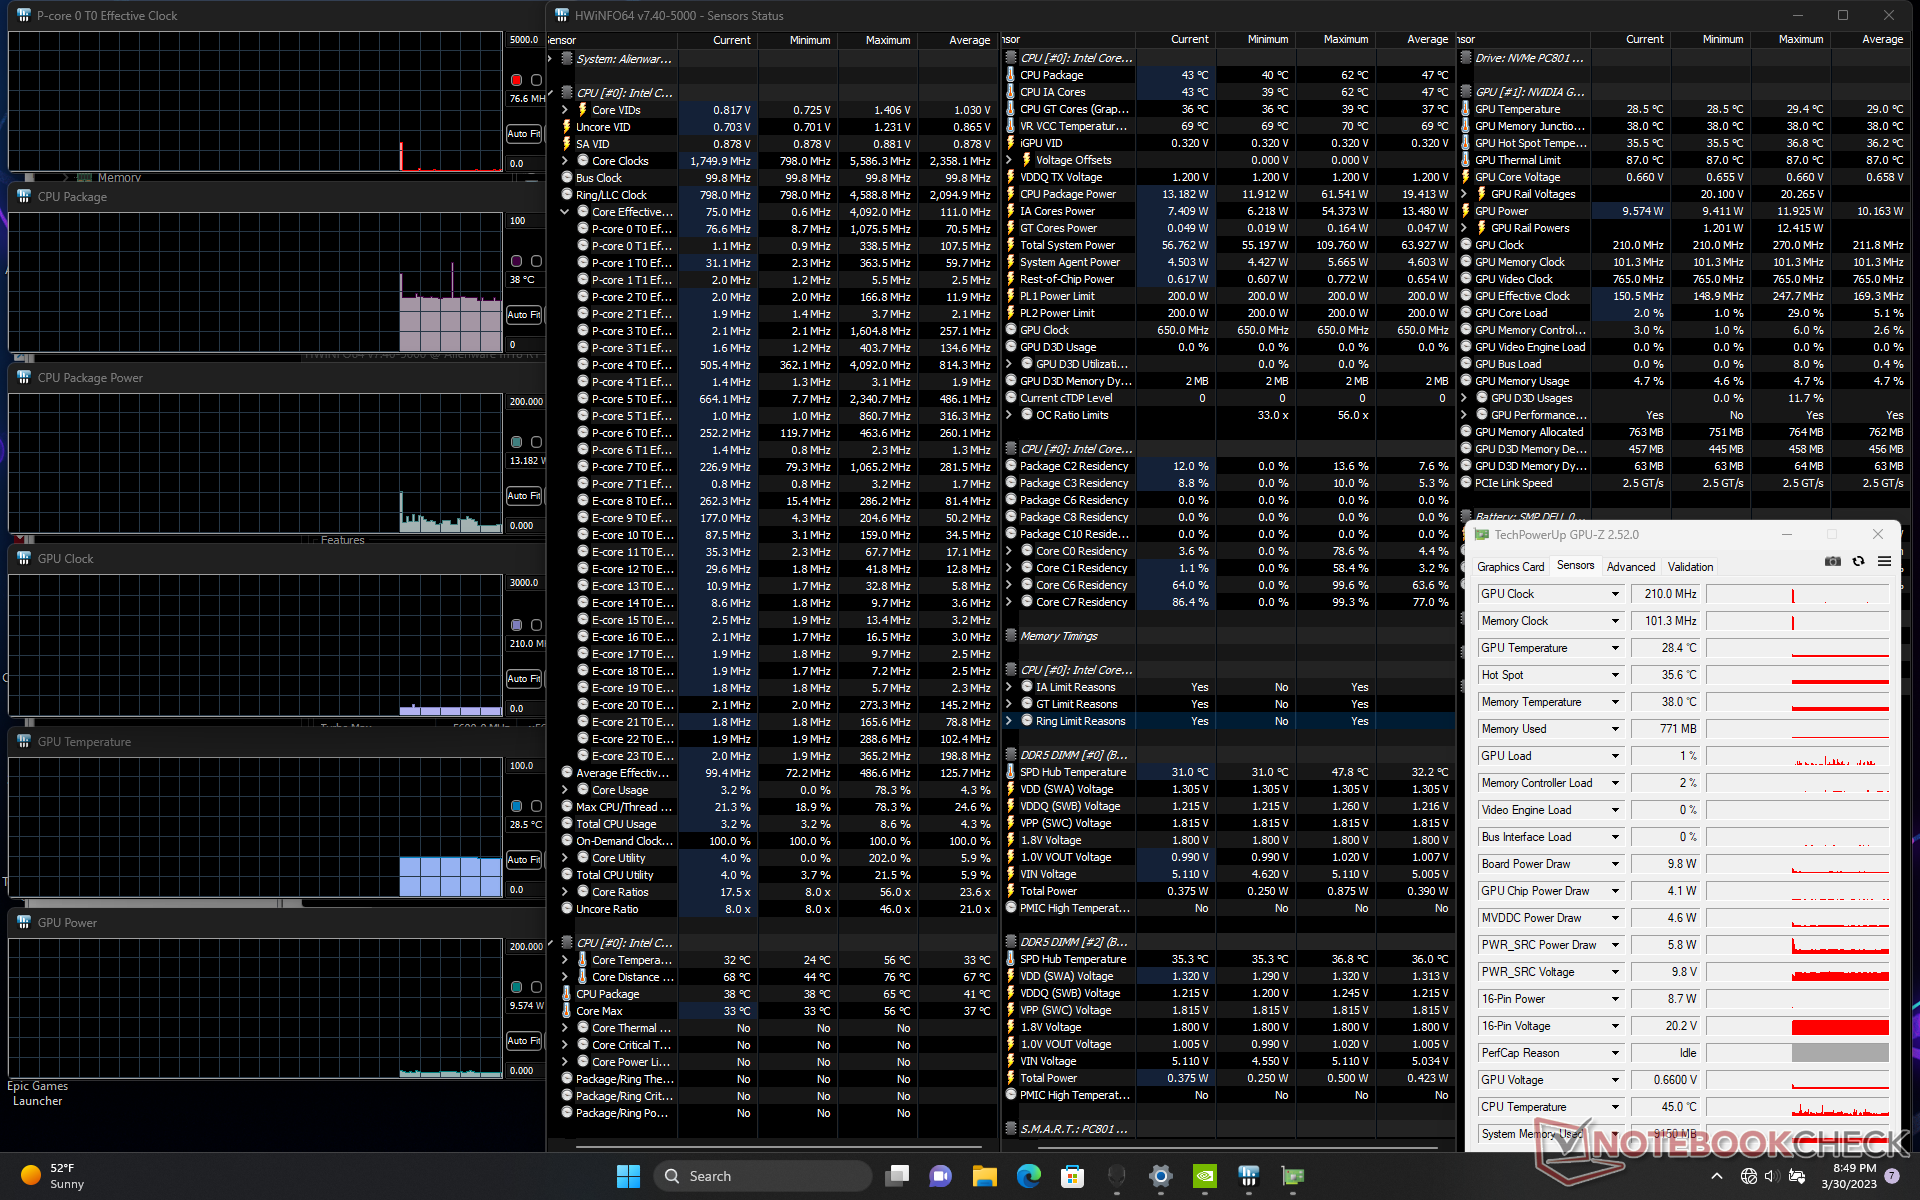
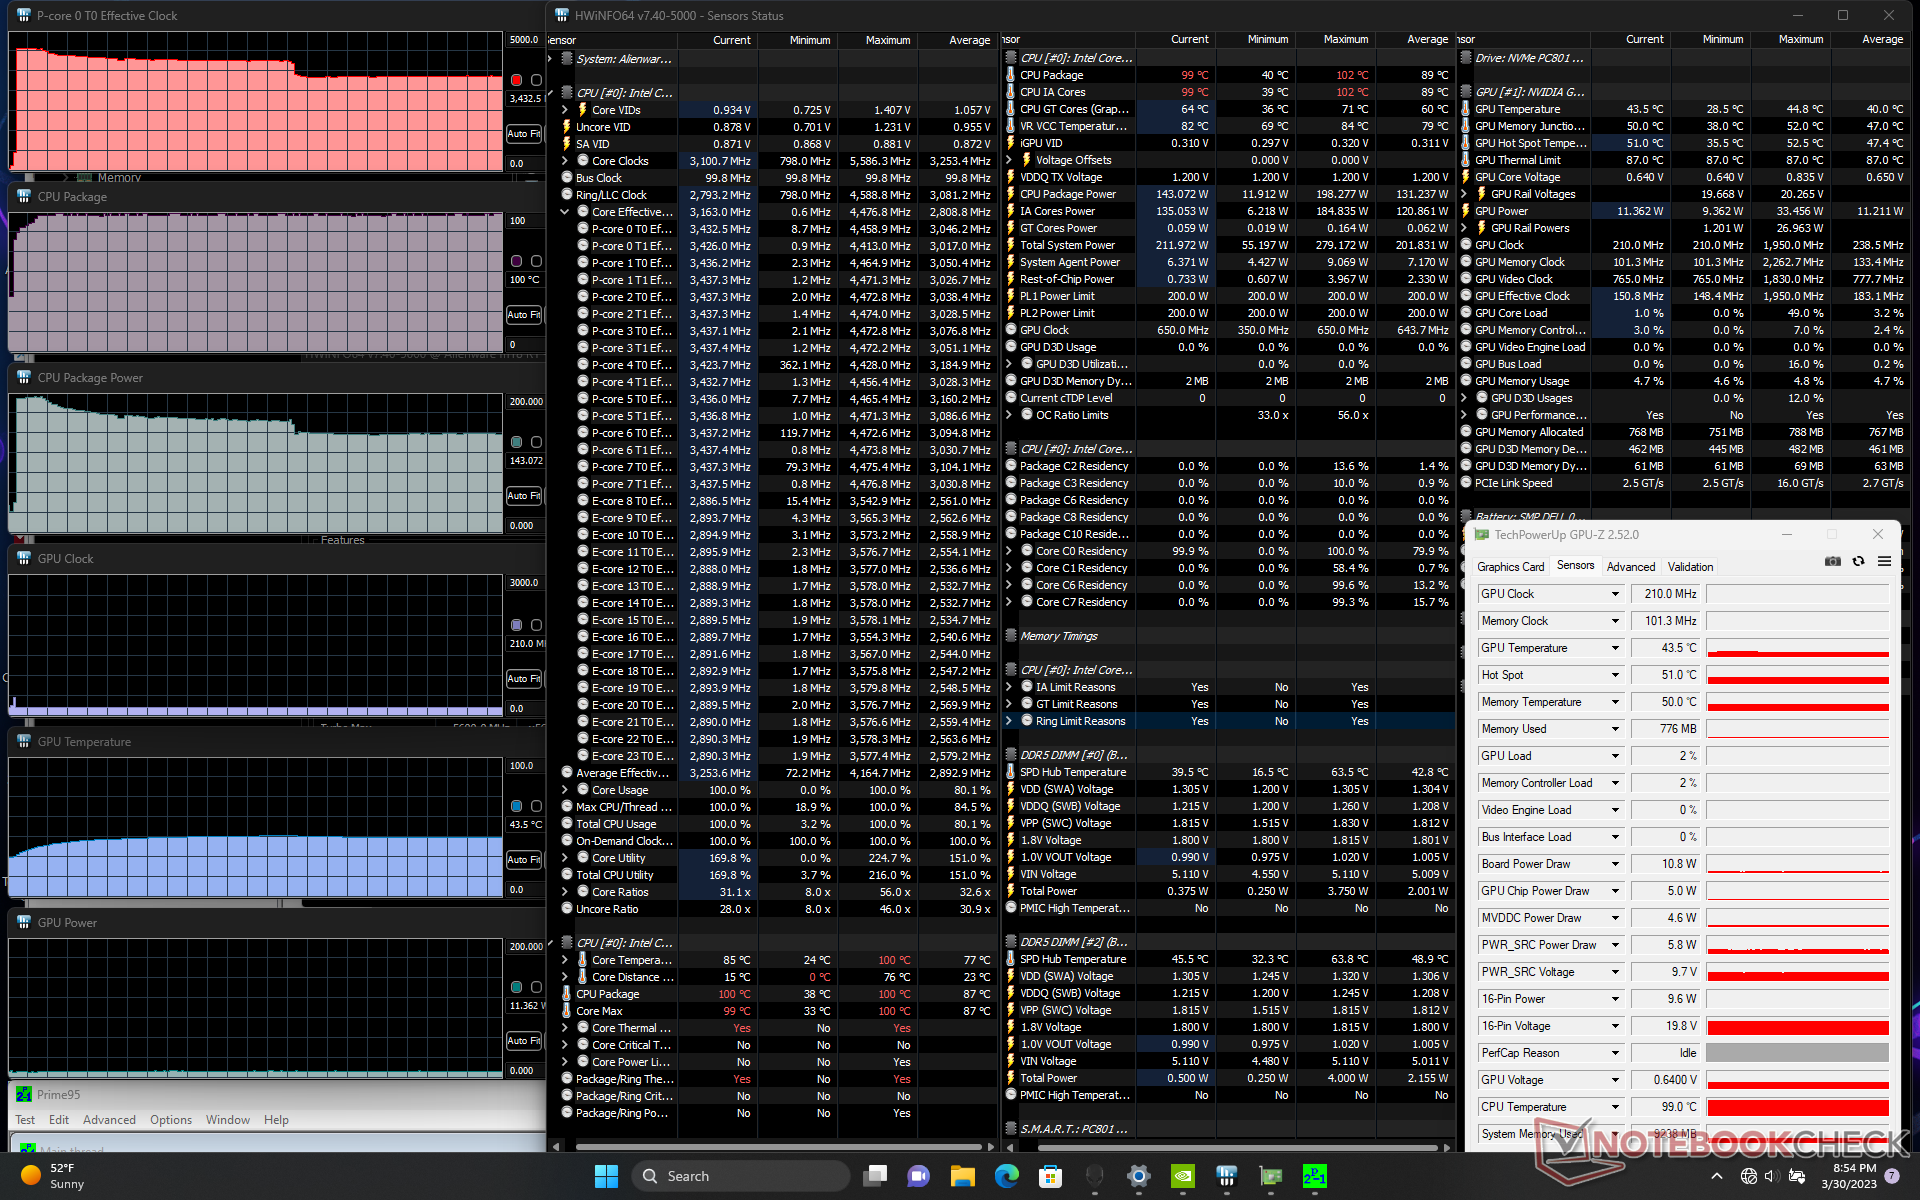
| Relógio CPU (GHz) | Relógio GPU (MHz) | Temperatura média da CPU (°C) | Temperatura média da GPU (°C) | |
| System Idle | -- | -- | 38 | 29 |
| Prime95 Stress | 3.4 | -- | 100 | 44 |
| Prime95 + FurMark Stress | 2.6+ | 1070 - 2370 | 82 - 100 | 57 |
| Witcher 3 Estresse (modo Overdrive) | ~2.0+ | 2370 | 96 | 63 |
| Witcher 3 Estresse (modo de desempenho) | ~1.8+ | 2370 | 81 | 66 |
| Witcher 3 Stress (modo equilibrado) | ~1.8 | 2310 | 81 | 67 |
Oradores
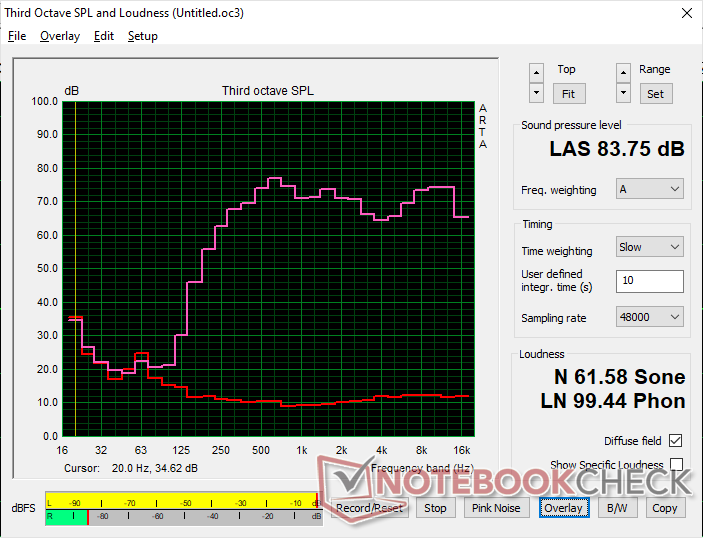
Alienware m18 R1 análise de áudio
(+) | os alto-falantes podem tocar relativamente alto (###valor### dB)
Graves 100 - 315Hz
(-) | quase nenhum baixo - em média 22.4% menor que a mediana
(±) | a linearidade dos graves é média (13.4% delta para a frequência anterior)
Médios 400 - 2.000 Hz
(+) | médios equilibrados - apenas 3.2% longe da mediana
(+) | médios são lineares (4.4% delta para frequência anterior)
Altos 2 - 16 kHz
(+) | agudos equilibrados - apenas 3.2% longe da mediana
(+) | os máximos são lineares (4% delta da frequência anterior)
Geral 100 - 16.000 Hz
(+) | o som geral é linear (14.6% diferença em relação à mediana)
Comparado com a mesma classe
» 28% de todos os dispositivos testados nesta classe foram melhores, 7% semelhantes, 65% piores
» O melhor teve um delta de 6%, a média foi 18%, o pior foi 132%
Comparado com todos os dispositivos testados
» 19% de todos os dispositivos testados foram melhores, 4% semelhantes, 77% piores
» O melhor teve um delta de 4%, a média foi 24%, o pior foi 134%
Apple MacBook Pro 16 2021 M1 Pro análise de áudio
(+) | os alto-falantes podem tocar relativamente alto (###valor### dB)
Graves 100 - 315Hz
(+) | bons graves - apenas 3.8% longe da mediana
(+) | o baixo é linear (5.2% delta para a frequência anterior)
Médios 400 - 2.000 Hz
(+) | médios equilibrados - apenas 1.3% longe da mediana
(+) | médios são lineares (2.1% delta para frequência anterior)
Altos 2 - 16 kHz
(+) | agudos equilibrados - apenas 1.9% longe da mediana
(+) | os máximos são lineares (2.7% delta da frequência anterior)
Geral 100 - 16.000 Hz
(+) | o som geral é linear (4.6% diferença em relação à mediana)
Comparado com a mesma classe
» 0% de todos os dispositivos testados nesta classe foram melhores, 0% semelhantes, 100% piores
» O melhor teve um delta de 5%, a média foi 17%, o pior foi 45%
Comparado com todos os dispositivos testados
» 0% de todos os dispositivos testados foram melhores, 0% semelhantes, 100% piores
» O melhor teve um delta de 4%, a média foi 24%, o pior foi 134%
Gerenciamento de energia - Mais de 300 W em jogos
Consumo de energia
O sistema é sem surpresas muito exigente mesmo quando não está rodando nenhuma aplicação. Somos capazes de gravar um mínimo nu de 21 W quando ociosos no modo Power Saver, modo Optimus e a configuração de brilho mais baixa. O modo Idling no modo Performance ou Turbo aumentaria o consumo em modo inativo em mais de 2x e por isso é altamente recomendado evitar as configurações de perfil mais alto se a potência extra não for necessária.
Rodando Witcher 3 para representar cargas de jogo típicas atrairia 311 W ou mais de 50 W do que no RTX 3080 Ti-powered do ano passado Alienware x17 R2. Assim, embora o desempenho seja mais rápido de geração para geração, os usuários ainda terão que pagar por ele através de contas de energia mais altas por causa da CPU mais exigente.
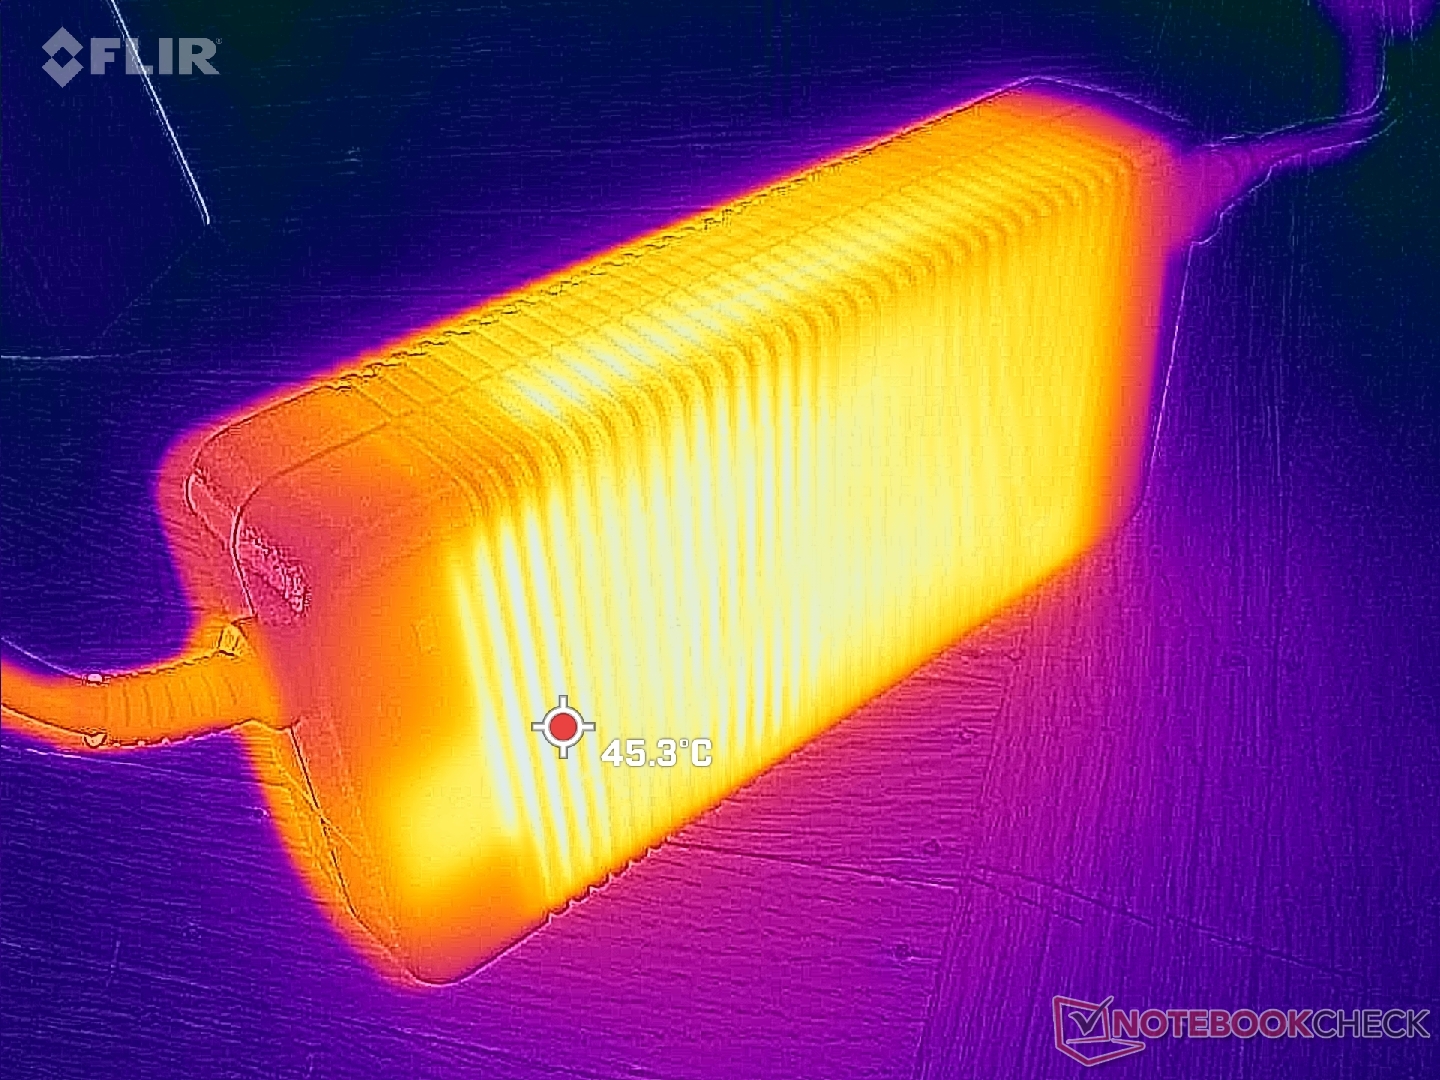
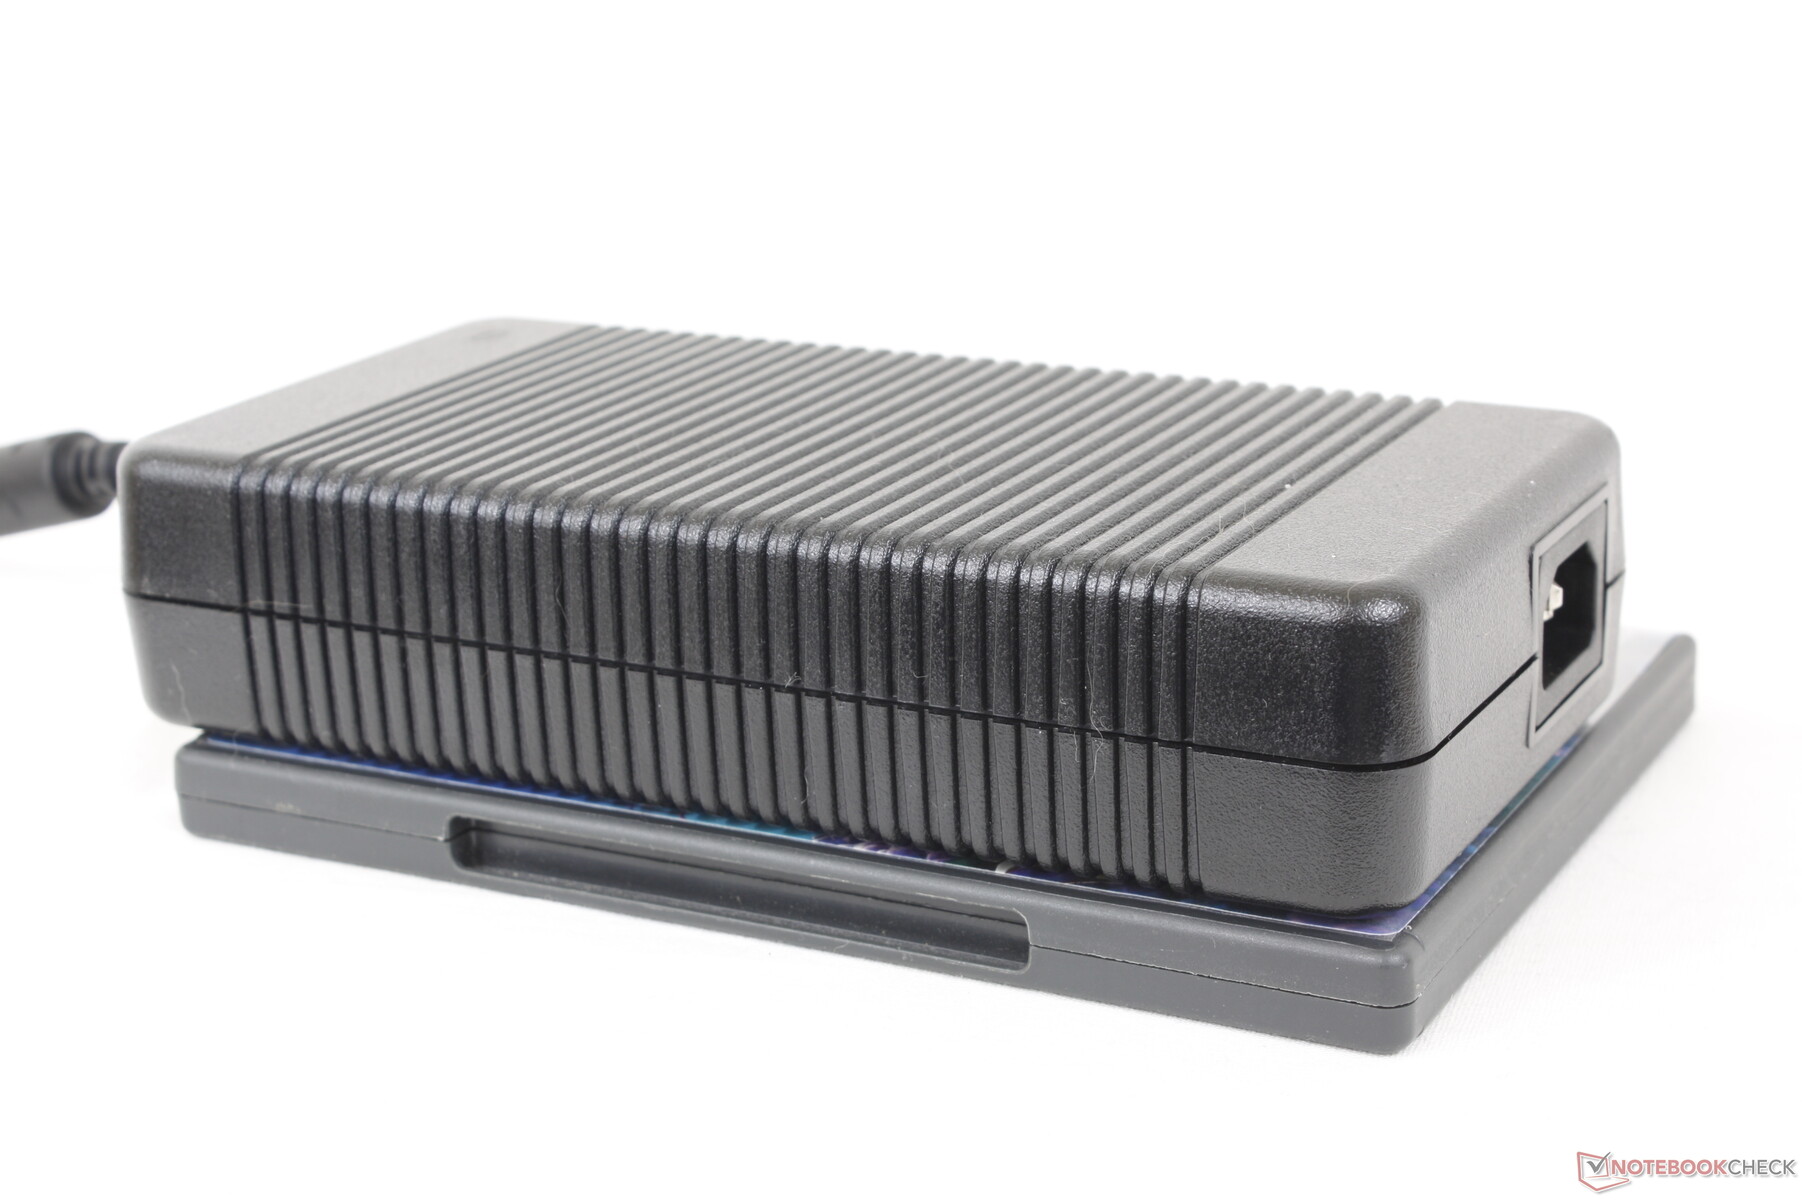
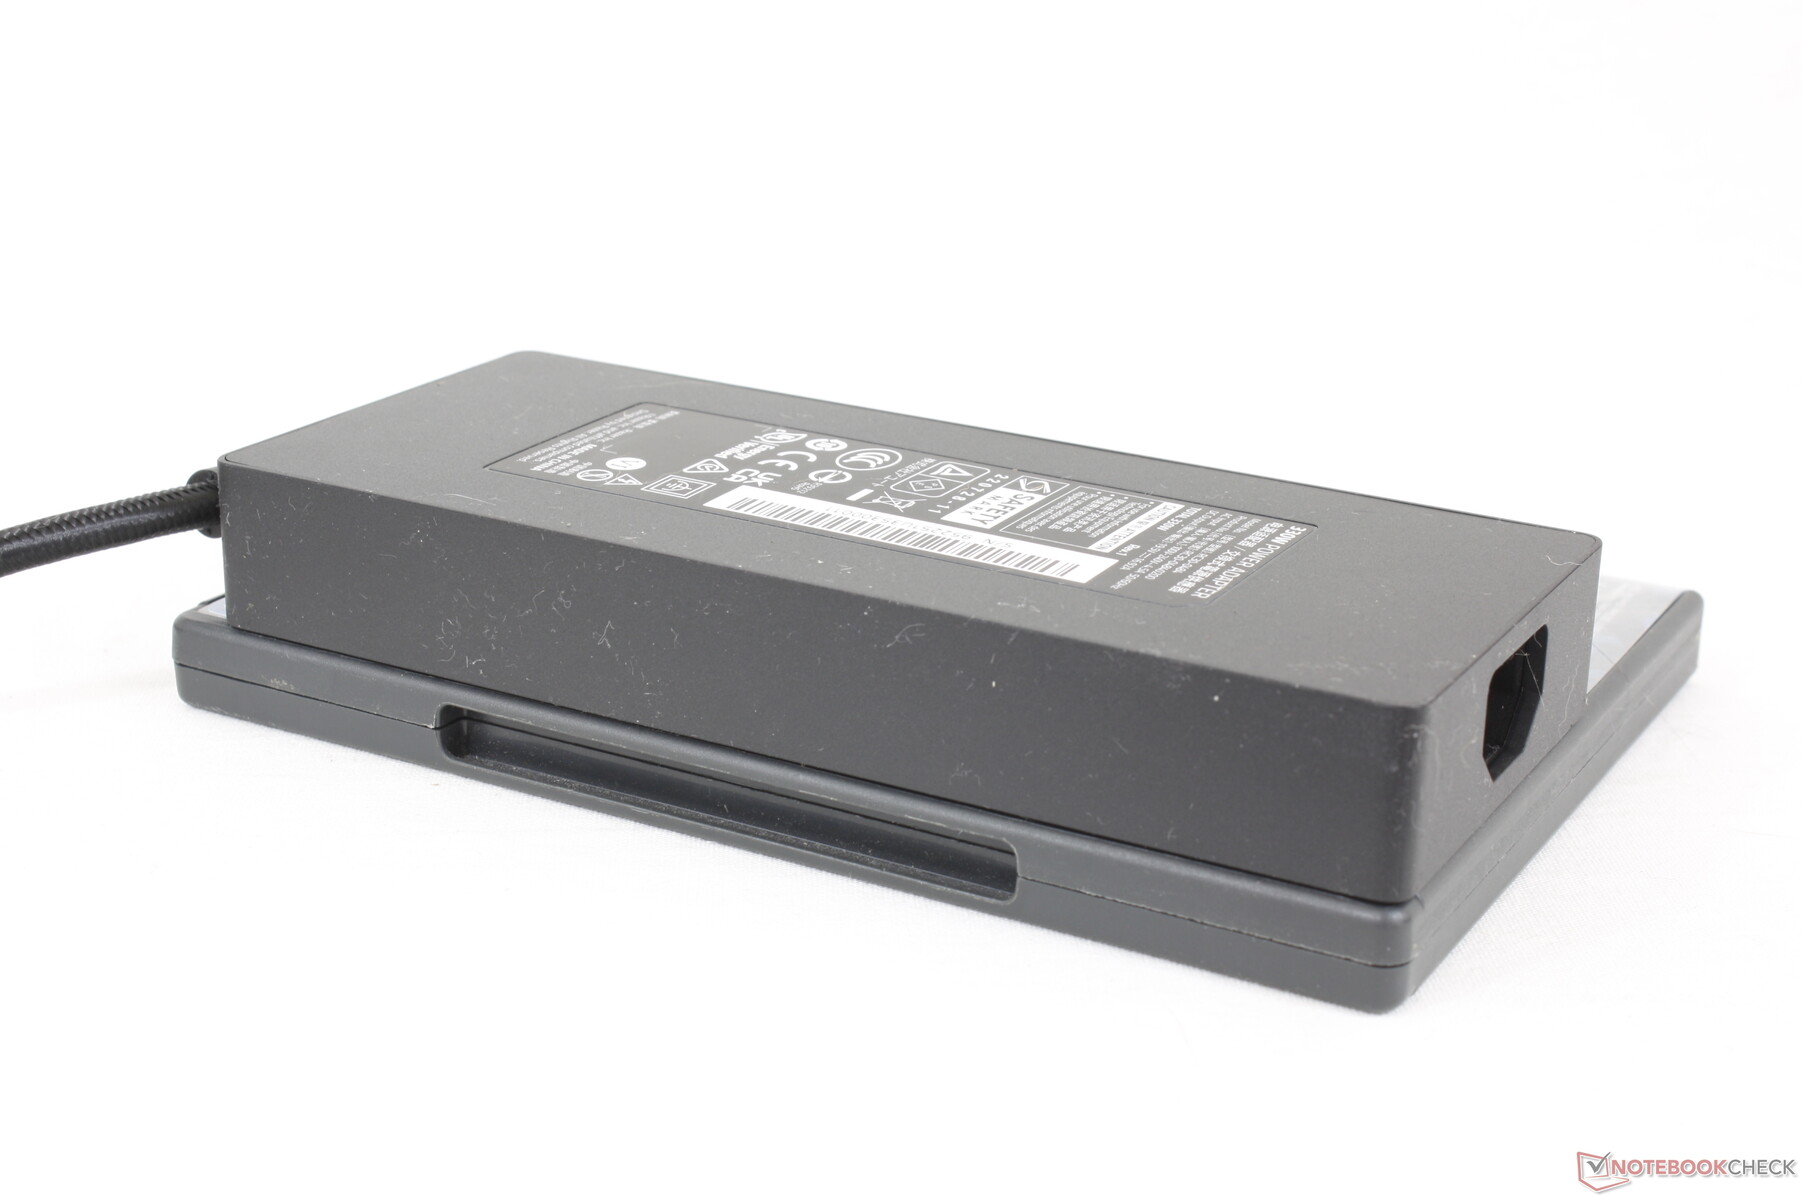
Somos capazes de registrar um consumo máximo de 339 W quando tanto a CPU quanto a GPU estão em 100% de utilização. O adaptador AC volumoso (~19,5 x 9,8 x 4 cm) é classificado para 330 W e por isso nossa unidade totalmente configurada está aproveitando ao máximo a energia disponível. Tenha em mente que a taxa de carga da bateria do laptop diminui quando se joga. De fato, podemos observar que nossa bateria cai de 100% para 91% quando executamos cargas extremamente exigentes como Prime95 e FurMark simultaneamente.
| desligado | |
| Ocioso | |
| Carga |
|
Key:
min: | |
| Alienware m18 R1 i9-13980HX, GeForce RTX 4090 Laptop GPU, SK hynix PC801 HFS001TEJ9X101N, IPS, 1920x1200, 18" | Razer Blade 18 RTX 4070 i9-13950HX, GeForce RTX 4070 Laptop GPU, SSSTC CA6-8D1024, IPS, 2560x1600, 18" | Asus ROG Strix Scar 18 2023 G834JY-N6005W i9-13980HX, GeForce RTX 4090 Laptop GPU, 2x Samsung PM9A1 MZVL21T0HCLR (RAID 0), IPS, 2560x1600, 18" | MSI GE78HX 13VH-070US i9-13950HX, GeForce RTX 4080 Laptop GPU, Samsung PM9A1 MZVL22T0HBLB, IPS, 2560x1600, 17" | Eluktronics Mech-17 GP2 i9-13900HX, GeForce RTX 4090 Laptop GPU, Samsung PM9A1 MZVL21T0HCLR, IPS, 2560x1600, 17" | MSI Titan GT77 HX 13VI i9-13950HX, GeForce RTX 4090 Laptop GPU, Samsung PM9A1 MZVL22T0HBLB, Mini-LED, 3840x2160, 17.3" | |
|---|---|---|---|---|---|---|
| Power Consumption | 7% | 11% | 20% | 21% | 20% | |
| Idle Minimum * (Watt) | 21.6 | 24.5 -13% | 17.3 20% | 16.1 25% | 14 35% | 14 35% |
| Idle Average * (Watt) | 25.2 | 34.1 -35% | 27 -7% | 24 5% | 19.3 23% | 21.6 14% |
| Idle Maximum * (Watt) | 56.7 | 47.7 16% | 46 19% | 34 40% | 36.8 35% | 24.8 56% |
| Load Average * (Watt) | 164.1 | 140 15% | 133 19% | 123.6 25% | 117.2 29% | 122.5 25% |
| Witcher 3 ultra * (Watt) | 311 | 202 35% | 286 8% | 304 2% | 265 15% | |
| Load Maximum * (Watt) | 338.9 | 261 23% | 329 3% | 285.7 16% | 342.5 -1% | 418 -23% |
* ... menor é melhor
Power Consumption Witcher 3 / Stresstest
Power Consumption external Monitor
Vida útil da bateria - Não é terrível para o tamanho
A vida útil da bateria nunca foi um ponto forte para a série Alienware. A série Alienware x17 R2 do ano passado, por exemplo, duraria apenas algumas horas, mesmo quando apenas navegando na web. O Alienware m18 inclui uma bateria de maior capacidade (97 Wh vs. 87 Wh) com melhor gerenciamento de energia para tempos de navegação visivelmente mais longos de cerca de 4 horas. Certamente não é tão longo quanto um típico Ultrabook, mas não é ruim para um laptop de jogos tão grande.
O carregamento do vazio ao cheio leva cerca de 2 horas com o adaptador AC de barril incluído. Os carregadores USB-C não são suportados, o que é uma pena porque isso significa que você está amarrado ao adaptador AC de 330 W, onde quer que vá.
| Alienware m18 R1 i9-13980HX, GeForce RTX 4090 Laptop GPU, 97 Wh | Razer Blade 18 RTX 4070 i9-13950HX, GeForce RTX 4070 Laptop GPU, 91.7 Wh | Asus ROG Strix Scar 18 2023 G834JY-N6005W i9-13980HX, GeForce RTX 4090 Laptop GPU, 90 Wh | Eluktronics Mech-17 GP2 i9-13900HX, GeForce RTX 4090 Laptop GPU, 99 Wh | MSI Titan GT77 HX 13VI i9-13950HX, GeForce RTX 4090 Laptop GPU, 99.9 Wh | Alienware x17 R2 P48E i9-12900HK, GeForce RTX 3080 Ti Laptop GPU, 87 Wh | |
|---|---|---|---|---|---|---|
| Duração da bateria | 35% | 47% | 19% | 62% | -23% | |
| Reader / Idle (h) | 5.6 | 7 25% | 3.9 -30% | |||
| WiFi v1.3 (h) | 4.3 | 4 -7% | 7.1 65% | 5.1 19% | 5.3 23% | 2 -53% |
| Load (h) | 0.7 | 1.3 86% | 0.9 29% | 1.4 100% | 0.8 14% | |
| H.264 (h) | 7 | 6 | ||||
| Witcher 3 ultra (h) | 0.9 |
Pro
Contra
Veredicto - Nove Libras de Potência Pura
Os laptops Alienware sempre tiveram essa mentalidade de "desempenho a qualquer custo" e o Alienware m18 R1 não é exceção. Esta máquina não tem medo de ser um dos maiores, mais pesados ou até mesmo mais barulhentos laptops do mercado se isso significar que ela pode espremer apenas um pouco mais de desempenho da CPU e GPU ou incorporar mais características que os jogadores zelosos possam apreciar. Os usuários que pretendem explorar os SSDs M.2 4x, as vastas opções de porta, o numpad integrado e a rápida taxa de atualização de 480 Hz e não se importam com o peso volumoso ou o adaptador AC gigantesco terão muito mais para desfrutar sobre o Alienware m18 R1.
Se você quiser maximizar o desempenho e as características mesmo que isso signifique um laptop muito mais pesado e maior, então o Alienware m18 R1 é para você.
Se as características auxiliares acima não o entusiasmam, então você pode obter quase o mesmo desempenho do núcleo do portátil visivelmente mais leve Lâmina Razer 18 ou Asus ROG Strix 18. Gostaríamos também de ver melhorias no novo software do Centro de Comando de Alienígenas, uma vez que ele carrega às vezes de forma excepcionalmente lenta.
Preço e Disponibilidade
O Alienware m18 R1 é agora enviado diretamente da Dell a partir de US$ 2100 para a configuração do Core i7/RTX 4060 até mais de US$ 5.000, se totalmente configurado. Nossa unidade como revendedores revisados por cerca de $3700 USD. O modelo ainda não está amplamente disponível em outros grandes varejistas no momento em que foi escrito.
Alienware m18 R1
- 04/01/2023 v7 (old)
Allen Ngo
Transparência
A seleção dos dispositivos a serem analisados é feita pela nossa equipe editorial. A amostra de teste foi fornecida ao autor como empréstimo pelo fabricante ou varejista para fins desta revisão. O credor não teve influência nesta revisão, nem o fabricante recebeu uma cópia desta revisão antes da publicação. Não houve obrigação de publicar esta revisão. Como empresa de mídia independente, a Notebookcheck não está sujeita à autoridade de fabricantes, varejistas ou editores.
É assim que o Notebookcheck está testando
Todos os anos, o Notebookcheck analisa de forma independente centenas de laptops e smartphones usando procedimentos padronizados para garantir que todos os resultados sejam comparáveis. Desenvolvemos continuamente nossos métodos de teste há cerca de 20 anos e definimos padrões da indústria no processo. Em nossos laboratórios de teste, equipamentos de medição de alta qualidade são utilizados por técnicos e editores experientes. Esses testes envolvem um processo de validação em vários estágios. Nosso complexo sistema de classificação é baseado em centenas de medições e benchmarks bem fundamentados, o que mantém a objetividade.Price comparison

