Análise do laptop Acer Predator Helios 18: RTX 4080 gamer com tela MiniLED de mais de 1.000 nits

A RTX 4060 equipado Acer Predator Helios 16 obteve uma pontuação total de 90% em nossa análise em julho. Agora, vamos dar uma olhada no modelo high-end de 18 polegadas com um processador Intel HX, um processador RTX 4080 e uma tela MiniLED.
Para fins de comparação, usamos outros modelos de 18 polegadas, bem como modelos de 17 polegadas com especificações semelhantes, já que o Predator Helios 18 é o primeiro com RTX 4080 em nossas análises de notebooks de 18 polegadas. Os concorrentes incluem oMSI Raider GE78 HX 13VHe o HP Omen 17, o Alienware m18 R1, o Asus ROG Strix G18 G814JI e o Razer Blade 18.
Possíveis concorrentes em comparação
Avaliação | Data | Modelo | Peso | Altura | Size | Resolução | Preço |
|---|---|---|---|---|---|---|---|
| 88.3 % v7 (old) | 10/2023 | Acer Predator Helios 18 N23Q2 i9-13900HX, GeForce RTX 4080 Laptop GPU | 3.2 kg | 29.15 mm | 18.00" | 2560x1600 | |
| 88.3 % v7 (old) | 03/2023 | MSI GE78HX 13VH-070US i9-13950HX, GeForce RTX 4080 Laptop GPU | 3 kg | 23 mm | 17.00" | 2560x1600 | |
| 85.4 % v7 (old) | 03/2023 | HP Omen 17-ck2097ng i9-13900HX, GeForce RTX 4080 Laptop GPU | 2.8 kg | 27 mm | 17.30" | 2560x1440 | |
| 90.7 % v7 (old) | 04/2023 | Alienware m18 R1 i9-13980HX, GeForce RTX 4090 Laptop GPU | 3.9 kg | 26.7 mm | 18.00" | 1920x1200 | |
| 87.4 % v7 (old) | 03/2023 | Asus ROG Strix G18 G814JI i7-13650HX, GeForce RTX 4070 Laptop GPU | 3 kg | 31 mm | 18.00" | 2560x1600 | |
| 91.4 % v7 (old) | 02/2023 | Razer Blade 18 RTX 4070 i9-13950HX, GeForce RTX 4070 Laptop GPU | 3 kg | 21.9 mm | 18.00" | 2560x1600 |
Case - Alumínio preto para o Acer Predator
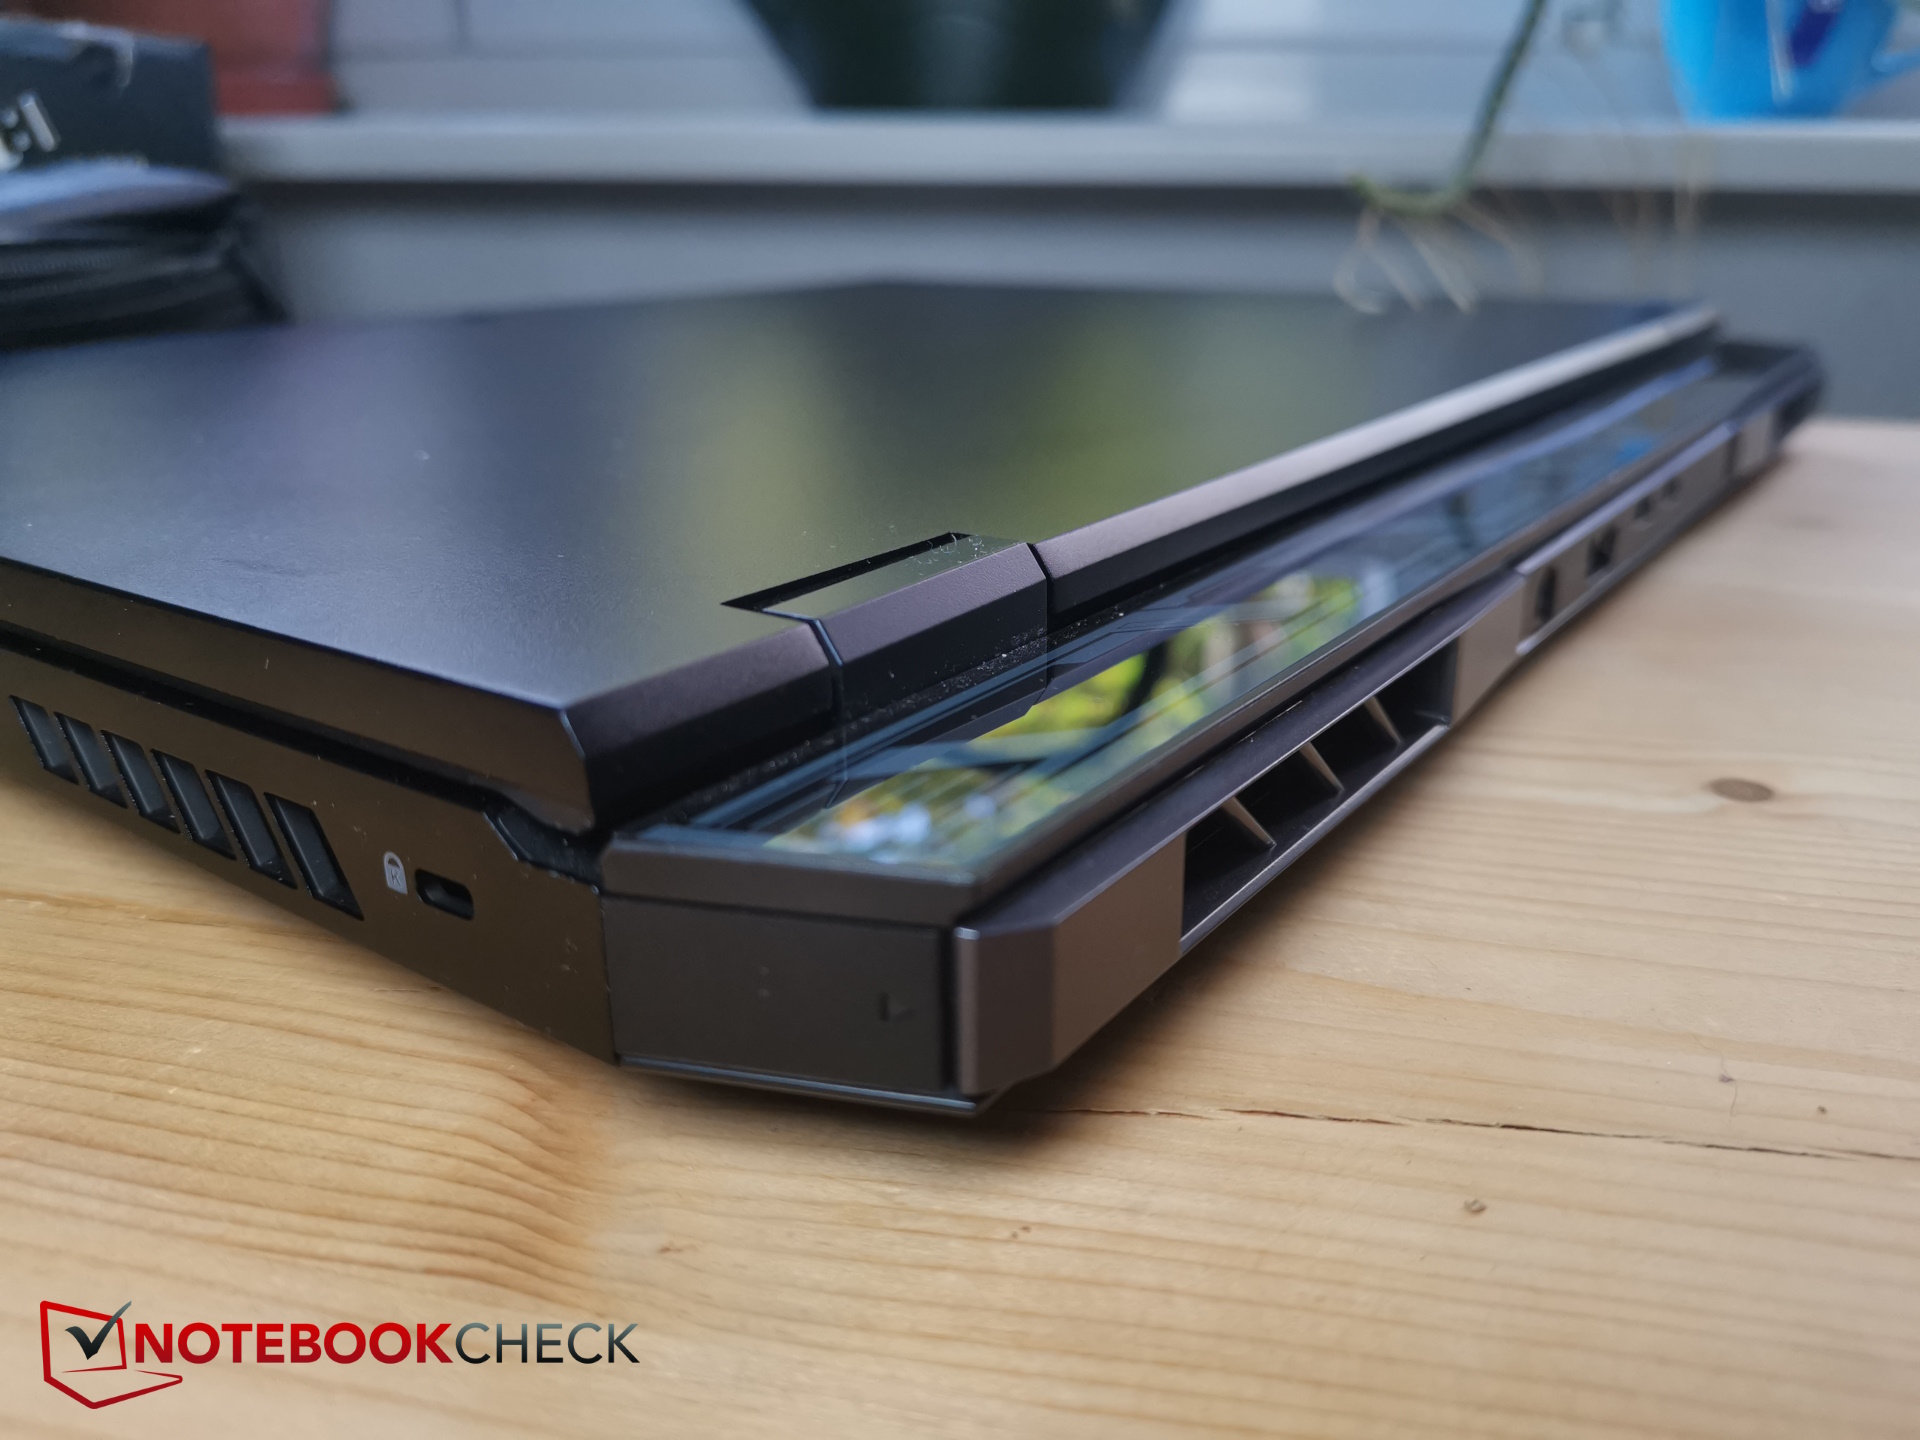
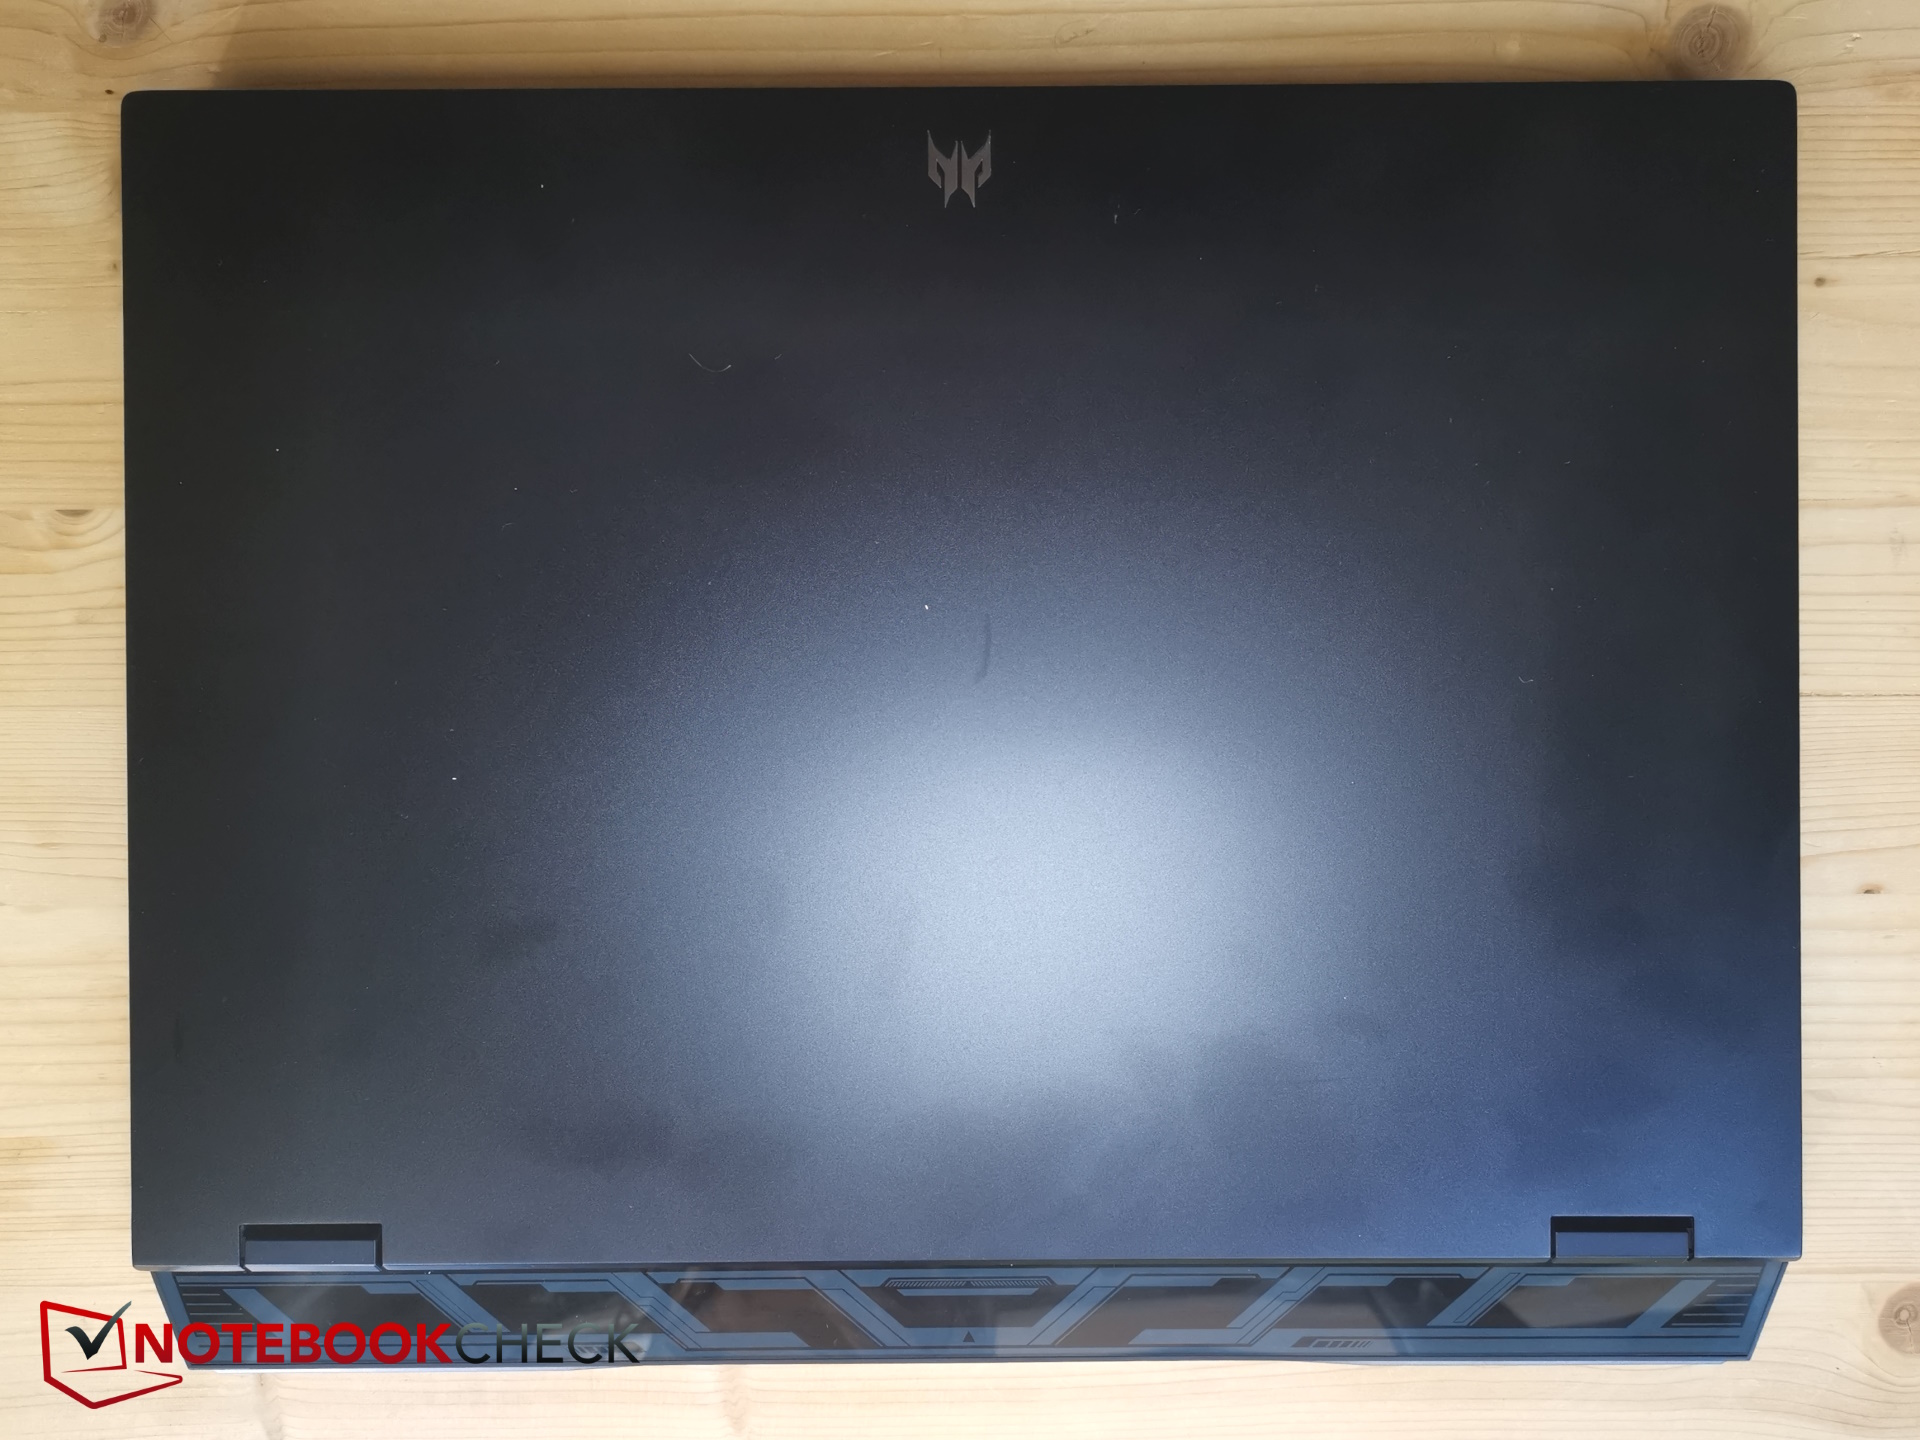
A Acer projeta o Helios 18 em preto escuro, quase imperceptível. Mas o dispositivo não faz nenhuma tentativa de ocultar sua natureza de jogo, caracterizada pelo pequeno logotipo Predator na tampa da tela e pelo sistema de resfriamento saliente na parte traseira.
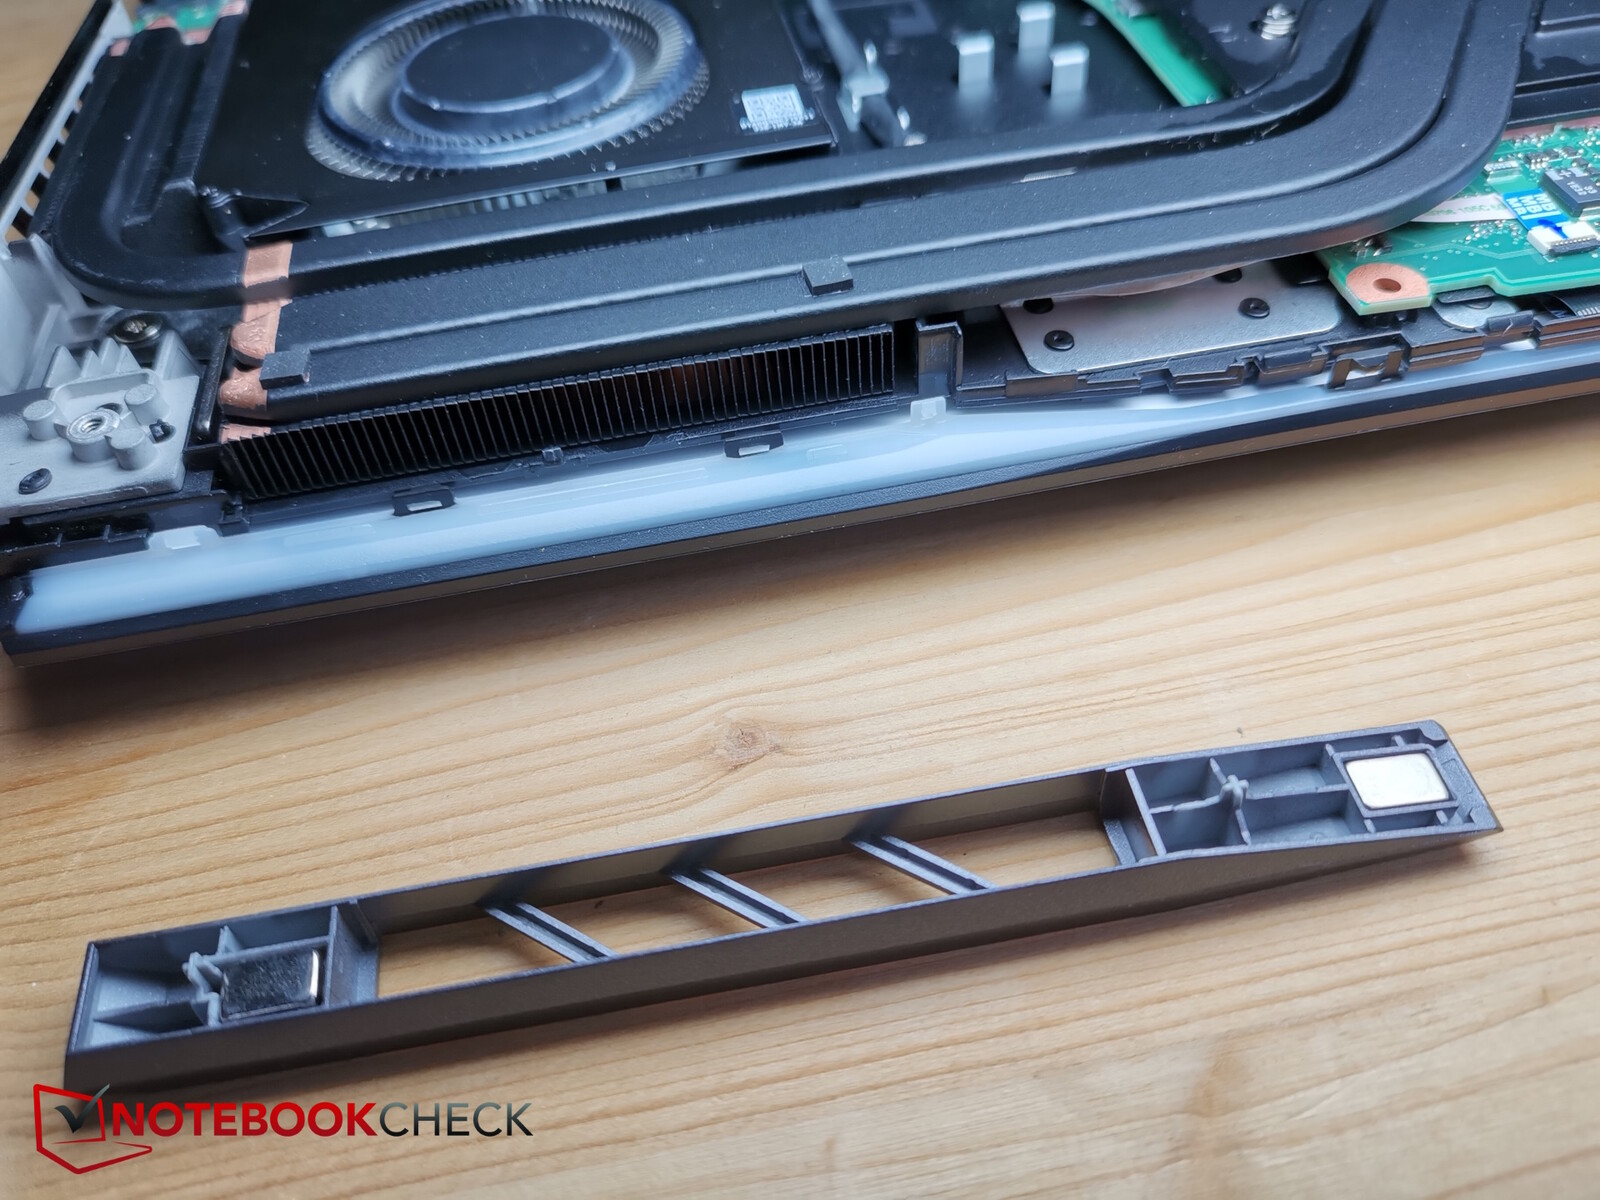
O acabamento não deixa espaço para críticas: as lacunas são imperceptíveis. As saídas de ar traseiras podem até ser personalizadas - a Acer inclui outro par de grades de ventilação, que podem ser personalizadas ainda mais com uma impressora 3D.
A tampa e a base da tela são feitas de alumínio, enquanto as bordas da tela, a unidade de resfriamento traseira e a parte inferior do laptop são feitas de plástico. O metal proporciona ao Helios 18 boa rigidez e nada range ou racha quando sujeito a estresse de torção. No entanto, as impressões digitais se acumulam facilmente aqui e a parte superior da base pode ser pressionada um pouco apesar do metal, mesmo ao digitar. Mas isso permanece dentro dos limites e se deve à grande superfície.
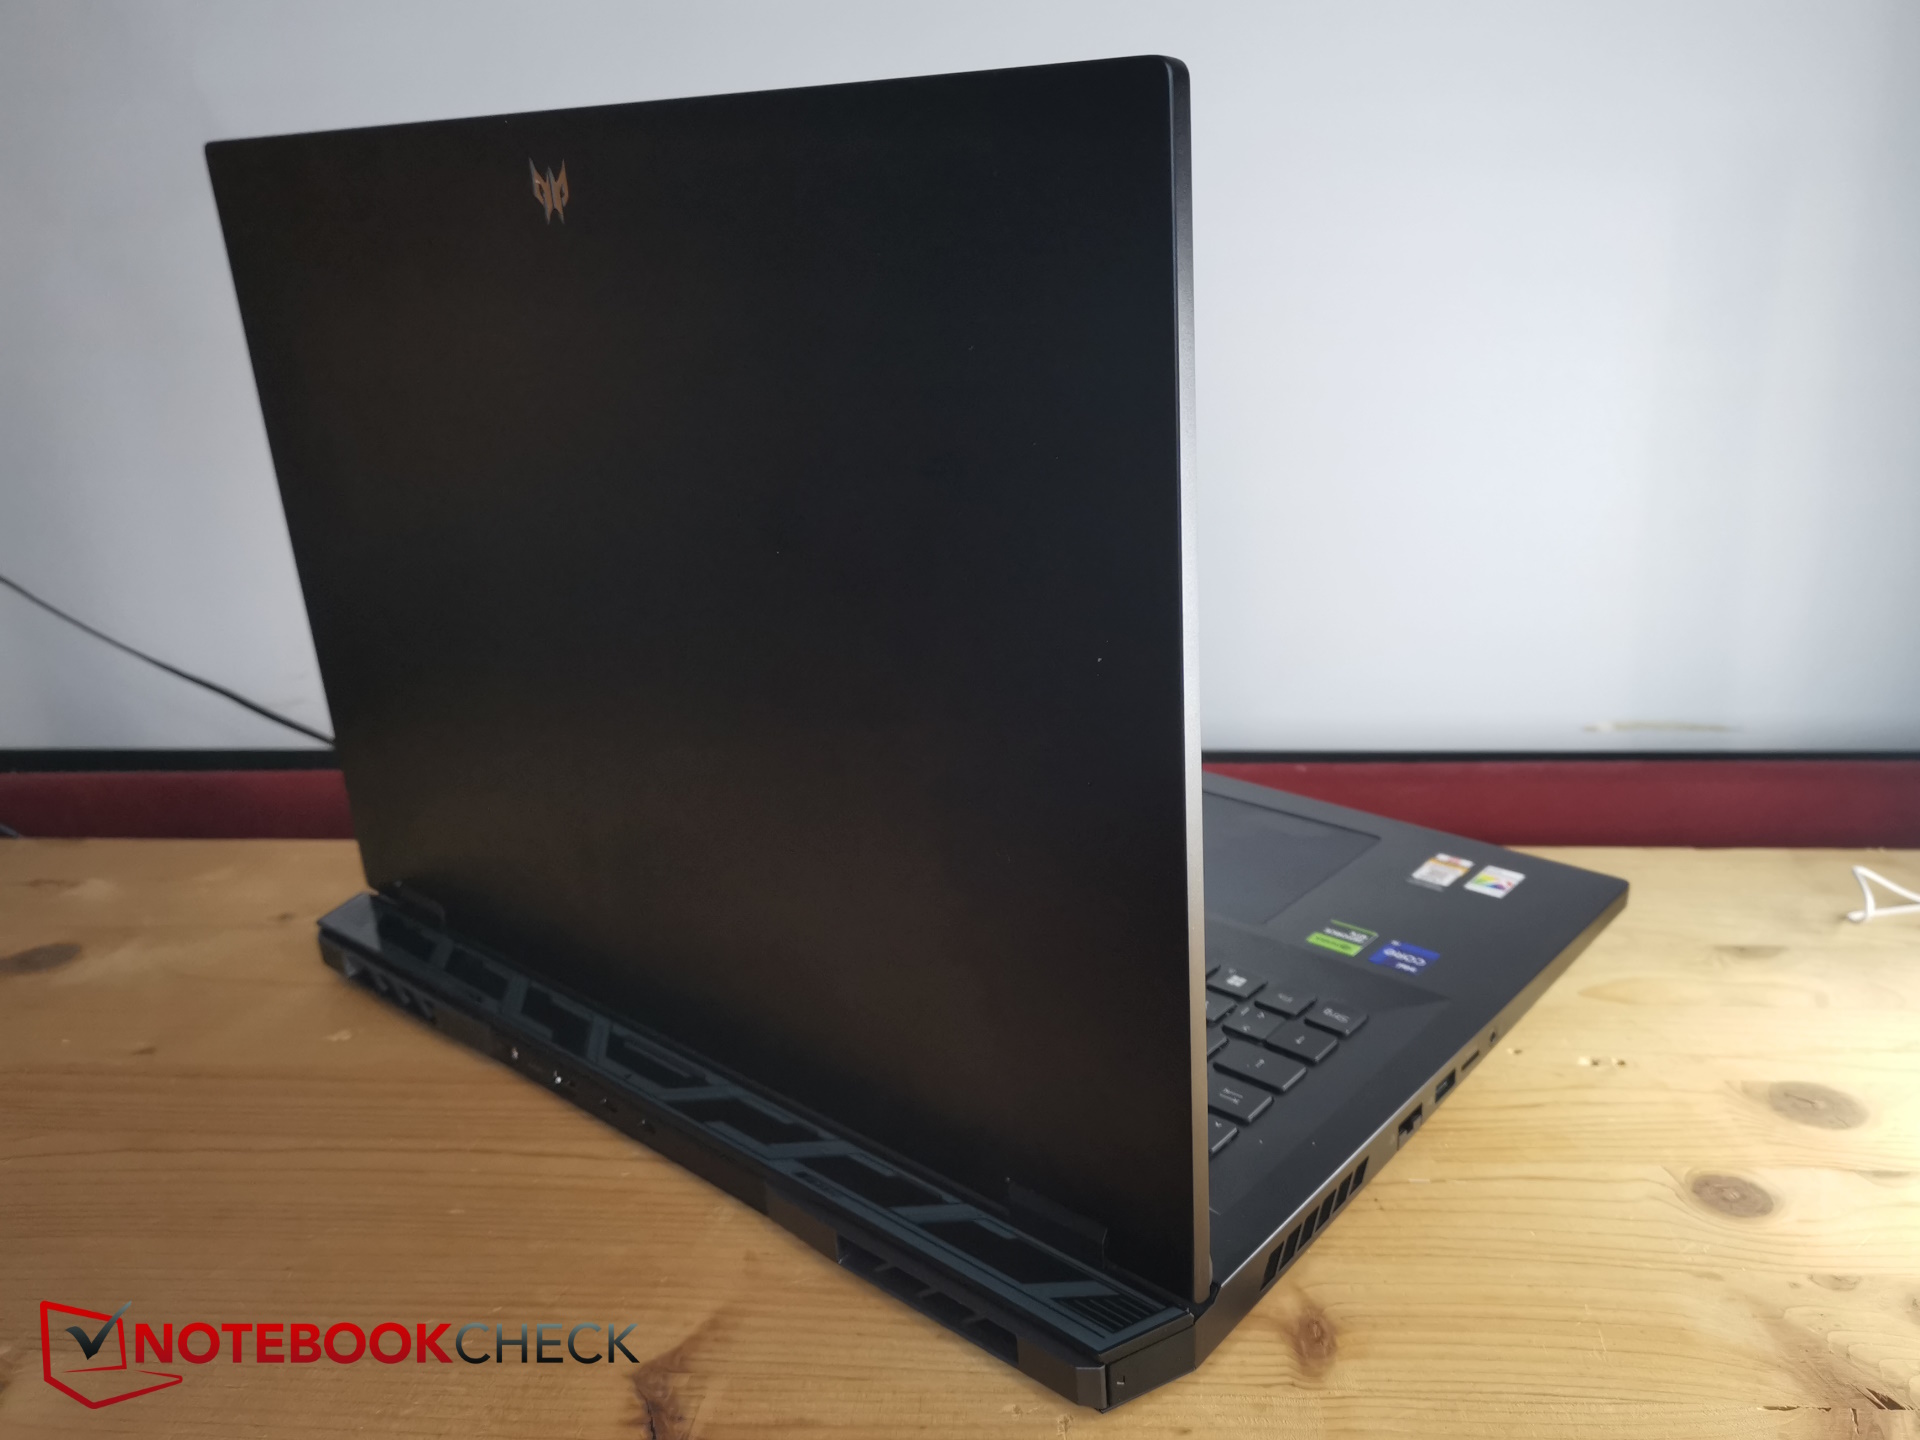
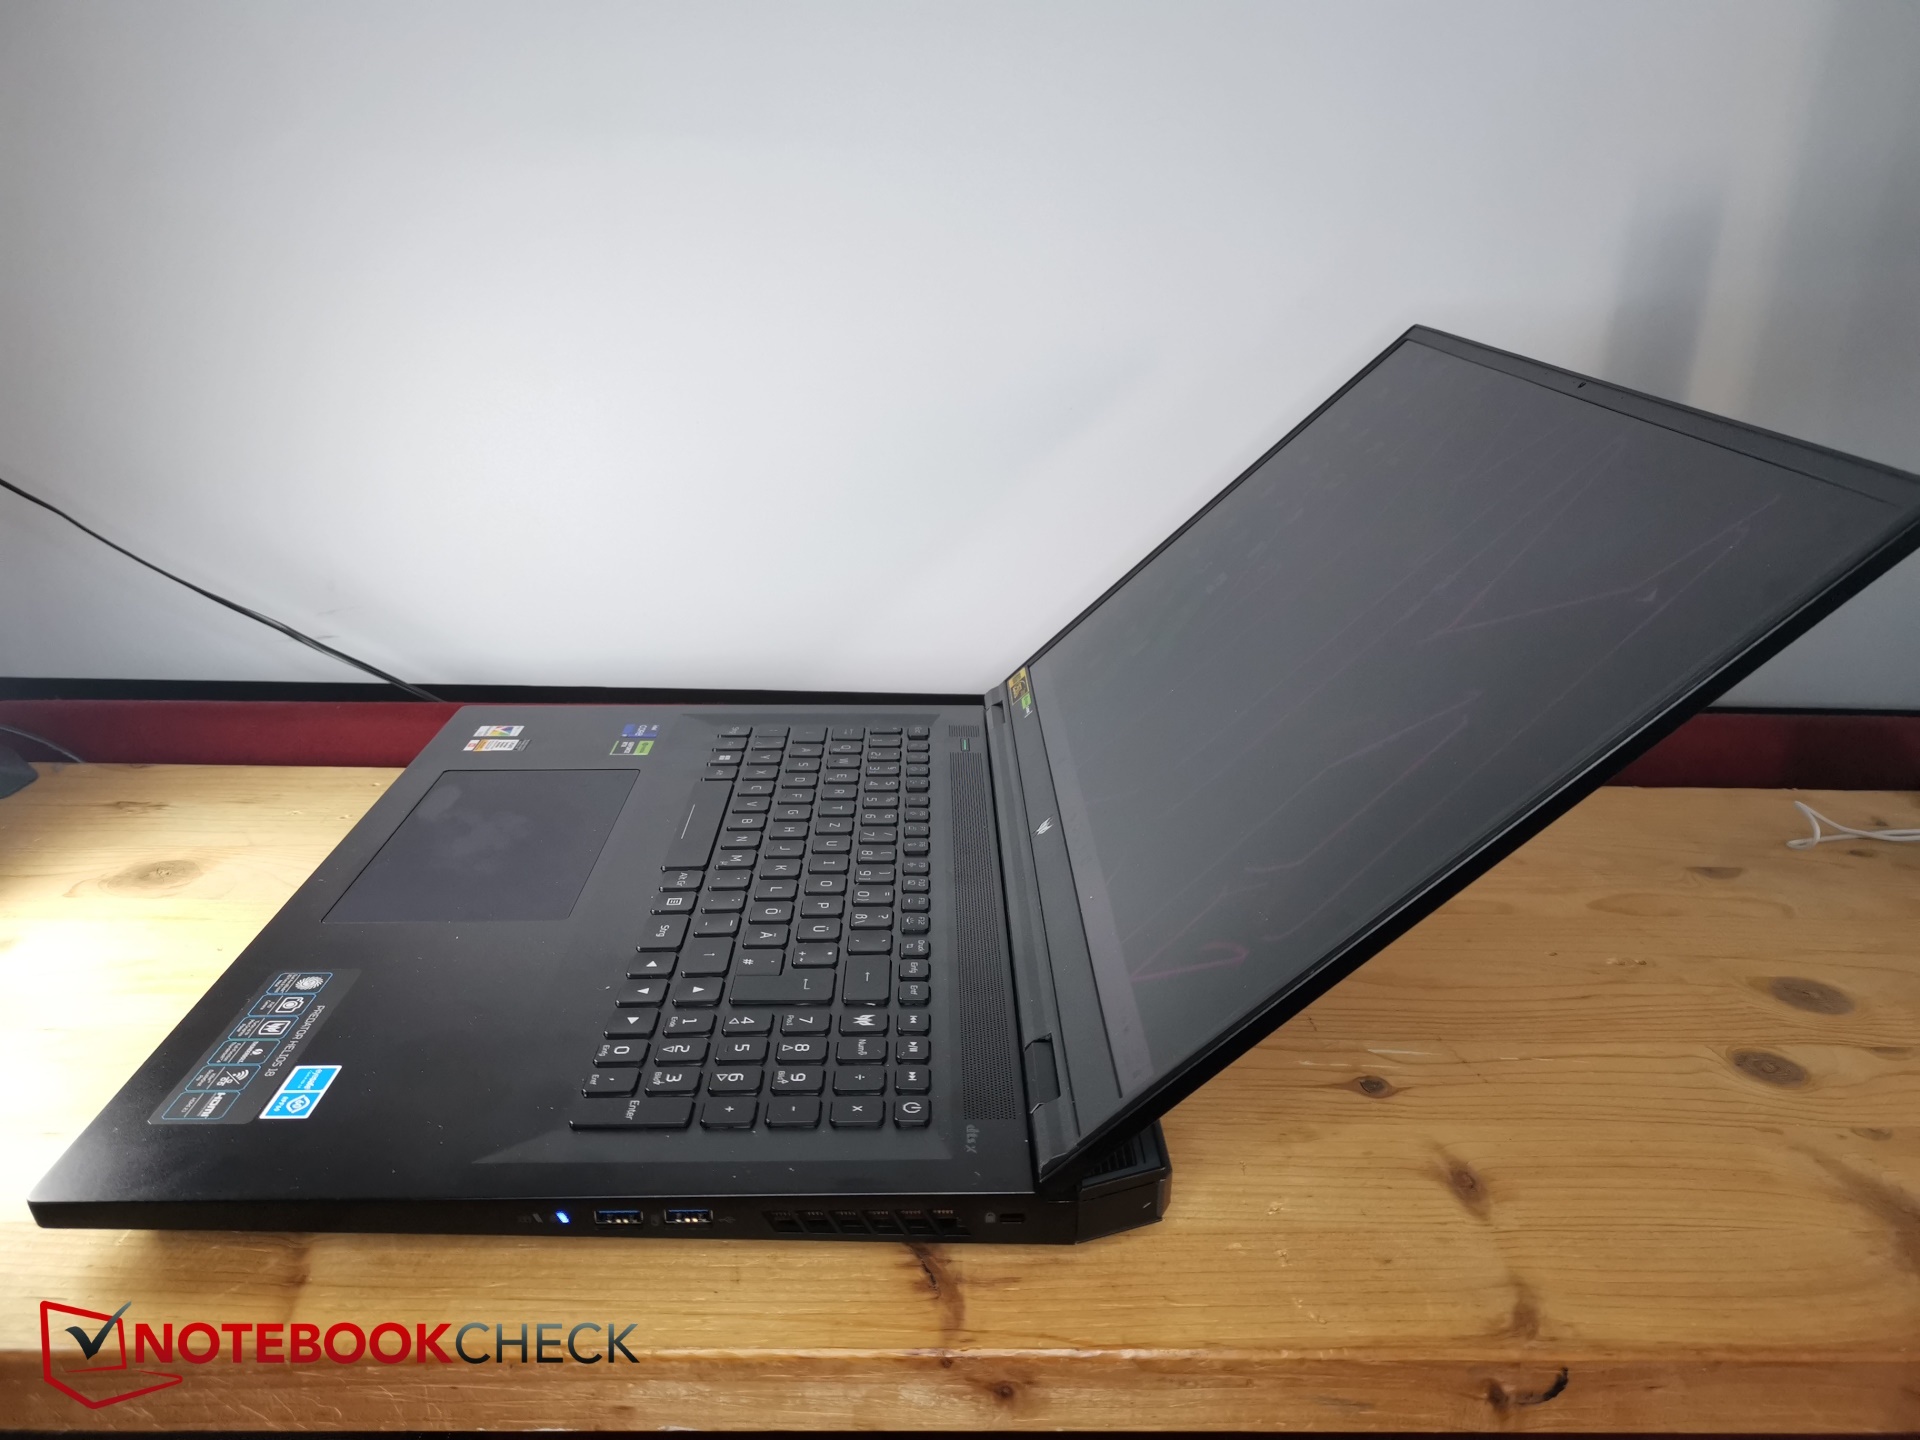
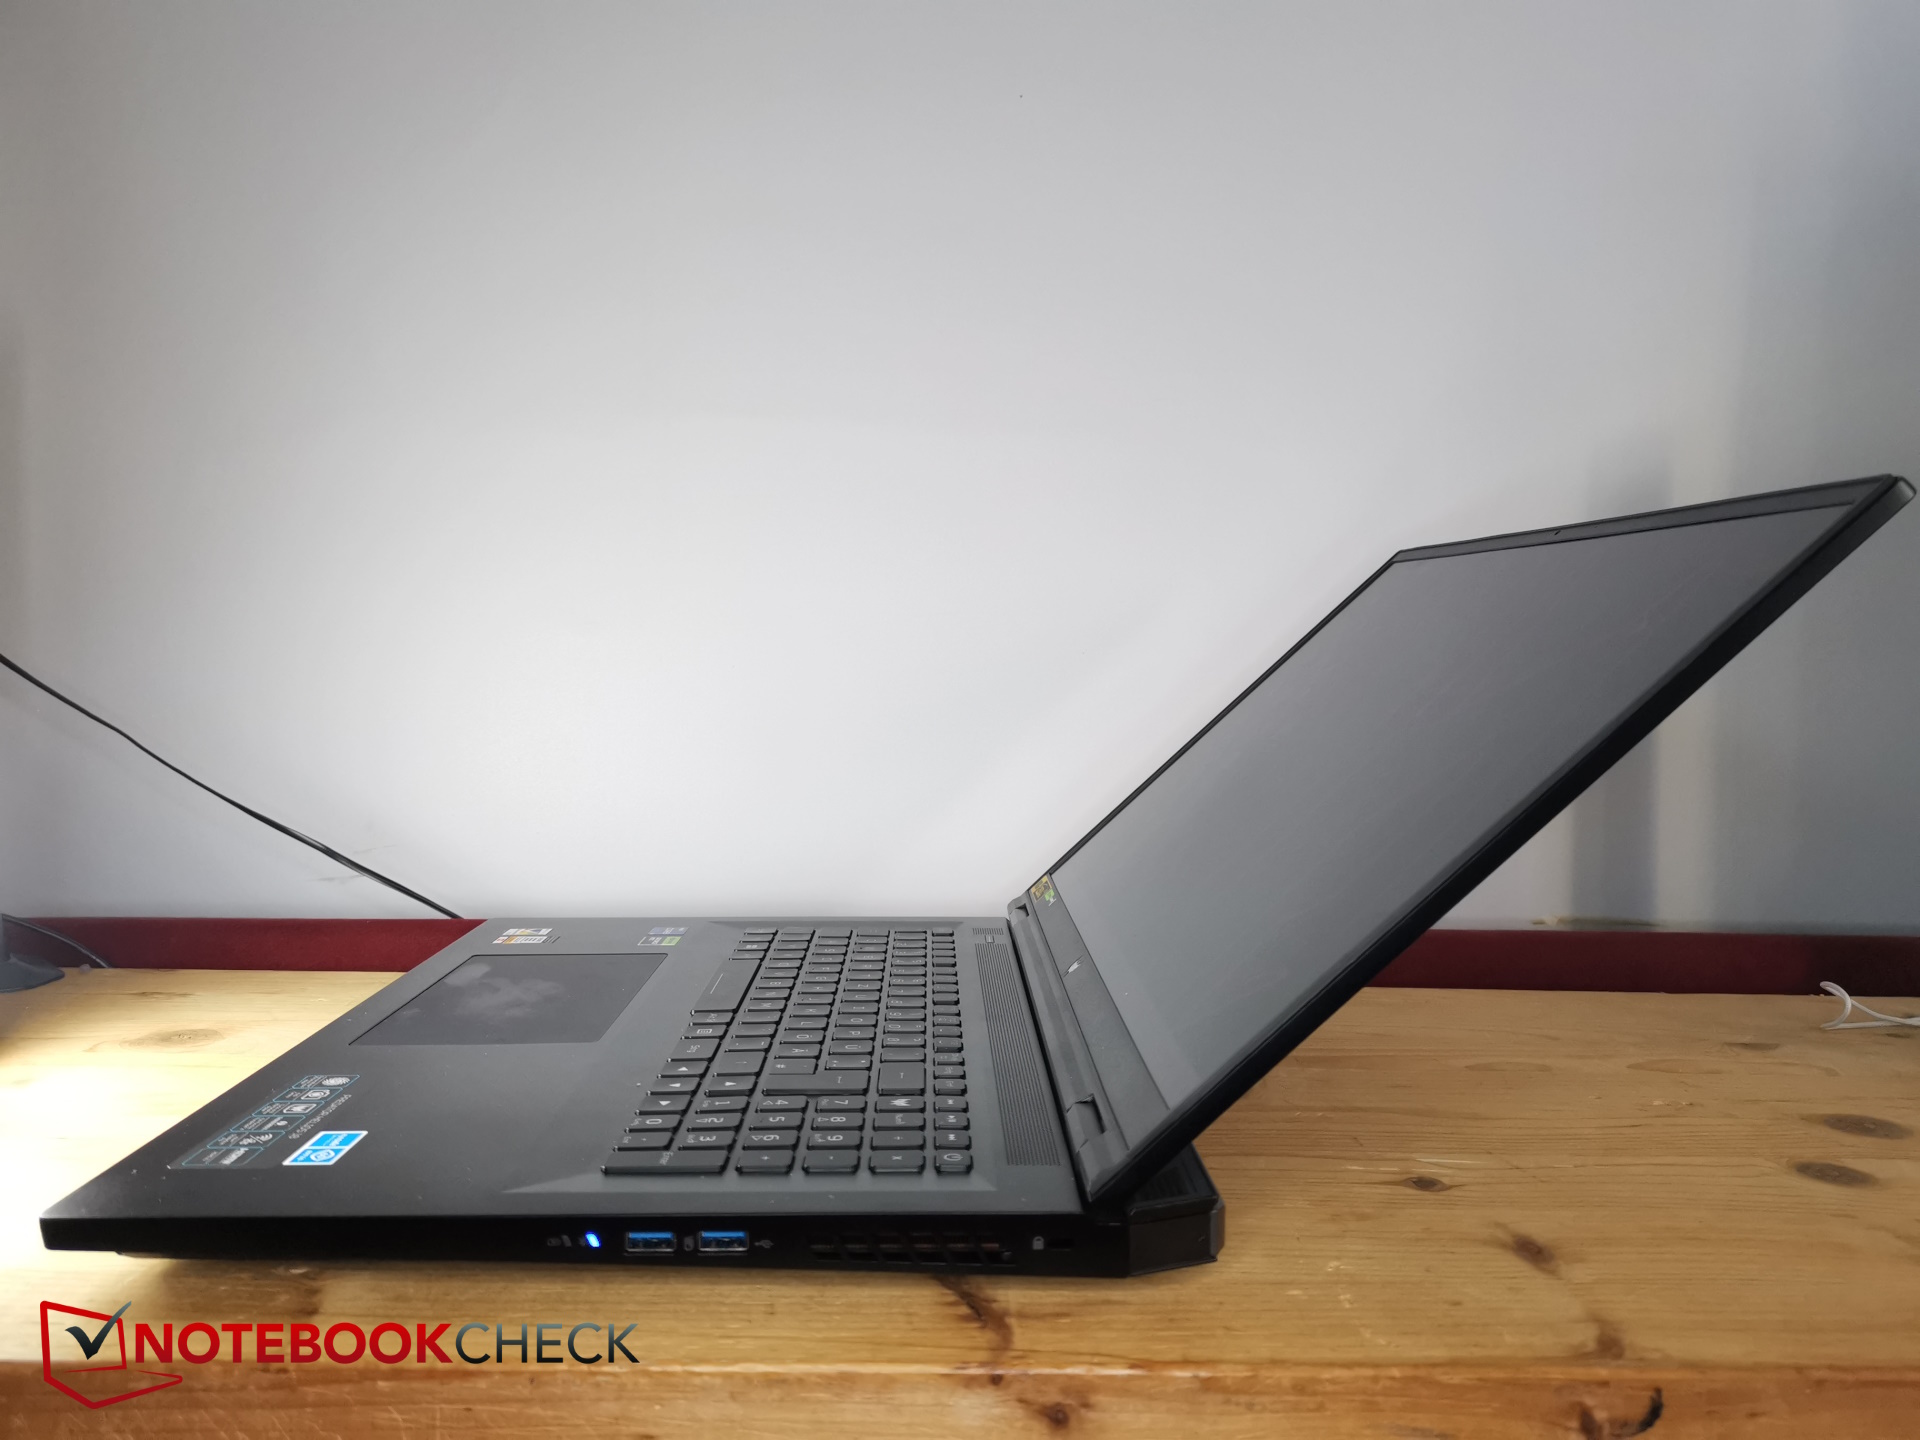
Em comparação com os concorrentes de 18 polegadas, o Helios 18 fica no meio termo em termos de tamanho. O Alienware m18 é um pouco maior e o Asus ROG Strix G18 é menor. Este último é um pouco mais grosso, enquanto o Alienware m18 é mais fino. Em termos de peso, o Alien é claramente mais pesado, o G18 é um pouco mais leve.
Os gamers de 17 polegadas são, em parte, muito menores e também mais finos.
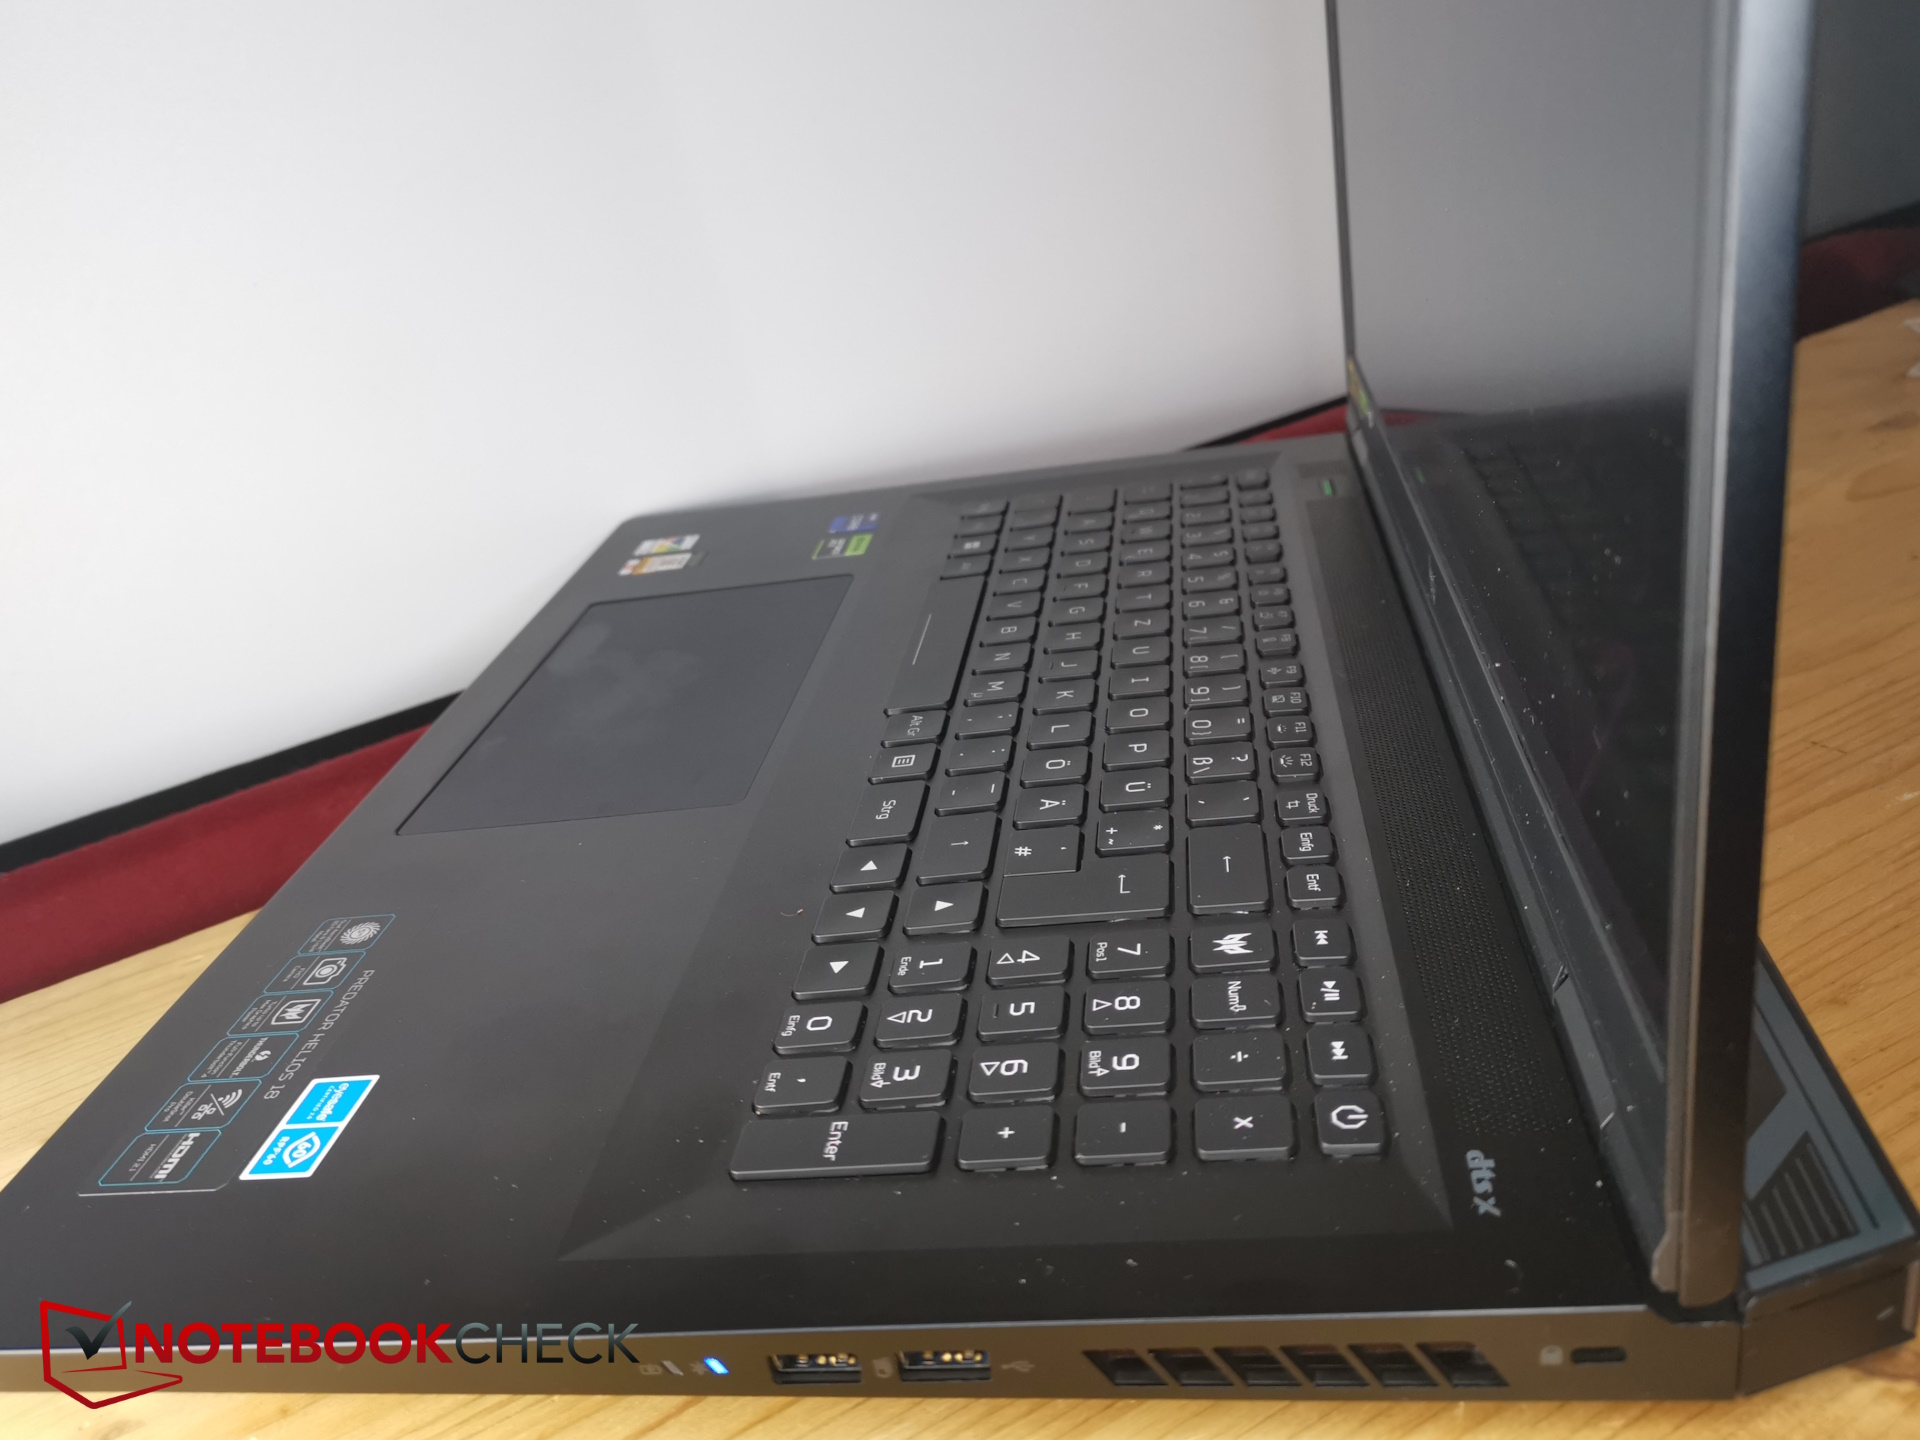
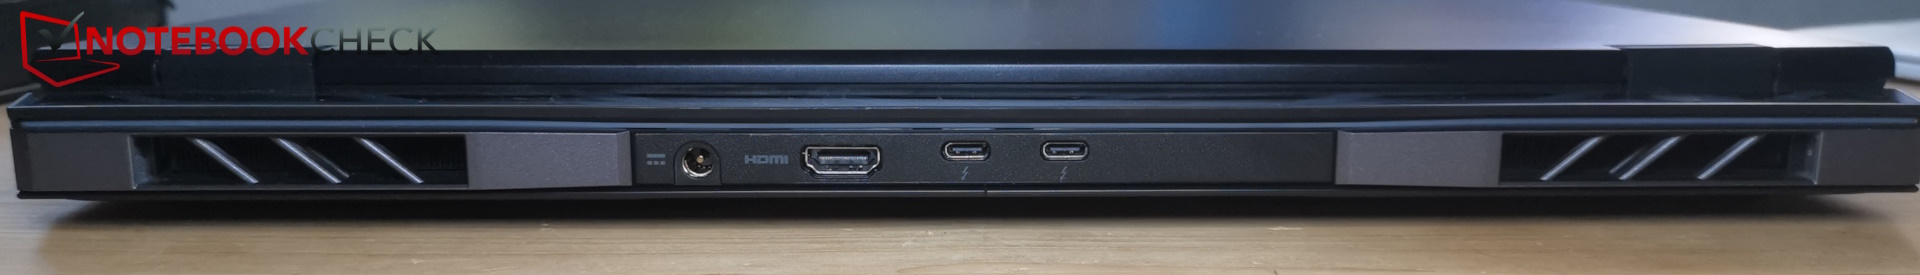
Equipamento - 2x Thunderbolt 4 no Predator Helios
O Helios 18 tem todas as portas necessárias. Duas portas Thunderbolt 4 na forma de USB-C estão a bordo. Apenas o PowerDelivery não está disponível. O leitor de cartão SD aceita "apenas" cartões MicroSD.
As portas estão espalhadas por três lados, embora a parte traseira ainda tenha espaço e poderia facilmente acomodar uma das muitas portas à esquerda. Teríamos preferido a porta LAN na parte traseira e uma das portas USB-C, cada vez mais importantes, na lateral.
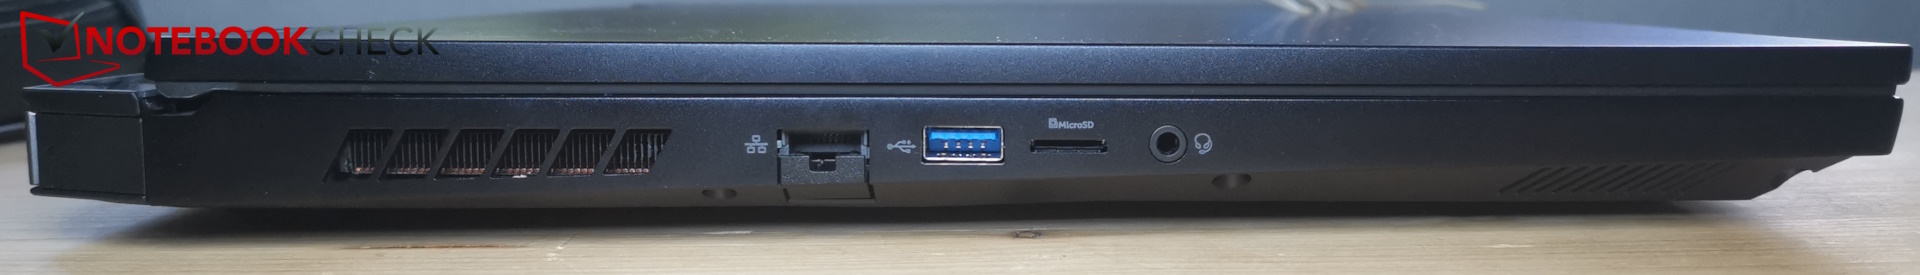
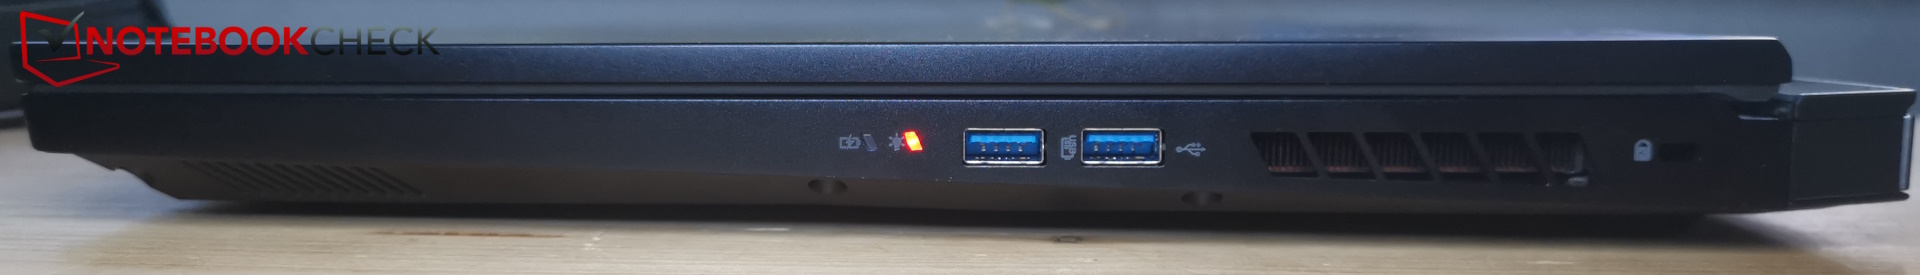
Leitor de cartão SD
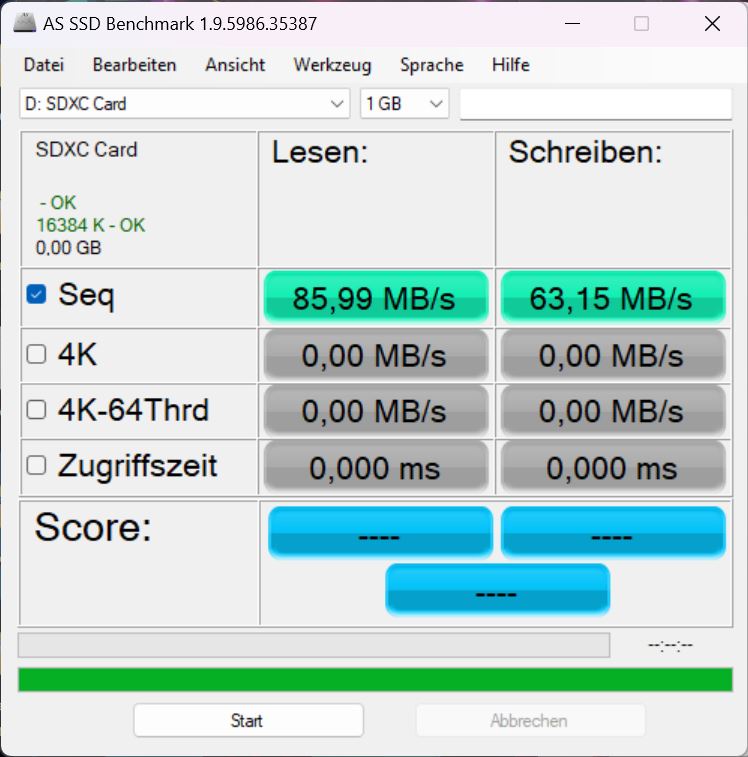
Os cartões microSD inseridos deslizam no lugar e não ficam salientes. A inserção do nosso AV PRO microSD 128 GB V60 mostrou-se um pouco complicada, pois foi necessário empurrá-lo para dentro um pouco mais do que o necessário para travá-lo e desencaixá-lo.
A velocidade está em um nível médio e normal; os leitores de cartão do Blade 18 ou no Alienware m18são significativamente mais rápidos.
| SD Card Reader | |
| average JPG Copy Test (av. of 3 runs) | |
| Razer Blade 18 RTX 4070 (Angelibird AV Pro V60) | |
| Alienware m18 R1 (Angelibird AV Pro V60) | |
| Média da turma Gaming (20.9 - 210, n=54, últimos 2 anos) | |
| HP Omen 17-ck2097ng (AV PRO microSD 128 GB V60) | |
| Acer Predator Helios 18 N23Q2 | |
| MSI GE78HX 13VH-070US (Angelibird AV Pro V60) | |
| maximum AS SSD Seq Read Test (1GB) | |
| Alienware m18 R1 (Angelibird AV Pro V60) | |
| Razer Blade 18 RTX 4070 (Angelibird AV Pro V60) | |
| Média da turma Gaming (25.5 - 261, n=51, últimos 2 anos) | |
| MSI GE78HX 13VH-070US (Angelibird AV Pro V60) | |
| Acer Predator Helios 18 N23Q2 | |
| HP Omen 17-ck2097ng (AV PRO microSD 128 GB V60) | |
Comunicação
A Acer utiliza o módulo WiFi Killer WiFi 6E AX1675i, que suporta 6E no modo 6 GHz e garante boas taxas de transferência de cerca de 1,5 Mbps. Na rede de 5 GHz, ele é consideravelmente mais lento, atingindo cerca de 900 Mbit/s.
As taxas de transferência são muito estáveis.
Webcam
A câmera tira fotos e grava vídeos em FullHD. A qualidade é aceitável: os desvios de cor permanecem dentro dos limites. Os tons azuis apresentam os maiores desvios.


Segurança
O TPM está integrado, assim como uma conexão para uma trava de aço. No entanto, não há sensor de impressão digital.
Acessórios e garantia
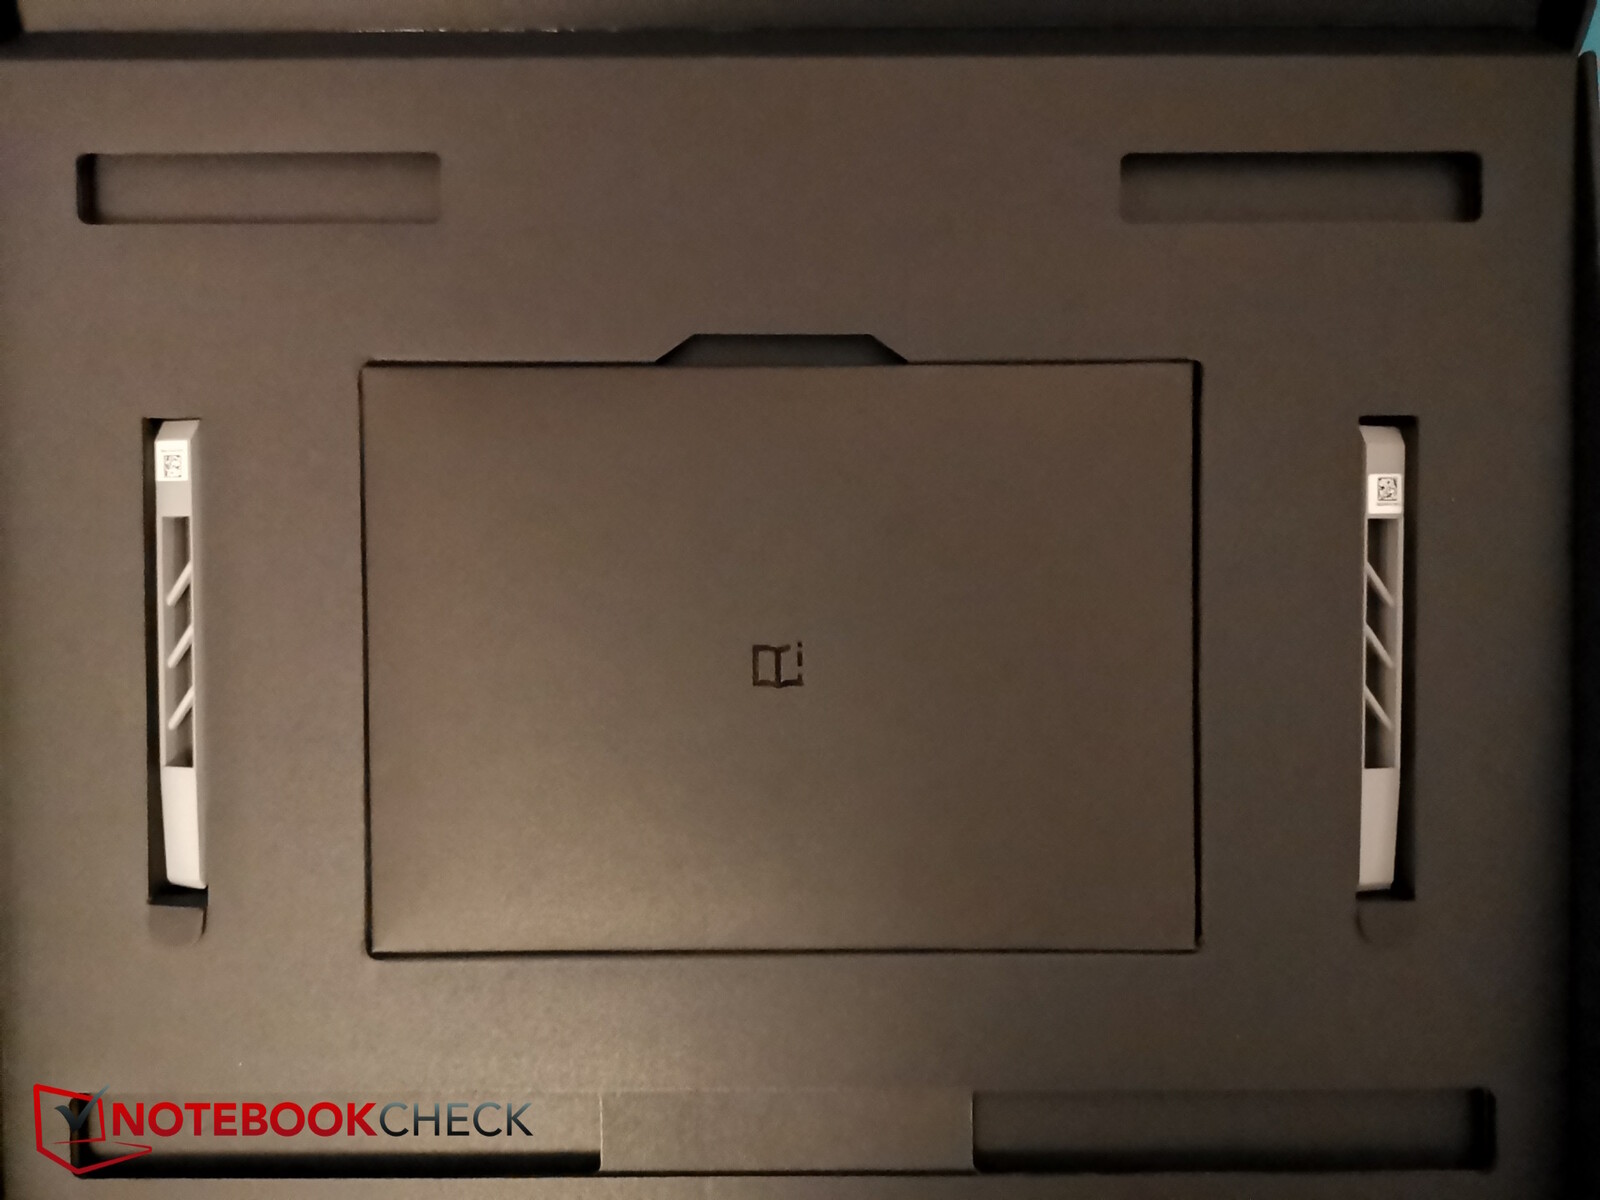
Além do laptop, da fonte de alimentação e da documentação habitual, um par de tampas de ventilador alternativas para a parte traseira do Helios 18 está incluído no escopo de entrega.
A Acer oferece uma garantia padrão de 24 meses na Alemanha. Isso pode ser diferente em outros países, portanto, os possíveis compradores devem verificar antes de comprar.
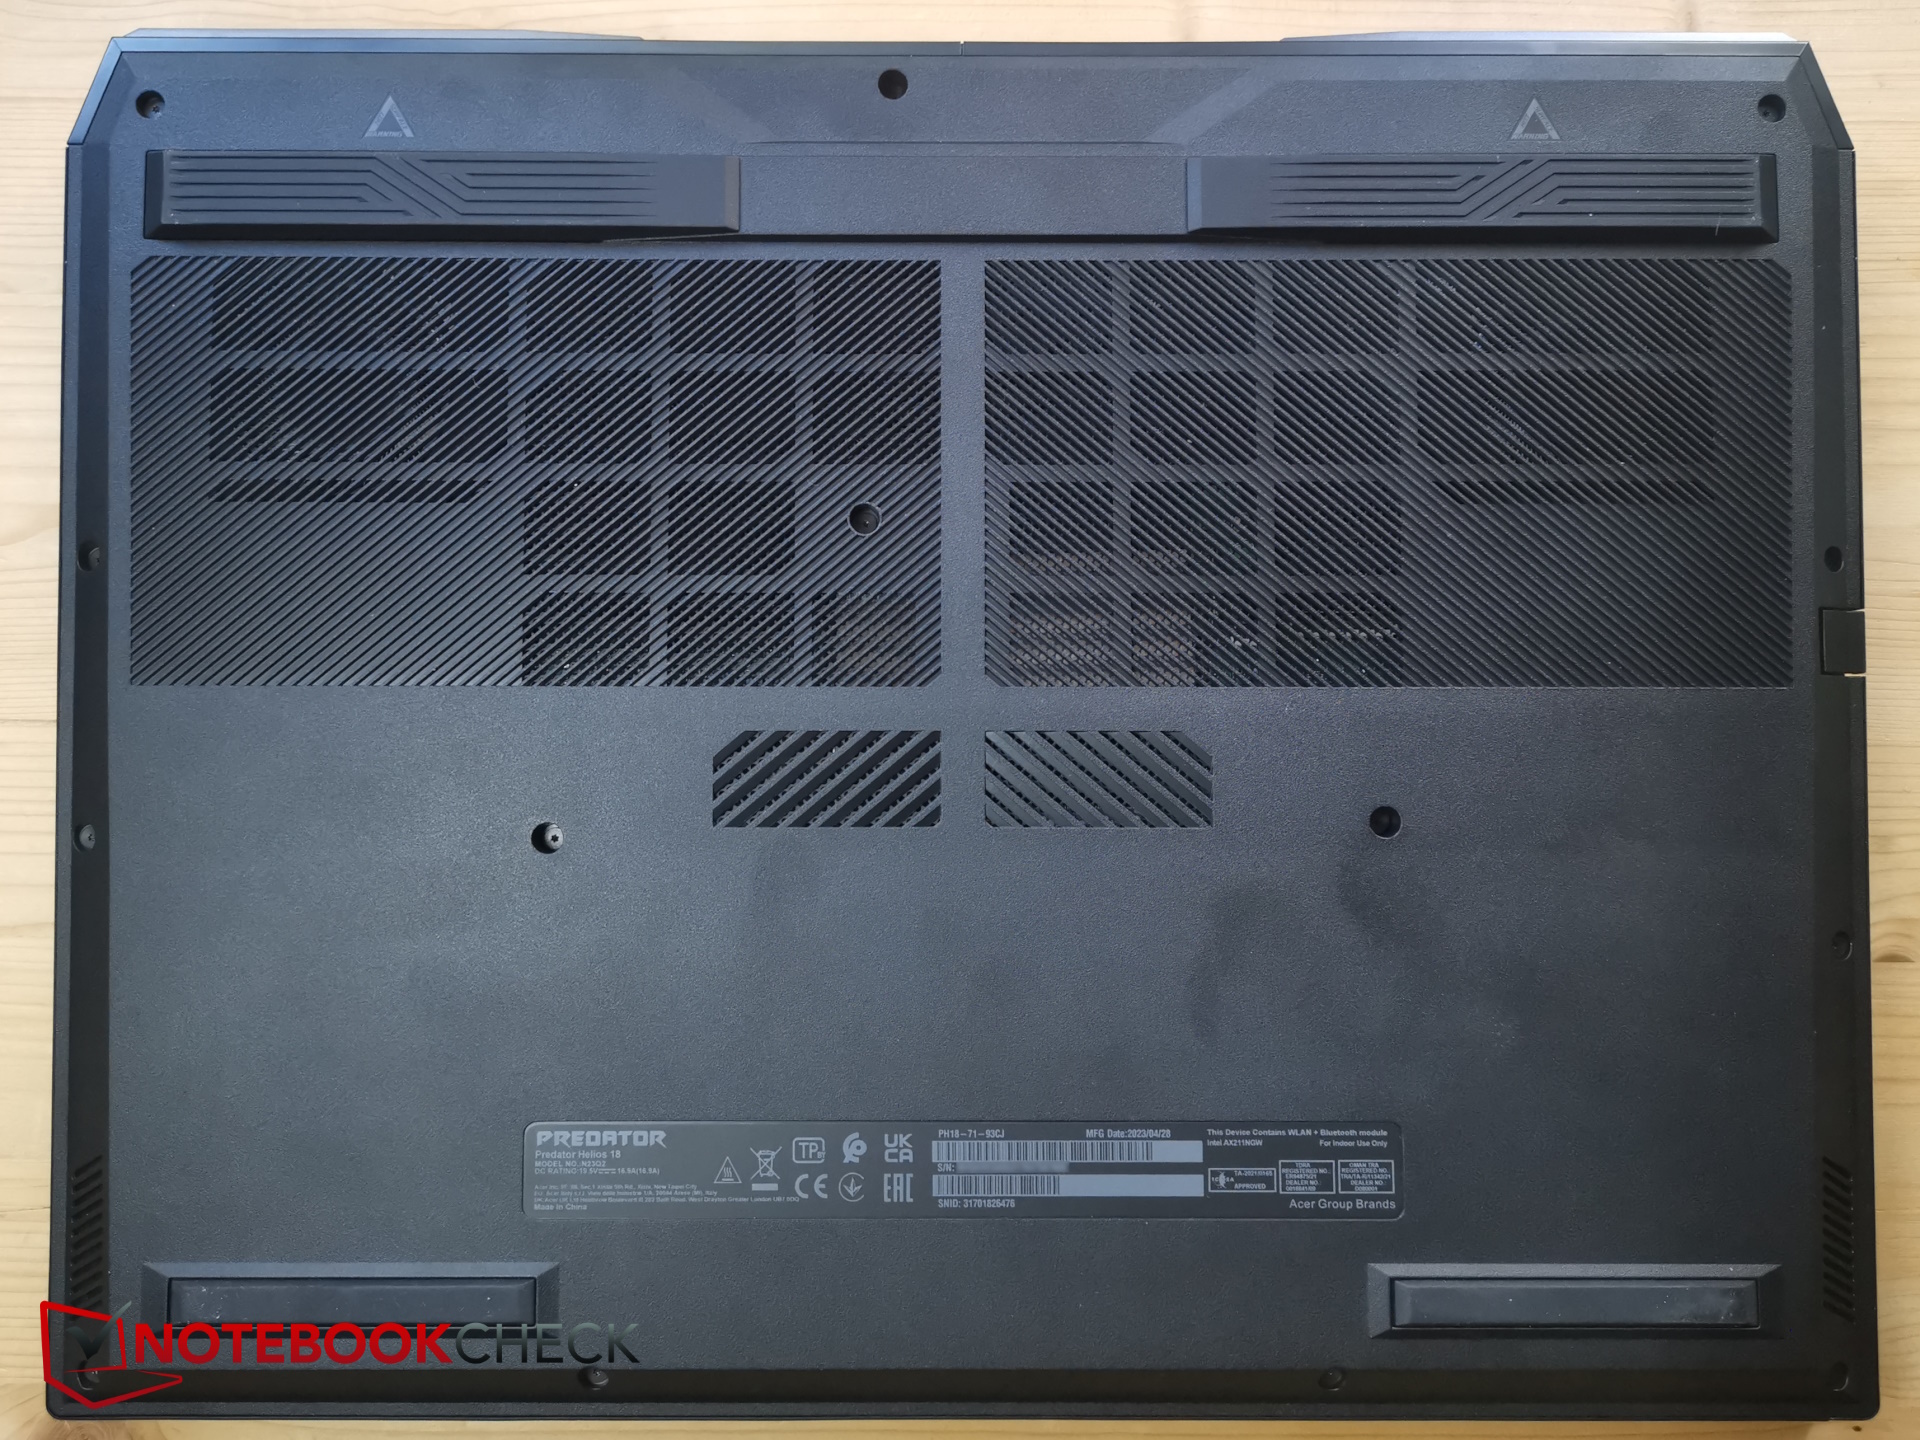
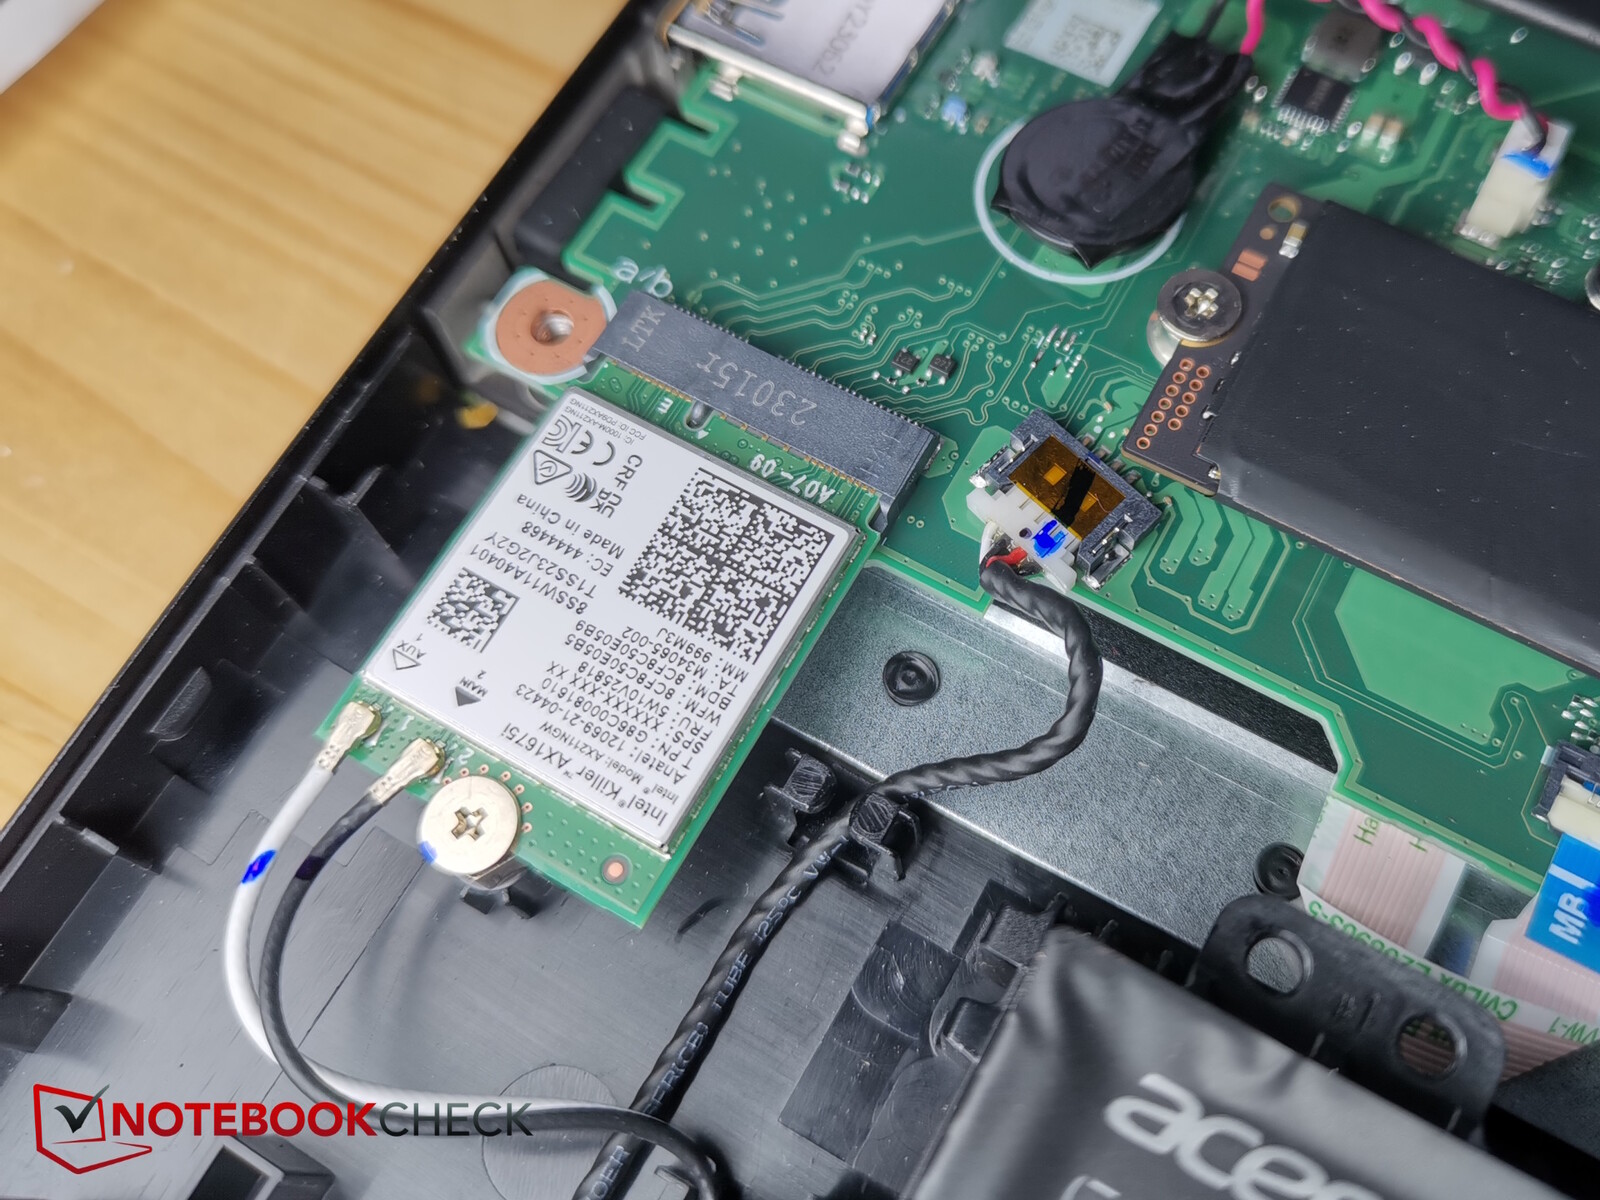
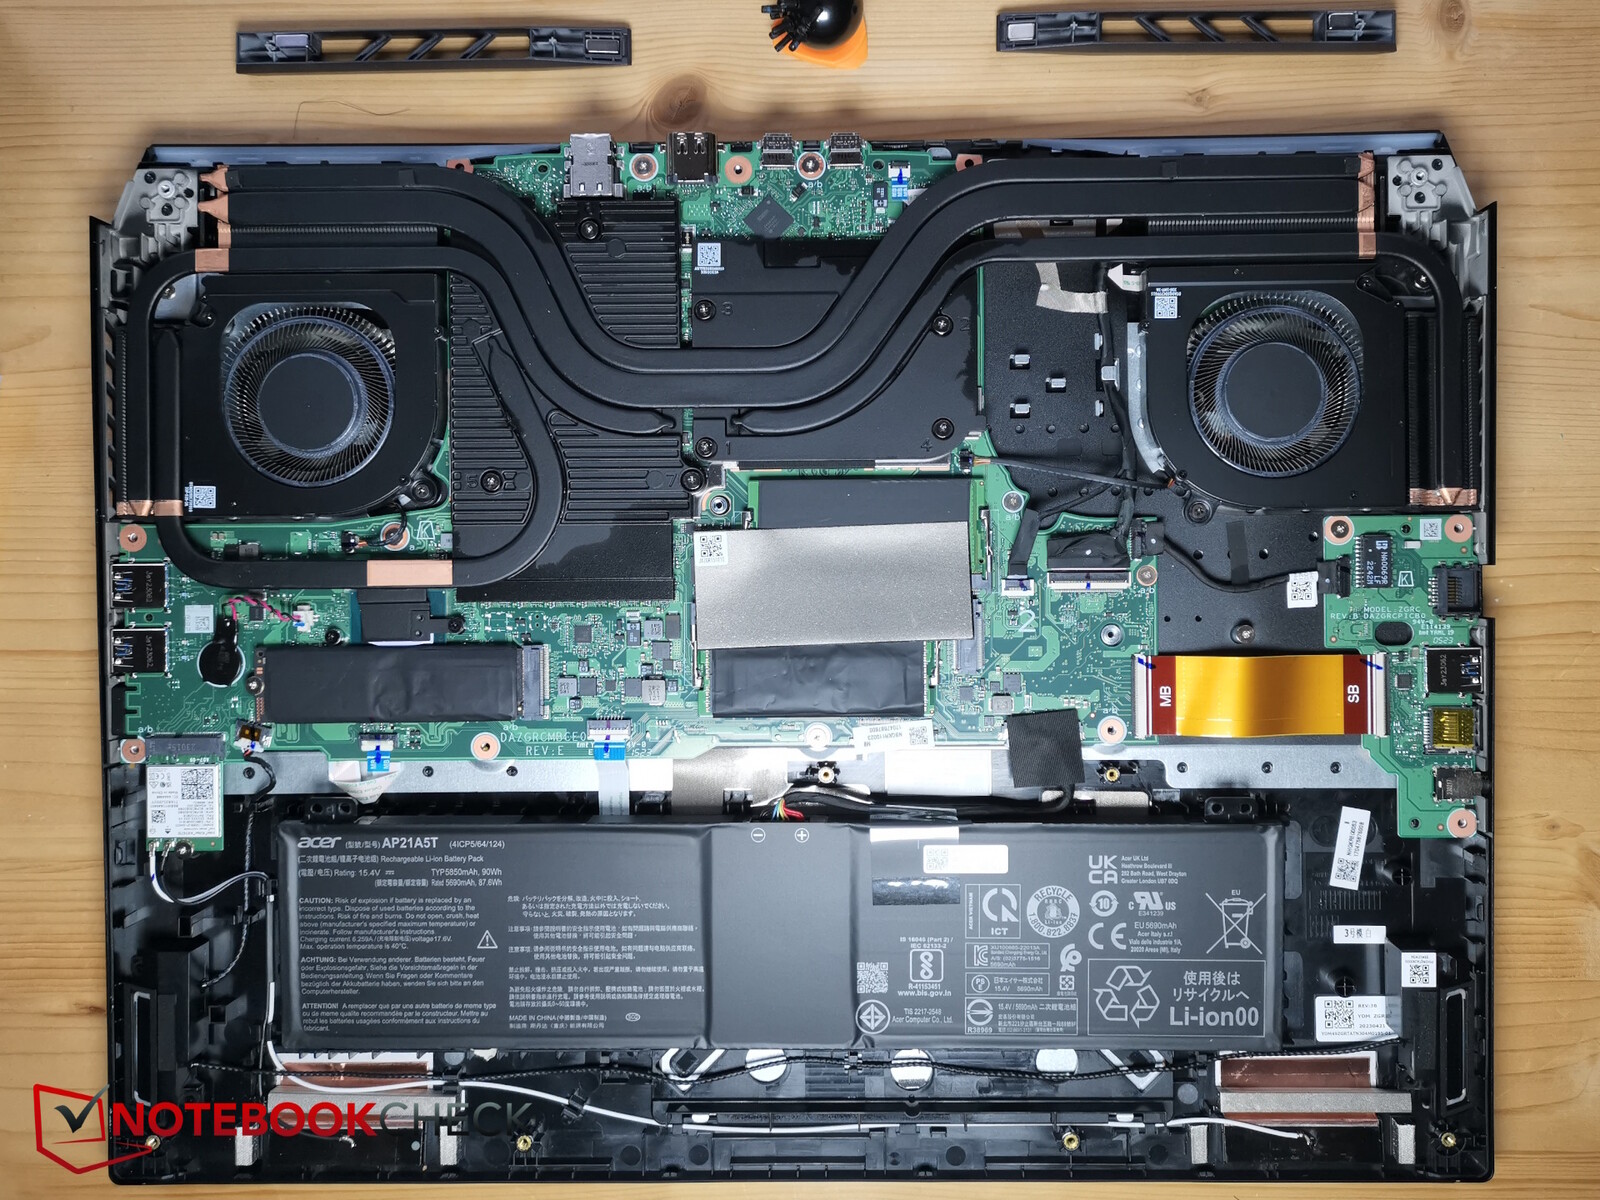
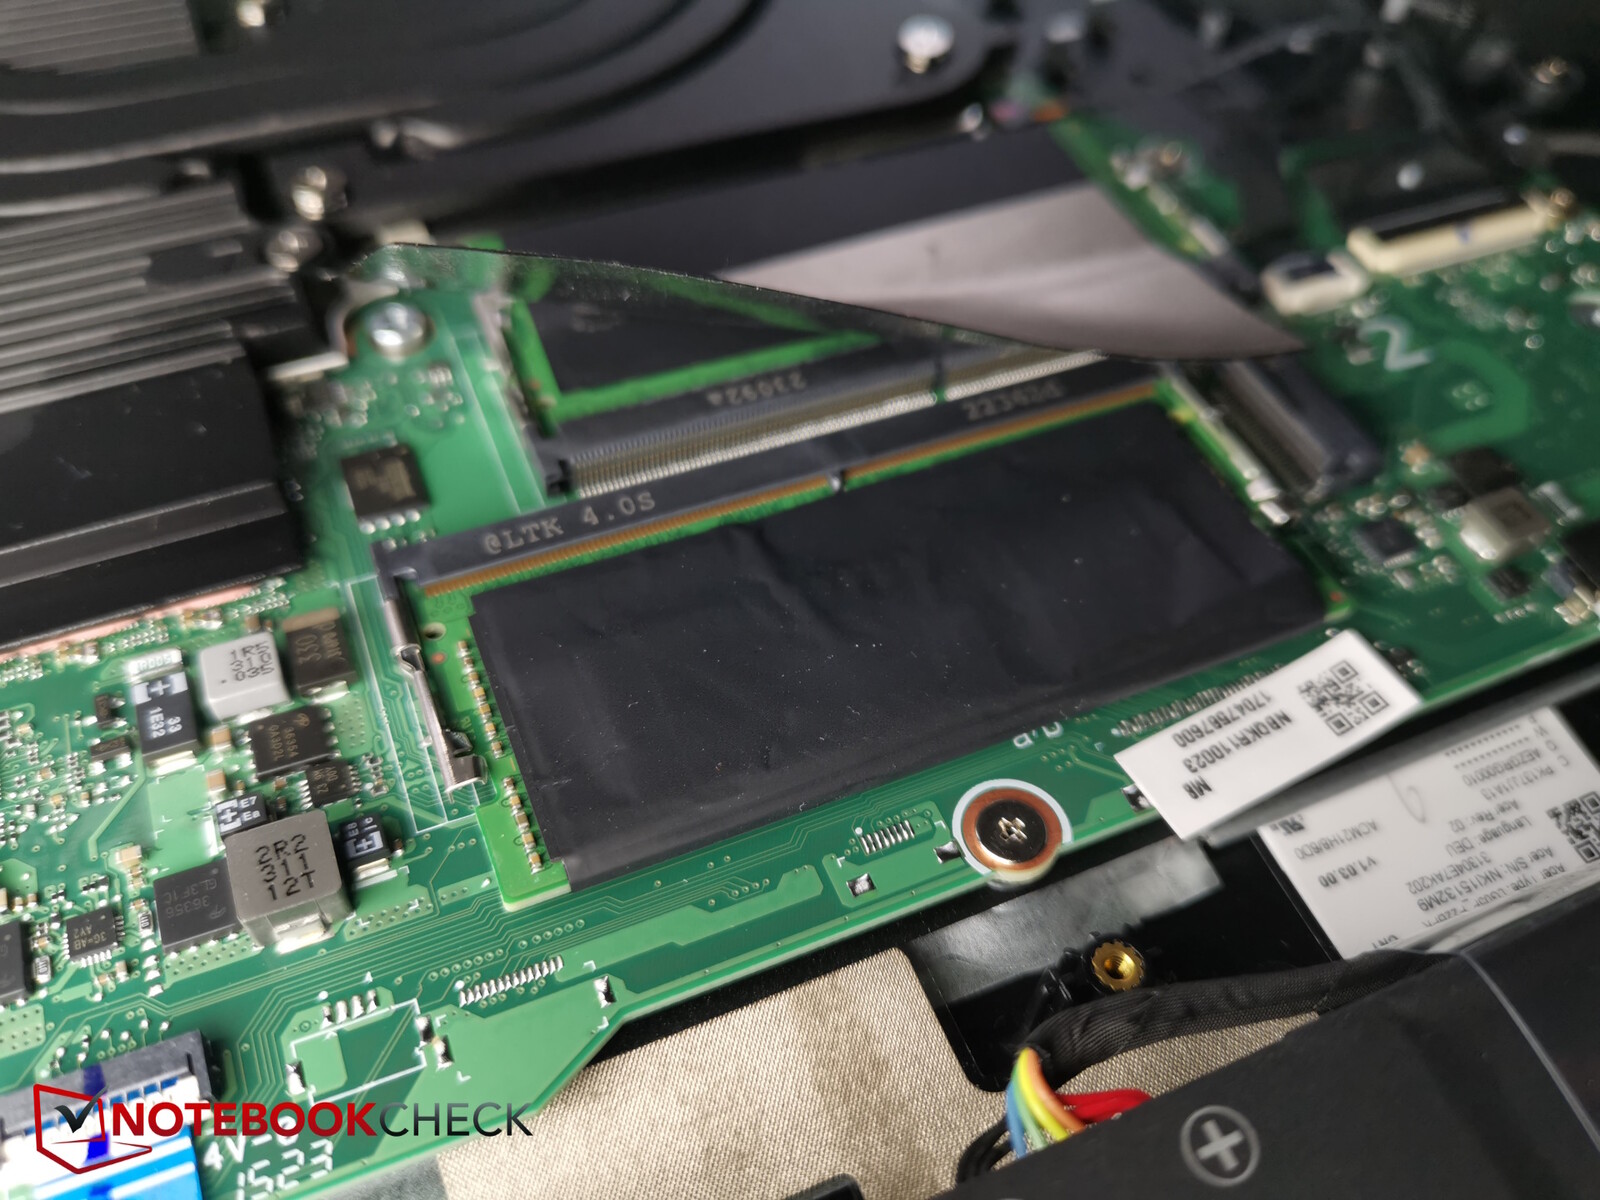
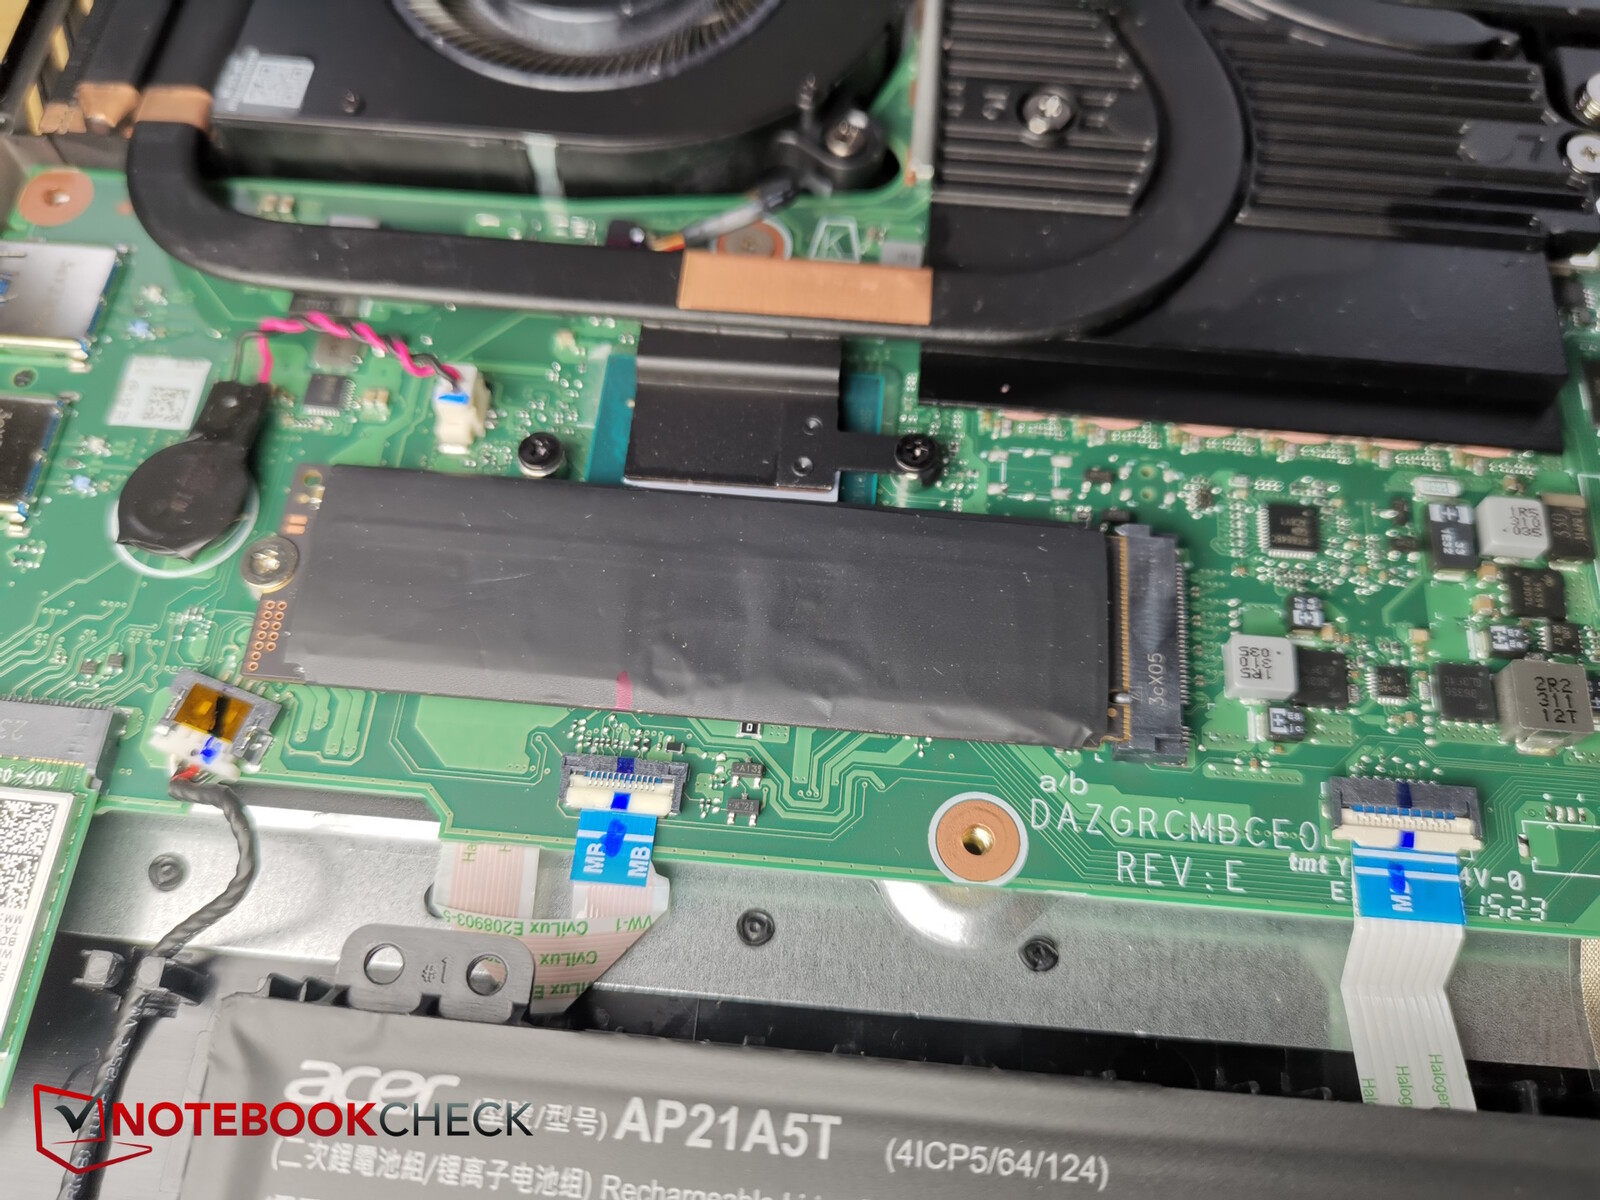
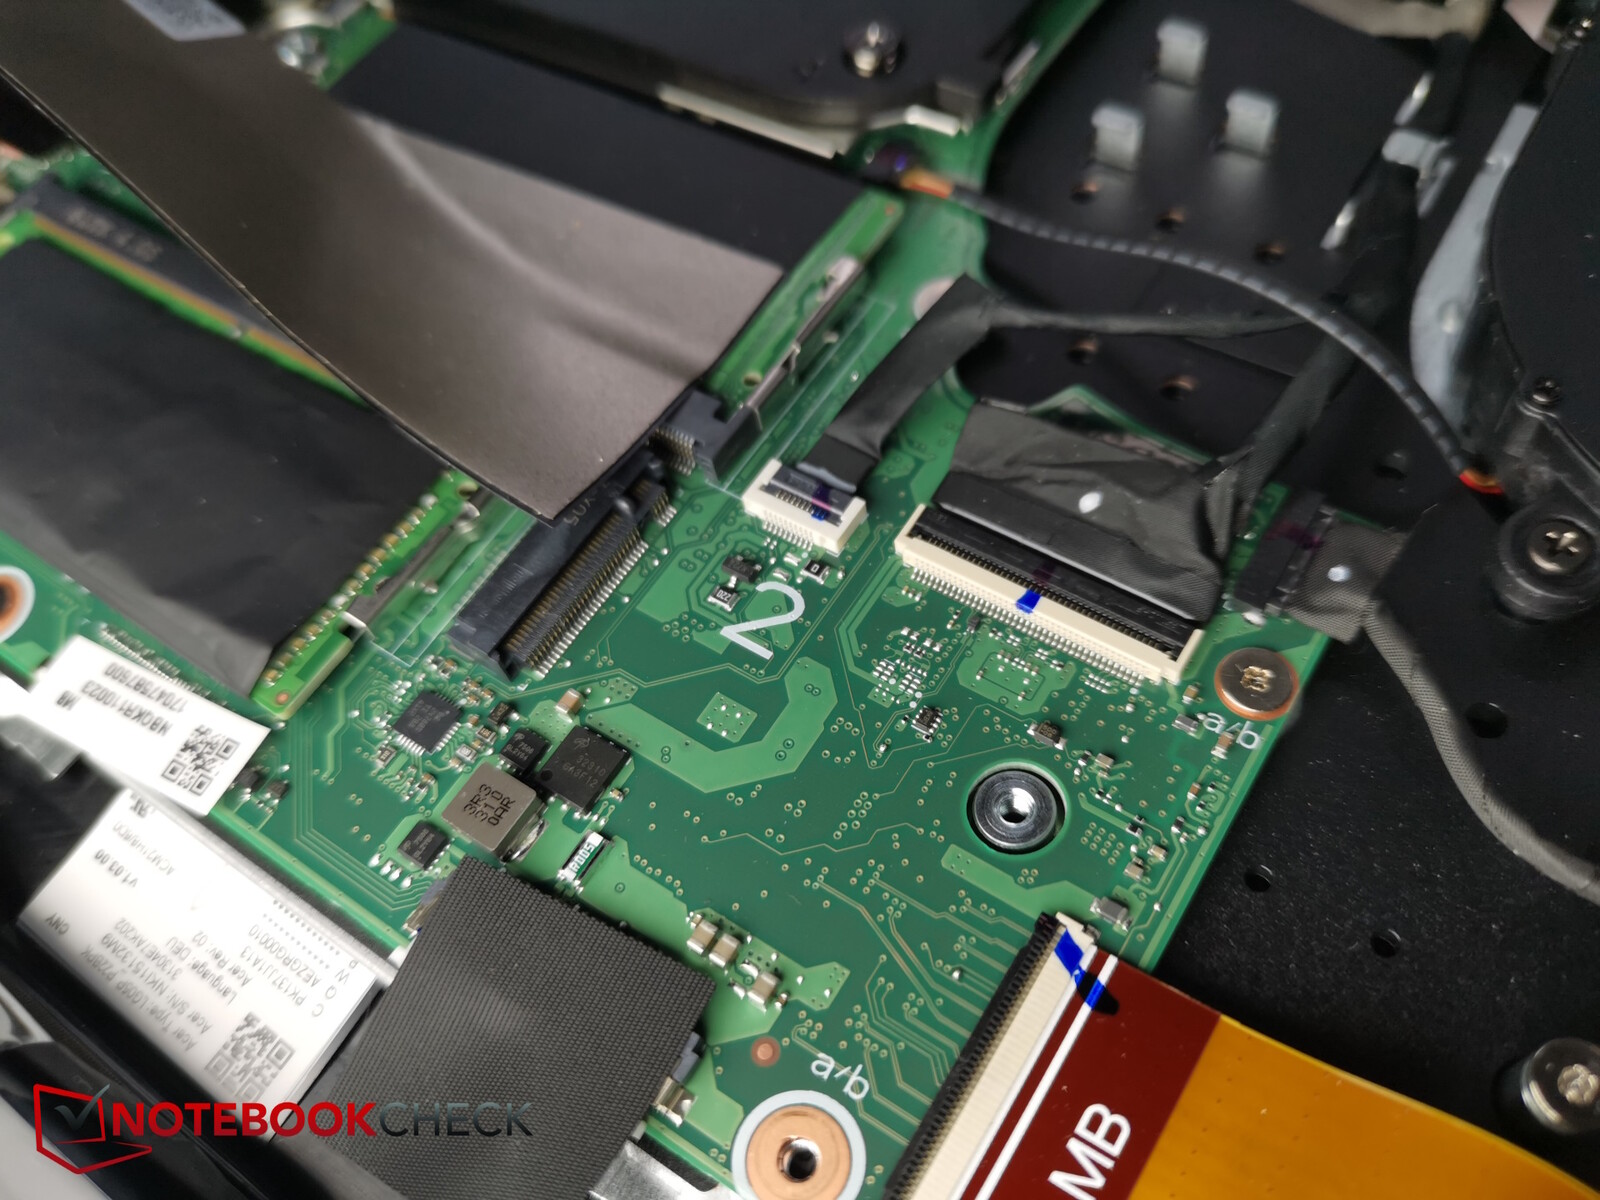
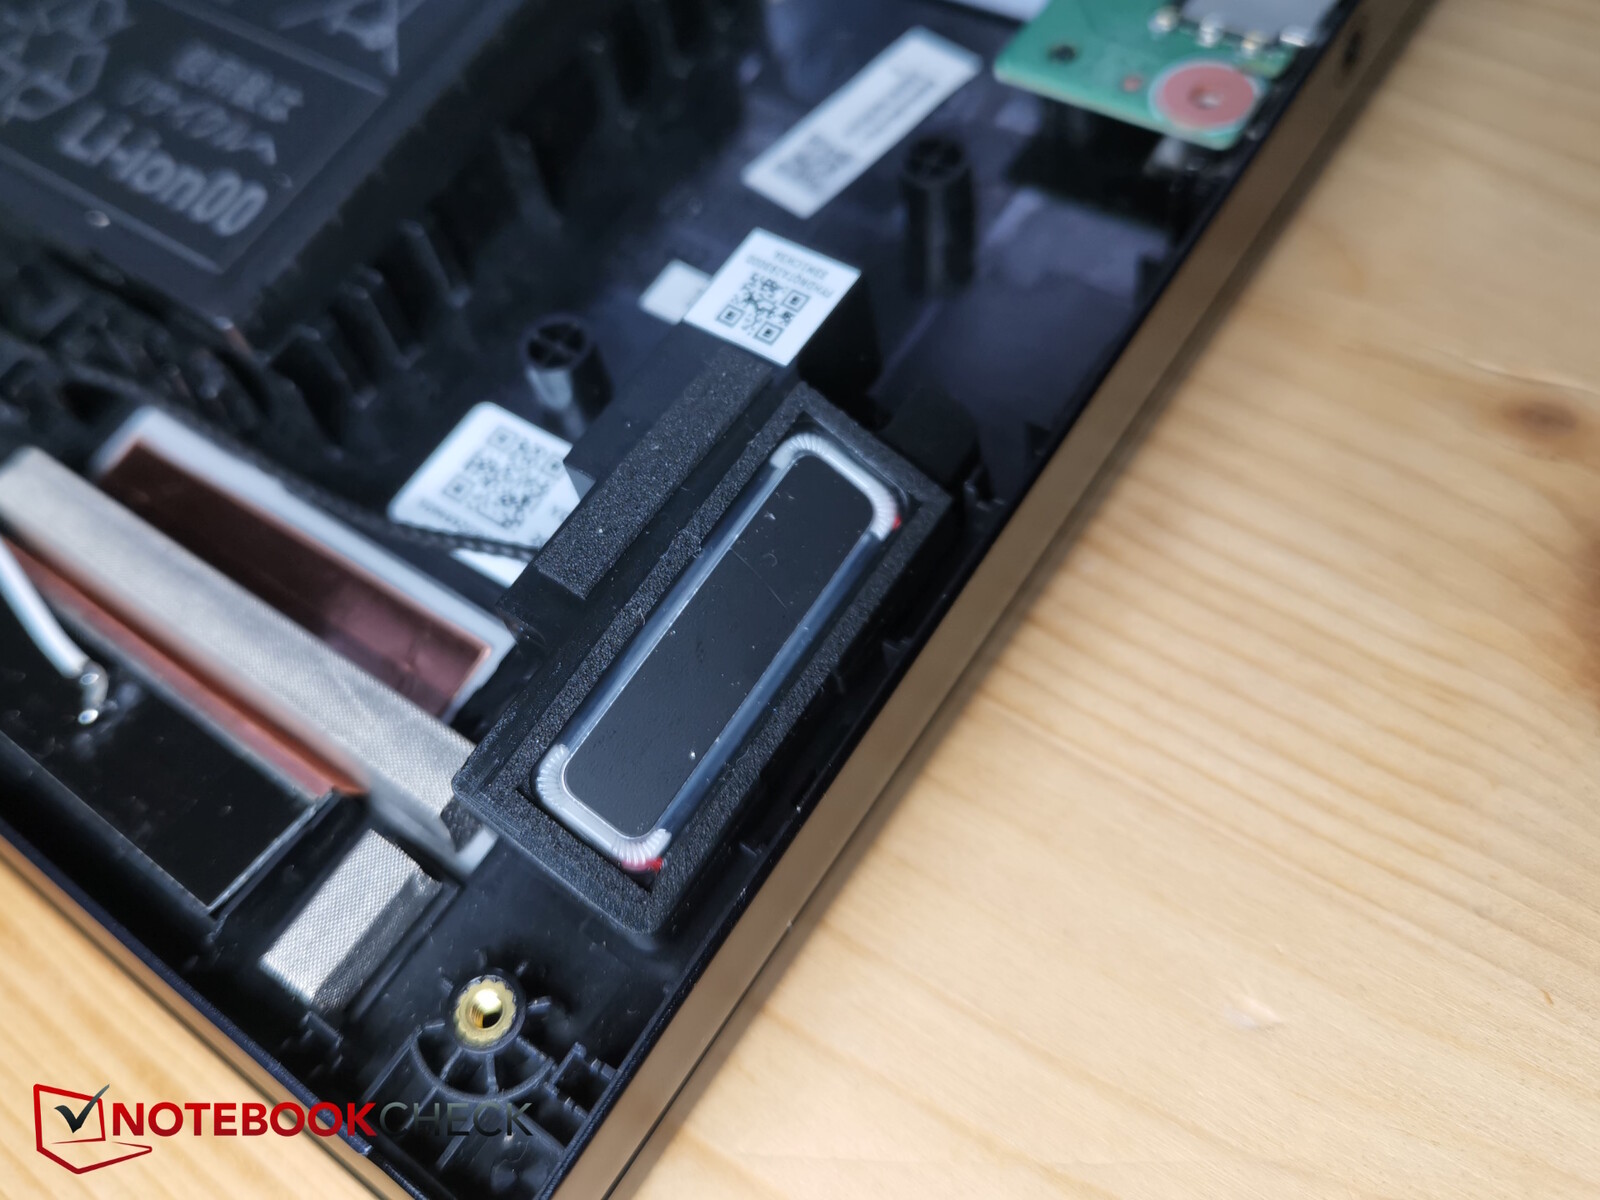
Manutenção
Abrir o Helios 18 não é tão fácil por causa dos grampos apertados e da base rígida de alumínio, mas ainda assim é possível. Primeiro, é necessário soltar 14 parafusos Torx do mesmo tamanho. Em seguida, é melhor abrir a parte traseira a partir dos cantos frontais, de preferência com uma ferramenta de plástico de ponta estreita
Uma vez dentro do Acer Predator, os usuários têm acesso aos ventiladores, à bateria, ao SSD (mais um segundo slot), aos slots de RAM e ao módulo WiFi.
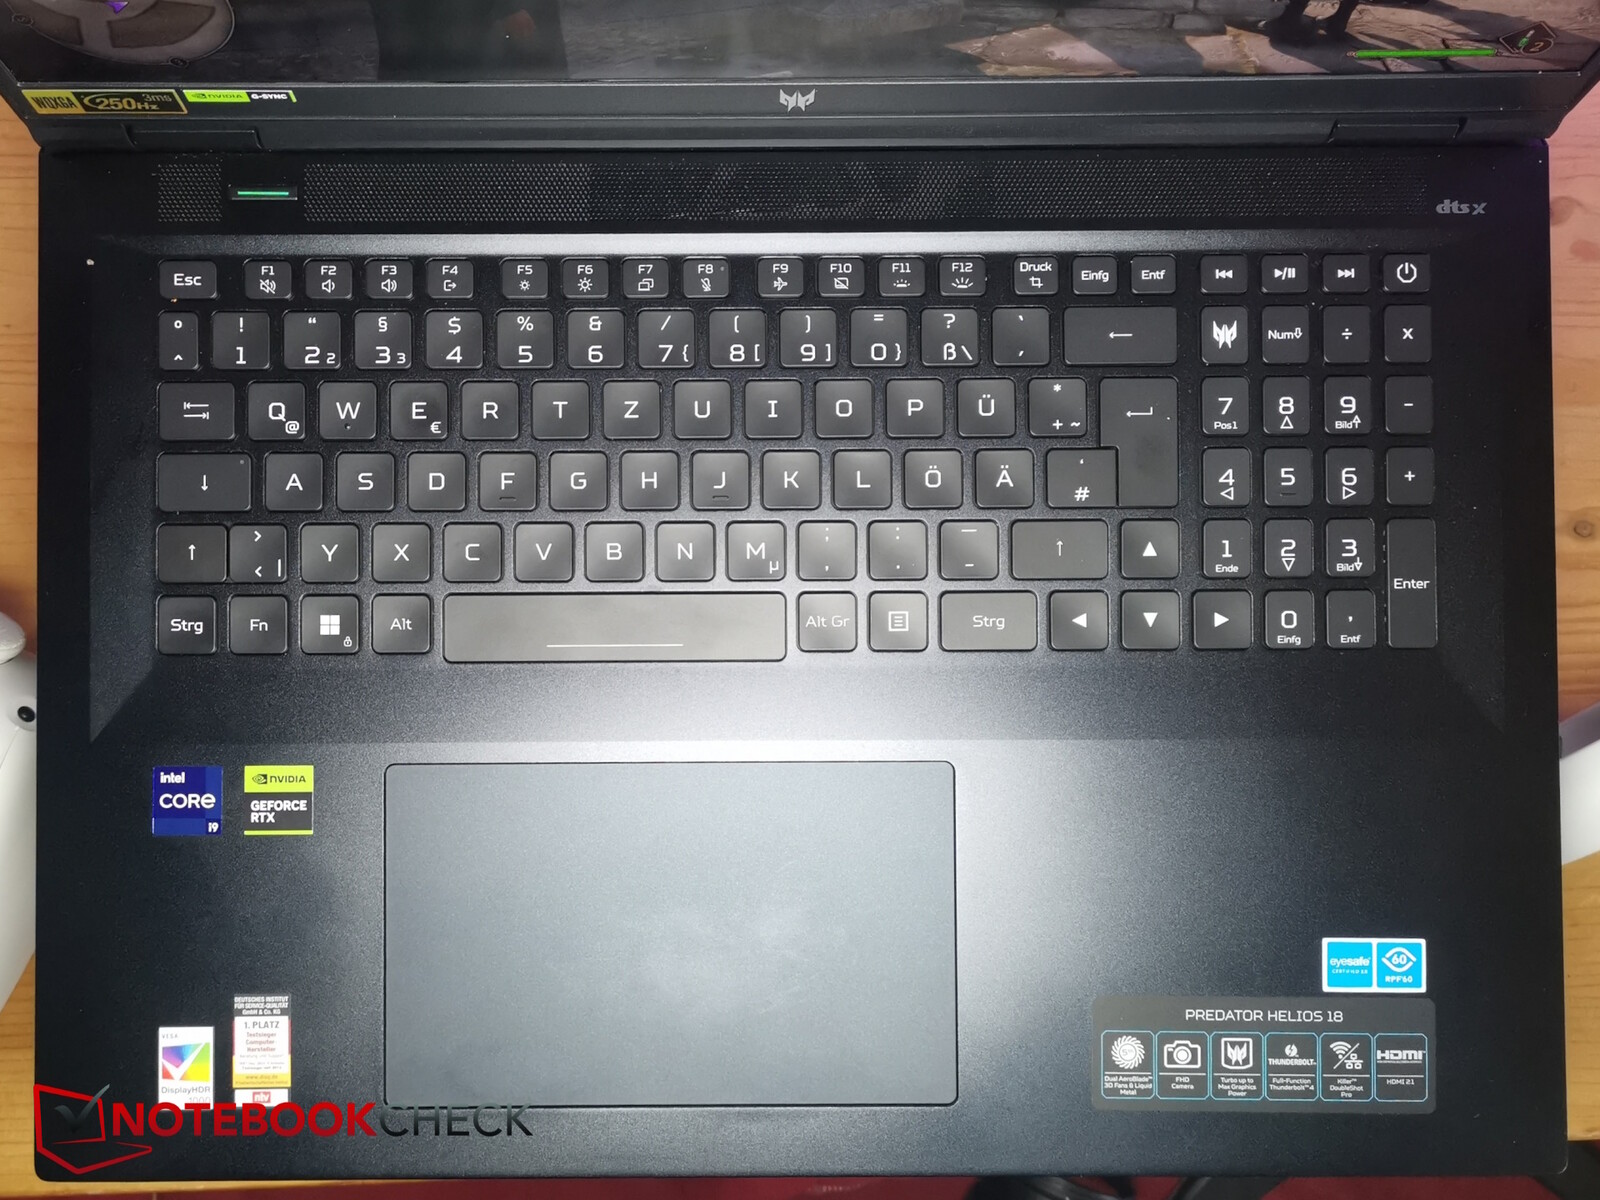
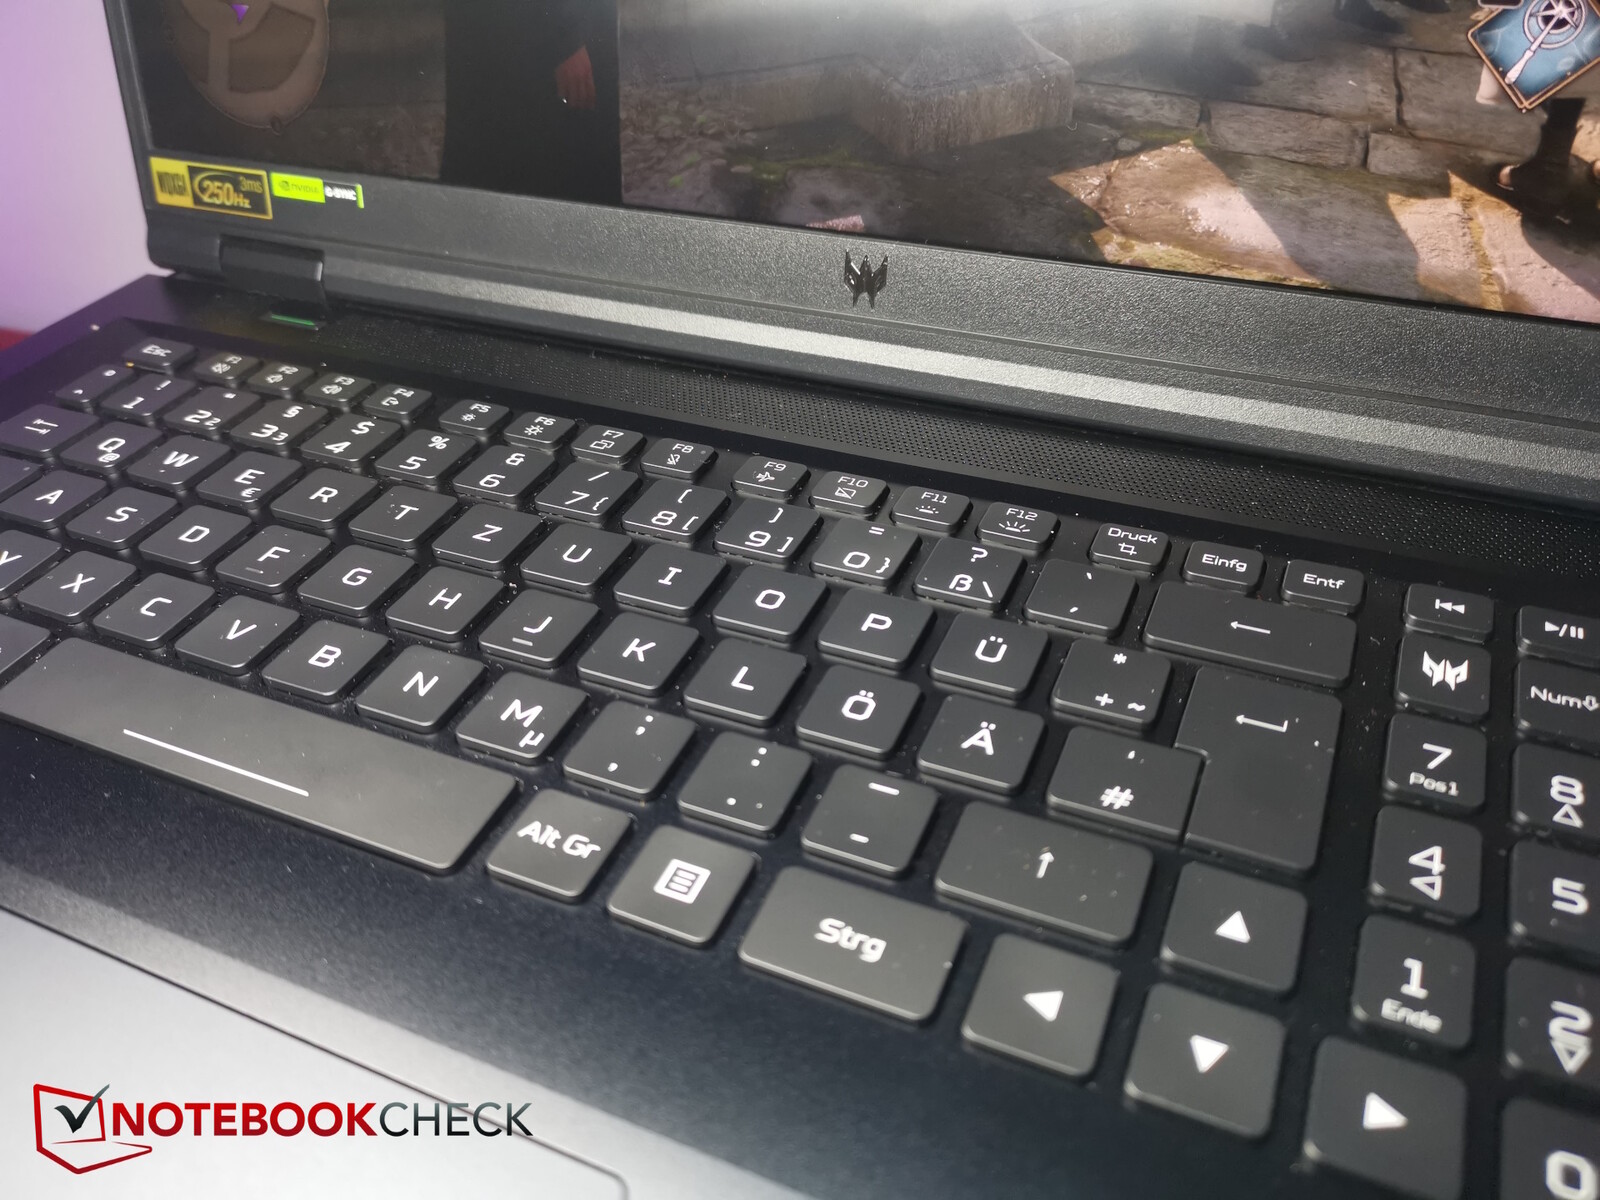
Dispositivos de entrada - MiniLED para as teclas também
Teclado
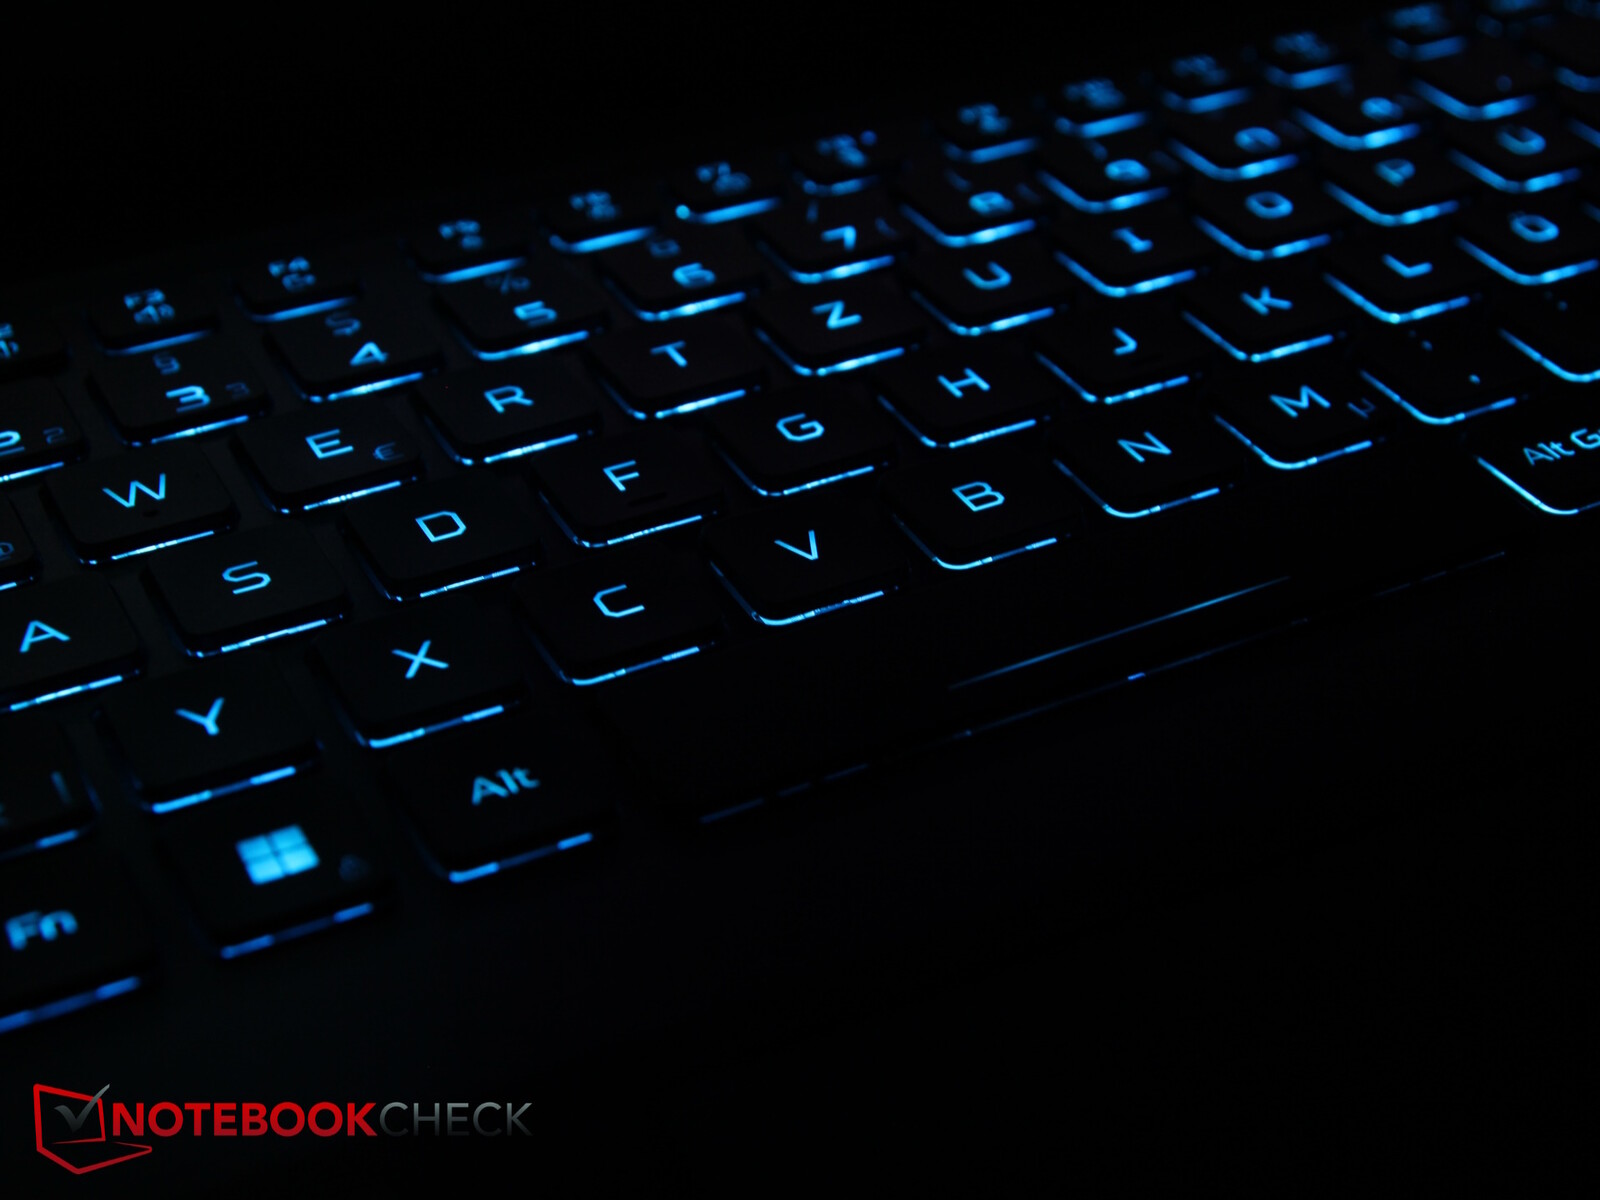
O Predator tem um layout bem organizado que inclui teclas de seta de tamanho normal, um teclado numérico à direita e teclas adicionais para acessar o software Predator Sense e alternar os modos de desempenho
As teclas são de 1,5 x 1,5 mm, têm um curso médio e feedback perceptível, que poderia ser um pouco mais firme. O ruído de digitação é moderado e a velocidade de digitação é rápida.
De acordo com a Acer, a luz de fundo RGB por tecla funciona por meio de MiniLEDs, assim como a tela, e pode ser ajustada em quatro níveis.
Touchpad
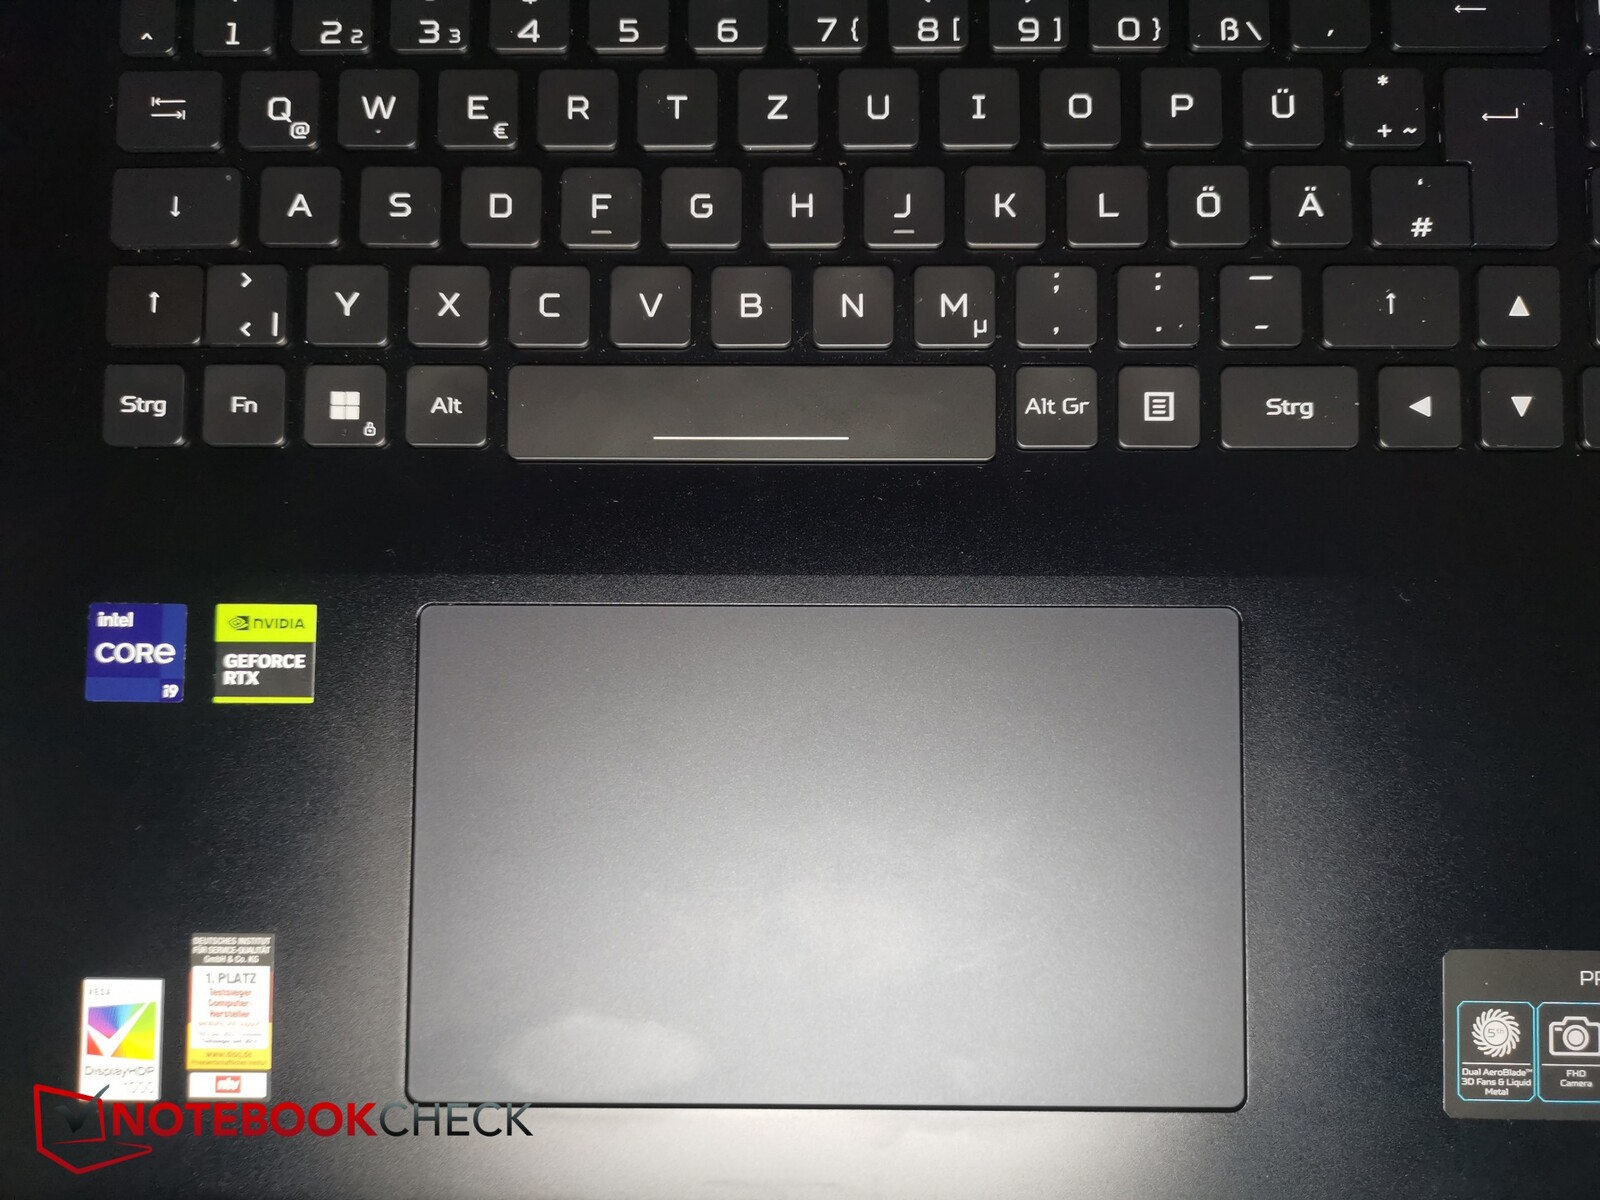
O touchpad do computador de 18 polegadas é enorme (aprox. 15,2 x 9,1 cm) e oferece propriedades de deslizamento muito boas que quase nunca causam falhas.
Os botões de clique integrados são muito silenciosos e têm um curso extremamente curto, mas são acionados de forma confiável e fornecem um bom feedback.
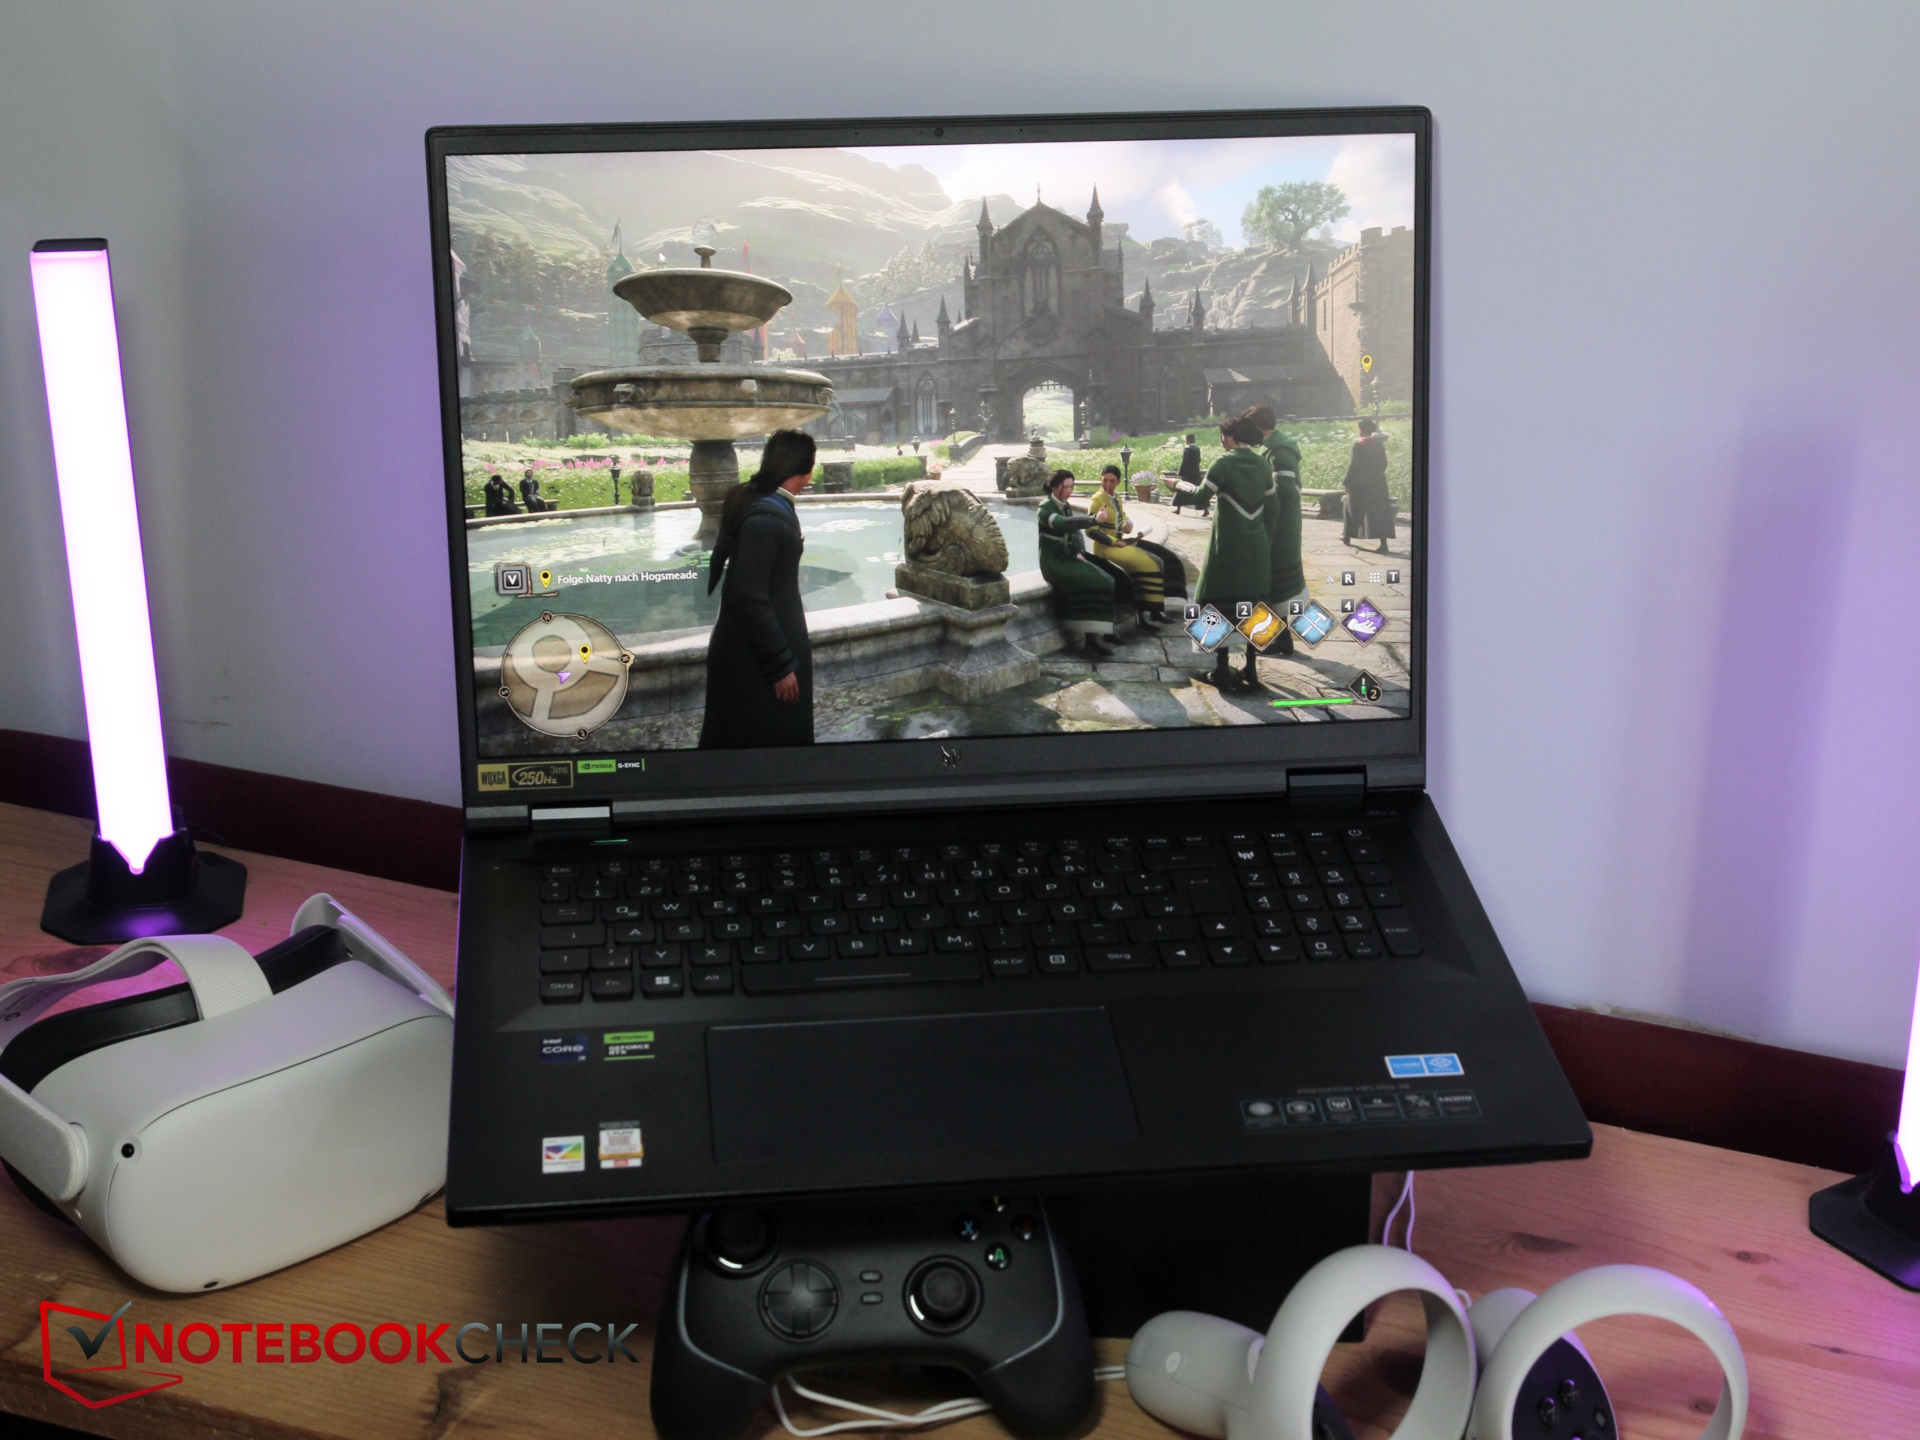
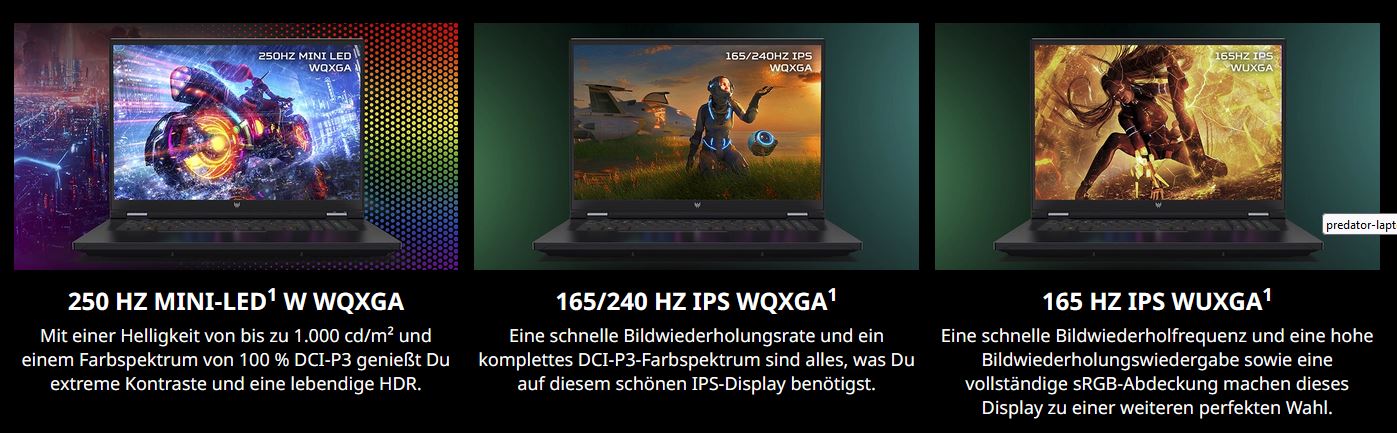
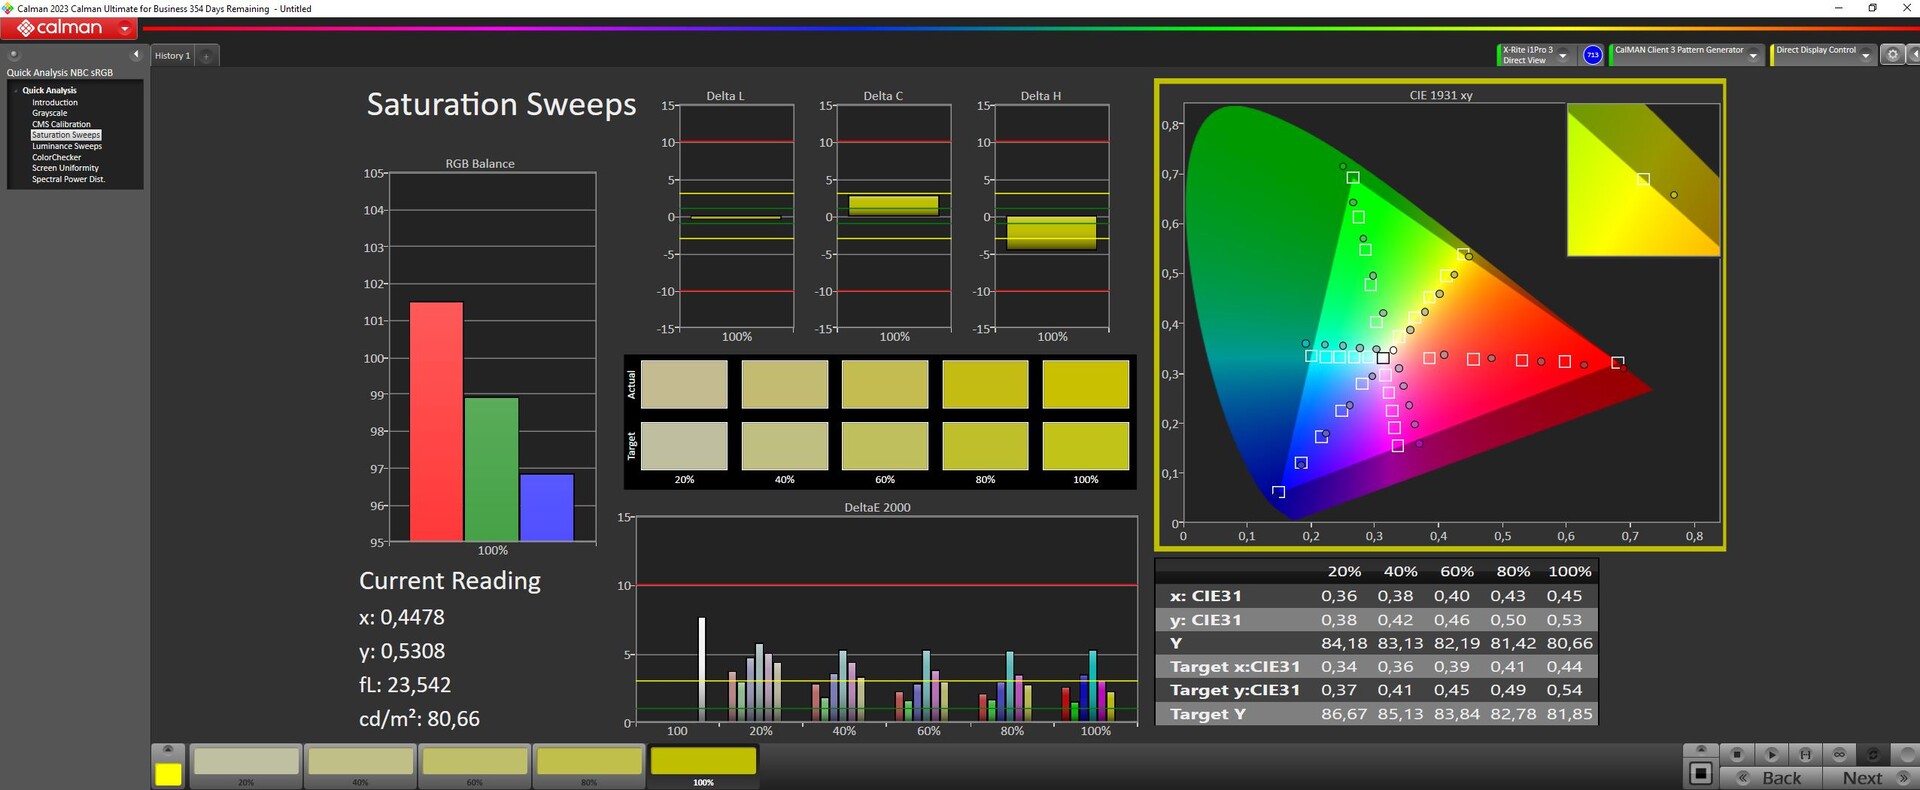
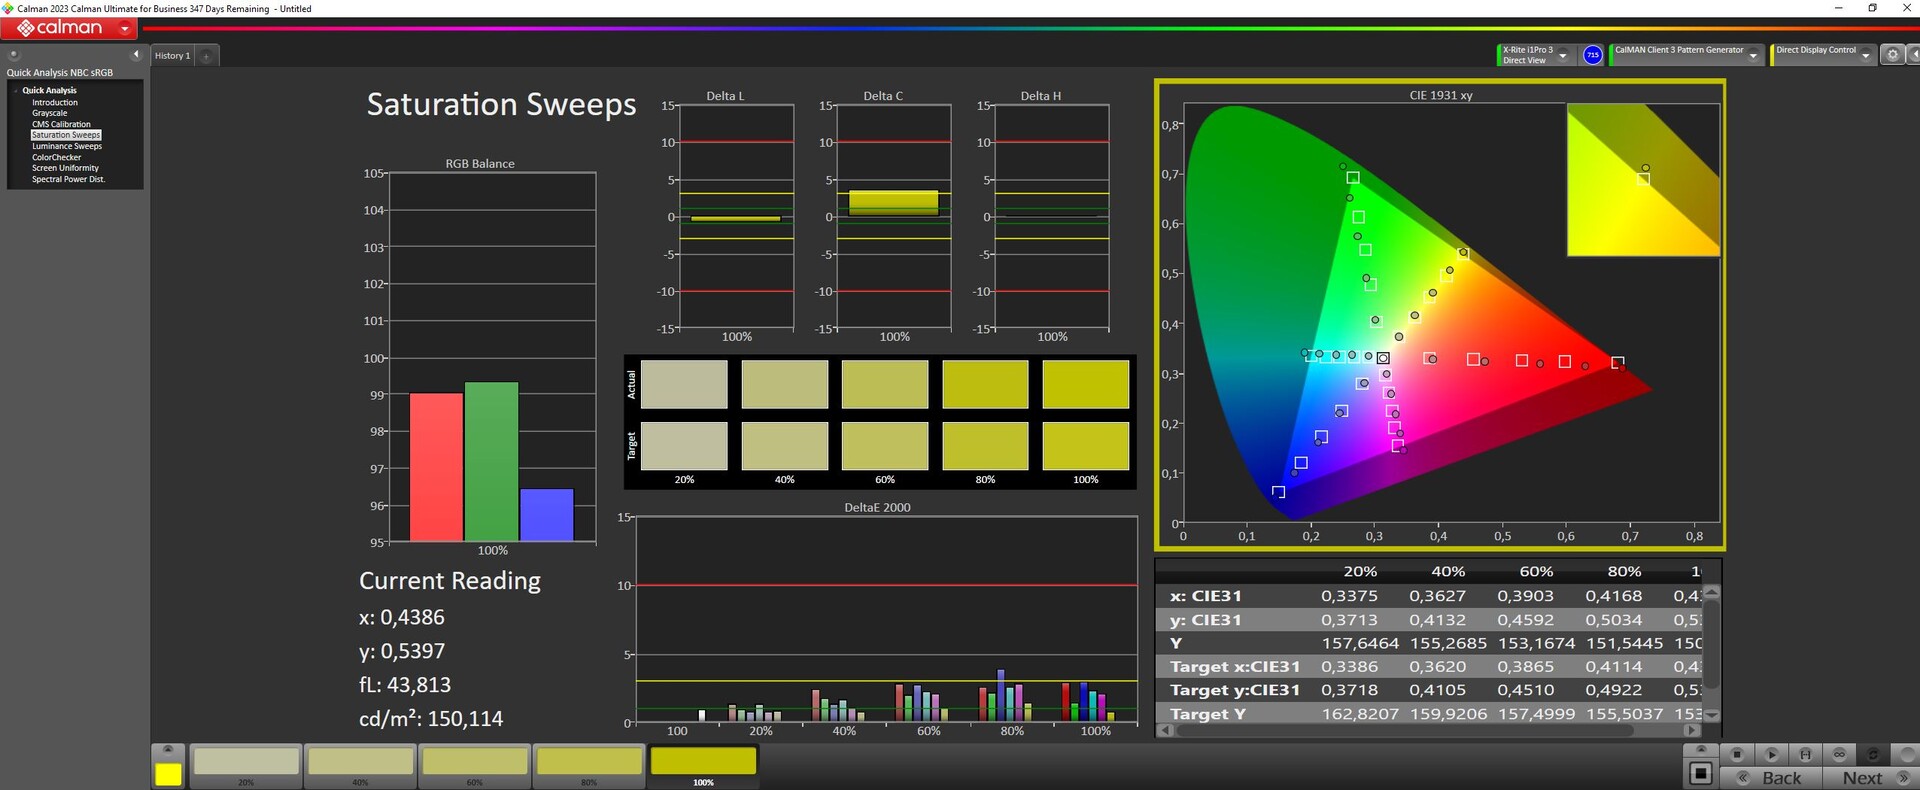
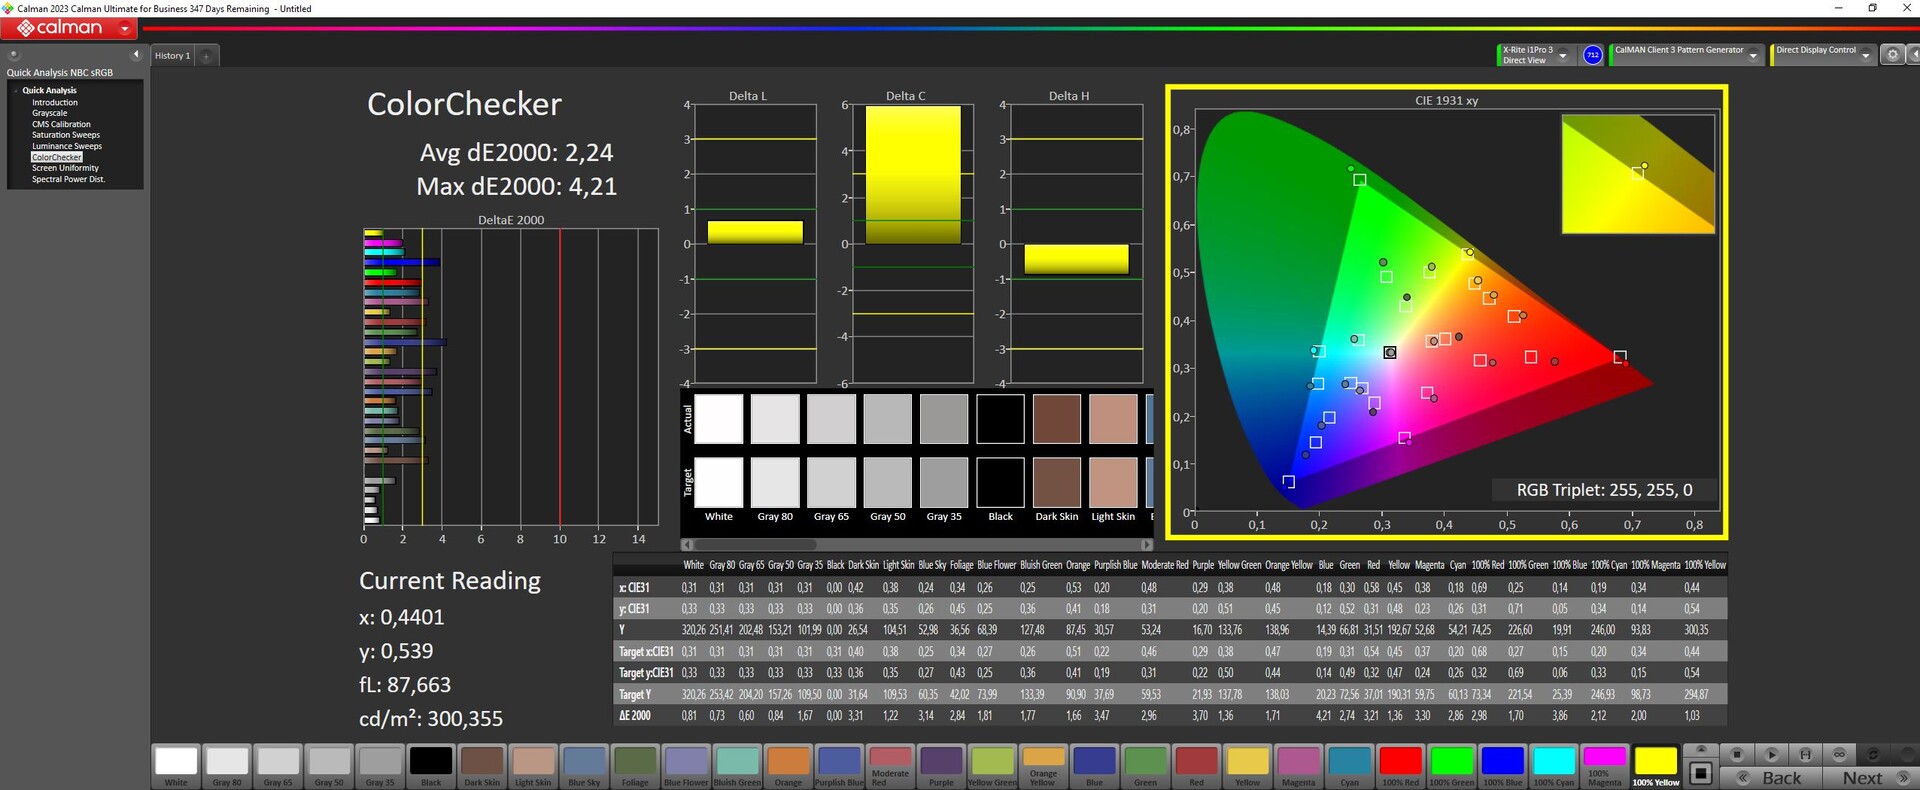
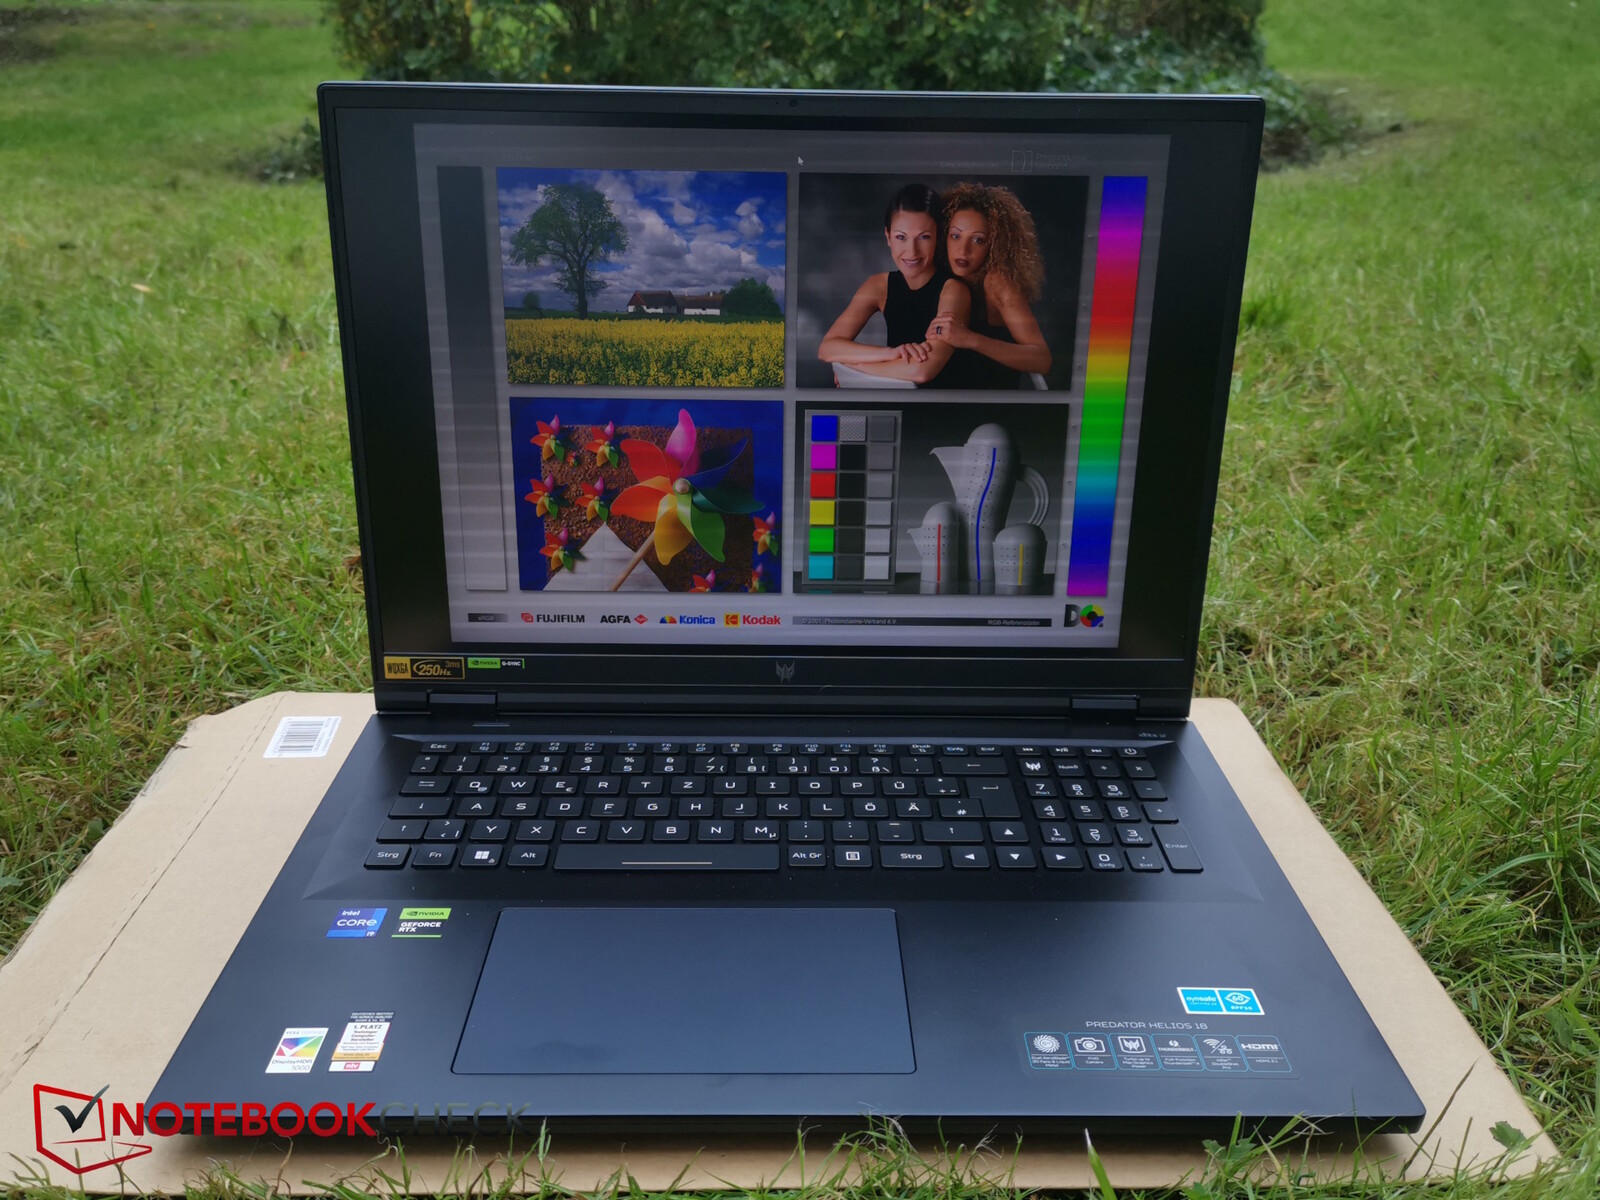
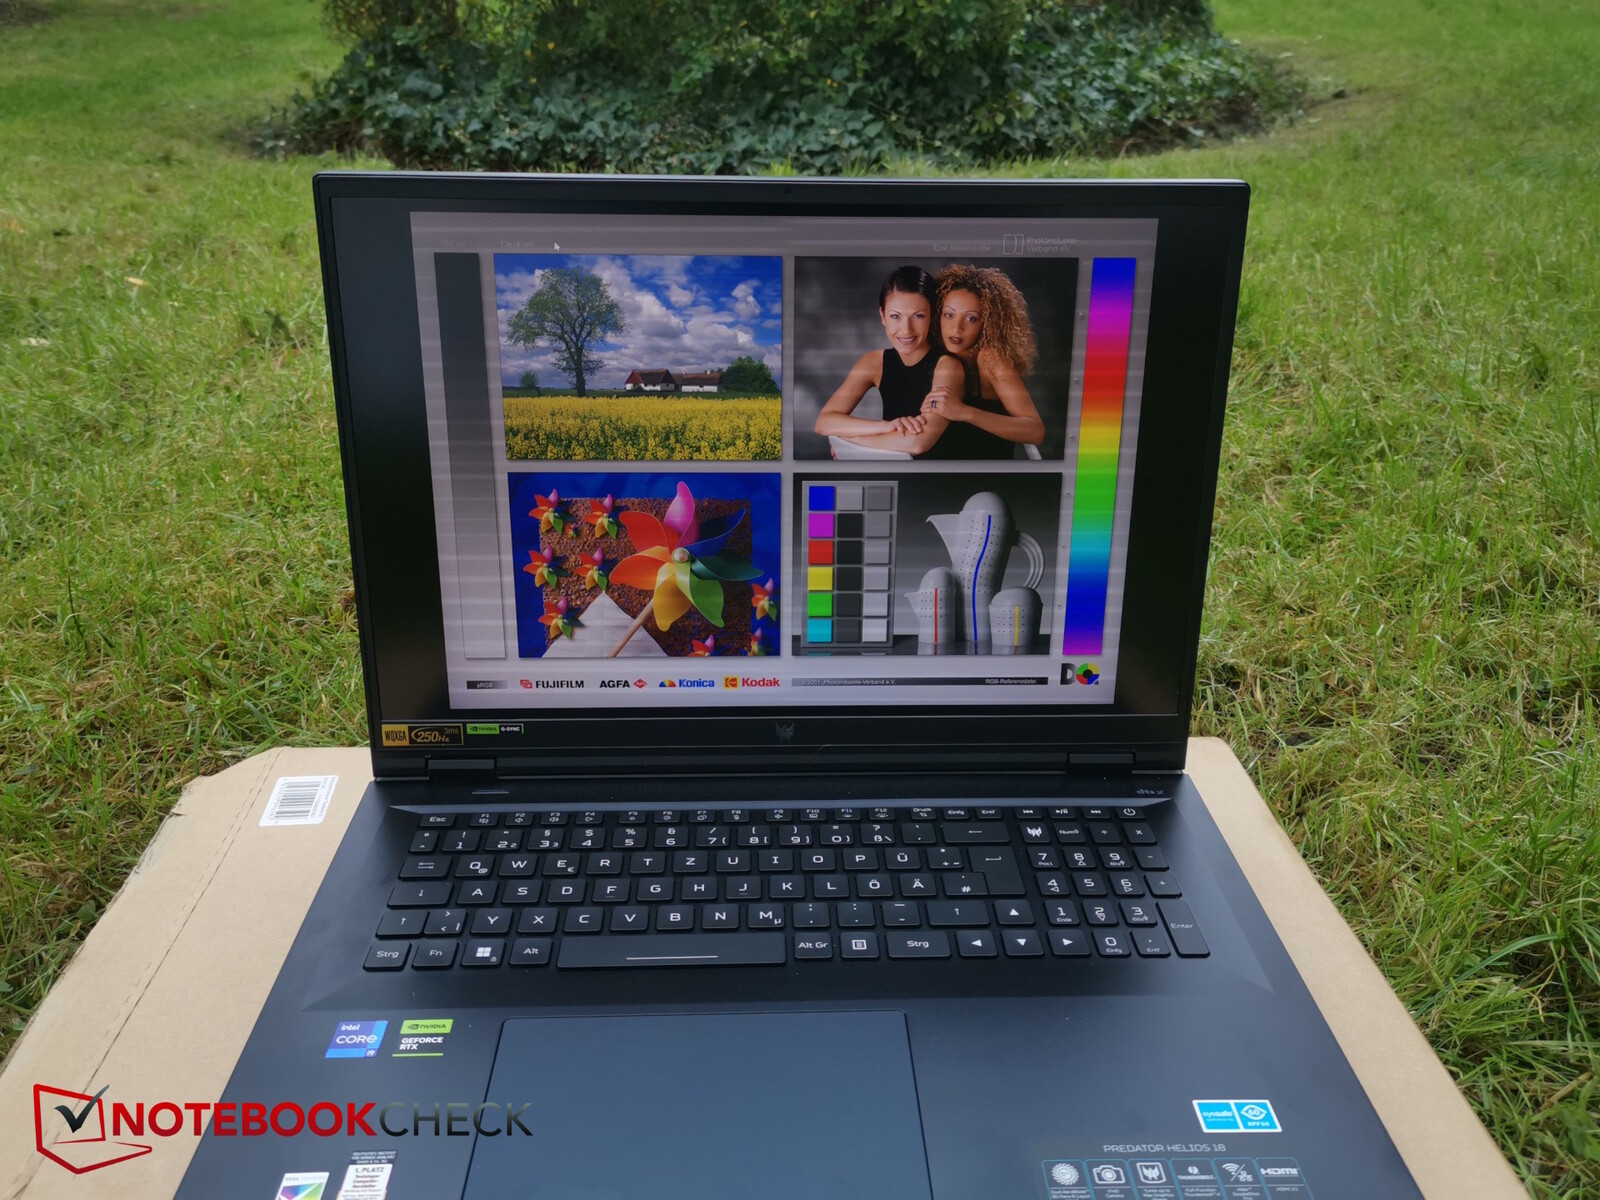
Tela - MiniLEDs com mais de 1.000 nits
O Helios 18 está disponível opcionalmente com a fantástica tela MiniLED de 250 Hz, que também está instalada em nosso dispositivo de teste. Não há halos visíveis aqui, o preto é rico sem nenhum artefato de luz irritante e o contraste é correspondentemente bom.
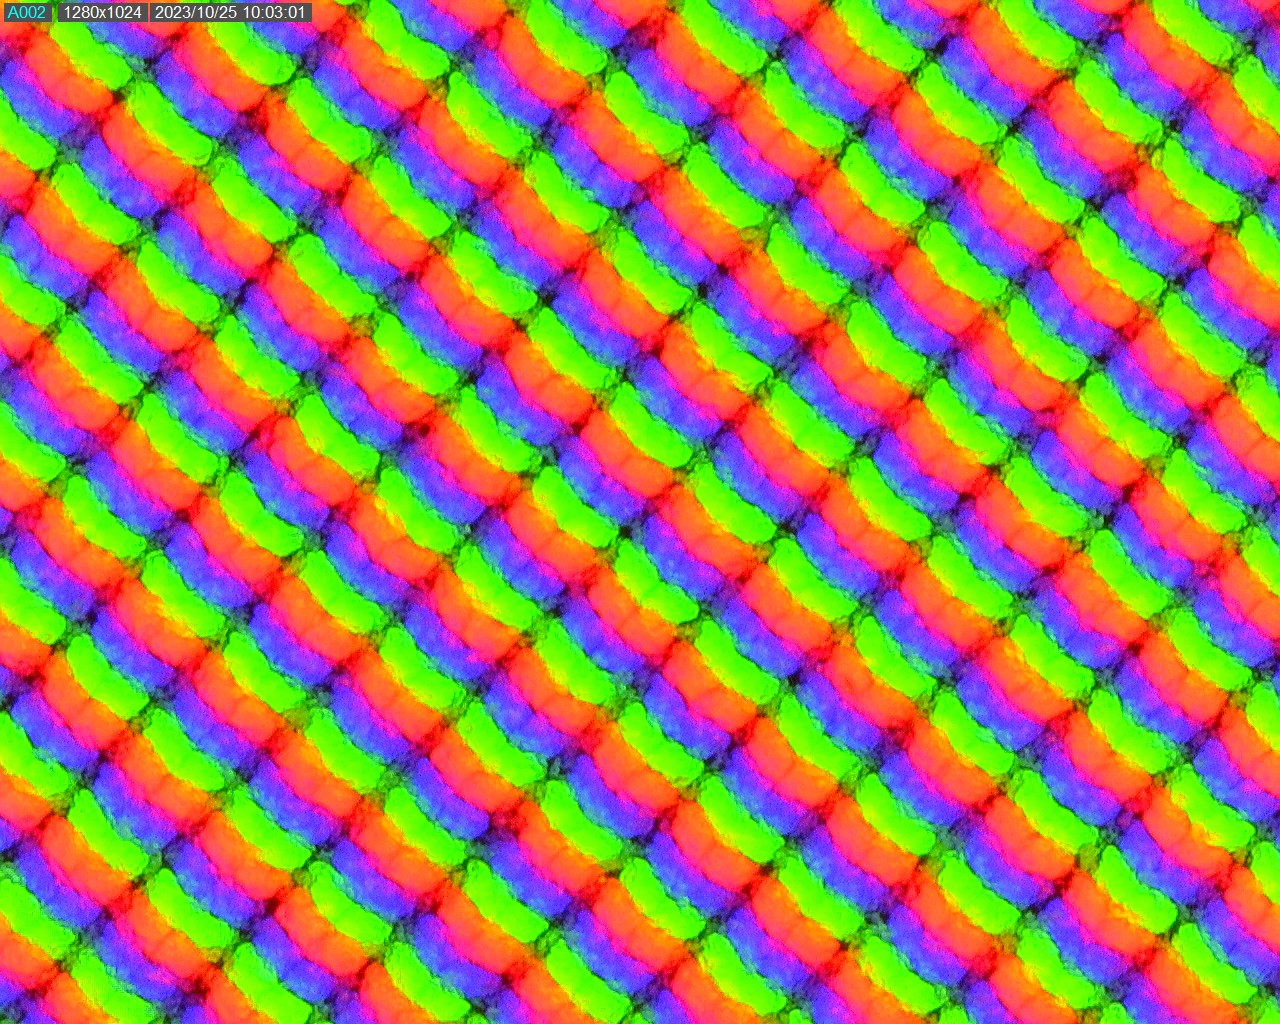
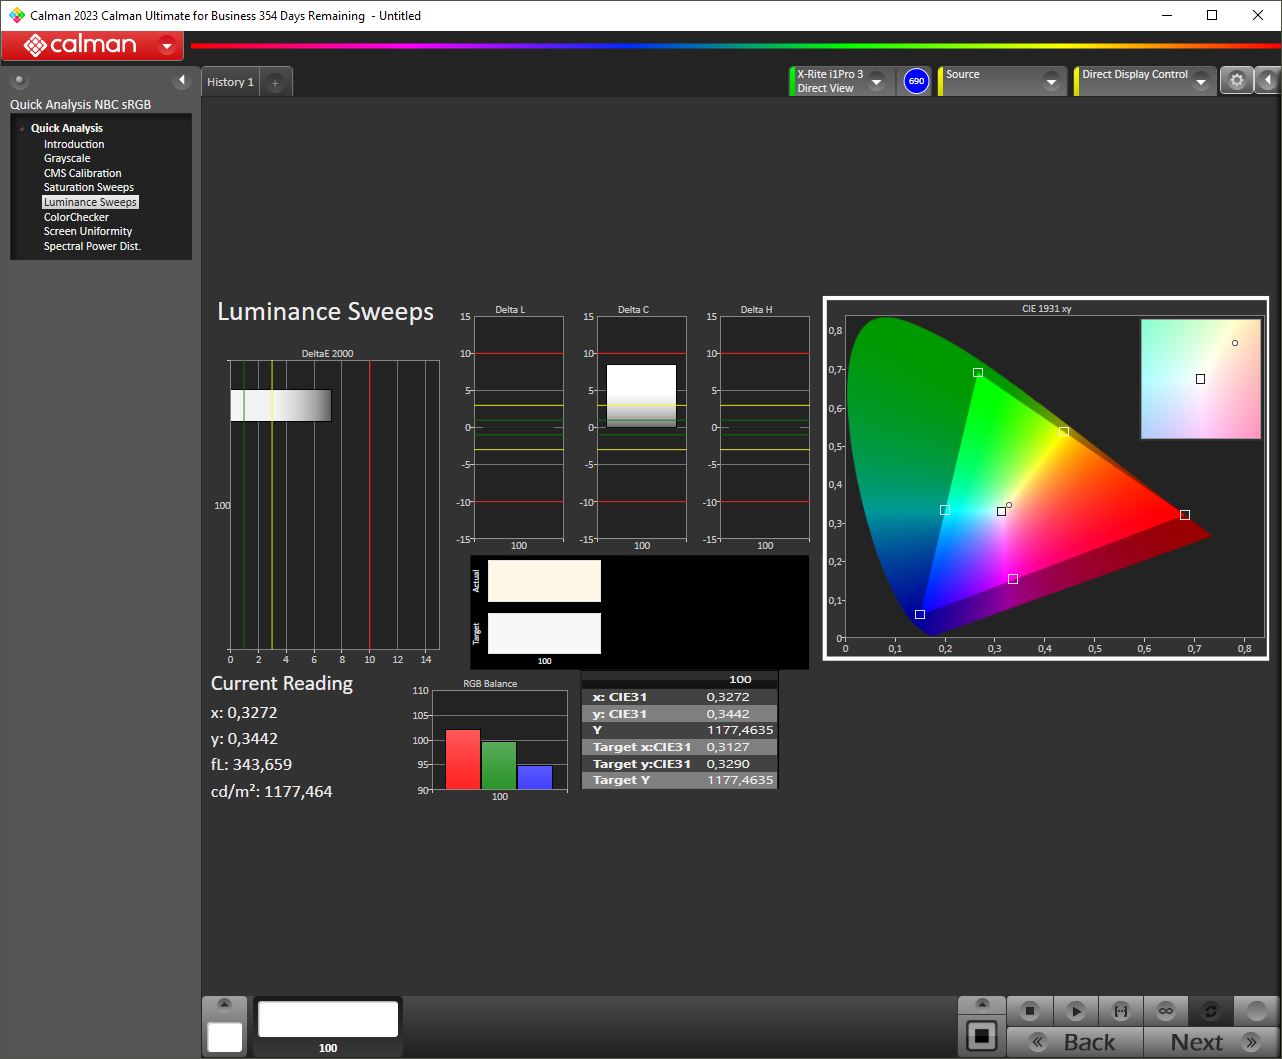
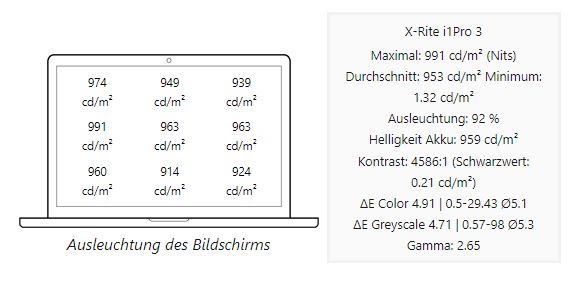
No modo SDR normal, o painel da AU Optronics atinge cerca de 350 nits. No entanto, a tela produz ainda mais brilho no modo HDR. Aqui, medimos um pico de brilho de mais de 1.100 nits! A iluminação é muito boa, 92% em ambos os casos.
Iluminação no modo HDR
Illumination in SDR mode
| |||||||||||||||||||||||||
iluminação: 92 %
iluminação com acumulador: 359 cd/m²
Contraste: 1714:1 (Preto: 0.21 cd/m²)
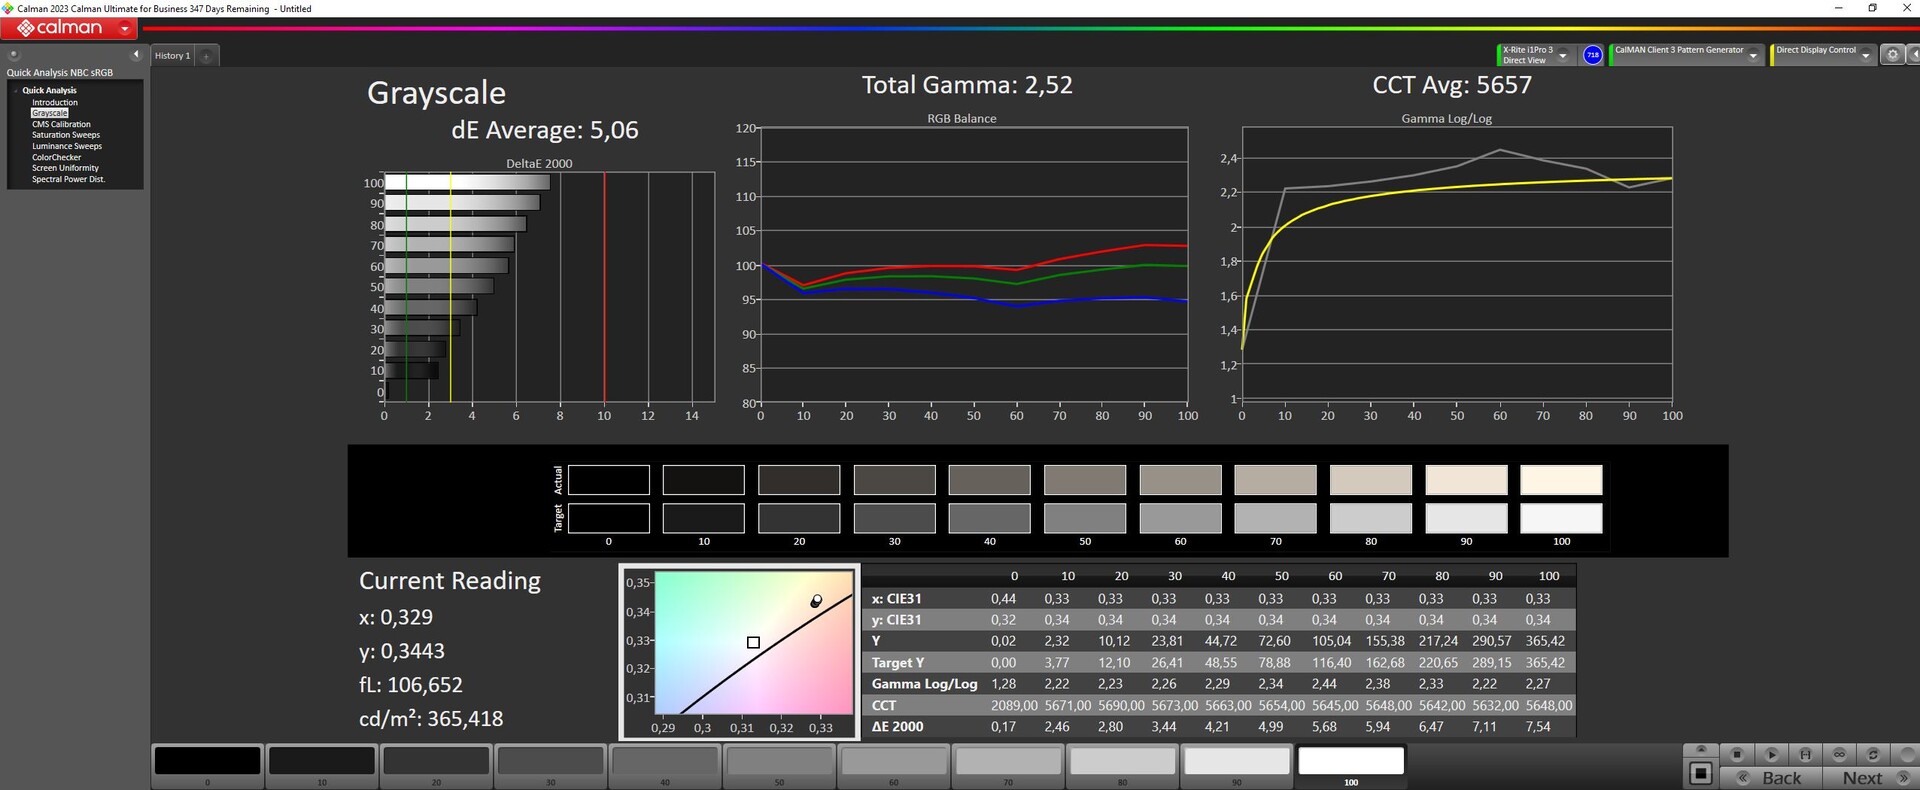
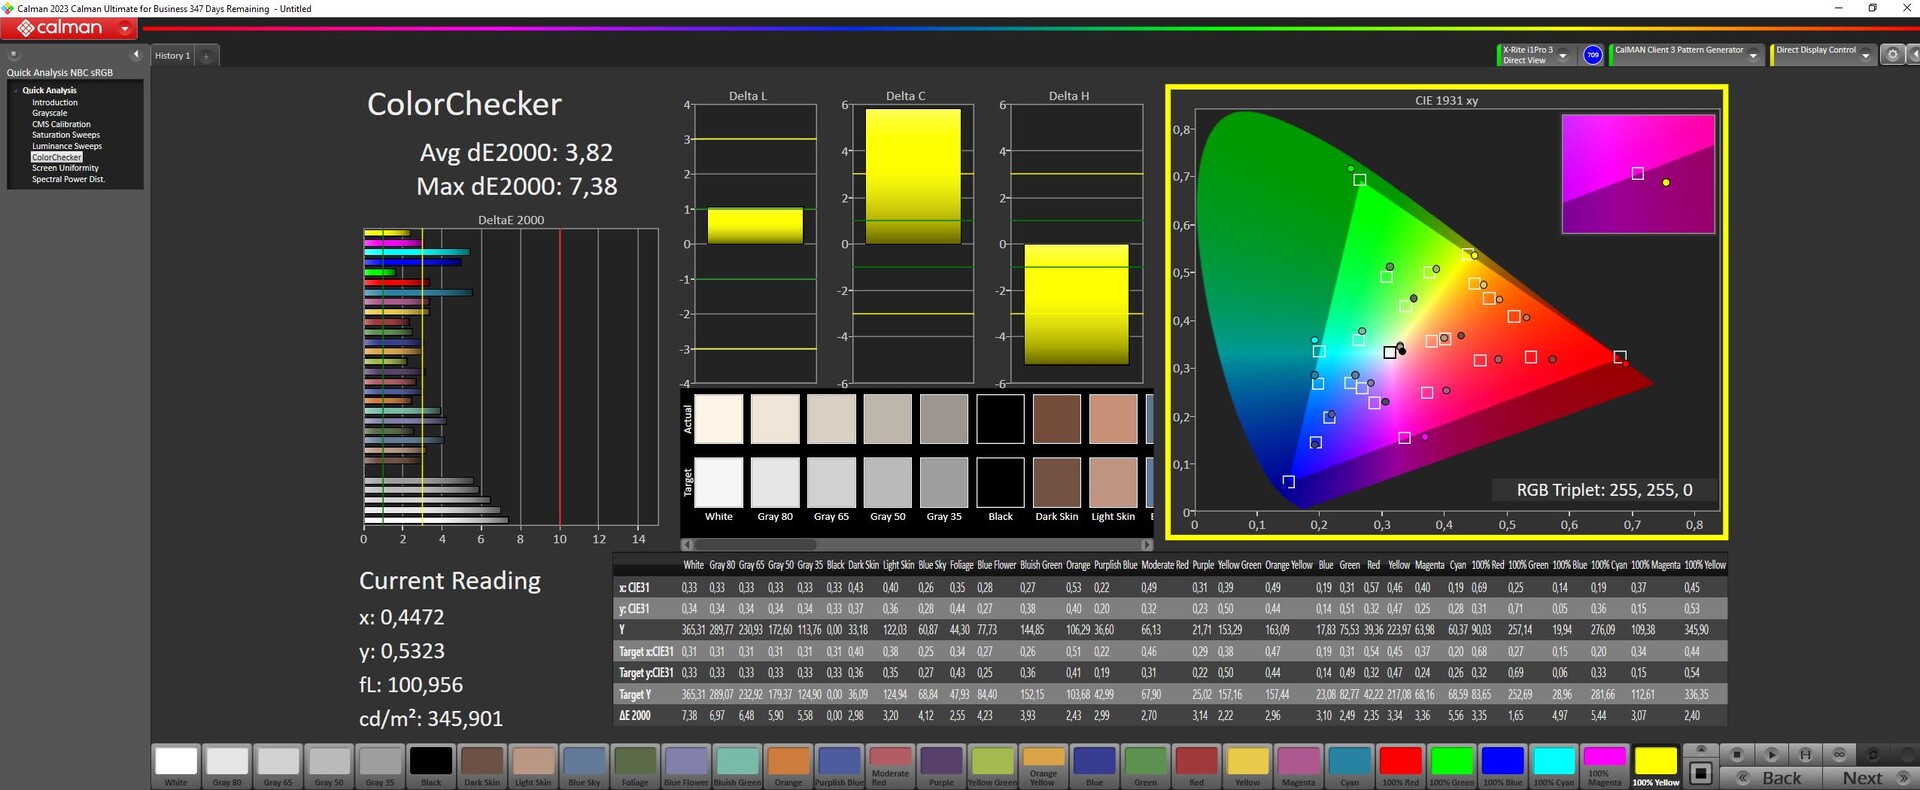
ΔE ColorChecker Calman: 3.82 | ∀{0.5-29.43 Ø4.71}
calibrated: 2.24
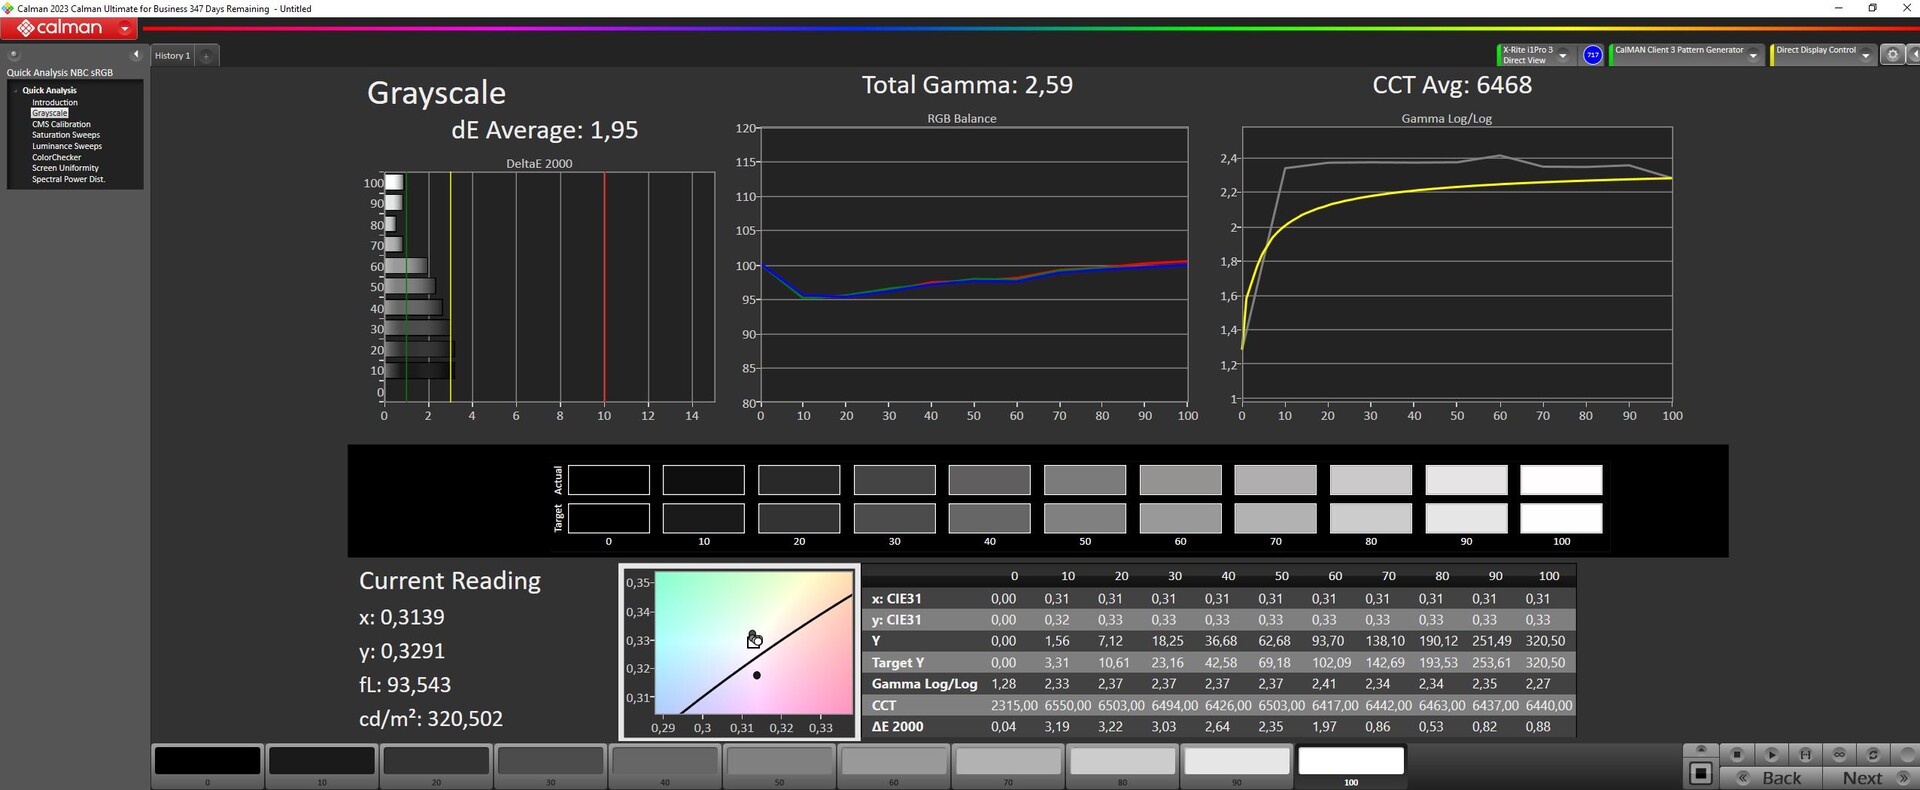
ΔE Greyscale Calman: 5.06 | ∀{0.09-98 Ø4.96}
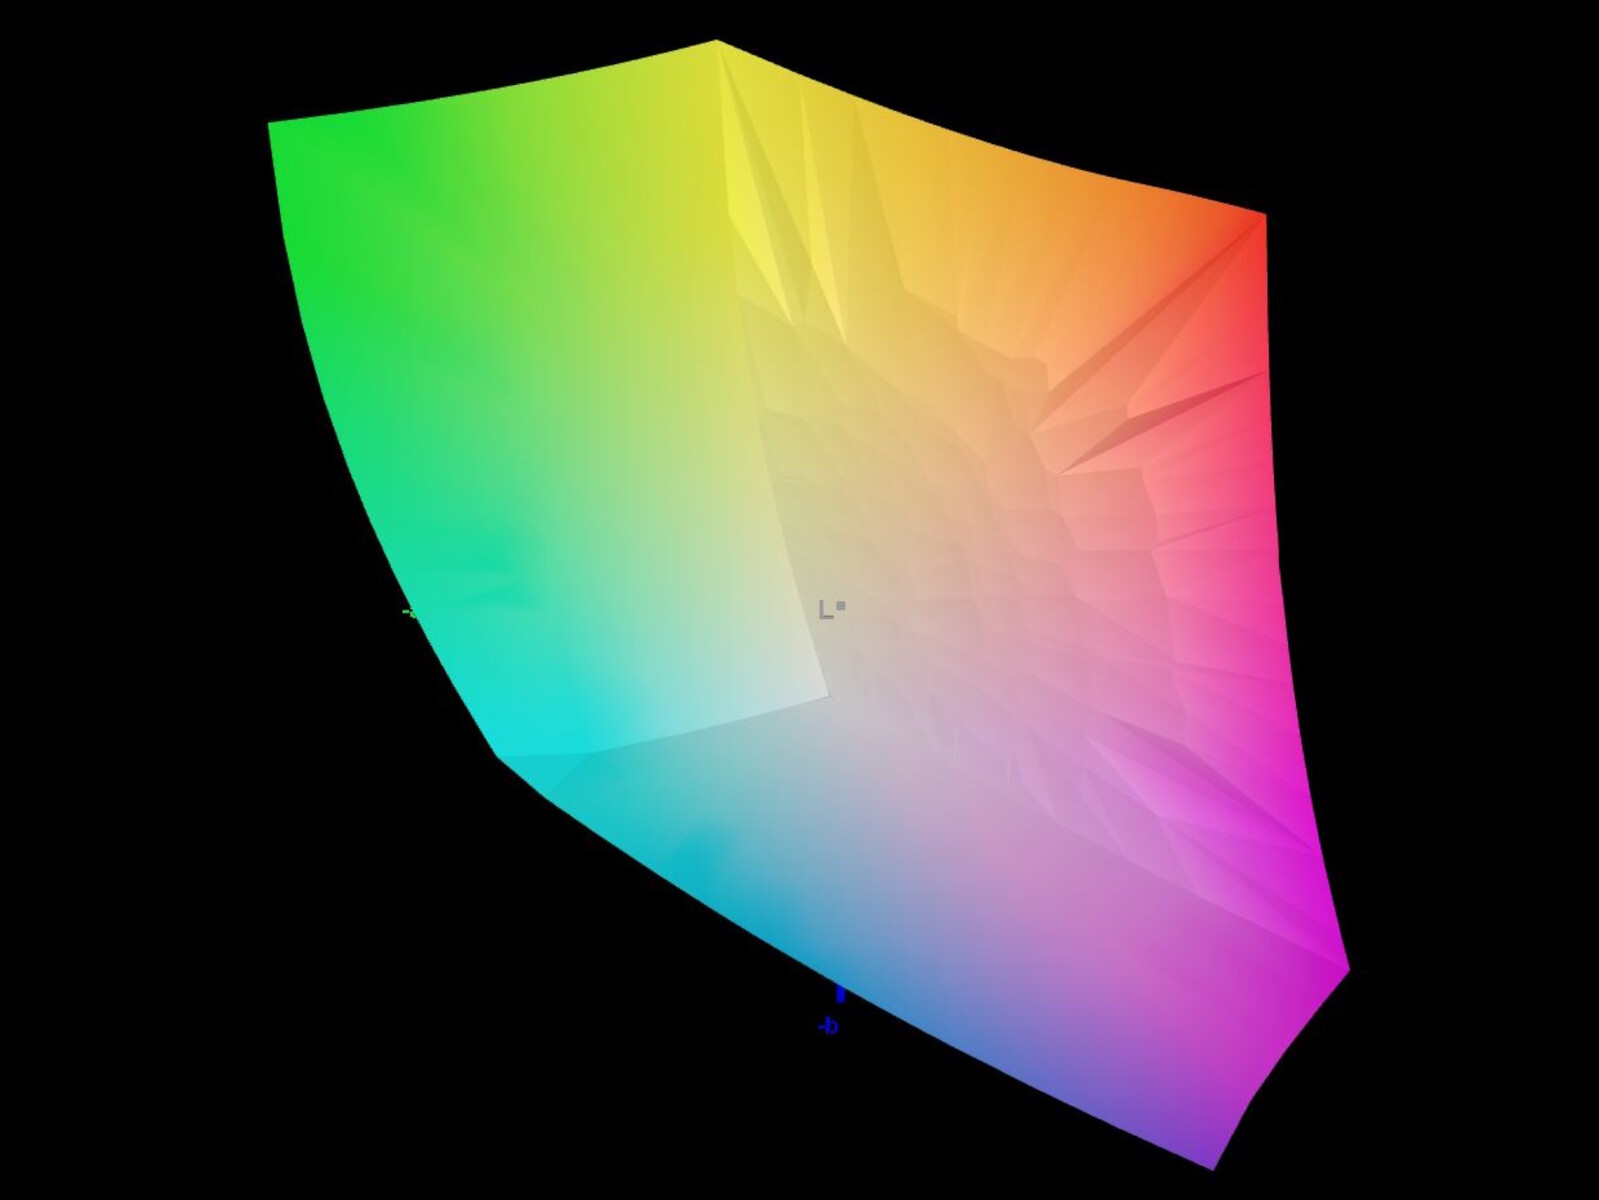
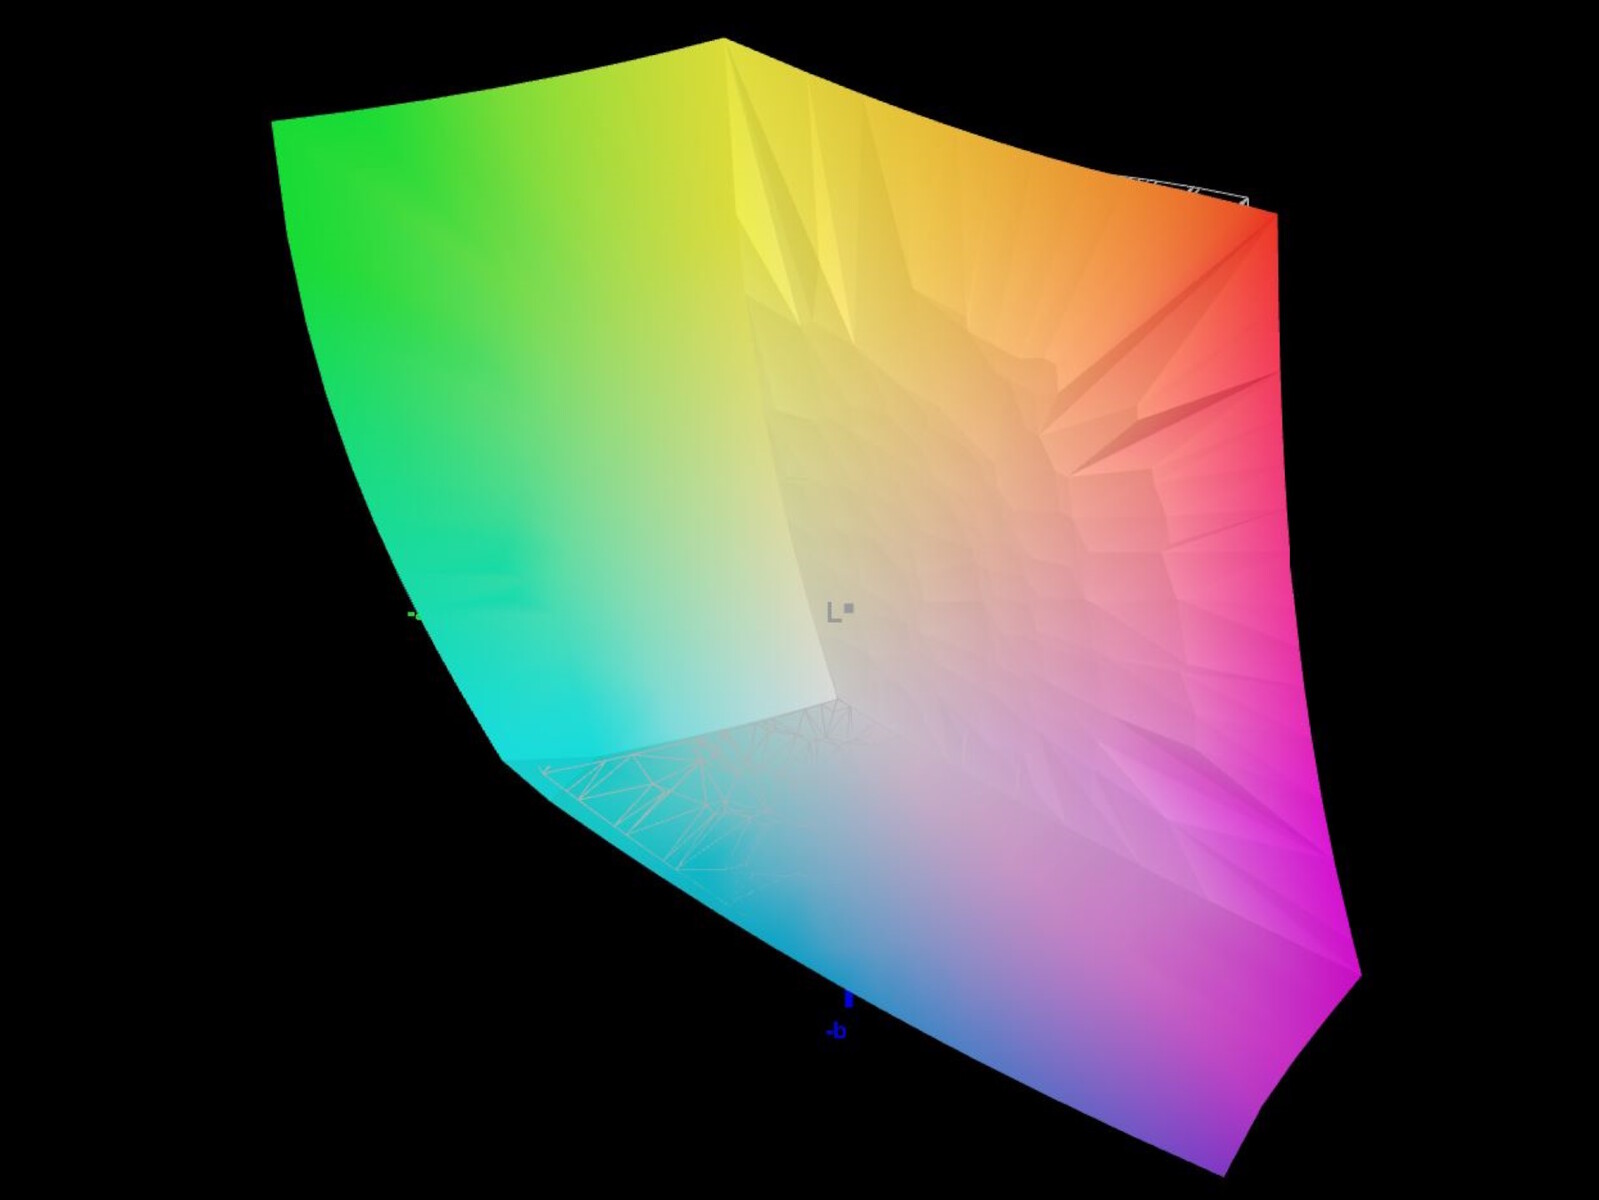
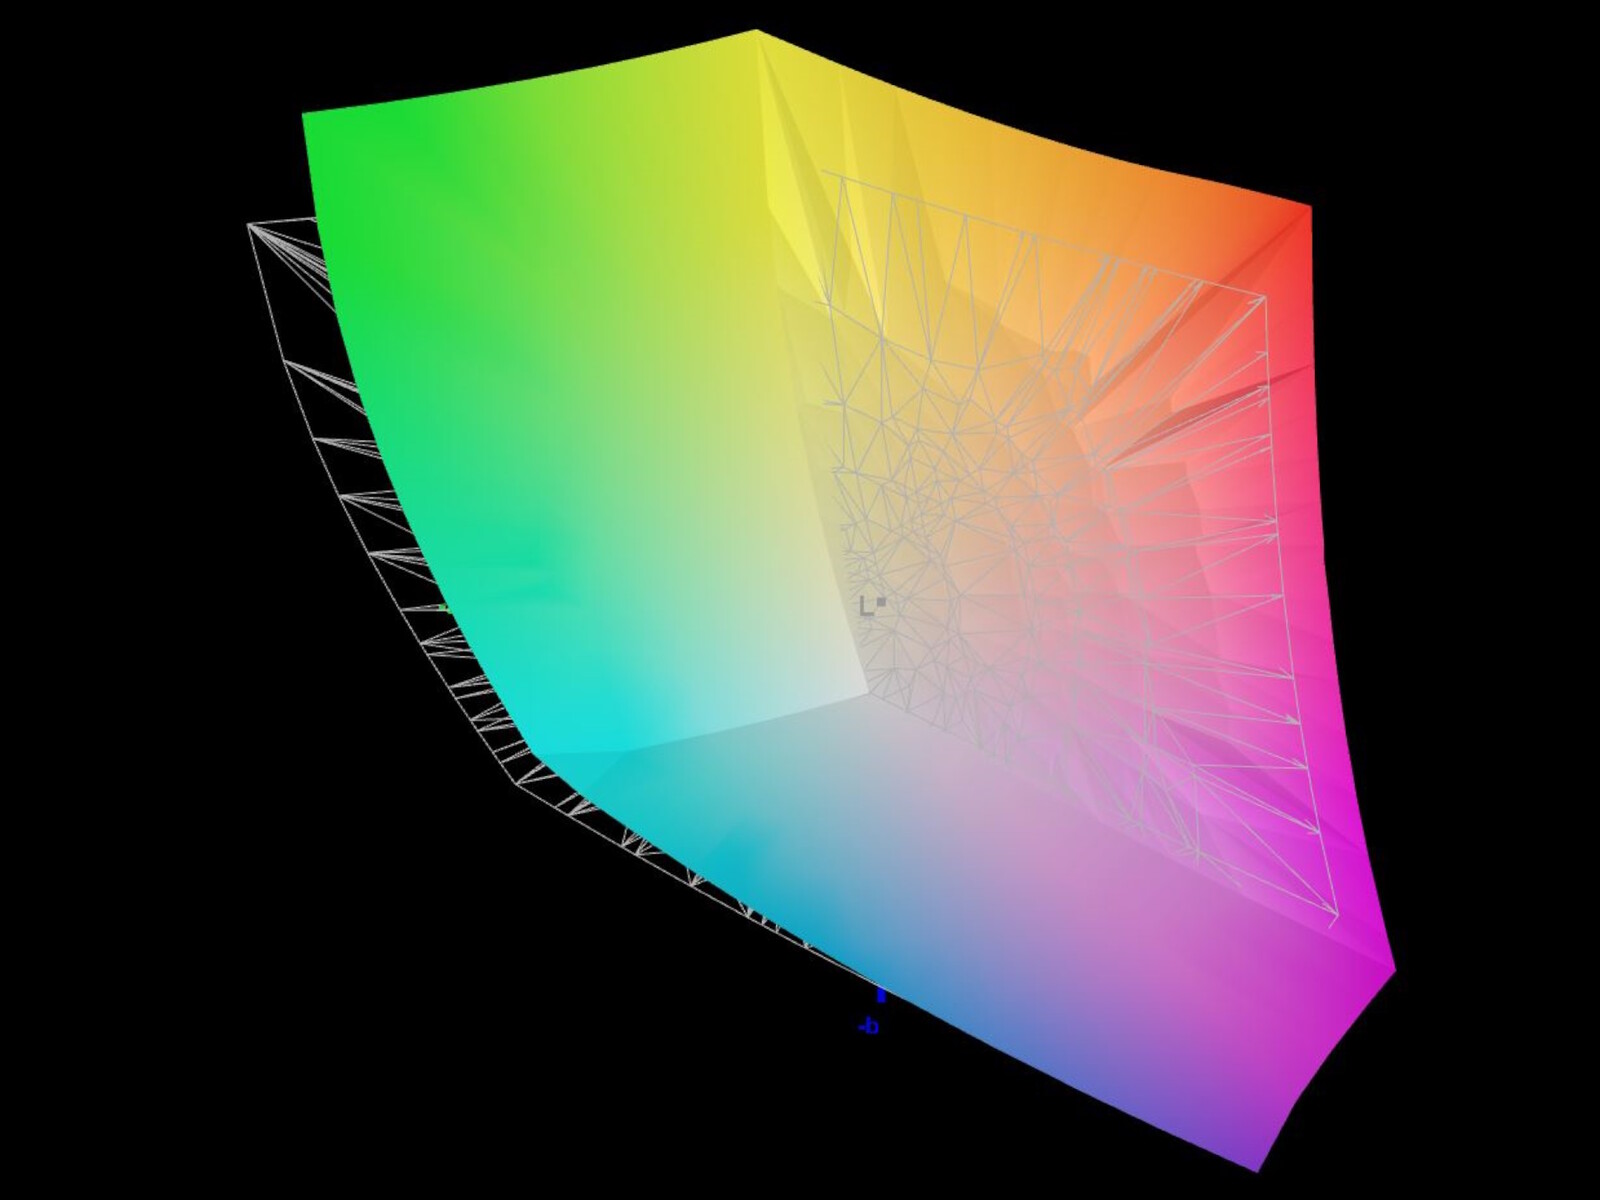
91.8% AdobeRGB 1998 (Argyll 3D)
100% sRGB (Argyll 3D)
99.8% Display P3 (Argyll 3D)
Gamma: 2.52
CCT: 5657 K
| Acer Predator Helios 18 N23Q2 AUO45A8 (B180QAN01.2), IPS, 2560x1600, 18" | MSI GE78HX 13VH-070US AU Optronics B170QAN01.2, IPS, 2560x1600, 17" | HP Omen 17-ck2097ng BOE BOE09BF, IPS, 2560x1440, 17.3" | Alienware m18 R1 Chi Mei 180JME, IPS, 1920x1200, 18" | Asus ROG Strix G18 G814JI NE180QDM-NZ2 (BOE0B35), IPS, 2560x1600, 18" | Razer Blade 18 RTX 4070 AU Optronics B180QAN01.0, IPS, 2560x1600, 18" | |
|---|---|---|---|---|---|---|
| Display | -3% | -19% | -1% | -3% | -3% | |
| Display P3 Coverage (%) | 99.8 | 97.6 -2% | 67.4 -32% | 97.7 -2% | 98.1 -2% | 96.9 -3% |
| sRGB Coverage (%) | 100 | 99.9 0% | 97.6 -2% | 100 0% | 99.9 0% | 99.8 0% |
| AdobeRGB 1998 Coverage (%) | 91.8 | 86.5 -6% | 69.6 -24% | 89.8 -2% | 85.6 -7% | 85.3 -7% |
| Response Times | 55% | -28% | 53% | 38% | 50% | |
| Response Time Grey 50% / Grey 80% * (ms) | 7.6 ? | 4.2 ? 45% | 15.6 ? -105% | 3 ? 61% | 5.6 ? 26% | 4.2 ? 45% |
| Response Time Black / White * (ms) | 17.8 ? | 6.4 ? 64% | 8.9 ? 50% | 9.9 ? 44% | 9 ? 49% | 8 ? 55% |
| PWM Frequency (Hz) | 2509 | |||||
| Screen | -17% | 13% | 20% | 8% | -3% | |
| Brightness middle (cd/m²) | 360 | 398.6 11% | 371 3% | 372.8 4% | 471 31% | 549.6 53% |
| Brightness (cd/m²) | 355 | 384 8% | 350 -1% | 367 3% | 422 19% | 524 48% |
| Brightness Distribution (%) | 92 | 89 -3% | 90 -2% | 97 5% | 83 -10% | 89 -3% |
| Black Level * (cd/m²) | 0.21 | 0.46 -119% | 0.32 -52% | 0.32 -52% | 0.47 -124% | 0.53 -152% |
| Contrast (:1) | 1714 | 867 -49% | 1159 -32% | 1165 -32% | 1002 -42% | 1037 -39% |
| Colorchecker dE 2000 * | 3.82 | 4.05 -6% | 1.74 54% | 1.92 50% | 2.05 46% | 3.32 13% |
| Colorchecker dE 2000 max. * | 7.38 | 8.68 -18% | 3.59 51% | 3.65 51% | 4.15 44% | 6.63 10% |
| Colorchecker dE 2000 calibrated * | 2.24 | 1.02 54% | 1.01 55% | 0.51 77% | 0.8 64% | 2.7 -21% |
| Greyscale dE 2000 * | 5.06 | 6.5 -28% | 2.8 45% | 1.5 70% | 2.8 45% | 2 60% |
| Gamma | 2.52 87% | 2.11 104% | 2.19 100% | 2.34 94% | 2.204 100% | 2.29 96% |
| CCT | 5657 115% | 7518 86% | 6474 100% | 6607 98% | 7122 91% | 6319 103% |
| Média Total (Programa/Configurações) | 12% /
-4% | -11% /
1% | 24% /
20% | 14% /
10% | 15% /
4% |
* ... menor é melhor
Fizemos a medição com base no espaço de cores P3. O monitor cobre sRGB e DisplayP3 quase completamente. O AdobeRGB tem 92% de cobertura. Graças ao P3 em particular, a tela brilhante e de alto contraste também é adequada para edição de imagens e vídeos.
No entanto, quando sai da caixa, a tela dispara acima do importante valor DeltaE de 3 para cores e escala de cinza. Nossa calibração manual melhora os desvios de cor e coloca os valores DeltaE abaixo do limite. Diminuir o brilho para 160 nits também pode trazer mais melhorias. Nosso arquivo icc calibrado pode ser baixado gratuitamente acima.
Exibir tempos de resposta
| ↔ Tempo de resposta preto para branco | ||
|---|---|---|
| 17.8 ms ... ascensão ↗ e queda ↘ combinadas | ↗ 15.6 ms ascensão | 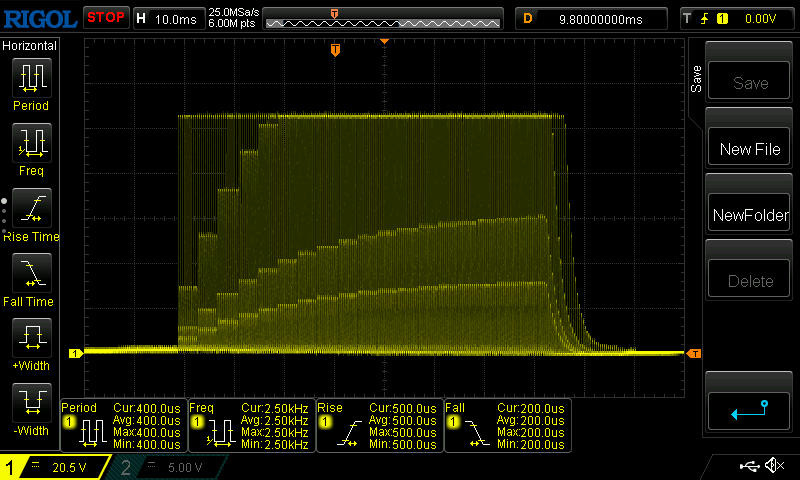 |
| ↘ 2.2 ms queda | ||
| A tela mostra boas taxas de resposta em nossos testes, mas pode ser muito lenta para jogadores competitivos. Em comparação, todos os dispositivos testados variam de 0.1 (mínimo) a 240 (máximo) ms. » 40 % de todos os dispositivos são melhores. Isso significa que o tempo de resposta medido é melhor que a média de todos os dispositivos testados (19.8 ms). | ||
| ↔ Tempo de resposta 50% cinza a 80% cinza | ||
| 7.6 ms ... ascensão ↗ e queda ↘ combinadas | ↗ 4.4 ms ascensão | 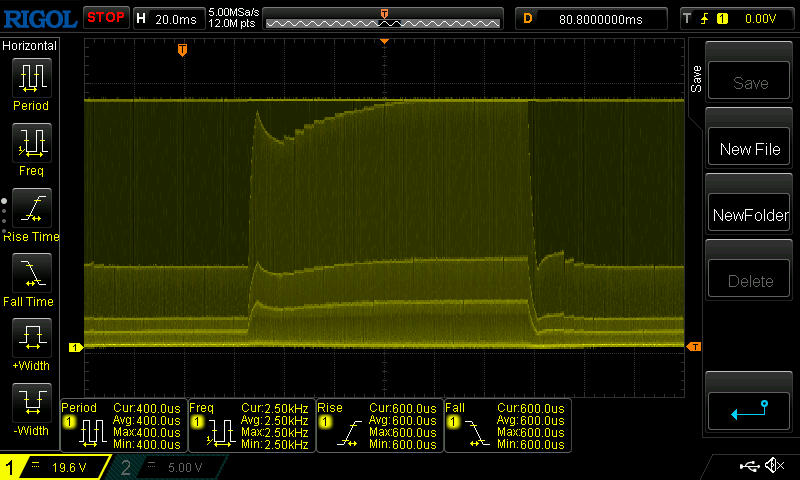 |
| ↘ 3.2 ms queda | ||
| A tela mostra taxas de resposta muito rápidas em nossos testes e deve ser muito adequada para jogos em ritmo acelerado. Em comparação, todos os dispositivos testados variam de 0.165 (mínimo) a 636 (máximo) ms. » 20 % de todos os dispositivos são melhores. Isso significa que o tempo de resposta medido é melhor que a média de todos os dispositivos testados (31 ms). | ||
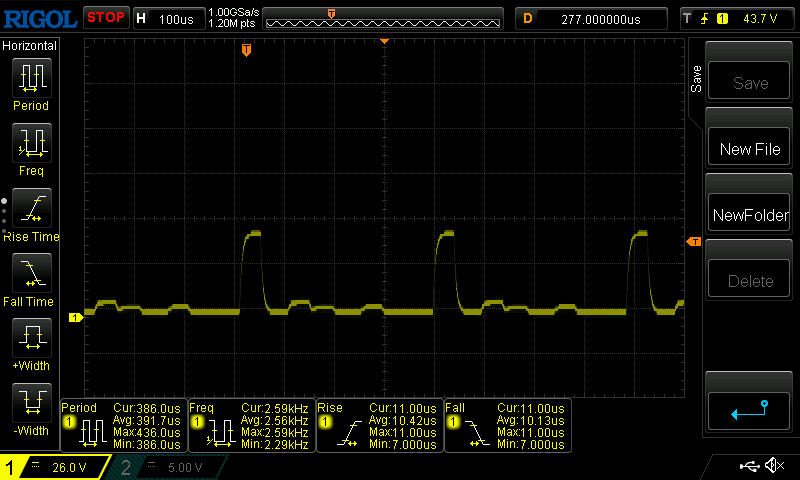
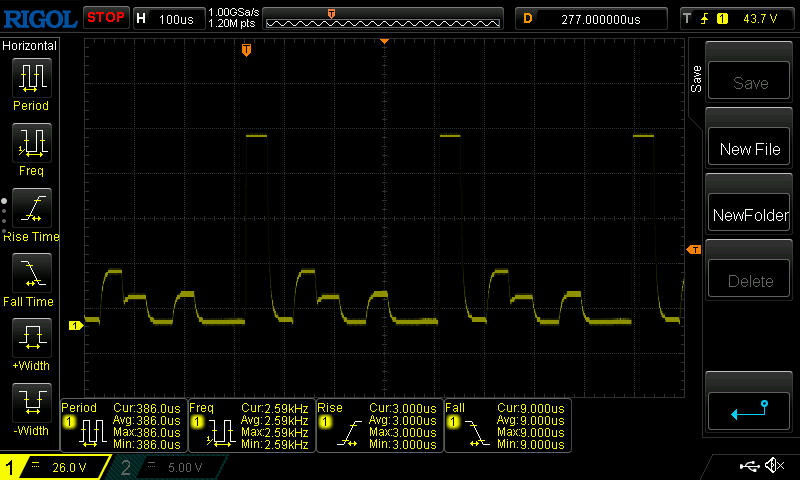
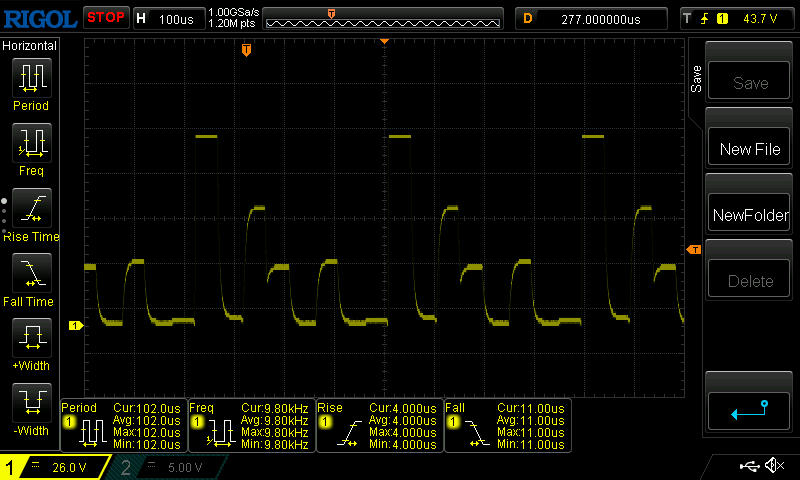
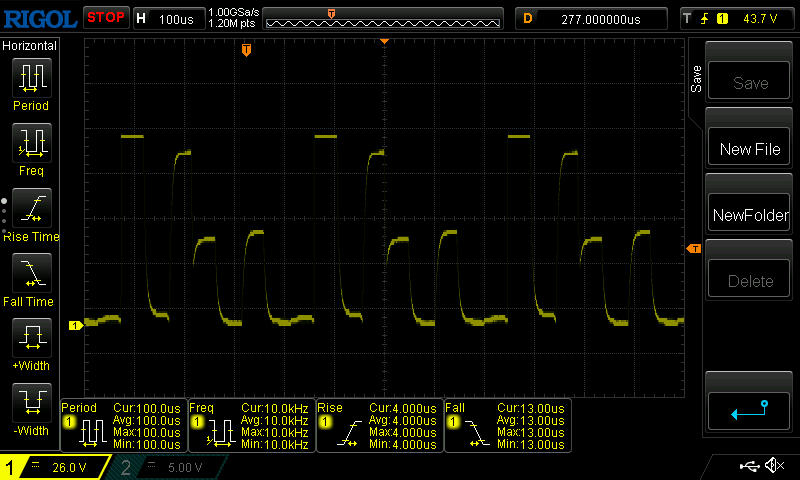
Cintilação da tela / PWM (modulação por largura de pulso)
| Tela tremeluzindo/PWM detectado | 2509 Hz | 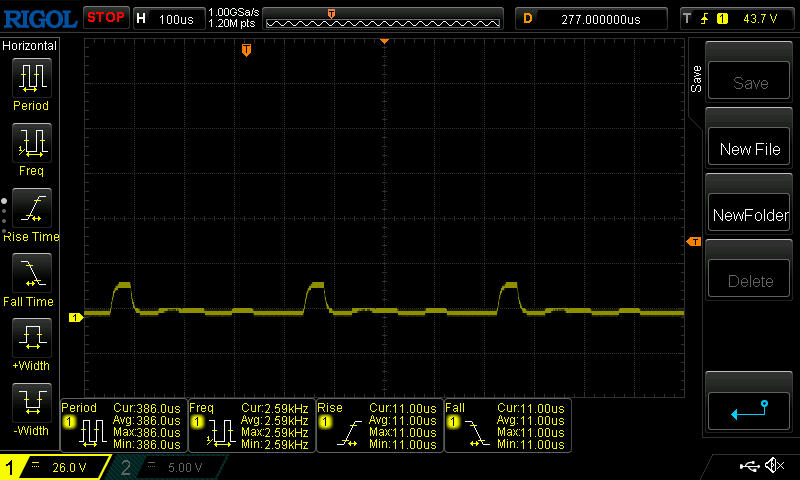 | |
A luz de fundo da tela pisca em 2509 Hz (pior caso, por exemplo, utilizando PWM) . A frequência de 2509 Hz é bastante alta, então a maioria dos usuários sensíveis ao PWM não deve notar nenhuma oscilação. [pwm_comparison] Em comparação: 52 % de todos os dispositivos testados não usam PWM para escurecer a tela. Se PWM foi detectado, uma média de 7754 (mínimo: 5 - máximo: 343500) Hz foi medida. | |||
O PWM é usado para controle de brilho no visor. No brilho mínimo, a frequência é mais baixa, em torno de 2,5 kHz, mas ainda é alta o suficiente para não causar problemas a pessoas sensíveis.
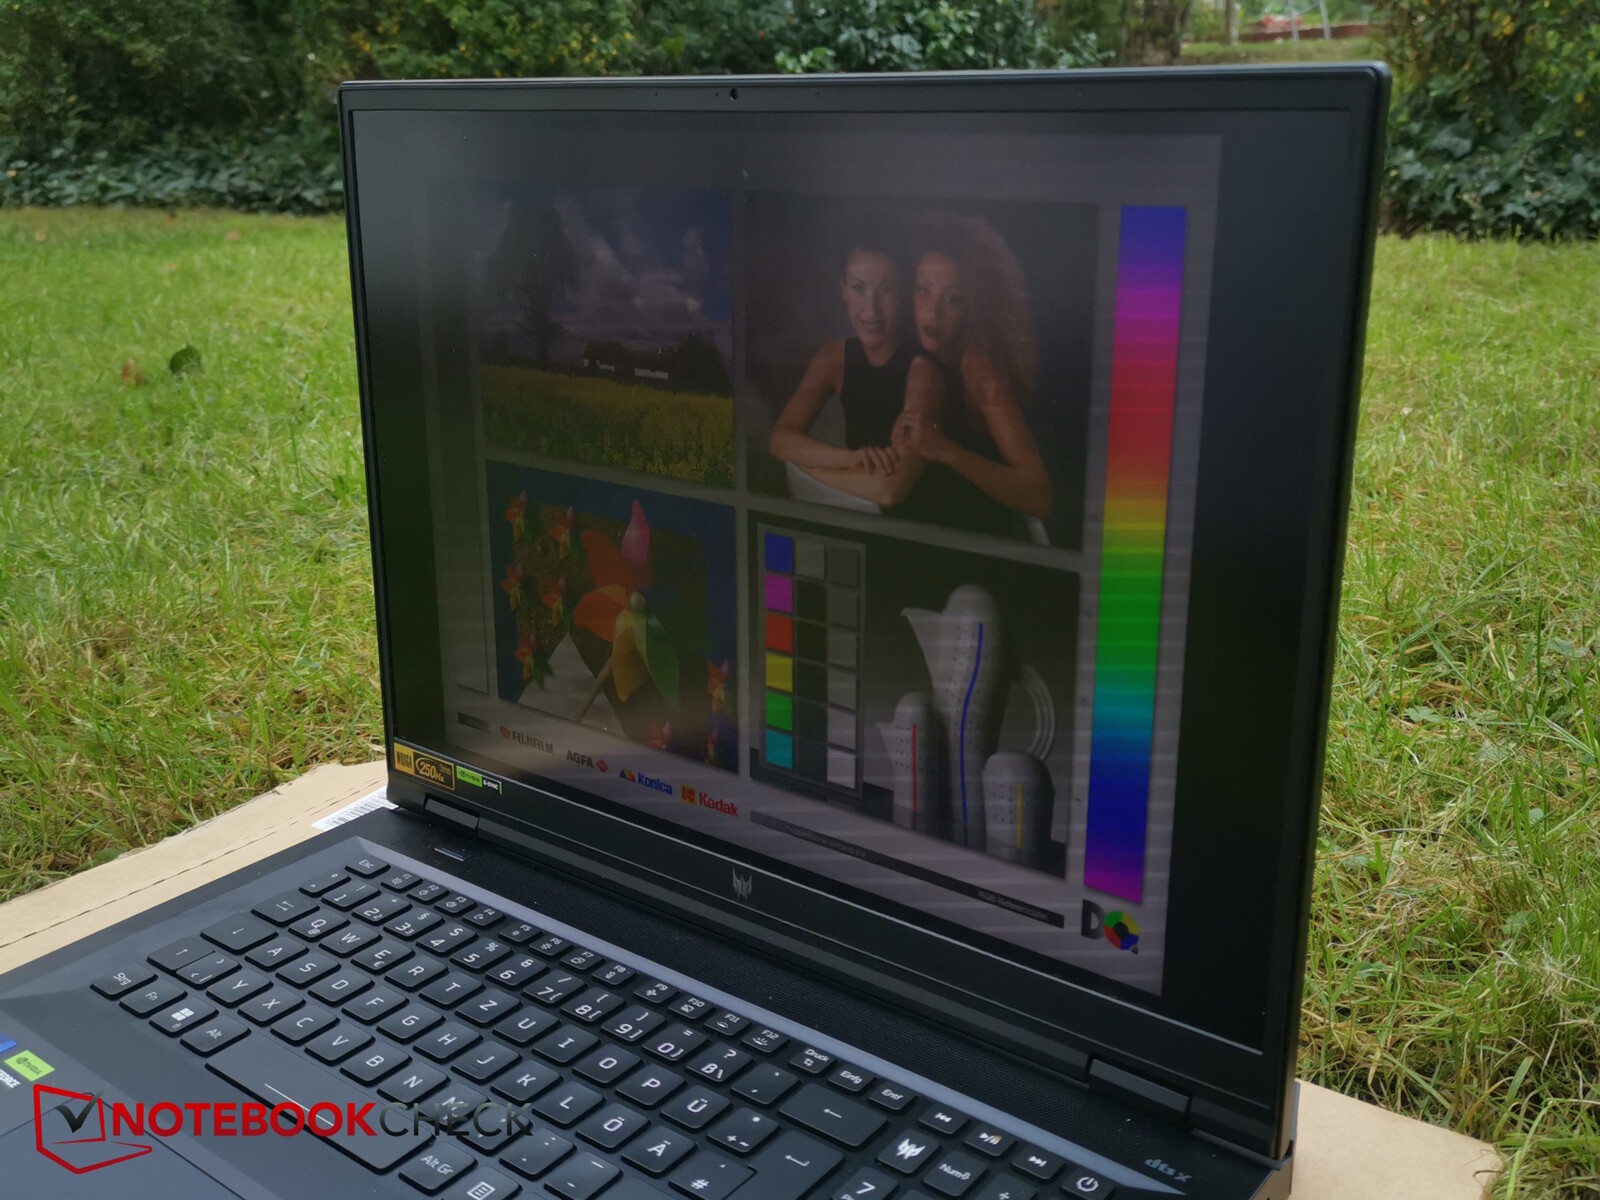
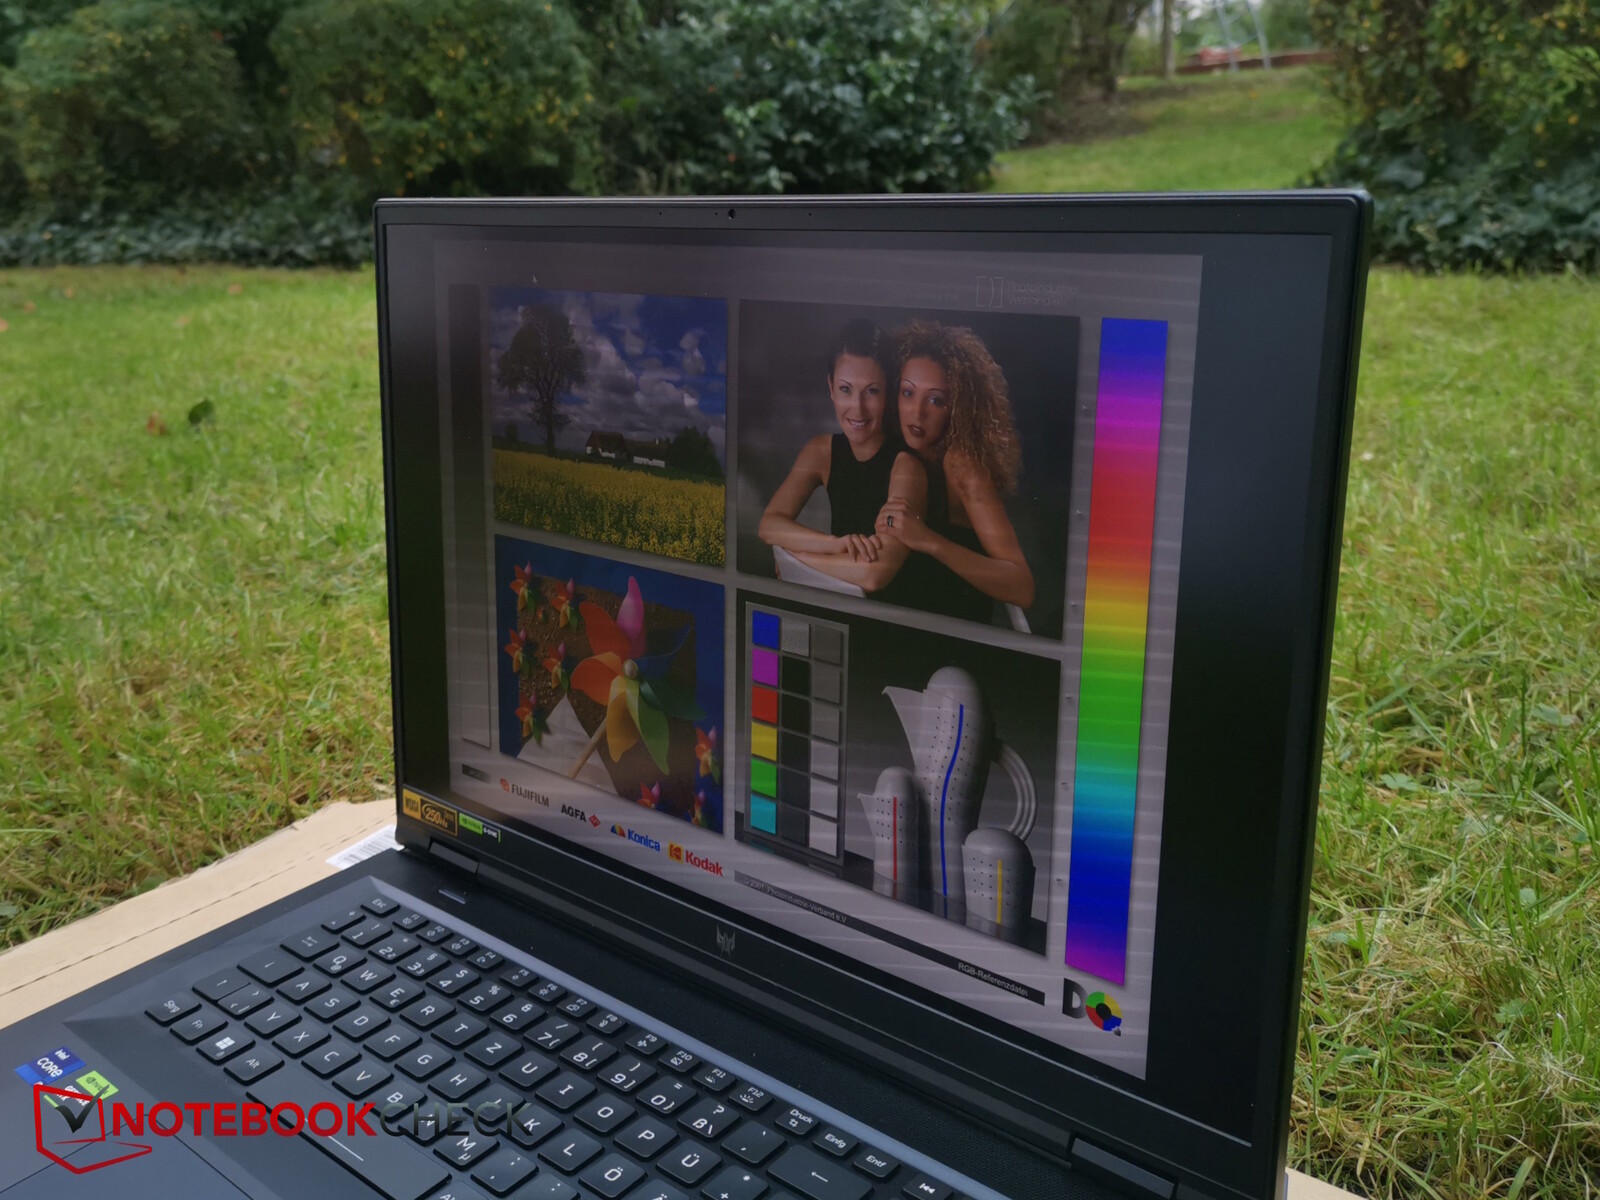
Em ambientes externos, pode valer a pena configurar a tela para HDR para torná-la ainda mais brilhante. Na sombra, o conteúdo ainda pode ser visto muito bem.

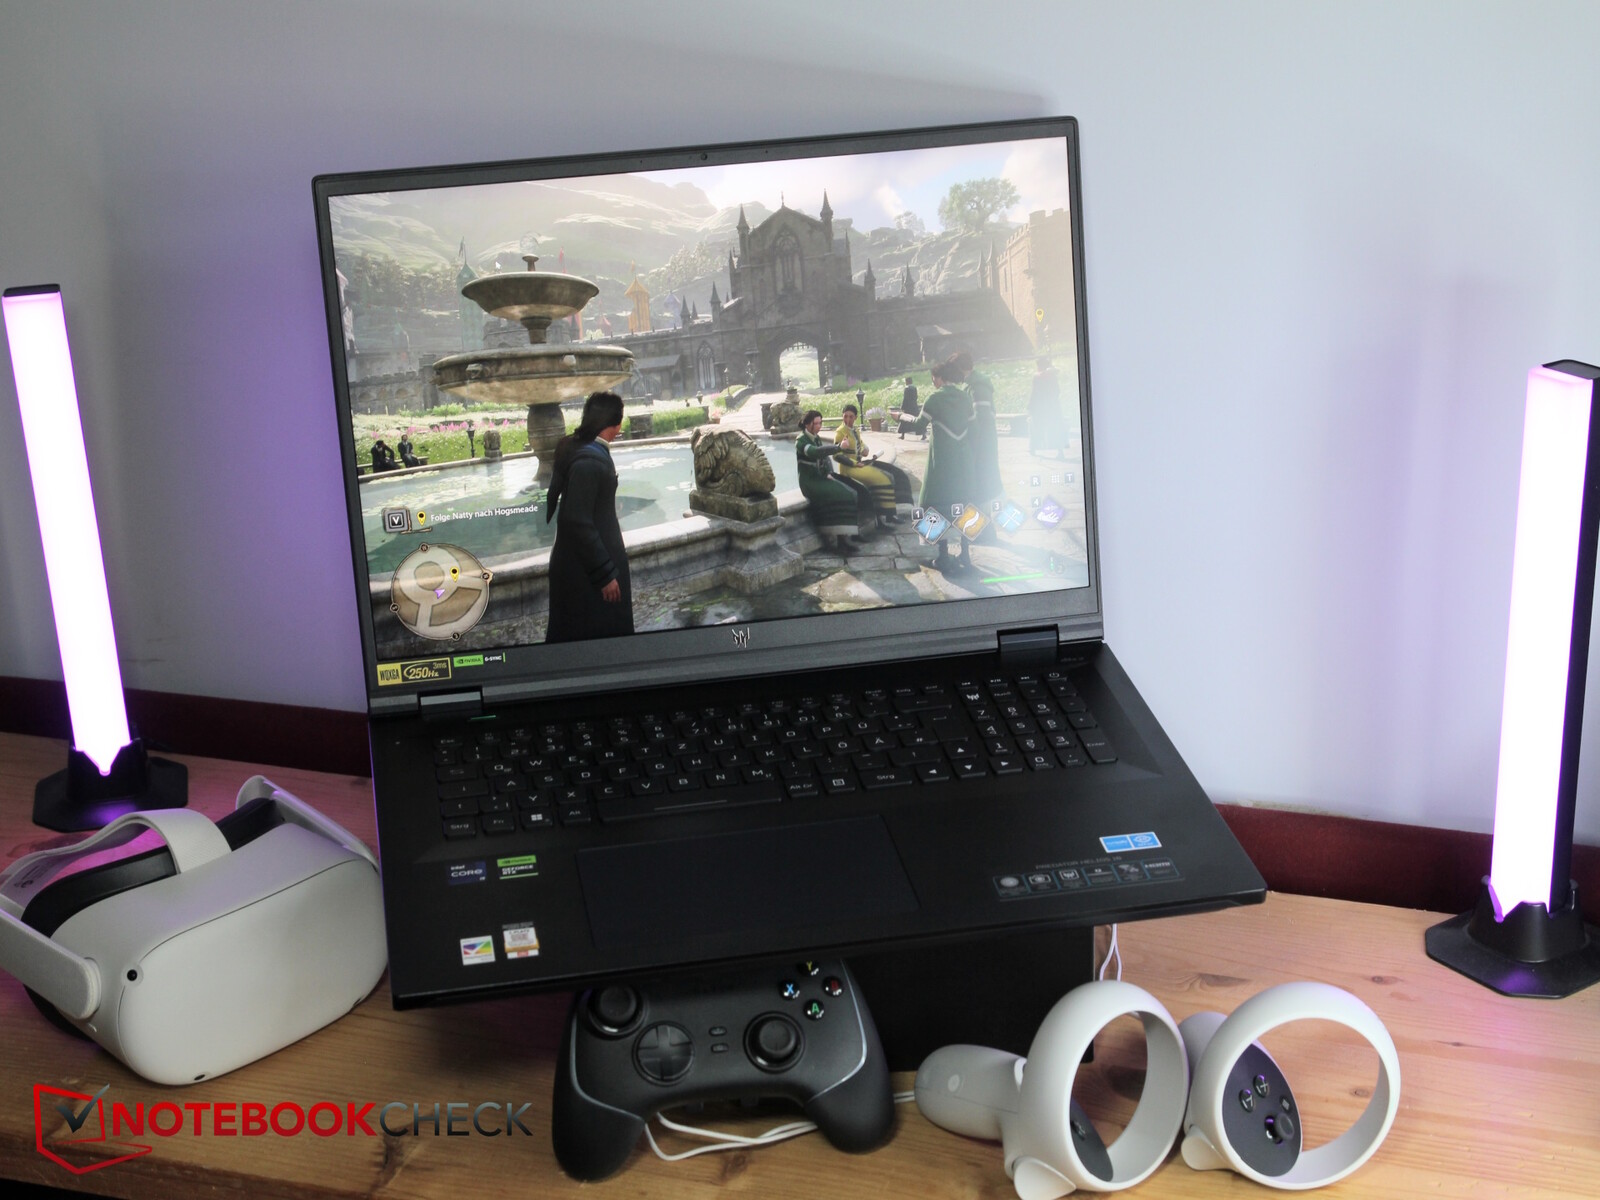
Desempenho - CPU HX e RTX 4080
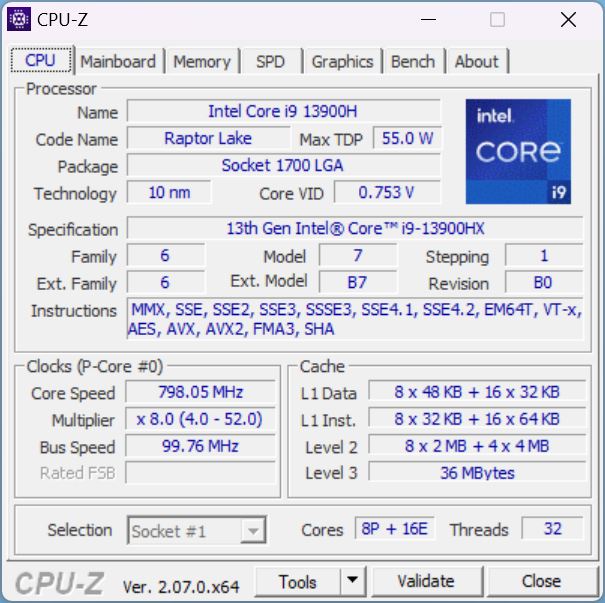
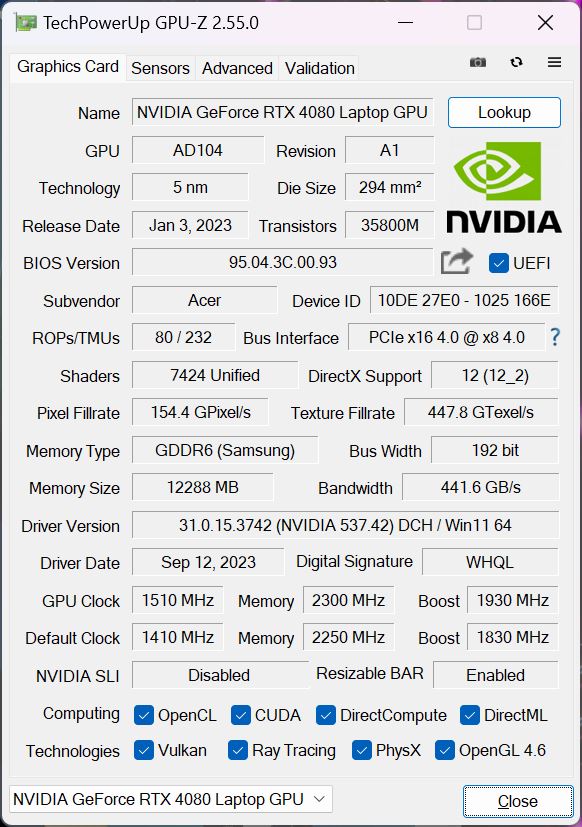
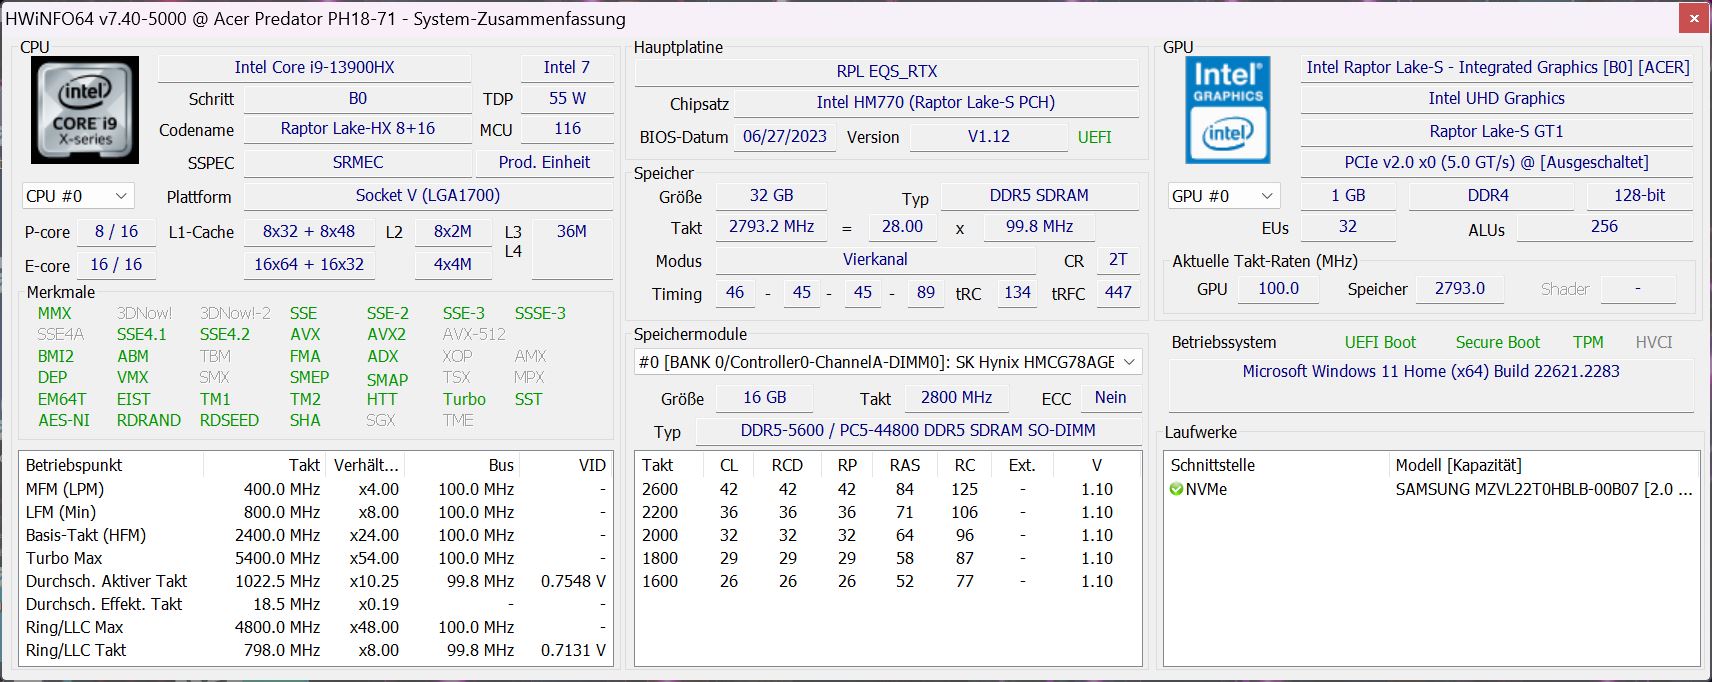
Equipado com um Intel Core i9-13900HX e uma GeForce GPU para laptop RTX 4080mais 32 GB de RAM e uma tela MiniLED de 18 polegadas, temos um substituto de desktop extremamente potente e um gamer de alto nível que deve renderizar todos os jogos atuais sem problemas, mesmo na resolução WQXGA nativa.
Graças à boa tela, o laptop também pode servir como uma estação de trabalho para pessoas criativas.
Condições de teste
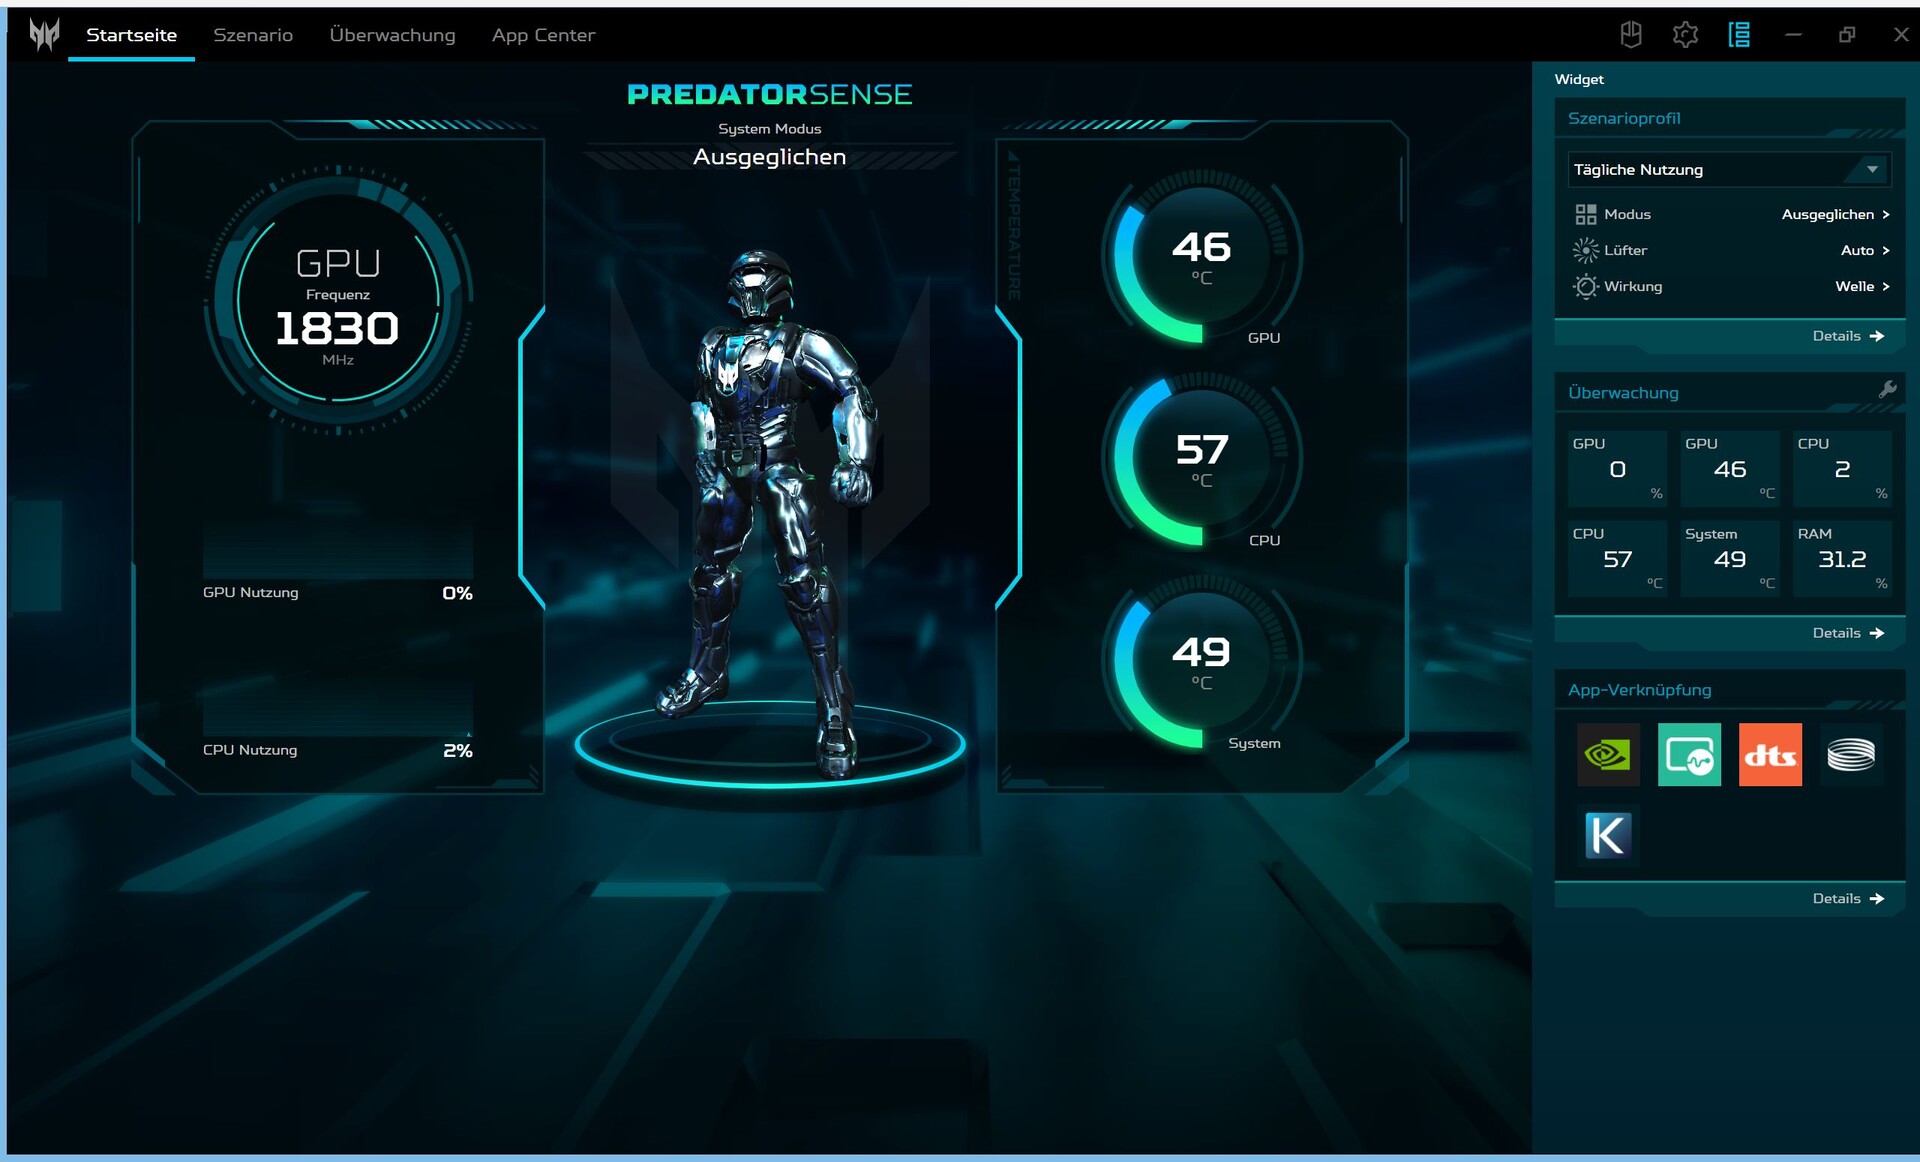
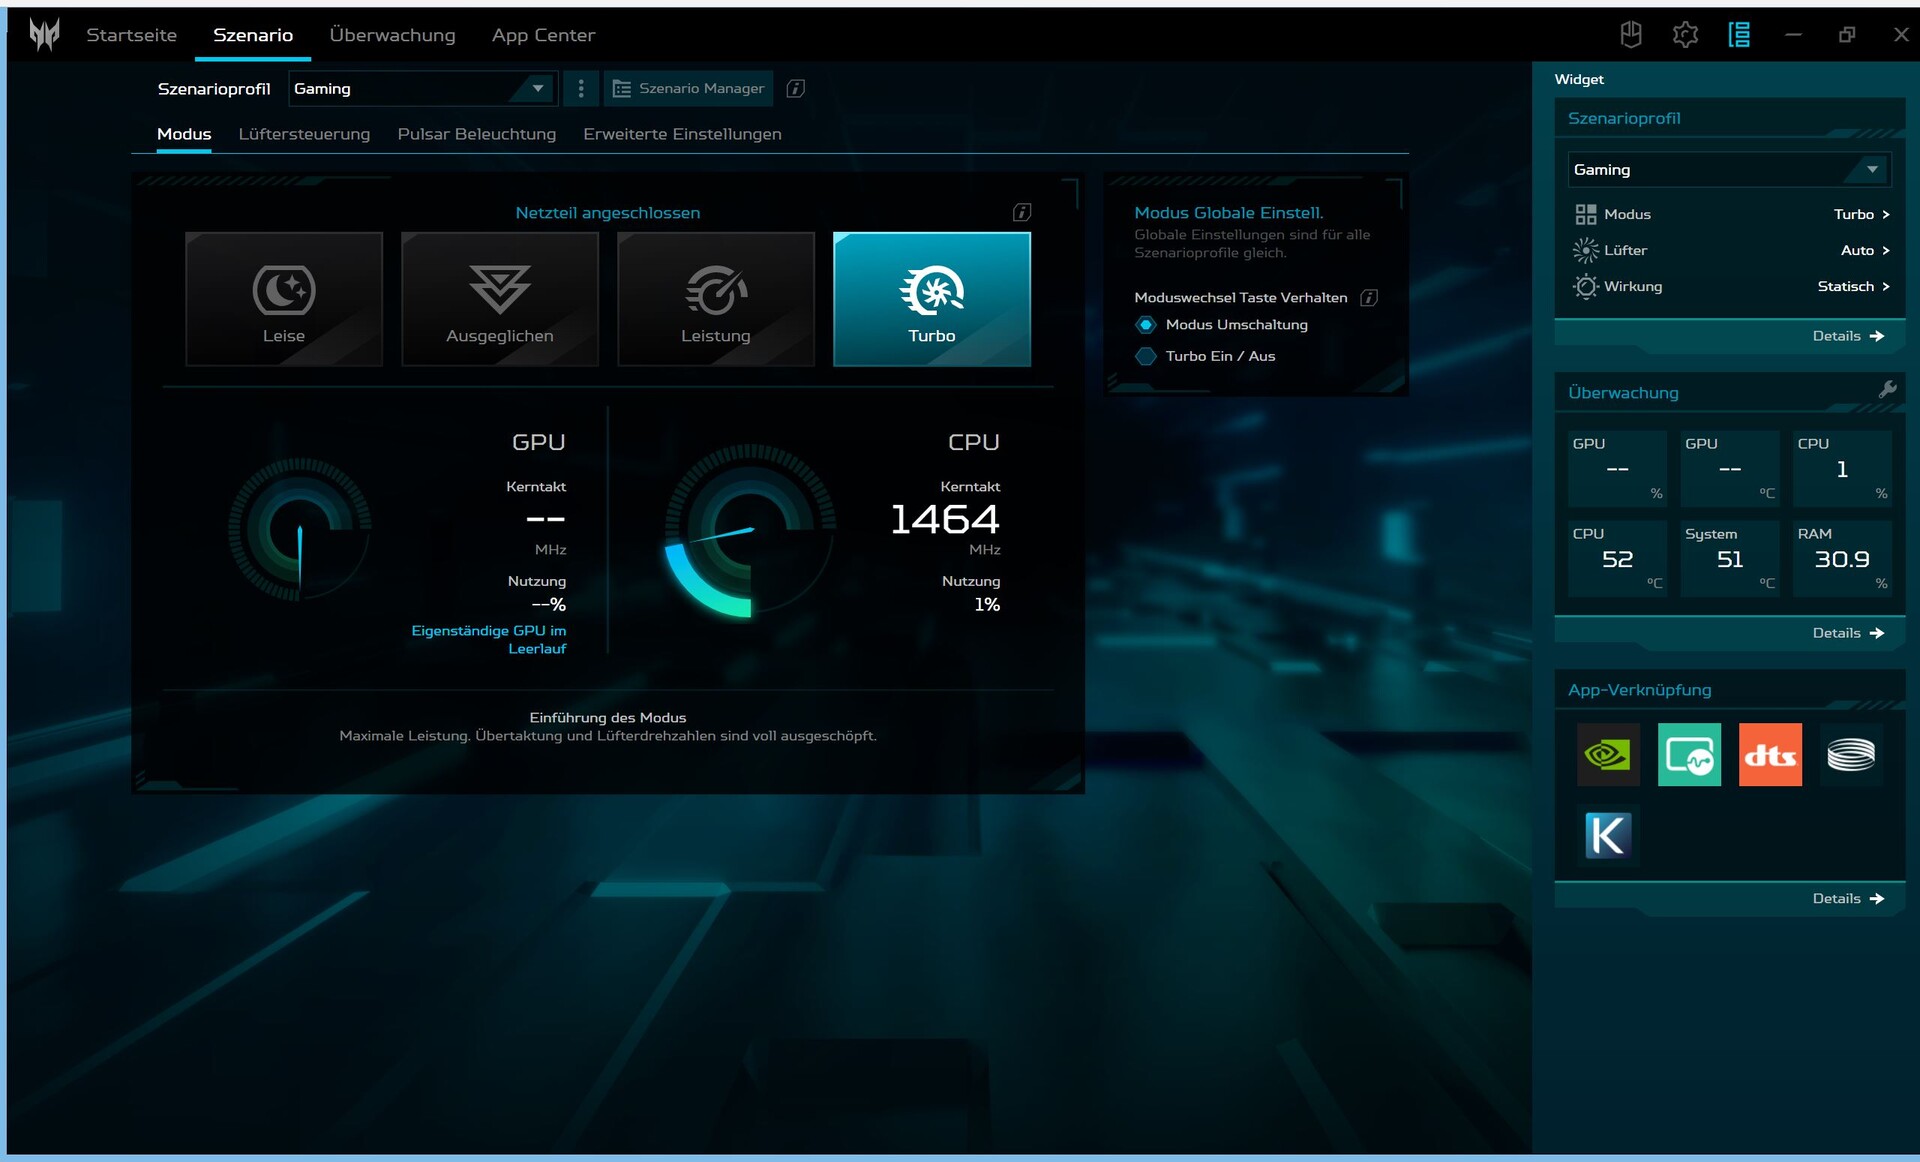
A Acer instala, entre outras coisas, o software Predator Sense em seu laptop para jogos. Quatro modos de desempenho(Eco, Balanced, Performance, Turbo), bem como outras opções (por exemplo, para a iluminação do teclado) podem ser personalizados aqui. O software é bastante claro, mas não oferece tantas configurações (manuais) quanto os dispositivos concorrentes. Por exemplo, falta uma opção para a troca de GPU, assim como configurações para ajustar manualmente os parâmetros de desempenho.
Infelizmente, a Acer também instala outro software, como o McAfee ou o Acer Care, que é mais voltado para o suporte. Além disso, recebemos publicidade não solicitada da Acer. Uma vez até recebemos uma solicitação não solicitada para instalar o navegador Opera. Essa publicidade forçada por meio de software obrigatório do fabricante é um verdadeiro incômodo e, infelizmente, está se tornando cada vez mais frequente, por exemplo, pela Lenovo no LOQ 16clicar no hub de jogos "Planet9" no Sense aciona uma solicitação de cookie que inclui vários botões irritantes de "interesse legítimo", que devem ser desmarcados individualmente se os usuários desejarem optar por não participar.
Usamos principalmente o modo Turbo para obter os melhores resultados de benchmark, mas também listamos informações sobre os outros modos.

Processador
O Intel Core i9-13900HXé uma verdadeira CPU de ponta da série Raptor-Lake. Ele pode executar 32 threads com 8 núcleos P (incluindo hyperthreading) e 16 núcleos E. Seus núcleos têm um clock base de 1,6 (núcleos E) e 2,2 GHz (núcleos P) e atingem um turbo de núcleo único de 3,9 a 5,4 GHz.
No loop Cinebench R15 (loop CB15), o Helios oferece um desempenho forte e, acima de tudo, consistente, que, no entanto, é minimamente superado peloMSI GE78HX e pelo Alienware m18 R1 com uma CPU um pouco mais potente (i9-13950HX e i9-13980HXo HP Omen com a mesma CPU supera facilmente o Helios, assim como os dispositivos concorrentes com CPUs H em vez de HX.
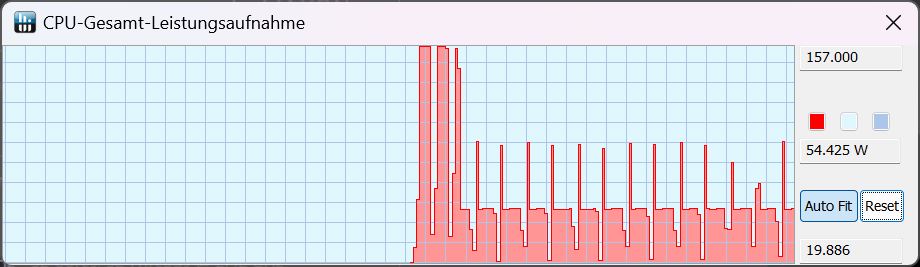
Listamos todos os valores de TDP alcançados para cada modo de desempenho durante os loops do CB15 em uma tabela abaixo. No modo de bateria, o senhor ainda tem a opção de escolher entre os modos Balanced e Eco . Em ambos os modos, o TDP ainda é de 25 W e a pontuação do CB15 é de cerca de 1.300 pontos, uma queda de mais de 70%! Portanto, não há diferença real de desempenho entre os dois modos.
| Modo TDP/Desempenho | Turbo | Desempenho | Balanceado | Silencioso | Bateria Balanceada | Bateria Silenciosa |
|---|---|---|---|---|---|---|
| Início do CB15 | 157 | 157 | 157 | 157 | 25 | 25 |
| Histórico posterior do CB15 | 157 | 125 | 85 | 25 | 55 | 25 |
Cinebench R15 Multi Sustained Load
Cinebench R23: Multi Core | Single Core
Cinebench R20: CPU (Multi Core) | CPU (Single Core)
Cinebench R15: CPU Multi 64Bit | CPU Single 64Bit
Blender: v2.79 BMW27 CPU
7-Zip 18.03: 7z b 4 | 7z b 4 -mmt1
Geekbench 5.5: Multi-Core | Single-Core
HWBOT x265 Benchmark v2.2: 4k Preset
LibreOffice : 20 Documents To PDF
R Benchmark 2.5: Overall mean
| CPU Performance rating | |
| MSI GE78HX 13VH-070US | |
| Alienware m18 R1 | |
| Acer Predator Helios 18 N23Q2 | |
| Razer Blade 18 RTX 4070 | |
| Média Intel Core i9-13900HX | |
| HP Omen 17-ck2097ng | |
| Média da turma Gaming | |
| Asus ROG Strix G18 G814JI | |
| Cinebench R23 / Multi Core | |
| MSI GE78HX 13VH-070US | |
| Alienware m18 R1 | |
| Acer Predator Helios 18 N23Q2 | |
| Razer Blade 18 RTX 4070 | |
| Média Intel Core i9-13900HX (24270 - 32623, n=23) | |
| HP Omen 17-ck2097ng | |
| Média da turma Gaming (10488 - 42661, n=107, últimos 2 anos) | |
| Asus ROG Strix G18 G814JI | |
| Cinebench R23 / Single Core | |
| MSI GE78HX 13VH-070US | |
| Alienware m18 R1 | |
| HP Omen 17-ck2097ng | |
| Acer Predator Helios 18 N23Q2 | |
| Razer Blade 18 RTX 4070 | |
| Média Intel Core i9-13900HX (1867 - 2105, n=20) | |
| Média da turma Gaming (1166 - 2415, n=107, últimos 2 anos) | |
| Asus ROG Strix G18 G814JI | |
| Cinebench R20 / CPU (Multi Core) | |
| MSI GE78HX 13VH-070US | |
| Alienware m18 R1 | |
| Acer Predator Helios 18 N23Q2 | |
| Razer Blade 18 RTX 4070 | |
| Média Intel Core i9-13900HX (9152 - 12541, n=21) | |
| Média da turma Gaming (4029 - 16433, n=106, últimos 2 anos) | |
| HP Omen 17-ck2097ng | |
| Asus ROG Strix G18 G814JI | |
| Cinebench R20 / CPU (Single Core) | |
| Alienware m18 R1 | |
| HP Omen 17-ck2097ng | |
| Acer Predator Helios 18 N23Q2 | |
| MSI GE78HX 13VH-070US | |
| Razer Blade 18 RTX 4070 | |
| Média Intel Core i9-13900HX (722 - 810, n=21) | |
| Média da turma Gaming (442 - 913, n=106, últimos 2 anos) | |
| Asus ROG Strix G18 G814JI | |
| Cinebench R15 / CPU Multi 64Bit | |
| MSI GE78HX 13VH-070US | |
| Alienware m18 R1 | |
| Acer Predator Helios 18 N23Q2 | |
| Média Intel Core i9-13900HX (3913 - 4970, n=22) | |
| Razer Blade 18 RTX 4070 | |
| HP Omen 17-ck2097ng | |
| Média da turma Gaming (1578 - 6330, n=105, últimos 2 anos) | |
| Asus ROG Strix G18 G814JI | |
| Cinebench R15 / CPU Single 64Bit | |
| MSI GE78HX 13VH-070US | |
| Alienware m18 R1 | |
| HP Omen 17-ck2097ng | |
| Razer Blade 18 RTX 4070 | |
| Média da turma Gaming (188.8 - 350, n=106, últimos 2 anos) | |
| Acer Predator Helios 18 N23Q2 | |
| Média Intel Core i9-13900HX (247 - 304, n=22) | |
| Asus ROG Strix G18 G814JI | |
| Blender / v2.79 BMW27 CPU | |
| Asus ROG Strix G18 G814JI | |
| HP Omen 17-ck2097ng | |
| Média da turma Gaming (79 - 330, n=104, últimos 2 anos) | |
| Média Intel Core i9-13900HX (101 - 153, n=22) | |
| Razer Blade 18 RTX 4070 | |
| Acer Predator Helios 18 N23Q2 | |
| MSI GE78HX 13VH-070US | |
| Alienware m18 R1 | |
| 7-Zip 18.03 / 7z b 4 | |
| Alienware m18 R1 | |
| MSI GE78HX 13VH-070US | |
| Acer Predator Helios 18 N23Q2 | |
| Razer Blade 18 RTX 4070 | |
| Média Intel Core i9-13900HX (90675 - 127283, n=21) | |
| HP Omen 17-ck2097ng | |
| Média da turma Gaming (33491 - 148086, n=105, últimos 2 anos) | |
| Asus ROG Strix G18 G814JI | |
| 7-Zip 18.03 / 7z b 4 -mmt1 | |
| MSI GE78HX 13VH-070US | |
| Acer Predator Helios 18 N23Q2 | |
| HP Omen 17-ck2097ng | |
| Alienware m18 R1 | |
| Razer Blade 18 RTX 4070 | |
| Média Intel Core i9-13900HX (6340 - 7177, n=21) | |
| Média da turma Gaming (4199 - 7436, n=105, últimos 2 anos) | |
| Asus ROG Strix G18 G814JI | |
| Geekbench 5.5 / Multi-Core | |
| Alienware m18 R1 | |
| MSI GE78HX 13VH-070US | |
| Acer Predator Helios 18 N23Q2 | |
| HP Omen 17-ck2097ng | |
| Razer Blade 18 RTX 4070 | |
| Média Intel Core i9-13900HX (17614 - 21075, n=22) | |
| Média da turma Gaming (6460 - 28263, n=105, últimos 2 anos) | |
| Asus ROG Strix G18 G814JI | |
| Geekbench 5.5 / Single-Core | |
| MSI GE78HX 13VH-070US | |
| HP Omen 17-ck2097ng | |
| Alienware m18 R1 | |
| Média da turma Gaming (986 - 2474, n=105, últimos 2 anos) | |
| Acer Predator Helios 18 N23Q2 | |
| Razer Blade 18 RTX 4070 | |
| Média Intel Core i9-13900HX (1345 - 2093, n=22) | |
| Asus ROG Strix G18 G814JI | |
| HWBOT x265 Benchmark v2.2 / 4k Preset | |
| MSI GE78HX 13VH-070US | |
| Alienware m18 R1 | |
| Razer Blade 18 RTX 4070 | |
| Acer Predator Helios 18 N23Q2 | |
| Média Intel Core i9-13900HX (23.5 - 34.4, n=22) | |
| Média da turma Gaming (11.5 - 44.4, n=105, últimos 2 anos) | |
| HP Omen 17-ck2097ng | |
| Asus ROG Strix G18 G814JI | |
| LibreOffice / 20 Documents To PDF | |
| Asus ROG Strix G18 G814JI | |
| Média da turma Gaming (33.2 - 88.8, n=105, últimos 2 anos) | |
| Acer Predator Helios 18 N23Q2 | |
| MSI GE78HX 13VH-070US | |
| Alienware m18 R1 | |
| HP Omen 17-ck2097ng | |
| Razer Blade 18 RTX 4070 | |
| Média Intel Core i9-13900HX (32.8 - 51.1, n=21) | |
| R Benchmark 2.5 / Overall mean | |
| Asus ROG Strix G18 G814JI | |
| Média da turma Gaming (0.3439 - 0.759, n=106, últimos 2 anos) | |
| Média Intel Core i9-13900HX (0.375 - 0.4564, n=22) | |
| Acer Predator Helios 18 N23Q2 | |
| Razer Blade 18 RTX 4070 | |
| Alienware m18 R1 | |
| HP Omen 17-ck2097ng | |
| MSI GE78HX 13VH-070US | |
* ... menor é melhor
AIDA64: FP32 Ray-Trace | FPU Julia | CPU SHA3 | CPU Queen | FPU SinJulia | FPU Mandel | CPU AES | CPU ZLib | FP64 Ray-Trace | CPU PhotoWorxx
| Performance rating | |
| Alienware m18 R1 | |
| Acer Predator Helios 18 N23Q2 | |
| MSI GE78HX 13VH-070US | |
| Média da turma Gaming | |
| Razer Blade 18 RTX 4070 | |
| Média Intel Core i9-13900HX | |
| HP Omen 17-ck2097ng | |
| Asus ROG Strix G18 G814JI | |
| AIDA64 / FP32 Ray-Trace | |
| Média da turma Gaming (10227 - 85542, n=105, últimos 2 anos) | |
| Alienware m18 R1 | |
| MSI GE78HX 13VH-070US | |
| Acer Predator Helios 18 N23Q2 | |
| Razer Blade 18 RTX 4070 | |
| Média Intel Core i9-13900HX (17589 - 27615, n=22) | |
| Asus ROG Strix G18 G814JI | |
| HP Omen 17-ck2097ng | |
| AIDA64 / FPU Julia | |
| Alienware m18 R1 | |
| MSI GE78HX 13VH-070US | |
| Média da turma Gaming (51376 - 238426, n=105, últimos 2 anos) | |
| Acer Predator Helios 18 N23Q2 | |
| Razer Blade 18 RTX 4070 | |
| Média Intel Core i9-13900HX (88686 - 137015, n=22) | |
| Asus ROG Strix G18 G814JI | |
| HP Omen 17-ck2097ng | |
| AIDA64 / CPU SHA3 | |
| Alienware m18 R1 | |
| MSI GE78HX 13VH-070US | |
| Acer Predator Helios 18 N23Q2 | |
| Média da turma Gaming (2180 - 10115, n=105, últimos 2 anos) | |
| Razer Blade 18 RTX 4070 | |
| Média Intel Core i9-13900HX (4362 - 7029, n=22) | |
| Asus ROG Strix G18 G814JI | |
| HP Omen 17-ck2097ng | |
| AIDA64 / CPU Queen | |
| Alienware m18 R1 | |
| MSI GE78HX 13VH-070US | |
| Razer Blade 18 RTX 4070 | |
| Acer Predator Helios 18 N23Q2 | |
| HP Omen 17-ck2097ng | |
| Média Intel Core i9-13900HX (125644 - 141385, n=22) | |
| Média da turma Gaming (49785 - 173351, n=90, últimos 2 anos) | |
| Asus ROG Strix G18 G814JI | |
| AIDA64 / FPU SinJulia | |
| MSI GE78HX 13VH-070US | |
| Alienware m18 R1 | |
| Razer Blade 18 RTX 4070 | |
| Acer Predator Helios 18 N23Q2 | |
| Média Intel Core i9-13900HX (12334 - 17179, n=22) | |
| Média da turma Gaming (4424 - 33636, n=105, últimos 2 anos) | |
| HP Omen 17-ck2097ng | |
| Asus ROG Strix G18 G814JI | |
| AIDA64 / FPU Mandel | |
| Alienware m18 R1 | |
| Média da turma Gaming (25115 - 128721, n=105, últimos 2 anos) | |
| MSI GE78HX 13VH-070US | |
| Acer Predator Helios 18 N23Q2 | |
| Razer Blade 18 RTX 4070 | |
| Média Intel Core i9-13900HX (43850 - 69202, n=22) | |
| Asus ROG Strix G18 G814JI | |
| HP Omen 17-ck2097ng | |
| AIDA64 / CPU AES | |
| Acer Predator Helios 18 N23Q2 | |
| Média Intel Core i9-13900HX (89413 - 237881, n=22) | |
| Alienware m18 R1 | |
| MSI GE78HX 13VH-070US | |
| Razer Blade 18 RTX 4070 | |
| Média da turma Gaming (39258 - 247074, n=105, últimos 2 anos) | |
| HP Omen 17-ck2097ng | |
| Asus ROG Strix G18 G814JI | |
| AIDA64 / CPU ZLib | |
| MSI GE78HX 13VH-070US | |
| Alienware m18 R1 | |
| Acer Predator Helios 18 N23Q2 | |
| Razer Blade 18 RTX 4070 | |
| Média Intel Core i9-13900HX (1284 - 1958, n=22) | |
| Média da turma Gaming (574 - 2531, n=105, últimos 2 anos) | |
| HP Omen 17-ck2097ng | |
| Asus ROG Strix G18 G814JI | |
| AIDA64 / FP64 Ray-Trace | |
| Média da turma Gaming (5509 - 45446, n=105, últimos 2 anos) | |
| Alienware m18 R1 | |
| MSI GE78HX 13VH-070US | |
| Acer Predator Helios 18 N23Q2 | |
| Razer Blade 18 RTX 4070 | |
| Média Intel Core i9-13900HX (9481 - 15279, n=22) | |
| Asus ROG Strix G18 G814JI | |
| HP Omen 17-ck2097ng | |
| AIDA64 / CPU PhotoWorxx | |
| Alienware m18 R1 | |
| HP Omen 17-ck2097ng | |
| Acer Predator Helios 18 N23Q2 | |
| MSI GE78HX 13VH-070US | |
| Razer Blade 18 RTX 4070 | |
| Média Intel Core i9-13900HX (42994 - 51994, n=22) | |
| Média da turma Gaming (12271 - 89891, n=105, últimos 2 anos) | |
| Asus ROG Strix G18 G814JI | |
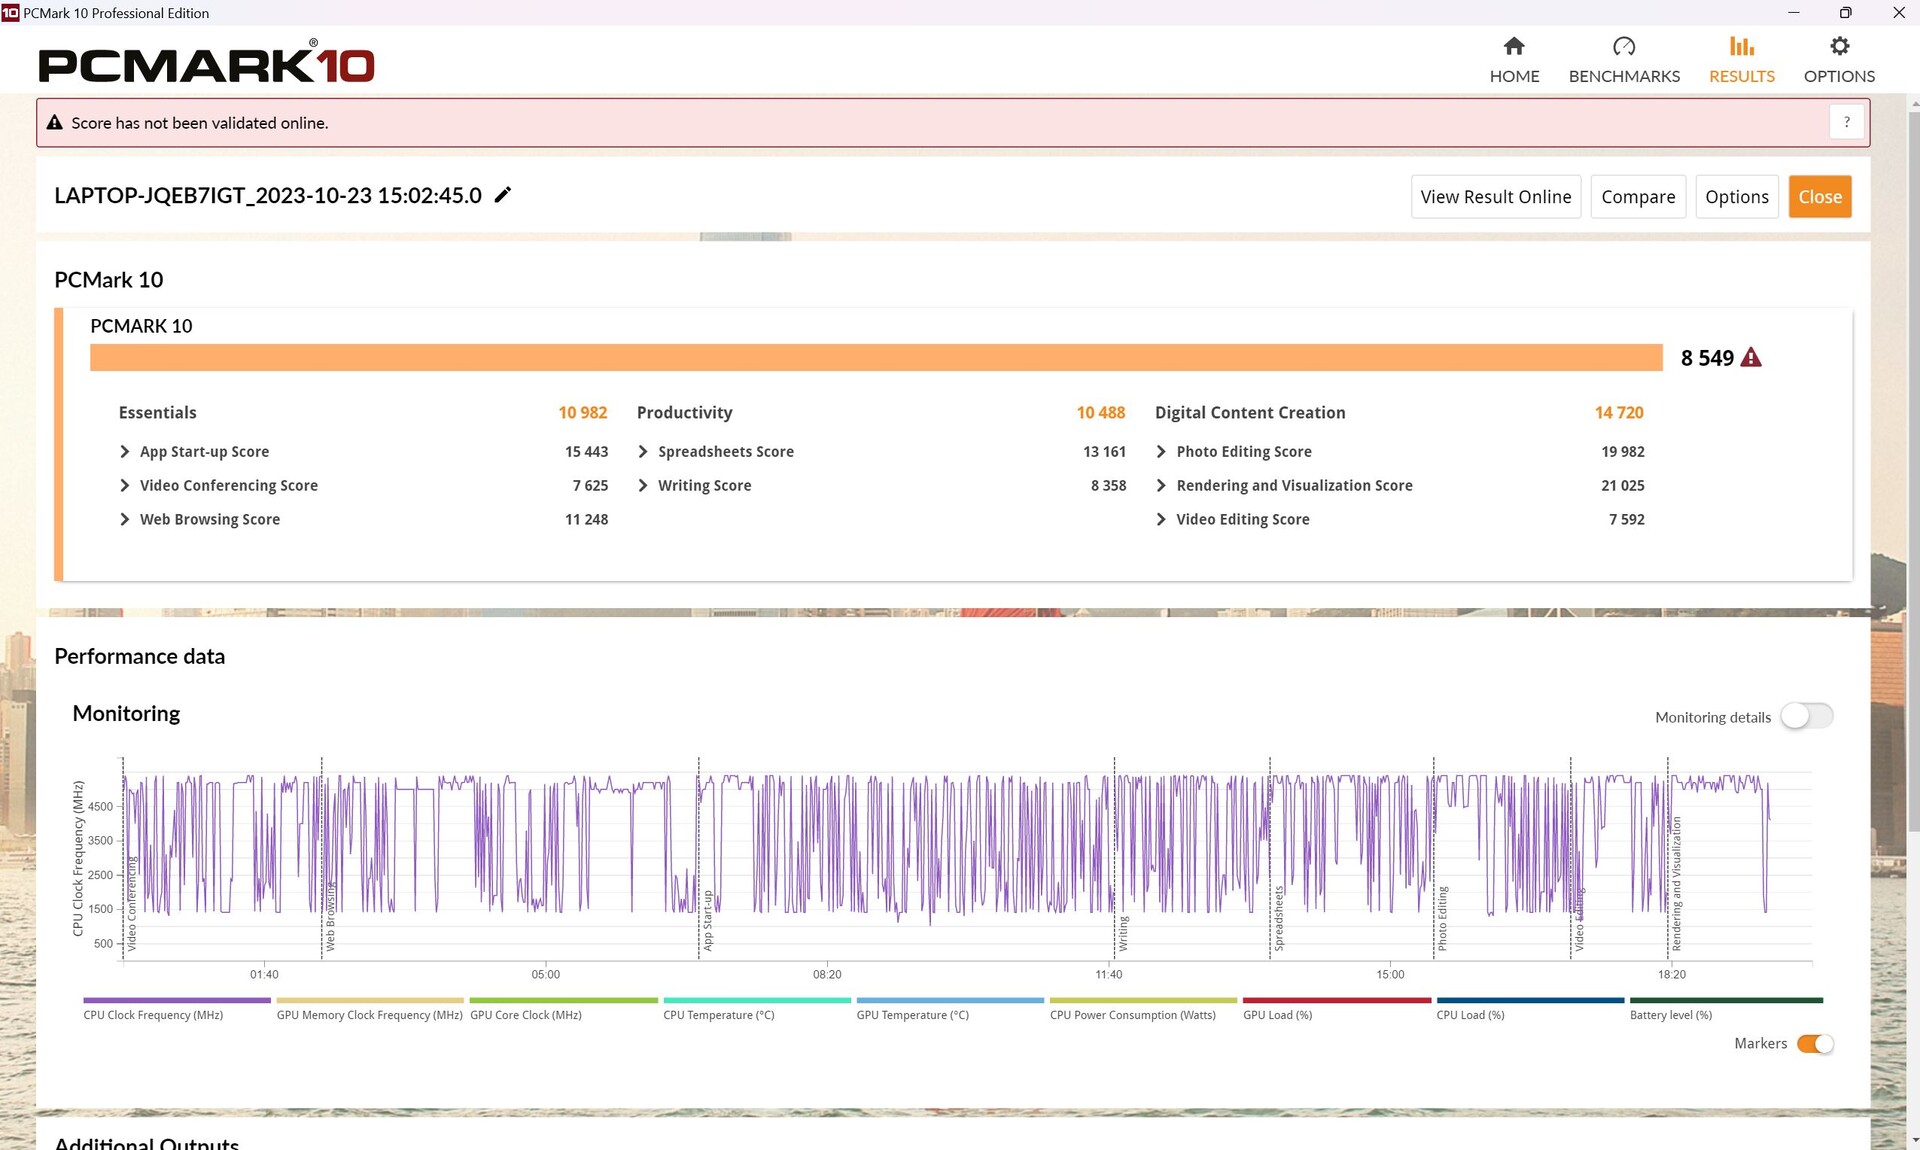
Desempenho do sistema
Assim como o desempenho da CPU, o Helios está apenas marginalmente atrás doMSI GE78HX e do Alienware m18 R1.
A maioria dos aplicativos é subjetivamente suave. Apenas a troca de gráficos (Advanced Optimus) é um problema constante para o laptop. Mais informações sobre isso e problemas de latência nas seções a seguir.
CrossMark: Overall | Productivity | Creativity | Responsiveness
| PCMark 10 / Score | |
| MSI GE78HX 13VH-070US | |
| Alienware m18 R1 | |
| Acer Predator Helios 18 N23Q2 | |
| Média da turma Gaming (5828 - 12414, n=93, últimos 2 anos) | |
| Média Intel Core i9-13900HX, NVIDIA GeForce RTX 4080 Laptop GPU (7609 - 8549, n=3) | |
| Razer Blade 18 RTX 4070 | |
| HP Omen 17-ck2097ng | |
| Asus ROG Strix G18 G814JI | |
| PCMark 10 / Essentials | |
| HP Omen 17-ck2097ng | |
| Razer Blade 18 RTX 4070 | |
| Média Intel Core i9-13900HX, NVIDIA GeForce RTX 4080 Laptop GPU (10982 - 11824, n=3) | |
| MSI GE78HX 13VH-070US | |
| Alienware m18 R1 | |
| Acer Predator Helios 18 N23Q2 | |
| Média da turma Gaming (8810 - 11935, n=97, últimos 2 anos) | |
| Asus ROG Strix G18 G814JI | |
| PCMark 10 / Productivity | |
| Média da turma Gaming (6845 - 25323, n=95, últimos 2 anos) | |
| Acer Predator Helios 18 N23Q2 | |
| MSI GE78HX 13VH-070US | |
| Média Intel Core i9-13900HX, NVIDIA GeForce RTX 4080 Laptop GPU (9976 - 10788, n=3) | |
| Alienware m18 R1 | |
| HP Omen 17-ck2097ng | |
| Razer Blade 18 RTX 4070 | |
| Asus ROG Strix G18 G814JI | |
| PCMark 10 / Digital Content Creation | |
| Alienware m18 R1 | |
| MSI GE78HX 13VH-070US | |
| Acer Predator Helios 18 N23Q2 | |
| Média da turma Gaming (7602 - 19954, n=95, últimos 2 anos) | |
| Média Intel Core i9-13900HX, NVIDIA GeForce RTX 4080 Laptop GPU (10135 - 14720, n=3) | |
| Razer Blade 18 RTX 4070 | |
| HP Omen 17-ck2097ng | |
| Asus ROG Strix G18 G814JI | |
| CrossMark / Overall | |
| Acer Predator Helios 18 N23Q2 | |
| Alienware m18 R1 | |
| Razer Blade 18 RTX 4070 | |
| Média Intel Core i9-13900HX, NVIDIA GeForce RTX 4080 Laptop GPU (1991 - 2194, n=2) | |
| HP Omen 17-ck2097ng | |
| Média da turma Gaming (1366 - 2409, n=94, últimos 2 anos) | |
| MSI GE78HX 13VH-070US | |
| CrossMark / Productivity | |
| Acer Predator Helios 18 N23Q2 | |
| Alienware m18 R1 | |
| Razer Blade 18 RTX 4070 | |
| Média Intel Core i9-13900HX, NVIDIA GeForce RTX 4080 Laptop GPU (1828 - 2059, n=2) | |
| Média da turma Gaming (1386 - 2254, n=94, últimos 2 anos) | |
| MSI GE78HX 13VH-070US | |
| HP Omen 17-ck2097ng | |
| CrossMark / Creativity | |
| Alienware m18 R1 | |
| Acer Predator Helios 18 N23Q2 | |
| Razer Blade 18 RTX 4070 | |
| Média Intel Core i9-13900HX, NVIDIA GeForce RTX 4080 Laptop GPU (2239 - 2411, n=2) | |
| Média da turma Gaming (1343 - 2786, n=94, últimos 2 anos) | |
| HP Omen 17-ck2097ng | |
| MSI GE78HX 13VH-070US | |
| CrossMark / Responsiveness | |
| Acer Predator Helios 18 N23Q2 | |
| Alienware m18 R1 | |
| Média Intel Core i9-13900HX, NVIDIA GeForce RTX 4080 Laptop GPU (1808 - 1998, n=2) | |
| Razer Blade 18 RTX 4070 | |
| HP Omen 17-ck2097ng | |
| Média da turma Gaming (1226 - 2334, n=94, últimos 2 anos) | |
| MSI GE78HX 13VH-070US | |
| PCMark 10 Score | 8549 pontos | |
Ajuda | ||
| AIDA64 / Memory Copy | |
| Alienware m18 R1 | |
| Acer Predator Helios 18 N23Q2 | |
| HP Omen 17-ck2097ng | |
| MSI GE78HX 13VH-070US | |
| Razer Blade 18 RTX 4070 | |
| Média Intel Core i9-13900HX (67716 - 79193, n=22) | |
| Média da turma Gaming (21750 - 129946, n=105, últimos 2 anos) | |
| Asus ROG Strix G18 G814JI | |
| AIDA64 / Memory Read | |
| Alienware m18 R1 | |
| Acer Predator Helios 18 N23Q2 | |
| HP Omen 17-ck2097ng | |
| Razer Blade 18 RTX 4070 | |
| MSI GE78HX 13VH-070US | |
| Média Intel Core i9-13900HX (73998 - 88462, n=22) | |
| Média da turma Gaming (22956 - 118858, n=105, últimos 2 anos) | |
| Asus ROG Strix G18 G814JI | |
| AIDA64 / Memory Write | |
| Alienware m18 R1 | |
| HP Omen 17-ck2097ng | |
| MSI GE78HX 13VH-070US | |
| Média da turma Gaming (22297 - 135096, n=105, últimos 2 anos) | |
| Razer Blade 18 RTX 4070 | |
| Acer Predator Helios 18 N23Q2 | |
| Média Intel Core i9-13900HX (65472 - 77045, n=22) | |
| Asus ROG Strix G18 G814JI | |
| AIDA64 / Memory Latency | |
| Média da turma Gaming (75.3 - 259, n=105, últimos 2 anos) | |
| Média Intel Core i9-13900HX (75.3 - 91.1, n=22) | |
| HP Omen 17-ck2097ng | |
| Razer Blade 18 RTX 4070 | |
| MSI GE78HX 13VH-070US | |
| Asus ROG Strix G18 G814JI | |
| Acer Predator Helios 18 N23Q2 | |
| Alienware m18 R1 | |
* ... menor é melhor
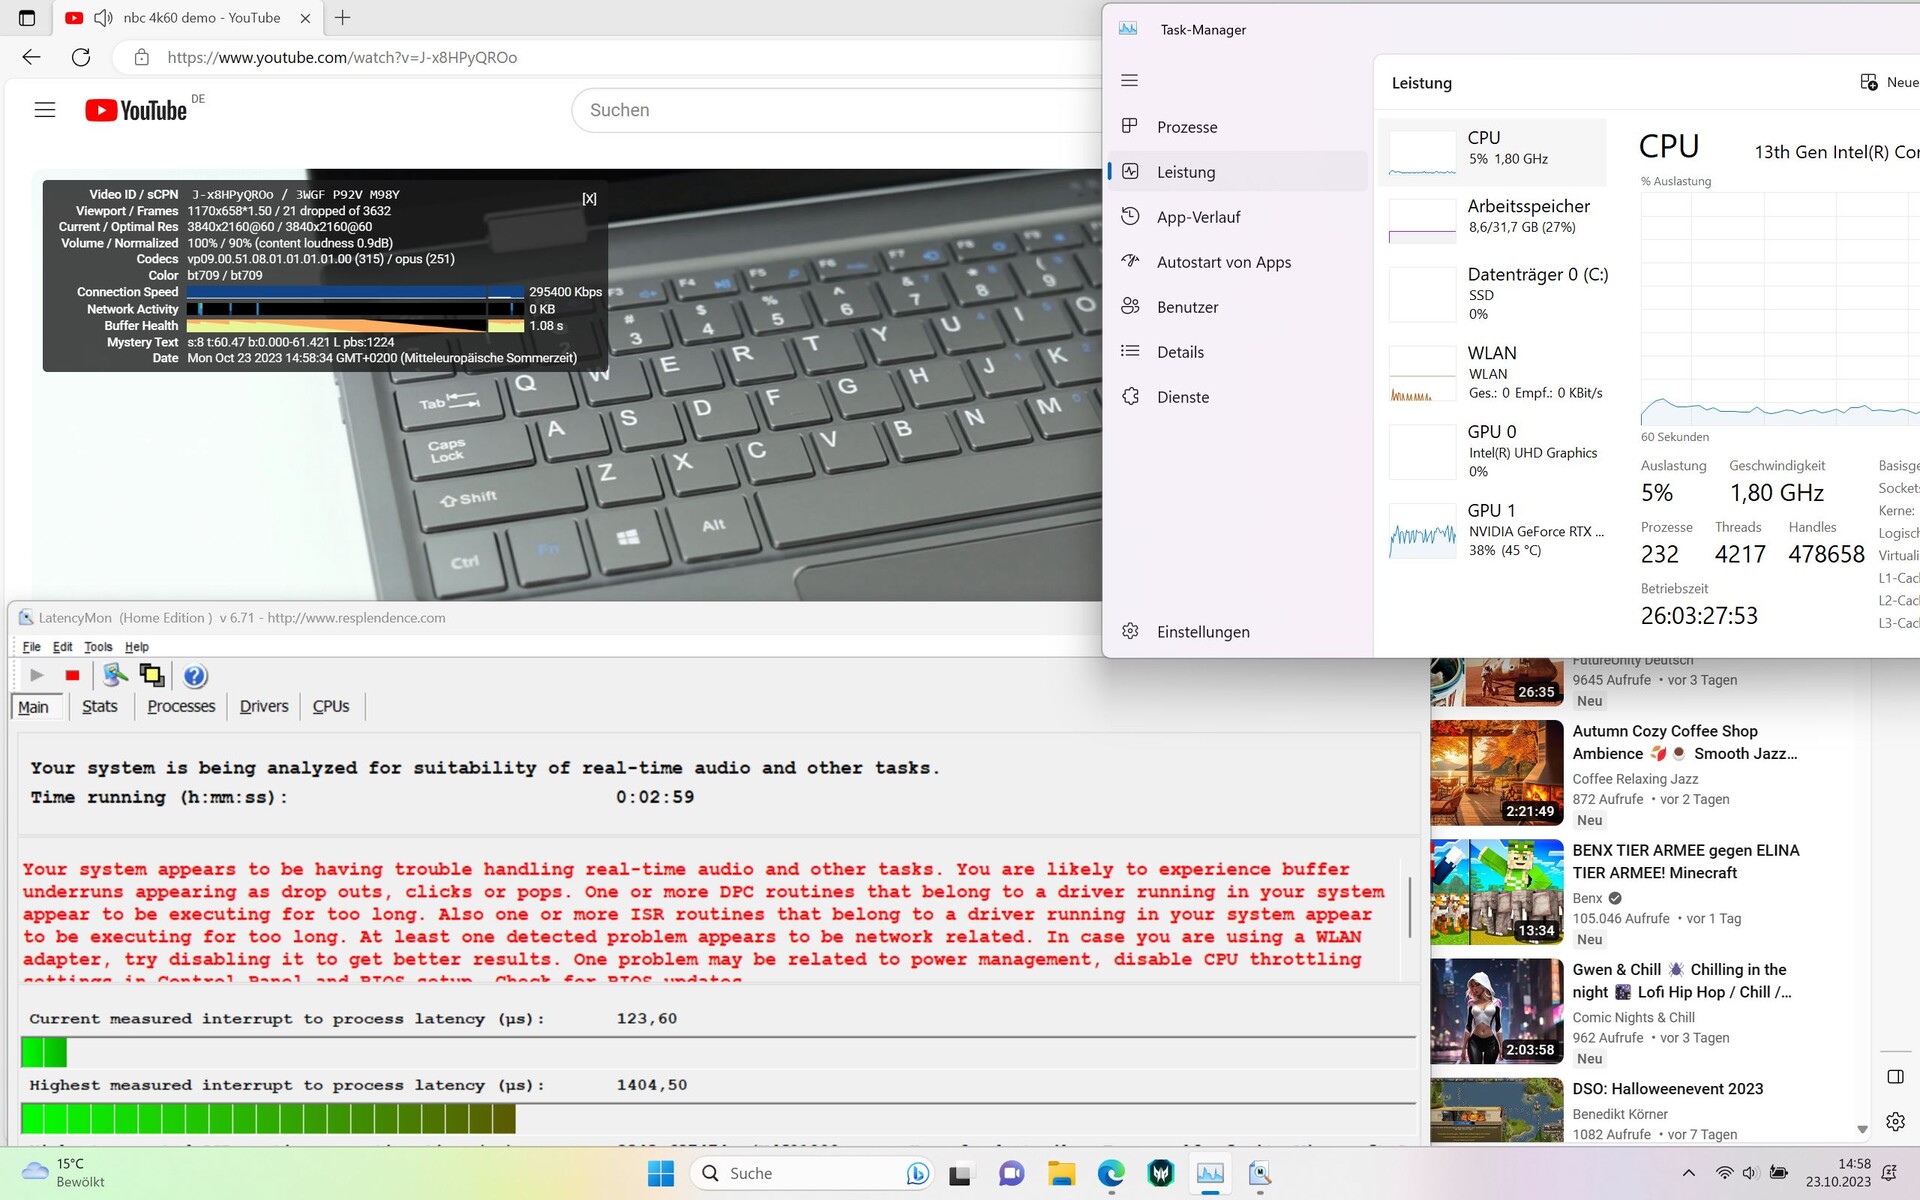
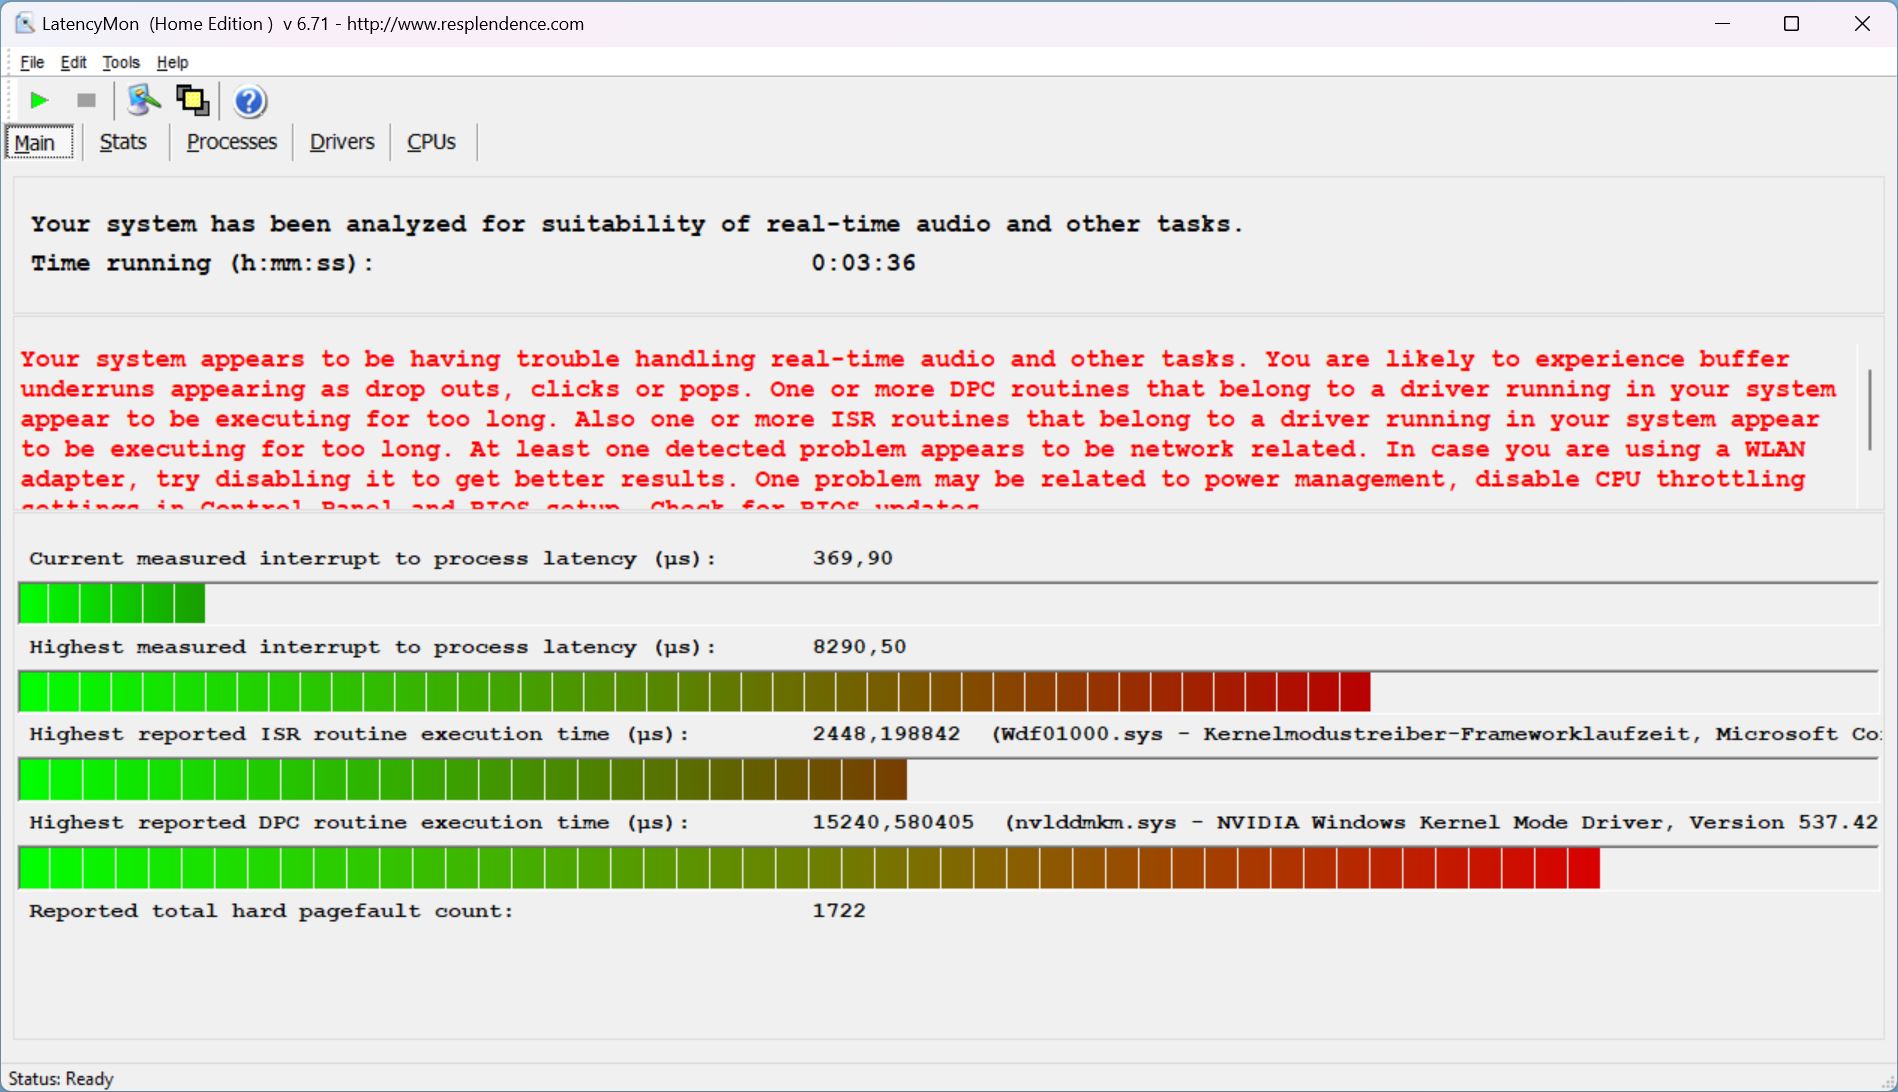
Latência DPC
No estado atual do driver, o laptop tem problemas graves de latência, como revela o LatencyMon. No modo Balanced , ocorrem atrasos ao abrir o navegador ou ao mover uma janela da área de trabalho. Esses atrasos aumentam ao abrir várias guias do navegador em nosso site, e até mesmo a reprodução de um vídeo do YouTube em 4K/60 fps resulta em 18 quadros pulados. A Acer precisa melhorar o driver aqui. No entanto, os notebooks rivais também apresentam problemas semelhantes.

| DPC Latencies / LatencyMon - interrupt to process latency (max), Web, Youtube, Prime95 | |
| Acer Predator Helios 18 N23Q2 | |
| MSI GE78HX 13VH-070US | |
| Alienware m18 R1 | |
| HP Omen 17-ck2097ng | |
| Razer Blade 18 RTX 4070 | |
| Asus ROG Strix G18 G814JI | |
* ... menor é melhor
Dispositivos de armazenamento
O Helios 18 está equipado com o Samsung PM9A1, um dos SSDs mais rápidos da nossaLista dos melhores SSDsinfelizmente, ele não tem um bom desempenho no Predator e seu desempenho é rapidamente reduzido, como mostra o gráfico abaixo. Repetimos o mesmo teste mais tarde e obtivemos o mesmo resultado, pois ficamos surpresos com a queda rápida e acentuada. Um comportamento semelhante de limitação da SSD também foi observado no Predator Helios 16.

* ... menor é melhor
Sustained Read Performance: DiskSpd Read Loop, Queue Depth 8
Grafikkarte
A RTX 4080é uma GPU de ponta que foi lançada no início de 2023. No Helios 18, ela pode consumir no máximo 175 W, incluindo o Dynamic Boost.
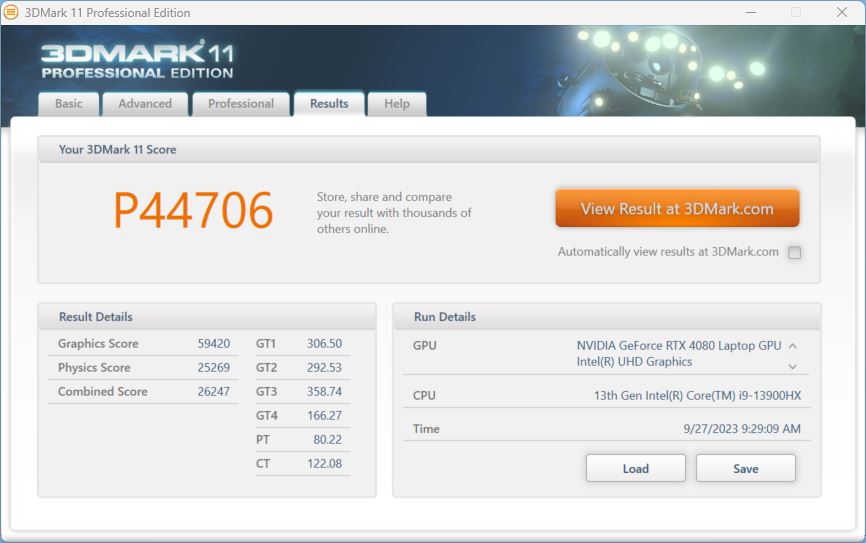
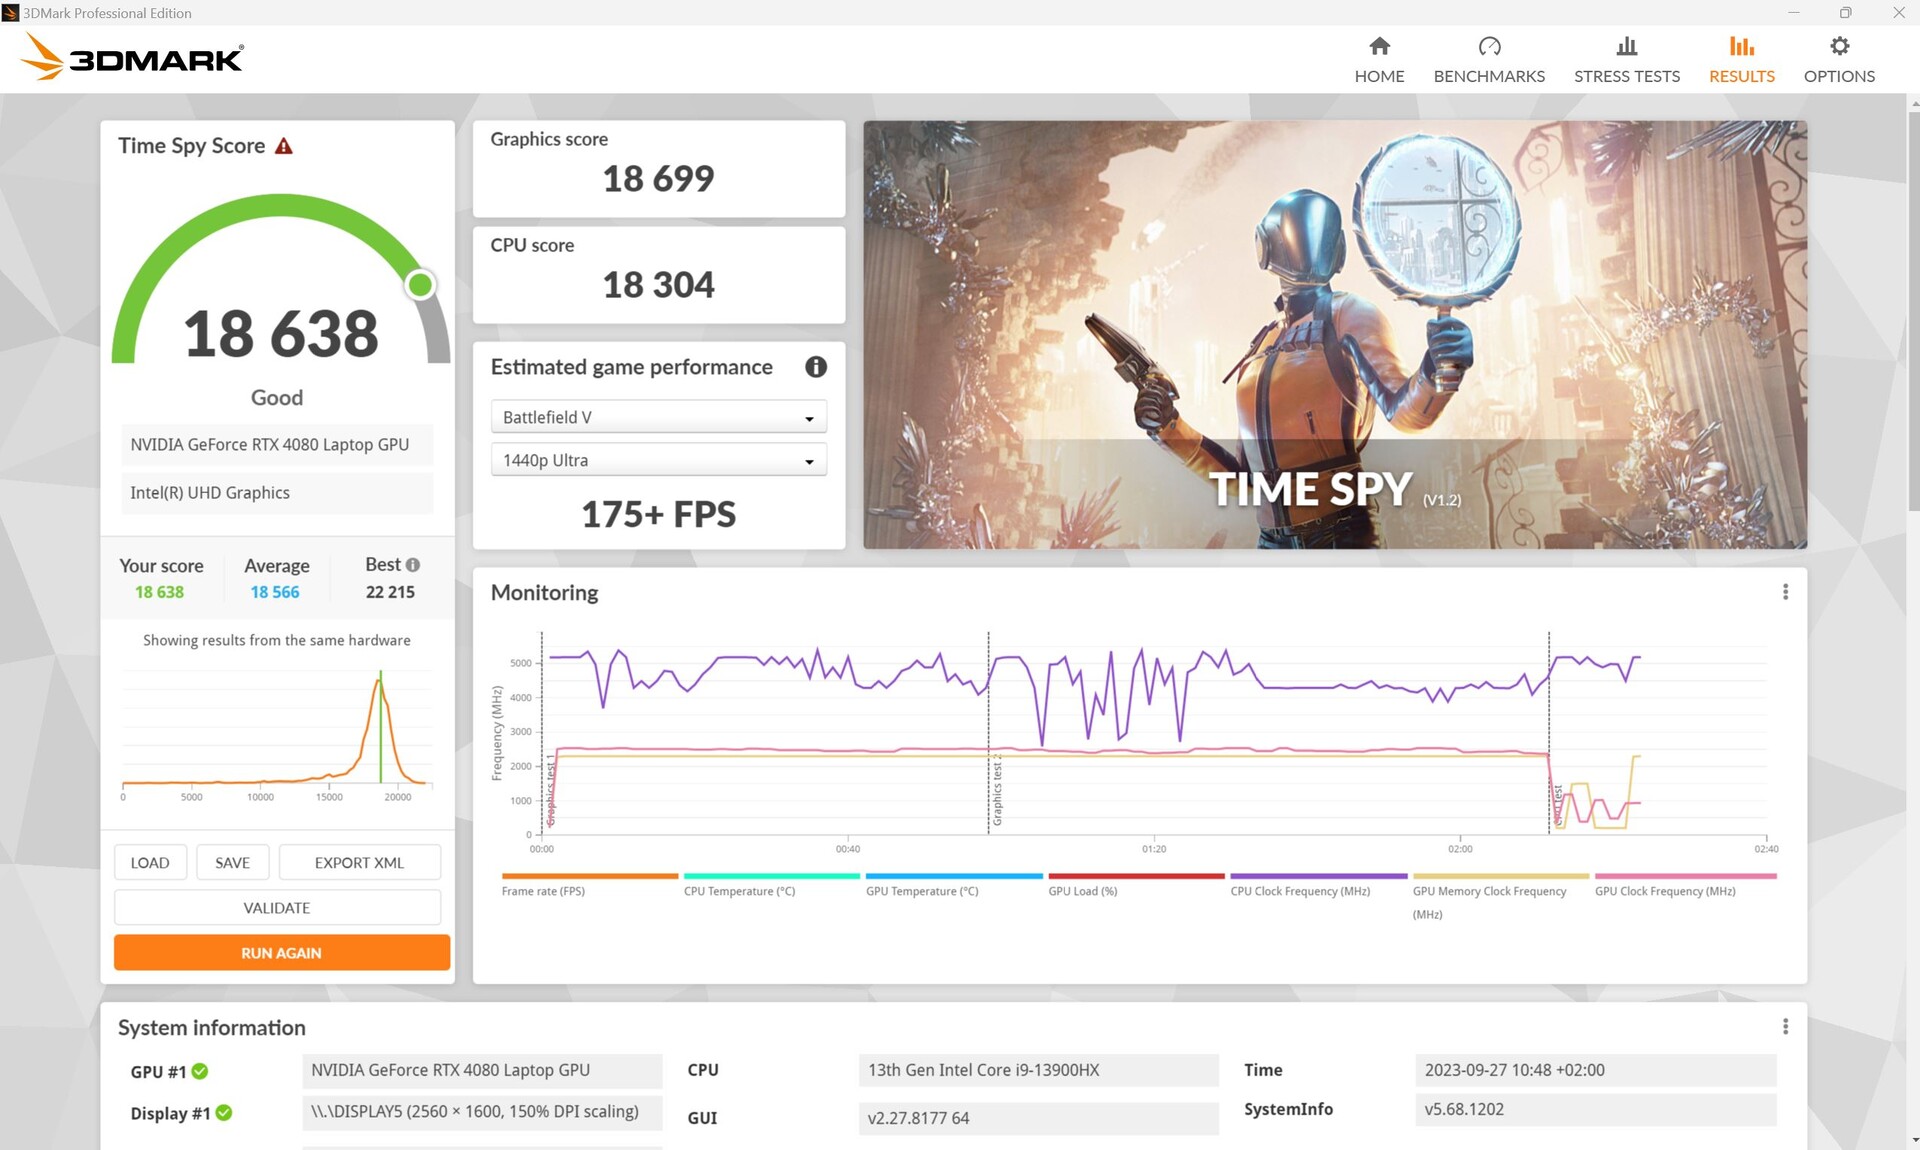
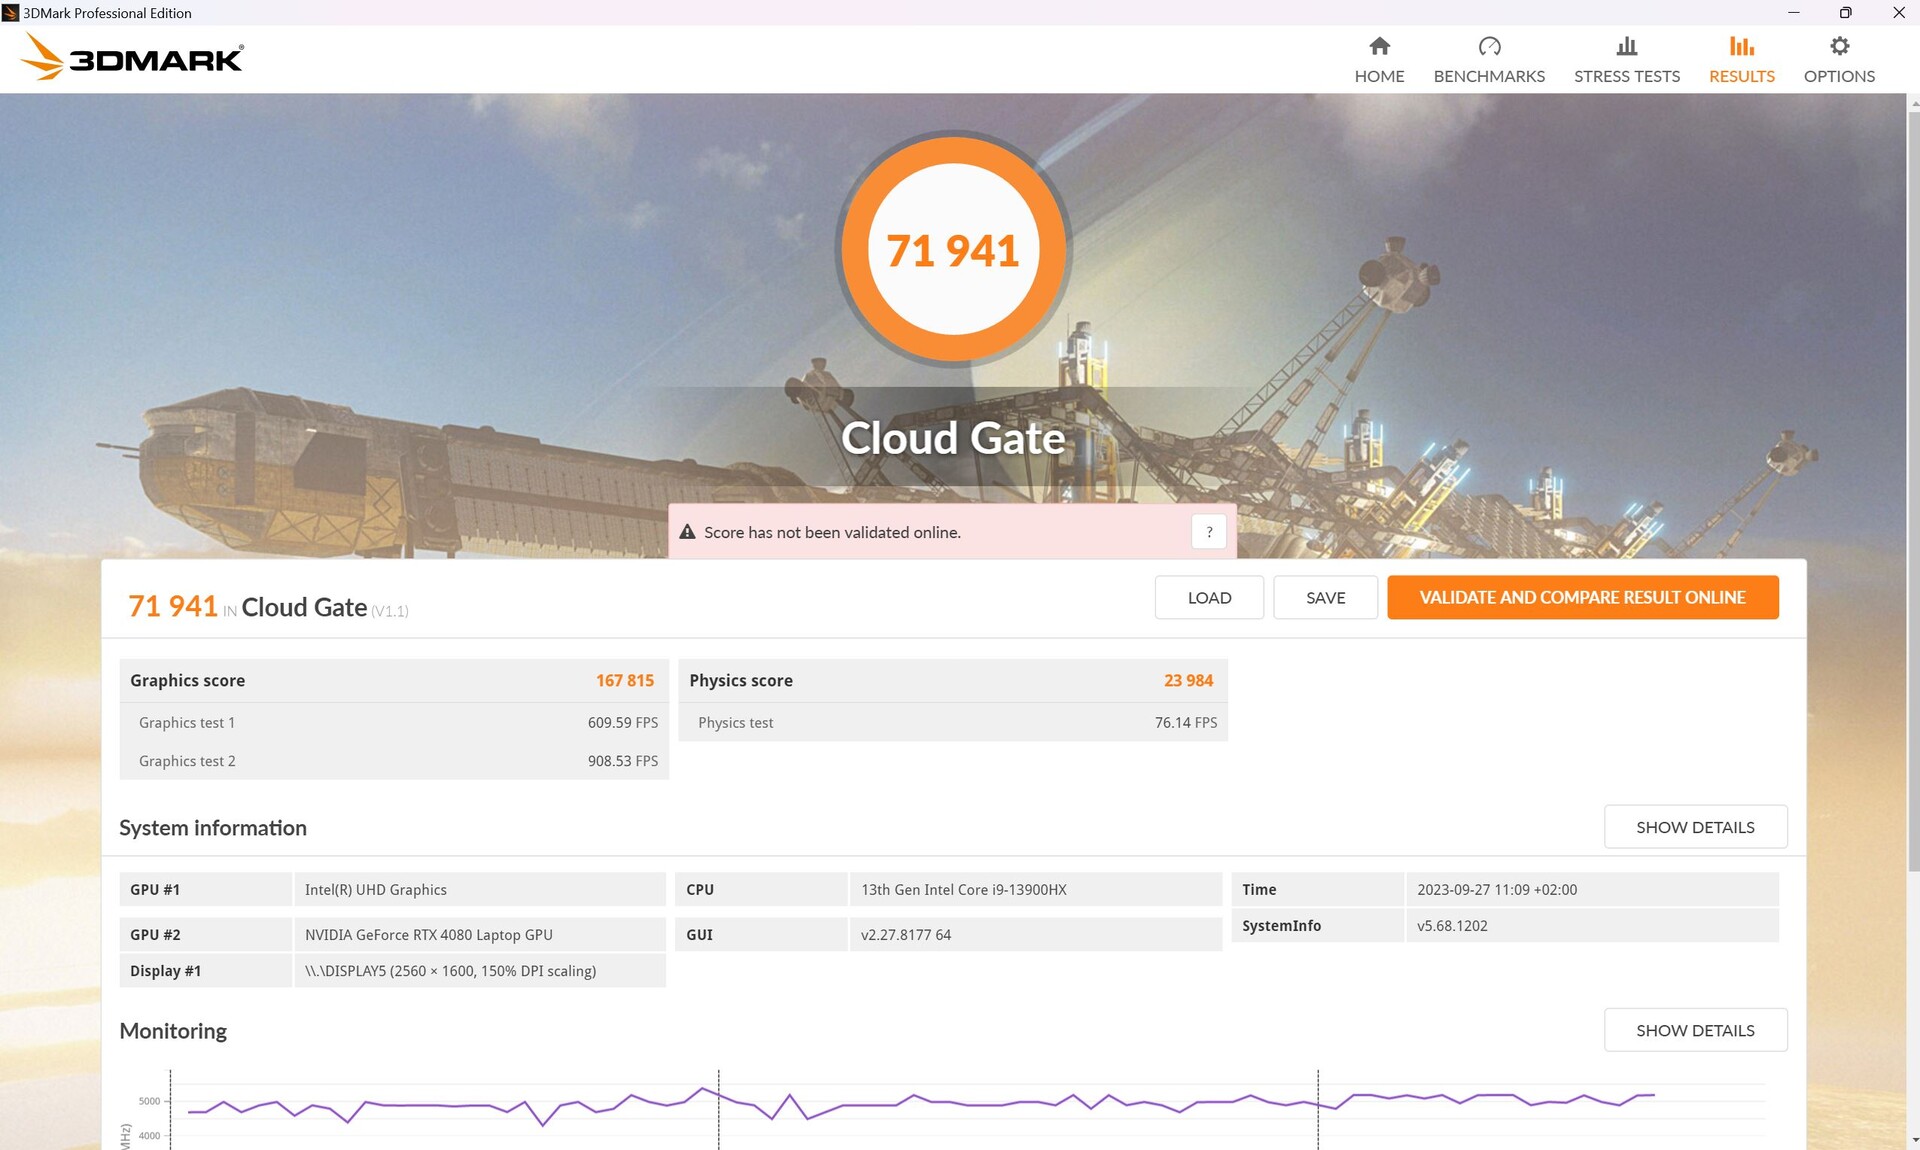
Nos testes sintéticos do 3DMark, o Helios supera por pouco o MSI GE78HXcom a mesma GPU pela primeira vez. O desempenho da RTX 4080 é cerca de 10% maior do que a média de todos os notebooks com a mesma GPU em nosso banco de dados.
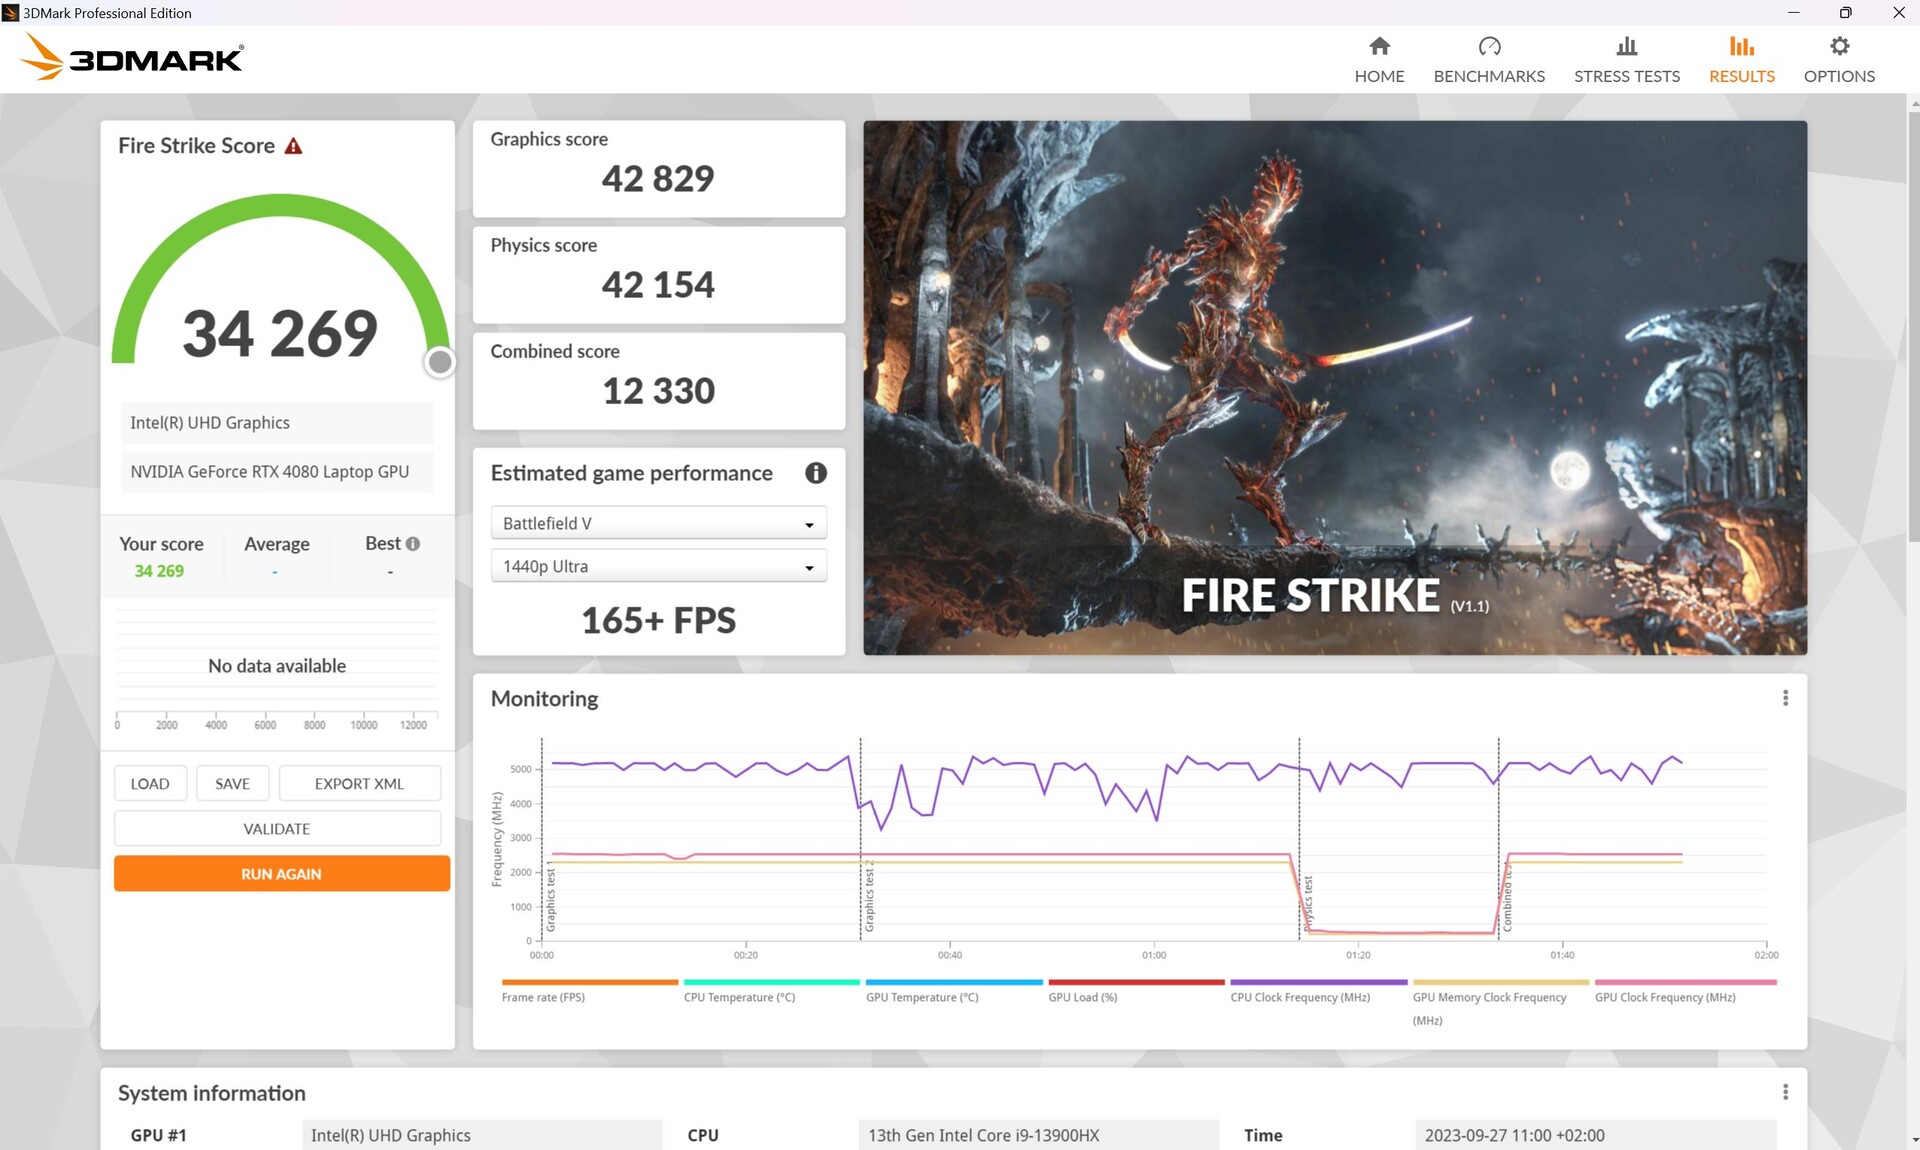
Longe do soquete, o Predator ainda consegue 6.897 pontos gráficos em Fire Strike, uma queda de 84%!
| 3DMark Performance rating - Percent | |
| Alienware m18 R1 -1! | |
| Acer Predator Helios 18 N23Q2 | |
| MSI GE78HX 13VH-070US -1! | |
| Média NVIDIA GeForce RTX 4080 Laptop GPU | |
| Média da turma Gaming | |
| HP Omen 17-ck2097ng | |
| Asus ROG Strix G18 G814JI | |
| Razer Blade 18 RTX 4070 -1! | |
| 3DMark 11 Performance | 44706 pontos | |
| 3DMark Cloud Gate Standard Score | 71941 pontos | |
| 3DMark Fire Strike Score | 34269 pontos | |
| 3DMark Time Spy Score | 18638 pontos | |
Ajuda | ||
* ... menor é melhor
Desempenho em jogos
A Helios 18 também supera por pouco aMSI GE78HX em jogos, mas ambos estão no mesmo nível. O Alienware m18 R1 com sua RTX 4090 é cerca de 7% mais rápido; a diferença é maior em Witcher 3, com +22%, e nosso Predator até lidera em GTA V.
| Performance rating - Percent | |
| Alienware m18 R1 | |
| Acer Predator Helios 18 N23Q2 | |
| Média da turma Gaming | |
| HP Omen 17-ck2097ng | |
| MSI GE78HX 13VH-070US | |
| Razer Blade 18 RTX 4070 | |
| Asus ROG Strix G18 G814JI | |
| The Witcher 3 - 1920x1080 Ultra Graphics & Postprocessing (HBAO+) | |
| Alienware m18 R1 | |
| Média da turma Gaming (104.7 - 240, n=7, últimos 2 anos) | |
| MSI GE78HX 13VH-070US | |
| Acer Predator Helios 18 N23Q2 | |
| HP Omen 17-ck2097ng | |
| Asus ROG Strix G18 G814JI | |
| Razer Blade 18 RTX 4070 | |
| GTA V - 1920x1080 Highest AA:4xMSAA + FX AF:16x | |
| Acer Predator Helios 18 N23Q2 | |
| Alienware m18 R1 | |
| Média da turma Gaming (48.3 - 186.9, n=94, últimos 2 anos) | |
| Razer Blade 18 RTX 4070 | |
| HP Omen 17-ck2097ng | |
| Asus ROG Strix G18 G814JI | |
| MSI GE78HX 13VH-070US | |
| Final Fantasy XV Benchmark - 1920x1080 High Quality | |
| Alienware m18 R1 | |
| Acer Predator Helios 18 N23Q2 | |
| Média da turma Gaming (41 - 215, n=95, últimos 2 anos) | |
| MSI GE78HX 13VH-070US | |
| HP Omen 17-ck2097ng | |
| Asus ROG Strix G18 G814JI | |
| Razer Blade 18 RTX 4070 | |
| Strange Brigade - 1920x1080 ultra AA:ultra AF:16 | |
| Alienware m18 R1 | |
| Acer Predator Helios 18 N23Q2 | |
| Média da turma Gaming (76.3 - 458, n=87, últimos 2 anos) | |
| HP Omen 17-ck2097ng | |
| MSI GE78HX 13VH-070US | |
| Asus ROG Strix G18 G814JI | |
| Razer Blade 18 RTX 4070 | |
| Dota 2 Reborn - 1920x1080 ultra (3/3) best looking | |
| Alienware m18 R1 | |
| Acer Predator Helios 18 N23Q2 | |
| Razer Blade 18 RTX 4070 | |
| HP Omen 17-ck2097ng | |
| Asus ROG Strix G18 G814JI | |
| Média da turma Gaming (84.8 - 248, n=107, últimos 2 anos) | |
| MSI GE78HX 13VH-070US | |
| The Witcher 3 | |
| 1920x1080 High Graphics & Postprocessing (Nvidia HairWorks Off) | |
| Alienware m18 R1 | |
| MSI GE78HX 13VH-070US | |
| Média da turma Gaming (341 - 404, n=2, últimos 2 anos) | |
| Acer Predator Helios 18 N23Q2 | |
| Média NVIDIA GeForce RTX 4080 Laptop GPU (246 - 385, n=14) | |
| HP Omen 17-ck2097ng | |
| Razer Blade 18 RTX 4070 | |
| Asus ROG Strix G18 G814JI | |
| 1920x1080 Ultra Graphics & Postprocessing (HBAO+) | |
| Alienware m18 R1 | |
| Média da turma Gaming (104.7 - 240, n=7, últimos 2 anos) | |
| MSI GE78HX 13VH-070US | |
| Acer Predator Helios 18 N23Q2 | |
| Média NVIDIA GeForce RTX 4080 Laptop GPU (130.4 - 186.1, n=20) | |
| HP Omen 17-ck2097ng | |
| Asus ROG Strix G18 G814JI | |
| Razer Blade 18 RTX 4070 | |
| Hogwarts Legacy | |
| 1920x1080 Ultra Preset AA:High T | |
| Média NVIDIA GeForce RTX 4080 Laptop GPU (108 - 131, n=3) | |
| Média da turma Gaming (n=1últimos 2 anos) | |
| Acer Predator Helios 18 N23Q2 | |
| Asus ROG Strix G18 G814JI | |
| 2560x1440 Ultra Preset AA:High T | |
| Média da turma Gaming (n=1últimos 2 anos) | |
| Média NVIDIA GeForce RTX 4080 Laptop GPU (76 - 102, n=3) | |
| Acer Predator Helios 18 N23Q2 | |
| Asus ROG Strix G18 G814JI | |
| 1920x1080 Ultra Preset + Full Ray Tracing AA:High T | |
| Acer Predator Helios 18 N23Q2 | |
| Média NVIDIA GeForce RTX 4080 Laptop GPU (53 - 66, n=2) | |
| Asus ROG Strix G18 G814JI | |
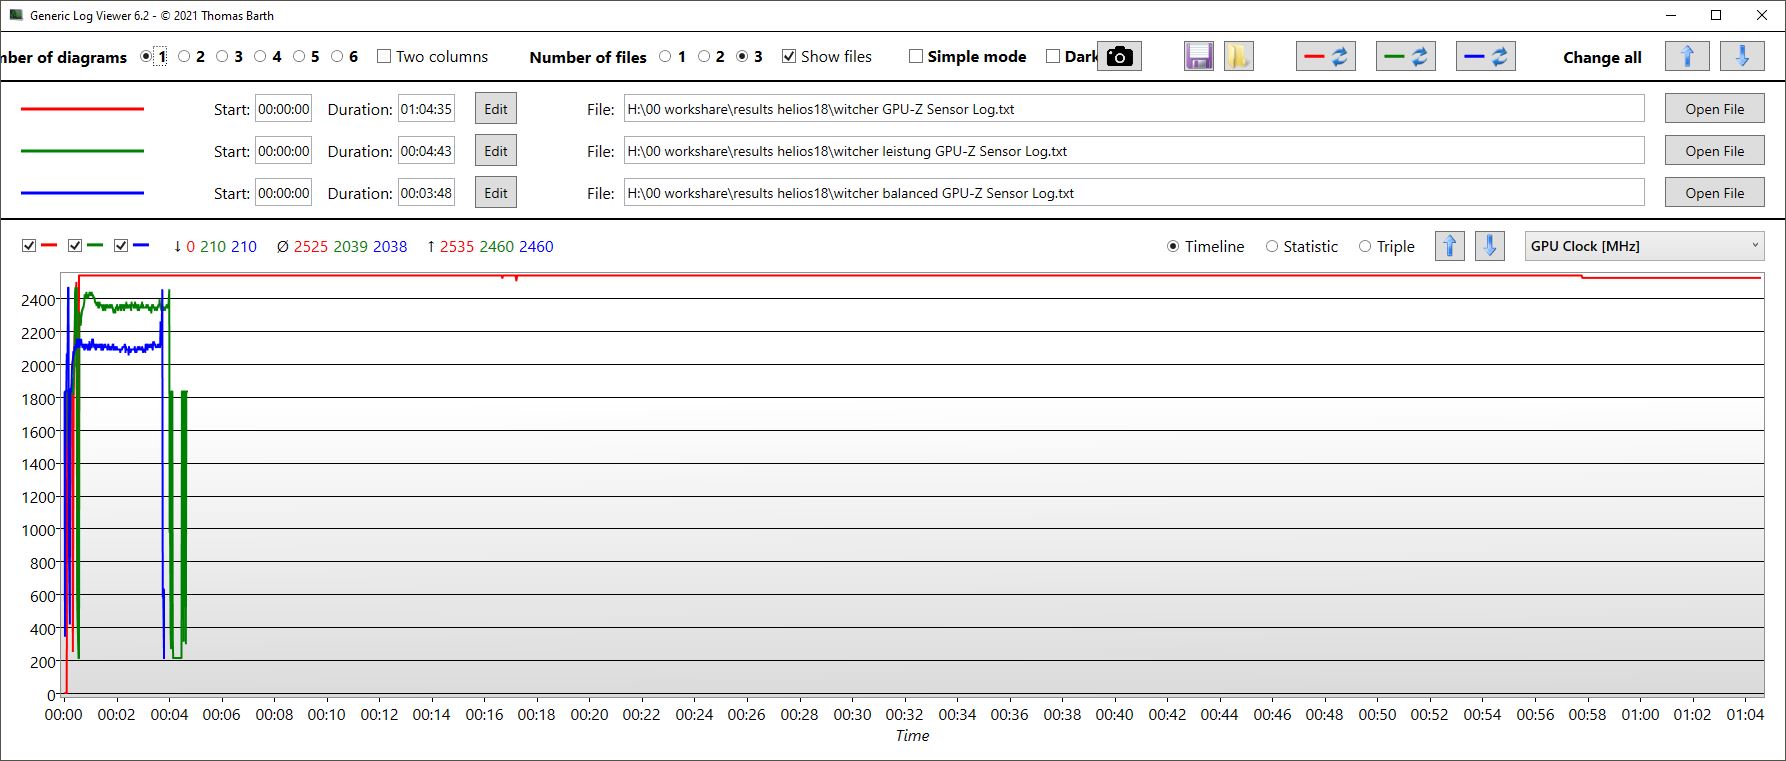
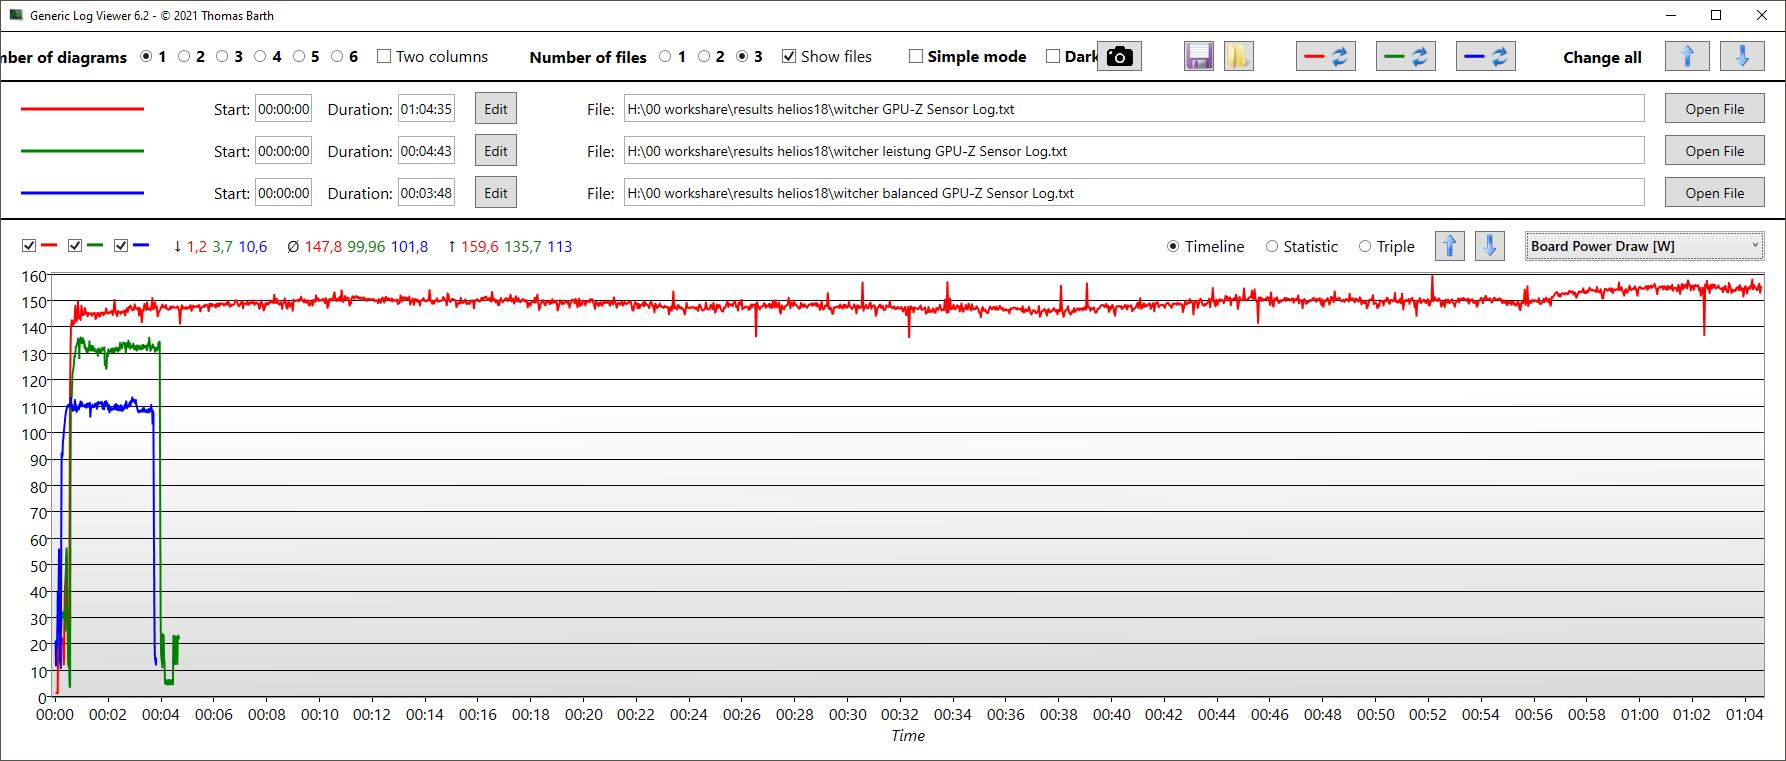
Ao longo de uma hora, a taxa de quadros em Witcher 3 permanece bastante estável; as pequenas flutuações se devem ao ciclo dia/noite típico do jogo.
Diferentemente do benchmark da CPU, agora há uma clara diferença entre os modos Balanced e Silent nos jogos. O último, fiel ao seu nome, é muito silencioso e também consome menos energia. As tabelas de fps, consumo e volume dos modos de desempenho individuais do Witcher 3 Ultra podem ser encontradas nas seções Emissões/Temperatura a seguir.
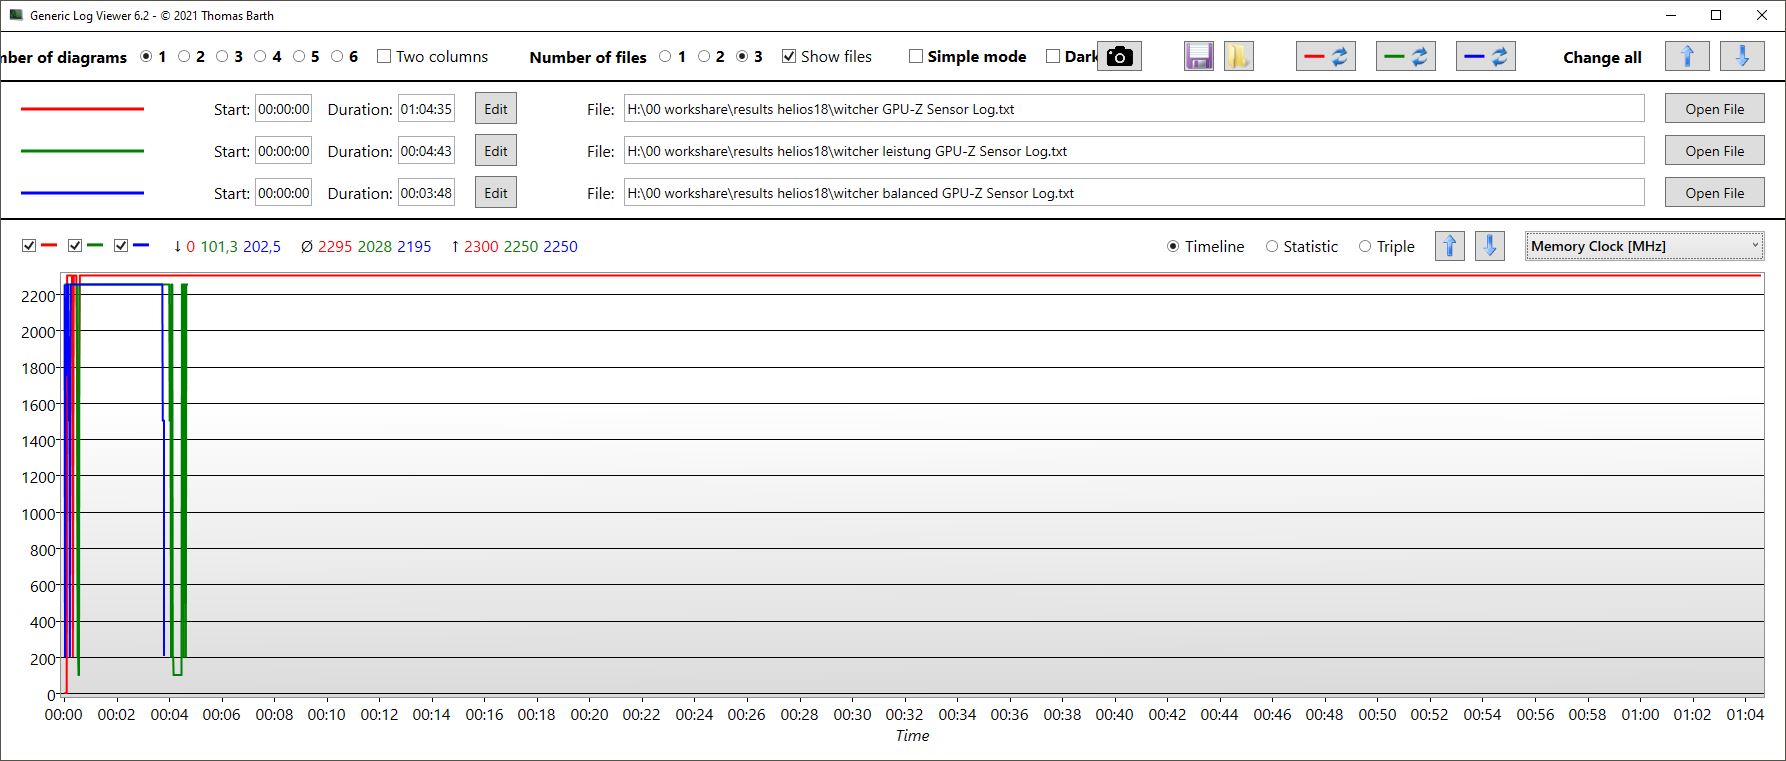
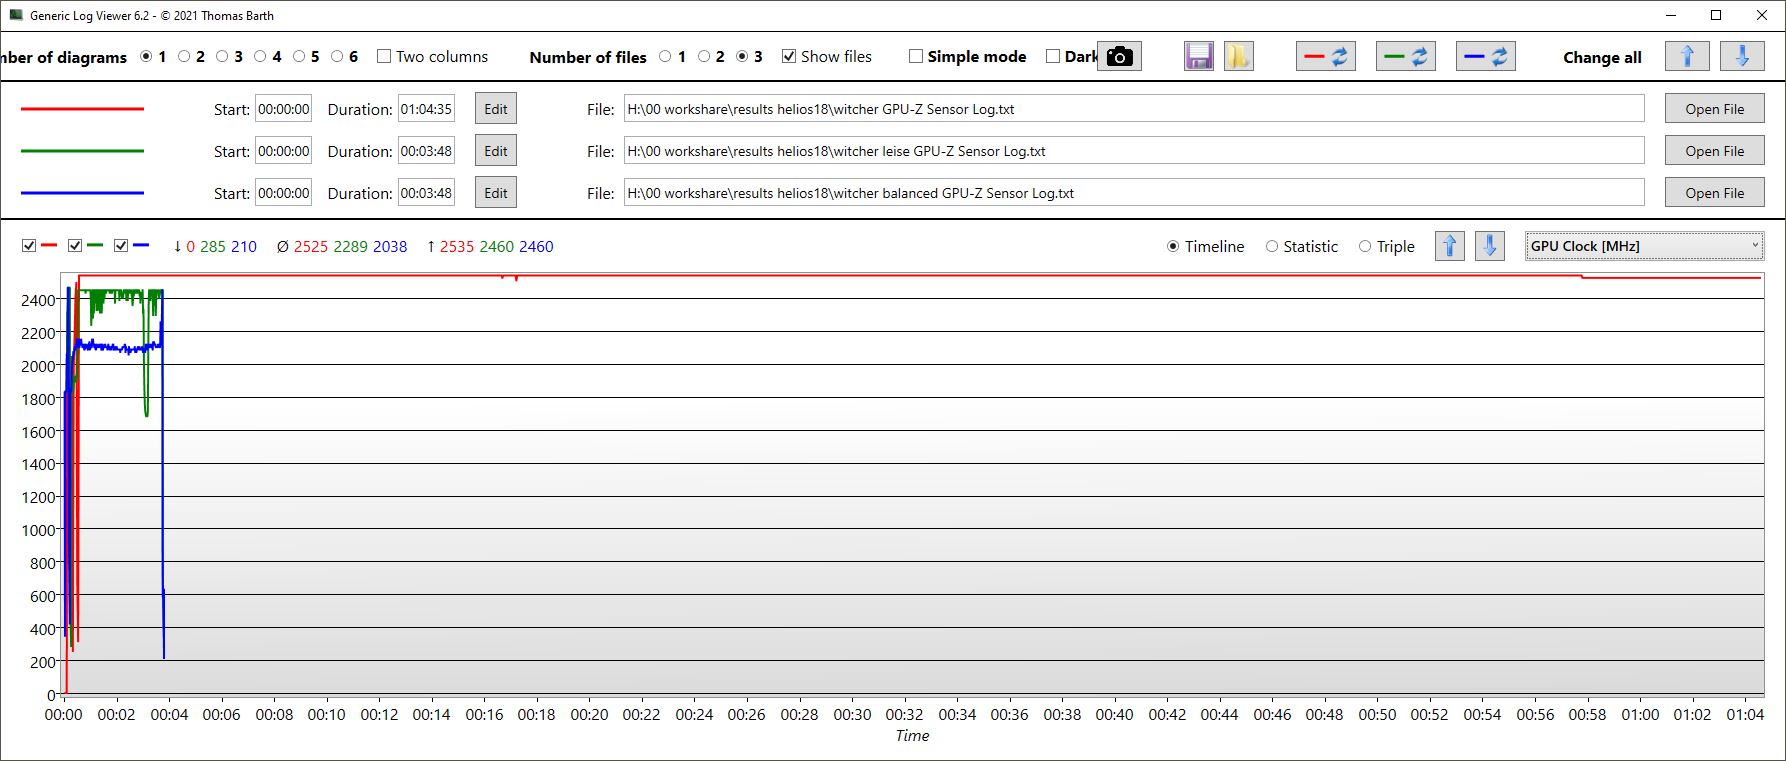
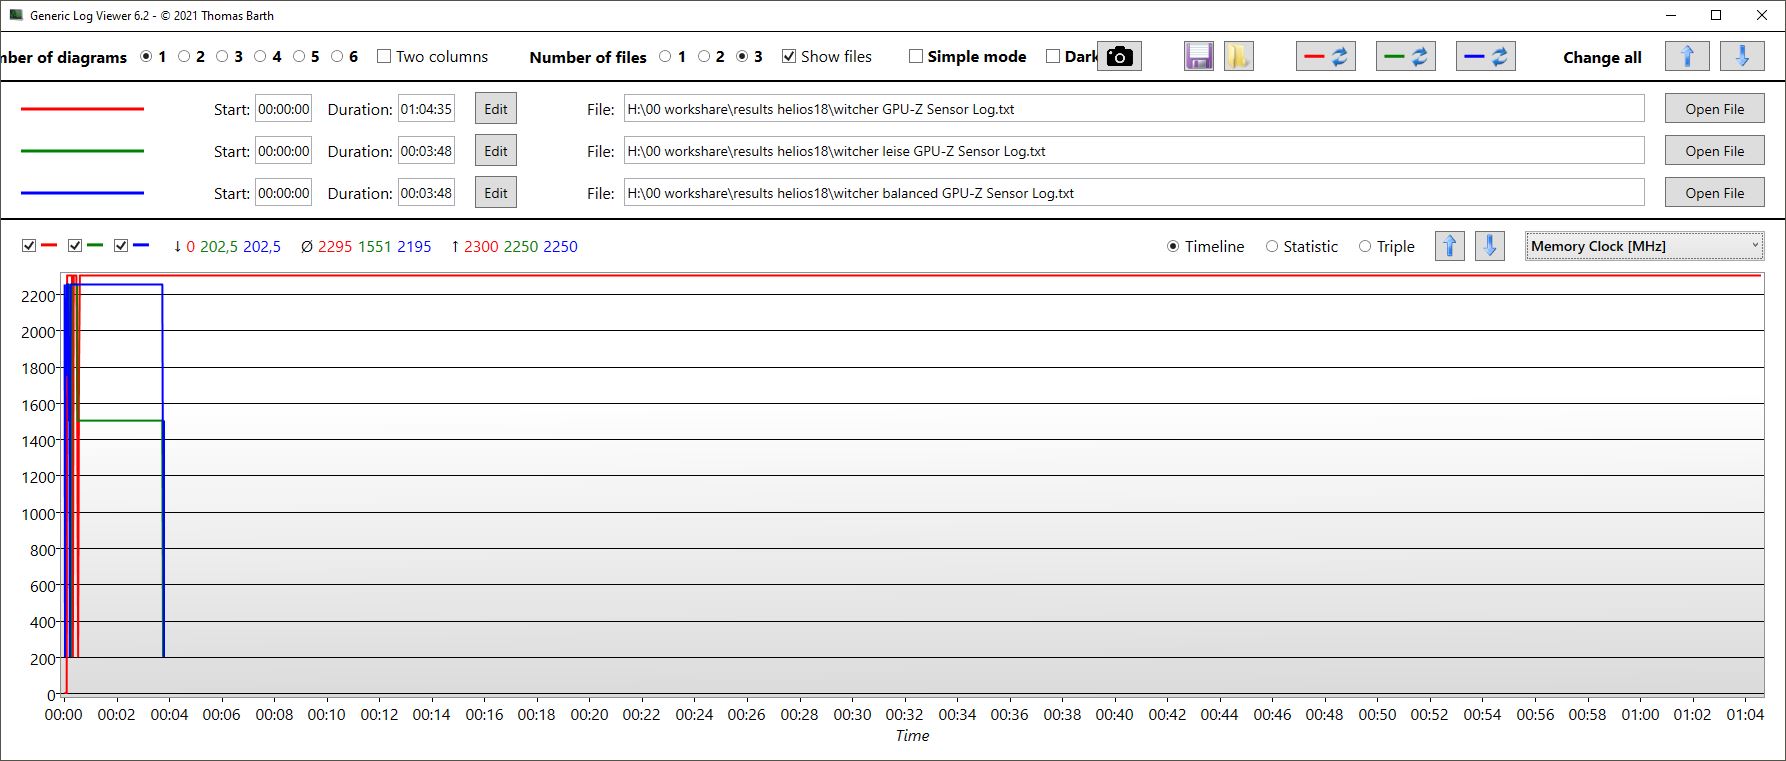
É interessante notar que o clock da GPU é ligeiramente mais alto no modo Silent do que no Balanced, mas o clock da memória é significativamente mais baixo e o consumo de energia também é menor.
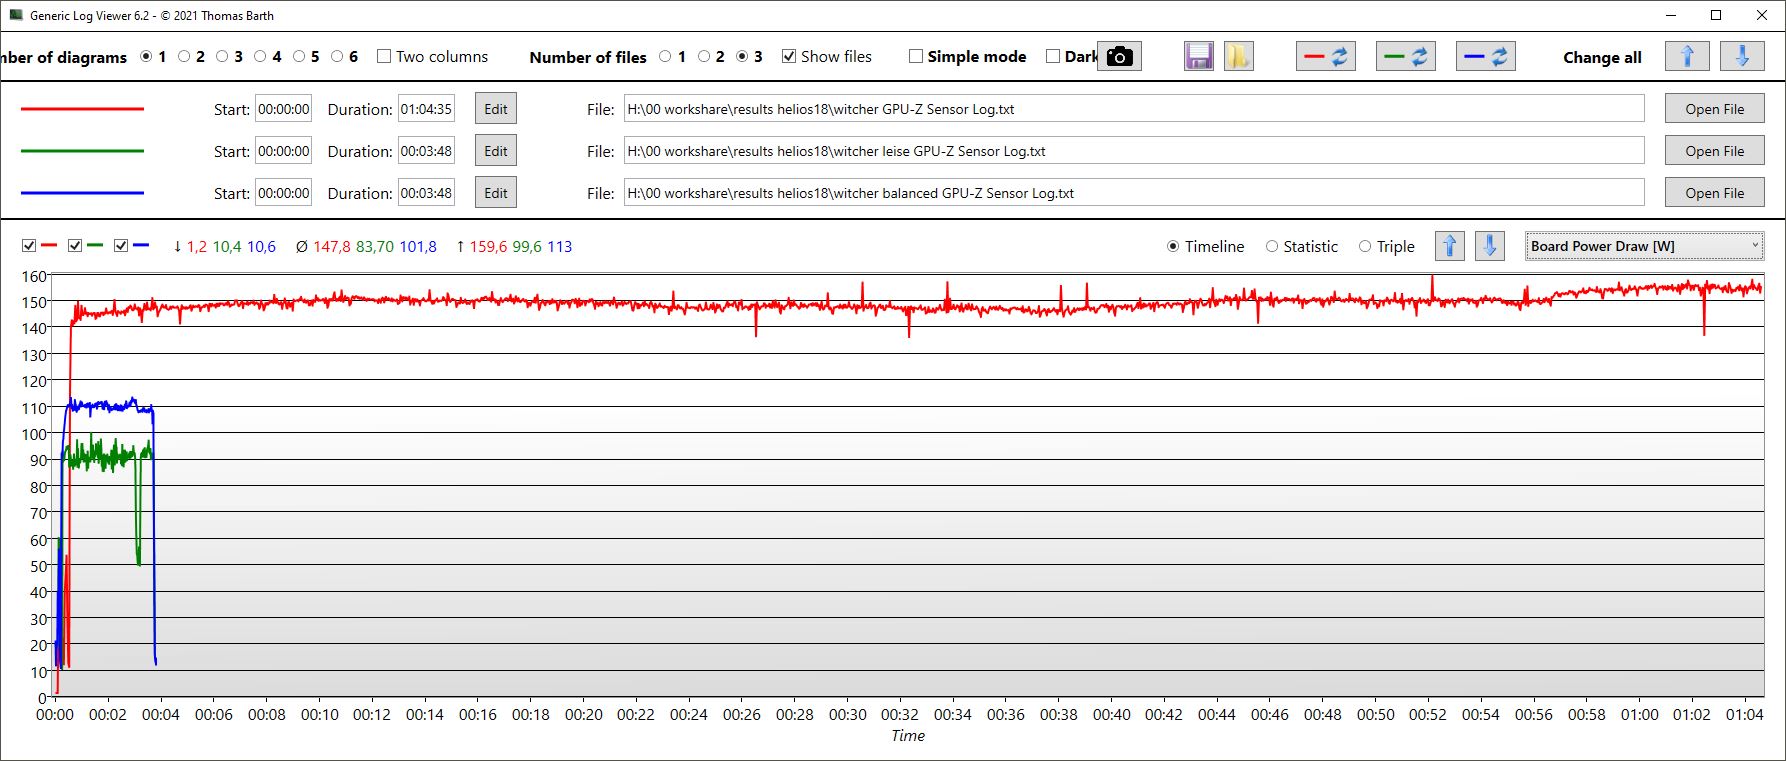
Witcher 3 FPS chart
| baixo | média | alto | ultra | QHD | 4K | |
|---|---|---|---|---|---|---|
| GTA V (2015) | 187.3 | 187.6 | 186.7 | 152.7 | 140.7 | |
| The Witcher 3 (2015) | 642 | 568 | 368 | 175 | 153 | |
| Dota 2 Reborn (2015) | 234 | 211 | 202 | 186.4 | 131 | |
| Final Fantasy XV Benchmark (2018) | 234 | 225 | 182.1 | 136.6 | 79.4 | |
| X-Plane 11.11 (2018) | 199 | 183.5 | 139.5 | 143.7 | ||
| Far Cry 5 (2018) | 199 | 175 | 168 | 158 | 155 | |
| Strange Brigade (2018) | 562 | 448 | 382 | 339 | 238 | |
| Call of Duty Modern Warfare 2 2022 (2022) | 167 | 124 | ||||
| Hogwarts Legacy (2023) | 173 | 157 | 134 | 108 | 81 | |
| F1 23 (2023) | 329 | 329 | 304 | 111 | 73 | |
| Cyberpunk 2077 (2023) | 127.13 | 77.03 | ||||
| Alan Wake 2 (2023) | 100.7 | 71 |
Emissões - Helios 18 muito barulhento no turbo
Ruído
Naturalmente, o ruído da ventoinha depende muito do modo de desempenho escolhido. No modo Turbo , o ruído de fundo é muito alto sob carga; medimos um máximo de pouco menos de 60 dB, tornando-o o dispositivo mais barulhento no campo de comparação. OAlienware com sua RTX 4090 permanece mais silencioso; apenas o MSI é igualmente barulhento. No volume máximo, o chassi começa a vibrar levemente. Portanto, recomendamos o modo Performance ou inferior. No primeiro, o senhor só perde de 3 a 5 por cento do desempenho em Witcher 3, mas o volume cai em quase 10 dB!
Pelo menos o Helios 18 regula bem as ventoinhas, dependendo da carga, e não libera imediatamente o volume máximo para os usuários com cargas médias. Entretanto, a rotação da ventoinha não permanece constante durante os jogos, mas flutua ciclicamente, às vezes mais e às vezes menos ruidosamente (Witcher 3).
Os outros modos de desempenho podem reduzir consideravelmente o nível de ruído, veja a tabela abaixo.
| Parâmetros/Modo de desempenho | Turbo | Desempenho | Balanceado | Silencioso |
|---|---|---|---|---|
| fps | 176 | 171 | 157 | 100 |
| Volume em dB | 59,82 | 50,74 | 40,77 | 32,36 |
| Consumo em W | 289 | 227 | 182 | 153 |
Barulho
| Ocioso |
| 23 / 23 / 23 dB |
| Carga |
| 45.26 / 59.94 dB |
 | ||
30 dB silencioso 40 dB(A) audível 50 dB(A) ruidosamente alto |
||
min: | ||
| Acer Predator Helios 18 N23Q2 GeForce RTX 4080 Laptop GPU, i9-13900HX, Samsung PM9A1 MZVL22T0HBLB | MSI GE78HX 13VH-070US GeForce RTX 4080 Laptop GPU, i9-13950HX, Samsung PM9A1 MZVL22T0HBLB | HP Omen 17-ck2097ng GeForce RTX 4080 Laptop GPU, i9-13900HX, SK hynix PC801 HFS001TEJ9X101N | Alienware m18 R1 GeForce RTX 4090 Laptop GPU, i9-13980HX, SK hynix PC801 HFS001TEJ9X101N | Asus ROG Strix G18 G814JI GeForce RTX 4070 Laptop GPU, i7-13650HX, Micron 2400 MTFDKBA1T0QFM | Razer Blade 18 RTX 4070 GeForce RTX 4070 Laptop GPU, i9-13950HX, SSSTC CA6-8D1024 | |
|---|---|---|---|---|---|---|
| Noise | -6% | -11% | 6% | -2% | 3% | |
| desligado / ambiente * (dB) | 23 | 23.4 -2% | 24 -4% | 22.8 1% | 25 -9% | 23.5 -2% |
| Idle Minimum * (dB) | 23 | 24.2 -5% | 31 -35% | 23 -0% | 26 -13% | 23.8 -3% |
| Idle Average * (dB) | 23 | 25.6 -11% | 32 -39% | 23 -0% | 28 -22% | 23.8 -3% |
| Idle Maximum * (dB) | 23 | 31 -35% | 33 -43% | 23 -0% | 29 -26% | 26.8 -17% |
| Load Average * (dB) | 45.26 | 43.3 4% | 45 1% | 35.6 21% | 41 9% | 37.3 18% |
| Witcher 3 ultra * (dB) | 59.82 | 56.3 6% | 45 25% | 51.3 14% | 44 26% | 48 20% |
| Load Maximum * (dB) | 59.94 | 59.1 1% | 50 17% | 56.7 5% | 46 23% | 53.5 11% |
* ... menor é melhor
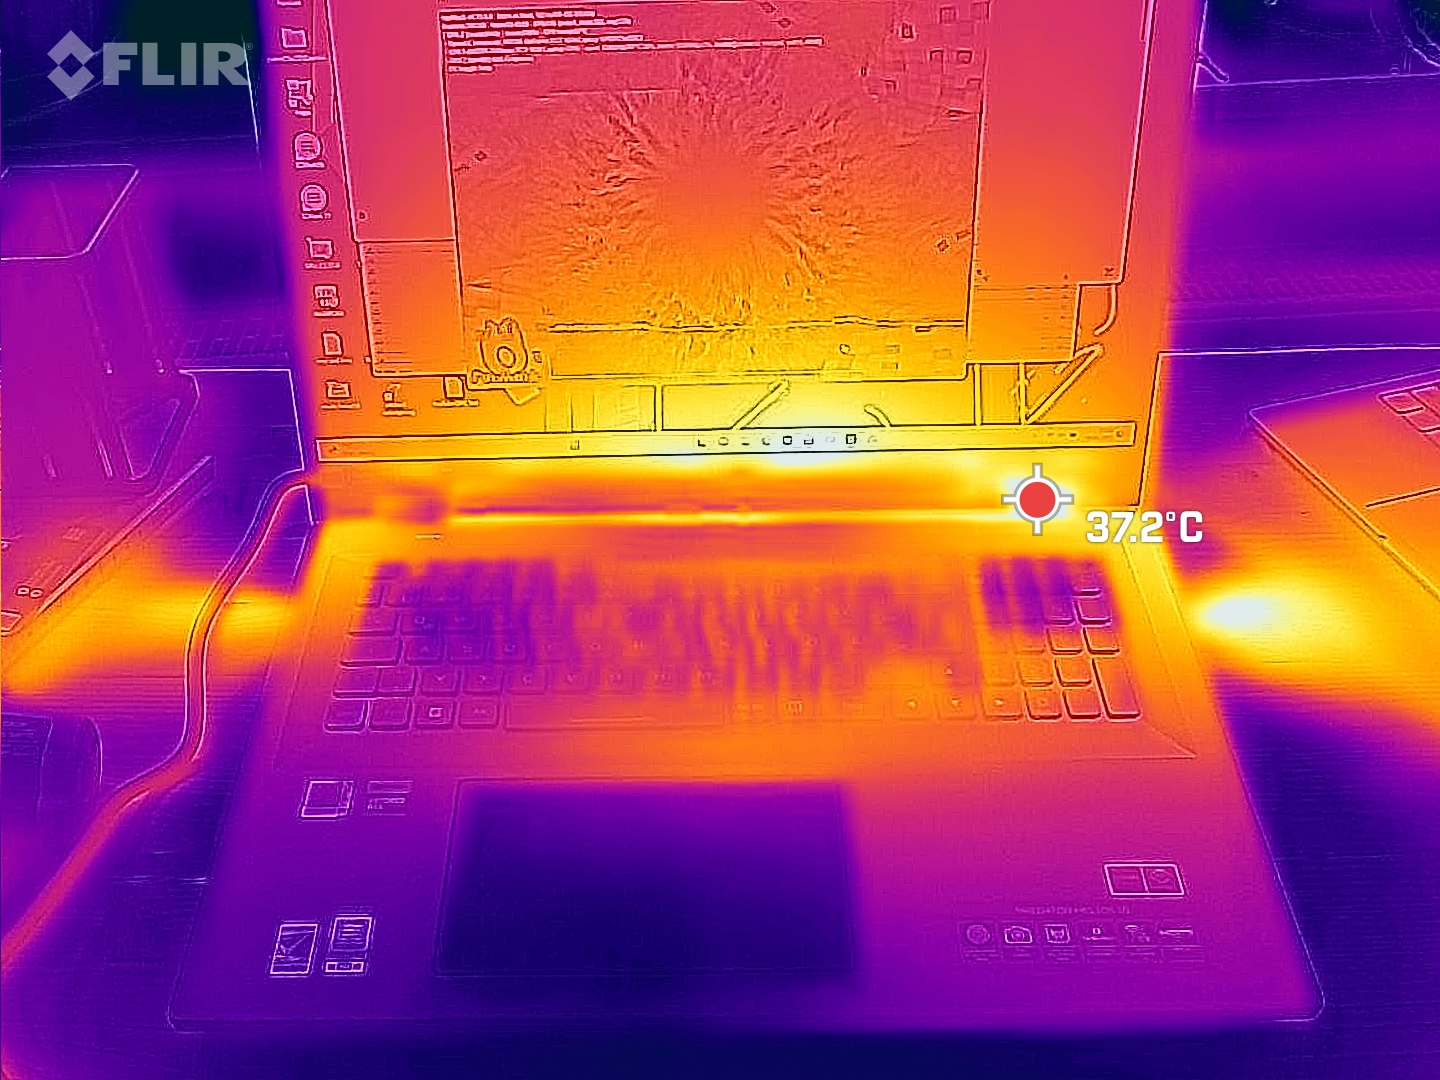
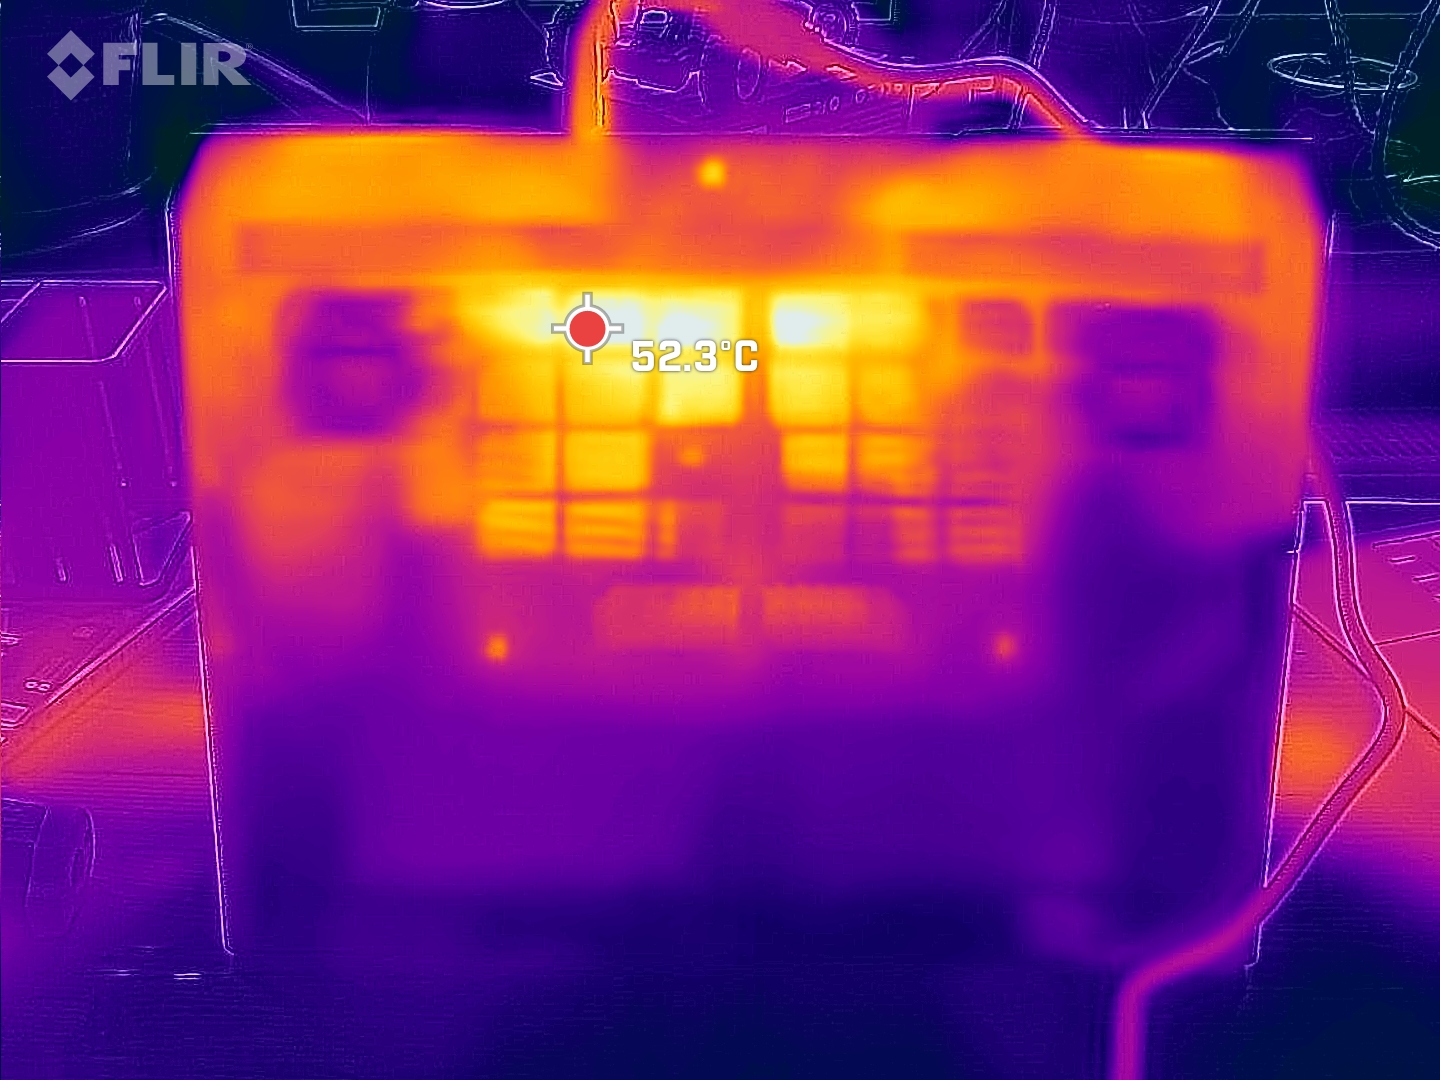
Temperatura
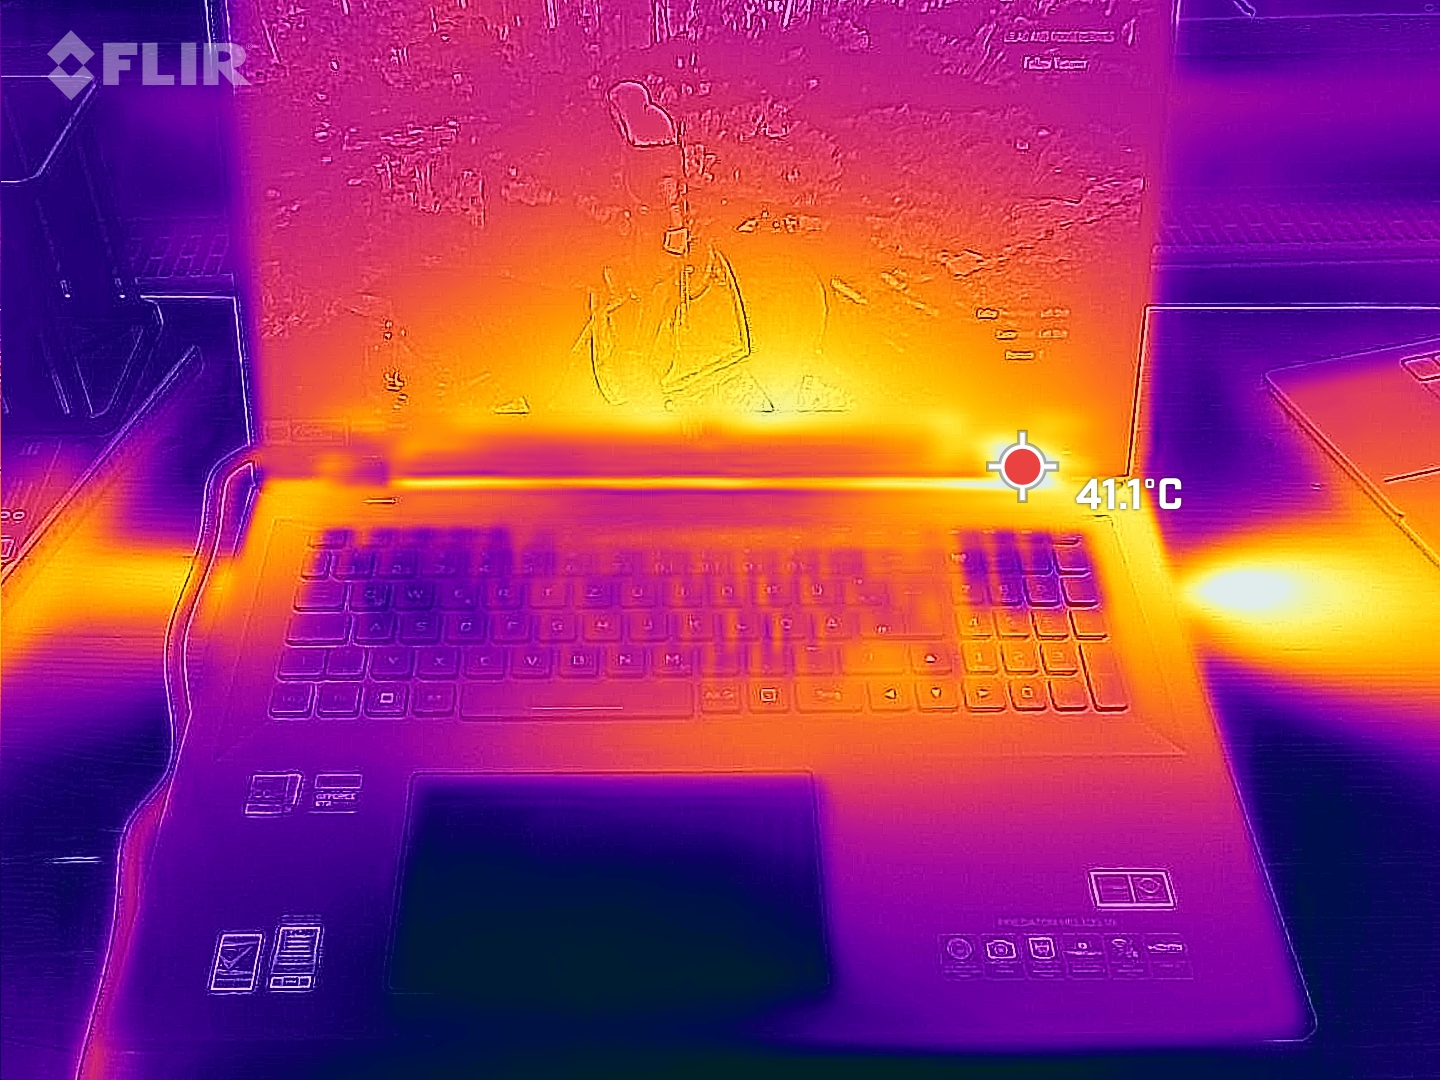
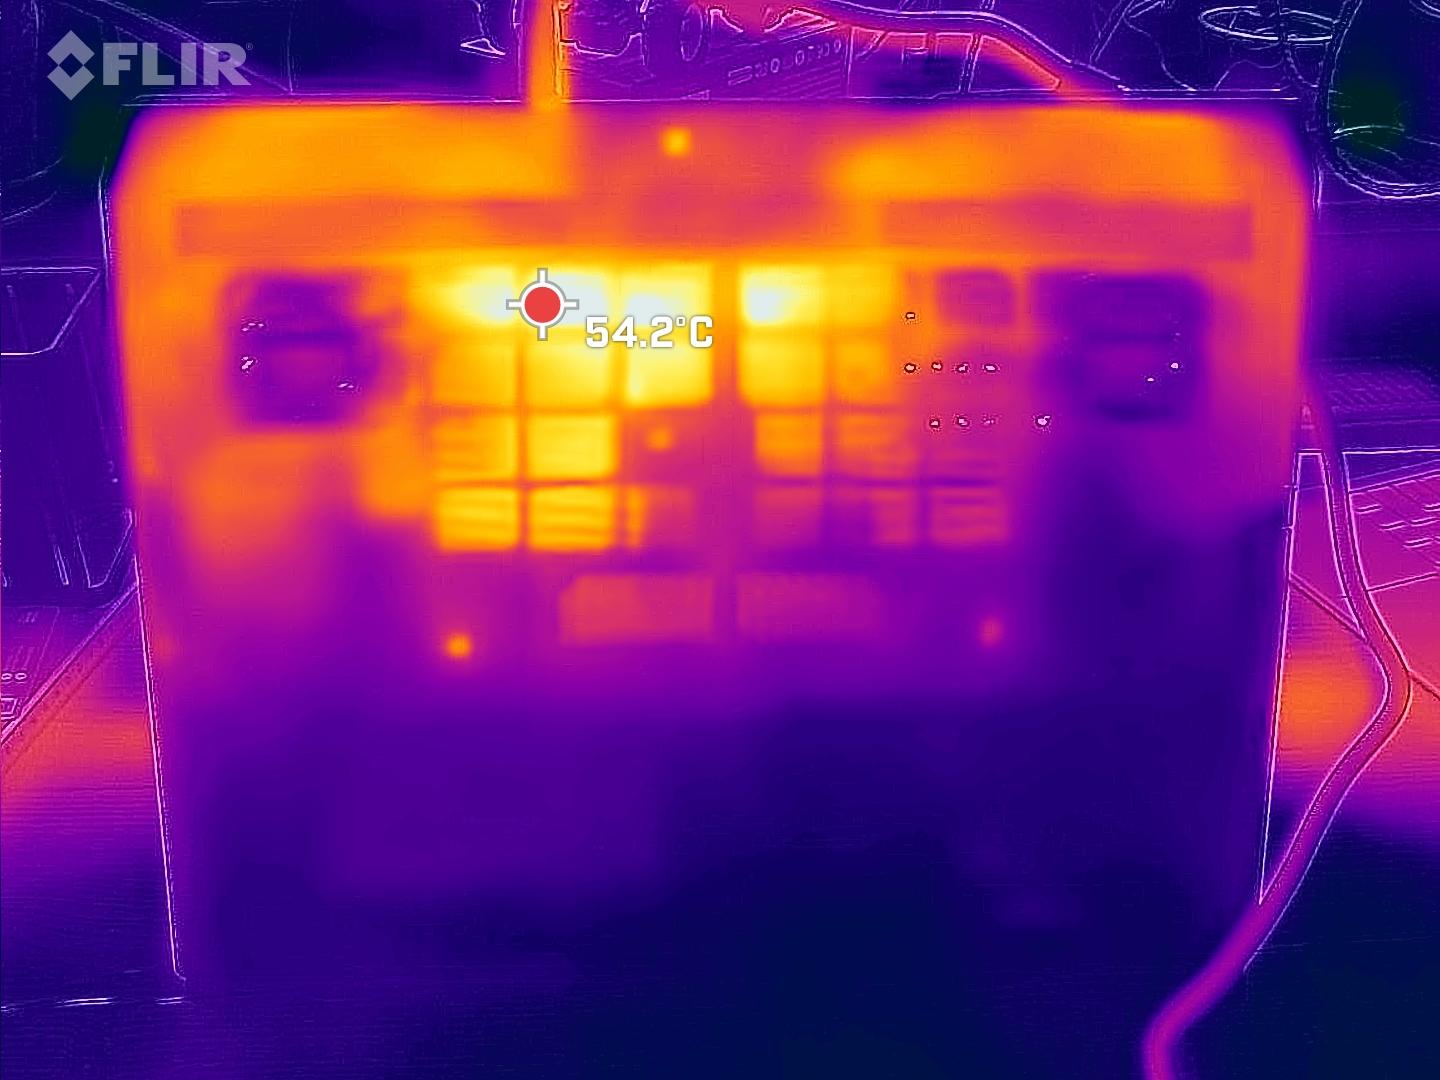
As temperaturas da superfície mostram que as ventoinhas barulhentas também têm um aspecto positivo. O Helios 18 aquece apenas de forma muito seletiva (parte inferior central e à esquerda da tela), mas, fora isso, permanece excepcionalmente frio. Por exemplo, o apoio para a palma da mão esquerda fica totalmente frio depois de uma hora de jogo. Isso mostra que, por um lado, os ventiladores barulhentos estão configurados de forma muito agressiva e, por outro lado, o calor não é distribuído muito bem.
(+) A temperatura máxima no lado superior é 35 °C / 95 F, em comparação com a média de 40.4 °C / 105 F , variando de 21.2 a 68.8 °C para a classe Gaming.
(-) A parte inferior aquece até um máximo de 56 °C / 133 F, em comparação com a média de 43.2 °C / 110 F
(+) Em uso inativo, a temperatura média para o lado superior é 31.1 °C / 88 F, em comparação com a média do dispositivo de 33.9 °C / ### class_avg_f### F.
(+) Jogando The Witcher 3, a temperatura média para o lado superior é 30.7 °C / 87 F, em comparação com a média do dispositivo de 33.9 °C / ## #class_avg_f### F.
(+) Os apoios para as mãos e o touchpad são mais frios que a temperatura da pele, com um máximo de 29 °C / 84.2 F e, portanto, são frios ao toque.
(±) A temperatura média da área do apoio para as mãos de dispositivos semelhantes foi 28.8 °C / 83.8 F (-0.2 °C / -0.4 F).
| Acer Predator Helios 18 N23Q2 Intel Core i9-13900HX, NVIDIA GeForce RTX 4080 Laptop GPU | MSI GE78HX 13VH-070US Intel Core i9-13950HX, NVIDIA GeForce RTX 4080 Laptop GPU | HP Omen 17-ck2097ng Intel Core i9-13900HX, NVIDIA GeForce RTX 4080 Laptop GPU | Alienware m18 R1 Intel Core i9-13980HX, NVIDIA GeForce RTX 4090 Laptop GPU | Asus ROG Strix G18 G814JI Intel Core i7-13650HX, NVIDIA GeForce RTX 4070 Laptop GPU | Razer Blade 18 RTX 4070 Intel Core i9-13950HX, NVIDIA GeForce RTX 4070 Laptop GPU | |
|---|---|---|---|---|---|---|
| Heat | 11% | 14% | 17% | 7% | 11% | |
| Maximum Upper Side * (°C) | 35 | 37.4 -7% | 41 -17% | 39 -11% | 45 -29% | 39.2 -12% |
| Maximum Bottom * (°C) | 56 | 45 20% | 51 9% | 36.4 35% | 47 16% | 35.6 36% |
| Idle Upper Side * (°C) | 34 | 29.8 12% | 24 29% | 29.2 14% | 28 18% | 31.8 6% |
| Idle Bottom * (°C) | 39 | 32.4 17% | 25 36% | 27.8 29% | 31 21% | 33.2 15% |
* ... menor é melhor
Testes de estresse
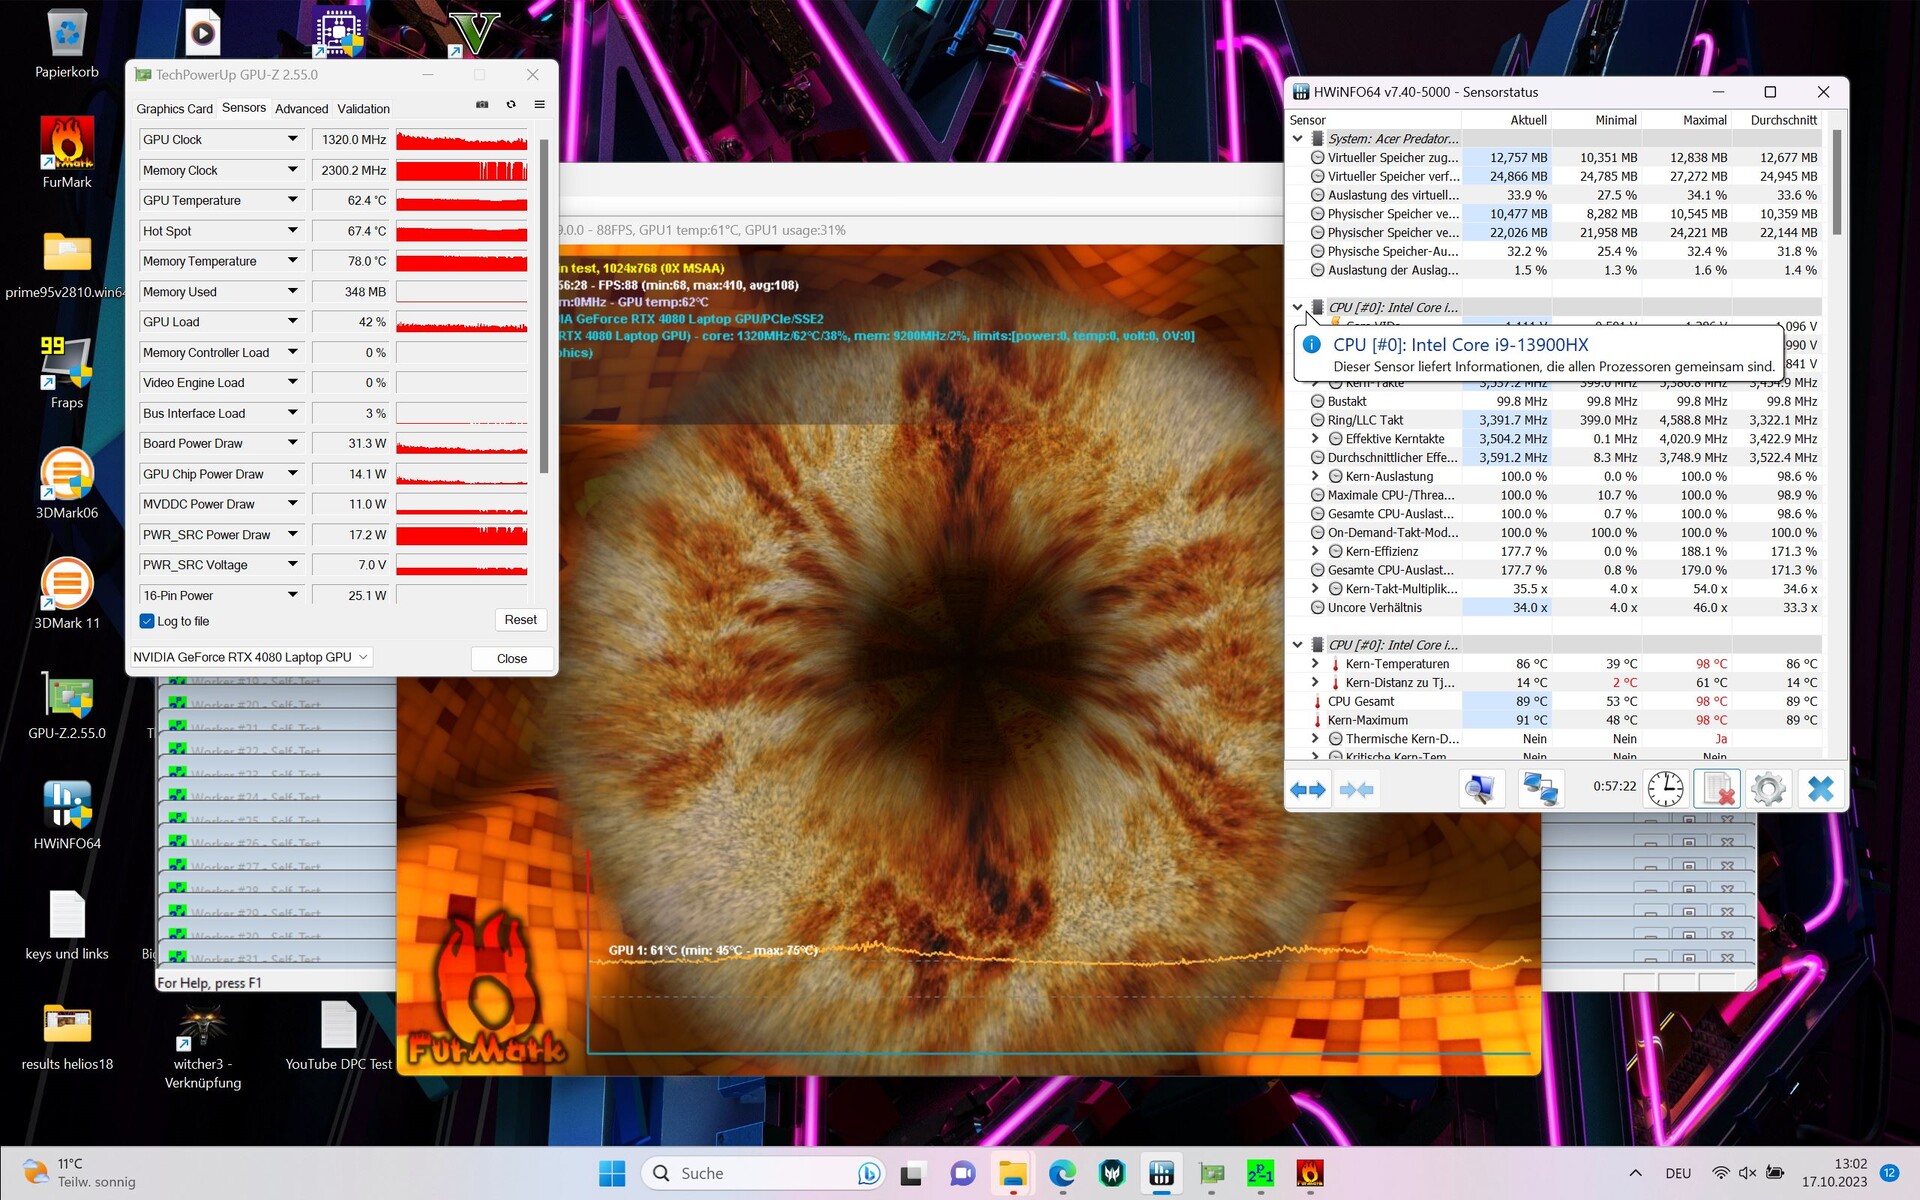
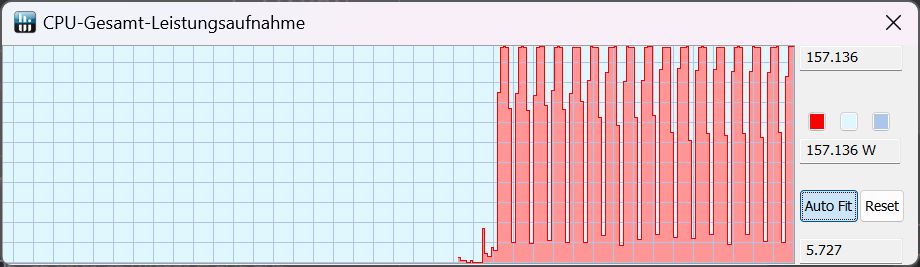
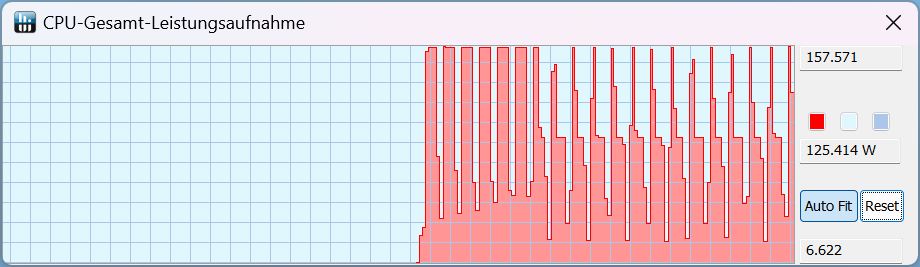
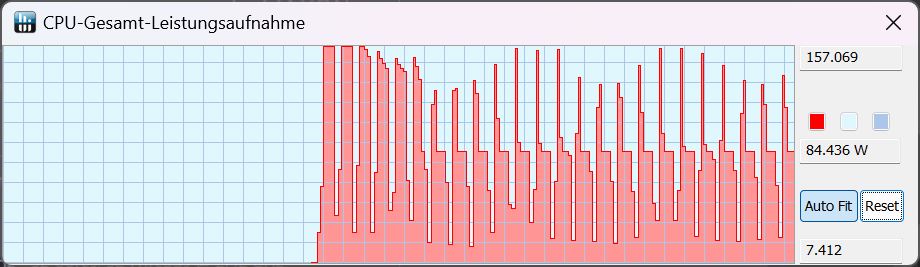
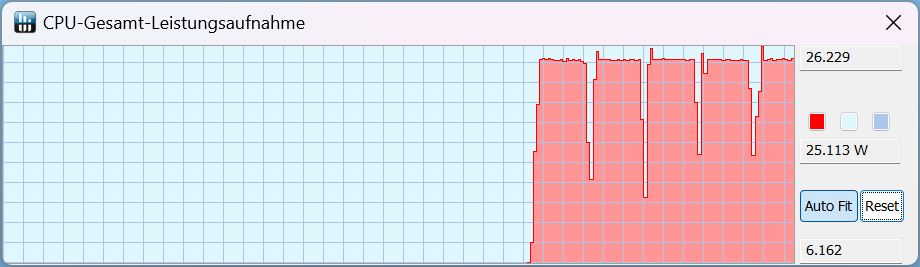
Depois de iniciar nosso teste de estresse, o desempenho da CPU do Predator permanece relativamente constante, com os núcleos com clock consistente entre 3,4 e 3,6 GHz. Sempre há pequenas flutuações que se refletem no consumo de energia e também na temperatura do núcleo. As temperaturas do núcleo da CPU aumentam até 98 °C, mas a média é de 89 °C. O consumo de energia da CPU atinge o pico de 156 W e a média é de 137 W.
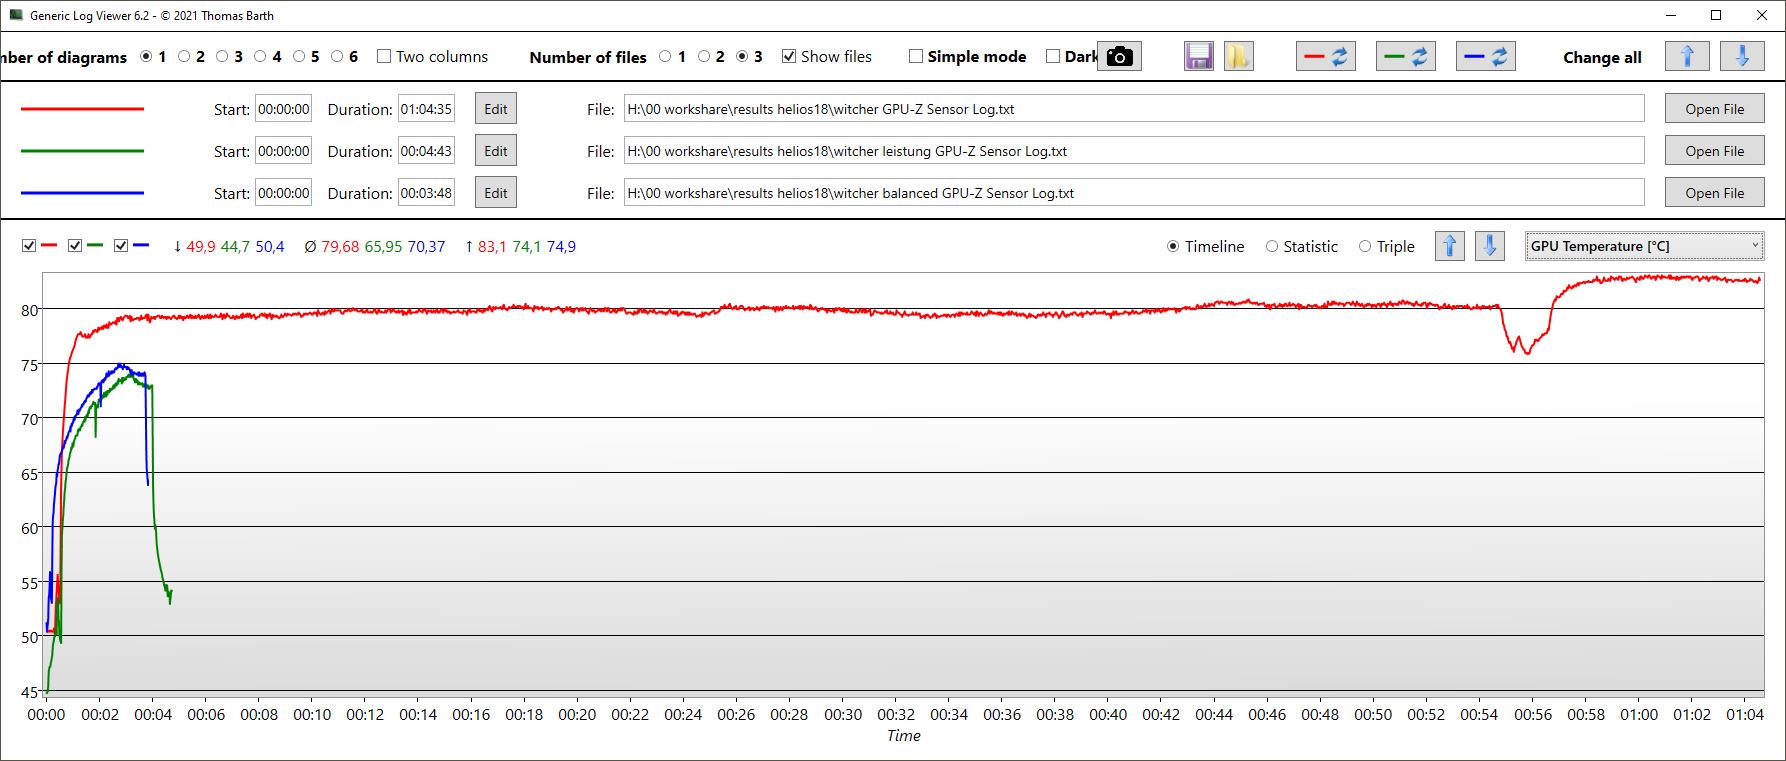
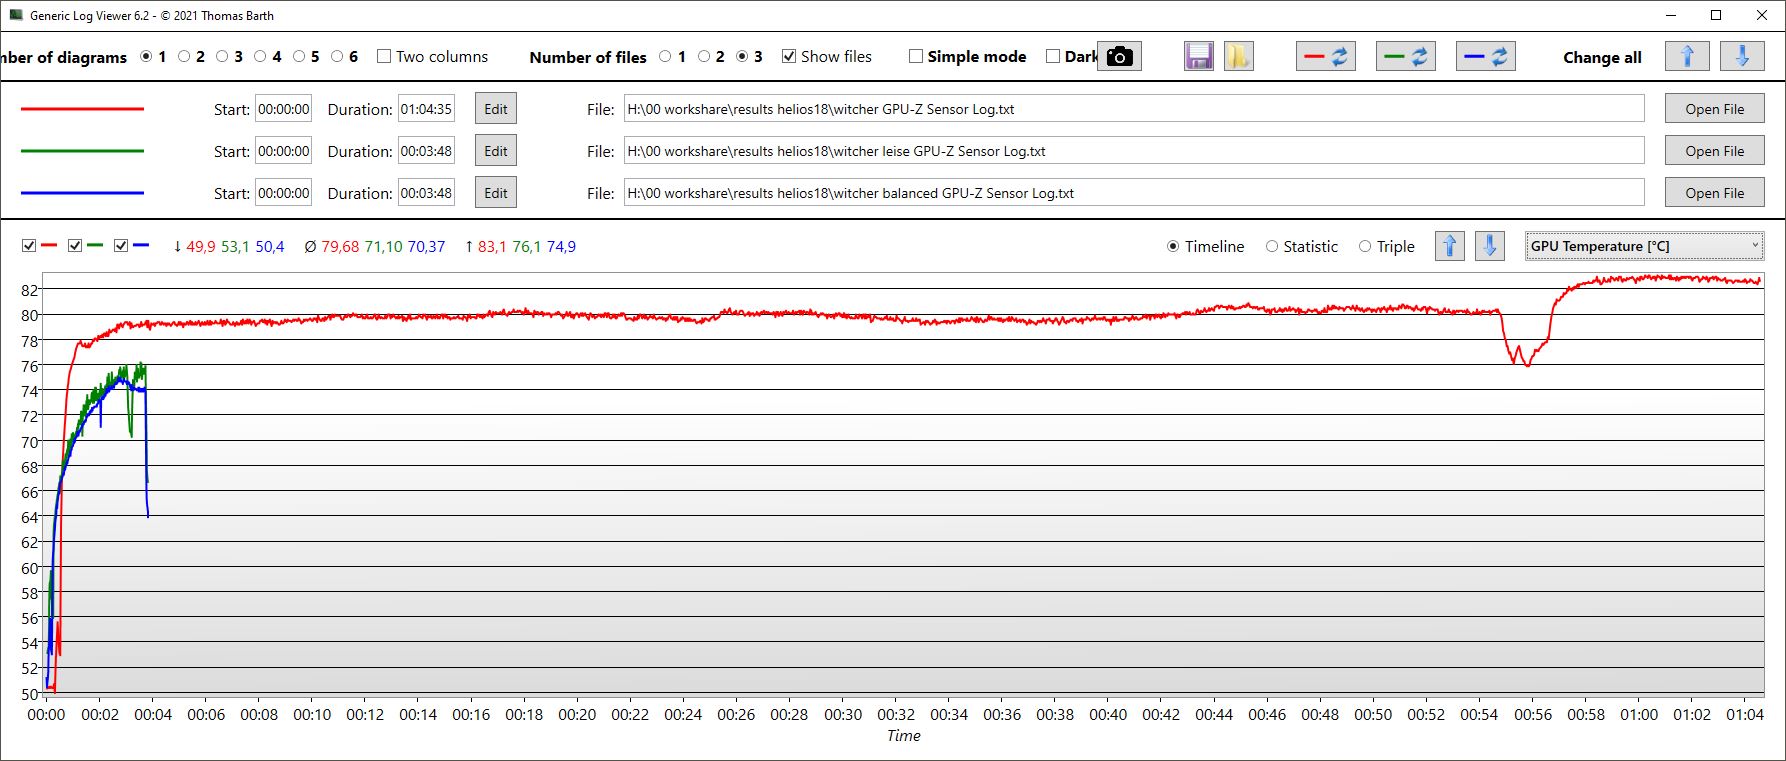
A GPU é muito menos consistente e apresenta uma curva de onda de desempenho. A taxa de clock atinge um máximo ciclicamente recorrente de 2,5 GHz e os vales da curva ficam em torno de 1,2 GHz. Ao mesmo tempo, medimos quedas muito espontâneas para apenas 200 MHz por frações de segundo no clock de memória constante de 2,3 GHz. A temperatura da GPU também oscila, mas é de apenas 64 °C em média, com um máximo de 76 °C. O consumo de energia oscila entre 25 W e 90 a 100 W.
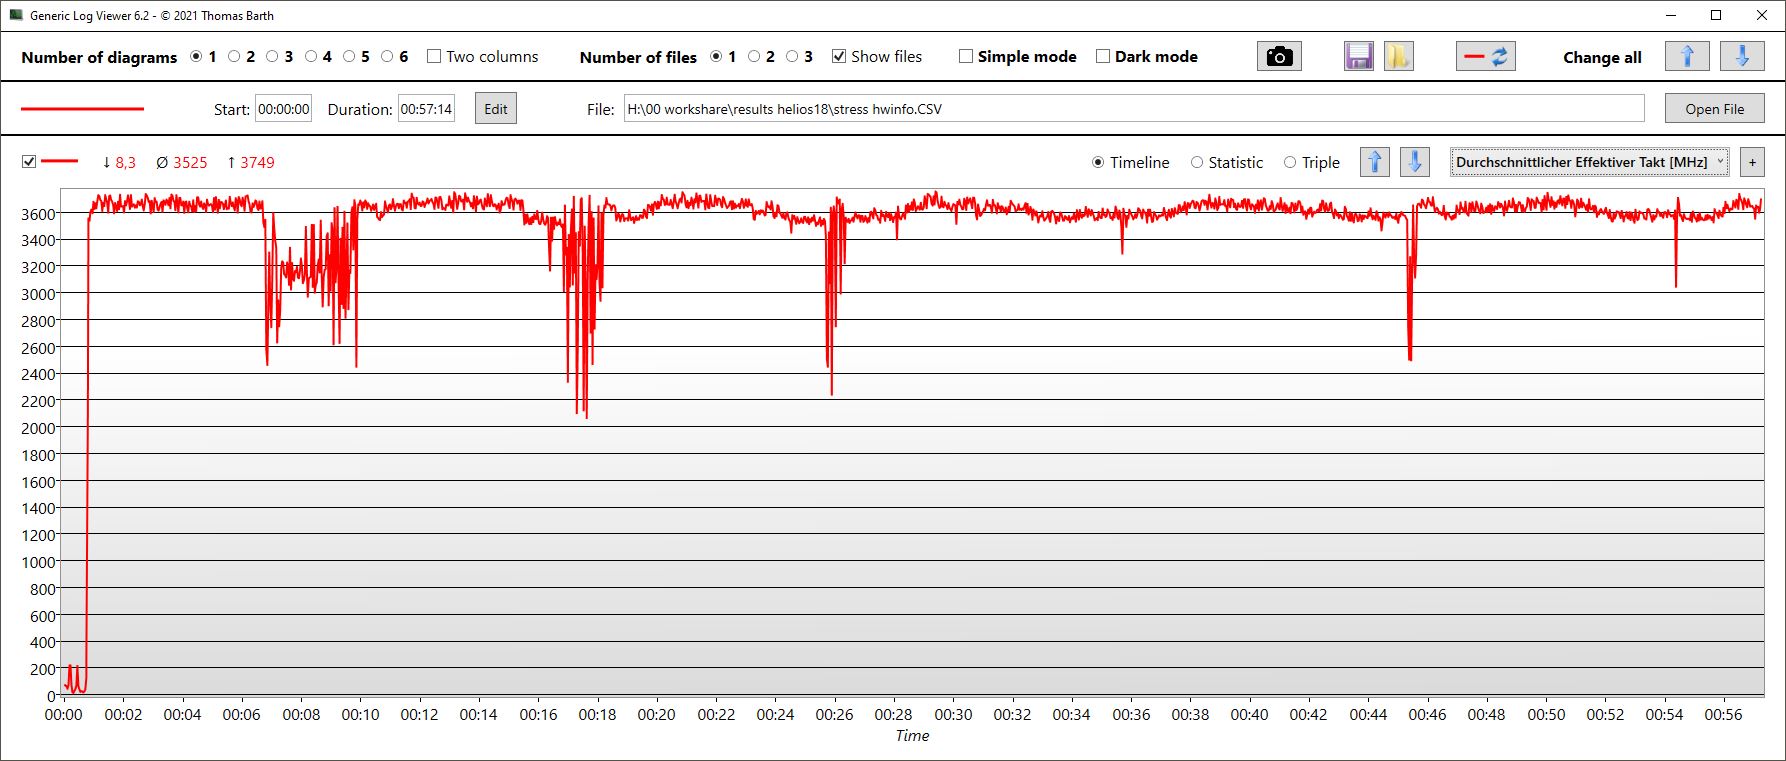
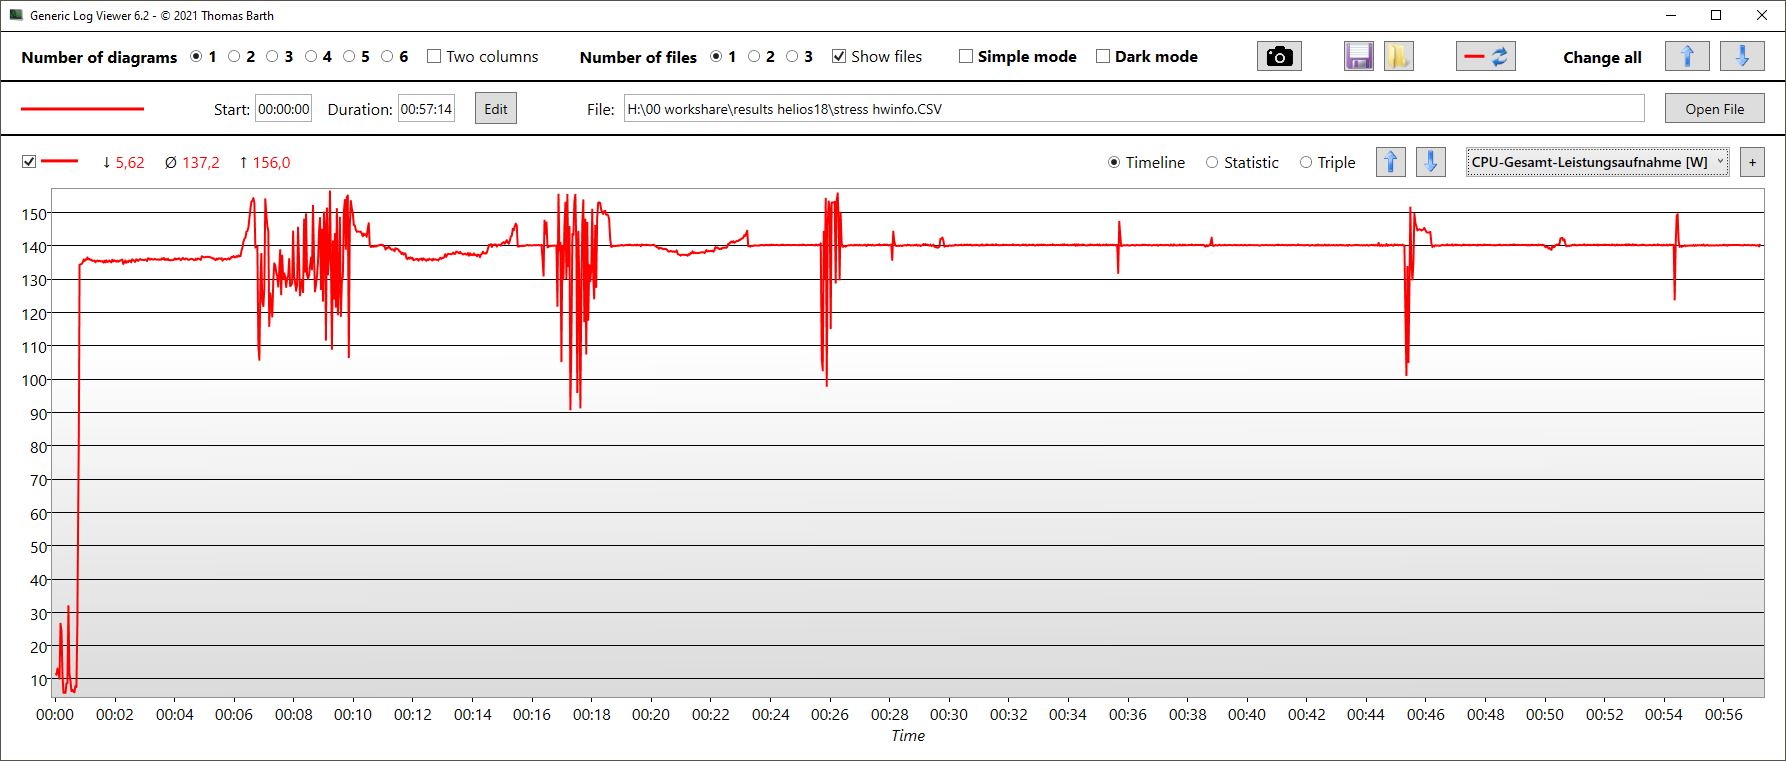
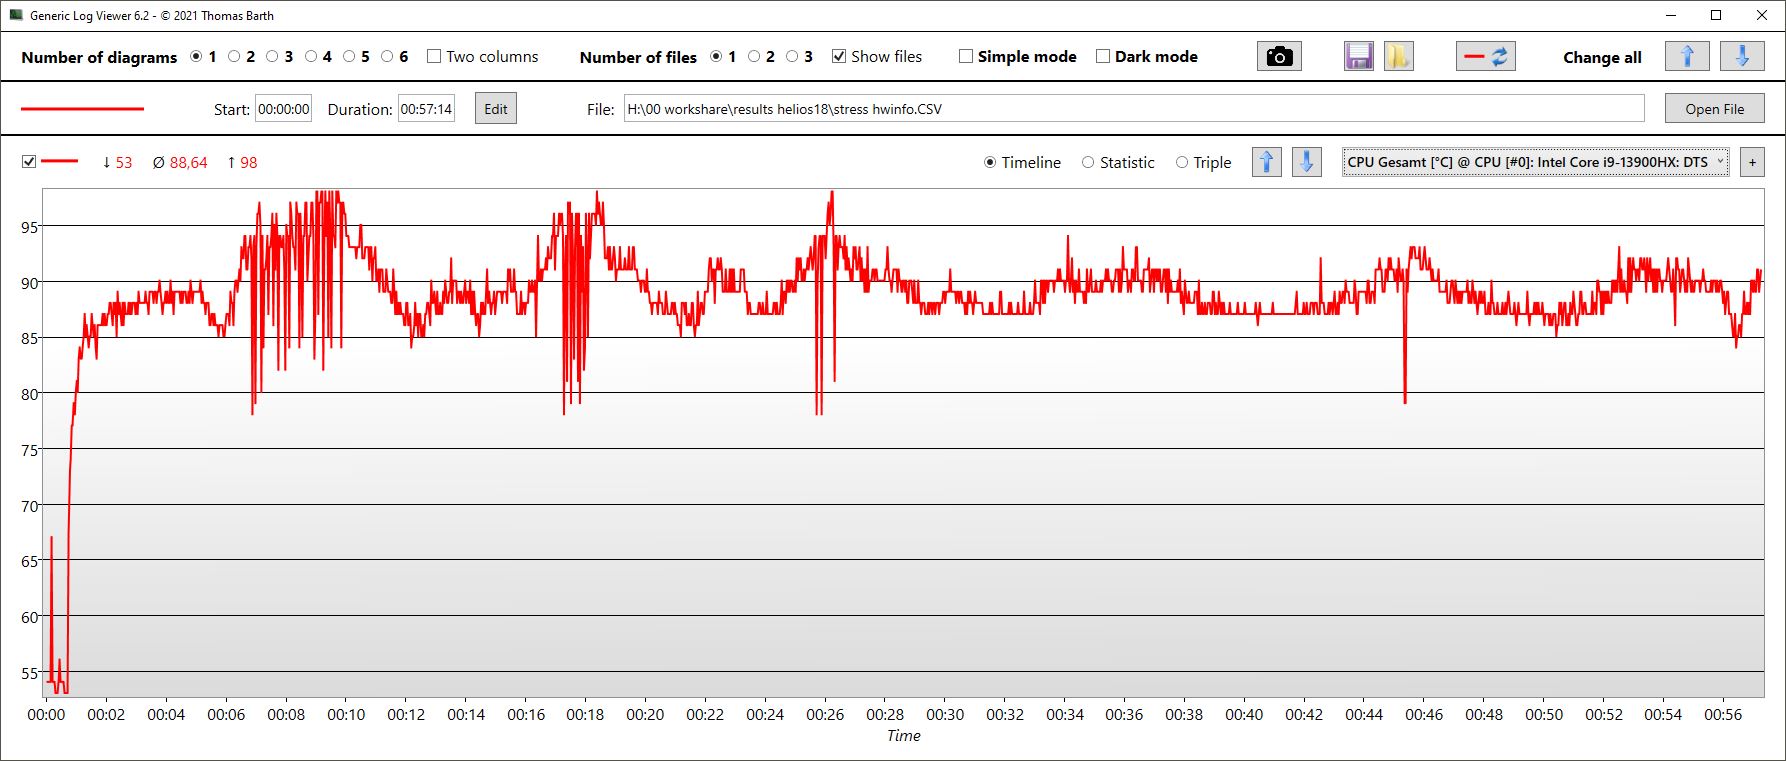
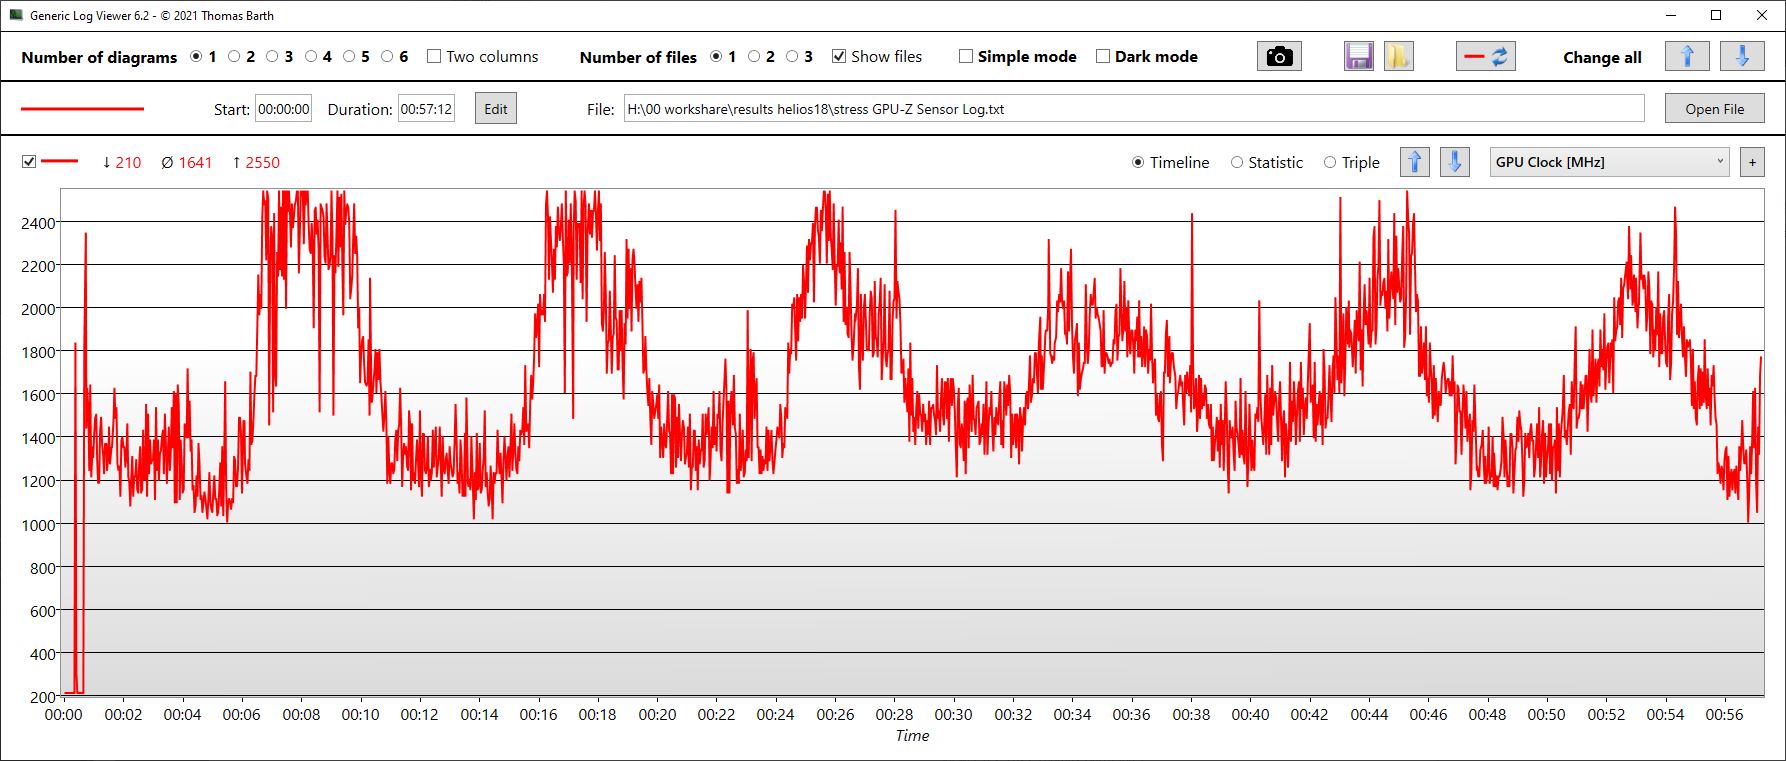
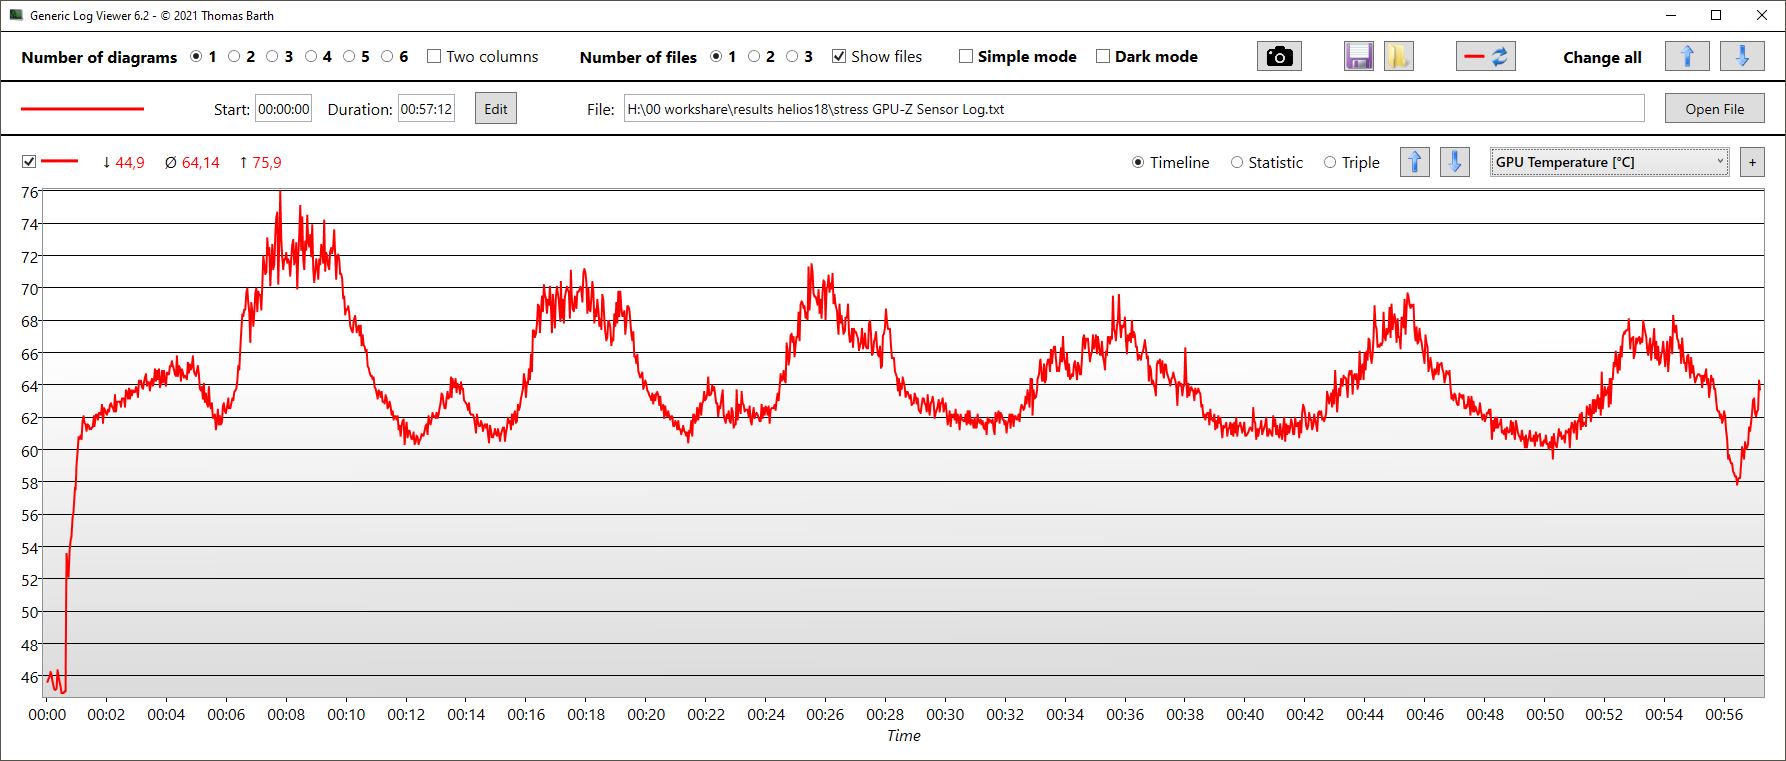
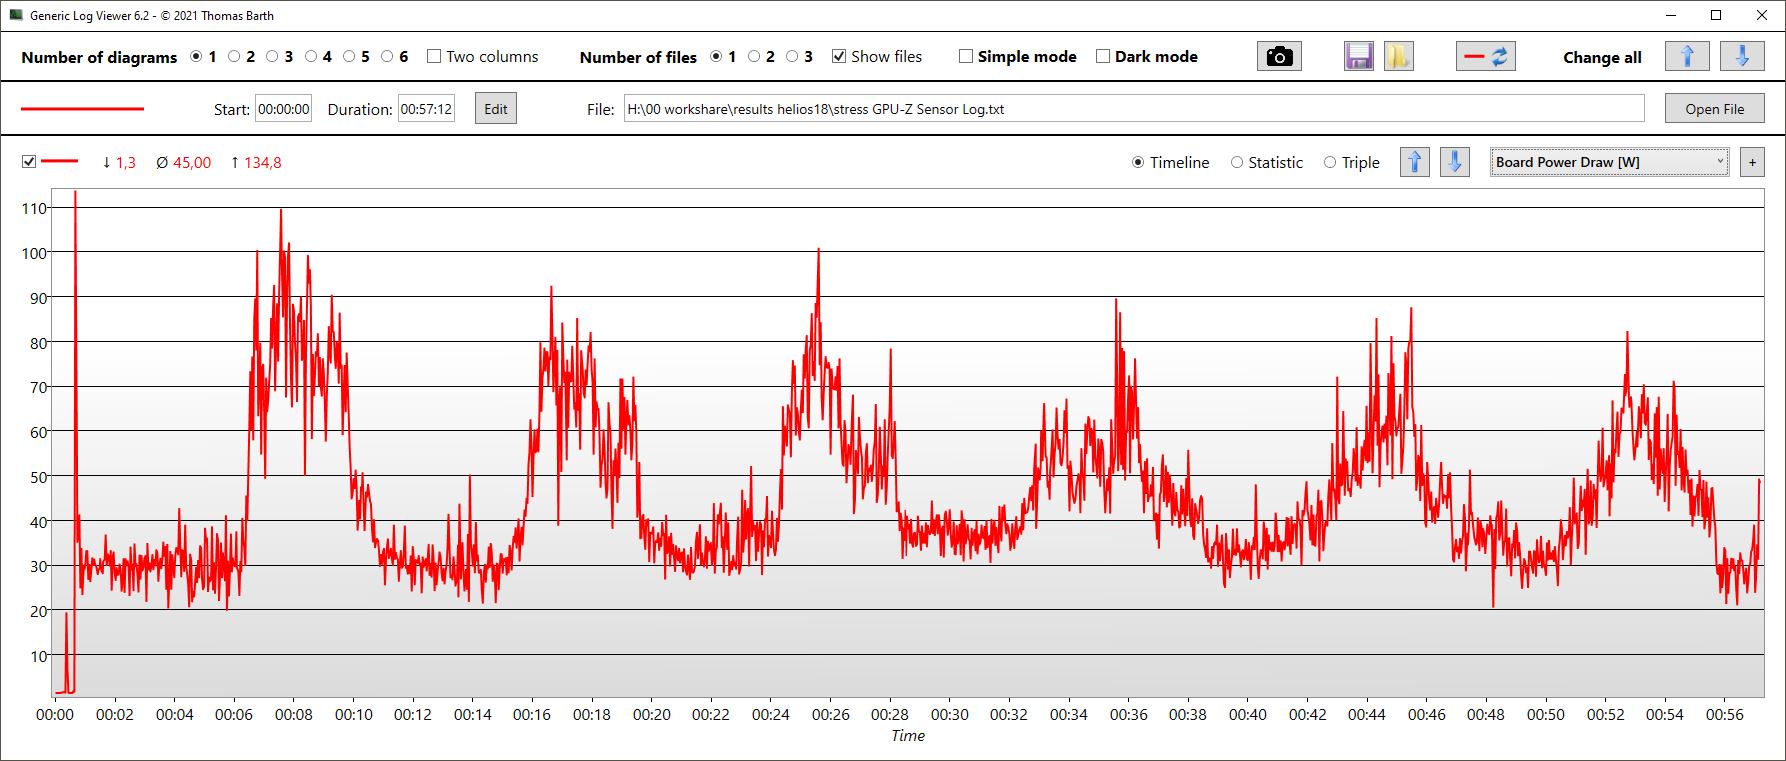
| Clock da CPU (GHz) | Clock da GPU (MHz) | Temperatura média da CPU (°C) | Temperatura média da GPU (°C) | |
| Prime95 + FurMark Stress | 3,5 | 1.640 | 89 | 64 |
| Witcher 3 Estresse | 527 | 2.525 | 88.5 | 80 |
Alto-falantes
Os alto-falantes podem ser bem altos, mas isso é tudo em termos de notícias positivas. O som é fraco, os graves são praticamente inexistentes e mesmo os médios e agudos não são particularmente equilibrados. Esperávamos uma qualidade de som melhor, especialmente em um laptop tão grande.
Dispositivos de áudio externos podem ser conectados por meio da entrada combinada para fone de ouvido, entre outras coisas. De qualquer forma, os fones de ouvido são indispensáveis ao jogar no modo Turbo , que é muito alto.
Acer Predator Helios 18 N23Q2 análise de áudio
(+) | os alto-falantes podem tocar relativamente alto (###valor### dB)
Graves 100 - 315Hz
(-) | quase nenhum baixo - em média 17.6% menor que a mediana
(±) | a linearidade dos graves é média (9.8% delta para a frequência anterior)
Médios 400 - 2.000 Hz
(±) | médios mais altos - em média 9.1% maior que a mediana
(±) | a linearidade dos médios é média (8.8% delta para frequência anterior)
Altos 2 - 16 kHz
(±) | máximos mais altos - em média 5.3% maior que a mediana
(+) | os máximos são lineares (6.4% delta da frequência anterior)
Geral 100 - 16.000 Hz
(±) | a linearidade do som geral é média (20.3% diferença em relação à mediana)
Comparado com a mesma classe
» 72% de todos os dispositivos testados nesta classe foram melhores, 6% semelhantes, 23% piores
» O melhor teve um delta de 6%, a média foi 18%, o pior foi 132%
Comparado com todos os dispositivos testados
» 53% de todos os dispositivos testados foram melhores, 8% semelhantes, 39% piores
» O melhor teve um delta de 4%, a média foi 23%, o pior foi 134%
Apple MacBook Pro 16 2021 M1 Pro análise de áudio
(+) | os alto-falantes podem tocar relativamente alto (###valor### dB)
Graves 100 - 315Hz
(+) | bons graves - apenas 3.8% longe da mediana
(+) | o baixo é linear (5.2% delta para a frequência anterior)
Médios 400 - 2.000 Hz
(+) | médios equilibrados - apenas 1.3% longe da mediana
(+) | médios são lineares (2.1% delta para frequência anterior)
Altos 2 - 16 kHz
(+) | agudos equilibrados - apenas 1.9% longe da mediana
(+) | os máximos são lineares (2.7% delta da frequência anterior)
Geral 100 - 16.000 Hz
(+) | o som geral é linear (4.6% diferença em relação à mediana)
Comparado com a mesma classe
» 0% de todos os dispositivos testados nesta classe foram melhores, 0% semelhantes, 100% piores
» O melhor teve um delta de 5%, a média foi 17%, o pior foi 45%
Comparado com todos os dispositivos testados
» 0% de todos os dispositivos testados foram melhores, 0% semelhantes, 100% piores
» O melhor teve um delta de 4%, a média foi 23%, o pior foi 134%
Gerenciamento de energia - Consumo e tempo de funcionamento de acordo com as expectativas
Consumo de energia
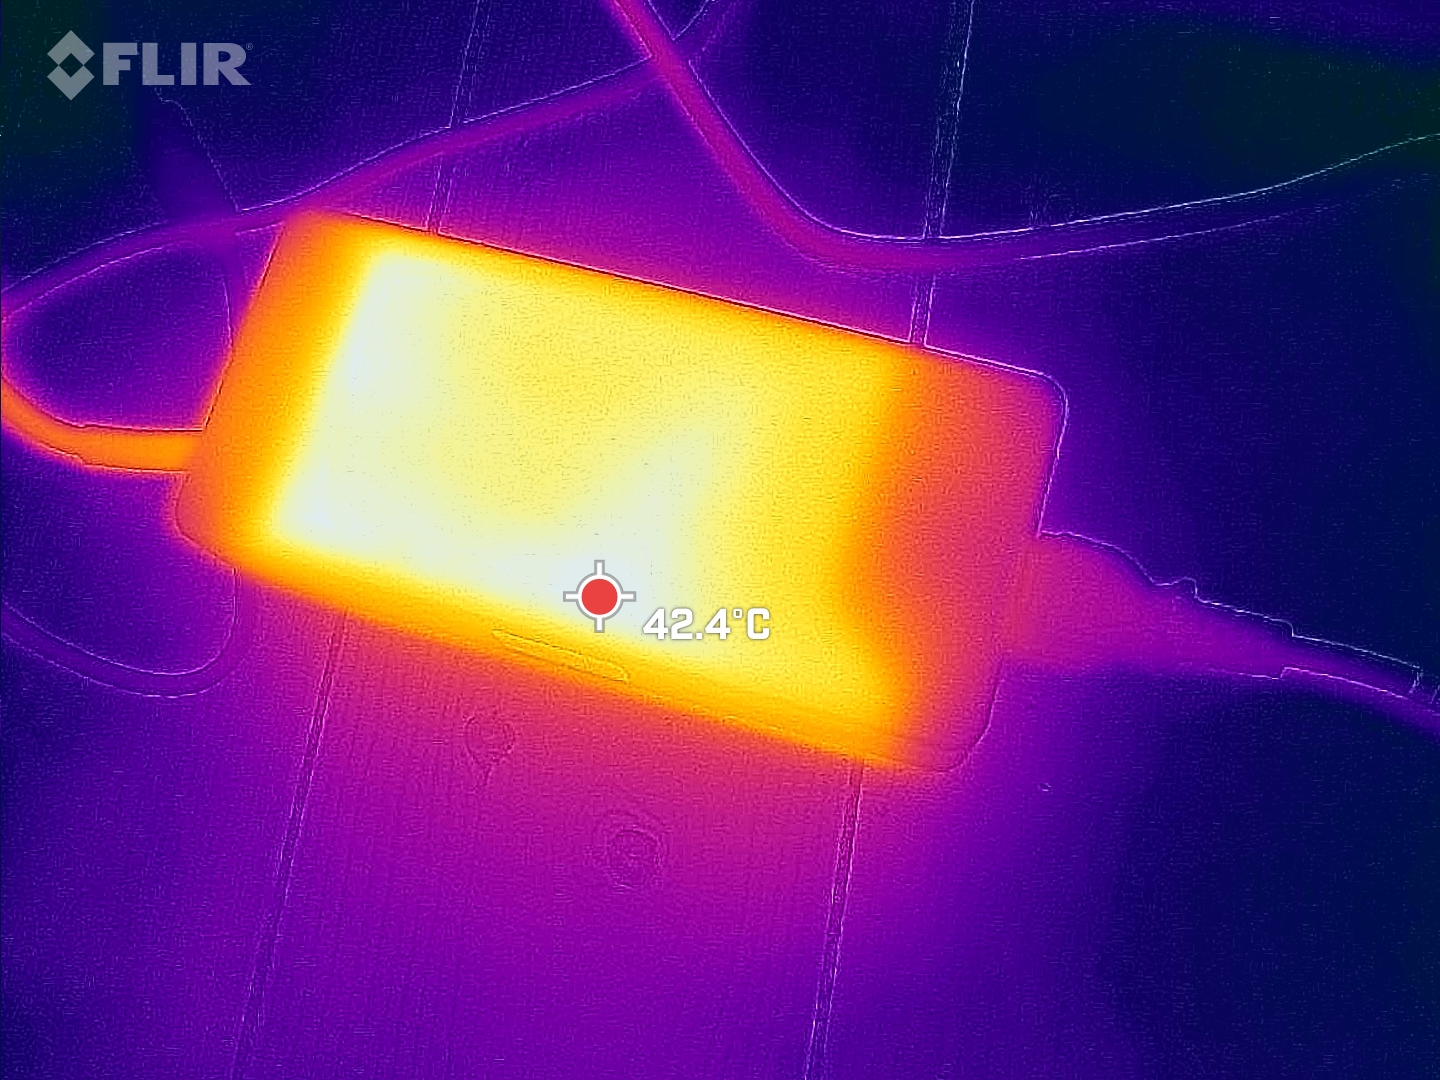
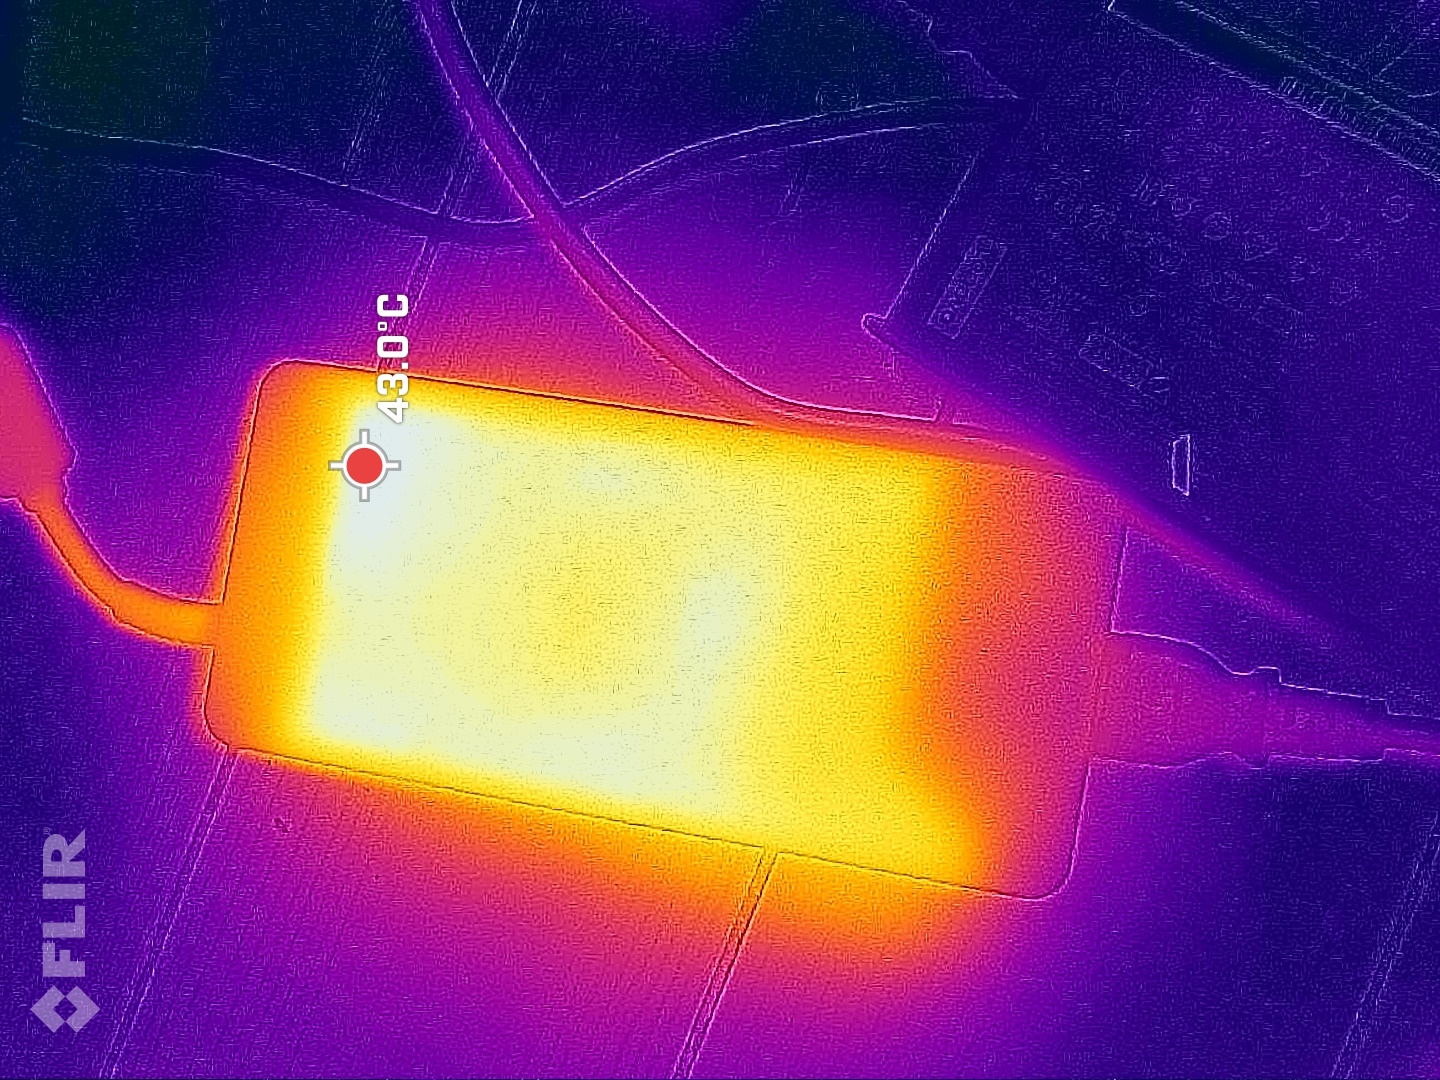
Ninguém espera frugalidade de uma CPU HX e de uma RTX 4080 e, portanto, o Helios 18 não é uma surpresa. Ele é bastante econômico quando está ocioso, mas quando está jogando, precisa de quase tanto quanto o igualmente poderosoMSI GE78HXsomente o consumo máximo de curto prazo de 319 W é maior do que o do MSI. A fonte de alimentação Chicony, grande e pesada, é classificada em 330 W e deve ser capaz de fornecer energia suficiente ao Predator o tempo todo, mesmo em cenários exigentes.
| desligado | |
| Ocioso | |
| Carga |
|
Key:
min: | |
| Acer Predator Helios 18 N23Q2 i9-13900HX, GeForce RTX 4080 Laptop GPU, Samsung PM9A1 MZVL22T0HBLB, IPS, 2560x1600, 18" | MSI GE78HX 13VH-070US i9-13950HX, GeForce RTX 4080 Laptop GPU, Samsung PM9A1 MZVL22T0HBLB, IPS, 2560x1600, 17" | HP Omen 17-ck2097ng i9-13900HX, GeForce RTX 4080 Laptop GPU, SK hynix PC801 HFS001TEJ9X101N, IPS, 2560x1440, 17.3" | Alienware m18 R1 i9-13980HX, GeForce RTX 4090 Laptop GPU, SK hynix PC801 HFS001TEJ9X101N, IPS, 1920x1200, 18" | Asus ROG Strix G18 G814JI i7-13650HX, GeForce RTX 4070 Laptop GPU, Micron 2400 MTFDKBA1T0QFM, IPS, 2560x1600, 18" | Razer Blade 18 RTX 4070 i9-13950HX, GeForce RTX 4070 Laptop GPU, SSSTC CA6-8D1024, IPS, 2560x1600, 18" | Média NVIDIA GeForce RTX 4080 Laptop GPU | Média da turma Gaming | |
|---|---|---|---|---|---|---|---|---|
| Power Consumption | -13% | -1% | -47% | 20% | -37% | -14% | 7% | |
| Idle Minimum * (Watt) | 16 | 16.1 -1% | 16 -0% | 21.6 -35% | 8 50% | 24.5 -53% | 16.9 ? -6% | 13 ? 19% |
| Idle Average * (Watt) | 19 | 24 -26% | 20 -5% | 25.2 -33% | 15 21% | 34.1 -79% | 22 ? -16% | 19 ? -0% |
| Idle Maximum * (Watt) | 21.3 | 34 -60% | 26 -22% | 56.7 -166% | 26 -22% | 47.7 -124% | 34.1 ? -60% | 24.6 ? -15% |
| Load Average * (Watt) | 124 | 123.6 -0% | 135 -9% | 164.1 -32% | 102 18% | 140 -13% | 117.9 ? 5% | 110.7 ? 11% |
| Witcher 3 ultra * (Watt) | 289 | 286 1% | 215 26% | 311 -8% | 178.6 38% | 202 30% | ||
| Load Maximum * (Watt) | 319 | 285.7 10% | 299 6% | 338.9 -6% | 267 16% | 261 18% | 297 ? 7% | 259 ? 19% |
* ... menor é melhor
Power consumption Witcher 3 / Stress test
Power consumption with an external monitor
Duração da bateria
A Acer instala uma bateria de 90 Wh, enquanto a MSI e a Alienware têm 99 e 97 Wh, respectivamente. Os usuários devem definitivamente usar o modo SDR para a tela no modo de bateria, caso contrário, os 1000 nits HDR esgotarão a bateria muito mais rapidamente.
O Helios 18 dura de 4,5 a quase 5 horas no teste de WiFi e vídeo com um brilho reduzido de 150 nits. O MSI é um pouco mais duradouro, e o Alienware dura o mesmo tempo no teste de WiFi.
| Acer Predator Helios 18 N23Q2 i9-13900HX, GeForce RTX 4080 Laptop GPU, 90 Wh | MSI GE78HX 13VH-070US i9-13950HX, GeForce RTX 4080 Laptop GPU, 99 Wh | HP Omen 17-ck2097ng i9-13900HX, GeForce RTX 4080 Laptop GPU, 83 Wh | Alienware m18 R1 i9-13980HX, GeForce RTX 4090 Laptop GPU, 97 Wh | Asus ROG Strix G18 G814JI i7-13650HX, GeForce RTX 4070 Laptop GPU, 90 Wh | Razer Blade 18 RTX 4070 i9-13950HX, GeForce RTX 4070 Laptop GPU, 91.7 Wh | Média da turma Gaming | |
|---|---|---|---|---|---|---|---|
| Duração da bateria | 14% | -20% | -31% | 28% | -17% | 41% | |
| H.264 (h) | 4.8 | 3.7 -23% | 8.32 ? 73% | ||||
| WiFi v1.3 (h) | 4.4 | 6.1 39% | 3.6 -18% | 4.3 -2% | 8.1 84% | 4 -9% | 7.11 ? 62% |
| Load (h) | 1.7 | 1.5 -12% | 1.4 -18% | 0.7 -59% | 1.2 -29% | 1.3 -24% | 1.502 ? -12% |
| Reader / Idle (h) | 7.3 | 4.2 | 5.6 | 11.7 | 7 | 8.27 ? |
Pro
Contra
Veredicto - Jogador forte com potencial de otimização no resfriamento
O gamer não revela nenhum ponto fraco em termos de desempenho. Tanto a CPU quanto a GPU têm um desempenho ligeiramente melhor do que a média dos notebooks com a mesma configuração do nosso banco de dados. Há também a tela MiniLED brilhante e de alto contraste, enquanto o acabamento e os recursos também são impressionantes.
Em contraste com o bem ajustado Helios 16 com sua RTX 4060, os pontos fracos do Helios 18 com uma RTX 4080 mais exigente se tornam aparentes: o sistema de resfriamento é muito barulhento no modo Turbo e não parece estar otimizado em outras áreas. Embora a maioria das áreas do laptop permaneça excepcionalmente fria, o ponto quente ainda é um dos mais quentes da categoria. Ao mesmo tempo, o modelo SSD teoricamente forte é acelerado muito rapidamente. Recomendamos que o laptop seja executado no modo Performance , mais silencioso.
O Acer Predator Helios 18 é um gigante com forte desempenho, mas o sistema de resfriamento barulhento precisa ser otimizado.
Até o momento, analisamos apenas concorrentes de 18 polegadas com GPUs mais fracas, e é por isso que recomendar alternativas não é tão fácil. Em termos de desempenho, o MSI Raider GE78HX de 17 polegadas MSI Raider GE78HX de 17 polegadas consegue acompanhar o ritmo, mas tem uma tela mais fraca.
Preço e disponibilidade
Nos EUA, a configuração RTX 4080 do Acer Predator Helios 18 parece estar em falta. A Best Buy tem as configurações RTX 4070 e 4060 em oferta por US$1999,99 e US$1699,99, respectivamente.
Os preços são válidos a partir de 27.10.2023 e estão sujeitos a alterações.
Acer Predator Helios 18 N23Q2
- 10/25/2023 v7 (old)
Christian Hintze
Transparência
A seleção dos dispositivos a serem analisados é feita pela nossa equipe editorial. A amostra de teste foi fornecida ao autor como empréstimo pelo fabricante ou varejista para fins desta revisão. O credor não teve influência nesta revisão, nem o fabricante recebeu uma cópia desta revisão antes da publicação. Não houve obrigação de publicar esta revisão. Como empresa de mídia independente, a Notebookcheck não está sujeita à autoridade de fabricantes, varejistas ou editores.
É assim que o Notebookcheck está testando
Todos os anos, o Notebookcheck analisa de forma independente centenas de laptops e smartphones usando procedimentos padronizados para garantir que todos os resultados sejam comparáveis. Desenvolvemos continuamente nossos métodos de teste há cerca de 20 anos e definimos padrões da indústria no processo. Em nossos laboratórios de teste, equipamentos de medição de alta qualidade são utilizados por técnicos e editores experientes. Esses testes envolvem um processo de validação em vários estágios. Nosso complexo sistema de classificação é baseado em centenas de medições e benchmarks bem fundamentados, o que mantém a objetividade.Price comparison

