Revisão do laptop Razer Blade 18: Menor do que muitos laptops de 17 polegadas para jogos
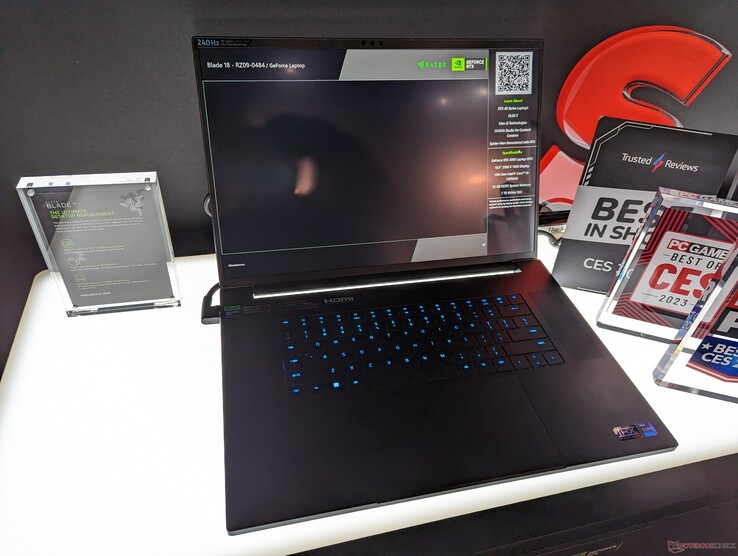
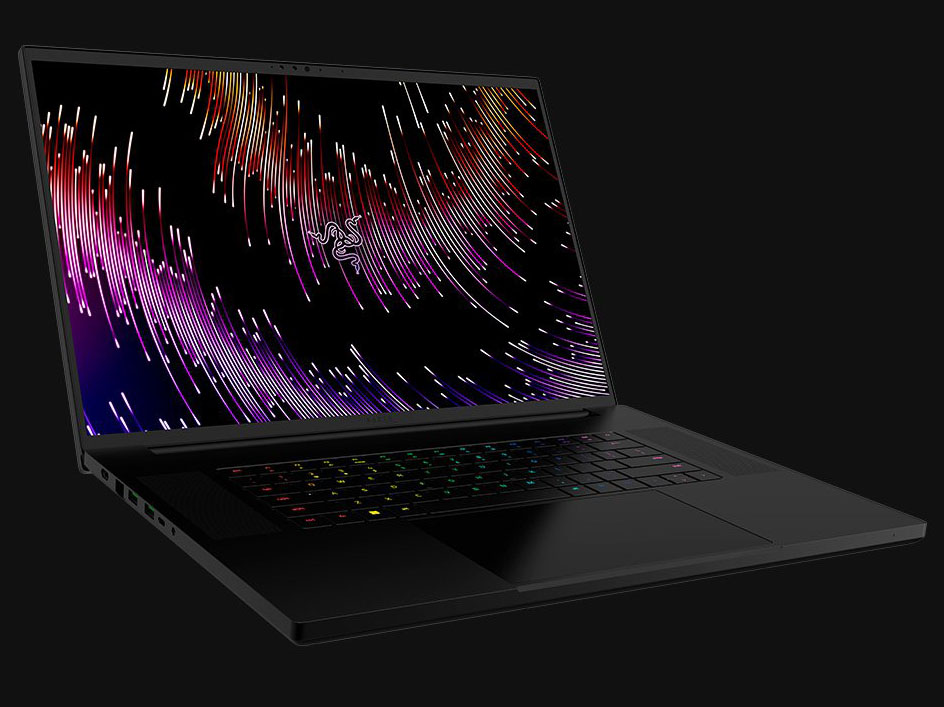
Apresentada no CES 2023, a Blade 18 oferece o maior tamanho de tela até agora para um laptop Blade enquanto ostenta aquele design familiar de chassi da Razer. O lançamento do modelo coincide com o lançamento da série Intel Core da 13ª geração móvel e da série Nvidia GeForce 40 Ada Lovelace, muito parecida com a recente Lâmina 16.
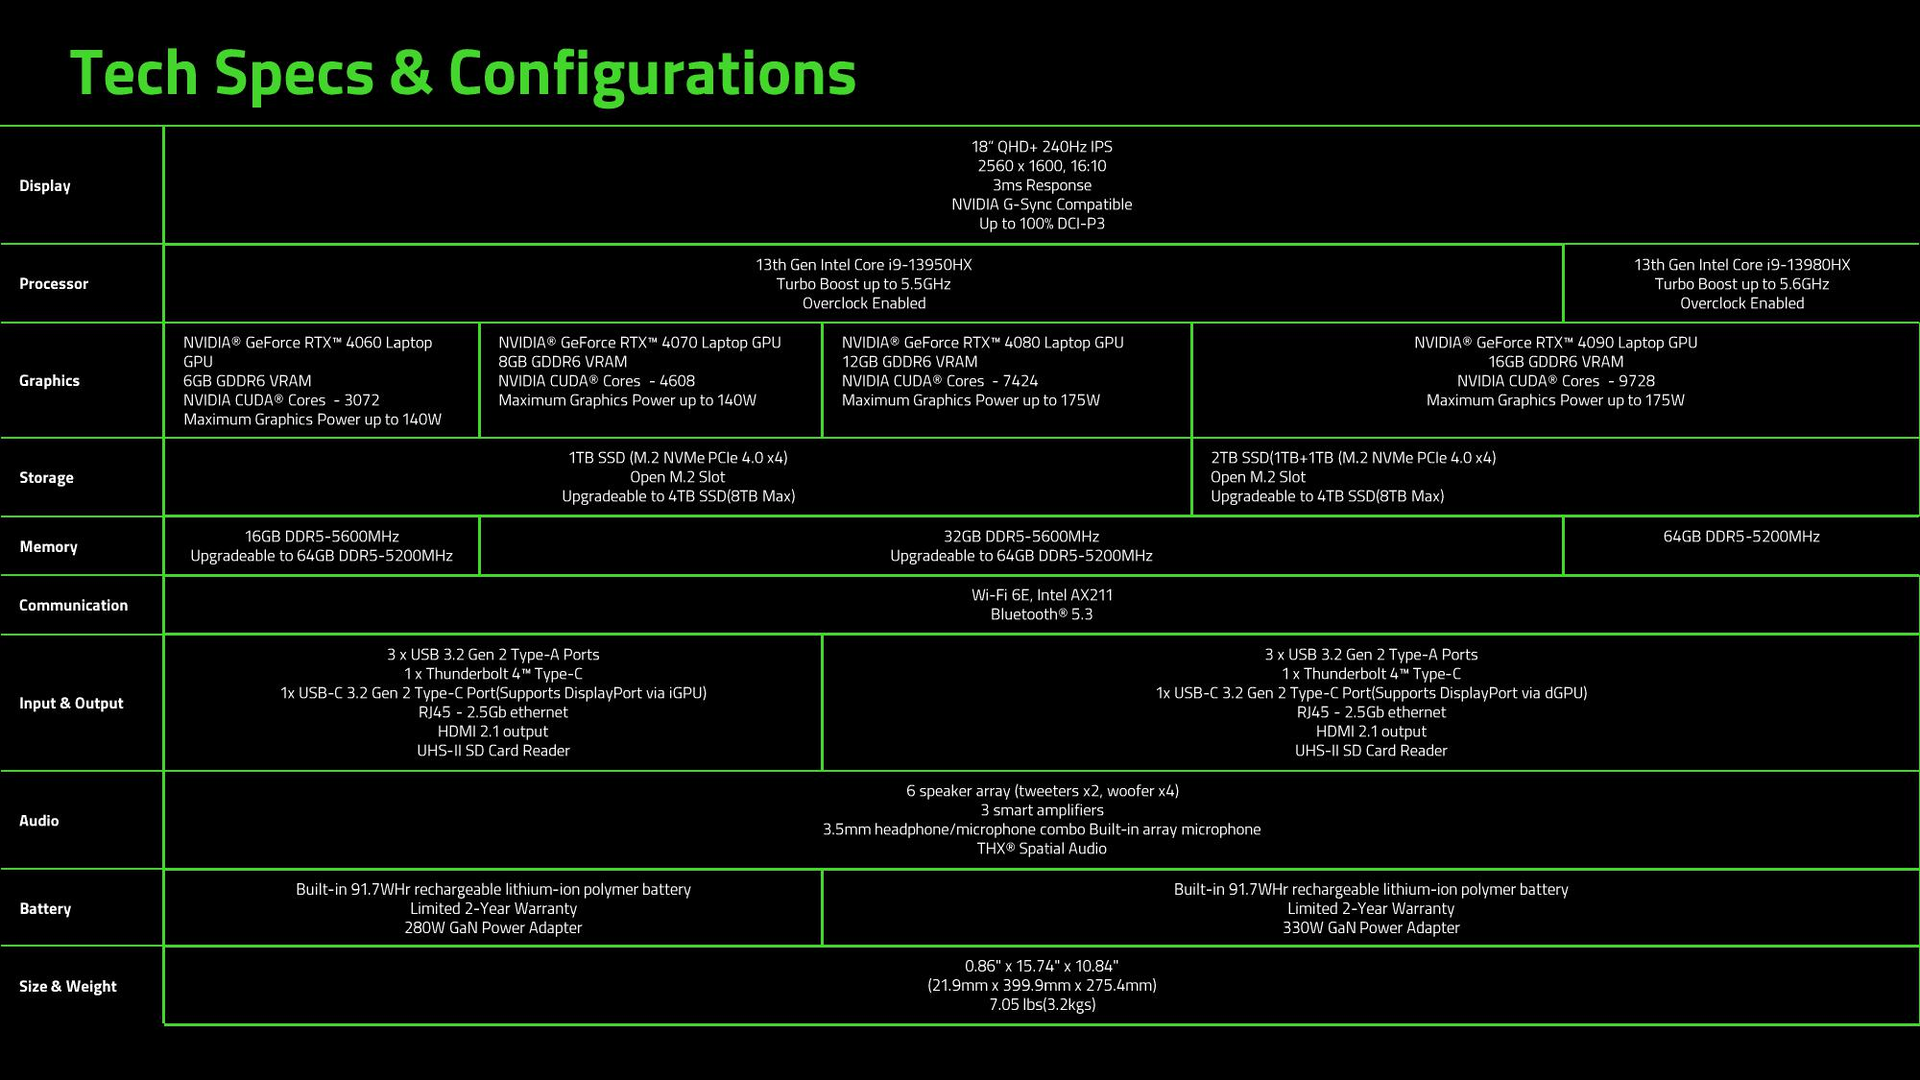
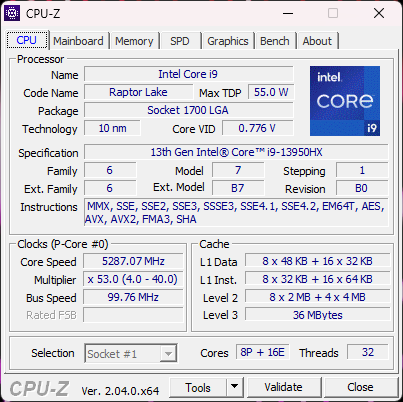
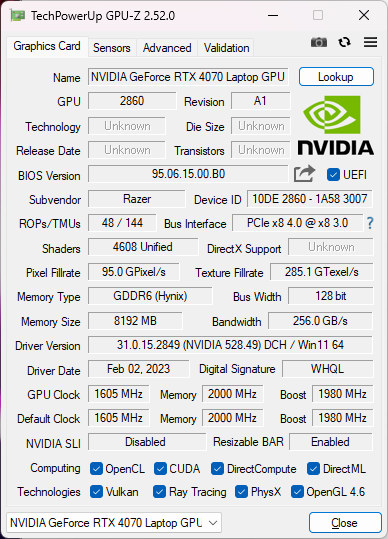
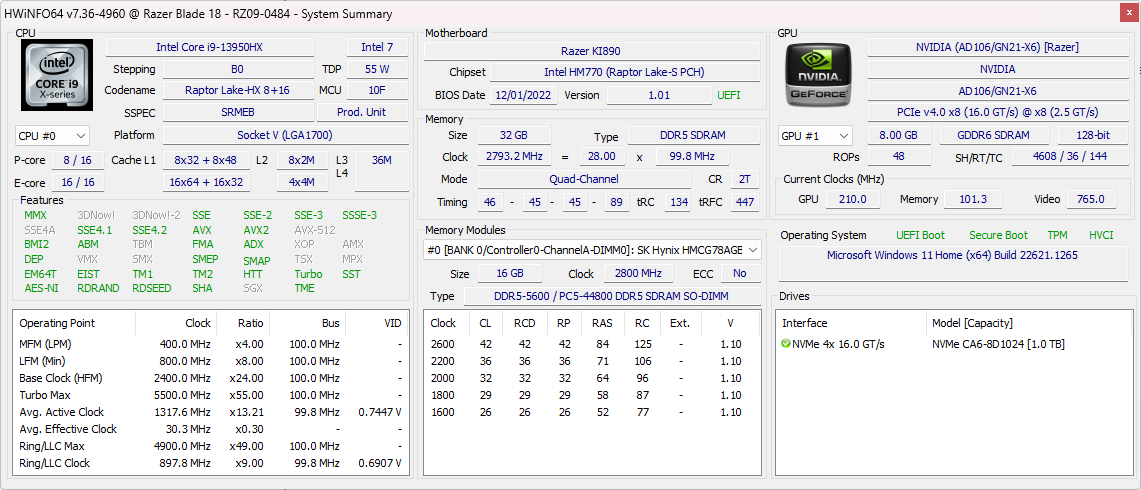
As configurações variam desde a CPU Core i9-13950HX e 140 W GeForce RTX 4060 GPU até a Core i9-13980HX e 175 W RTX 4090. Todas as configurações são enviadas com o mesmo painel IPS 16:10 QHD+ 240 Hz. Nossa unidade de revisão específica é uma configuração intermediária com o RTX 4070 de 140 W por cerca de $3200 USD.
os laptops de 18 polegadas são incomuns, sendo o MSI GT83 Titan um exemplo notável. A Asus e a Dell devem lançar o ROG Strix Scar 18 e Alienware m18, respectivamente, para competir diretamente contra o Razer Blade 18.
Mais resenhas da Razer:
Possíveis concorrentes em comparação
Avaliação | Data | Modelo | Peso | Altura | Size | Resolução | Preço |
|---|---|---|---|---|---|---|---|
| 91.4 % v7 (old) | 02/2023 | Razer Blade 18 RTX 4070 i9-13950HX, GeForce RTX 4070 Laptop GPU | 3 kg | 21.9 mm | 18.00" | 2560x1600 | |
| 89.9 % v7 (old) | 07/2022 | Razer Blade 17 Early 2022 i9-12900H, GeForce RTX 3080 Ti Laptop GPU | 2.8 kg | 19.9 mm | 17.30" | 3840x2160 | |
| 89 % v7 (old) | 02/2023 | MSI Titan GT77 HX 13VI i9-13950HX, GeForce RTX 4090 Laptop GPU | 3.5 kg | 23 mm | 17.30" | 3840x2160 | |
| 83.3 % v7 (old) | 01/2023 | Gigabyte G7 KE i5-12500H, GeForce RTX 3060 Laptop GPU | 2.6 kg | 25 mm | 17.30" | 1920x1080 | |
| 86.1 % v7 (old) | 01/2023 | Alienware m17 R5 (R9 6900HX, RX 6850M XT) R9 6900HX, Radeon RX 6850M XT | 3.4 kg | 26.7 mm | 17.00" | 3840x2160 | |
| 86.9 % v7 (old) | 11/2022 | Asus ROG Strix Scar 17 SE G733CX-LL014W i9-12950HX, GeForce RTX 3080 Ti Laptop GPU | 2.9 kg | 28.3 mm | 17.30" | 2560x1440 |
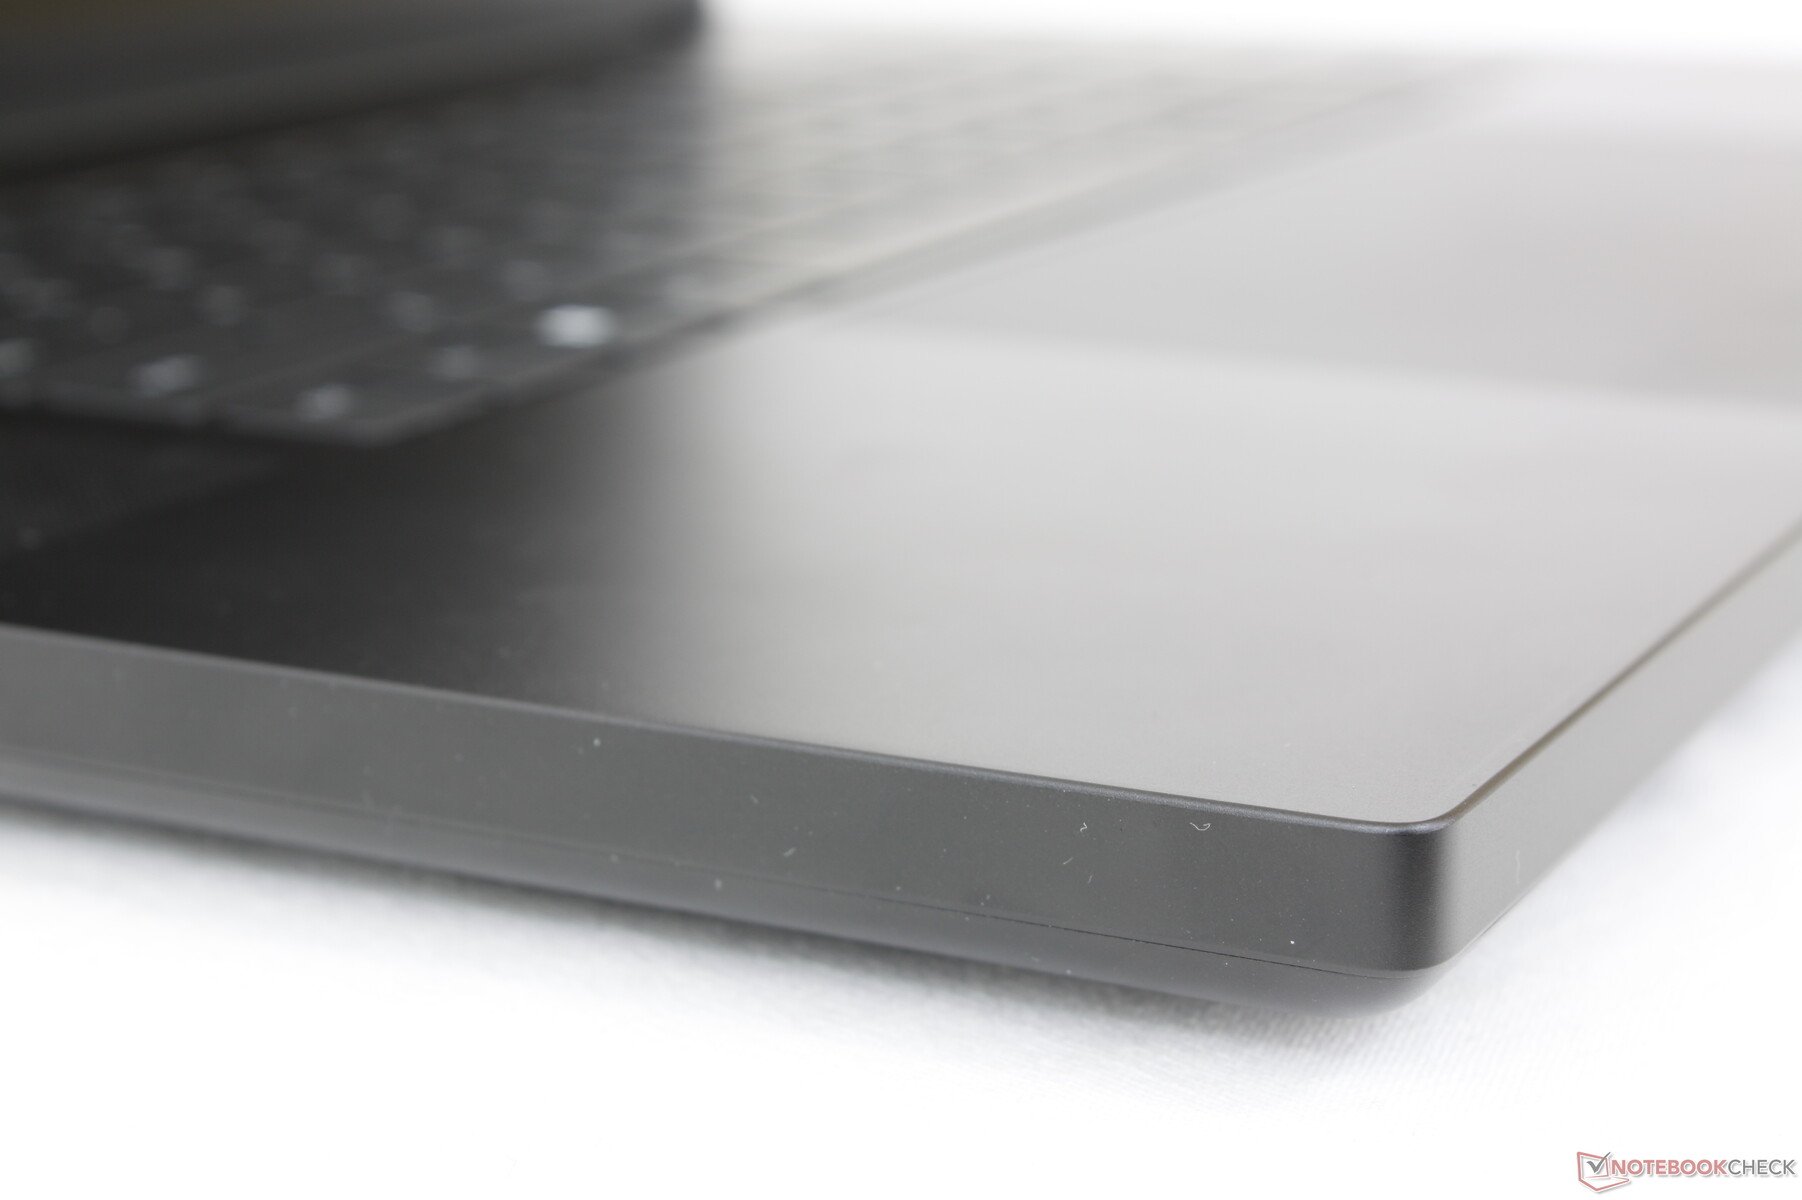
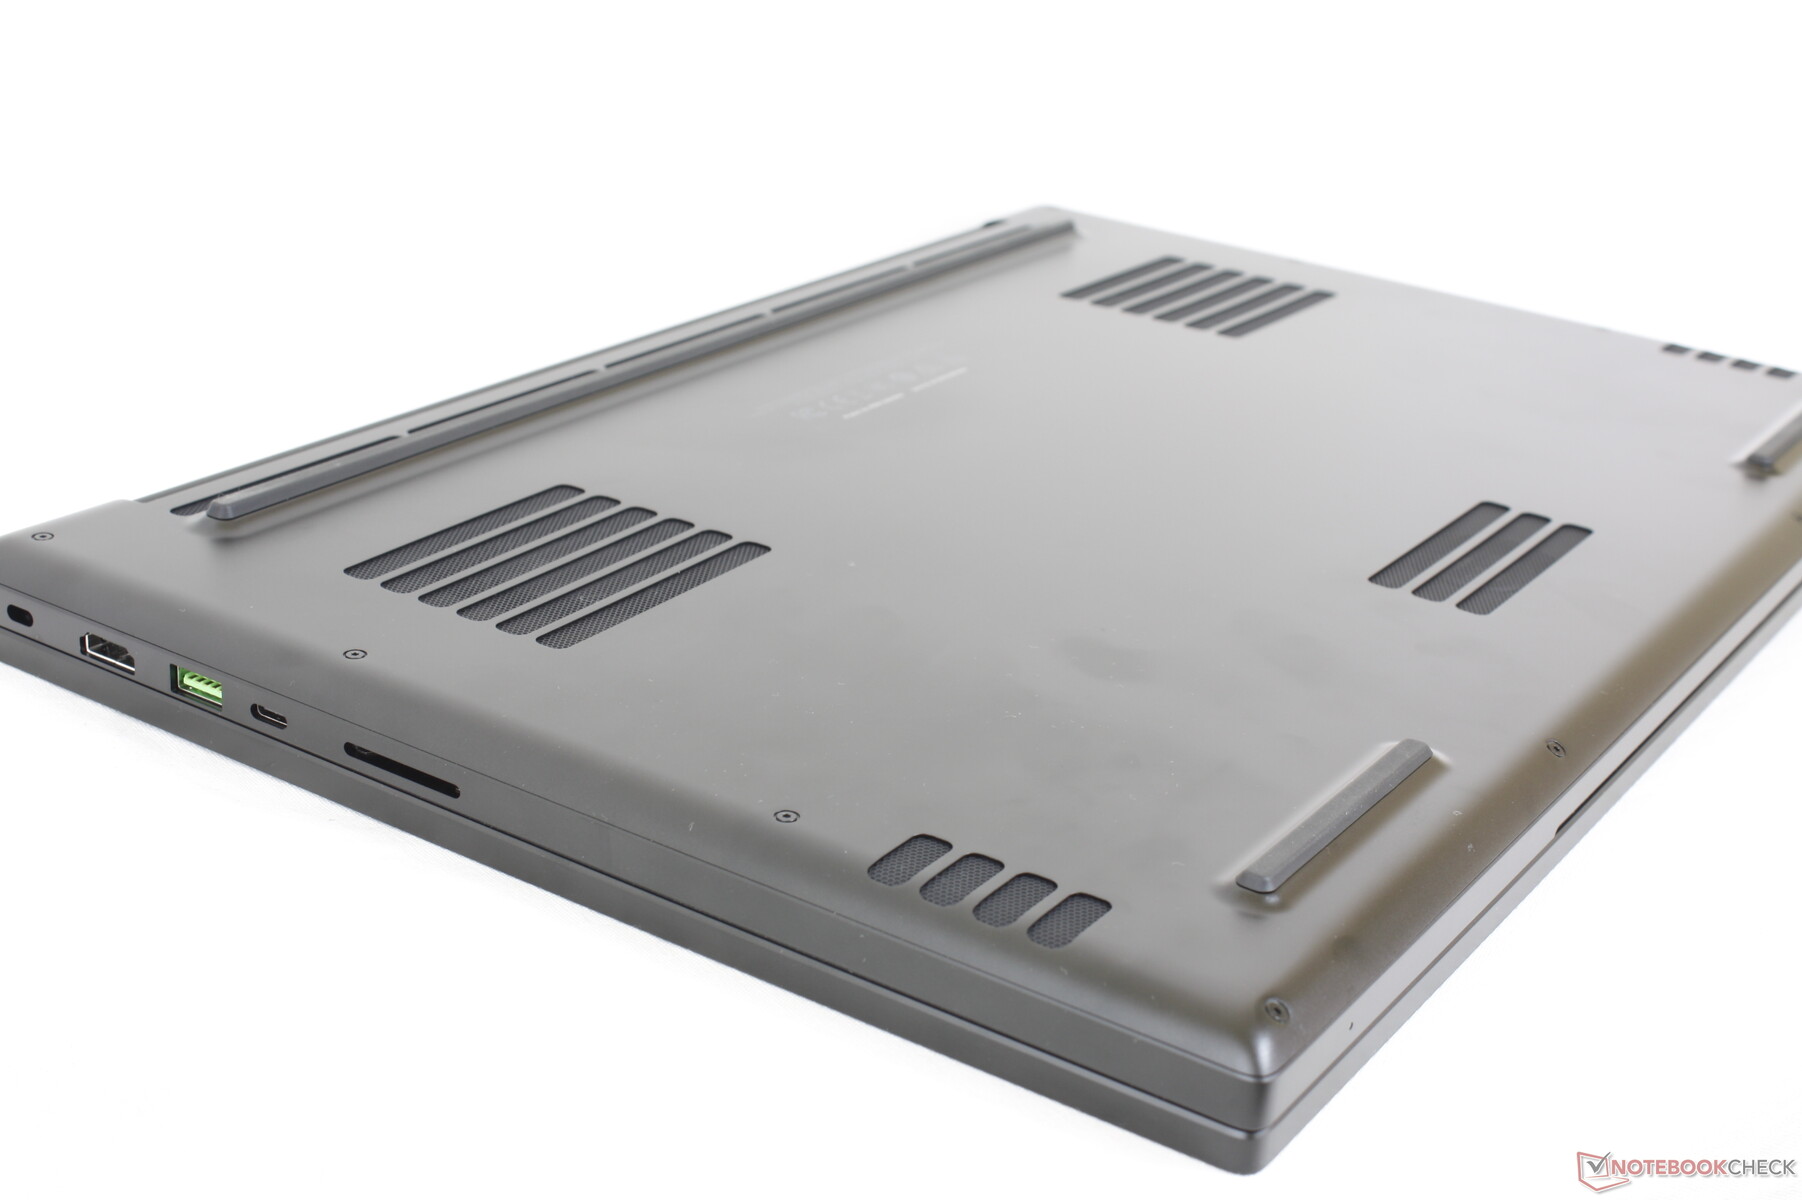
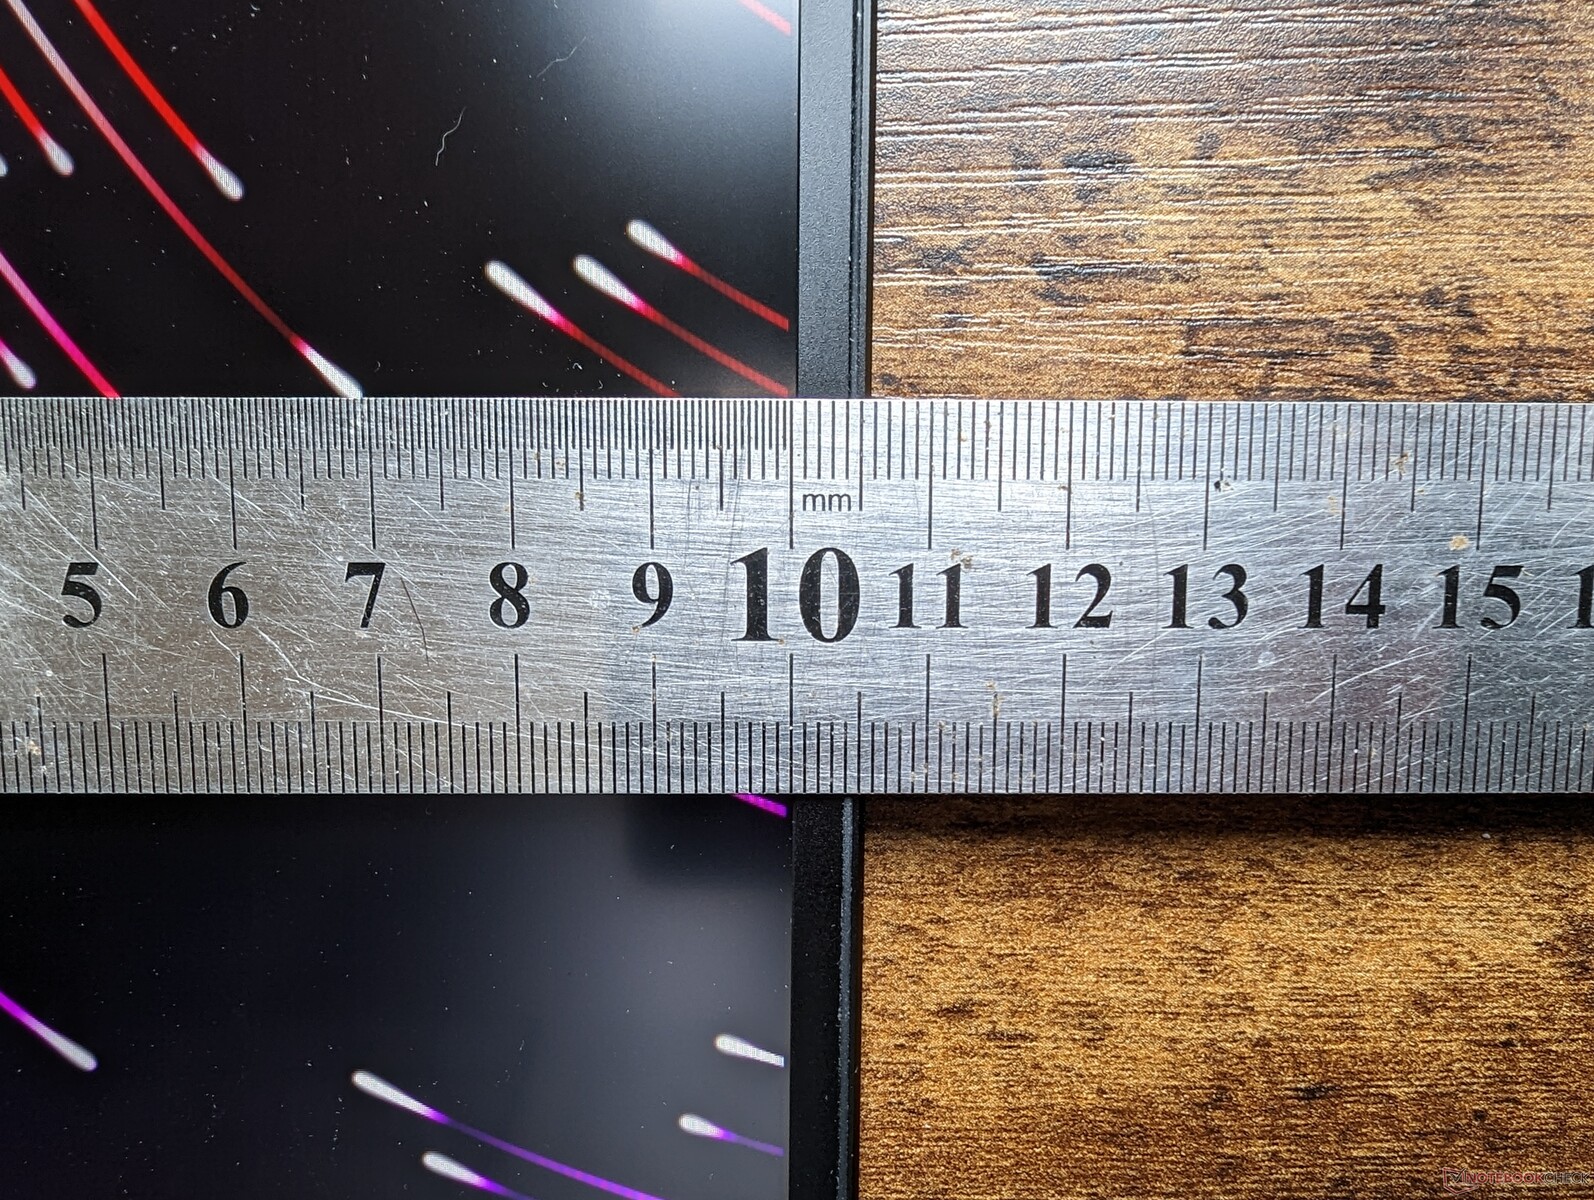
Estojo - Pouco maior do que a lâmina 17
O Blade 18 pode ser um novo tamanho de tela, mas não traz novas surpresas em termos de design de chassis. O modelo se parece e se sente como um Lâmina 17 de cima para baixo. A maior diferença visual está relacionada à luneta do queixo muito menor na Lâmina 18 quando comparada à Lâmina 17 para uma relação tela/corpo mais alta.
O fator de forma maior de 18 polegadas, felizmente não afeta a rigidez do chassi. Tanto a base quanto a tampa são tão sólidas quanto na lâmina 17 para impressões fortes do tipo MacBook Pro. As dobradiças em particular se sustentam bem apesar da grande tela, mas seu ângulo máximo ainda está bem abaixo dos 180 graus completos. O ponto mais fraco do laptop talvez esteja no centro da tampa externa, onde a superfície se empena mais facilmente devido à pressão aplicada.
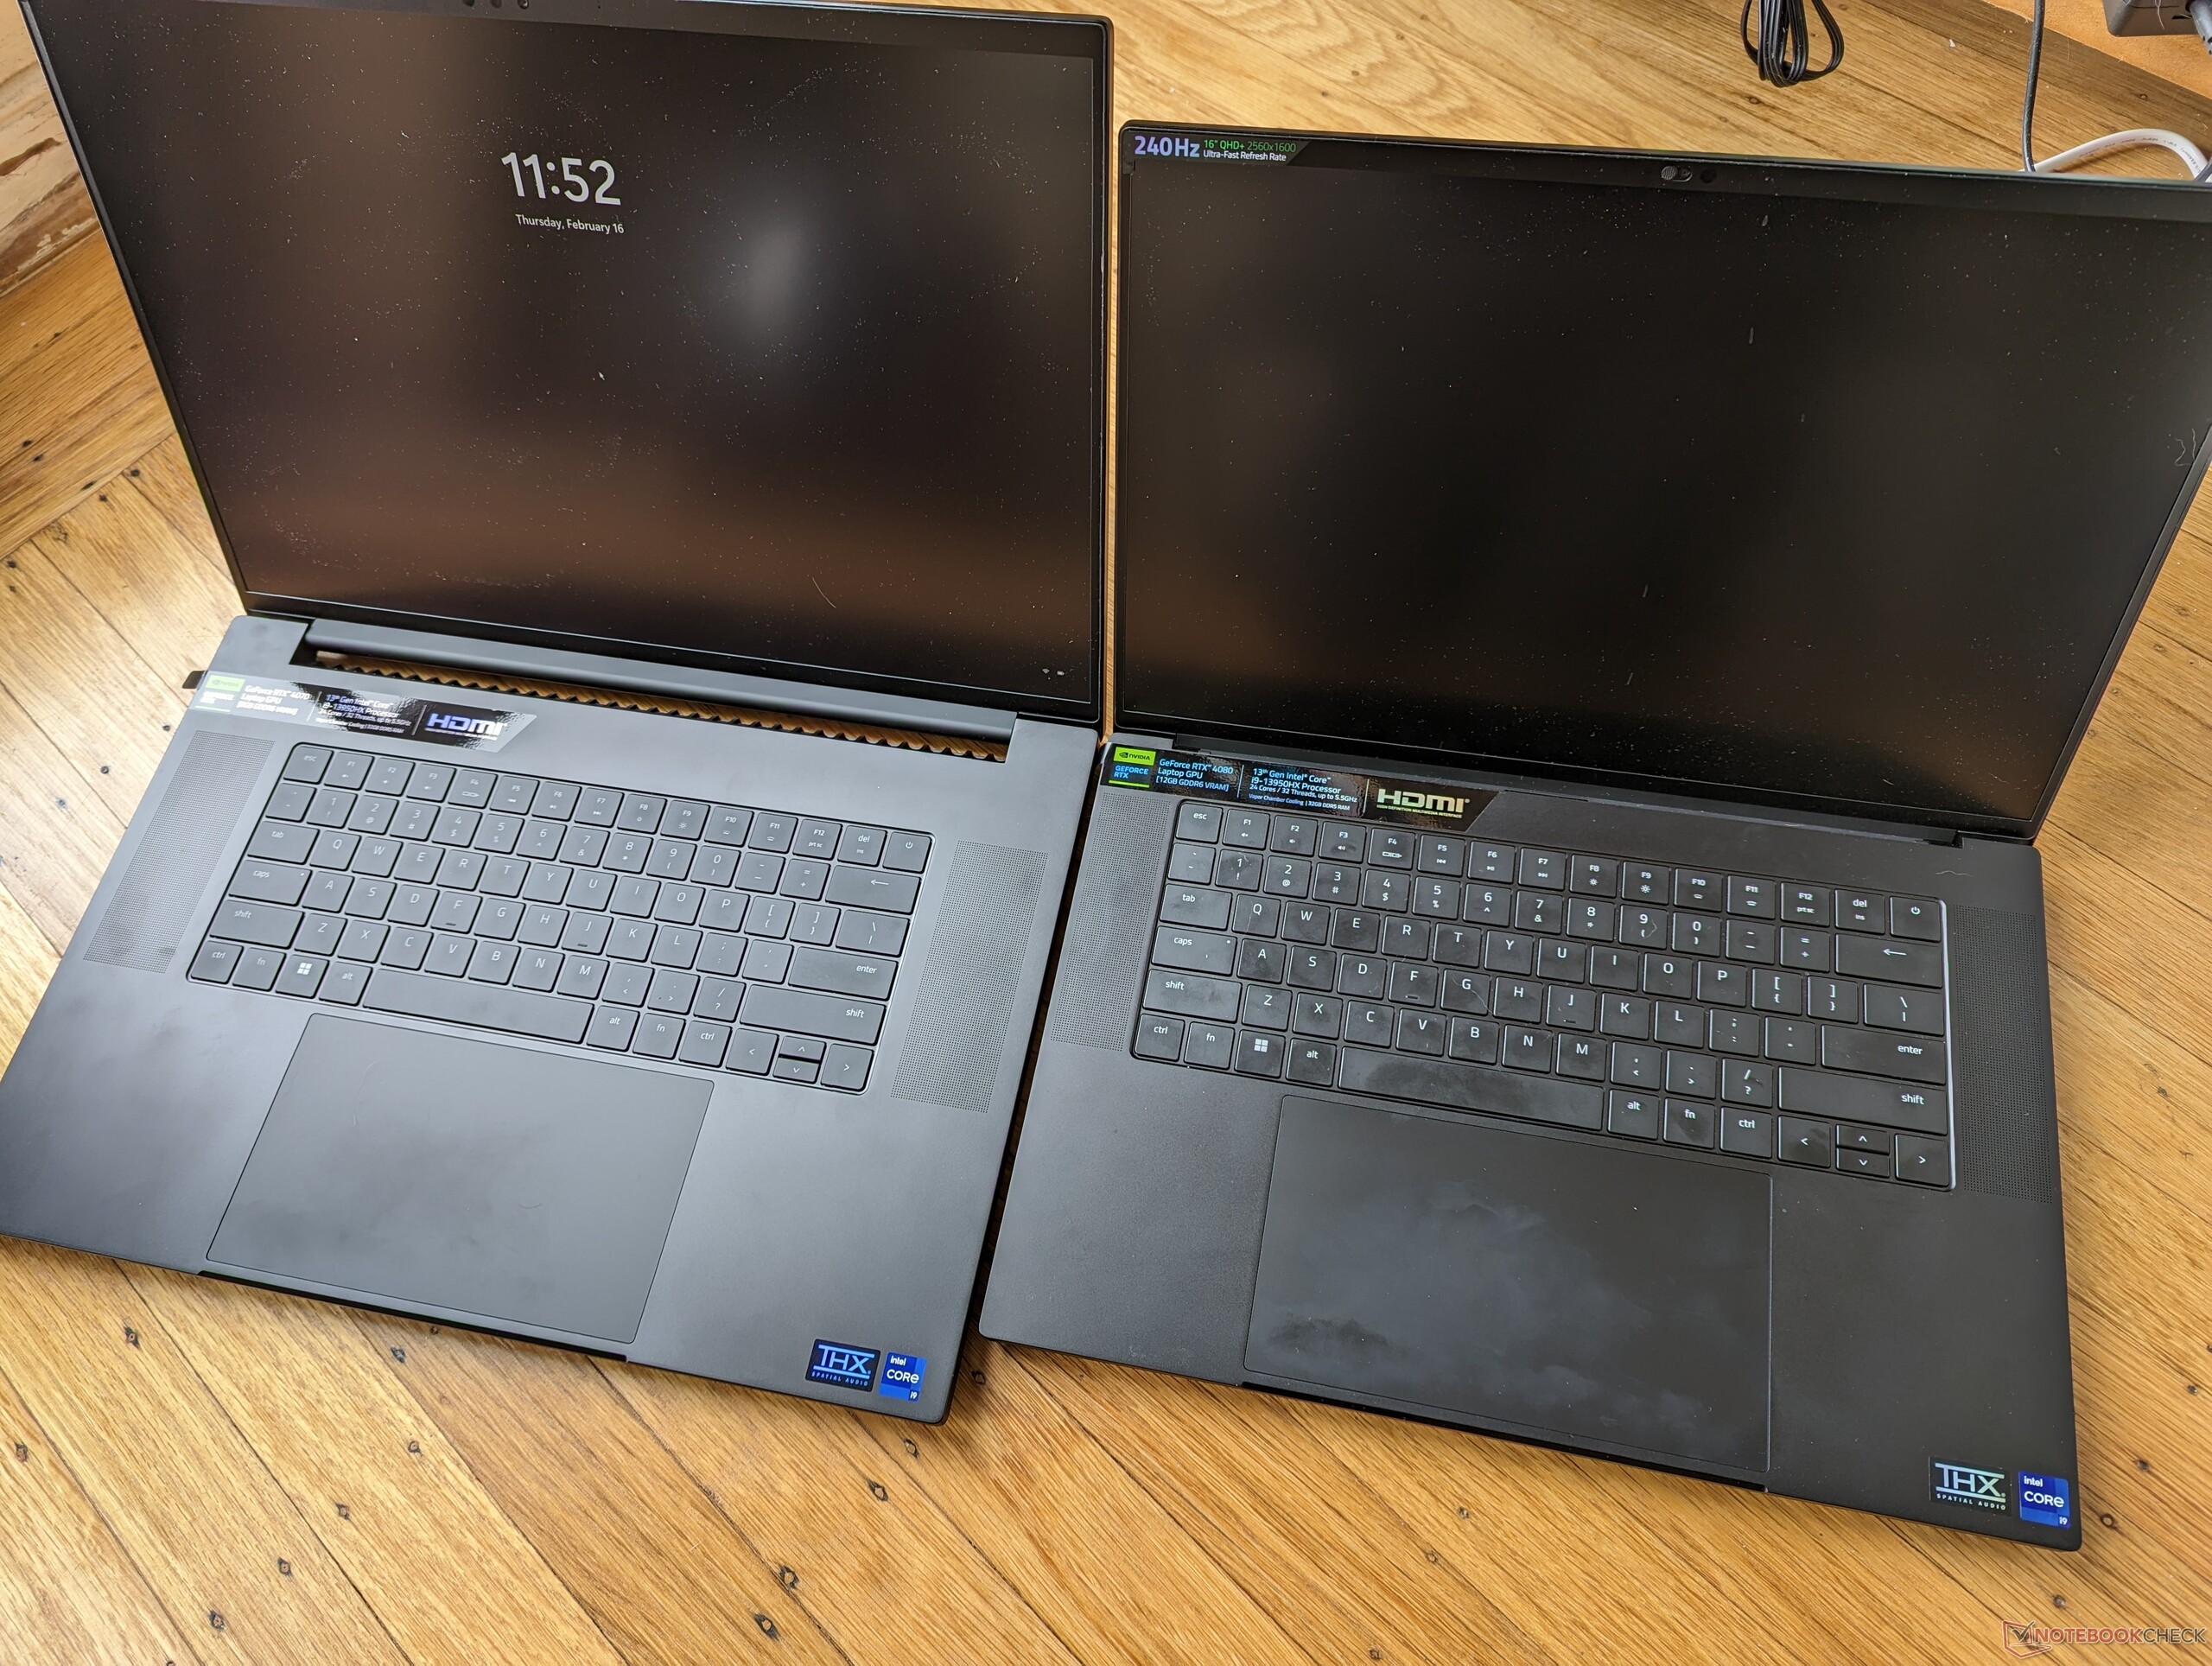
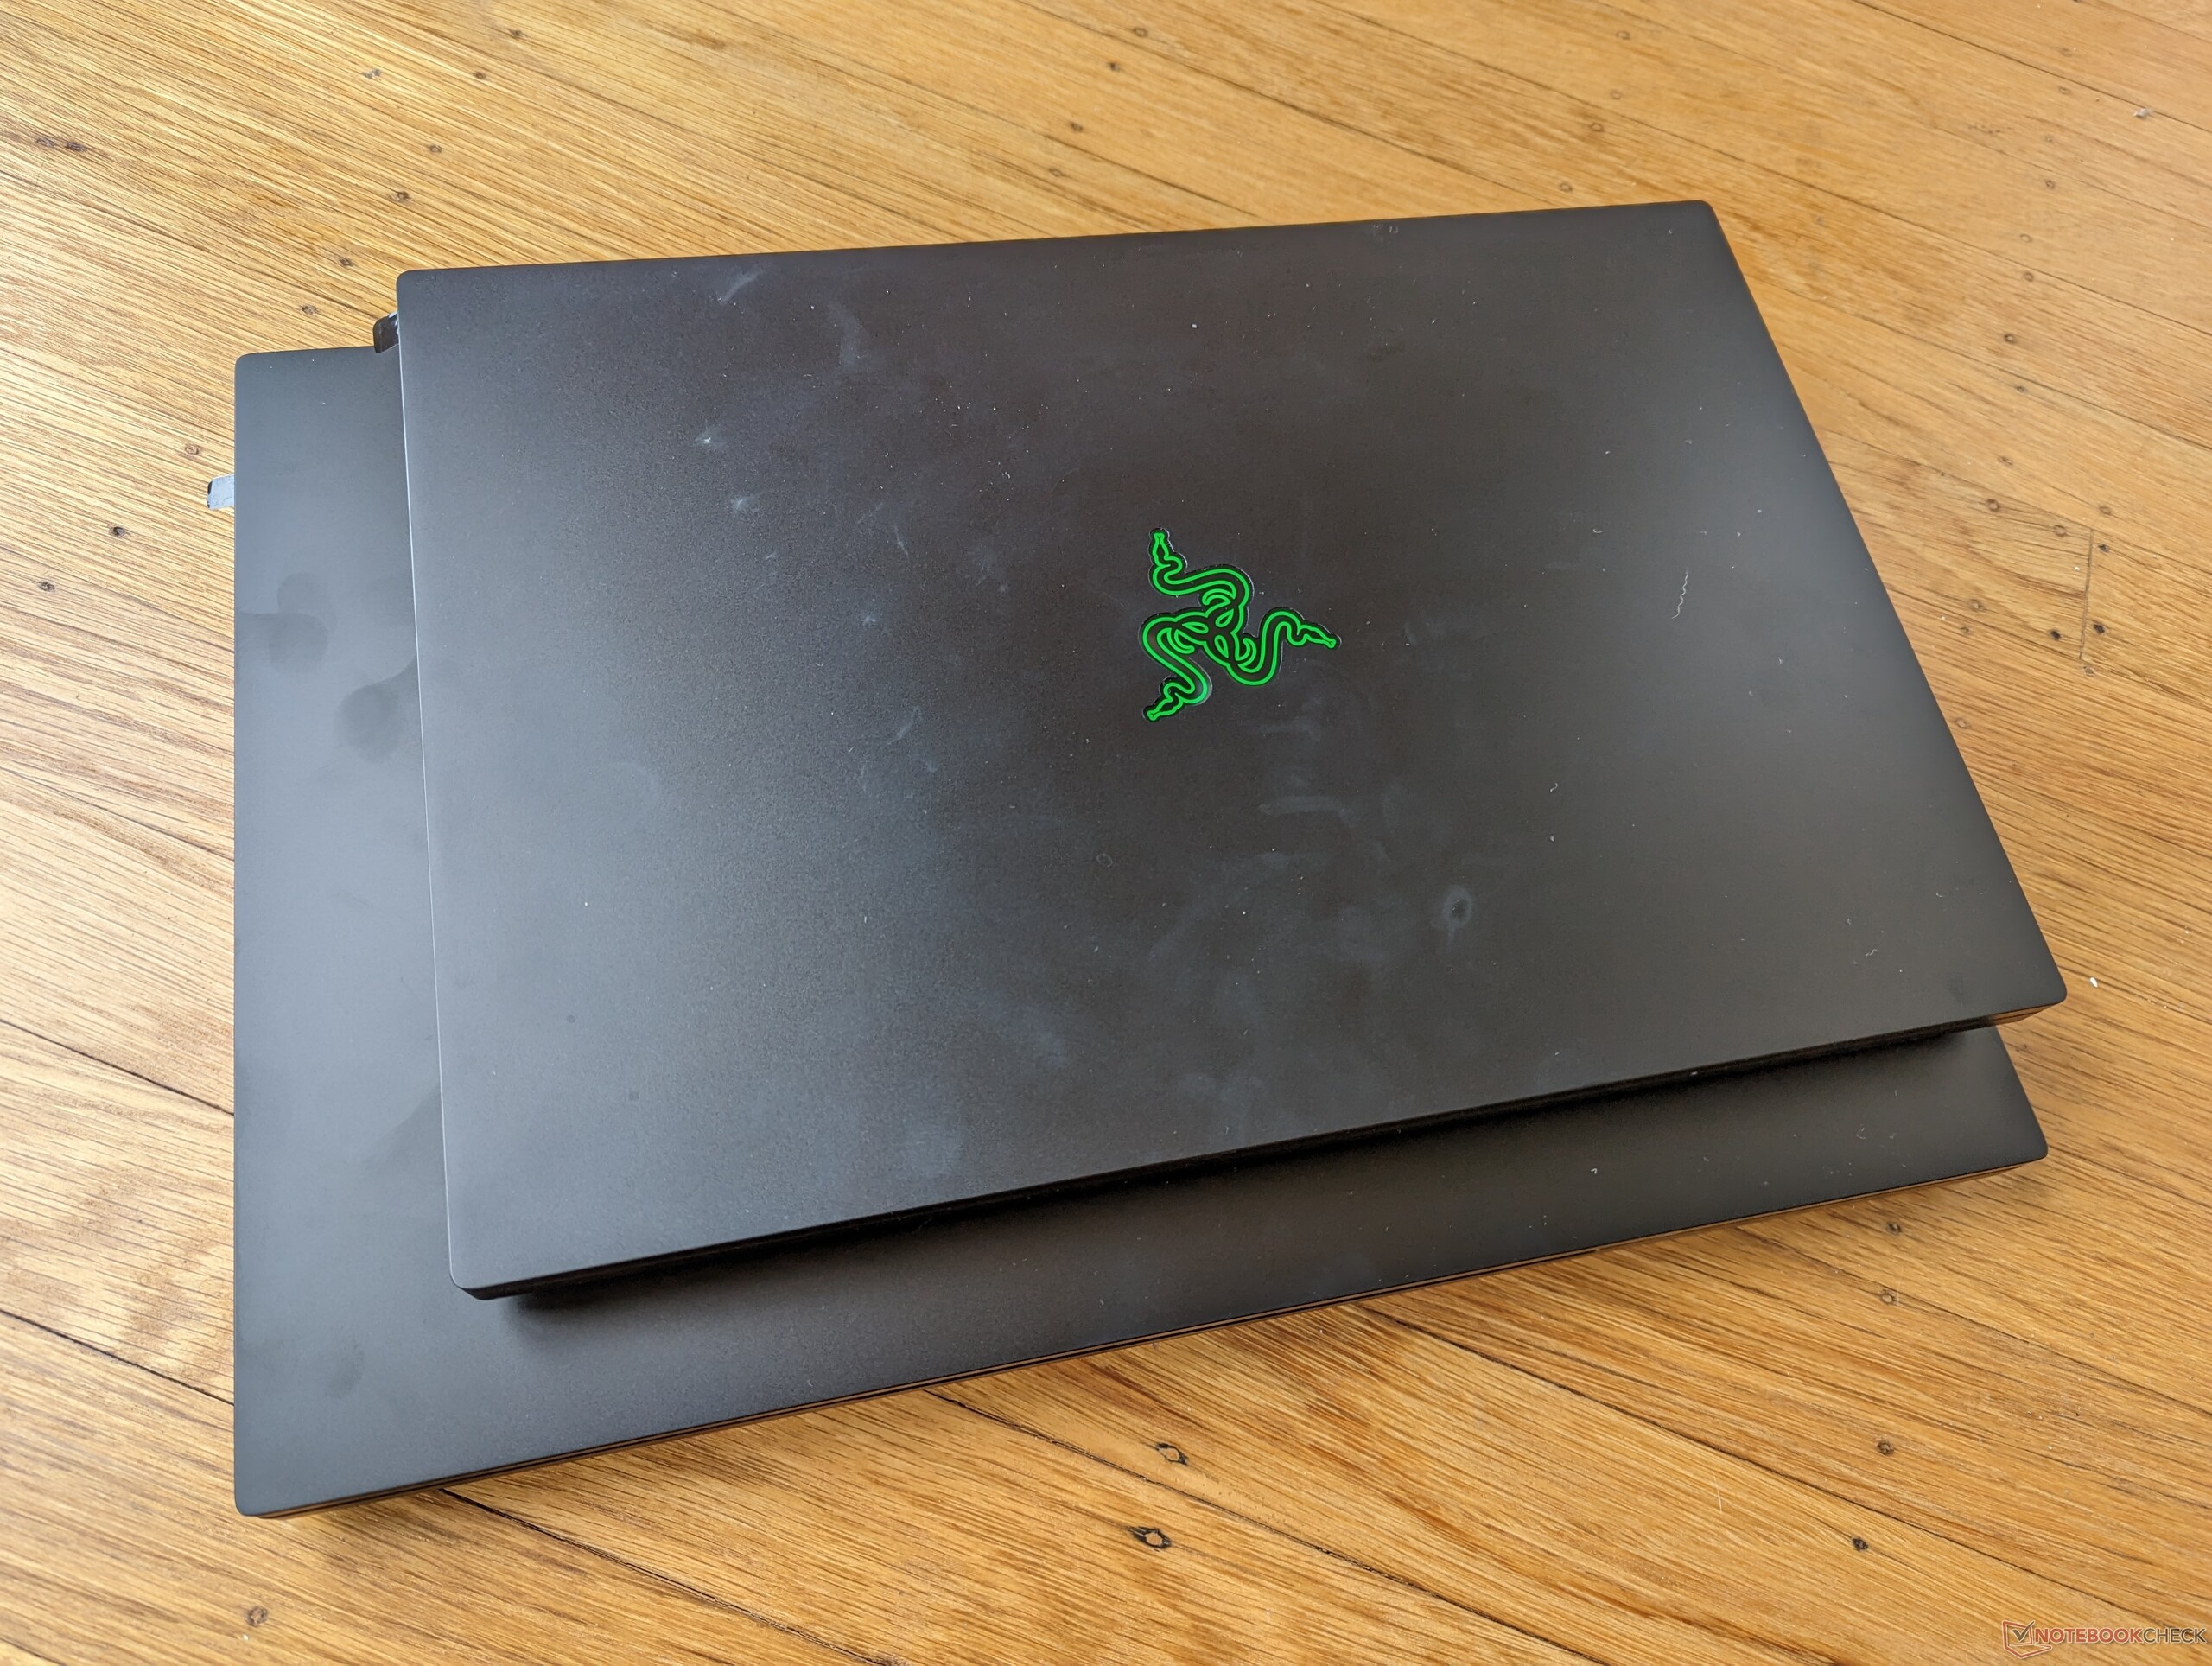
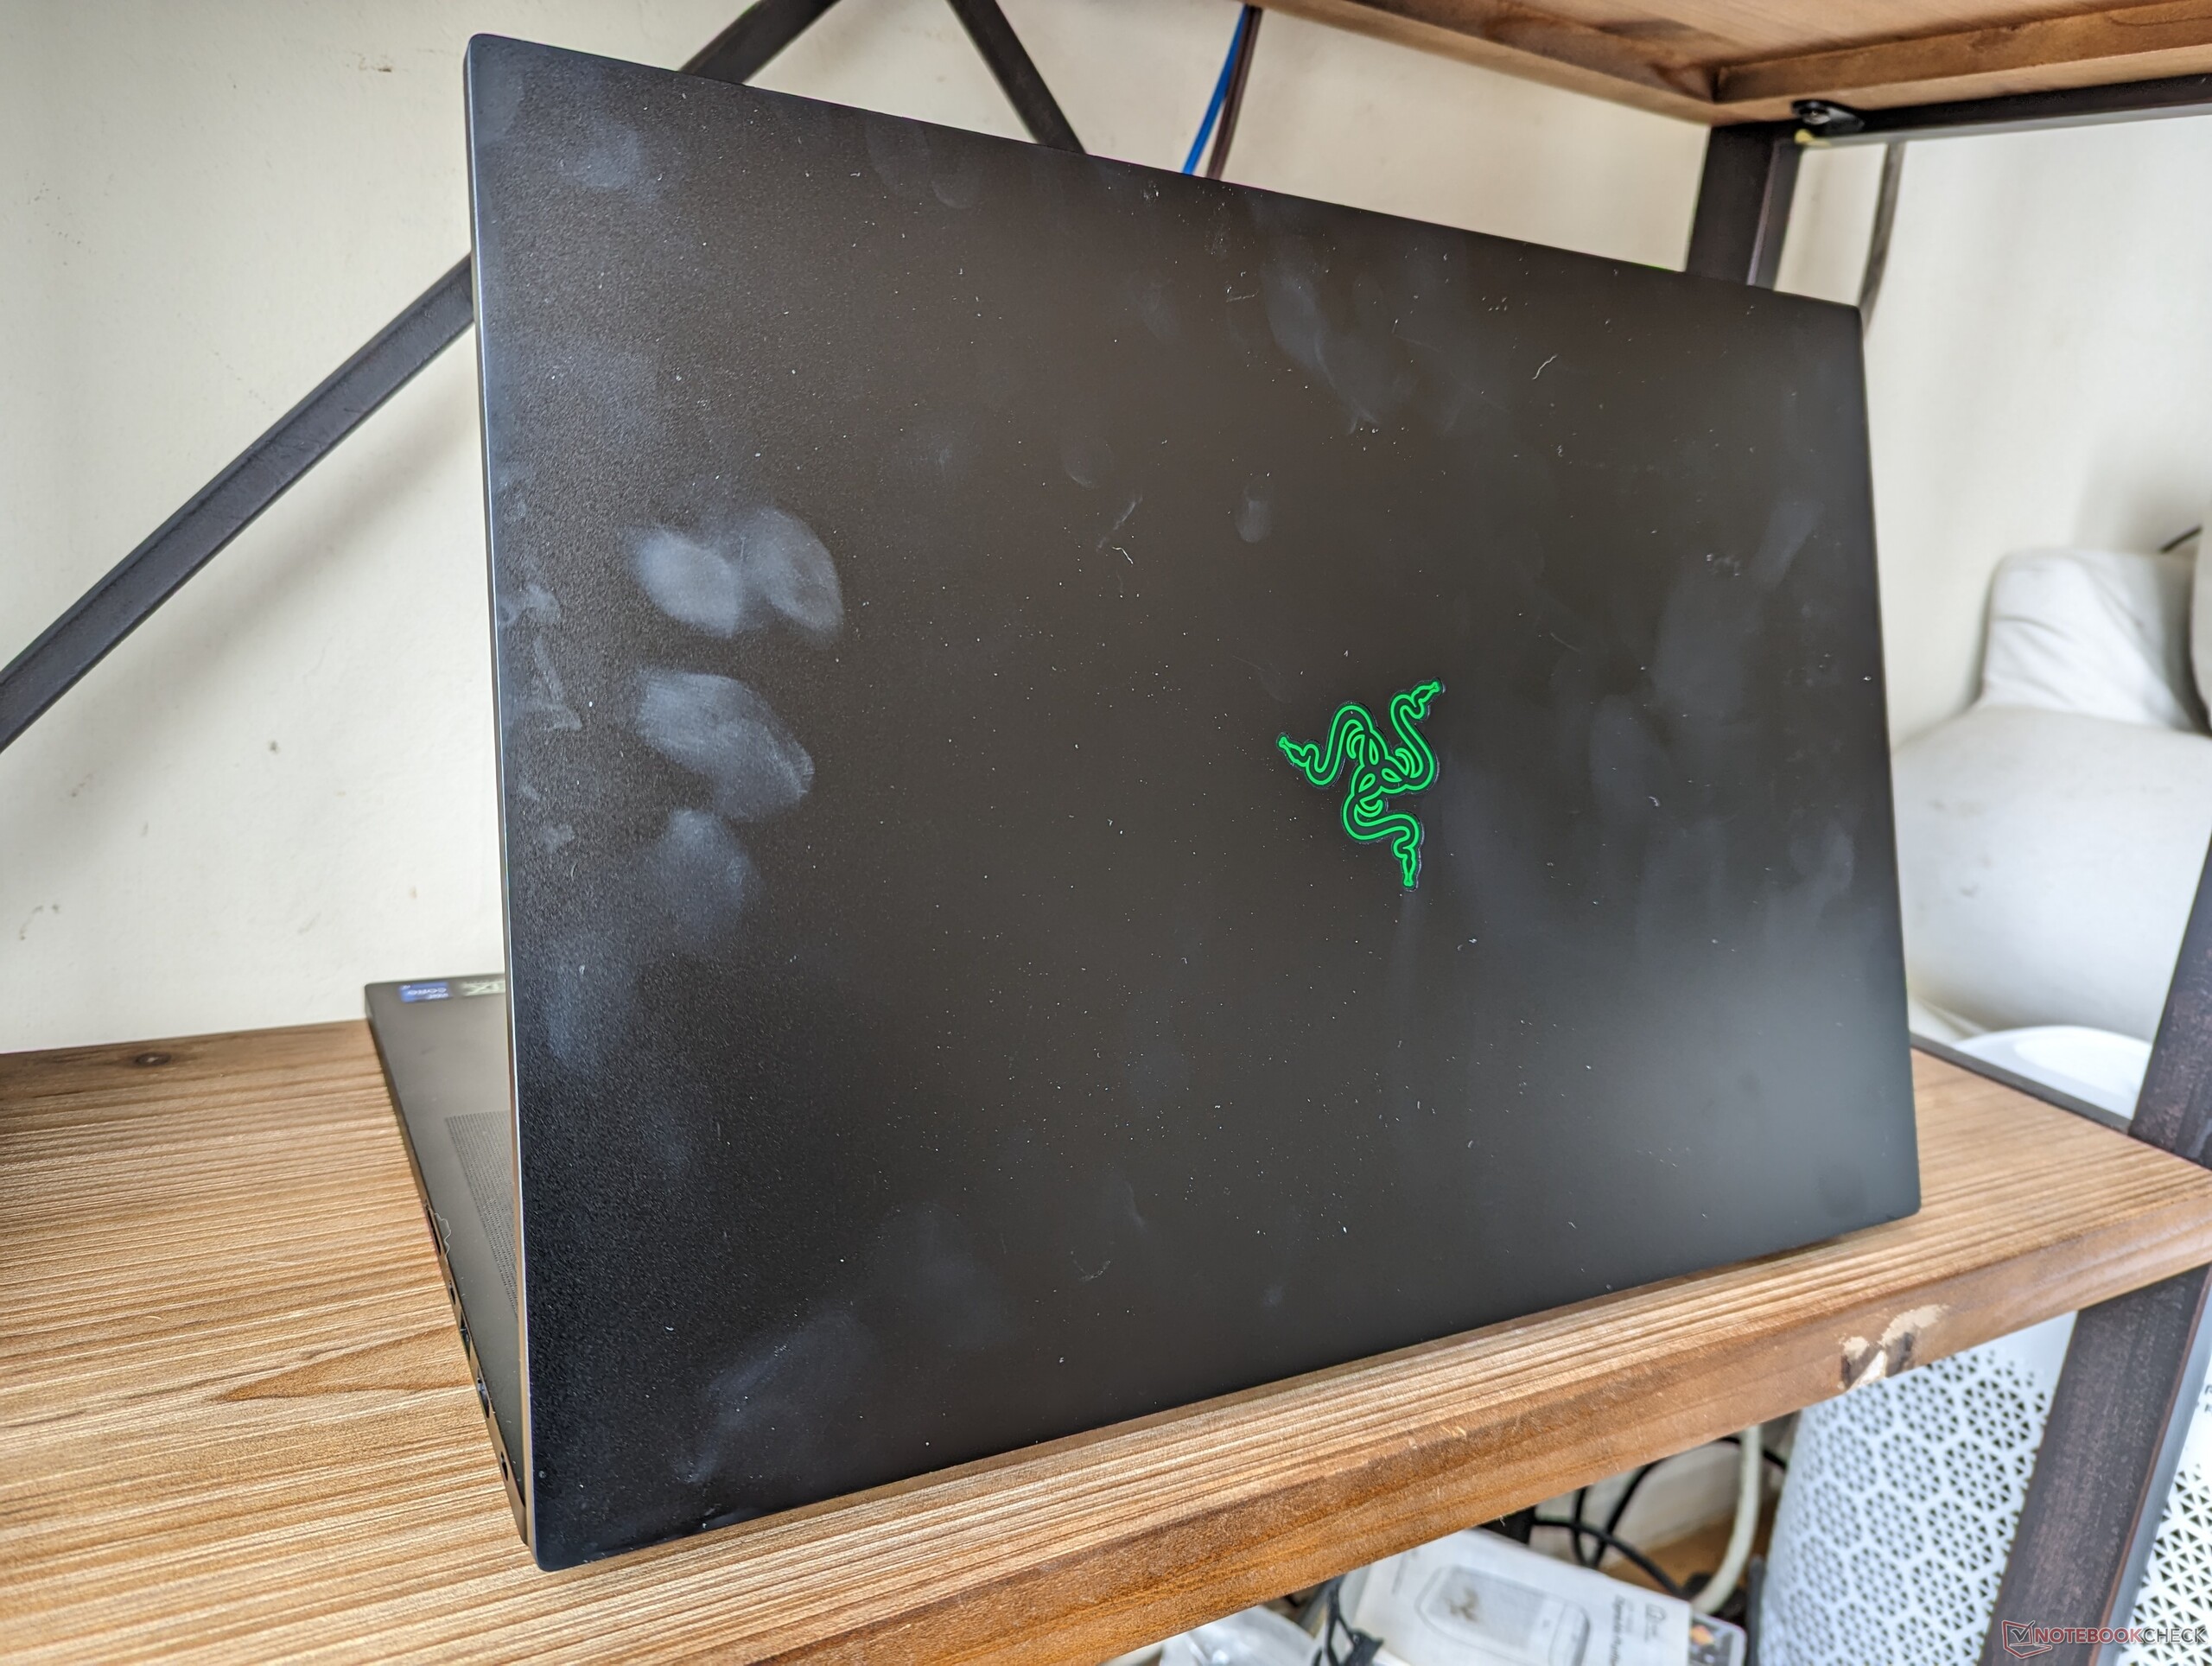
A Razer tem orgulho de salientar que a Lâmina 18 é apenas 18% maior em volume e 7% mais pesada do que a Lâmina 17 de 2022, apesar de suas diferenças de tamanho de tela. Assim, o novo modelo de 18 polegadas não se sente tão volumoso como se poderia esperar inicialmente. De fato, alguns laptops para jogos de 17,3 polegadas são maiores ou até mais pesados que o Blade 18, incluindo oAsus ROG Strix Scar 17 SE ou Alienware m17 R5.
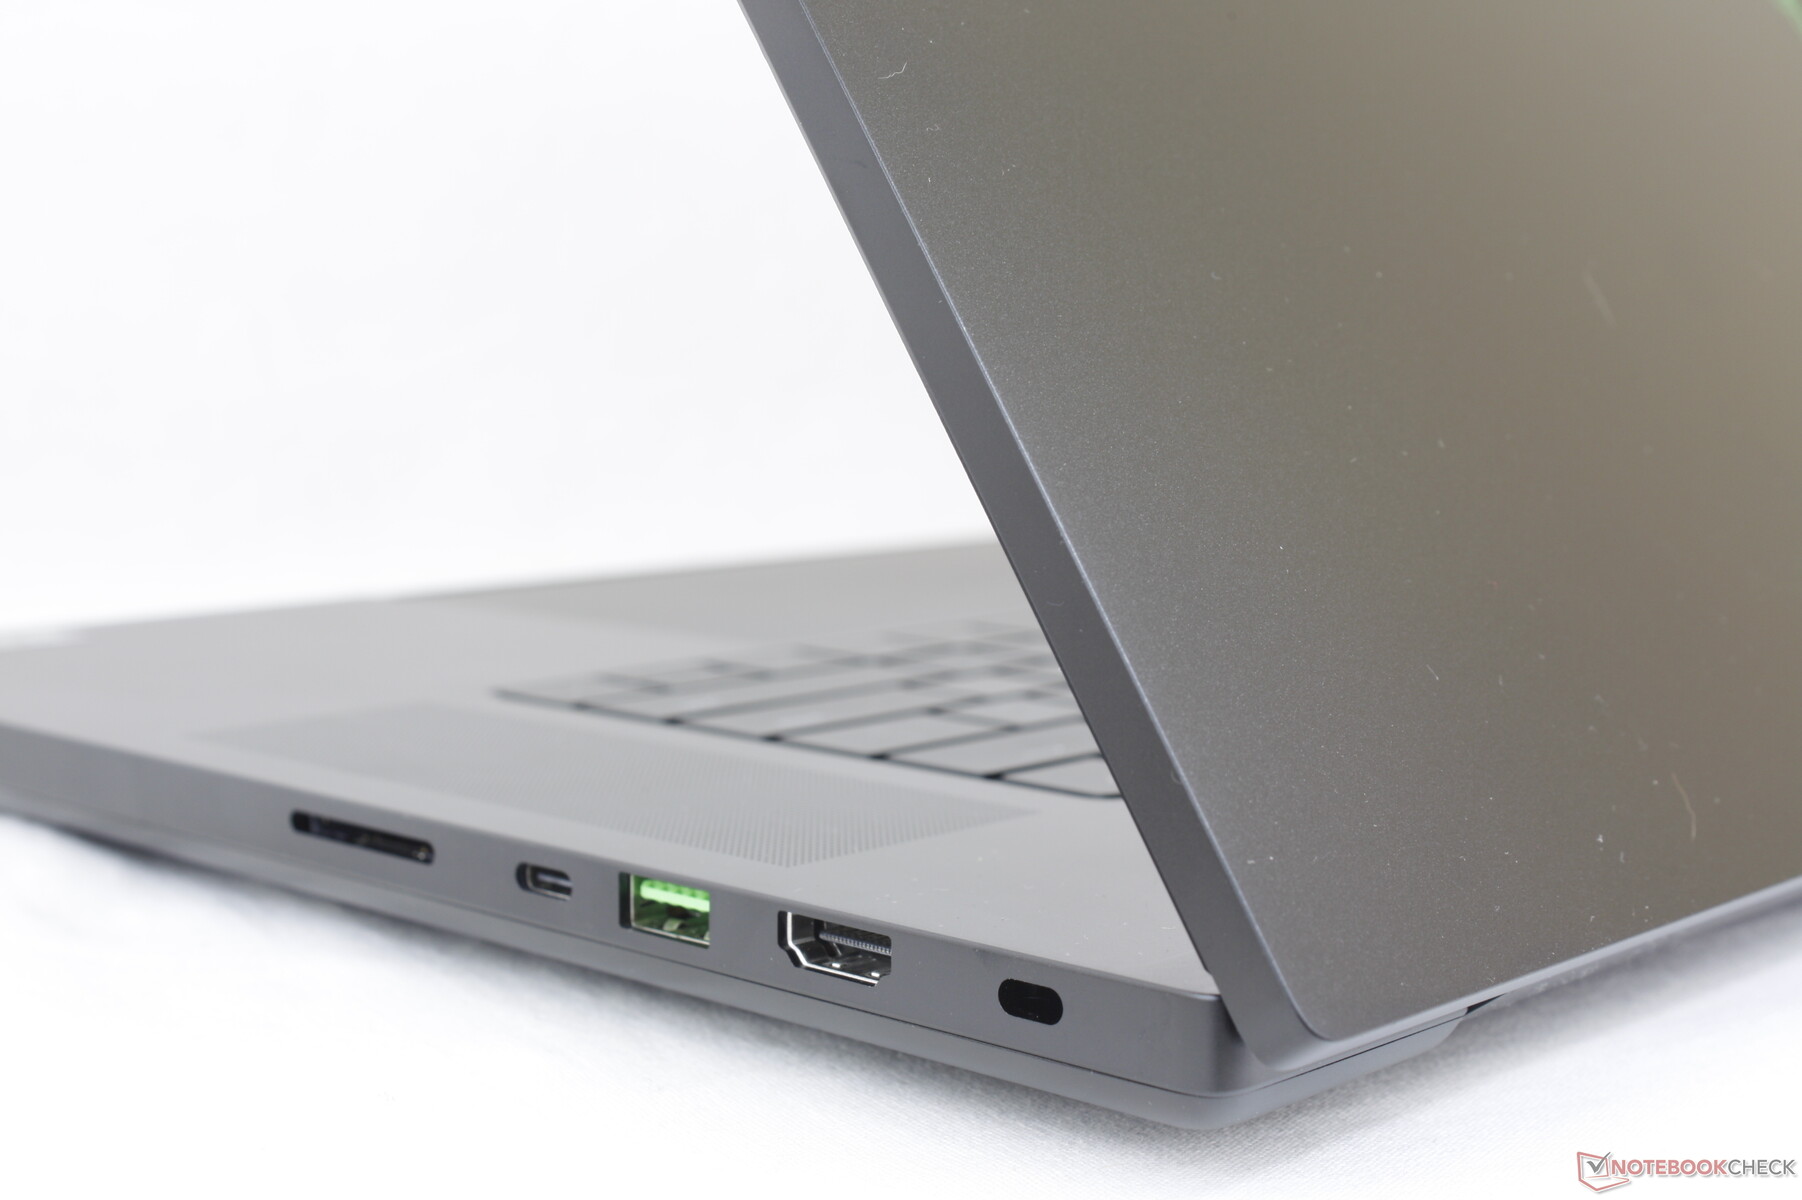
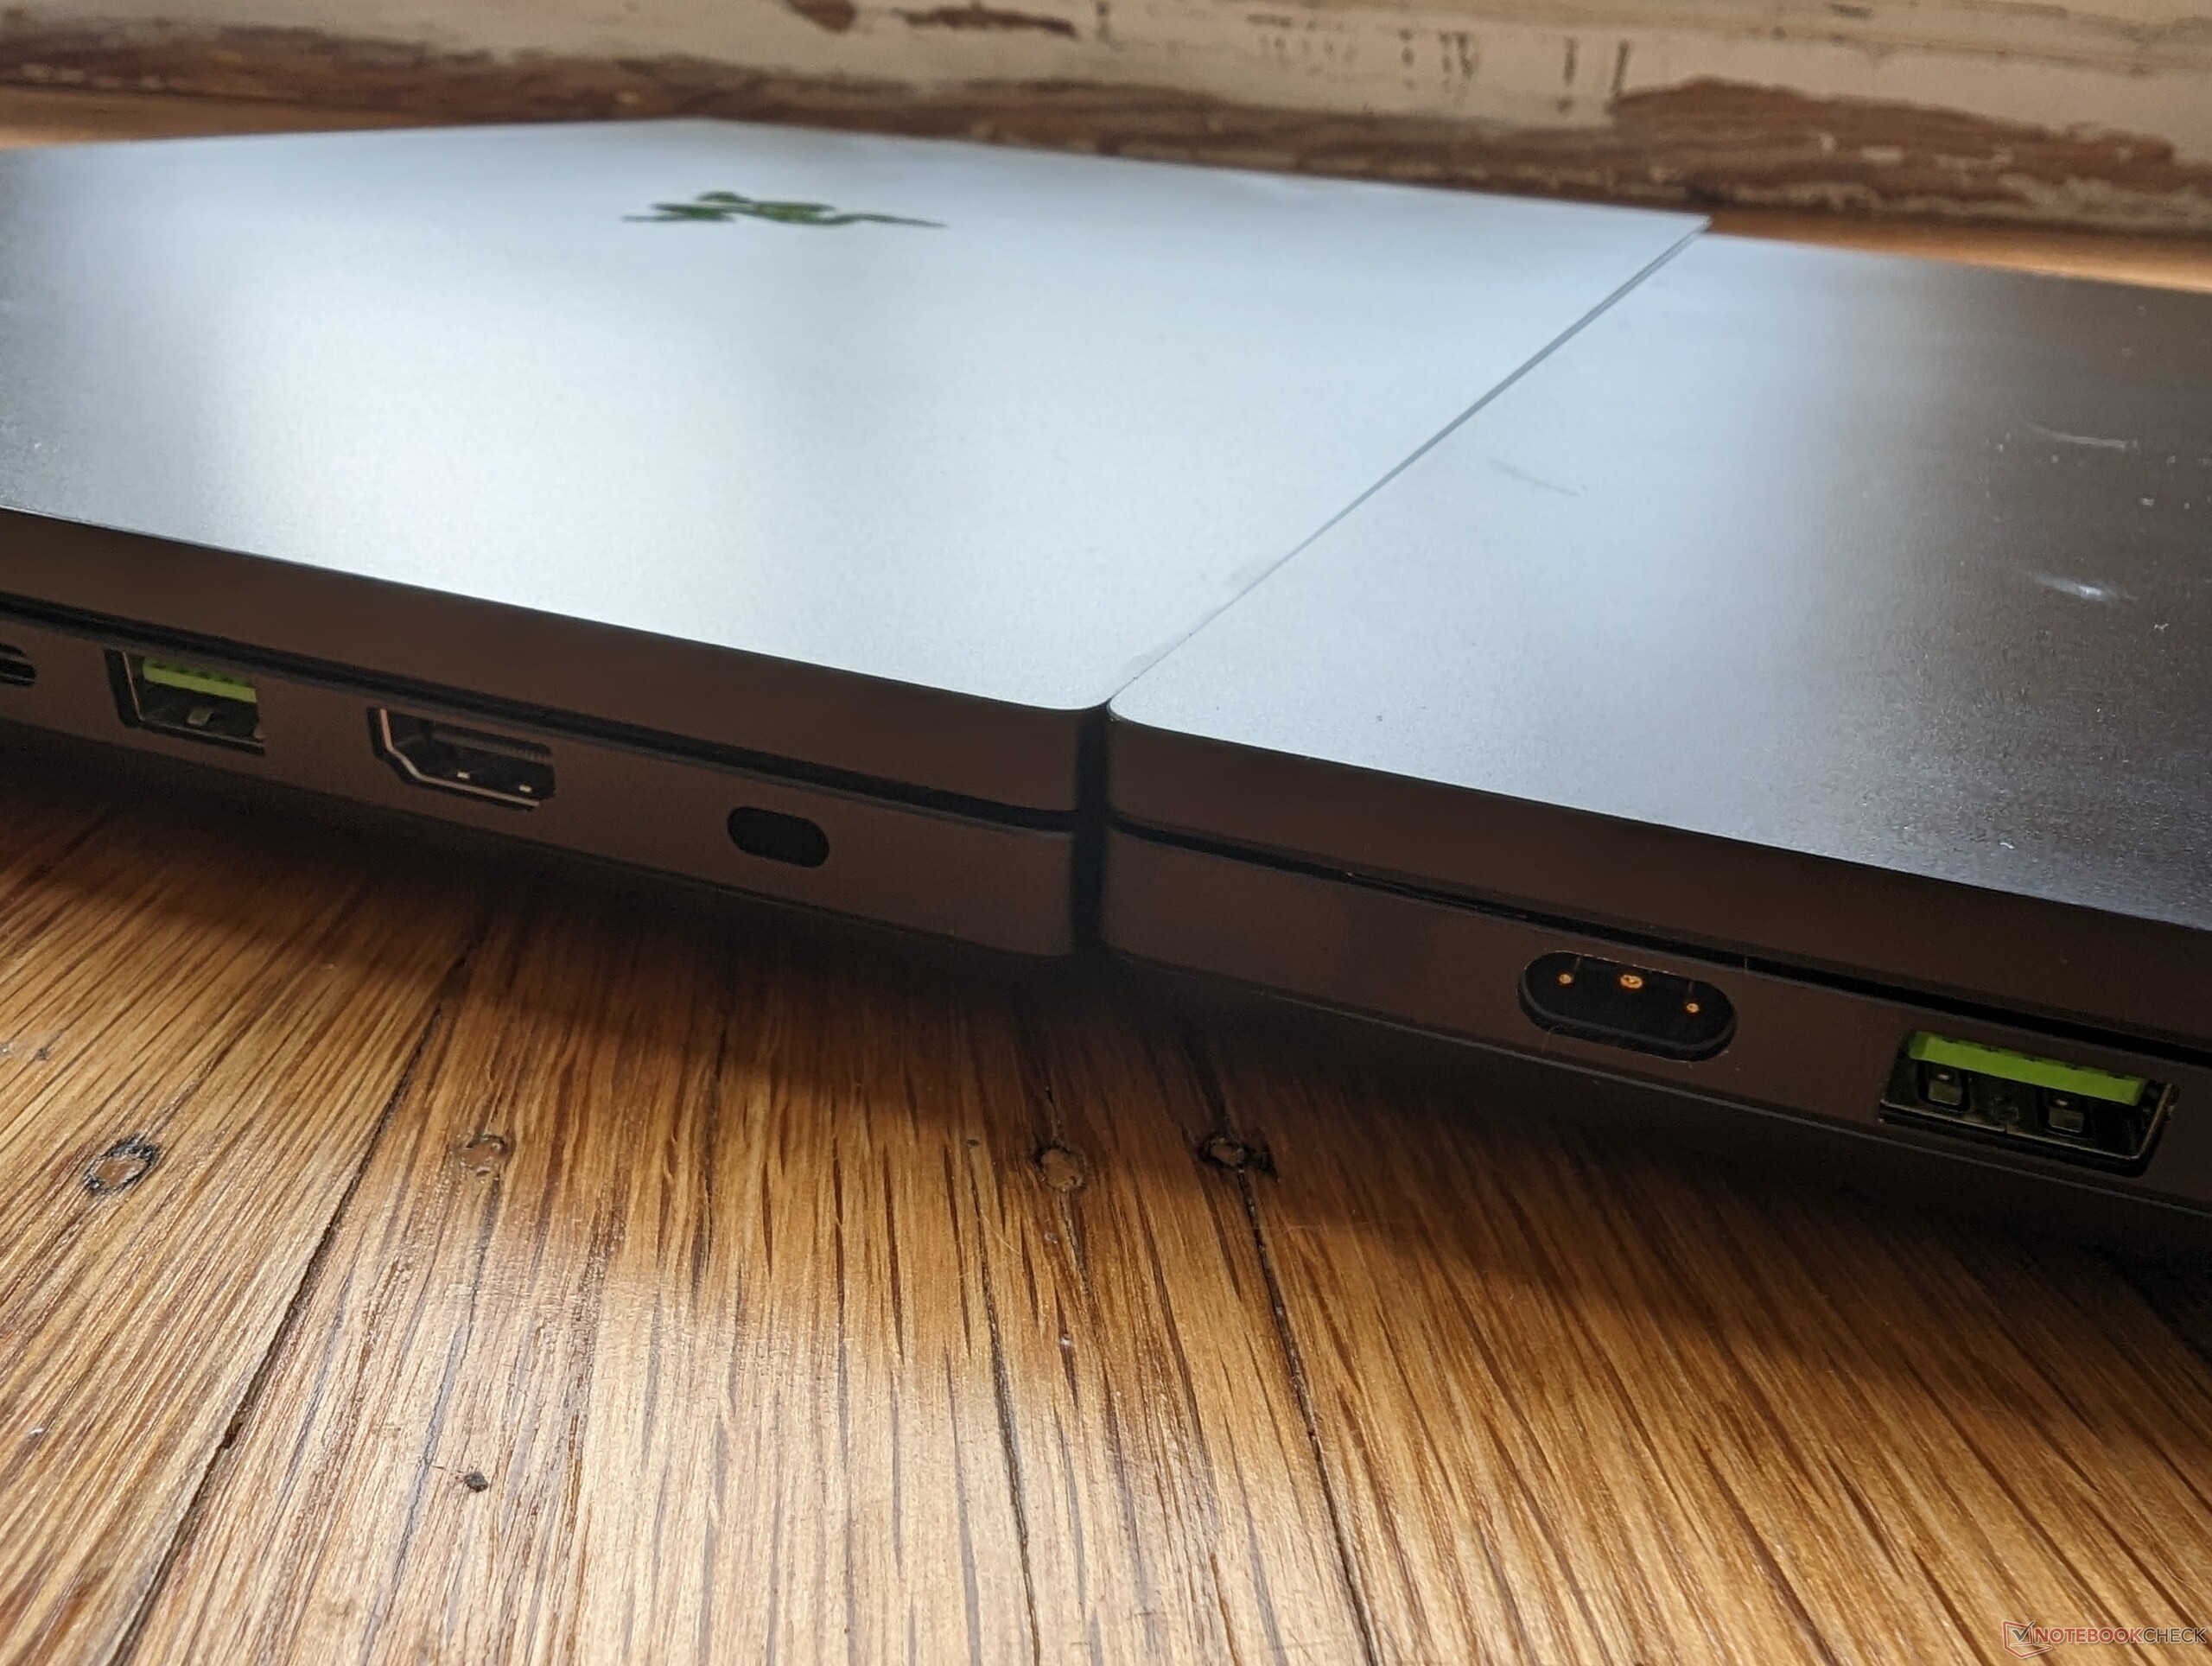
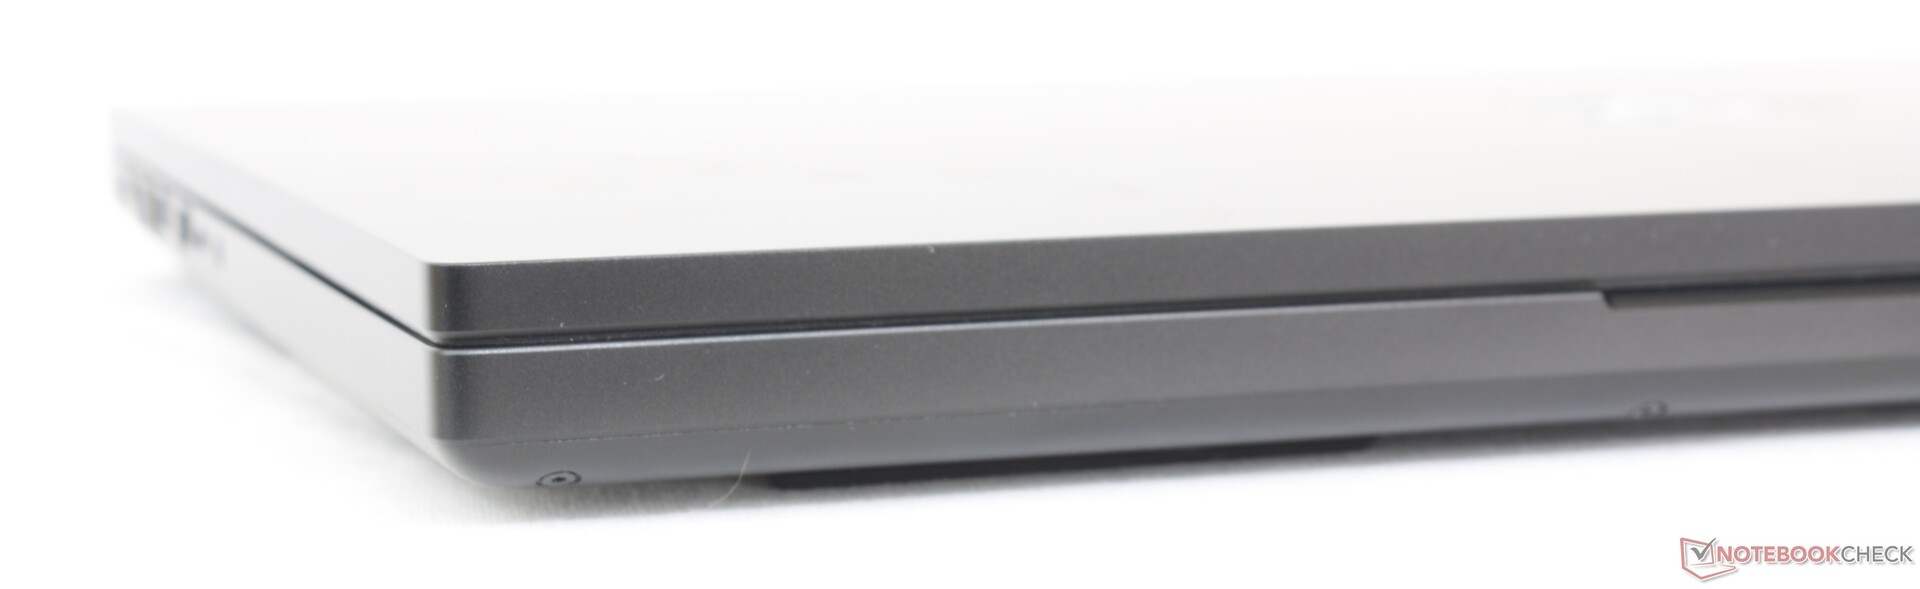
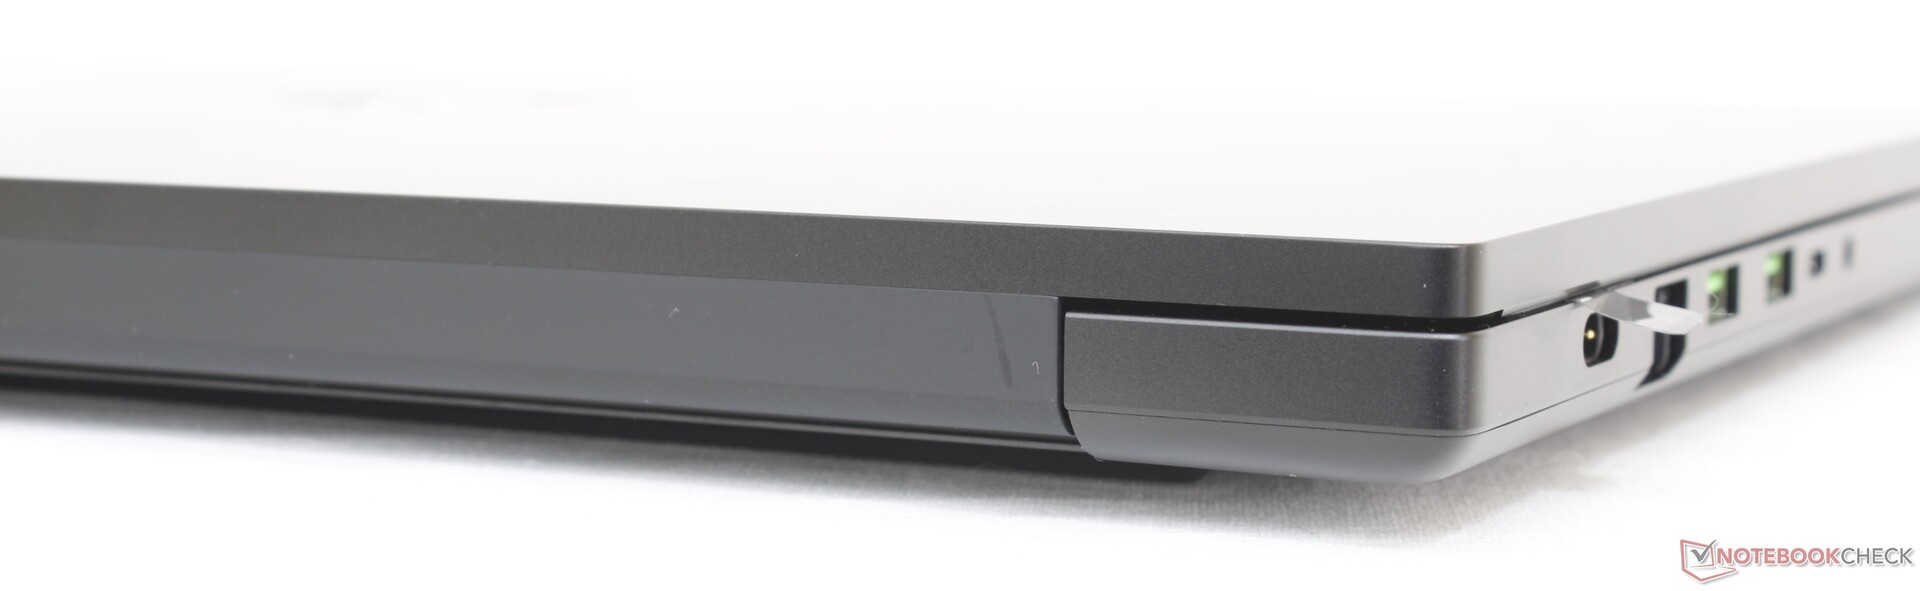
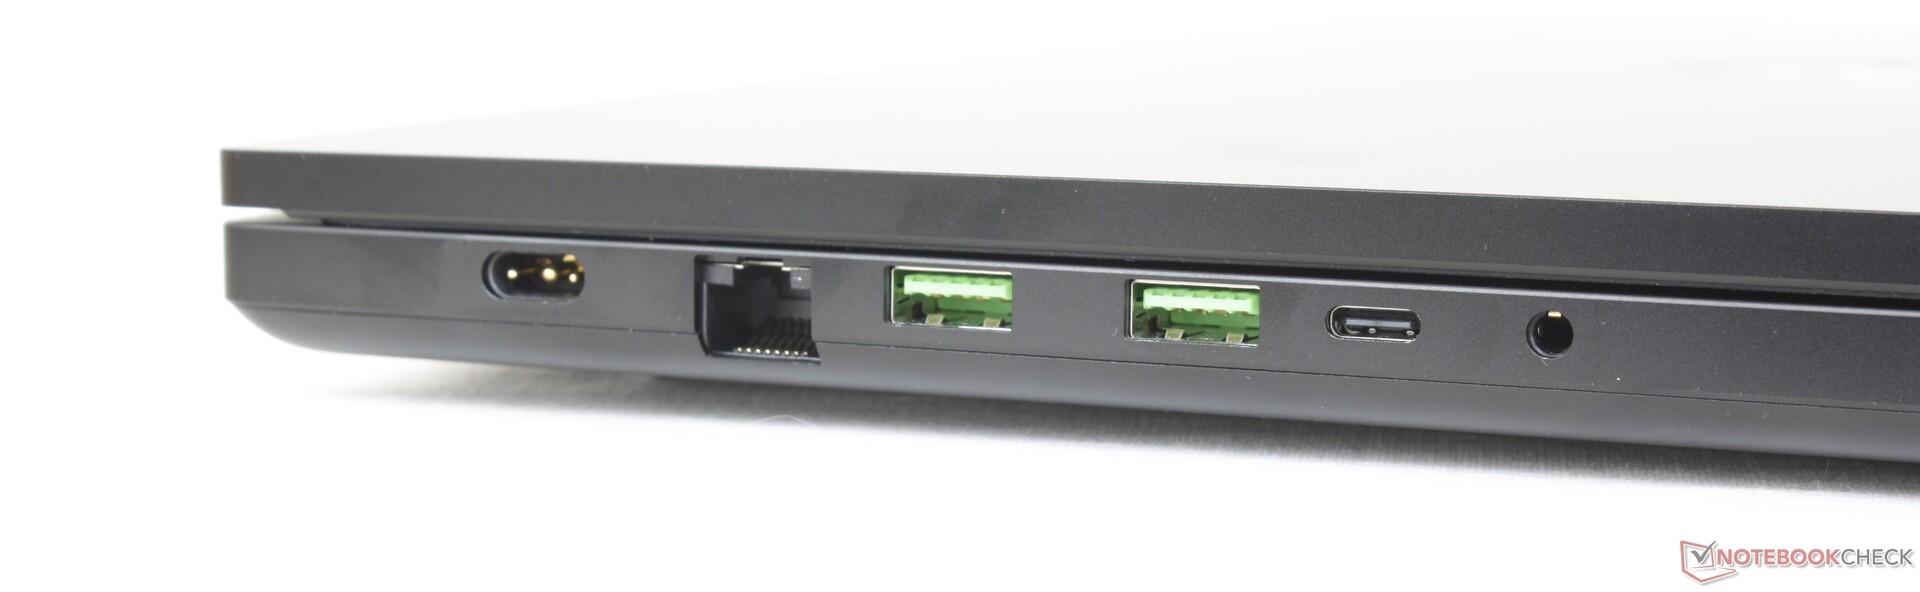
Conectividade - Apenas o habitual
O novo modelo herda todos os portos do Blade 17 para uma seleção saudável de opções de conectividade. Mesmo assim, gostaríamos de ver um pouco mais para melhor distinguir a Lâmina 18 de seus irmãos menores. Por exemplo, uma porta HDMI-in teria acrescentado mais versatilidade à espaçosa tela de 18 polegadas.
Tenha em mente que apenas uma das duas portas USB-C é compatível com os dispositivos Thunderbolt.
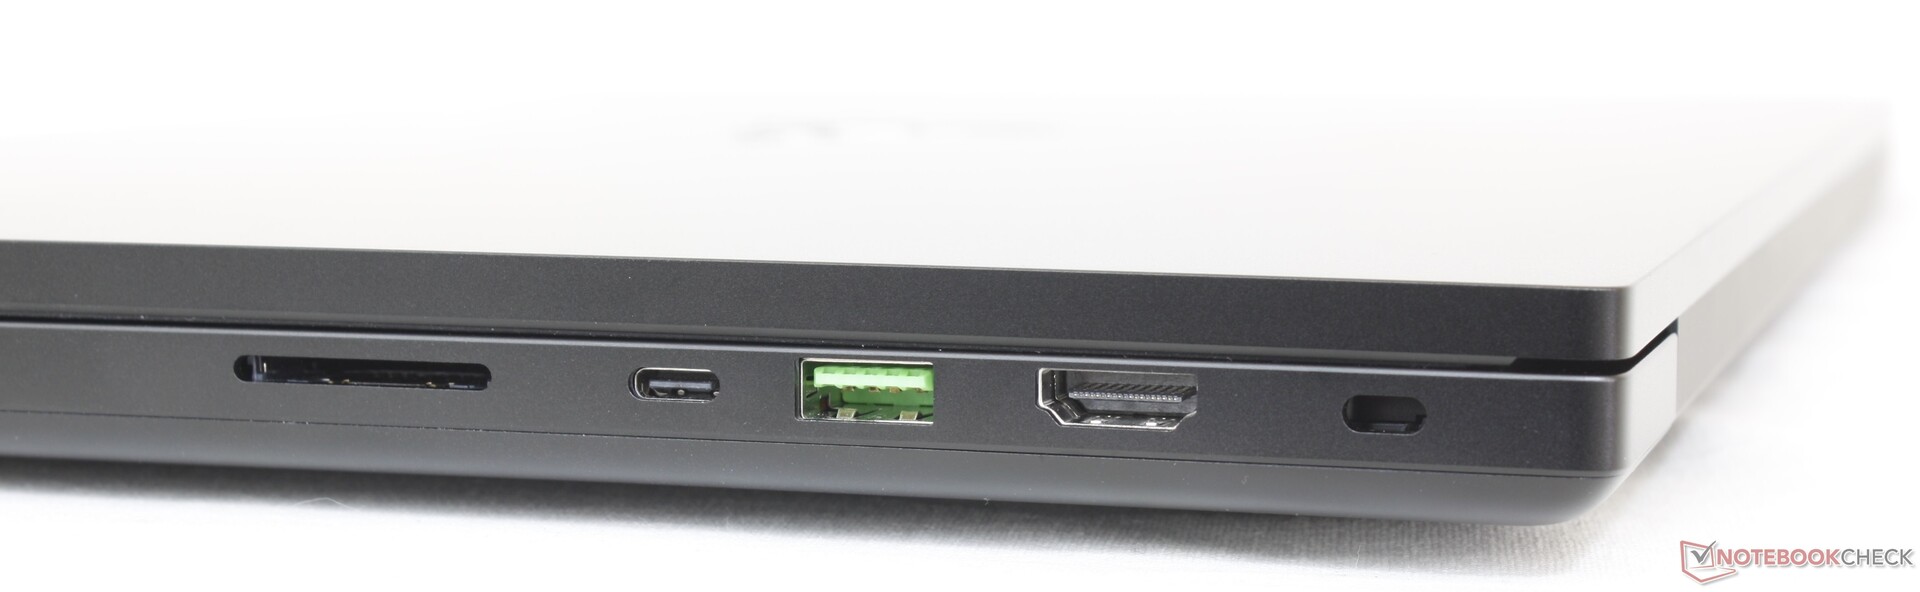
Leitor de cartões SD
Somos capazes de mover 1 GB de fotos de nossa placa de teste UHS-II para a área de trabalho em apenas 5 segundos, em comparação com ~13 segundos noMSI Titan GT77.
| SD Card Reader | |
| average JPG Copy Test (av. of 3 runs) | |
| Razer Blade 18 RTX 4070 (Angelibird AV Pro V60) | |
| Razer Blade 17 Early 2022 (AV PRO microSD 128 GB V60) | |
| Razer Blade 16 Early 2023 (AV PRO microSD 128 GB V60) | |
| MSI Titan GT77 HX 13VI (Angelibird AV Pro V60) | |
| maximum AS SSD Seq Read Test (1GB) | |
| Razer Blade 18 RTX 4070 (Angelibird AV Pro V60) | |
| Razer Blade 16 Early 2023 (AV PRO microSD 128 GB V60) | |
| Gigabyte G7 KE (AV PRO microSD 128 GB V60) | |
| MSI Titan GT77 HX 13VI (Angelibird AV Pro V60) | |
Comunicação
Um Intel AX211 vem como padrão para conectividade Wi-Fi 6E e Bluetooth 5.3 enquanto que o Blade 17 vem com o Killer AX1690i em comparação. O Killer AX1690i é o derivado específico para jogos do Intel AX211 e, portanto, os usuários não devem ver nenhuma diferença significativa de desempenho entre os dois.
| Networking | |
| iperf3 transmit AXE11000 6GHz | |
| Asus ROG Strix Scar 17 SE G733CX-LL014W | |
| Razer Blade 18 RTX 4070 | |
| iperf3 receive AXE11000 6GHz | |
| Asus ROG Strix Scar 17 SE G733CX-LL014W | |
| Razer Blade 18 RTX 4070 | |
| iperf3 receive AXE11000 | |
| Razer Blade 17 Early 2022 | |
| Gigabyte G7 KE | |
| MSI Titan GT77 HX 13VI | |
| Razer Blade 18 RTX 4070 | |
| Alienware m17 R5 (R9 6900HX, RX 6850M XT) | |
| iperf3 transmit AXE11000 | |
| Gigabyte G7 KE | |
| MSI Titan GT77 HX 13VI | |
| Razer Blade 18 RTX 4070 | |
| Alienware m17 R5 (R9 6900HX, RX 6850M XT) | |
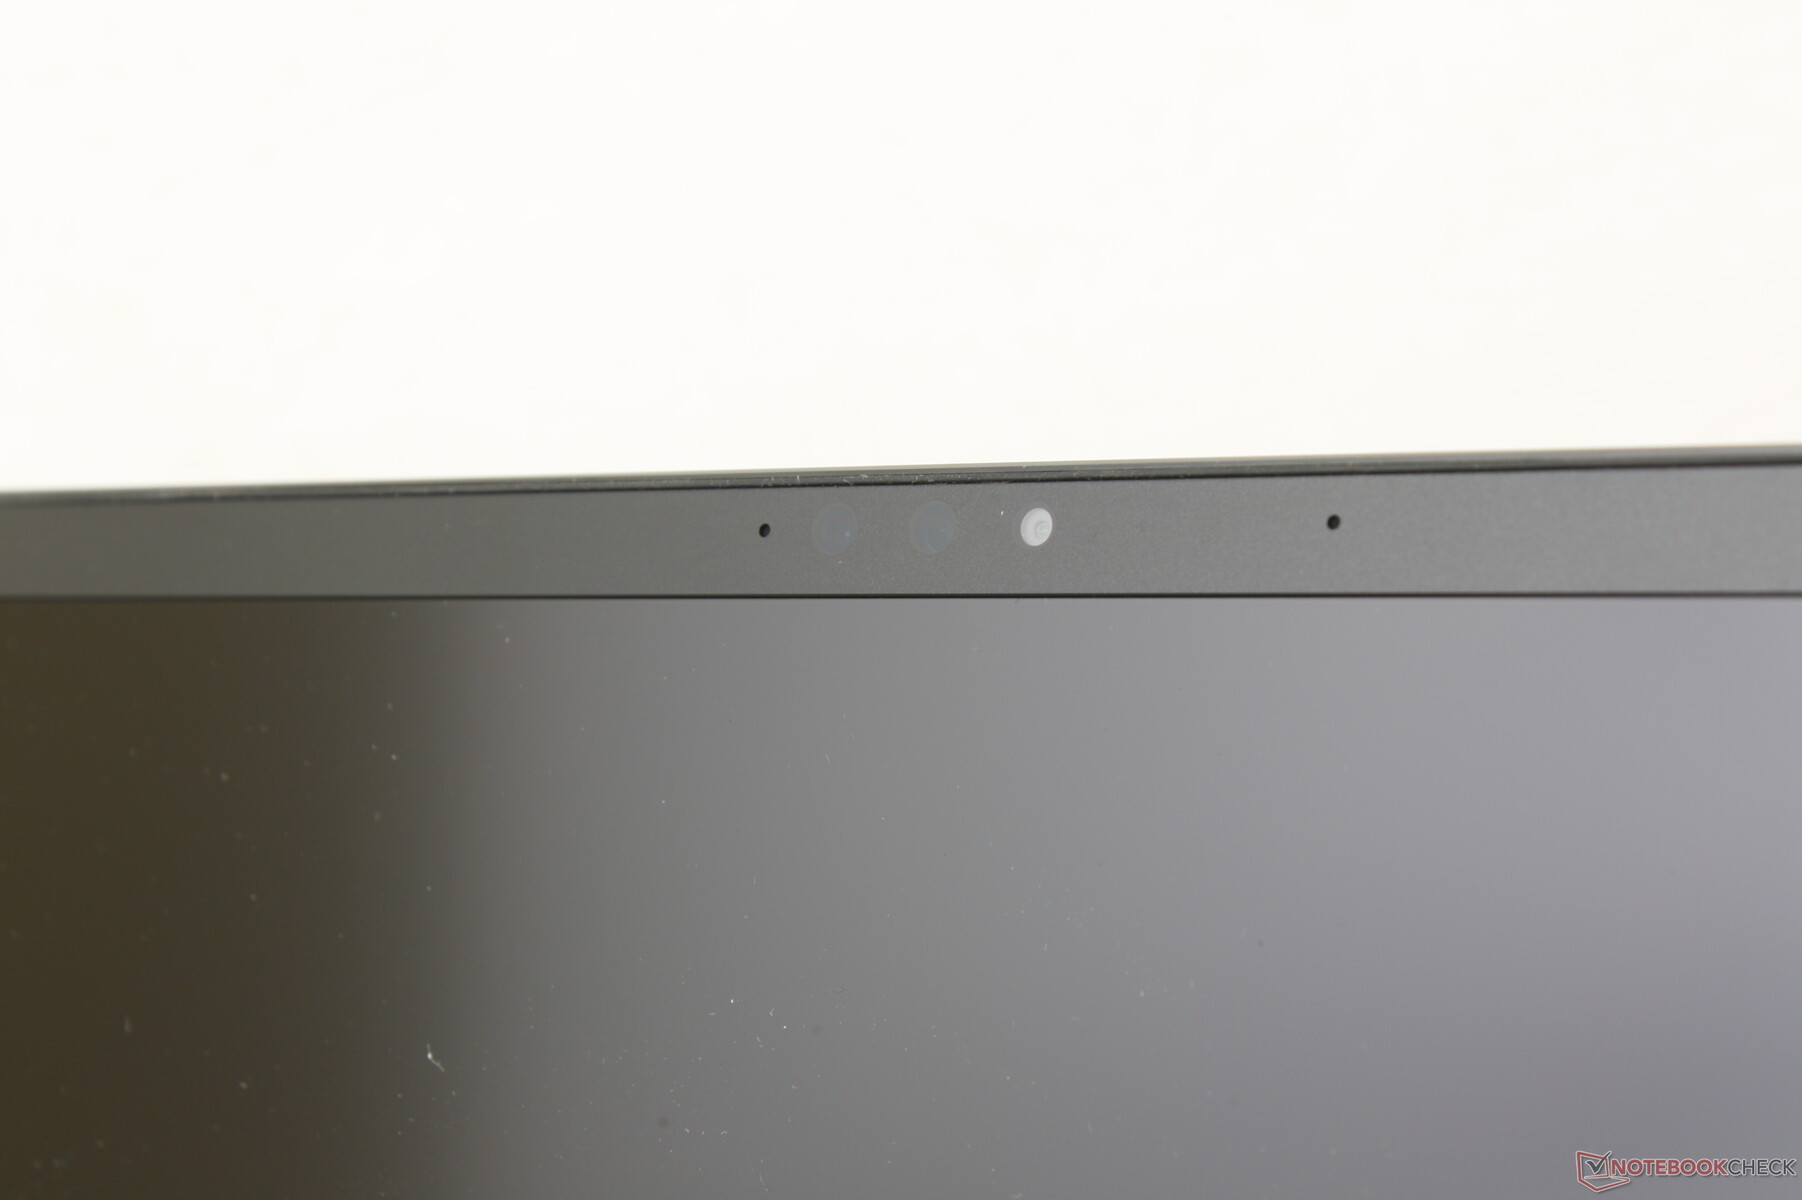
Webcam - Agora com 5 MP
A Razer atualizou a webcam de 2 MP na Lâmina 17 para 5 MP na Lâmina 18. Esperamos plenamente que o fabricante comece a atualizar seus modelos menores de Lâmina com o mesmo sensor de 5 MP em algum momento no futuro próximo. As imagens são mais nítidas com o sensor de 5 MP enquanto as cores não mudaram muito. IR vem como padrão para suporte ao Windows Olá.
Estranhamente, não há obturador físico de privacidade da webcam, embora o Lâmina 16 incorpora um. Não há sequer um interruptor digital ou uma tecla de atalho.


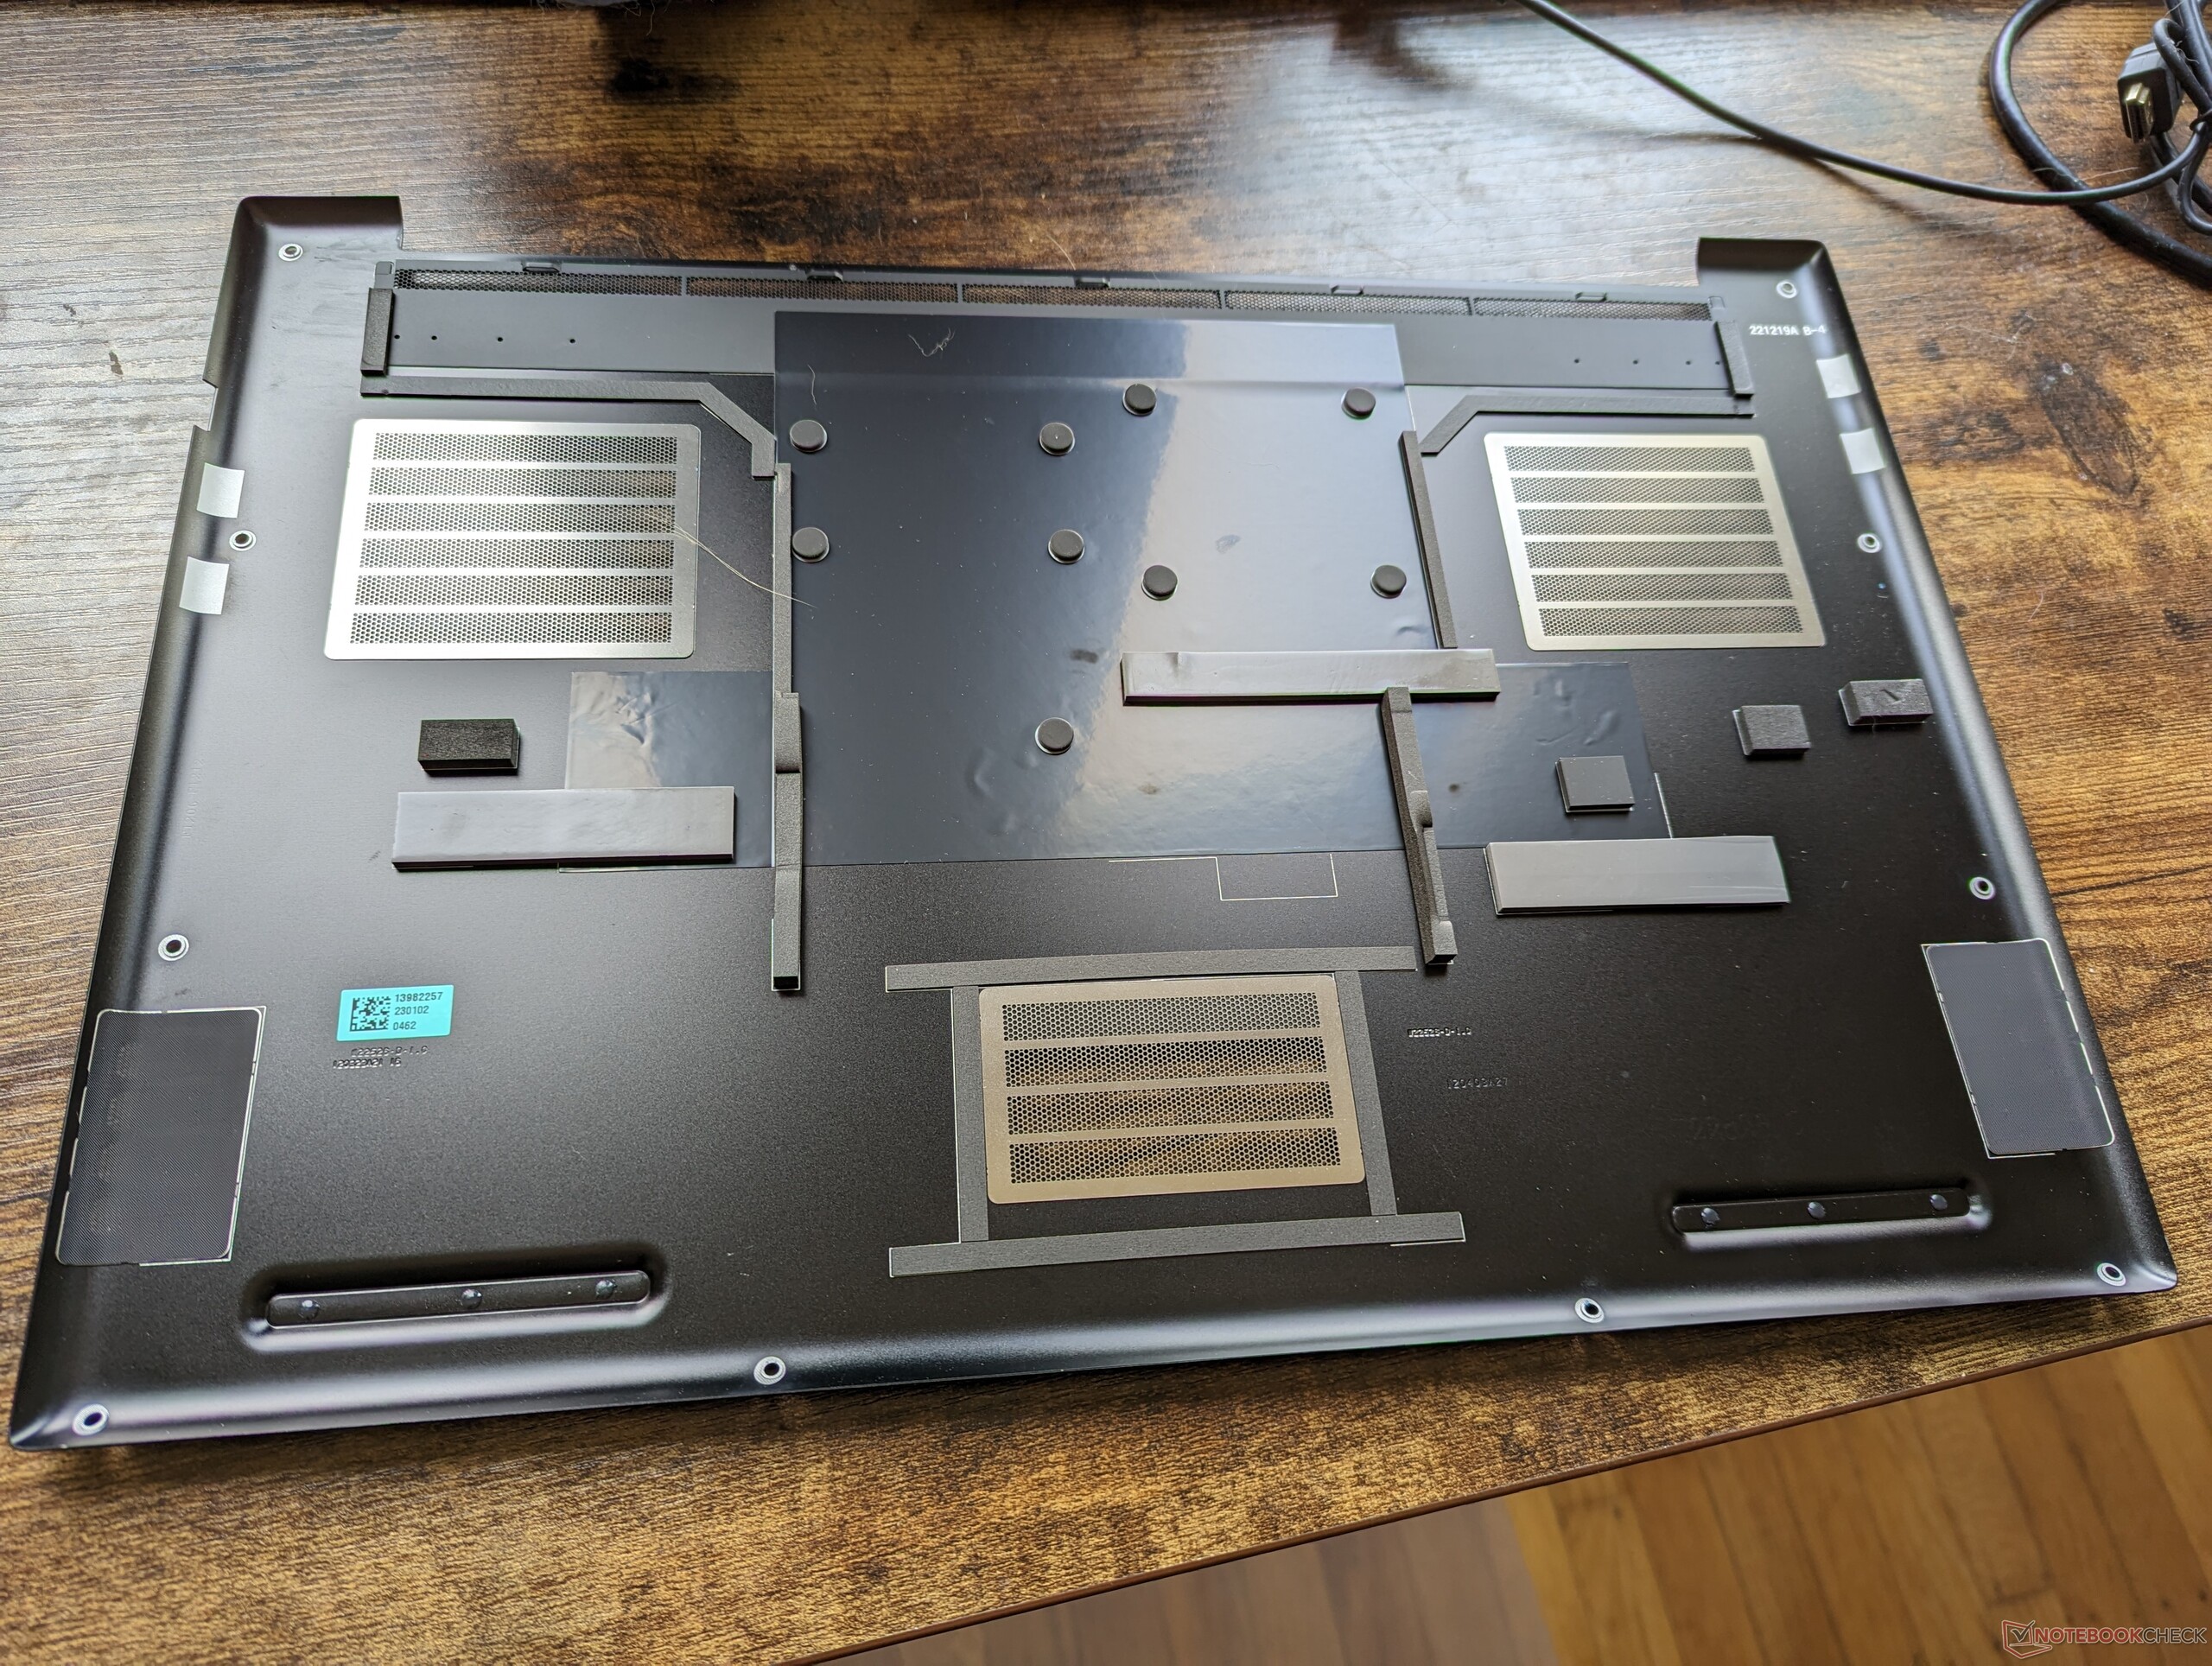
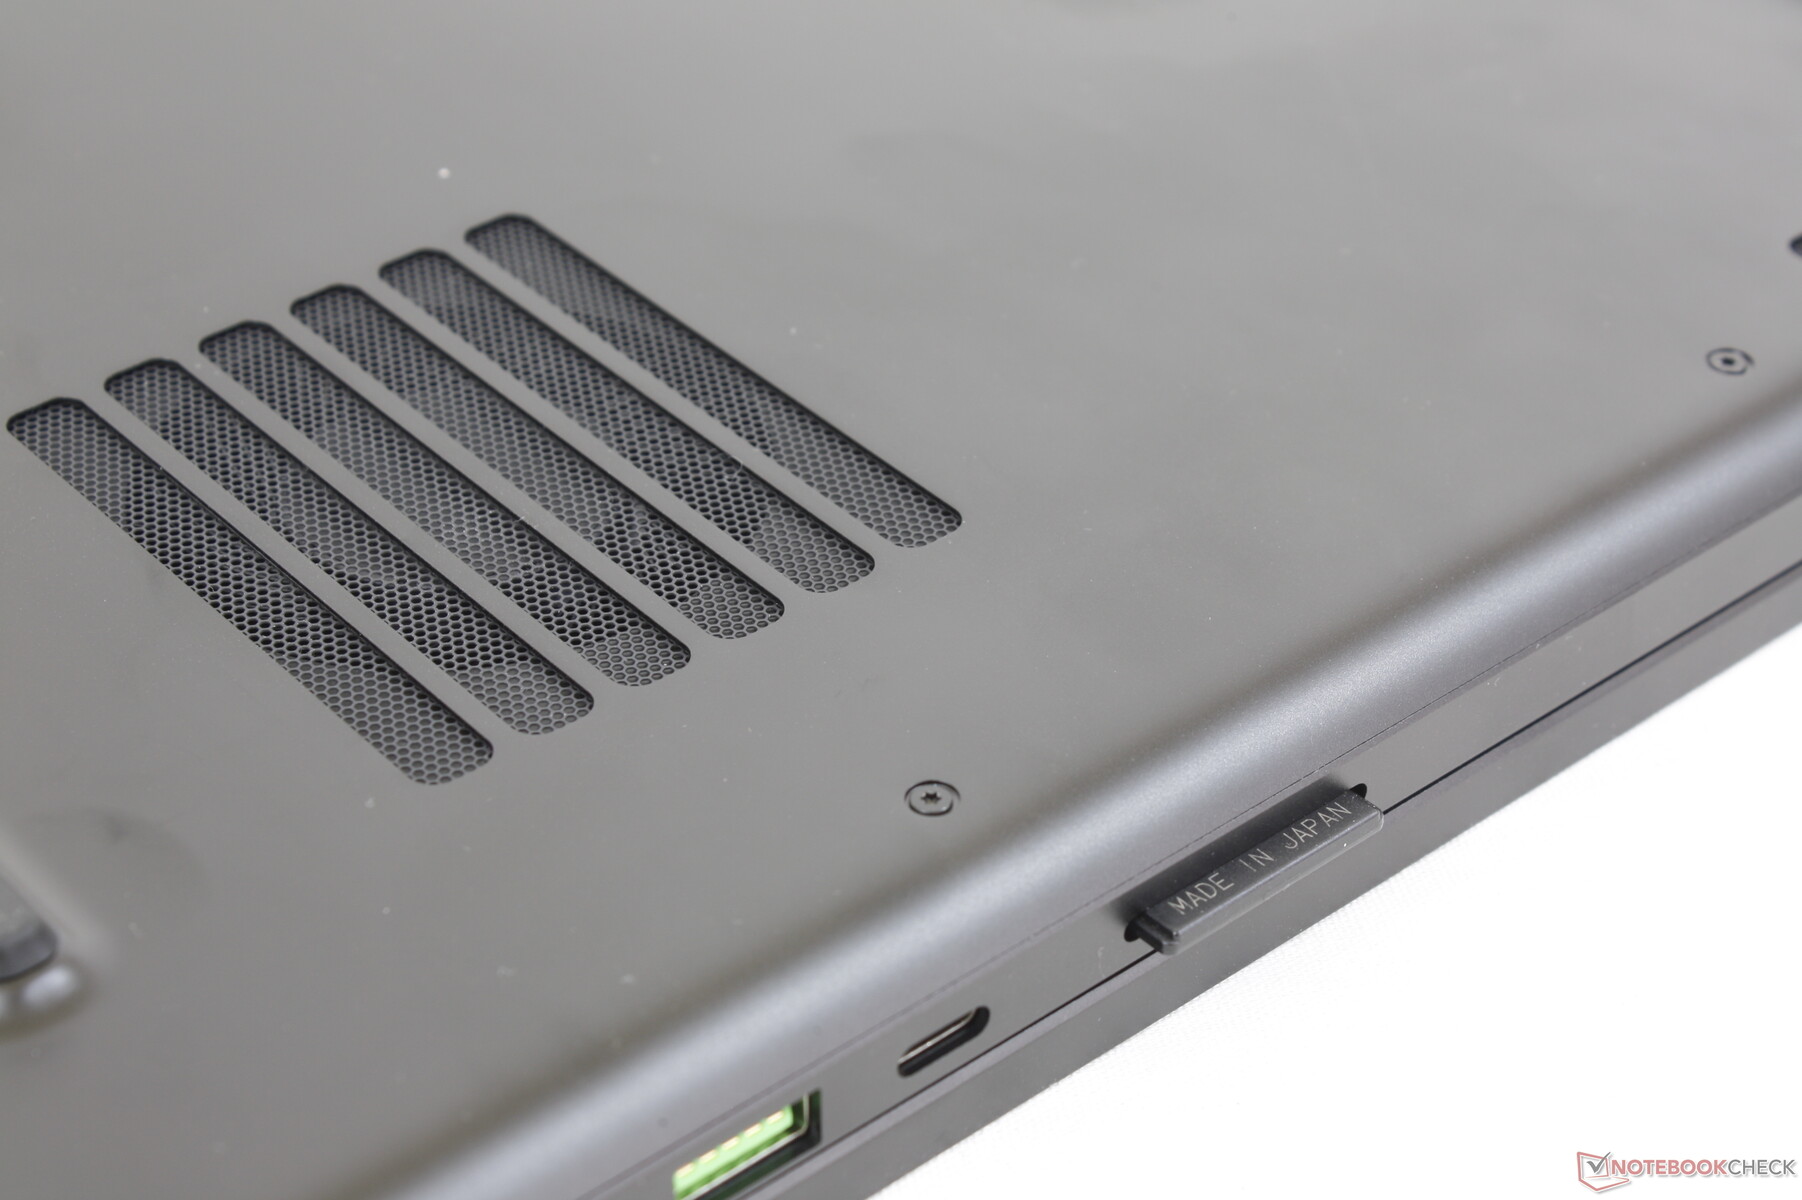
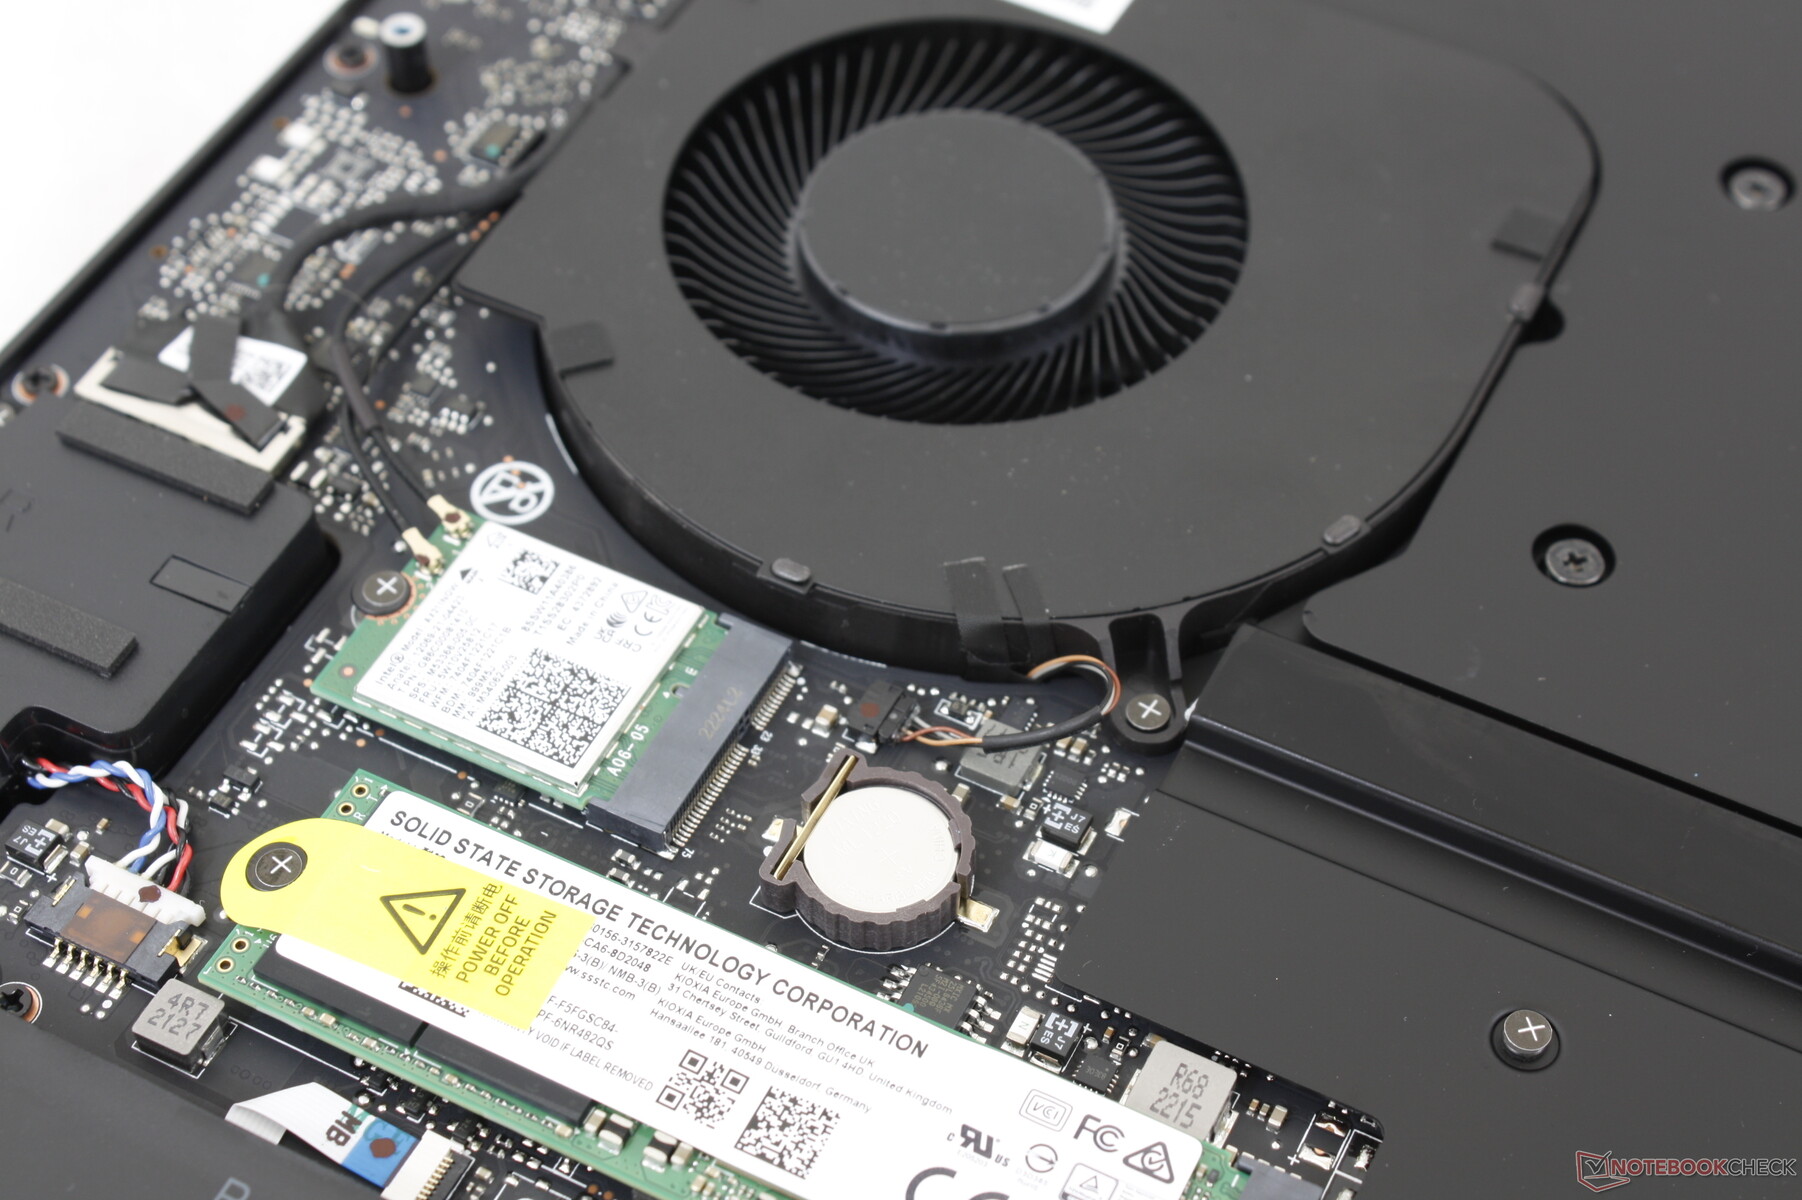
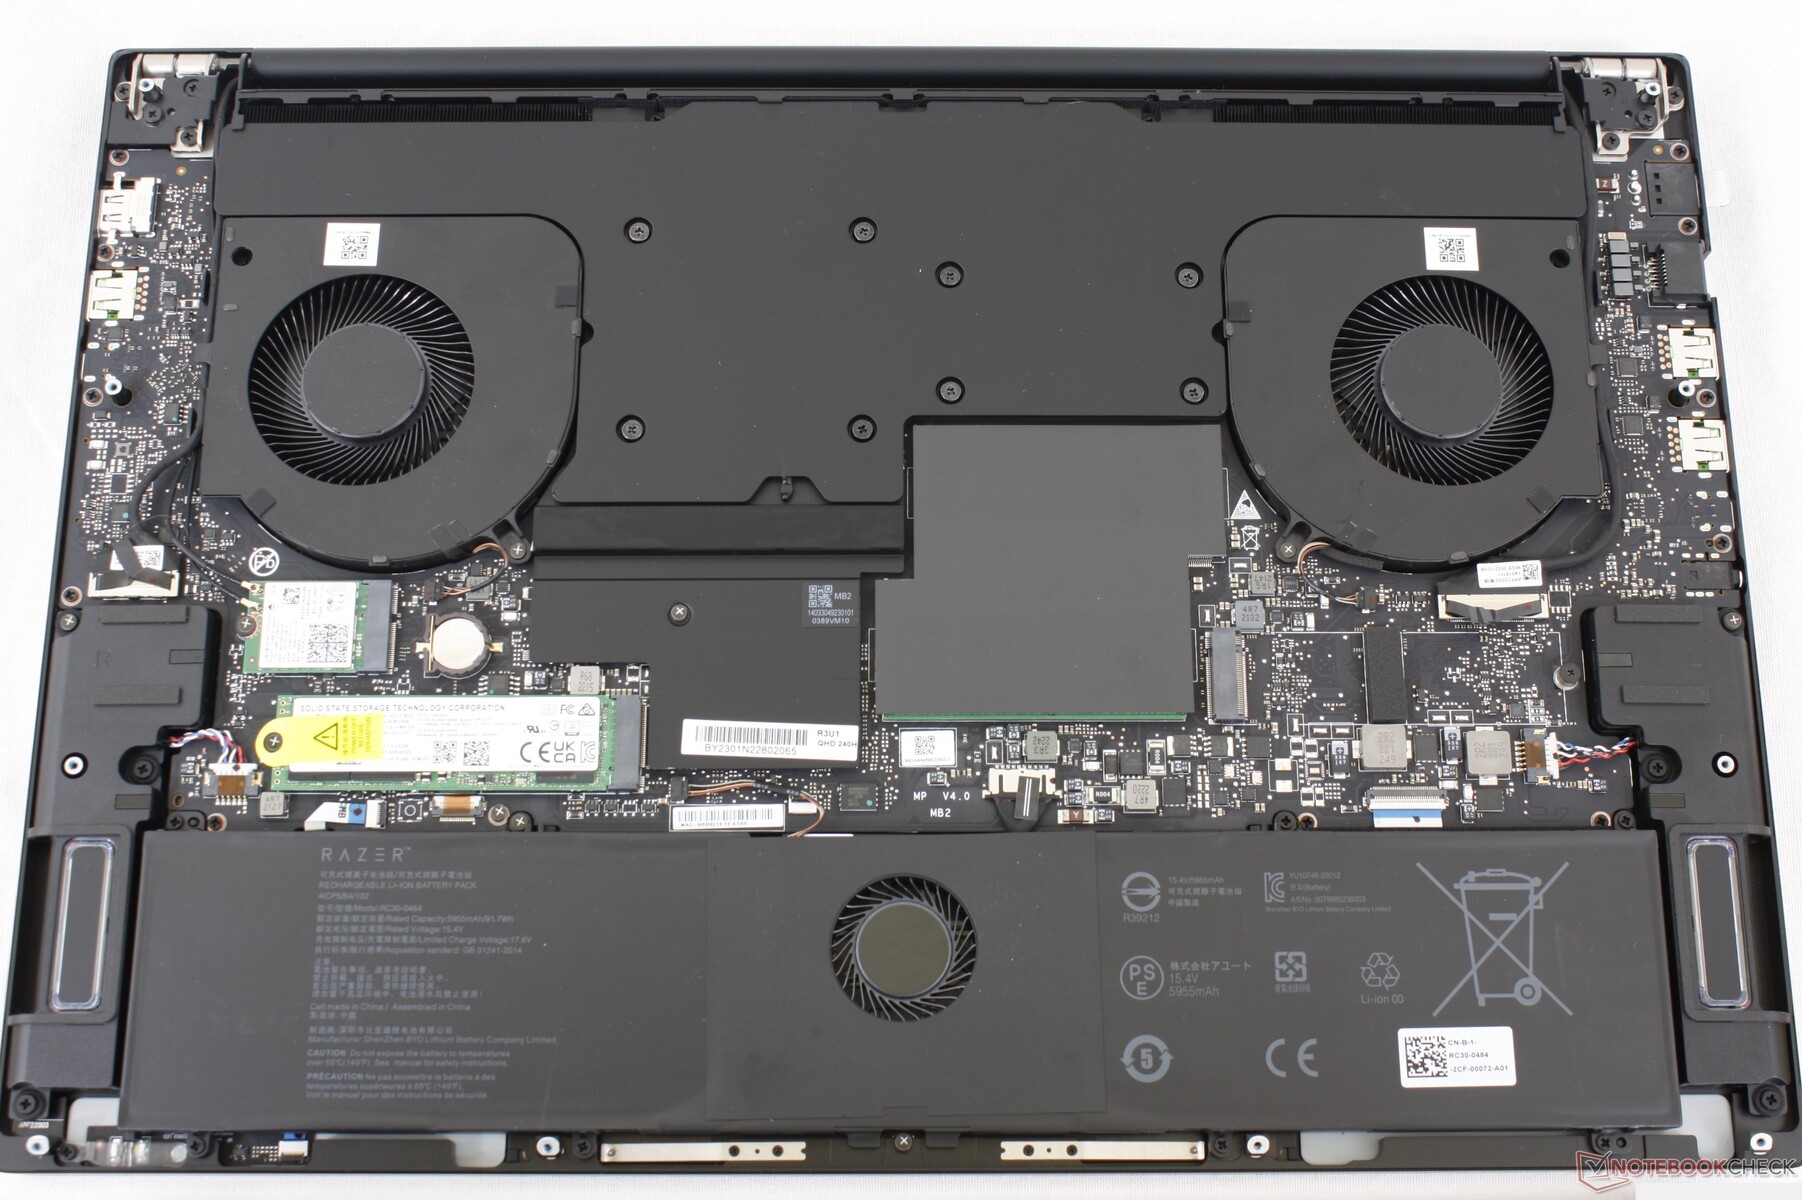
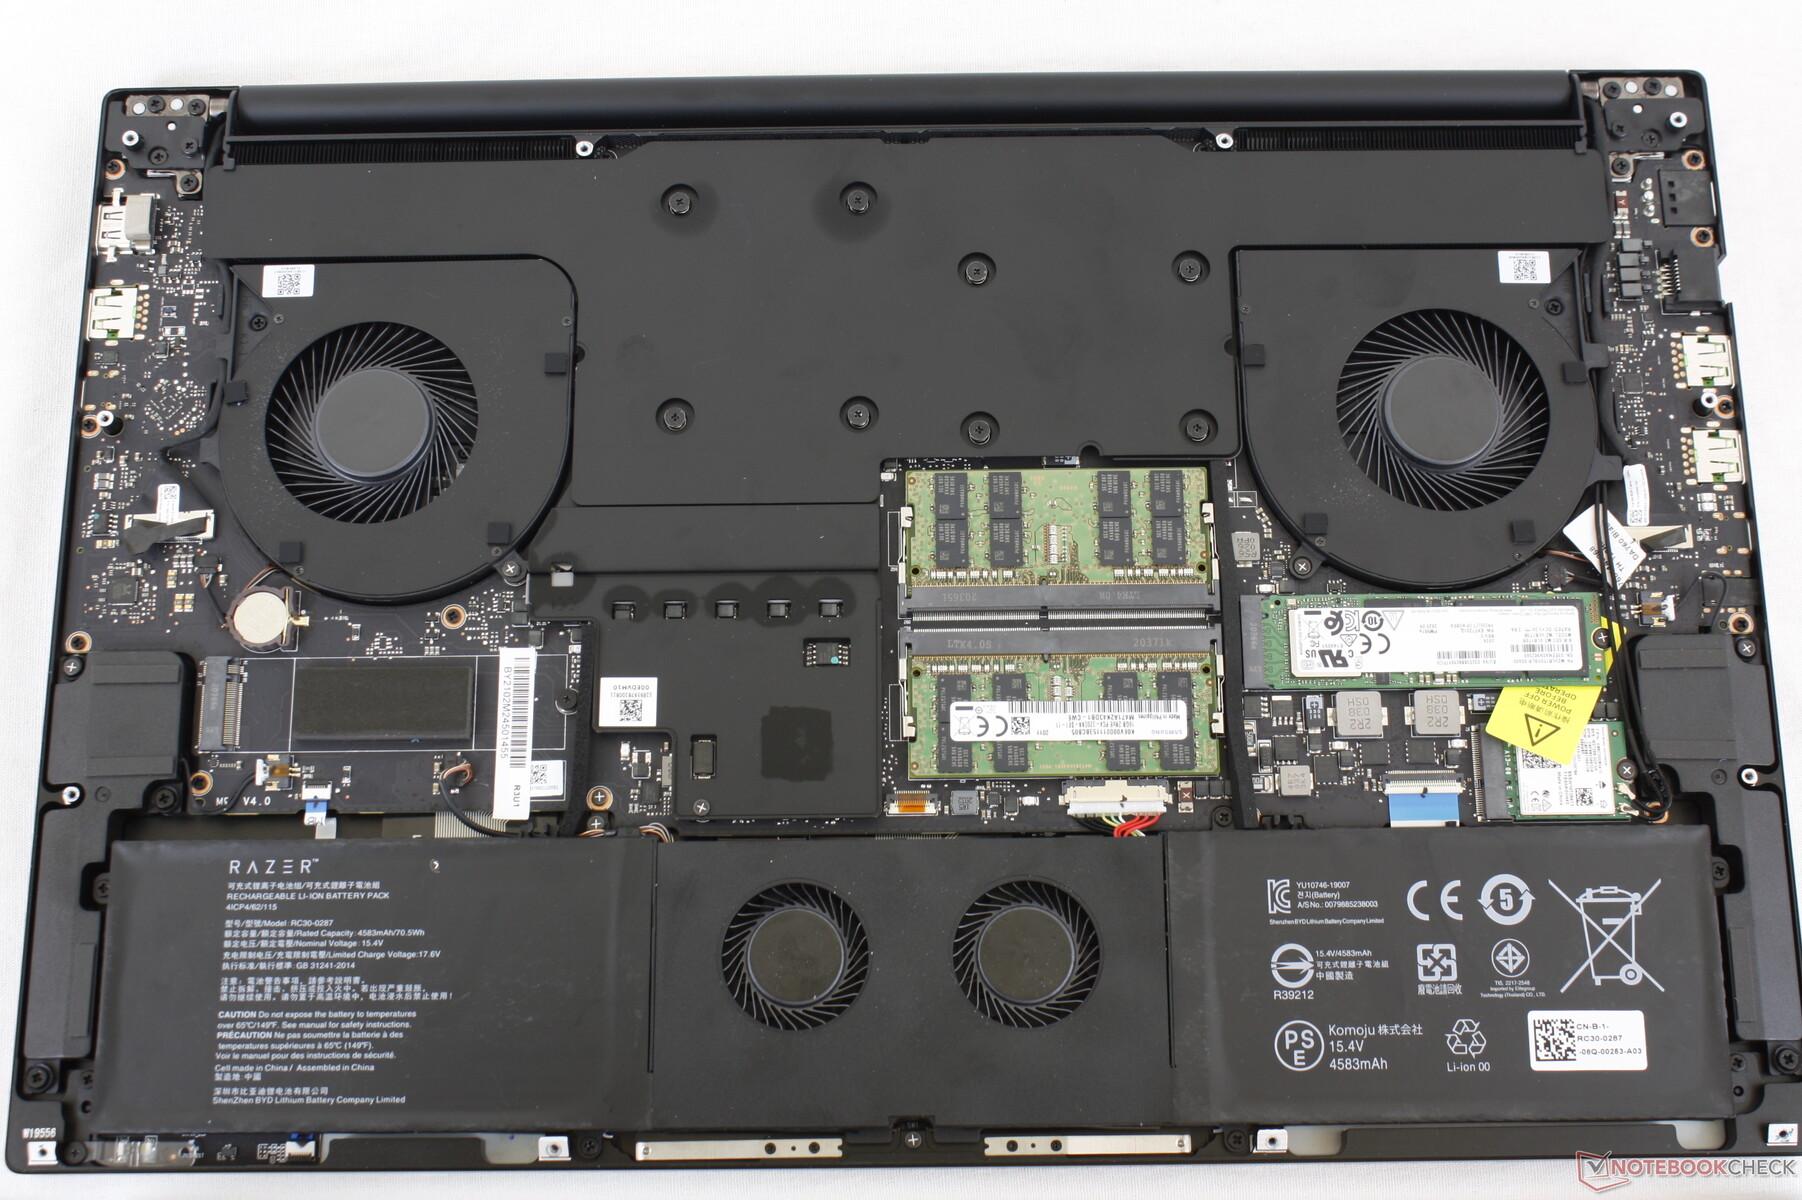
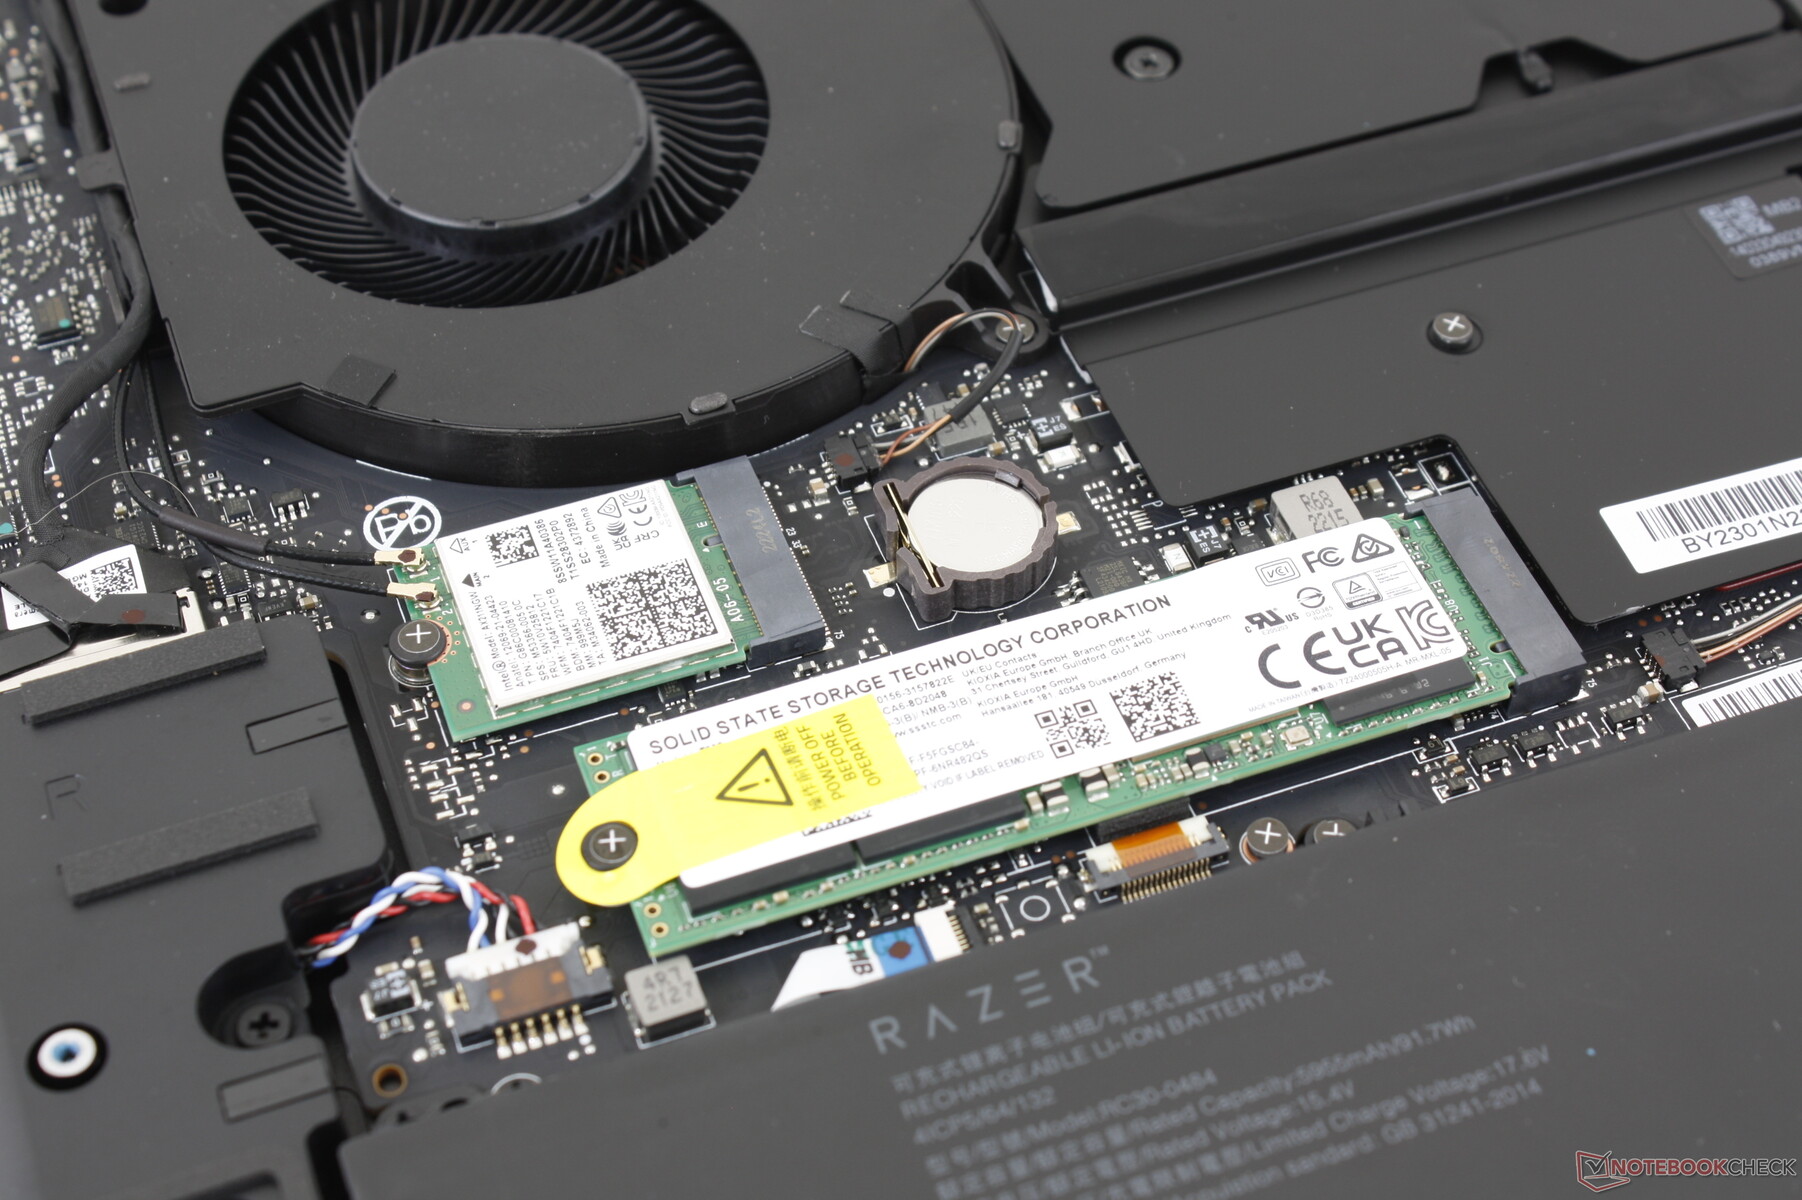
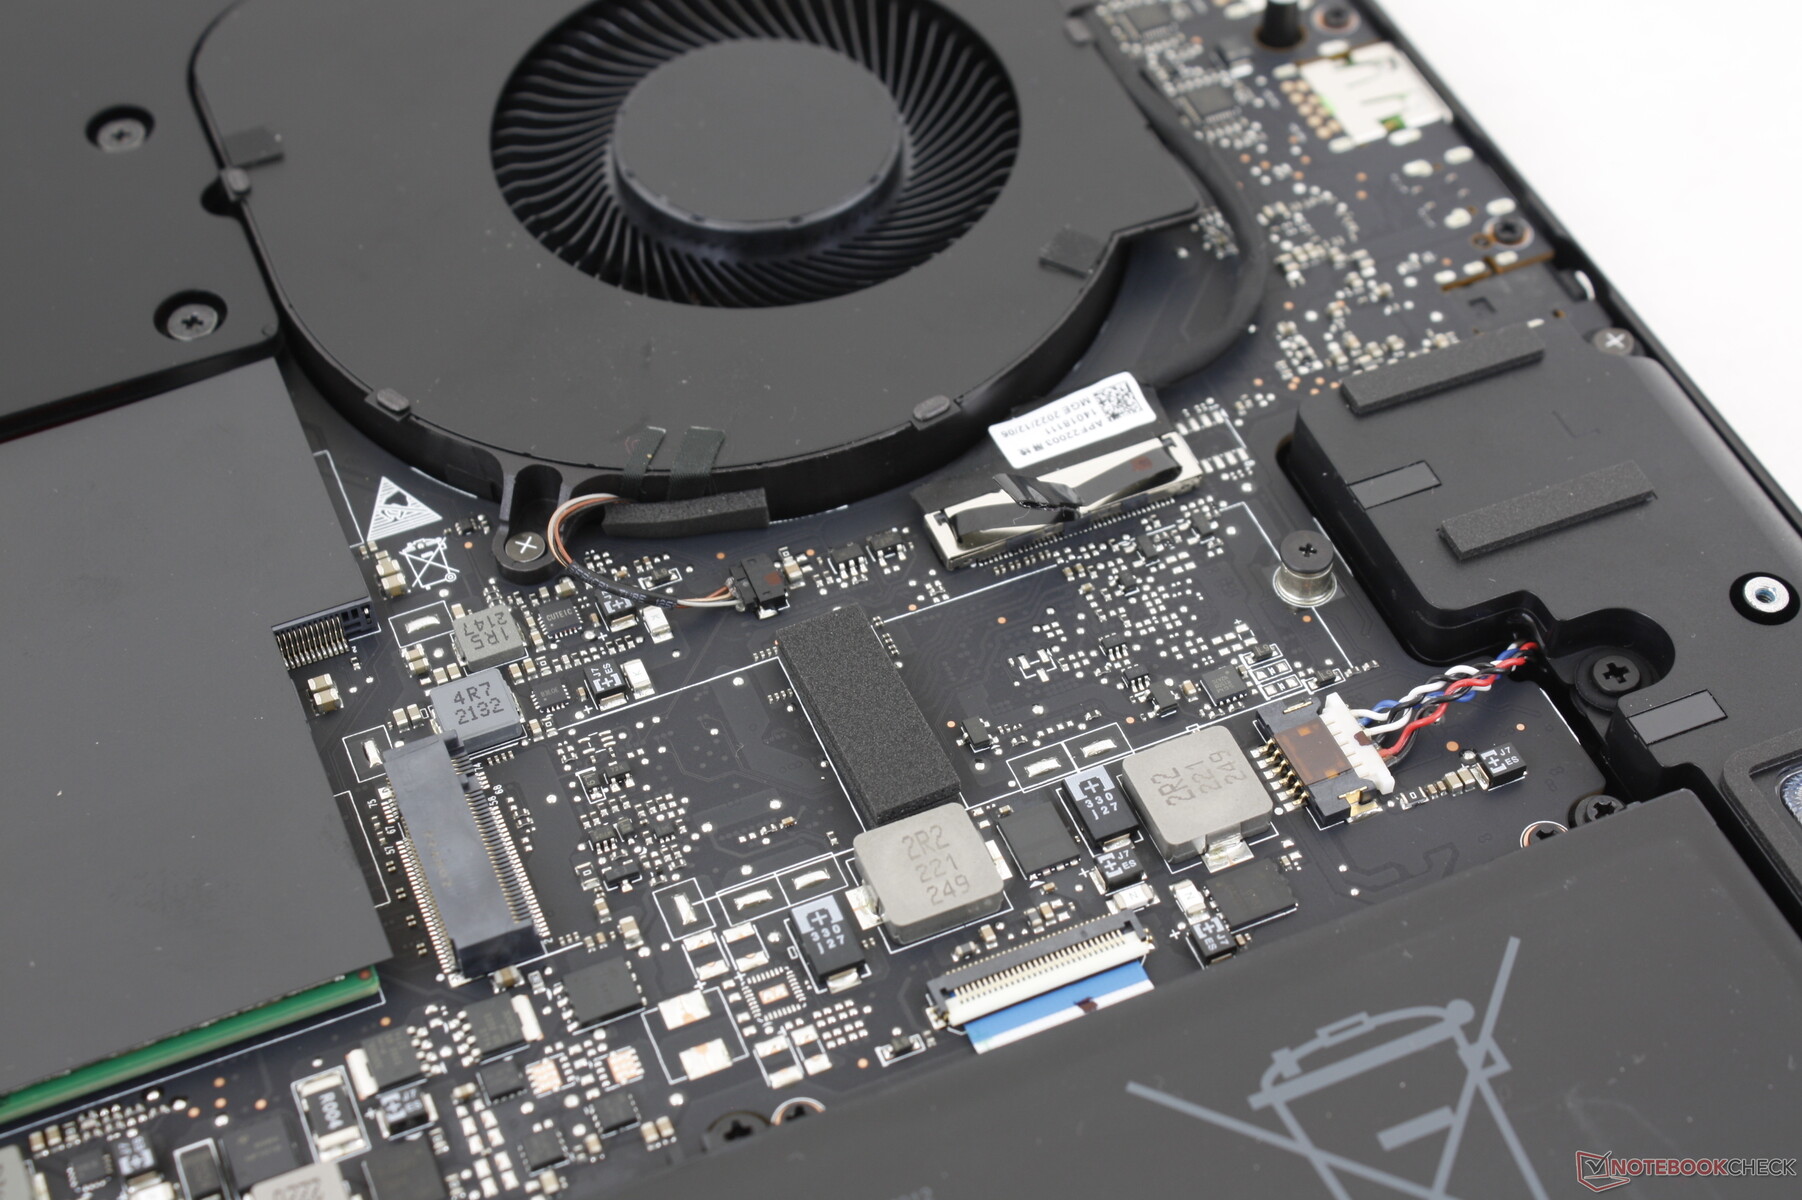
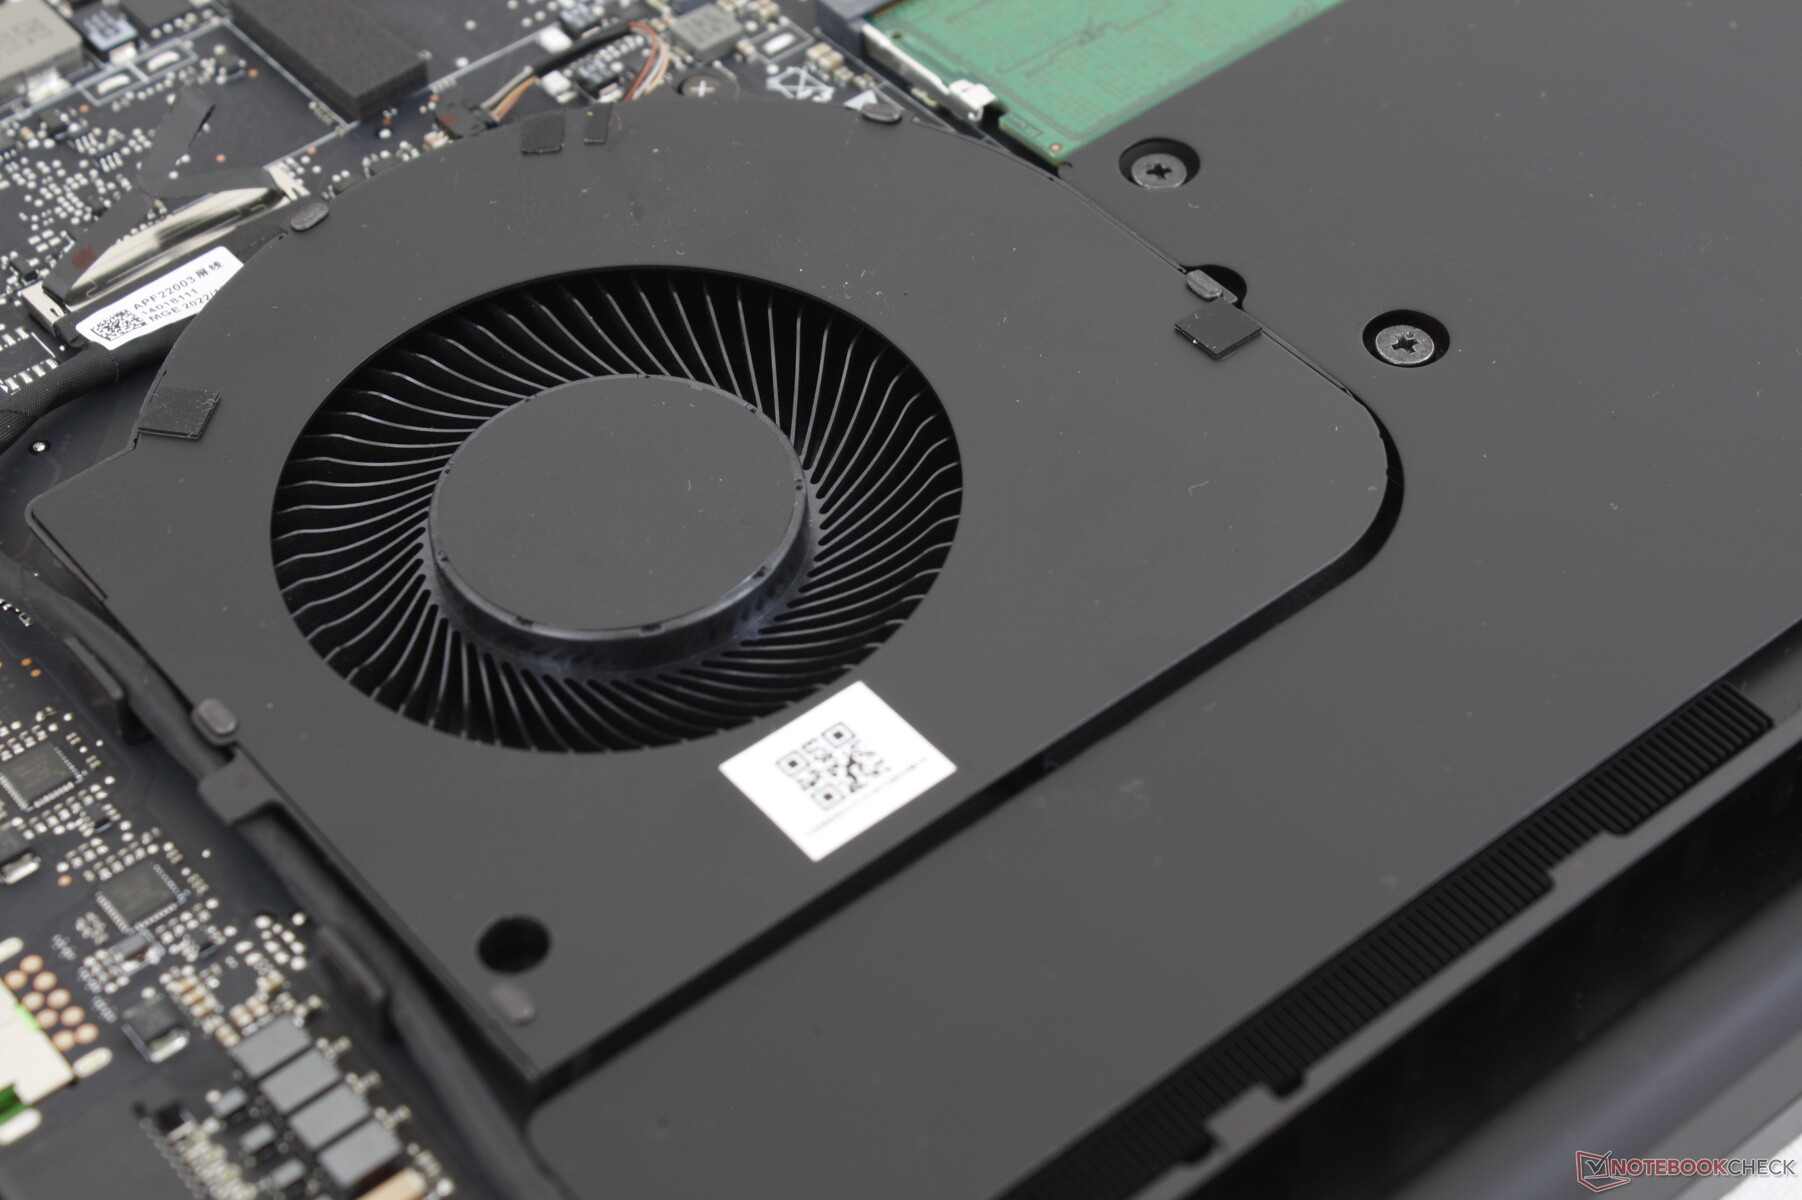
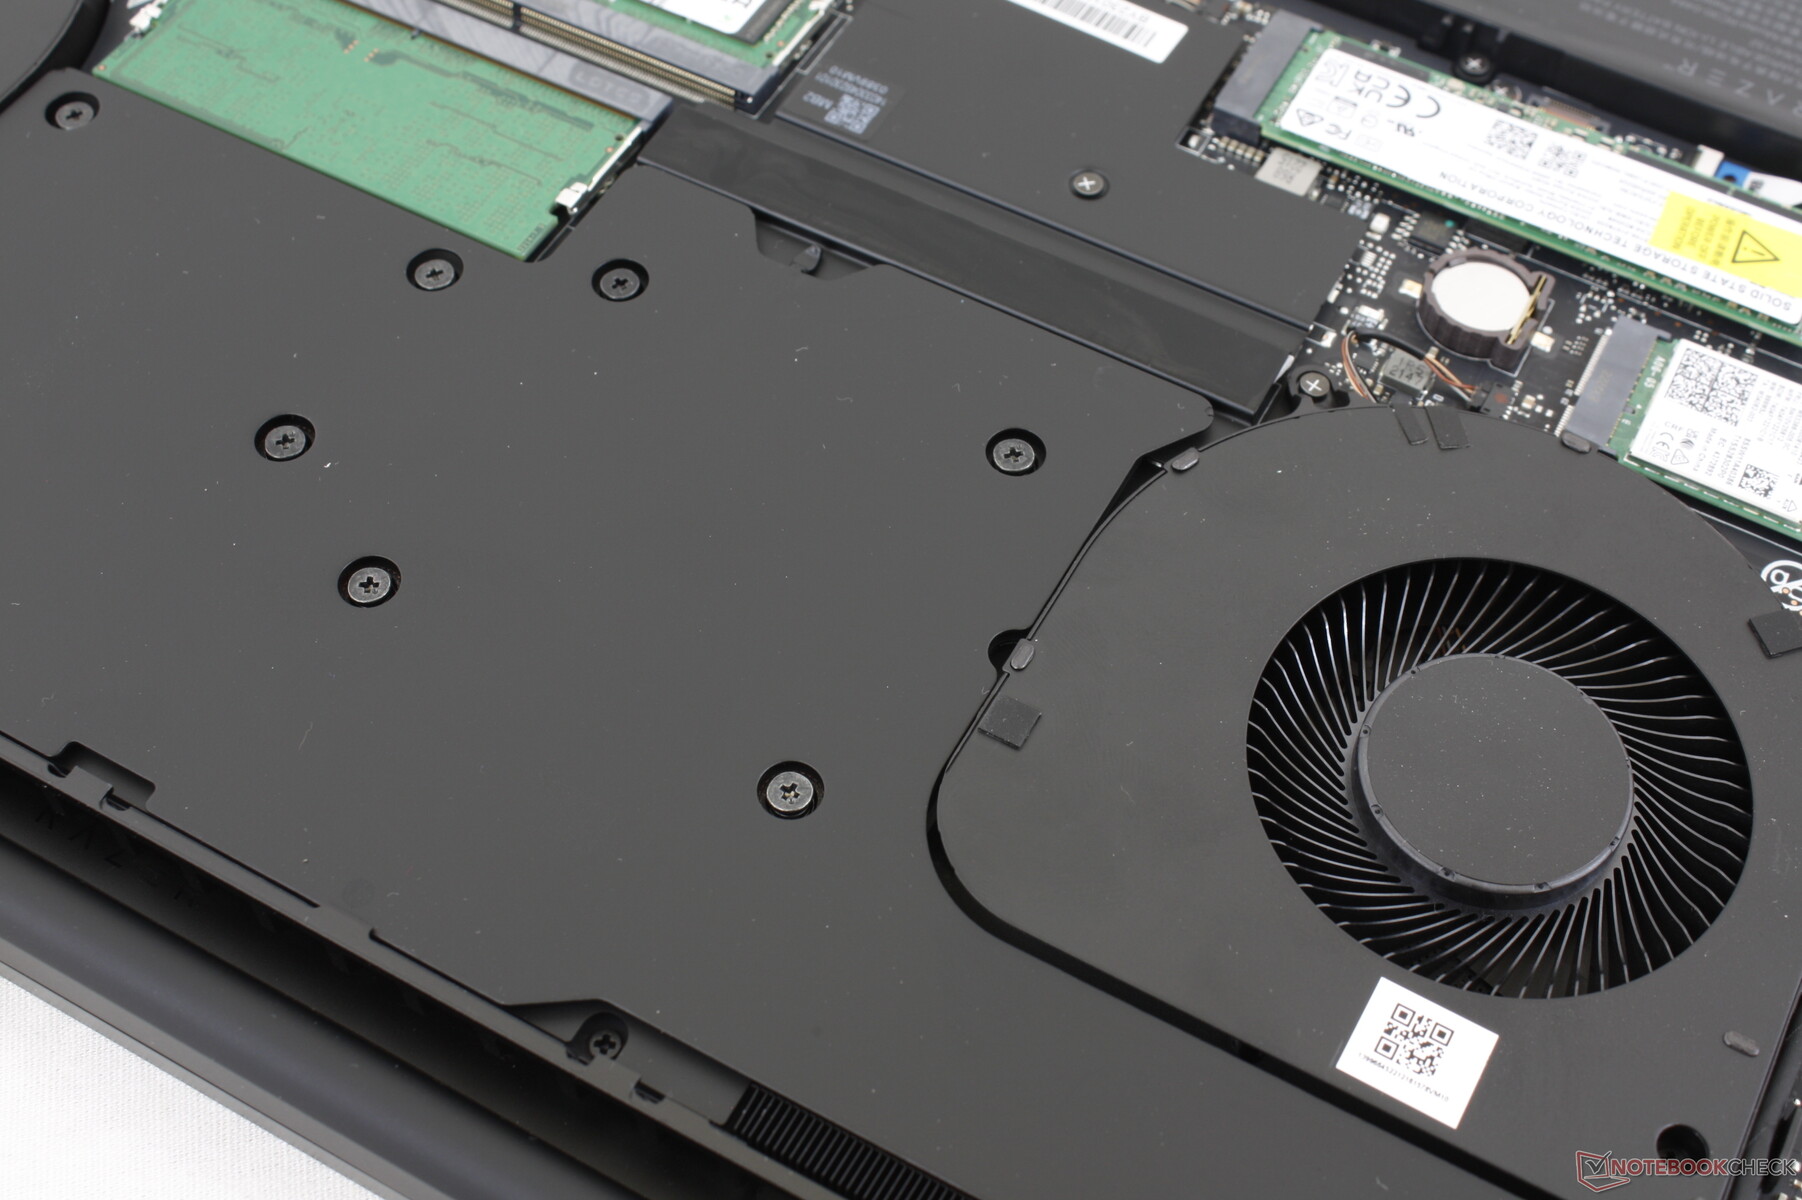
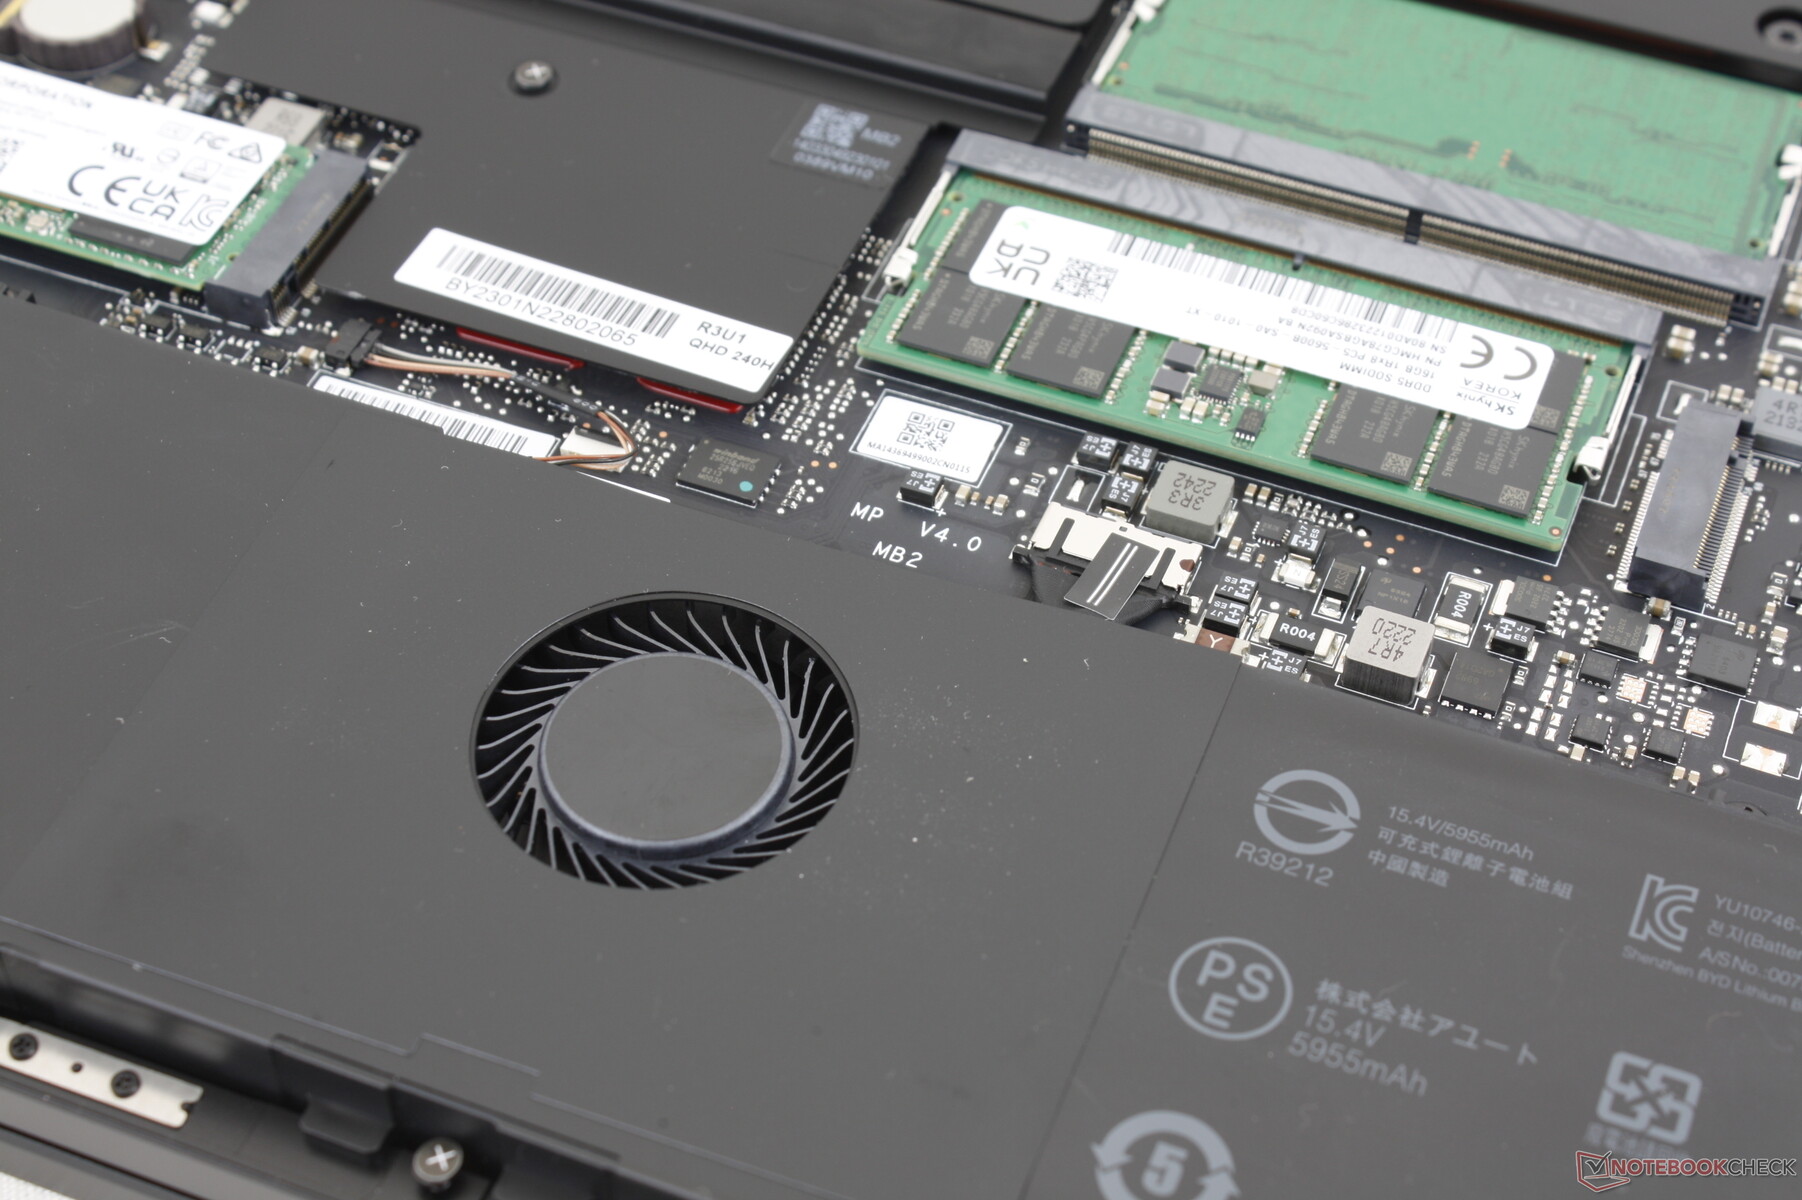
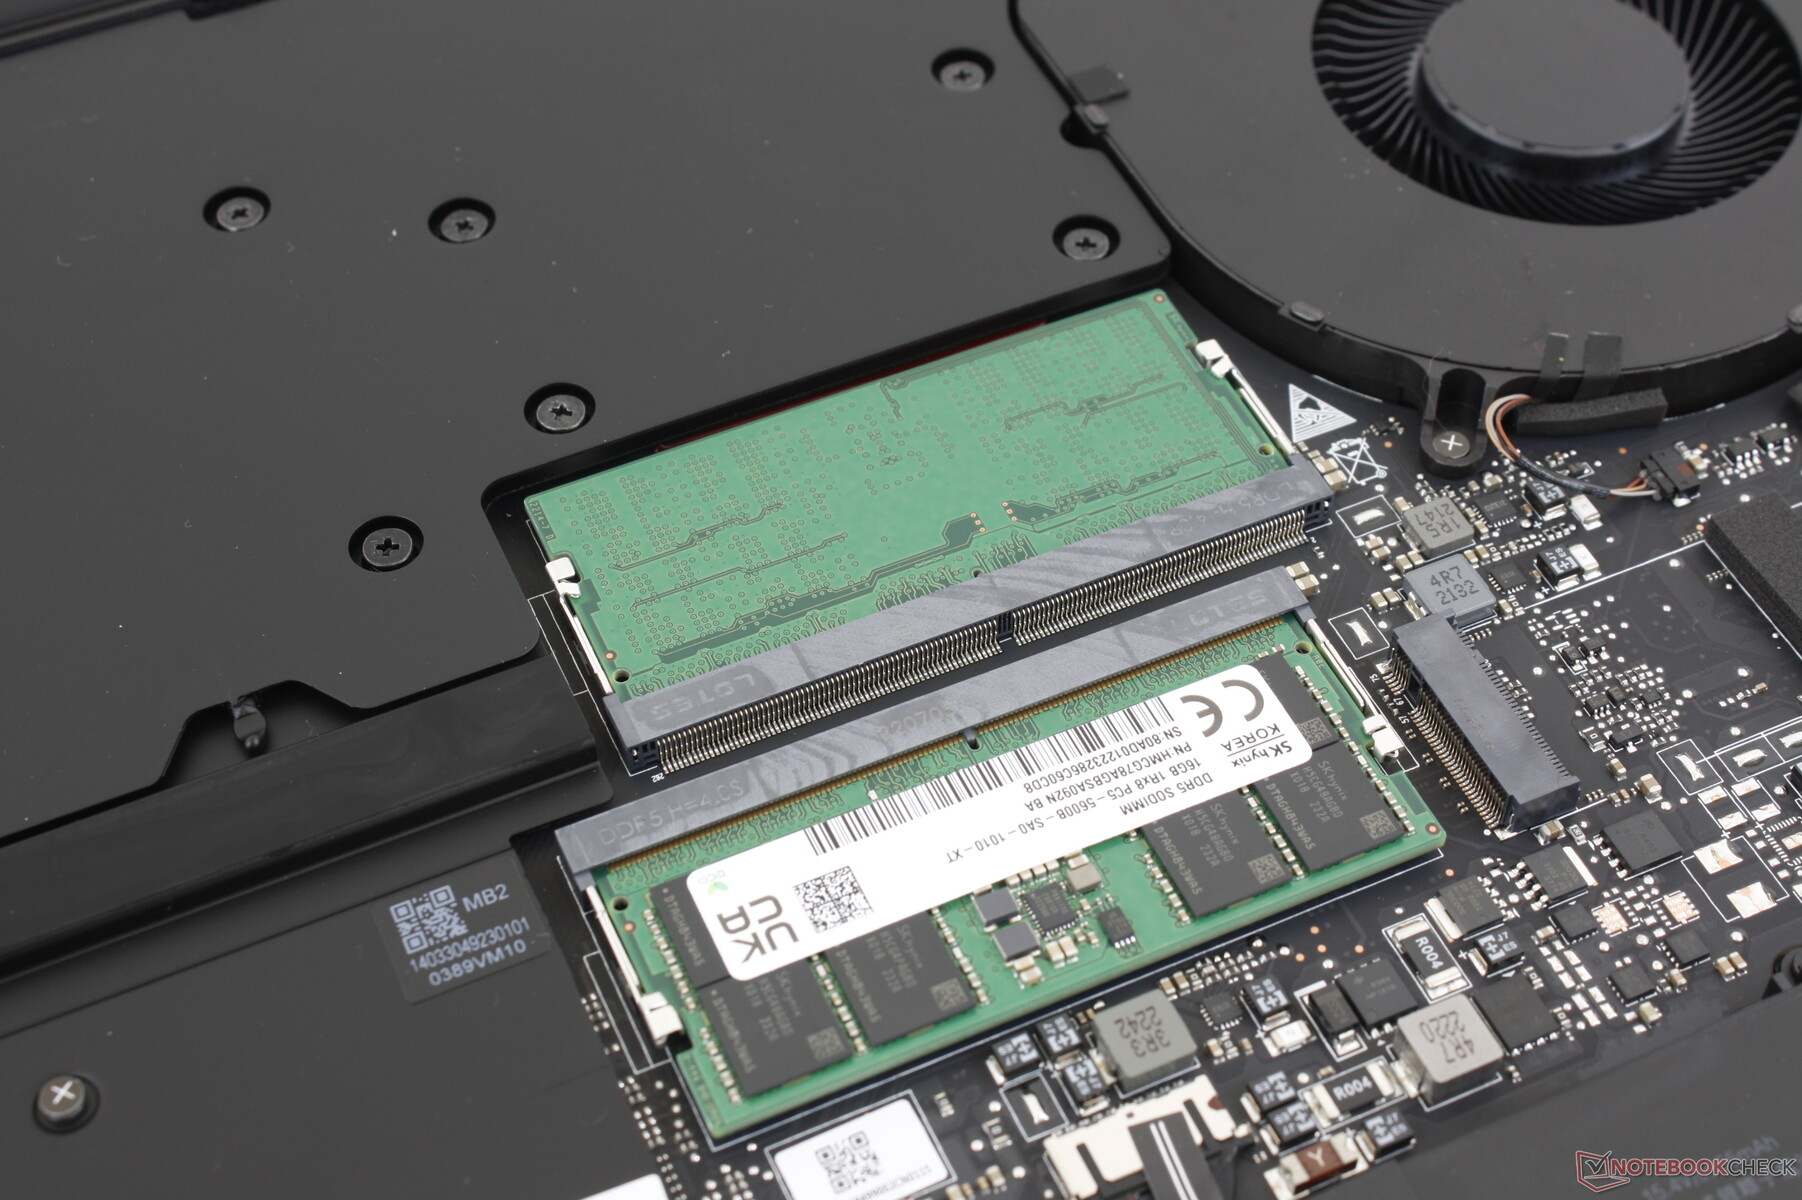
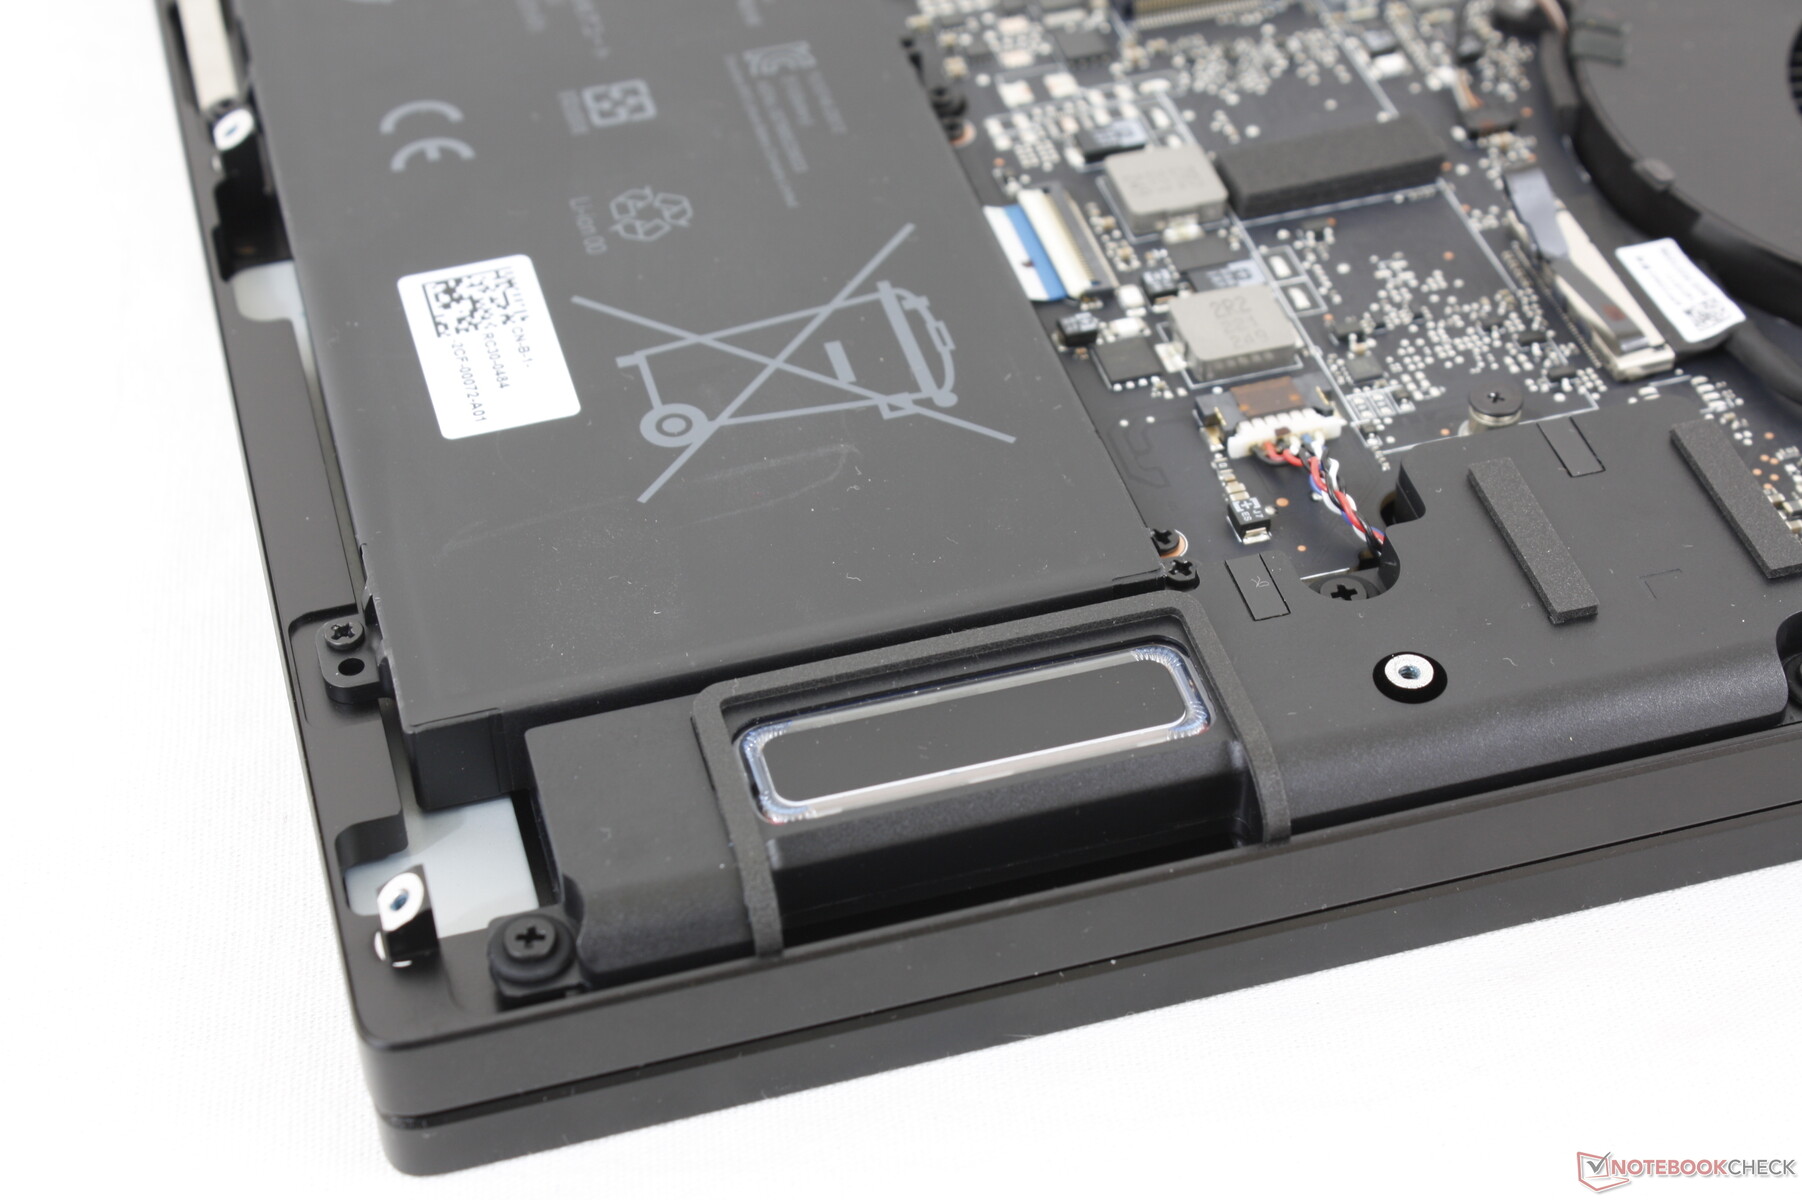
Manutenção
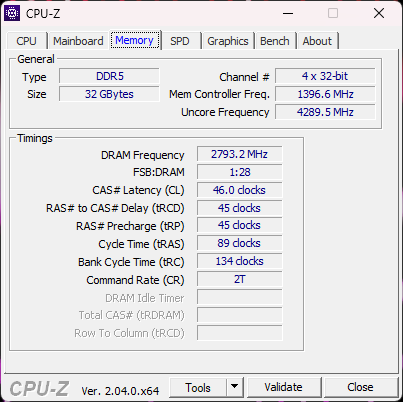
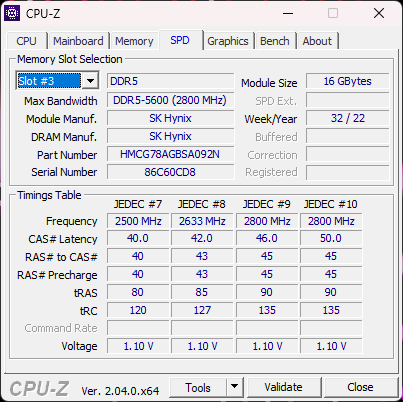
O painel inferior é fixado por dez parafusos Torx T5 para facilitar a manutenção. Os usuários têm acesso direto a dois slots M.2 2280 SSD, dois slots SODIMM para até 32 GB DDR5-5600 ou 64 GB DDR5-5200, e o módulo WLAN removível. Mais notavelmente, o design atual da Lâmina 18 incorpora um ventilador adicional diretamente abaixo do clickpad, semelhante aos designs mais antigos da Lâmina 17.
Acessórios e Garantia
Não há extras na caixa de varejo. Aplica-se uma garantia limitada de um ano do fabricante enquanto a bateria interna vem com uma garantia separada de dois anos se comprada nos EUA.
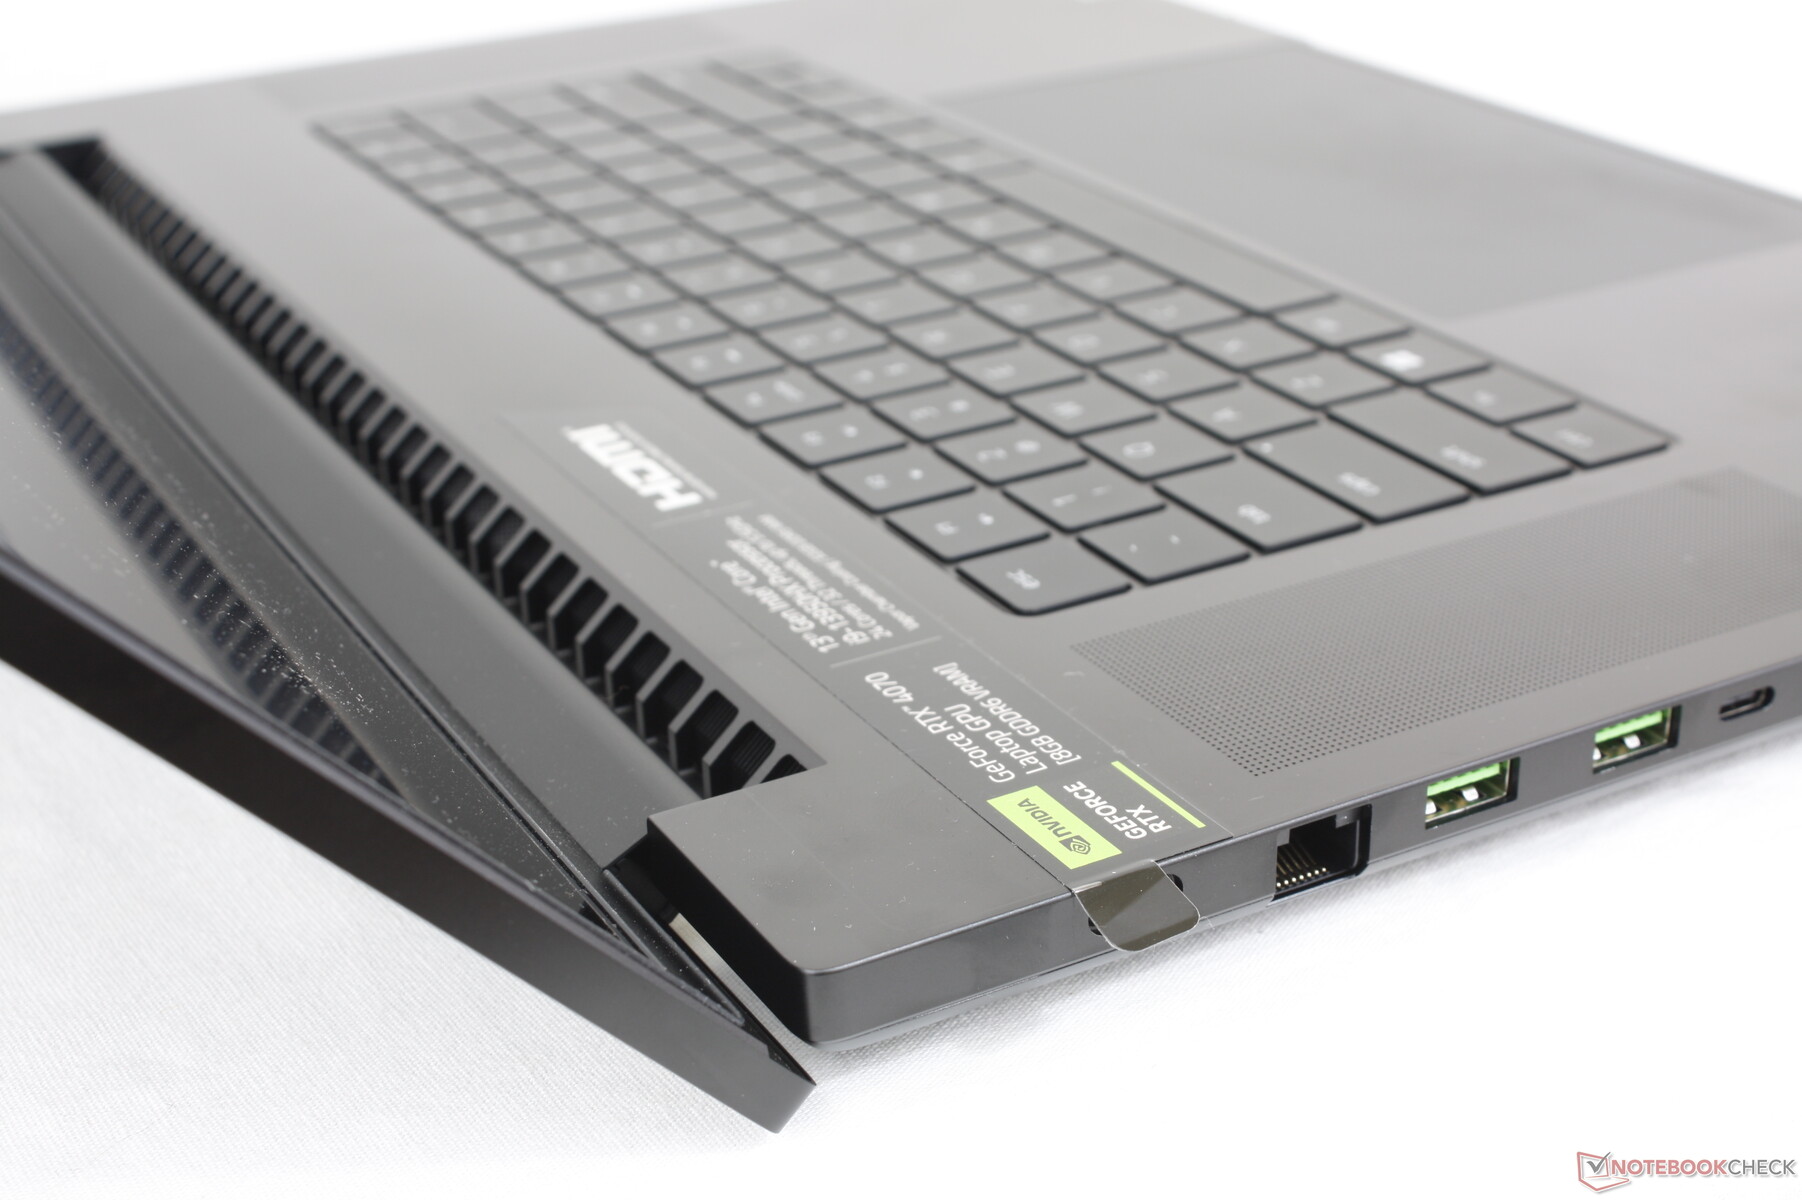
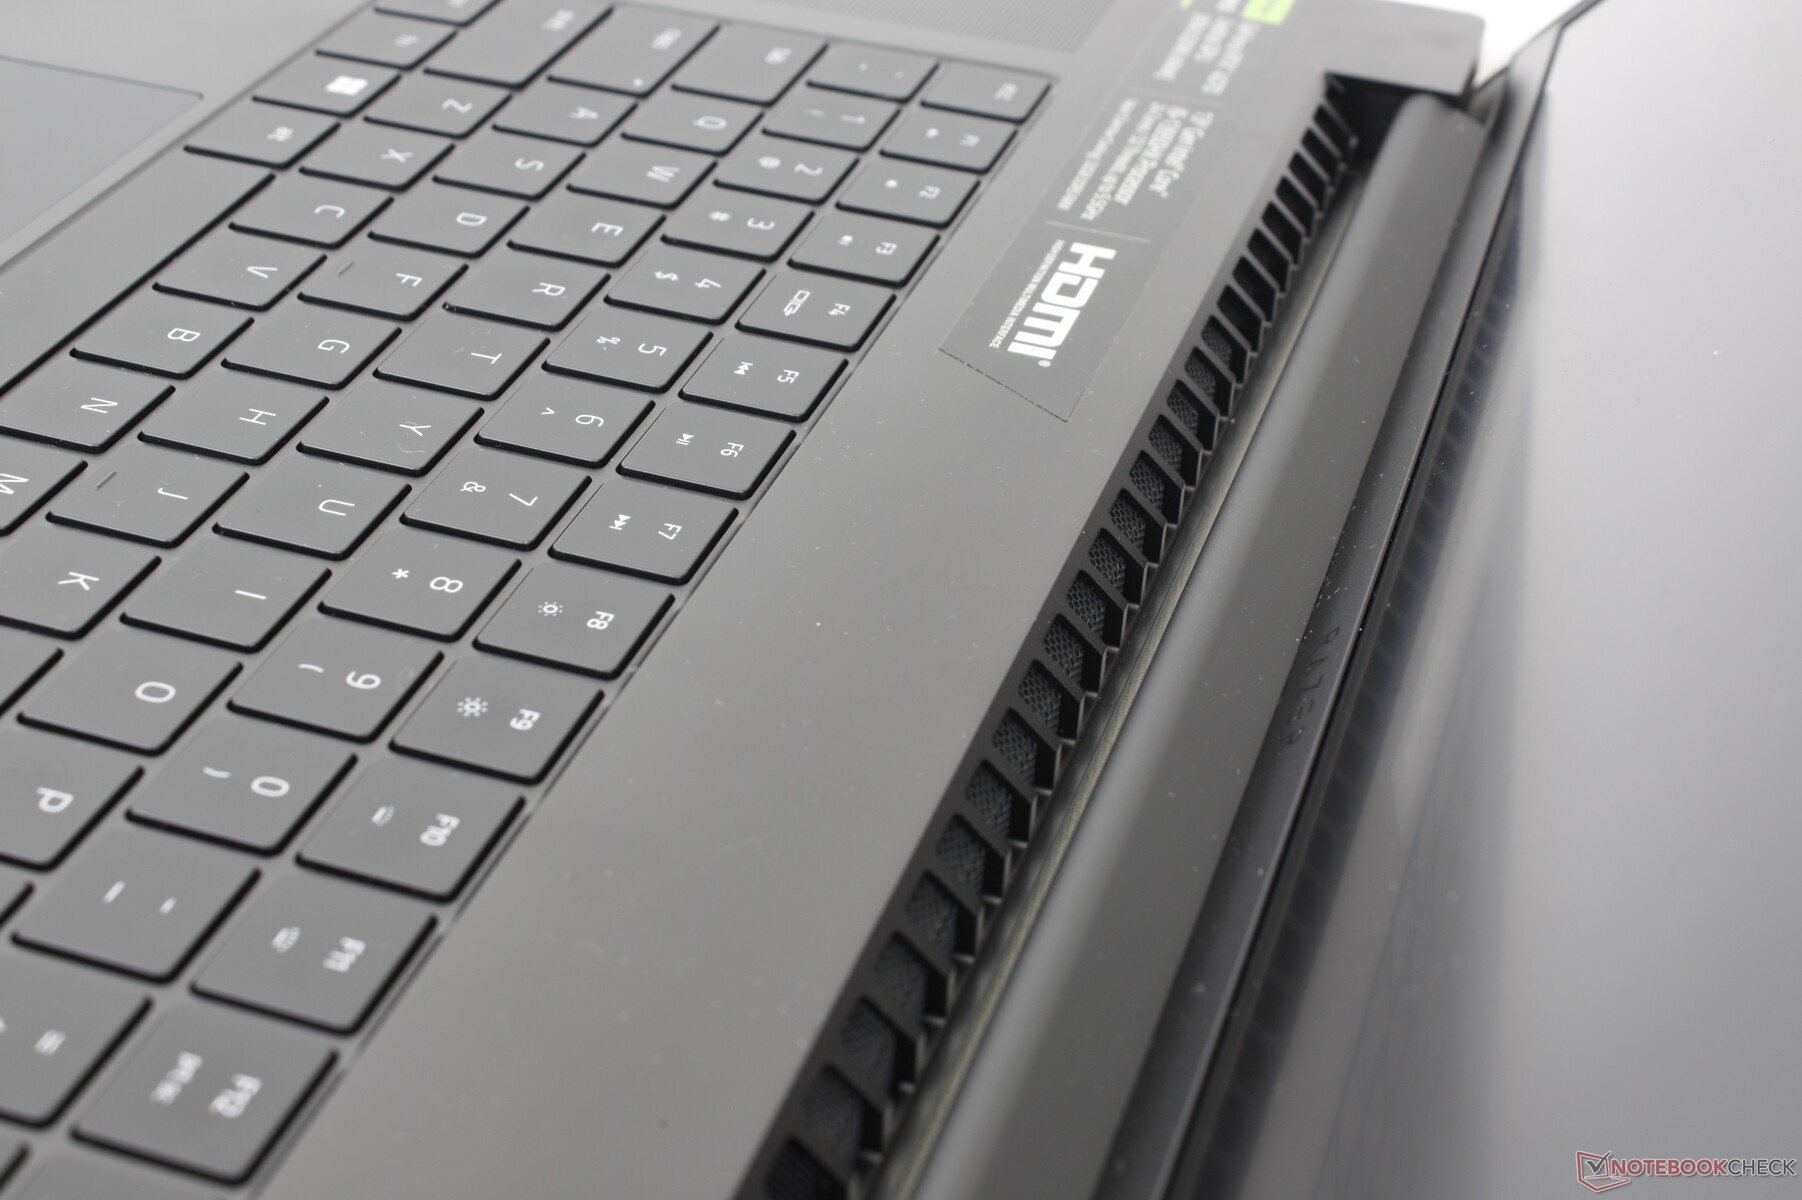
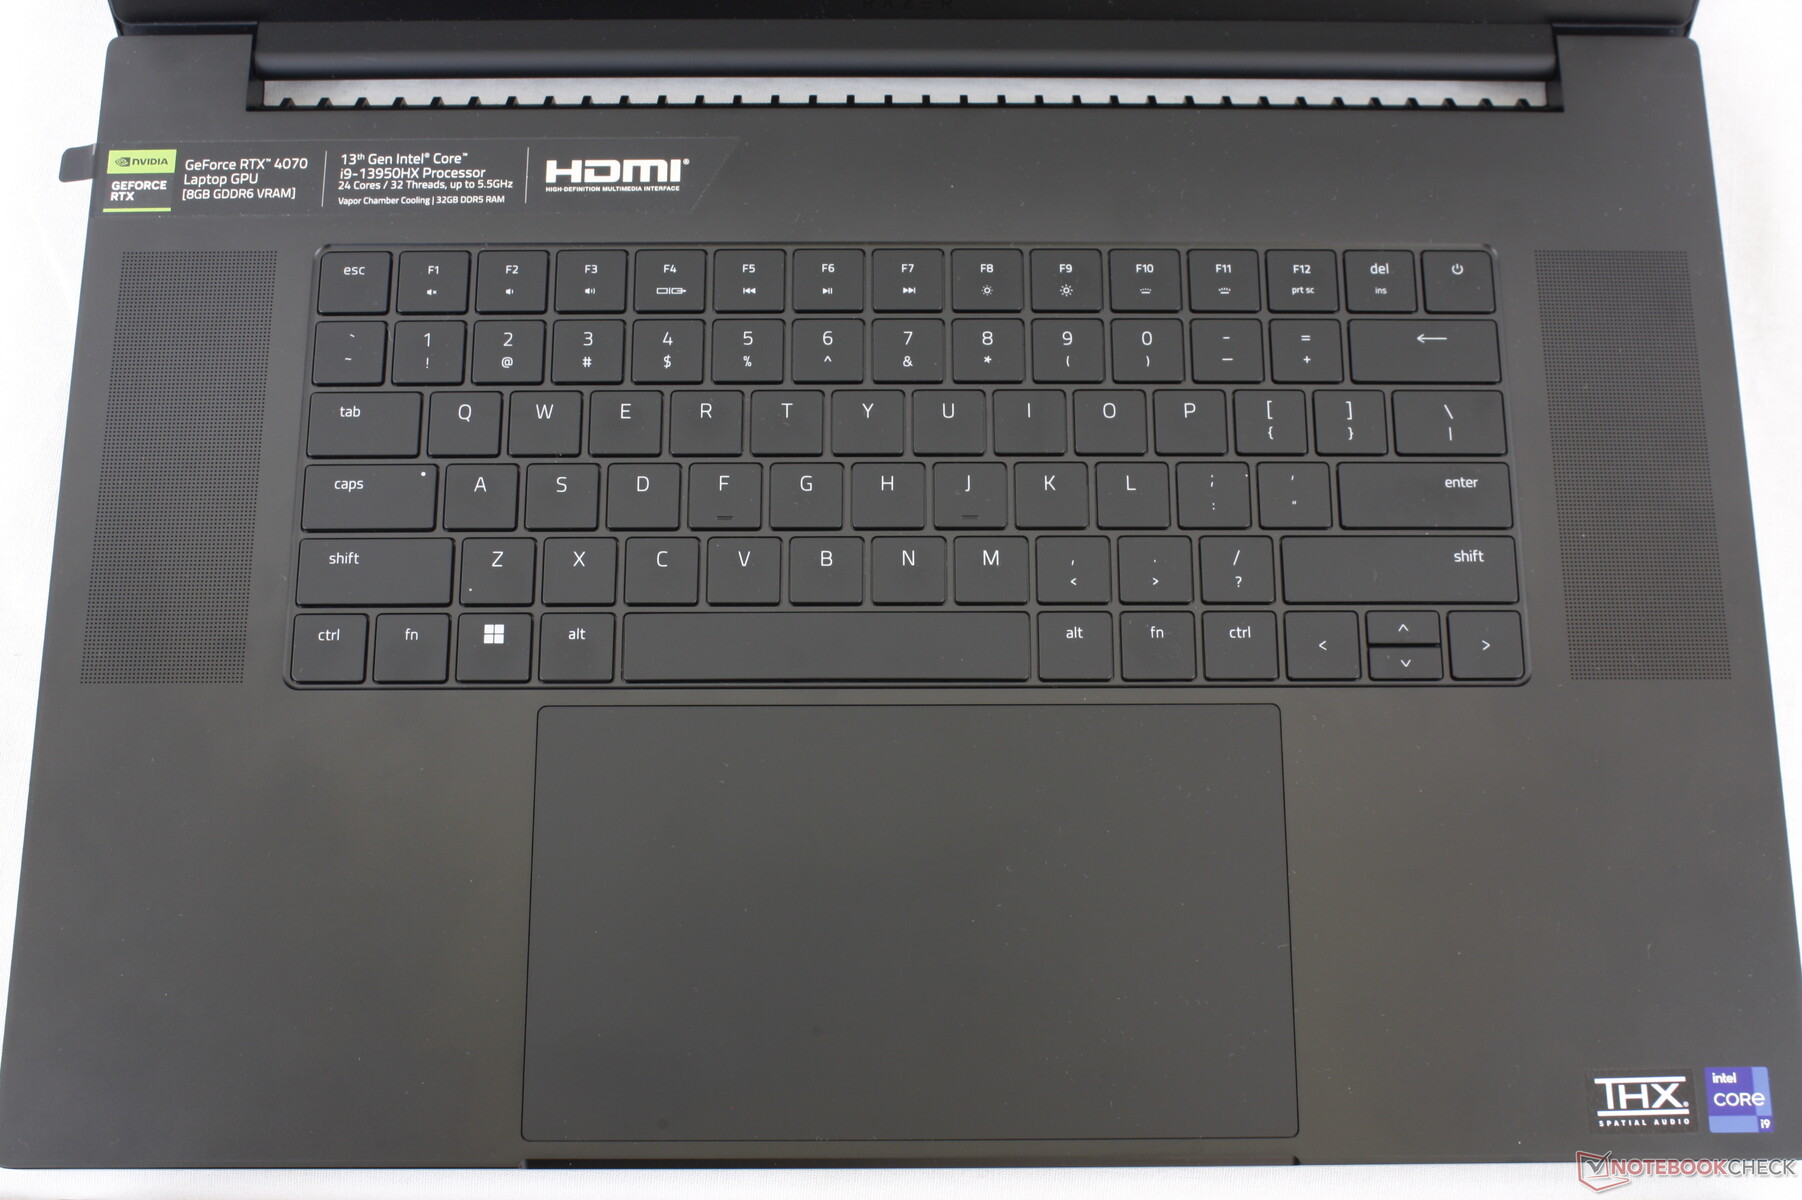
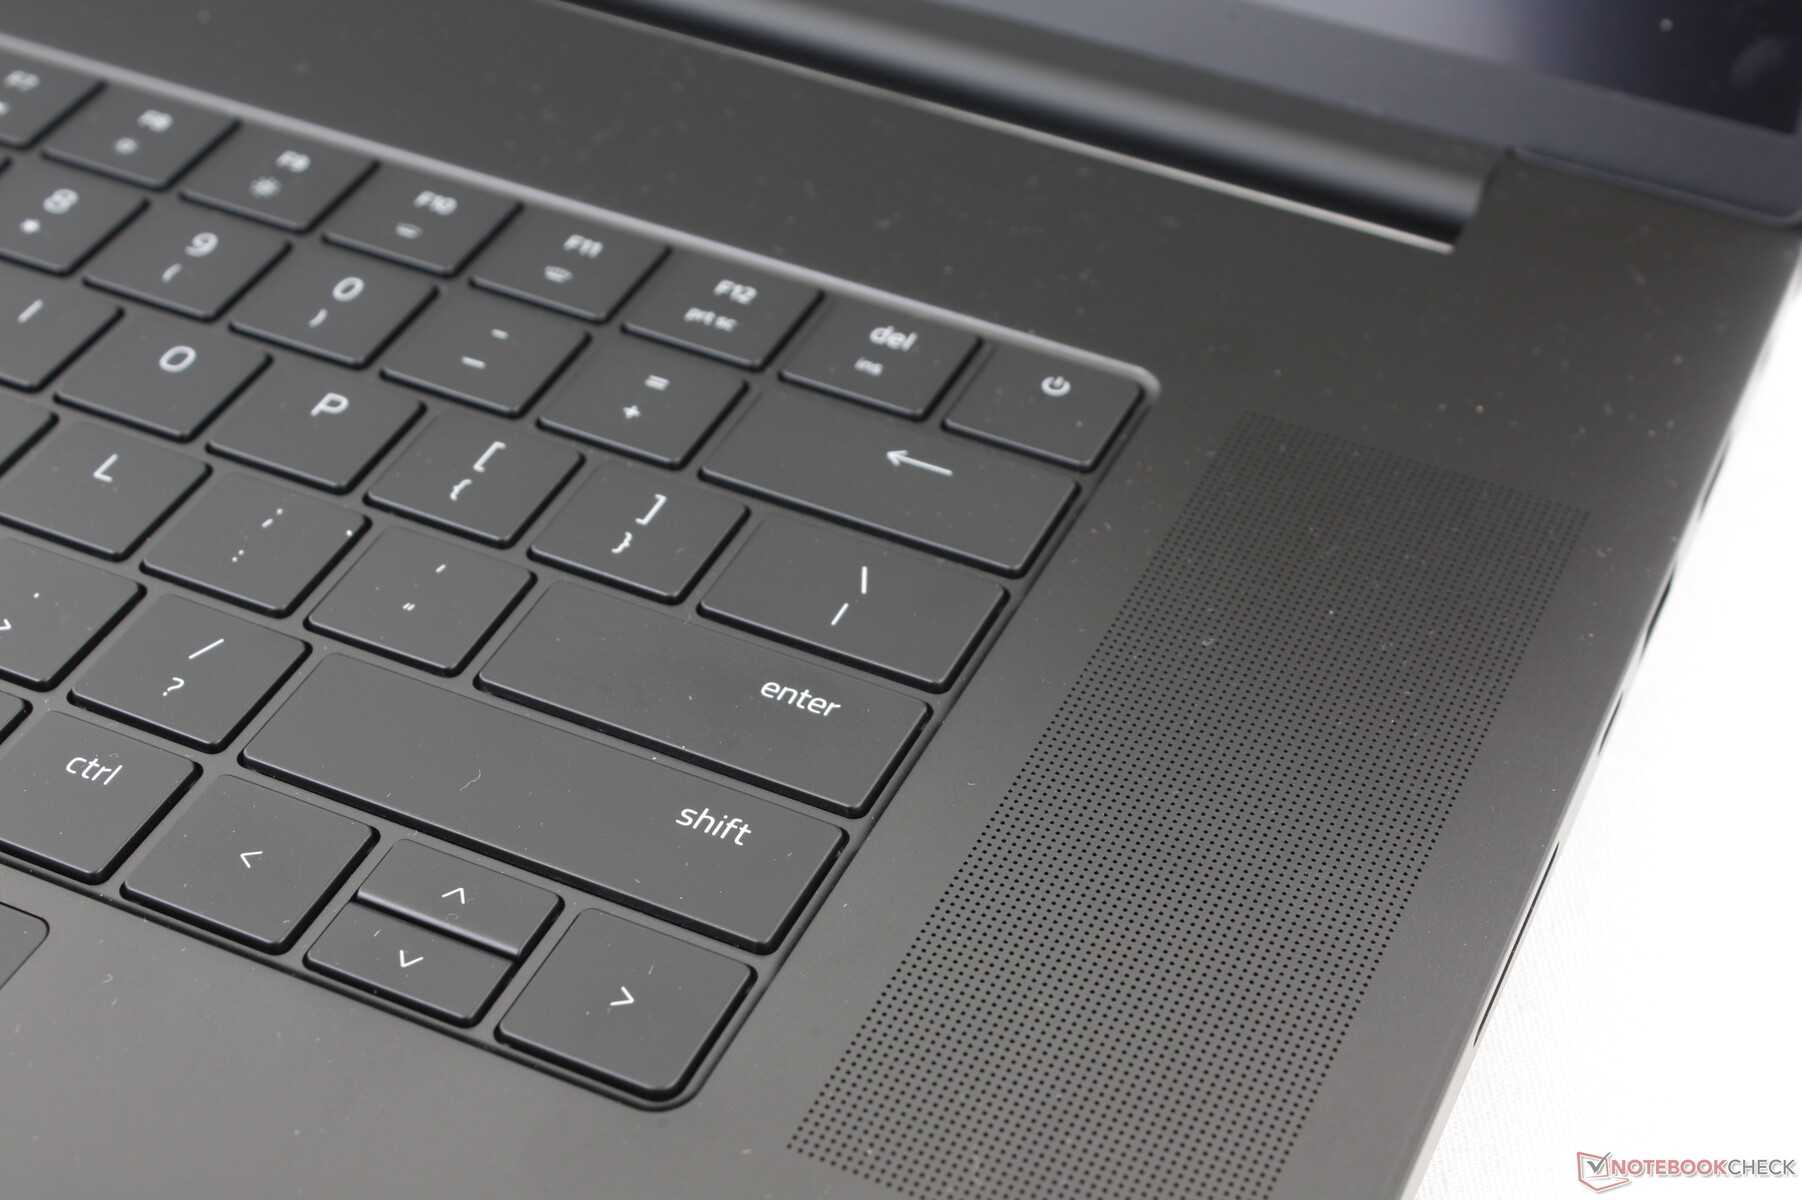
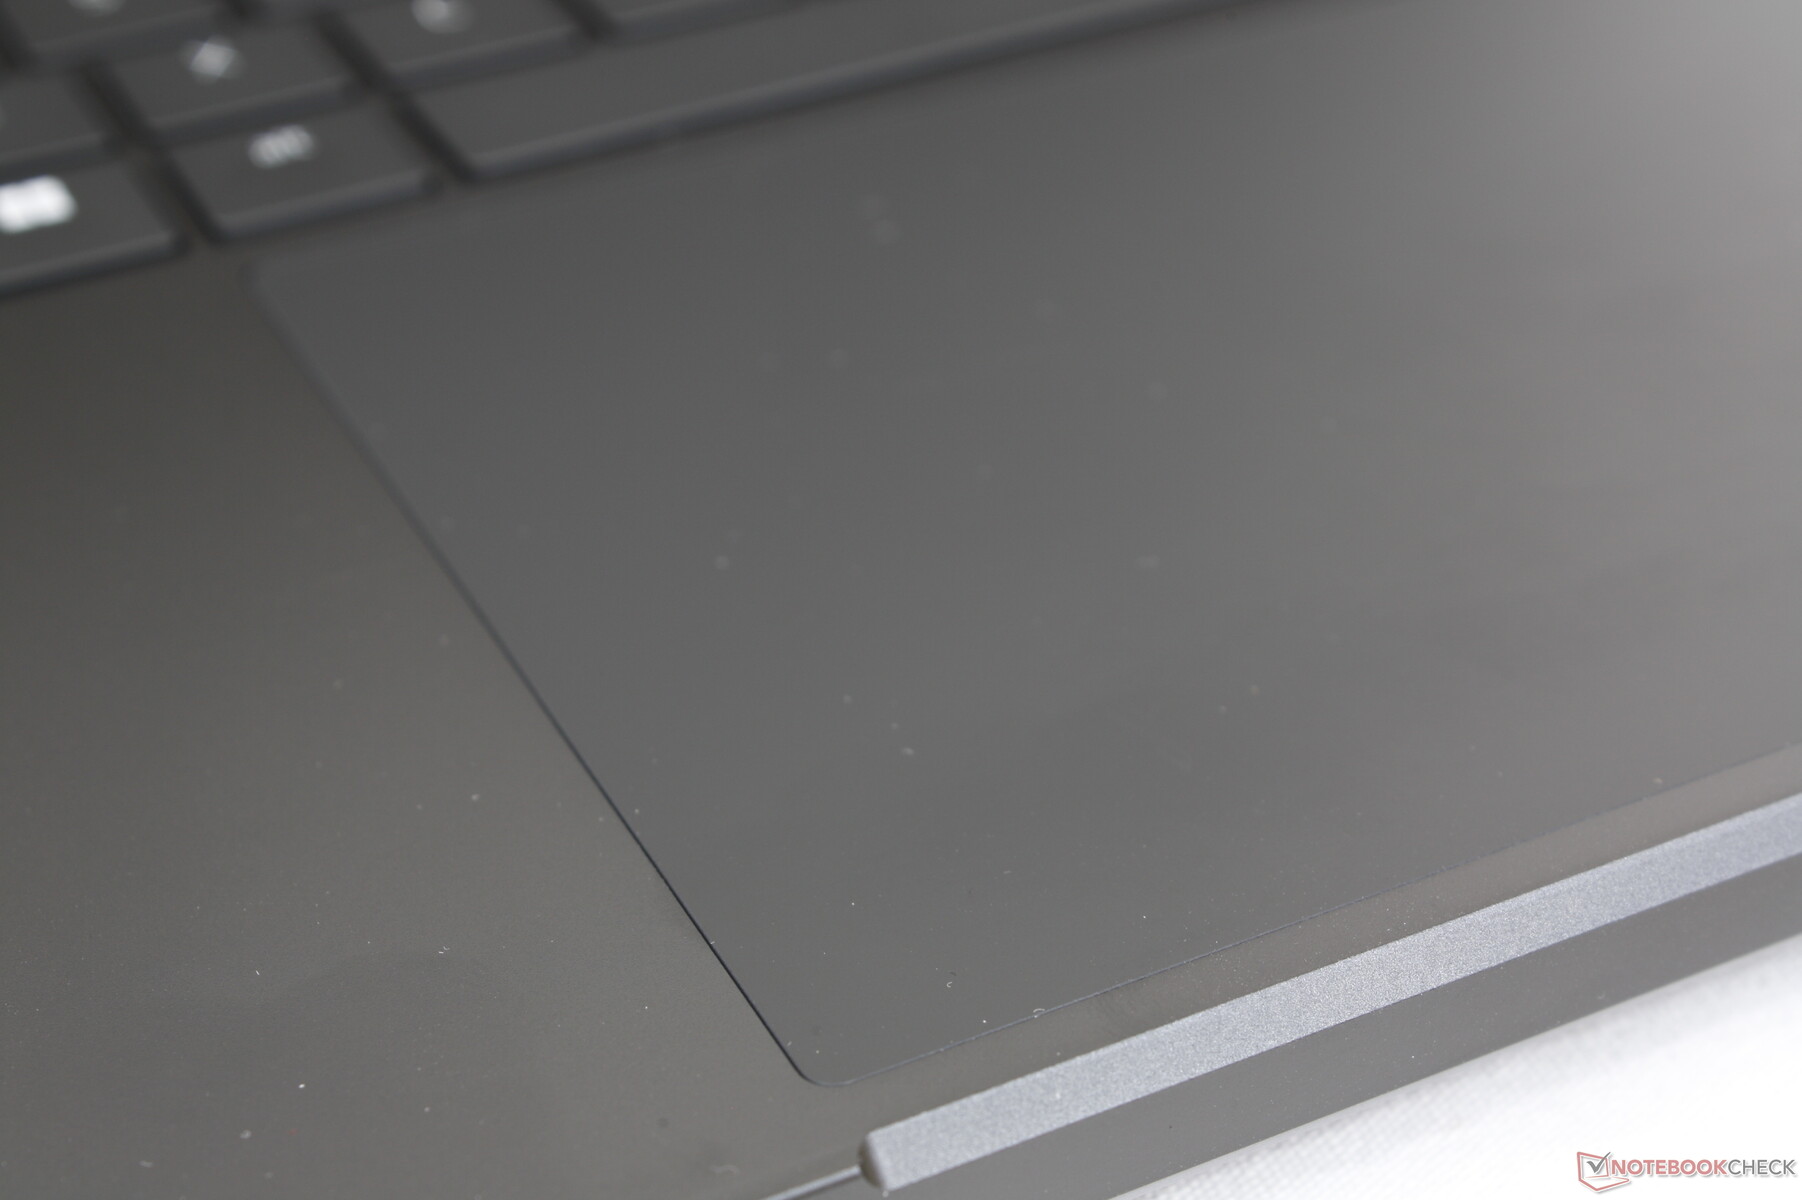
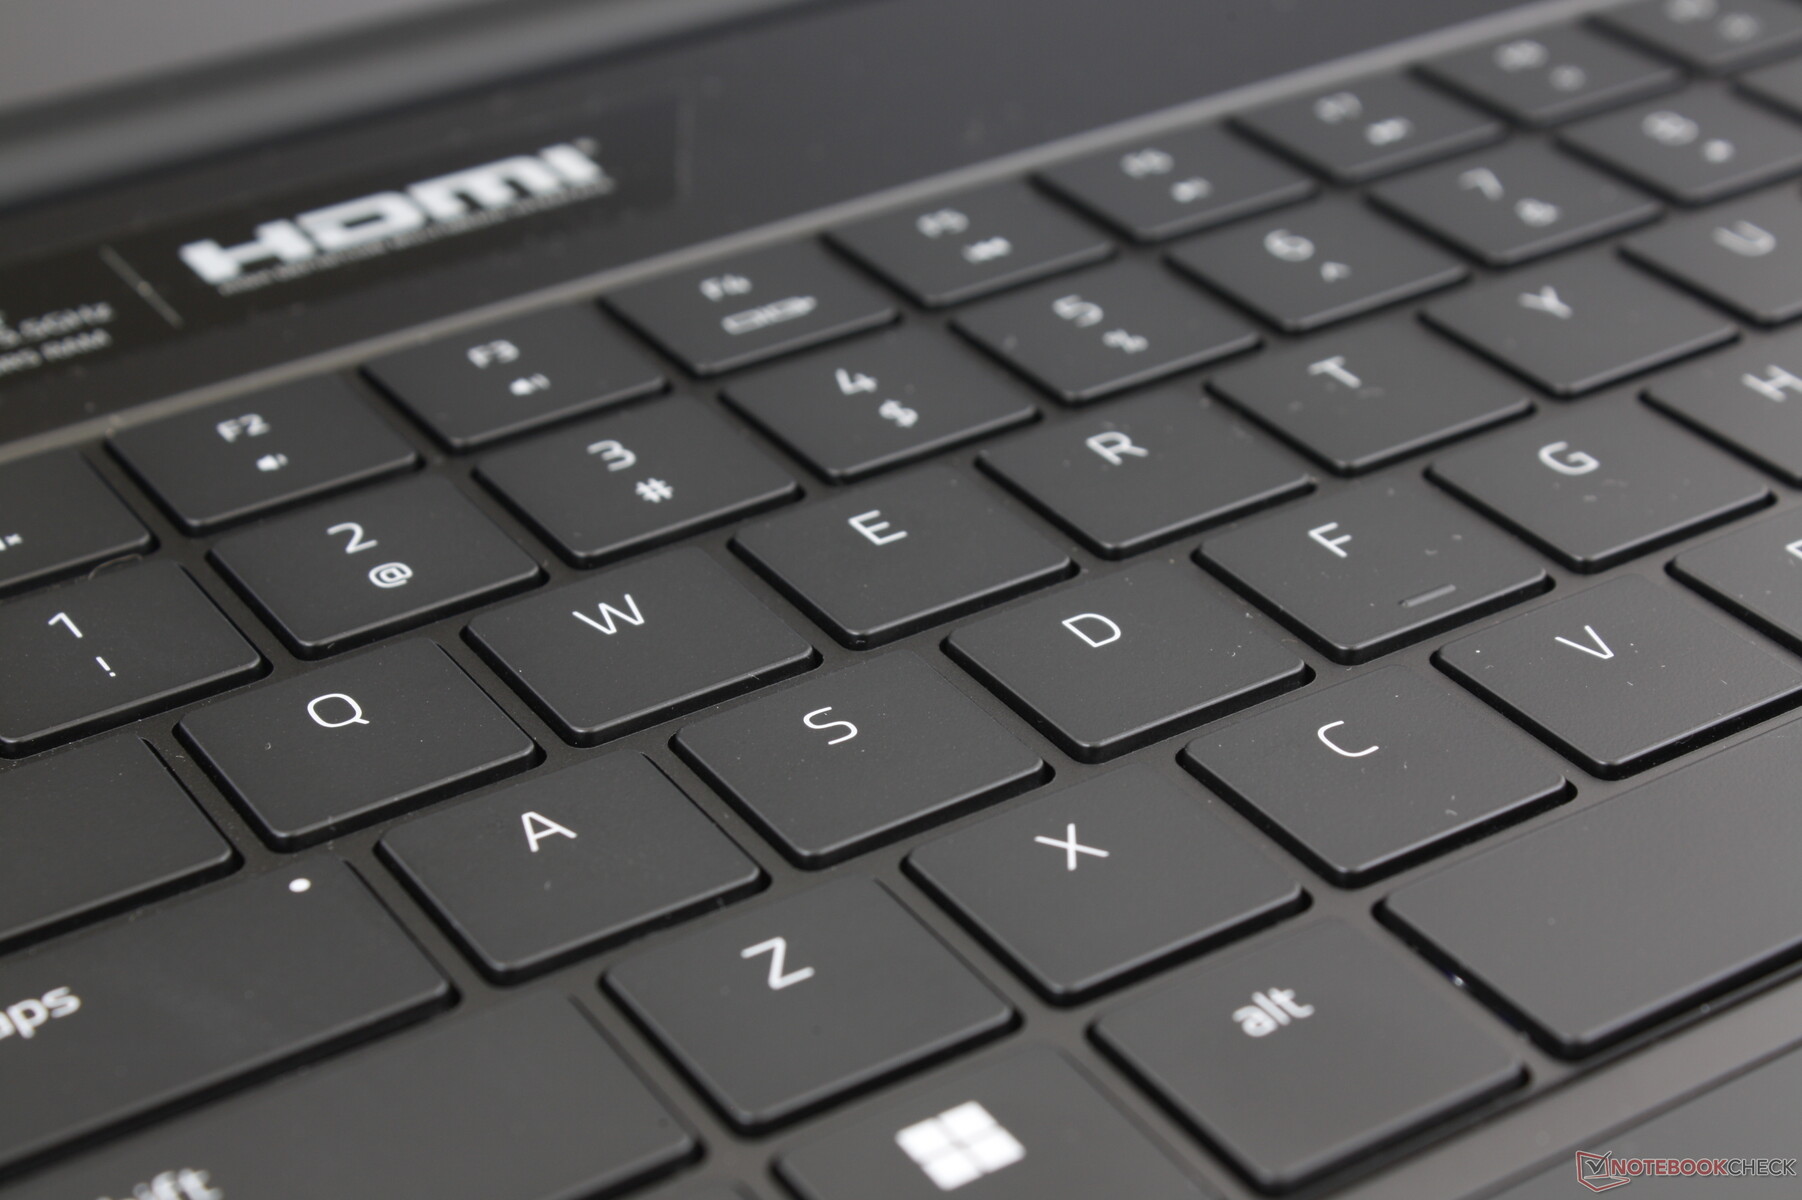
Dispositivos de Entrada - Idênticos à Lâmina 16
Teclado e Touchpad
Tanto o teclado quanto o clickpad são os mesmos do Blade 16, apesar das diferenças de tamanho da tela entre os dois modelos. Mesmo as dimensões do clickpad (17 x 9,7 cm) e do teclado não mudaram e, portanto, nosso comentários existentes na experiência de digitação na Lâmina 16 se aplicam aqui na Lâmina 18. É uma pena que a Razer não tenha utilizado a área de superfície extra para teclas de seta maiores ou um numpad potencial.
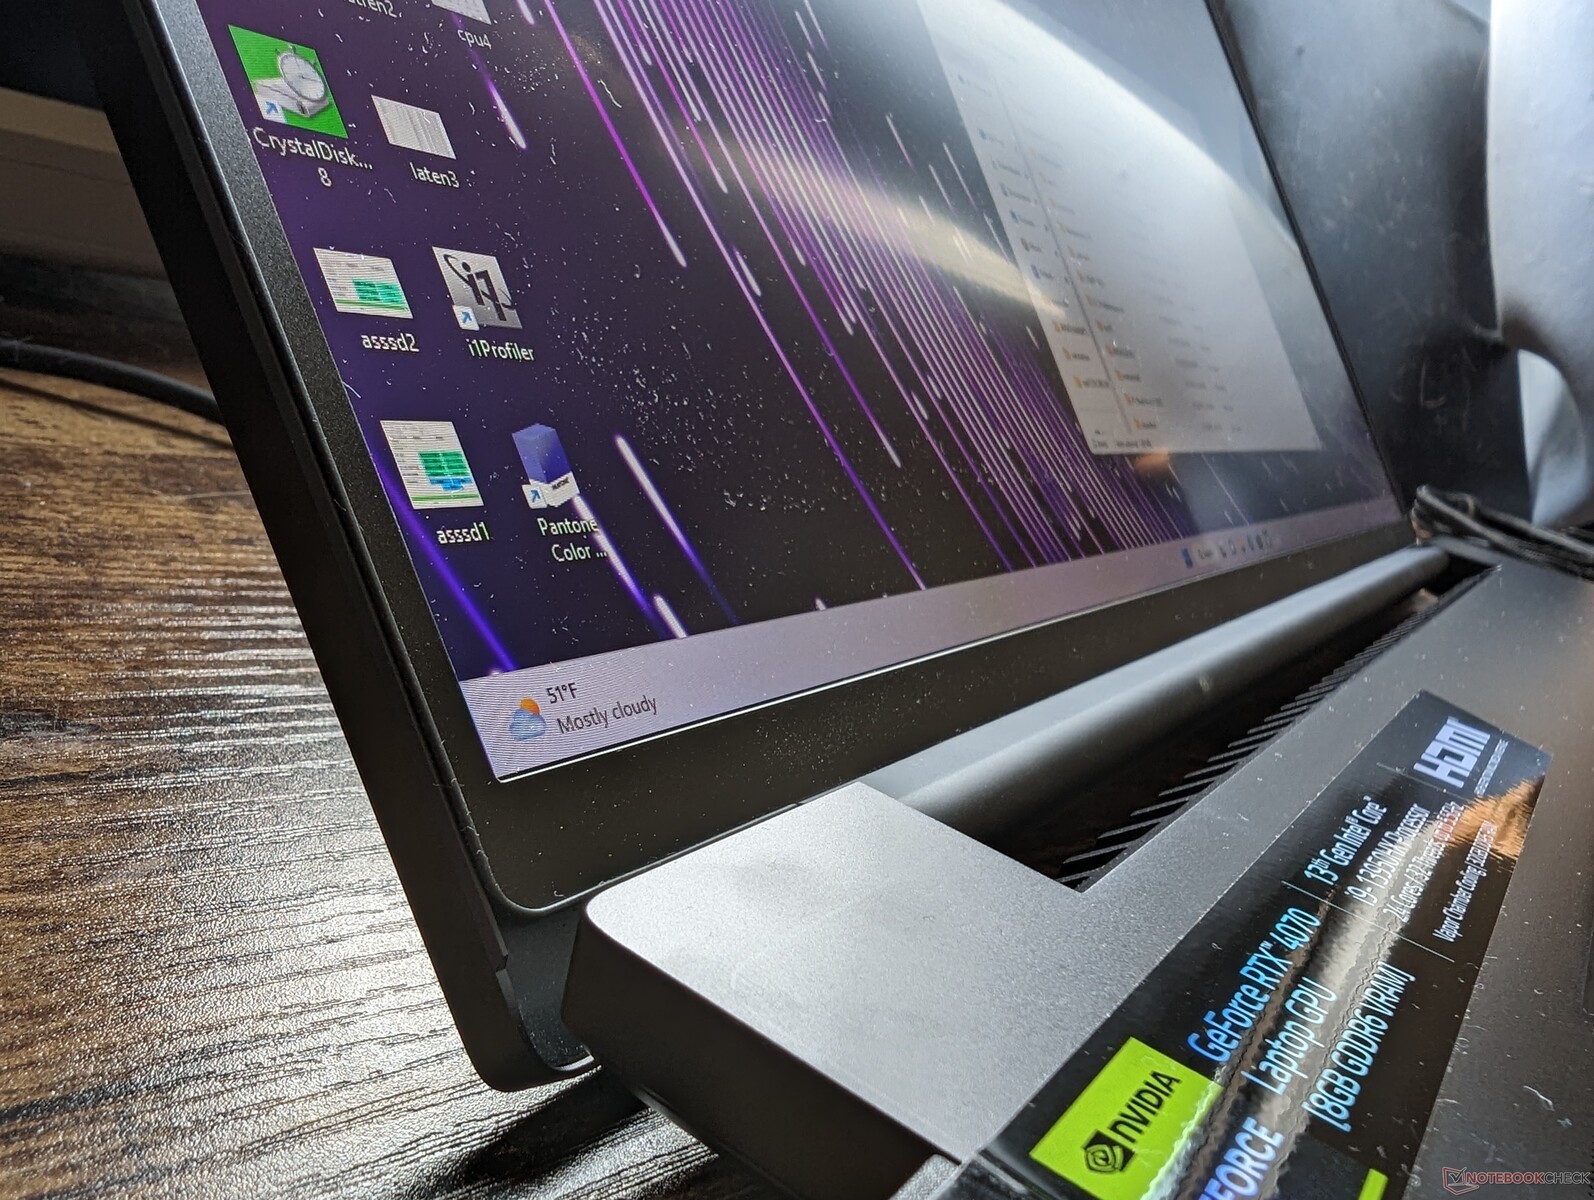
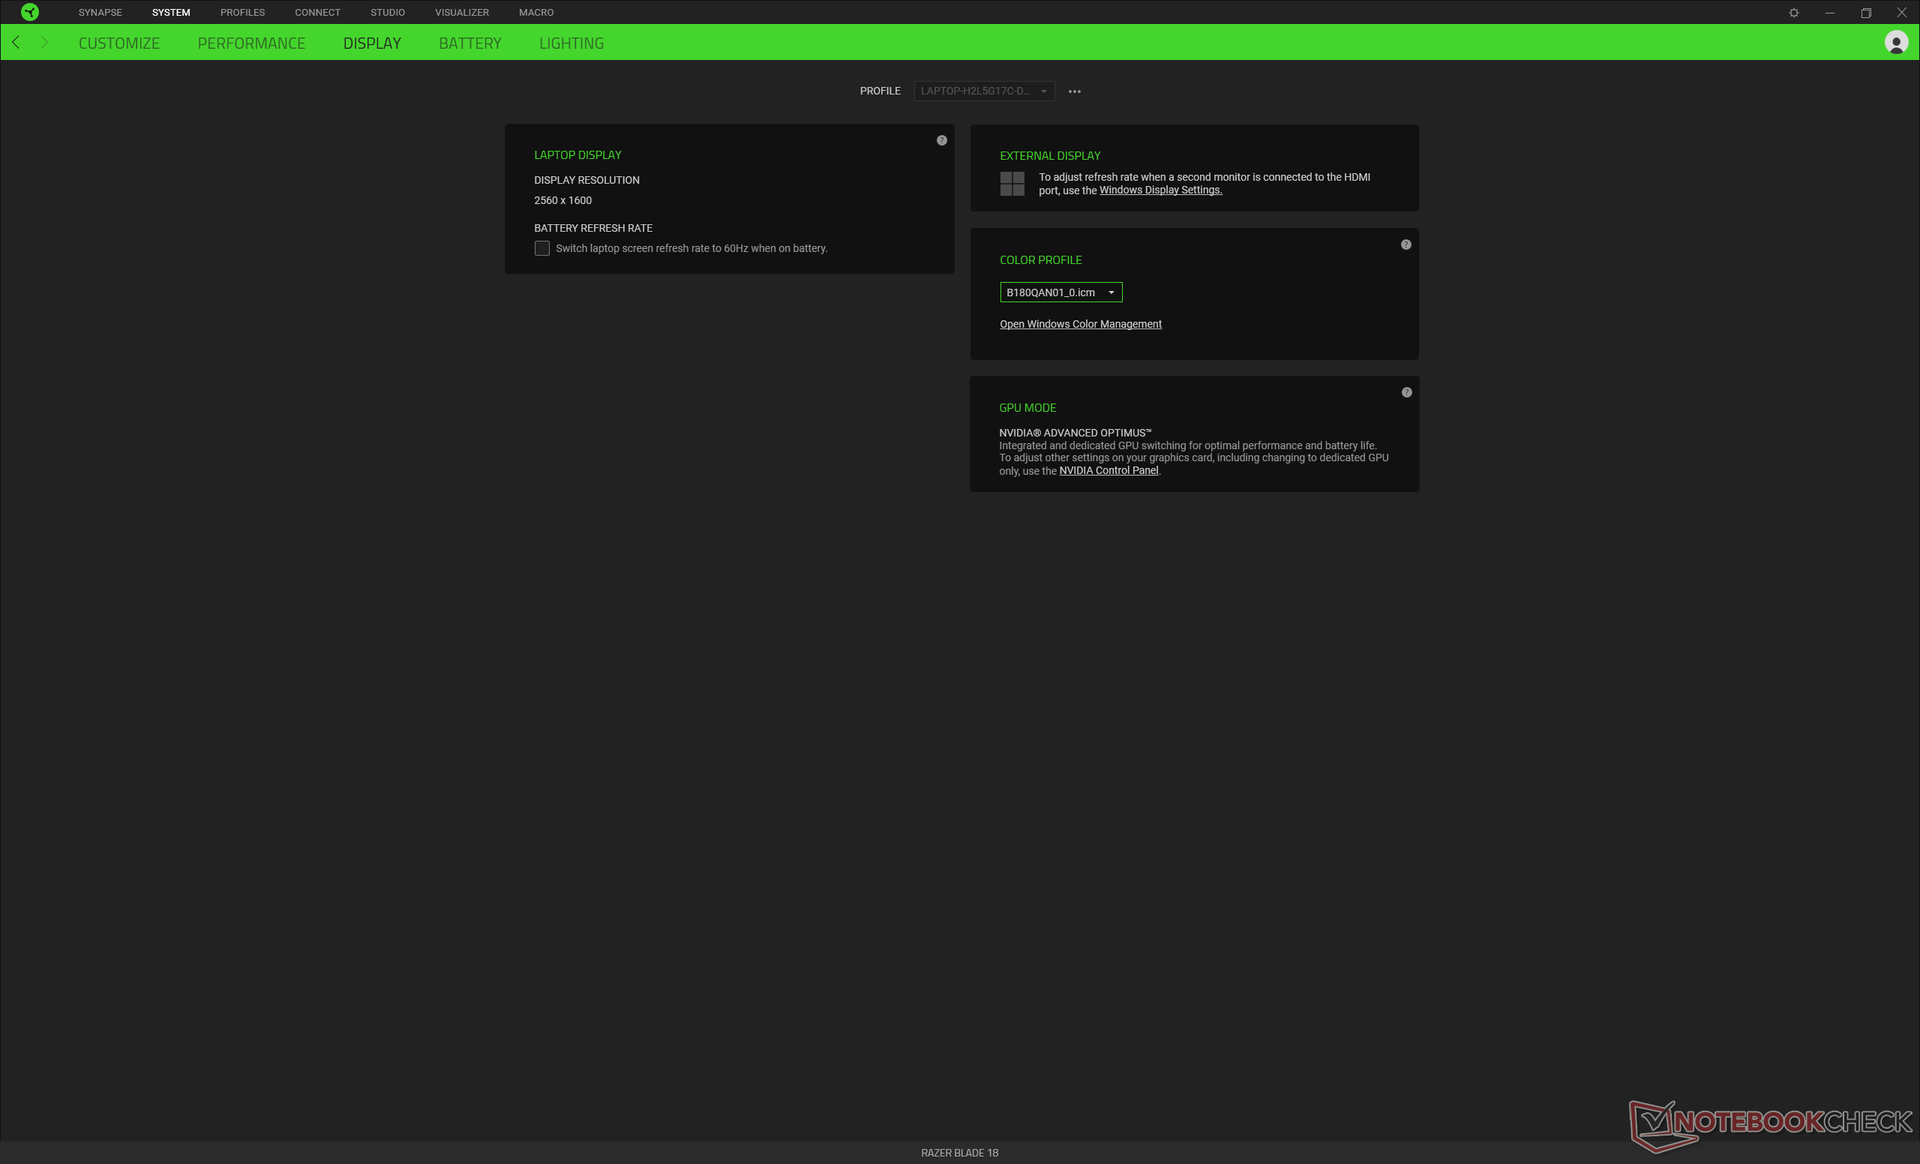
Mostrador - Muito espaçoso
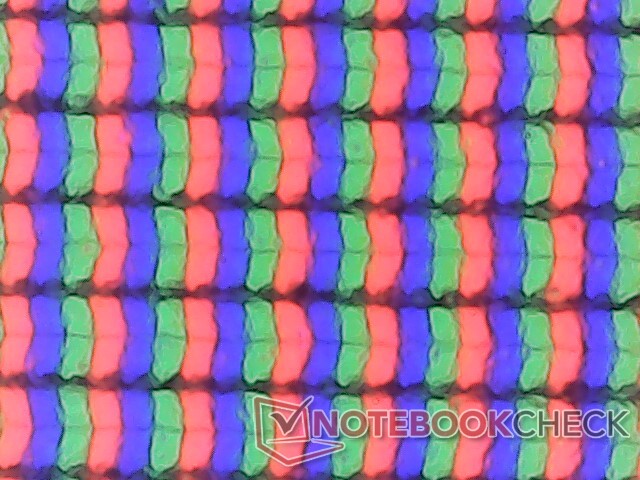
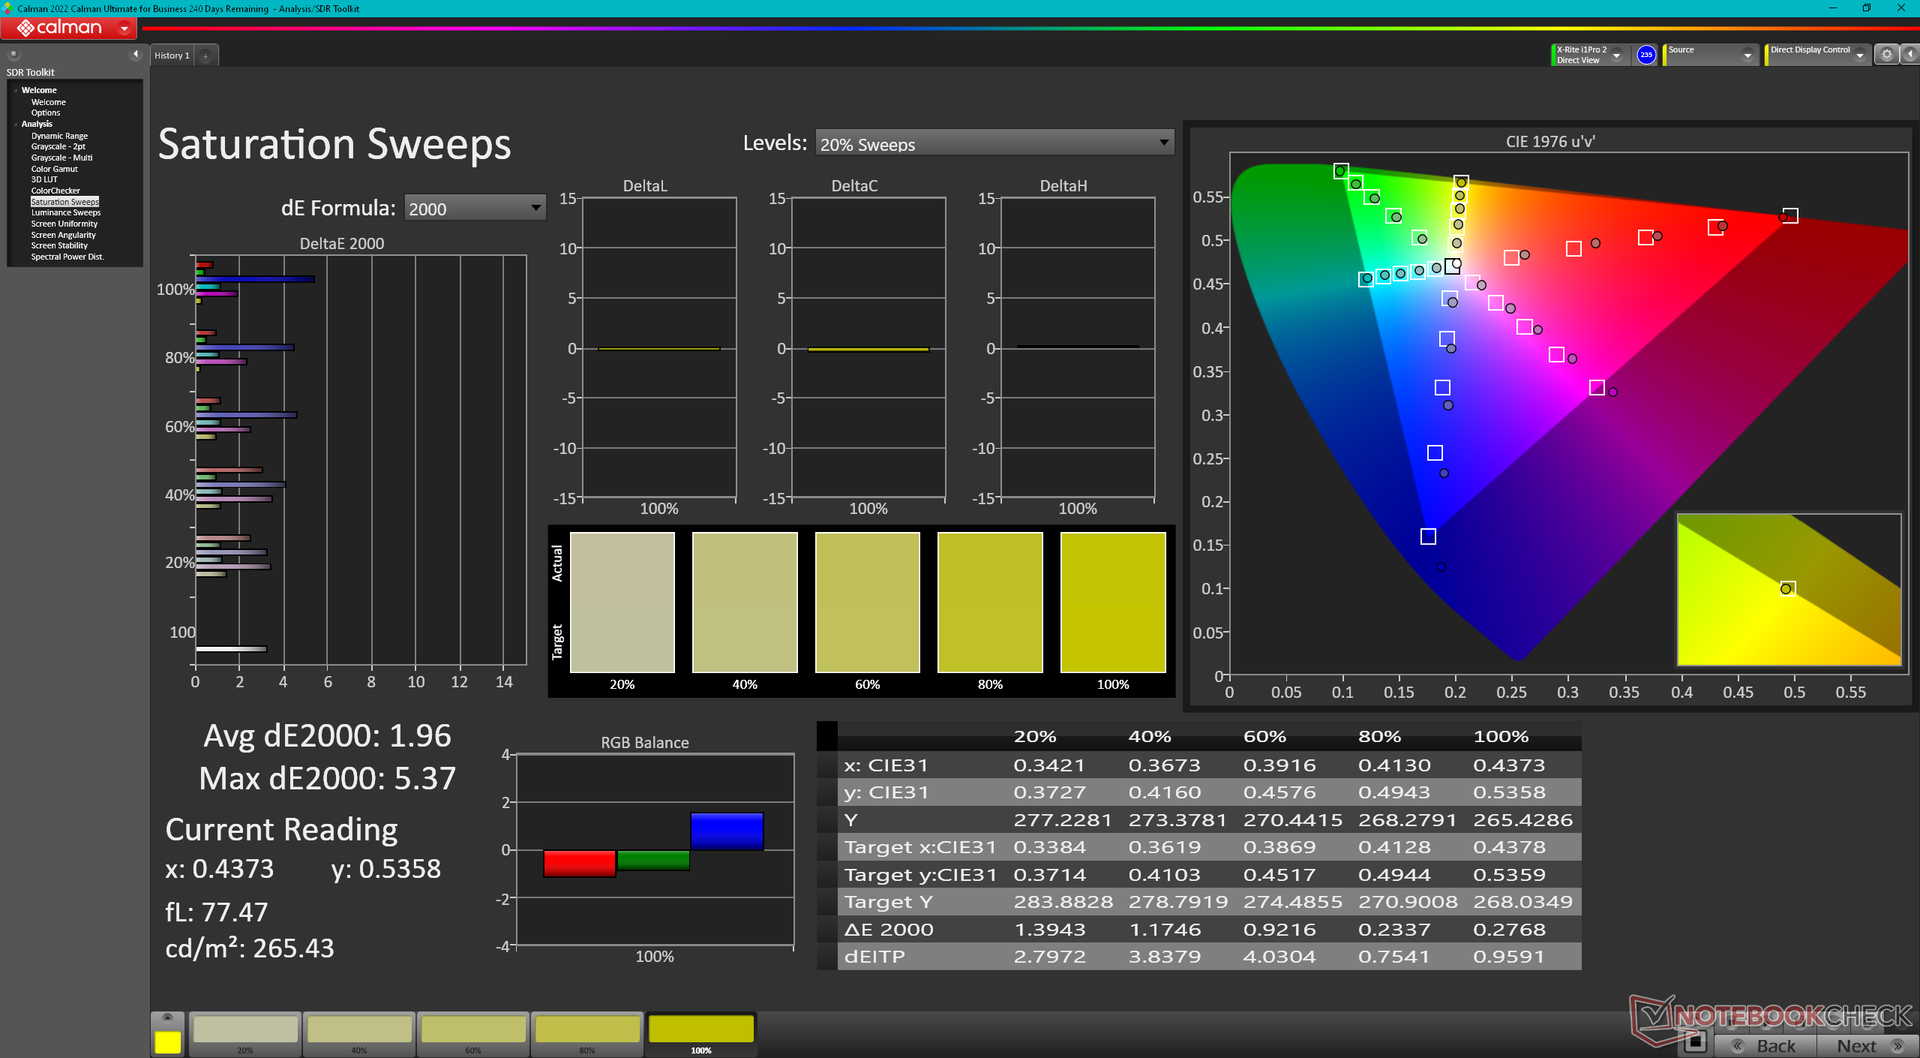
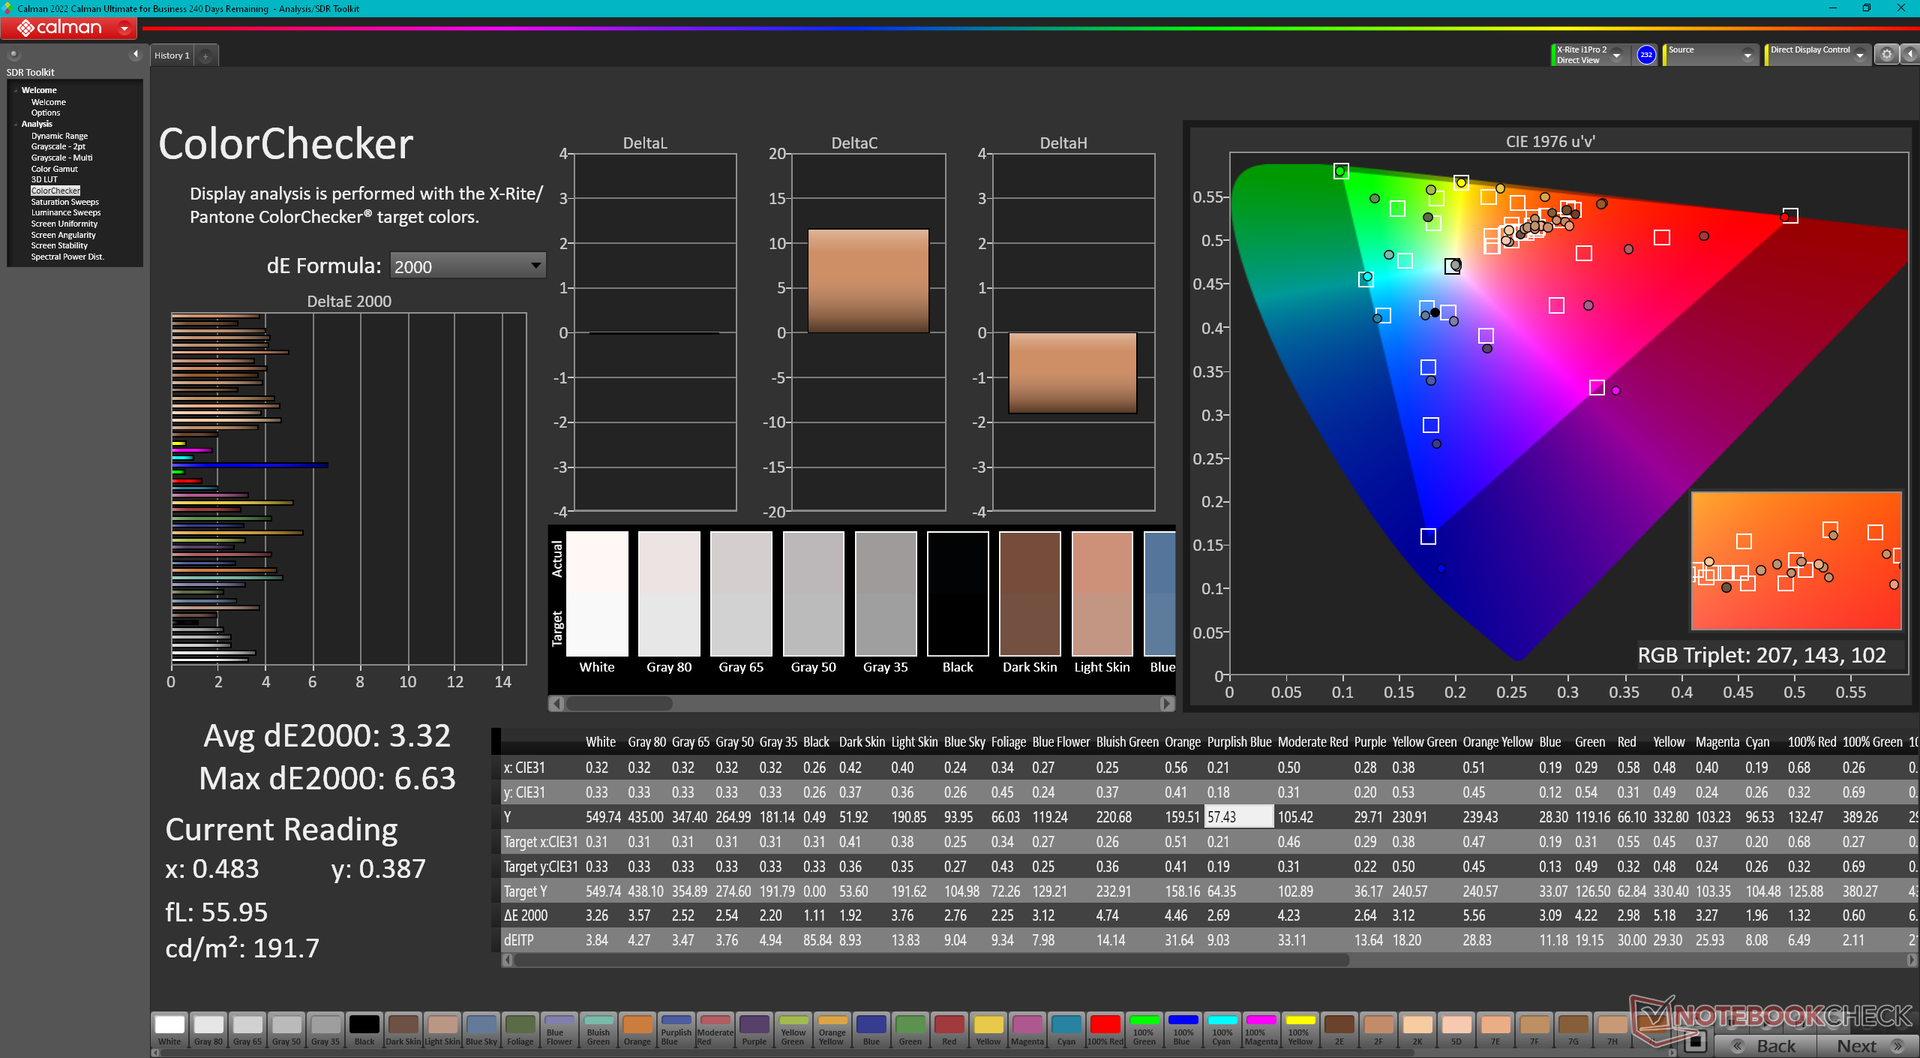
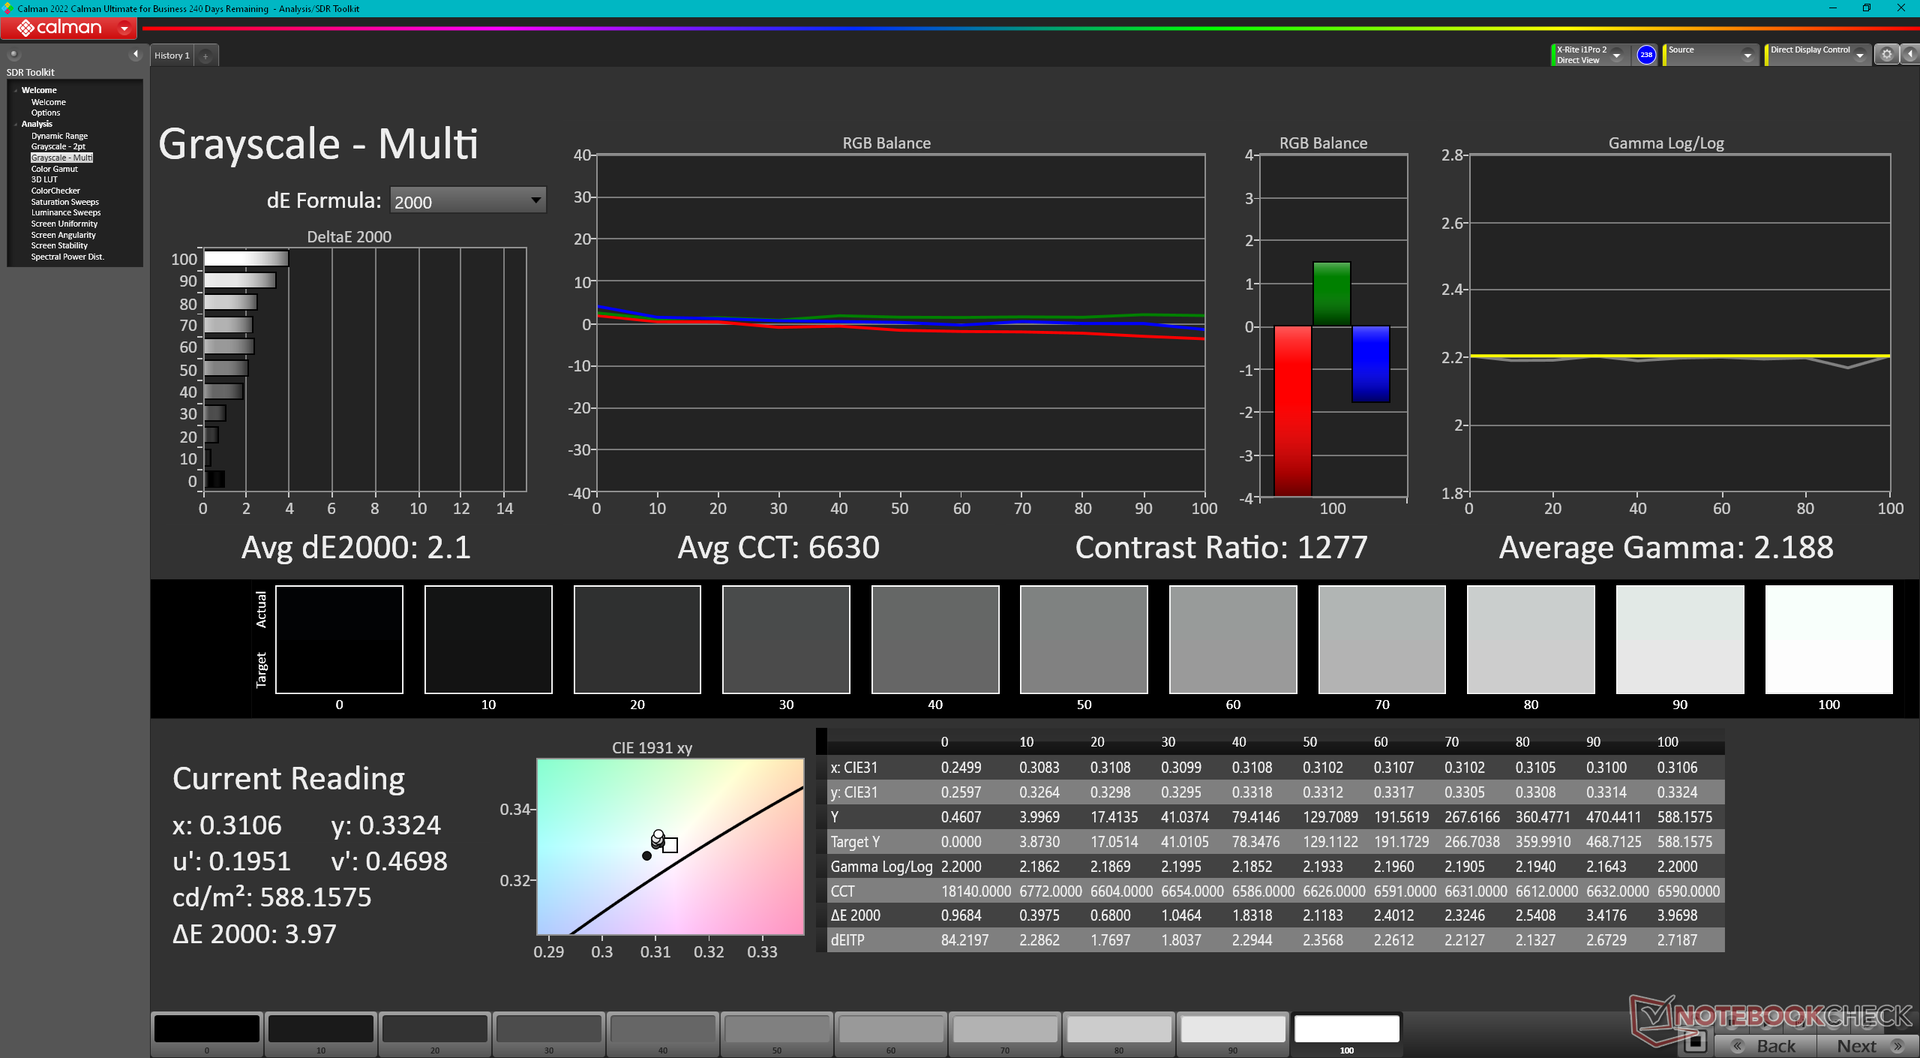
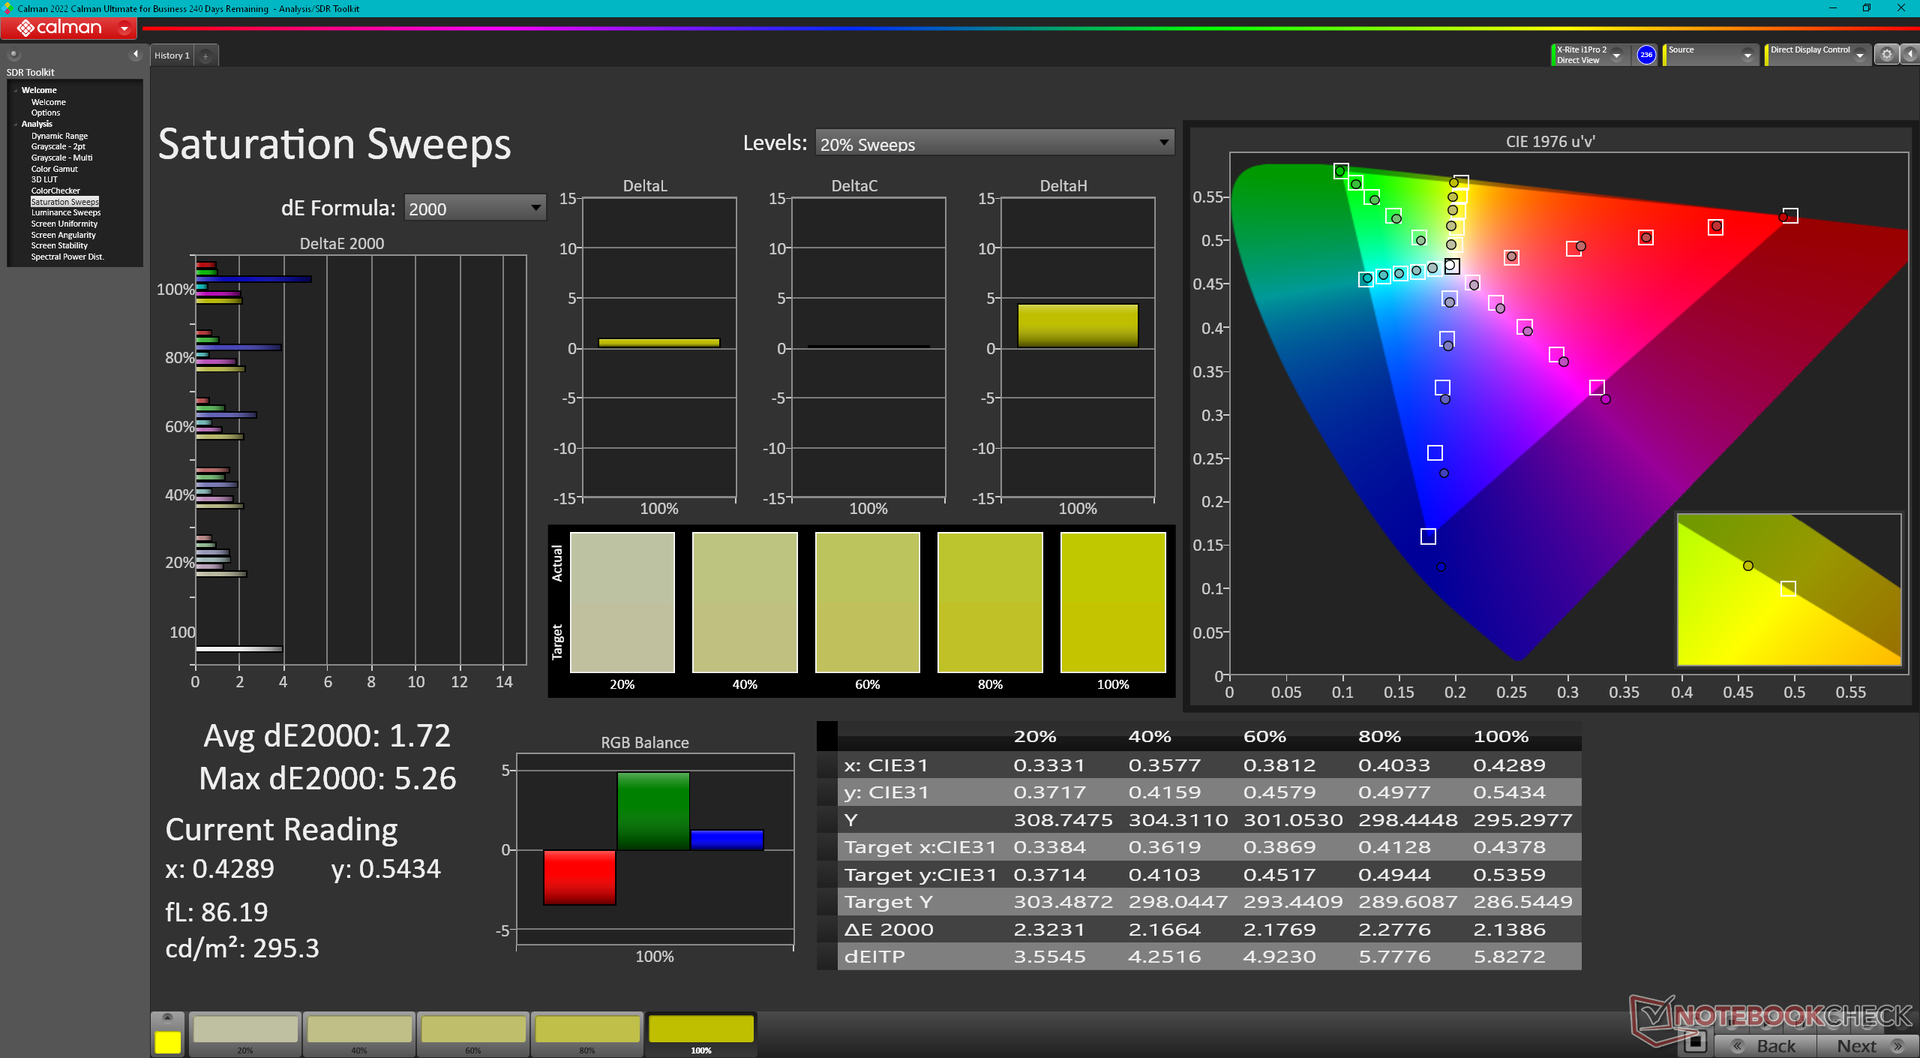
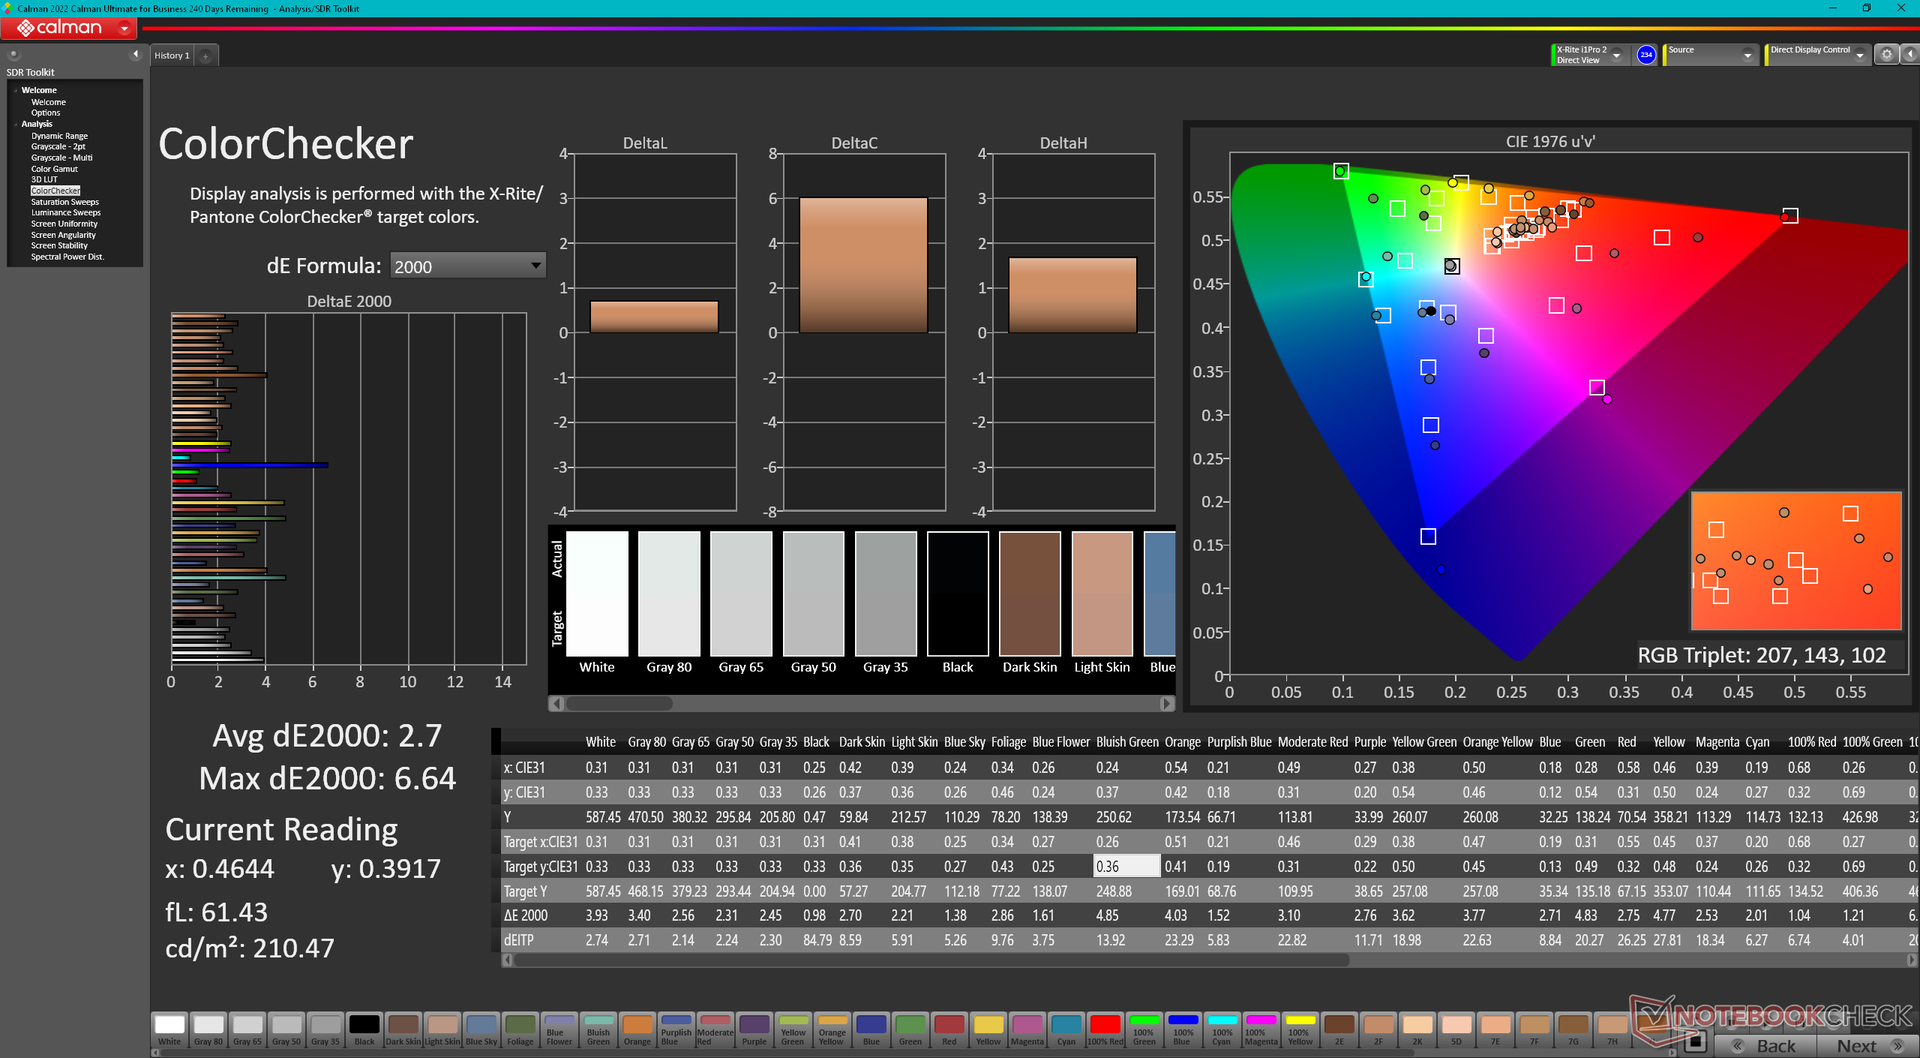
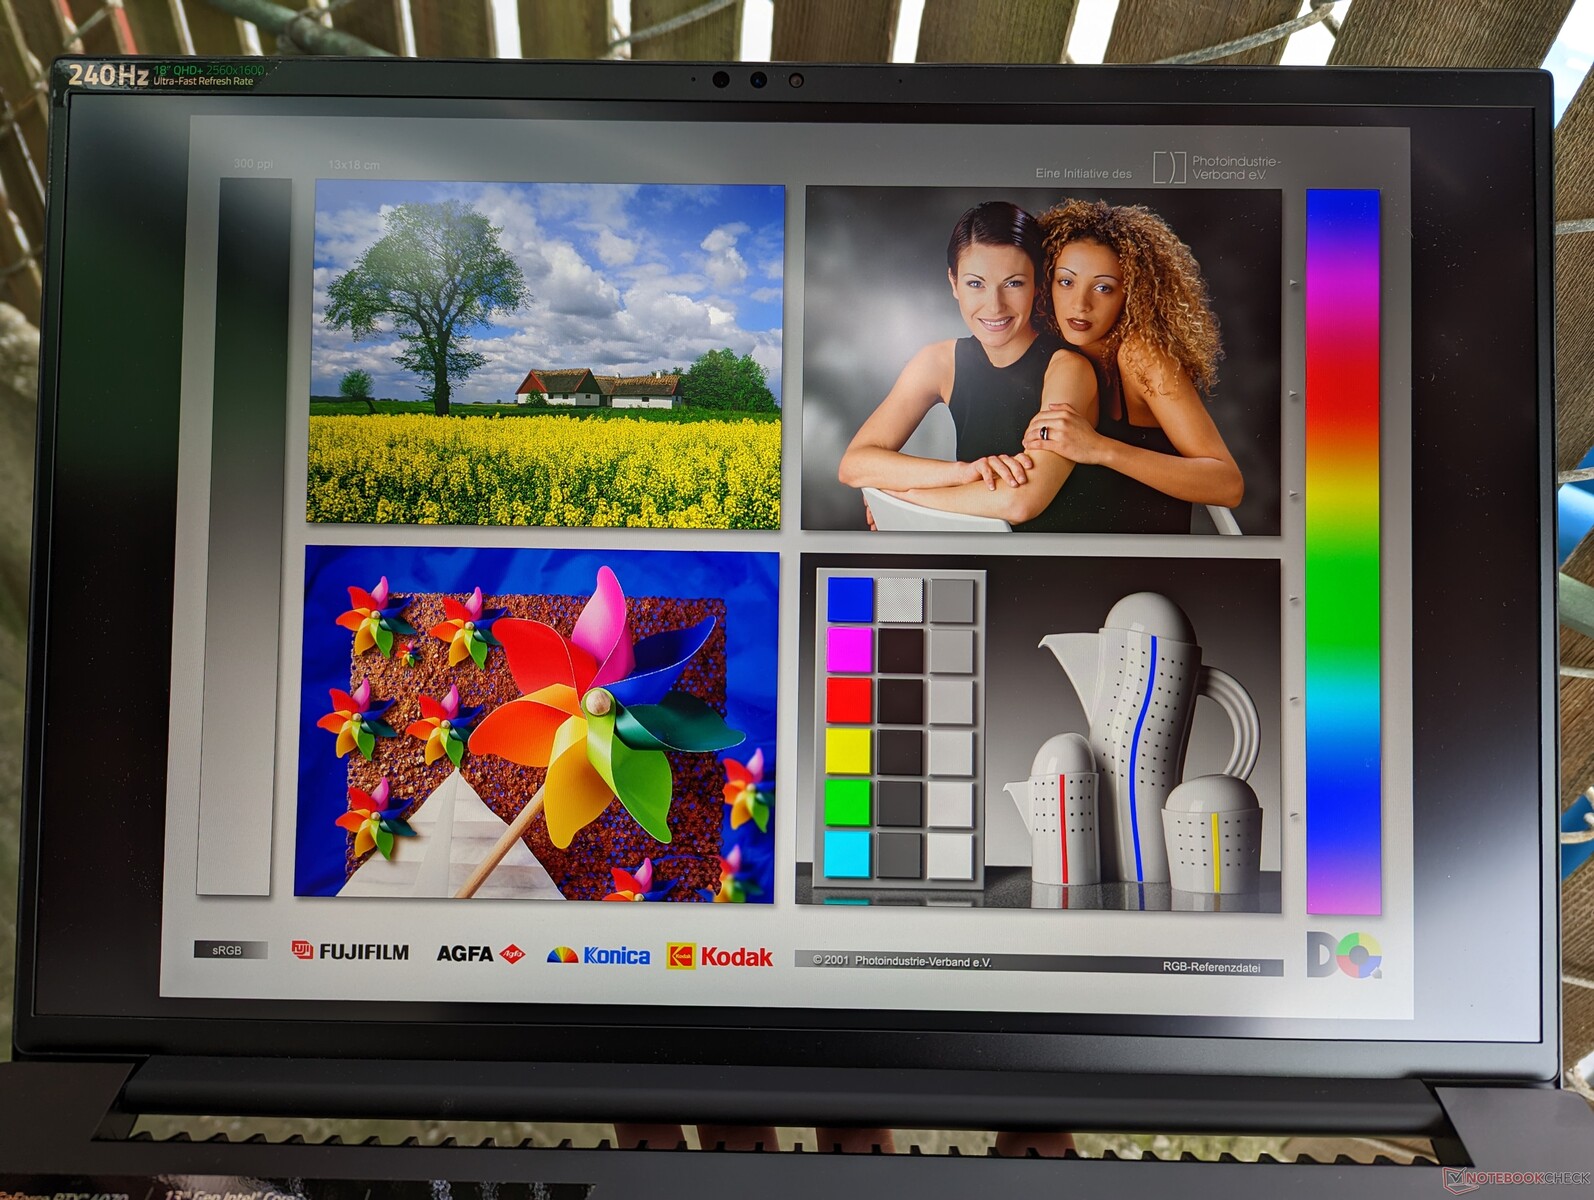
A lâmina 18 vem sem opção de segundo painel no lançamento provavelmente devido ao fornecimento limitado. De fato, o Asus ROG Strix Scar 18 de 18,0 polegadas utilizará provavelmente o mesmo painel IPS AU Optronics B180QAN01.0 que o da Lâmina 18. Dito isto, este ainda é um painel de alta qualidade com as características usuais comuns em laptops de alta qualidade, incluindo a rápida taxa de atualização nativa de 240 Hz, tempos de resposta rápidos de 3 ms, cobertura colorida DCI-P3 completa, brilho de 500-nit e calibração de fábrica. Nossas medições independentes com um colorímetro e osciloscópio X-Rite confirmaram estas afirmações.
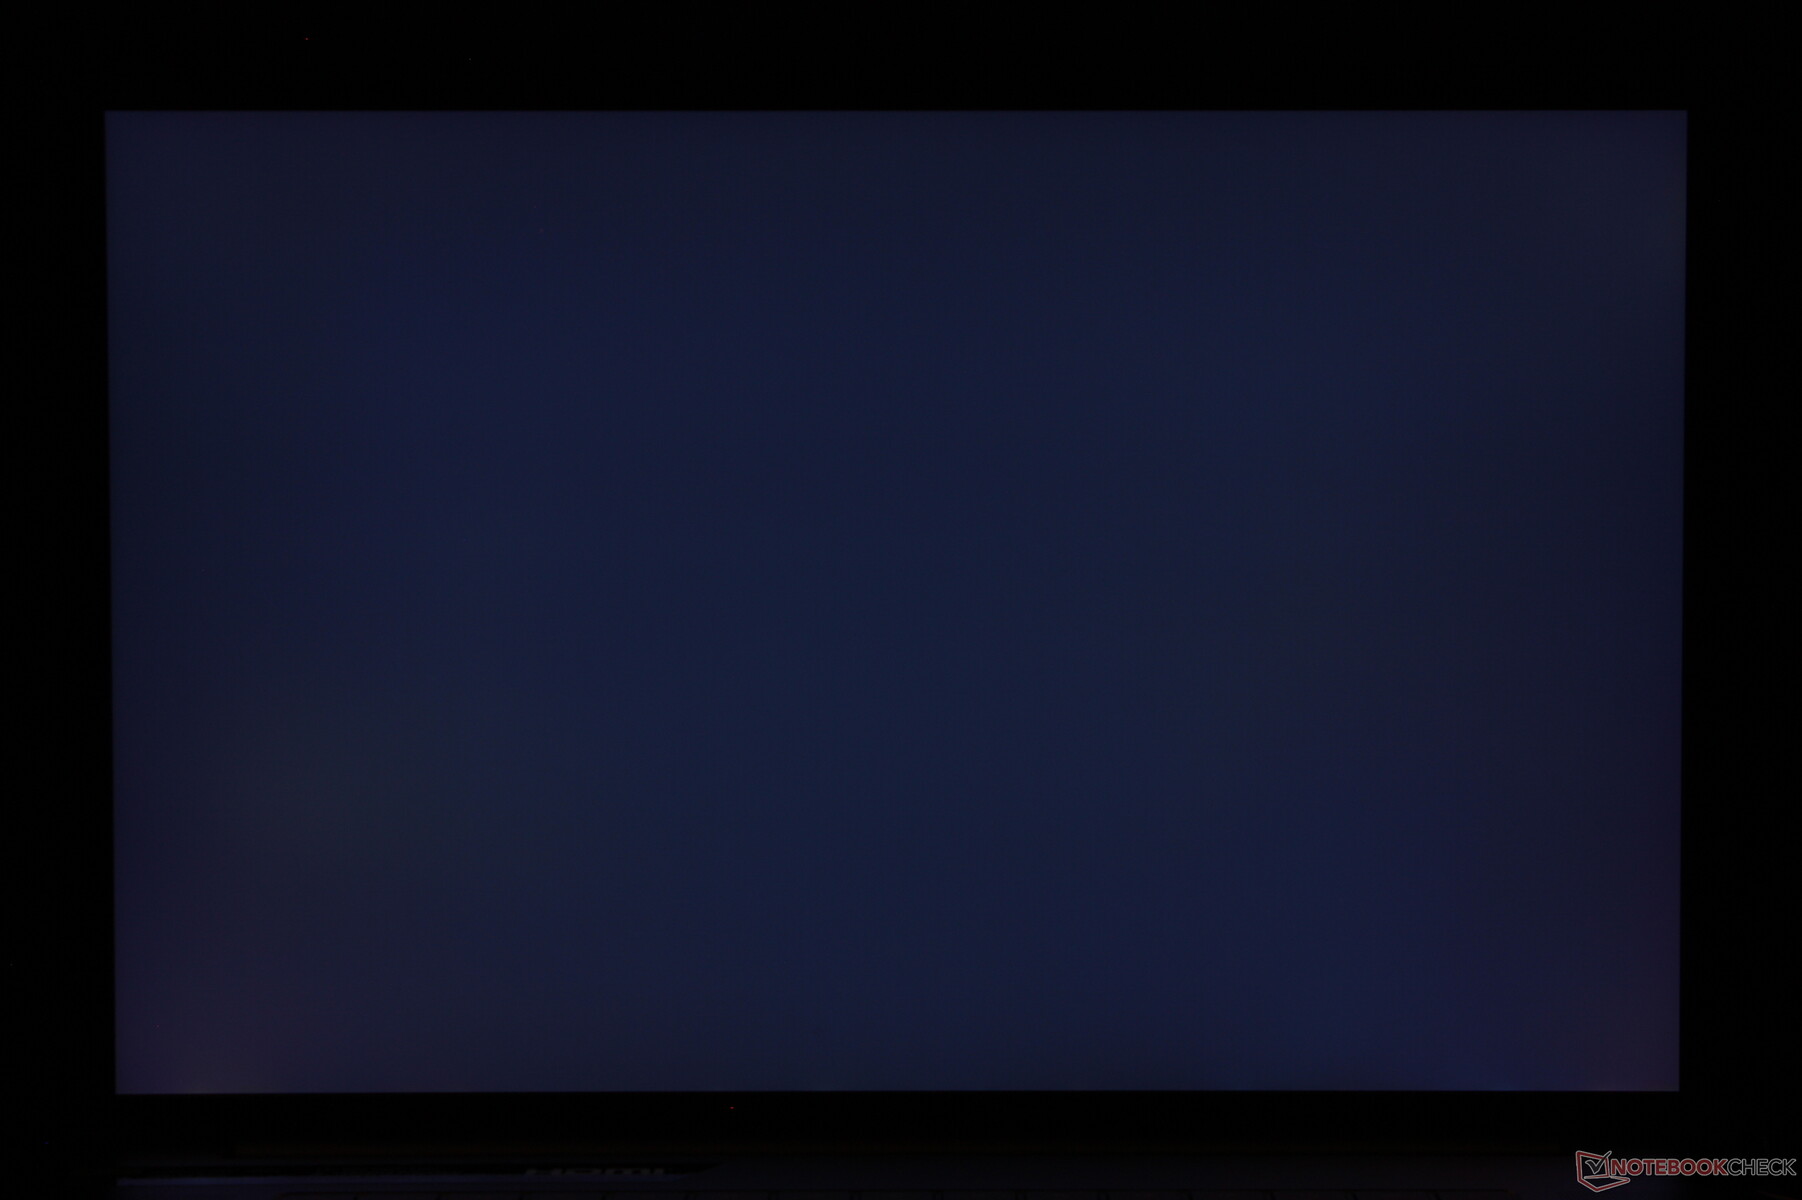
Infelizmente, o mostrador em nossa unidade de teste, ocasionalmente, cintilaria entre diferentes níveis de brilho, aparentemente sem razão aparente. A cintilação não está relacionada à modulação por largura de pulso, pois o painel não utiliza PWM para controle de brilho. Isto é provavelmente uma falha com a tela, mas ainda não podemos confirmar se se trata de um problema de software ou hardware. Supostamente, alguns consumidores que já compraram a Lâmina 18 também têm tido problemas semelhantes de cintilação. Esta seção será atualizada assim que tivermos uma palavra oficial da Razer.
| |||||||||||||||||||||||||
iluminação: 89 %
iluminação com acumulador: 549.6 cd/m²
Contraste: 1037:1 (Preto: 0.53 cd/m²)
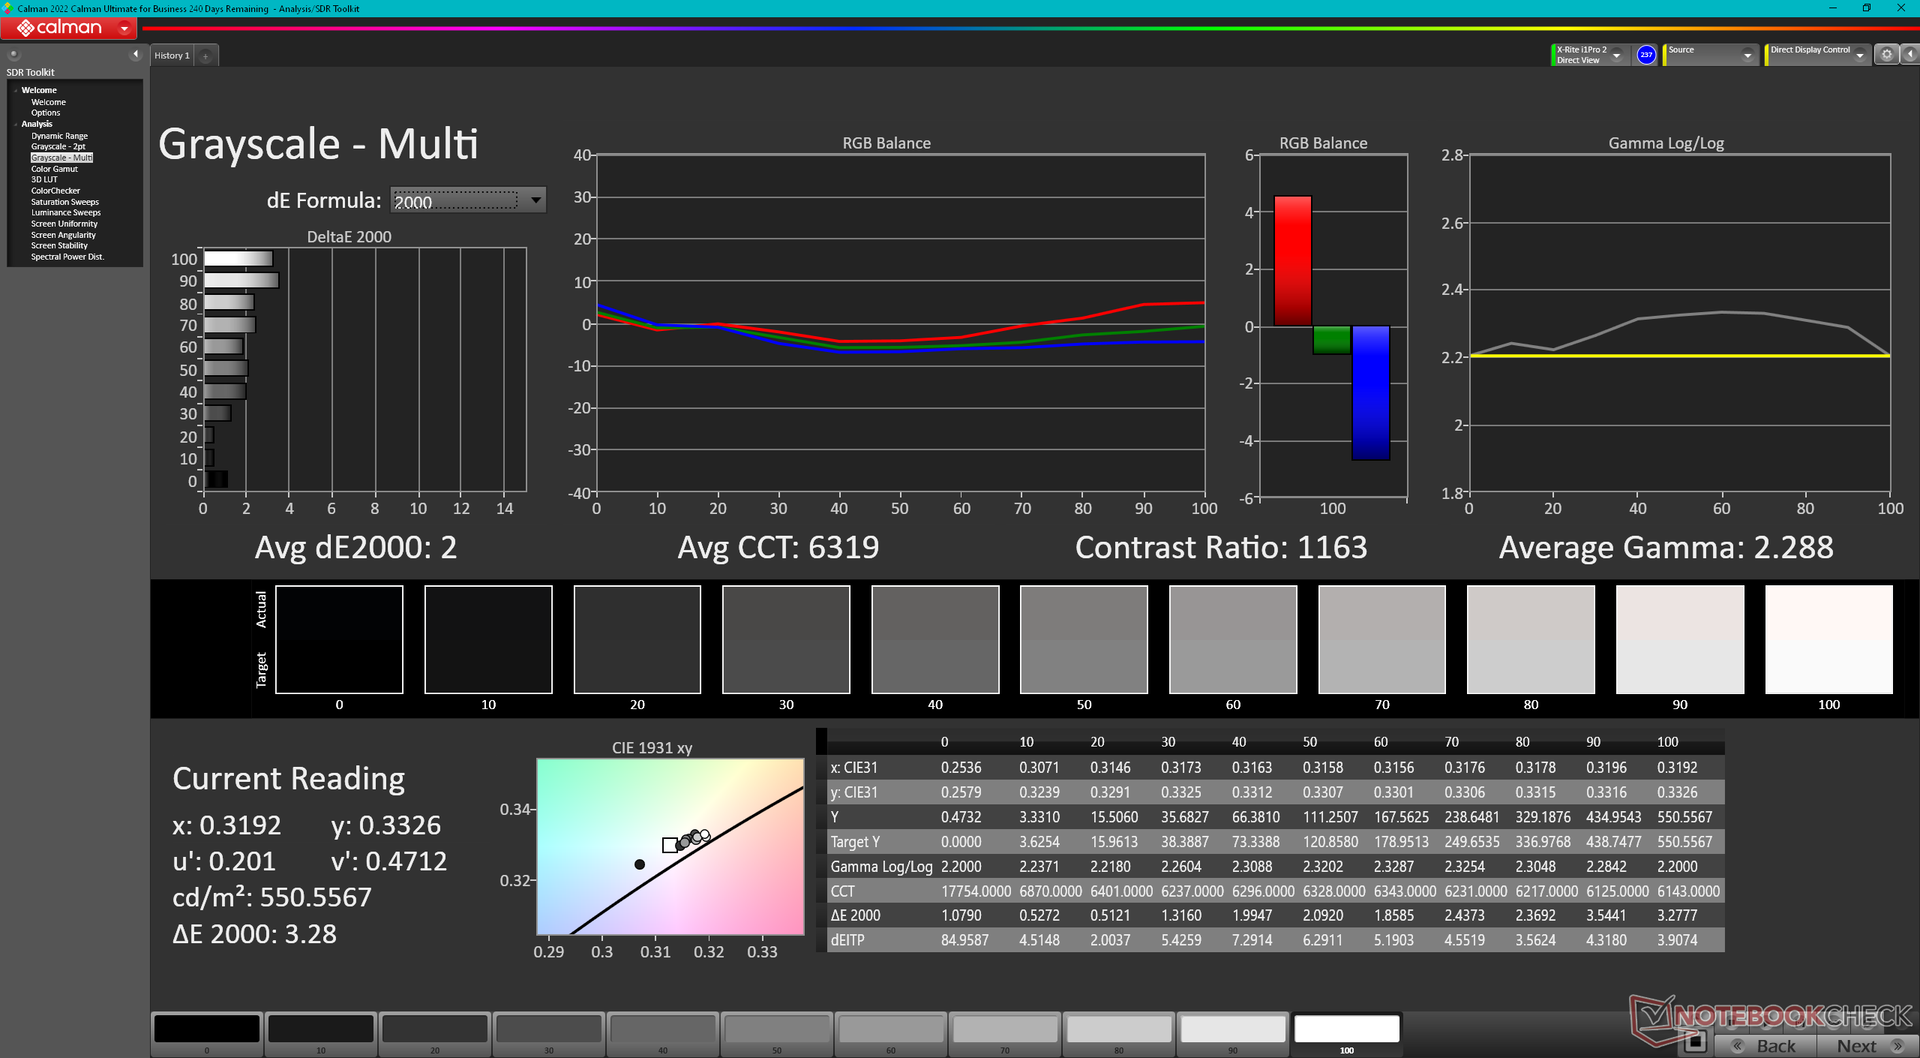
ΔE ColorChecker Calman: 3.32 | ∀{0.5-29.43 Ø4.71}
calibrated: 2.7
ΔE Greyscale Calman: 2 | ∀{0.09-98 Ø4.96}
85.3% AdobeRGB 1998 (Argyll 3D)
99.8% sRGB (Argyll 3D)
96.9% Display P3 (Argyll 3D)
Gamma: 2.29
CCT: 6319 K
| Razer Blade 18 RTX 4070 AU Optronics B180QAN01.0, IPS, 2560x1600, 18" | Razer Blade 17 Early 2022 AU Optronics B173ZAN06.9, IPS, 3840x2160, 17.3" | MSI Titan GT77 HX 13VI B173ZAN06.C, Mini-LED, 3840x2160, 17.3" | Gigabyte G7 KE AU Optronics B173HAN05.1, IPS, 1920x1080, 17.3" | Alienware m17 R5 (R9 6900HX, RX 6850M XT) AU Optronics AUODBA3, IPS, 3840x2160, 17" | Asus ROG Strix Scar 17 SE G733CX-LL014W NE173QHM-NZ2, IPS, 2560x1440, 17.3" | |
|---|---|---|---|---|---|---|
| Display | 2% | 2% | -14% | 1% | -0% | |
| Display P3 Coverage (%) | 96.9 | 99.4 3% | 94.9 -2% | 70.4 -27% | 97.2 0% | 97.1 0% |
| sRGB Coverage (%) | 99.8 | 100 0% | 99.9 0% | 99.8 0% | 99.6 0% | 99.9 0% |
| AdobeRGB 1998 Coverage (%) | 85.3 | 87.3 2% | 92.4 8% | 71.7 -16% | 88.4 4% | 84.8 -1% |
| Response Times | -25% | -524% | -12% | -168% | -31% | |
| Response Time Grey 50% / Grey 80% * (ms) | 4.2 ? | 7.5 ? -79% | 38.4 ? -814% | 5 ? -19% | 16.4 ? -290% | 5.7 ? -36% |
| Response Time Black / White * (ms) | 8 ? | 5.6 ? 30% | 26.6 ? -233% | 8.3 ? -4% | 11.6 ? -45% | 10.1 ? -26% |
| PWM Frequency (Hz) | 2380 ? | |||||
| Screen | 24% | 64905% | 19% | -40% | 16% | |
| Brightness middle (cd/m²) | 549.6 | 503 -8% | 606 10% | 307 -44% | 484 -12% | 320 -42% |
| Brightness (cd/m²) | 524 | 486 -7% | 602 15% | 301 -43% | 449 -14% | 303 -42% |
| Brightness Distribution (%) | 89 | 84 -6% | 93 4% | 93 4% | 87 -2% | 87 -2% |
| Black Level * (cd/m²) | 0.53 | 0.44 17% | 0.0001 100% | 0.2 62% | 0.55 -4% | 0.3 43% |
| Contrast (:1) | 1037 | 1143 10% | 6060000 584278% | 1535 48% | 880 -15% | 1067 3% |
| Colorchecker dE 2000 * | 3.32 | 1.08 67% | 4.8 -45% | 1.32 60% | 4.8 -45% | 1.1 67% |
| Colorchecker dE 2000 max. * | 6.63 | 4.54 32% | 8.2 -24% | 4.6 31% | 7.48 -13% | 2.7 59% |
| Colorchecker dE 2000 calibrated * | 2.7 | 0.6 78% | 1.8 33% | 1.03 62% | 4.74 -76% | |
| Greyscale dE 2000 * | 2 | 1.3 35% | 6.5 -225% | 2.1 -5% | 5.5 -175% | 1.1 45% |
| Gamma | 2.29 96% | 2.151 102% | 2.63 84% | 2.247 98% | 2.42 91% | 2.13 103% |
| CCT | 6319 103% | 6541 99% | 6596 99% | 6815 95% | 6148 106% | 6599 98% |
| Média Total (Programa/Configurações) | 0% /
12% | 21461% /
41650% | -2% /
8% | -69% /
-49% | -5% /
5% |
* ... menor é melhor
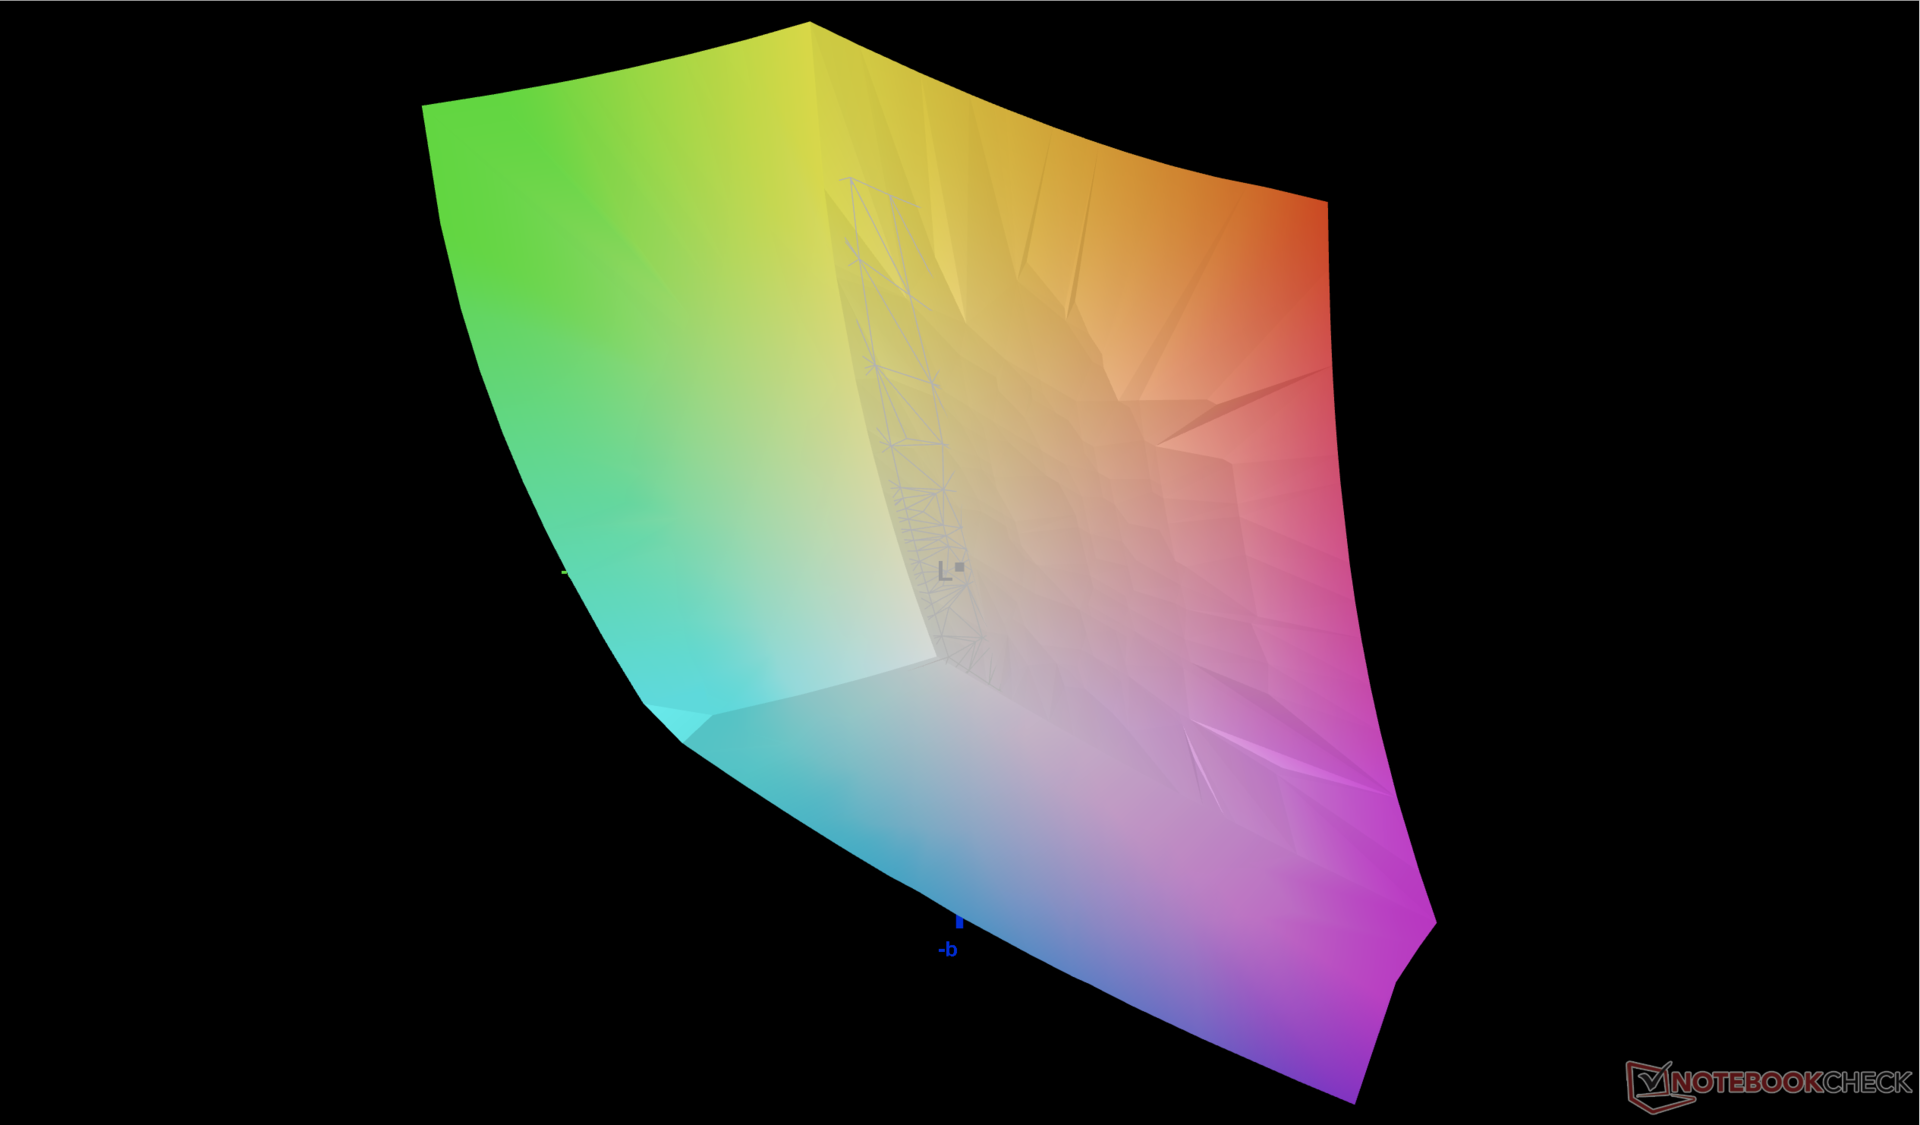

Os valores médios de escala de cinza e deltaE de cor são apenas 2,0 e 3,32 fora da caixa, respectivamente, pois o painel vem pré-calibrado contra o padrão P3. A tentativa de calibrar ainda mais o painel não melhoraria as cores por uma margem significativa. O azul, entretanto, parece ser representado de forma mais imprecisa do que qualquer outra cor primária ou secundária.
Exibir tempos de resposta
| ↔ Tempo de resposta preto para branco | ||
|---|---|---|
| 8 ms ... ascensão ↗ e queda ↘ combinadas | ↗ 3.8 ms ascensão | 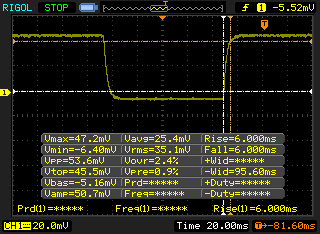 |
| ↘ 4.2 ms queda | ||
| A tela mostra taxas de resposta rápidas em nossos testes e deve ser adequada para jogos. Em comparação, todos os dispositivos testados variam de 0.1 (mínimo) a 240 (máximo) ms. » 22 % de todos os dispositivos são melhores. Isso significa que o tempo de resposta medido é melhor que a média de todos os dispositivos testados (19.8 ms). | ||
| ↔ Tempo de resposta 50% cinza a 80% cinza | ||
| 4.2 ms ... ascensão ↗ e queda ↘ combinadas | ↗ 2.1 ms ascensão | 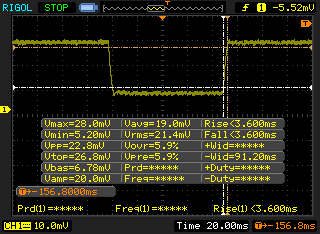 |
| ↘ 2.1 ms queda | ||
| A tela mostra taxas de resposta muito rápidas em nossos testes e deve ser muito adequada para jogos em ritmo acelerado. Em comparação, todos os dispositivos testados variam de 0.165 (mínimo) a 636 (máximo) ms. » 16 % de todos os dispositivos são melhores. Isso significa que o tempo de resposta medido é melhor que a média de todos os dispositivos testados (31 ms). | ||
Cintilação da tela / PWM (modulação por largura de pulso)
| Tela tremeluzindo / PWM não detectado | 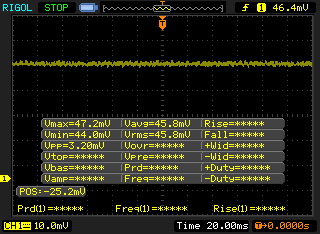 | ||
[pwm_comparison] Em comparação: 52 % de todos os dispositivos testados não usam PWM para escurecer a tela. Se PWM foi detectado, uma média de 7754 (mínimo: 5 - máximo: 343500) Hz foi medida. | |||
A visibilidade externa é semelhante à da Lâmina 17, uma vez que cada um deles exibe um alvo de 500-nit no máximo. A sombra é sempre recomendada para cores ótimas e para reduzir o brilho o máximo possível.
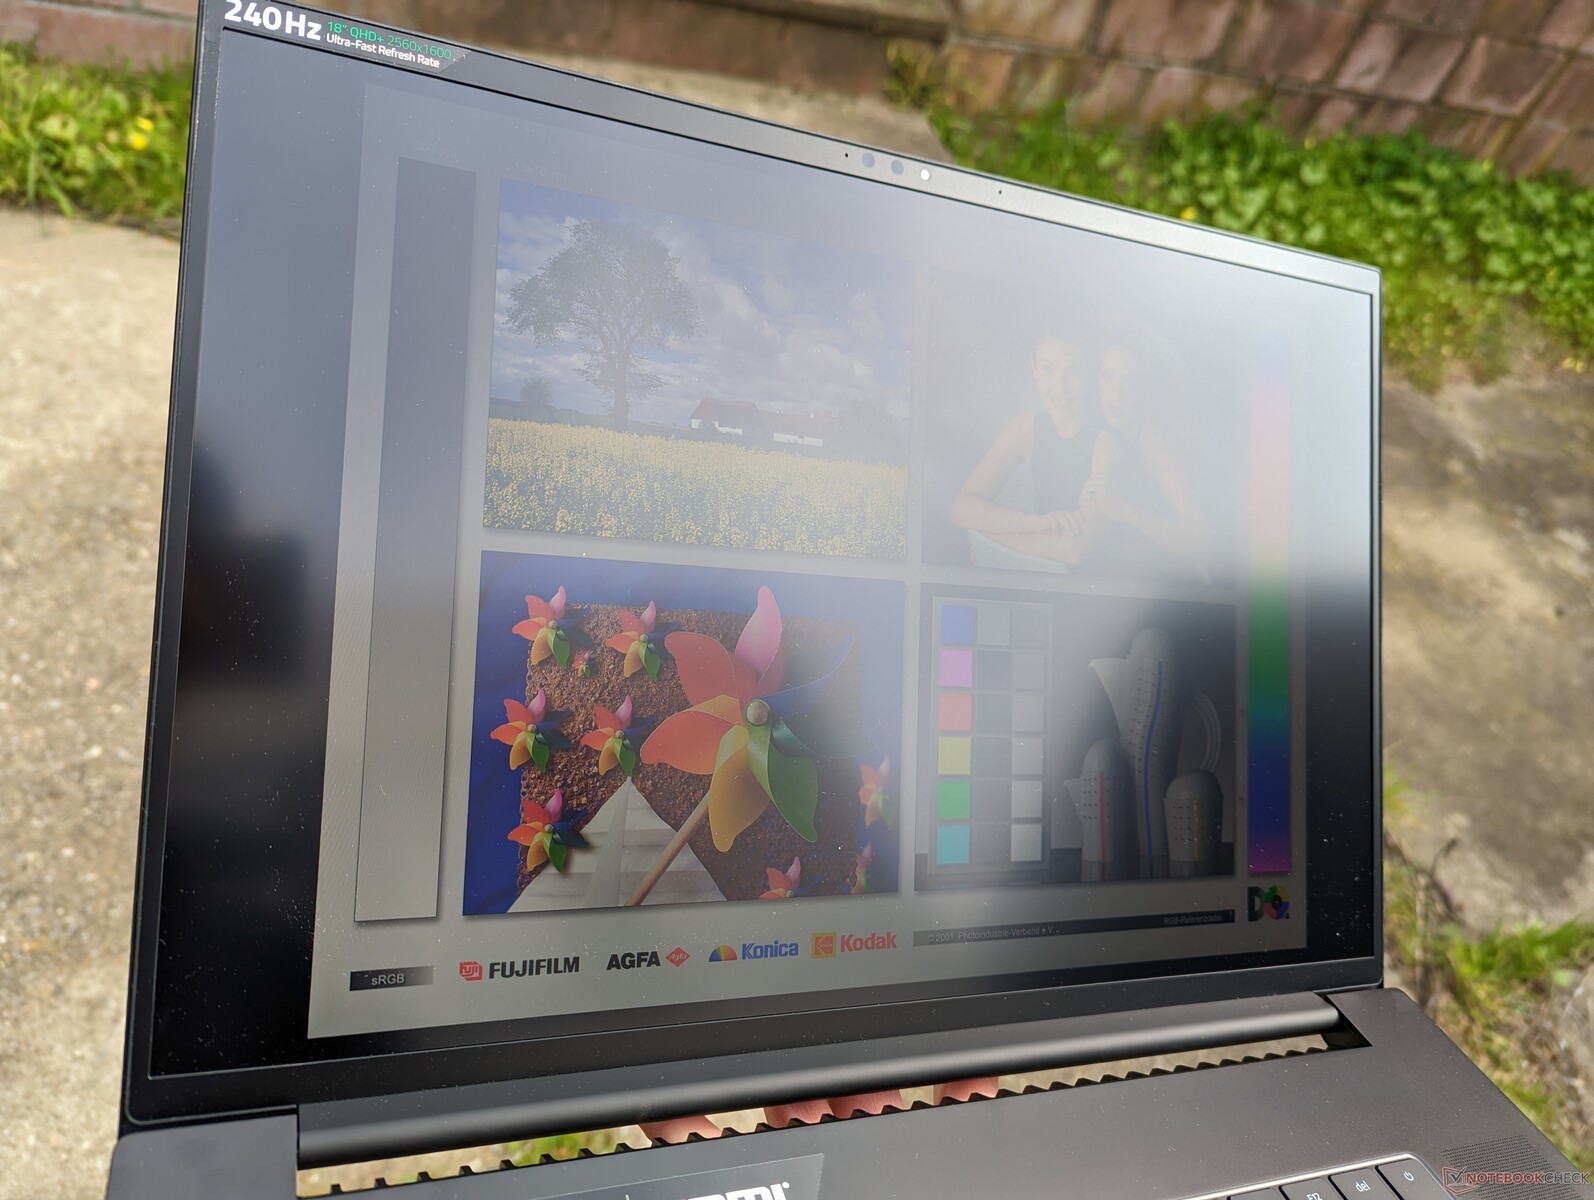
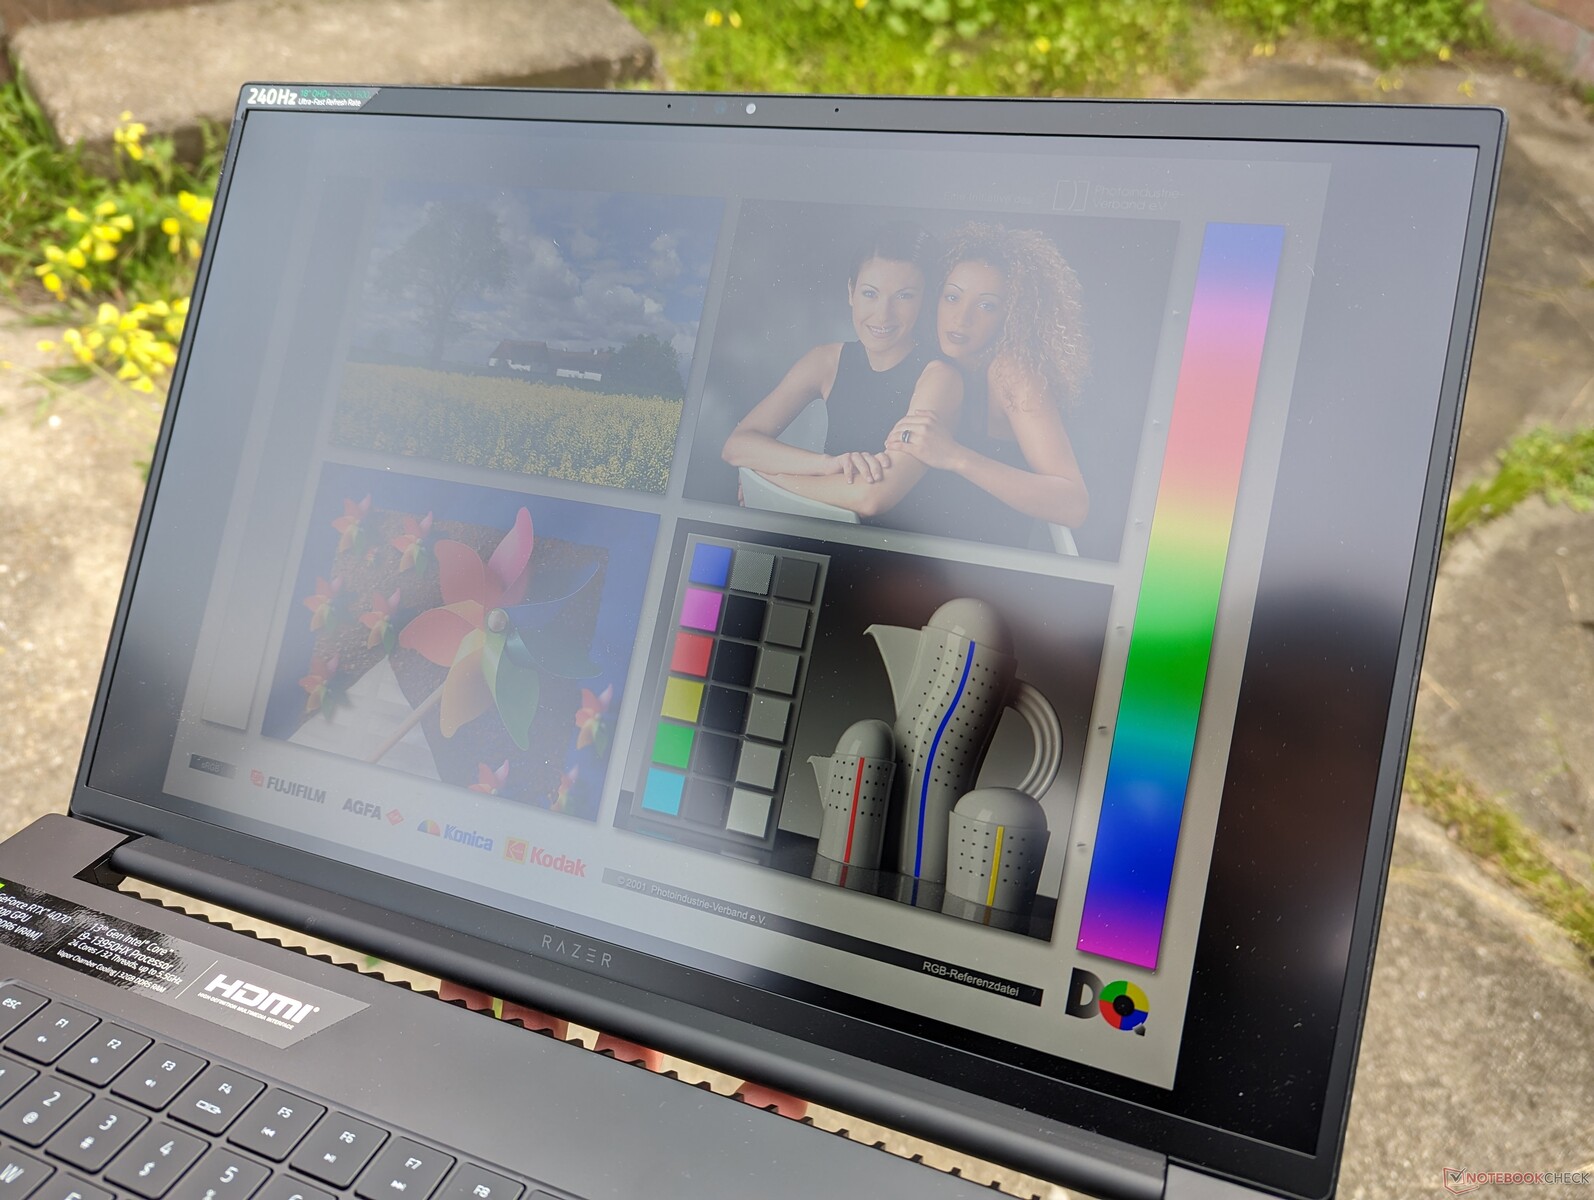
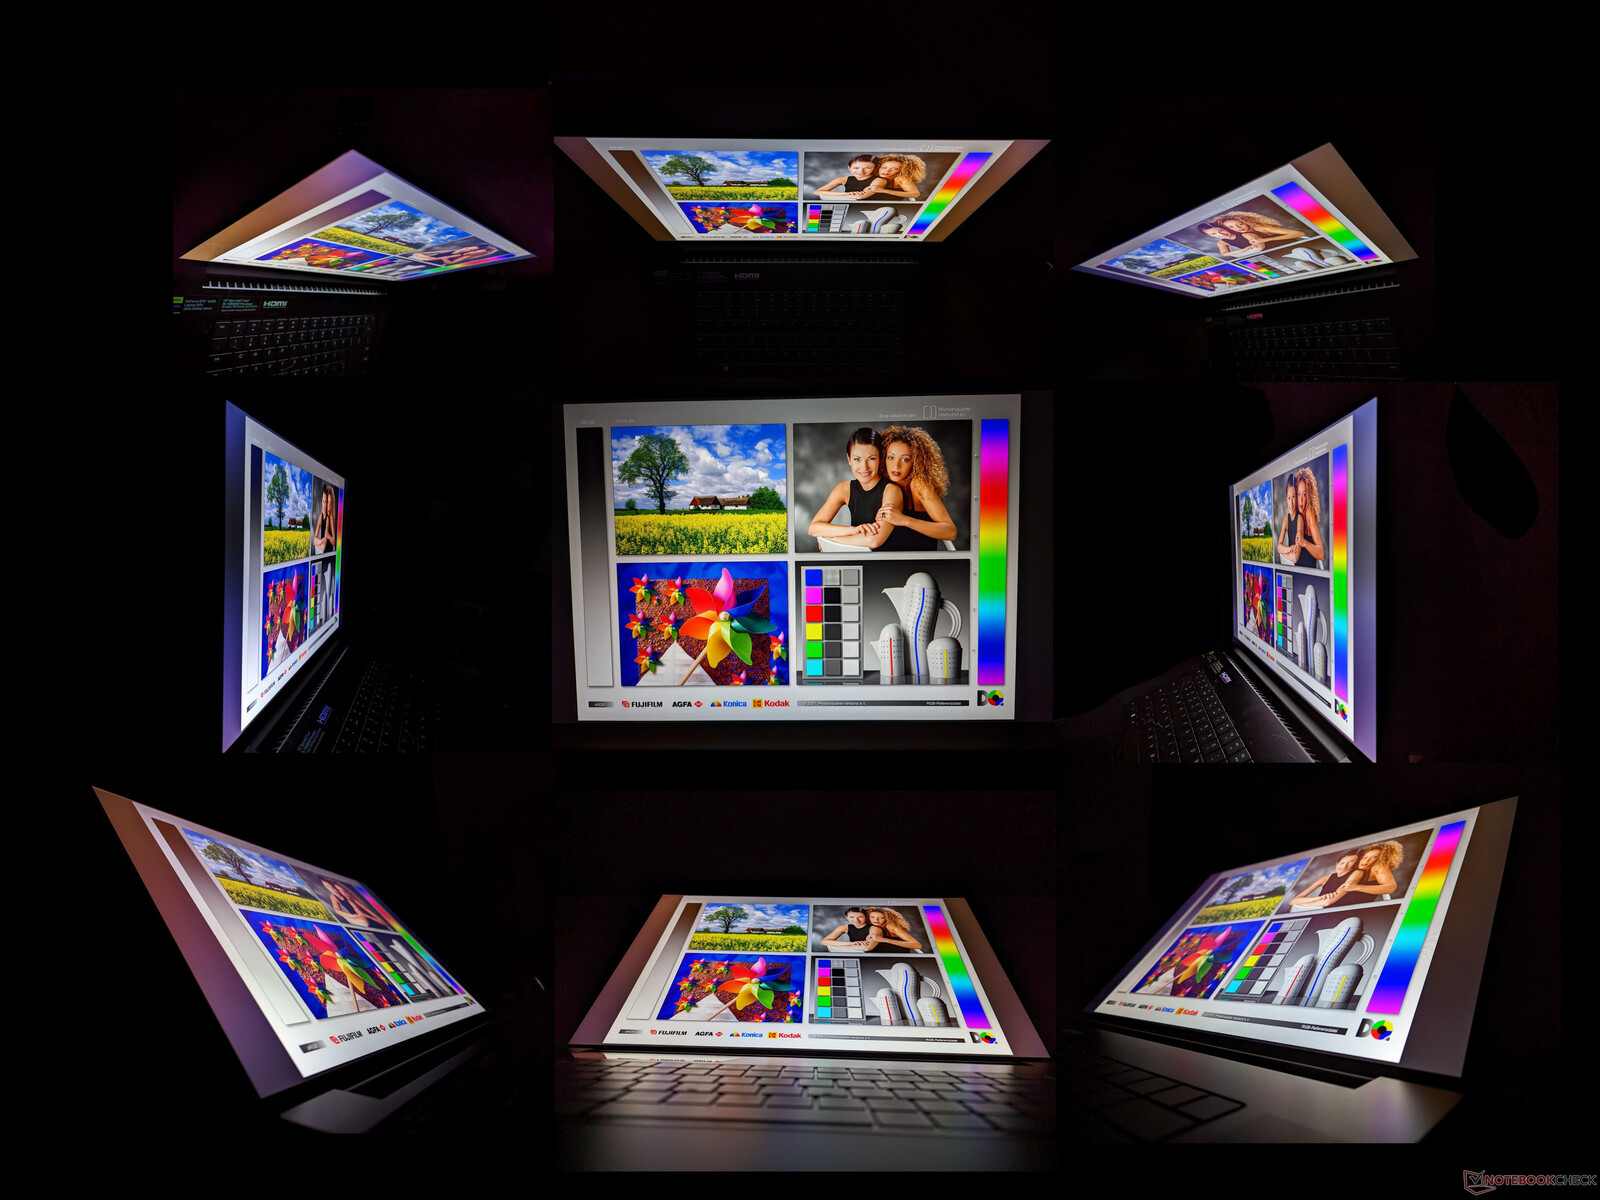
Os ângulos de visão são amplos, como se espera de um painel IPS. Cores e contraste somente se a visualização for feita a partir de ângulos extremos.
Desempenho - Intel Raptor Lake + Nvidia Ada Lovelace
Condições de teste
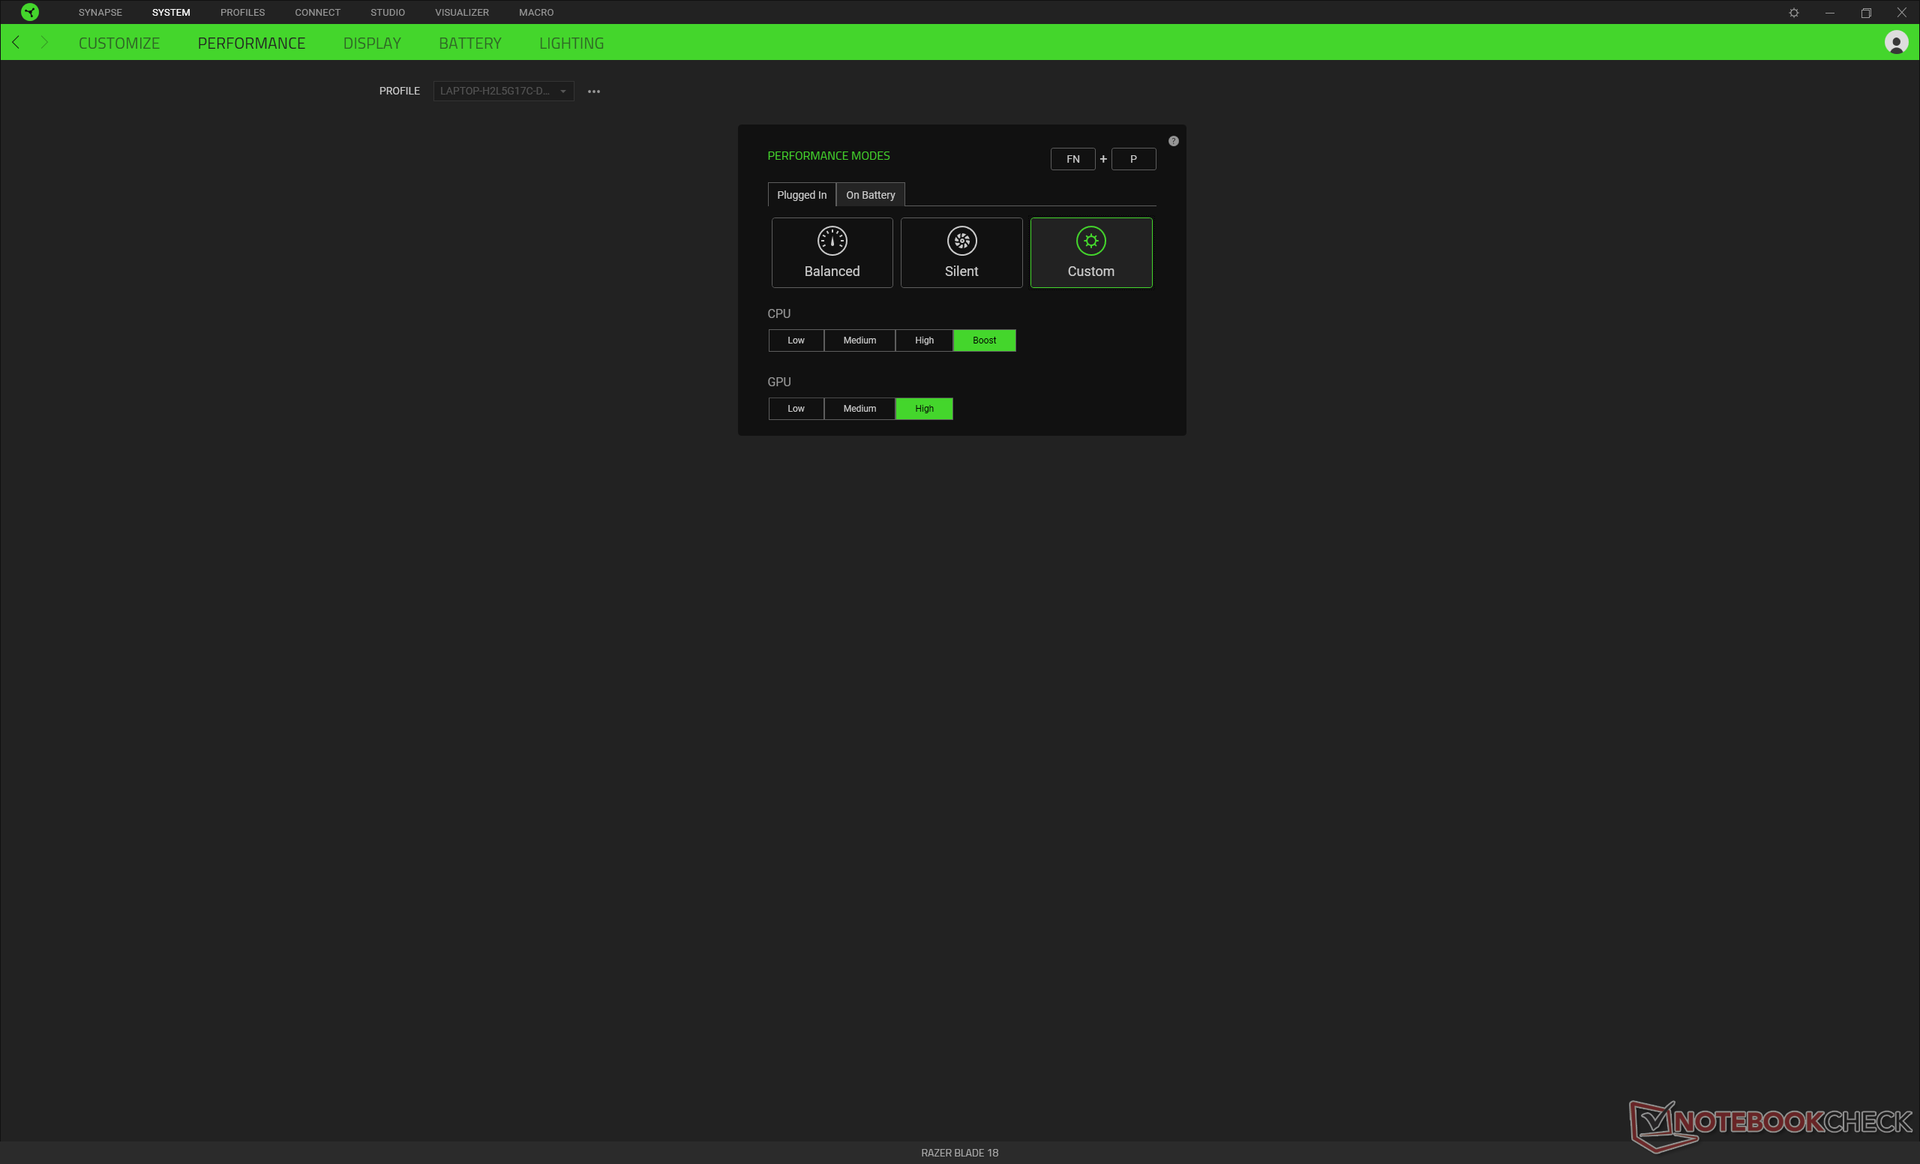
Ajustamos nossa unidade ao modo Performance via Windows e a CPU e GPU para Boost e High, respectivamente, através do software Razer Synapse, como mostrado abaixo. É recomendado que os usuários se familiarizem com o Synapse, pois ele é o hub para ajustar quaisquer efeitos de iluminação RGB, perfis de performance, macros e outras características auxiliares. O software nem sempre é confiável, infelizmente, pois às vezes ele se tornaria insensível ou não seria lançado se não houvesse conectividade com a Internet.
O Blade 18 não suporta MUX ou Advanced Optimus, ao contrário do Blade 16. Nossa unidade também não suportaria a G-Sync, apesar do que a Razer está anunciando. Chegamos até a Razer sobre a falta da G-Sync e atualizaremos esta seção quando apropriado.
Processador
O desempenho da CPU está dentro de apenas alguns pontos percentuais da lâmina 16 ou GT77 cada uma equipada com o mesmo Núcleo i9-13950HX processador. Assim, a CPU aqui não parece estar sofrendo de grandes problemas de estrangulamento. O desempenho de várias roscas é cerca de 45% mais rápido do que a geração anteriorNúcleo i9-12950HX estar em pé de igualdade com uma mesa de trabalho de estoque Núcleo i9-12900K. O salto de desempenho de gênero para gênero é significativo a este respeito.
Nossos resultados usuais do loop test do CineBench R15 xT não estão incluídos abaixo, pois os resultados são excepcionalmente baixos e não representam o desempenho do processador. A execução do CineBench R15 ativa tanto a CPU quanto o dGPU e, portanto, o desempenho da CPU às vezes pode ser limitado pela potência do dGPU. Esta questão também pode ser observada em alguns outros laptops. O CineBench R23 é uma referência de CPU pura que não ativa o dGPU e, portanto, estes resultados são fornecidos abaixo.
Cinebench R23 Multi Loop
Cinebench R23: Multi Core | Single Core
Cinebench R20: CPU (Multi Core) | CPU (Single Core)
Cinebench R15: CPU Multi 64Bit | CPU Single 64Bit
Blender: v2.79 BMW27 CPU
7-Zip 18.03: 7z b 4 | 7z b 4 -mmt1
Geekbench 5.5: Multi-Core | Single-Core
HWBOT x265 Benchmark v2.2: 4k Preset
LibreOffice : 20 Documents To PDF
R Benchmark 2.5: Overall mean
* ... menor é melhor
AIDA64: FP32 Ray-Trace | FPU Julia | CPU SHA3 | CPU Queen | FPU SinJulia | FPU Mandel | CPU AES | CPU ZLib | FP64 Ray-Trace | CPU PhotoWorxx
| Performance rating | |
| MSI Titan GT77 HX 13VI | |
| Razer Blade 18 RTX 4070 | |
| Média Intel Core i9-13950HX | |
| Asus ROG Strix Scar 17 SE G733CX-LL014W | |
| Alienware m17 R5 (R9 6900HX, RX 6850M XT) | |
| Gigabyte G7 KE | |
| Razer Blade 17 Early 2022 | |
| AIDA64 / FP32 Ray-Trace | |
| MSI Titan GT77 HX 13VI | |
| Razer Blade 18 RTX 4070 | |
| Média Intel Core i9-13950HX (17993 - 28957, n=9) | |
| Asus ROG Strix Scar 17 SE G733CX-LL014W | |
| Alienware m17 R5 (R9 6900HX, RX 6850M XT) | |
| Gigabyte G7 KE | |
| Razer Blade 17 Early 2022 | |
| AIDA64 / FPU Julia | |
| MSI Titan GT77 HX 13VI | |
| Razer Blade 18 RTX 4070 | |
| Média Intel Core i9-13950HX (89362 - 144303, n=9) | |
| Alienware m17 R5 (R9 6900HX, RX 6850M XT) | |
| Asus ROG Strix Scar 17 SE G733CX-LL014W | |
| Gigabyte G7 KE | |
| Razer Blade 17 Early 2022 | |
| AIDA64 / CPU SHA3 | |
| MSI Titan GT77 HX 13VI | |
| Razer Blade 18 RTX 4070 | |
| Média Intel Core i9-13950HX (4518 - 7093, n=9) | |
| Asus ROG Strix Scar 17 SE G733CX-LL014W | |
| Alienware m17 R5 (R9 6900HX, RX 6850M XT) | |
| Gigabyte G7 KE | |
| Razer Blade 17 Early 2022 | |
| AIDA64 / CPU Queen | |
| MSI Titan GT77 HX 13VI | |
| Razer Blade 18 RTX 4070 | |
| Média Intel Core i9-13950HX (131931 - 140103, n=8) | |
| Alienware m17 R5 (R9 6900HX, RX 6850M XT) | |
| Asus ROG Strix Scar 17 SE G733CX-LL014W | |
| Razer Blade 17 Early 2022 | |
| Gigabyte G7 KE | |
| AIDA64 / FPU SinJulia | |
| MSI Titan GT77 HX 13VI | |
| Razer Blade 18 RTX 4070 | |
| Média Intel Core i9-13950HX (12318 - 17057, n=9) | |
| Alienware m17 R5 (R9 6900HX, RX 6850M XT) | |
| Asus ROG Strix Scar 17 SE G733CX-LL014W | |
| Gigabyte G7 KE | |
| Razer Blade 17 Early 2022 | |
| AIDA64 / FPU Mandel | |
| MSI Titan GT77 HX 13VI | |
| Razer Blade 18 RTX 4070 | |
| Média Intel Core i9-13950HX (44372 - 71038, n=9) | |
| Alienware m17 R5 (R9 6900HX, RX 6850M XT) | |
| Asus ROG Strix Scar 17 SE G733CX-LL014W | |
| Gigabyte G7 KE | |
| Razer Blade 17 Early 2022 | |
| AIDA64 / CPU AES | |
| Asus ROG Strix Scar 17 SE G733CX-LL014W | |
| Média Intel Core i9-13950HX (99981 - 204491, n=9) | |
| MSI Titan GT77 HX 13VI | |
| Razer Blade 18 RTX 4070 | |
| Gigabyte G7 KE | |
| Alienware m17 R5 (R9 6900HX, RX 6850M XT) | |
| Razer Blade 17 Early 2022 | |
| AIDA64 / CPU ZLib | |
| MSI Titan GT77 HX 13VI | |
| Razer Blade 18 RTX 4070 | |
| Média Intel Core i9-13950HX (1263 - 2069, n=9) | |
| Asus ROG Strix Scar 17 SE G733CX-LL014W | |
| Gigabyte G7 KE | |
| Alienware m17 R5 (R9 6900HX, RX 6850M XT) | |
| Razer Blade 17 Early 2022 | |
| AIDA64 / FP64 Ray-Trace | |
| MSI Titan GT77 HX 13VI | |
| Razer Blade 18 RTX 4070 | |
| Média Intel Core i9-13950HX (9649 - 15573, n=9) | |
| Asus ROG Strix Scar 17 SE G733CX-LL014W | |
| Alienware m17 R5 (R9 6900HX, RX 6850M XT) | |
| Gigabyte G7 KE | |
| Razer Blade 17 Early 2022 | |
| AIDA64 / CPU PhotoWorxx | |
| Razer Blade 18 RTX 4070 | |
| Média Intel Core i9-13950HX (40233 - 50864, n=9) | |
| Asus ROG Strix Scar 17 SE G733CX-LL014W | |
| MSI Titan GT77 HX 13VI | |
| Razer Blade 17 Early 2022 | |
| Alienware m17 R5 (R9 6900HX, RX 6850M XT) | |
| Gigabyte G7 KE | |
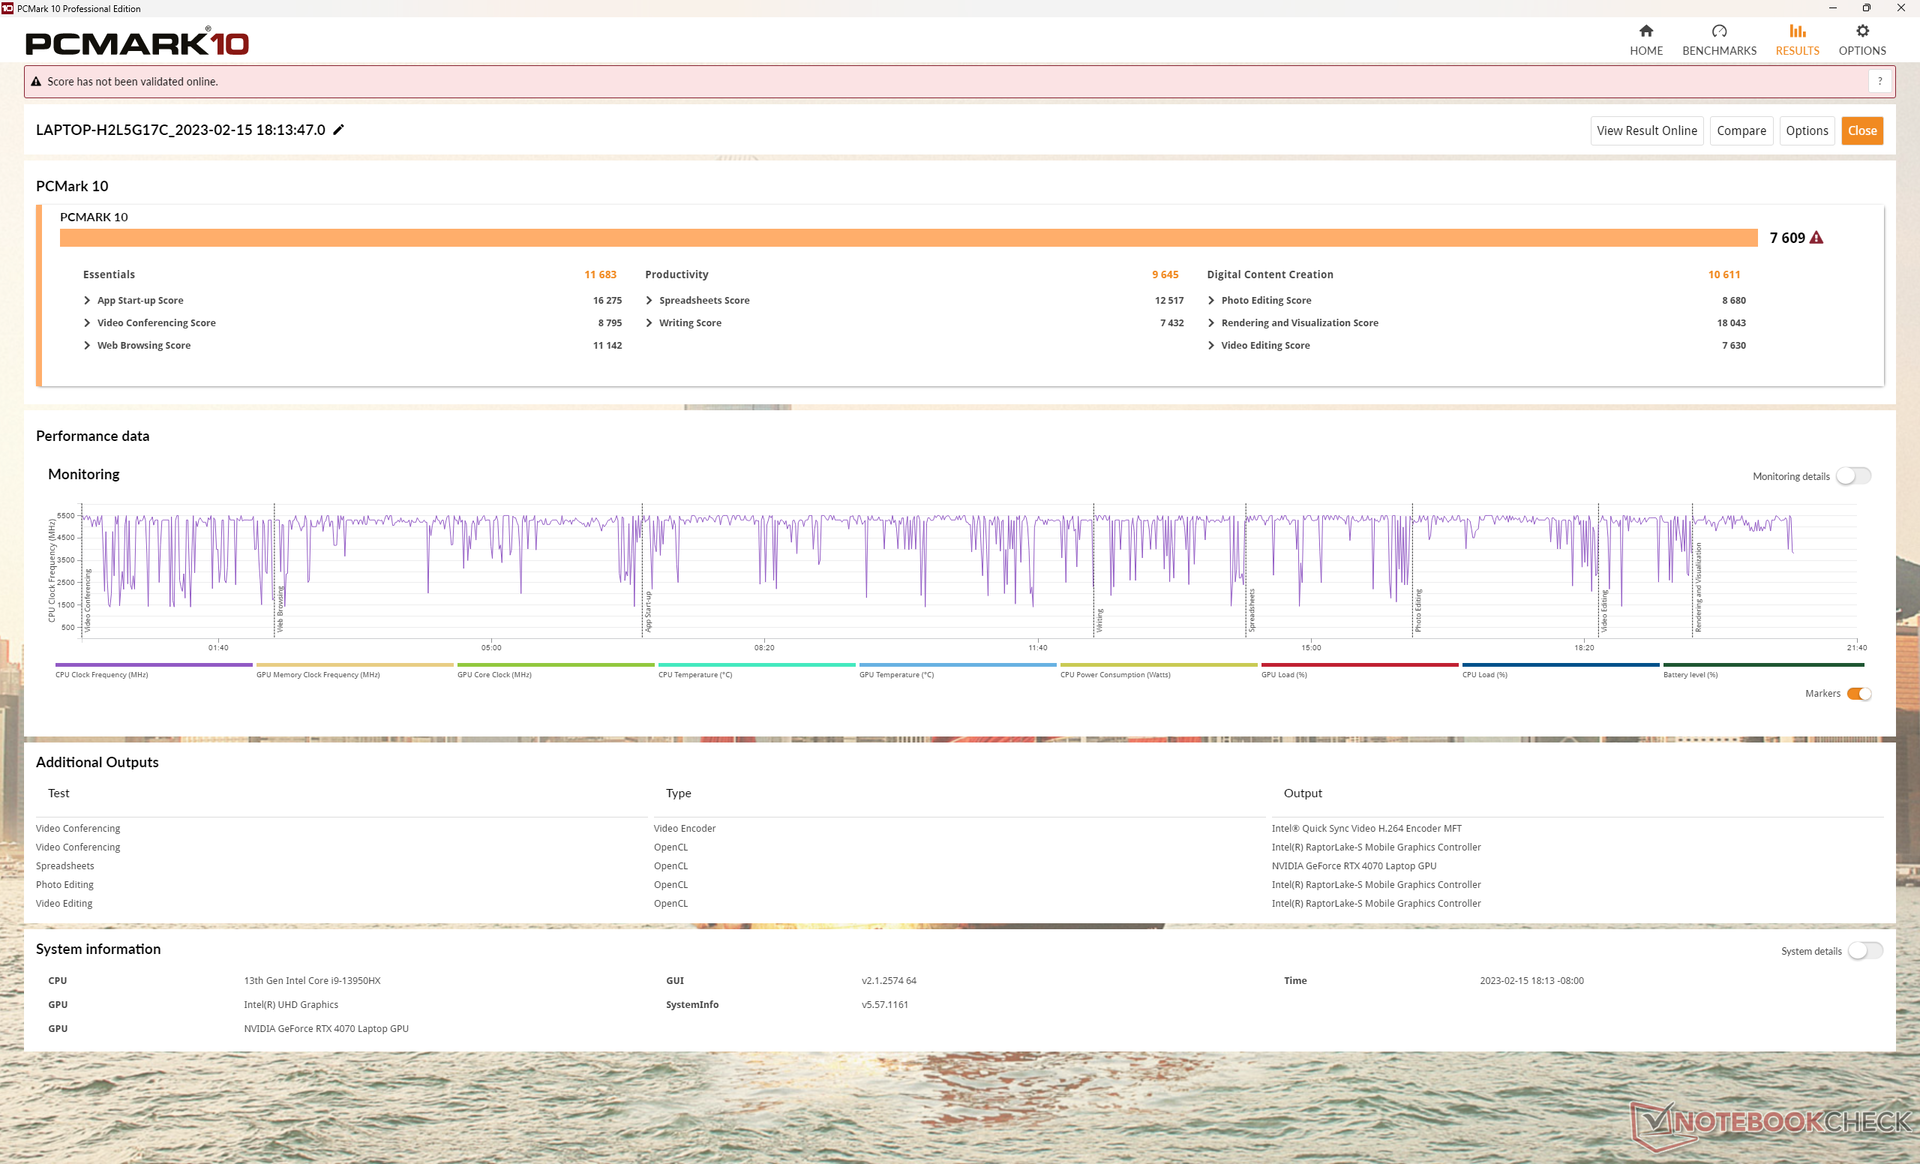
Desempenho do sistema
A pontuação PCMark 10 é consistentemente mais alta do que na 2022 Lâmina 17 mesmo que as margens sejam menores. O Lâmina 16 e MSI GT77 pontuam melhor à medida que cada um deles esporte mais rápido RTX 4080 e 4090 GPUs, respectivamente.
CrossMark: Overall | Productivity | Creativity | Responsiveness
| PCMark 10 / Score | |
| MSI Titan GT77 HX 13VI | |
| Razer Blade 18 RTX 4070 | |
| Média Intel Core i9-13950HX, NVIDIA GeForce RTX 4070 Laptop GPU (n=1) | |
| Alienware m17 R5 (R9 6900HX, RX 6850M XT) | |
| Asus ROG Strix Scar 17 SE G733CX-LL014W | |
| Razer Blade 17 Early 2022 | |
| Gigabyte G7 KE | |
| PCMark 10 / Essentials | |
| MSI Titan GT77 HX 13VI | |
| Razer Blade 18 RTX 4070 | |
| Média Intel Core i9-13950HX, NVIDIA GeForce RTX 4070 Laptop GPU (n=1) | |
| Asus ROG Strix Scar 17 SE G733CX-LL014W | |
| Gigabyte G7 KE | |
| Razer Blade 17 Early 2022 | |
| Alienware m17 R5 (R9 6900HX, RX 6850M XT) | |
| PCMark 10 / Productivity | |
| Asus ROG Strix Scar 17 SE G733CX-LL014W | |
| MSI Titan GT77 HX 13VI | |
| Razer Blade 18 RTX 4070 | |
| Média Intel Core i9-13950HX, NVIDIA GeForce RTX 4070 Laptop GPU (n=1) | |
| Razer Blade 17 Early 2022 | |
| Alienware m17 R5 (R9 6900HX, RX 6850M XT) | |
| Gigabyte G7 KE | |
| PCMark 10 / Digital Content Creation | |
| MSI Titan GT77 HX 13VI | |
| Alienware m17 R5 (R9 6900HX, RX 6850M XT) | |
| Razer Blade 18 RTX 4070 | |
| Média Intel Core i9-13950HX, NVIDIA GeForce RTX 4070 Laptop GPU (n=1) | |
| Razer Blade 17 Early 2022 | |
| Asus ROG Strix Scar 17 SE G733CX-LL014W | |
| Gigabyte G7 KE | |
| CrossMark / Overall | |
| MSI Titan GT77 HX 13VI | |
| Razer Blade 18 RTX 4070 | |
| Média Intel Core i9-13950HX, NVIDIA GeForce RTX 4070 Laptop GPU (n=1) | |
| Asus ROG Strix Scar 17 SE G733CX-LL014W | |
| Gigabyte G7 KE | |
| Razer Blade 17 Early 2022 | |
| Alienware m17 R5 (R9 6900HX, RX 6850M XT) | |
| CrossMark / Productivity | |
| MSI Titan GT77 HX 13VI | |
| Razer Blade 18 RTX 4070 | |
| Média Intel Core i9-13950HX, NVIDIA GeForce RTX 4070 Laptop GPU (n=1) | |
| Asus ROG Strix Scar 17 SE G733CX-LL014W | |
| Gigabyte G7 KE | |
| Razer Blade 17 Early 2022 | |
| Alienware m17 R5 (R9 6900HX, RX 6850M XT) | |
| CrossMark / Creativity | |
| MSI Titan GT77 HX 13VI | |
| Razer Blade 18 RTX 4070 | |
| Média Intel Core i9-13950HX, NVIDIA GeForce RTX 4070 Laptop GPU (n=1) | |
| Asus ROG Strix Scar 17 SE G733CX-LL014W | |
| Razer Blade 17 Early 2022 | |
| Gigabyte G7 KE | |
| Alienware m17 R5 (R9 6900HX, RX 6850M XT) | |
| CrossMark / Responsiveness | |
| Gigabyte G7 KE | |
| Asus ROG Strix Scar 17 SE G733CX-LL014W | |
| Razer Blade 18 RTX 4070 | |
| Média Intel Core i9-13950HX, NVIDIA GeForce RTX 4070 Laptop GPU (n=1) | |
| MSI Titan GT77 HX 13VI | |
| Razer Blade 17 Early 2022 | |
| Alienware m17 R5 (R9 6900HX, RX 6850M XT) | |
| PCMark 10 Score | 7609 pontos | |
Ajuda | ||
| AIDA64 / Memory Copy | |
| Razer Blade 18 RTX 4070 | |
| Média Intel Core i9-13950HX (61938 - 78813, n=9) | |
| MSI Titan GT77 HX 13VI | |
| Asus ROG Strix Scar 17 SE G733CX-LL014W | |
| Razer Blade 17 Early 2022 | |
| Alienware m17 R5 (R9 6900HX, RX 6850M XT) | |
| Gigabyte G7 KE | |
| AIDA64 / Memory Read | |
| Razer Blade 18 RTX 4070 | |
| Média Intel Core i9-13950HX (62368 - 86831, n=9) | |
| Asus ROG Strix Scar 17 SE G733CX-LL014W | |
| MSI Titan GT77 HX 13VI | |
| Razer Blade 17 Early 2022 | |
| Alienware m17 R5 (R9 6900HX, RX 6850M XT) | |
| Gigabyte G7 KE | |
| AIDA64 / Memory Write | |
| Razer Blade 18 RTX 4070 | |
| Média Intel Core i9-13950HX (59501 - 80441, n=9) | |
| Asus ROG Strix Scar 17 SE G733CX-LL014W | |
| MSI Titan GT77 HX 13VI | |
| Razer Blade 17 Early 2022 | |
| Alienware m17 R5 (R9 6900HX, RX 6850M XT) | |
| Gigabyte G7 KE | |
| AIDA64 / Memory Latency | |
| Alienware m17 R5 (R9 6900HX, RX 6850M XT) | |
| MSI Titan GT77 HX 13VI | |
| Gigabyte G7 KE | |
| Média Intel Core i9-13950HX (84.4 - 99.5, n=9) | |
| Asus ROG Strix Scar 17 SE G733CX-LL014W | |
| Razer Blade 18 RTX 4070 | |
* ... menor é melhor
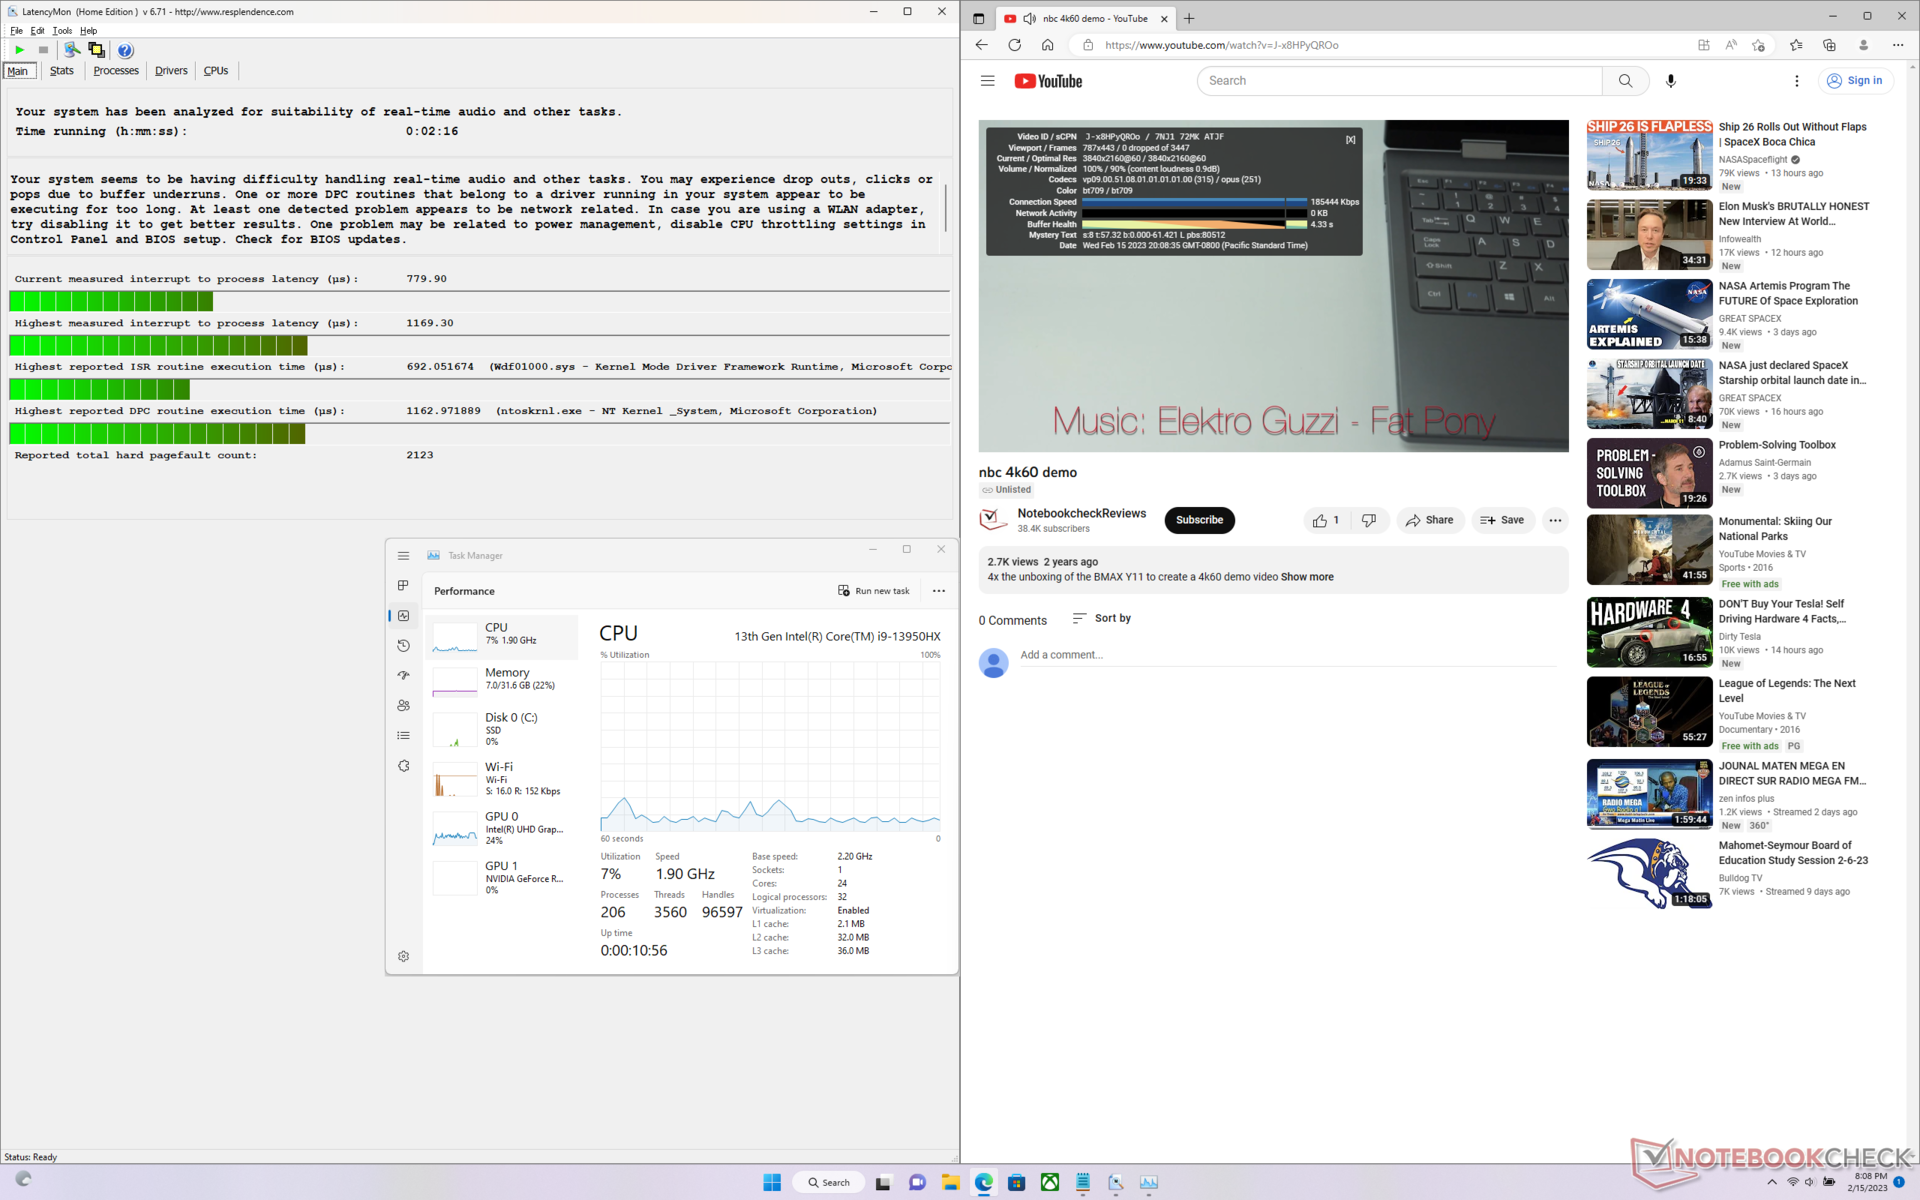
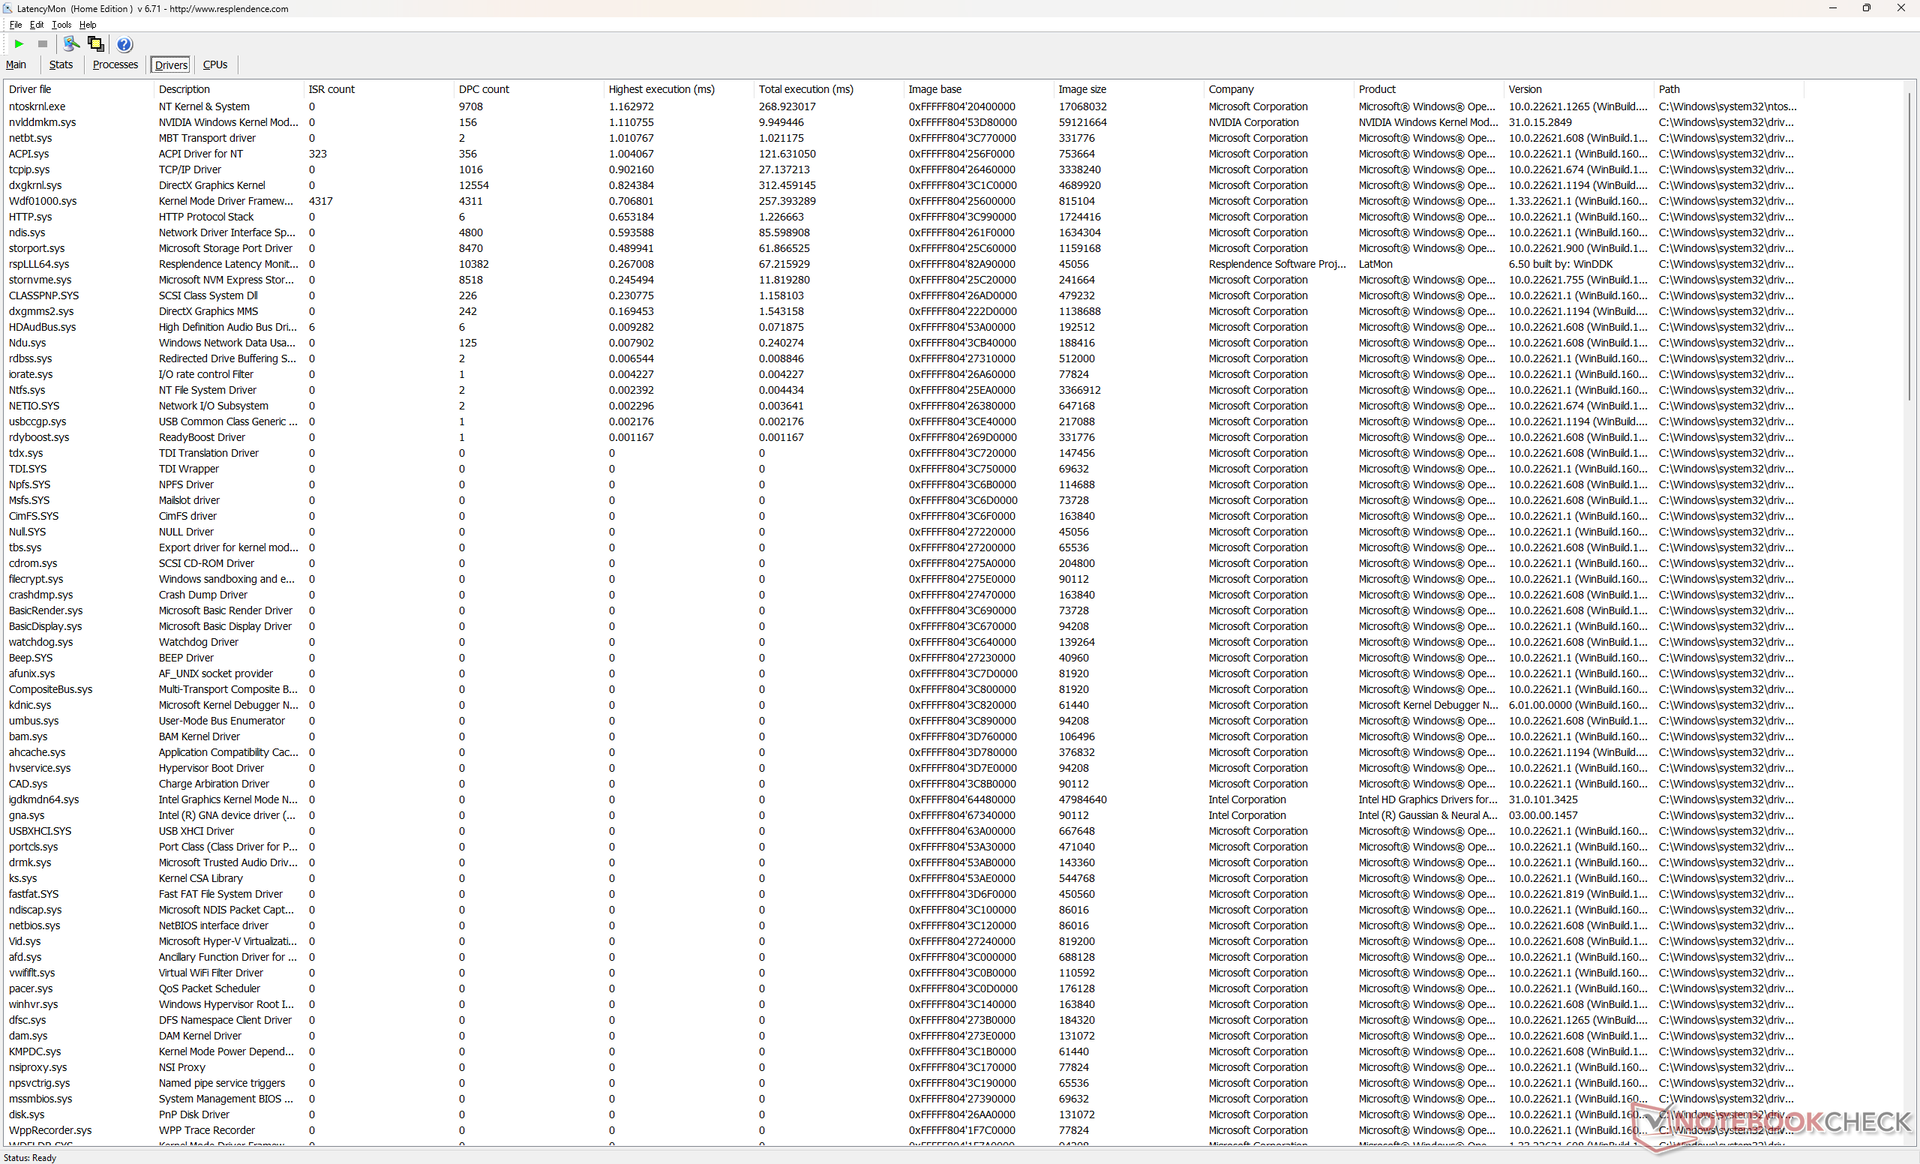
Latência do DPC
LatencyMon revela pequenos problemas de DPC ao abrir várias abas do navegador em nossa página inicial. a reprodução de vídeo de 4K a 60 FPS é, de outra forma, impecável, tanto com baixa utilização de CPU quanto de GPU.
| DPC Latencies / LatencyMon - interrupt to process latency (max), Web, Youtube, Prime95 | |
| MSI Titan GT77 HX 13VI | |
| Asus ROG Strix Scar 17 SE G733CX-LL014W | |
| Gigabyte G7 KE | |
| Alienware m17 R5 (R9 6900HX, RX 6850M XT) | |
| Razer Blade 18 RTX 4070 | |
| Razer Blade 17 Early 2022 | |
* ... menor é melhor
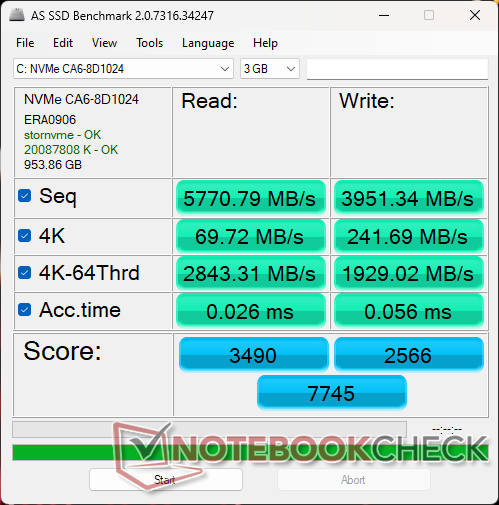
Dispositivos de armazenamento - Até dois SSDs
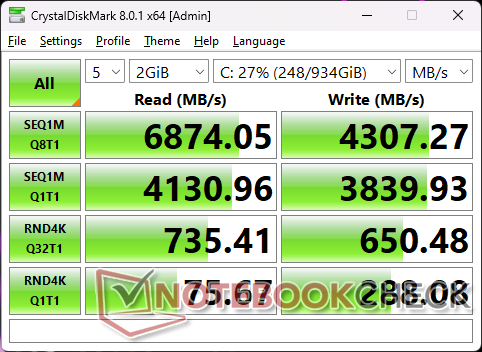
Nossa unidade de teste é enviada com o mesmo 1 TB SSSTC CA6-8D1024 PCIe4 x4 NVMe SSD como encontrado no Alienware m17 R5. As taxas de transferência são comparáveis às populares Samsung PM9A1 com taxas de leitura e escrita sequenciais estáveis, aproximando-se de 6900 MB/s e 4300 MB/s, respectivamente. A Razer inclui uma almofada térmica para cada um dos dois slots SSD para dissipar o calor no painel inferior metálico.

| Drive Performance rating - Percent | |
| Asus ROG Strix Scar 17 SE G733CX-LL014W | |
| Gigabyte G7 KE | |
| Razer Blade 17 Early 2022 | |
| MSI Titan GT77 HX 13VI | |
| Razer Blade 18 RTX 4070 | |
| Alienware m17 R5 (R9 6900HX, RX 6850M XT) | |
* ... menor é melhor
Disk Throttling: DiskSpd Read Loop, Queue Depth 8
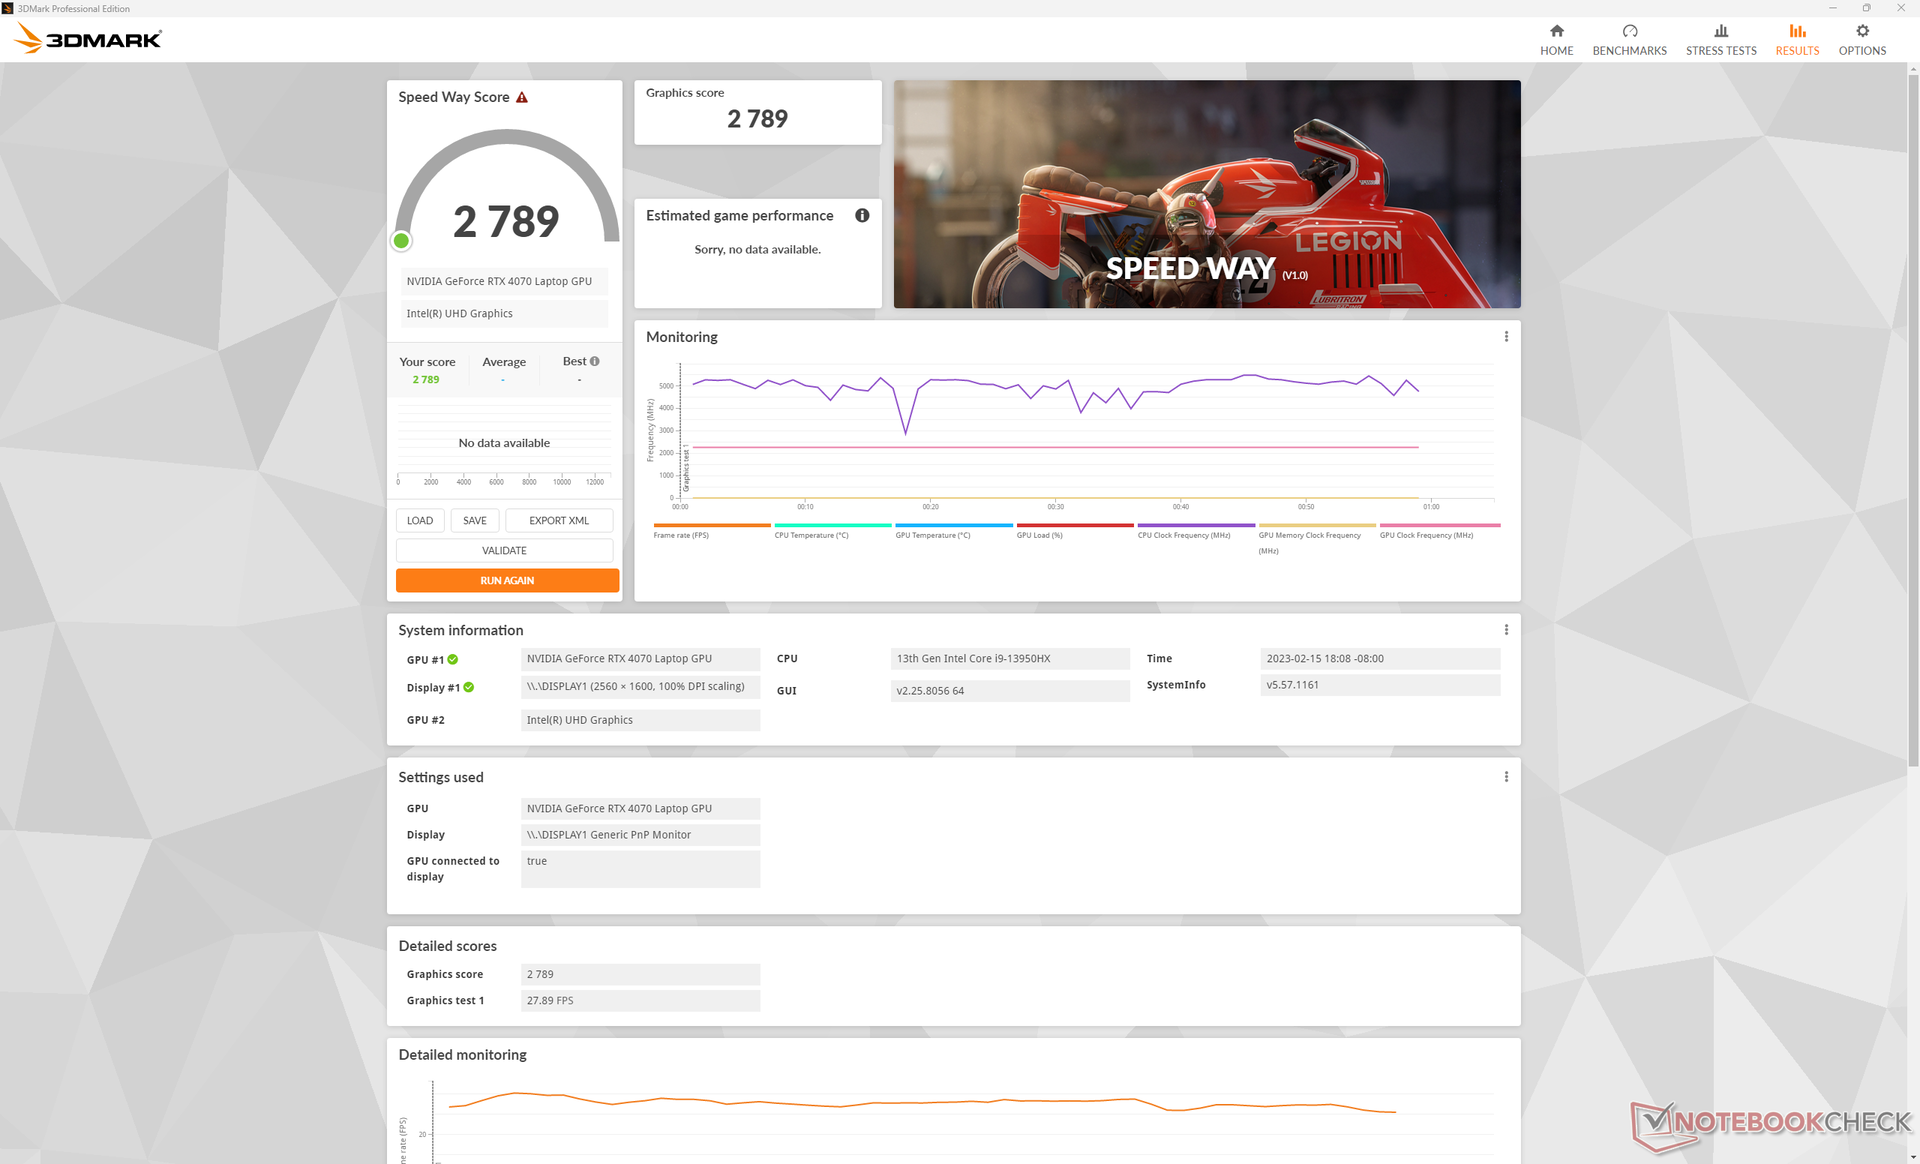
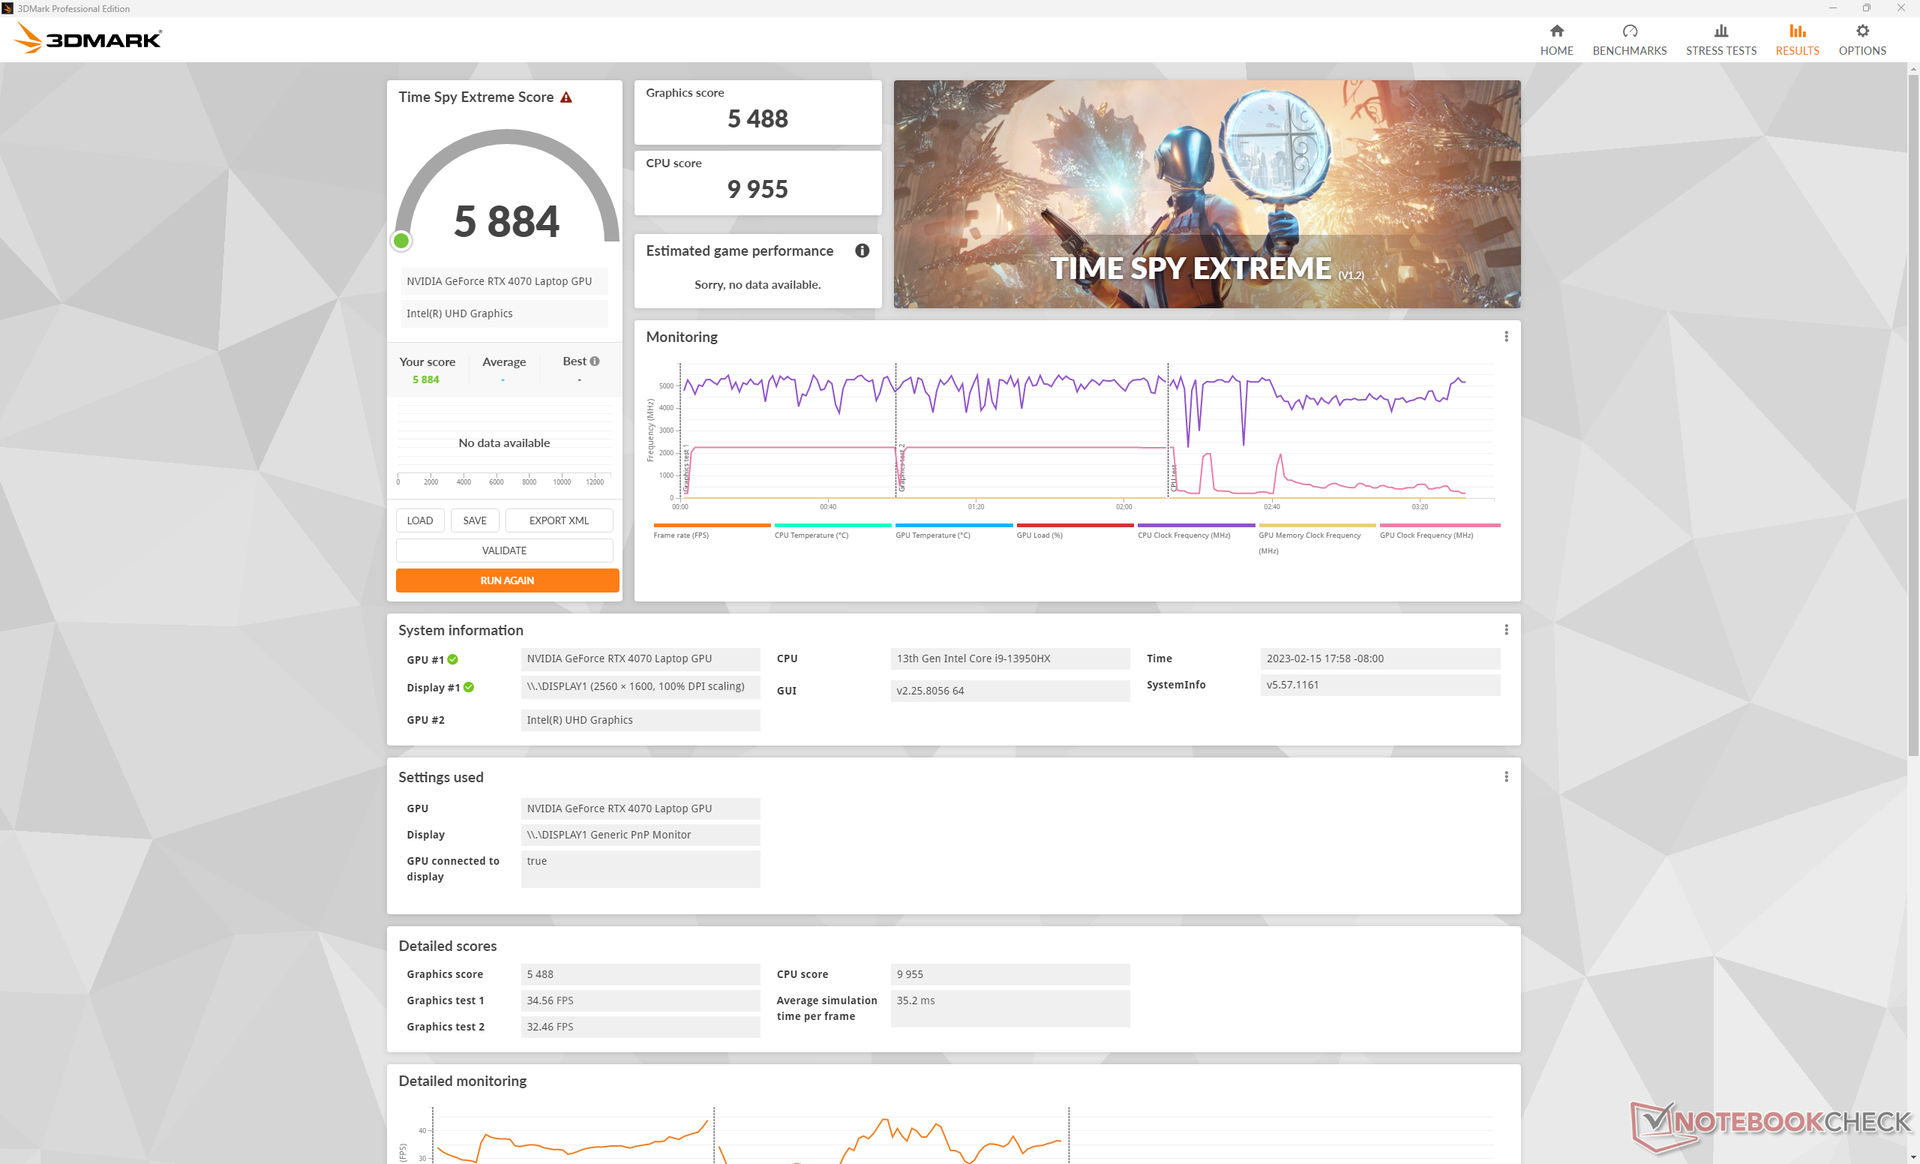
GPU Performance - Performance similar à de um desktop GeForce RTX 3070
Os 140 Wmóvel GeForce RTX 4070 senta-se confortavelmente no meio do móvel RTX 3080 emóvel RTX 3080 Ti em termos de desempenho bruto. É apenas cerca de 10 a 20 por cento mais rápido do que a saída móvel RTX 3070o que, no entanto, é um pouco decepcionante quando se considera que o móvel RTX 4080 é cerca de 40 a 50 por cento mais rápido que o móvel RTX 3080. Isto significa que a lacuna de desempenho entre o RTX 4070 móvel e o RTX 4080 móvel é mais significativa, de 40 a 60 por cento.
Quando comparado com as GPUs de mesa, o RTX 4070 móvel é cerca de 5% a 10% mais lento do que o desktop RTX 3070 que foi lançado há três anos.
Um grande ponto de venda para GeForce 40 GPUs é seu suporte para geração de quadros ou DLSS 3. Infelizmente, nossa unidade de teste Blade 18 RTX 4070 exibiria problemas ao executar jogos suportados com DLSS 3 habilitado em um monitor externo HDMI ou USB-C 4K. As taxas de quadros seriam de <30 FPS em todos os títulos testados por aparentemente nenhum motivo, enquanto o Blade 16 RTX 4080 não teria tais problemas. Curiosamente, o DLSS 3 funcionaria perfeitamente bem no monitor interno da Blade 18. Chegamos até a Razer para uma solução potencial e atualizaremos esta seção quando apropriado. Por enquanto, no entanto, você vai querer jogar jogos no visor interno se o DLSS 3 estiver habilitado.
Jogos adicionais serão comparados nos dias que se seguirão.
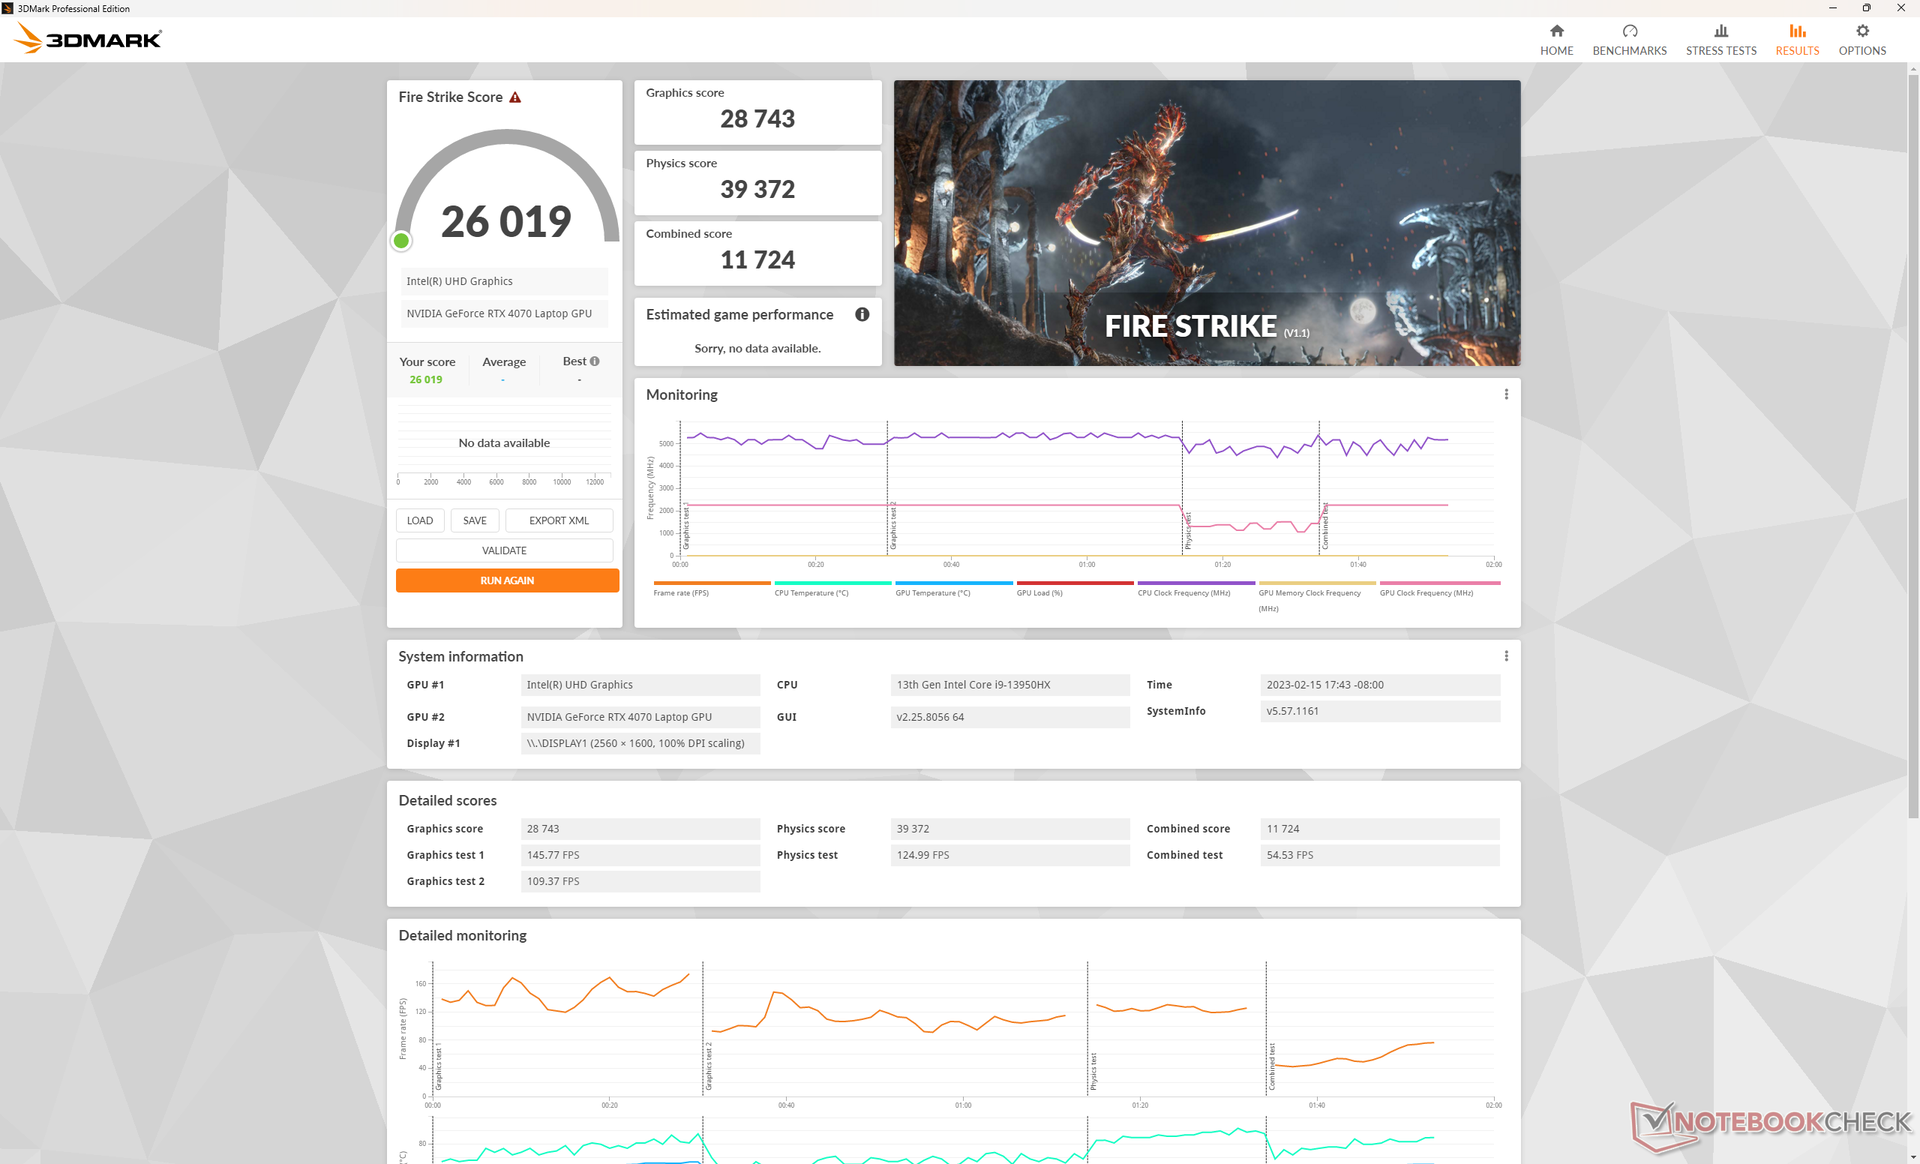
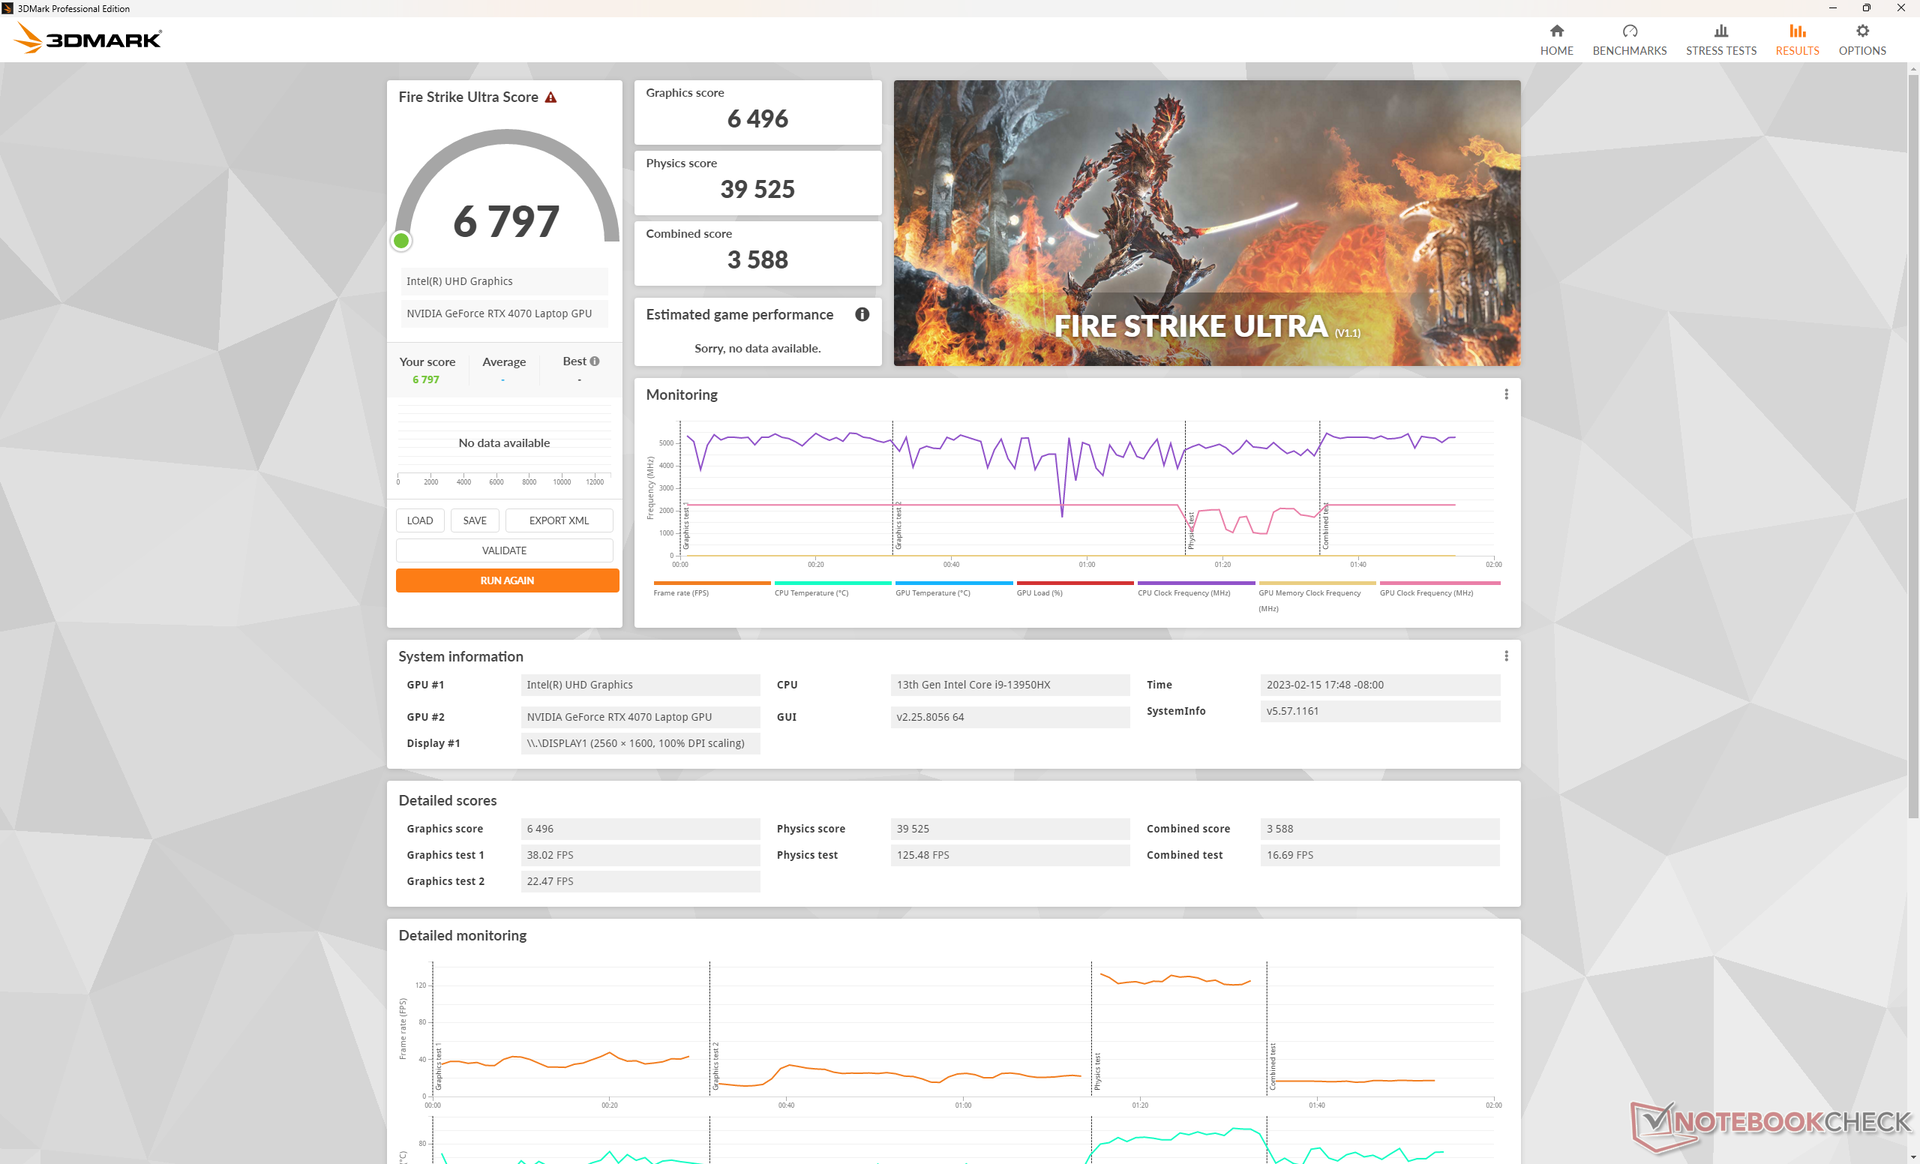
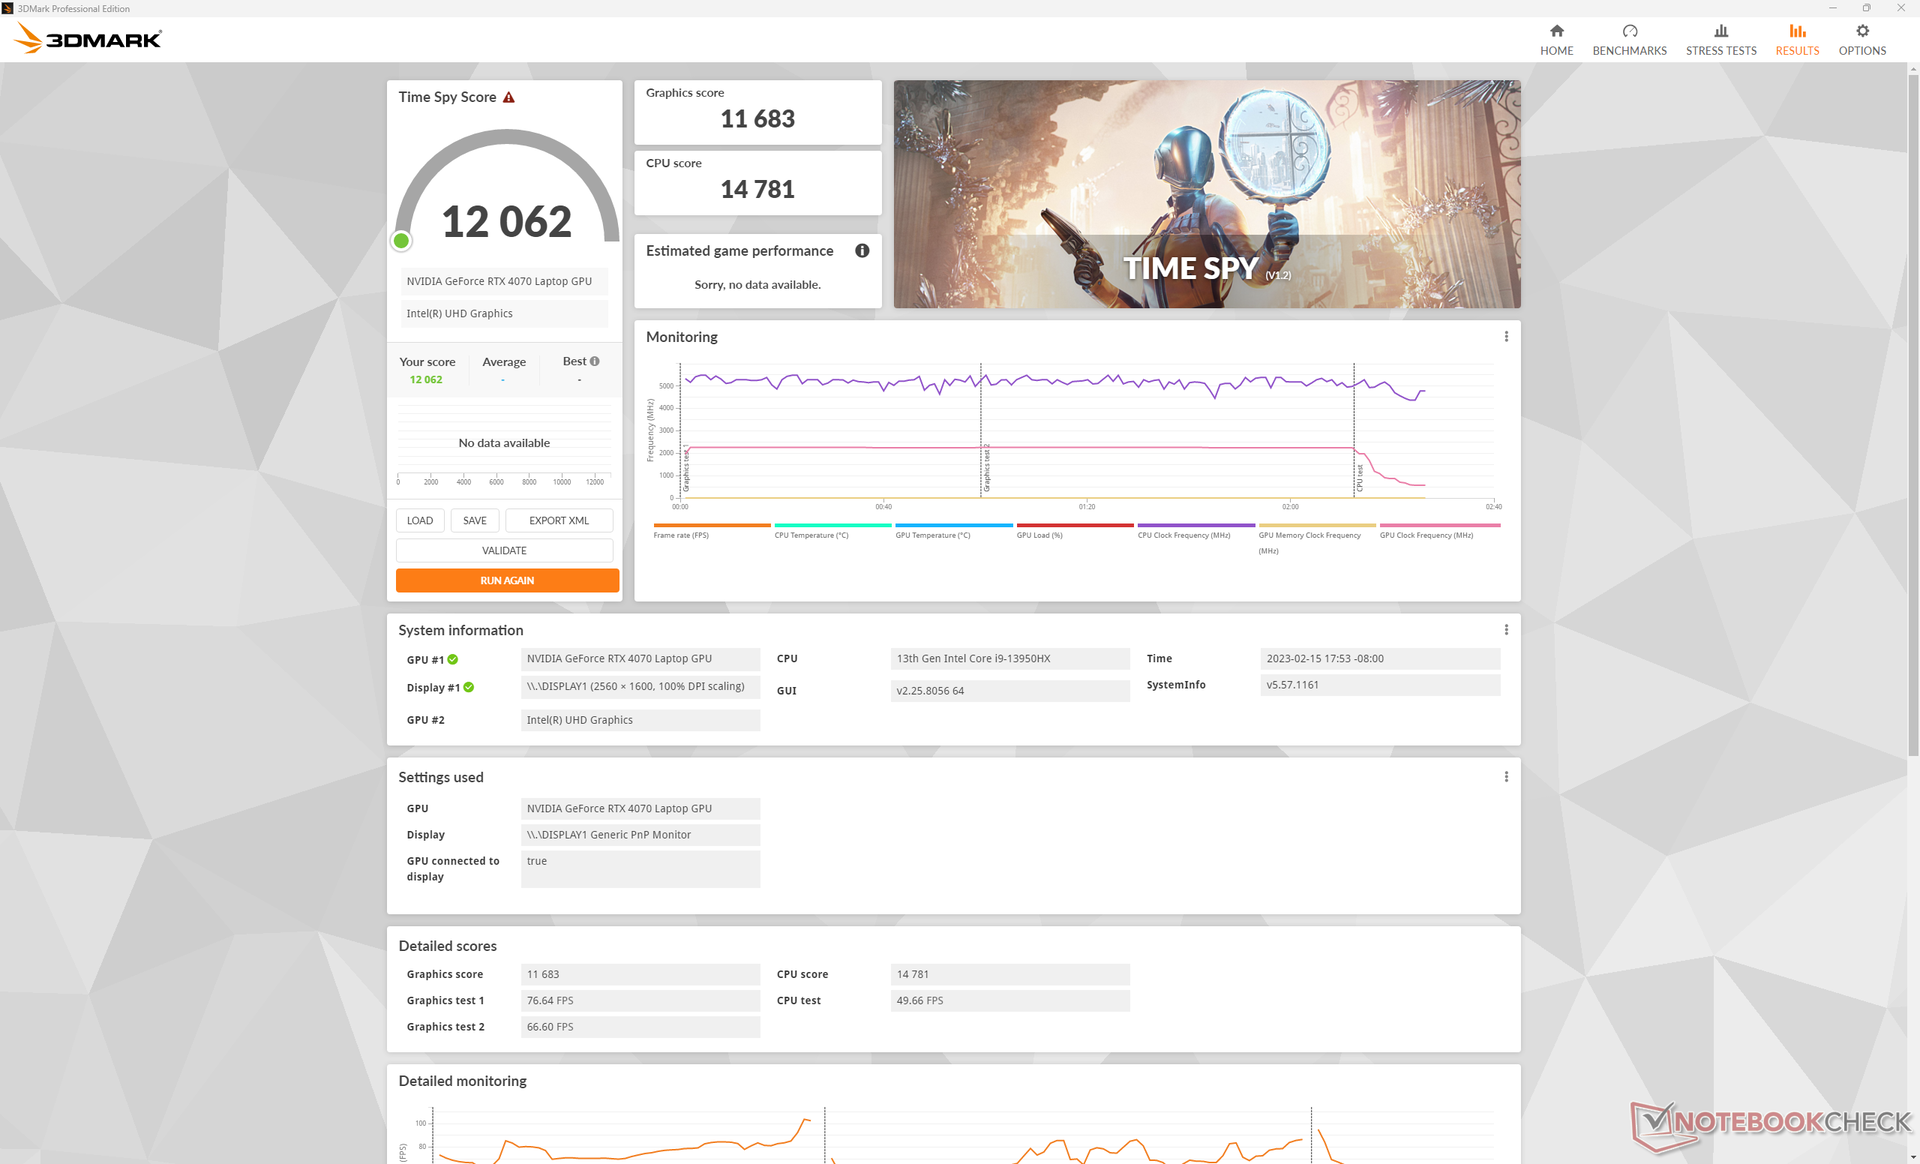
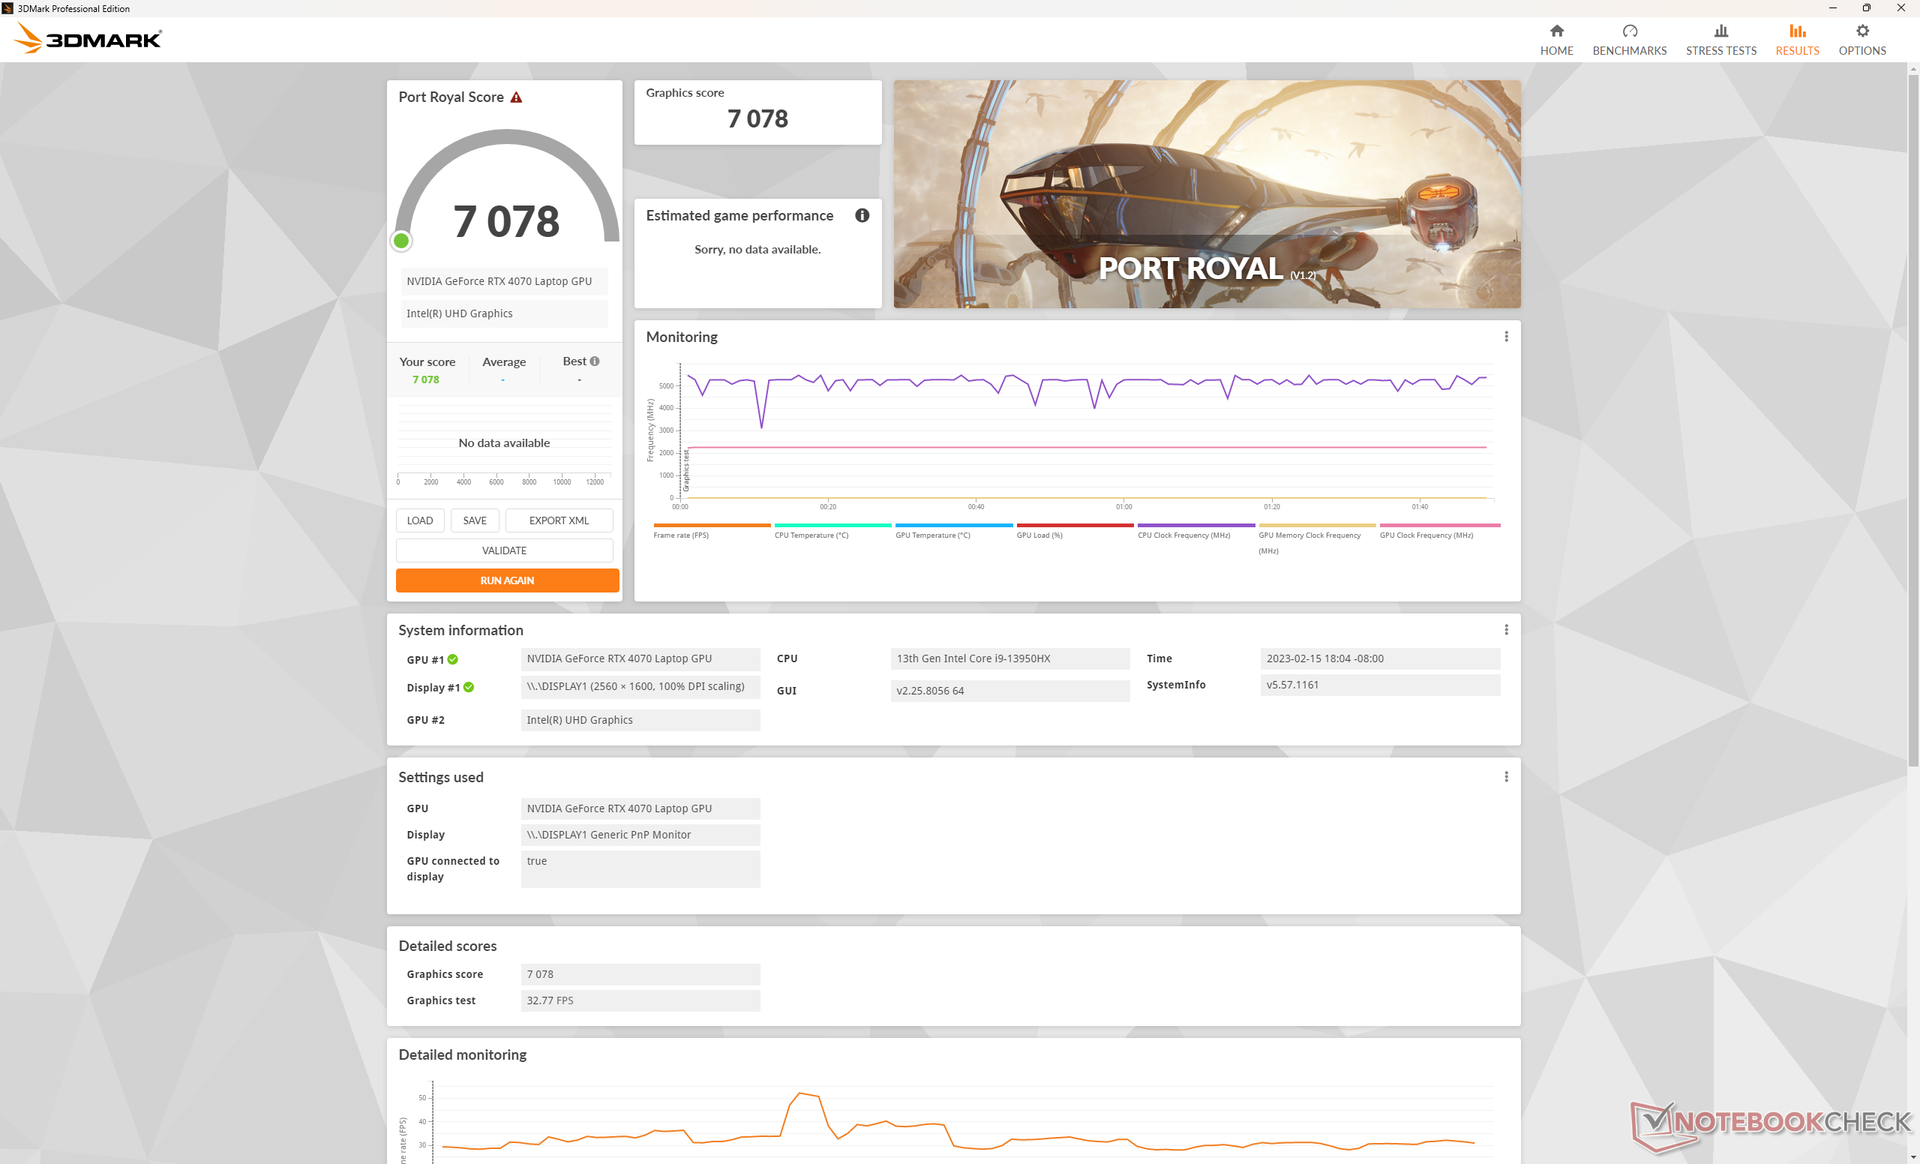
| 3DMark 11 Performance | 34754 pontos | |
| 3DMark Fire Strike Score | 26019 pontos | |
| 3DMark Time Spy Score | 12062 pontos | |
Ajuda | ||
* ... menor é melhor
Manejando em Witcher 3 por uma hora retornaria taxas de quadros estáveis, sem quedas recorrentes no desempenho para sugerir nenhuma interrupção nas aplicações de fundo ou grande estrangulamento.
Witcher 3 FPS Chart
| baixo | média | alto | ultra | QHD | 4K | |
|---|---|---|---|---|---|---|
| GTA V (2015) | 186.1 | 184.7 | 181.6 | 121.4 | 87.6 | 88.5 |
| The Witcher 3 (2015) | 617 | 405.9 | 240.9 | 113.9 | 72.5 | |
| Dota 2 Reborn (2015) | 225 | 200 | 191 | 178.6 | 145.5 | |
| Final Fantasy XV Benchmark (2018) | 231 | 166.9 | 115.2 | 82 | 46.6 | |
| X-Plane 11.11 (2018) | 203 | 178.9 | 137.9 | 117.7 | ||
| Strange Brigade (2018) | 464 | 315 | 243 | 208 | 136.7 | 71.9 |
| Metro Exodus (2019) | 208.9 | 139.8 | 109.7 | 86.8 | 69 | 44 |
| Borderlands 3 (2019) | 258.5 | 200.1 | 131.8 | 100.3 | 68.7 | 35.7 |
| Hitman 3 (2021) | 294.3 | 234 | 208.4 | 197.4 | 129.9 | 68.5 |
| Cyberpunk 2077 1.6 (2022) | 147.8 | 125.7 | 111.5 | 92.1 | 54 | 23.3 |
Emissões
Ruído do sistema - Silencioso quando não se joga
Os ventiladores internos são silenciosos quando executam cargas não exigentes como streaming de vídeo ou navegação na web. O ruído dos ventiladores normalmente pairaria pouco menos de 27 dB(A) contra um fundo silencioso de 23,5 dB(A) para ser essencialmente inaudível na maioria das condições. Isto é mais silencioso do que o esperado, dado o tamanho e a potência sob a madeira.
Correr com cargas mais altas, como jogos, aumentará a rotação do ventilador lenta mas firmemente antes de estabilizar-se em 48 dB(A). Se for enfatizado a 100% de utilização, o ruído do ventilador pode até chegar a 54 dB(A). A faixa baixa de 50 dB(A) é típica da maioria dos laptops de jogos, incluindo o GT77 ou a própria Lâmina 17 da Razer. A Lâmina 18 é tão barulhenta quanto seus irmãos menores quando jogam, apesar de suas diferenças de tamanho.
Barulho
| Ocioso |
| 23.8 / 23.8 / 26.8 dB |
| Carga |
| 37.3 / 53.5 dB |
 | ||
30 dB silencioso 40 dB(A) audível 50 dB(A) ruidosamente alto |
||
min: | ||
| Razer Blade 18 RTX 4070 GeForce RTX 4070 Laptop GPU, i9-13950HX, SSSTC CA6-8D1024 | Razer Blade 17 Early 2022 GeForce RTX 3080 Ti Laptop GPU, i9-12900H, Samsung PM9A1 MZVL21T0HCLR | MSI Titan GT77 HX 13VI GeForce RTX 4090 Laptop GPU, i9-13950HX, Samsung PM9A1 MZVL22T0HBLB | Gigabyte G7 KE GeForce RTX 3060 Laptop GPU, i5-12500H, Gigabyte AG470S1TB-SI B10 | Alienware m17 R5 (R9 6900HX, RX 6850M XT) Radeon RX 6850M XT, R9 6900HX, SSSTC CA6-8D1024 | Asus ROG Strix Scar 17 SE G733CX-LL014W GeForce RTX 3080 Ti Laptop GPU, i9-12950HX, Samsung PM9A1 MZVL22T0HBLB | |
|---|---|---|---|---|---|---|
| Noise | -12% | -17% | -26% | 0% | 5% | |
| desligado / ambiente * (dB) | 23.5 | 26 -11% | 24.6 -5% | 27 -15% | 23 2% | 23.9 -2% |
| Idle Minimum * (dB) | 23.8 | 26 -9% | 29.2 -23% | 27 -13% | 23 3% | 23.9 -0% |
| Idle Average * (dB) | 23.8 | 27 -13% | 29.2 -23% | 35 -47% | 28.11 -18% | 23.9 -0% |
| Idle Maximum * (dB) | 26.8 | 32 -19% | 29.2 -9% | 38 -42% | 28.11 -5% | 23.9 11% |
| Load Average * (dB) | 37.3 | 50 -34% | 50.7 -36% | 52 -39% | 30.62 18% | 34.3 8% |
| Witcher 3 ultra * (dB) | 48 | 51 -6% | 53.3 -11% | 56 -17% | 49.75 -4% | |
| Load Maximum * (dB) | 53.5 | 51 5% | 61 -14% | 59 -10% | 50.17 6% | 45.9 14% |
* ... menor é melhor
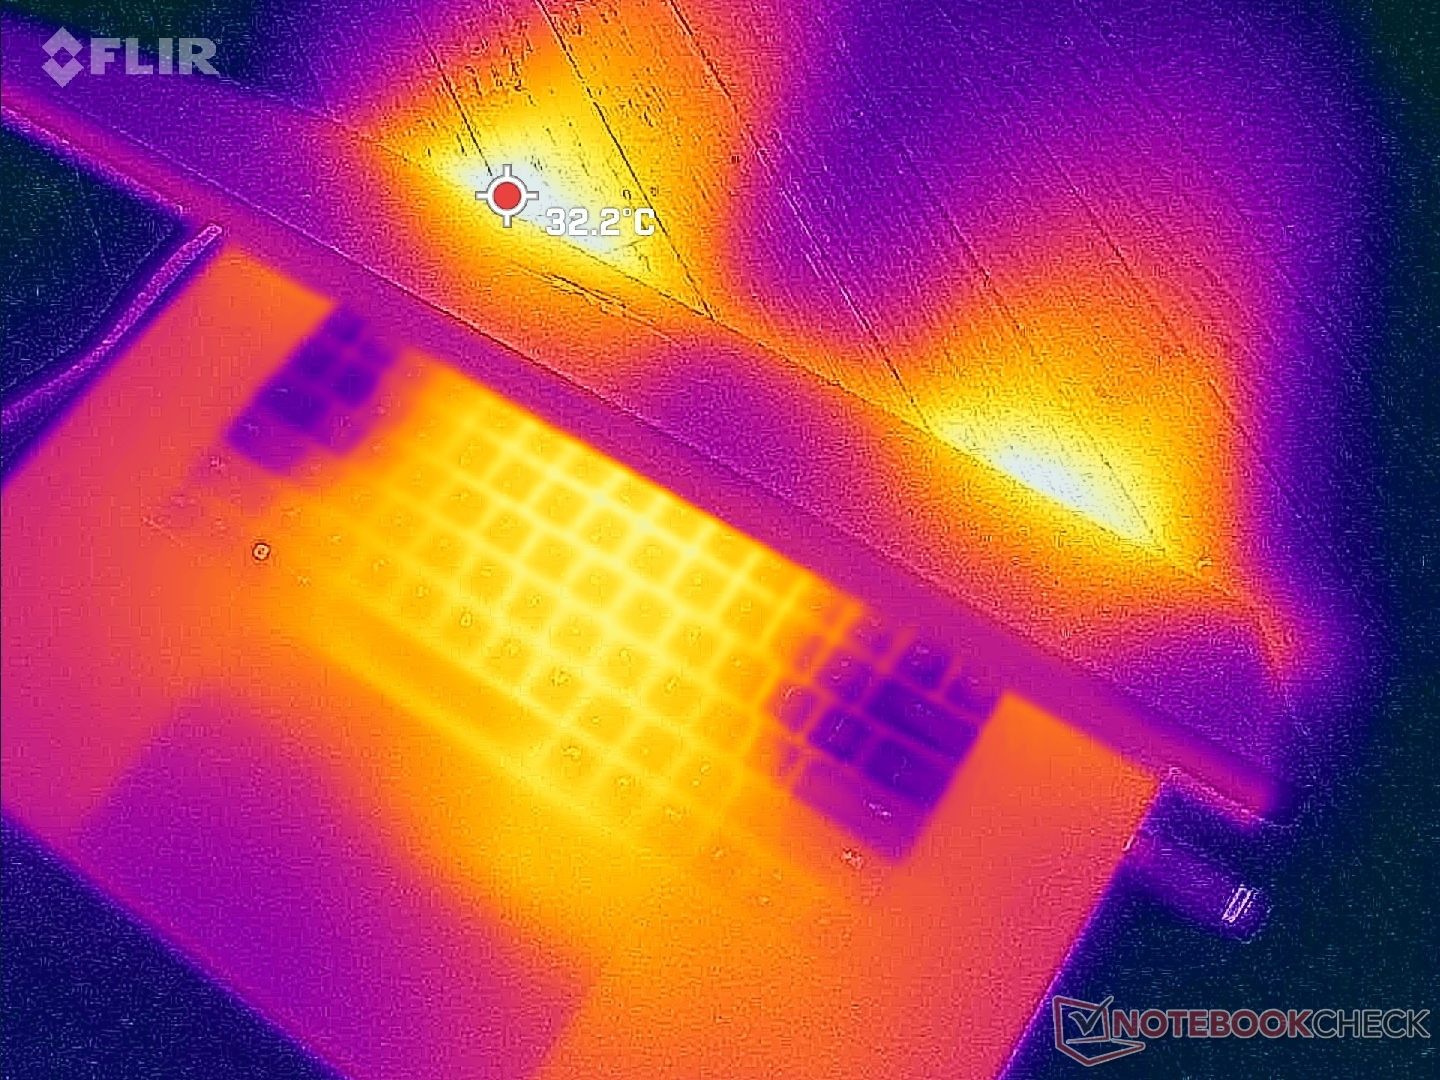
Temperatura
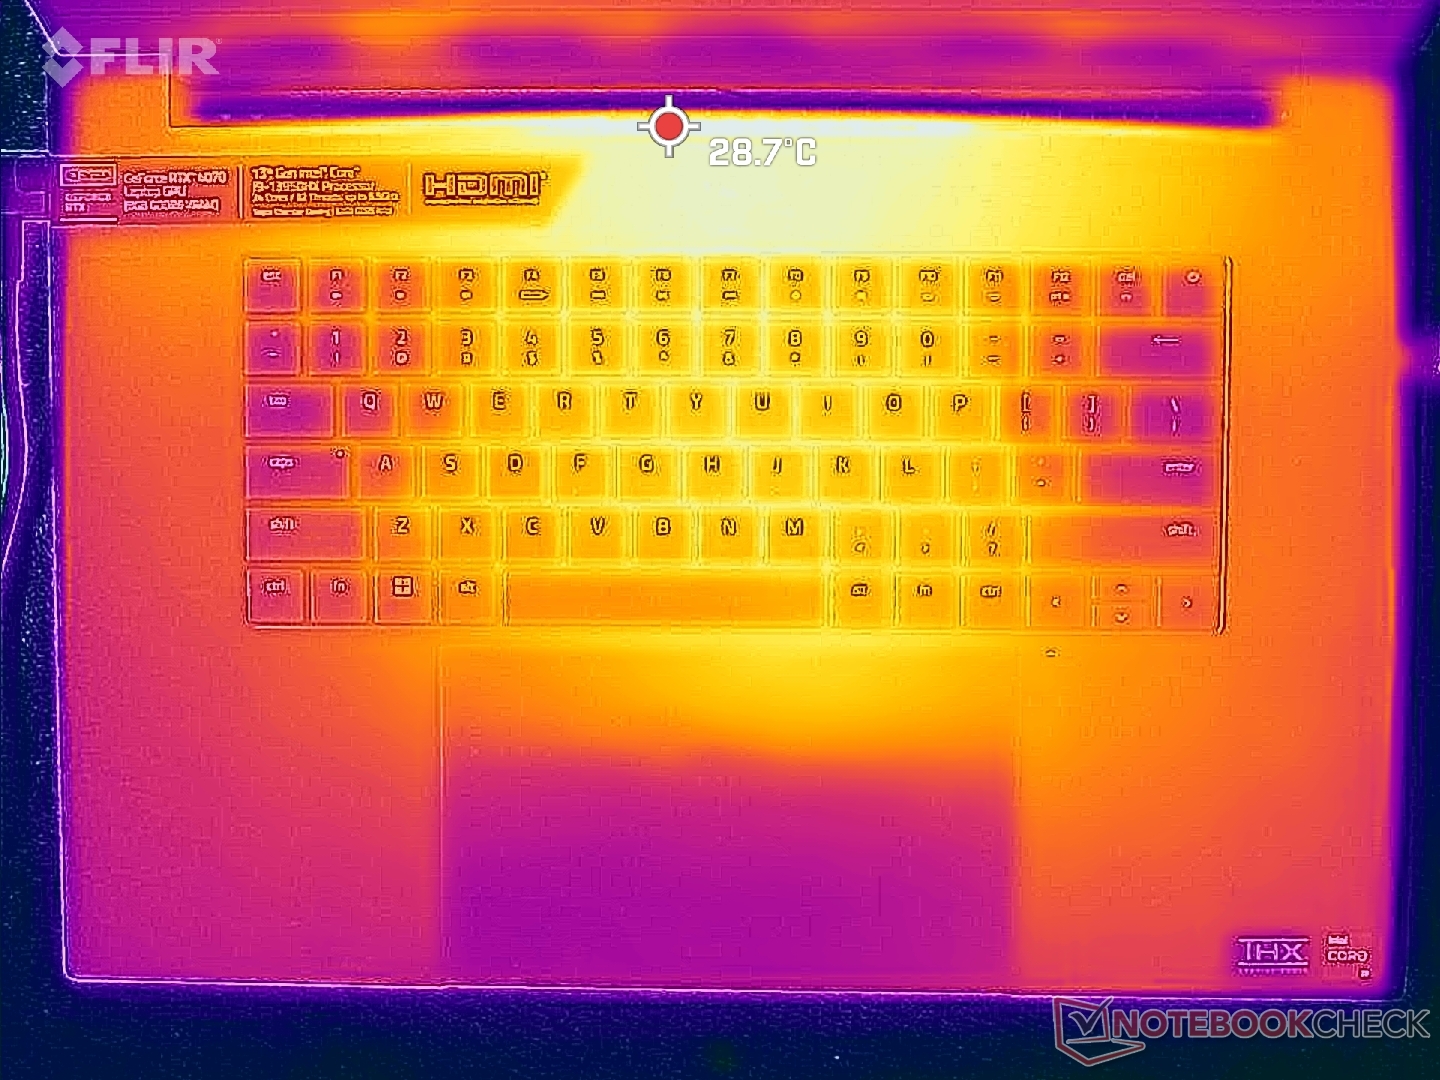
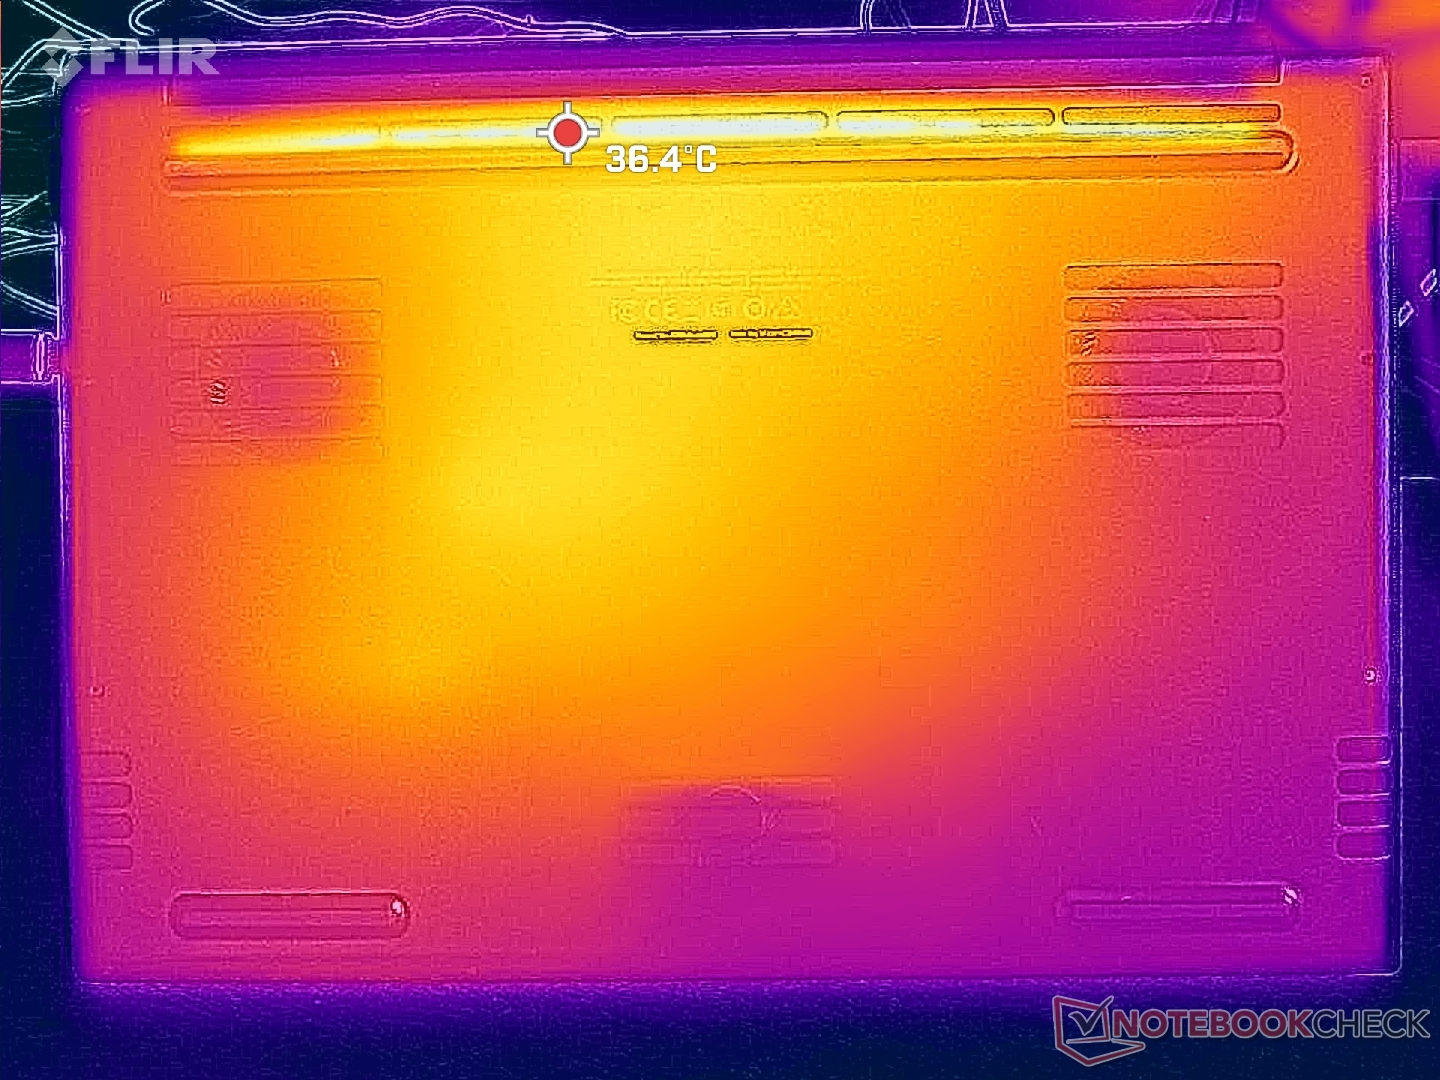
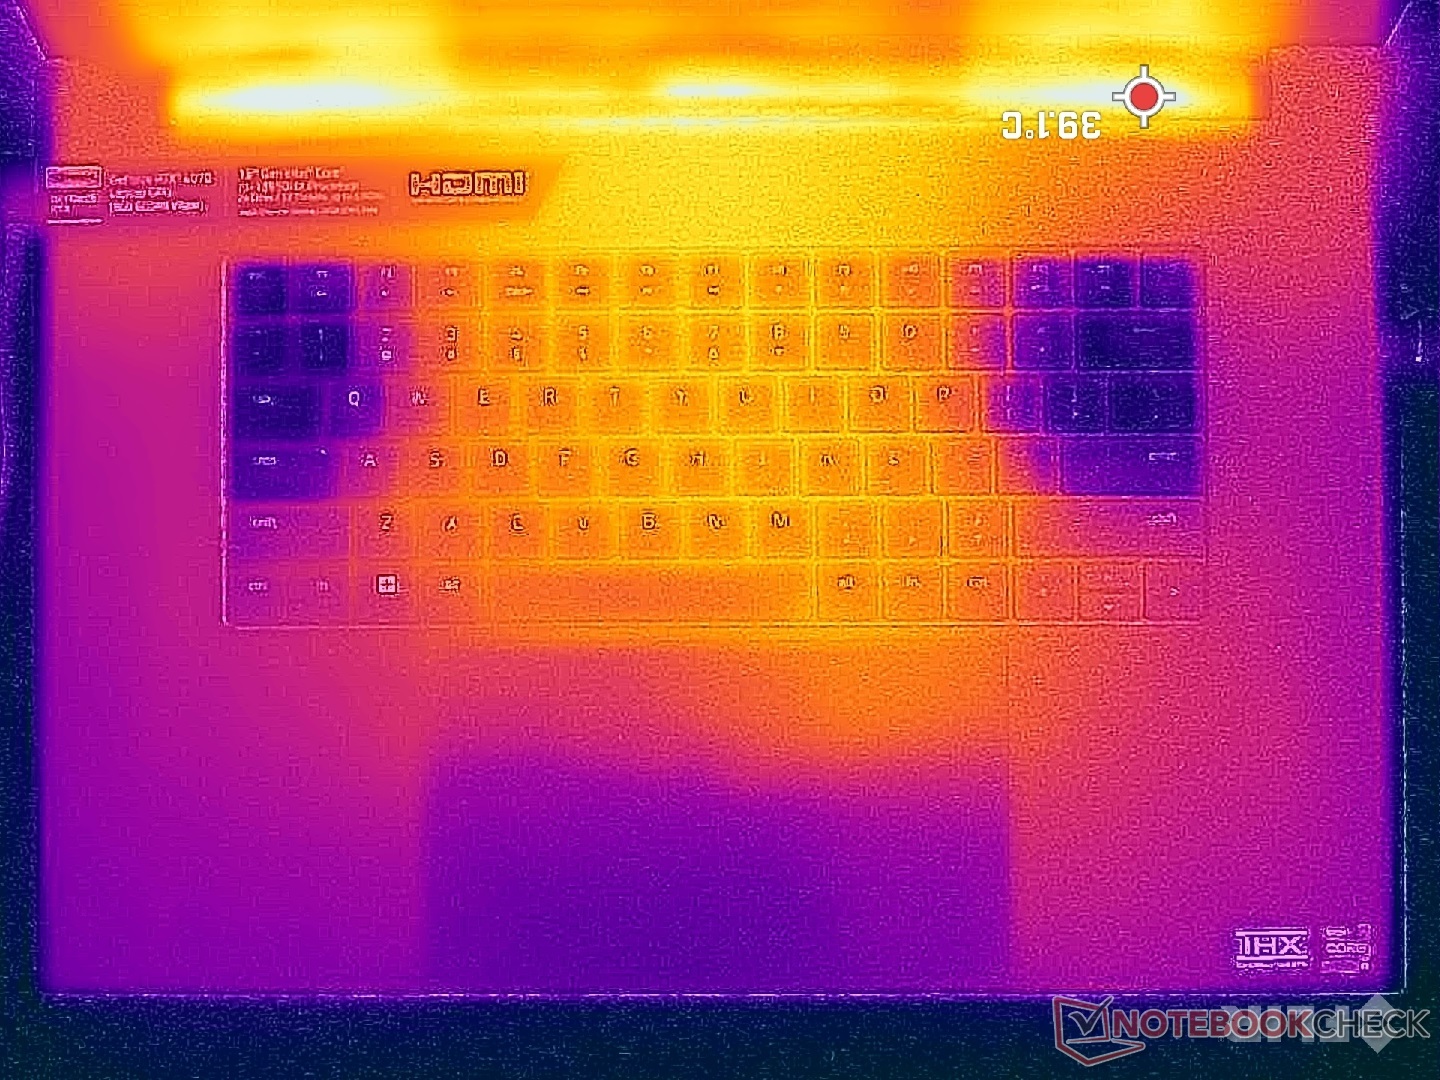
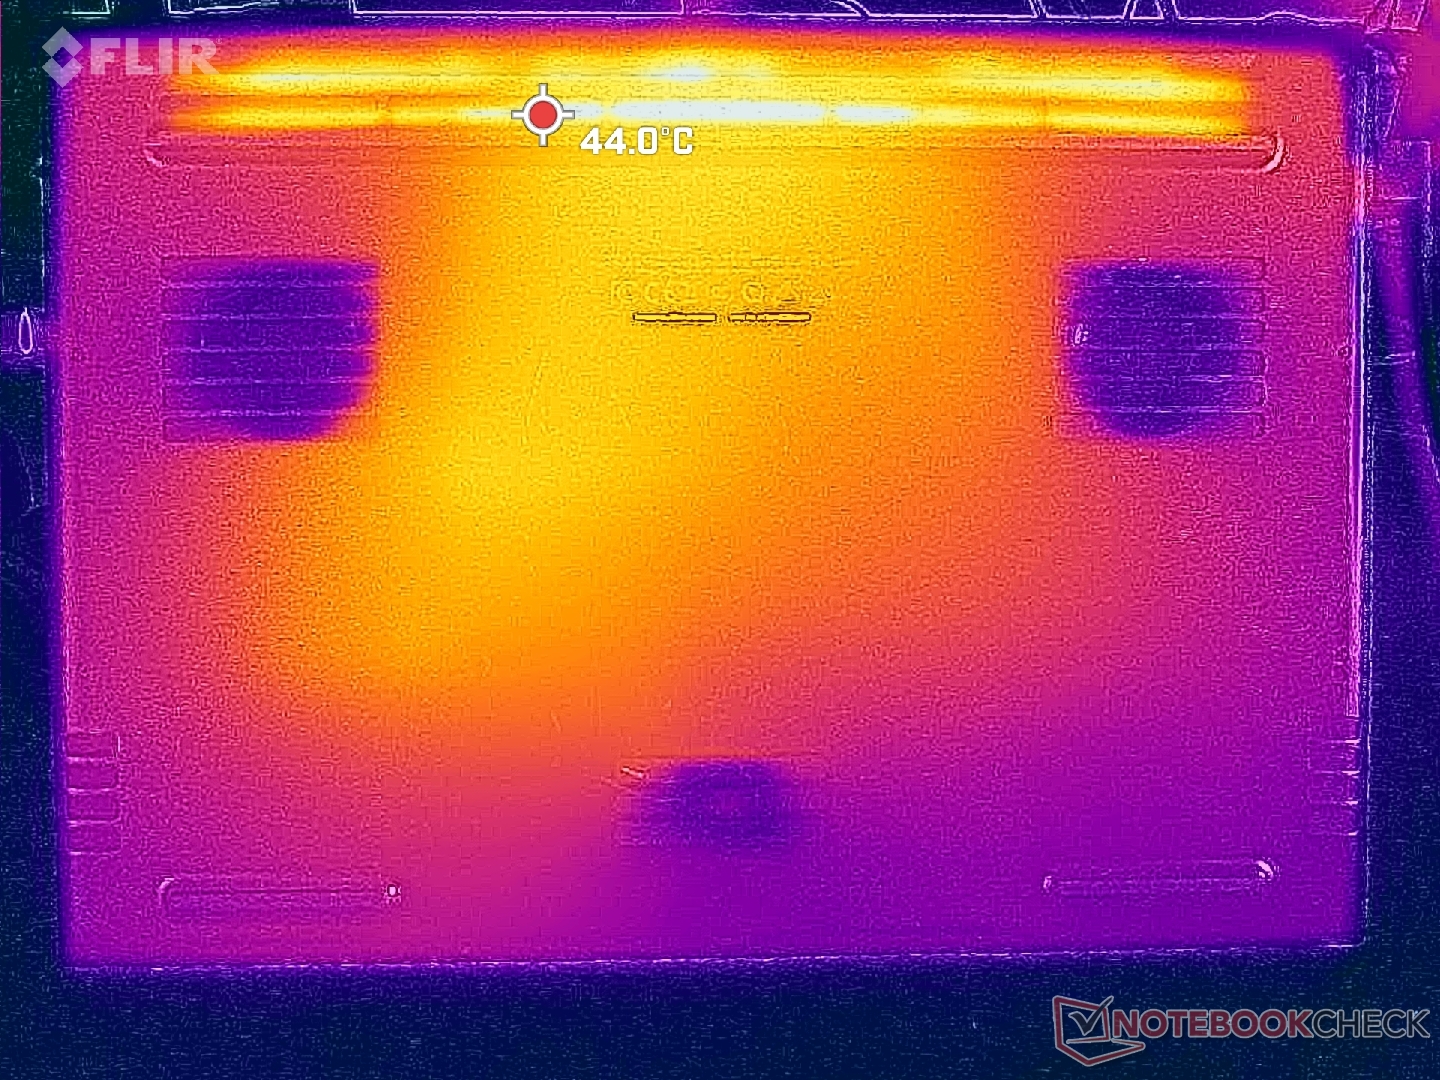
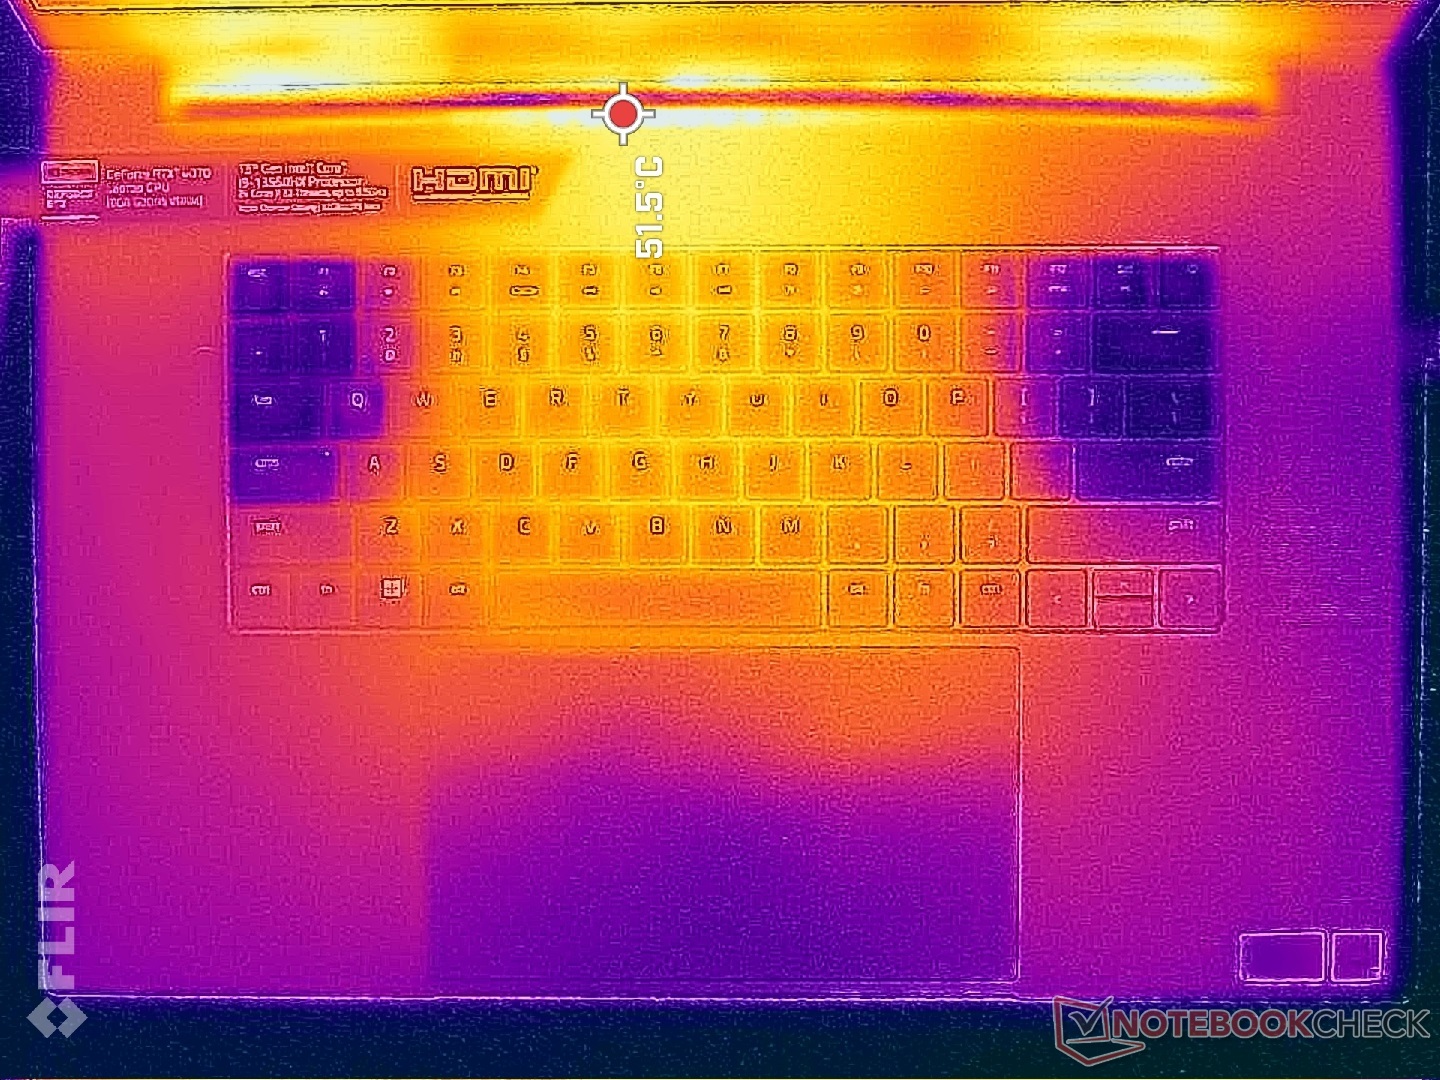
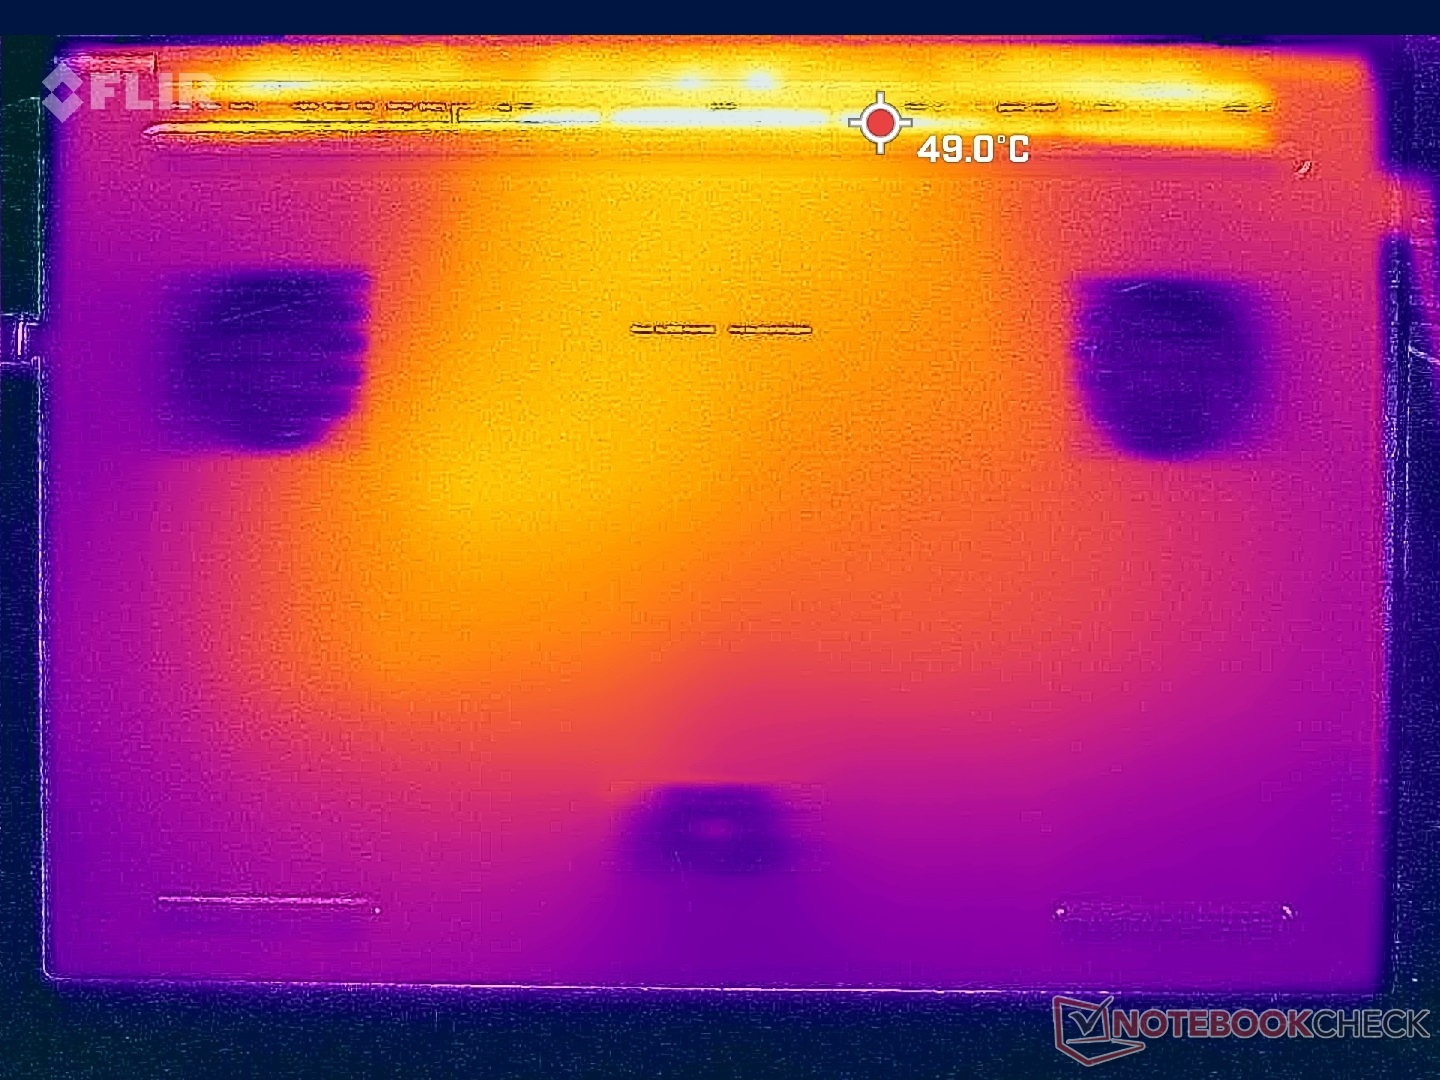
As temperaturas de superfície são relativamente frias para um laptop de jogo provavelmente devido ao grande fator de forma de 18 polegadas, ao resfriador da câmara de vapor com ventiladores triplos e à GPU TGP de 140 W. As configurações RTX 4080 ou 4090 mais rápidas provavelmente funcionarão mais quentes do que as que registramos aqui, já que cada uma delas tem um teto superior de 175 W.
Pontos quentes ao correr Witcher 3 de cima a apenas 36 C na parte superior e 33 C na parte inferior em comparação com 50 C a 57 C na Alienware m17 R5. O Blade 18 com RTX 4070 é um dos portáteis de jogos mais legais que testamos até agora e é claro que o chassi foi construído para lidar com opções mais poderosas do que nossa configuração RTX 4070.
As temperaturas da superfície quando ociosas são ligeiramente mais quentes do que o esperado, uma vez que os ventiladores tendem a ficar ociosos durante cargas baixas. A lâmina 18 nunca se torna desconfortável para a pele, desde que a borda traseira seja bem ventilada.
(+) A temperatura máxima no lado superior é 39.2 °C / 103 F, em comparação com a média de 40.4 °C / 105 F , variando de 21.2 a 68.8 °C para a classe Gaming.
(+) A parte inferior aquece até um máximo de 35.6 °C / 96 F, em comparação com a média de 43.2 °C / 110 F
(+) Em uso inativo, a temperatura média para o lado superior é 28.1 °C / 83 F, em comparação com a média do dispositivo de 33.9 °C / ### class_avg_f### F.
(+) Jogando The Witcher 3, a temperatura média para o lado superior é 28.9 °C / 84 F, em comparação com a média do dispositivo de 33.9 °C / ## #class_avg_f### F.
(+) Os apoios para as mãos e o touchpad são mais frios que a temperatura da pele, com um máximo de 26 °C / 78.8 F e, portanto, são frios ao toque.
(+) A temperatura média da área do apoio para as mãos de dispositivos semelhantes foi 28.8 °C / 83.8 F (+2.8 °C / 5 F).
| Razer Blade 18 RTX 4070 Intel Core i9-13950HX, NVIDIA GeForce RTX 4070 Laptop GPU | Razer Blade 17 Early 2022 Intel Core i9-12900H, NVIDIA GeForce RTX 3080 Ti Laptop GPU | MSI Titan GT77 HX 13VI Intel Core i9-13950HX, NVIDIA GeForce RTX 4090 Laptop GPU | Gigabyte G7 KE Intel Core i5-12500H, NVIDIA GeForce RTX 3060 Laptop GPU | Alienware m17 R5 (R9 6900HX, RX 6850M XT) AMD Ryzen 9 6900HX, AMD Radeon RX 6850M XT | Asus ROG Strix Scar 17 SE G733CX-LL014W Intel Core i9-12950HX, NVIDIA GeForce RTX 3080 Ti Laptop GPU | |
|---|---|---|---|---|---|---|
| Heat | -28% | 2% | -17% | -18% | -18% | |
| Maximum Upper Side * (°C) | 39.2 | 50 -28% | 40.6 -4% | 52 -33% | 53 -35% | 48.8 -24% |
| Maximum Bottom * (°C) | 35.6 | 56 -57% | 41.1 -15% | 54 -52% | 56 -57% | 52.4 -47% |
| Idle Upper Side * (°C) | 31.8 | 36 -13% | 26.2 18% | 28 12% | 30 6% | 30.4 4% |
| Idle Bottom * (°C) | 33.2 | 38 -14% | 30.3 9% | 32 4% | 29 13% | 34.1 -3% |
* ... menor é melhor
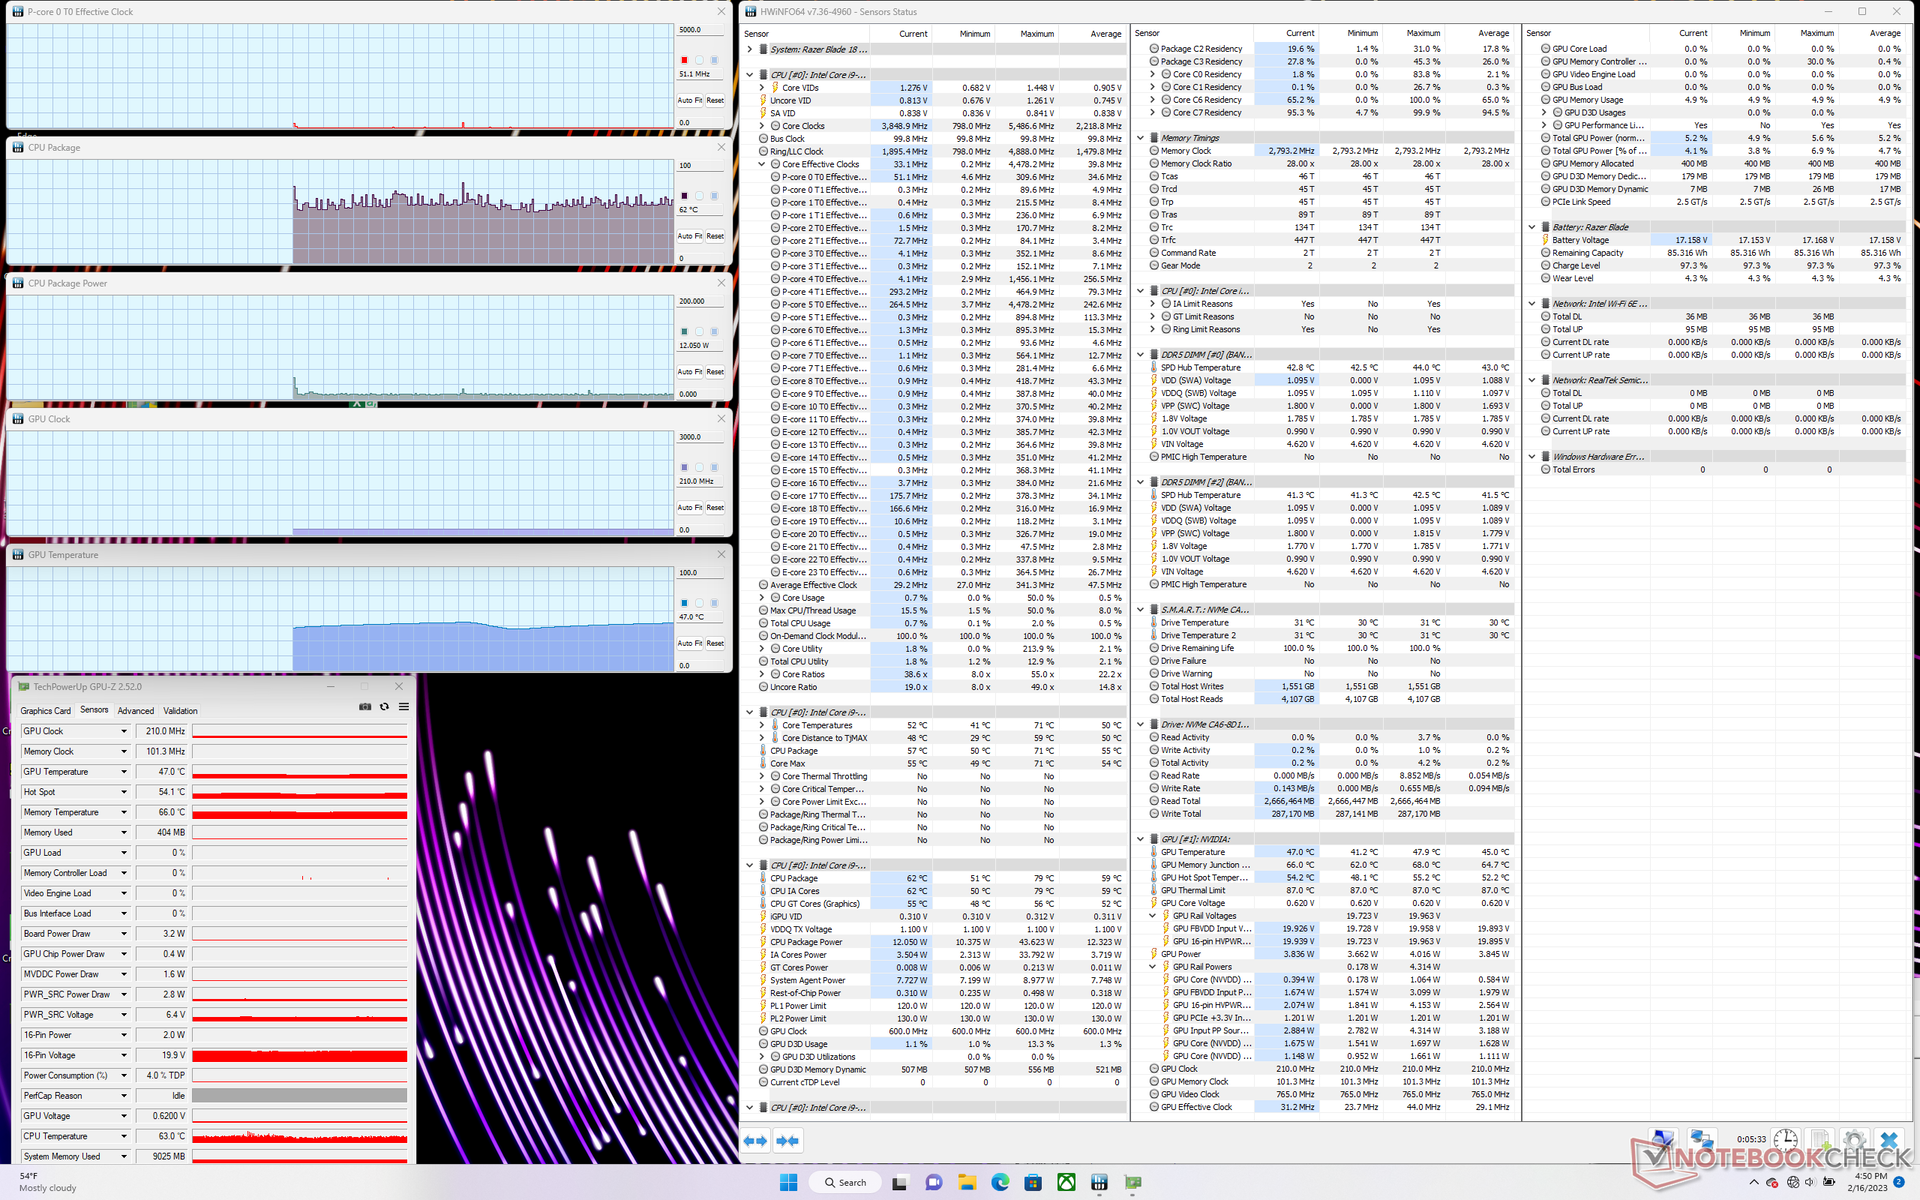
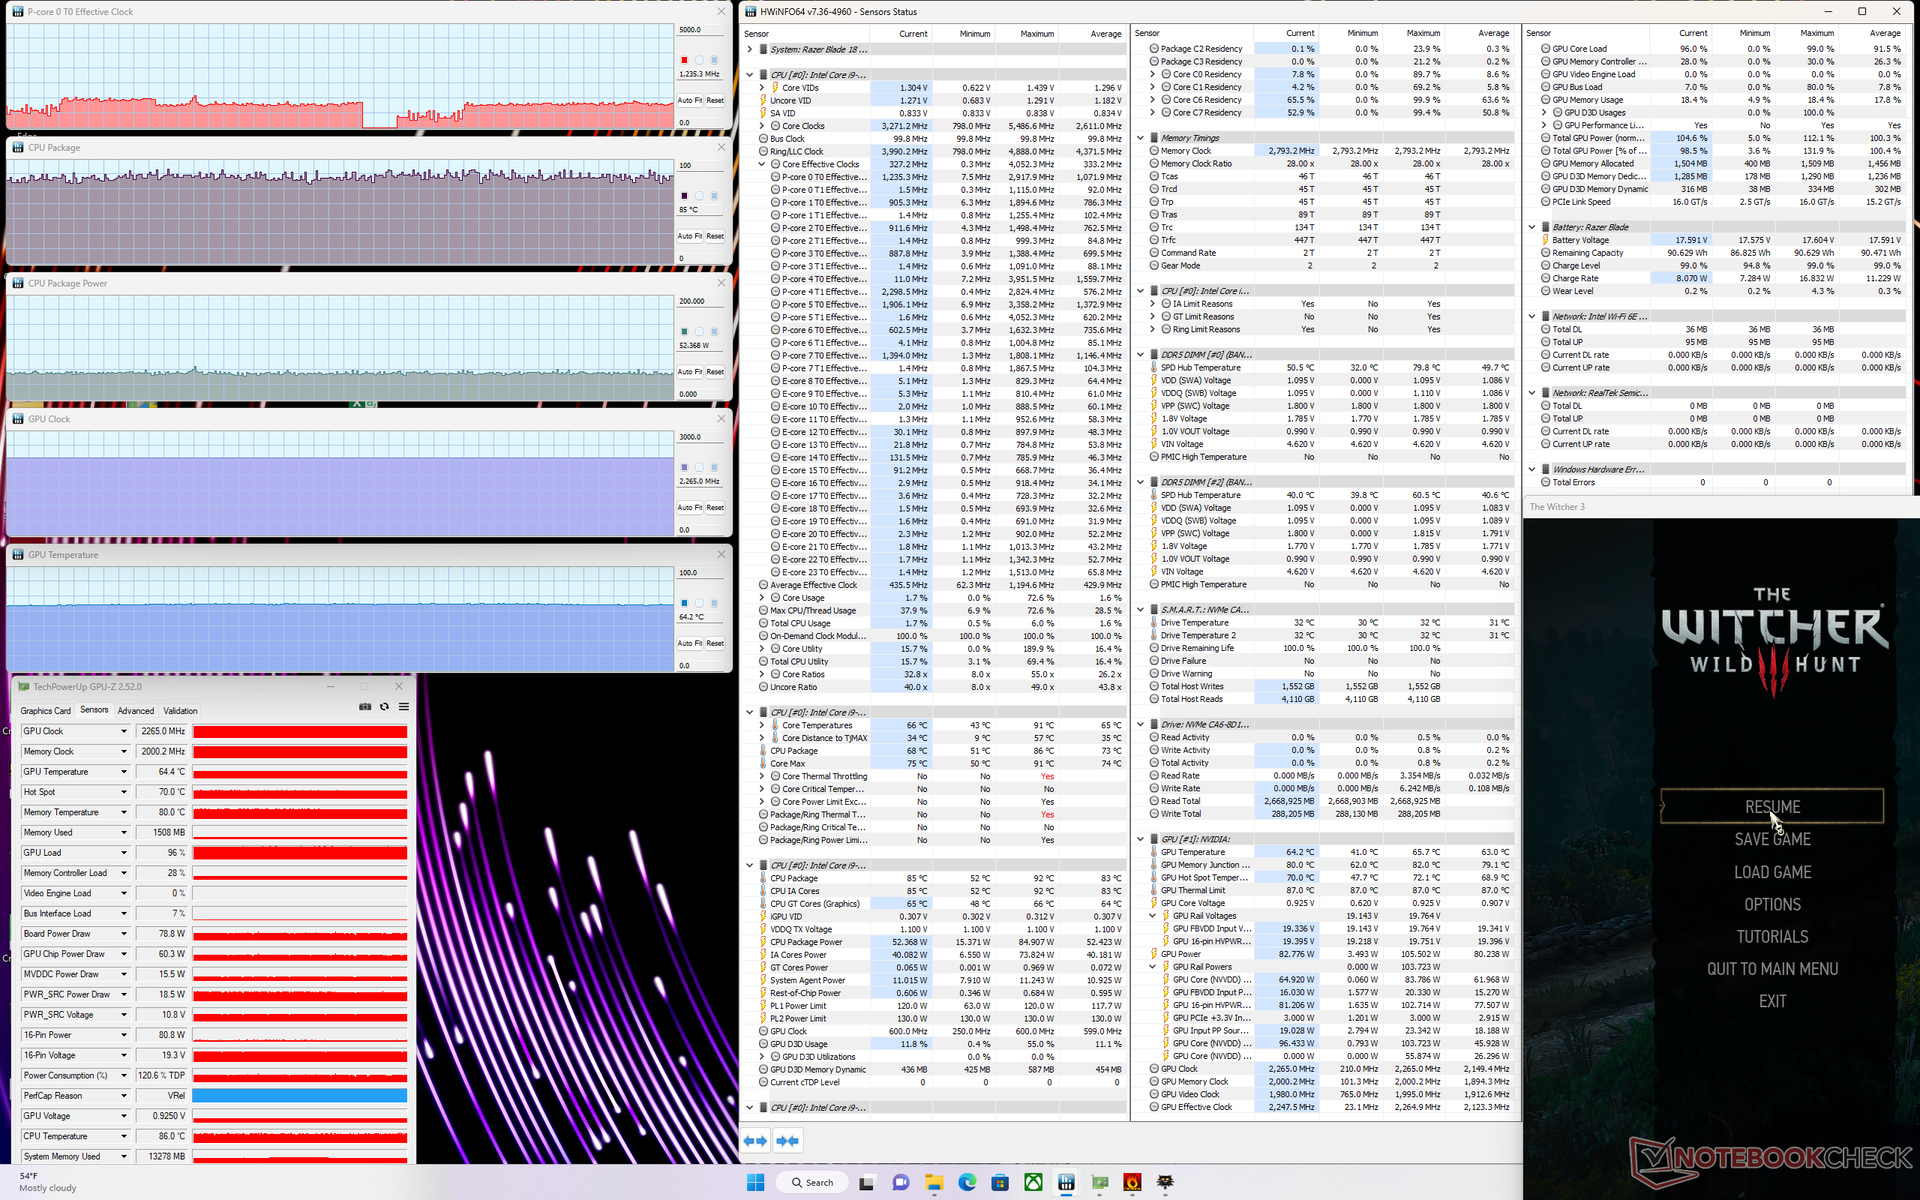
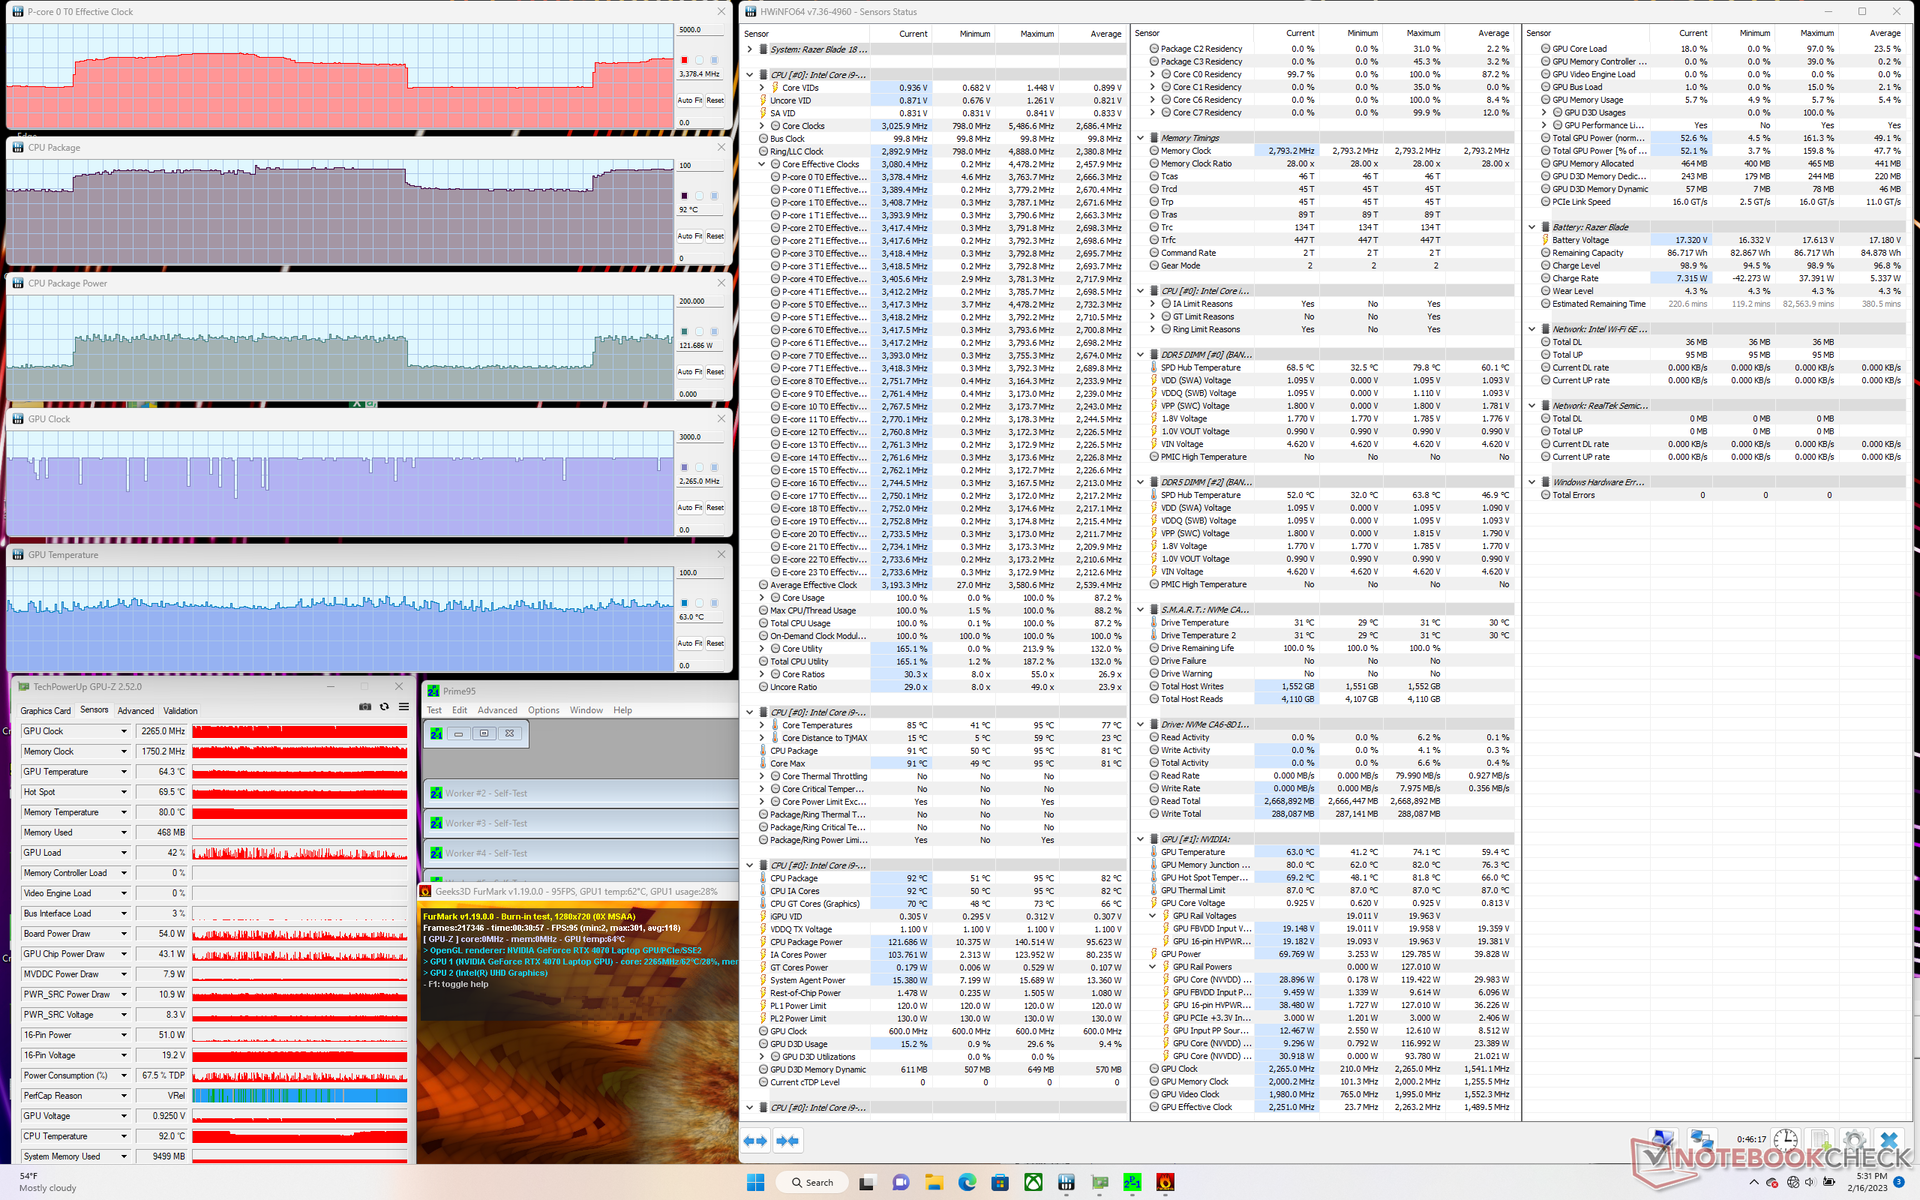
Teste de estresse
Ao executar Prime95 para enfatizar a CPU, as taxas de clock e o consumo de energia da placa aumentariam para 3,8 GHz e 140 W, respectivamente, antes de cair para 3,1 GHz e a faixa de 110 a 120 W cerca de 70 segundos depois. A temperatura central se estabilizaria em 87 C em comparação com 82 C na lâmina 16 equipada com a mesma CPU.
A taxa de clock da GPU, temperatura e consumo de energia da placa estabilizariam em 2265 MHz, 64 C, e 80 a 90 W, respectivamente, quando em funcionamento Witcher 3. A GPU em si é classificada para um TGP de 140 W e, portanto, a faixa de ~80 W é muito mais baixa do que o esperado, mesmo quando definida para o modo Performance. Só somos capazes de atingir um pico de 100 W para a GPU quando executamos um jogo mais exigente como o Cyberpunk 2077. Em comparação, a GPU RTX 4080 no Lâmina 16 se estabilizaria em ~160 W contra sua meta de 175 W TGP ao rodar o mesmo Witcher 3 teste.
Funcionando com a energia da bateria limita o desempenho. Um teste 3DMark 11 com baterias retornaria pontuações de Física e Gráficos de 10336 e 18043 pontos, respectivamente, em comparação com 25874 e 39733 pontos quando em rede elétrica.
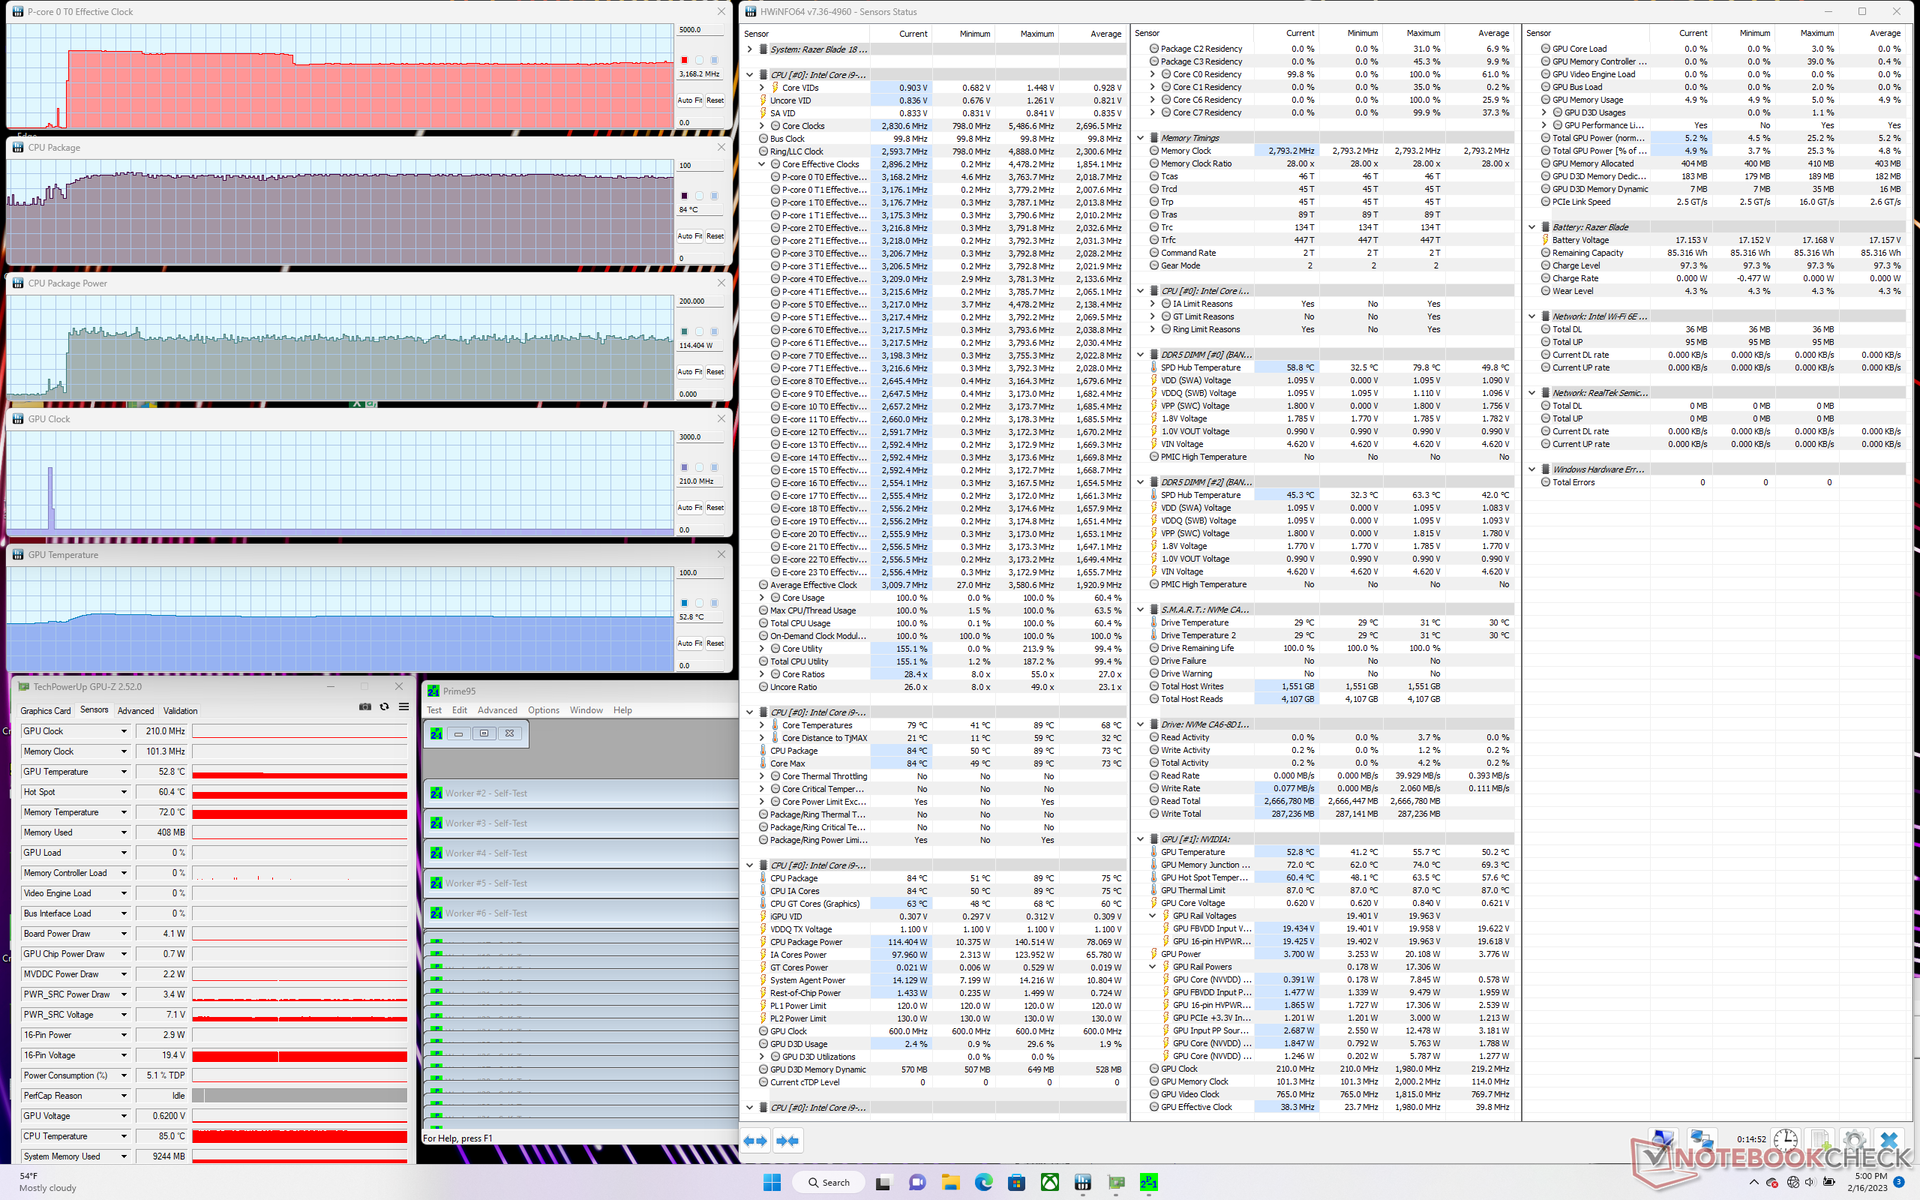
| Relógio CPU (GHz) | Relógio GPU (MHz) | Temperatura média da CPU (°C) | Temperatura média da GPU (°C) | |
| System Idle | -- | -- | 62 | 47 |
| Prime95 Stress | 3.2 | -- | 84 | 53 |
| Prime95 + FurMark Stress | 2.0 - 3.7 | 2265 | 70 - 91 | 63 |
| Witcher 3 Estresse | ~1.2 | 2265 | 85 | 64 |
Oradores
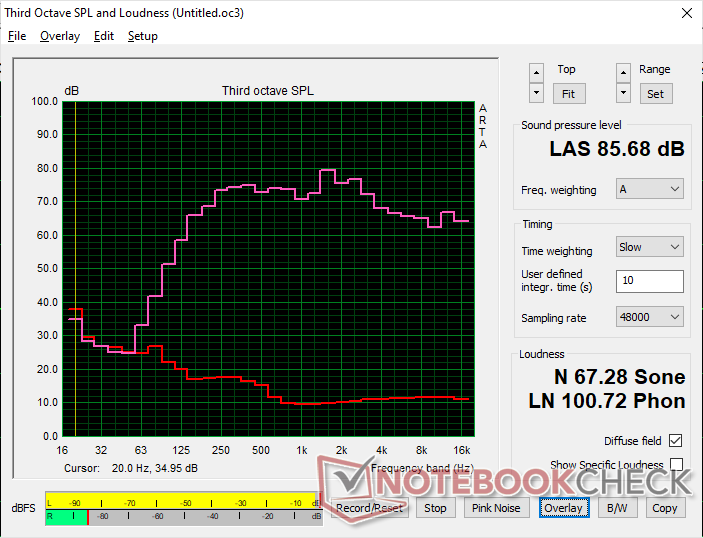
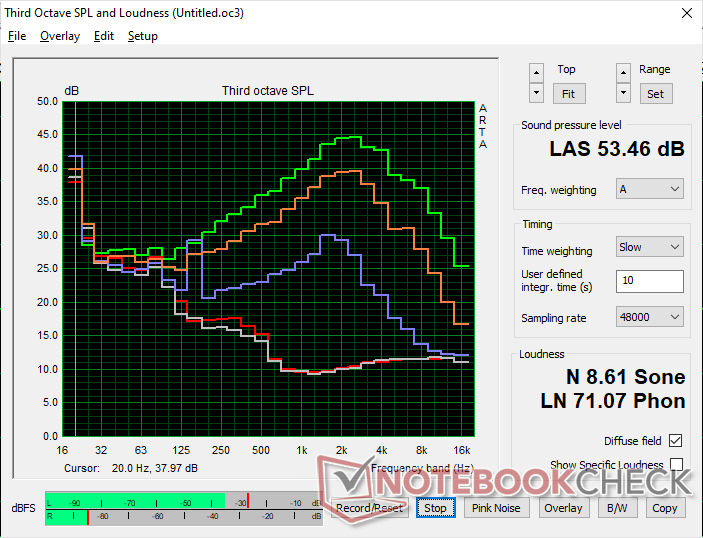
Razer Blade 18 RTX 4070 análise de áudio
(+) | os alto-falantes podem tocar relativamente alto (###valor### dB)
Graves 100 - 315Hz
(±) | graves reduzidos - em média 7.5% menor que a mediana
(±) | a linearidade dos graves é média (9.2% delta para a frequência anterior)
Médios 400 - 2.000 Hz
(+) | médios equilibrados - apenas 3.5% longe da mediana
(+) | médios são lineares (4.1% delta para frequência anterior)
Altos 2 - 16 kHz
(+) | agudos equilibrados - apenas 4.8% longe da mediana
(+) | os máximos são lineares (3.8% delta da frequência anterior)
Geral 100 - 16.000 Hz
(+) | o som geral é linear (9.2% diferença em relação à mediana)
Comparado com a mesma classe
» 3% de todos os dispositivos testados nesta classe foram melhores, 1% semelhantes, 96% piores
» O melhor teve um delta de 6%, a média foi 18%, o pior foi 132%
Comparado com todos os dispositivos testados
» 3% de todos os dispositivos testados foram melhores, 1% semelhantes, 96% piores
» O melhor teve um delta de 4%, a média foi 23%, o pior foi 134%
Apple MacBook Pro 16 2021 M1 Pro análise de áudio
(+) | os alto-falantes podem tocar relativamente alto (###valor### dB)
Graves 100 - 315Hz
(+) | bons graves - apenas 3.8% longe da mediana
(+) | o baixo é linear (5.2% delta para a frequência anterior)
Médios 400 - 2.000 Hz
(+) | médios equilibrados - apenas 1.3% longe da mediana
(+) | médios são lineares (2.1% delta para frequência anterior)
Altos 2 - 16 kHz
(+) | agudos equilibrados - apenas 1.9% longe da mediana
(+) | os máximos são lineares (2.7% delta da frequência anterior)
Geral 100 - 16.000 Hz
(+) | o som geral é linear (4.6% diferença em relação à mediana)
Comparado com a mesma classe
» 0% de todos os dispositivos testados nesta classe foram melhores, 0% semelhantes, 100% piores
» O melhor teve um delta de 5%, a média foi 17%, o pior foi 45%
Comparado com todos os dispositivos testados
» 0% de todos os dispositivos testados foram melhores, 0% semelhantes, 100% piores
» O melhor teve um delta de 4%, a média foi 23%, o pior foi 134%
Gerenciamento de energia - Grande visor, grande demanda de energia
Consumo de energia
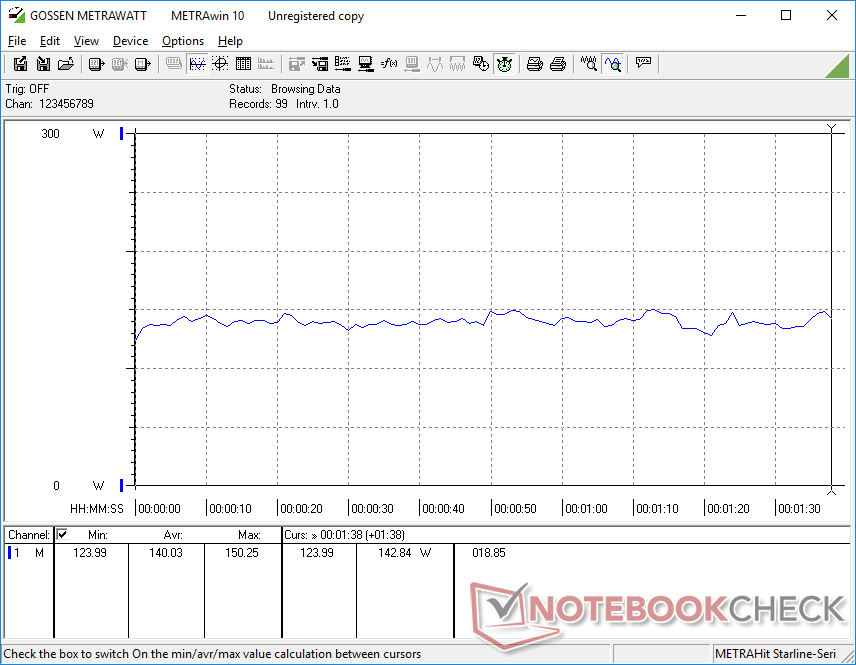
O consumo de energia quando ocioso na área de trabalho varia entre 24 W e 48 W, dependendo da configuração de brilho e do perfil de energia. Na verdade, a diferença entre as configurações de brilho mínimo e máximo é de até 10 W. Esta faixa é visivelmente maior do que na maioria dos outros laptops menores, o que pode explicar os resultados não conceituais da vida útil da bateria na próxima seção.
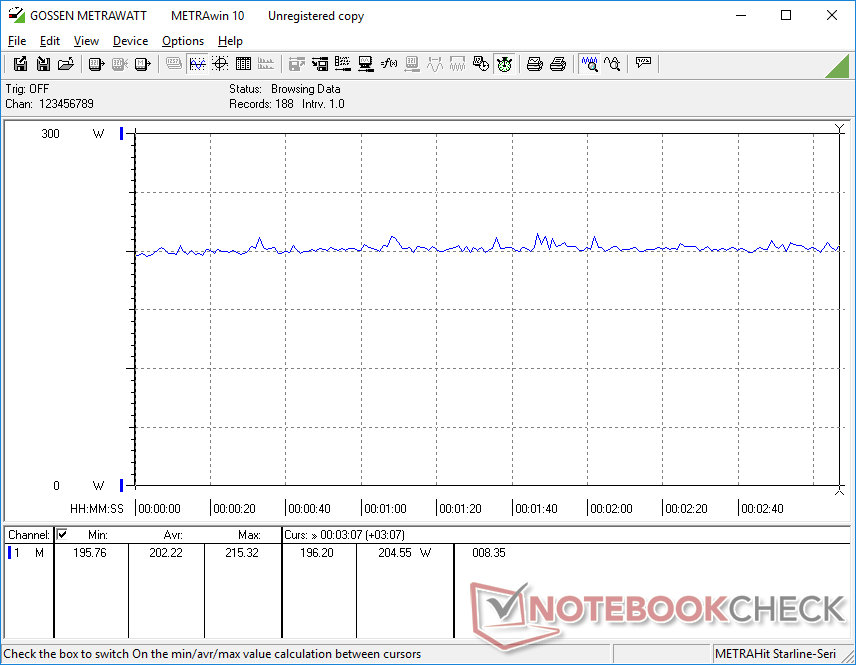
Quando em funcionamento Witcher 3 para representar cargas de jogo típicas, o sistema exigiria uma média de 202 W em comparação com 229 W ou 225 W na Lâmina RTX 3080 Ti-powered 17 ouAsus ROG Strix Scar 17 SErespectivamente. Assim, nosso sistema de 18 polegadas RTX 4070 consome cerca de 10% menos energia e oferece quase o mesmo desempenho gráfico que o RTX 3080 Ti móvel de última geração. A atualização para a configuração RTX 4080 ou RTX 4090 provavelmente consumirá cerca de 40 W a 50 W mais potência, semelhante ao que observamos na Lâmina 16.
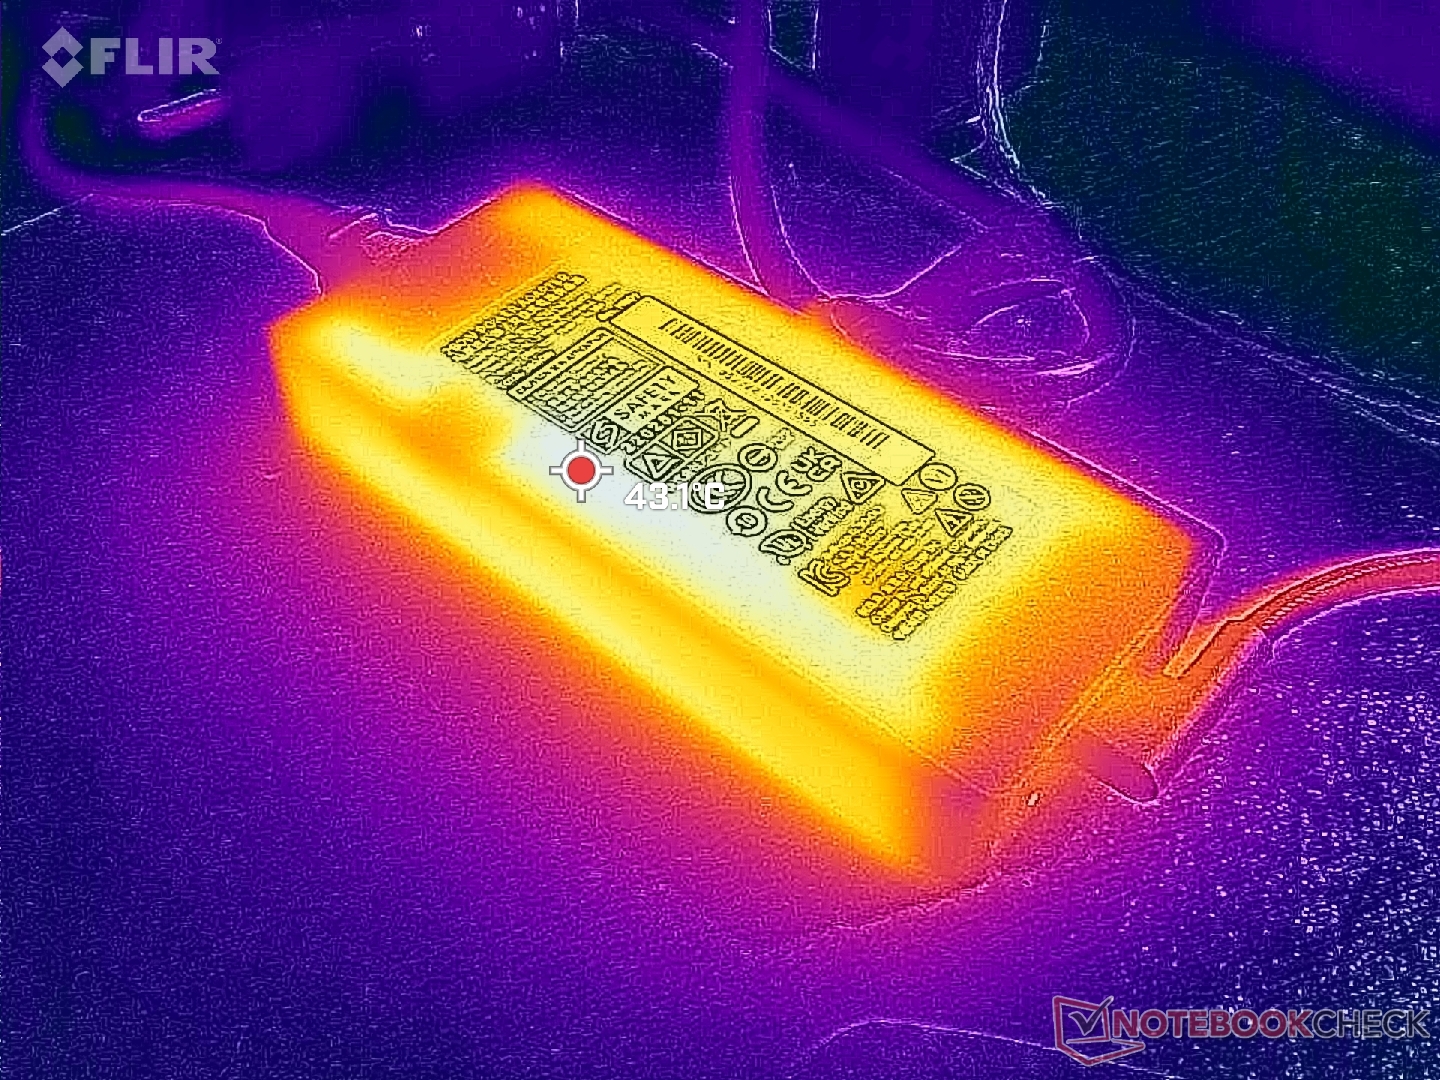
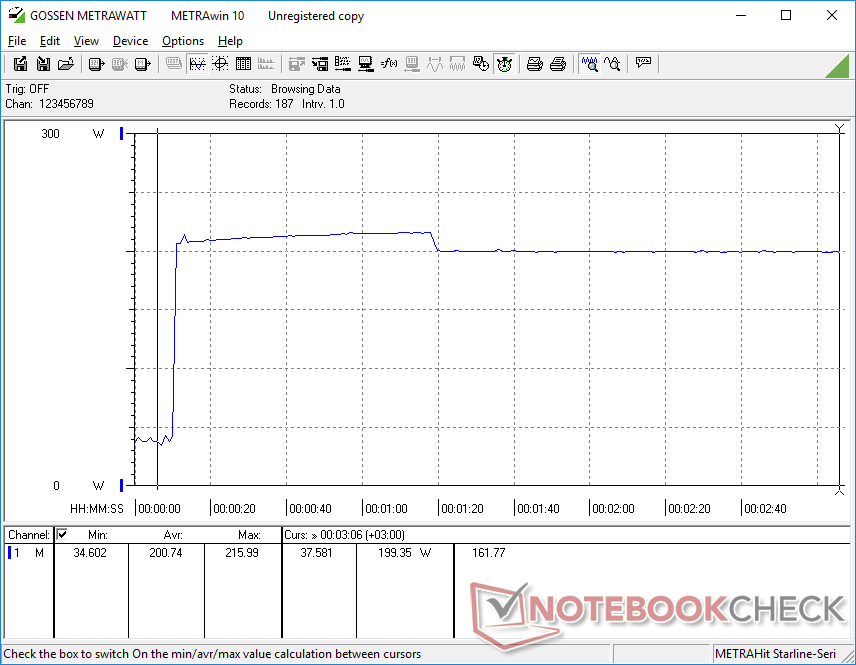
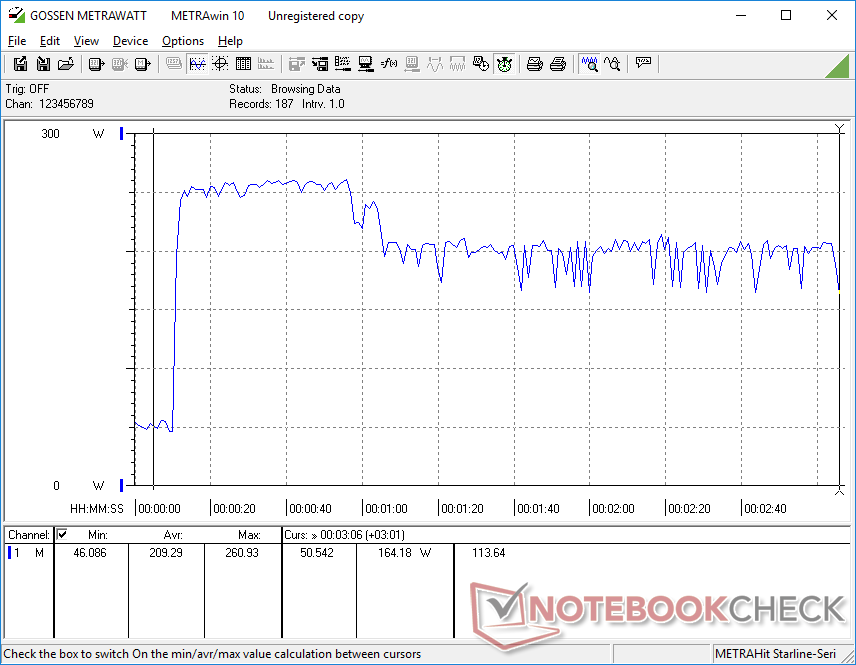
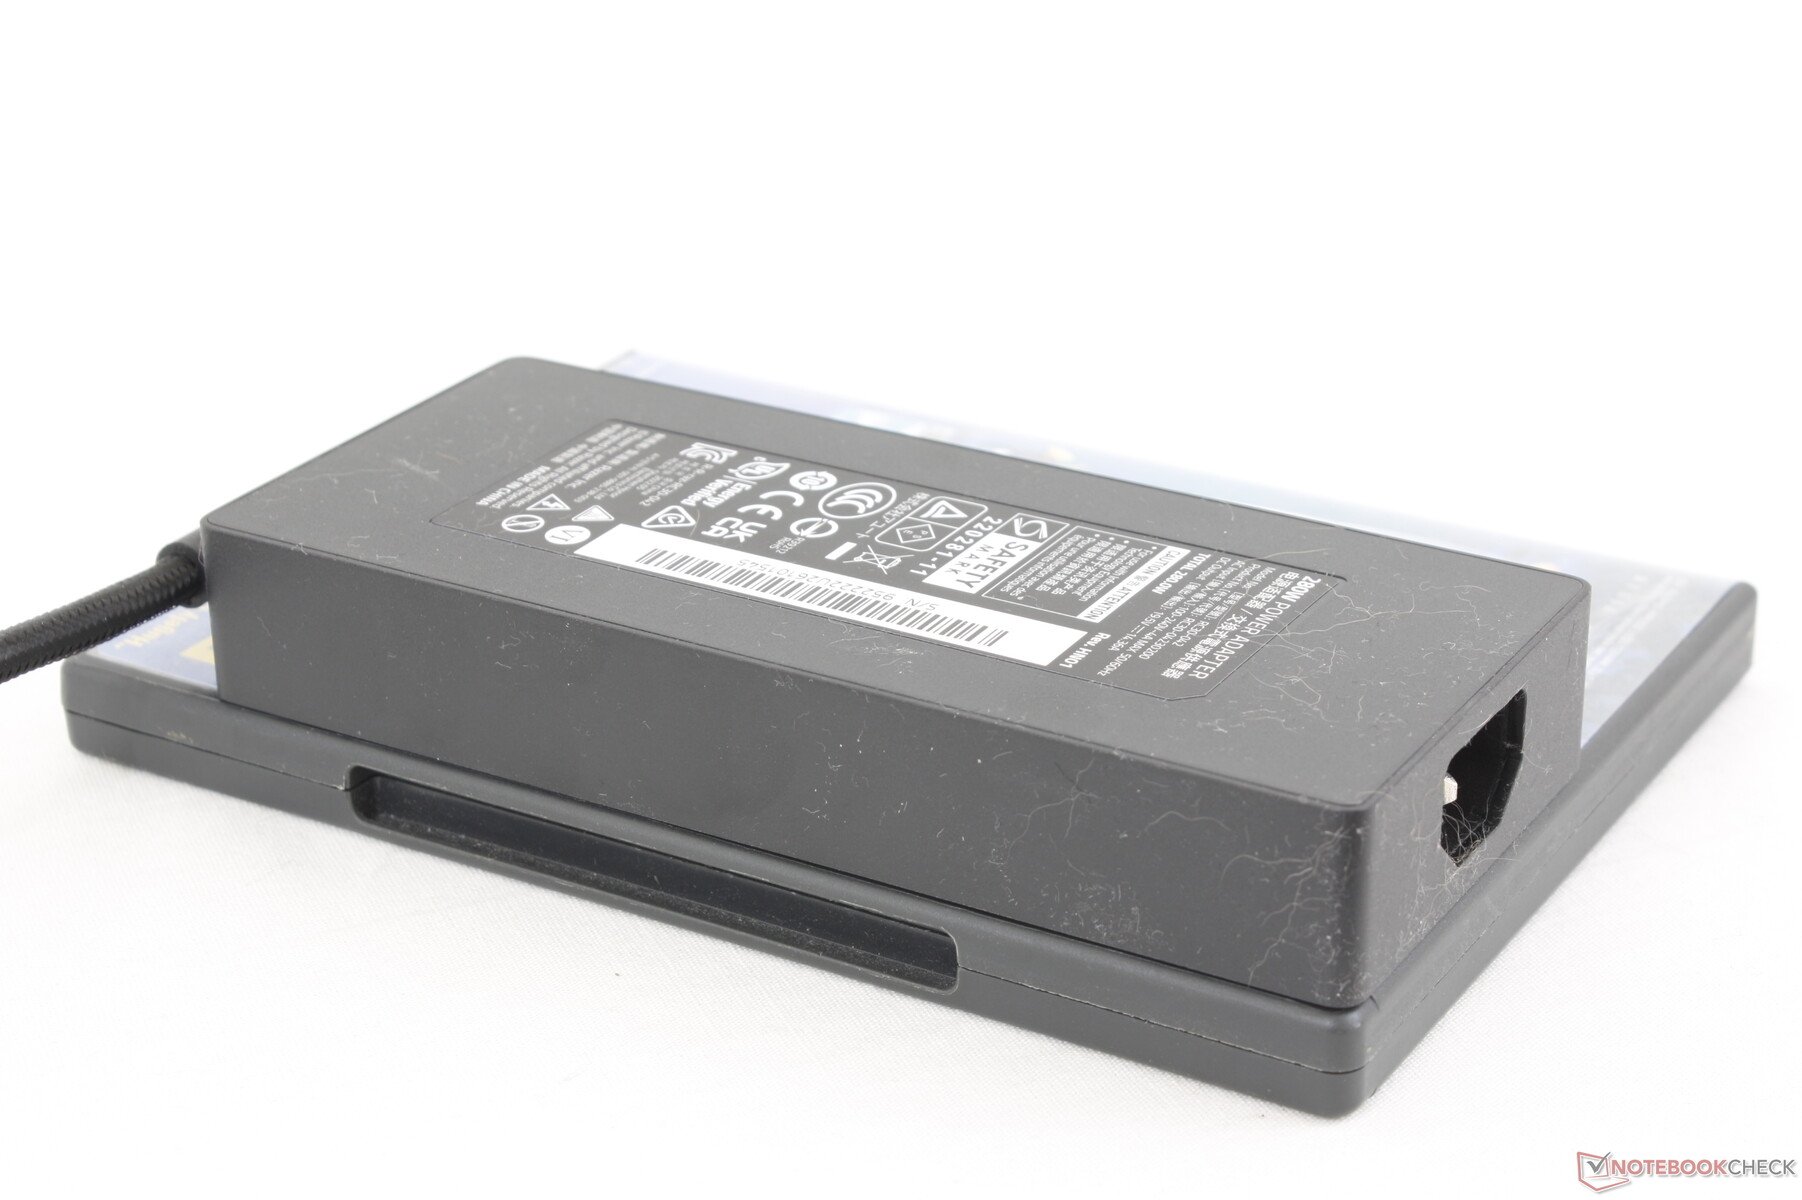
Somos capazes de registrar um consumo máximo temporário de 261 W a partir do pequeno-médio (~16,3 x 7 x 2,5 cm) 280 W de adaptador GaN AC ao rodar simultaneamente o Prime95 e o FurMark. Tenha em mente que existem dois adaptadores CA diferentes dependendo da configuração: um adaptador menor de 280 W para os SKUs RTX 4060 e 4070 e um adaptador maior de 330 W para os SKUs RTX 4080 e 4090.
| desligado | |
| Ocioso | |
| Carga |
|
Key:
min: | |
| Razer Blade 18 RTX 4070 i9-13950HX, GeForce RTX 4070 Laptop GPU, SSSTC CA6-8D1024, IPS, 2560x1600, 18" | Razer Blade 17 Early 2022 i9-12900H, GeForce RTX 3080 Ti Laptop GPU, Samsung PM9A1 MZVL21T0HCLR, IPS, 3840x2160, 17.3" | MSI Titan GT77 HX 13VI i9-13950HX, GeForce RTX 4090 Laptop GPU, Samsung PM9A1 MZVL22T0HBLB, Mini-LED, 3840x2160, 17.3" | Gigabyte G7 KE i5-12500H, GeForce RTX 3060 Laptop GPU, Gigabyte AG470S1TB-SI B10, IPS, 1920x1080, 17.3" | Alienware m17 R5 (R9 6900HX, RX 6850M XT) R9 6900HX, Radeon RX 6850M XT, SSSTC CA6-8D1024, IPS, 3840x2160, 17" | Asus ROG Strix Scar 17 SE G733CX-LL014W i9-12950HX, GeForce RTX 3080 Ti Laptop GPU, Samsung PM9A1 MZVL22T0HBLB, IPS, 2560x1440, 17.3" | |
|---|---|---|---|---|---|---|
| Power Consumption | 17% | 8% | 32% | 31% | 9% | |
| Idle Minimum * (Watt) | 24.5 | 17 31% | 14 43% | 15 39% | 13 47% | 19.3 21% |
| Idle Average * (Watt) | 34.1 | 23 33% | 21.6 37% | 17 50% | 16.5 52% | 26.5 22% |
| Idle Maximum * (Watt) | 47.7 | 34 29% | 24.8 48% | 24 50% | 17 64% | 27.1 43% |
| Load Average * (Watt) | 140 | 120 14% | 122.5 12% | 111 21% | 93 34% | 141 -1% |
| Witcher 3 ultra * (Watt) | 202 | 229 -13% | 265 -31% | 174.1 14% | 239 -18% | 225 -11% |
| Load Maximum * (Watt) | 261 | 243 7% | 418 -60% | 208 20% | 251 4% | 307.9 -18% |
* ... menor é melhor
Power Consumption Witcher 3 / Stresstest
Power Consumption external Monitor
Vida útil da bateria
Não é coincidência que o maior modelo Blade também carrega a maior capacidade de bateria da família aos 91,7 Wh. Entretanto, a vida útil da bateria não é necessariamente mais longa e pode até ser mais curta em muitos cenários. Somos capazes de navegar na web no perfil Balanced power por 4 horas antes de precisar recarregar, o que é quase uma hora inteira mais curto do que no Blade 15 do ano passado. A queda da taxa de atualização do visor para 60 Hz em vez de 240 Hz pode prolongar a vida útil da bateria apenas marginalmente.
A recarga de vazio para cheio leva cerca de 90 minutos. Os usuários também podem carregar o sistema via USB-C, embora a uma taxa mais lenta.
| Razer Blade 18 RTX 4070 i9-13950HX, GeForce RTX 4070 Laptop GPU, 91.7 Wh | Razer Blade 17 Early 2022 i9-12900H, GeForce RTX 3080 Ti Laptop GPU, 82 Wh | MSI Titan GT77 HX 13VI i9-13950HX, GeForce RTX 4090 Laptop GPU, 99.9 Wh | Gigabyte G7 KE i5-12500H, GeForce RTX 3060 Laptop GPU, 54 Wh | Alienware m17 R5 (R9 6900HX, RX 6850M XT) R9 6900HX, Radeon RX 6850M XT, 97 Wh | Asus ROG Strix Scar 17 SE G733CX-LL014W i9-12950HX, GeForce RTX 3080 Ti Laptop GPU, 90 Wh | |
|---|---|---|---|---|---|---|
| Duração da bateria | 9% | 21% | 11% | 29% | 5% | |
| Reader / Idle (h) | 7 | 7.1 1% | 7.1 1% | |||
| WiFi v1.3 (h) | 4 | 3.8 -5% | 5.3 33% | 5.3 33% | 4.8 20% | 4.2 5% |
| Load (h) | 1.3 | 1.7 31% | 1.4 8% | 1.3 0% | 1.8 38% | |
| H.264 (h) | 4.8 | 6 | 2.2 | 4.9 |
Pro
Contra
Veredicto - Ame as ferragens, odeie os insetos
Nós nos afastamos impressionado com a lâmina 16mas o mesmo não pode ser dito da Lâmina 18. Nossa unidade exibiria grandes problemas, incluindo o desempenho do buggy DLSS 3 em um monitor externo, falta de suporte G-Sync quando o G-Sync é supostamente incluído, e uma tela cintilante potencialmente defeituosa. Consideramos a possibilidade de suspender esta revisão até que estes problemas pudessem ser resolvidos, mas o Blade 18 já está sendo enviado aos clientes e por isso sentimos que era correto informar nossos leitores que podem estar no mercado por um. Esta página será atualizada com uma pontuação final quando tivermos uma solução adequada por parte do fabricante.
O Blade 18 mostra potencial para ser mais uma excelente adição à família Blade quando se olha além das questões acima. A tela de 18 polegadas é deslumbrante e maciça em relação à pegada e ao peso. O fato de o sistema não ser muito maior ou mais pesado que o Blade 17 deve torná-lo muito atraente para os usuários que já estejam considerando um Blade 17 ou algum outro laptop de 17 polegadas para jogos. Seu relativamente pequeno adaptador GaN AC acrescenta ainda mais à natureza híbrida portátil-DTR da Lâmina 18.
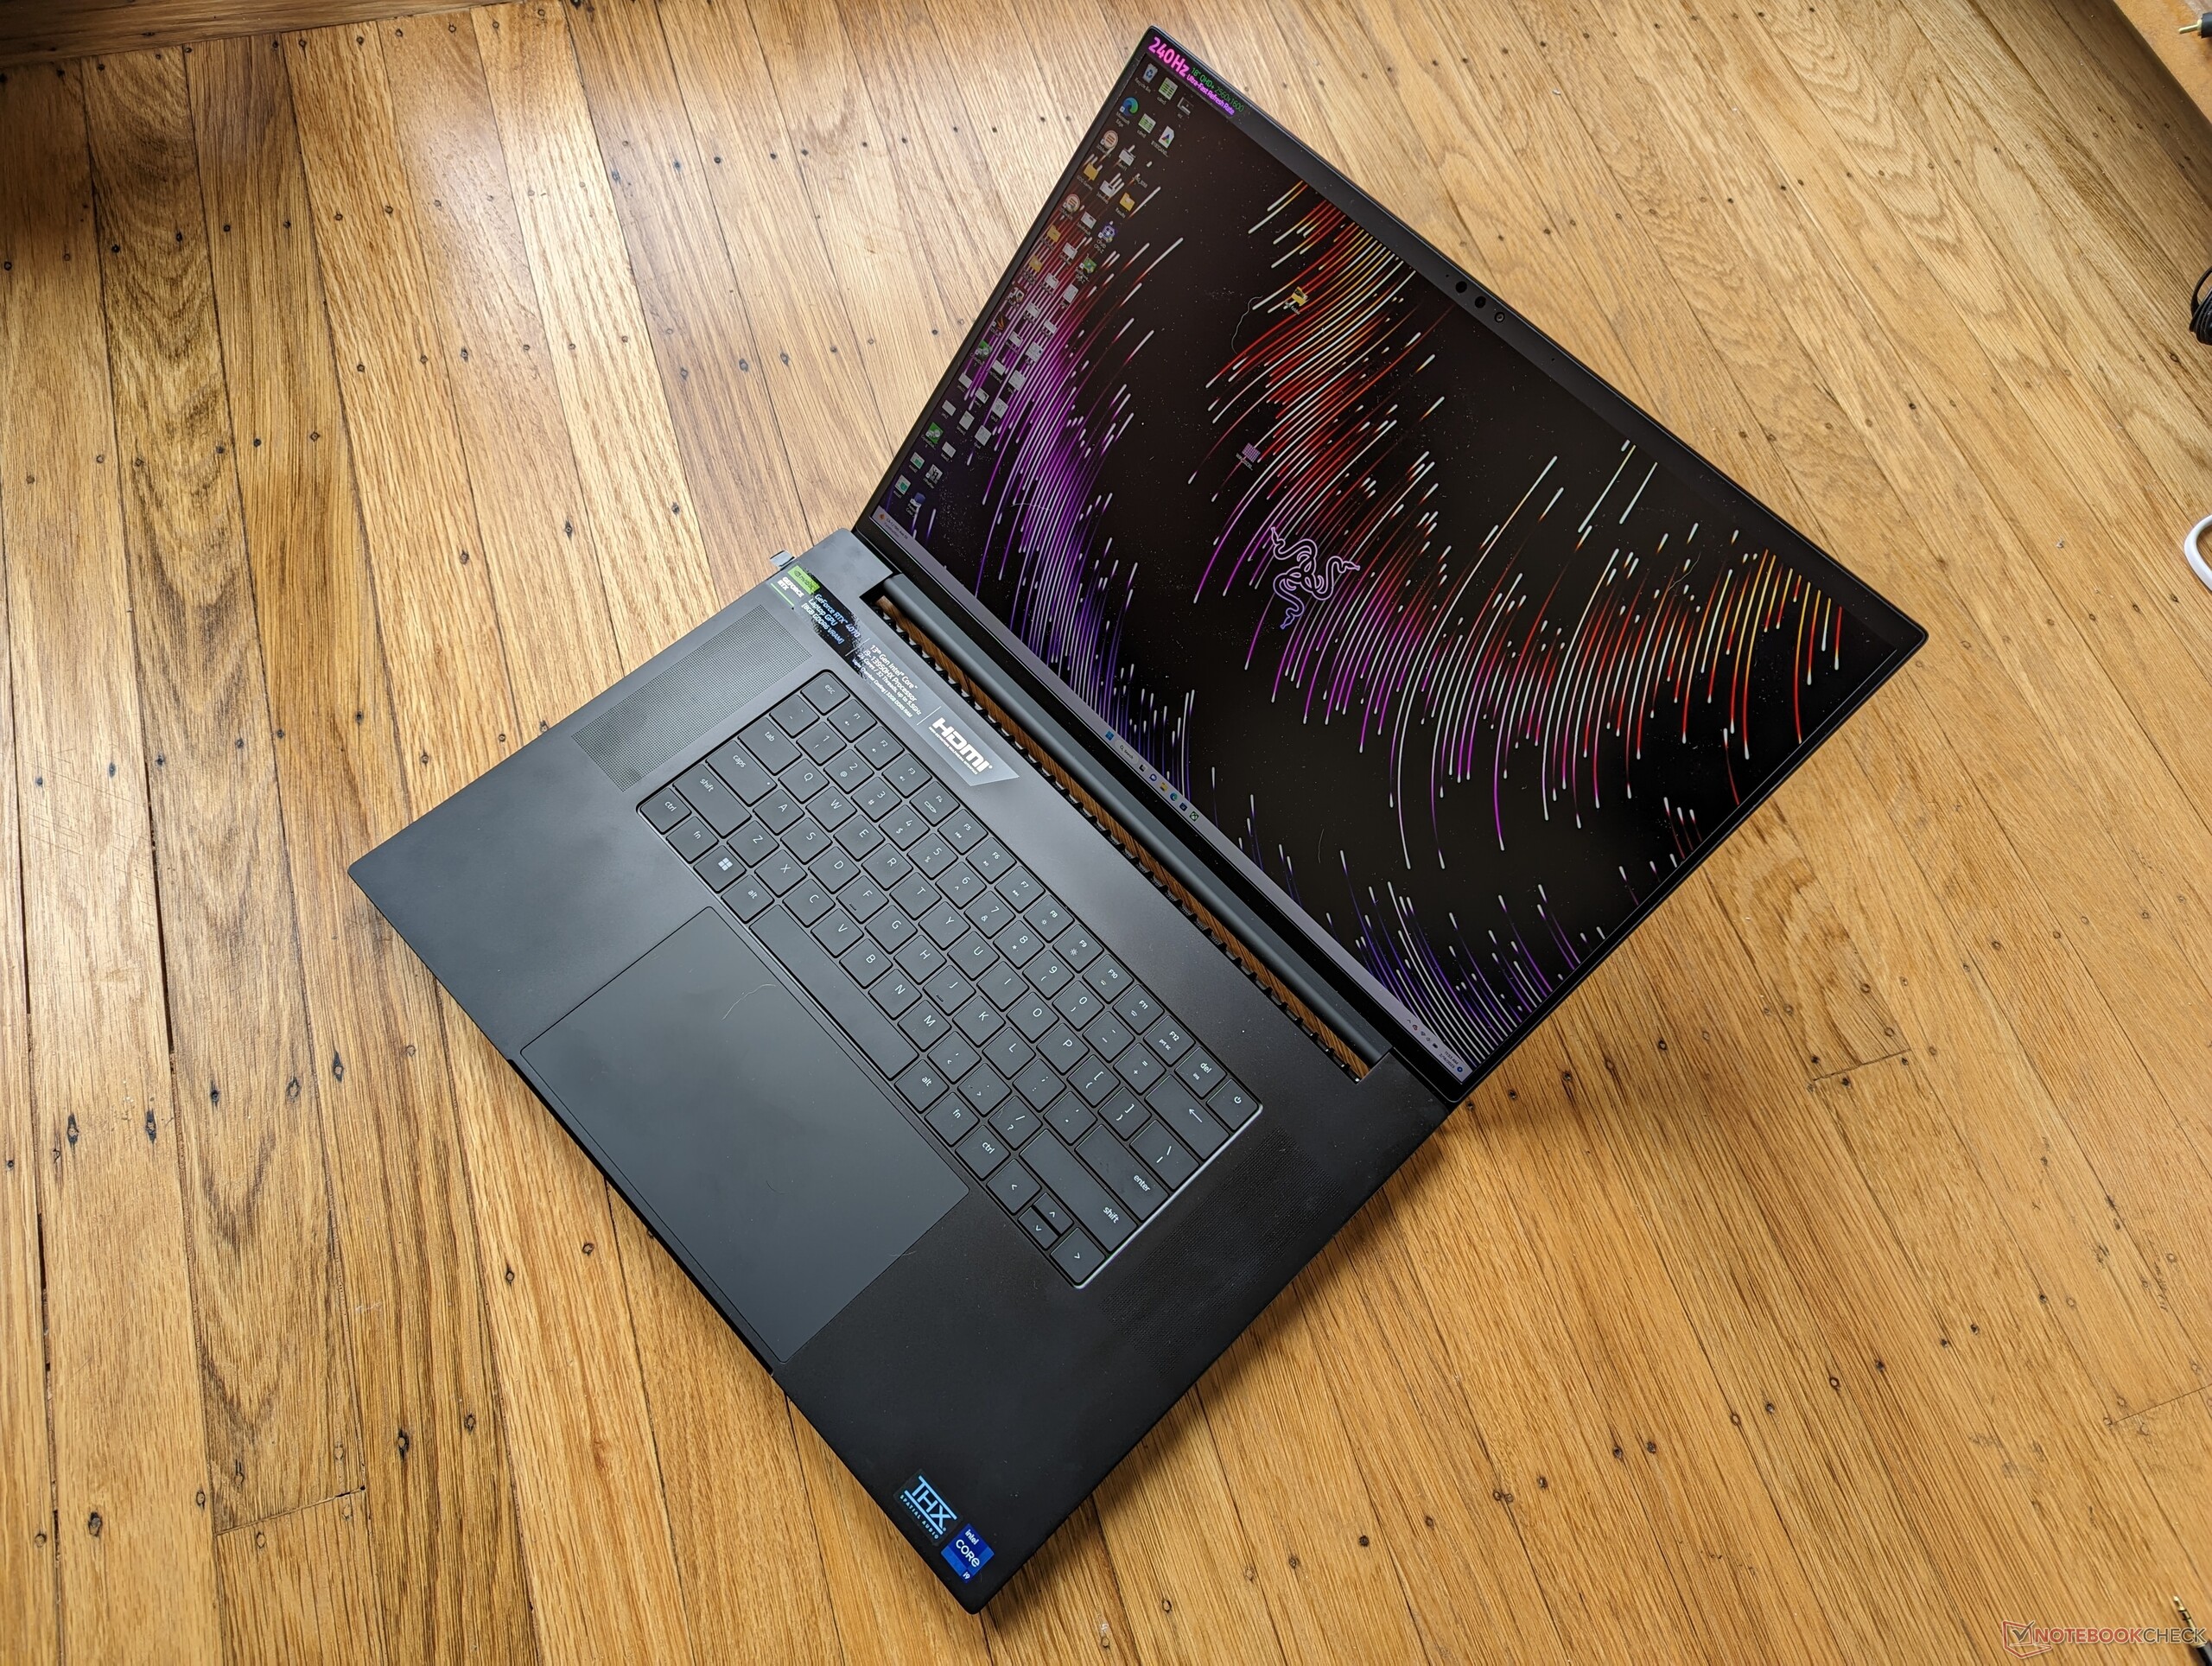
A Lâmina 18 pode parecer ginorme no início, mas realmente não é muito maior do que a Lâmina 17 existente. Sua grande tela e sua alta relação tela/corpo são impressionantes.
Quanto ao RTX 4070 móvel, seu desempenho pode ser abaixo do esperado, dependendo do jogo. Os títulos que suportam o DLSS 3 funcionam como manteiga no RTX 4070 móvel. Caso contrário, espera-se que o desempenho seja semelhante ao do RTX 3080 móvel do ano passado ou um RTX 3070 de mesa. Felizmente, a lista de títulos que suportam o DLSS 3 tem se expandido constantemente.
É um começo forte para a série Blade de 18 polegadas, prejudicada por alguns problemas notáveis de lançamento. O próximo Asus ROG Strix Scar 18 e o Dell Alienware m18 podem significar problemas para o Blade 18 se alguns problemas-chave não forem resolvidos.
Preço e Disponibilidade
Transparência
A seleção dos dispositivos a serem analisados é feita pela nossa equipe editorial. A amostra de teste foi fornecida ao autor como empréstimo pelo fabricante ou varejista para fins desta revisão. O credor não teve influência nesta revisão, nem o fabricante recebeu uma cópia desta revisão antes da publicação. Não houve obrigação de publicar esta revisão. Como empresa de mídia independente, a Notebookcheck não está sujeita à autoridade de fabricantes, varejistas ou editores.
É assim que o Notebookcheck está testando
Todos os anos, o Notebookcheck analisa de forma independente centenas de laptops e smartphones usando procedimentos padronizados para garantir que todos os resultados sejam comparáveis. Desenvolvemos continuamente nossos métodos de teste há cerca de 20 anos e definimos padrões da indústria no processo. Em nossos laboratórios de teste, equipamentos de medição de alta qualidade são utilizados por técnicos e editores experientes. Esses testes envolvem um processo de validação em vários estágios. Nosso complexo sistema de classificação é baseado em centenas de medições e benchmarks bem fundamentados, o que mantém a objetividade.Price comparison

