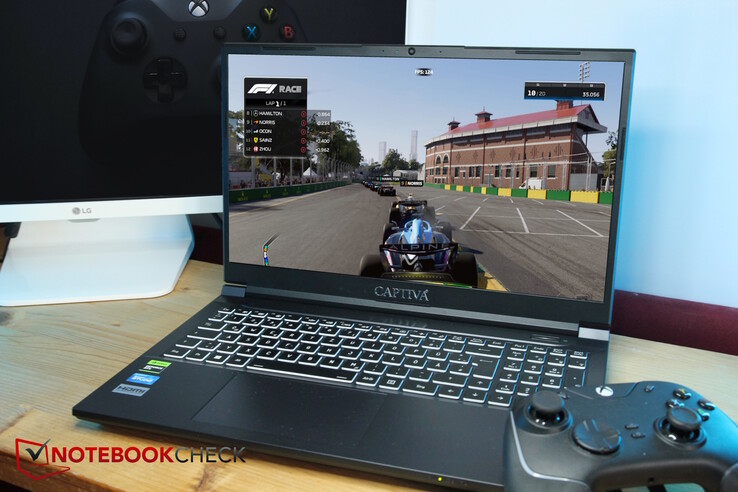
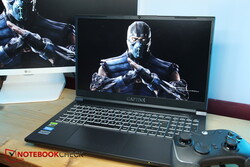
Análise do Captiva Advanced Gaming I74-121 (Clevo V150RND): Um laptop econômico para jogos com uma potente RTX 4060
Em algumas lojas on-line selecionadas, você pode começar a ver laptops (para jogos) da Captiva, mas quem é esse fabricante? A Captiva é uma empresa subsidiária da Ecom Trading GmbH, um atacadista alemão de TI com sede em Dachau. Pelo que parece, a maioria de seus notebooks é fabricada na China. Como nunca testamos anteriormente os notebooks da Captiva, já é hora de fazê-lo!
Você pode encontrar versões de 17 e 15 polegadas do laptop Captiva, que diferem principalmente na configuração do hardware. Somente as de 17 polegadas vêm opcionalmente com um processadori9-13900HX- os dispositivos de 15 polegadas vêm apenas com umi5-13500Hinstalado. Além disso, nossa amostra de teste está equipada com umaRTX 4060. Como alternativa, você pode obter o laptop com umaRTX 4070e a versão de 17 polegadas também pode ser adquirida com umaRTX 4080.
Nossa configuração é vendida por cerca de US$ 1.800. Os concorrentes incluem outros laptops para jogos introdutórios, como oMSI Cyborg 15, Dell G15 5530, Lenovo Legion Slim 5 16APH8, Lenovo LOQ 15e o Schenker XMG Core 15 M22.
Possíveis concorrentes em comparação
Avaliação | Data | Modelo | Peso | Altura | Size | Resolução | Preço |
|---|---|---|---|---|---|---|---|
| 85.7 % v7 (old) | 09/2023 | Captiva Advanced Gaming I74-121 i5-13500H, GeForce RTX 4060 Laptop GPU | 2.3 kg | 29 mm | 15.60" | 1920x1080 | |
| 82.4 % v7 (old) | 04/2023 | MSI Cyborg 15 A12VF i7-12650H, GeForce RTX 4060 Laptop GPU | 2 kg | 22.9 mm | 15.60" | 1920x1080 | |
| 84.2 % v7 (old) | 06/2023 | Dell G15 5530 i7-13650HX, GeForce RTX 4060 Laptop GPU | 3 kg | 26.95 mm | 15.60" | 1920x1080 | |
| 87.7 % v7 (old) | 08/2023 | Lenovo Legion Slim 5 16APH8 R7 7840HS, GeForce RTX 4060 Laptop GPU | 2.4 kg | 25.2 mm | 16.00" | 2560x1600 | |
| 85.7 % v7 (old) | 07/2023 | Lenovo LOQ 15APH8 R7 7840HS, GeForce RTX 4050 Laptop GPU | 2.5 kg | 25.2 mm | 15.60" | 1920x1080 | |
| 87.9 % v7 (old) | 01/2023 | Schenker XMG Core 15 (M22) R7 6800H, GeForce RTX 3060 Laptop GPU | 2.1 kg | 23 mm | 15.60" | 2560x1440 |
Caso - O Captiva barebone é um segredo (Clevo)
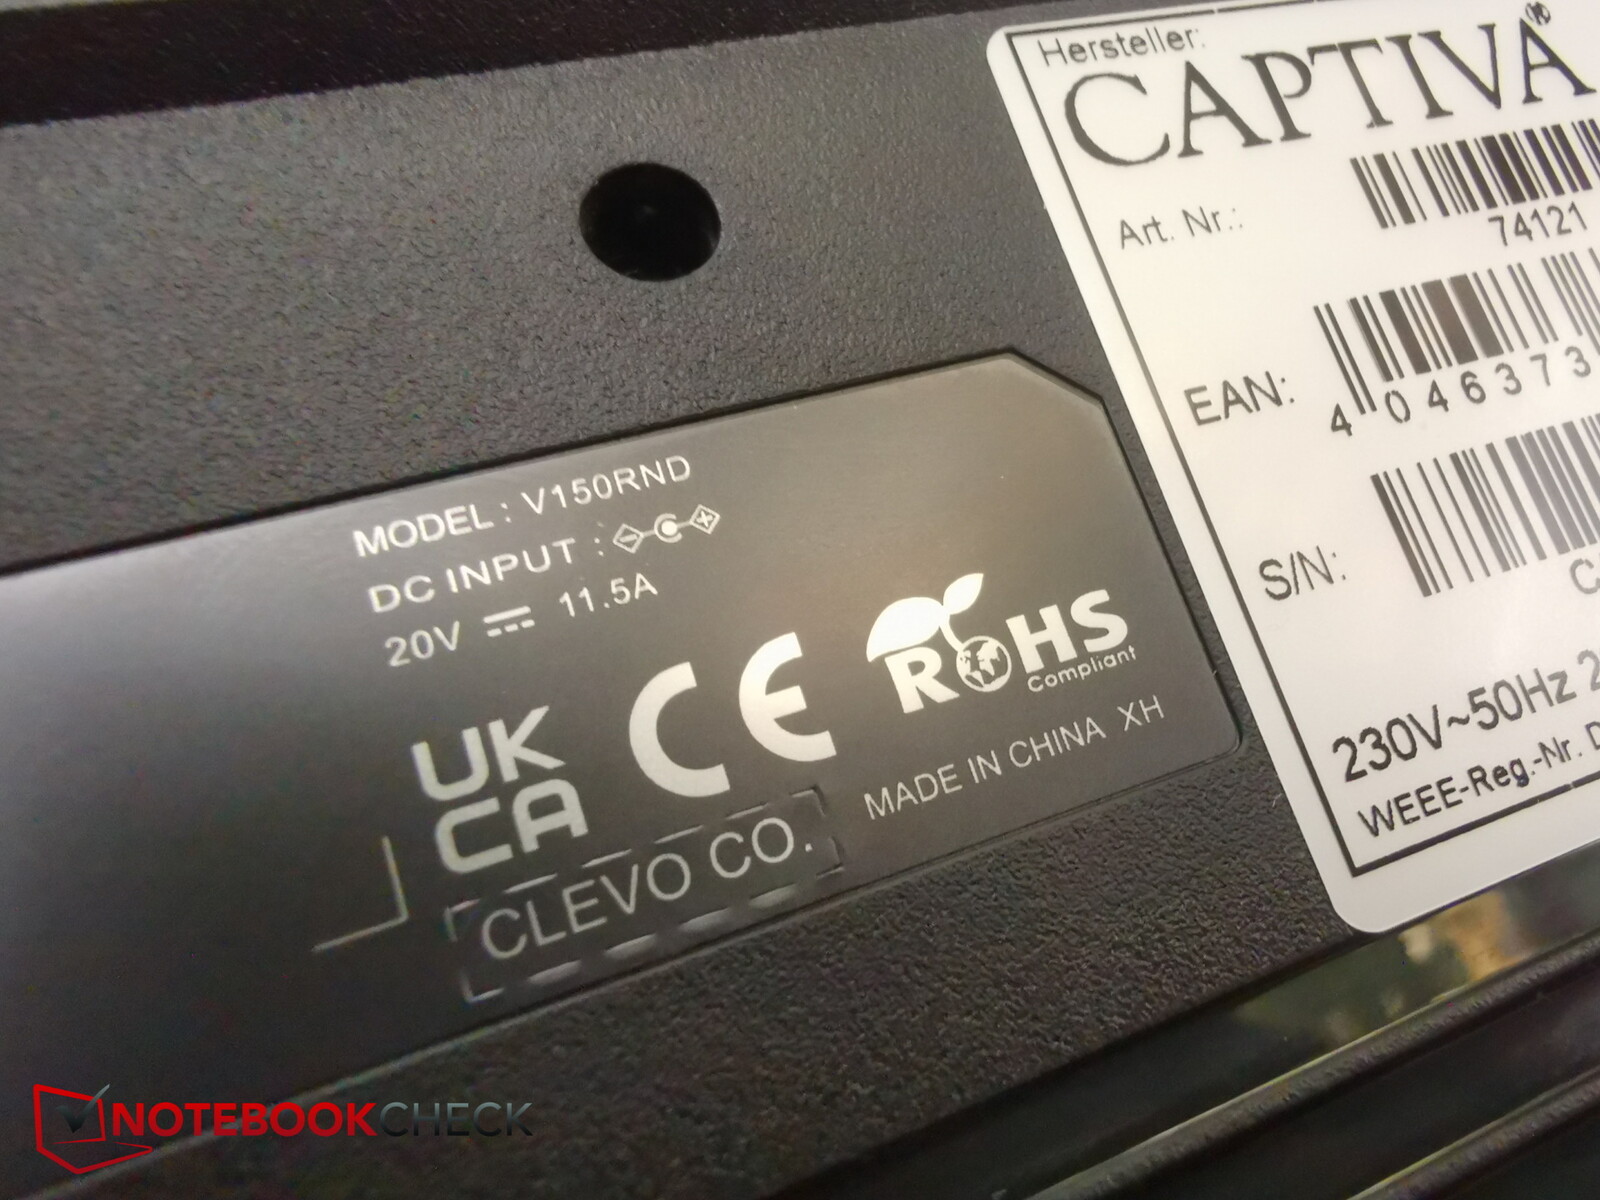
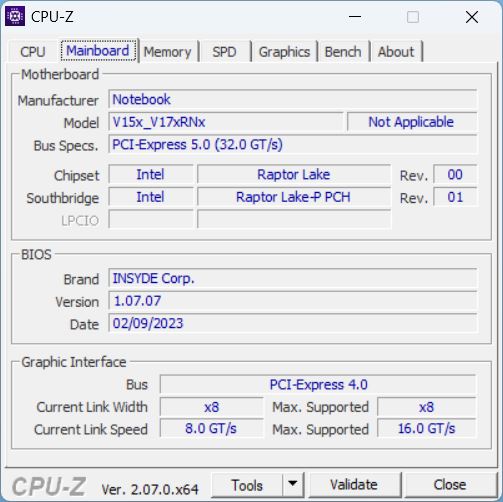
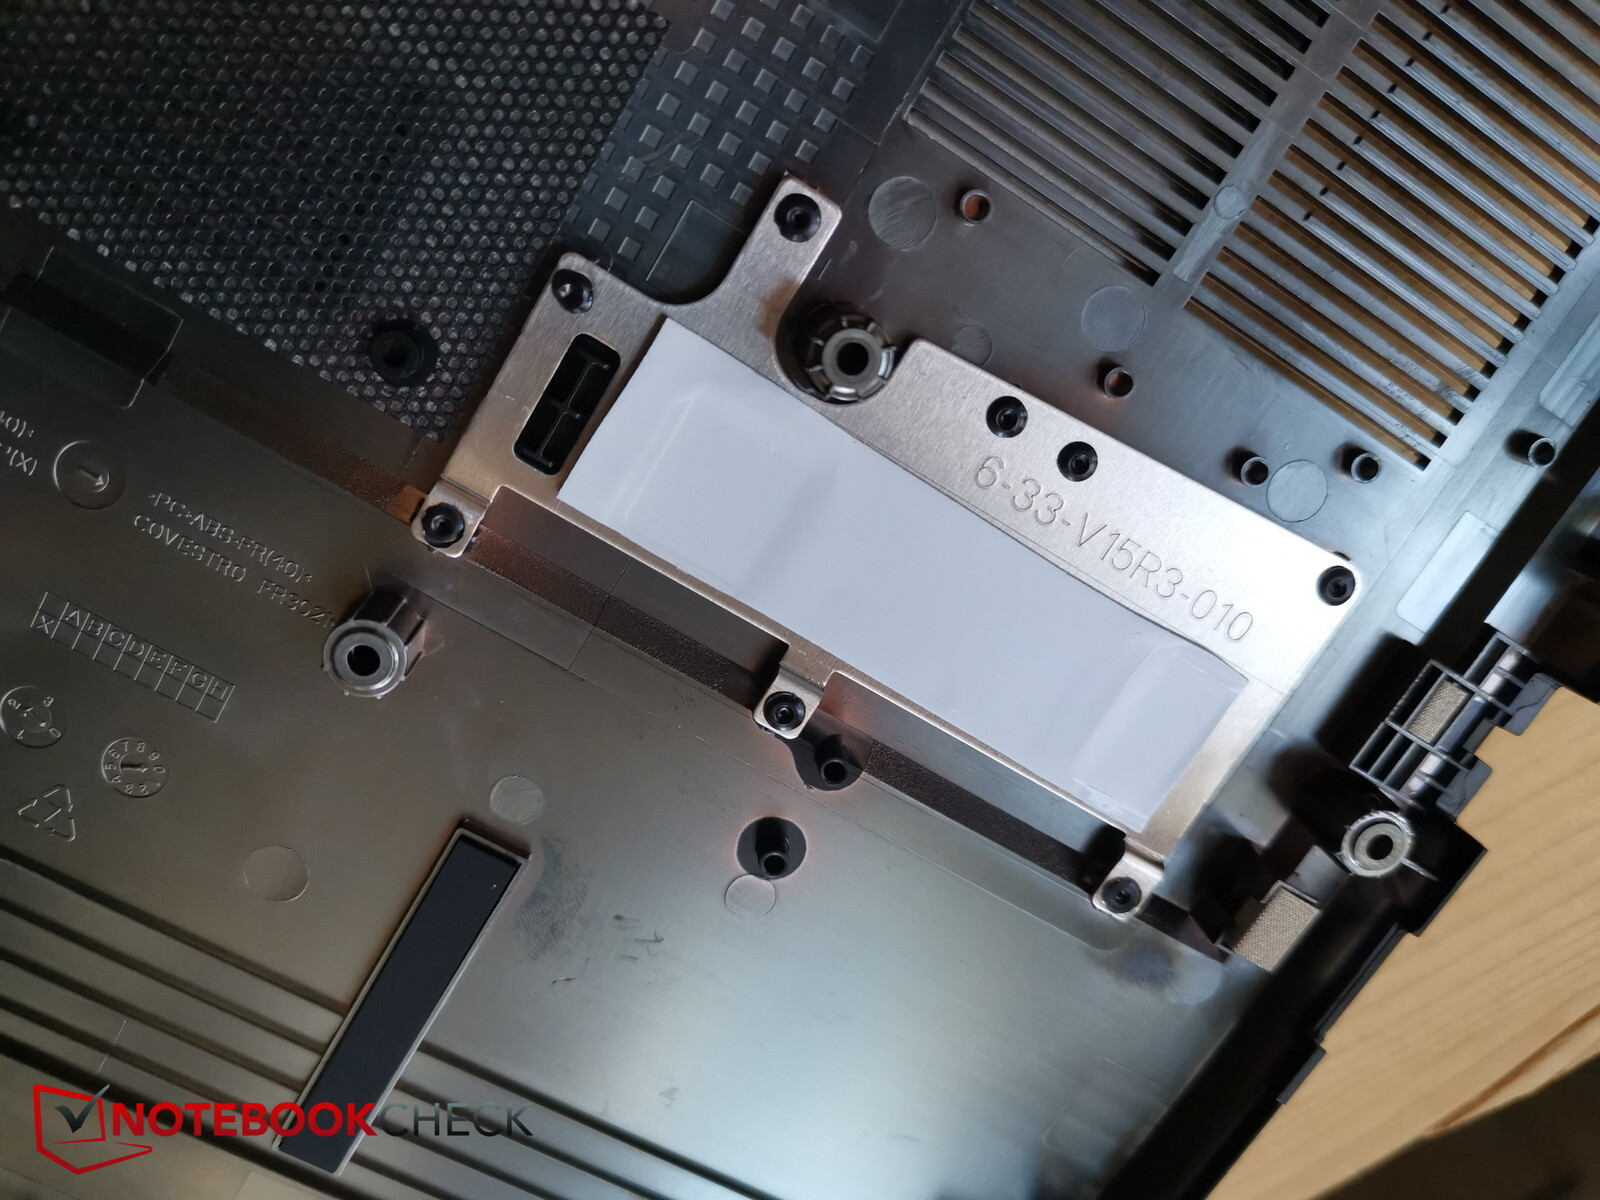
Quando perguntada, a Captiva se recusou a nos dizer qual barebone é usado - aparentemente, eles são feitos "especialmente para a Captiva". Entretanto, um adesivo na parte inferior nos revela que o fabricante Clevo está envolvido. Não está claro para nós por que a Captiva está ocultando essas informações. Identificamos o barebone da Clevo como sendo o Clevo V150RND.
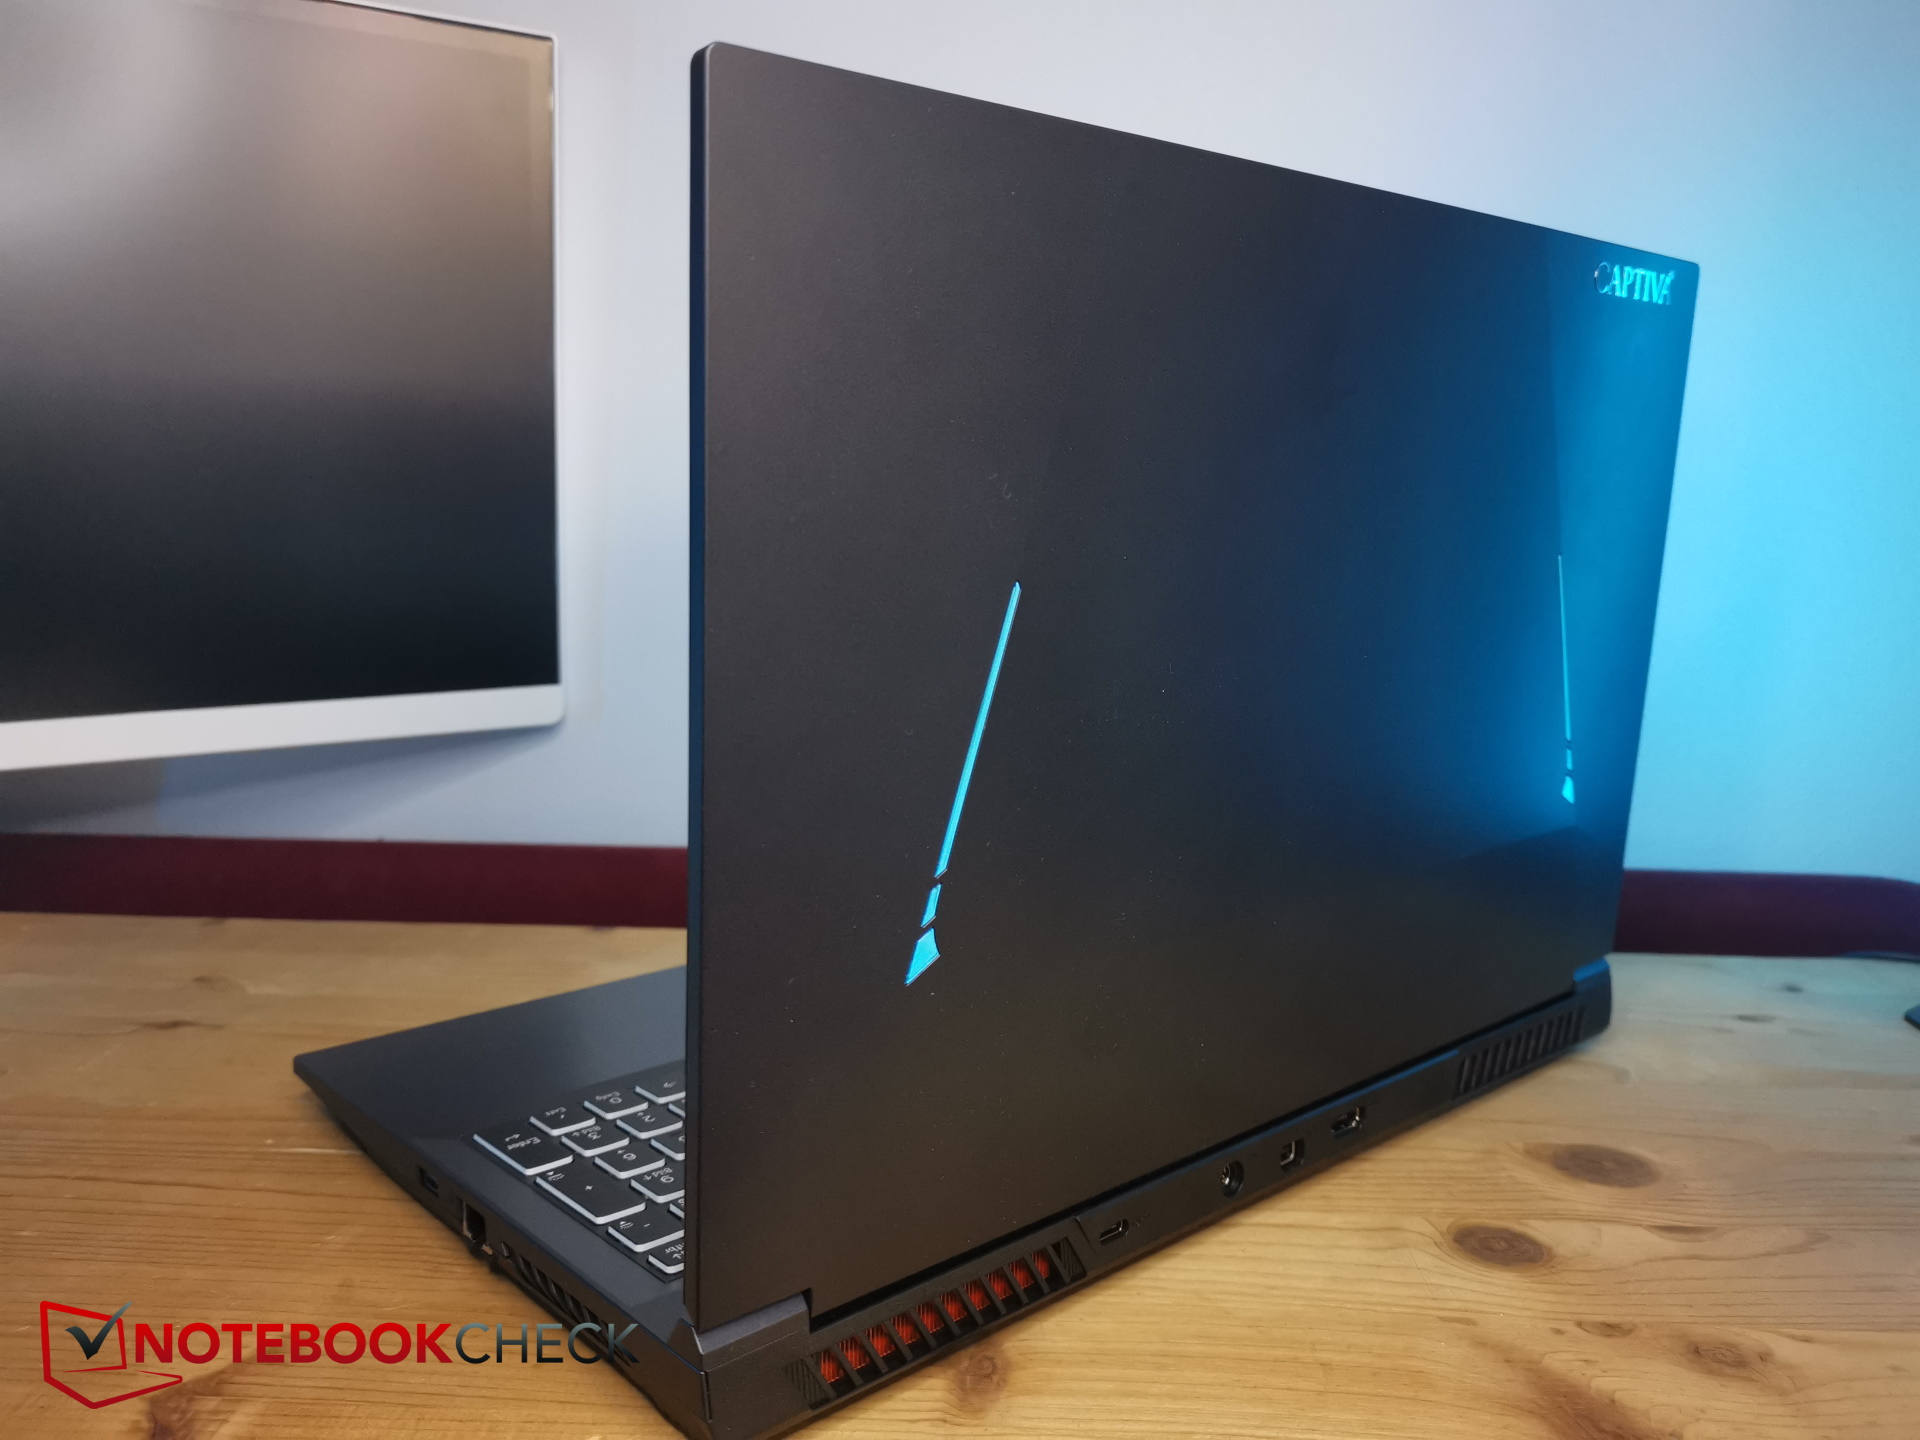
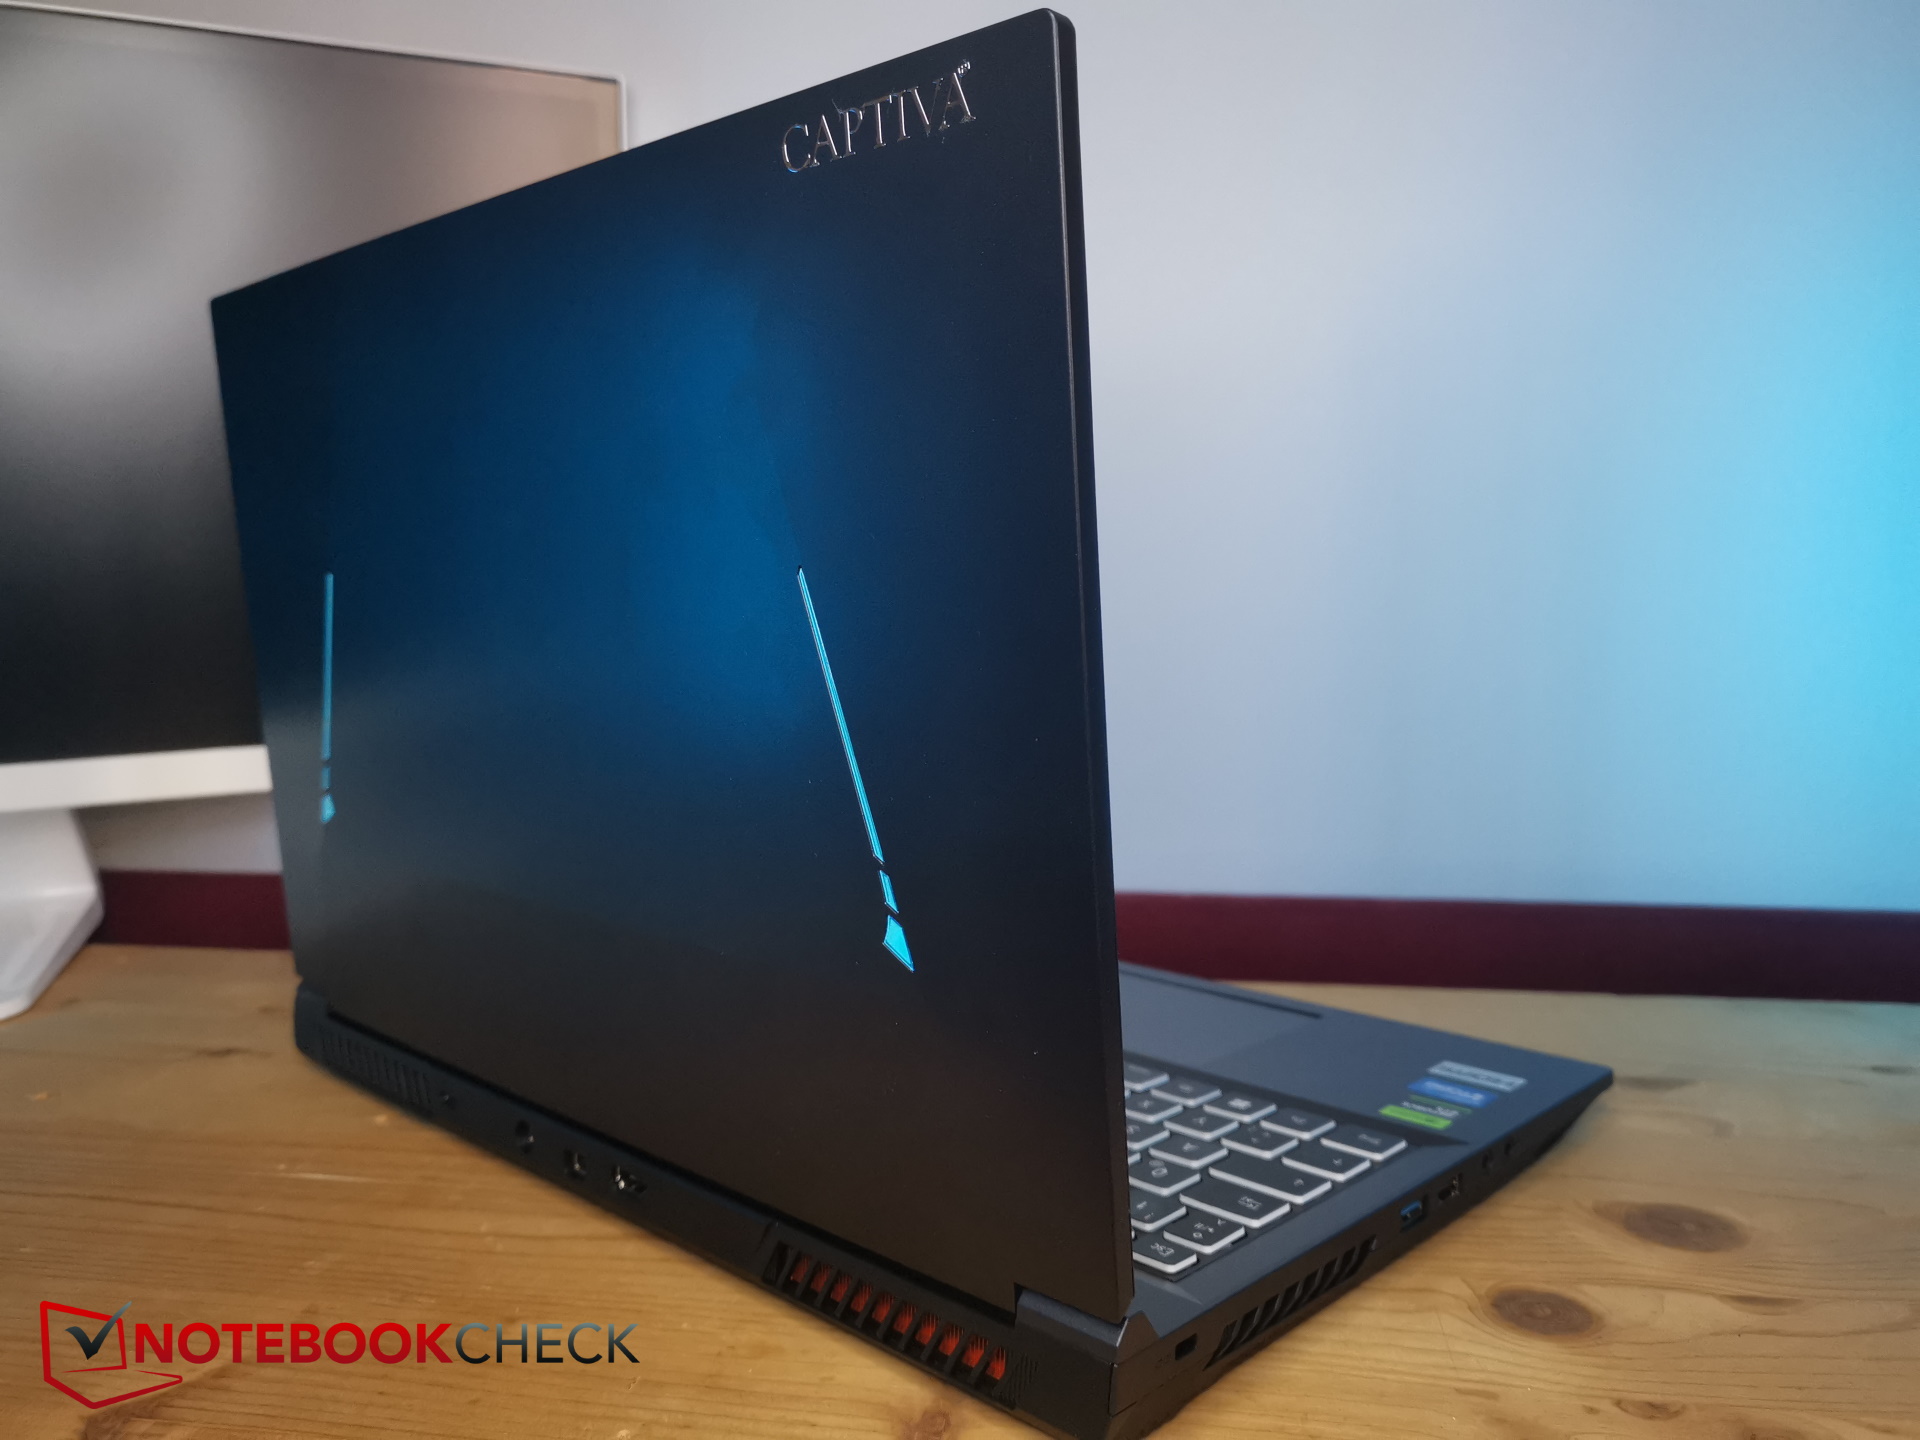
O gabinete interno do laptop lembra o Gigabyte G5 quando está dobrado e aberto. Seu teclado é ligeiramente recuado e o layout também é semelhante, embora não pareça ser exatamente o mesmo.
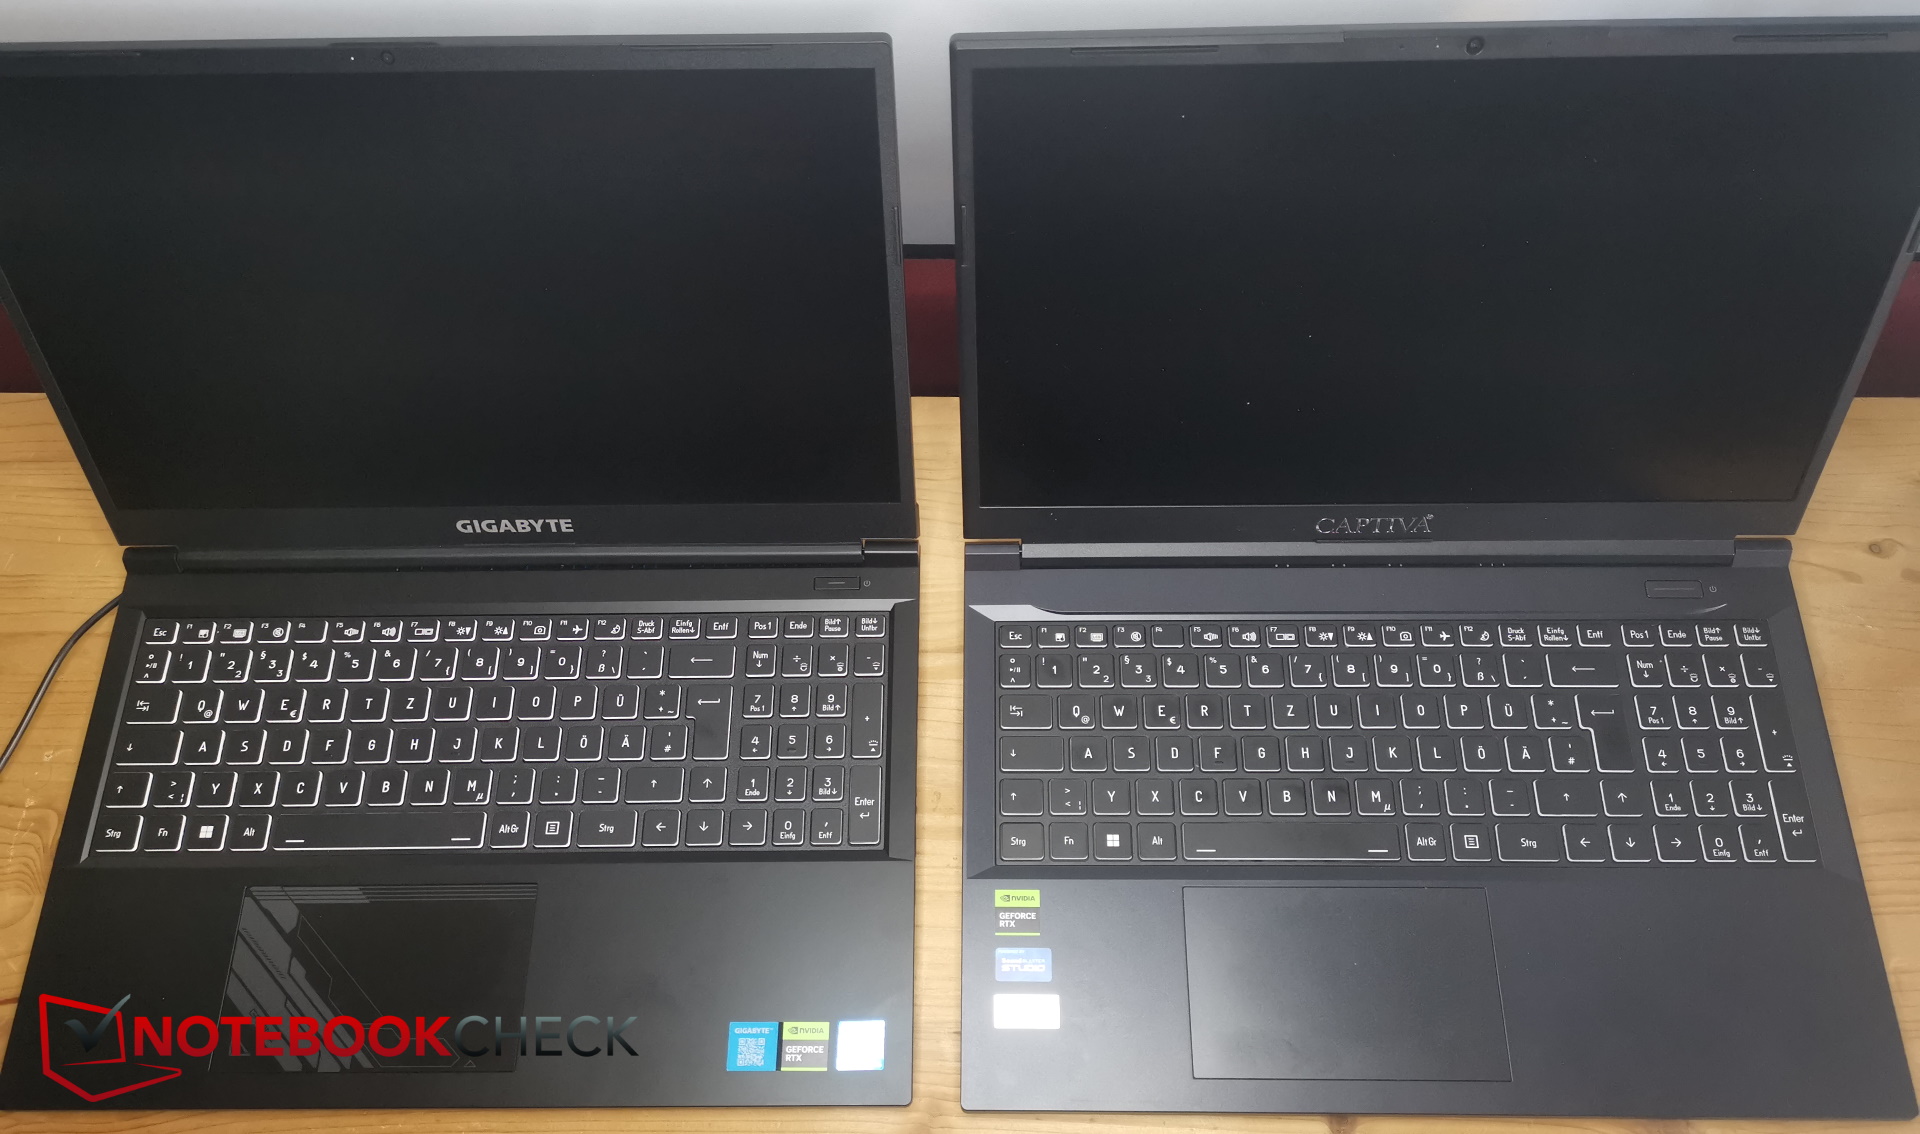
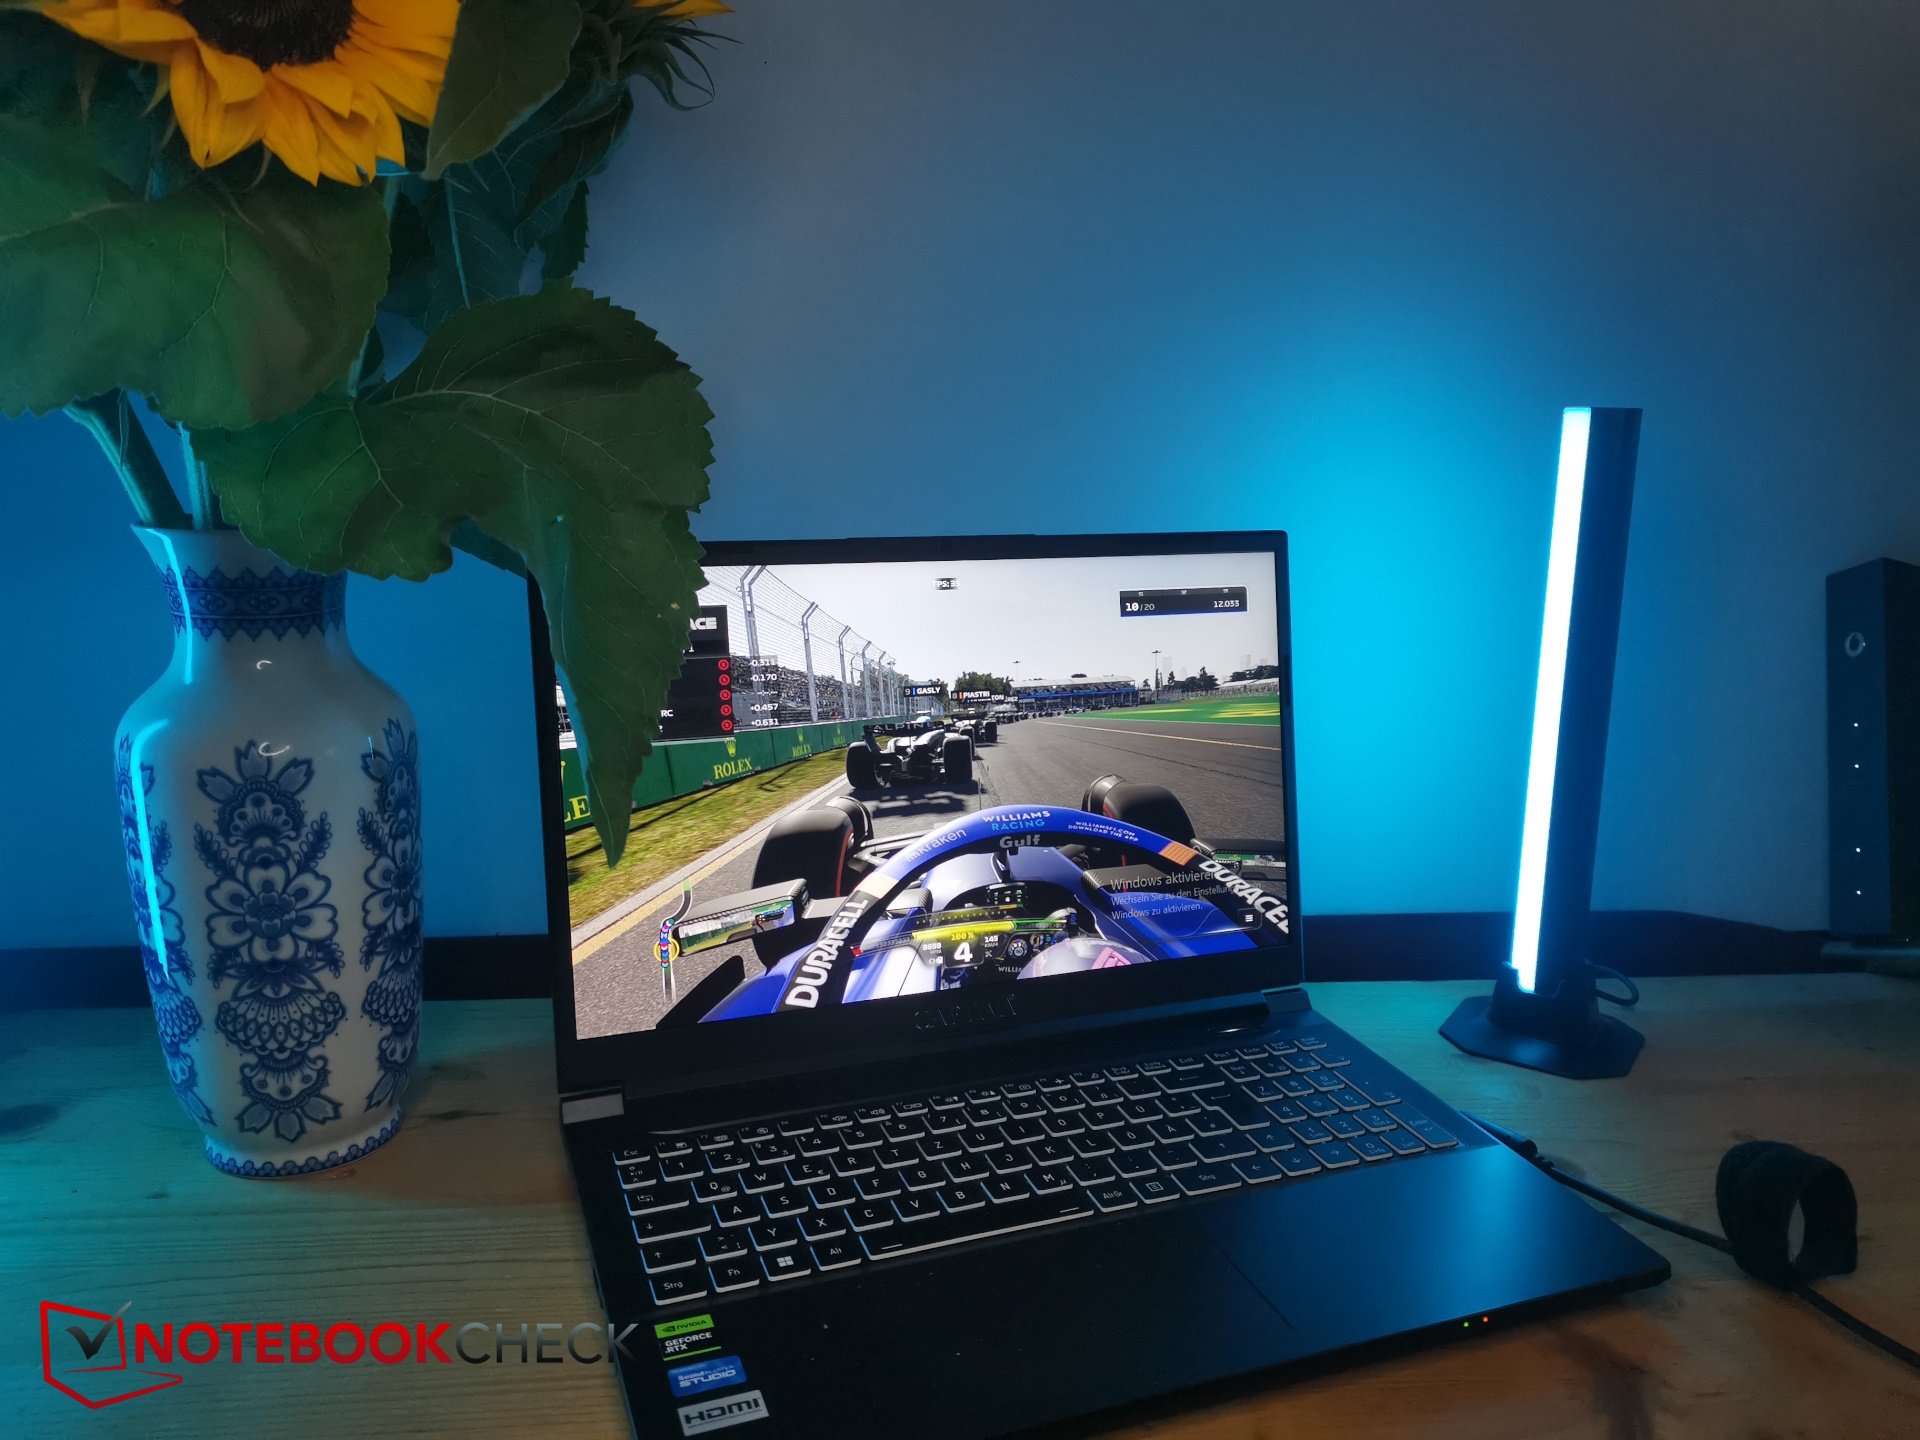
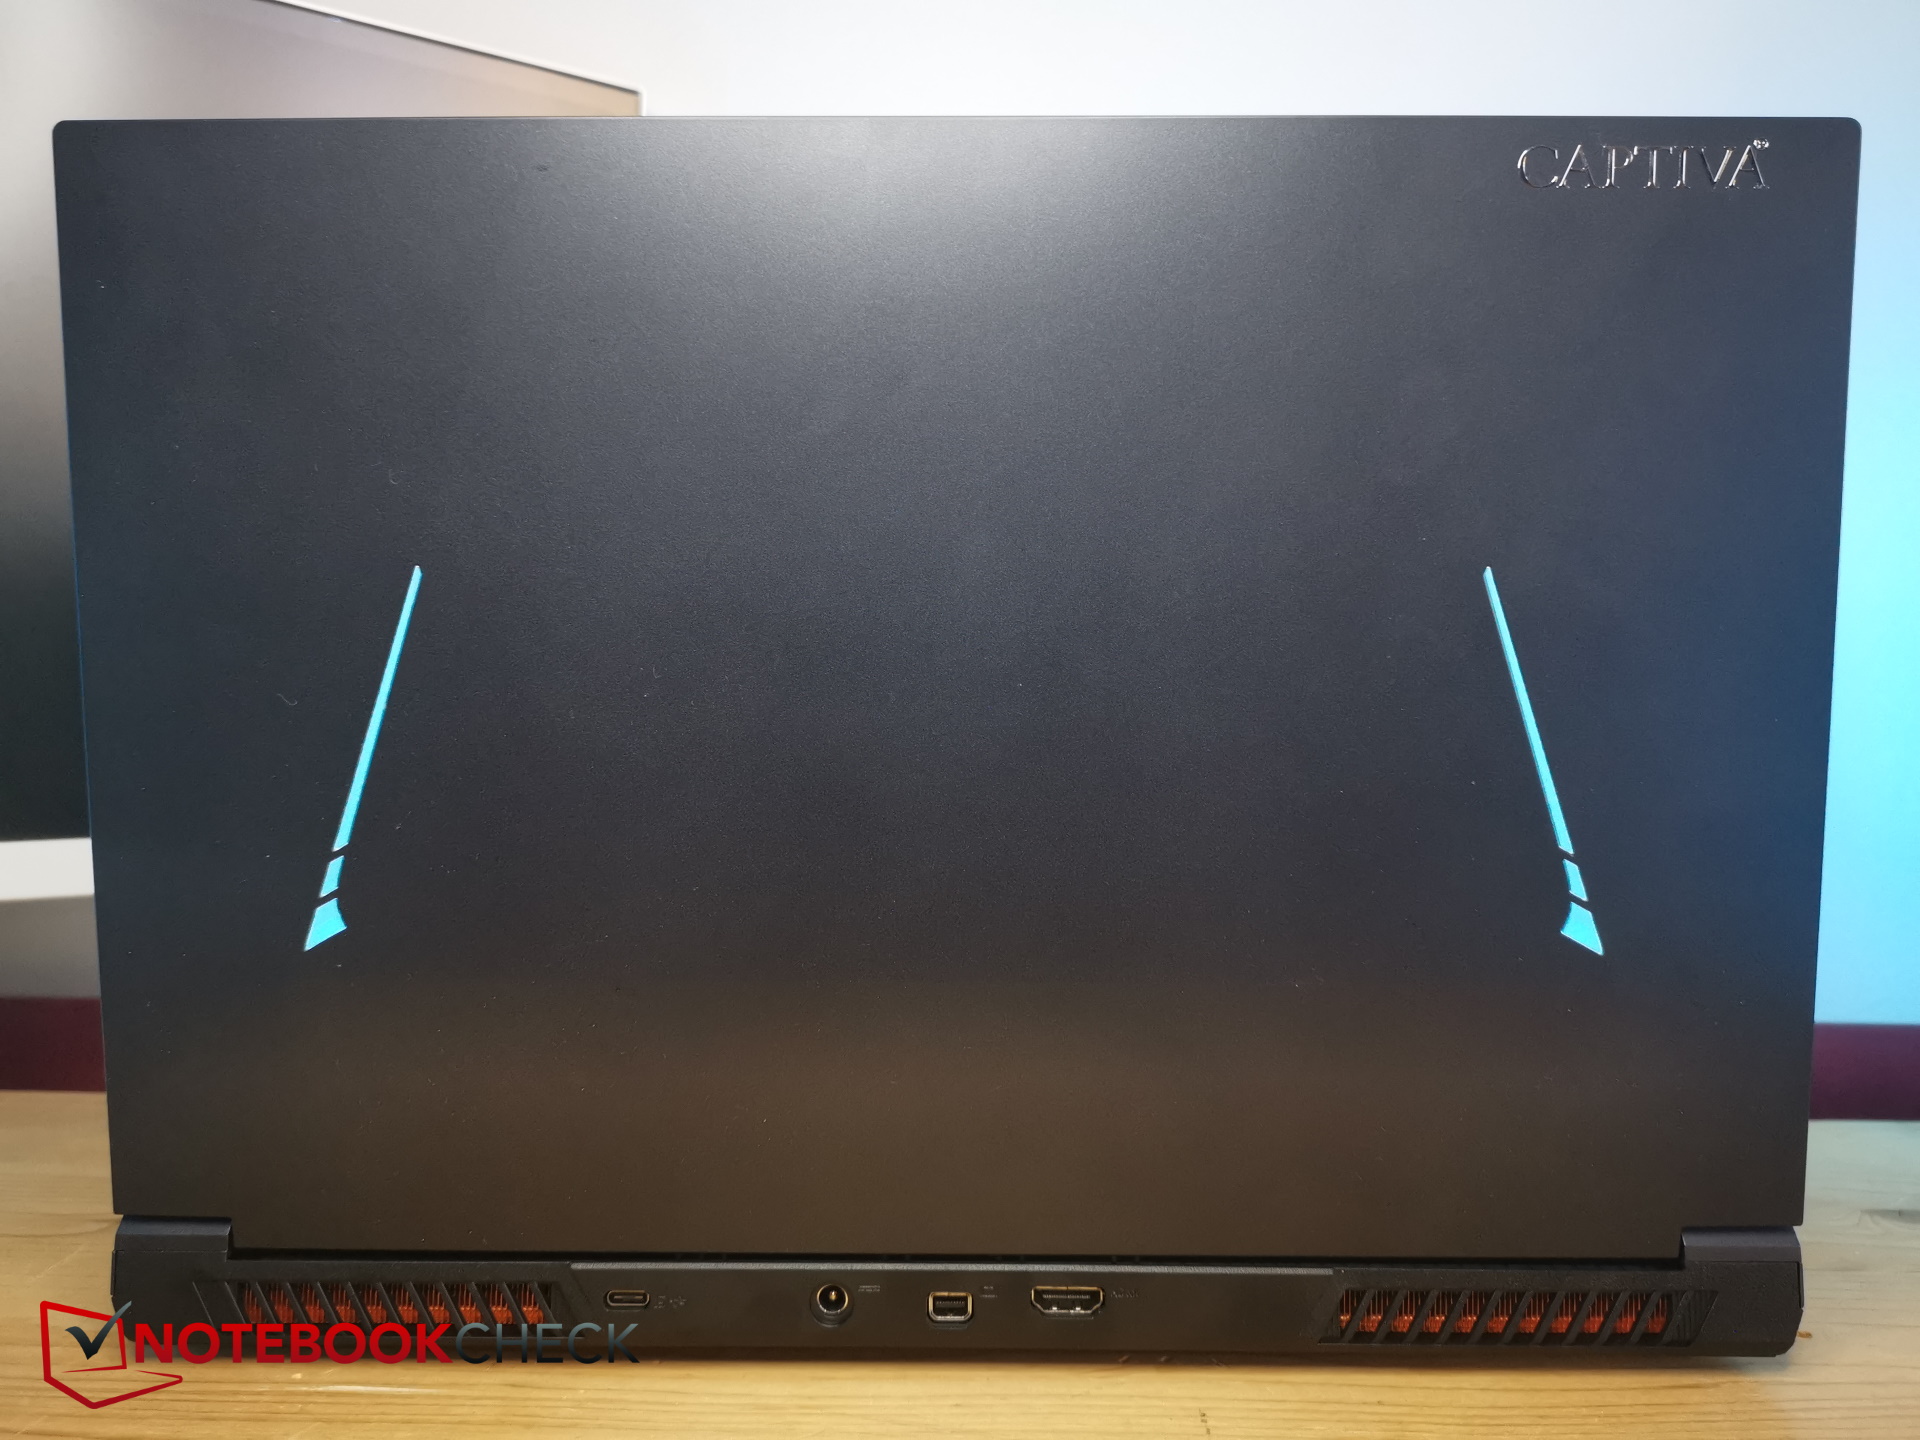
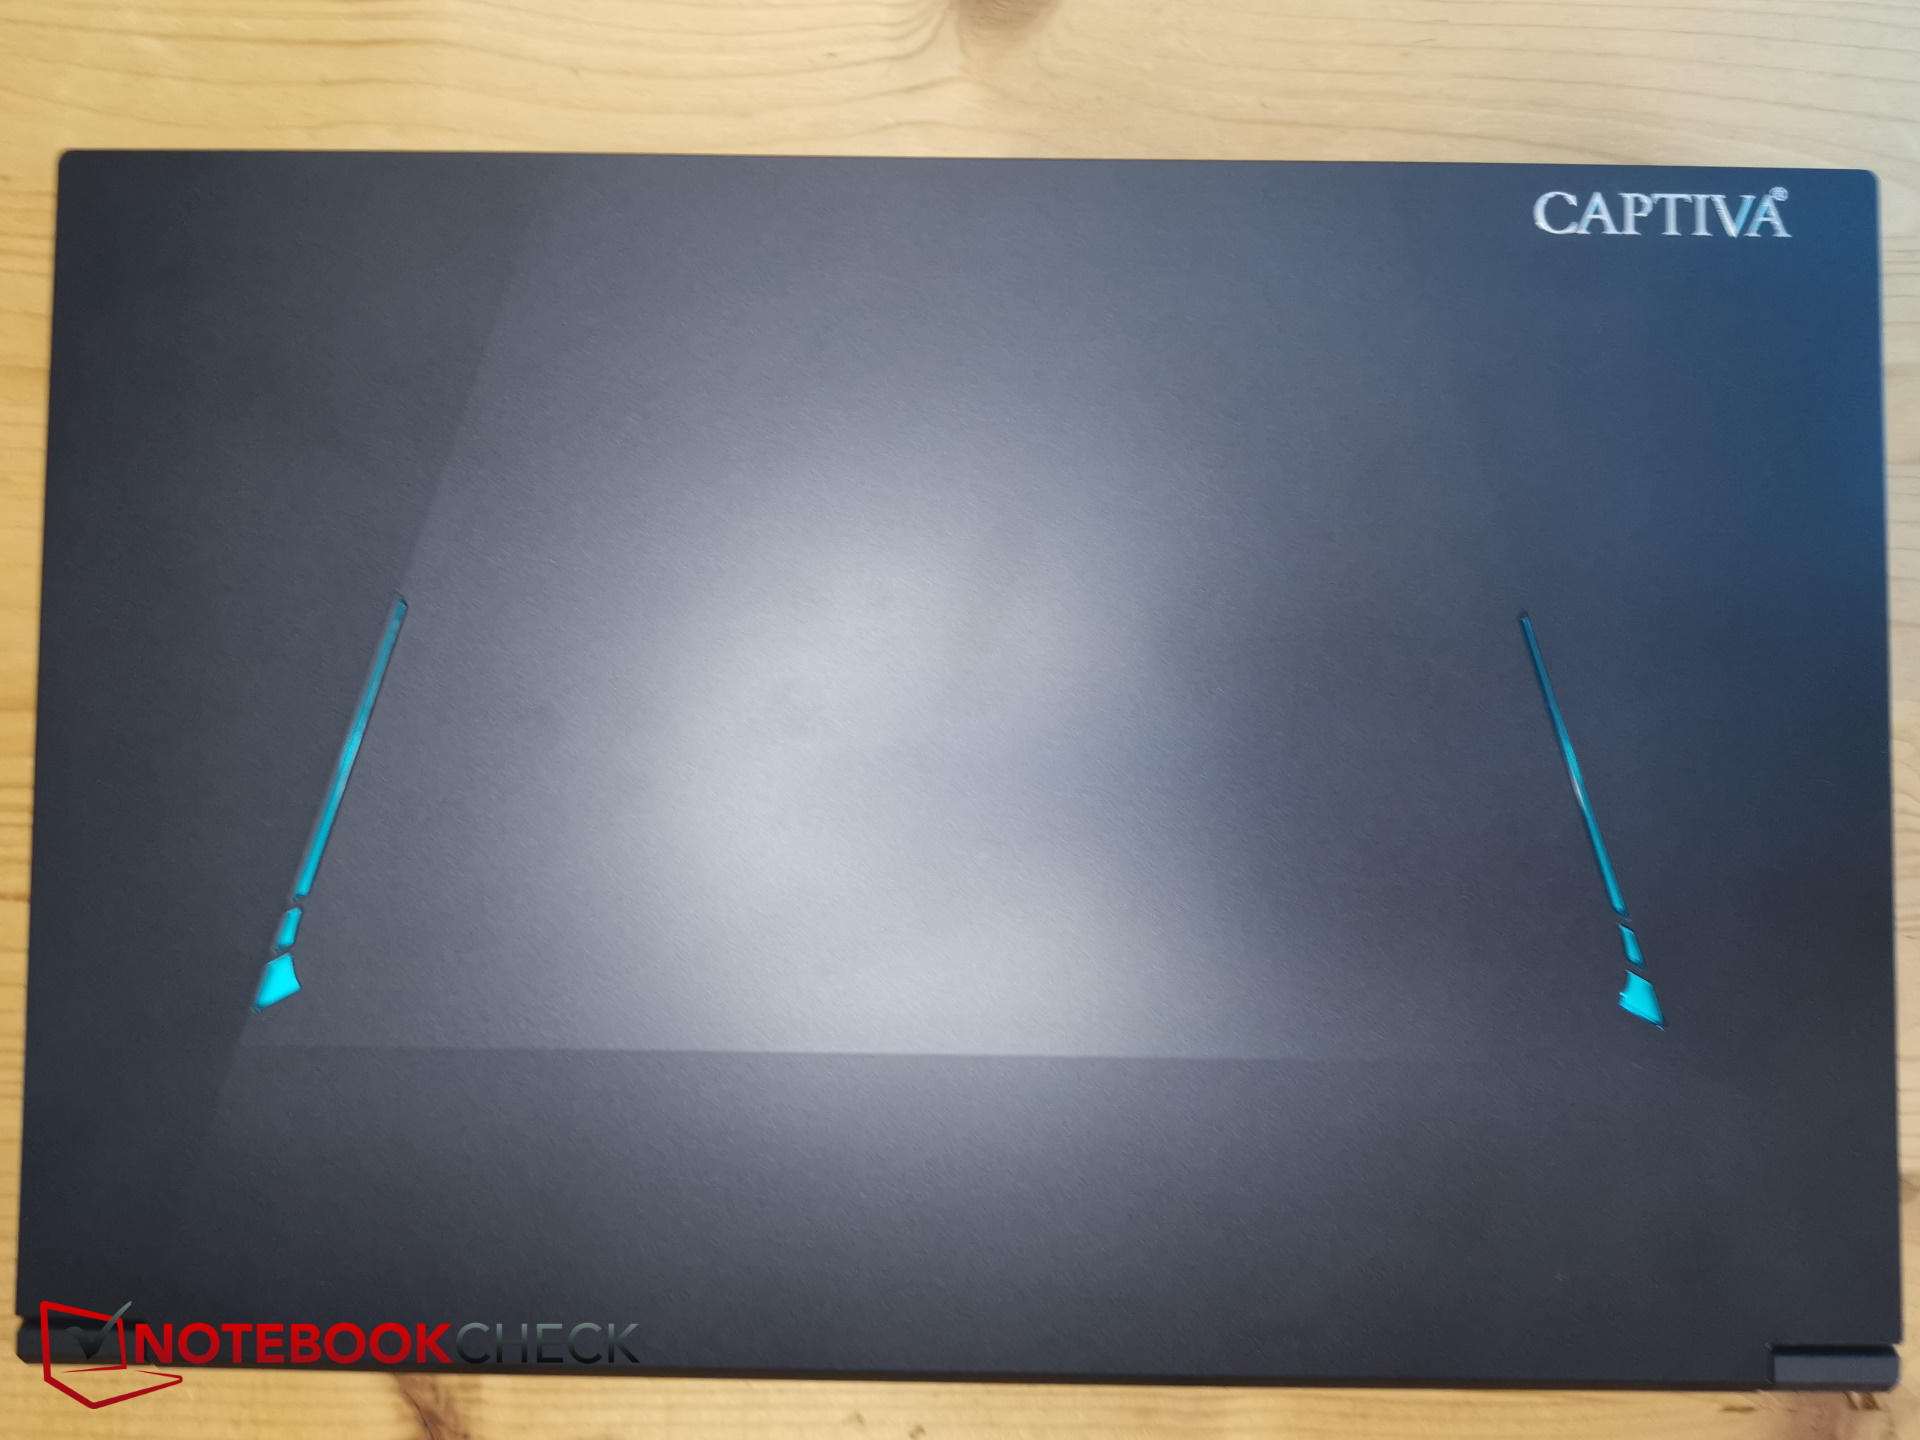
Por fora, os dois modelos parecem bem diferentes, mesmo que suas dimensões sejam semelhantes. O laptop Captiva é um pouco mais grosso que o G5. Na parte superior, há faixas de LED azuis e inclinadas na superfície preta fosca - em um canto, a inscrição "Captiva" prateada brilha. Além disso, a parte superior do I74-121 não é totalmente plana; em vez disso, ela tem uma leve curvatura.
O plástico é o único material utilizado, mas sua base ainda é suficientemente rígida e não é possível ouvir ruídos de rachaduras quando se tenta dobrá-la. Não notamos nenhuma folga incomum e sua construção é, em geral, muito boa.
A dobradiça larga é boa, mas não excelente - ela permite apenas um ângulo máximo de abertura de 135 a 140 graus.
Como resultado de seu design minimalista, o laptop Captiva é um dos menores dispositivos no campo de comparação, especialmente quando se trata de profundidade. Por sua vez, ele também é um dos laptops mais espessos desta comparação. O fabricante declarou uma espessura de 28 mm, mas medimos pelo menos 29 mm ao longo da borda central da parte traseira do dispositivo.
Ele tem um peso médio - os dispositivos Schenker e MSI são um pouco mais leves e os demais são mais pesados, especialmente o Dell G15.
Conectividade - Um pouco desatualizada
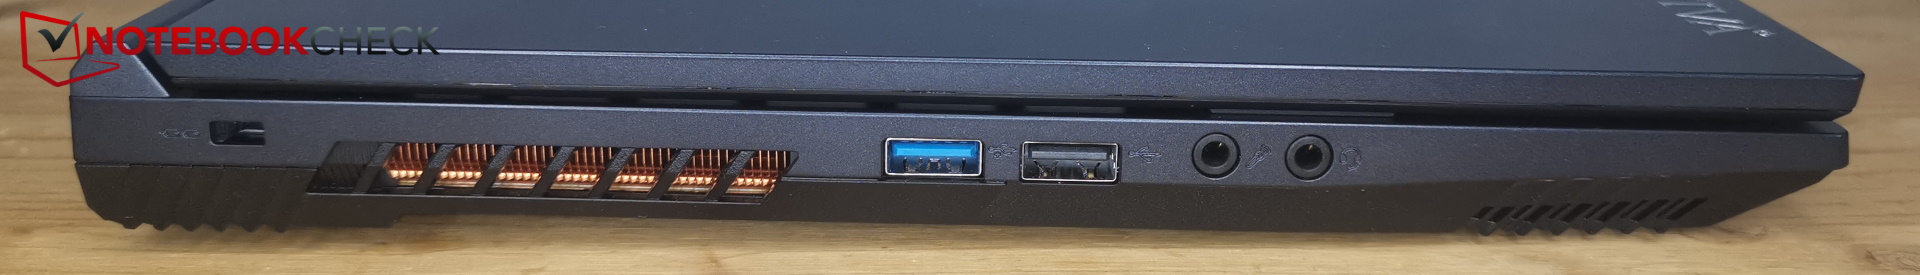
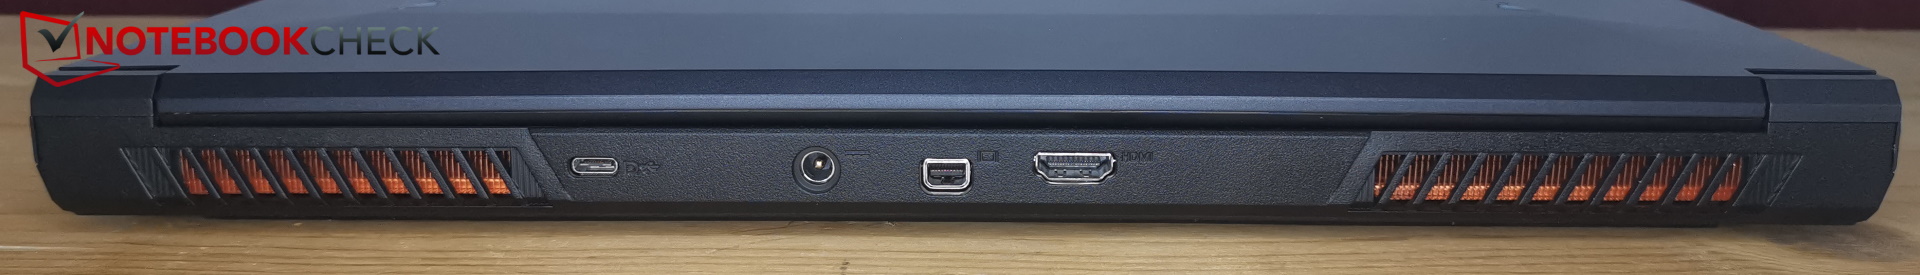
À primeira vista, o laptop apresenta todas as opções de conectividade mais importantes. Em uma segunda olhada, fica claro que esse não é o caso - ou, pelo menos, que elas estão desatualizadas.
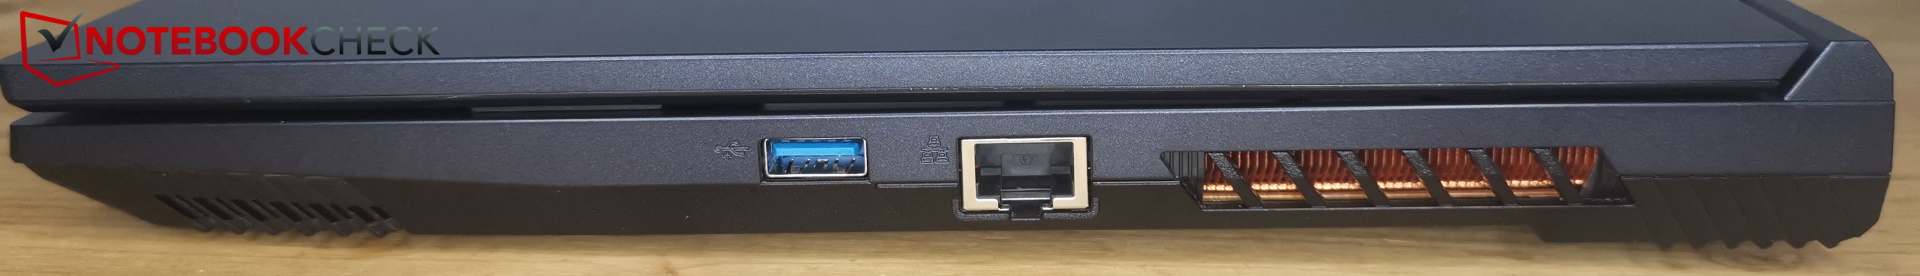
Uma de suas portas USB-A ainda é do tipo 2.0, a Thunderbolt está ausente e ele também não tem um leitor de cartão SD. Pelo menos, o laptop está pronto para VR graças à sua conexão MiniDP. Uma das duas portas USB-A 3.2 tem velocidade Gen2 e a outra apenas Gen1. Não é possível identificar qual delas é a conexão mais rápida pelo lado de fora.
Ambas as portas USB-A do lado esquerdo estão posicionadas muito próximas umas das outras, o que significa que pendrives grossos não podem ser conectados um ao lado do outro. Todas as outras portas têm espaço suficiente entre elas. No entanto, a conexão de rede está do lado direito, o que é um pouco incômodo se você usar um mouse com a mão direita.
Comunicação
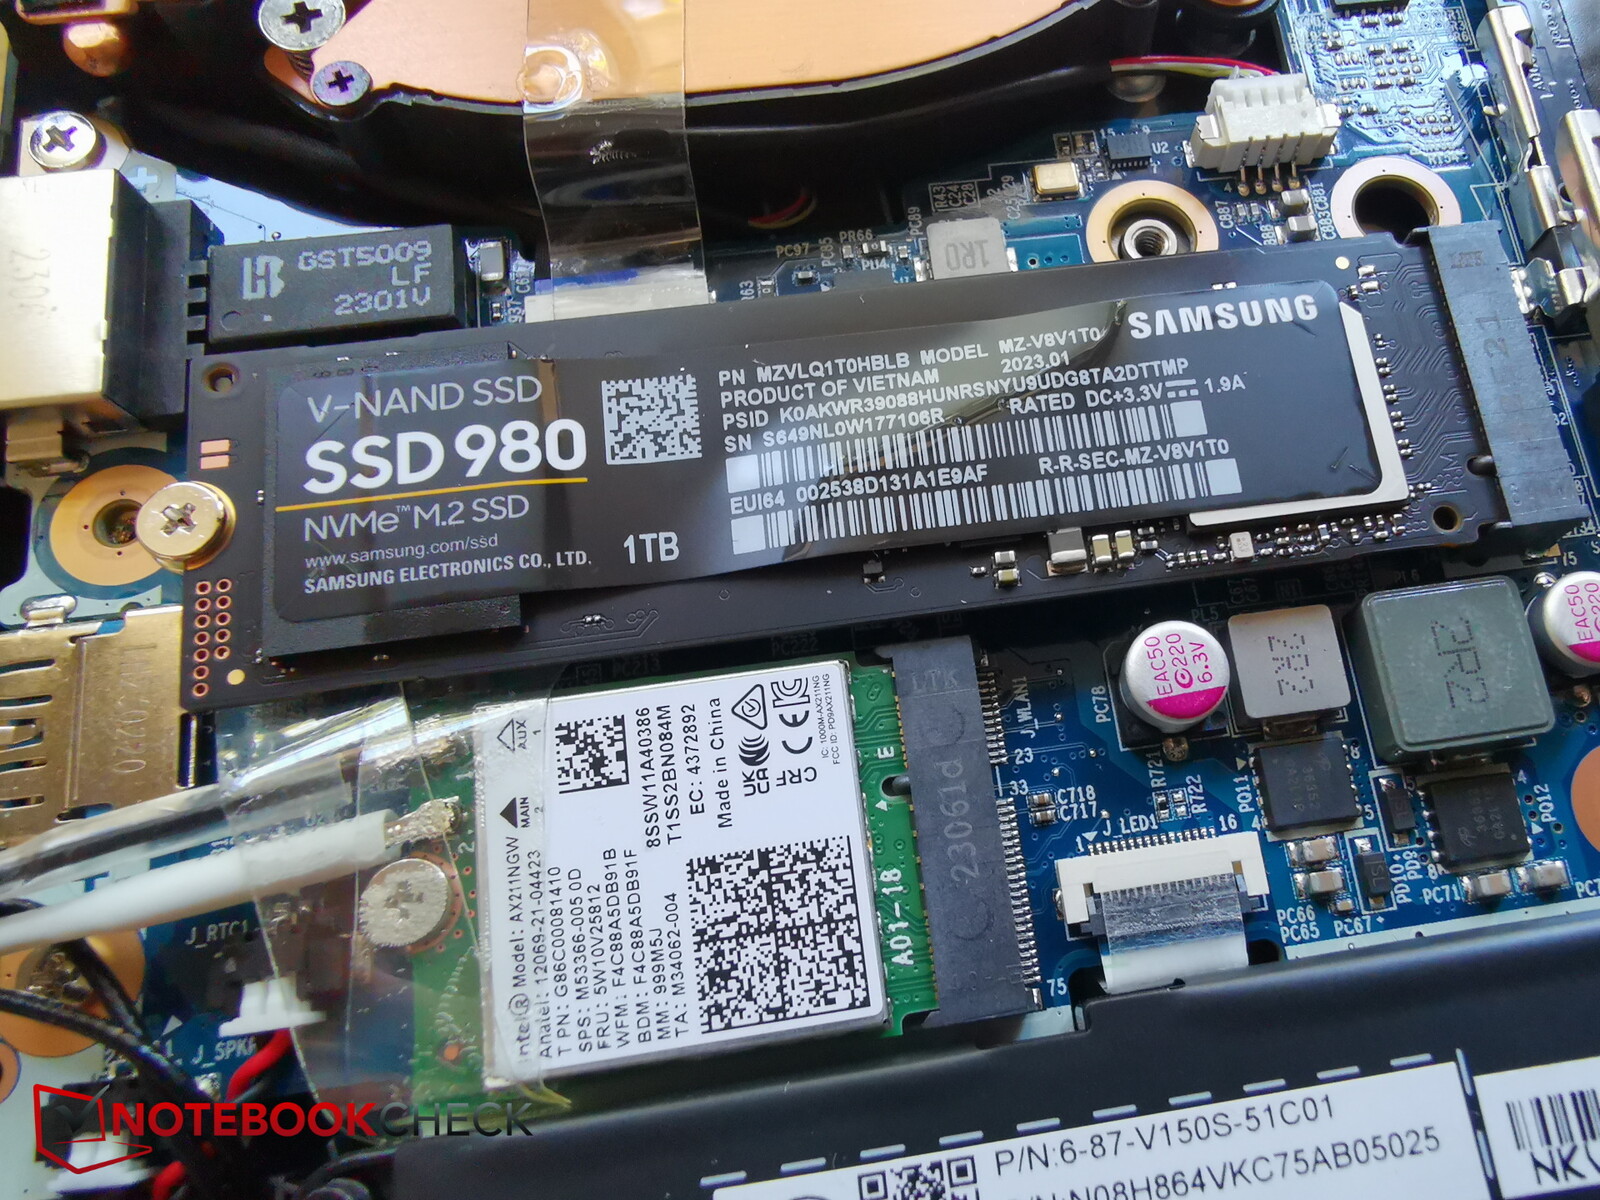
O módulo Intel AX211 do laptop Captiva suporta WiFi 6E, o que significa que ele pode receber e emitir usando as frequências de 2,4 GHz, 6 GHz e 6 GHz. Usando 6 GHz, suas velocidades de transferência são boas, embora, ao usar 5 GHz, o laptop seja o mais fraco no campo de comparação.
Webcam
Sua webcam também não está totalmente atualizada. Em vez de uma webcam Full HD moderna, o laptop usa uma webcam HD desatualizada com resolução de 720p.
Seu desvio de cor é bom e baixo, mas mesmo em boas condições de iluminação, a imagem é bastante granulada e não mostra muitos detalhes.


Segurança
O TPM está integrado graças ao chip Intel e o dispositivo possui uma trava Kensington, mas, como acontece em muitos laptops para jogos, o Captiva não possui um scanner de impressões digitais.
Escopo de entrega e garantia
Além do próprio laptop e da fonte de alimentação proprietária, o escopo da entrega inclui toda a papelada usual, dois parafusos pequenos e um CD de driver. Esse último é um pouco inútil, já que o laptop não tem unidade de CD - um pendrive de driver como o que a Schenker inclui teria feito muito mais sentido.
Manutenção
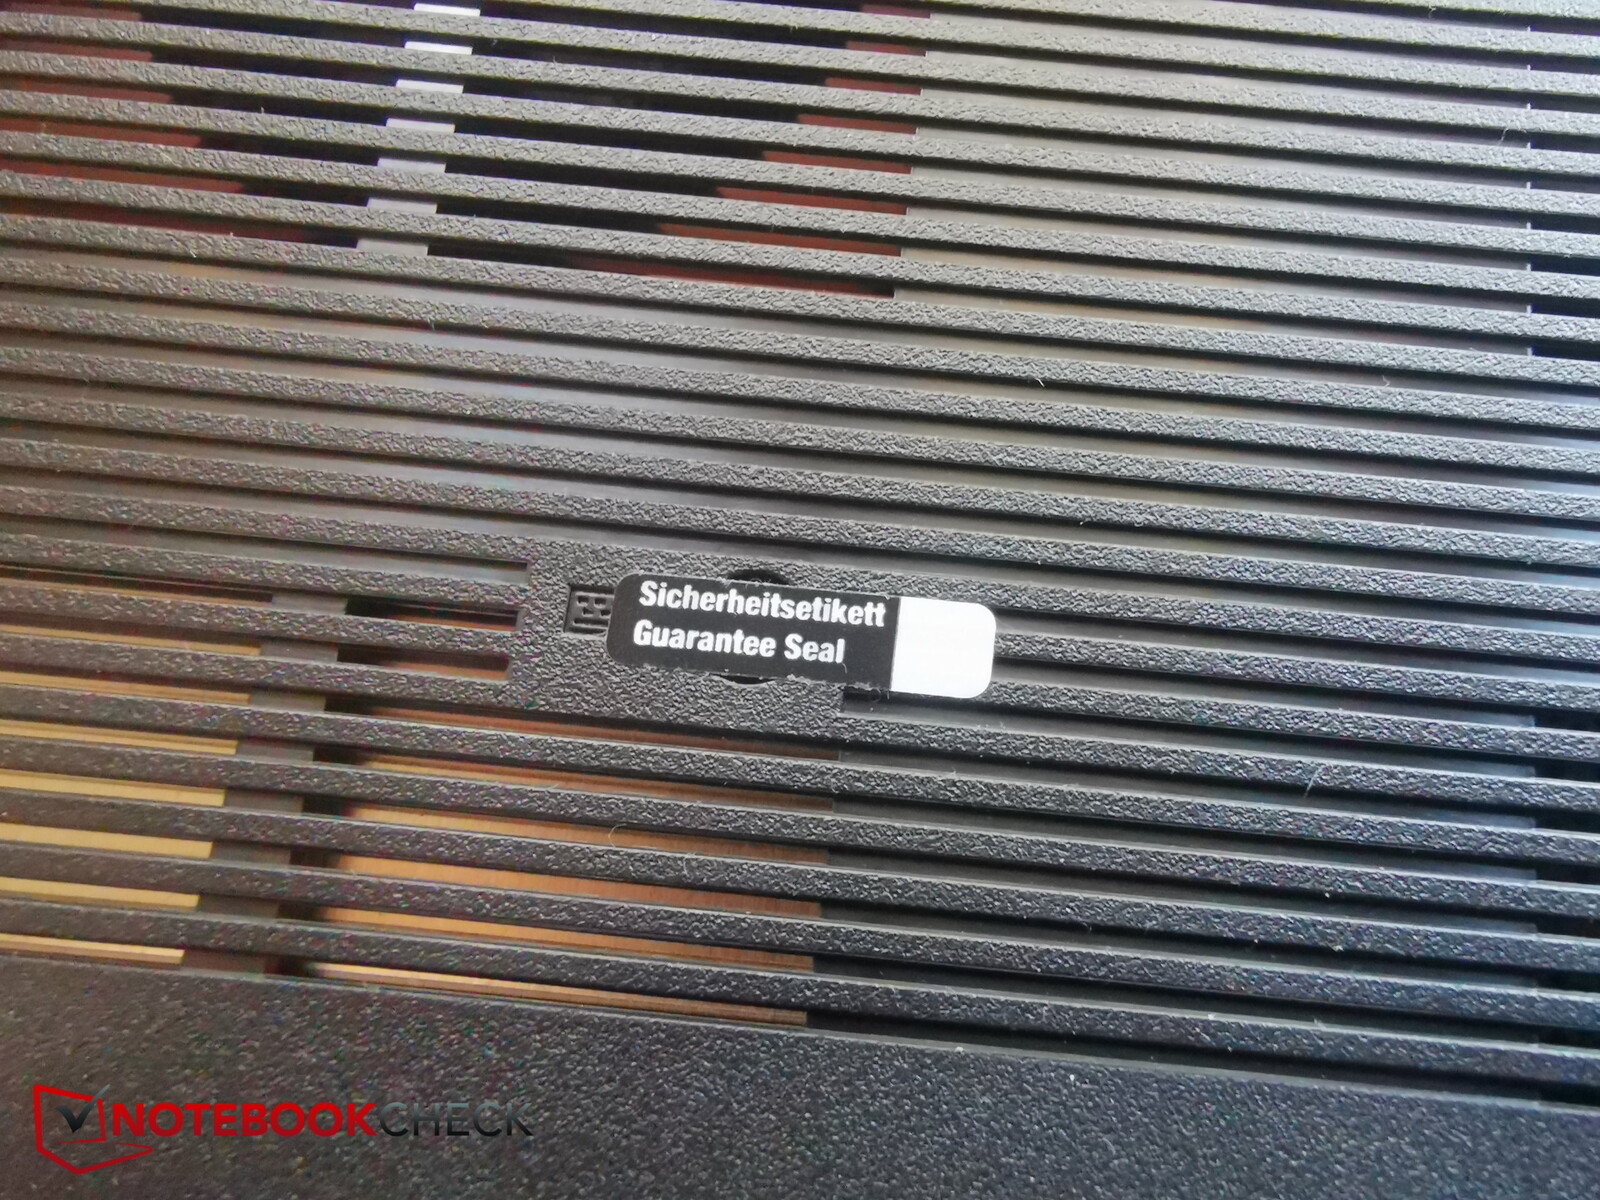
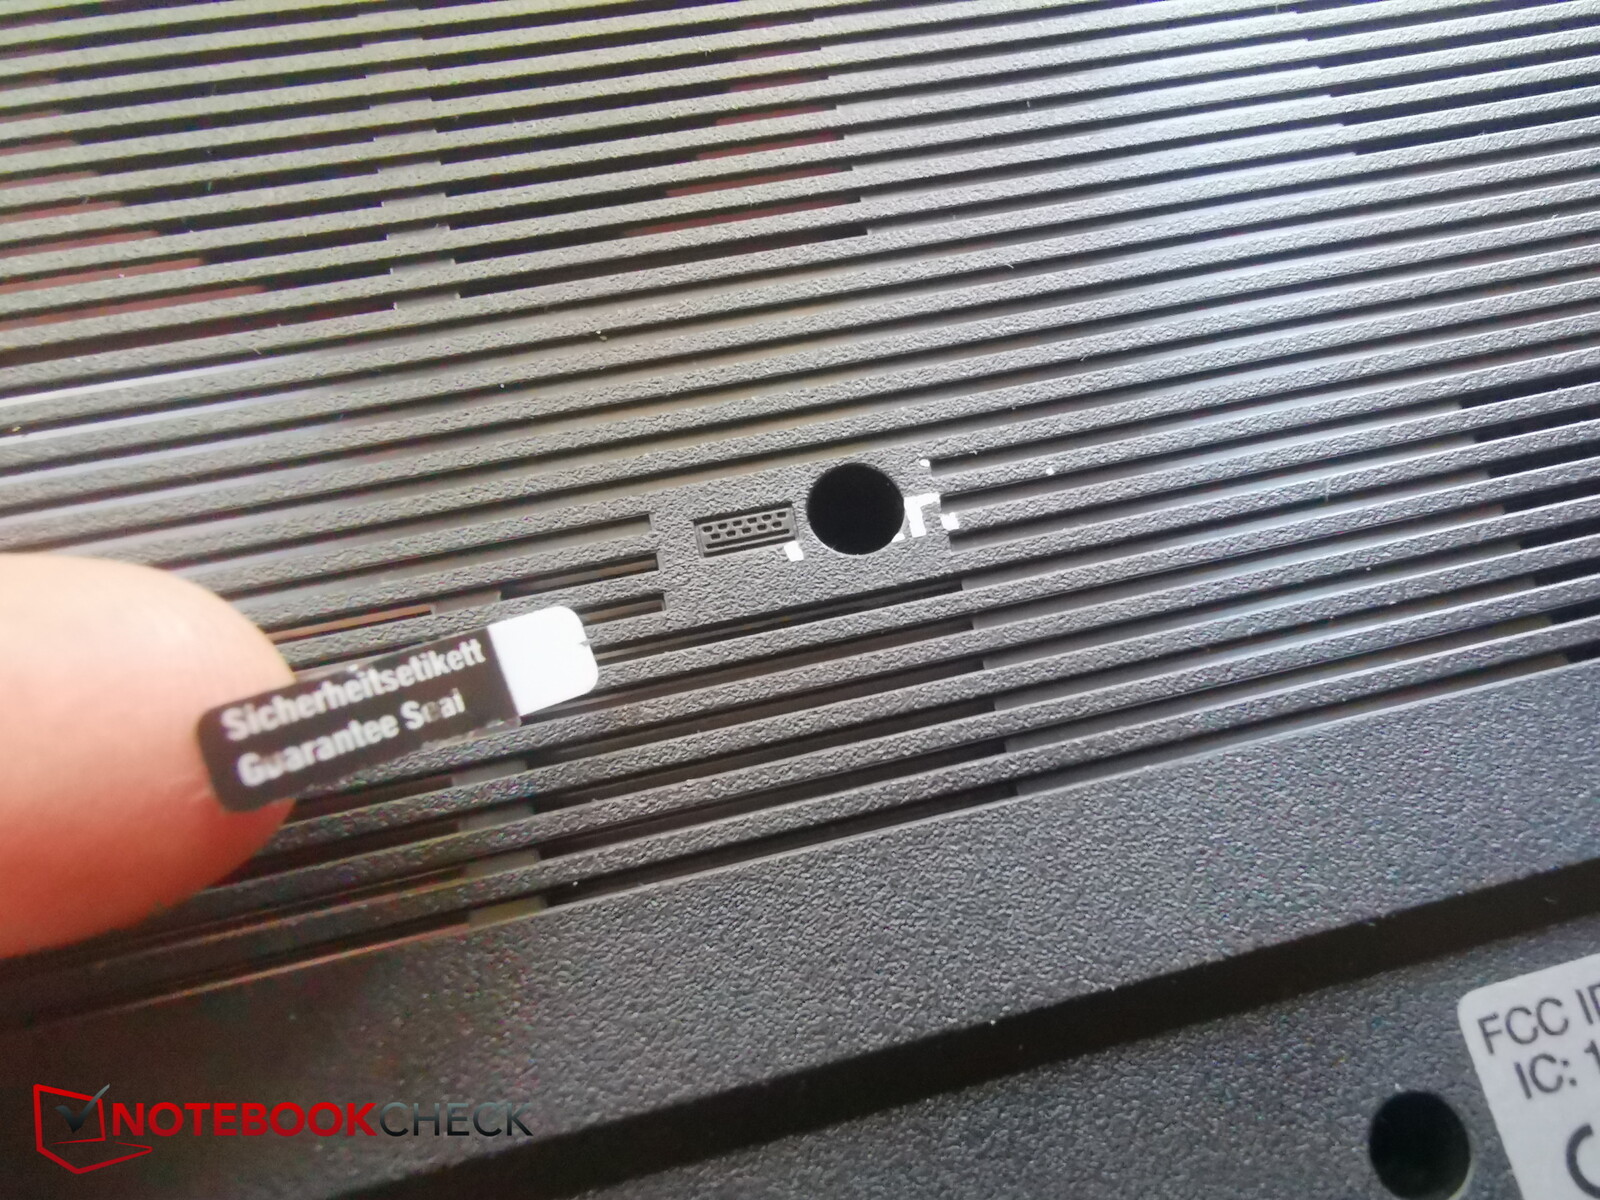
Dos 14 parafusos cruzados no total (que, felizmente, são todos do mesmo tamanho), um está situado abaixo de um selo de garantia. De acordo com o Captiva, a garantia expira assim que você abre o dispositivo. O fabricante nos deu permissão para romper o lacre.
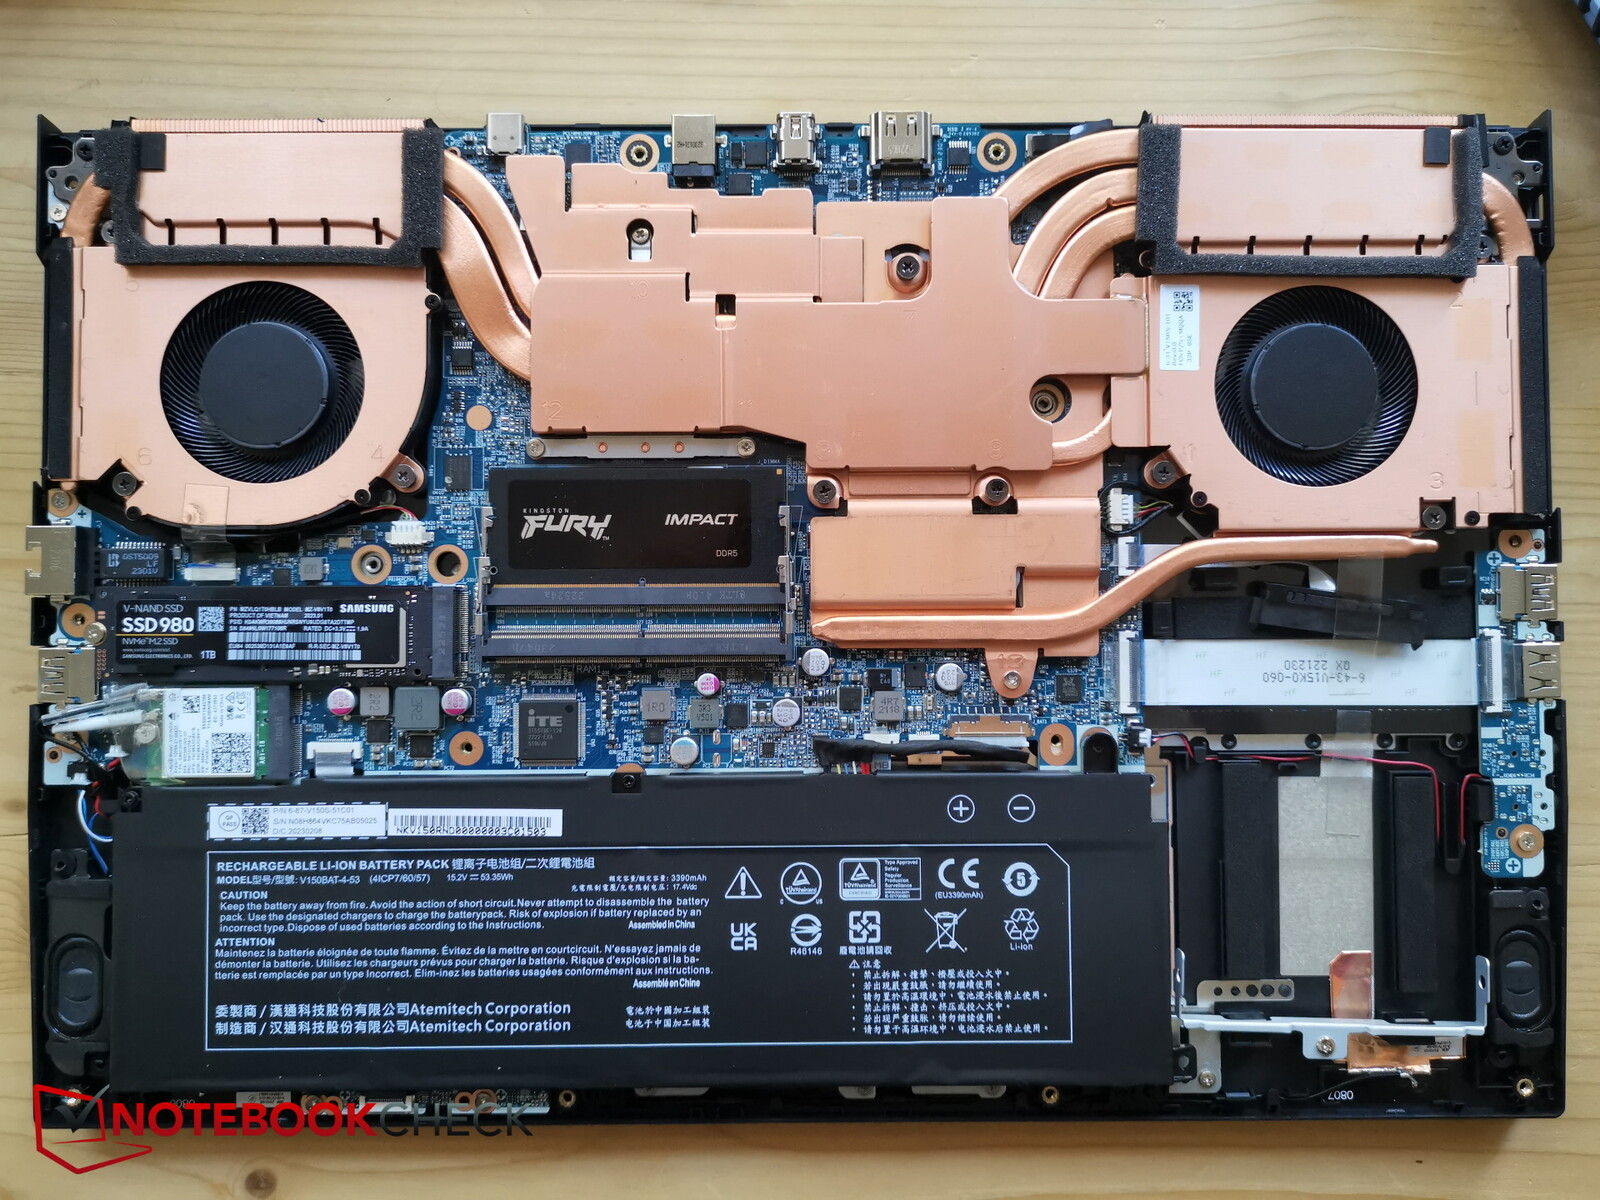
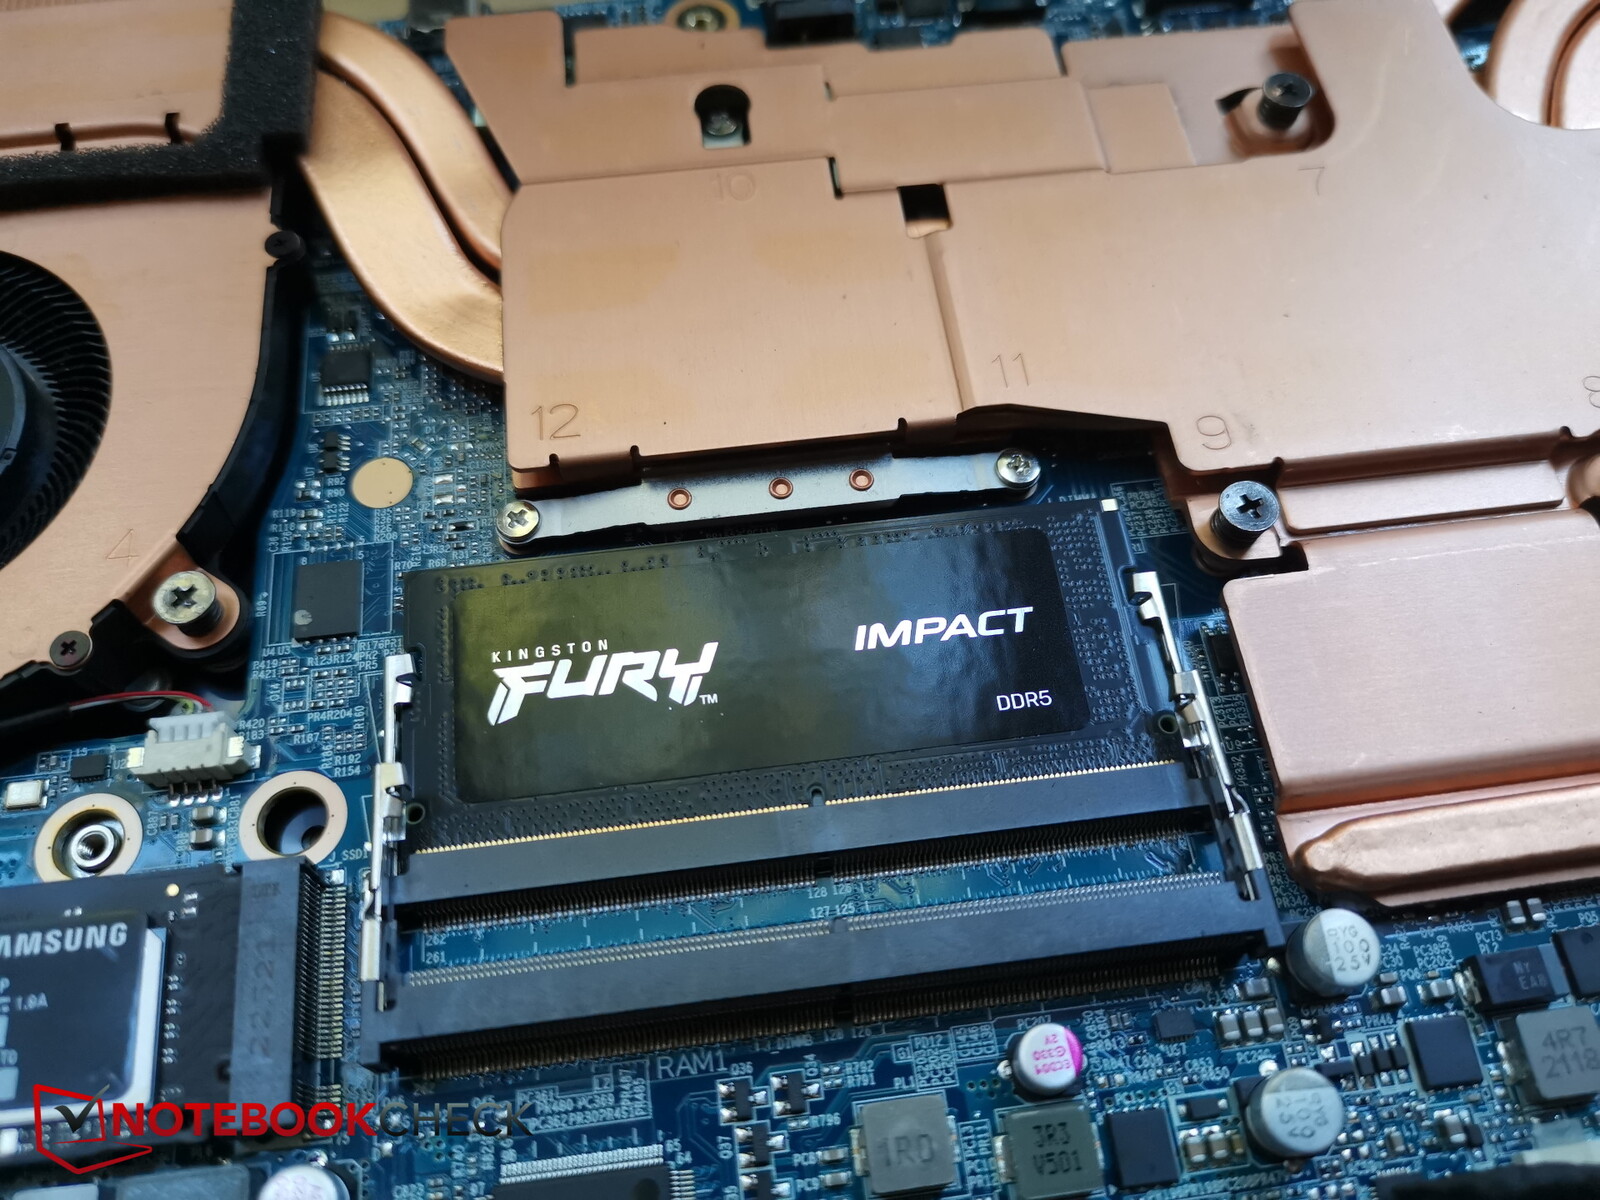
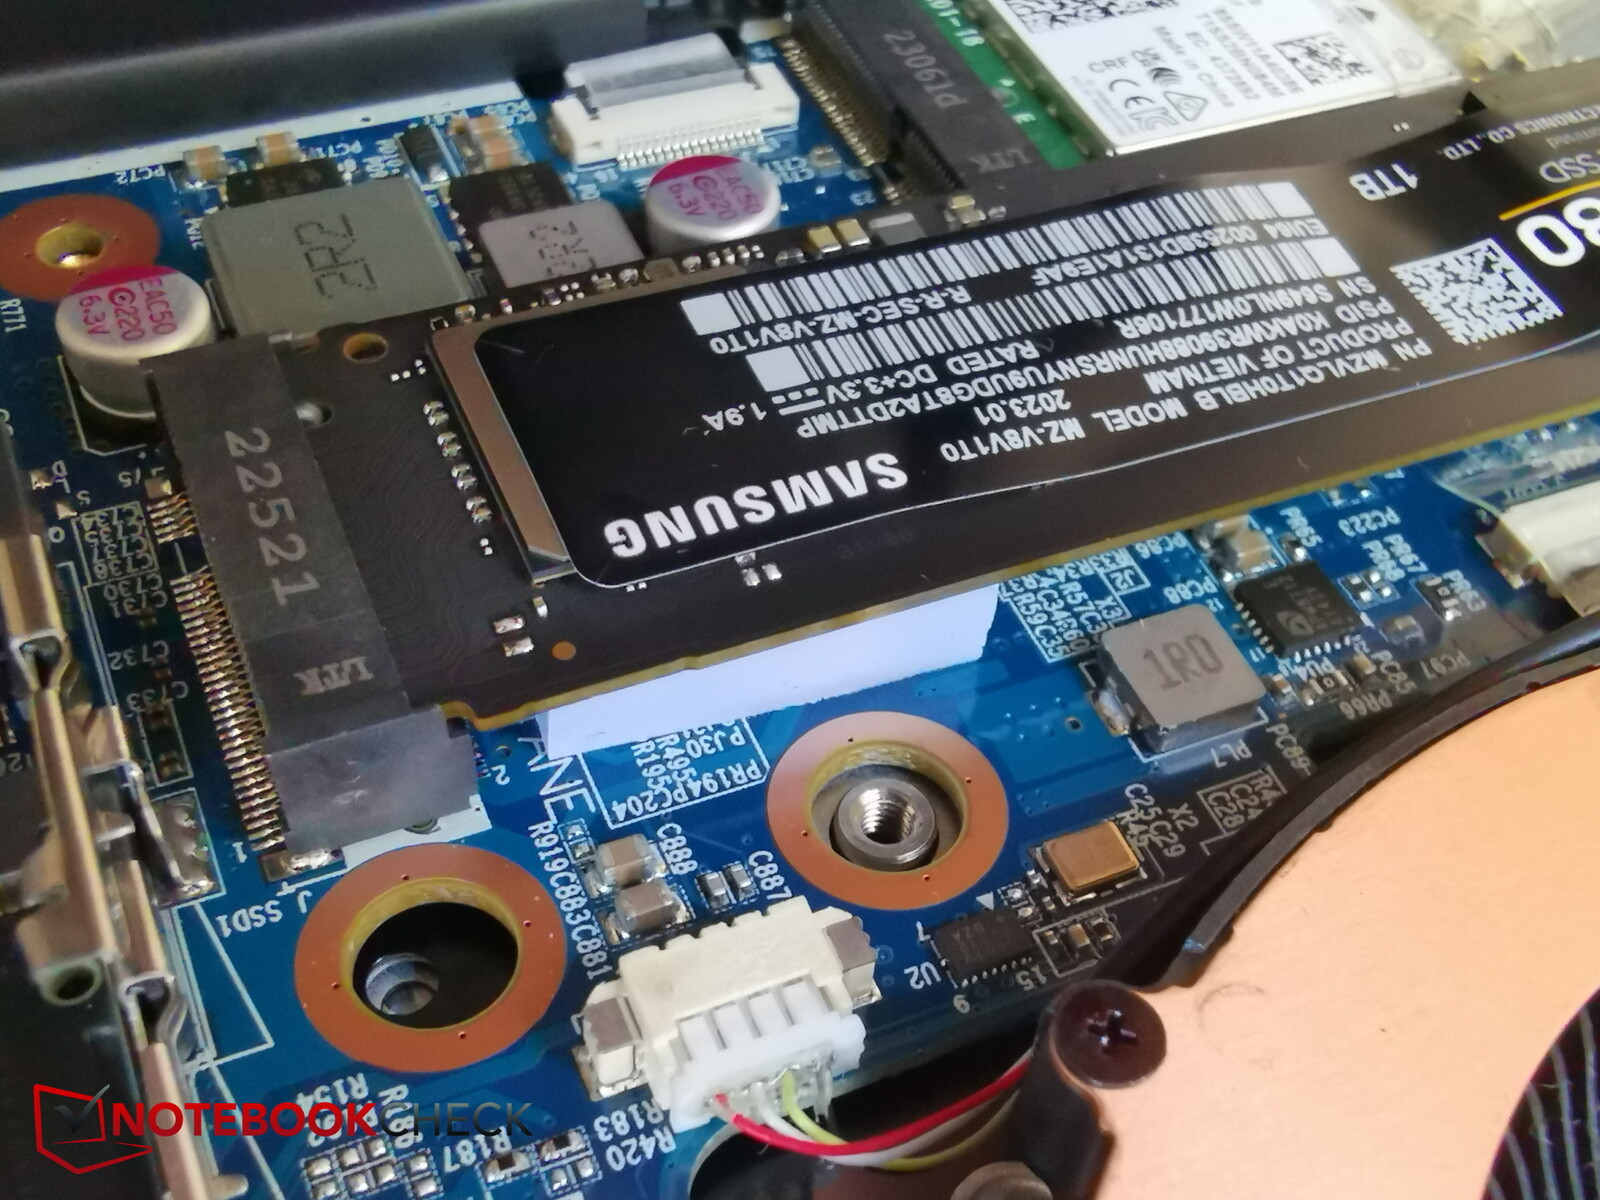
Depois de remover os parafusos, é muito fácil retirar a placa inferior sem a necessidade de nenhuma ferramenta. Abaixo, você pode ver o sistema de resfriamento composto por duas ventoinhas e muito cobre entre elas, os dois bancos de RAM, dos quais um está desocupado, o SSD intercambiável e o módulo WiFi intercambiável.
Em vez de um segundo slot NVMe, há um slot SATA que pode acomodar unidades de 2,5 polegadas. Além do selo de garantia, é muito fácil realizar trabalhos de manutenção nesse laptop.
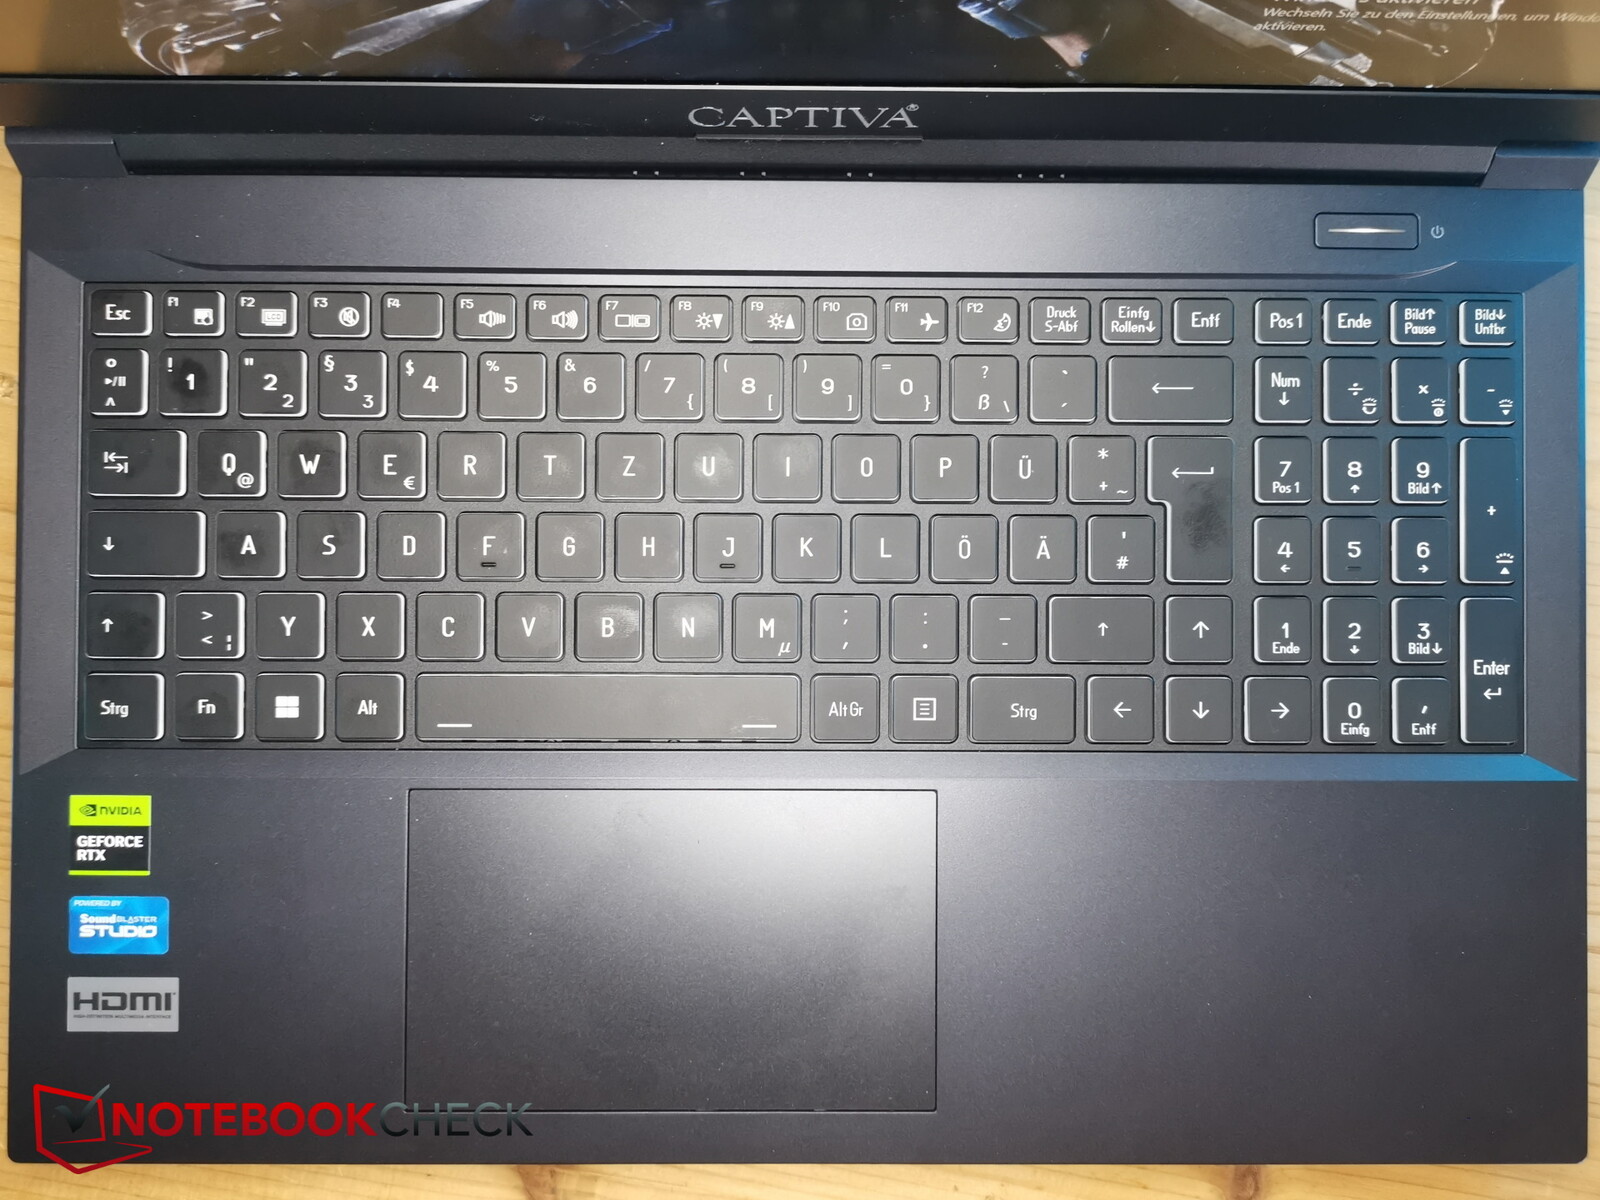
Dispositivos de entrada - sólidos e adequados para o uso diário
Teclado
O layout do teclado é funcional e não apresenta problemas. As teclas de seta têm o tamanho normal (cerca de 15 x 15 mm), o teclado numérico tem teclas menores (15 x 12,6 mm) e se conecta perfeitamente no lado direito. No canto superior direito, há um botão extra para ligar e desligar.
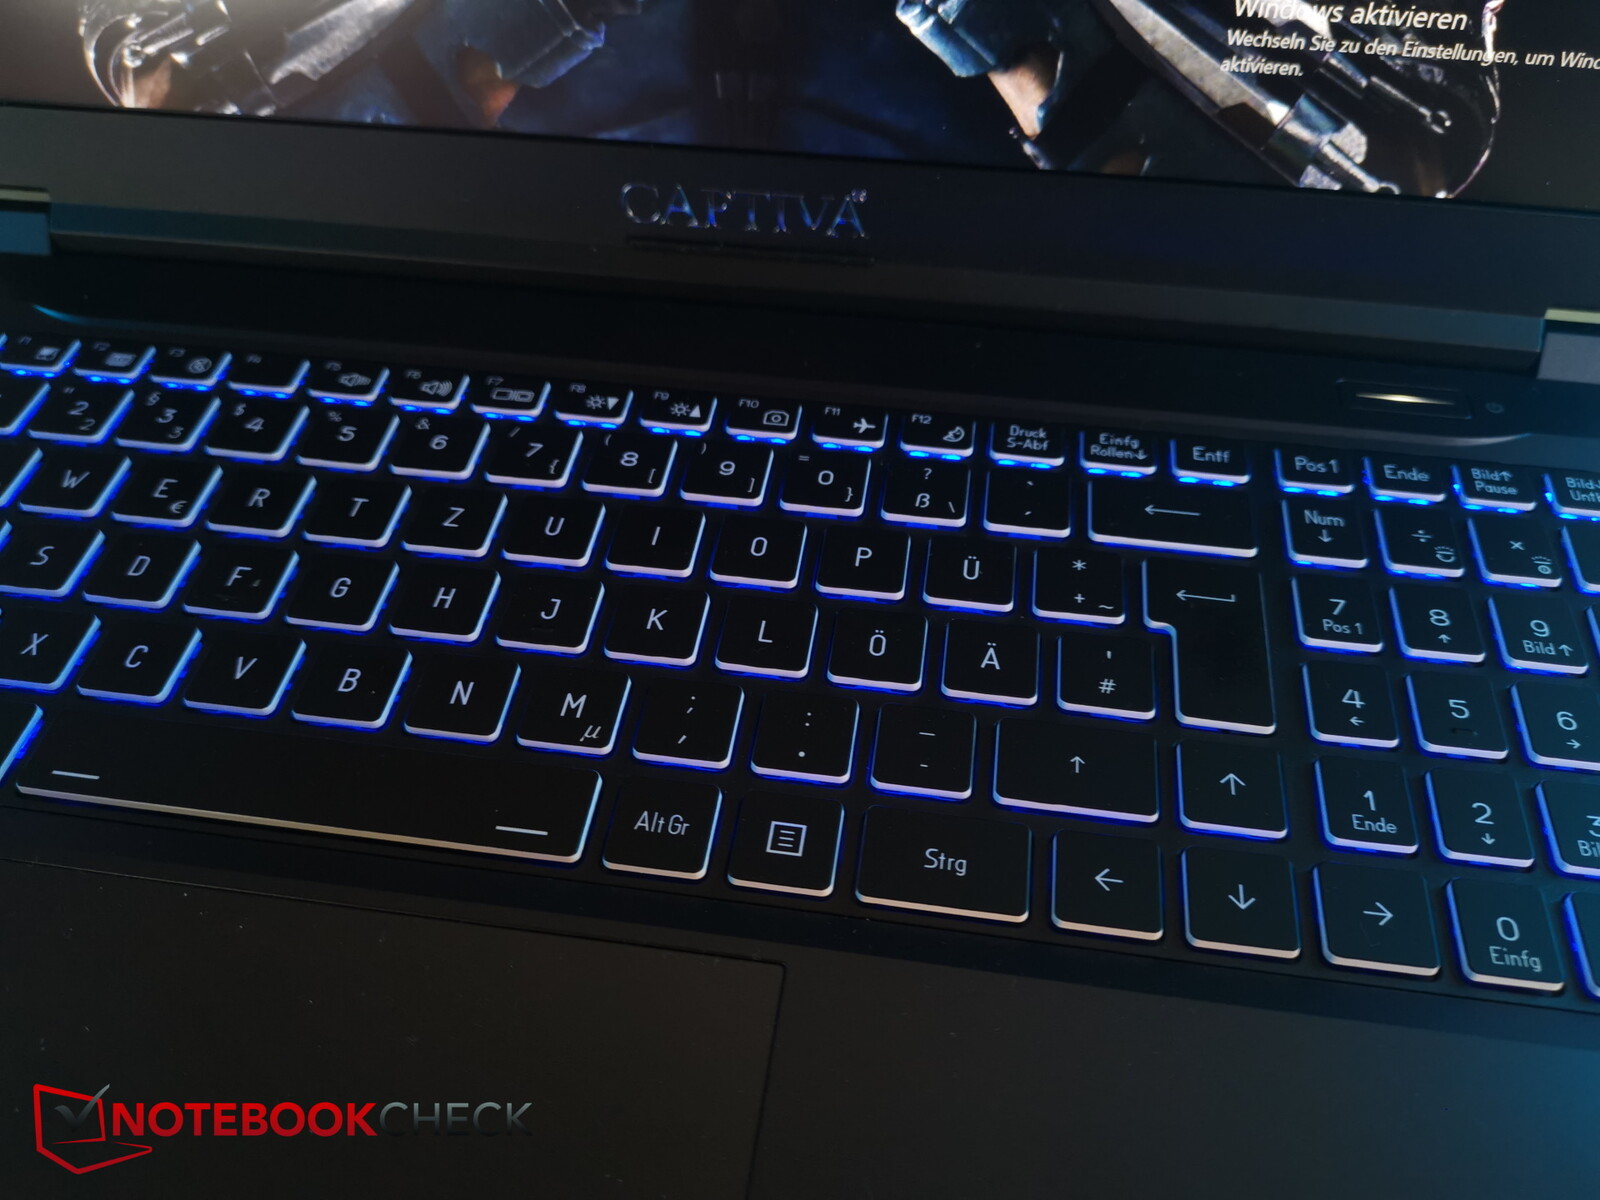
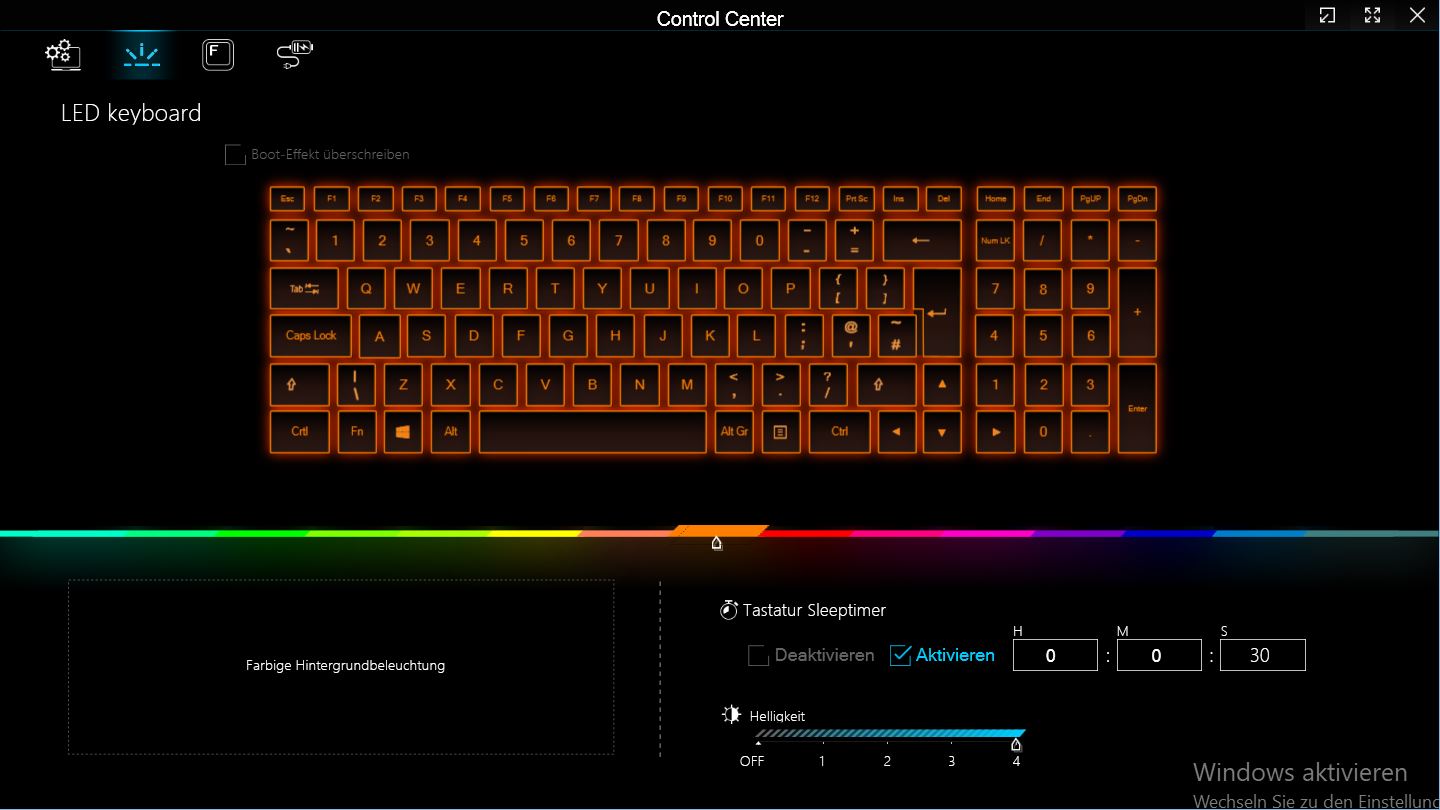
As teclas têm uma elevação confortável, não muito curta, com feedback decente. Os ruídos produzidos pela digitação são bastante moderados. Além disso, a rotulagem das teclas é muito legível e é compatível com condições de iluminação mais escuras por meio da luz de fundo multicolorida de uma zona.
Touchpad
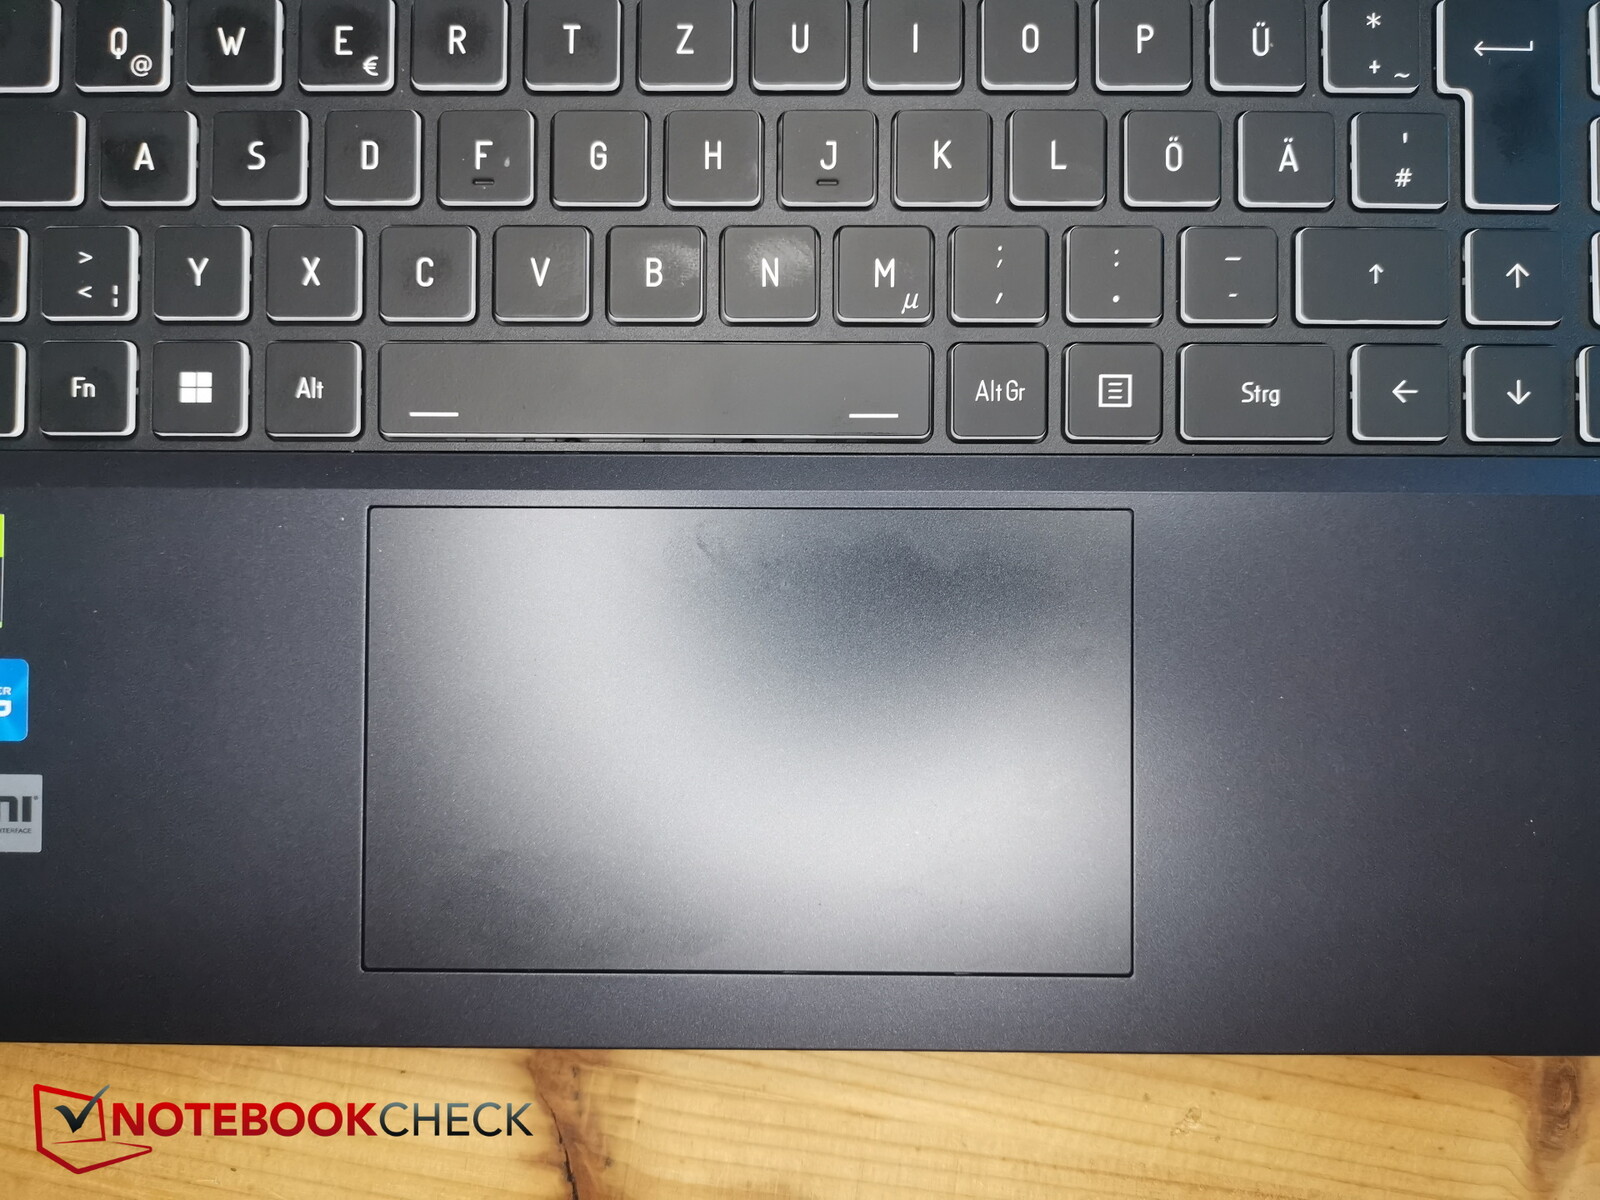
Como resultado do teclado numérico, o touchpad (12 x 7,2 cm) está situado ligeiramente à esquerda, o que parece correto. Ele pode grudar um pouco durante movimentos lentos ou se suas mãos estiverem suando, mas em situações normais, seus dedos deslizam suavemente sobre a superfície.
As teclas integradas também têm bons níveis de feedback - o ruído do clique é um pouco mais alto, mas não é irritante.
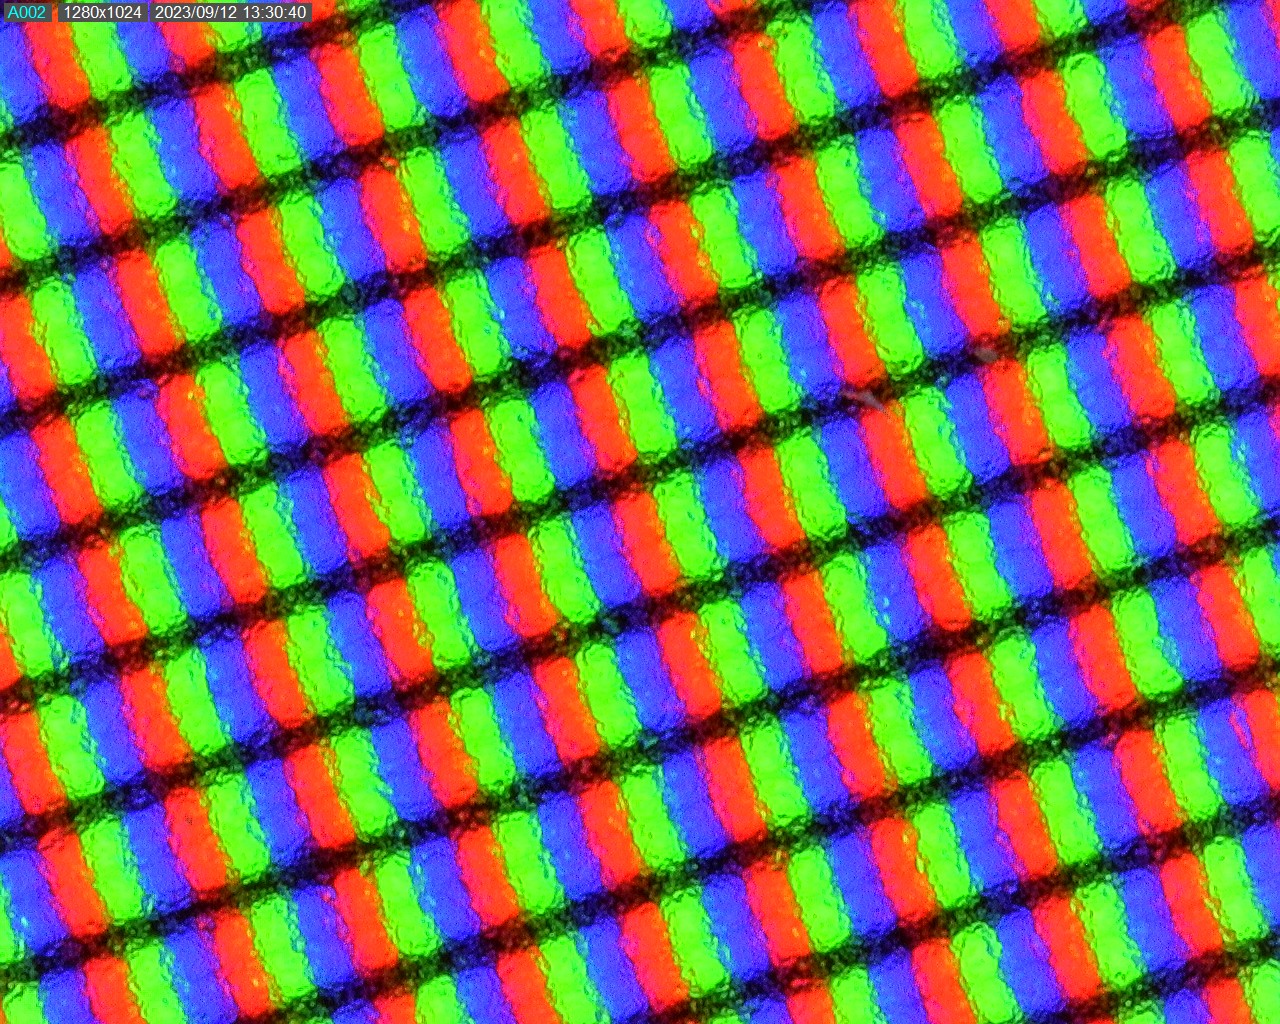
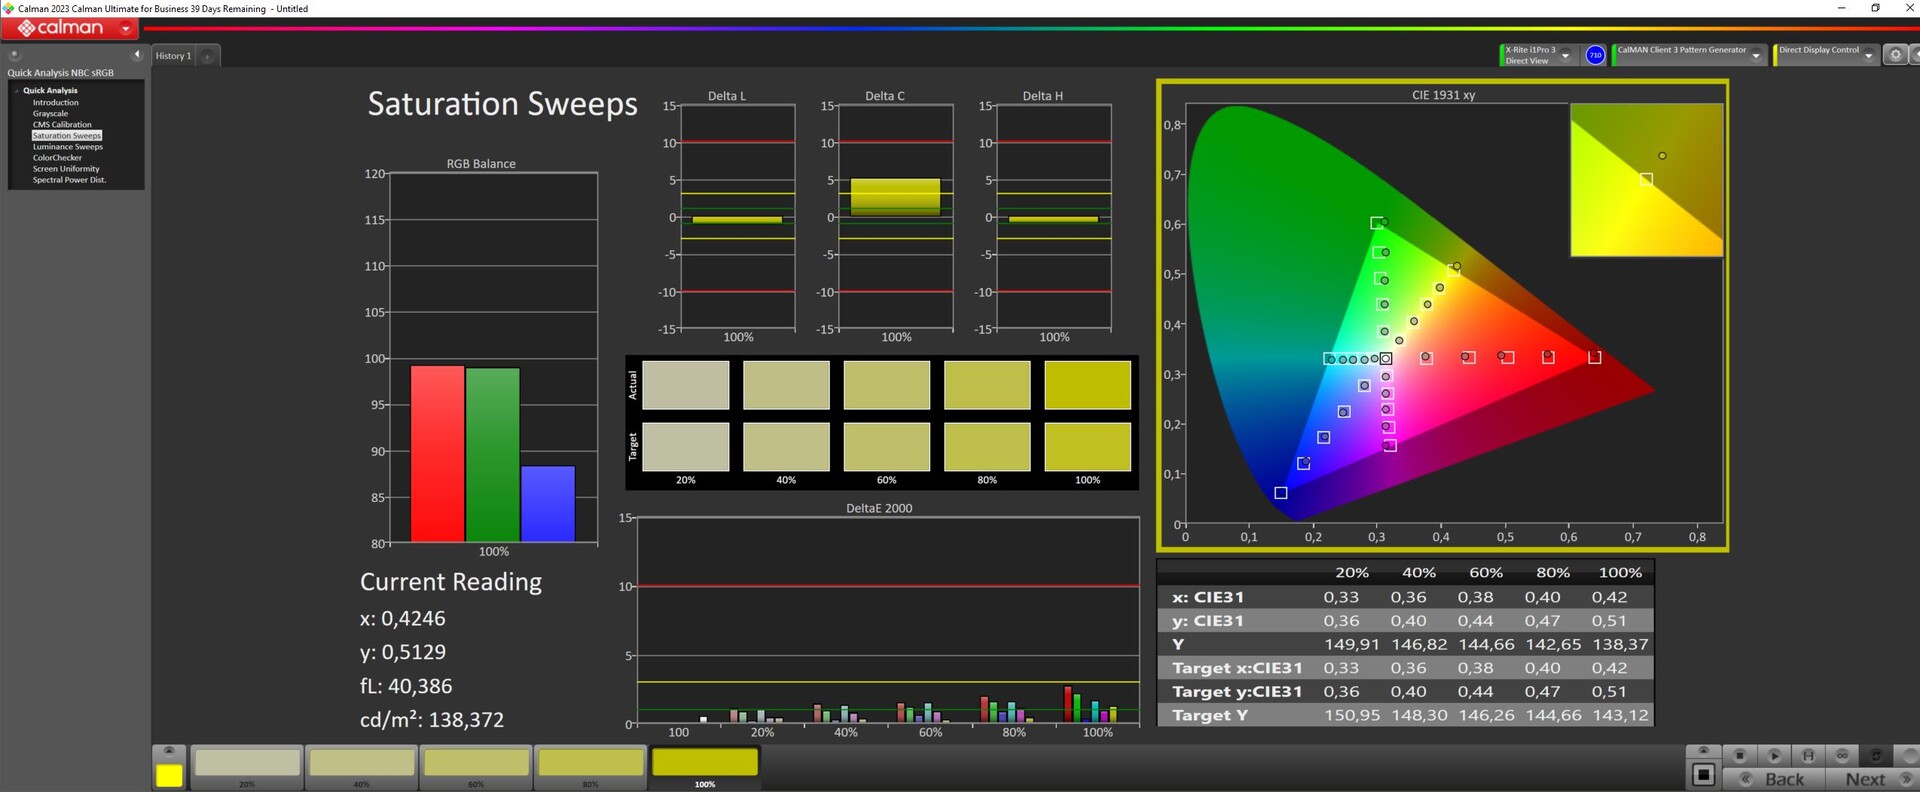
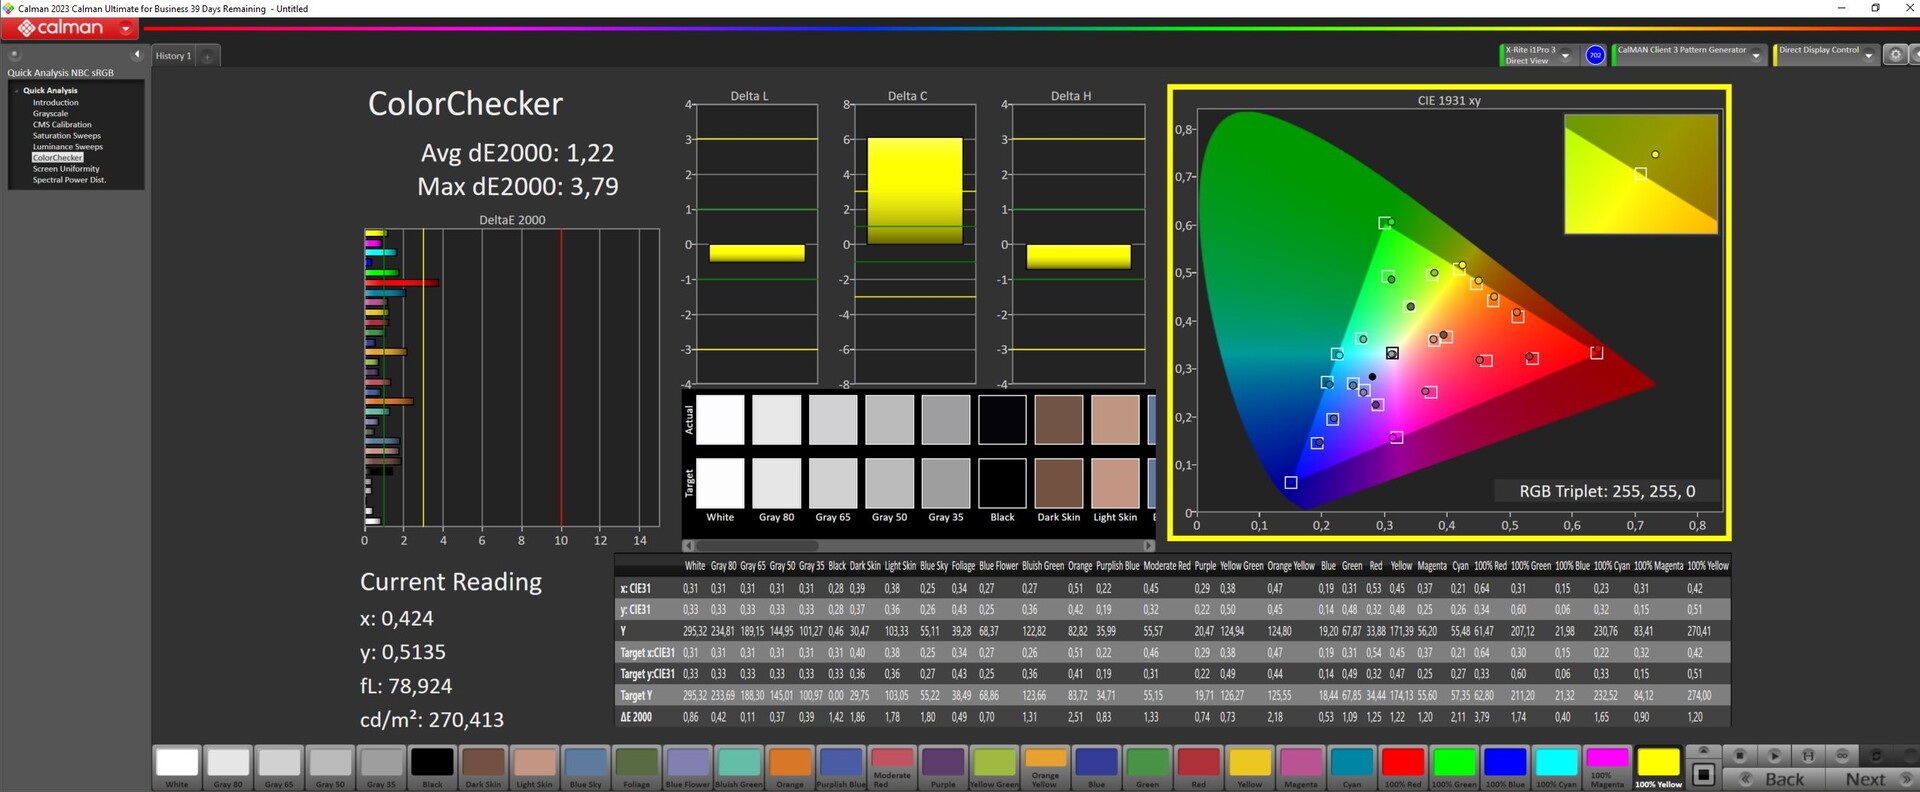
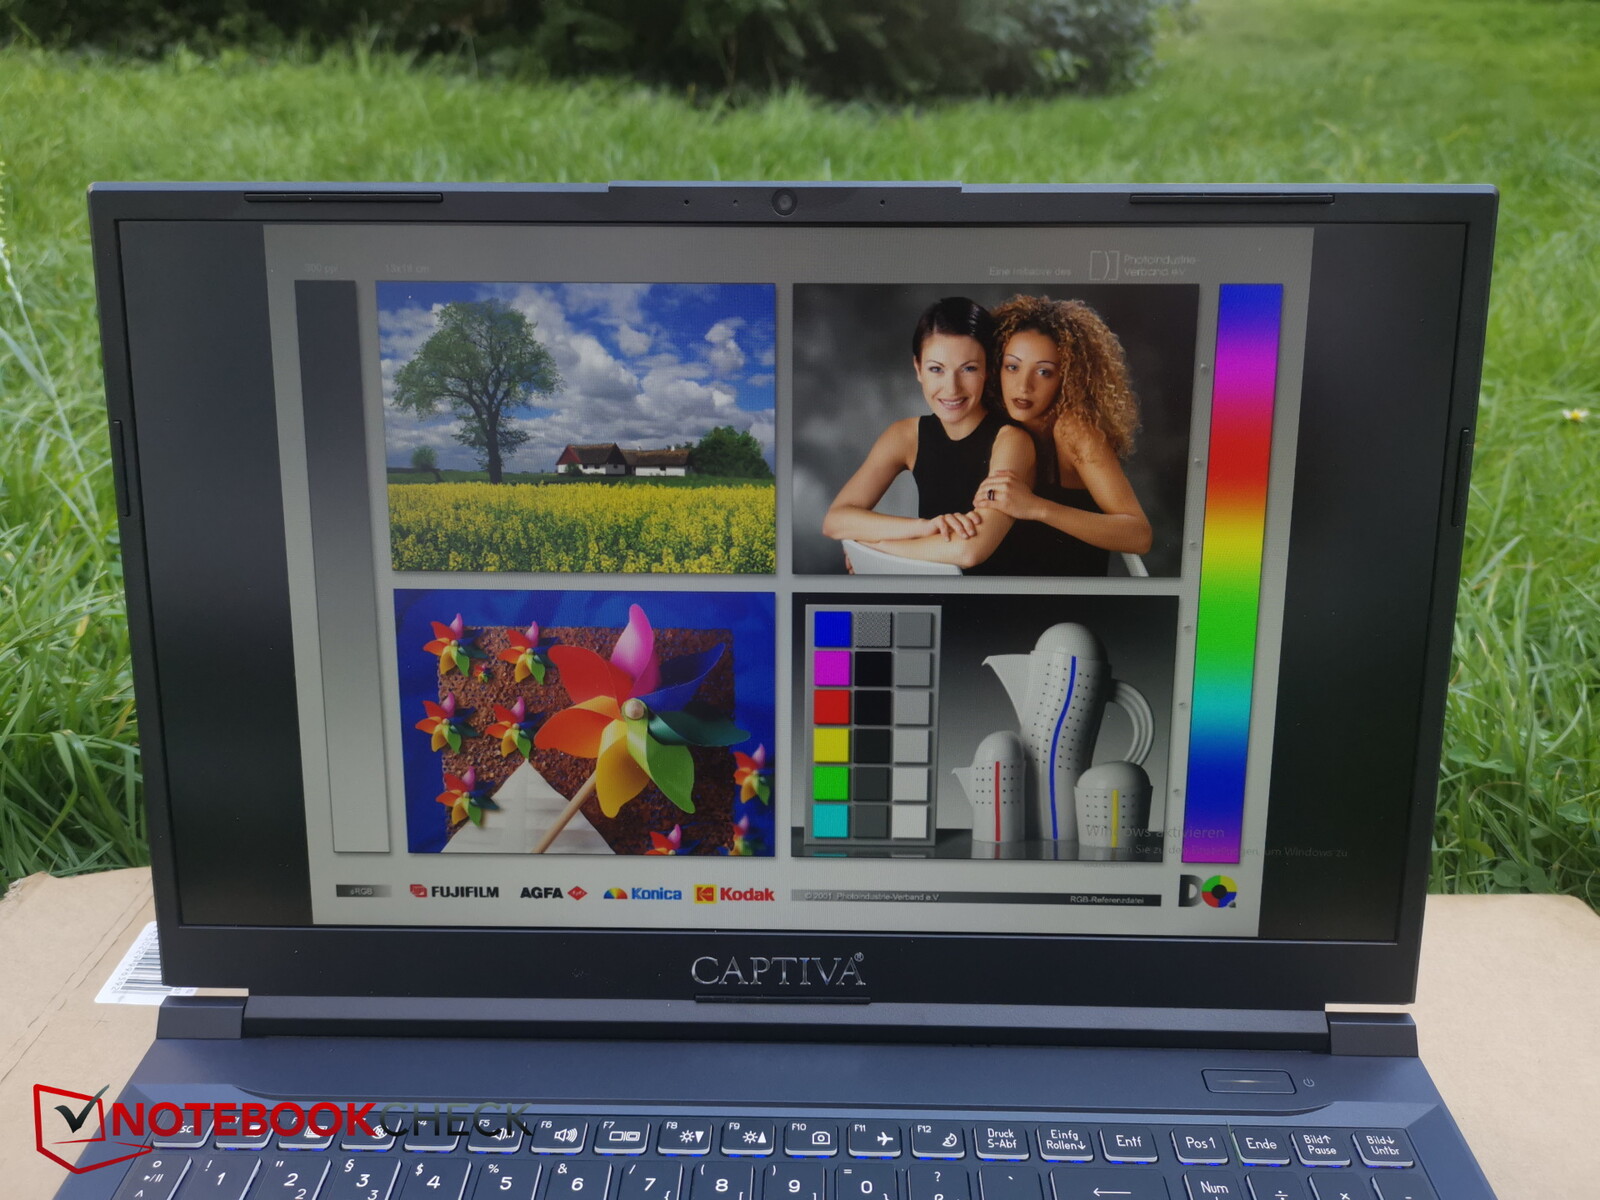
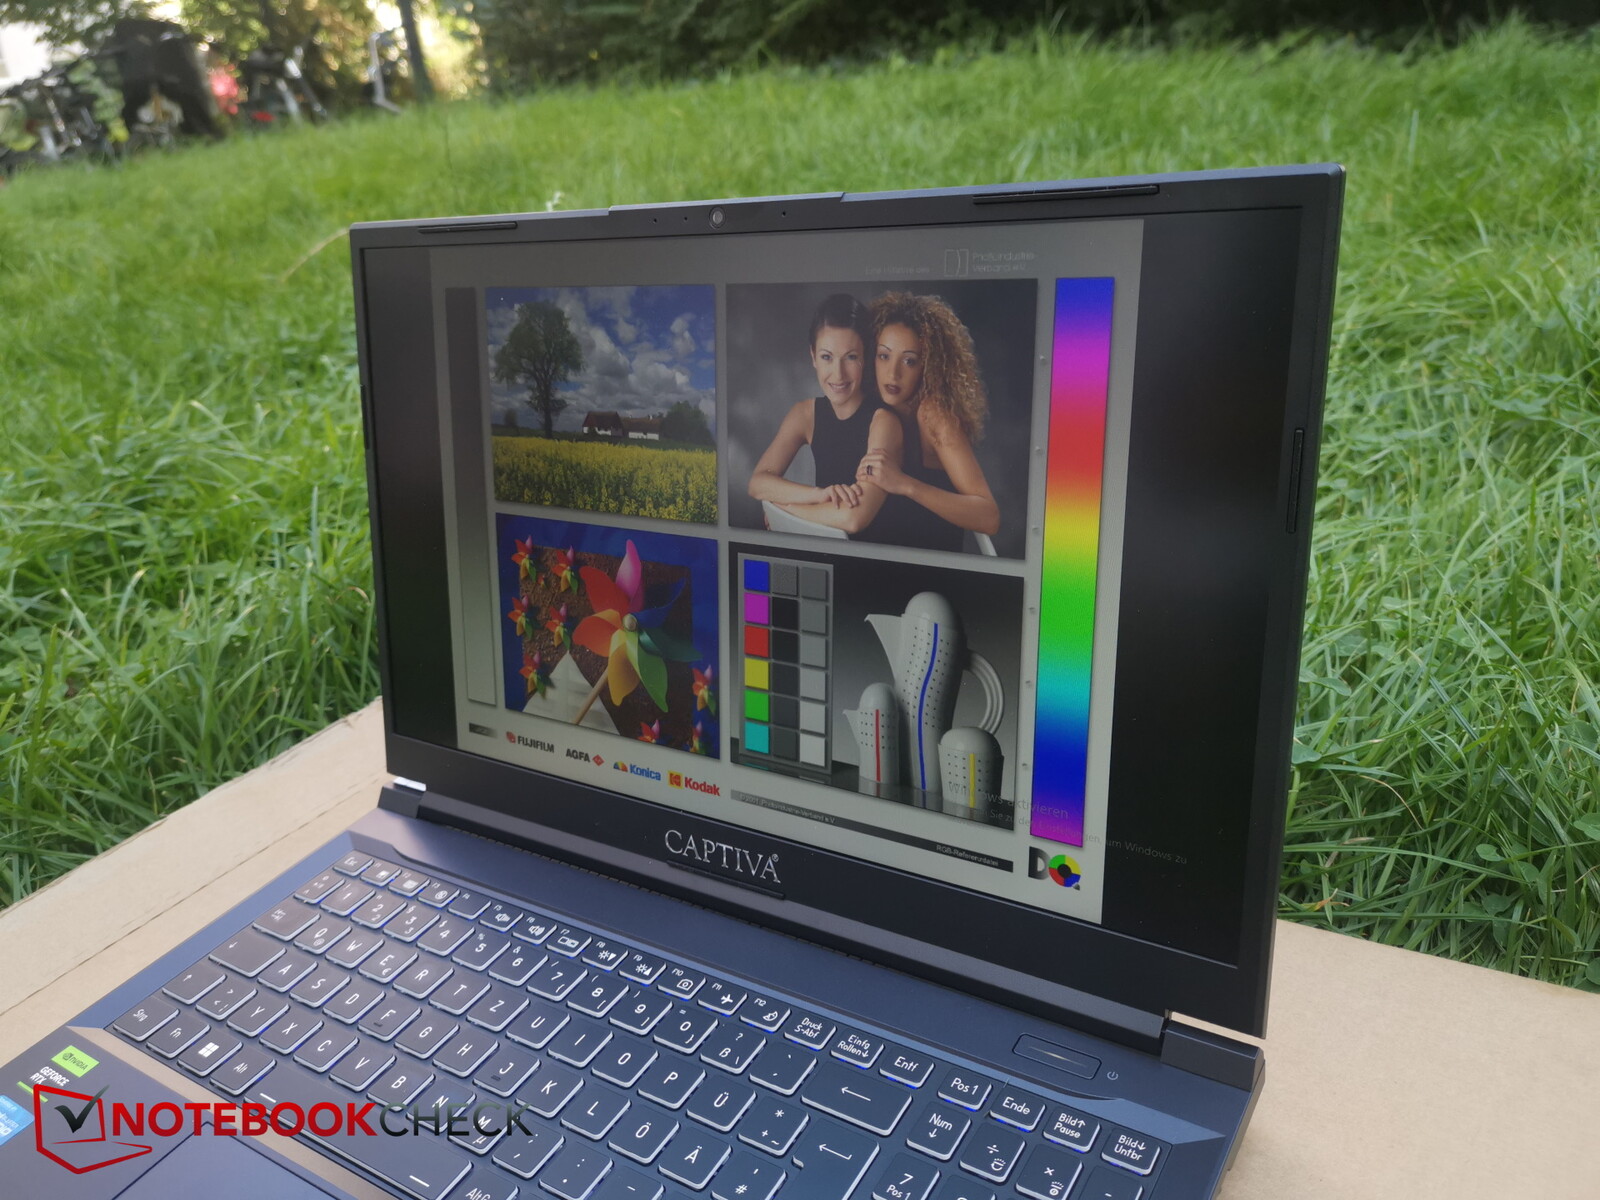
Tela - O Advanced Gaming tem apenas Full HD
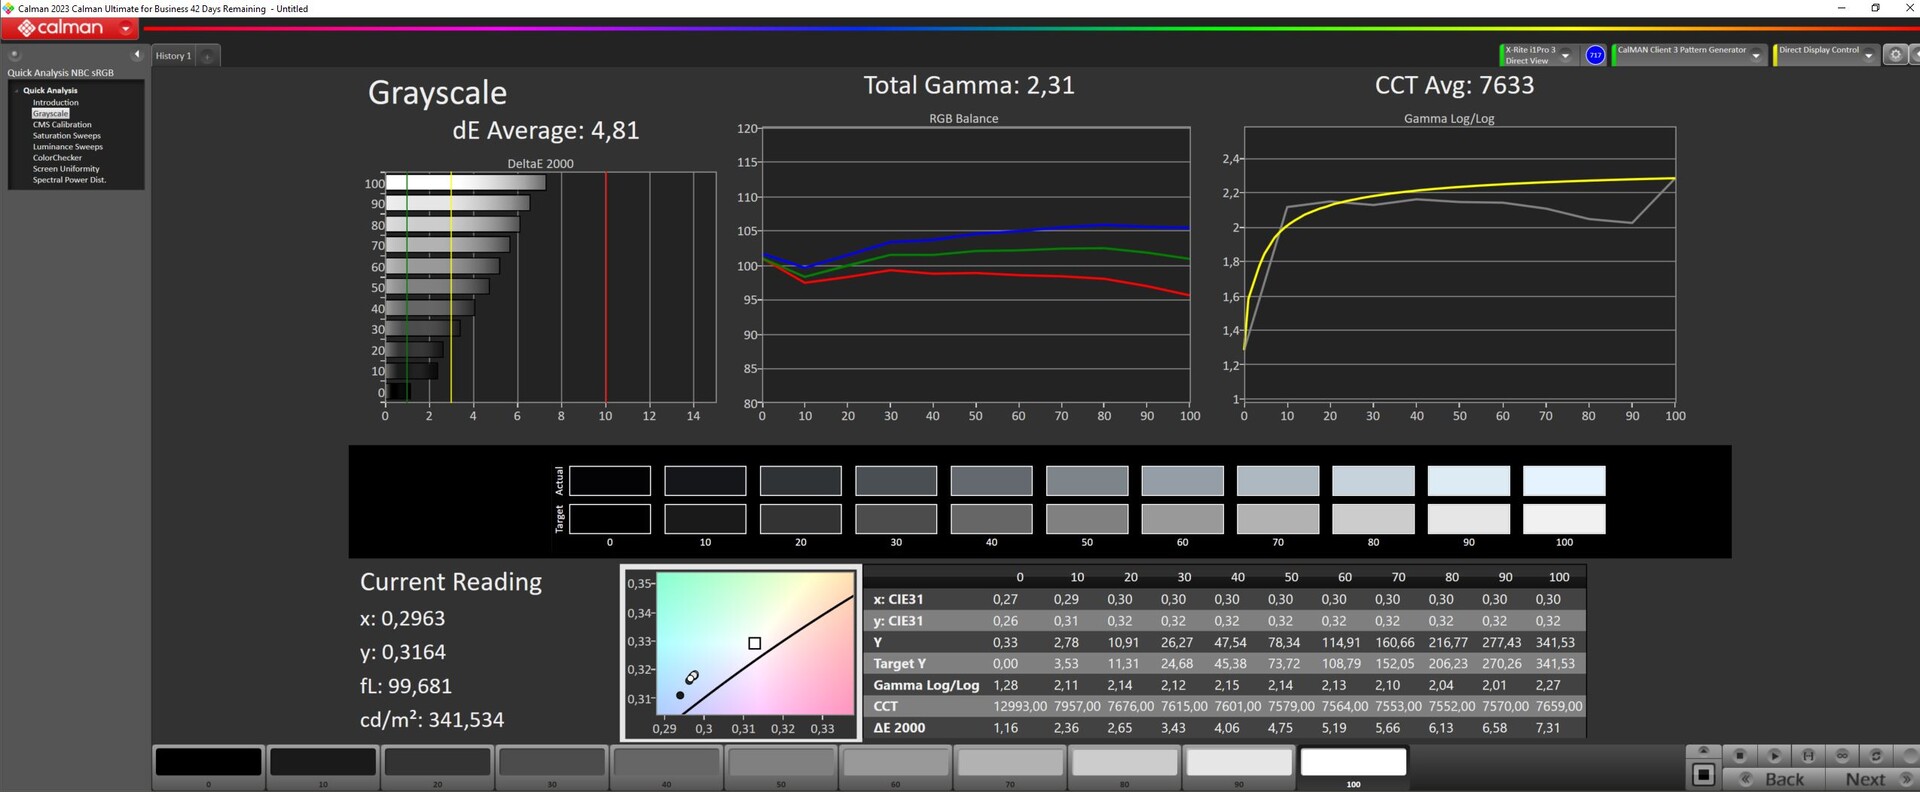
A Captiva instalou um painel Full HD de 144 Hz da BOE no laptop. Testamos o mesmo painel no Gigabyte A5 K1. Aqui, a tela é um pouco mais brilhante (324 vs. 281 nits), mas, por sua vez, o valor de preto e o contraste são um pouco piores. Sua iluminação de 90 por cento é suficiente.
As velocidades de reação do painel são boas, não notamos nenhuma oscilação de PWM e há apenas uma pequena quantidade de sangramento da luz de fundo que é quase imperceptível.
| |||||||||||||||||||||||||
iluminação: 90 %
iluminação com acumulador: 346 cd/m²
Contraste: 989:1 (Preto: 0.35 cd/m²)
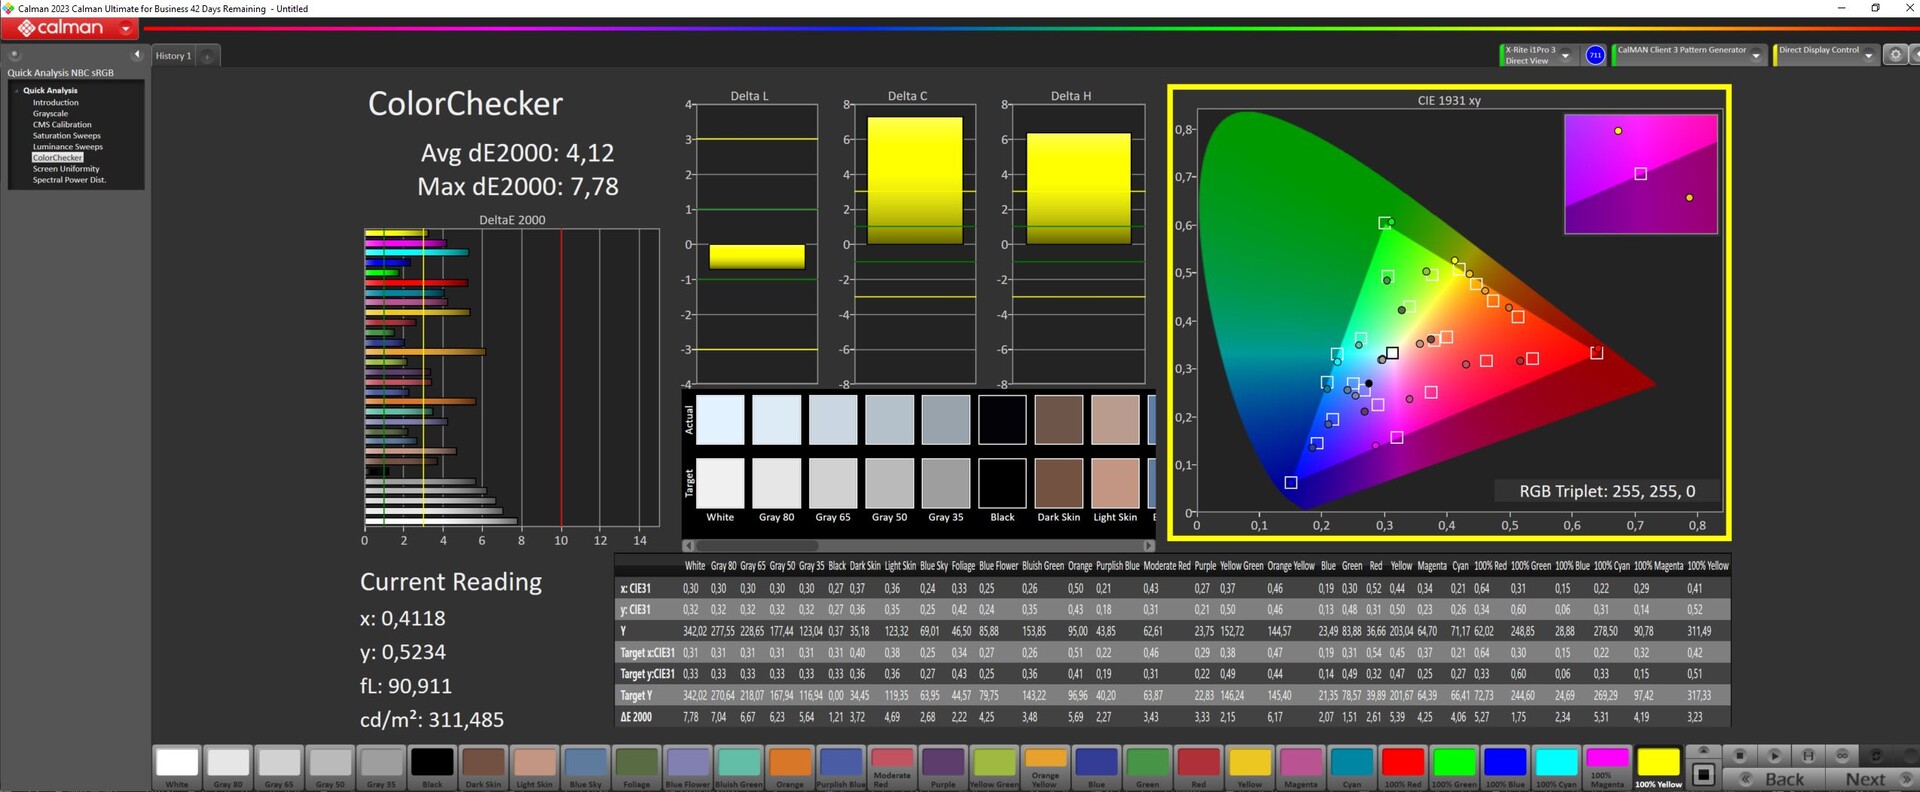
ΔE ColorChecker Calman: 4.12 | ∀{0.5-29.43 Ø4.72}
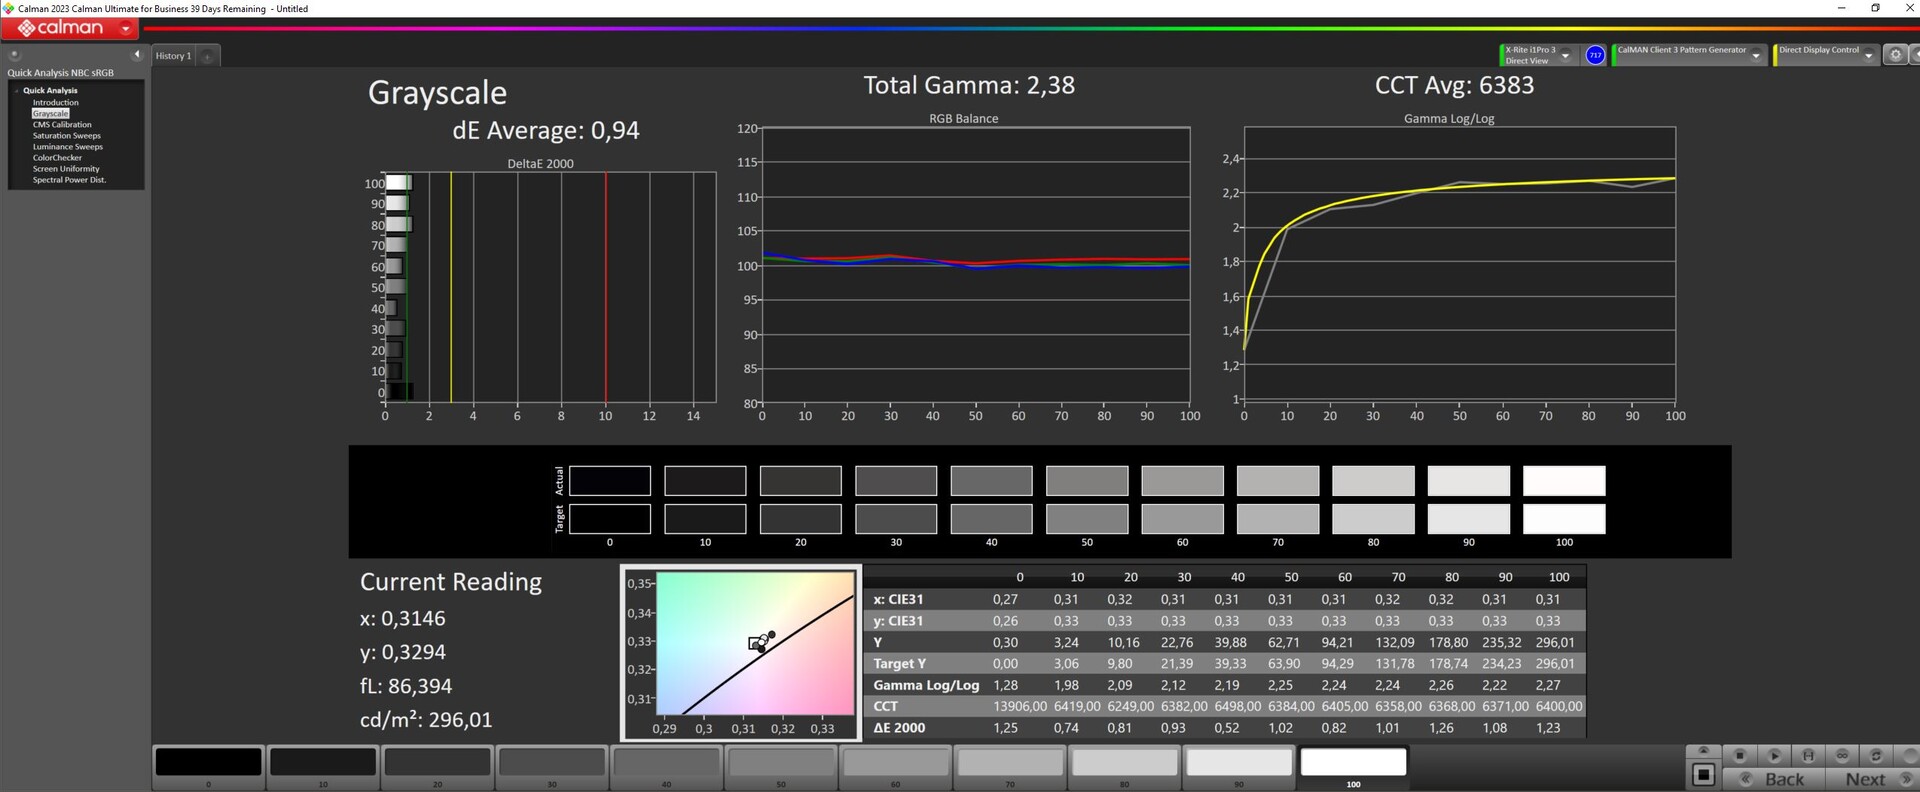
calibrated: 1.22
ΔE Greyscale Calman: 4.81 | ∀{0.09-98 Ø4.97}
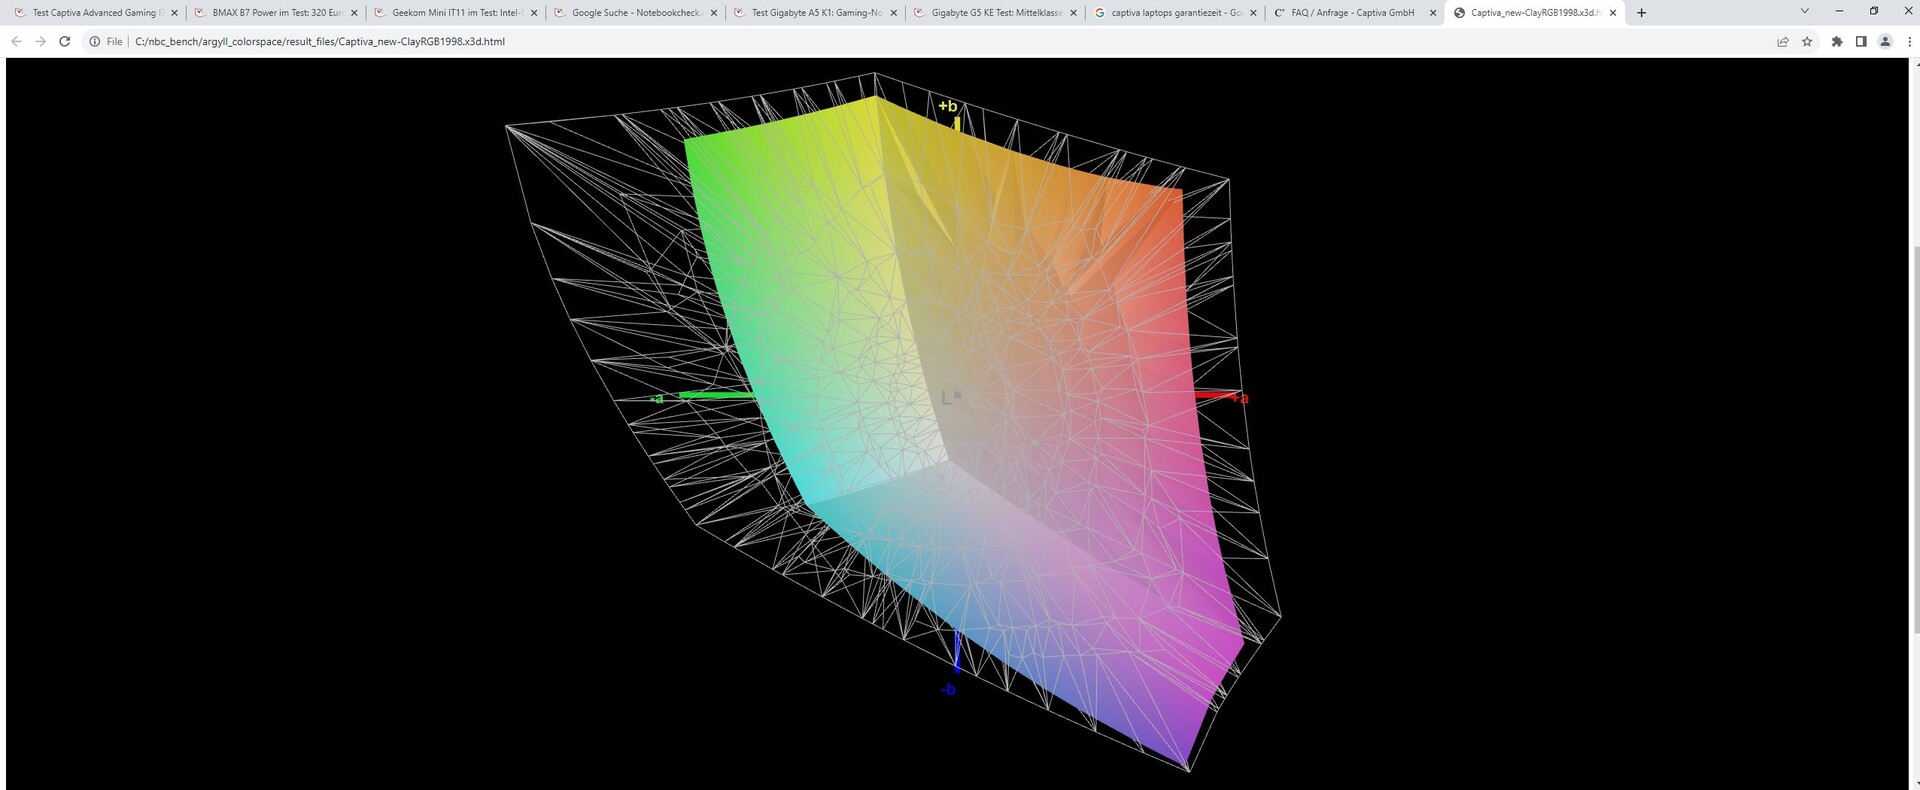
66% AdobeRGB 1998 (Argyll 3D)
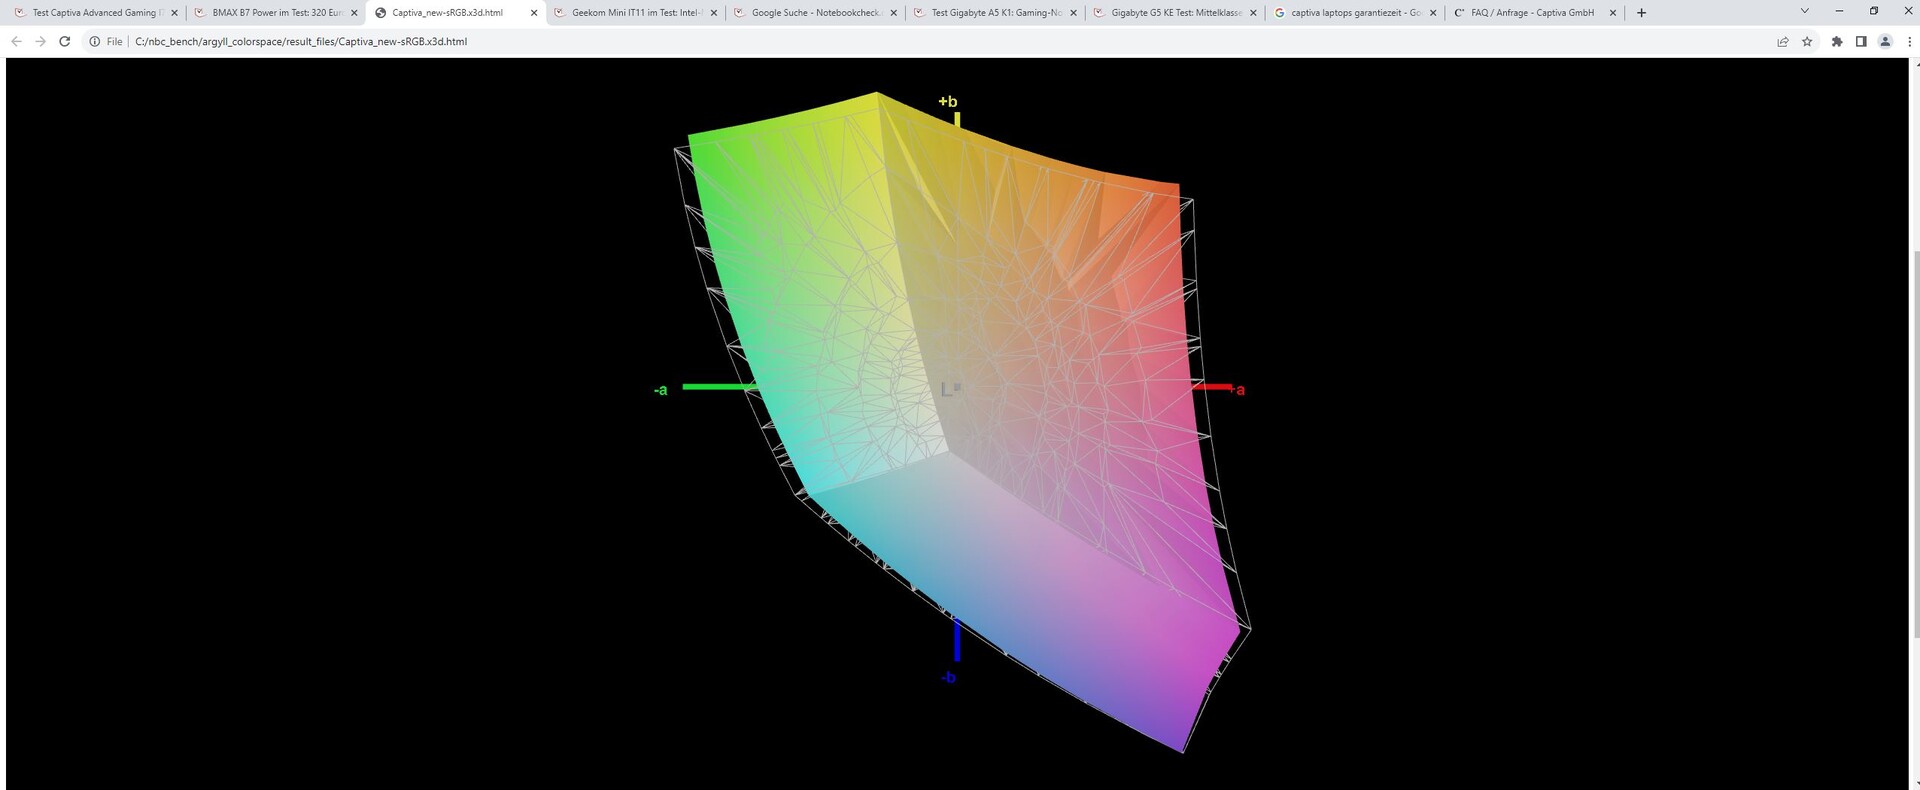
93.2% sRGB (Argyll 3D)
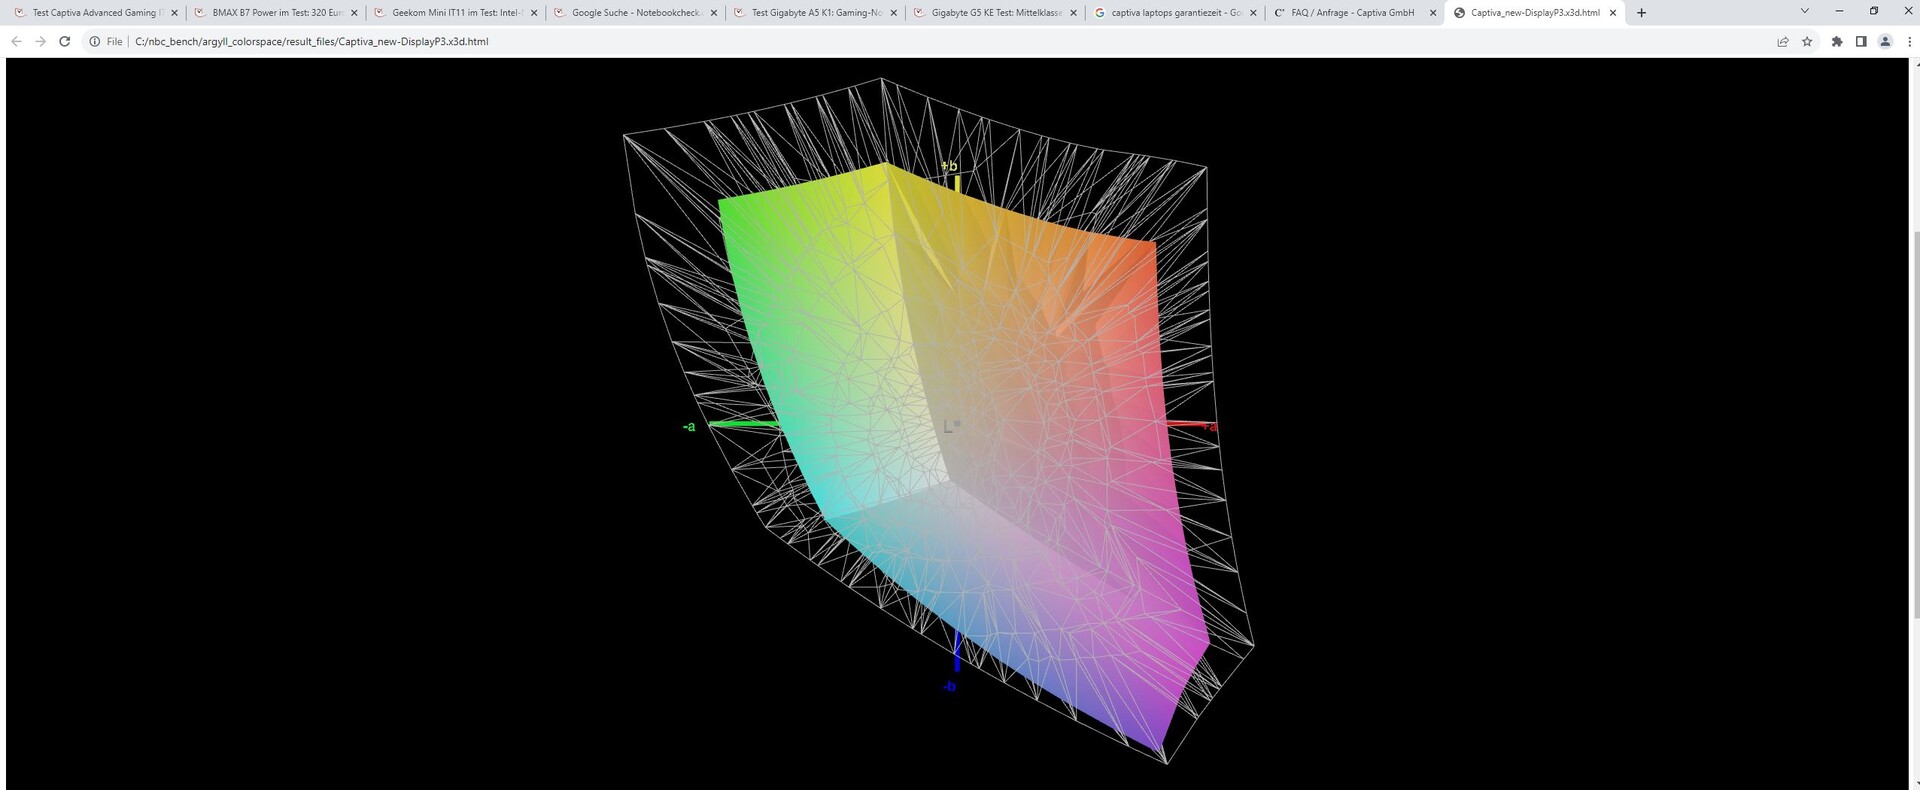
64% Display P3 (Argyll 3D)
Gamma: 2.31
CCT: 7633 K
| Captiva Advanced Gaming I74-121 BOE08B3, IPS, 1920x1080, 15.6" | MSI Cyborg 15 A12VF AU Optronics B156HAN15.1, IPS, 1920x1080, 15.6" | Dell G15 5530 AUO B156HAN, IPS, 1920x1080, 15.6" | Lenovo Legion Slim 5 16APH8 BOE NJ NE160QDM-NYC, IPS, 2560x1600, 16" | Lenovo LOQ 15APH8 BOE NJ NE156FHM-NX3, IPS, 1920x1080, 15.6" | Schenker XMG Core 15 (M22) CSOT MNF601CA1-1, IPS, 2560x1440, 15.6" | |
|---|---|---|---|---|---|---|
| Display | -34% | 11% | 7% | -36% | 7% | |
| Display P3 Coverage (%) | 64 | 42.3 -34% | 73.1 14% | 69.3 8% | 40.2 -37% | 68.8 8% |
| sRGB Coverage (%) | 93.2 | 62.6 -33% | 98.4 6% | 100 7% | 60.2 -35% | 99.3 7% |
| AdobeRGB 1998 Coverage (%) | 66 | 43.7 -34% | 74.4 13% | 70 6% | 41.5 -37% | 69.9 6% |
| Response Times | -213% | 31% | -59% | -490% | -111% | |
| Response Time Grey 50% / Grey 80% * (ms) | 5 ? | 22 ? -340% | 3.39 ? 32% | 10.7 ? -114% | 42.7 ? -754% | 16 ? -220% |
| Response Time Black / White * (ms) | 7.55 ? | 14 ? -85% | 5.35 ? 29% | 7.8 ? -3% | 24.5 ? -225% | 7.6 ? -1% |
| PWM Frequency (Hz) | 21620 ? | |||||
| Screen | -19% | -0% | 27% | -14% | -0% | |
| Brightness middle (cd/m²) | 346 | 247 -29% | 320 -8% | 371.6 7% | 346.2 0% | 378 9% |
| Brightness (cd/m²) | 324 | 234 -28% | 316 -2% | 343 6% | 329 2% | 371 15% |
| Brightness Distribution (%) | 90 | 89 -1% | 94 4% | 84 -7% | 81 -10% | 93 3% |
| Black Level * (cd/m²) | 0.35 | 0.25 29% | 0.21 40% | 0.44 -26% | 0.31 11% | 0.33 6% |
| Contrast (:1) | 989 | 988 0% | 1524 54% | 845 -15% | 1117 13% | 1145 16% |
| Colorchecker dE 2000 * | 4.12 | 3.78 8% | 4.55 -10% | 1.52 63% | 4.19 -2% | 2.84 31% |
| Colorchecker dE 2000 max. * | 7.78 | 6.42 17% | 9.83 -26% | 2.68 66% | 19.19 -147% | 5.51 29% |
| Colorchecker dE 2000 calibrated * | 1.22 | 3.94 -223% | 1.51 -24% | 0.33 73% | 1.66 -36% | 2.75 -125% |
| Greyscale dE 2000 * | 4.81 | 2.16 55% | 6.2 -29% | 1.2 75% | 2.6 46% | 4.08 15% |
| Gamma | 2.31 95% | 2.33 94% | 2.07 106% | 2.1 105% | 2.19 100% | 2.4 92% |
| CCT | 7633 85% | 6906 94% | 6479 100% | 6503 100% | 6749 96% | 5841 111% |
| Média Total (Programa/Configurações) | -89% /
-50% | 14% /
7% | -8% /
10% | -180% /
-87% | -35% /
-14% |
* ... menor é melhor
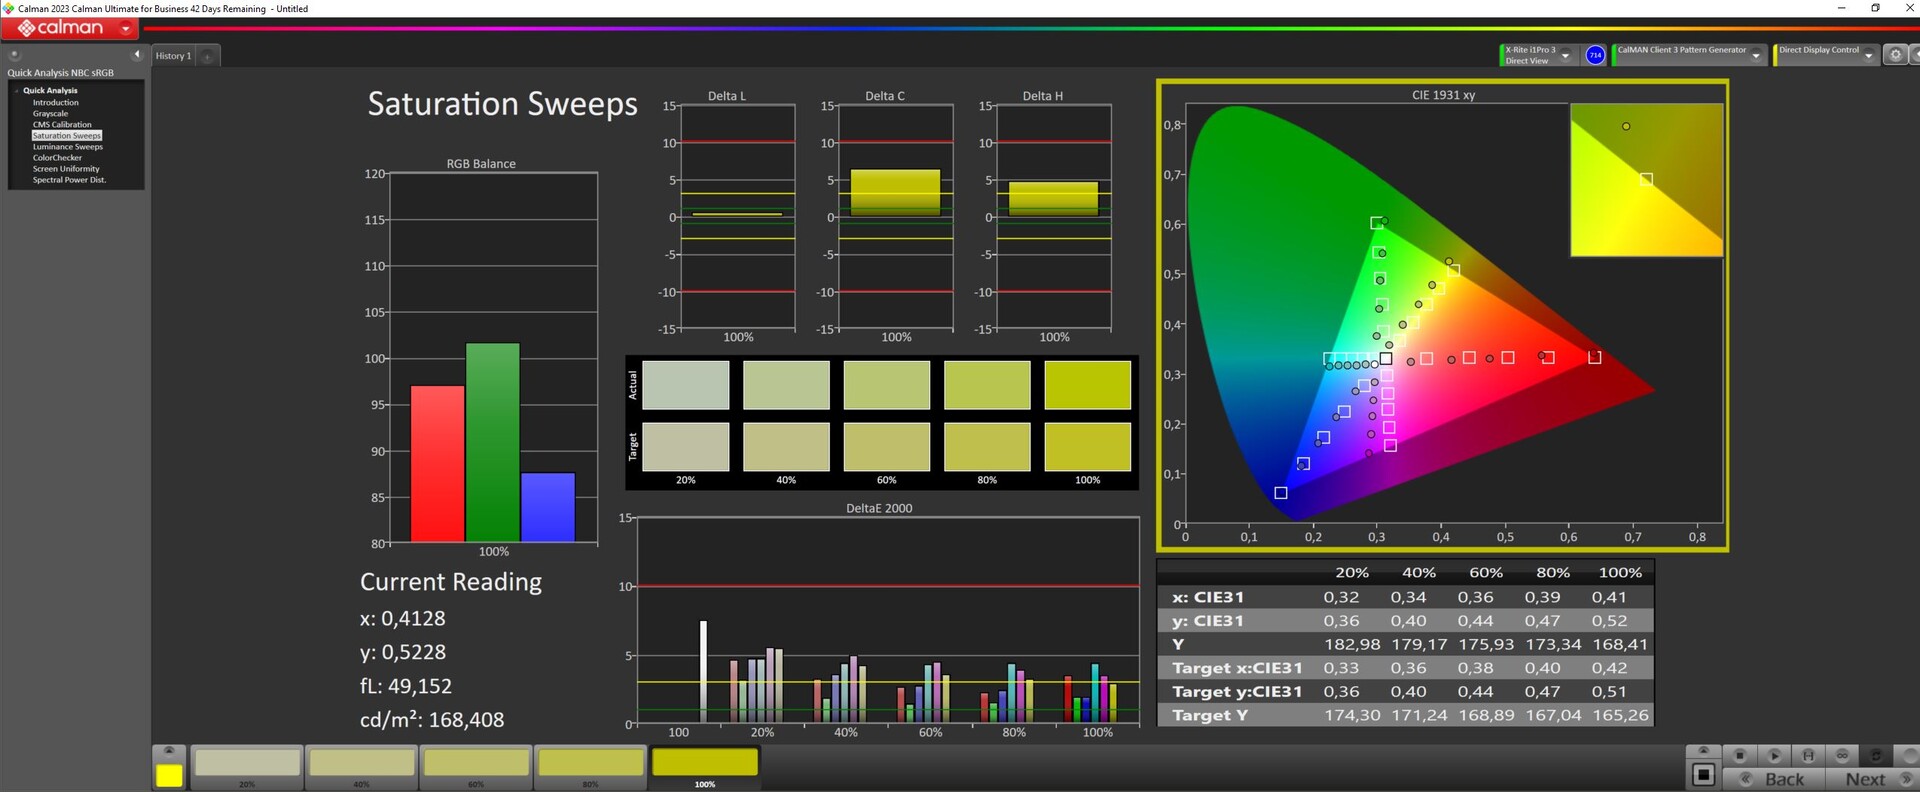
O painel BOE não tem uma cobertura de espaço de cores muito boa. Mesmo o sRGB é coberto por apenas 93%, o DisplayP3 e o AdobeRGB por cerca de 65%.
Em trabalhos anteriores, o painel é calibrado de forma subótima e seus desvios de cor são bastante altos. Uma calibração com a ajuda de um dispositivo de medição de cores XRite e do software Calman reduziu significativamente os valores DeltaE de cores e tons de cinza. Antes, os desvios estavam acima de 4 e, depois, ficaram em torno de 1.
Nosso perfil icc calibrado pode ser baixado gratuitamente se você rolar a tela um pouco mais para cima.
Exibir tempos de resposta
| ↔ Tempo de resposta preto para branco | ||
|---|---|---|
| 7.55 ms ... ascensão ↗ e queda ↘ combinadas | ↗ 3.7 ms ascensão | 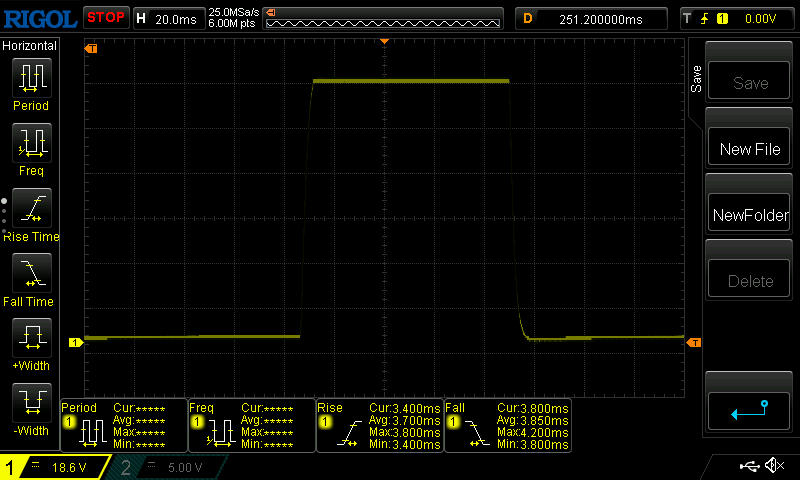 |
| ↘ 3.85 ms queda | ||
| A tela mostra taxas de resposta muito rápidas em nossos testes e deve ser muito adequada para jogos em ritmo acelerado. Em comparação, todos os dispositivos testados variam de 0.1 (mínimo) a 240 (máximo) ms. » 22 % de todos os dispositivos são melhores. Isso significa que o tempo de resposta medido é melhor que a média de todos os dispositivos testados (19.8 ms). | ||
| ↔ Tempo de resposta 50% cinza a 80% cinza | ||
| 5 ms ... ascensão ↗ e queda ↘ combinadas | ↗ 2.422 ms ascensão | 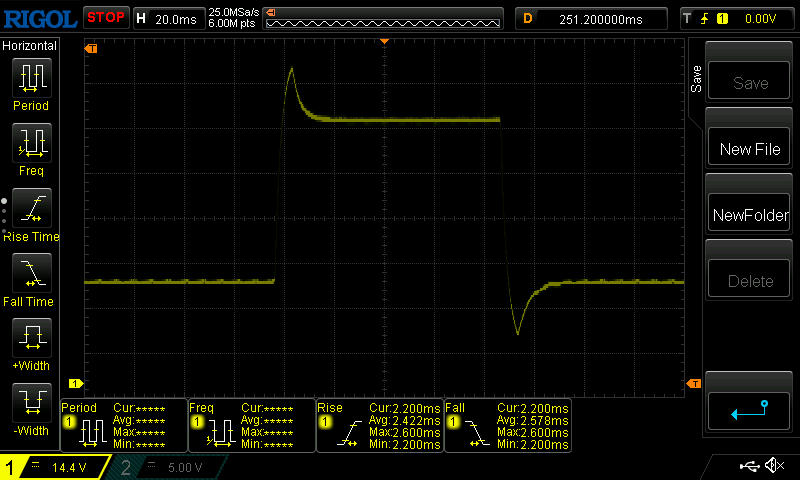 |
| ↘ 2.578 ms queda | ||
| A tela mostra taxas de resposta muito rápidas em nossos testes e deve ser muito adequada para jogos em ritmo acelerado. Em comparação, todos os dispositivos testados variam de 0.165 (mínimo) a 636 (máximo) ms. » 17 % de todos os dispositivos são melhores. Isso significa que o tempo de resposta medido é melhor que a média de todos os dispositivos testados (31 ms). | ||
Cintilação da tela / PWM (modulação por largura de pulso)
| Tela tremeluzindo / PWM não detectado | 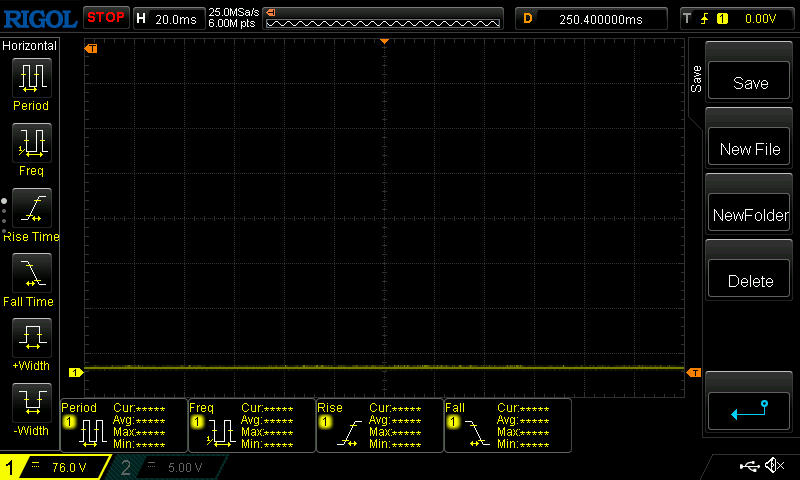 | ||
[pwm_comparison] Em comparação: 52 % de todos os dispositivos testados não usam PWM para escurecer a tela. Se PWM foi detectado, uma média de 7753 (mínimo: 5 - máximo: 343500) Hz foi medida. | |||
Na parte externa, é possível ler na tela sem problemas à sombra. Sua superfície fosca evita a maioria dos reflexos e o brilho é suficiente, com mais de 300 nits. No entanto, você definitivamente terá que evitar a luz solar direta.

Desempenho - O i5-13500H com uma RTX 4060 (140 W)
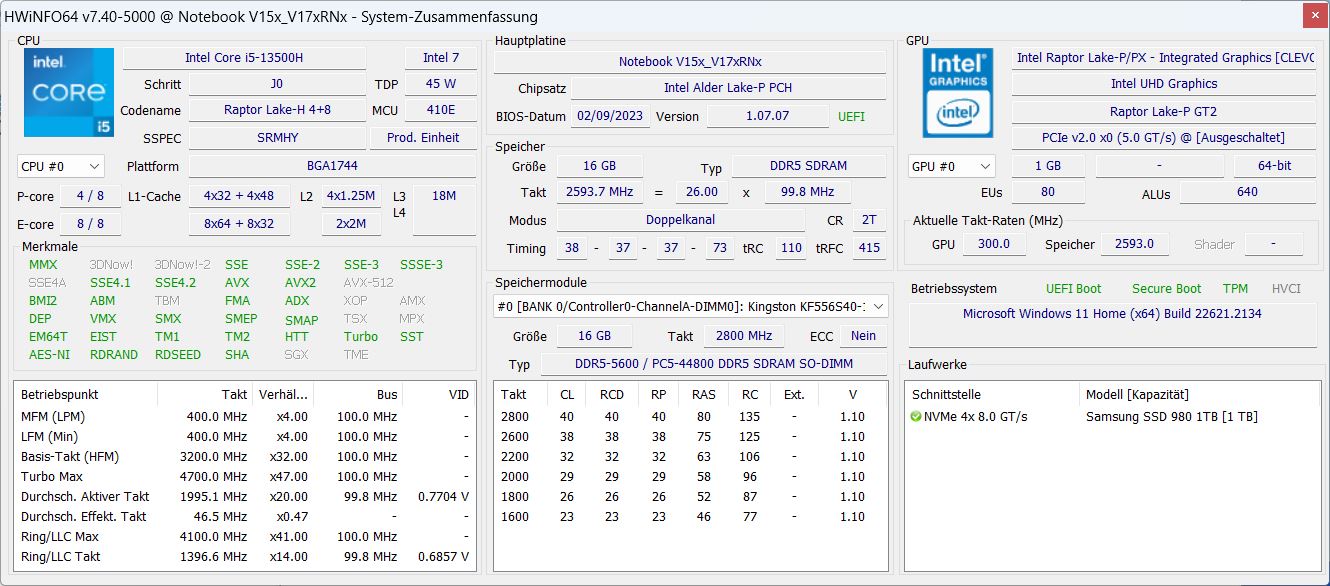
Nosso modelo de 15 polegadas está equipado com umCore i5-13500He umaRTX 406016 GB de RAM e um SSD de 1 TB, o que o torna um laptop para jogos de nível introdutório a médio. Sua tela Full HD 16:9 e seu preço relativamente baixo sugerem que ele pode ser classificado mais como um dispositivo econômico.
Como alternativa, você pode adquirir o laptop com umaRTX 4070em vez de uma RTX 4060 - mas somente os modelos de 17 polegadas oferecem a opção de escolher umaRTX 4080bem como os processadores Intel HX significativamente mais rápidos.
Condições de teste
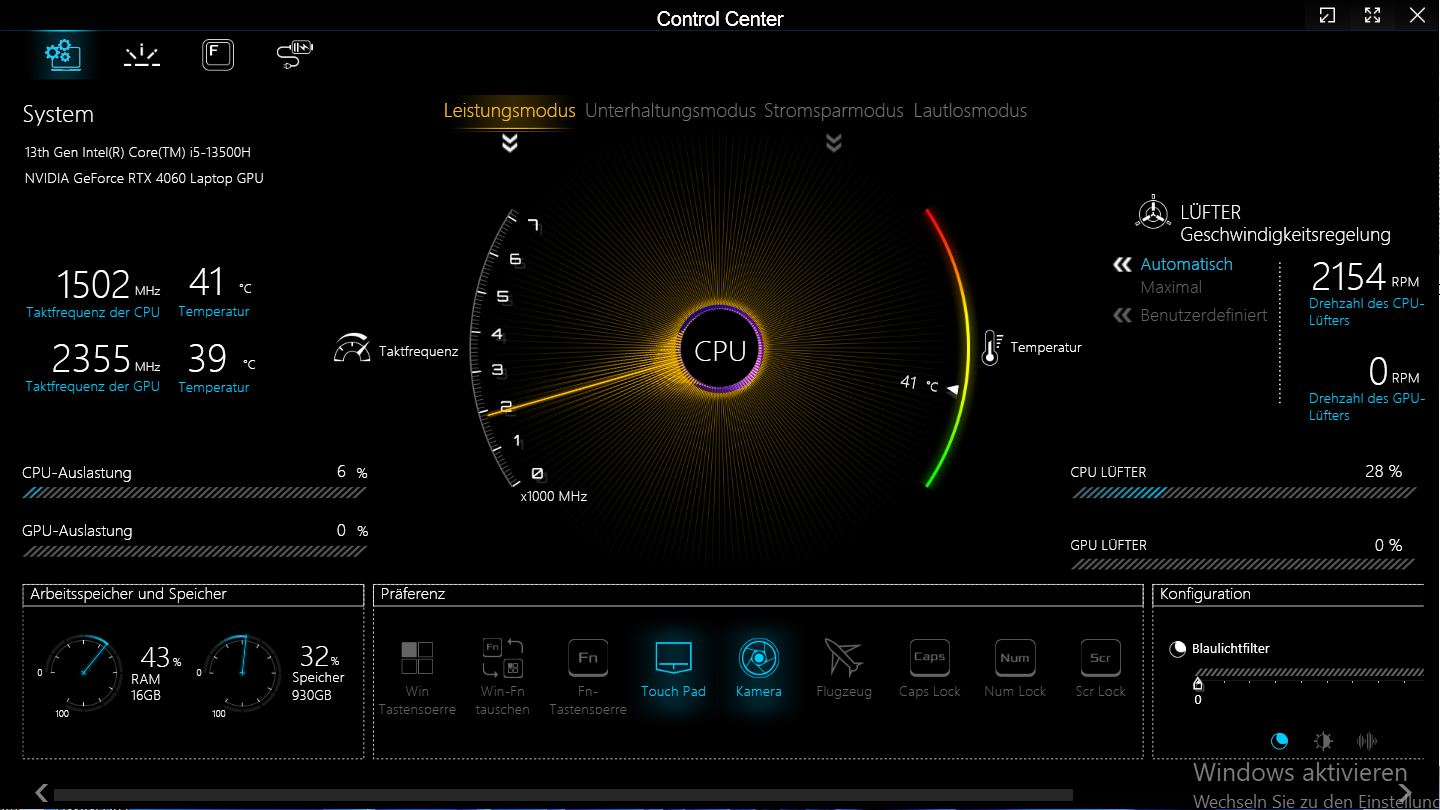
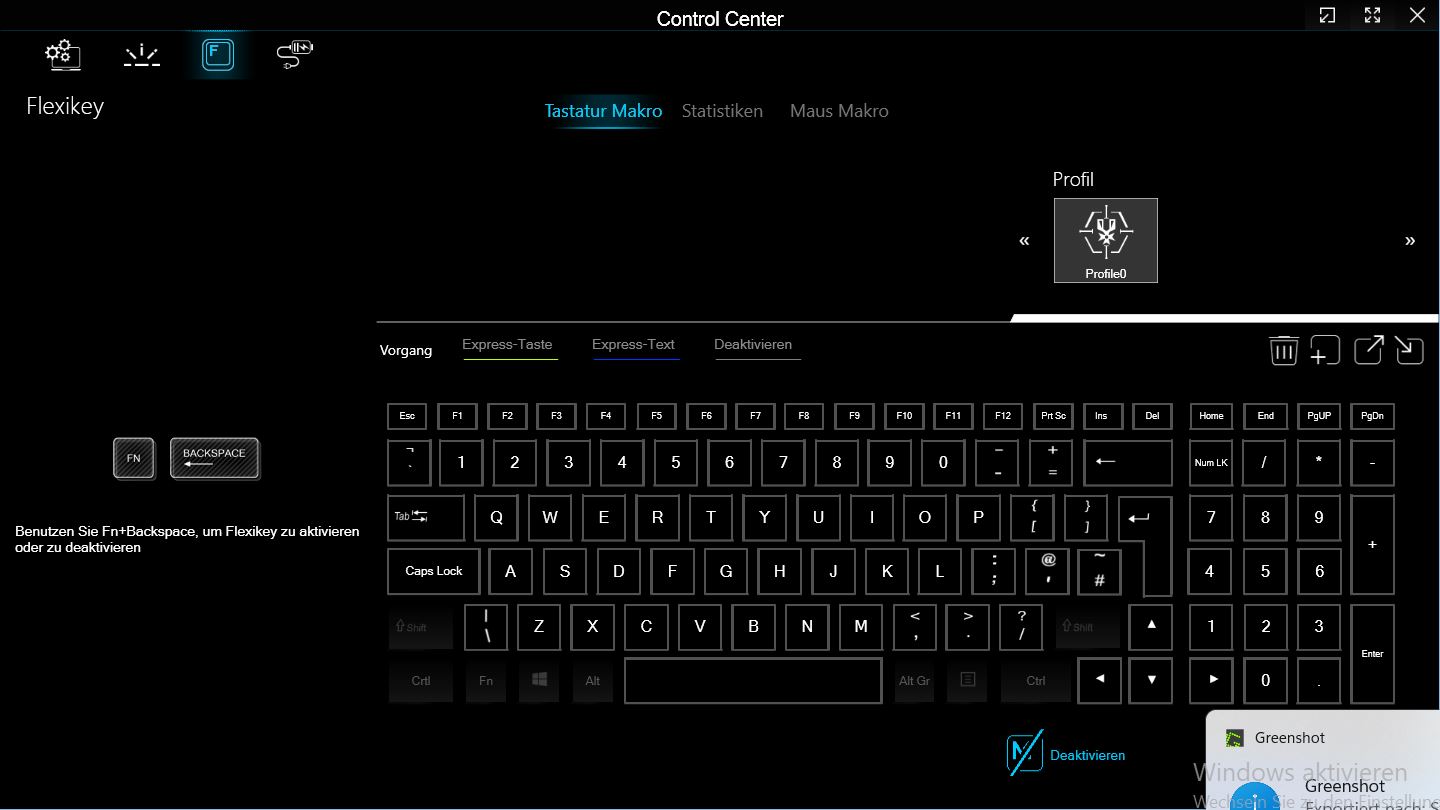
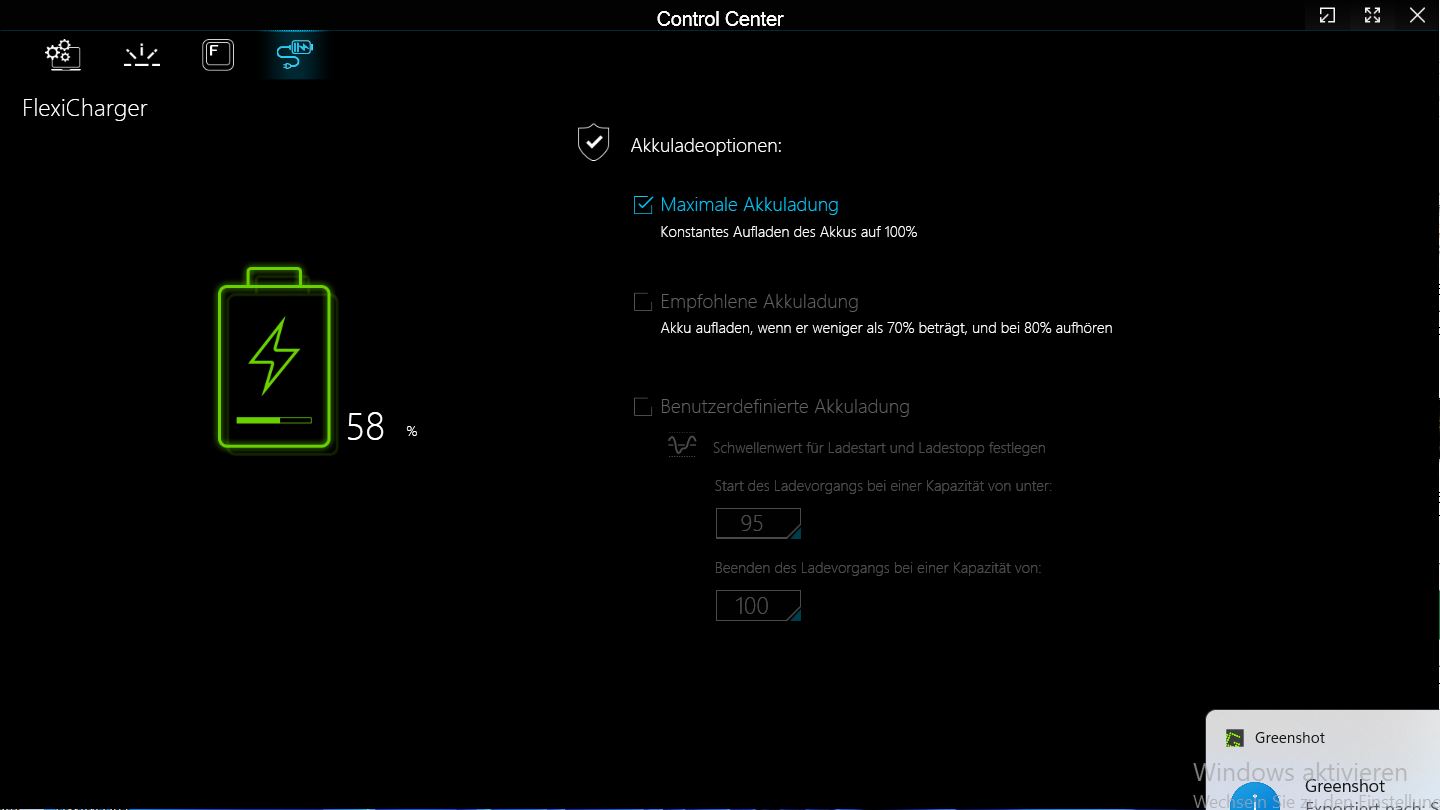
O Centro de Controle está instalado no Captiva. Há as configurações usuais para controlar o desempenho, o teclado, a webcam e assim por diante. É possível escolher entre quatro modos de desempenho: modo de desempenho, modo de entretenimento, modo de economia de energia e modo silencioso.
Para obter os melhores resultados de benchmark, selecionamos o modo de desempenho; no entanto, também falaremos um pouco mais sobre os outros modos durante nossos testes.
Processador
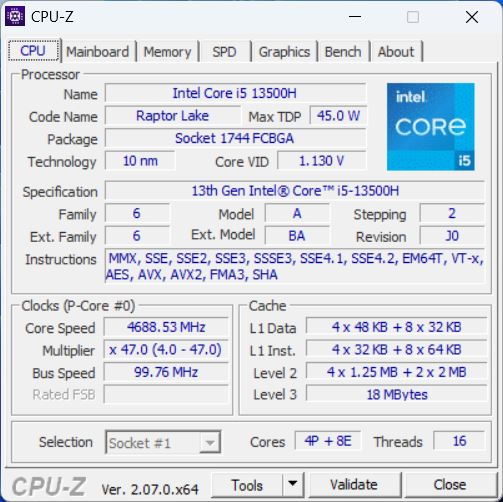
O Intel Core i5-13500H é uma CPU de médio porte da série Raptor Lake H lançada em janeiro de 2023. A CPU apresenta quatro núcleos de desempenho e oito núcleos de eficiência. Isso totaliza 16 threads, já que somente os núcleos P suportam hyper-threading - eles têm clock de 2,6 a 4,7 GHz (aumento de núcleo único, aumento de múltiplos núcleos permite um máximo de 4,6 GHz). Os núcleos E têm clock de 1,9 a 3,5 GHz.
Em nosso loop Cinebench R15, seu desempenho permaneceu muito estável e não notamos nenhuma queda no desempenho após as primeiras execuções.
No decorrer de todos os testes de CPU, o i5-13500H do Captiva obteve resultados ligeiramente acima da média em comparação com todos os outros notebooks com a mesma CPU em nosso banco de dados. O Dell G15 com sua CPU HX ainda é um pouco mais rápido, mas os dispositivos Lenovo com as atuais CPUs AMD tiveram apenas uma pequena vantagem em termos de velocidade.
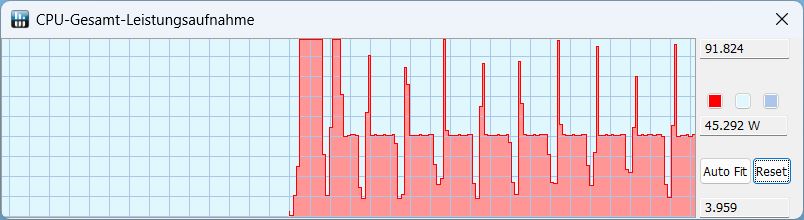
No modo de bateria, o TGP consome cerca de 20 watts e o desempenho da CPU cai em cerca de 50%.
Cinebench R15 Multi continuous test
Cinebench R23: Multi Core | Single Core
Cinebench R20: CPU (Multi Core) | CPU (Single Core)
Cinebench R15: CPU Multi 64Bit | CPU Single 64Bit
Blender: v2.79 BMW27 CPU
7-Zip 18.03: 7z b 4 | 7z b 4 -mmt1
Geekbench 5.5: Multi-Core | Single-Core
HWBOT x265 Benchmark v2.2: 4k Preset
LibreOffice : 20 Documents To PDF
R Benchmark 2.5: Overall mean
| CPU Performance rating | |
| Média da turma Gaming | |
| Dell G15 5530 | |
| Lenovo Legion Slim 5 16APH8 | |
| Lenovo LOQ 15APH8 | |
| Captiva Advanced Gaming I74-121 | |
| MSI Cyborg 15 A12VF | |
| Média Intel Core i5-13500H | |
| Schenker XMG Core 15 (M22) | |
| Cinebench R23 / Multi Core | |
| Média da turma Gaming (10488 - 40970, n=108, últimos 2 anos) | |
| Dell G15 5530 | |
| Lenovo Legion Slim 5 16APH8 | |
| Lenovo LOQ 15APH8 | |
| Captiva Advanced Gaming I74-121 | |
| Média Intel Core i5-13500H (13542 - 16335, n=5) | |
| Schenker XMG Core 15 (M22) | |
| MSI Cyborg 15 A12VF | |
| Cinebench R23 / Single Core | |
| Média da turma Gaming (1166 - 2356, n=108, últimos 2 anos) | |
| Dell G15 5530 | |
| Lenovo Legion Slim 5 16APH8 | |
| Lenovo LOQ 15APH8 | |
| Captiva Advanced Gaming I74-121 | |
| MSI Cyborg 15 A12VF | |
| Média Intel Core i5-13500H (1704 - 1799, n=5) | |
| Schenker XMG Core 15 (M22) | |
| Cinebench R20 / CPU (Multi Core) | |
| Média da turma Gaming (4029 - 16108, n=107, últimos 2 anos) | |
| Dell G15 5530 | |
| Lenovo Legion Slim 5 16APH8 | |
| Lenovo LOQ 15APH8 | |
| Captiva Advanced Gaming I74-121 | |
| Schenker XMG Core 15 (M22) | |
| MSI Cyborg 15 A12VF | |
| Média Intel Core i5-13500H (5108 - 6212, n=5) | |
| Cinebench R20 / CPU (Single Core) | |
| Média da turma Gaming (442 - 895, n=107, últimos 2 anos) | |
| Dell G15 5530 | |
| Lenovo Legion Slim 5 16APH8 | |
| Lenovo LOQ 15APH8 | |
| Captiva Advanced Gaming I74-121 | |
| MSI Cyborg 15 A12VF | |
| Média Intel Core i5-13500H (655 - 687, n=5) | |
| Schenker XMG Core 15 (M22) | |
| Cinebench R15 / CPU Multi 64Bit | |
| Média da turma Gaming (1578 - 6271, n=106, últimos 2 anos) | |
| Dell G15 5530 | |
| Lenovo LOQ 15APH8 | |
| Lenovo Legion Slim 5 16APH8 | |
| Captiva Advanced Gaming I74-121 | |
| Schenker XMG Core 15 (M22) | |
| Média Intel Core i5-13500H (2234 - 2475, n=5) | |
| MSI Cyborg 15 A12VF | |
| Cinebench R15 / CPU Single 64Bit | |
| Média da turma Gaming (188.8 - 343, n=107, últimos 2 anos) | |
| Lenovo Legion Slim 5 16APH8 | |
| Lenovo LOQ 15APH8 | |
| Dell G15 5530 | |
| Captiva Advanced Gaming I74-121 | |
| Média Intel Core i5-13500H (243 - 261, n=5) | |
| Schenker XMG Core 15 (M22) | |
| MSI Cyborg 15 A12VF | |
| Blender / v2.79 BMW27 CPU | |
| MSI Cyborg 15 A12VF | |
| Média Intel Core i5-13500H (205 - 263, n=6) | |
| Schenker XMG Core 15 (M22) | |
| Captiva Advanced Gaming I74-121 | |
| Lenovo LOQ 15APH8 | |
| Lenovo Legion Slim 5 16APH8 | |
| Dell G15 5530 | |
| Média da turma Gaming (80 - 330, n=105, últimos 2 anos) | |
| 7-Zip 18.03 / 7z b 4 | |
| Média da turma Gaming (33491 - 148086, n=106, últimos 2 anos) | |
| Dell G15 5530 | |
| Lenovo Legion Slim 5 16APH8 | |
| Schenker XMG Core 15 (M22) | |
| Lenovo LOQ 15APH8 | |
| Captiva Advanced Gaming I74-121 | |
| MSI Cyborg 15 A12VF | |
| Média Intel Core i5-13500H (50846 - 58567, n=6) | |
| 7-Zip 18.03 / 7z b 4 -mmt1 | |
| Lenovo Legion Slim 5 16APH8 | |
| Média da turma Gaming (4199 - 7436, n=106, últimos 2 anos) | |
| Lenovo LOQ 15APH8 | |
| Captiva Advanced Gaming I74-121 | |
| Dell G15 5530 | |
| Schenker XMG Core 15 (M22) | |
| MSI Cyborg 15 A12VF | |
| Média Intel Core i5-13500H (5500 - 5885, n=6) | |
| Geekbench 5.5 / Multi-Core | |
| Média da turma Gaming (6460 - 27010, n=106, últimos 2 anos) | |
| Dell G15 5530 | |
| Lenovo Legion Slim 5 16APH8 | |
| MSI Cyborg 15 A12VF | |
| Média Intel Core i5-13500H (9312 - 11465, n=5) | |
| Captiva Advanced Gaming I74-121 | |
| Schenker XMG Core 15 (M22) | |
| Lenovo LOQ 15APH8 | |
| Geekbench 5.5 / Single-Core | |
| Média da turma Gaming (986 - 2474, n=106, últimos 2 anos) | |
| Lenovo Legion Slim 5 16APH8 | |
| Dell G15 5530 | |
| Lenovo LOQ 15APH8 | |
| MSI Cyborg 15 A12VF | |
| Captiva Advanced Gaming I74-121 | |
| Média Intel Core i5-13500H (1674 - 1762, n=5) | |
| Schenker XMG Core 15 (M22) | |
| HWBOT x265 Benchmark v2.2 / 4k Preset | |
| Média da turma Gaming (11.5 - 44.3, n=106, últimos 2 anos) | |
| Dell G15 5530 | |
| Lenovo Legion Slim 5 16APH8 | |
| Schenker XMG Core 15 (M22) | |
| Captiva Advanced Gaming I74-121 | |
| Lenovo LOQ 15APH8 | |
| MSI Cyborg 15 A12VF | |
| MSI Cyborg 15 A12VF | |
| Média Intel Core i5-13500H (14.4 - 17.9, n=6) | |
| LibreOffice / 20 Documents To PDF | |
| Schenker XMG Core 15 (M22) | |
| Captiva Advanced Gaming I74-121 | |
| Média Intel Core i5-13500H (44 - 65.5, n=5) | |
| Média da turma Gaming (33.2 - 88.8, n=106, últimos 2 anos) | |
| Dell G15 5530 | |
| Lenovo LOQ 15APH8 | |
| MSI Cyborg 15 A12VF | |
| Lenovo Legion Slim 5 16APH8 | |
| R Benchmark 2.5 / Overall mean | |
| Média Intel Core i5-13500H (0.471 - 0.51, n=6) | |
| Captiva Advanced Gaming I74-121 | |
| Schenker XMG Core 15 (M22) | |
| MSI Cyborg 15 A12VF | |
| Lenovo LOQ 15APH8 | |
| Lenovo Legion Slim 5 16APH8 | |
| Média da turma Gaming (0.3439 - 0.759, n=107, últimos 2 anos) | |
| Dell G15 5530 | |
* ... menor é melhor
AIDA64: FP32 Ray-Trace | FPU Julia | CPU SHA3 | CPU Queen | FPU SinJulia | FPU Mandel | CPU AES | CPU ZLib | FP64 Ray-Trace | CPU PhotoWorxx
| Performance rating | |
| Média da turma Gaming | |
| Lenovo Legion Slim 5 16APH8 | |
| Lenovo LOQ 15APH8 | |
| Dell G15 5530 | |
| Schenker XMG Core 15 (M22) | |
| Captiva Advanced Gaming I74-121 | |
| Média Intel Core i5-13500H | |
| MSI Cyborg 15 A12VF | |
| AIDA64 / FP32 Ray-Trace | |
| Média da turma Gaming (10227 - 85542, n=105, últimos 2 anos) | |
| Lenovo LOQ 15APH8 | |
| Lenovo Legion Slim 5 16APH8 | |
| Dell G15 5530 | |
| Schenker XMG Core 15 (M22) | |
| Captiva Advanced Gaming I74-121 | |
| Média Intel Core i5-13500H (11081 - 15390, n=6) | |
| MSI Cyborg 15 A12VF | |
| AIDA64 / FPU Julia | |
| Média da turma Gaming (51376 - 238426, n=105, últimos 2 anos) | |
| Lenovo LOQ 15APH8 | |
| Lenovo Legion Slim 5 16APH8 | |
| Schenker XMG Core 15 (M22) | |
| Dell G15 5530 | |
| Captiva Advanced Gaming I74-121 | |
| MSI Cyborg 15 A12VF | |
| Média Intel Core i5-13500H (56813 - 74251, n=6) | |
| AIDA64 / CPU SHA3 | |
| Média da turma Gaming (2180 - 9817, n=105, últimos 2 anos) | |
| Lenovo LOQ 15APH8 | |
| Lenovo Legion Slim 5 16APH8 | |
| Dell G15 5530 | |
| Captiva Advanced Gaming I74-121 | |
| Schenker XMG Core 15 (M22) | |
| Média Intel Core i5-13500H (2621 - 3623, n=6) | |
| MSI Cyborg 15 A12VF | |
| AIDA64 / CPU Queen | |
| Lenovo Legion Slim 5 16APH8 | |
| Lenovo LOQ 15APH8 | |
| Média da turma Gaming (49785 - 173351, n=92, últimos 2 anos) | |
| Dell G15 5530 | |
| Schenker XMG Core 15 (M22) | |
| Captiva Advanced Gaming I74-121 | |
| MSI Cyborg 15 A12VF | |
| Média Intel Core i5-13500H (77835 - 85727, n=6) | |
| AIDA64 / FPU SinJulia | |
| Lenovo Legion Slim 5 16APH8 | |
| Lenovo LOQ 15APH8 | |
| Média da turma Gaming (4424 - 33636, n=105, últimos 2 anos) | |
| Schenker XMG Core 15 (M22) | |
| Dell G15 5530 | |
| MSI Cyborg 15 A12VF | |
| Captiva Advanced Gaming I74-121 | |
| Média Intel Core i5-13500H (7249 - 8086, n=6) | |
| AIDA64 / FPU Mandel | |
| Média da turma Gaming (25115 - 128721, n=105, últimos 2 anos) | |
| Lenovo LOQ 15APH8 | |
| Lenovo Legion Slim 5 16APH8 | |
| Schenker XMG Core 15 (M22) | |
| Dell G15 5530 | |
| Captiva Advanced Gaming I74-121 | |
| Média Intel Core i5-13500H (27820 - 38336, n=6) | |
| MSI Cyborg 15 A12VF | |
| AIDA64 / CPU AES | |
| Captiva Advanced Gaming I74-121 | |
| Média da turma Gaming (39258 - 247074, n=105, últimos 2 anos) | |
| Média Intel Core i5-13500H (62657 - 120493, n=6) | |
| Dell G15 5530 | |
| Lenovo LOQ 15APH8 | |
| Lenovo Legion Slim 5 16APH8 | |
| Schenker XMG Core 15 (M22) | |
| MSI Cyborg 15 A12VF | |
| AIDA64 / CPU ZLib | |
| Média da turma Gaming (574 - 2531, n=105, últimos 2 anos) | |
| Dell G15 5530 | |
| Lenovo LOQ 15APH8 | |
| Lenovo Legion Slim 5 16APH8 | |
| Captiva Advanced Gaming I74-121 | |
| Média Intel Core i5-13500H (782 - 992, n=6) | |
| Schenker XMG Core 15 (M22) | |
| MSI Cyborg 15 A12VF | |
| AIDA64 / FP64 Ray-Trace | |
| Média da turma Gaming (5509 - 45446, n=105, últimos 2 anos) | |
| Lenovo LOQ 15APH8 | |
| Lenovo Legion Slim 5 16APH8 | |
| Dell G15 5530 | |
| Schenker XMG Core 15 (M22) | |
| Captiva Advanced Gaming I74-121 | |
| Média Intel Core i5-13500H (5955 - 8495, n=6) | |
| MSI Cyborg 15 A12VF | |
| AIDA64 / CPU PhotoWorxx | |
| Média da turma Gaming (12271 - 89891, n=105, últimos 2 anos) | |
| Dell G15 5530 | |
| MSI Cyborg 15 A12VF | |
| Lenovo Legion Slim 5 16APH8 | |
| Média Intel Core i5-13500H (20212 - 37618, n=6) | |
| Schenker XMG Core 15 (M22) | |
| Captiva Advanced Gaming I74-121 | |
| Lenovo LOQ 15APH8 | |
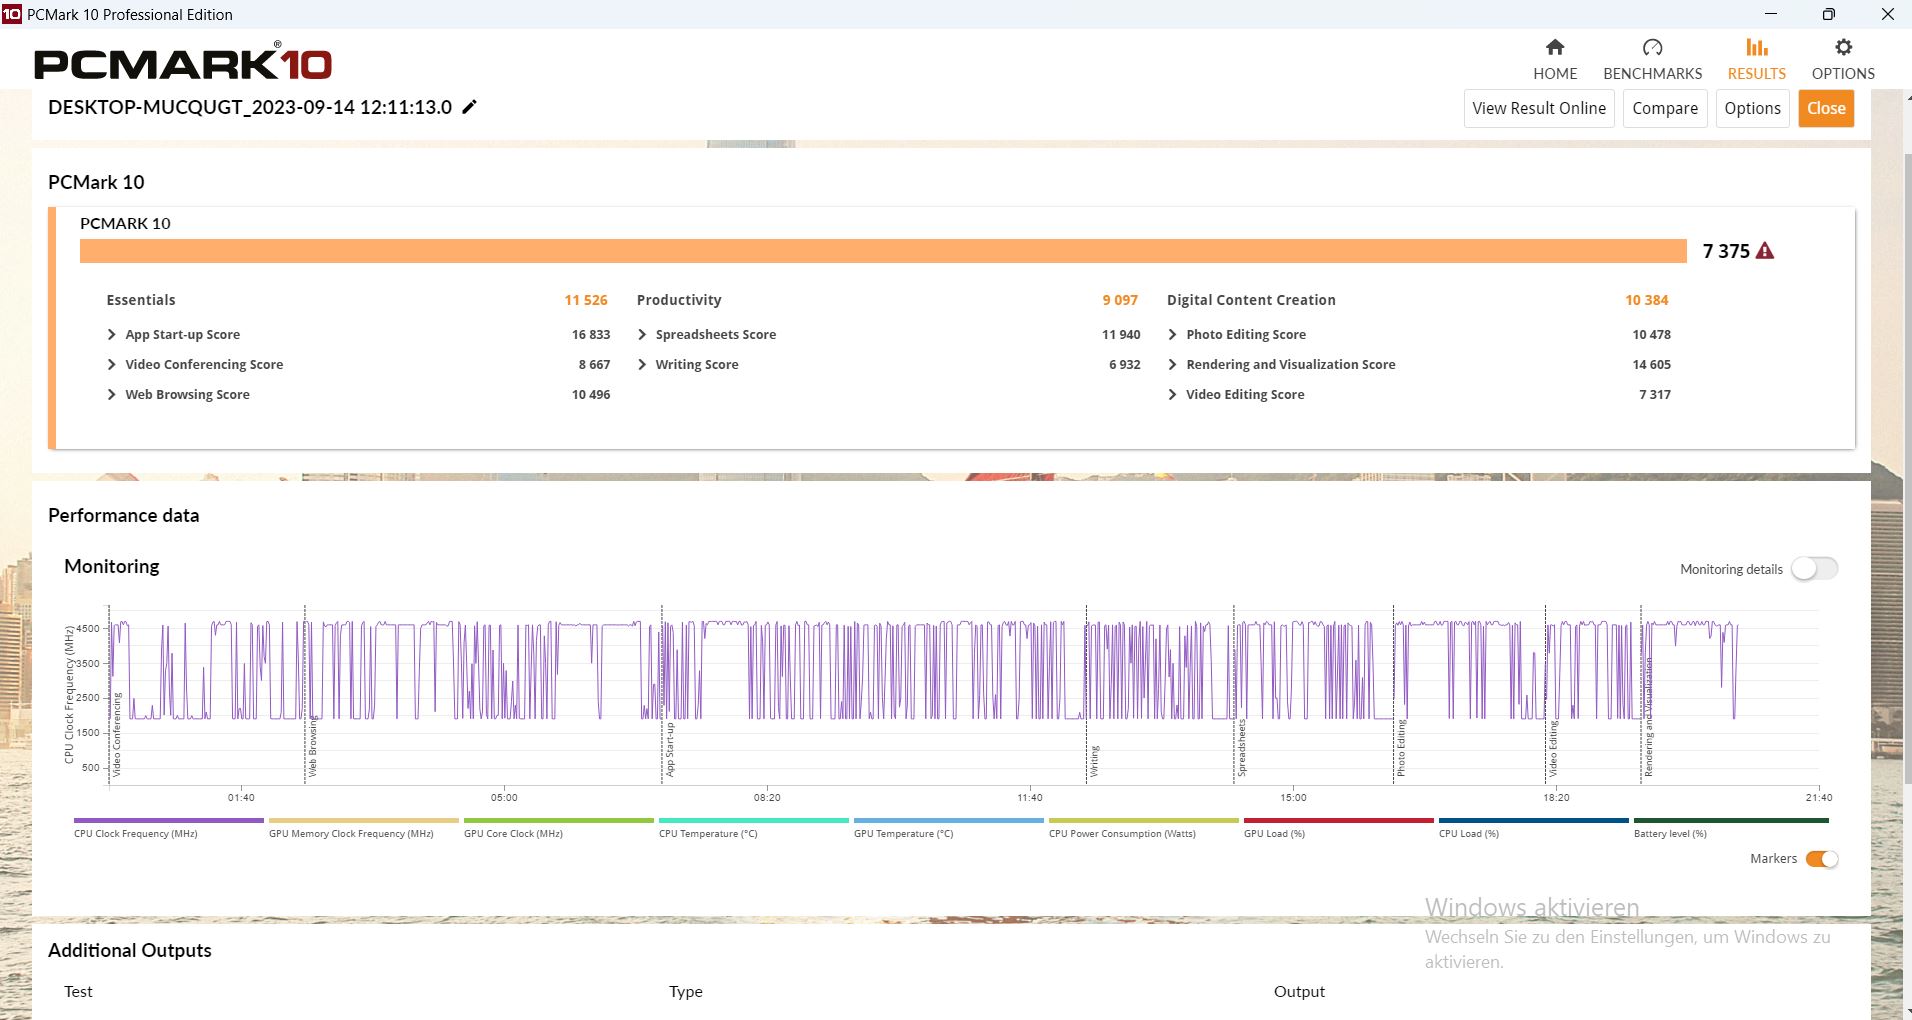
Desempenho do sistema
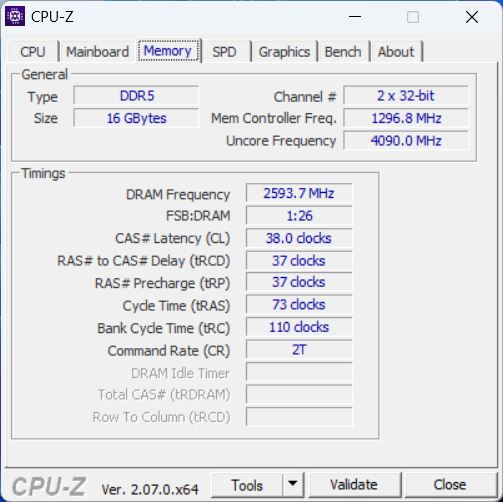
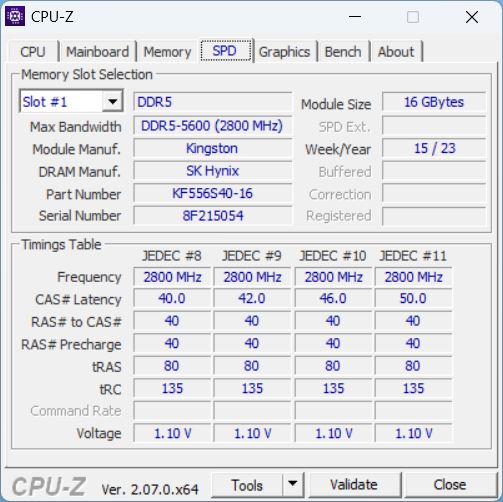
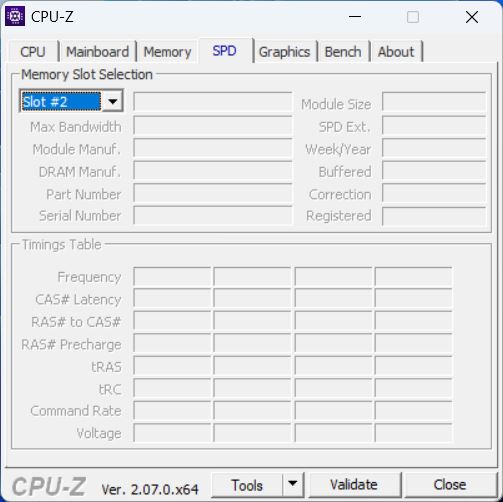
A pontuação do laptop Captiva no PCMark foi a esperada. No subteste Essentials, ele até ficou em primeiro lugar. Por sua vez, o laptop ficou mais fraco em produtividade, o que provavelmente se deve à sua RAM um pouco mais lenta, conforme mostrado pelo AIDA. No geral, o dispositivo obteve resultados acima da média para um laptop para jogos.
CrossMark: Overall | Productivity | Creativity | Responsiveness
| PCMark 10 / Score | |
| Média da turma Gaming (5828 - 11574, n=94, últimos 2 anos) | |
| Lenovo Legion Slim 5 16APH8 | |
| Lenovo LOQ 15APH8 | |
| Captiva Advanced Gaming I74-121 | |
| Média Intel Core i5-13500H, NVIDIA GeForce RTX 4060 Laptop GPU (n=1) | |
| Schenker XMG Core 15 (M22) | |
| MSI Cyborg 15 A12VF | |
| Dell G15 5530 | |
| PCMark 10 / Essentials | |
| Captiva Advanced Gaming I74-121 | |
| Média Intel Core i5-13500H, NVIDIA GeForce RTX 4060 Laptop GPU (n=1) | |
| Lenovo Legion Slim 5 16APH8 | |
| Dell G15 5530 | |
| Schenker XMG Core 15 (M22) | |
| MSI Cyborg 15 A12VF | |
| Média da turma Gaming (8810 - 11935, n=98, últimos 2 anos) | |
| Lenovo LOQ 15APH8 | |
| PCMark 10 / Productivity | |
| Média da turma Gaming (6845 - 21327, n=96, últimos 2 anos) | |
| Lenovo Legion Slim 5 16APH8 | |
| Dell G15 5530 | |
| Lenovo LOQ 15APH8 | |
| MSI Cyborg 15 A12VF | |
| Schenker XMG Core 15 (M22) | |
| Captiva Advanced Gaming I74-121 | |
| Média Intel Core i5-13500H, NVIDIA GeForce RTX 4060 Laptop GPU (n=1) | |
| PCMark 10 / Digital Content Creation | |
| Média da turma Gaming (7602 - 19657, n=96, últimos 2 anos) | |
| Lenovo Legion Slim 5 16APH8 | |
| Lenovo LOQ 15APH8 | |
| Captiva Advanced Gaming I74-121 | |
| Média Intel Core i5-13500H, NVIDIA GeForce RTX 4060 Laptop GPU (n=1) | |
| Schenker XMG Core 15 (M22) | |
| MSI Cyborg 15 A12VF | |
| Dell G15 5530 | |
| CrossMark / Overall | |
| Média da turma Gaming (1366 - 2409, n=94, últimos 2 anos) | |
| Dell G15 5530 | |
| Lenovo Legion Slim 5 16APH8 | |
| MSI Cyborg 15 A12VF | |
| Captiva Advanced Gaming I74-121 | |
| Média Intel Core i5-13500H, NVIDIA GeForce RTX 4060 Laptop GPU (n=1) | |
| Lenovo LOQ 15APH8 | |
| Schenker XMG Core 15 (M22) | |
| CrossMark / Productivity | |
| Média da turma Gaming (1386 - 2254, n=94, últimos 2 anos) | |
| Lenovo Legion Slim 5 16APH8 | |
| Dell G15 5530 | |
| MSI Cyborg 15 A12VF | |
| Captiva Advanced Gaming I74-121 | |
| Média Intel Core i5-13500H, NVIDIA GeForce RTX 4060 Laptop GPU (n=1) | |
| Lenovo LOQ 15APH8 | |
| Schenker XMG Core 15 (M22) | |
| CrossMark / Creativity | |
| Média da turma Gaming (1343 - 2729, n=94, últimos 2 anos) | |
| Dell G15 5530 | |
| Lenovo Legion Slim 5 16APH8 | |
| MSI Cyborg 15 A12VF | |
| Schenker XMG Core 15 (M22) | |
| Captiva Advanced Gaming I74-121 | |
| Média Intel Core i5-13500H, NVIDIA GeForce RTX 4060 Laptop GPU (n=1) | |
| Lenovo LOQ 15APH8 | |
| CrossMark / Responsiveness | |
| Média da turma Gaming (1226 - 2334, n=94, últimos 2 anos) | |
| MSI Cyborg 15 A12VF | |
| Captiva Advanced Gaming I74-121 | |
| Média Intel Core i5-13500H, NVIDIA GeForce RTX 4060 Laptop GPU (n=1) | |
| Dell G15 5530 | |
| Lenovo Legion Slim 5 16APH8 | |
| Lenovo LOQ 15APH8 | |
| Schenker XMG Core 15 (M22) | |
| PCMark 10 Score | 7375 pontos | |
Ajuda | ||
| AIDA64 / Memory Copy | |
| Média da turma Gaming (21750 - 129946, n=105, últimos 2 anos) | |
| Lenovo Legion Slim 5 16APH8 | |
| Dell G15 5530 | |
| MSI Cyborg 15 A12VF | |
| Schenker XMG Core 15 (M22) | |
| Média Intel Core i5-13500H (36916 - 57830, n=6) | |
| Captiva Advanced Gaming I74-121 | |
| Lenovo LOQ 15APH8 | |
| AIDA64 / Memory Read | |
| Média da turma Gaming (22956 - 118858, n=105, últimos 2 anos) | |
| Dell G15 5530 | |
| MSI Cyborg 15 A12VF | |
| Lenovo Legion Slim 5 16APH8 | |
| Média Intel Core i5-13500H (41676 - 65633, n=6) | |
| Schenker XMG Core 15 (M22) | |
| Captiva Advanced Gaming I74-121 | |
| Lenovo LOQ 15APH8 | |
| AIDA64 / Memory Write | |
| Lenovo Legion Slim 5 16APH8 | |
| Média da turma Gaming (22297 - 135096, n=105, últimos 2 anos) | |
| Dell G15 5530 | |
| MSI Cyborg 15 A12VF | |
| Schenker XMG Core 15 (M22) | |
| Média Intel Core i5-13500H (36826 - 60523, n=6) | |
| Captiva Advanced Gaming I74-121 | |
| Lenovo LOQ 15APH8 | |
| AIDA64 / Memory Latency | |
| Média da turma Gaming (75.3 - 259, n=105, últimos 2 anos) | |
| Lenovo LOQ 15APH8 | |
| Lenovo Legion Slim 5 16APH8 | |
| Média Intel Core i5-13500H (86.2 - 96.1, n=6) | |
| MSI Cyborg 15 A12VF | |
| Dell G15 5530 | |
| Captiva Advanced Gaming I74-121 | |
| Schenker XMG Core 15 (M22) | |
* ... menor é melhor
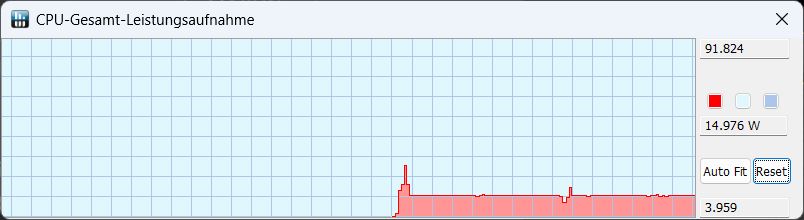
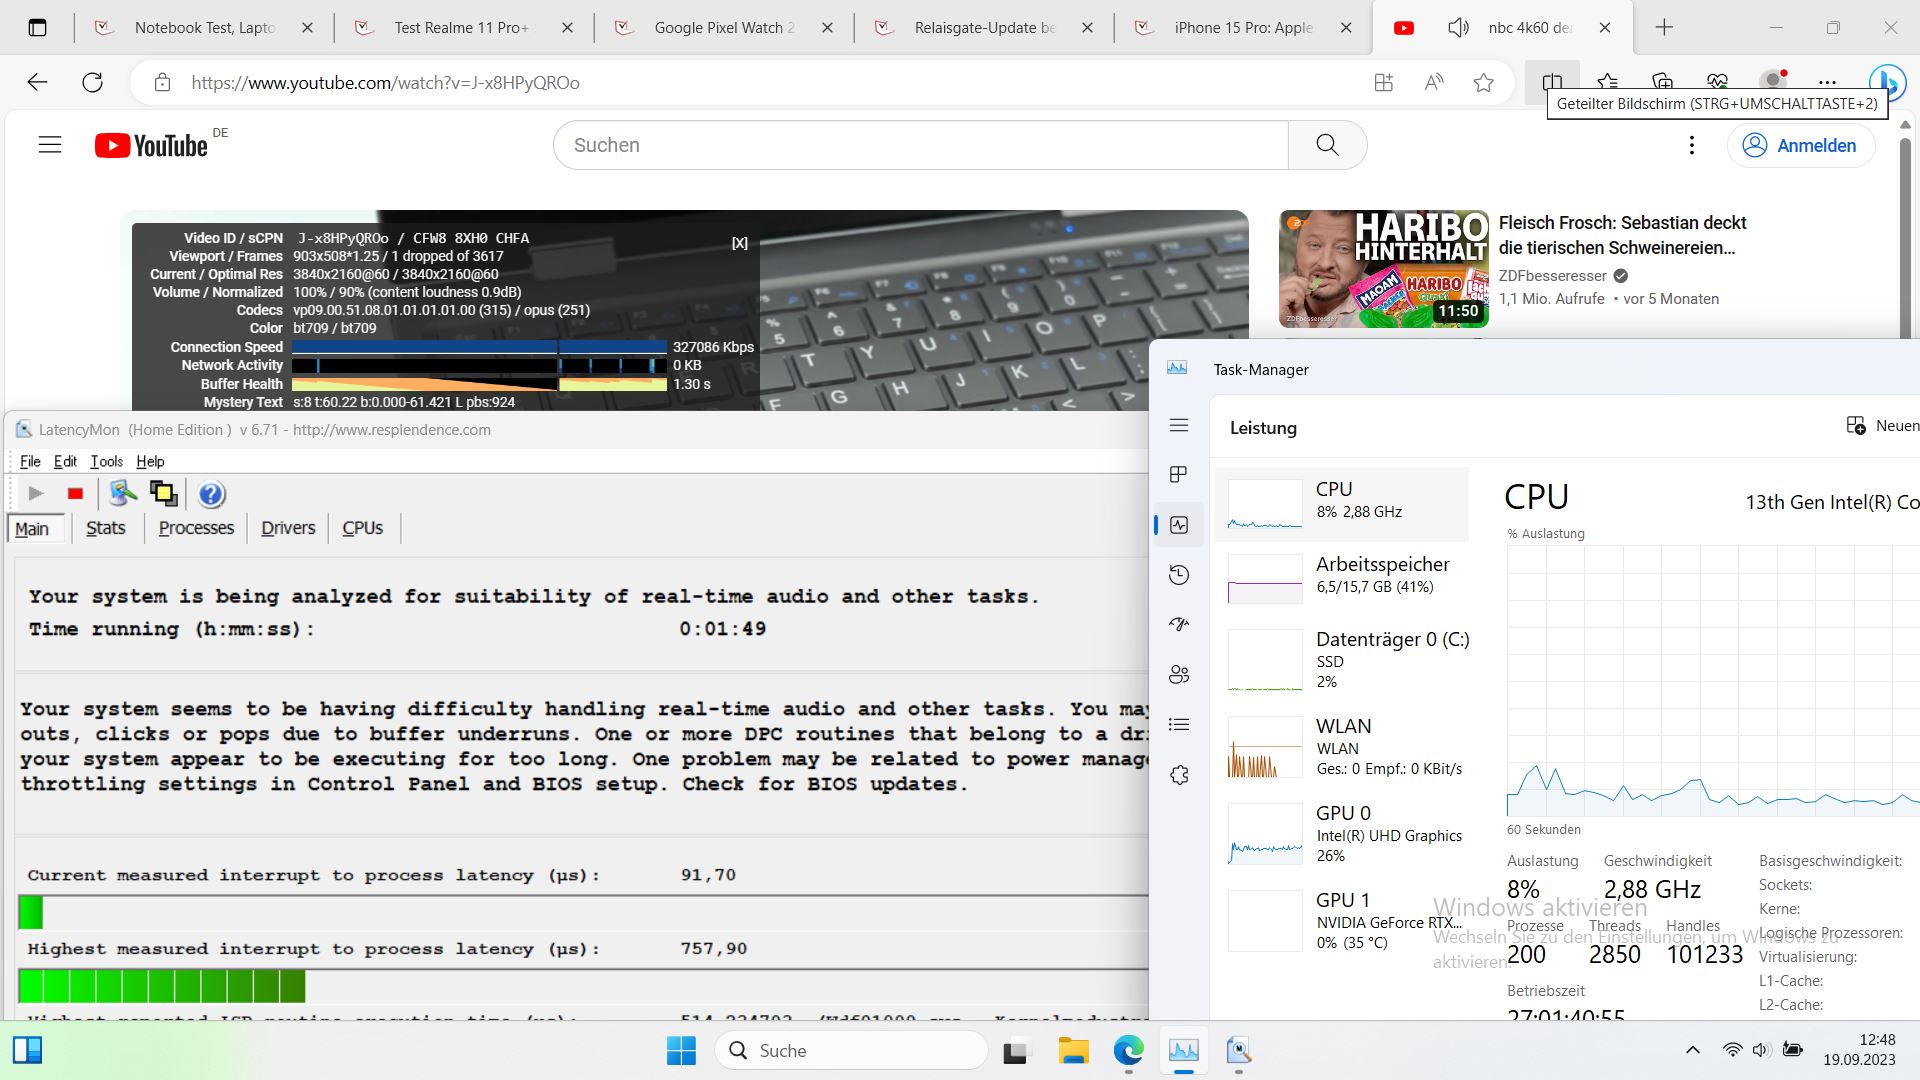
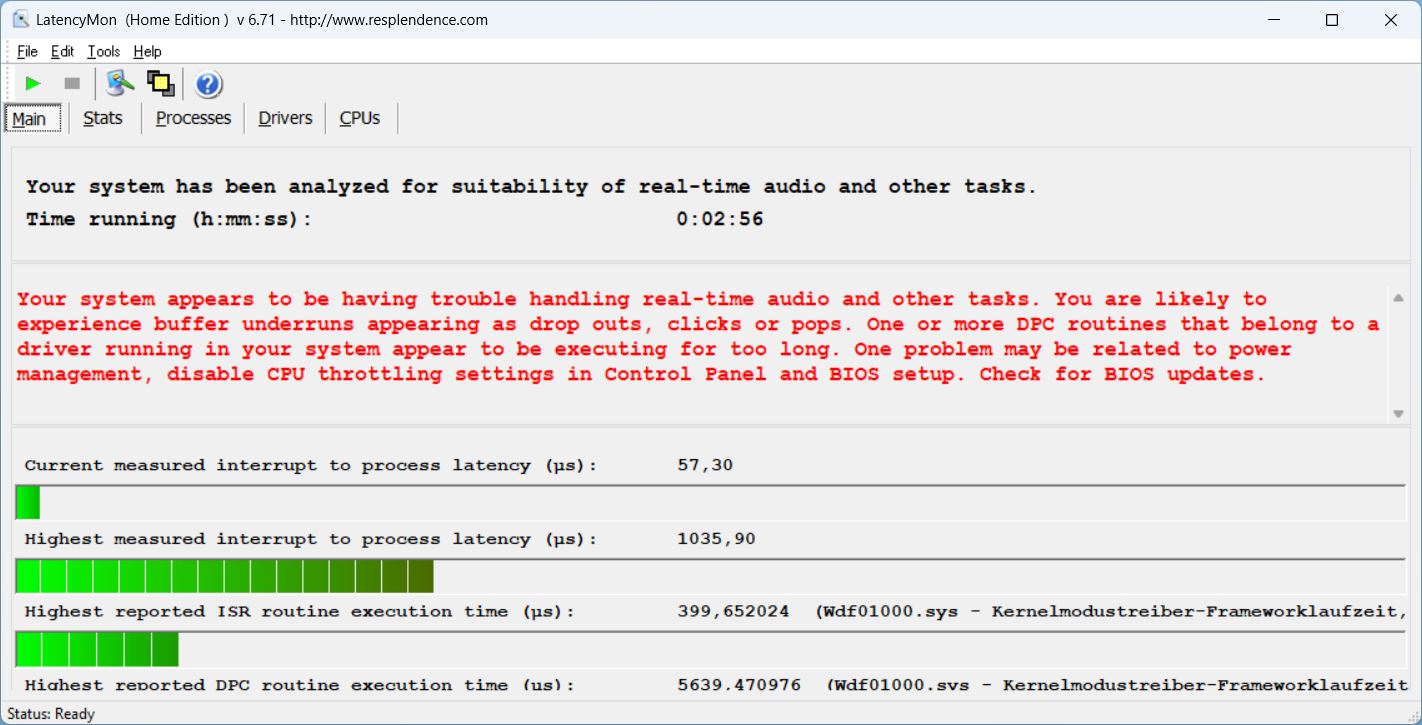
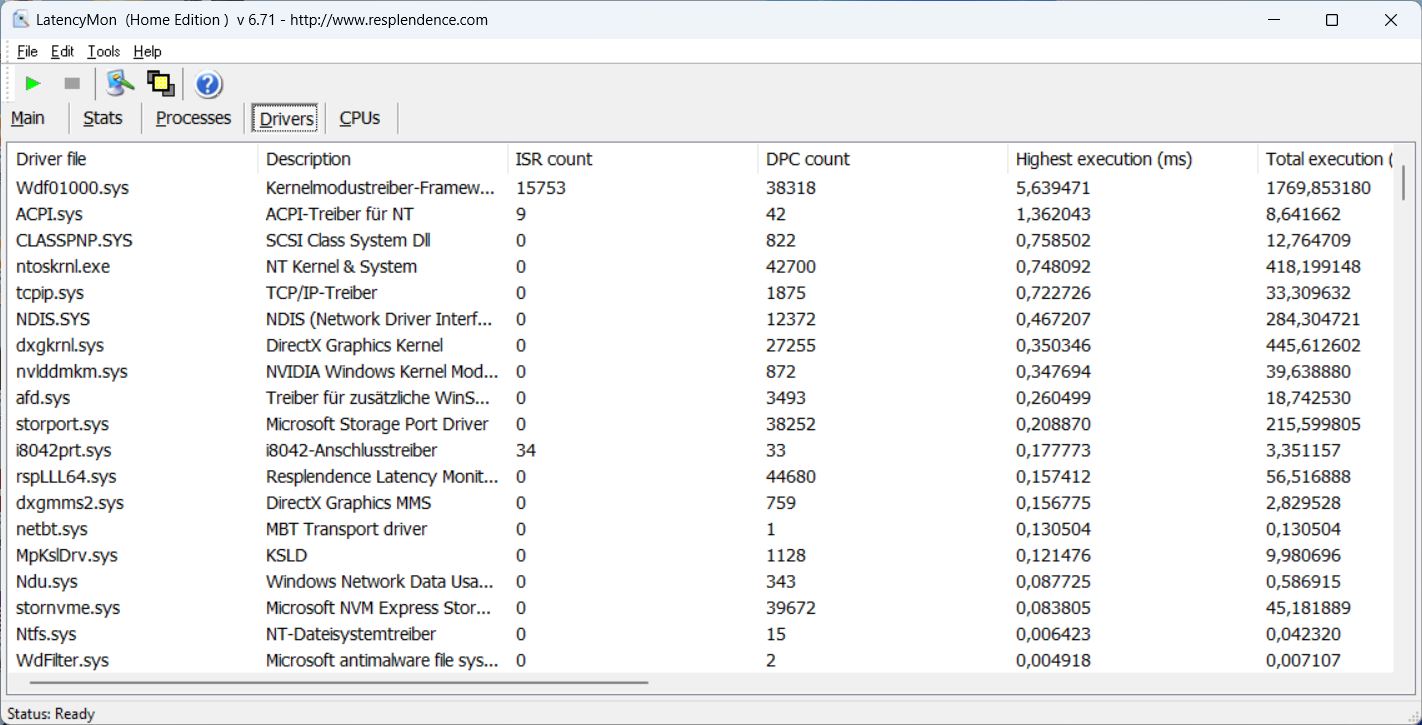
Latência DPC
Ao abrir várias guias do navegador ou nosso site, o Captiva não apresentou problemas, mesmo com várias guias. Os primeiros pequenos problemas foram observados ao abrir nosso vídeo do YouTube em 4K/60 fps. As latências foram relativamente baixas - com exceção de um quadro perdido, o vídeo foi reproduzido sem problemas.
| DPC Latencies / LatencyMon - interrupt to process latency (max), Web, Youtube, Prime95 | |
| Dell G15 5530 | |
| Schenker XMG Core 15 (M22) | |
| Lenovo LOQ 15APH8 | |
| MSI Cyborg 15 A12VF | |
| Captiva Advanced Gaming I74-121 | |
| Lenovo Legion Slim 5 16APH8 | |
* ... menor é melhor
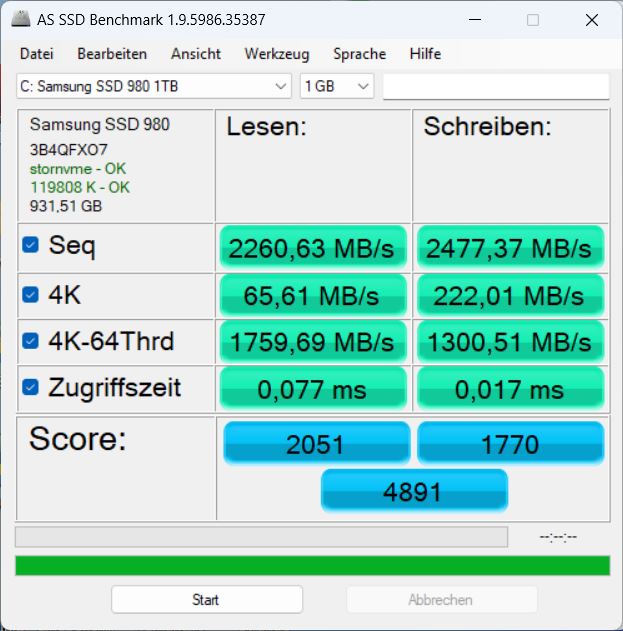
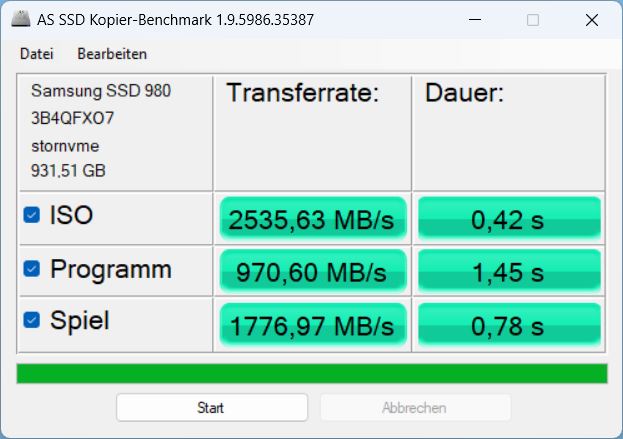
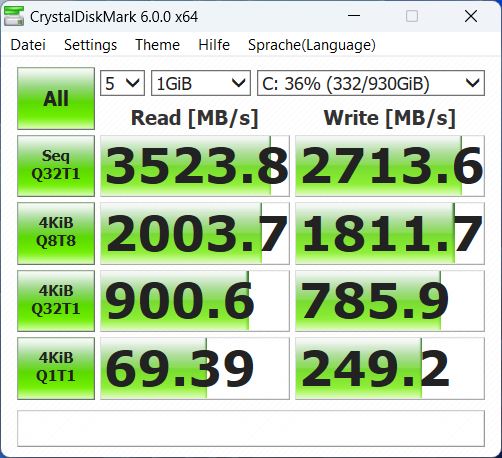
Dispositivos de armazenamento
O Captiva não apresenta nenhum ponto fraco quando se trata de armazenamento em massa. Em nosso modelo de teste, foi instalado um SSD 980 da Samsung muito conhecido, com 1 TB de armazenamento. Ele ainda pode ser da geração PCIe 3.0, mas é um de seus melhores modelos. Atualmente, também existem alguns SSDs mais rápidos (como mostra nossa comparação), mas esse dispositivo de armazenamento ainda obteve resultados acima da média.
Dentro do Captiva, a SSD teve um desempenho cerca de 10% mais rápido do que o modelo médio (Samsung 980 1 TB) do nosso banco de dados e, além disso, seu desempenho foi constante durante um longo período de tempo e a limitação térmica nunca foi um problema.

* ... menor é melhor
Reading continuous performance: DiskSpd Read Loop, Queue Depth 8
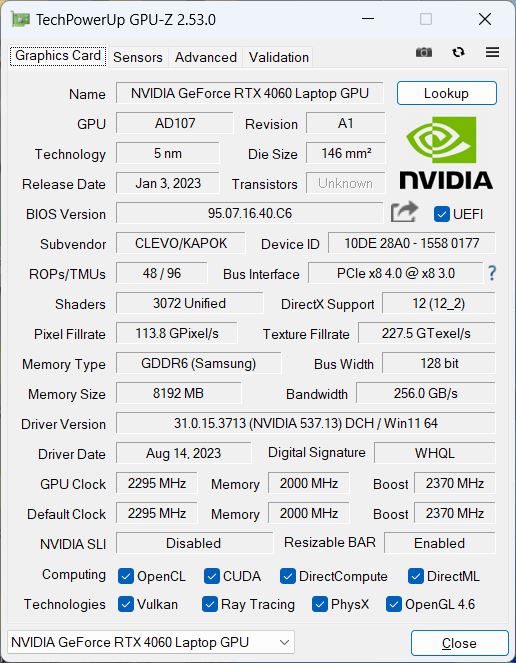
Placa de vídeo
O Captiva conta com aNvidia Geforce RTX 4060como placa de vídeo e tem acesso a até 140 watts, incluindo o Dynamic Boost.
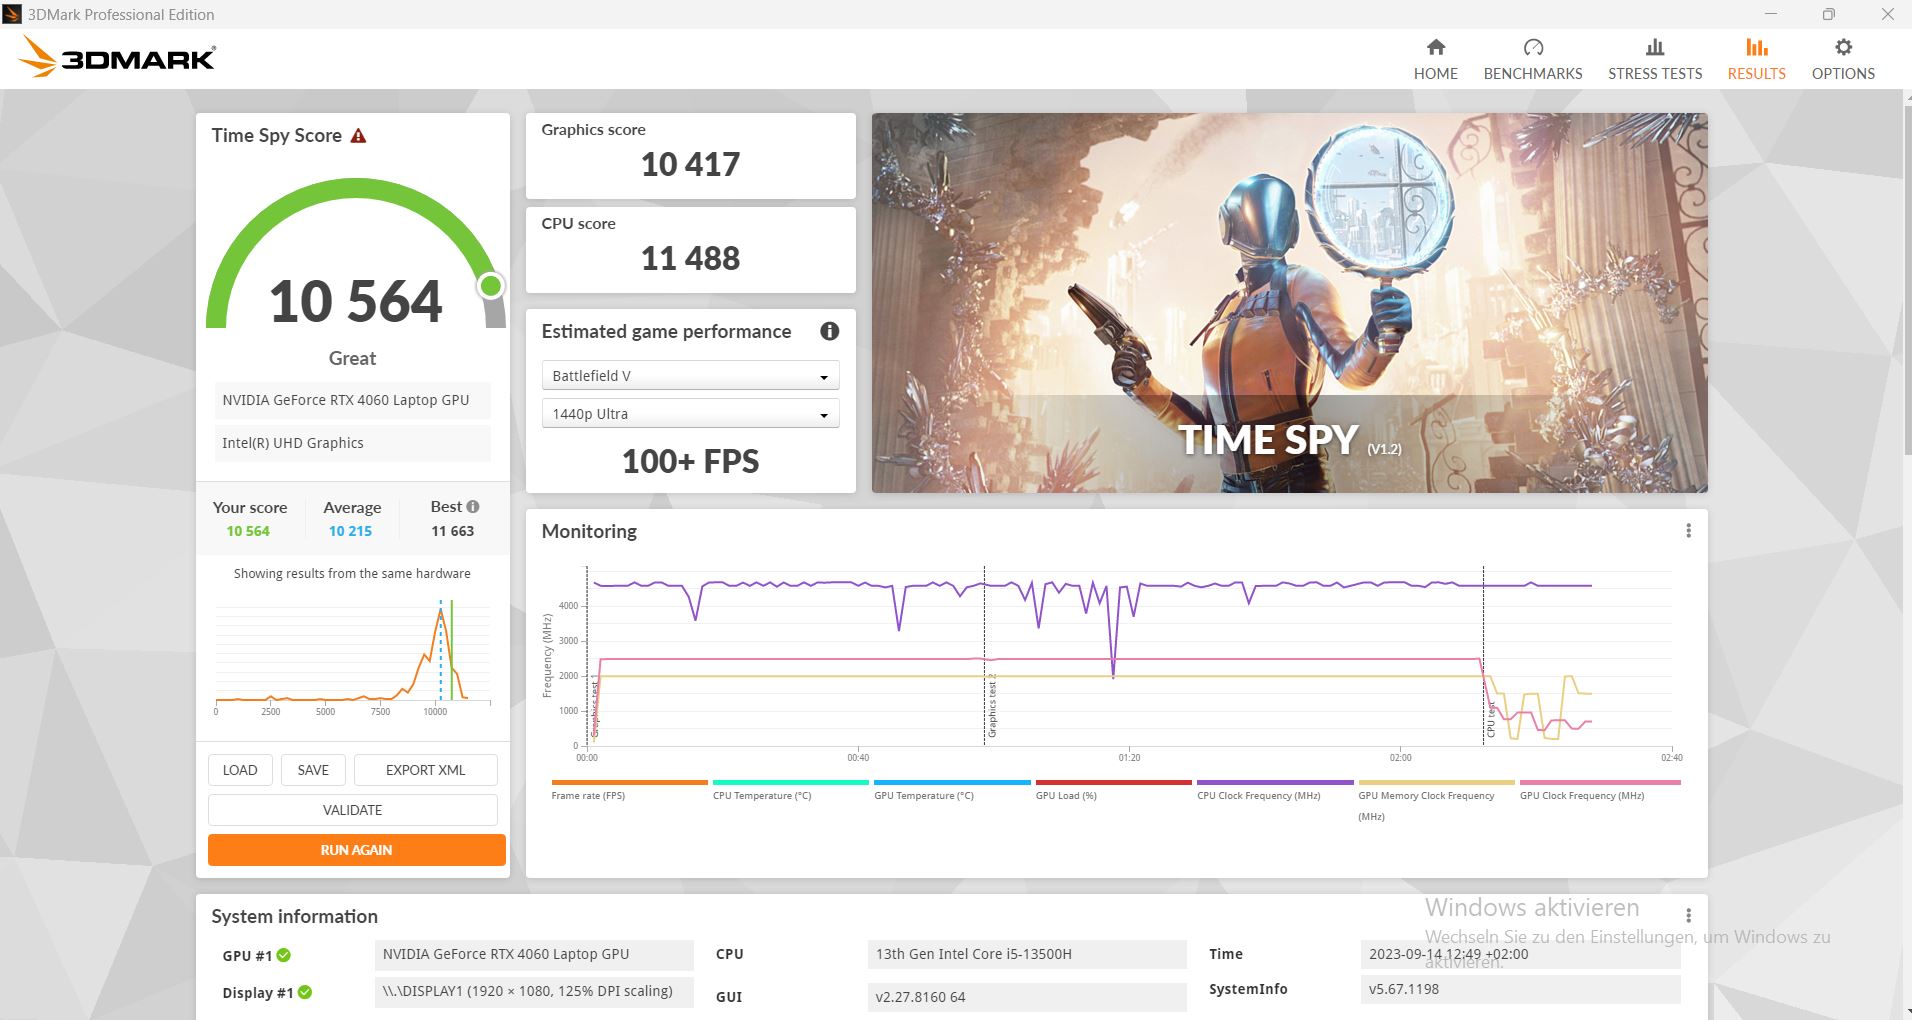
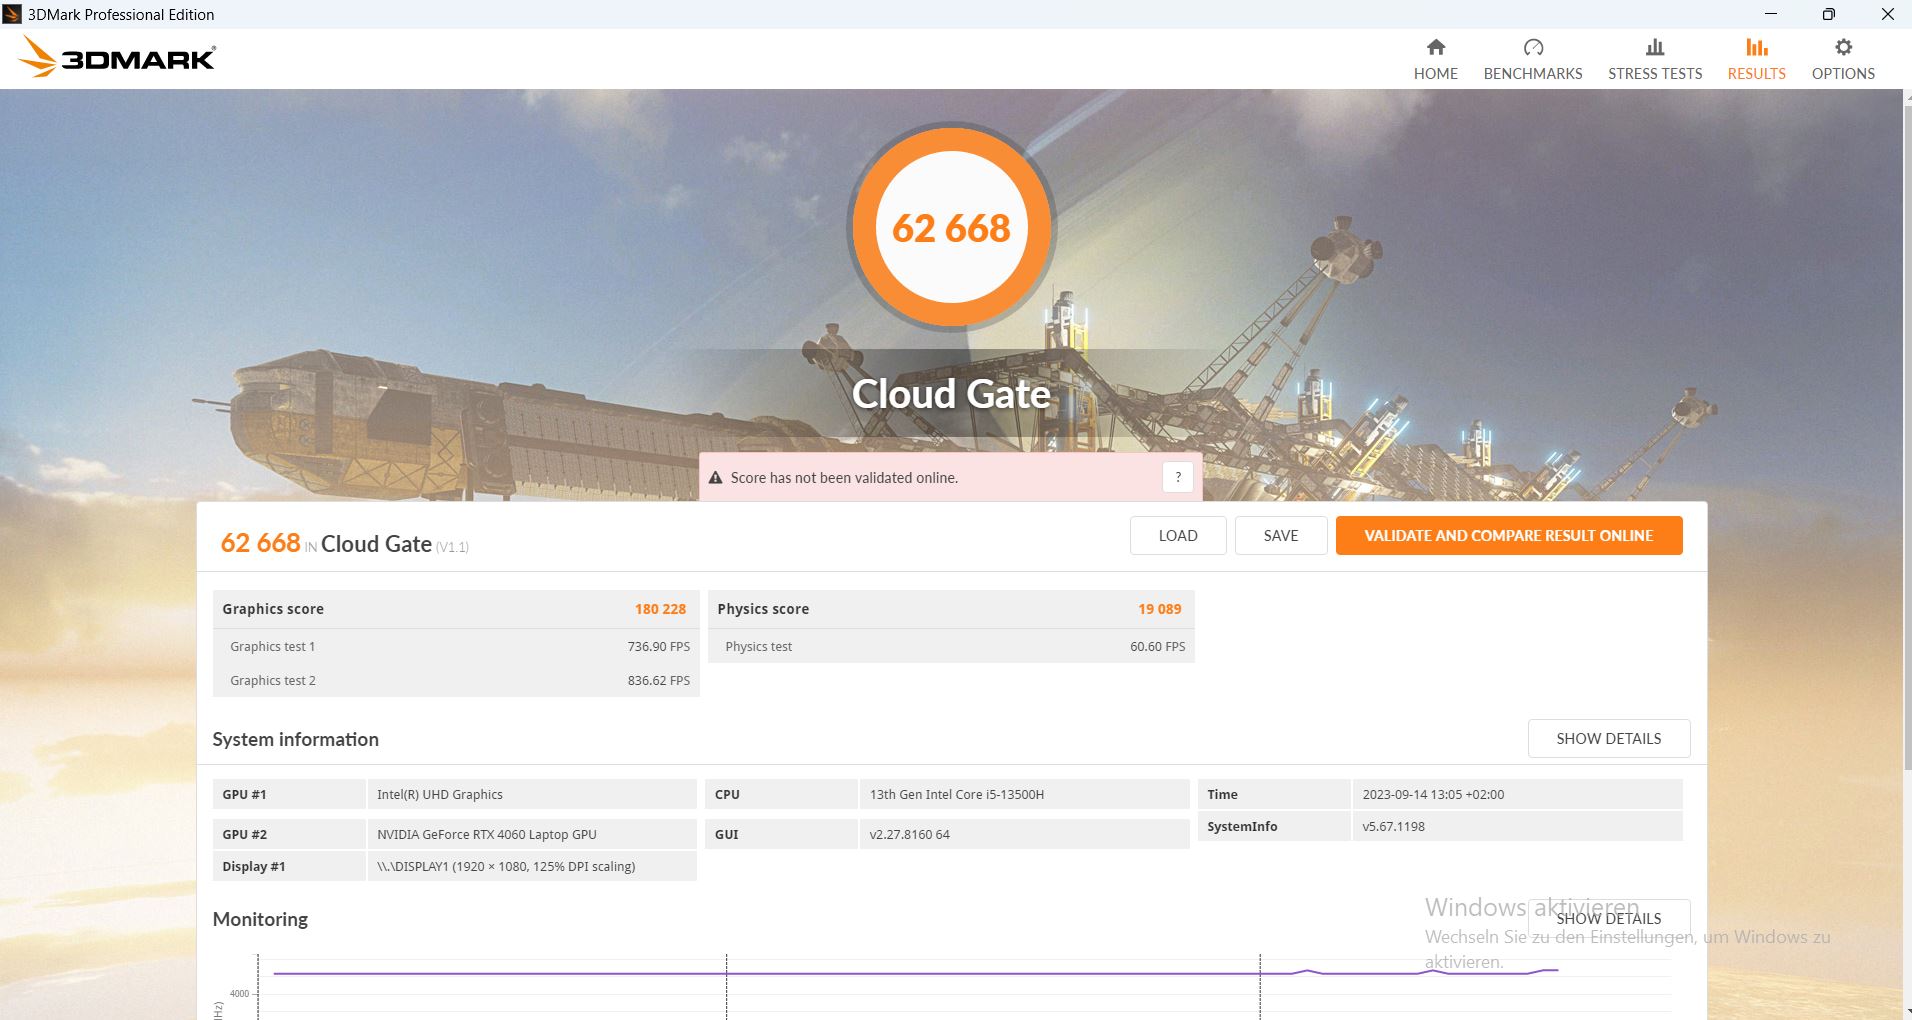
Embora o desempenho do processador tenha ficado na média inferior, os resultados do benchmark 3DMark do laptop o levaram a ficar em primeiro lugar - somente oDell G15foi capaz de acompanhá-lo. OLOQ 15e oCyborg 15com a mesma GPU foram claramente derrotados.
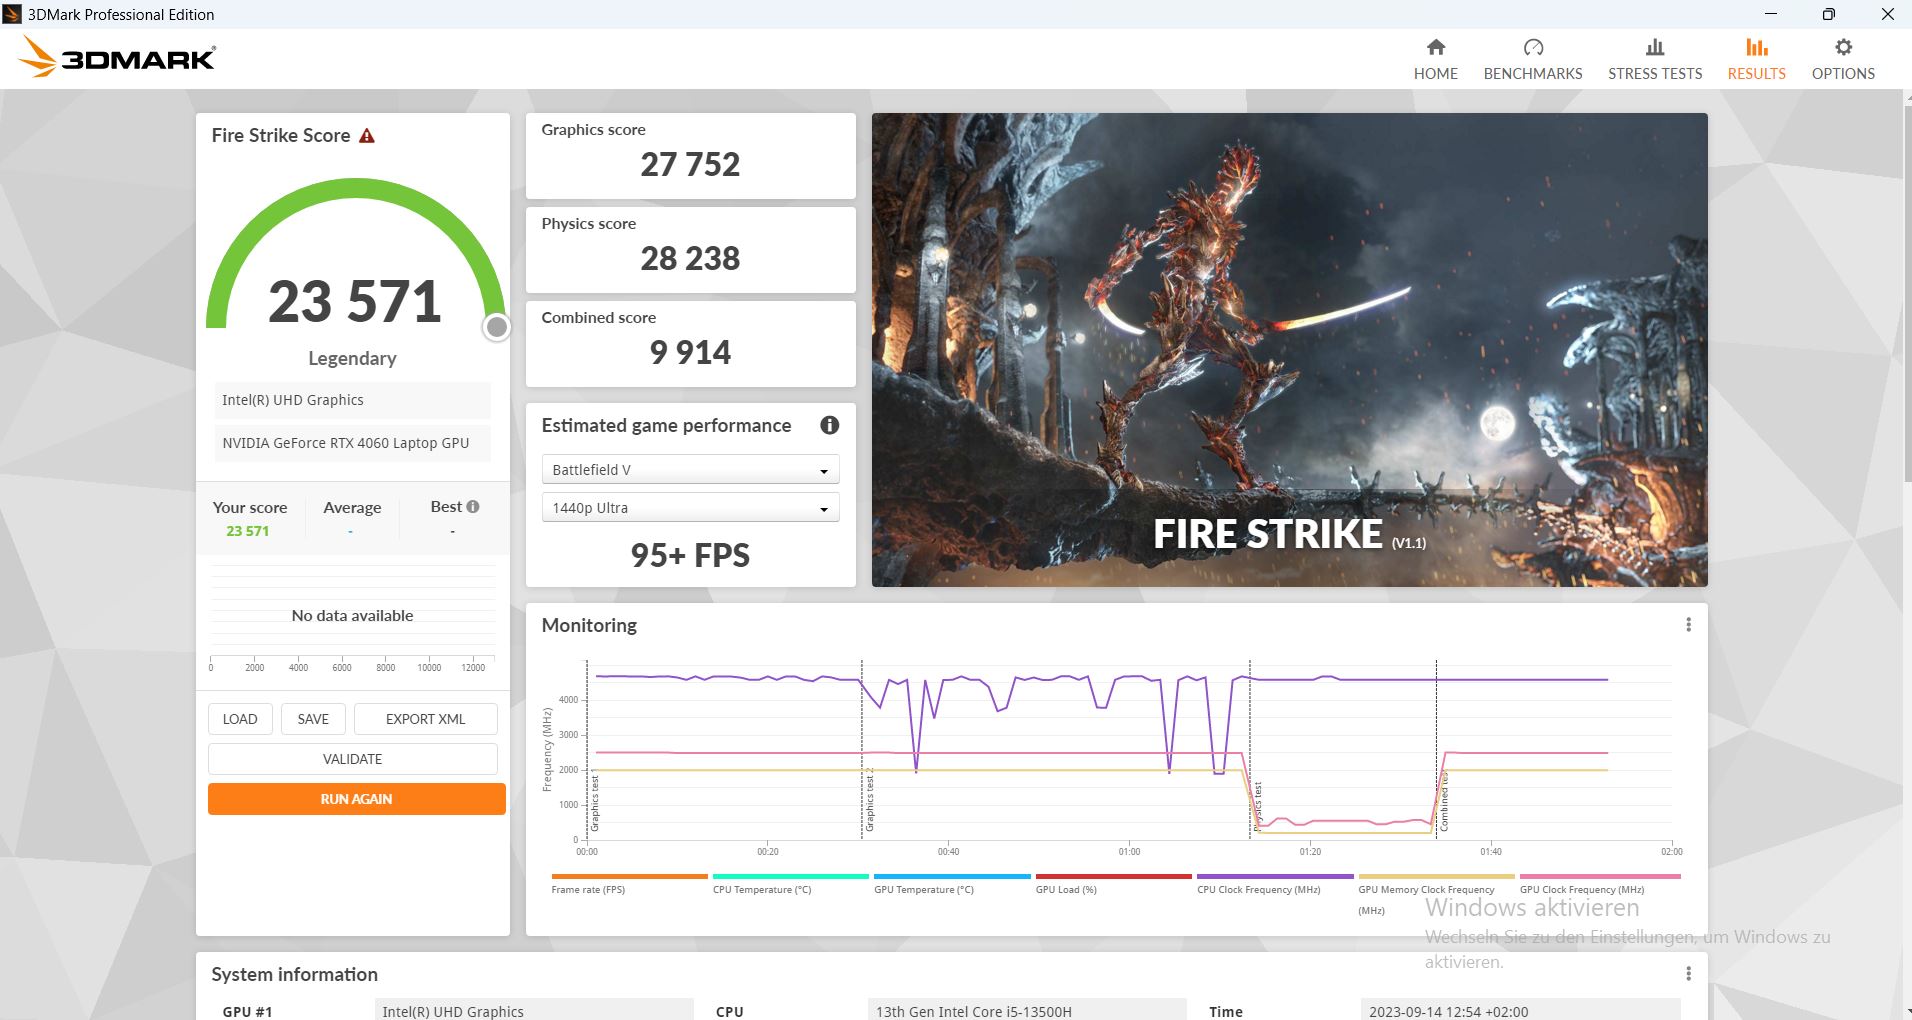
Longe de uma tomada elétrica, seu desempenho 3D diminui consideravelmente. De um total inicial de 23.571 pontos obtidos durante o teste em Fire Strike, ele agora atingiu apenas 6.693 pontos. Isso representa 72% a menos!

| 3DMark 11 Performance | 30608 pontos | |
| 3DMark Cloud Gate Standard Score | 62668 pontos | |
| 3DMark Fire Strike Score | 23571 pontos | |
| 3DMark Time Spy Score | 10564 pontos | |
Ajuda | ||
* ... menor é melhor
Desempenho em jogos
O Captiva estava em um duelo acirrado com oDell G15em todos os aspectos relacionados a jogos, sendo que o último conseguiu ficar em primeiro lugar. Isso provavelmente se deve ao melhor desempenho da CPU em jogos com o foco correspondente.
No total, o Captiva é capaz de executar sem problemas quase todos os jogos atuais em resoluções muito altas e ficou um pouco acima da média de todos os notebooks com a mesma GPU que armazenamos em nosso banco de dados.
| Performance rating - Percent | |
| Média da turma Gaming | |
| Dell G15 5530 | |
| Captiva Advanced Gaming I74-121 | |
| Lenovo Legion Slim 5 16APH8 | |
| MSI Cyborg 15 A12VF | |
| Schenker XMG Core 15 (M22) | |
| Lenovo LOQ 15APH8 | |
| The Witcher 3 - 1920x1080 Ultra Graphics & Postprocessing (HBAO+) | |
| Média da turma Gaming (95 - 240, n=7, últimos 2 anos) | |
| Dell G15 5530 | |
| Captiva Advanced Gaming I74-121 | |
| Lenovo Legion Slim 5 16APH8 | |
| Lenovo LOQ 15APH8 | |
| Schenker XMG Core 15 (M22) | |
| MSI Cyborg 15 A12VF | |
| GTA V - 1920x1080 Highest AA:4xMSAA + FX AF:16x | |
| Média da turma Gaming (48.3 - 186.9, n=95, últimos 2 anos) | |
| Captiva Advanced Gaming I74-121 | |
| Dell G15 5530 | |
| Lenovo Legion Slim 5 16APH8 | |
| Schenker XMG Core 15 (M22) | |
| MSI Cyborg 15 A12VF | |
| Lenovo LOQ 15APH8 | |
| Final Fantasy XV Benchmark - 1920x1080 High Quality | |
| Média da turma Gaming (41 - 215, n=96, últimos 2 anos) | |
| Captiva Advanced Gaming I74-121 | |
| Dell G15 5530 | |
| Lenovo Legion Slim 5 16APH8 | |
| Schenker XMG Core 15 (M22) | |
| Lenovo LOQ 15APH8 | |
| MSI Cyborg 15 A12VF | |
| Strange Brigade - 1920x1080 ultra AA:ultra AF:16 | |
| Média da turma Gaming (76.3 - 456, n=86, últimos 2 anos) | |
| Dell G15 5530 | |
| Captiva Advanced Gaming I74-121 | |
| Lenovo Legion Slim 5 16APH8 | |
| Lenovo LOQ 15APH8 | |
| Schenker XMG Core 15 (M22) | |
| MSI Cyborg 15 A12VF | |
| Dota 2 Reborn - 1920x1080 ultra (3/3) best looking | |
| Média da turma Gaming (84.8 - 248, n=108, últimos 2 anos) | |
| Dell G15 5530 | |
| Captiva Advanced Gaming I74-121 | |
| Lenovo Legion Slim 5 16APH8 | |
| MSI Cyborg 15 A12VF | |
| Lenovo LOQ 15APH8 | |
| Schenker XMG Core 15 (M22) | |
| The Witcher 3 | |
| 1920x1080 High Graphics & Postprocessing (Nvidia HairWorks Off) | |
| Média da turma Gaming (181 - 341, n=2, últimos 2 anos) | |
| Dell G15 5530 | |
| Captiva Advanced Gaming I74-121 | |
| Média NVIDIA GeForce RTX 4060 Laptop GPU (110 - 229, n=36) | |
| Lenovo Legion Slim 5 16APH8 | |
| Lenovo LOQ 15APH8 | |
| Schenker XMG Core 15 (M22) | |
| MSI Cyborg 15 A12VF | |
| 1920x1080 Ultra Graphics & Postprocessing (HBAO+) | |
| Média da turma Gaming (95 - 240, n=7, últimos 2 anos) | |
| Dell G15 5530 | |
| Captiva Advanced Gaming I74-121 | |
| Média NVIDIA GeForce RTX 4060 Laptop GPU (77 - 159.7, n=42) | |
| Lenovo Legion Slim 5 16APH8 | |
| Lenovo LOQ 15APH8 | |
| Schenker XMG Core 15 (M22) | |
| MSI Cyborg 15 A12VF | |
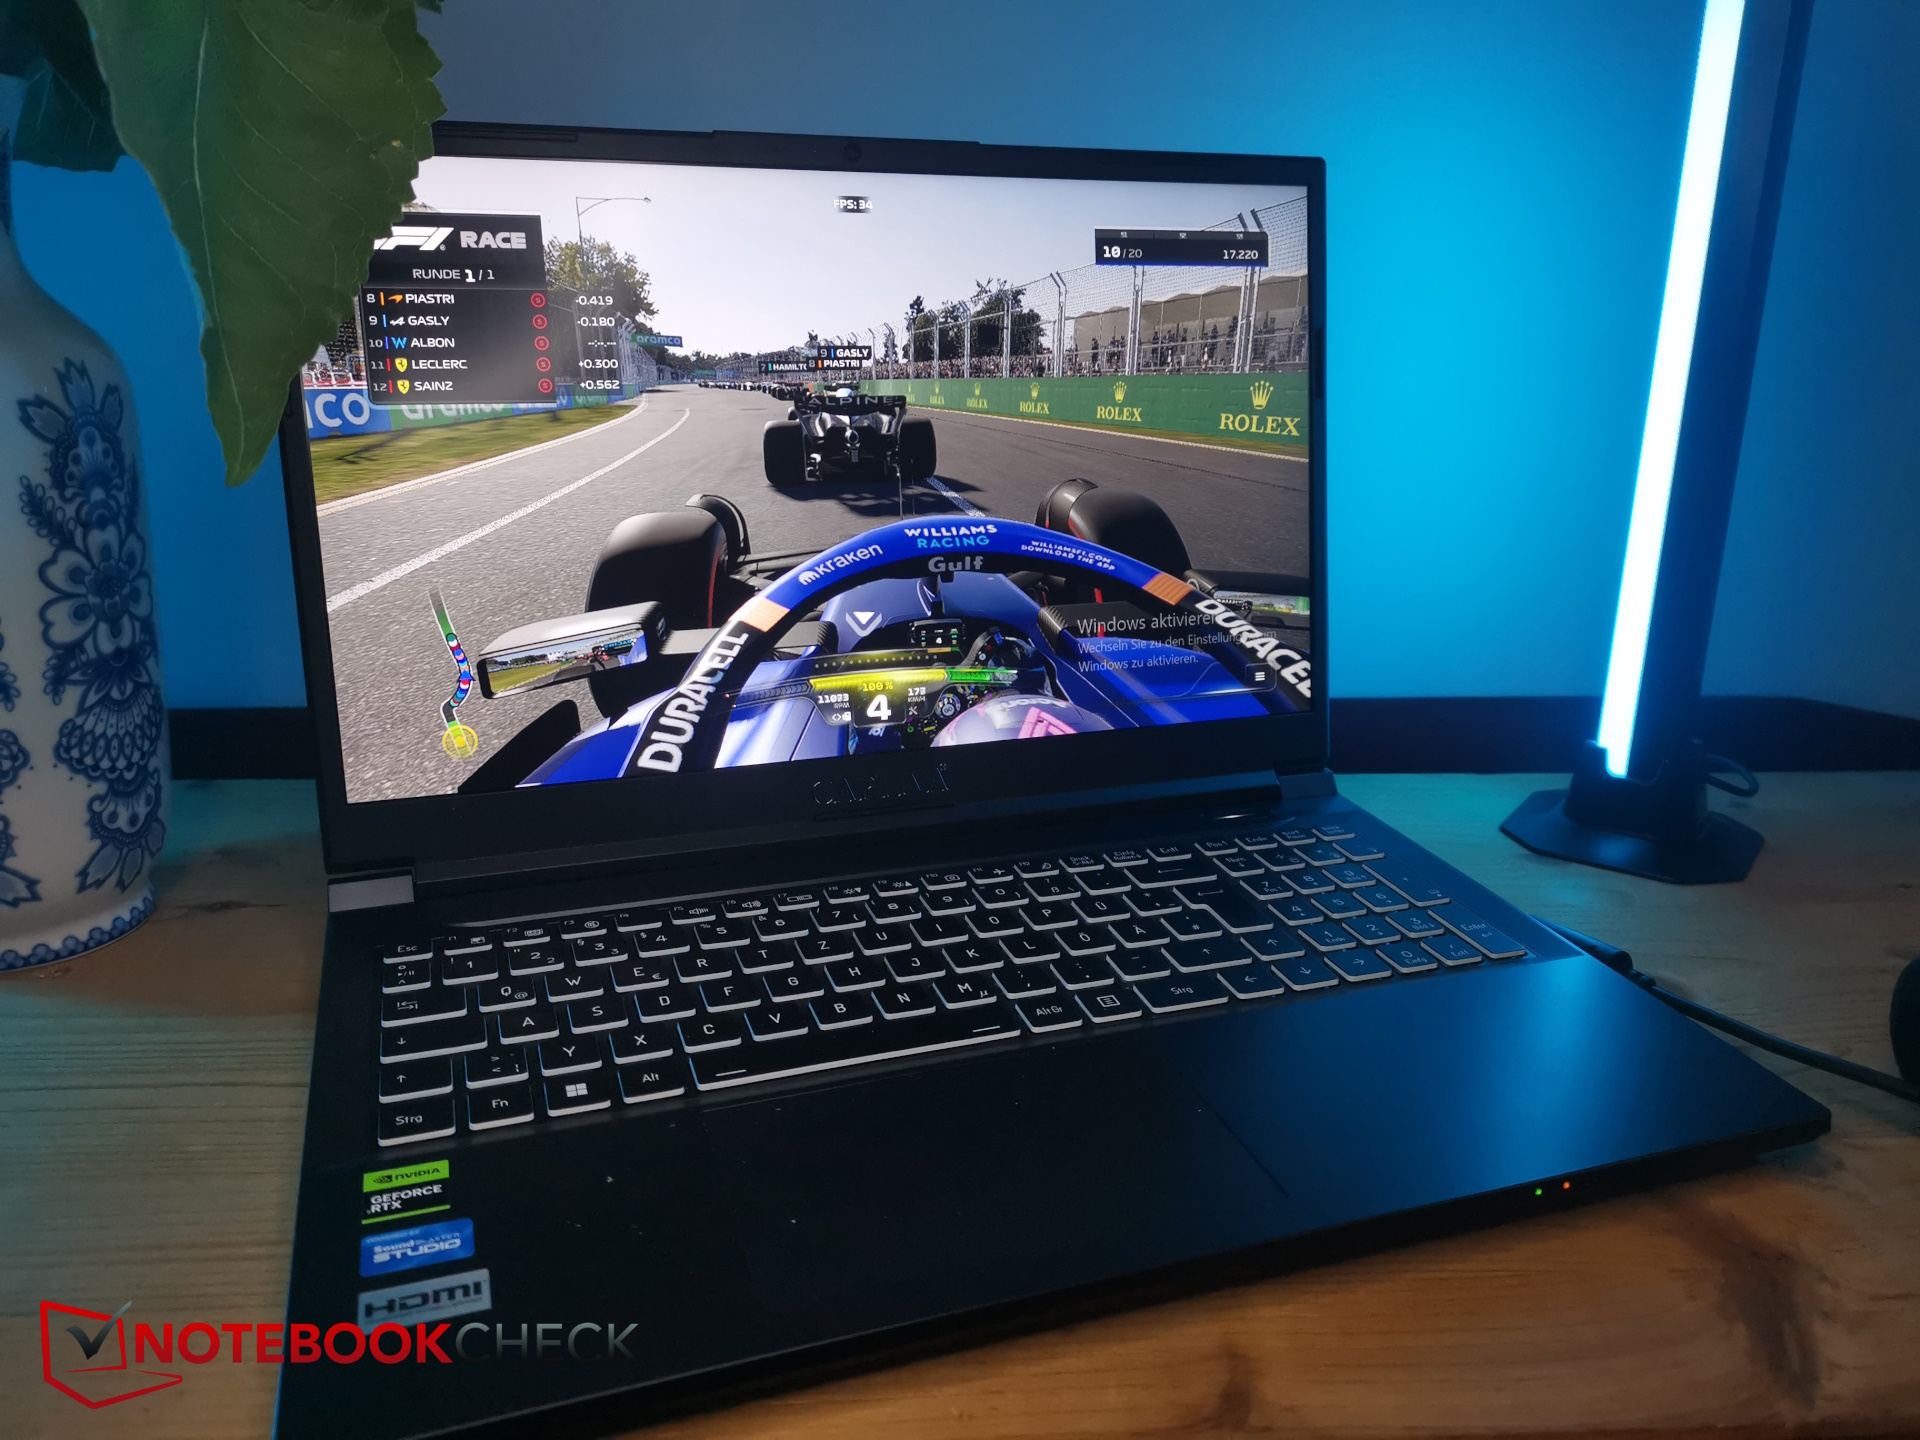
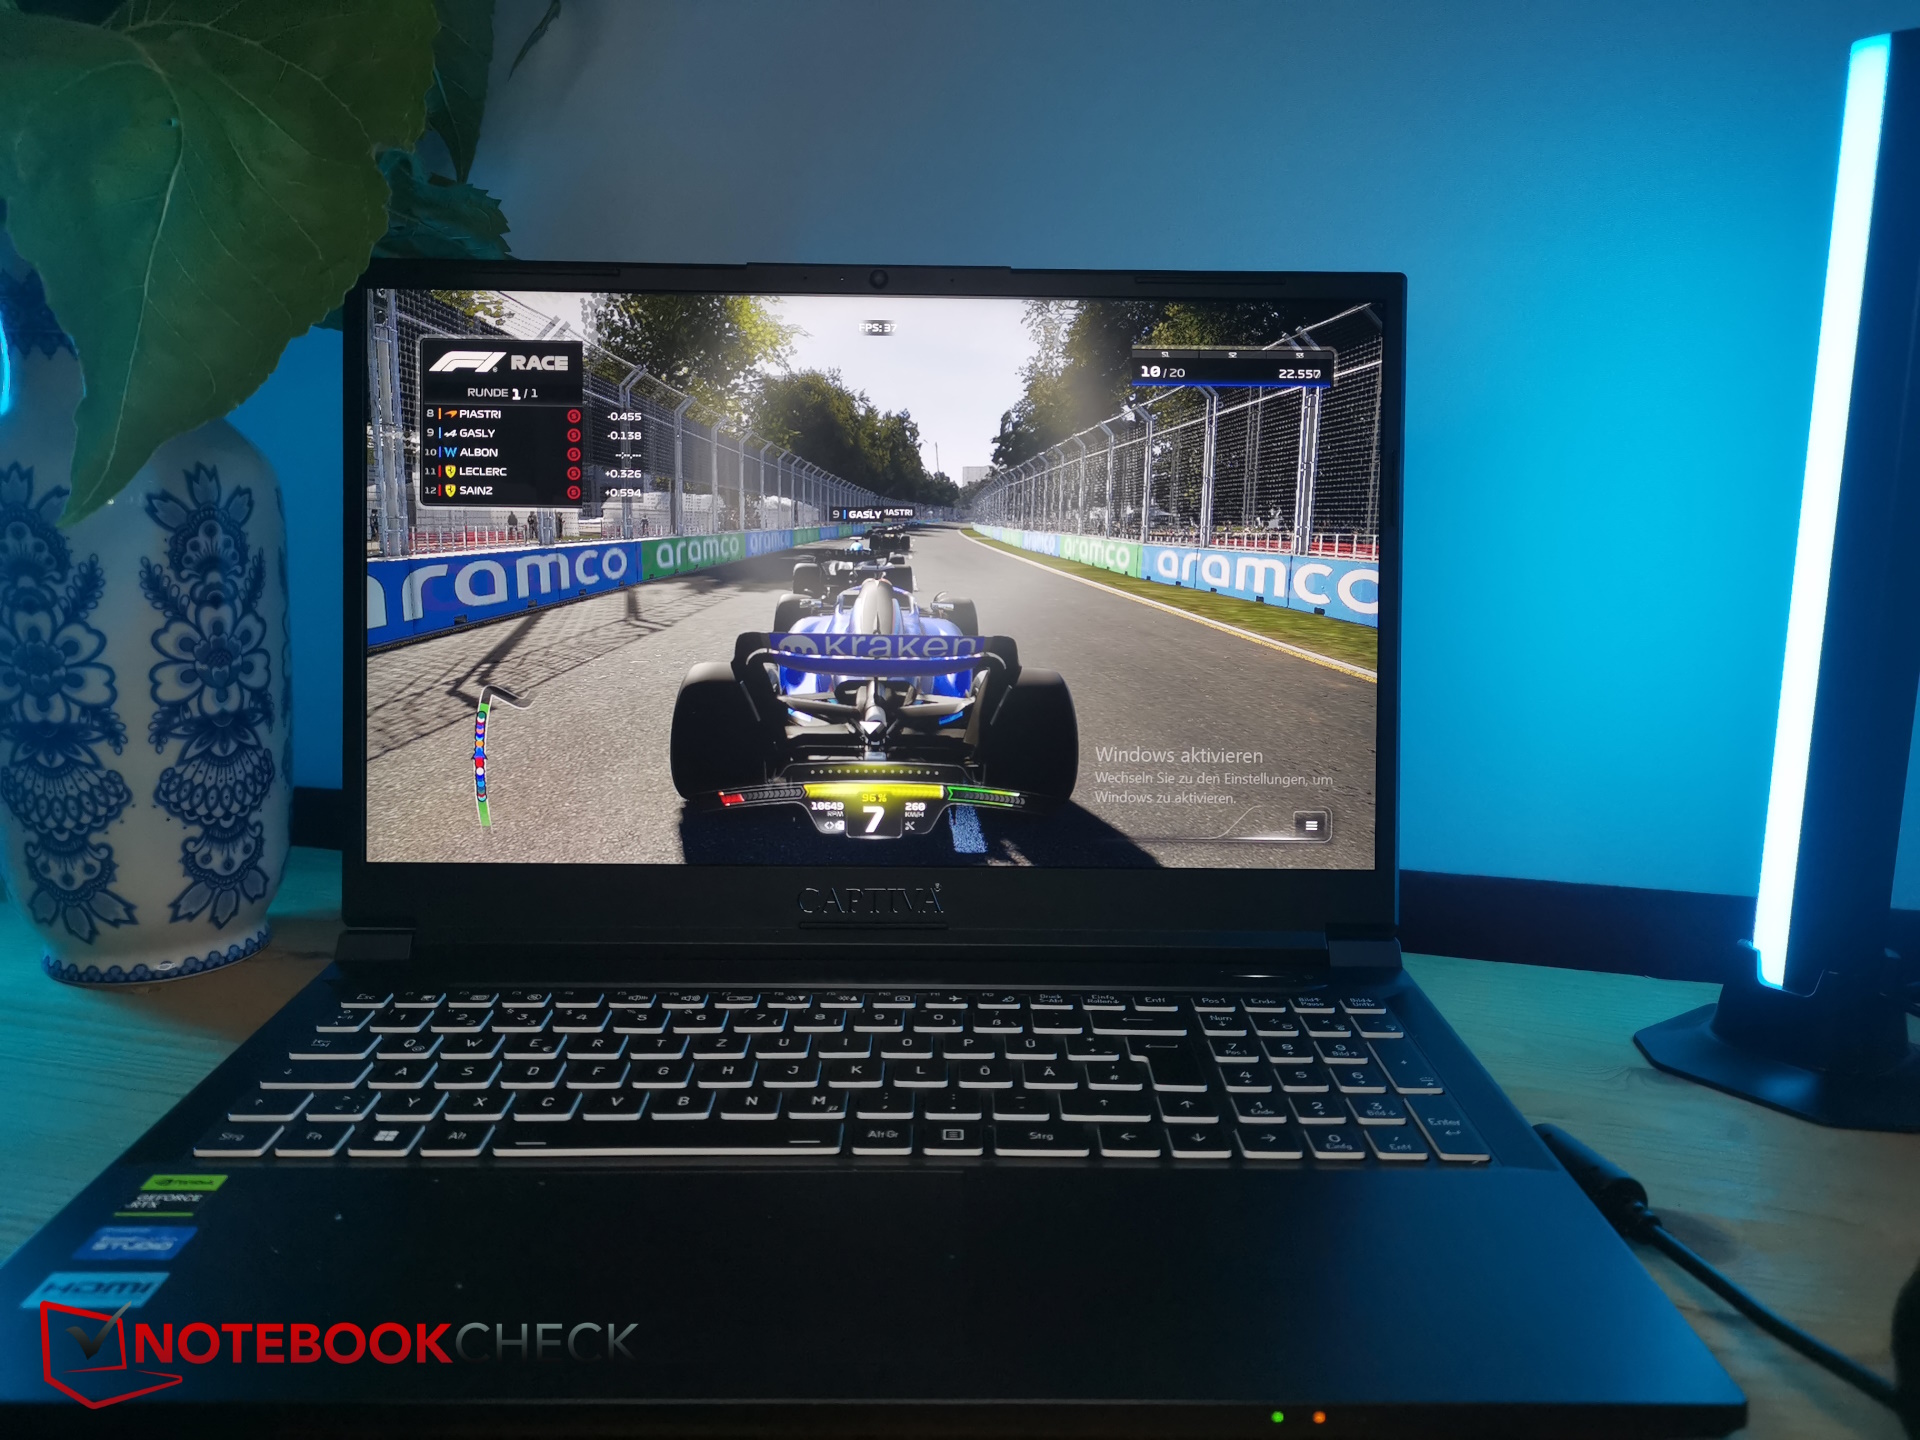
| F1 23 | |
| 1920x1080 Ultra High Preset AA:T AF:16x | |
| Média NVIDIA GeForce RTX 4060 Laptop GPU (43.8 - 119.9, n=13) | |
| Captiva Advanced Gaming I74-121 | |
| Média da turma Gaming (n=1últimos 2 anos) | |
| 1920x1080 High Preset AA:T AF:16x | |
| Captiva Advanced Gaming I74-121 | |
| Média NVIDIA GeForce RTX 4060 Laptop GPU (143.7 - 207, n=13) | |
| Média da turma Gaming (n=1últimos 2 anos) | |
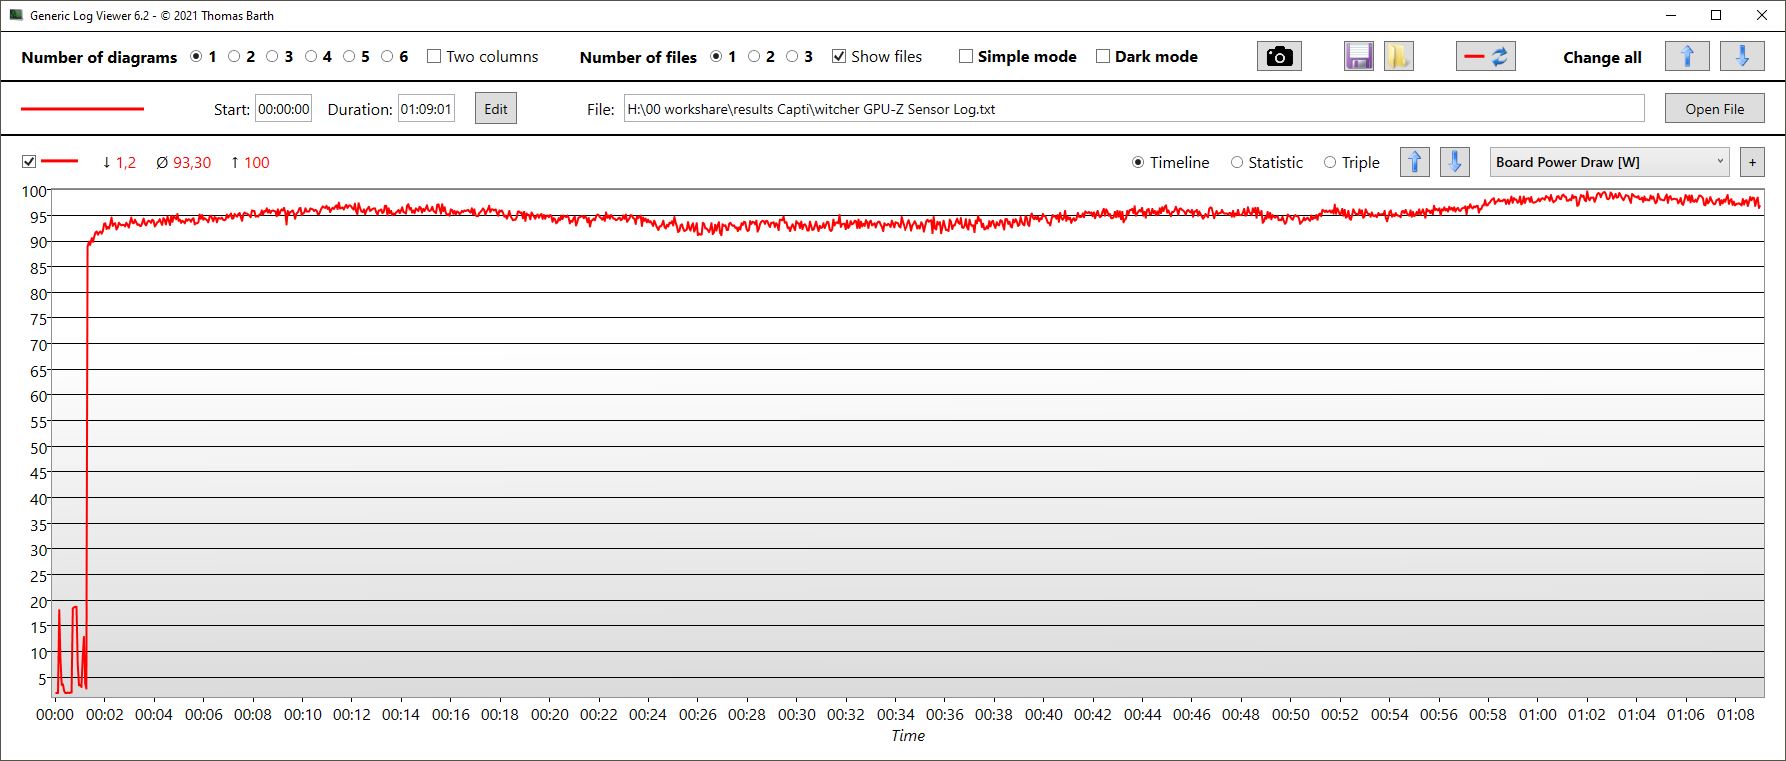
Além do ritmo habitual de dia e noite, a taxa de quadros no Witcher 3 permaneceu muito estável. Somente o Dell G15 foi um pouco mais rápido.
A GPU atingiu consistentemente o clock de mais de 2.400 MHz durante o tempo de benchmark de uma hora de execução do Witcher 3, e o clock da memória foi constante em 2.000 MHz. Durante esse tempo, a GPU aqueceu até 72 °C e o consumo de energia ficou em torno de 95 watts.
A CPU reduziu seu TDP para cerca de 30 watts durante o mesmo período e aqueceu até cerca de 77 °C.
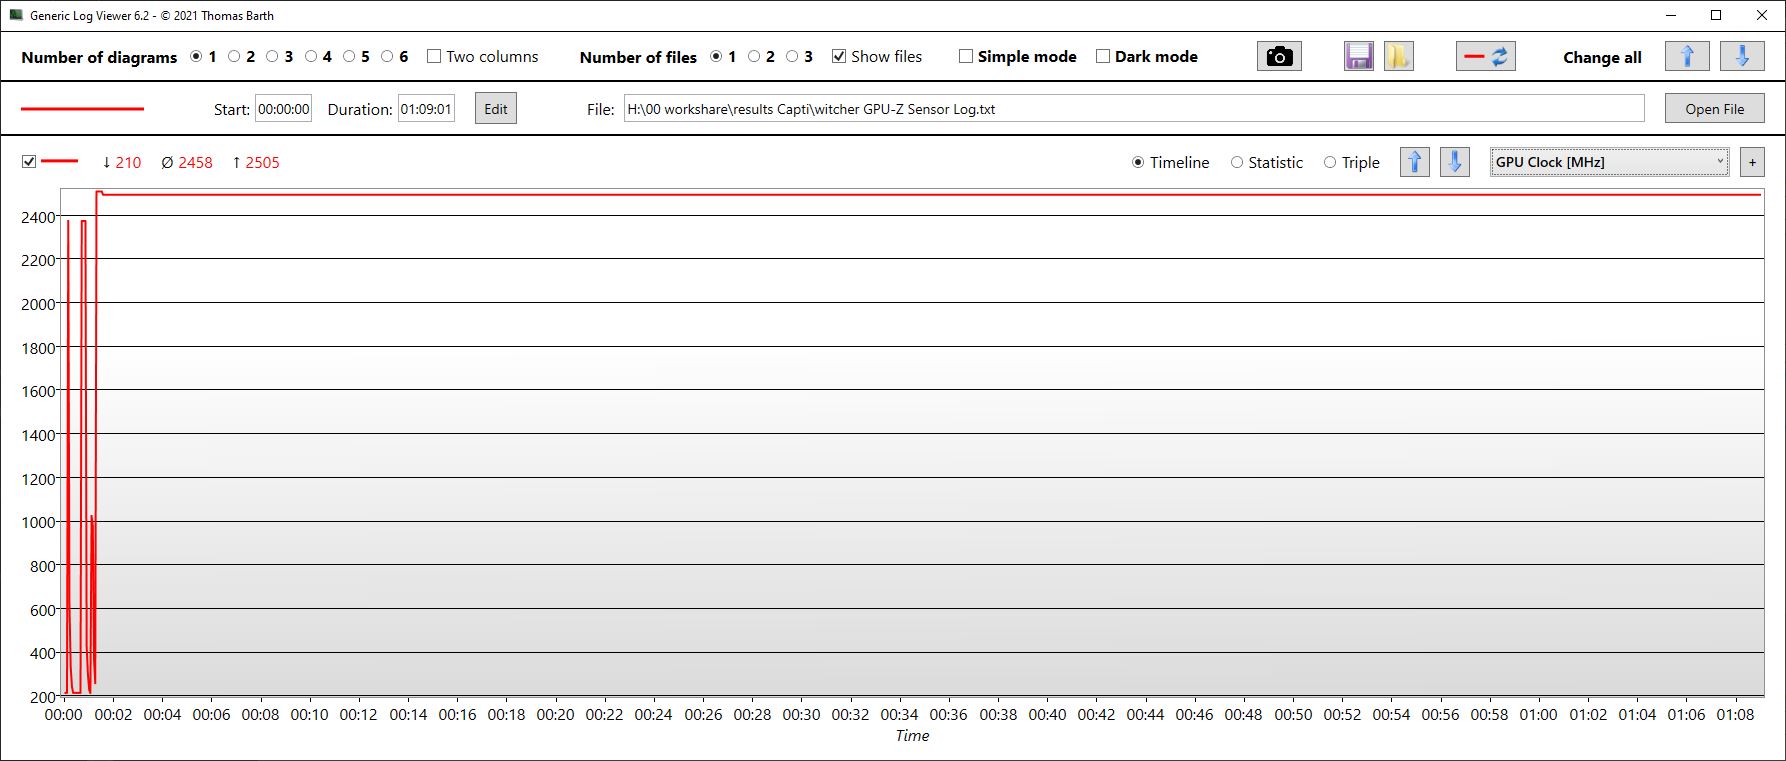
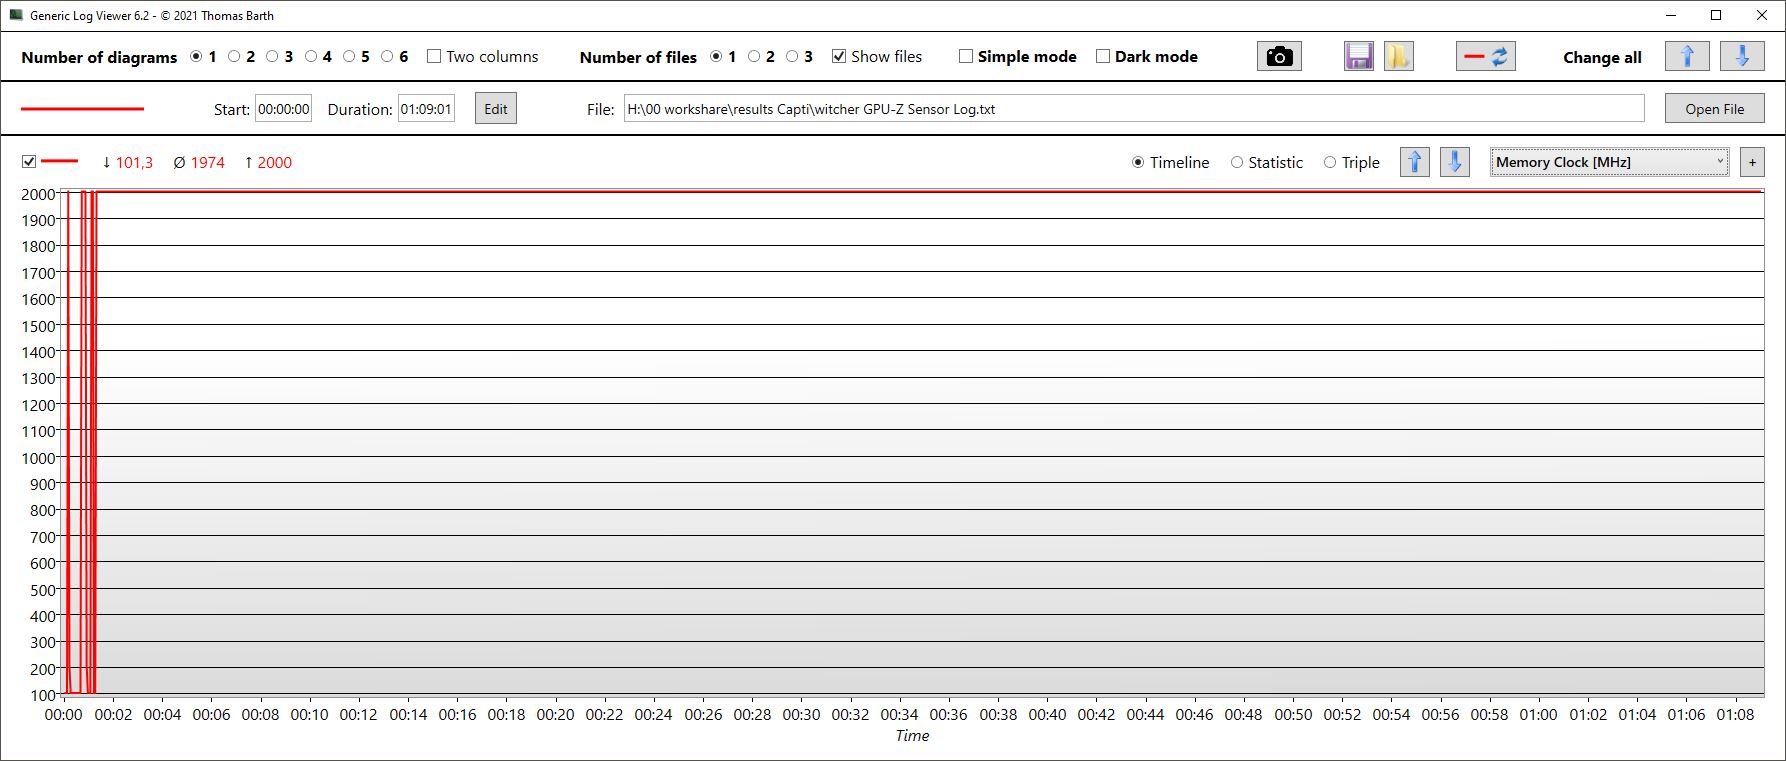
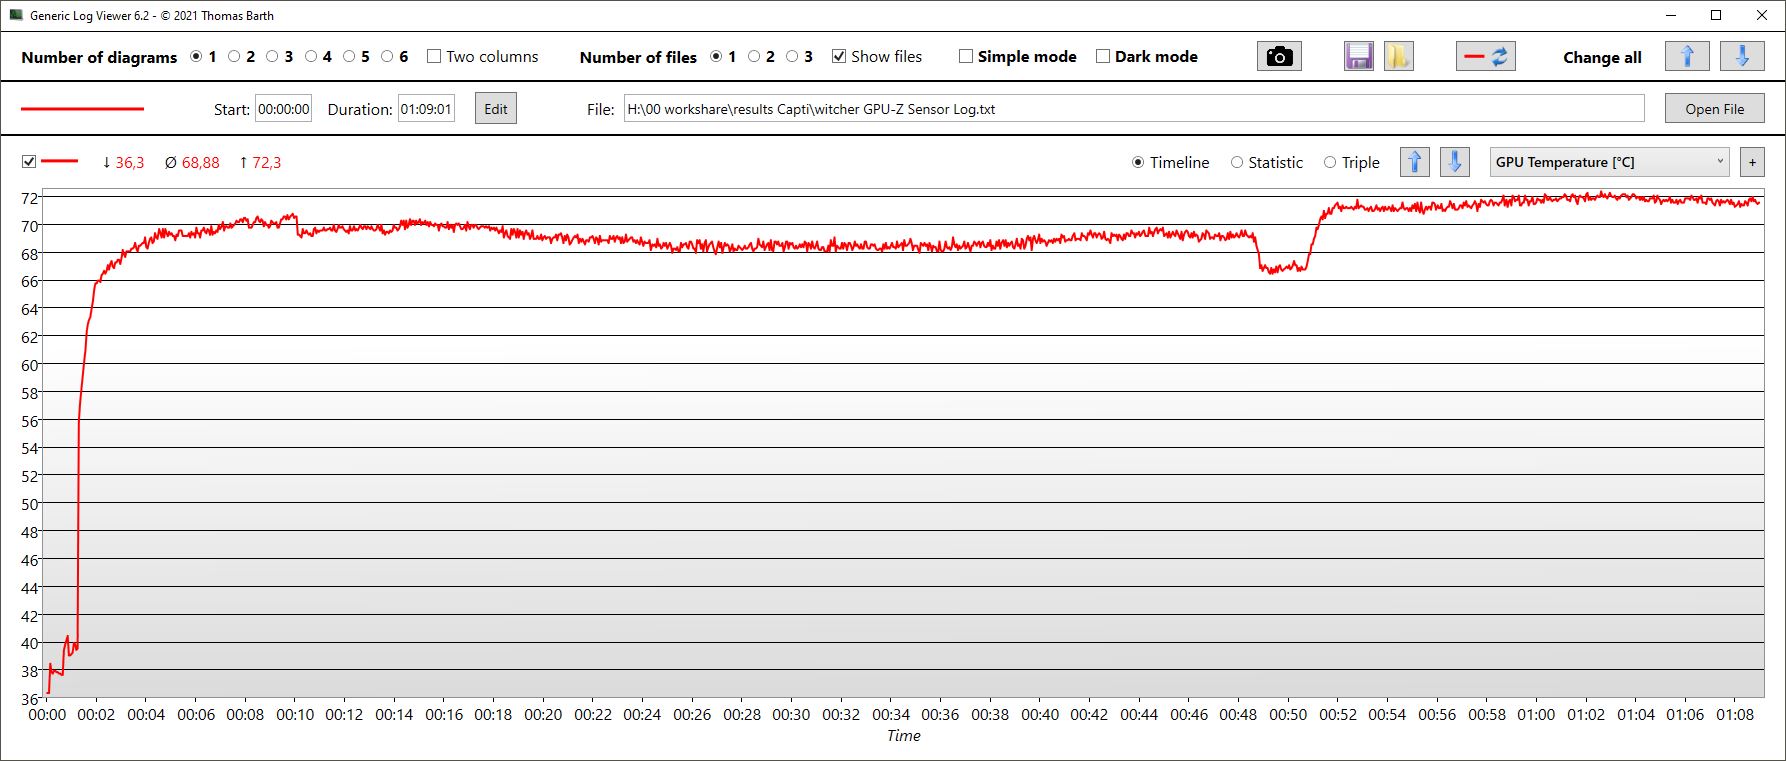
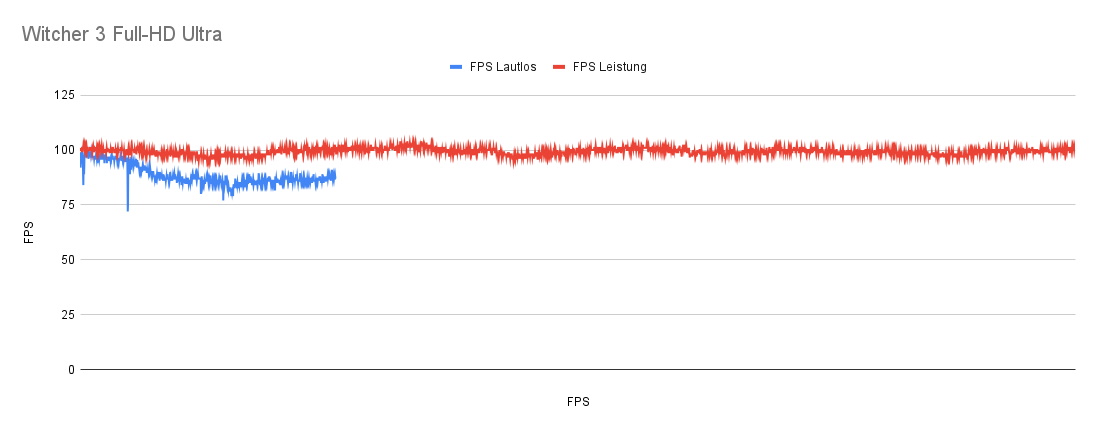
Witcher 3 FPS diagram
O modo de entretenimento resultou praticamente nos mesmos valores e não foi nem um pouco mais silencioso.
No modo silencioso, o PC funciona de forma um pouco mais silenciosa (31,43 dB). As ventoinhas menos ativas fazem com que a temperatura da GPU aumente muito mais rapidamente. Após cerca de 3,5 minutos, a temperatura já estava em 87 °C, o que fez com que o clock da GPU e o consumo de energia diminuíssem ligeiramente. Em seguida, a temperatura permaneceu constante em 89 °C. O TGP caiu de 100 watts para 80 watts. Ao mesmo tempo, a taxa de quadros caiu de 100 fps para apenas cerca de 85 fps.
| baixo | média | alto | ultra | QHD | |
|---|---|---|---|---|---|
| GTA V (2015) | 186.5 | 182.4 | 177.2 | 117 | |
| The Witcher 3 (2015) | 367 | 296 | 199 | 101 | |
| Dota 2 Reborn (2015) | 181 | 168.1 | 147.2 | 140.5 | |
| Final Fantasy XV Benchmark (2018) | 185.6 | 148 | 102.2 | 75.6 | |
| X-Plane 11.11 (2018) | 142.7 | 128.1 | 99.4 | ||
| Far Cry 5 (2018) | 175 | 153 | 147 | 138 | |
| Strange Brigade (2018) | 470 | 276 | 219 | 187.9 | |
| F1 23 (2023) | 221 | 225 | 184 | 59 |
Emissões - Frio, mas não silencioso
Emissões de ruído
As duas ventoinhas do Captiva Advanced Gaming estão praticamente sempre ativas, mesmo no chamado "modo silencioso". Mesmo assim, as ventoinhas funcionam muito silenciosamente no modo inativo. Durante os jogos, o laptop fica bastante barulhento e atinge as mesmas emissões de ruído que em carga máxima. Infelizmente, não notamos nenhuma diferença, por exemplo, como noLenovo LOQ.
Pelo menos, suas emissões máximas de ruído não são fora do comum - elas são praticamente as mesmas de outros notebooks para jogos. O Dell G15 é mais silencioso, apesar de ter o mesmo desempenho 3D.
O modo de entretenimento não levou a resultados mais silenciosos em nosso teste. Ao usar o modo silencioso, os níveis de ruído dos jogos diminuíram consideravelmente e, no modo inativo, as ventoinhas ainda permaneceram ativas.
O Witcher 3 Full HD Ultra
| Modo/valor | Emissões de ruído em dB | FPS |
|---|---|---|
| Desempenho | 55 | 101 |
| Entretenimento | 55 | 101 |
| Silencioso | 31.43 | 85 (redução lenta a partir de 100 fps) |
Barulho
| Ocioso |
| 23 / 25.67 / 25.67 dB |
| Carga |
| 38.52 / 54.17 dB |
 | ||
30 dB silencioso 40 dB(A) audível 50 dB(A) ruidosamente alto |
||
min: | ||
| Captiva Advanced Gaming I74-121 GeForce RTX 4060 Laptop GPU, i5-13500H, Samsung SSD 980 1TB MZ-V8V1T0BW | MSI Cyborg 15 A12VF GeForce RTX 4060 Laptop GPU, i7-12650H, Samsung PM9B1 1024GB MZVL41T0HBLB | Dell G15 5530 GeForce RTX 4060 Laptop GPU, i7-13650HX, SSTC CL4-3D512-Q11 | Lenovo Legion Slim 5 16APH8 GeForce RTX 4060 Laptop GPU, R7 7840HS, SK hynix PC801 HFS512GEJ9X115N | Lenovo LOQ 15APH8 GeForce RTX 4050 Laptop GPU, R7 7840HS, Micron 2450 512GB MTFDKCD512TFK | Schenker XMG Core 15 (M22) GeForce RTX 3060 Laptop GPU, R7 6800H, Samsung SSD 980 Pro 1TB MZ-V8P1T0BW | |
|---|---|---|---|---|---|---|
| Noise | -30% | 5% | 2% | 2% | 1% | |
| desligado / ambiente * (dB) | 23 | 27 -17% | 20.41 11% | 22.9 -0% | 23.1 -0% | 23 -0% |
| Idle Minimum * (dB) | 23 | 27 -17% | 26.85 -17% | 23.1 -0% | 23.1 -0% | 23 -0% |
| Idle Average * (dB) | 25.67 | 37.5 -46% | 26.85 -5% | 23.1 10% | 23.1 10% | 23 10% |
| Idle Maximum * (dB) | 25.67 | 38 -48% | 26.85 -5% | 27.7 -8% | 25.2 2% | 23 10% |
| Load Average * (dB) | 38.52 | 56.3 -46% | 27.65 28% | 33.3 14% | 44.3 -15% | 42.41 -10% |
| Witcher 3 ultra * (dB) | 54.17 | 47.9 12% | 54 -0% | 45.8 15% | 54.71 -1% | |
| Load Maximum * (dB) | 54.17 | 56.3 -4% | 47.86 12% | 54 -0% | 52 4% | 55.05 -2% |
* ... menor é melhor
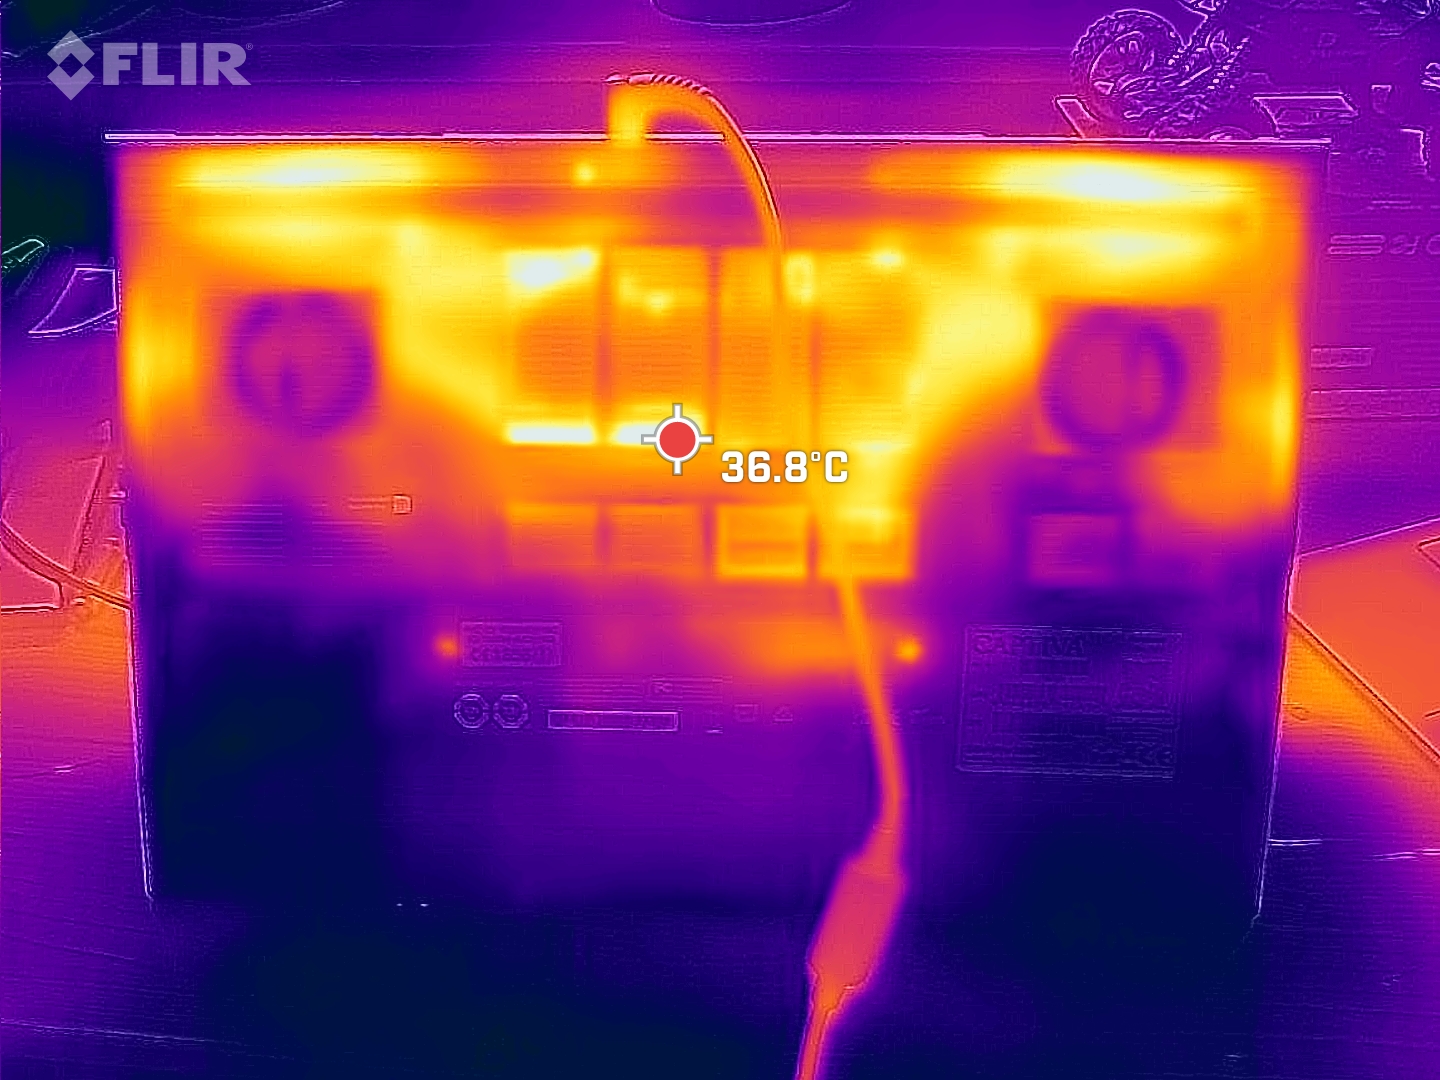
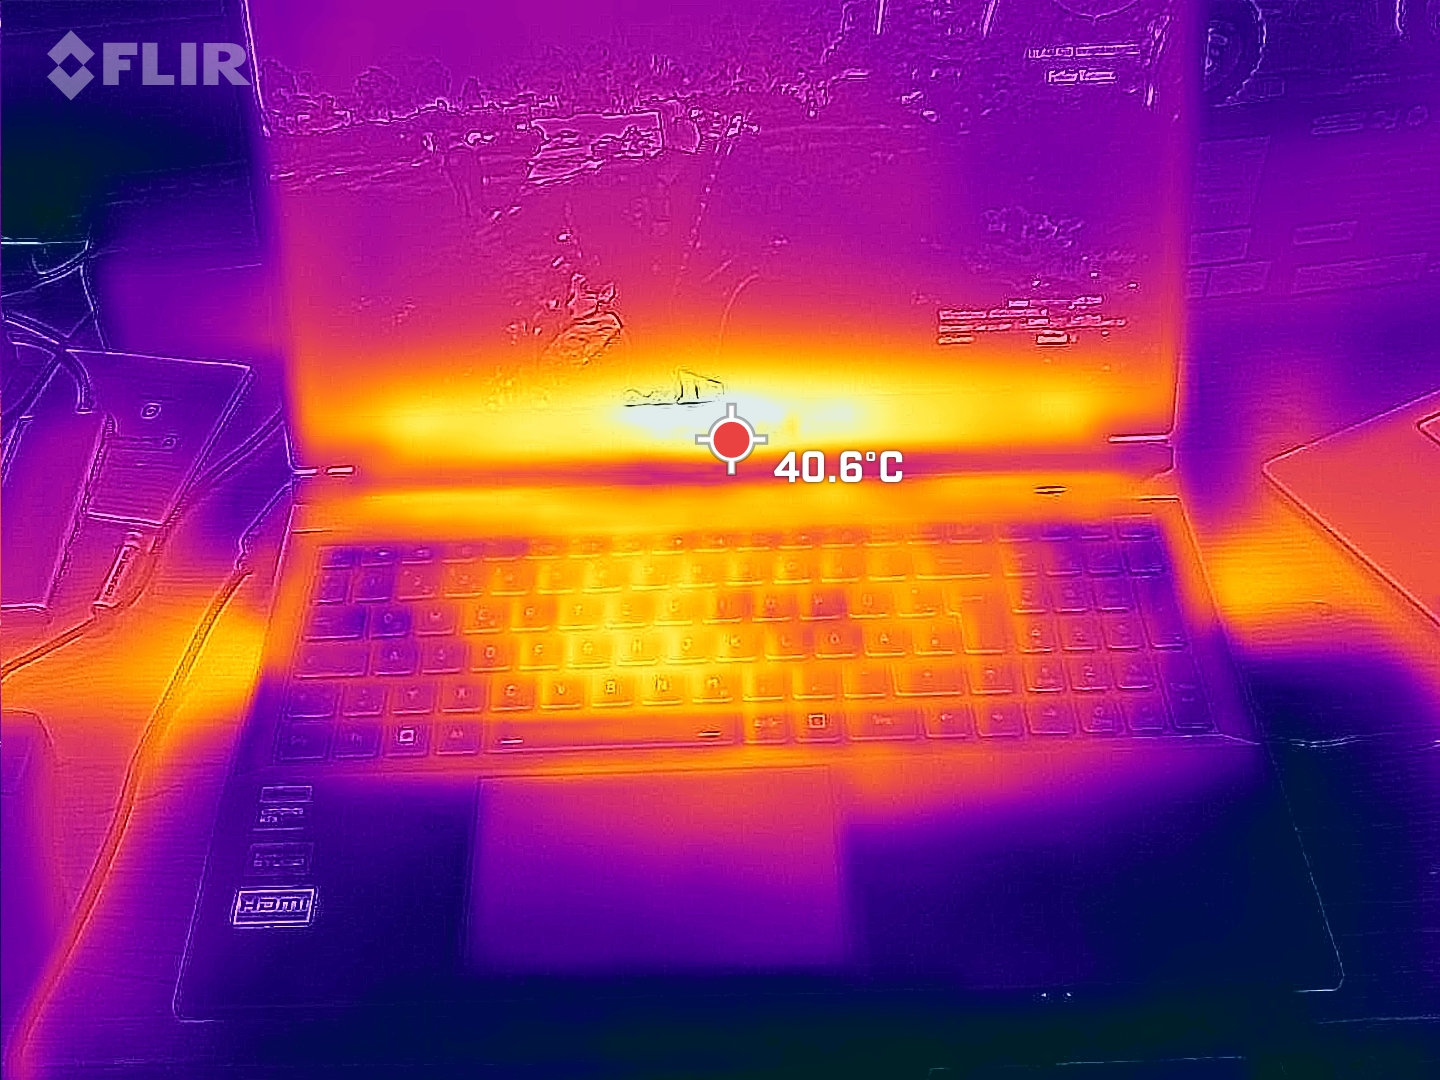
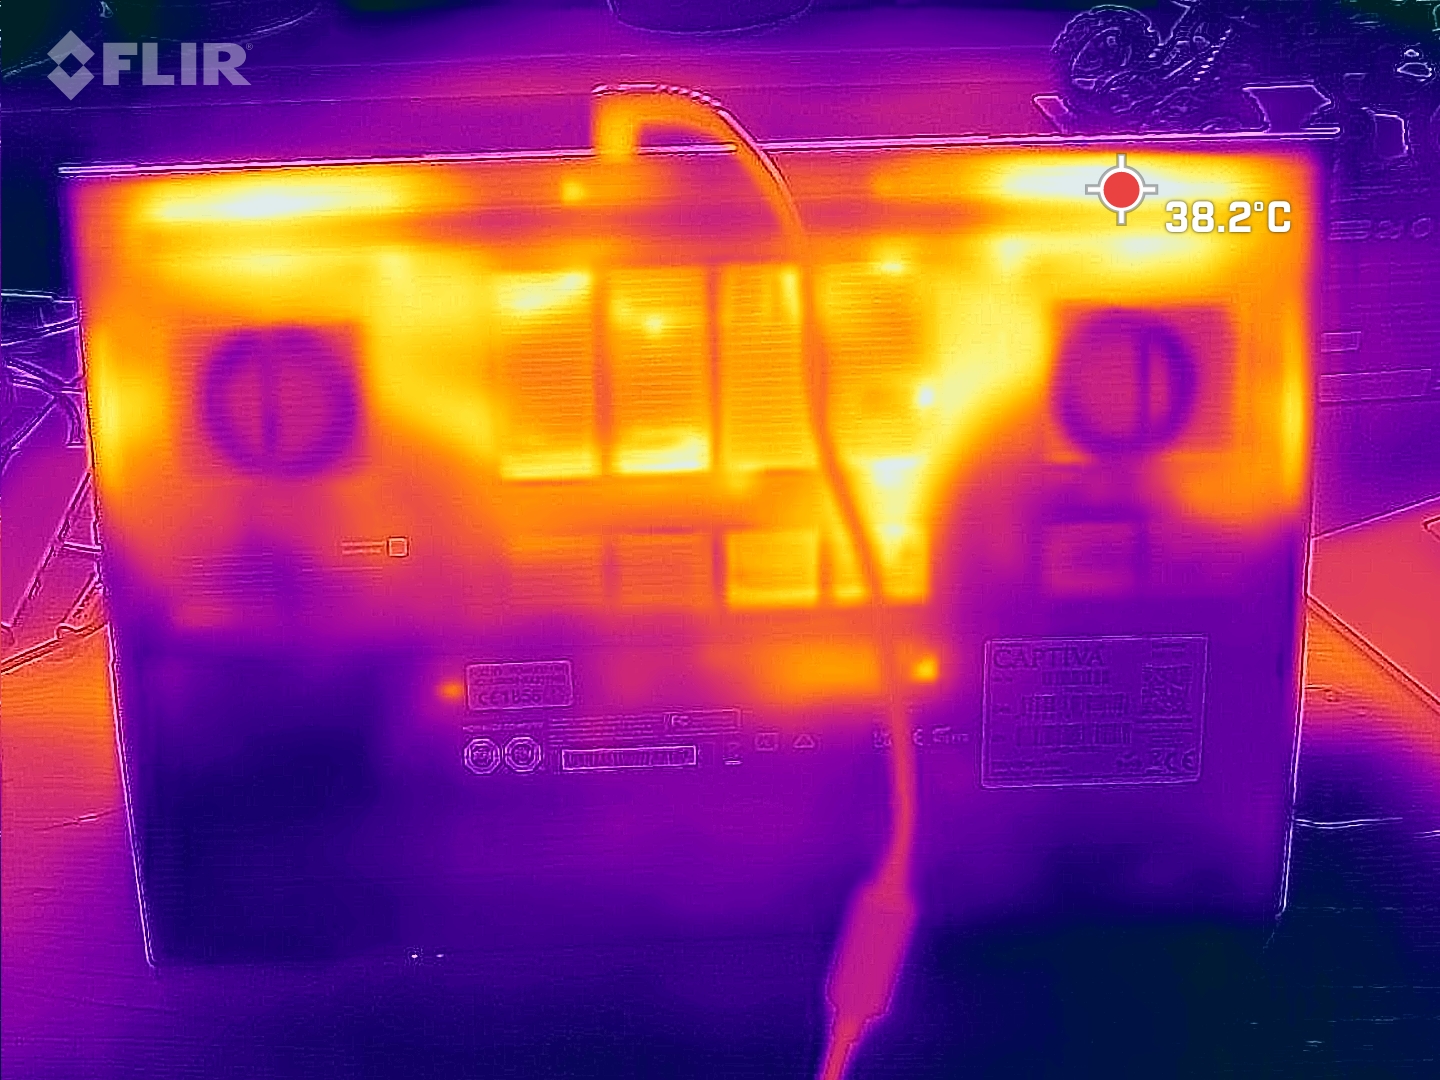
Temperatura
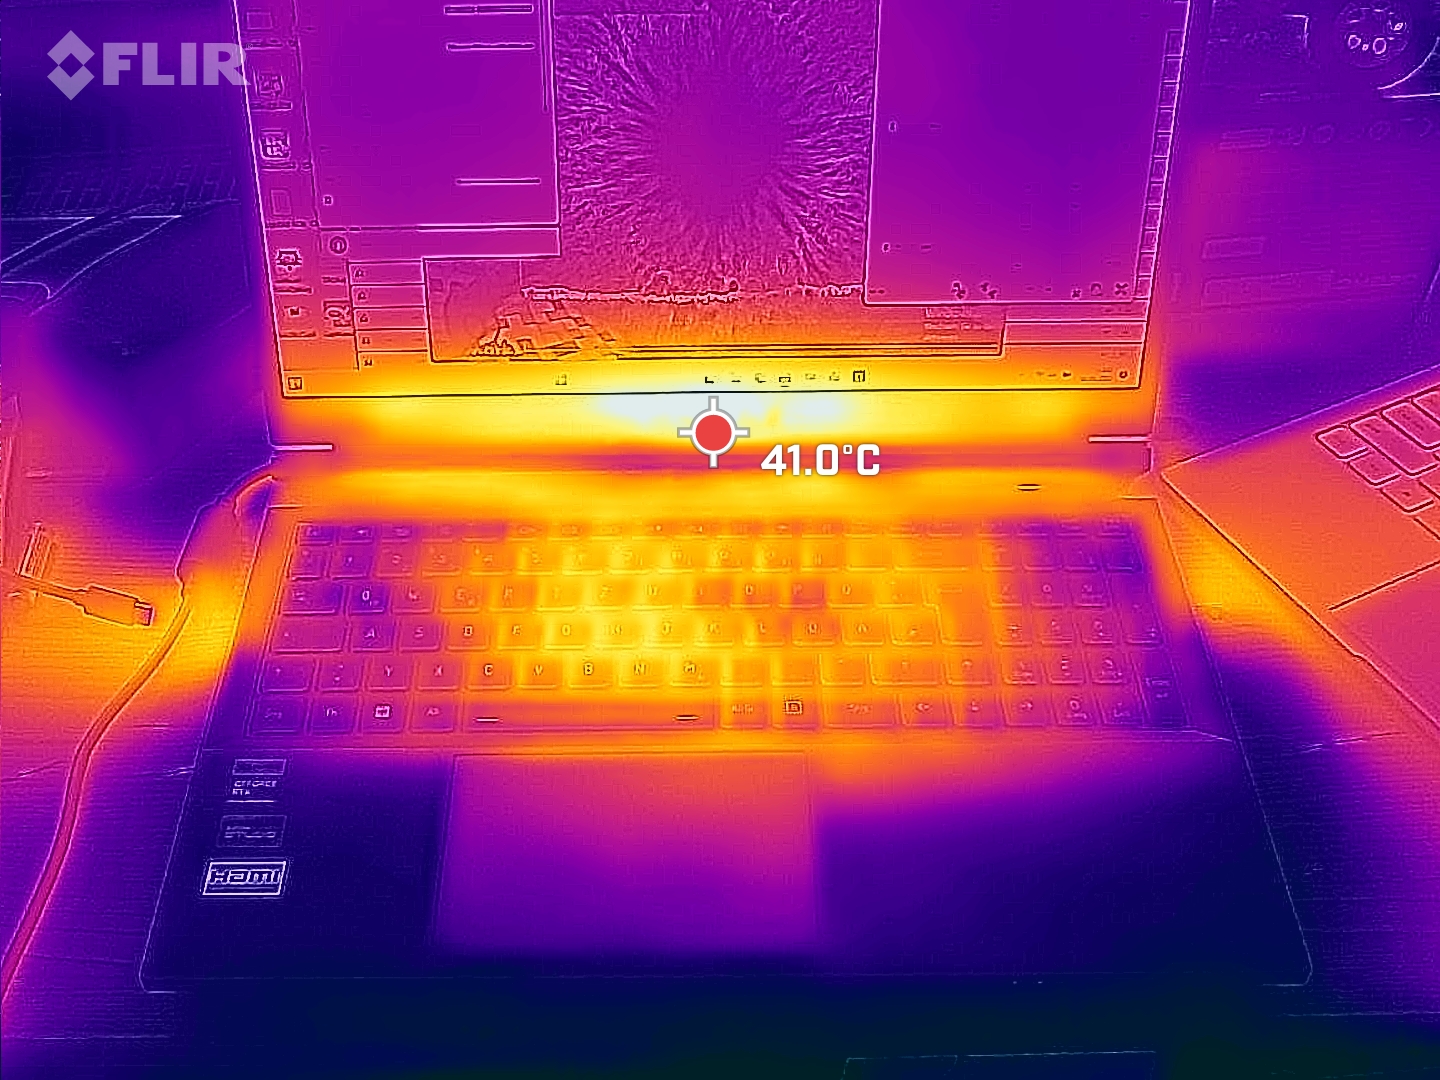
Graças ao uso generoso de cobre e às ventoinhas do laptop, o dispositivo para jogos permanece relativamente frio. Mesmo sob carga total após uma hora, medimos apenas um máximo de 42 °C. Aqui, oDell G15realmente mostra a que custo os ventiladores mais silenciosos chegam - ele atinge temperaturas de mais de 60 °C!
(±) A temperatura máxima no lado superior é 41 °C / 106 F, em comparação com a média de 40.4 °C / 105 F , variando de 21.2 a 68.8 °C para a classe Gaming.
(±) A parte inferior aquece até um máximo de 42 °C / 108 F, em comparação com a média de 43.2 °C / 110 F
(+) Em uso inativo, a temperatura média para o lado superior é 28.3 °C / 83 F, em comparação com a média do dispositivo de 33.9 °C / ### class_avg_f### F.
(±) Jogando The Witcher 3, a temperatura média para o lado superior é 32.9 °C / 91 F, em comparação com a média do dispositivo de 33.9 °C / ## #class_avg_f### F.
(+) Os apoios para as mãos e o touchpad são mais frios que a temperatura da pele, com um máximo de 30 °C / 86 F e, portanto, são frios ao toque.
(±) A temperatura média da área do apoio para as mãos de dispositivos semelhantes foi 28.8 °C / 83.8 F (-1.2 °C / -2.2 F).
| Captiva Advanced Gaming I74-121 Intel Core i5-13500H, NVIDIA GeForce RTX 4060 Laptop GPU | MSI Cyborg 15 A12VF Intel Core i7-12650H, NVIDIA GeForce RTX 4060 Laptop GPU | Dell G15 5530 Intel Core i7-13650HX, NVIDIA GeForce RTX 4060 Laptop GPU | Lenovo Legion Slim 5 16APH8 AMD Ryzen 7 7840HS, NVIDIA GeForce RTX 4060 Laptop GPU | Lenovo LOQ 15APH8 AMD Ryzen 7 7840HS, NVIDIA GeForce RTX 4050 Laptop GPU | Schenker XMG Core 15 (M22) AMD Ryzen 7 6800H, NVIDIA GeForce RTX 3060 Laptop GPU | |
|---|---|---|---|---|---|---|
| Heat | 7% | -20% | 10% | -1% | -5% | |
| Maximum Upper Side * (°C) | 41 | 47.5 -16% | 54 -32% | 40.6 1% | 44.4 -8% | 48 -17% |
| Maximum Bottom * (°C) | 42 | 35.5 15% | 62.2 -48% | 42 -0% | 52 -24% | 51 -21% |
| Idle Upper Side * (°C) | 32 | 27.7 13% | 33.4 -4% | 27.8 13% | 28 12% | 28 12% |
| Idle Bottom * (°C) | 35 | 29.5 16% | 33.4 5% | 26.6 24% | 29.6 15% | 33 6% |
* ... menor é melhor
Teste de estresse
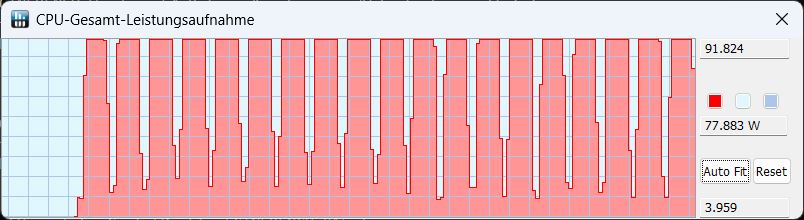
A taxa de clock da CPU permaneceu surpreendentemente constante durante o nosso teste de estresse de uma hora. Foi alcançada uma média de cerca de 3,1 GHz. A CPU aqueceu até cerca de 72 °C e teve um TDP constante de 45 watts.
A GPU se comportou de forma semelhante e consistente: Seu clock foi de 2.460 MHz, o clock da memória foi de 2.000 MHz e a temperatura foi de 69 °C em média.
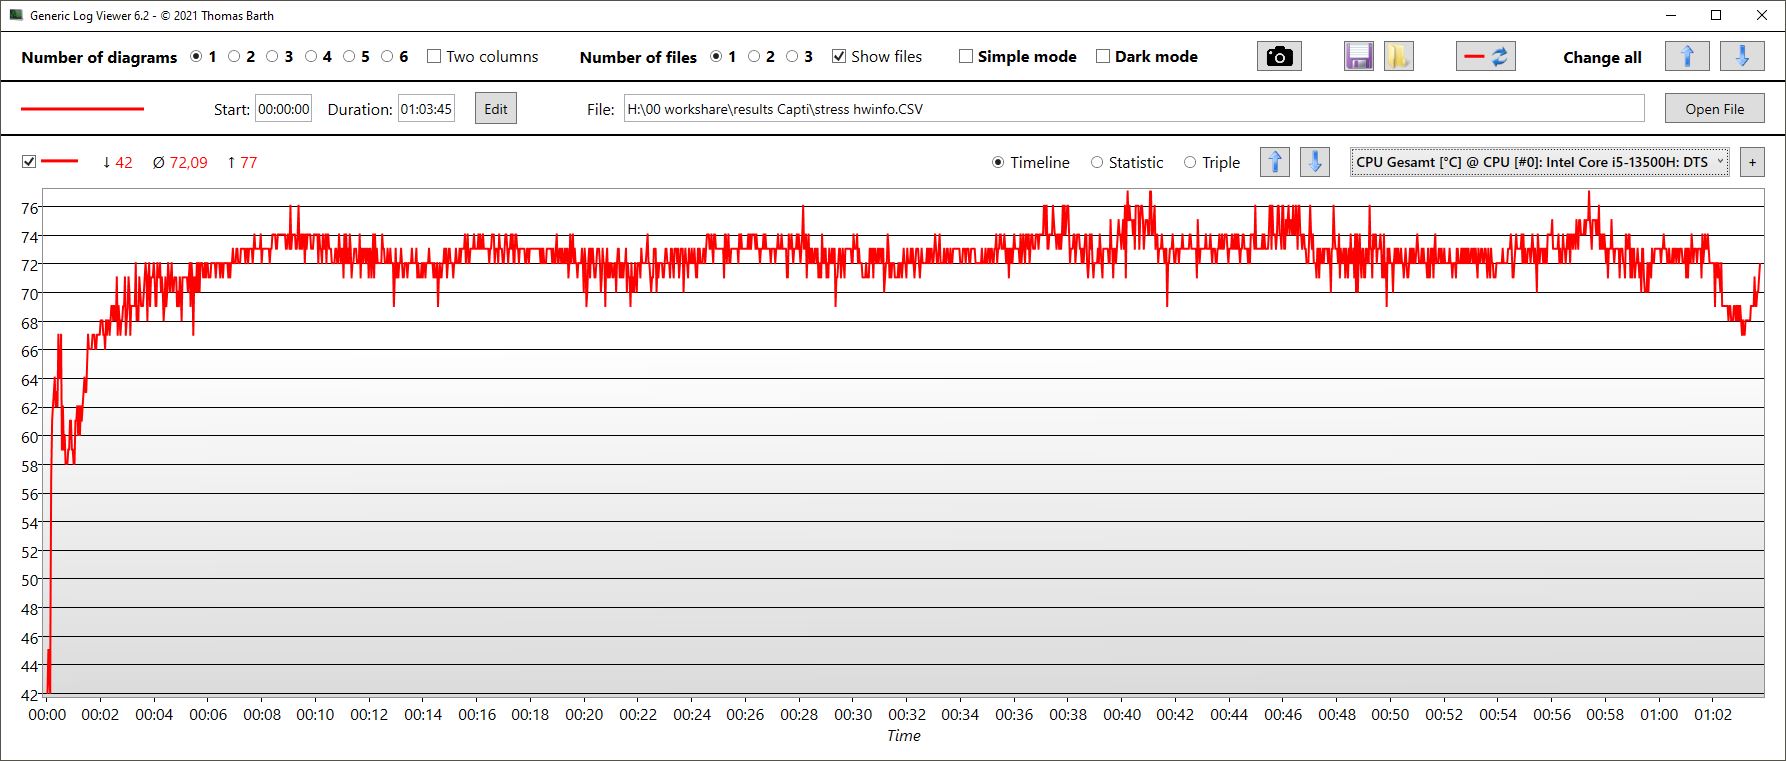
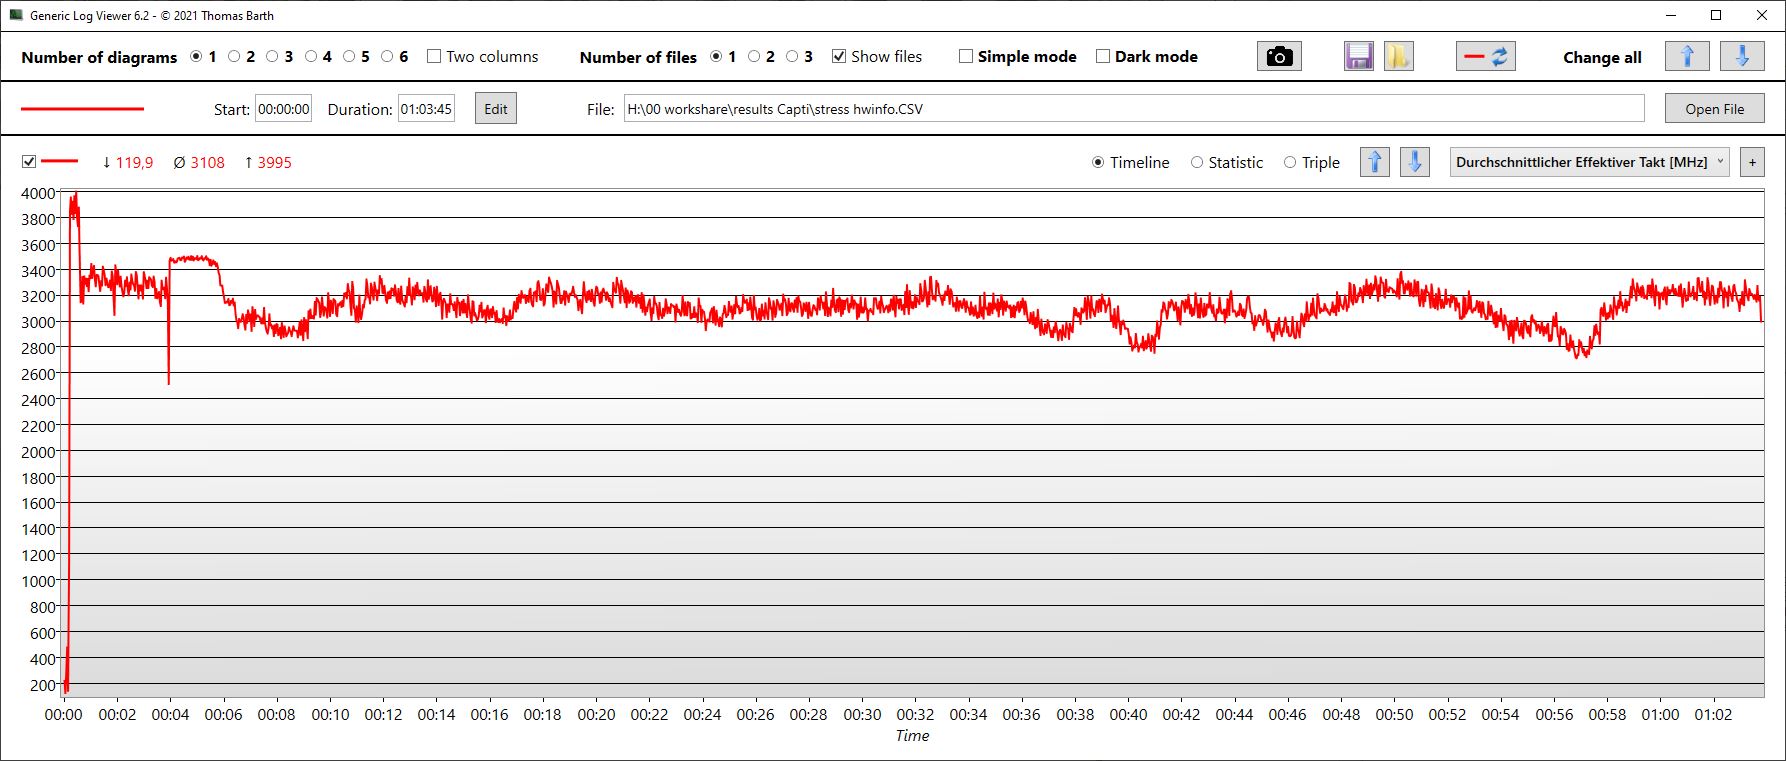
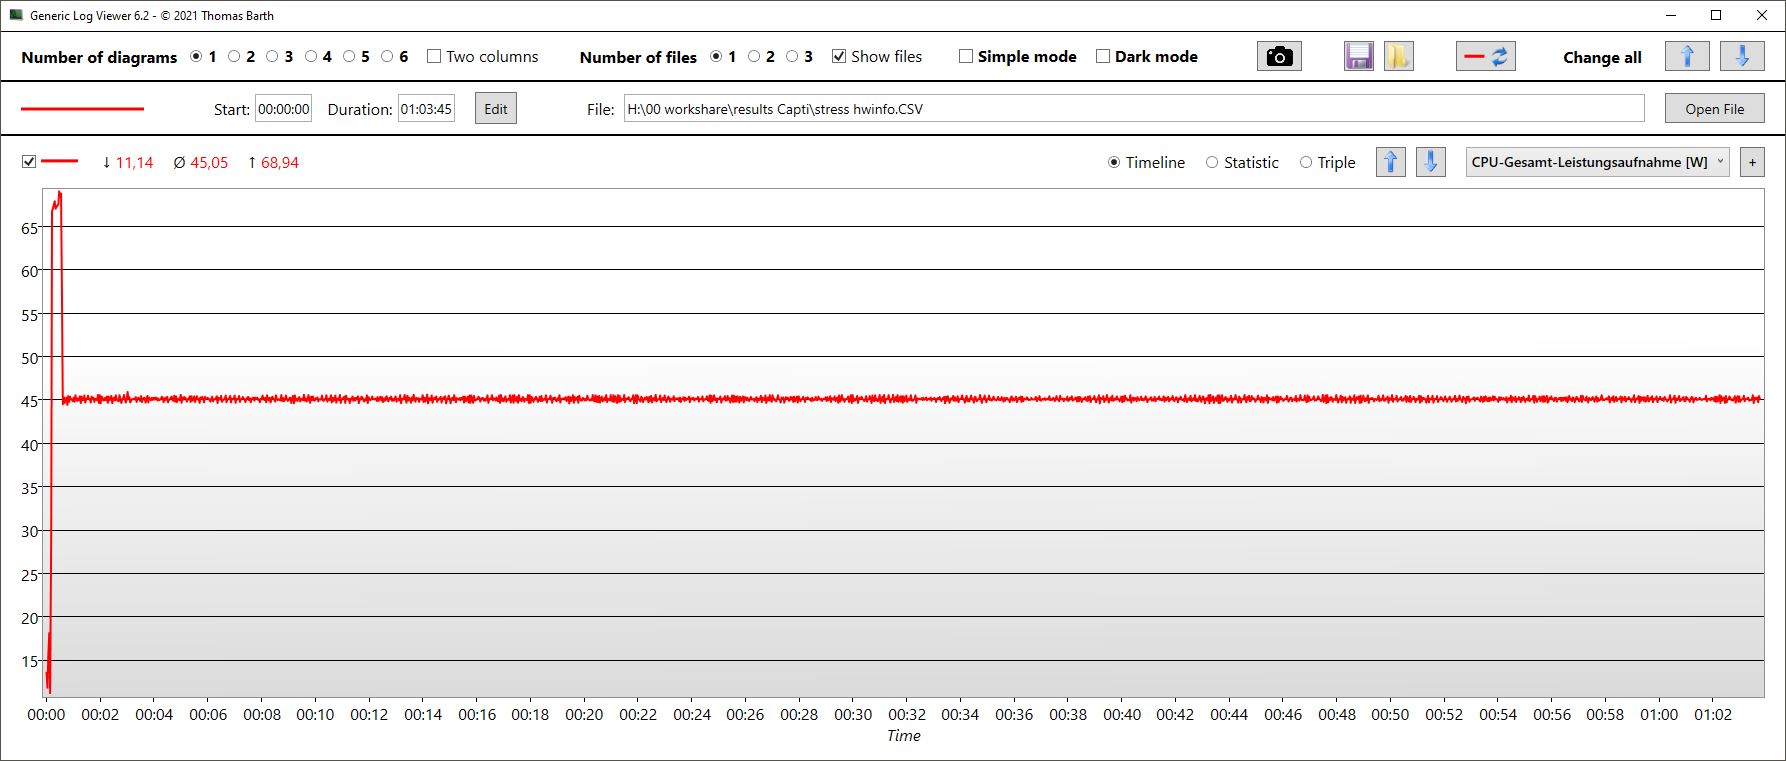
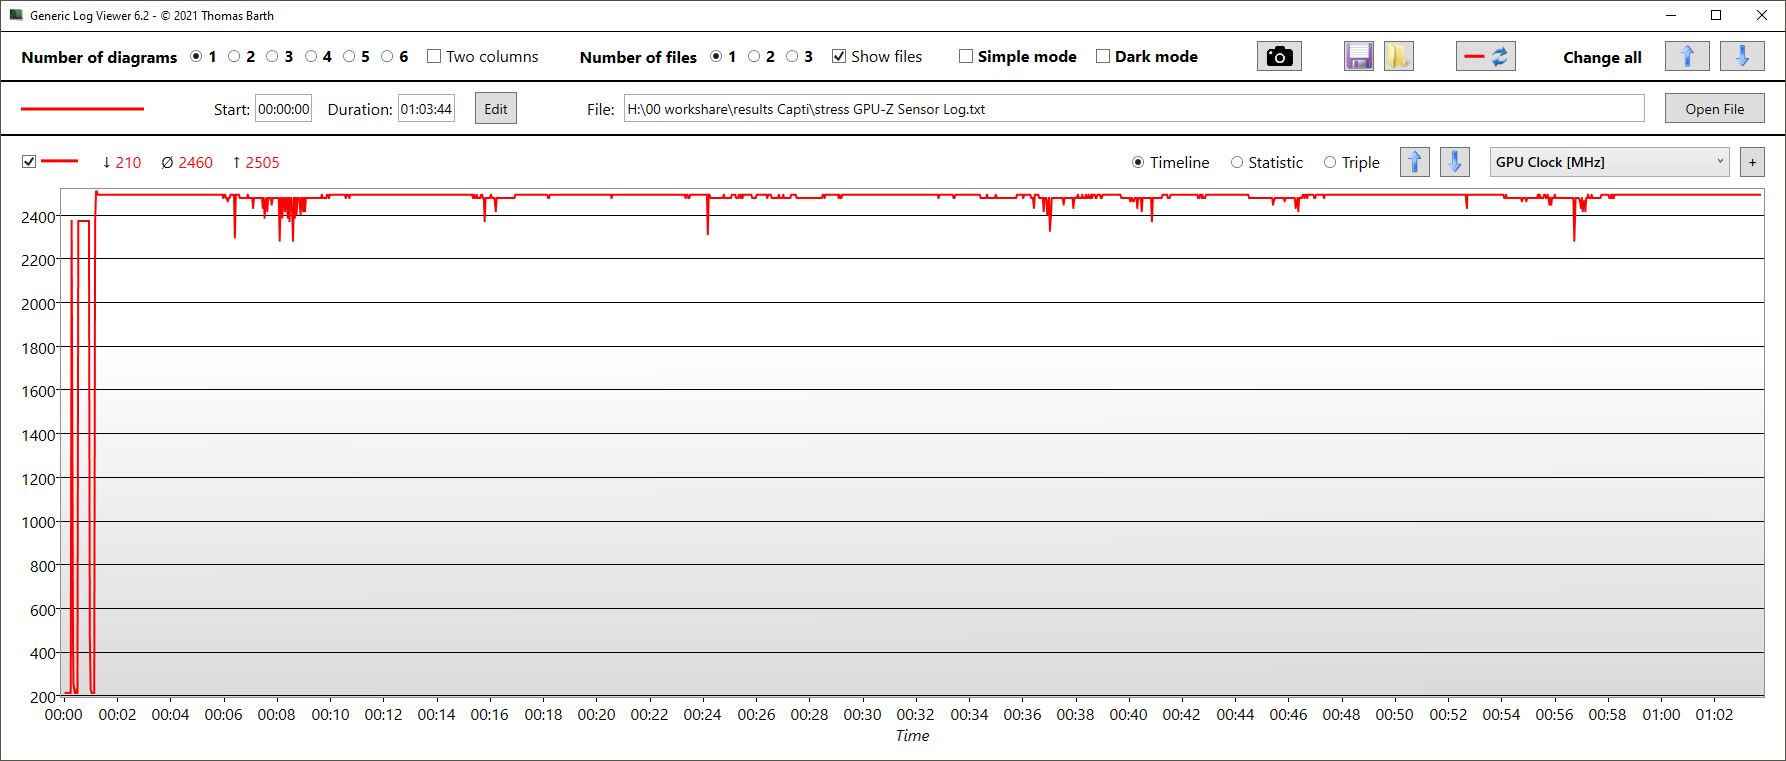
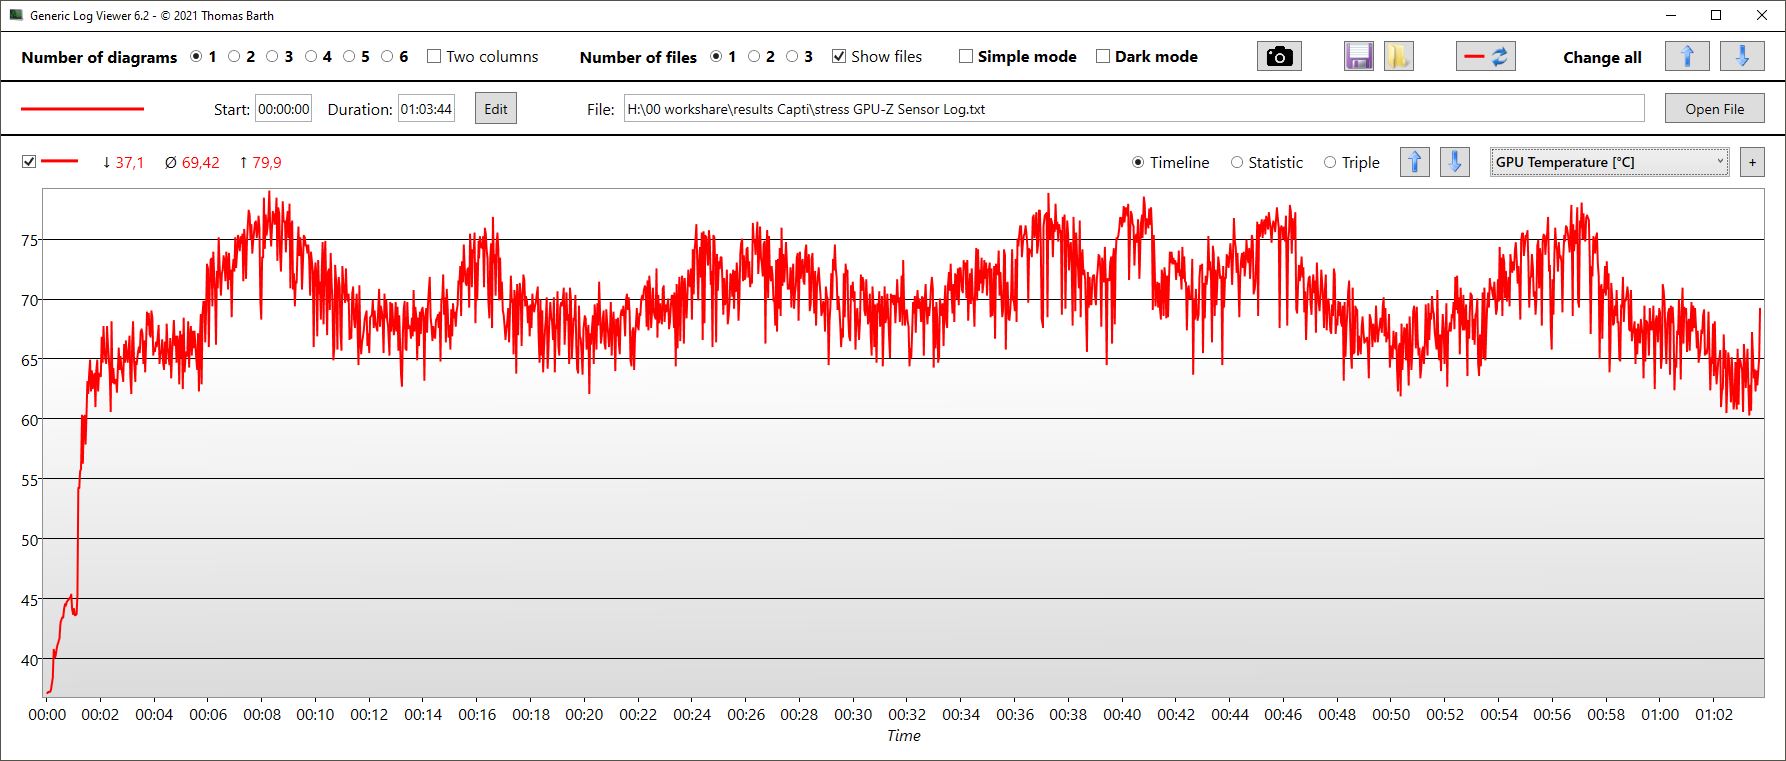
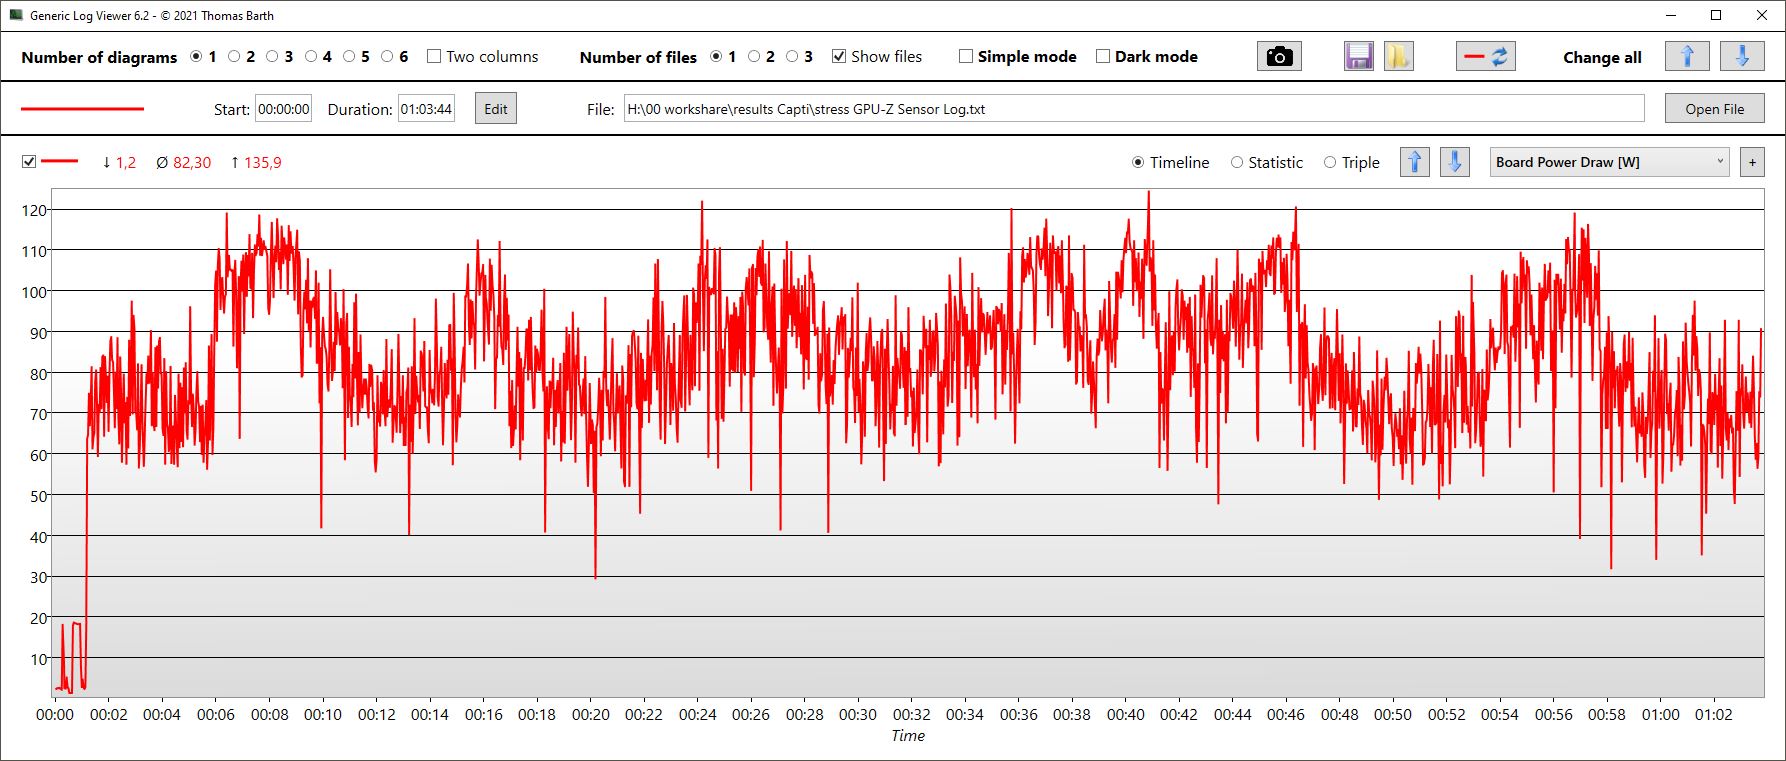
| Clock da CPU (GHz) | Clock da GPU (MHz) | Temperatura média da CPU (°C) | Temperatura média da GPU (°C) | |
| Prime95 + FurMark Stress | 3.1 | 2.460 | 72 | 69 |
| Witcher 3 Estresse | 0,8 | 2.400 | 77 | 72 |
Alto-falantes
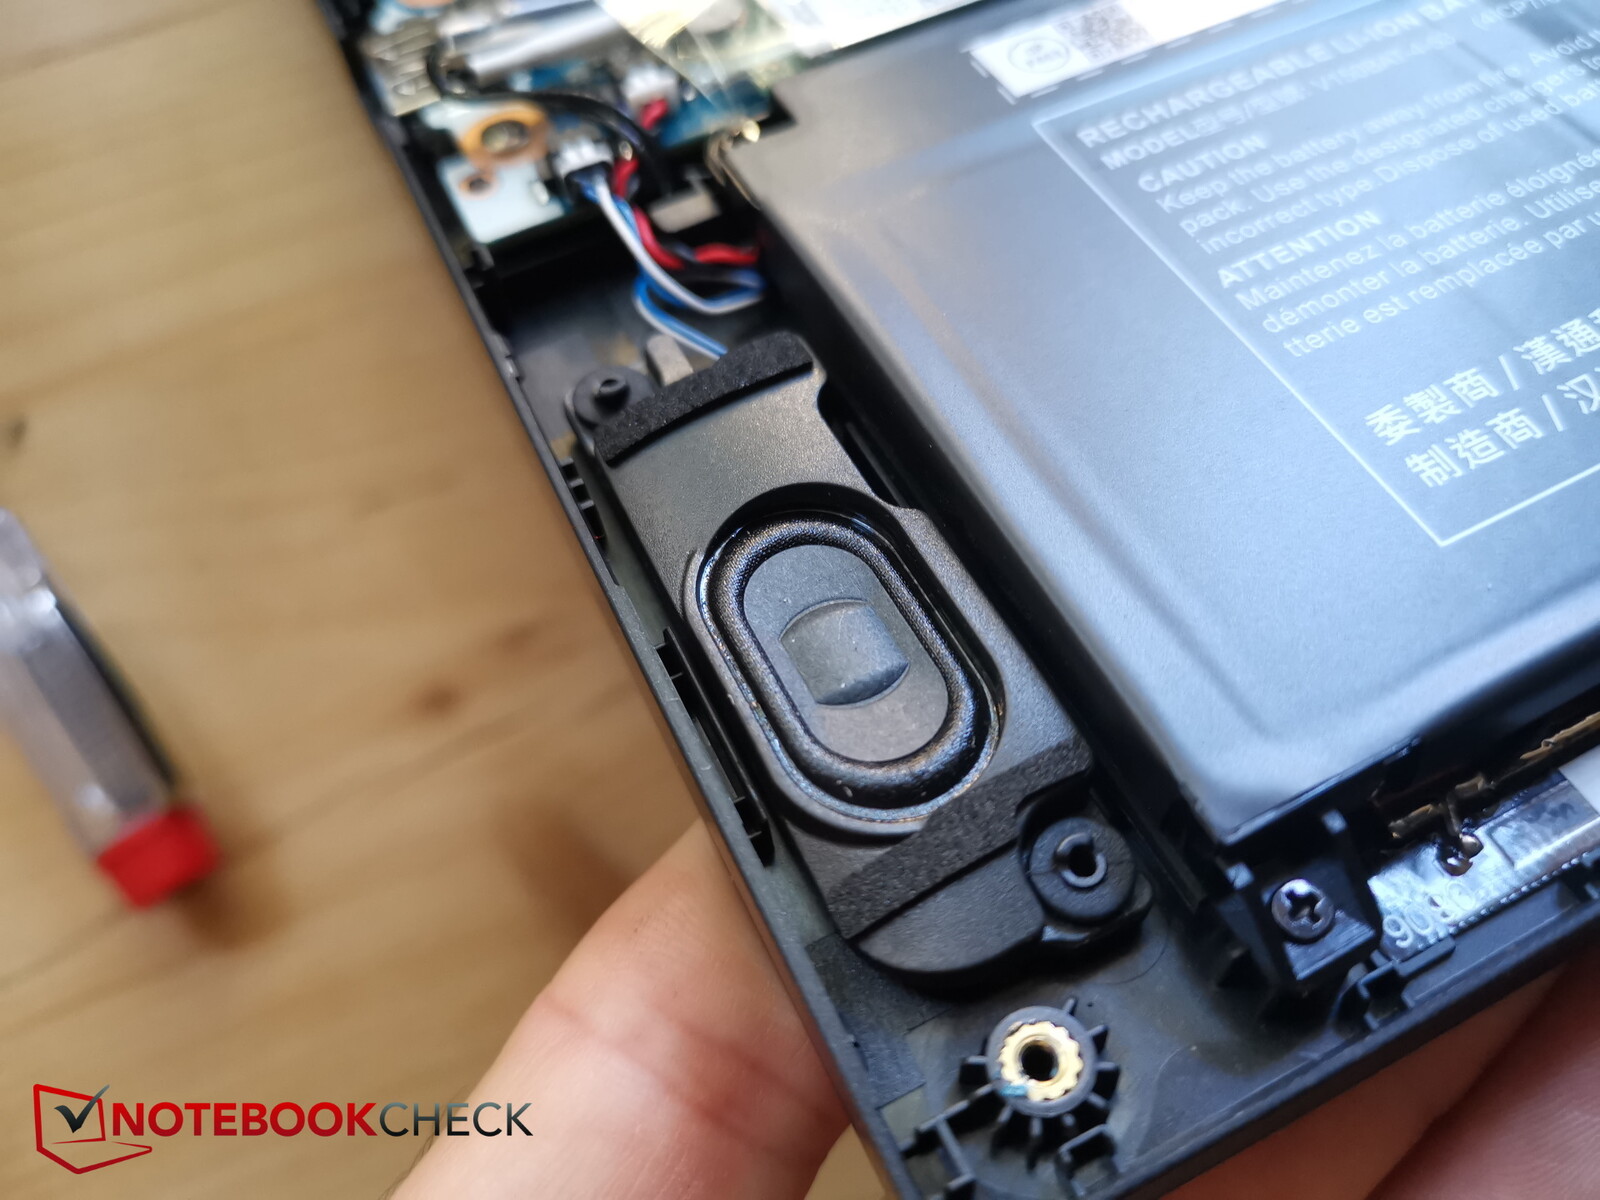
O Captiva instalou alto-falantes estéreo na área dos cantos dianteiros. Eles irradiam para baixo, poderiam ser um pouco mais altos, quase não têm graves e são bastante medíocres.
Além das portas digitais, há dois conectores disponíveis para a conexão de outros dispositivos de áudio - um para fones de ouvido e headphones e outro para microfones.
Captiva Advanced Gaming I74-121 análise de áudio
(±) | o volume do alto-falante é médio, mas bom (###valor### dB)
Graves 100 - 315Hz
(-) | quase nenhum baixo - em média 27.2% menor que a mediana
(±) | a linearidade dos graves é média (12.7% delta para a frequência anterior)
Médios 400 - 2.000 Hz
(±) | médios mais altos - em média 10% maior que a mediana
(±) | a linearidade dos médios é média (14.2% delta para frequência anterior)
Altos 2 - 16 kHz
(+) | agudos equilibrados - apenas 4.3% longe da mediana
(±) | a linearidade dos máximos é média (9.9% delta para frequência anterior)
Geral 100 - 16.000 Hz
(-) | o som geral não é linear (30.3% diferença em relação à mediana)
Comparado com a mesma classe
» 96% de todos os dispositivos testados nesta classe foram melhores, 2% semelhantes, 3% piores
» O melhor teve um delta de 6%, a média foi 18%, o pior foi 132%
Comparado com todos os dispositivos testados
» 89% de todos os dispositivos testados foram melhores, 3% semelhantes, 9% piores
» O melhor teve um delta de 4%, a média foi 23%, o pior foi 134%
Apple MacBook Pro 16 2021 M1 Pro análise de áudio
(+) | os alto-falantes podem tocar relativamente alto (###valor### dB)
Graves 100 - 315Hz
(+) | bons graves - apenas 3.8% longe da mediana
(+) | o baixo é linear (5.2% delta para a frequência anterior)
Médios 400 - 2.000 Hz
(+) | médios equilibrados - apenas 1.3% longe da mediana
(+) | médios são lineares (2.1% delta para frequência anterior)
Altos 2 - 16 kHz
(+) | agudos equilibrados - apenas 1.9% longe da mediana
(+) | os máximos são lineares (2.7% delta da frequência anterior)
Geral 100 - 16.000 Hz
(+) | o som geral é linear (4.6% diferença em relação à mediana)
Comparado com a mesma classe
» 0% de todos os dispositivos testados nesta classe foram melhores, 0% semelhantes, 100% piores
» O melhor teve um delta de 5%, a média foi 17%, o pior foi 45%
Comparado com todos os dispositivos testados
» 0% de todos os dispositivos testados foram melhores, 0% semelhantes, 100% piores
» O melhor teve um delta de 4%, a média foi 23%, o pior foi 134%
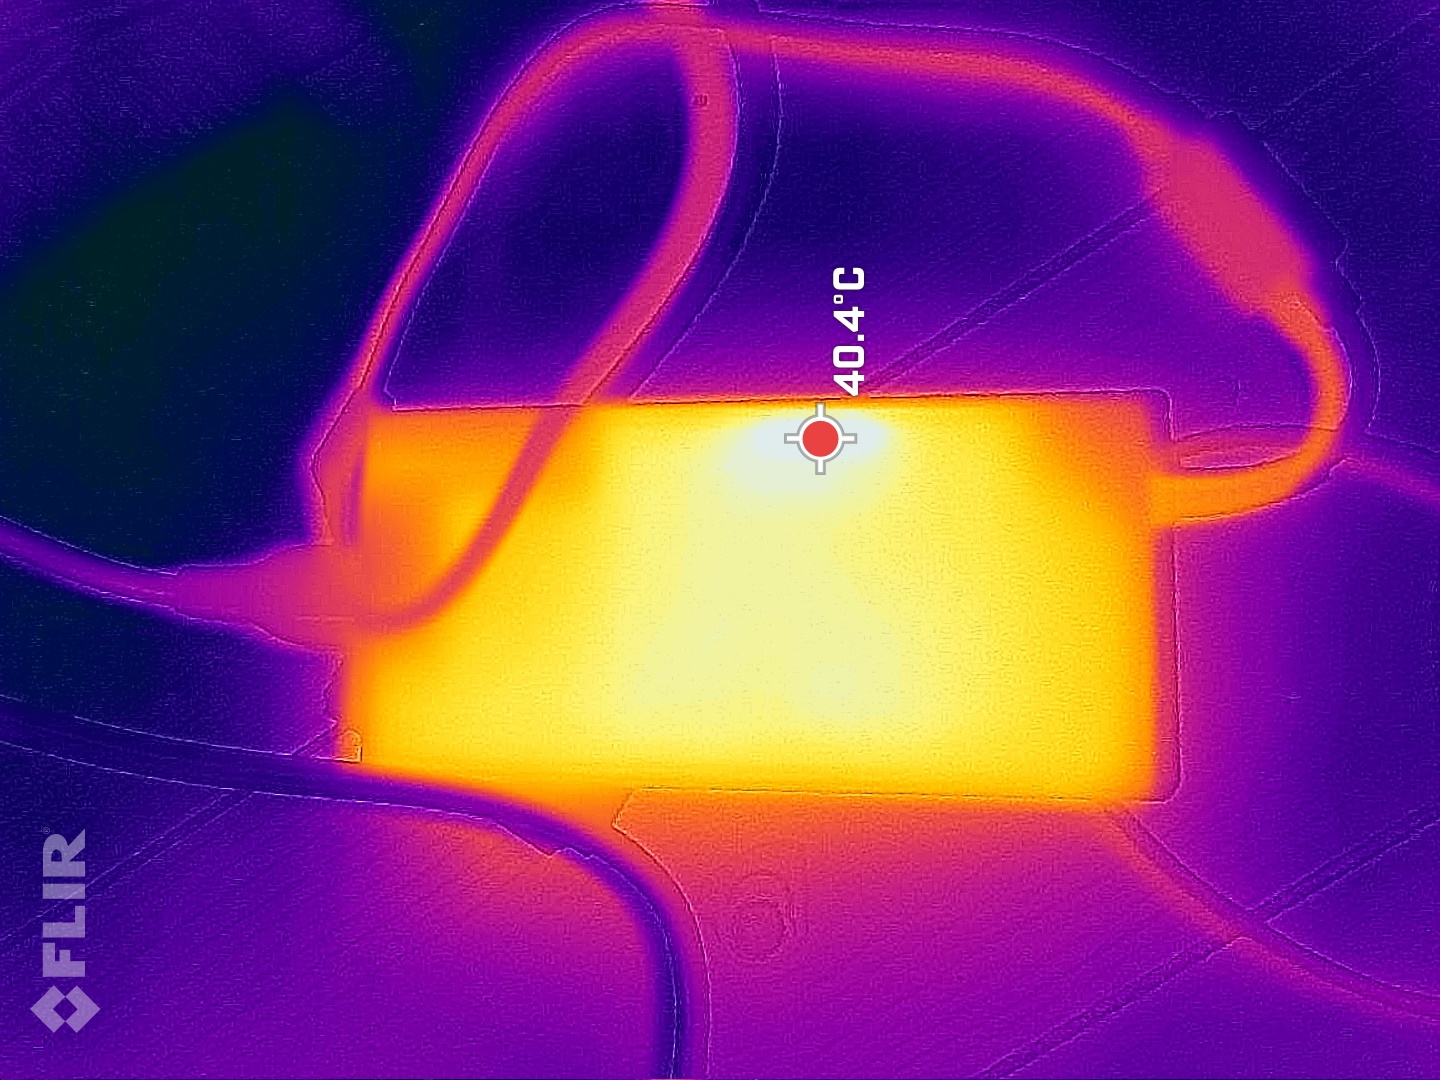
Gerenciamento de energia - O Captiva tem uma bateria pequena
Consumo de energia
O laptop Captiva poderia ser um pouco mais econômico no modo inativo, mas suas taxas de consumo são razoáveis em vista do seu desempenho. O Dell G15, que é quase tão potente quando se trata de jogos, consome consideravelmente mais devido ao seu processador HX mais potente.
Os outros concorrentes, mais fracos, são limitados e, como resultado, são muito mais econômicos sob carga.
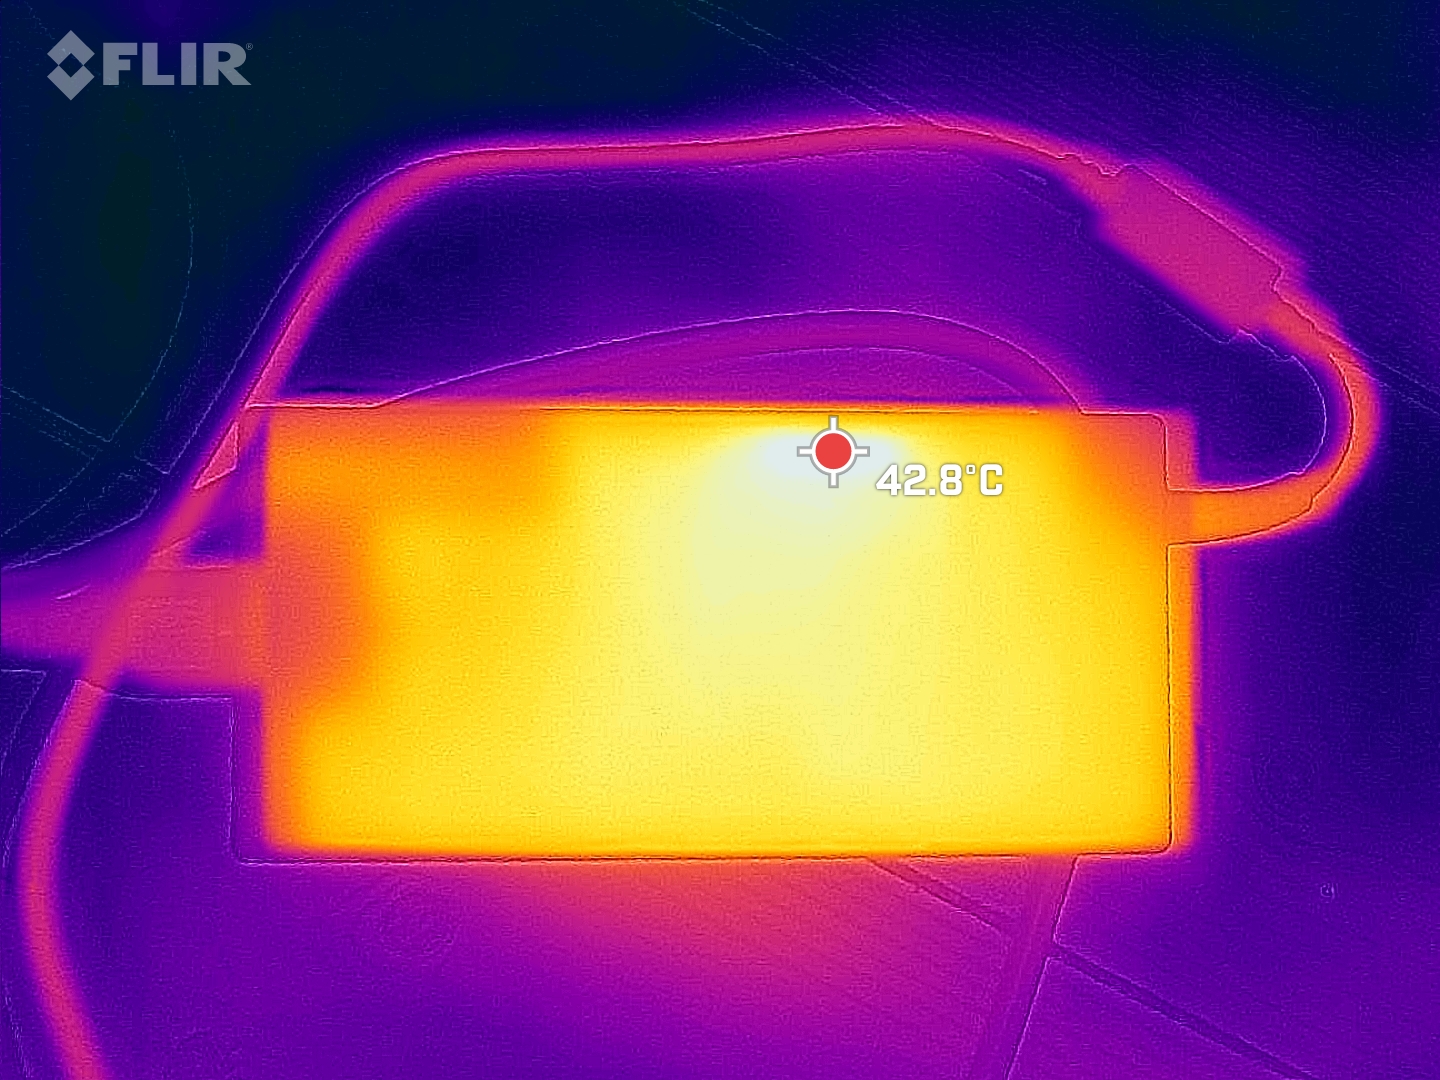
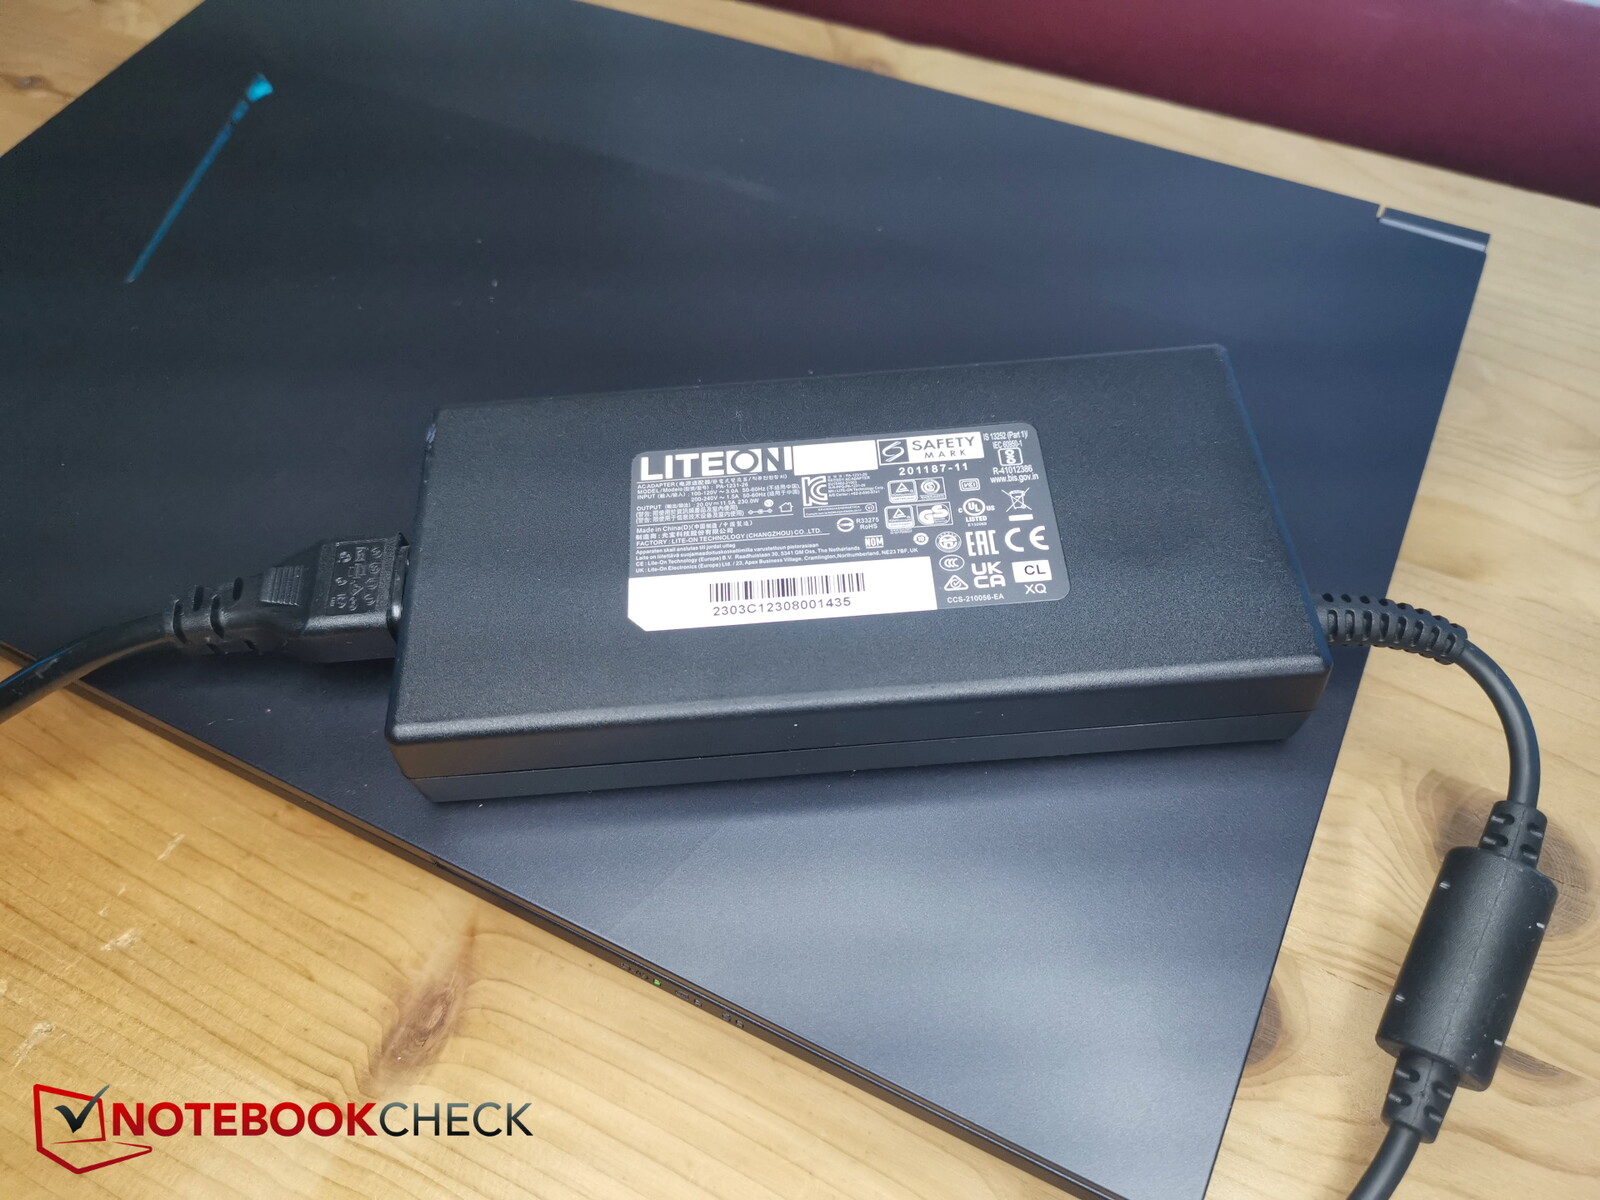
Medimos uma carga máxima de 219 watts por um curto período de tempo, que a fonte de alimentação de 230 watts conseguiu suportar bem.
| desligado | |
| Ocioso | |
| Carga |
|
Key:
min: | |
| Captiva Advanced Gaming I74-121 i5-13500H, GeForce RTX 4060 Laptop GPU, Samsung SSD 980 1TB MZ-V8V1T0BW, IPS, 1920x1080, 15.6" | MSI Cyborg 15 A12VF i7-12650H, GeForce RTX 4060 Laptop GPU, Samsung PM9B1 1024GB MZVL41T0HBLB, IPS, 1920x1080, 15.6" | Dell G15 5530 i7-13650HX, GeForce RTX 4060 Laptop GPU, SSTC CL4-3D512-Q11, IPS, 1920x1080, 15.6" | Lenovo Legion Slim 5 16APH8 R7 7840HS, GeForce RTX 4060 Laptop GPU, SK hynix PC801 HFS512GEJ9X115N, IPS, 2560x1600, 16" | Lenovo LOQ 15APH8 R7 7840HS, GeForce RTX 4050 Laptop GPU, Micron 2450 512GB MTFDKCD512TFK, IPS, 1920x1080, 15.6" | Schenker XMG Core 15 (M22) R7 6800H, GeForce RTX 3060 Laptop GPU, Samsung SSD 980 Pro 1TB MZ-V8P1T0BW, IPS, 2560x1440, 15.6" | Média NVIDIA GeForce RTX 4060 Laptop GPU | Média da turma Gaming | |
|---|---|---|---|---|---|---|---|---|
| Power Consumption | 44% | 9% | 17% | 12% | 9% | 11% | -5% | |
| Idle Minimum * (Watt) | 18.4 | 6 67% | 8.4 54% | 9.4 49% | 15 18% | 11.8 36% | 11.5 ? 37% | 12.9 ? 30% |
| Idle Average * (Watt) | 20 | 8.8 56% | 14.98 25% | 15.5 22% | 17.7 11% | 14.7 26% | 16 ? 20% | 18.5 ? 7% |
| Idle Maximum * (Watt) | 20.7 | 11.9 43% | 15.56 25% | 24.4 -18% | 21.5 -4% | 15 28% | 20.3 ? 2% | 24.1 ? -16% |
| Load Average * (Watt) | 85 | 89 -5% | 96.8 -14% | 74.1 13% | 73.5 14% | 100 -18% | 92.9 ? -9% | 108.4 ? -28% |
| Witcher 3 ultra * (Watt) | 164 | 90.3 45% | 186 -13% | 112.9 31% | 138.6 15% | 184 -12% | ||
| Load Maximum * (Watt) | 219 | 99 55% | 271.42 -24% | 206.5 6% | 176.5 19% | 237 -8% | 210 ? 4% | 254 ? -16% |
* ... menor é melhor
Power consumption Witcher 3 / Stress test
Power consumption with external monitor
Tempos de execução
Equipado com uma bateria de 53 Wh, o Captiva de baixo custo não é o melhor; o Dell G15 tem uma bateria de 86 Wh, o Schenker e o Lenovo usam 60 Wh e apenas o MSI Cyborg também usa 53 Wh.
Posteriormente, o Captiva durou pouco menos de 5 horas em nosso teste de WLAN e vídeo ao usar seu próprio modo de economia de energia.
| Captiva Advanced Gaming I74-121 i5-13500H, GeForce RTX 4060 Laptop GPU, 53 Wh | MSI Cyborg 15 A12VF i7-12650H, GeForce RTX 4060 Laptop GPU, 53.5 Wh | Dell G15 5530 i7-13650HX, GeForce RTX 4060 Laptop GPU, 86 Wh | Lenovo Legion Slim 5 16APH8 R7 7840HS, GeForce RTX 4060 Laptop GPU, 80 Wh | Lenovo LOQ 15APH8 R7 7840HS, GeForce RTX 4050 Laptop GPU, 60 Wh | Schenker XMG Core 15 (M22) R7 6800H, GeForce RTX 3060 Laptop GPU, 62 Wh | Média da turma Gaming | |
|---|---|---|---|---|---|---|---|
| Duração da bateria | 50% | 4% | 5% | 5% | 8% | 37% | |
| H.264 (h) | 4.9 | 8 63% | 6.8 39% | 8.9 ? 82% | |||
| WiFi v1.3 (h) | 5.3 | 7.5 42% | 6.5 23% | 7.1 34% | 7.4 40% | 7.8 47% | 7.08 ? 34% |
| Load (h) | 1.6 | 2.3 44% | 0.8 -50% | 1.2 -25% | 1.1 -31% | 1.1 -31% | 1.51 ? -6% |
| Reader / Idle (h) | 13.6 | 11.7 | 9.8 | 8.71 ? | |||
| Witcher 3 ultra (h) | 0.8 |
Pro
Contra
Veredicto - Foco nos aspectos essenciais de um laptop para jogos
O Captiva Advanced Gaming pode não usar o processador mais rápido, mas, mesmo assim, não deixa dúvidas sobre o desempenho 3D de sua placa ligeiramente acima da média RTX 4060. Posteriormente, o fabricante se concentra no essencial: desempenho em jogos.
Pelo preço relativamente baixo de US$ 1.800, você também precisa fazer algumas concessões. Isso inclui a falta de Thunderbolt e de um leitor de cartão SD, além de sua porta USB 2.0 desatualizada.
O Captiva Advanced Gaming I74-121 oferece um desempenho 3D bastante alto por um preço relativamente baixo. É preciso fazer concessões quando se trata de suas opções de conectividade.
Existem algumas alternativas viáveis, embora seu preço seja tentadoramente baixo. Em muitas comparações, oDell G15é um de seus concorrentes mais fortes. Ele oferece melhor desempenho da CPU e uma bateria maior, mas, em contrapartida, esquenta muito mais e tem um consumo maior.
Preço e disponibilidade
Nosso modelo de teste é vendido por cerca de US$ 1.800. Atualmente, ele não pode ser encontrado para compra em nenhum varejista on-line dos EUA.
Você pode conferir dispositivos semelhantes, como o Dell G15, na Amazon.
Captiva Advanced Gaming I74-121
- 09/22/2023 v7 (old)
Christian Hintze
Transparência
A seleção dos dispositivos a serem analisados é feita pela nossa equipe editorial. A amostra de teste foi fornecida ao autor como empréstimo pelo fabricante ou varejista para fins desta revisão. O credor não teve influência nesta revisão, nem o fabricante recebeu uma cópia desta revisão antes da publicação. Não houve obrigação de publicar esta revisão. Como empresa de mídia independente, a Notebookcheck não está sujeita à autoridade de fabricantes, varejistas ou editores.
É assim que o Notebookcheck está testando
Todos os anos, o Notebookcheck analisa de forma independente centenas de laptops e smartphones usando procedimentos padronizados para garantir que todos os resultados sejam comparáveis. Desenvolvemos continuamente nossos métodos de teste há cerca de 20 anos e definimos padrões da indústria no processo. Em nossos laboratórios de teste, equipamentos de medição de alta qualidade são utilizados por técnicos e editores experientes. Esses testes envolvem um processo de validação em vários estágios. Nosso complexo sistema de classificação é baseado em centenas de medições e benchmarks bem fundamentados, o que mantém a objetividade.Price comparison

