Análise do laptop Lenovo LOQ 15 Ryzen 7 7840HS: Não o chame de Legion

A família LOQ consiste em laptops econômicos para jogos da Lenovo, projetados para substituir a antiga Série IdeaPad Gaming 3. O novo nome LOQ ajuda a criar uma distância entre seus produtos econômicos para jogos e a série Ideapad, mais voltada para home office ou estudantes. Também não se trata de um produto Legion, pois a Lenovo quer posicionar o nome Legion como uma série "emblemática", apenas com máquinas de jogos de alta qualidade.
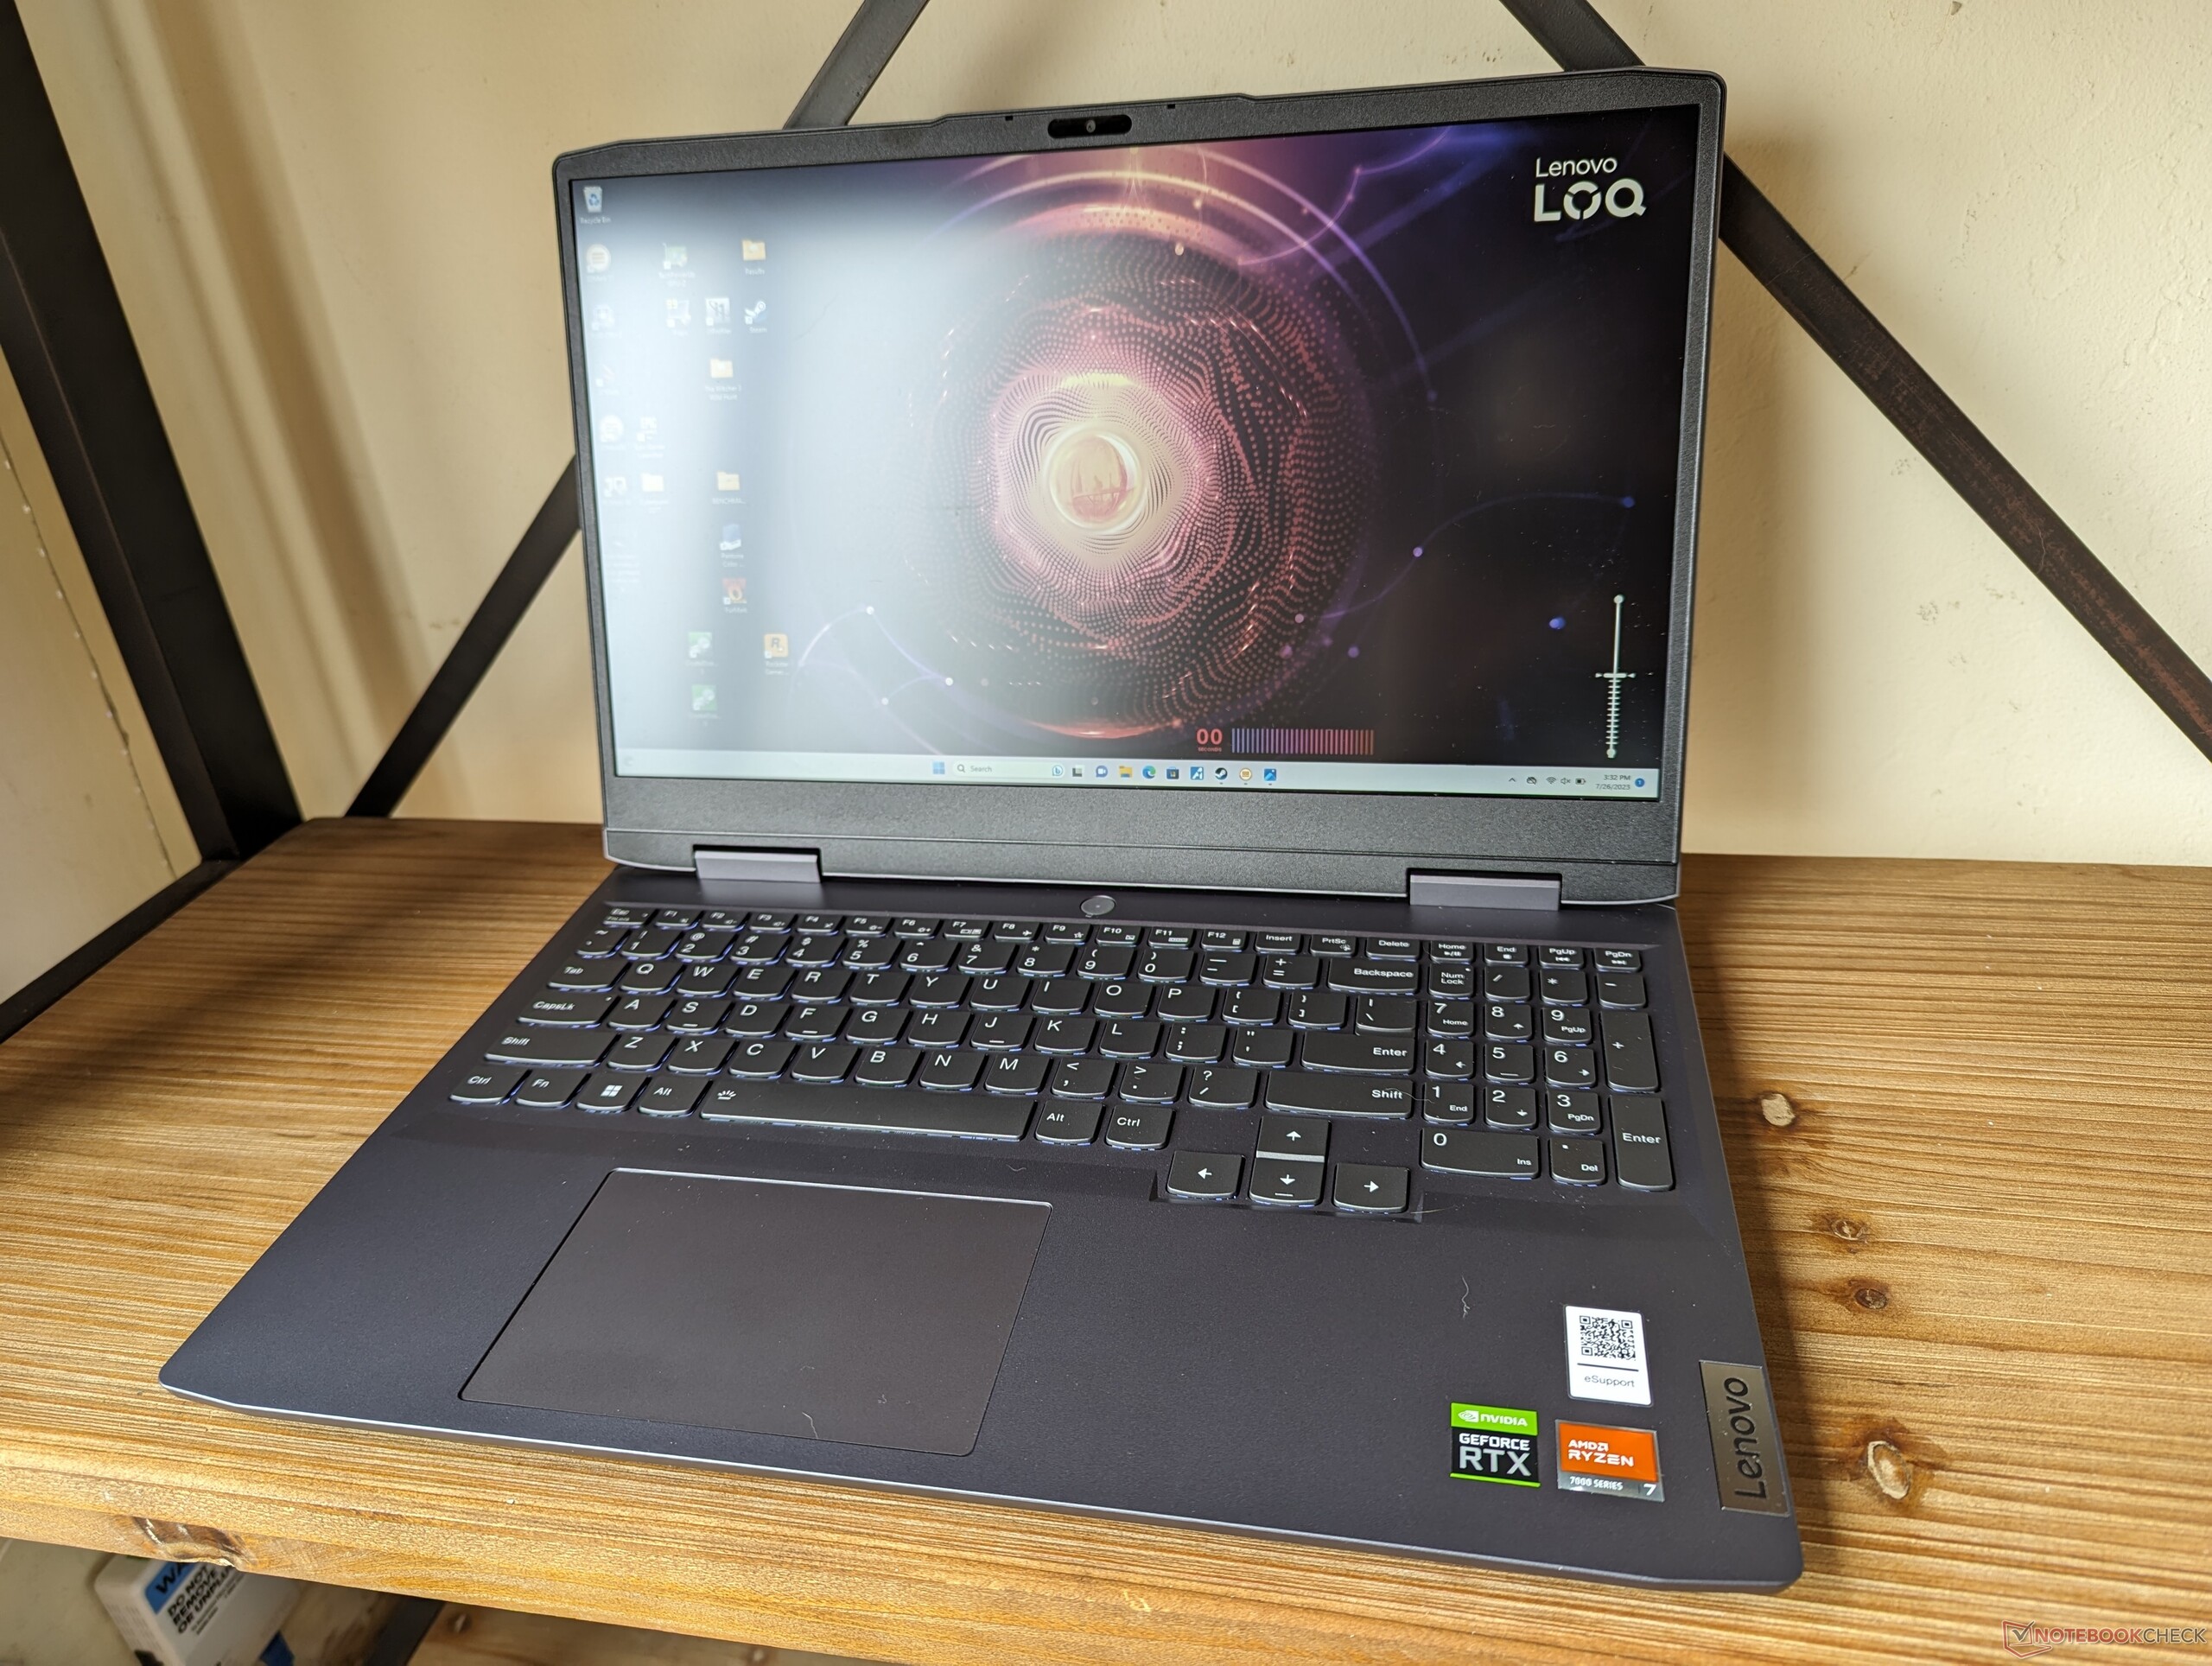
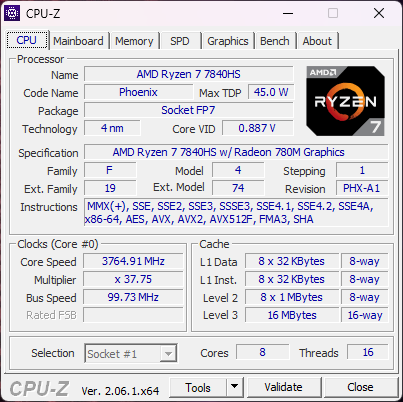
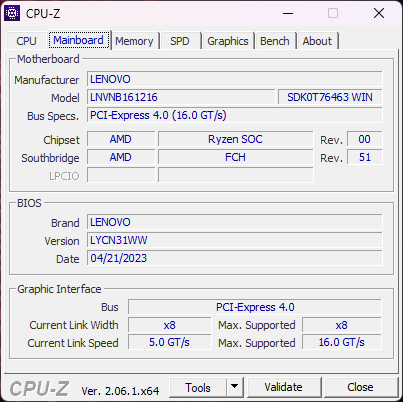
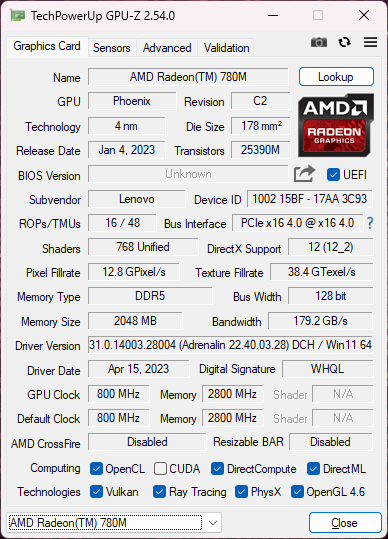
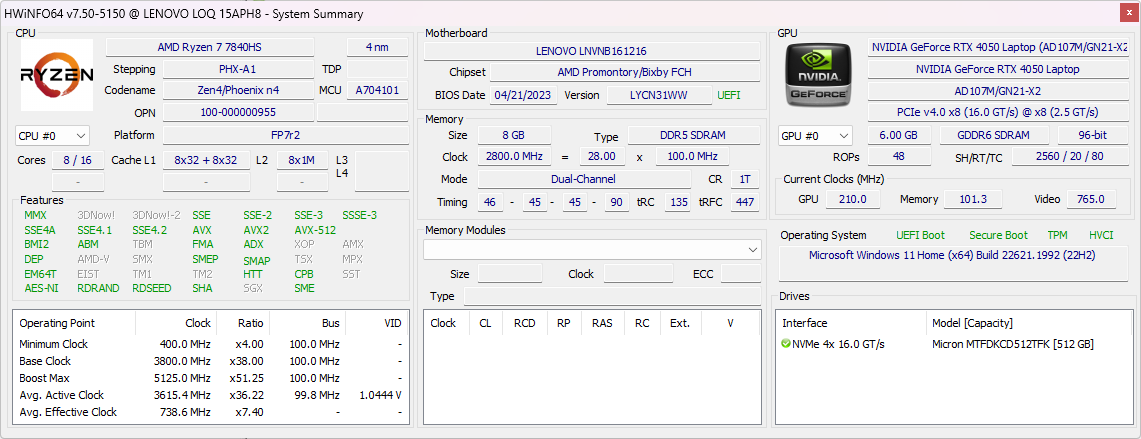
Nossa unidade em análise é uma versão AMD de médio porte (15APH8) com a CPU Zen 4 Ryzen 7 7840HS, GPU GeForce RTX 4050 e tela IPS de 1080p 144 Hz, vendida no varejo por aproximadamente US$ 1.000. Ele vem apenas com 8 GB de RAM, mas felizmente pode ser atualizado pelo usuário. Existem SKUs mais baratas e mais caras com o Ryzen 5 7640HS, RTX 3050 ou 4060 e tela de 1080p 60 Hz a 1440p 165 Hz, variando de menos de US$ 800 a mais de US$ 1100. As versões Intel do LOQ 15 (15IRH8) também estão disponíveis nos tamanhos de tela de 15 e 16 polegadas (LOQ 16).
Os concorrentes incluem outros notebooks econômicos para jogos de 15 polegadas, como o Dell G15 5530,Asus TUF A15 FA507,MSI Cyborg 15ou HP Victus 15.
Mais análises da Lenovo:
Possíveis concorrentes em comparação
Avaliação | Data | Modelo | Peso | Altura | Size | Resolução | Preço |
|---|---|---|---|---|---|---|---|
| 85.7 % v7 (old) | 07/2023 | Lenovo LOQ 15APH8 R7 7840HS, GeForce RTX 4050 Laptop GPU | 2.5 kg | 25.2 mm | 15.60" | 1920x1080 | |
| 87.5 % v7 (old) | 11/2022 | Lenovo Legion 5 15IAH7H 82RB i7-12700H, GeForce RTX 3060 Laptop GPU | 2.4 kg | 19.99 mm | 15.60" | 1920x1080 | |
| 84.2 % v7 (old) | 06/2023 | Dell G15 5530 i7-13650HX, GeForce RTX 4060 Laptop GPU | 3 kg | 26.95 mm | 15.60" | 1920x1080 | |
| 86.3 % v7 (old) | 06/2023 | Asus TUF A15 FA507 R7 7735HS, GeForce RTX 4050 Laptop GPU | 2.2 kg | 24.9 mm | 15.60" | 1920x1080 | |
| 82.4 % v7 (old) | 04/2023 | MSI Cyborg 15 A12VF i7-12650H, GeForce RTX 4060 Laptop GPU | 2 kg | 22.9 mm | 15.60" | 1920x1080 | |
| 81 % v7 (old) | 01/2023 | HP Victus 15 fa0020nr i7-12700H, GeForce RTX 3050 Ti Laptop GPU | 2.3 kg | 23.6 mm | 15.60" | 1920x1080 |
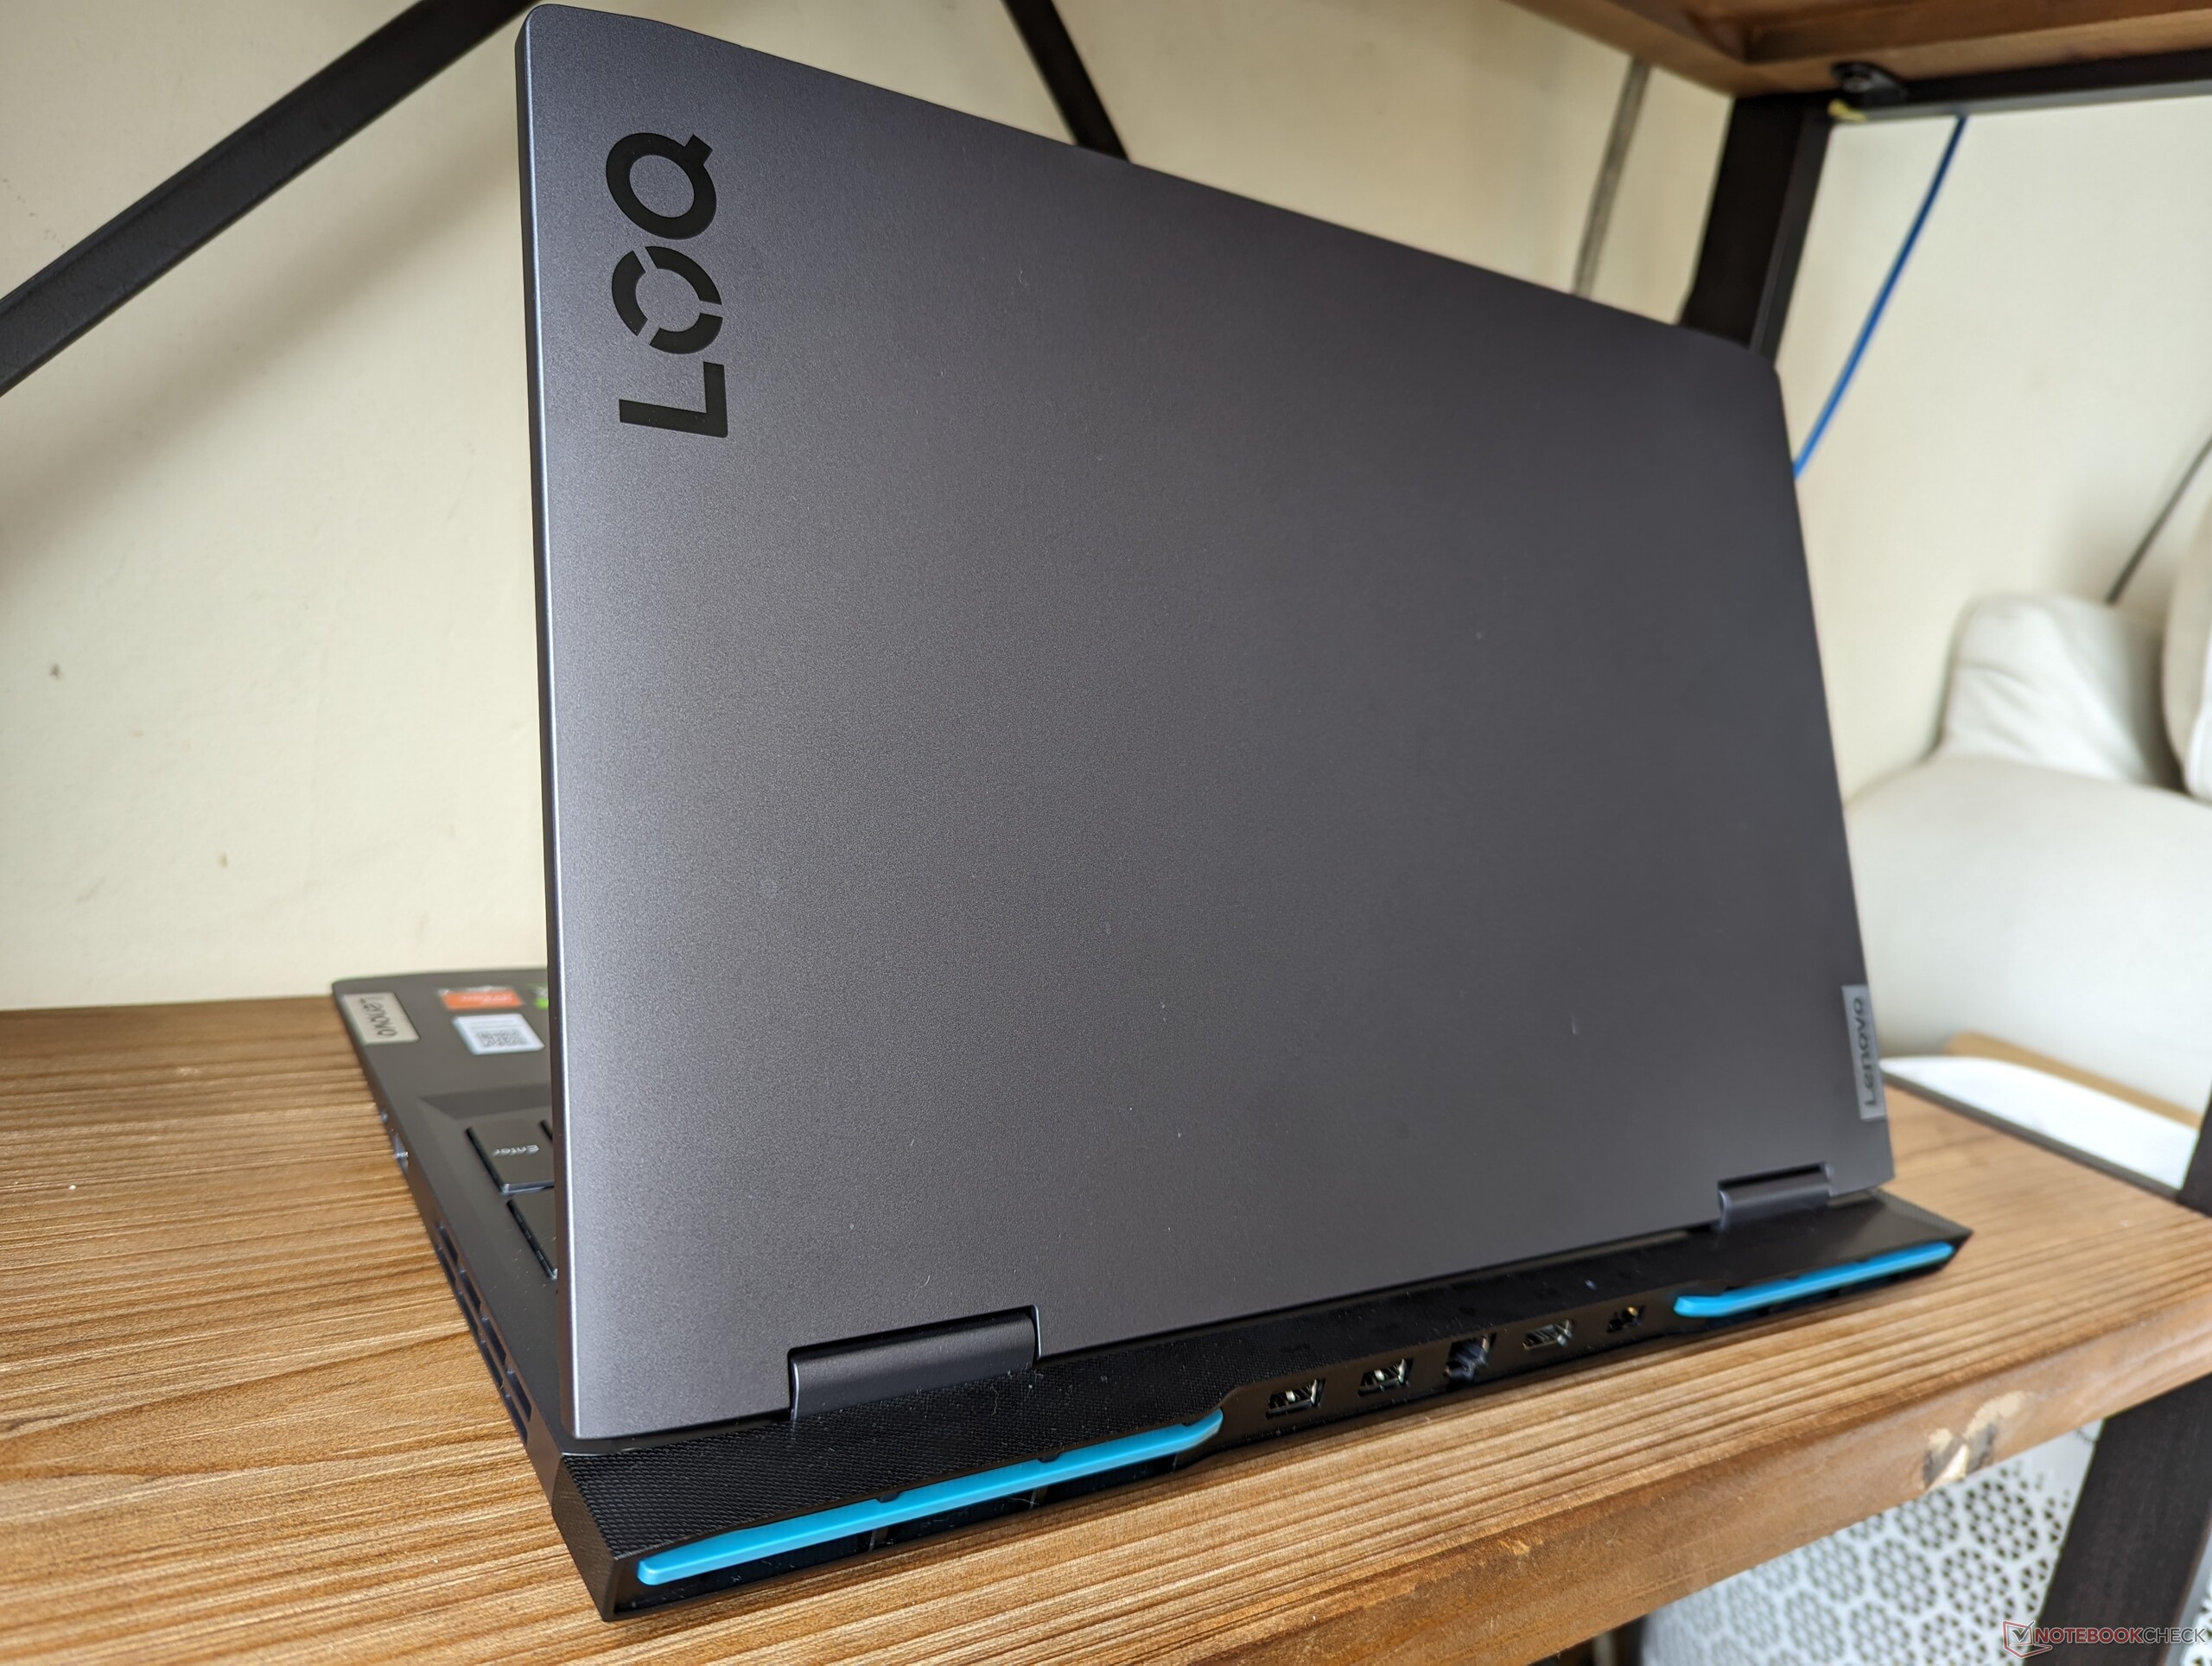
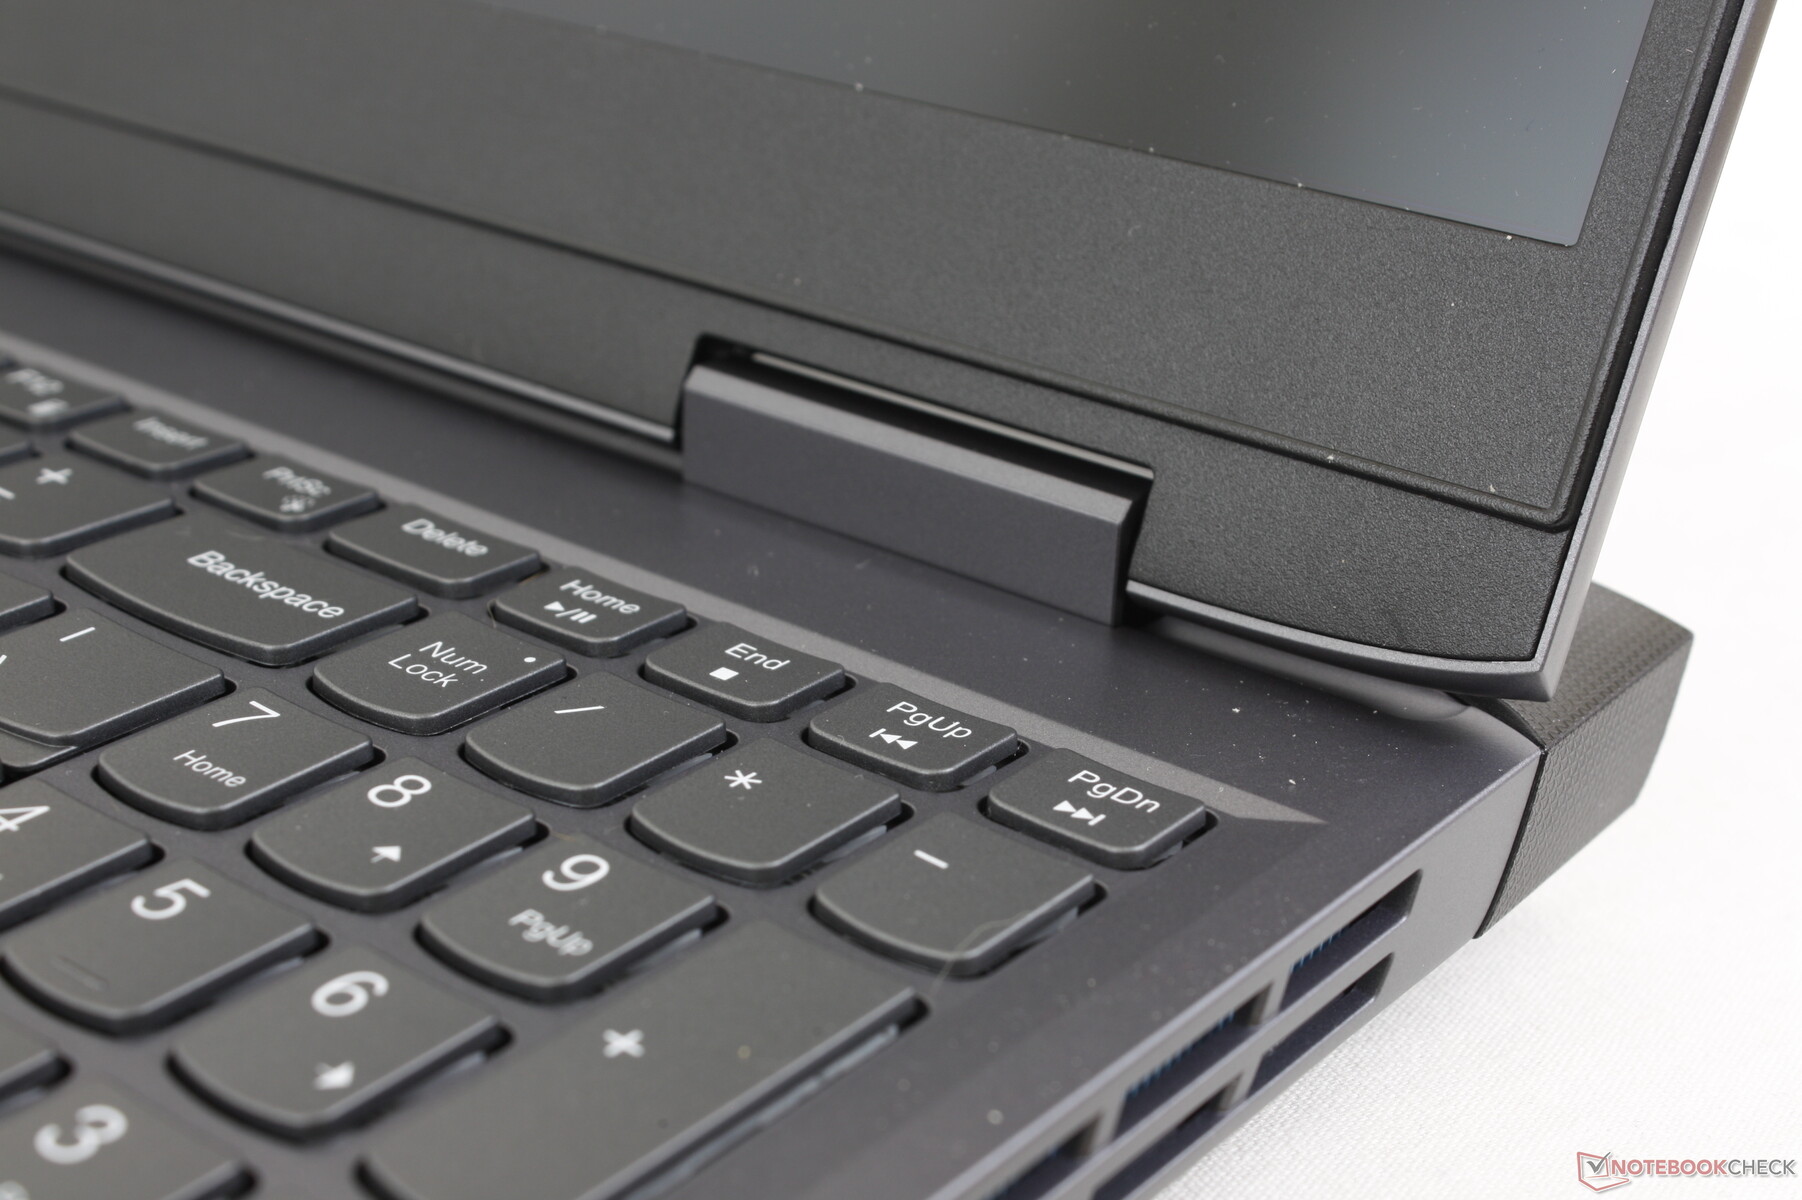
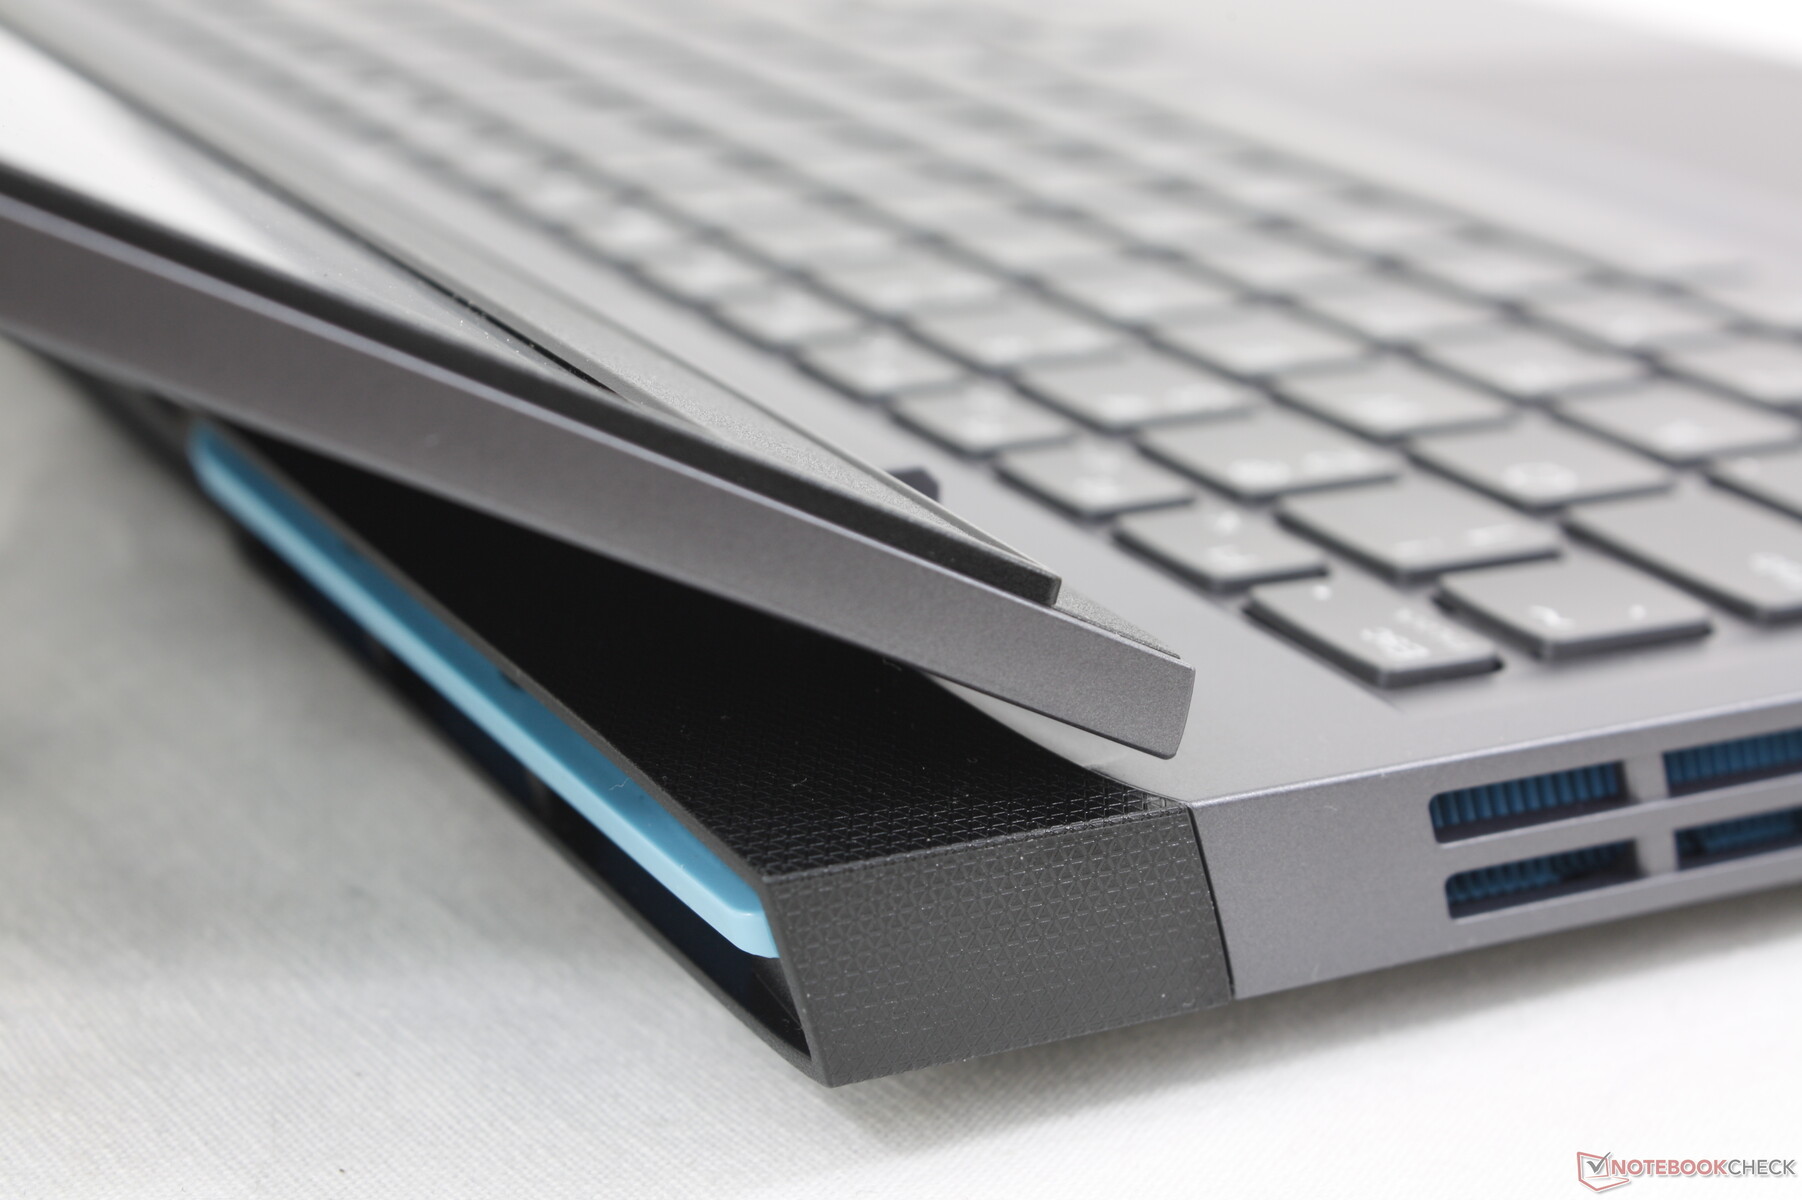
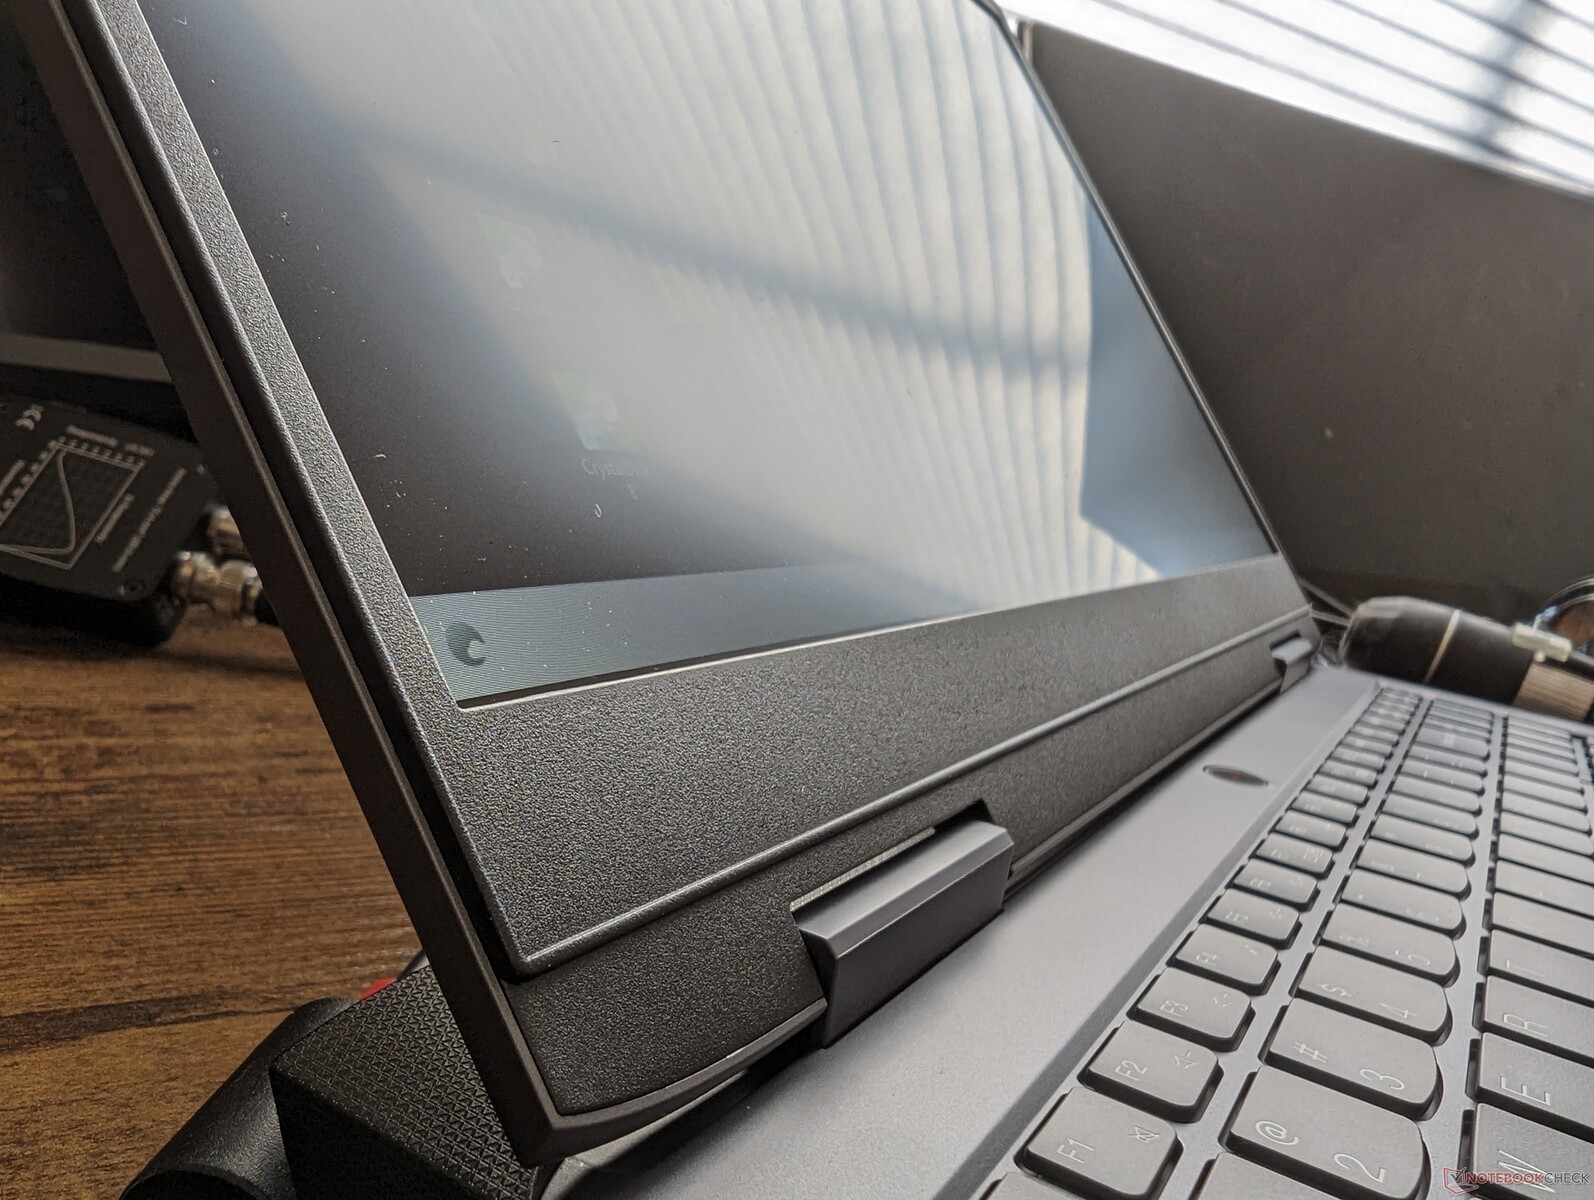
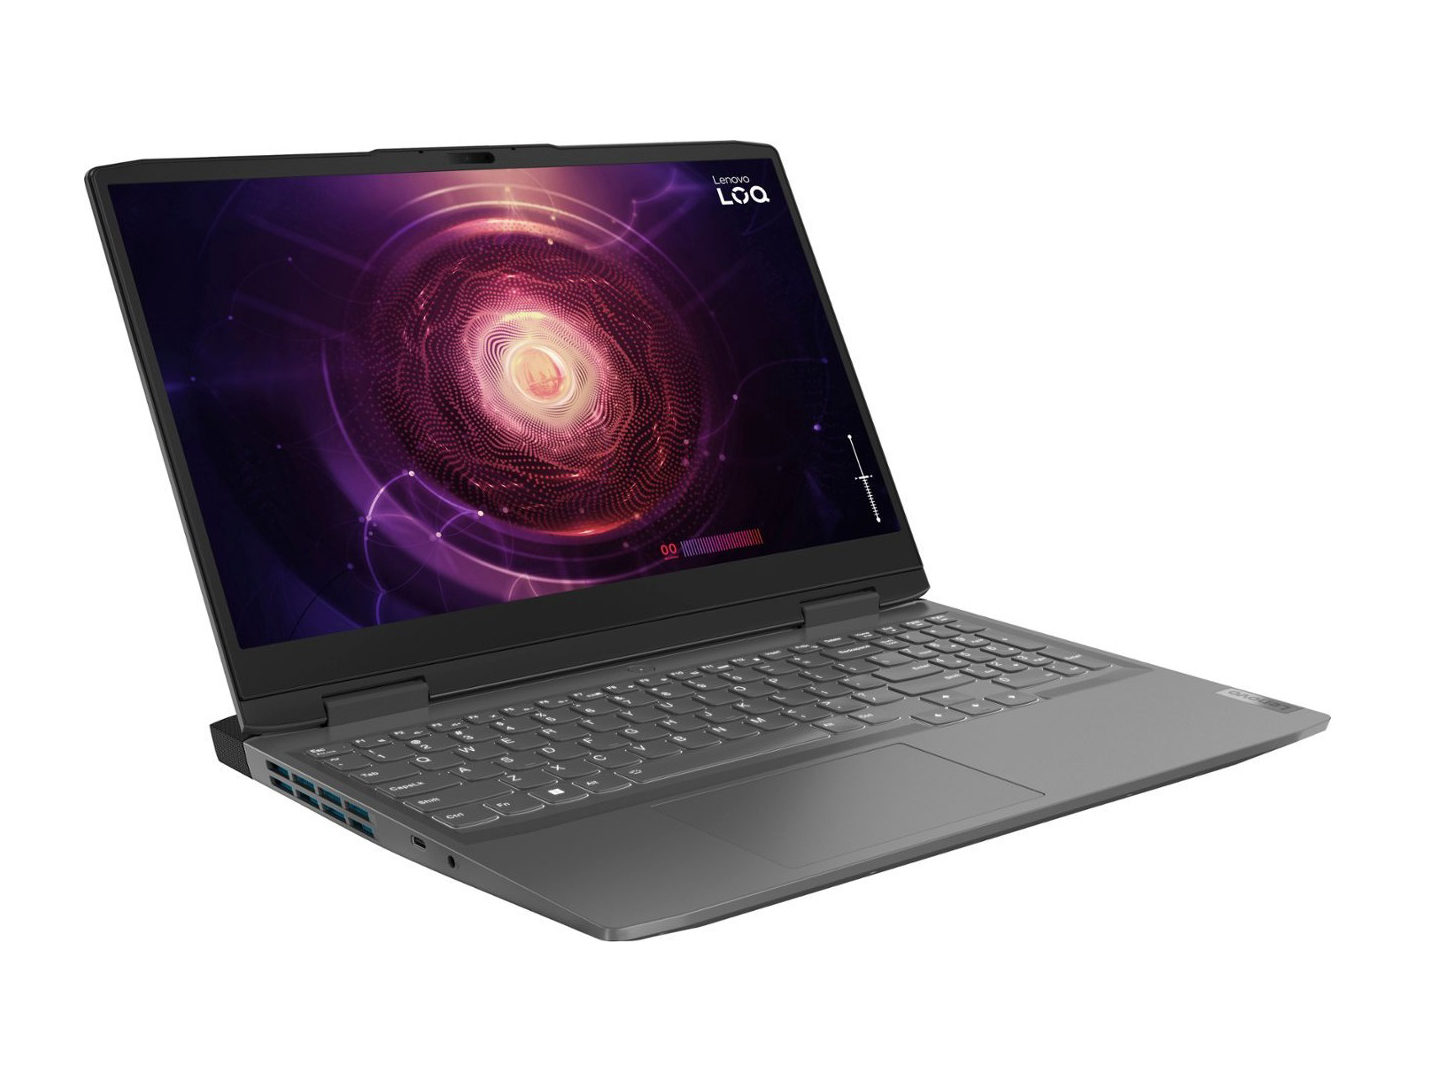
Case - Essencialmente um plástico Legion
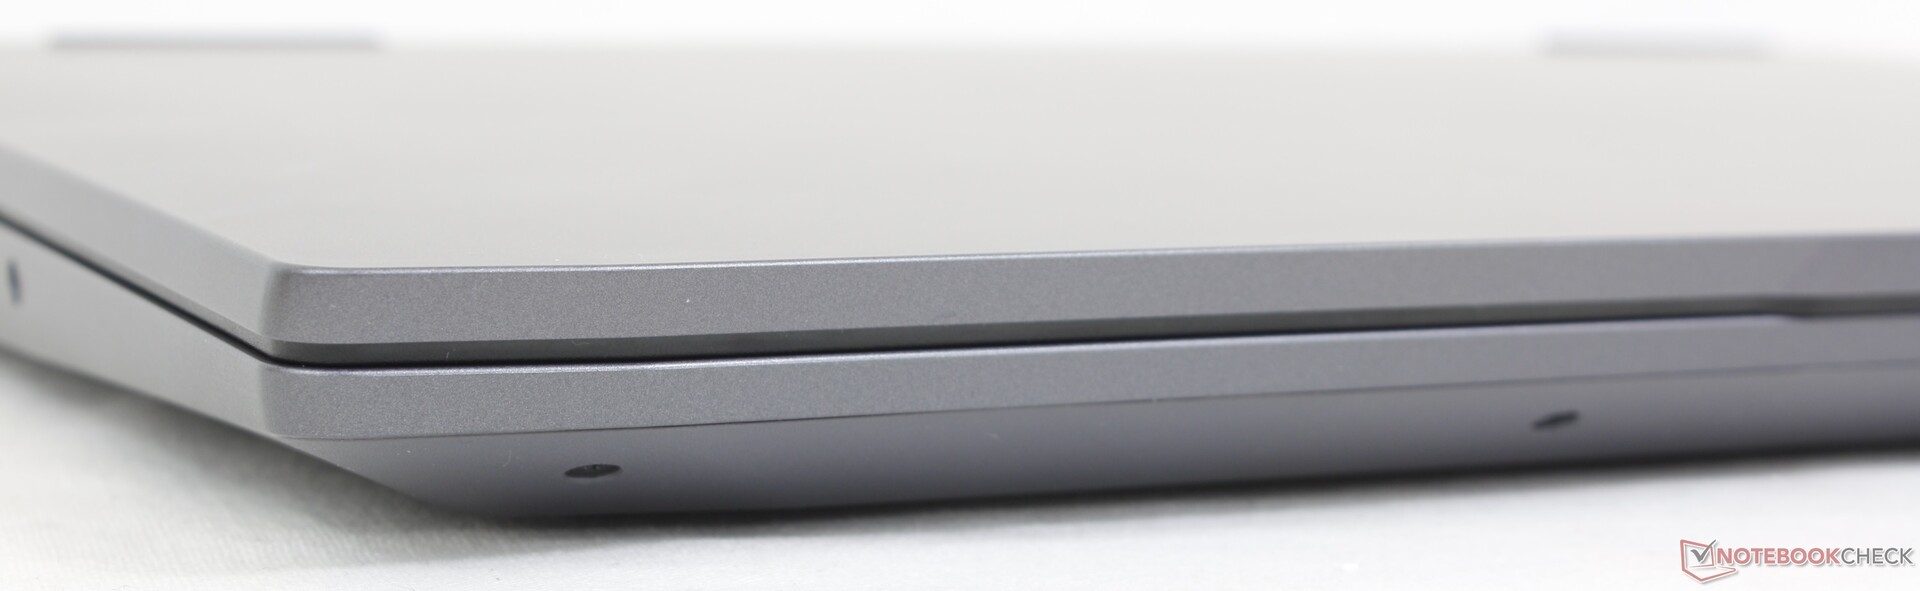
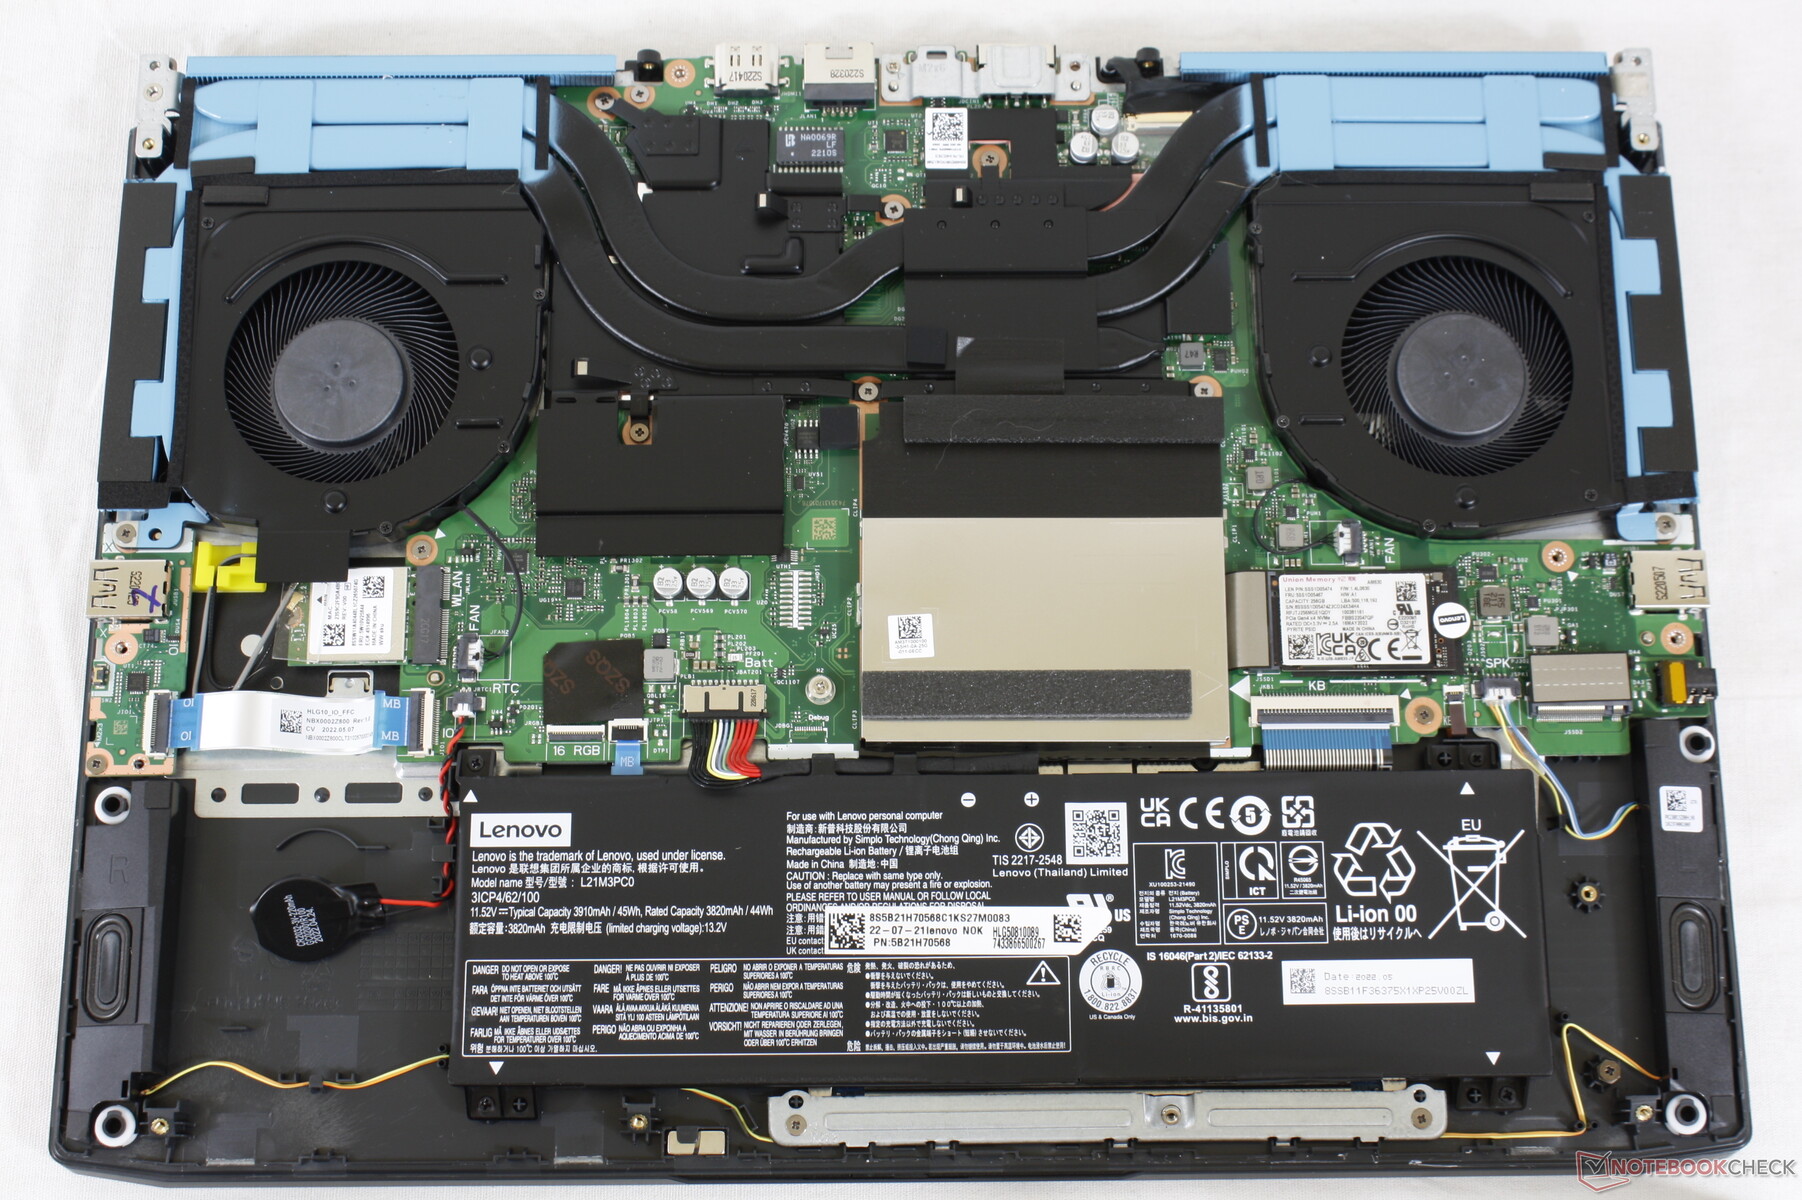
O fato de não ser um produto da Legion não significa que não possa ser inspirado no design da Legion. O chassi LOQ 15 pode ser melhor descrito como uma versão diluída do Legion 5 15 pois todos os materiais metálicos do Legion foram substituídos por plástico ABS na tampa superior e na parte inferior. Como resultado dessas mudanças, ele parece mais barato, mas isso é normal quando comparado a outros notebooks econômicos para jogos, como o MSI Cyborg 15 ou HP Victus 15, que também são predominantemente de plástico.
A rigidez do chassi é mais fraca nos apoios para as mãos e no centro do teclado. A aplicação de pressão nessas áreas deformaria a superfície um pouco mais do que na maioria dos outros laptops para jogos, inclusive os mais baratos, como o HP Victus 15. Felizmente, isso não é motivo de preocupação e o restante do laptop parece sólido para o preço.
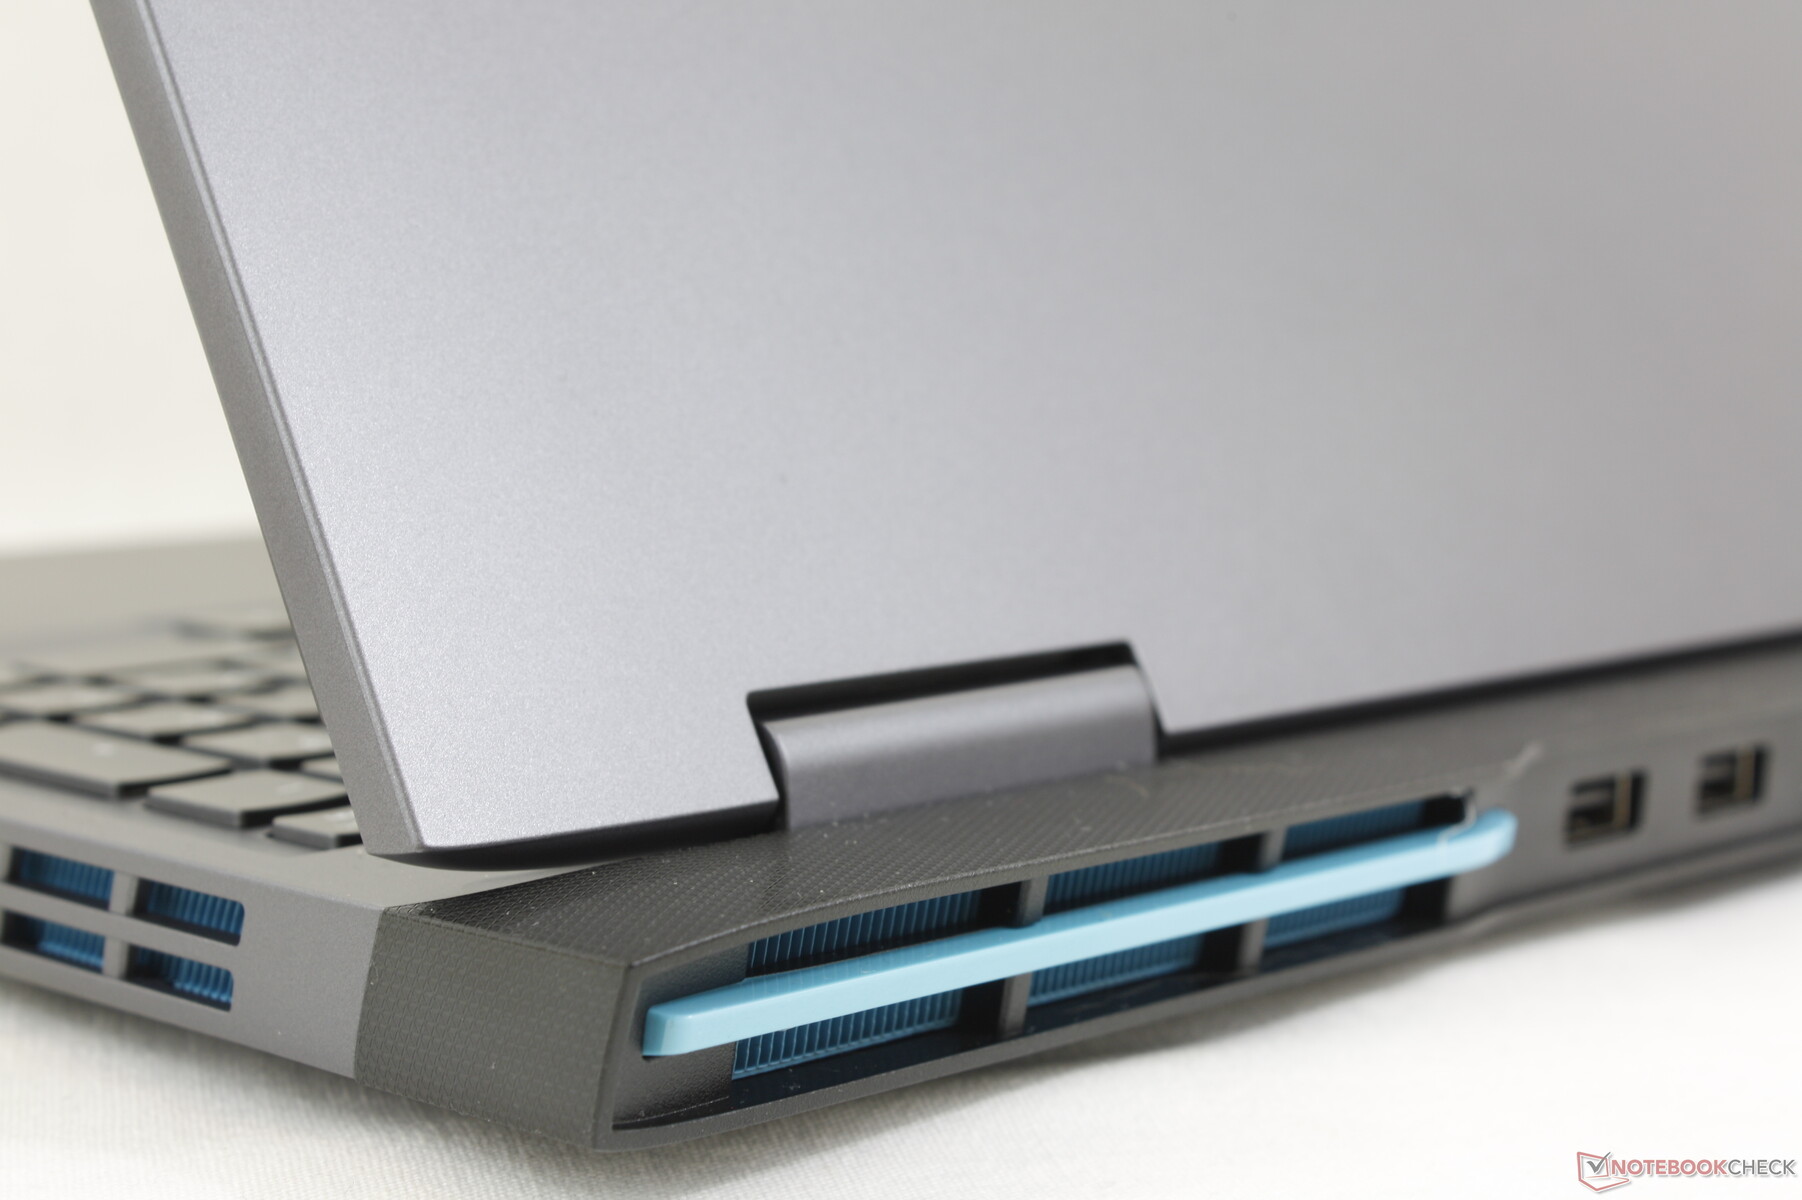
O LOQ 15 é um pouco mais grosso e pesado do que a maioria dos outros notebooks econômicos para jogos, incluindo o Asus TUF A15,HP Victus 15ou MSI Cyborg 15 devido, em parte, à sua grande parte traseira estendida. Uma exceção notável é o volumoso Dell G15 5530 que é ainda mais pesado e maior.
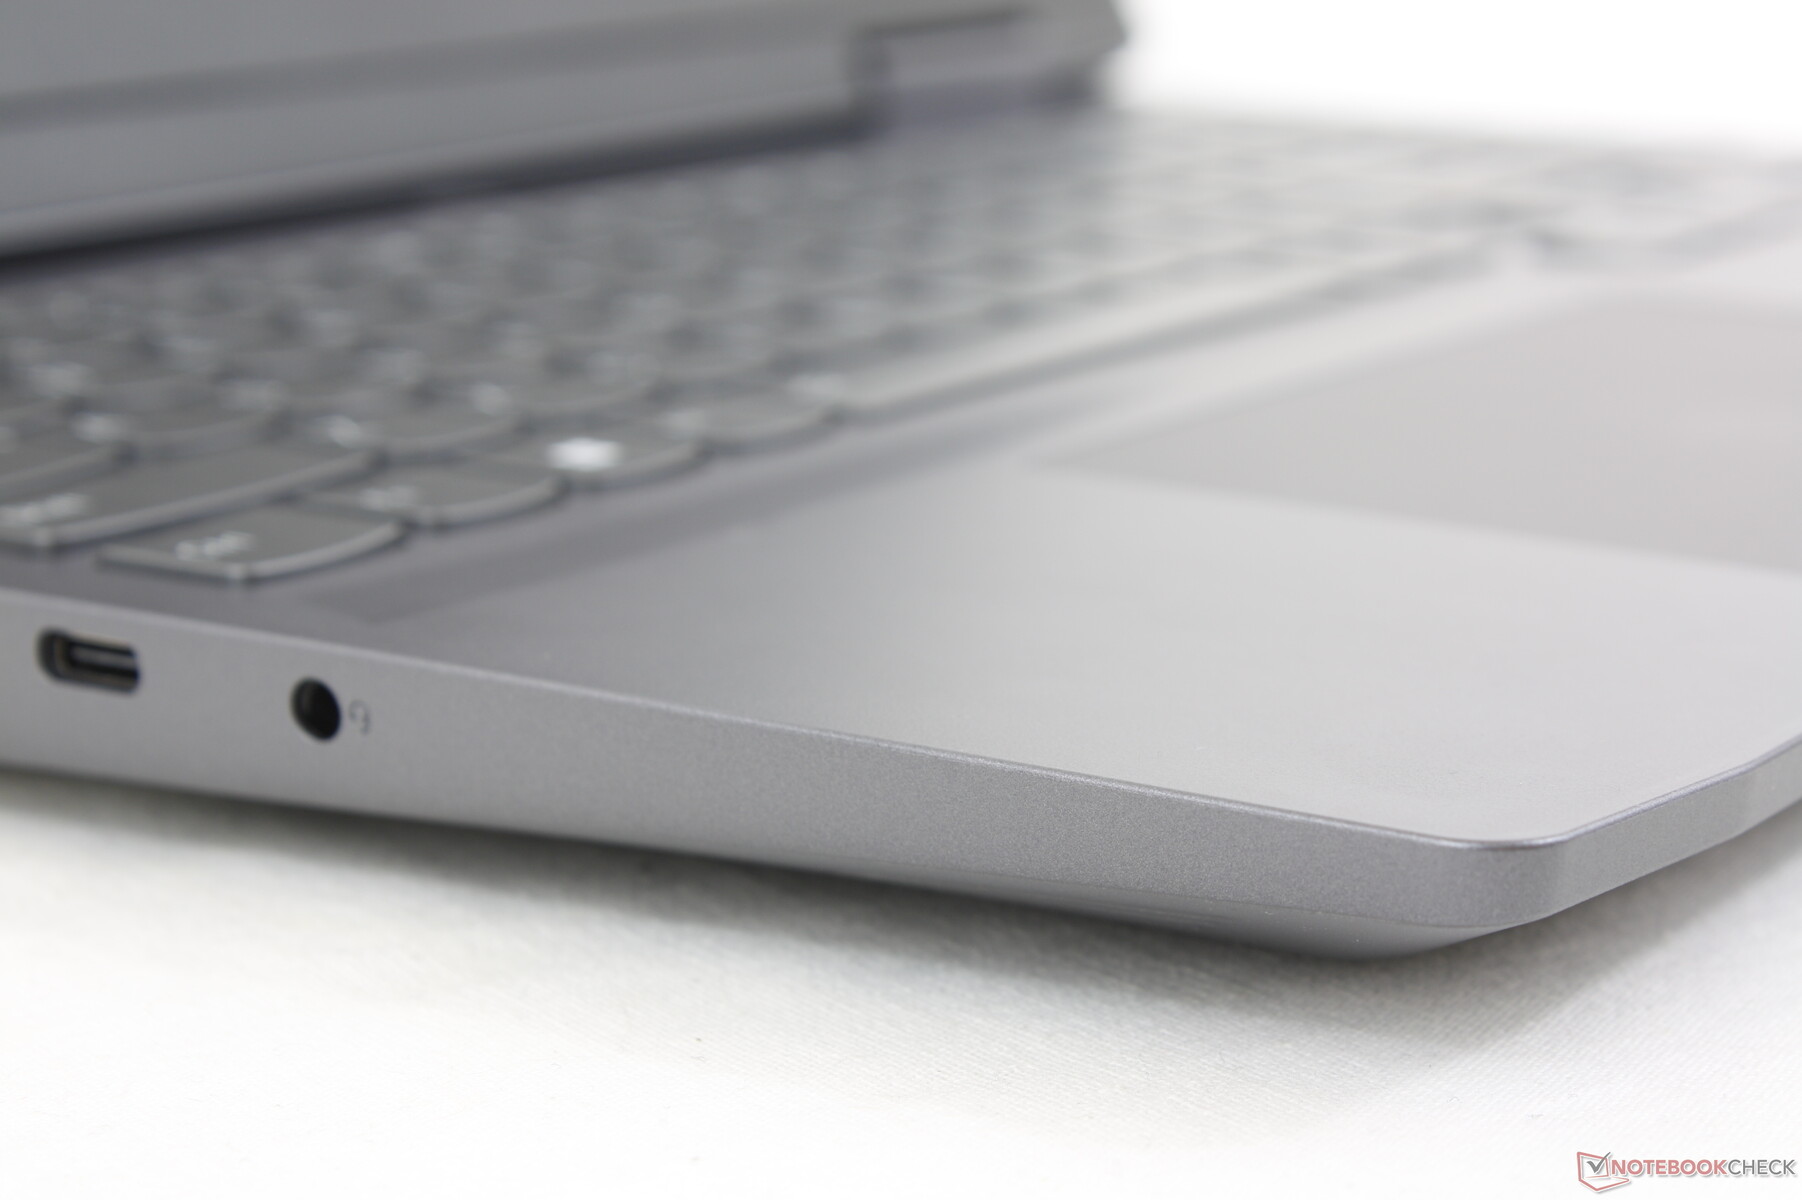
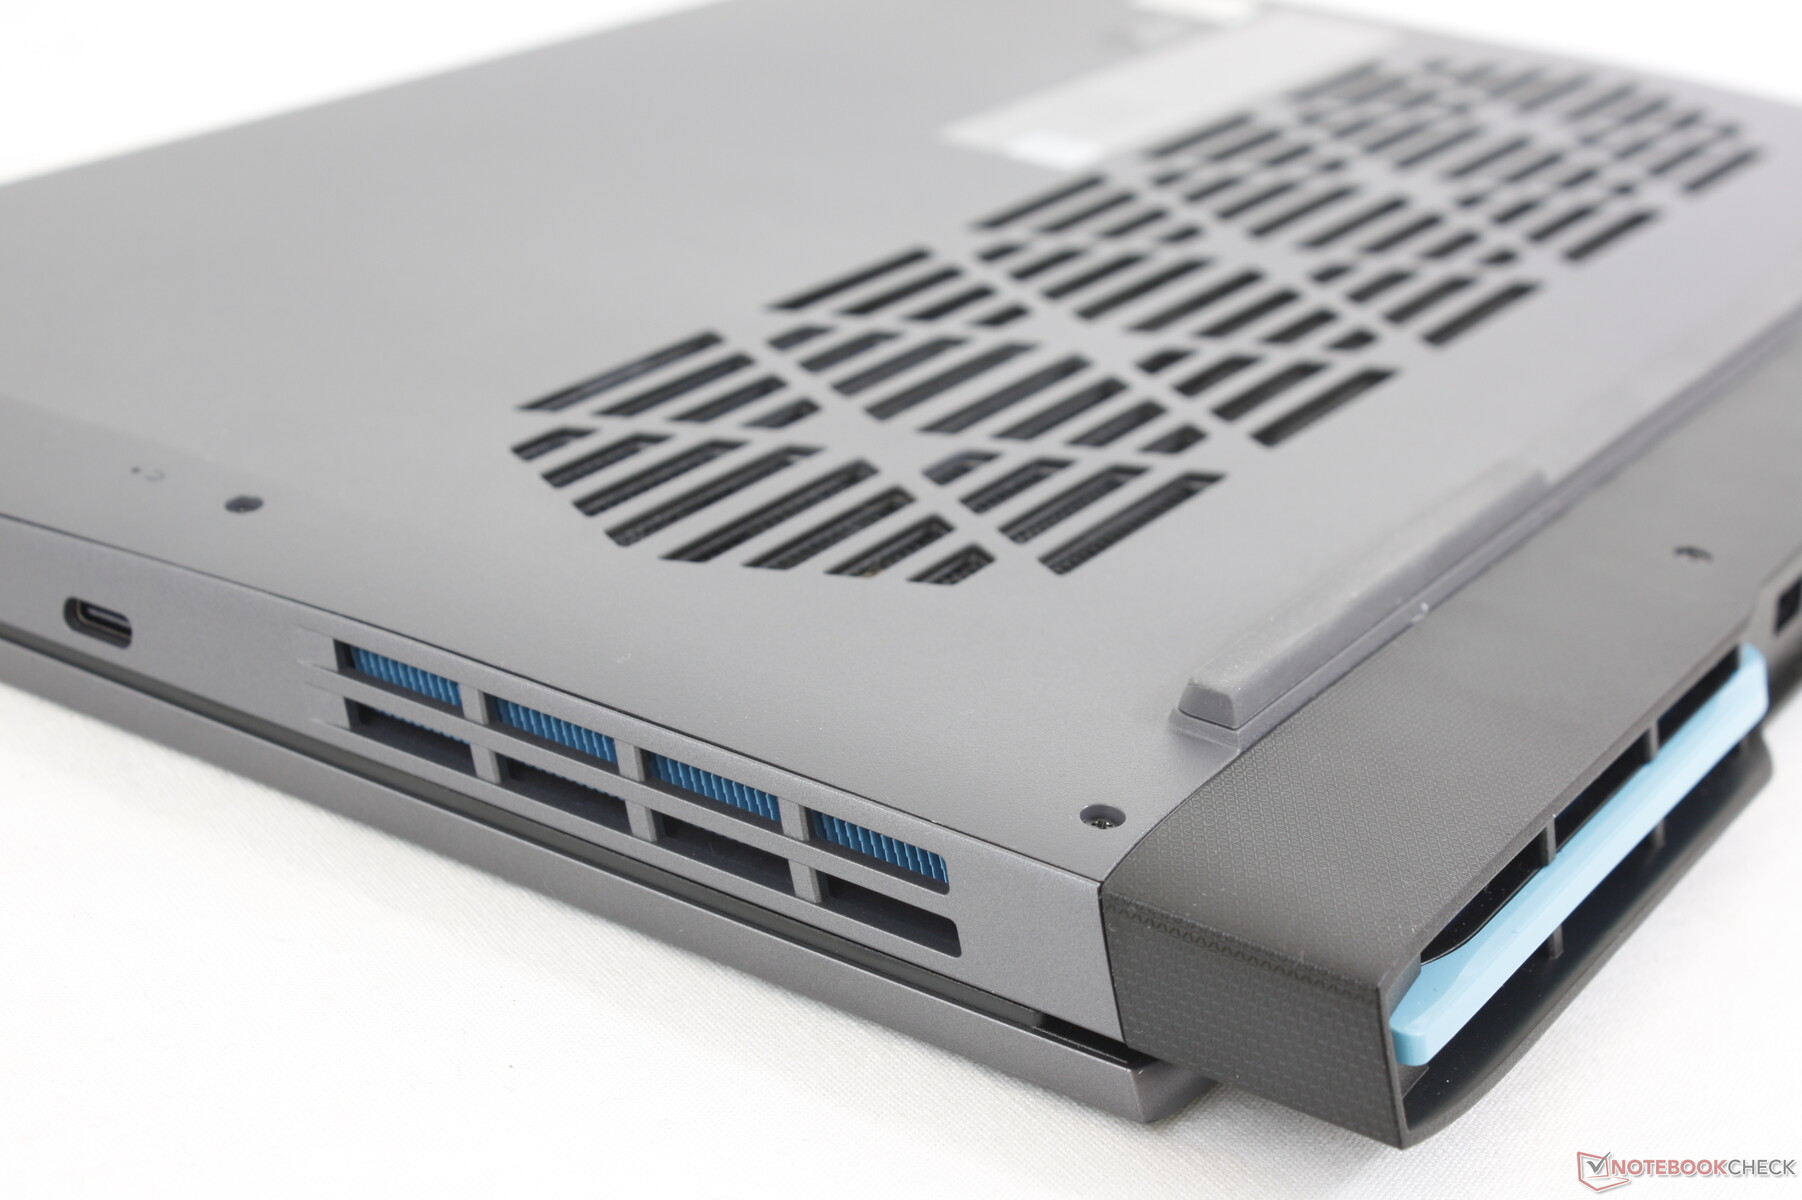
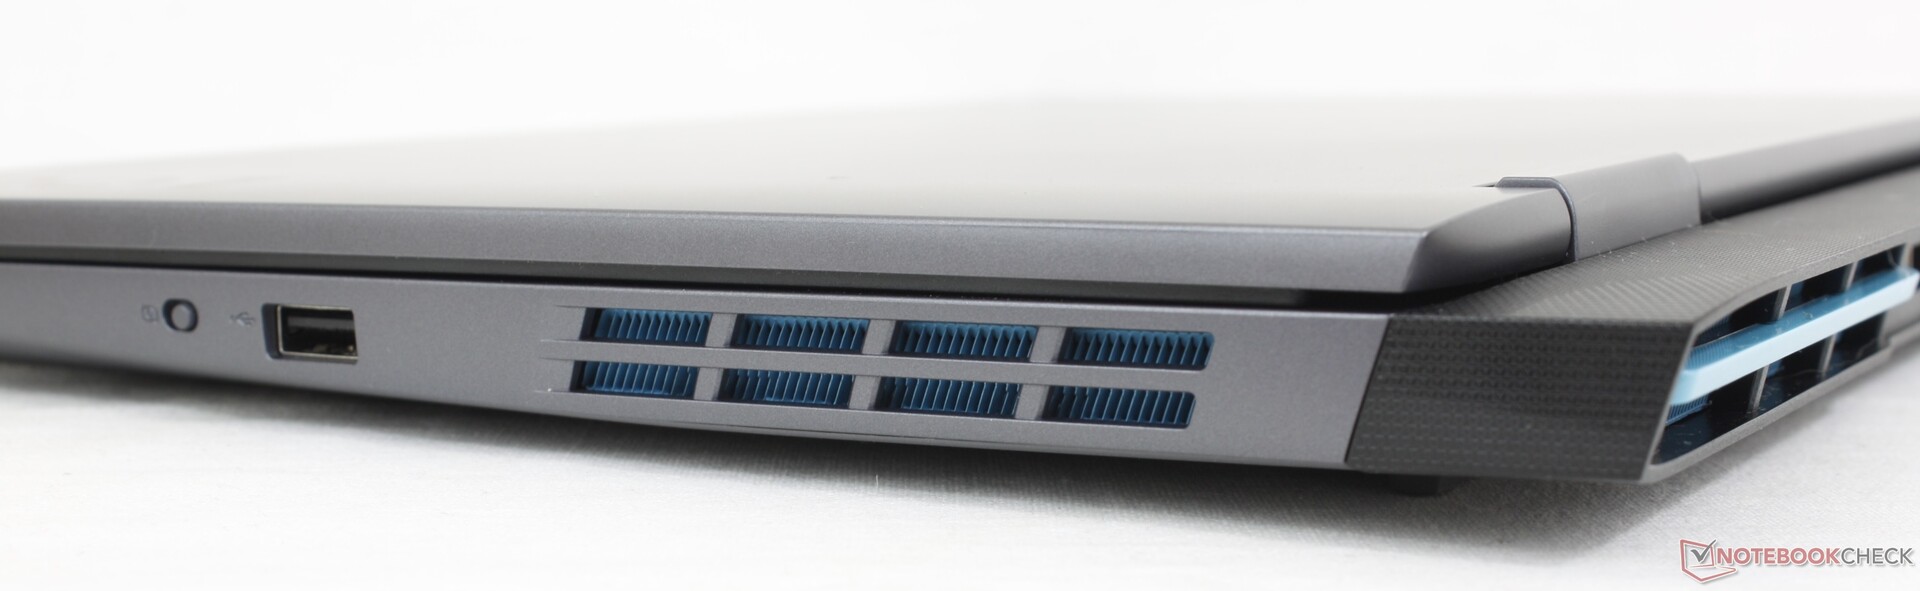
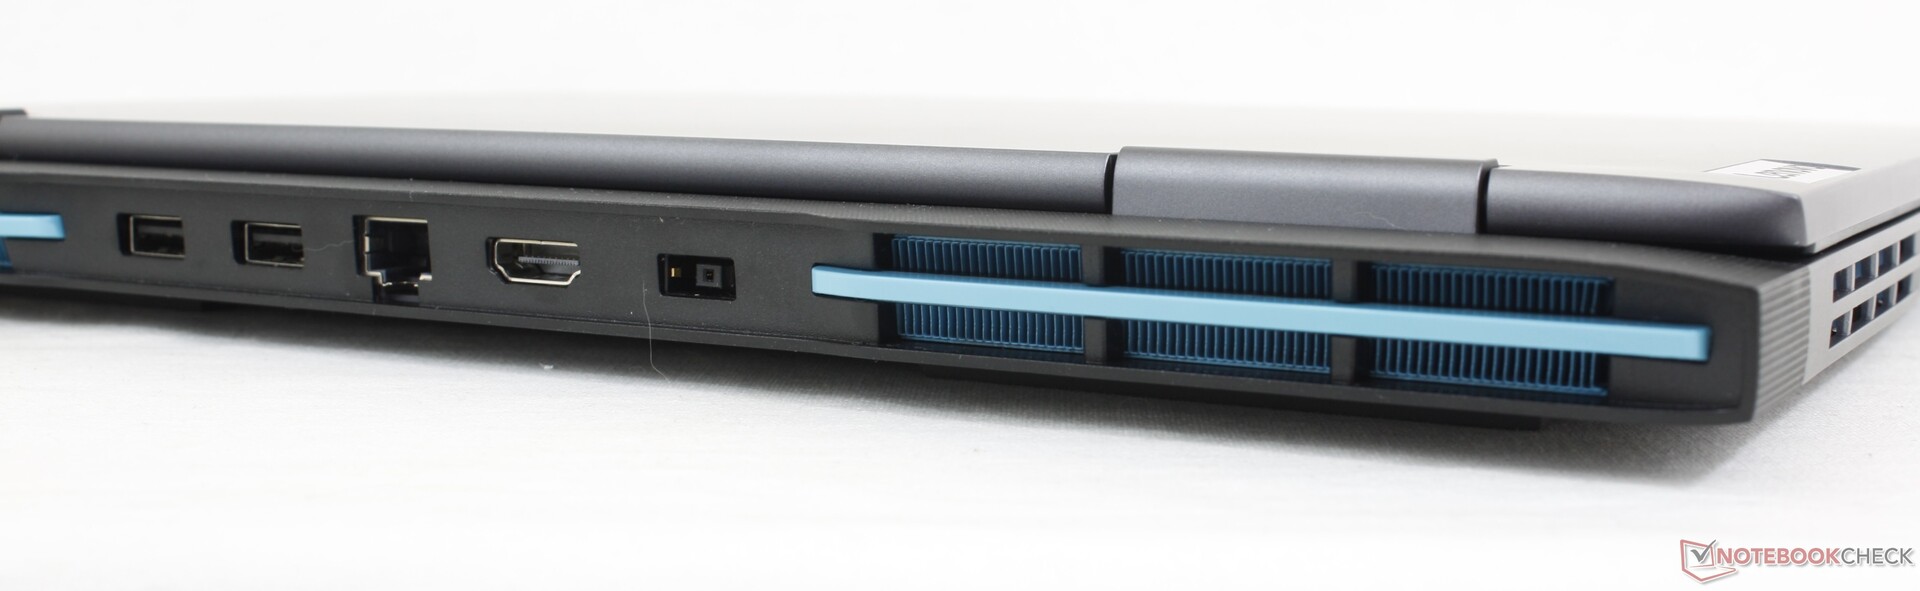
Conectividade - Sem USB4 ou Thunderbolt
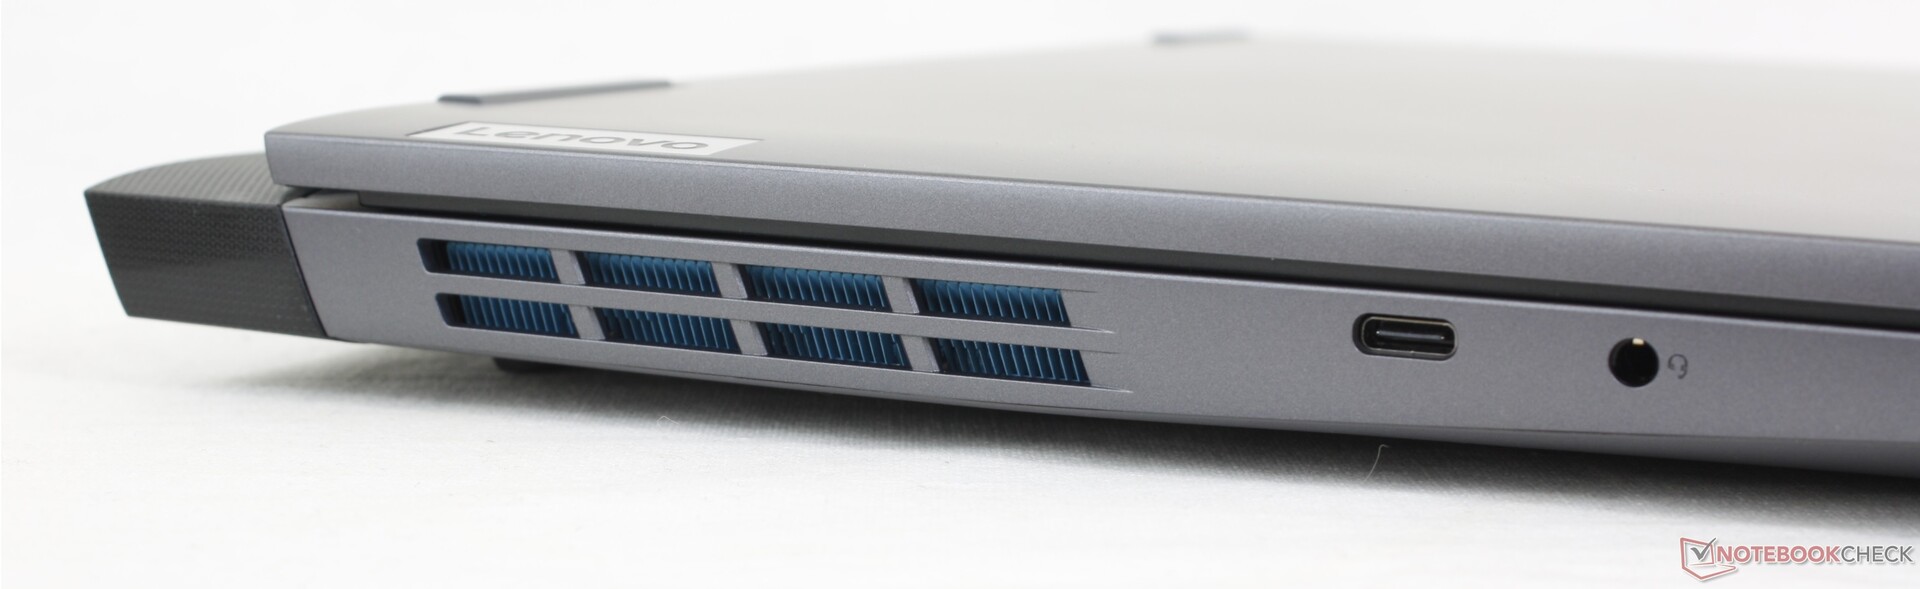
As opções de portas incluem tudo o que foi oferecido no IdeaPad Gaming 3 15 do ano passado, além de uma porta USB-A adicional. A maioria das portas está na parte traseira, mas a única porta USB-C foi movida para a borda esquerda desta vez para facilitar o acesso.
Comunicação
O Realtek RTL8852BE oferece conectividade Wi-Fi 6 e Bluetooth 5.1, sem suporte a Wi-Fi 6E ou 6 GHz, provavelmente para economizar nos custos. Mesmo assim, as taxas de transferência são estáveis e confiáveis quando emparelhadas com o roteador de teste Asus AXE11000.
| Networking | |
| iperf3 transmit AXE11000 | |
| MSI Cyborg 15 A12VF | |
| Dell G15 5530 | |
| Lenovo Legion 5 15IAH7H 82RB | |
| Asus TUF A15 FA507 | |
| Lenovo LOQ 15APH8 | |
| HP Victus 15 fa0020nr | |
| iperf3 receive AXE11000 | |
| MSI Cyborg 15 A12VF | |
| Dell G15 5530 | |
| Lenovo Legion 5 15IAH7H 82RB | |
| Asus TUF A15 FA507 | |
| HP Victus 15 fa0020nr | |
| Lenovo LOQ 15APH8 | |
| iperf3 transmit AXE11000 6GHz | |
| Lenovo Legion 5 15IAH7H 82RB | |
| iperf3 receive AXE11000 6GHz | |
| Lenovo Legion 5 15IAH7H 82RB | |
Webcam
A webcam de 2 MP é uma atualização das webcams de 1 MP das séries mais antigas Legion 5 15 ou IdeaPad Gaming 15. Um interruptor de desativação da câmera está incluído, mas o IR não está presente.


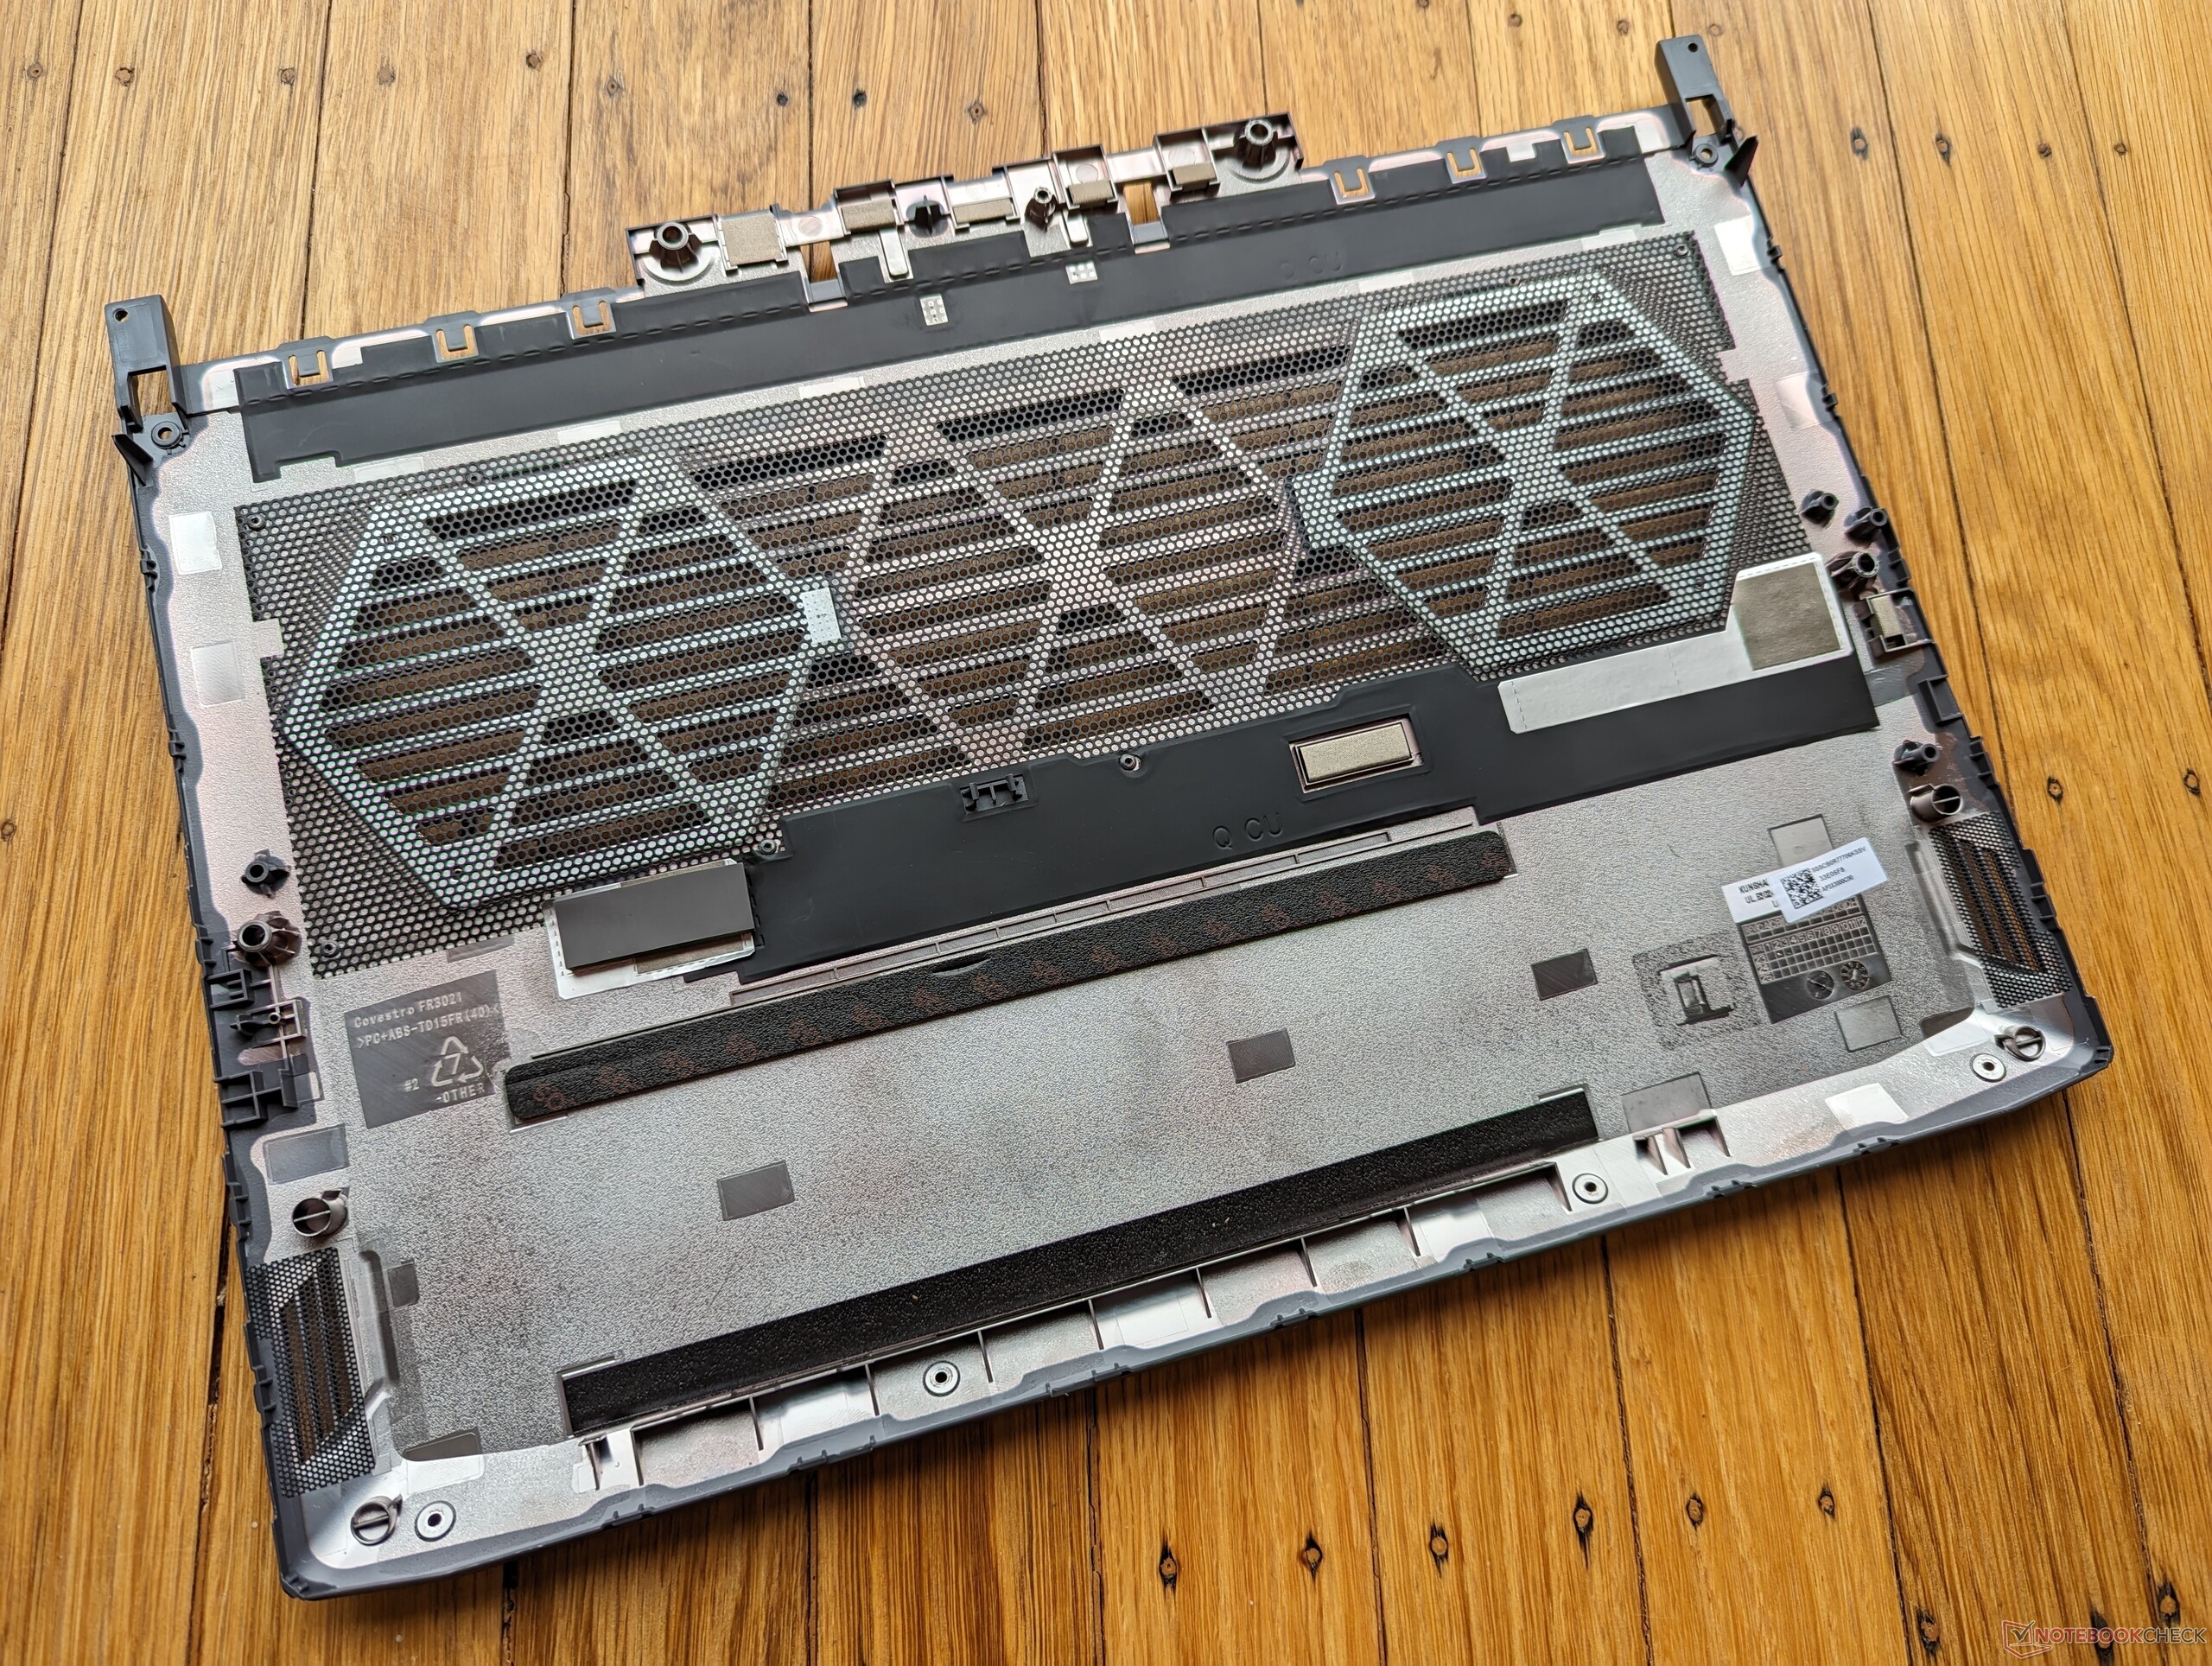
Manutenção
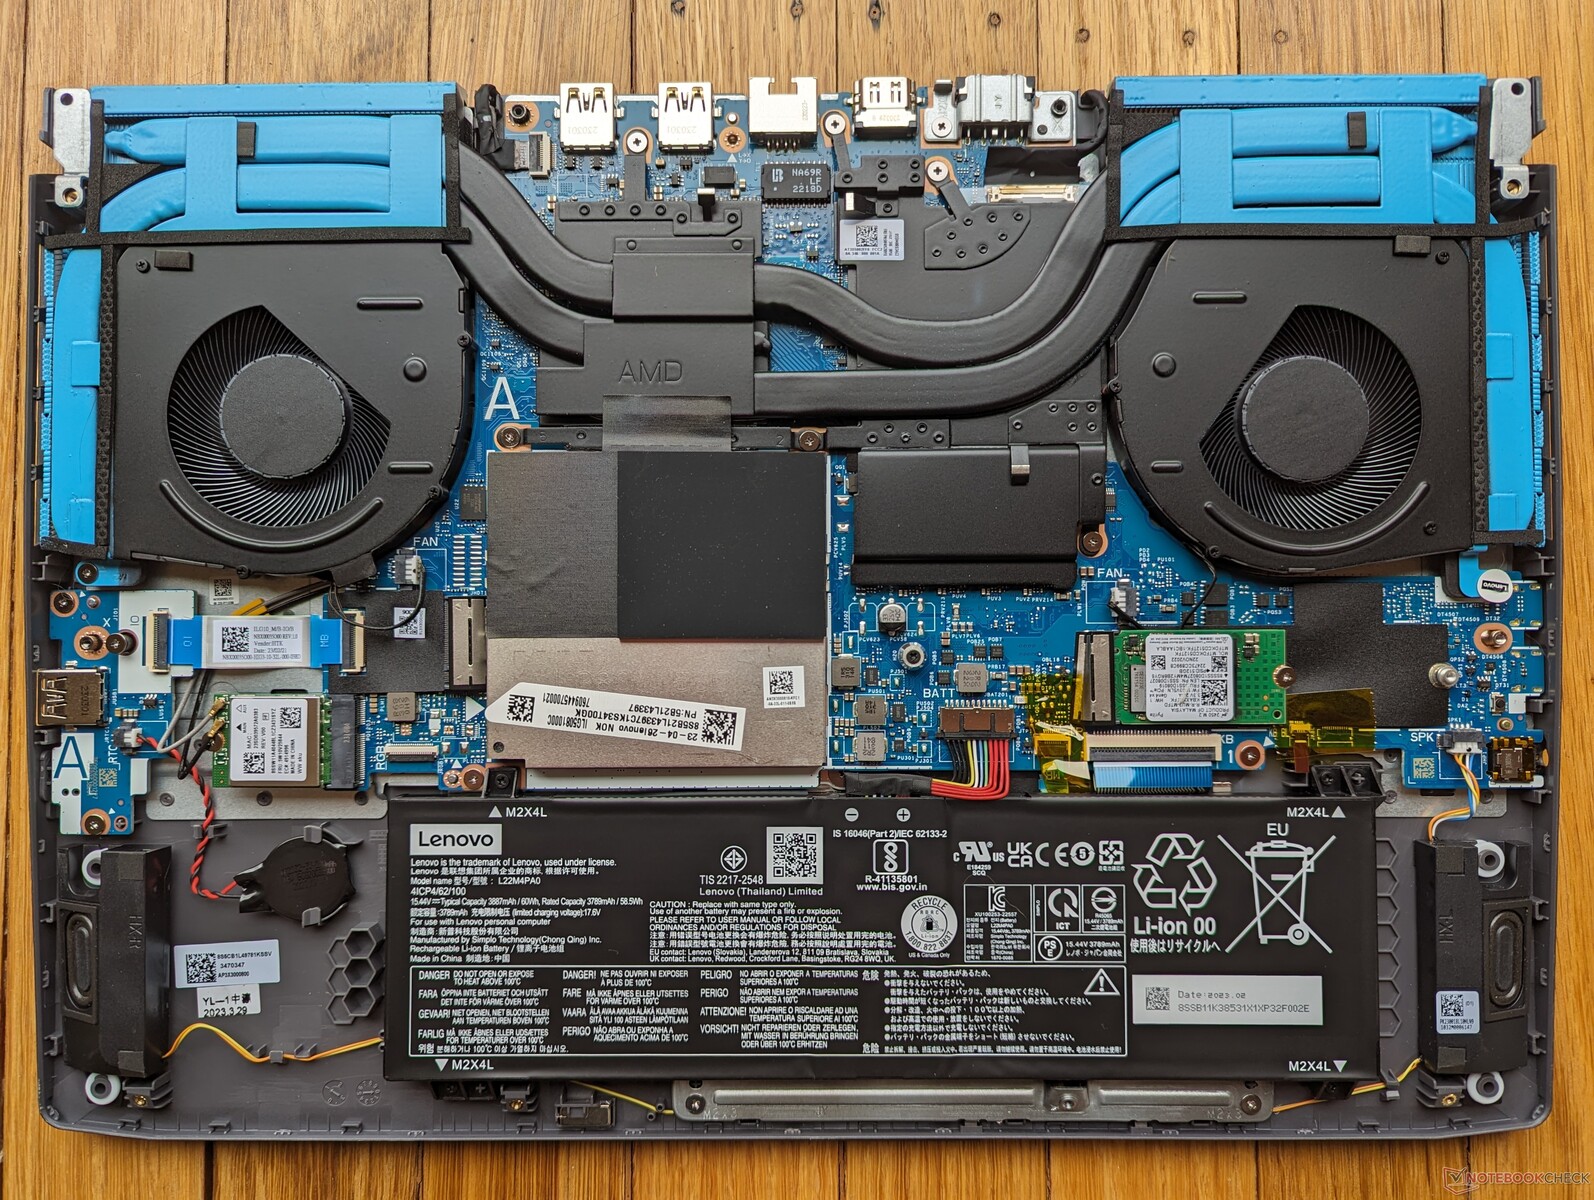
As atualizações para o usuário final exigem um pouco mais de esforço do que na maioria dos outros laptops para jogos, pois a parte traseira do chassi deve ser removida antes que o painel inferior possa ser retirado. Um total de 13 parafusos Phillips prendem as partes inferior e traseira.
Acessórios e garantia
Não há extras na caixa além do adaptador CA e da documentação. A garantia padrão limitada de um ano do fabricante se aplica se for comprada nos EUA.
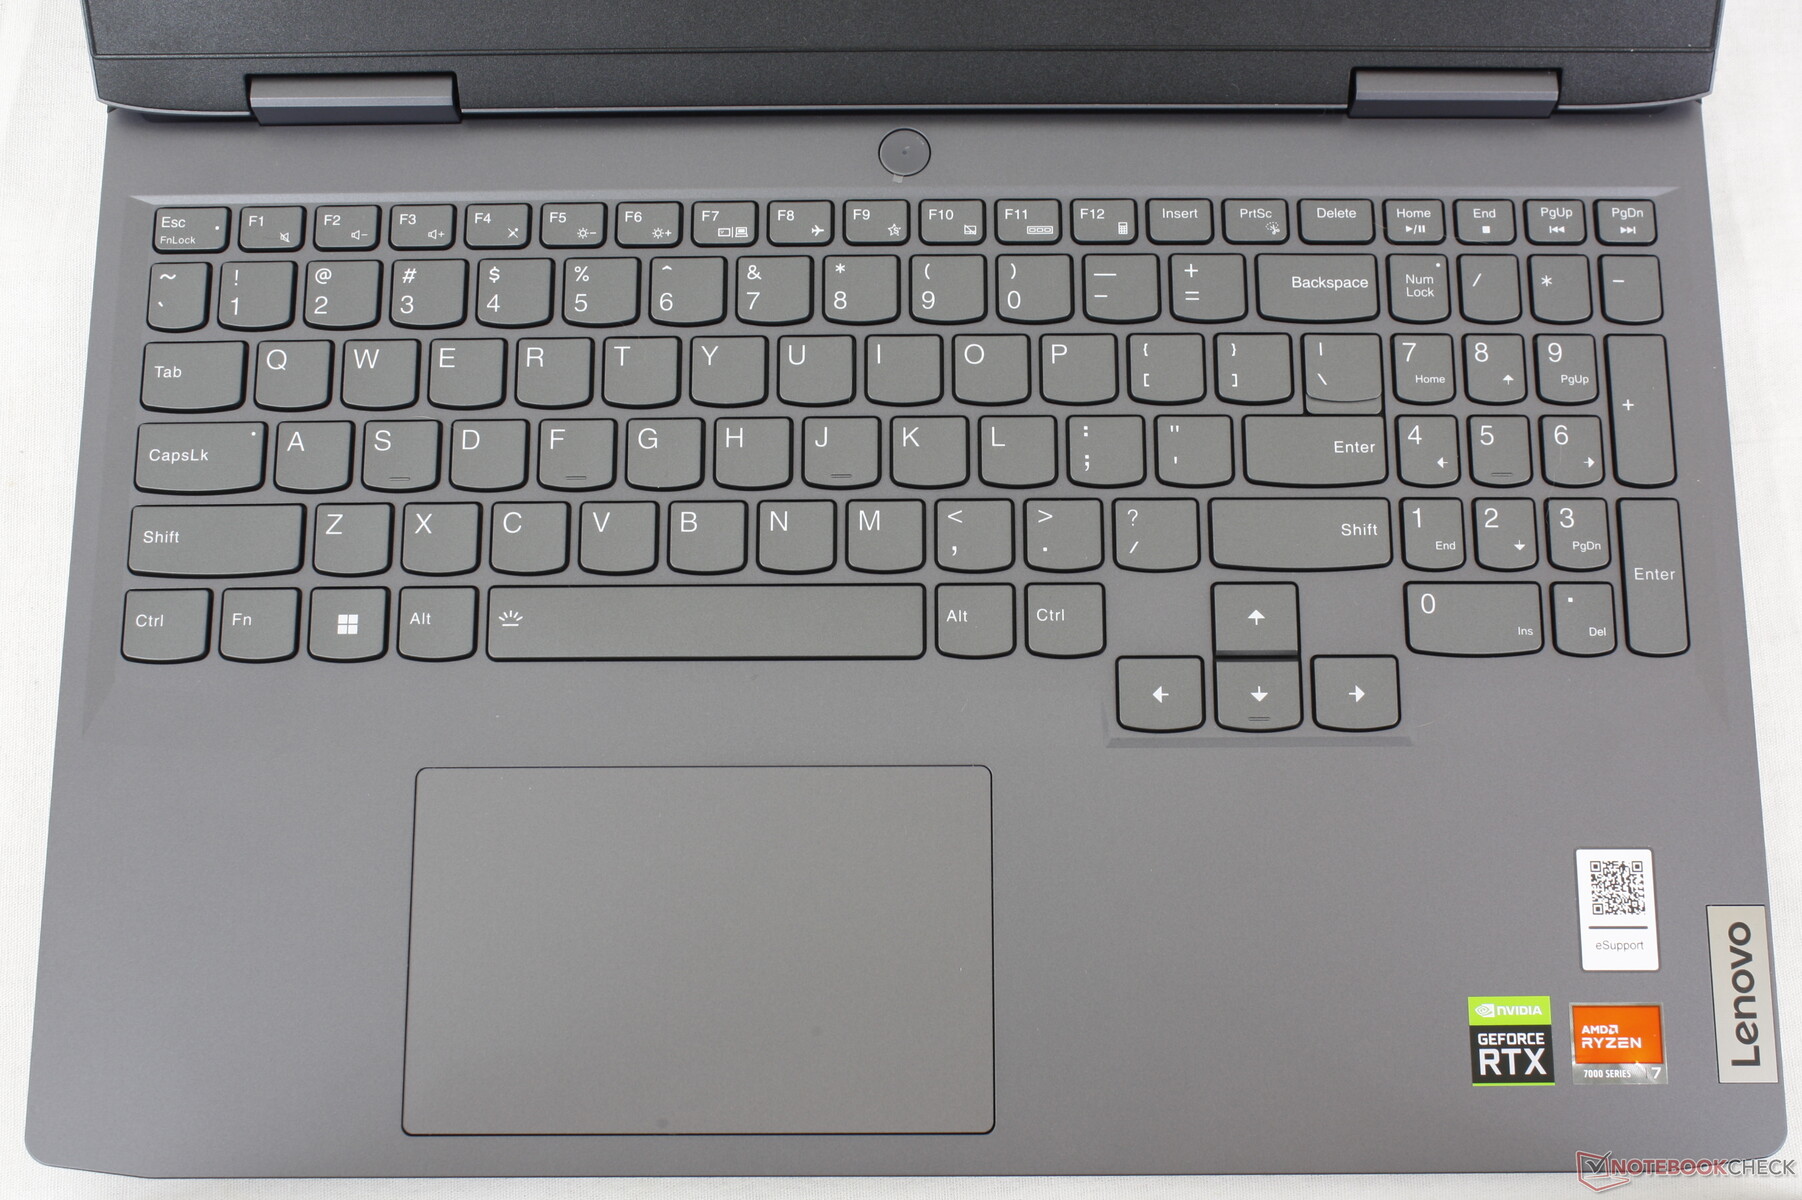
Dispositivos de entrada - Muito parecido com um IdeaPad
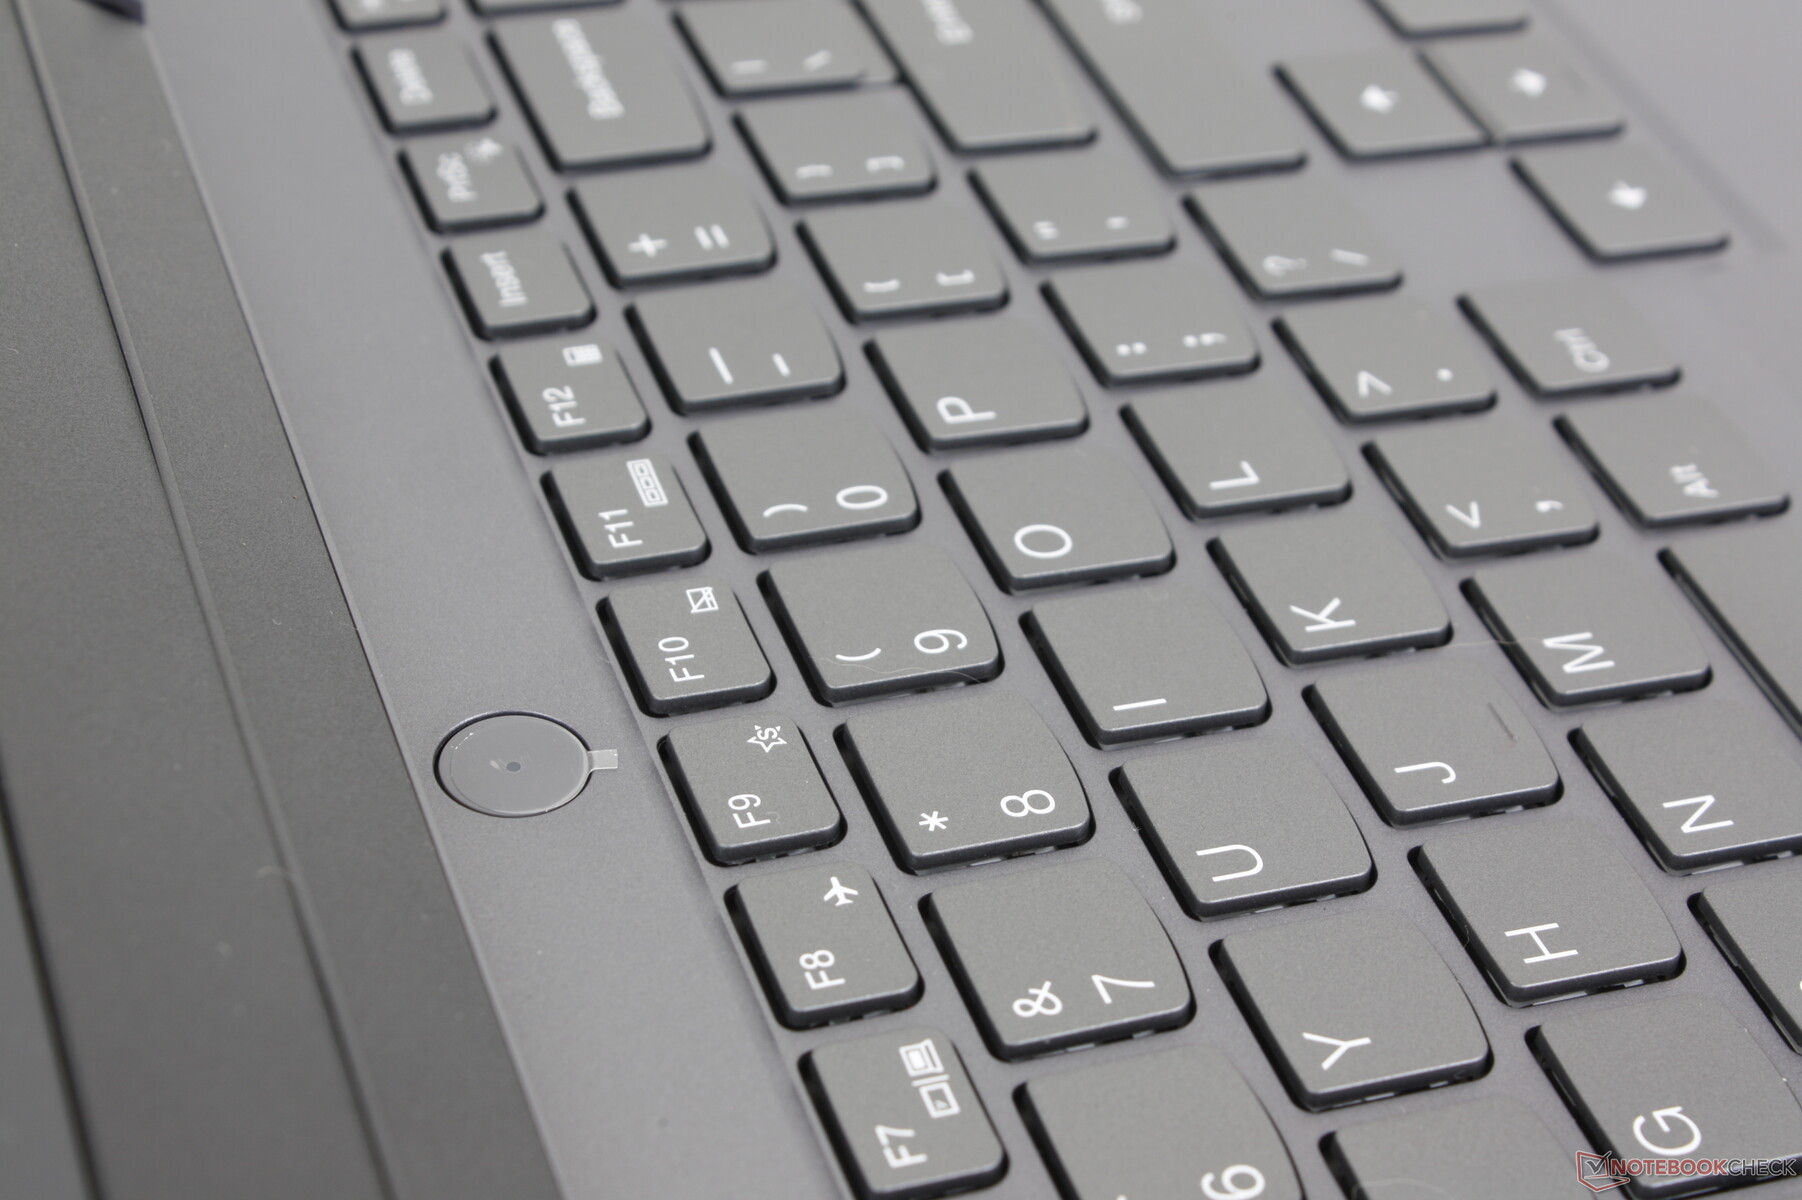
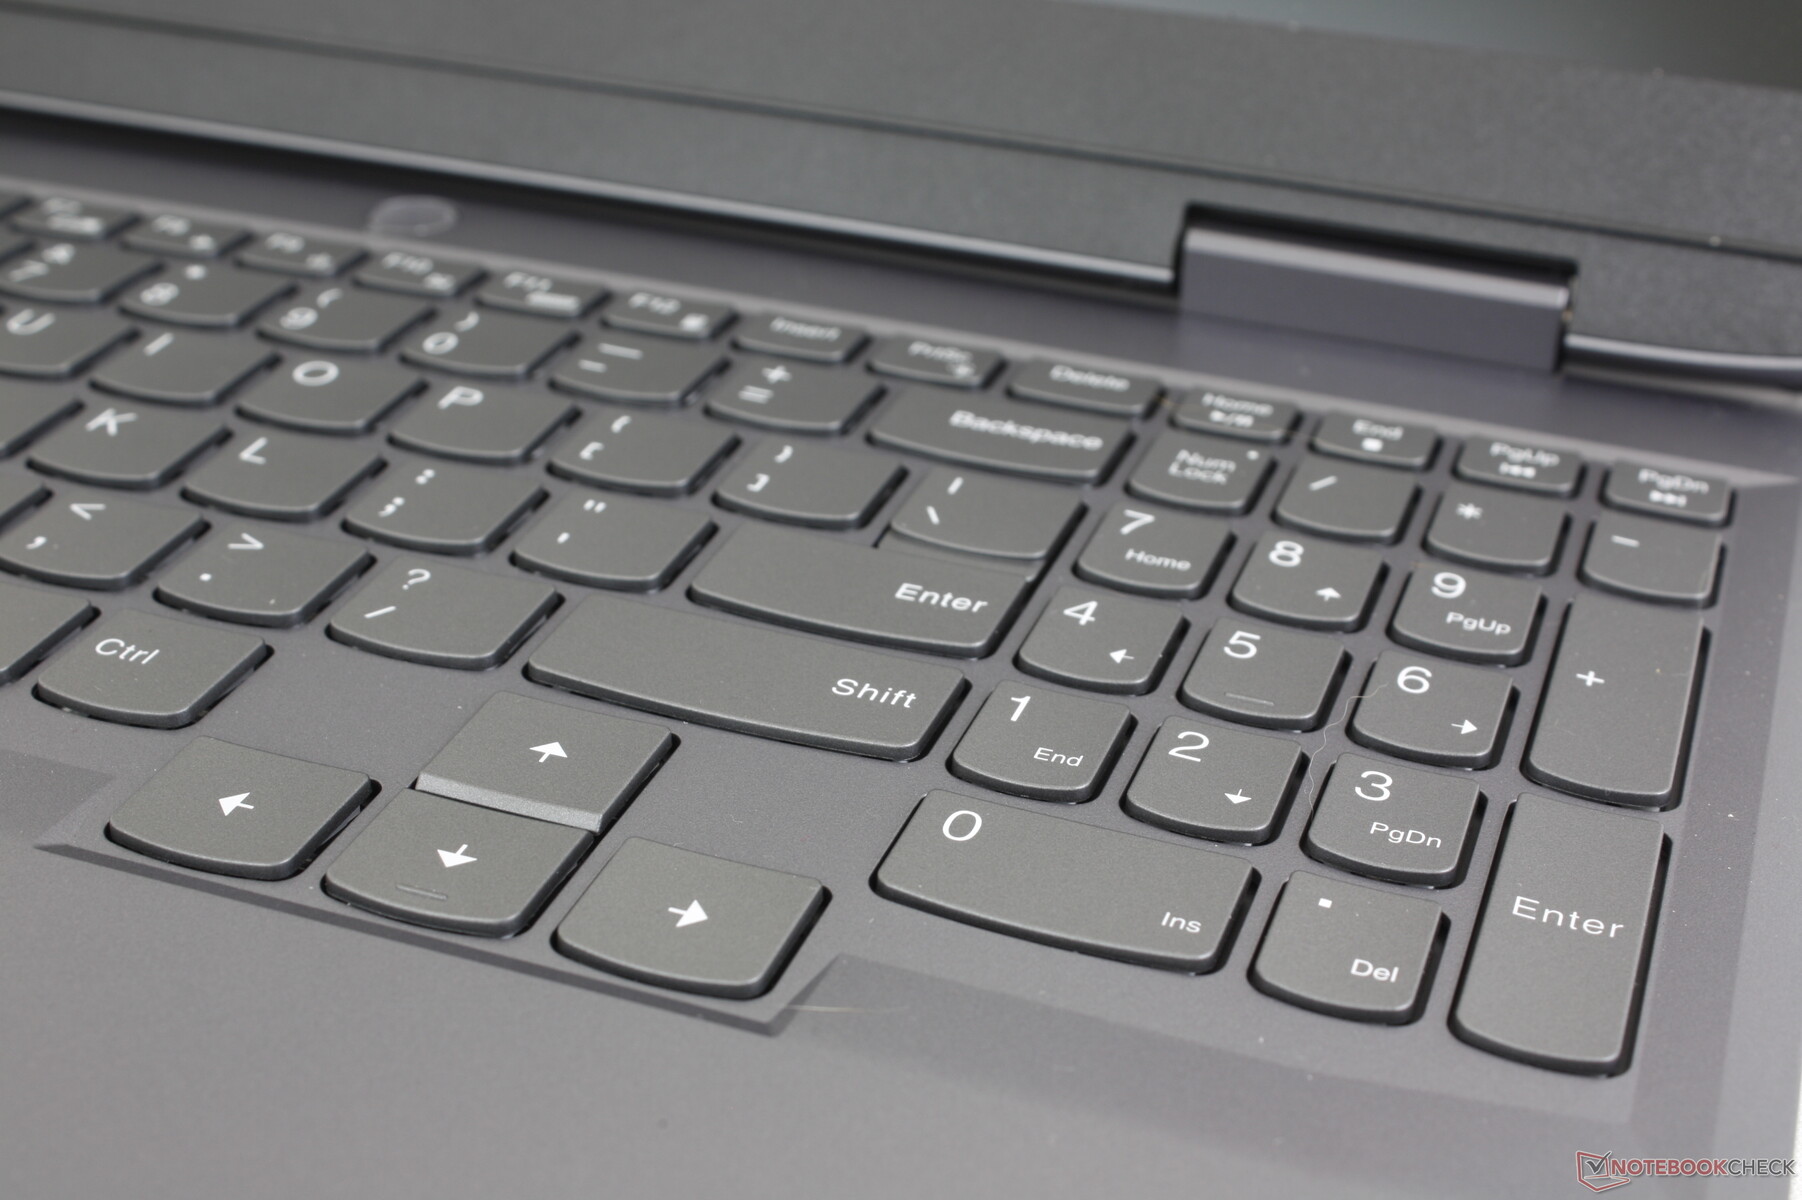
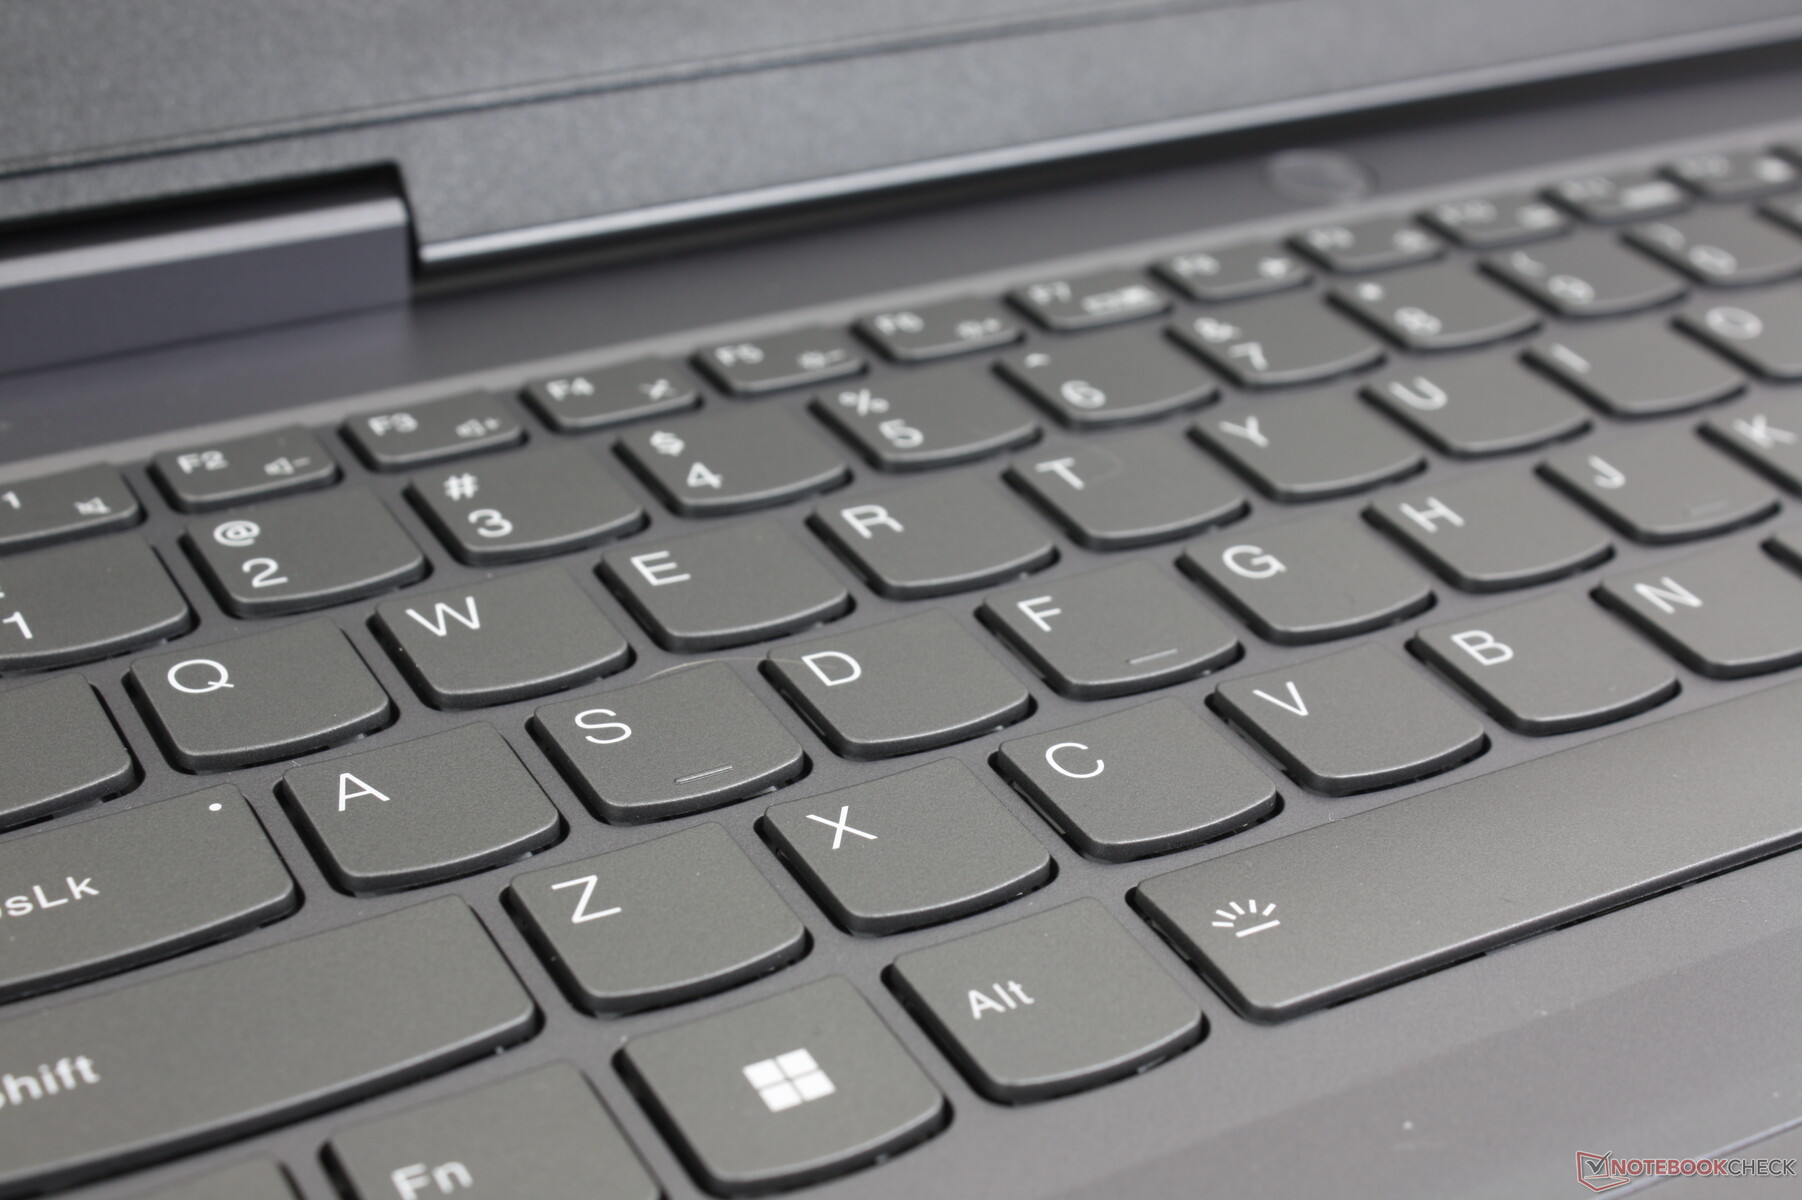
Teclado
O teclado permanece idêntico ao do IdeaPad Gaming 3 15 apesar da mudança de nome. Se você já digitou em um laptop IdeaPad ou Yoga no passado, o teclado do LOQ 15 lhe parecerá imediatamente familiar. Subjetivamente, as teclas do LOQ 15 parecem um pouco mais firmes e clicáveis do que o normal, proporcionando uma experiência de digitação melhor do que a de um Asus VivoBook ou HP Pavilion 15.
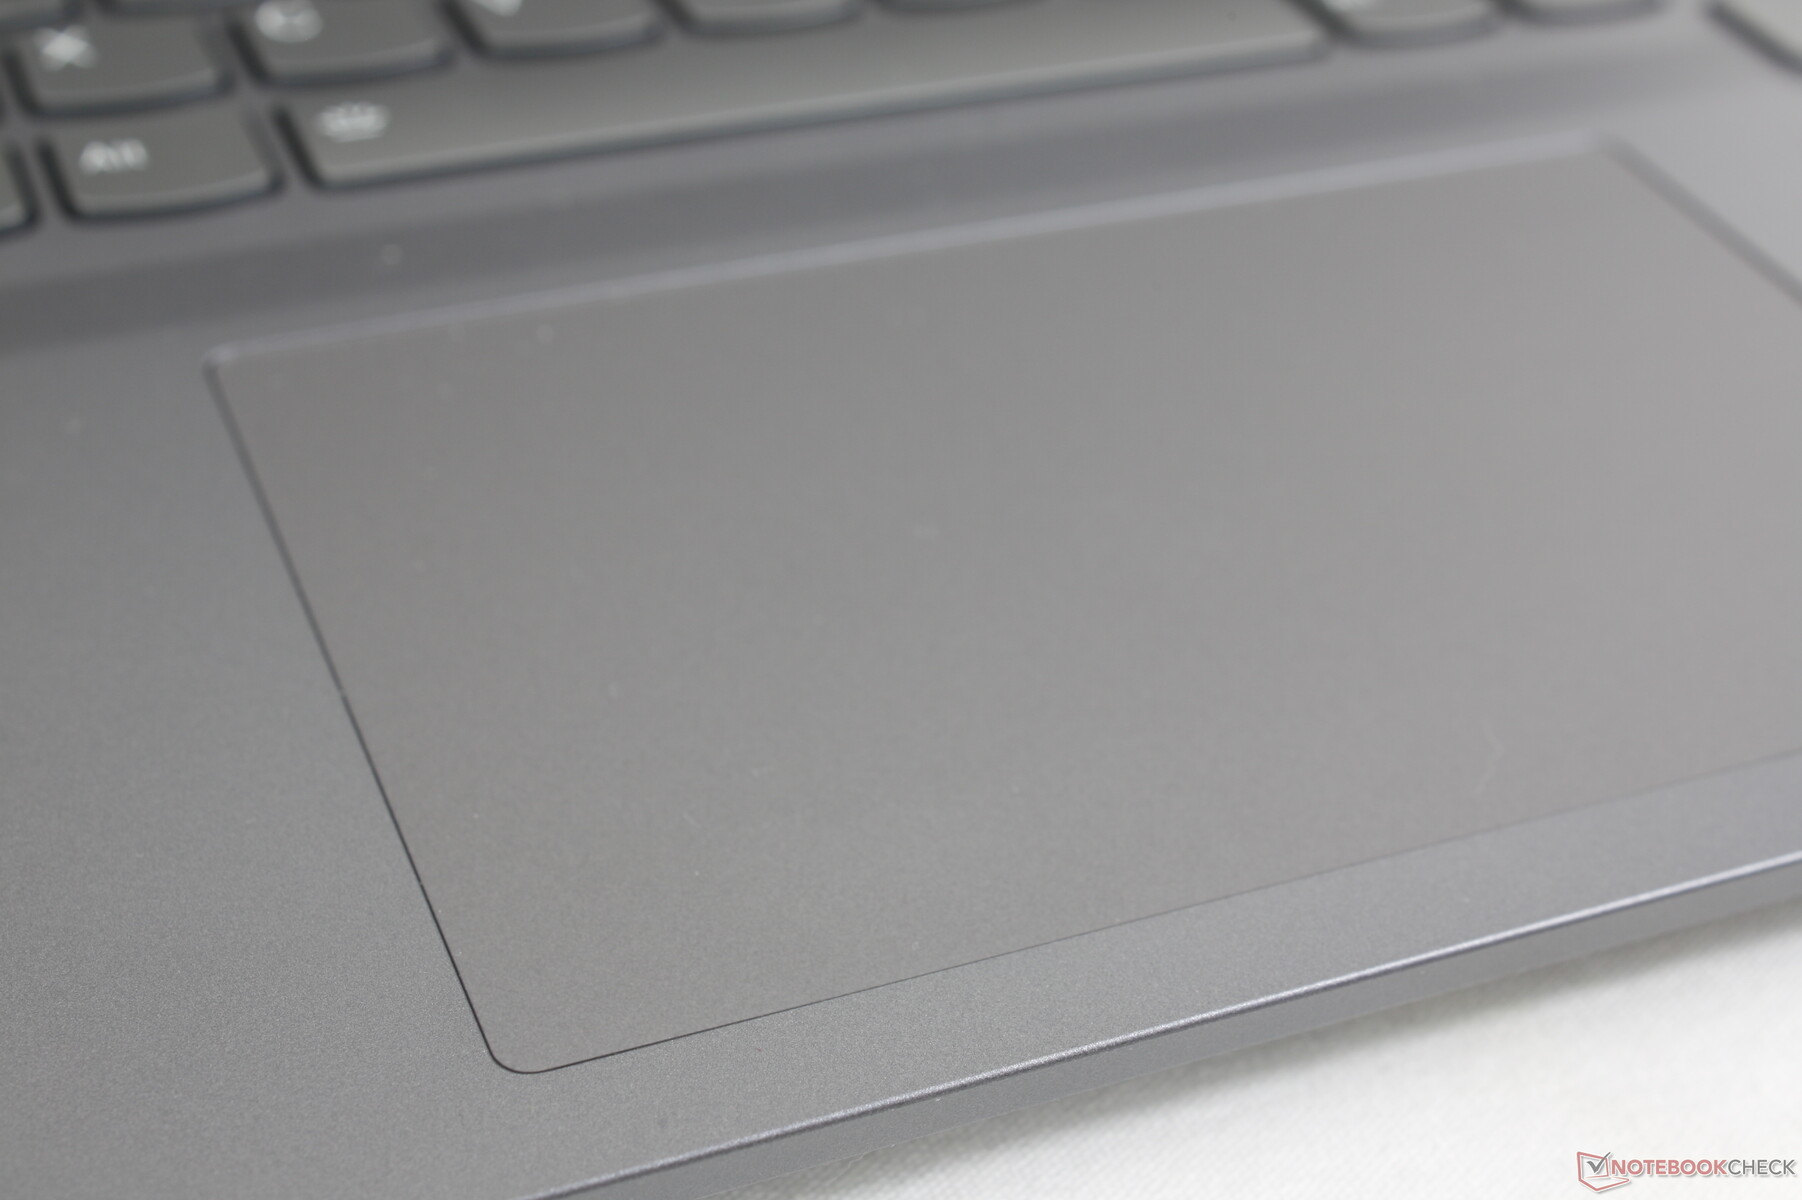
Touchpad
O clickpad é um pouco menor do que o do IdeaPad Gaming 3 15 do ano passado (12 x 7,5 cm vs. 12,5 x 7,5 cm). No entanto, o clickpad do LOQ 15 parece mais firme e mais sensível do que o clickpad do IdeaPad, o que o torna mais agradável de usar. O ruído é visivelmente mais alto como resultado do feedback mais nítido.
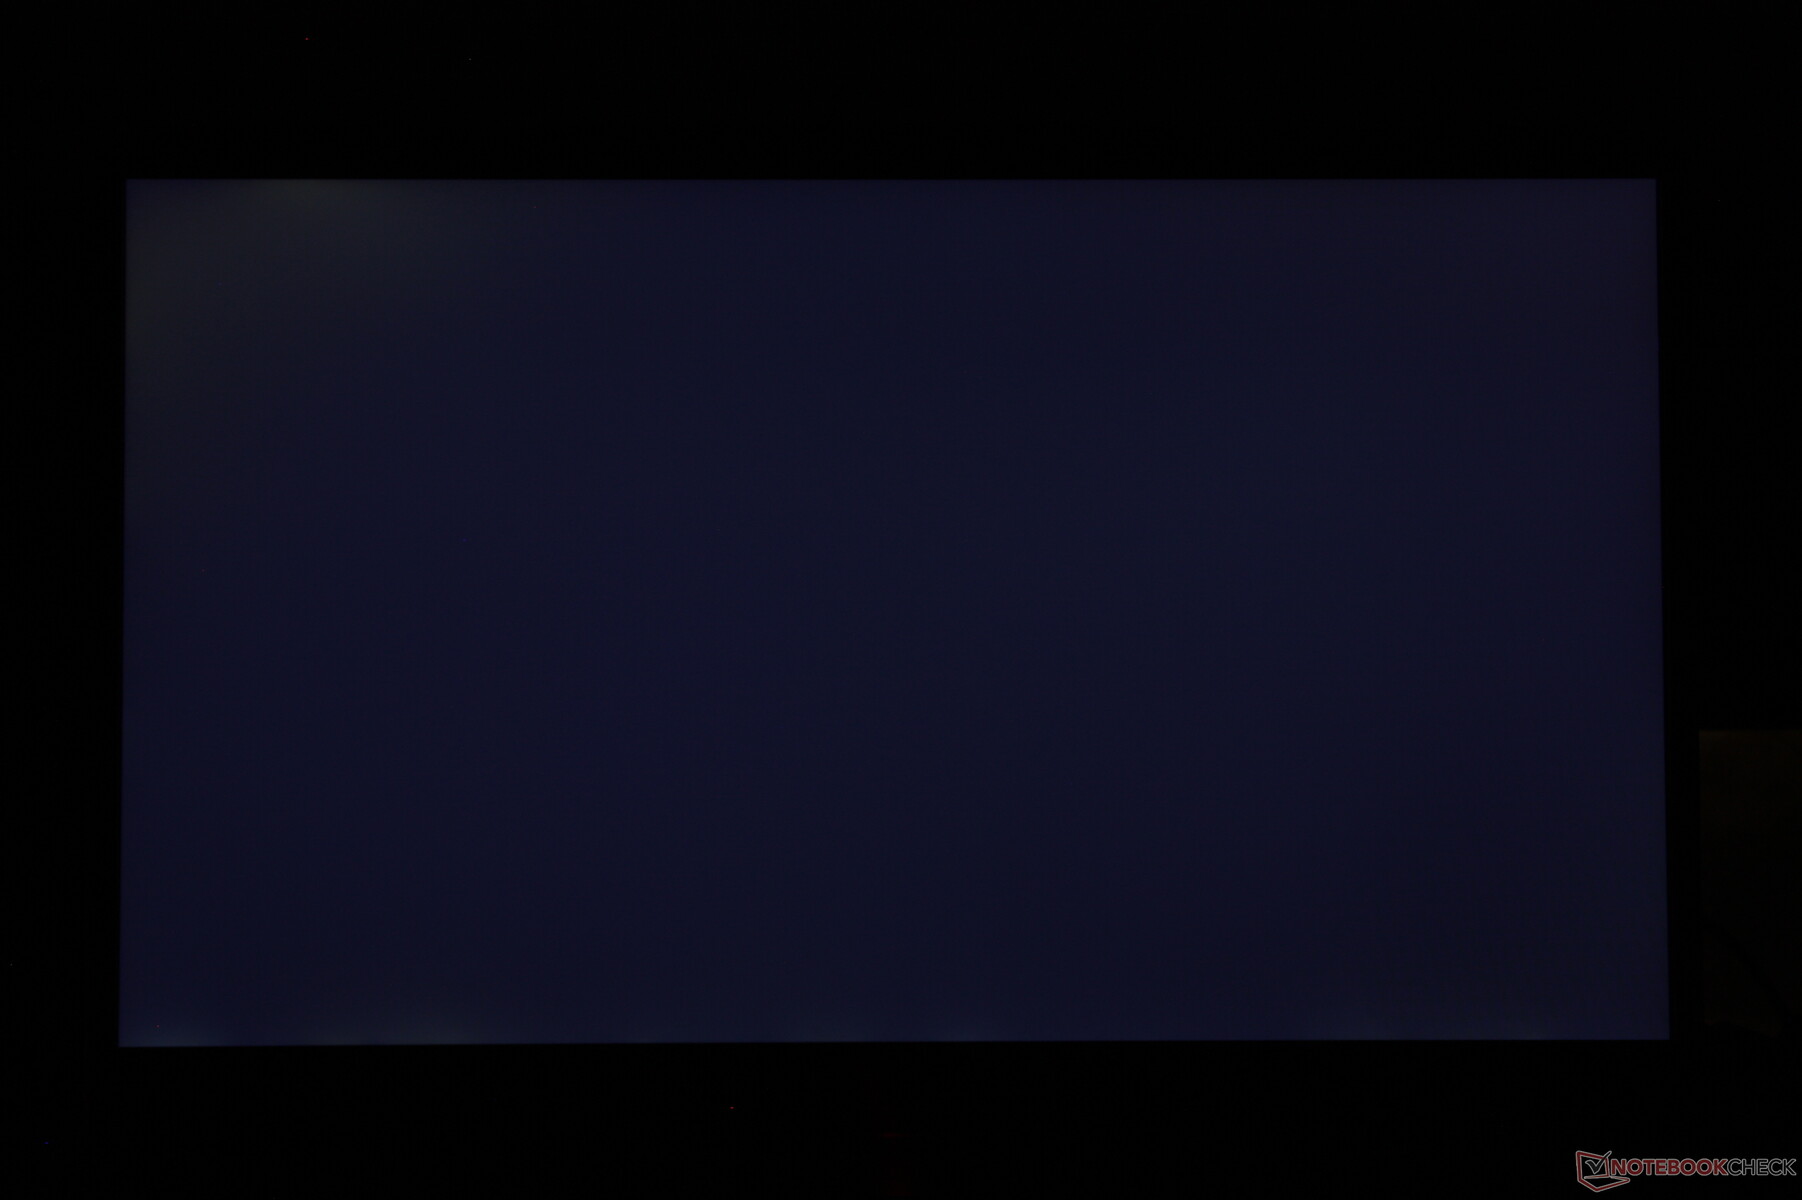
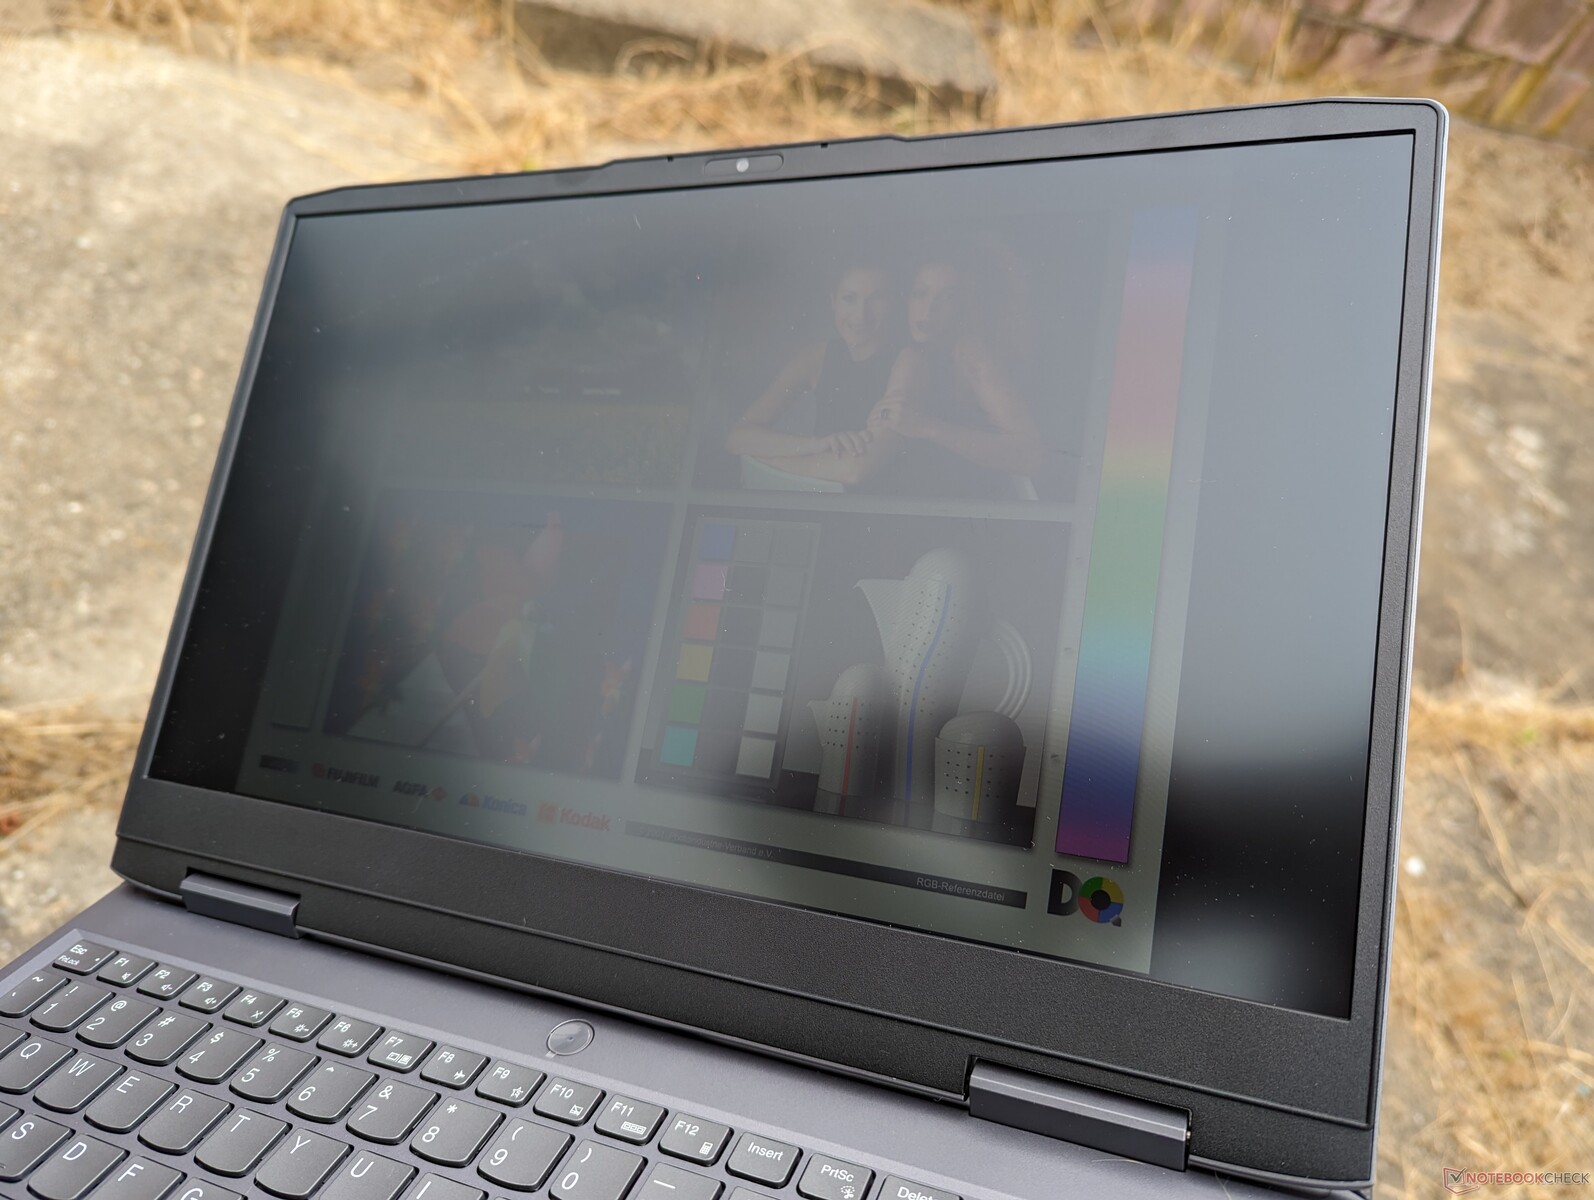
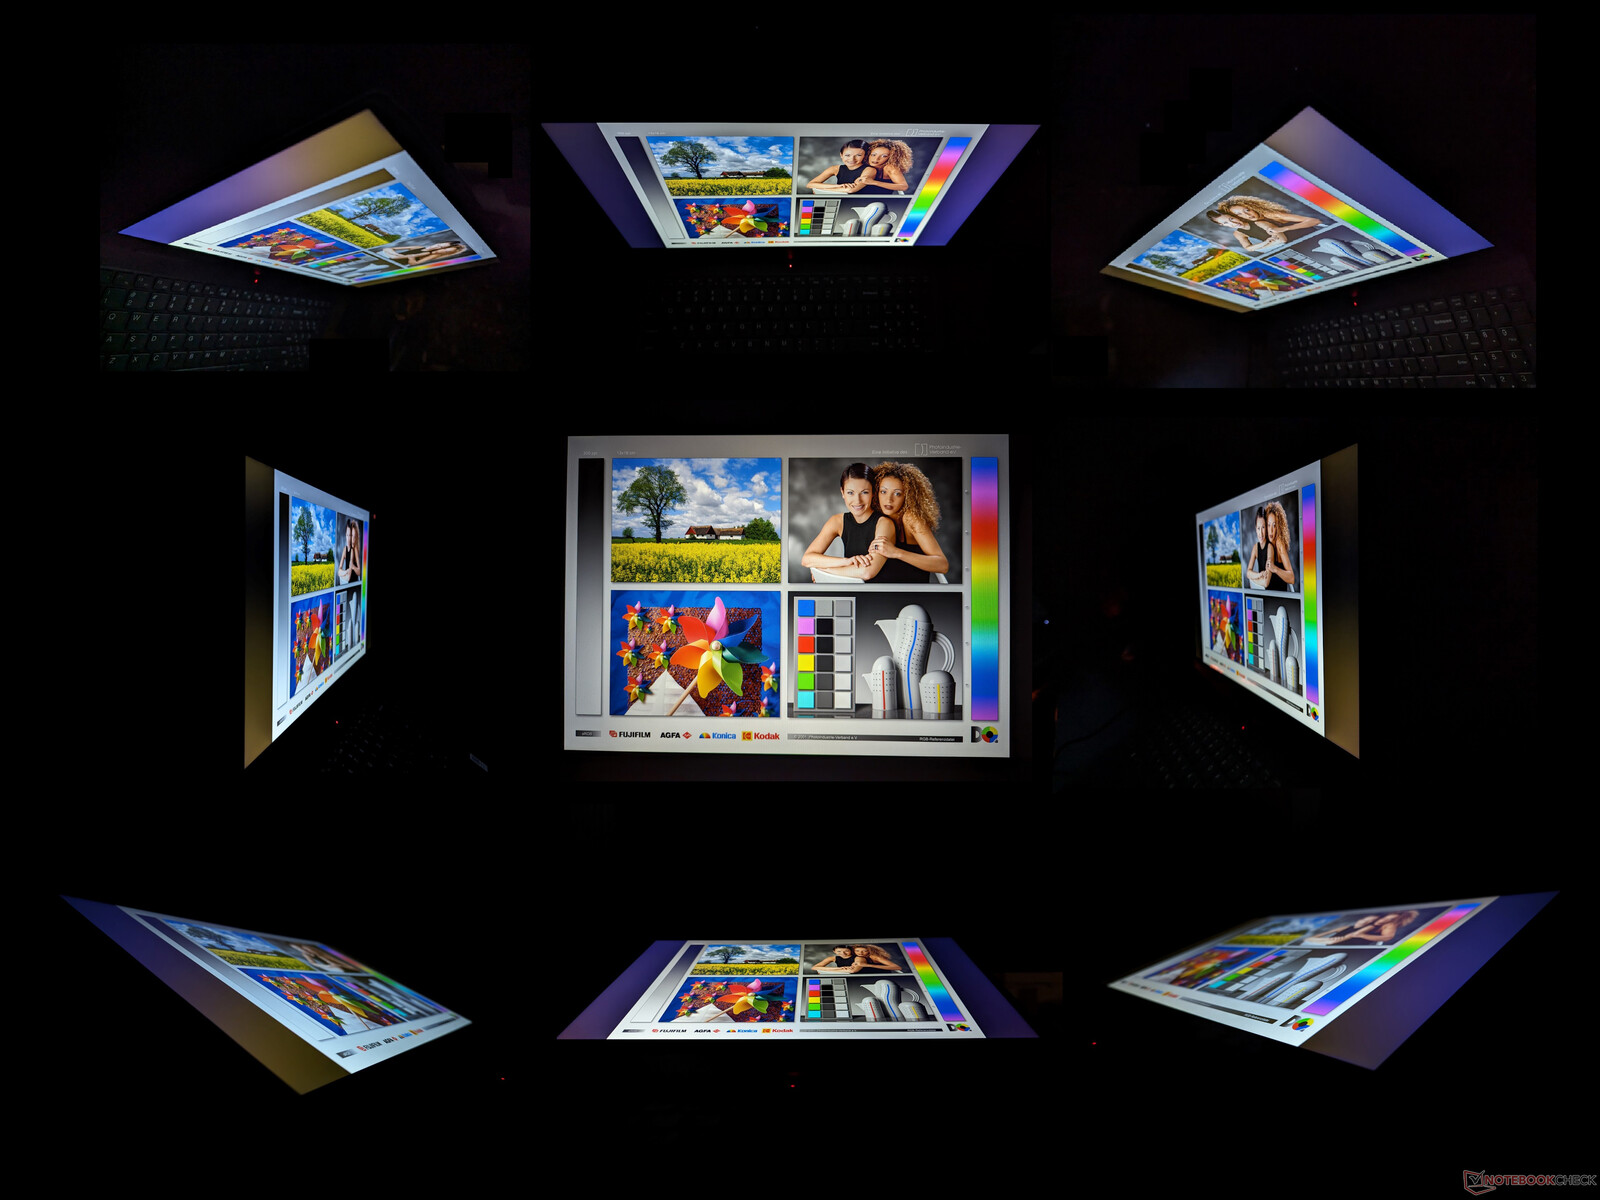
Tela - 1080p combina bem com a GeForce RTX 4050
Há três configurações de tela disponíveis, todas com painéis IPS:
- 1080p, 300 nits, 60% sRGB, 60 Hz
- 1080p, 350 nits, 60% sRGB, 144 Hz, Advanced Optimus, G-Sync
- 1440p, 350 nits, 100% sRGB, 165 Hz, Advanced Optimus, G-Sync
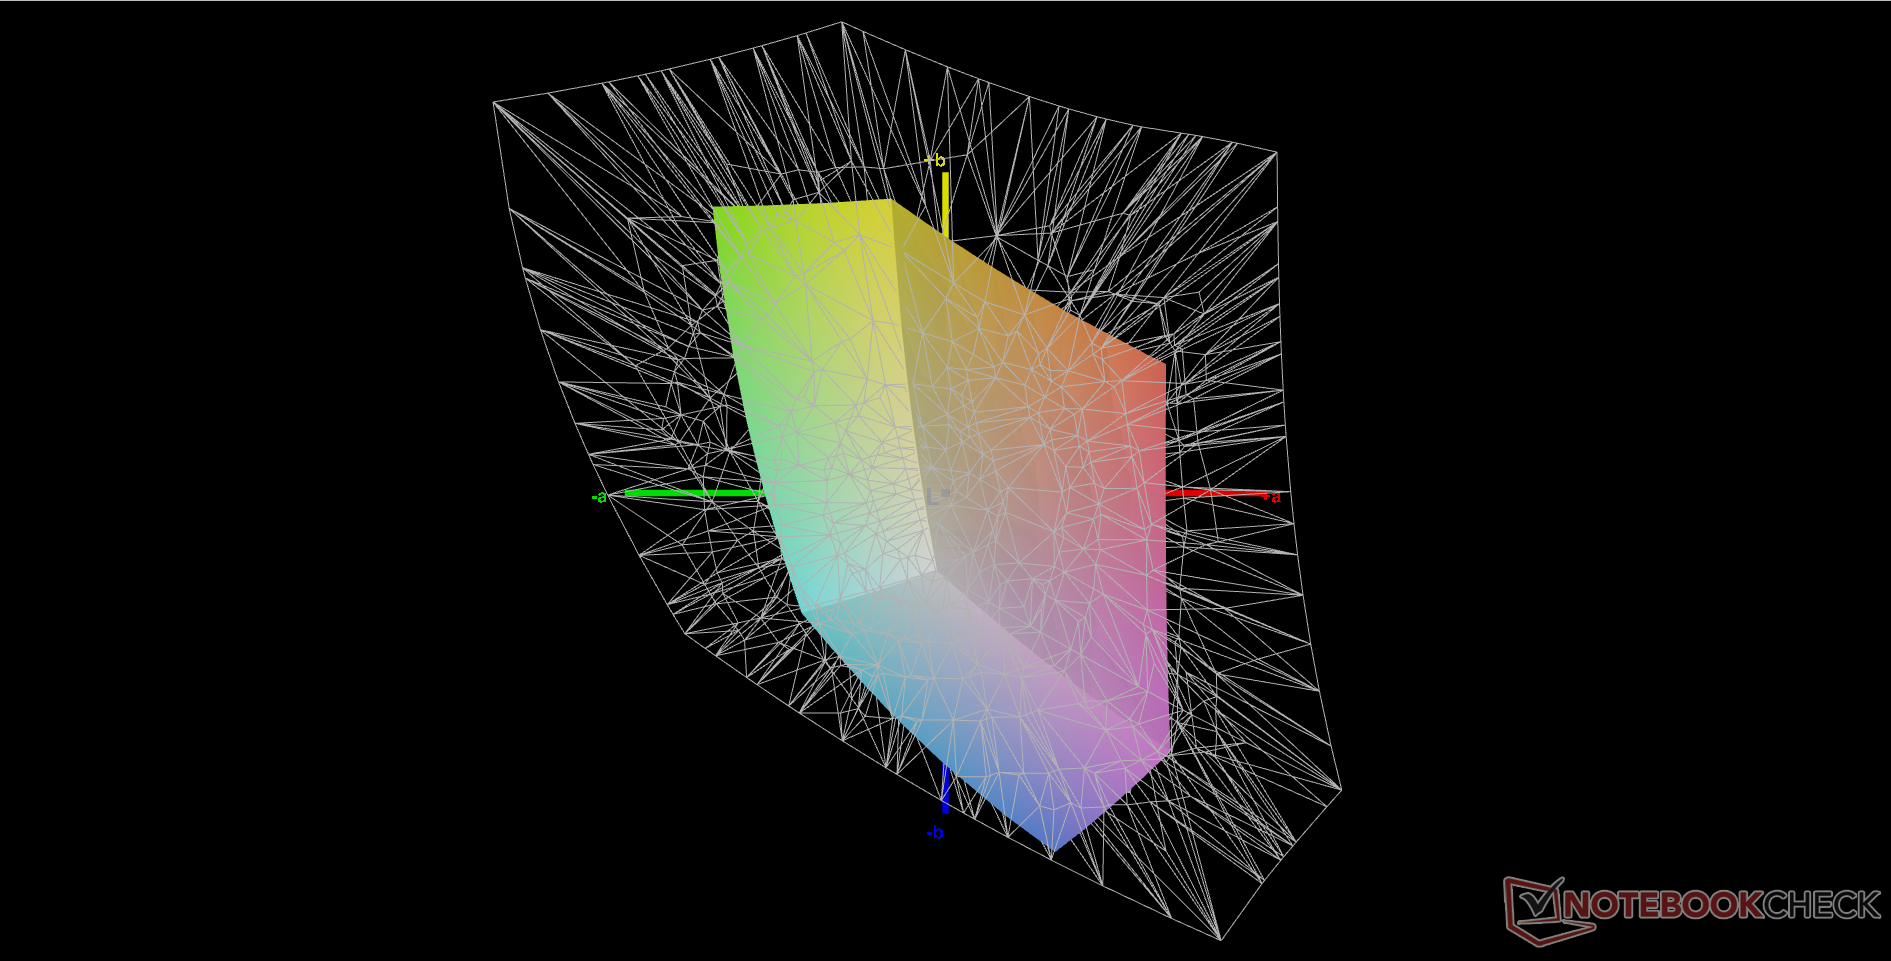
Nossa configuração e medições refletem apenas a opção em negrito acima. Embora 1080p seja suficiente para uma máquina de jogos barata, a cobertura limitada de cores e os tempos de resposta relativamente lentos são imediatamente perceptíveis por meio de cores mais rasas e fantasmas, respectivamente. Se você gosta de edição de gráficos ou de jogos de tiro em primeira pessoa, é recomendável conectar um monitor externo com cores melhores e tempos de resposta mais rápidos ou selecionar a opção de painel de 1440p de qualidade superior. Os concorrentesAsus TUF A15 da Asus, oferece um painel de 1080p com cobertura total de sRGB, enquanto o Lenovo não oferece.

| |||||||||||||||||||||||||
iluminação: 81 %
iluminação com acumulador: 346.2 cd/m²
Contraste: 1117:1 (Preto: 0.31 cd/m²)
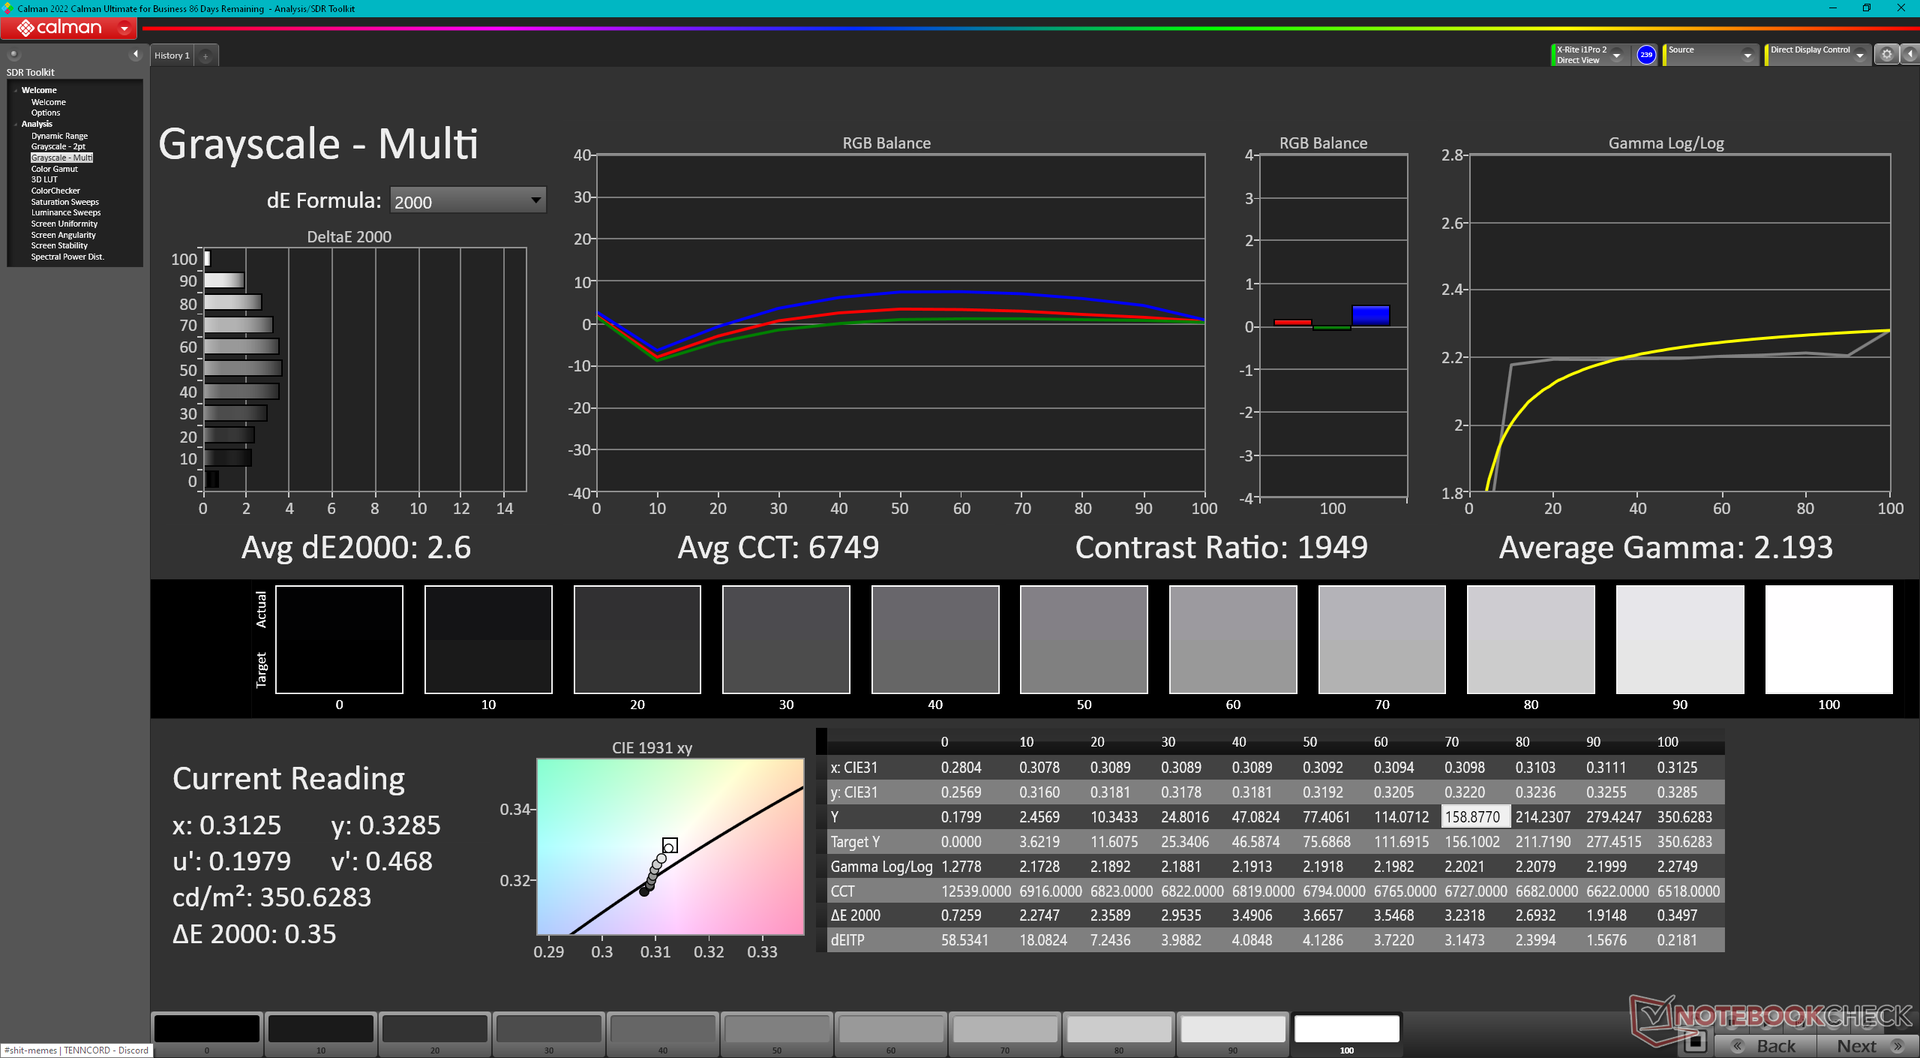
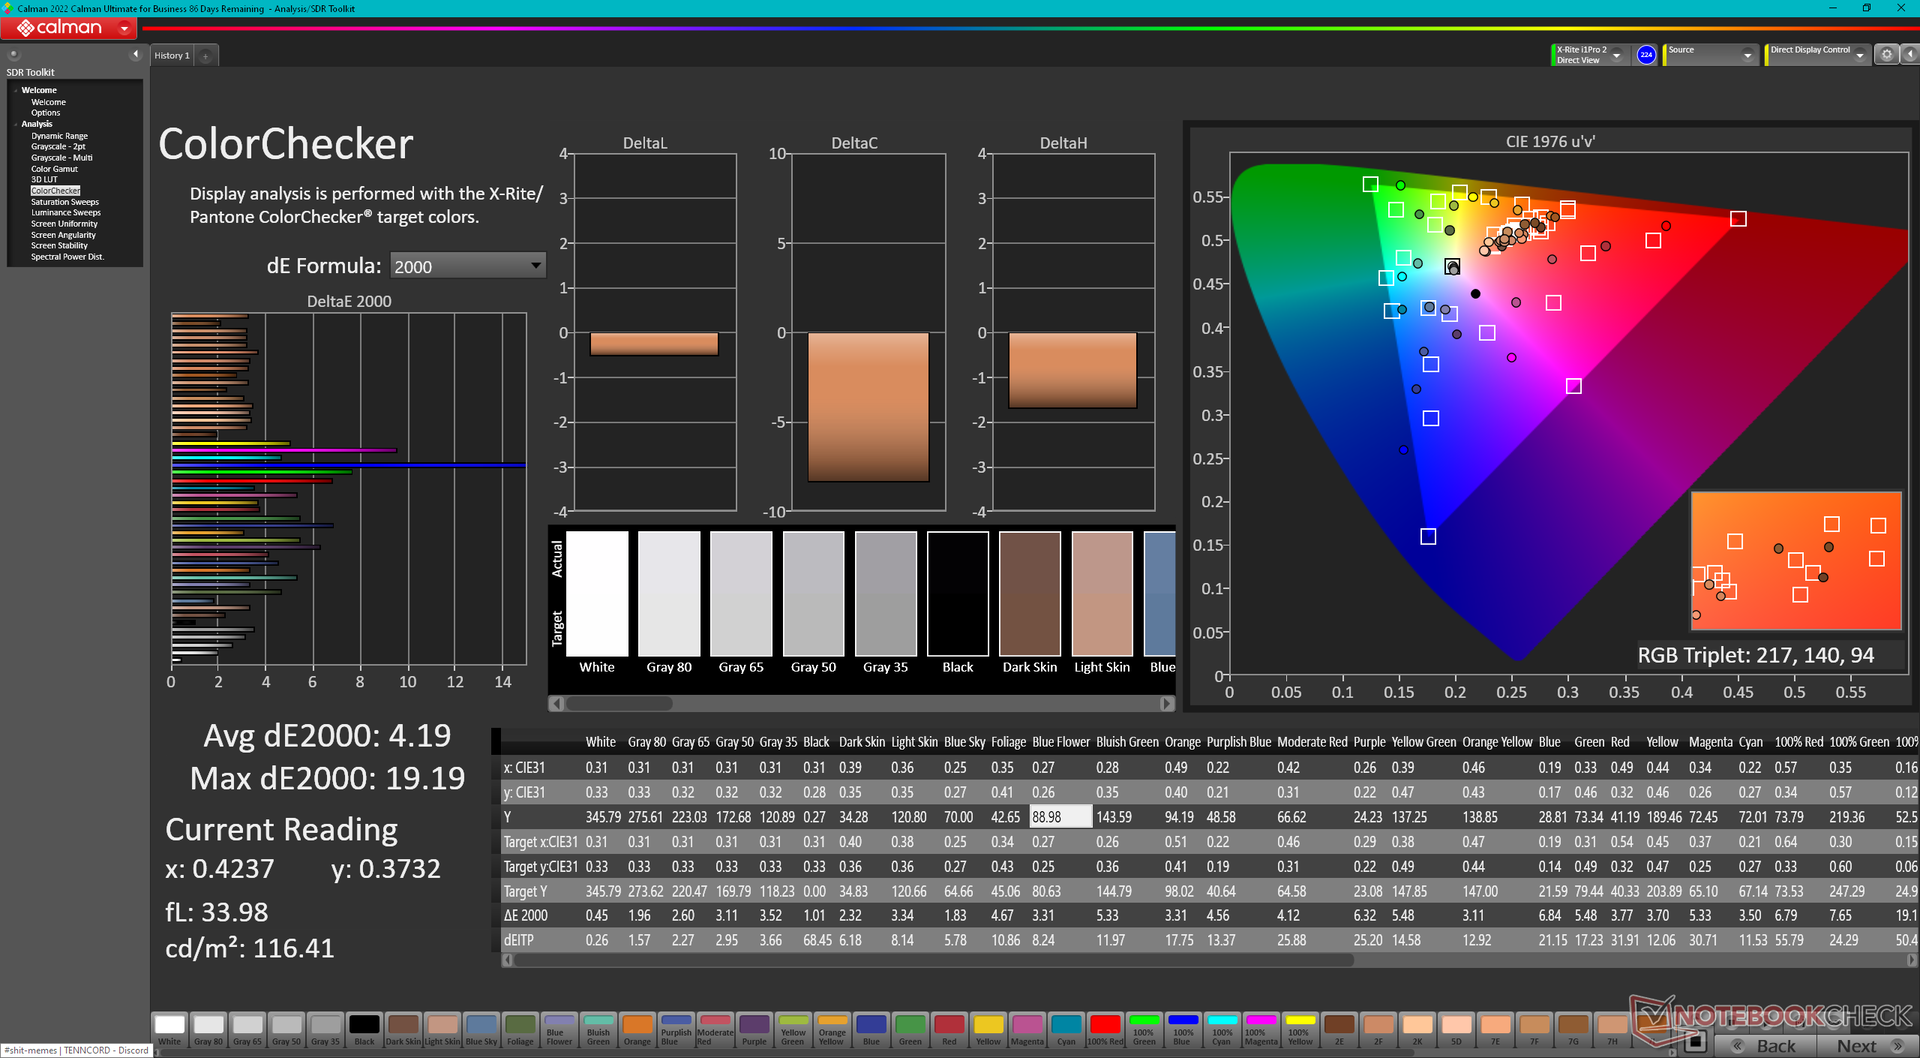
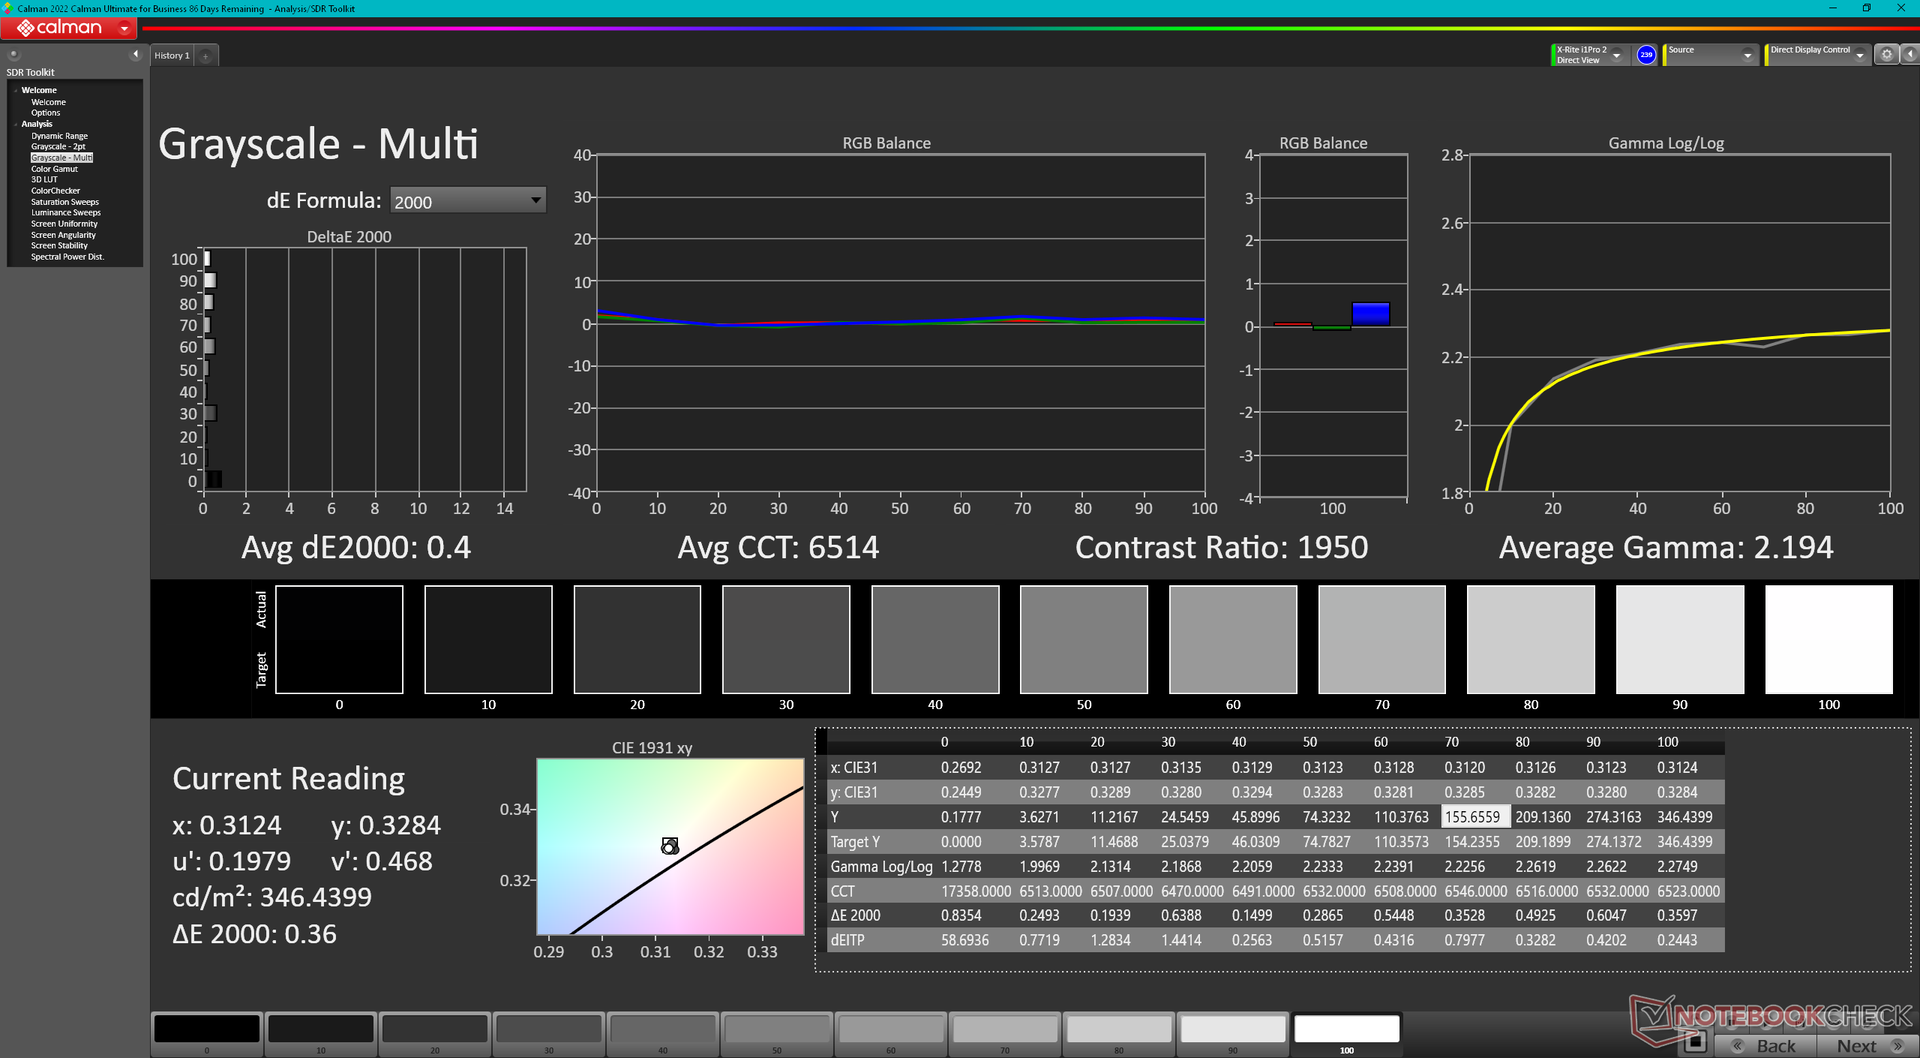
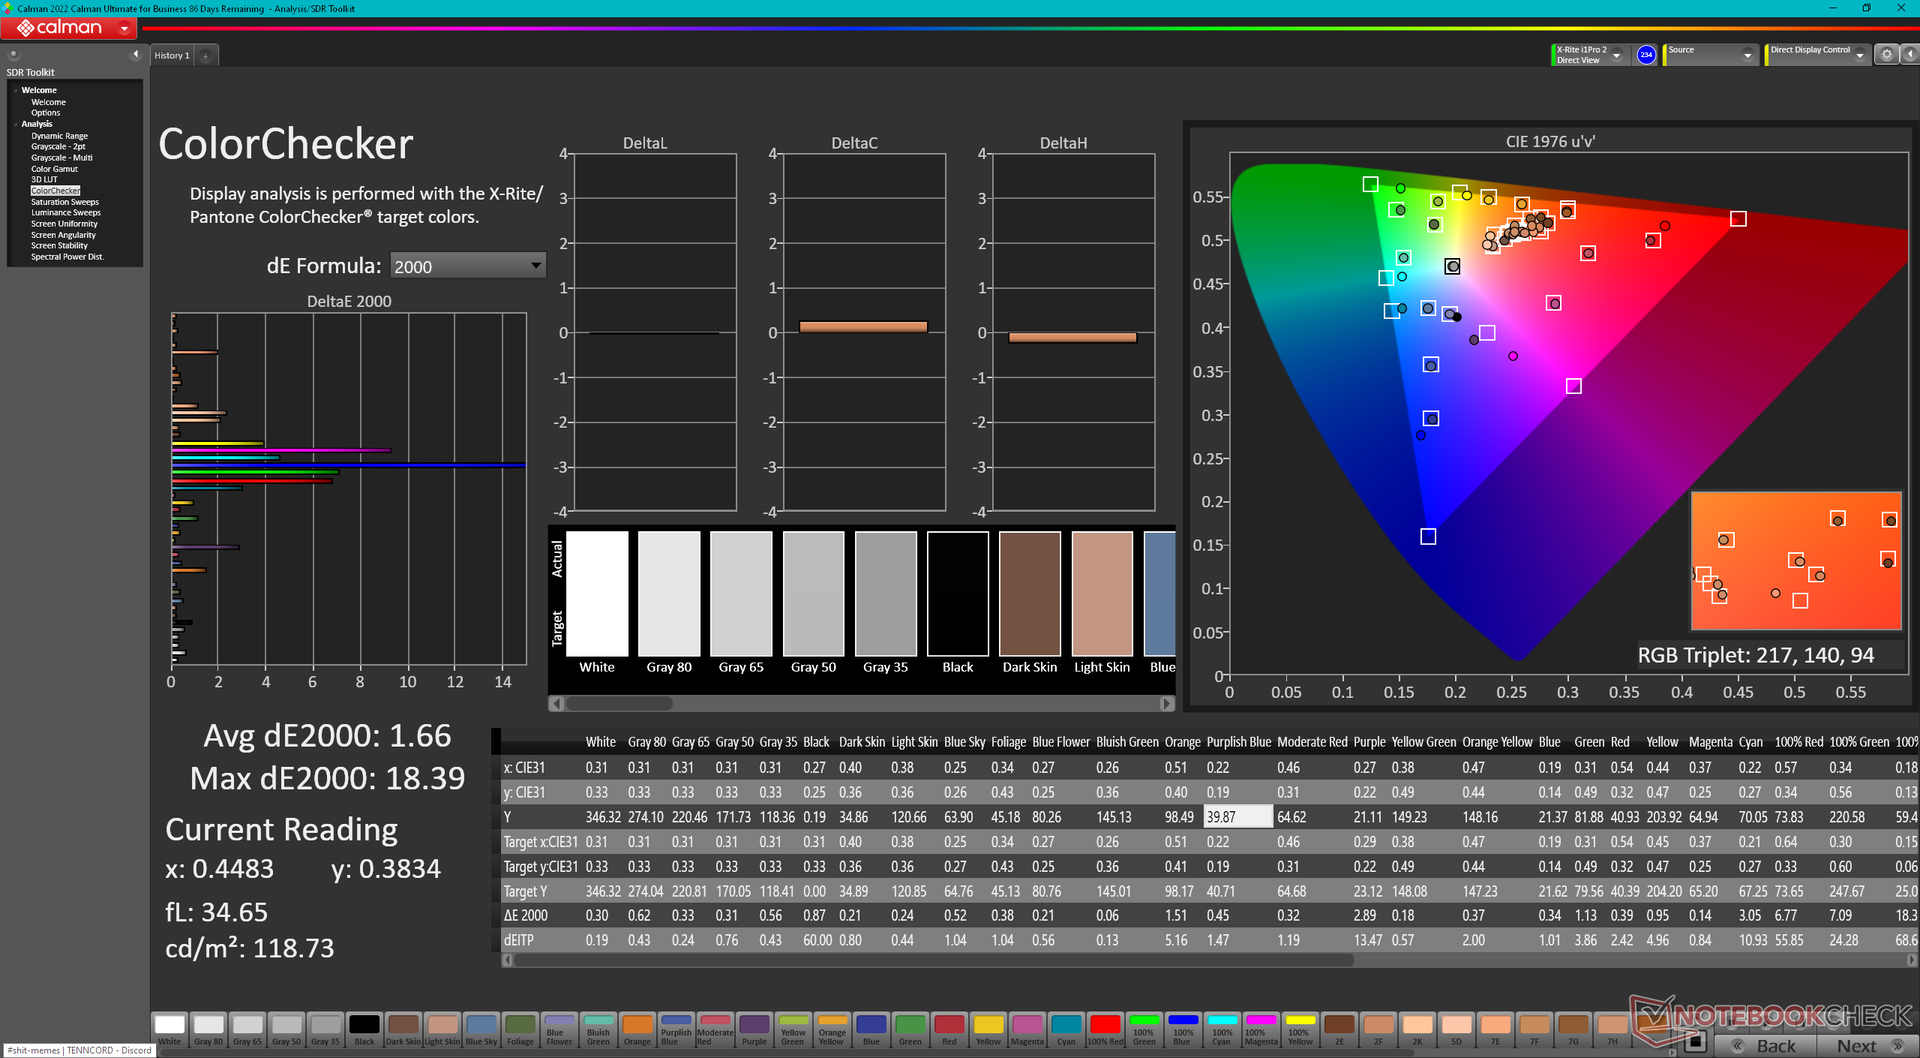
ΔE ColorChecker Calman: 4.19 | ∀{0.5-29.43 Ø4.71}
calibrated: 1.66
ΔE Greyscale Calman: 2.6 | ∀{0.09-98 Ø4.96}
41.5% AdobeRGB 1998 (Argyll 3D)
60.2% sRGB (Argyll 3D)
40.2% Display P3 (Argyll 3D)
Gamma: 2.19
CCT: 6749 K
| Lenovo LOQ 15APH8 BOE NJ NE156FHM-NX3, IPS, 1920x1080, 15.6" | Lenovo Legion 5 15IAH7H 82RB CSOT MNF601CA1-3, IPS, 1920x1080, 15.6" | Dell G15 5530 AUO B156HAN, IPS, 1920x1080, 15.6" | Asus TUF A15 FA507 N156HMA-GA1, IPS, 1920x1080, 15.6" | MSI Cyborg 15 A12VF AU Optronics B156HAN15.1, IPS, 1920x1080, 15.6" | HP Victus 15 fa0020nr CMN1521, IPS, 1920x1080, 15.6" | |
|---|---|---|---|---|---|---|
| Display | 69% | 75% | 60% | 5% | 4% | |
| Display P3 Coverage (%) | 40.2 | 69.1 72% | 73.1 82% | 64.9 61% | 42.3 5% | 42 4% |
| sRGB Coverage (%) | 60.2 | 99.5 65% | 98.4 63% | 96.5 60% | 62.6 4% | 62.7 4% |
| AdobeRGB 1998 Coverage (%) | 41.5 | 70 69% | 74.4 79% | 66.6 60% | 43.7 5% | 43.4 5% |
| Response Times | 58% | 85% | 22% | 46% | 4% | |
| Response Time Grey 50% / Grey 80% * (ms) | 42.7 ? | 14.8 ? 65% | 3.39 ? 92% | 30.4 ? 29% | 22 ? 48% | 35.2 ? 18% |
| Response Time Black / White * (ms) | 24.5 ? | 12 ? 51% | 5.35 ? 78% | 20.8 ? 15% | 14 ? 43% | 27.2 ? -11% |
| PWM Frequency (Hz) | 21620 ? | |||||
| Screen | -4% | -2% | 28% | -9% | 1% | |
| Brightness middle (cd/m²) | 346.2 | 363.5 5% | 320 -8% | 288 -17% | 247 -29% | 284.3 -18% |
| Brightness (cd/m²) | 329 | 350 6% | 316 -4% | 271 -18% | 234 -29% | 262 -20% |
| Brightness Distribution (%) | 81 | 89 10% | 94 16% | 91 12% | 89 10% | 87 7% |
| Black Level * (cd/m²) | 0.31 | 0.39 -26% | 0.21 32% | 0.17 45% | 0.25 19% | 0.17 45% |
| Contrast (:1) | 1117 | 932 -17% | 1524 36% | 1694 52% | 988 -12% | 1672 50% |
| Colorchecker dE 2000 * | 4.19 | 3.68 12% | 4.55 -9% | 1.9 55% | 3.78 10% | 4.52 -8% |
| Colorchecker dE 2000 max. * | 19.19 | 8.92 54% | 9.83 49% | 3.3 83% | 6.42 67% | 18.67 3% |
| Colorchecker dE 2000 calibrated * | 1.66 | 0.53 68% | 1.51 9% | 0.9 46% | 3.94 -137% | 1.55 7% |
| Greyscale dE 2000 * | 2.6 | 6.5 -150% | 6.2 -138% | 2.7 -4% | 2.16 17% | 4.1 -58% |
| Gamma | 2.19 100% | 2.2 100% | 2.07 106% | 2.32 95% | 2.33 94% | 2.3 96% |
| CCT | 6749 96% | 5995 108% | 6479 100% | 6535 99% | 6906 94% | 6529 100% |
| Média Total (Programa/Configurações) | 41% /
20% | 53% /
27% | 37% /
34% | 14% /
2% | 3% /
2% |
* ... menor é melhor
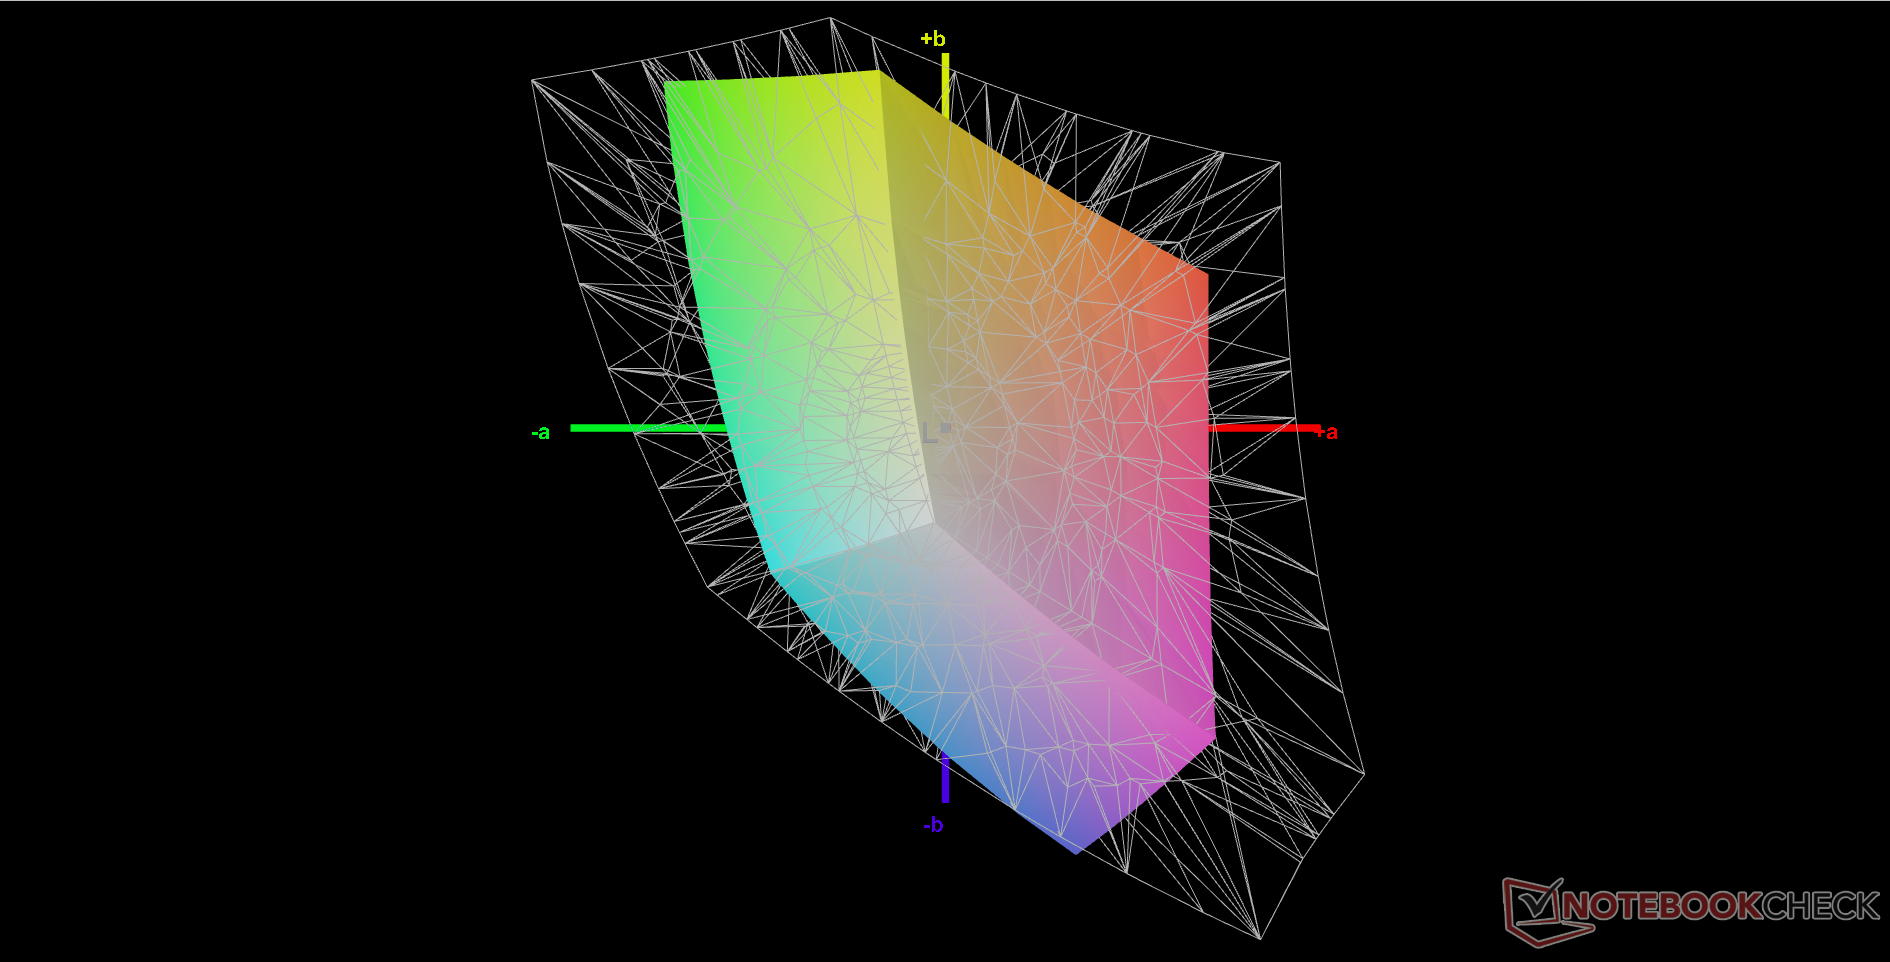
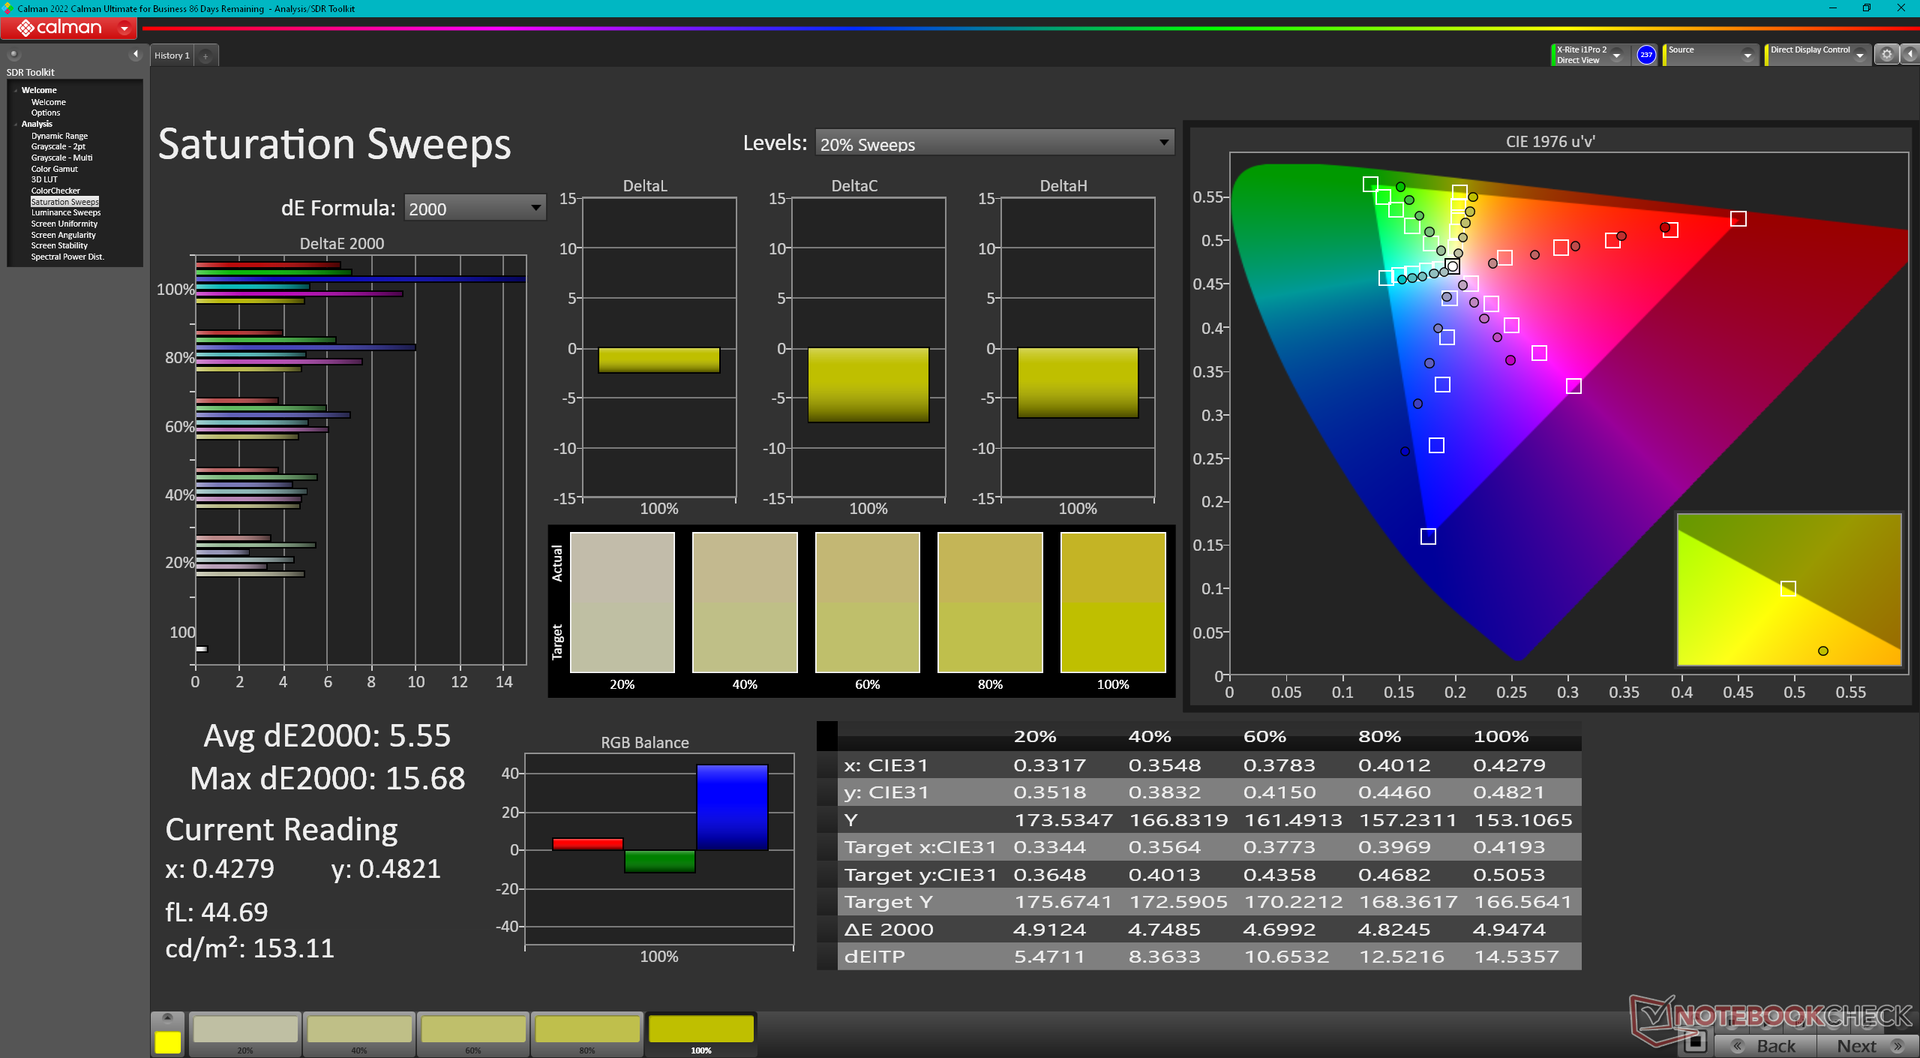
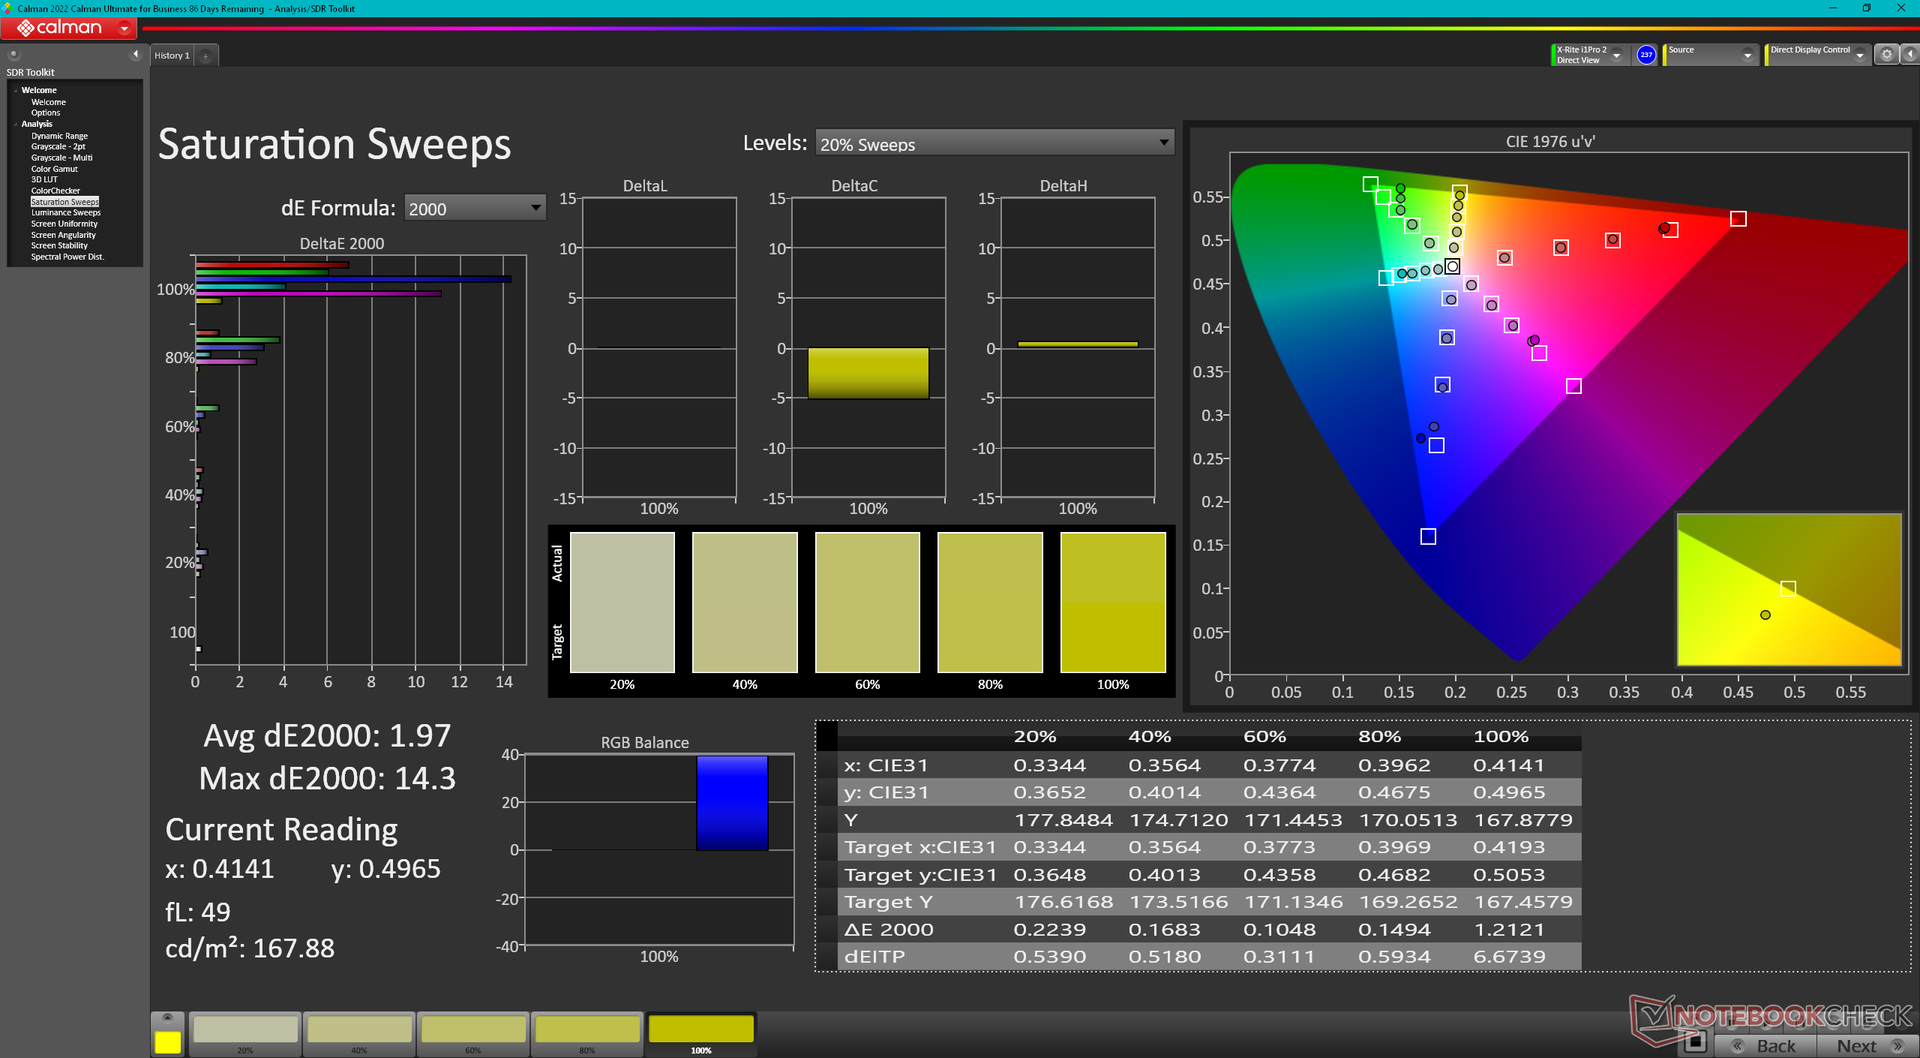
Os valores médios de escala de cinza e deltaE de cor não são terríveis para um laptop econômico para jogos, com apenas 2,6 e 4,19, respectivamente. Conseguimos reduzir esses valores para apenas 0,4 e 1,66 após uma calibração adequada com nosso colorímetro X-Rite. Entretanto, lembre-se de que as cores ainda se tornam cada vez mais imprecisas em níveis de saturação mais altos devido à gama de cores estreita mencionada acima.
Nosso perfil ICM calibrado está disponível gratuitamente acima.
Exibir tempos de resposta
| ↔ Tempo de resposta preto para branco | ||
|---|---|---|
| 24.5 ms ... ascensão ↗ e queda ↘ combinadas | ↗ 12.2 ms ascensão | 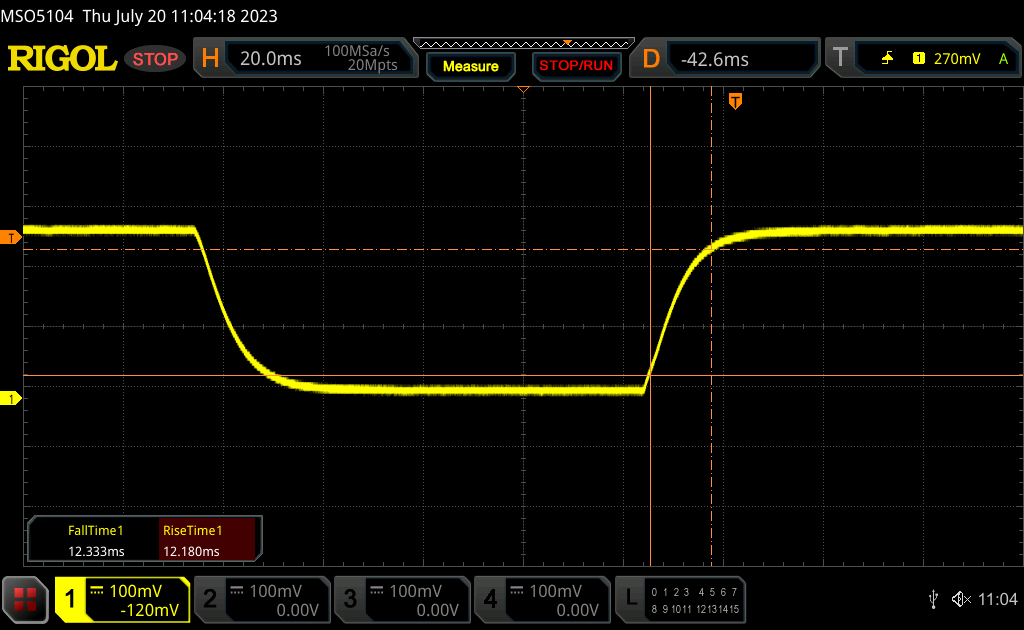 |
| ↘ 12.3 ms queda | ||
| A tela mostra boas taxas de resposta em nossos testes, mas pode ser muito lenta para jogadores competitivos. Em comparação, todos os dispositivos testados variam de 0.1 (mínimo) a 240 (máximo) ms. » 58 % de todos os dispositivos são melhores. Isso significa que o tempo de resposta medido é pior que a média de todos os dispositivos testados (19.8 ms). | ||
| ↔ Tempo de resposta 50% cinza a 80% cinza | ||
| 42.7 ms ... ascensão ↗ e queda ↘ combinadas | ↗ 19.2 ms ascensão | 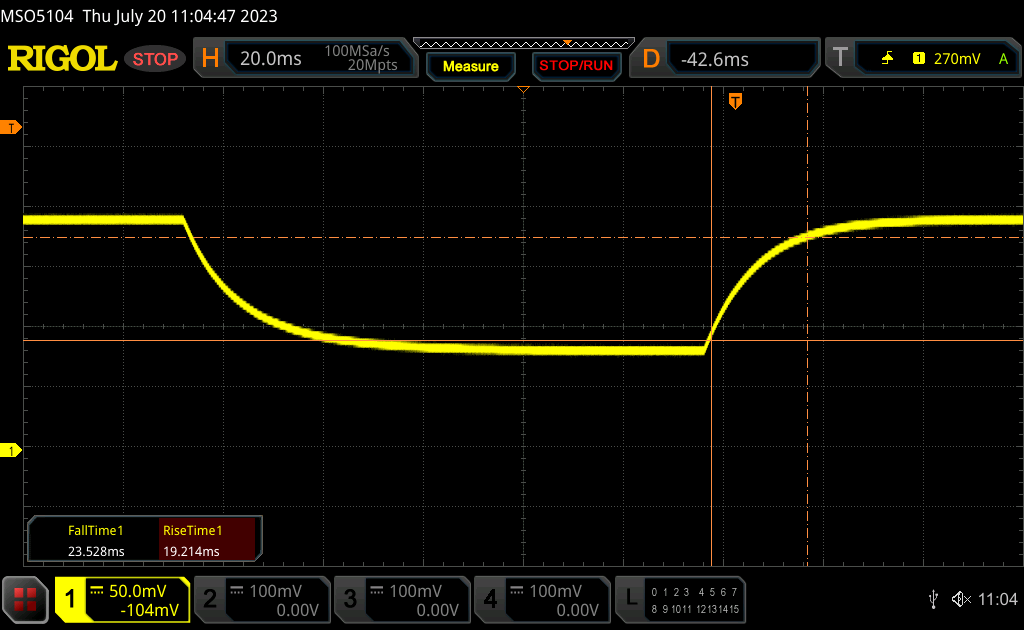 |
| ↘ 23.5 ms queda | ||
| A tela mostra taxas de resposta lentas em nossos testes e será insatisfatória para os jogadores. Em comparação, todos os dispositivos testados variam de 0.165 (mínimo) a 636 (máximo) ms. » 70 % de todos os dispositivos são melhores. Isso significa que o tempo de resposta medido é pior que a média de todos os dispositivos testados (31 ms). | ||
Cintilação da tela / PWM (modulação por largura de pulso)
| Tela tremeluzindo / PWM não detectado | 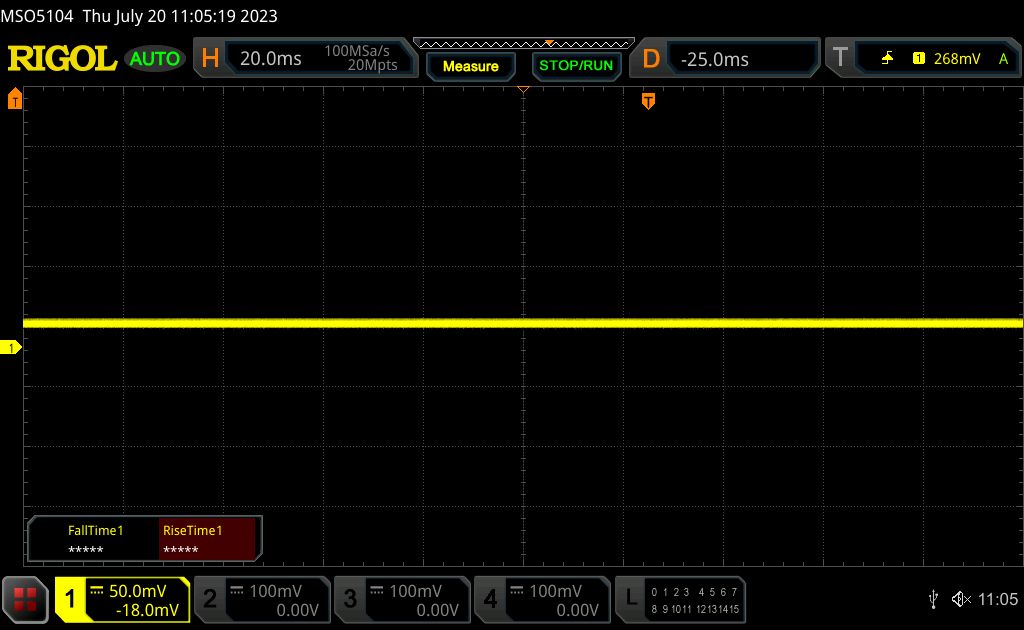 | ||
[pwm_comparison] Em comparação: 52 % de todos os dispositivos testados não usam PWM para escurecer a tela. Se PWM foi detectado, uma média de 7757 (mínimo: 5 - máximo: 343500) Hz foi medida. | |||
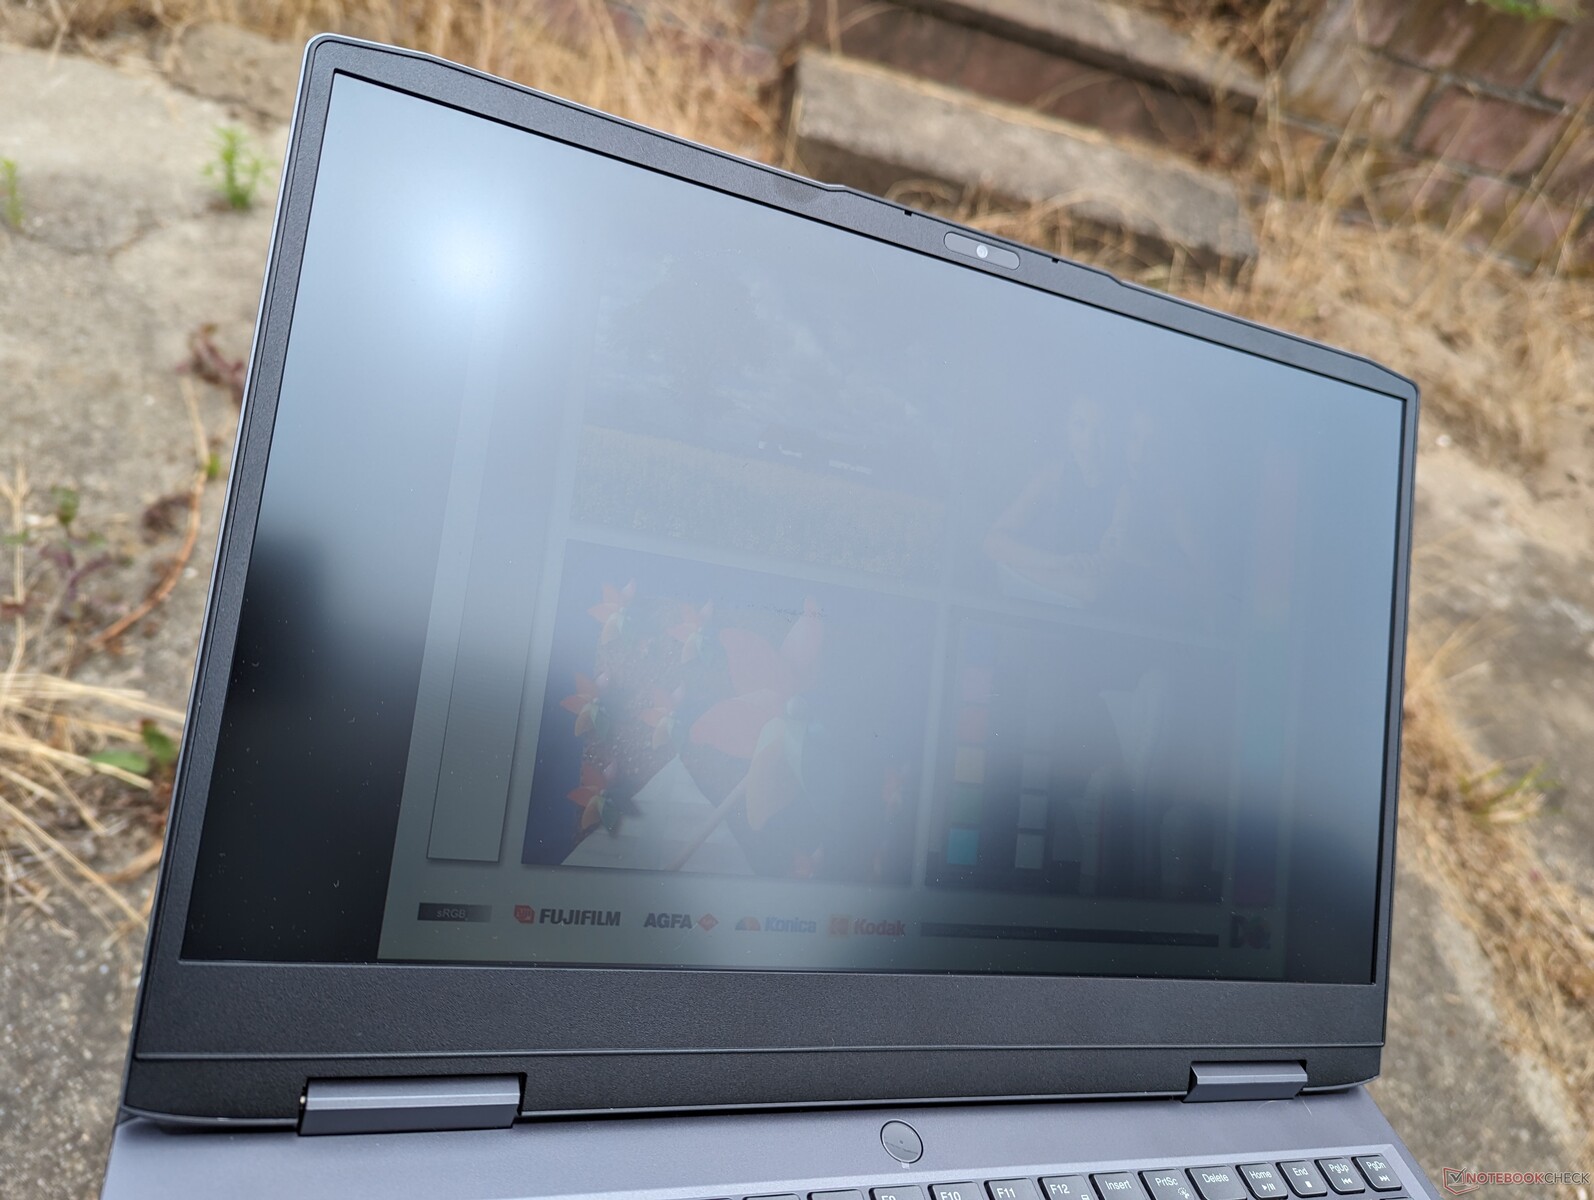
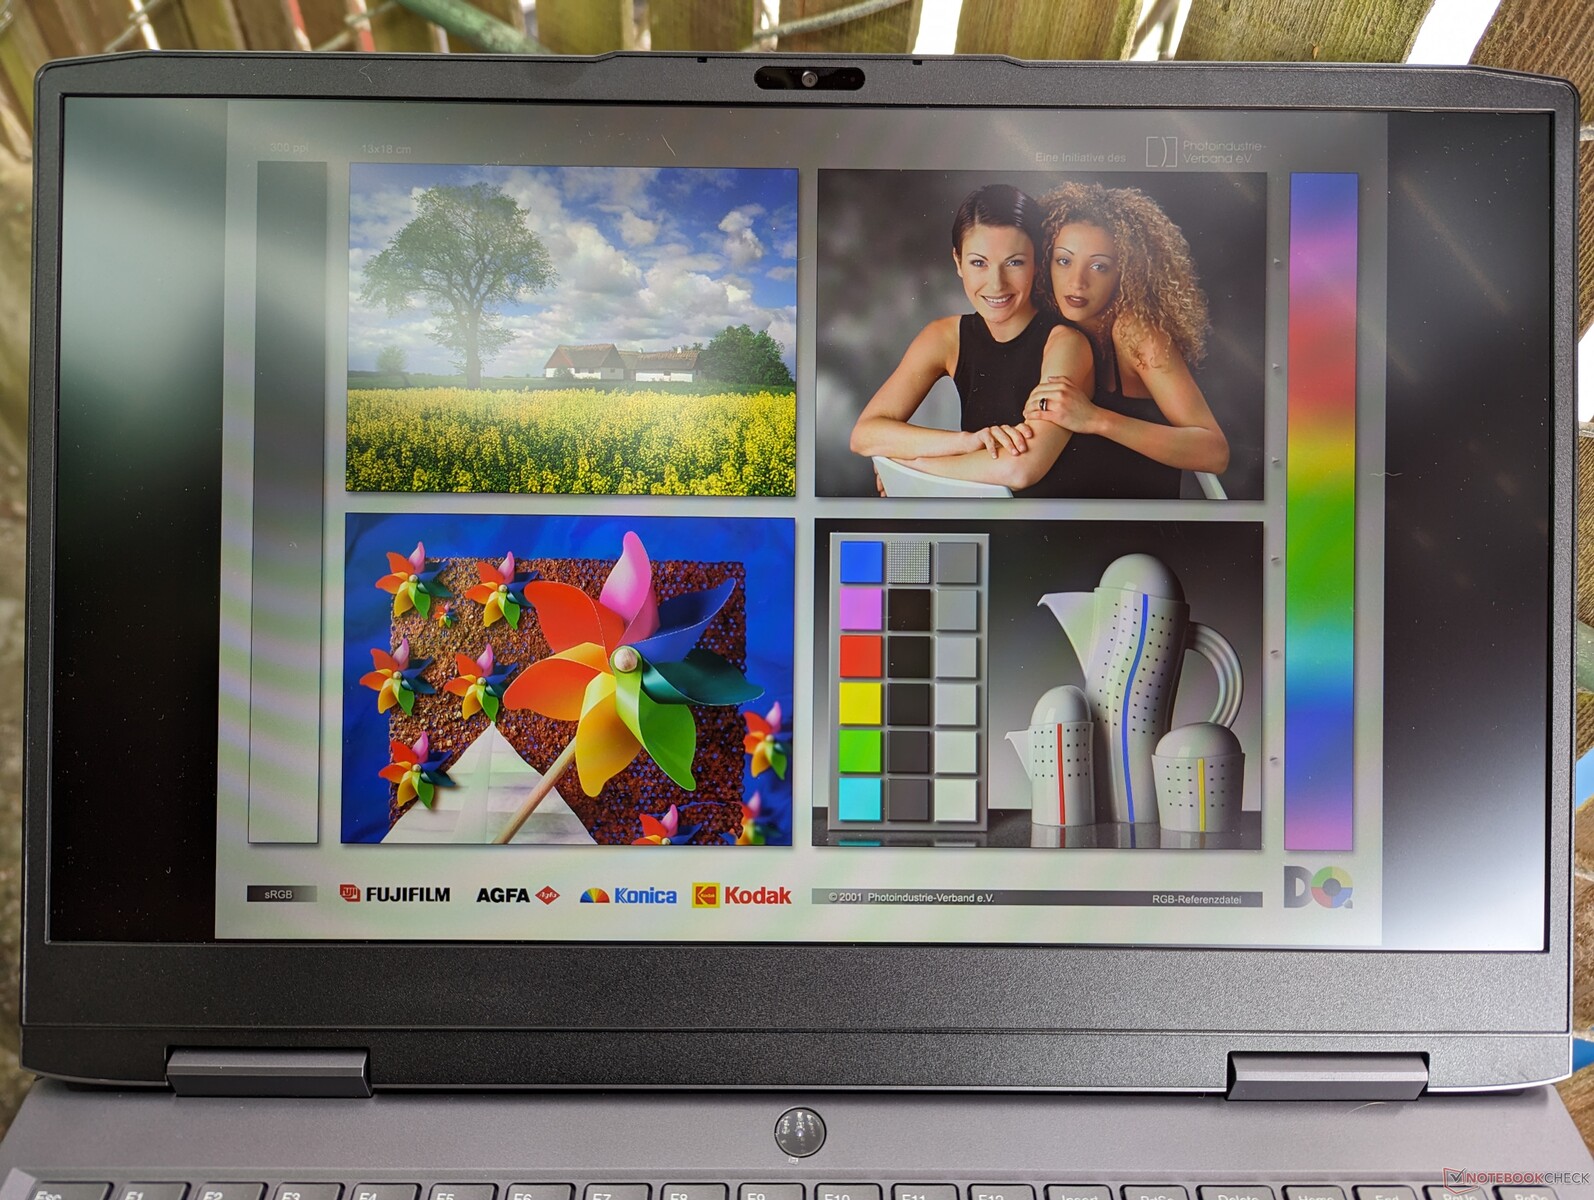
A maioria dos laptops para jogos com painéis IPS tende a ficar na faixa de brilho de 300 nits e o LOQ 15 não é exceção. Portanto, a visibilidade externa é média para a categoria, sem nada digno de nota. Qualquer coisa mais brilhante do que um local com sombra causará um brilho imenso e apagará as cores da tela.
Desempenho - AMD Zen 4 de médio porte
Condições de teste
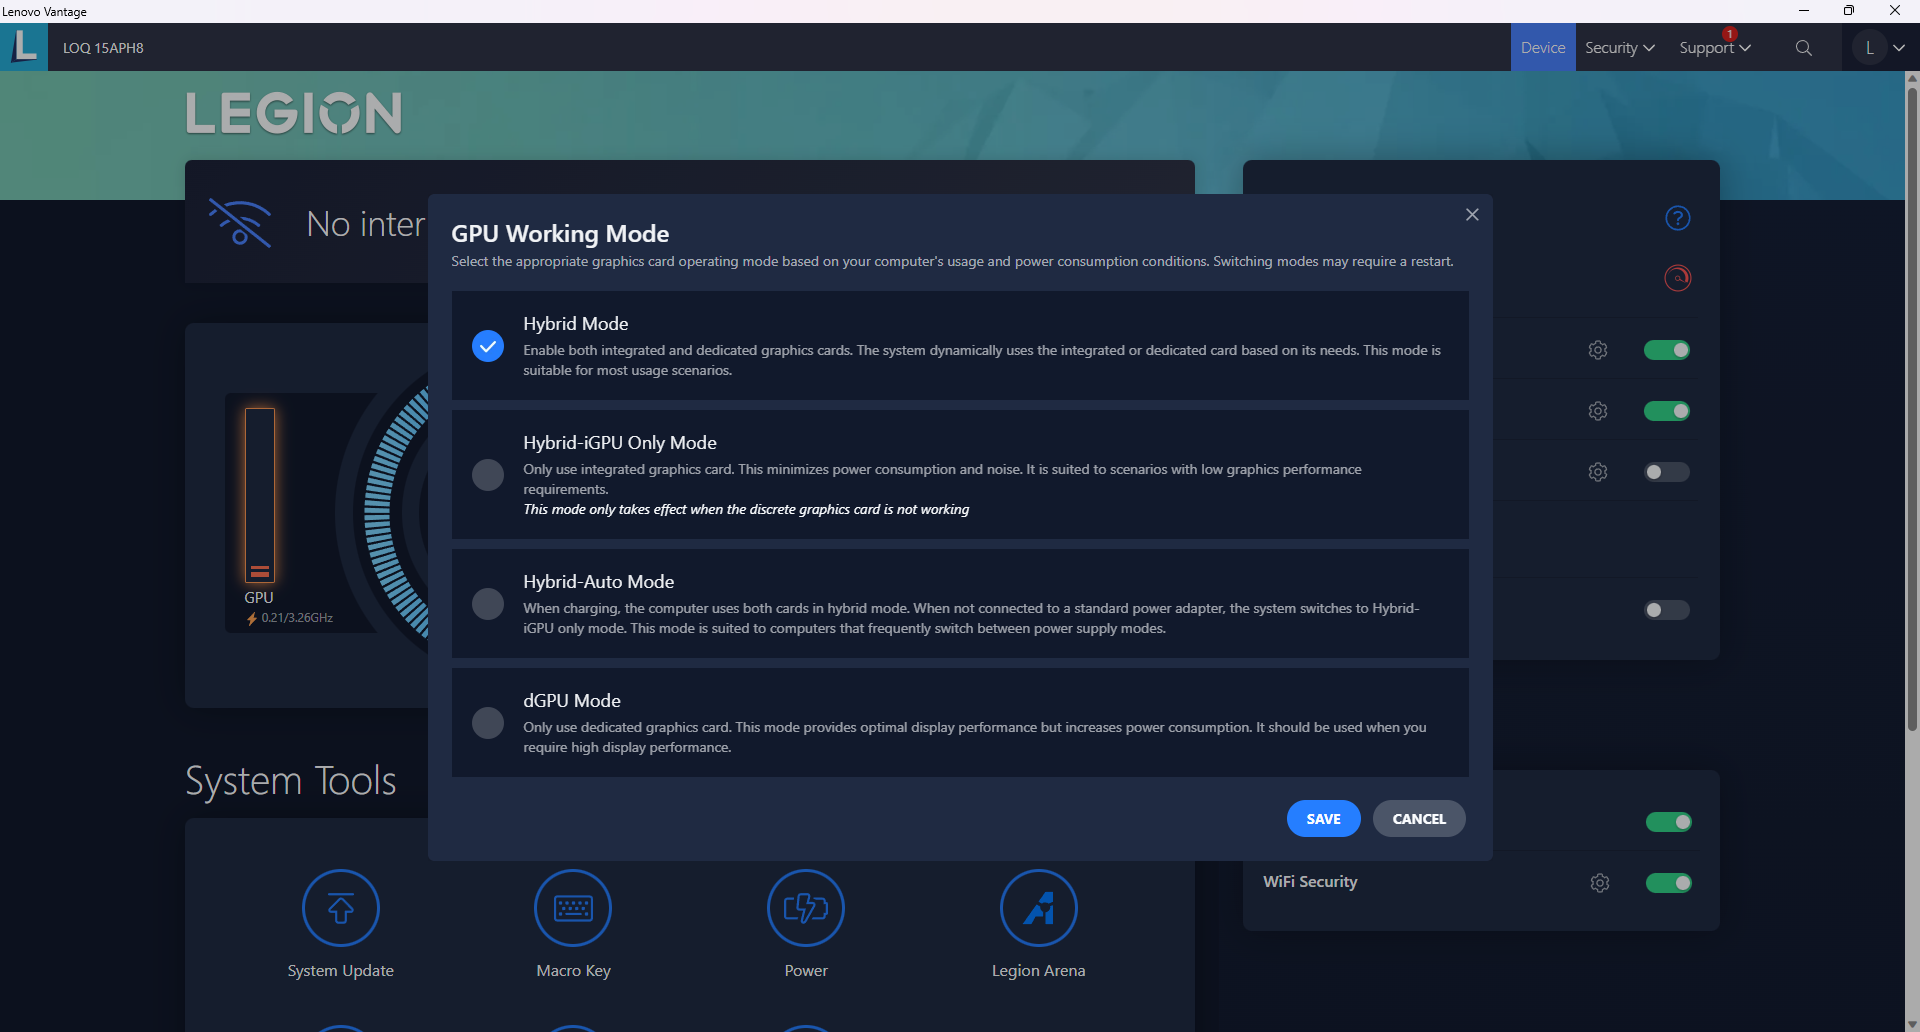
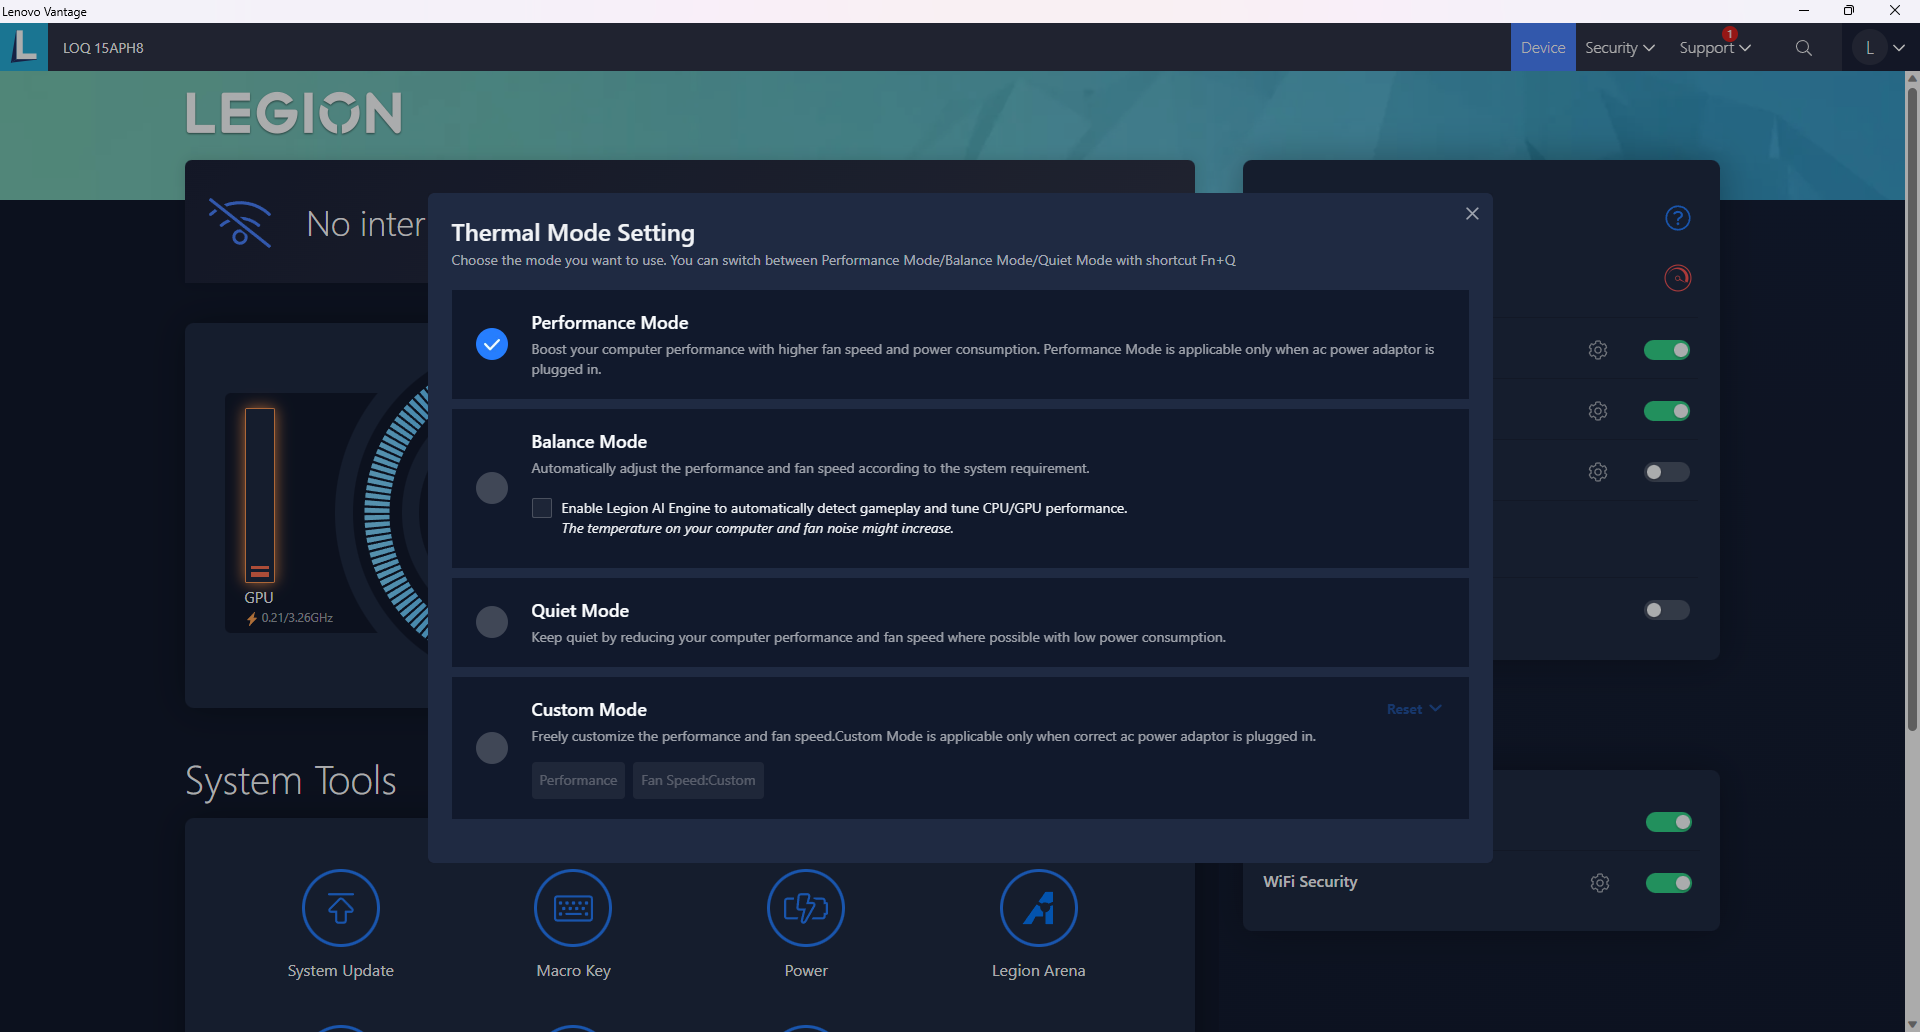
Configuramos nossa unidade para o modo Desempenho por meio do Windows e do Lenovo Vantage antes de executar os benchmarks abaixo. Também nos certificamos de configurar o sistema para o modo dGPU, já que o Advanced Optimus é suportado. Recomenda-se que os usuários se familiarizem com o software Vantage, pois ele é o hub central para atualizações do BIOS da Lenovo, configurações de energia, informações de garantia e outros recursos específicos do modelo.
Processador
ORyzen 7 7840HS é um pequeno passo abaixo do Ryzen 7 7745HX com um déficit de desempenho de apenas 5%. Portanto, o desempenho geral é comparável ao do processador de 12ª geração Core i7-12700H que equipou a maioria dos notebooks para jogos de 2022. Ficamos aliviados com o fato de a série LOQ estar sendo fornecida com CPUs Zen 4 em vez de opções Zen 3 com nova marca, como o Ryzen 7 7735HS que é visivelmente mais lento e muito menos impressionante.
A atualização para a versão Intel do LOQ 15 com o Core i7-13700H deverá aumentar o desempenho da CPU em cerca de 20%, com base em nosso tempo com o recente Aorus 15X.
Cinebench R15 Multi Loop
Cinebench R23: Multi Core | Single Core
Cinebench R20: CPU (Multi Core) | CPU (Single Core)
Cinebench R15: CPU Multi 64Bit | CPU Single 64Bit
Blender: v2.79 BMW27 CPU
7-Zip 18.03: 7z b 4 | 7z b 4 -mmt1
Geekbench 5.5: Multi-Core | Single-Core
HWBOT x265 Benchmark v2.2: 4k Preset
LibreOffice : 20 Documents To PDF
R Benchmark 2.5: Overall mean
* ... menor é melhor
AIDA64: FP32 Ray-Trace | FPU Julia | CPU SHA3 | CPU Queen | FPU SinJulia | FPU Mandel | CPU AES | CPU ZLib | FP64 Ray-Trace | CPU PhotoWorxx
| Performance rating | |
| Média AMD Ryzen 7 7840HS | |
| Lenovo LOQ 15APH8 | |
| Lenovo Legion 5 15IAH7H 82RB | |
| Dell G15 5530 | |
| Asus TUF A15 FA507 | |
| MSI Cyborg 15 A12VF | |
| HP Victus 15 fa0020nr | |
| AIDA64 / FP32 Ray-Trace | |
| Lenovo LOQ 15APH8 | |
| Média AMD Ryzen 7 7840HS (22845 - 28921, n=21) | |
| Dell G15 5530 | |
| Lenovo Legion 5 15IAH7H 82RB | |
| Asus TUF A15 FA507 | |
| HP Victus 15 fa0020nr | |
| MSI Cyborg 15 A12VF | |
| AIDA64 / FPU Julia | |
| Lenovo LOQ 15APH8 | |
| Média AMD Ryzen 7 7840HS (97164 - 123167, n=21) | |
| Asus TUF A15 FA507 | |
| Dell G15 5530 | |
| Lenovo Legion 5 15IAH7H 82RB | |
| MSI Cyborg 15 A12VF | |
| HP Victus 15 fa0020nr | |
| AIDA64 / CPU SHA3 | |
| Lenovo LOQ 15APH8 | |
| Média AMD Ryzen 7 7840HS (4293 - 5155, n=21) | |
| Dell G15 5530 | |
| Lenovo Legion 5 15IAH7H 82RB | |
| Asus TUF A15 FA507 | |
| MSI Cyborg 15 A12VF | |
| HP Victus 15 fa0020nr | |
| AIDA64 / CPU Queen | |
| Lenovo LOQ 15APH8 | |
| Média AMD Ryzen 7 7840HS (102271 - 125820, n=21) | |
| Dell G15 5530 | |
| Asus TUF A15 FA507 | |
| Lenovo Legion 5 15IAH7H 82RB | |
| HP Victus 15 fa0020nr | |
| MSI Cyborg 15 A12VF | |
| AIDA64 / FPU SinJulia | |
| Lenovo LOQ 15APH8 | |
| Média AMD Ryzen 7 7840HS (13767 - 15525, n=21) | |
| Asus TUF A15 FA507 | |
| Dell G15 5530 | |
| Lenovo Legion 5 15IAH7H 82RB | |
| MSI Cyborg 15 A12VF | |
| HP Victus 15 fa0020nr | |
| AIDA64 / FPU Mandel | |
| Lenovo LOQ 15APH8 | |
| Média AMD Ryzen 7 7840HS (52084 - 65812, n=21) | |
| Asus TUF A15 FA507 | |
| Dell G15 5530 | |
| Lenovo Legion 5 15IAH7H 82RB | |
| HP Victus 15 fa0020nr | |
| MSI Cyborg 15 A12VF | |
| AIDA64 / CPU AES | |
| Lenovo Legion 5 15IAH7H 82RB | |
| Média AMD Ryzen 7 7840HS (67389 - 177158, n=21) | |
| Dell G15 5530 | |
| Lenovo LOQ 15APH8 | |
| Asus TUF A15 FA507 | |
| MSI Cyborg 15 A12VF | |
| HP Victus 15 fa0020nr | |
| AIDA64 / CPU ZLib | |
| Dell G15 5530 | |
| Lenovo Legion 5 15IAH7H 82RB | |
| Lenovo LOQ 15APH8 | |
| Média AMD Ryzen 7 7840HS (944 - 1123, n=21) | |
| MSI Cyborg 15 A12VF | |
| HP Victus 15 fa0020nr | |
| Asus TUF A15 FA507 | |
| AIDA64 / FP64 Ray-Trace | |
| Lenovo LOQ 15APH8 | |
| Média AMD Ryzen 7 7840HS (12248 - 15599, n=21) | |
| Dell G15 5530 | |
| Lenovo Legion 5 15IAH7H 82RB | |
| Asus TUF A15 FA507 | |
| HP Victus 15 fa0020nr | |
| MSI Cyborg 15 A12VF | |
| AIDA64 / CPU PhotoWorxx | |
| Média AMD Ryzen 7 7840HS (17615 - 41516, n=21) | |
| Dell G15 5530 | |
| MSI Cyborg 15 A12VF | |
| Lenovo Legion 5 15IAH7H 82RB | |
| Asus TUF A15 FA507 | |
| HP Victus 15 fa0020nr | |
| Lenovo LOQ 15APH8 | |
Desempenho do sistema
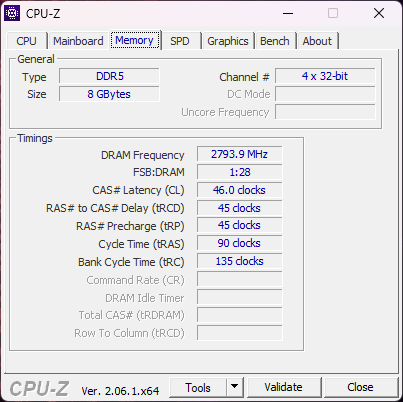
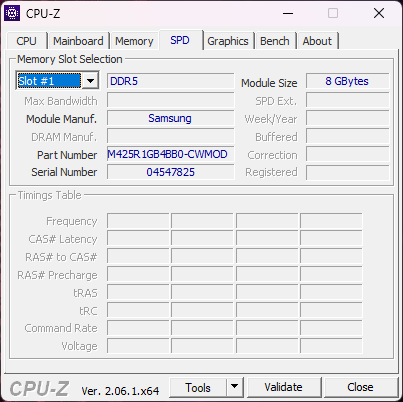
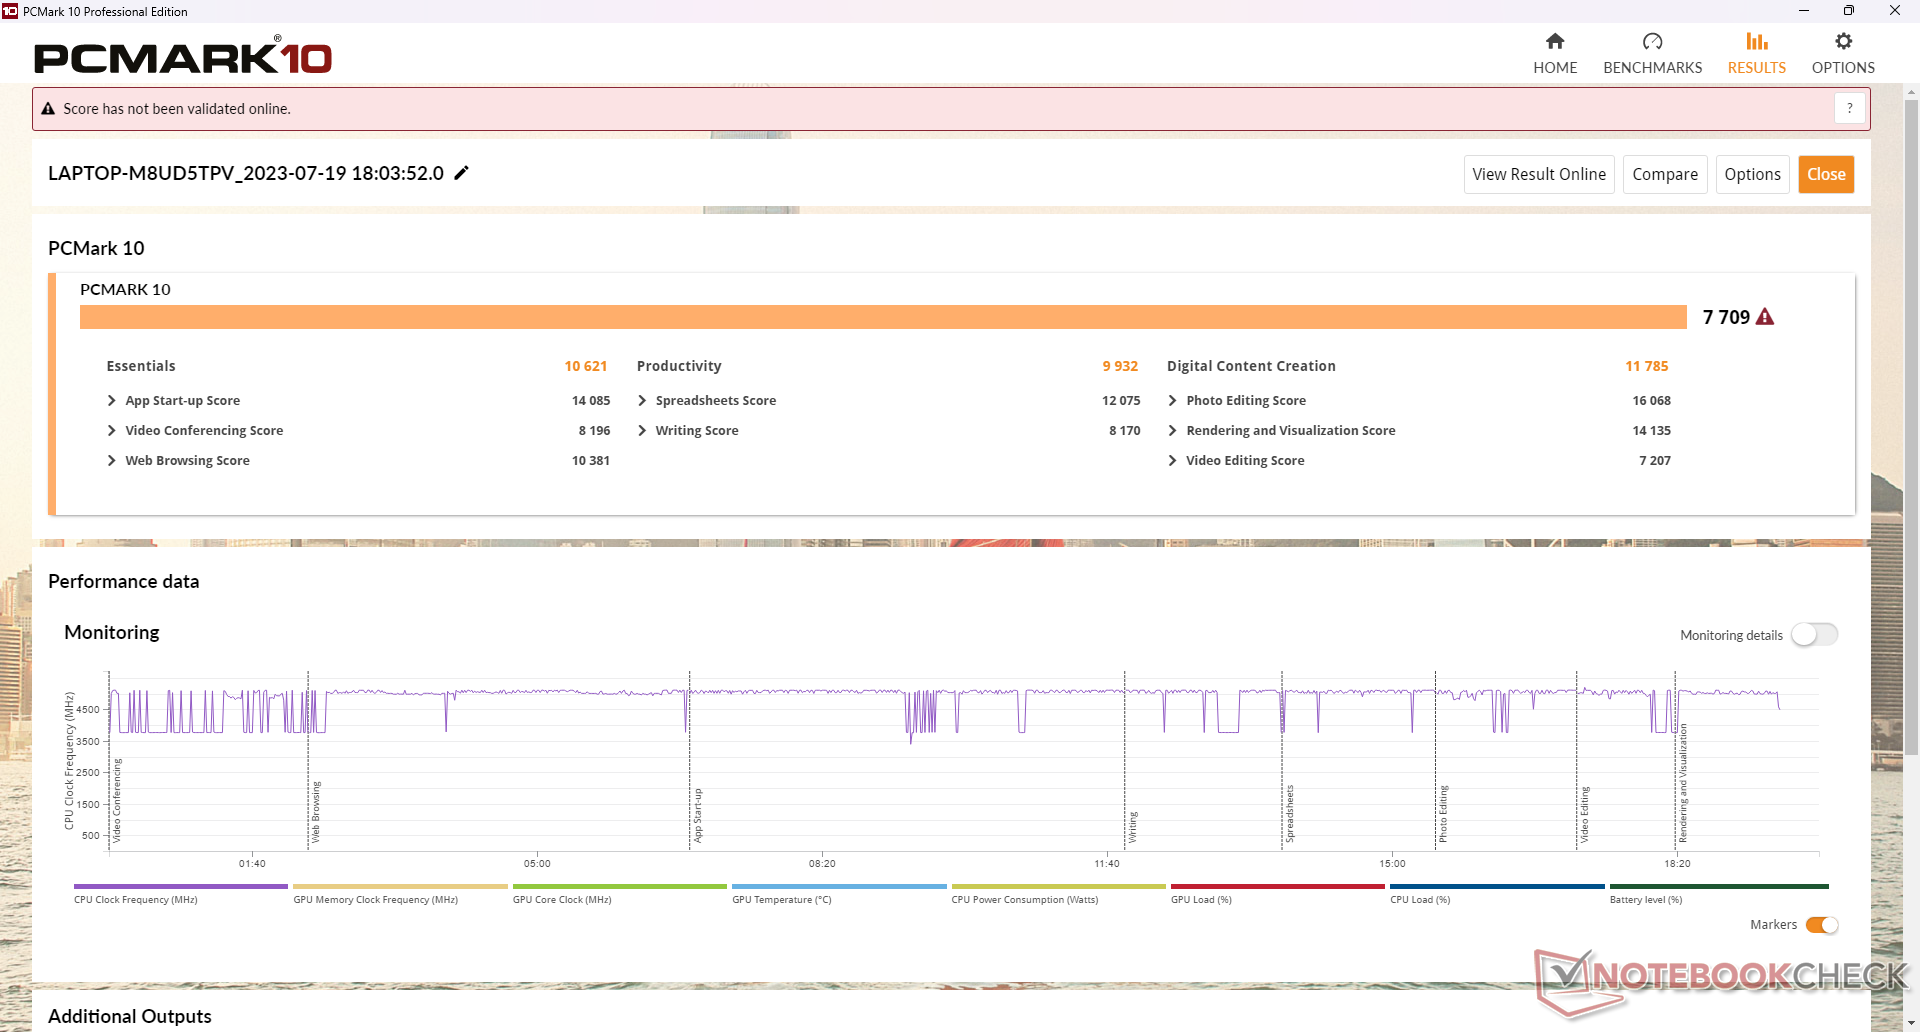
Os resultados do PCMark 10 são comparáveis aos dos modelos concorrentes, como o Dell G15 5530, e até mesmo um pouco distantes do antigo 2022 Lenovo Legion 5 15. No entanto, os testes de memória AIDA64 são apenas metade da velocidade em nossa unidade LOQ 15 devido aos seus limitados 8 GB de RAM de canal único. Recomendamos adicionar um segundo módulo de RAM para um total de 16 GB sempre que possível.
CrossMark: Overall | Productivity | Creativity | Responsiveness
| PCMark 10 / Score | |
| Lenovo Legion 5 15IAH7H 82RB | |
| Lenovo LOQ 15APH8 | |
| Média AMD Ryzen 7 7840HS, NVIDIA GeForce RTX 4050 Laptop GPU (7683 - 7709, n=2) | |
| Asus TUF A15 FA507 | |
| MSI Cyborg 15 A12VF | |
| Dell G15 5530 | |
| HP Victus 15 fa0020nr | |
| PCMark 10 / Essentials | |
| Lenovo Legion 5 15IAH7H 82RB | |
| Dell G15 5530 | |
| Média AMD Ryzen 7 7840HS, NVIDIA GeForce RTX 4050 Laptop GPU (10621 - 10755, n=2) | |
| MSI Cyborg 15 A12VF | |
| Lenovo LOQ 15APH8 | |
| Asus TUF A15 FA507 | |
| HP Victus 15 fa0020nr | |
| PCMark 10 / Productivity | |
| Lenovo Legion 5 15IAH7H 82RB | |
| Dell G15 5530 | |
| Média AMD Ryzen 7 7840HS, NVIDIA GeForce RTX 4050 Laptop GPU (9932 - 9980, n=2) | |
| Lenovo LOQ 15APH8 | |
| MSI Cyborg 15 A12VF | |
| Asus TUF A15 FA507 | |
| HP Victus 15 fa0020nr | |
| PCMark 10 / Digital Content Creation | |
| Lenovo Legion 5 15IAH7H 82RB | |
| Lenovo LOQ 15APH8 | |
| Média AMD Ryzen 7 7840HS, NVIDIA GeForce RTX 4050 Laptop GPU (11467 - 11785, n=2) | |
| Asus TUF A15 FA507 | |
| HP Victus 15 fa0020nr | |
| MSI Cyborg 15 A12VF | |
| Dell G15 5530 | |
| CrossMark / Overall | |
| Lenovo Legion 5 15IAH7H 82RB | |
| Dell G15 5530 | |
| MSI Cyborg 15 A12VF | |
| Média AMD Ryzen 7 7840HS, NVIDIA GeForce RTX 4050 Laptop GPU (1586 - 1749, n=2) | |
| HP Victus 15 fa0020nr | |
| Lenovo LOQ 15APH8 | |
| Asus TUF A15 FA507 | |
| CrossMark / Productivity | |
| Lenovo Legion 5 15IAH7H 82RB | |
| Dell G15 5530 | |
| MSI Cyborg 15 A12VF | |
| Média AMD Ryzen 7 7840HS, NVIDIA GeForce RTX 4050 Laptop GPU (1625 - 1677, n=2) | |
| Lenovo LOQ 15APH8 | |
| HP Victus 15 fa0020nr | |
| Asus TUF A15 FA507 | |
| CrossMark / Creativity | |
| Dell G15 5530 | |
| Lenovo Legion 5 15IAH7H 82RB | |
| MSI Cyborg 15 A12VF | |
| HP Victus 15 fa0020nr | |
| Média AMD Ryzen 7 7840HS, NVIDIA GeForce RTX 4050 Laptop GPU (1628 - 1930, n=2) | |
| Asus TUF A15 FA507 | |
| Lenovo LOQ 15APH8 | |
| CrossMark / Responsiveness | |
| Lenovo Legion 5 15IAH7H 82RB | |
| MSI Cyborg 15 A12VF | |
| Dell G15 5530 | |
| Média AMD Ryzen 7 7840HS, NVIDIA GeForce RTX 4050 Laptop GPU (1364 - 1480, n=2) | |
| HP Victus 15 fa0020nr | |
| Lenovo LOQ 15APH8 | |
| Asus TUF A15 FA507 | |
| PCMark 10 Score | 7709 pontos | |
Ajuda | ||
| AIDA64 / Memory Copy | |
| Média AMD Ryzen 7 7840HS (30937 - 72158, n=21) | |
| Dell G15 5530 | |
| MSI Cyborg 15 A12VF | |
| Lenovo Legion 5 15IAH7H 82RB | |
| Asus TUF A15 FA507 | |
| HP Victus 15 fa0020nr | |
| Lenovo LOQ 15APH8 | |
| AIDA64 / Memory Read | |
| Dell G15 5530 | |
| MSI Cyborg 15 A12VF | |
| Lenovo Legion 5 15IAH7H 82RB | |
| Média AMD Ryzen 7 7840HS (30497 - 62147, n=21) | |
| Asus TUF A15 FA507 | |
| HP Victus 15 fa0020nr | |
| Lenovo LOQ 15APH8 | |
| AIDA64 / Memory Write | |
| Média AMD Ryzen 7 7840HS (34590 - 93323, n=21) | |
| Dell G15 5530 | |
| Lenovo Legion 5 15IAH7H 82RB | |
| MSI Cyborg 15 A12VF | |
| Asus TUF A15 FA507 | |
| HP Victus 15 fa0020nr | |
| Lenovo LOQ 15APH8 | |
| AIDA64 / Memory Latency | |
| Lenovo Legion 5 15IAH7H 82RB | |
| Lenovo LOQ 15APH8 | |
| Média AMD Ryzen 7 7840HS (85.1 - 112, n=21) | |
| MSI Cyborg 15 A12VF | |
| Dell G15 5530 | |
| Asus TUF A15 FA507 | |
| HP Victus 15 fa0020nr | |
* ... menor é melhor
Latência DPC
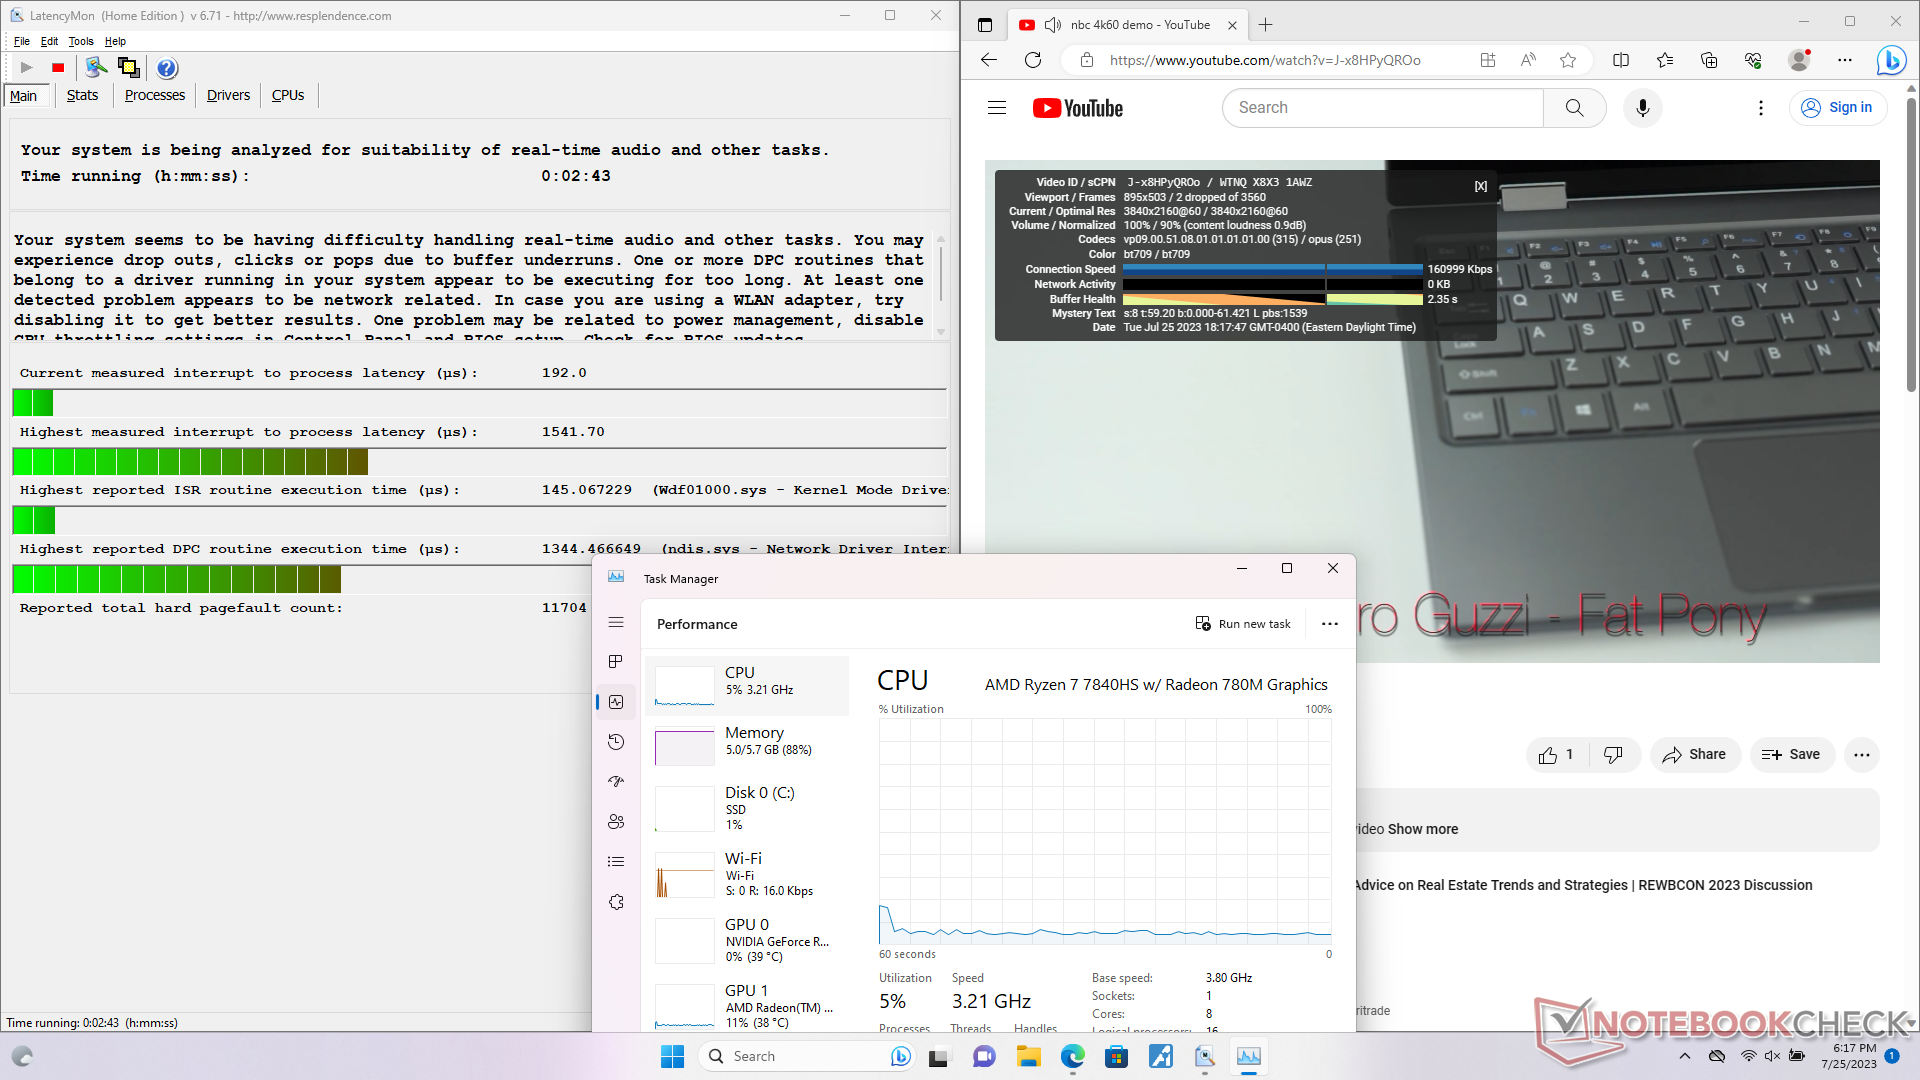
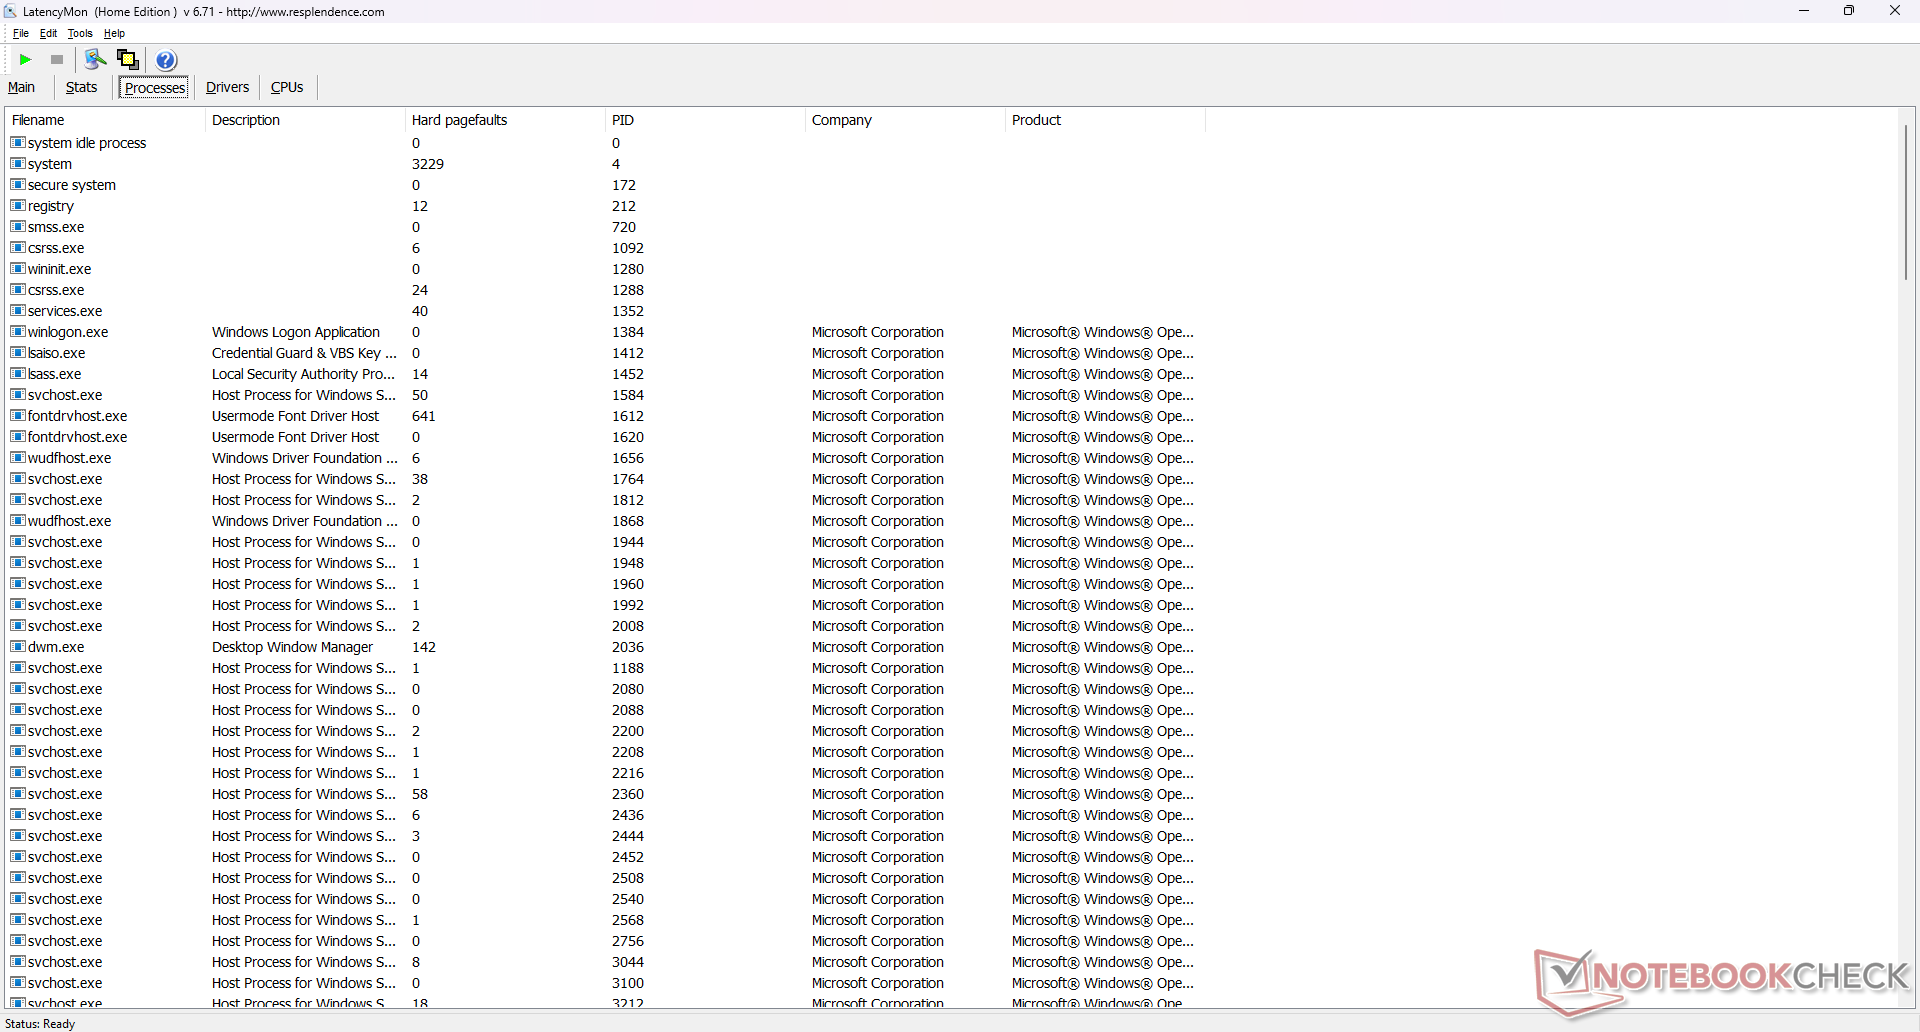
O LatencyMon revela pequenos problemas de DPC ao abrir várias guias do navegador em nossa página inicial. a reprodução de vídeo 4K a 60 FPS é quase perfeita, com apenas 2 quadros perdidos em um período de um minuto.
| DPC Latencies / LatencyMon - interrupt to process latency (max), Web, Youtube, Prime95 | |
| Dell G15 5530 | |
| HP Victus 15 fa0020nr | |
| Lenovo LOQ 15APH8 | |
| MSI Cyborg 15 A12VF | |
| Lenovo Legion 5 15IAH7H 82RB | |
* ... menor é melhor
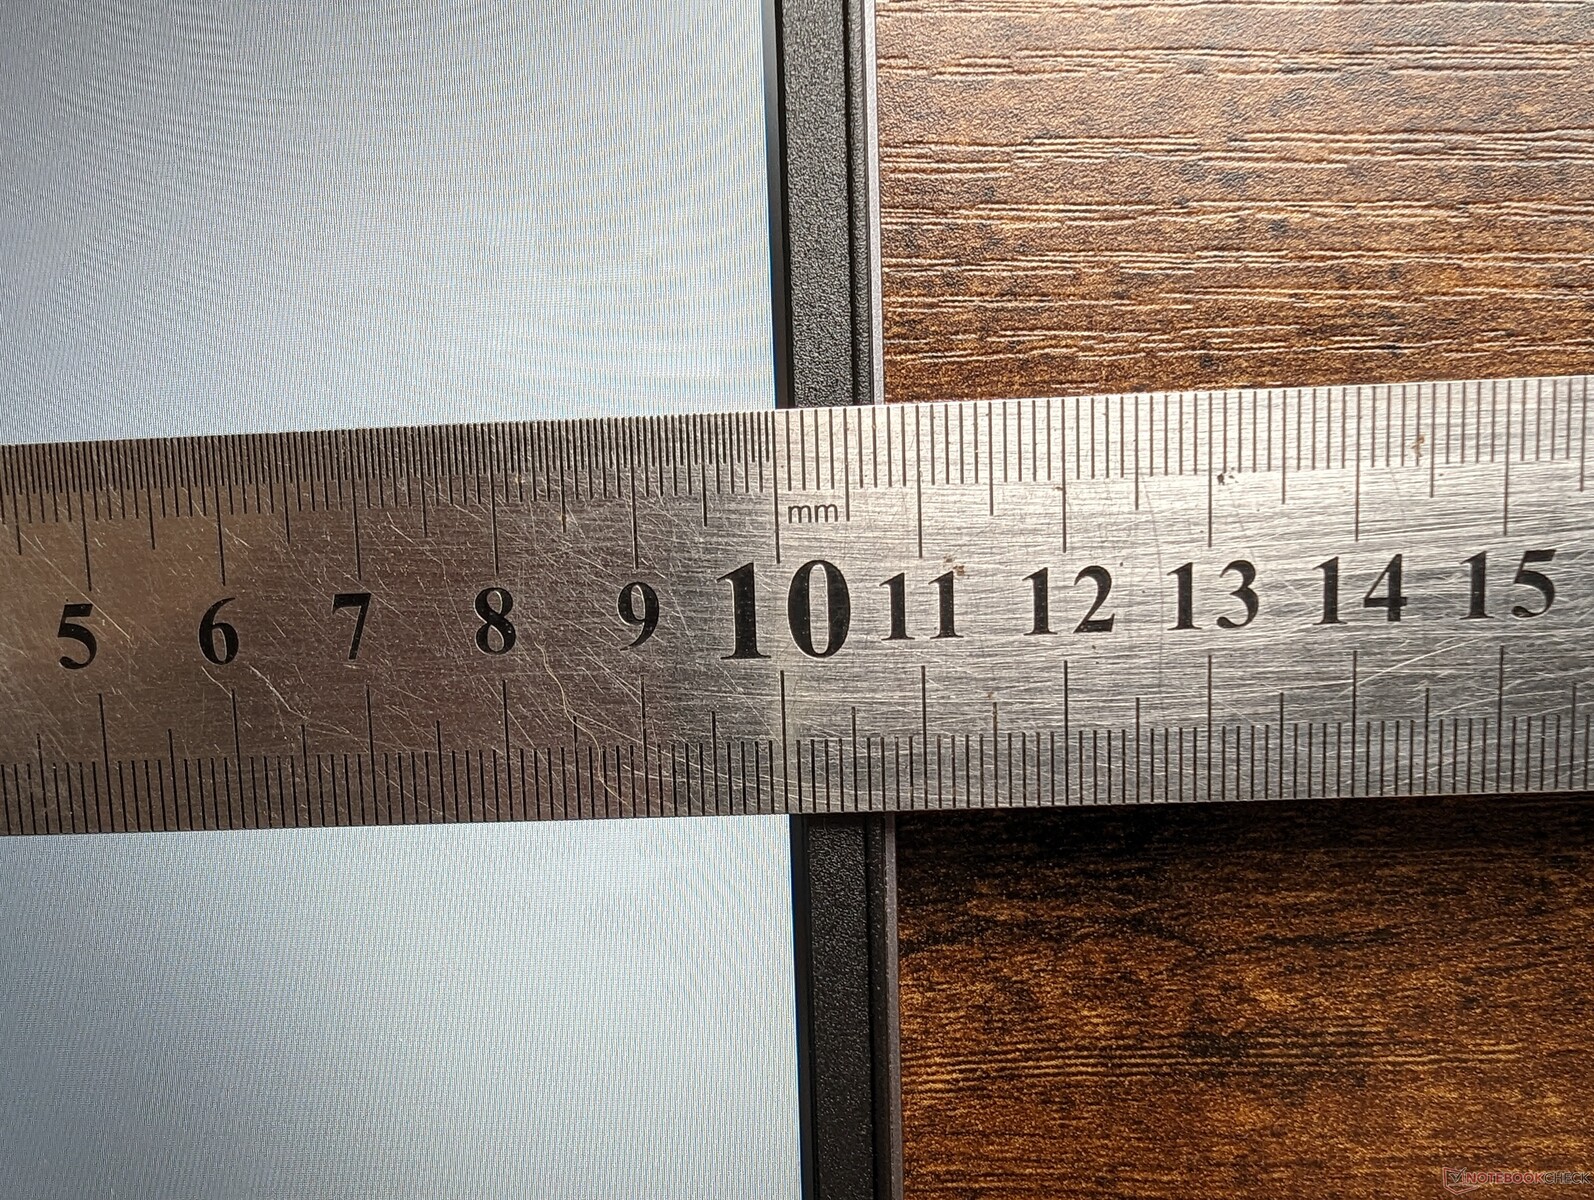
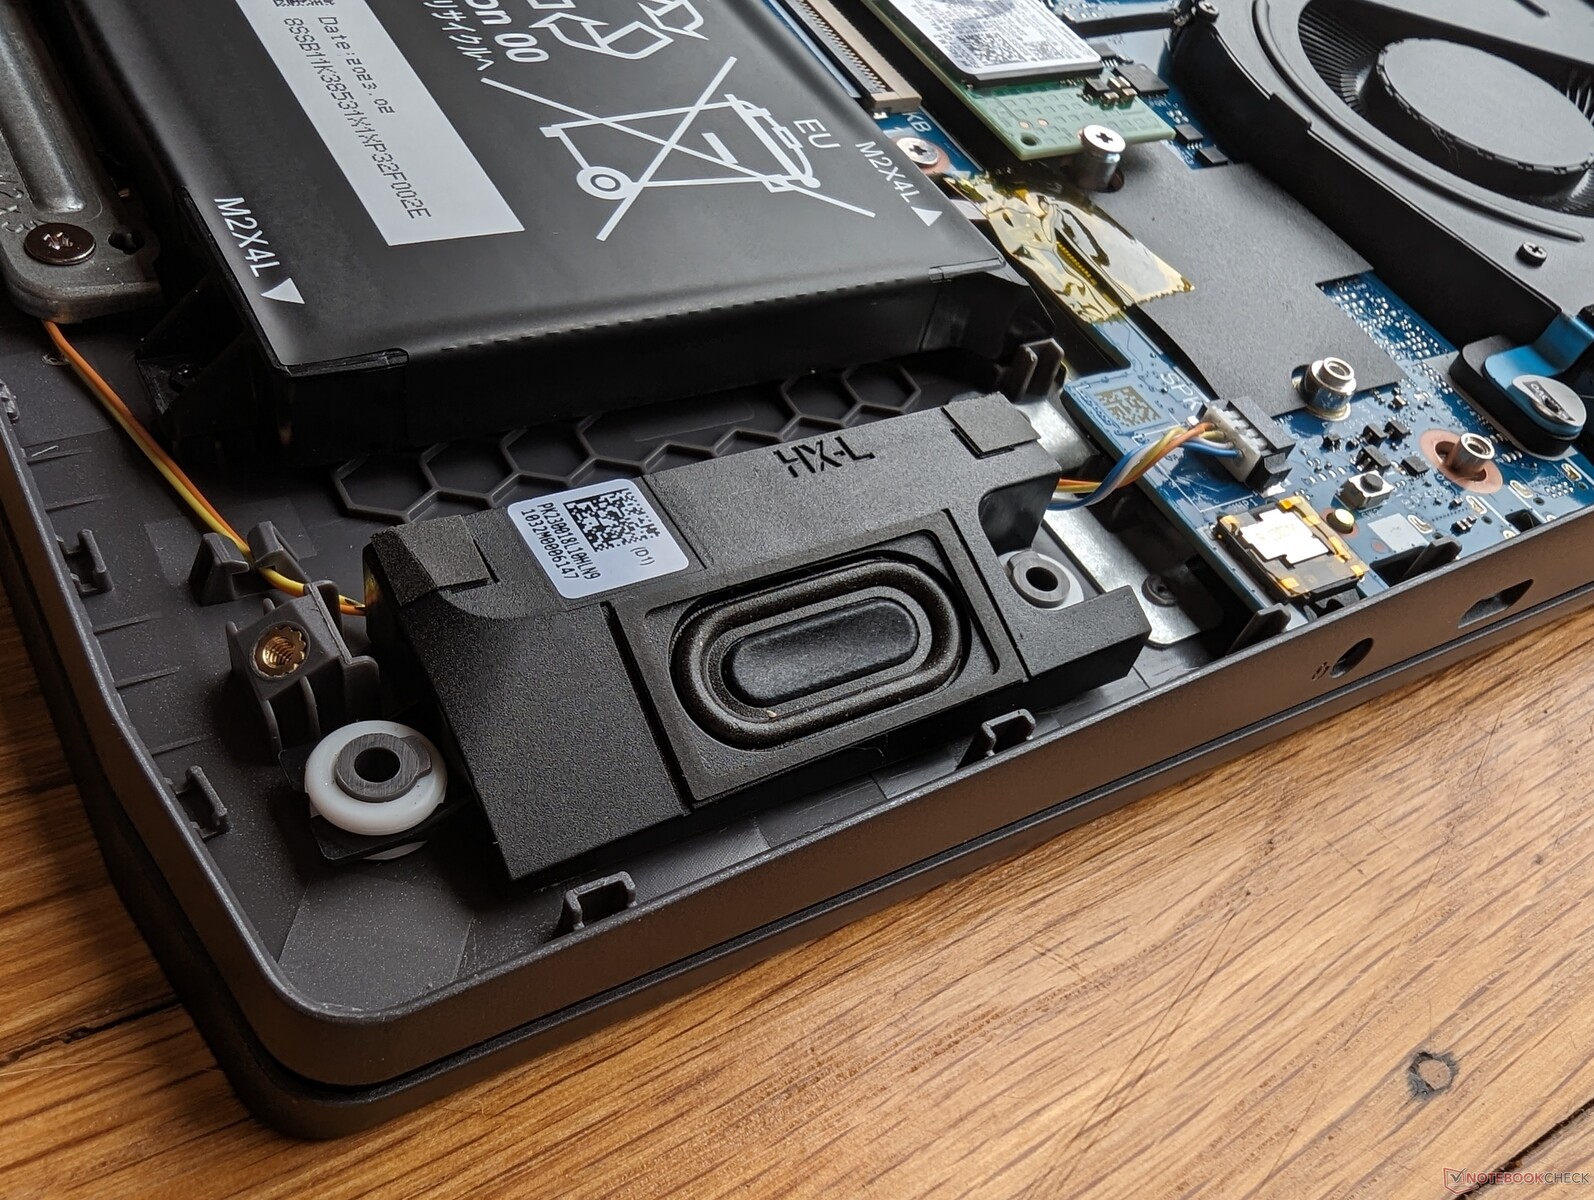
Dispositivos de armazenamento - Suporte a PCIe4 x4 NVMe
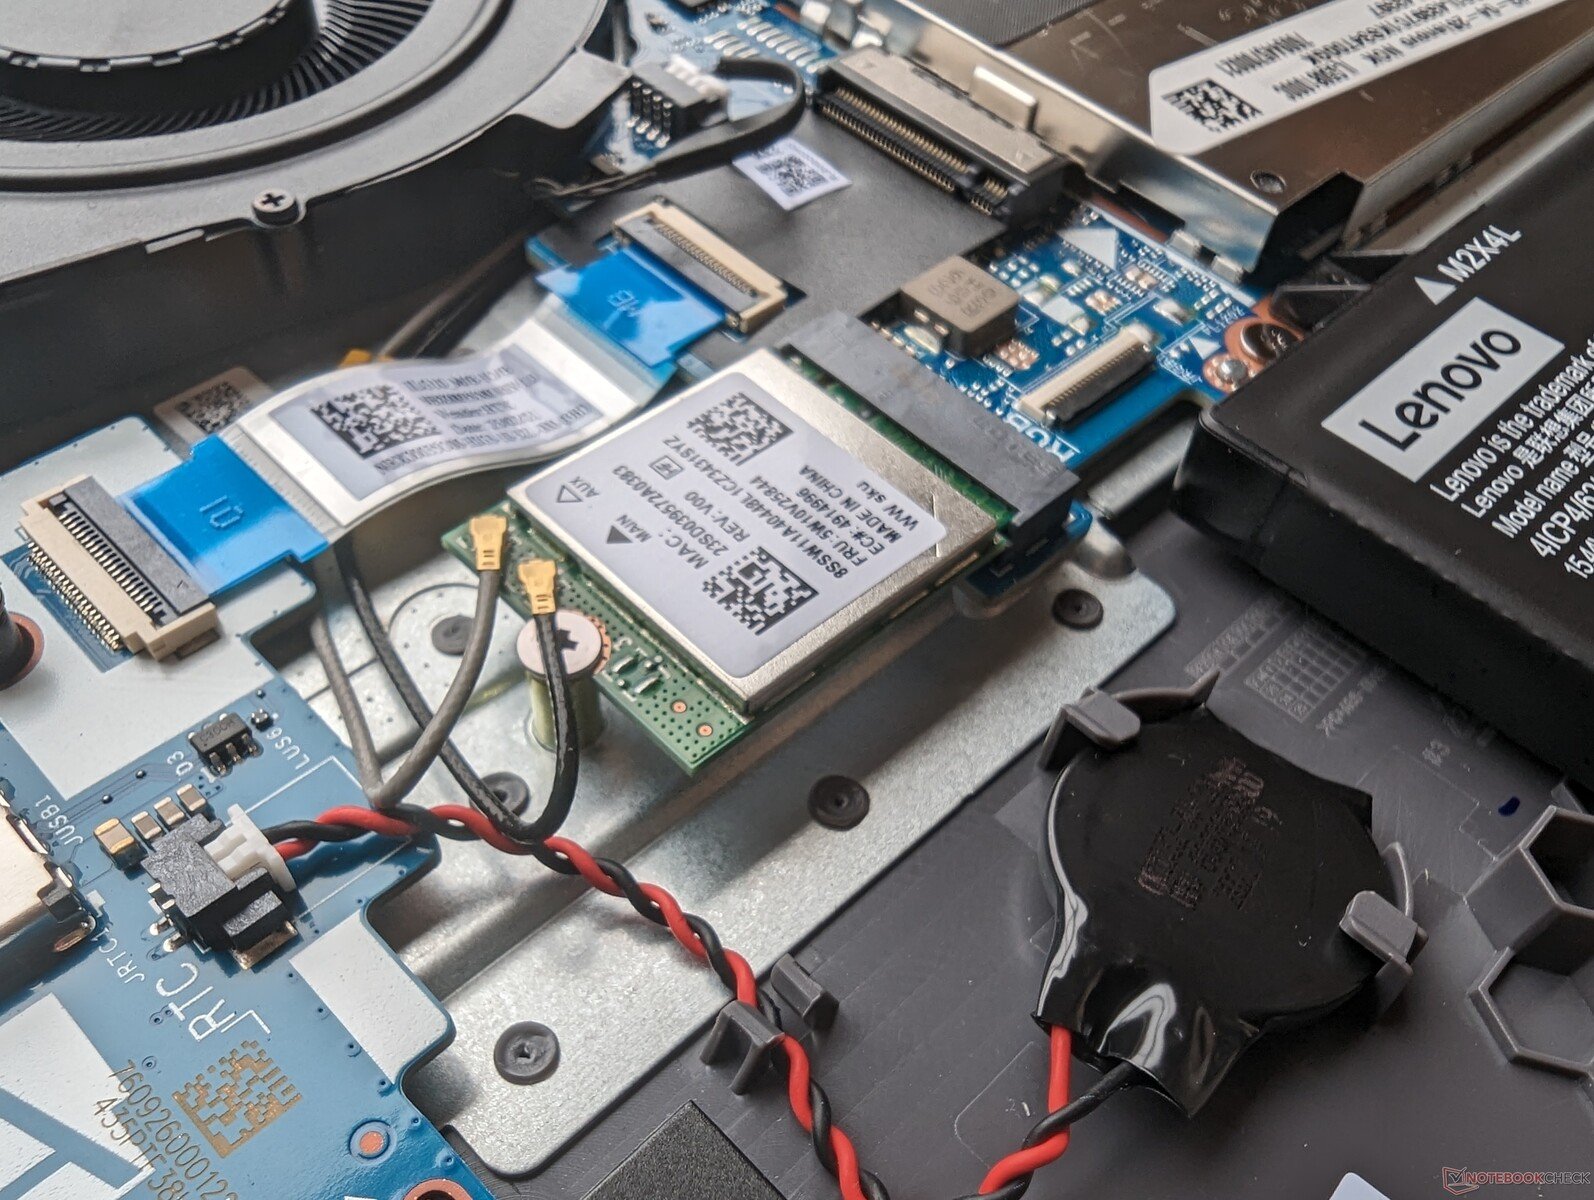
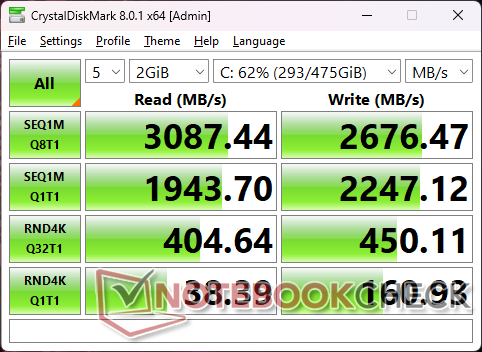
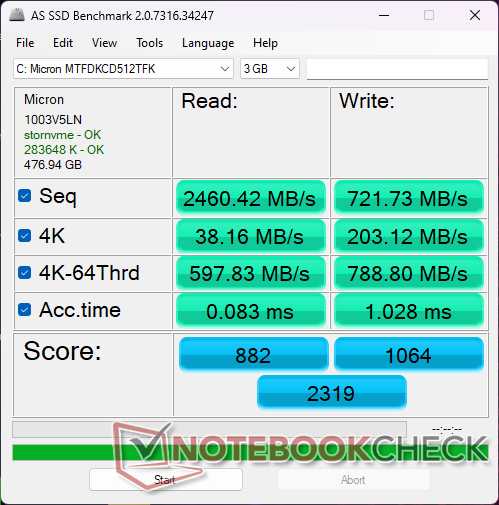
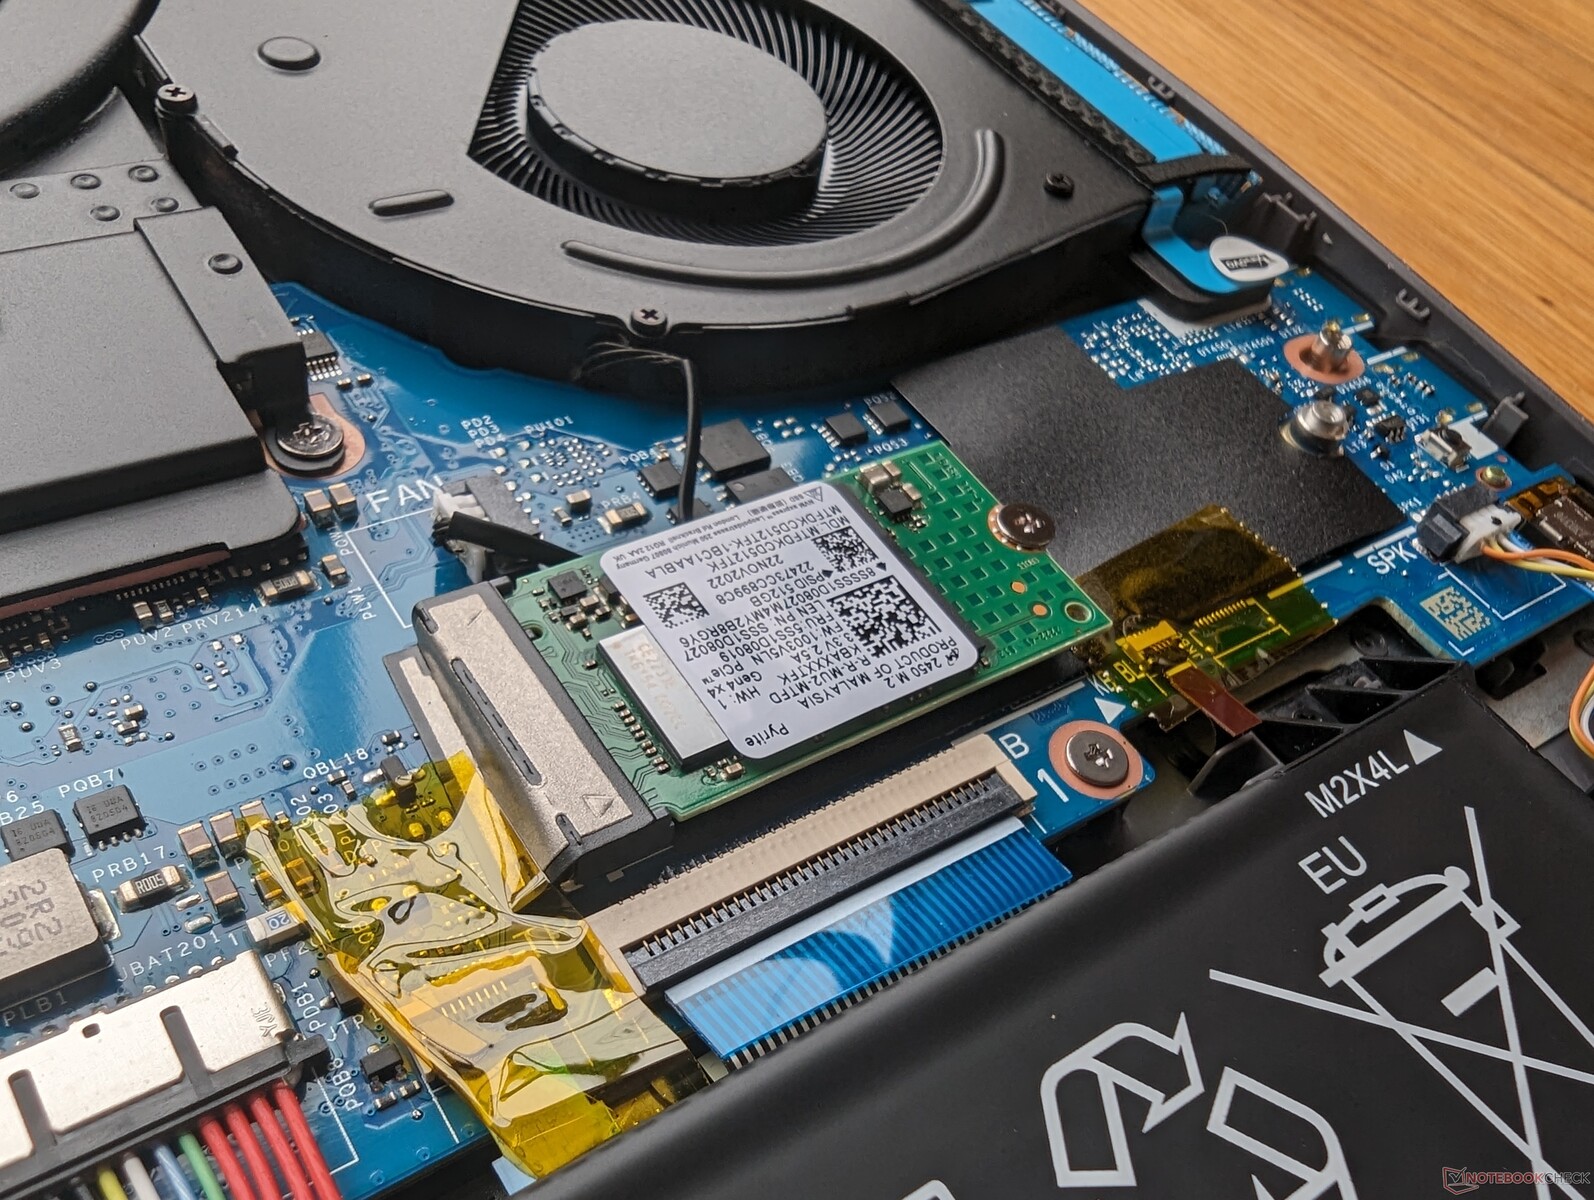
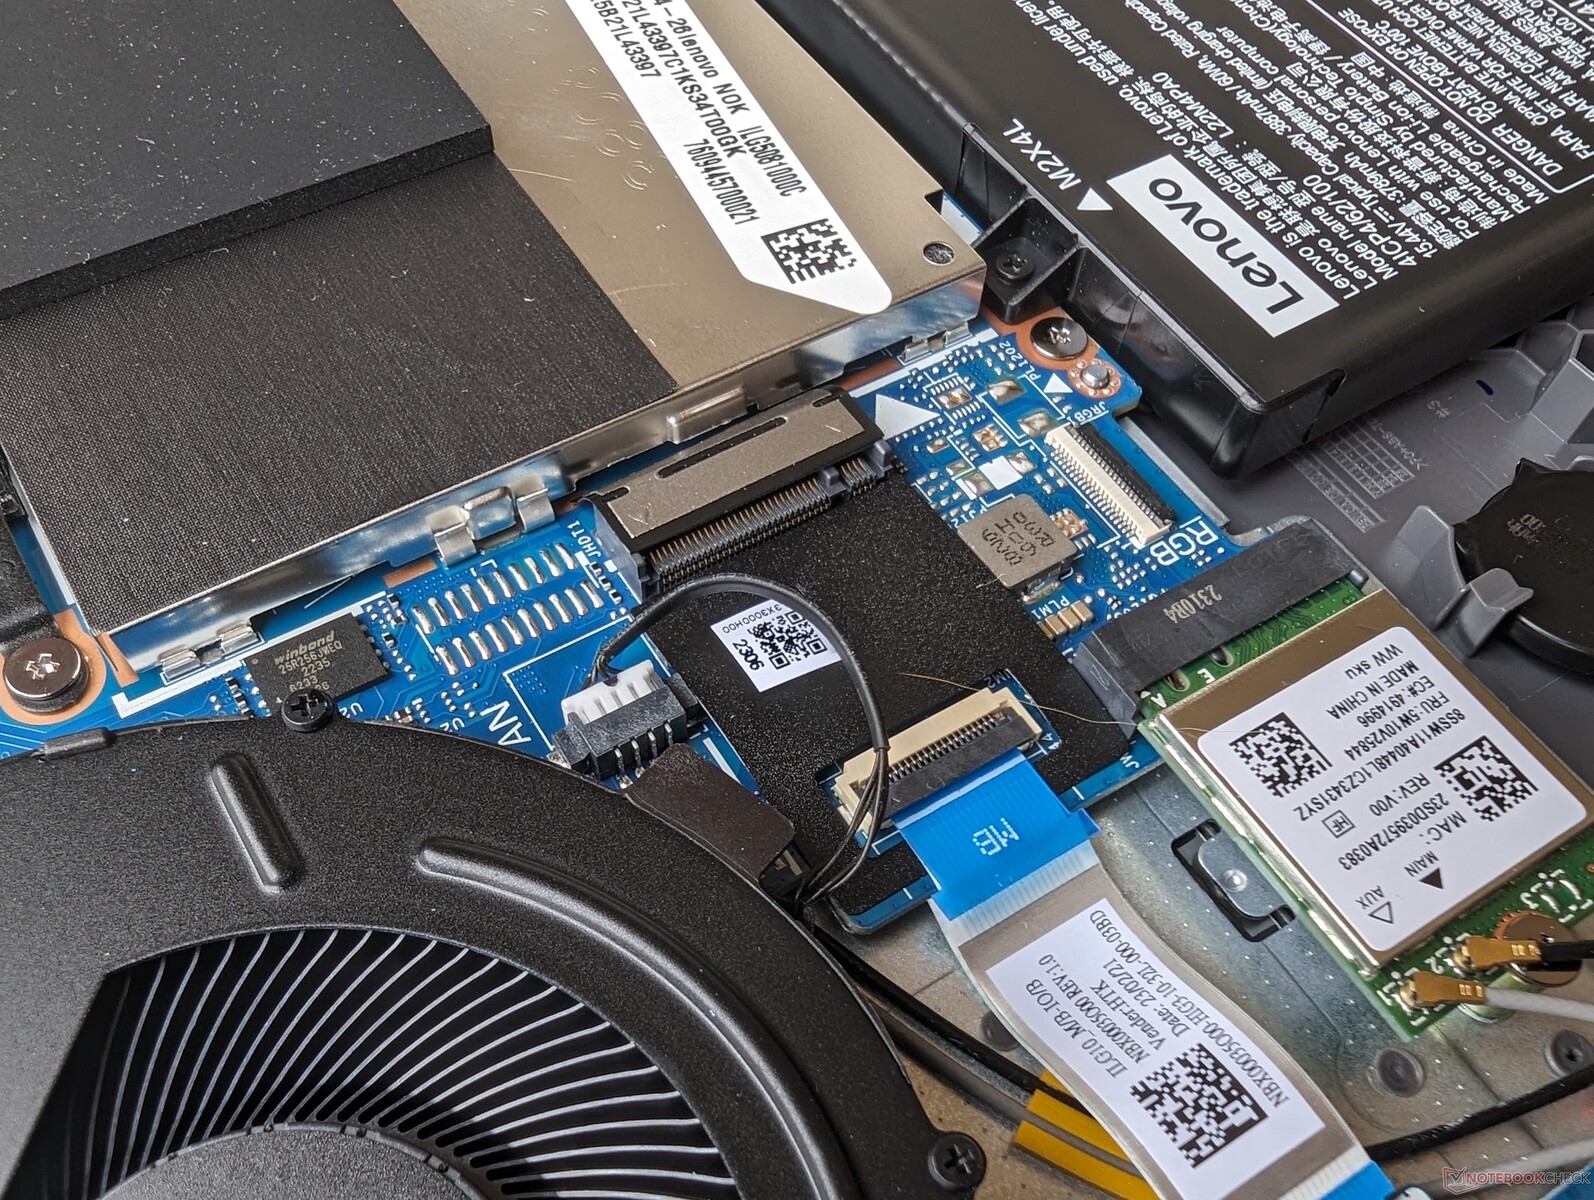
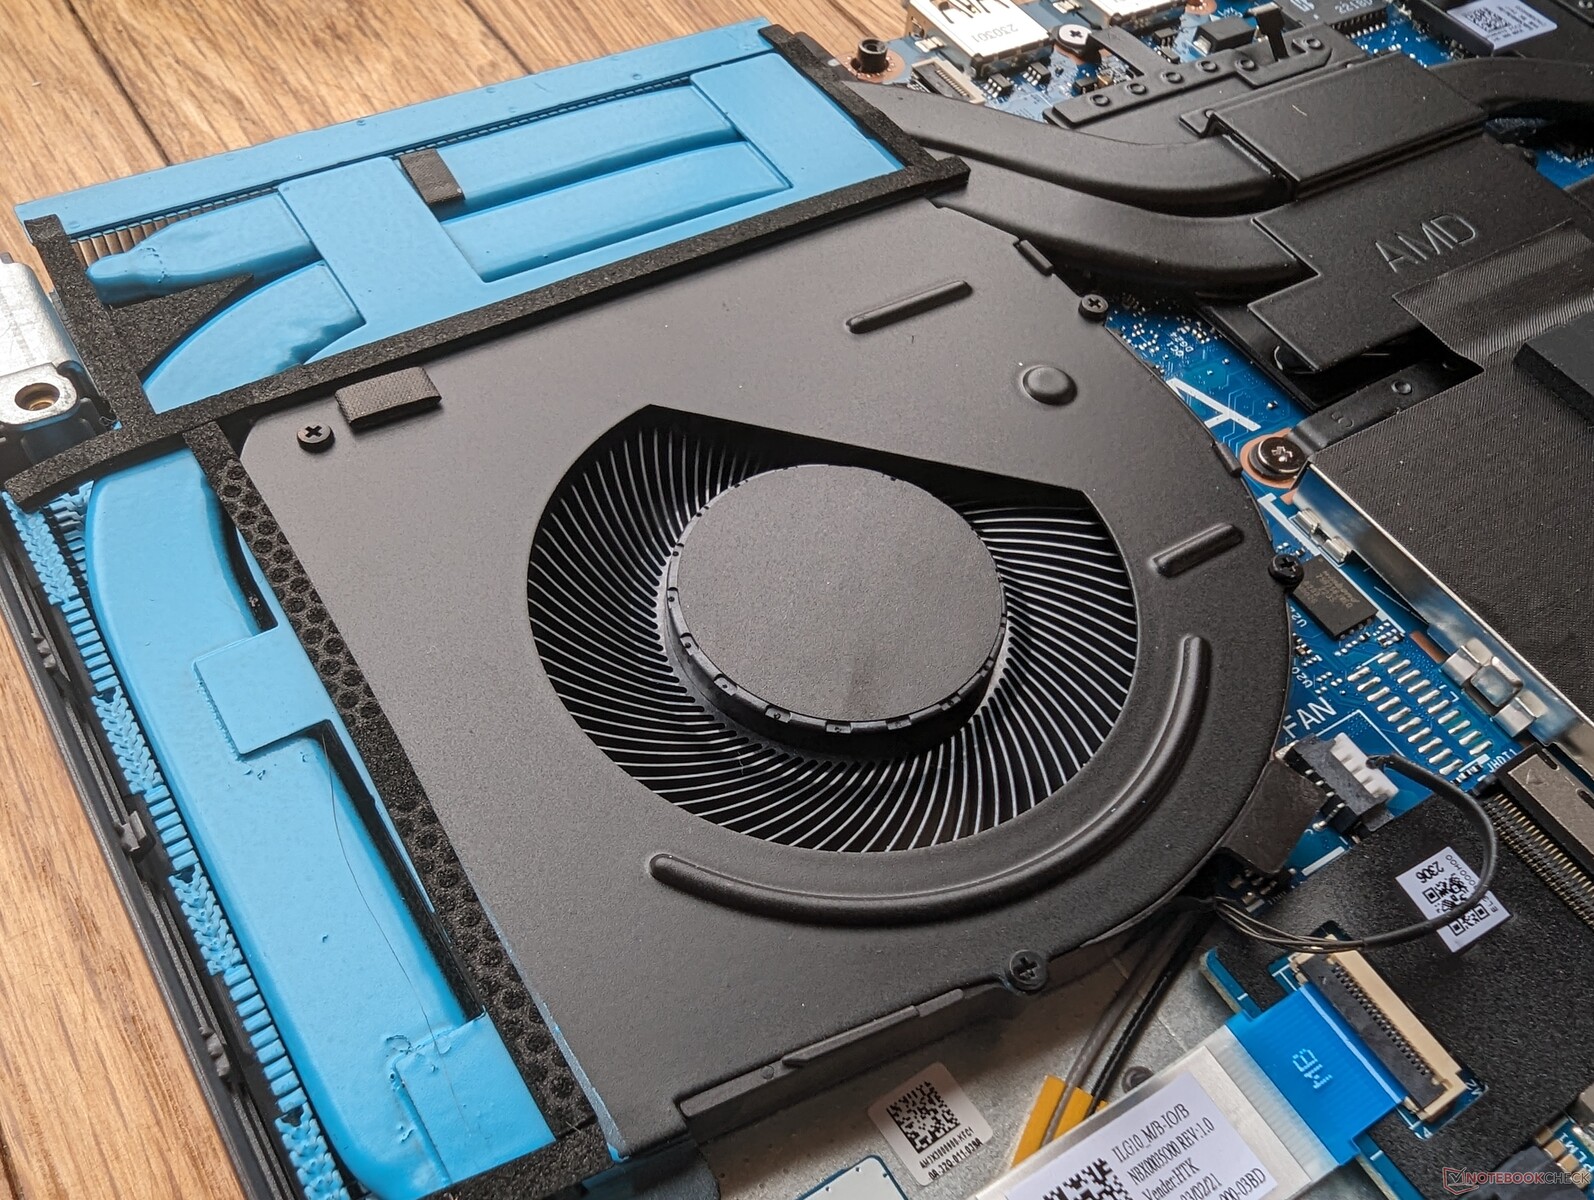
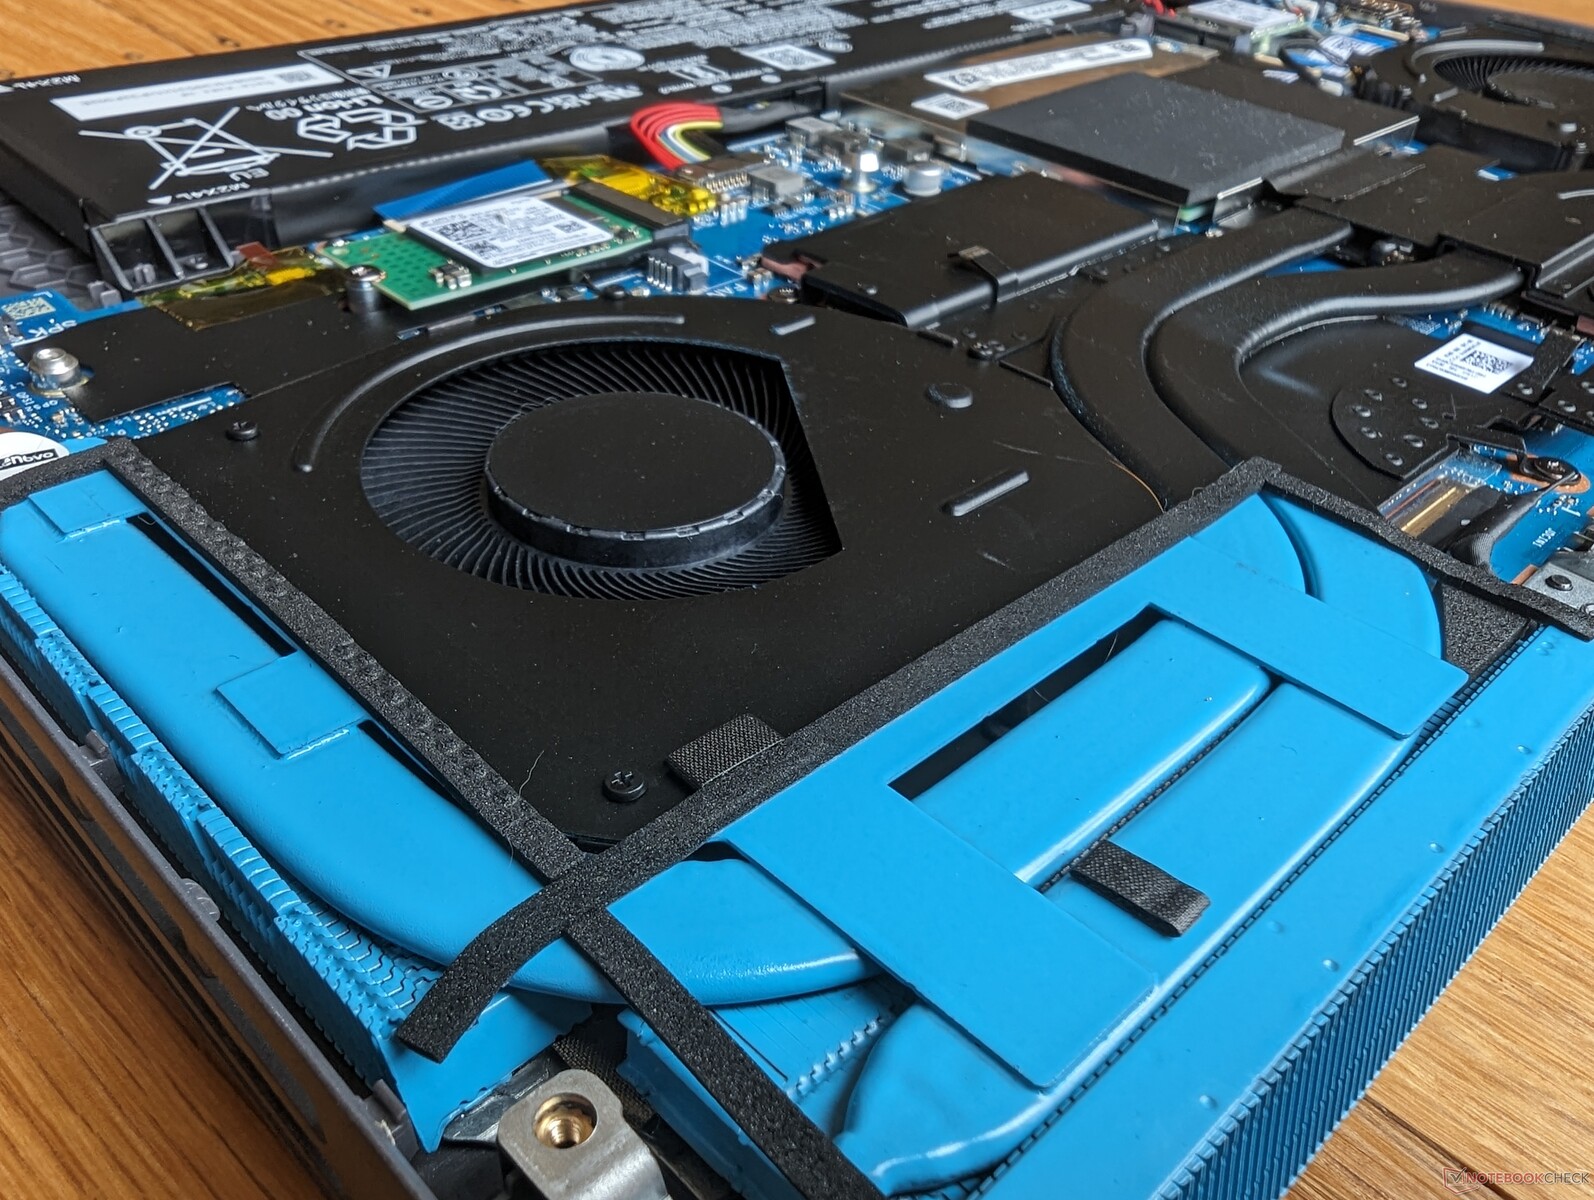
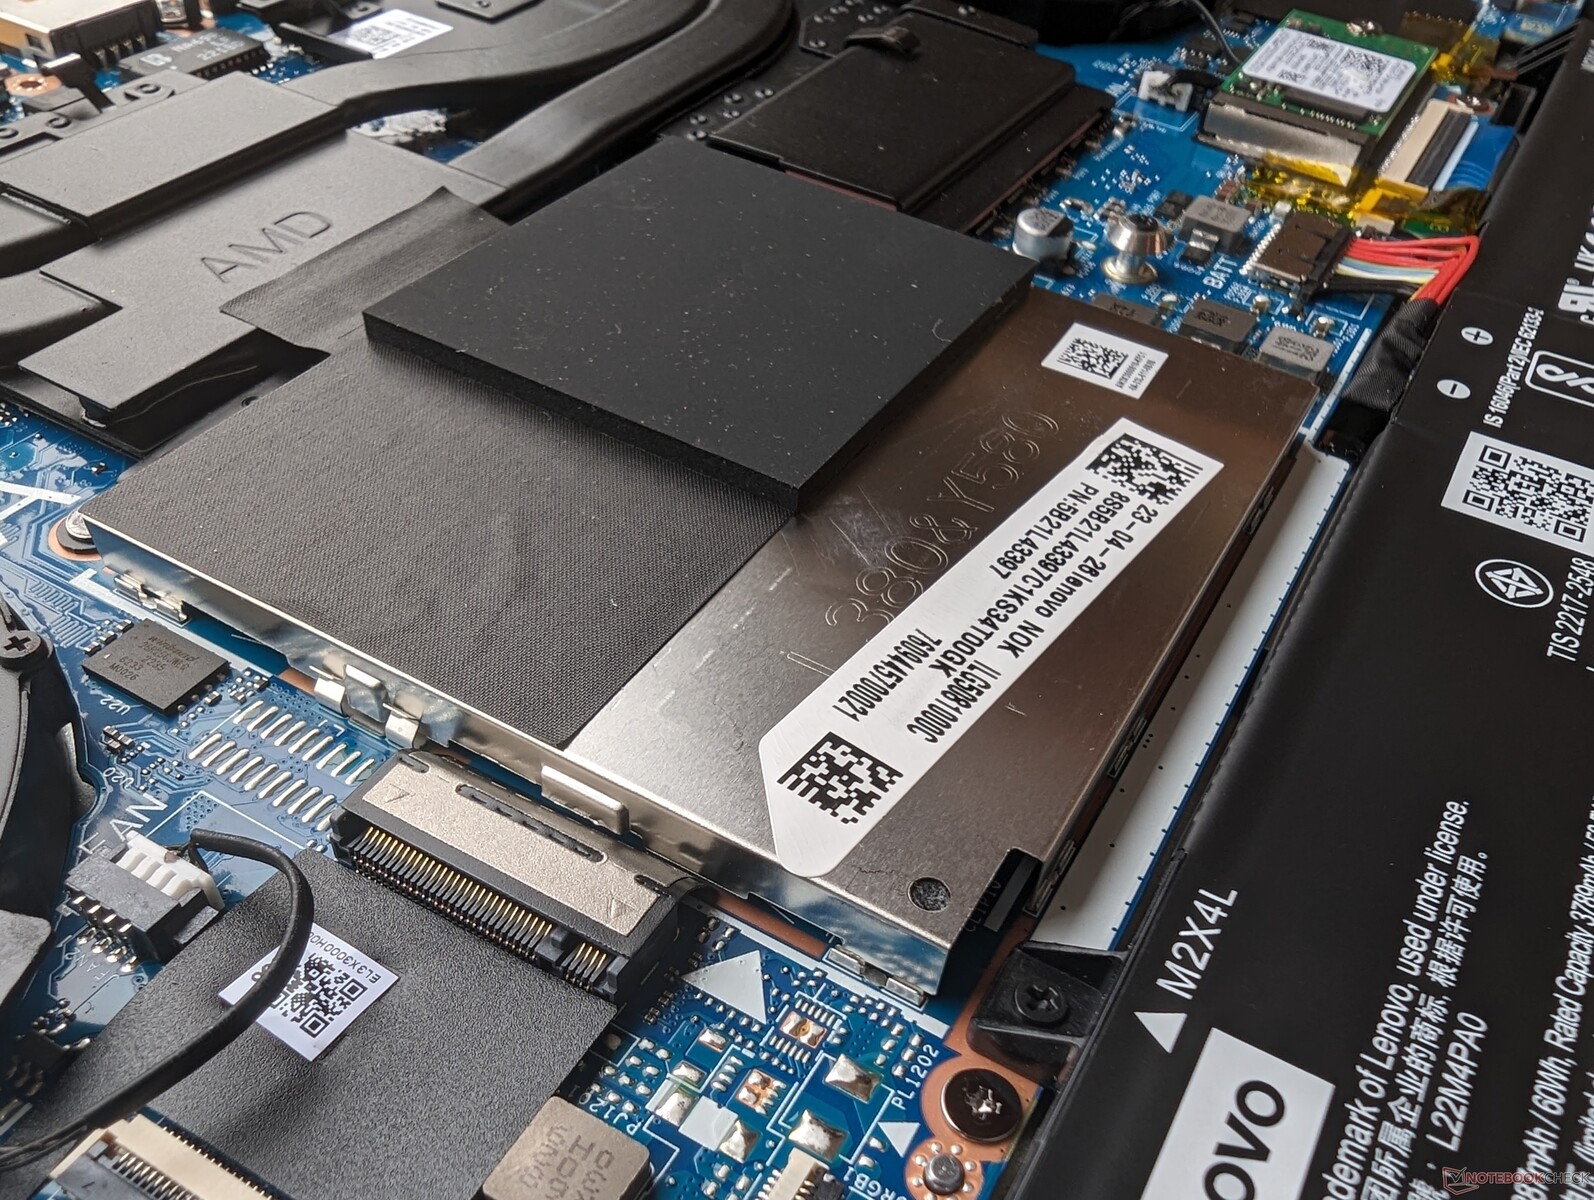
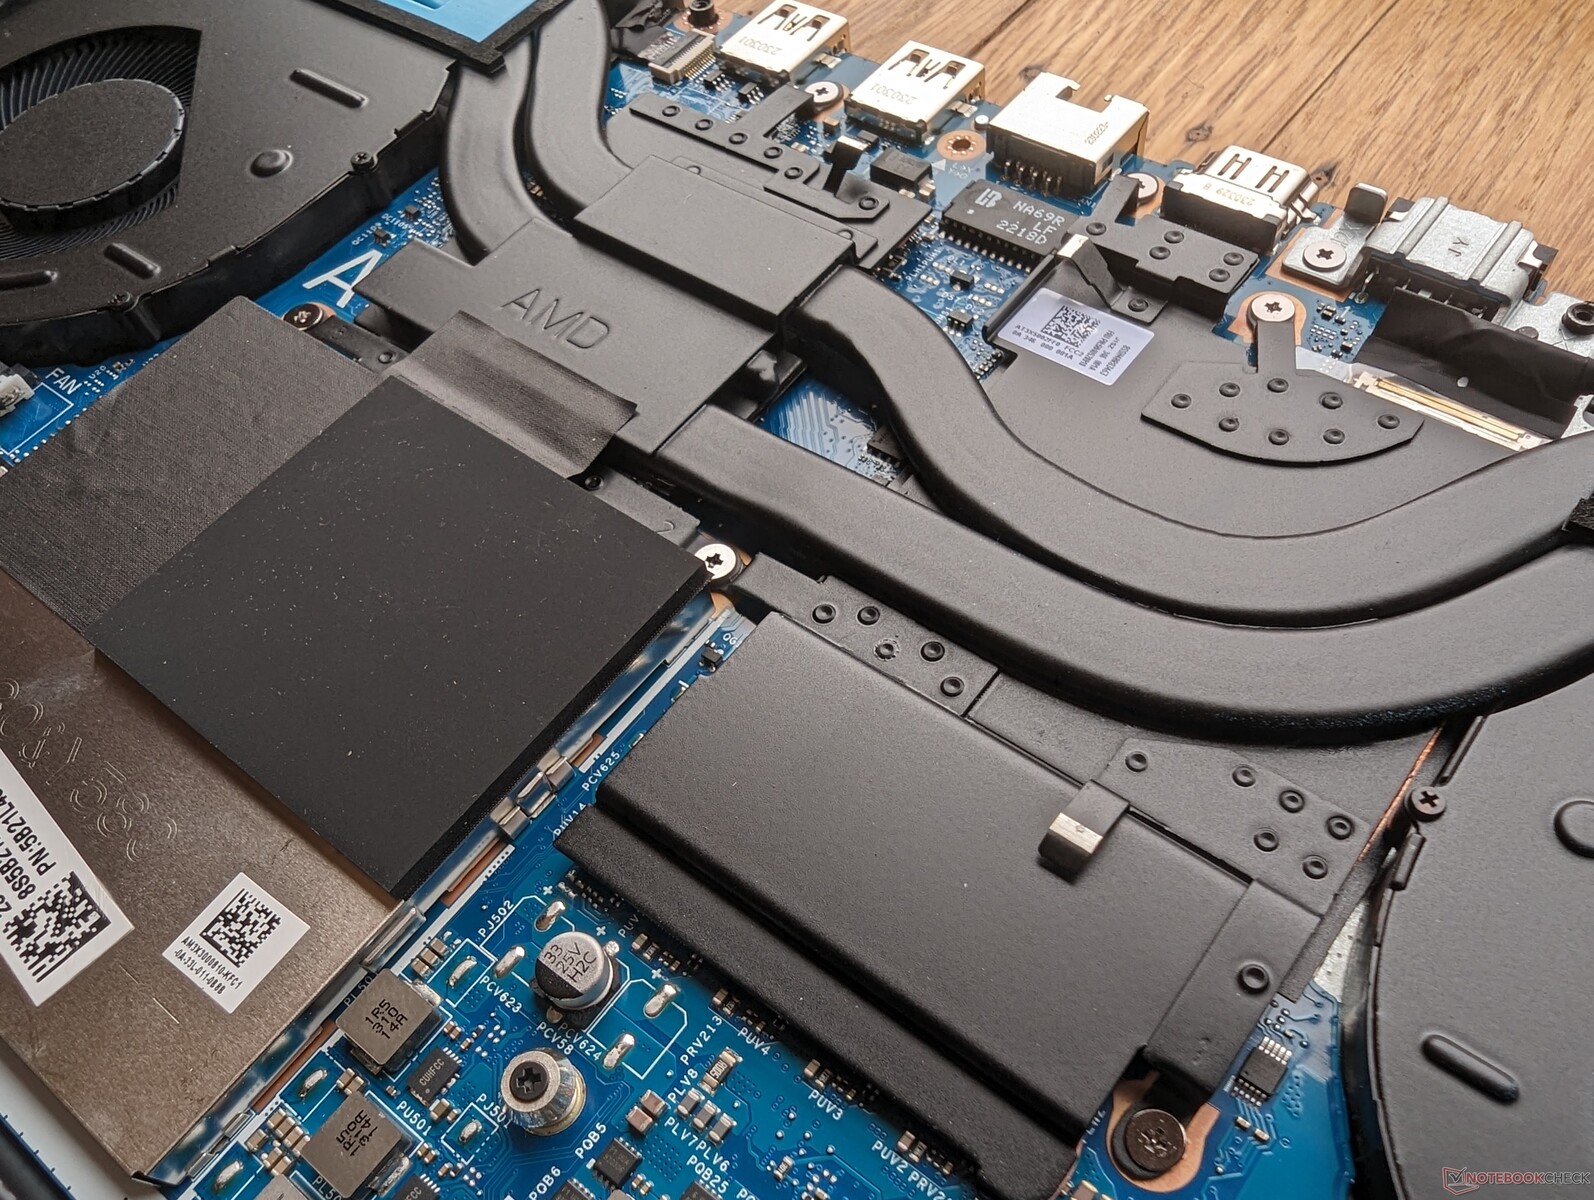
Nossa unidade vem com um orçamentoSSD Micron 2450 PCIe4 x4 NVMe capaz de sustentar taxas de leitura reais de até 2600 MB/s sem qualquer limitação. Há suporte para até duas SSDs internas, mas a segunda unidade deve ter 42 mm de comprimento, conforme mostrado nas imagens abaixo.

| Drive Performance rating - Percent | |
| Lenovo Legion 5 15IAH7H 82RB | |
| HP Victus 15 fa0020nr | |
| MSI Cyborg 15 A12VF | |
| Asus TUF A15 FA507 | |
| Dell G15 5530 | |
| Lenovo LOQ 15APH8 | |
* ... menor é melhor
Disk Throttling: DiskSpd Read Loop, Queue Depth 8
Desempenho da GPU
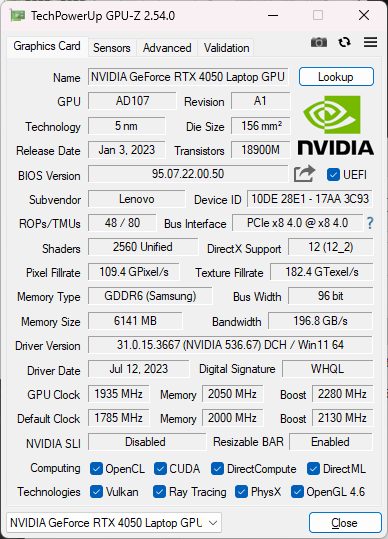
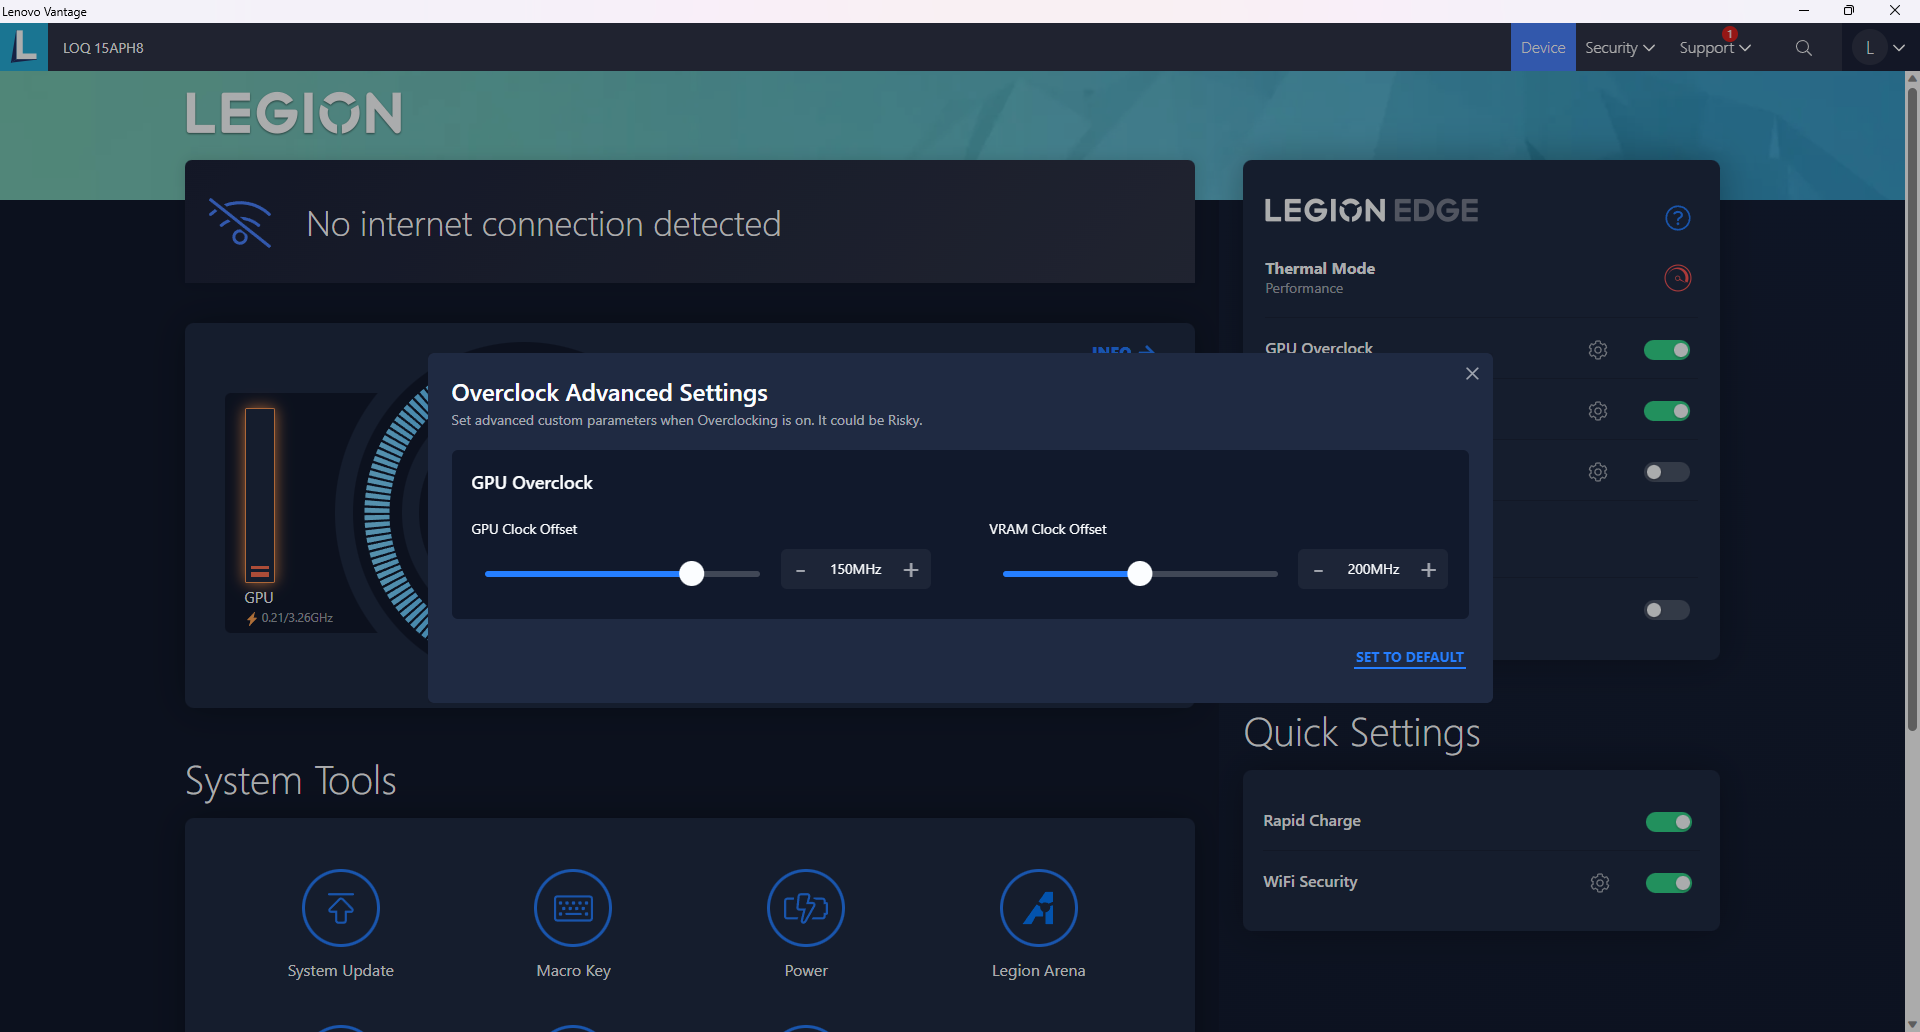
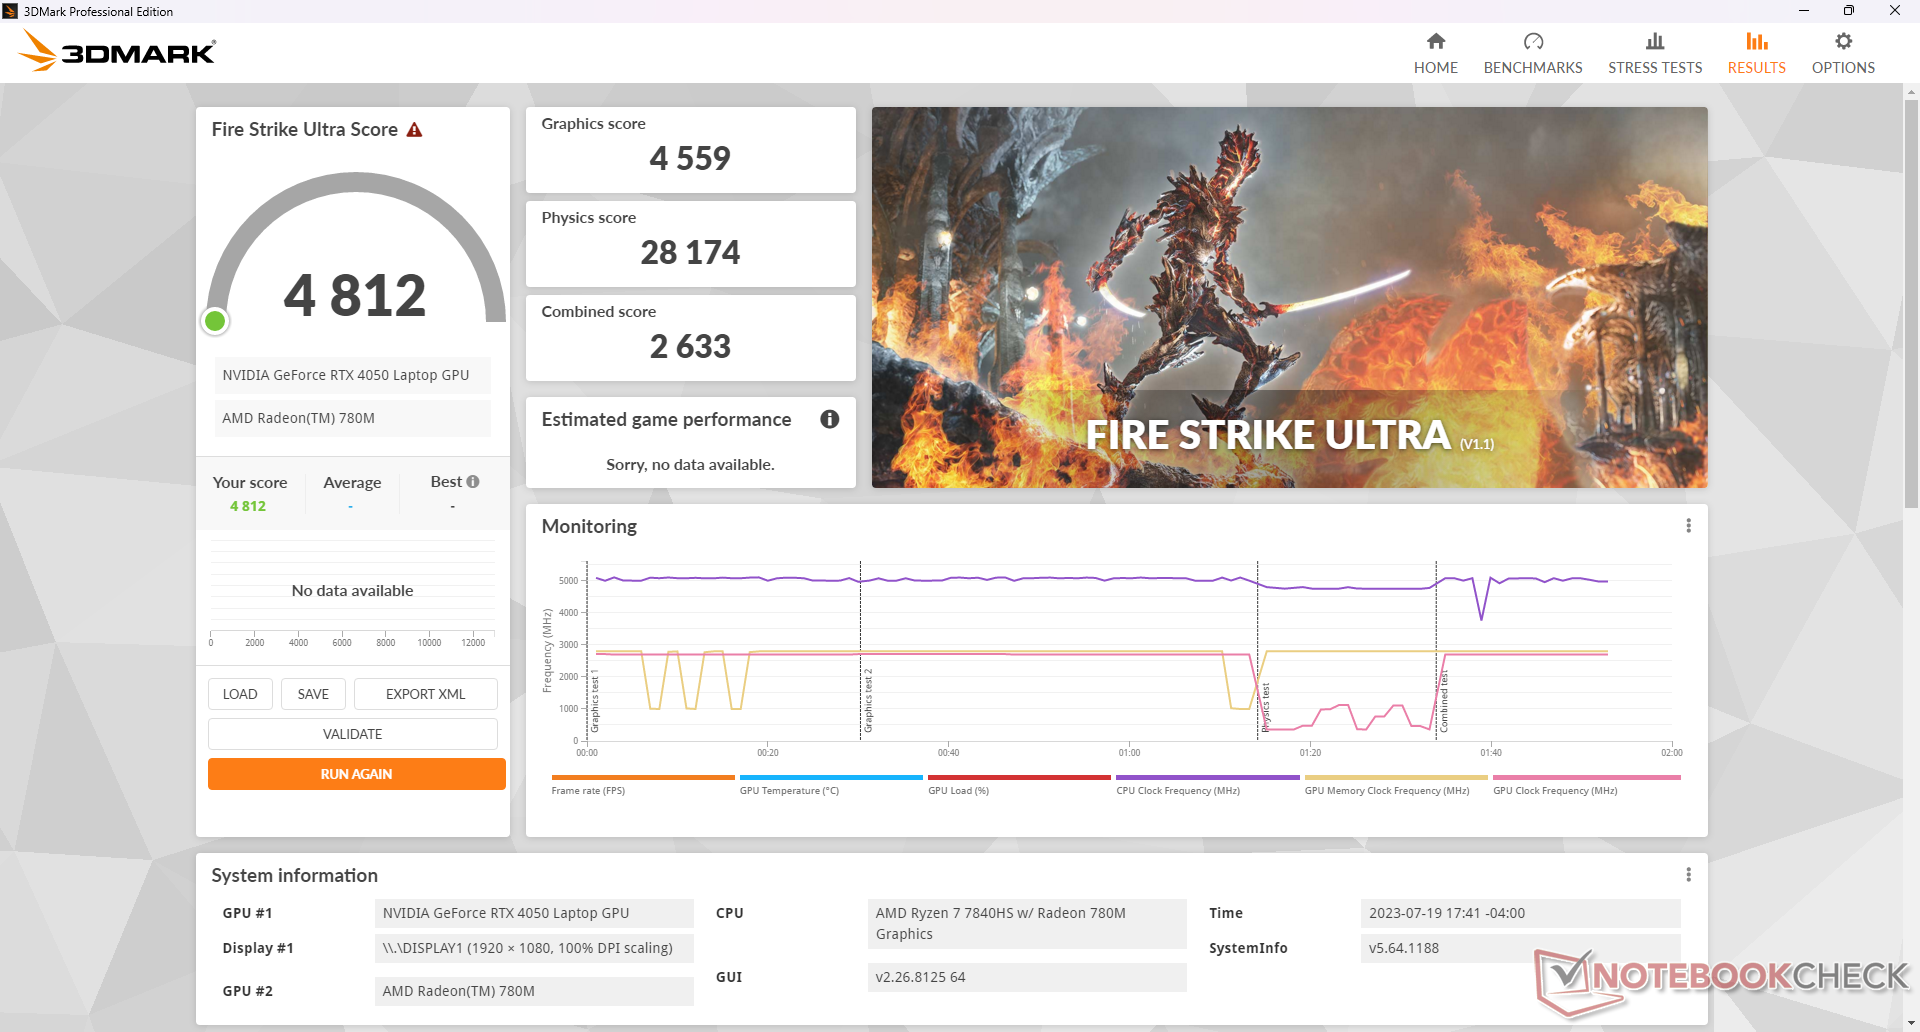
O desempenho gráfico é muito bom, com pontuações no 3DMark que são cerca de 10% mais altas do que a média dos laptops em nosso banco de dados equipados com a mesma GeForce RTX 4050 GPU. O desempenho bruto está no mesmo nível da rTX 3060 móvel como era de se esperar.
O downgrade para a RTX 3050 reduziria o desempenho da GPU em até 45%, enquanto o upgrade para a configuração RTX 4060 aumentaria o desempenho em 15 a 20 por cento. Para os gamers com orçamento limitado, recomendamos que fiquem com as opções RTX 4050 ou RTX 4060.
A execução com bateria reduz o desempenho. Um teste no site Fire Strike com baterias retornaria pontuações de Física e Gráficos de 25672 e 16335 pontos, respectivamente, em comparação com 28136 e 23345 pontos quando ligado à rede elétrica.
A execução do sistema no modo balanceado em vez do modo de desempenho afetará o desempenho apenas ligeiramente, conforme demonstrado pelos resultados do site Fire Strike na tabela abaixo.
| Perfil de energia | Pontuação de gráficos | Pontuação de física | Pontuação combinada |
| Equilibrado | 22598 (-3%) | 25910 (-8%) | 9507 (-1%) |
| Desempenho | 23345 | 28136 | 9593 |
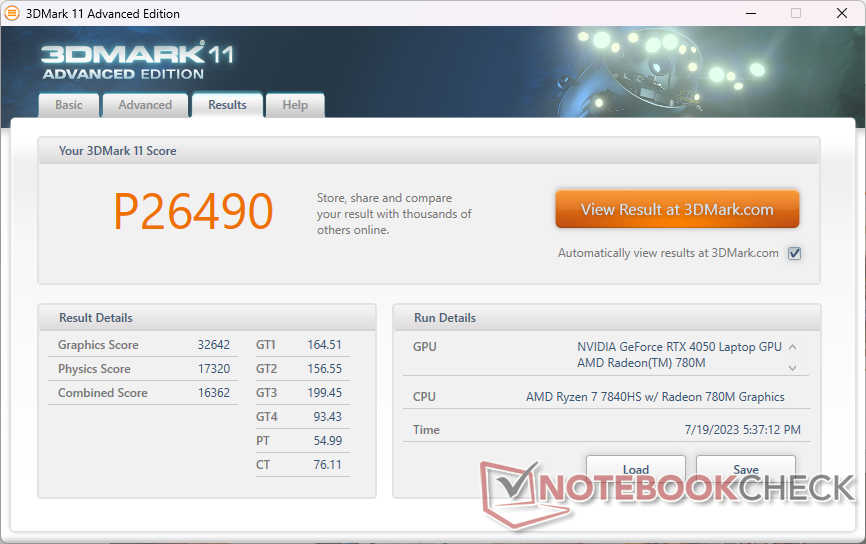
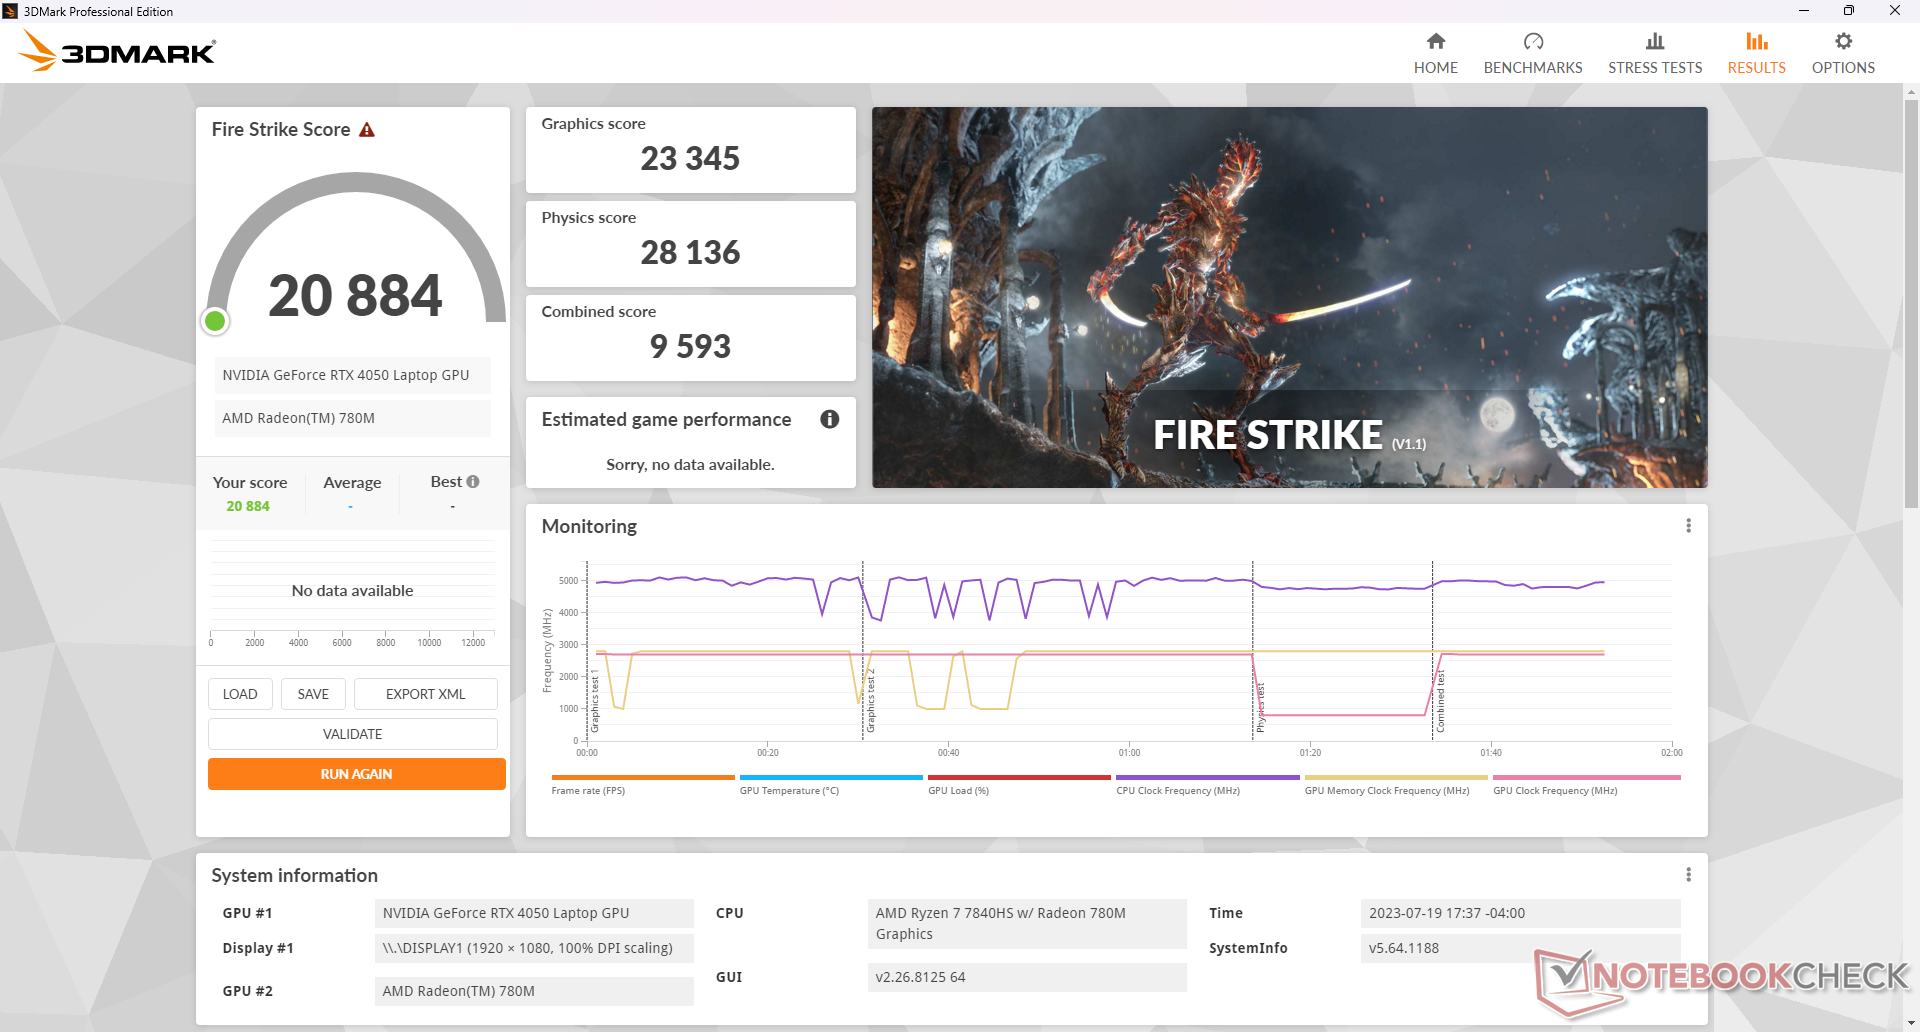
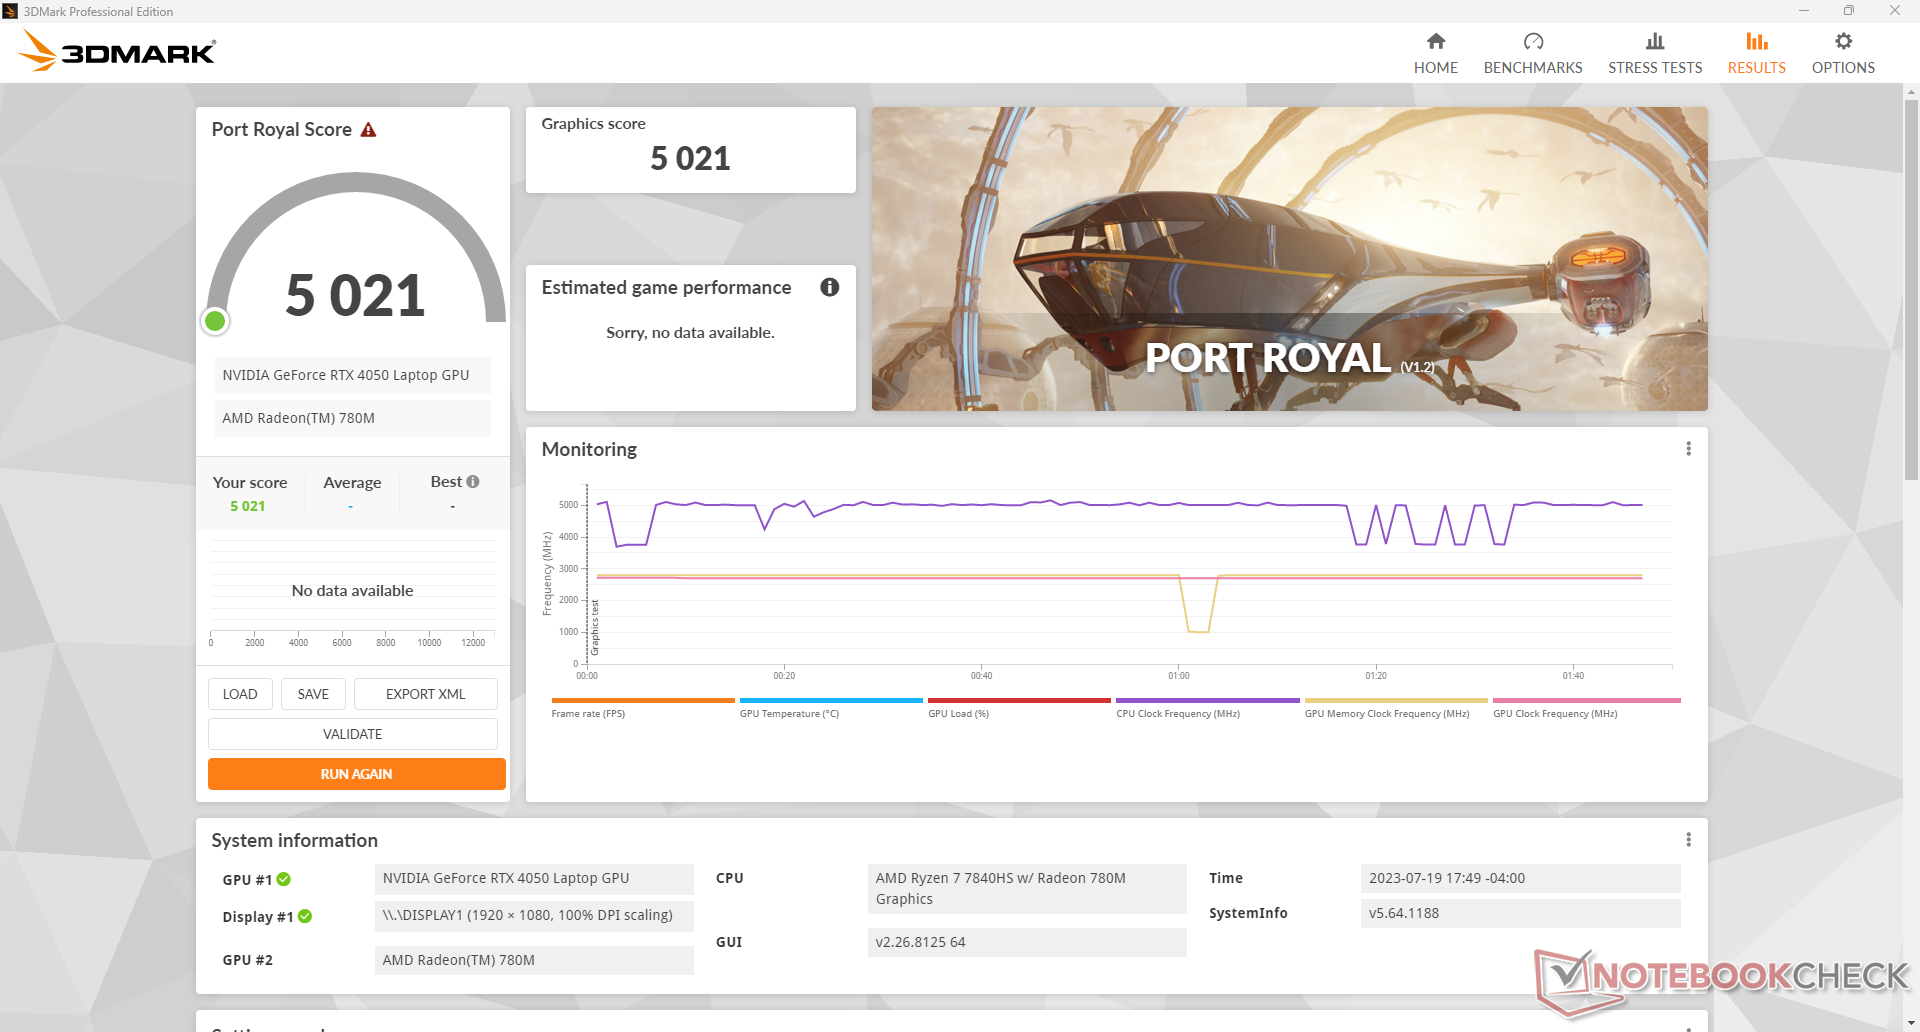
| 3DMark 11 Performance | 26490 pontos | |
| 3DMark Fire Strike Score | 20884 pontos | |
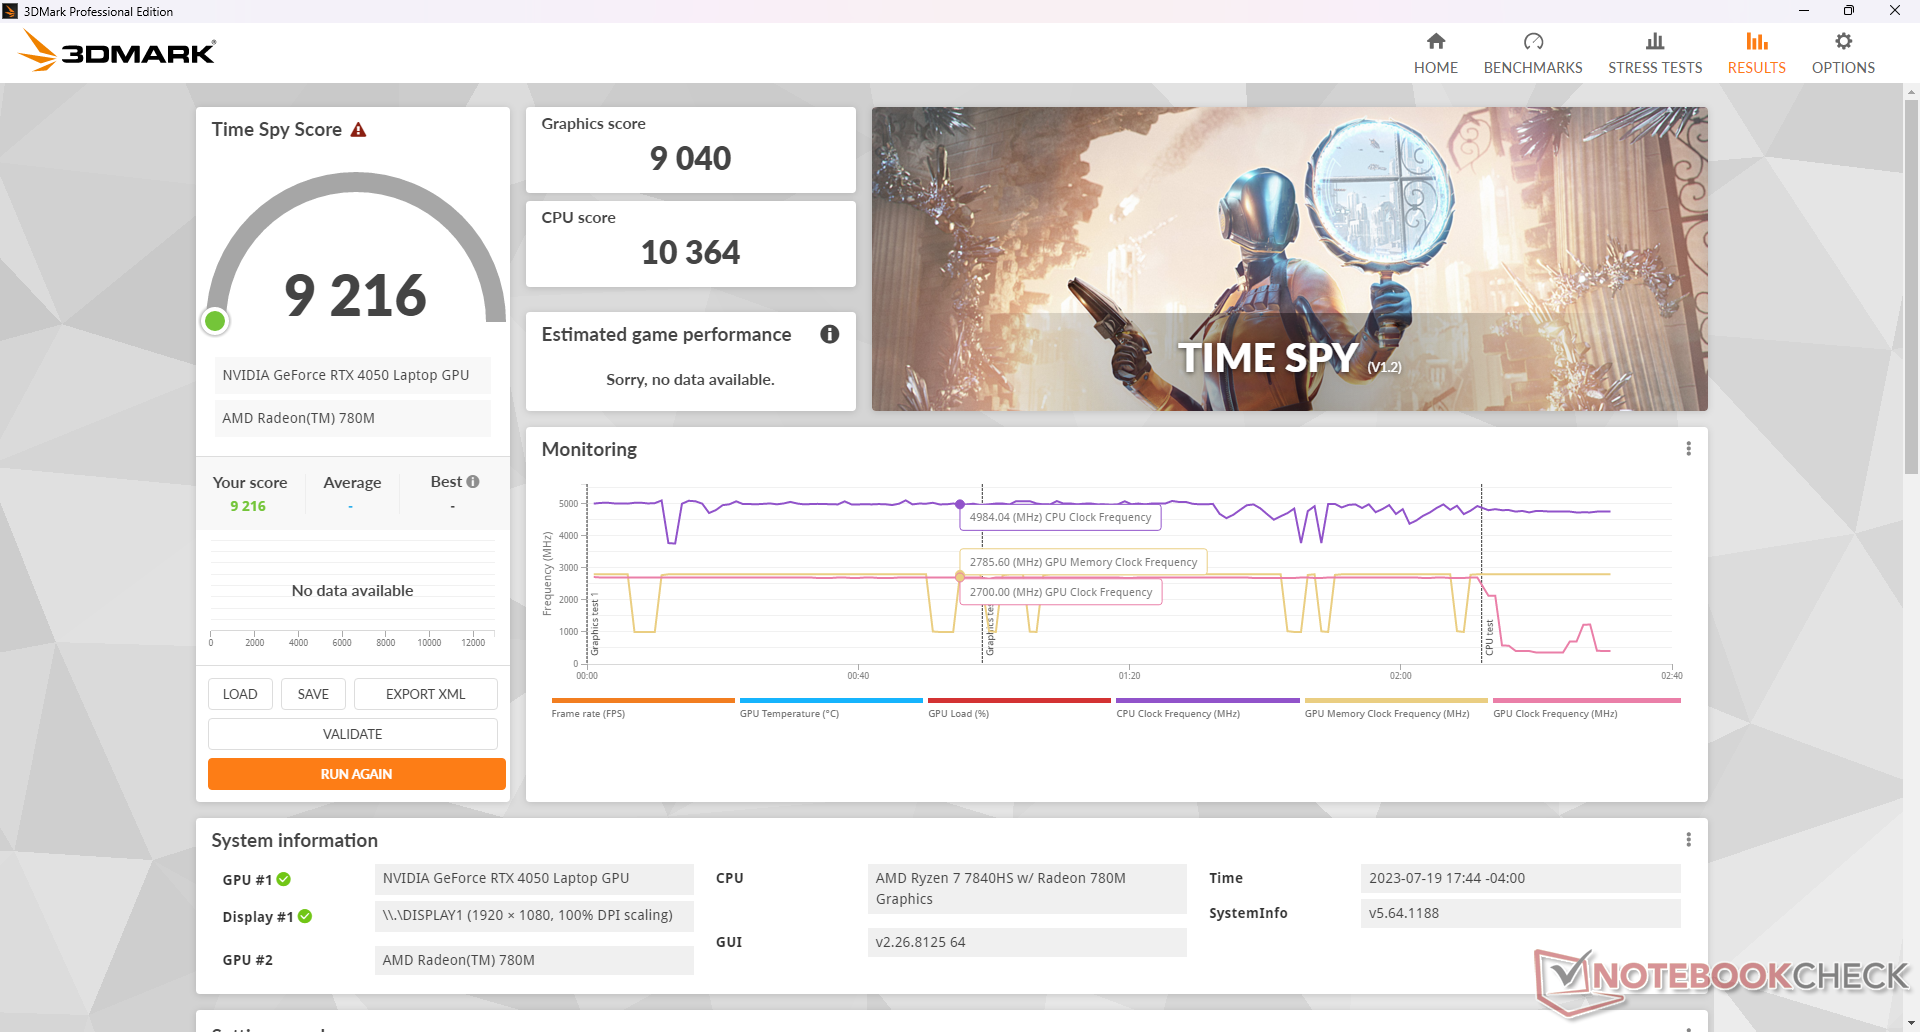
| 3DMark Time Spy Score | 9216 pontos | |
Ajuda | ||
* ... menor é melhor
Desempenho em jogos
Surpreendentemente, os 8 GB de RAM do sistema têm pouco impacto sobre o desempenho do sistema em jogos. Na verdade, as taxas de quadros estão onde esperávamos que estivessem na maioria dos casos, quando comparadas a outros notebooks com a mesma GPU RTX 4050, se não um pouco mais rápidas. Há algumas exceções, no entanto, em que certas configurações gráficas Ultra travariam o jogo devido a limitações de memória, incluindo F1 22 e Returnal.
Witcher 3 FPS Chart
| baixo | média | alto | ultra | |
|---|---|---|---|---|
| GTA V (2015) | 163.6 | 156 | 132.9 | 78.4 |
| The Witcher 3 (2015) | 286.5 | 251.2 | 165 | 83.8 |
| Dota 2 Reborn (2015) | 148 | 134.9 | 130 | 123.9 |
| Final Fantasy XV Benchmark (2018) | 166.8 | 122.4 | 86.1 | |
| X-Plane 11.11 (2018) | 113.2 | 101.4 | 81.3 | |
| Strange Brigade (2018) | 309 | 214 | 177 | 156.6 |
| Cyberpunk 2077 1.6 (2022) | 117 | 106.4 | 82.2 | 70.1 |
| Tiny Tina's Wonderlands (2022) | 169.2 | 148.8 | 99.5 | 77.3 |
| F1 22 (2022) | 191.2 | 184.3 | 163.2 | |
| Returnal (2023) | 66 | 66 | 63 | 53 |
Emissões
Ruído do sistema - Loud Gamer
O ruído do ventilador tende a se estabelecer em 25 dB(A) contra um fundo silencioso de 23 dB(A) durante a navegação leve ou streaming, o que é essencialmente inaudível em um ambiente típico de escritório ou sala. A execuçãoWitcher 3 no modo Desempenho pode chegar a 46 dB(A), enquanto a execução de jogos no modo Balanceado é apenas um pouco mais silenciosa, com 44 dB(A). No entanto, esse último modo acarreta um pequeno impacto no desempenho, conforme observado acima.
Se a CPU e a GPU forem utilizadas a 100%, o ruído da ventoinha pode chegar a 52 dB(A), o que seria quase tão alto quanto o ruído doCyborg 15.
Barulho
| Ocioso |
| 23.1 / 23.1 / 25.2 dB |
| Carga |
| 44.3 / 52 dB |
 | ||
30 dB silencioso 40 dB(A) audível 50 dB(A) ruidosamente alto |
||
min: | ||
| Lenovo LOQ 15APH8 GeForce RTX 4050 Laptop GPU, R7 7840HS, Micron 2450 512GB MTFDKCD512TFK | Lenovo Legion 5 15IAH7H 82RB GeForce RTX 3060 Laptop GPU, i7-12700H | Dell G15 5530 GeForce RTX 4060 Laptop GPU, i7-13650HX, SSTC CL4-3D512-Q11 | Asus TUF A15 FA507 GeForce RTX 4050 Laptop GPU, R7 7735HS, Micron 2400 MTFDKBA512QFM | MSI Cyborg 15 A12VF GeForce RTX 4060 Laptop GPU, i7-12650H, Samsung PM9B1 1024GB MZVL41T0HBLB | HP Victus 15 fa0020nr GeForce RTX 3050 Ti Laptop GPU, i7-12700H, Samsung PM9A1 MZVL2512HCJQ | |
|---|---|---|---|---|---|---|
| Noise | 1% | 2% | 9% | -30% | -1% | |
| desligado / ambiente * (dB) | 23.1 | 23.3 -1% | 20.41 12% | 23.3 -1% | 27 -17% | 24.8 -7% |
| Idle Minimum * (dB) | 23.1 | 23.5 -2% | 26.85 -16% | 23.3 -1% | 27 -17% | 26.2 -13% |
| Idle Average * (dB) | 23.1 | 23.5 -2% | 26.85 -16% | 23.3 -1% | 37.5 -62% | 29.2 -26% |
| Idle Maximum * (dB) | 25.2 | 26.8 -6% | 26.85 -7% | 23.3 8% | 38 -51% | 29.4 -17% |
| Load Average * (dB) | 44.3 | 29.3 34% | 27.65 38% | 29.6 33% | 56.3 -27% | 29.9 33% |
| Witcher 3 ultra * (dB) | 45.8 | 51.4 -12% | 47.9 -5% | 43 6% | 41.1 10% | |
| Load Maximum * (dB) | 52 | 53 -2% | 47.86 8% | 43 17% | 56.3 -8% | 45.5 12% |
* ... menor é melhor
Temperatura
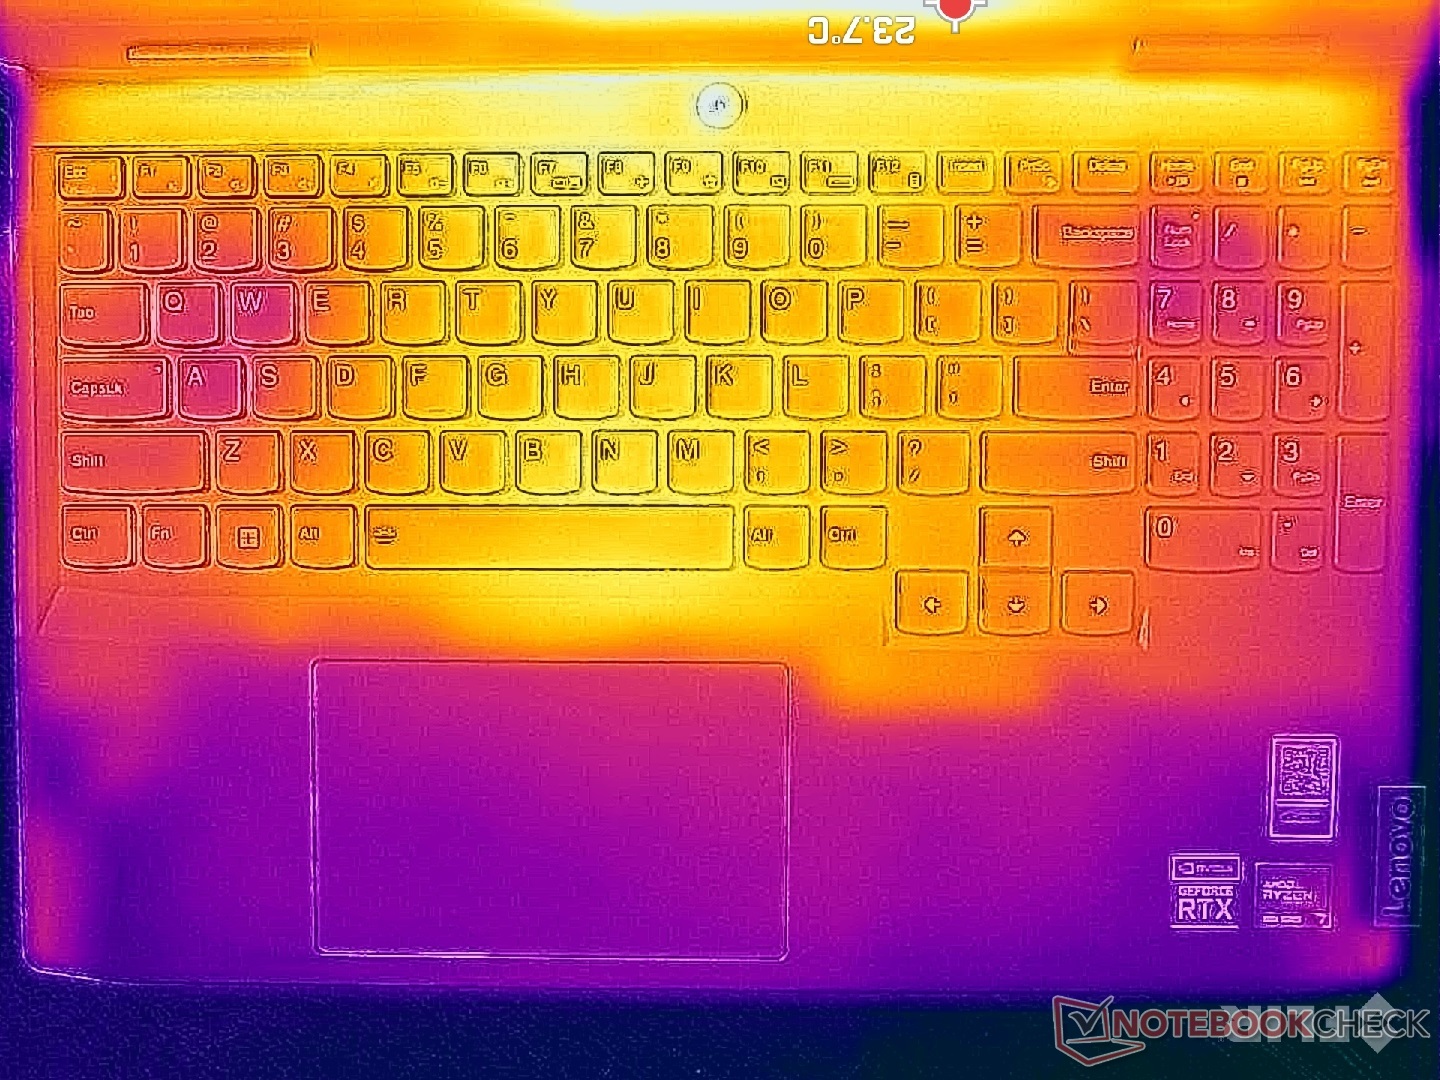
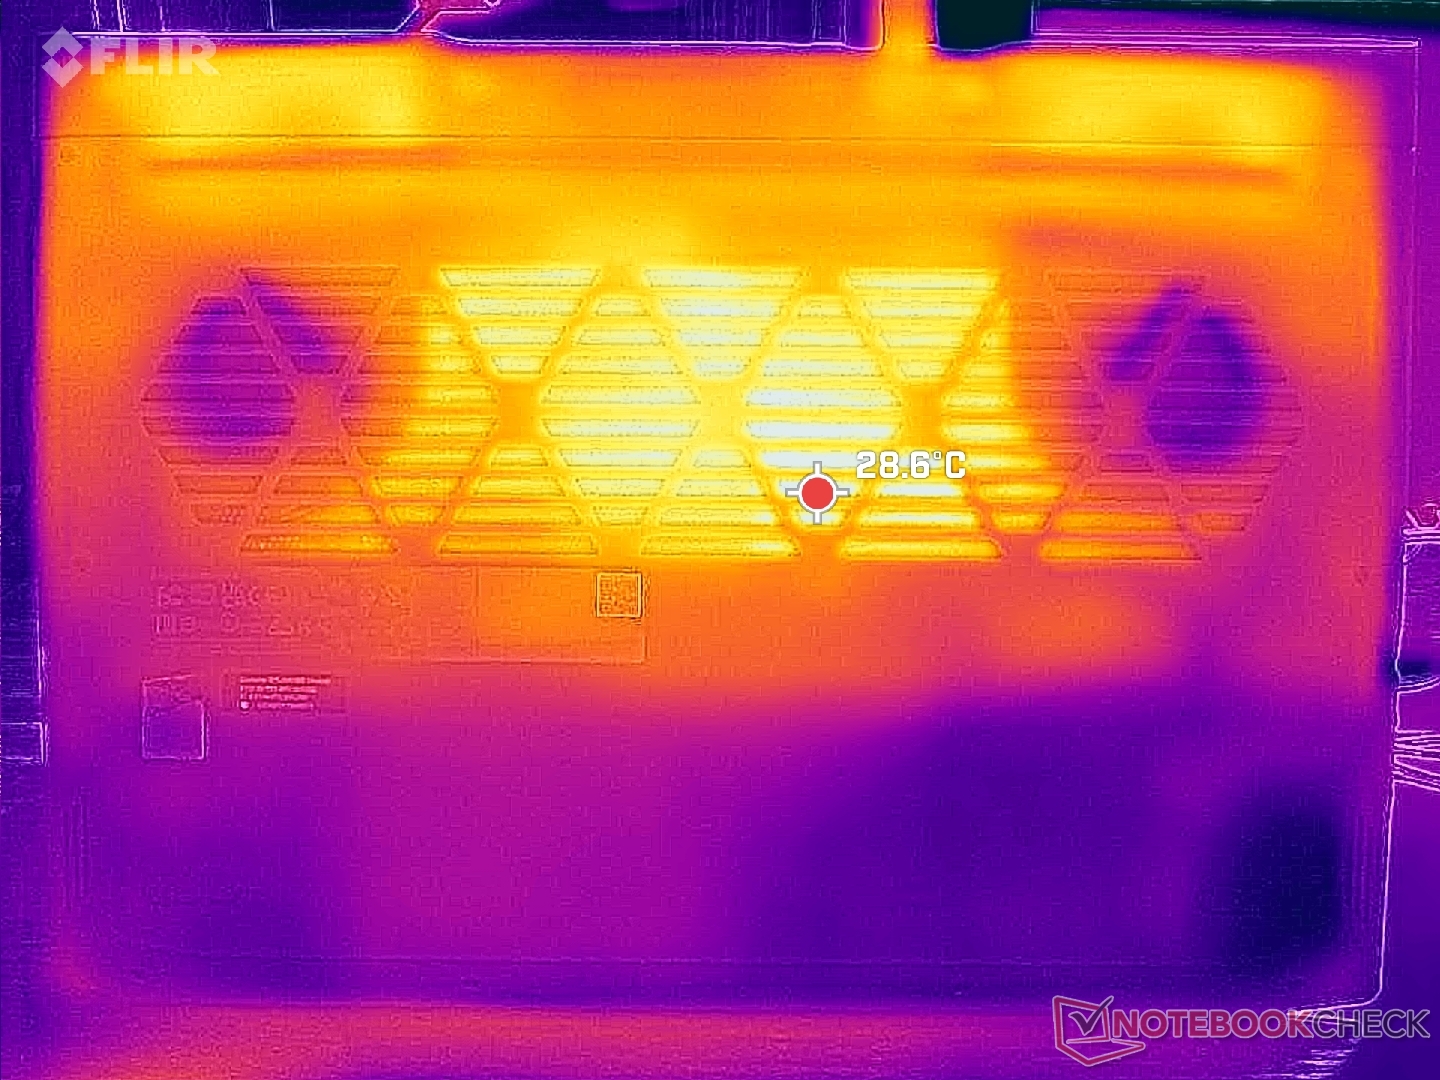
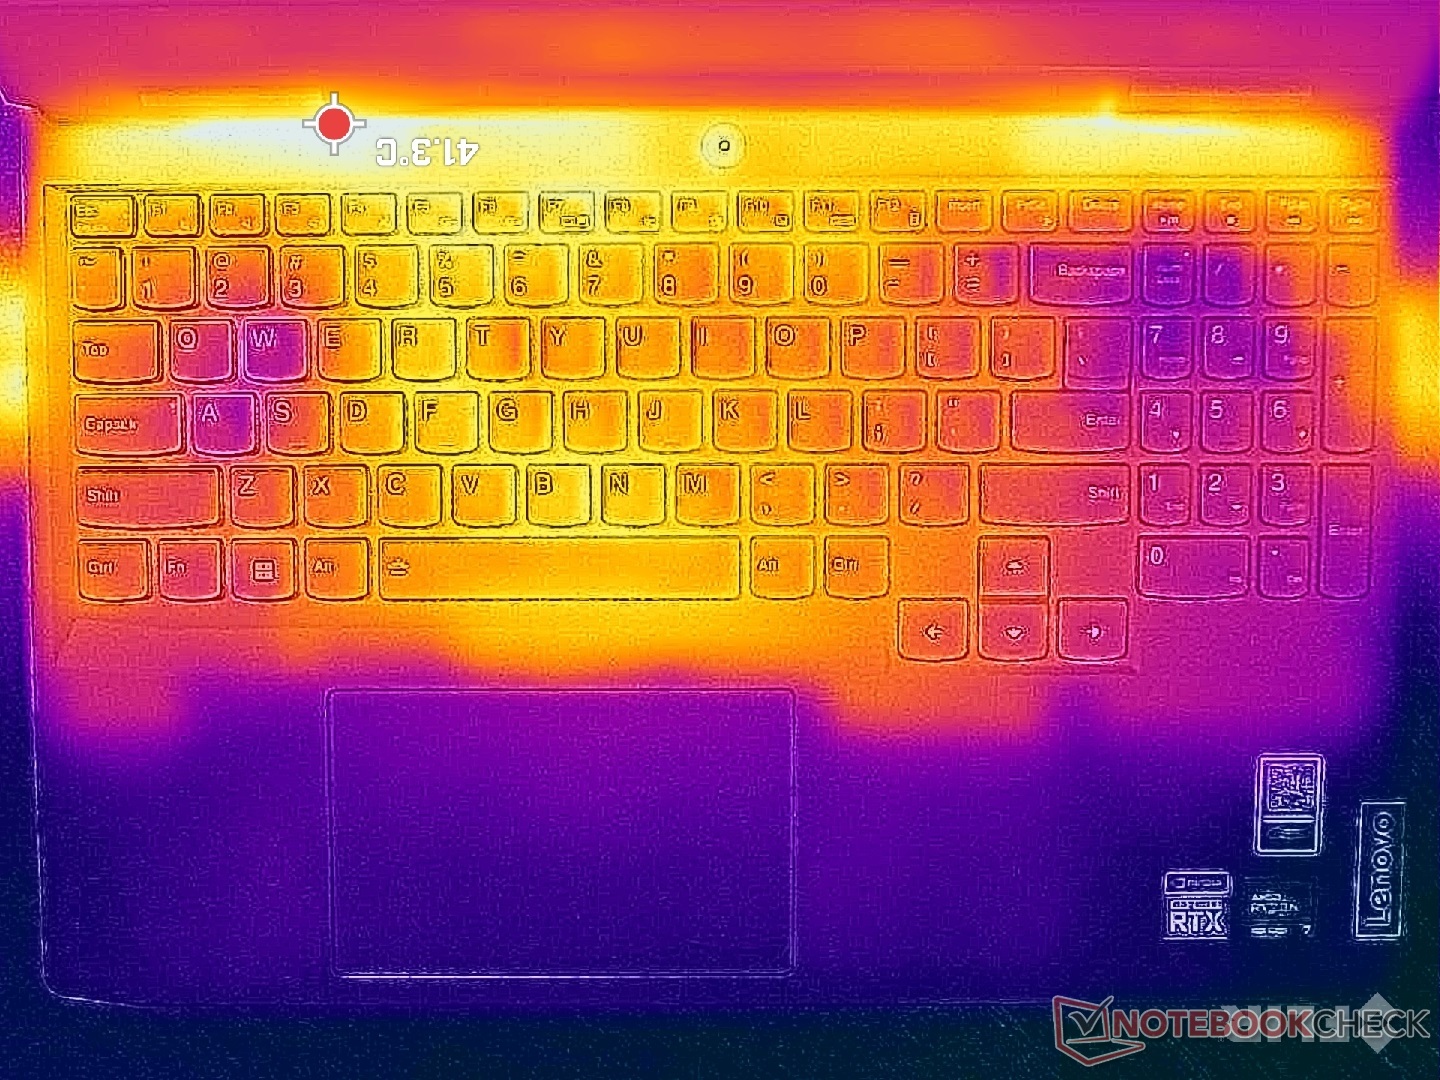
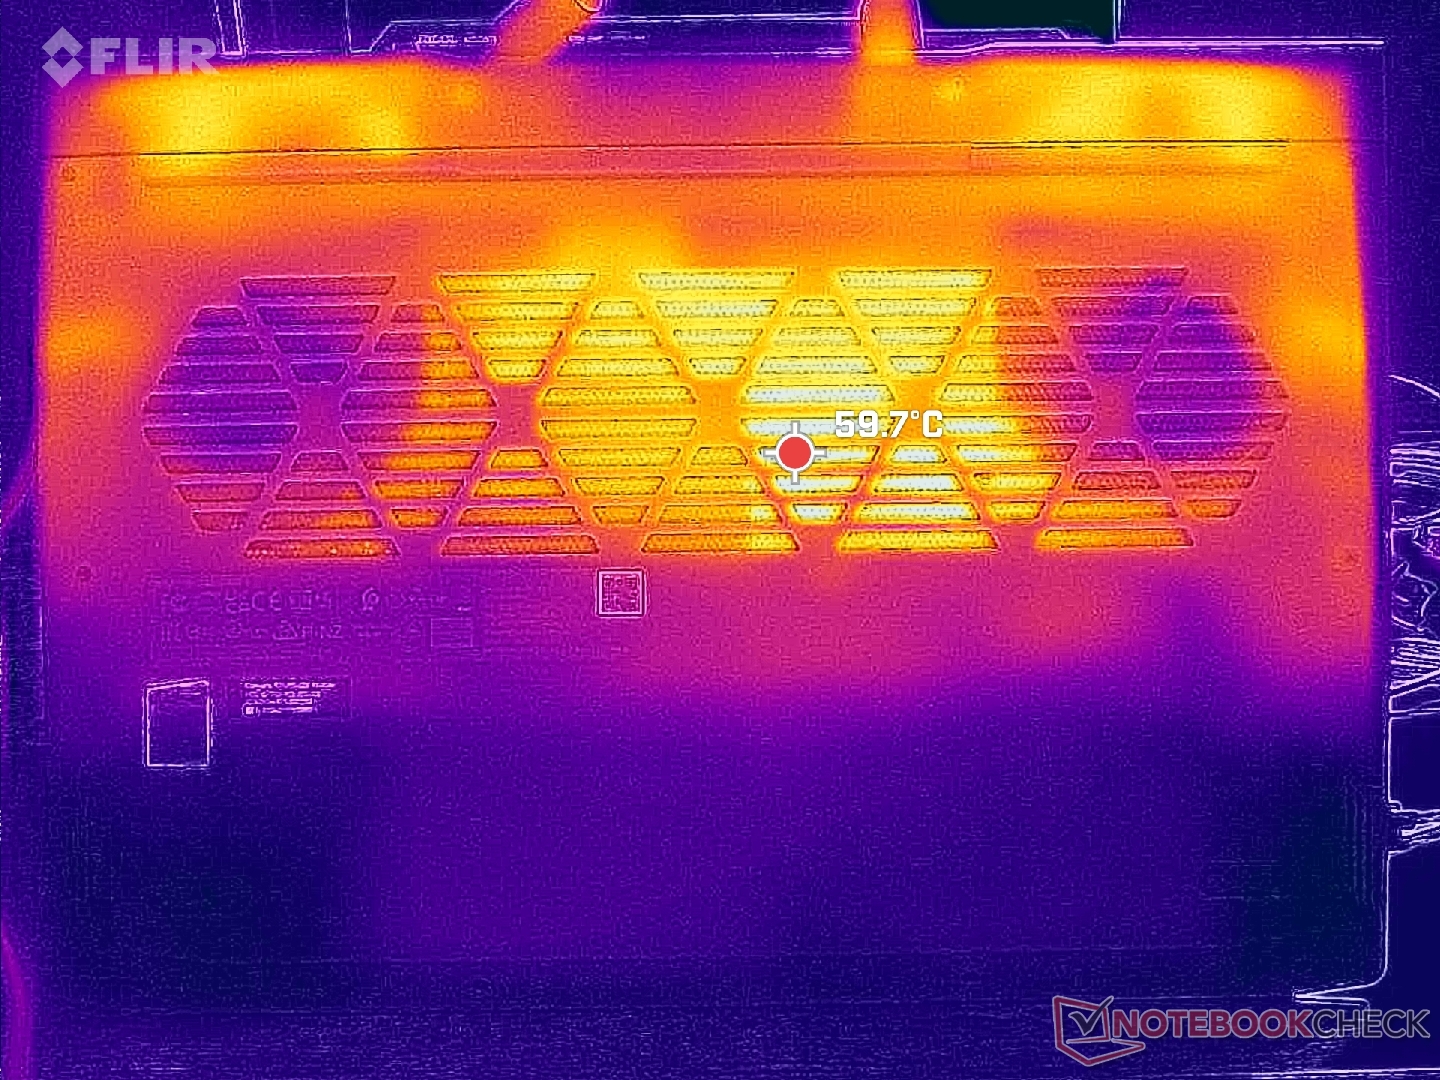
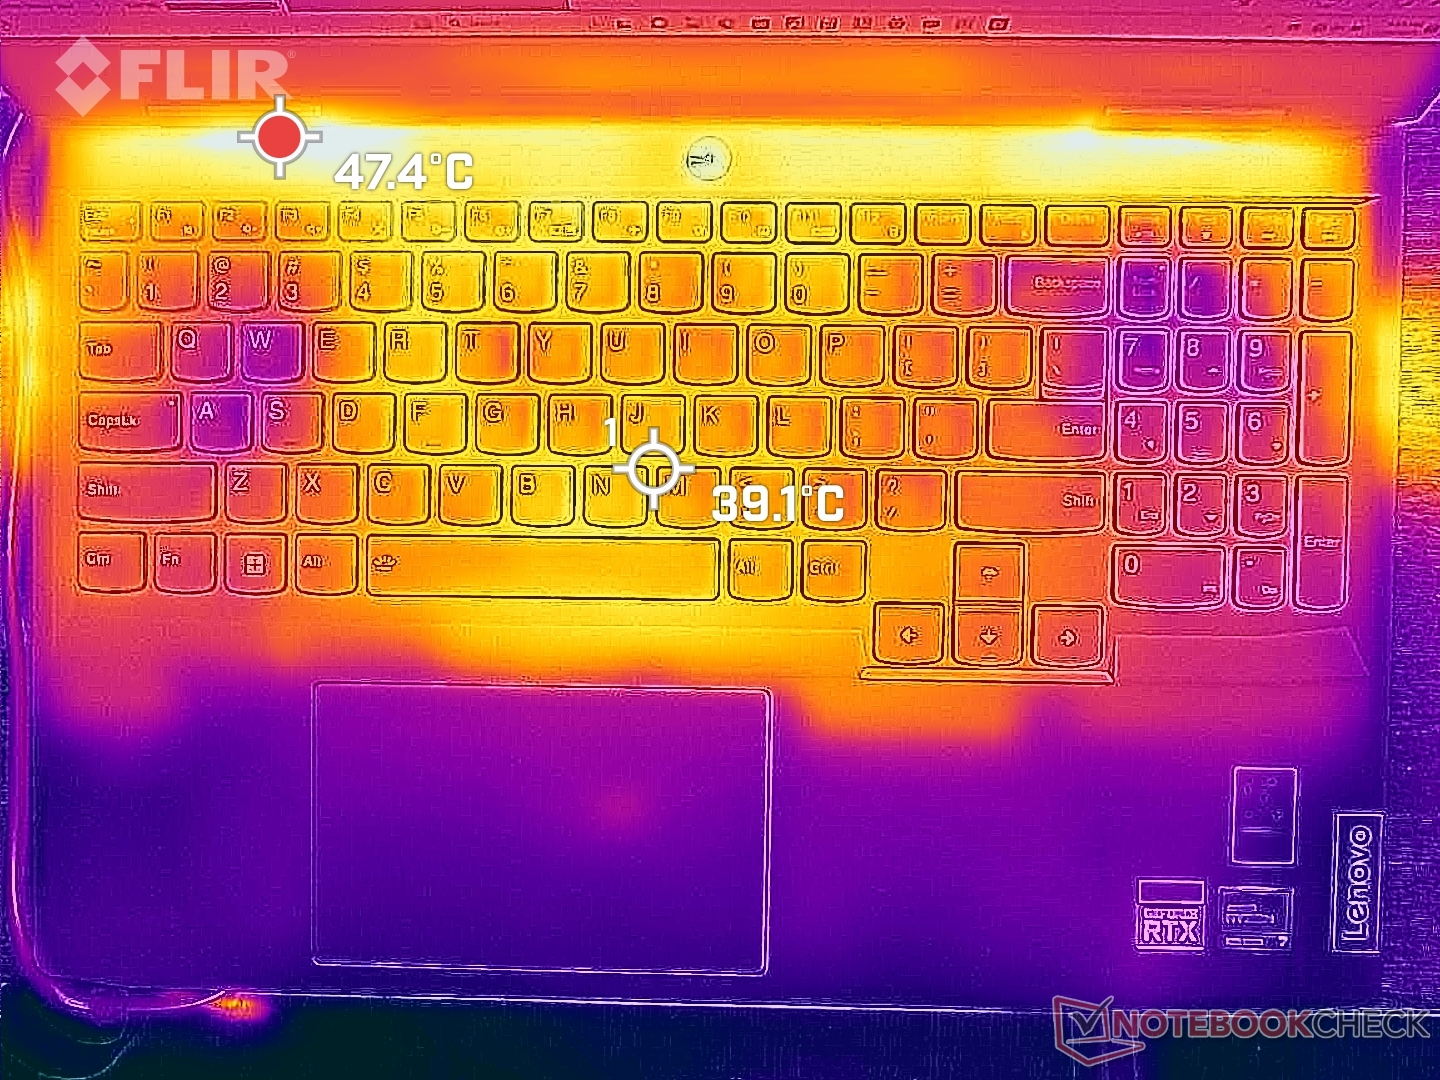
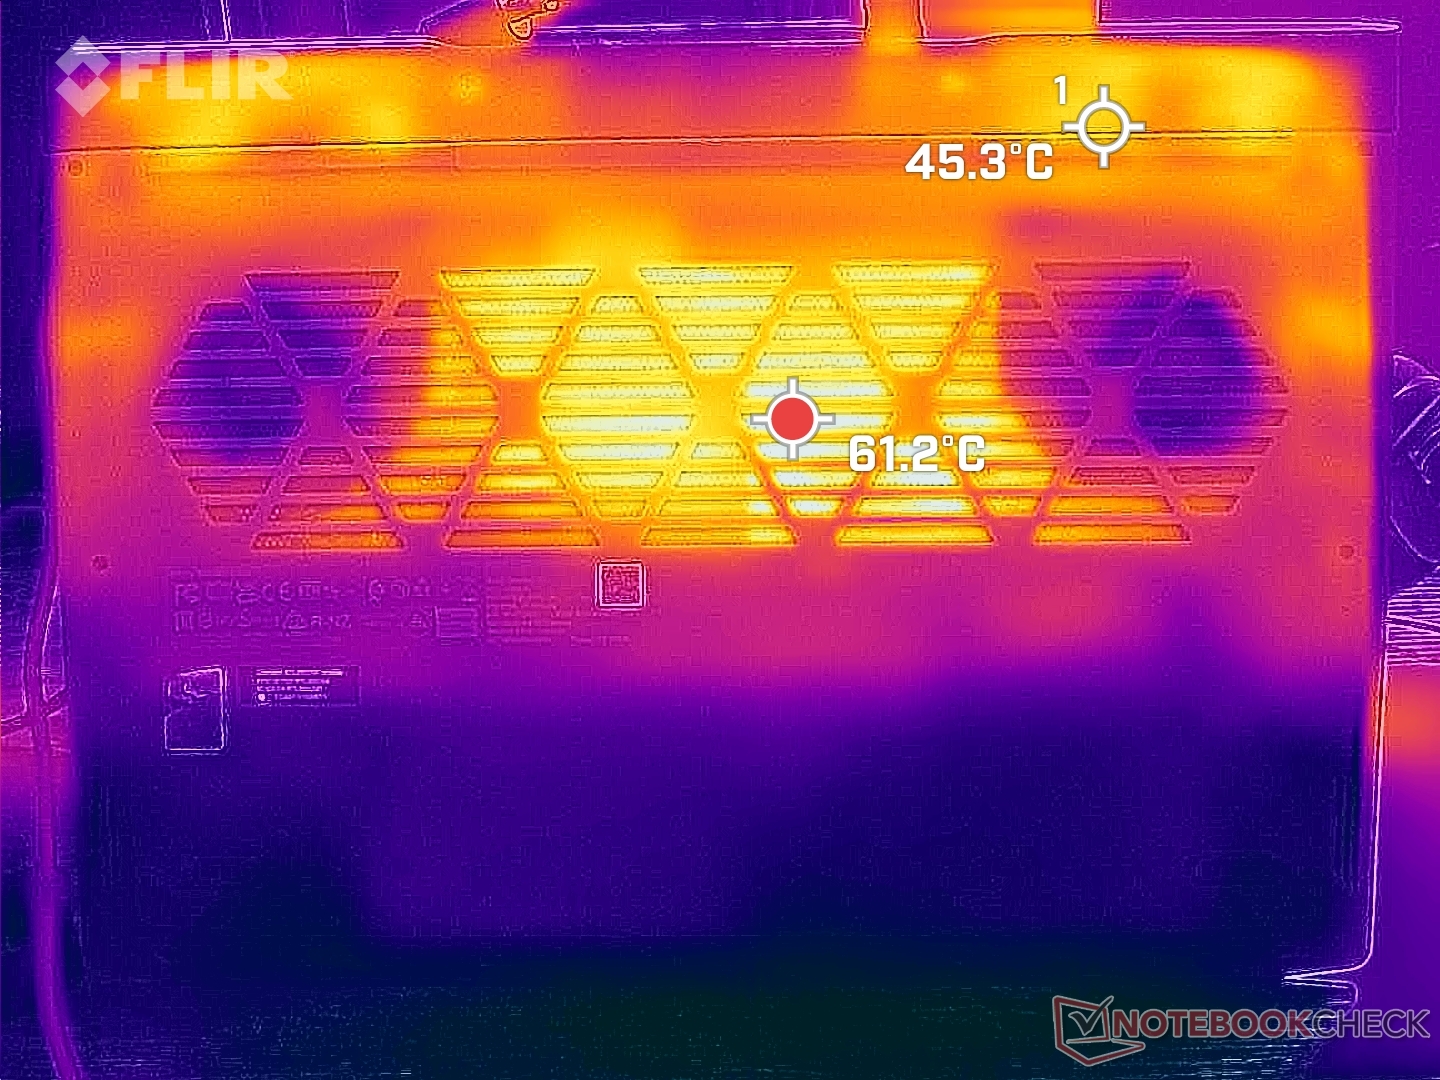
As temperaturas da superfície quando sob carga podem ser muito quentes, chegando a 50 °C, em comparação com apenas 38 °C no HP Victus 15. Felizmente, os pontos quentes do LOQ 15 estão na parte traseira, onde é improvável que os dedos toquem. As teclas WASD, o teclado numérico e os apoios para as mãos permanecem muito mais frios do que a parte traseira e o centro do teclado durante os jogos, conforme mostram os mapas de temperatura abaixo.
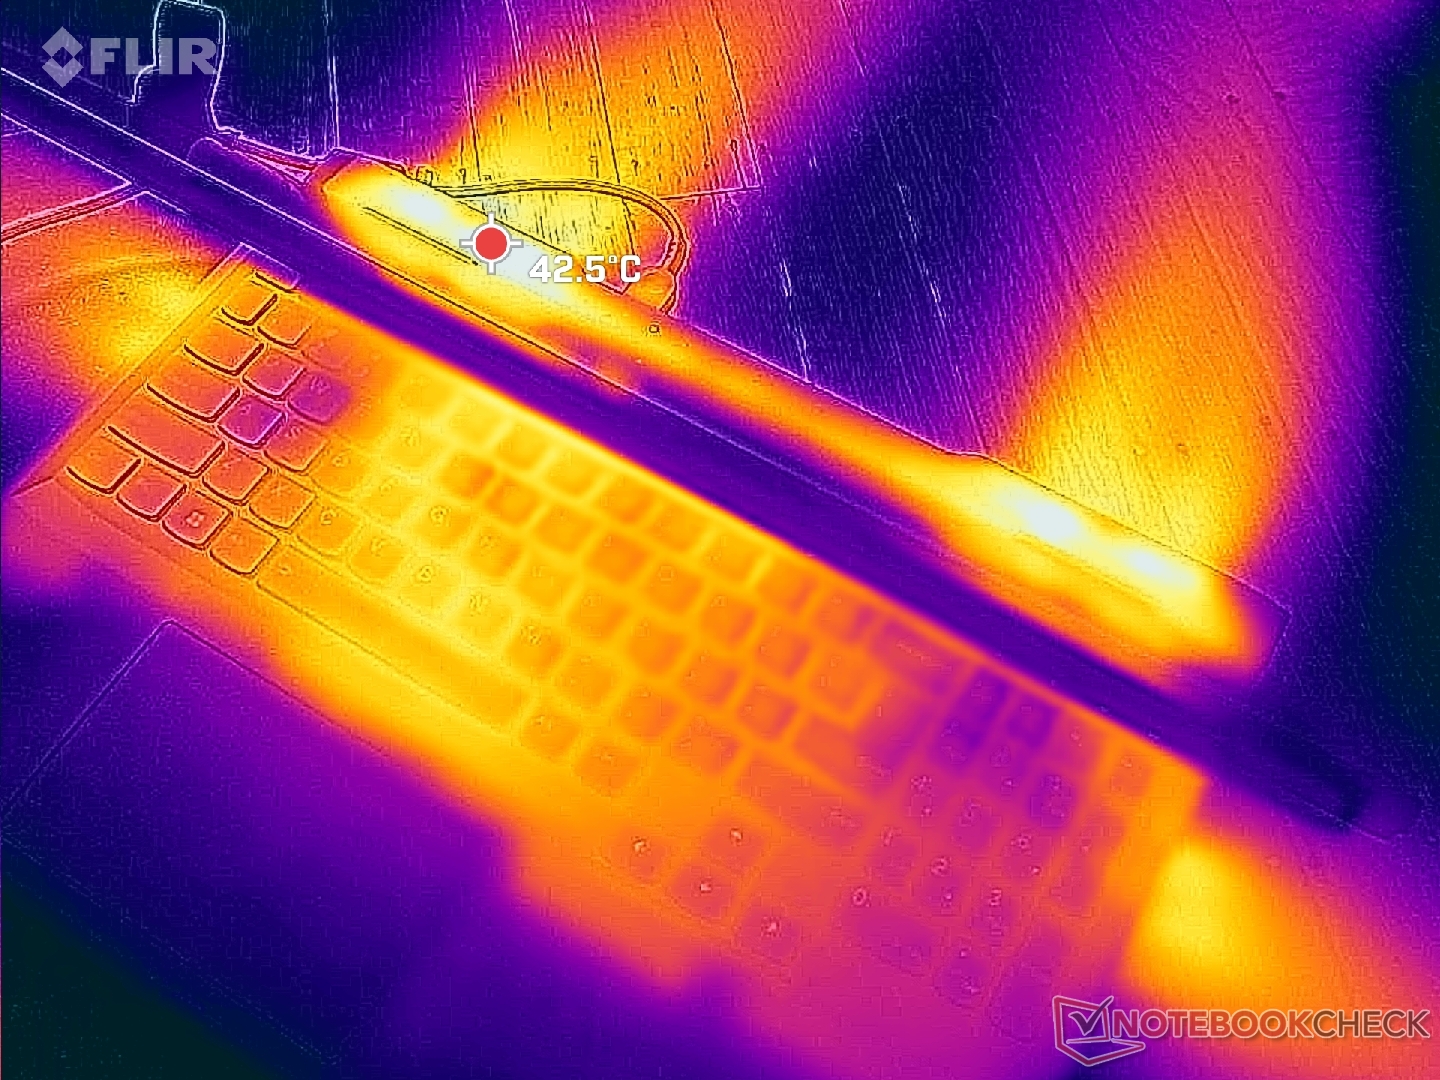
(±) A temperatura máxima no lado superior é 44.4 °C / 112 F, em comparação com a média de 40.4 °C / 105 F , variando de 21.2 a 68.8 °C para a classe Gaming.
(-) A parte inferior aquece até um máximo de 52 °C / 126 F, em comparação com a média de 43.2 °C / 110 F
(+) Em uso inativo, a temperatura média para o lado superior é 25.1 °C / 77 F, em comparação com a média do dispositivo de 33.9 °C / ### class_avg_f### F.
(±) Jogando The Witcher 3, a temperatura média para o lado superior é 32.7 °C / 91 F, em comparação com a média do dispositivo de 33.9 °C / ## #class_avg_f### F.
(+) Os apoios para as mãos e o touchpad são mais frios que a temperatura da pele, com um máximo de 30 °C / 86 F e, portanto, são frios ao toque.
(±) A temperatura média da área do apoio para as mãos de dispositivos semelhantes foi 28.8 °C / 83.8 F (-1.2 °C / -2.2 F).
| Lenovo LOQ 15APH8 AMD Ryzen 7 7840HS, NVIDIA GeForce RTX 4050 Laptop GPU | Lenovo Legion 5 15IAH7H 82RB Intel Core i7-12700H, NVIDIA GeForce RTX 3060 Laptop GPU | Dell G15 5530 Intel Core i7-13650HX, NVIDIA GeForce RTX 4060 Laptop GPU | Asus TUF A15 FA507 AMD Ryzen 7 7735HS, NVIDIA GeForce RTX 4050 Laptop GPU | MSI Cyborg 15 A12VF Intel Core i7-12650H, NVIDIA GeForce RTX 4060 Laptop GPU | HP Victus 15 fa0020nr Intel Core i7-12700H, NVIDIA GeForce RTX 3050 Ti Laptop GPU | |
|---|---|---|---|---|---|---|
| Heat | 7% | -19% | 4% | 7% | 23% | |
| Maximum Upper Side * (°C) | 44.4 | 37.8 15% | 54 -22% | 48.9 -10% | 47.5 -7% | 37.2 16% |
| Maximum Bottom * (°C) | 52 | 51 2% | 62.2 -20% | 44.6 14% | 35.5 32% | 35.4 32% |
| Idle Upper Side * (°C) | 28 | 25.8 8% | 33.4 -19% | 27.1 3% | 27.7 1% | 22.4 20% |
| Idle Bottom * (°C) | 29.6 | 28.8 3% | 33.4 -13% | 27.5 7% | 29.5 -0% | 22.6 24% |
* ... menor é melhor
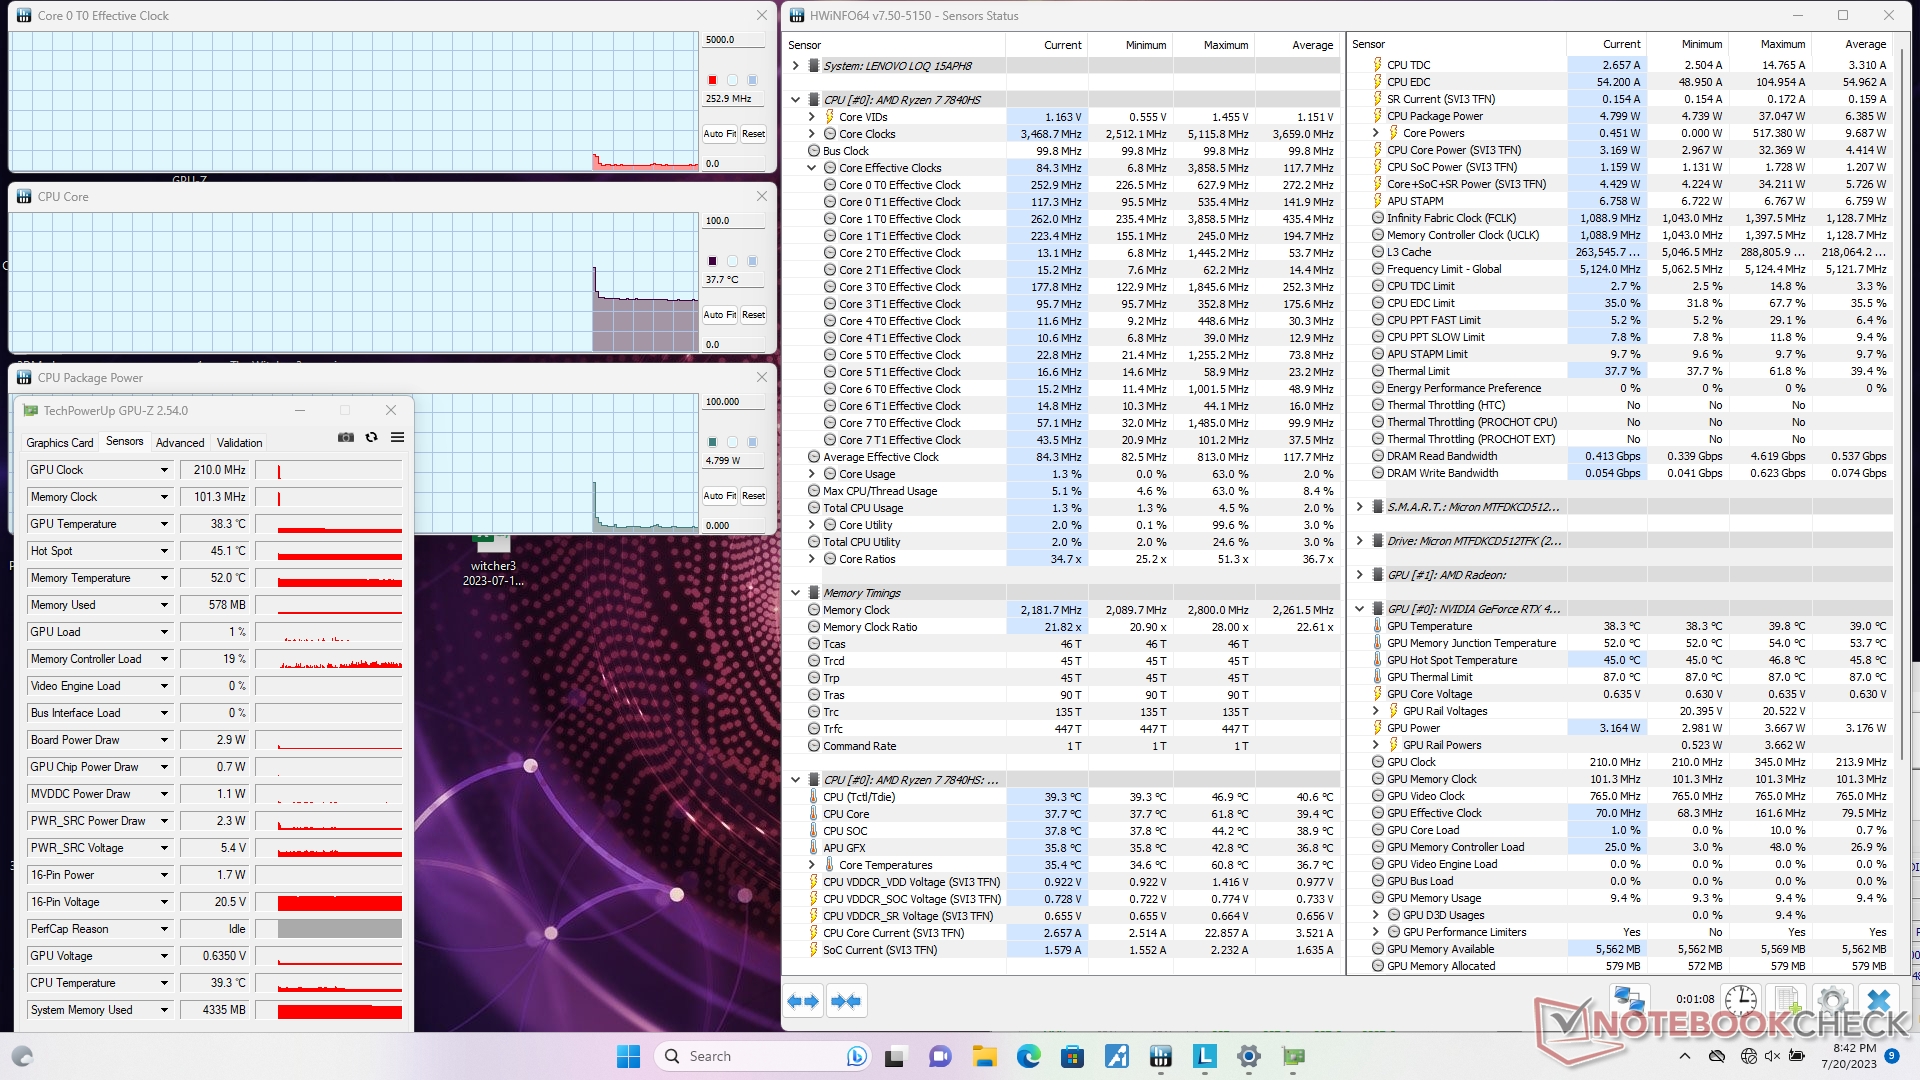
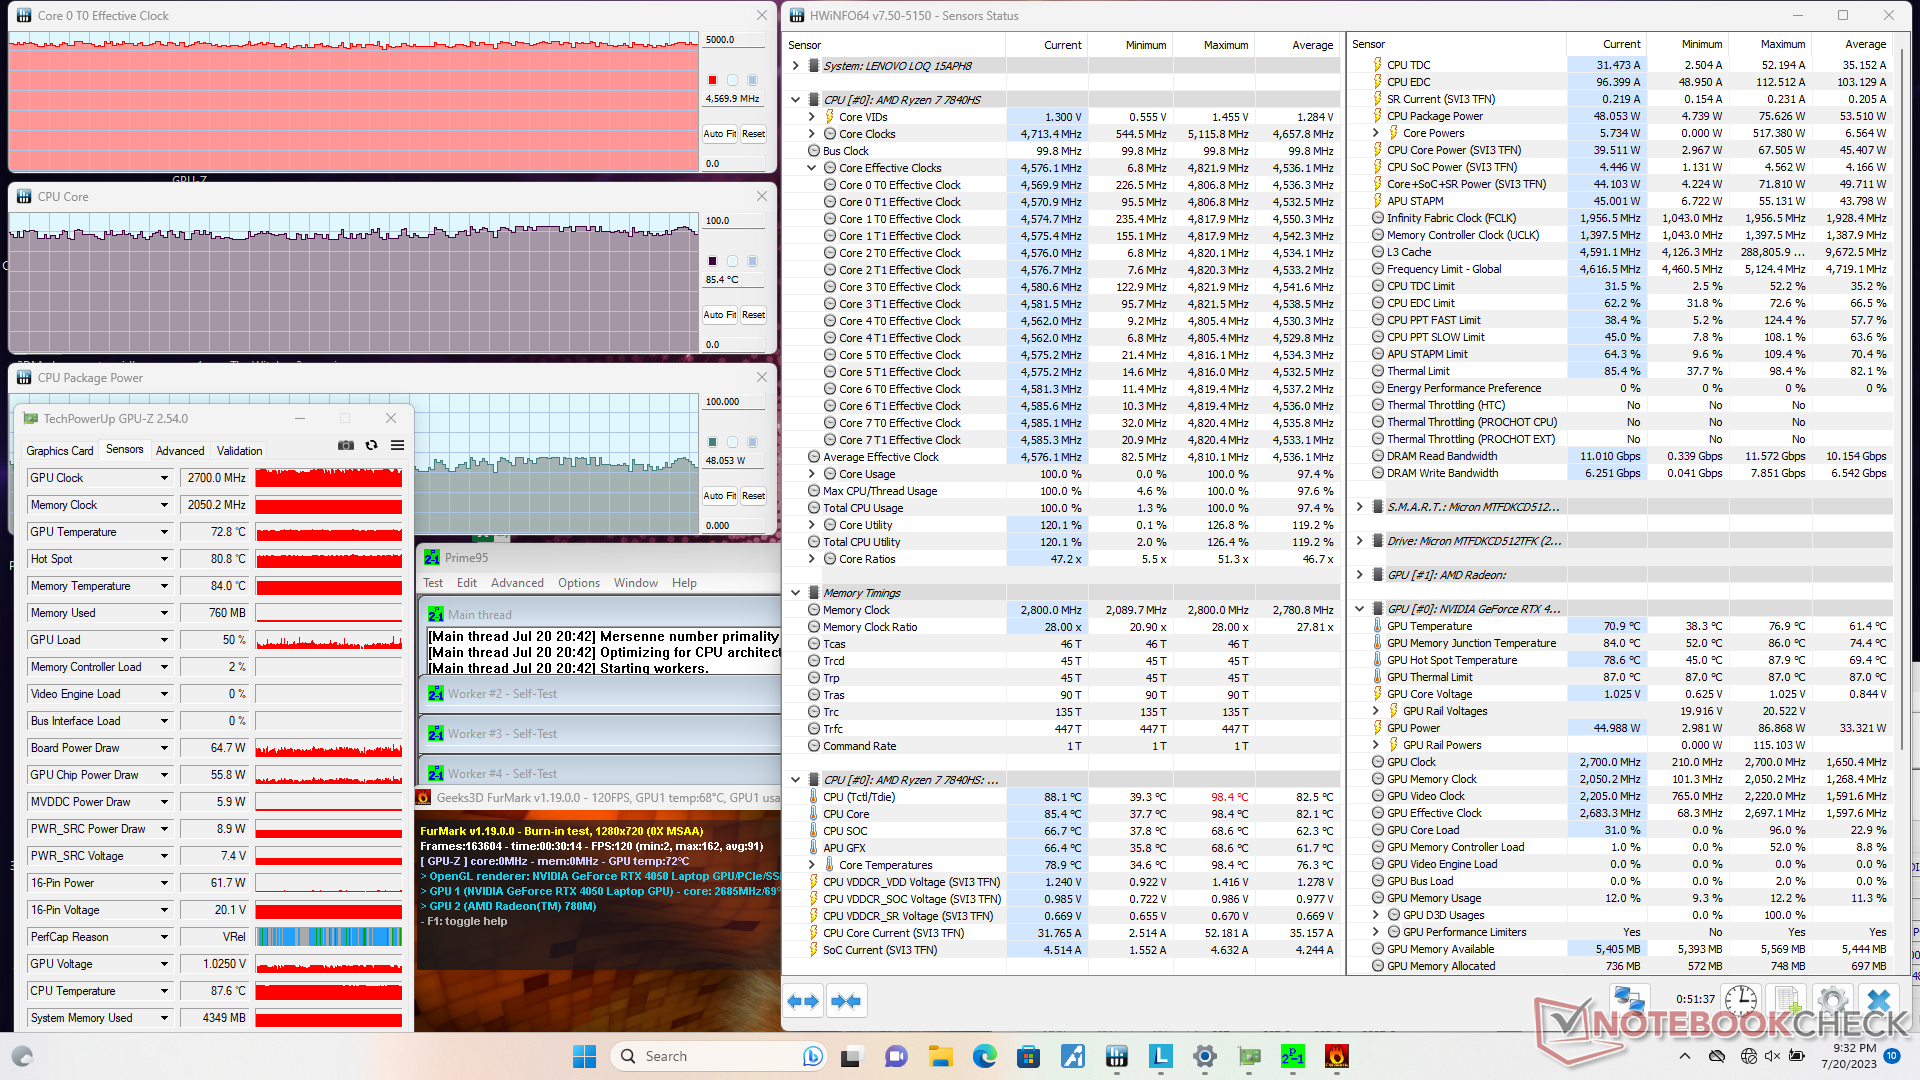
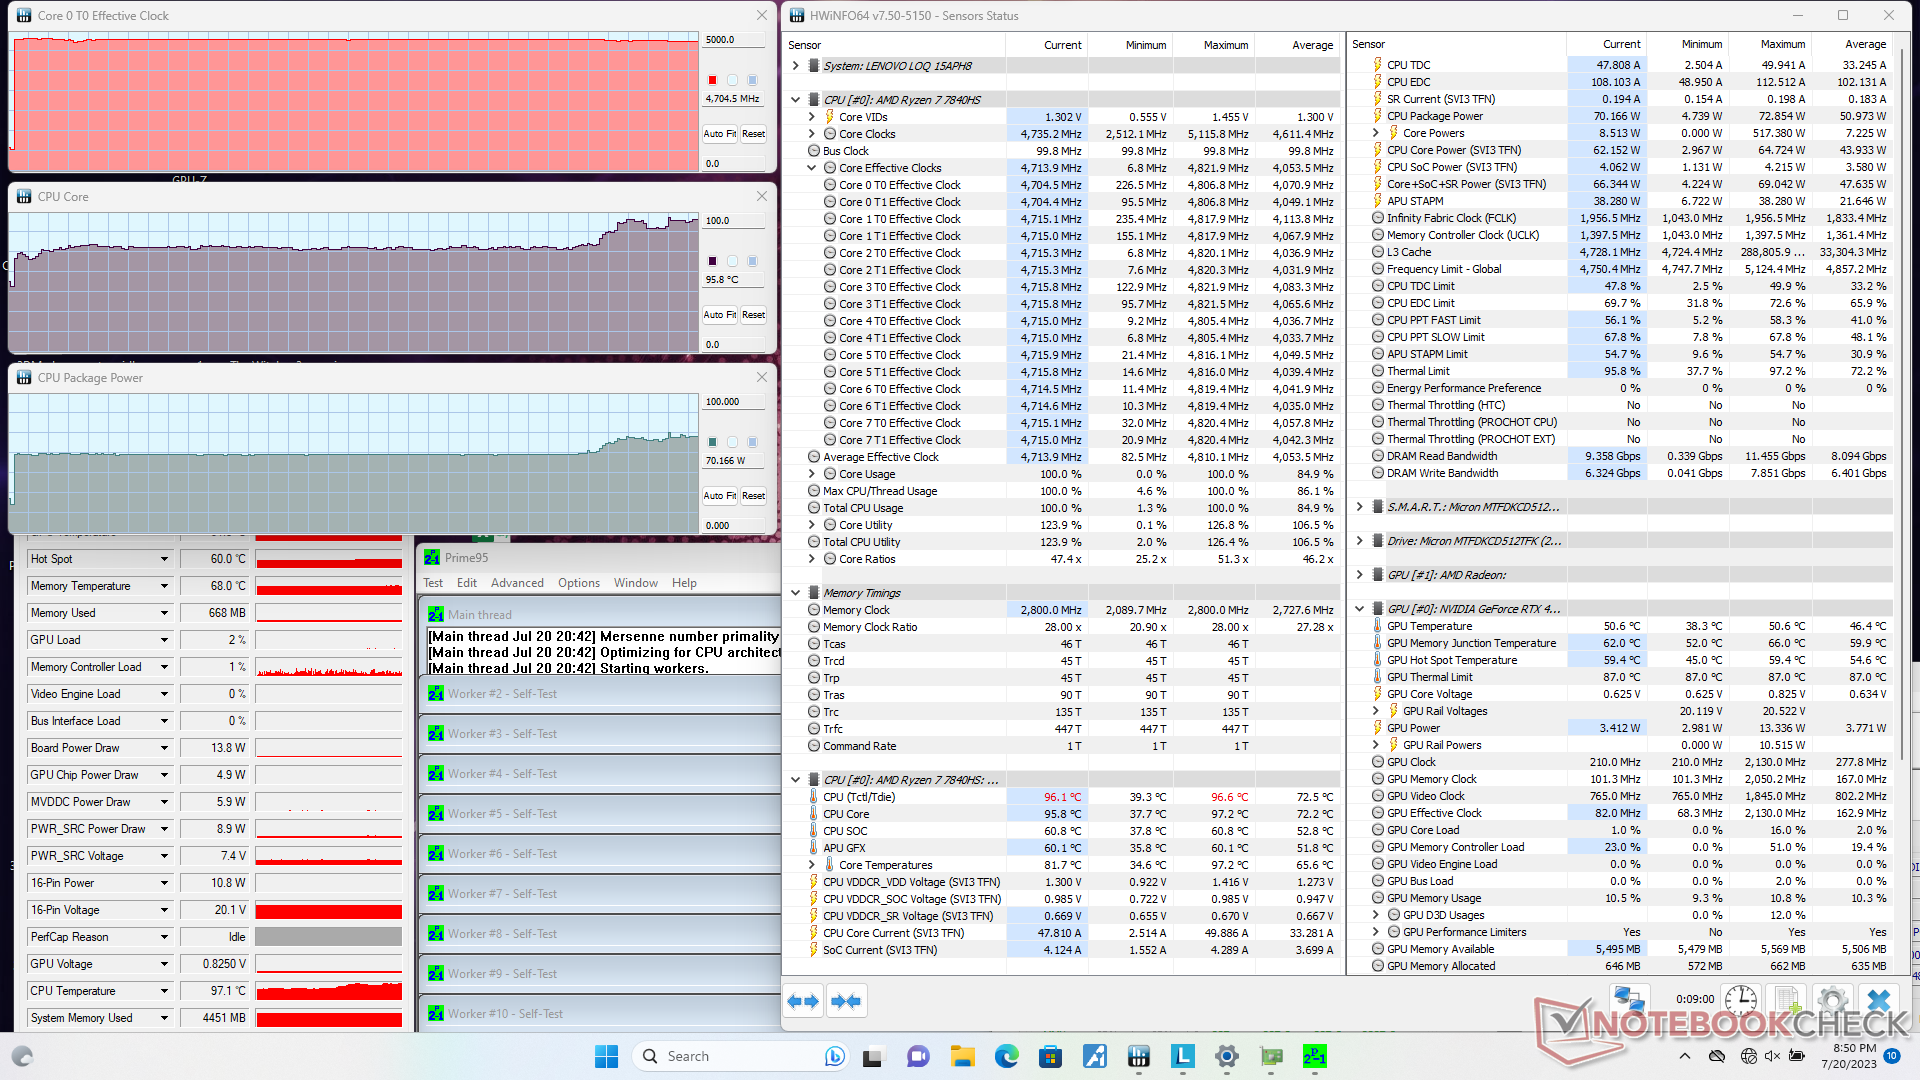
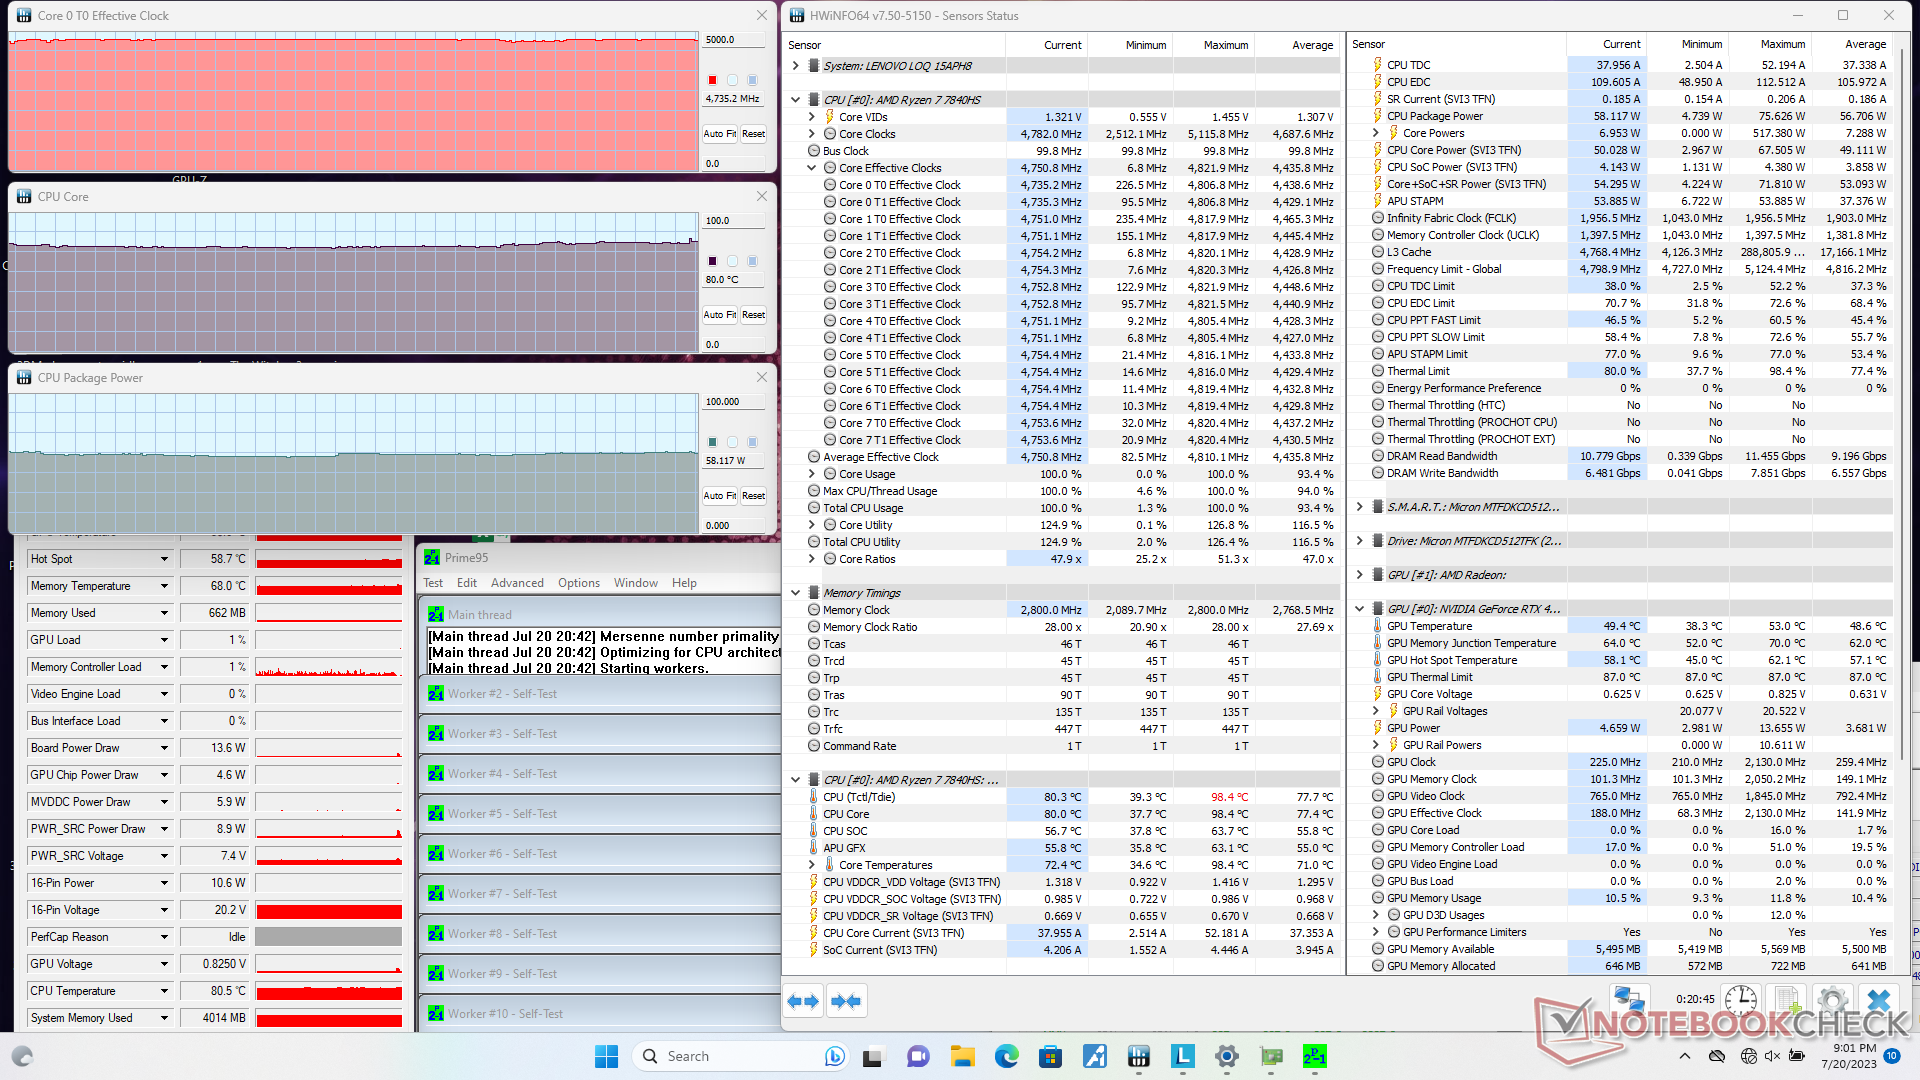
Teste de estresse
As taxas de clock da CPU, a temperatura e o consumo de energia da placa aumentavam para 4,8 GHz, 75 °C e 58 W, respectivamente, ao iniciar o estresse do Prime95. A taxa de clock e o consumo de energia da placa são sustentáveis por longos períodos, com a temperatura do núcleo atingindo um platô de 80 °C em comparação com 76 °C no Victus 15.
Ao executar o Witcher 3 no modo Performance, a GPU da Nvidia se estabilizaria em 2685 MHz, 75 °C e 80 W. Não há alterações significativas se for executada no modo Balanced, o que se alinha com nossas observações na seção Desempenho da GPU acima. Em vez disso, o consumo de energia da placa da CPU cairia em até 15 W. Portanto, o modo Balanced afetaria mais o desempenho da CPU do que o da GPU.
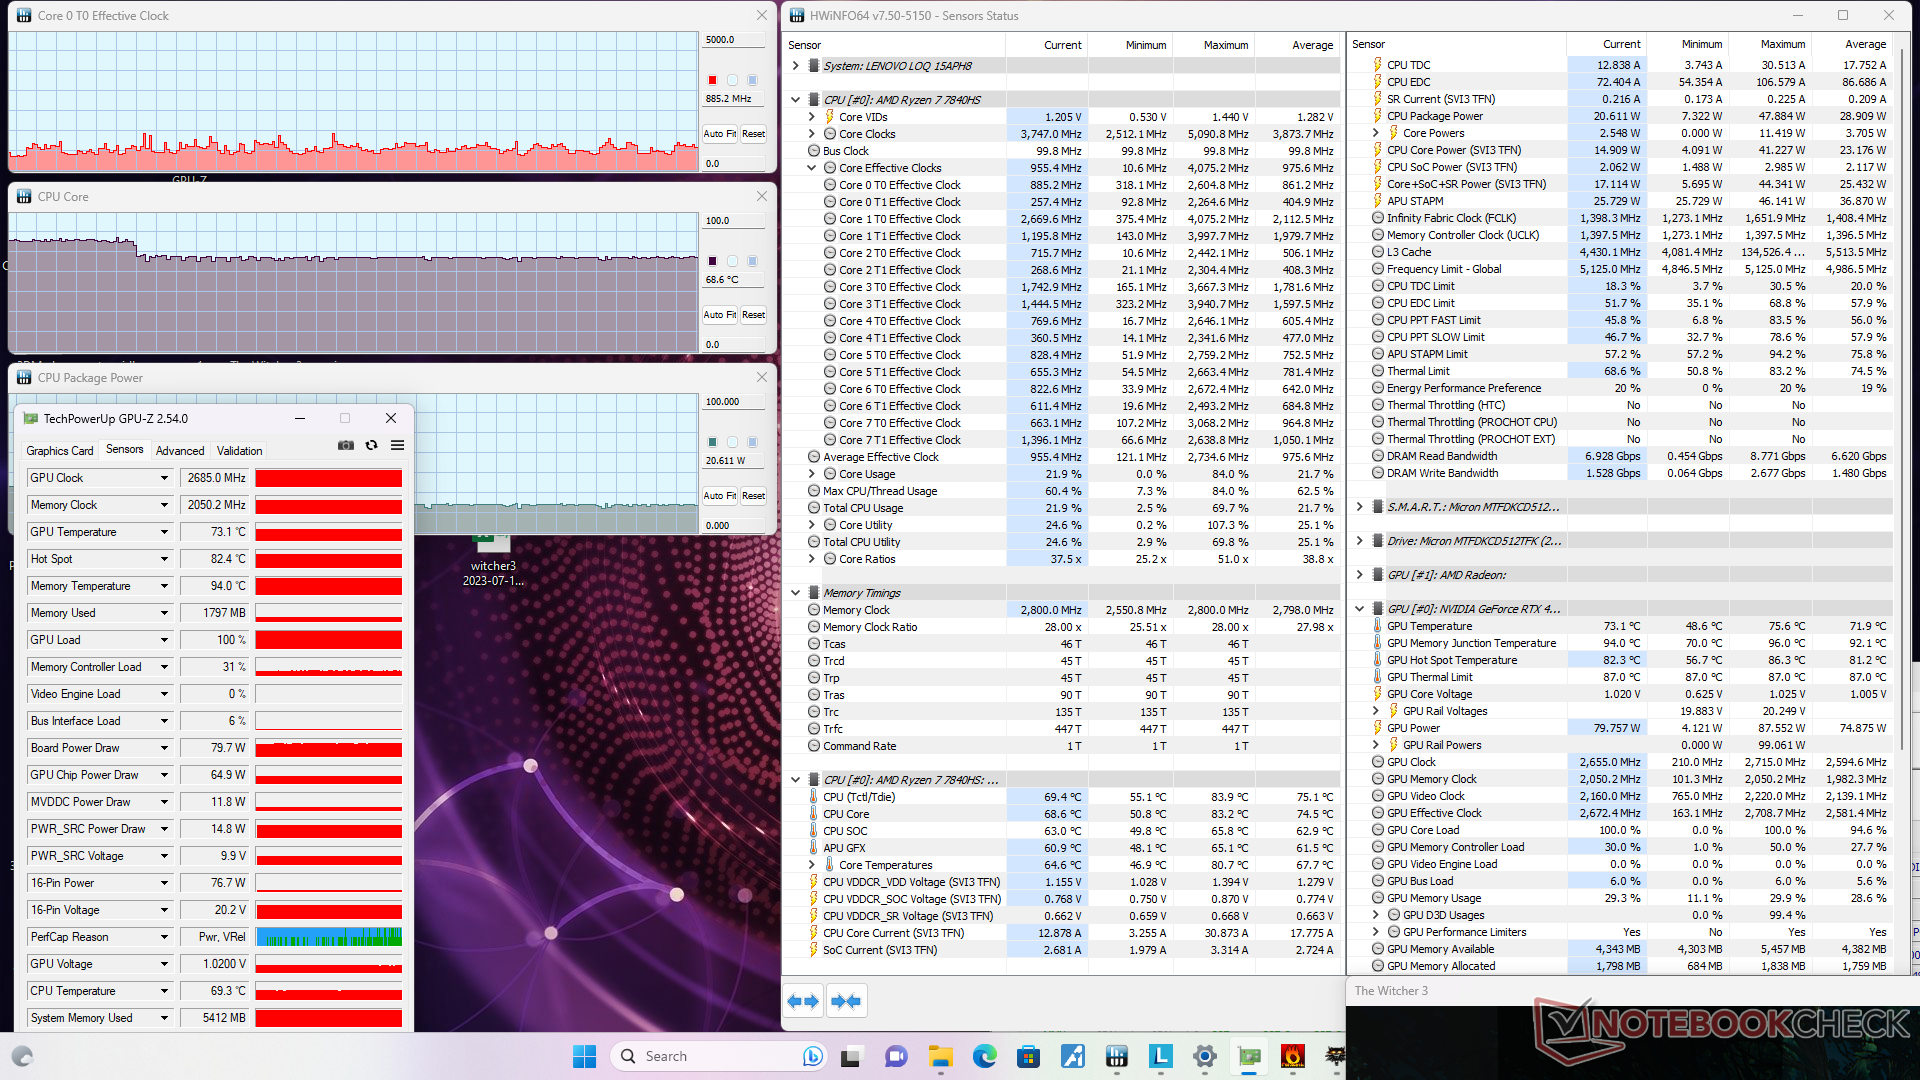

| Clock da CPU (GHz) | Clock da GPU (MHz) | Temperatura média da CPU (°C) | Temperatura média da GPU (°C) | |
| Sistema ocioso | -- | -- | 37 | 38 |
| Estressedo Prime95 | 4.7 | -- | 80 | 49 |
| Estresse doPrime95 + FurMark | 4.5 | 2700 | 85 | 73 |
| Witcher 3 Estresse(modo balanceado) | ~0,9 | 2685 | 69 | 73 |
| Witcher 3 Estresse(modo de desempenho) | ~0,8 | 2685 | 81 | 75 |
Alto-falantes
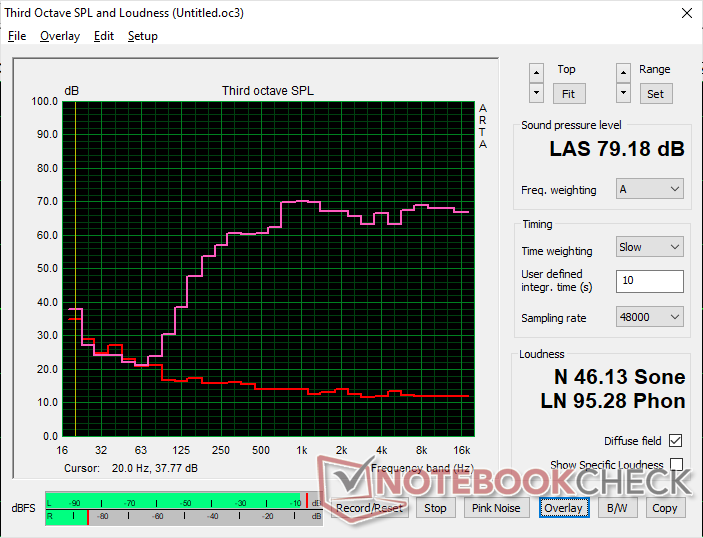
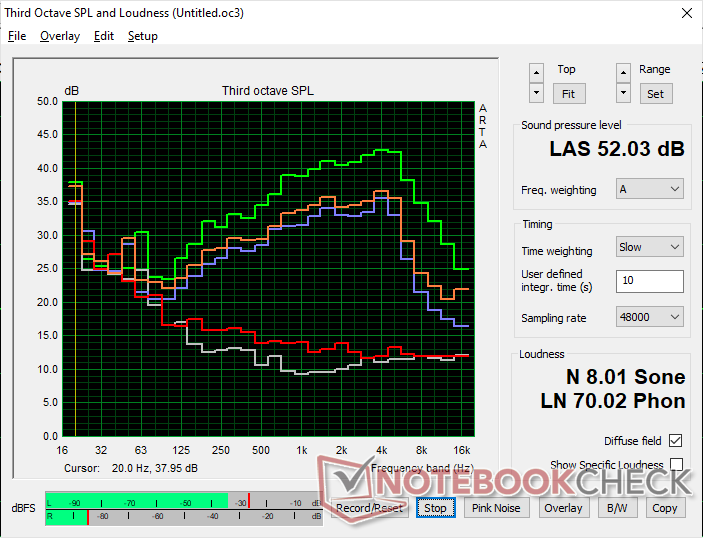
Lenovo LOQ 15APH8 análise de áudio
(±) | o volume do alto-falante é médio, mas bom (###valor### dB)
Graves 100 - 315Hz
(-) | quase nenhum baixo - em média 17.6% menor que a mediana
(±) | a linearidade dos graves é média (11.8% delta para a frequência anterior)
Médios 400 - 2.000 Hz
(+) | médios equilibrados - apenas 3.7% longe da mediana
(+) | médios são lineares (3.1% delta para frequência anterior)
Altos 2 - 16 kHz
(+) | agudos equilibrados - apenas 1.9% longe da mediana
(+) | os máximos são lineares (4.7% delta da frequência anterior)
Geral 100 - 16.000 Hz
(+) | o som geral é linear (14.3% diferença em relação à mediana)
Comparado com a mesma classe
» 26% de todos os dispositivos testados nesta classe foram melhores, 7% semelhantes, 67% piores
» O melhor teve um delta de 6%, a média foi 18%, o pior foi 132%
Comparado com todos os dispositivos testados
» 18% de todos os dispositivos testados foram melhores, 4% semelhantes, 78% piores
» O melhor teve um delta de 4%, a média foi 23%, o pior foi 134%
Apple MacBook Pro 16 2021 M1 Pro análise de áudio
(+) | os alto-falantes podem tocar relativamente alto (###valor### dB)
Graves 100 - 315Hz
(+) | bons graves - apenas 3.8% longe da mediana
(+) | o baixo é linear (5.2% delta para a frequência anterior)
Médios 400 - 2.000 Hz
(+) | médios equilibrados - apenas 1.3% longe da mediana
(+) | médios são lineares (2.1% delta para frequência anterior)
Altos 2 - 16 kHz
(+) | agudos equilibrados - apenas 1.9% longe da mediana
(+) | os máximos são lineares (2.7% delta da frequência anterior)
Geral 100 - 16.000 Hz
(+) | o som geral é linear (4.6% diferença em relação à mediana)
Comparado com a mesma classe
» 0% de todos os dispositivos testados nesta classe foram melhores, 0% semelhantes, 100% piores
» O melhor teve um delta de 5%, a média foi 17%, o pior foi 45%
Comparado com todos os dispositivos testados
» 0% de todos os dispositivos testados foram melhores, 0% semelhantes, 100% piores
» O melhor teve um delta de 4%, a média foi 23%, o pior foi 134%
Gerenciamento de energia - combinação de CPU e GPU muito eficiente
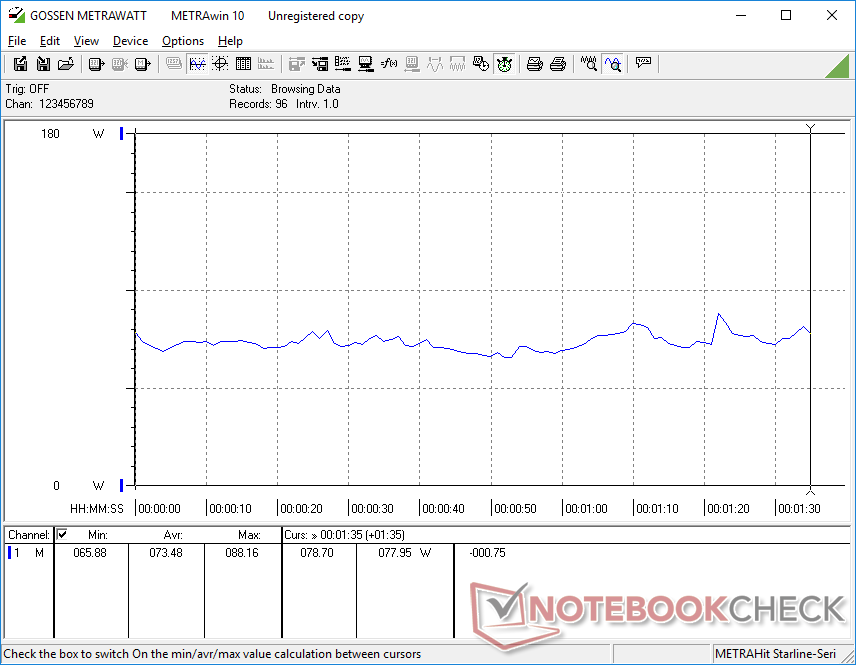
Consumo de energia
O consumo de energia em jogos é, na verdade, muito próximo ao do ano passado IdeaPad Gaming 3 15 do ano passado do ano passado, apesar do aumento significativo de 60 a 70% no desempenho gráfico em relação à RTX 3050 Ti e de 15 a 20% no desempenho do processador em relação ao Core i5-12500H. Os ganhos em desempenho por watt são, portanto, excelentes para uma máquina de jogos econômica.
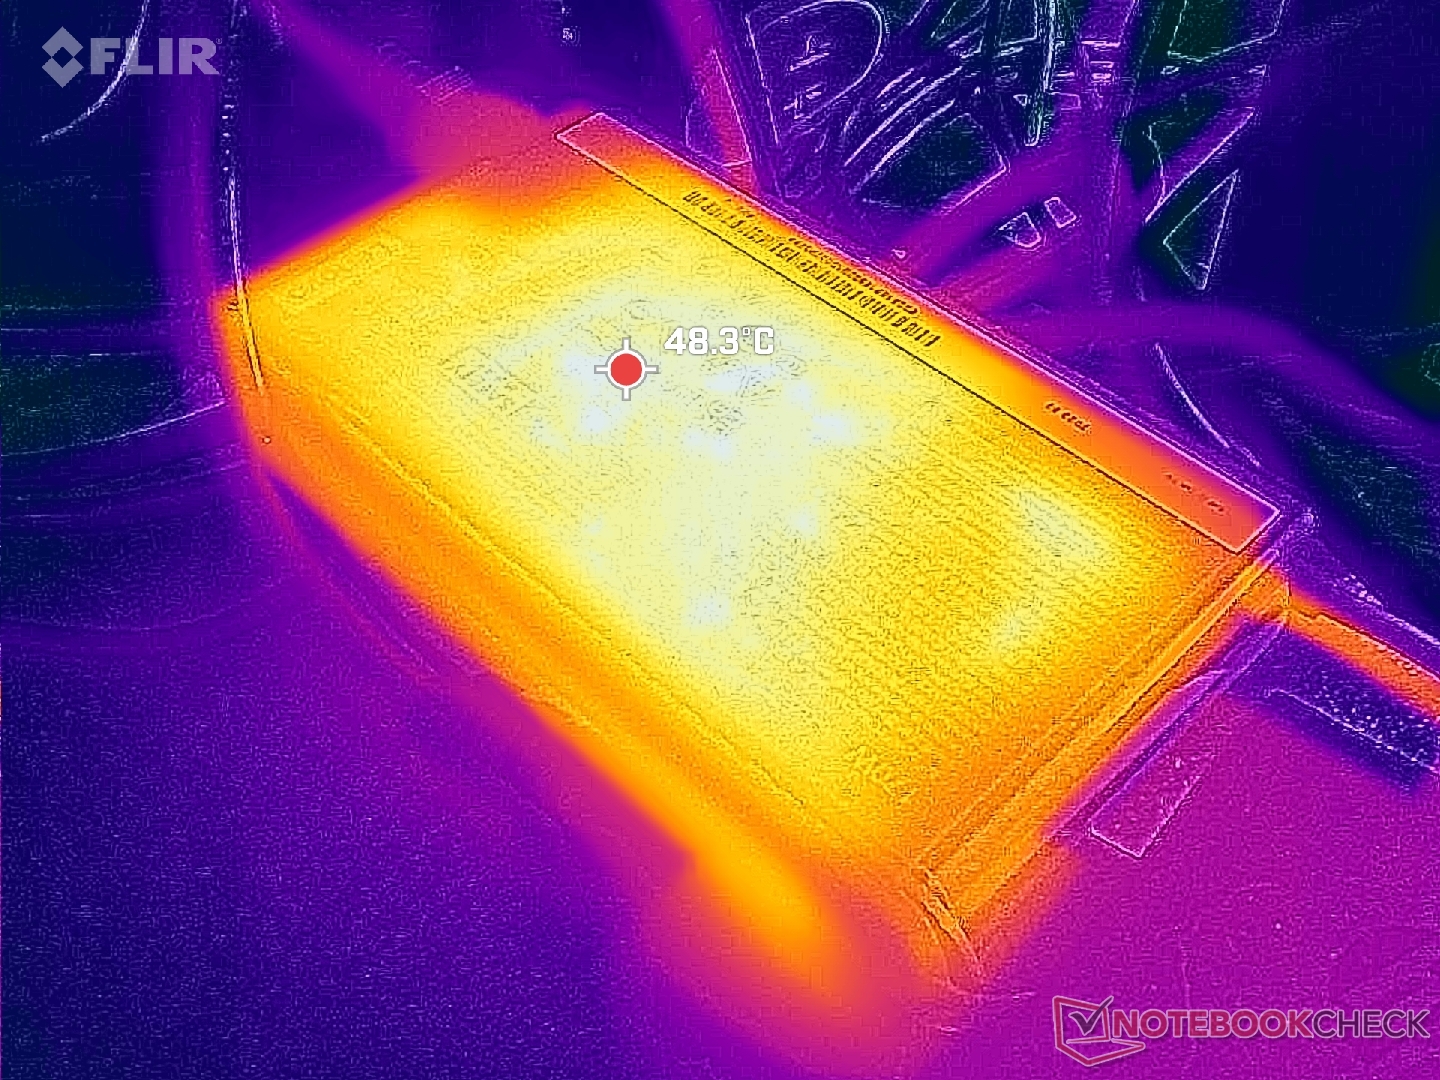
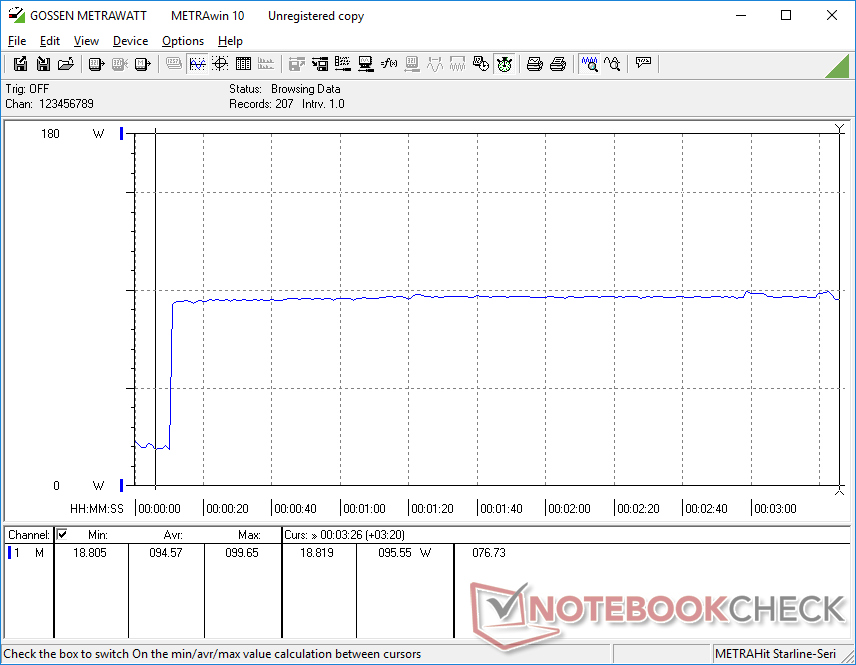
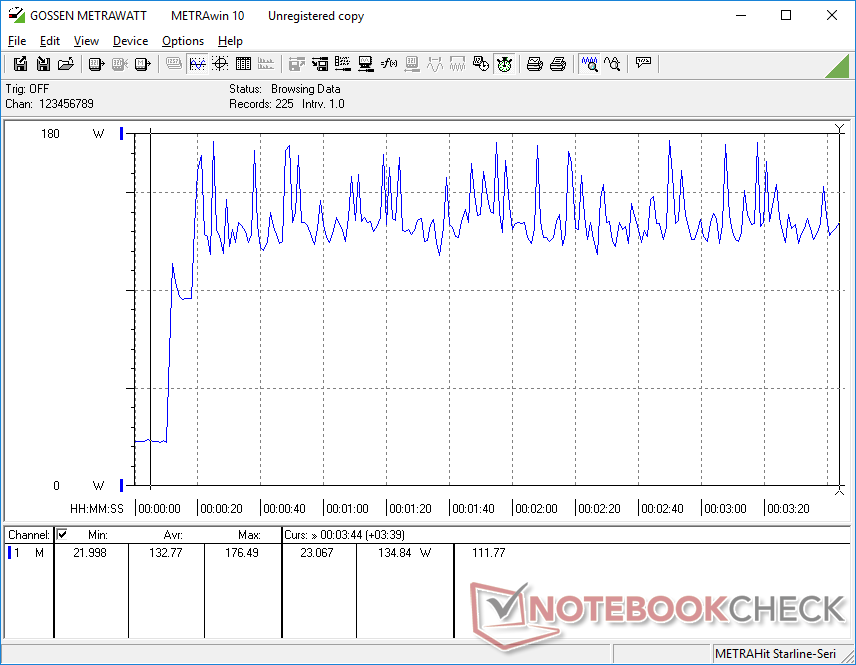
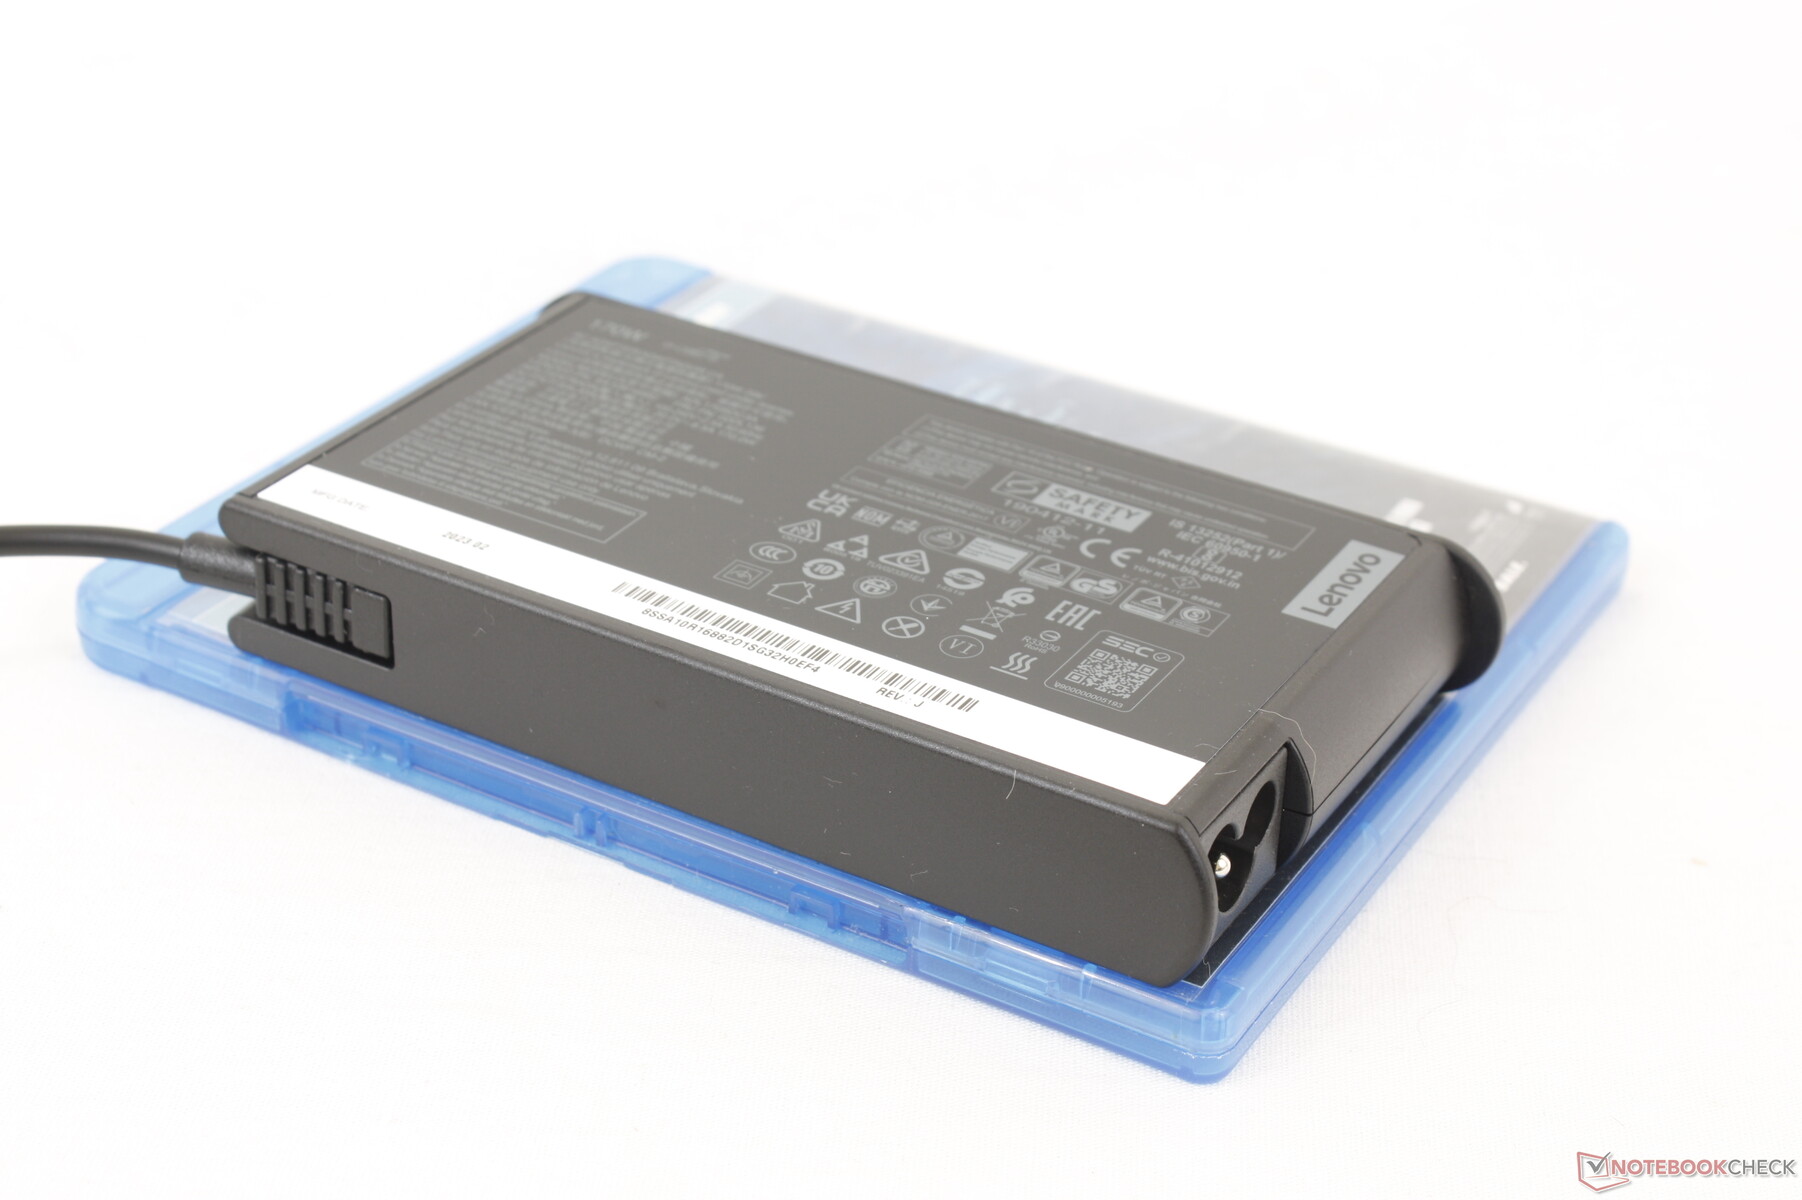
Conseguimos registrar um consumo máximo de 177 W do adaptador CA de 170 W de tamanho médio (~15 x 7,8 x 2,3 cm) quando a CPU e a GPU estão com 100% de utilização. Portanto, a taxa de carregamento será mais lenta se forem executadas simultaneamente cargas elevadas, como jogos.
| desligado | |
| Ocioso | |
| Carga |
|
Key:
min: | |
| Lenovo LOQ 15APH8 R7 7840HS, GeForce RTX 4050 Laptop GPU, Micron 2450 512GB MTFDKCD512TFK, IPS, 1920x1080, 15.6" | Lenovo Legion 5 15IAH7H 82RB i7-12700H, GeForce RTX 3060 Laptop GPU, , IPS, 1920x1080, 15.6" | Dell G15 5530 i7-13650HX, GeForce RTX 4060 Laptop GPU, SSTC CL4-3D512-Q11, IPS, 1920x1080, 15.6" | Asus TUF A15 FA507 R7 7735HS, GeForce RTX 4050 Laptop GPU, Micron 2400 MTFDKBA512QFM, IPS, 1920x1080, 15.6" | MSI Cyborg 15 A12VF i7-12650H, GeForce RTX 4060 Laptop GPU, Samsung PM9B1 1024GB MZVL41T0HBLB, IPS, 1920x1080, 15.6" | HP Victus 15 fa0020nr i7-12700H, GeForce RTX 3050 Ti Laptop GPU, Samsung PM9A1 MZVL2512HCJQ, IPS, 1920x1080, 15.6" | |
|---|---|---|---|---|---|---|
| Power Consumption | -55% | -6% | 19% | 36% | 10% | |
| Idle Minimum * (Watt) | 15 | 19.8 -32% | 8.4 44% | 8 47% | 6 60% | 5.1 66% |
| Idle Average * (Watt) | 17.7 | 26.2 -48% | 14.98 15% | 12.1 32% | 8.8 50% | 15.1 15% |
| Idle Maximum * (Watt) | 21.5 | 48.2 -124% | 15.56 28% | 12.5 42% | 11.9 45% | 18.9 12% |
| Load Average * (Watt) | 73.5 | 102.9 -40% | 96.8 -32% | 74.9 -2% | 89 -21% | 114.5 -56% |
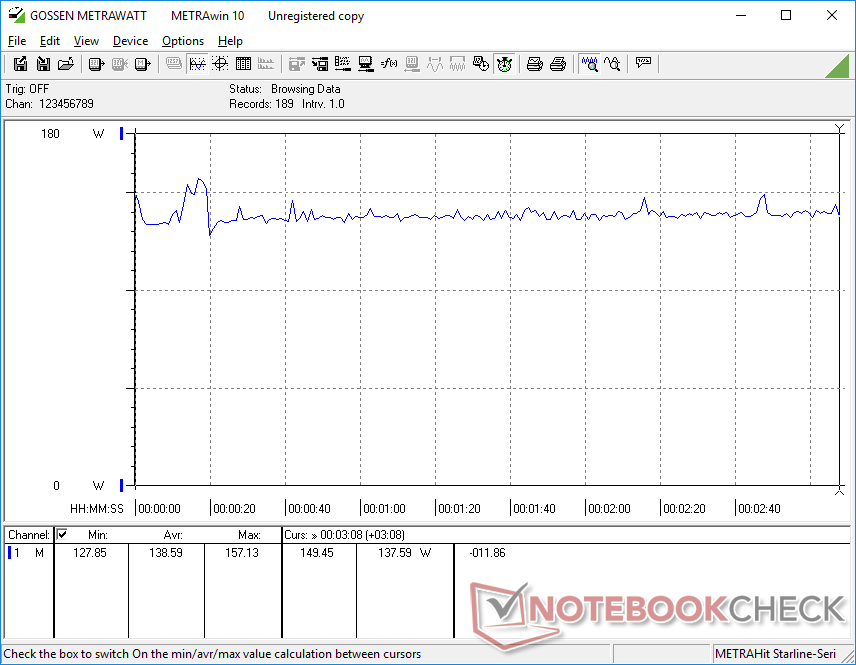
| Witcher 3 ultra * (Watt) | 138.6 | 186.7 -35% | 186 -34% | 136.6 1% | 90.3 35% | 113.9 18% |
| Load Maximum * (Watt) | 176.5 | 268 -52% | 271.42 -54% | 185 -5% | 99 44% | 165.8 6% |
* ... menor é melhor
Power Consumption Witcher 3 / Stresstest
Power Consumption external Monitor
Duração da bateria
Nossa bateria de 60 Wh é relativamente pequena, pois a maioria dos outros notebooks de 15 polegadas para jogos normalmente vem com baterias de 70 Wh ou mais. No entanto, os tempos de execução ainda são respeitáveis, com quase 7,5 horas de navegação em WLAN no mundo real, o que é comparável aoCyborg 15.
O carregamento da bateria vazia até a capacidade total com o adaptador CA incluído é muito rápido, cerca de 45 minutos ou aproximadamente duas vezes mais rápido do que na maioria dos outros notebooks para jogos. O Lenovo Rapid Charge é ativado por padrão por meio do software Vantage.
O sistema pode ser recarregado via USB-C, mas a compatibilidade com a maioria dos adaptadores CA USB-C não é garantida. A Lenovo vende seu próprio adaptador CA USB-C de 140 W que deve ser compatível com a maioria dos notebooks Lenovo.
| Lenovo LOQ 15APH8 R7 7840HS, GeForce RTX 4050 Laptop GPU, 60 Wh | Lenovo Legion 5 15IAH7H 82RB i7-12700H, GeForce RTX 3060 Laptop GPU, 80 Wh | Dell G15 5530 i7-13650HX, GeForce RTX 4060 Laptop GPU, 86 Wh | Asus TUF A15 FA507 R7 7735HS, GeForce RTX 4050 Laptop GPU, 90 Wh | MSI Cyborg 15 A12VF i7-12650H, GeForce RTX 4060 Laptop GPU, 53.5 Wh | HP Victus 15 fa0020nr i7-12700H, GeForce RTX 3050 Ti Laptop GPU, 70 Wh | |
|---|---|---|---|---|---|---|
| Duração da bateria | -16% | -20% | 25% | 50% | -48% | |
| Reader / Idle (h) | 9.8 | 8.1 -17% | 13.6 39% | 2.6 -73% | ||
| WiFi v1.3 (h) | 7.4 | 5 -32% | 6.5 -12% | 11.7 58% | 7.5 1% | 2.1 -72% |
| Load (h) | 1.1 | 1.1 0% | 0.8 -27% | 1 -9% | 2.3 109% | 1.1 0% |
| H.264 (h) | 6.8 | 12.5 | 8 | |||
| Witcher 3 ultra (h) | 0.8 |
Pro
Contra
Veredicto - Ryzen 7 7840HS e GeForce RTX 4050 atingem um ótimo equilíbrio
Para uma máquina de jogos econômica com apenas 8 GB de RAM de sistema atualizável, o Lenovo LOQ 15 tem um desempenho melhor do que o esperado e com excelente desempenho por watt quando comparado a laptops para jogos com CPUs da série Core-H de 12ª geração, como o IdeaPad Gaming 15 ou oHP Victus 15. Seu painel G-Sync de 1080p combina muito bem com o GeForce RTX 4050 para jogos suaves de 60 FPS em títulos modernos, o que é uma meta razoável para qualquer laptop para jogos de baixo custo.
O chassi de plástico e os 8 GB de RAM são um ponto negativo, mas a facilidade de atualização e o desempenho rápido em relação ao preço ajudam a colocar o LOQ 15 acima dos demais na categoria de US$ 1.000 ou menos.
A principal desvantagem do LOQ 15 é a gama limitada de cores e os tempos médios de resposta preto-branco e cinza-cinza. A opção de painel de 1440p de última geração resolve essas preocupações, mas o aumento de preço subsequente se tornaria muito próximo de um modelo Legion 5 e a proposta de valor do LOQ 15 começaria a diminuir. A faixa de preço de US$ 1.000,00 ou menos é o ponto ideal para o LOQ 15, especialmente porque o Ryzen 7 7840HS e o GeForce RTX 4050 estão no mesmo patamar do Core i7-12700H e do RTX 3060, que equiparam muitos laptops para jogos de 2022, vendidos no varejo por cerca de US$ 1.500,00. Os principais fabricantes concorrentes, como MSI, HP ou Asus, ainda não ofereceram laptops para jogos acessíveis com as mesmas opções do Ryzen 7 7840HS até o momento da redação deste artigo.
Preço e disponibilidade
A Best Buy está enviando atualmente o Lenovo LOQ 15 em nossa configuração exata por US$ 1100. A Lenovo tem configurações adicionais disponíveis diretamente em seu site por preços mais baixos.
Lenovo LOQ 15APH8
- 07/26/2023 v7 (old)
Allen Ngo
Transparência
A seleção dos dispositivos a serem analisados é feita pela nossa equipe editorial. A amostra de teste foi fornecida ao autor como empréstimo pelo fabricante ou varejista para fins desta revisão. O credor não teve influência nesta revisão, nem o fabricante recebeu uma cópia desta revisão antes da publicação. Não houve obrigação de publicar esta revisão. Como empresa de mídia independente, a Notebookcheck não está sujeita à autoridade de fabricantes, varejistas ou editores.
É assim que o Notebookcheck está testando
Todos os anos, o Notebookcheck analisa de forma independente centenas de laptops e smartphones usando procedimentos padronizados para garantir que todos os resultados sejam comparáveis. Desenvolvemos continuamente nossos métodos de teste há cerca de 20 anos e definimos padrões da indústria no processo. Em nossos laboratórios de teste, equipamentos de medição de alta qualidade são utilizados por técnicos e editores experientes. Esses testes envolvem um processo de validação em vários estágios. Nosso complexo sistema de classificação é baseado em centenas de medições e benchmarks bem fundamentados, o que mantém a objetividade.Price comparison

