Análise do Dell G15 5530: Uma alternativa viável à Alienware, agora com Raptor Lake-HX

A série Dell G tem o objetivo de levar as proezas da Alienware para aqueles que preferem não pagar caro por um laptop para jogos. Durante o MWC 2023, a Dell apresentou as séries G15 e G16 atualizadas com as opções de GPU Intel Raptor Lake-HX e Nvidia GeForce RTX série 40.
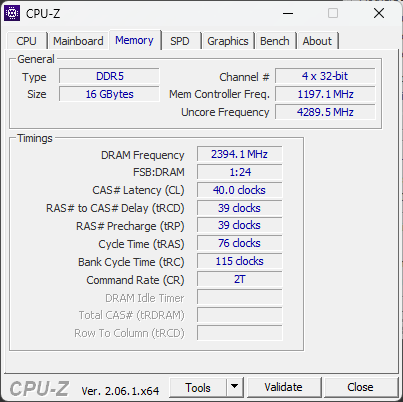
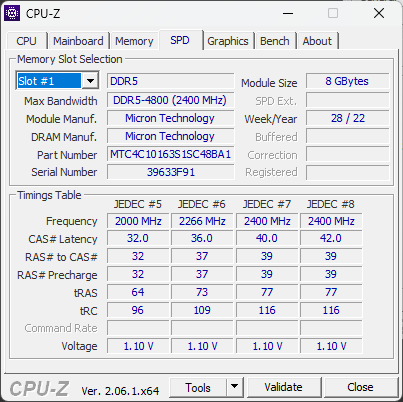
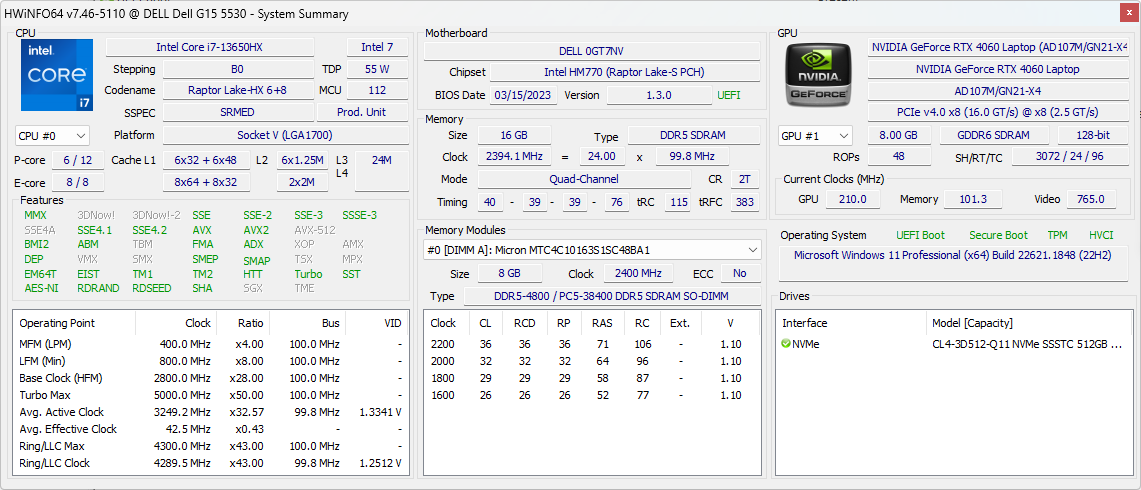
Agora temos conosco o Dell G15 5530 com uma configuração de ponta que apresenta o Intel Core i7-13650HX, GPU para laptop Nvidia GeForce RTX 406016 GB de RAM DDR5-4800, SSD NVMe de 512 GB e uma tela FHD G-Sync de 15,6 polegadas e 165 Hz.
Nesta análise, vamos dar uma volta com o Dell G15 5530 e ver como ele se sai em relação à concorrência pelo preço pedido de ₹1.58.990 (€1.449 ou US$1659,99).
Possíveis concorrentes em comparação
Avaliação | Data | Modelo | Peso | Altura | Size | Resolução | Preço |
|---|---|---|---|---|---|---|---|
| 84.2 % v7 (old) | 06/2023 | Dell G15 5530 i7-13650HX, GeForce RTX 4060 Laptop GPU | 3 kg | 26.95 mm | 15.60" | 1920x1080 | |
| 87.4 % v7 (old) | 03/2023 | Asus ROG Strix G18 G814JI i7-13650HX, GeForce RTX 4070 Laptop GPU | 3 kg | 31 mm | 18.00" | 2560x1600 | |
| 87.9 % v7 (old) | 05/2023 | Lenovo Legion Pro 5 16IRX8 i7-13700HX, GeForce RTX 4060 Laptop GPU | 2.5 kg | 26.8 mm | 16.00" | 2560x1600 | |
| 89.7 % v7 (old) | 06/2023 | Asus ROG Flow X16 GV601V i9-13900H, GeForce RTX 4060 Laptop GPU | 2.1 kg | 19.4 mm | 16.00" | 2560x1600 | |
| 82.1 % v7 (old) | 02/2023 | MSI Katana 17 B13VFK i7-13620H, GeForce RTX 4060 Laptop GPU | 2.8 kg | 25.2 mm | 17.30" | 1920x1080 | |
| 86.9 % v7 (old) | 06/2023 | Asus TUF Gaming A16 FA617XS R9 7940HS, Radeon RX 7600S | 2.2 kg | 22.1 mm | 16.00" | 1920x1200 | |
| 88.4 % v7 (old) | 04/2023 | Asus ROG Strix G17 G713PI R9 7945HX, GeForce RTX 4070 Laptop GPU | 2.8 kg | 30.7 mm | 17.30" | 2560x1440 | |
| 89 % v7 (old) | 04/2023 | Medion Erazer Major X20 i9-13900HX, GeForce RTX 4070 Laptop GPU | 2.4 kg | 29 mm | 16.00" | 2560x1600 |
Chassi: Peso pesado de plástico complementado por um bloco de energia volumoso
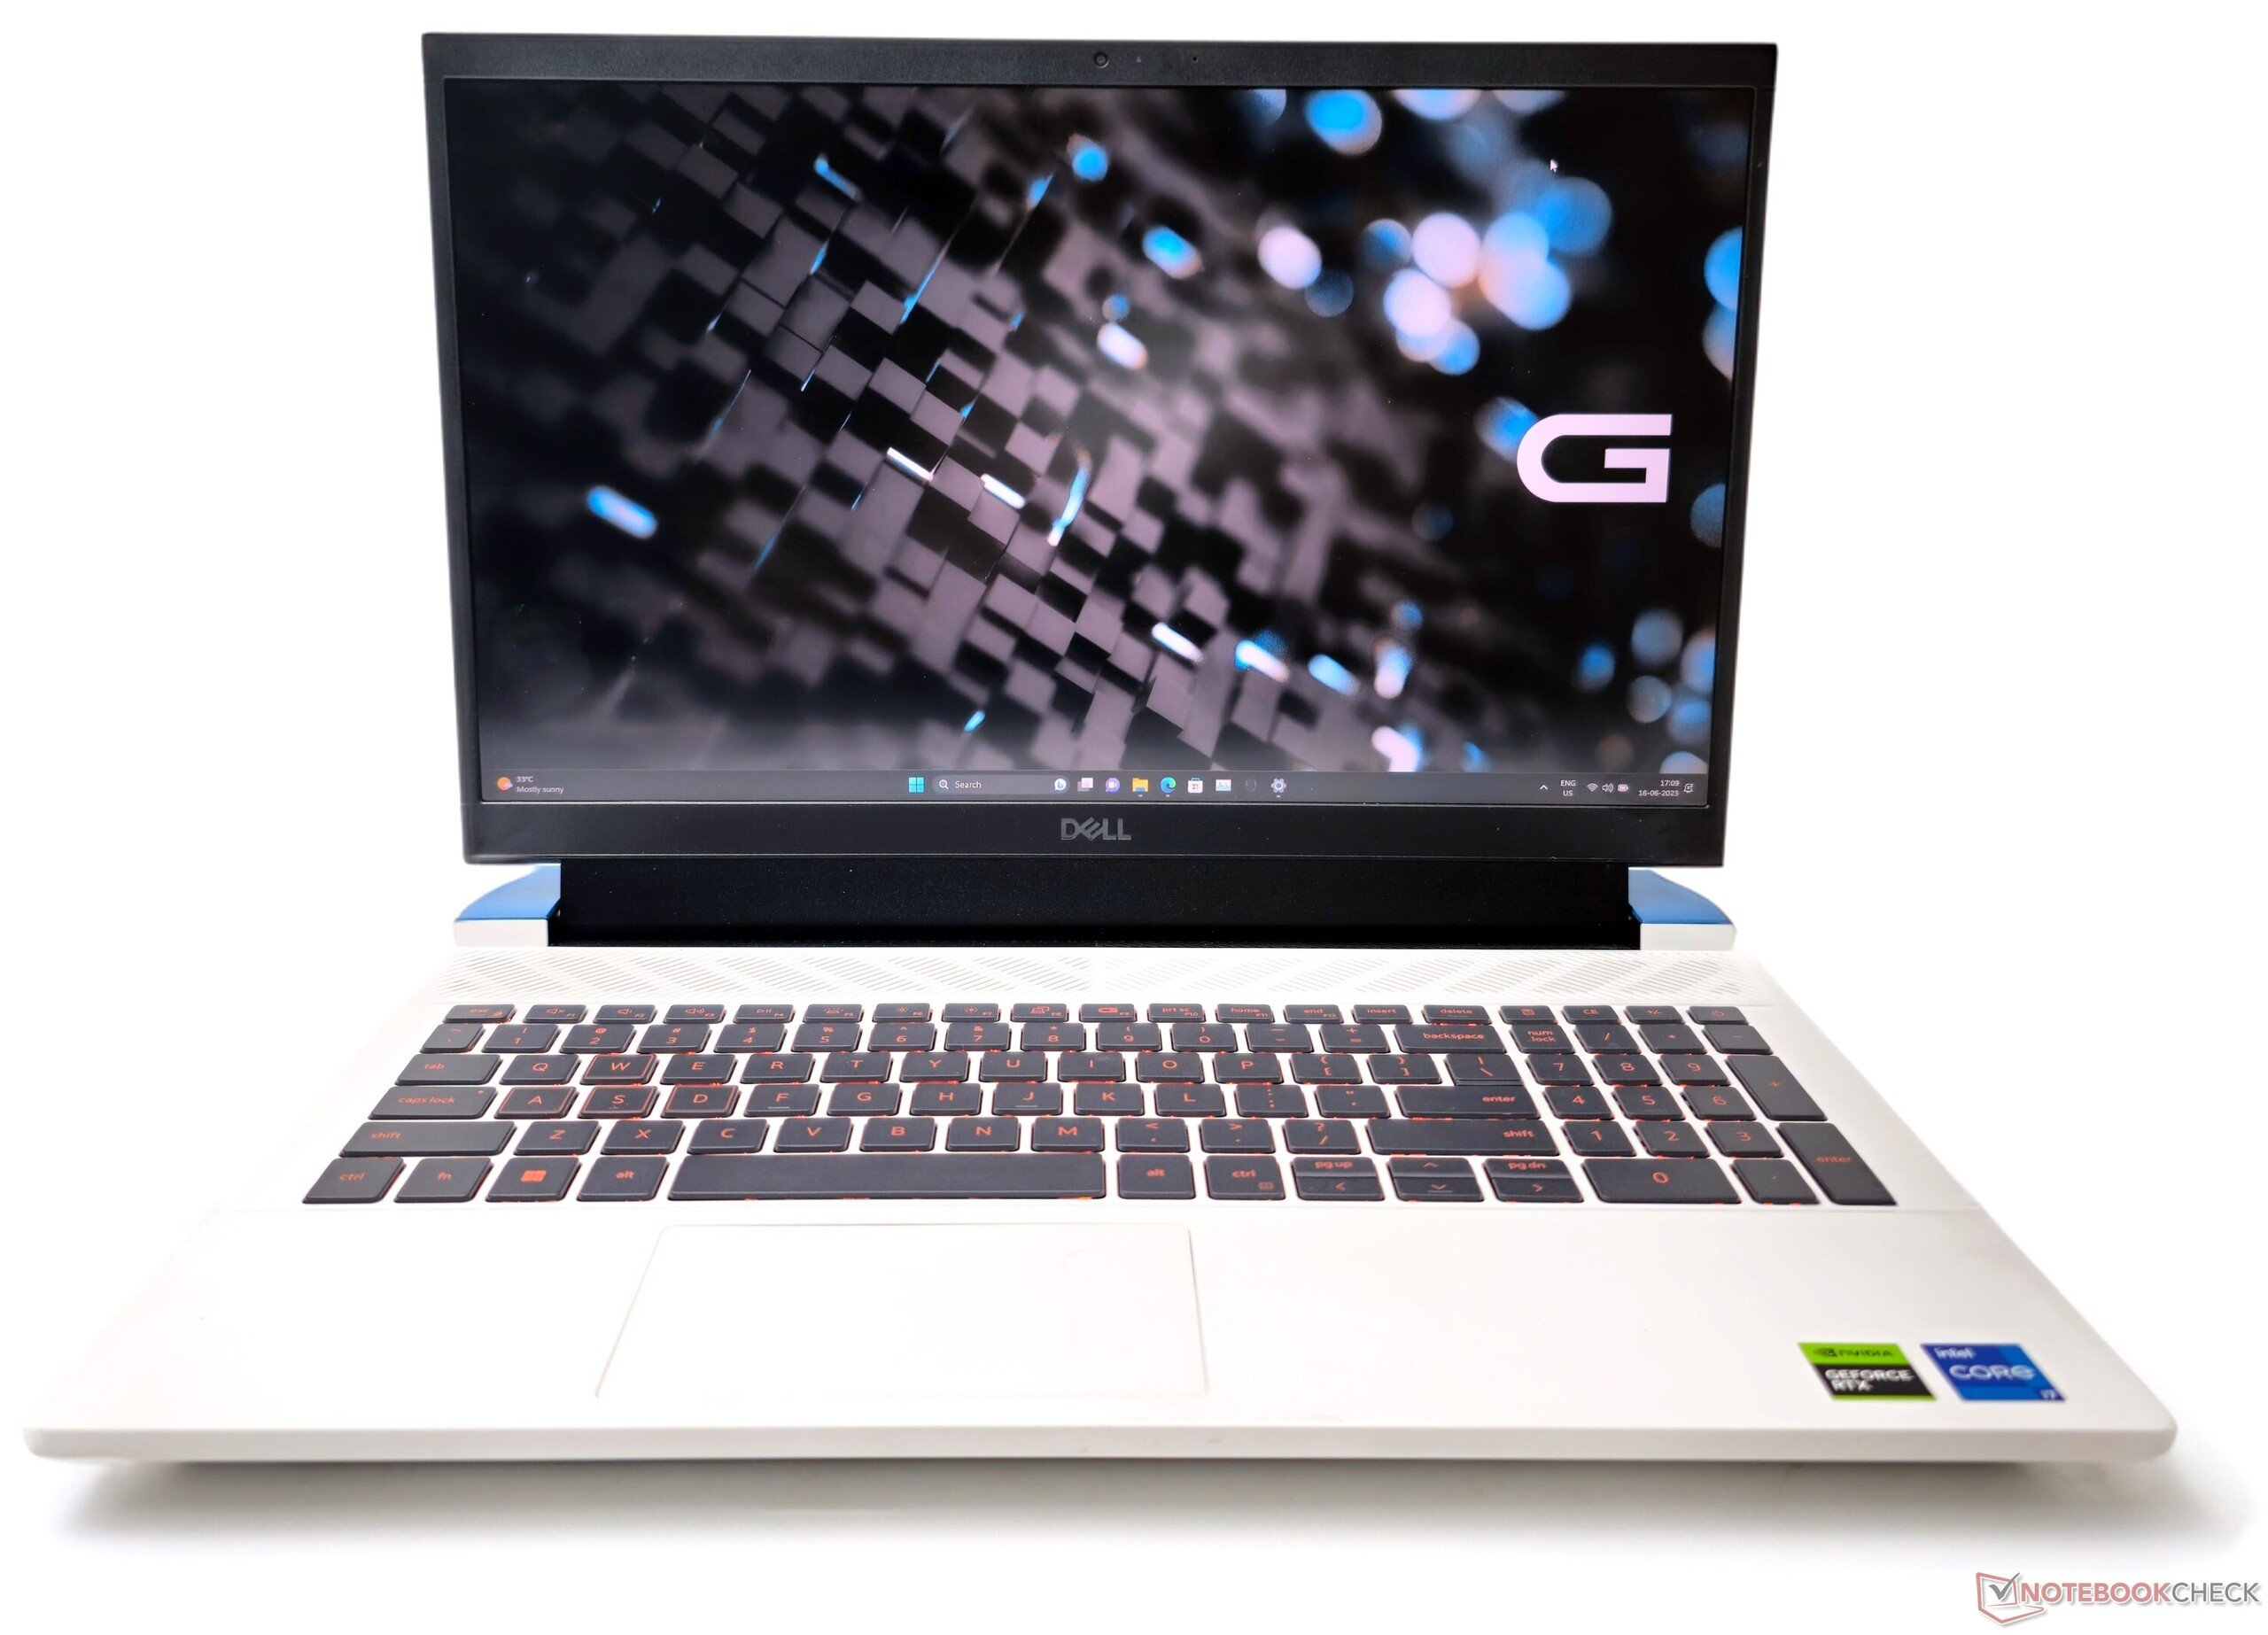
A Dell parece ter reduzido o brilho RGB desta vez, ao contrário do que vimos anteriormente com oG15 5520e G15 5521 Special Edition. O chassi do 5530 é mais ou menos idêntico ao do G15 5510.
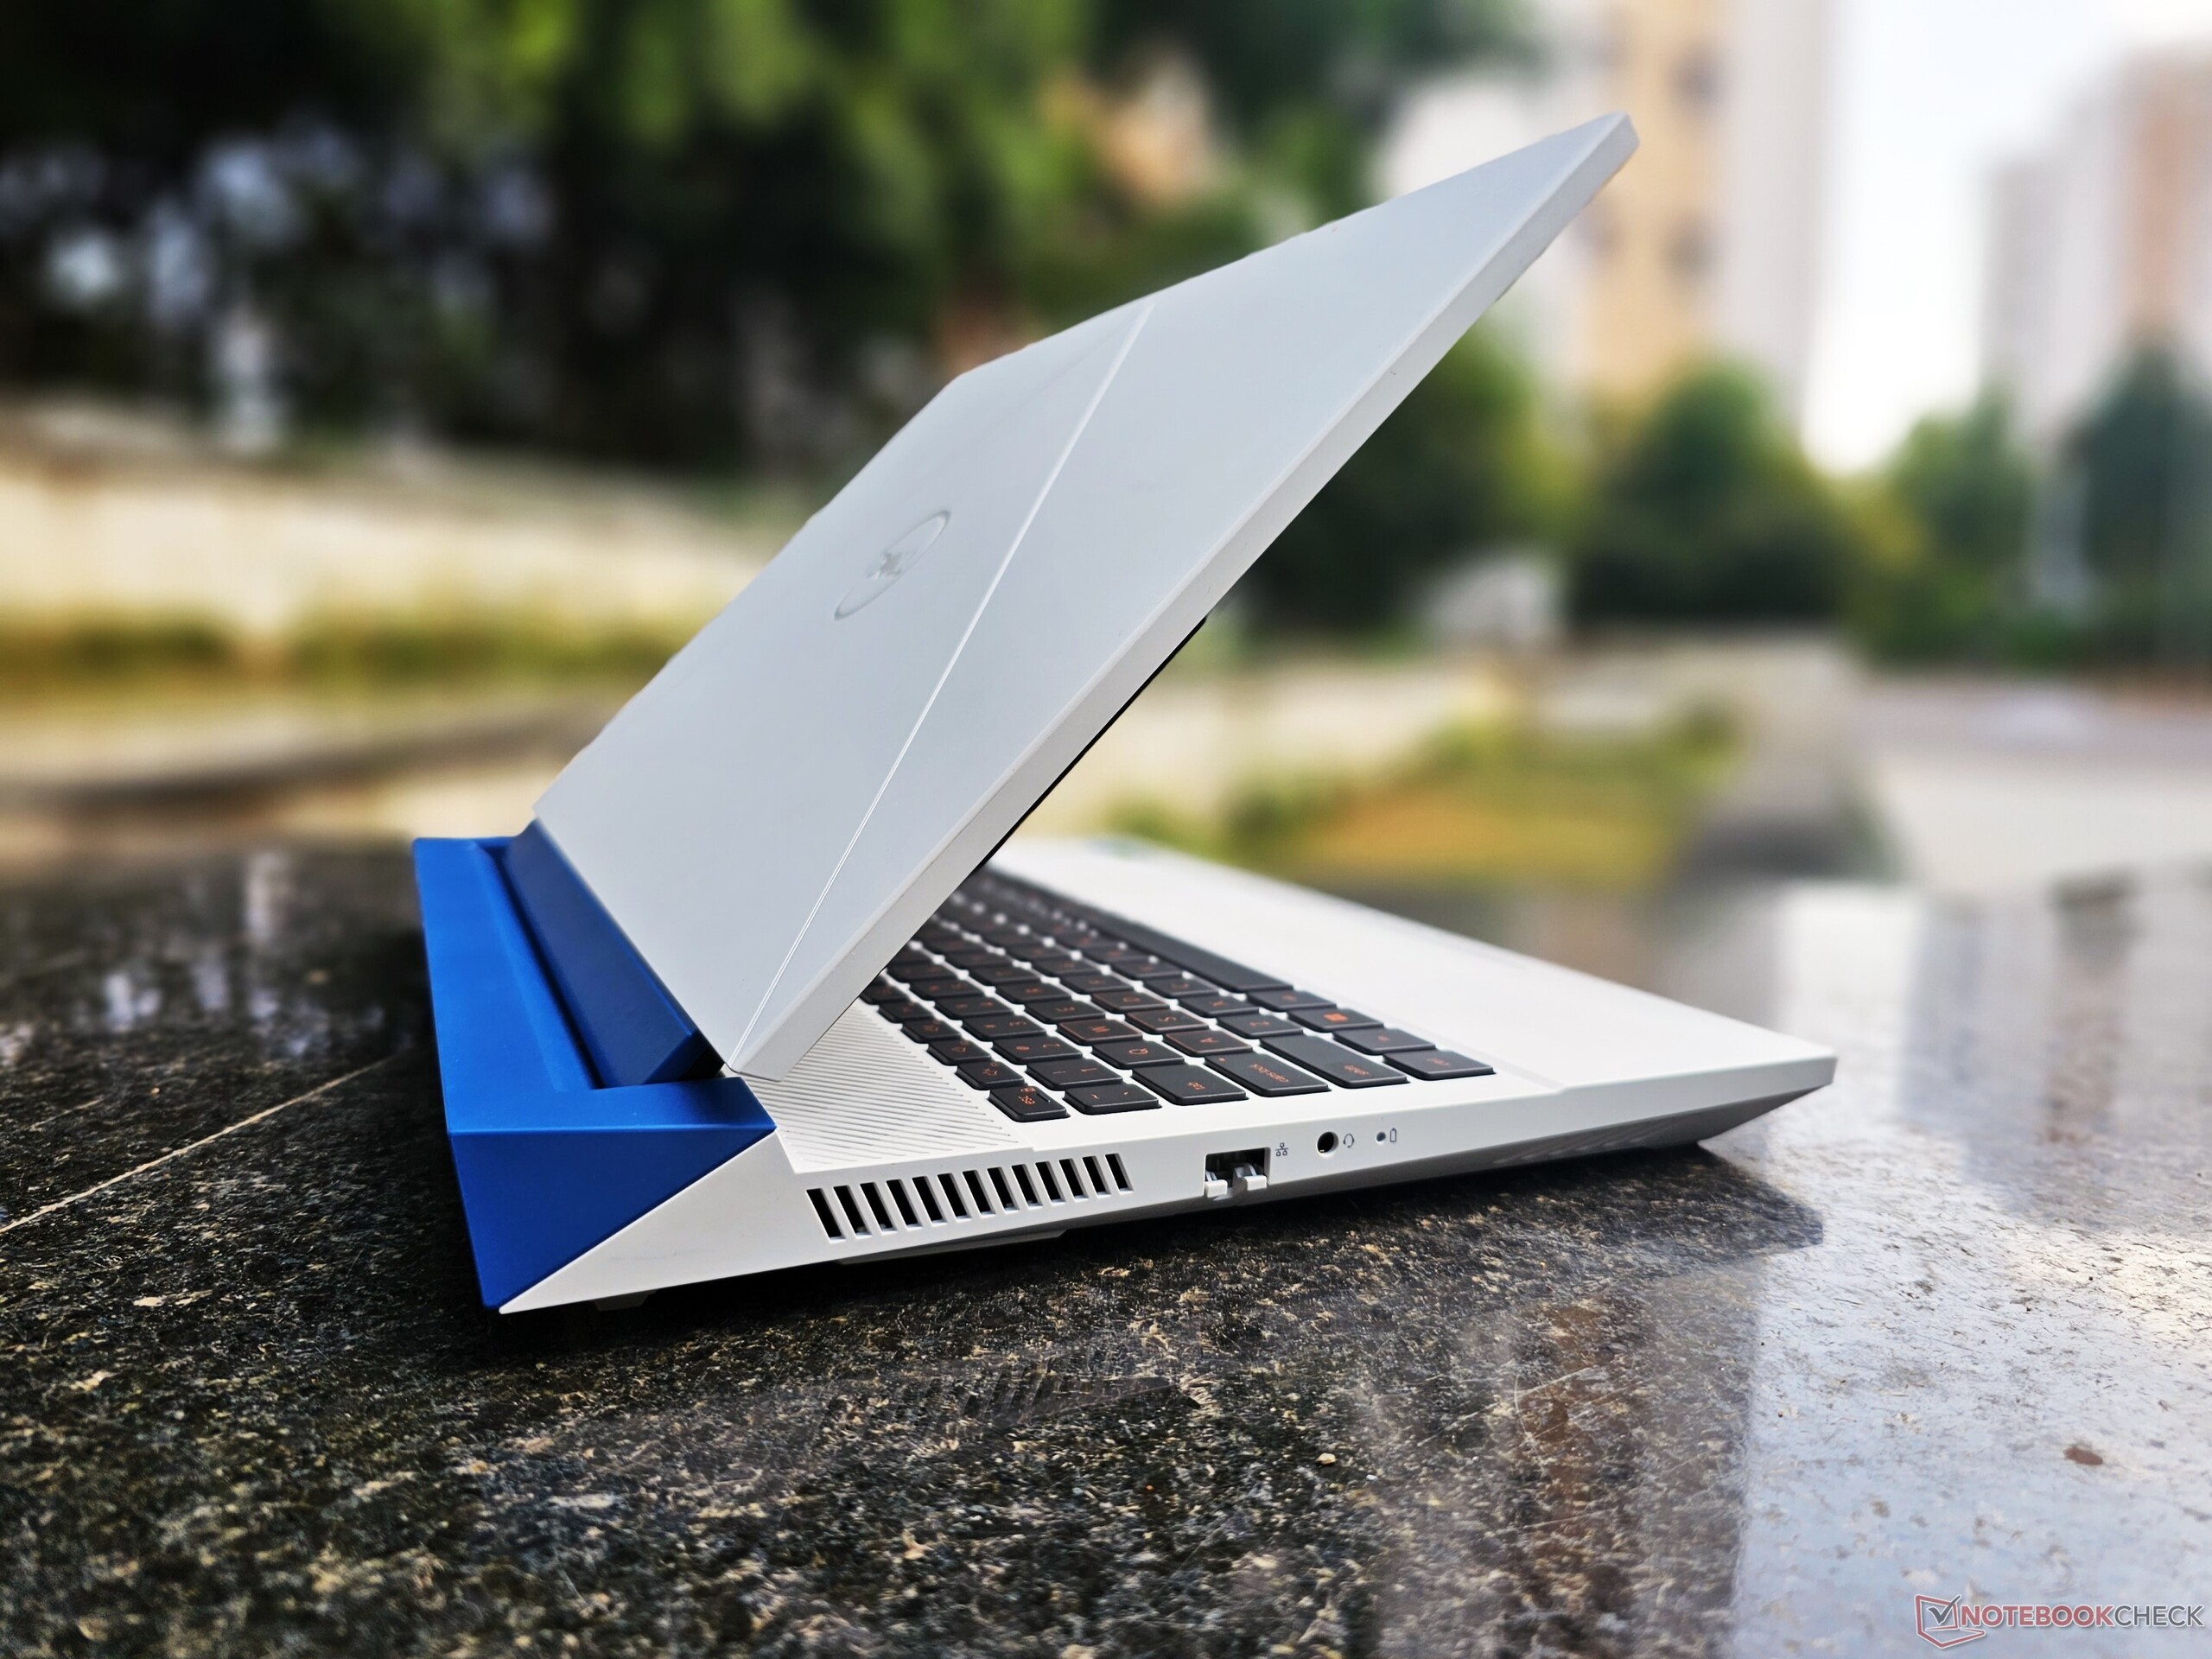
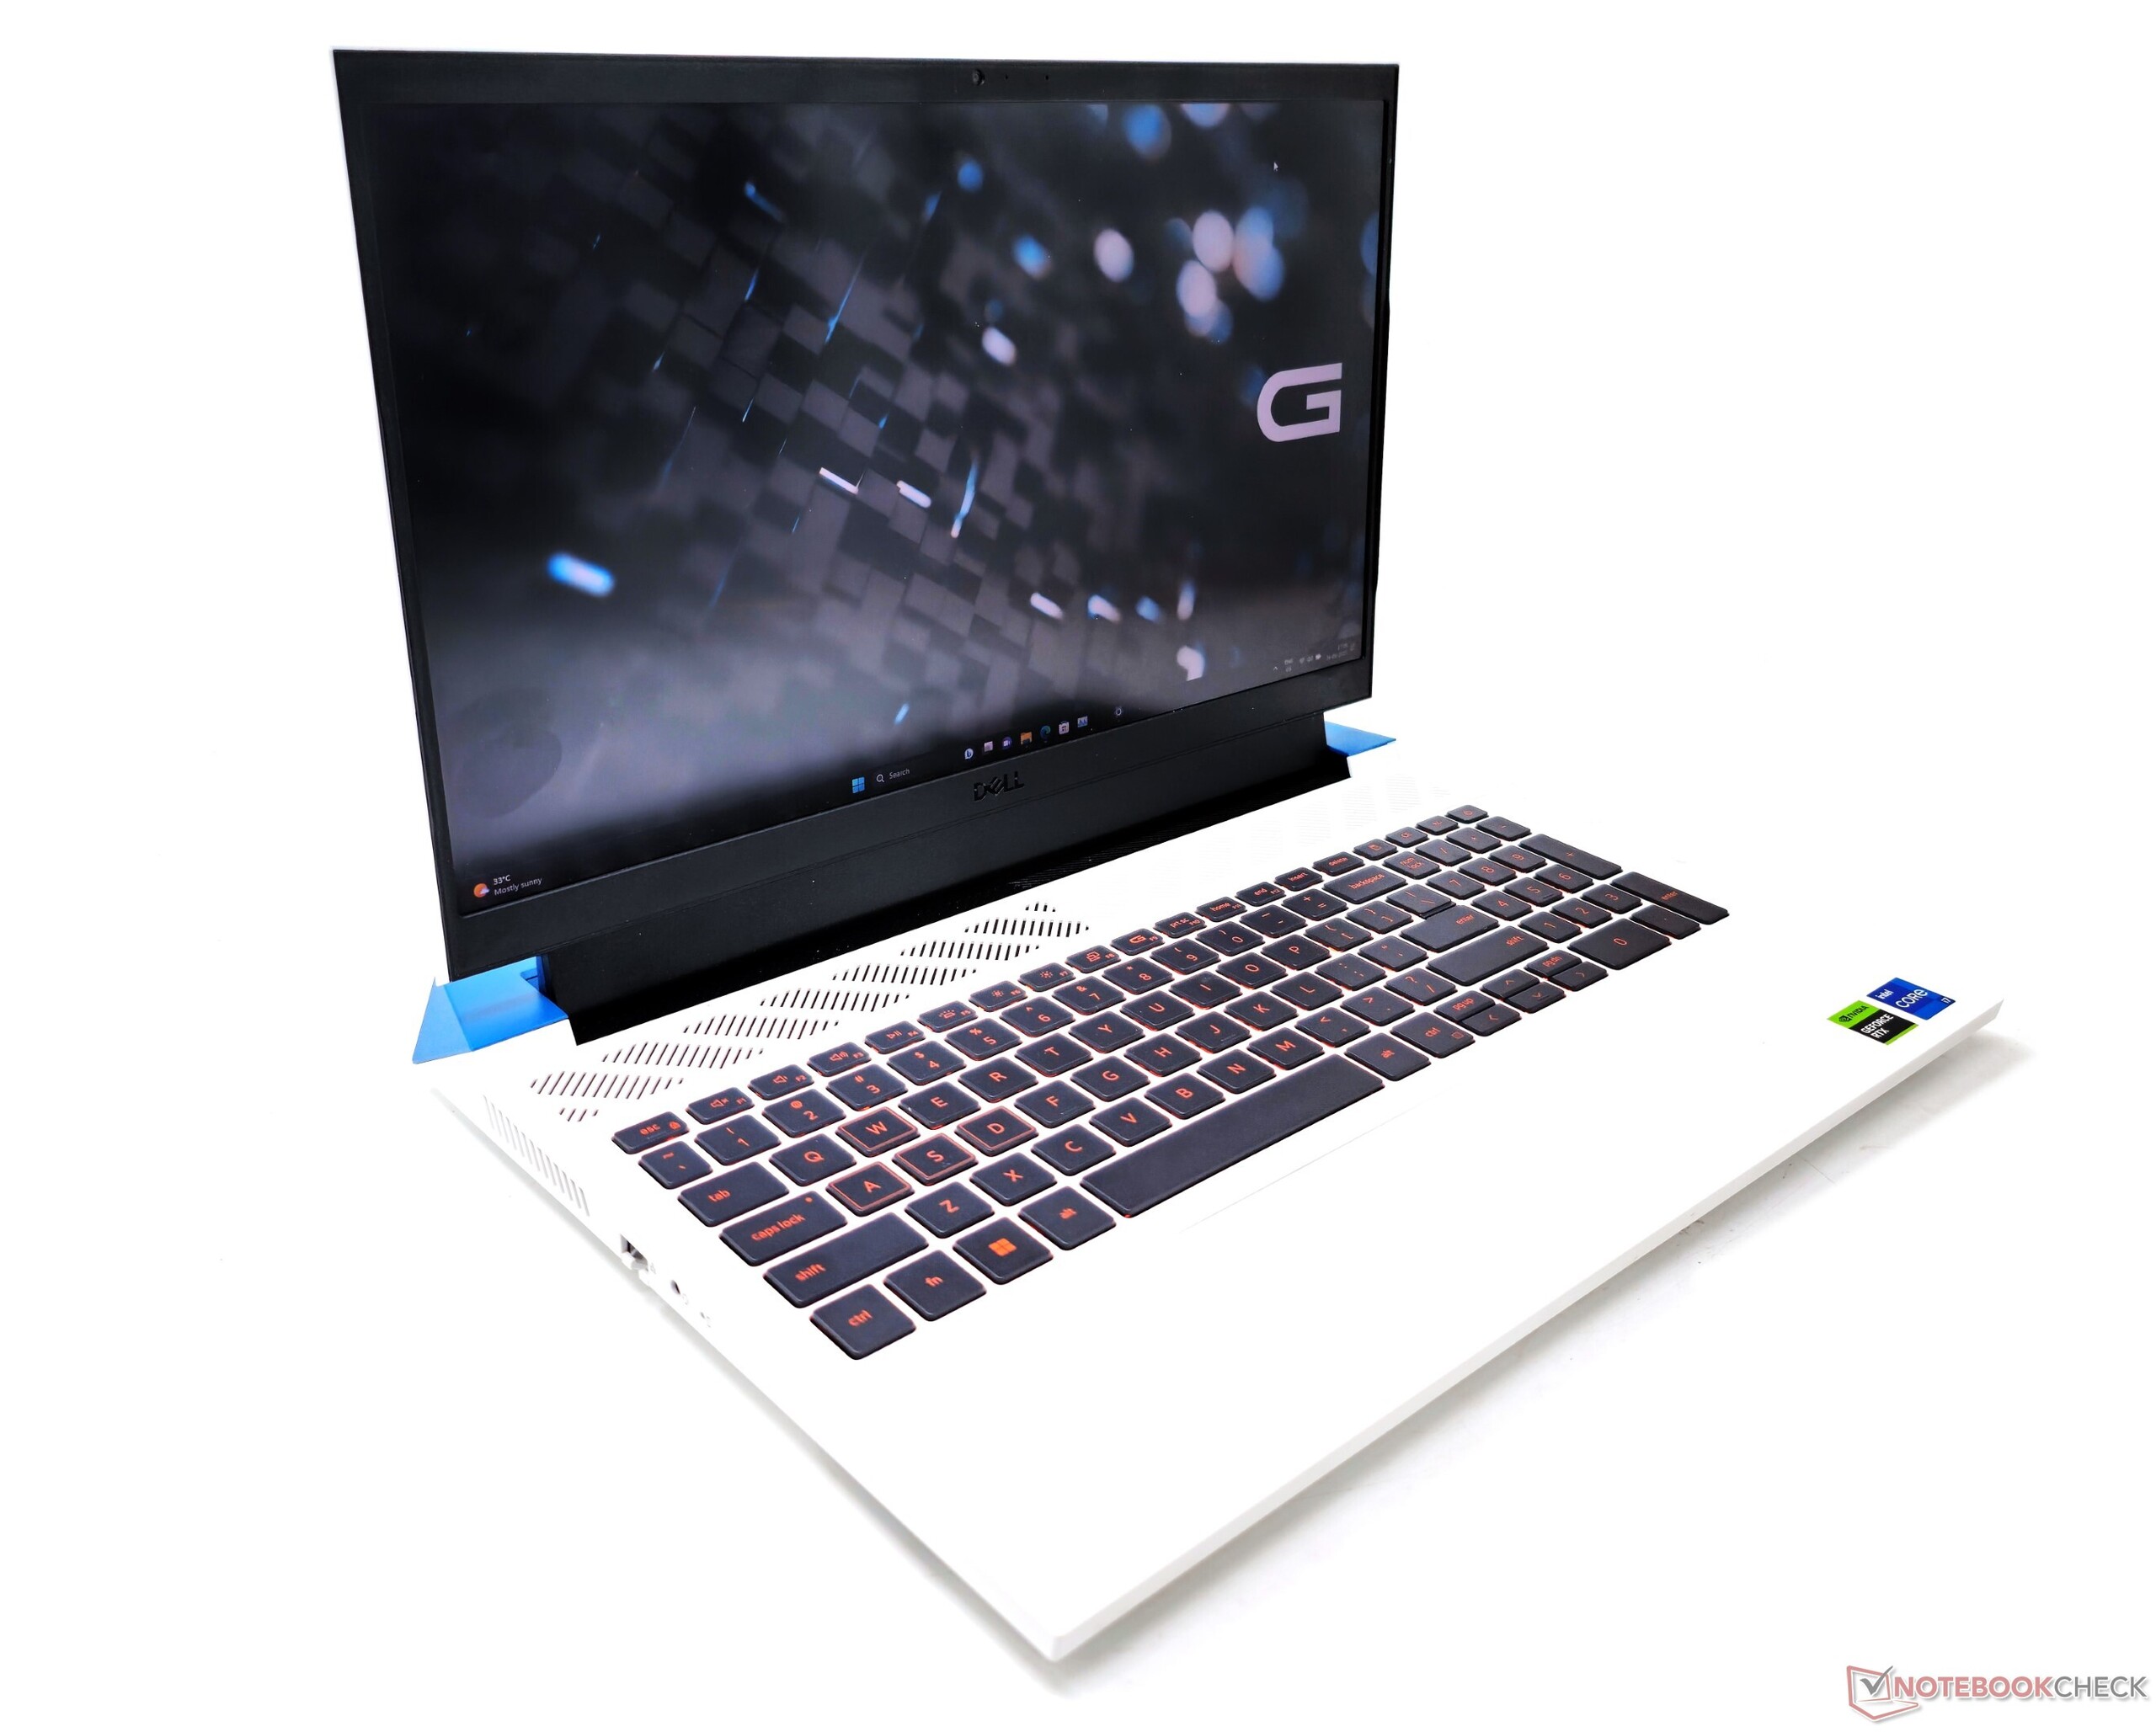
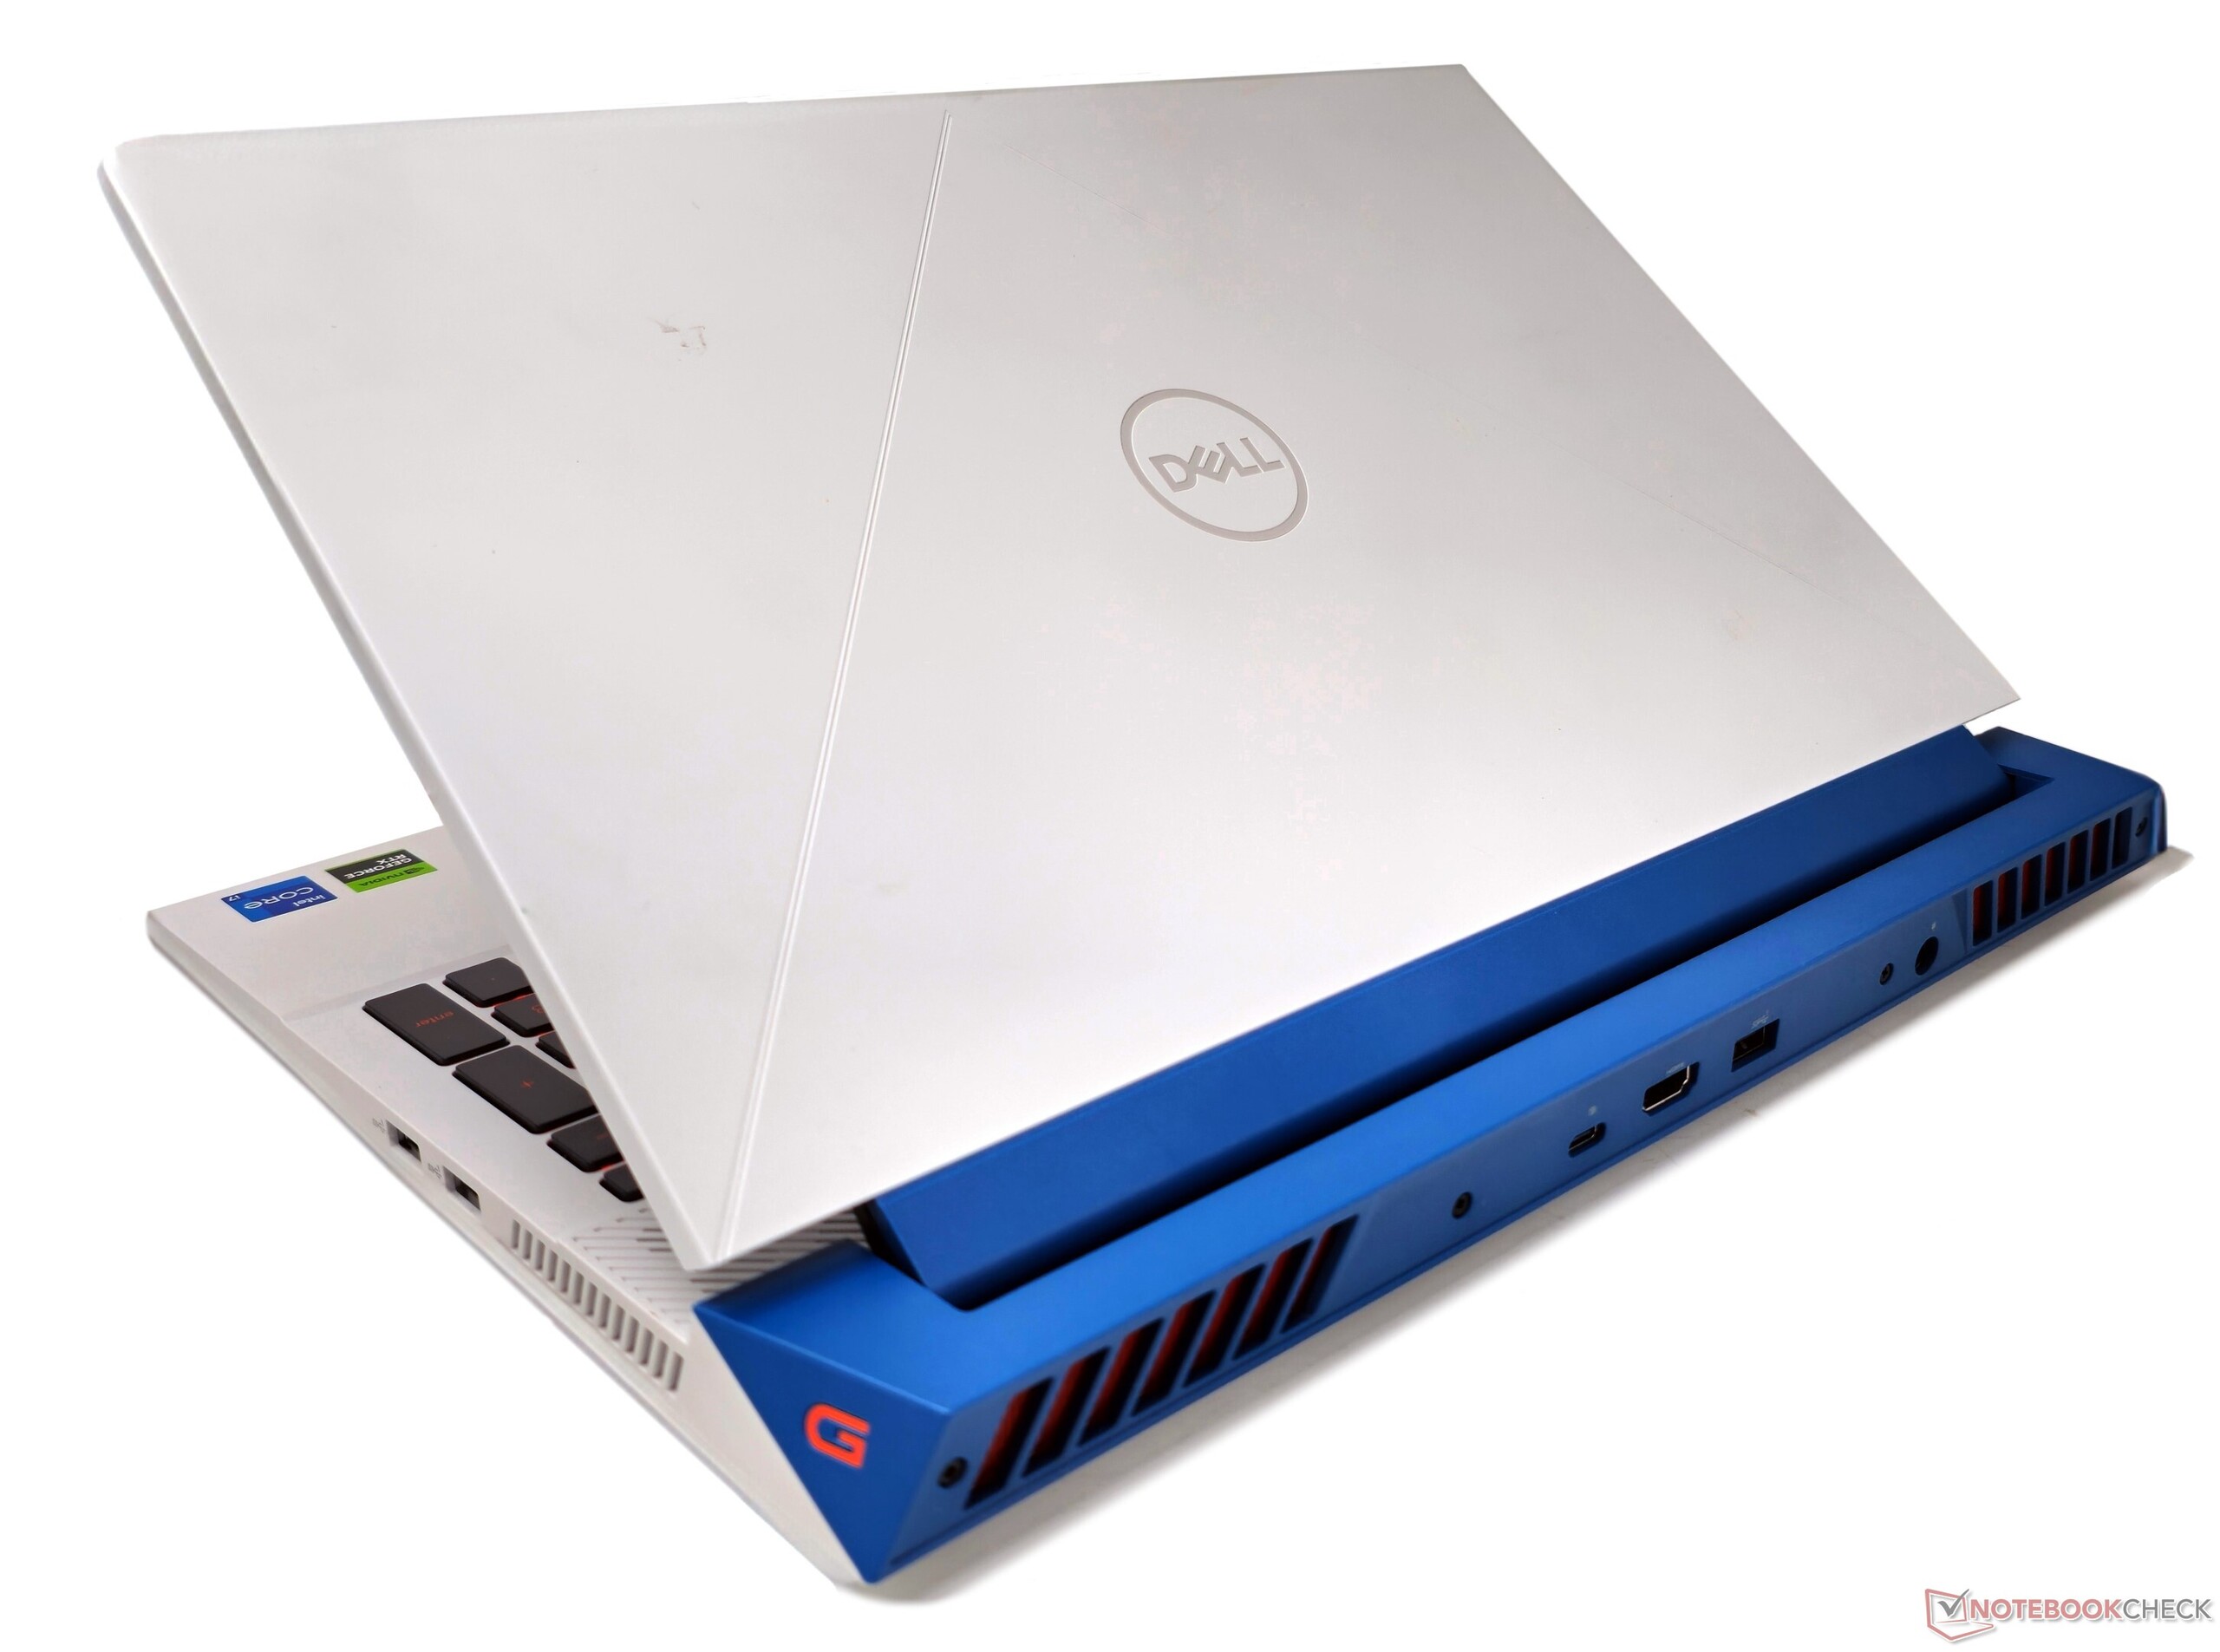
Nossa unidade G15 5530 é a variante Quantum White com uma prateleira térmica Deep Space Blue. Além disso, a Dell oferece duas opções de cores alternativas para este modelo: Dark Shadow Gray com uma prateleira térmica Black e Pop Purple com uma prateleira térmica Neo Mint.
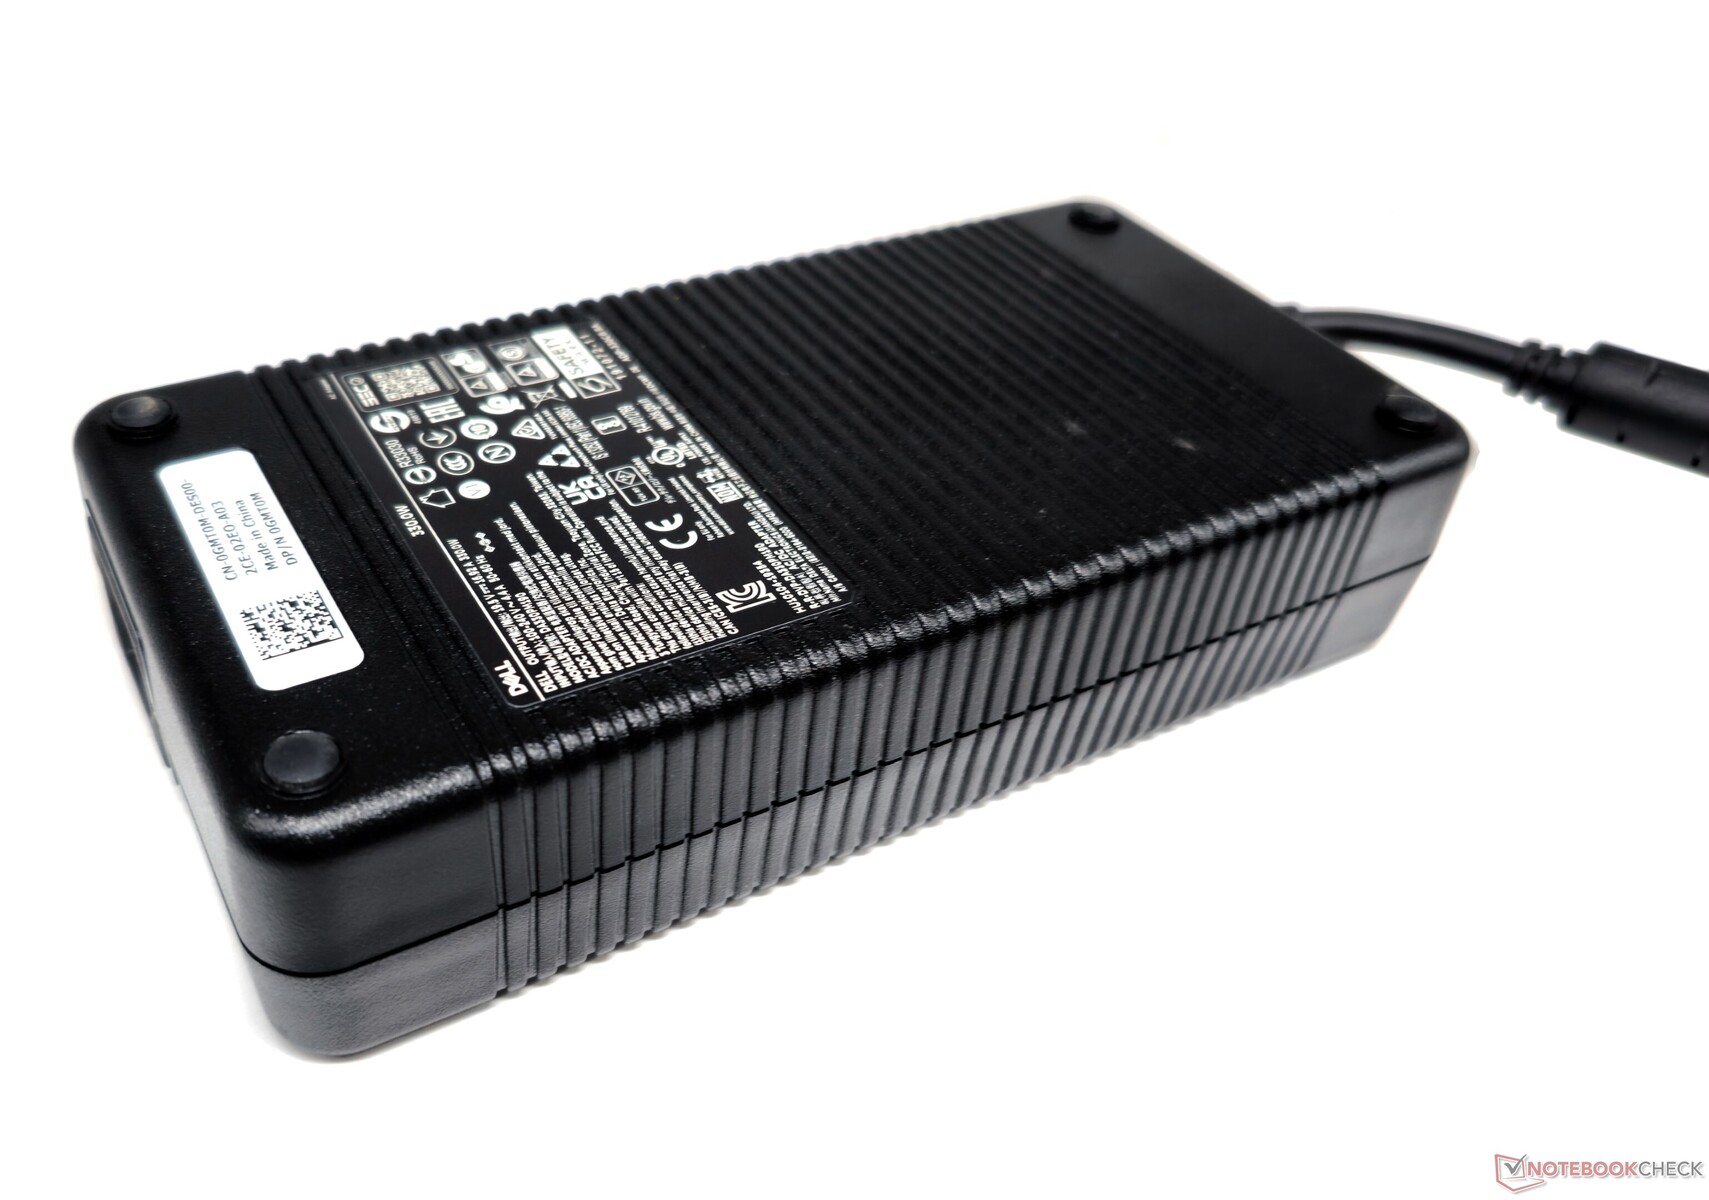
O laptop G15 5530 possui um chassi de plástico que pesa quase 3 kg, o que é sua principal desvantagem. Além do peso, há também um adaptador de energia de 330 W de 1,34 kg, portanto, os jogadores podem esperar um grande esforço ao carregar esse laptop.
As dobradiças da nossa unidade pareciam um pouco rígidas, mas a tampa pode ser aberta com um único dedo com algum esforço. Embora a tampa se flexione facilmente com força mínima, ela permanece estável sem oscilar em uso normal.
Não há surpresas no design geral do chassi, mas os cantos afiados e o peso elevado podem não agradar a todos.

Conectividade: Distribuição de portas não ideal para gamers
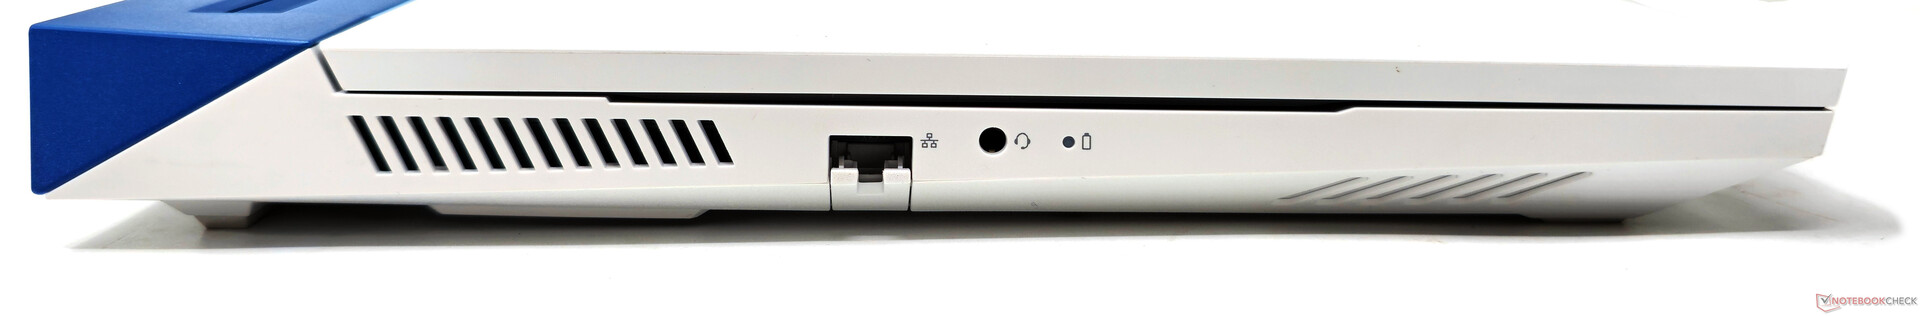
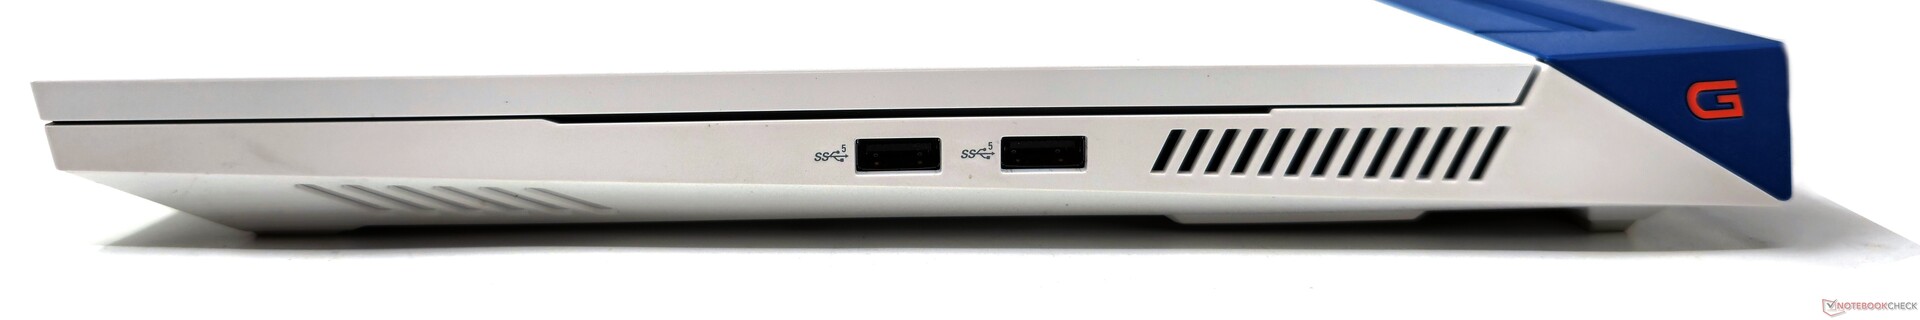
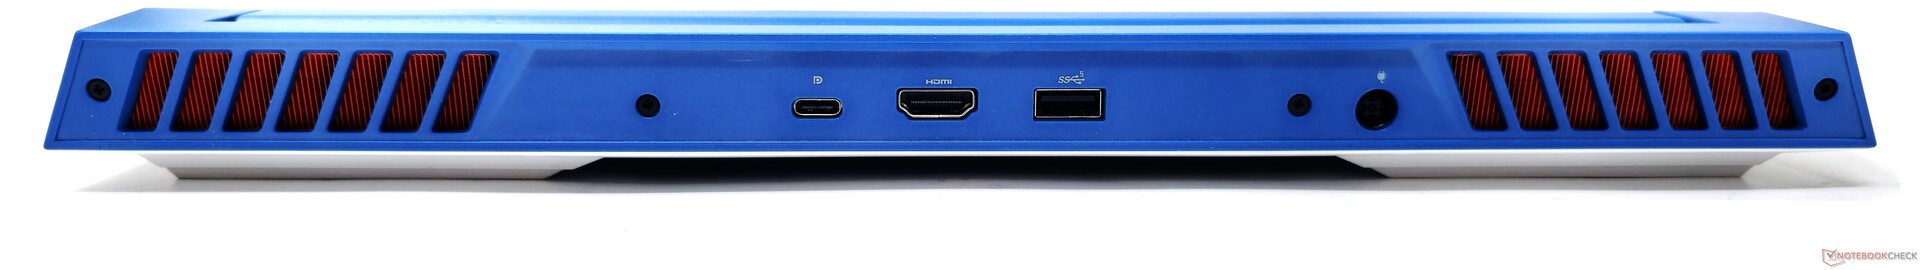
O posicionamento das portas no G15 5530 não é o ideal. Apenas a porta LAN e um conector de fone de ouvido estão presentes no lado esquerdo, enquanto o lado direito apresenta duas portas USB 3.2 Gen1 Tipo A. As portas restantes estão localizadas na parte traseira.
A ausência de portas USB no lado esquerdo pode ser incômoda para a conectividade de periféricos, especialmente para os jogadores que usam um mouse com fio.
Além disso, a única porta USB Tipo C oferece a funcionalidade DisplayPort-out, mas não possui Power Delivery. Como resultado, o laptop não pode ser carregado sem a utilização de um bloco de energia volumoso.
Comunicação
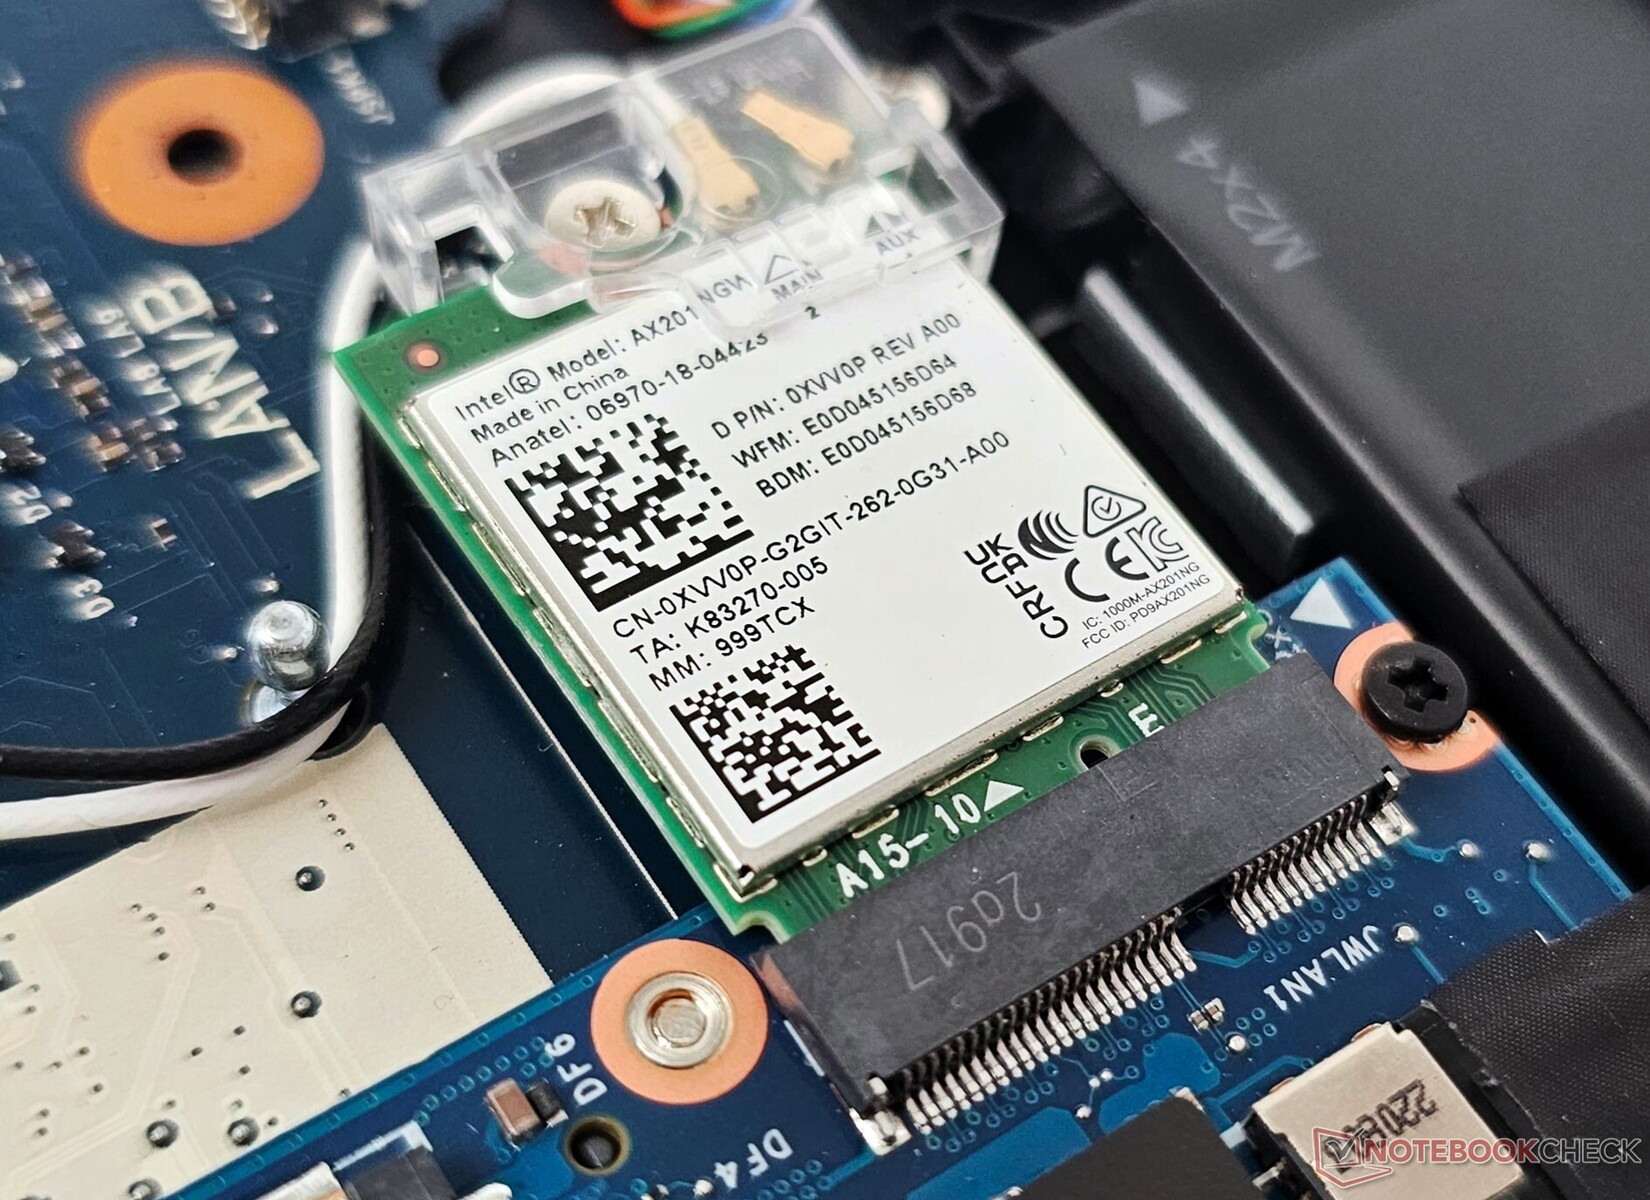
Embora a placa WLAN Intel AX201 no G15 5530 não ofereça suporte para Wi-Fi 6E, descobrimos que sua implementação no G15 5530 ainda oferece excelente taxa de transferência.
Nossos testes, conduzidos com o roteador de referência Asus ROG Rapture GT-AXE11000, mostraram um desempenho relativamente estável quando o laptop foi posicionado a 1 m de distância do roteador, com uma linha de visão clara e sem interferência externa.
Webcam
A qualidade da imagem da webcam de 720p não é nada agradável, com grandes desvios de cor (principalmente em tons de azul) e falta de nitidez e clareza em geral.


Segurança
Além do módulo TPM 2.0, o G15 5530 não oferece nenhum recurso de segurança adicional ou logins biométricos.
Acessórios e garantia
Não há nenhum acessório na caixa além do adaptador de energia de 330 W e a documentação usual.
Na Índia, a Dell oferece um ano de suporte premium de hardware e software no local como padrão.
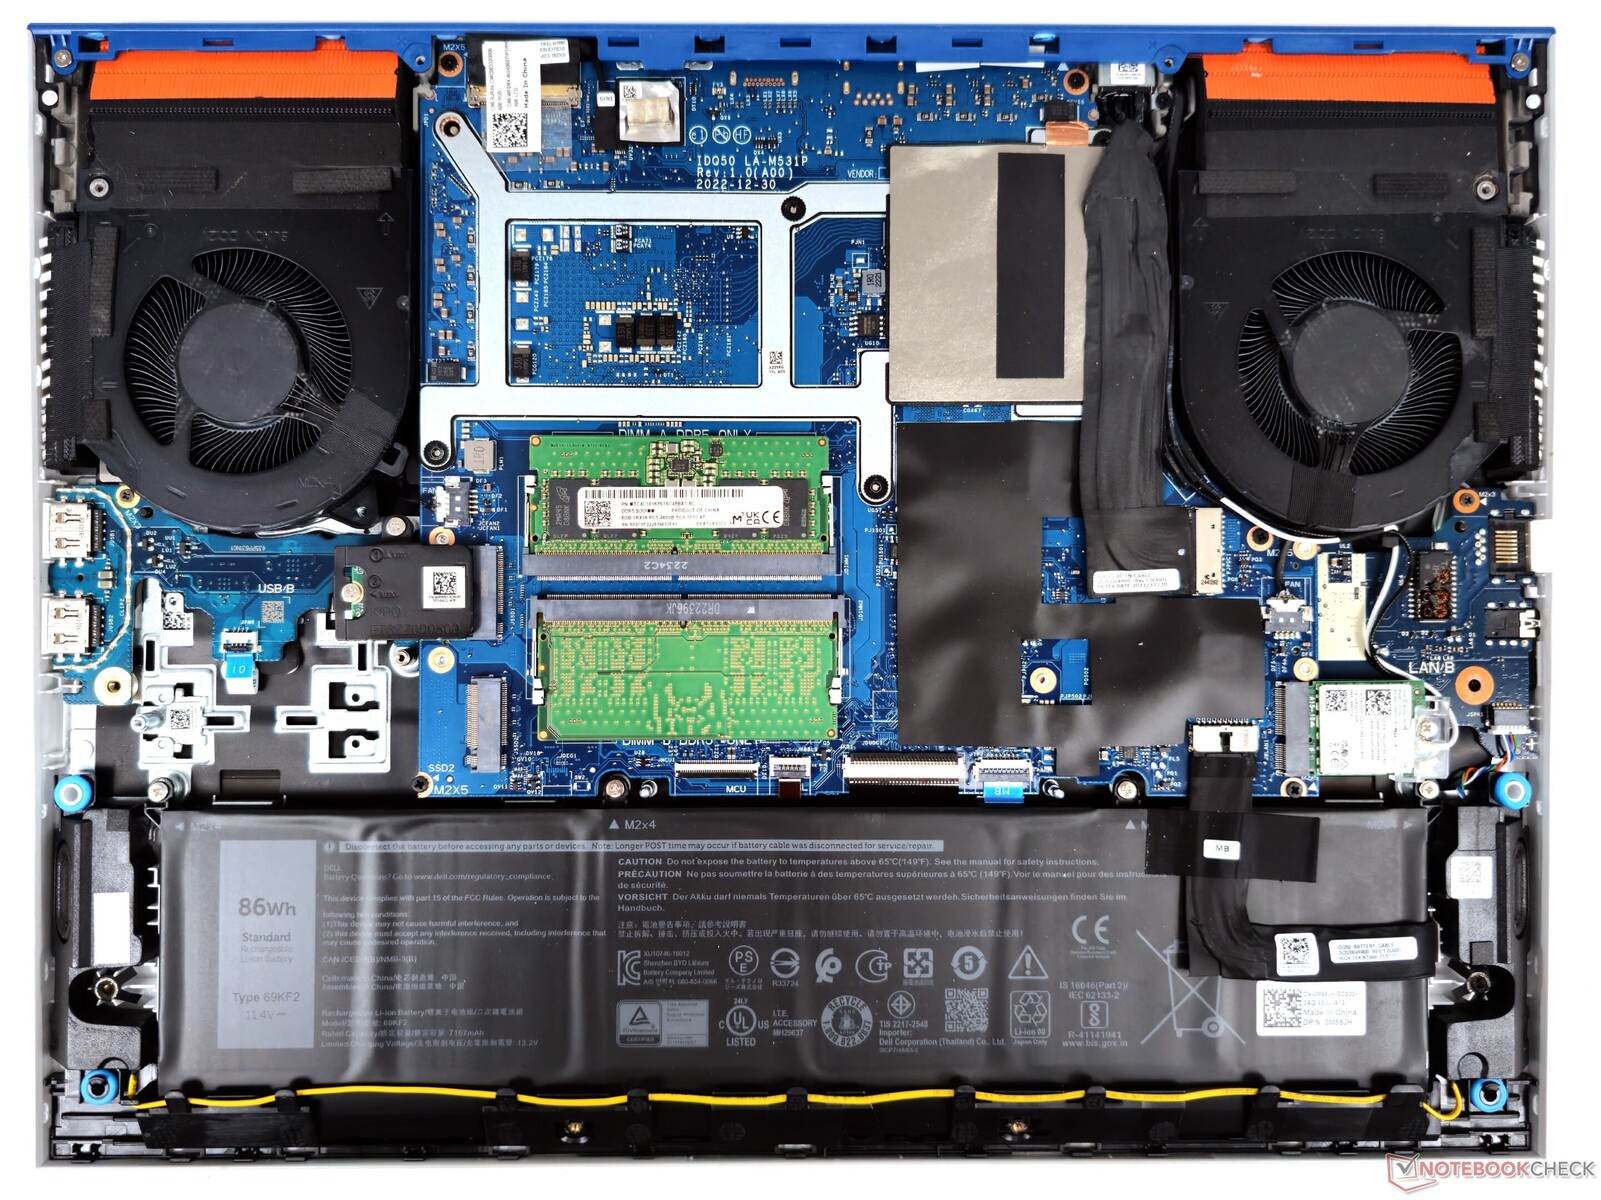
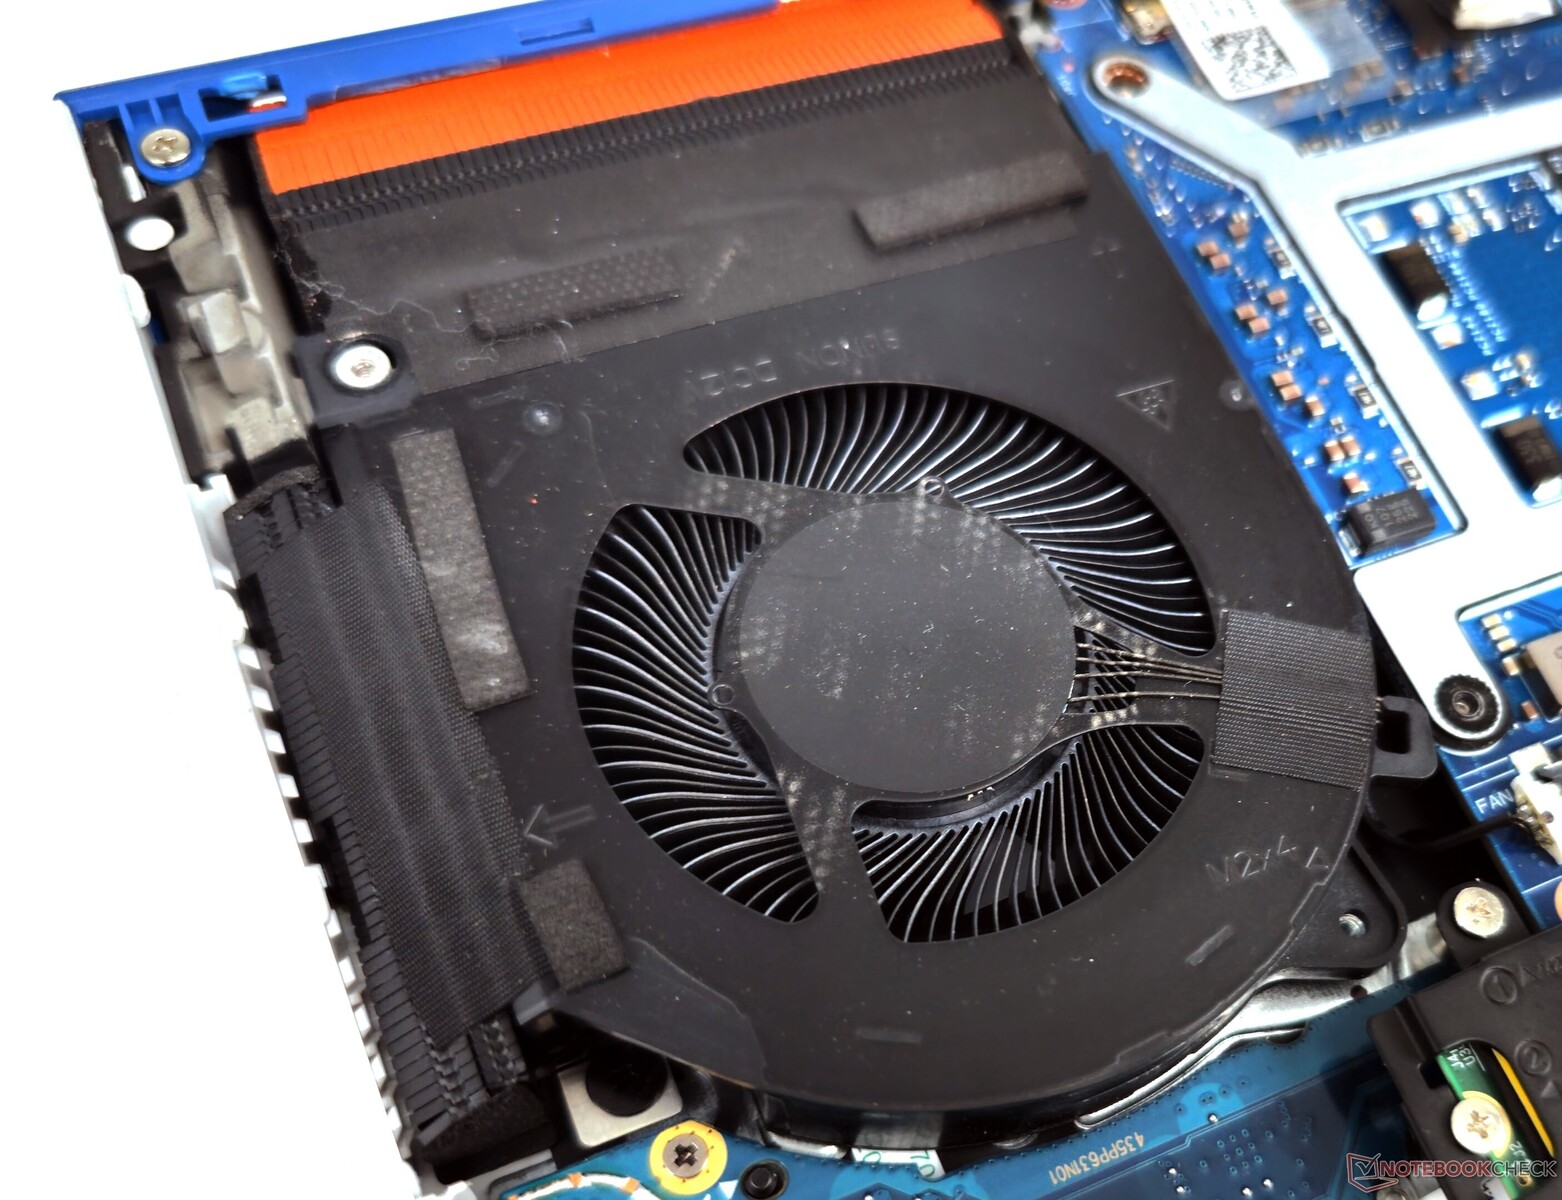
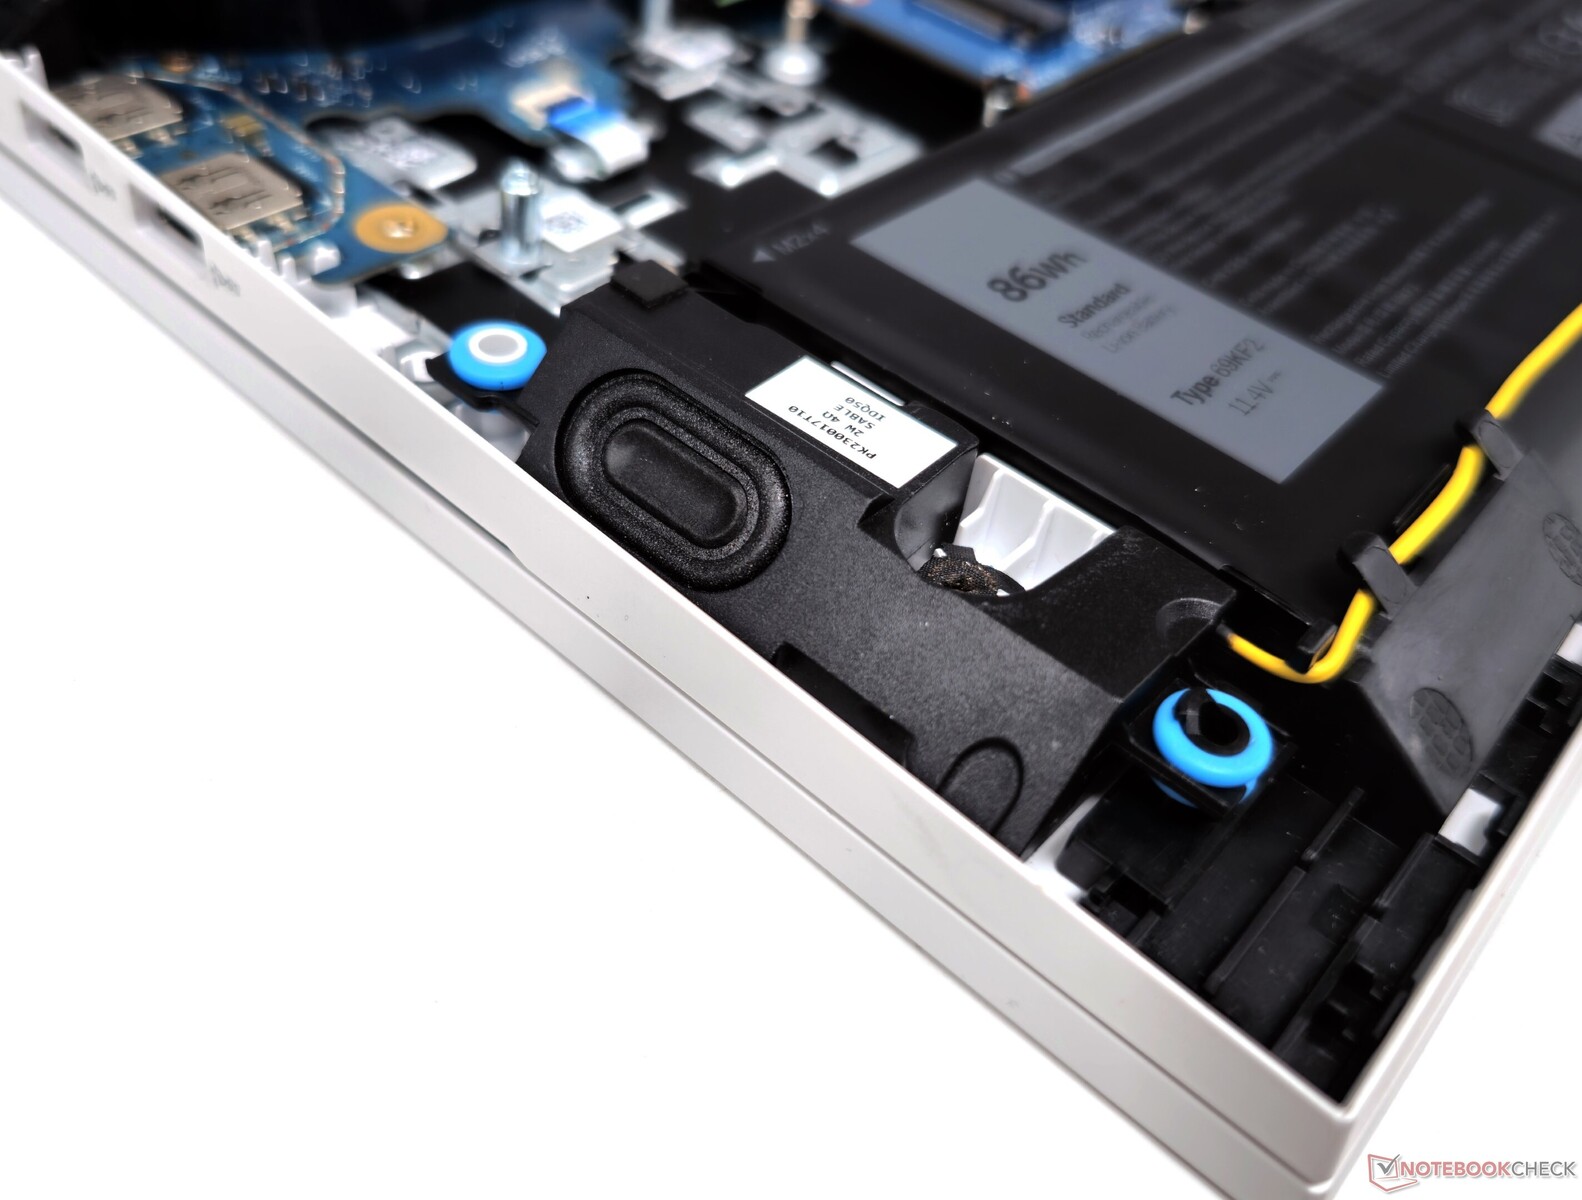
Manutenção
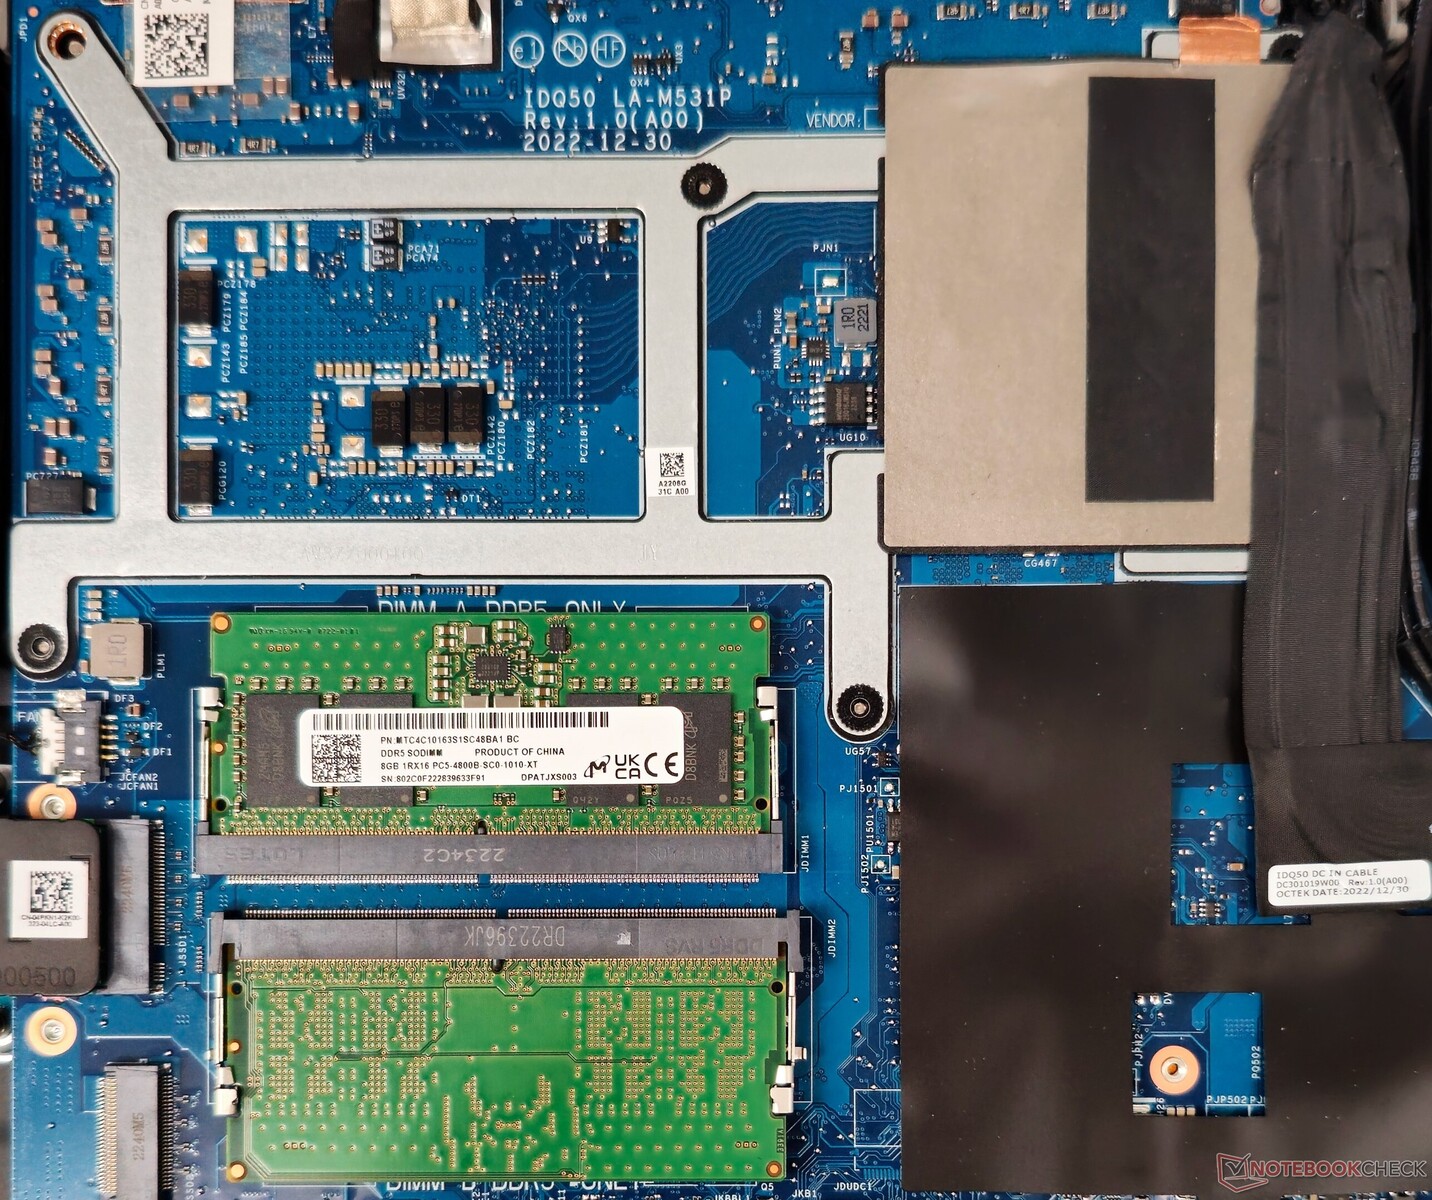
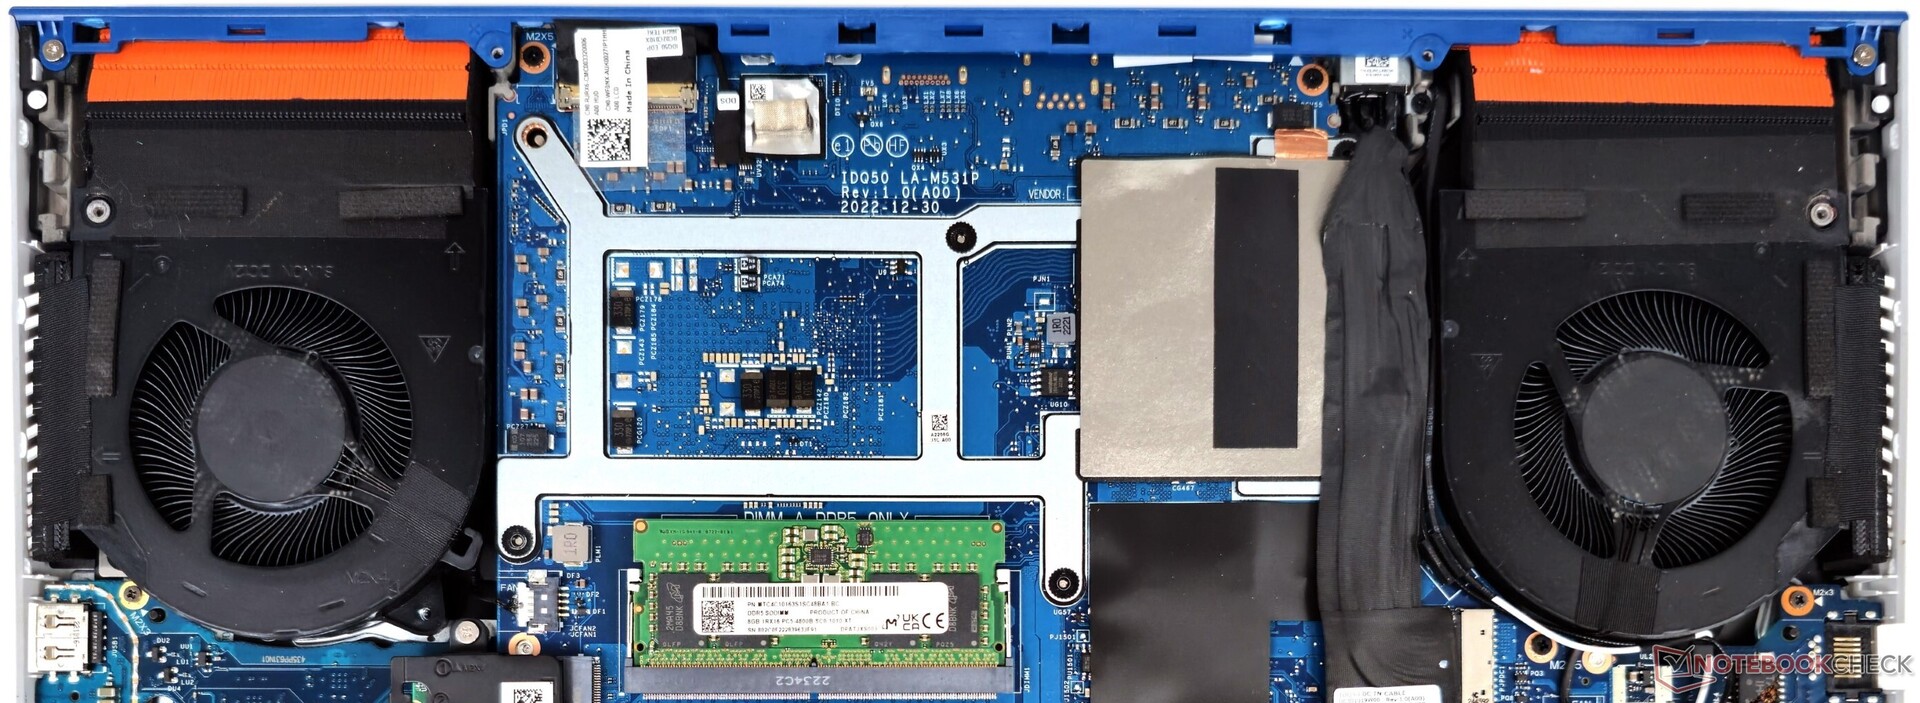
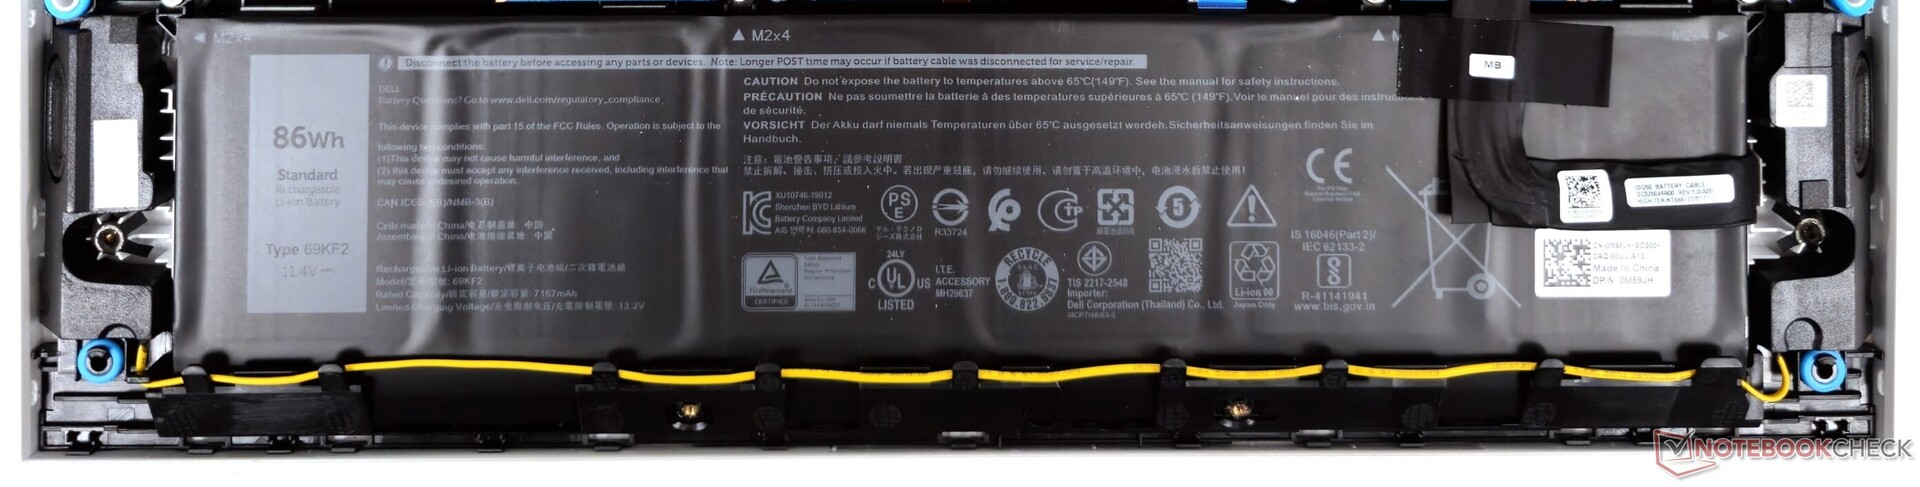
O painel traseiro do G15 5530 pode ser facilmente aberto após a remoção de 10 parafusos PH00. O sistema de resfriamento está localizado na parte inferior da placa. A WLAN, o SSD e a RAM DDR5 podem ser atualizados.
A Dell utiliza slots M.2 2242 não convencionais (M-key) para armazenamento. Os usuários devem levar isso em consideração ao adicionar ou substituir unidades NVMe. A bateria pode ser desparafusada e substituída, se necessário.
Dispositivos de entrada: Teclas planas com curso raso e um touchpad apertado
Teclado
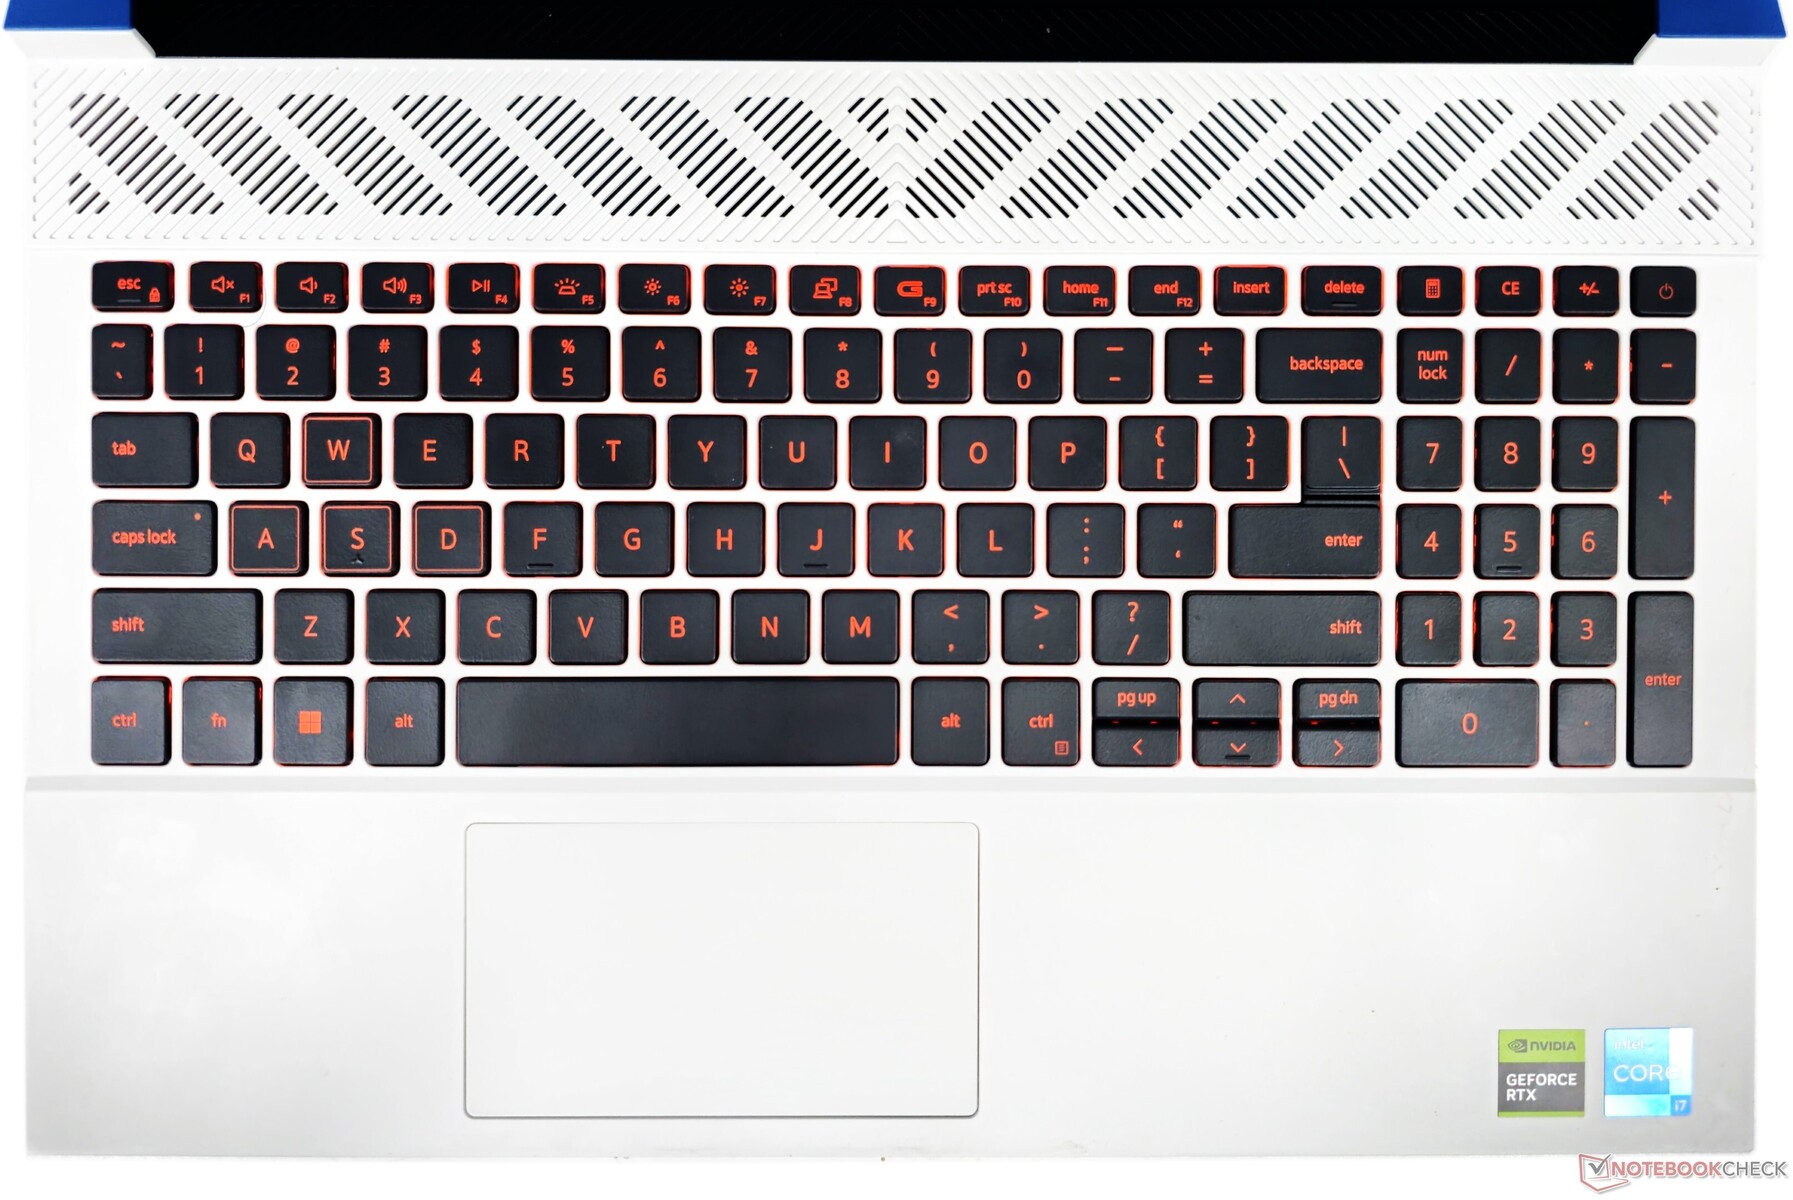
O teclado do G15 5530 tem flexibilidade mínima e apresenta teclas planas e uniformemente espaçadas que oferecem um deslocamento um pouco superficial. Ele inclui um teclado numérico junto com atalhos de calculadora para maior conveniência. Entretanto, esse layout faz com que as teclas Page Up e Page Down fiquem amontoadas junto com as minúsculas teclas de seta.
De acordo com a Dell, o teclado do G15 5530 está equipado com retroiluminação RGB de 4 zonas. No entanto, em nossa unidade, apenas LEDs laranja estavam presentes com um ajuste de brilho de dois estágios. Além disso, o teclado não foi reconhecido no Alienware Command Center, limitando as opções de personalização.
A tecla F9 inclui um atalho Game Shift, que permite a mudança instantânea para o desempenho máximo e a velocidade da ventoinha sempre que necessário.
Touchpad
O touchpad de 6 cm x 10,5 cm parece apertado em comparação com outros notebooks 2023. Dito isso, ele oferece deslizamento suave, suporta gestos do Windows Precision e é responsivo mesmo nos cantos.
Os cliques podem ser altos às vezes, o que pode ser um pequeno incômodo para aqueles que preferem uma entrada mais silenciosa.
Os dispositivos de entrada do G15 não são ruins em si, mas os usuários certamente podem se beneficiar de um teclado e mouse externos.
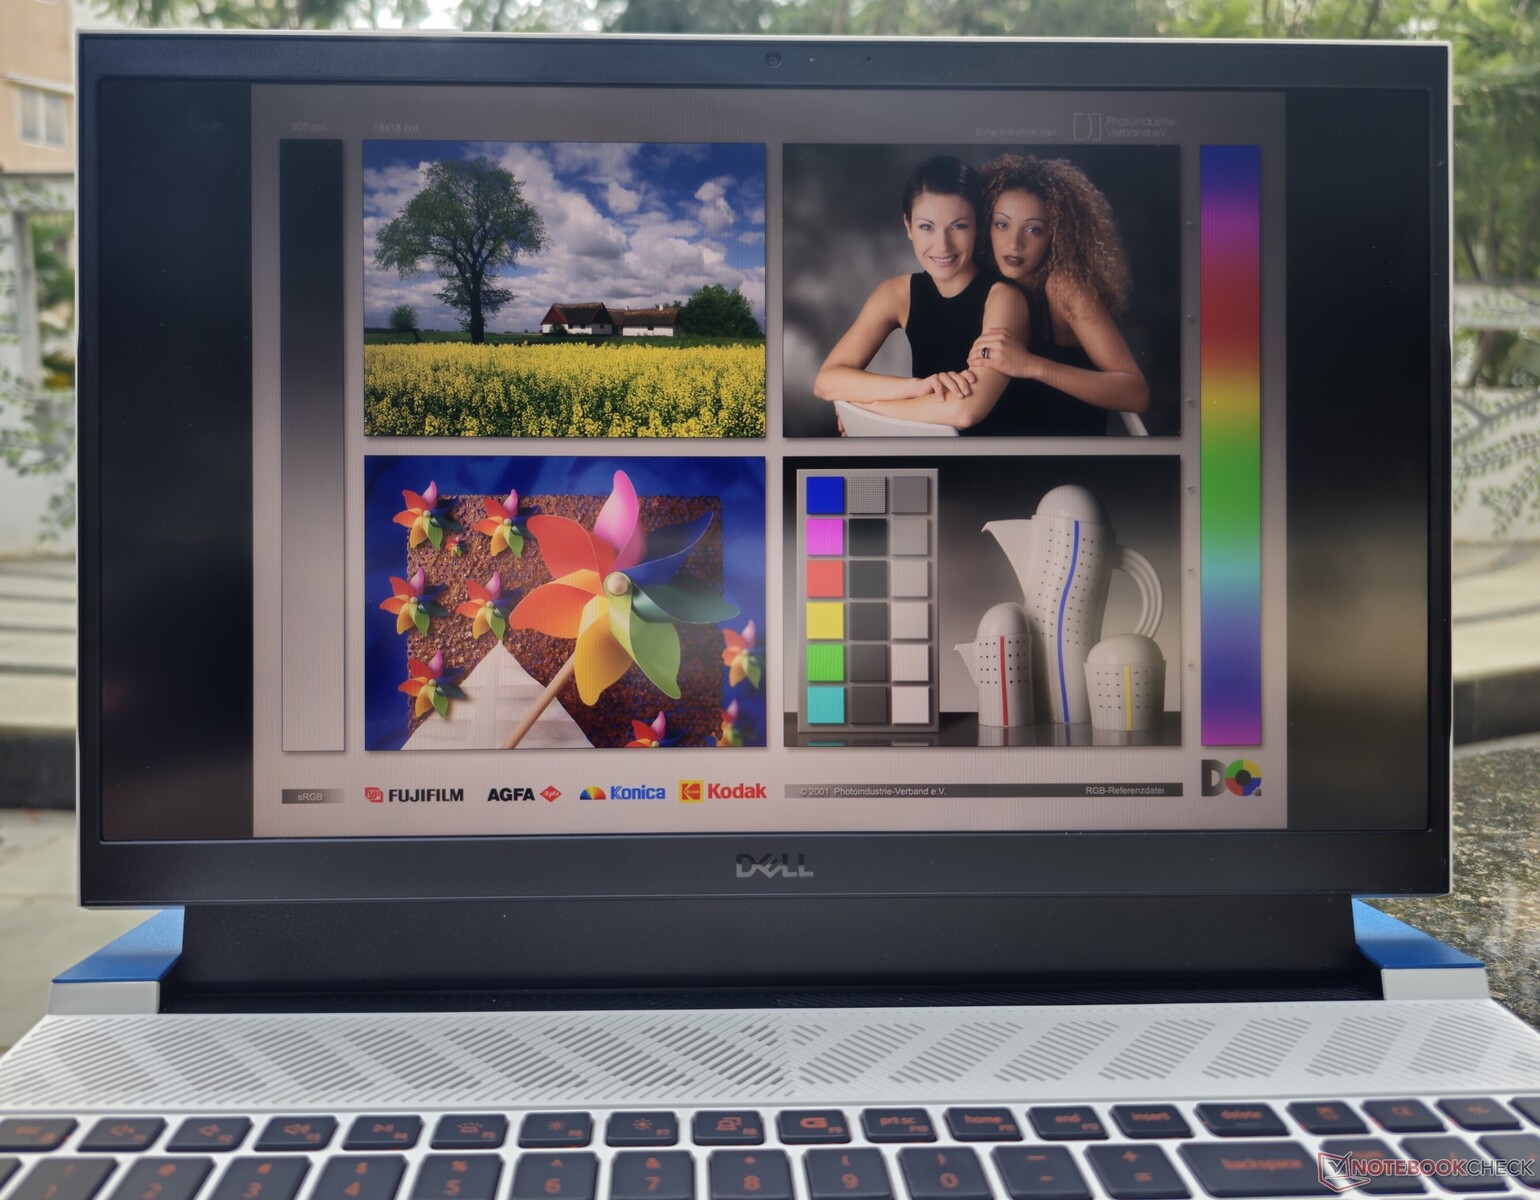
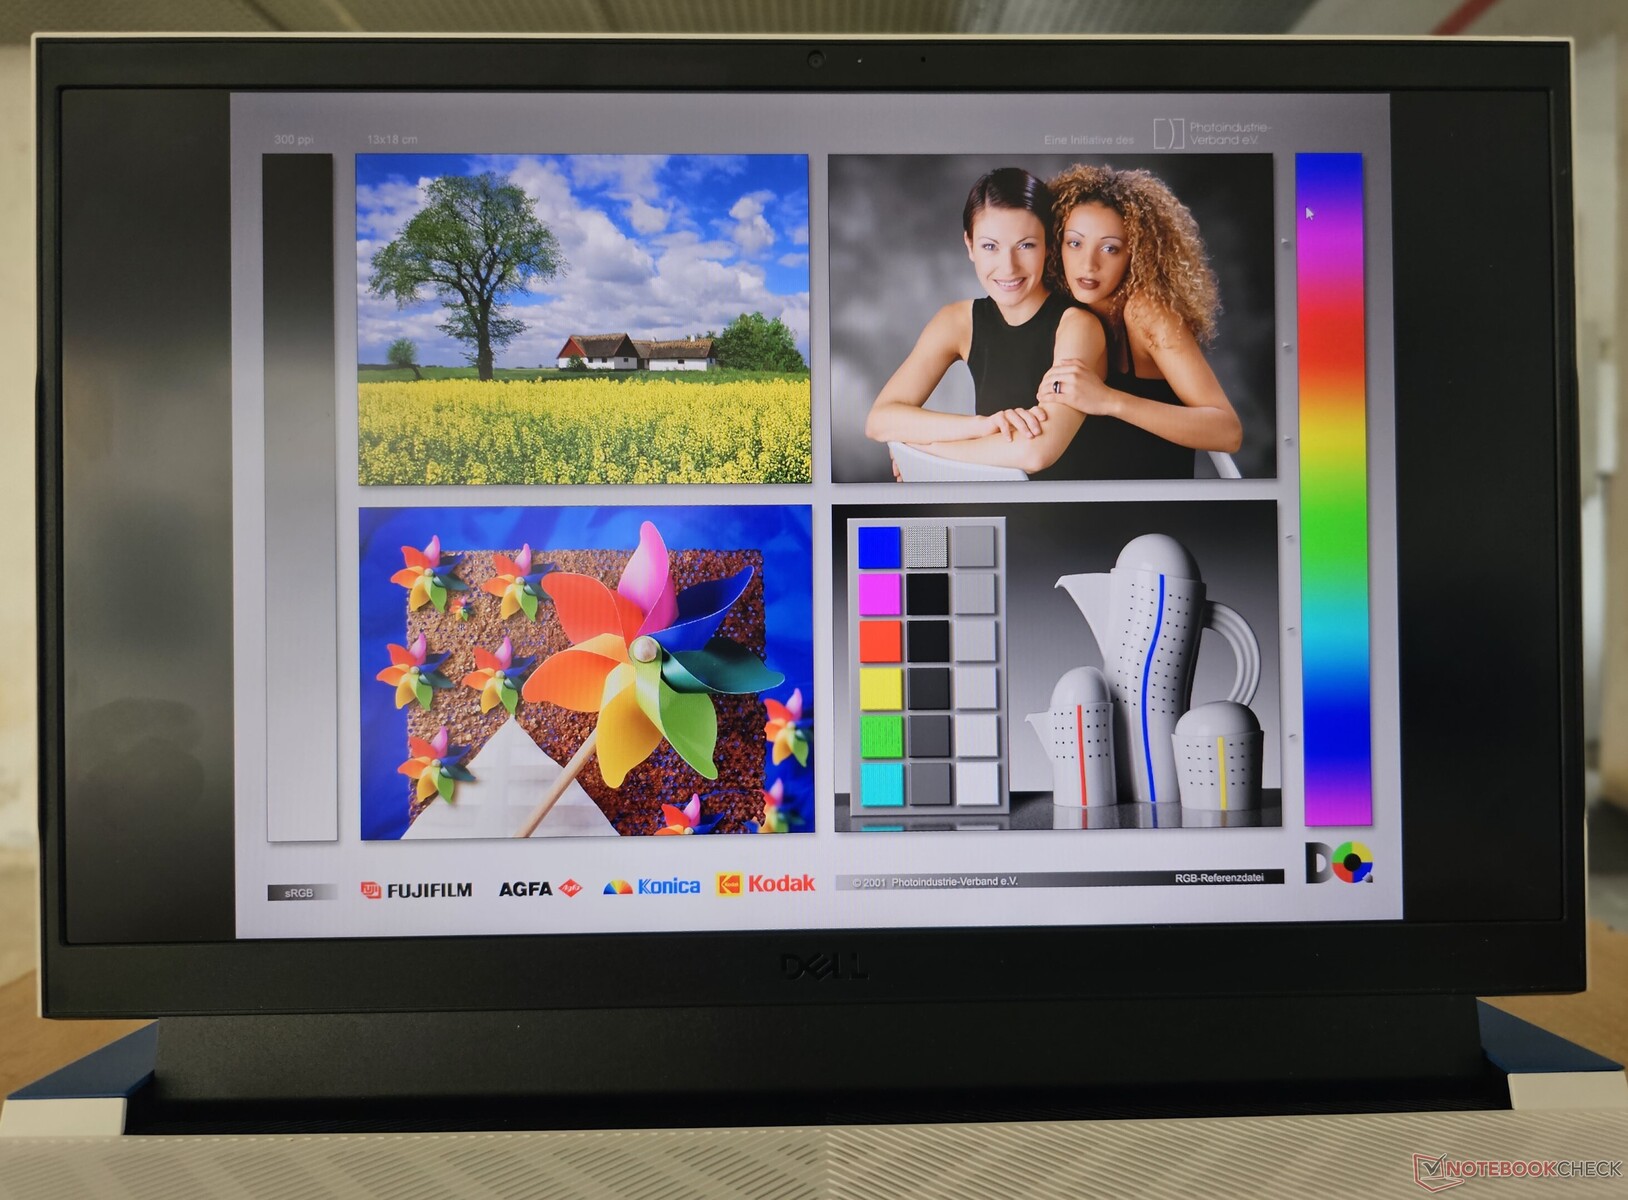
Tela: painel de 165 Hz 1080p com overdrive
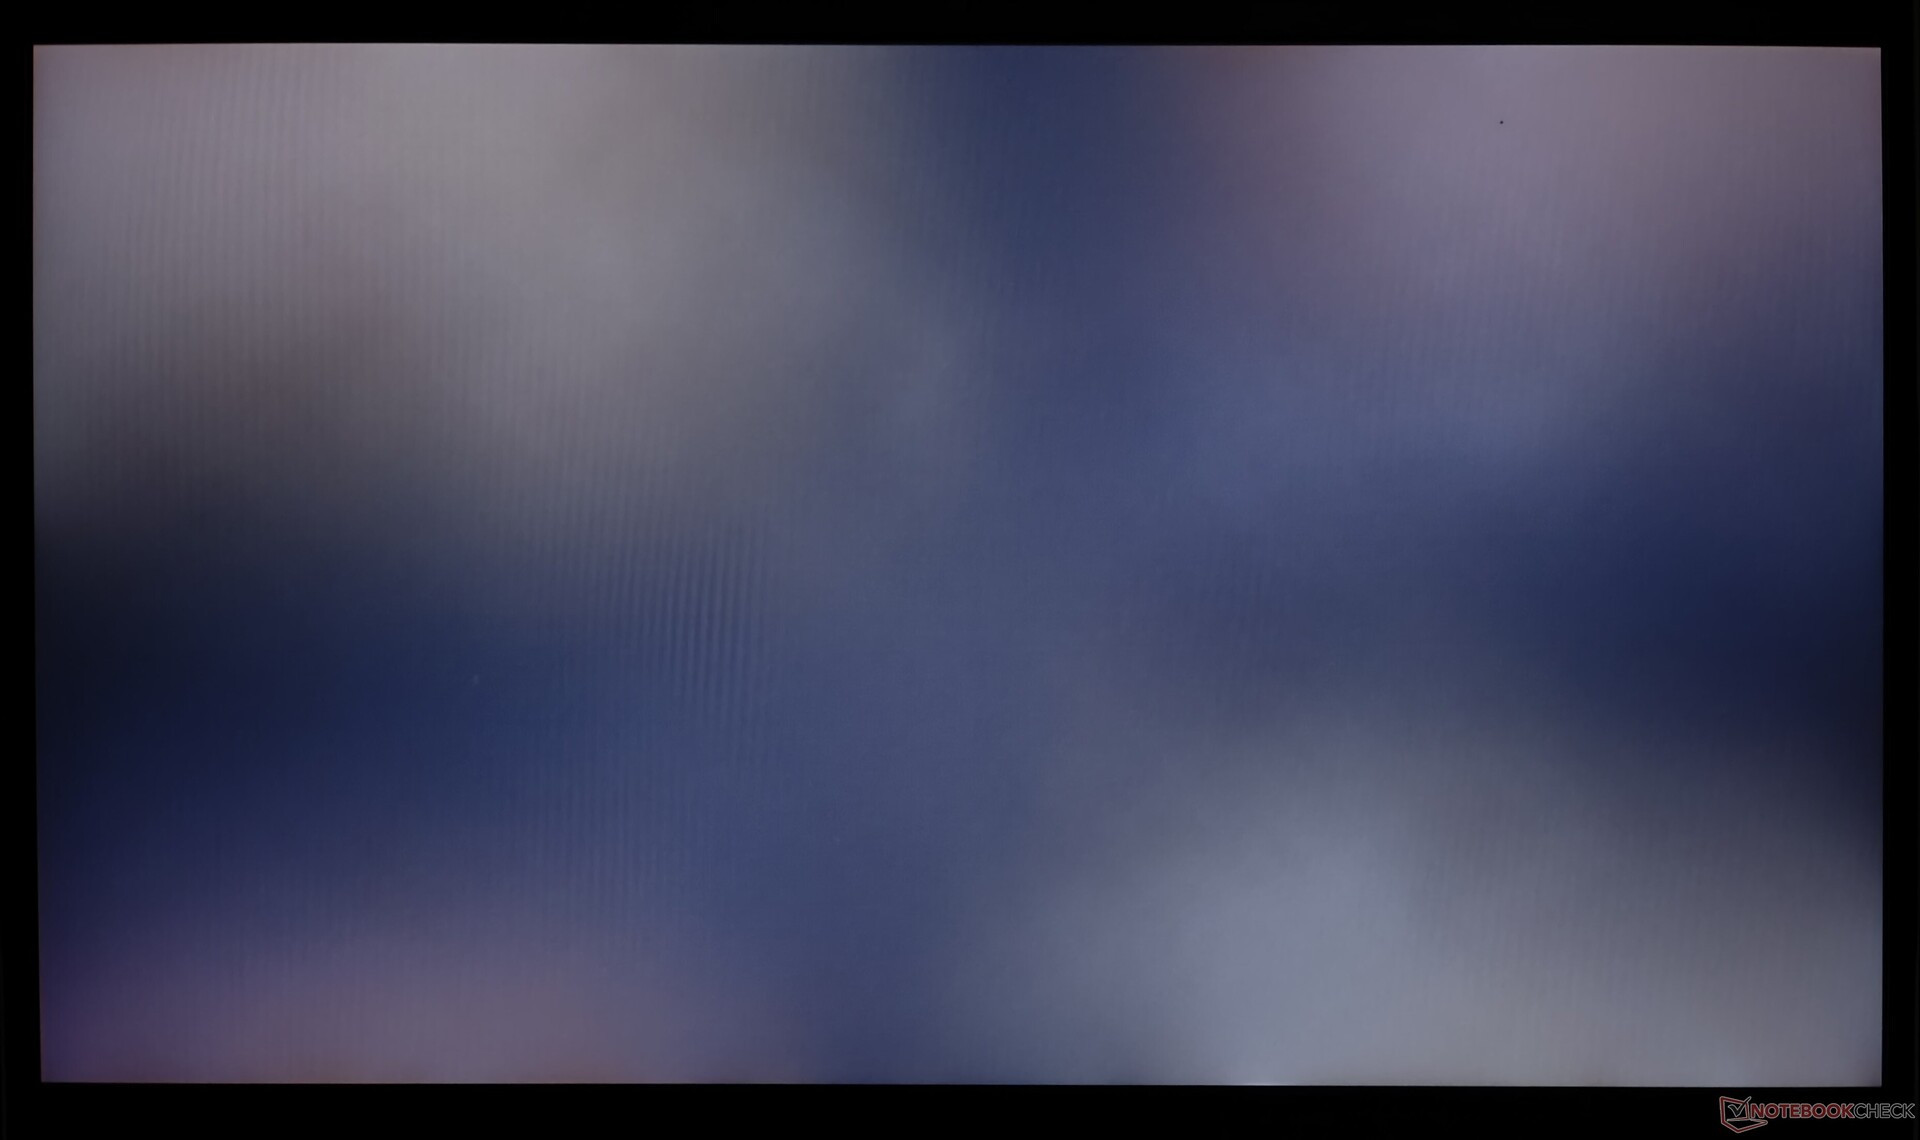
A Dell equipa o G15 com um painel AUO IPS de 1080p que oferece uma taxa de atualização de 165 Hz com G-Sync. Observamos um sangramento significativo da luz negra nos cantos, como é típico das telas IPS.
A distribuição de brilho é bastante uniforme, com 94%, e a taxa de contraste é de respeitáveis 1524:1, o que deve oferecer uma boa experiência de visualização para jogos.

| |||||||||||||||||||||||||
iluminação: 94 %
iluminação com acumulador: 321 cd/m²
Contraste: 1524:1 (Preto: 0.21 cd/m²)
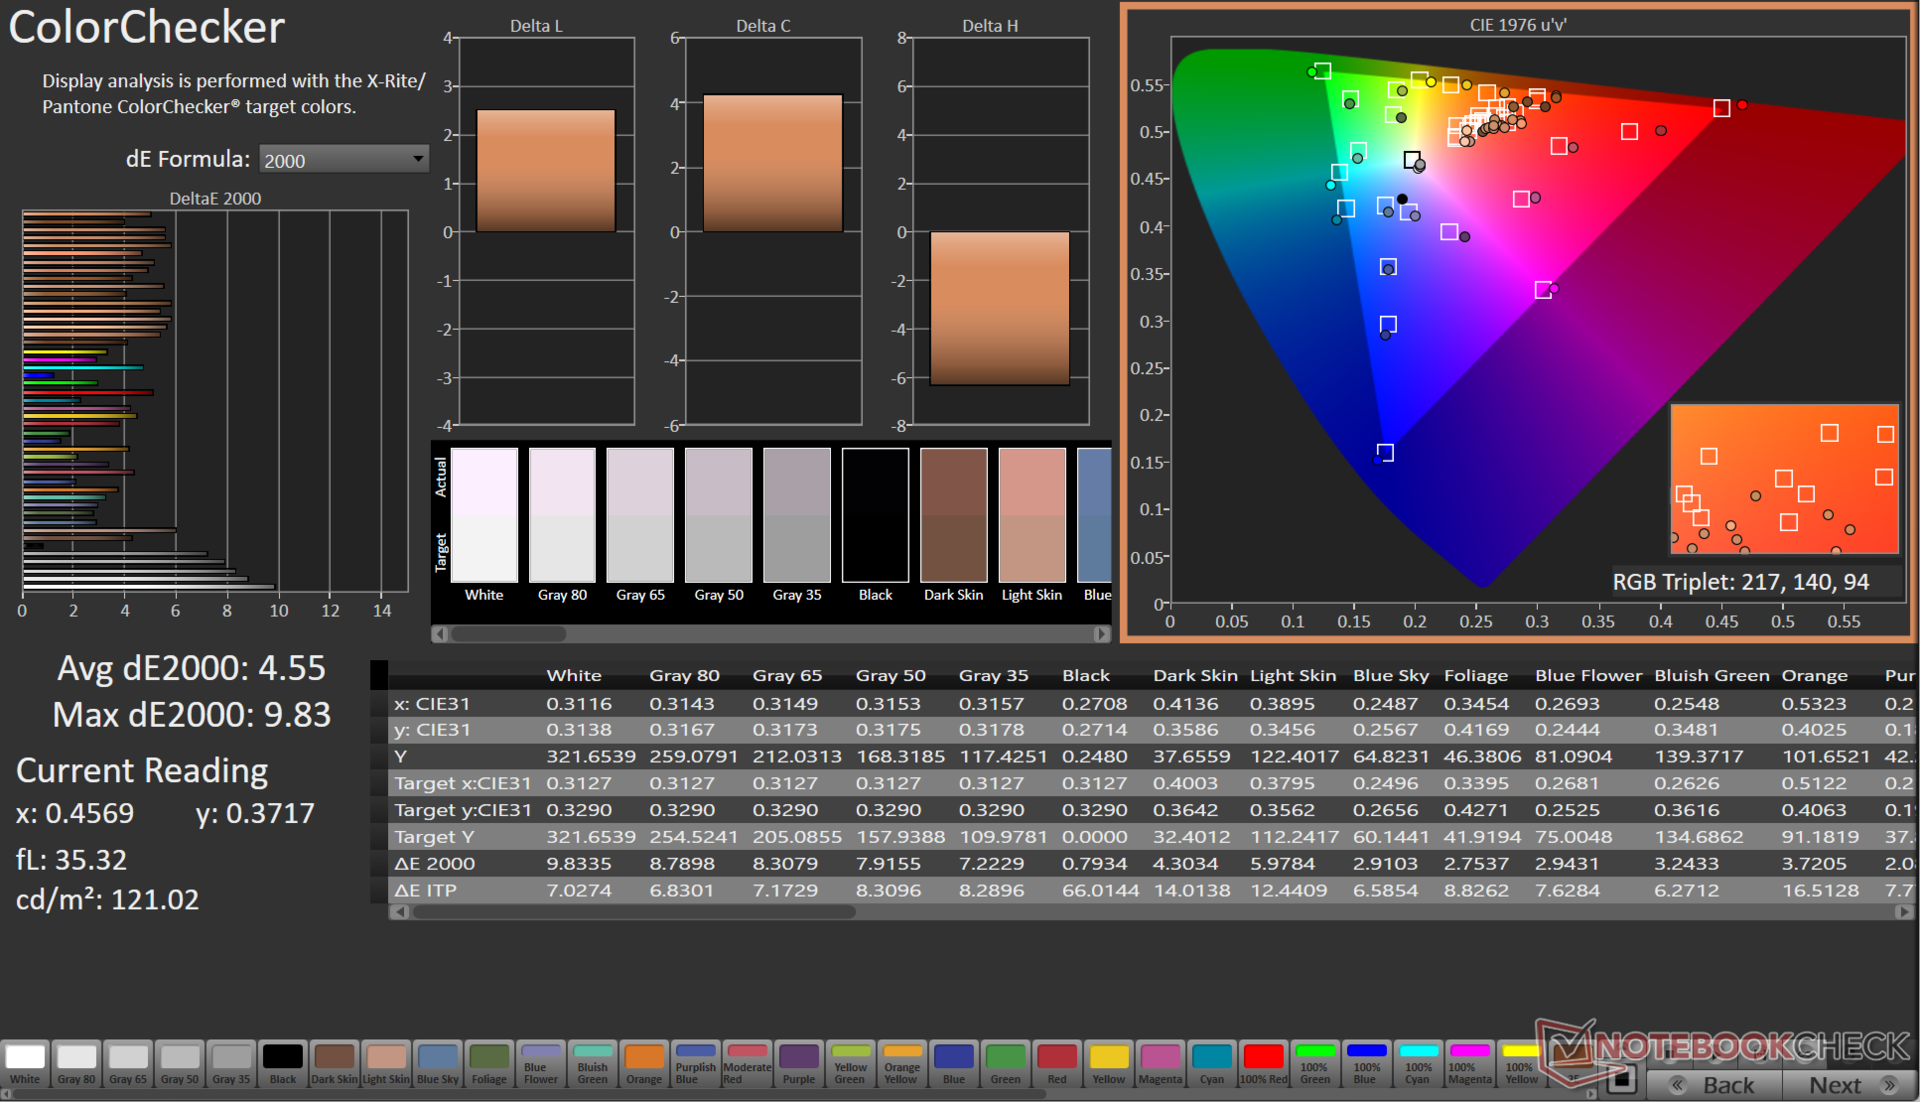
ΔE ColorChecker Calman: 4.55 | ∀{0.5-29.43 Ø4.72}
calibrated: 1.51
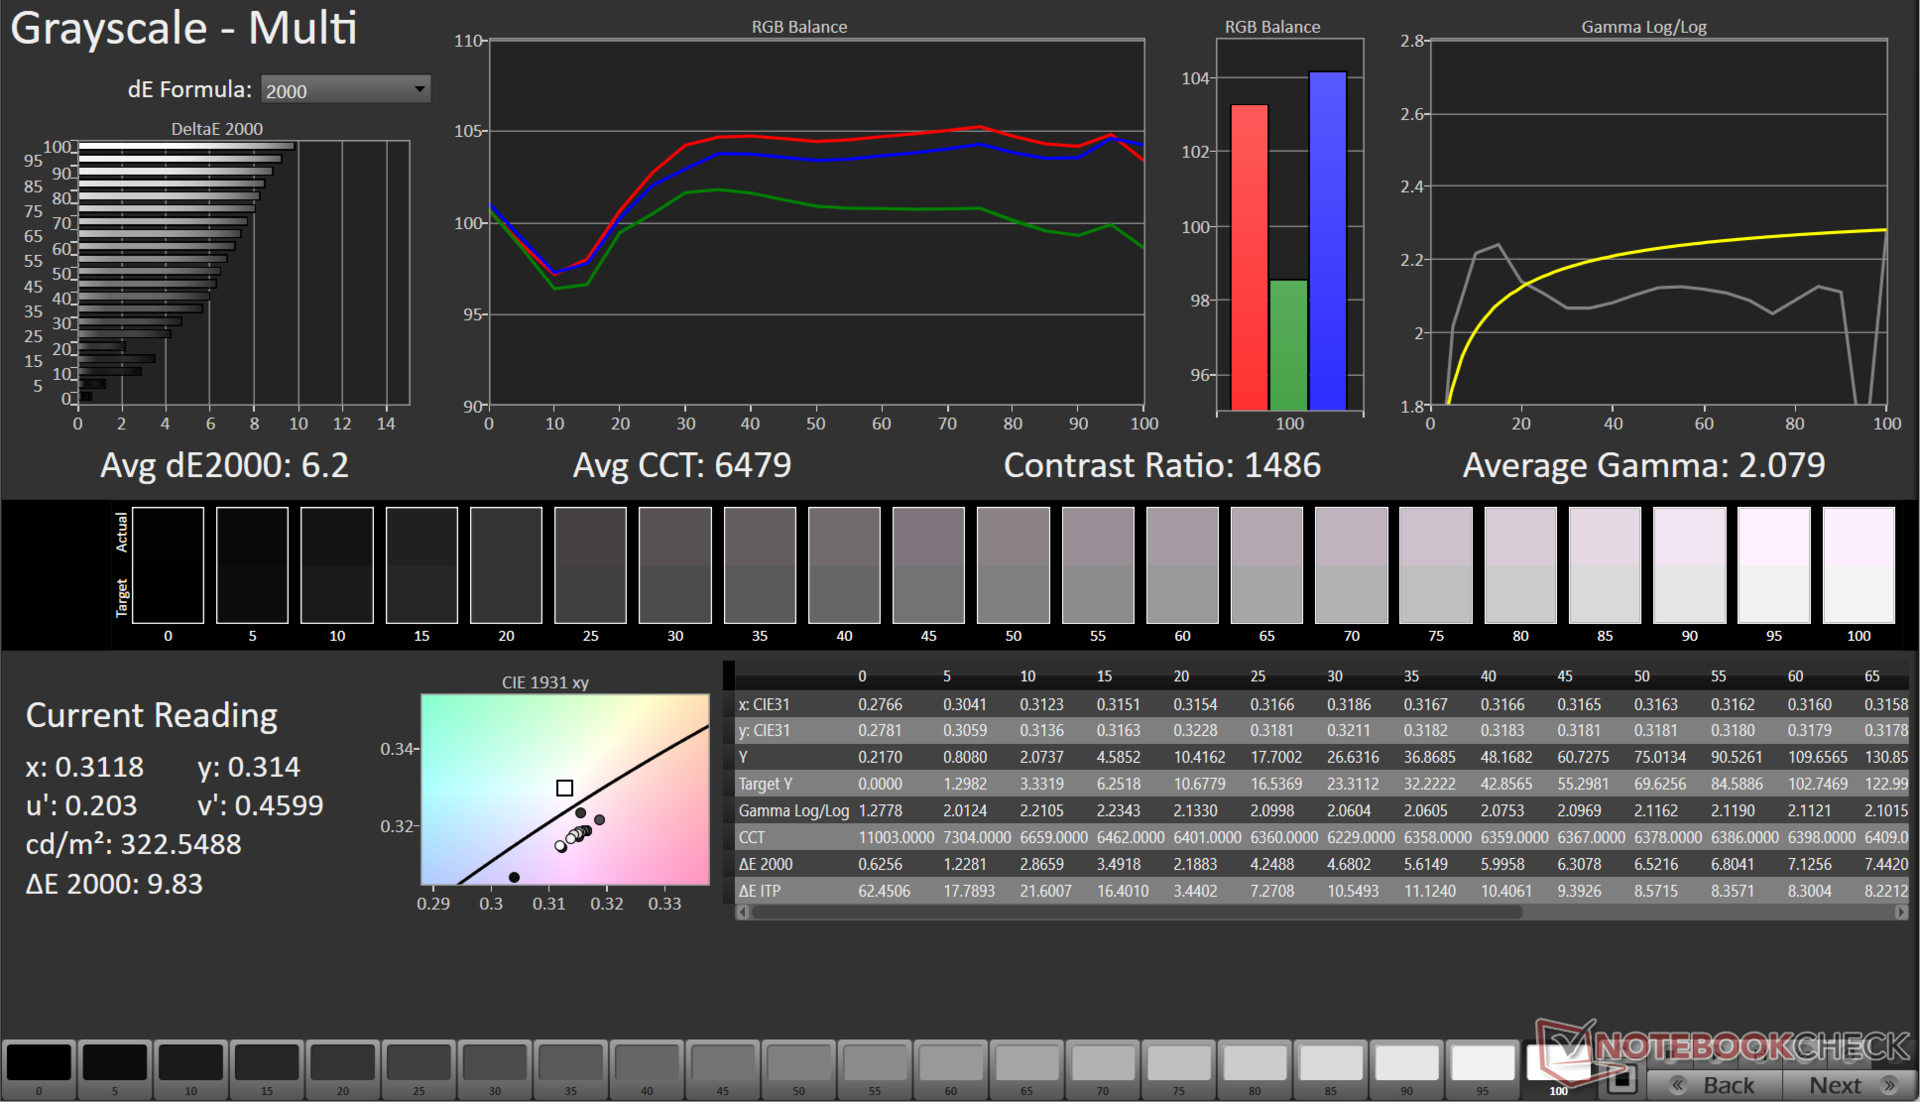
ΔE Greyscale Calman: 6.2 | ∀{0.09-98 Ø4.97}
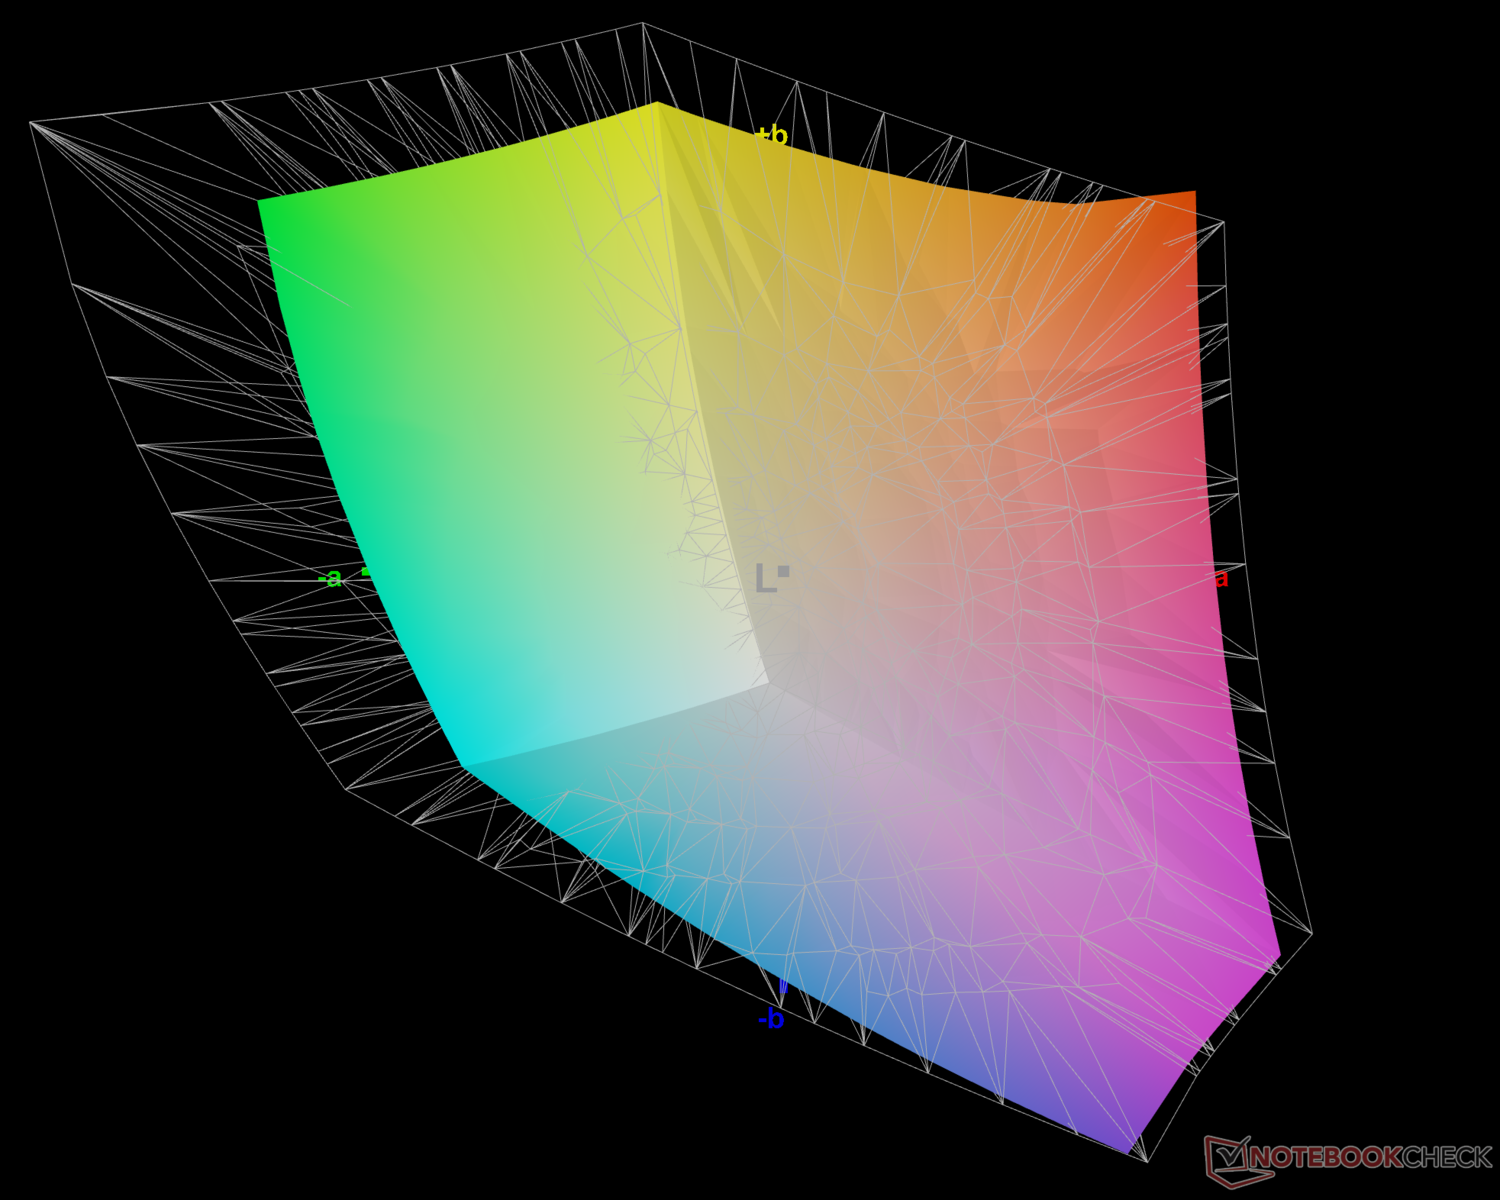
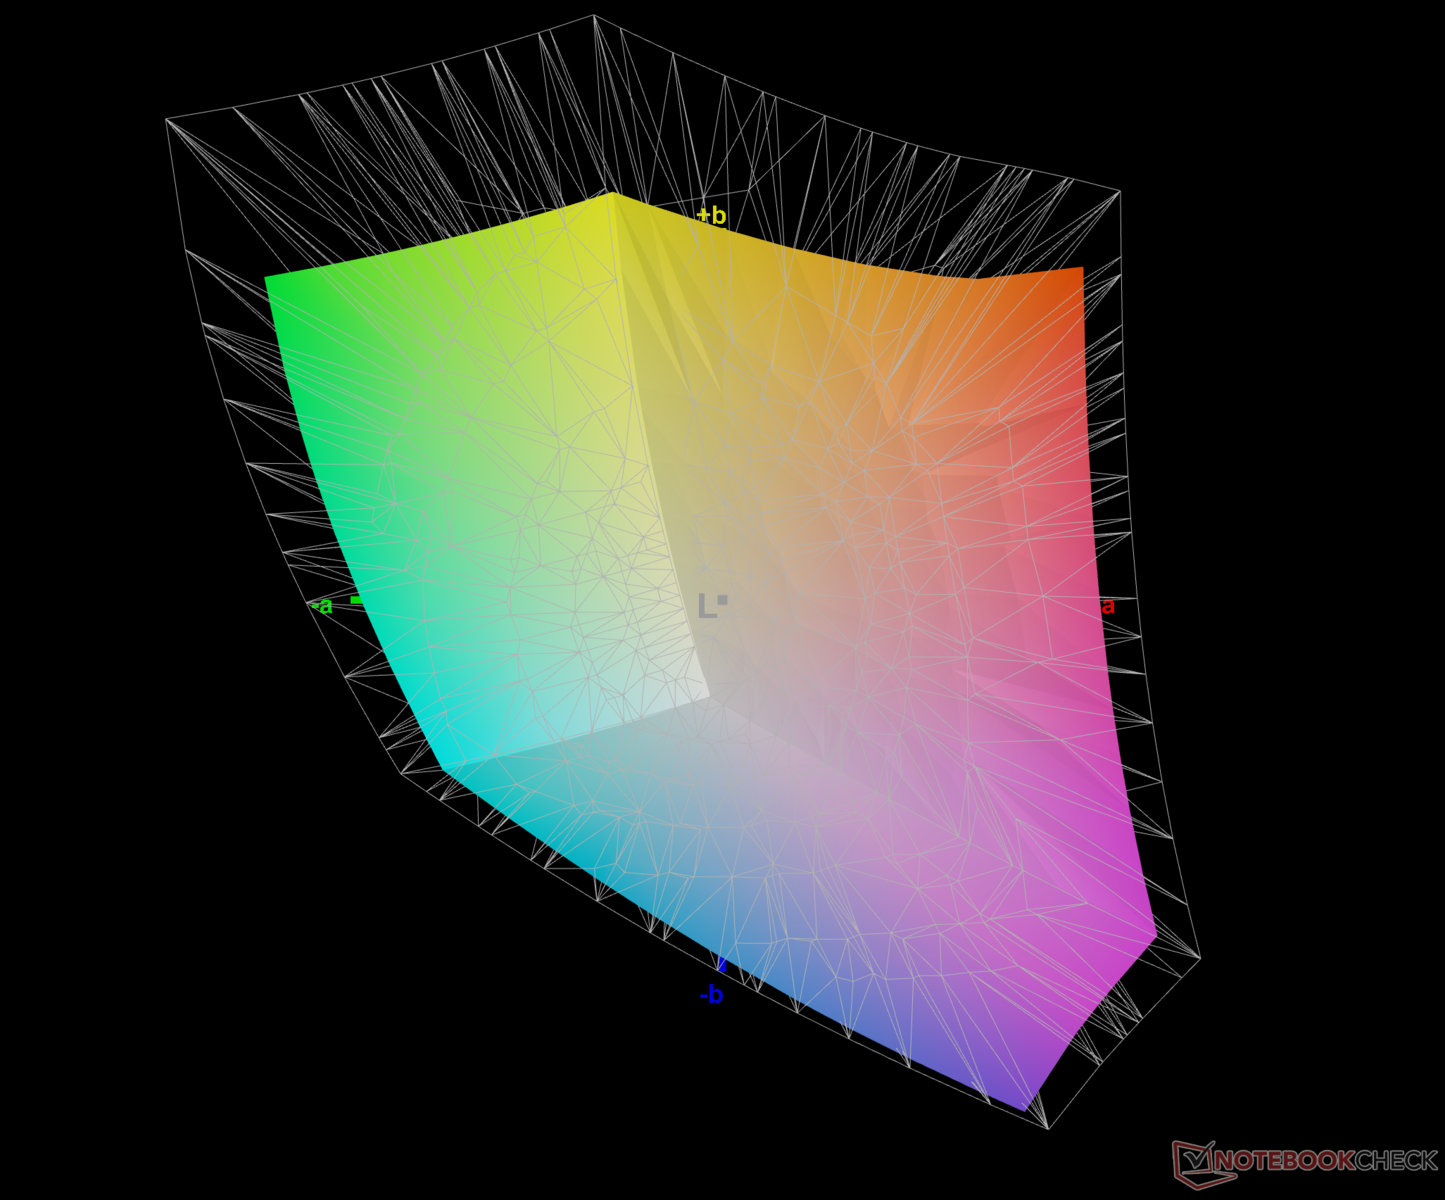
74.4% AdobeRGB 1998 (Argyll 3D)
98.4% sRGB (Argyll 3D)
73.1% Display P3 (Argyll 3D)
Gamma: 2.07
CCT: 6479 K
| Dell G15 5530 AUO B156HAN, IPS, 1920x1080, 15.6" | Asus ROG Strix G18 G814JI NE180QDM-NZ2 (BOE0B35), IPS, 2560x1600, 18" | Lenovo Legion Pro 5 16IRX8 AU Optronics B160QAN03.1, IPS, 2560x1600, 16" | Asus ROG Flow X16 GV601V TMX1603 (TL160ADMP03-0), IPS, 2560x1600, 16" | MSI Katana 17 B13VFK B173HAN04.9, IPS LED, 1920x1080, 17.3" | Asus TUF Gaming A16 FA617XS BOE NE160WUM-NX2, IPS, 1920x1200, 16" | Asus ROG Strix G17 G713PI BOE0B69, IPS, 2560x1440, 17.3" | Medion Erazer Major X20 BOE CQ NE160QDM-NZ1, IPS, 2560x1600, 16" | |
|---|---|---|---|---|---|---|---|---|
| Display | 17% | -1% | 16% | -42% | -4% | 17% | -3% | |
| Display P3 Coverage (%) | 73.1 | 98.1 34% | 71.2 -3% | 96.61 32% | 40.8 -44% | 69.3 -5% | 98.3 34% | 69.4 -5% |
| sRGB Coverage (%) | 98.4 | 99.9 2% | 98.8 0% | 99.92 2% | 61 -38% | 97.3 -1% | 100 2% | 98 0% |
| AdobeRGB 1998 Coverage (%) | 74.4 | 85.6 15% | 73.3 -1% | 84.63 14% | 42.2 -43% | 70.7 -5% | 85.9 15% | 70.9 -5% |
| Response Times | -67% | -211% | -27% | -630% | -224% | -59% | -161% | |
| Response Time Grey 50% / Grey 80% * (ms) | 3.39 ? | 5.6 ? -65% | 14.5 ? -328% | 3.8 ? -12% | 33 ? -873% | 15.6 ? -360% | 5.3 ? -56% | 13.1 ? -286% |
| Response Time Black / White * (ms) | 5.35 ? | 9 ? -68% | 10.4 ? -94% | 7.6 ? -42% | 26 ? -386% | 10 ? -87% | 8.6 ? -61% | 7.3 ? -36% |
| PWM Frequency (Hz) | 21620 ? | |||||||
| Screen | 14% | 21% | 21% | -32% | 21% | 17% | 12% | |
| Brightness middle (cd/m²) | 320 | 471 47% | 405.7 27% | 486 52% | 267 -17% | 301 -6% | 327 2% | 374 17% |
| Brightness (cd/m²) | 316 | 422 34% | 368 16% | 469 48% | 256 -19% | 294 -7% | 320 1% | 357 13% |
| Brightness Distribution (%) | 94 | 83 -12% | 87 -7% | 91 -3% | 93 -1% | 94 0% | 89 -5% | 92 -2% |
| Black Level * (cd/m²) | 0.21 | 0.47 -124% | 0.38 -81% | 0.39 -86% | 0.21 -0% | 0.21 -0% | 0.38 -81% | 0.33 -57% |
| Contrast (:1) | 1524 | 1002 -34% | 1068 -30% | 1246 -18% | 1271 -17% | 1433 -6% | 861 -44% | 1133 -26% |
| Colorchecker dE 2000 * | 4.55 | 2.05 55% | 1.65 64% | 2.27 50% | 4.7 -3% | 1.79 61% | 1.01 78% | 2.43 47% |
| Colorchecker dE 2000 max. * | 9.83 | 4.15 58% | 4.2 57% | 5.73 42% | 20.4 -108% | 3.48 65% | 4.01 59% | 3.97 60% |
| Colorchecker dE 2000 calibrated * | 1.51 | 0.8 47% | 0.53 65% | 0.6 60% | 4.5 -198% | 1.2 21% | 0.41 73% | 1.4 7% |
| Greyscale dE 2000 * | 6.2 | 2.8 55% | 1.2 81% | 3.36 46% | 1.5 76% | 2.5 60% | 1.6 74% | 3.1 50% |
| Gamma | 2.07 106% | 2.204 100% | 2.3 96% | 2.46 89% | 2.12 104% | 2.265 97% | 2.168 101% | 2.191 100% |
| CCT | 6479 100% | 7122 91% | 6453 101% | 6625 98% | 6552 99% | 6157 106% | 6659 98% | 6194 105% |
| Média Total (Programa/Configurações) | -12% /
3% | -64% /
-17% | 3% /
13% | -235% /
-119% | -69% /
-19% | -8% /
7% | -51% /
-16% |
* ... menor é melhor
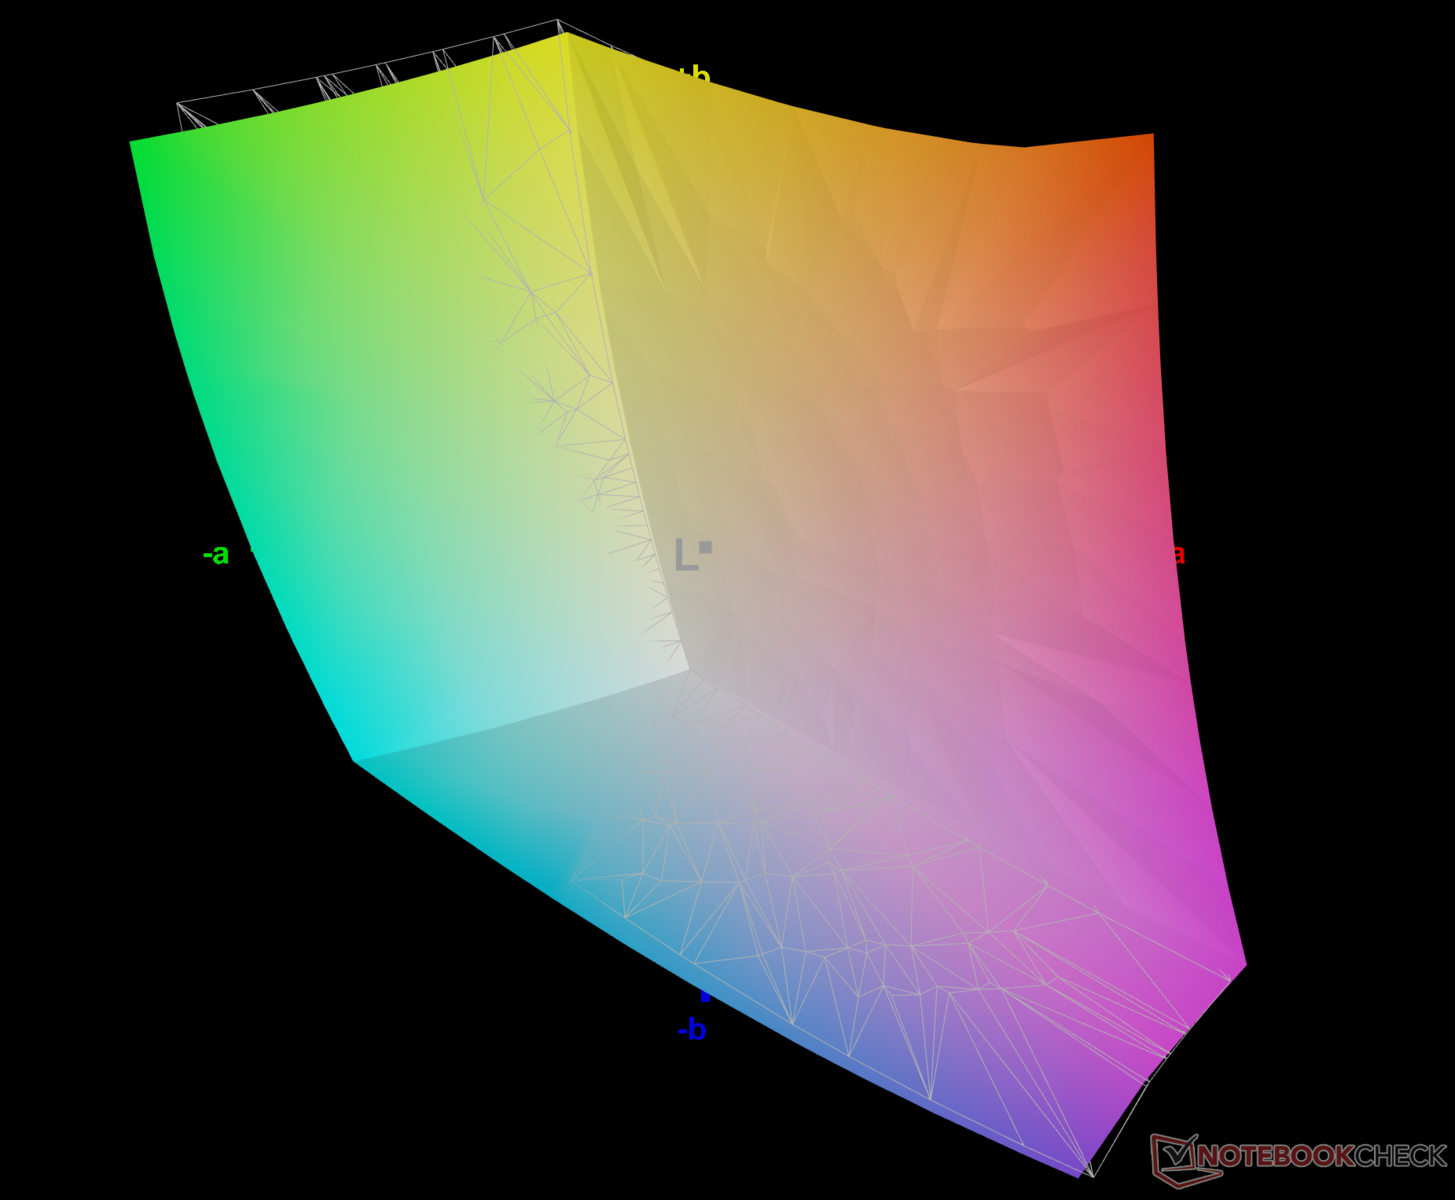
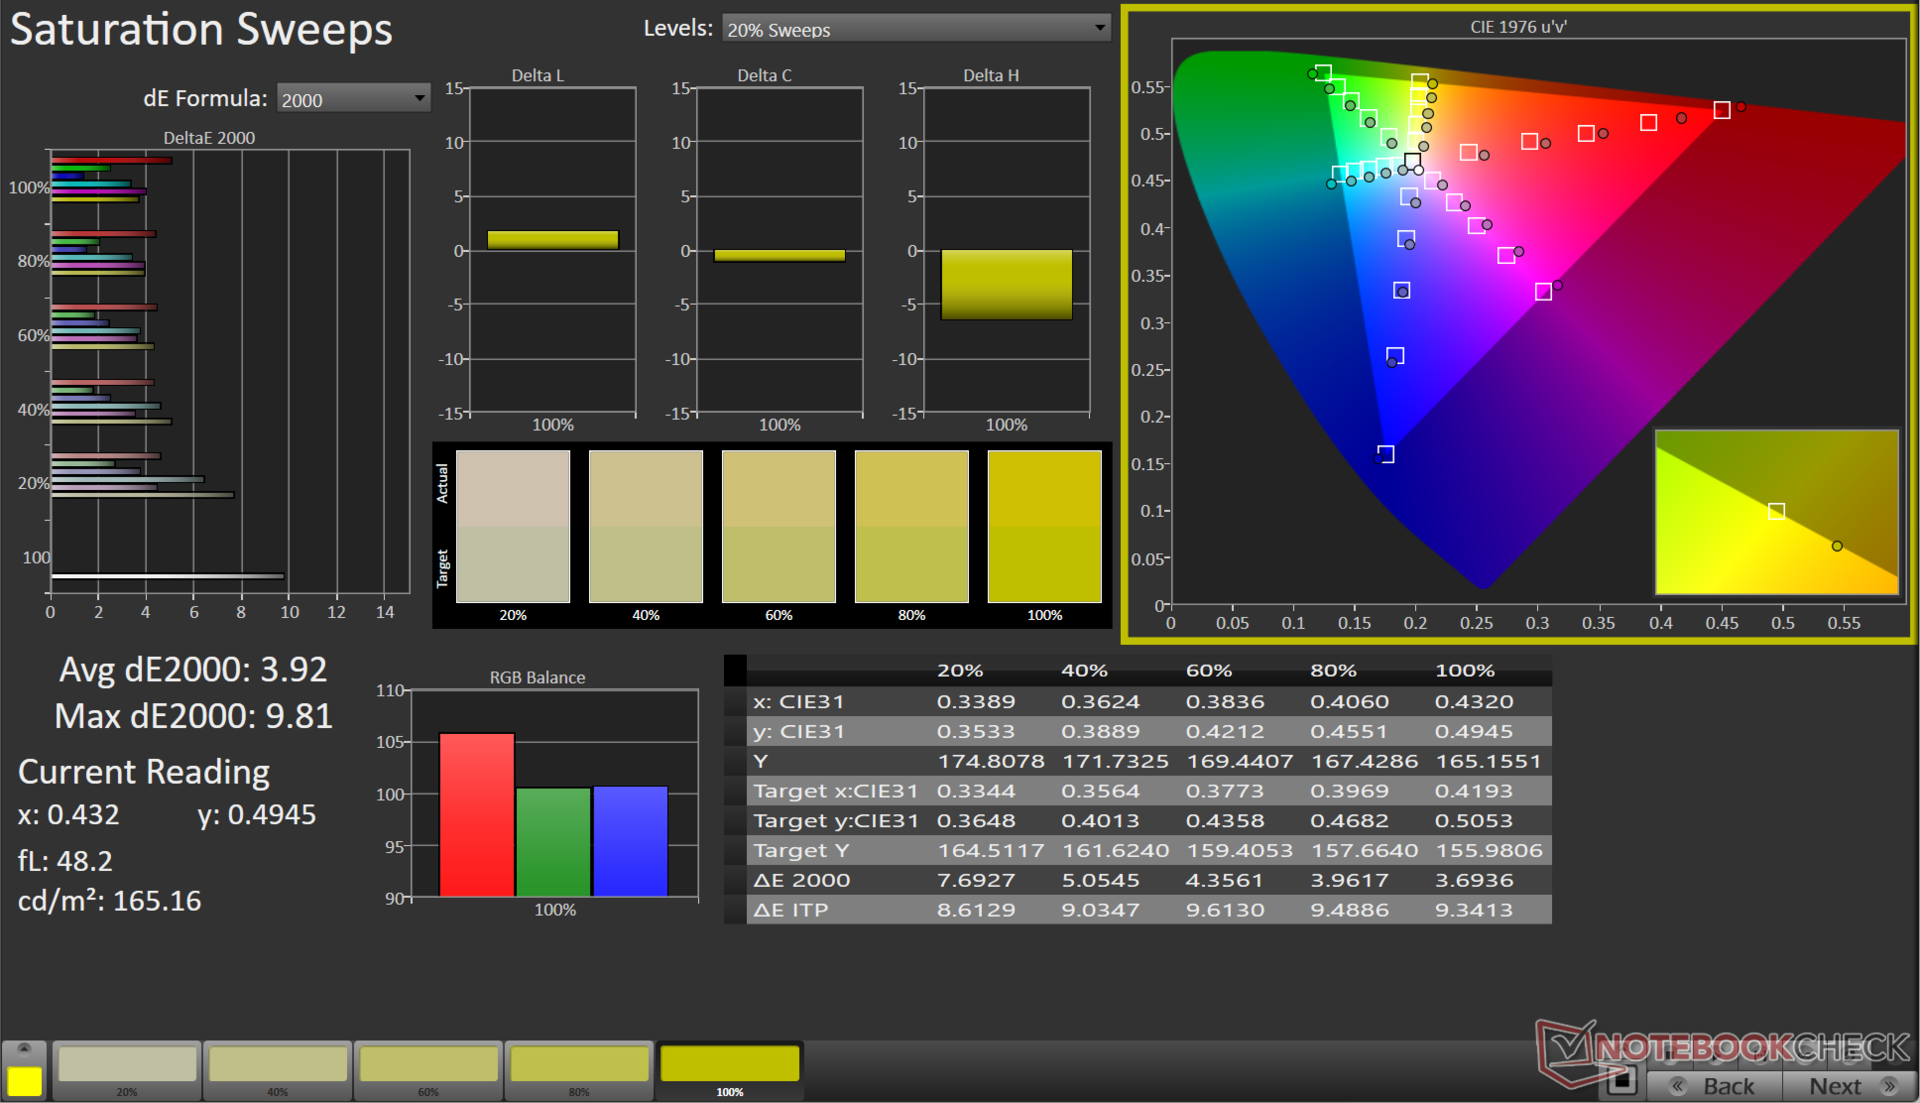
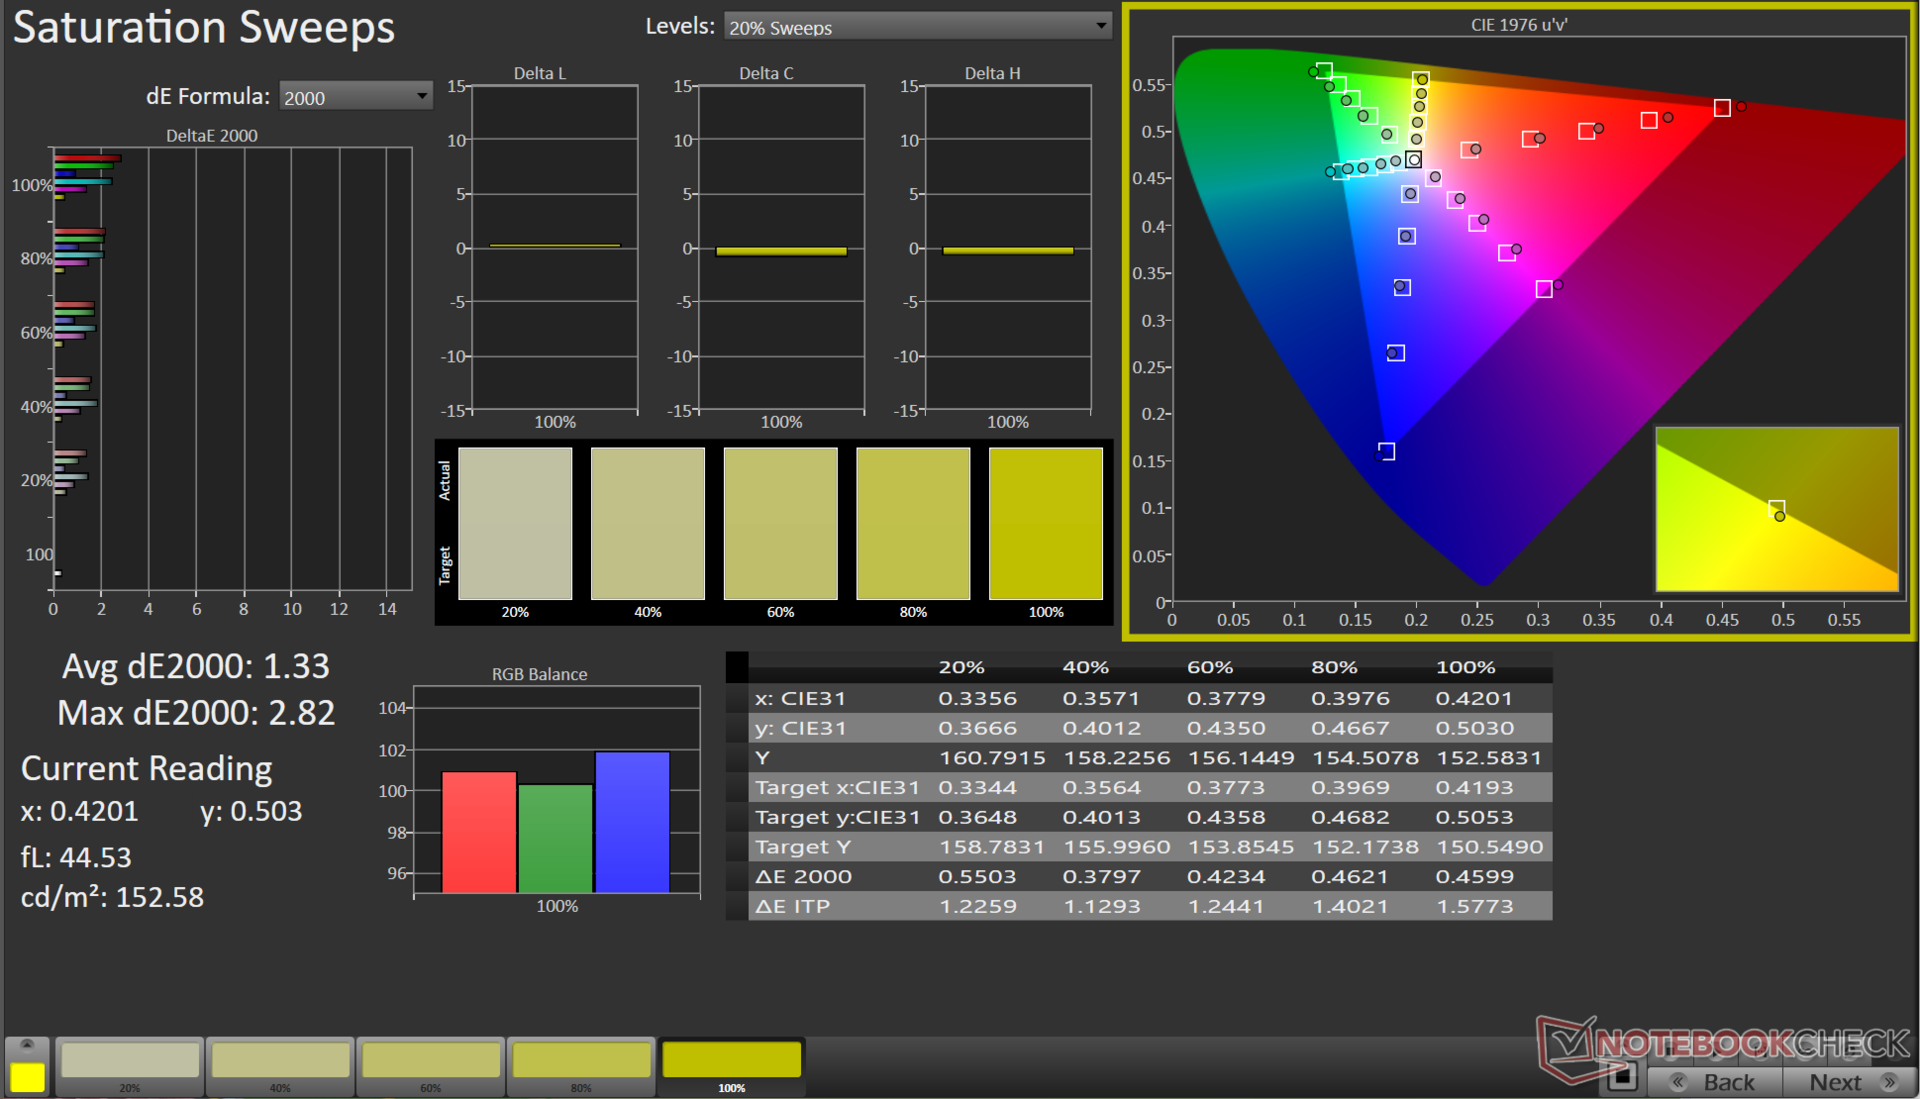
A tela cobre quase toda a gama de cores sRGB com desempenho decente nos espaços de cores Adobe RGB e Display P3, o que deve ser adequado para jogos e para fazer edições básicas.
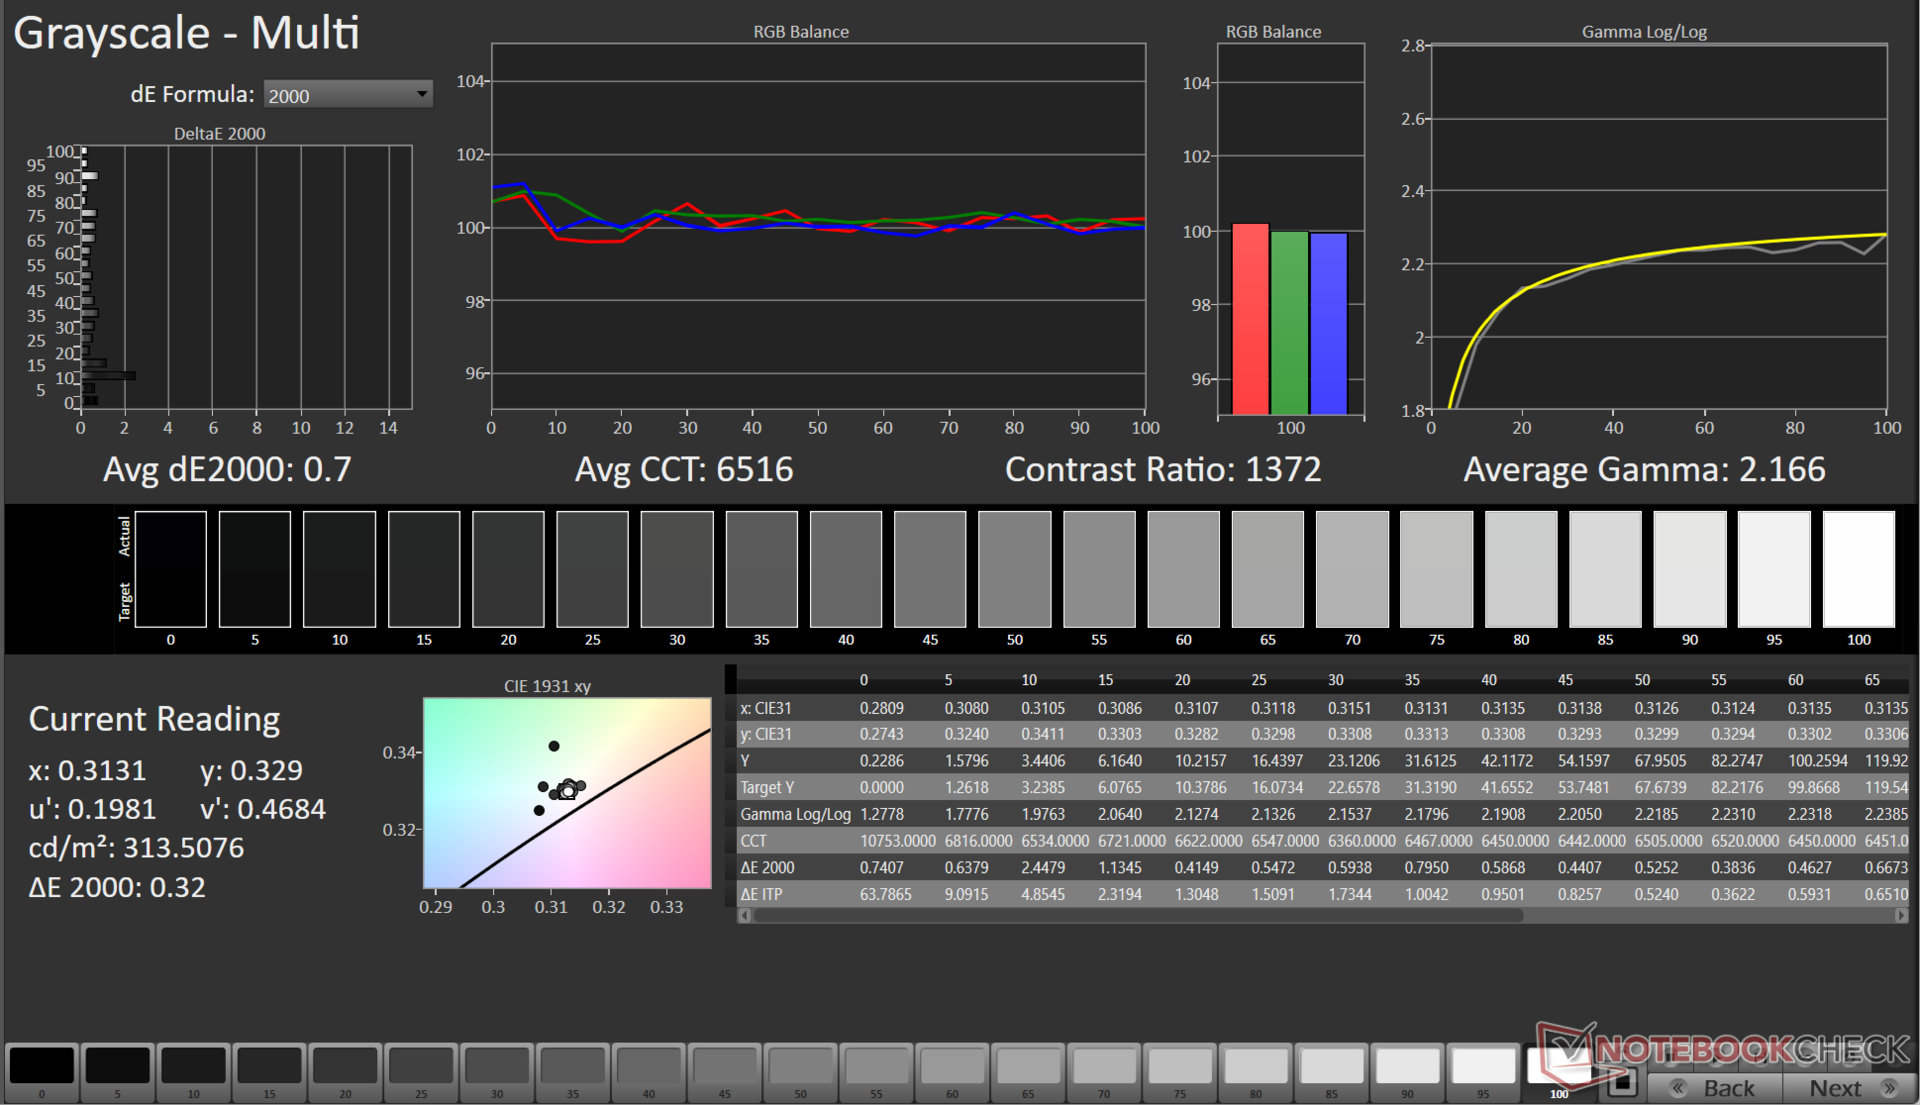
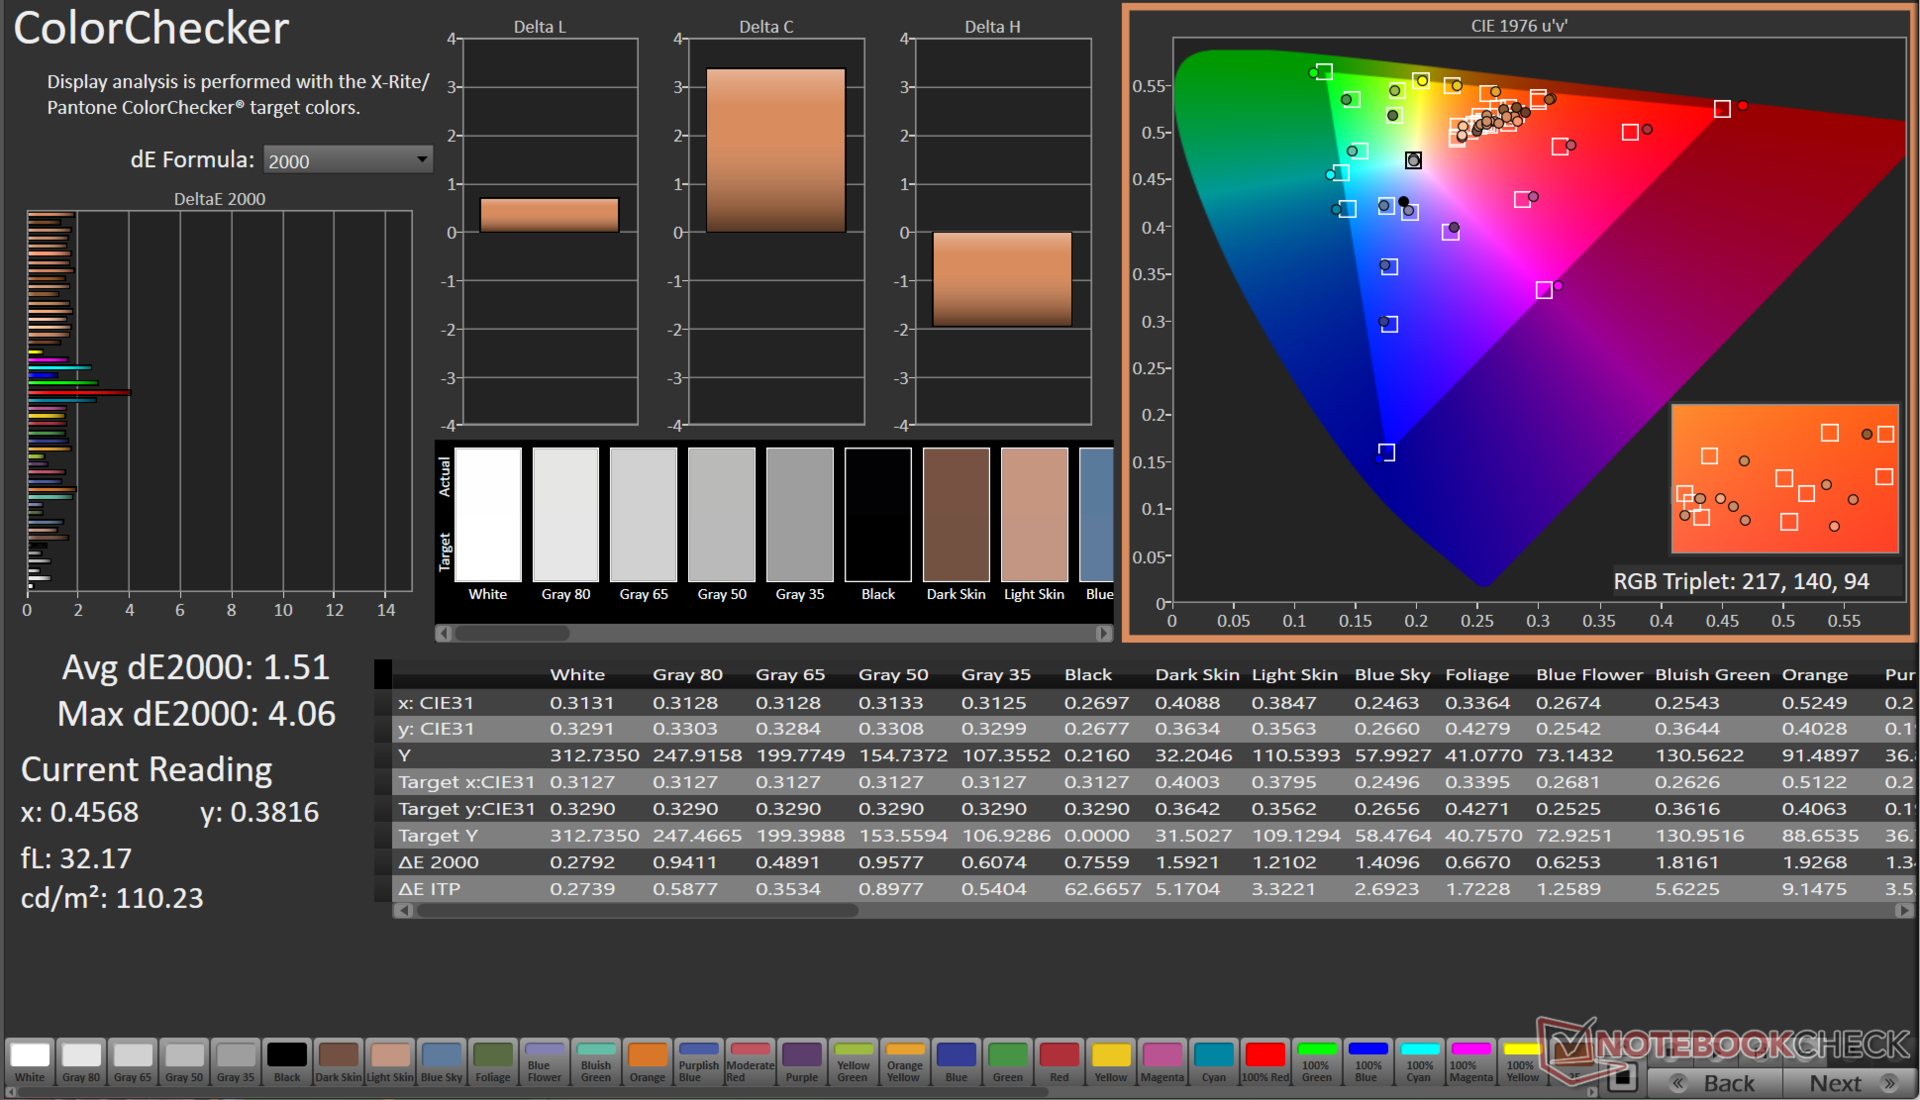
A precisão de cores do G15, pronta para uso, apresenta desvios perceptíveis. No entanto, conseguimos obter melhorias significativas com nossa rotina de calibração usando o espectrofotômetro X-Rite i1Basic Pro 3 e o software de calibração de cores Calman Ultimate da Portrait Display.
O Delta E 2000 médio da escala de cinza pôde ser reduzido para 0,7, enquanto o Delta E 2000 médio do ColorChecker melhorou para 1,51.
O arquivo ICC calibrado pode ser baixado no link acima.
Exibir tempos de resposta
| ↔ Tempo de resposta preto para branco | ||
|---|---|---|
| 5.35 ms ... ascensão ↗ e queda ↘ combinadas | ↗ 2.34 ms ascensão | 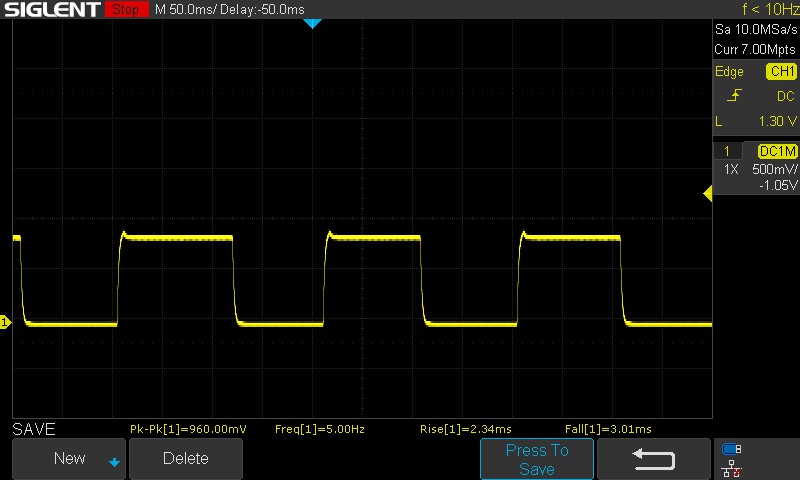 |
| ↘ 3.01 ms queda | ||
| A tela mostra taxas de resposta muito rápidas em nossos testes e deve ser muito adequada para jogos em ritmo acelerado. Em comparação, todos os dispositivos testados variam de 0.1 (mínimo) a 240 (máximo) ms. » 18 % de todos os dispositivos são melhores. Isso significa que o tempo de resposta medido é melhor que a média de todos os dispositivos testados (19.8 ms). | ||
| ↔ Tempo de resposta 50% cinza a 80% cinza | ||
| 3.39 ms ... ascensão ↗ e queda ↘ combinadas | ↗ 1.4 ms ascensão | 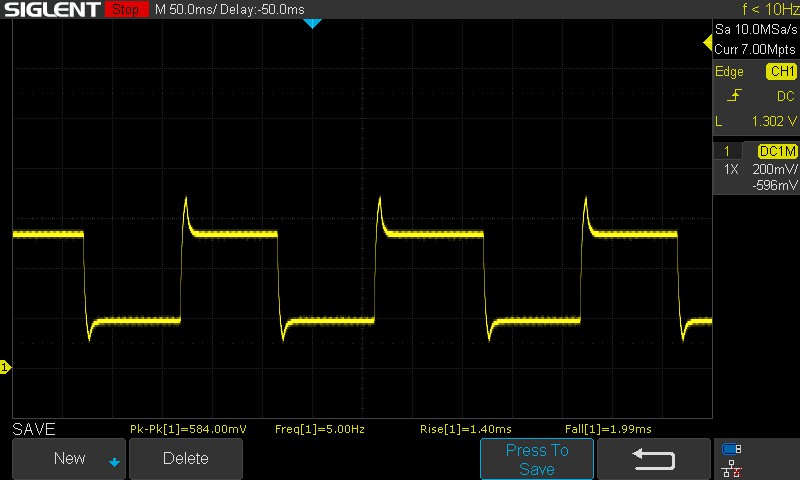 |
| ↘ 1.99 ms queda | ||
| A tela mostra taxas de resposta muito rápidas em nossos testes e deve ser muito adequada para jogos em ritmo acelerado. Em comparação, todos os dispositivos testados variam de 0.165 (mínimo) a 636 (máximo) ms. » 14 % de todos os dispositivos são melhores. Isso significa que o tempo de resposta medido é melhor que a média de todos os dispositivos testados (31 ms). | ||
Cintilação da tela / PWM (modulação por largura de pulso)
| Tela tremeluzindo/PWM detectado | 21620 Hz | ≤ 100 % configuração de brilho | 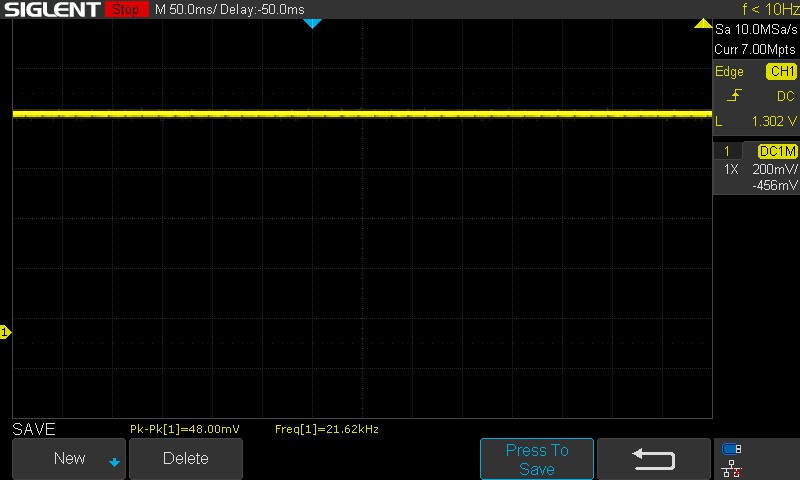 |
A luz de fundo da tela pisca em 21620 Hz (pior caso, por exemplo, utilizando PWM) Cintilação detectada em uma configuração de brilho de 100 % e abaixo. Não deve haver cintilação ou PWM acima desta configuração de brilho. A frequência de 21620 Hz é bastante alta, então a maioria dos usuários sensíveis ao PWM não deve notar nenhuma oscilação. [pwm_comparison] Em comparação: 52 % de todos os dispositivos testados não usam PWM para escurecer a tela. Se PWM foi detectado, uma média de 7763 (mínimo: 5 - máximo: 343500) Hz foi medida. | |||
O painel do G15 emprega o overdrive para obter tempos de resposta mais baixos. Vale a pena observar que não há opção para desativar o overdrive do painel por meio do Alienware Command Center.
Embora o painel não utilize PWM para ajuste de brilho, ele ainda apresenta cintilação. No entanto, é improvável que isso cause cansaço visual significativo ou desconforto para a maioria dos usuários devido à sua alta frequência.
Para obter mais informações, consulte nosso artigo "Por que o PWM é uma dor de cabeça". Além disso, a Tabela de classificação de PWM fornece uma visão geral das frequências de PWM medidas em todos os dispositivos analisados até o momento.
A visualização em ambientes externos não apresenta grandes problemas, desde que não haja incidência direta de luz solar sobre a tela. Os ângulos de visão são amplos e relativamente estáveis, exceto por alguma perda perceptível de brilho nos extremos.

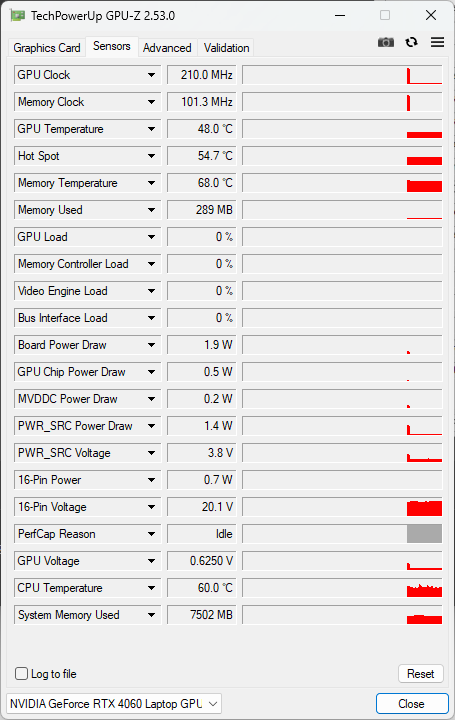
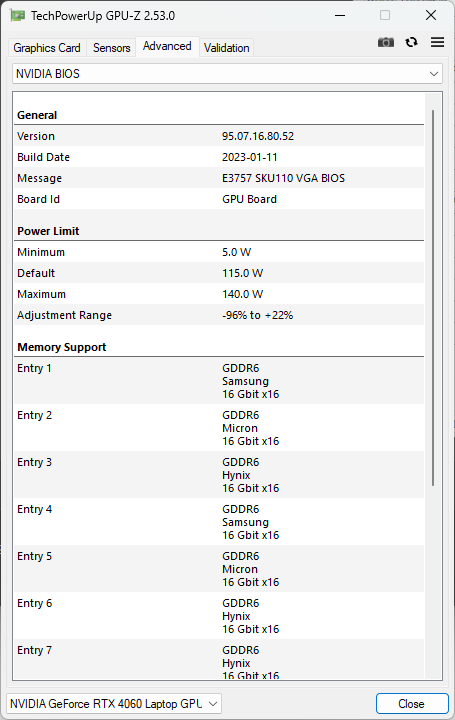
Desempenho: Na linha esperada para uma combinação de Core i7-13650HX e RTX 4060
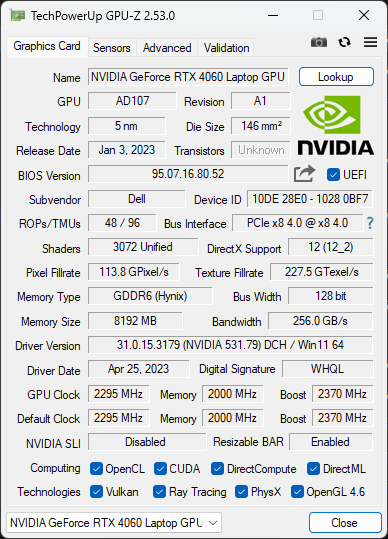
Nossa unidade Dell G15 5530 é equipada com o Intel Core i7-13650HX e aGPU para laptop Nvidia GeForce RTX 4060. Dependendo da região, os compradores também podem configurar esse laptop com um Core i5-13450HX e uma GPU RTX 3050 6 GB ou GPU para laptop RTX 4050.
Observe que a opção RTX 3050 só está disponível em combinação com o Core i5-13450HX.
Condições de teste
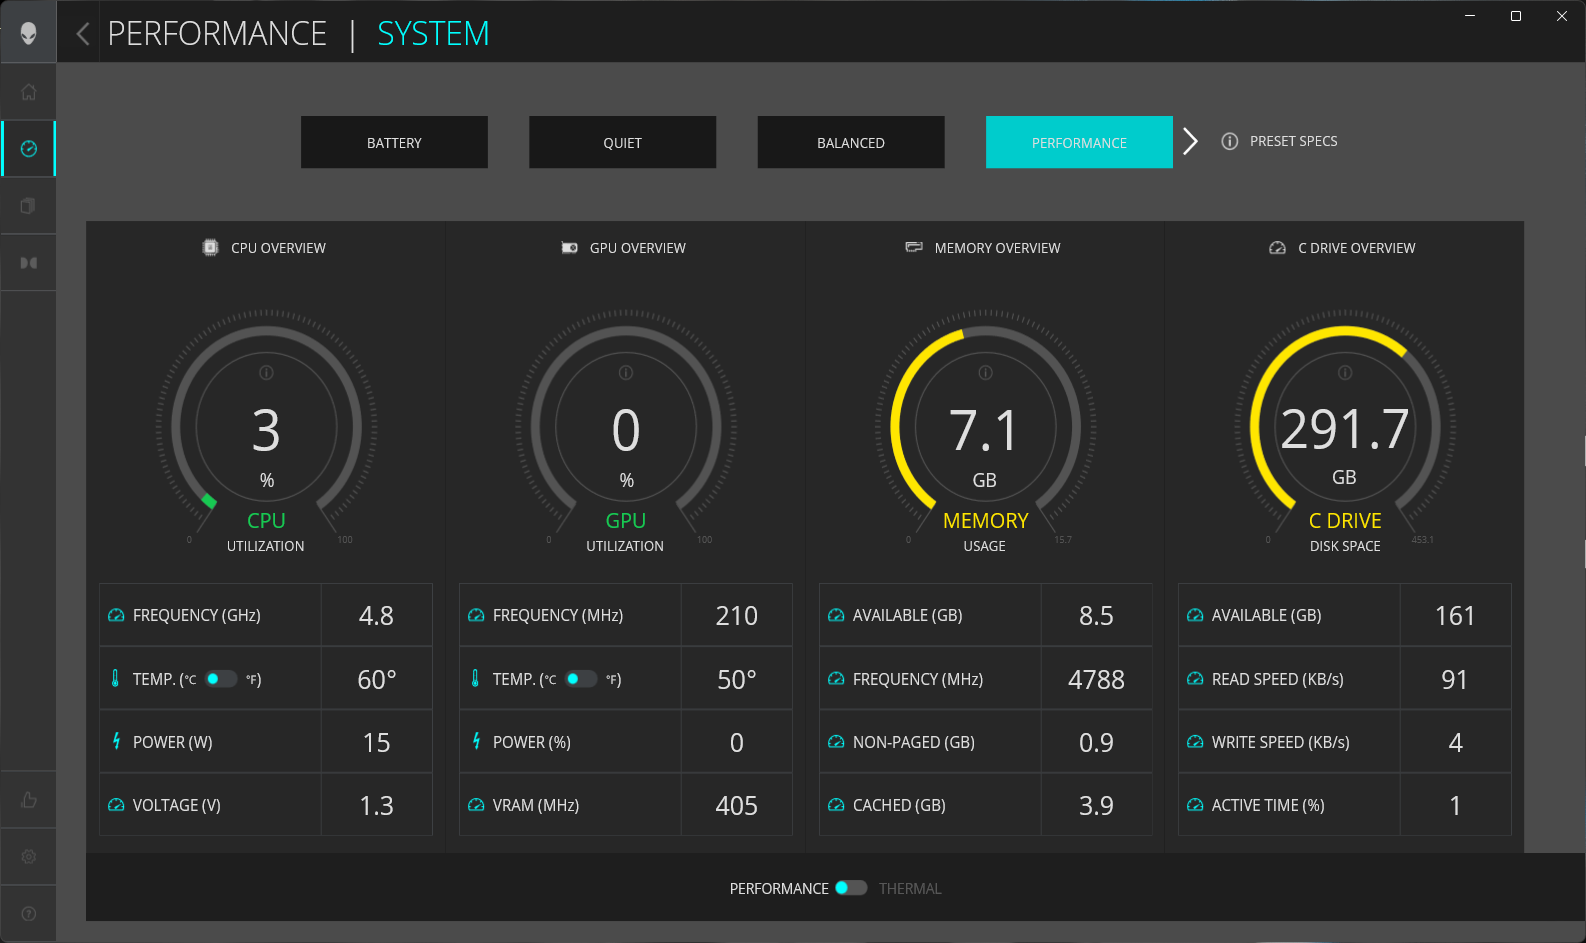
O Alienware Command Center oferece quatro predefinições de desempenho predefinidas, mas também permite que os usuários criem e personalizem seus próprios perfis.
Utilizamos o modo Desempenho para todos os benchmarks e testes, exceto para avaliar a duração da bateria, para a qual usamos o perfil Bateria.
A tabela abaixo ilustra as variações na potência básica do processador (PBP) e na potência máxima do turbo (MTP) para cada cenário:
| Modo de desempenho | PL1 (PBP) / Tau | PL2 (MTP) / Tau | PL4 |
|---|---|---|---|
| Bateria | 55 W / 56 s | 157 W / 2,44 ms | 242 W |
| Silenciosa | 55 W / 56 s | 157 W / 2,44 ms | 242 W |
| Balanceado | 157 W / 56 s | 157 W / 2,44 ms | 242 W |
| Desempenho | 191 W / 56 s | 191 W / 2,44 ms | 242 W |
Processador
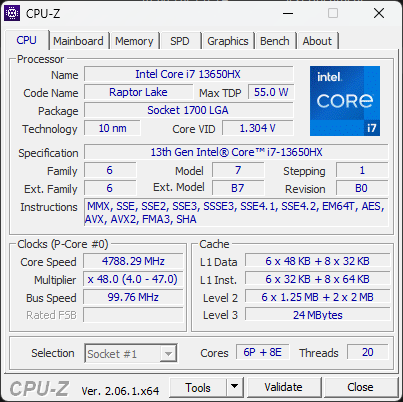
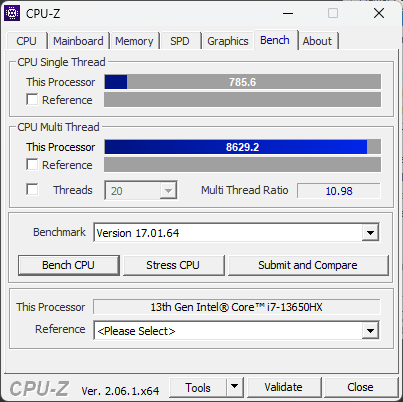
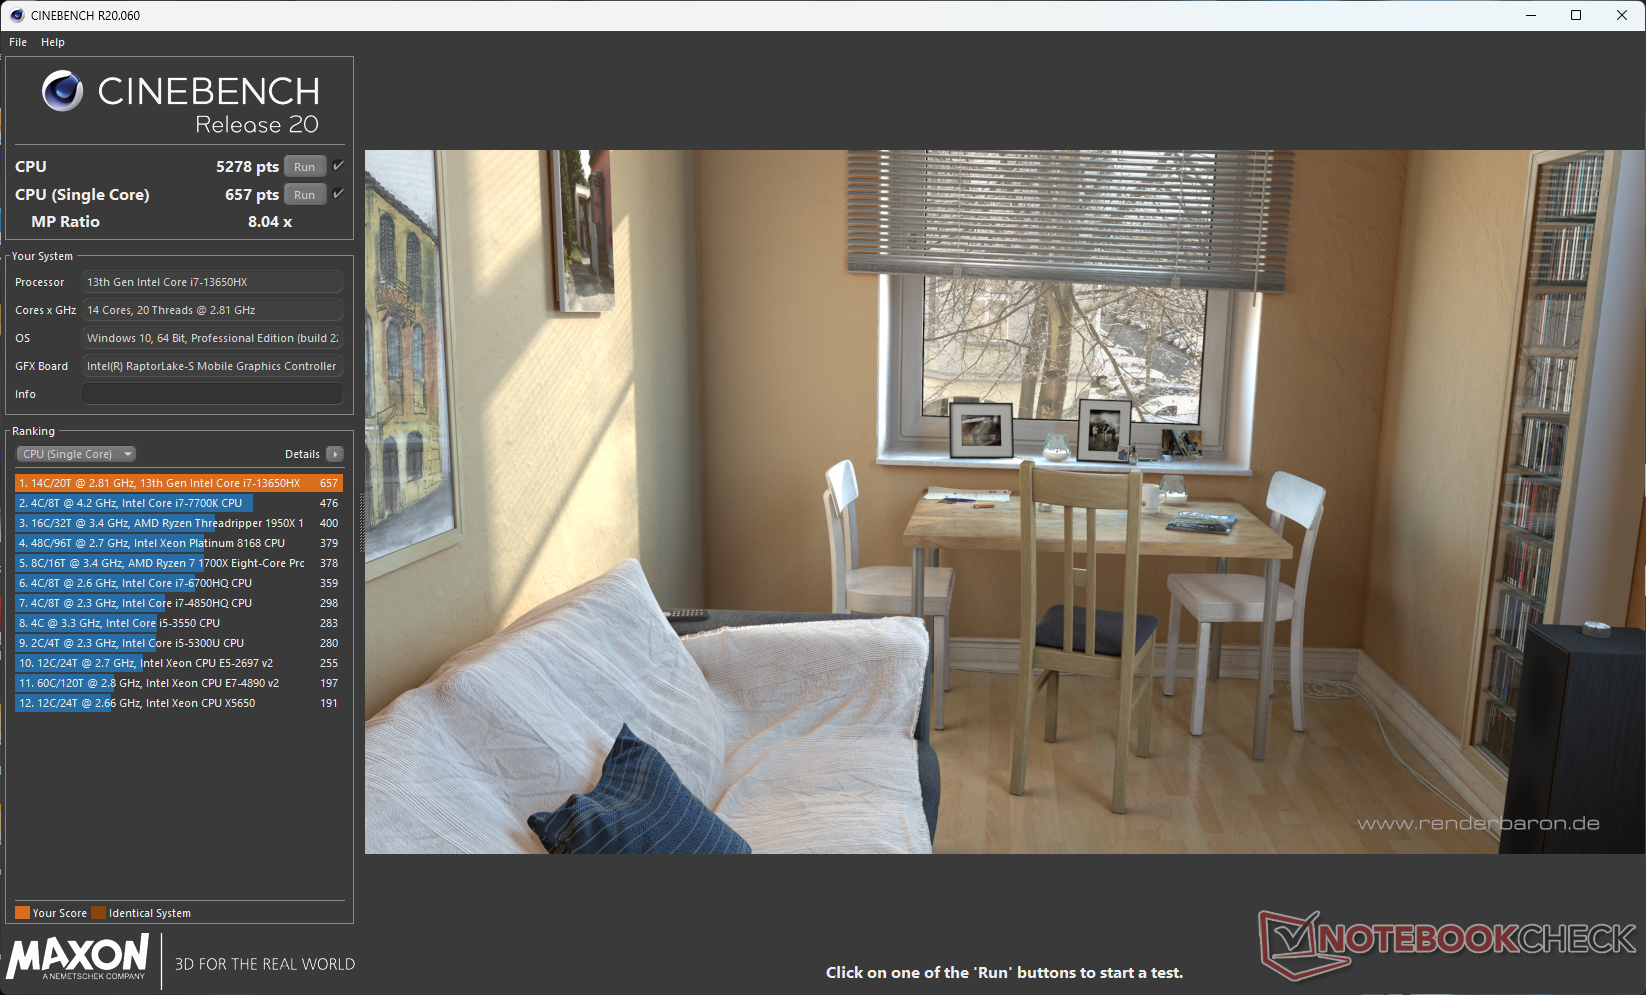
O Intel Core i7-13650HX é uma peça Raptor Lake-HX de 14 núcleos e 20 threads que oferece um aumento de núcleo único de até 4,9 GHz em seus núcleos P.
No teste de loop de vários núcleos Cinebench R15, o G15 5530 começa no mesmo nível do Asus ROG Strix G18, que utiliza a mesma CPU. No entanto, observamos uma leve aceleração no meio do teste. O desempenho geral da CPU é praticamente idêntico em ambos os modelos.
O Core i7-13650HX do G15 5530 oferece uma boa vantagem nos testes de vários núcleos em relação ao Ryzen 9 7940HS do Asus TUF Gaming A16, mas este último consegue se manter a uma distância impressionante no desempenho cumulativo devido aos seus altos ganhos de um único núcleo.
Cinebench R15 Multi Loop
Cinebench R23: Multi Core | Single Core
Cinebench R20: CPU (Multi Core) | CPU (Single Core)
Cinebench R15: CPU Multi 64Bit | CPU Single 64Bit
Blender: v2.79 BMW27 CPU
7-Zip 18.03: 7z b 4 | 7z b 4 -mmt1
Geekbench 5.5: Multi-Core | Single-Core
HWBOT x265 Benchmark v2.2: 4k Preset
LibreOffice : 20 Documents To PDF
R Benchmark 2.5: Overall mean
| CPU Performance rating | |
| Asus ROG Strix G17 G713PI | |
| Medion Erazer Major X20 | |
| Média da turma Gaming | |
| Asus ROG Flow X16 GV601V | |
| Dell G15 5530 | |
| Asus ROG Strix G18 G814JI | |
| Lenovo Legion Pro 5 16IRX8 | |
| Média Intel Core i7-13650HX | |
| Asus TUF Gaming A16 FA617XS | |
| MSI Katana 17 B13VFK | |
| Cinebench R23 / Multi Core | |
| Asus ROG Strix G17 G713PI | |
| Medion Erazer Major X20 | |
| Média da turma Gaming (10488 - 40970, n=109, últimos 2 anos) | |
| Asus ROG Strix G18 G814JI | |
| Dell G15 5530 | |
| Média Intel Core i7-13650HX (18744 - 21006, n=6) | |
| Lenovo Legion Pro 5 16IRX8 | |
| Asus ROG Flow X16 GV601V | |
| Asus TUF Gaming A16 FA617XS | |
| MSI Katana 17 B13VFK | |
| Cinebench R23 / Single Core | |
| Medion Erazer Major X20 | |
| Asus ROG Flow X16 GV601V | |
| Média da turma Gaming (1166 - 2356, n=109, últimos 2 anos) | |
| Asus ROG Strix G18 G814JI | |
| Asus ROG Strix G17 G713PI | |
| Dell G15 5530 | |
| Média Intel Core i7-13650HX (1693 - 1903, n=6) | |
| MSI Katana 17 B13VFK | |
| Asus TUF Gaming A16 FA617XS | |
| Lenovo Legion Pro 5 16IRX8 | |
| Cinebench R20 / CPU (Multi Core) | |
| Medion Erazer Major X20 | |
| Asus ROG Strix G17 G713PI | |
| Média da turma Gaming (4029 - 16108, n=108, últimos 2 anos) | |
| Dell G15 5530 | |
| Asus ROG Strix G18 G814JI | |
| Média Intel Core i7-13650HX (7197 - 8021, n=5) | |
| Asus ROG Flow X16 GV601V | |
| Lenovo Legion Pro 5 16IRX8 | |
| Asus TUF Gaming A16 FA617XS | |
| MSI Katana 17 B13VFK | |
| Cinebench R20 / CPU (Single Core) | |
| Medion Erazer Major X20 | |
| Média da turma Gaming (442 - 895, n=108, últimos 2 anos) | |
| Asus ROG Flow X16 GV601V | |
| Asus ROG Strix G18 G814JI | |
| Média Intel Core i7-13650HX (700 - 728, n=5) | |
| Asus ROG Strix G17 G713PI | |
| Dell G15 5530 | |
| Asus TUF Gaming A16 FA617XS | |
| MSI Katana 17 B13VFK | |
| Lenovo Legion Pro 5 16IRX8 | |
| Cinebench R15 / CPU Multi 64Bit | |
| Asus ROG Strix G17 G713PI | |
| Medion Erazer Major X20 | |
| Média da turma Gaming (1578 - 6271, n=107, últimos 2 anos) | |
| Lenovo Legion Pro 5 16IRX8 | |
| Dell G15 5530 | |
| Asus ROG Strix G18 G814JI | |
| Asus ROG Flow X16 GV601V | |
| Média Intel Core i7-13650HX (2864 - 3147, n=5) | |
| Asus TUF Gaming A16 FA617XS | |
| MSI Katana 17 B13VFK | |
| Cinebench R15 / CPU Single 64Bit | |
| Medion Erazer Major X20 | |
| Média da turma Gaming (188.8 - 343, n=108, últimos 2 anos) | |
| Asus ROG Strix G17 G713PI | |
| Asus ROG Flow X16 GV601V | |
| Asus TUF Gaming A16 FA617XS | |
| Asus ROG Strix G18 G814JI | |
| Dell G15 5530 | |
| Média Intel Core i7-13650HX (256 - 275, n=5) | |
| Lenovo Legion Pro 5 16IRX8 | |
| MSI Katana 17 B13VFK | |
| Blender / v2.79 BMW27 CPU | |
| MSI Katana 17 B13VFK | |
| Asus TUF Gaming A16 FA617XS | |
| Asus ROG Flow X16 GV601V | |
| Média Intel Core i7-13650HX (158 - 226, n=5) | |
| Dell G15 5530 | |
| Asus ROG Strix G18 G814JI | |
| Média da turma Gaming (80 - 330, n=106, últimos 2 anos) | |
| Lenovo Legion Pro 5 16IRX8 | |
| Medion Erazer Major X20 | |
| Asus ROG Strix G17 G713PI | |
| 7-Zip 18.03 / 7z b 4 | |
| Asus ROG Strix G17 G713PI | |
| Medion Erazer Major X20 | |
| Média da turma Gaming (33491 - 148086, n=107, últimos 2 anos) | |
| Asus ROG Strix G18 G814JI | |
| Lenovo Legion Pro 5 16IRX8 | |
| Dell G15 5530 | |
| Média Intel Core i7-13650HX (73927 - 80057, n=5) | |
| Asus ROG Flow X16 GV601V | |
| Asus TUF Gaming A16 FA617XS | |
| MSI Katana 17 B13VFK | |
| 7-Zip 18.03 / 7z b 4 -mmt1 | |
| Asus ROG Strix G17 G713PI | |
| Medion Erazer Major X20 | |
| Asus TUF Gaming A16 FA617XS | |
| Média da turma Gaming (4199 - 7436, n=107, últimos 2 anos) | |
| Asus ROG Flow X16 GV601V | |
| Asus ROG Strix G18 G814JI | |
| Média Intel Core i7-13650HX (5828 - 6125, n=5) | |
| Dell G15 5530 | |
| MSI Katana 17 B13VFK | |
| Lenovo Legion Pro 5 16IRX8 | |
| Geekbench 5.5 / Multi-Core | |
| Medion Erazer Major X20 | |
| Asus ROG Strix G17 G713PI | |
| Média da turma Gaming (6460 - 27010, n=107, últimos 2 anos) | |
| Asus ROG Strix G18 G814JI | |
| Lenovo Legion Pro 5 16IRX8 | |
| Dell G15 5530 | |
| Asus ROG Flow X16 GV601V | |
| Média Intel Core i7-13650HX (12509 - 14778, n=5) | |
| Asus TUF Gaming A16 FA617XS | |
| MSI Katana 17 B13VFK | |
| Geekbench 5.5 / Single-Core | |
| Asus ROG Strix G17 G713PI | |
| Média da turma Gaming (986 - 2474, n=107, últimos 2 anos) | |
| Medion Erazer Major X20 | |
| Asus TUF Gaming A16 FA617XS | |
| Asus ROG Flow X16 GV601V | |
| Dell G15 5530 | |
| Média Intel Core i7-13650HX (1810 - 1866, n=5) | |
| Asus ROG Strix G18 G814JI | |
| MSI Katana 17 B13VFK | |
| Lenovo Legion Pro 5 16IRX8 | |
| HWBOT x265 Benchmark v2.2 / 4k Preset | |
| Asus ROG Strix G17 G713PI | |
| Medion Erazer Major X20 | |
| Média da turma Gaming (11.5 - 44.3, n=107, últimos 2 anos) | |
| Lenovo Legion Pro 5 16IRX8 | |
| Asus ROG Strix G18 G814JI | |
| Dell G15 5530 | |
| Asus ROG Flow X16 GV601V | |
| Média Intel Core i7-13650HX (18.9 - 23.6, n=5) | |
| Asus TUF Gaming A16 FA617XS | |
| MSI Katana 17 B13VFK | |
| LibreOffice / 20 Documents To PDF | |
| Asus ROG Strix G18 G814JI | |
| MSI Katana 17 B13VFK | |
| Média da turma Gaming (33.2 - 88.8, n=107, últimos 2 anos) | |
| Média Intel Core i7-13650HX (38.9 - 58.8, n=5) | |
| Dell G15 5530 | |
| Asus ROG Strix G17 G713PI | |
| Medion Erazer Major X20 | |
| Asus TUF Gaming A16 FA617XS | |
| Asus ROG Flow X16 GV601V | |
| Lenovo Legion Pro 5 16IRX8 | |
| R Benchmark 2.5 / Overall mean | |
| Lenovo Legion Pro 5 16IRX8 | |
| MSI Katana 17 B13VFK | |
| Asus ROG Strix G18 G814JI | |
| Média Intel Core i7-13650HX (0.4217 - 0.4461, n=6) | |
| Média da turma Gaming (0.3439 - 0.759, n=108, últimos 2 anos) | |
| Dell G15 5530 | |
| Asus TUF Gaming A16 FA617XS | |
| Asus ROG Flow X16 GV601V | |
| Asus ROG Strix G17 G713PI | |
| Medion Erazer Major X20 | |
* ... menor é melhor
O gráfico abaixo ilustra como vários parâmetros da CPU variam em cada modo de desempenho durante um loop de vários núcleos do Cinebench R15.
Os modos Desempenho e Equilibrado mostram clocks de aumento médios semelhantes em torno da marca de 3,6 GHz, enquanto o modo Silencioso se contenta com um aumento médio de apenas 2,6 GHz.
O modo Balanced é cerca de 9 W mais econômico do que o Performance em termos de consumo de energia de pico do pacote da CPU. No entanto, as temperaturas do núcleo são mais ou menos idênticas em ambas as predefinições.
Vale a pena observar que, embora o modo Silencioso consuma apenas cerca de 50,5 W de energia do pacote em média, ele também resulta em uma perda de desempenho de 23%.
Com a energia da bateria, o desempenho de núcleo único do Cinebench R20 sofre apenas uma queda de 7%. No entanto, a pontuação de vários núcleos cai 34%.
AIDA64: FP32 Ray-Trace | FPU Julia | CPU SHA3 | CPU Queen | FPU SinJulia | FPU Mandel | CPU AES | CPU ZLib | FP64 Ray-Trace | CPU PhotoWorxx
| Performance rating | |
| Asus ROG Strix G17 G713PI | |
| Média da turma Gaming | |
| Medion Erazer Major X20 | |
| Asus TUF Gaming A16 FA617XS | |
| Lenovo Legion Pro 5 16IRX8 | |
| Asus ROG Strix G18 G814JI | |
| Dell G15 5530 | |
| Média Intel Core i7-13650HX | |
| Asus ROG Flow X16 GV601V | |
| MSI Katana 17 B13VFK | |
| AIDA64 / FP32 Ray-Trace | |
| Asus ROG Strix G17 G713PI | |
| Média da turma Gaming (10227 - 85542, n=106, últimos 2 anos) | |
| Asus TUF Gaming A16 FA617XS | |
| Medion Erazer Major X20 | |
| Lenovo Legion Pro 5 16IRX8 | |
| Asus ROG Strix G18 G814JI | |
| Dell G15 5530 | |
| Média Intel Core i7-13650HX (13404 - 20012, n=5) | |
| MSI Katana 17 B13VFK | |
| Asus ROG Flow X16 GV601V | |
| AIDA64 / FPU Julia | |
| Asus ROG Strix G17 G713PI | |
| Média da turma Gaming (51376 - 238426, n=106, últimos 2 anos) | |
| Medion Erazer Major X20 | |
| Asus TUF Gaming A16 FA617XS | |
| Lenovo Legion Pro 5 16IRX8 | |
| Asus ROG Strix G18 G814JI | |
| Dell G15 5530 | |
| Média Intel Core i7-13650HX (68241 - 97317, n=5) | |
| Asus ROG Flow X16 GV601V | |
| MSI Katana 17 B13VFK | |
| AIDA64 / CPU SHA3 | |
| Asus ROG Strix G17 G713PI | |
| Medion Erazer Major X20 | |
| Média da turma Gaming (2180 - 9817, n=106, últimos 2 anos) | |
| Lenovo Legion Pro 5 16IRX8 | |
| Asus TUF Gaming A16 FA617XS | |
| Asus ROG Strix G18 G814JI | |
| Dell G15 5530 | |
| Asus ROG Flow X16 GV601V | |
| Média Intel Core i7-13650HX (3127 - 4487, n=5) | |
| MSI Katana 17 B13VFK | |
| AIDA64 / CPU Queen | |
| Asus ROG Strix G17 G713PI | |
| Medion Erazer Major X20 | |
| Asus TUF Gaming A16 FA617XS | |
| Média da turma Gaming (49785 - 173351, n=93, últimos 2 anos) | |
| Lenovo Legion Pro 5 16IRX8 | |
| Asus ROG Flow X16 GV601V | |
| Asus ROG Strix G18 G814JI | |
| Média Intel Core i7-13650HX (108627 - 110589, n=5) | |
| Dell G15 5530 | |
| MSI Katana 17 B13VFK | |
| AIDA64 / FPU SinJulia | |
| Asus ROG Strix G17 G713PI | |
| Asus TUF Gaming A16 FA617XS | |
| Medion Erazer Major X20 | |
| Média da turma Gaming (4424 - 33636, n=106, últimos 2 anos) | |
| Lenovo Legion Pro 5 16IRX8 | |
| Asus ROG Flow X16 GV601V | |
| Dell G15 5530 | |
| Asus ROG Strix G18 G814JI | |
| Média Intel Core i7-13650HX (9134 - 10887, n=5) | |
| MSI Katana 17 B13VFK | |
| AIDA64 / FPU Mandel | |
| Asus ROG Strix G17 G713PI | |
| Média da turma Gaming (25115 - 128721, n=106, últimos 2 anos) | |
| Asus TUF Gaming A16 FA617XS | |
| Medion Erazer Major X20 | |
| Lenovo Legion Pro 5 16IRX8 | |
| Asus ROG Strix G18 G814JI | |
| Dell G15 5530 | |
| Média Intel Core i7-13650HX (33391 - 48323, n=5) | |
| Asus ROG Flow X16 GV601V | |
| MSI Katana 17 B13VFK | |
| AIDA64 / CPU AES | |
| Asus ROG Strix G17 G713PI | |
| Medion Erazer Major X20 | |
| Média da turma Gaming (39258 - 247074, n=106, últimos 2 anos) | |
| Lenovo Legion Pro 5 16IRX8 | |
| Asus TUF Gaming A16 FA617XS | |
| Dell G15 5530 | |
| Asus ROG Strix G18 G814JI | |
| Asus ROG Flow X16 GV601V | |
| Média Intel Core i7-13650HX (64436 - 85343, n=5) | |
| MSI Katana 17 B13VFK | |
| AIDA64 / CPU ZLib | |
| Asus ROG Strix G17 G713PI | |
| Medion Erazer Major X20 | |
| Média da turma Gaming (574 - 2531, n=106, últimos 2 anos) | |
| Lenovo Legion Pro 5 16IRX8 | |
| Dell G15 5530 | |
| Asus ROG Strix G18 G814JI | |
| Média Intel Core i7-13650HX (1136 - 1285, n=5) | |
| Asus ROG Flow X16 GV601V | |
| Asus TUF Gaming A16 FA617XS | |
| MSI Katana 17 B13VFK | |
| AIDA64 / FP64 Ray-Trace | |
| Asus ROG Strix G17 G713PI | |
| Média da turma Gaming (5509 - 45446, n=106, últimos 2 anos) | |
| Asus TUF Gaming A16 FA617XS | |
| Medion Erazer Major X20 | |
| Lenovo Legion Pro 5 16IRX8 | |
| Asus ROG Strix G18 G814JI | |
| Dell G15 5530 | |
| Média Intel Core i7-13650HX (7270 - 10900, n=5) | |
| Asus ROG Flow X16 GV601V | |
| MSI Katana 17 B13VFK | |
| AIDA64 / CPU PhotoWorxx | |
| Média da turma Gaming (12271 - 89891, n=106, últimos 2 anos) | |
| Medion Erazer Major X20 | |
| Asus ROG Strix G18 G814JI | |
| Média Intel Core i7-13650HX (36170 - 43289, n=5) | |
| Asus ROG Flow X16 GV601V | |
| Dell G15 5530 | |
| Lenovo Legion Pro 5 16IRX8 | |
| MSI Katana 17 B13VFK | |
| Asus ROG Strix G17 G713PI | |
| Asus TUF Gaming A16 FA617XS | |
Nossos produtos dedicados Intel Core i7-13650HX oferece mais informações e comparações de desempenho.
Desempenho do sistema
O G15 5530 atinge uma pontuação geral menor no PCMark 10 em relação à concorrência, mas não enfrentamos nenhum problema na computação de uso geral.
O MSI Katana 17 com um Core i7-13620H consegue superar ligeiramente o G15 5530 nas pontuações gerais do PCMark 10 e do CrossMark.
CrossMark: Overall | Productivity | Creativity | Responsiveness
AIDA64: Memory Copy | Memory Read | Memory Write | Memory Latency
| PCMark 10 / Score | |
| Média da turma Gaming (5828 - 11574, n=94, últimos 2 anos) | |
| Asus TUF Gaming A16 FA617XS | |
| Asus ROG Flow X16 GV601V | |
| Lenovo Legion Pro 5 16IRX8 | |
| Medion Erazer Major X20 | |
| Asus ROG Strix G17 G713PI | |
| Média Intel Core i7-13650HX, NVIDIA GeForce RTX 4060 Laptop GPU (6984 - 7613, n=3) | |
| MSI Katana 17 B13VFK | |
| Dell G15 5530 | |
| Asus ROG Strix G18 G814JI | |
| PCMark 10 / Essentials | |
| Medion Erazer Major X20 | |
| Asus ROG Flow X16 GV601V | |
| Asus ROG Strix G17 G713PI | |
| Dell G15 5530 | |
| Lenovo Legion Pro 5 16IRX8 | |
| Asus TUF Gaming A16 FA617XS | |
| MSI Katana 17 B13VFK | |
| Média da turma Gaming (8810 - 11935, n=98, últimos 2 anos) | |
| Média Intel Core i7-13650HX, NVIDIA GeForce RTX 4060 Laptop GPU (9532 - 11151, n=3) | |
| Asus ROG Strix G18 G814JI | |
| PCMark 10 / Productivity | |
| Asus ROG Strix G17 G713PI | |
| Média da turma Gaming (6845 - 21327, n=96, últimos 2 anos) | |
| Asus TUF Gaming A16 FA617XS | |
| Asus ROG Flow X16 GV601V | |
| Média Intel Core i7-13650HX, NVIDIA GeForce RTX 4060 Laptop GPU (9961 - 10204, n=3) | |
| Dell G15 5530 | |
| Medion Erazer Major X20 | |
| MSI Katana 17 B13VFK | |
| Lenovo Legion Pro 5 16IRX8 | |
| Asus ROG Strix G18 G814JI | |
| PCMark 10 / Digital Content Creation | |
| Média da turma Gaming (7602 - 19657, n=96, últimos 2 anos) | |
| Lenovo Legion Pro 5 16IRX8 | |
| Asus TUF Gaming A16 FA617XS | |
| Asus ROG Flow X16 GV601V | |
| Média Intel Core i7-13650HX, NVIDIA GeForce RTX 4060 Laptop GPU (8323 - 11686, n=3) | |
| Medion Erazer Major X20 | |
| MSI Katana 17 B13VFK | |
| Asus ROG Strix G17 G713PI | |
| Dell G15 5530 | |
| Asus ROG Strix G18 G814JI | |
| CrossMark / Overall | |
| Asus ROG Strix G17 G713PI | |
| Média da turma Gaming (1366 - 2409, n=95, últimos 2 anos) | |
| Asus ROG Flow X16 GV601V | |
| Média Intel Core i7-13650HX, NVIDIA GeForce RTX 4060 Laptop GPU (1839 - 1951, n=3) | |
| MSI Katana 17 B13VFK | |
| Medion Erazer Major X20 | |
| Dell G15 5530 | |
| Asus TUF Gaming A16 FA617XS | |
| Lenovo Legion Pro 5 16IRX8 | |
| CrossMark / Productivity | |
| Asus ROG Strix G17 G713PI | |
| Asus ROG Flow X16 GV601V | |
| Média da turma Gaming (1386 - 2254, n=95, últimos 2 anos) | |
| Média Intel Core i7-13650HX, NVIDIA GeForce RTX 4060 Laptop GPU (1730 - 1864, n=3) | |
| MSI Katana 17 B13VFK | |
| Dell G15 5530 | |
| Asus TUF Gaming A16 FA617XS | |
| Medion Erazer Major X20 | |
| Lenovo Legion Pro 5 16IRX8 | |
| CrossMark / Creativity | |
| Asus ROG Strix G17 G713PI | |
| Média da turma Gaming (1343 - 2729, n=95, últimos 2 anos) | |
| Asus ROG Flow X16 GV601V | |
| Medion Erazer Major X20 | |
| Dell G15 5530 | |
| Média Intel Core i7-13650HX, NVIDIA GeForce RTX 4060 Laptop GPU (2020 - 2063, n=3) | |
| MSI Katana 17 B13VFK | |
| Asus TUF Gaming A16 FA617XS | |
| Lenovo Legion Pro 5 16IRX8 | |
| CrossMark / Responsiveness | |
| MSI Katana 17 B13VFK | |
| Média Intel Core i7-13650HX, NVIDIA GeForce RTX 4060 Laptop GPU (1544 - 1907, n=3) | |
| Média da turma Gaming (1226 - 2334, n=95, últimos 2 anos) | |
| Asus ROG Flow X16 GV601V | |
| Asus ROG Strix G17 G713PI | |
| Lenovo Legion Pro 5 16IRX8 | |
| Medion Erazer Major X20 | |
| Dell G15 5530 | |
| Asus TUF Gaming A16 FA617XS | |
| AIDA64 / Memory Copy | |
| Média da turma Gaming (21750 - 129946, n=106, últimos 2 anos) | |
| Medion Erazer Major X20 | |
| Asus ROG Strix G18 G814JI | |
| Asus ROG Flow X16 GV601V | |
| Asus TUF Gaming A16 FA617XS | |
| Média Intel Core i7-13650HX, NVIDIA GeForce RTX 4060 Laptop GPU (59266 - 59896, n=3) | |
| Dell G15 5530 | |
| Lenovo Legion Pro 5 16IRX8 | |
| MSI Katana 17 B13VFK | |
| Asus ROG Strix G17 G713PI | |
| AIDA64 / Memory Read | |
| Medion Erazer Major X20 | |
| Média da turma Gaming (22956 - 118858, n=106, últimos 2 anos) | |
| Asus ROG Strix G18 G814JI | |
| Asus ROG Flow X16 GV601V | |
| Média Intel Core i7-13650HX, NVIDIA GeForce RTX 4060 Laptop GPU (67305 - 68612, n=3) | |
| Dell G15 5530 | |
| Lenovo Legion Pro 5 16IRX8 | |
| MSI Katana 17 B13VFK | |
| Asus TUF Gaming A16 FA617XS | |
| Asus ROG Strix G17 G713PI | |
| AIDA64 / Memory Write | |
| Média da turma Gaming (22297 - 135096, n=106, últimos 2 anos) | |
| Asus TUF Gaming A16 FA617XS | |
| Lenovo Legion Pro 5 16IRX8 | |
| Medion Erazer Major X20 | |
| Asus ROG Flow X16 GV601V | |
| Asus ROG Strix G18 G814JI | |
| Dell G15 5530 | |
| Média Intel Core i7-13650HX, NVIDIA GeForce RTX 4060 Laptop GPU (58028 - 60298, n=3) | |
| Asus ROG Strix G17 G713PI | |
| MSI Katana 17 B13VFK | |
| AIDA64 / Memory Latency | |
| Média da turma Gaming (75.3 - 259, n=106, últimos 2 anos) | |
| MSI Katana 17 B13VFK | |
| Asus ROG Flow X16 GV601V | |
| Dell G15 5530 | |
| Medion Erazer Major X20 | |
| Média Intel Core i7-13650HX, NVIDIA GeForce RTX 4060 Laptop GPU (90.4 - 90.8, n=3) | |
| Asus TUF Gaming A16 FA617XS | |
| Asus ROG Strix G17 G713PI | |
| Asus ROG Strix G18 G814JI | |
| Lenovo Legion Pro 5 16IRX8 | |
* ... menor é melhor
| PCMark 8 Home Score Accelerated v2 | 4748 pontos | |
| PCMark 8 Work Score Accelerated v2 | 6712 pontos | |
| PCMark 10 Score | 6984 pontos | |
Ajuda | ||
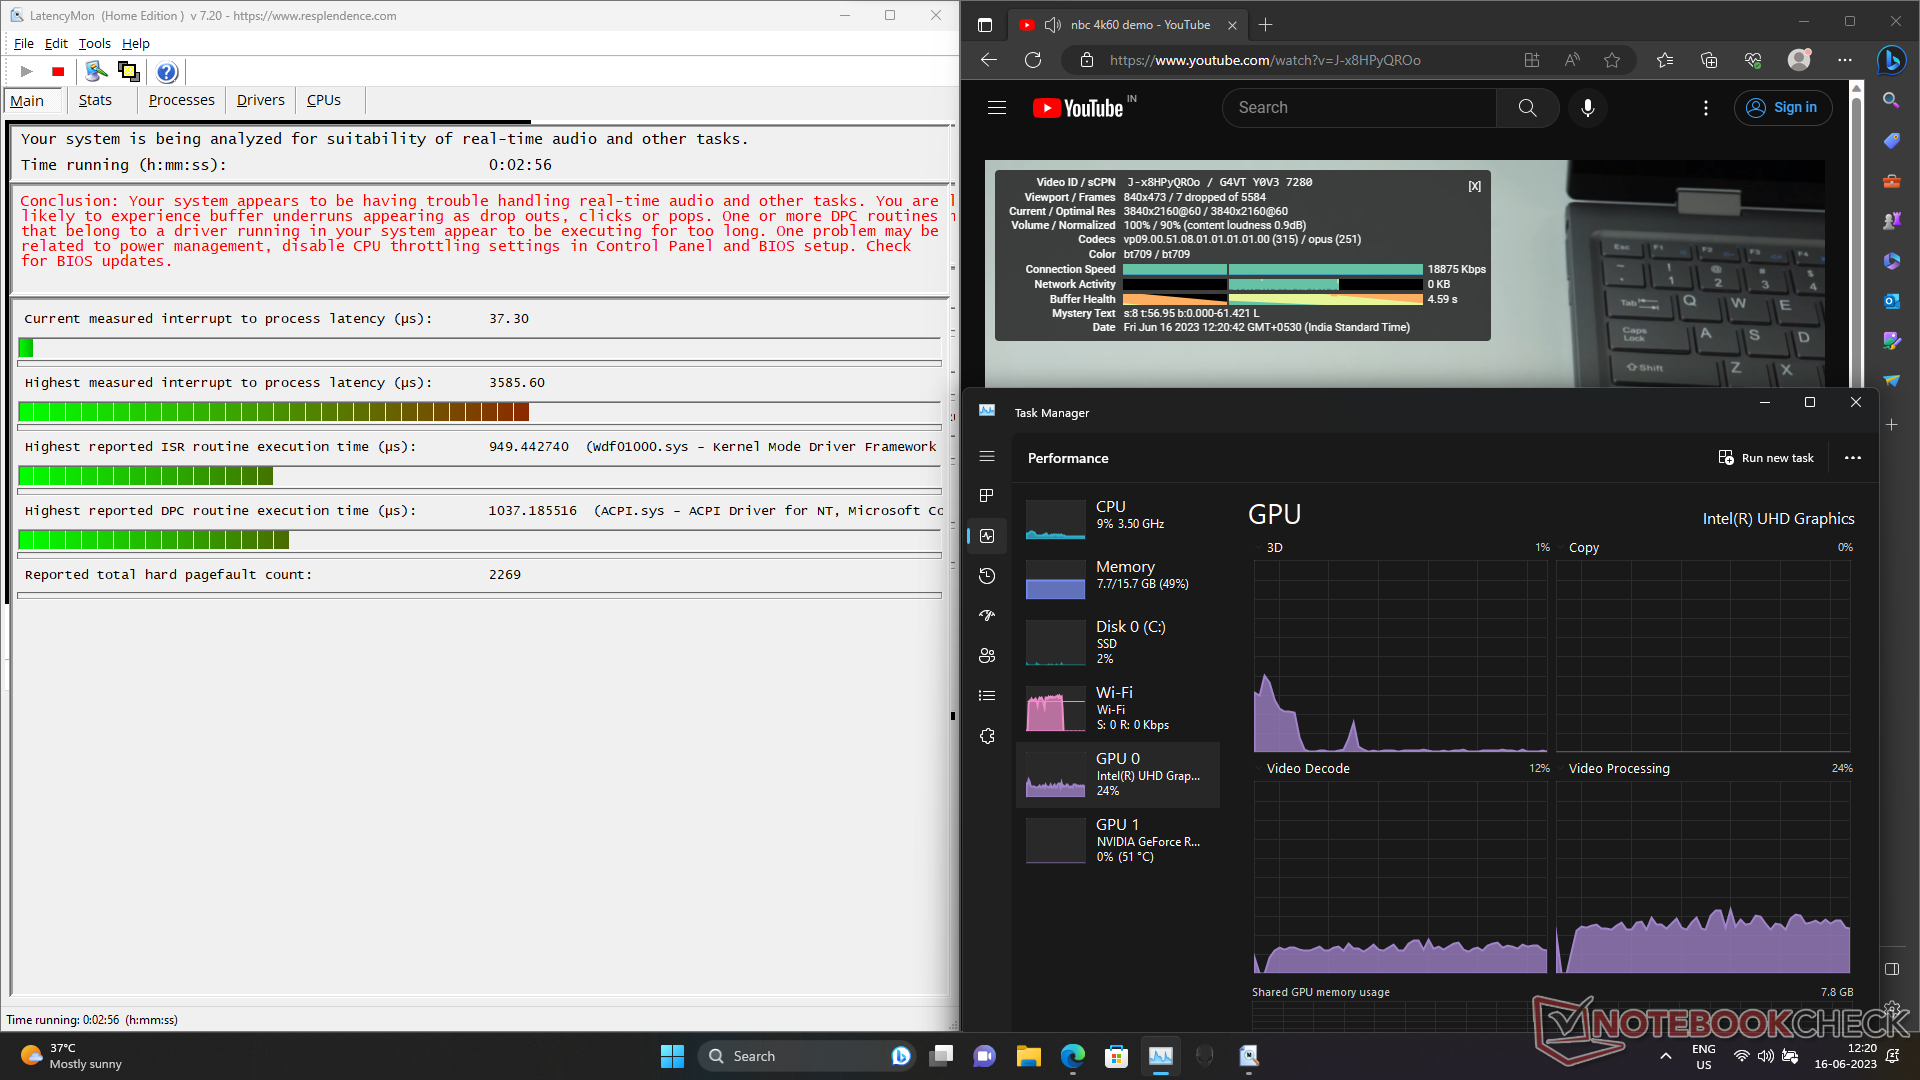
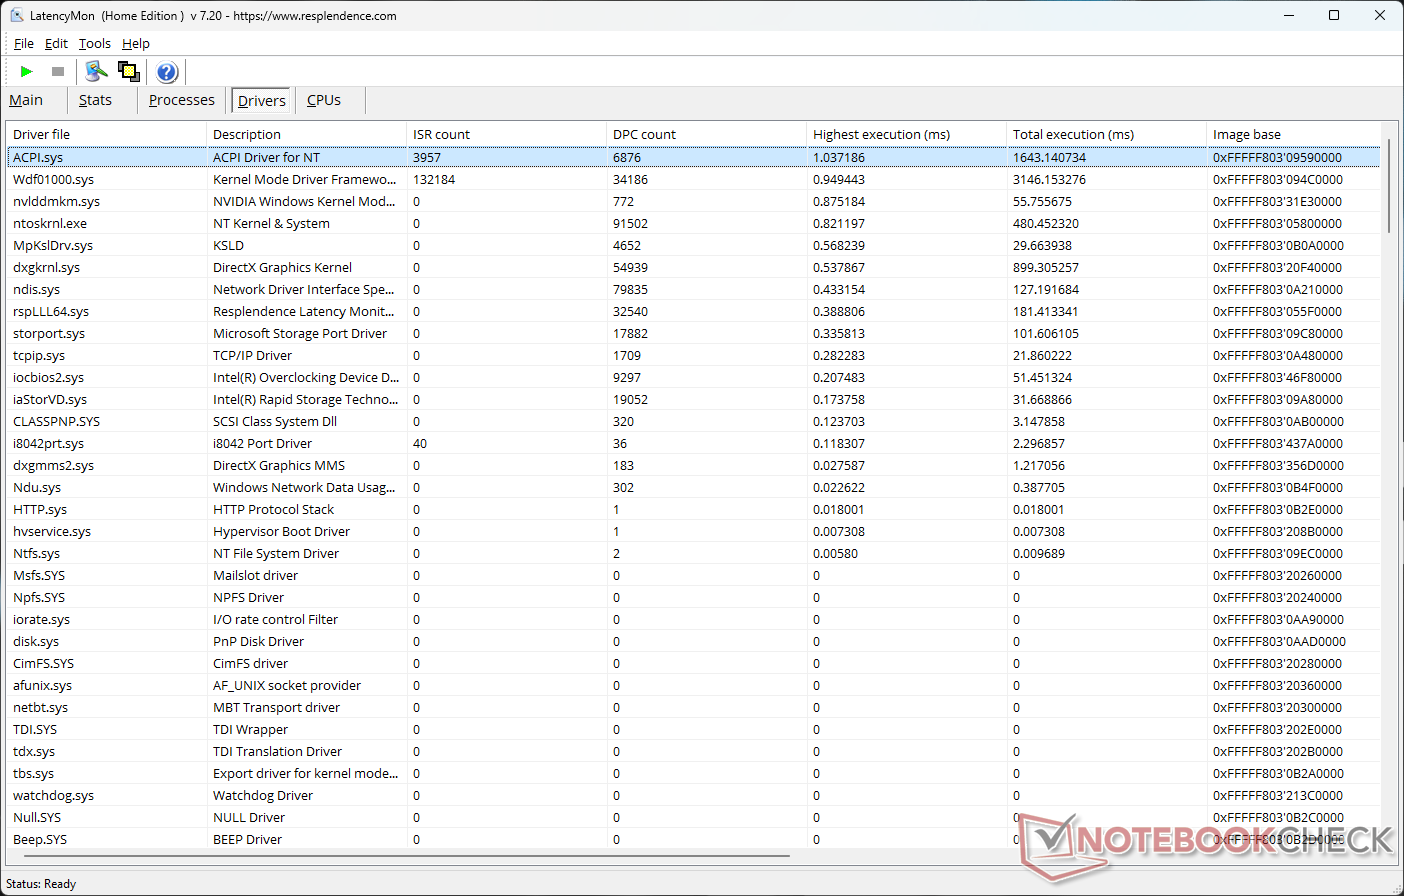
Latência DPC
O G15 5530 sofre com uma alta latência de interrupção para processo de 3585,6 µs devido aos altos tempos de execução do driver ACPI.sys.
| DPC Latencies / LatencyMon - interrupt to process latency (max), Web, Youtube, Prime95 | |
| Dell G15 5530 | |
| MSI Katana 17 B13VFK | |
| Medion Erazer Major X20 | |
| Asus ROG Strix G17 G713PI | |
| Asus ROG Flow X16 GV601V | |
| Asus TUF Gaming A16 FA617XS | |
| Asus ROG Strix G18 G814JI | |
| Lenovo Legion Pro 5 16IRX8 | |
* ... menor é melhor
Dispositivos de armazenamento
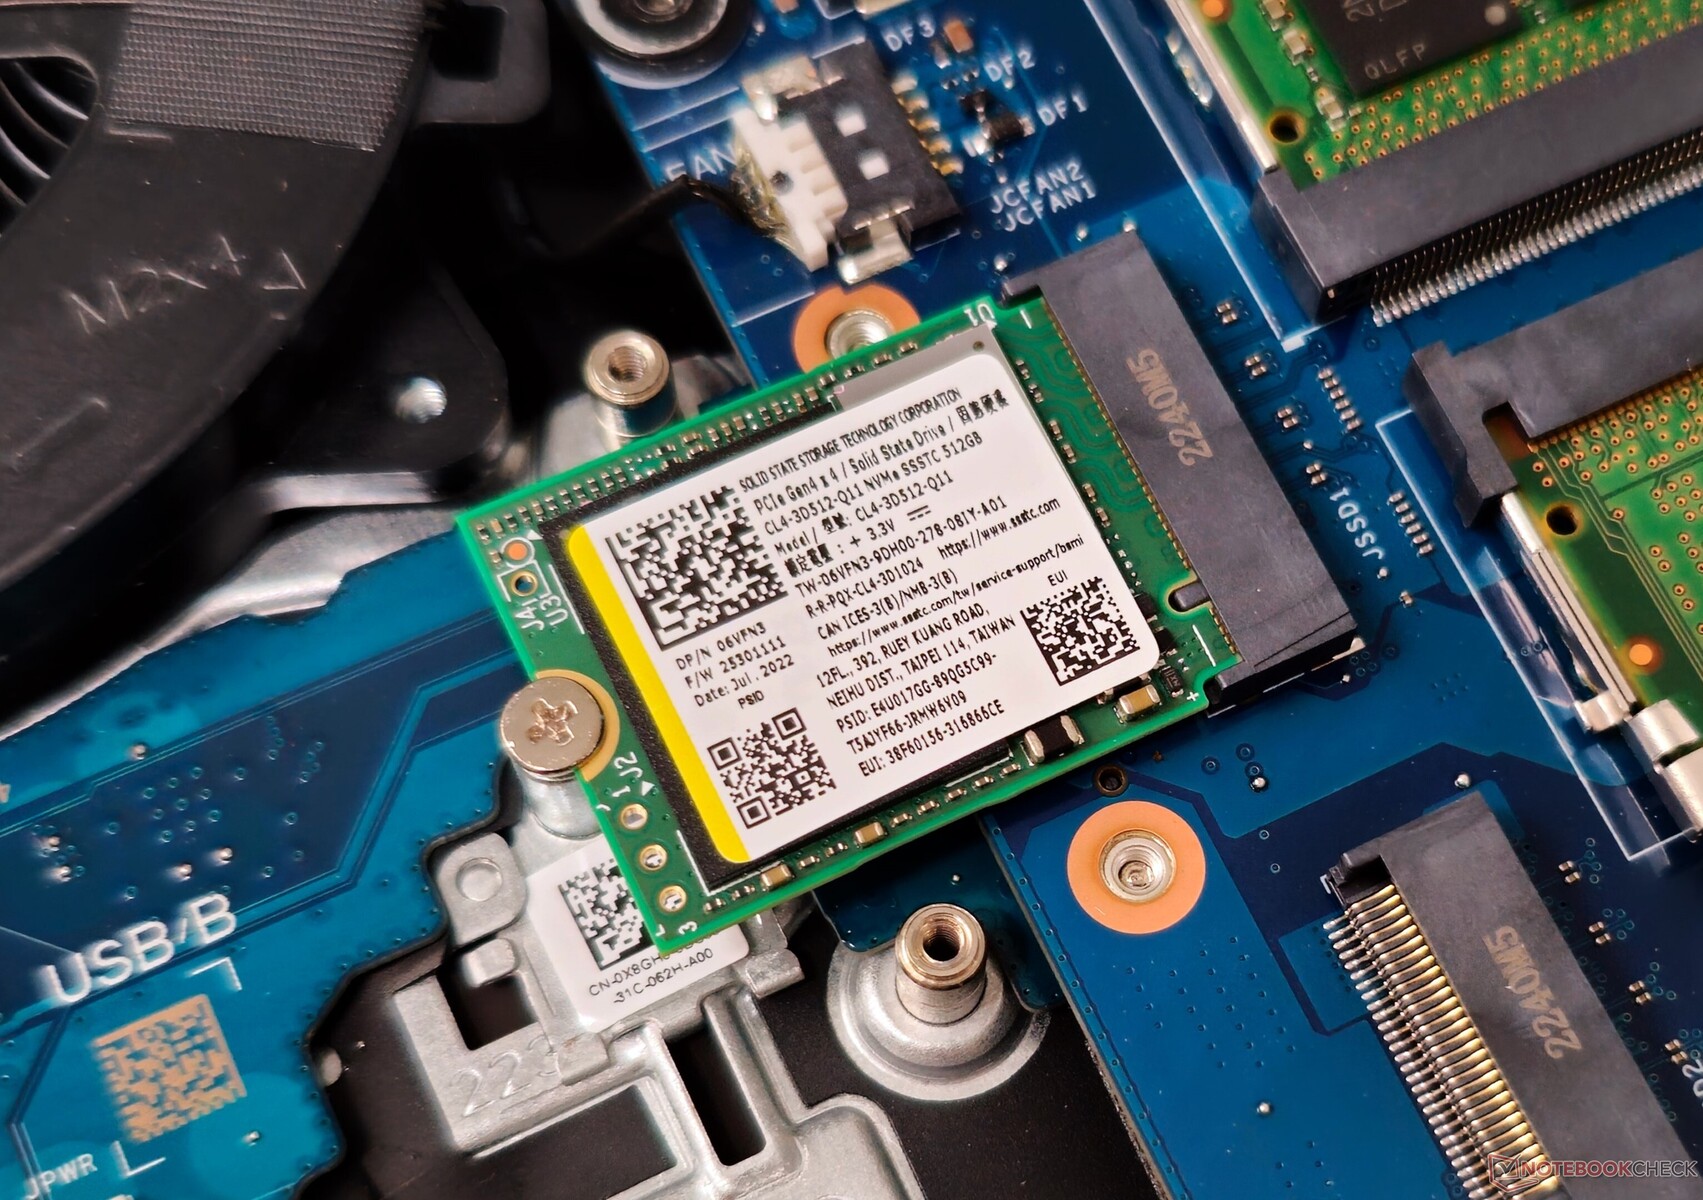
A Dell oferece dois slots M.2 2242 para unidades de armazenamento em vez da variedade mais onipresente M.2 2280.
Os usuários devem atualizar a unidade se pretenderem instalar um grande número de jogos, pois a imagem de fábrica fornece apenas 398 GB livres da capacidade de 512 GB.
Com leituras sequenciais de menos de 3.000 MB/s e gravações sequenciais em torno da marca de 500 MB/s, o desempenho do SSTC CL4 está longe de ser impressionante.
Não há espaço para expansão do armazenamento por meio de unidades SATA de 2,5 polegadas.

* ... menor é melhor
A SSD oferece leituras sustentadas em uma profundidade de fila de 8, mas somente depois que o desempenho cai drasticamente na décima execução.
Disk Throttling: DiskSpd Read Loop, Queue Depth 8
Desempenho da GPU
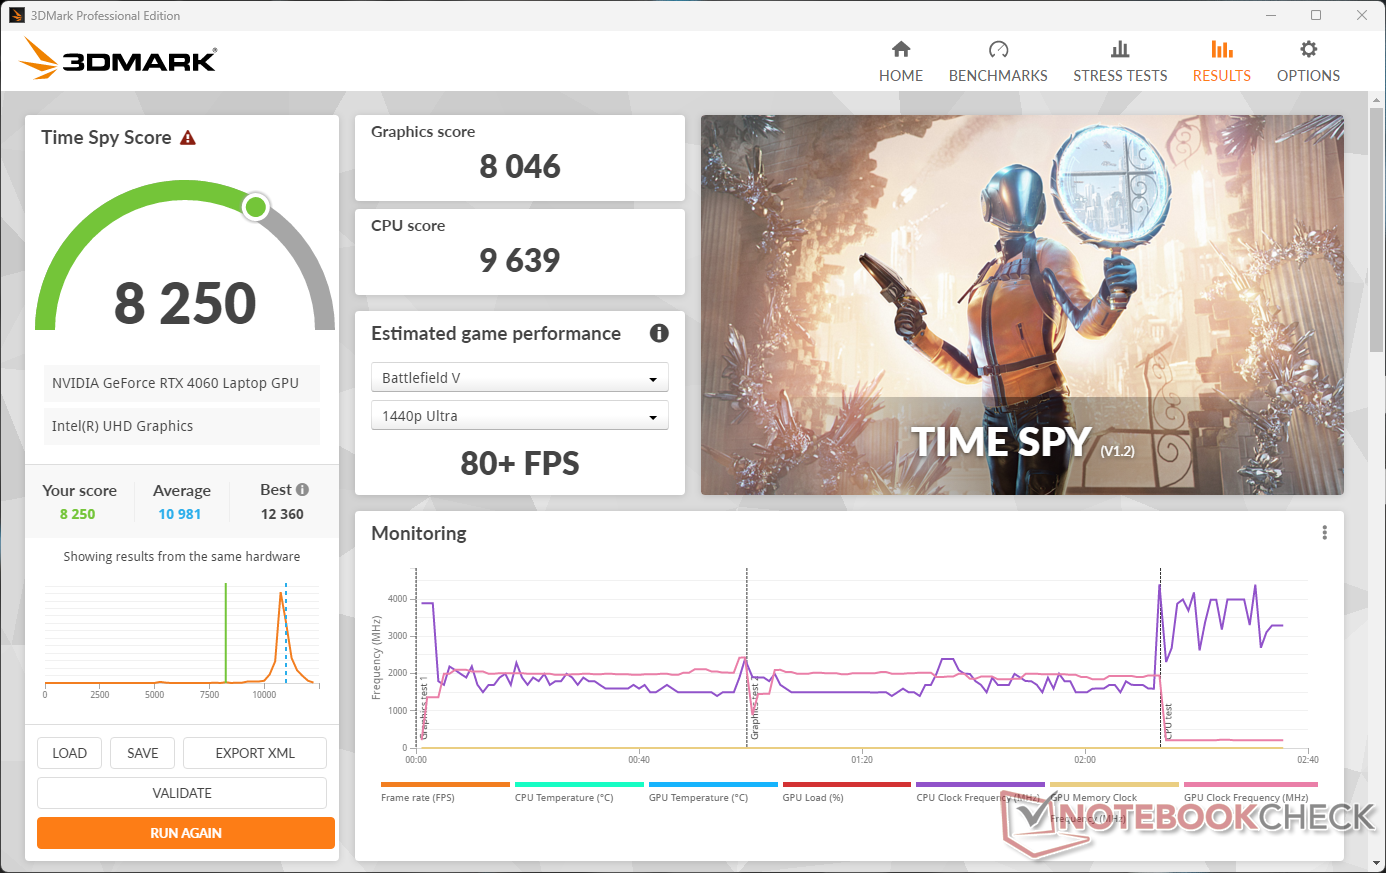
A GPU para laptop Nvidia GeForce RTX 4060 de 140 W apresenta o desempenho esperado nos testes cumulativos do 3DMark. Curiosamente, o MSI Katana 17 com uma RTX 4060 de 105 W tem uma ligeira vantagem de desempenho sobre outros notebooks com RTX 4060 na comparação.
Por outro lado, o G15 5530 compensa essa diferença de desempenho nos testes do Blender.
pontuação 3DMark Time Spy A pontuação gráfica cai 24% com a energia da bateria.
| 3DMark 11 Performance | 32321 pontos | |
| 3DMark Ice Storm Standard Score | 242288 pontos | |
| 3DMark Cloud Gate Standard Score | 66116 pontos | |
| 3DMark Fire Strike Score | 24323 pontos | |
| 3DMark Fire Strike Extreme Score | 12237 pontos | |
| 3DMark Time Spy Score | 11007 pontos | |
Ajuda | ||
| Blender / v3.3 Classroom OPTIX/RTX | |
| MSI Katana 17 B13VFK | |
| Asus ROG Strix G18 G814JI | |
| Média NVIDIA GeForce RTX 4060 Laptop GPU (19 - 28, n=53) | |
| Asus ROG Flow X16 GV601V | |
| Lenovo Legion Pro 5 16IRX8 | |
| Dell G15 5530 | |
| Asus ROG Strix G17 G713PI | |
| Medion Erazer Major X20 | |
| Média da turma Gaming (9 - 32, n=108, últimos 2 anos) | |
| Blender / v3.3 Classroom CUDA | |
| MSI Katana 17 B13VFK | |
| Média NVIDIA GeForce RTX 4060 Laptop GPU (39 - 53, n=53) | |
| Asus ROG Flow X16 GV601V | |
| Dell G15 5530 | |
| Lenovo Legion Pro 5 16IRX8 | |
| Asus ROG Strix G18 G814JI | |
| Média da turma Gaming (15 - 233, n=109, últimos 2 anos) | |
| Asus ROG Strix G17 G713PI | |
| Medion Erazer Major X20 | |
| Blender / v3.3 Classroom CPU | |
| MSI Katana 17 B13VFK | |
| Asus ROG Flow X16 GV601V | |
| Média NVIDIA GeForce RTX 4060 Laptop GPU (189 - 452, n=53) | |
| Asus TUF Gaming A16 FA617XS | |
| Dell G15 5530 | |
| Asus ROG Strix G18 G814JI | |
| Lenovo Legion Pro 5 16IRX8 | |
| Média da turma Gaming (122 - 565, n=104, últimos 2 anos) | |
| Medion Erazer Major X20 | |
| Asus ROG Strix G17 G713PI | |
* ... menor é melhor
Desempenho em jogos
A GPU para laptop RTX 4060 é capaz de atingir quadros de três dígitos por segundo (fps) em jogos relativamente antigos em configurações Ultra de 1080p. Mesmo em jogos mais recentes, ela pode fornecer taxas de quadros consistentemente bem acima de 60 fps em 1080p Ultra.
Para os usuários interessados em jogar em resoluções mais altas usando um monitor externo, ativar o Nvidia DLSS (Deep Learning Super Sampling) ou o AMD FSR (FidelityFX Super Resolution) em títulos compatíveis pode proporcionar bons aumentos de fps.
| The Witcher 3 - 1920x1080 Ultra Graphics & Postprocessing (HBAO+) | |
| Média da turma Gaming (95 - 240, n=7, últimos 2 anos) | |
| Medion Erazer Major X20 | |
| Asus ROG Strix G17 G713PI | |
| Asus ROG Strix G18 G814JI | |
| Lenovo Legion Pro 5 16IRX8 | |
| Asus ROG Flow X16 GV601V | |
| MSI Katana 17 B13VFK | |
| Dell G15 5530 | |
| Asus TUF Gaming A16 FA617XS | |
| Cyberpunk 2077 1.6 | |
| 1920x1080 High Preset | |
| Lenovo Legion Pro 5 16IRX8 | |
| Dell G15 5530 | |
| Asus ROG Strix G17 G713PI | |
| Asus ROG Flow X16 GV601V | |
| Média NVIDIA GeForce RTX 4060 Laptop GPU (63.5 - 114.9, n=16) | |
| 1920x1080 Ultra Preset | |
| Lenovo Legion Pro 5 16IRX8 | |
| Asus ROG Strix G17 G713PI | |
| Dell G15 5530 | |
| Asus ROG Flow X16 GV601V | |
| Média NVIDIA GeForce RTX 4060 Laptop GPU (57.9 - 93.2, n=18) | |
| MSI Katana 17 B13VFK | |
| 1920x1080 Ray Tracing Ultra Preset (DLSS off) | |
| Média NVIDIA GeForce RTX 4060 Laptop GPU (25.6 - 60, n=6) | |
| Dell G15 5530 | |
| Asus ROG Flow X16 GV601V | |
| MSI Katana 17 B13VFK | |
O gráfico Witcher 3 FPS
O sistema de resfriamento do G15 5530 parece ser bastante eficaz, como fica evidente pelas taxas de quadros relativamente estáveis vistas abaixo em Teste Witcher 3 teste de estresse.
| baixo | média | alto | ultra | |
|---|---|---|---|---|
| GTA V (2015) | 182.6 | 175.3 | 172.8 | 111.8 |
| The Witcher 3 (2015) | 407 | 335 | 205 | 104.6 |
| Dota 2 Reborn (2015) | 179.9 | 163.8 | 154.9 | 144.8 |
| Final Fantasy XV Benchmark (2018) | 212 | 137.3 | 100.1 | |
| X-Plane 11.11 (2018) | 160.1 | 146.8 | 115.6 | |
| Far Cry 5 (2018) | 168 | 152 | 146 | 139 |
| Strange Brigade (2018) | 467 | 281 | 222 | 189.6 |
| Cyberpunk 2077 1.6 (2022) | 123.2 | 99.4 | 86.1 | 80 |
| F1 22 (2022) | 244 | 235 | 177.7 | 66.1 |
Confira nossa GPU para laptop Nvidia GeForce RTX 4060 para obter mais comparações de desempenho.
Emissões: Fica quente quando estressado
Ruído do sistema
Sob carga, o G15 pode gerar emissões de ruído logo abaixo da marca de 50 dB(A). É interessante notar que o modo Silencioso produz um nível de pressão sonora (SPL) mais alto em comparação com os modos Equilibrado e Desempenho, mesmo em uma carga leve do 3DMark 06. Dito isso, o ruído máximo do ventilador permanece abaixo de 40 dB(A) nesse perfil.
Não foram observadas grandes regressões de desempenho entre os diferentes perfis quando testado com o Witcher 3 a 1080p Ultra.
Barulho
| Ocioso |
| 26.85 / 26.85 / 26.85 dB |
| Carga |
| 27.65 / 47.86 dB |
 | ||
30 dB silencioso 40 dB(A) audível 50 dB(A) ruidosamente alto |
||
min: | ||
Conforme mencionado anteriormente, o modo Silencioso pode apresentar algumas limitações no desempenho da CPU, mas ainda deve permitir taxas de quadros satisfatórias e manter o ruído da ventoinha em um nível aceitável.
| Modo de desempenho | Idle dB(A) | Load average dB(A) | Load maximum dB(A) | The Witcher 3 1080p Ultra dB(A) |
|---|---|---|---|---|
| Bateria | 20.90 | 32.60 | 33.21 | 44.36 / 104 fps |
| Silenciosa | 20,74 | 32,95 | 37,68 | 37,63 / 99 fps |
| Equilibrado | 20,80 | 26,40 | 45,97 | 45,92 / 104 fps |
| Desempenho | 26.85 | 27.65 | 47.86 | 47.86 / 105 fps |
| Dell G15 5530 Intel Core i7-13650HX, GeForce RTX 4060 Laptop GPU | Asus ROG Strix G18 G814JI Intel Core i7-13650HX, GeForce RTX 4070 Laptop GPU | Lenovo Legion Pro 5 16IRX8 Intel Core i7-13700HX, GeForce RTX 4060 Laptop GPU | Asus ROG Flow X16 GV601V Intel Core i9-13900H, GeForce RTX 4060 Laptop GPU | MSI Katana 17 B13VFK Intel Core i7-13620H, GeForce RTX 4060 Laptop GPU | Asus TUF Gaming A16 FA617XS AMD Ryzen 9 7940HS, Radeon RX 7600S | Asus ROG Strix G17 G713PI AMD Ryzen 9 7945HX, GeForce RTX 4070 Laptop GPU | Medion Erazer Major X20 Intel Core i9-13900HX, GeForce RTX 4070 Laptop GPU | |
|---|---|---|---|---|---|---|---|---|
| Noise | -10% | -3% | -4% | -24% | -13% | -14% | -21% | |
| desligado / ambiente * (dB) | 20.41 | 25 -22% | 23 -13% | 24 -18% | 24.5 -20% | 25 -22% | 25 -22% | 24 -18% |
| Idle Minimum * (dB) | 26.85 | 26 3% | 23.1 14% | 24 11% | 24.5 9% | 25 7% | 26 3% | 25 7% |
| Idle Average * (dB) | 26.85 | 28 -4% | 23.1 14% | 24 11% | 24.5 9% | 26 3% | 29 -8% | 29 -8% |
| Idle Maximum * (dB) | 26.85 | 29 -8% | 26.6 1% | 24 11% | 40 -49% | 28 -4% | 30 -12% | 31 -15% |
| Load Average * (dB) | 27.65 | 41 -48% | 34.7 -25% | 36.71 -33% | 48.3 -75% | 43 -56% | 46 -66% | 50 -81% |
| Witcher 3 ultra * (dB) | 47.9 | 44 8% | 47.6 1% | 50.92 -6% | 56 -17% | 51 -6% | 46 4% | 53 -11% |
| Load Maximum * (dB) | 47.86 | 46 4% | 54.8 -15% | 50.92 -6% | 59.1 -23% | 53 -11% | 47 2% | 57 -19% |
* ... menor é melhor
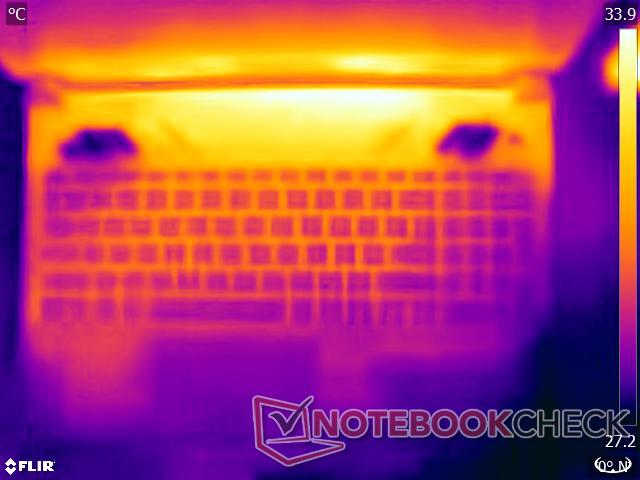
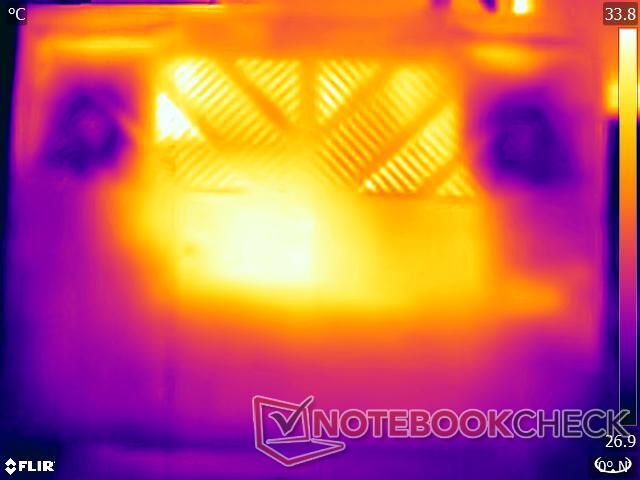
Temperatura
De acordo com a Dell, os SKUs G15 5530 equipados com uma RTX 4050 e superior utilizam um sistema de resfriamento de câmara de vapor, juntamente com o material de interface térmica Element 31, semelhante aos seus primos Alienware.
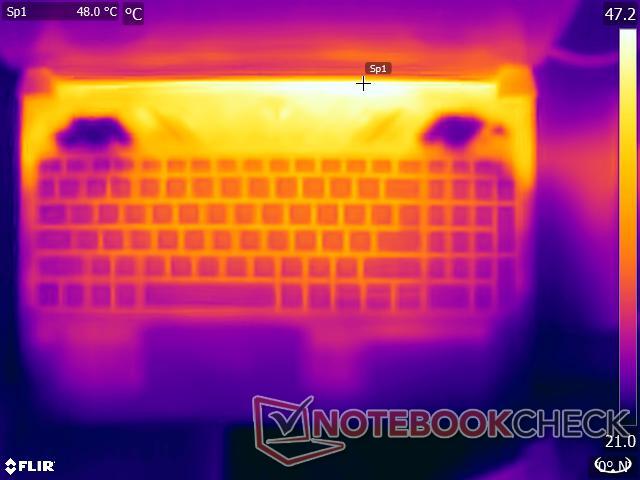
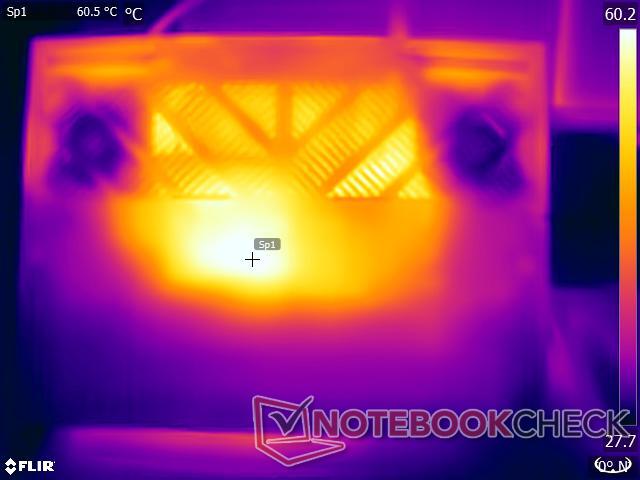
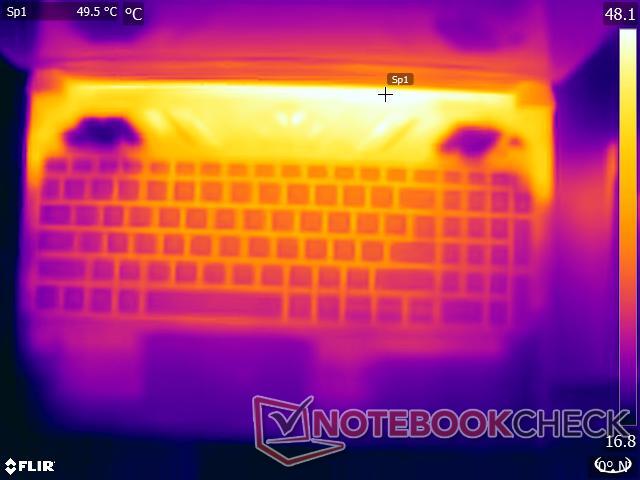
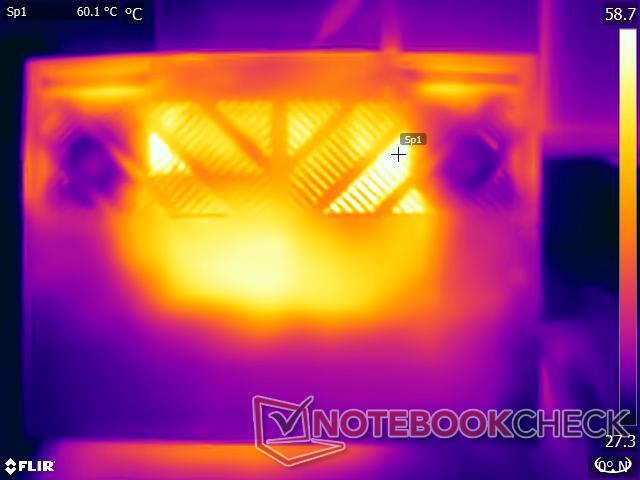
Apesar da presença de uma câmara de vapor, observamos altas temperaturas de superfície sob carga. No entanto, os apoios para as mãos e as áreas do touchpad permanecem relativamente frios.
(-) A temperatura máxima no lado superior é 54 °C / 129 F, em comparação com a média de 40.4 °C / 105 F , variando de 21.2 a 68.8 °C para a classe Gaming.
(-) A parte inferior aquece até um máximo de 62.2 °C / 144 F, em comparação com a média de 43.2 °C / 110 F
(+) Em uso inativo, a temperatura média para o lado superior é 31 °C / 88 F, em comparação com a média do dispositivo de 33.9 °C / ### class_avg_f### F.
(-) Jogando The Witcher 3, a temperatura média para o lado superior é 41.9 °C / 107 F, em comparação com a média do dispositivo de 33.9 °C / ## #class_avg_f### F.
(+) Os apoios para as mãos e o touchpad estão atingindo a temperatura máxima da pele (34.4 °C / 93.9 F) e, portanto, não estão quentes.
(-) A temperatura média da área do apoio para as mãos de dispositivos semelhantes foi 28.8 °C / 83.8 F (-5.6 °C / -10.1 F).
| Dell G15 5530 Intel Core i7-13650HX, NVIDIA GeForce RTX 4060 Laptop GPU | Asus ROG Strix G18 G814JI Intel Core i7-13650HX, NVIDIA GeForce RTX 4070 Laptop GPU | Lenovo Legion Pro 5 16IRX8 Intel Core i7-13700HX, NVIDIA GeForce RTX 4060 Laptop GPU | Asus ROG Flow X16 GV601V Intel Core i9-13900H, NVIDIA GeForce RTX 4060 Laptop GPU | MSI Katana 17 B13VFK Intel Core i7-13620H, NVIDIA GeForce RTX 4060 Laptop GPU | Asus TUF Gaming A16 FA617XS AMD Ryzen 9 7940HS, AMD Radeon RX 7600S | Asus ROG Strix G17 G713PI AMD Ryzen 9 7945HX, NVIDIA GeForce RTX 4070 Laptop GPU | Medion Erazer Major X20 Intel Core i9-13900HX, NVIDIA GeForce RTX 4070 Laptop GPU | |
|---|---|---|---|---|---|---|---|---|
| Heat | 16% | 13% | 11% | 13% | 11% | 14% | 3% | |
| Maximum Upper Side * (°C) | 54 | 45 17% | 42.8 21% | 46 15% | 41.6 23% | 53 2% | 42 22% | 46 15% |
| Maximum Bottom * (°C) | 62.2 | 47 24% | 50 20% | 41 34% | 43.1 31% | 48 23% | 41 34% | 49 21% |
| Idle Upper Side * (°C) | 33.4 | 28 16% | 29.6 11% | 36 -8% | 32 4% | 30 10% | 33 1% | 37 -11% |
| Idle Bottom * (°C) | 33.4 | 31 7% | 34 -2% | 33 1% | 35.8 -7% | 30 10% | 34 -2% | 38 -14% |
* ... menor é melhor
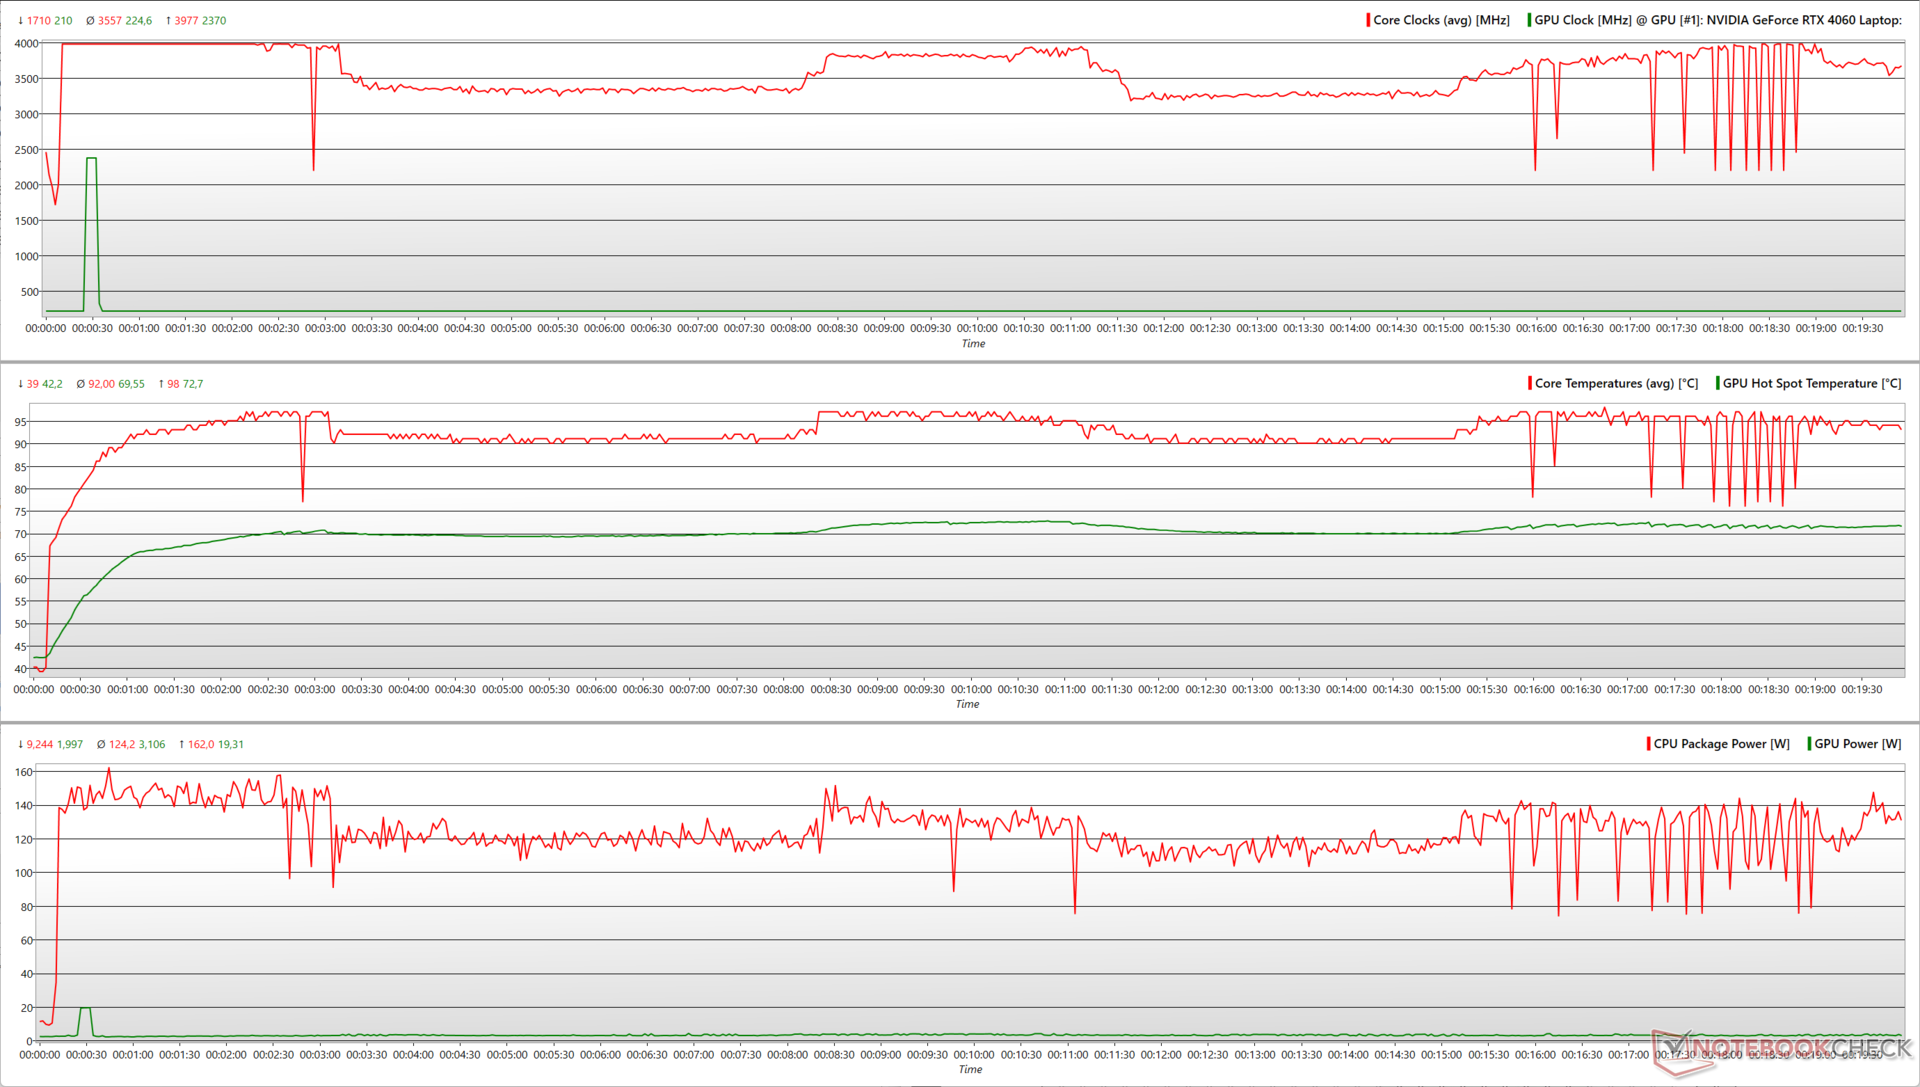
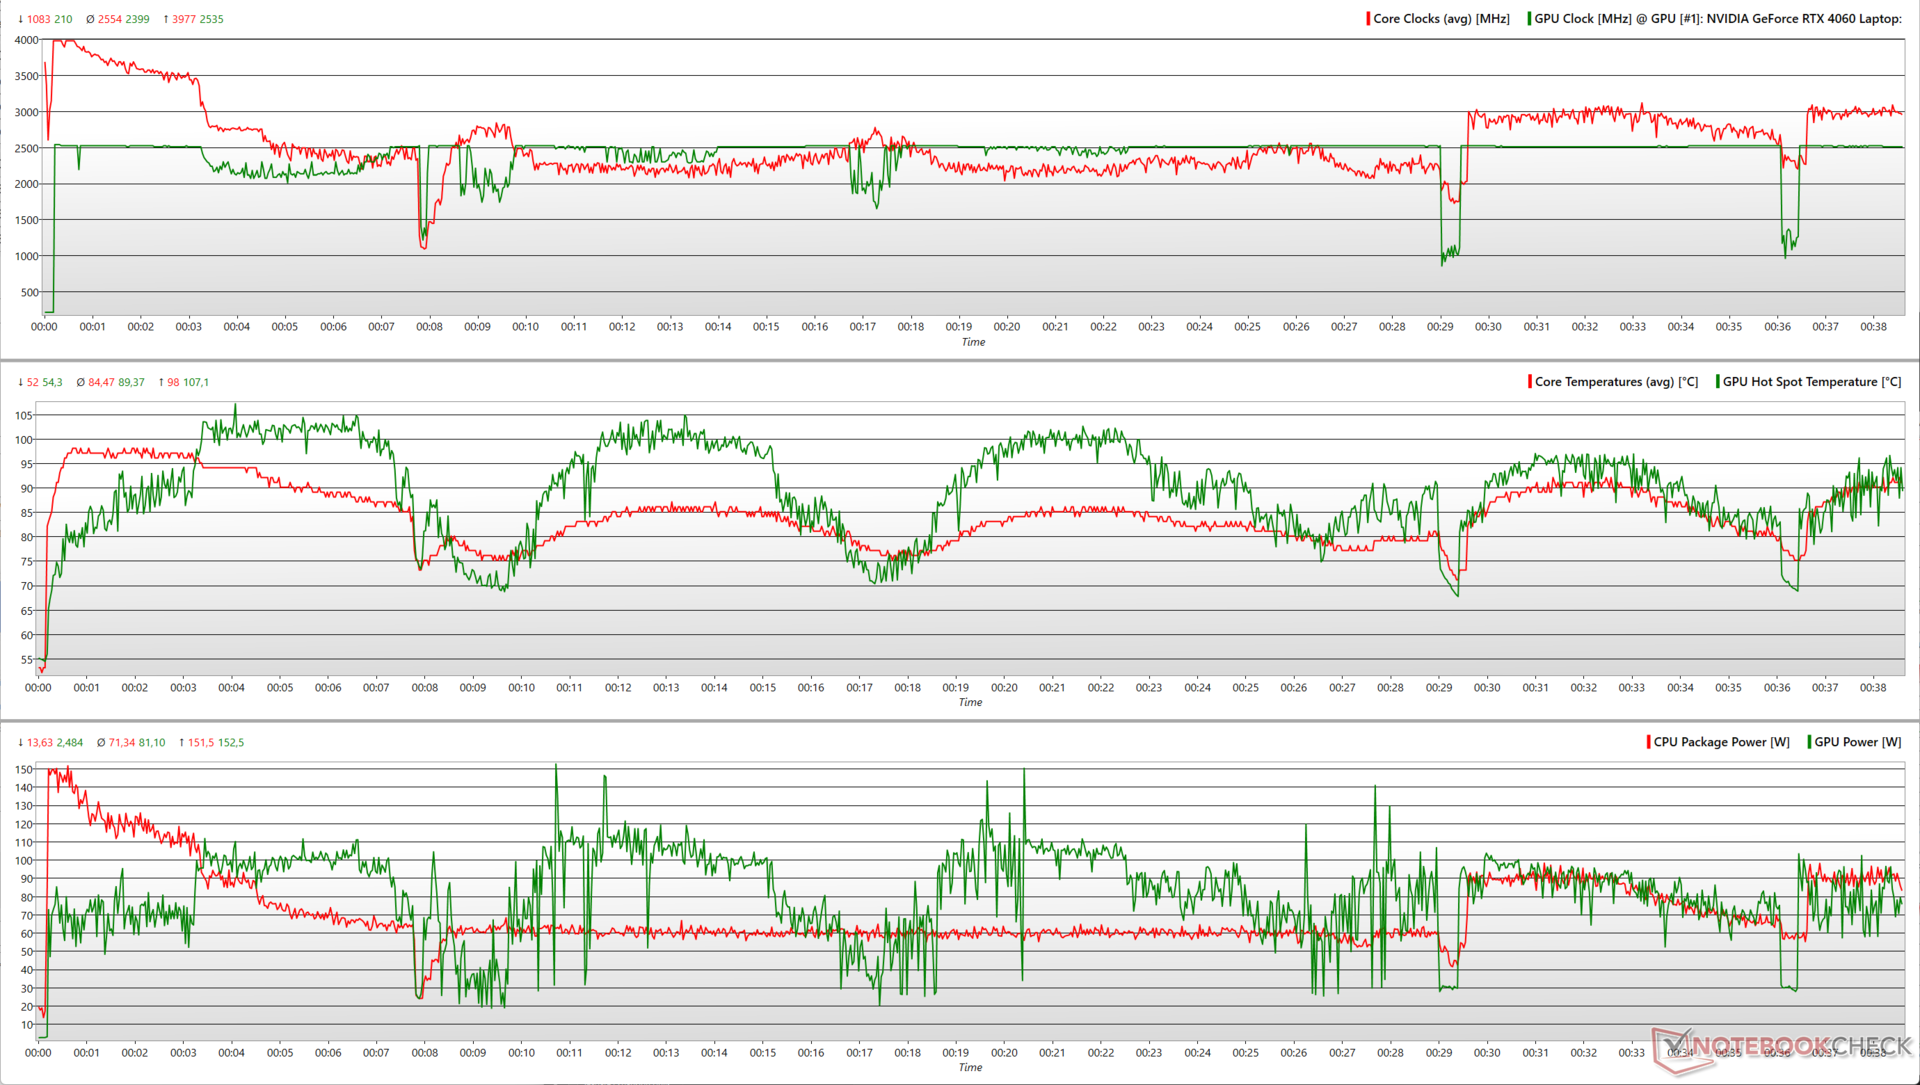
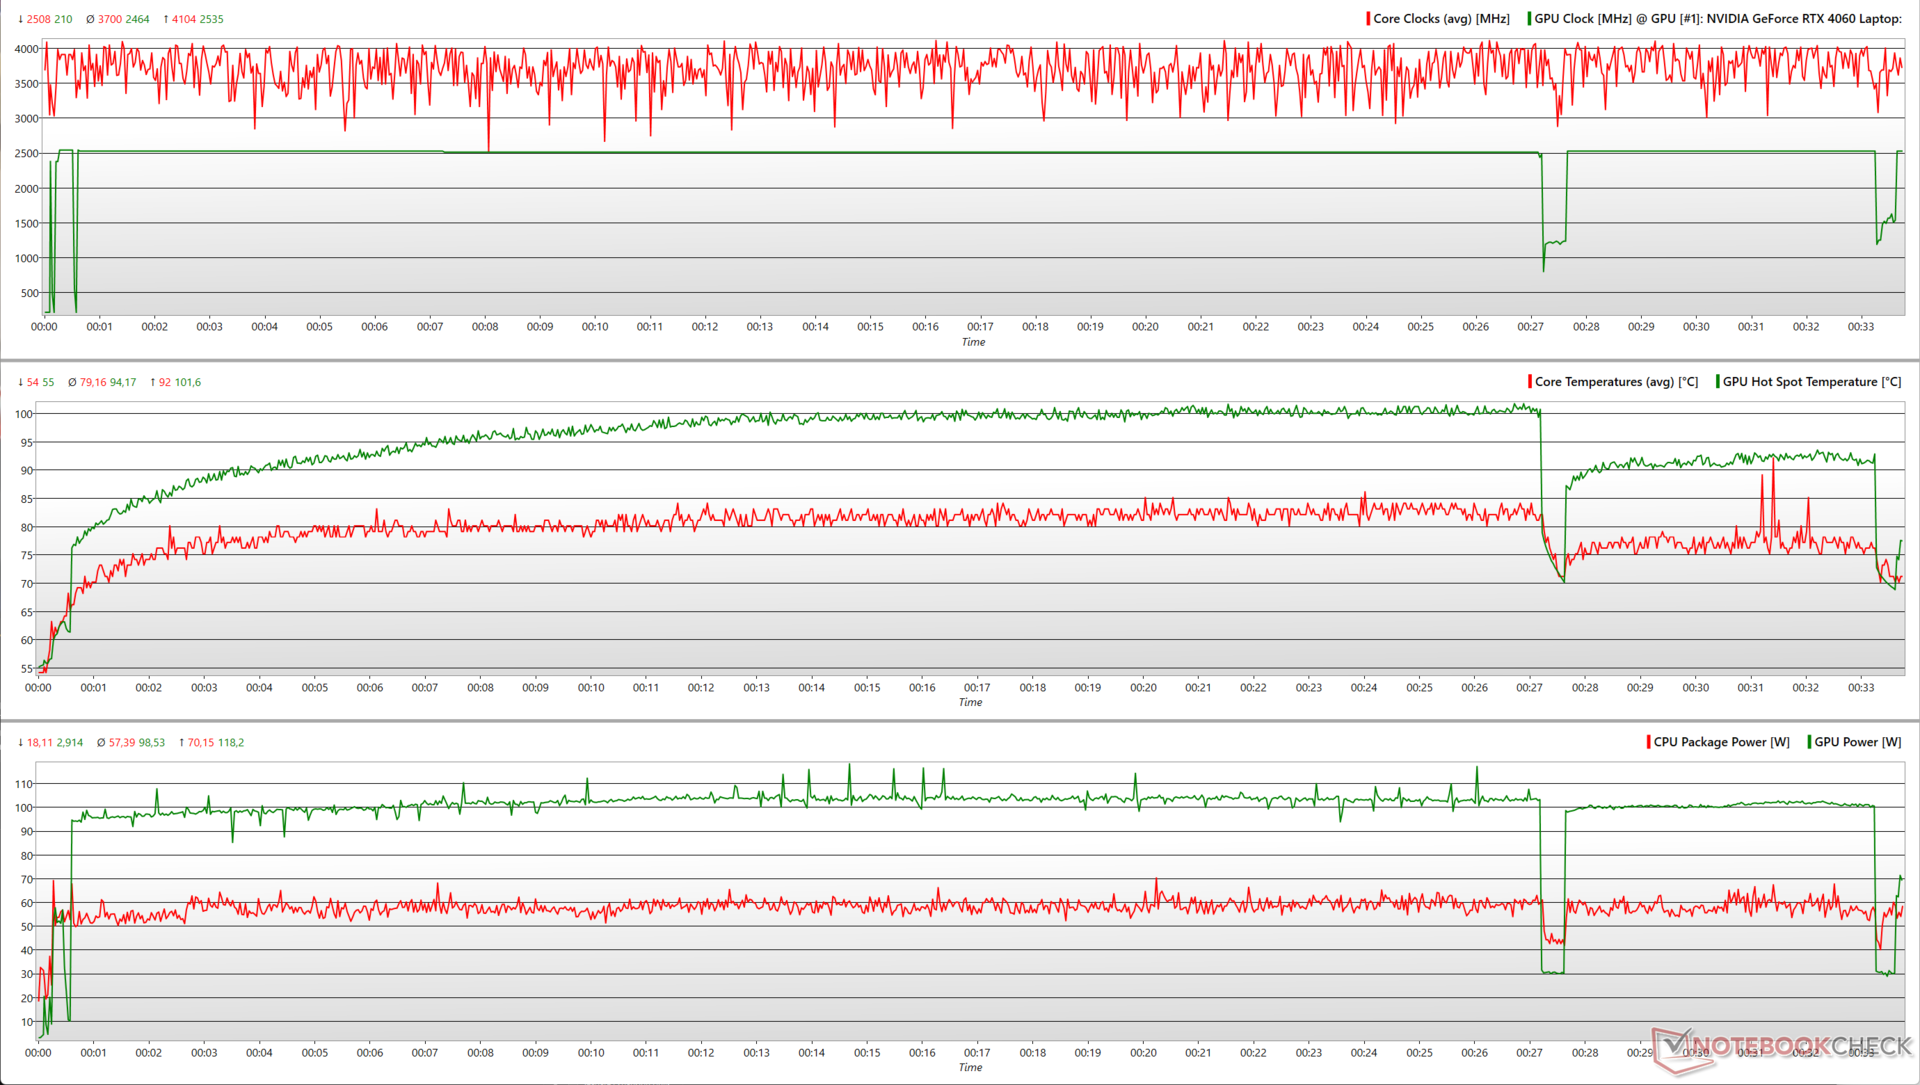
Teste de estresse
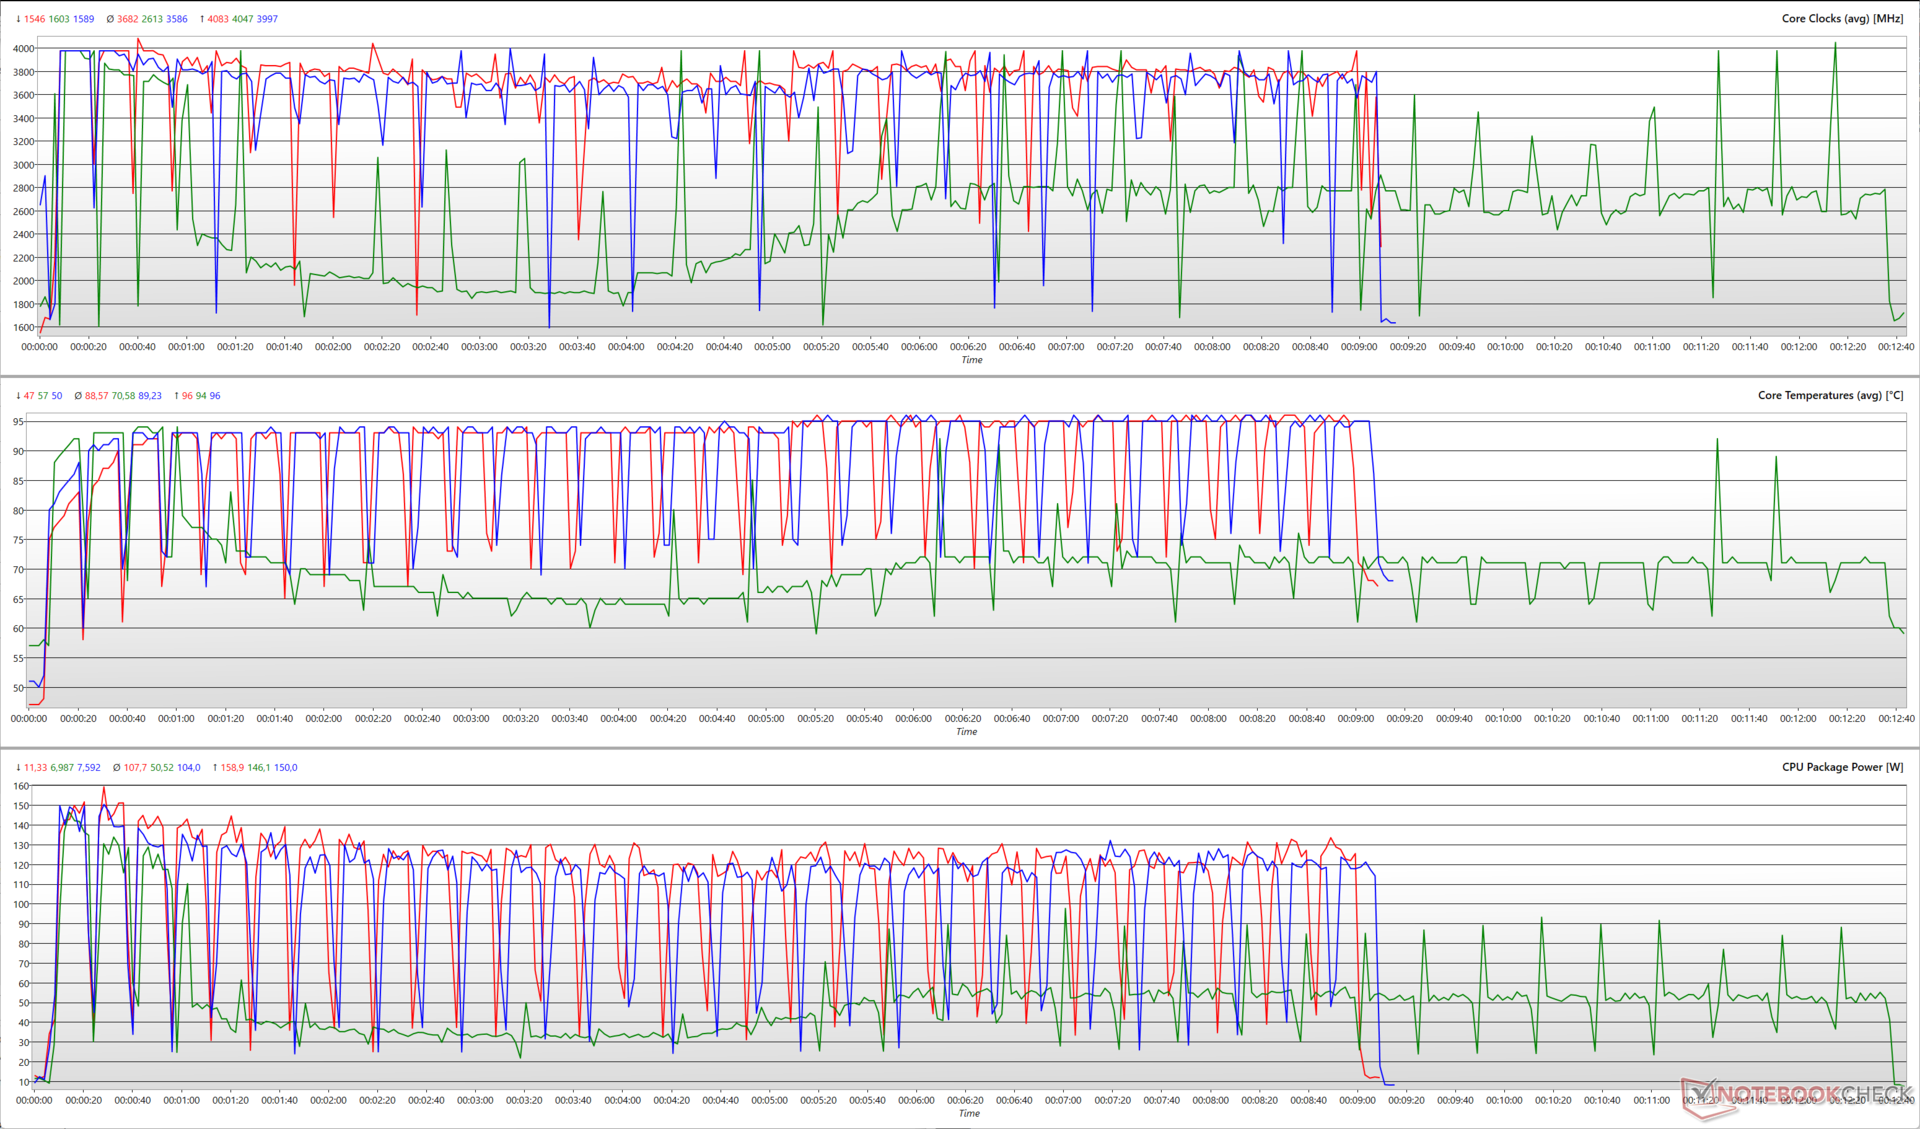
Durante o teste de estresse usando as grandes FFTs in-loco do Prime95, o Core i7-13650HX atinge um pico de potência do pacote de 162 W e alcança uma frequência máxima de aumento de quase 4 GHz. No entanto, esse alto consumo de energia e essa alta frequência não são sustentados, e a CPU se estabelece em uma potência média de 124 W durante todo o teste de estresse.
Quando o FurMark é introduzido, a GPU RTX 4060 atinge um pico de consumo de energia de 152,5 W com uma velocidade de clock de 2.535 MHz. Por fim, tanto a CPU quanto a GPU se estabelecem em um consumo médio de energia de 71 W (com clock de 2,5 GHz) e 81 W (com clock de 2.399 MHz), respectivamente.
| Teste de estresse | Clock da CPU (GHz) | Clock da GPU (MHz) | Temperatura média da CPU (°C) | Temperatura média da GPU (°C) |
| Sistema ocioso | 1,6 | 210 | 39 | 36,3 |
| Prime95 | 3.7 | 210 | 92 | 61.3 |
| Prime95 + FurMark | 3.05 | 2,505 | 84.5 | 89.3 |
| O Witcher 3 1080p Ultra | 4 | 1.485 | 79 | 94 |
A CPU e a GPU demonstram uma resposta mais previsível durante o teste de estresse com o The Witcher 3 a 1080p Ultra. Elas atingem clocks de pico de 4,1 GHz e 2.535 MHz, respectivamente, com a CPU consumindo no máximo 70 W e a GPU consumindo no máximo 118 W. Há uma breve queda nas métricas da CPU e da GPU por volta da marca de 30 minutos do teste, mas elas se recuperam rapidamente para suas velocidades de clock originais.
Alto-falantes
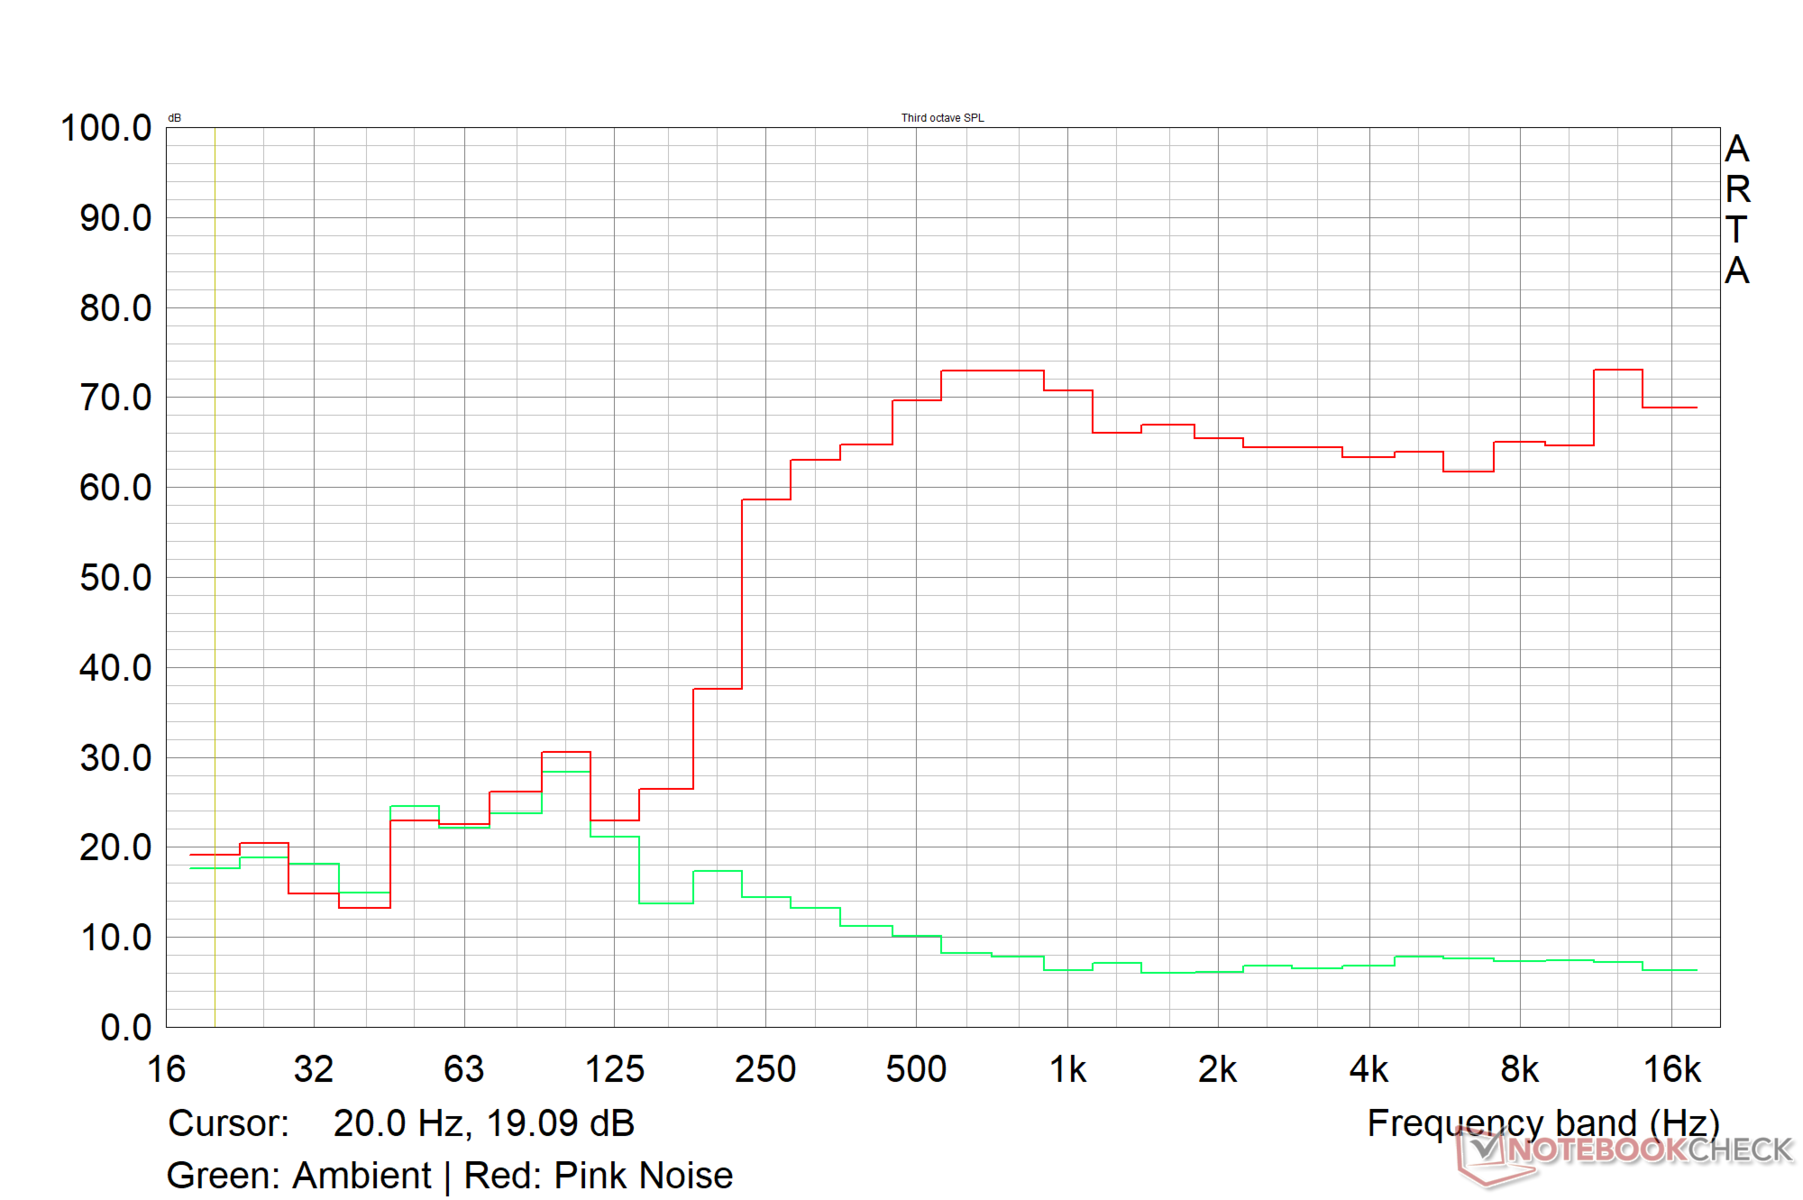
Os alto-falantes do G15 são razoavelmente altos, com 79,6 dB(A). No entanto, parece que a Dell poderia ter utilizado o chassi grande de forma mais eficaz para fornecer uma resposta de graves mais forte. No lado positivo, os sons médios e agudos são bem reproduzidos.
A qualidade do áudio é razoável, mas os usuários podem obter uma experiência de áudio melhor conectando dispositivos de áudio externos por meio do conector de áudio de 3,5 mm ou via Bluetooth.
Dell G15 5530 análise de áudio
(±) | o volume do alto-falante é médio, mas bom (###valor### dB)
Graves 100 - 315Hz
(-) | quase nenhum baixo - em média 24.7% menor que a mediana
(-) | graves não são lineares (15.2% delta para frequência anterior)
Médios 400 - 2.000 Hz
(+) | médios equilibrados - apenas 4.1% longe da mediana
(+) | médios são lineares (4.2% delta para frequência anterior)
Altos 2 - 16 kHz
(+) | agudos equilibrados - apenas 0.8% longe da mediana
(+) | os máximos são lineares (2.2% delta da frequência anterior)
Geral 100 - 16.000 Hz
(±) | a linearidade do som geral é média (16.3% diferença em relação à mediana)
Comparado com a mesma classe
» 41% de todos os dispositivos testados nesta classe foram melhores, 6% semelhantes, 53% piores
» O melhor teve um delta de 6%, a média foi 18%, o pior foi 132%
Comparado com todos os dispositivos testados
» 27% de todos os dispositivos testados foram melhores, 6% semelhantes, 68% piores
» O melhor teve um delta de 4%, a média foi 23%, o pior foi 134%
Apple MacBook Pro 16 2021 M1 Pro análise de áudio
(+) | os alto-falantes podem tocar relativamente alto (###valor### dB)
Graves 100 - 315Hz
(+) | bons graves - apenas 3.8% longe da mediana
(+) | o baixo é linear (5.2% delta para a frequência anterior)
Médios 400 - 2.000 Hz
(+) | médios equilibrados - apenas 1.3% longe da mediana
(+) | médios são lineares (2.1% delta para frequência anterior)
Altos 2 - 16 kHz
(+) | agudos equilibrados - apenas 1.9% longe da mediana
(+) | os máximos são lineares (2.7% delta da frequência anterior)
Geral 100 - 16.000 Hz
(+) | o som geral é linear (4.6% diferença em relação à mediana)
Comparado com a mesma classe
» 0% de todos os dispositivos testados nesta classe foram melhores, 0% semelhantes, 100% piores
» O melhor teve um delta de 5%, a média foi 17%, o pior foi 45%
Comparado com todos os dispositivos testados
» 0% de todos os dispositivos testados foram melhores, 0% semelhantes, 100% piores
» O melhor teve um delta de 4%, a média foi 23%, o pior foi 134%
Gerenciamento de energia: Não é muito econômico sob carga
Consumo de energia
Embora o G15 5530 demonstre um consumo de energia razoavelmente eficiente quando ocioso, ele consome mais energia sob carga em comparação com o ROG Strix G18 equipado com uma RTX 4070.
O Lenovo Legion Pro 5 16com um Core i7-13700HX e RTX 4060, mostra uma inversão de papéis com um consumo de energia ligeiramente menor sob carga do que o G15 5530, mas maior consumo de energia quando ocioso.
O enorme adaptador de energia de 330 W fornecido é capaz de manter o G15 alimentado adequadamente, mesmo sob estresse.
| desligado | |
| Ocioso | |
| Carga |
|
Key:
min: | |
| Dell G15 5530 i7-13650HX, GeForce RTX 4060 Laptop GPU, IPS, 1920x1080, 15.6" | Asus ROG Strix G18 G814JI i7-13650HX, GeForce RTX 4070 Laptop GPU, IPS, 2560x1600, 18" | Lenovo Legion Pro 5 16IRX8 i7-13700HX, GeForce RTX 4060 Laptop GPU, IPS, 2560x1600, 16" | Asus ROG Flow X16 GV601V i9-13900H, GeForce RTX 4060 Laptop GPU, IPS, 2560x1600, 16" | MSI Katana 17 B13VFK i7-13620H, GeForce RTX 4060 Laptop GPU, IPS LED, 1920x1080, 17.3" | Asus TUF Gaming A16 FA617XS R9 7940HS, Radeon RX 7600S, IPS, 1920x1200, 16" | Asus ROG Strix G17 G713PI R9 7945HX, GeForce RTX 4070 Laptop GPU, IPS, 2560x1440, 17.3" | Medion Erazer Major X20 i9-13900HX, GeForce RTX 4070 Laptop GPU, IPS, 2560x1600, 16" | Média NVIDIA GeForce RTX 4060 Laptop GPU | Média da turma Gaming | |
|---|---|---|---|---|---|---|---|---|---|---|
| Power Consumption | -10% | -66% | 1% | 1% | 19% | -35% | -26% | -9% | -27% | |
| Idle Minimum * (Watt) | 8.4 | 8 5% | 24.5 -192% | 9.6 -14% | 12.2 -45% | 7 17% | 15 -79% | 12 -43% | 11.5 ? -37% | 12.8 ? -52% |
| Idle Average * (Watt) | 14.98 | 15 -0% | 29.2 -95% | 16 -7% | 14.9 1% | 10 33% | 20 -34% | 16 -7% | 16 ? -7% | 18.5 ? -23% |
| Idle Maximum * (Watt) | 15.56 | 26 -67% | 34.3 -120% | 16.9 -9% | 15.8 -2% | 15 4% | 29 -86% | 26 -67% | 20.3 ? -30% | 24 ? -54% |
| Load Average * (Watt) | 96.8 | 102 -5% | 98.7 -2% | 104 -7% | 85.22 12% | 86 11% | 121 -25% | 115 -19% | 92.9 ? 4% | 108.2 ? -12% |
| Witcher 3 ultra * (Watt) | 186 | 178.6 4% | 178.6 4% | 142 24% | 151.1 19% | 160.6 14% | 179.8 3% | 191.6 -3% | ||
| Load Maximum * (Watt) | 271.42 | 267 2% | 249.6 8% | 214 21% | 212.8 22% | 172 37% | 246 9% | 319 -18% | 210 ? 23% | 254 ? 6% |
* ... menor é melhor
Power Consumption: The Witcher 3 / Stress test
Power Consumption: External monitor
Duração da bateria
O G15 muda para o perfil de energia da bateria quando é desconectado da tomada. Entretanto, a taxa de atualização não é reduzida automaticamente para 60 Hz.
A bateria de 86 WHr oferece tempos de execução decentes, desde que o laptop não esteja sob forte estresse. Por exemplo, durante a reprodução de vídeo em 1080p a 150 nits, a bateria pode durar quase 7 horas. Entretanto, ao jogar com o mesmo nível de brilho, a bateria mal dura uma hora.
| Dell G15 5530 Intel Core i7-13650HX, GeForce RTX 4060 Laptop GPU, 86 Wh | Asus ROG Strix G18 G814JI Intel Core i7-13650HX, GeForce RTX 4070 Laptop GPU, 90 Wh | Lenovo Legion Pro 5 16IRX8 Intel Core i7-13700HX, GeForce RTX 4060 Laptop GPU, 80 Wh | Asus ROG Flow X16 GV601V Intel Core i9-13900H, GeForce RTX 4060 Laptop GPU, 90 Wh | MSI Katana 17 B13VFK Intel Core i7-13620H, GeForce RTX 4060 Laptop GPU, 53.5 Wh | Asus TUF Gaming A16 FA617XS AMD Ryzen 9 7940HS, Radeon RX 7600S, 90 Wh | Asus ROG Strix G17 G713PI AMD Ryzen 9 7945HX, GeForce RTX 4070 Laptop GPU, 90 Wh | Medion Erazer Major X20 Intel Core i9-13900HX, GeForce RTX 4070 Laptop GPU, 62.3 Wh | Média da turma Gaming | |
|---|---|---|---|---|---|---|---|---|---|
| Duração da bateria | 38% | -31% | 47% | -15% | 62% | -8% | 7% | 43% | |
| H.264 (h) | 6.8 | 8.9 31% | 12.4 82% | 2.8 -59% | 4.2 -38% | 8.9 ? 31% | |||
| WiFi v1.3 (h) | 6.5 | 8.1 25% | 3.4 -48% | 7.9 22% | 2.9 -55% | 12.4 91% | 4.3 -34% | 3.9 -40% | 7.09 ? 9% |
| Witcher 3 ultra (h) | 0.8 | 1.1 38% | |||||||
| Load (h) | 0.8 | 1.2 50% | 0.7 -13% | 1.5 88% | 1 25% | 0.9 13% | 1 25% | 1.6 100% | 1.51 ? 89% |
| Reader / Idle (h) | 11.7 | 6.7 | 20.3 | 5.8 | 8.71 ? |
Pro
Contra
Veredicto: Tenta acertar sem gastar muito

O renovado G15 5530 da Dell traz a potência do Intel Raptor Lake-HX para desktop em um chassi pesado, mas moderno, complementado por um adaptador de energia volumoso.
O G15 5530 tem muitas coisas boas a seu favor. Você obtém uma boa taxa de transferência Wi-Fi e um painel IPS rápido de 1080p com reprodução de cores decente. A manutenção e os upgrades são fáceis, desde que você não se importe com o slot não convencional para SSD M.2 2242.
Em termos de desempenho, a combinação do Core i7-13650HX e da GPU para laptop Nvidia GeForce RTX 4060 de 140 W oferece um desempenho sólido para jogos Ultra de 1080p, com potencial para resoluções mais altas usando DLSS ou FSR. Em sua maior parte, o G15 5530 tem desempenho equivalente ao doLenovo Legion Pro 5 16 com um Core i7-13700HX.
O Dell G15 5530 oferece um bom desempenho, atualizações fáceis e é uma alternativa acessível aos seus irmãos da Alienware, desde que você não leve em conta o volume e aceite algumas de suas limitações."
No entanto, há algumas compensações inevitáveis que precisam ser feitas. O posicionamento das portas não é muito ideal, o armazenamento é lento, não há fornecimento de energia via USB e a webcam é decepcionante para um dispositivo de 2023. As temperaturas da superfície e o consumo de energia sob carga também são mais altos para essa configuração. Até mesmo um Asus ROG Strix G17 com um AMD Ryzen 9 7945HX e RTX 4070 consome menos energia sob carga.
Em suma, o Dell G15 5530 faz o possível para equilibrar potência e preço e, sem dúvida, merece ser considerado se você estiver procurando um laptop para jogos na faixa de ₹ 1.50.000 (US$ 1.400).
Preço e disponibilidade
O Dell G15 5530 pode ser configurado e adquirido diretamente nas lojas on-line Dell India e nas lojas on-line da Dell nos EUA. O G15 5530 com a RTX 4060 também está listado na Amazon dos EUA.
A Amazon Índia tem uma versão RTX 4050 com disponibilidade desconhecida. O Dell G15 5530 com Core i7-13650HX, RTX 4050 e um SSD de 1 TB pode ser adquirido na Best Buy por US$ 1.150.
Dell G15 5530
- 06/25/2023 v7 (old)
Vaidyanathan Subramaniam
Transparência
A seleção dos dispositivos a serem analisados é feita pela nossa equipe editorial. A amostra de teste foi fornecida ao autor como empréstimo pelo fabricante ou varejista para fins desta revisão. O credor não teve influência nesta revisão, nem o fabricante recebeu uma cópia desta revisão antes da publicação. Não houve obrigação de publicar esta revisão. Como empresa de mídia independente, a Notebookcheck não está sujeita à autoridade de fabricantes, varejistas ou editores.
É assim que o Notebookcheck está testando
Todos os anos, o Notebookcheck analisa de forma independente centenas de laptops e smartphones usando procedimentos padronizados para garantir que todos os resultados sejam comparáveis. Desenvolvemos continuamente nossos métodos de teste há cerca de 20 anos e definimos padrões da indústria no processo. Em nossos laboratórios de teste, equipamentos de medição de alta qualidade são utilizados por técnicos e editores experientes. Esses testes envolvem um processo de validação em vários estágios. Nosso complexo sistema de classificação é baseado em centenas de medições e benchmarks bem fundamentados, o que mantém a objetividade.Price comparison

