Análise do Durabook R8: O primeiro tablet robusto sem ventilador do mundo com Intel de 12ª geração

A Durabook é especializada em laptops e tablets robustos projetados para ambientes exigentes, como fabricação, aplicação da lei, pesquisa de campo, agências governamentais e outros setores fora do espaço tradicional de escritório. O modelo mais recente é o Durabook R8, totalmente robusto, que é um dos primeiros em sua categoria de tamanho a ter CPUs Alder Lake-U de 12ª geração em um design sem ventoinha.
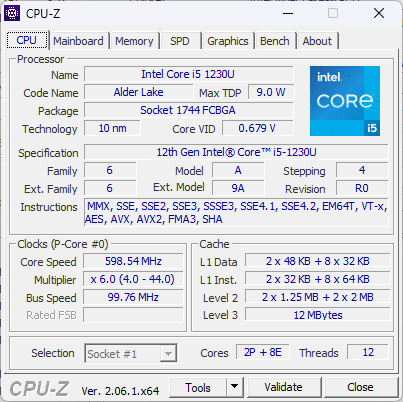
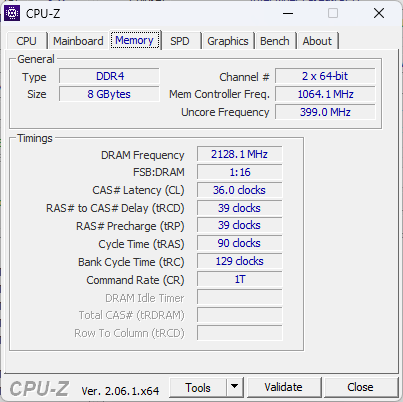
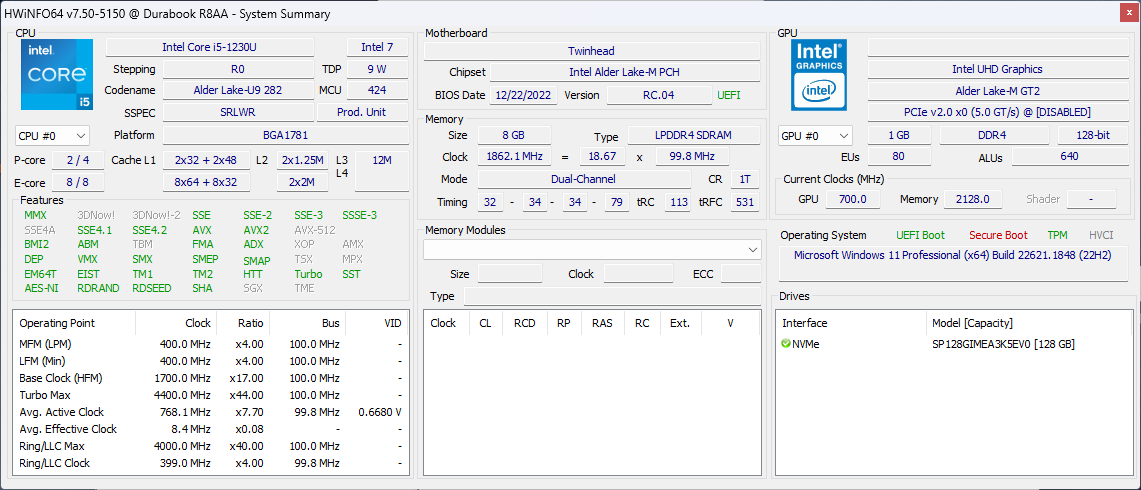
Nossa unidade de teste tem um Core i5-1230U, 8 GB de RAM LPDDR4x-2133 soldada e um SSD de 128 GB. Outras SKUs estão disponíveis com o Pentium 8500, Core i7-1250U, 16 GB de RAM ou SSD de 1 TB, mas todas as opções são fornecidas com a mesma tela sensível ao toque de 8 polegadas com resolução de 1280 x 800.
As alternativas ao Durabook R8 incluem outros tablets robustos, como oAcer Enduro T1,Dell Latitude 7230 Rugged Extremeou oPanasonic Toughbook FZ-G2.
Mais análises de Durabook:
Possíveis concorrentes em comparação
Avaliação | Data | Modelo | Peso | Altura | Size | Resolução | Preço |
|---|---|---|---|---|---|---|---|
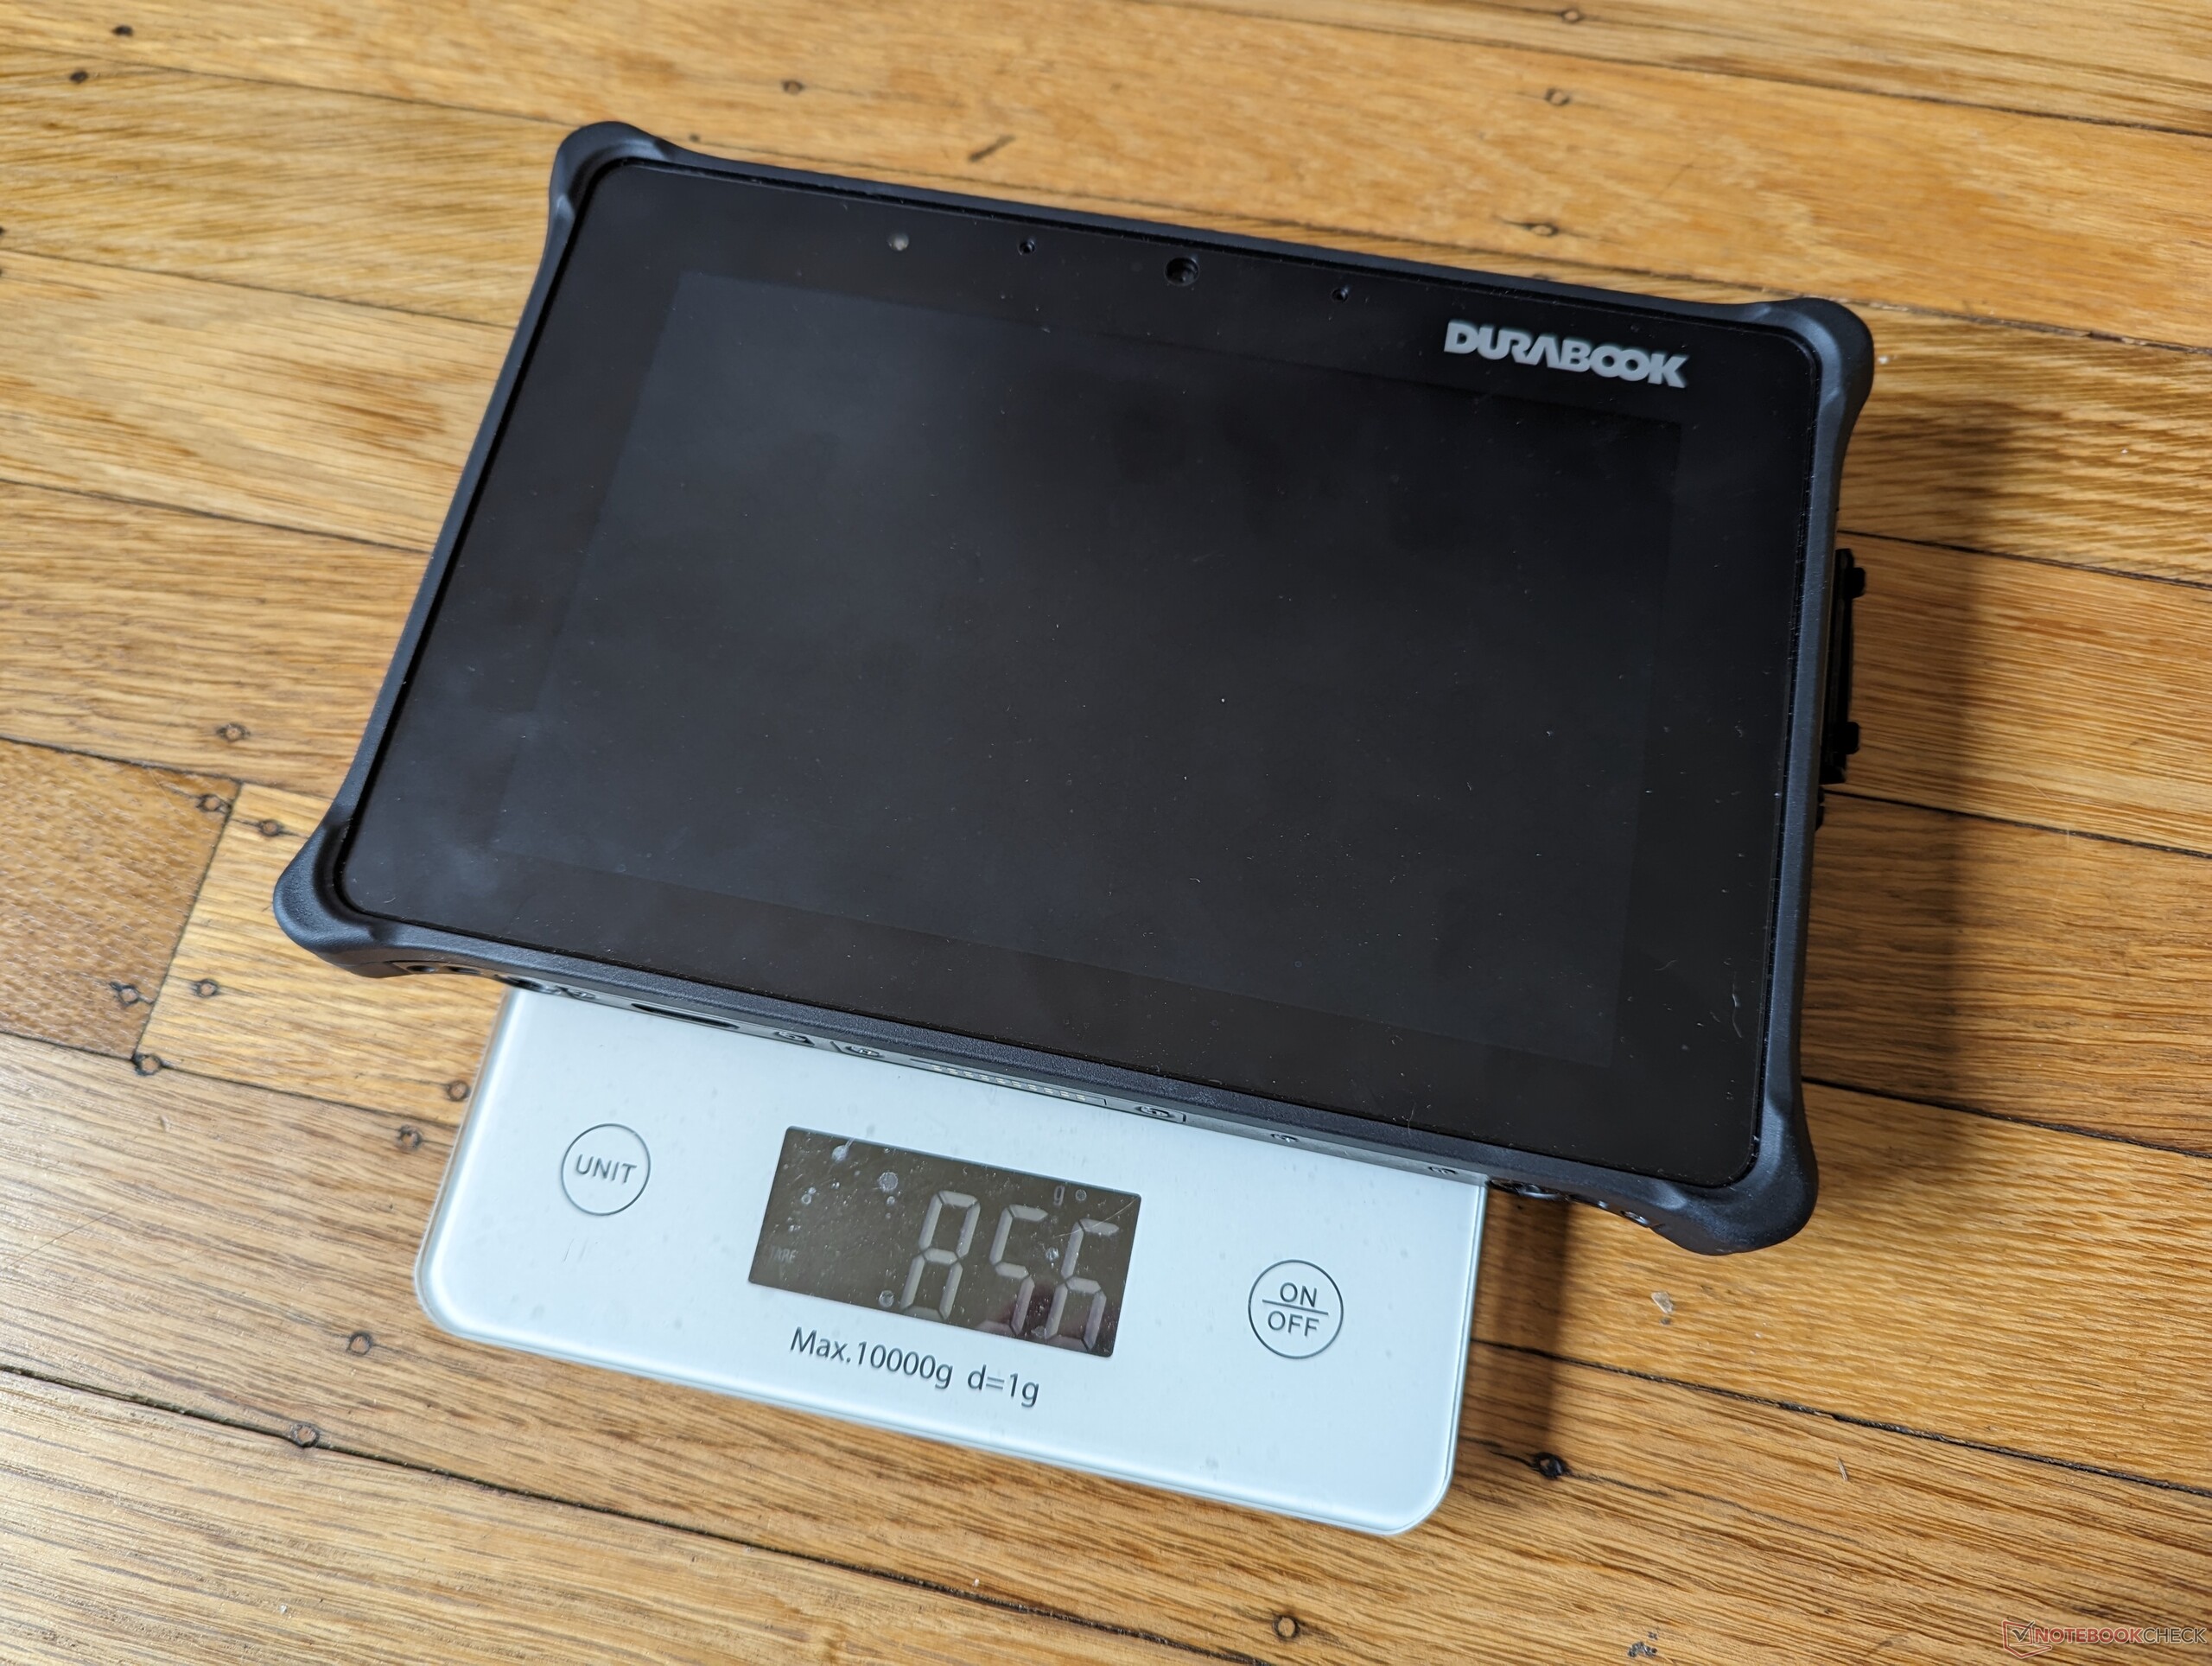
| 79.6 % v7 (old) | 07/2023 | Durabook R8 Tablet i5-1230U, Iris Xe G7 80EUs | 856 g | 20.6 mm | 8.00" | 1280x800 | |
v (old) | Acer Enduro T1 ET108-11A A9001 | 499 g | 10.9 mm | 8.00" | 1280x800 | ||
| 79.5 % v7 (old) | 05/2023 | Lenovo Tab M8 (Gen 4) Helio A22 MT6761, PowerVR GE8300 | 320 g | 9 mm | 8.00" | 1280x800 | |
| 83.9 % v7 (old) | 04/2023 | Dell Latitude 7230 Rugged Extreme i5-1240U, Iris Xe G7 80EUs | 1.6 kg | 23.9 mm | 12.00" | 1920x1200 | |
v (old) | 08/2021 | Panasonic Toughbook FZ-G2 i5-10310U, UHD Graphics 620 | 1.5 kg | 28 mm | 10.10" | 1920x1200 |
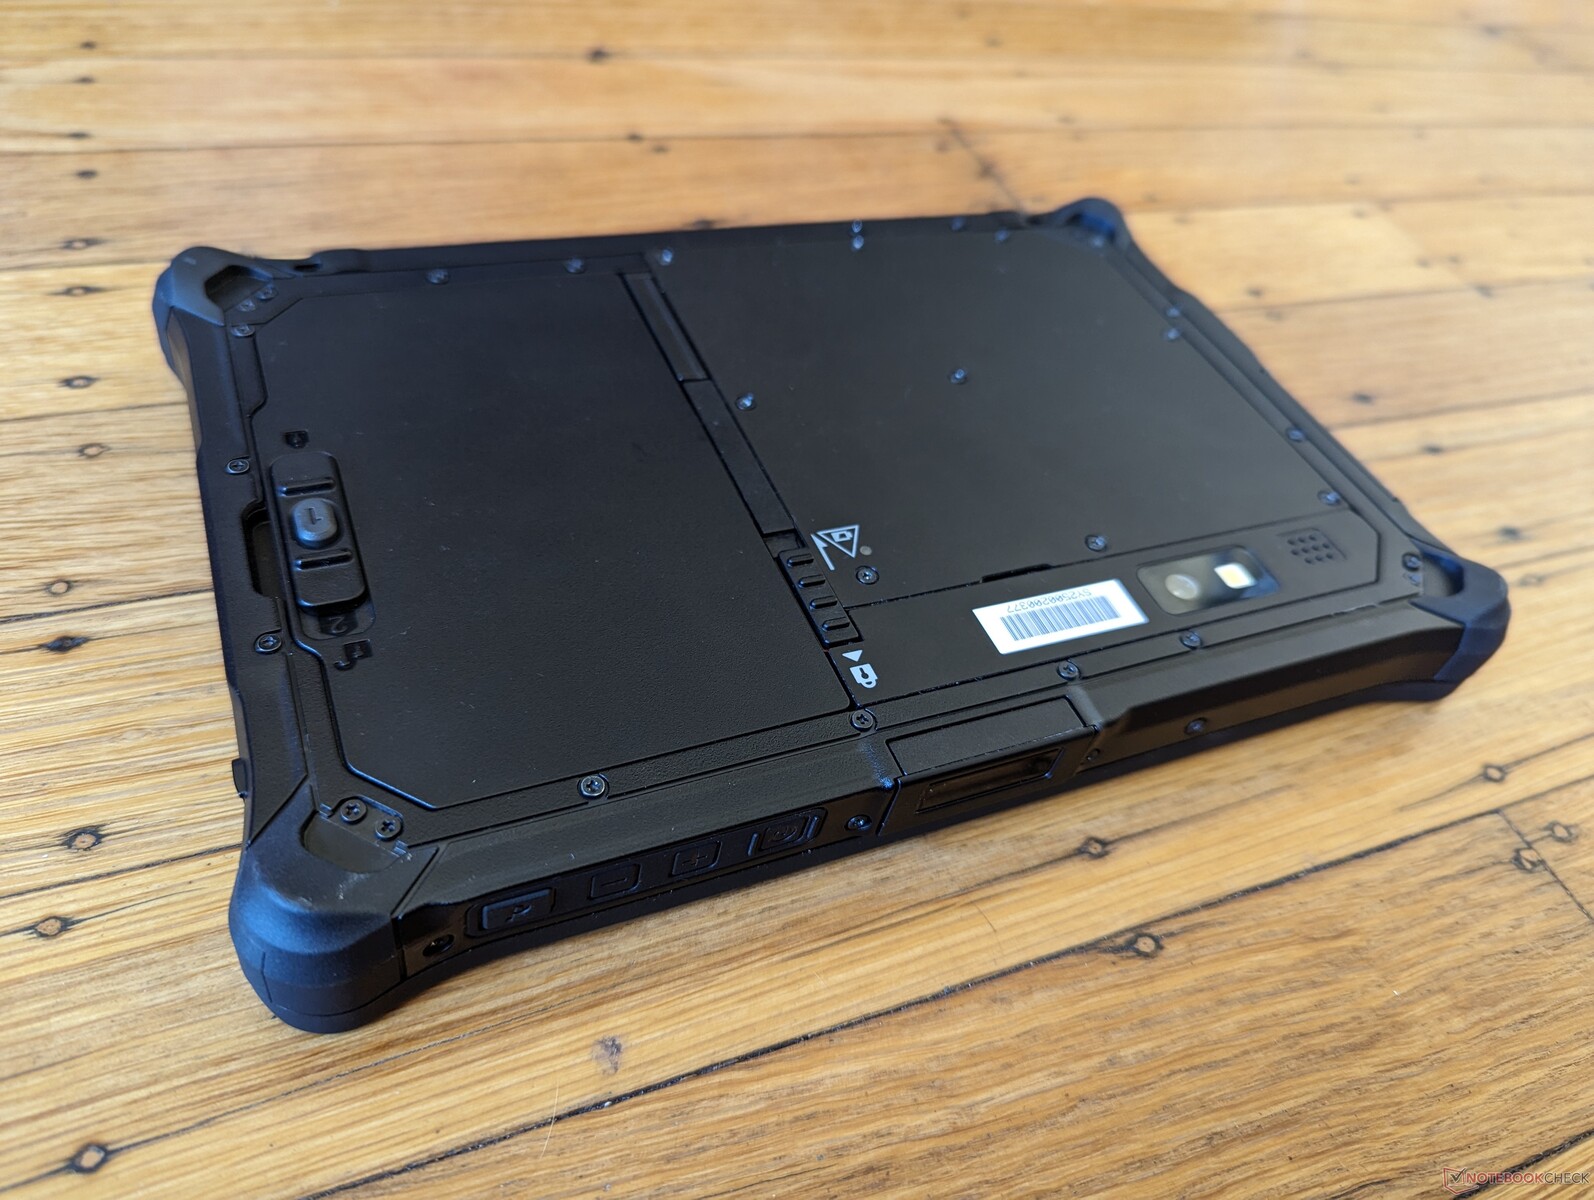
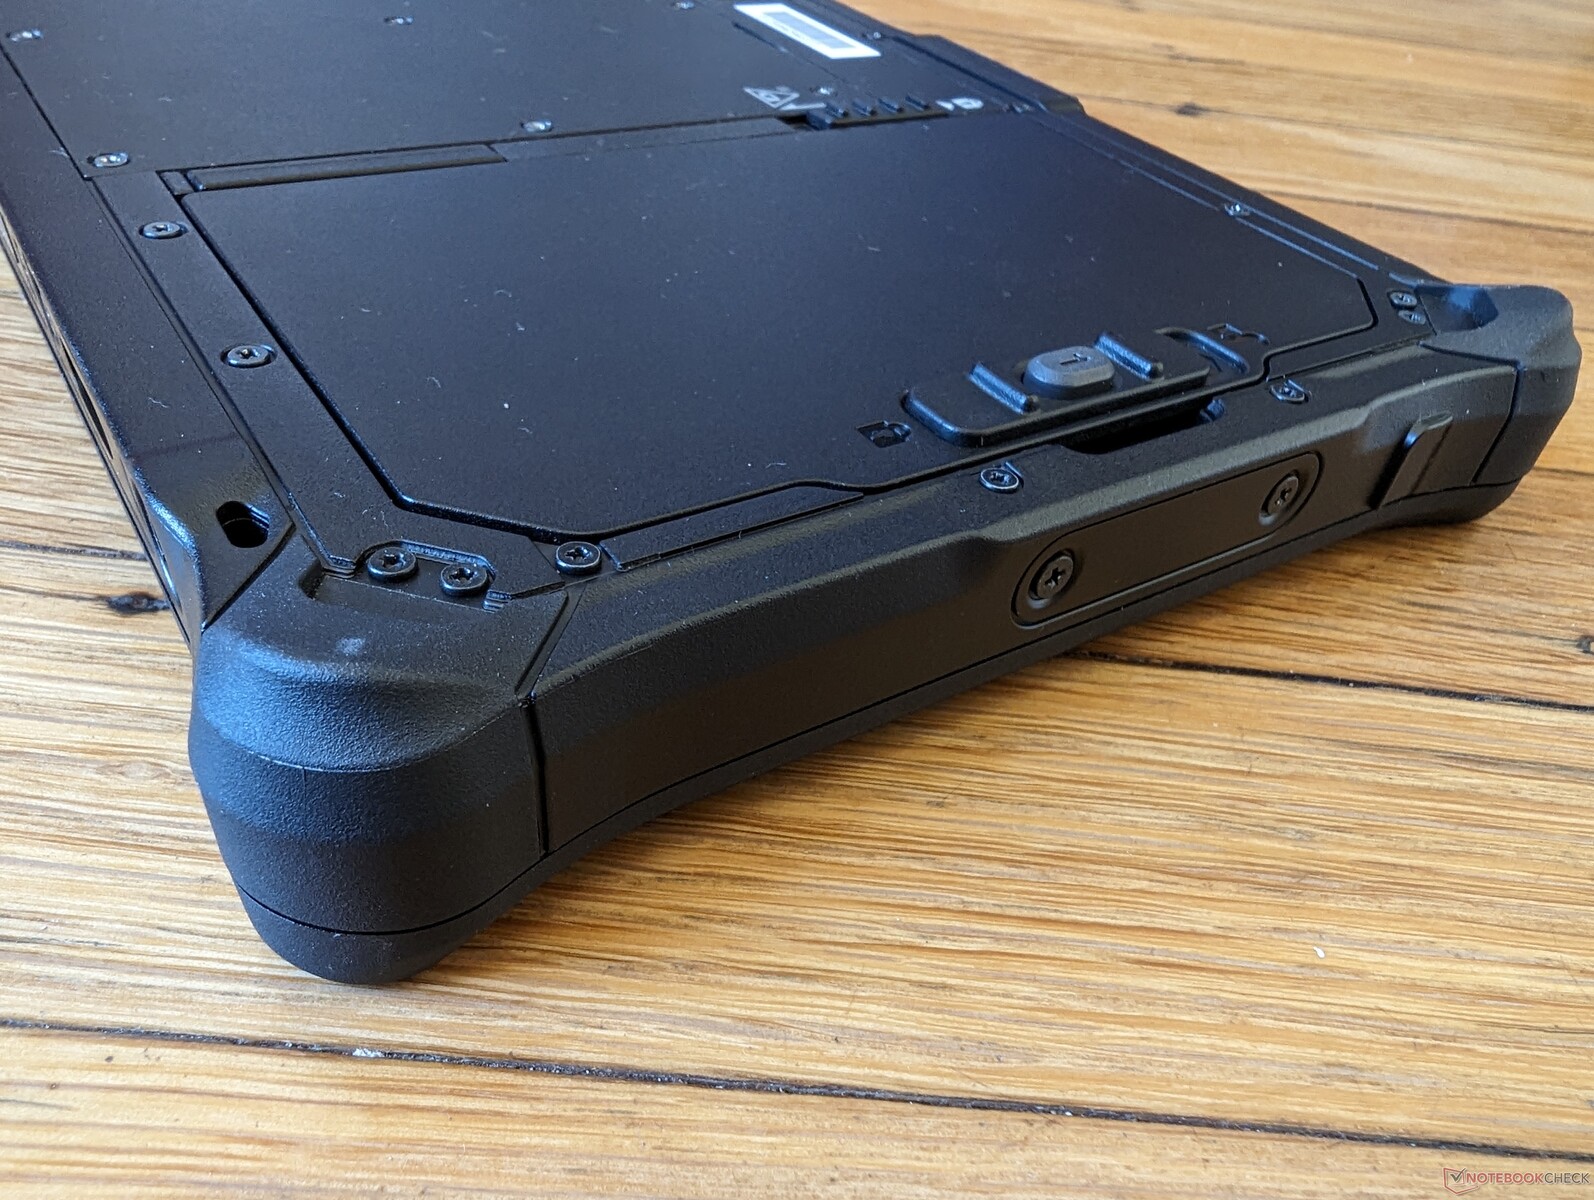
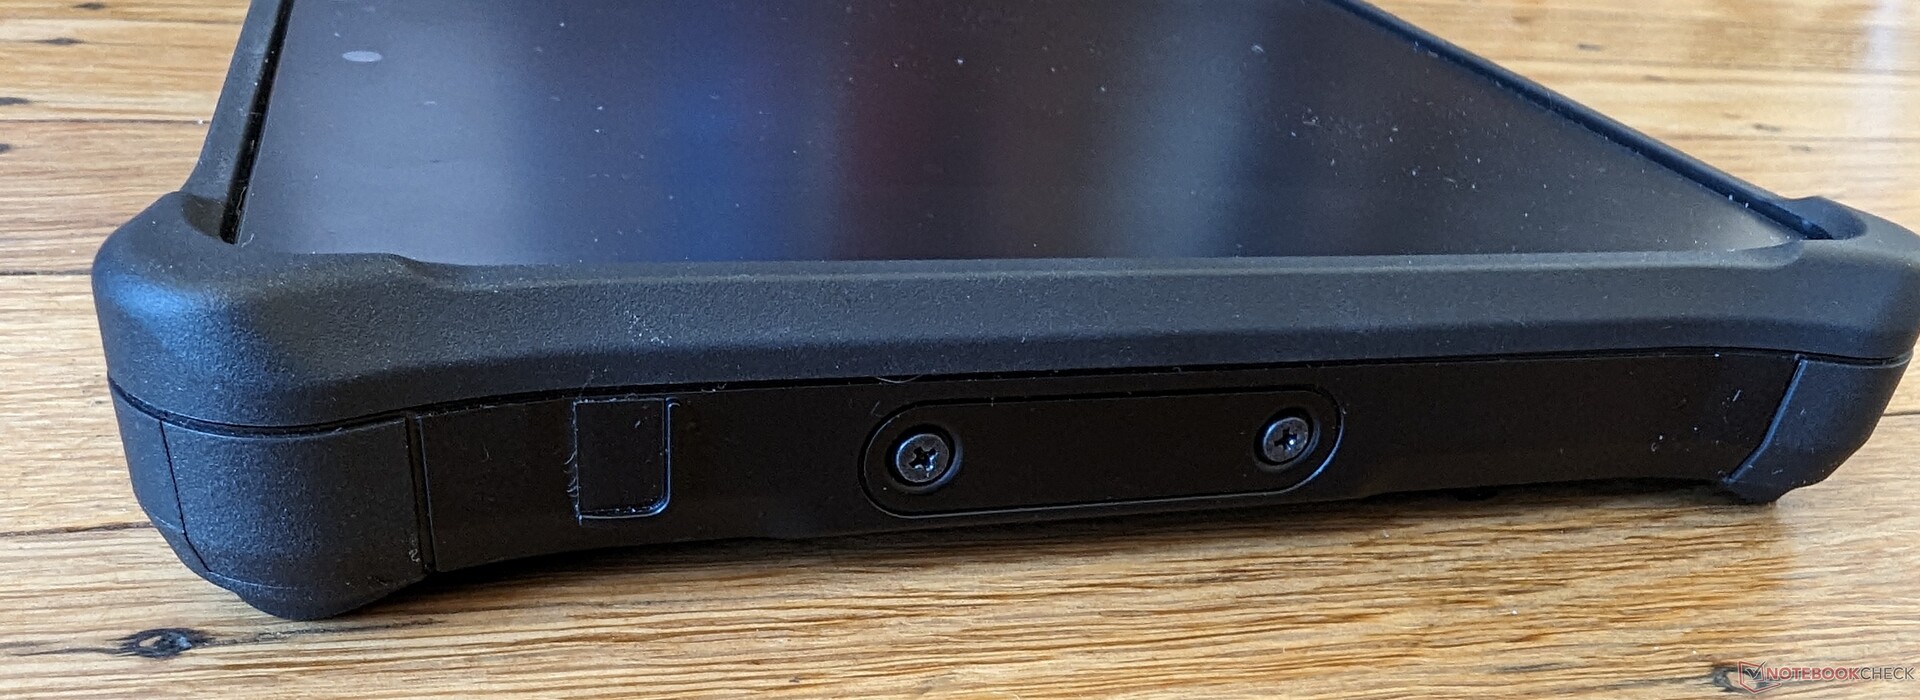
Estojo - Durabook durável
O chassi tem certificação MIL-STD 810H, MIL-STD 461G e IP66 contra uma ampla gama de elementos ambientais. A tentativa de girar o tablet pelos cantos ou pressionar o centro da tela não resultaria em nenhum rangido ou deformação perceptível, o que proporciona uma primeira impressão sólida.
A especificação totalmente robusta, sem dúvida, acrescenta peso e espessura ao design. Quando comparado ao concorrente Acer Enduro T1, por exemplo, nosso Durabook é quase duas vezes mais grosso e pesado, embora ambos tenham telas sensíveis ao toque de 8 polegadas.
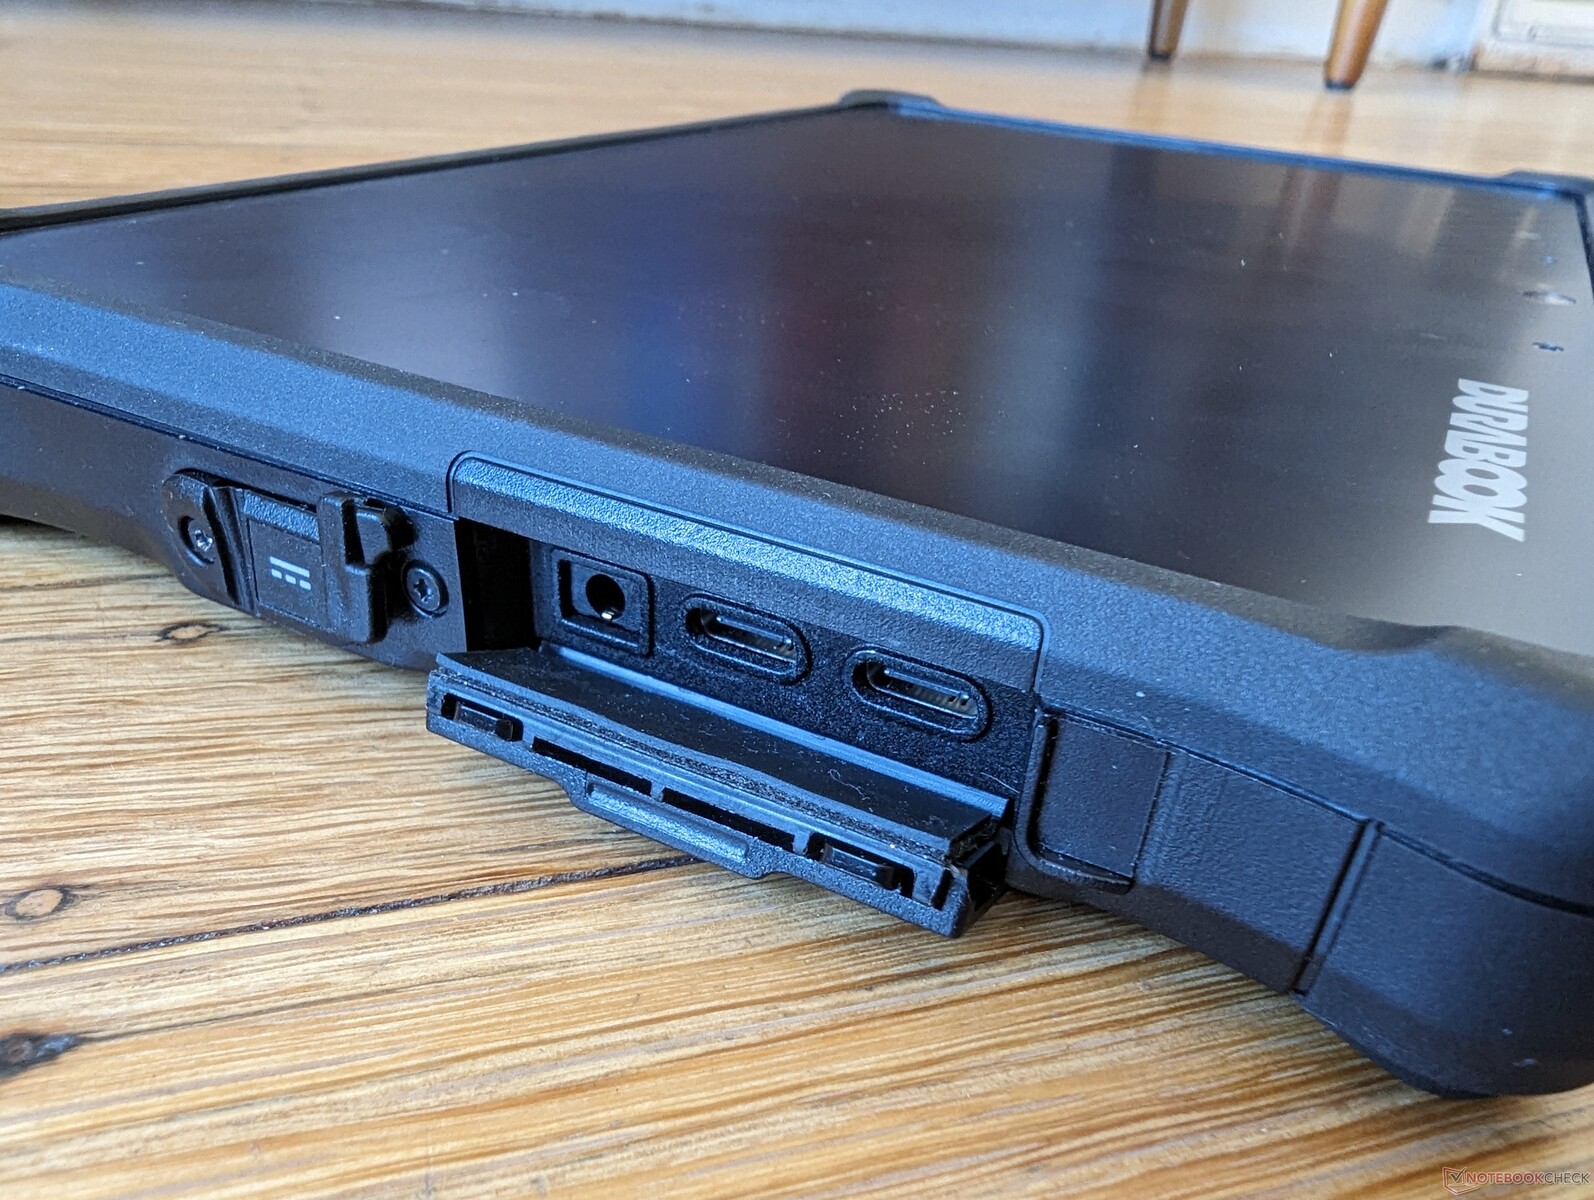
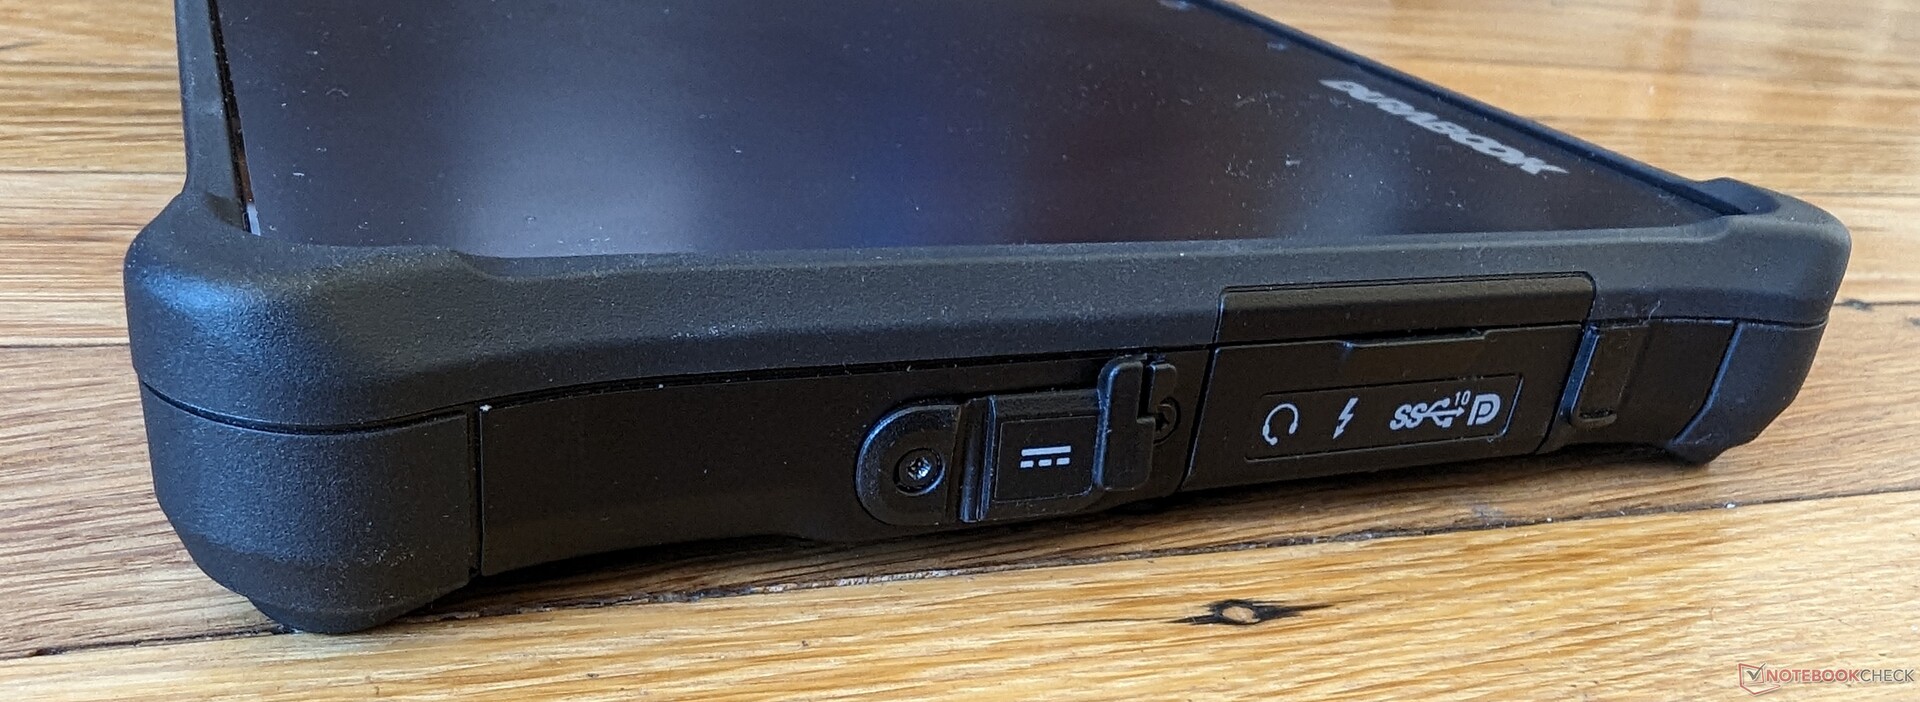
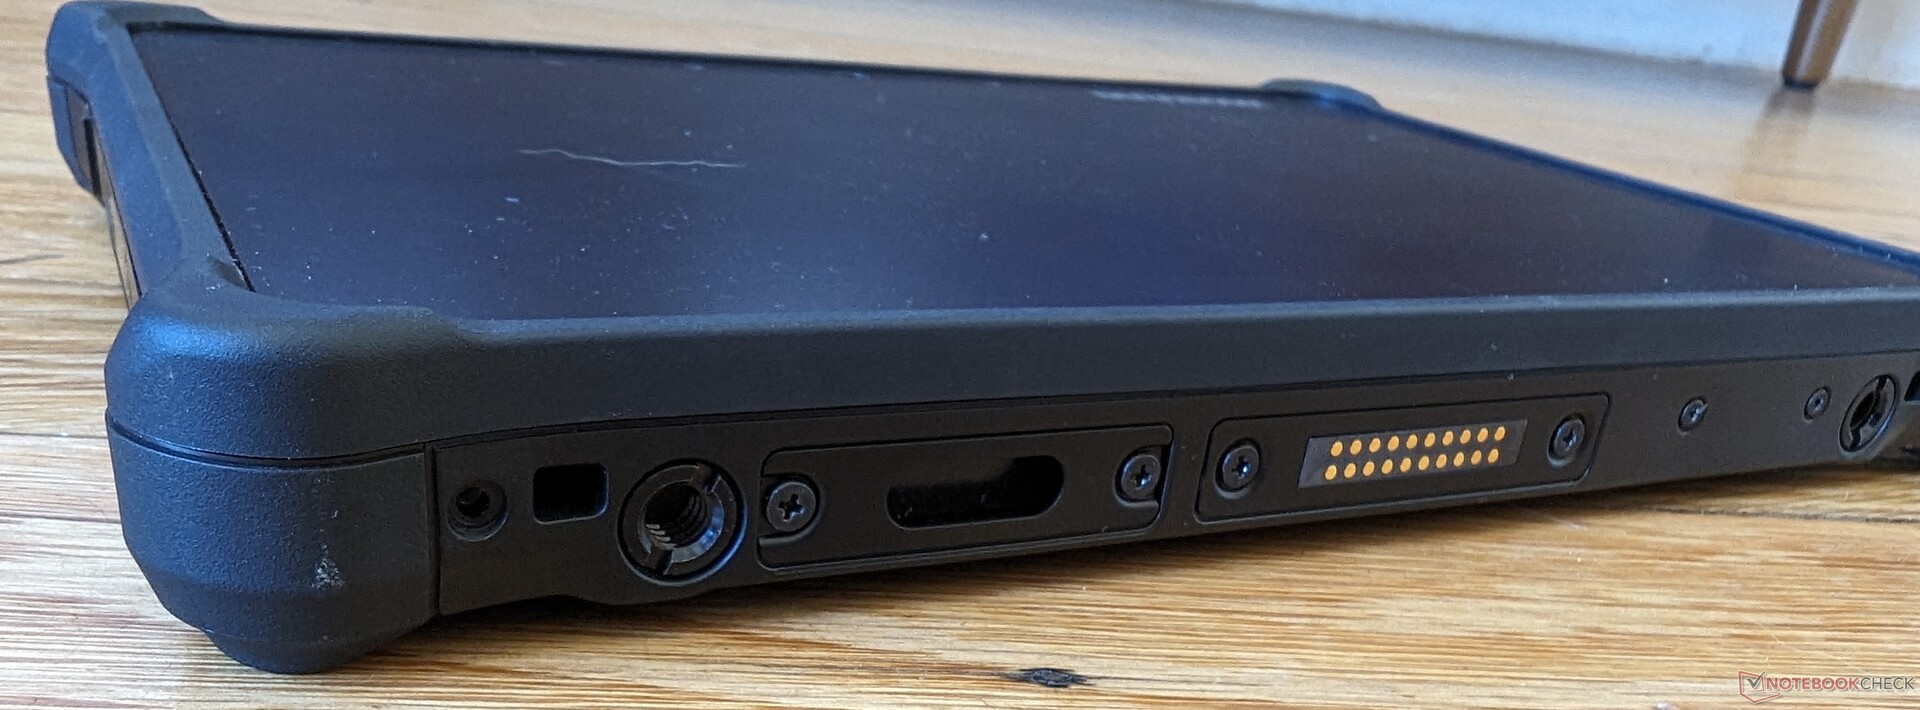
Conectividade - Suporte a Thunderbolt 4
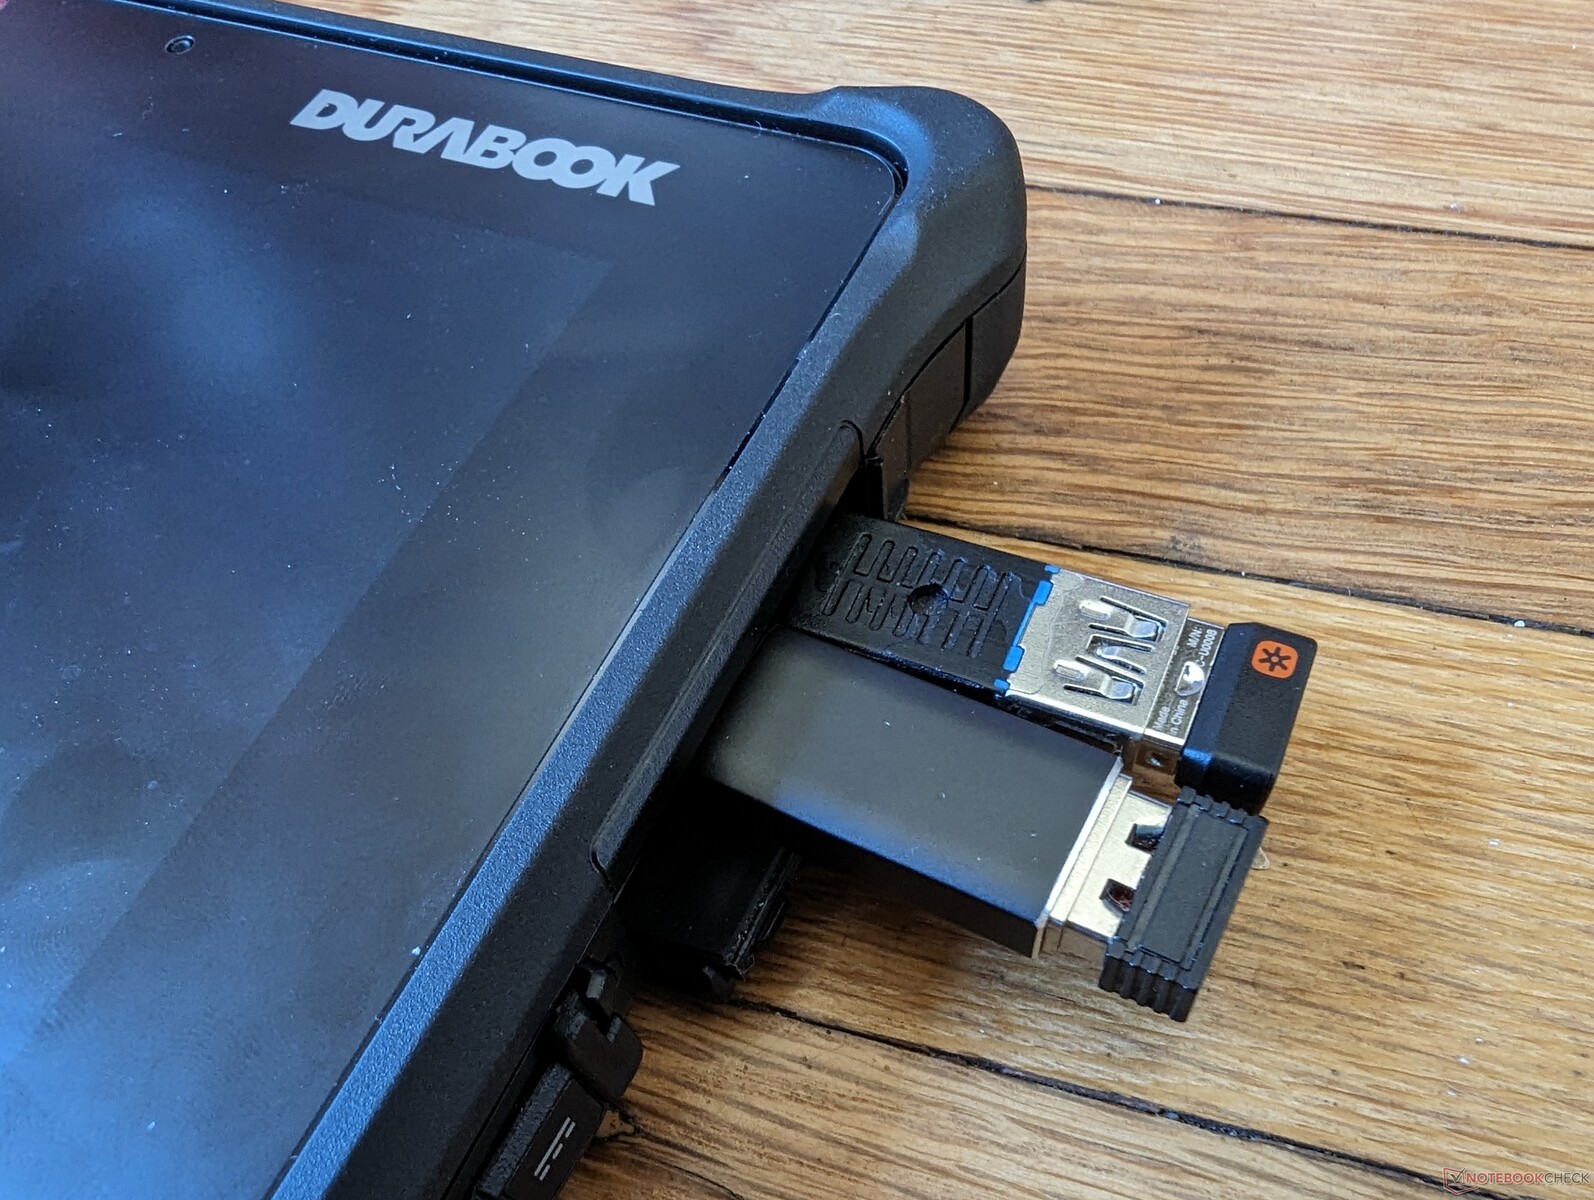
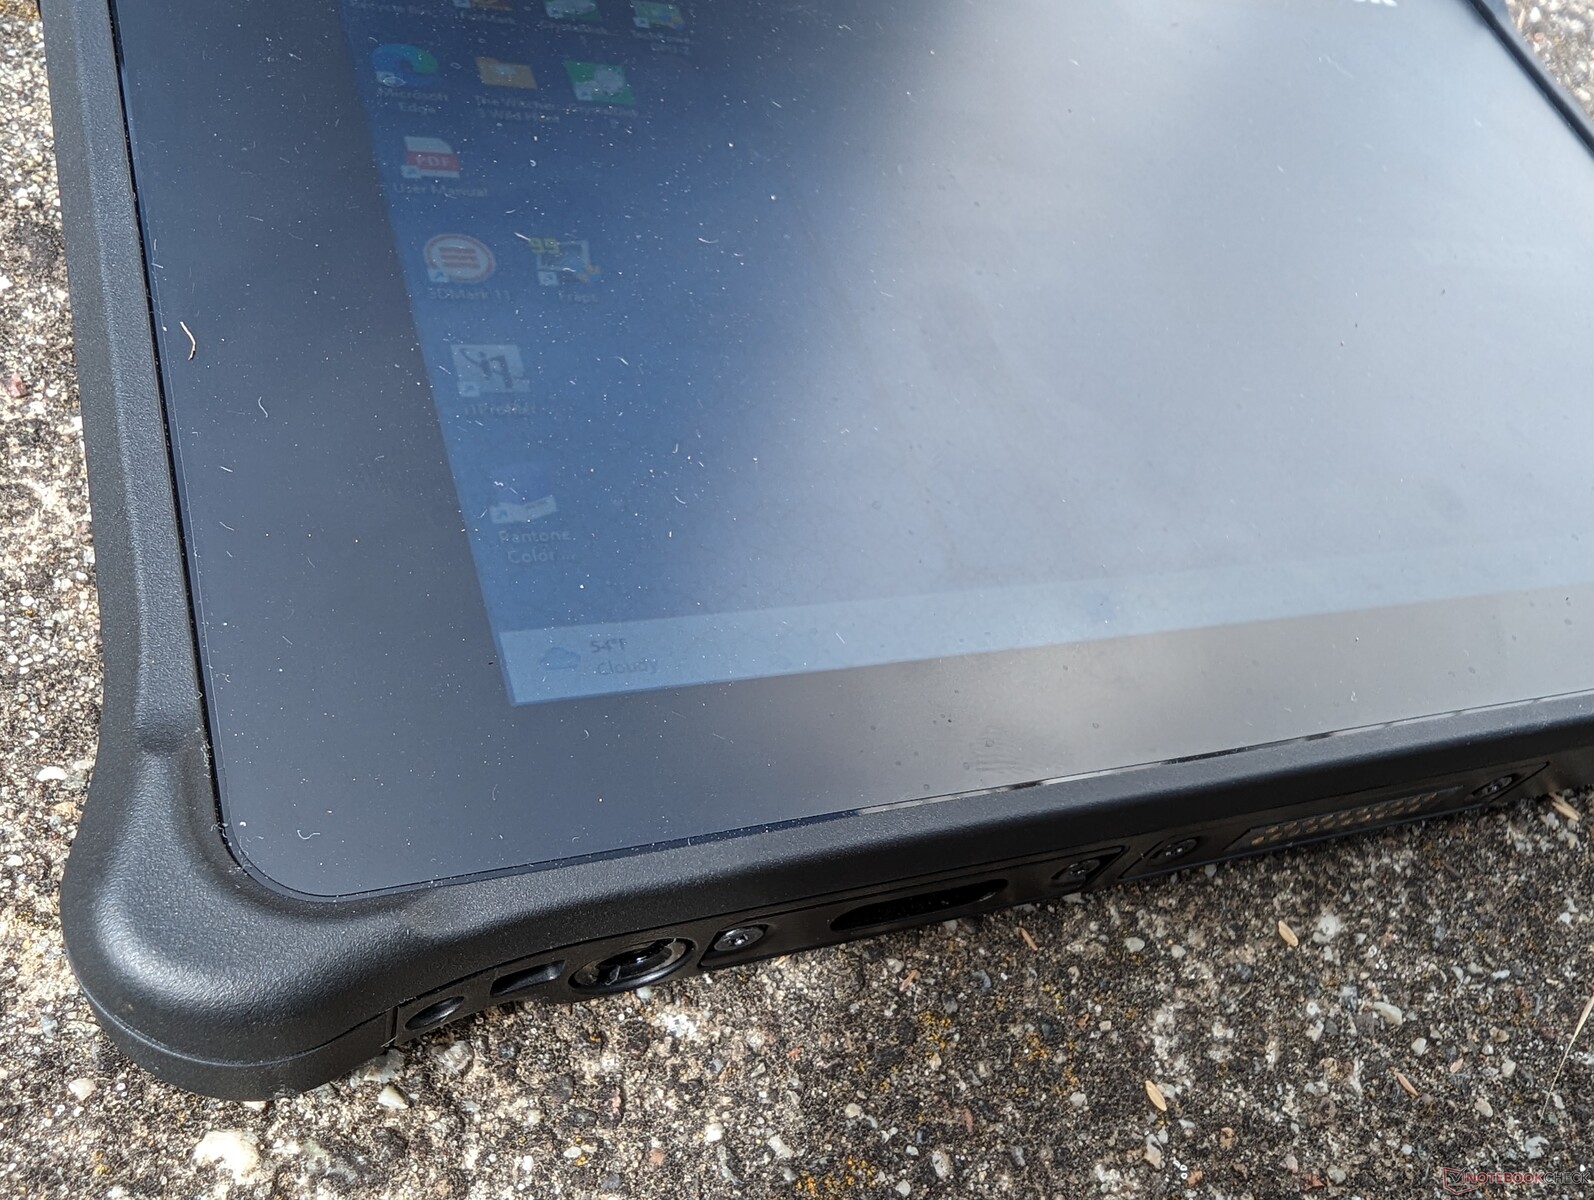
Algumas portas são padrão em todas as SKUs, enquanto outras podem ser adicionadas por um custo adicional, incluindo USB-A, Gigabit RJ-45, RS232 ou um leitor de código de barras.
Uma das duas portas USB-C é compatível com Thunderbolt 4 para uma ampla gama de dispositivos externos compatíveis. No entanto, apenas uma das portas é compatível com o Power Delivery. As portas estão muito próximas umas das outras e, portanto, alguns cabos ou adaptadores USB-C mais grossos podem bloquear parcialmente o acesso às outras portas, conforme mostrado na imagem à direita.
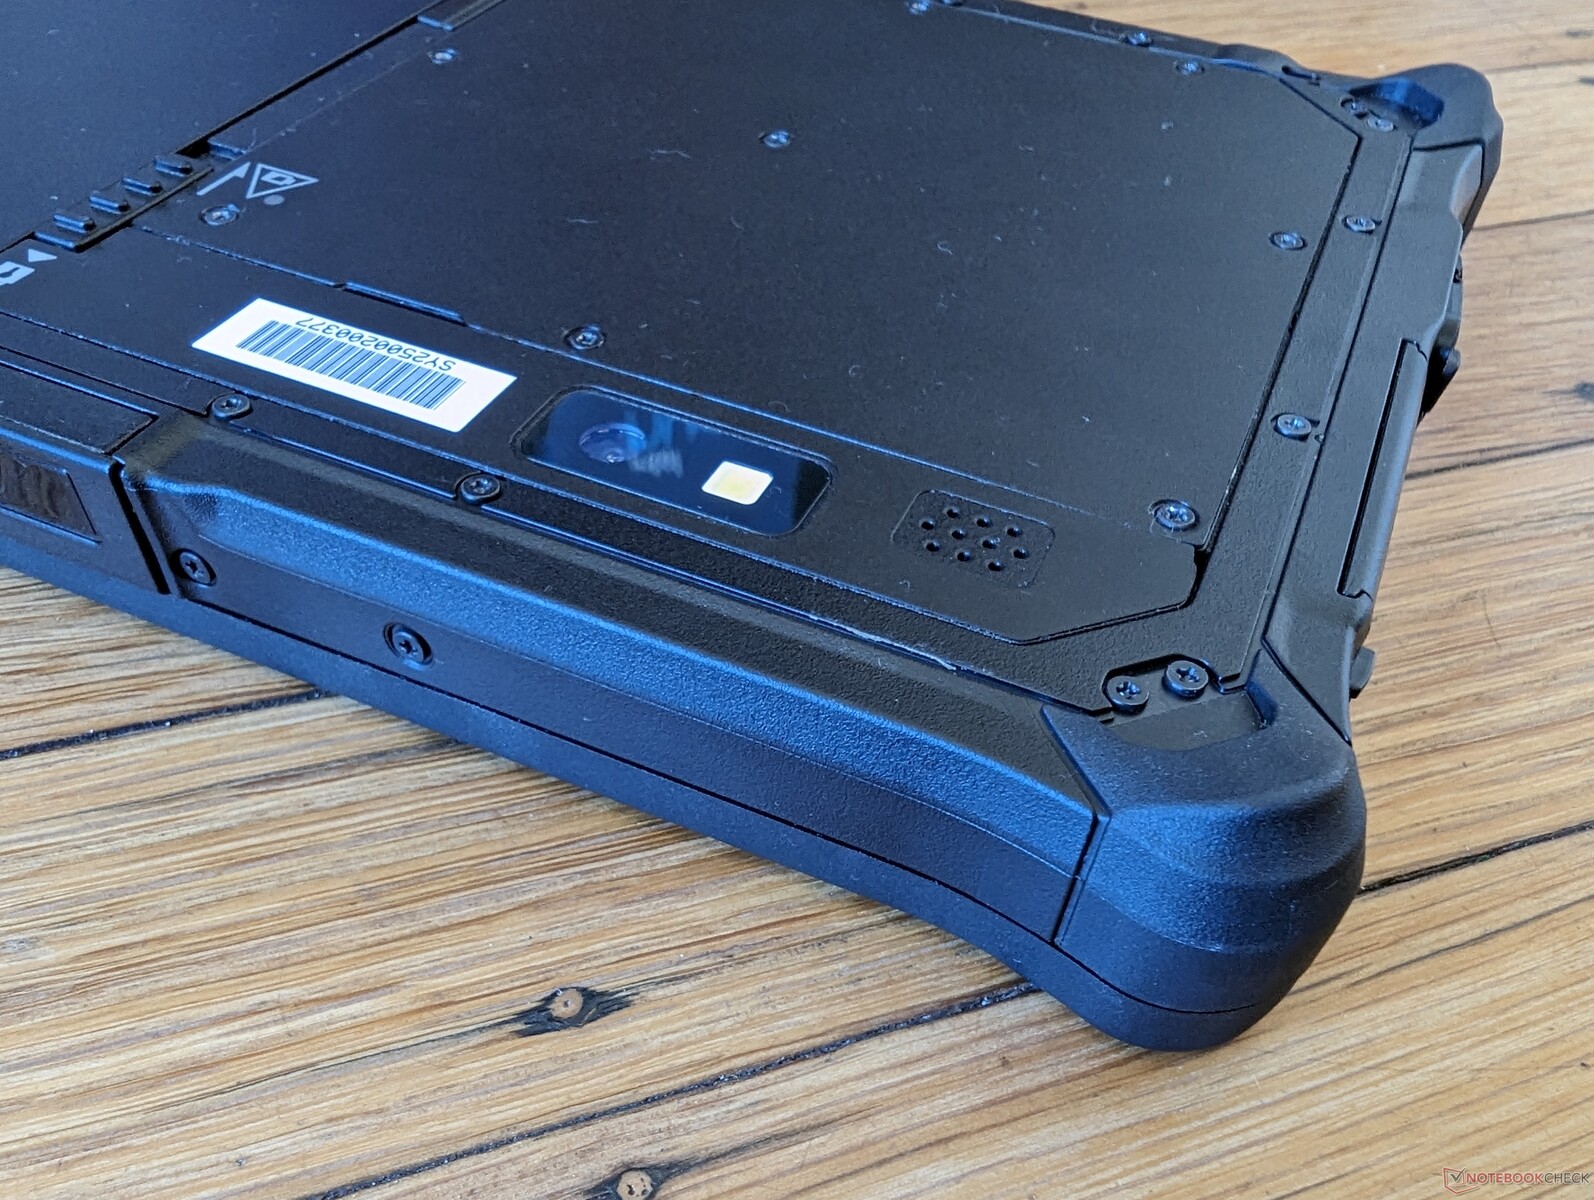
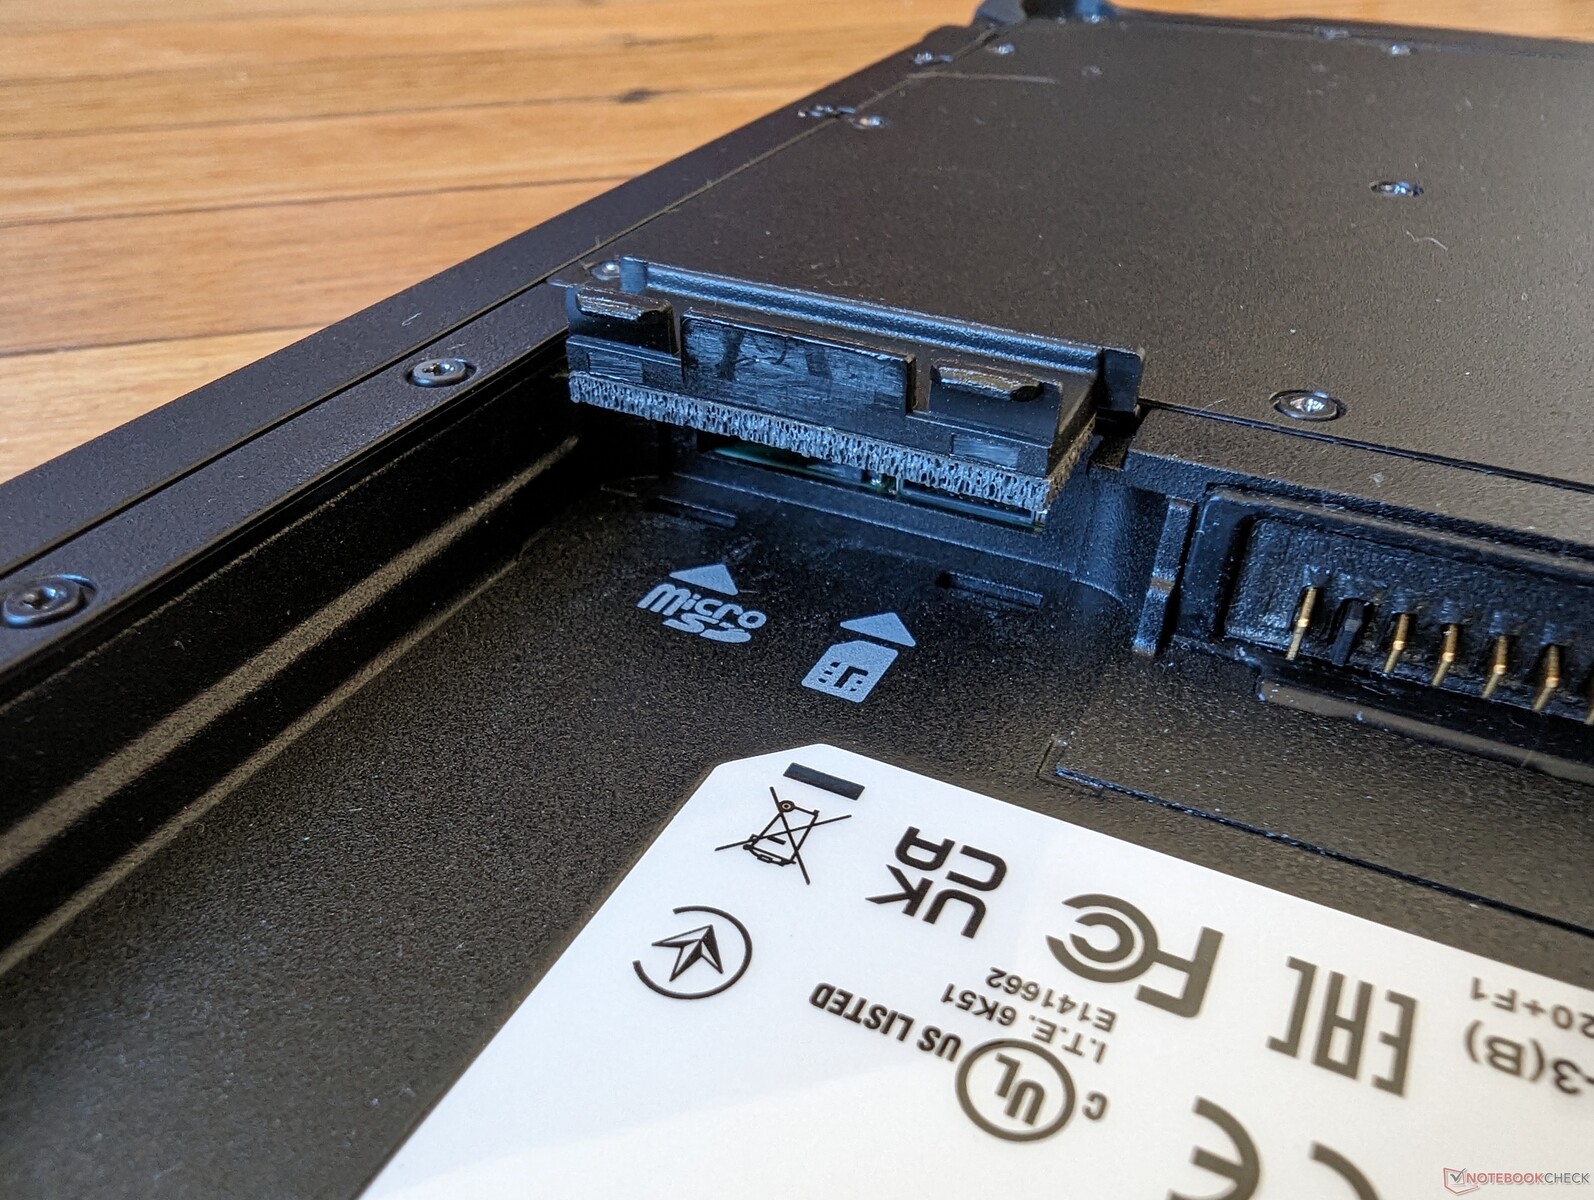
Leitor de cartão SD - Seu cartão MicroSD ficará preso
A mola de liberação do leitor de cartão SD integrado é muito fraca em comparação com os leitores de cartão da maioria dos outros laptops e tablets. Nosso cartão MicroSD de teste ficou preso e precisou de uma pinça para ser removido com cuidado.
| SD Card Reader | |
| average JPG Copy Test (av. of 3 runs) | |
| Dell Latitude 7230 Rugged Extreme (AV Pro V60) | |
| Durabook R8 Tablet (AV Pro V60) | |
| Lenovo Tab M8 (Gen 4) (Angelbird V60) | |
| maximum AS SSD Seq Read Test (1GB) | |
| Dell Latitude 7230 Rugged Extreme (AV Pro V60) | |
| Durabook R8 Tablet (AV Pro V60) | |
Comunicação
Um Intel AX211 é padrão para conectividade Wi-Fi 6E e Bluetooth 5.3. As taxas de transferência são estáveis, sem problemas.
| Networking | |
| iperf3 transmit AX12 | |
| Panasonic Toughbook FZ-G2 | |
| Acer Enduro T1 ET108-11A A9001 | |
| iperf3 receive AX12 | |
| Panasonic Toughbook FZ-G2 | |
| Acer Enduro T1 ET108-11A A9001 | |
| iperf3 transmit AXE11000 | |
| Durabook R8 Tablet | |
| Dell Latitude 7230 Rugged Extreme | |
| Lenovo Tab M8 (Gen 4) | |
| iperf3 receive AXE11000 | |
| Durabook R8 Tablet | |
| Dell Latitude 7230 Rugged Extreme | |
| Lenovo Tab M8 (Gen 4) | |
| iperf3 transmit AXE11000 6GHz | |
| Dell Latitude 7230 Rugged Extreme | |
| Durabook R8 Tablet | |
| iperf3 receive AXE11000 6GHz | |
| Durabook R8 Tablet | |
| Dell Latitude 7230 Rugged Extreme | |
Webcam
A câmera frontal de 2 MP é padrão, enquanto a câmera traseira de 8 MP com flash é um upgrade opcional. A qualidade da imagem é mais nítida do que a das webcams dos laptops, mas a qualidade do vídeo é limitada a 1080p e 30 FPS, apesar do sensor de resolução mais alta.


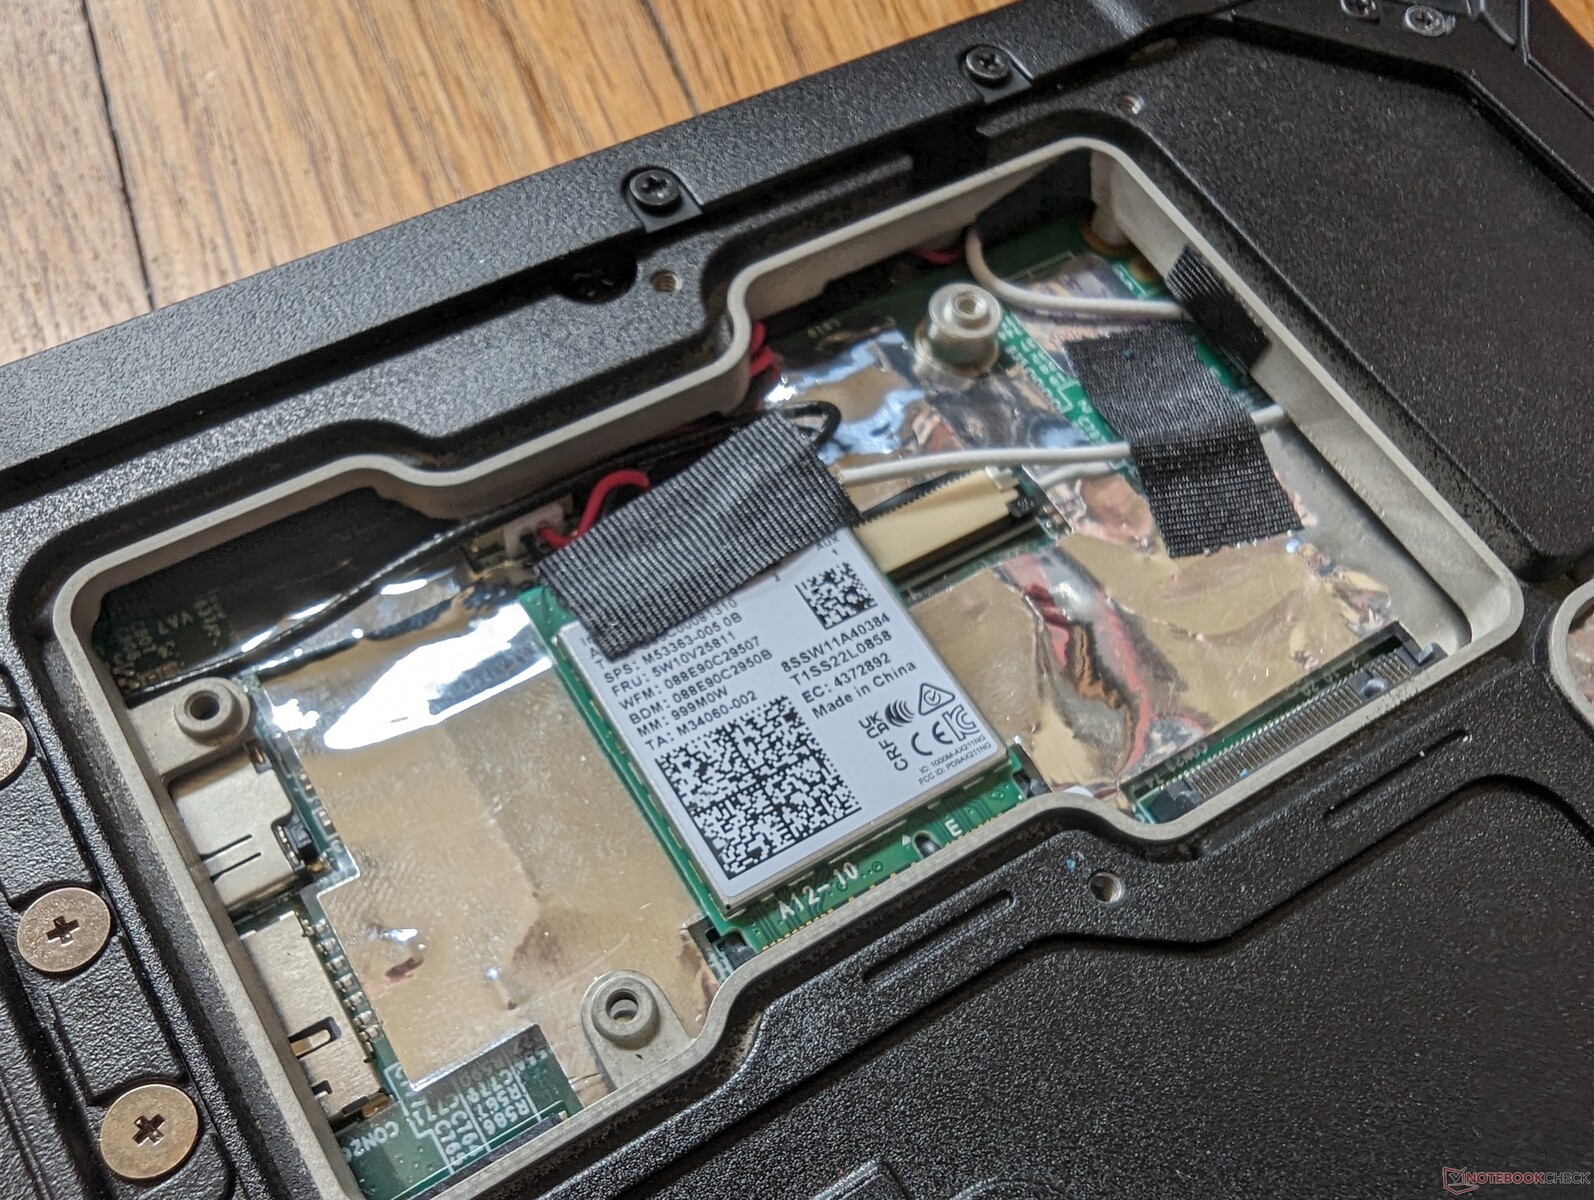
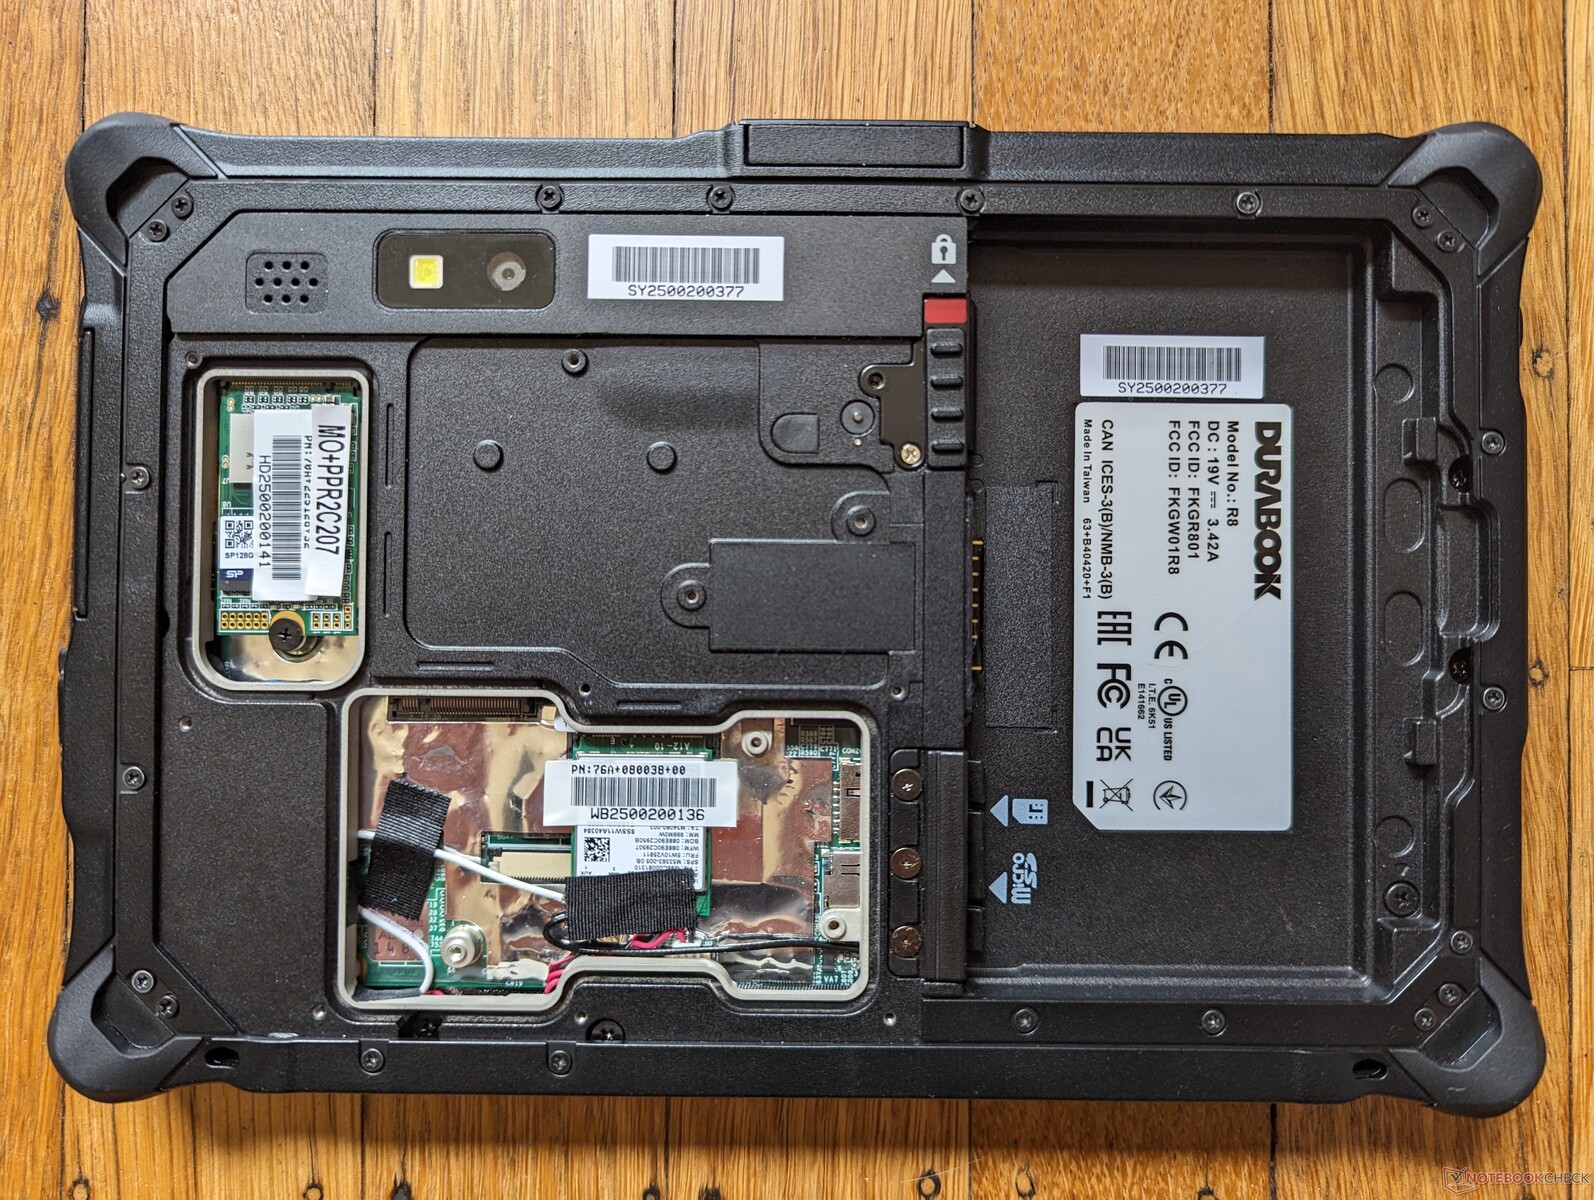
Manutenção
Acessórios e garantia
A caixa de varejo inclui uma caneta stylus passiva e um cordão de pulso. Os acessórios opcionais são abrangentes, como um suporte de estação de acoplamento especializado com portas adicionais, bateria sobressalente de maior capacidade, compartimentos de carregamento de bateria, leitores de cartão inteligente, diferentes tipos de adaptadores CA e muito mais, conforme detalhado em aqui.
Uma garantia de três anos contra danos acidentais é padrão.
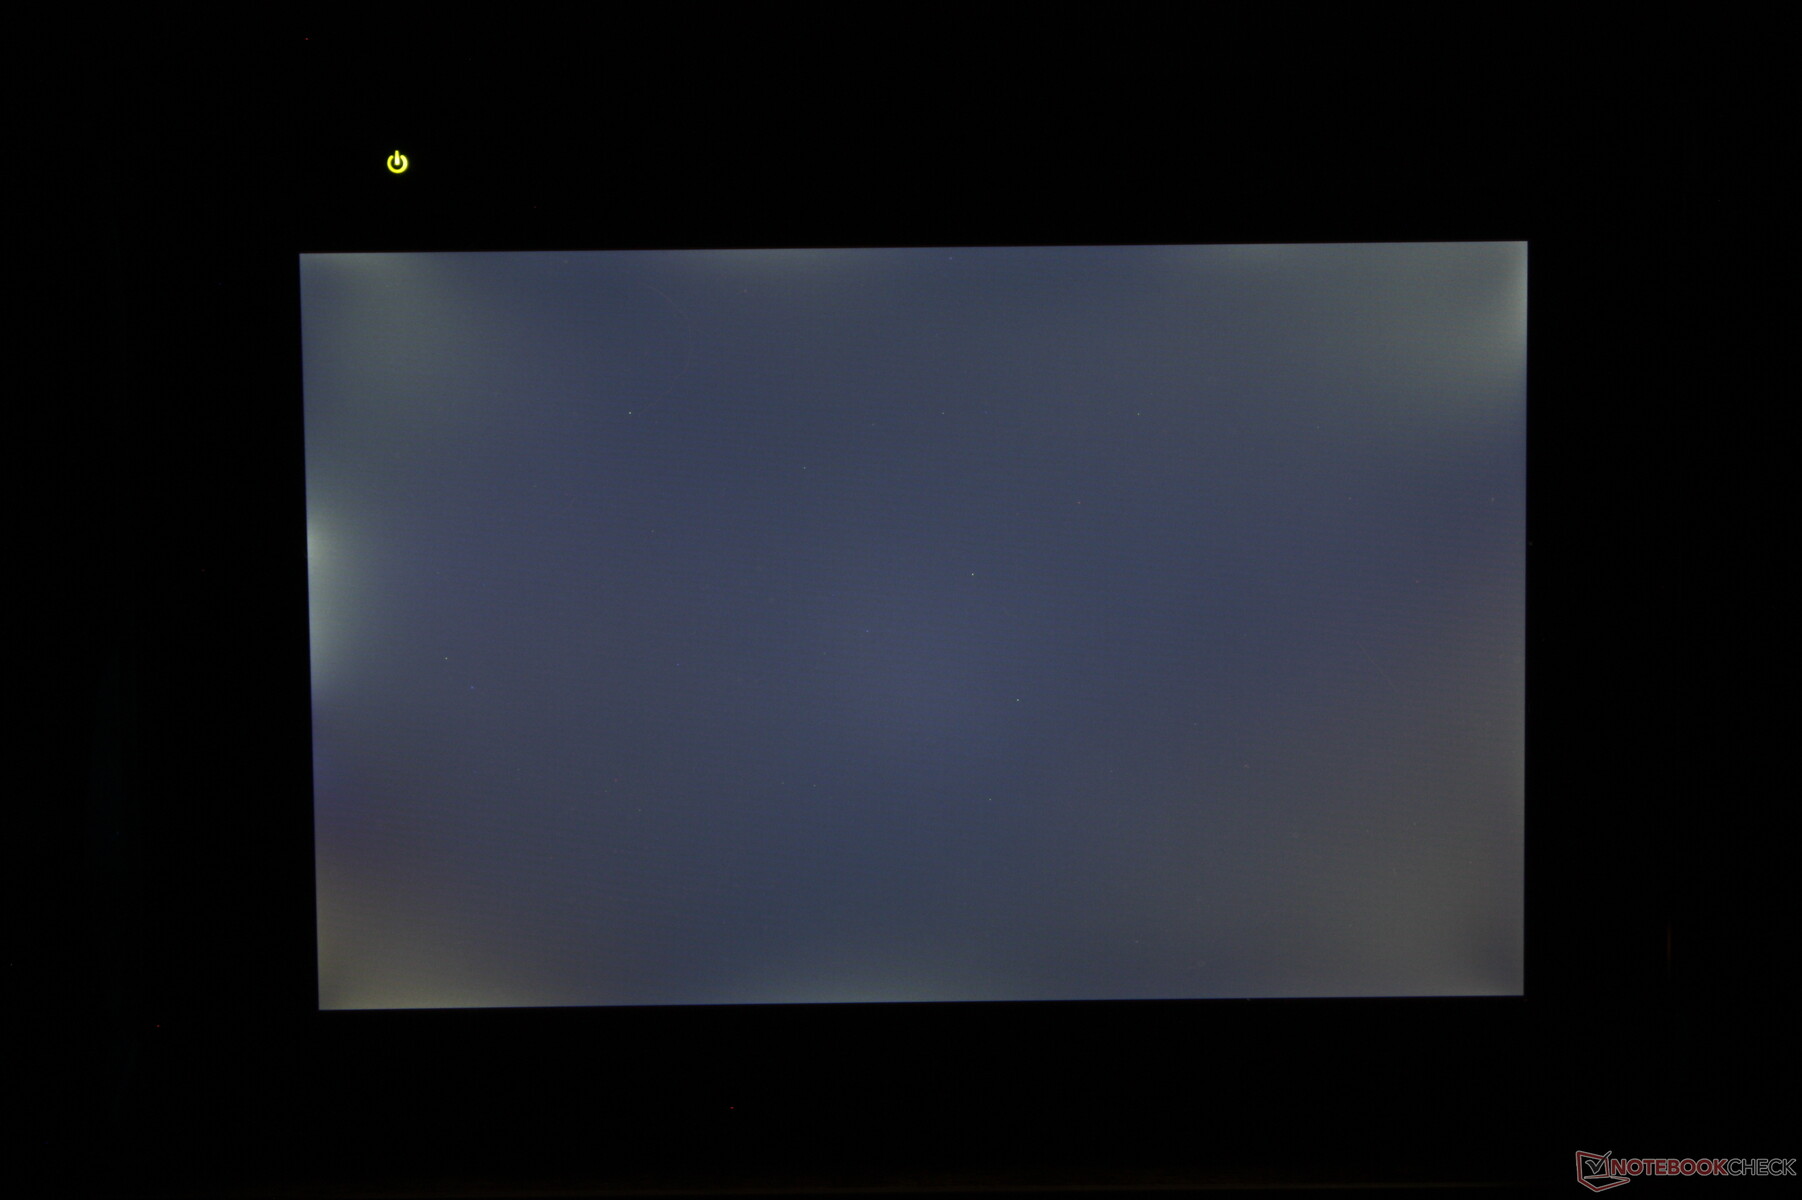
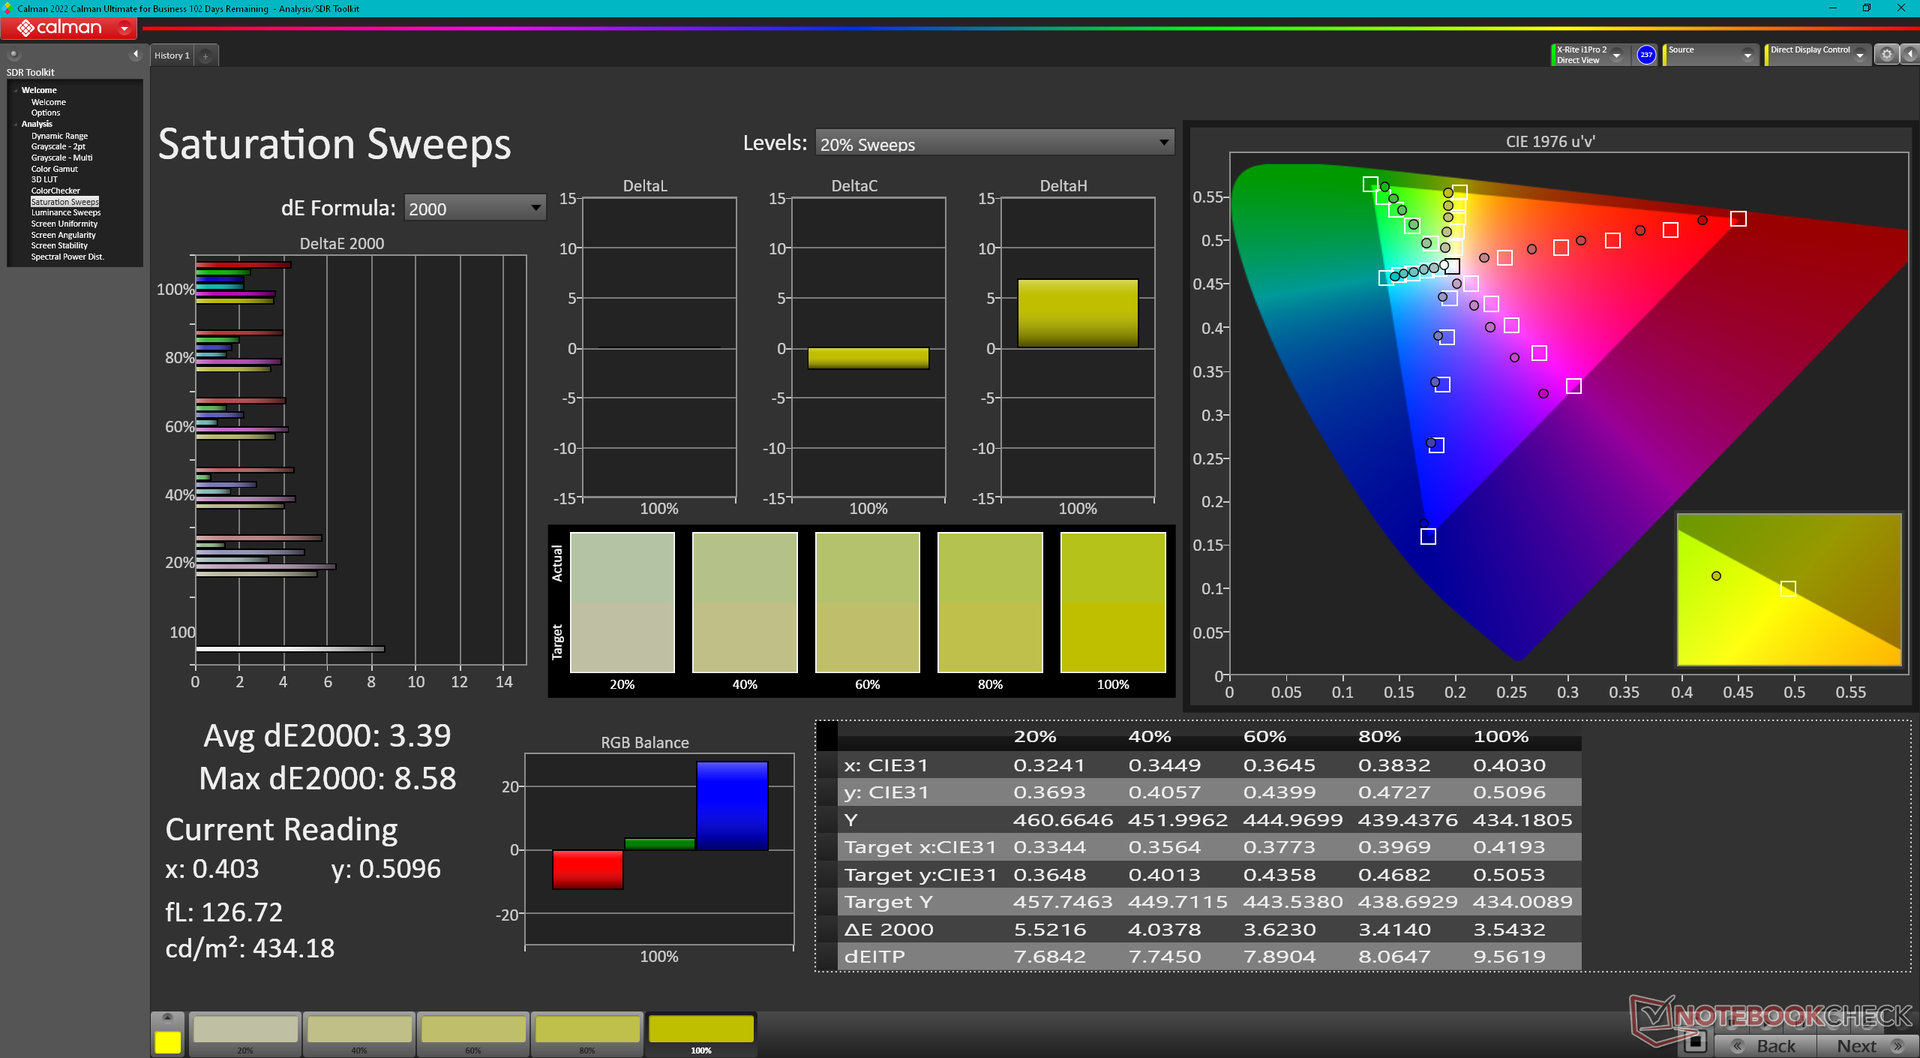
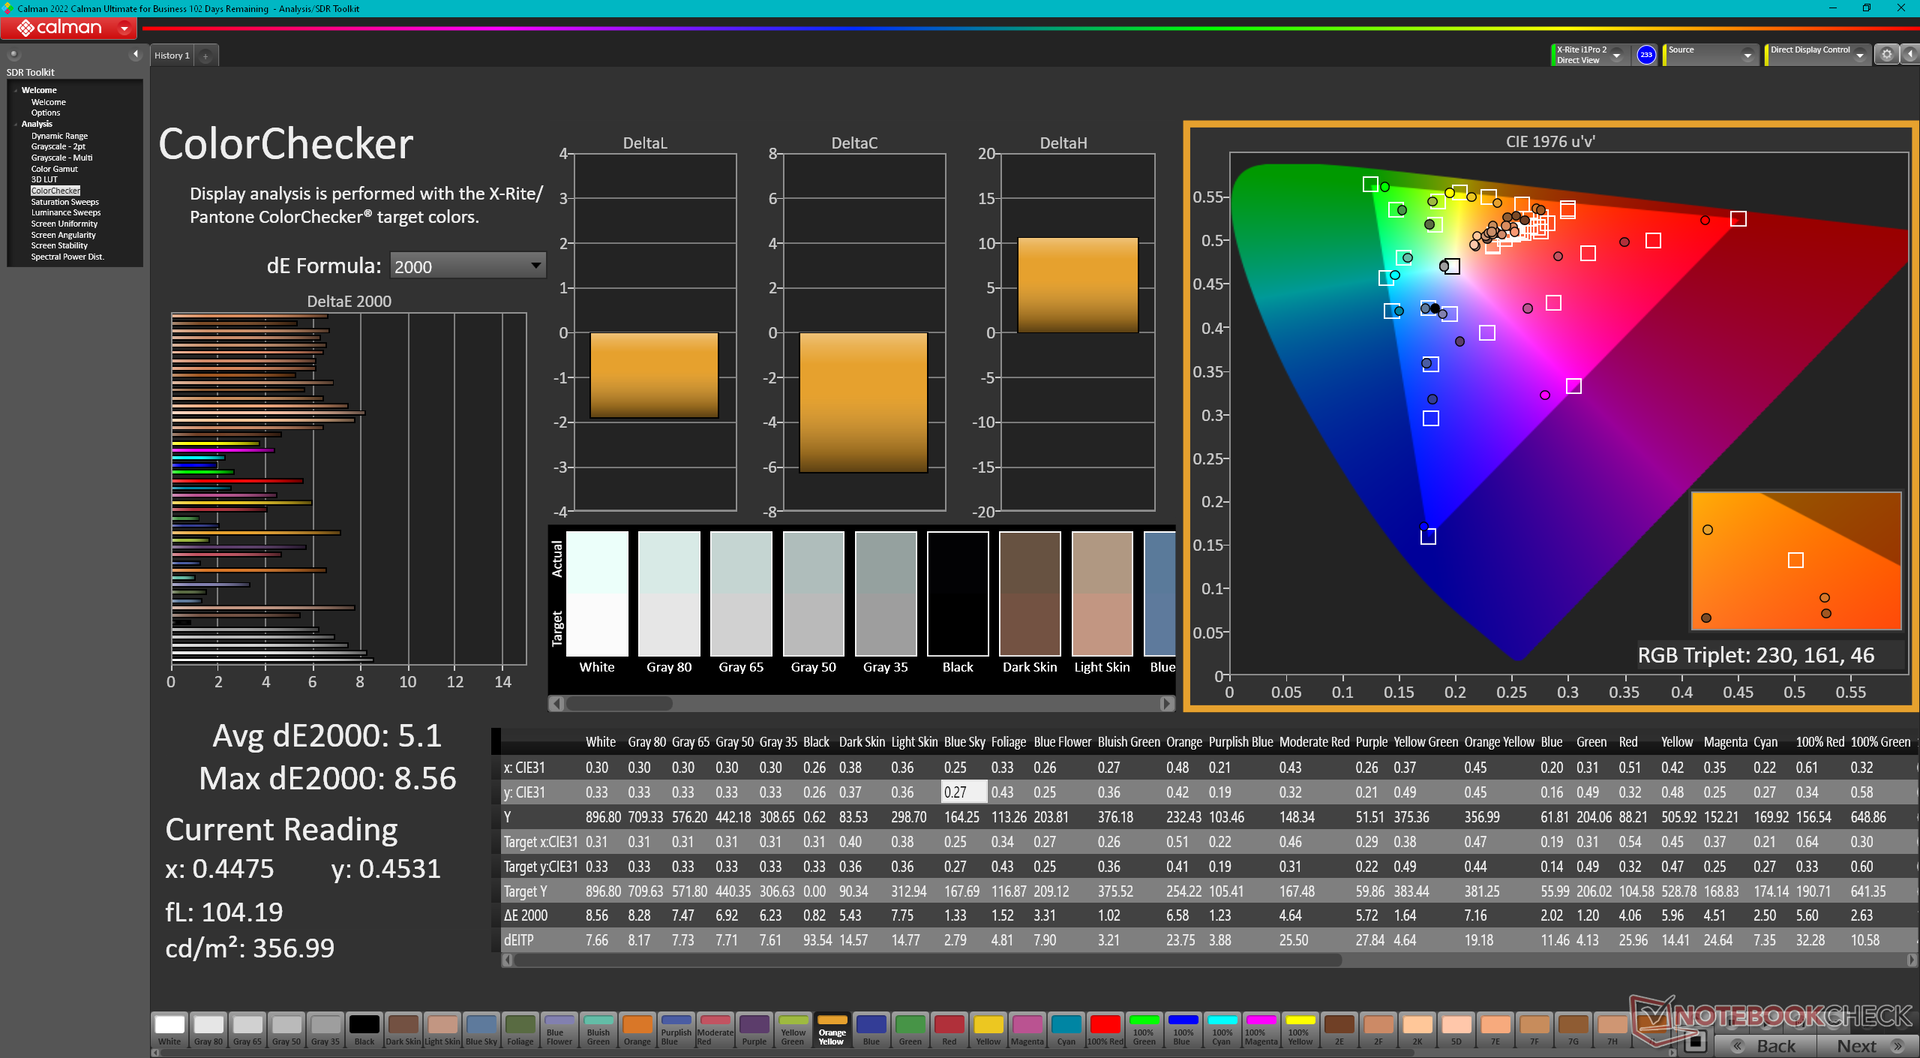
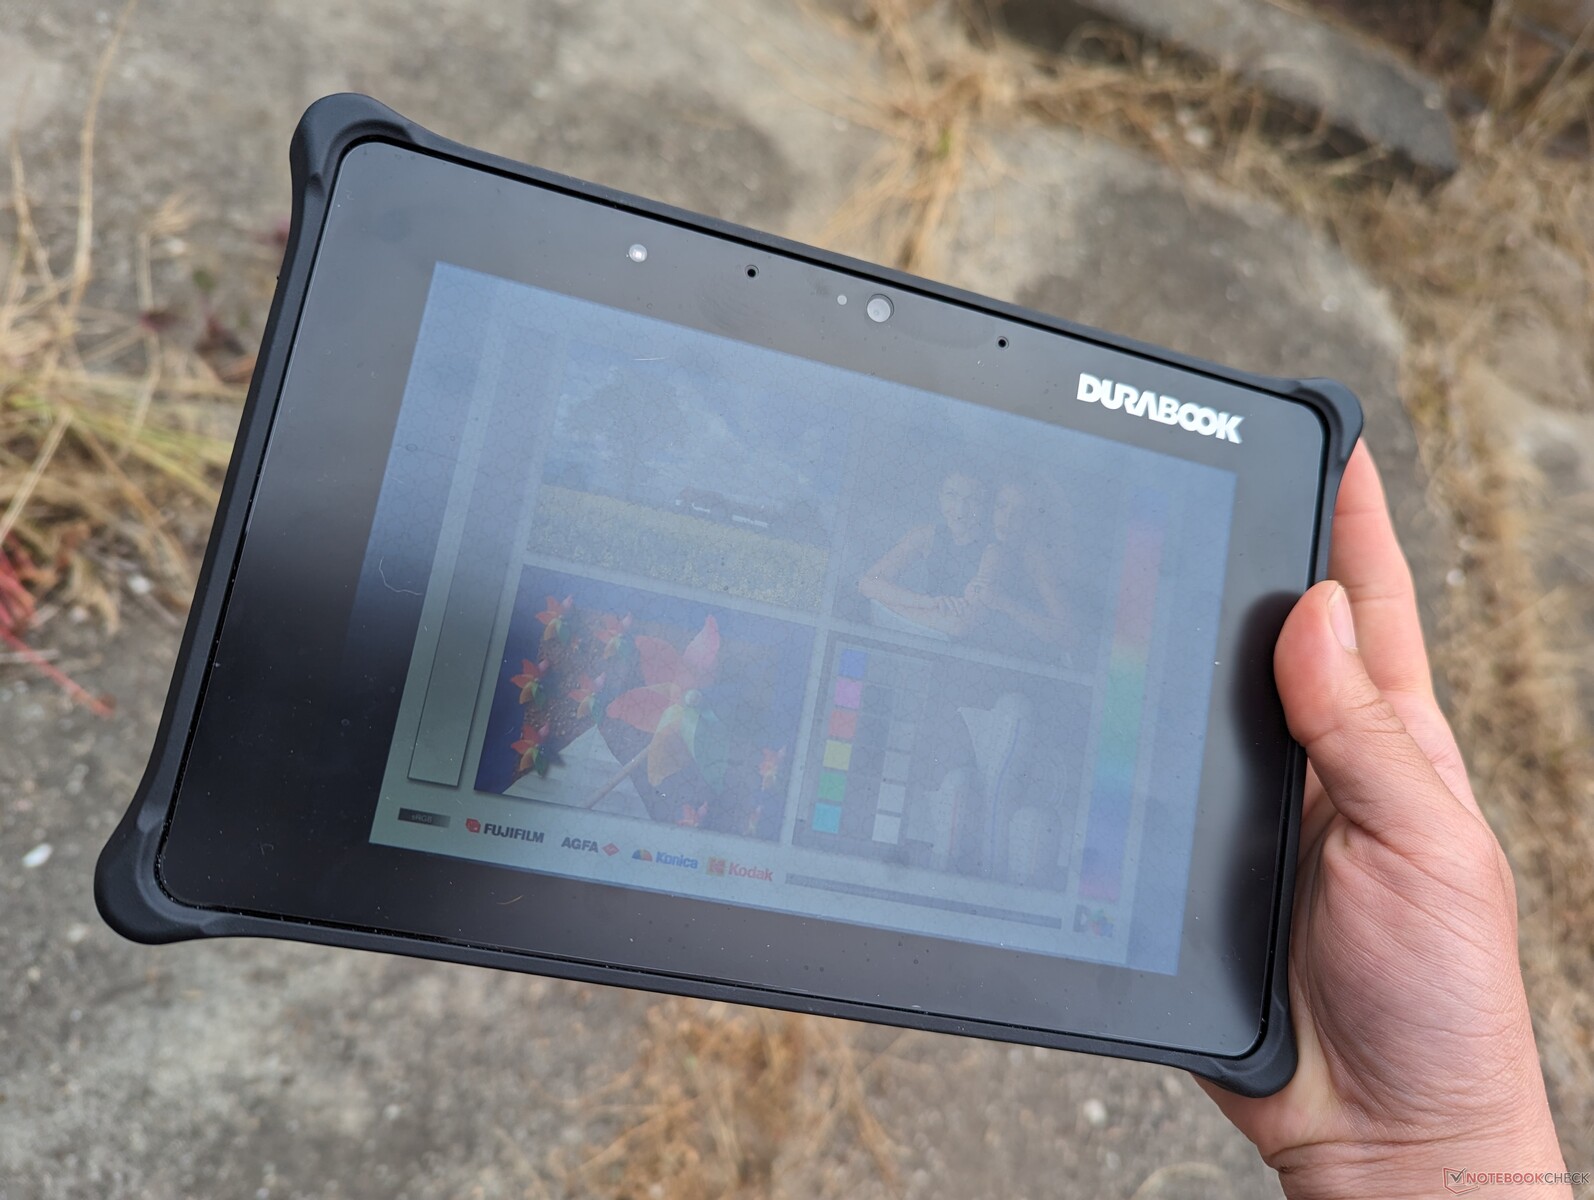
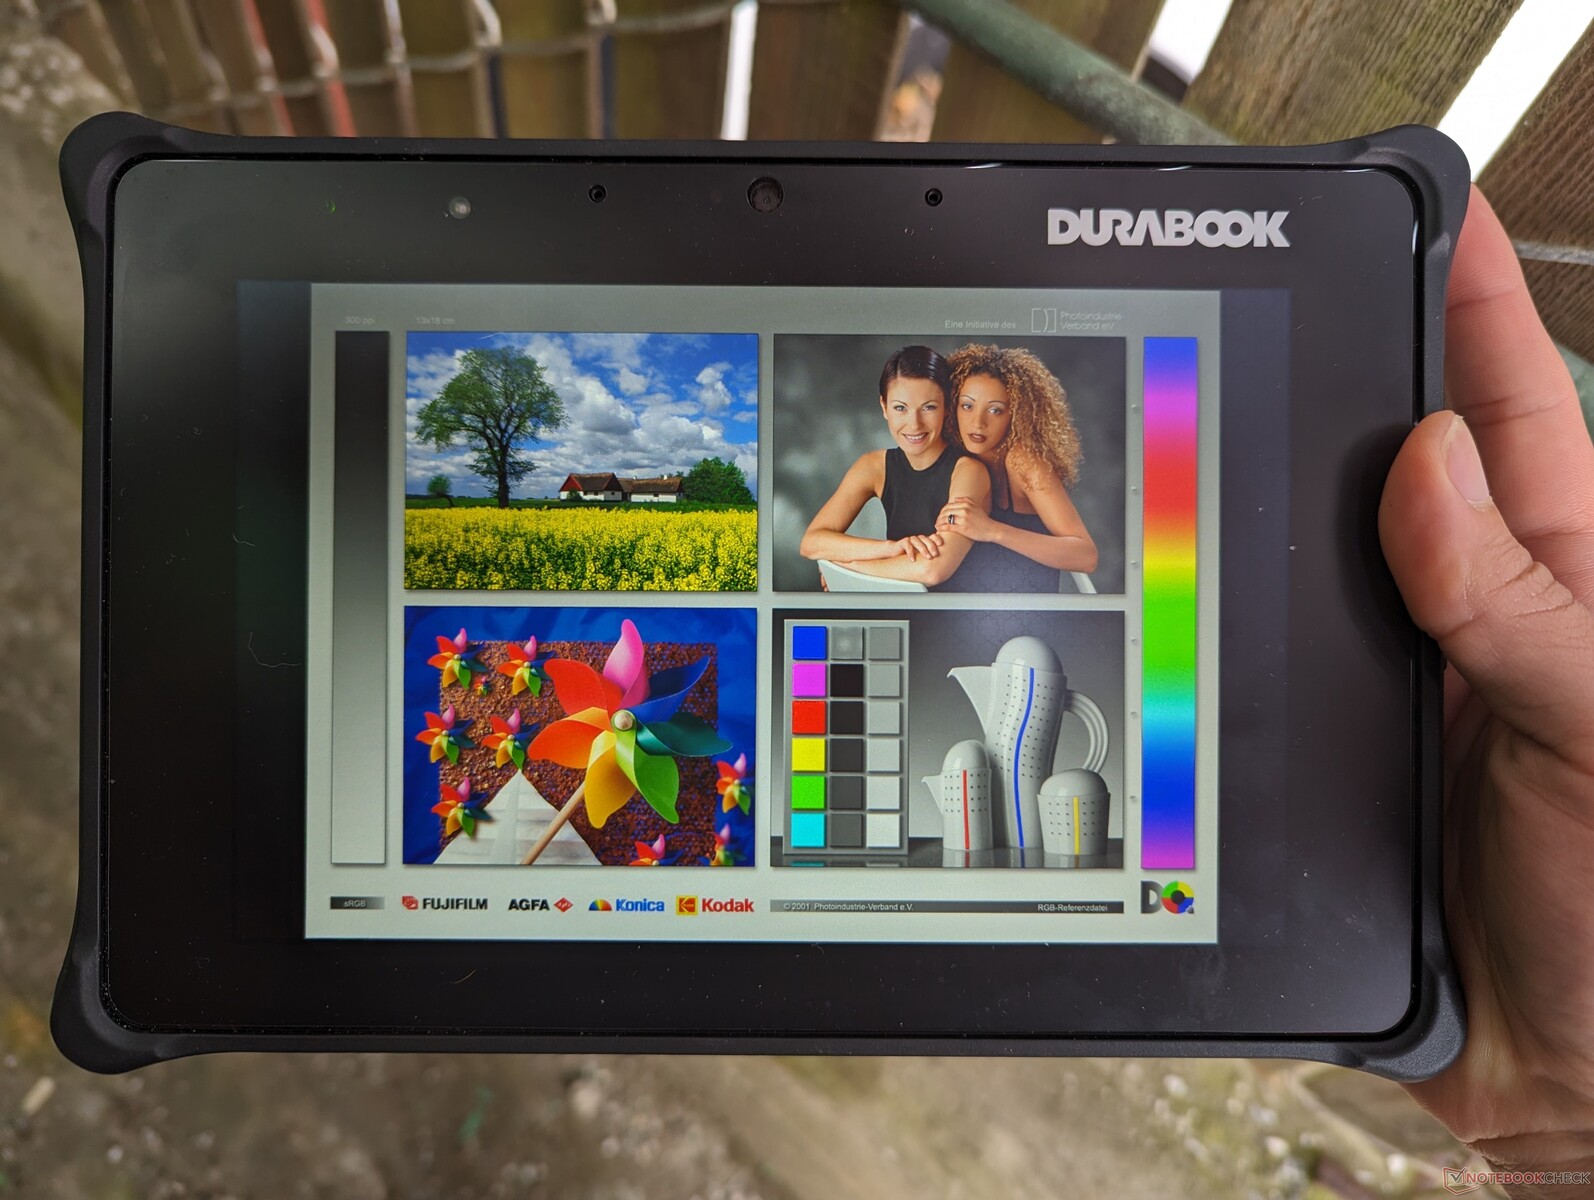
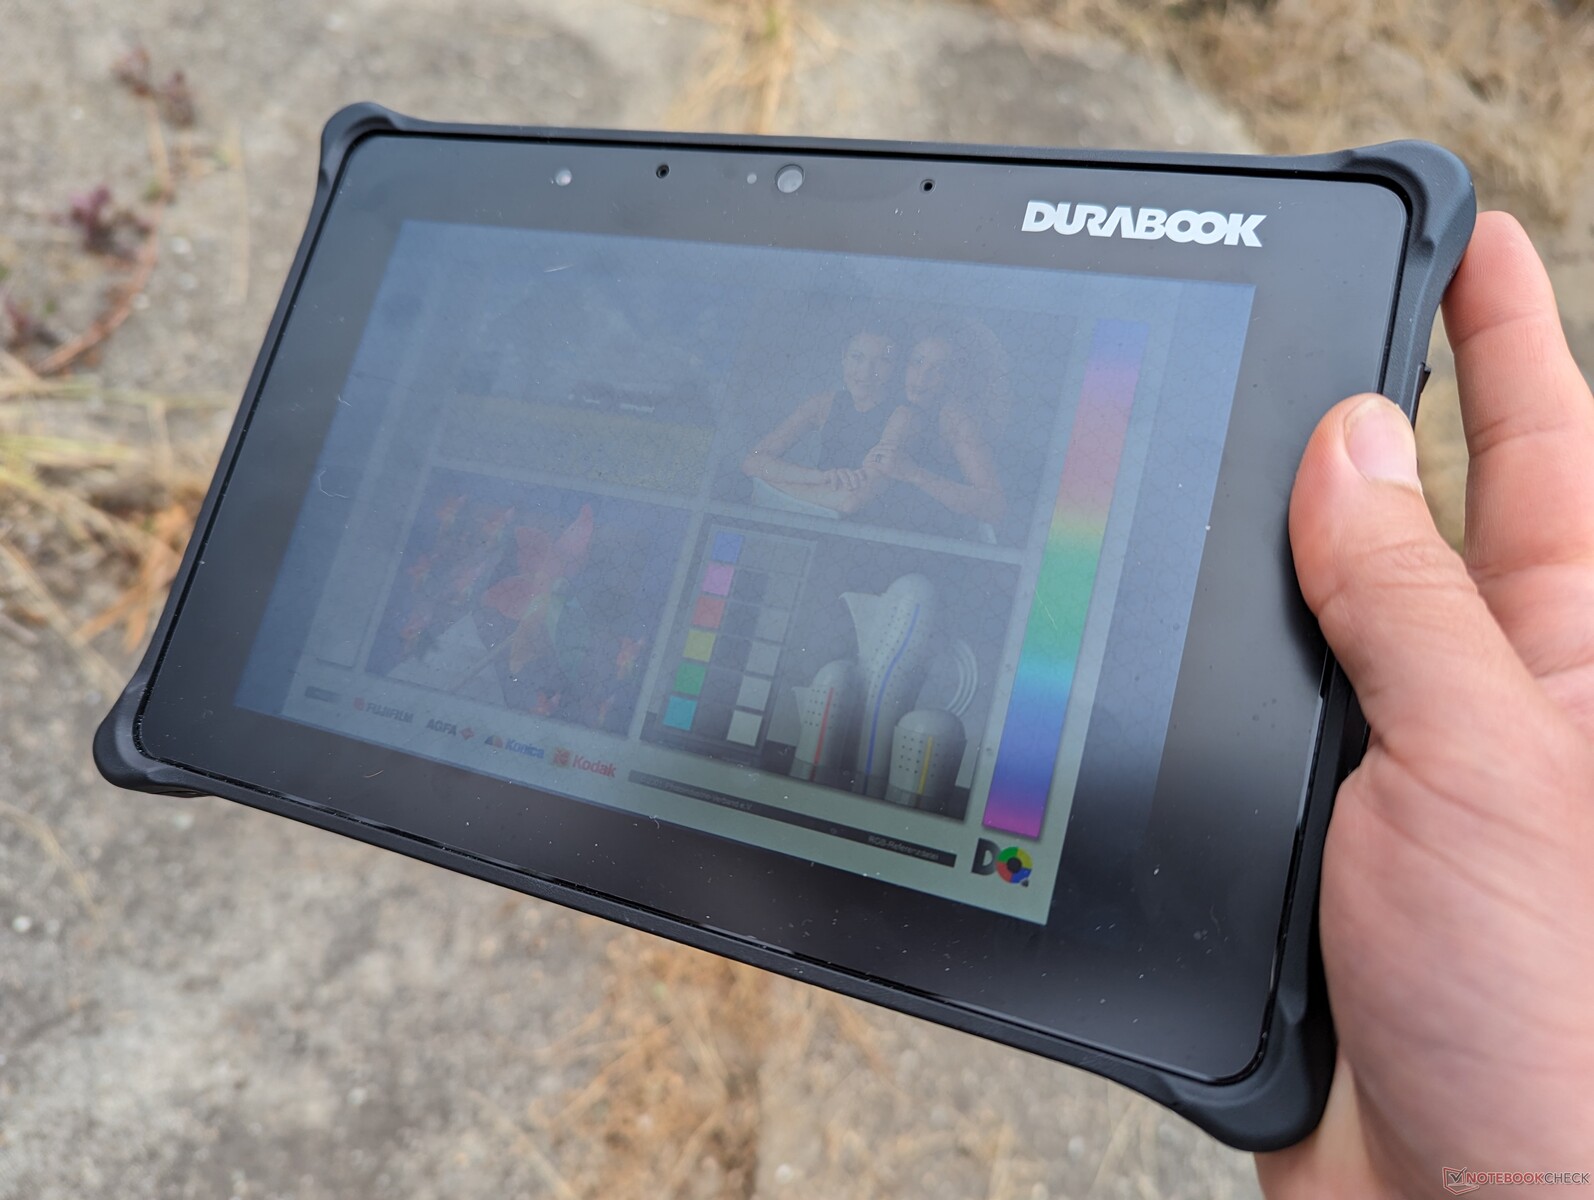
Tela - Tela sensível ao toque brilhante de 800 nits
O fabricante anuncia um brilho máximo de 800 nits, o que podemos confirmar com nossas próprias medições independentes. A taxa de contraste também é respeitável, com pouco mais de 1000:1, semelhante às telas da maioria dos laptops de consumo. Infelizmente, outros aspectos da tela são medíocres, incluindo a cobertura limitada de cores, tempos de resposta médios e pixels um tanto granulados. Se suas cargas de trabalho exigem que as imagens e pequenos textos sejam tão nítidos quanto possível, o Durabook R8 pode não ser para você.
A tela sensível ao toque multitoque pode ser alternada entre o modo capacitivo para entradas com os dedos ou o modo resistivo para entradas com luvas ou canetas.

| |||||||||||||||||||||||||
iluminação: 85 %
iluminação com acumulador: 943.7 cd/m²
Contraste: 1110:1 (Preto: 0.85 cd/m²)
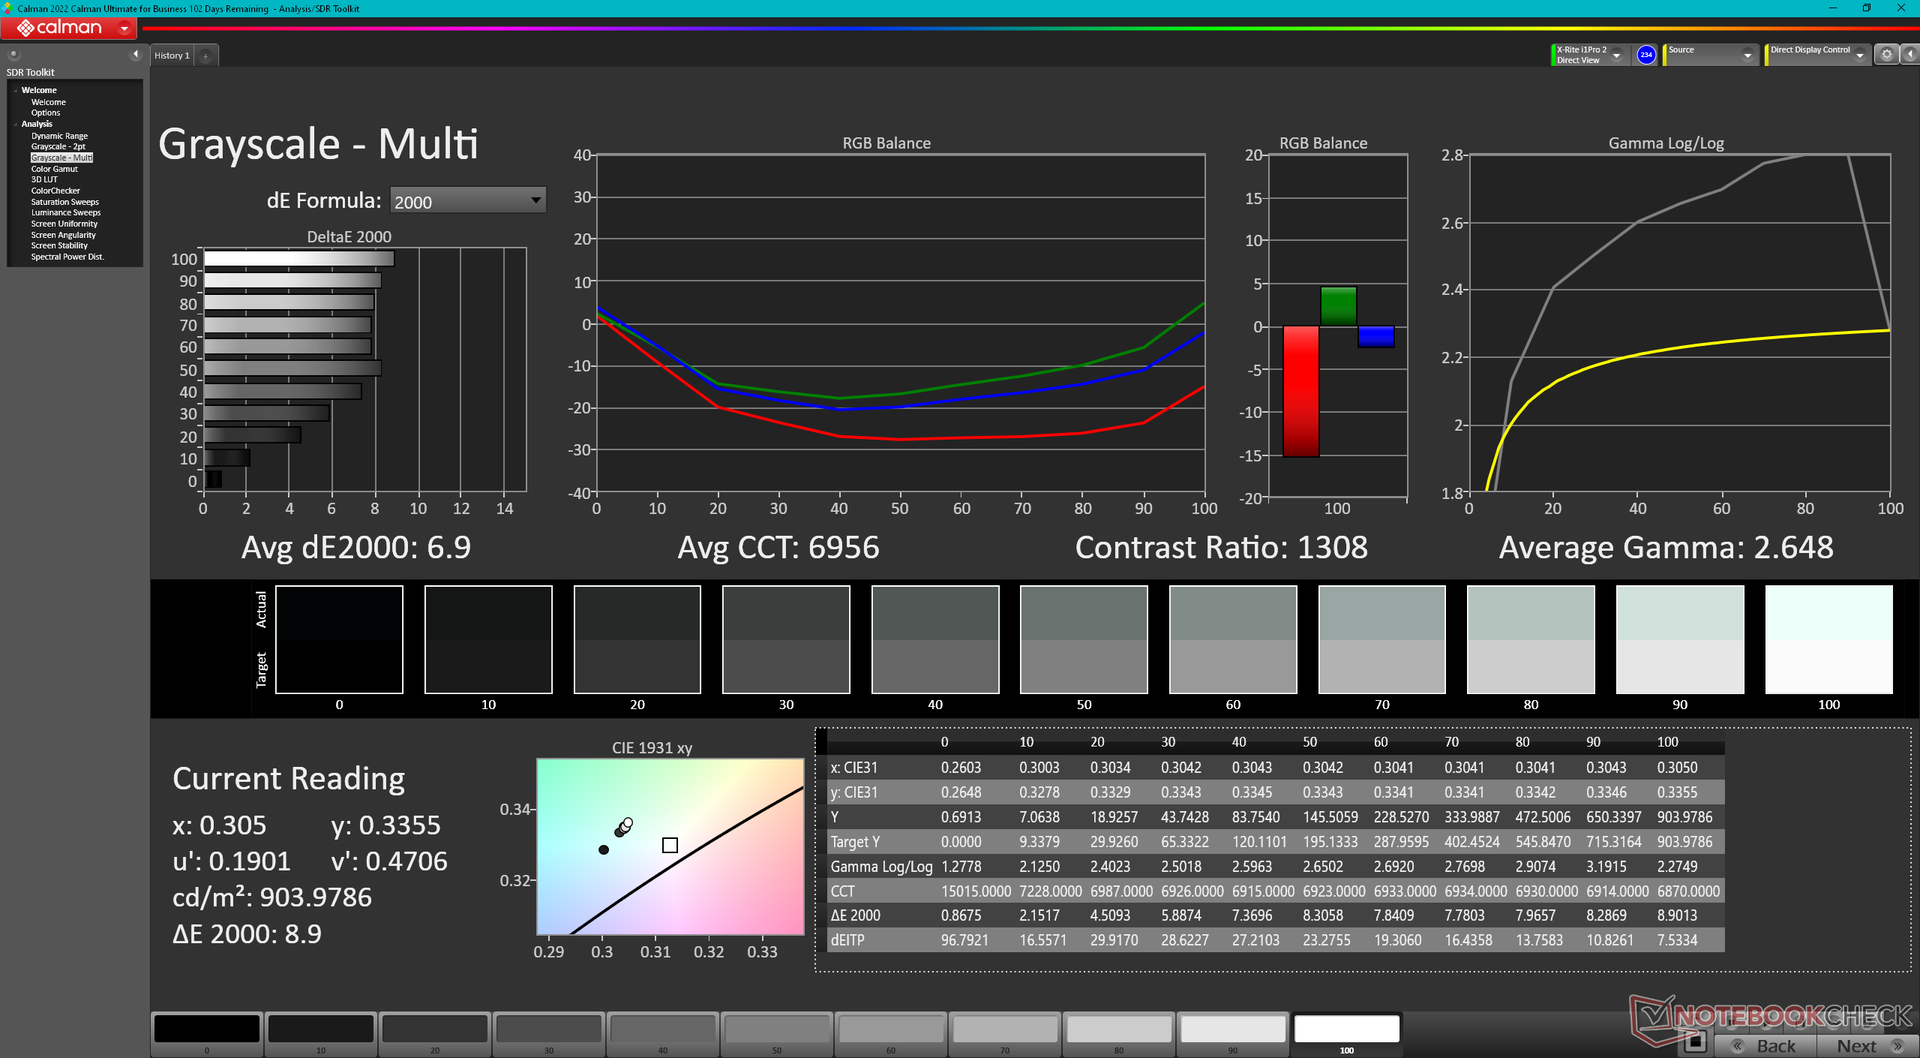
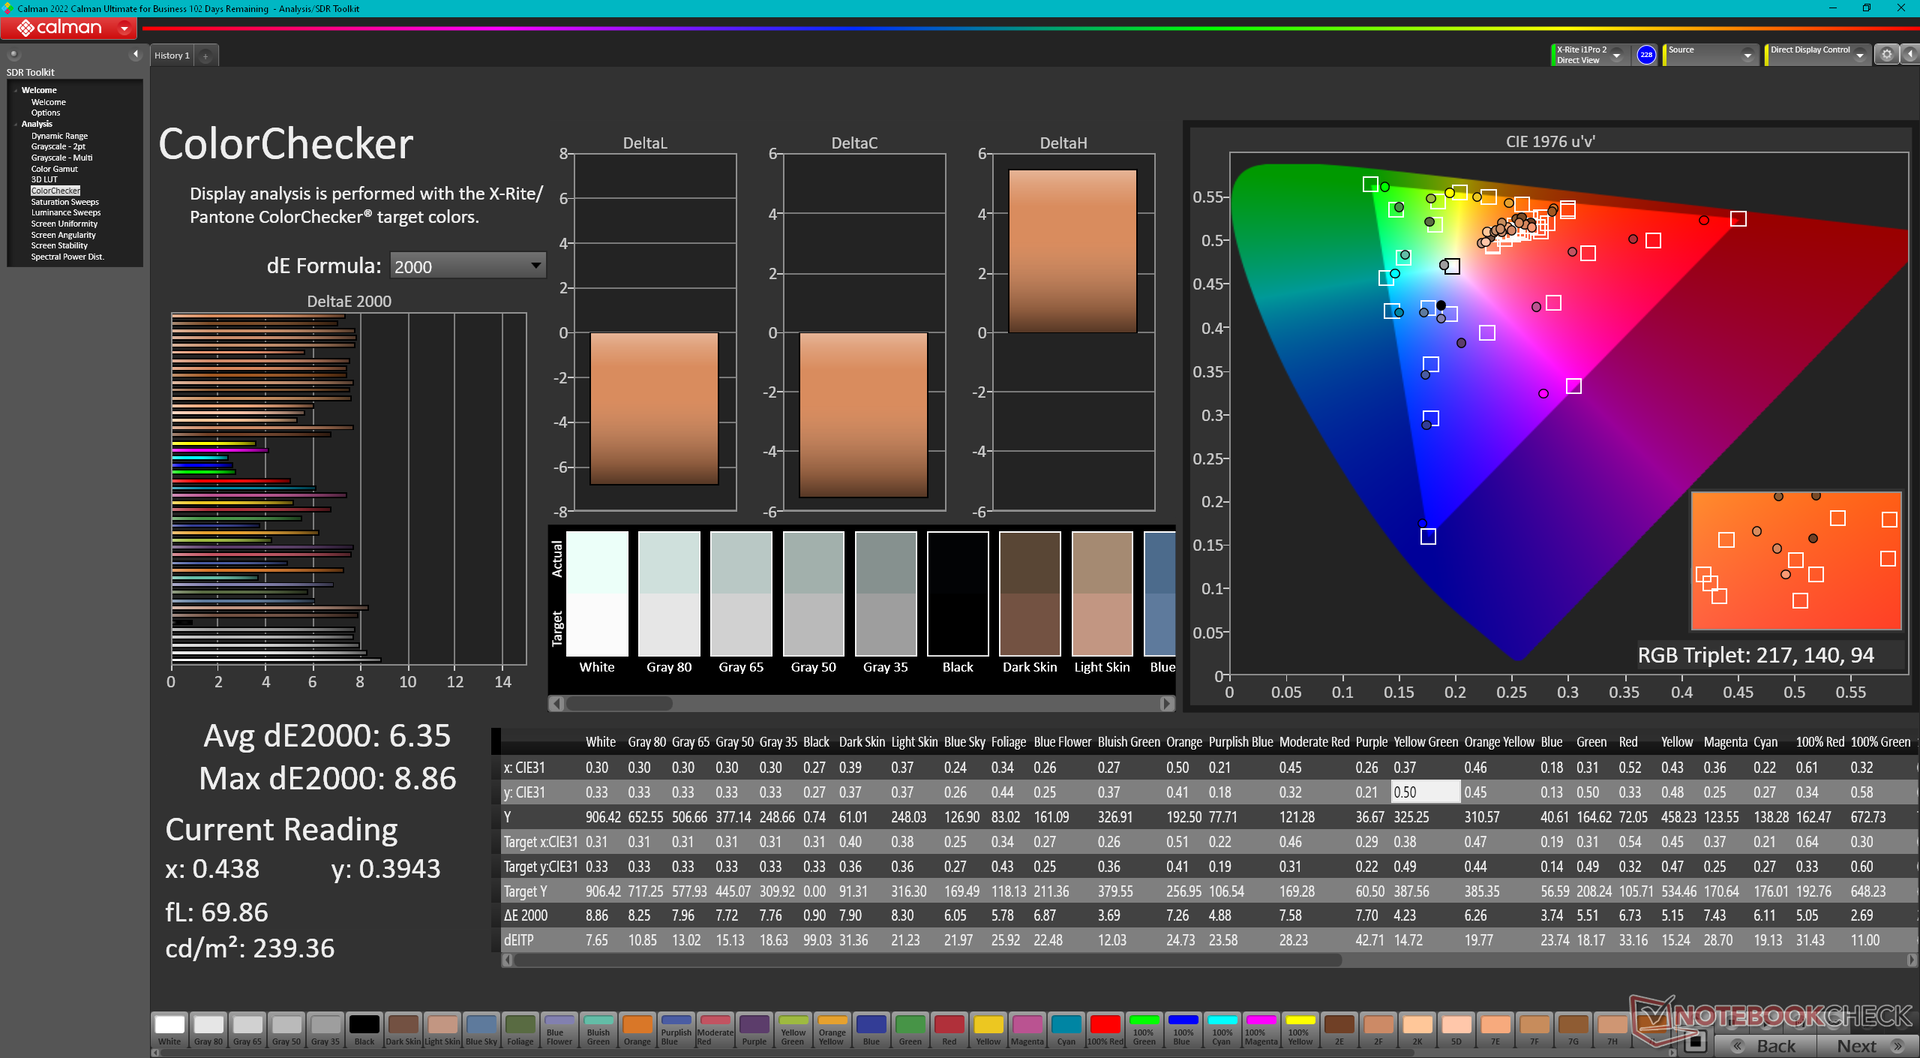
ΔE ColorChecker Calman: 6.35 | ∀{0.5-29.43 Ø4.71}
calibrated: 5.1
ΔE Greyscale Calman: 6.9 | ∀{0.09-98 Ø4.96}
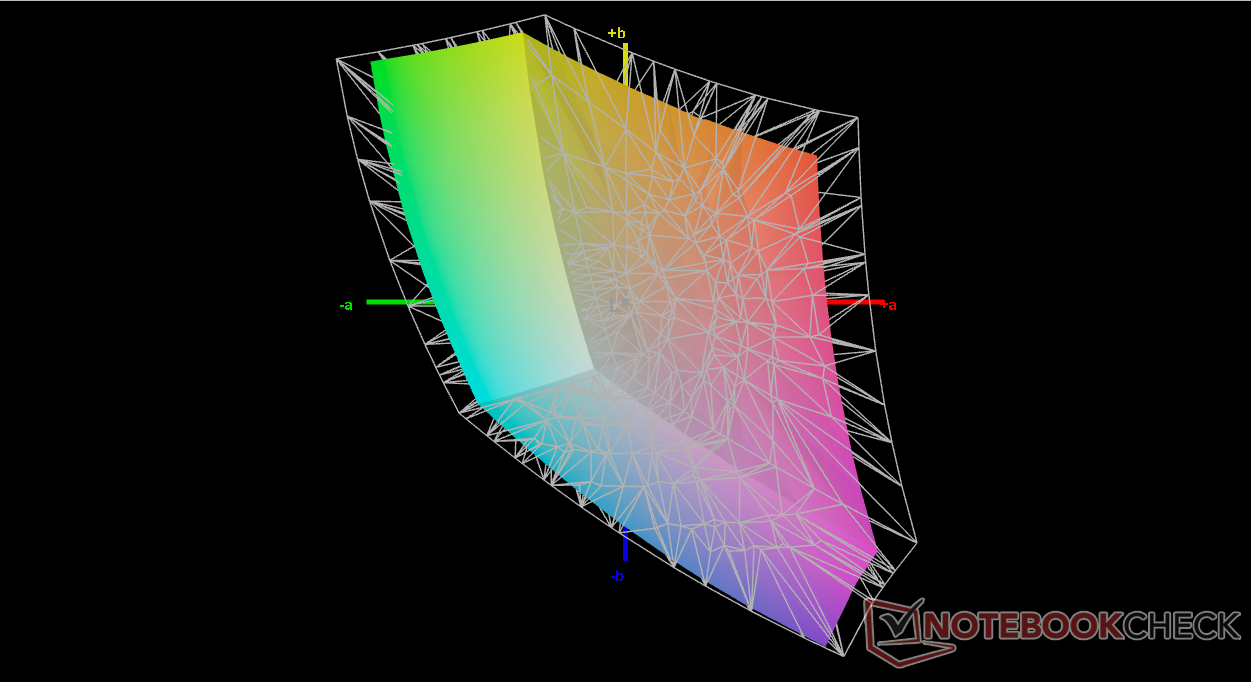
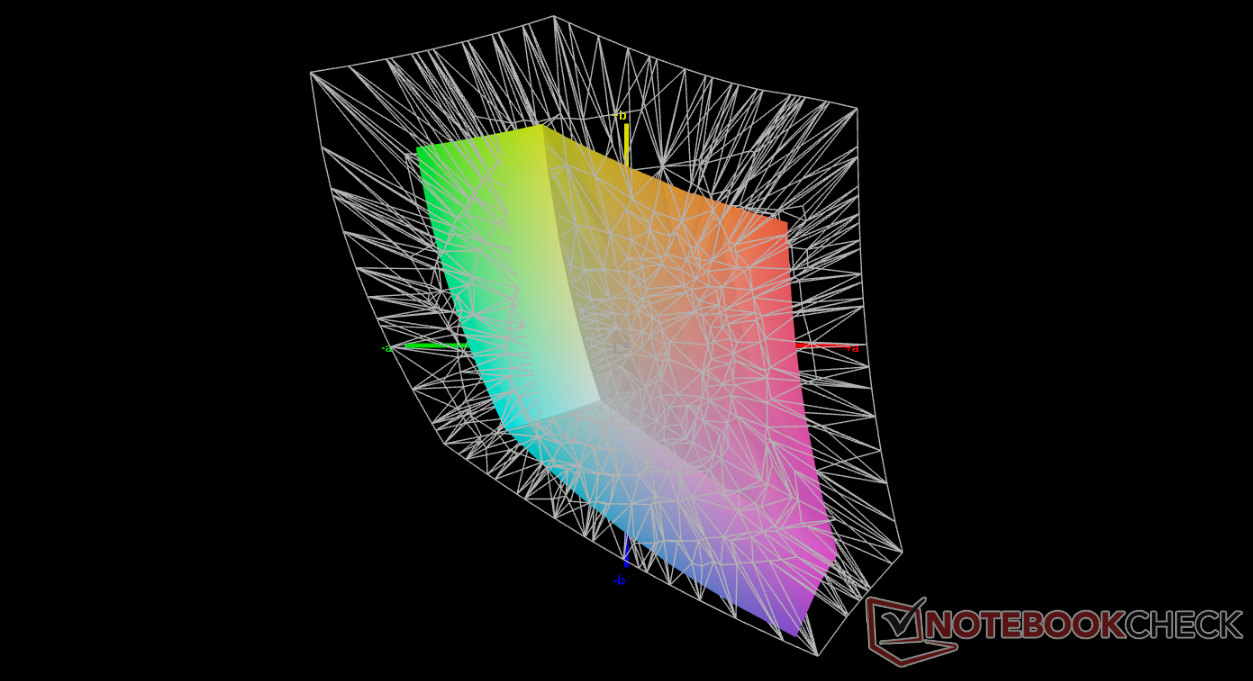
53.1% AdobeRGB 1998 (Argyll 3D)
77.4% sRGB (Argyll 3D)
51.5% Display P3 (Argyll 3D)
Gamma: 2.65
CCT: 6956 K
| Durabook R8 Tablet Digital Flat Panel, IPS, 1280x800, 8" | Acer Enduro T1 ET108-11A A9001 IPS, 1280x800, 8" | Lenovo Tab M8 (Gen 4) IPS, 1280x800, 8" | Dell Latitude 7230 Rugged Extreme Sharp LQ120N1, IPS, 1920x1200, 12" | Panasonic Toughbook FZ-G2 InfoVision M133NWFD R1, IPS, 1920x1200, 10.1" | |
|---|---|---|---|---|---|
| Display | 27% | 1% | |||
| Display P3 Coverage (%) | 51.5 | 66.2 29% | 52.1 1% | ||
| sRGB Coverage (%) | 77.4 | 96.1 24% | 78.5 1% | ||
| AdobeRGB 1998 Coverage (%) | 53.1 | 68.4 29% | 53.8 1% | ||
| Response Times | -20% | -34% | 12% | -63% | |
| Response Time Grey 50% / Grey 80% * (ms) | 32.4 ? | 33.6 ? -4% | 29.2 ? 10% | 28.4 ? 12% | 54.4 ? -68% |
| Response Time Black / White * (ms) | 21.9 ? | 29.6 ? -35% | 39 ? -78% | 19.4 ? 11% | 34.4 ? -57% |
| PWM Frequency (Hz) | 300 ? | 211.9 ? | |||
| Screen | 2% | 17% | 47% | 38% | |
| Brightness middle (cd/m²) | 943.7 | 350 -63% | 410 -57% | 1326.7 41% | 1078.6 14% |
| Brightness (cd/m²) | 870 | 353 -59% | 380 -56% | 1193 37% | 1056 21% |
| Brightness Distribution (%) | 85 | 92 8% | 86 1% | 82 -4% | 90 6% |
| Black Level * (cd/m²) | 0.85 | 0.21 75% | 0.16 81% | 0.85 -0% | 0.48 44% |
| Contrast (:1) | 1110 | 1667 50% | 2563 131% | 1561 41% | 2247 102% |
| Colorchecker dE 2000 * | 6.35 | 5.68 11% | 4.6 28% | 1.06 83% | 4.18 34% |
| Colorchecker dE 2000 max. * | 8.86 | 10.51 -19% | 9.03 -2% | 3.78 57% | 6.2 30% |
| Colorchecker dE 2000 calibrated * | 5.1 | 0.71 86% | 1.95 62% | ||
| Greyscale dE 2000 * | 6.9 | 6.3 9% | 6.3 9% | 1.5 78% | 4.8 30% |
| Gamma | 2.65 83% | 2.12 104% | 2.519 87% | 2.19 100% | 2.05 107% |
| CCT | 6956 93% | 7390 88% | 7707 84% | 6804 96% | 7565 86% |
| Média Total (Programa/Configurações) | -9% /
-3% | -9% /
7% | 29% /
37% | -8% /
16% |
* ... menor é melhor
A temperatura da cor está no lado frio por padrão. Calibrar a tela com nosso colorímetro X-Rite não resultaria em melhorias significativas devido à gama limitada do painel mencionada acima.
Exibir tempos de resposta
| ↔ Tempo de resposta preto para branco | ||
|---|---|---|
| 21.9 ms ... ascensão ↗ e queda ↘ combinadas | ↗ 14.2 ms ascensão | 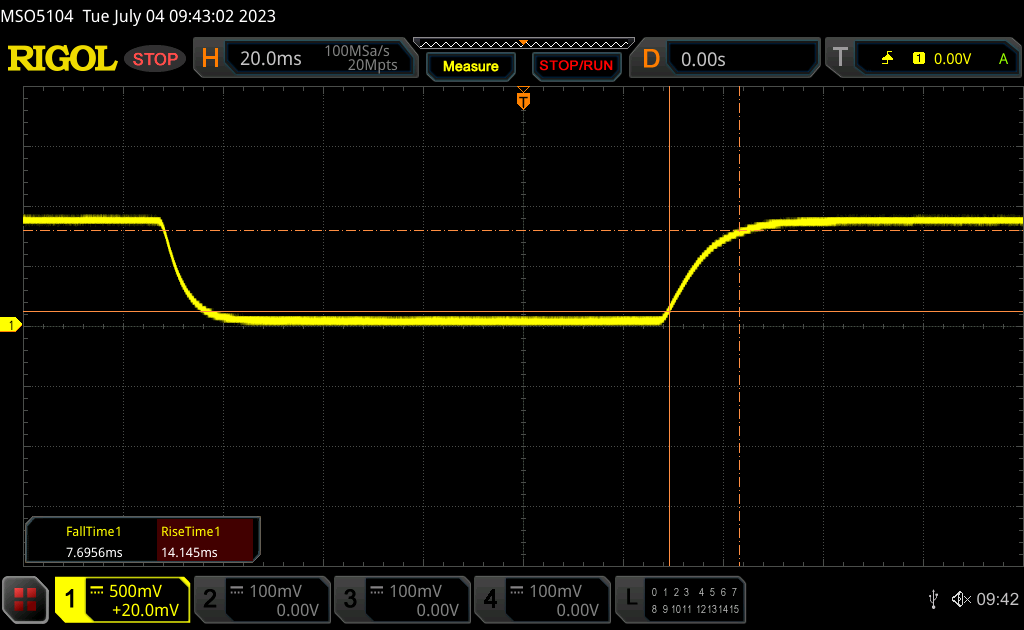 |
| ↘ 7.7 ms queda | ||
| A tela mostra boas taxas de resposta em nossos testes, mas pode ser muito lenta para jogadores competitivos. Em comparação, todos os dispositivos testados variam de 0.1 (mínimo) a 240 (máximo) ms. » 49 % de todos os dispositivos são melhores. Isso significa que o tempo de resposta medido é pior que a média de todos os dispositivos testados (19.8 ms). | ||
| ↔ Tempo de resposta 50% cinza a 80% cinza | ||
| 32.4 ms ... ascensão ↗ e queda ↘ combinadas | ↗ 16.4 ms ascensão | 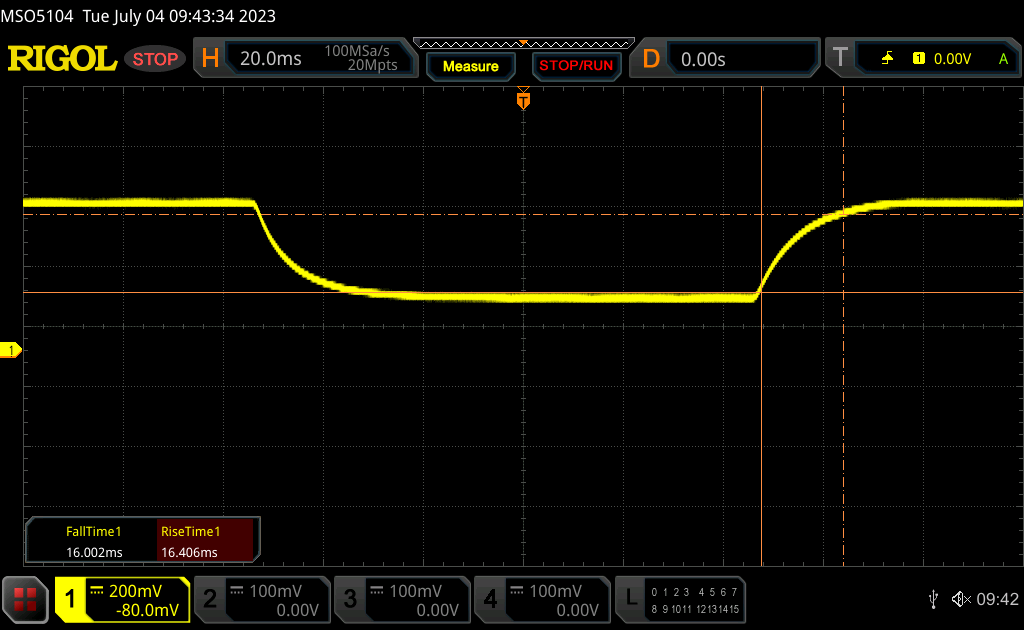 |
| ↘ 16 ms queda | ||
| A tela mostra taxas de resposta lentas em nossos testes e será insatisfatória para os jogadores. Em comparação, todos os dispositivos testados variam de 0.165 (mínimo) a 636 (máximo) ms. » 44 % de todos os dispositivos são melhores. Isso significa que o tempo de resposta medido é semelhante à média de todos os dispositivos testados (31 ms). | ||
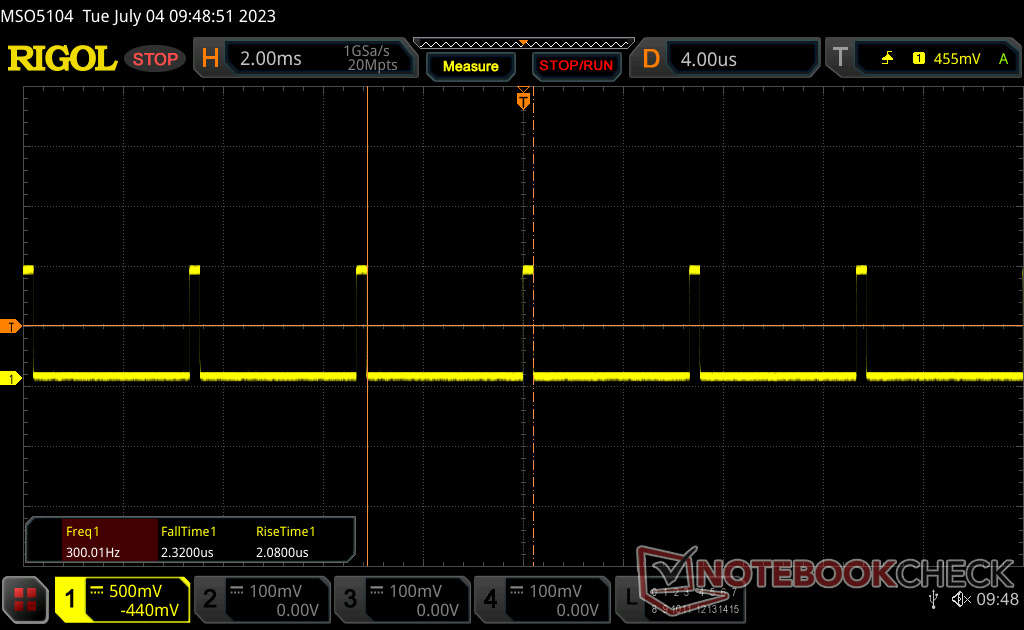
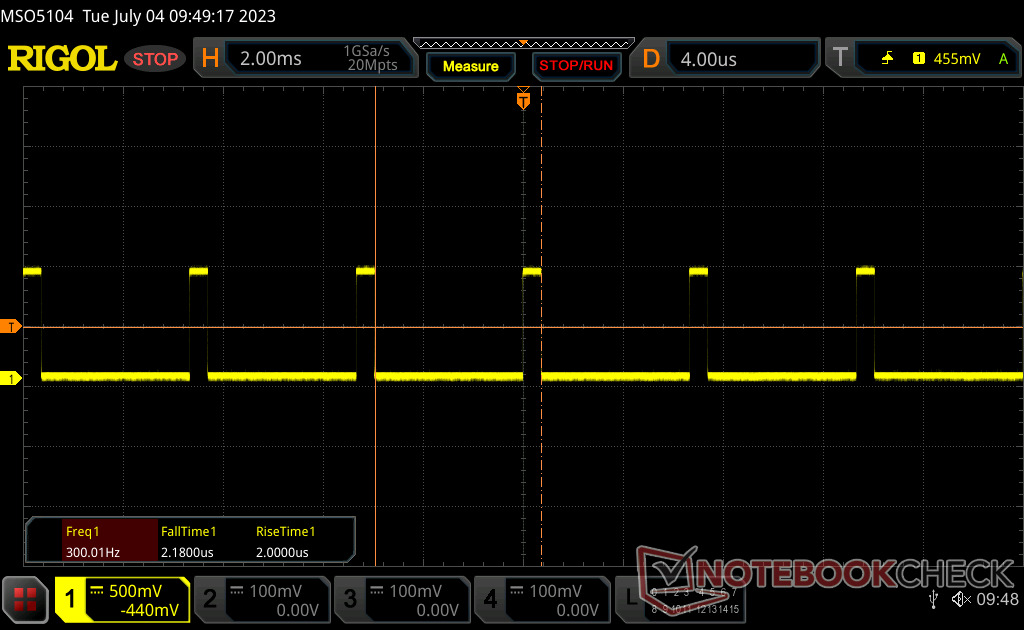
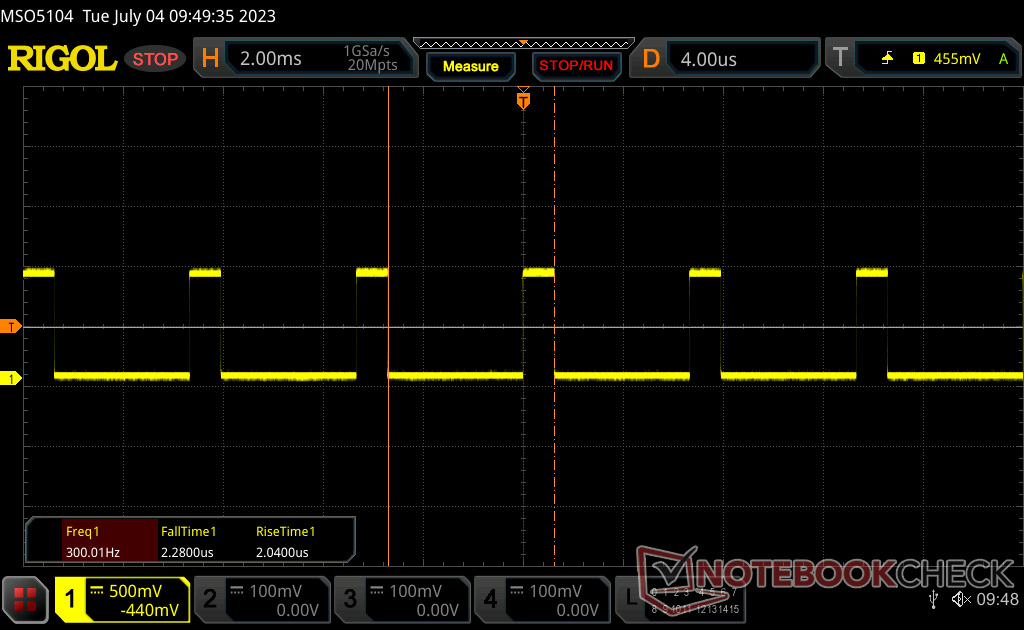
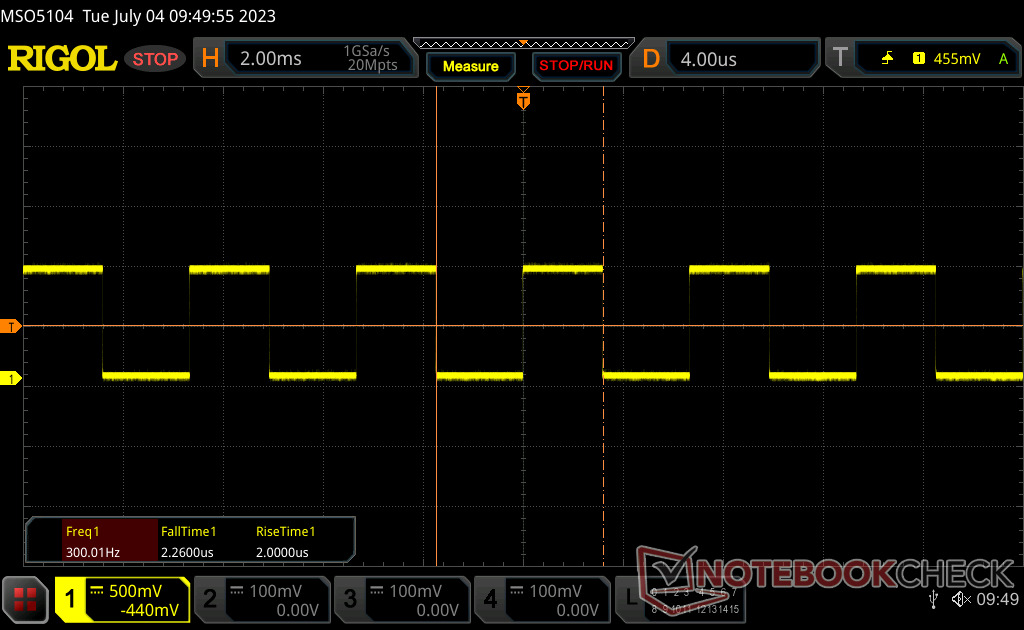
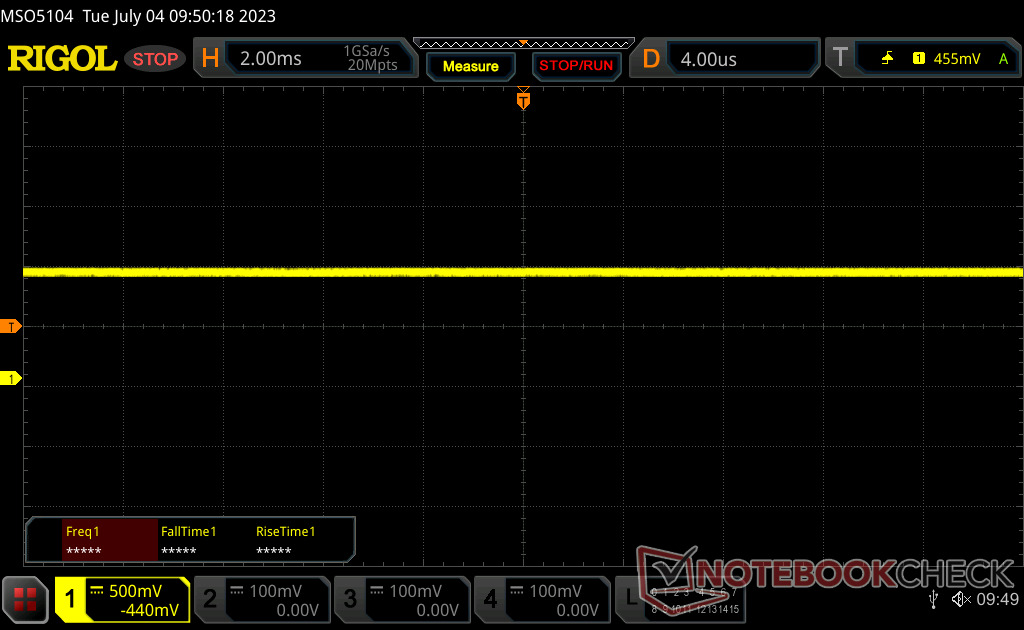
Cintilação da tela / PWM (modulação por largura de pulso)
| Tela tremeluzindo/PWM detectado | 300 Hz | ≤ 99 % configuração de brilho | 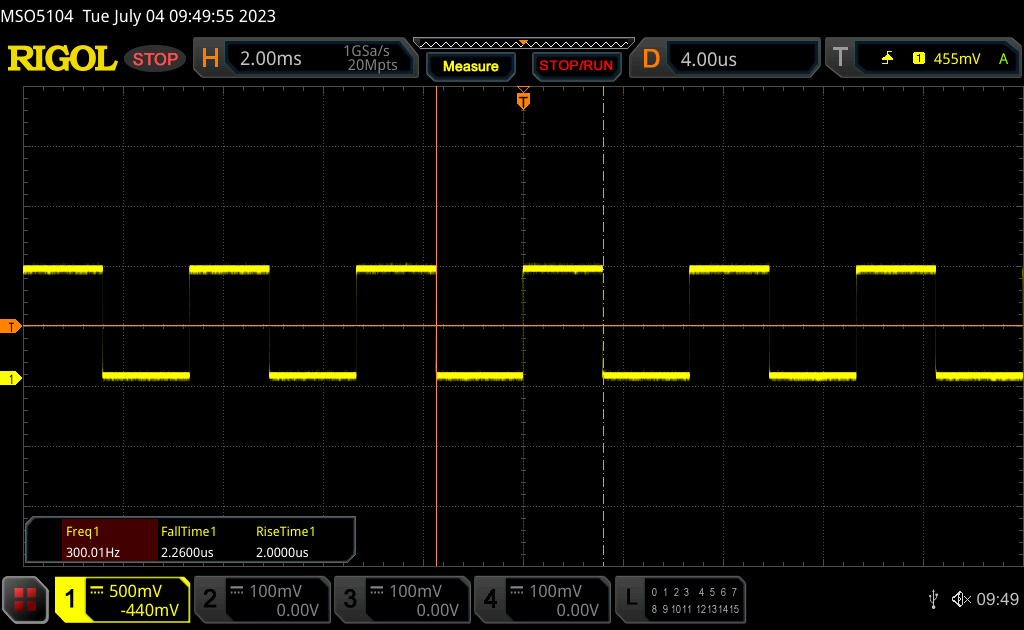 |
A luz de fundo da tela pisca em 300 Hz (pior caso, por exemplo, utilizando PWM) Cintilação detectada em uma configuração de brilho de 99 % e abaixo. Não deve haver cintilação ou PWM acima desta configuração de brilho. A frequência de 300 Hz é relativamente alta, portanto, a maioria dos usuários sensíveis ao PWM não deve notar nenhuma oscilação. No entanto, há relatos de que alguns usuários ainda são sensíveis ao PWM em 500 Hz e acima, portanto, esteja atento. [pwm_comparison] Em comparação: 52 % de todos os dispositivos testados não usam PWM para escurecer a tela. Se PWM foi detectado, uma média de 7757 (mínimo: 5 - máximo: 343500) Hz foi medida. | |||
A modulação de largura de pulso ou cintilação de 300 Hz está presente em todos os níveis de brilho até 99%.
A visibilidade em ambientes externos é excelente quando está sob a sombra, devido à tela extrabrilhante. O reflexo ainda pode desbotar as cores e ser um problema em condições mais claras.
Desempenho - Intel 12ª geração com underclock
Condições de teste
Definimos o Windows para o modo Desempenho antes de executar os benchmarks abaixo.
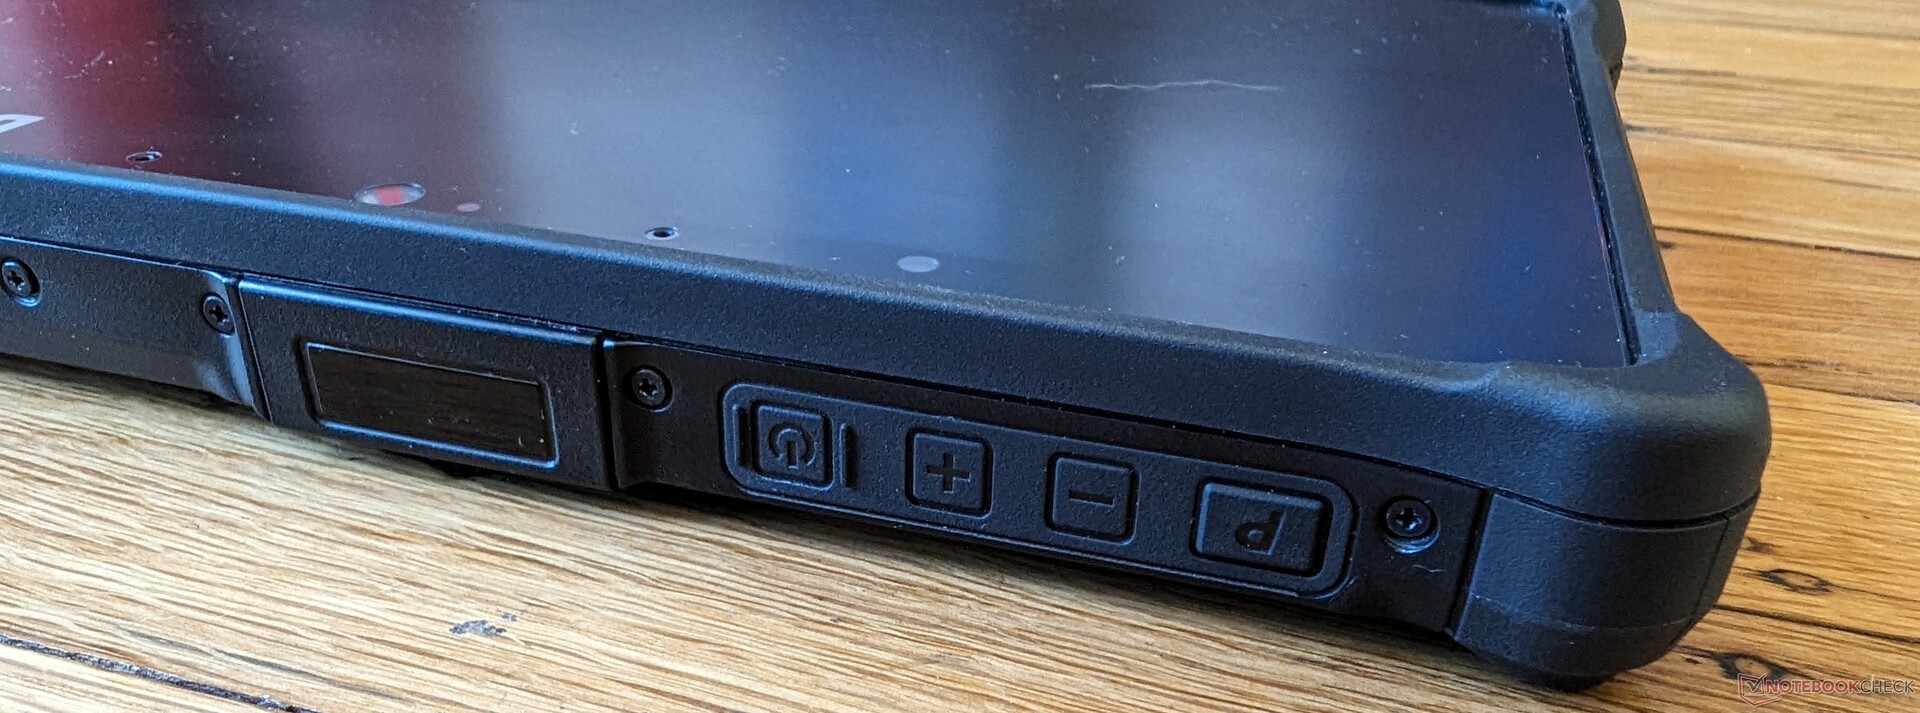
Pressionar o botão "P" na parte superior abre o menu da central de controle para ajustar diferentes aspectos do tablet, como o comportamento de carregamento da bateria, as ações dos botões e os modos de tela sensível ao toque com luvas e dedos.
Processador
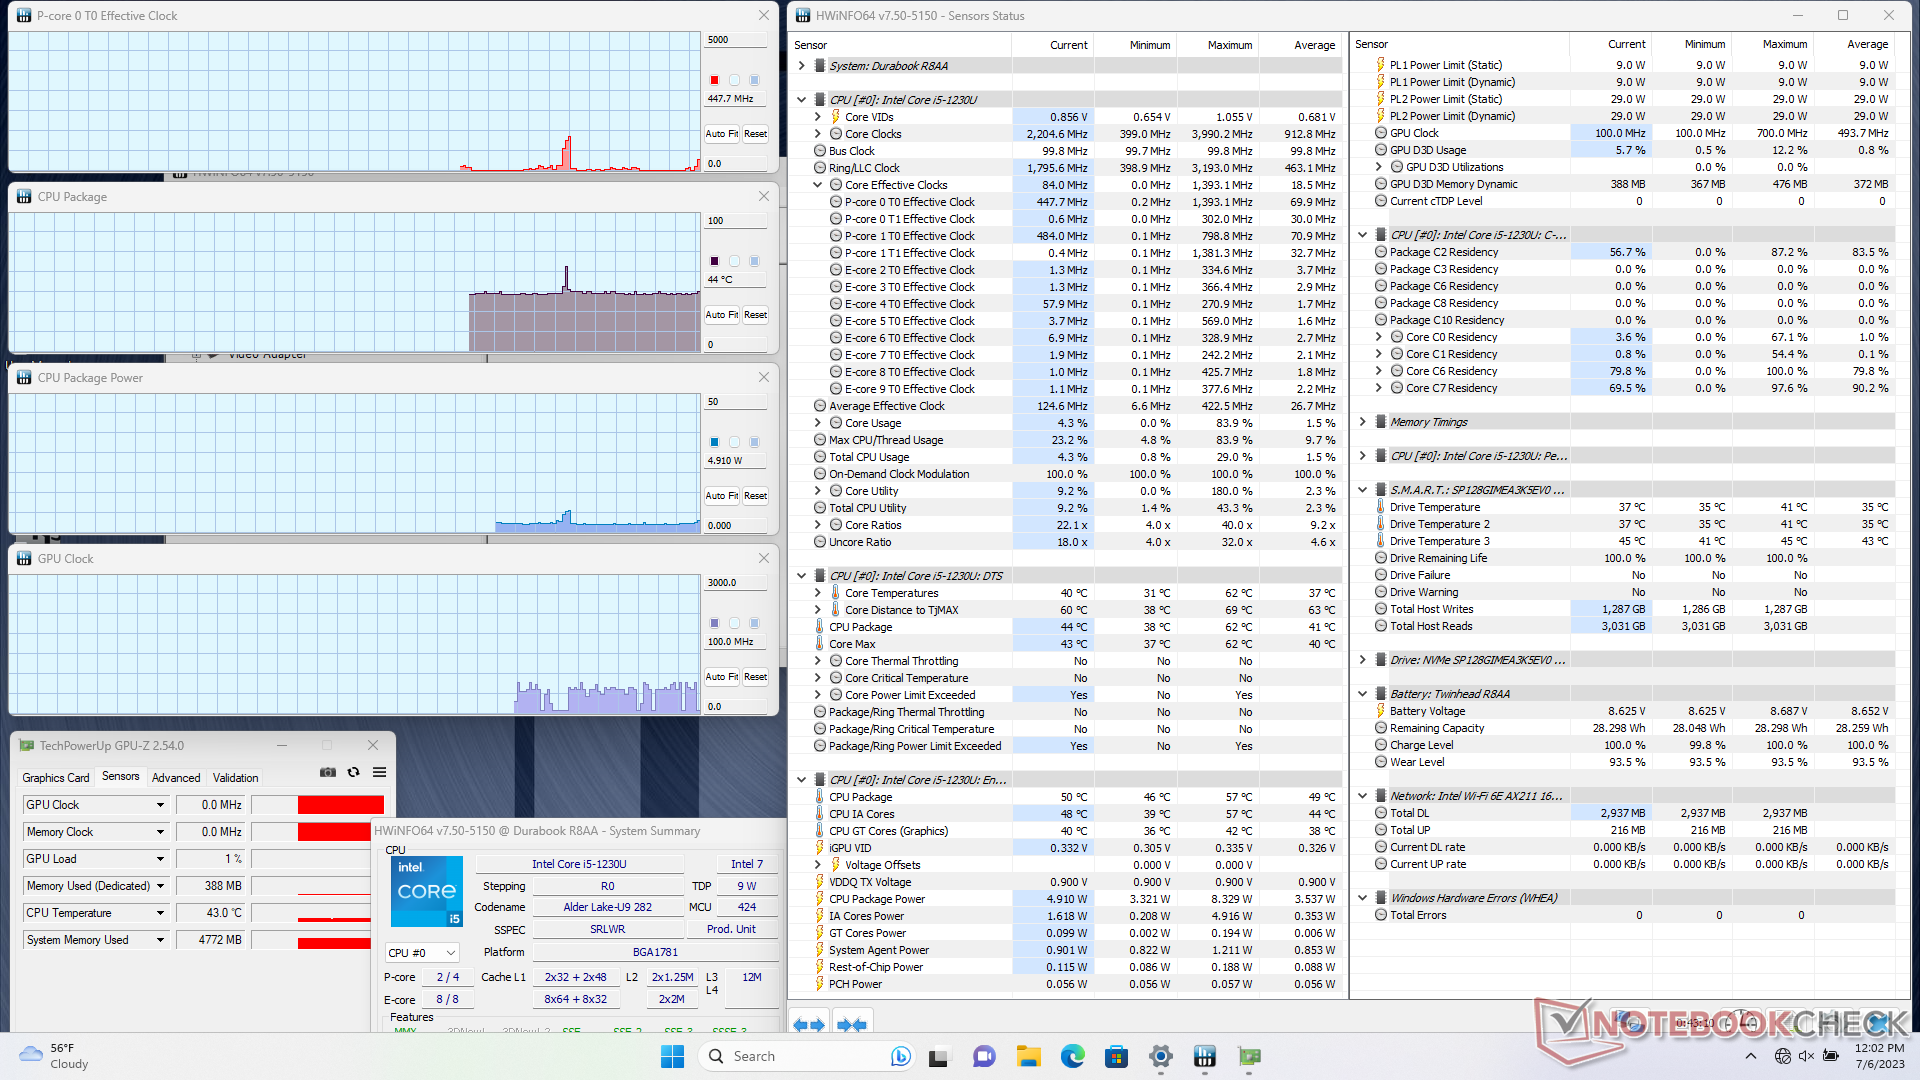
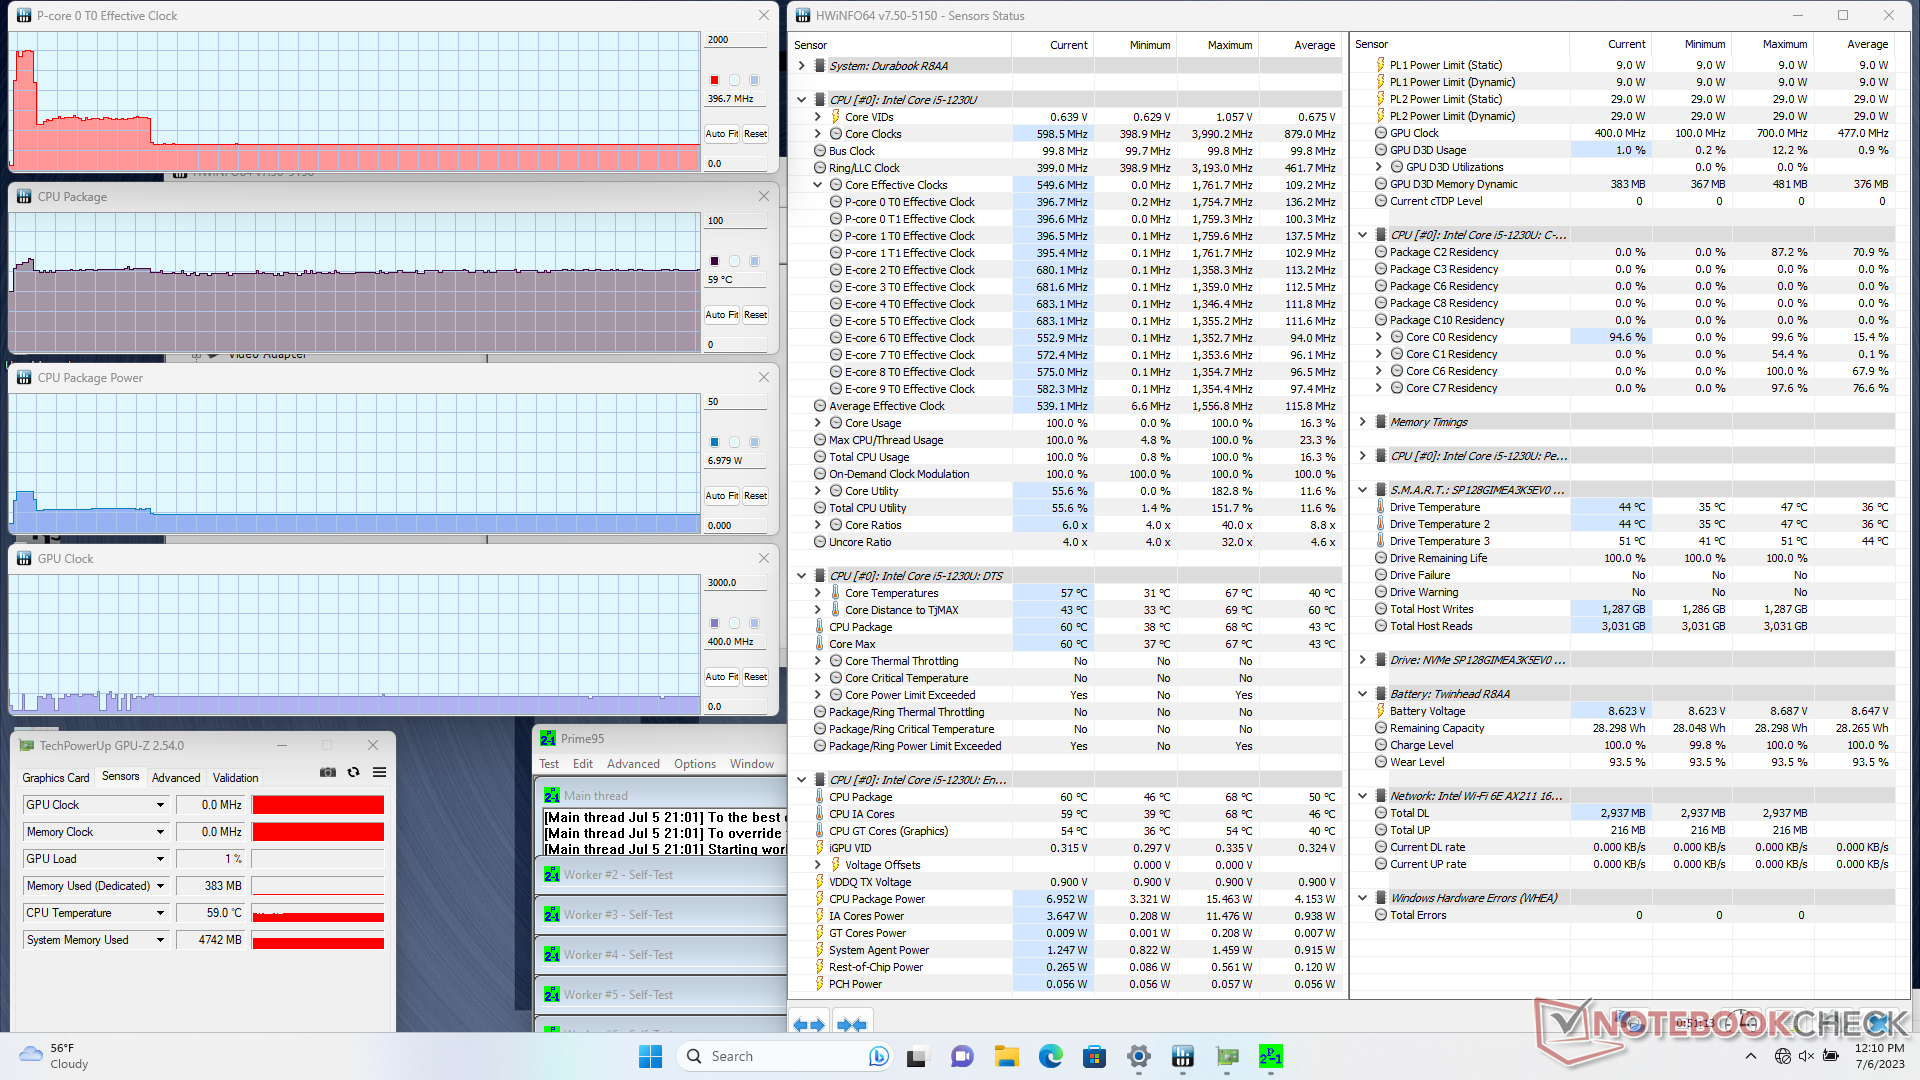
Nossa unidade de análise utiliza o mesmo Core i5-1230U encontrado no Dell XPS 13 9315 e no XPS 9315 2 em 1. Infelizmente, o desempenho foi significativamente prejudicado pelo underclock, provavelmente para maximizar a estabilidade. O desempenho single-thread e multi-thread é cerca de 25% e 60% mais lento, respectivamente, do que o mesmo processador no sistema da Dell mencionado anteriormente. Portanto, o desempenho geral está mais próximo do processador de 10ª geração Core i5-10310U.
É difícil dizer quanto de aumento de desempenho os usuários podem esperar se atualizarem para oCore i7-1250U já que nossa unidade Core i5-1230U é mais lenta do que o esperado. Entretanto, é provável que o SKU do Core i7 também tenha um underclock.
Cinebench R15 Multi Loop
Cinebench R23: Multi Core | Single Core
Cinebench R20: CPU (Multi Core) | CPU (Single Core)
Cinebench R15: CPU Multi 64Bit | CPU Single 64Bit
Blender: v2.79 BMW27 CPU
7-Zip 18.03: 7z b 4 | 7z b 4 -mmt1
Geekbench 5.5: Multi-Core | Single-Core
HWBOT x265 Benchmark v2.2: 4k Preset
LibreOffice : 20 Documents To PDF
R Benchmark 2.5: Overall mean
| CPU Performance rating | |
| Lenovo Yoga 7-14ARB G7 | |
| Samsung Galaxy Book3 Pro 14 | |
| Lenovo ThinkPad T14s G3 21BR00CDGE | |
| HP Envy x360 13-bf0013dx | |
| Dell Latitude 7230 Rugged Extreme | |
| Dell XPS 13 9315 2-in-1 Core i5-1230U | |
| Dell Latitude 7330 Rugged Extreme | |
| Dynabook Satellite Pro C50D-B-115 | |
| Asus ZenBook 14X OLED UX5400EA-L7154W | |
| Média Intel Core i5-1230U | |
| Durabook R8 Tablet | |
| Panasonic Toughbook FZ-G2 -2! | |
| Acer Enduro T1 ET108-11A A9001 -12! | |
| Chuwi LapBook Plus -6! | |
| Lenovo Tab M8 (Gen 4) -12! | |
| Cinebench R23 / Multi Core | |
| Lenovo Yoga 7-14ARB G7 | |
| Lenovo ThinkPad T14s G3 21BR00CDGE | |
| Samsung Galaxy Book3 Pro 14 | |
| Dell Latitude 7230 Rugged Extreme | |
| HP Envy x360 13-bf0013dx | |
| Dell XPS 13 9315 2-in-1 Core i5-1230U | |
| Dynabook Satellite Pro C50D-B-115 | |
| Asus ZenBook 14X OLED UX5400EA-L7154W | |
| Dell Latitude 7330 Rugged Extreme | |
| Média Intel Core i5-1230U (3066 - 7264, n=3) | |
| Panasonic Toughbook FZ-G2 | |
| Durabook R8 Tablet | |
| Cinebench R23 / Single Core | |
| Lenovo ThinkPad T14s G3 21BR00CDGE | |
| Samsung Galaxy Book3 Pro 14 | |
| HP Envy x360 13-bf0013dx | |
| Dell Latitude 7230 Rugged Extreme | |
| Dell Latitude 7330 Rugged Extreme | |
| Lenovo Yoga 7-14ARB G7 | |
| Dell XPS 13 9315 2-in-1 Core i5-1230U | |
| Asus ZenBook 14X OLED UX5400EA-L7154W | |
| Dynabook Satellite Pro C50D-B-115 | |
| Média Intel Core i5-1230U (1135 - 1512, n=3) | |
| Durabook R8 Tablet | |
| Panasonic Toughbook FZ-G2 | |
| Cinebench R20 / CPU (Multi Core) | |
| Lenovo Yoga 7-14ARB G7 | |
| Lenovo ThinkPad T14s G3 21BR00CDGE | |
| Samsung Galaxy Book3 Pro 14 | |
| Dell Latitude 7230 Rugged Extreme | |
| HP Envy x360 13-bf0013dx | |
| Dell XPS 13 9315 2-in-1 Core i5-1230U | |
| Asus ZenBook 14X OLED UX5400EA-L7154W | |
| Dynabook Satellite Pro C50D-B-115 | |
| Dell Latitude 7330 Rugged Extreme | |
| Média Intel Core i5-1230U (1175 - 2802, n=3) | |
| Panasonic Toughbook FZ-G2 | |
| Durabook R8 Tablet | |
| Chuwi LapBook Plus | |
| Cinebench R20 / CPU (Single Core) | |
| Lenovo ThinkPad T14s G3 21BR00CDGE | |
| Samsung Galaxy Book3 Pro 14 | |
| HP Envy x360 13-bf0013dx | |
| Lenovo Yoga 7-14ARB G7 | |
| Dell Latitude 7230 Rugged Extreme | |
| Dell Latitude 7330 Rugged Extreme | |
| Dell XPS 13 9315 2-in-1 Core i5-1230U | |
| Asus ZenBook 14X OLED UX5400EA-L7154W | |
| Dynabook Satellite Pro C50D-B-115 | |
| Média Intel Core i5-1230U (441 - 580, n=3) | |
| Durabook R8 Tablet | |
| Panasonic Toughbook FZ-G2 | |
| Chuwi LapBook Plus | |
| Cinebench R15 / CPU Multi 64Bit | |
| Lenovo Yoga 7-14ARB G7 | |
| Samsung Galaxy Book3 Pro 14 | |
| Lenovo ThinkPad T14s G3 21BR00CDGE | |
| HP Envy x360 13-bf0013dx | |
| Dynabook Satellite Pro C50D-B-115 | |
| Dell XPS 13 9315 2-in-1 Core i5-1230U | |
| Dell Latitude 7230 Rugged Extreme | |
| Asus ZenBook 14X OLED UX5400EA-L7154W | |
| Dell Latitude 7330 Rugged Extreme | |
| Média Intel Core i5-1230U (433 - 1254, n=3) | |
| Panasonic Toughbook FZ-G2 | |
| Durabook R8 Tablet | |
| Chuwi LapBook Plus | |
| Cinebench R15 / CPU Single 64Bit | |
| Lenovo Yoga 7-14ARB G7 | |
| Lenovo ThinkPad T14s G3 21BR00CDGE | |
| Samsung Galaxy Book3 Pro 14 | |
| Dell Latitude 7330 Rugged Extreme | |
| HP Envy x360 13-bf0013dx | |
| Dell Latitude 7230 Rugged Extreme | |
| Dell XPS 13 9315 2-in-1 Core i5-1230U | |
| Dynabook Satellite Pro C50D-B-115 | |
| Asus ZenBook 14X OLED UX5400EA-L7154W | |
| Média Intel Core i5-1230U (120.1 - 221, n=3) | |
| Panasonic Toughbook FZ-G2 | |
| Durabook R8 Tablet | |
| Chuwi LapBook Plus | |
| Blender / v2.79 BMW27 CPU | |
| Chuwi LapBook Plus | |
| Durabook R8 Tablet | |
| Panasonic Toughbook FZ-G2 | |
| Média Intel Core i5-1230U (503 - 1005, n=2) | |
| Dell Latitude 7330 Rugged Extreme | |
| Asus ZenBook 14X OLED UX5400EA-L7154W | |
| Dell XPS 13 9315 2-in-1 Core i5-1230U | |
| Dynabook Satellite Pro C50D-B-115 | |
| HP Envy x360 13-bf0013dx | |
| Dell Latitude 7230 Rugged Extreme | |
| Lenovo ThinkPad T14s G3 21BR00CDGE | |
| Samsung Galaxy Book3 Pro 14 | |
| Lenovo Yoga 7-14ARB G7 | |
| 7-Zip 18.03 / 7z b 4 | |
| Lenovo Yoga 7-14ARB G7 | |
| Lenovo ThinkPad T14s G3 21BR00CDGE | |
| Samsung Galaxy Book3 Pro 14 | |
| Dell XPS 13 9315 2-in-1 Core i5-1230U | |
| Dynabook Satellite Pro C50D-B-115 | |
| HP Envy x360 13-bf0013dx | |
| Dell Latitude 7230 Rugged Extreme | |
| Asus ZenBook 14X OLED UX5400EA-L7154W | |
| Dell Latitude 7330 Rugged Extreme | |
| Média Intel Core i5-1230U (12470 - 34505, n=3) | |
| Panasonic Toughbook FZ-G2 | |
| Durabook R8 Tablet | |
| Chuwi LapBook Plus | |
| 7-Zip 18.03 / 7z b 4 -mmt1 | |
| Samsung Galaxy Book3 Pro 14 | |
| Lenovo Yoga 7-14ARB G7 | |
| Dell Latitude 7330 Rugged Extreme | |
| Lenovo ThinkPad T14s G3 21BR00CDGE | |
| Dynabook Satellite Pro C50D-B-115 | |
| Asus ZenBook 14X OLED UX5400EA-L7154W | |
| Dell XPS 13 9315 2-in-1 Core i5-1230U | |
| HP Envy x360 13-bf0013dx | |
| Dell Latitude 7230 Rugged Extreme | |
| Média Intel Core i5-1230U (3873 - 4870, n=3) | |
| Panasonic Toughbook FZ-G2 | |
| Durabook R8 Tablet | |
| Chuwi LapBook Plus | |
| Geekbench 5.5 / Multi-Core | |
| Samsung Galaxy Book3 Pro 14 | |
| Lenovo Yoga 7-14ARB G7 | |
| Lenovo ThinkPad T14s G3 21BR00CDGE | |
| Dell XPS 13 9315 2-in-1 Core i5-1230U | |
| HP Envy x360 13-bf0013dx | |
| Dell Latitude 7230 Rugged Extreme | |
| Média Intel Core i5-1230U (4193 - 7309, n=3) | |
| Asus ZenBook 14X OLED UX5400EA-L7154W | |
| Asus ZenBook 14X OLED UX5400EA-L7154W | |
| Dell Latitude 7330 Rugged Extreme | |
| Dynabook Satellite Pro C50D-B-115 | |
| Durabook R8 Tablet | |
| Acer Enduro T1 ET108-11A A9001 | |
| Lenovo Tab M8 (Gen 4) | |
| Geekbench 5.5 / Single-Core | |
| Samsung Galaxy Book3 Pro 14 | |
| Lenovo ThinkPad T14s G3 21BR00CDGE | |
| Dell Latitude 7230 Rugged Extreme | |
| HP Envy x360 13-bf0013dx | |
| Dell Latitude 7330 Rugged Extreme | |
| Lenovo Yoga 7-14ARB G7 | |
| Média Intel Core i5-1230U (1454 - 1640, n=3) | |
| Dell XPS 13 9315 2-in-1 Core i5-1230U | |
| Asus ZenBook 14X OLED UX5400EA-L7154W | |
| Asus ZenBook 14X OLED UX5400EA-L7154W | |
| Durabook R8 Tablet | |
| Dynabook Satellite Pro C50D-B-115 | |
| Acer Enduro T1 ET108-11A A9001 | |
| Lenovo Tab M8 (Gen 4) | |
| HWBOT x265 Benchmark v2.2 / 4k Preset | |
| Lenovo Yoga 7-14ARB G7 | |
| Samsung Galaxy Book3 Pro 14 | |
| Lenovo ThinkPad T14s G3 21BR00CDGE | |
| Dell Latitude 7230 Rugged Extreme | |
| HP Envy x360 13-bf0013dx | |
| Dell XPS 13 9315 2-in-1 Core i5-1230U | |
| Asus ZenBook 14X OLED UX5400EA-L7154W | |
| Dynabook Satellite Pro C50D-B-115 | |
| Dell Latitude 7330 Rugged Extreme | |
| Média Intel Core i5-1230U (3.59 - 8.33, n=2) | |
| Panasonic Toughbook FZ-G2 | |
| Durabook R8 Tablet | |
| Chuwi LapBook Plus | |
| LibreOffice / 20 Documents To PDF | |
| Asus ZenBook 14X OLED UX5400EA-L7154W | |
| Panasonic Toughbook FZ-G2 | |
| Durabook R8 Tablet | |
| Média Intel Core i5-1230U (51.2 - 62.5, n=2) | |
| Lenovo Yoga 7-14ARB G7 | |
| Dynabook Satellite Pro C50D-B-115 | |
| HP Envy x360 13-bf0013dx | |
| Dell Latitude 7230 Rugged Extreme | |
| Dell XPS 13 9315 2-in-1 Core i5-1230U | |
| Dell Latitude 7330 Rugged Extreme | |
| Samsung Galaxy Book3 Pro 14 | |
| Lenovo ThinkPad T14s G3 21BR00CDGE | |
| R Benchmark 2.5 / Overall mean | |
| Panasonic Toughbook FZ-G2 | |
| Durabook R8 Tablet | |
| Asus ZenBook 14X OLED UX5400EA-L7154W | |
| Média Intel Core i5-1230U (0.527 - 0.676, n=2) | |
| Dynabook Satellite Pro C50D-B-115 | |
| Dell Latitude 7330 Rugged Extreme | |
| HP Envy x360 13-bf0013dx | |
| Dell Latitude 7230 Rugged Extreme | |
| Dell XPS 13 9315 2-in-1 Core i5-1230U | |
| Lenovo Yoga 7-14ARB G7 | |
| Lenovo ThinkPad T14s G3 21BR00CDGE | |
| Samsung Galaxy Book3 Pro 14 | |
Cinebench R23: Multi Core | Single Core
Cinebench R20: CPU (Multi Core) | CPU (Single Core)
Cinebench R15: CPU Multi 64Bit | CPU Single 64Bit
Blender: v2.79 BMW27 CPU
7-Zip 18.03: 7z b 4 | 7z b 4 -mmt1
Geekbench 5.5: Multi-Core | Single-Core
HWBOT x265 Benchmark v2.2: 4k Preset
LibreOffice : 20 Documents To PDF
R Benchmark 2.5: Overall mean
* ... menor é melhor
* ... menor é melhor
AIDA64: FP32 Ray-Trace | FPU Julia | CPU SHA3 | CPU Queen | FPU SinJulia | FPU Mandel | CPU AES | CPU ZLib | FP64 Ray-Trace | CPU PhotoWorxx
| Performance rating | |
| Dell Latitude 7230 Rugged Extreme | |
| Média Intel Core i5-1230U | |
| Panasonic Toughbook FZ-G2 | |
| Durabook R8 Tablet | |
| AIDA64 / FP32 Ray-Trace | |
| Dell Latitude 7230 Rugged Extreme | |
| Média Intel Core i5-1230U (2344 - 6360, n=3) | |
| Panasonic Toughbook FZ-G2 | |
| Durabook R8 Tablet | |
| AIDA64 / FPU Julia | |
| Dell Latitude 7230 Rugged Extreme | |
| Média Intel Core i5-1230U (11867 - 31714, n=3) | |
| Panasonic Toughbook FZ-G2 | |
| Durabook R8 Tablet | |
| AIDA64 / CPU SHA3 | |
| Dell Latitude 7230 Rugged Extreme | |
| Média Intel Core i5-1230U (772 - 1711, n=3) | |
| Panasonic Toughbook FZ-G2 | |
| Durabook R8 Tablet | |
| AIDA64 / CPU Queen | |
| Dell Latitude 7230 Rugged Extreme | |
| Média Intel Core i5-1230U (30824 - 52533, n=3) | |
| Panasonic Toughbook FZ-G2 | |
| Durabook R8 Tablet | |
| AIDA64 / FPU SinJulia | |
| Dell Latitude 7230 Rugged Extreme | |
| Panasonic Toughbook FZ-G2 | |
| Média Intel Core i5-1230U (2269 - 3947, n=3) | |
| Durabook R8 Tablet | |
| AIDA64 / FPU Mandel | |
| Dell Latitude 7230 Rugged Extreme | |
| Média Intel Core i5-1230U (6379 - 15896, n=3) | |
| Panasonic Toughbook FZ-G2 | |
| Durabook R8 Tablet | |
| AIDA64 / CPU AES | |
| Dell Latitude 7230 Rugged Extreme | |
| Durabook R8 Tablet | |
| Média Intel Core i5-1230U (18011 - 31941, n=3) | |
| Panasonic Toughbook FZ-G2 | |
| AIDA64 / CPU ZLib | |
| Dell Latitude 7230 Rugged Extreme | |
| Média Intel Core i5-1230U (229 - 495, n=3) | |
| Durabook R8 Tablet | |
| Panasonic Toughbook FZ-G2 | |
| AIDA64 / FP64 Ray-Trace | |
| Dell Latitude 7230 Rugged Extreme | |
| Média Intel Core i5-1230U (1328 - 3305, n=3) | |
| Panasonic Toughbook FZ-G2 | |
| Durabook R8 Tablet | |
| AIDA64 / CPU PhotoWorxx | |
| Dell Latitude 7230 Rugged Extreme | |
| Média Intel Core i5-1230U (17516 - 37042, n=3) | |
| Panasonic Toughbook FZ-G2 | |
| Durabook R8 Tablet | |
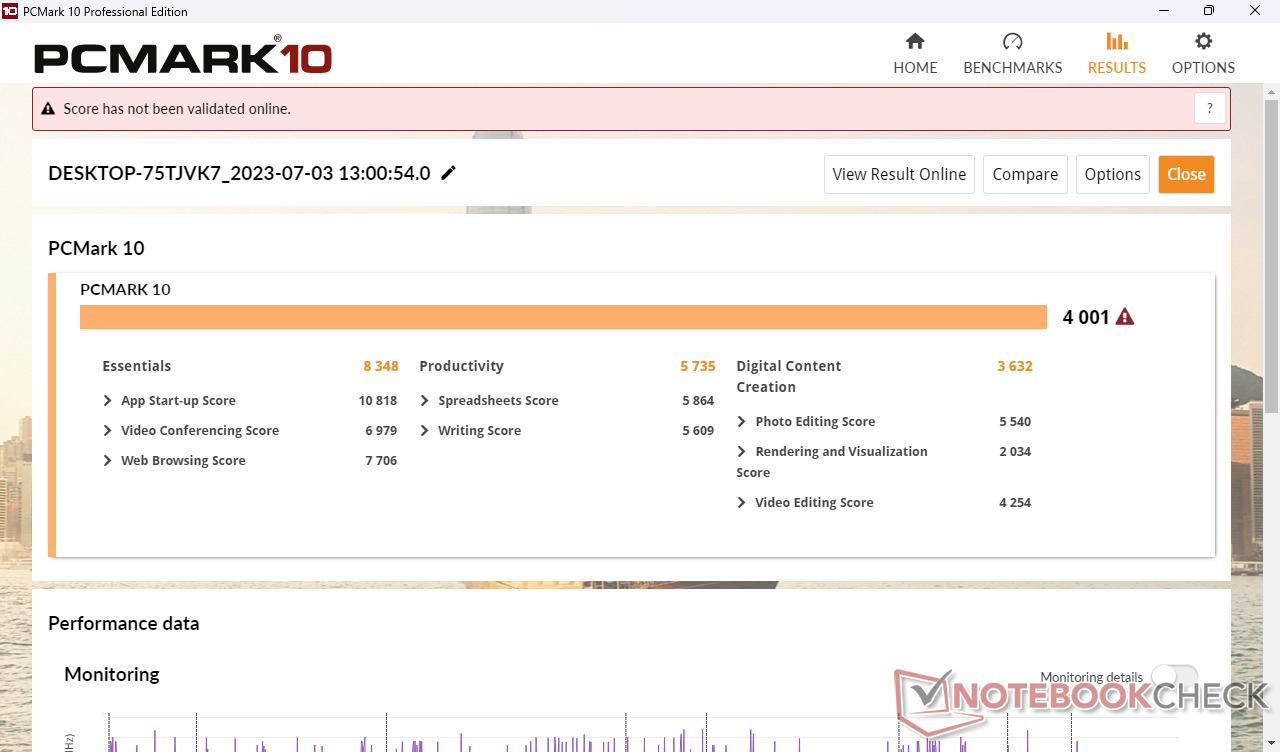
Desempenho do sistema
Os resultados do PCMark são comparáveis aos do antigo Panasonic Toughbook FZ-G2 já que o processador em nossa unidade foi desbloqueado para funcionar de forma mais semelhante ao Toughbook.
CrossMark: Overall | Productivity | Creativity | Responsiveness
| PCMark 10 / Score | |
| Dell Latitude 7230 Rugged Extreme | |
| Média Intel Core i5-1230U, Intel Iris Xe Graphics G7 80EUs (4001 - 4943, n=3) | |
| Durabook R8 Tablet | |
| Panasonic Toughbook FZ-G2 | |
| PCMark 10 / Essentials | |
| Dell Latitude 7230 Rugged Extreme | |
| Média Intel Core i5-1230U, Intel Iris Xe Graphics G7 80EUs (8348 - 10139, n=3) | |
| Panasonic Toughbook FZ-G2 | |
| Durabook R8 Tablet | |
| PCMark 10 / Productivity | |
| Dell Latitude 7230 Rugged Extreme | |
| Média Intel Core i5-1230U, Intel Iris Xe Graphics G7 80EUs (5735 - 6692, n=3) | |
| Panasonic Toughbook FZ-G2 | |
| Durabook R8 Tablet | |
| PCMark 10 / Digital Content Creation | |
| Dell Latitude 7230 Rugged Extreme | |
| Média Intel Core i5-1230U, Intel Iris Xe Graphics G7 80EUs (3632 - 4833, n=3) | |
| Durabook R8 Tablet | |
| Panasonic Toughbook FZ-G2 | |
| CrossMark / Overall | |
| Dell Latitude 7230 Rugged Extreme | |
| Média Intel Core i5-1230U, Intel Iris Xe Graphics G7 80EUs (1117 - 1383, n=3) | |
| Durabook R8 Tablet | |
| Lenovo Tab M8 (Gen 4) | |
| CrossMark / Productivity | |
| Dell Latitude 7230 Rugged Extreme | |
| Média Intel Core i5-1230U, Intel Iris Xe Graphics G7 80EUs (1187 - 1356, n=3) | |
| Durabook R8 Tablet | |
| Lenovo Tab M8 (Gen 4) | |
| CrossMark / Creativity | |
| Dell Latitude 7230 Rugged Extreme | |
| Média Intel Core i5-1230U, Intel Iris Xe Graphics G7 80EUs (1095 - 1469, n=3) | |
| Durabook R8 Tablet | |
| Lenovo Tab M8 (Gen 4) | |
| CrossMark / Responsiveness | |
| Dell Latitude 7230 Rugged Extreme | |
| Média Intel Core i5-1230U, Intel Iris Xe Graphics G7 80EUs (990 - 1224, n=3) | |
| Durabook R8 Tablet | |
| Lenovo Tab M8 (Gen 4) | |
| PCMark 10 Score | 4001 pontos | |
Ajuda | ||
| AIDA64 / Memory Copy | |
| Média da turma Tablet (60613 - 110050, n=3, últimos 2 anos) | |
| Média Intel Core i5-1230U (32539 - 60944, n=3) | |
| Durabook R8 Tablet | |
| AIDA64 / Memory Read | |
| Média da turma Tablet (85395 - 122306, n=3, últimos 2 anos) | |
| Média Intel Core i5-1230U (31342 - 60435, n=3) | |
| Durabook R8 Tablet | |
| AIDA64 / Memory Write | |
| Média da turma Tablet (43045 - 117859, n=3, últimos 2 anos) | |
| Média Intel Core i5-1230U (33224 - 65665, n=3) | |
| Durabook R8 Tablet | |
| AIDA64 / Memory Latency | |
| Durabook R8 Tablet | |
| Média da turma Tablet (94.4 - 101.7, n=2, últimos 2 anos) | |
| Média Intel Core i5-1230U (104.3 - 105.3, n=3) | |
* ... menor é melhor
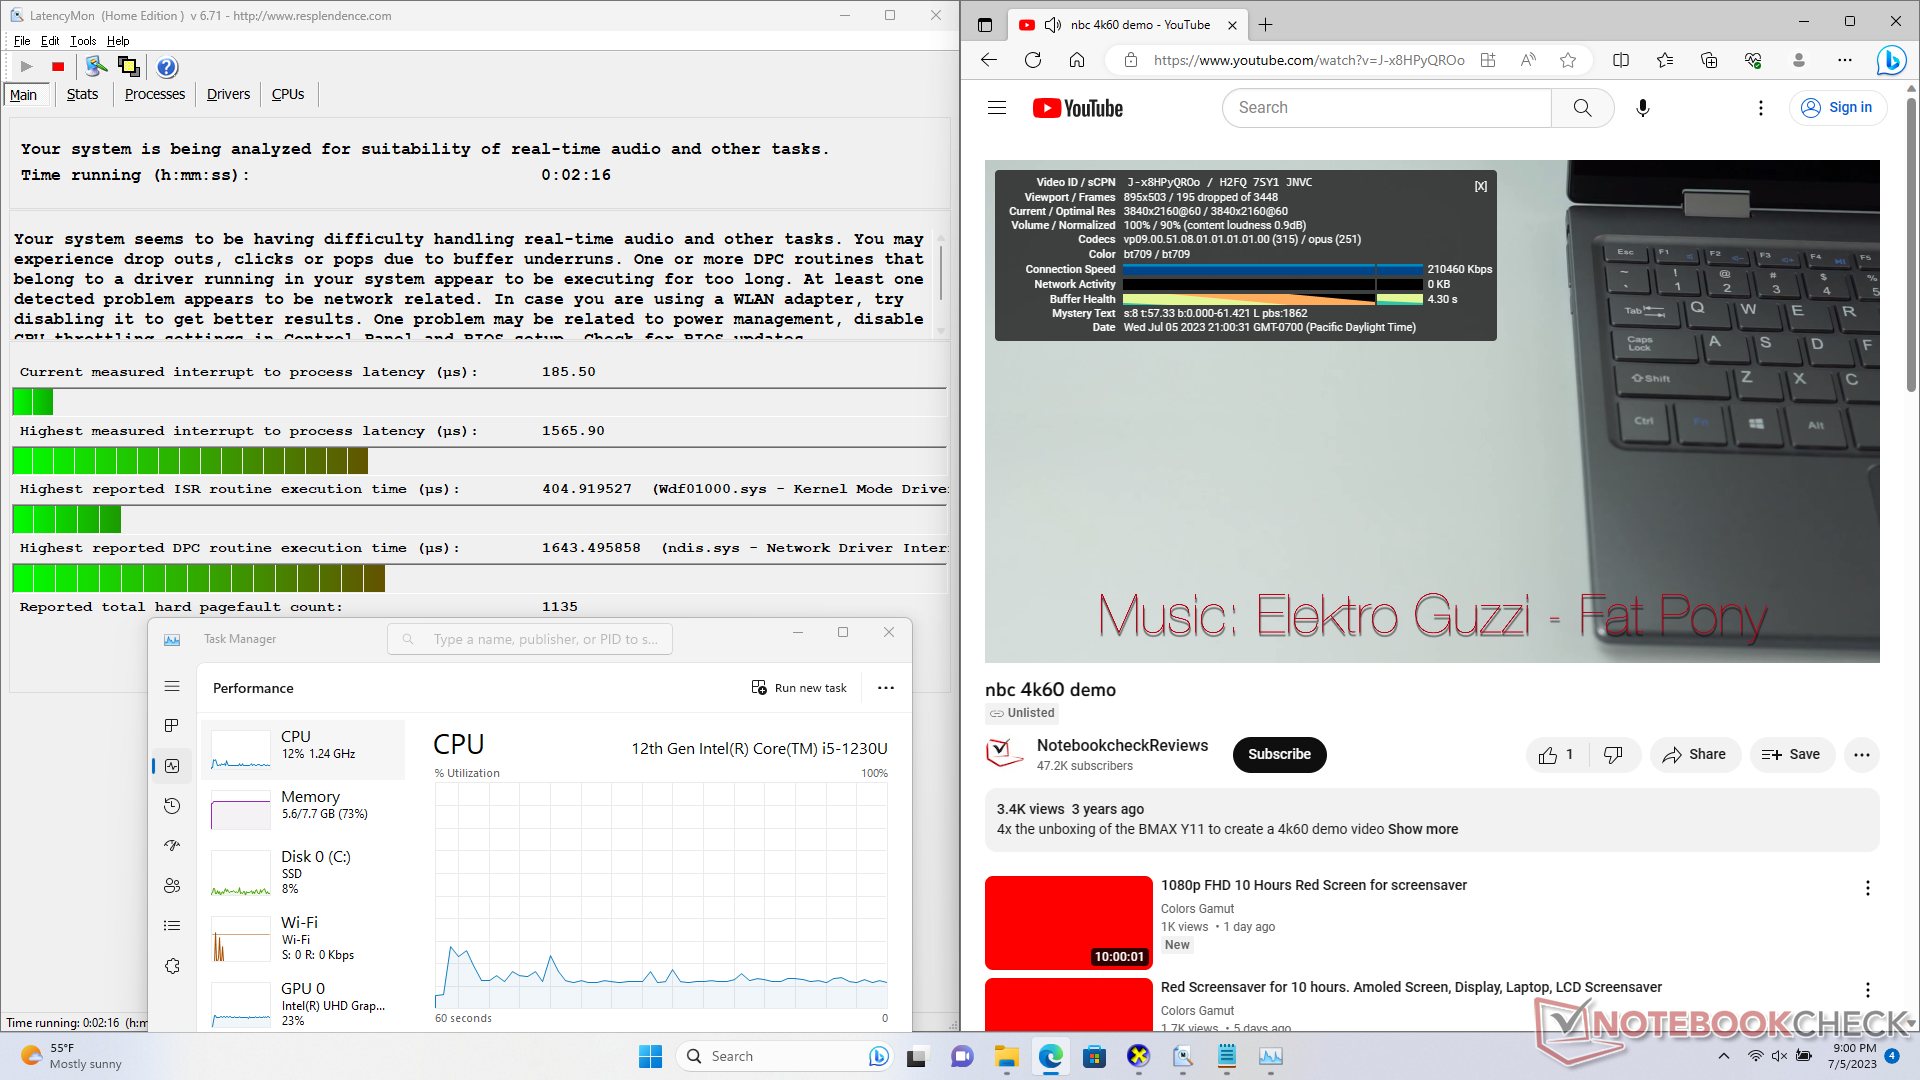
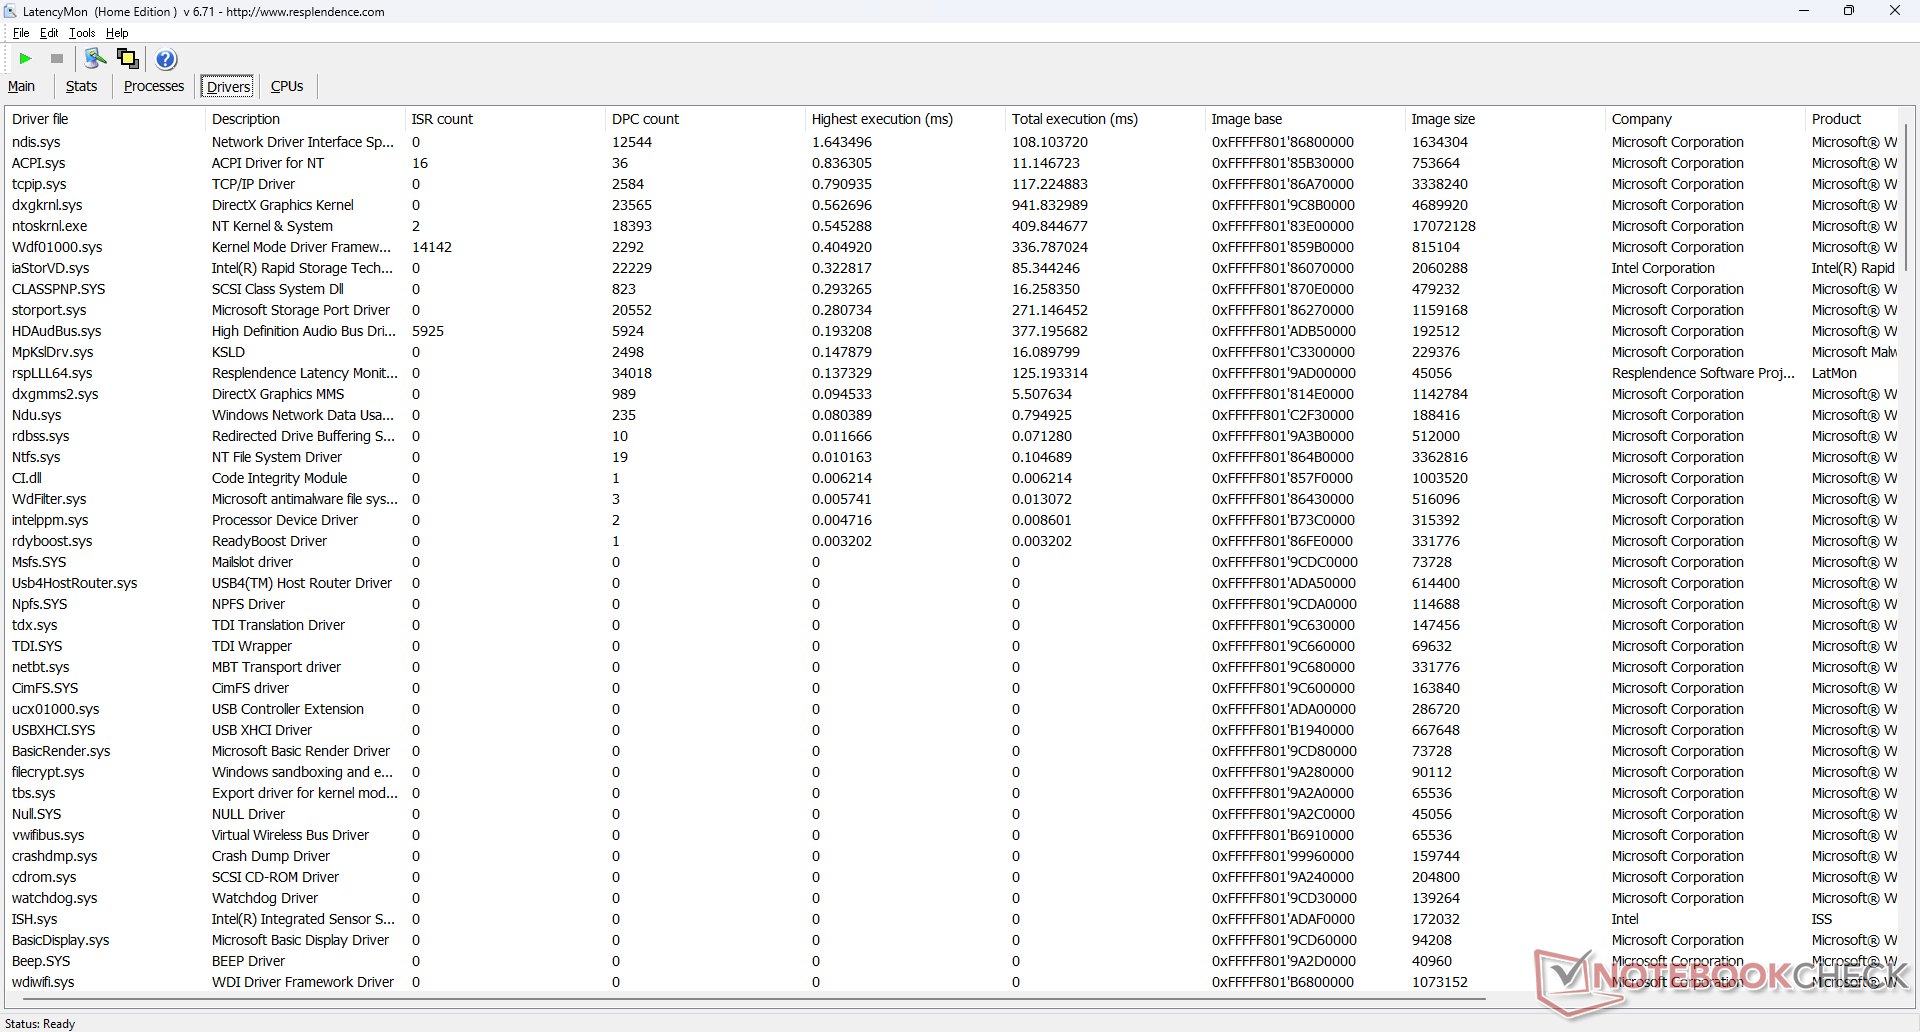
Latência DPC
O LatencyMon revela problemas de DPC ao abrir várias guias do navegador em nossa página inicial. Além disso, a reprodução de vídeo 4K a 60 FPS também apresentou problemas, pois registramos 195 quadros perdidos durante nosso vídeo de teste de um minuto.
| DPC Latencies / LatencyMon - interrupt to process latency (max), Web, Youtube, Prime95 | |
| Dell Latitude 7230 Rugged Extreme | |
| Panasonic Toughbook FZ-G2 | |
| Durabook R8 Tablet | |
* ... menor é melhor
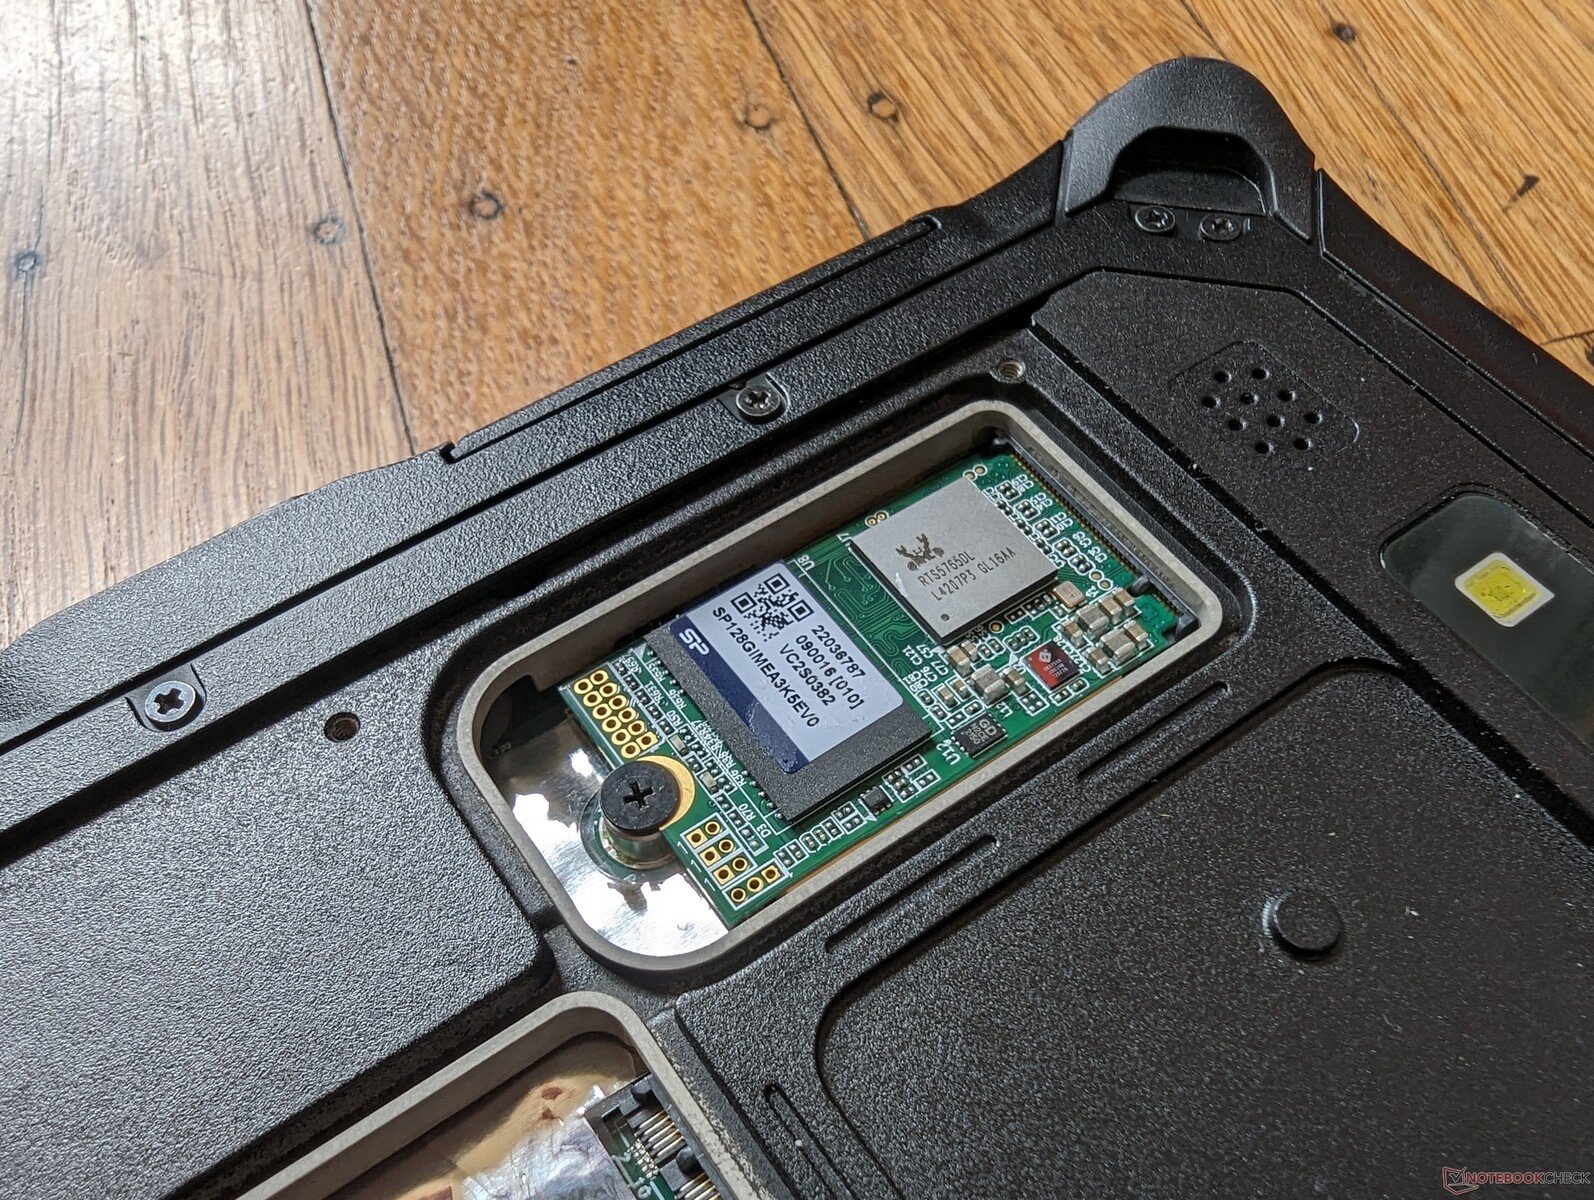
Dispositivos de armazenamento
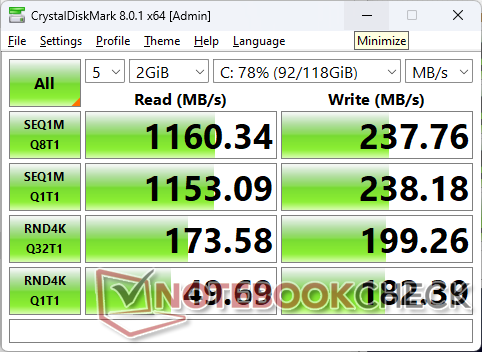
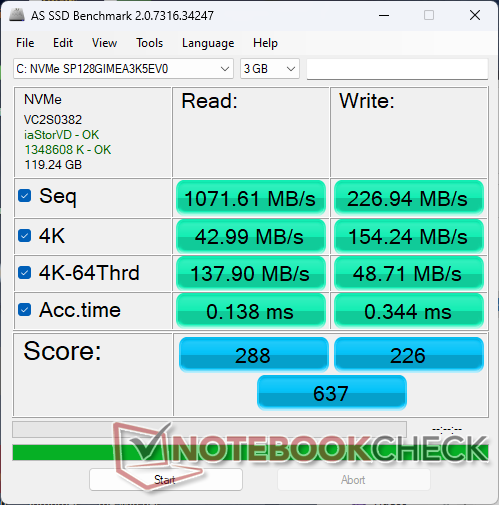
O SSD removível sSD NVMe de 128 GB removível removível de 128 GB pode sustentar taxas de leitura e gravação de até 1.100 MB/s e 240 MB/s, respectivamente, por períodos prolongados. As taxas de gravação são significativamente mais lentas, o que não deve ser um problema para o público-alvo. Espera-se que as opções de maior capacidade de 256 GB, 512 GB ou 1 TB tenham um desempenho mais rápido.

| Drive Performance rating - Percent | |
| Dell Latitude 7230 Rugged Extreme | |
| Panasonic Toughbook FZ-G2 | |
| Durabook R8 Tablet | |
* ... menor é melhor
Disk Throttling: DiskSpd Read Loop, Queue Depth 8
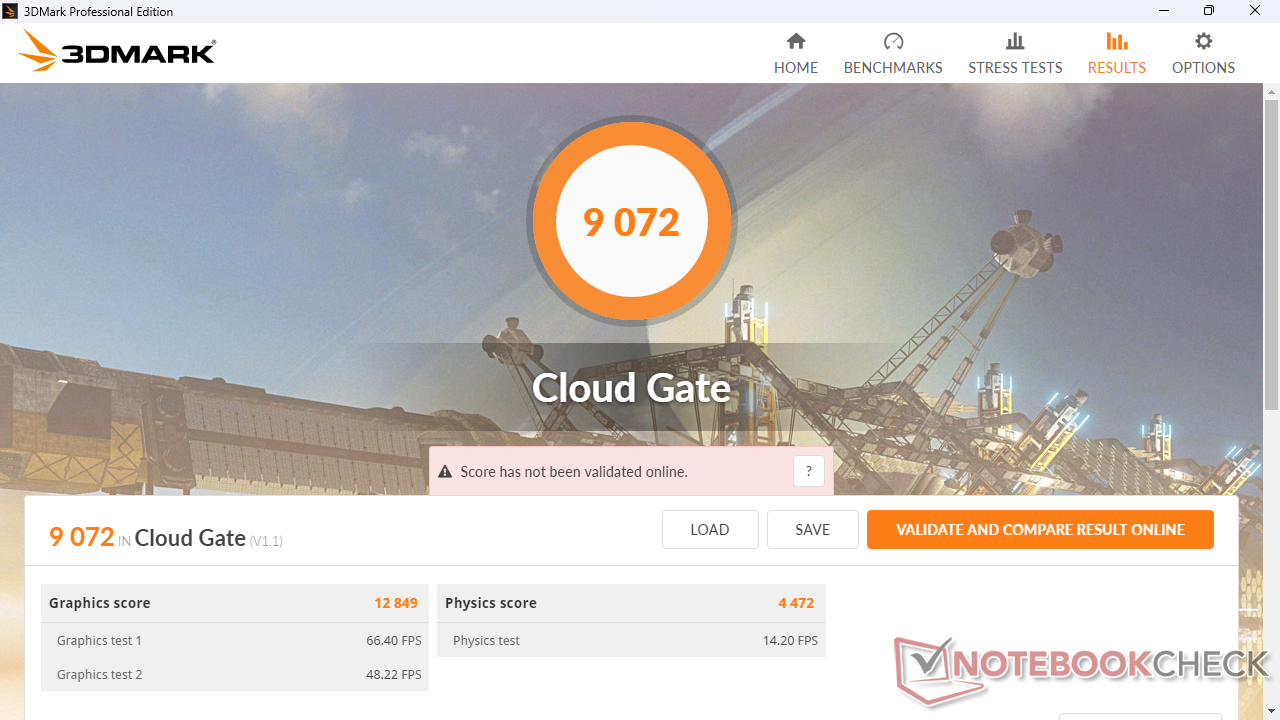
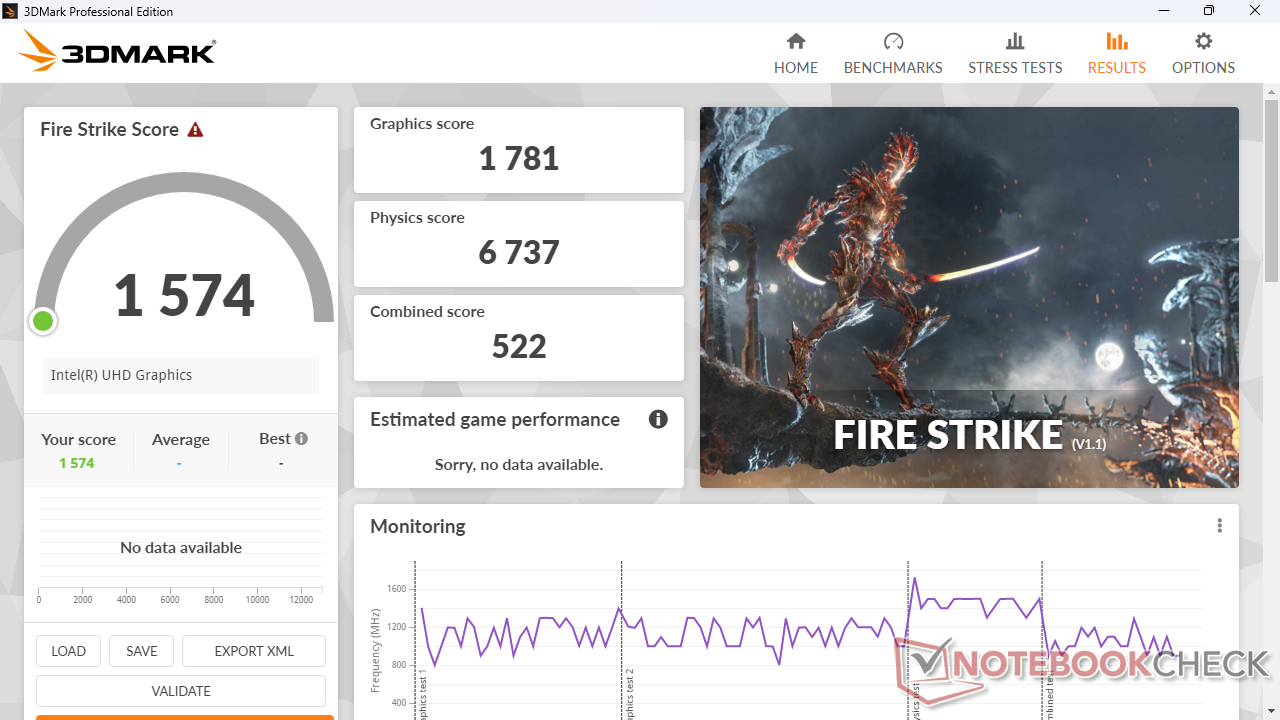
Desempenho da GPU
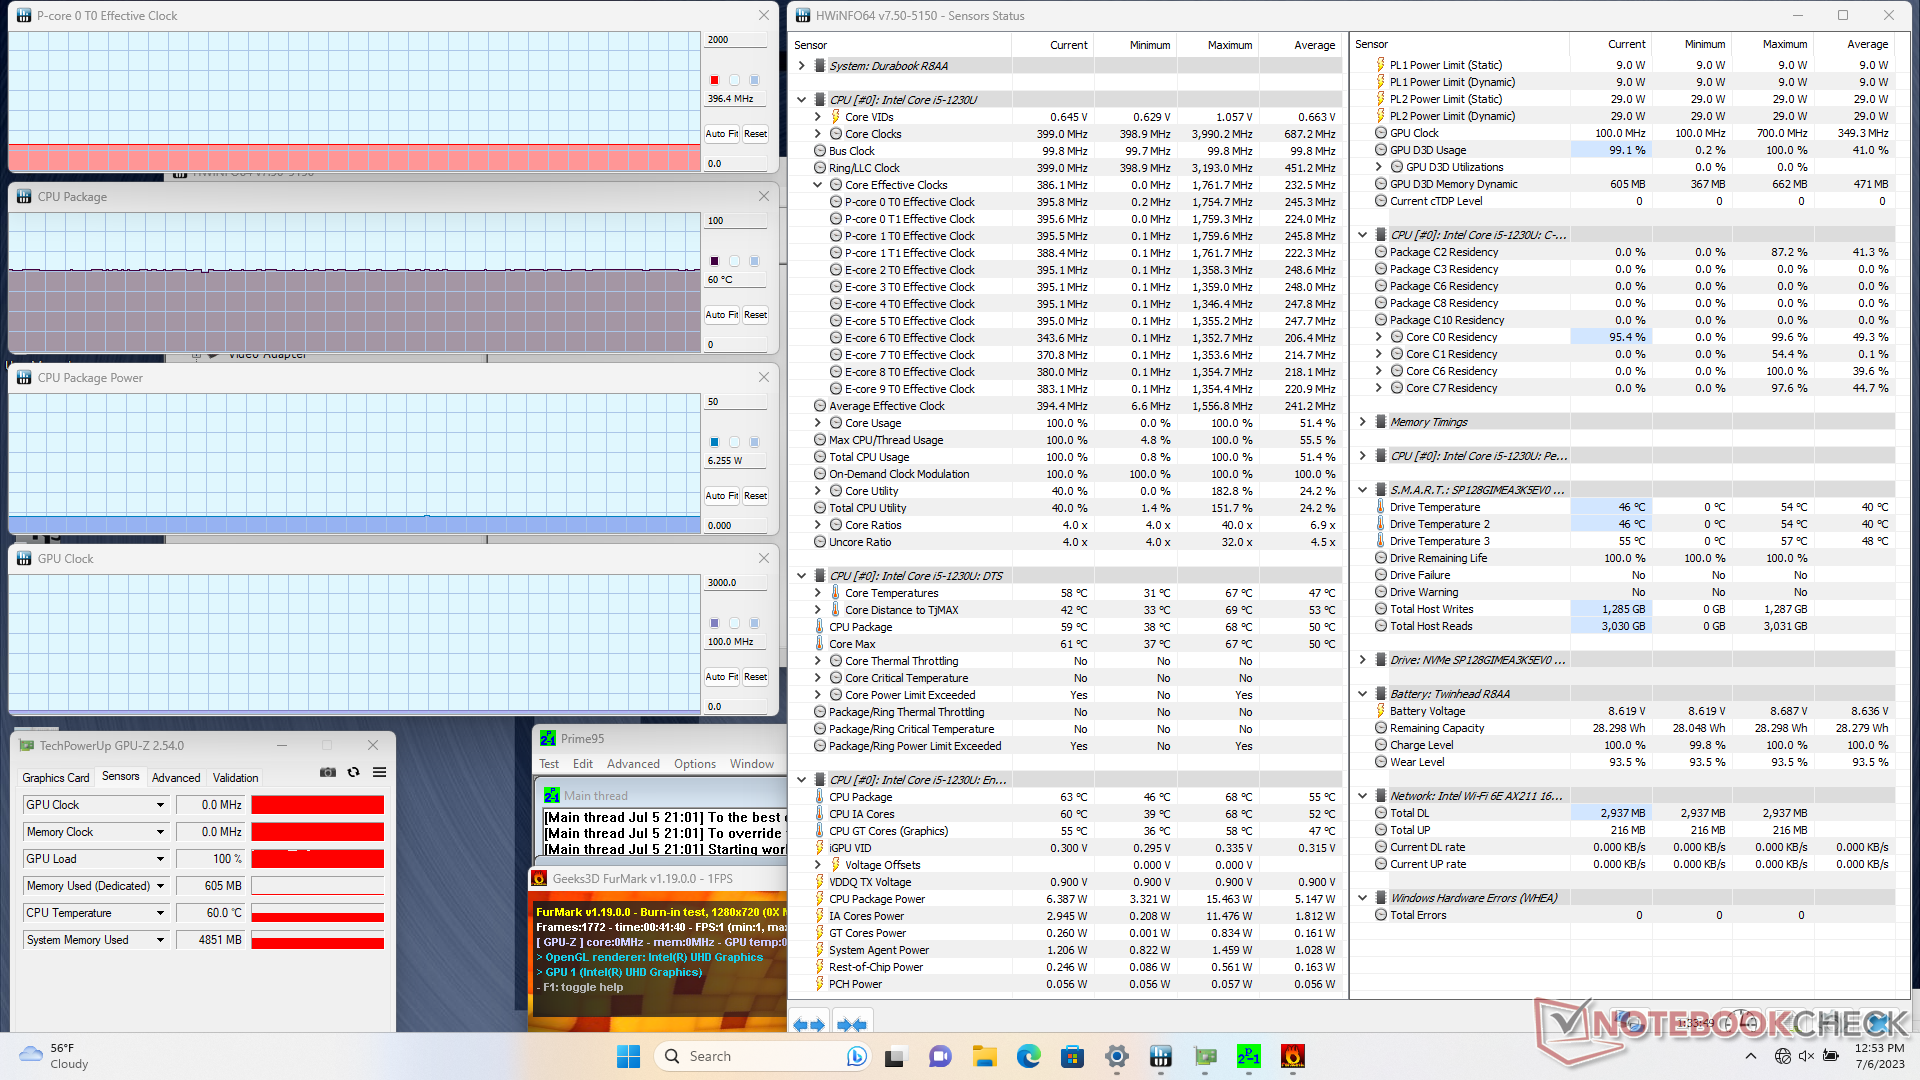
O desempenho gráfico é cerca de 30 a 40 por cento mais lento do que o mesmo Iris Xe 80 EUs Do XPS 13 9315 devido, em parte, à CPU com underclock e à RAM de canal único mais lenta. No entanto, o desempenho geral ainda é mais rápido do que o muito mais antigo UHD Graphics 620 em cerca de 40 a 50%.
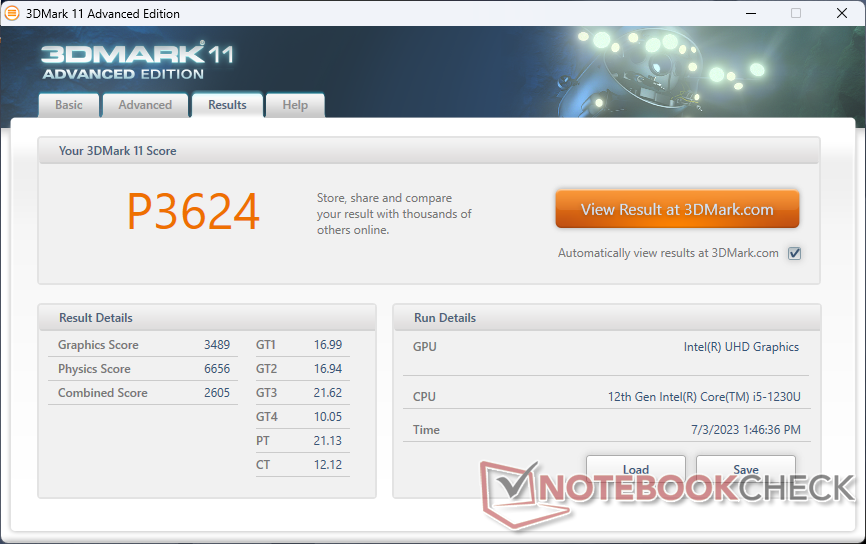
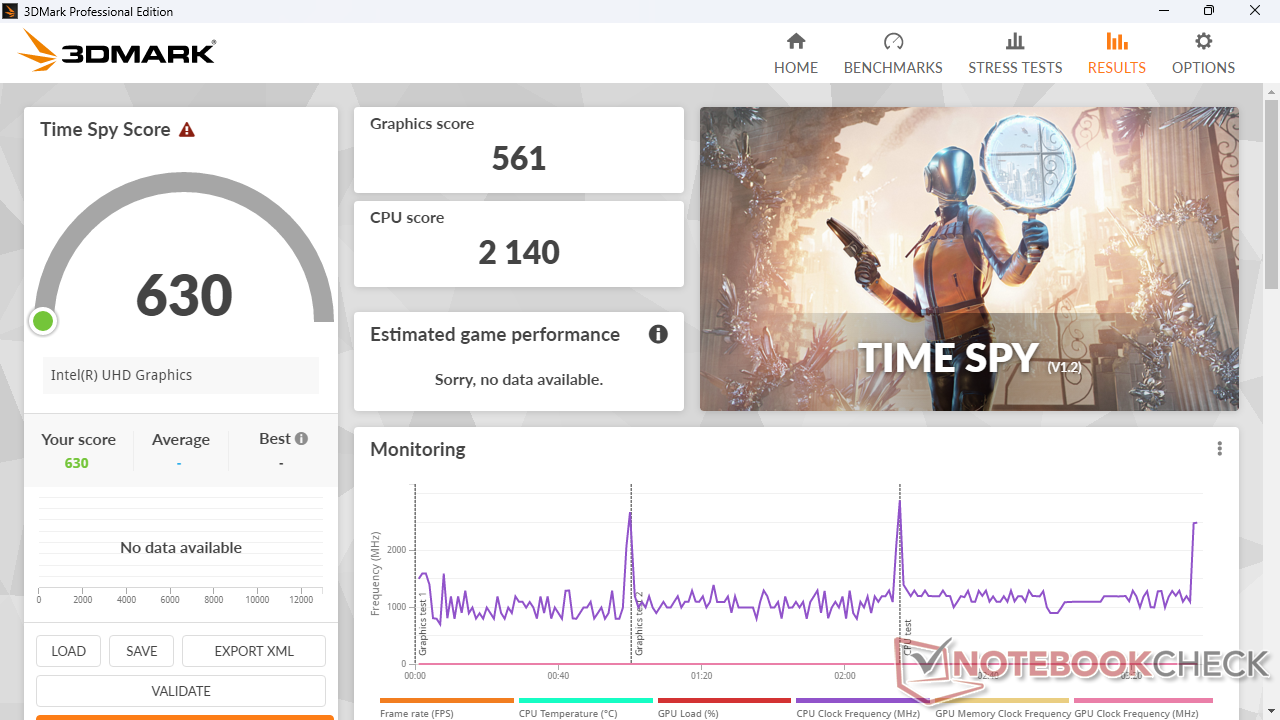
| 3DMark 11 Performance | 3624 pontos | |
| 3DMark Cloud Gate Standard Score | 9072 pontos | |
| 3DMark Fire Strike Score | 1574 pontos | |
| 3DMark Time Spy Score | 630 pontos | |
Ajuda | ||
| Final Fantasy XV Benchmark - 1280x720 Lite Quality | |
| Asus ZenBook 14X OLED UX5400EA-L7154W | |
| Lenovo Yoga 7-14ARB G7 | |
| Dell Latitude 7330 Rugged Extreme | |
| Lenovo ThinkPad T14s G3 21BR00CDGE | |
| Samsung Galaxy Book3 Pro 14 | |
| Média Intel Iris Xe Graphics G7 80EUs (8.32 - 45.6, n=107) | |
| Dell Latitude 7230 Rugged Extreme | |
| Dell XPS 13 9315 2-in-1 Core i5-1230U | |
| Dynabook Satellite Pro C50D-B-115 | |
| Panasonic Toughbook FZ-G2 | |
| Durabook R8 Tablet | |
Witcher 3 FPS Chart
| baixo | média | alto | ultra | |
|---|---|---|---|---|
| The Witcher 3 (2015) | 30.2 | |||
| Dota 2 Reborn (2015) | 62.9 | 41.7 | 19.6 | 13.2 |
| Final Fantasy XV Benchmark (2018) | 12.1 | |||
| X-Plane 11.11 (2018) | 26.2 | 21.8 | 20.1 |
Emissões - Design sem ventilador
Temperatura
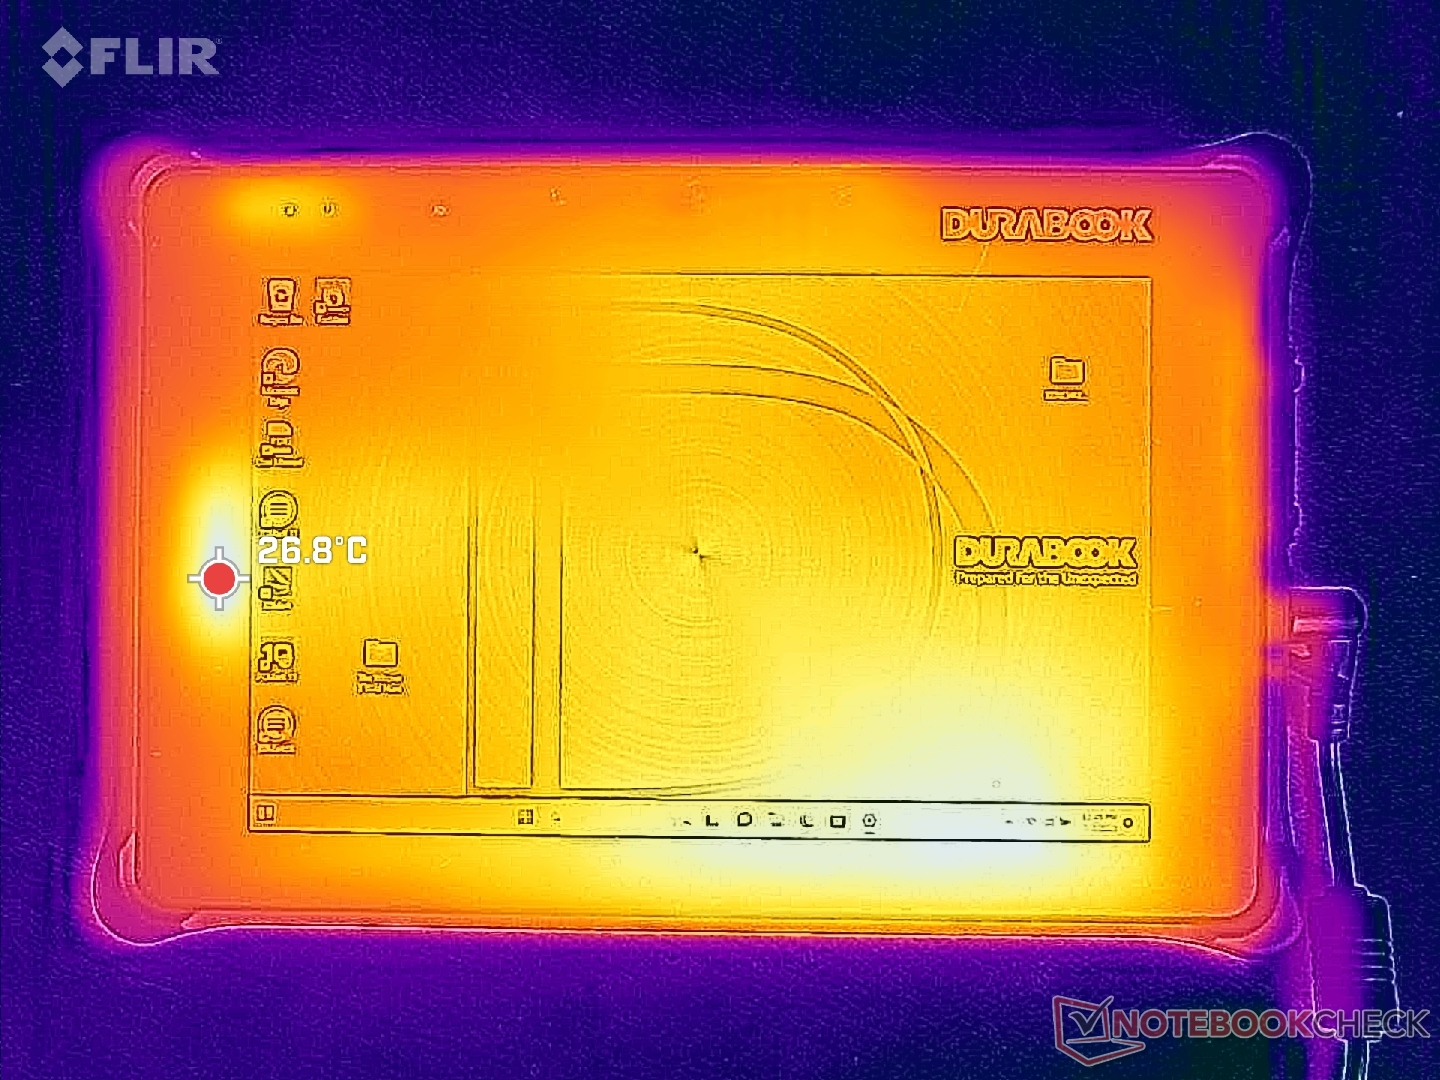
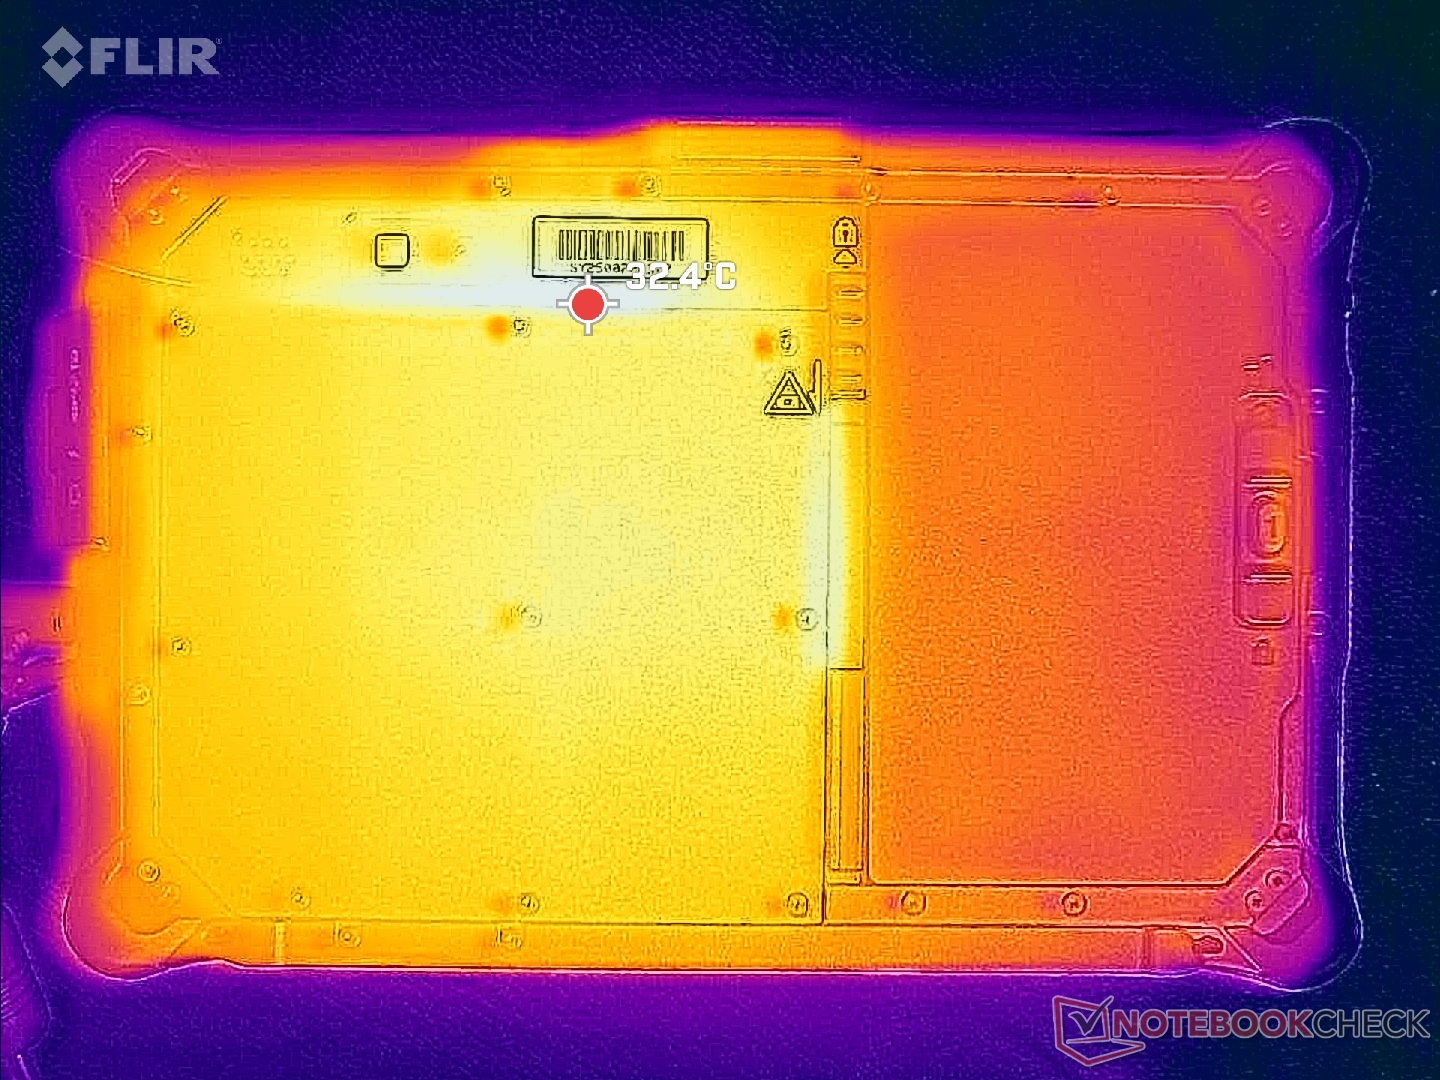
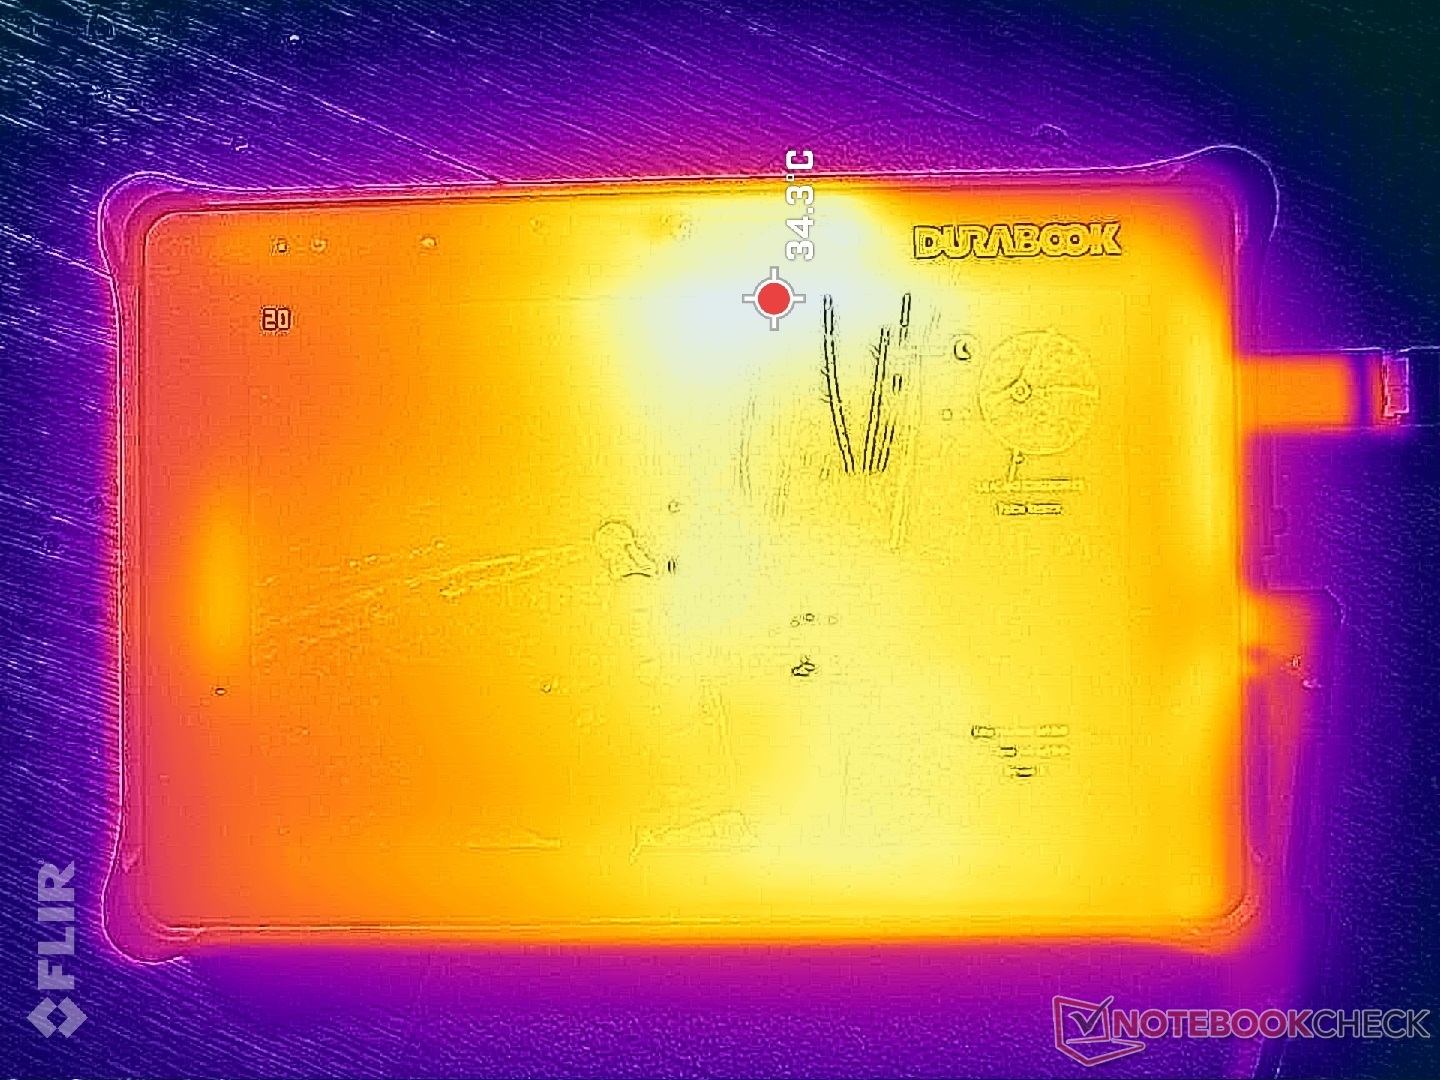
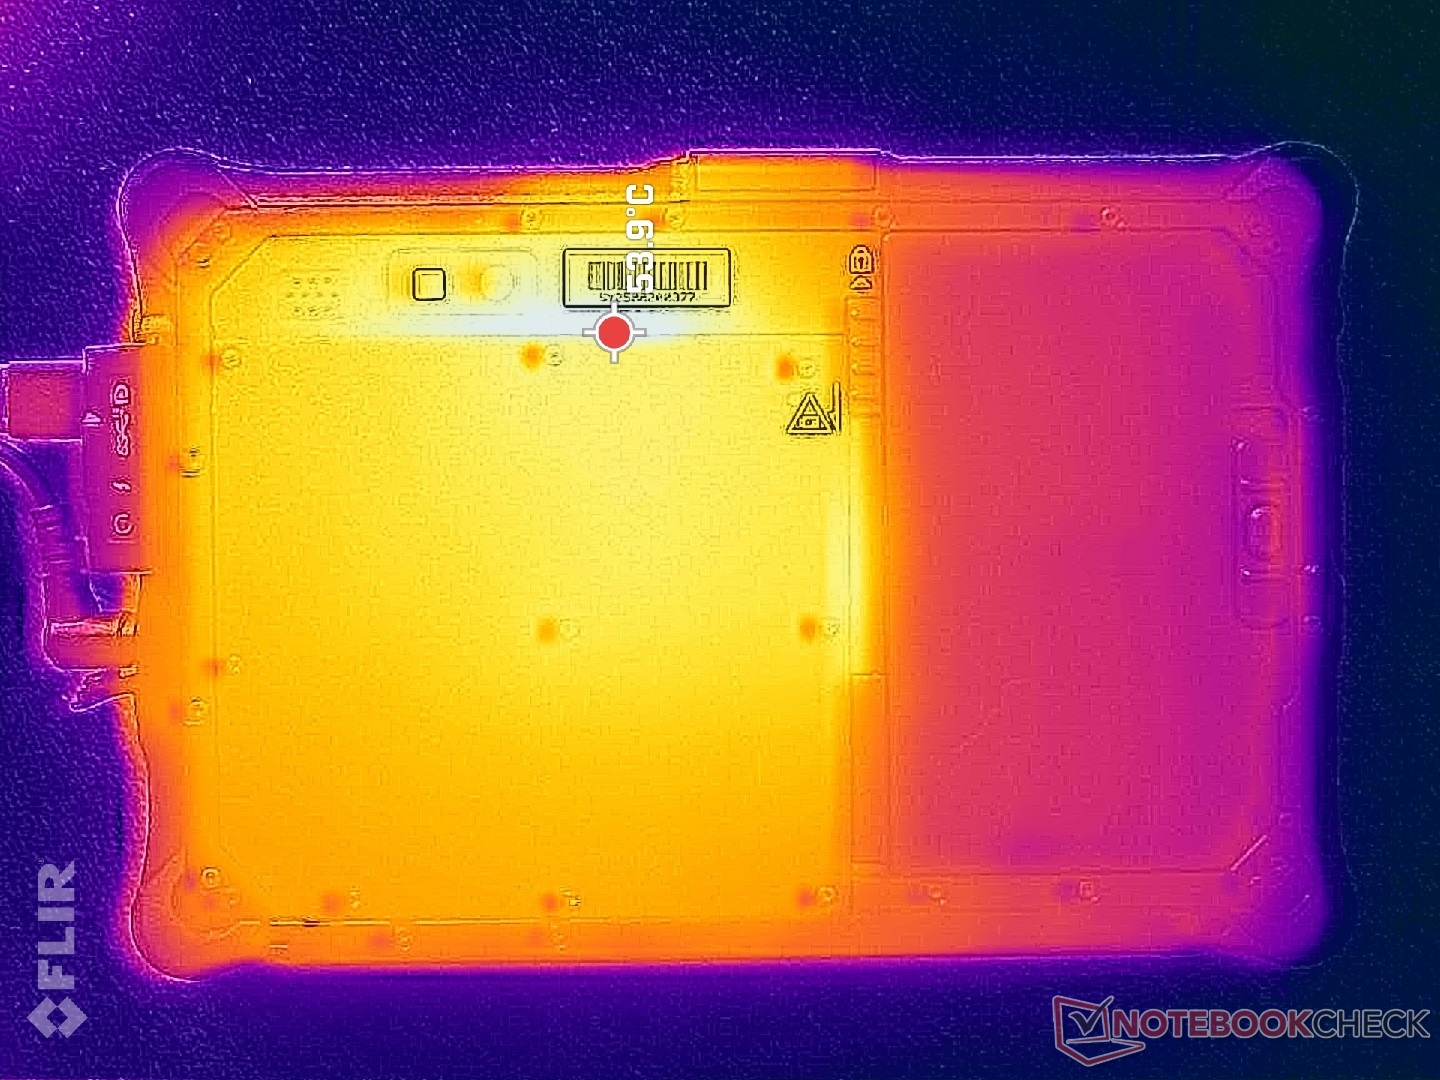
As temperaturas da superfície são mais altas na metade direita do tablet do que na esquerda devido ao posicionamento da placa-mãe e da bateria. A parte traseira pode ficar muito quente, chegando a 54 °C ao executar cargas exigentes, em comparação com apenas 40 °C no AndroidAcer Enduro T1.
(+) A temperatura máxima no lado superior é 38.2 °C / 101 F, em comparação com a média de 33.7 °C / 93 F , variando de 20.7 a 53.2 °C para a classe Tablet.
(-) A parte inferior aquece até um máximo de 49.6 °C / 121 F, em comparação com a média de 33.2 °C / 92 F
(+) Em uso inativo, a temperatura média para o lado superior é 30.8 °C / 87 F, em comparação com a média do dispositivo de 30 °C / ### class_avg_f### F.
| Durabook R8 Tablet Intel Core i5-1230U, Intel Iris Xe Graphics G7 80EUs | Acer Enduro T1 ET108-11A A9001 | Lenovo Tab M8 (Gen 4) Mediatek Helio A22 MT6761, PowerVR GE8300 | Dell Latitude 7230 Rugged Extreme Intel Core i5-1240U, Intel Iris Xe Graphics G7 80EUs | Panasonic Toughbook FZ-G2 Intel Core i5-10310U, Intel UHD Graphics 620 | |
|---|---|---|---|---|---|
| Heat | 7% | 29% | 9% | 19% | |
| Maximum Upper Side * (°C) | 38.2 | 37.8 1% | 28.6 25% | 32.6 15% | 37.4 2% |
| Maximum Bottom * (°C) | 49.6 | 39.4 21% | 30.1 39% | 40.2 19% | 36.6 26% |
| Idle Upper Side * (°C) | 32.2 | 32.8 -2% | 23.1 28% | 30.6 5% | 25.6 20% |
| Idle Bottom * (°C) | 33.4 | 31.2 7% | 25.1 25% | 35 -5% | 24 28% |
* ... menor é melhor
Teste de estresse
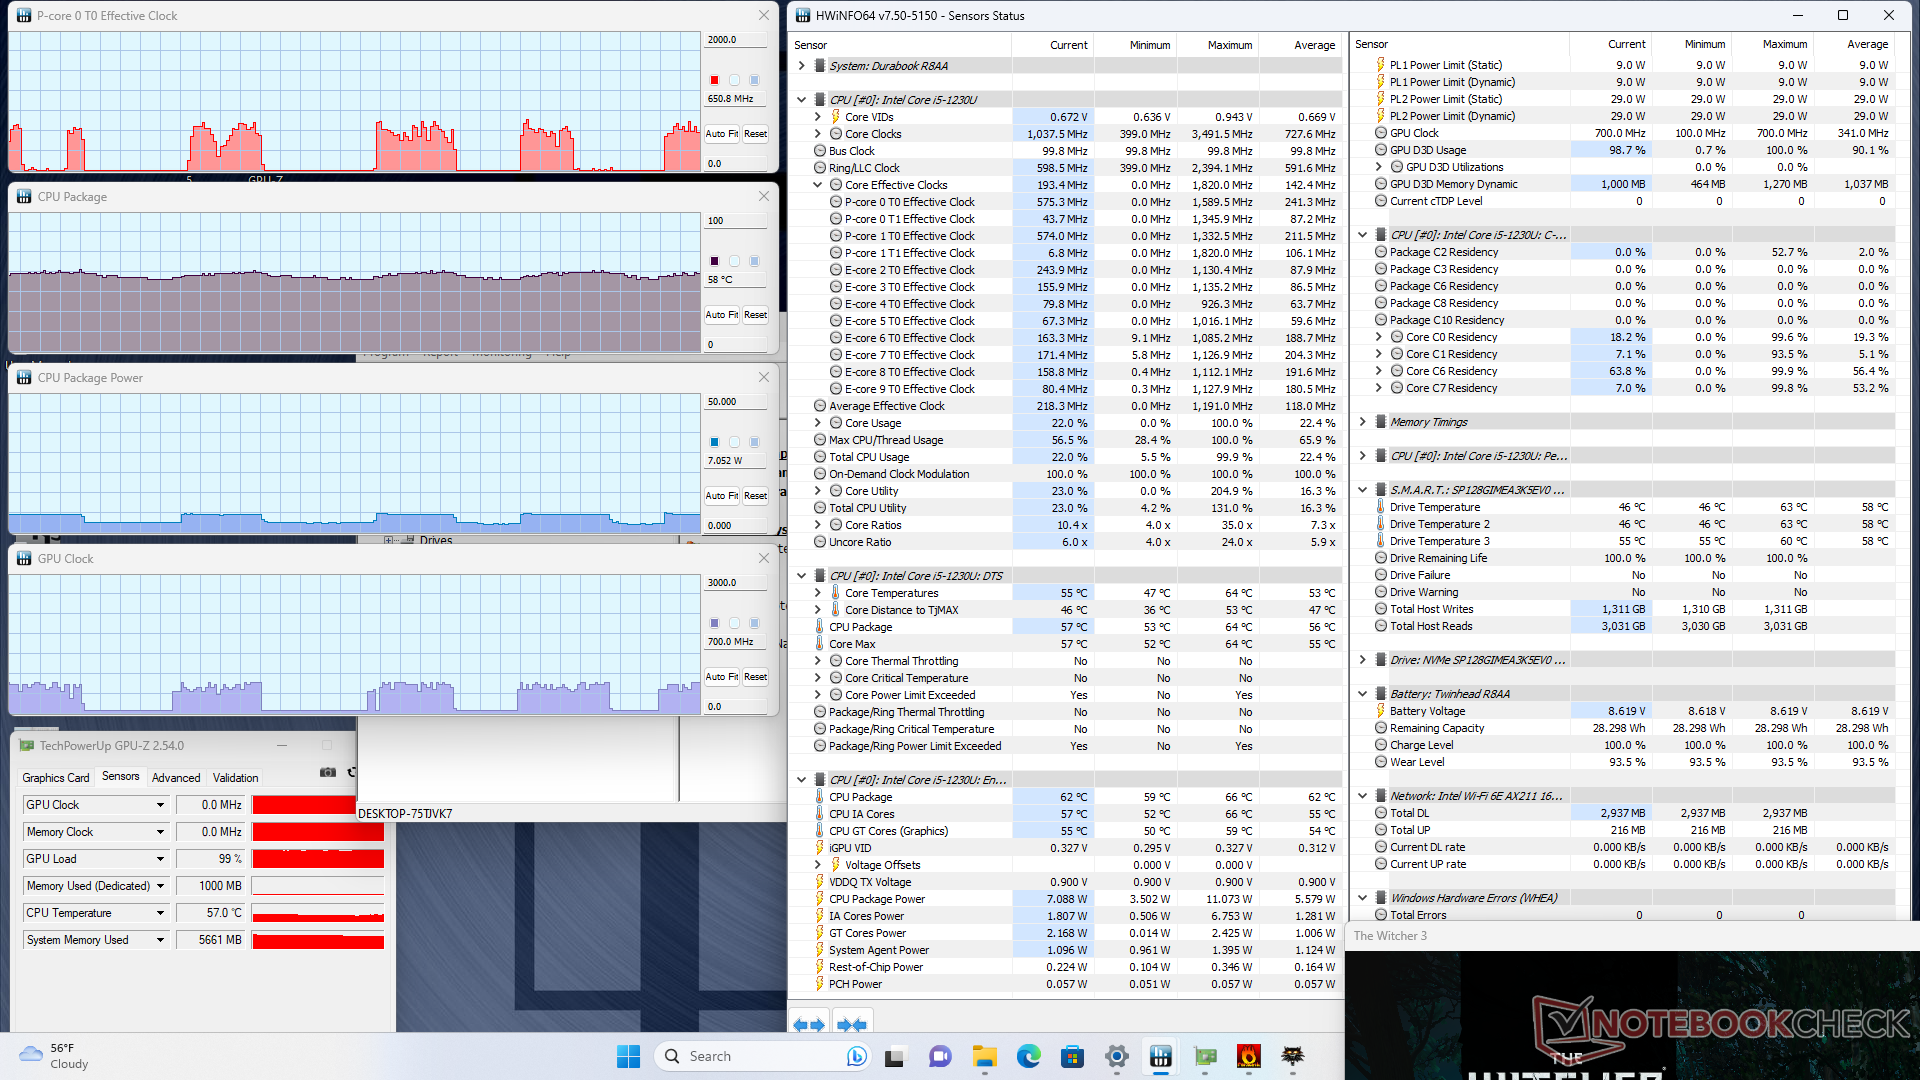
A CPU aumentaria para 1,8 GHz, 67 C e 15 W nos primeiros segundos após iniciar o estresse do Prime95, antes de cair e se estabilizar em apenas 400 MHz, 59 C e 7 W. Esses resultados são significativamente mais baixos do que no Dell XPS 13 9315 que vem com exatamente a mesma CPU, o que explica os resultados de benchmark abaixo do esperado na seção Desempenho da CPU acima.
O desempenho com relação à energia da bateria permaneceria idêntico.
| Clock da CPU (GHz) | Clock da GPU (MHz) | Temperatura média da CPU (°C) | |
| Sistema ocioso | -- | -- | 44 |
| Estresse doPrime95 | 0,4 | -- | 59 |
| Estresse doPrime95 + FurMark | 0,4 | 100 | 60 |
| Witcher 3 Estresse | ~0,6 | ~700 | 58 |
Alto-falantes
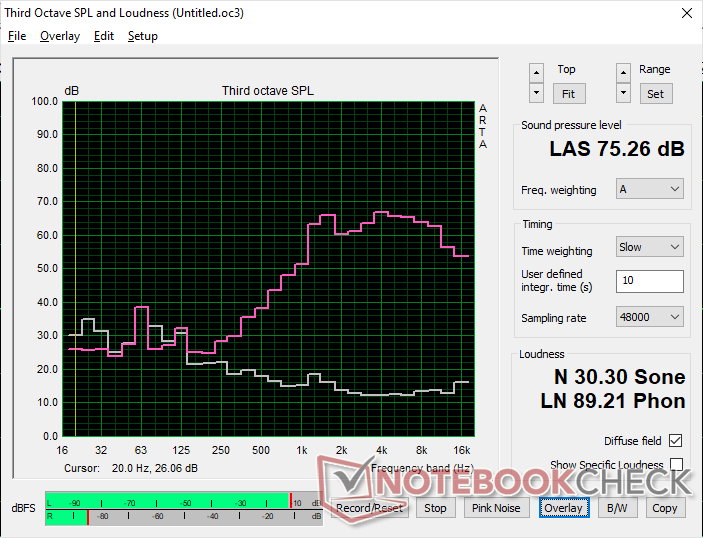
Os graves são fracos, como era de se esperar, mas o volume máximo poderia ser mais alto, com apenas 75 dB(A), em comparação com os 88 dB(A) do Acer Enduro T1. O alto-falante do Durabook R8 está voltado para a parte traseira, o que não é ideal para o usuário.
Durabook R8 Tablet análise de áudio
(±) | o volume do alto-falante é médio, mas bom (###valor### dB)
Graves 100 - 315Hz
(-) | quase nenhum baixo - em média 25.7% menor que a mediana
(±) | a linearidade dos graves é média (8.4% delta para a frequência anterior)
Médios 400 - 2.000 Hz
(±) | médios reduzidos - em média 10% menor que a mediana
(±) | a linearidade dos médios é média (13.9% delta para frequência anterior)
Altos 2 - 16 kHz
(±) | máximos mais altos - em média 10.6% maior que a mediana
(+) | os máximos são lineares (4.1% delta da frequência anterior)
Geral 100 - 16.000 Hz
(-) | o som geral não é linear (38% diferença em relação à mediana)
Comparado com a mesma classe
» 97% de todos os dispositivos testados nesta classe foram melhores, 1% semelhantes, 2% piores
» O melhor teve um delta de 7%, a média foi 20%, o pior foi 129%
Comparado com todos os dispositivos testados
» 95% de todos os dispositivos testados foram melhores, 1% semelhantes, 5% piores
» O melhor teve um delta de 4%, a média foi 23%, o pior foi 134%
Apple MacBook Pro 16 2021 M1 Pro análise de áudio
(+) | os alto-falantes podem tocar relativamente alto (###valor### dB)
Graves 100 - 315Hz
(+) | bons graves - apenas 3.8% longe da mediana
(+) | o baixo é linear (5.2% delta para a frequência anterior)
Médios 400 - 2.000 Hz
(+) | médios equilibrados - apenas 1.3% longe da mediana
(+) | médios são lineares (2.1% delta para frequência anterior)
Altos 2 - 16 kHz
(+) | agudos equilibrados - apenas 1.9% longe da mediana
(+) | os máximos são lineares (2.7% delta da frequência anterior)
Geral 100 - 16.000 Hz
(+) | o som geral é linear (4.6% diferença em relação à mediana)
Comparado com a mesma classe
» 0% de todos os dispositivos testados nesta classe foram melhores, 0% semelhantes, 100% piores
» O melhor teve um delta de 5%, a média foi 17%, o pior foi 45%
Comparado com todos os dispositivos testados
» 0% de todos os dispositivos testados foram melhores, 0% semelhantes, 100% piores
» O melhor teve um delta de 4%, a média foi 23%, o pior foi 134%
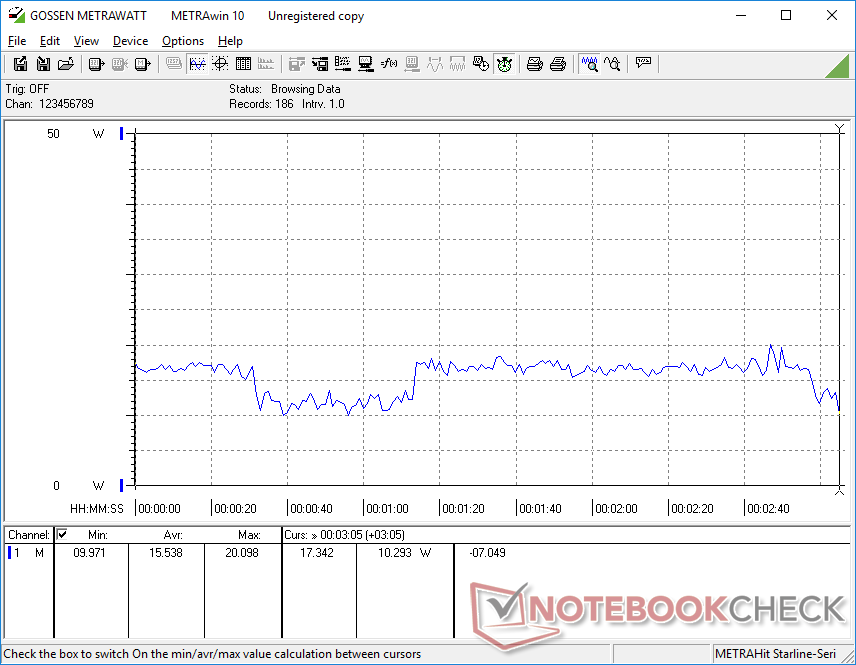
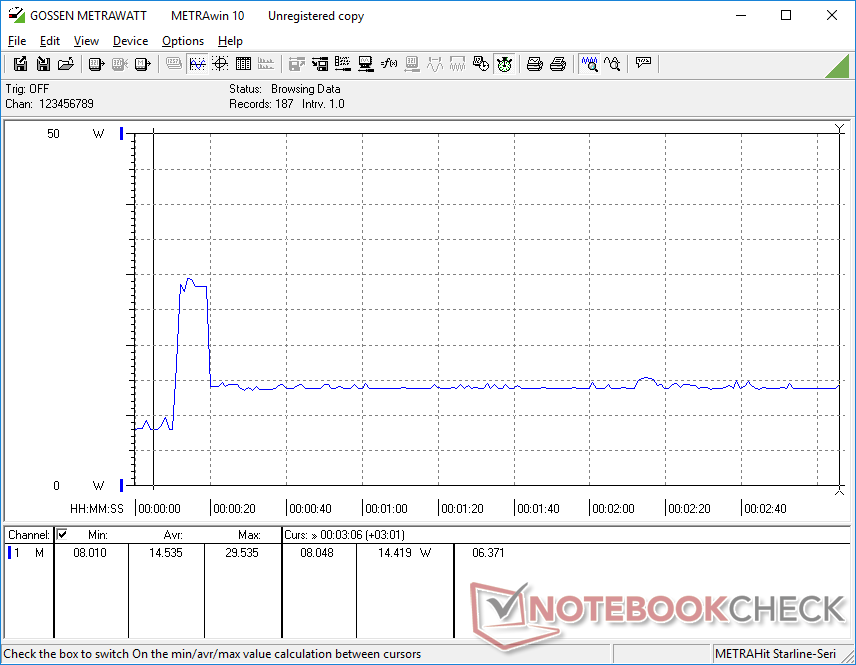
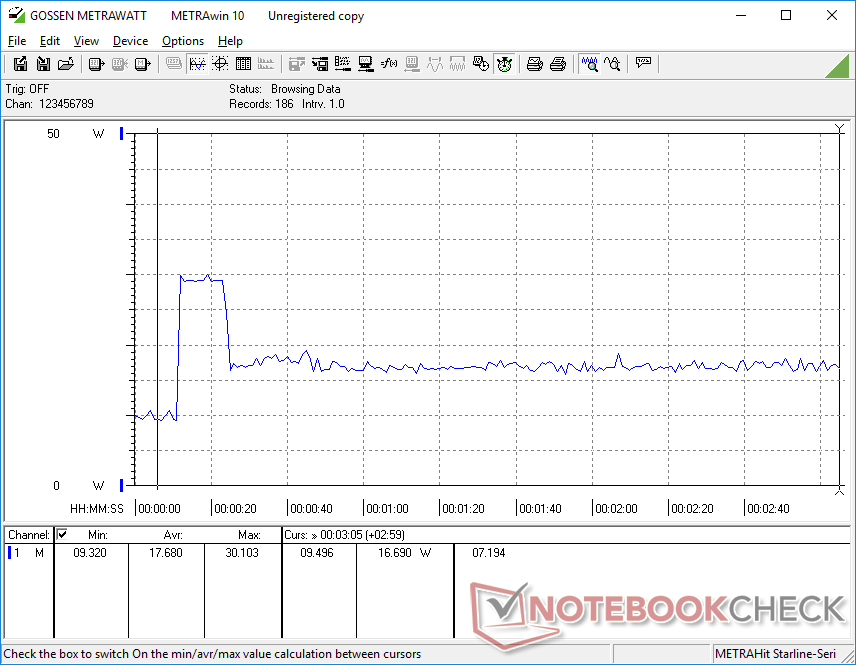
Gerenciamento de energia - Alto desempenho por watt
Consumo de energia
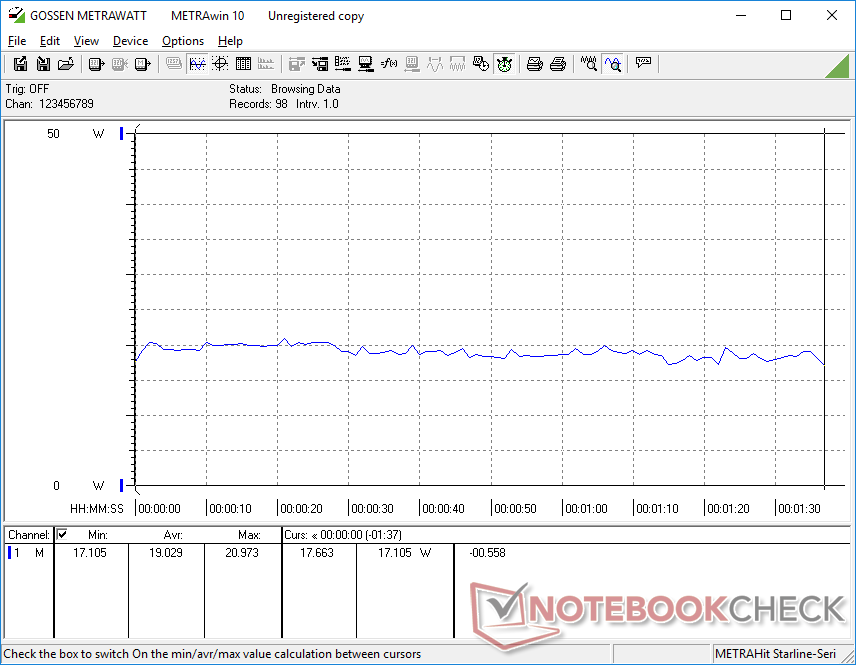
O consumo de energia pode ser tão baixo quanto 3 W quando em marcha lenta na área de trabalho com a configuração de brilho mais baixa ou até quase 7 W se o brilho for aumentado para o máximo.
O consumo geral quando submetido a cargas mais pesadas é cerca de metade do consumo do Panasonic Toughbook FZ-G2 mais antigo, embora o desempenho do processador seja praticamente o mesmo entre eles. Assim, os usuários ainda podem se beneficiar do maior desempenho por watt do novo Core i5-1230U.
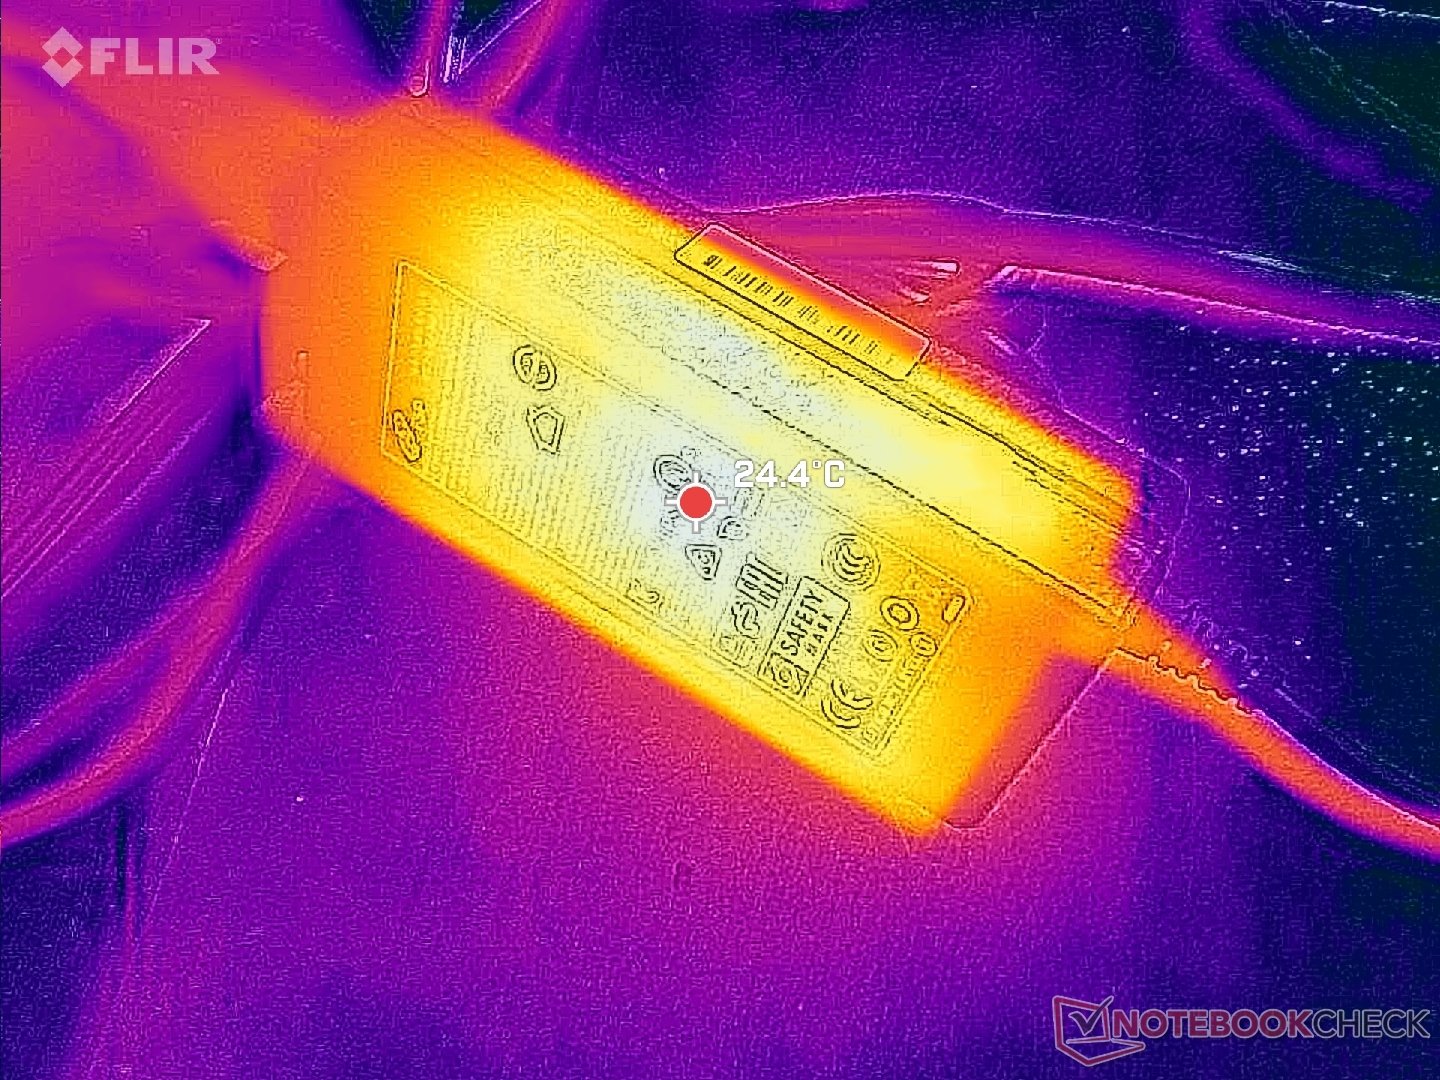
Conseguimos medir um consumo máximo de 30 W com o pequeno adaptador CA de 65 W (~10,5 x 4,5 x 3 cm).
| desligado | |
| Ocioso | |
| Carga |
|
Key:
min: | |
| Durabook R8 Tablet i5-1230U, Iris Xe G7 80EUs, Silicon Power SP128GIMEA3K5EV0, IPS, 1280x800, 8" | Acer Enduro T1 ET108-11A A9001 64 GB eMMC Flash, IPS, 1280x800, 8" | Lenovo Tab M8 (Gen 4) Helio A22 MT6761, PowerVR GE8300, 32 GB eMMC Flash, IPS, 1280x800, 8" | Dell Latitude 7230 Rugged Extreme i5-1240U, Iris Xe G7 80EUs, WD PC SN740 512GB SDDPMQD-512G-1101, IPS, 1920x1200, 12" | Panasonic Toughbook FZ-G2 i5-10310U, UHD Graphics 620, Toshiba KIOXIA KBG4AZNV512G M.2 2280 OPAL, IPS, 1920x1200, 10.1" | |
|---|---|---|---|---|---|
| Power Consumption | 73% | 71% | -102% | -65% | |
| Idle Minimum * (Watt) | 2.8 | 1.1 61% | 1.7 39% | 6.5 -132% | 3.5 -25% |
| Idle Average * (Watt) | 6.3 | 2.2 65% | 1.9 70% | 8.9 -41% | 8.1 -29% |
| Idle Maximum * (Watt) | 10.3 | 2.2 79% | 2.4 77% | 14.3 -39% | 8.2 20% |
| Load Average * (Watt) | 19 | 3.6 81% | 3 84% | 44.9 -136% | 34.7 -83% |
| Witcher 3 ultra * (Watt) | 15.5 | 43.2 -179% | 31.8 -105% | ||
| Load Maximum * (Watt) | 30.1 | 6.7 78% | 3.9 87% | 54.8 -82% | 79.7 -165% |
* ... menor é melhor
Power Consumption Witcher 3 / Stresstest
Power Consumption external Monitor
Duração da bateria
O tempo de funcionamento da WLAN no mundo real é de apenas 5,5 horas com a bateria removível de 27 Wh. Os usuários podem fazer upgrade para baterias maiores e mais pesadas ou carregar várias de uma vez para fins de troca, mas a duração da bateria ainda é decepcionante.
O carregamento da bateria de 27 Wh de vazio para cheio é relativamente lento, cerca de 2 horas.
| Durabook R8 Tablet i5-1230U, Iris Xe G7 80EUs, 27.4 Wh | Acer Enduro T1 ET108-11A A9001 Wh | Lenovo Tab M8 (Gen 4) Helio A22 MT6761, PowerVR GE8300, Wh | Dell Latitude 7230 Rugged Extreme i5-1240U, Iris Xe G7 80EUs, 72 Wh | Panasonic Toughbook FZ-G2 i5-10310U, UHD Graphics 620, 68 Wh | |
|---|---|---|---|---|---|
| Duração da bateria | 194% | 192% | 145% | 111% | |
| WiFi v1.3 (h) | 5.3 | 15.6 194% | 15.5 192% | 13 145% | 11.2 111% |
| Reader / Idle (h) | 37.1 | ||||
| H.264 (h) | 16.6 | ||||
| Load (h) | 3.8 | 3.6 |
Pro
Contra
Veredicto - Design robusto com alguns inconvenientes
Os maiores pontos fortes do Durabook R8 estão em seu design sem ventilador, opções configuráveis versáteis e suporte a Thunderbolt 4. É uma combinação incomum de recursos que pode agradar a uma determinada categoria ou profissionais. Gostamos especialmente dos módulos SSD, WLAN e WAN de fácil acesso na parte traseira.
No entanto, a abordagem sem ventilador vem com o conjunto usual de ressalvas. O desempenho da CPU foi reduzido em uma margem considerável e as temperaturas da superfície podem ficar muito quentes, especialmente na parte traseira. Isso não quer dizer que o tablet seja lento, mas não espere que ele tenha um desempenho tão rápido quanto o de um laptop com o mesmo processador.
Você vai querer o Durabook R8 principalmente por seu design sem ventoinha, facilidade de uso e amplo suporte a periféricos. Outros aspectos, como a duração da bateria e as cores, poderiam ser melhores.
Há vários aspectos menores que poderiam ser aprimorados em futuras revisões. O mecanismo de ejeção do leitor de MicroSD, por exemplo, precisa ser mais forte e mais confiável. O alto-falante poderia estar voltado para a frente em vez de para trás para ser mais útil. As portas USB-C apertadas poderiam ser ampliadas para reduzir a aglomeração. A porta de barril AC proprietária poderia ser removida em favor do carregamento universal por USB-C. E, por fim, a duração da bateria padrão poderia ser mais longa e o PWM deveria ser reduzido ou eliminado.
Preço e disponibilidade
Os usuários podem solicitar uma cotação para o Tablet Durabook R8 diretamente do fabricante aqui.
Durabook R8 Tablet
- 07/12/2023 v7 (old)
Allen Ngo
Transparência
A seleção dos dispositivos a serem analisados é feita pela nossa equipe editorial. A amostra de teste foi fornecida ao autor como empréstimo pelo fabricante ou varejista para fins desta revisão. O credor não teve influência nesta revisão, nem o fabricante recebeu uma cópia desta revisão antes da publicação. Não houve obrigação de publicar esta revisão. Como empresa de mídia independente, a Notebookcheck não está sujeita à autoridade de fabricantes, varejistas ou editores.
É assim que o Notebookcheck está testando
Todos os anos, o Notebookcheck analisa de forma independente centenas de laptops e smartphones usando procedimentos padronizados para garantir que todos os resultados sejam comparáveis. Desenvolvemos continuamente nossos métodos de teste há cerca de 20 anos e definimos padrões da indústria no processo. Em nossos laboratórios de teste, equipamentos de medição de alta qualidade são utilizados por técnicos e editores experientes. Esses testes envolvem um processo de validação em vários estágios. Nosso complexo sistema de classificação é baseado em centenas de medições e benchmarks bem fundamentados, o que mantém a objetividade.Price comparison

