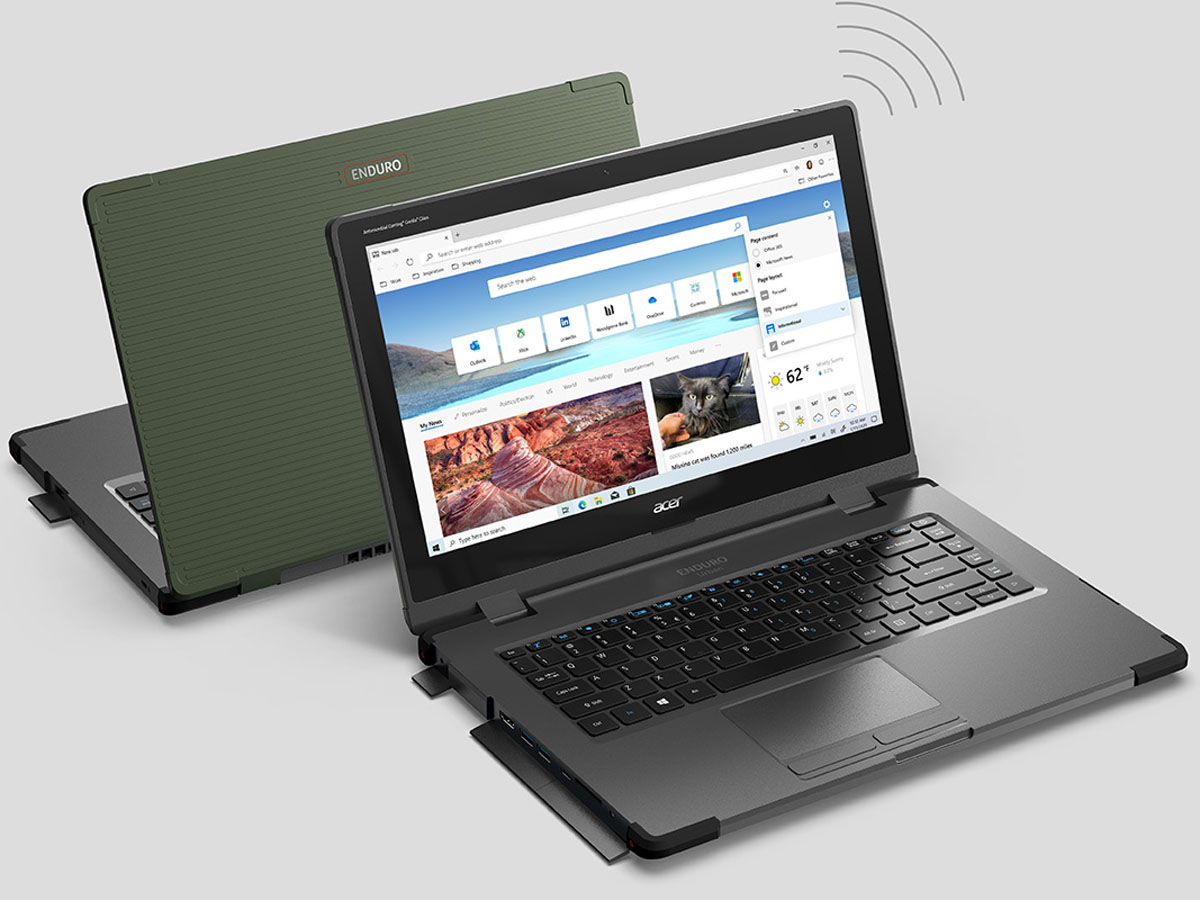
Revisão do laptop Acer Enduro Urban N3 EUN314: Parte robusta, parte Ultrabook
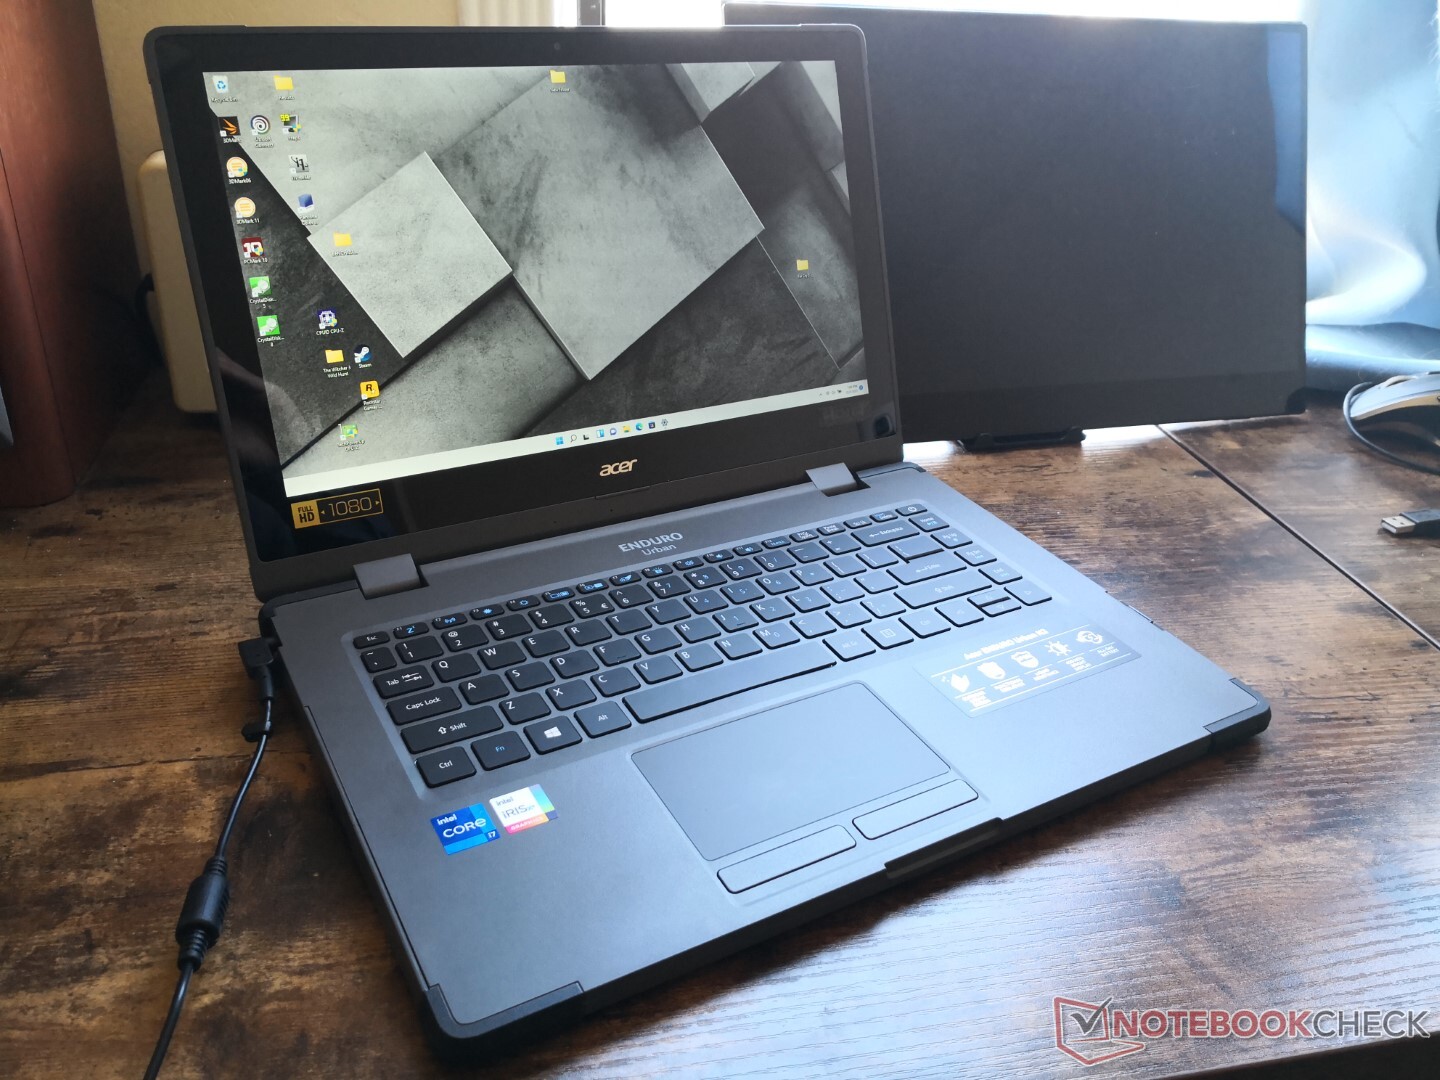
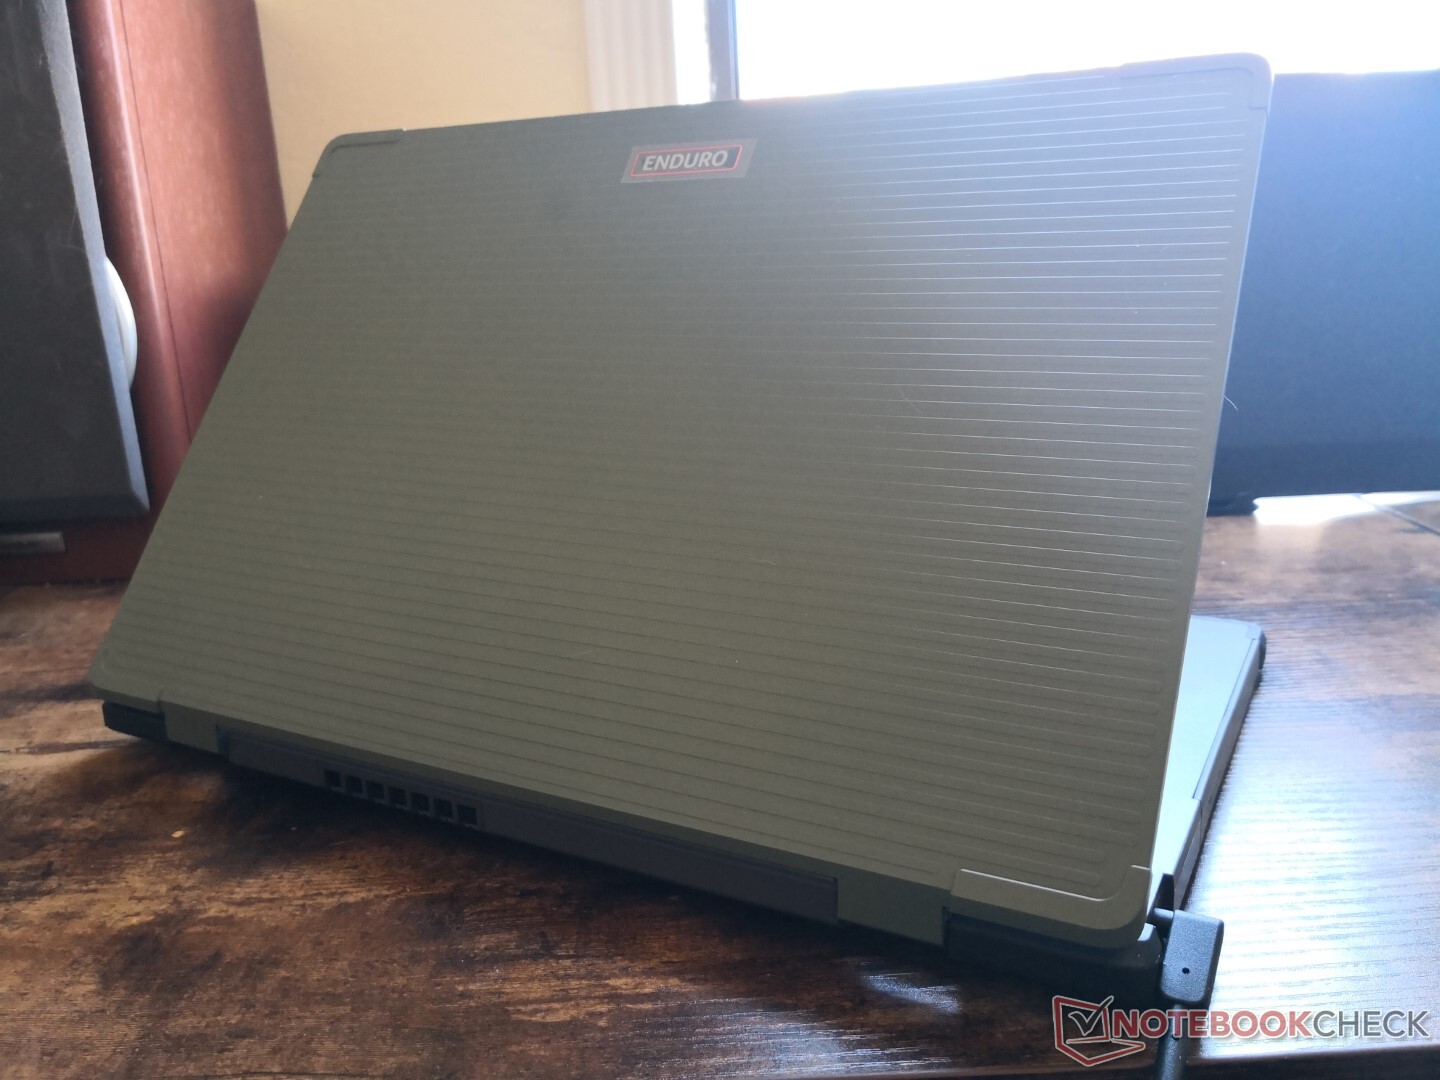
Se um laptop robusto ou semi-robusto e um Ultrabook tivesse um bebê, então provavelmente se pareceria muito com o Acer Enduro Urban N3. Este laptop de 14 polegadas integra algumas características comuns de laptops robustos, incluindo pára-choques amortecedores e portas de E/S resistentes à água, mantendo a portabilidade de um Ultrabook tradicional
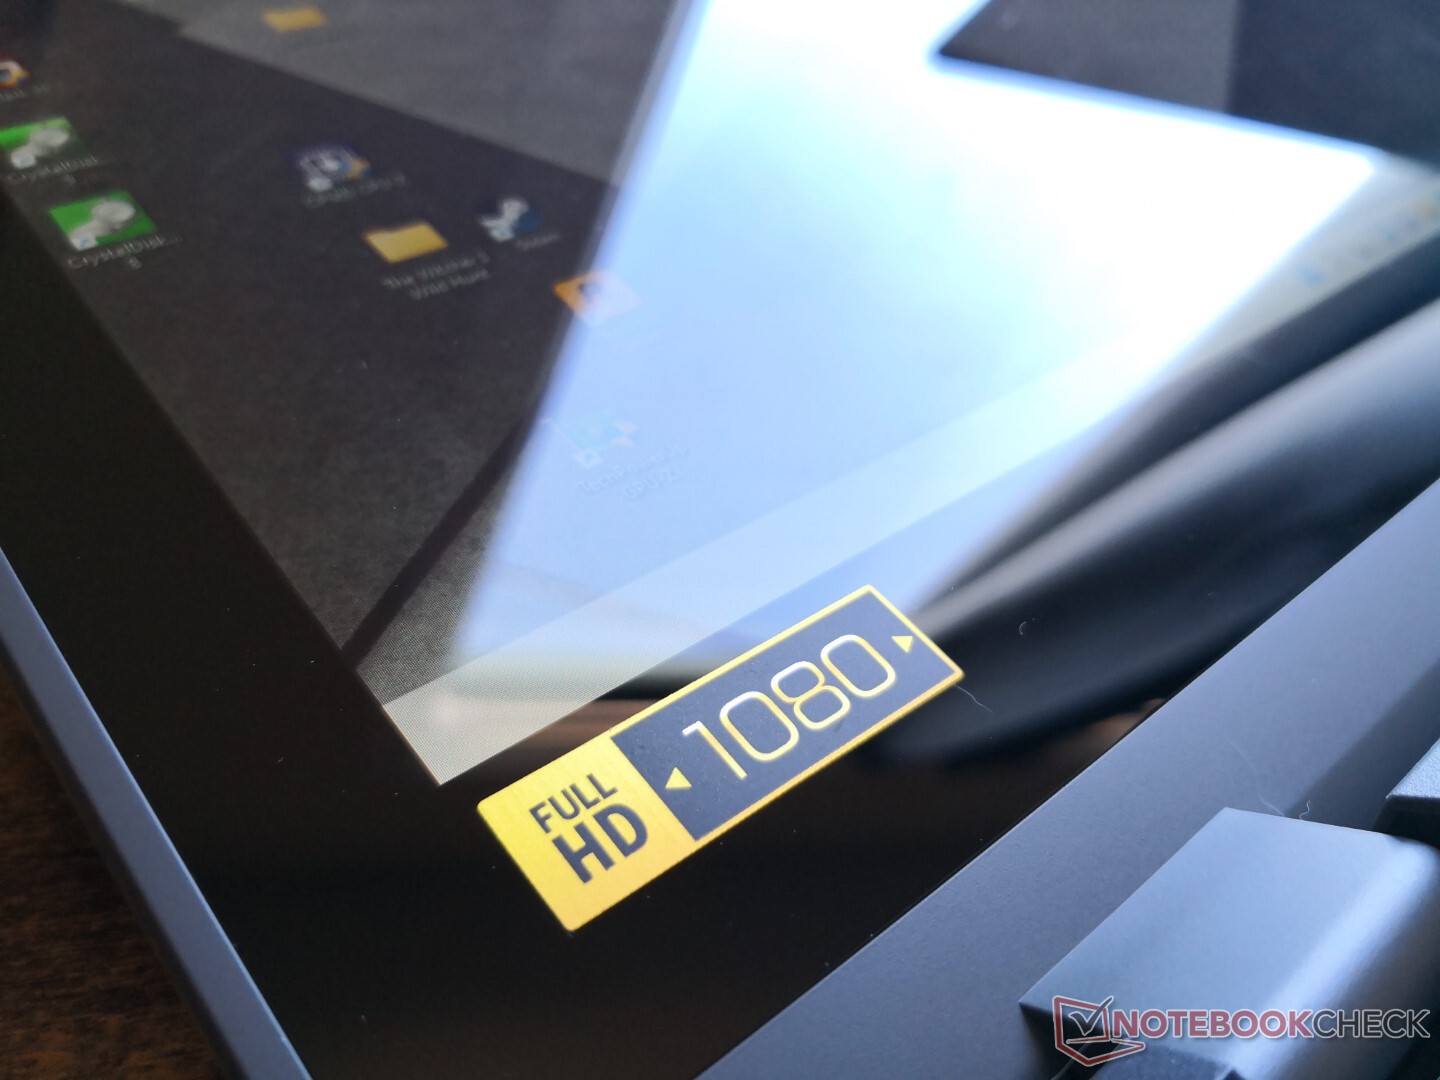
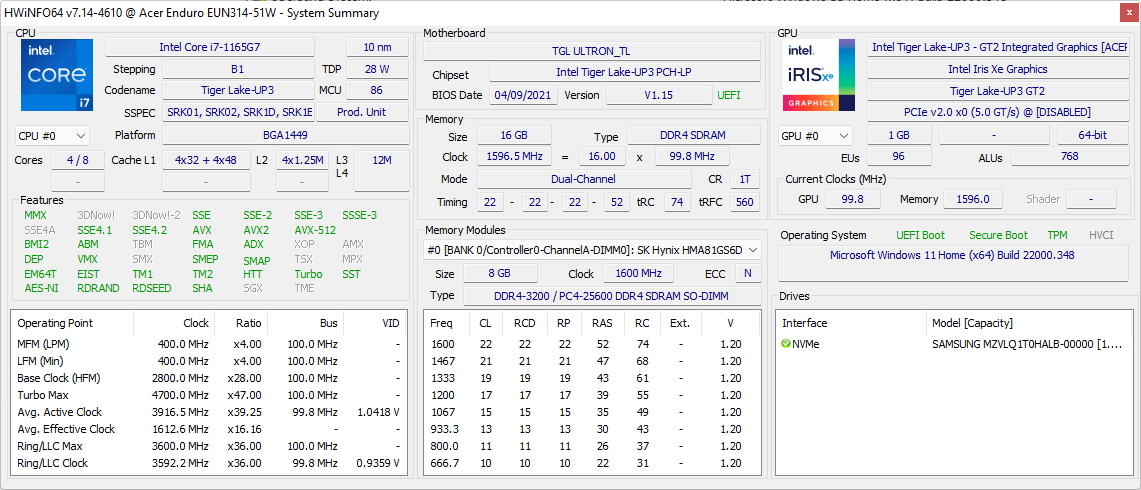
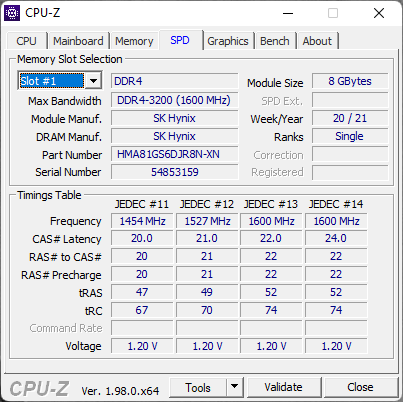
Nossa configuração em revisão inclui a CPU Core i7-1165G7 da 11ª geração, 16 GB de RAM e 1 TB NVMe SSD por cerca de US$999, o que é muito mais barato do que muitos sistemas robustos ou semi-robustos. Outros SKUs estão disponíveis com a antiga CPU Core i5-10210U de 10ª geração ou discreta GeForce MX230 gráficos, mas todas as opções incluem a mesma tela de 1080p
Mais análises da Acer:
Potential Competitors in Comparison
Avaliação | Data | Modelo | Peso | Altura | Size | Resolução | Preço |
|---|---|---|---|---|---|---|---|
| 82.4 % v7 (old) | 12/2021 | Acer Enduro Urban N3 EUN314 i7-1165G7, Iris Xe G7 96EUs | 1.8 kg | 21.95 mm | 14.00" | 1920x1080 | |
| 89.2 % v6 (old) | Dell Latitude 5420 Rugged-P85G i7-8650U, Radeon RX 540 | 2.8 kg | 32.9 mm | 14.00" | 1920x1080 | ||
| 83.9 % v7 (old) | 09/2021 | Panasonic Toughbook FZ-55 MK2 i7-1185G7, Iris Xe G7 96EUs | 2.3 kg | 33 mm | 14.00" | 1920x1080 | |
v (old) | 04/2021 | Durabook S14I i7-1165G7, Iris Xe G7 96EUs | 3 kg | 38.1 mm | 14.00" | 1920x1080 | |
| 81.9 % v6 (old) | 10/2018 | Getac S410 i5-8550U, UHD Graphics 620 | 3.2 kg | 34.9 mm | 14.00" | 1366x768 |
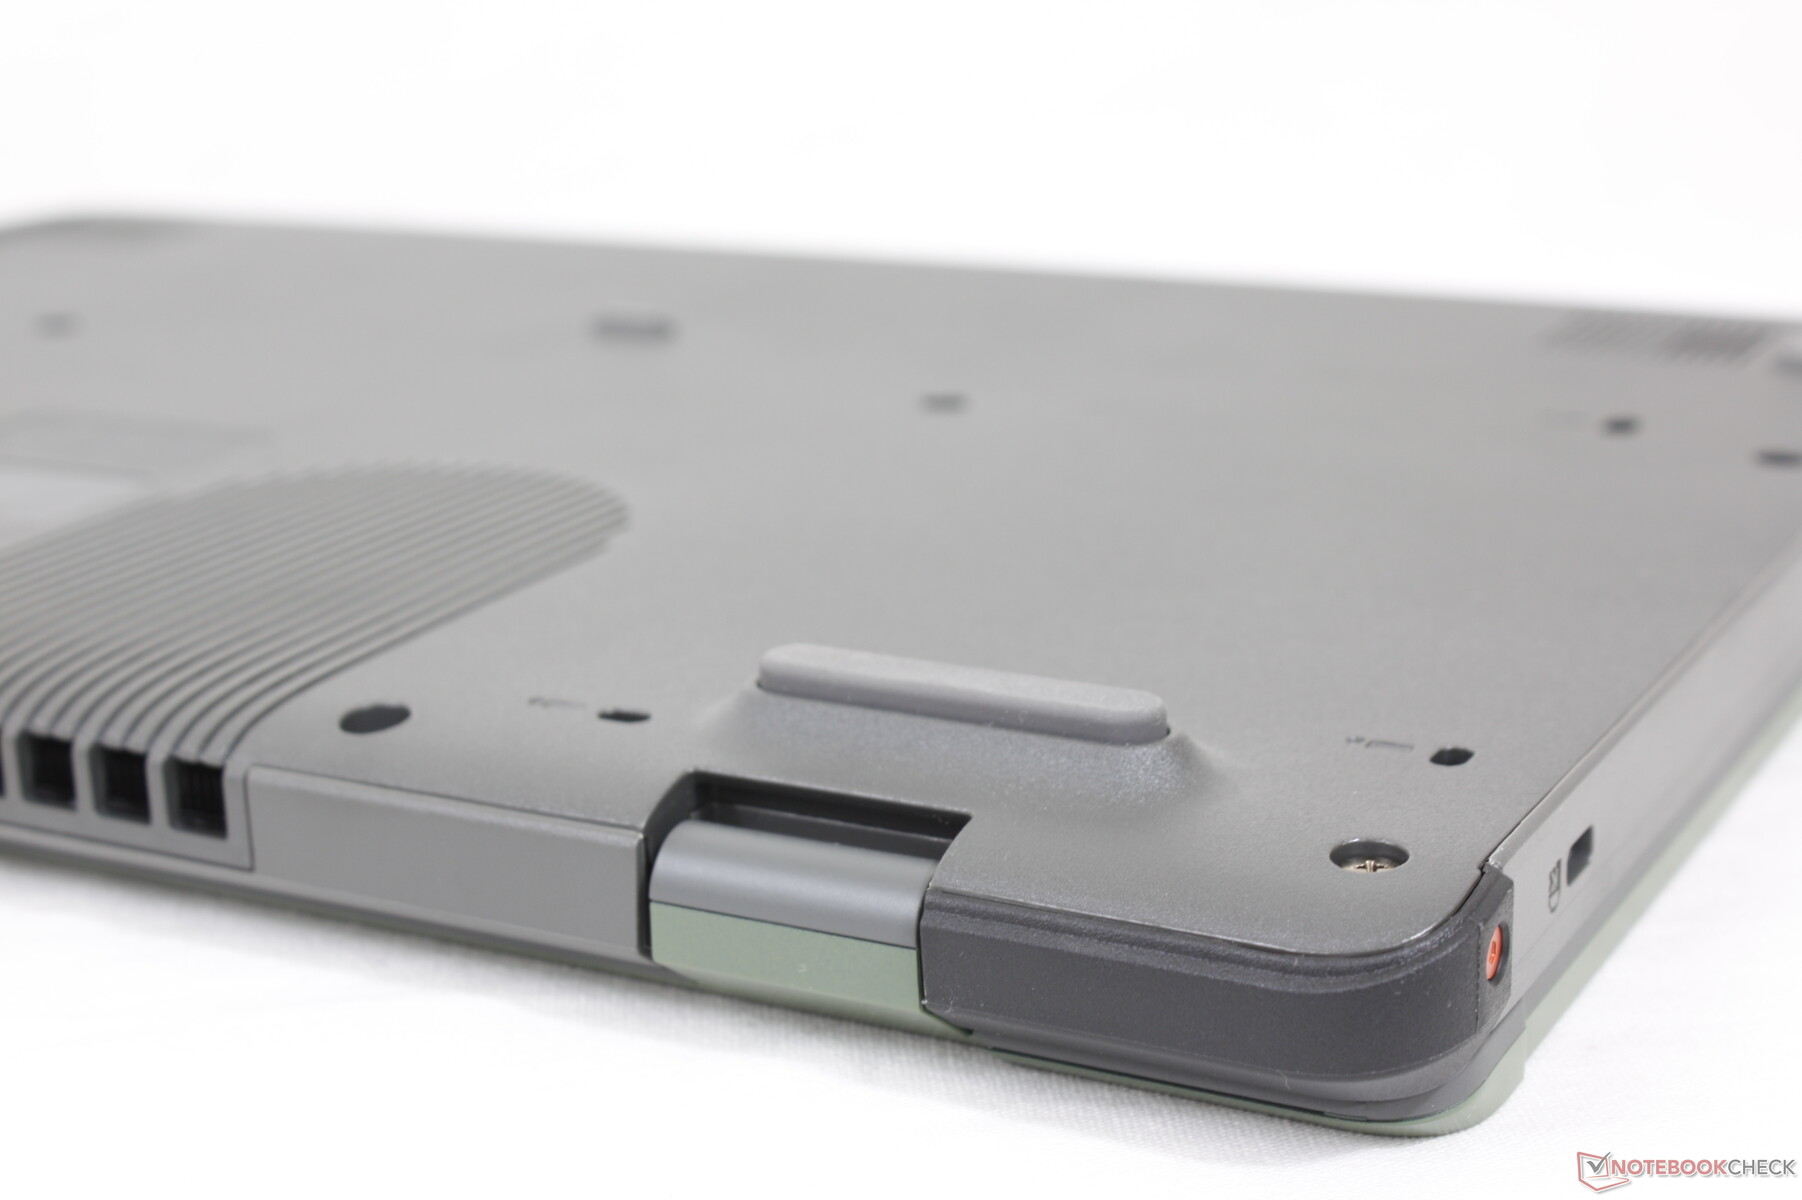
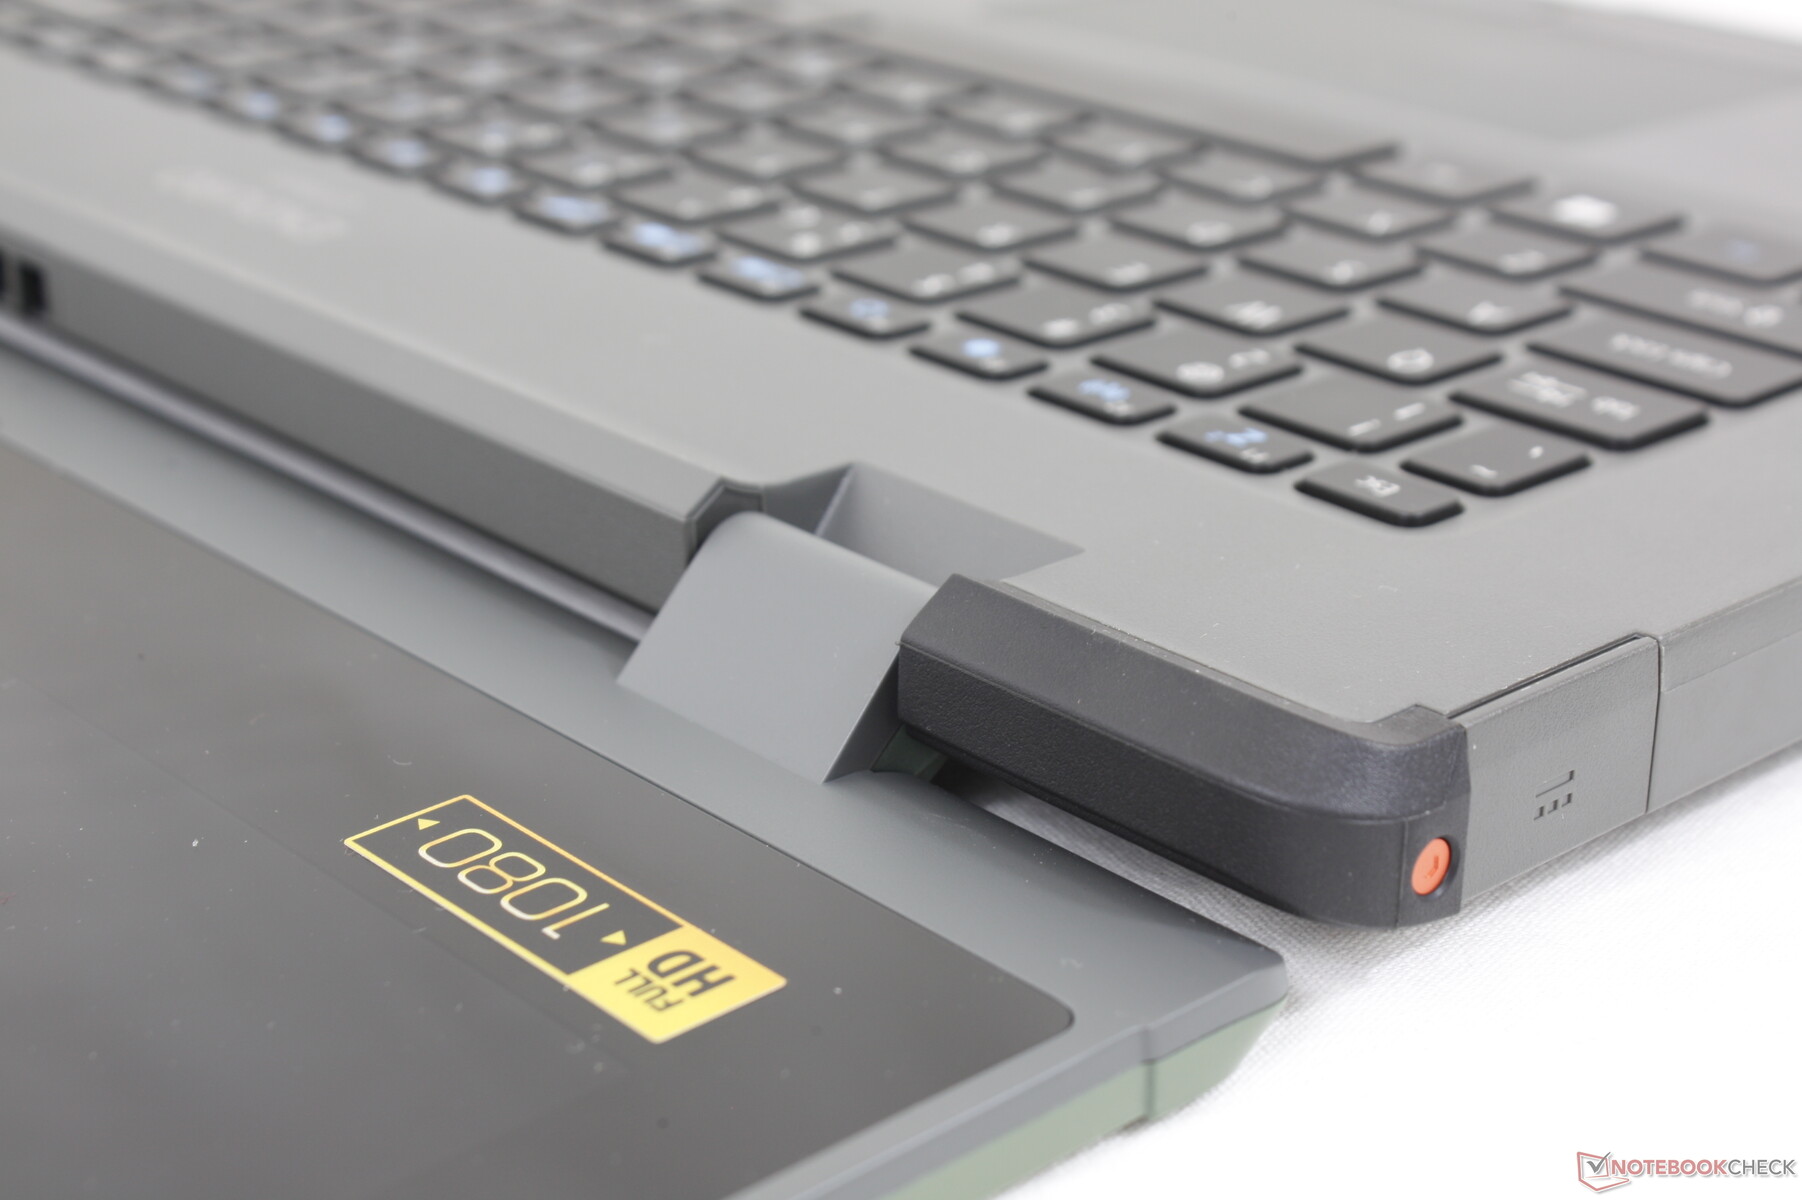
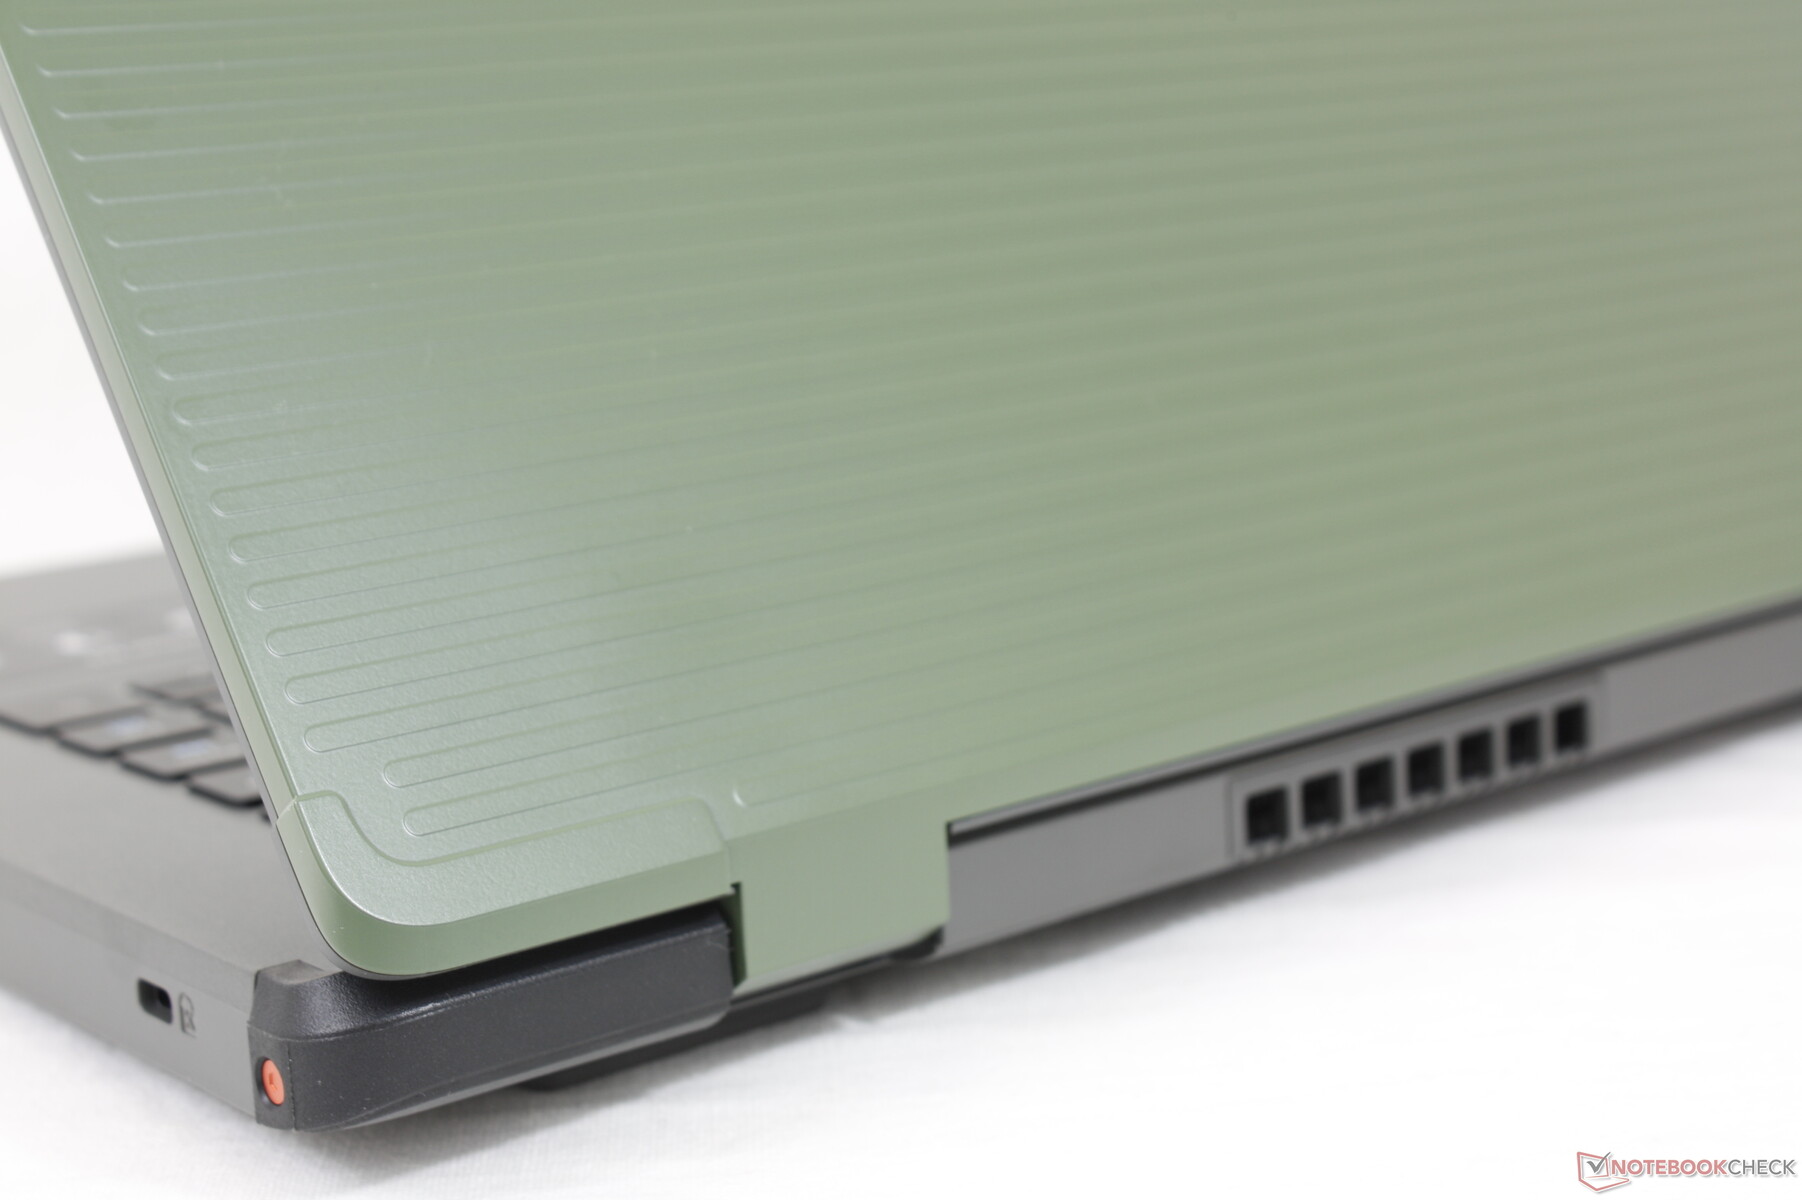
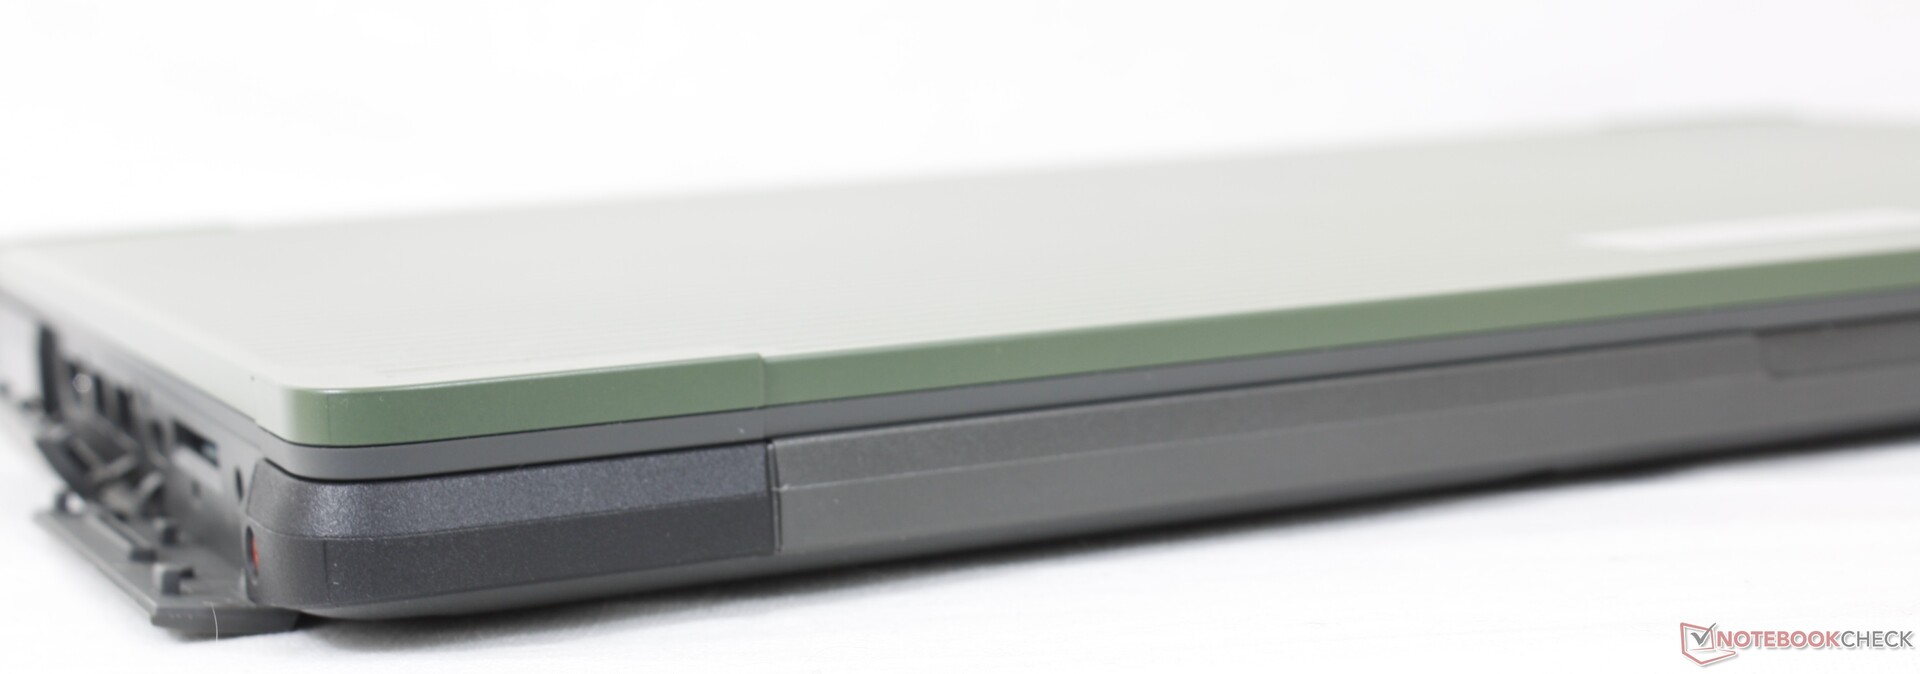
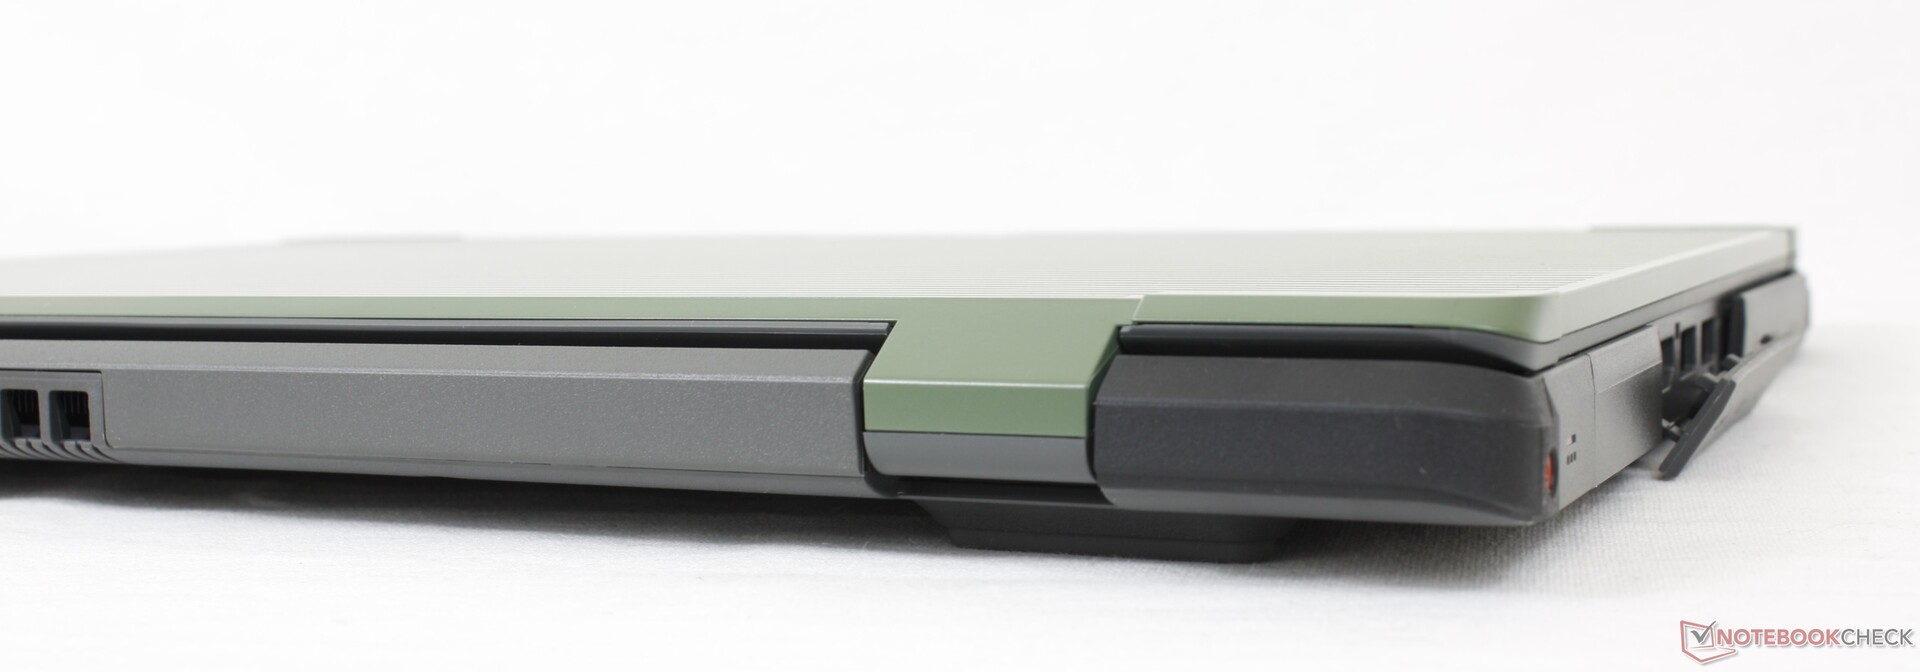
Caso
As características mais notáveis da N3 Urbana são sua portabilidade e tamanho pequeno em relação a outros dispositivos robustos de 14 polegadas. Com apenas 1,8 kg, o sistema Acer é várias centenas de gramas mais leve que o Getac S410 ouPanasonic Toughbook FZ-55 MK2 ser muito mais próximo em tamanho de um típico laptop de 15,6 polegadas de consumo. Suas moldura espessas podem ser inestéticas, mas famílias robustas como o Enduro sempre se preocuparam com a função sobre a forma.
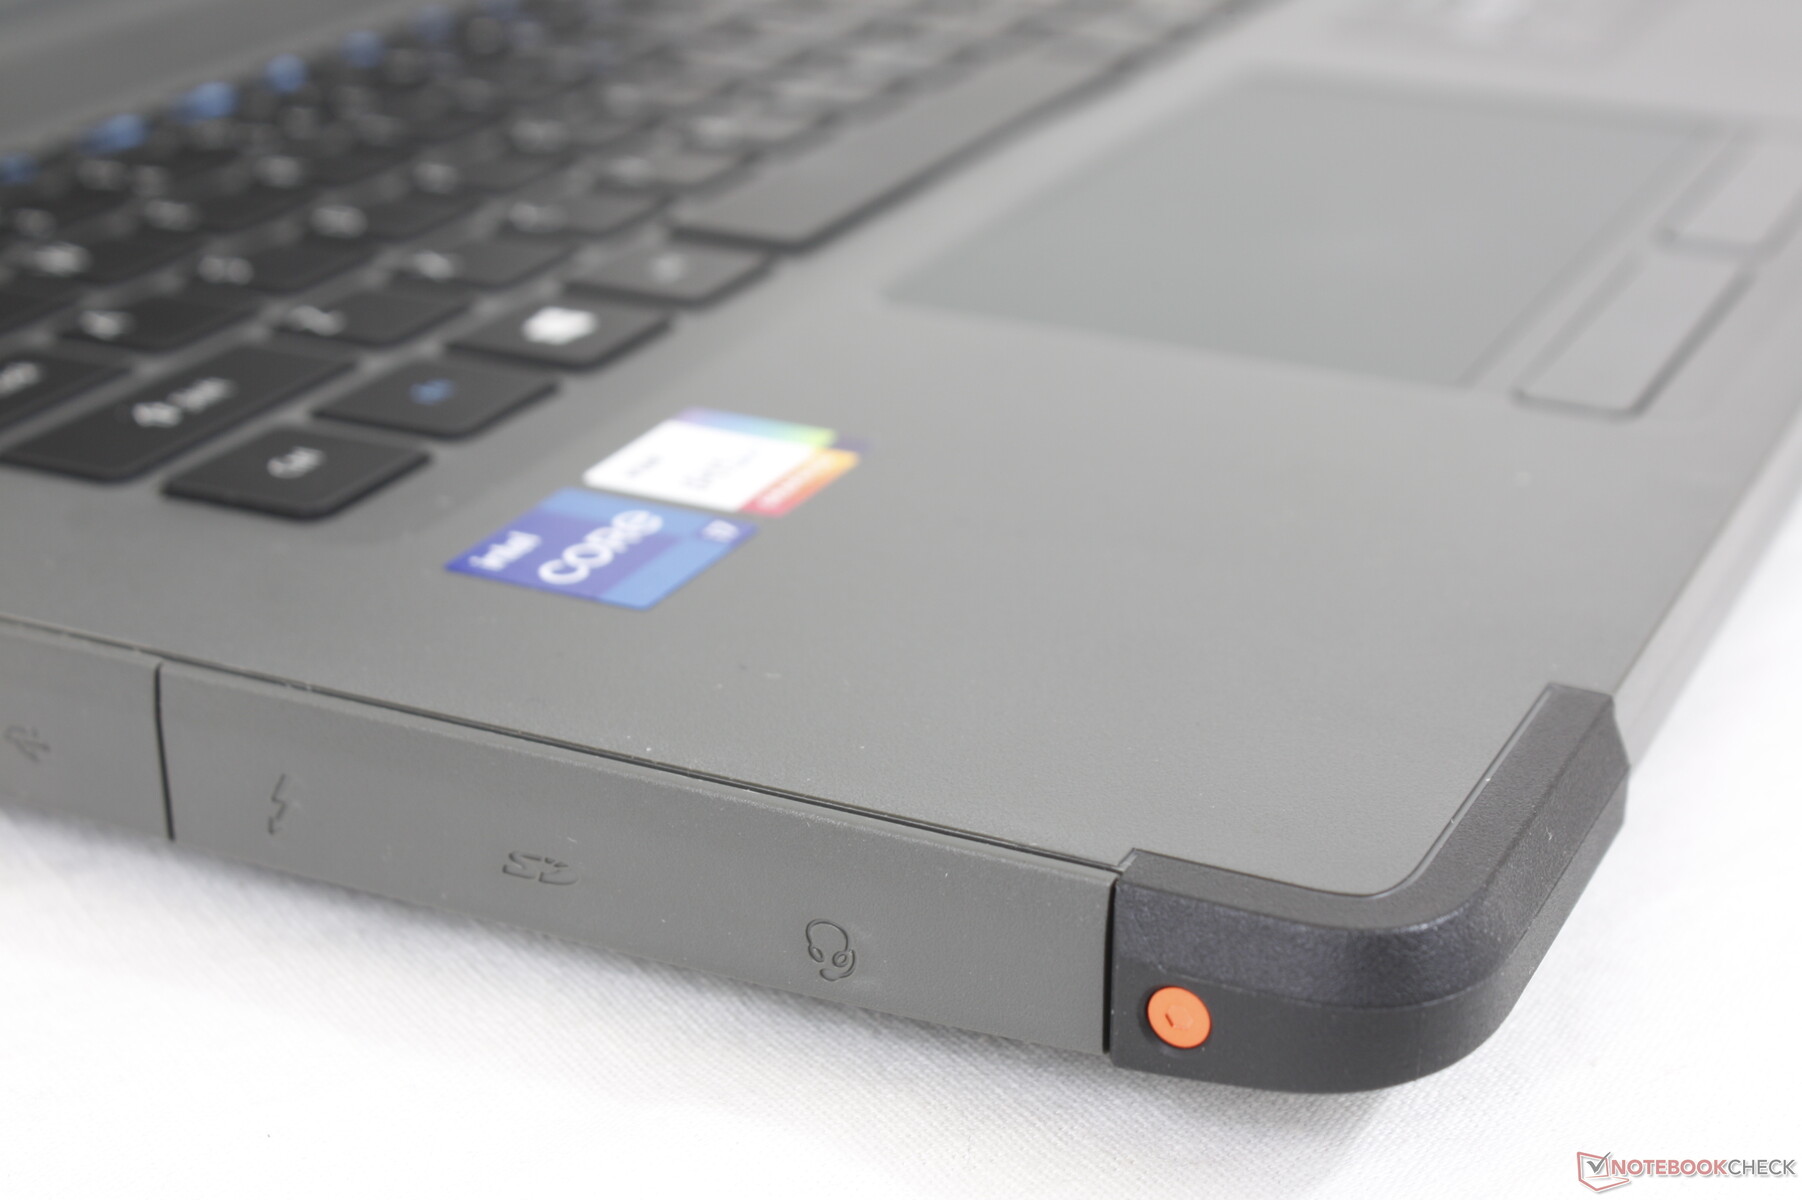
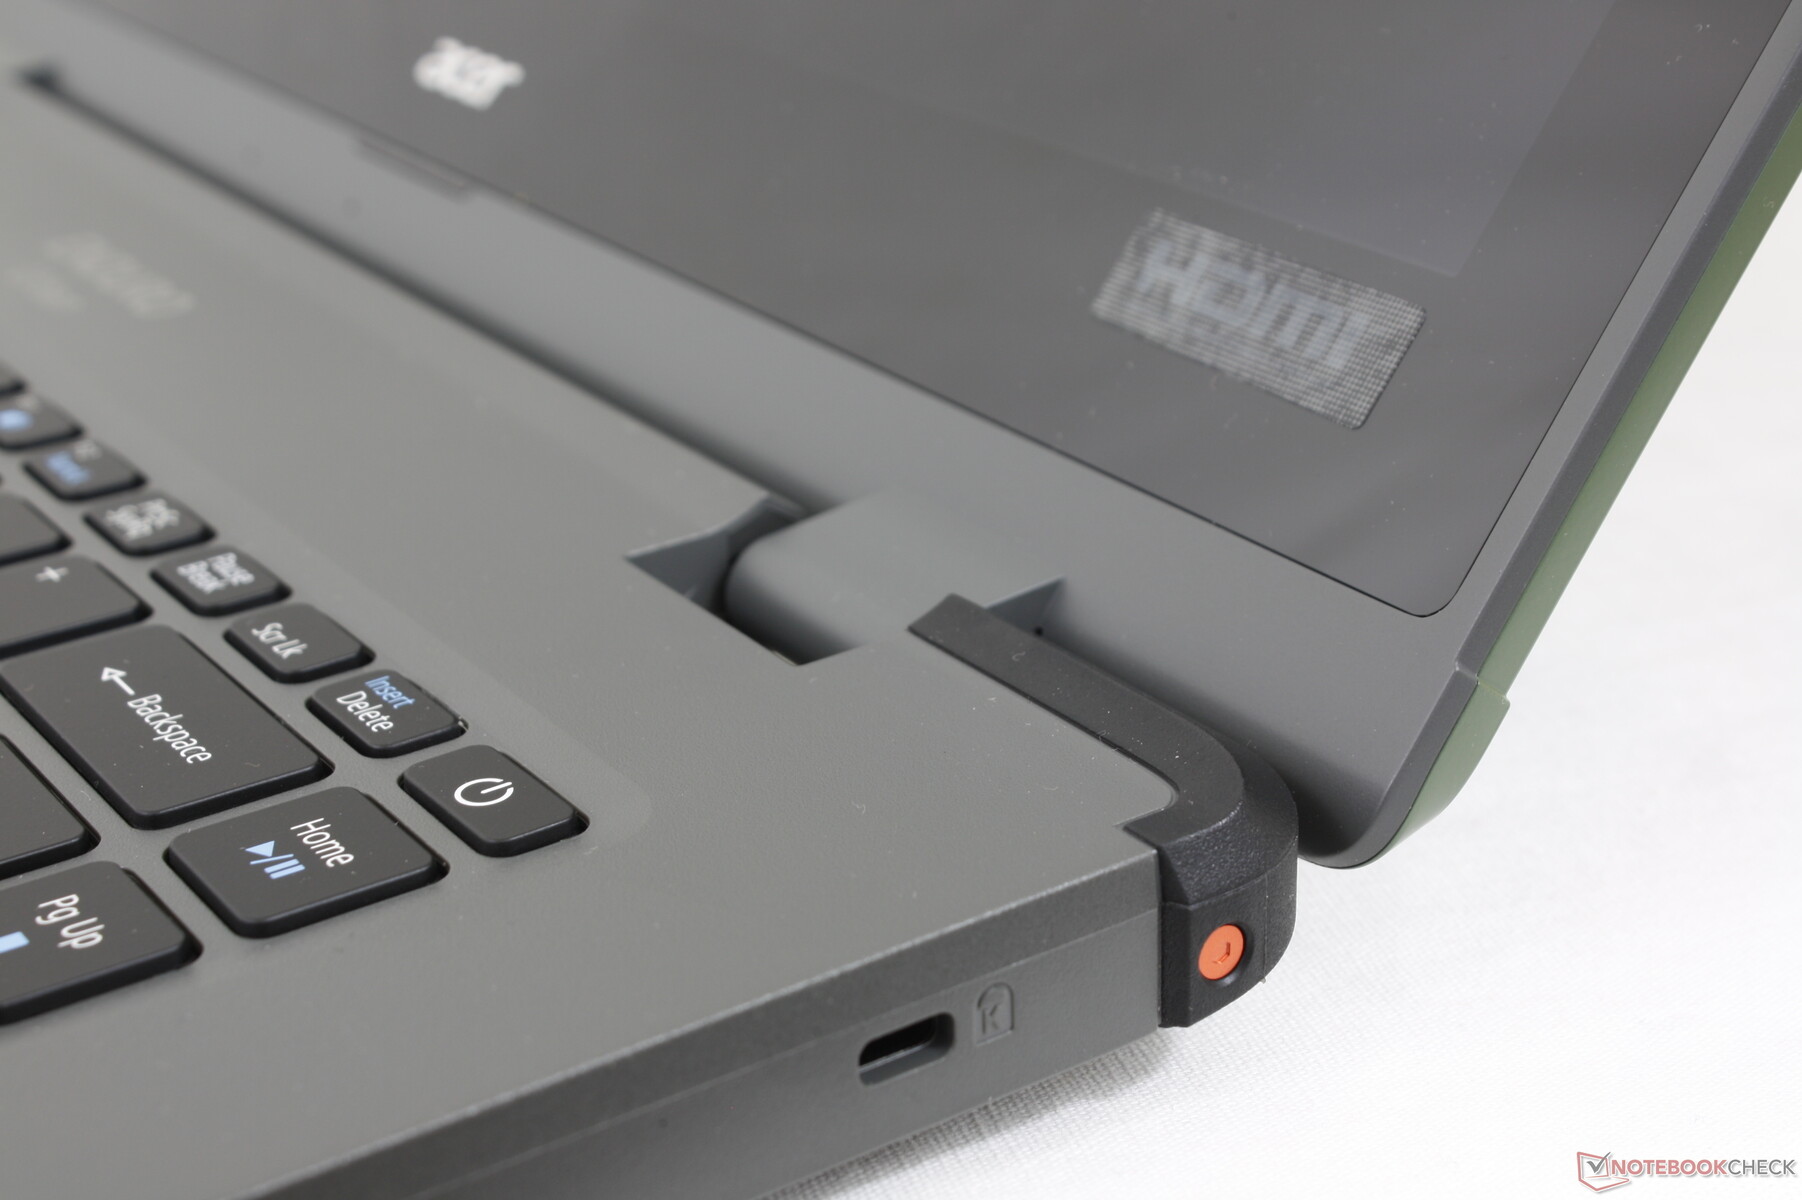
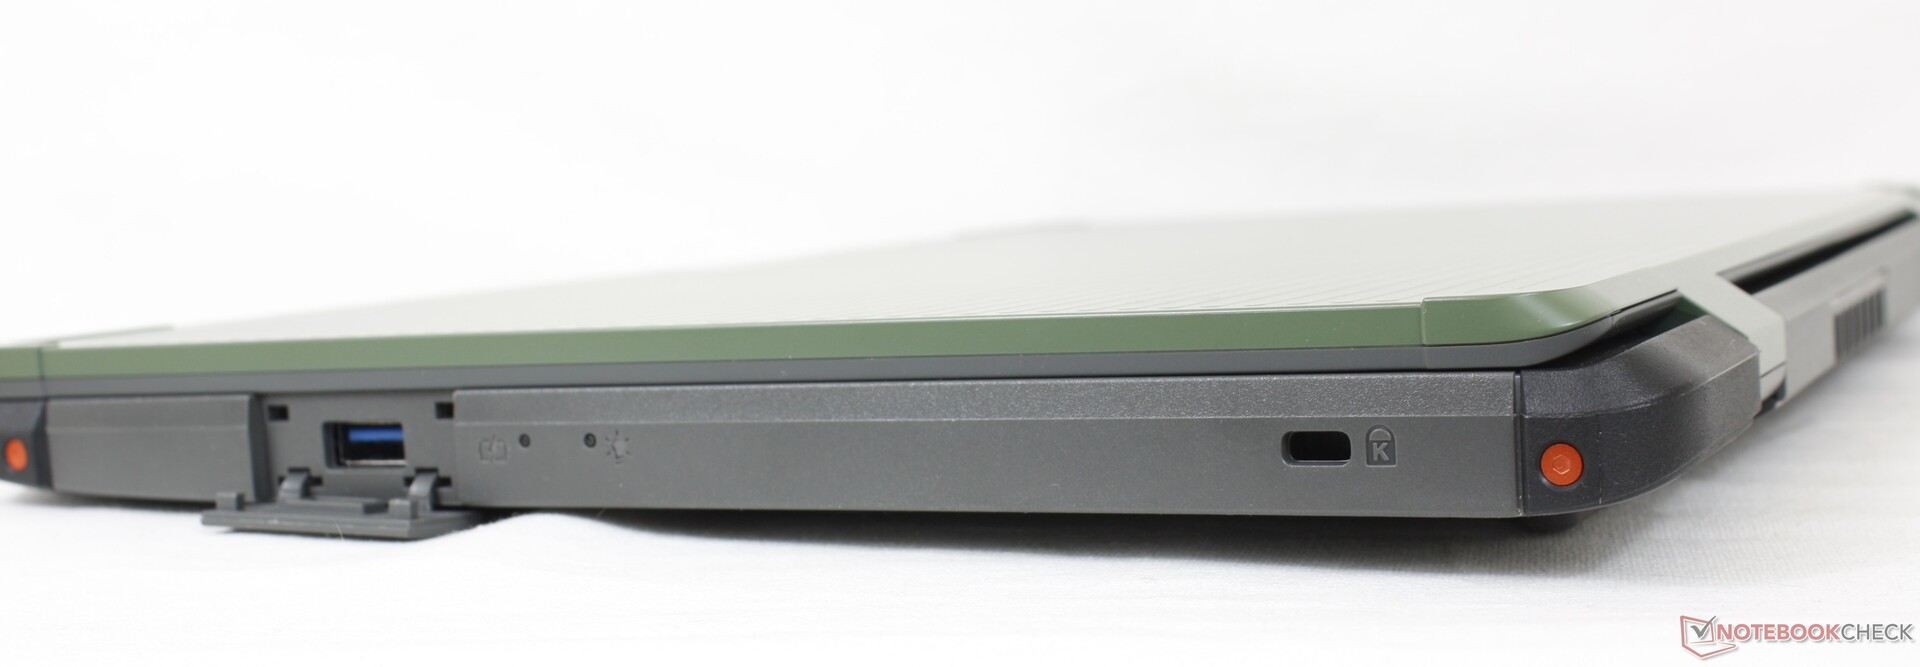
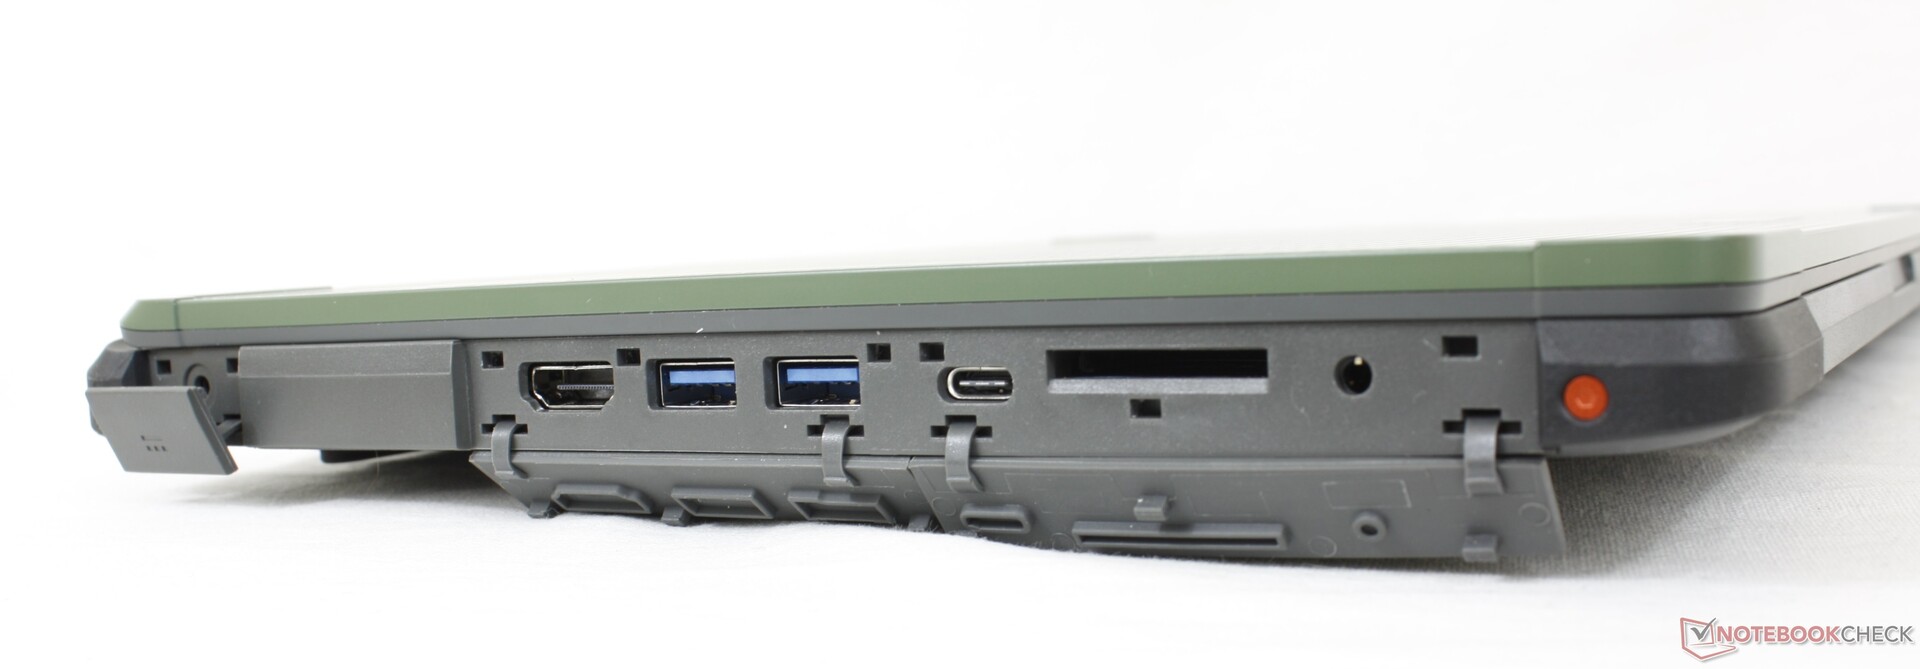
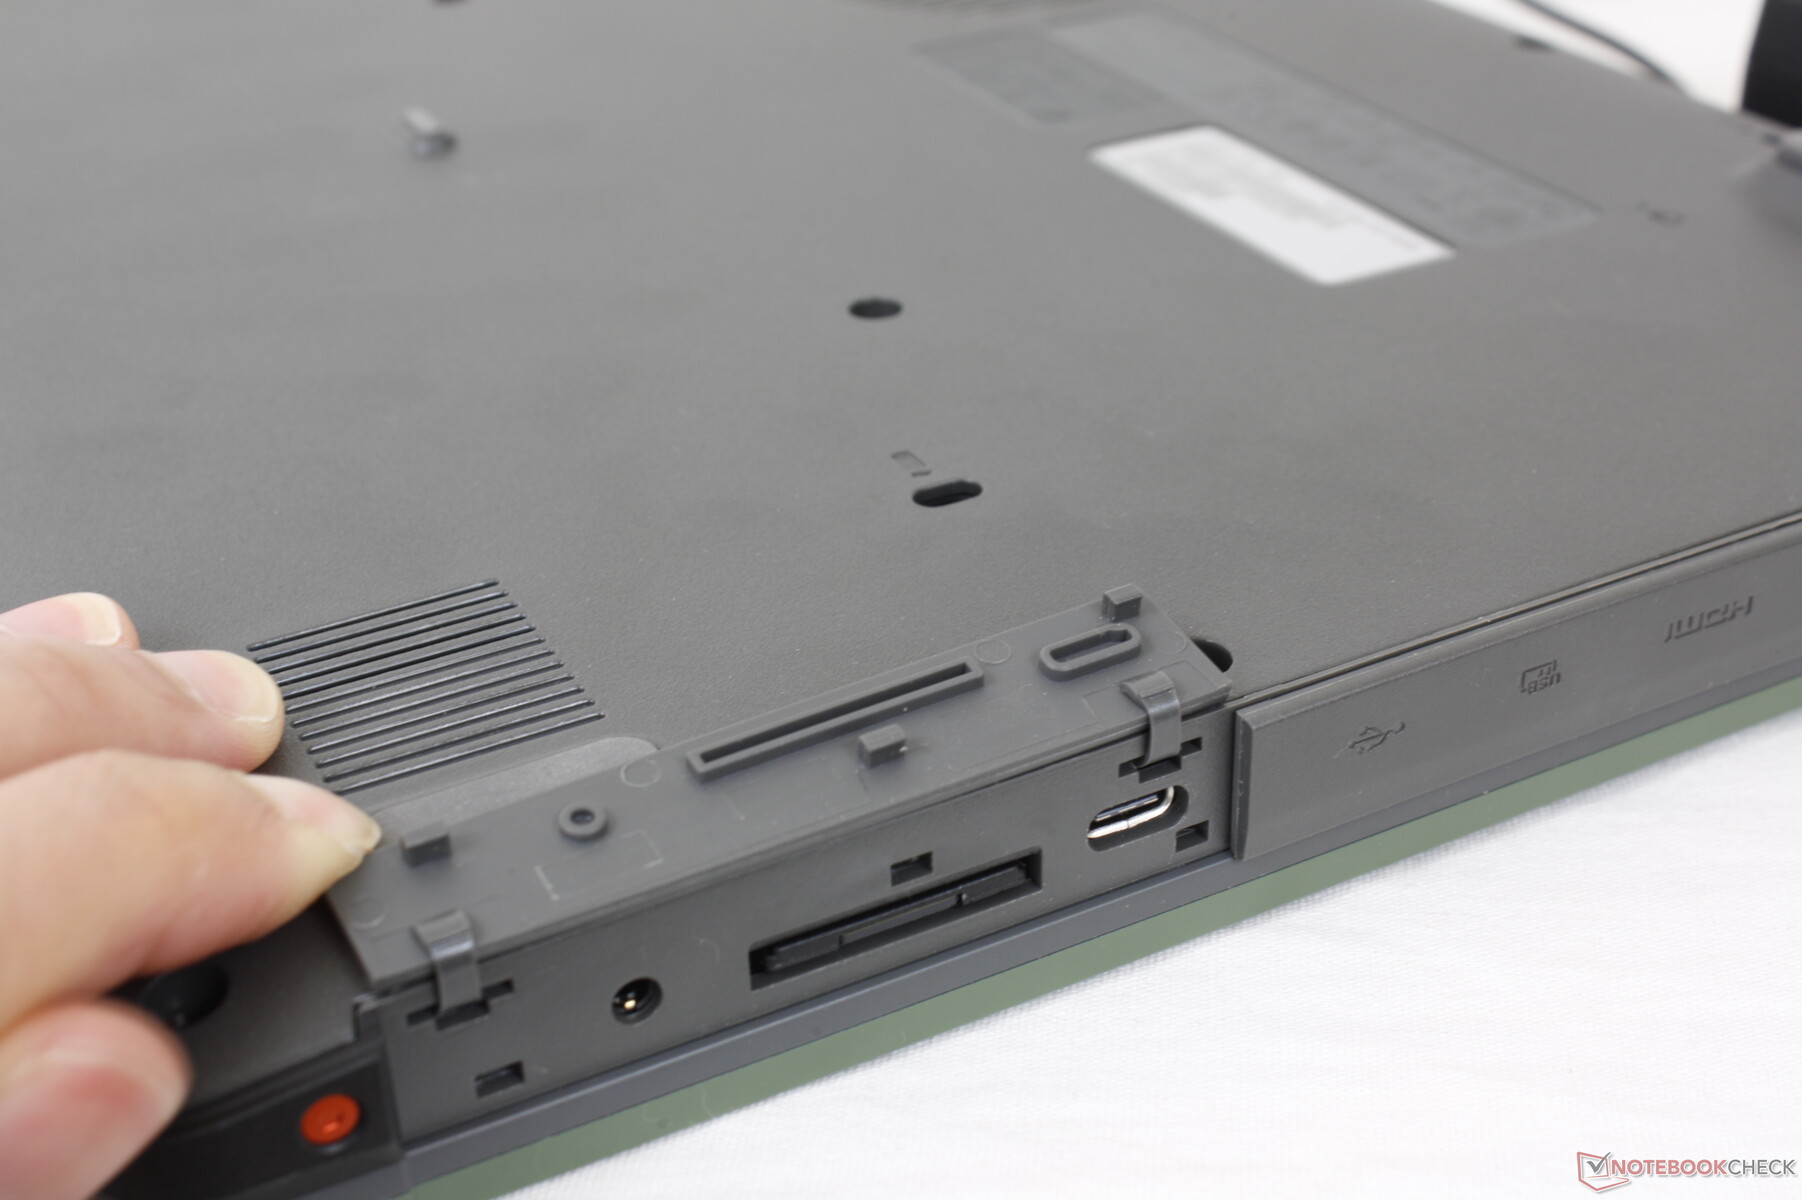
Conectividade
As opções de porta são similares a muitos Ultrabooks, incluindo a importantíssima porta Thunderbolt 4. Regulars em laptops robustos como Serial RS232, VGA, e RJ-45 são omitidos.
Leitor de cartões SD
O leitor de cartões SD integrado é lento. A movimentação de 1 GB de fotos de nosso cartão de teste UHS-II para a área de trabalho leva cerca de 45 segundos em comparação com os 12 segundos do Getac S410.
| SD Card Reader | |
| average JPG Copy Test (av. of 3 runs) | |
| Dell Latitude 5420 Rugged-P85G (Toshiba Exceria Pro SDXC 64 GB UHS-II) | |
| Getac S410 (Toshiba Exceria Pro SDXC 64 GB UHS-II) | |
| Panasonic Toughbook FZ-55 MK2 (AV Pro V60) | |
| Acer Enduro Urban N3 EUN314 (AV Pro V60) | |
| Durabook S14I (Angelbird 128GB AV Pro UHS-II) | |
| maximum AS SSD Seq Read Test (1GB) | |
| Dell Latitude 5420 Rugged-P85G (Toshiba Exceria Pro SDXC 64 GB UHS-II) | |
| Panasonic Toughbook FZ-55 MK2 (AV Pro V60) | |
| Getac S410 (Toshiba Exceria Pro SDXC 64 GB UHS-II) | |
| Durabook S14I (Angelbird 128GB AV Pro UHS-II) | |
| Acer Enduro Urban N3 EUN314 (AV Pro V60) | |
Comunicação
| Networking | |
| iperf3 transmit AX12 | |
| Acer Enduro Urban N3 EUN314 | |
| Panasonic Toughbook FZ-55 MK2 | |
| Durabook S14I | |
| Dell Latitude 5420 Rugged-P85G | |
| Getac S410 | |
| iperf3 receive AX12 | |
| Durabook S14I | |
| Acer Enduro Urban N3 EUN314 | |
| Panasonic Toughbook FZ-55 MK2 | |
| Dell Latitude 5420 Rugged-P85G | |
| Getac S410 | |
Webcam
A webcam 720p é de má qualidade, sem obturador de privacidade ou câmera IR.


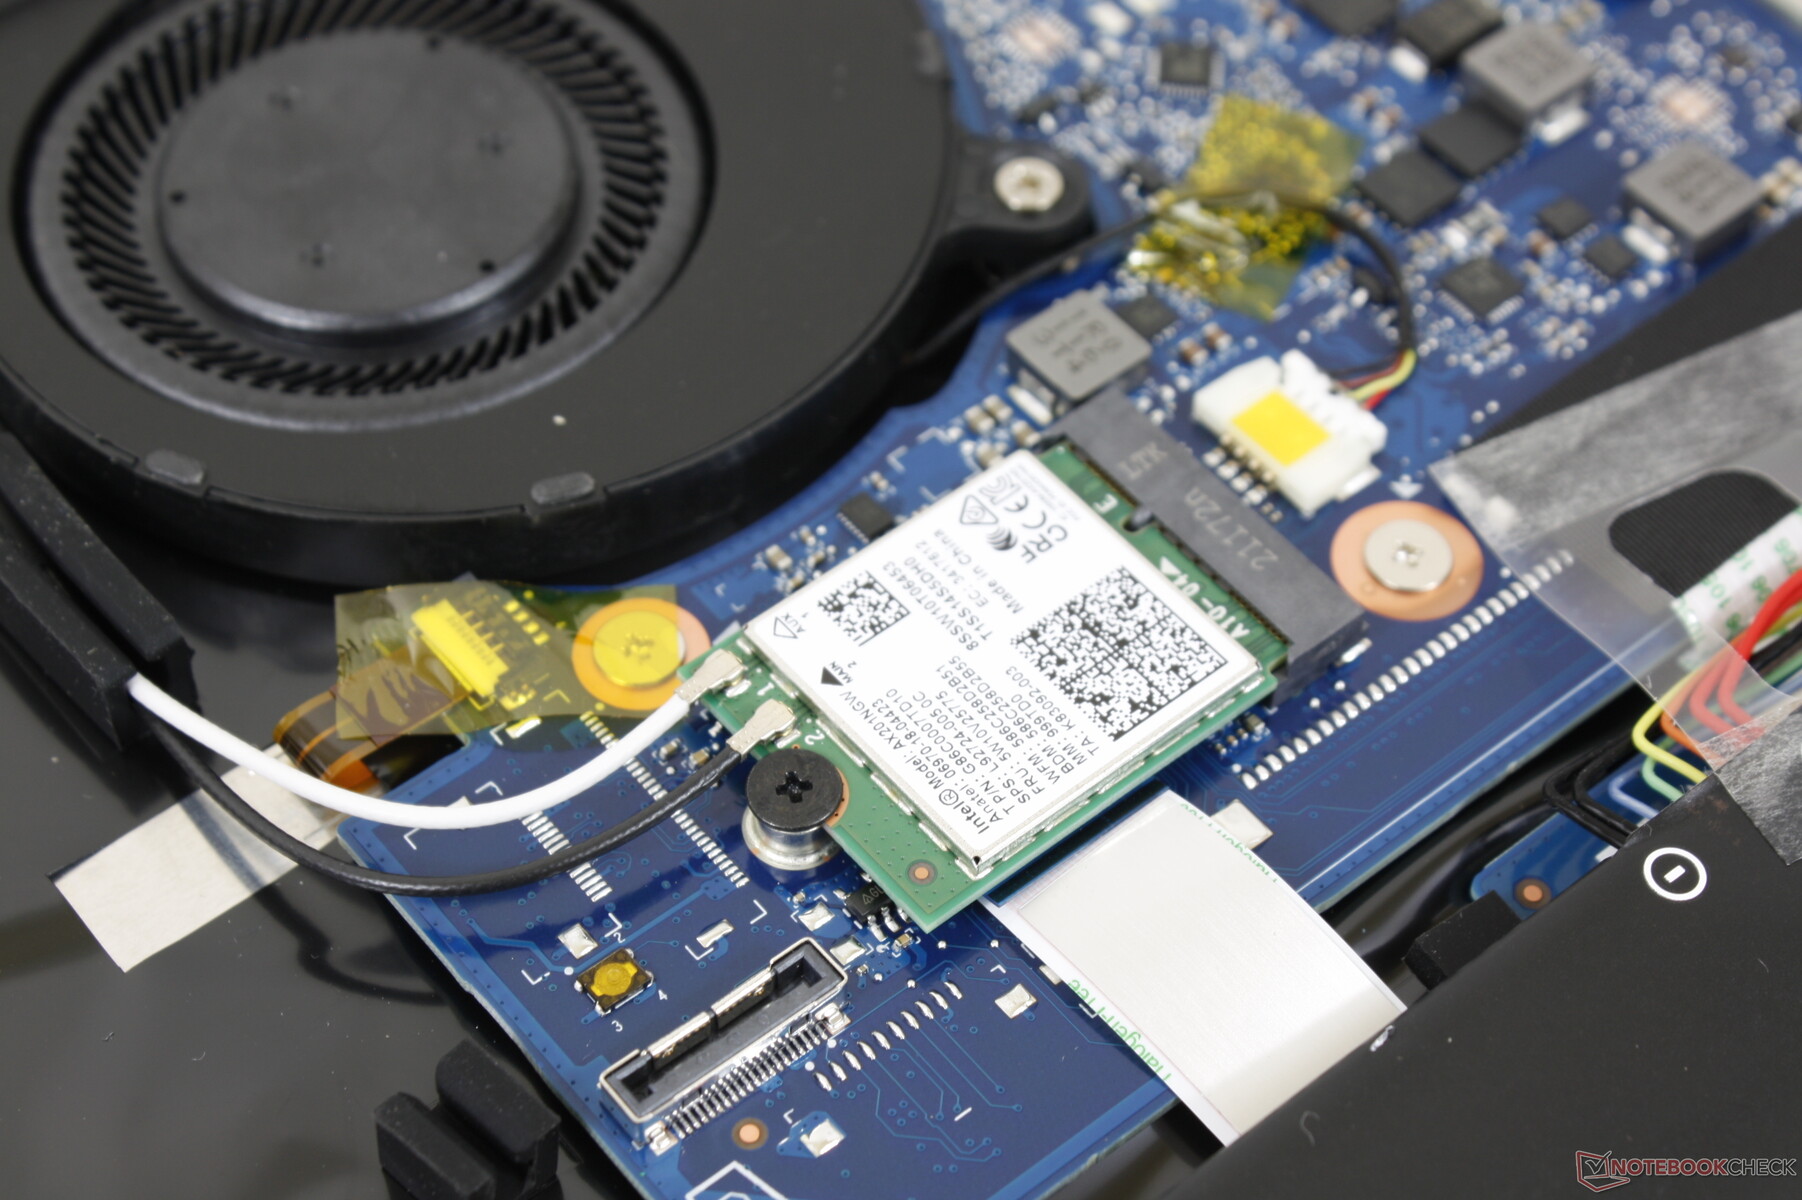
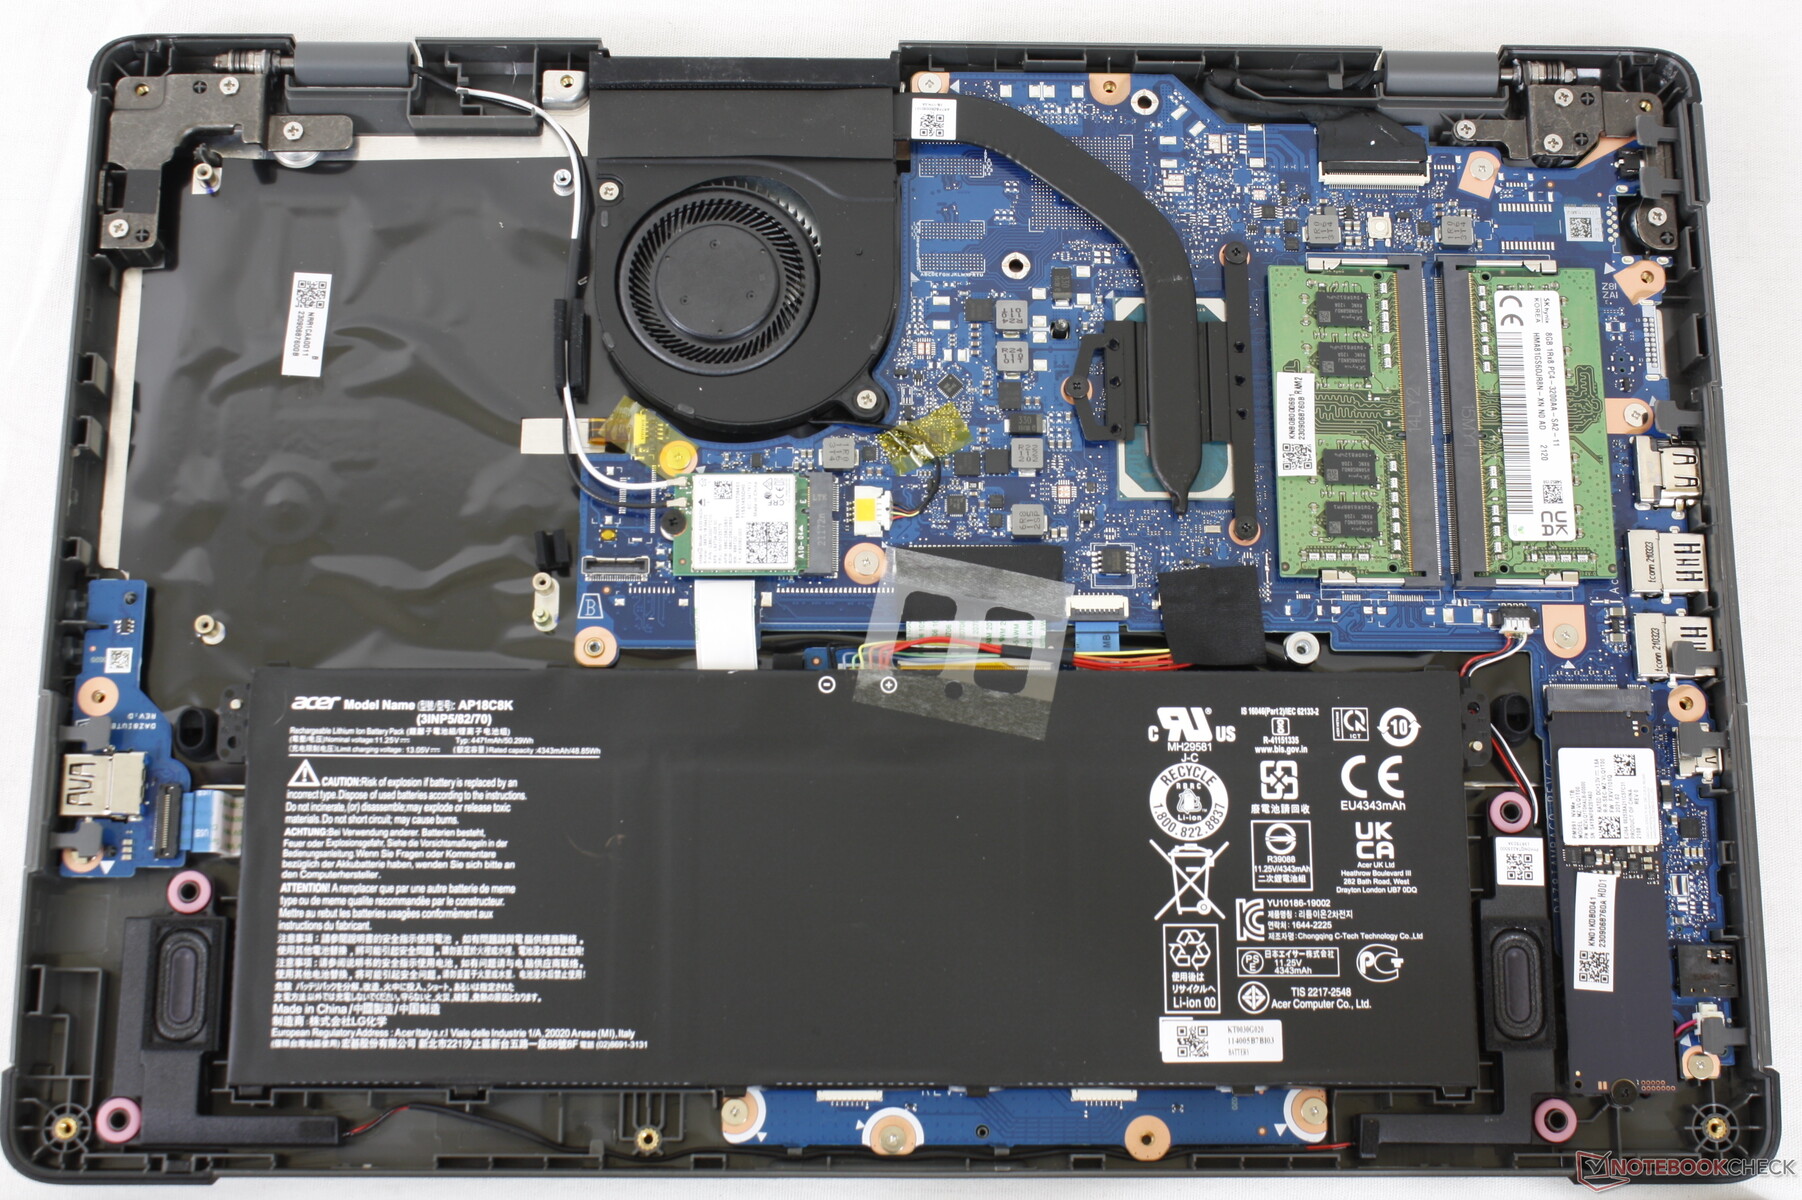
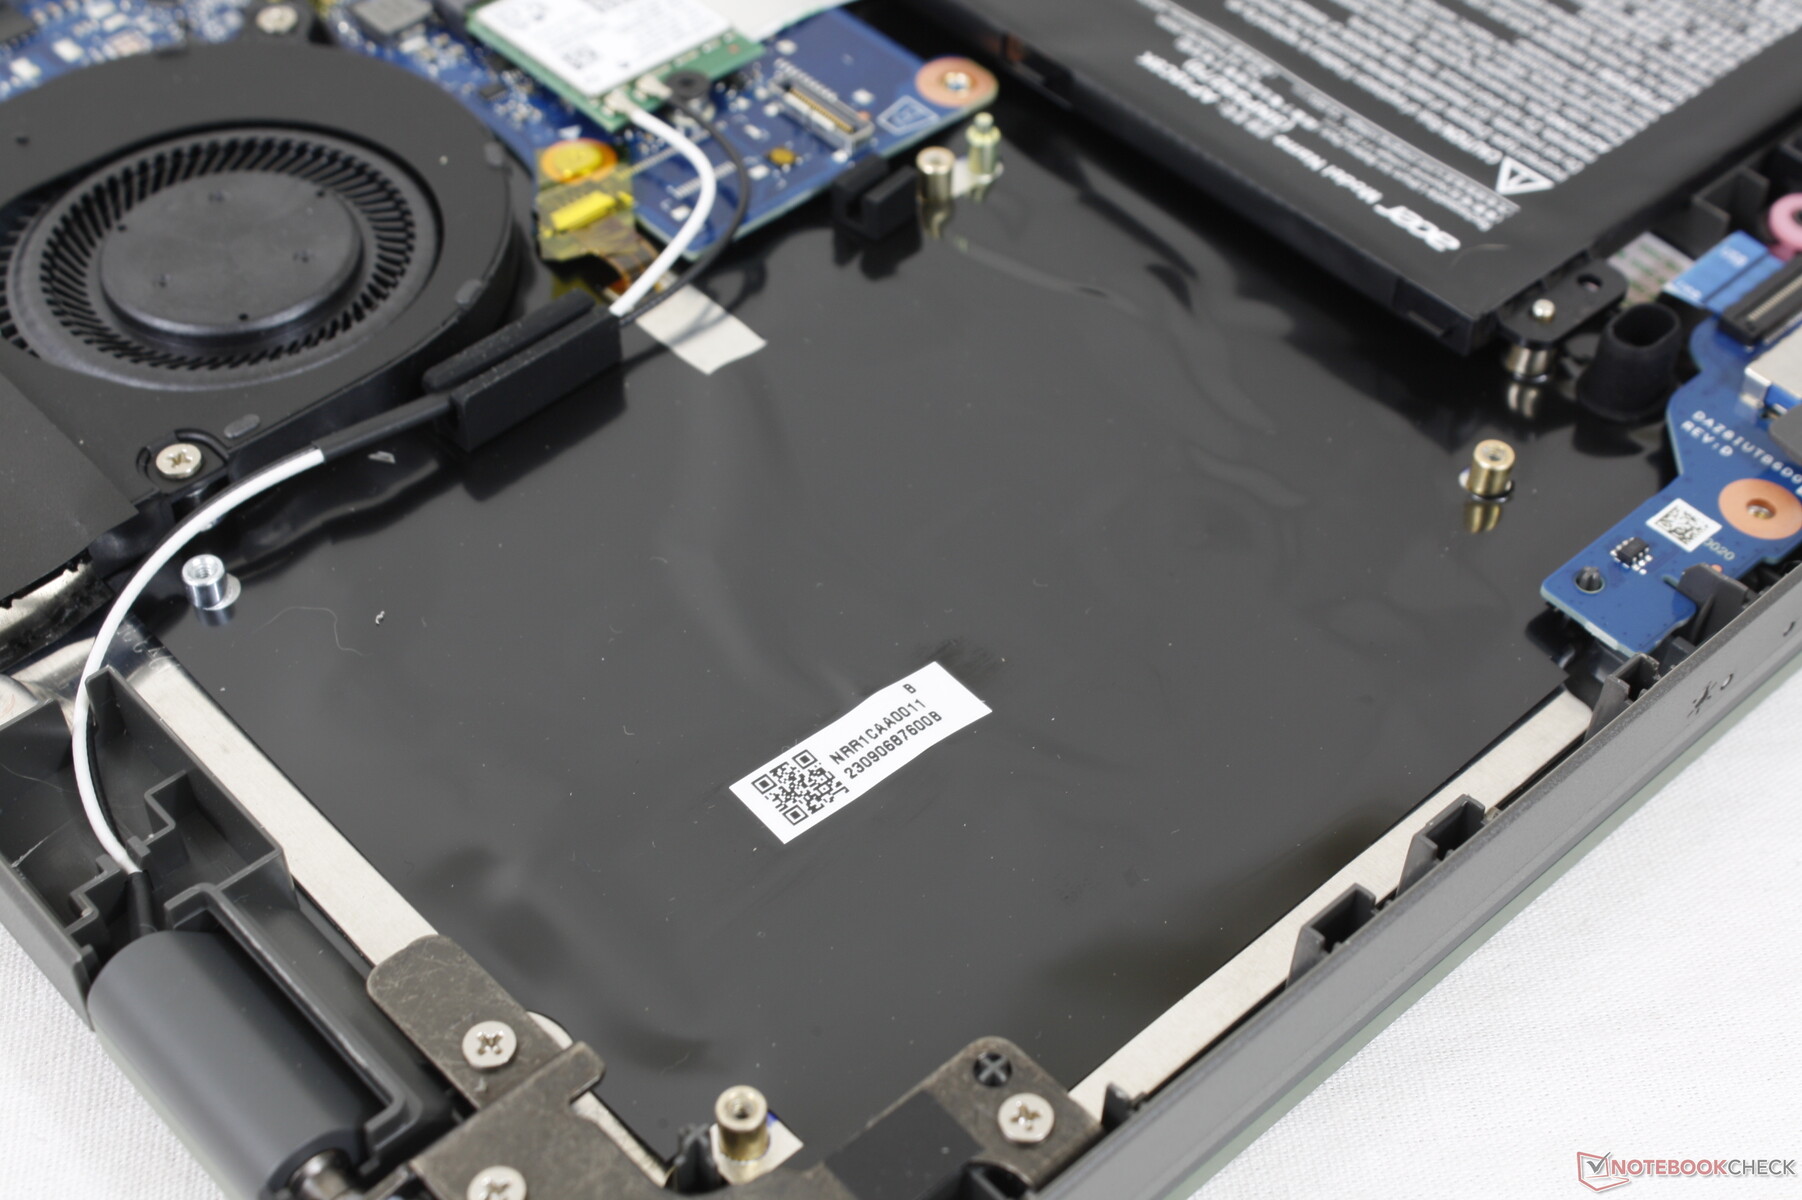
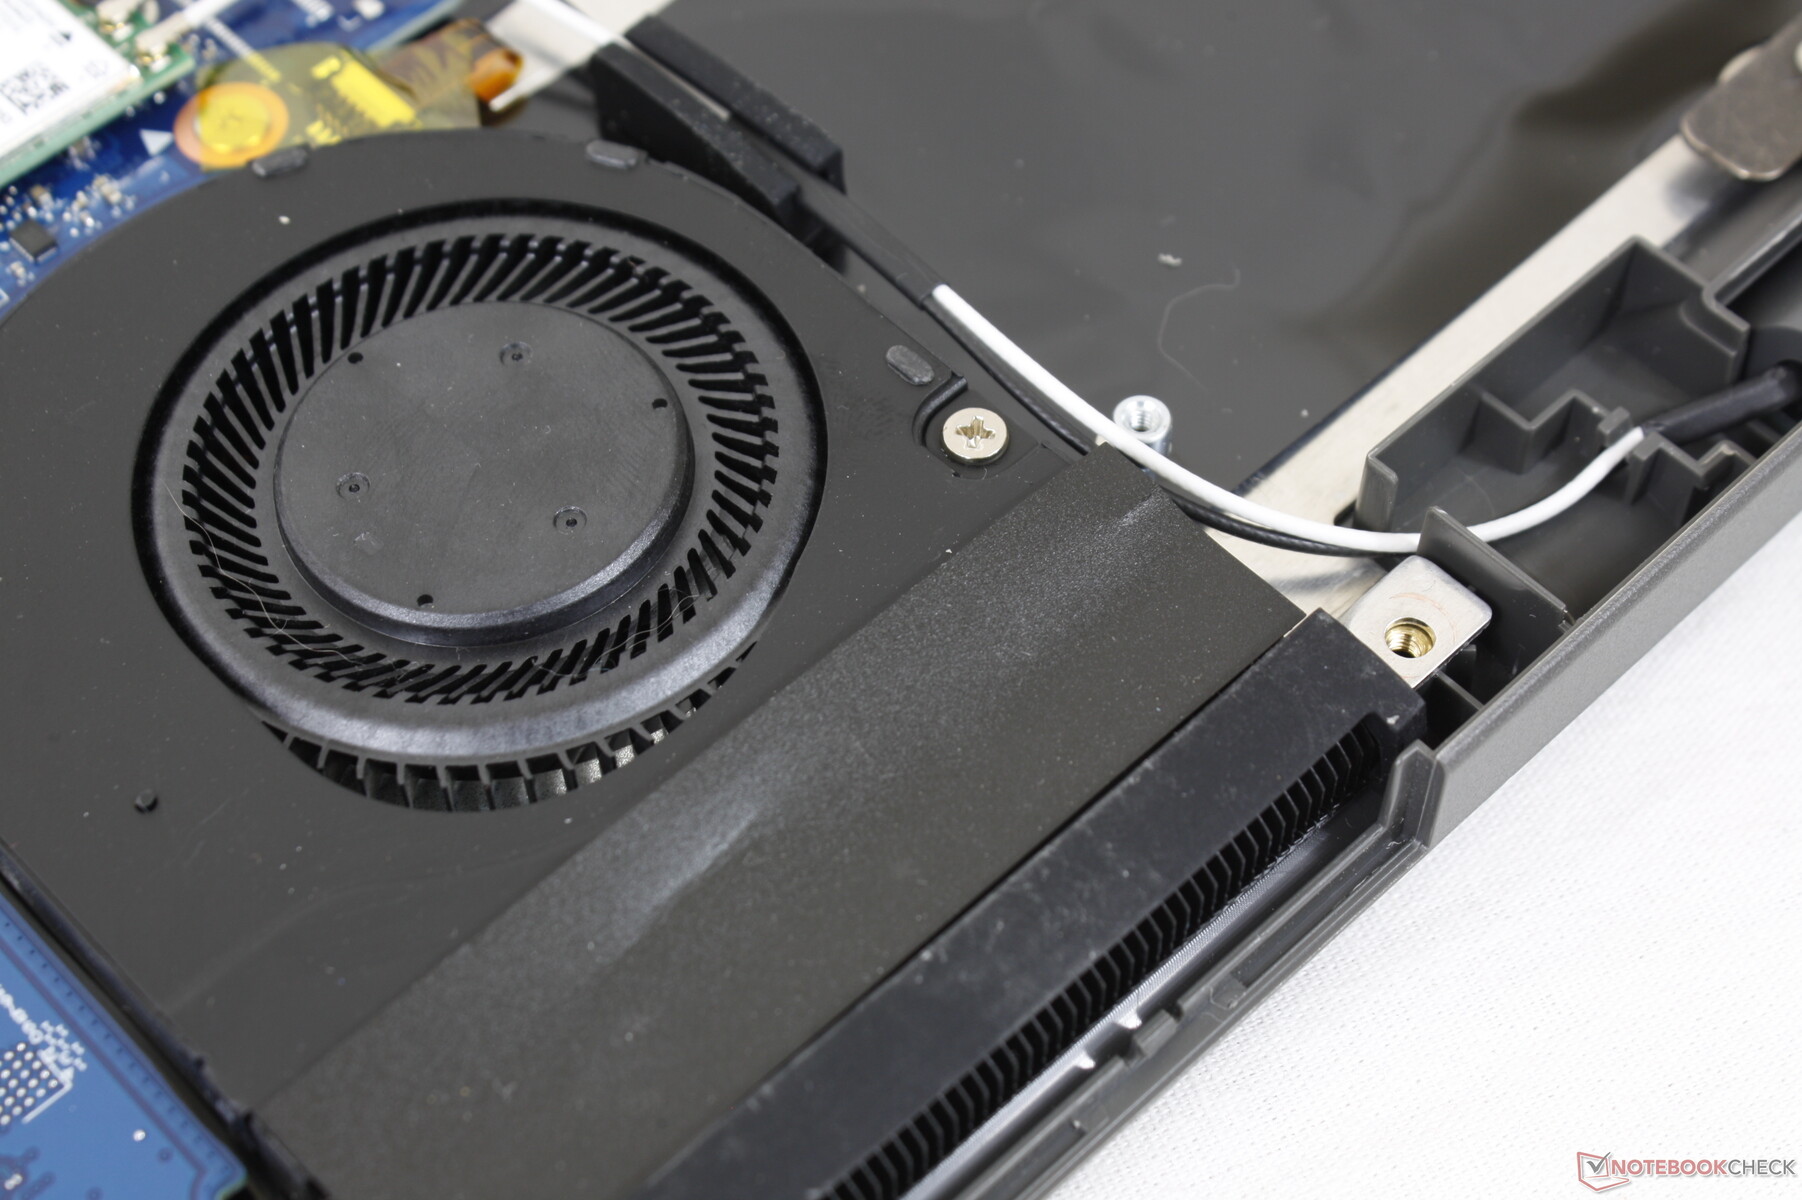
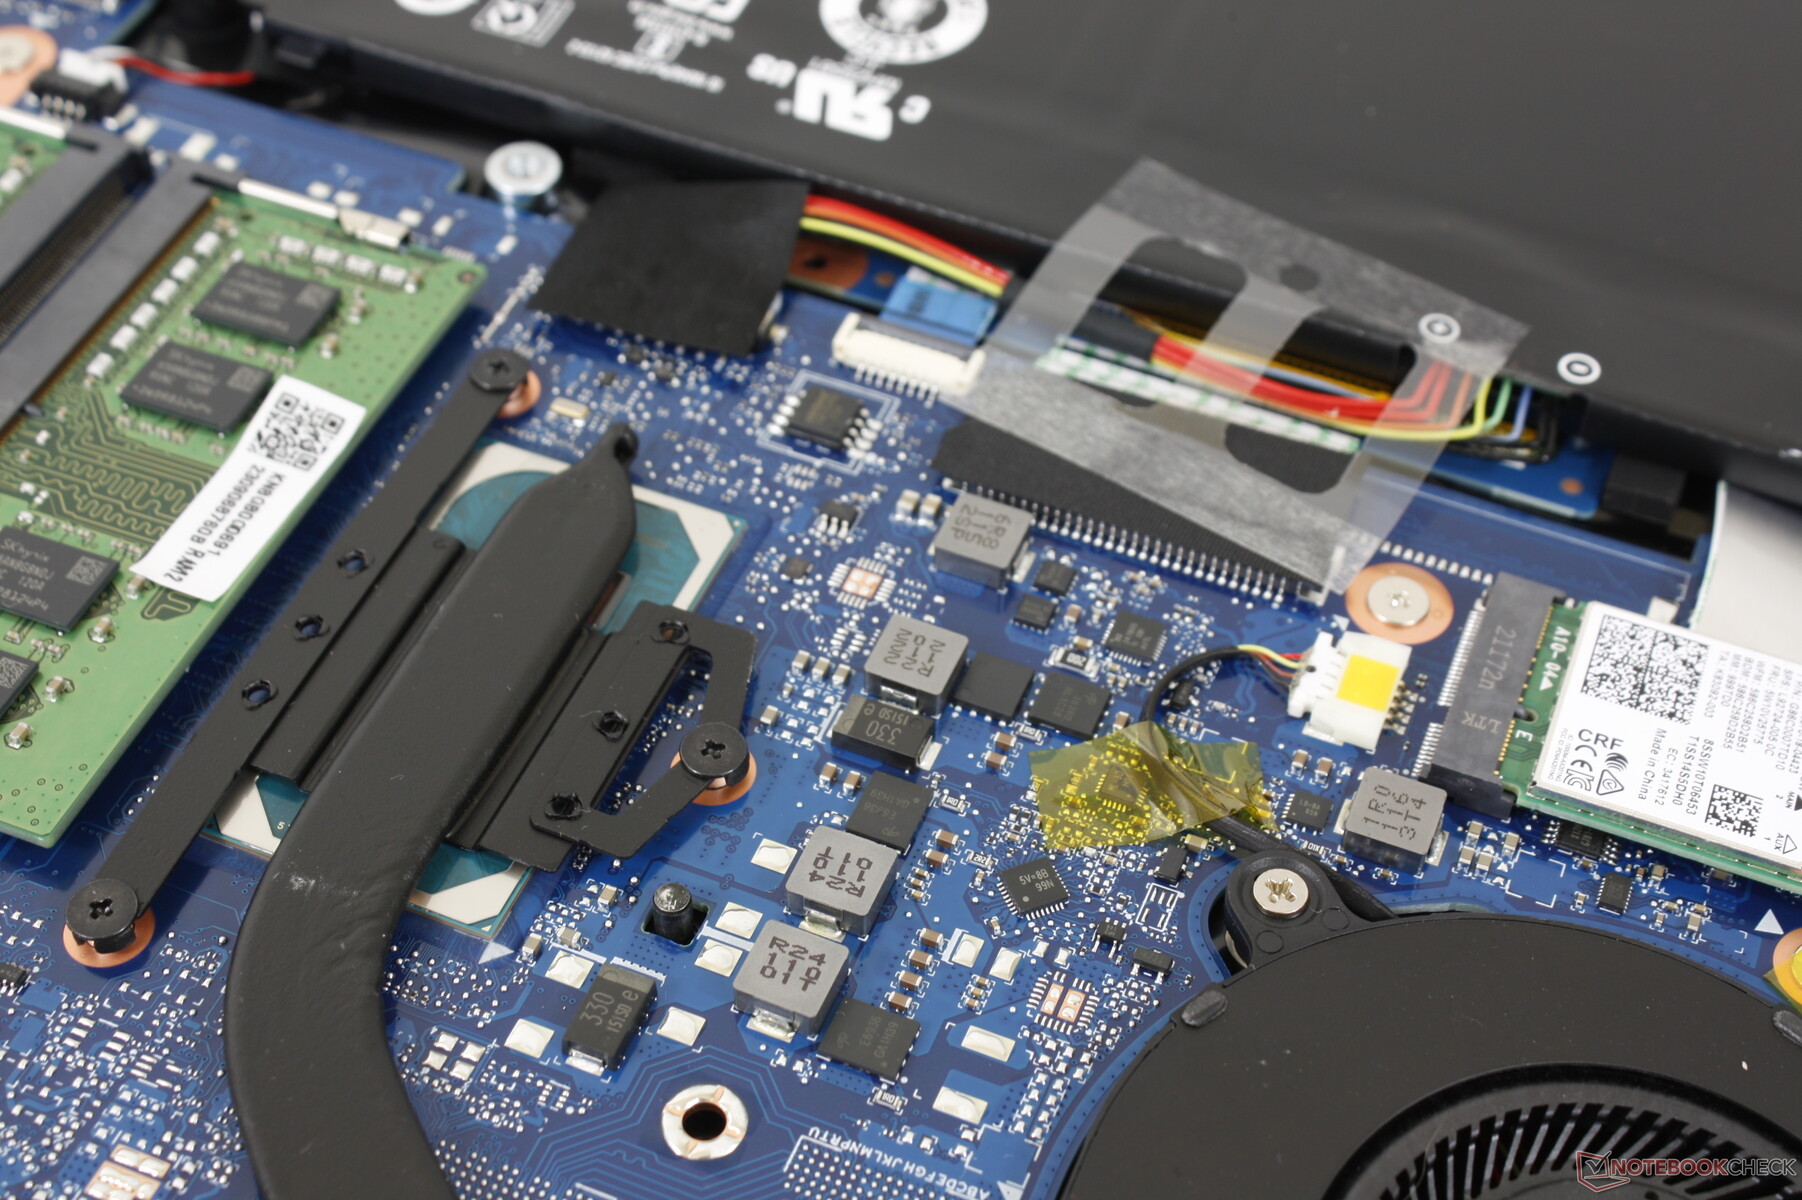
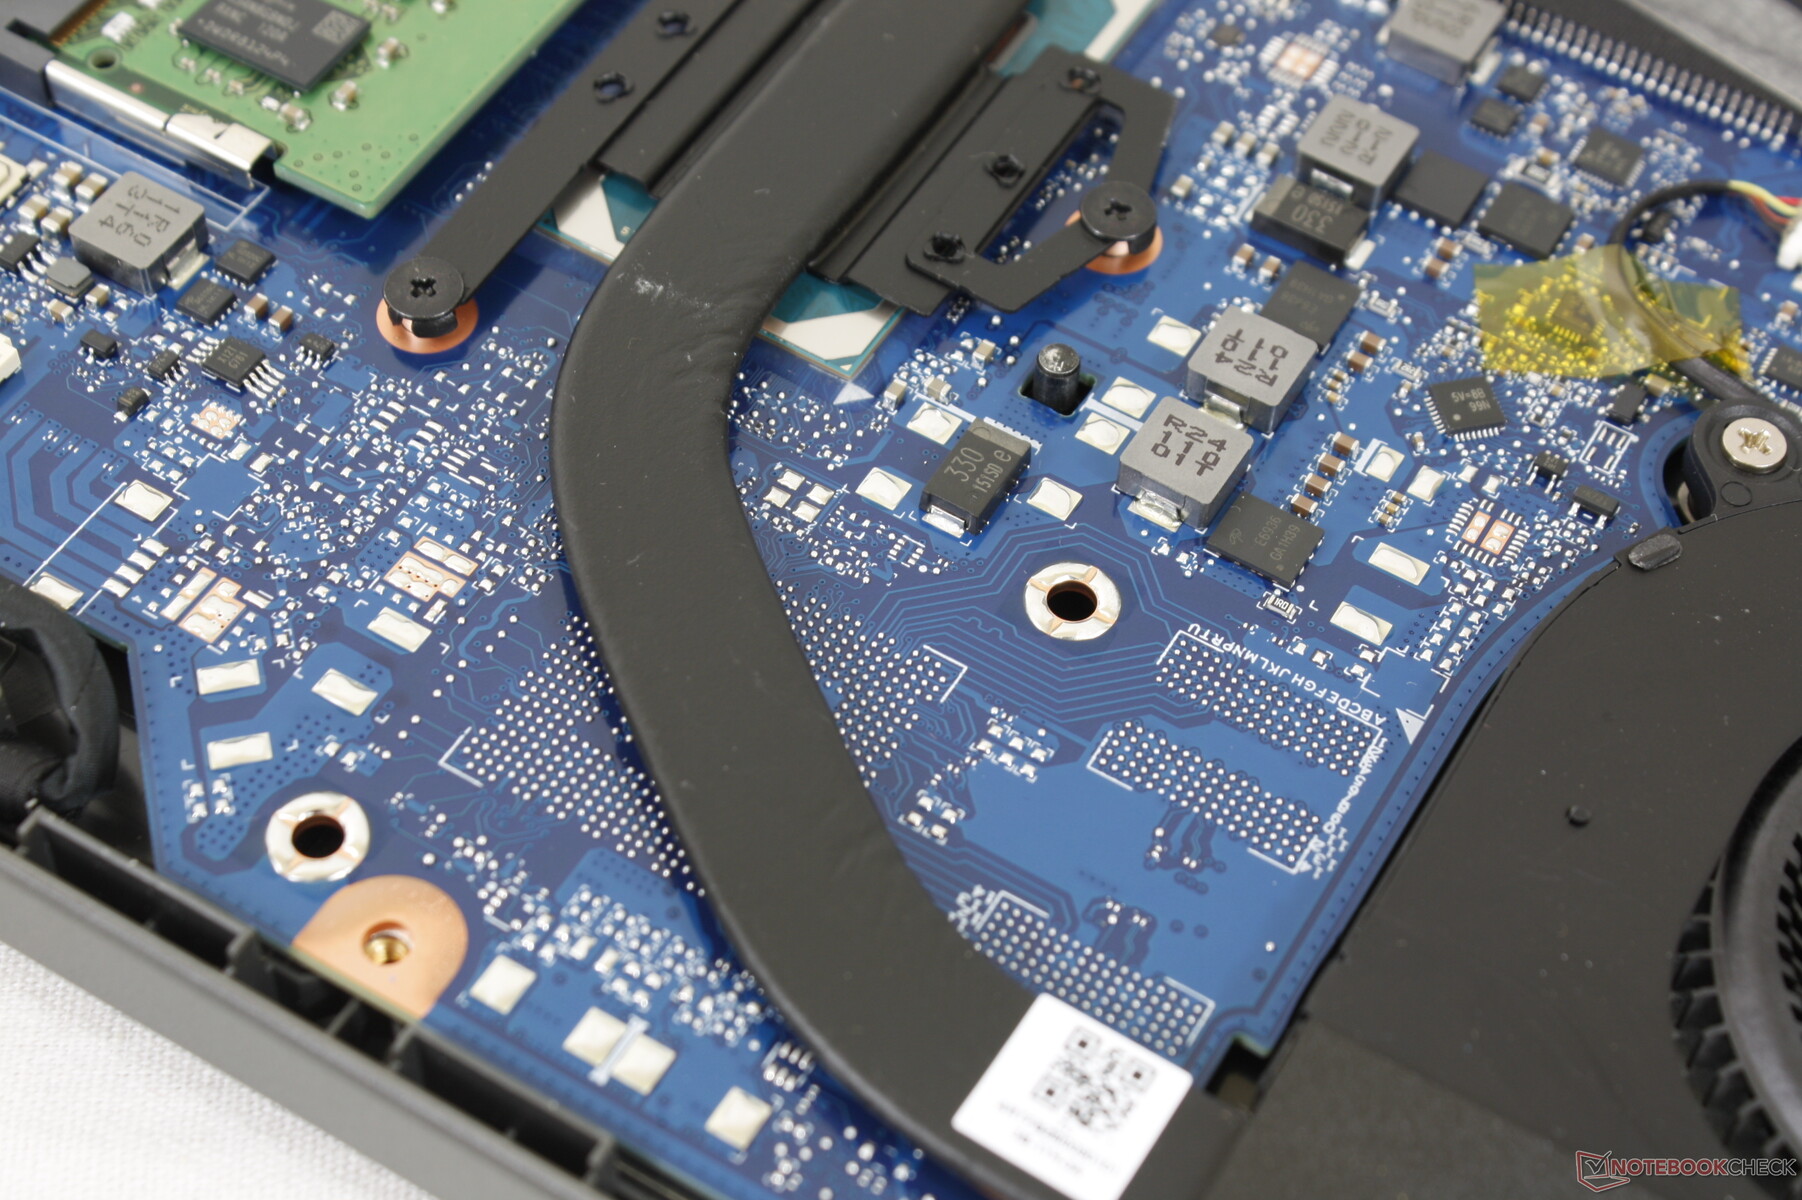
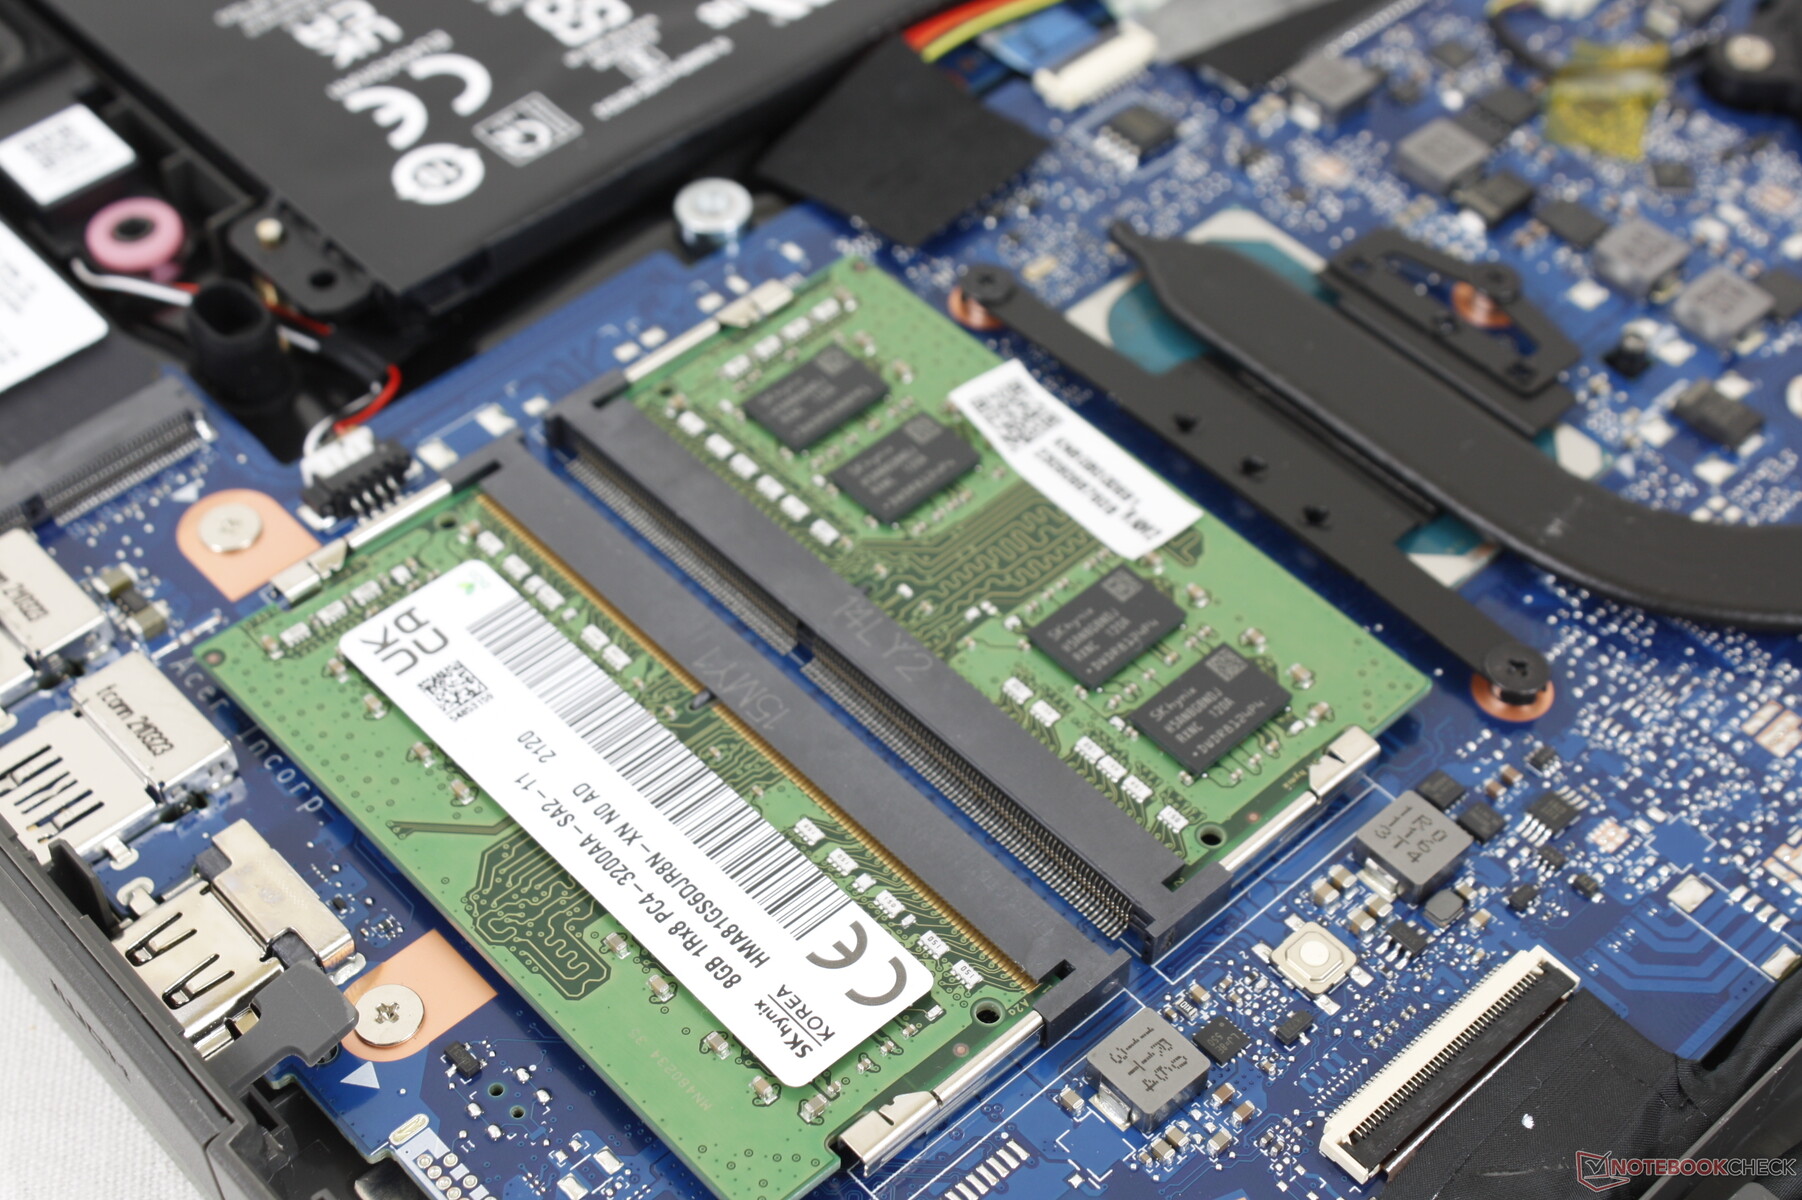
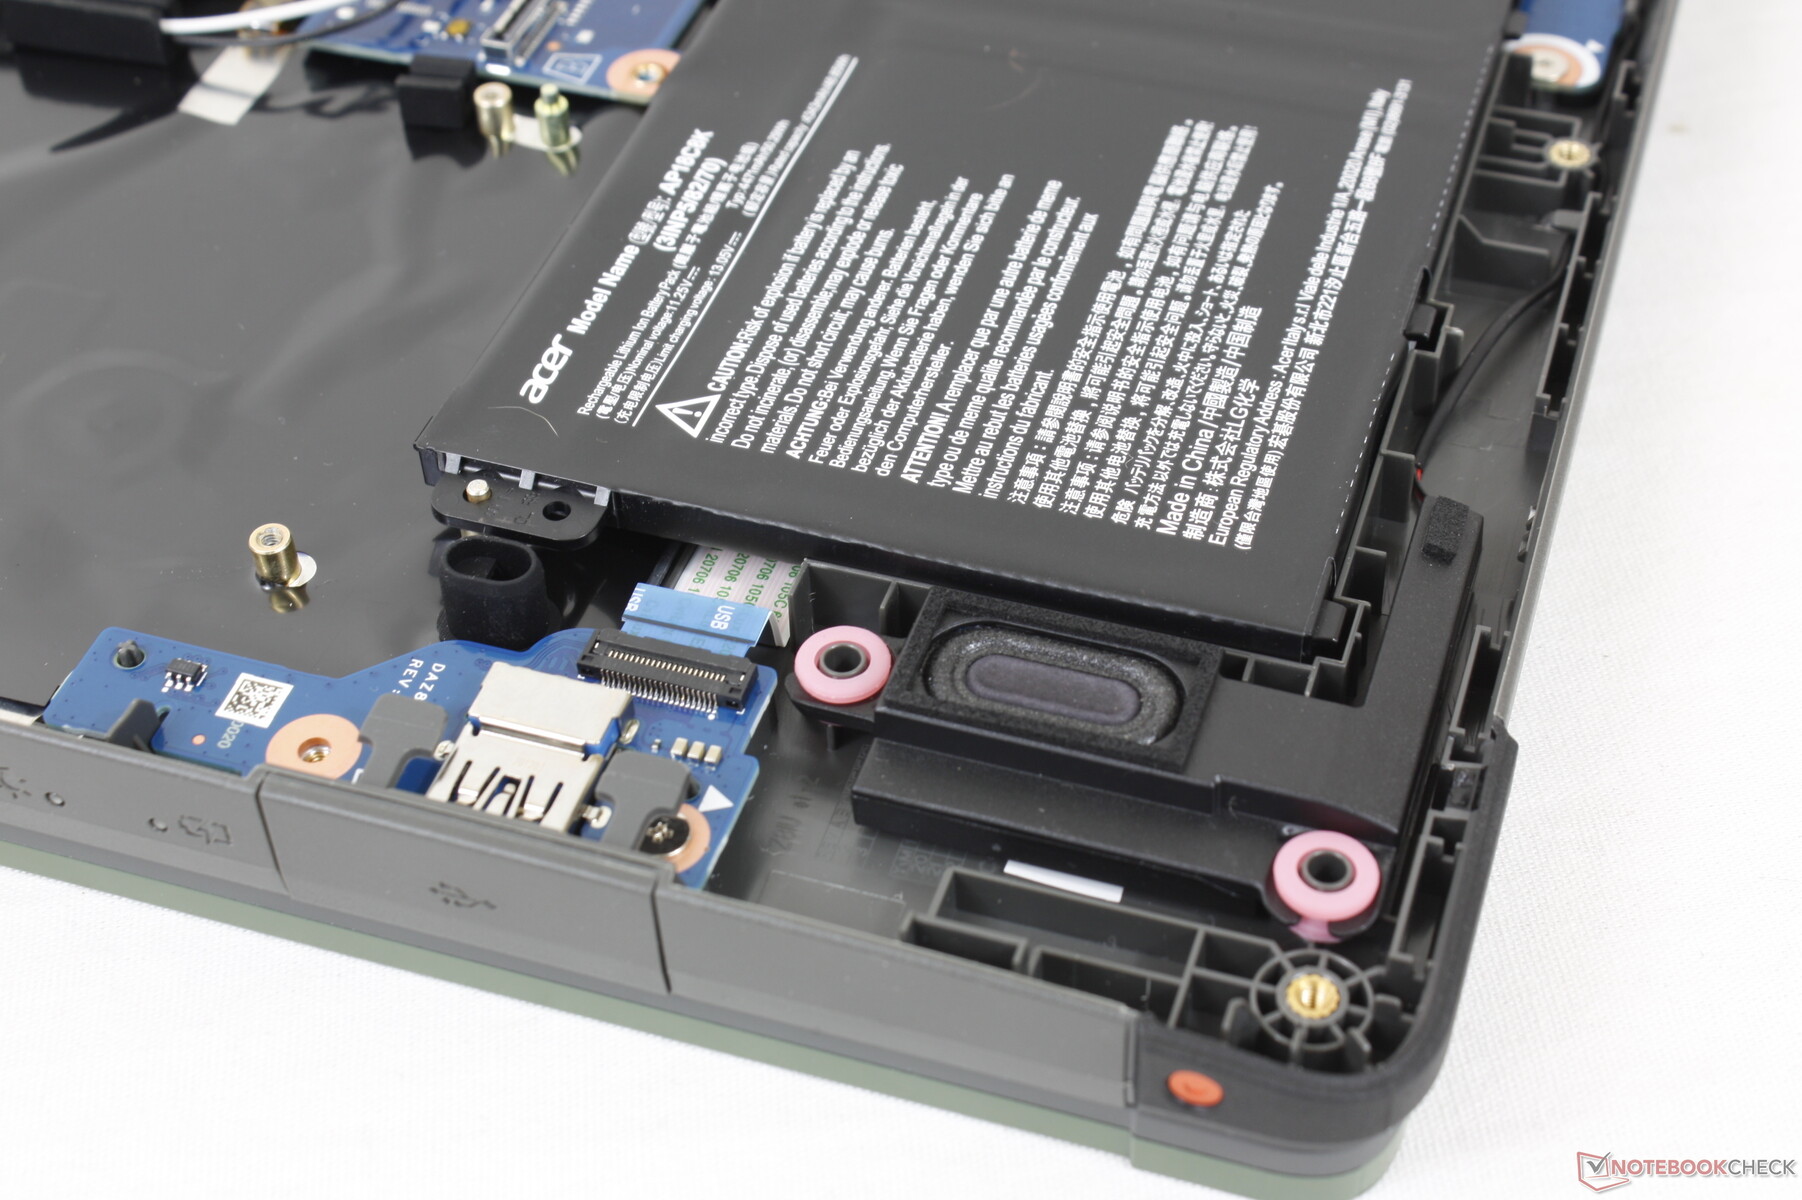
Manutenção
O painel de plástico inferior se solta com bastante facilidade após a remoção de seus 13 parafusos Philips. Os usuários têm acesso direto à bateria, aos dois slots SODIMM, ao módulo WLAN e ao slot M.2 PCIe3 x4 2280.
Acessórios e Garantia
Não há extras na caixa de varejo além do adaptador AC e da papelada. Aplica-se uma garantia limitada de um ano, enquanto muitos laptops profissionais normalmente viriam com garantias de dois ou três anos
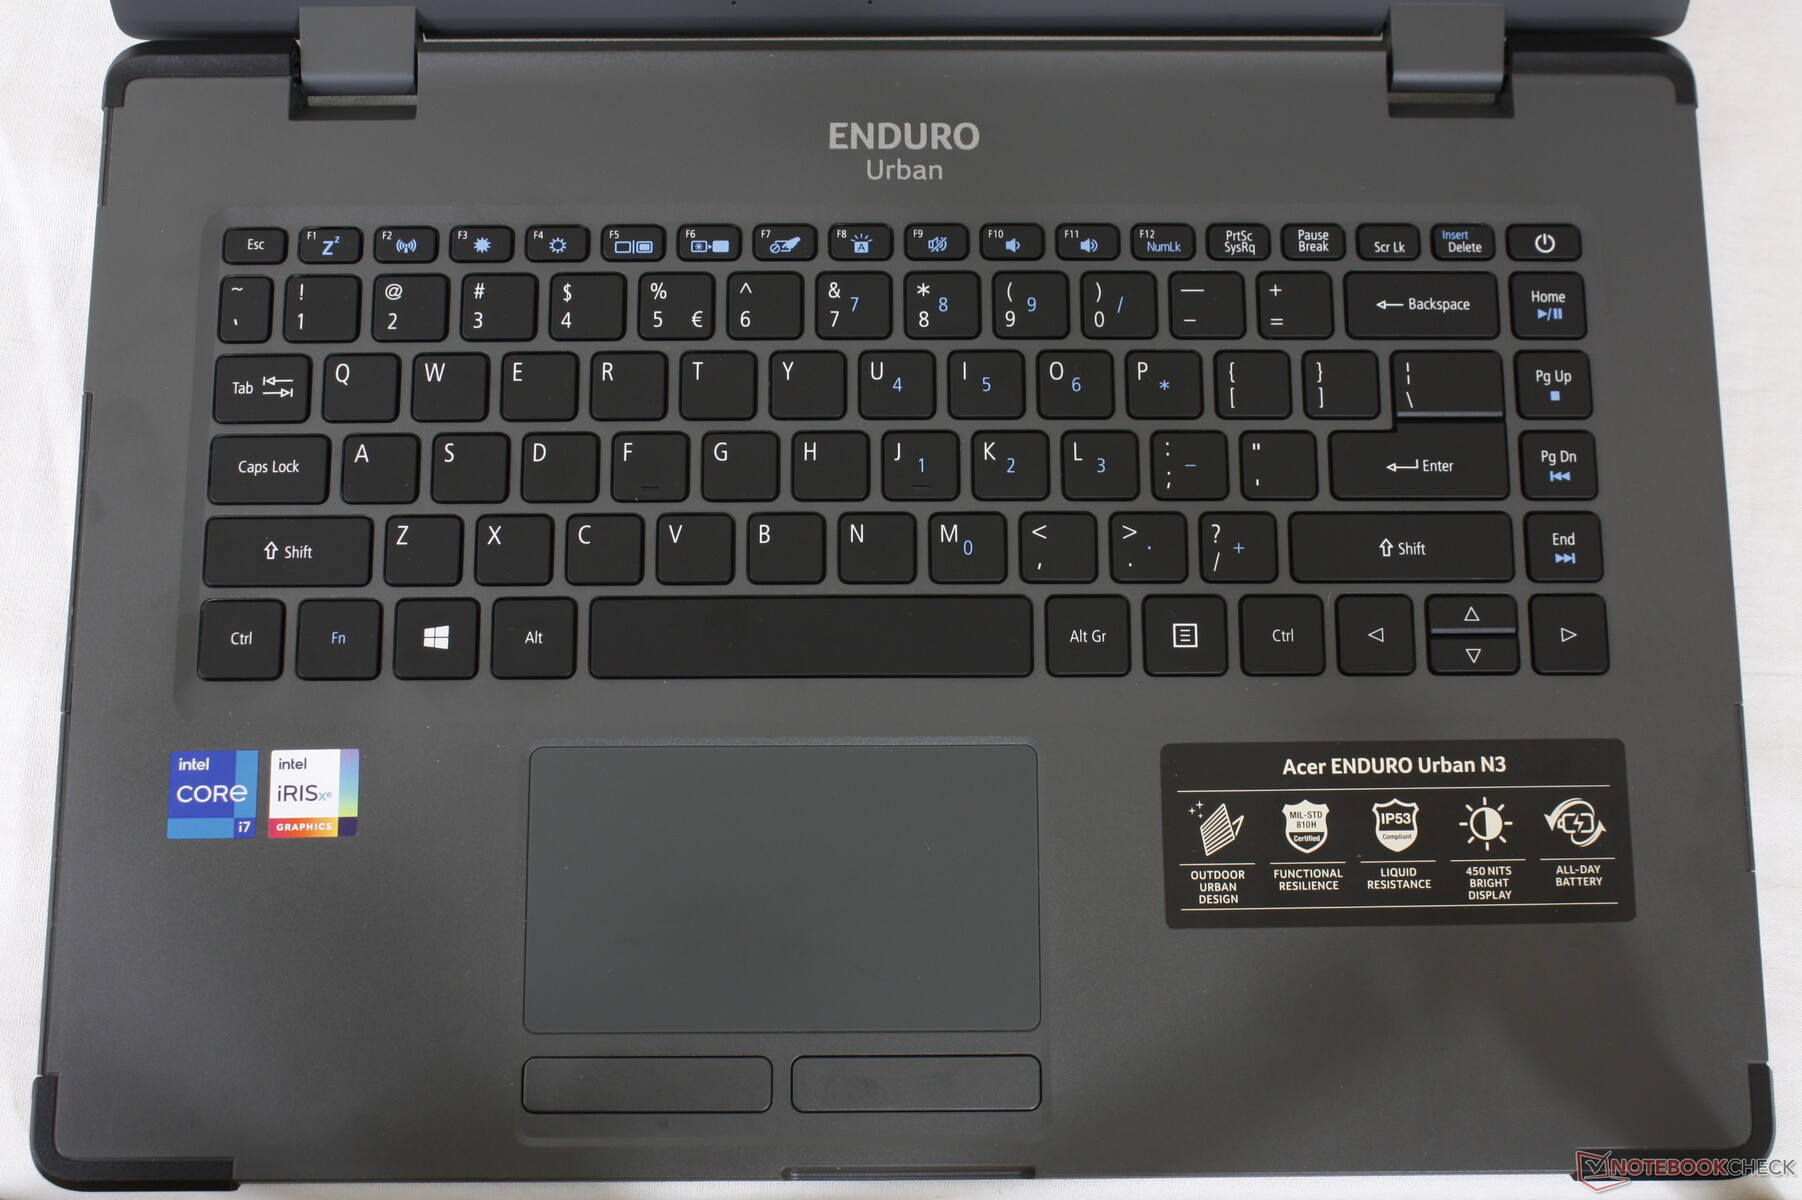
Dispositivos de entrada
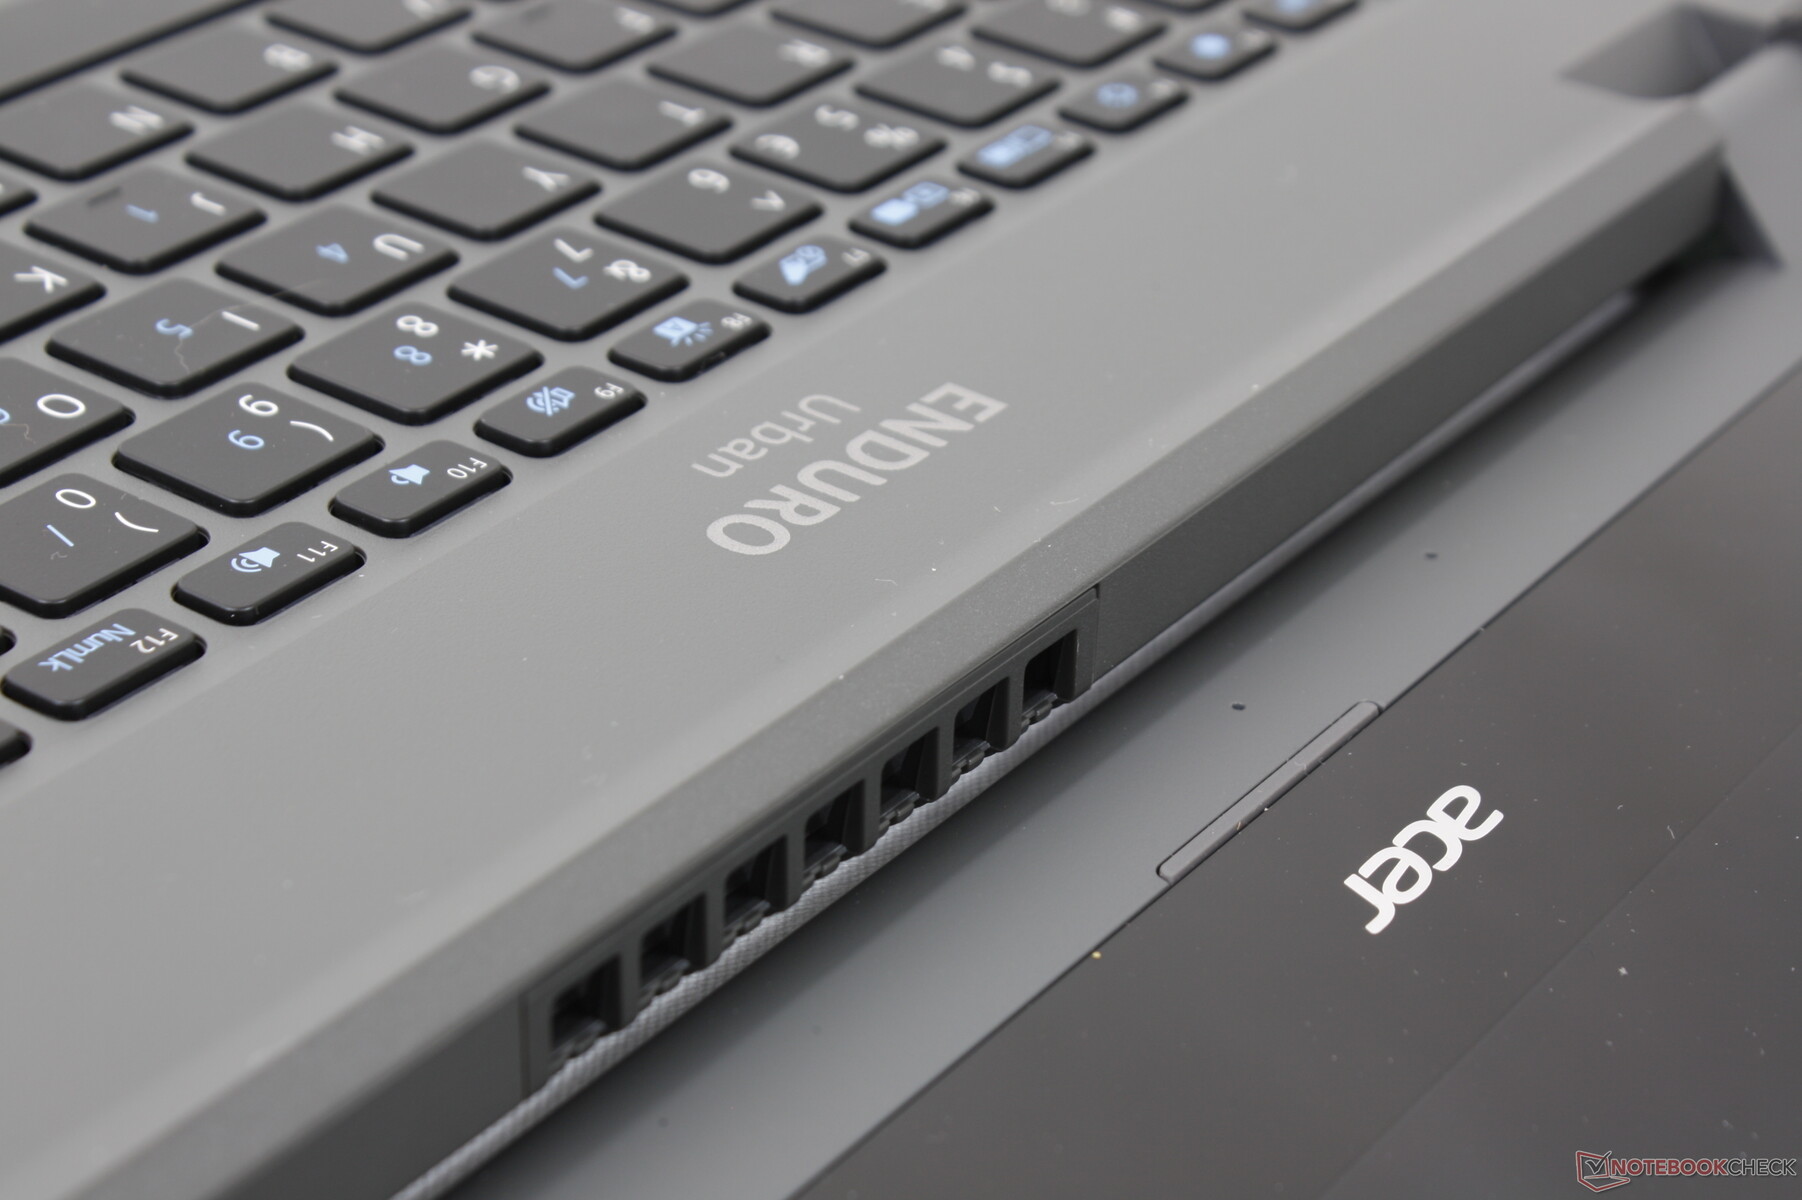
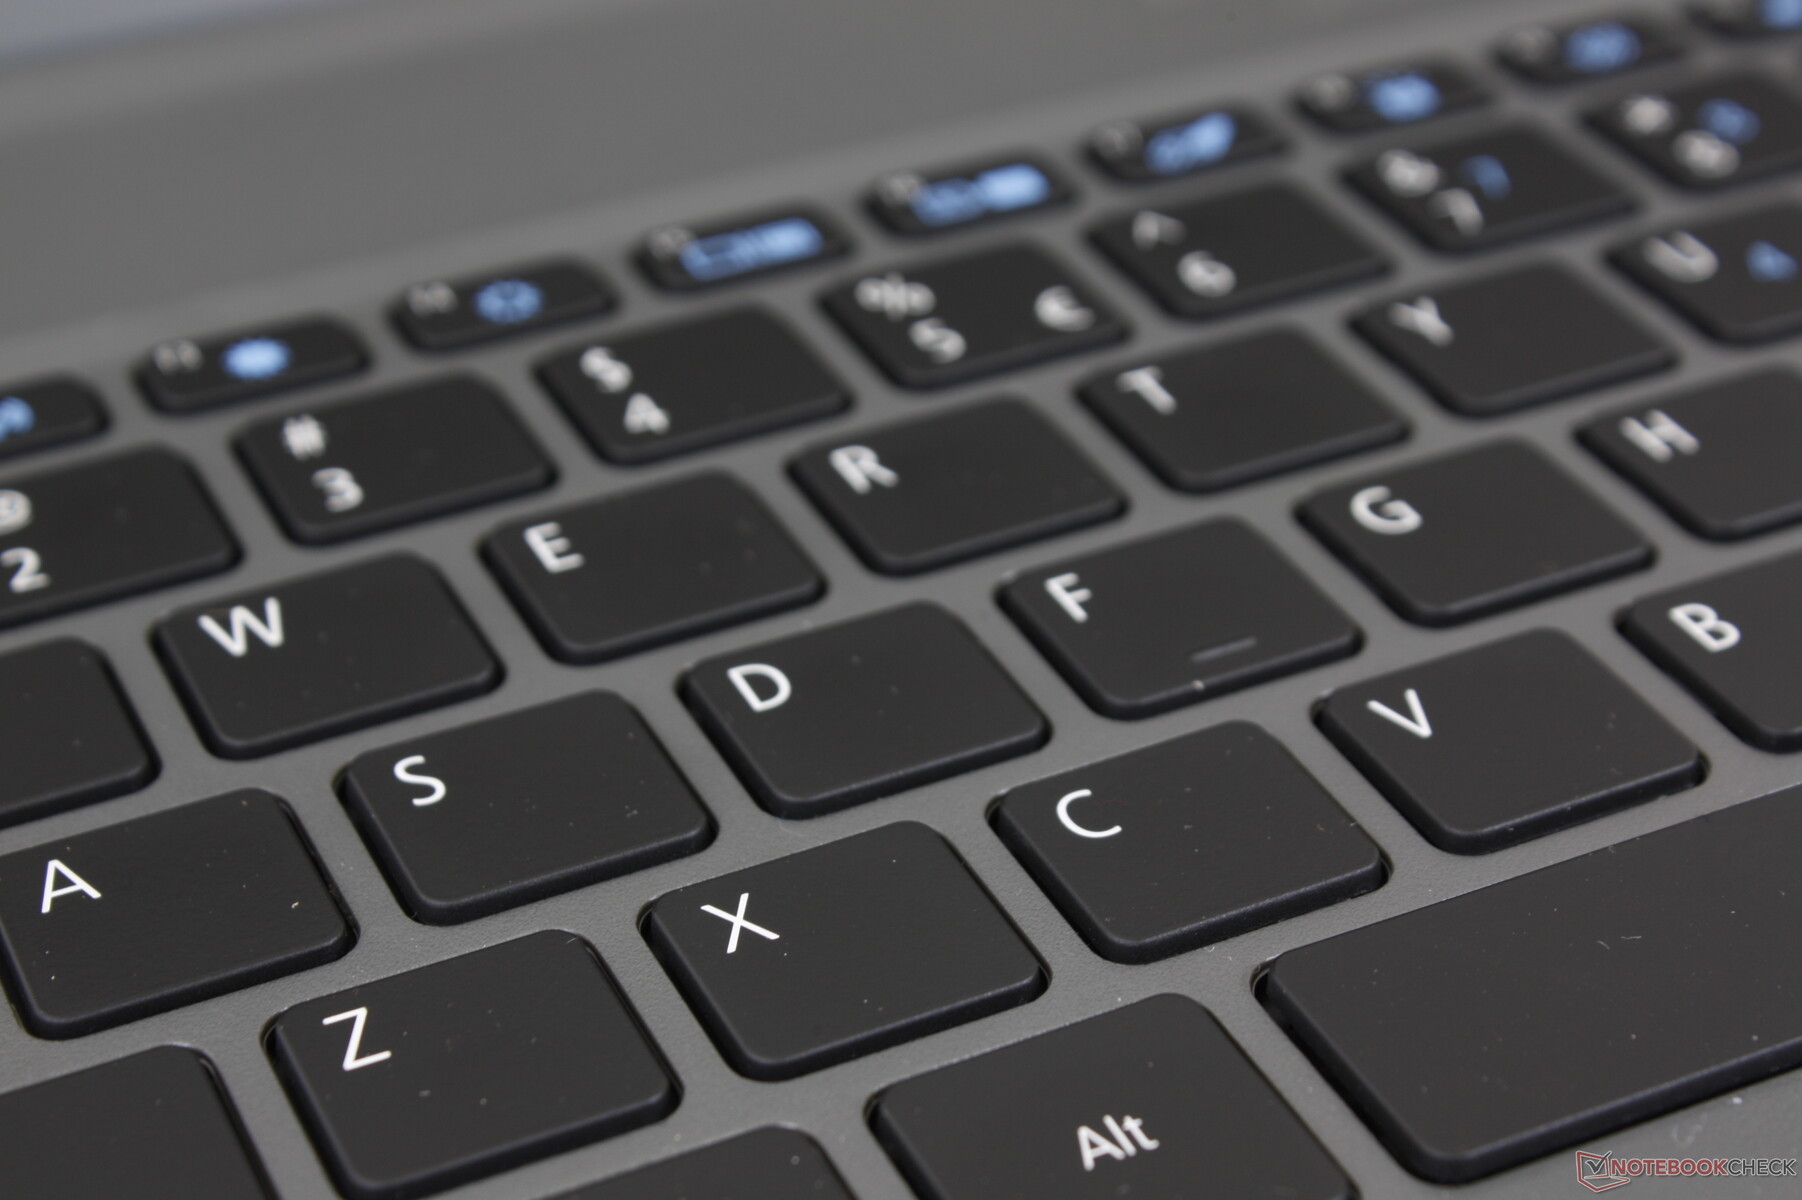
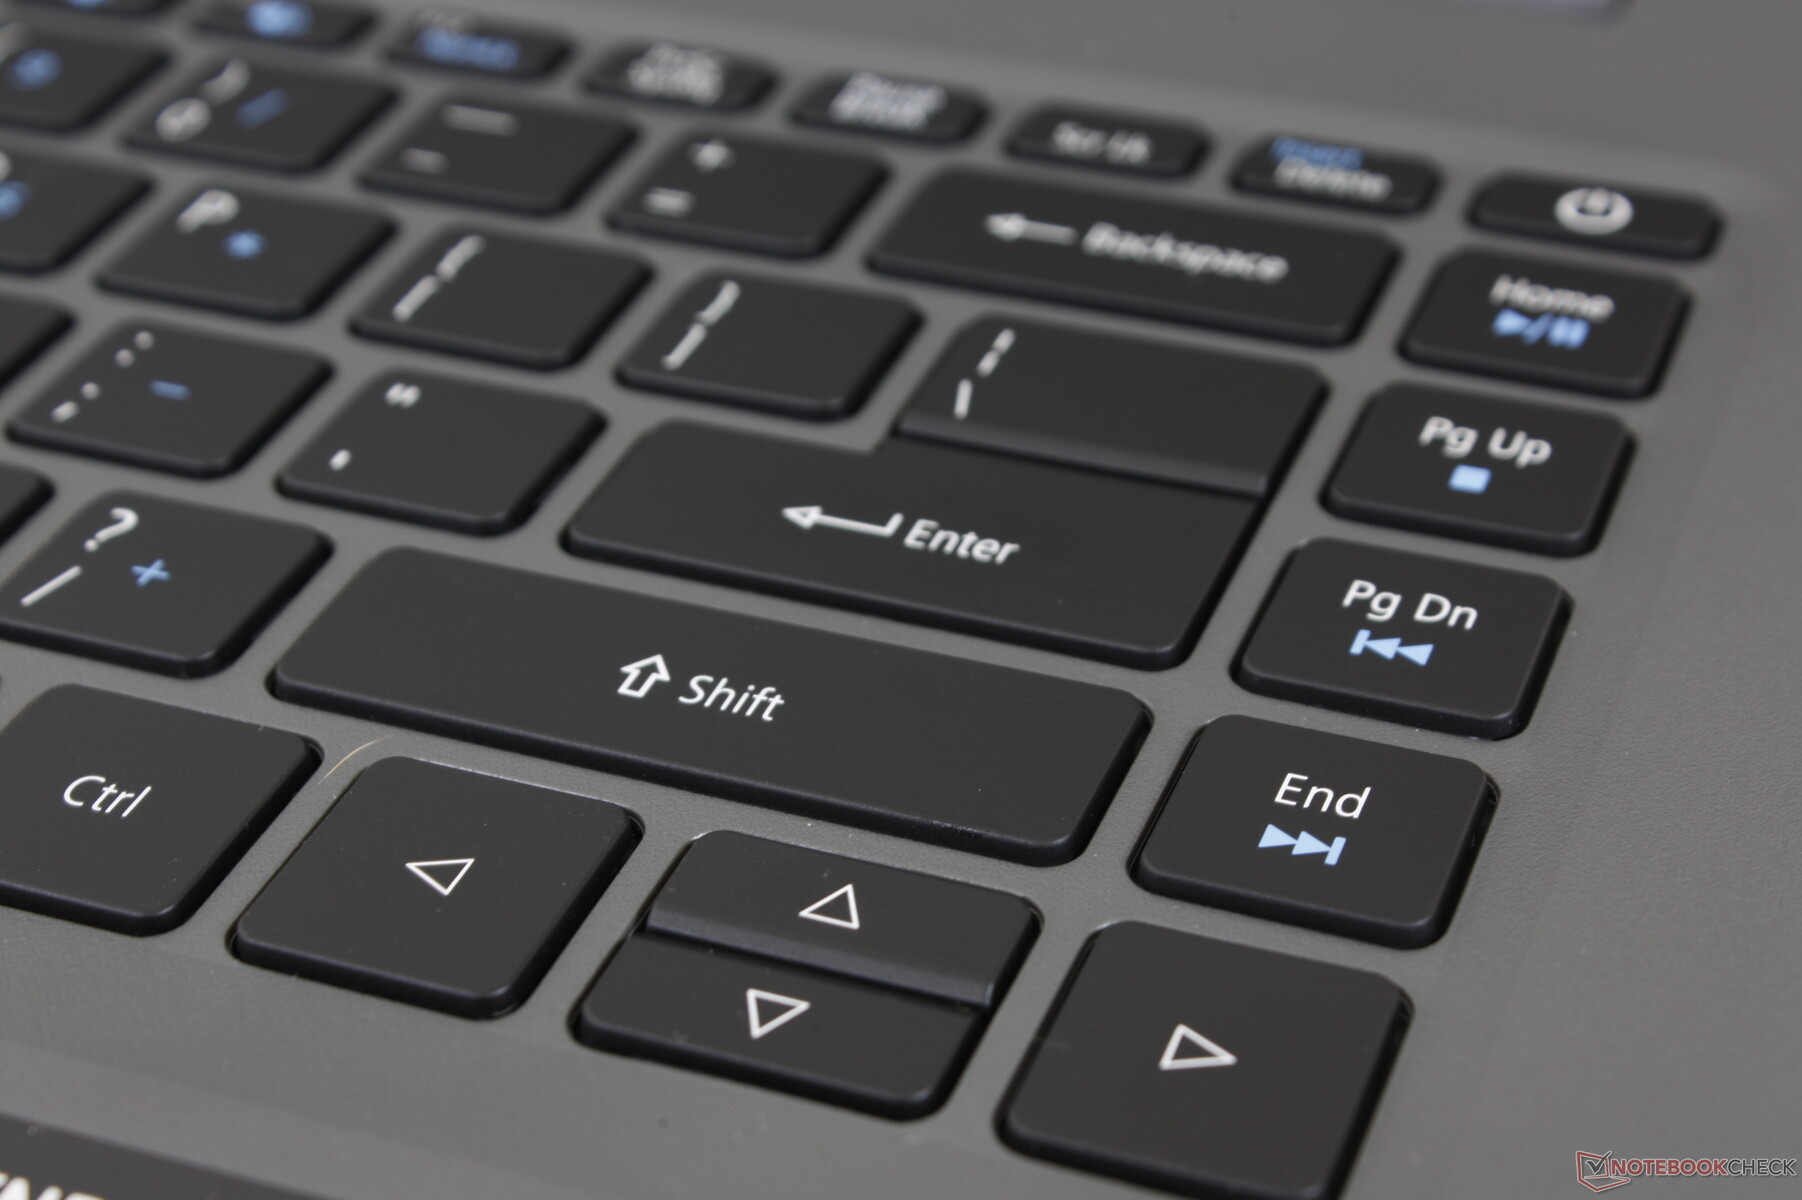
Teclado
A experiência de digitação é mais parecida com um Ultrabook padrão como o Asus VivoBook ou Dell Inspiron do que em laptops mais profissionais como o Durabook S14I ou Lenovo ThinkPad que tendem a ter chaves mais firmes e profundas. Se você está acostumado a digitar em laptops de grau de consumidor, então o teclado do Urban N3 não se sentirá tão diferente para o melhor ou para o pior. O ruído das teclas está no lado silencioso com um feedback suave, mas uniforme, em todas as teclas.
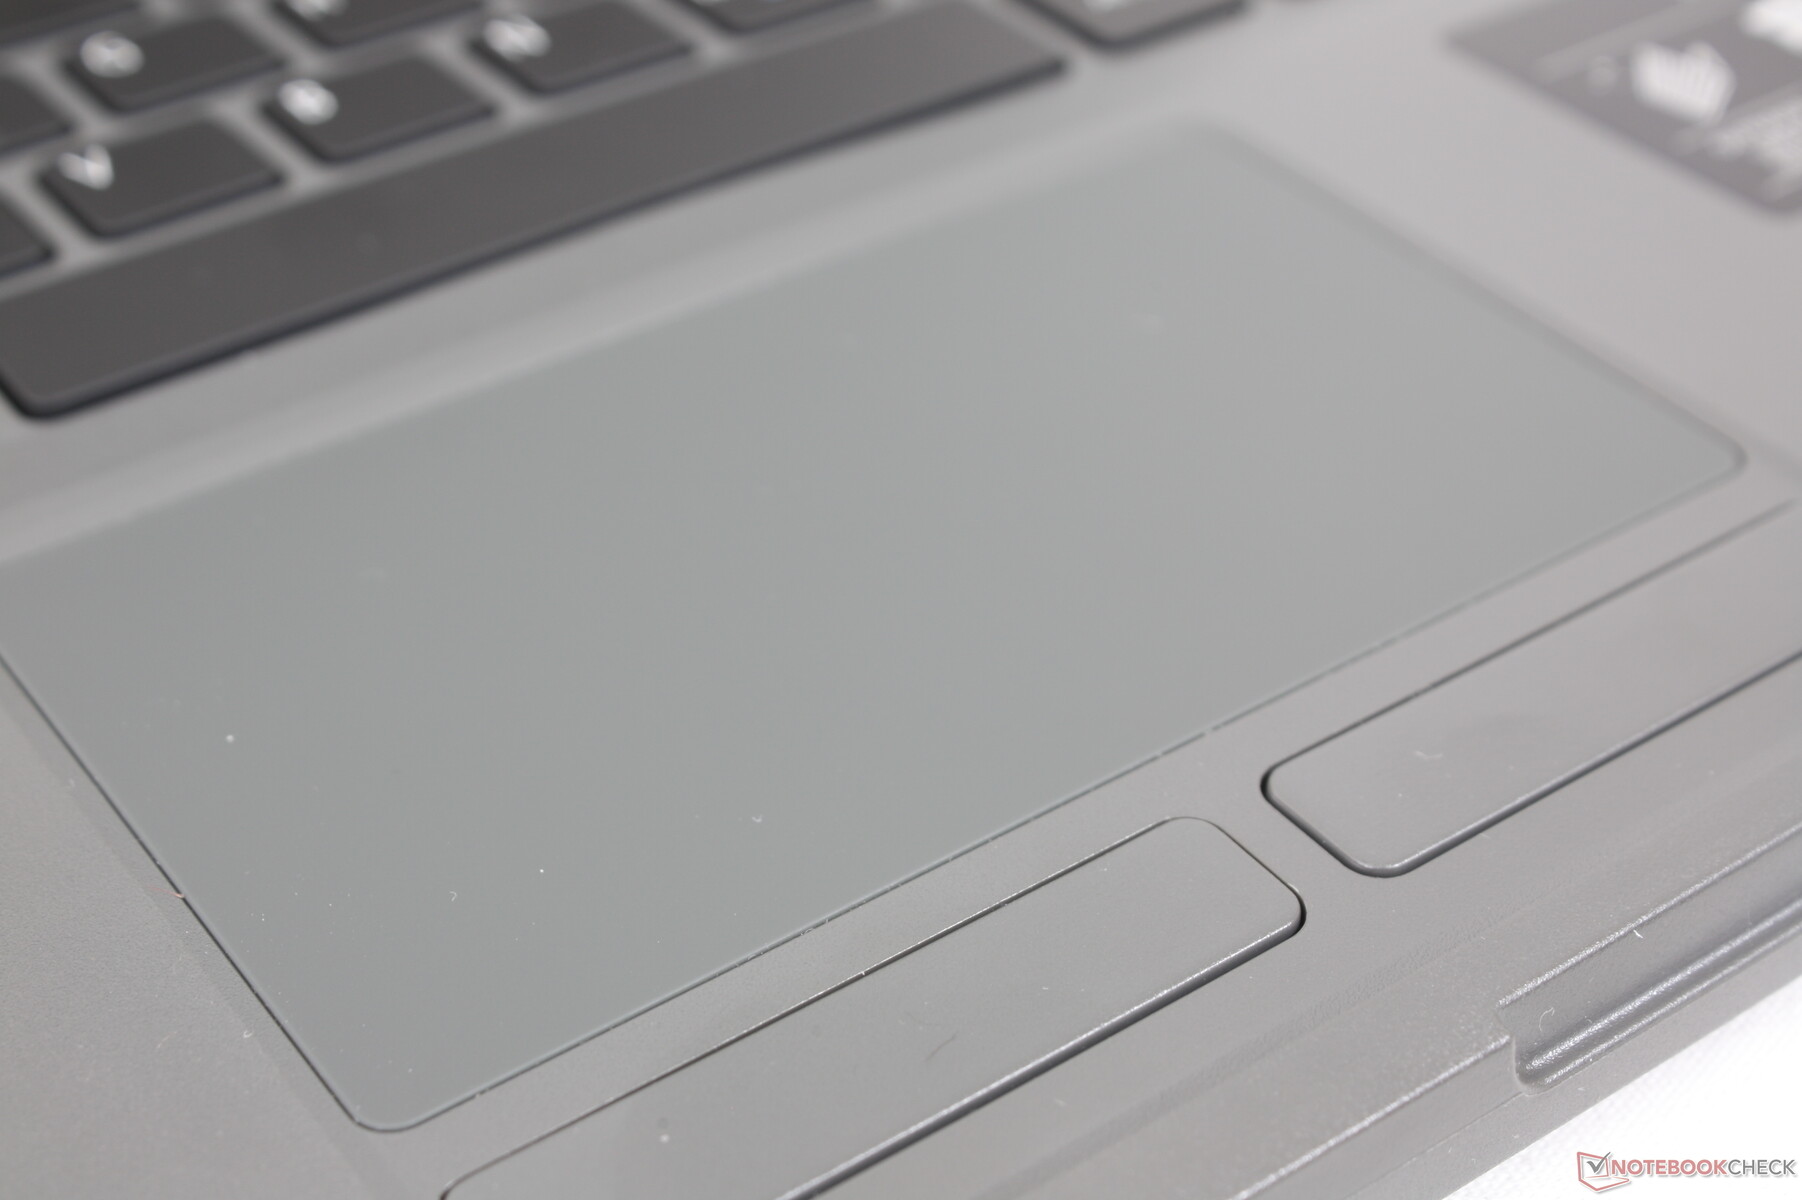
Touchpad
O touchpad é de tamanho decente a 10,5 x 5,9 cm. O deslizamento em velocidades médias a rápidas é suave, enquanto velocidades mais lentas tendem a grudar para mais arrastamentos e quedas.
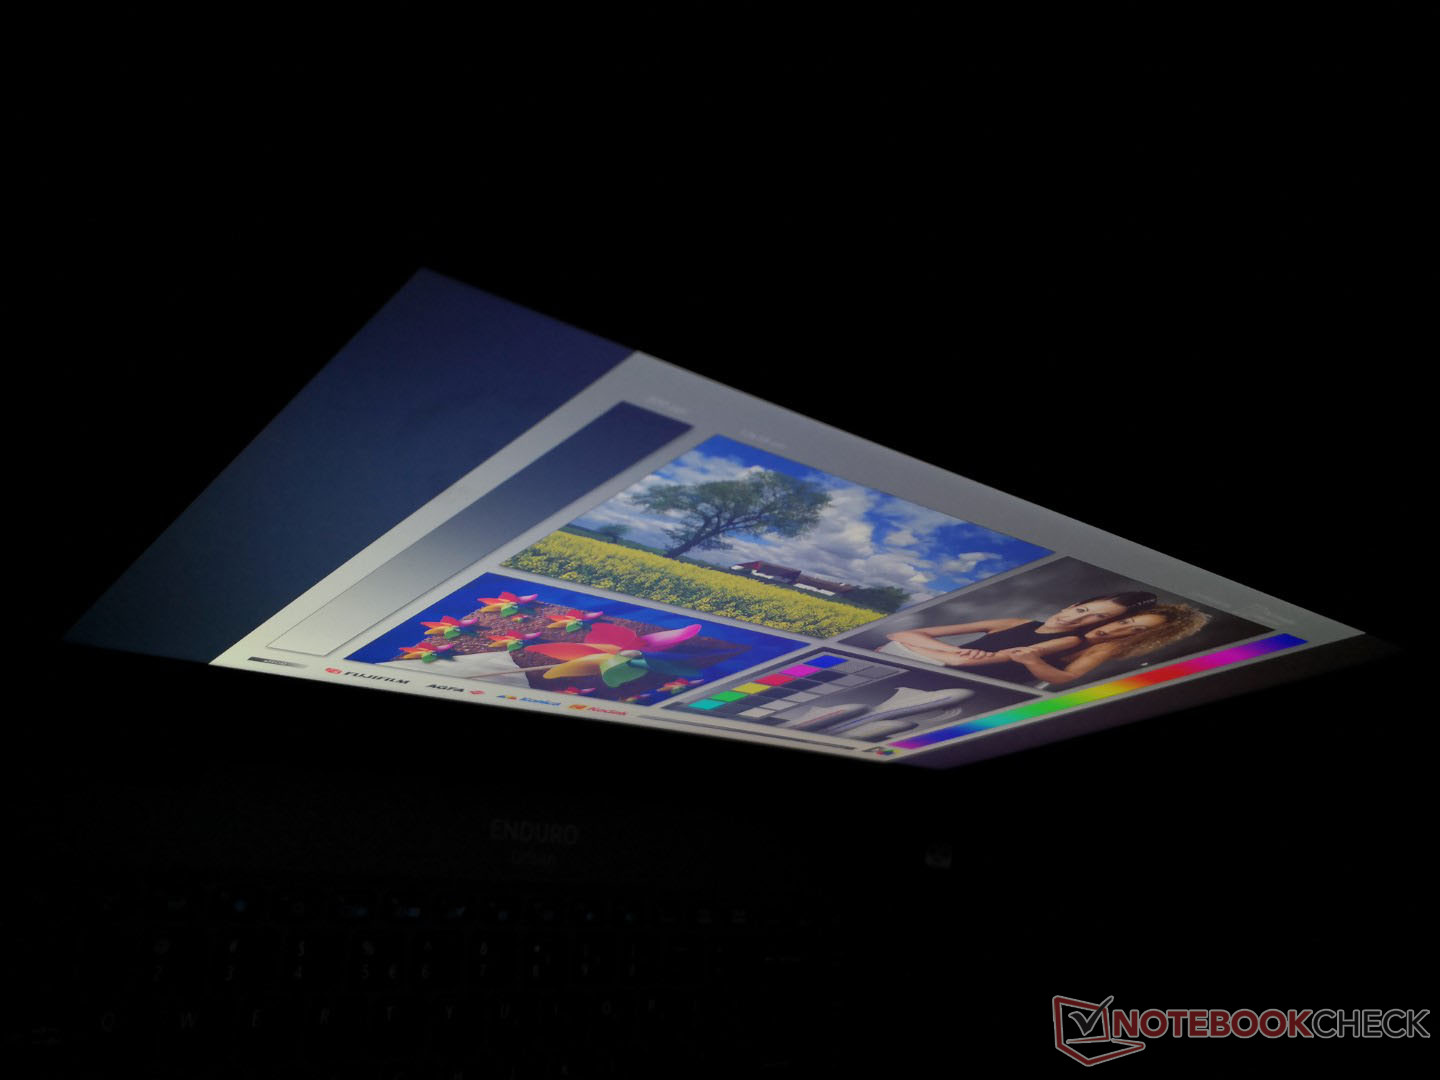
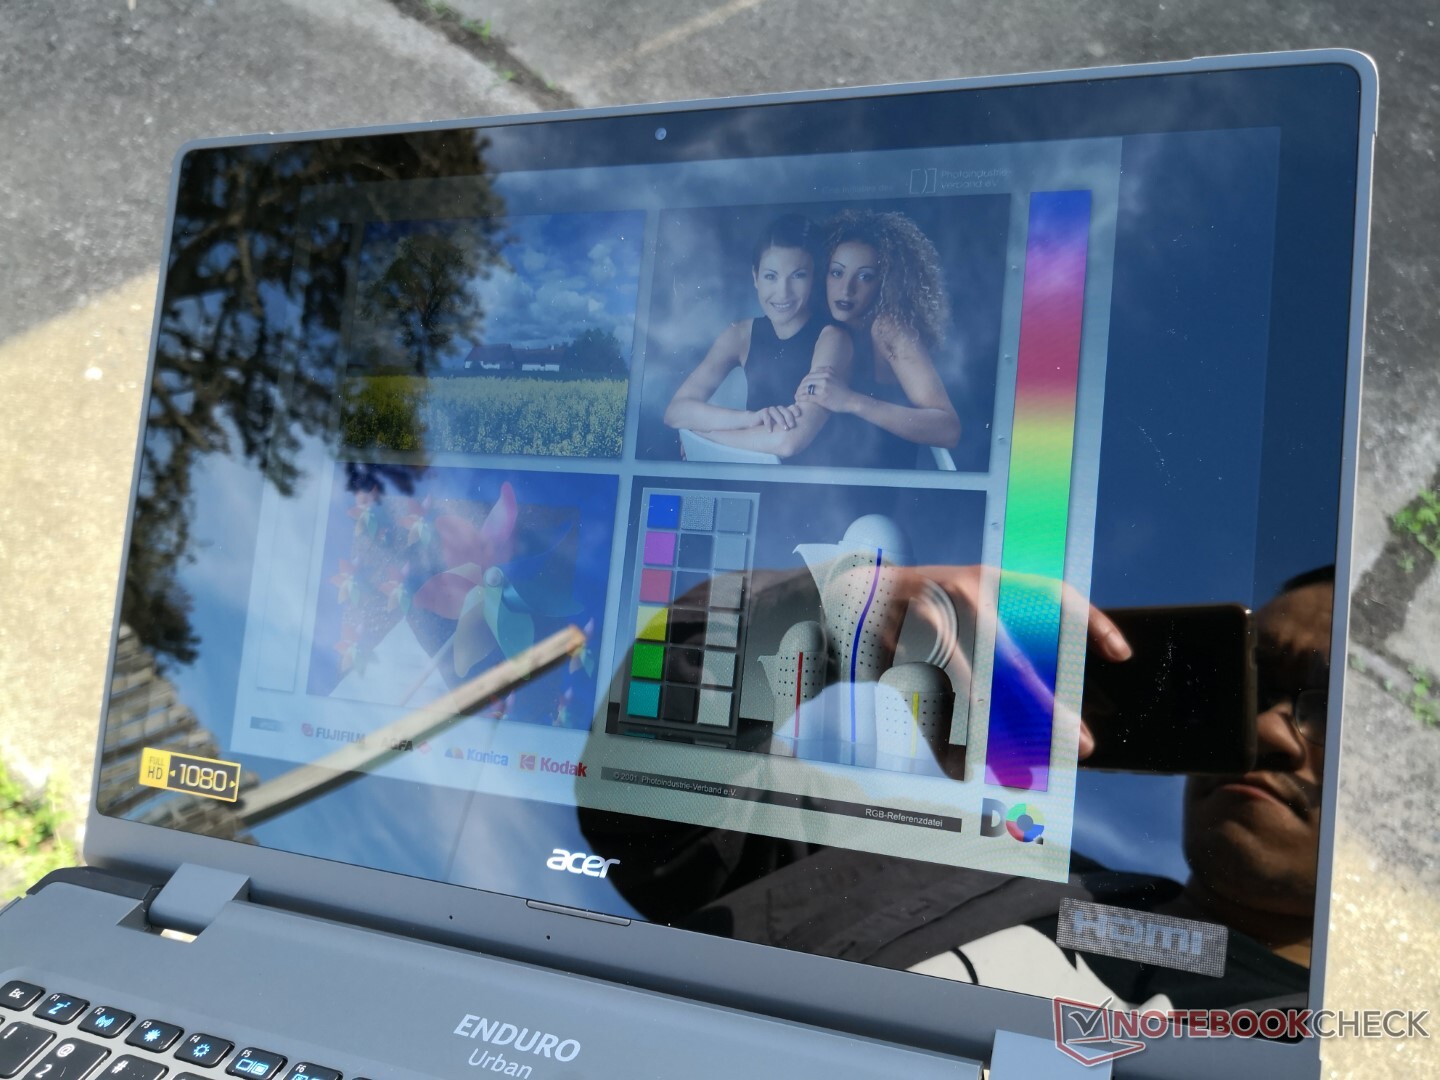
Mostrar
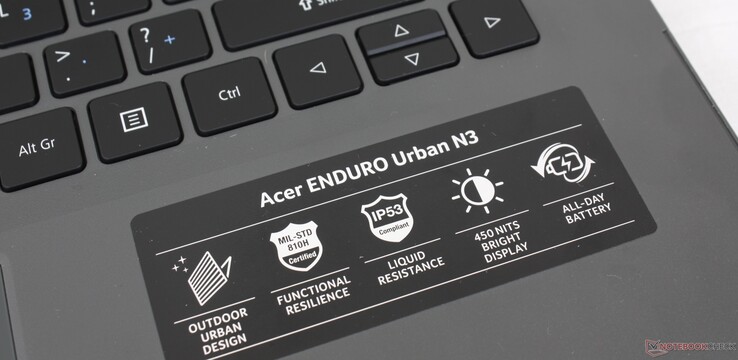
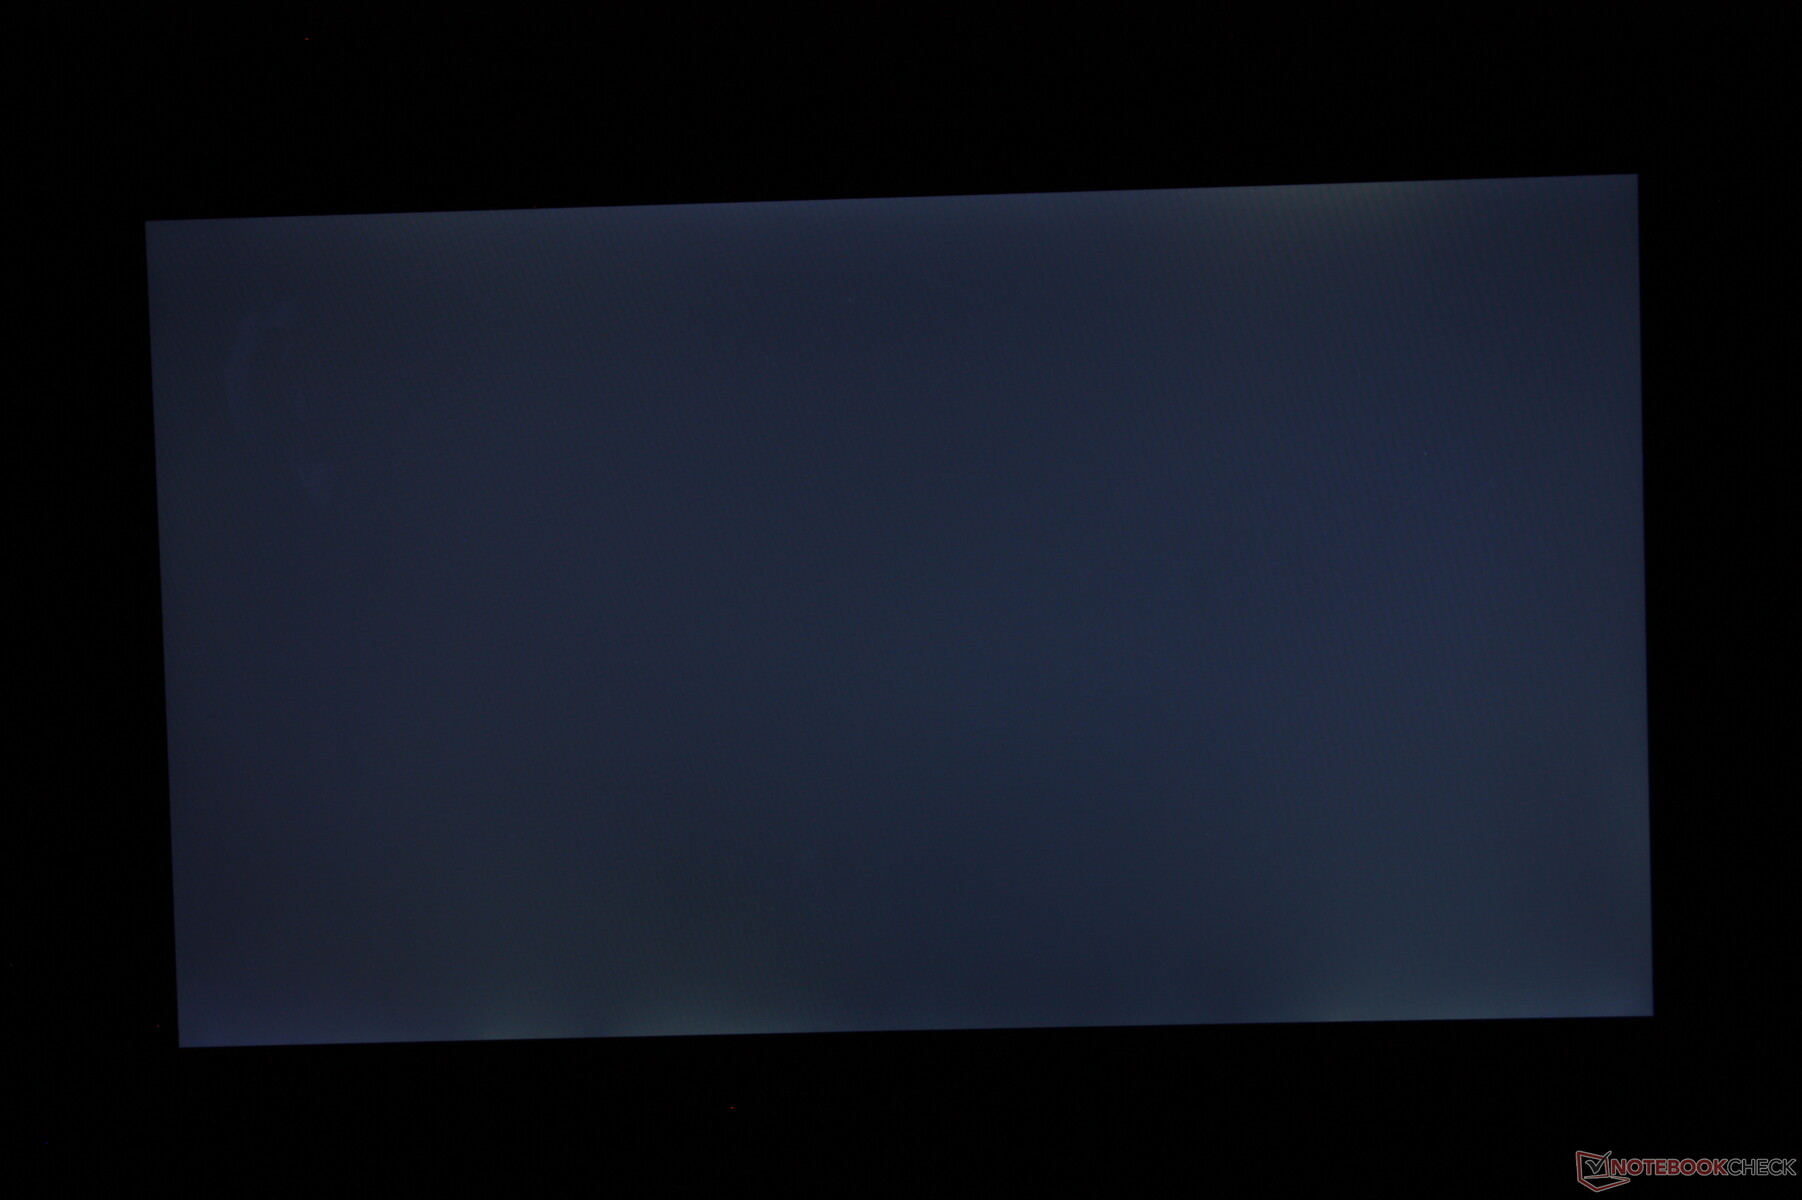
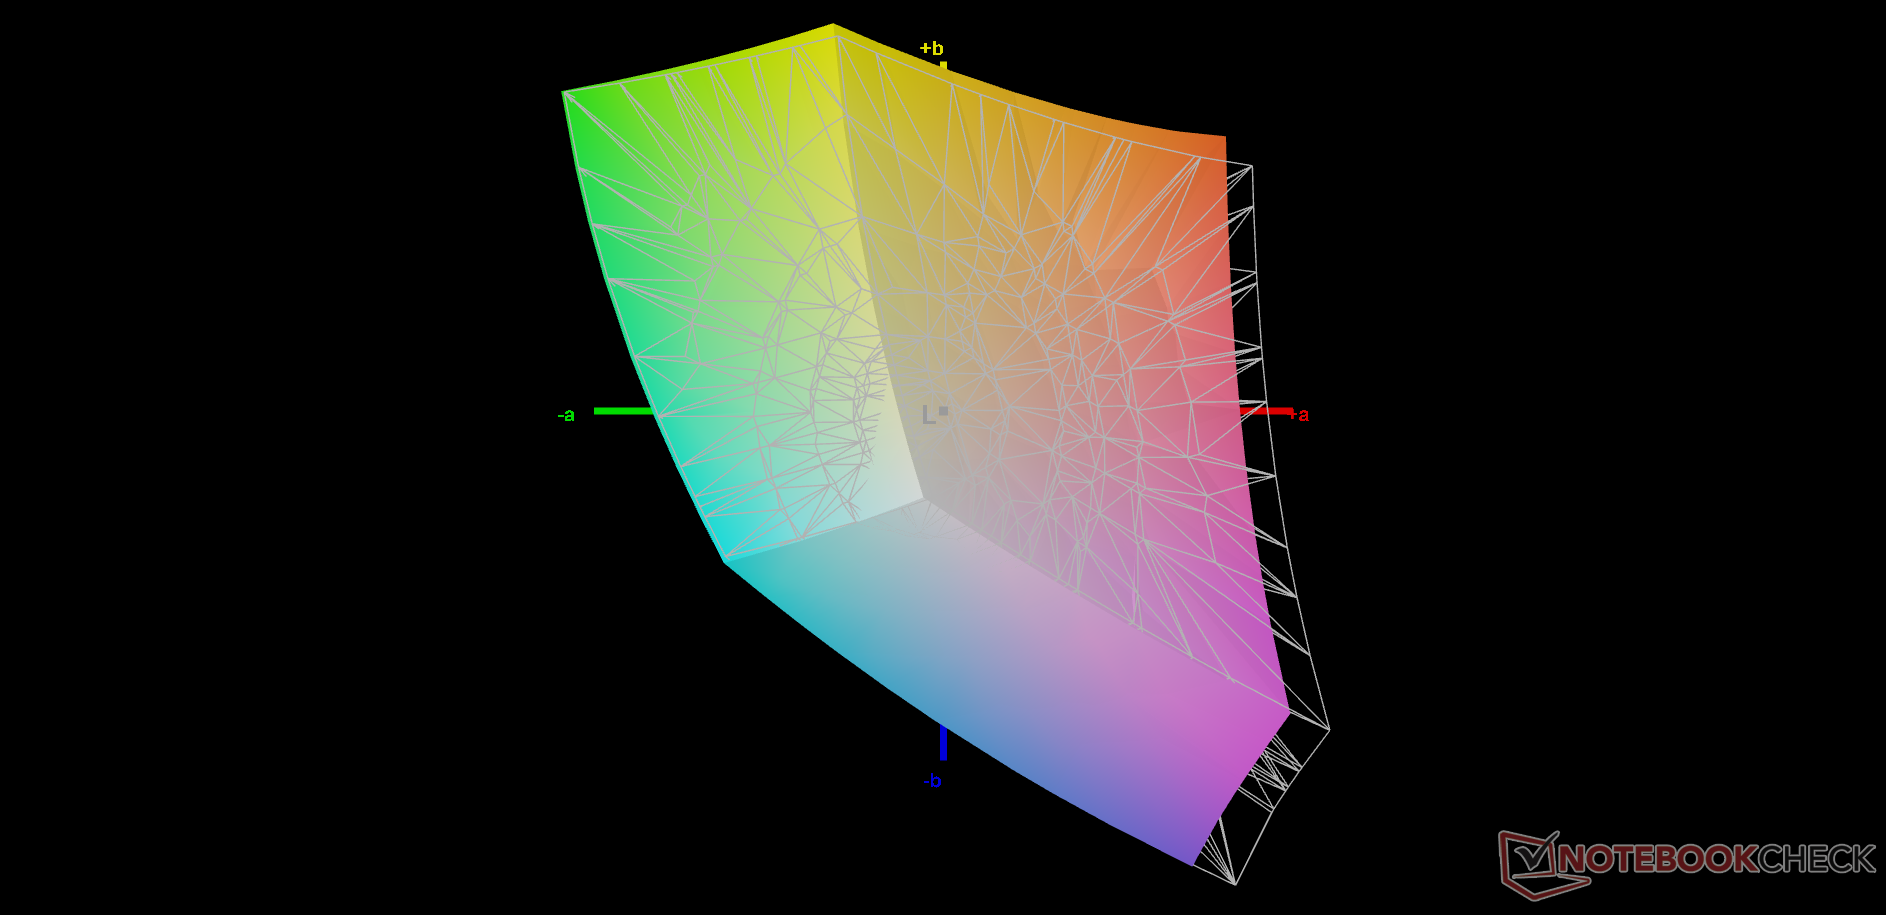
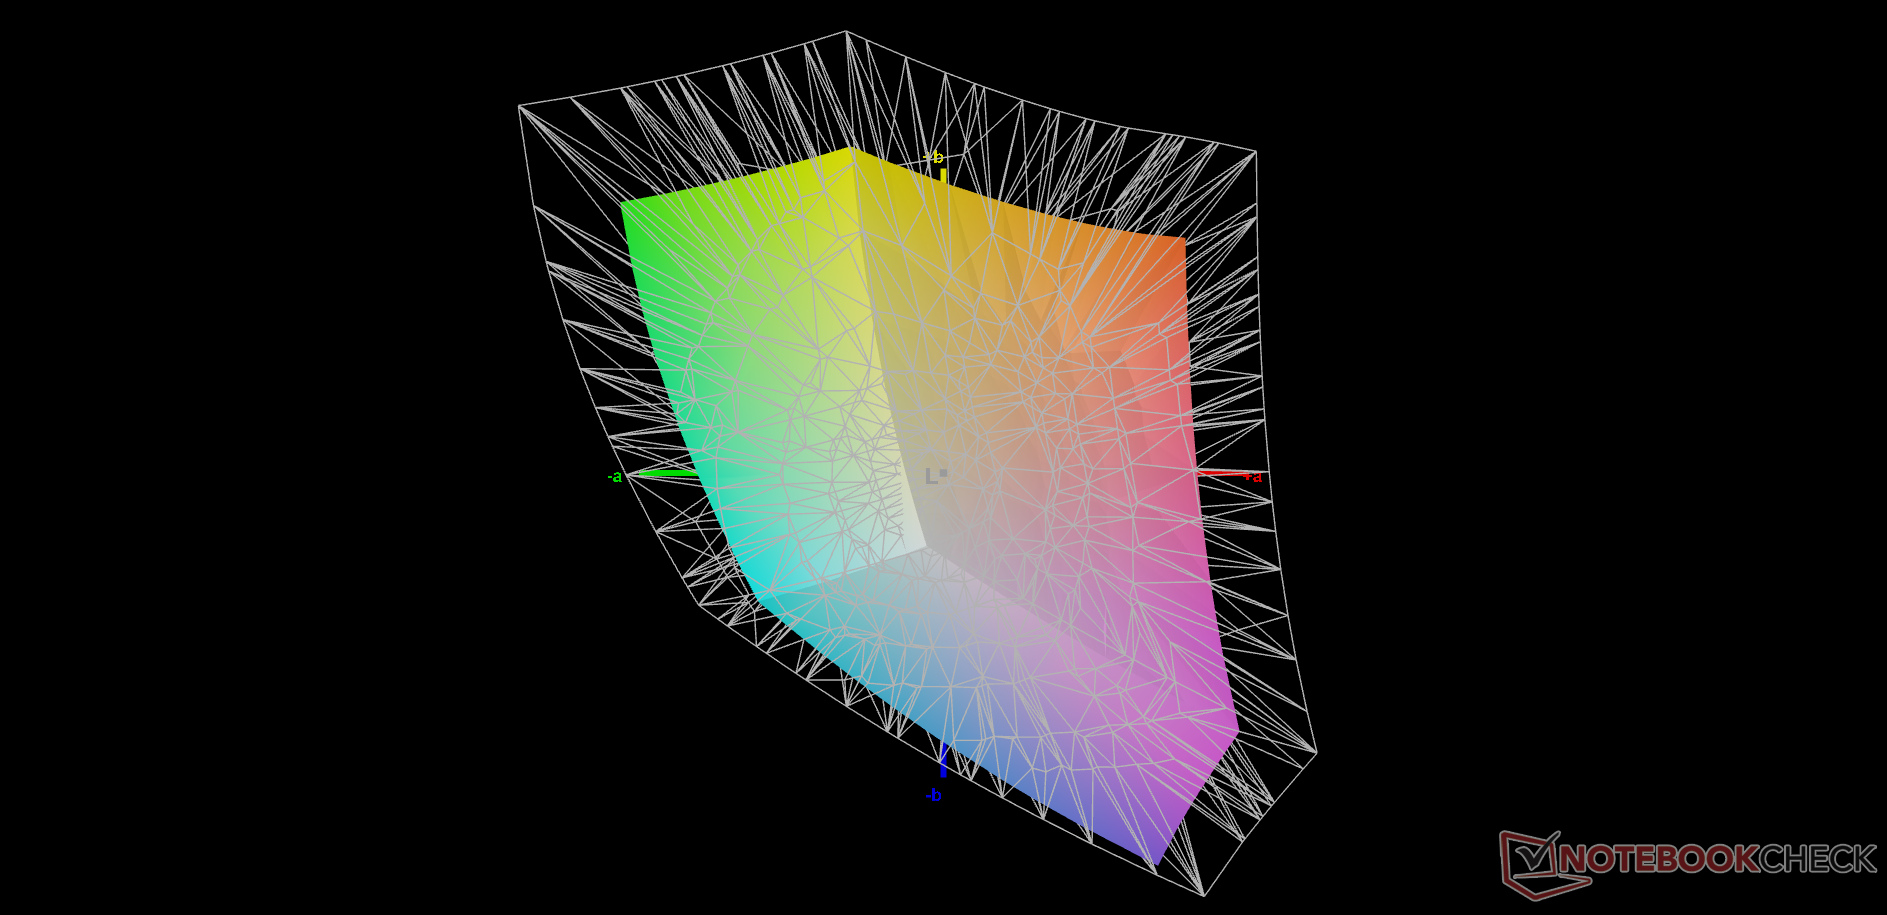
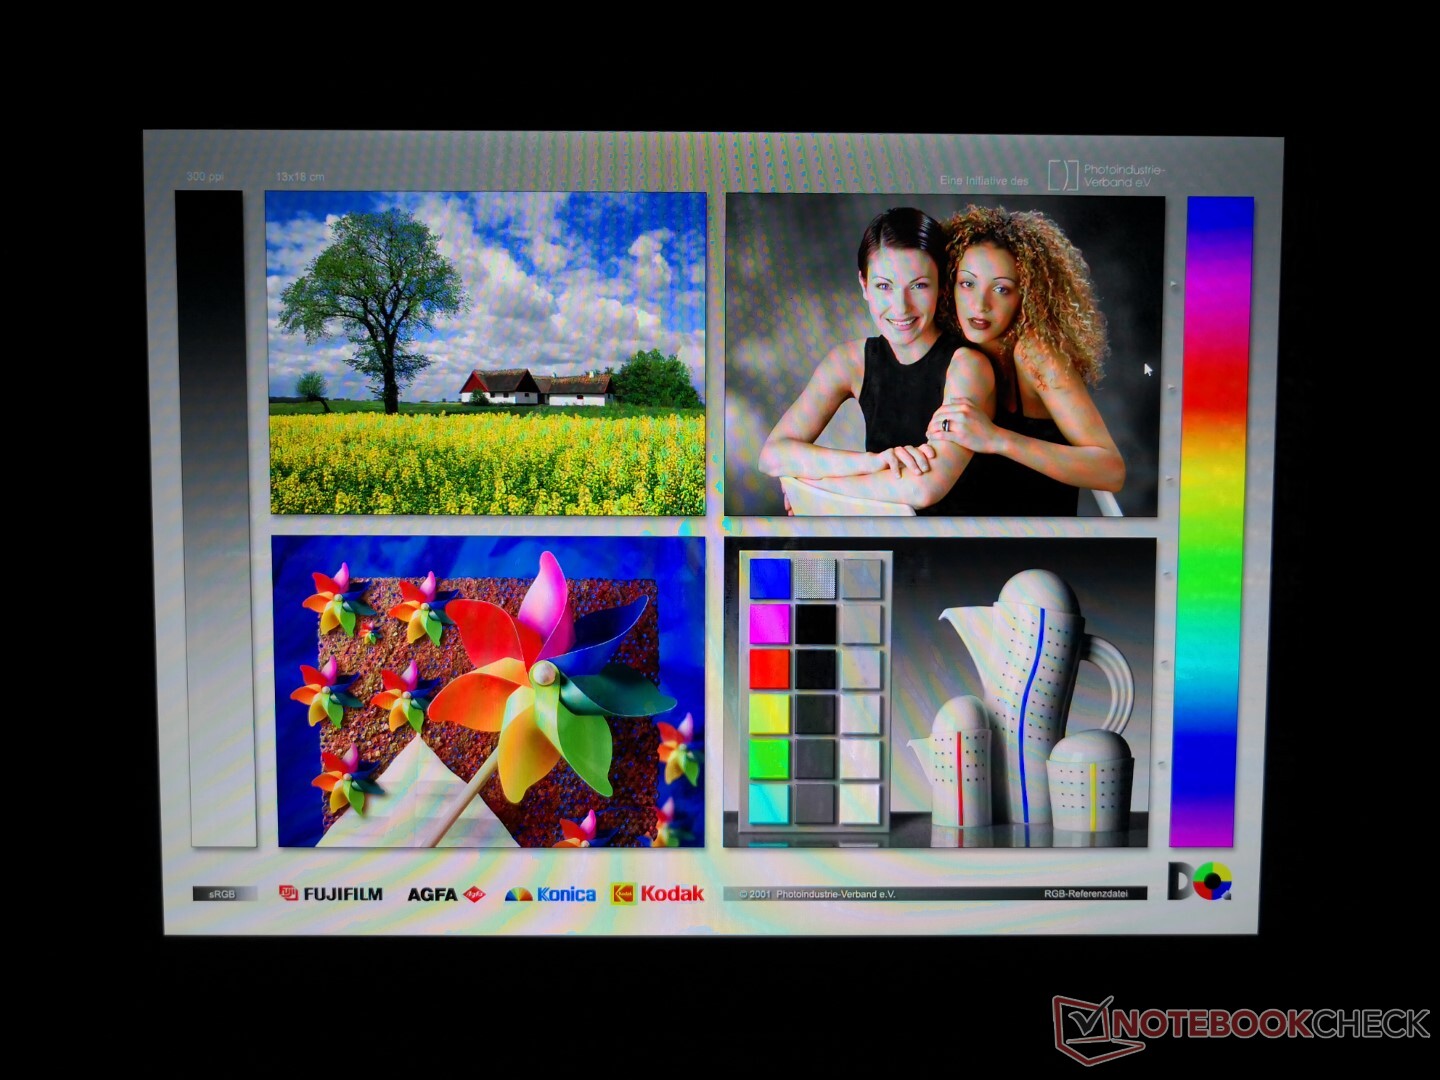
O painel XR140EA6T não pode ser encontrado em nenhum outro laptop em nosso banco de dados. Felizmente, seus principais atributos são excelentes, especialmente para um laptop robusto. Sua luz de fundo é brilhante em quase 500 lêndeas com alto contraste (>1000:1) e uma respeitável cobertura de cores
Os inconvenientes incluem o lento tempo de resposta preto-branco para a detecção de fantasmas e a presença de PWM em todos os níveis de brilho de até 99 por cento. Você pode querer evitar este laptop se seus olhos forem sensíveis à cintilação na tela. Outros laptops robustos como o Durabook S14I podem oferecer exibições ainda mais brilhantes de mais de 1000 lêndeas.
| |||||||||||||||||||||||||
iluminação: 89 %
iluminação com acumulador: 487.8 cd/m²
Contraste: 1016:1 (Preto: 0.48 cd/m²)
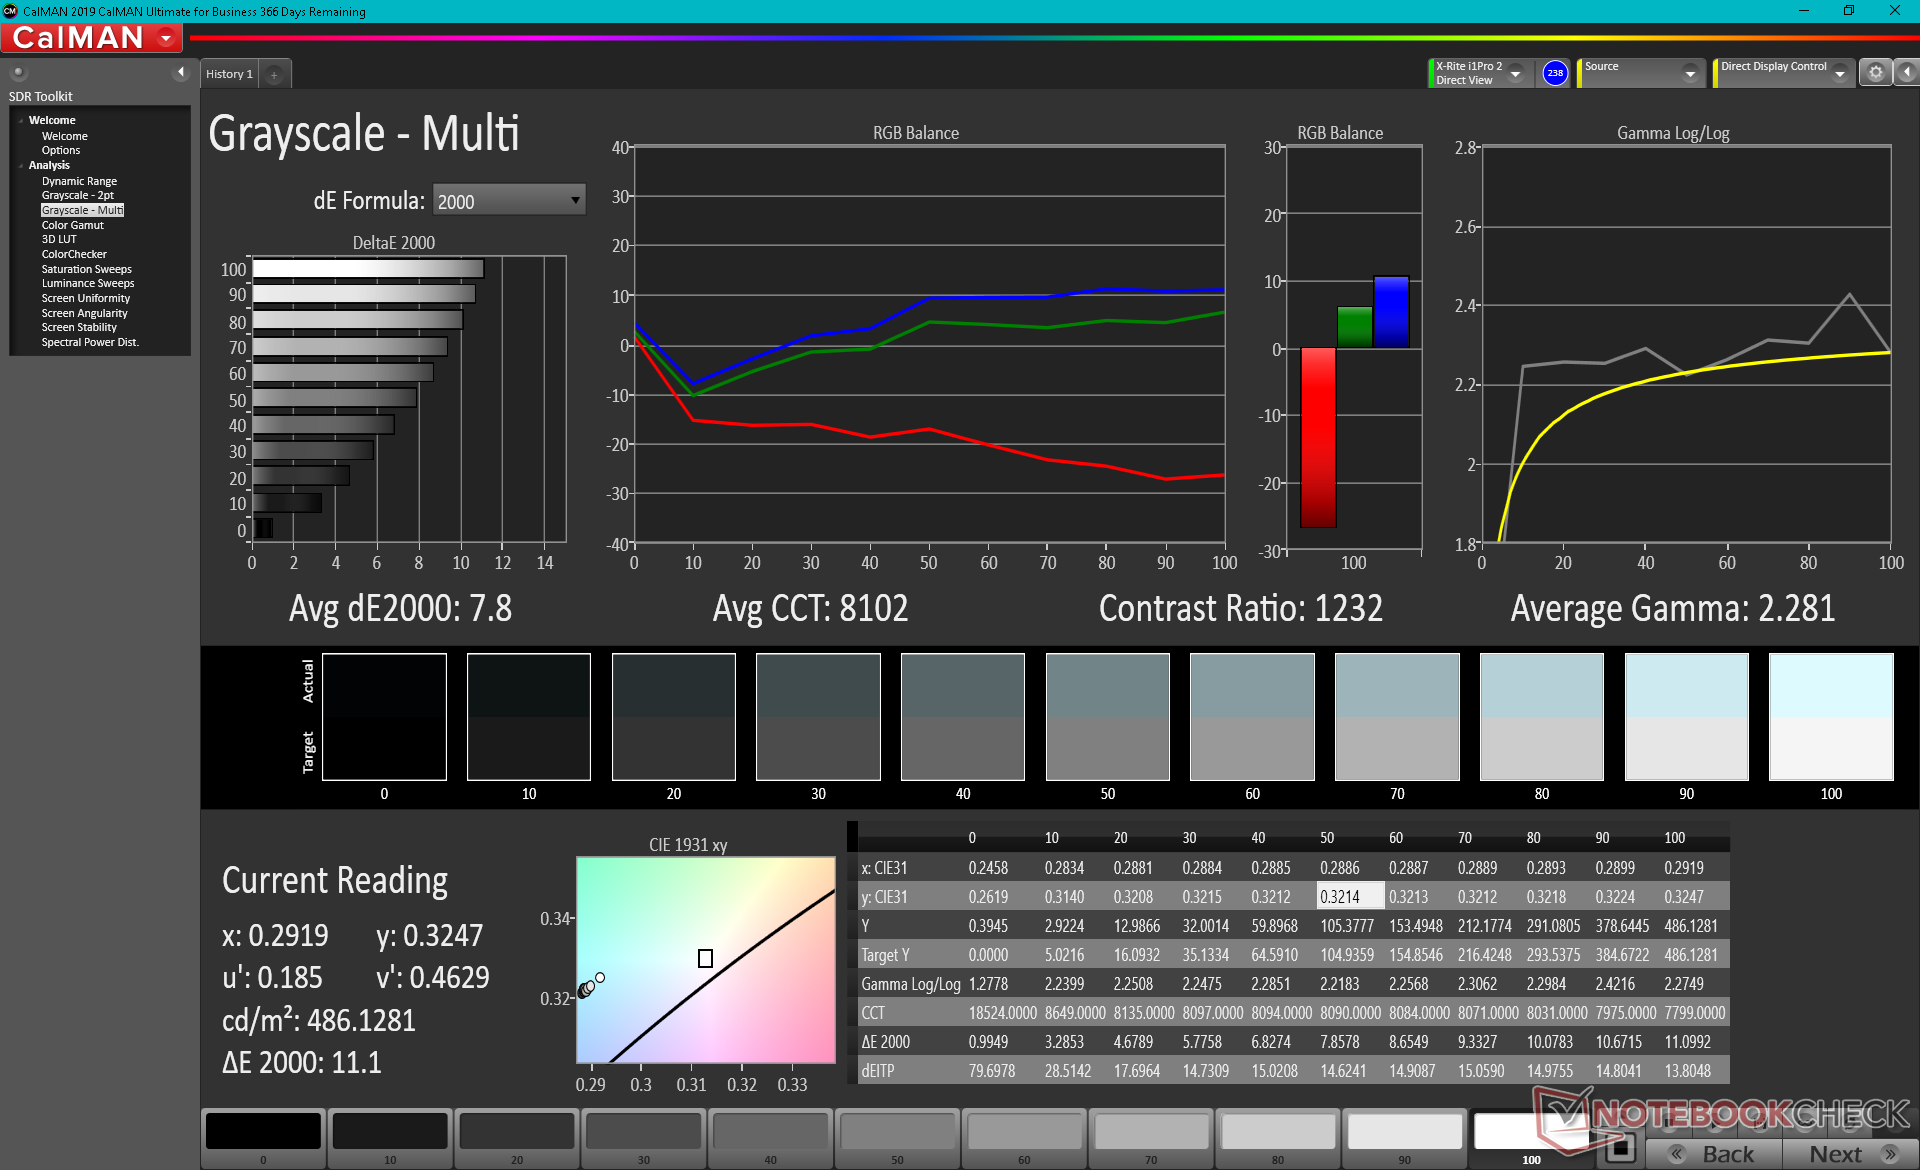
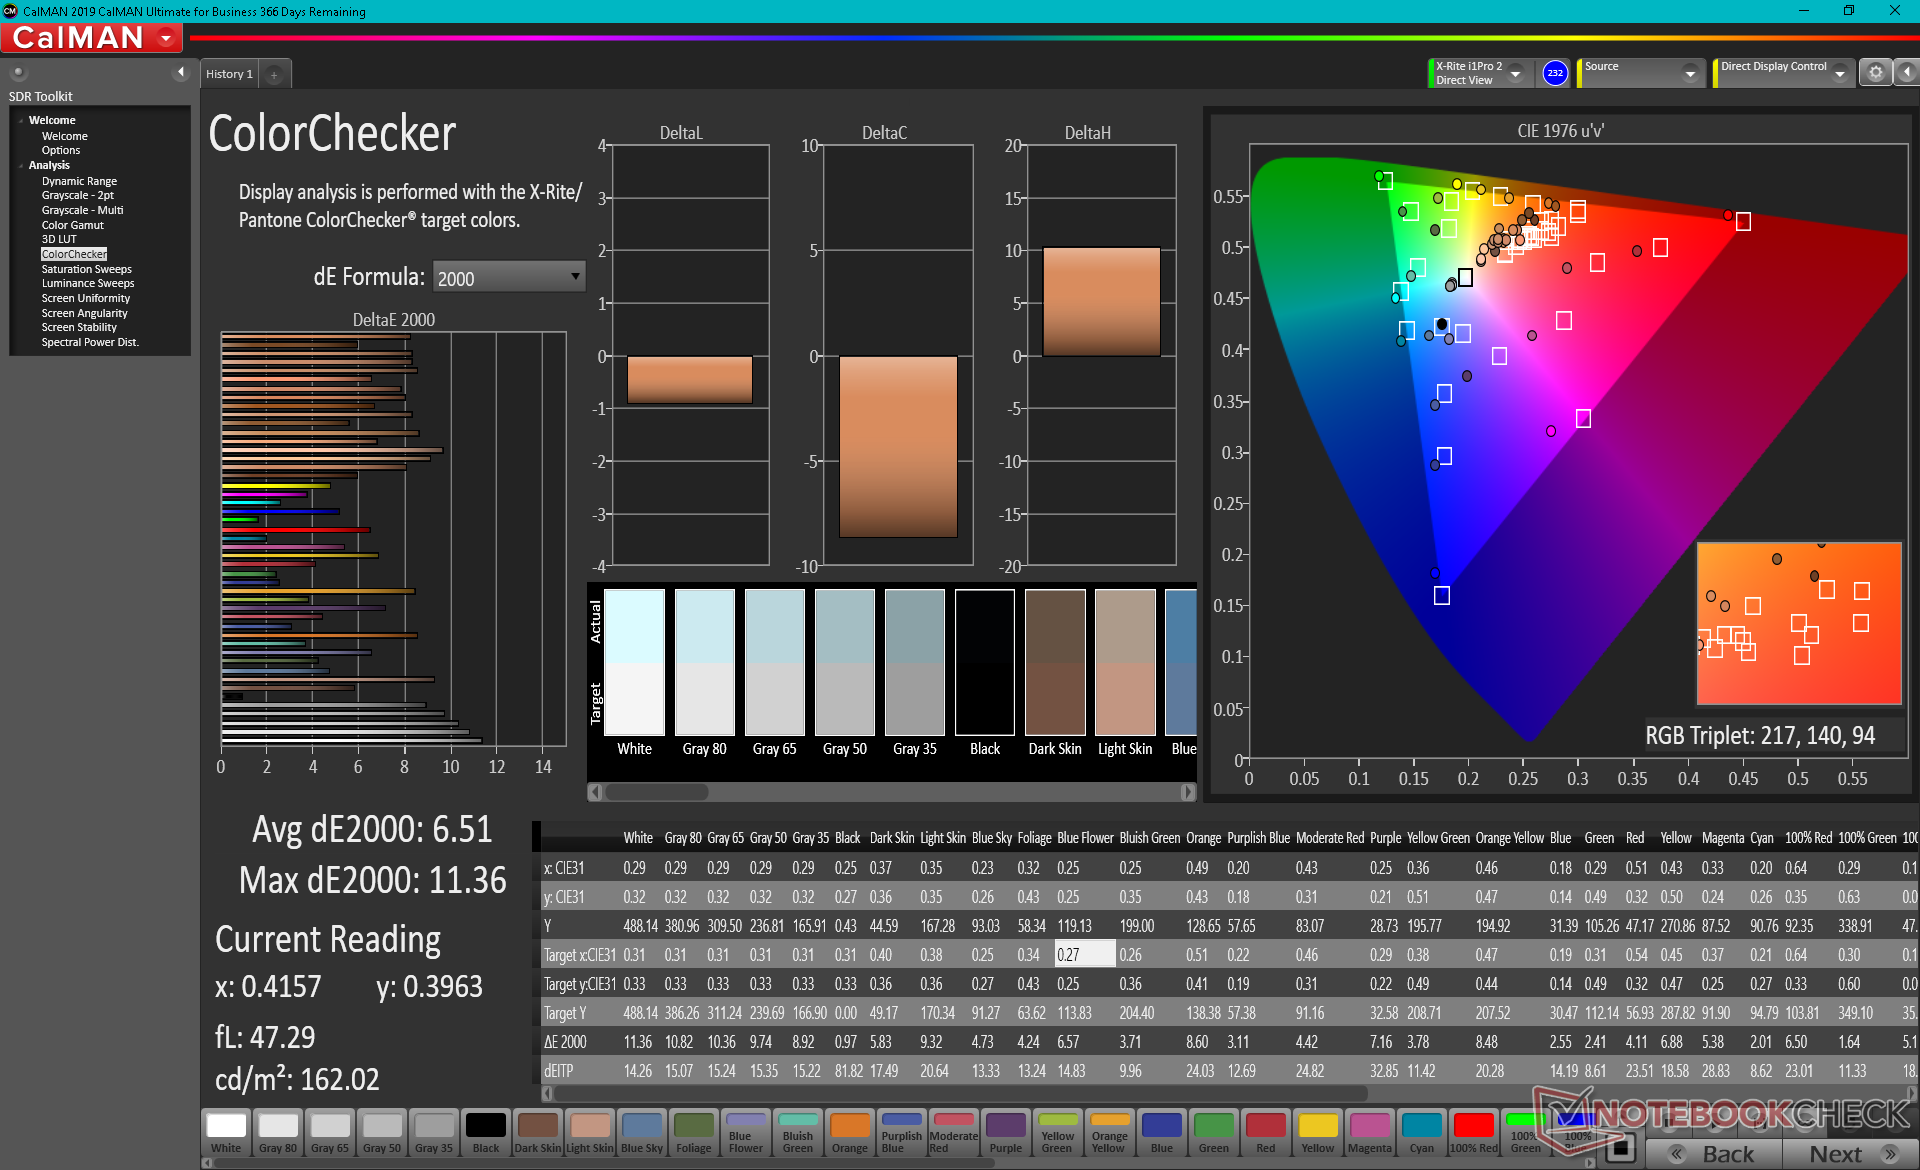
ΔE ColorChecker Calman: 6.51 | ∀{0.5-29.43 Ø4.71}
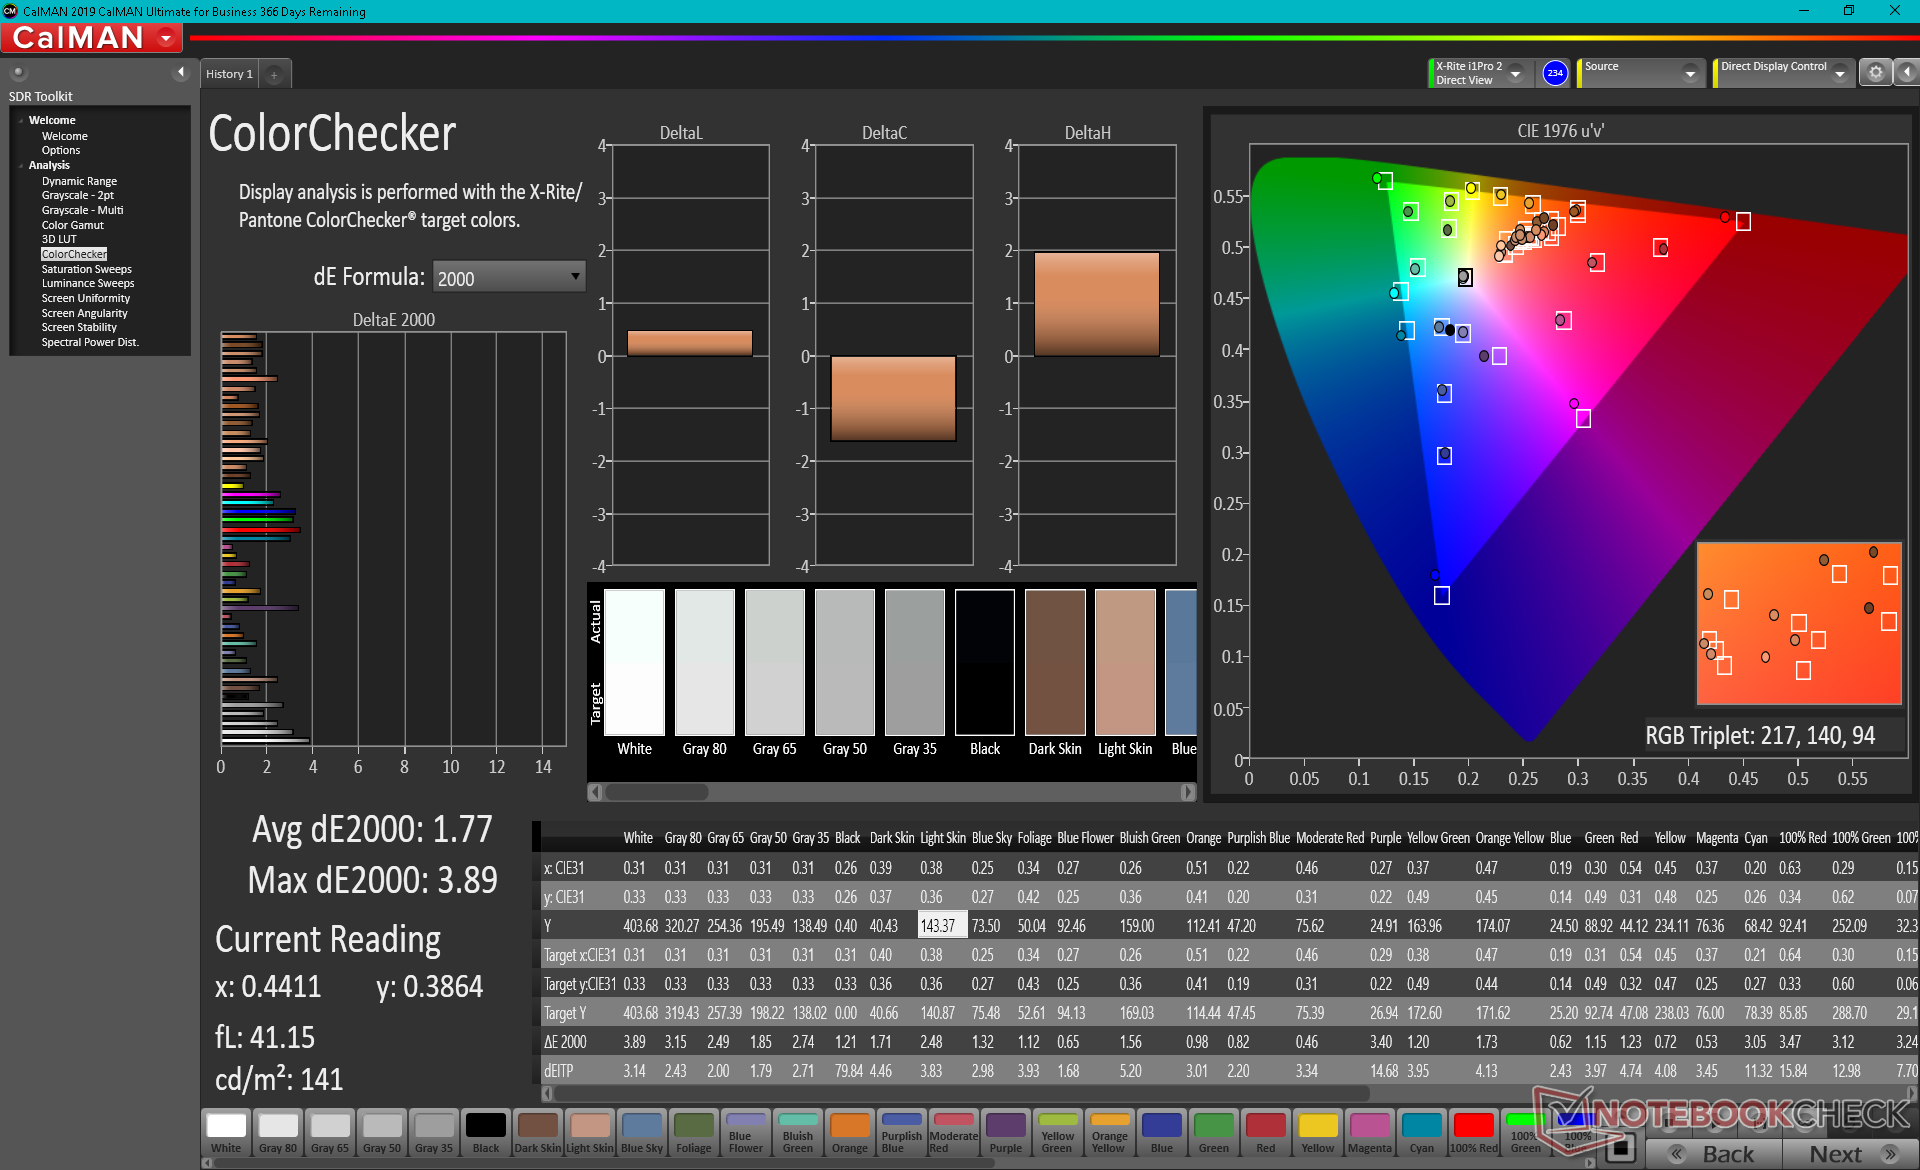
calibrated: 1.77
ΔE Greyscale Calman: 7.8 | ∀{0.09-98 Ø4.96}
65.5% AdobeRGB 1998 (Argyll 3D)
91.9% sRGB (Argyll 3D)
63.5% Display P3 (Argyll 3D)
Gamma: 2.28
CCT: 8102 K
| Acer Enduro Urban N3 EUN314 XR140EA6T, IPS, 1920x1080, 14" | Dell Latitude 5420 Rugged-P85G AU Optronics AUO523D, IPS, 1920x1080, 14" | Panasonic Toughbook FZ-55 MK2 InfoVision M140NWF5 R3, IPS, 1920x1080, 14" | Durabook S14I KD140N0730A01, TN, 1920x1080, 14" | Getac S410 CMN N140BGE-E33, TN PED, 1366x768, 14" | |
|---|---|---|---|---|---|
| Display | -1% | -44% | -30% | -35% | |
| Display P3 Coverage (%) | 63.5 | 62.5 -2% | 34.8 -45% | 43.55 -31% | 40.46 -36% |
| sRGB Coverage (%) | 91.9 | 92.4 1% | 52.2 -43% | 65.4 -29% | 60.9 -34% |
| AdobeRGB 1998 Coverage (%) | 65.5 | 64.2 -2% | 36 -45% | 45 -31% | 41.8 -36% |
| Response Times | -8% | 32% | 56% | 43% | |
| Response Time Grey 50% / Grey 80% * (ms) | 56 ? | 68 ? -21% | 28.4 ? 49% | 30.4 ? 46% | 41.2 ? 26% |
| Response Time Black / White * (ms) | 35.2 ? | 33.6 ? 5% | 30 ? 15% | 11.8 ? 66% | 14 ? 60% |
| PWM Frequency (Hz) | 1000 ? | 735 ? | 685 ? | 304.9 ? | 877 ? |
| Screen | 26% | 21% | -49% | -71% | |
| Brightness middle (cd/m²) | 487.8 | 1111.7 128% | 1061.1 118% | 1180.7 142% | 265.1 -46% |
| Brightness (cd/m²) | 464 | 1026 121% | 997 115% | 1102 138% | 246 -47% |
| Brightness Distribution (%) | 89 | 80 -10% | 76 -15% | 89 0% | 81 -9% |
| Black Level * (cd/m²) | 0.48 | 0.81 -69% | 0.7 -46% | 1.91 -298% | 0.58 -21% |
| Contrast (:1) | 1016 | 1372 35% | 1516 49% | 618 -39% | 457 -55% |
| Colorchecker dE 2000 * | 6.51 | 3.83 41% | 4.64 29% | 13.45 -107% | 14.24 -119% |
| Colorchecker dE 2000 max. * | 11.36 | 7.85 31% | 20.92 -84% | 22.52 -98% | 26.66 -135% |
| Colorchecker dE 2000 calibrated * | 1.77 | 2.98 -68% | 2.52 -42% | 3.19 -80% | 3.94 -123% |
| Greyscale dE 2000 * | 7.8 | 5.6 28% | 2.8 64% | 15.4 -97% | 14.2 -82% |
| Gamma | 2.28 96% | 2.306 95% | 2.08 106% | 1.97 112% | 2.03 108% |
| CCT | 8102 80% | 7676 85% | 6364 102% | 21134 31% | 17152 38% |
| Color Space (Percent of AdobeRGB 1998) (%) | 59 | 41.6 | 38.7 | ||
| Color Space (Percent of sRGB) (%) | 93 | 65.5 | 61 | ||
| Média Total (Programa/Configurações) | 6% /
16% | 3% /
9% | -8% /
-30% | -21% /
-47% |
* ... menor é melhor
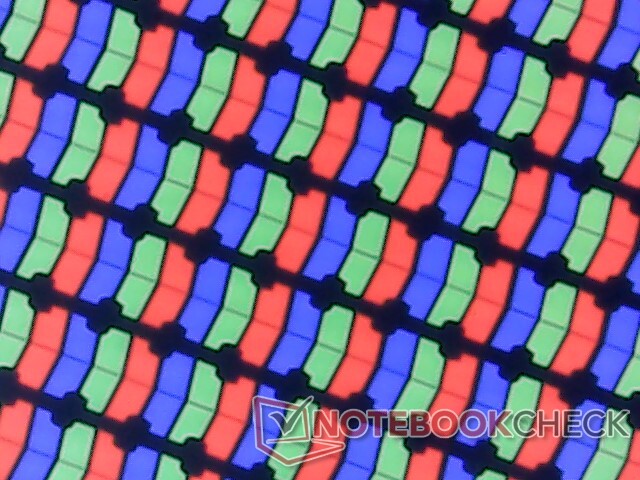
O painel oferece >90% de cobertura sRGB que é muito maior do que em muitos outros laptops robustos ou semi-robustos onde as cores não são normalmente uma prioridade
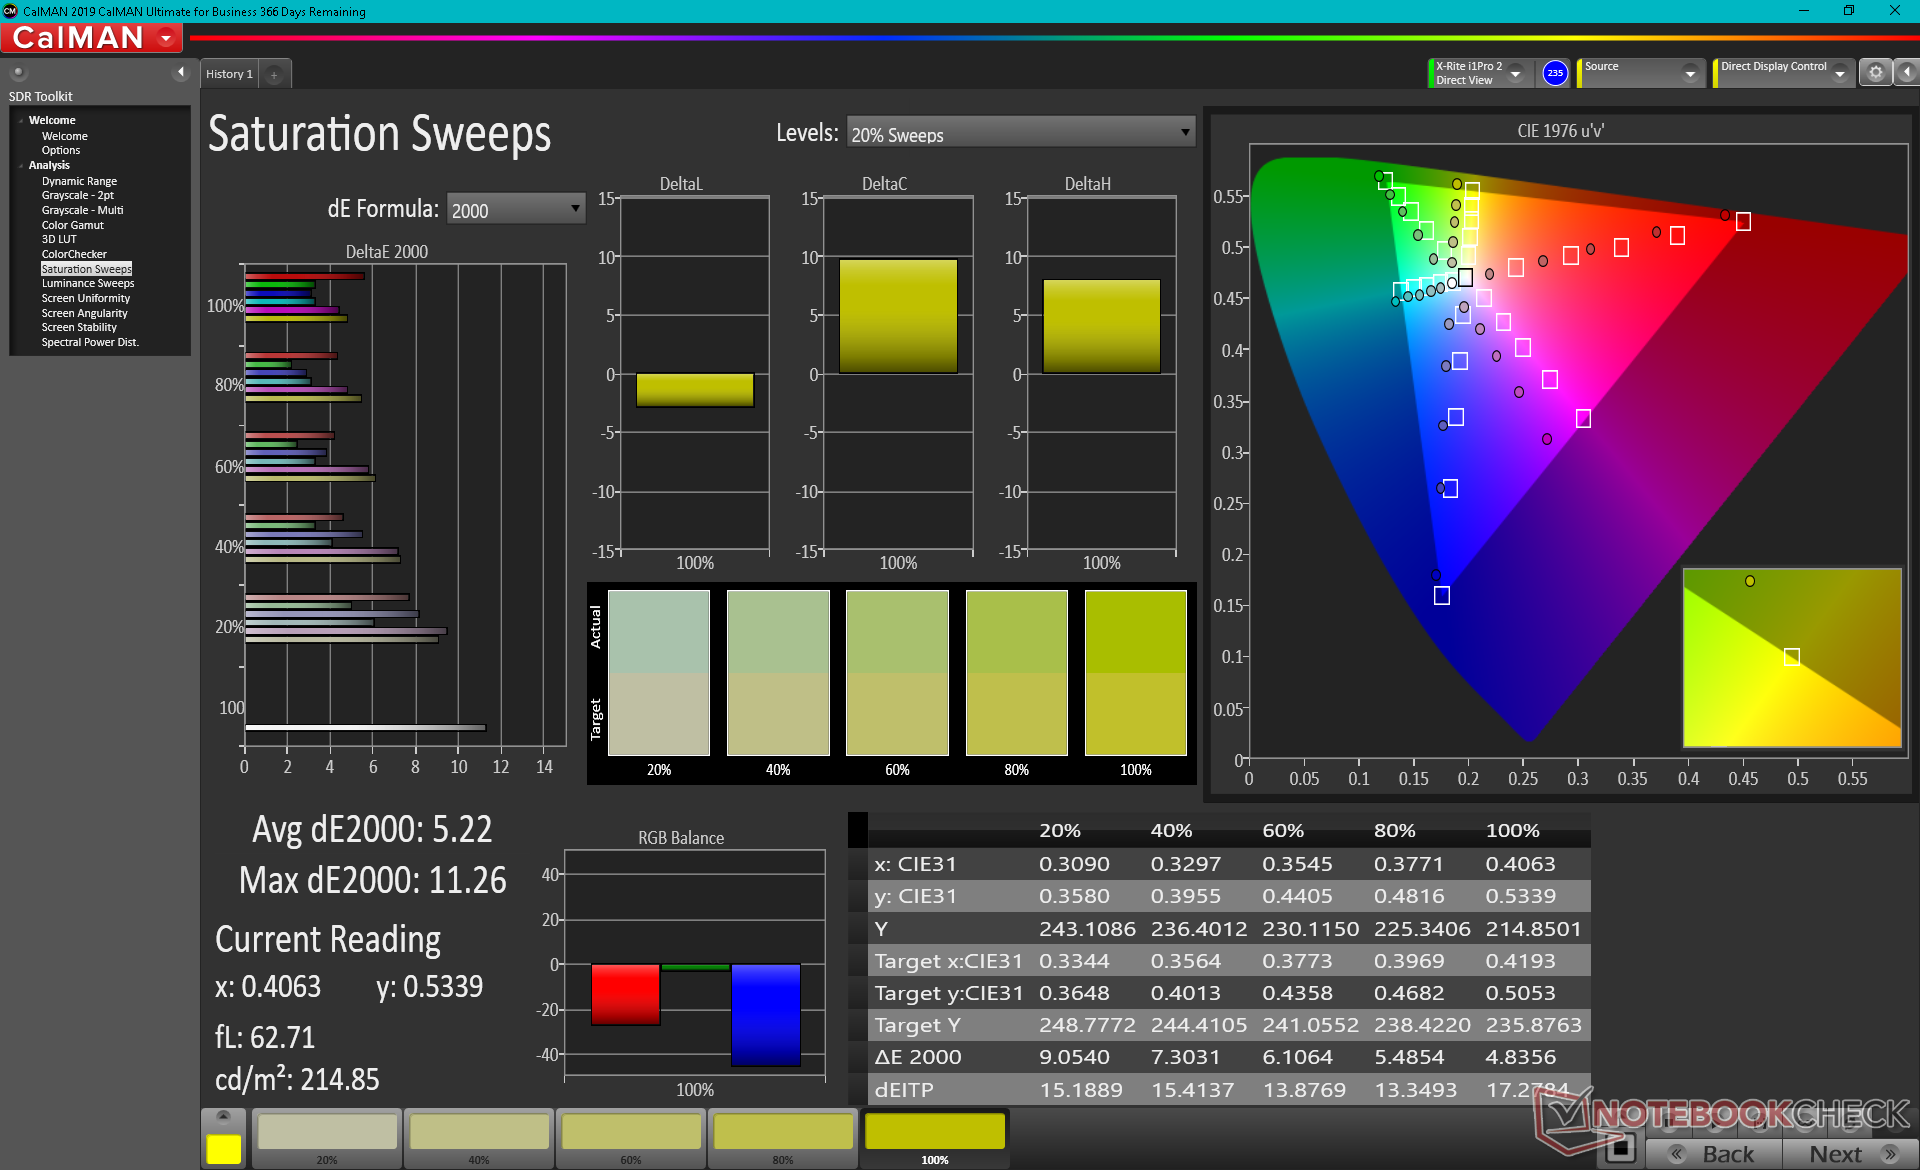
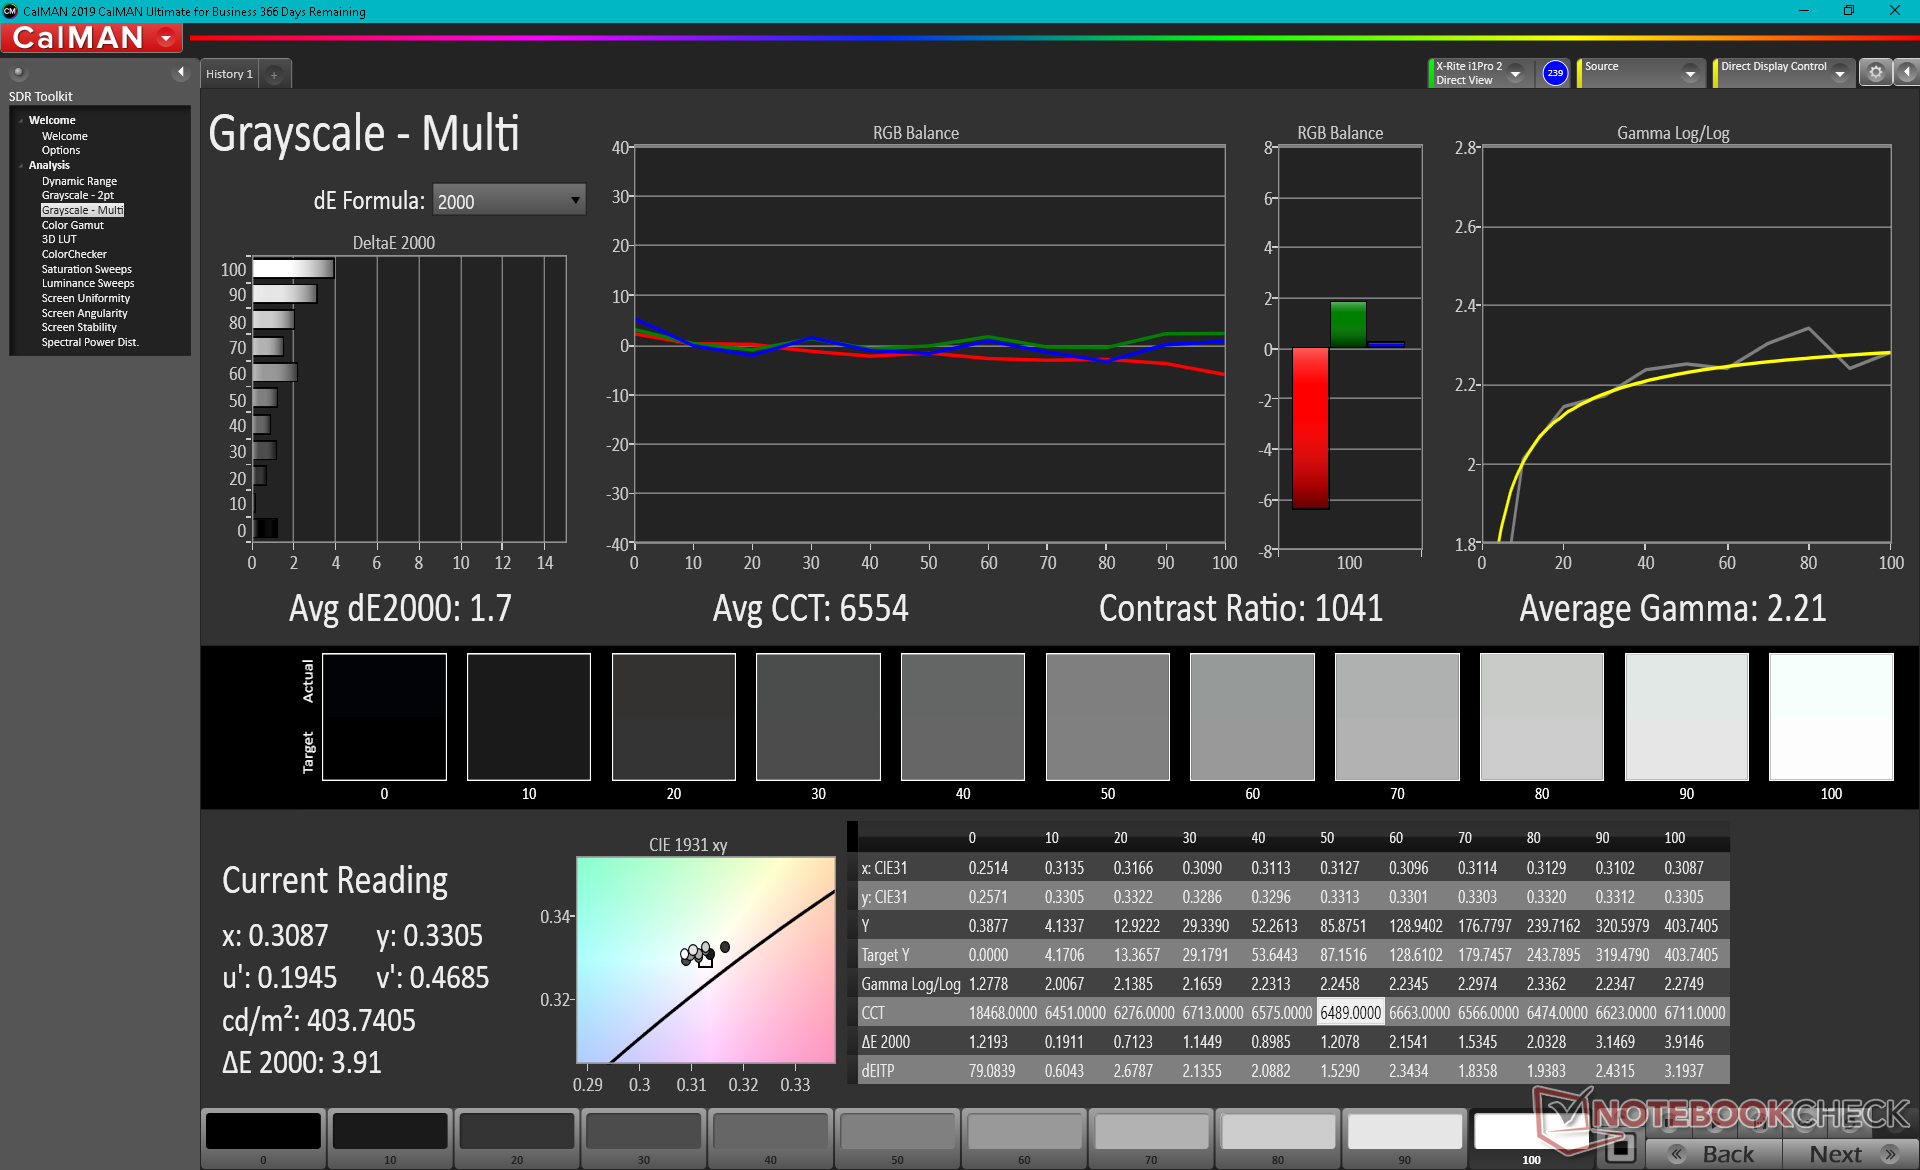
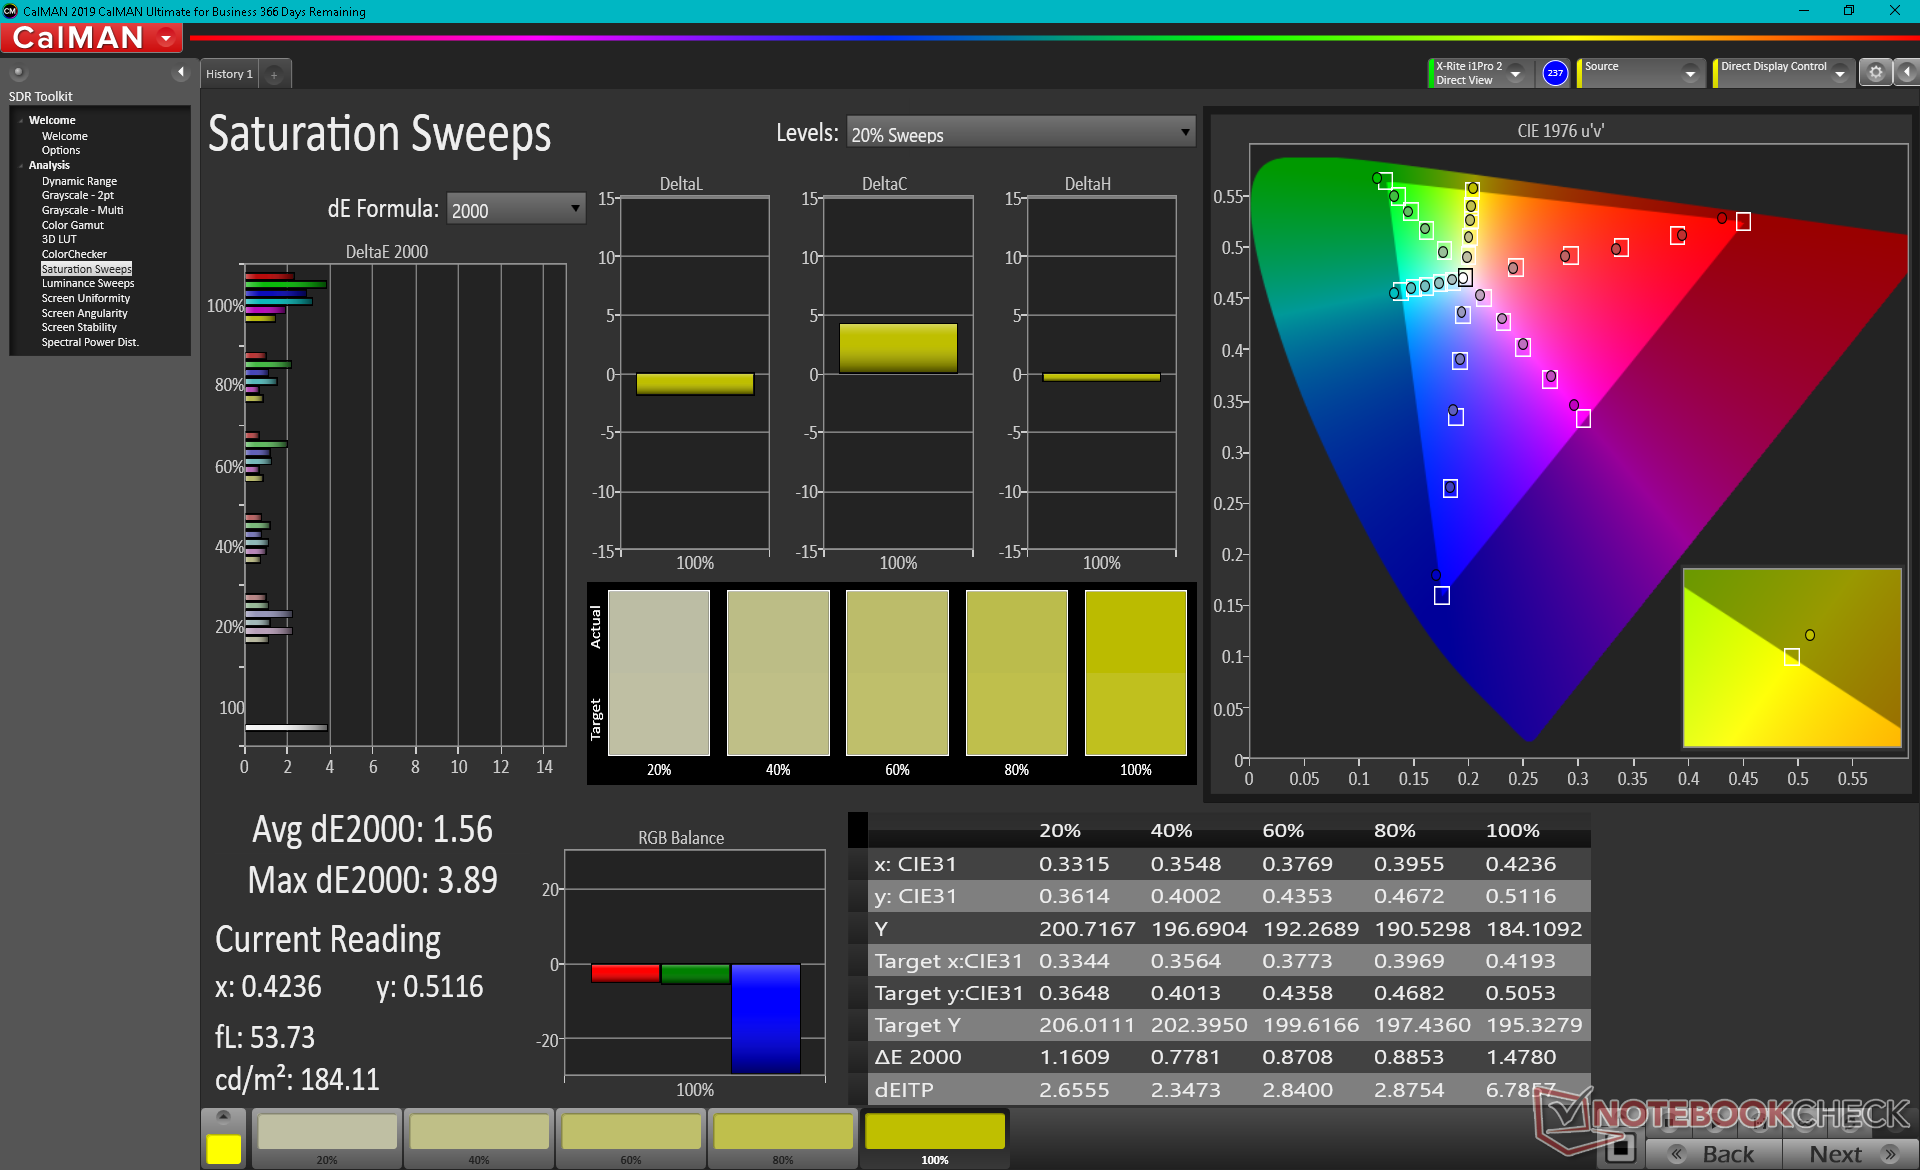
As medidas do colorímetro do X-Rite mostram a temperatura da cor a ser muito fria fora da caixa. Uma vez devidamente calibrados, a escala de cinza e as cores melhorariam drasticamente, como mostram nossos resultados CalMAN abaixo. Recomendamos uma calibração do usuário final para melhor explorar o espaço de cores relativamente amplo do painel.
Exibir tempos de resposta
| ↔ Tempo de resposta preto para branco | ||
|---|---|---|
| 35.2 ms ... ascensão ↗ e queda ↘ combinadas | ↗ 16.4 ms ascensão | 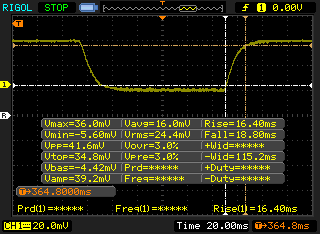 |
| ↘ 18.8 ms queda | ||
| A tela mostra taxas de resposta lentas em nossos testes e será insatisfatória para os jogadores. Em comparação, todos os dispositivos testados variam de 0.1 (mínimo) a 240 (máximo) ms. » 93 % de todos os dispositivos são melhores. Isso significa que o tempo de resposta medido é pior que a média de todos os dispositivos testados (19.8 ms). | ||
| ↔ Tempo de resposta 50% cinza a 80% cinza | ||
| 56 ms ... ascensão ↗ e queda ↘ combinadas | ↗ 25.2 ms ascensão | 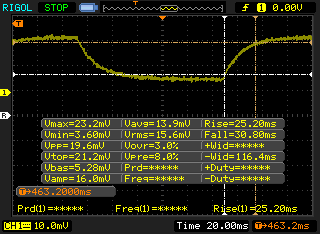 |
| ↘ 30.8 ms queda | ||
| A tela mostra taxas de resposta lentas em nossos testes e será insatisfatória para os jogadores. Em comparação, todos os dispositivos testados variam de 0.165 (mínimo) a 636 (máximo) ms. » 93 % de todos os dispositivos são melhores. Isso significa que o tempo de resposta medido é pior que a média de todos os dispositivos testados (31 ms). | ||
Cintilação da tela / PWM (modulação por largura de pulso)
| Tela tremeluzindo/PWM detectado | 1000 Hz | ≤ 99 % configuração de brilho | 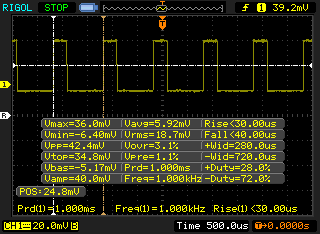 |
A luz de fundo da tela pisca em 1000 Hz (pior caso, por exemplo, utilizando PWM) Cintilação detectada em uma configuração de brilho de 99 % e abaixo. Não deve haver cintilação ou PWM acima desta configuração de brilho. A frequência de 1000 Hz é bastante alta, então a maioria dos usuários sensíveis ao PWM não deve notar nenhuma oscilação. [pwm_comparison] Em comparação: 52 % de todos os dispositivos testados não usam PWM para escurecer a tela. Se PWM foi detectado, uma média de 7754 (mínimo: 5 - máximo: 343500) Hz foi medida. | |||
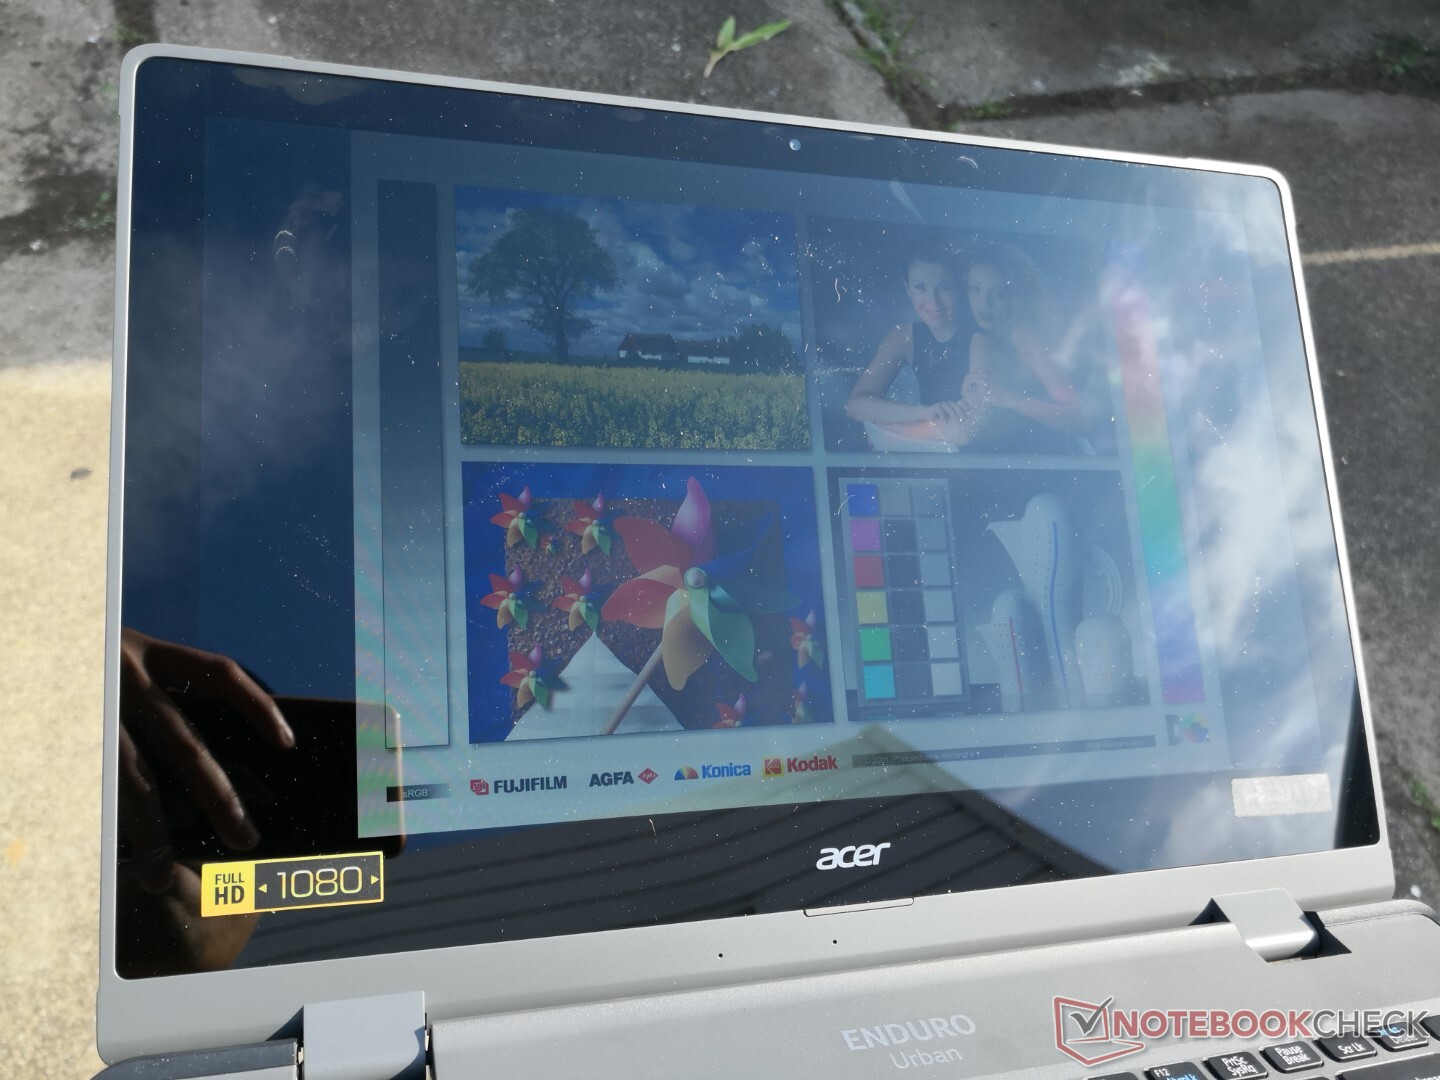
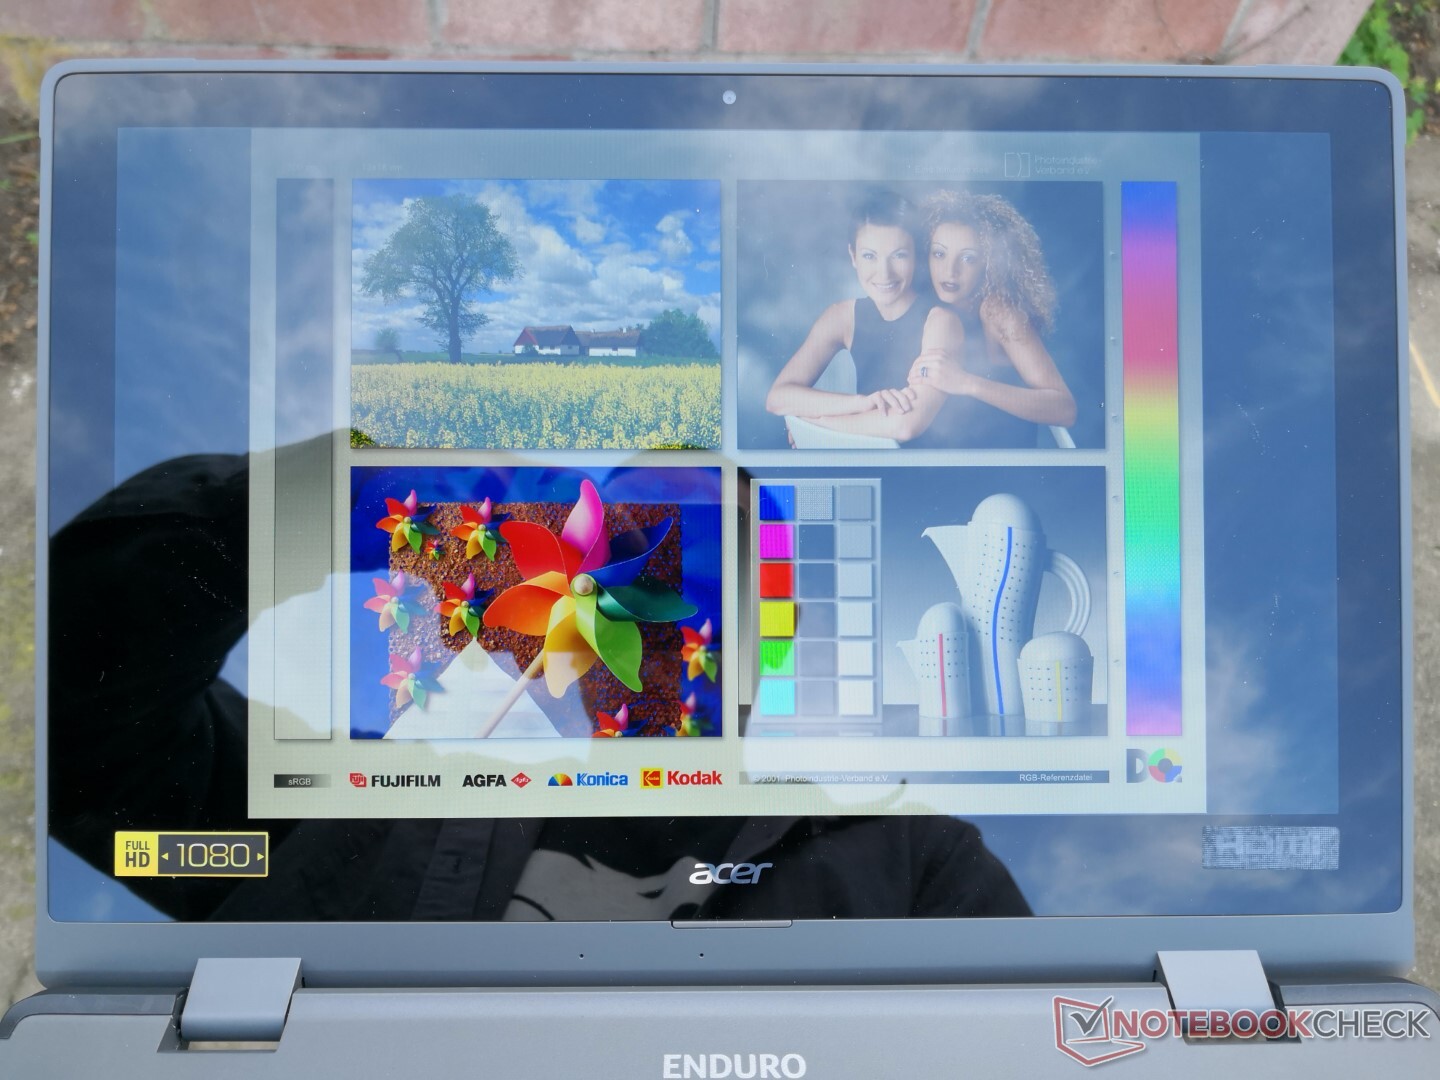
A visibilidade ao ar livre é geralmente melhor do que a maioria dos laptops de consumo como o Dell XPS, uma vez que a tela Acer é visivelmente mais brilhante. No entanto, o brilho ainda está presente e é difícil de ignorar devido à sobreposição de brilho. Uma opção mate teria sido desejável em vez de forçar o brilho em todas as configurações
Desempenho
Condições de teste
Nossa unidade foi configurada para o modo Melhor Desempenho via Windows antes de executar qualquer benchmark de desempenho abaixo para obter as melhores pontuações possíveis.
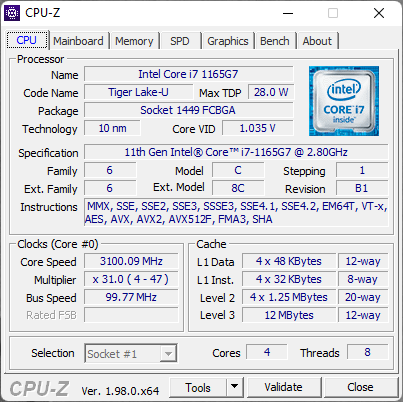
Processador
O desempenho da CPU é excelente e cerca de 40 por cento mais rápido do que o Durabook S14I mesmo que ambos carreguem o mesmo Núcleo i7-1165G7 CPU. Downgrading para a Núcleo i5-1135G7 espera-se que a configuração acarrete apenas perdas de desempenho muito pequenas com base em nossa experiência com outros notebooks Core i5-1135G7.
Cinebench R15 Multi Loop
Cinebench R23: Multi Core | Single Core
Cinebench R20: CPU (Multi Core) | CPU (Single Core)
Cinebench R15: CPU Multi 64Bit | CPU Single 64Bit
Blender: v2.79 BMW27 CPU
7-Zip 18.03: 7z b 4 | 7z b 4 -mmt1
Geekbench 5.5: Multi-Core | Single-Core
HWBOT x265 Benchmark v2.2: 4k Preset
LibreOffice : 20 Documents To PDF
R Benchmark 2.5: Overall mean
| CPU Performance rating | |
| Lenovo IdeaPad Flex 5 14ALC05 82HU002YUS | |
| Lenovo Yoga Slim 7 14ARE05 82A20008GE | |
| Lenovo ThinkPad E14 G3-20Y7003SGE | |
| Dell XPS 13 7390 Core i7-10710U -6! | |
| Acer Enduro Urban N3 EUN314 | |
| Média Intel Core i7-1165G7 | |
| Panasonic Toughbook FZ-55 MK2 -2! | |
| Dynabook Tecra A40-J-12E | |
| Durabook S14I | |
| Lenovo ThinkPad L14-20U50003GE -2! | |
| Lenovo ThinkPad P14s Gen1 20S40009GE | |
| Getac S410 -12! | |
| Infinix INBook X1 Pro -2! | |
| HP ZBook 14u G6 6TP71EA -6! | |
| Dell Latitude 5420 Rugged-P85G -12! | |
| HP 14s-dq1431ng -2! | |
Cinebench R23: Multi Core | Single Core
Cinebench R20: CPU (Multi Core) | CPU (Single Core)
Cinebench R15: CPU Multi 64Bit | CPU Single 64Bit
Blender: v2.79 BMW27 CPU
7-Zip 18.03: 7z b 4 | 7z b 4 -mmt1
Geekbench 5.5: Multi-Core | Single-Core
HWBOT x265 Benchmark v2.2: 4k Preset
LibreOffice : 20 Documents To PDF
R Benchmark 2.5: Overall mean
* ... menor é melhor
AIDA64: FP32 Ray-Trace | FPU Julia | CPU SHA3 | CPU Queen | FPU SinJulia | FPU Mandel | CPU AES | CPU ZLib | FP64 Ray-Trace | CPU PhotoWorxx
| Performance rating | |
| Acer Enduro Urban N3 EUN314 | |
| Média Intel Core i7-1165G7 | |
| Panasonic Toughbook FZ-55 MK2 | |
| Durabook S14I | |
| AIDA64 / FP32 Ray-Trace | |
| Acer Enduro Urban N3 EUN314 | |
| Média Intel Core i7-1165G7 (3933 - 8184, n=58) | |
| Panasonic Toughbook FZ-55 MK2 | |
| Durabook S14I | |
| AIDA64 / FPU Julia | |
| Acer Enduro Urban N3 EUN314 | |
| Panasonic Toughbook FZ-55 MK2 | |
| Média Intel Core i7-1165G7 (17720 - 34369, n=58) | |
| Durabook S14I | |
| AIDA64 / CPU SHA3 | |
| Acer Enduro Urban N3 EUN314 | |
| Média Intel Core i7-1165G7 (958 - 2338, n=58) | |
| Panasonic Toughbook FZ-55 MK2 | |
| Durabook S14I | |
| AIDA64 / CPU Queen | |
| Acer Enduro Urban N3 EUN314 | |
| Durabook S14I | |
| Panasonic Toughbook FZ-55 MK2 | |
| Média Intel Core i7-1165G7 (44161 - 50624, n=58) | |
| AIDA64 / FPU SinJulia | |
| Acer Enduro Urban N3 EUN314 | |
| Panasonic Toughbook FZ-55 MK2 | |
| Média Intel Core i7-1165G7 (3183 - 4796, n=58) | |
| Durabook S14I | |
| AIDA64 / FPU Mandel | |
| Acer Enduro Urban N3 EUN314 | |
| Panasonic Toughbook FZ-55 MK2 | |
| Média Intel Core i7-1165G7 (11876 - 20468, n=58) | |
| Durabook S14I | |
| AIDA64 / CPU AES | |
| Acer Enduro Urban N3 EUN314 | |
| Média Intel Core i7-1165G7 (29506 - 73387, n=58) | |
| Durabook S14I | |
| Panasonic Toughbook FZ-55 MK2 | |
| AIDA64 / CPU ZLib | |
| Acer Enduro Urban N3 EUN314 | |
| Média Intel Core i7-1165G7 (169 - 402, n=65) | |
| Panasonic Toughbook FZ-55 MK2 | |
| Durabook S14I | |
| AIDA64 / FP64 Ray-Trace | |
| Acer Enduro Urban N3 EUN314 | |
| Panasonic Toughbook FZ-55 MK2 | |
| Média Intel Core i7-1165G7 (2033 - 4461, n=58) | |
| Durabook S14I | |
| AIDA64 / CPU PhotoWorxx | |
| Média Intel Core i7-1165G7 (12392 - 45694, n=58) | |
| Acer Enduro Urban N3 EUN314 | |
| Panasonic Toughbook FZ-55 MK2 | |
| Durabook S14I | |
Desempenho do sistema
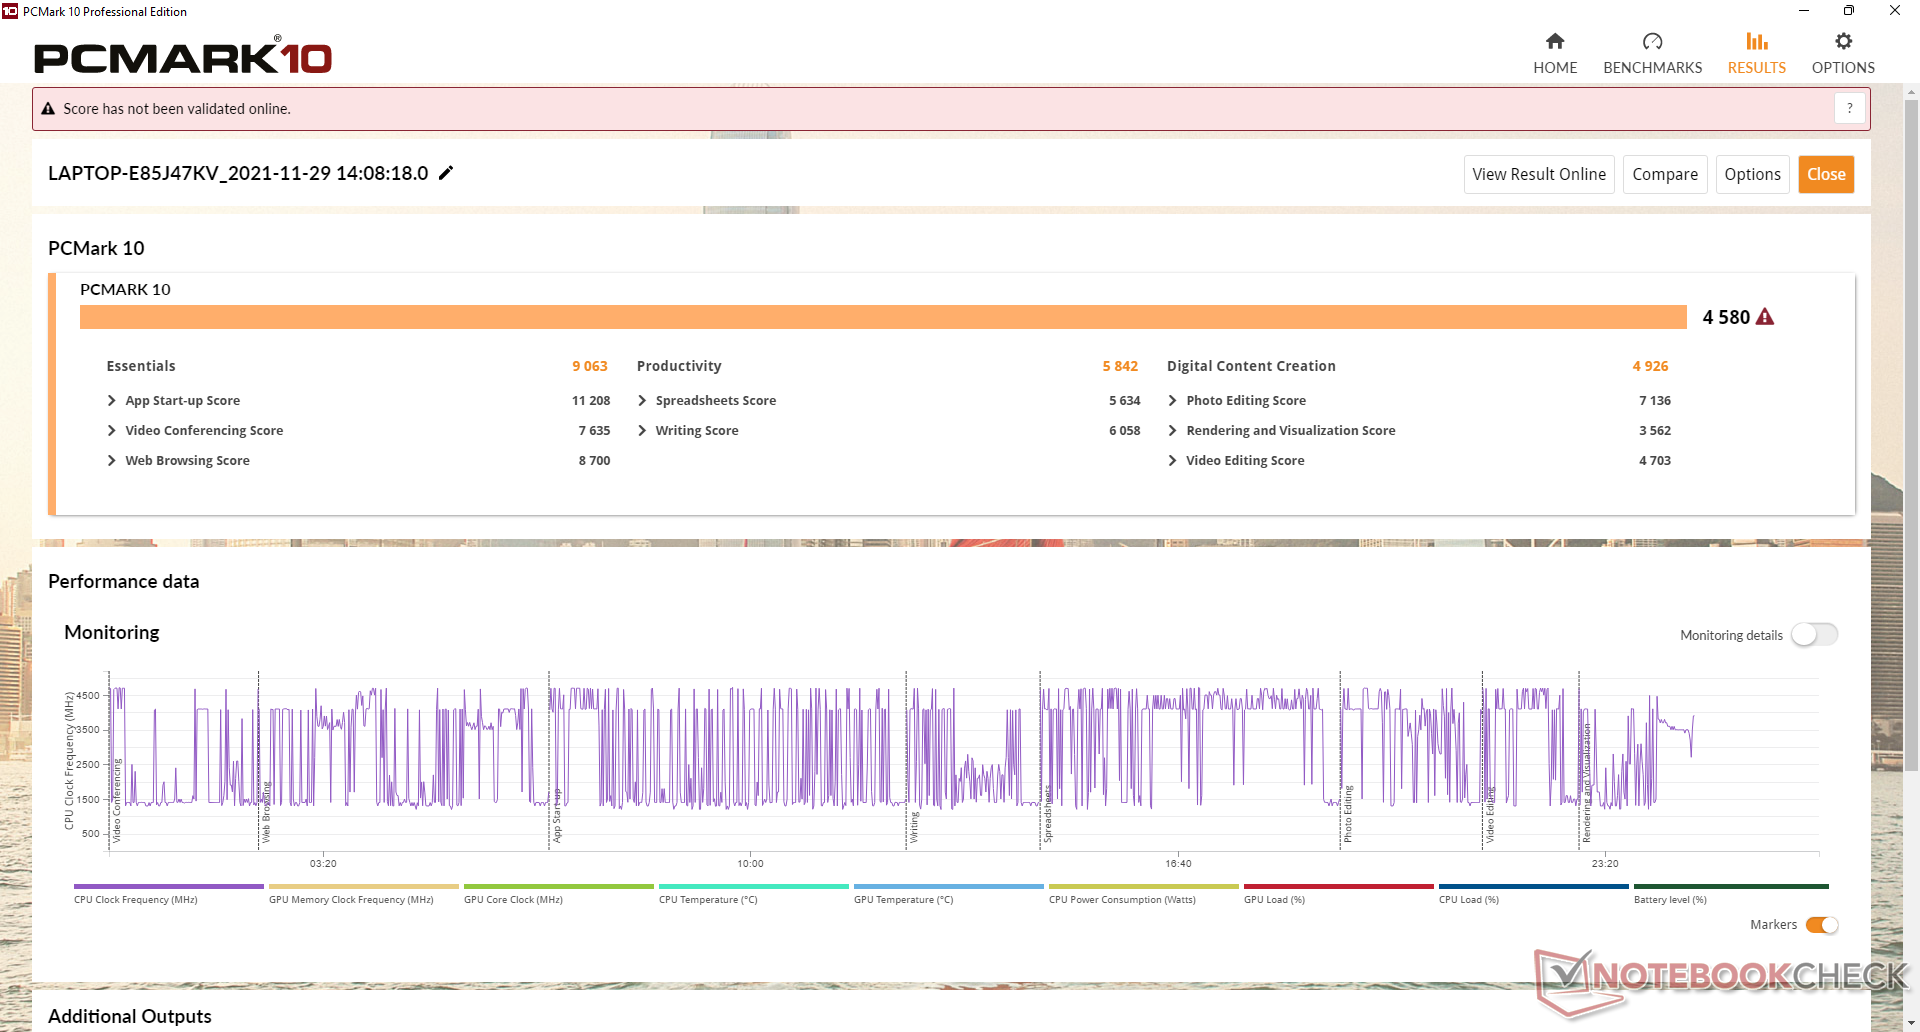
Os resultados da PCMark estão estranhamente atrás do DuraBook S14I, embora nossa Acer tenha a mesma CPU, mas com uma meta PL1 mais alta (28 W vs. 15 W).
| PCMark 10 / Score | |
| Panasonic Toughbook FZ-55 MK2 | |
| Média Intel Core i7-1165G7, Intel Iris Xe Graphics G7 96EUs (4531 - 5454, n=50) | |
| Durabook S14I | |
| Acer Enduro Urban N3 EUN314 | |
| Dell Latitude 5420 Rugged-P85G | |
| Getac S410 | |
| PCMark 10 / Essentials | |
| Panasonic Toughbook FZ-55 MK2 | |
| Durabook S14I | |
| Média Intel Core i7-1165G7, Intel Iris Xe Graphics G7 96EUs (8997 - 11505, n=50) | |
| Acer Enduro Urban N3 EUN314 | |
| Dell Latitude 5420 Rugged-P85G | |
| Getac S410 | |
| PCMark 10 / Productivity | |
| Dell Latitude 5420 Rugged-P85G | |
| Durabook S14I | |
| Getac S410 | |
| Média Intel Core i7-1165G7, Intel Iris Xe Graphics G7 96EUs (5570 - 7136, n=50) | |
| Panasonic Toughbook FZ-55 MK2 | |
| Acer Enduro Urban N3 EUN314 | |
| PCMark 10 / Digital Content Creation | |
| Panasonic Toughbook FZ-55 MK2 | |
| Média Intel Core i7-1165G7, Intel Iris Xe Graphics G7 96EUs (4083 - 5550, n=50) | |
| Acer Enduro Urban N3 EUN314 | |
| Durabook S14I | |
| Dell Latitude 5420 Rugged-P85G | |
| Getac S410 | |
| PCMark 10 Score | 4580 pontos | |
Ajuda | ||
| AIDA64 / Memory Copy | |
| Média Intel Core i7-1165G7 (20032 - 65446, n=58) | |
| Acer Enduro Urban N3 EUN314 | |
| Panasonic Toughbook FZ-55 MK2 | |
| Durabook S14I | |
| AIDA64 / Memory Read | |
| Média Intel Core i7-1165G7 (23033 - 64524, n=58) | |
| Acer Enduro Urban N3 EUN314 | |
| Panasonic Toughbook FZ-55 MK2 | |
| Durabook S14I | |
| AIDA64 / Memory Write | |
| Média Intel Core i7-1165G7 (21736 - 66791, n=58) | |
| Acer Enduro Urban N3 EUN314 | |
| Panasonic Toughbook FZ-55 MK2 | |
| Durabook S14I | |
| AIDA64 / Memory Latency | |
| Acer Enduro Urban N3 EUN314 | |
| Panasonic Toughbook FZ-55 MK2 | |
| Média Intel Core i7-1165G7 (69 - 110, n=65) | |
| Durabook S14I | |
* ... menor é melhor
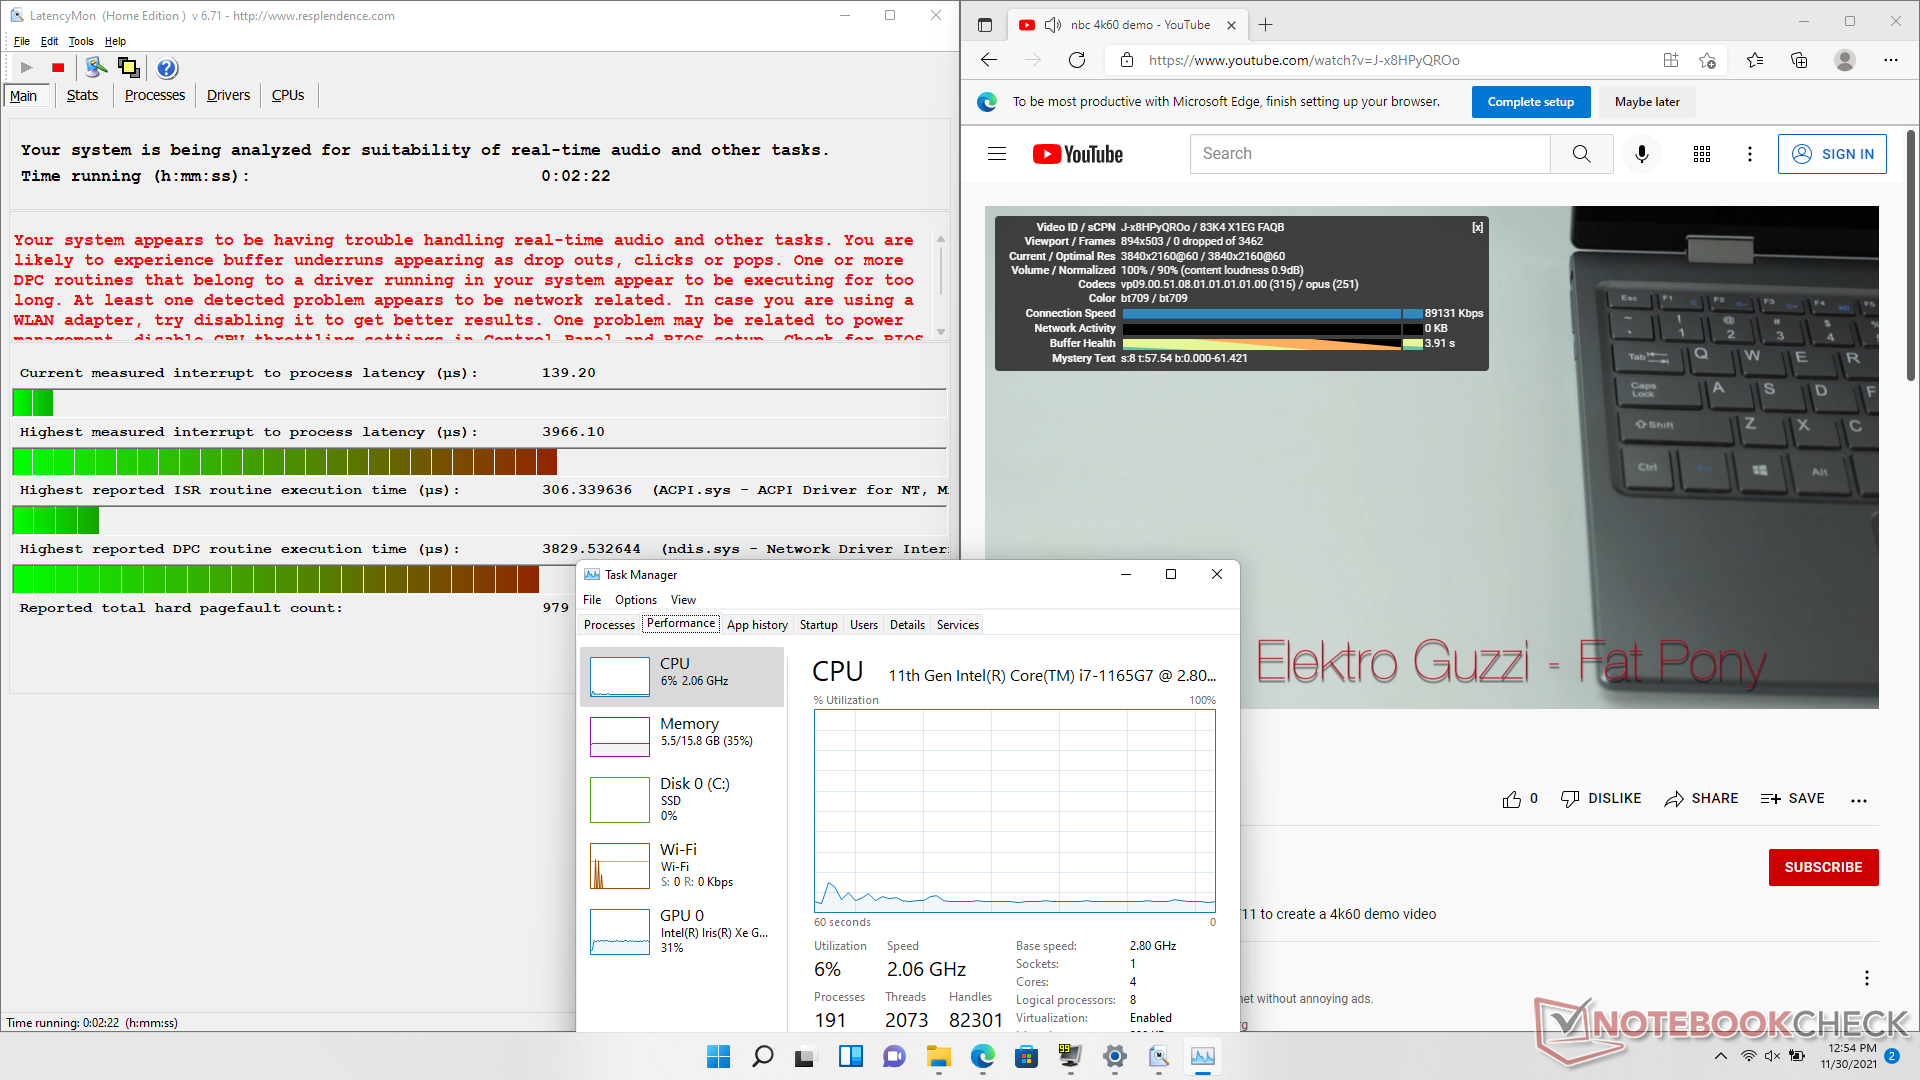
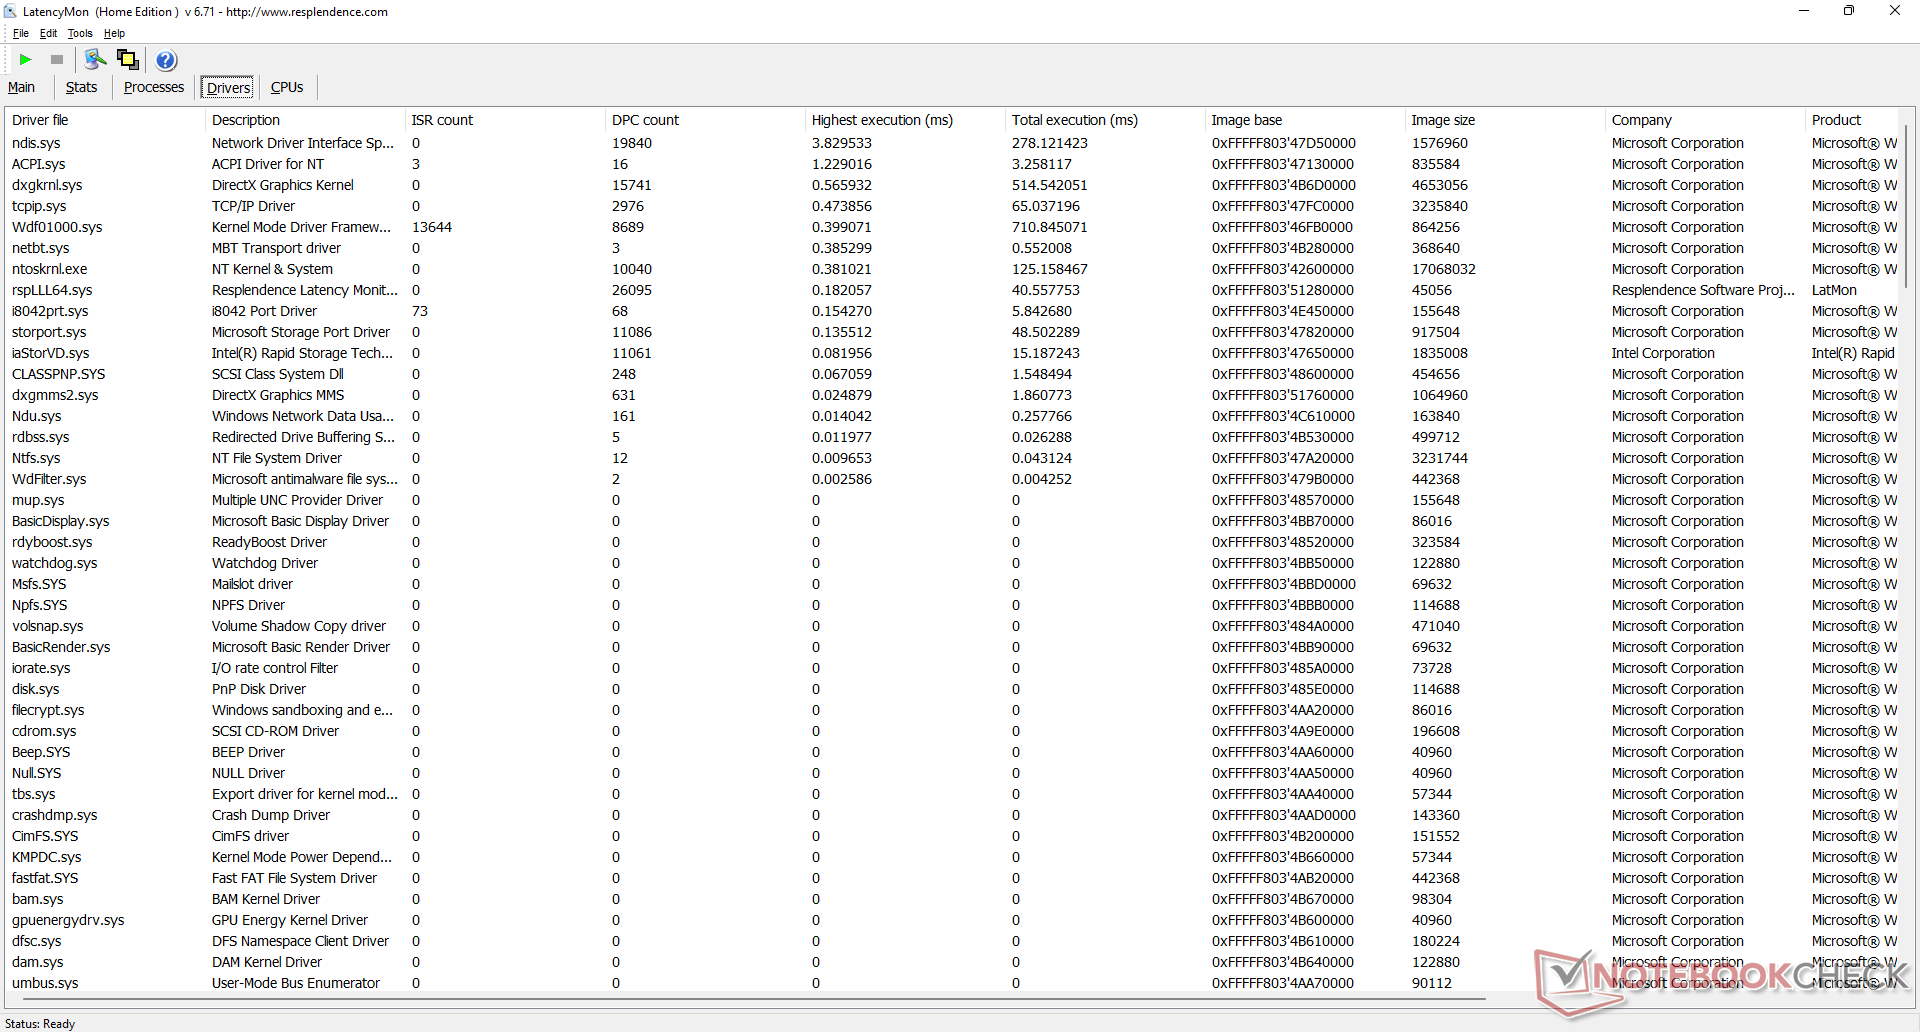
Latência do DPC
LatencyMon mostra os problemas de DPC ao abrir várias abas do navegador em nossa página inicial. A reprodução de vídeo de 4K a 60 FPS é, de outra forma, suave e sem qualquer queda de quadros.
| DPC Latencies / LatencyMon - interrupt to process latency (max), Web, Youtube, Prime95 | |
| Acer Enduro Urban N3 EUN314 | |
| Panasonic Toughbook FZ-55 MK2 | |
| Durabook S14I | |
* ... menor é melhor
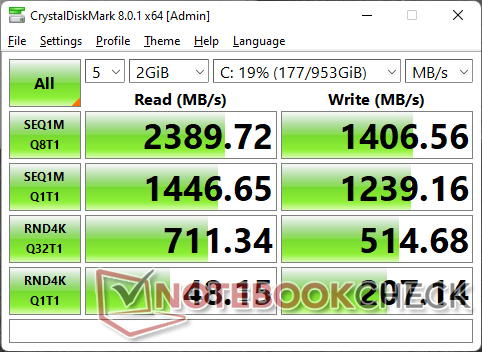
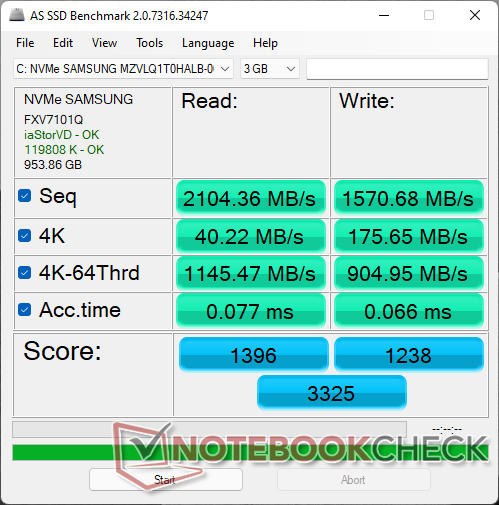
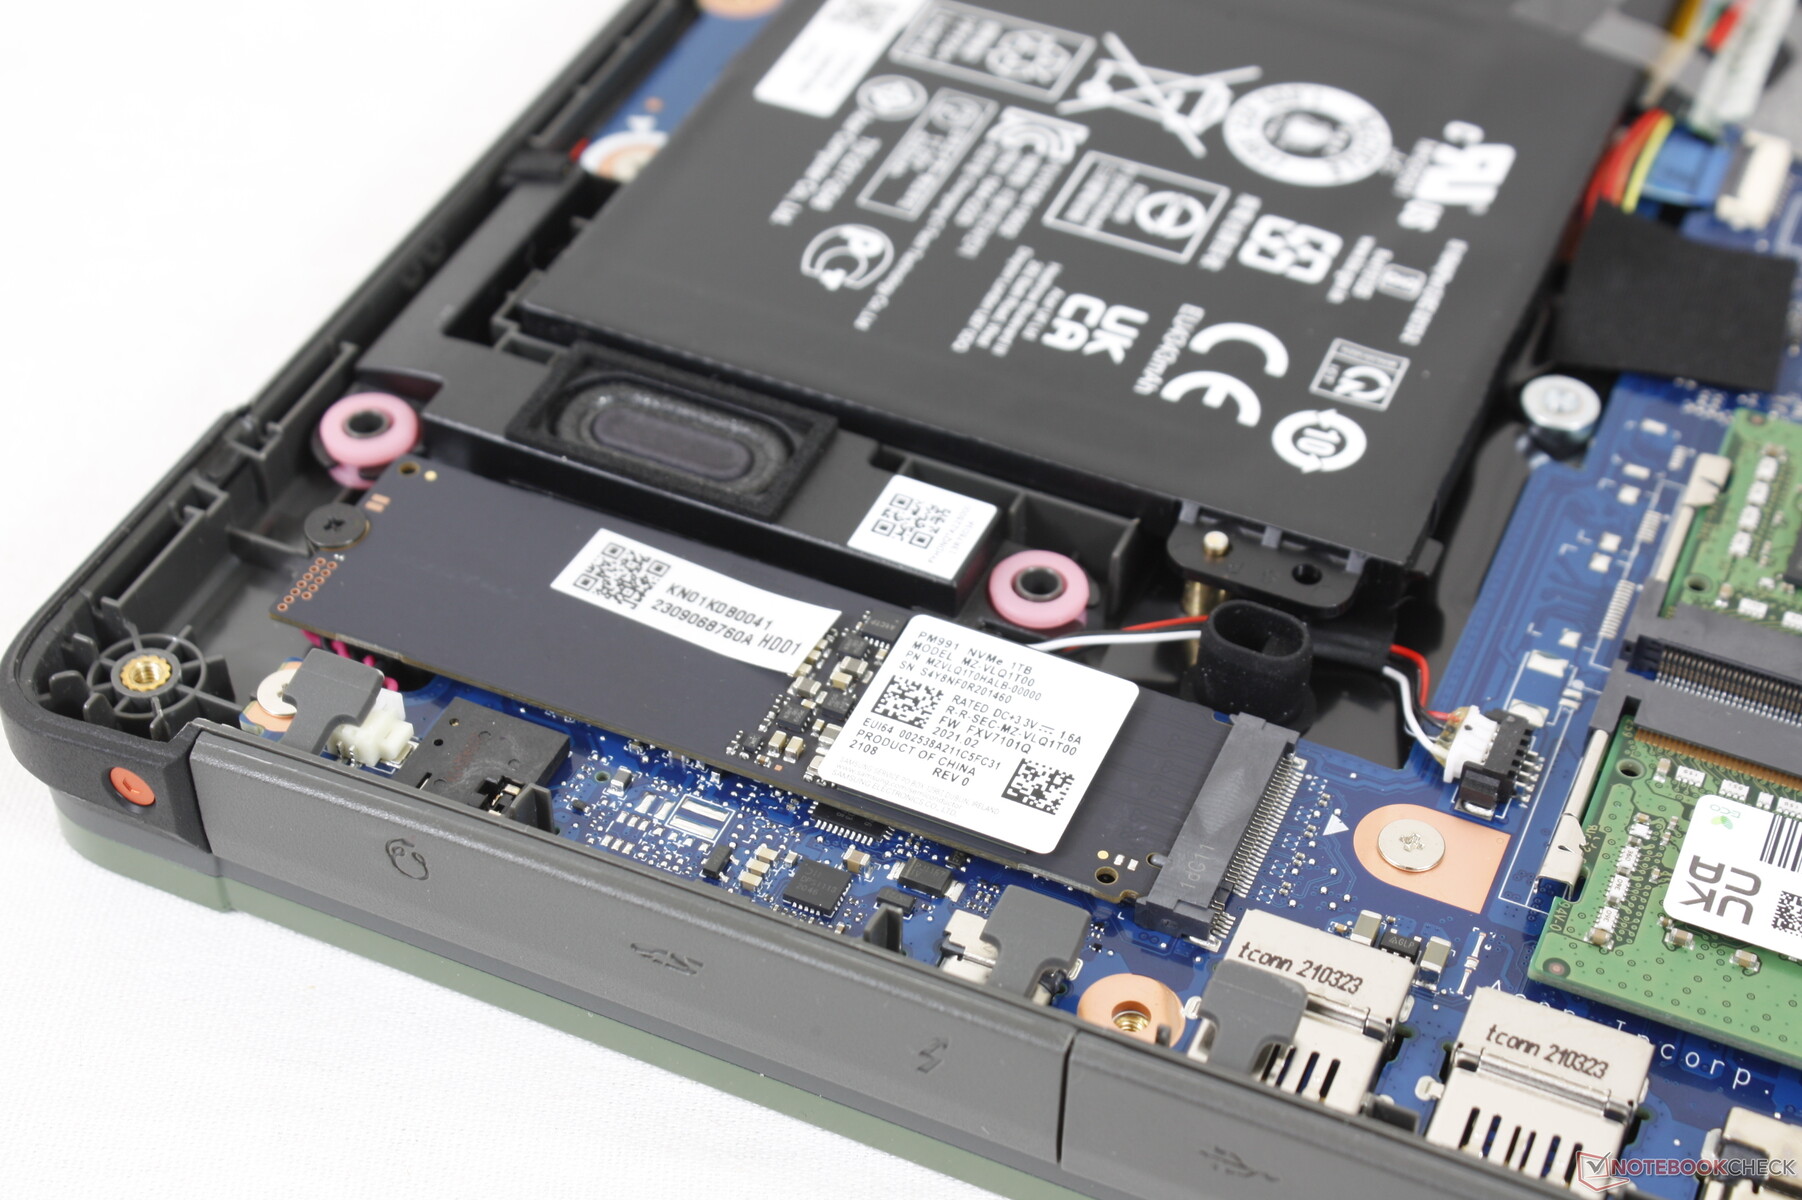
Dispositivos de armazenamento
Nossa unidade vem com uma unidade de 1 TB Samsung PM991 (não PM991a) que é uma SSD NVMe de médio alcance PCIe3. As taxas de leitura seqüencial atingem 2300 MB/s, mas a falta de um espalhador de calor para auxiliar no resfriamento significa que o desempenho cairá quando estressado, como mostram os resultados do nosso teste de leitura em loop de DiskSpd abaixo. Curiosamente, os usuários só são capazes de adicionar um segundo drive de armazenamento em alguns SKUs e não em todos.

| Drive Performance rating - Percent | |
| Acer Enduro Urban N3 EUN314 | |
| Durabook S14I | |
| Dell Latitude 5420 Rugged-P85G -8! | |
| Panasonic Toughbook FZ-55 MK2 | |
| Getac S410 -8! | |
* ... menor é melhor
Disk Throttling: DiskSpd Read Loop, Queue Depth 8
Desempenho da GPU
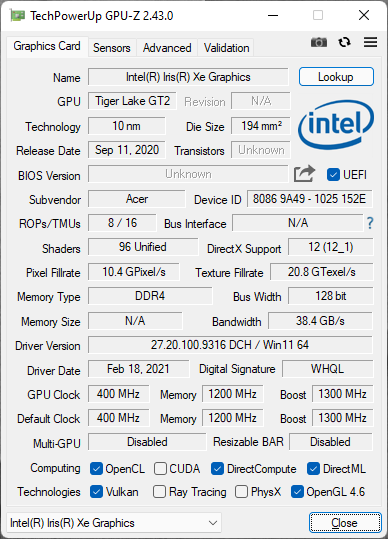
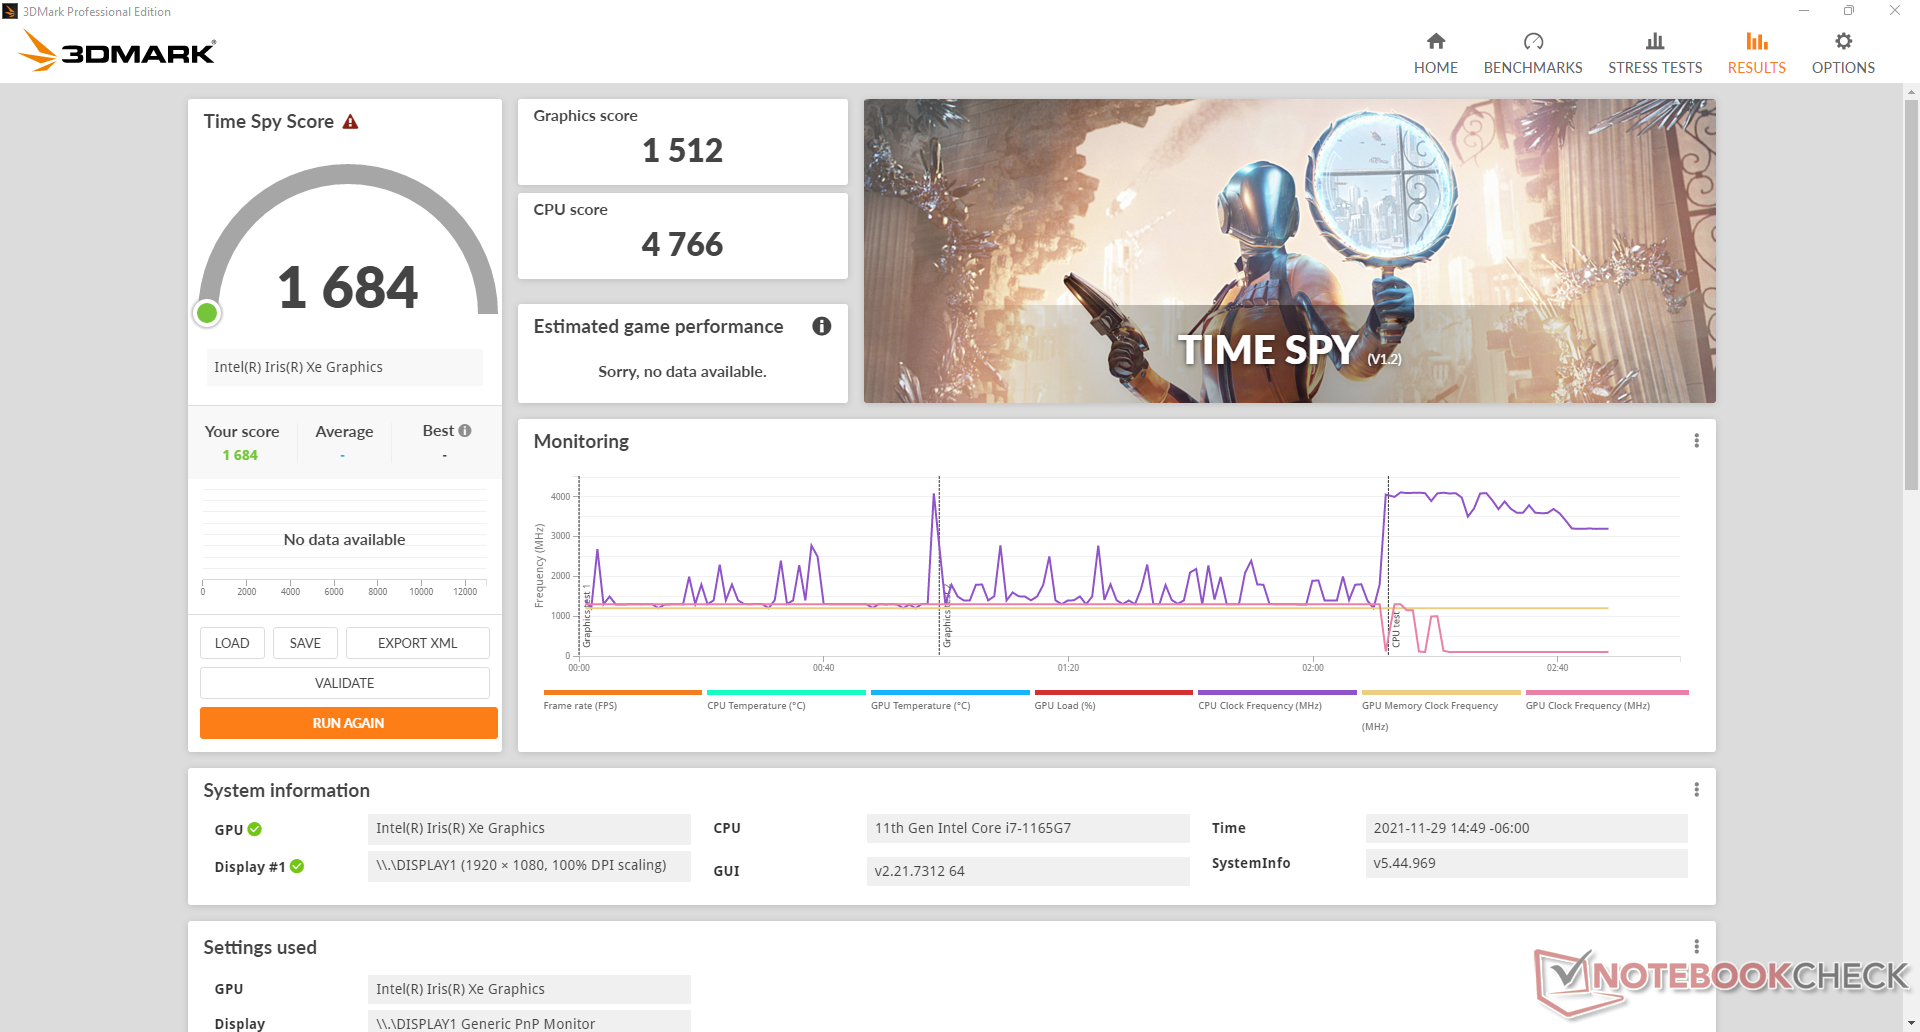
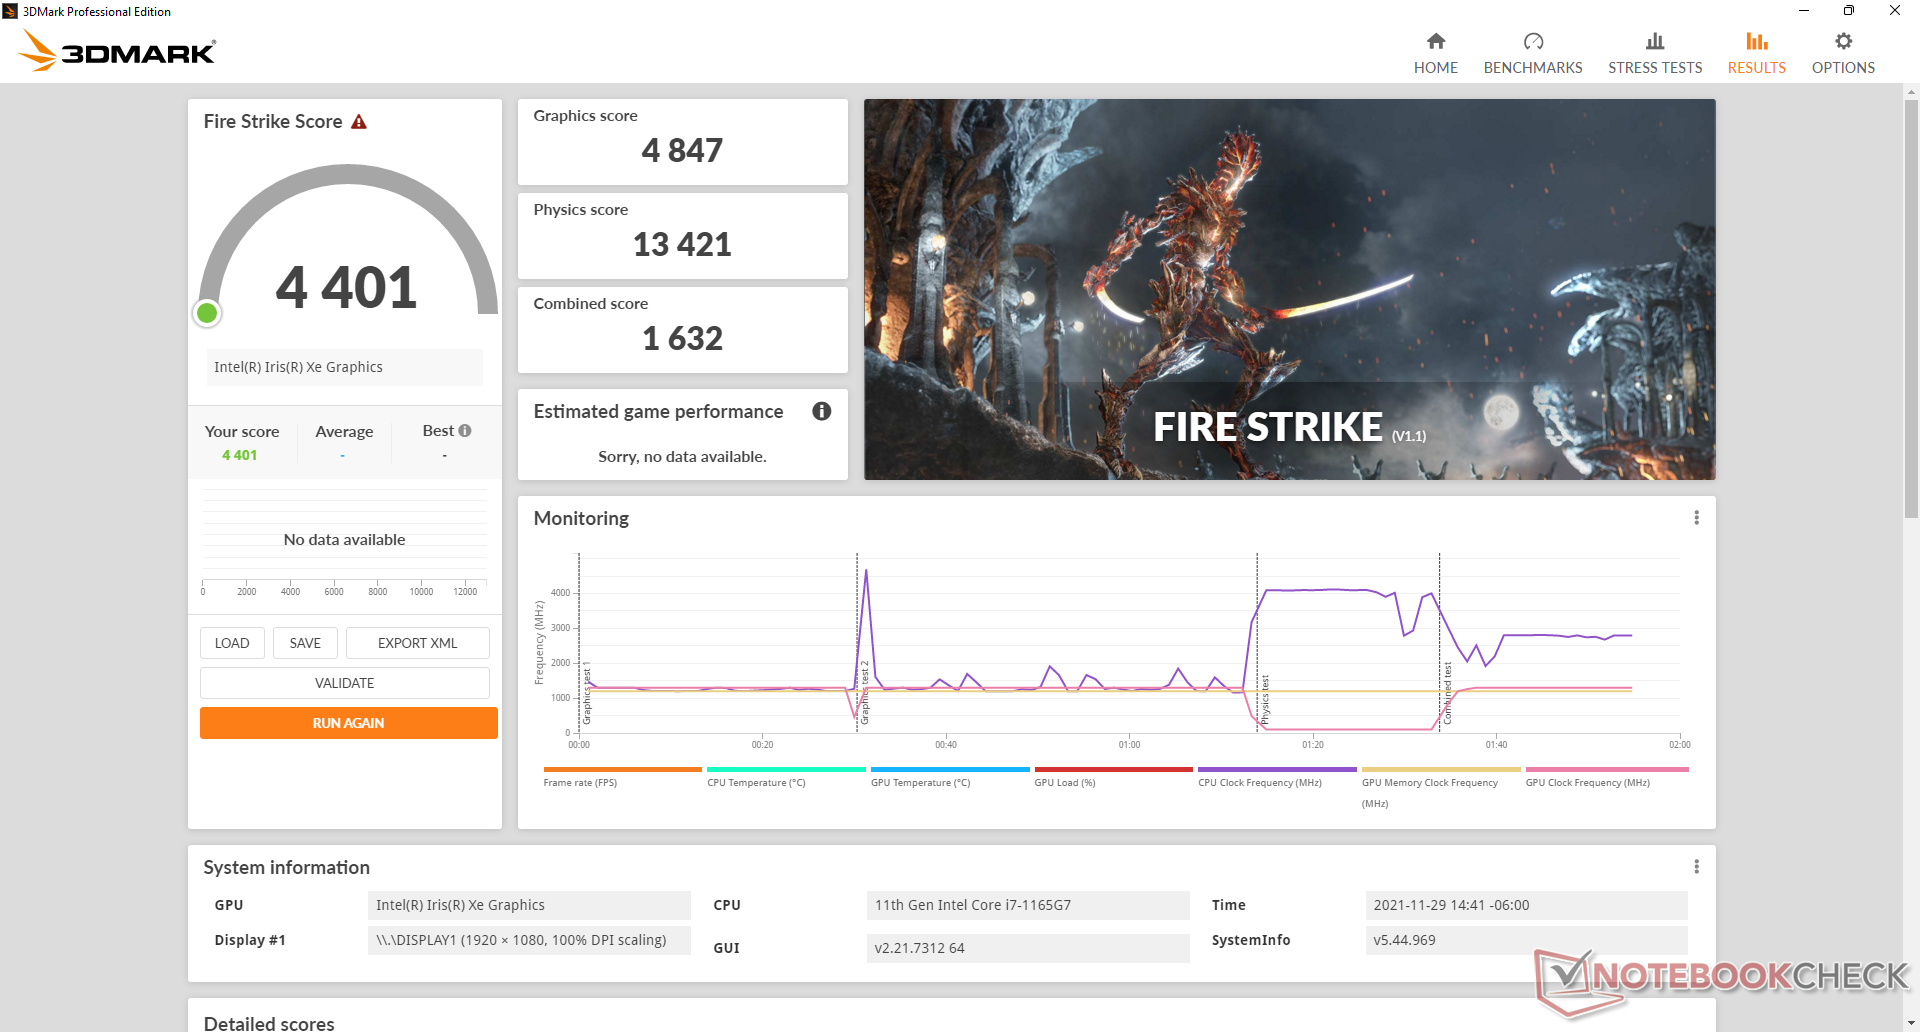
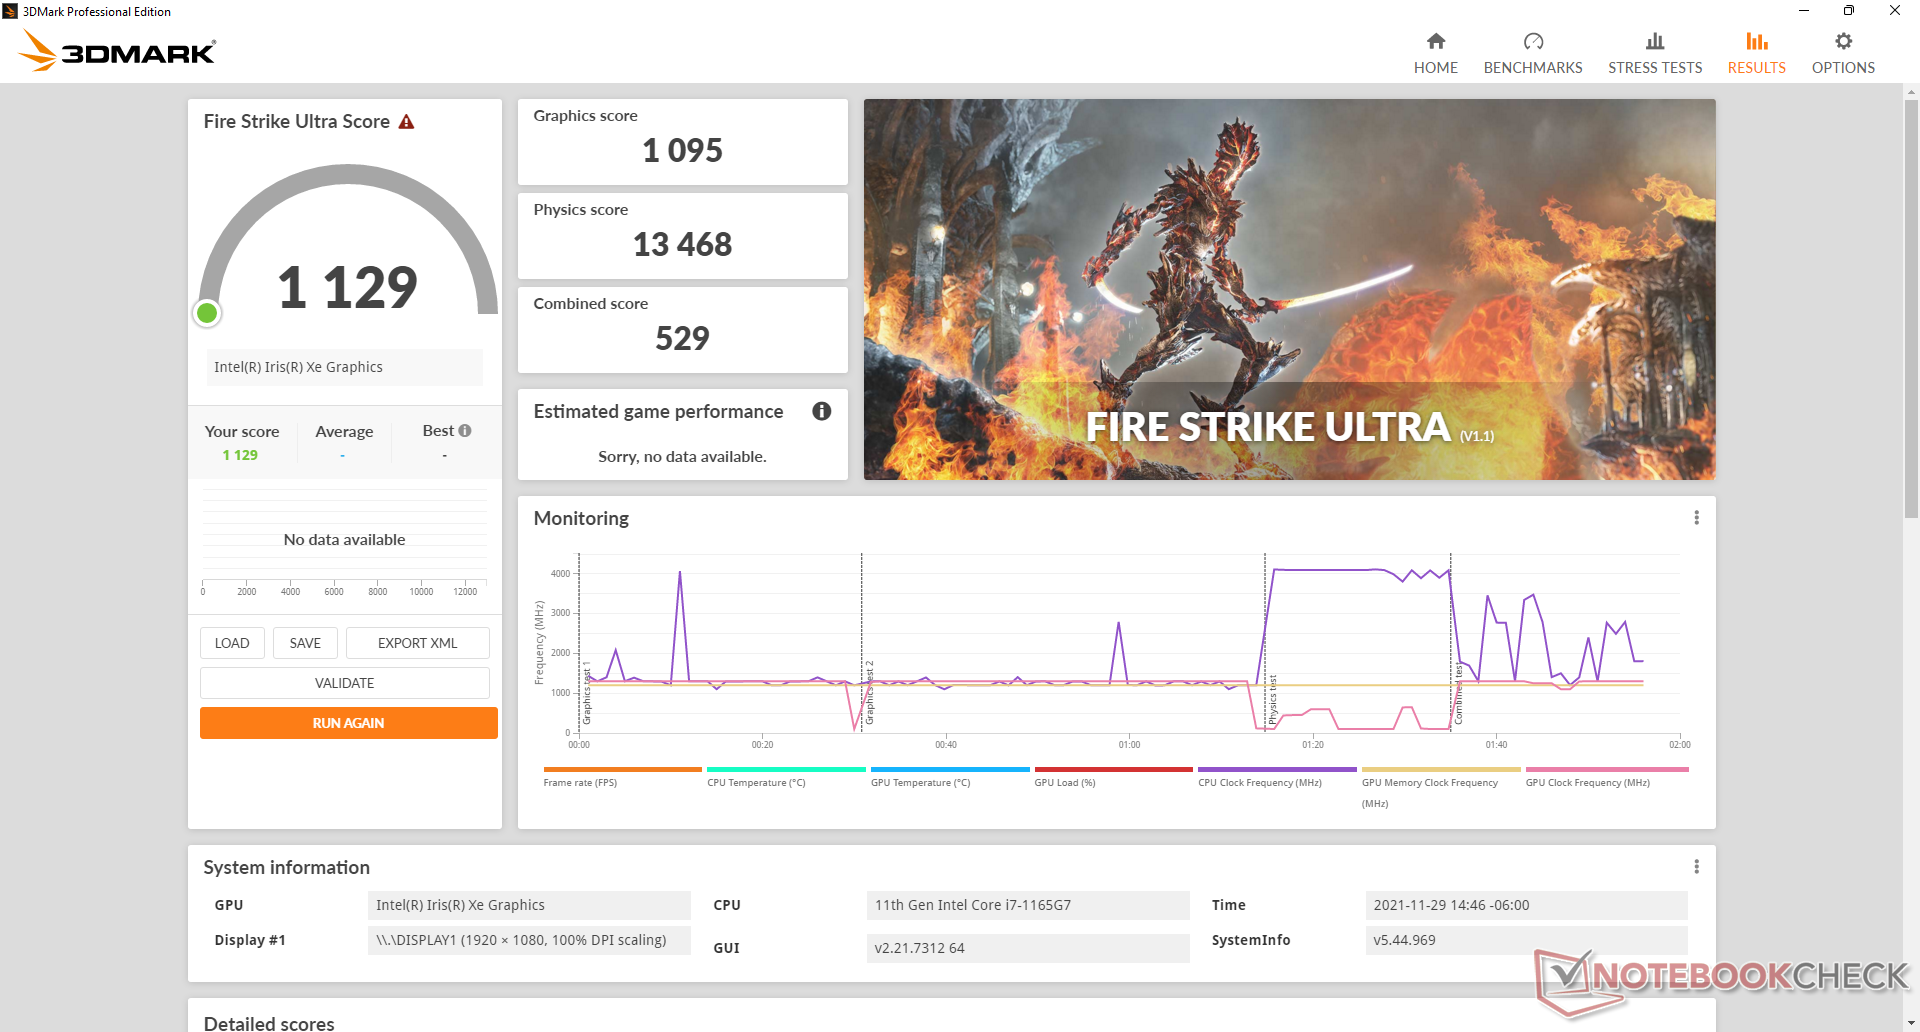
A integração Iris Xe 96 EUs A GPU está atuando onde esperamos que seja relativa à média em nosso banco de dados. Downgrading para o Core i5 SKU com a menor Iris Xe 80 EUs implicaria uma queda de desempenho de cerca de 30 a 40 por cento.
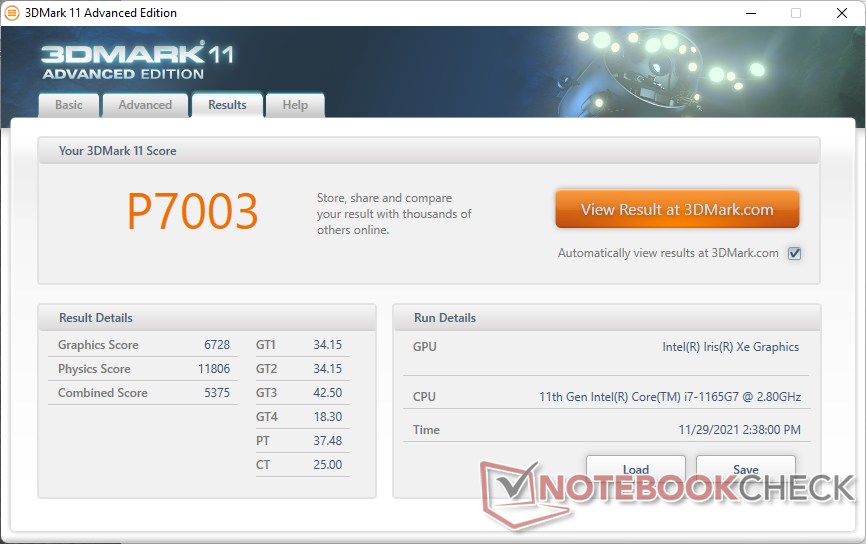
| 3DMark 11 Performance | 7003 pontos | |
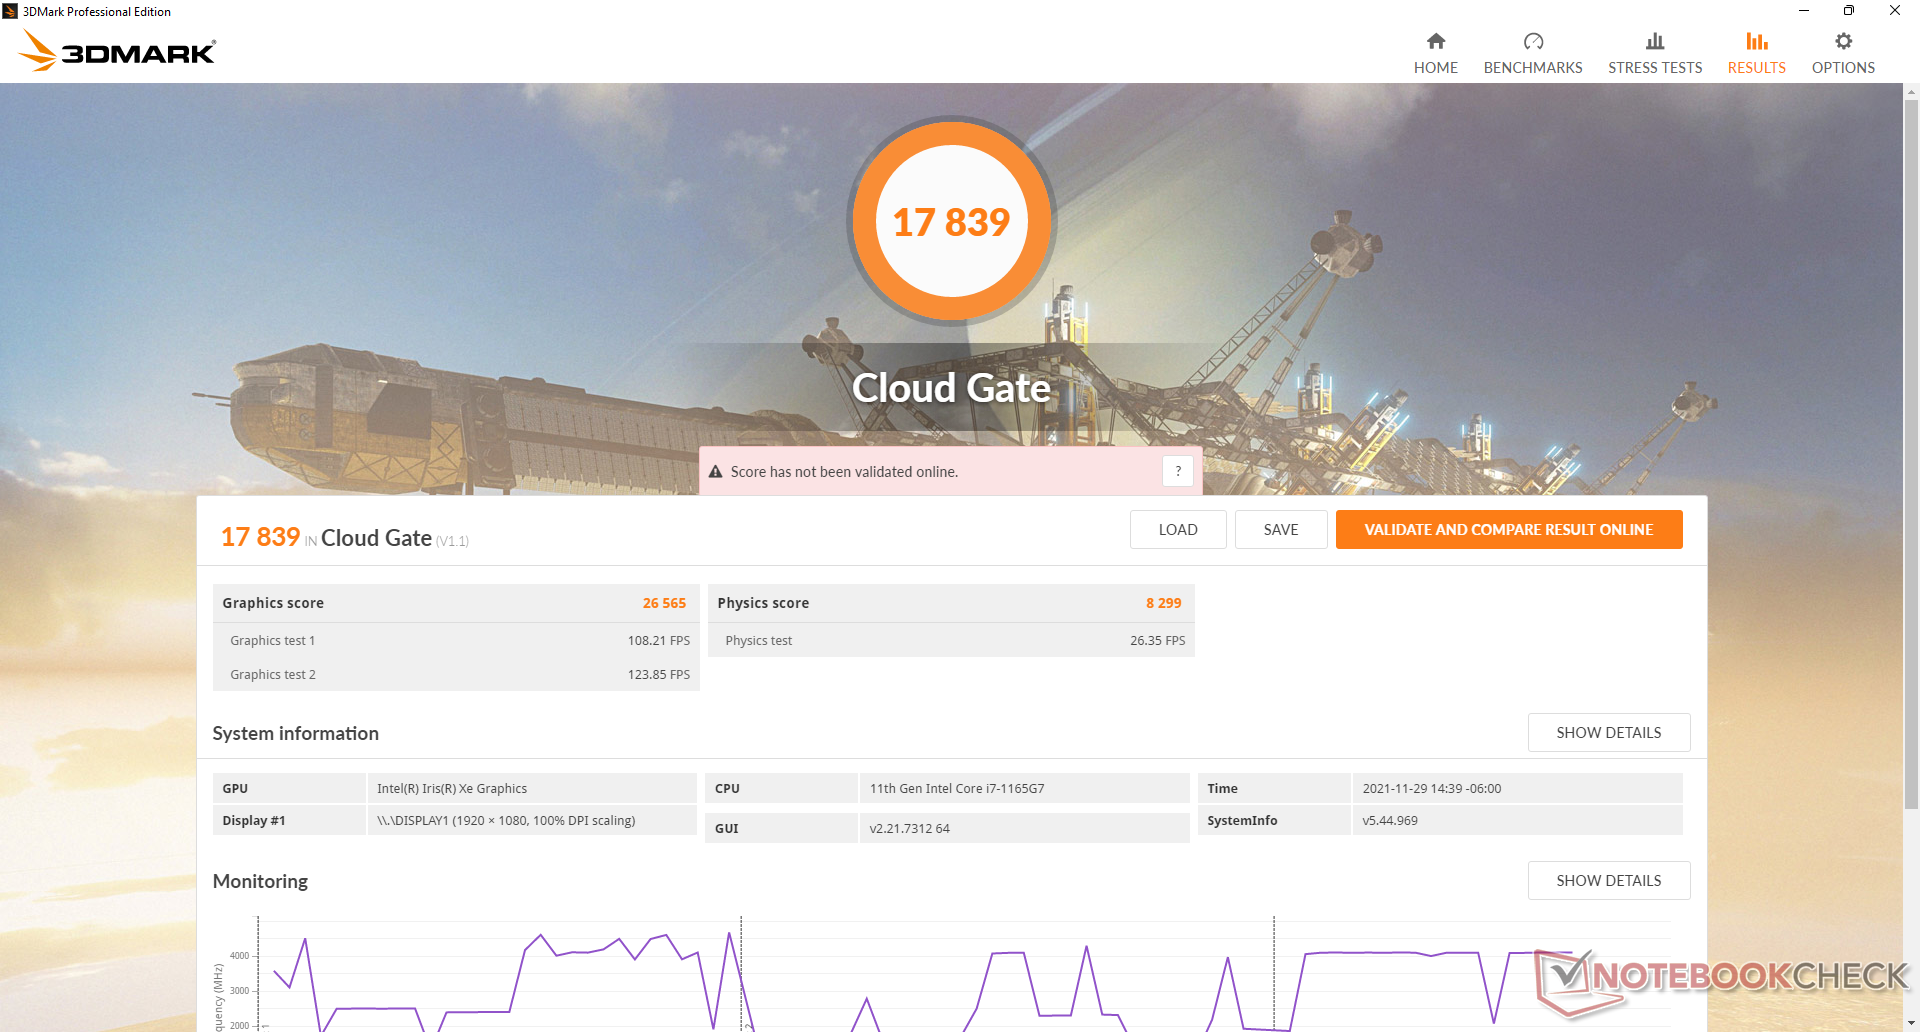
| 3DMark Cloud Gate Standard Score | 17839 pontos | |
| 3DMark Fire Strike Score | 4401 pontos | |
| 3DMark Time Spy Score | 1684 pontos | |
Ajuda | ||
| Far Cry 5 | |
| 1280x720 Low Preset AA:T | |
| Acer Enduro Urban N3 EUN314 | |
| Média Intel Iris Xe Graphics G7 96EUs (23 - 75, n=93) | |
| Dell Latitude 5420 Rugged-P85G | |
| Lenovo ThinkPad E14 G3-20Y7003SGE | |
| Dynabook Tecra A40-J-12E | |
| 1920x1080 Low Preset AA:T | |
| Média Intel Iris Xe Graphics G7 96EUs (15 - 48, n=41) | |
| Acer Enduro Urban N3 EUN314 | |
| Dynabook Tecra A40-J-12E | |
| 1920x1080 Medium Preset AA:T | |
| Média Intel Iris Xe Graphics G7 96EUs (14 - 39, n=91) | |
| Dell Latitude 5420 Rugged-P85G | |
| Acer Enduro Urban N3 EUN314 | |
| Lenovo ThinkPad E14 G3-20Y7003SGE | |
| Dynabook Tecra A40-J-12E | |
| 1920x1080 High Preset AA:T | |
| Média Intel Iris Xe Graphics G7 96EUs (10 - 35, n=89) | |
| Dell Latitude 5420 Rugged-P85G | |
| Acer Enduro Urban N3 EUN314 | |
| Lenovo ThinkPad E14 G3-20Y7003SGE | |
| Dynabook Tecra A40-J-12E | |
| 1920x1080 Ultra Preset AA:T | |
| Média Intel Iris Xe Graphics G7 96EUs (11 - 33, n=75) | |
| Acer Enduro Urban N3 EUN314 | |
| Dell Latitude 5420 Rugged-P85G | |
| Lenovo ThinkPad E14 G3-20Y7003SGE | |
| Dynabook Tecra A40-J-12E | |
Witcher 3 FPS Chart
| baixo | média | alto | ultra | |
|---|---|---|---|---|
| GTA V (2015) | 91.1 | 78.1 | 19.2 | 8.32 |
| The Witcher 3 (2015) | 89.5 | 57.3 | 29.2 | 13.4 |
| Dota 2 Reborn (2015) | 78.5 | 81.6 | 48.7 | 43.4 |
| Final Fantasy XV Benchmark (2018) | 39.9 | 22.1 | 15.9 | |
| X-Plane 11.11 (2018) | 22.1 | 41.4 | 36.5 | |
| Far Cry 5 (2018) | 49 | 22 | 21 | 20 |
| Strange Brigade (2018) | 82.9 | 34.1 | 28.2 | 22.7 |
Emissões
Ruído do sistema
O ruído do ventilador é silencioso quando ocioso na área de trabalho, sem aplicações em execução. Na maioria das vezes, no entanto, os usuários estarão navegando ou fazendo streaming de vídeo, o que induzirá um ruído do ventilador de 27,9 dB(A) contra um fundo silencioso de 23,8 dB(A). Tanto o tom quanto o ruído são baixos e fáceis de ignorar quando sentados a uma distância normal do laptop.
Cargas mais altas como jogos induzirão um ruído do ventilador de até 39 dB(A).
Nossa unidade de teste exibiria uma bobina de lamentação menor que, felizmente, só era perceptível ao colocar um ouvido perto das teclas do teclado.
Barulho
| Ocioso |
| 24.1 / 24.1 / 24.1 dB |
| Carga |
| 27.9 / 38.6 dB |
 | ||
30 dB silencioso 40 dB(A) audível 50 dB(A) ruidosamente alto |
||
min: | ||
| Acer Enduro Urban N3 EUN314 Iris Xe G7 96EUs, i7-1165G7, Samsung PM991 MZVLQ1T0HALB | Dell Latitude 5420 Rugged-P85G Radeon RX 540, i7-8650U, SK hynix PC401 NVMe 500 GB | Panasonic Toughbook FZ-55 MK2 Iris Xe G7 96EUs, i7-1185G7, Toshiba KIOXIA KBG4AZNV512G M.2 2280 OPAL | Durabook S14I Iris Xe G7 96EUs, i7-1165G7, UDinfo M2P M2P80DE512GBAEP | Getac S410 UHD Graphics 620, i5-8550U, CUKUSA 1 TB SATA SSD Q0526A | |
|---|---|---|---|---|---|
| Noise | -13% | -1% | -13% | -11% | |
| desligado / ambiente * (dB) | 23.8 | 28.3 -19% | 23.8 -0% | 25.2 -6% | 28.4 -19% |
| Idle Minimum * (dB) | 24.1 | 28.3 -17% | 24 -0% | 25.2 -5% | 28.4 -18% |
| Idle Average * (dB) | 24.1 | 28.3 -17% | 24 -0% | 25.2 -5% | 28.4 -18% |
| Idle Maximum * (dB) | 24.1 | 28.3 -17% | 24 -0% | 34.5 -43% | 28.4 -18% |
| Load Average * (dB) | 27.9 | 29.9 -7% | 26.7 4% | 34.5 -24% | 30.3 -9% |
| Witcher 3 ultra * (dB) | 35.7 | ||||
| Load Maximum * (dB) | 38.6 | 38 2% | 41.7 -8% | 36.2 6% | 33.3 14% |
* ... menor é melhor
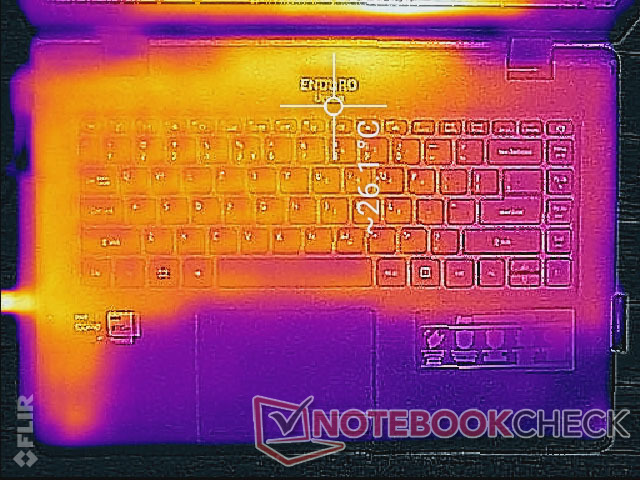
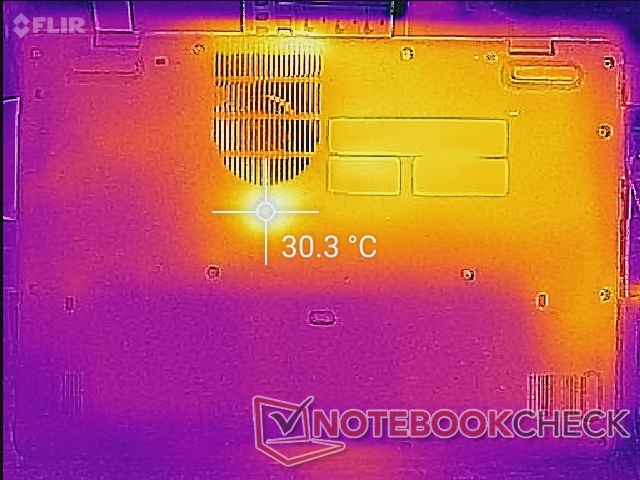
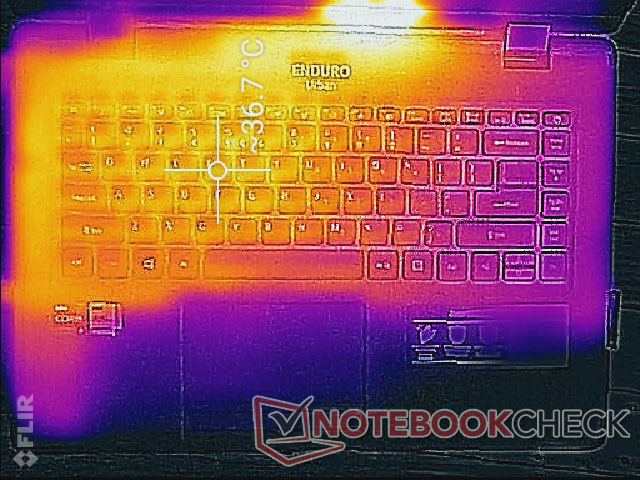
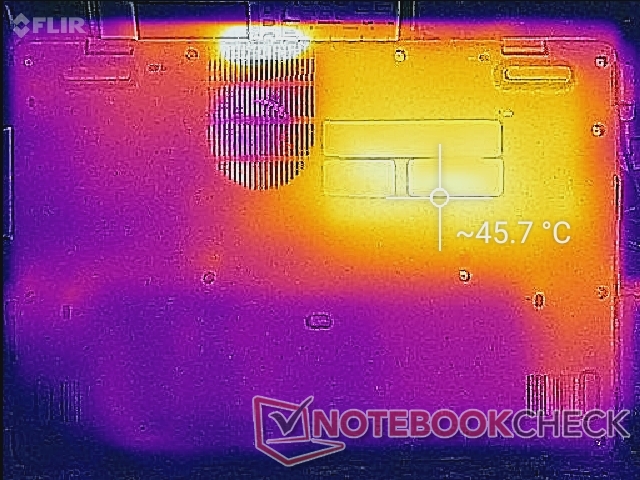
Temperatura
As temperaturas superficiais são mais quentes na metade esquerda do laptop quando comparadas com a metade direita devido à forma como a solução de resfriamento é projetada. Os pontos quentes podem atingir até 37 C e 46 C na parte superior e inferior, respectivamente, enquanto o Durabook S14I mais espesso ficaria em 39 C em ambos os lados quando sujeito a condições similares.
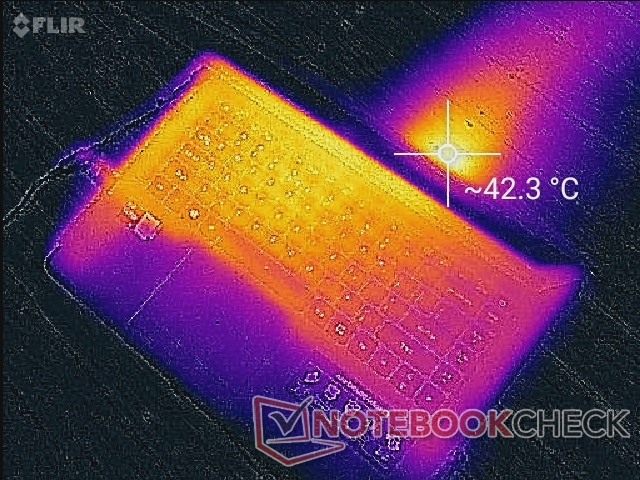
(+) A temperatura máxima no lado superior é 37.8 °C / 100 F, em comparação com a média de 34.3 °C / 94 F , variando de 21.2 a 62.5 °C para a classe Office.
(-) A parte inferior aquece até um máximo de 45.8 °C / 114 F, em comparação com a média de 36.8 °C / 98 F
(+) Em uso inativo, a temperatura média para o lado superior é 24.7 °C / 76 F, em comparação com a média do dispositivo de 29.5 °C / ### class_avg_f### F.
(+) Os apoios para as mãos e o touchpad são mais frios que a temperatura da pele, com um máximo de 28.6 °C / 83.5 F e, portanto, são frios ao toque.
(±) A temperatura média da área do apoio para as mãos de dispositivos semelhantes foi 27.5 °C / 81.5 F (-1.1 °C / -2 F).
| Acer Enduro Urban N3 EUN314 Intel Core i7-1165G7, Intel Iris Xe Graphics G7 96EUs | Dell Latitude 5420 Rugged-P85G Intel Core i7-8650U, AMD Radeon RX 540 | Panasonic Toughbook FZ-55 MK2 Intel Core i7-1185G7, Intel Iris Xe Graphics G7 96EUs | Durabook S14I Intel Core i7-1165G7, Intel Iris Xe Graphics G7 96EUs | Getac S410 Intel Core i7-8550U, Intel UHD Graphics 620 | |
|---|---|---|---|---|---|
| Heat | -7% | -5% | -4% | -13% | |
| Maximum Upper Side * (°C) | 37.8 | 42.2 -12% | 36.2 4% | 36.4 4% | 42.6 -13% |
| Maximum Bottom * (°C) | 45.8 | 42 8% | 42.2 8% | 38.6 16% | 49 -7% |
| Idle Upper Side * (°C) | 26.4 | 31.6 -20% | 31 -17% | 32.6 -23% | 30.8 -17% |
| Idle Bottom * (°C) | 30.2 | 31.8 -5% | 34 -13% | 33.8 -12% | 34.4 -14% |
* ... menor é melhor
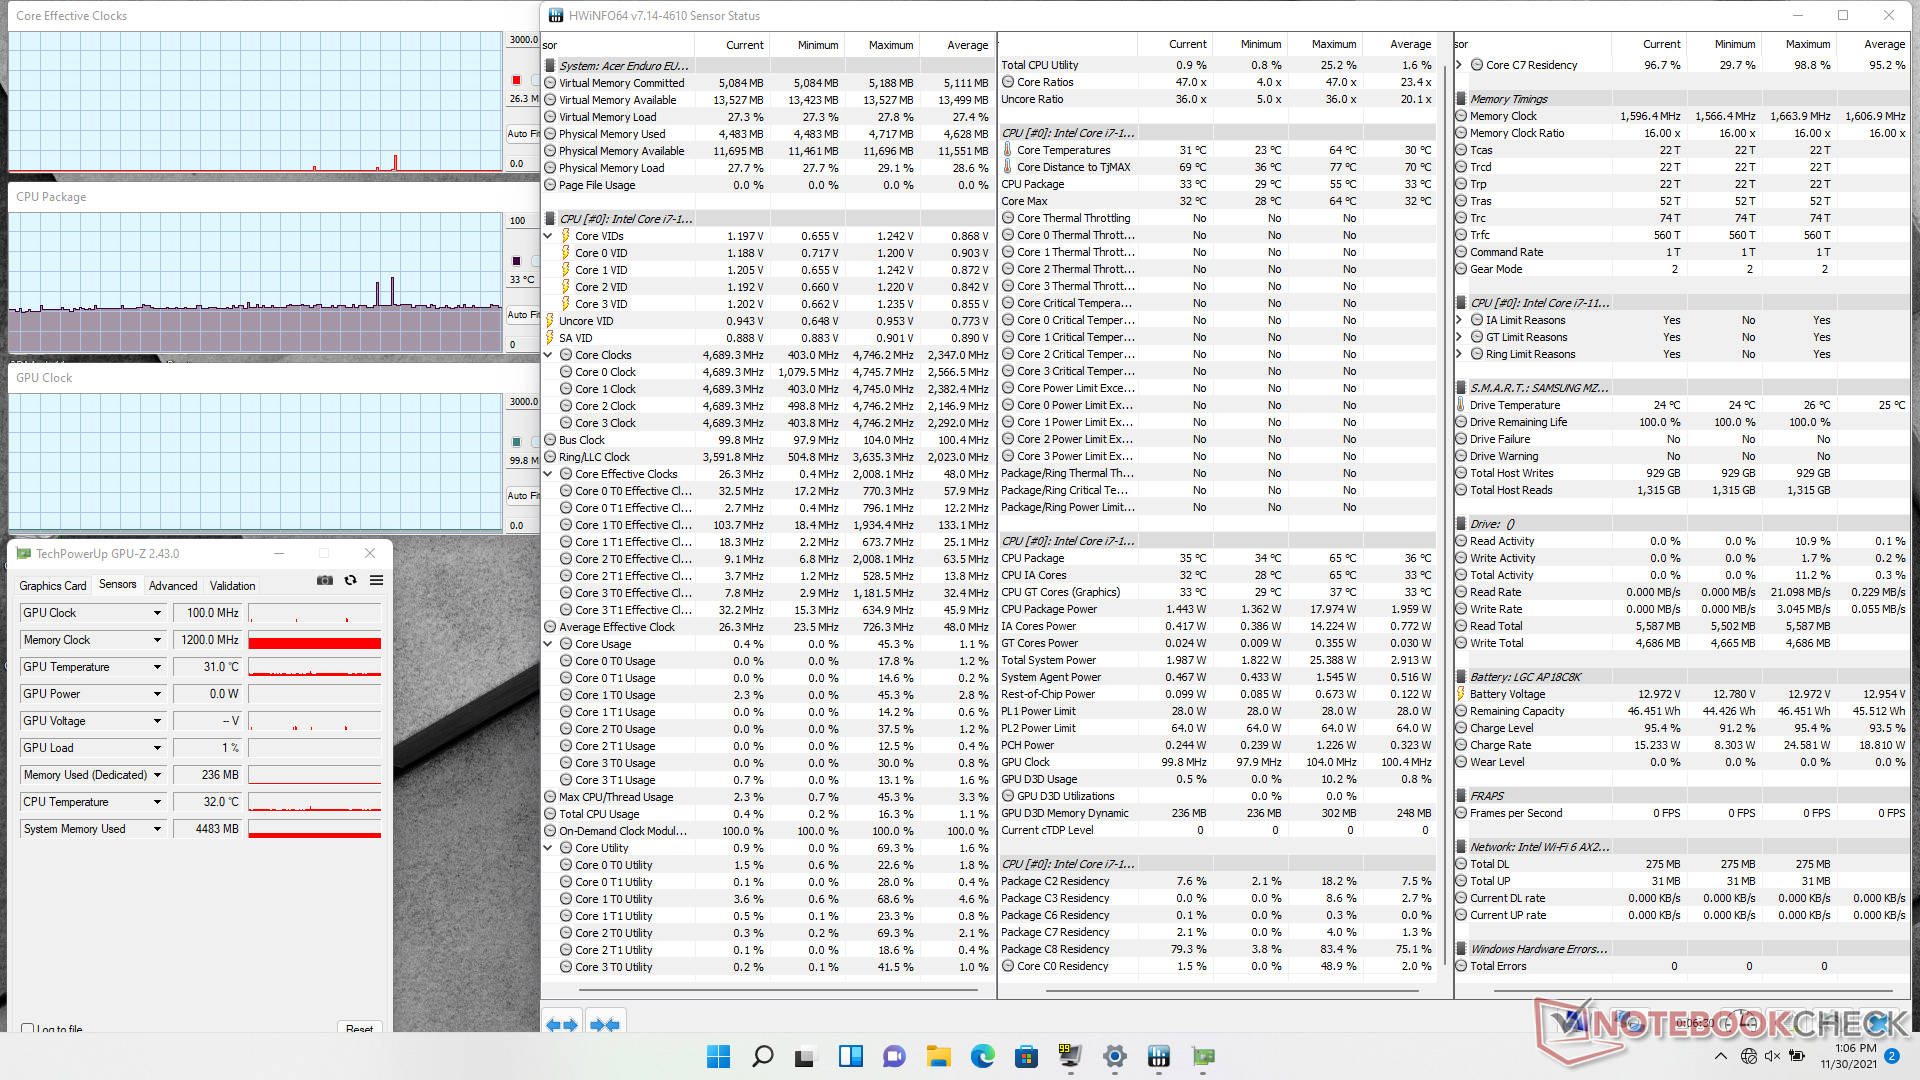
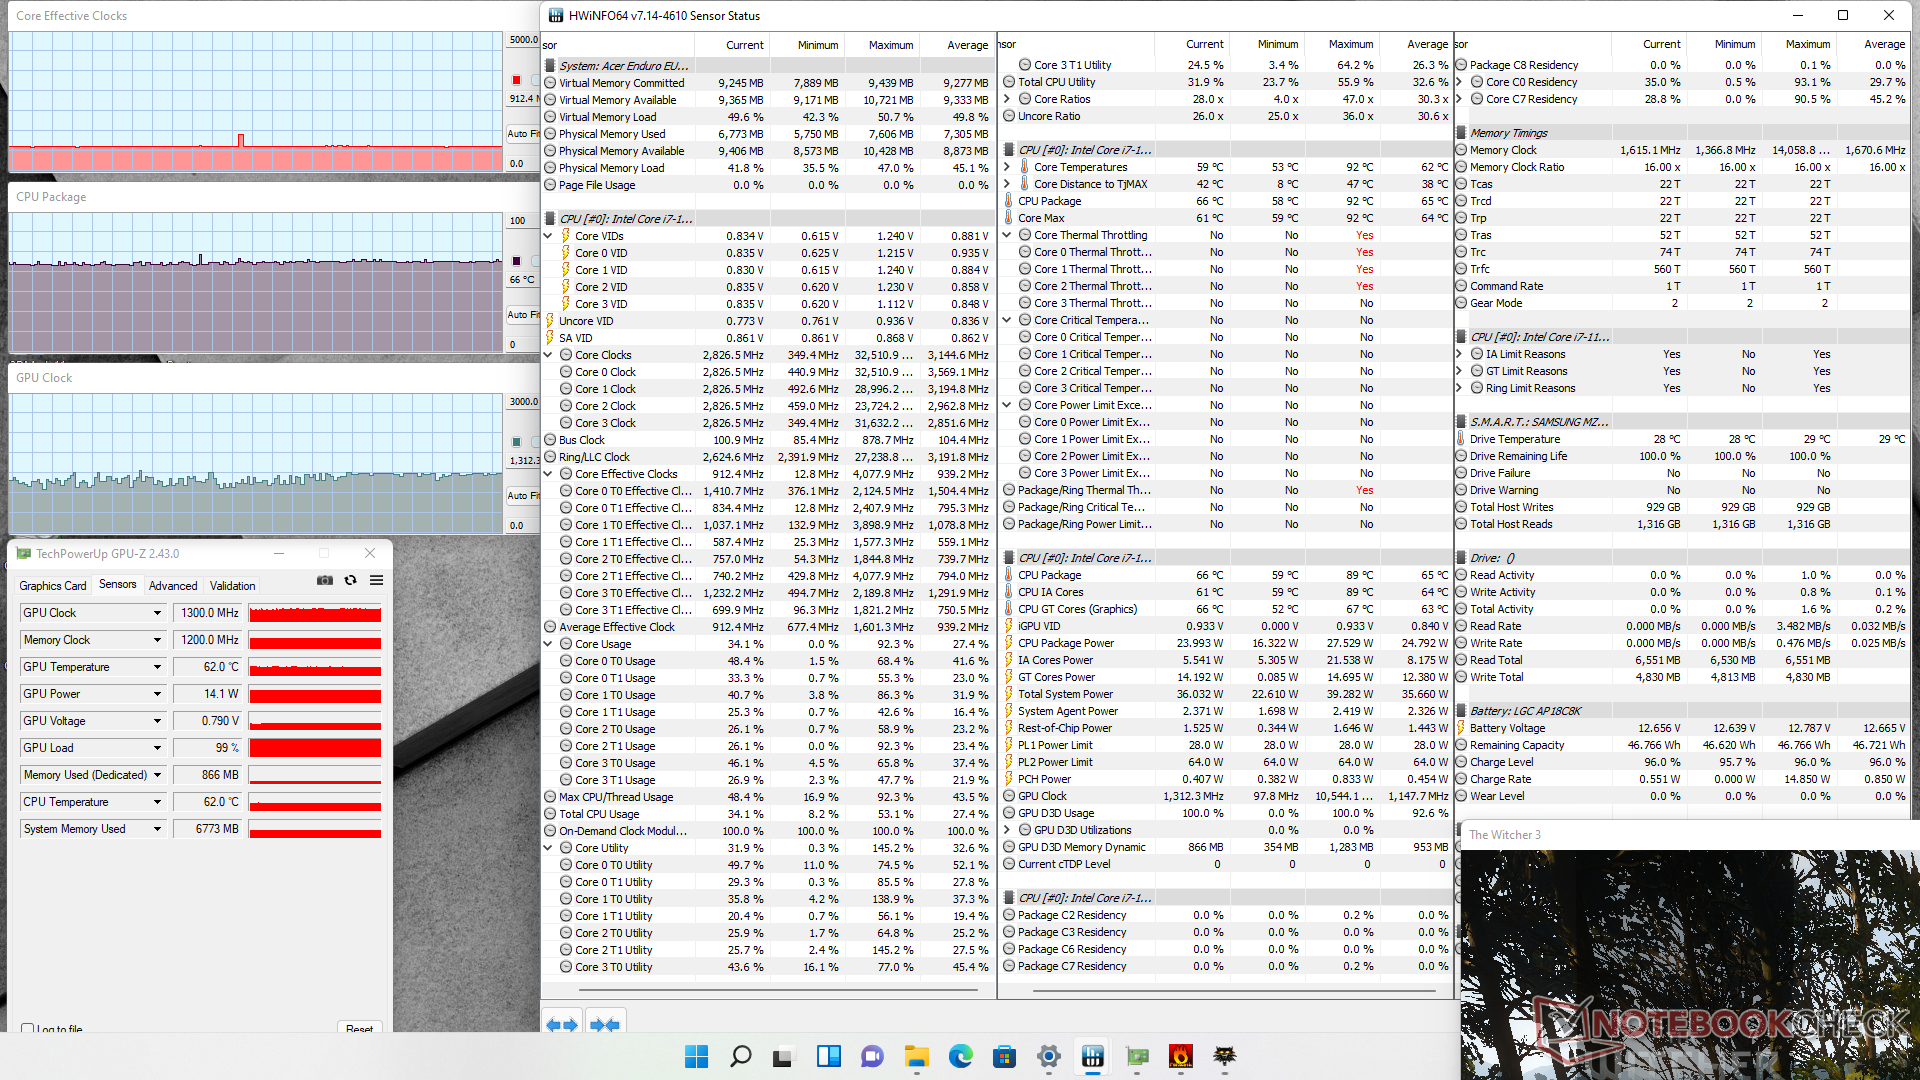
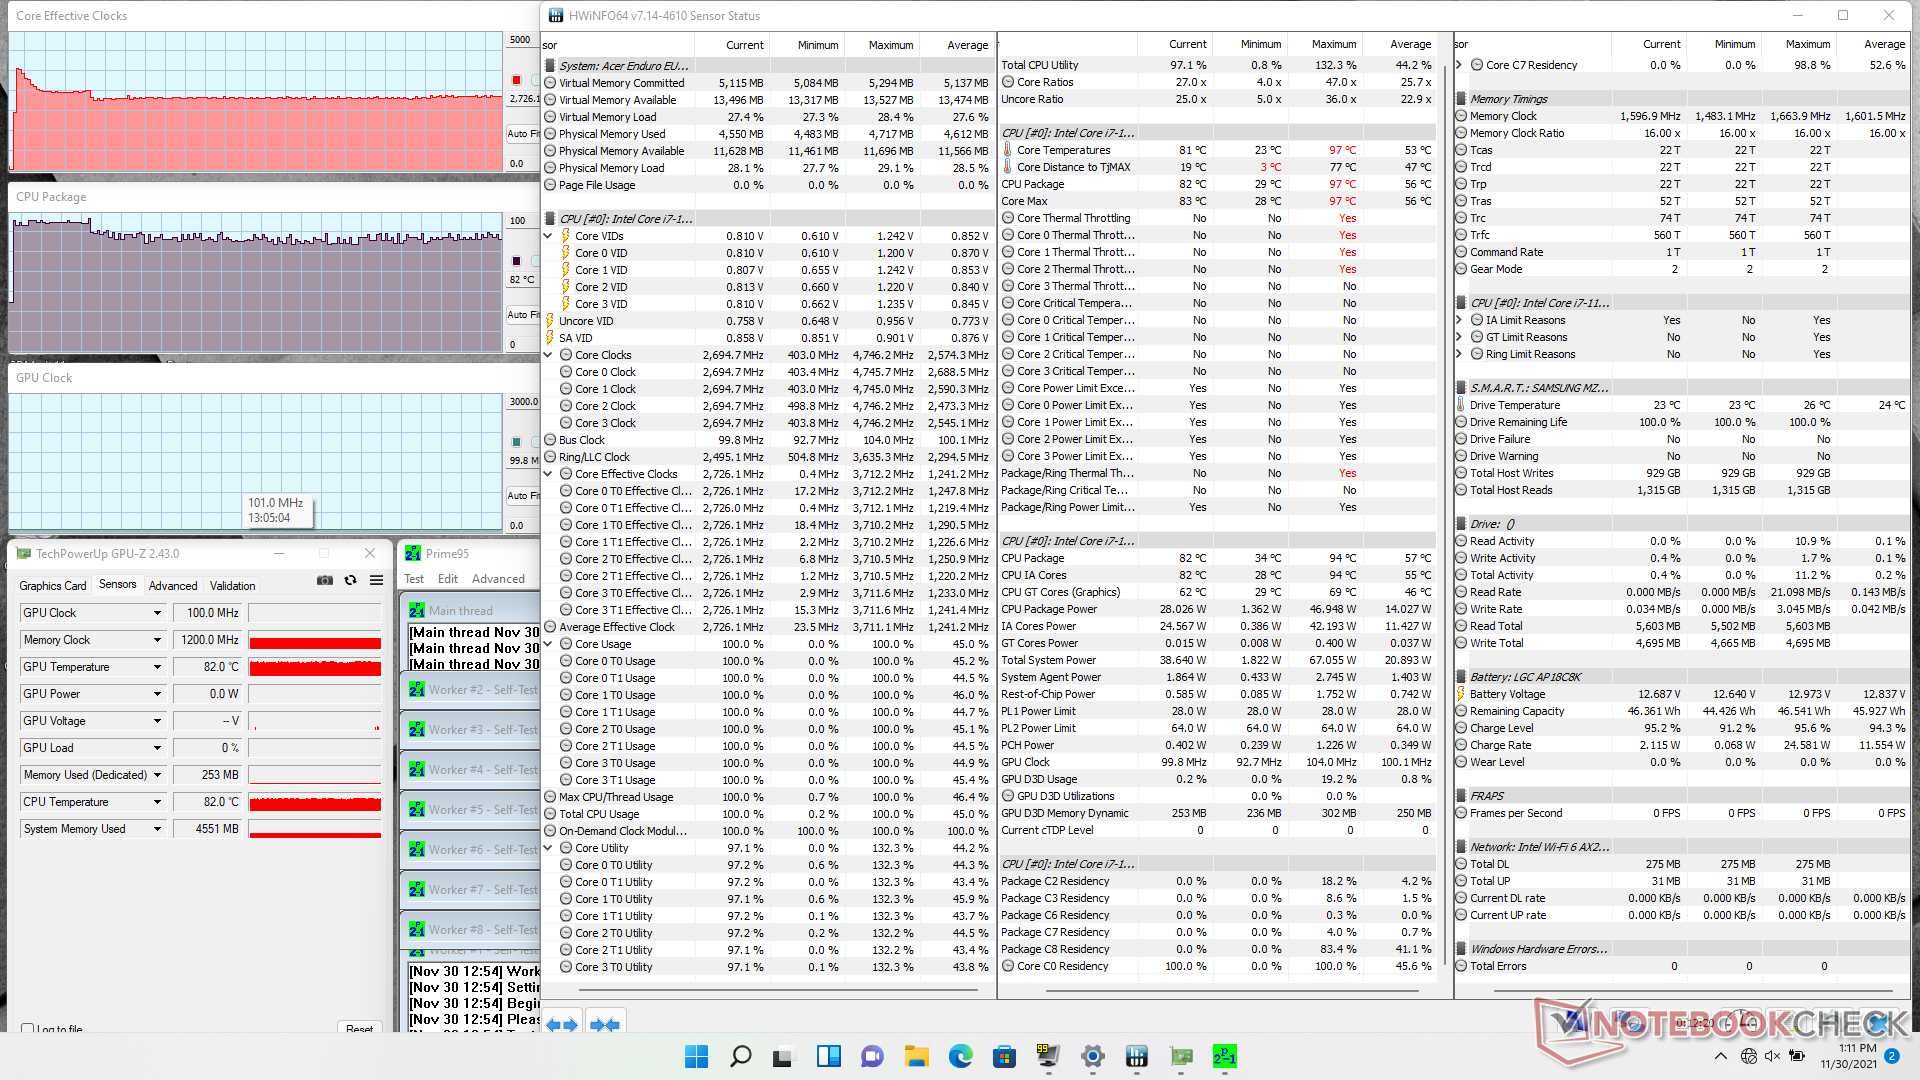
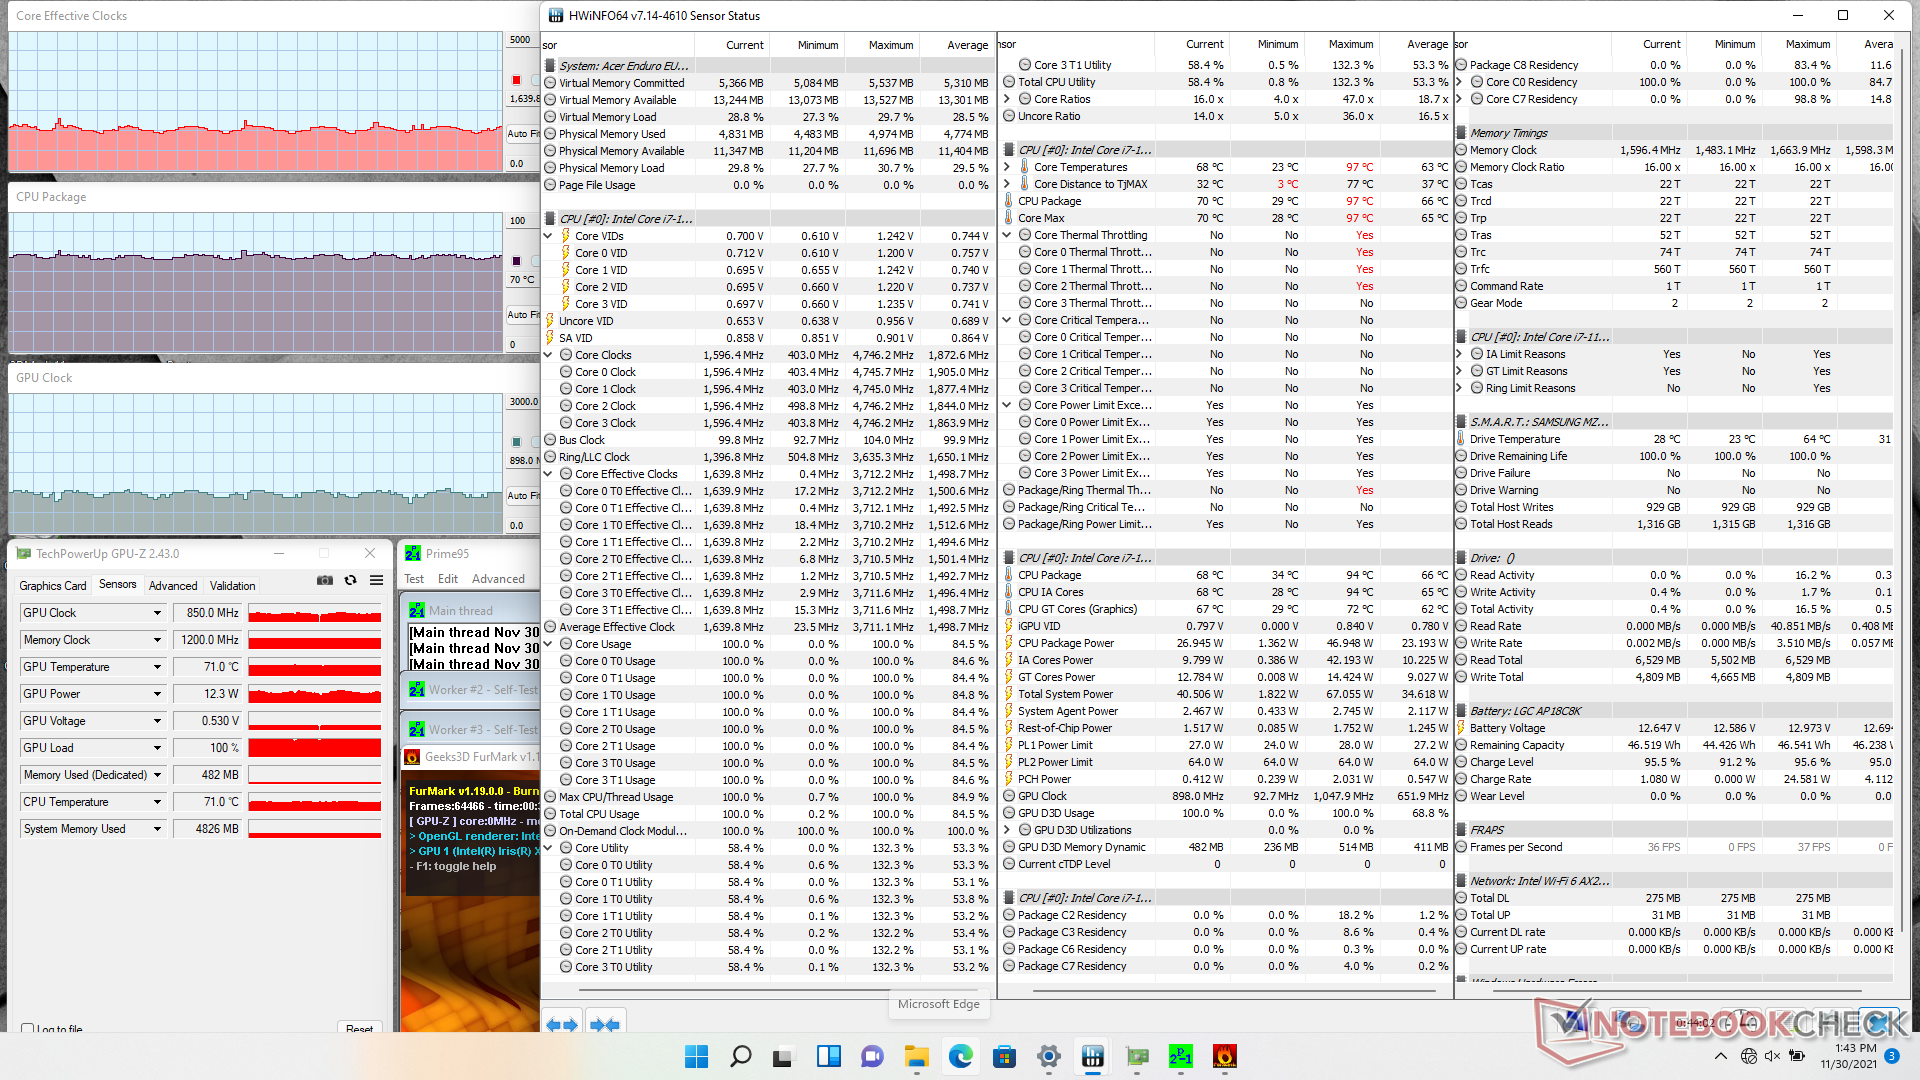
Teste de estresse
Ao executar Prime95 para enfatizar a CPU, as taxas de relógio aumentariam para 3,7 GHz no primeiro segundo ou dois antes de cair para 2,9 GHz e depois, finalmente, para 2,7 GHz. A temperatura central e a potência do pacote da CPU se estabilizariam em 82 C e 28 W, respectivamente. O Durabook S14I se estabilizaria a taxas de relógio mais lentas na faixa de 1,8 a 1,9 GHz, mas também a uma temperatura central mais fria de 63 C.
O funcionamento com baterias limitará o desempenho. Um teste 3DMark 11 na potência da bateria retornaria as pontuações de Física e Gráficos de 10264 e 5615 pontos, respectivamente, em comparação com 11806 e 6728 pontos quando em rede elétrica.
| RelógioCPU (GHz) | RelógioGPU (MHz) | Temperaturamédiada CPU (°C) | |
| System Idle | -- | --33 | |
| Prime95 Stress | 2.7 | --82 | |
| Prime95 + FurMark Stress | 1.4 - 1.6 | 800 - 950 | 66 - 71 |
| Witcher 3 Stress | 0.9 | ~1300 | 66 |
Oradores

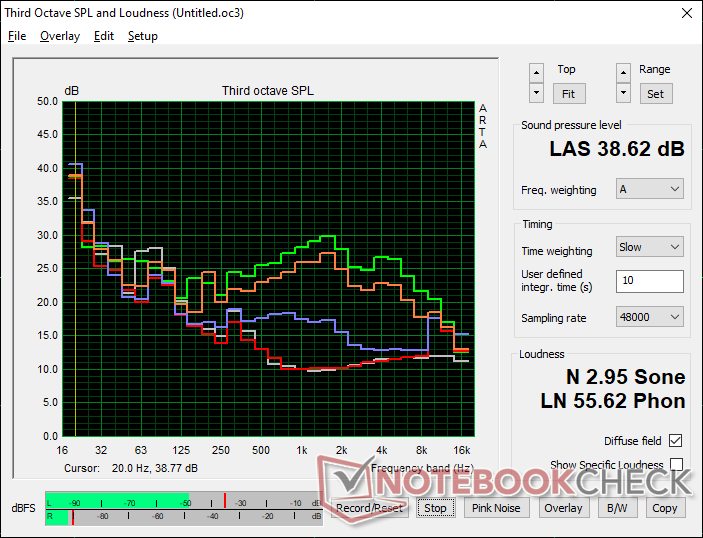
Acer Enduro Urban N3 EUN314 análise de áudio
(±) | o volume do alto-falante é médio, mas bom (###valor### dB)
Graves 100 - 315Hz
(-) | quase nenhum baixo - em média 21.2% menor que a mediana
(±) | a linearidade dos graves é média (14.2% delta para a frequência anterior)
Médios 400 - 2.000 Hz
(+) | médios equilibrados - apenas 4.2% longe da mediana
(±) | a linearidade dos médios é média (7.9% delta para frequência anterior)
Altos 2 - 16 kHz
(±) | máximos mais altos - em média 5.5% maior que a mediana
(±) | a linearidade dos máximos é média (8.6% delta para frequência anterior)
Geral 100 - 16.000 Hz
(±) | a linearidade do som geral é média (23% diferença em relação à mediana)
Comparado com a mesma classe
» 64% de todos os dispositivos testados nesta classe foram melhores, 7% semelhantes, 29% piores
» O melhor teve um delta de 7%, a média foi 21%, o pior foi 53%
Comparado com todos os dispositivos testados
» 69% de todos os dispositivos testados foram melhores, 5% semelhantes, 26% piores
» O melhor teve um delta de 4%, a média foi 23%, o pior foi 134%
Apple MacBook 12 (Early 2016) 1.1 GHz análise de áudio
(+) | os alto-falantes podem tocar relativamente alto (###valor### dB)
Graves 100 - 315Hz
(±) | graves reduzidos - em média 11.3% menor que a mediana
(±) | a linearidade dos graves é média (14.2% delta para a frequência anterior)
Médios 400 - 2.000 Hz
(+) | médios equilibrados - apenas 2.4% longe da mediana
(+) | médios são lineares (5.5% delta para frequência anterior)
Altos 2 - 16 kHz
(+) | agudos equilibrados - apenas 2% longe da mediana
(+) | os máximos são lineares (4.5% delta da frequência anterior)
Geral 100 - 16.000 Hz
(+) | o som geral é linear (10.2% diferença em relação à mediana)
Comparado com a mesma classe
» 7% de todos os dispositivos testados nesta classe foram melhores, 2% semelhantes, 90% piores
» O melhor teve um delta de 5%, a média foi 18%, o pior foi 53%
Comparado com todos os dispositivos testados
» 5% de todos os dispositivos testados foram melhores, 1% semelhantes, 94% piores
» O melhor teve um delta de 4%, a média foi 23%, o pior foi 134%
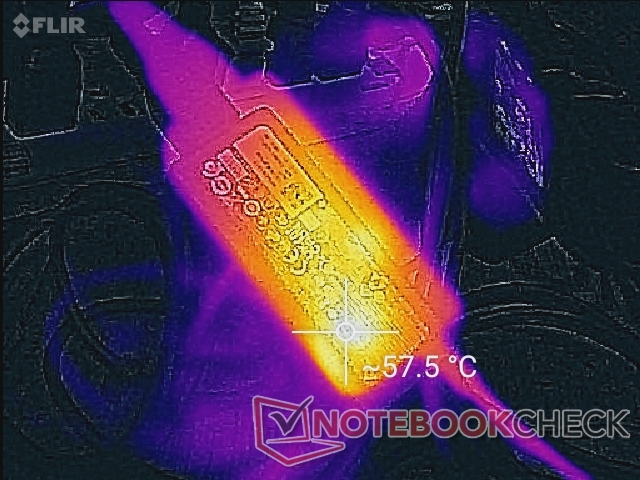
Gestão de energia
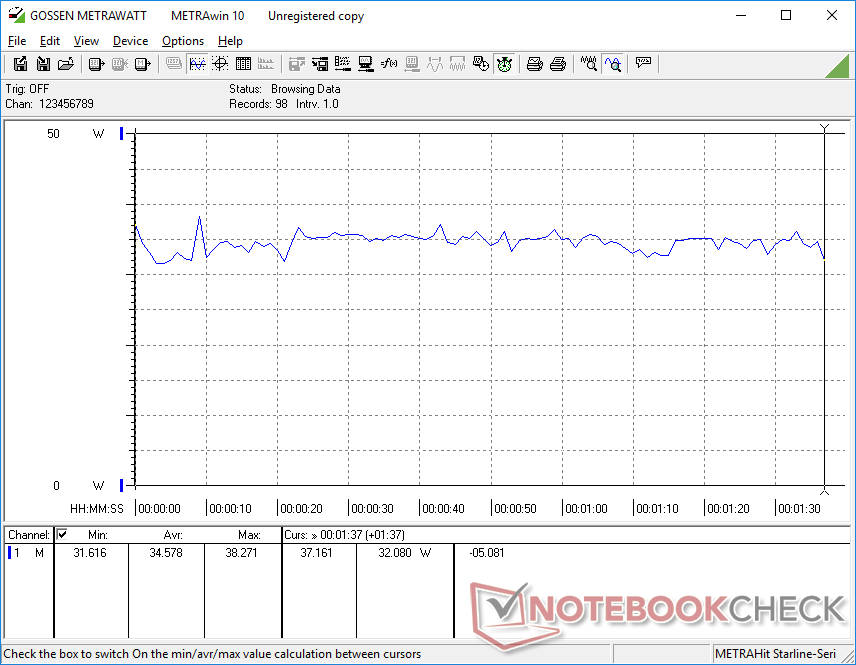
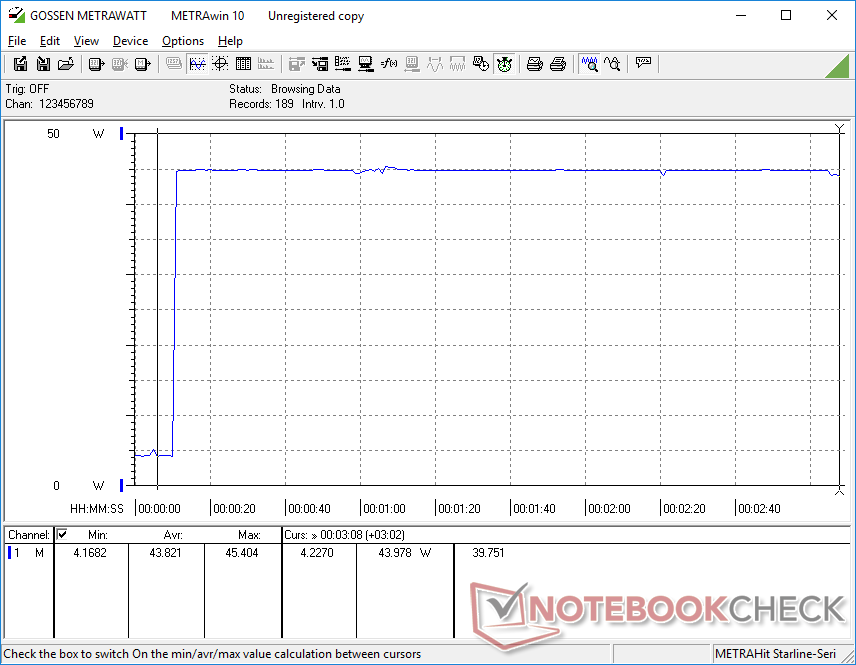
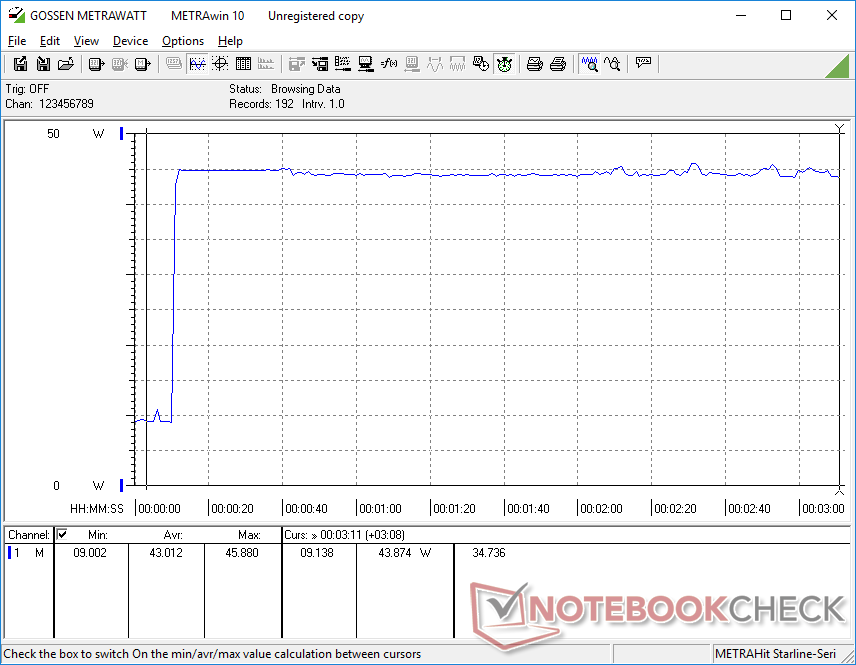
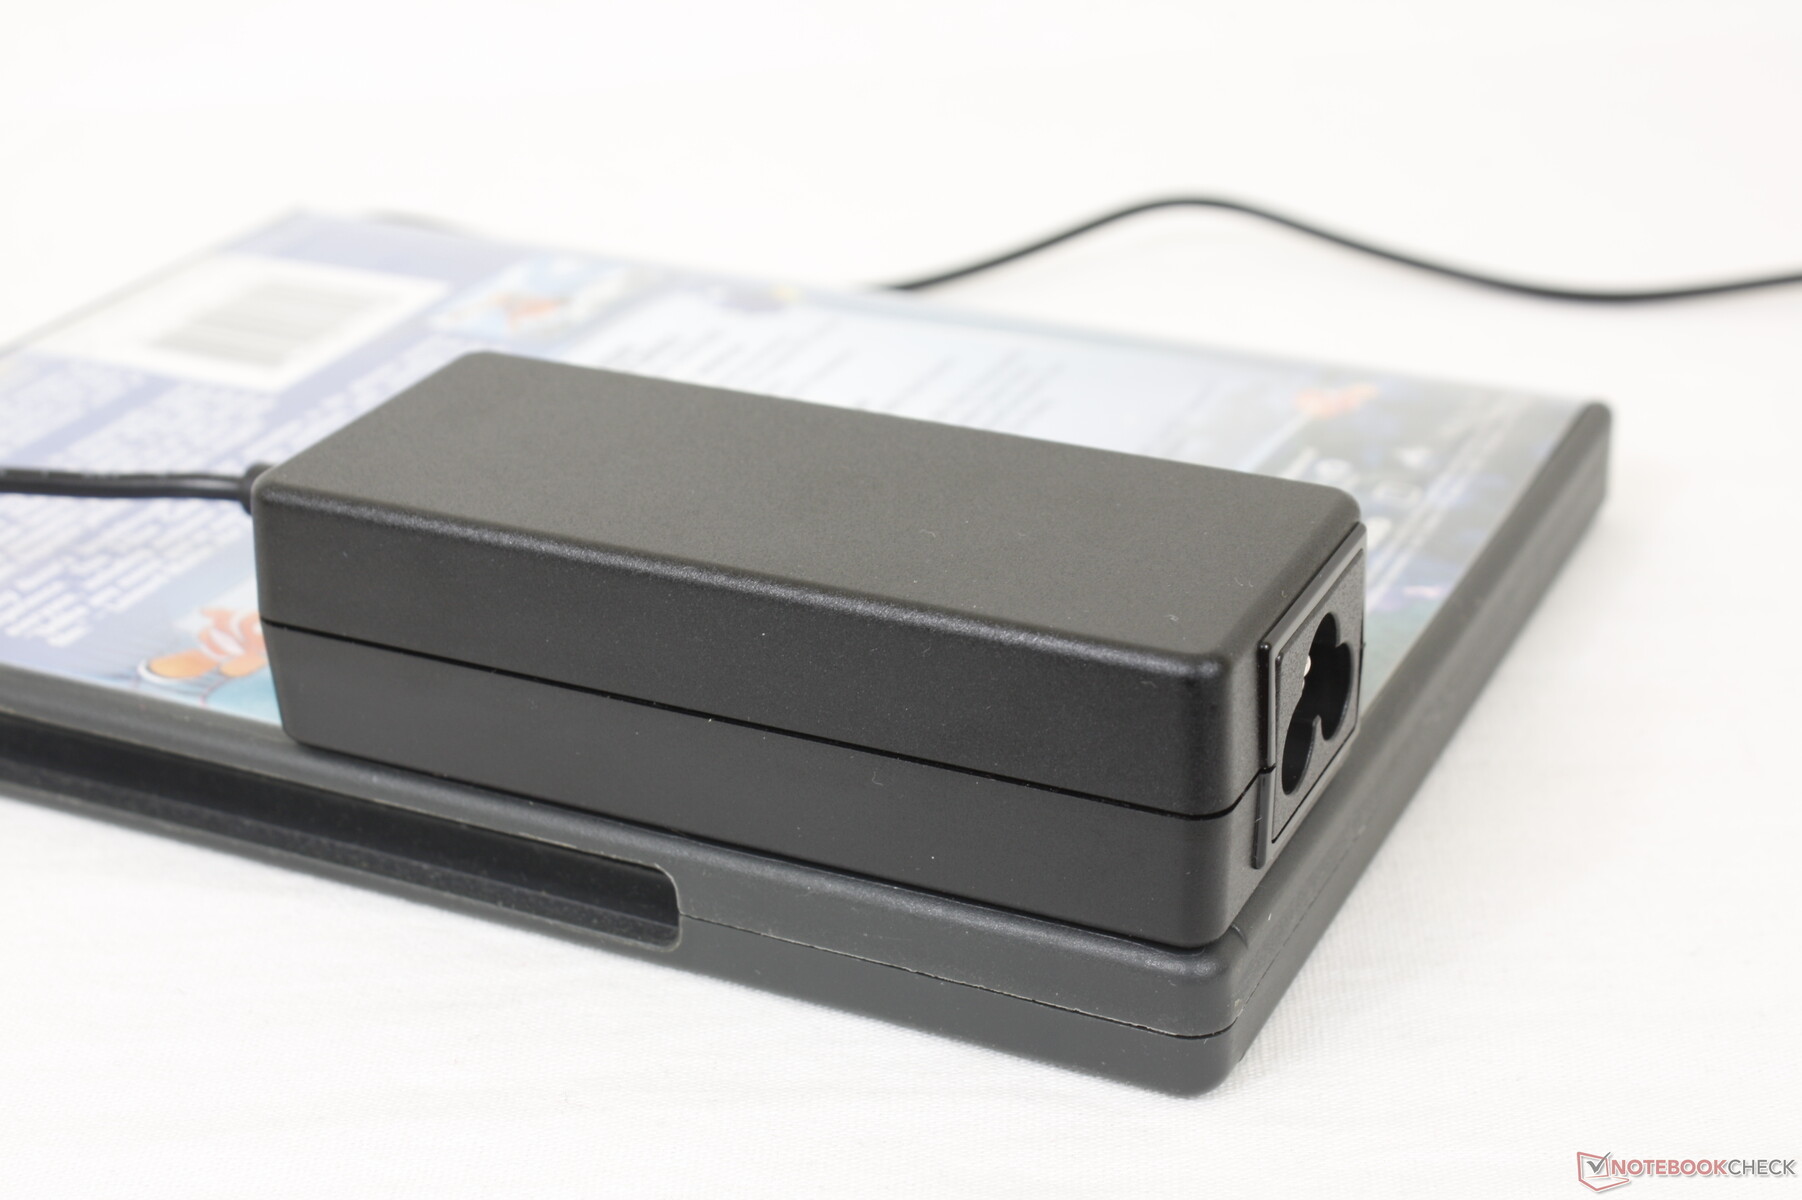
Consumo de energia
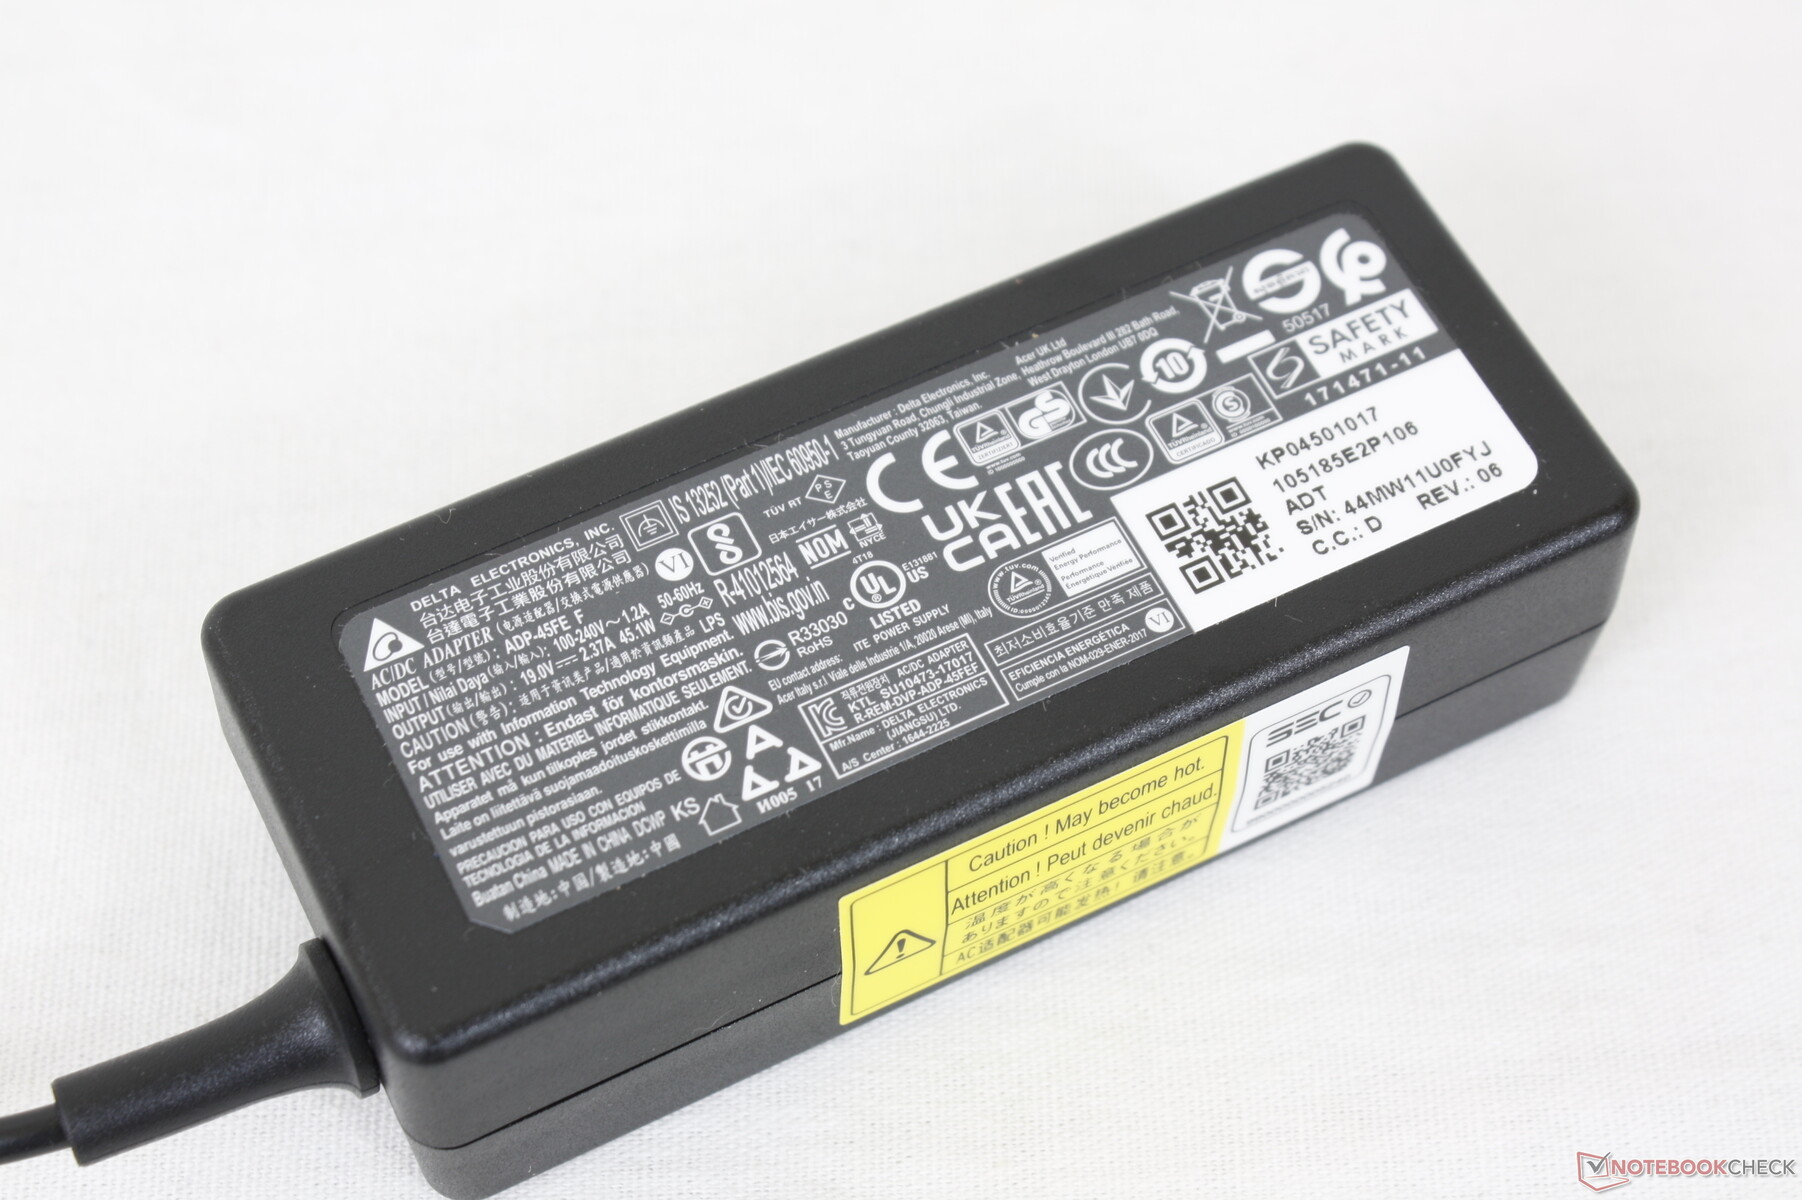
O Acer é mais eficiente em termos de potência do que o Durabook S14I rodando no mesmo processador Core i7 provavelmente porque a tela no Durabook é mais 2x mais brilhante do que a tela em nosso Acer. Somos capazes de gravar um consumo máximo de 45,4 W do pequeno (~9,3 x 3,8 x 2,7 cm) adaptador CA de 45 W quando executando cargas extremas. A taxa de recarga do Acer irá, portanto, diminuir significativamente se o processador estiver sendo estressado.
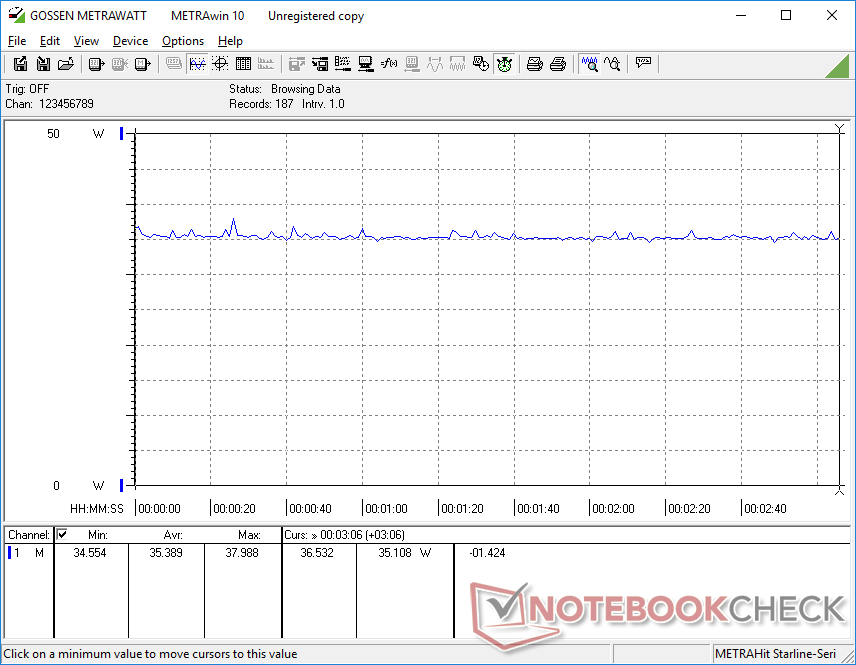
| desligado | |
| Ocioso | |
| Carga |
|
Key:
min: | |
| Acer Enduro Urban N3 EUN314 i7-1165G7, Iris Xe G7 96EUs, Samsung PM991 MZVLQ1T0HALB, IPS, 1920x1080, 14" | Dell Latitude 5420 Rugged-P85G i7-8650U, Radeon RX 540, SK hynix PC401 NVMe 500 GB, IPS, 1920x1080, 14" | Panasonic Toughbook FZ-55 MK2 i7-1185G7, Iris Xe G7 96EUs, Toshiba KIOXIA KBG4AZNV512G M.2 2280 OPAL, IPS, 1920x1080, 14" | Durabook S14I i7-1165G7, Iris Xe G7 96EUs, UDinfo M2P M2P80DE512GBAEP, TN, 1920x1080, 14" | Getac S410 i5-8550U, UHD Graphics 620, CUKUSA 1 TB SATA SSD Q0526A, TN PED, 1366x768, 14" | |
|---|---|---|---|---|---|
| Power Consumption | -75% | -36% | -70% | -3% | |
| Idle Minimum * (Watt) | 3.8 | 4.8 -26% | 3.5 8% | 6.8 -79% | 5.6 -47% |
| Idle Average * (Watt) | 8 | 13.6 -70% | 10.4 -30% | 16.4 -105% | 7.9 1% |
| Idle Maximum * (Watt) | 8.7 | 13.8 -59% | 10.5 -21% | 16.9 -94% | 8.4 3% |
| Load Average * (Watt) | 34.6 | 67.8 -96% | 45.4 -31% | 39.2 -13% | 32.8 5% |
| Witcher 3 ultra * (Watt) | 35.4 | 69.1 -95% | 43 -21% | ||
| Load Maximum * (Watt) | 45.4 | 93.5 -106% | 99.3 -119% | 73.1 -61% | 34.3 24% |
* ... menor é melhor
Power Consumption Witcher 3 / Stresstest
Power Consumption external Monitor
Vida útil da bateria
Somos capazes de registrar um tempo de execução WLAN no mundo real de quase 6,5 horas com carga total e com 150 nit de brilho de tela. Carregar o sistema de cheio para vazio levará cerca de 100 minutos. Os usuários também podem carregar o sistema com adaptadores USB-C AC genéricos.
| Acer Enduro Urban N3 EUN314 i7-1165G7, Iris Xe G7 96EUs, 50.3 Wh | Dell Latitude 5420 Rugged-P85G i7-8650U, Radeon RX 540, 102 Wh | Panasonic Toughbook FZ-55 MK2 i7-1185G7, Iris Xe G7 96EUs, 71 Wh | Durabook S14I i7-1165G7, Iris Xe G7 96EUs, 50 Wh | Getac S410 i5-8550U, UHD Graphics 620, 46.6 Wh | |
|---|---|---|---|---|---|
| Duração da bateria | 153% | 113% | -14% | -19% | |
| WiFi v1.3 (h) | 6.4 | 16.2 153% | 13.6 113% | 5.5 -14% | 5.2 -19% |
| Reader / Idle (h) | 31.4 | ||||
| Load (h) | 3.2 |
Pro
Contra
Veredicto
O Enduro Urban N3 é um laptop de 14 polegadas que se parece com um laptop de 15,6 polegadas. A largura e espessura extras quando comparado aos laptops tradicionais centrados no consumidor de 14 polegadas, como o Asus VivoBook ou Acer Swift 5 SF514 tornam a N3 Urbana mais resistente aos elementos, sem custo quase tão alto quanto os laptops "próprios", robustos ou semi-robustos como o Durabook S14I ou Panasonic Toughbook. se você se encontrar usando seu laptop no campo ou em pilhas de rochas com mais freqüência do que uma mesa de escritório bem organizada, então o Urban N3 pode ser para você.
O Enduro Urban N3 é um laptop robusto e acessível, que não prejudica o desempenho do processador ou a qualidade da tela. Alguns aspectos como duração da bateria, volume e modulação de largura de pulso para controle de brilho poderiam ter sido melhores.
O desempenho e a exibição são destaques notáveis da Acer. Entretanto, os usuários terão que calibrar o painel eles mesmos para explorar plenamente suas cores relativamente profundas
Muitos aspectos ainda podem ser melhorados. O volume do alto-falante, por exemplo, está no lado baixo, enquanto as dobradiças poderiam ser mais rígidas em ângulos mais amplos para evitar que a tampa caia para trás. O PWM é decepcionante de se ver e a duração da bateria poderia ter sido melhor em apenas 6,5 horas. Há um volume não utilizado dentro do chassi que poderia ter sido usado para melhorar as características do sistema. Uma opção mate também teria sido apreciada para reduzir o encandeamento.
Preço e Disponibilidade
Acer Enduro Urban N3 EUN314
- 12/03/2021 v7 (old)
Allen Ngo
Price comparison

