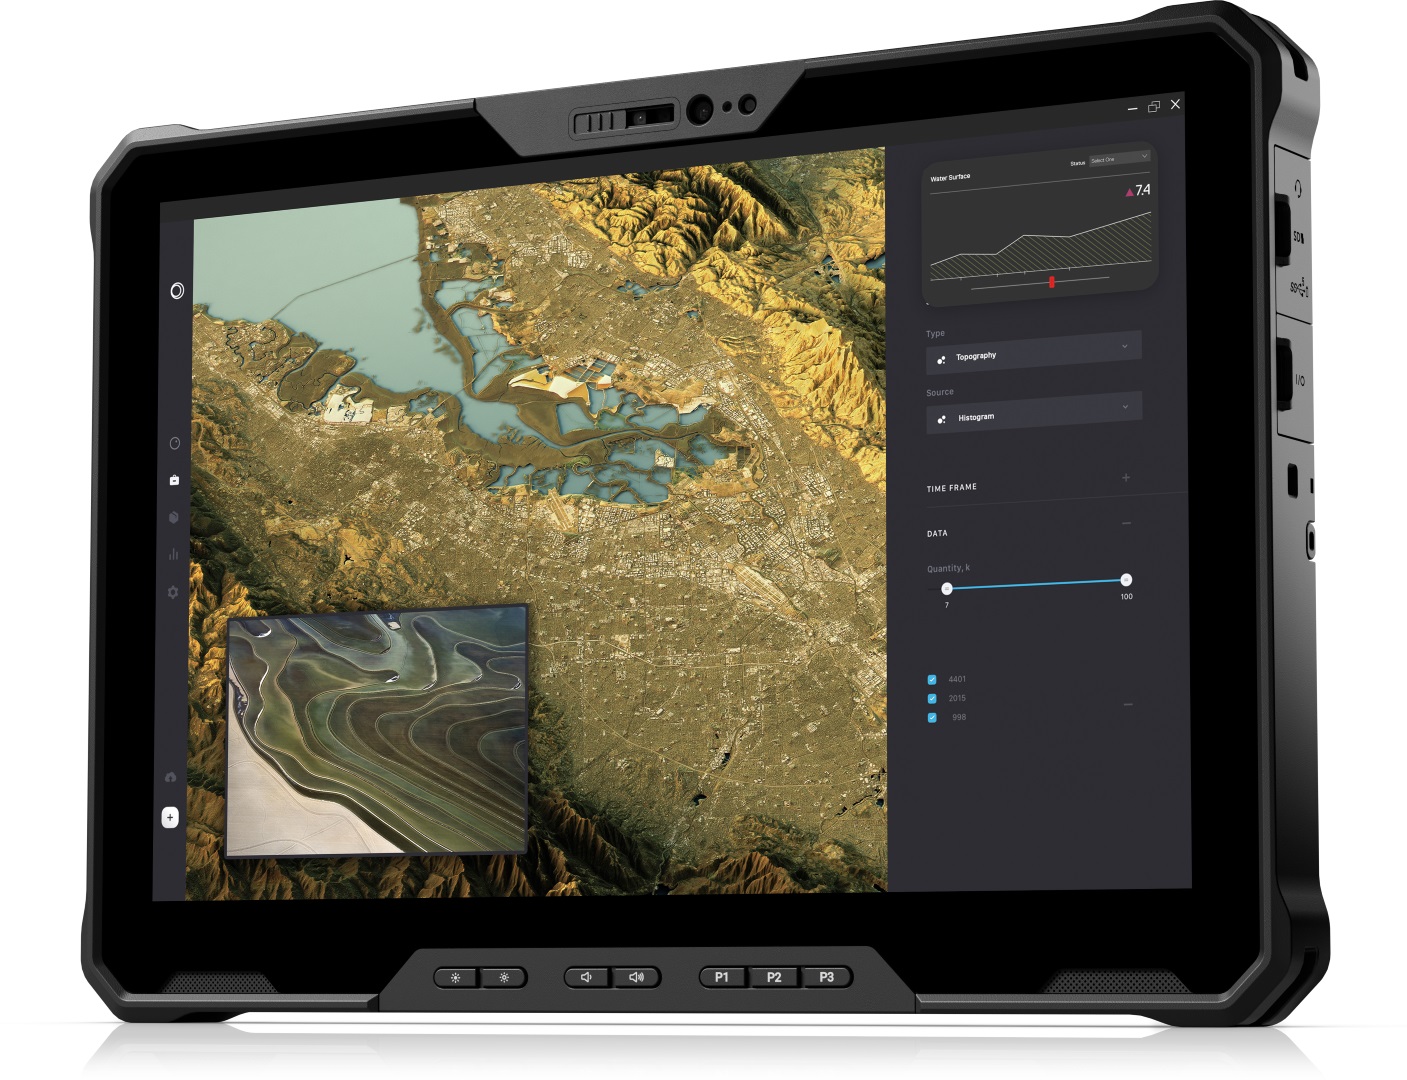
Dell Latitude 7230 Revisão de comprimidos Rugged Extreme: Uma das melhores exibições em sua categoria

O Latitude 7230 Rugged Extreme foi anunciado em Outubro do ano passado como o sucessor do Latitude 7220 Rugged Extreme. Ele introduz um chassi atualizado com um tamanho de tela maior (11,6 a 12 polegadas), opções de CPU Intel mais rápidas (8ª geração a 12ª geração) e opções de conectividade mais rápidas (Wi-Fi 6 a 6E, 5G).
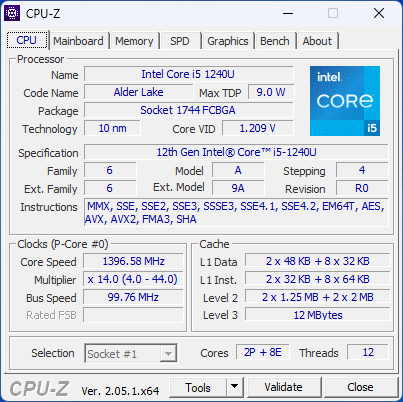
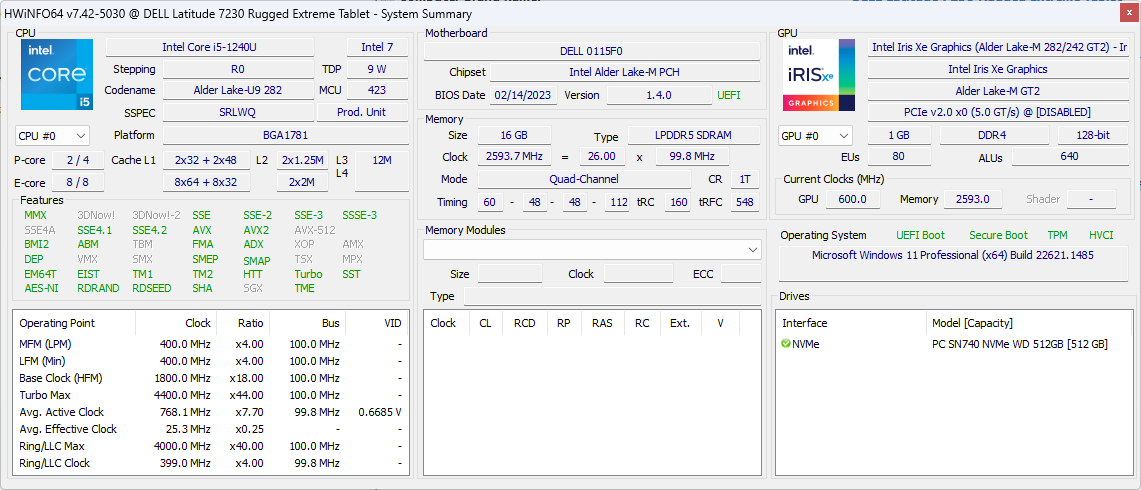
Nossa unidade em revisão em uma SKU de médio alcance com o Core i5-1240U, 16 GB RAM e 512 GB NVMe SSD por aproximadamente $3200 USD. Outras SKUs estão disponíveis com o Core i3-1210U mais lento, i7-1260U mais rápido, mais RAM ou armazenamento, e outras expansões. Todas as outras configurações são fornecidas com a mesma tela sensível ao toque IPS de 1920 x 1200 1200-nit. A folha de especificações completa do Latitude 7230 Rugged Extreme está disponível publicamente através da Dell aqui.
As alternativas incluem o Acer Enduro T1o Samsung Galaxy Tab Série ativaou o Panasonic Toughbook série FZ-G2.
Mais análises da Dell:
Possíveis concorrentes em comparação
Avaliação | Data | Modelo | Peso | Altura | Size | Resolução | Preço |
|---|---|---|---|---|---|---|---|
| 83.9 % v7 (old) | 04/2023 | Dell Latitude 7230 Rugged Extreme i5-1240U, Iris Xe G7 80EUs | 1.6 kg | 23.9 mm | 12.00" | 1920x1200 | |
v (old) | 05/2022 | Dell Latitude 7330 Rugged Extreme i7-1185G7, Iris Xe G7 96EUs | 2.7 kg | 36.5 mm | 13.30" | 1920x1080 | |
v (old) | 07/2022 | Panasonic Toughbook 40 i7-1185G7, Iris Xe G7 96EUs | 3.9 kg | 53.4 mm | 14.00" | 1920x1080 | |
| 83.8 % v7 (old) | 01/2022 | Getac B360 i7-10710U, UHD Graphics 620 | 2.4 kg | 34.9 mm | 13.30" | 1920x1080 | |
| 82.4 % v7 (old) | 12/2021 | Acer Enduro Urban N3 EUN314 i7-1165G7, Iris Xe G7 96EUs | 1.8 kg | 21.95 mm | 14.00" | 1920x1080 | |
v (old) | 04/2021 | Durabook S14I i7-1165G7, Iris Xe G7 96EUs | 3 kg | 38.1 mm | 14.00" | 1920x1080 |
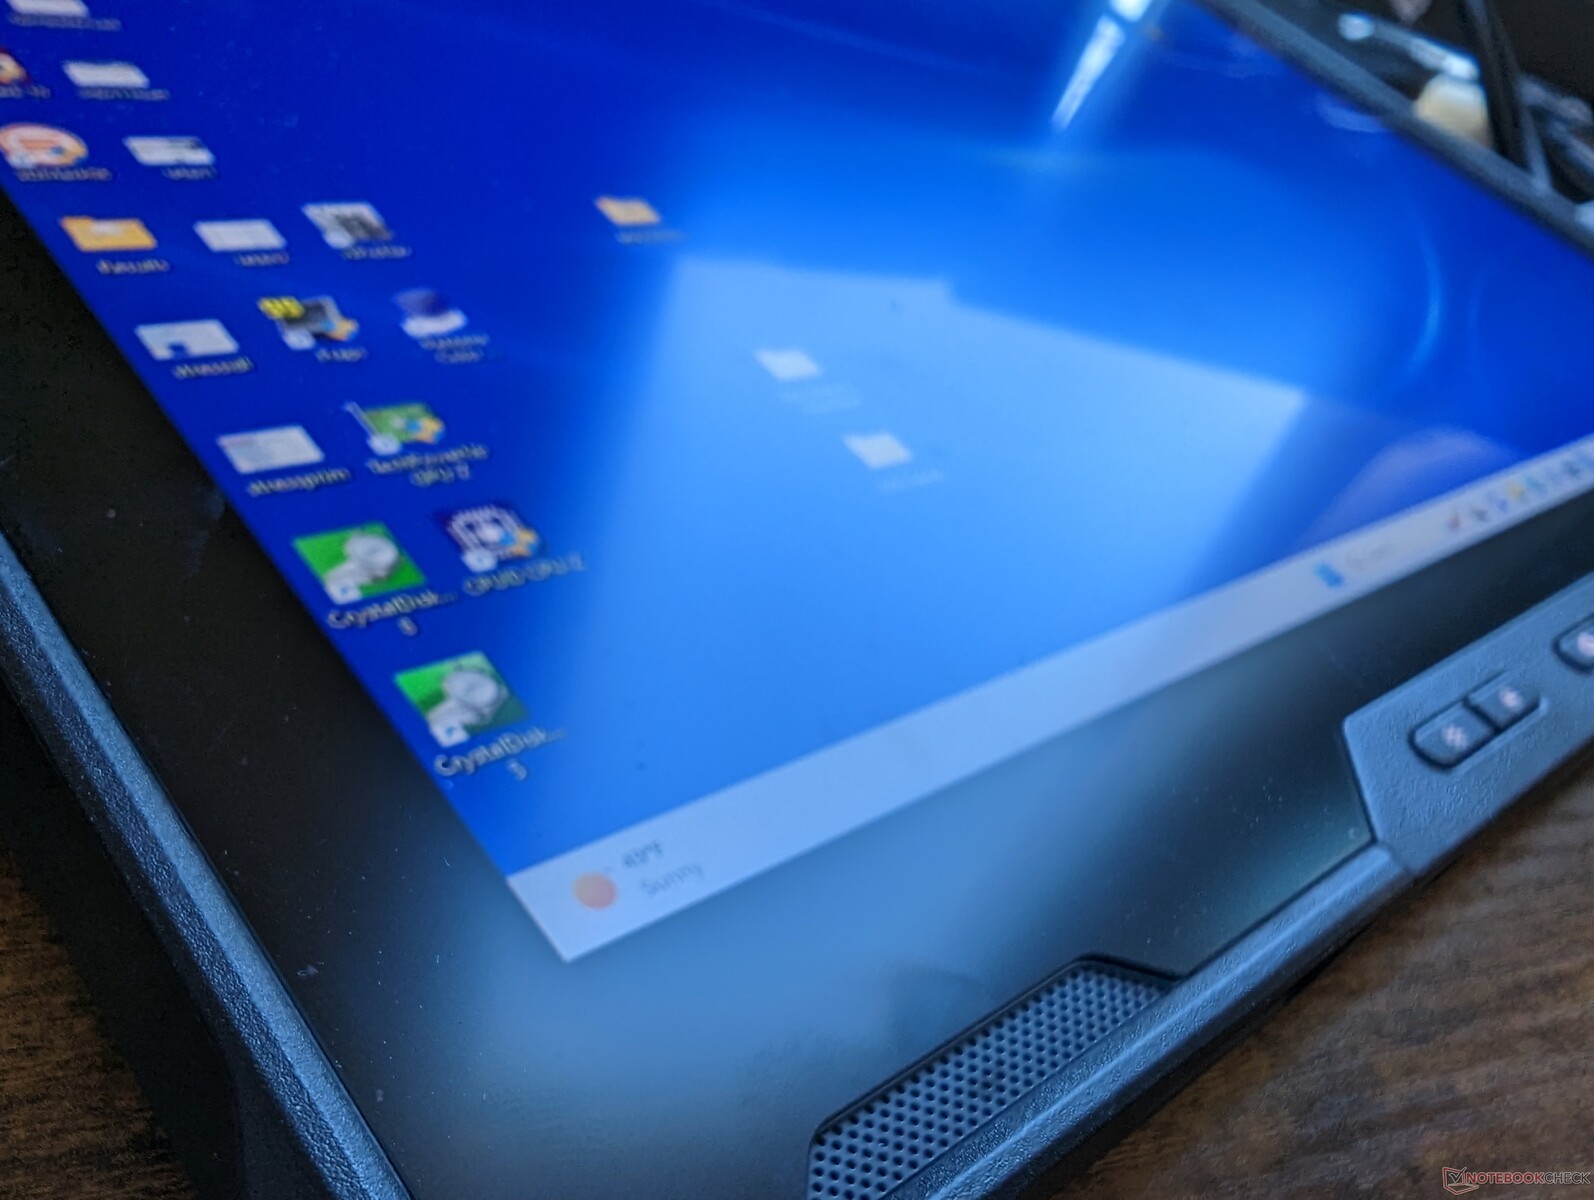
Estojo - Grosso com Bezels relativamente estreitos
O chassi é resistente de todos os ângulos, especialmente ao longo de suas bordas e cantos emborrachados. Seu ponto mais fraco está diretamente no centro da tela sensível ao toque, onde a deformação é perceptível ao pressioná-la firmemente com um dedo. Não é uma grande preocupação nem nada, mas qualquer deformação é digna de menção.
Alguns aspectos irritantes do estojo incluem as tampas de fidgety para os portos e botões esponjosos frontais. As tampas das portas são difíceis de segurar enquanto os atalhos dos botões poderiam usar um pouco mais de dar quando pressionados. O concorrente Toughbook FZ-G2 faz as coisas um pouco melhor a este respeito.
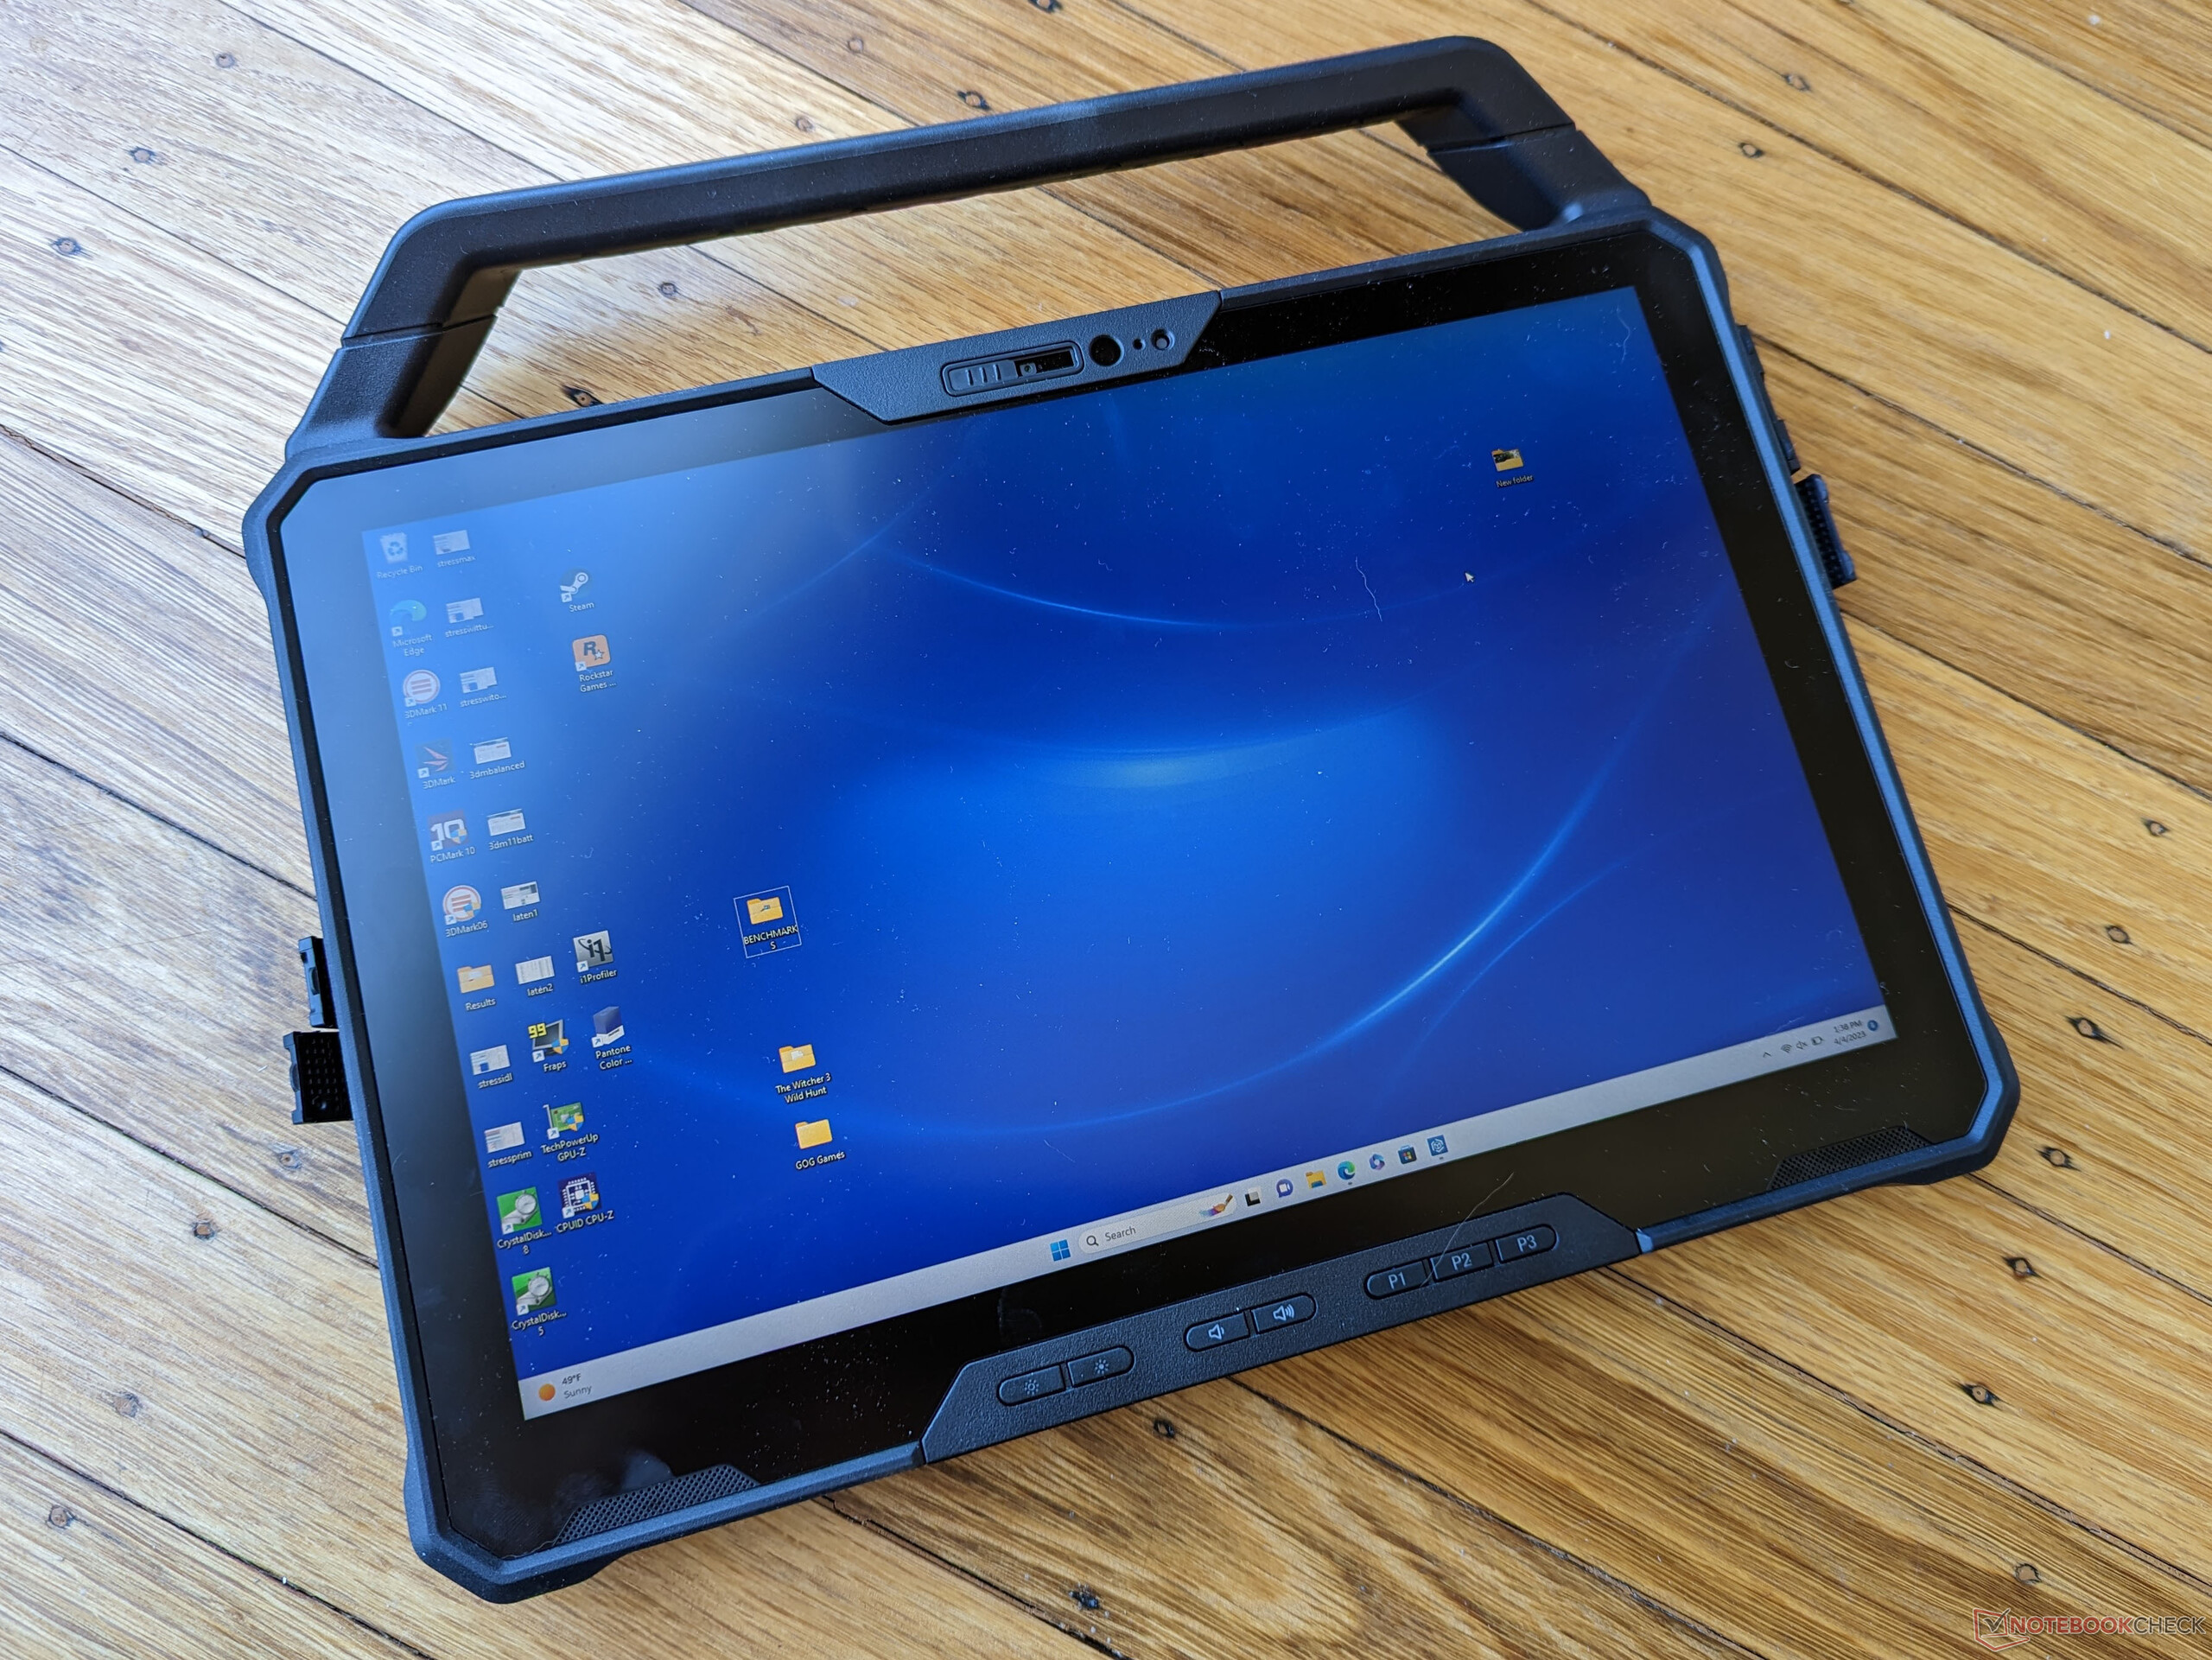
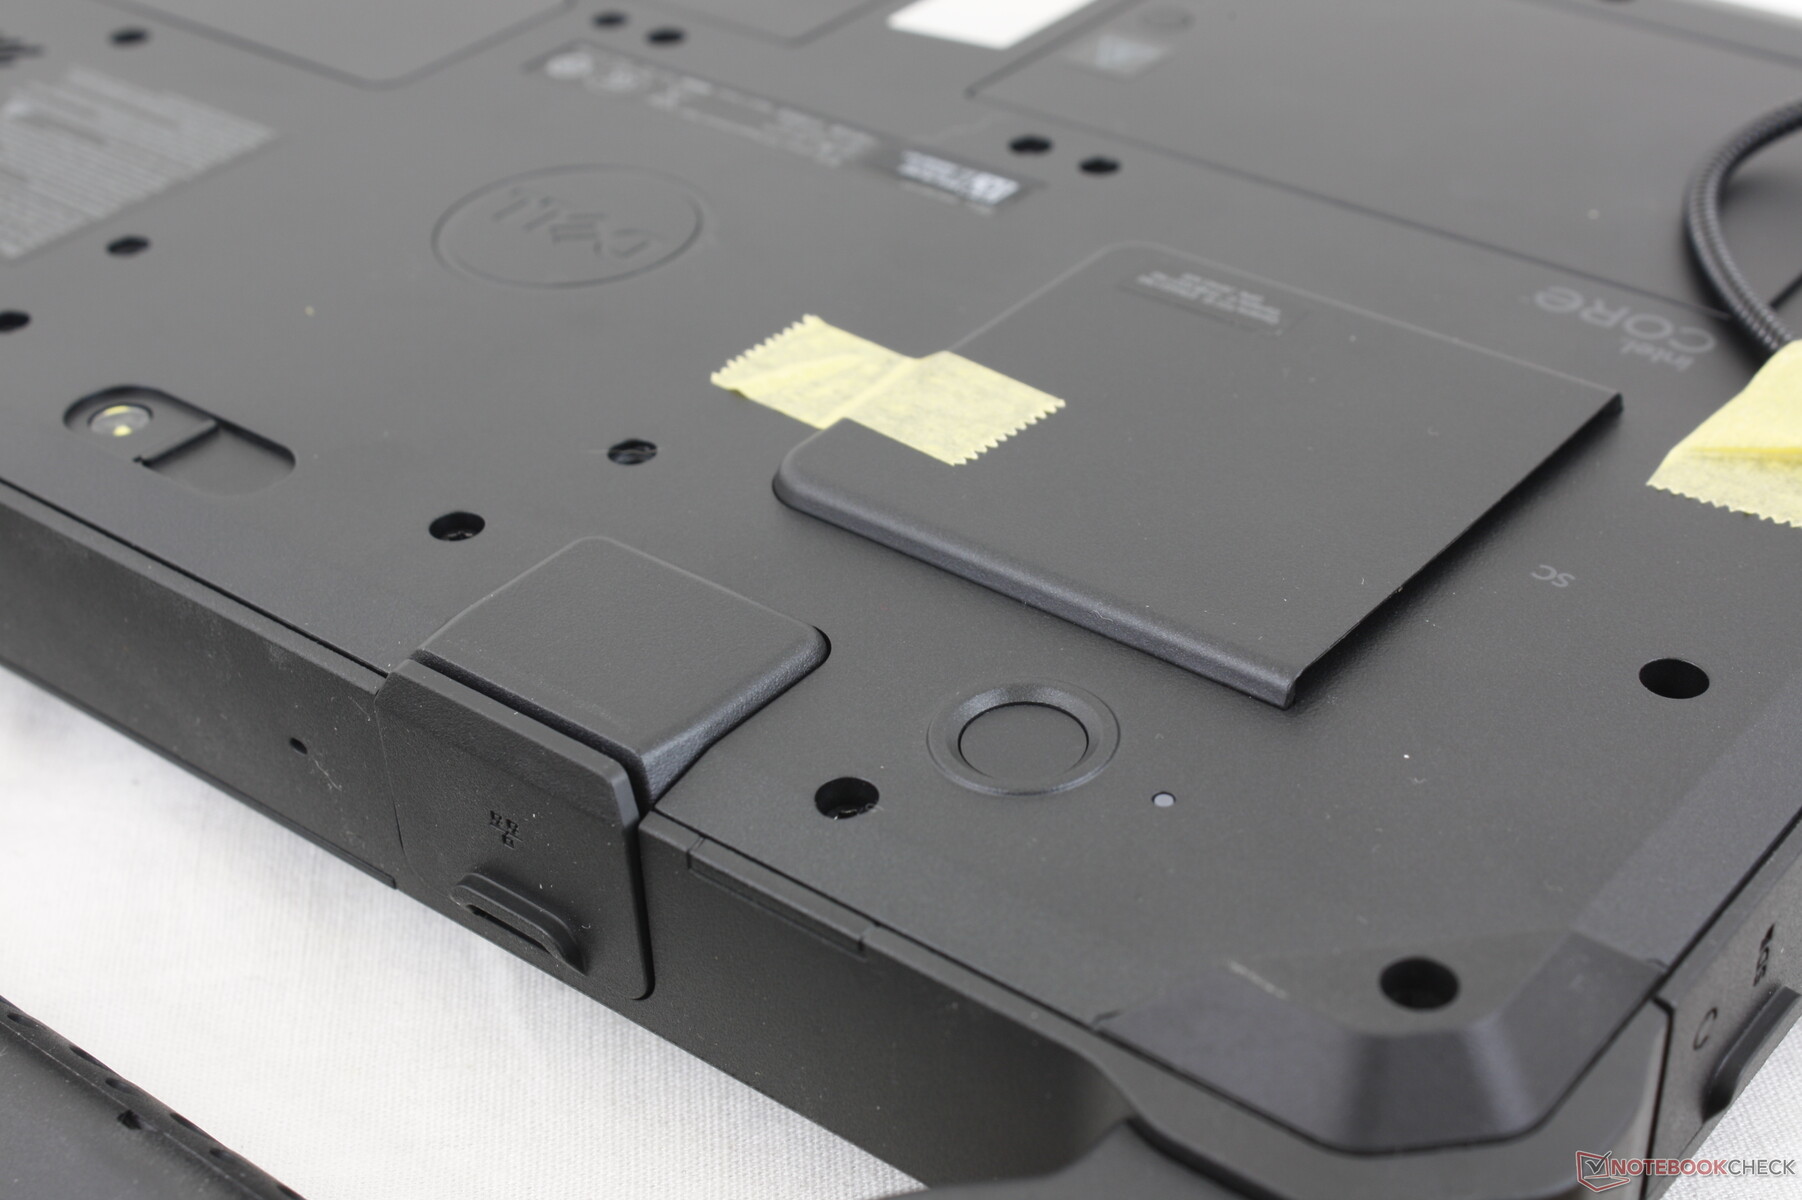
Com cerca de 1,6 kg, incluindo suas duas baterias removíveis, a unidade é uma das pastilhas mais leves e resistentes de sua categoria. O comprimento e largura são convenientemente muito próximos da norma DIN A4 quando não se leva em conta a alça de transporte removível.
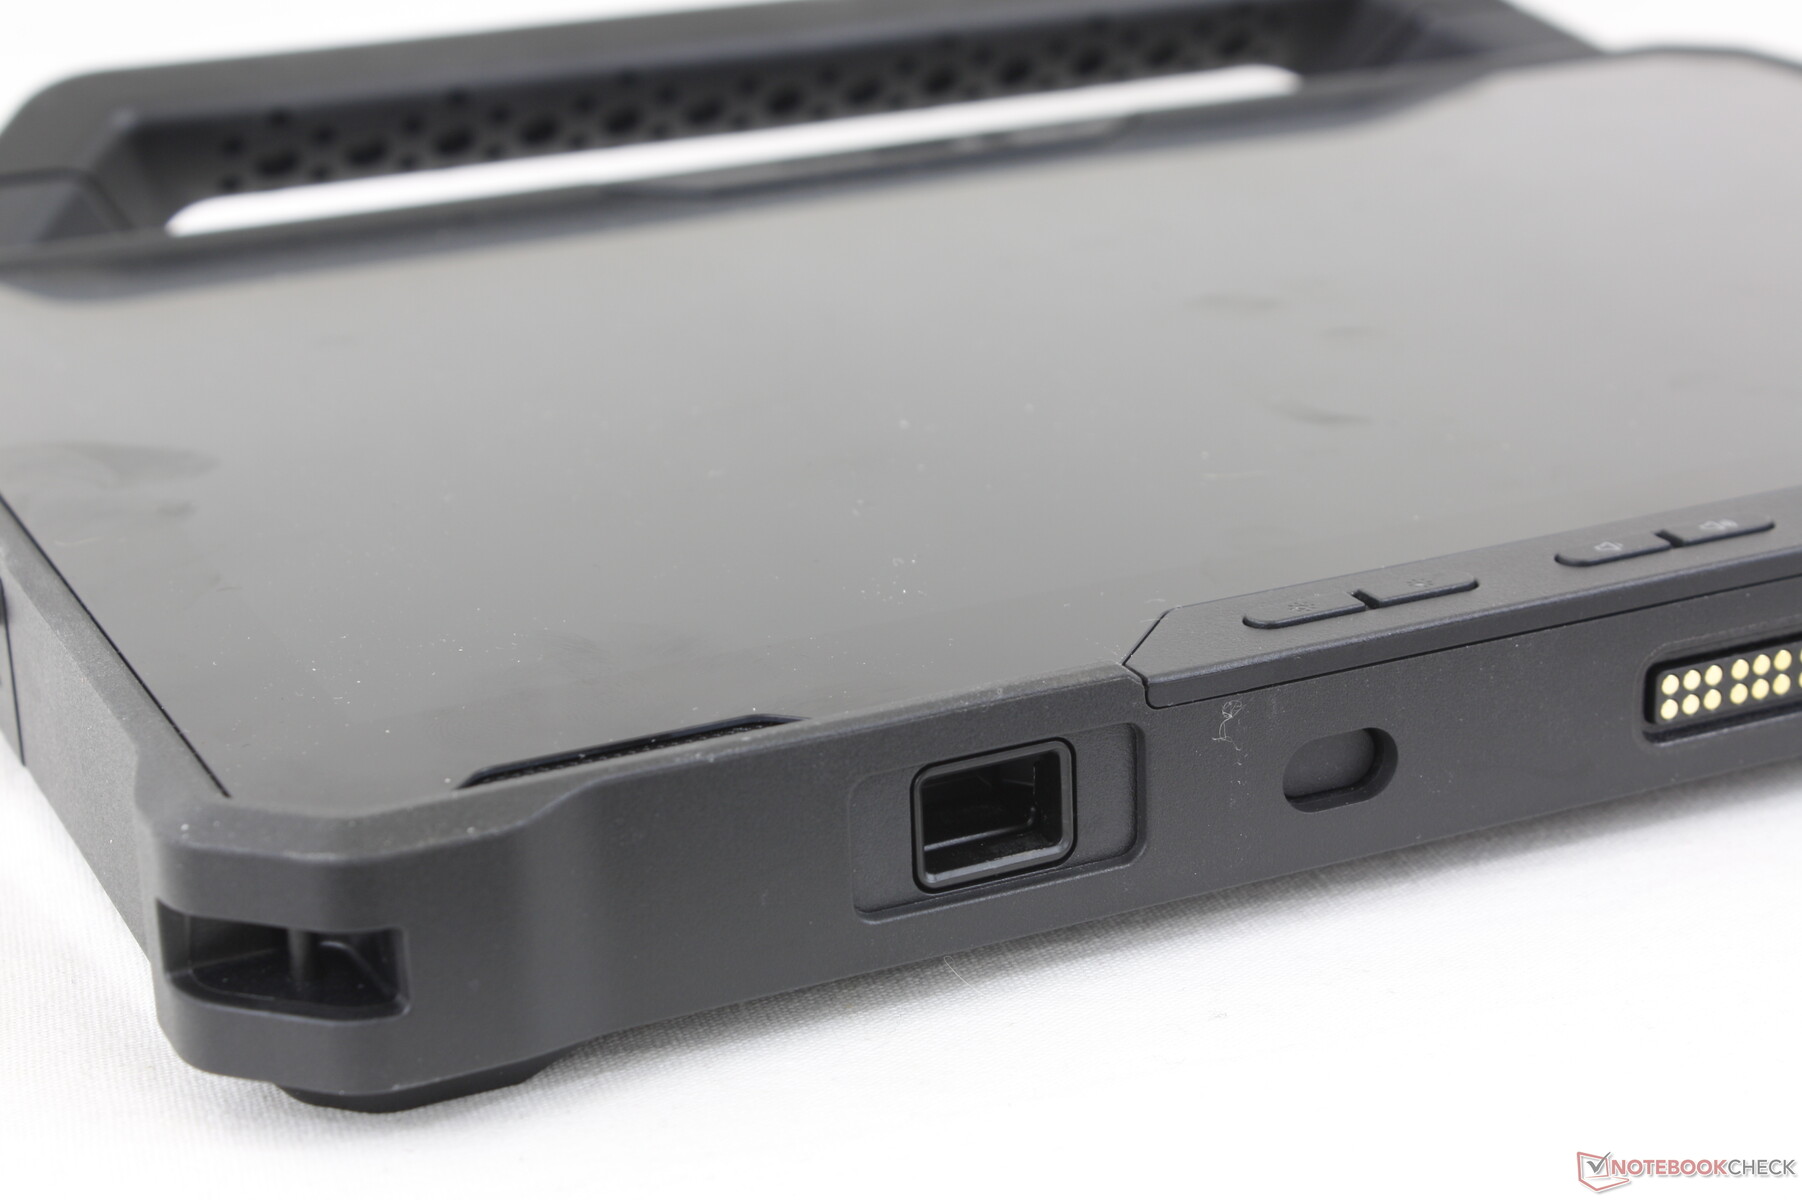
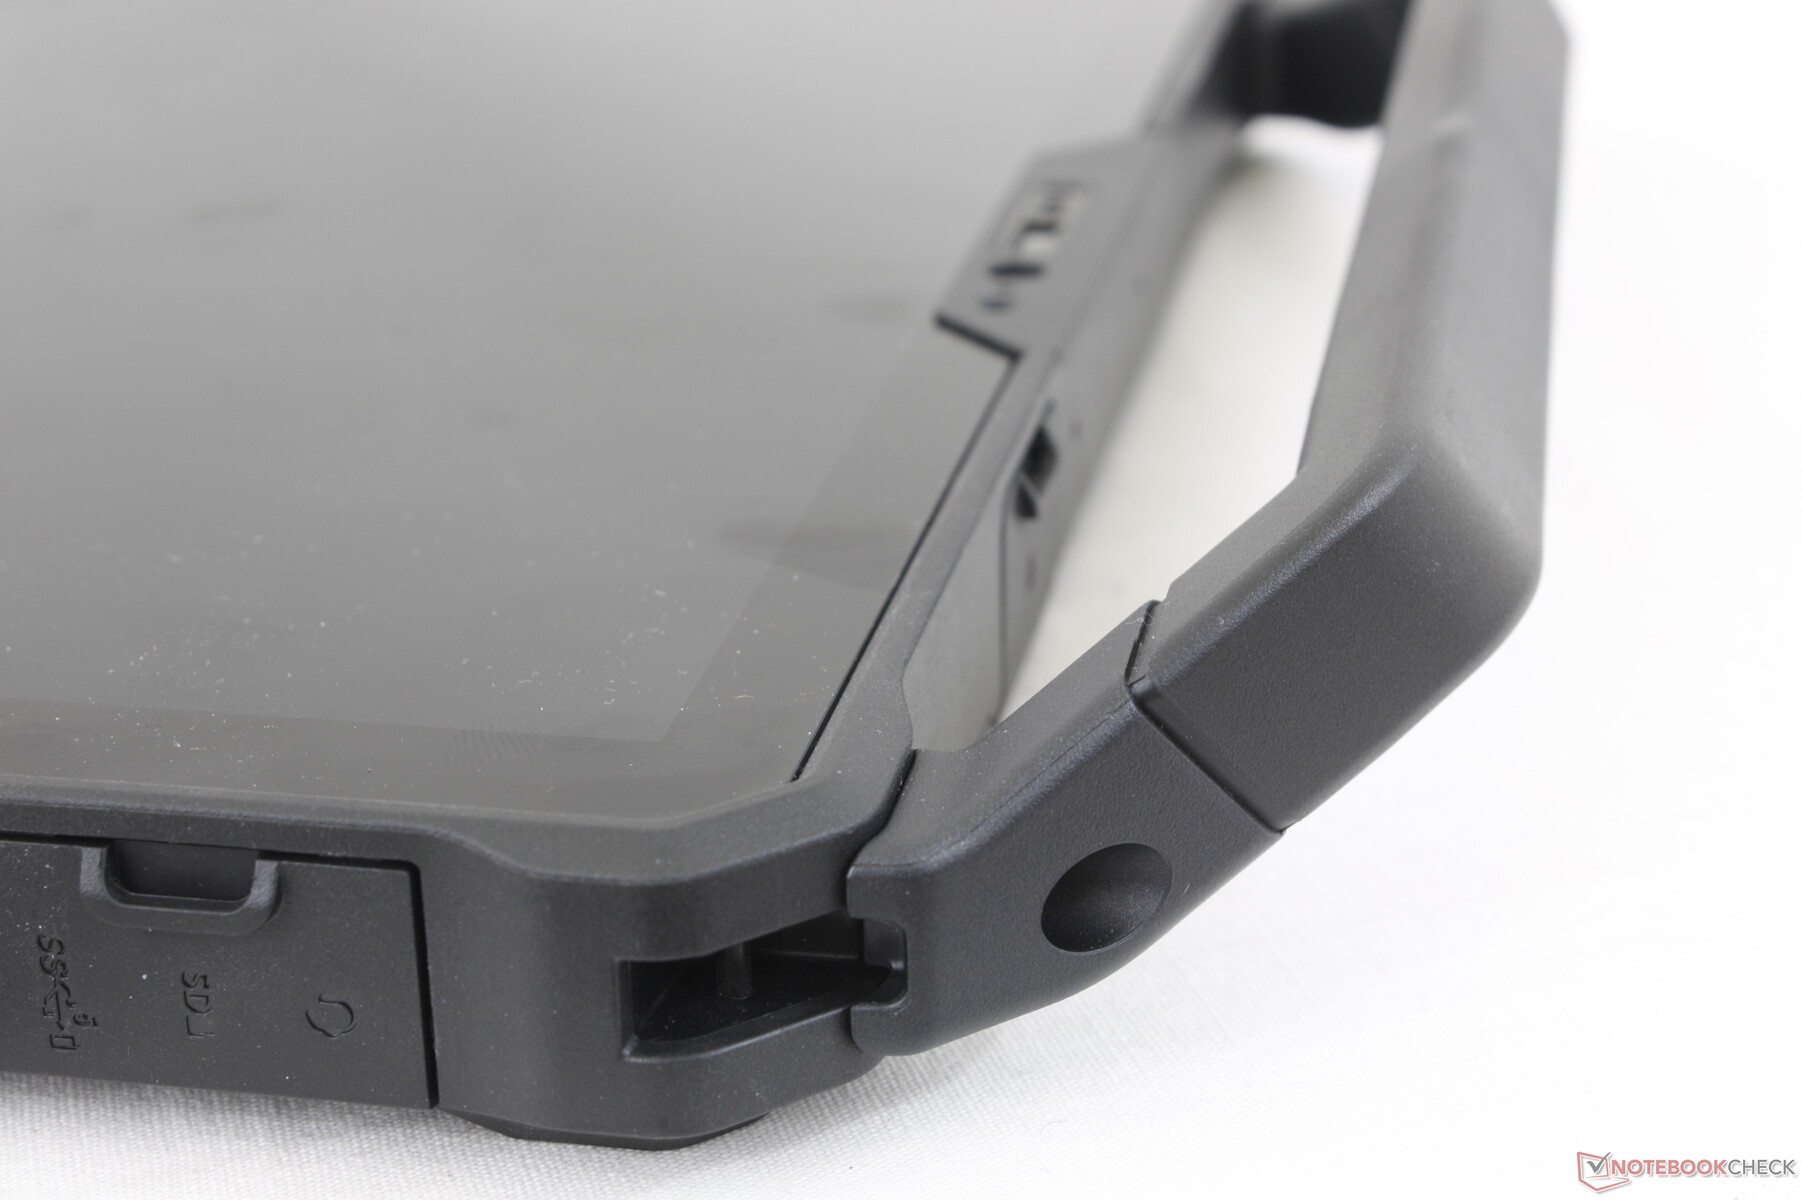
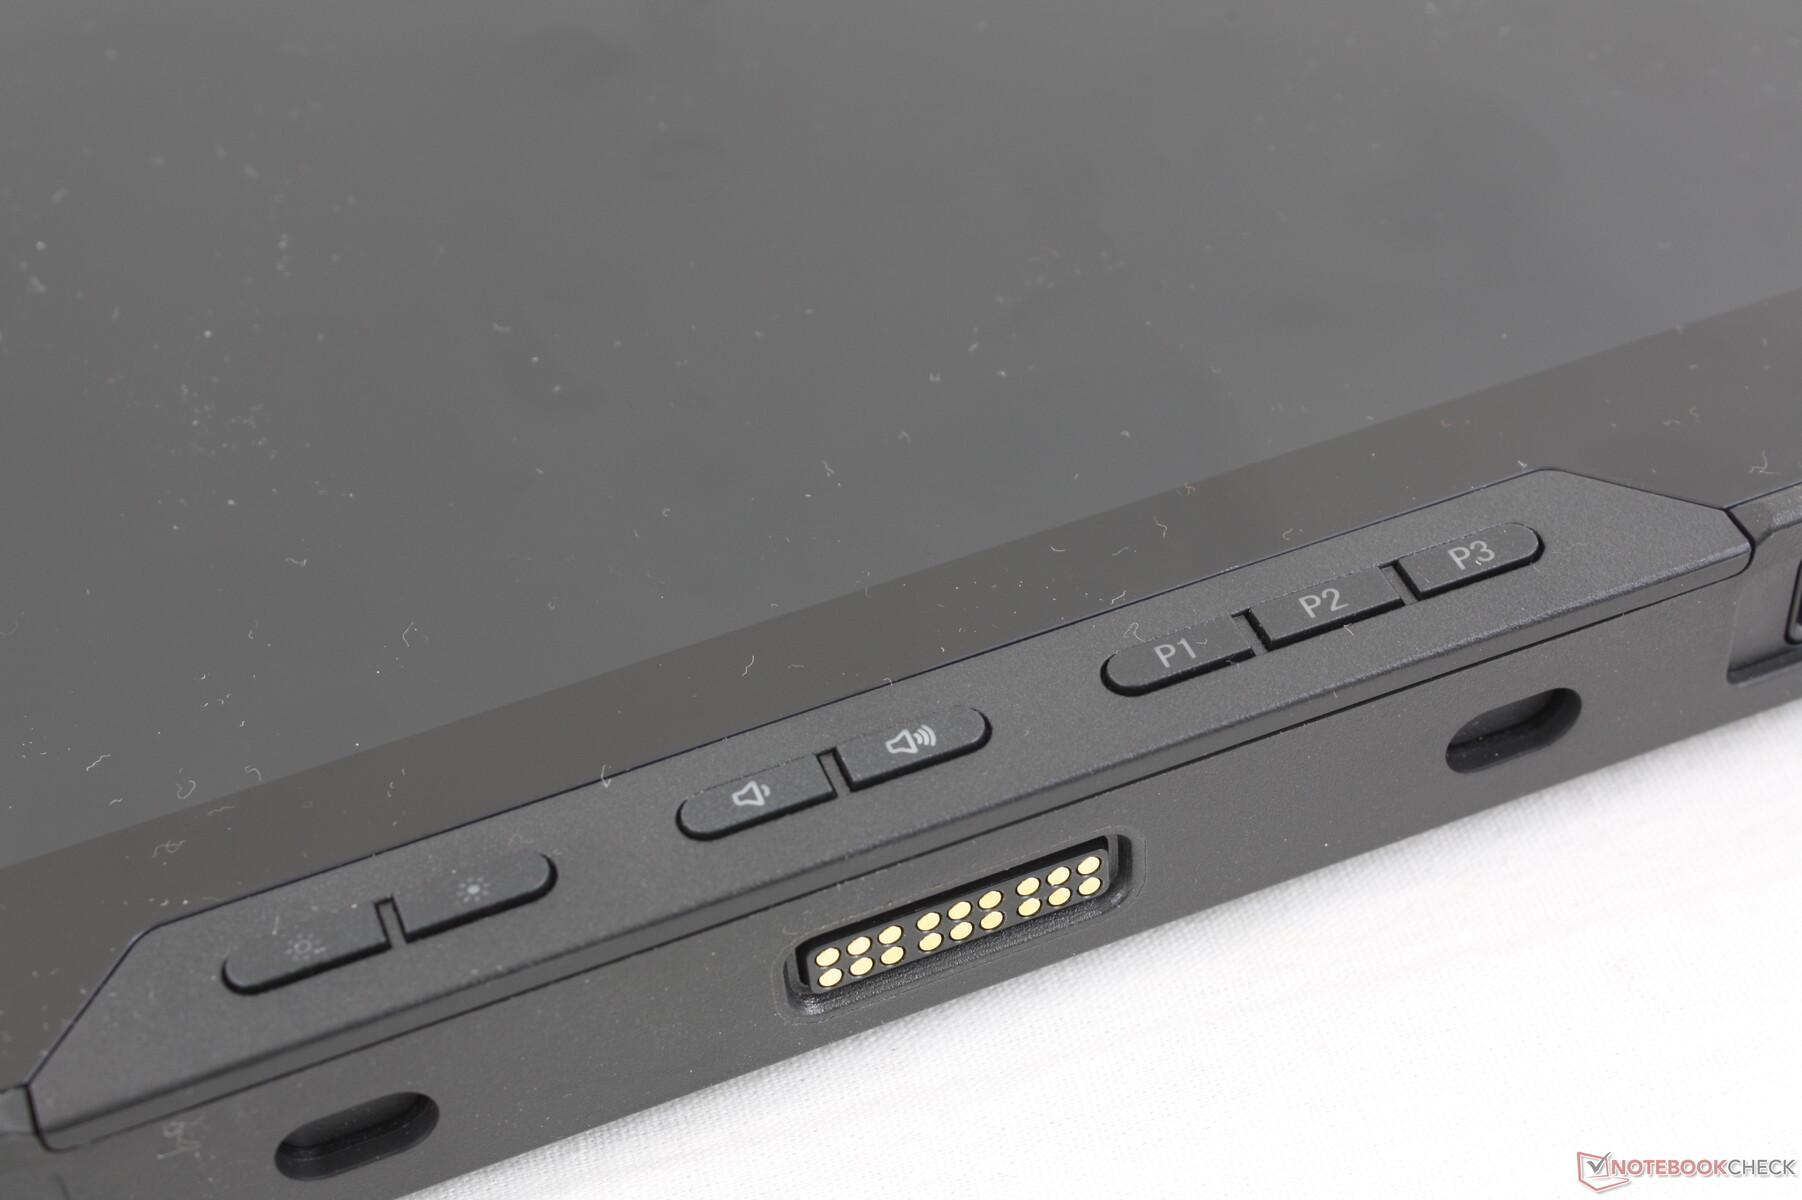
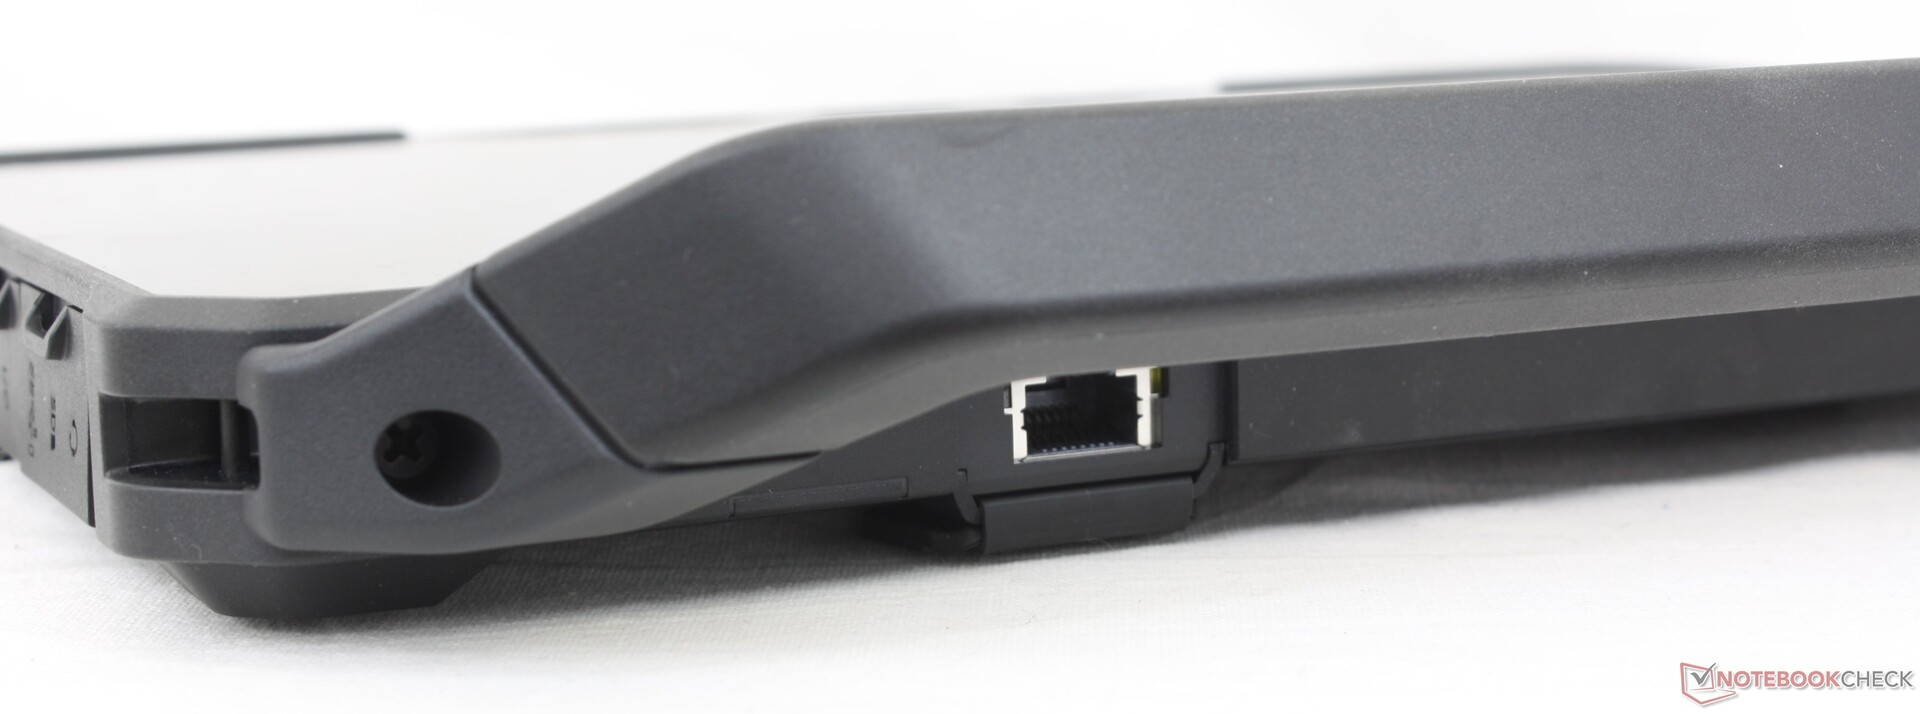
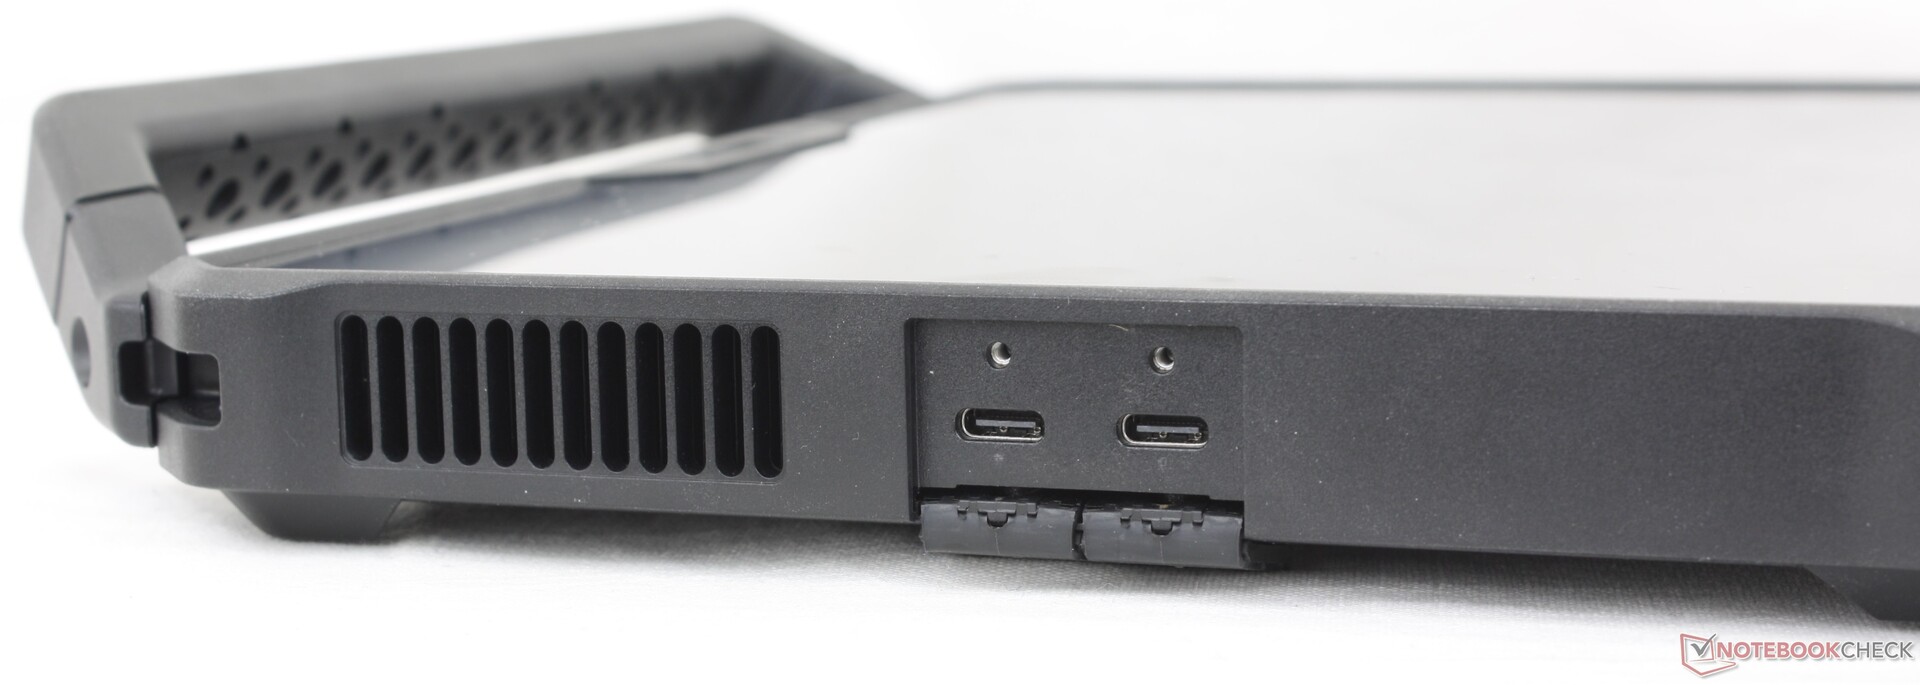
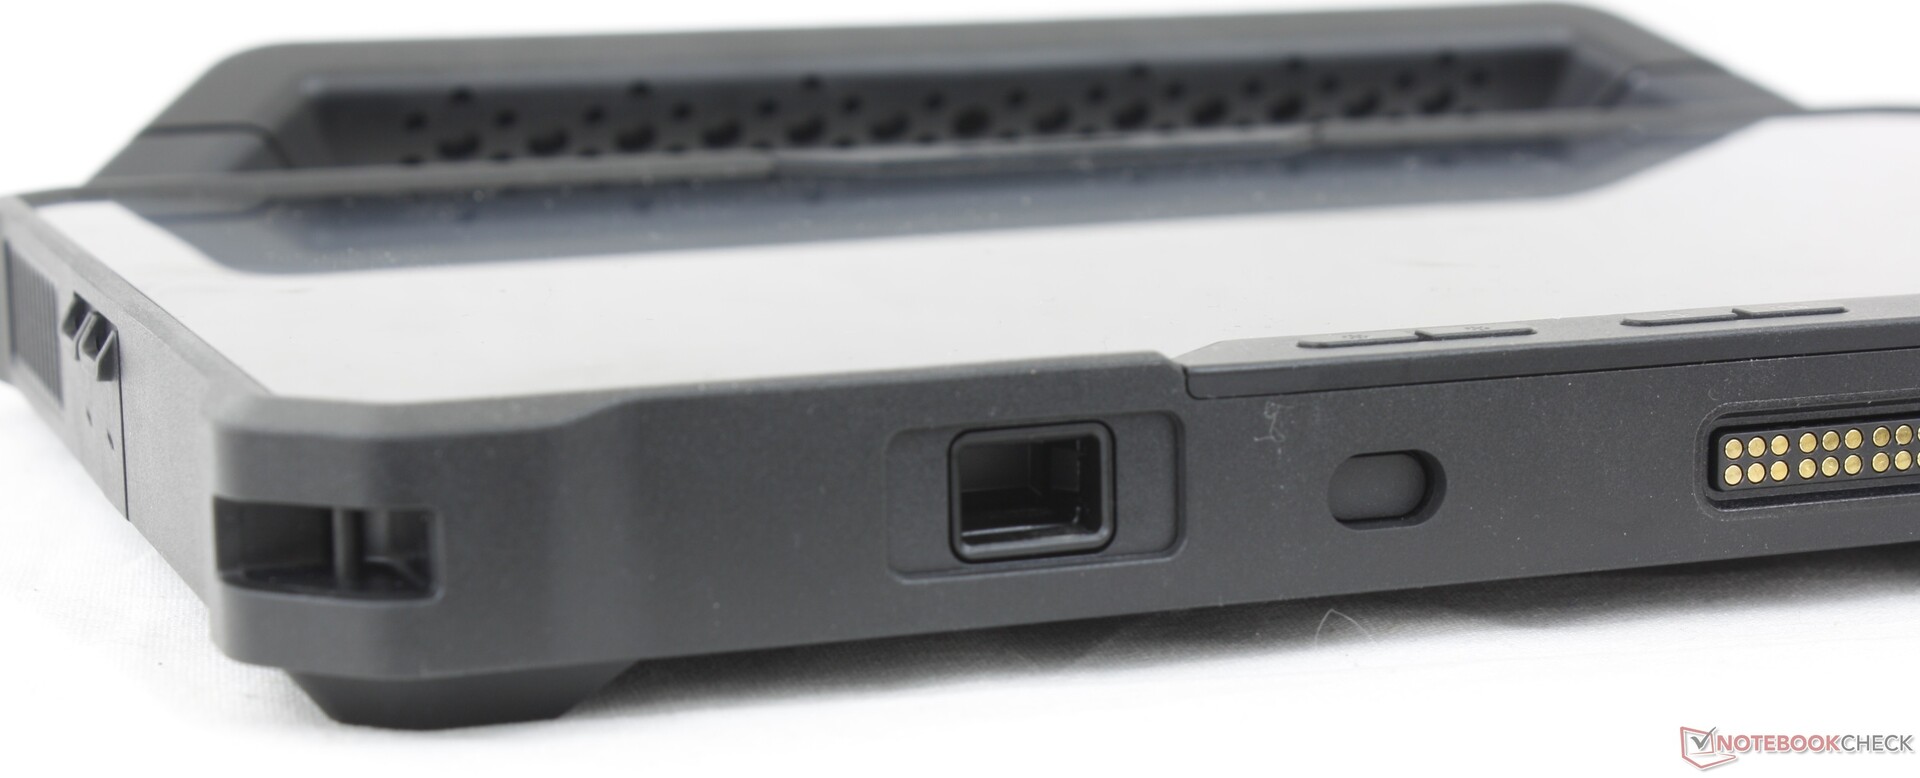
Conectividade - 2x Suporte Thunderbolt 4
Há uma seleção saudável de portos integrados para seleção. As duas portas Thunderbolt 4 em particular são dignas de nota, pois permitem as mesmas capacidades de ancoragem e suporte de monitor externo que os ultra-livros modernos de consumo. No entanto, tenha em mente que uma estará sempre ocupada para fins de cobrança.
A maioria das outras portas são opcionais e podem ser configuradas no checkout incluindo HDMI 2.0, USB-A, RJ-45, RS-232, ou um leitor de código de barras.
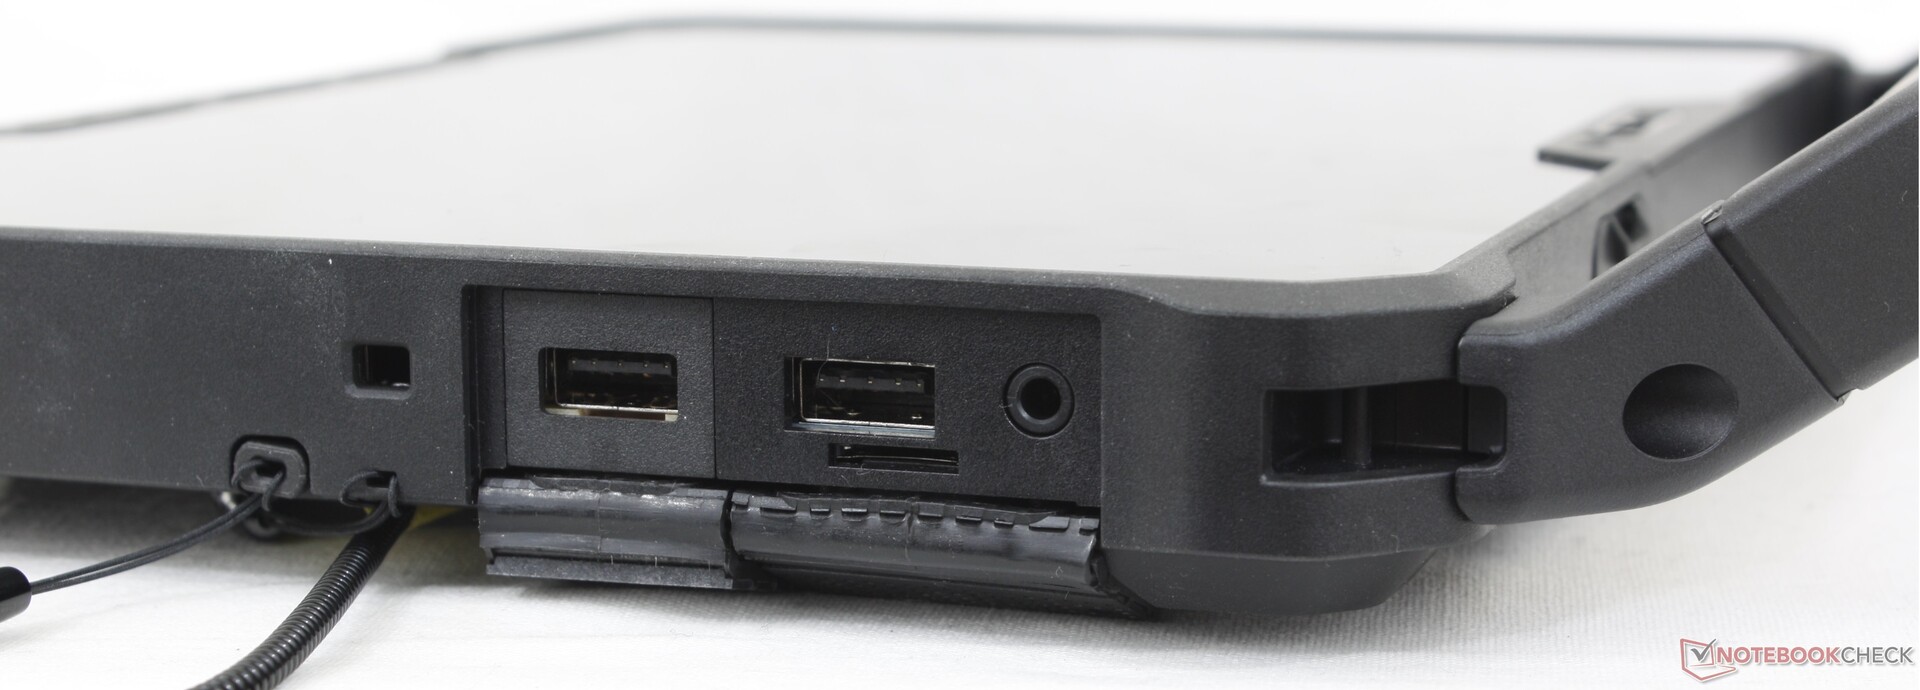
Leitor de cartões SD
| SD Card Reader | |
| average JPG Copy Test (av. of 3 runs) | |
| Dell Latitude 7330 Rugged Extreme (AV Pro V60) | |
| Dell Latitude 7230 Rugged Extreme (AV Pro V60) | |
| Panasonic Toughbook 40 (AV Pro V60) | |
| Acer Enduro Urban N3 EUN314 (AV Pro V60) | |
| Durabook S14I (Angelbird 128GB AV Pro UHS-II) | |
| maximum AS SSD Seq Read Test (1GB) | |
| Dell Latitude 7330 Rugged Extreme (AV Pro V60) | |
| Dell Latitude 7230 Rugged Extreme (AV Pro V60) | |
| Panasonic Toughbook 40 (AV Pro V60) | |
| Durabook S14I (Angelbird 128GB AV Pro UHS-II) | |
| Acer Enduro Urban N3 EUN314 (AV Pro V60) | |
Comunicação
O Intel AX211 funciona de forma confiável quando acoplado ao nosso roteador de teste Asus AXE11000 habilitado para Wi-Fi 6E. O modelo pode ser configurado sem Wi-Fi, mas recomendamos escolher cuidadosamente como instalação do usuário final no Latitude 7230 Rugged Extreme está muito mais envolvido do que um típico ultrabook.
| Networking | |
| iperf3 transmit AX12 | |
| Acer Enduro Urban N3 EUN314 | |
| Durabook S14I | |
| Dell Latitude 7330 Rugged Extreme | |
| Getac B360 | |
| iperf3 receive AX12 | |
| Durabook S14I | |
| Acer Enduro Urban N3 EUN314 | |
| Getac B360 | |
| Dell Latitude 7330 Rugged Extreme | |
| iperf3 transmit AXE11000 | |
| Panasonic Toughbook 40 | |
| Dell Latitude 7230 Rugged Extreme | |
| iperf3 receive AXE11000 | |
| Panasonic Toughbook 40 | |
| Dell Latitude 7230 Rugged Extreme | |
| iperf3 transmit AXE11000 6GHz | |
| Dell Latitude 7230 Rugged Extreme | |
| iperf3 receive AXE11000 6GHz | |
| Dell Latitude 7230 Rugged Extreme | |
Webcam
A webcam traseira de 11 MP e até mesmo a webcam dianteira de 5 MP são ambas mais nítidas do que qualquer coisa que você encontraria em um laptop de concha de consumidor. Cada webcam tem seu próprio slider de privacidade física enquanto a webcam traseira tem um flash embutido.
Windows Olá é suportado com a webcam voltada para a frente.


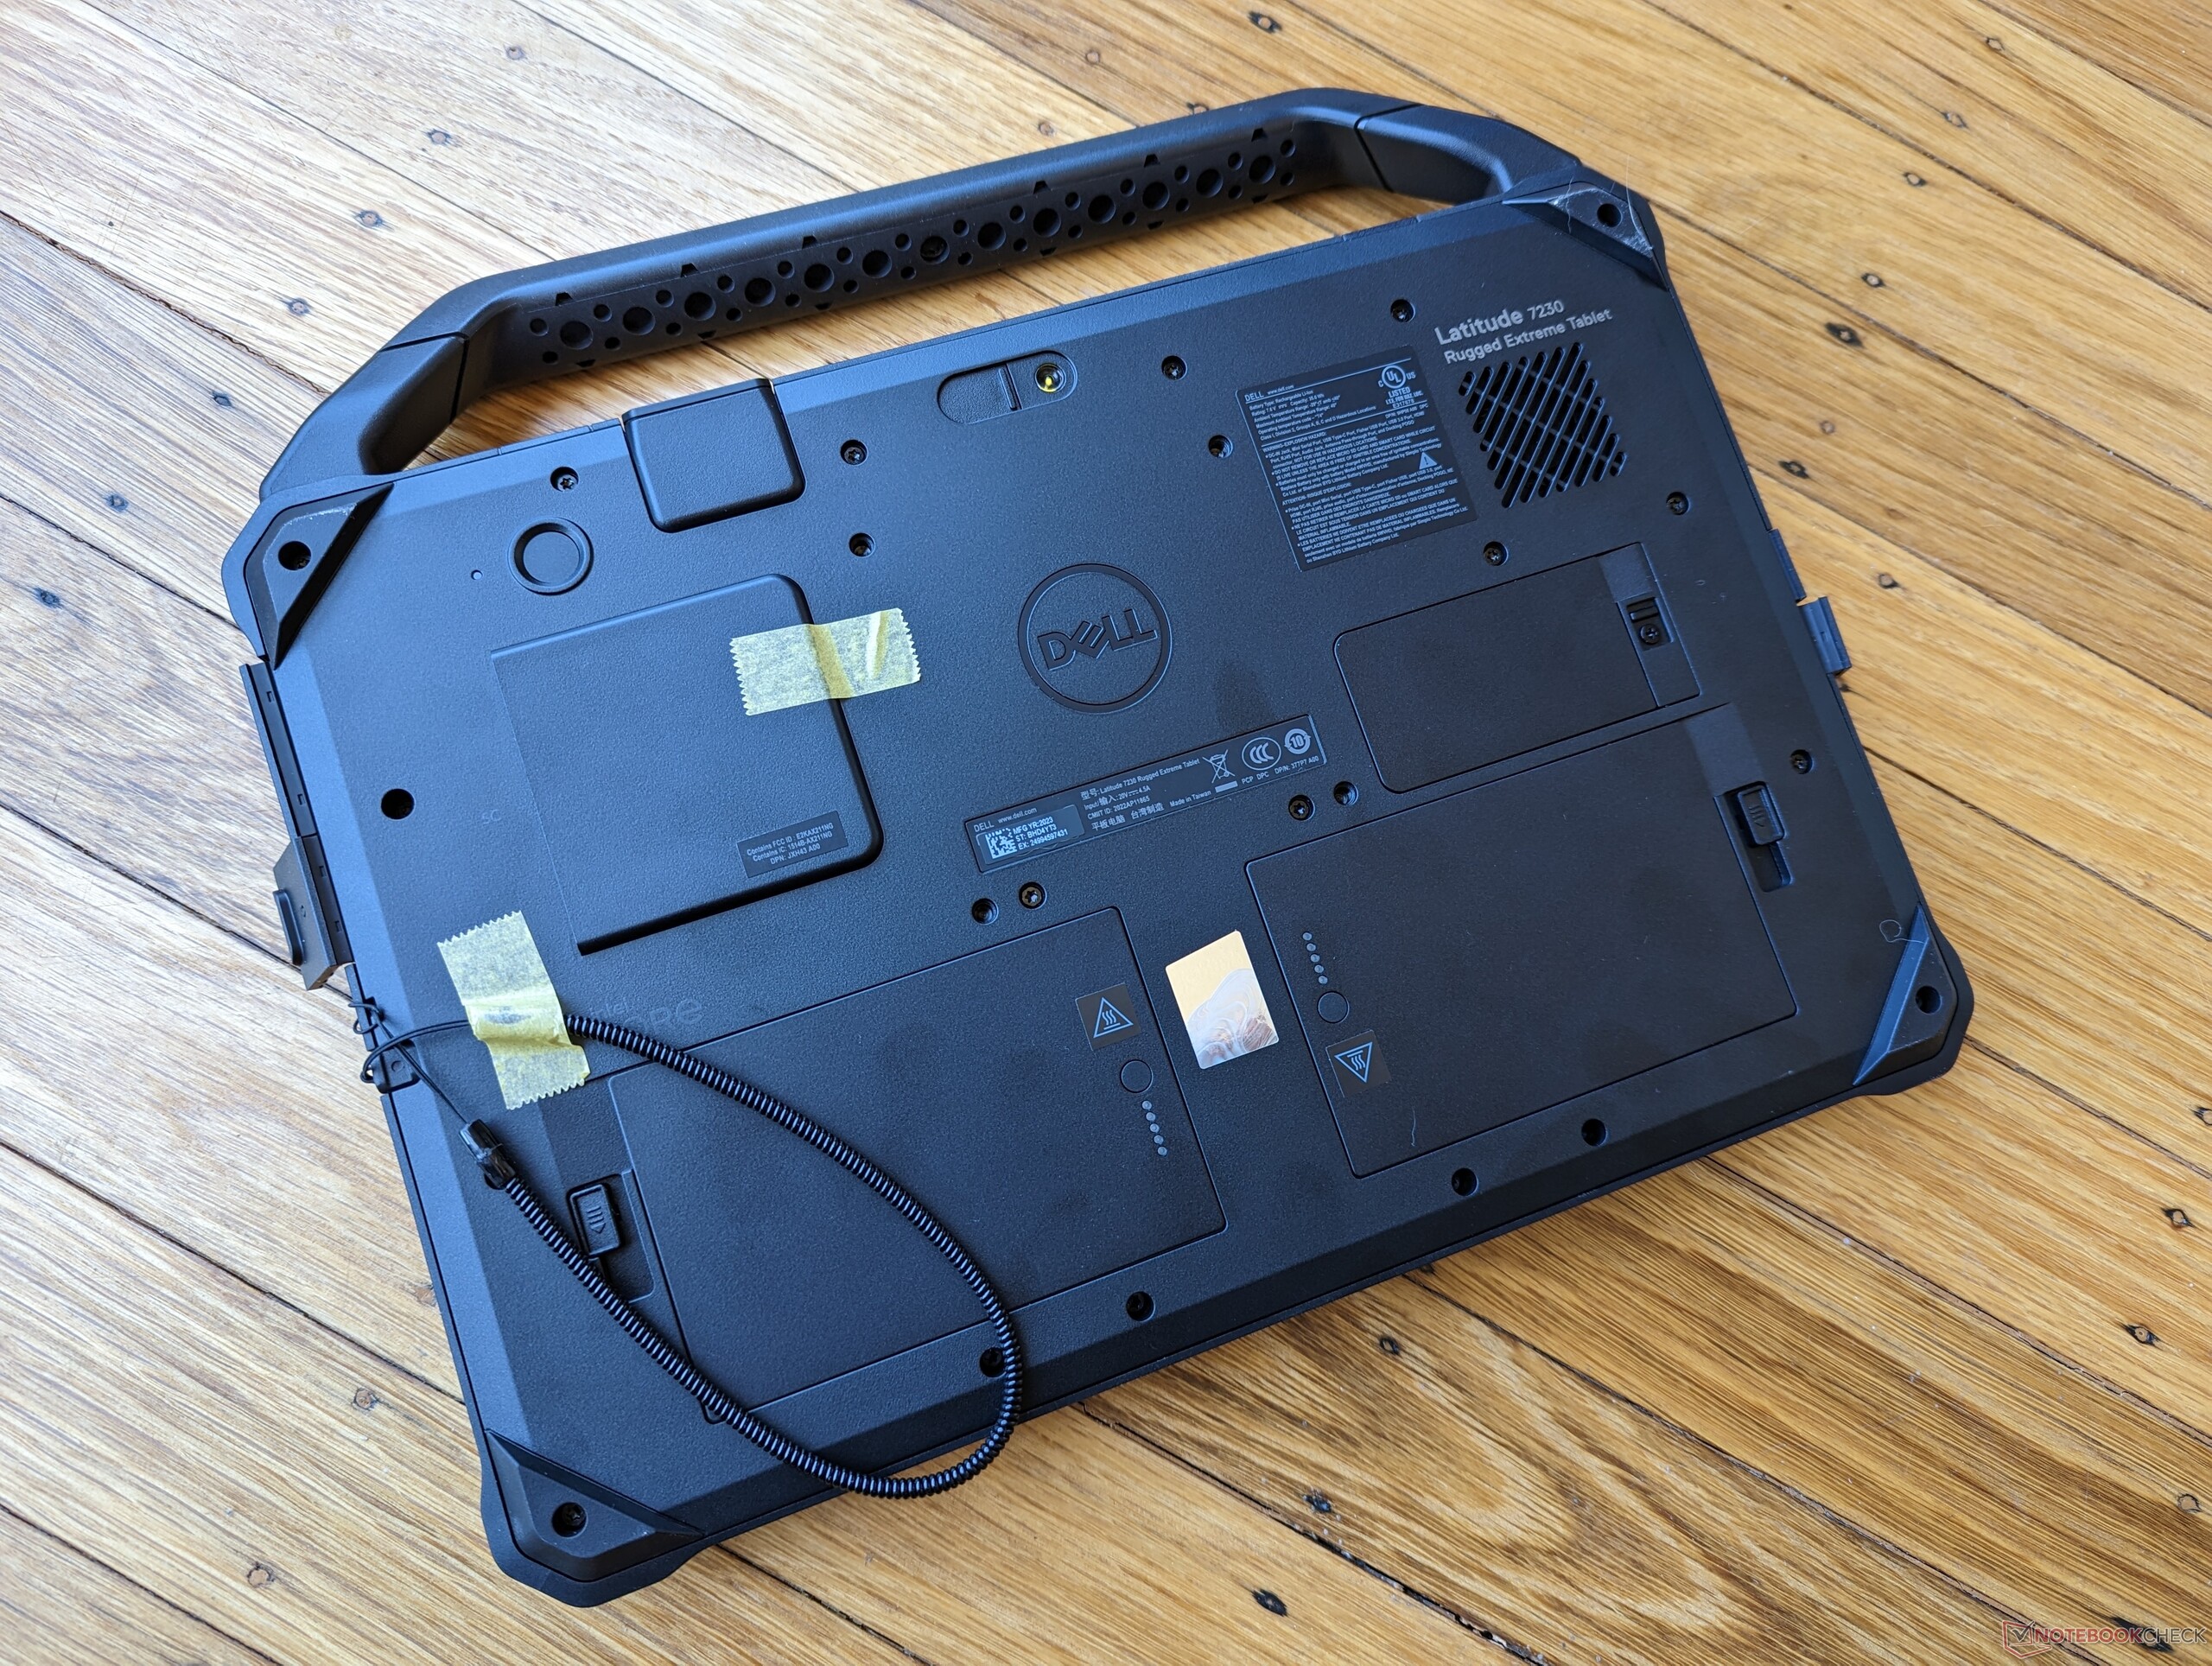
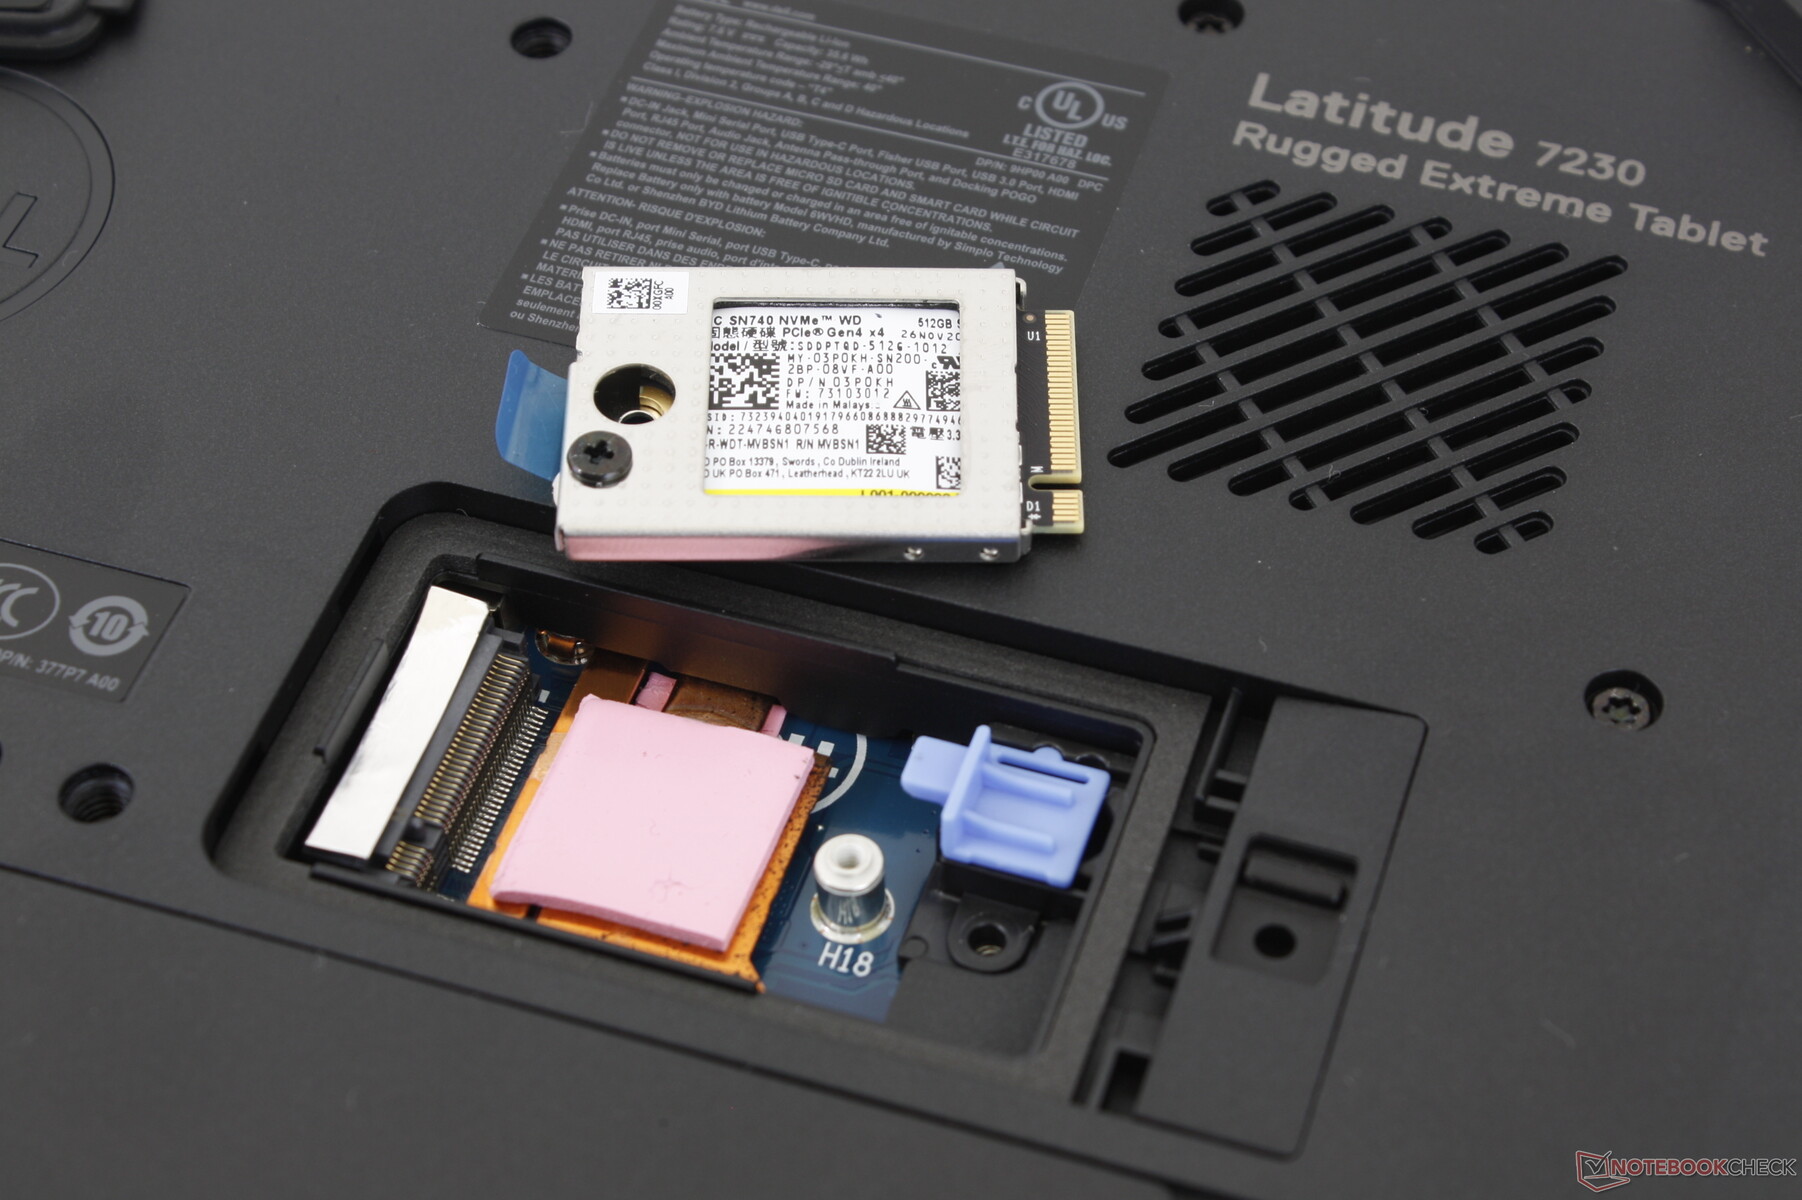
Manutenção
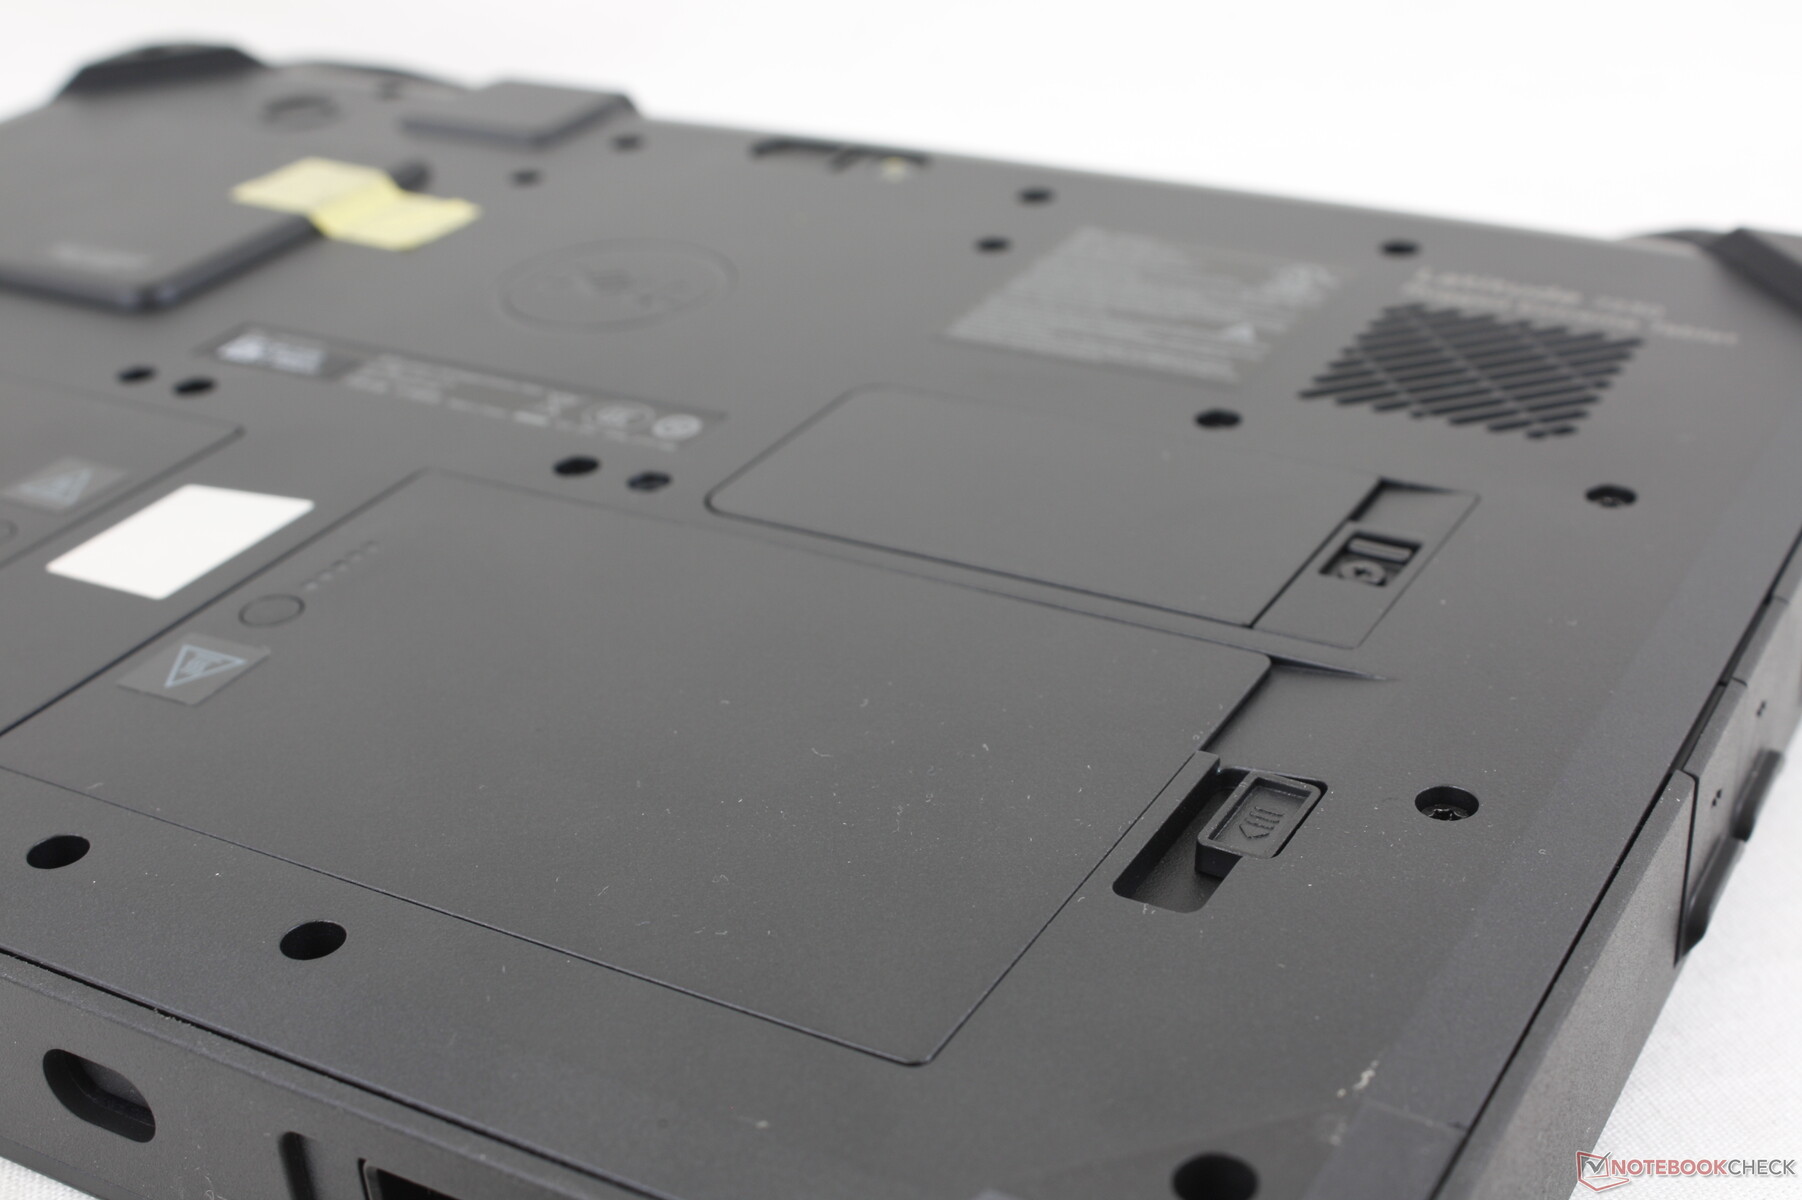
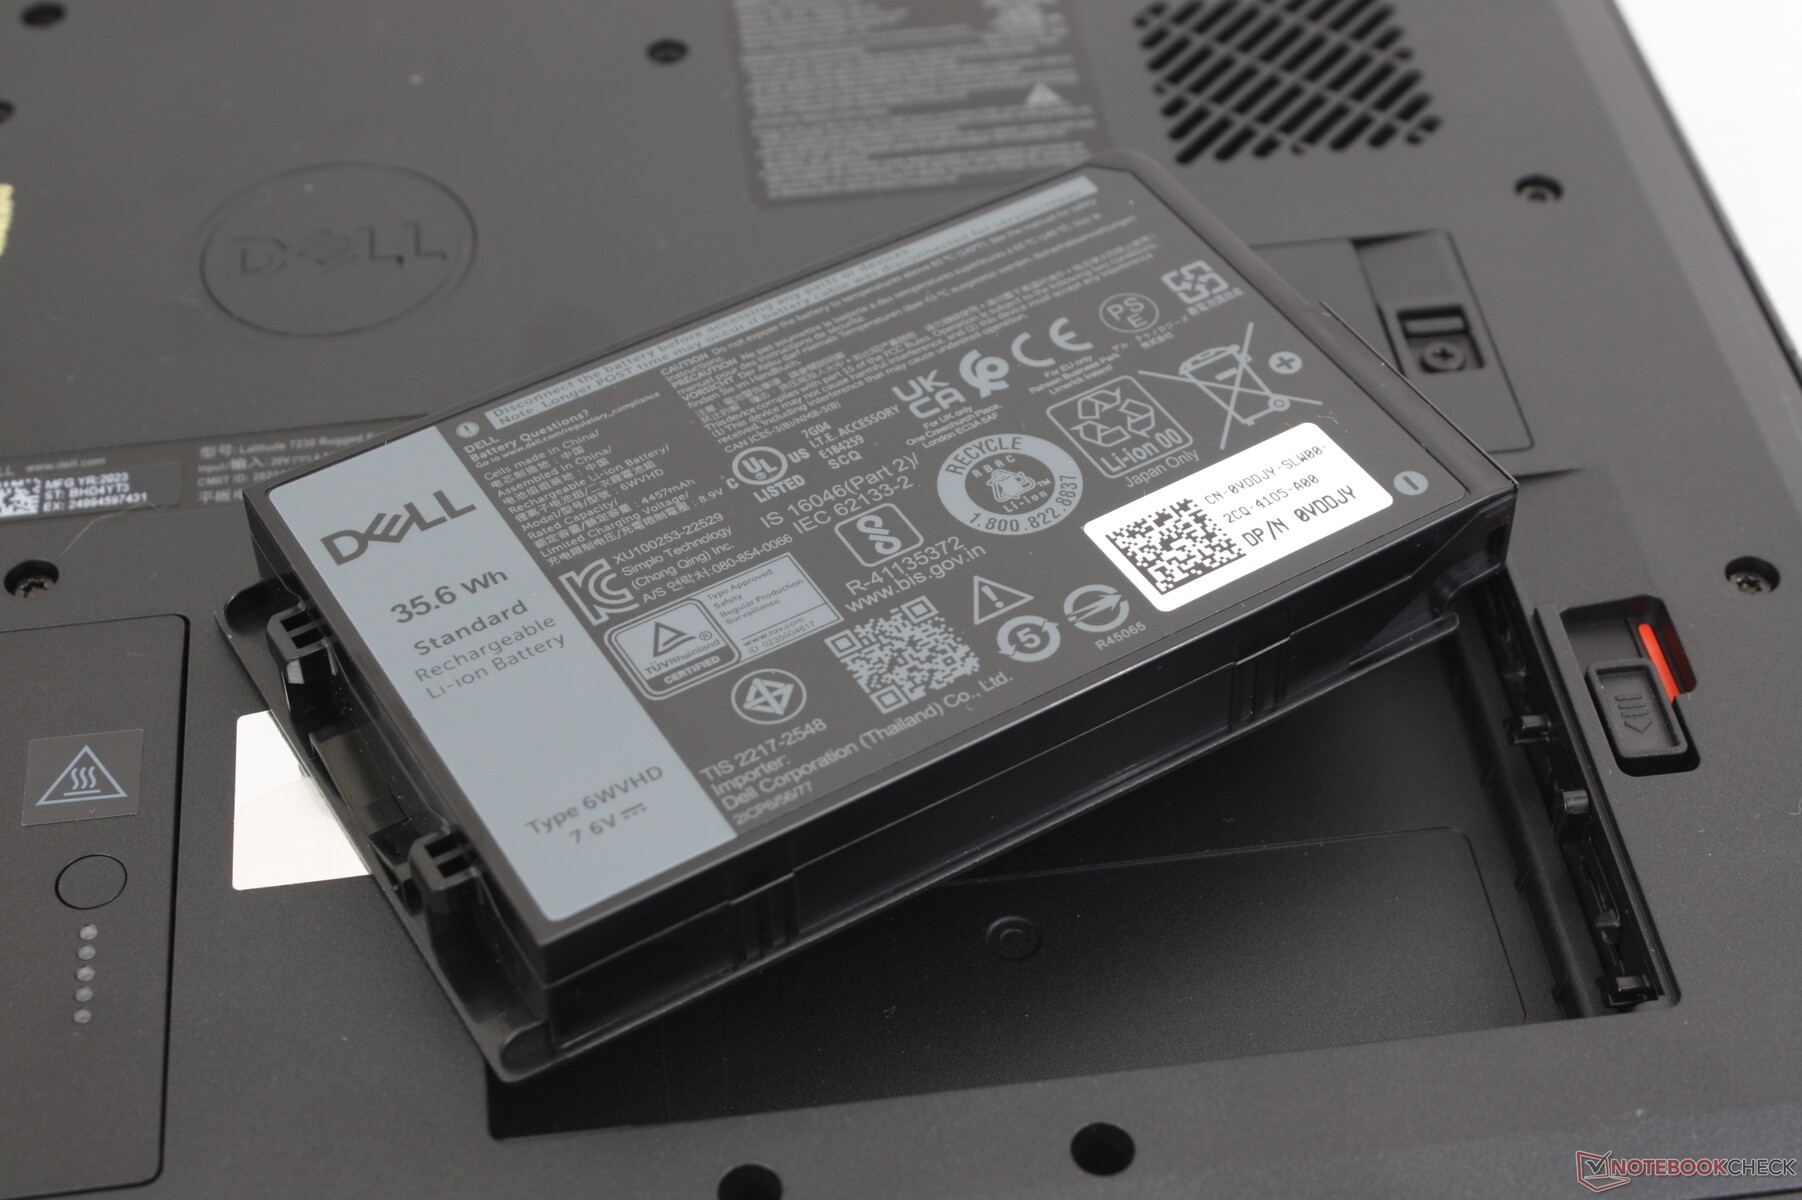
O painel traseiro é fixado por nada menos que duas dúzias de parafusos Torx. Felizmente, as duas baterias e o slot único M.2 SSD são mais facilmente acessíveis. A RAM é soldada e somente configurável no checkout.
Um manual de serviço oficial https://dl.dell.com/content/manual25603516-latitude-7230-rugged-extreme-tablet-service-manual.pdf?language=en-us está disponível diretamente da Dell, caso seja necessária uma desmontagem posterior.
Acessórios e Garantia
Os acessórios opcionais incluem o teclado premium, alça de mão, caneta ativa, e muitos outros. A caixa de varejo inclui uma caneta passiva e uma alça rígida de transporte já acoplada. Aplica-se uma garantia limitada de três anos se comprada nos EUA.
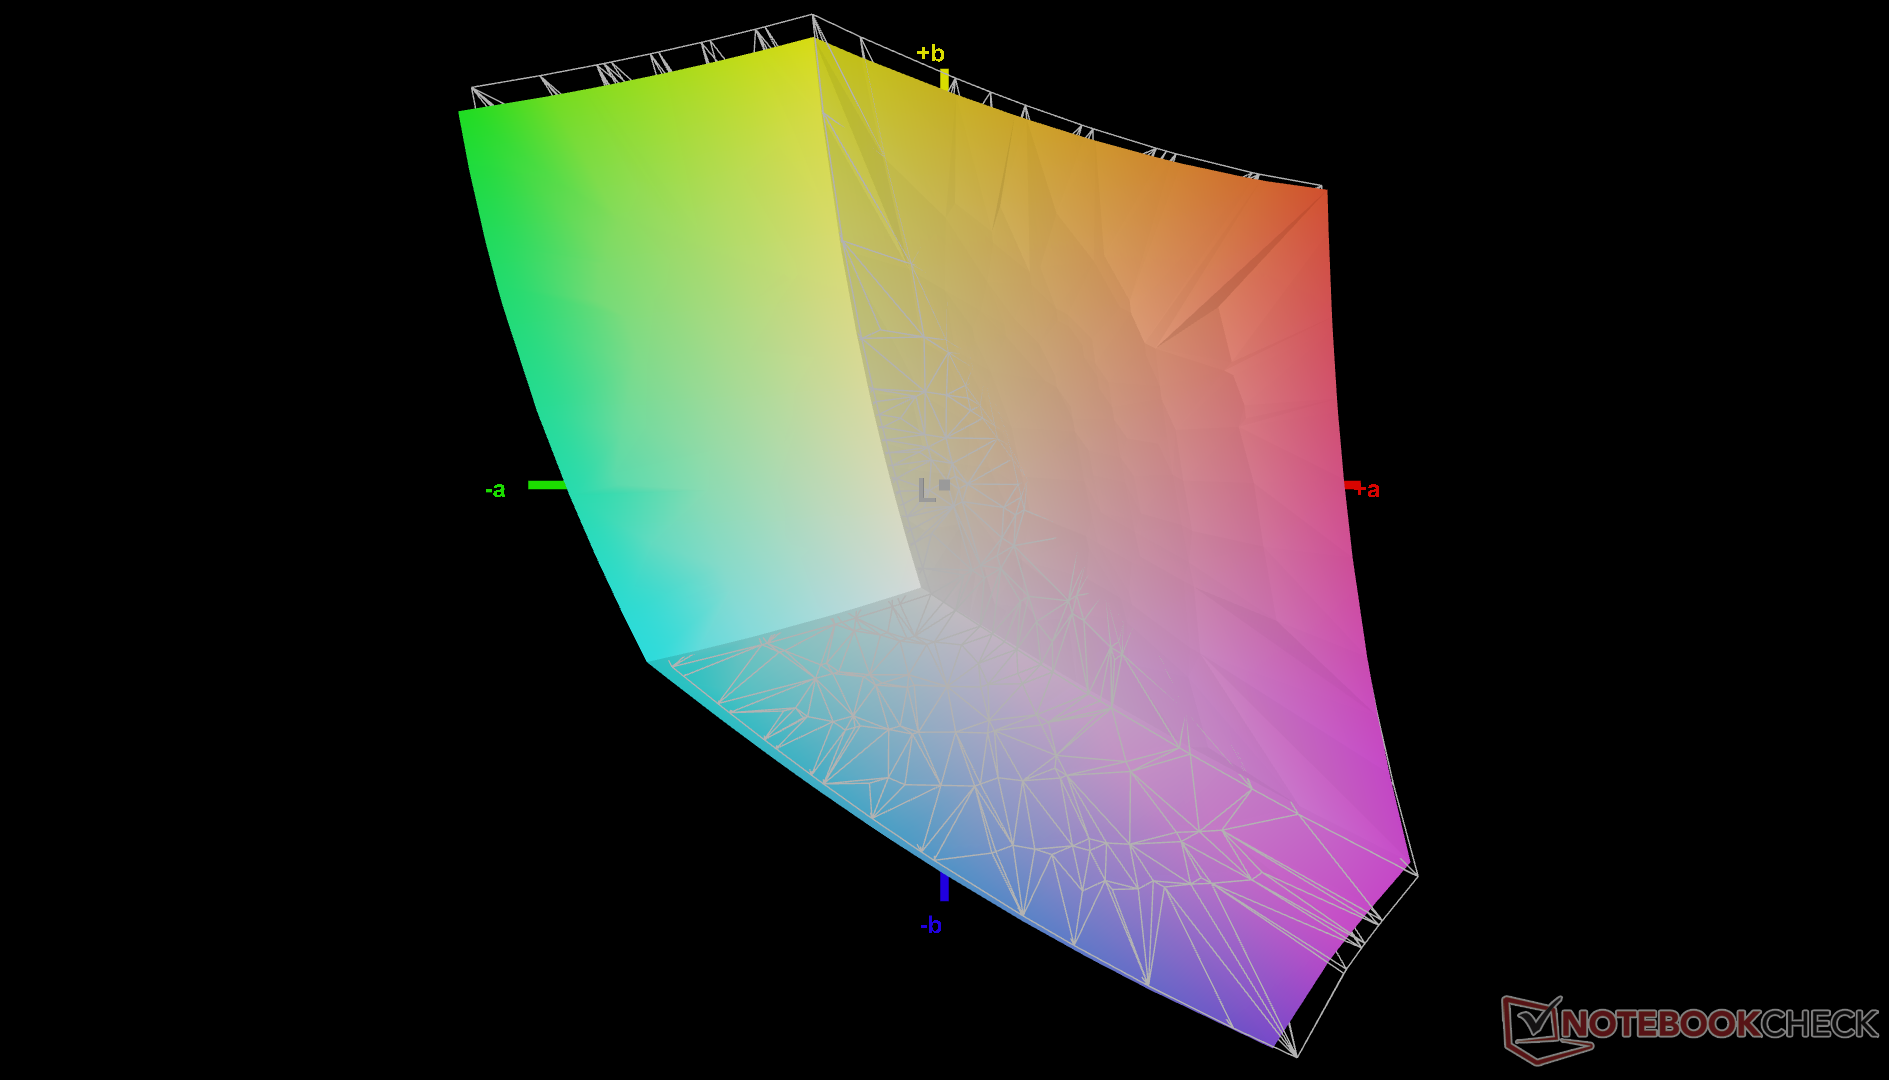
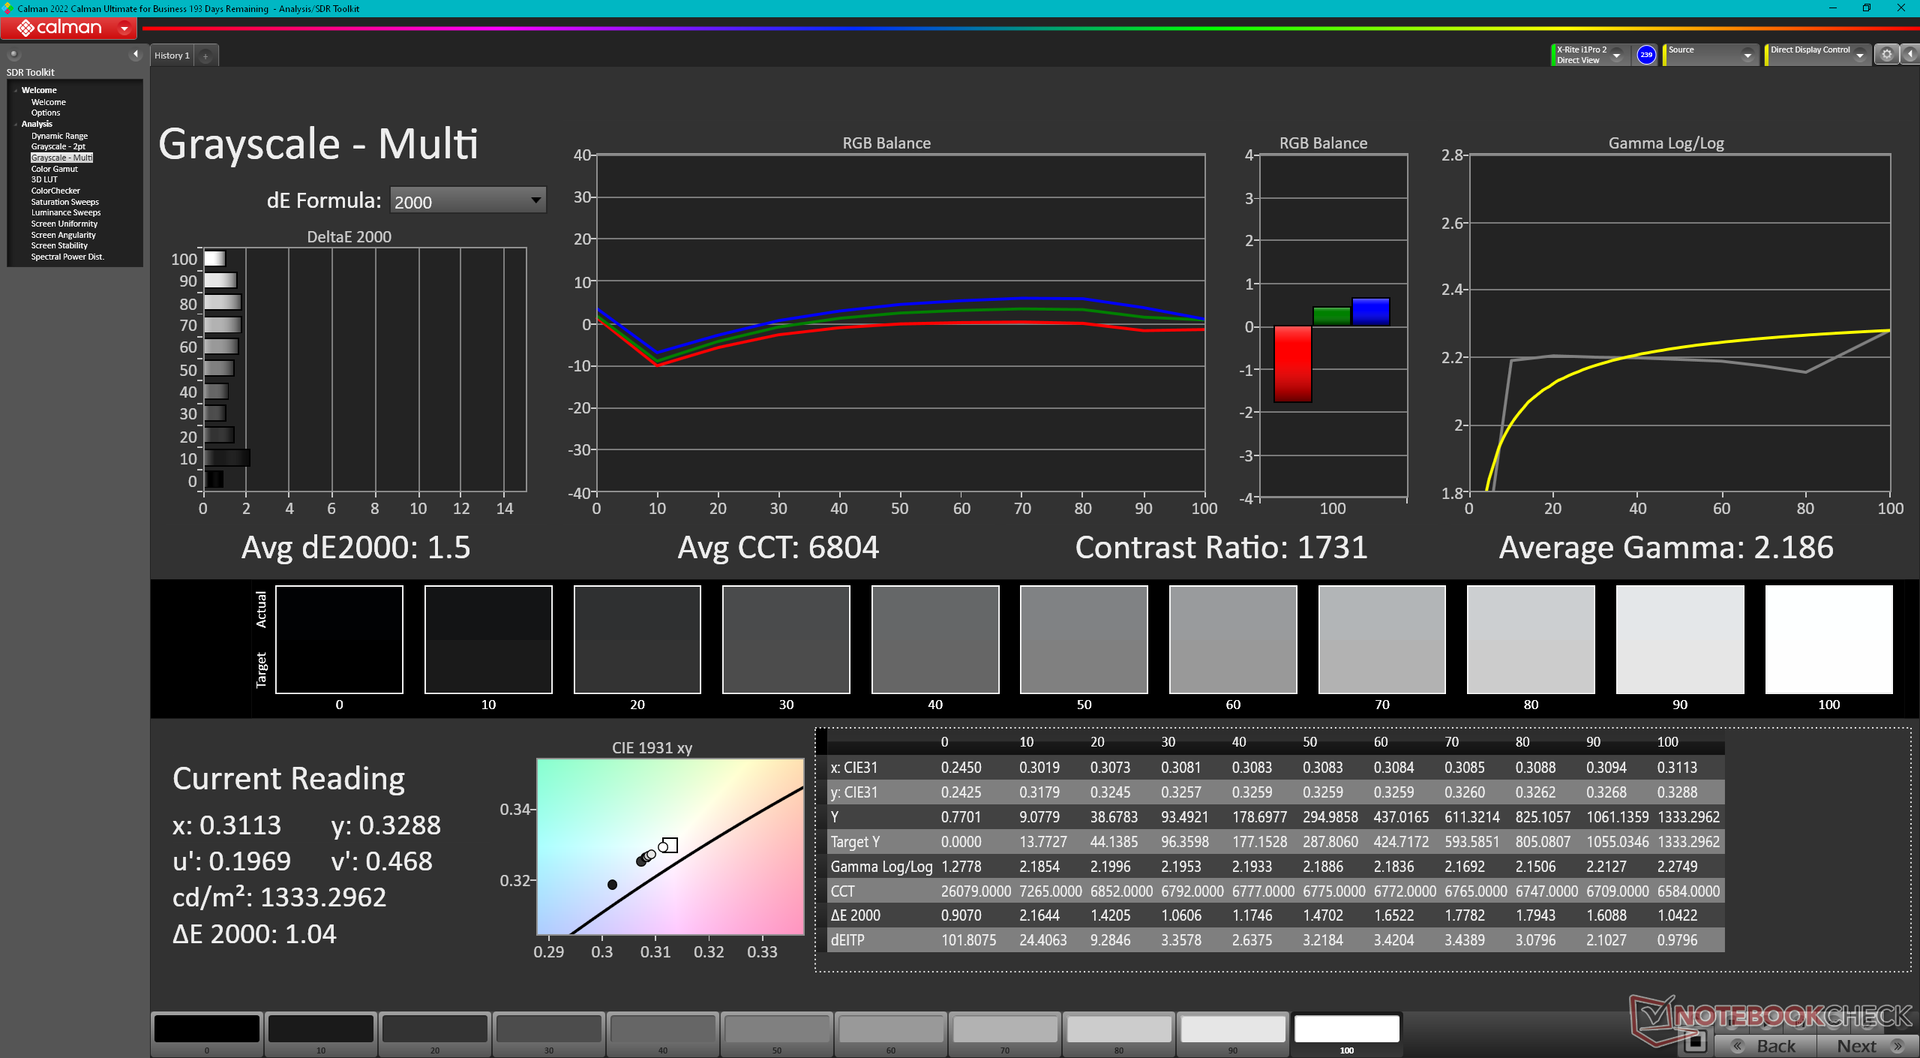
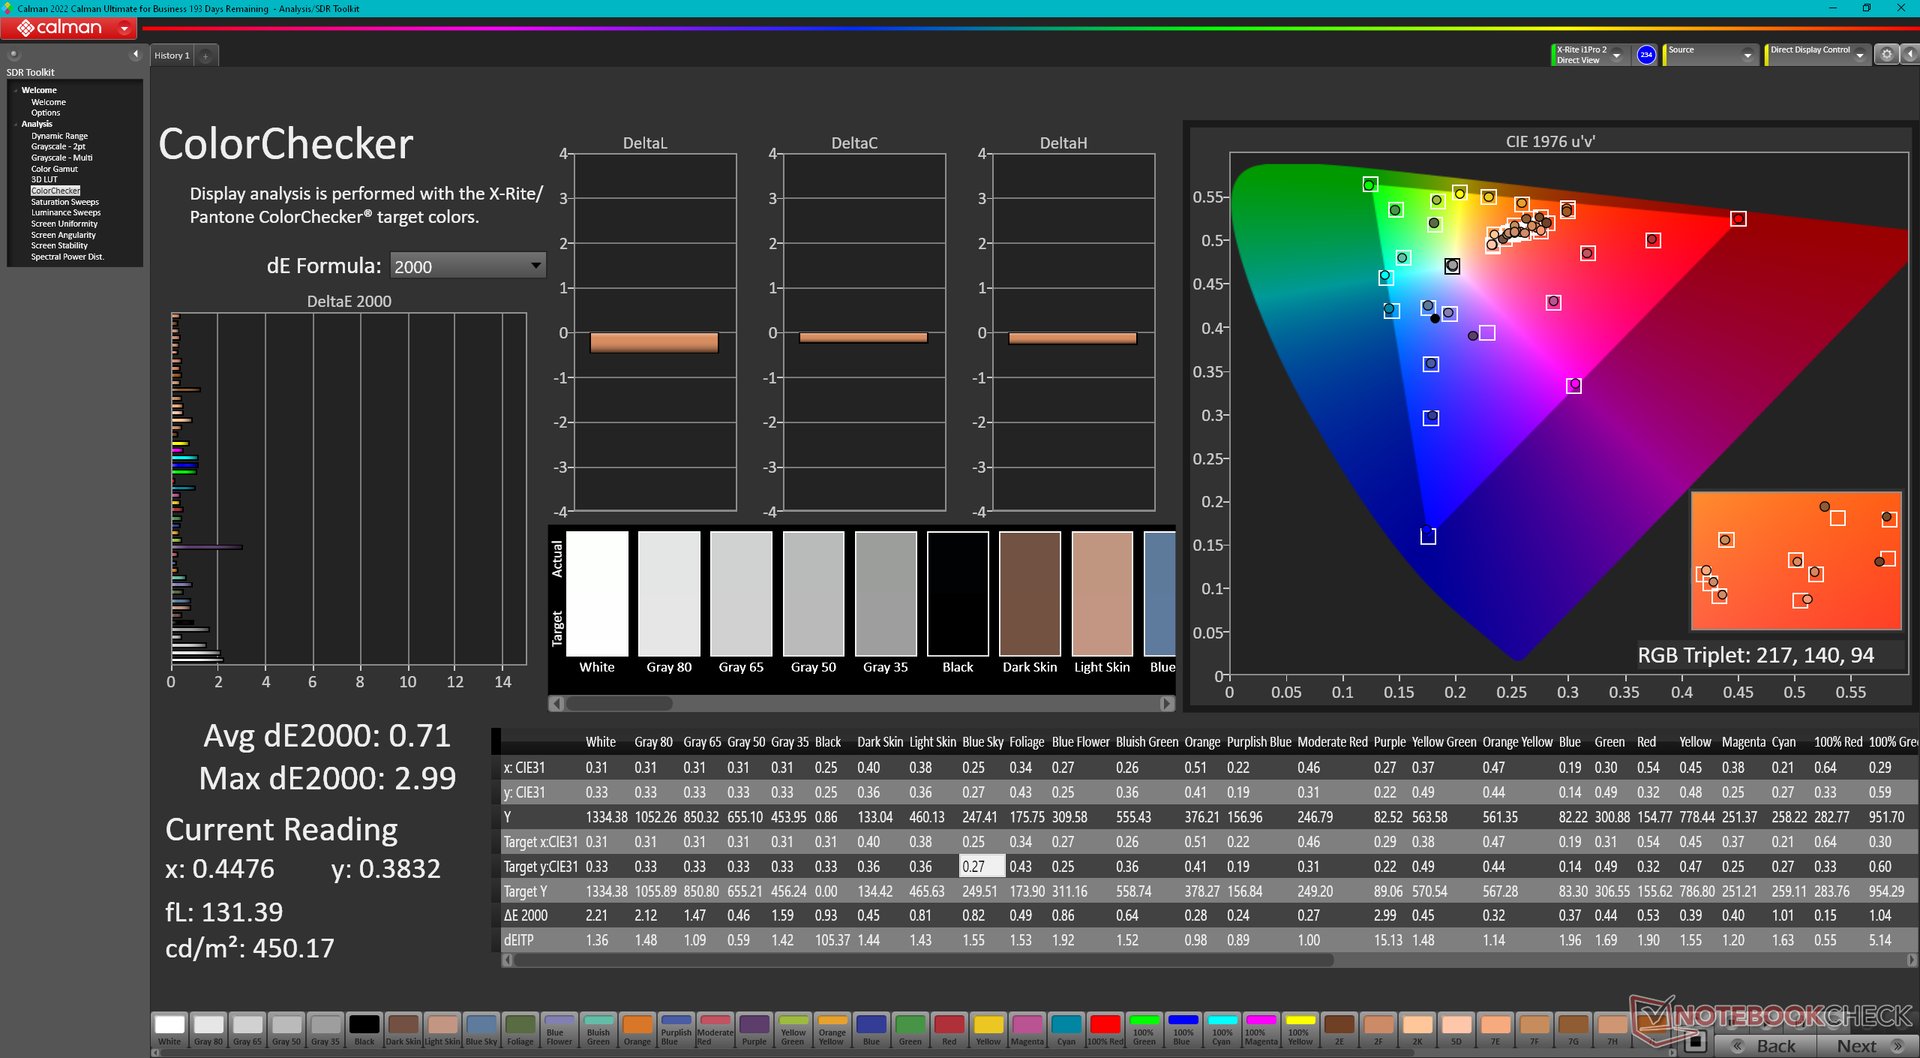
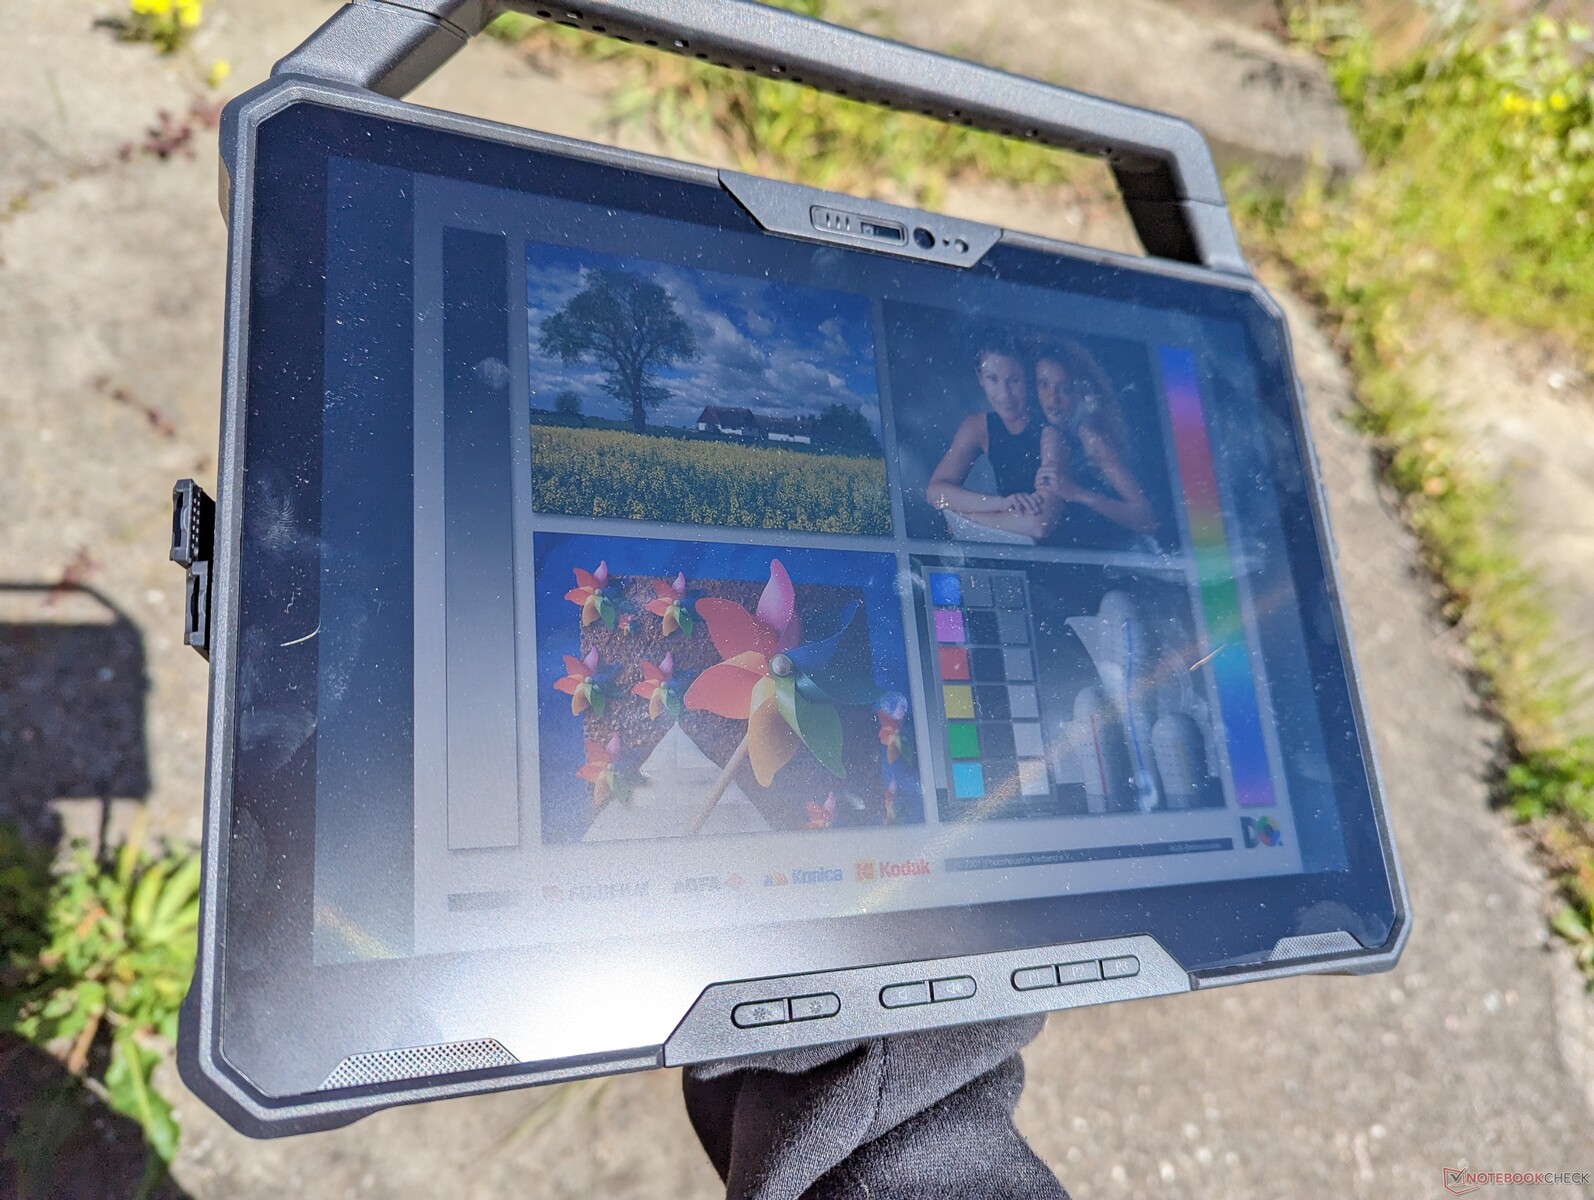
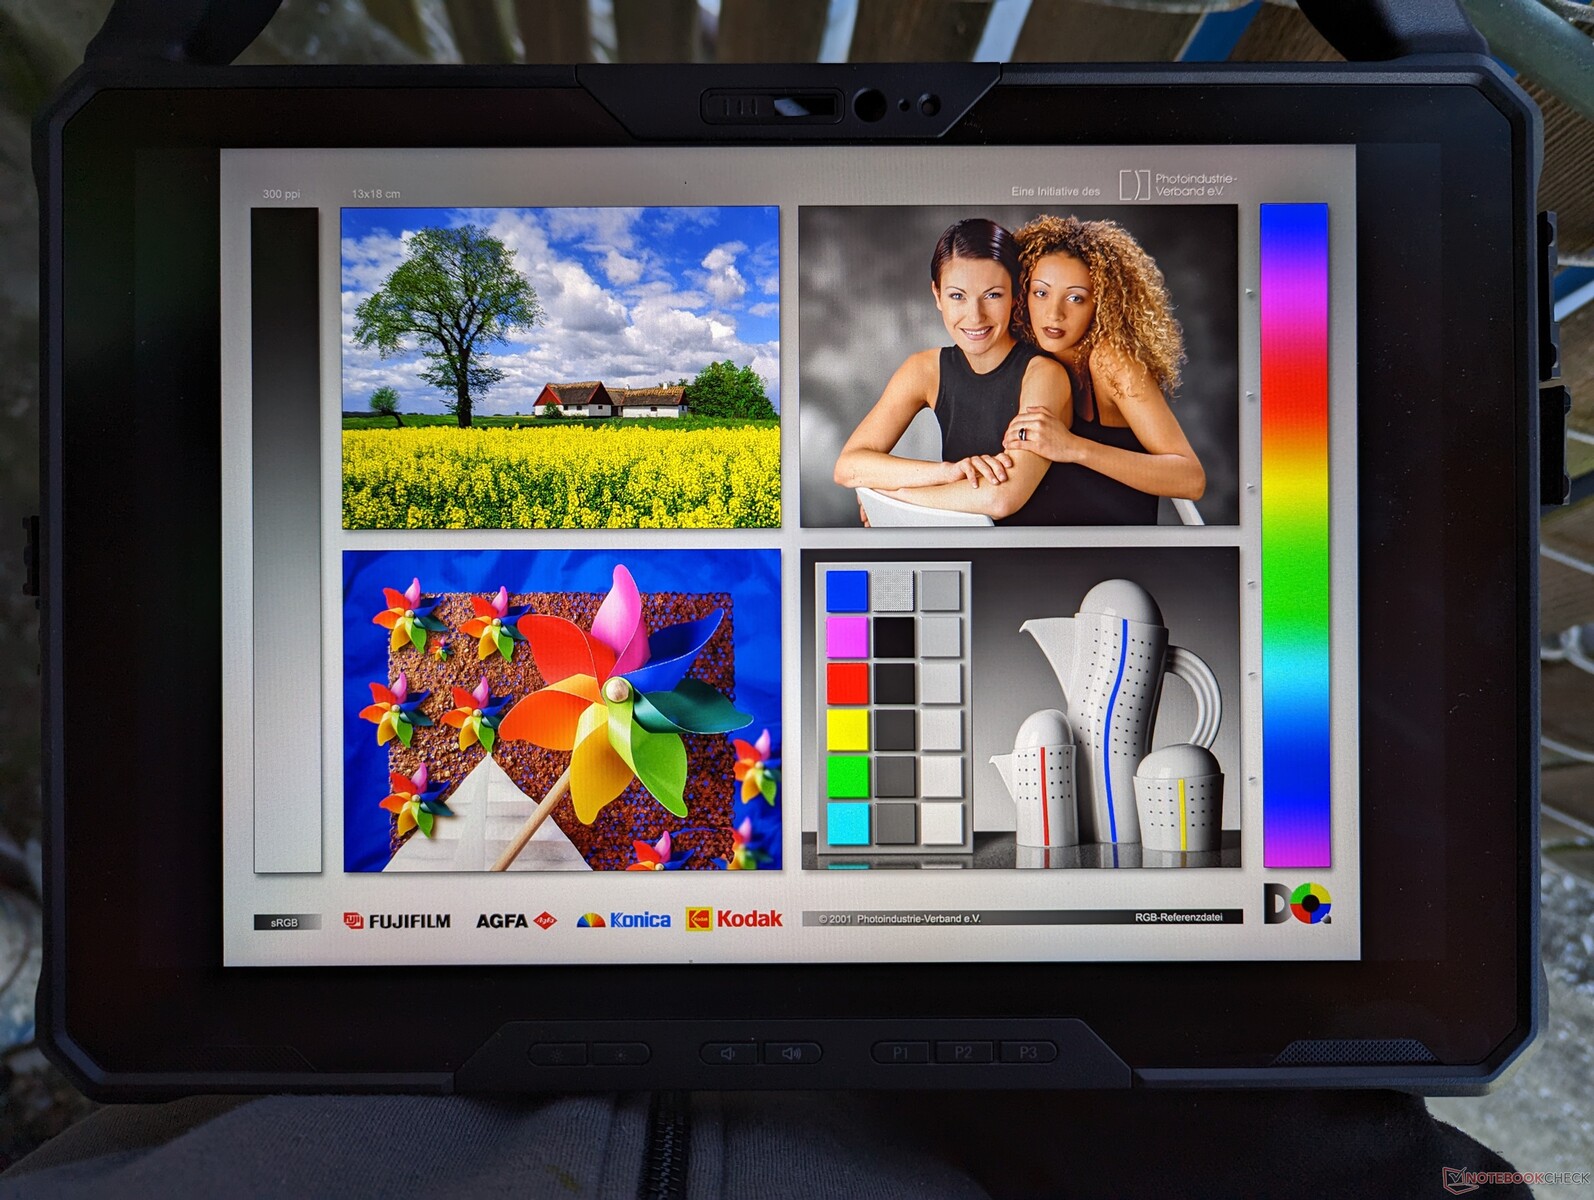
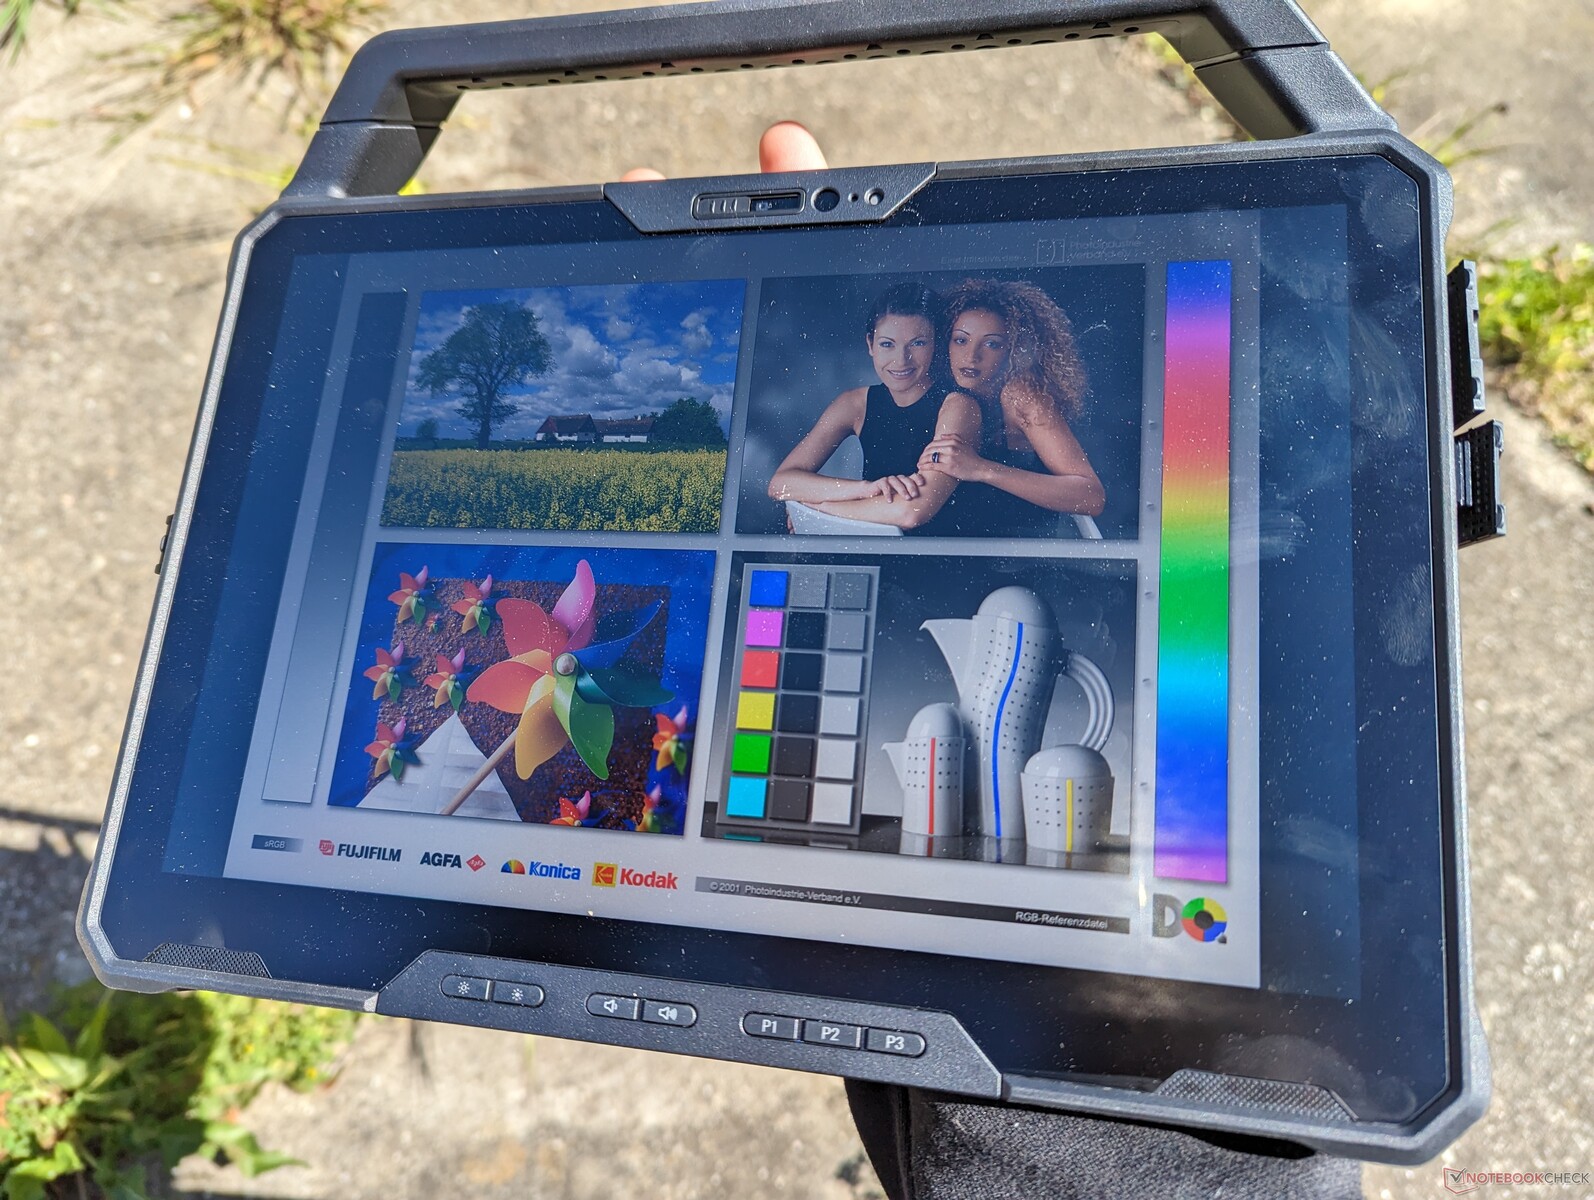
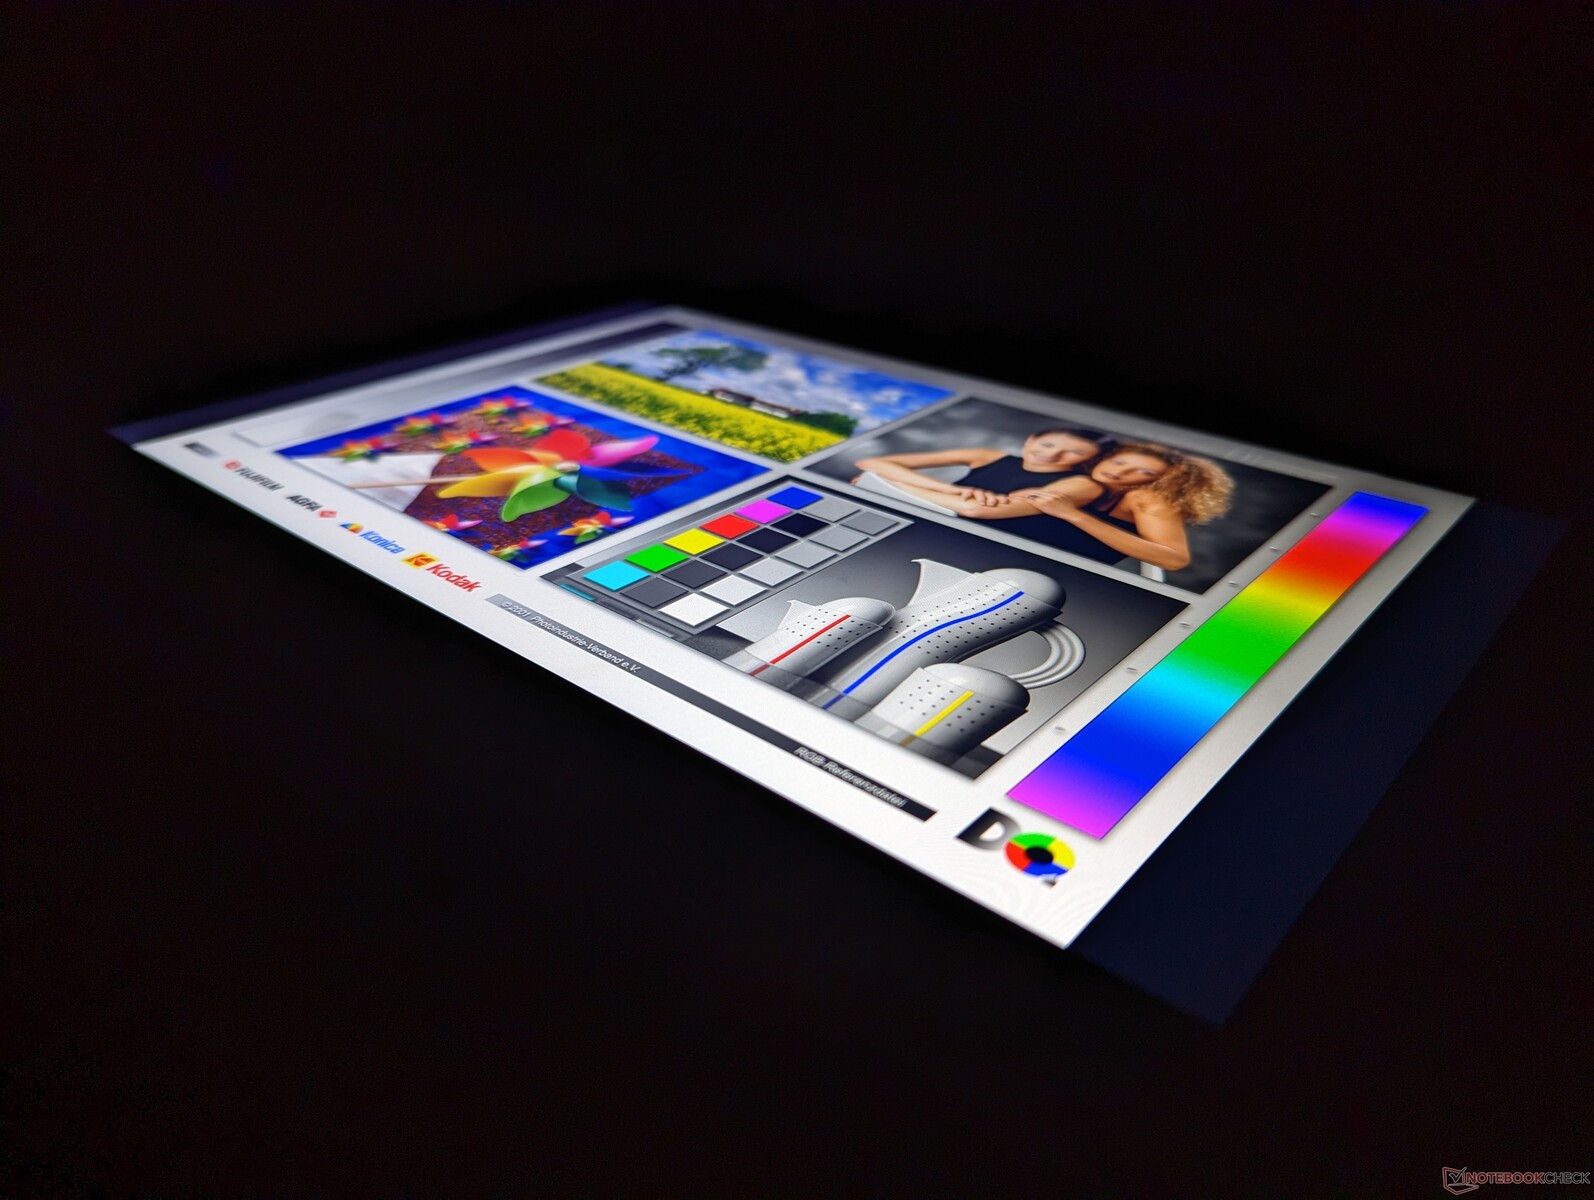
Mostrador - 1200 Lêndeas e Cobertura total sRGB
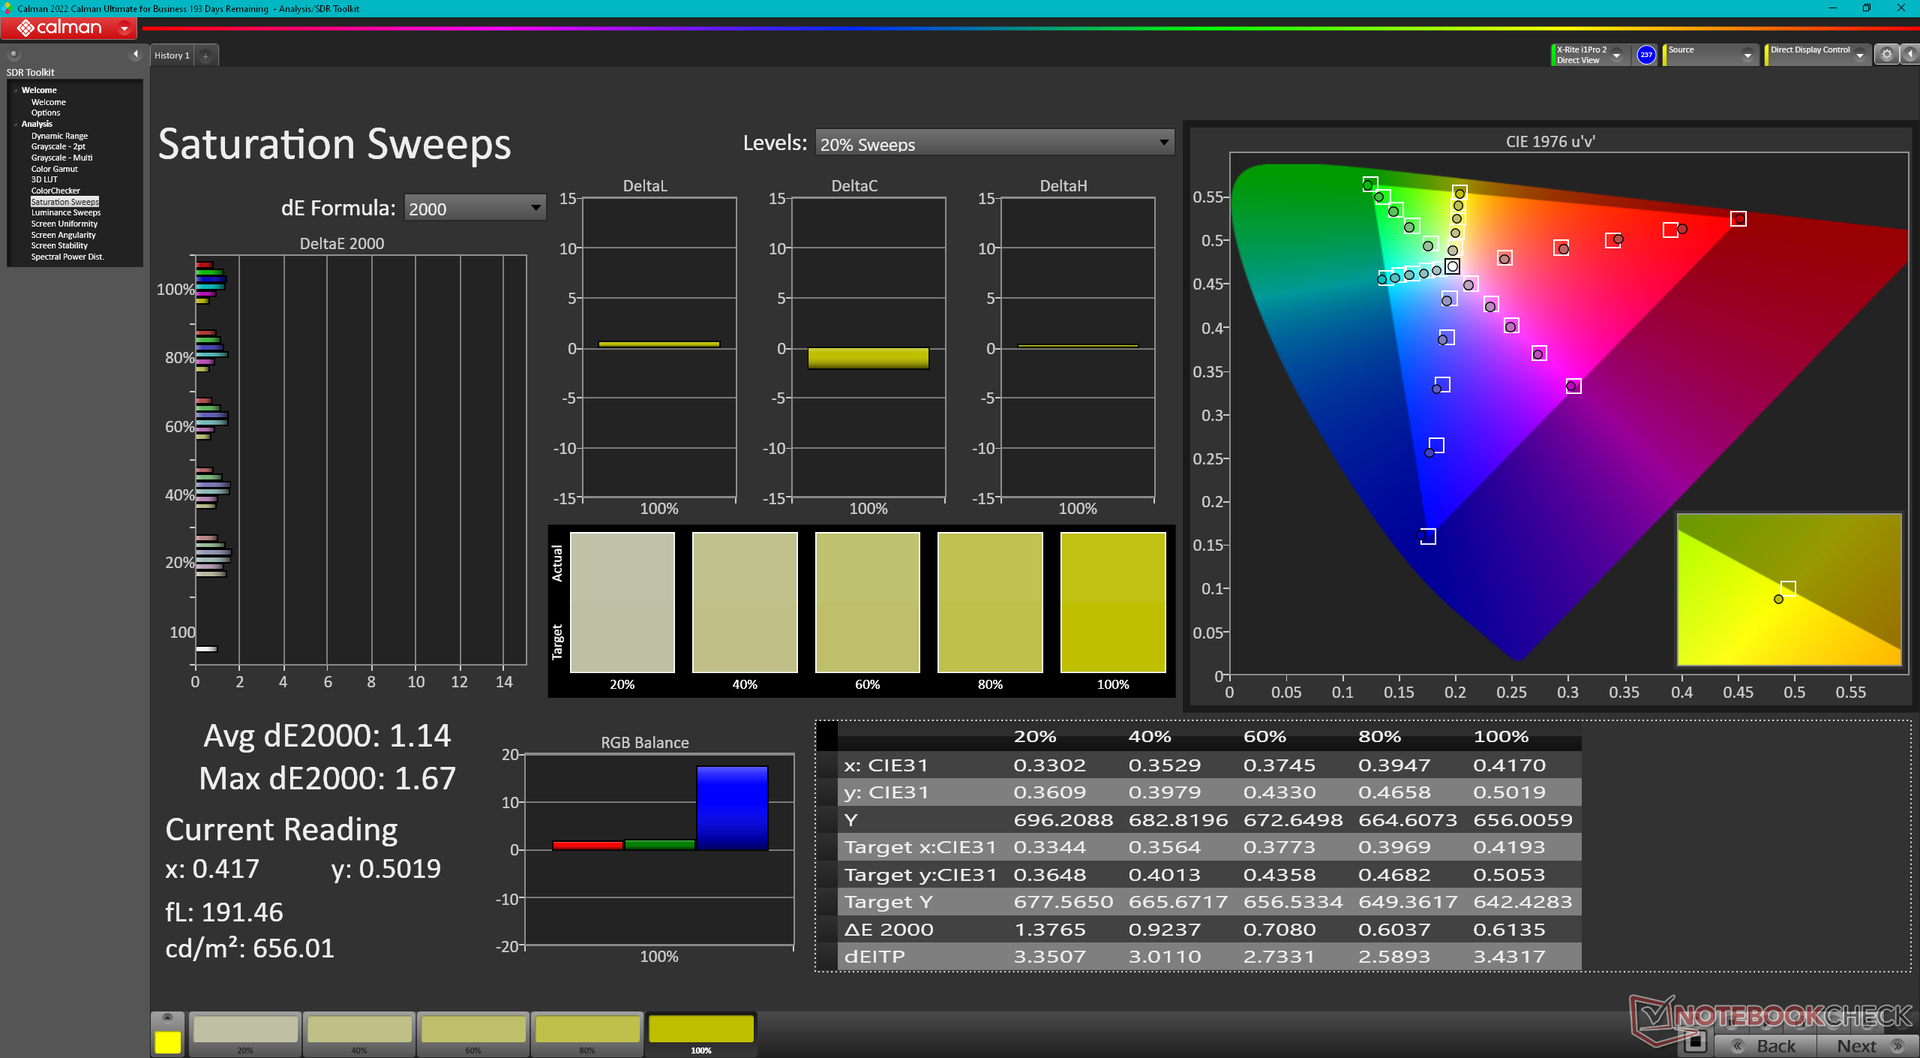
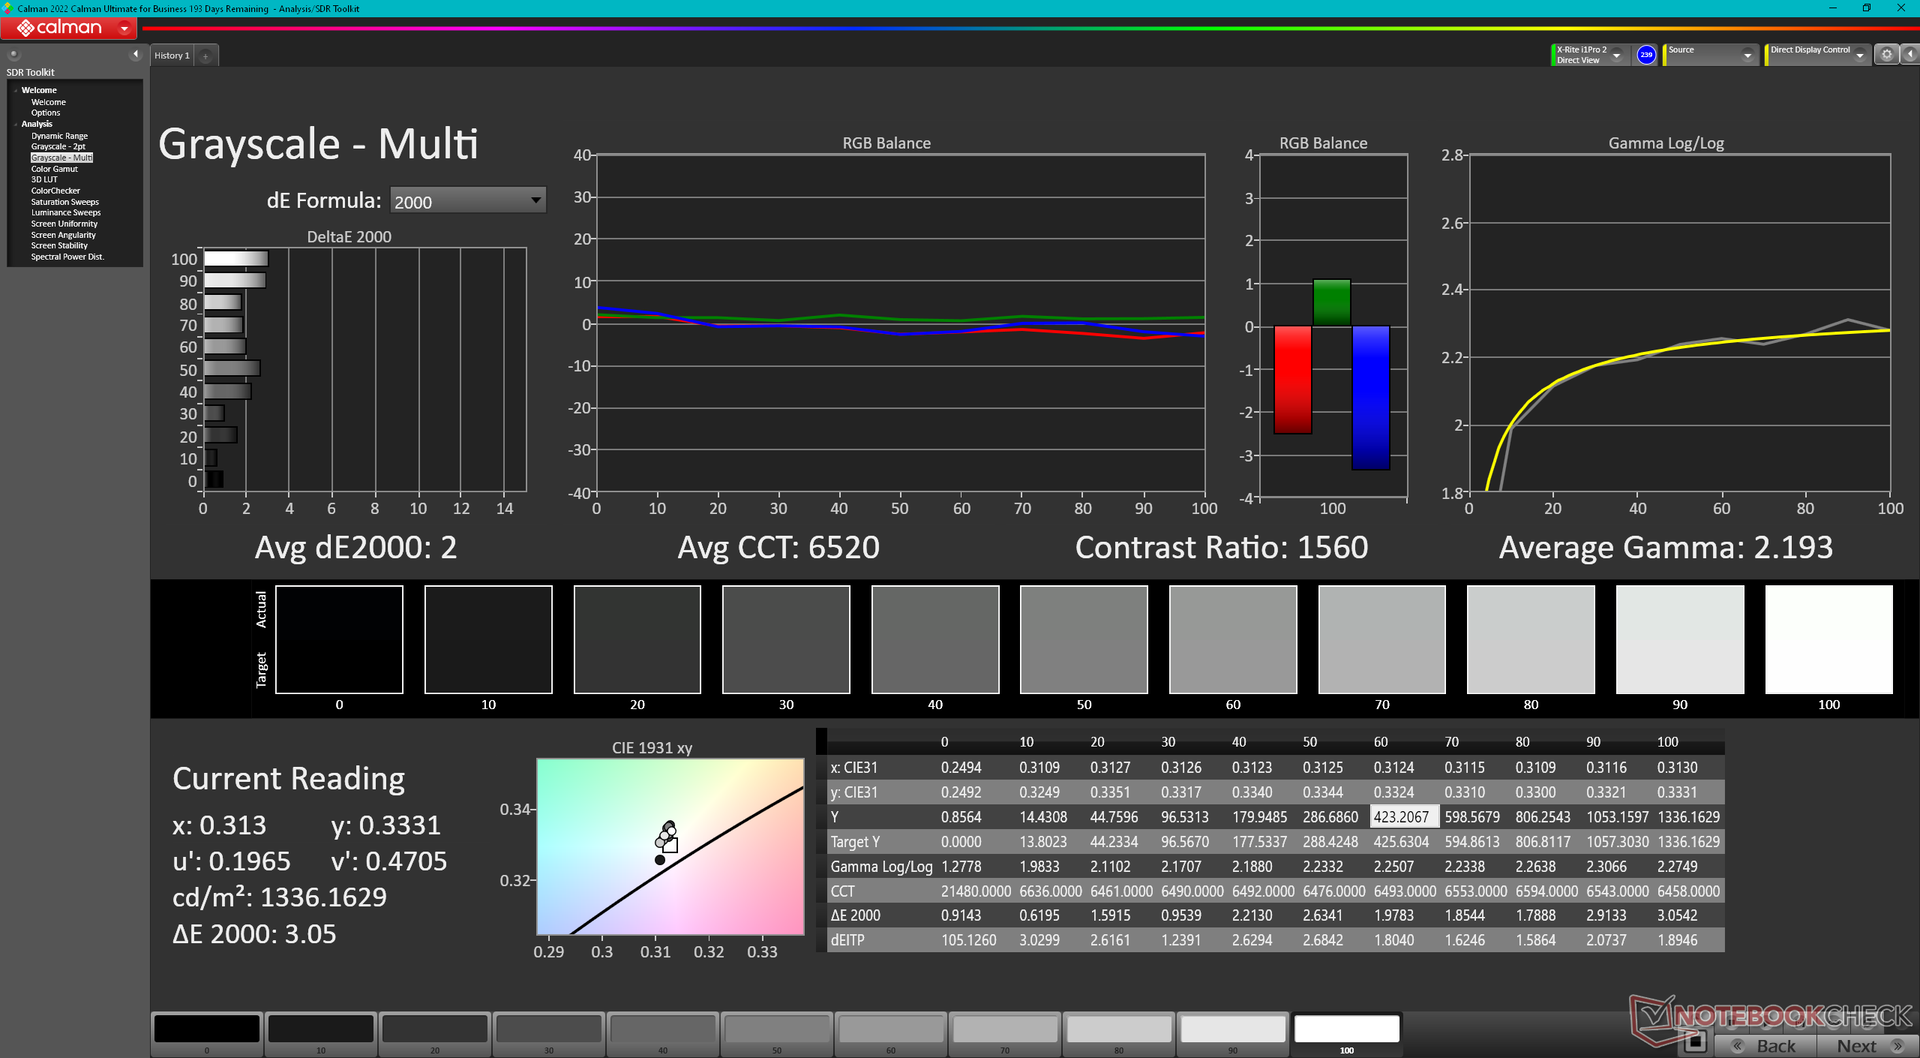
O Latitude 7230 Rugged é um dos poucos dispositivos em sua categoria e tamanho a oferecer >95 por cento sRGB para cores mais precisas e vibrantes. Os tempos de resposta preto-branco e cinza-cinza também são razoavelmente rápidos para uma menor percepção de fantasmas. Não há modulação de largura de pulso para o controle de brilho, o que significa que você pode usar o tablet com níveis de brilho muito baixos sem fadiga ocular ou cintilação perceptível. Este é um dos melhores displays que já vimos em uma tábua resistente.
A maior desvantagem do visor é sua granulosidade, apesar das excelentes cores e da luz de fundo brilhante. Quando comparada às telas mais nítidas em tabletes ou laptops de consumo, a tela tátil do Latitude 7230 Rugged está sob camadas mais grossas de vidro e proteção que, em última análise, impactam a qualidade da imagem. Para o público alvo, no entanto, as imagens de super-crise geralmente não são uma prioridade.


| |||||||||||||||||||||||||
iluminação: 82 %
iluminação com acumulador: 1326.7 cd/m²
Contraste: 1561:1 (Preto: 0.85 cd/m²)
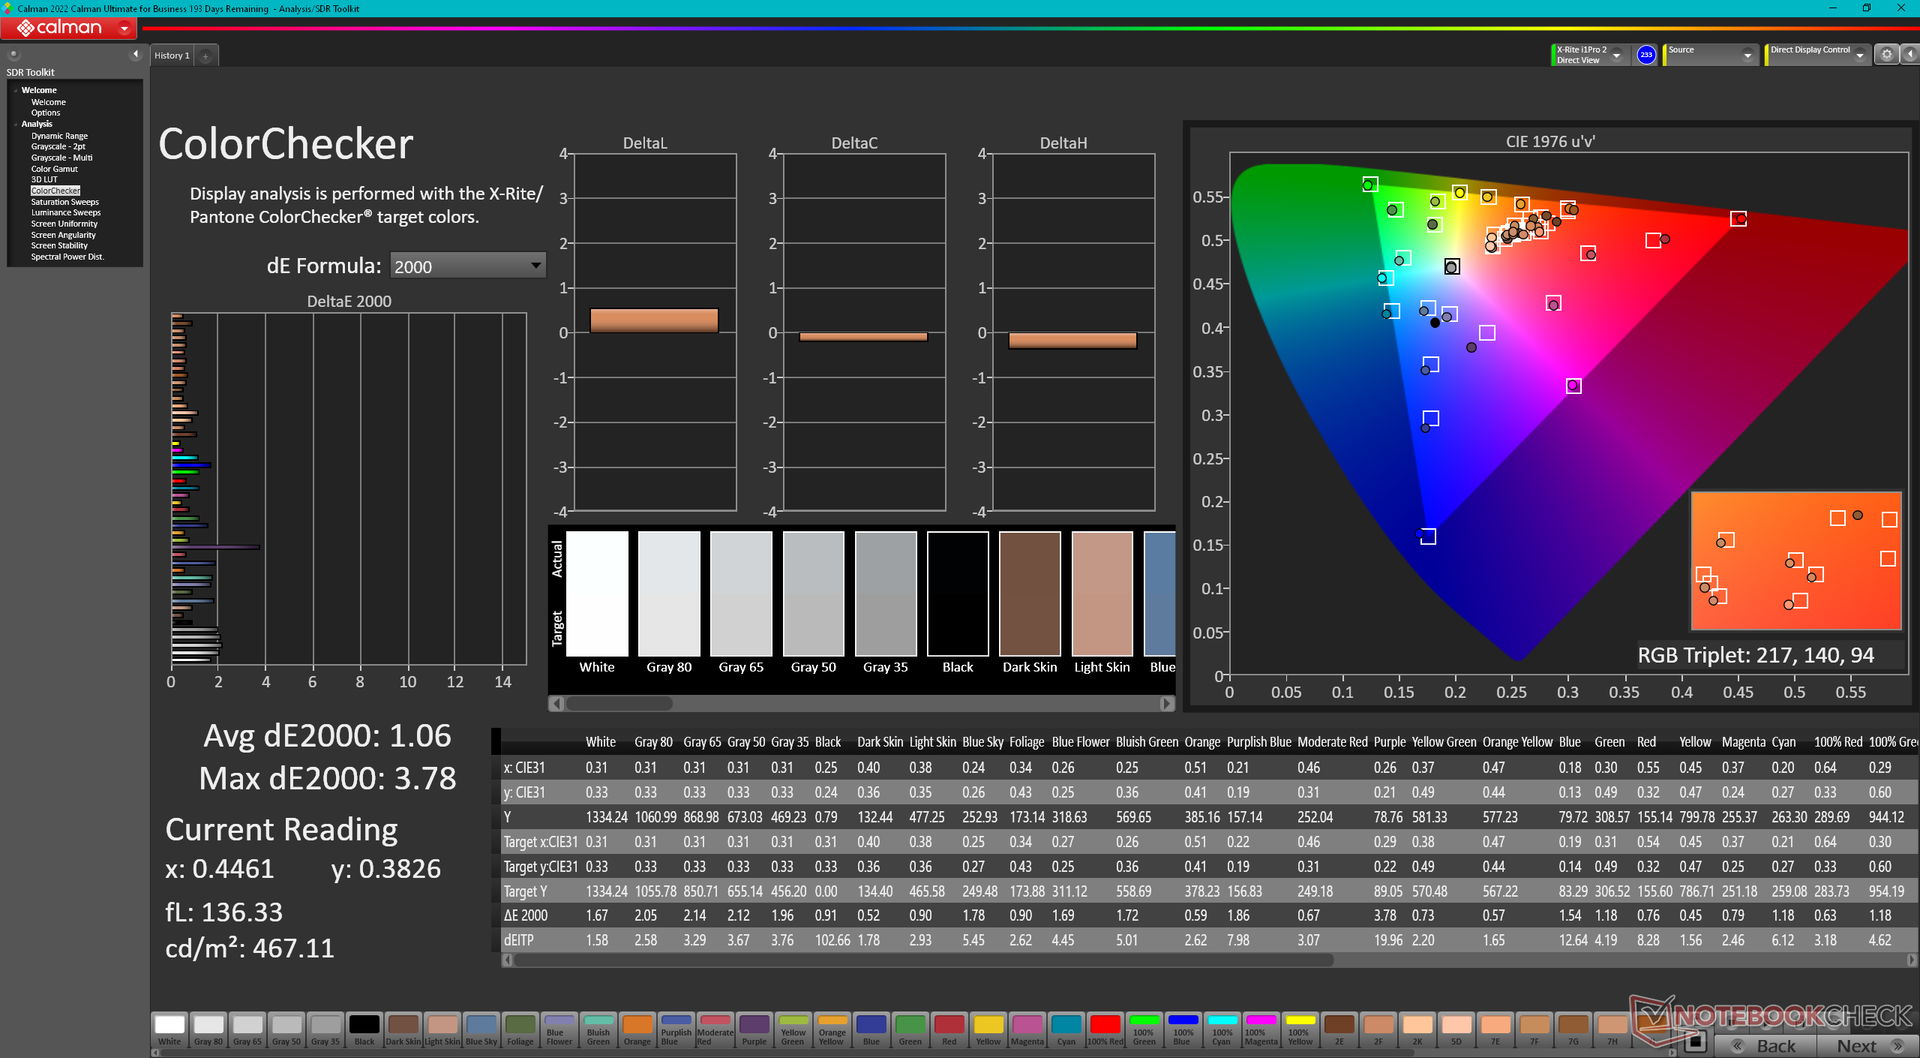
ΔE ColorChecker Calman: 1.06 | ∀{0.5-29.43 Ø4.71}
calibrated: 0.71
ΔE Greyscale Calman: 1.5 | ∀{0.09-98 Ø4.96}
68.4% AdobeRGB 1998 (Argyll 3D)
96.1% sRGB (Argyll 3D)
66.2% Display P3 (Argyll 3D)
Gamma: 2.19
CCT: 6804 K
| Dell Latitude 7230 Rugged Extreme Sharp LQ120N1, IPS, 1920x1200, 12" | Dell Latitude 7330 Rugged Extreme Sharp LQ133M1, IPS, 1920x1080, 13.3" | Panasonic Toughbook 40 InfoVision M140NWF5 R3, IPS, 1920x1080, 14" | Getac B360 AU Optronics AUO572D, IPS, 1920x1080, 13.3" | Acer Enduro Urban N3 EUN314 XR140EA6T, IPS, 1920x1080, 14" | Durabook S14I KD140N0730A01, TN, 1920x1080, 14" | |
|---|---|---|---|---|---|---|
| Display | 1% | -45% | -24% | -4% | -33% | |
| Display P3 Coverage (%) | 66.2 | 67.1 1% | 35.8 -46% | 51.3 -23% | 63.5 -4% | 43.55 -34% |
| sRGB Coverage (%) | 96.1 | 98.2 2% | 53.8 -44% | 72 -25% | 91.9 -4% | 65.4 -32% |
| AdobeRGB 1998 Coverage (%) | 68.4 | 69 1% | 37 -46% | 52.2 -24% | 65.5 -4% | 45 -34% |
| Response Times | -141% | -60% | -58% | -89% | 16% | |
| Response Time Grey 50% / Grey 80% * (ms) | 28.4 ? | 74.4 ? -162% | 50.4 ? -77% | 33 ? -16% | 56 ? -97% | 30.4 ? -7% |
| Response Time Black / White * (ms) | 19.4 ? | 42.4 ? -119% | 27.6 ? -42% | 38.8 ? -100% | 35.2 ? -81% | 11.8 ? 39% |
| PWM Frequency (Hz) | 694.4 ? | 870 ? | 1000 ? | 304.9 ? | ||
| Screen | -16% | -118% | -216% | -154% | -348% | |
| Brightness middle (cd/m²) | 1326.7 | 1414.1 7% | 1284.3 -3% | 1505.6 13% | 487.8 -63% | 1180.7 -11% |
| Brightness (cd/m²) | 1193 | 1282 7% | 1289 8% | 1383 16% | 464 -61% | 1102 -8% |
| Brightness Distribution (%) | 82 | 84 2% | 82 0% | 86 5% | 89 9% | 89 9% |
| Black Level * (cd/m²) | 0.85 | 0.83 2% | 0.89 -5% | 0.95 -12% | 0.48 44% | 1.91 -125% |
| Contrast (:1) | 1561 | 1704 9% | 1443 -8% | 1585 2% | 1016 -35% | 618 -60% |
| Colorchecker dE 2000 * | 1.06 | 1.99 -88% | 4.67 -341% | 9.81 -825% | 6.51 -514% | 13.45 -1169% |
| Colorchecker dE 2000 max. * | 3.78 | 3.75 1% | 19.85 -425% | 16.64 -340% | 11.36 -201% | 22.52 -496% |
| Colorchecker dE 2000 calibrated * | 0.71 | 0.72 -1% | 2.21 -211% | 1.44 -103% | 1.77 -149% | 3.19 -349% |
| Greyscale dE 2000 * | 1.5 | 2.8 -87% | 2.7 -80% | 12 -700% | 7.8 -420% | 15.4 -927% |
| Gamma | 2.19 100% | 2.06 107% | 1.97 112% | 1.98 111% | 2.28 96% | 1.97 112% |
| CCT | 6804 96% | 6775 96% | 6222 104% | 4838 134% | 8102 80% | 21134 31% |
| Color Space (Percent of AdobeRGB 1998) (%) | 41.6 | |||||
| Color Space (Percent of sRGB) (%) | 65.5 | |||||
| Média Total (Programa/Configurações) | -52% /
-30% | -74% /
-94% | -99% /
-152% | -82% /
-113% | -122% /
-229% |
* ... menor é melhor
O display é bem calibrado fora da caixa com valores médios de escala de cinza e deltaE de cor de apenas 1,5 e 1,06, respectivamente. A tentativa de calibrar ainda mais nós mesmos com um colorímetro X-Rite não melhoraria significativamente a precisão e, portanto, não é necessária uma calibração do usuário final.

Exibir tempos de resposta
| ↔ Tempo de resposta preto para branco | ||
|---|---|---|
| 19.4 ms ... ascensão ↗ e queda ↘ combinadas | ↗ 9.7 ms ascensão | 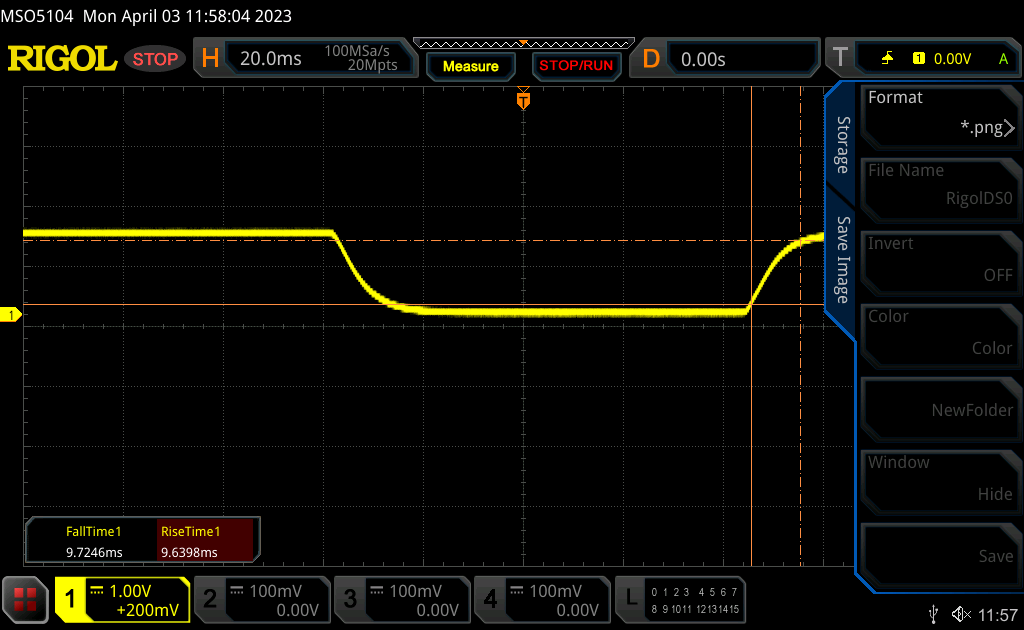 |
| ↘ 9.7 ms queda | ||
| A tela mostra boas taxas de resposta em nossos testes, mas pode ser muito lenta para jogadores competitivos. Em comparação, todos os dispositivos testados variam de 0.1 (mínimo) a 240 (máximo) ms. » 43 % de todos os dispositivos são melhores. Isso significa que o tempo de resposta medido é semelhante à média de todos os dispositivos testados (19.8 ms). | ||
| ↔ Tempo de resposta 50% cinza a 80% cinza | ||
| 28.4 ms ... ascensão ↗ e queda ↘ combinadas | ↗ 13.8 ms ascensão | 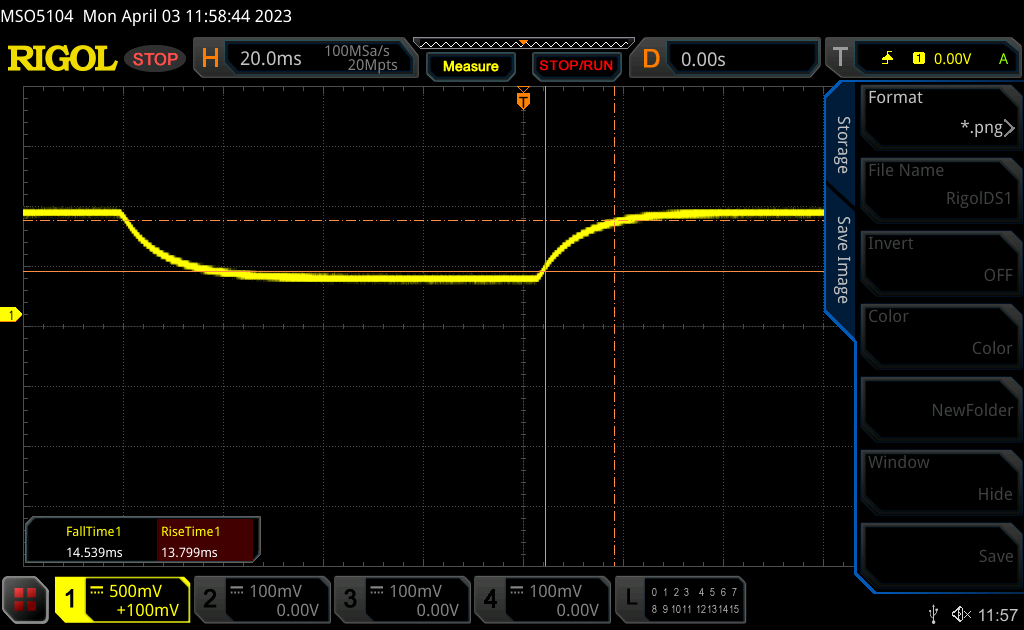 |
| ↘ 14.6 ms queda | ||
| A tela mostra taxas de resposta relativamente lentas em nossos testes e pode ser muito lenta para os jogadores. Em comparação, todos os dispositivos testados variam de 0.165 (mínimo) a 636 (máximo) ms. » 38 % de todos os dispositivos são melhores. Isso significa que o tempo de resposta medido é semelhante à média de todos os dispositivos testados (31 ms). | ||
Cintilação da tela / PWM (modulação por largura de pulso)
| Tela tremeluzindo / PWM não detectado |  | ||
[pwm_comparison] Em comparação: 52 % de todos os dispositivos testados não usam PWM para escurecer a tela. Se PWM foi detectado, uma média de 7757 (mínimo: 5 - máximo: 343500) Hz foi medida. | |||
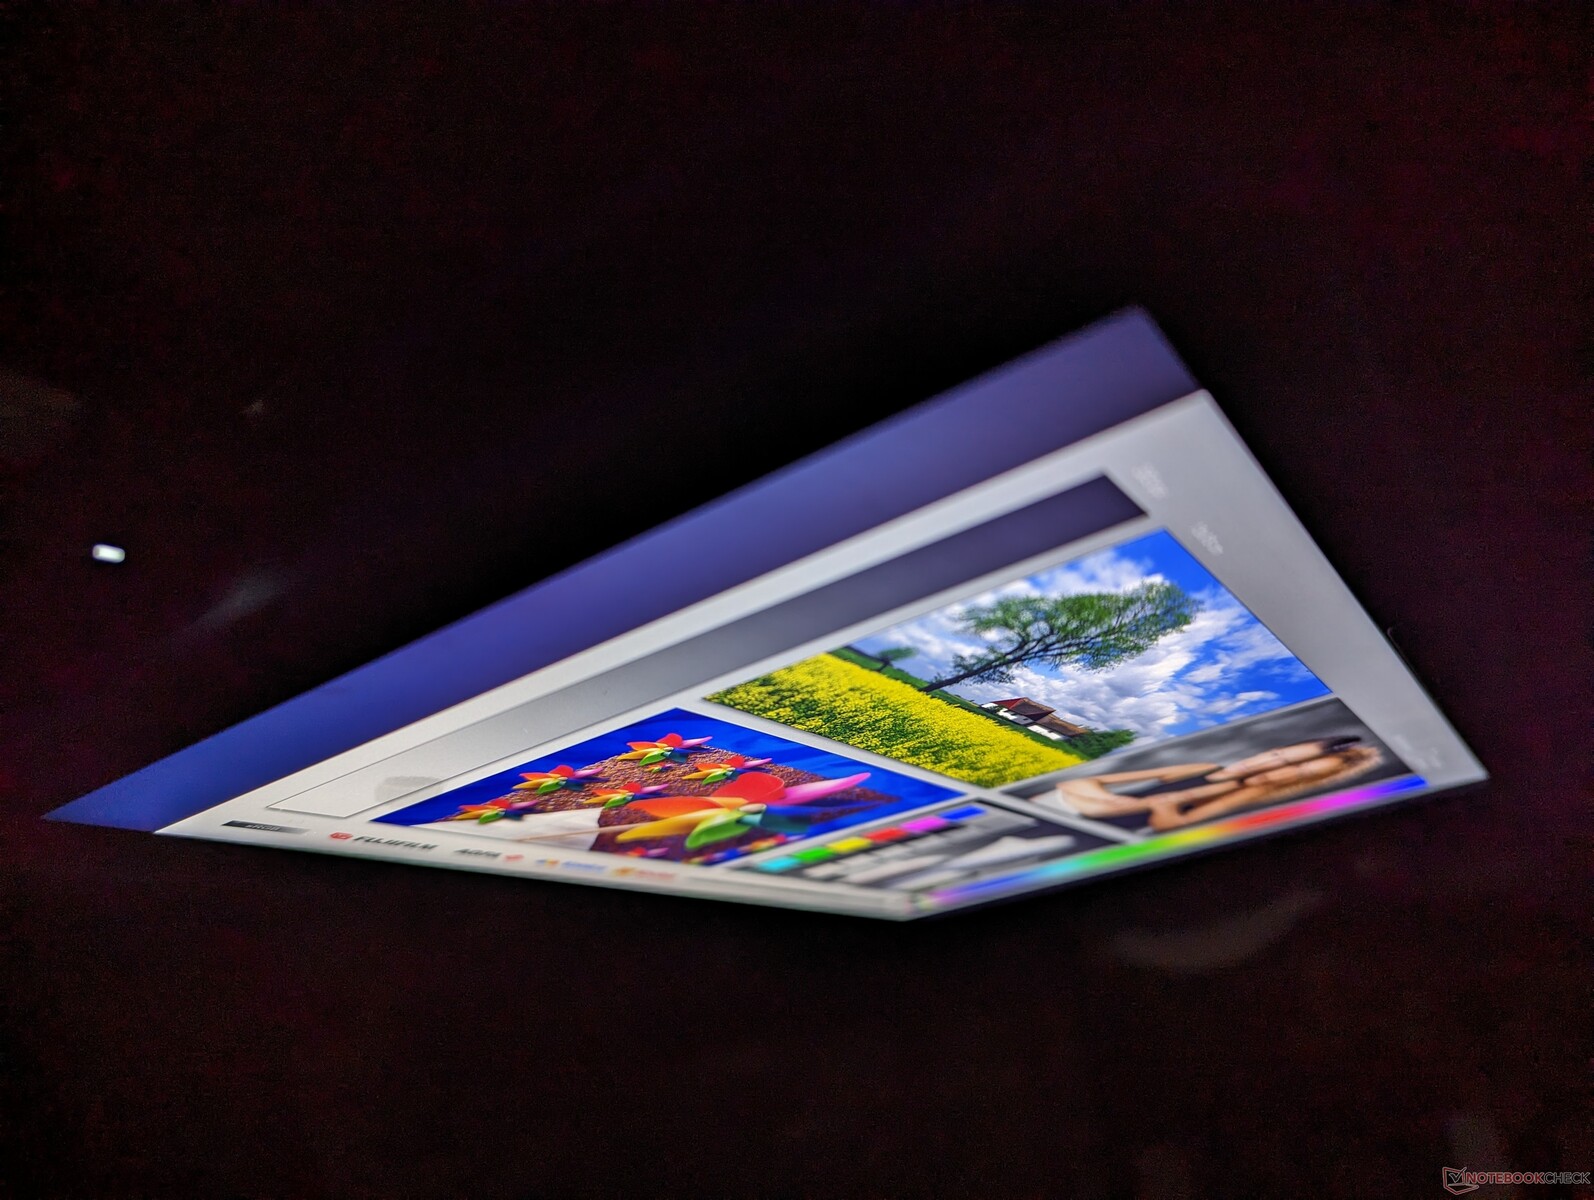
A visibilidade ao ar livre é excelente, pois a tela tem mais de 1000 lêndeas ou mais de duas vezes mais brilhante que o típico tablet ou laptop do consumidor. No entanto, ainda ocorrem algumas cores brilhantes e lavadas e, portanto, a luz direta do sol deve ser evitada sempre que possível para maximizar a qualidade da imagem.

Desempenho
Condições de teste
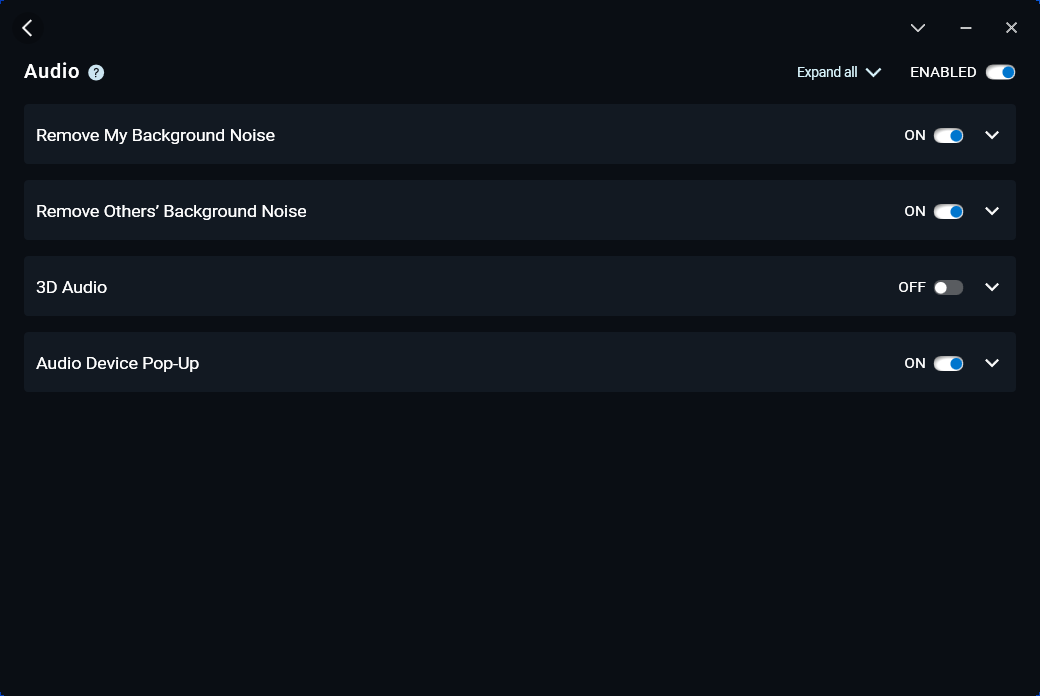
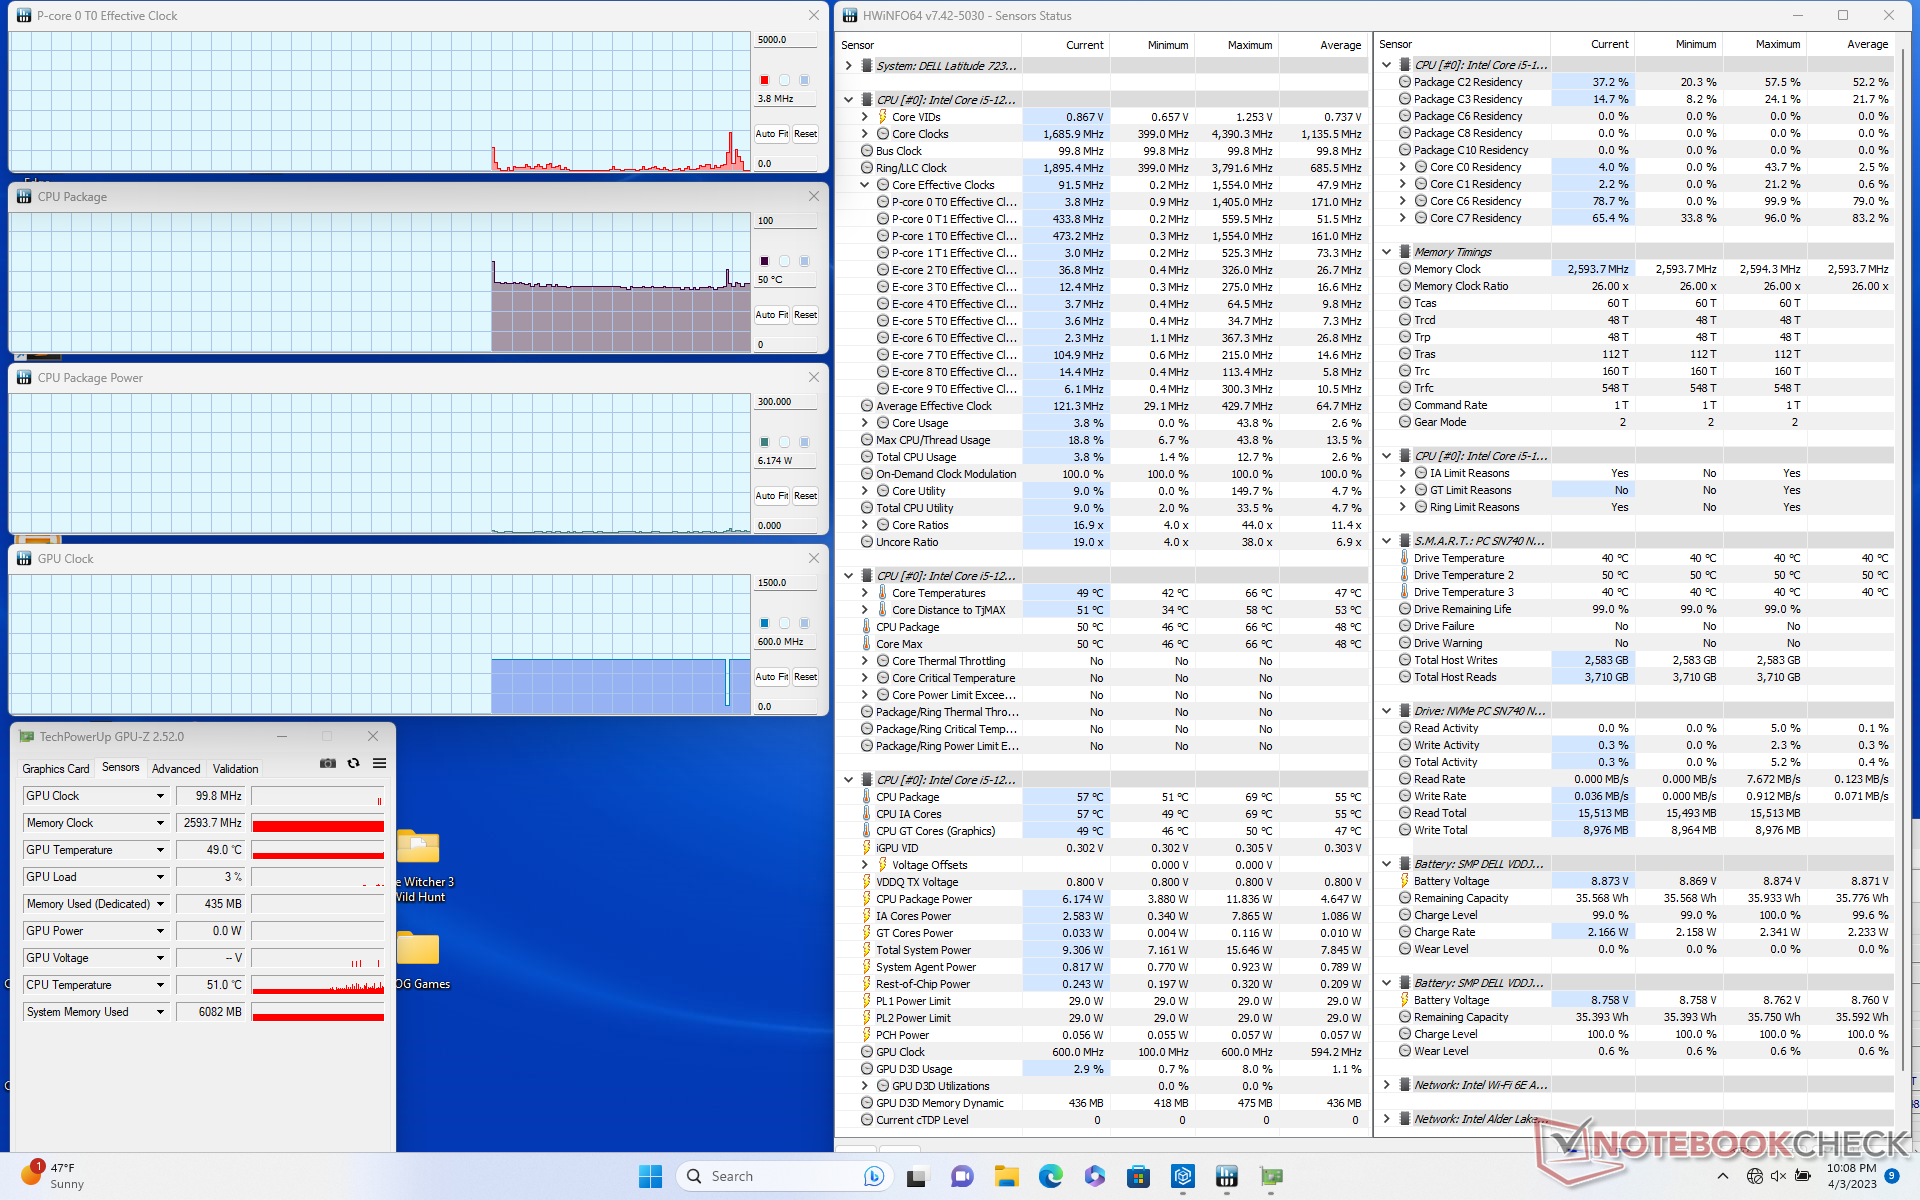
Ajustamos nossa unidade para o modo Ultra Performance através do software Dell Optimizer pré-instalado antes de executar quaisquer benchmarks abaixo. Os usuários devem se acostumar ao Optimizer, pois ele controla aspectos chave do modelo incluindo perfis de potência, áudio, microfone e conectividade sem fio.
O Dell Presence Detection não é compatível com o modelo.
Processador - Tão rápido quanto o Core i7-1260U
O desempenho da CPU é excelente, especialmente após o abaixo do esperado Núcleo i7-1260U que experimentamos no Latitude 7330. O desempenho com várias roscas é significativamente mais rápido do que o popular Núcleo i7-1165G7 ou i7-1185G7 que alimentou a maioria dos Ultrabooks e dispositivos robustos de outrora.
Talvez o aspecto mais importante a ter em mente ao escolher entre o Núcleo i5-1240U ou Core i7-1260U é que o desempenho do processador bruto entre eles é quase idêntico. Ao invés disso, eles diferem principalmente no desempenho gráfico integrado. Se você precisar da potência adicional da GPU, então a opção Core i7 seria a melhor. Caso contrário, ambos os processadores são pescoço a pescoço quando se trata de cargas de trabalho de CPU mono e multi-tarefa.
Cinebench R15 Multi Loop
Cinebench R23: Multi Core | Single Core
Cinebench R20: CPU (Multi Core) | CPU (Single Core)
Cinebench R15: CPU Multi 64Bit | CPU Single 64Bit
Blender: v2.79 BMW27 CPU
7-Zip 18.03: 7z b 4 | 7z b 4 -mmt1
Geekbench 5.5: Multi-Core | Single-Core
HWBOT x265 Benchmark v2.2: 4k Preset
LibreOffice : 20 Documents To PDF
R Benchmark 2.5: Overall mean
| CPU Performance rating | |
| HP EliteBook 840 G9 | |
| Asus ExpertBook B5 Flip B5602FBN | |
| Lenovo ThinkPad P14s G3 AMD 21J6S05000 | |
| HP ZBook Firefly 14 G9-6B8A2EA | |
| Lenovo ThinkBook 13s G3 20YA0005GE | |
| HP ProBook 440 G9-5Y3Z3EA | |
| Dell Latitude 7230 Rugged Extreme | |
| Média Intel Core i5-1240U | |
| Dell Latitude 9330 | |
| Dell Latitude 7330 Rugged Extreme | |
| Acer Enduro Urban N3 EUN314 | |
| Panasonic Toughbook 40 | |
| Durabook S14I | |
| Getac B360 -1! | |
| Cinebench R23 / Multi Core | |
| Asus ExpertBook B5 Flip B5602FBN | |
| Lenovo ThinkPad P14s G3 AMD 21J6S05000 | |
| HP EliteBook 840 G9 | |
| HP ZBook Firefly 14 G9-6B8A2EA | |
| Lenovo ThinkBook 13s G3 20YA0005GE | |
| Dell Latitude 7230 Rugged Extreme | |
| Média Intel Core i5-1240U (n=1) | |
| HP ProBook 440 G9-5Y3Z3EA | |
| Dell Latitude 9330 | |
| Dell Latitude 7330 Rugged Extreme | |
| Acer Enduro Urban N3 EUN314 | |
| Panasonic Toughbook 40 | |
| Getac B360 | |
| Durabook S14I | |
| Cinebench R23 / Single Core | |
| Asus ExpertBook B5 Flip B5602FBN | |
| HP ZBook Firefly 14 G9-6B8A2EA | |
| HP EliteBook 840 G9 | |
| HP ProBook 440 G9-5Y3Z3EA | |
| Dell Latitude 7230 Rugged Extreme | |
| Média Intel Core i5-1240U (n=1) | |
| Dell Latitude 9330 | |
| Dell Latitude 7330 Rugged Extreme | |
| Lenovo ThinkPad P14s G3 AMD 21J6S05000 | |
| Lenovo ThinkBook 13s G3 20YA0005GE | |
| Acer Enduro Urban N3 EUN314 | |
| Panasonic Toughbook 40 | |
| Durabook S14I | |
| Getac B360 | |
| Cinebench R20 / CPU (Multi Core) | |
| Lenovo ThinkPad P14s G3 AMD 21J6S05000 | |
| HP EliteBook 840 G9 | |
| Asus ExpertBook B5 Flip B5602FBN | |
| HP ZBook Firefly 14 G9-6B8A2EA | |
| Lenovo ThinkBook 13s G3 20YA0005GE | |
| Dell Latitude 7230 Rugged Extreme | |
| Média Intel Core i5-1240U (n=1) | |
| HP ProBook 440 G9-5Y3Z3EA | |
| Dell Latitude 9330 | |
| Dell Latitude 7330 Rugged Extreme | |
| Acer Enduro Urban N3 EUN314 | |
| Panasonic Toughbook 40 | |
| Getac B360 | |
| Durabook S14I | |
| Cinebench R20 / CPU (Single Core) | |
| Asus ExpertBook B5 Flip B5602FBN | |
| HP ZBook Firefly 14 G9-6B8A2EA | |
| HP ProBook 440 G9-5Y3Z3EA | |
| HP EliteBook 840 G9 | |
| Lenovo ThinkPad P14s G3 AMD 21J6S05000 | |
| Dell Latitude 7230 Rugged Extreme | |
| Média Intel Core i5-1240U (n=1) | |
| Dell Latitude 7330 Rugged Extreme | |
| Dell Latitude 9330 | |
| Lenovo ThinkBook 13s G3 20YA0005GE | |
| Acer Enduro Urban N3 EUN314 | |
| Durabook S14I | |
| Panasonic Toughbook 40 | |
| Getac B360 | |
| Cinebench R15 / CPU Multi 64Bit | |
| Asus ExpertBook B5 Flip B5602FBN | |
| HP EliteBook 840 G9 | |
| Lenovo ThinkBook 13s G3 20YA0005GE | |
| Lenovo ThinkBook 13s G3 20YA0005GE | |
| Lenovo ThinkPad P14s G3 AMD 21J6S05000 | |
| HP ZBook Firefly 14 G9-6B8A2EA | |
| HP ProBook 440 G9-5Y3Z3EA | |
| Dell Latitude 7230 Rugged Extreme | |
| Média Intel Core i5-1240U (n=1) | |
| Dell Latitude 9330 | |
| Acer Enduro Urban N3 EUN314 | |
| Dell Latitude 7330 Rugged Extreme | |
| Panasonic Toughbook 40 | |
| Getac B360 | |
| Durabook S14I | |
| Cinebench R15 / CPU Single 64Bit | |
| HP EliteBook 840 G9 | |
| HP ZBook Firefly 14 G9-6B8A2EA | |
| Asus ExpertBook B5 Flip B5602FBN | |
| HP ProBook 440 G9-5Y3Z3EA | |
| HP ProBook 440 G9-5Y3Z3EA | |
| Lenovo ThinkPad P14s G3 AMD 21J6S05000 | |
| Lenovo ThinkBook 13s G3 20YA0005GE | |
| Dell Latitude 7330 Rugged Extreme | |
| Dell Latitude 7230 Rugged Extreme | |
| Média Intel Core i5-1240U (n=1) | |
| Dell Latitude 9330 | |
| Acer Enduro Urban N3 EUN314 | |
| Durabook S14I | |
| Panasonic Toughbook 40 | |
| Getac B360 | |
| Blender / v2.79 BMW27 CPU | |
| Durabook S14I | |
| Getac B360 | |
| Panasonic Toughbook 40 | |
| Acer Enduro Urban N3 EUN314 | |
| Dell Latitude 7330 Rugged Extreme | |
| Dell Latitude 9330 | |
| HP ZBook Firefly 14 G9-6B8A2EA | |
| HP ProBook 440 G9-5Y3Z3EA | |
| Dell Latitude 7230 Rugged Extreme | |
| Média Intel Core i5-1240U (n=1) | |
| Lenovo ThinkBook 13s G3 20YA0005GE | |
| Lenovo ThinkPad P14s G3 AMD 21J6S05000 | |
| Asus ExpertBook B5 Flip B5602FBN | |
| HP EliteBook 840 G9 | |
| 7-Zip 18.03 / 7z b 4 | |
| HP EliteBook 840 G9 | |
| Lenovo ThinkPad P14s G3 AMD 21J6S05000 | |
| Asus ExpertBook B5 Flip B5602FBN | |
| Lenovo ThinkBook 13s G3 20YA0005GE | |
| HP ZBook Firefly 14 G9-6B8A2EA | |
| Dell Latitude 9330 | |
| Dell Latitude 7230 Rugged Extreme | |
| Média Intel Core i5-1240U (n=1) | |
| HP ProBook 440 G9-5Y3Z3EA | |
| Acer Enduro Urban N3 EUN314 | |
| Dell Latitude 7330 Rugged Extreme | |
| Getac B360 | |
| Panasonic Toughbook 40 | |
| Durabook S14I | |
| 7-Zip 18.03 / 7z b 4 -mmt1 | |
| HP EliteBook 840 G9 | |
| HP ZBook Firefly 14 G9-6B8A2EA | |
| Asus ExpertBook B5 Flip B5602FBN | |
| Dell Latitude 7330 Rugged Extreme | |
| Acer Enduro Urban N3 EUN314 | |
| Lenovo ThinkBook 13s G3 20YA0005GE | |
| Durabook S14I | |
| HP ProBook 440 G9-5Y3Z3EA | |
| Lenovo ThinkPad P14s G3 AMD 21J6S05000 | |
| Panasonic Toughbook 40 | |
| Dell Latitude 9330 | |
| Getac B360 | |
| Dell Latitude 7230 Rugged Extreme | |
| Média Intel Core i5-1240U (n=1) | |
| Geekbench 5.5 / Multi-Core | |
| HP EliteBook 840 G9 | |
| Asus ExpertBook B5 Flip B5602FBN | |
| HP ZBook Firefly 14 G9-6B8A2EA | |
| Lenovo ThinkPad P14s G3 AMD 21J6S05000 | |
| Dell Latitude 9330 | |
| Dell Latitude 7230 Rugged Extreme | |
| Média Intel Core i5-1240U (n=1) | |
| Lenovo ThinkBook 13s G3 20YA0005GE | |
| HP ProBook 440 G9-5Y3Z3EA | |
| Dell Latitude 7330 Rugged Extreme | |
| Acer Enduro Urban N3 EUN314 | |
| Panasonic Toughbook 40 | |
| Getac B360 | |
| Durabook S14I | |
| Geekbench 5.5 / Single-Core | |
| HP EliteBook 840 G9 | |
| HP ZBook Firefly 14 G9-6B8A2EA | |
| Dell Latitude 7230 Rugged Extreme | |
| Média Intel Core i5-1240U (n=1) | |
| HP ProBook 440 G9-5Y3Z3EA | |
| Dell Latitude 9330 | |
| Dell Latitude 7330 Rugged Extreme | |
| Acer Enduro Urban N3 EUN314 | |
| Asus ExpertBook B5 Flip B5602FBN | |
| Durabook S14I | |
| Lenovo ThinkPad P14s G3 AMD 21J6S05000 | |
| Panasonic Toughbook 40 | |
| Lenovo ThinkBook 13s G3 20YA0005GE | |
| Getac B360 | |
| HWBOT x265 Benchmark v2.2 / 4k Preset | |
| Lenovo ThinkPad P14s G3 AMD 21J6S05000 | |
| HP EliteBook 840 G9 | |
| Asus ExpertBook B5 Flip B5602FBN | |
| Lenovo ThinkBook 13s G3 20YA0005GE | |
| HP ZBook Firefly 14 G9-6B8A2EA | |
| Dell Latitude 7230 Rugged Extreme | |
| Média Intel Core i5-1240U (n=1) | |
| HP ProBook 440 G9-5Y3Z3EA | |
| Dell Latitude 9330 | |
| Dell Latitude 7330 Rugged Extreme | |
| Acer Enduro Urban N3 EUN314 | |
| Panasonic Toughbook 40 | |
| Getac B360 | |
| Durabook S14I | |
| LibreOffice / 20 Documents To PDF | |
| Acer Enduro Urban N3 EUN314 | |
| Lenovo ThinkPad P14s G3 AMD 21J6S05000 | |
| Panasonic Toughbook 40 | |
| Dell Latitude 7230 Rugged Extreme | |
| Média Intel Core i5-1240U (n=1) | |
| HP ProBook 440 G9-5Y3Z3EA | |
| Dell Latitude 9330 | |
| Lenovo ThinkBook 13s G3 20YA0005GE | |
| Dell Latitude 7330 Rugged Extreme | |
| Asus ExpertBook B5 Flip B5602FBN | |
| Durabook S14I | |
| HP EliteBook 840 G9 | |
| HP ZBook Firefly 14 G9-6B8A2EA | |
| R Benchmark 2.5 / Overall mean | |
| Getac B360 | |
| Panasonic Toughbook 40 | |
| Durabook S14I | |
| Acer Enduro Urban N3 EUN314 | |
| Dell Latitude 7330 Rugged Extreme | |
| Lenovo ThinkBook 13s G3 20YA0005GE | |
| Lenovo ThinkPad P14s G3 AMD 21J6S05000 | |
| Dell Latitude 7230 Rugged Extreme | |
| Média Intel Core i5-1240U (n=1) | |
| Dell Latitude 9330 | |
| HP ProBook 440 G9-5Y3Z3EA | |
| Asus ExpertBook B5 Flip B5602FBN | |
| HP ZBook Firefly 14 G9-6B8A2EA | |
| HP EliteBook 840 G9 | |
Cinebench R23: Multi Core | Single Core
Cinebench R20: CPU (Multi Core) | CPU (Single Core)
Cinebench R15: CPU Multi 64Bit | CPU Single 64Bit
Blender: v2.79 BMW27 CPU
7-Zip 18.03: 7z b 4 | 7z b 4 -mmt1
Geekbench 5.5: Multi-Core | Single-Core
HWBOT x265 Benchmark v2.2: 4k Preset
LibreOffice : 20 Documents To PDF
R Benchmark 2.5: Overall mean
* ... menor é melhor
| Blender | |
| v3.3 Classroom HIP/AMD | |
| Lenovo ThinkPad P14s G3 AMD 21J6S05000 | |
| Lenovo ThinkPad P14s G3 AMD 21J6S05000 | |
| v3.3 Classroom OPTIX/RTX | |
| HP ZBook Firefly 14 G9-6B8A2EA | |
| v3.3 Classroom CUDA | |
| HP ZBook Firefly 14 G9-6B8A2EA | |
| v3.3 Classroom CPU | |
| Dell Latitude 7230 Rugged Extreme | |
| HP ProBook 440 G9-5Y3Z3EA | |
| HP ZBook Firefly 14 G9-6B8A2EA | |
| HP EliteBook 840 G9 | |
| Asus ExpertBook B5 Flip B5602FBN | |
| Lenovo ThinkPad P14s G3 AMD 21J6S05000 | |
* ... menor é melhor
AIDA64: FP32 Ray-Trace | FPU Julia | CPU SHA3 | CPU Queen | FPU SinJulia | FPU Mandel | CPU AES | CPU ZLib | FP64 Ray-Trace | CPU PhotoWorxx
| Performance rating | |
| Dell Latitude 7330 Rugged Extreme | |
| Acer Enduro Urban N3 EUN314 | |
| Dell Latitude 7230 Rugged Extreme | |
| Média Intel Core i5-1240U | |
| Panasonic Toughbook 40 | |
| Getac B360 | |
| Durabook S14I | |
| AIDA64 / FP32 Ray-Trace | |
| Dell Latitude 7330 Rugged Extreme | |
| Acer Enduro Urban N3 EUN314 | |
| Dell Latitude 7230 Rugged Extreme | |
| Média Intel Core i5-1240U (n=1) | |
| Panasonic Toughbook 40 | |
| Durabook S14I | |
| Getac B360 | |
| AIDA64 / FPU Julia | |
| Dell Latitude 7230 Rugged Extreme | |
| Média Intel Core i5-1240U (n=1) | |
| Dell Latitude 7330 Rugged Extreme | |
| Acer Enduro Urban N3 EUN314 | |
| Getac B360 | |
| Panasonic Toughbook 40 | |
| Durabook S14I | |
| AIDA64 / CPU SHA3 | |
| Dell Latitude 7330 Rugged Extreme | |
| Acer Enduro Urban N3 EUN314 | |
| Dell Latitude 7230 Rugged Extreme | |
| Média Intel Core i5-1240U (n=1) | |
| Panasonic Toughbook 40 | |
| Durabook S14I | |
| Getac B360 | |
| AIDA64 / CPU Queen | |
| Getac B360 | |
| Dell Latitude 7330 Rugged Extreme | |
| Acer Enduro Urban N3 EUN314 | |
| Durabook S14I | |
| Dell Latitude 7230 Rugged Extreme | |
| Média Intel Core i5-1240U (n=1) | |
| Panasonic Toughbook 40 | |
| AIDA64 / FPU SinJulia | |
| Dell Latitude 7330 Rugged Extreme | |
| Acer Enduro Urban N3 EUN314 | |
| Getac B360 | |
| Panasonic Toughbook 40 | |
| Dell Latitude 7230 Rugged Extreme | |
| Média Intel Core i5-1240U (n=1) | |
| Durabook S14I | |
| AIDA64 / FPU Mandel | |
| Dell Latitude 7330 Rugged Extreme | |
| Acer Enduro Urban N3 EUN314 | |
| Dell Latitude 7230 Rugged Extreme | |
| Média Intel Core i5-1240U (n=1) | |
| Panasonic Toughbook 40 | |
| Durabook S14I | |
| Getac B360 | |
| AIDA64 / CPU AES | |
| Dell Latitude 7330 Rugged Extreme | |
| Acer Enduro Urban N3 EUN314 | |
| Durabook S14I | |
| Dell Latitude 7230 Rugged Extreme | |
| Média Intel Core i5-1240U (n=1) | |
| Panasonic Toughbook 40 | |
| Getac B360 | |
| AIDA64 / CPU ZLib | |
| Dell Latitude 7230 Rugged Extreme | |
| Média Intel Core i5-1240U (n=1) | |
| Dell Latitude 7330 Rugged Extreme | |
| Acer Enduro Urban N3 EUN314 | |
| Panasonic Toughbook 40 | |
| Getac B360 | |
| Durabook S14I | |
| AIDA64 / FP64 Ray-Trace | |
| Dell Latitude 7330 Rugged Extreme | |
| Acer Enduro Urban N3 EUN314 | |
| Dell Latitude 7230 Rugged Extreme | |
| Média Intel Core i5-1240U (n=1) | |
| Panasonic Toughbook 40 | |
| Durabook S14I | |
| Getac B360 | |
| AIDA64 / CPU PhotoWorxx | |
| Dell Latitude 7330 Rugged Extreme | |
| Dell Latitude 7230 Rugged Extreme | |
| Média Intel Core i5-1240U (n=1) | |
| Acer Enduro Urban N3 EUN314 | |
| Panasonic Toughbook 40 | |
| Getac B360 | |
| Durabook S14I | |
Desempenho do sistema
CrossMark: Overall | Productivity | Creativity | Responsiveness
| PCMark 10 / Score | |
| Dell Latitude 7330 Rugged Extreme | |
| Panasonic Toughbook 40 | |
| Dell Latitude 7230 Rugged Extreme | |
| Média Intel Core i5-1240U, Intel Iris Xe Graphics G7 80EUs (n=1) | |
| Durabook S14I | |
| Acer Enduro Urban N3 EUN314 | |
| Getac B360 | |
| PCMark 10 / Essentials | |
| Dell Latitude 7330 Rugged Extreme | |
| Durabook S14I | |
| Dell Latitude 7230 Rugged Extreme | |
| Média Intel Core i5-1240U, Intel Iris Xe Graphics G7 80EUs (n=1) | |
| Panasonic Toughbook 40 | |
| Acer Enduro Urban N3 EUN314 | |
| Getac B360 | |
| PCMark 10 / Productivity | |
| Getac B360 | |
| Durabook S14I | |
| Dell Latitude 7330 Rugged Extreme | |
| Panasonic Toughbook 40 | |
| Dell Latitude 7230 Rugged Extreme | |
| Média Intel Core i5-1240U, Intel Iris Xe Graphics G7 80EUs (n=1) | |
| Acer Enduro Urban N3 EUN314 | |
| PCMark 10 / Digital Content Creation | |
| Dell Latitude 7330 Rugged Extreme | |
| Panasonic Toughbook 40 | |
| Acer Enduro Urban N3 EUN314 | |
| Dell Latitude 7230 Rugged Extreme | |
| Média Intel Core i5-1240U, Intel Iris Xe Graphics G7 80EUs (n=1) | |
| Durabook S14I | |
| Getac B360 | |
| CrossMark / Overall | |
| Dell Latitude 7230 Rugged Extreme | |
| Média Intel Core i5-1240U, Intel Iris Xe Graphics G7 80EUs (n=1) | |
| Panasonic Toughbook 40 | |
| CrossMark / Productivity | |
| Dell Latitude 7230 Rugged Extreme | |
| Média Intel Core i5-1240U, Intel Iris Xe Graphics G7 80EUs (n=1) | |
| Panasonic Toughbook 40 | |
| CrossMark / Creativity | |
| Dell Latitude 7230 Rugged Extreme | |
| Média Intel Core i5-1240U, Intel Iris Xe Graphics G7 80EUs (n=1) | |
| Panasonic Toughbook 40 | |
| CrossMark / Responsiveness | |
| Dell Latitude 7230 Rugged Extreme | |
| Média Intel Core i5-1240U, Intel Iris Xe Graphics G7 80EUs (n=1) | |
| Panasonic Toughbook 40 | |
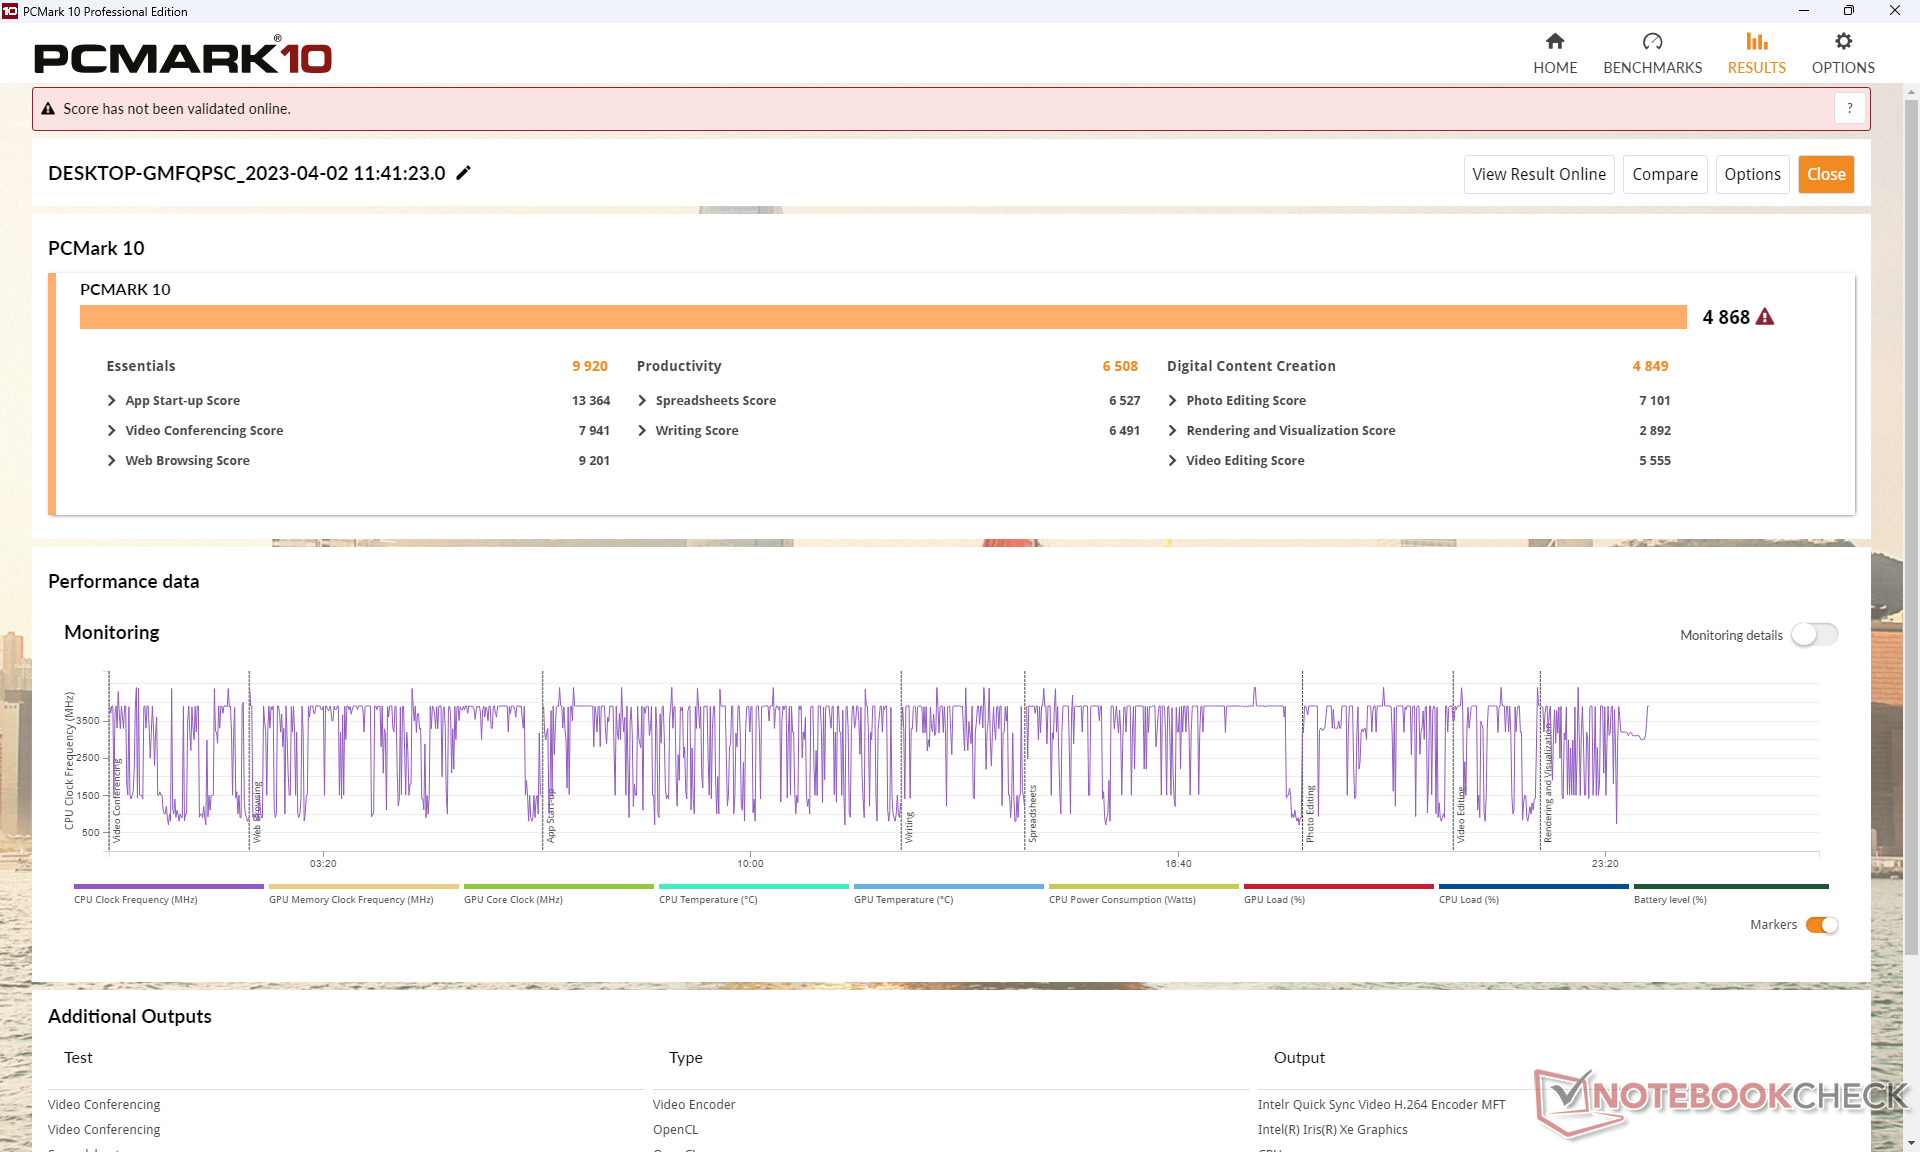
| PCMark 10 Score | 4868 pontos | |
Ajuda | ||
| AIDA64 / Memory Copy | |
| Dell Latitude 7230 Rugged Extreme | |
| Média Intel Core i5-1240U (n=1) | |
| Dell Latitude 7330 Rugged Extreme | |
| Acer Enduro Urban N3 EUN314 | |
| Panasonic Toughbook 40 | |
| Getac B360 | |
| Durabook S14I | |
| AIDA64 / Memory Read | |
| Dell Latitude 7330 Rugged Extreme | |
| Dell Latitude 7230 Rugged Extreme | |
| Média Intel Core i5-1240U (n=1) | |
| Acer Enduro Urban N3 EUN314 | |
| Panasonic Toughbook 40 | |
| Getac B360 | |
| Durabook S14I | |
| AIDA64 / Memory Write | |
| Dell Latitude 7330 Rugged Extreme | |
| Dell Latitude 7230 Rugged Extreme | |
| Média Intel Core i5-1240U (n=1) | |
| Acer Enduro Urban N3 EUN314 | |
| Getac B360 | |
| Panasonic Toughbook 40 | |
| Durabook S14I | |
| AIDA64 / Memory Latency | |
| Dell Latitude 7230 Rugged Extreme | |
| Média Intel Core i5-1240U (n=1) | |
| Panasonic Toughbook 40 | |
| Dell Latitude 7330 Rugged Extreme | |
| Acer Enduro Urban N3 EUN314 | |
| Durabook S14I | |
| Getac B360 | |
* ... menor é melhor
Latência do DPC
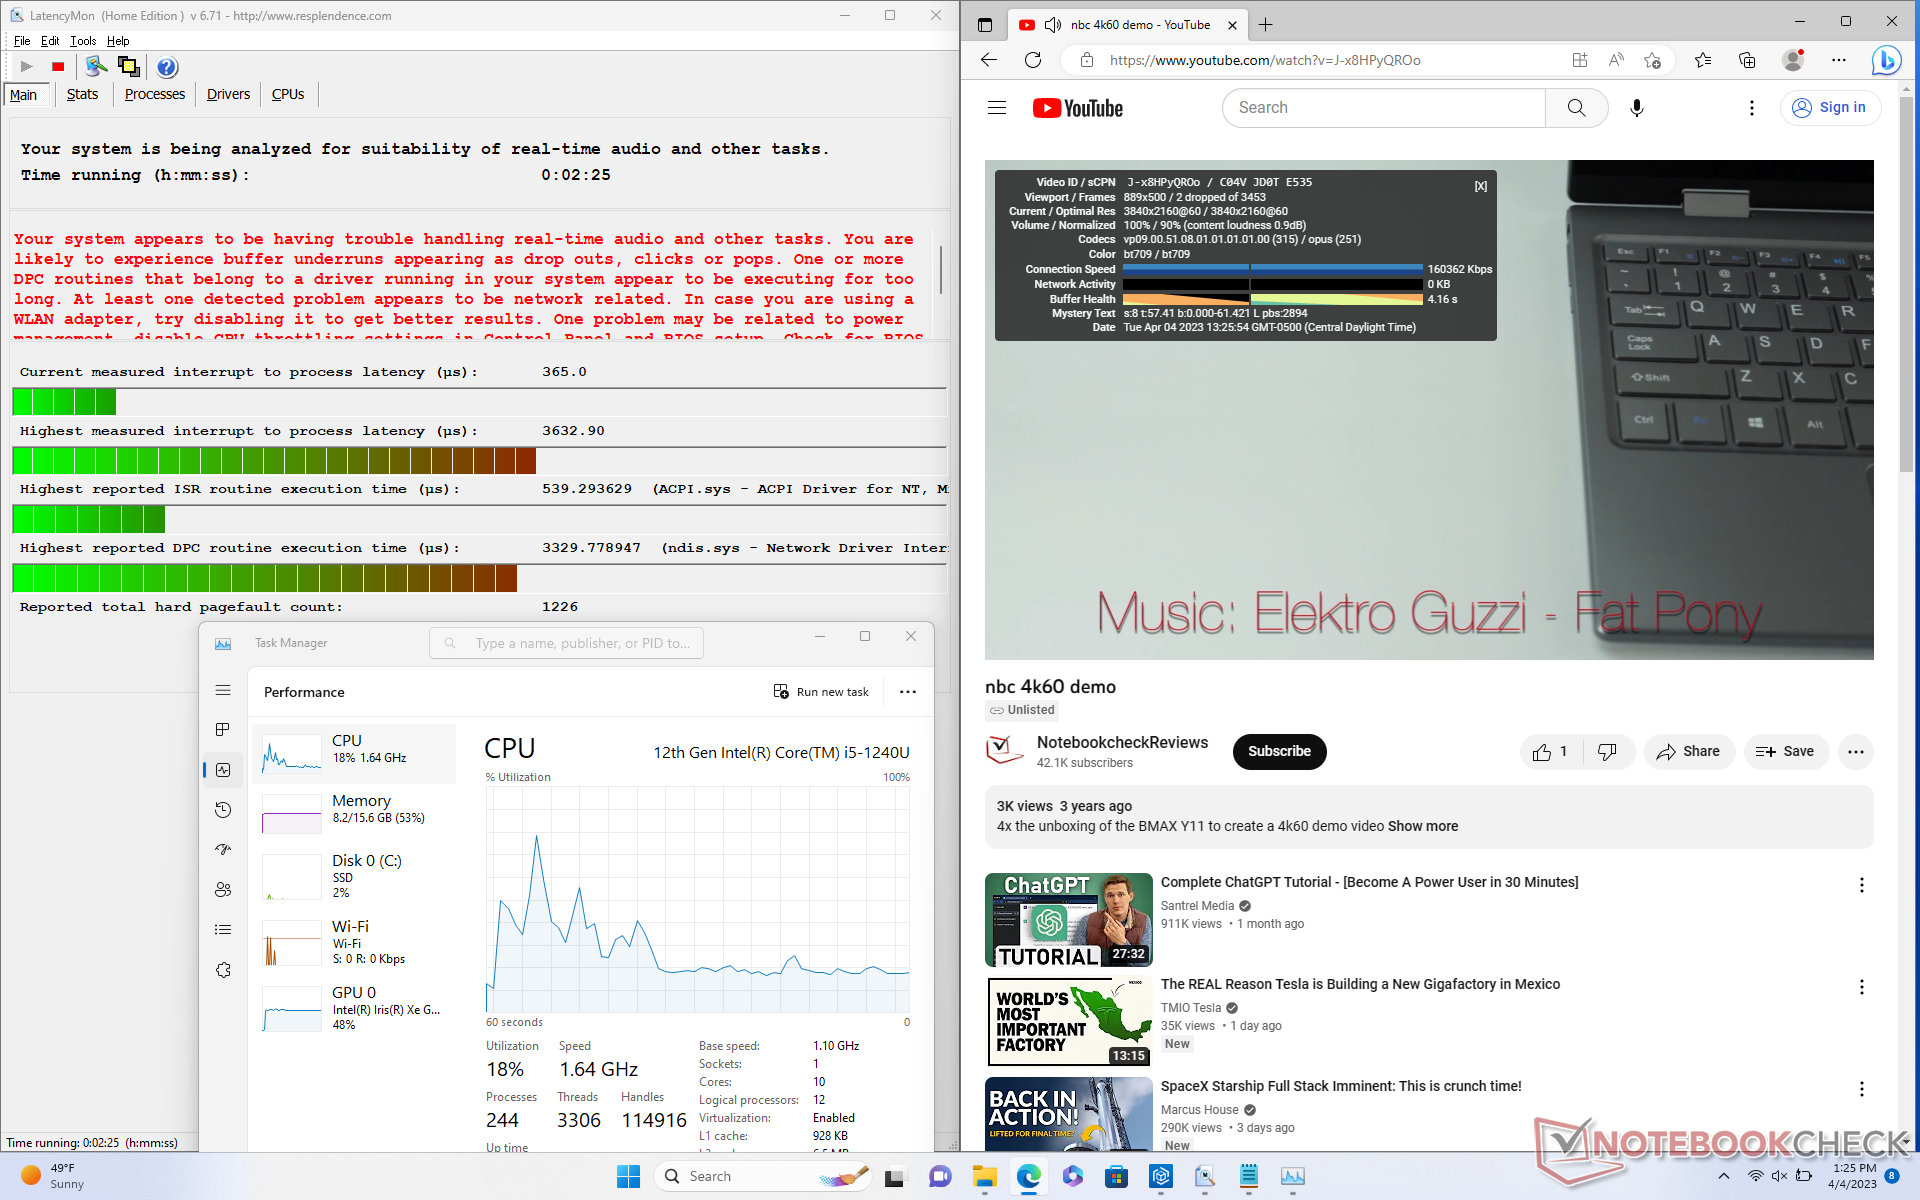
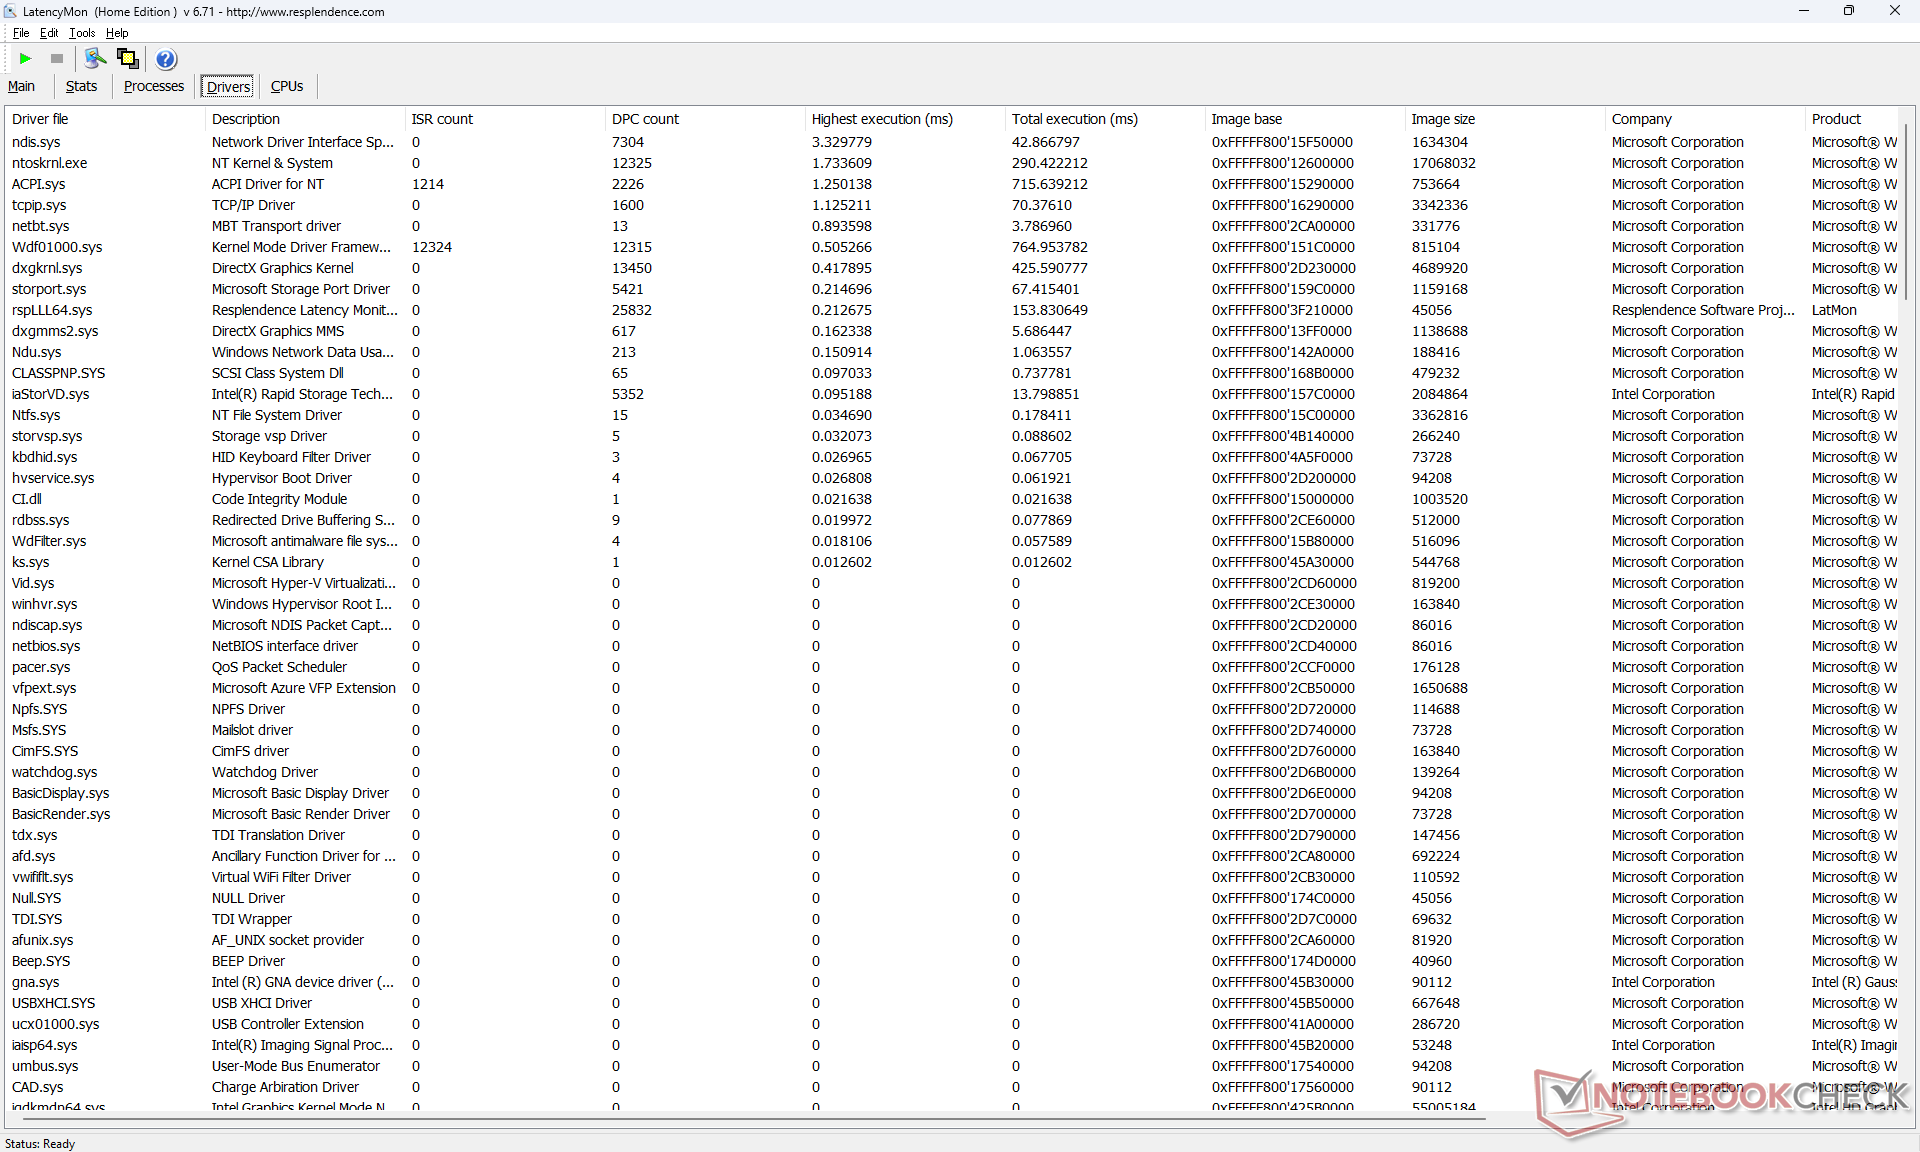
LatencyMon revela problemas de DPC ao abrir várias abas do navegador em nossa página inicial, o que é decepcionante de se ver em um dispositivo robusto onde a estabilidade de desempenho é primordial. a reprodução de vídeo de 4K a 60 FPS é imperfeita também com 2 quadros descartados durante nosso vídeo de teste de minutos.
| DPC Latencies / LatencyMon - interrupt to process latency (max), Web, Youtube, Prime95 | |
| Acer Enduro Urban N3 EUN314 | |
| Dell Latitude 7230 Rugged Extreme | |
| Durabook S14I | |
| Panasonic Toughbook 40 | |
| Getac B360 | |
| Dell Latitude 7330 Rugged Extreme | |
* ... menor é melhor
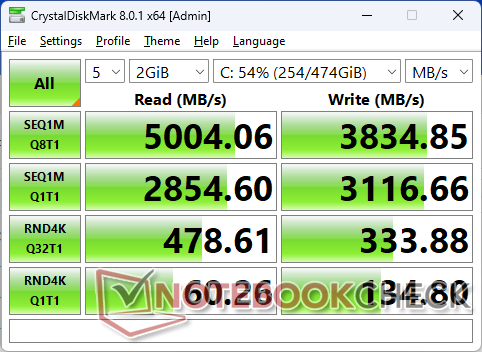
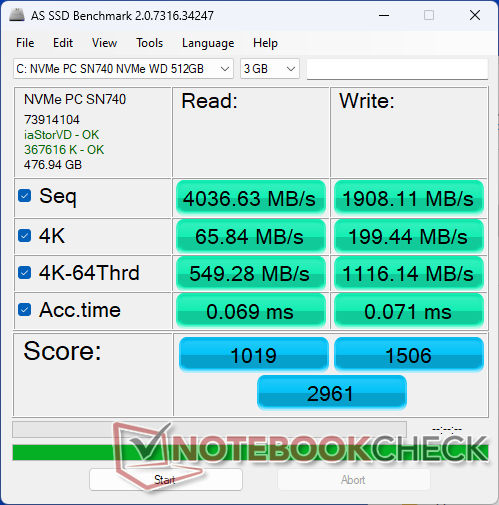
Dispositivos de armazenamento
Nossa unidade de teste é enviada com um WD PC SN740 PCIe4 x4 NVMe SSD para taxas de transferência seqüencial de até 4800 MB/s. O desempenho máximo não é sustentável, no entanto, pois as taxas de transferência acelerariam até 2300 MB/s após apenas alguns minutos, como mostra o gráfico abaixo.

| Drive Performance rating - Percent | |
| Dell Latitude 7330 Rugged Extreme | |
| Dell Latitude 7230 Rugged Extreme | |
| Acer Enduro Urban N3 EUN314 | |
| Getac B360 | |
| Durabook S14I | |
| Panasonic Toughbook 40 | |
* ... menor é melhor
Disk Throttling: DiskSpd Read Loop, Queue Depth 8
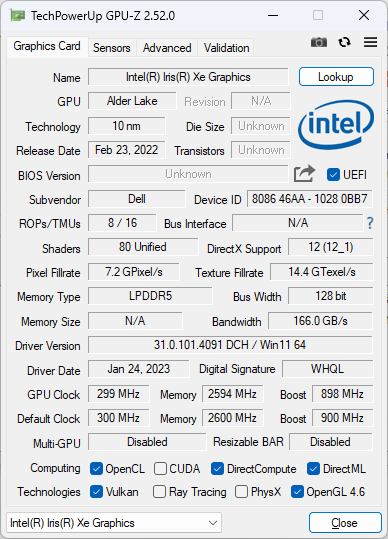
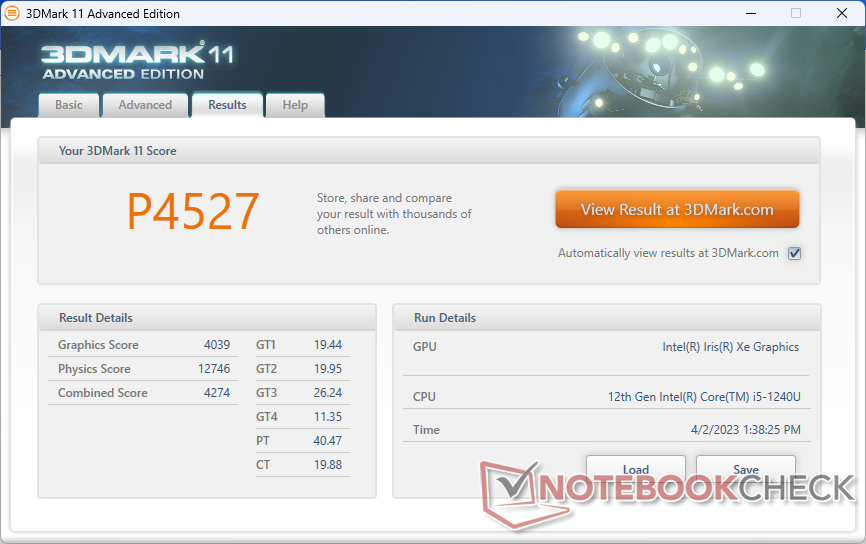
GPU Performance - Média Iris Xe 80 EUs
O desempenho dos gráficos é inferior em cerca de 5% a 15% quando comparado com a média dos PCs em nosso banco de dados equipados com o mesmo GPU Iris Xe 80 EUs. Esperar que o desempenho geral seja cerca de 30% a 40% mais lento do que o comum Iris Xe 96 EUs. Felizmente, o modelo pode ser configurado com o Core i7-1260U que vem com o Iris Xe 96 EU mais rápido para aqueles que precisam dele, como mencionado anteriormente.
O desempenho do sistema parece ser idêntico entre os perfis Optimized e Ultra power. Um teste 3DMark 11 em ambos os modos de potência resultaria quase na mesma pontuação final entre eles.
| 3DMark | |
| 1920x1080 Fire Strike Graphics | |
| Lenovo ThinkPad P14s G3 AMD 21J6S05000 | |
| Asus ExpertBook B5 Flip B5602FBN | |
| HP EliteBook 840 G9 | |
| HP ZBook Firefly 14 G9-6B8A2EA | |
| Dell Latitude 7330 Rugged Extreme | |
| Acer Enduro Urban N3 EUN314 | |
| Panasonic Toughbook 40 | |
| Média Intel Iris Xe Graphics G7 80EUs (1560 - 5398, n=114) | |
| Dell Latitude 7230 Rugged Extreme | |
| Lenovo ThinkBook 13s G3 20YA0005GE | |
| Durabook S14I | |
| HP ProBook 440 G9-5Y3Z3EA | |
| Getac B360 | |
| 2560x1440 Time Spy Graphics | |
| Asus ExpertBook B5 Flip B5602FBN | |
| Lenovo ThinkPad P14s G3 AMD 21J6S05000 | |
| HP ZBook Firefly 14 G9-6B8A2EA | |
| HP EliteBook 840 G9 | |
| Dell Latitude 7330 Rugged Extreme | |
| Acer Enduro Urban N3 EUN314 | |
| Panasonic Toughbook 40 | |
| HP ProBook 440 G9-5Y3Z3EA | |
| Média Intel Iris Xe Graphics G7 80EUs (561 - 1576, n=111) | |
| Lenovo ThinkBook 13s G3 20YA0005GE | |
| Durabook S14I | |
| Dell Latitude 7230 Rugged Extreme | |
| Getac B360 | |
| 3DMark 11 - 1280x720 Performance GPU | |
| Lenovo ThinkPad P14s G3 AMD 21J6S05000 | |
| Asus ExpertBook B5 Flip B5602FBN | |
| HP ZBook Firefly 14 G9-6B8A2EA | |
| HP EliteBook 840 G9 | |
| Acer Enduro Urban N3 EUN314 | |
| Dell Latitude 7330 Rugged Extreme | |
| Panasonic Toughbook 40 | |
| Lenovo ThinkBook 13s G3 20YA0005GE | |
| Média Intel Iris Xe Graphics G7 80EUs (2246 - 6579, n=112) | |
| Durabook S14I | |
| HP ProBook 440 G9-5Y3Z3EA | |
| Dell Latitude 7230 Rugged Extreme | |
| Getac B360 | |
| 3DMark 11 Performance | 4527 pontos | |
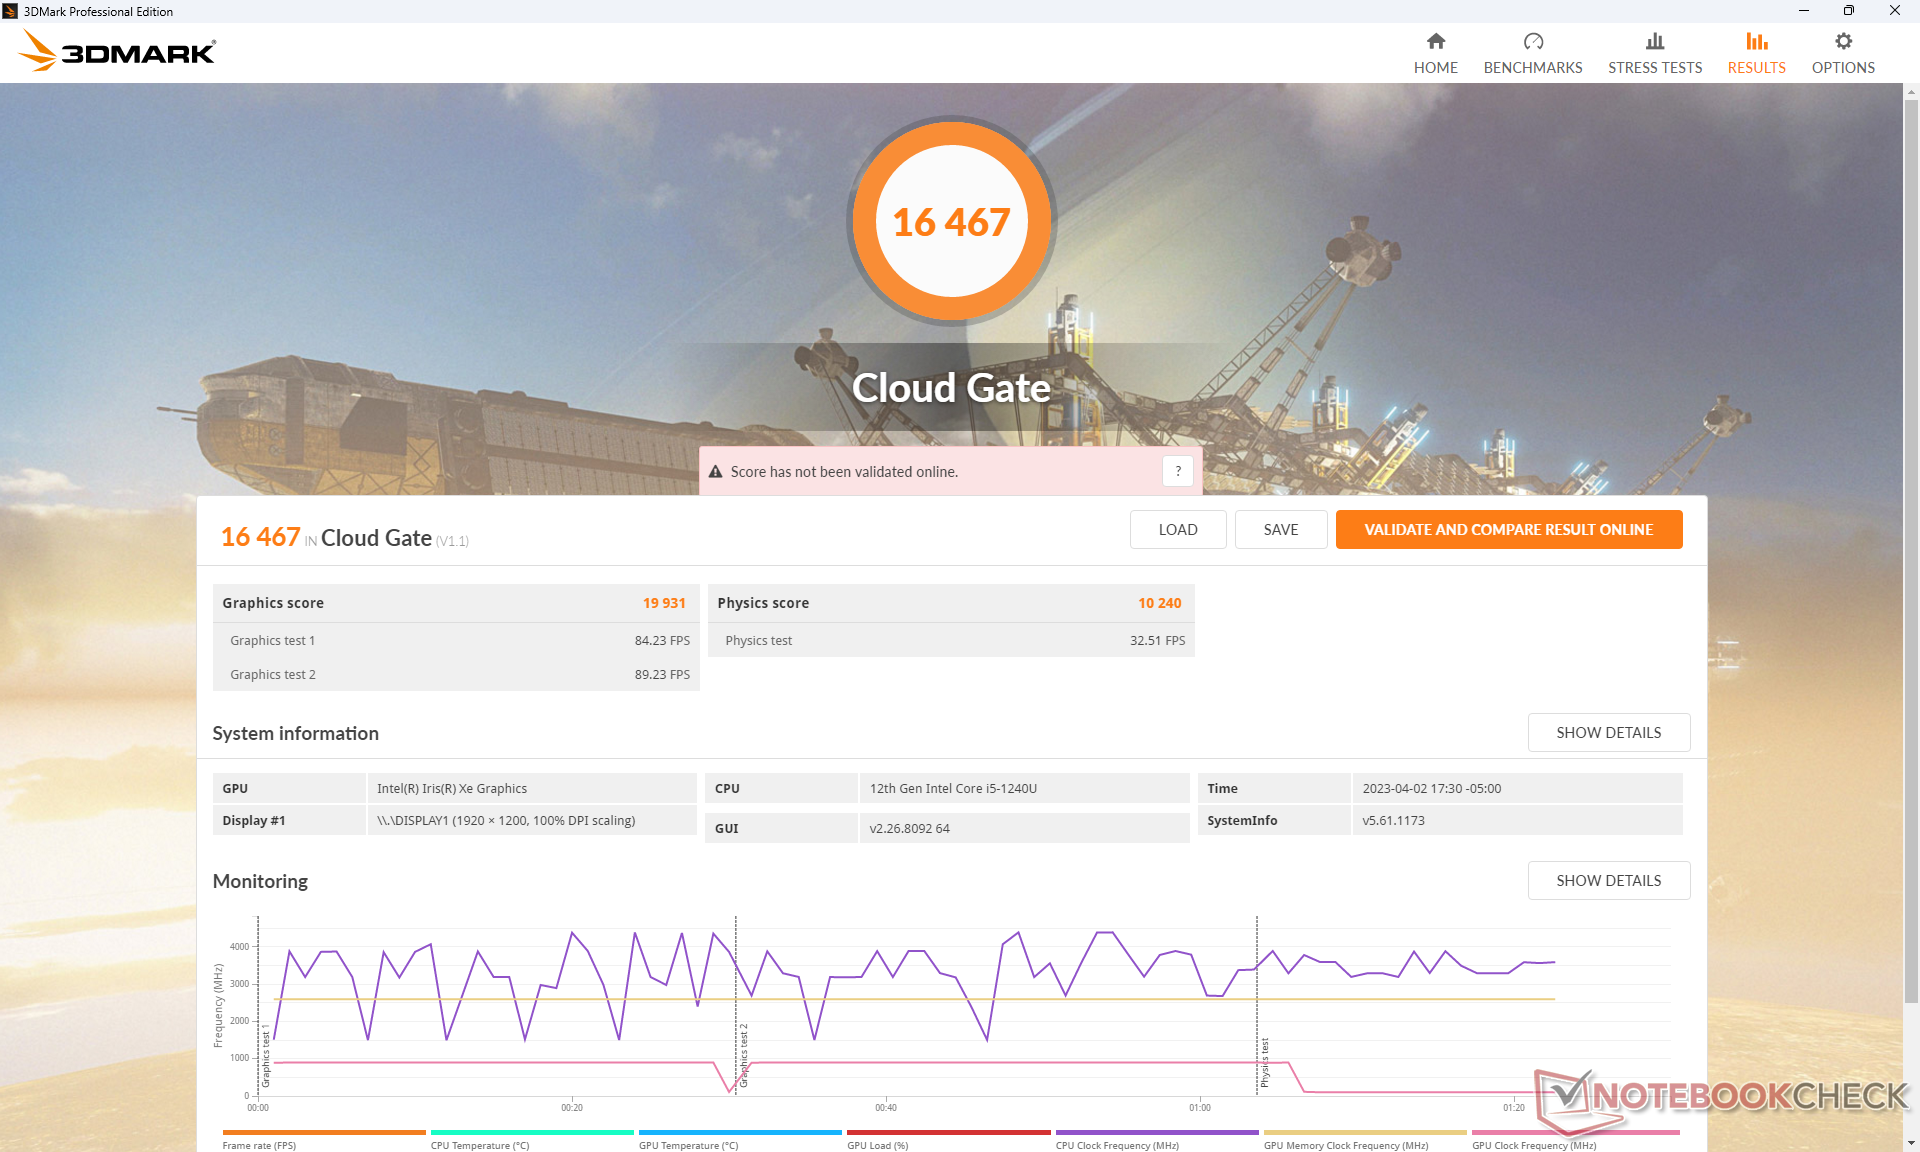
| 3DMark Cloud Gate Standard Score | 16467 pontos | |
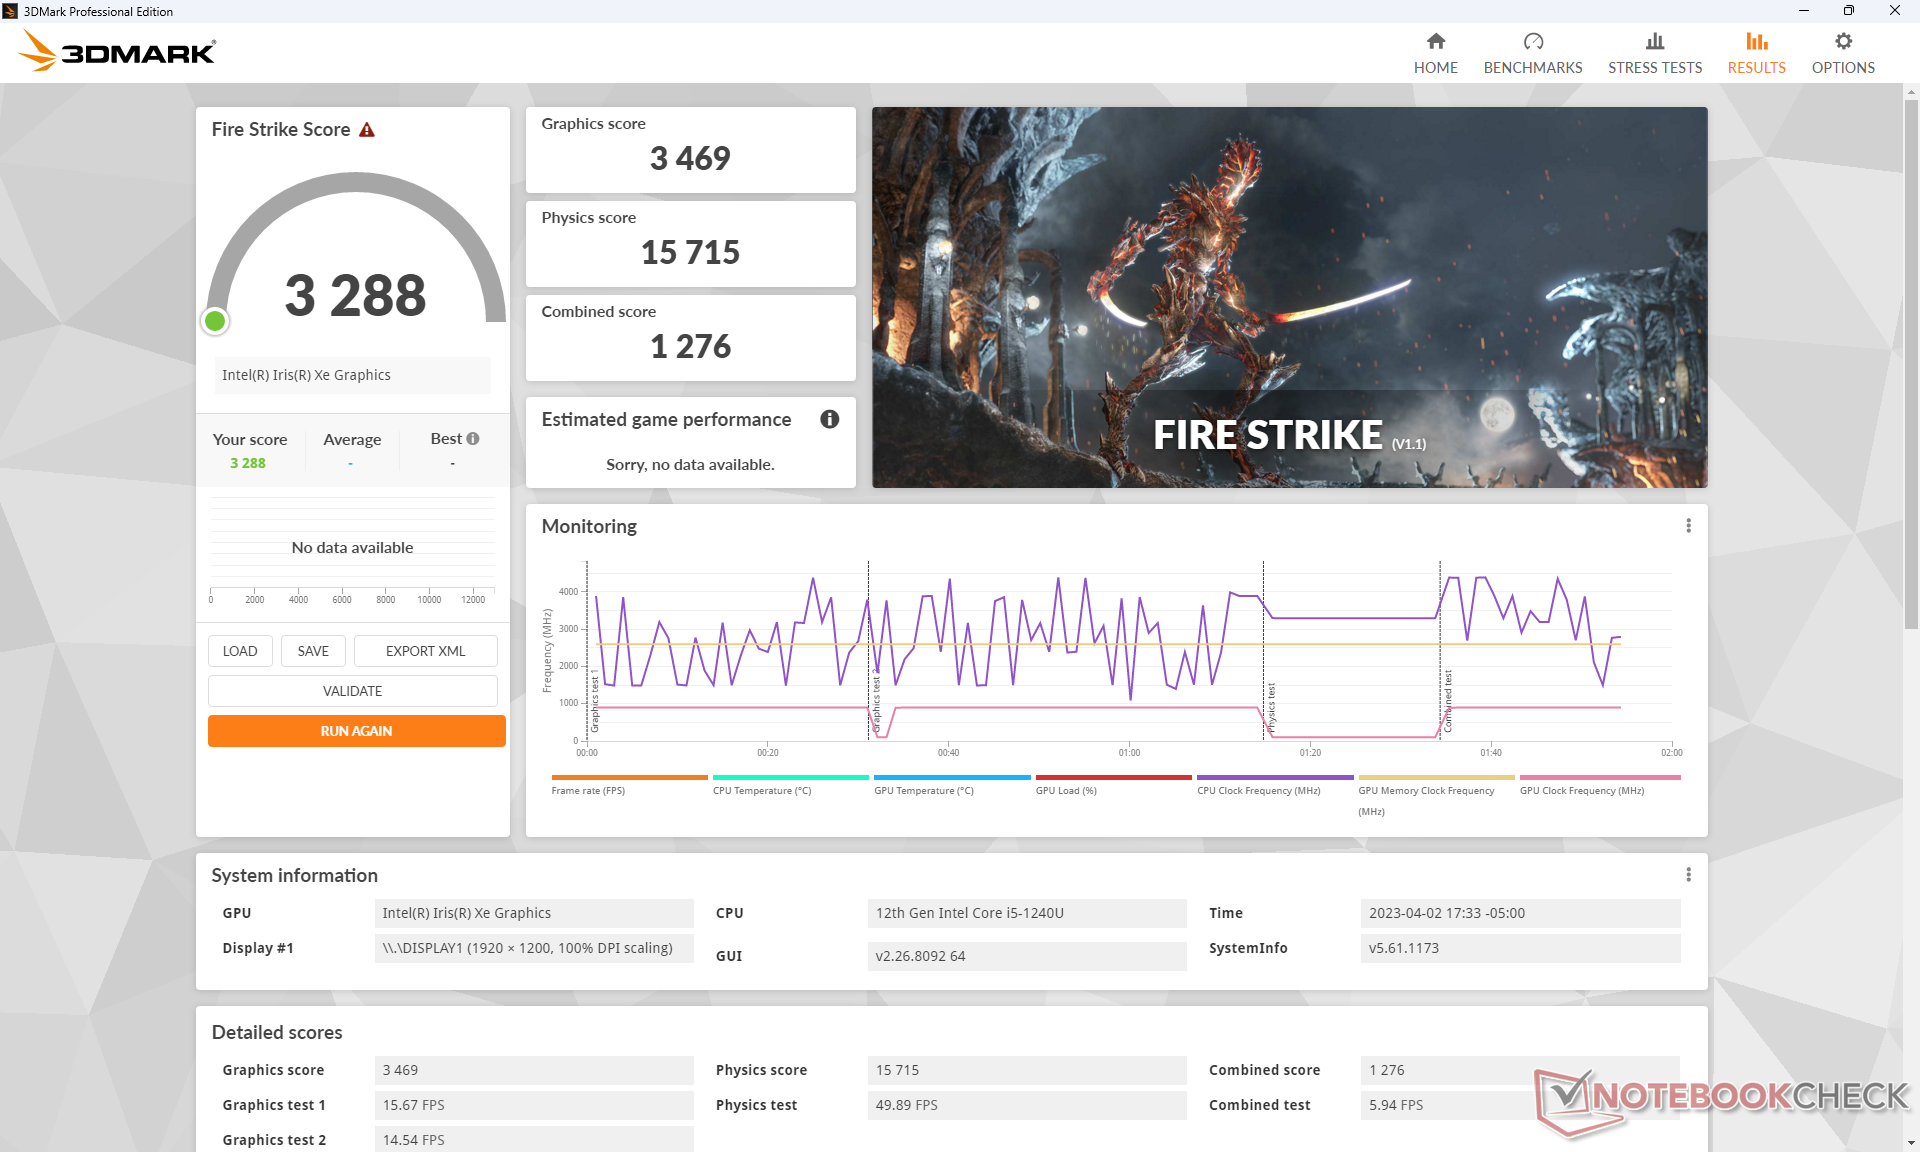
| 3DMark Fire Strike Score | 3288 pontos | |
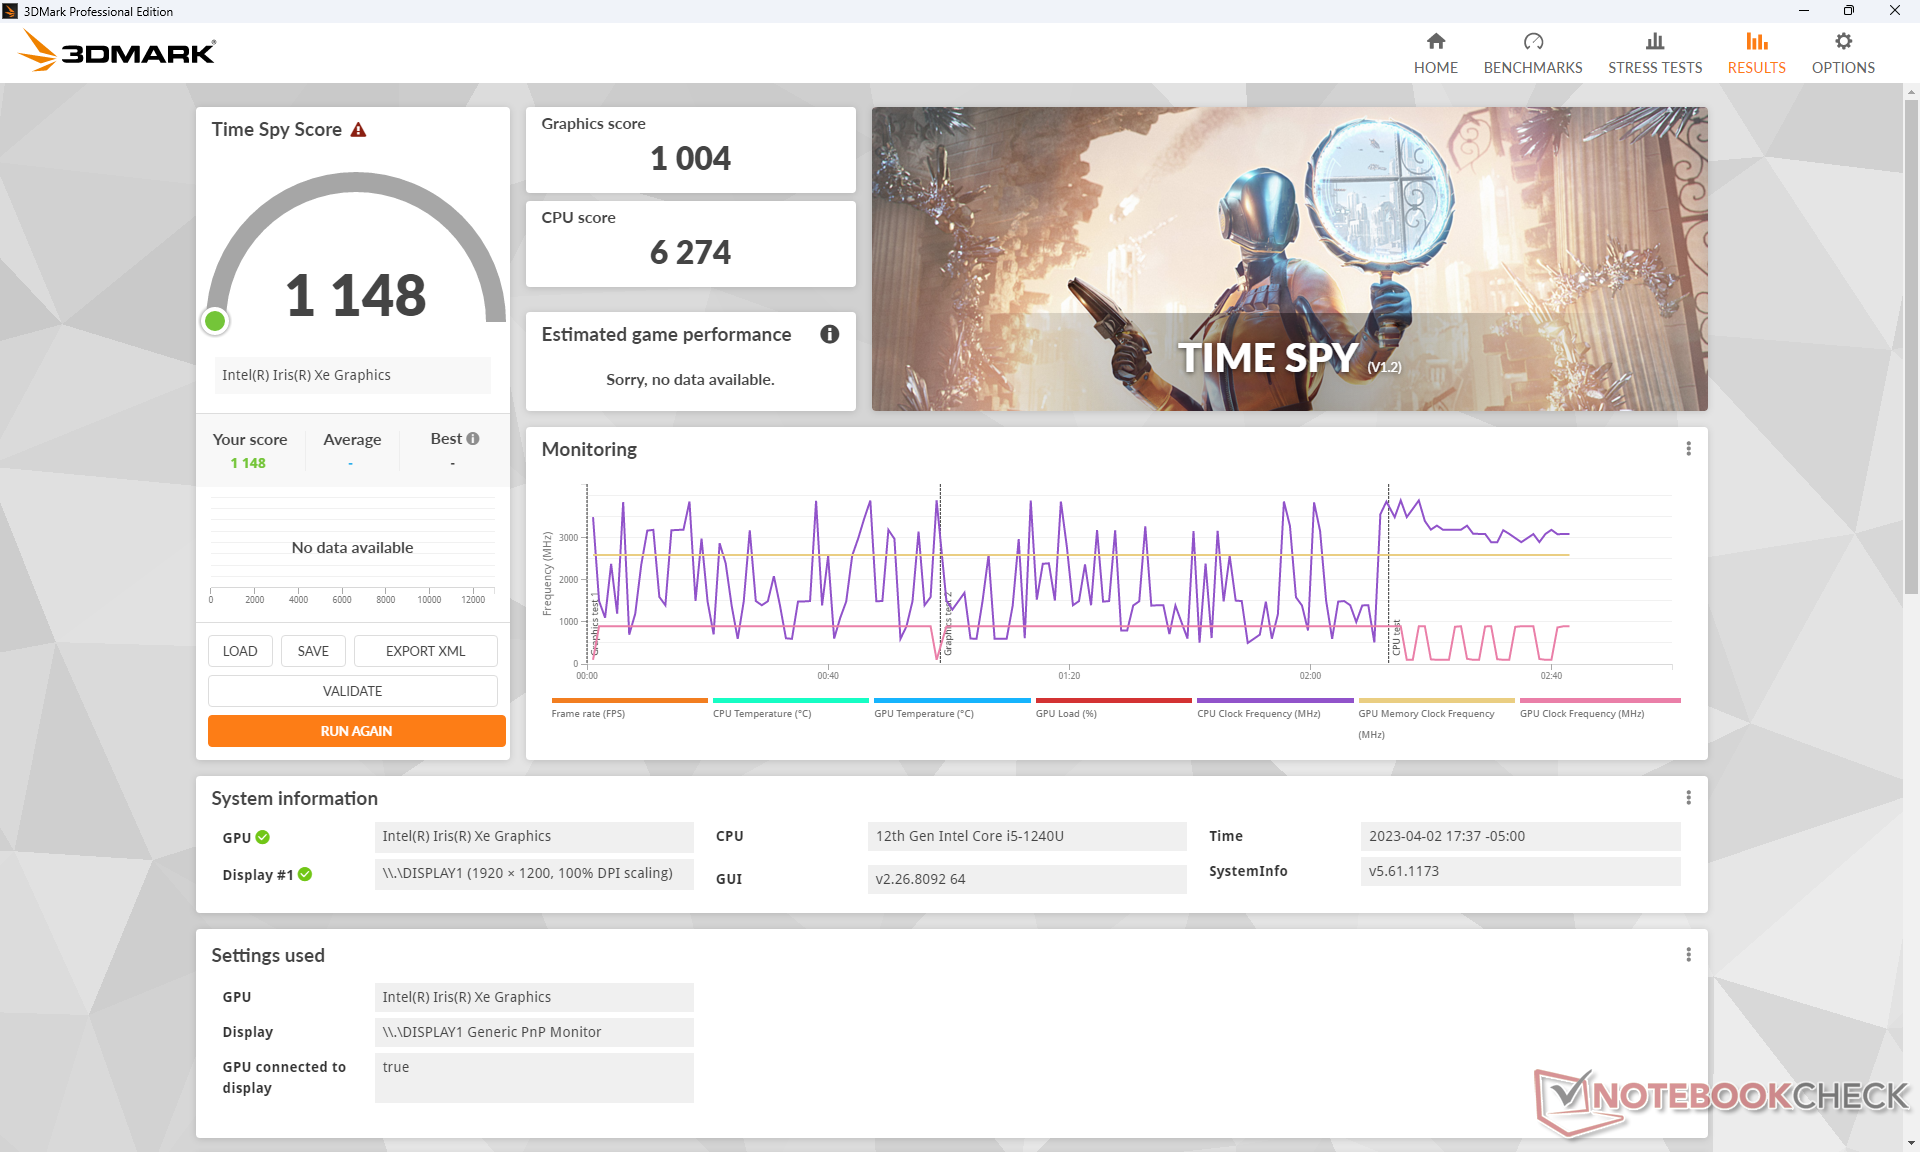
| 3DMark Time Spy Score | 1148 pontos | |
Ajuda | ||
| Performance rating - Percent | |
| HP ZBook Firefly 14 G9-6B8A2EA | |
| Lenovo ThinkPad P14s G3 AMD 21J6S05000 | |
| Asus ExpertBook B5 Flip B5602FBN | |
| Dell Latitude 7330 Rugged Extreme -2! | |
| HP EliteBook 840 G9 | |
| Panasonic Toughbook 40 -2! | |
| Lenovo ThinkBook 13s G3 20YA0005GE -2! | |
| Acer Enduro Urban N3 EUN314 | |
| HP ProBook 440 G9-5Y3Z3EA -2! | |
| Durabook S14I -3! | |
| Dell Latitude 7230 Rugged Extreme | |
| Getac B360 -2! | |
| The Witcher 3 - 1920x1080 Ultra Graphics & Postprocessing (HBAO+) | |
| Lenovo ThinkPad P14s G3 AMD 21J6S05000 | |
| HP ZBook Firefly 14 G9-6B8A2EA | |
| Asus ExpertBook B5 Flip B5602FBN | |
| HP EliteBook 840 G9 | |
| Dell Latitude 7330 Rugged Extreme | |
| Panasonic Toughbook 40 | |
| Lenovo ThinkBook 13s G3 20YA0005GE | |
| Acer Enduro Urban N3 EUN314 | |
| Dell Latitude 7230 Rugged Extreme | |
| HP ProBook 440 G9-5Y3Z3EA | |
| Getac B360 | |
| GTA V - 1920x1080 Highest AA:4xMSAA + FX AF:16x | |
| HP ZBook Firefly 14 G9-6B8A2EA | |
| Lenovo ThinkPad P14s G3 AMD 21J6S05000 | |
| Asus ExpertBook B5 Flip B5602FBN | |
| HP EliteBook 840 G9 | |
| Acer Enduro Urban N3 EUN314 | |
| Dell Latitude 7230 Rugged Extreme | |
| Final Fantasy XV Benchmark - 1920x1080 High Quality | |
| Dell Latitude 7330 Rugged Extreme | |
| Lenovo ThinkPad P14s G3 AMD 21J6S05000 | |
| HP ZBook Firefly 14 G9-6B8A2EA | |
| HP EliteBook 840 G9 | |
| Asus ExpertBook B5 Flip B5602FBN | |
| Acer Enduro Urban N3 EUN314 | |
| Panasonic Toughbook 40 | |
| Lenovo ThinkBook 13s G3 20YA0005GE | |
| Dell Latitude 7230 Rugged Extreme | |
| HP ProBook 440 G9-5Y3Z3EA | |
| Durabook S14I | |
| Getac B360 | |
| Strange Brigade - 1920x1080 ultra AA:ultra AF:16 | |
| Asus ExpertBook B5 Flip B5602FBN | |
| HP ZBook Firefly 14 G9-6B8A2EA | |
| Lenovo ThinkPad P14s G3 AMD 21J6S05000 | |
| HP EliteBook 840 G9 | |
| Acer Enduro Urban N3 EUN314 | |
| Dell Latitude 7230 Rugged Extreme | |
| Dota 2 Reborn - 1920x1080 ultra (3/3) best looking | |
| HP ZBook Firefly 14 G9-6B8A2EA | |
| HP EliteBook 840 G9 | |
| Lenovo ThinkPad P14s G3 AMD 21J6S05000 | |
| Dell Latitude 7330 Rugged Extreme | |
| Asus ExpertBook B5 Flip B5602FBN | |
| Panasonic Toughbook 40 | |
| Lenovo ThinkBook 13s G3 20YA0005GE | |
| Dell Latitude 7230 Rugged Extreme | |
| Acer Enduro Urban N3 EUN314 | |
| Durabook S14I | |
| HP ProBook 440 G9-5Y3Z3EA | |
| Getac B360 | |
| X-Plane 11.11 - 1920x1080 high (fps_test=3) | |
| HP ZBook Firefly 14 G9-6B8A2EA | |
| Acer Enduro Urban N3 EUN314 | |
| HP EliteBook 840 G9 | |
| Lenovo ThinkPad P14s G3 AMD 21J6S05000 | |
| HP ProBook 440 G9-5Y3Z3EA | |
| Lenovo ThinkBook 13s G3 20YA0005GE | |
| Asus ExpertBook B5 Flip B5602FBN | |
| Durabook S14I | |
| Panasonic Toughbook 40 | |
| Dell Latitude 7330 Rugged Extreme | |
| Dell Latitude 7230 Rugged Extreme | |
| Getac B360 | |
Witcher 3 FPS Chart
| baixo | média | alto | ultra | |
|---|---|---|---|---|
| GTA V (2015) | 103.3 | 93.3 | 18.5 | 7.79 |
| The Witcher 3 (2015) | 67.3 | 40.9 | 24.1 | 10.6 |
| Dota 2 Reborn (2015) | 98.9 | 77.8 | 50.7 | 45.7 |
| Final Fantasy XV Benchmark (2018) | 31 | 17.3 | 11.8 | |
| X-Plane 11.11 (2018) | 32.6 | 22.6 | 20.6 | |
| Strange Brigade (2018) | 60.2 | 27.4 | 21.4 | 17.9 |
Emissões - Silêncio até que seja barulhento
Ruído do sistema
O ruído dos ventiladores é silencioso e essencialmente inaudível durante cargas baixas a baixas-médias. A execução da primeira cena de referência do 3DMark 06, por exemplo, não induziria nenhum ruído do ventilador até o final da referência.
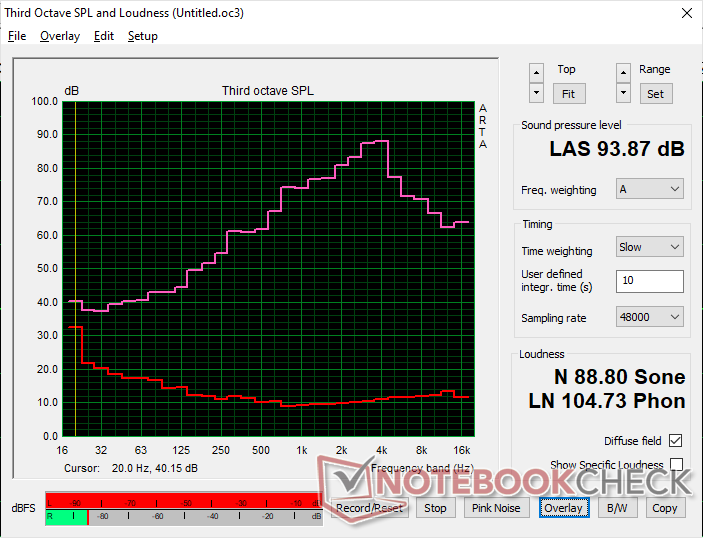
Infelizmente, o ventilador de pequeno diâmetro é mais potente do que na maioria dos laptops. Se rodando em aplicações muito exigentes como jogos ou Prime95, o ruído do ventilador pode chegar a 43 dB(A) para ser uma das pastilhas mais barulhentas e resistentes que testamos. No entanto, você teria que realmente empurrar o tablet aos seus limites para atingir níveis de ruído tão altos.
Barulho
| Ocioso |
| 22.9 / 22.9 / 22.9 dB |
| Carga |
| 24.5 / 43.2 dB |
 | ||
30 dB silencioso 40 dB(A) audível 50 dB(A) ruidosamente alto |
||
min: | ||
| Dell Latitude 7230 Rugged Extreme Iris Xe G7 80EUs, i5-1240U, WD PC SN740 512GB SDDPMQD-512G-1101 | Dell Latitude 7330 Rugged Extreme Iris Xe G7 96EUs, i7-1185G7 | Panasonic Toughbook 40 Iris Xe G7 96EUs, i7-1185G7, Samsung PM991 MZVLQ1T0HALB | Getac B360 UHD Graphics 620, i7-10710U, Lite-On CA5-8D512 | Acer Enduro Urban N3 EUN314 Iris Xe G7 96EUs, i7-1165G7, Samsung PM991 MZVLQ1T0HALB | Durabook S14I Iris Xe G7 96EUs, i7-1165G7, UDinfo M2P M2P80DE512GBAEP | |
|---|---|---|---|---|---|---|
| Noise | 2% | -13% | 0% | -3% | -18% | |
| desligado / ambiente * (dB) | 22.8 | 22.9 -0% | 22.8 -0% | 24.3 -7% | 23.8 -4% | 25.2 -11% |
| Idle Minimum * (dB) | 22.9 | 23.1 -1% | 26 -14% | 24.5 -7% | 24.1 -5% | 25.2 -10% |
| Idle Average * (dB) | 22.9 | 23.1 -1% | 26 -14% | 24.5 -7% | 24.1 -5% | 25.2 -10% |
| Idle Maximum * (dB) | 22.9 | 23.1 -1% | 26 -14% | 24.6 -7% | 24.1 -5% | 34.5 -51% |
| Load Average * (dB) | 24.5 | 28 -14% | 37.6 -53% | 29.8 -22% | 27.9 -14% | 34.5 -41% |
| Witcher 3 ultra * (dB) | 36 | 31.2 13% | 37.8 -5% | 27.3 24% | 35.7 1% | |
| Load Maximum * (dB) | 43.2 | 36.2 16% | 40.3 7% | 30.8 29% | 38.6 11% | 36.2 16% |
* ... menor é melhor
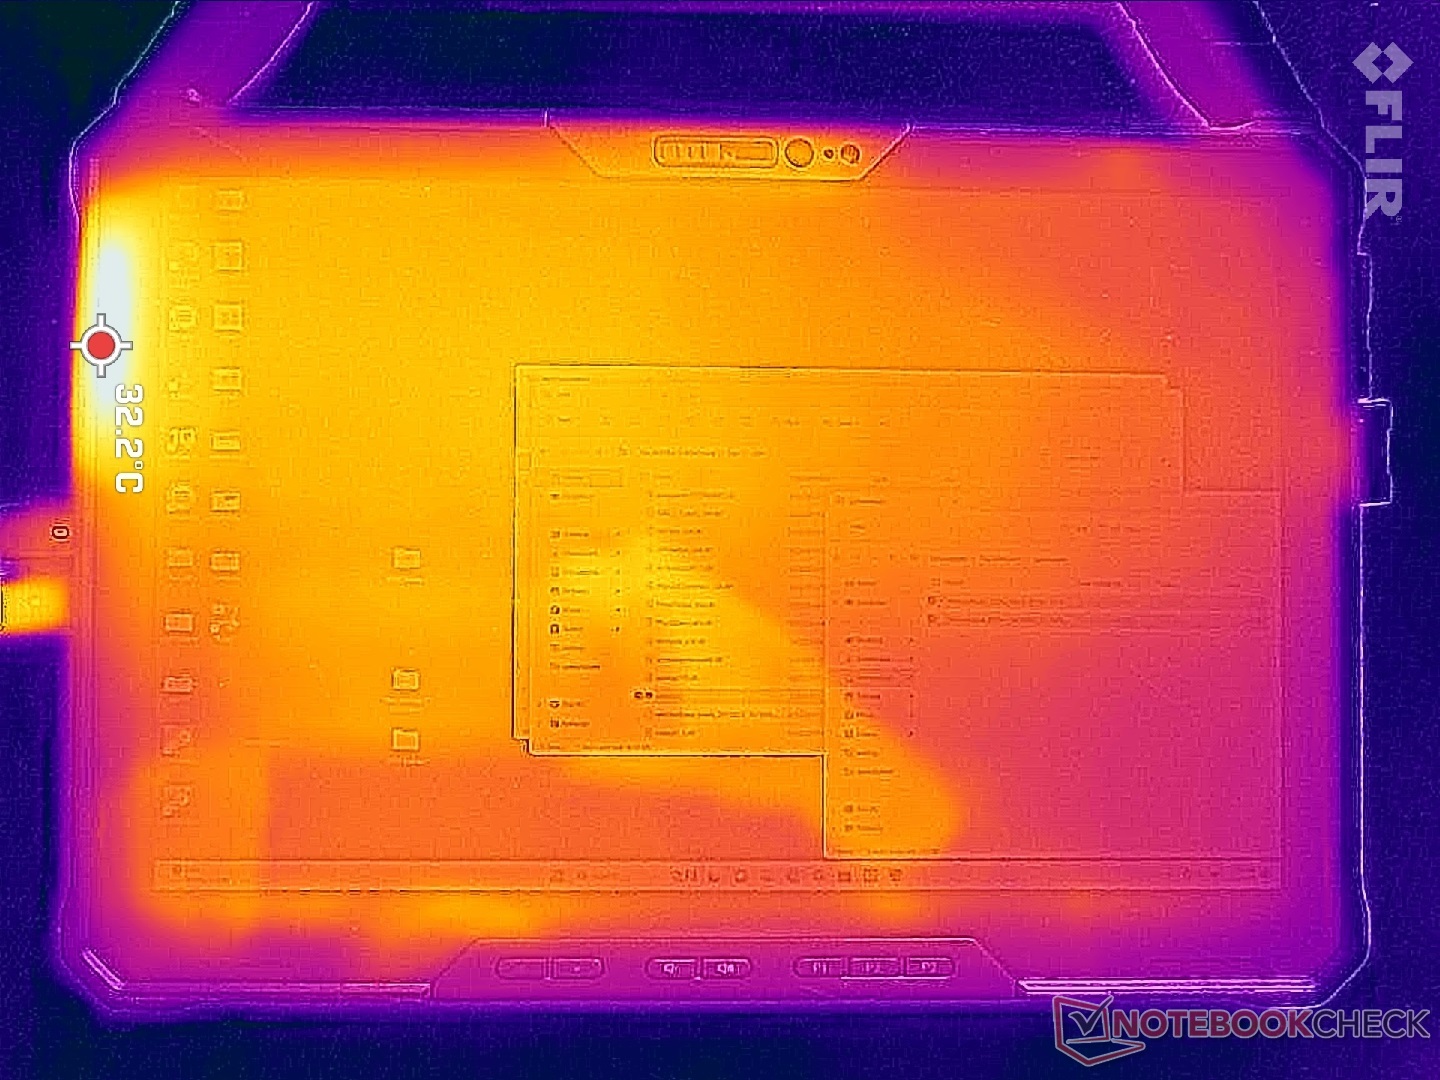
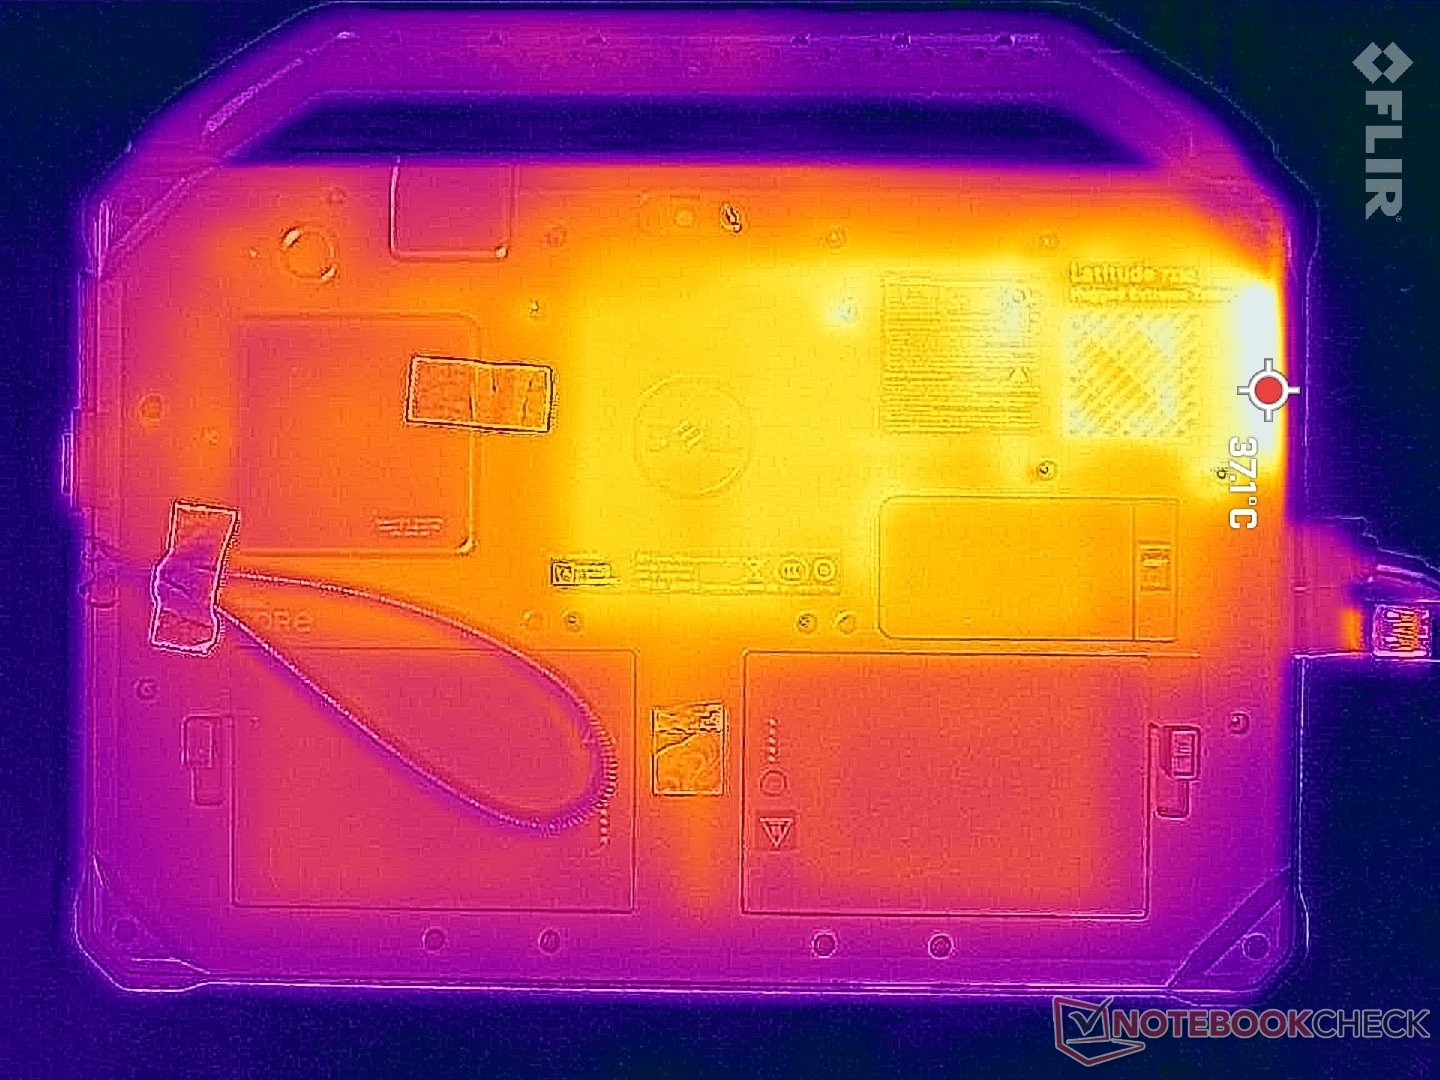
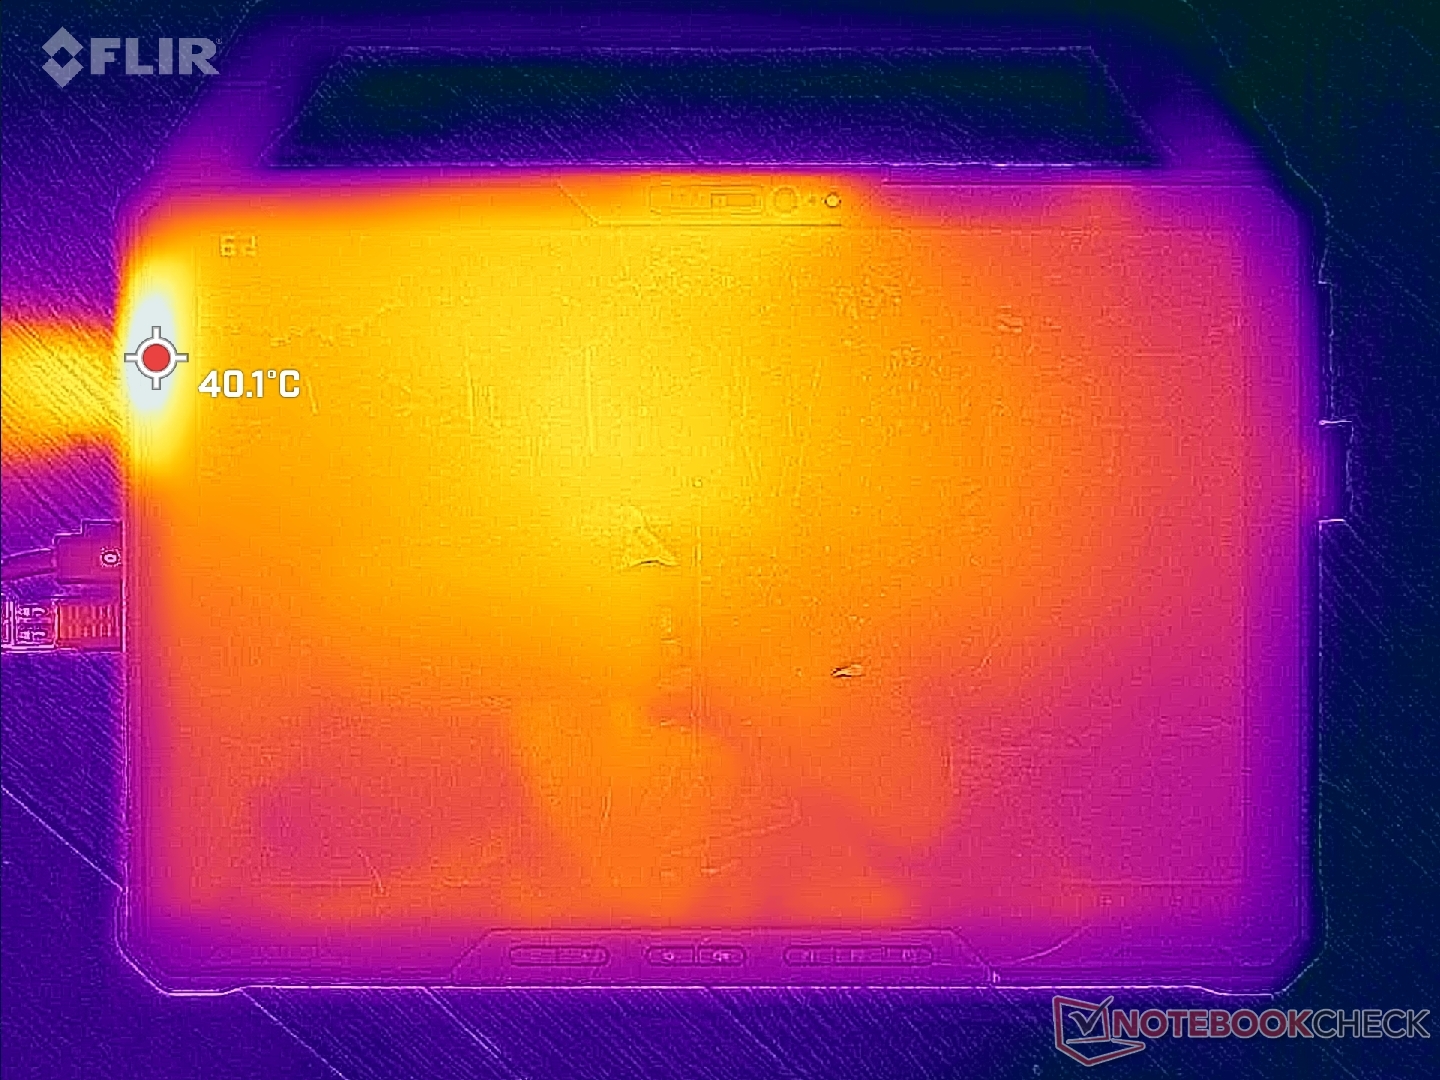
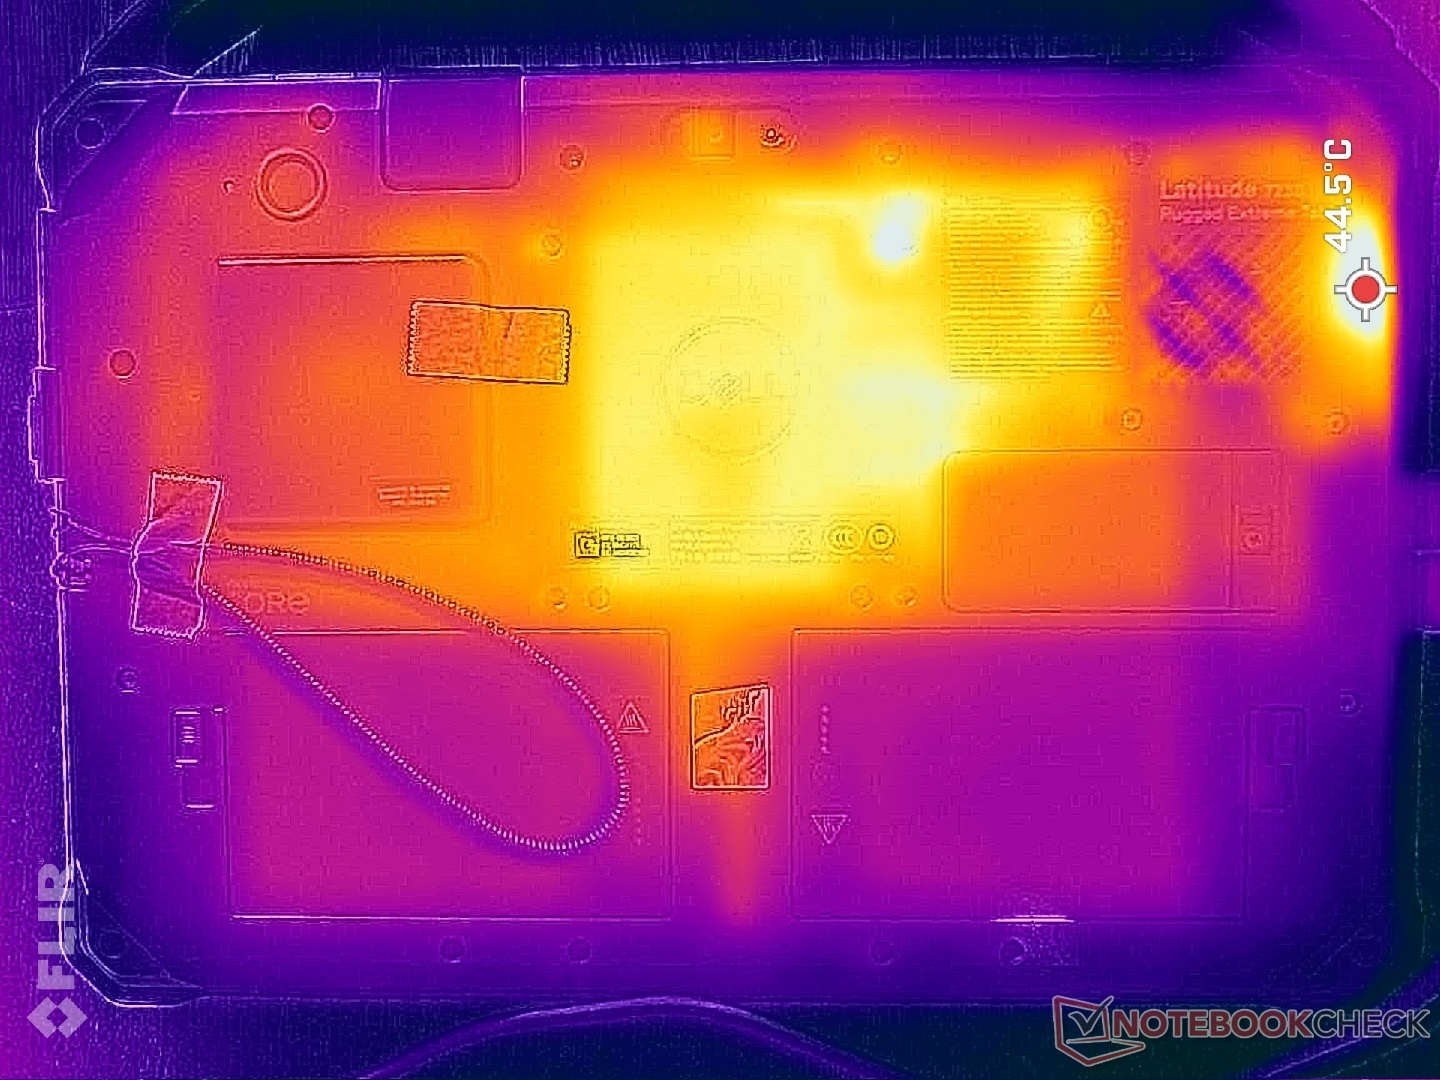
Temperatura
As temperaturas de superfície não são um problema devido ao perfil espesso e robusto, como na maioria dos outros dispositivos robustos. Na pior das hipóteses, somos capazes de registrar uma alta de 40 C ao longo da borda da unidade mais próxima das grelhas de ventilação quando a CPU está em 100% de utilização.
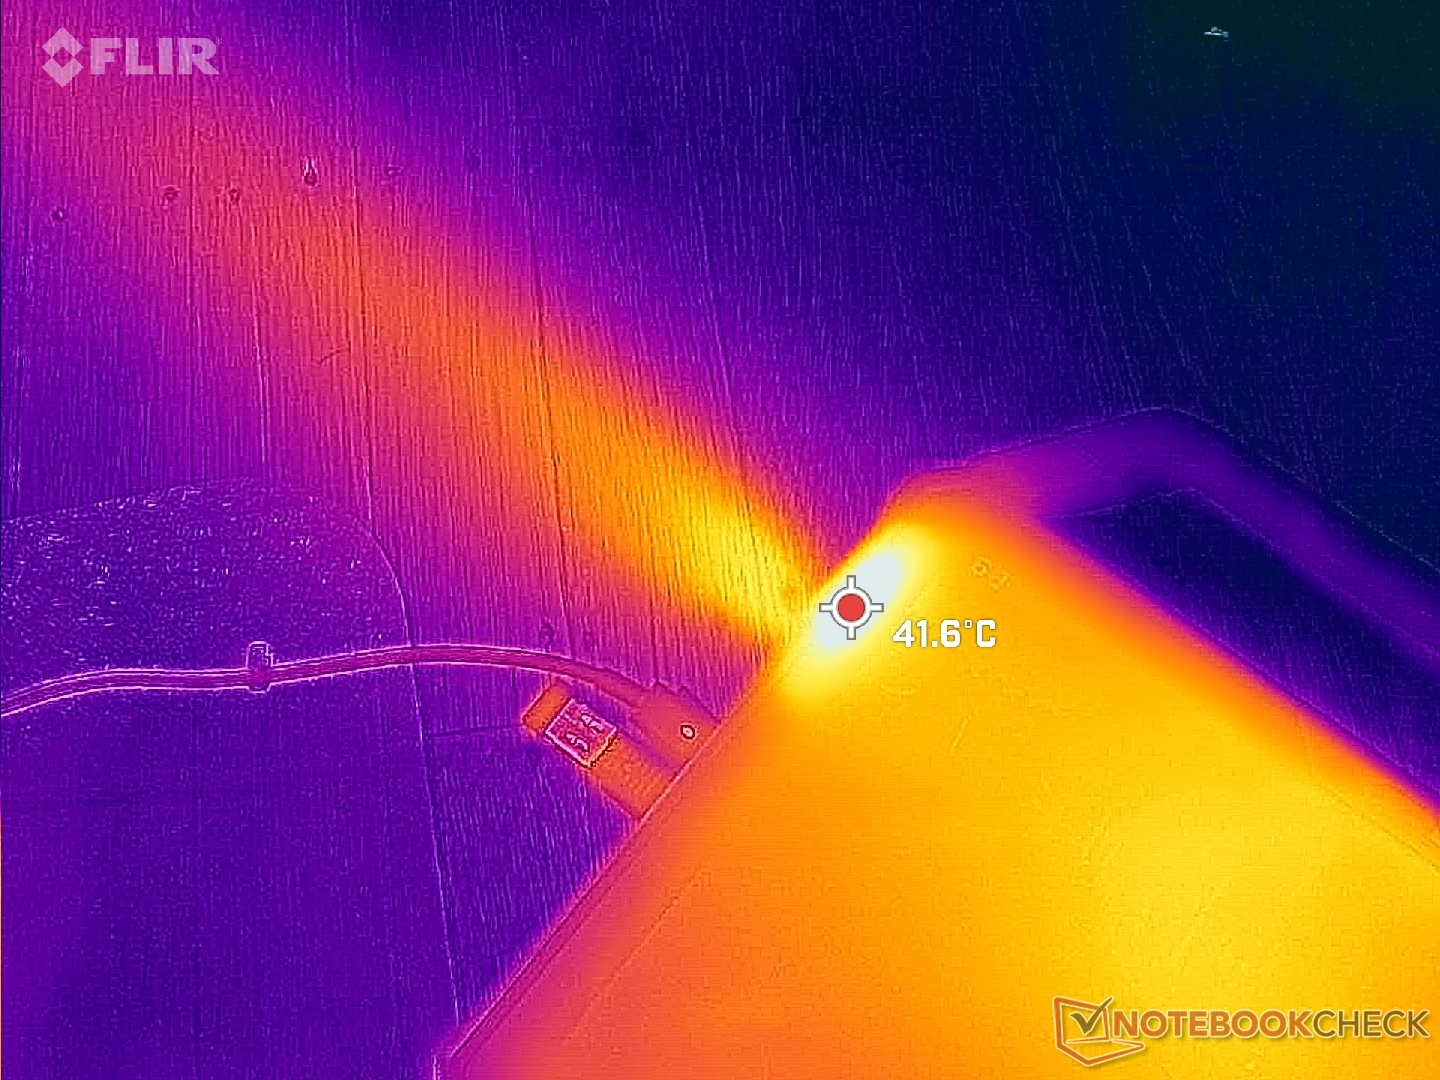
(+) A temperatura máxima no lado superior é 32.6 °C / 91 F, em comparação com a média de 33.7 °C / 93 F , variando de 20.7 a 53.2 °C para a classe Tablet.
(±) A parte inferior aquece até um máximo de 40.2 °C / 104 F, em comparação com a média de 33.2 °C / 92 F
(+) Em uso inativo, a temperatura média para o lado superior é 29 °C / 84 F, em comparação com a média do dispositivo de 30 °C / ### class_avg_f### F.
| Dell Latitude 7230 Rugged Extreme Intel Core i5-1240U, Intel Iris Xe Graphics G7 80EUs | Dell Latitude 7330 Rugged Extreme Intel Core i7-1185G7, Intel Iris Xe Graphics G7 96EUs | Panasonic Toughbook 40 Intel Core i7-1185G7, Intel Iris Xe Graphics G7 96EUs | Getac B360 Intel Core i7-10710U, Intel UHD Graphics 620 | Acer Enduro Urban N3 EUN314 Intel Core i7-1165G7, Intel Iris Xe Graphics G7 96EUs | Durabook S14I Intel Core i7-1165G7, Intel Iris Xe Graphics G7 96EUs | |
|---|---|---|---|---|---|---|
| Heat | 13% | 4% | 10% | -1% | -3% | |
| Maximum Upper Side * (°C) | 32.6 | 34.6 -6% | 35.6 -9% | 33.4 -2% | 37.8 -16% | 36.4 -12% |
| Maximum Bottom * (°C) | 40.2 | 36.6 9% | 40 -0% | 42.6 -6% | 45.8 -14% | 38.6 4% |
| Idle Upper Side * (°C) | 30.6 | 24.8 19% | 28.6 7% | 24.2 21% | 26.4 14% | 32.6 -7% |
| Idle Bottom * (°C) | 35 | 25.2 28% | 29.4 16% | 26.2 25% | 30.2 14% | 33.8 3% |
* ... menor é melhor
Teste de estresse
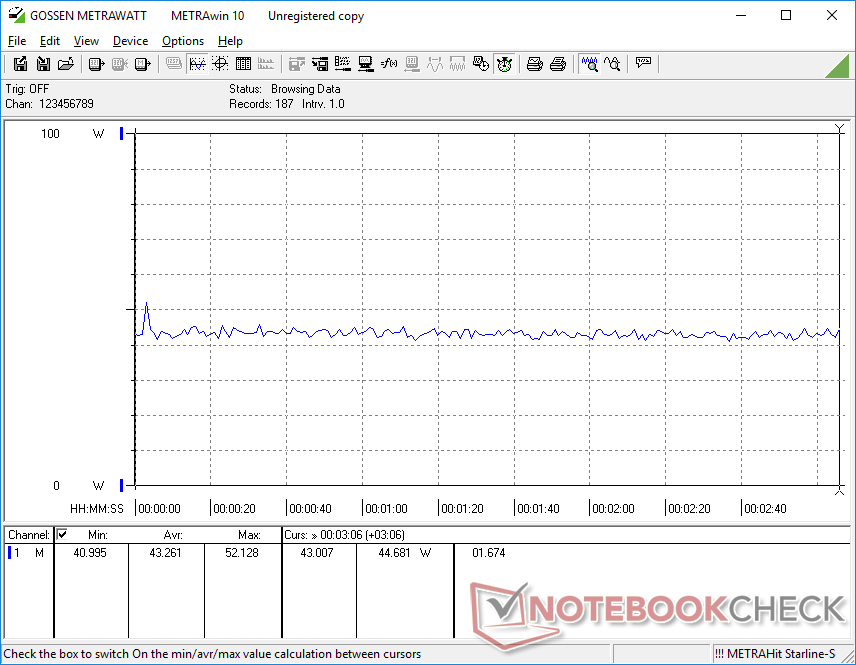
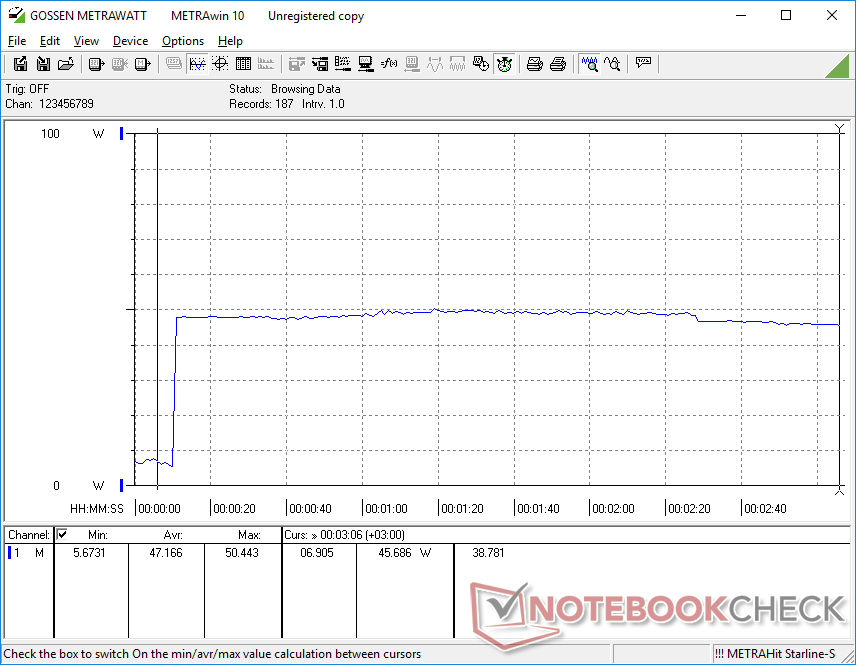
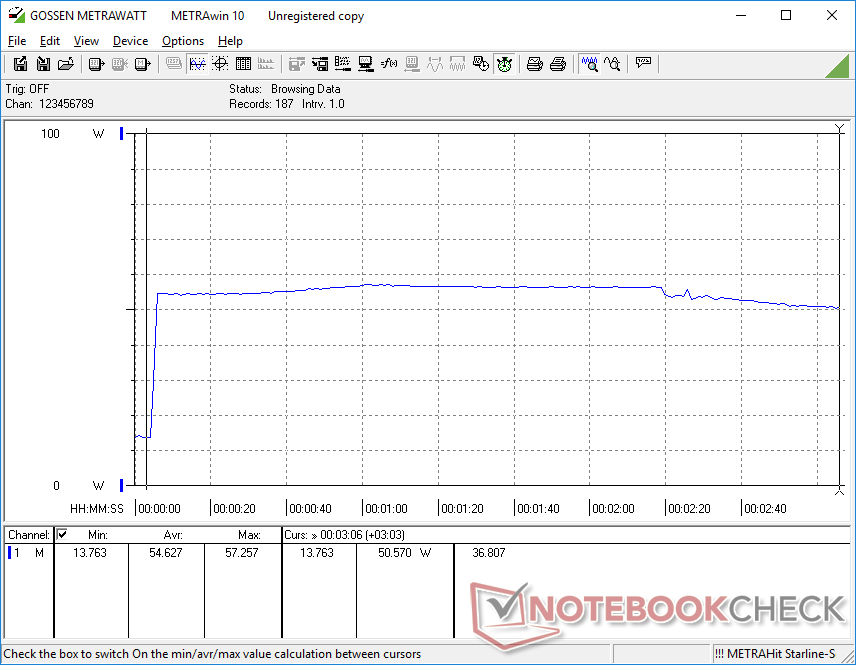
Ao executar Prime95 para enfatizar a CPU, as taxas de clock e o consumo de energia da placa aumentariam para 2,6 GHz e 30 W, respectivamente, antes de cair ligeiramente para 2,5 GHz e 26 W alguns segundos depois. A temperatura central se estabilizaria a uma temperatura muito alta de 97 C, que é mais quente do que gostaríamos. A repetição deste teste na grande Dell Latitude 7330 Rugged resultaria em uma temperatura de núcleo muito mais fria de apenas 68 C.
O funcionamento com a energia da bateria afeta ligeiramente o desempenho da CPU. Um teste 3DMark 11 com baterias retornaria pontuações de Física e Gráficos de 10743 e 4041 pontos, respectivamente, em comparação com 12765 e 4053 pontos quando em rede elétrica.
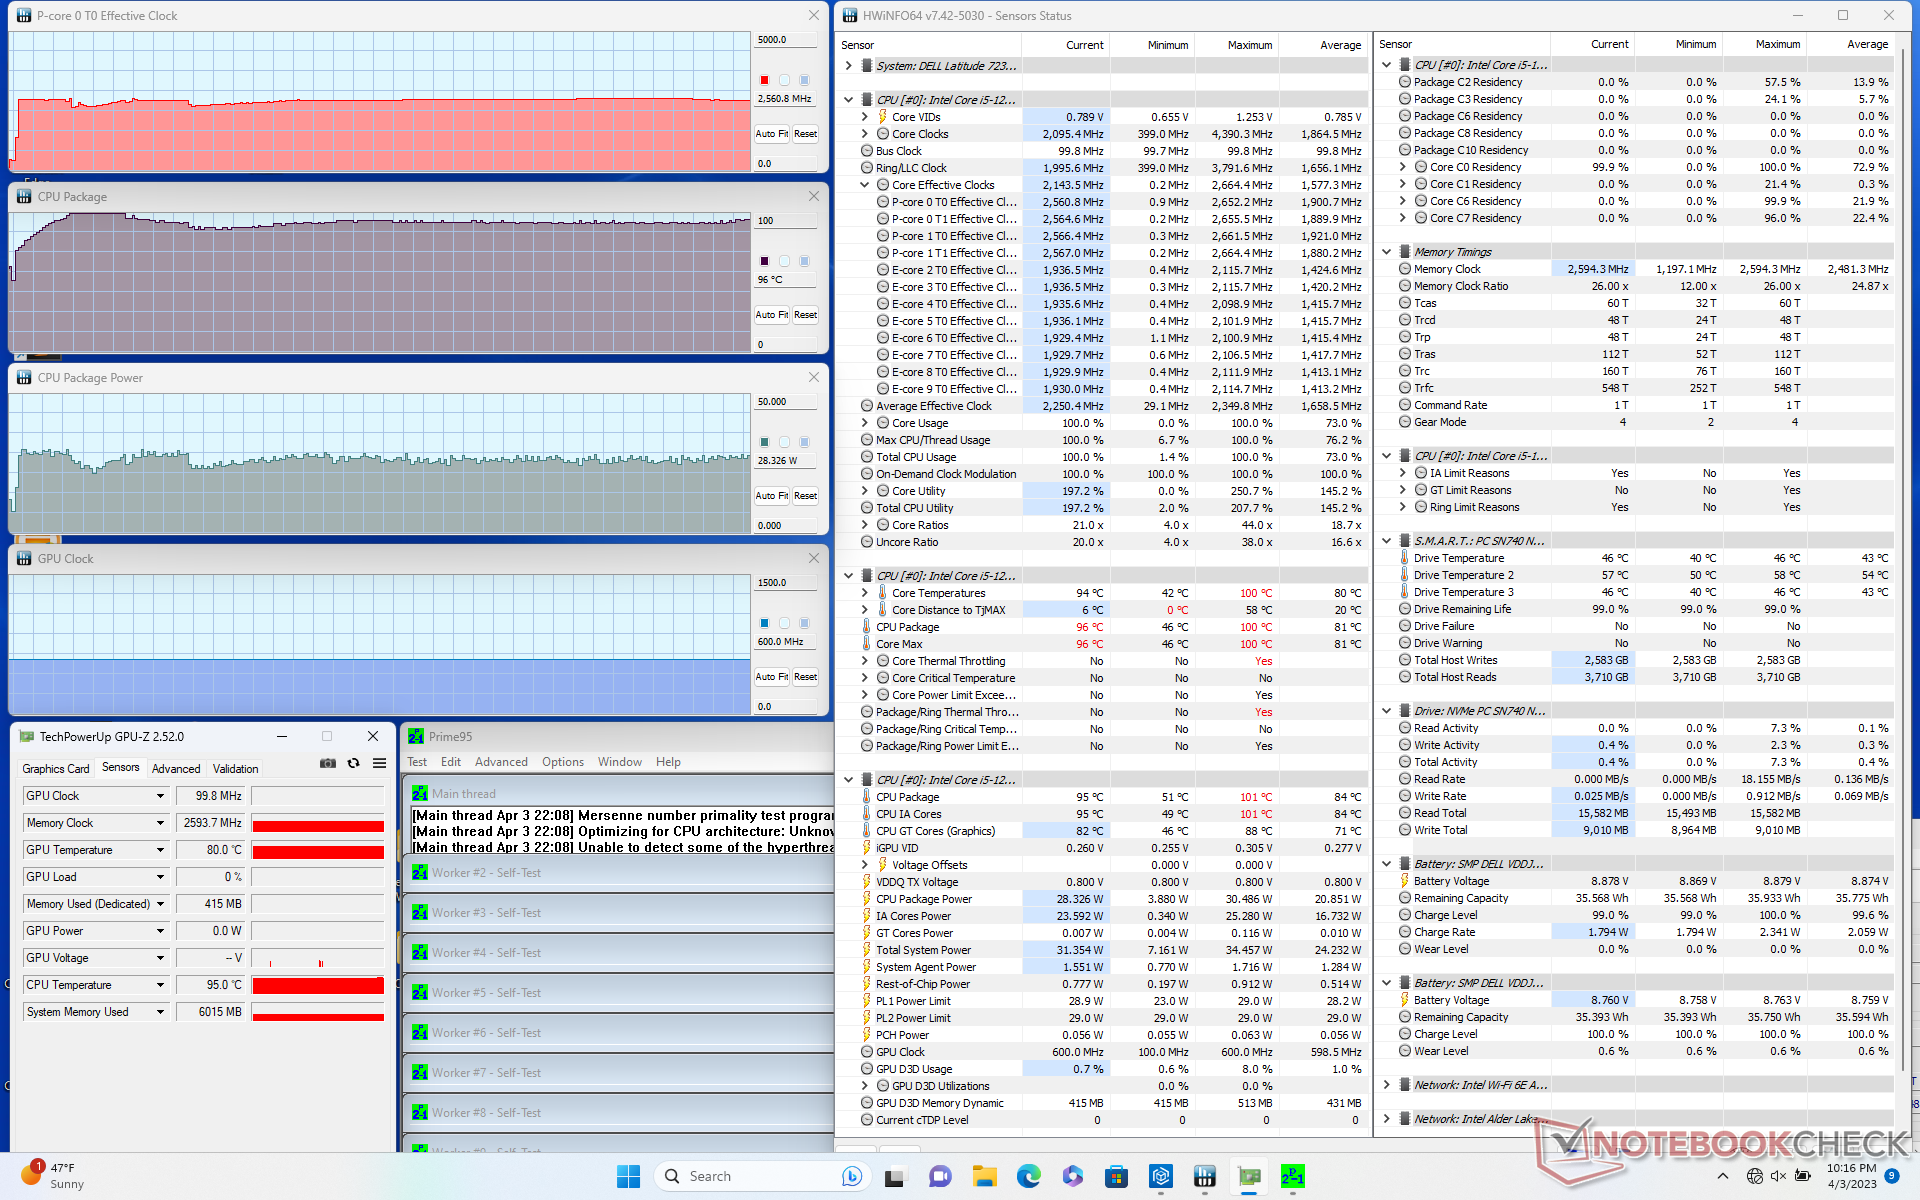
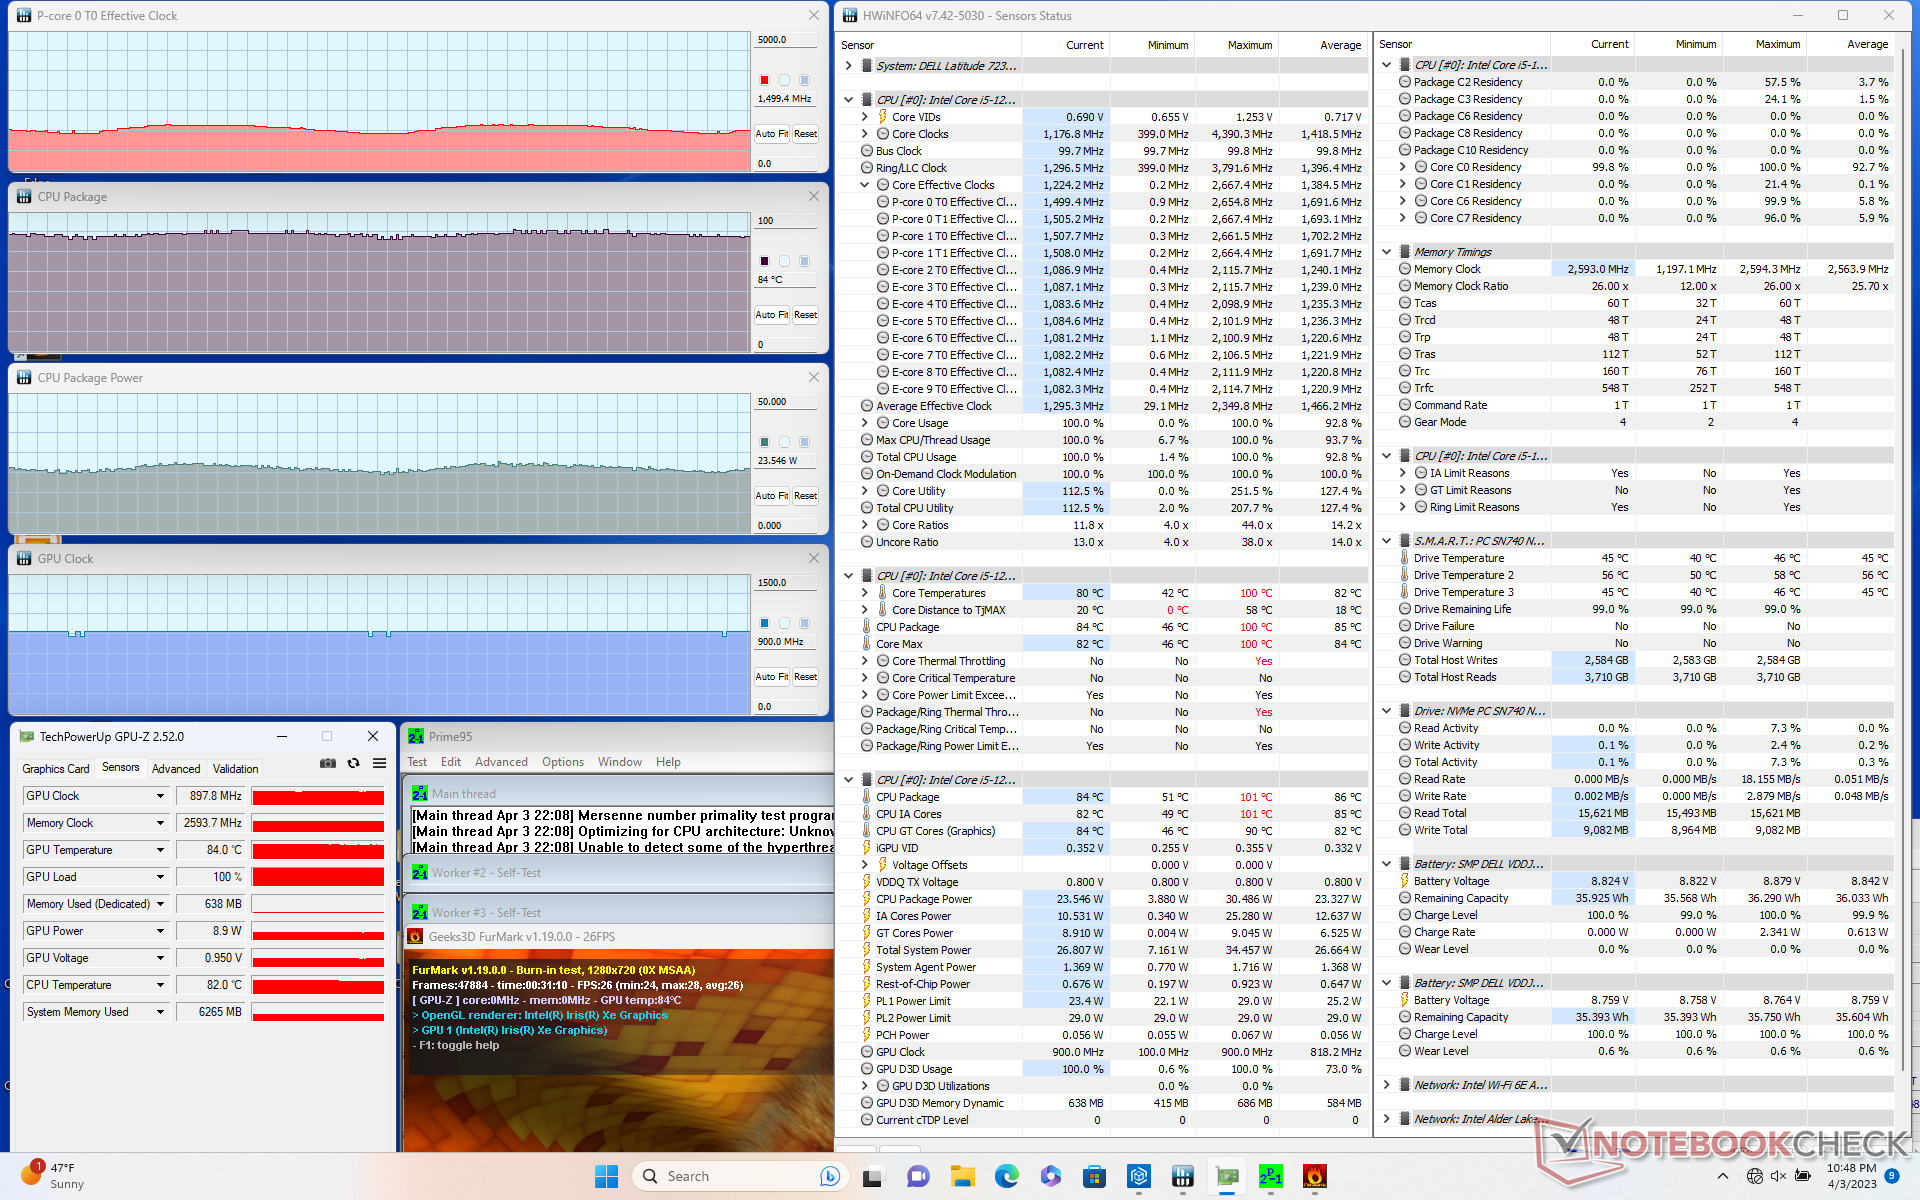

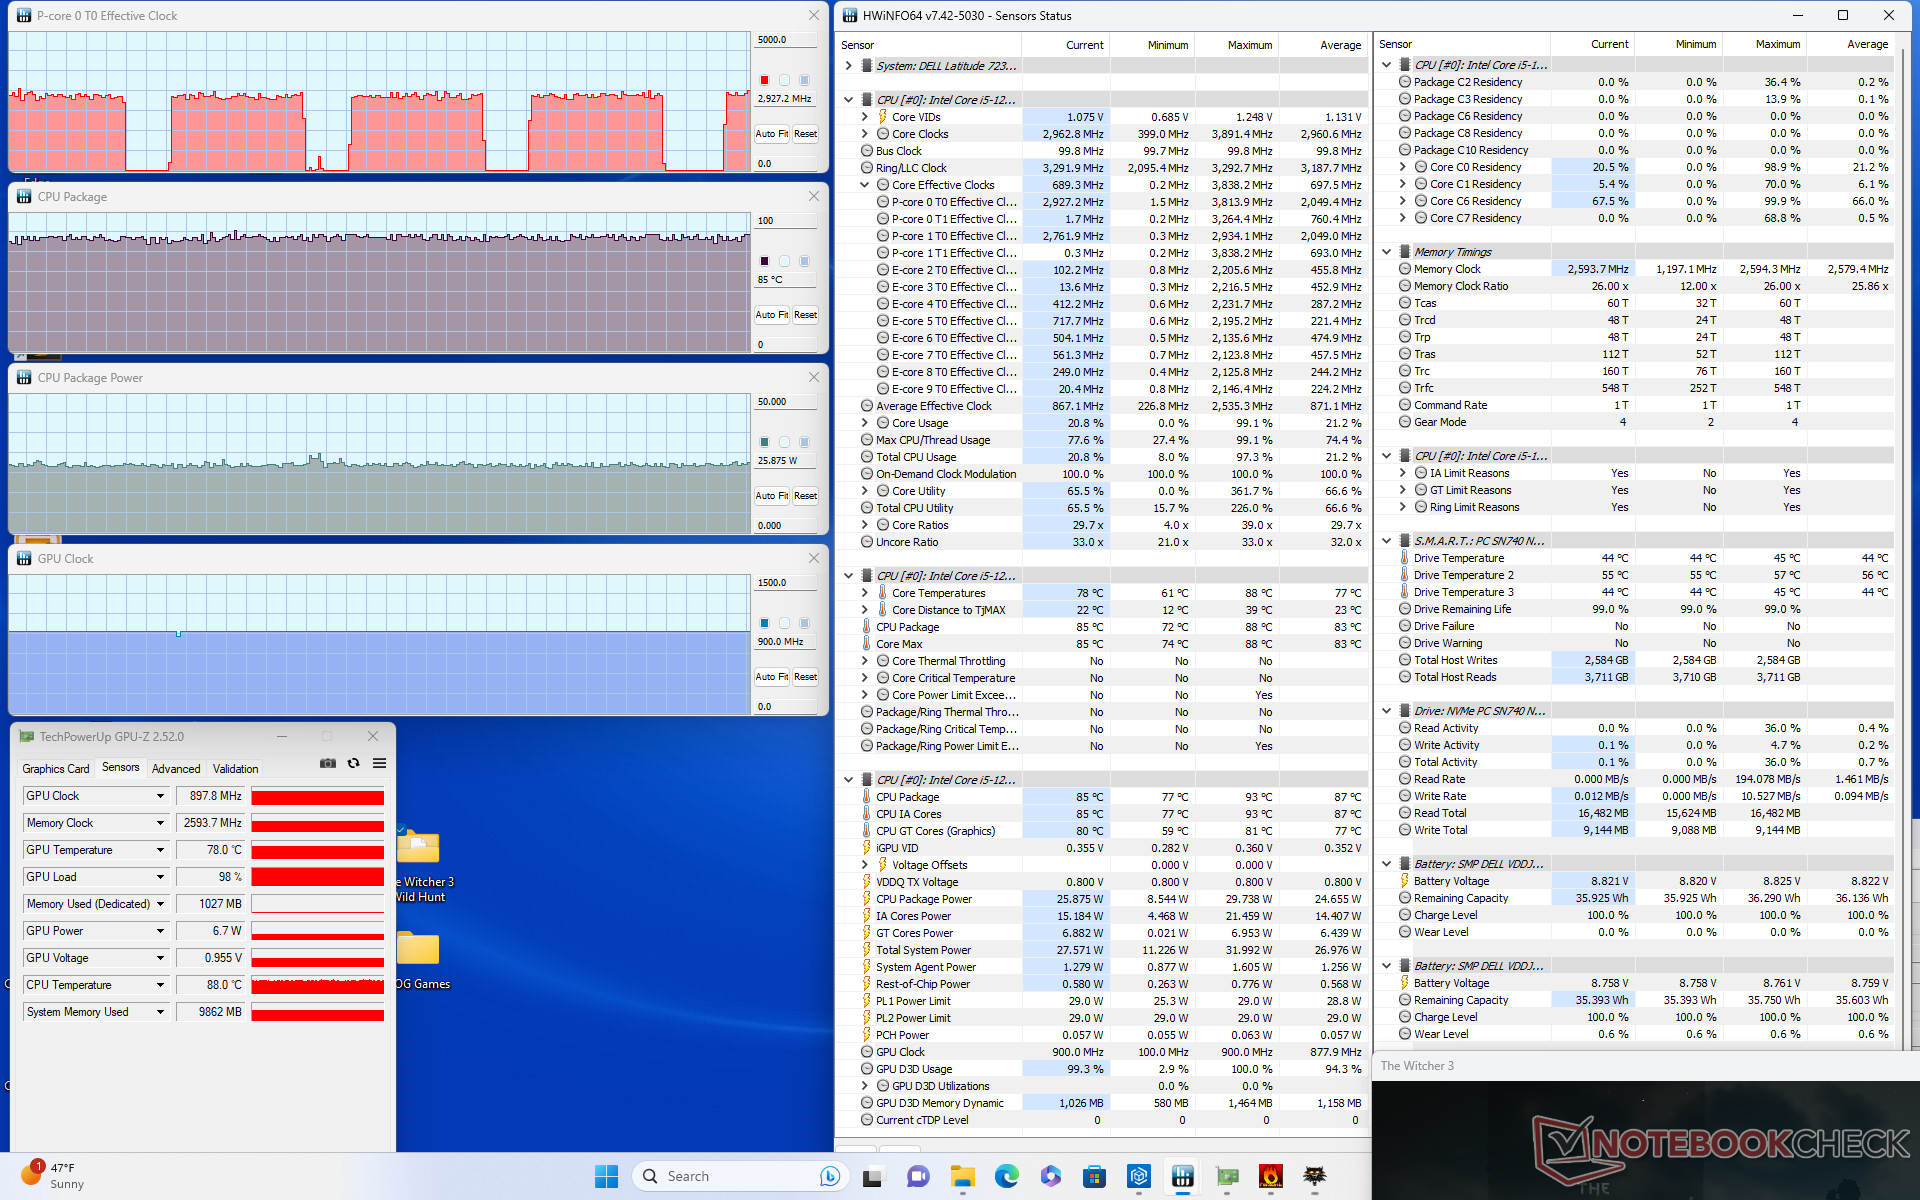
| Relógio CPU (GHz) | Relógio GPU (MHz) | Temperatura média da CPU (°C) | |
| System Idle | -- | -- | 50 |
| Prime95 Stress | 2.6 | -- | 96 |
| Prime95 + FurMark Stress | 1.4 - 1.6 | 898 | 84 |
| Witcher 3 Estresse (modo Ultra) | ~3.0 | 898 | 85 |
| Witcher 3 Stress (Modo otimizado) | ~1.7 | 898 | 83 |
Oradores
Dell Latitude 7230 Rugged Extreme análise de áudio
(+) | os alto-falantes podem tocar relativamente alto (###valor### dB)
Graves 100 - 315Hz
(-) | quase nenhum baixo - em média 19.9% menor que a mediana
(+) | o baixo é linear (5.2% delta para a frequência anterior)
Médios 400 - 2.000 Hz
(±) | médios mais altos - em média 6.5% maior que a mediana
(+) | médios são lineares (4.5% delta para frequência anterior)
Altos 2 - 16 kHz
(±) | máximos mais altos - em média 8.4% maior que a mediana
(±) | a linearidade dos máximos é média (7% delta para frequência anterior)
Geral 100 - 16.000 Hz
(±) | a linearidade do som geral é média (19.4% diferença em relação à mediana)
Comparado com a mesma classe
» 54% de todos os dispositivos testados nesta classe foram melhores, 7% semelhantes, 39% piores
» O melhor teve um delta de 7%, a média foi 20%, o pior foi 129%
Comparado com todos os dispositivos testados
» 48% de todos os dispositivos testados foram melhores, 7% semelhantes, 45% piores
» O melhor teve um delta de 4%, a média foi 23%, o pior foi 134%
Apple MacBook Pro 16 2021 M1 Pro análise de áudio
(+) | os alto-falantes podem tocar relativamente alto (###valor### dB)
Graves 100 - 315Hz
(+) | bons graves - apenas 3.8% longe da mediana
(+) | o baixo é linear (5.2% delta para a frequência anterior)
Médios 400 - 2.000 Hz
(+) | médios equilibrados - apenas 1.3% longe da mediana
(+) | médios são lineares (2.1% delta para frequência anterior)
Altos 2 - 16 kHz
(+) | agudos equilibrados - apenas 1.9% longe da mediana
(+) | os máximos são lineares (2.7% delta da frequência anterior)
Geral 100 - 16.000 Hz
(+) | o som geral é linear (4.6% diferença em relação à mediana)
Comparado com a mesma classe
» 0% de todos os dispositivos testados nesta classe foram melhores, 0% semelhantes, 100% piores
» O melhor teve um delta de 5%, a média foi 17%, o pior foi 45%
Comparado com todos os dispositivos testados
» 0% de todos os dispositivos testados foram melhores, 0% semelhantes, 100% piores
» O melhor teve um delta de 4%, a média foi 23%, o pior foi 134%
Gestão de energia
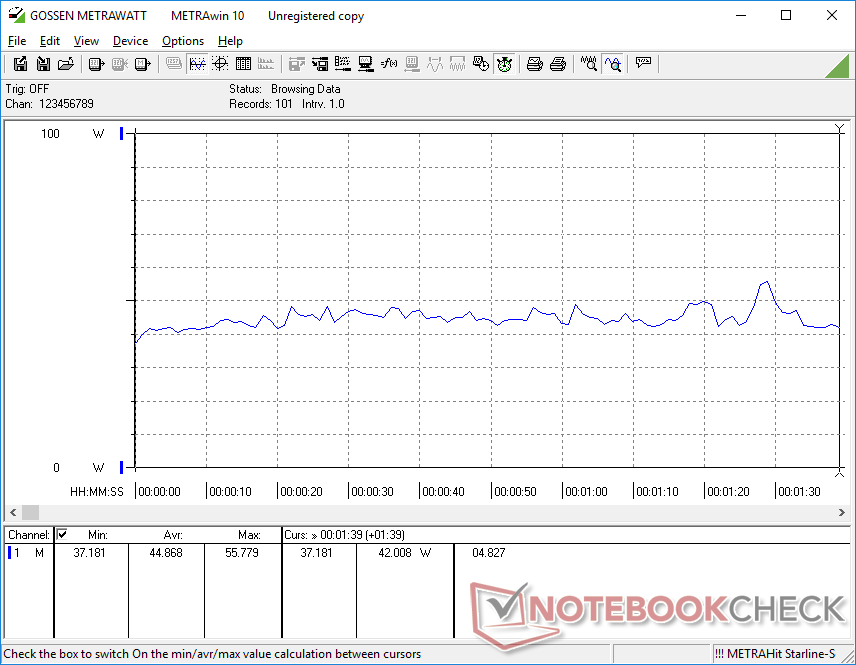
Consumo de energia
O consumo de energia é em sua maioria semelhante a outros dispositivos robustos funcionando em CPUs mais antigas do 11º gênero, como o Dell Latitude 7330 Rugged Extreme ou Panasonic Toughbook 40. O desempenho por watt, no entanto, pode ser muito diferente. Mais especificamente, nosso Latitude 7230 Rugged pode oferecer um desempenho de processador 40 a 50% mais rápido do que o Core i7-1185G7 noDell Latitude 7330 Resistente sem a necessidade de consumir mais energia. Por outro lado, o desempenho da GPU é 30 a 40 por cento mais lento.
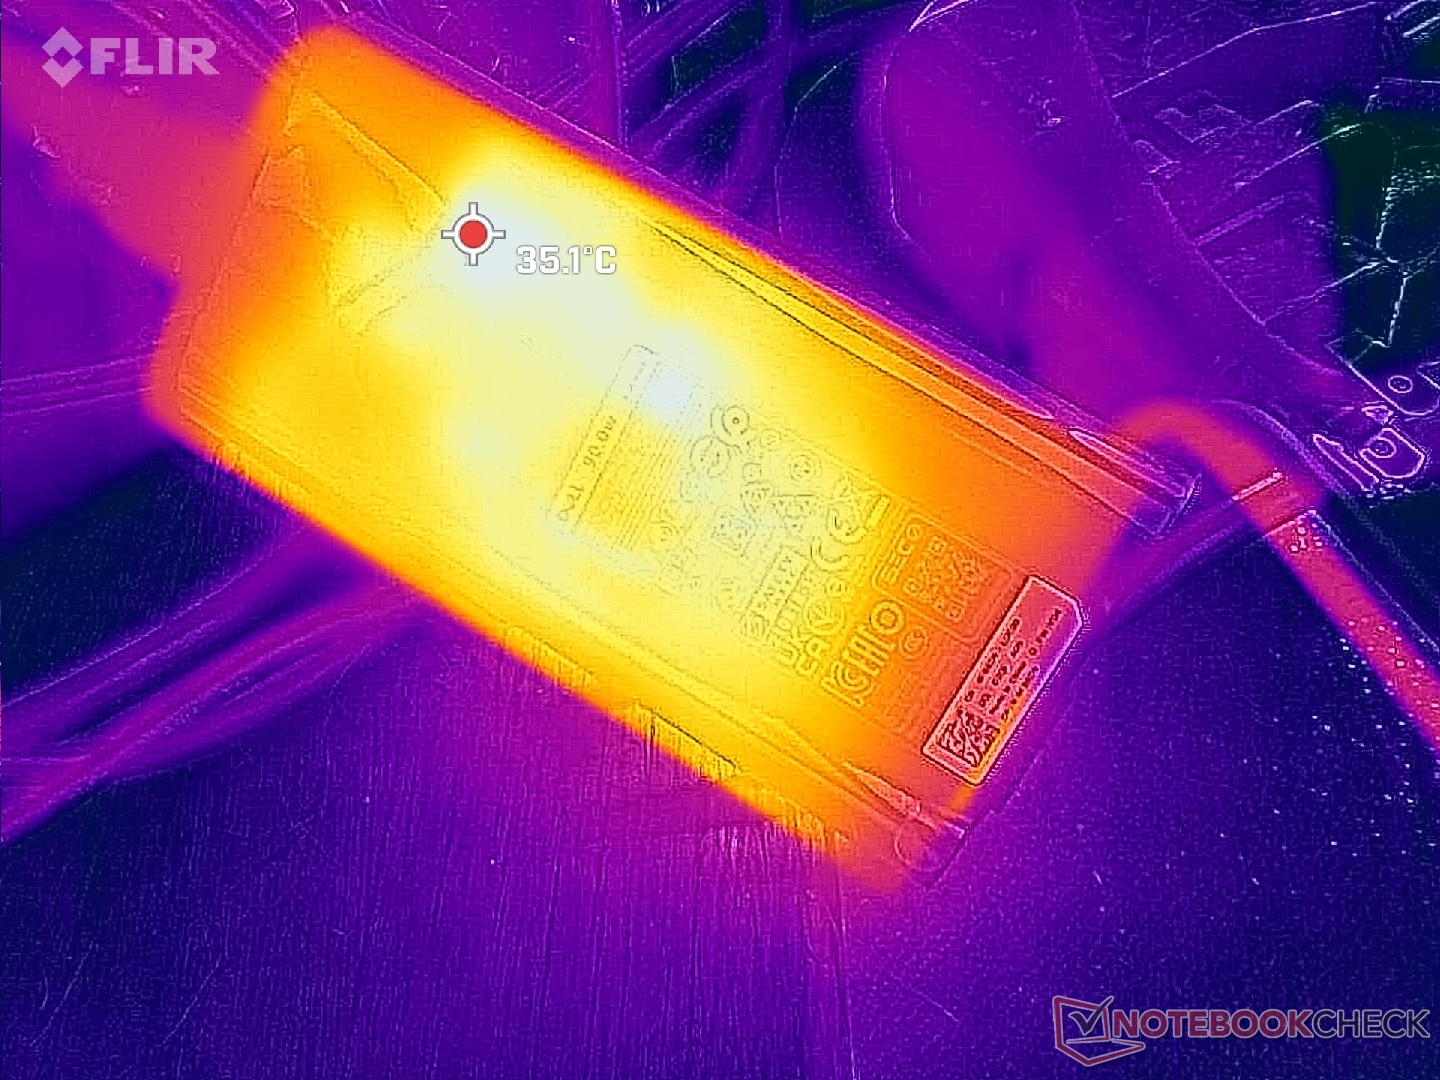
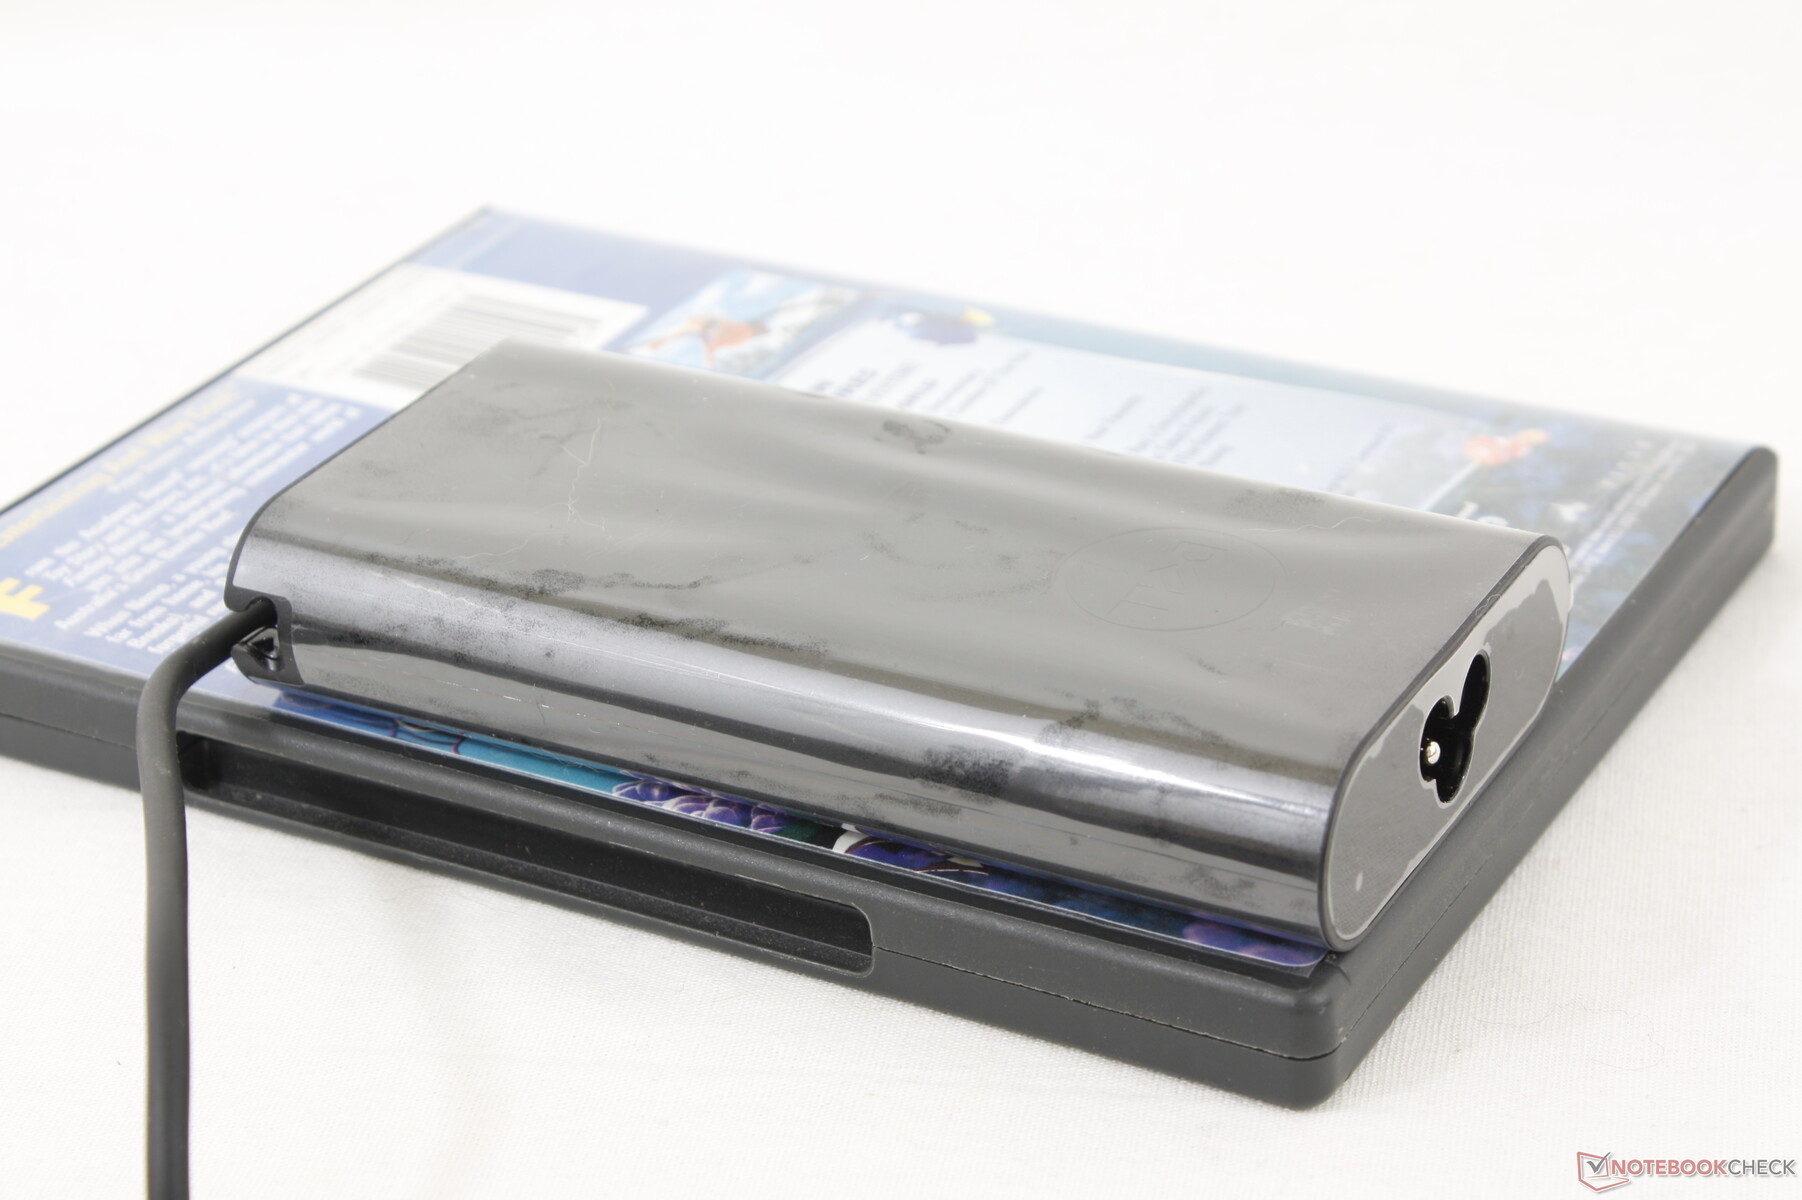
Somos capazes de registrar um consumo máximo de 55 W a partir do pequeno-médio (~13 x 6,5 x 2,3 cm) adaptador USB-C AC de 90 W. Esta leitura máxima é relativamente baixa quando comparada a muitas alternativas do Core i7, uma vez que nosso Core i5 tem um limite de Turbo Boost mais baixo. Note que o modelo vem com o mesmo adaptador AC encontrado em certos laptops XPS.
| desligado | |
| Ocioso | |
| Carga |
|
Key:
min: | |
| Dell Latitude 7230 Rugged Extreme i5-1240U, Iris Xe G7 80EUs, WD PC SN740 512GB SDDPMQD-512G-1101, IPS, 1920x1200, 12" | Dell Latitude 7330 Rugged Extreme i7-1185G7, Iris Xe G7 96EUs, , IPS, 1920x1080, 13.3" | Panasonic Toughbook 40 i7-1185G7, Iris Xe G7 96EUs, Samsung PM991 MZVLQ1T0HALB, IPS, 1920x1080, 14" | Getac B360 i7-10710U, UHD Graphics 620, Lite-On CA5-8D512, IPS, 1920x1080, 13.3" | Acer Enduro Urban N3 EUN314 i7-1165G7, Iris Xe G7 96EUs, Samsung PM991 MZVLQ1T0HALB, IPS, 1920x1080, 14" | Durabook S14I i7-1165G7, Iris Xe G7 96EUs, UDinfo M2P M2P80DE512GBAEP, TN, 1920x1080, 14" | |
|---|---|---|---|---|---|---|
| Power Consumption | -9% | -15% | -5% | 25% | -25% | |
| Idle Minimum * (Watt) | 6.5 | 4.1 37% | 4.9 25% | 5.4 17% | 3.8 42% | 6.8 -5% |
| Idle Average * (Watt) | 8.9 | 11.7 -31% | 12.3 -38% | 12.2 -37% | 8 10% | 16.4 -84% |
| Idle Maximum * (Watt) | 14.3 | 11.8 17% | 14 2% | 12.6 12% | 8.7 39% | 16.9 -18% |
| Load Average * (Watt) | 44.9 | 48.5 -8% | 54 -20% | 39.1 13% | 34.6 23% | 39.2 13% |
| Witcher 3 ultra * (Watt) | 43.2 | 44.3 -3% | 46.3 -7% | 36.5 16% | 35.4 18% | |
| Load Maximum * (Watt) | 54.8 | 91 -66% | 83.6 -53% | 81.8 -49% | 45.4 17% | 73.1 -33% |
* ... menor é melhor
Power Consumption Witcher 3 / Stresstest
Power Consumption external Monitor
Vida útil da bateria - 3,5 horas sob uso extremo
São suportadas até duas baterias removíveis. O tempo de funcionamento da WLAN é de quase 13 horas quando ambas as baterias (36 Wh x2) são instaladas. Por outro lado, o funcionamento com cargas exigentes no nível máximo de brilho deve durar cerca de 3,5 horas.
Carregar ambas as baterias de vazias para cheias é infelizmente bastante lento em 4 a 5 horas, comparado a 1,5 a 2 horas na maioria dos Ultrabooks.
| Dell Latitude 7230 Rugged Extreme i5-1240U, Iris Xe G7 80EUs, 72 Wh | Dell Latitude 7330 Rugged Extreme i7-1185G7, Iris Xe G7 96EUs, 107 Wh | Panasonic Toughbook 40 i7-1185G7, Iris Xe G7 96EUs, 136 Wh | Getac B360 i7-10710U, UHD Graphics 620, 46 Wh | Acer Enduro Urban N3 EUN314 i7-1165G7, Iris Xe G7 96EUs, 50.3 Wh | Durabook S14I i7-1165G7, Iris Xe G7 96EUs, 50 Wh | |
|---|---|---|---|---|---|---|
| Duração da bateria | 38% | 46% | -38% | -51% | -58% | |
| WiFi v1.3 (h) | 13 | 18 38% | 19 46% | 8.1 -38% | 6.4 -51% | 5.5 -58% |
| Load (h) | 3.6 |
Pro
Contra
Veredicto - Sobretudo um Home Run
As características distintivas do Latitude 7230 Rugged Extreme são sua total cobertura sRGB, desempenho rápido da CPU e baixo peso em relação a outros tablets robustos. A maioria das alternativas tem cores mais pobres e biséis mais grossos em comparação.
Gostaríamos de ver melhorias nas tampas das portas e botões frontais que são muito escorregadios e pequenos, respectivamente. Estes se tornam ainda mais difíceis de manusear se por acaso você estiver usando luvas.
A excelente duração da bateria, o display super brilhante e a cobertura completa de sRGB do Latitude 7230 Rugged Extreme definem o padrão para futuros comprimidos robustos.
Os potenciais compradores vão querer ter em mente que o Core i5-1240U mais barato tem um desempenho semelhante ao Core i7-1260U quando se trata de desempenho da CPU. Assim, os usuários só devem selecionar este último se o desempenho gráfico mais rápido for necessário. Espere que o ruído do ventilador seja mais alto do que o normal se você planeja executar tarefas mais exigentes no modelo.
Preço e Disponibilidade
A Dell está agora enviando o Latitude 7230 Rugged Extreme a partir de $2700 USD para a configuração base até mais de $5000 se totalmente configurado. Nossa unidade de revisão de varejo por cerca de US$3200.
Dell Latitude 7230 Rugged Extreme
- 04/07/2023 v7 (old)
Allen Ngo
Transparência
A seleção dos dispositivos a serem analisados é feita pela nossa equipe editorial. A amostra de teste foi fornecida ao autor como empréstimo pelo fabricante ou varejista para fins desta revisão. O credor não teve influência nesta revisão, nem o fabricante recebeu uma cópia desta revisão antes da publicação. Não houve obrigação de publicar esta revisão. Como empresa de mídia independente, a Notebookcheck não está sujeita à autoridade de fabricantes, varejistas ou editores.
É assim que o Notebookcheck está testando
Todos os anos, o Notebookcheck analisa de forma independente centenas de laptops e smartphones usando procedimentos padronizados para garantir que todos os resultados sejam comparáveis. Desenvolvemos continuamente nossos métodos de teste há cerca de 20 anos e definimos padrões da indústria no processo. Em nossos laboratórios de teste, equipamentos de medição de alta qualidade são utilizados por técnicos e editores experientes. Esses testes envolvem um processo de validação em vários estágios. Nosso complexo sistema de classificação é baseado em centenas de medições e benchmarks bem fundamentados, o que mantém a objetividade.Price comparison

