Dell Latitude 7330 Rugged Extreme review: Um dos melhores laptops robustos de 13 polegadas
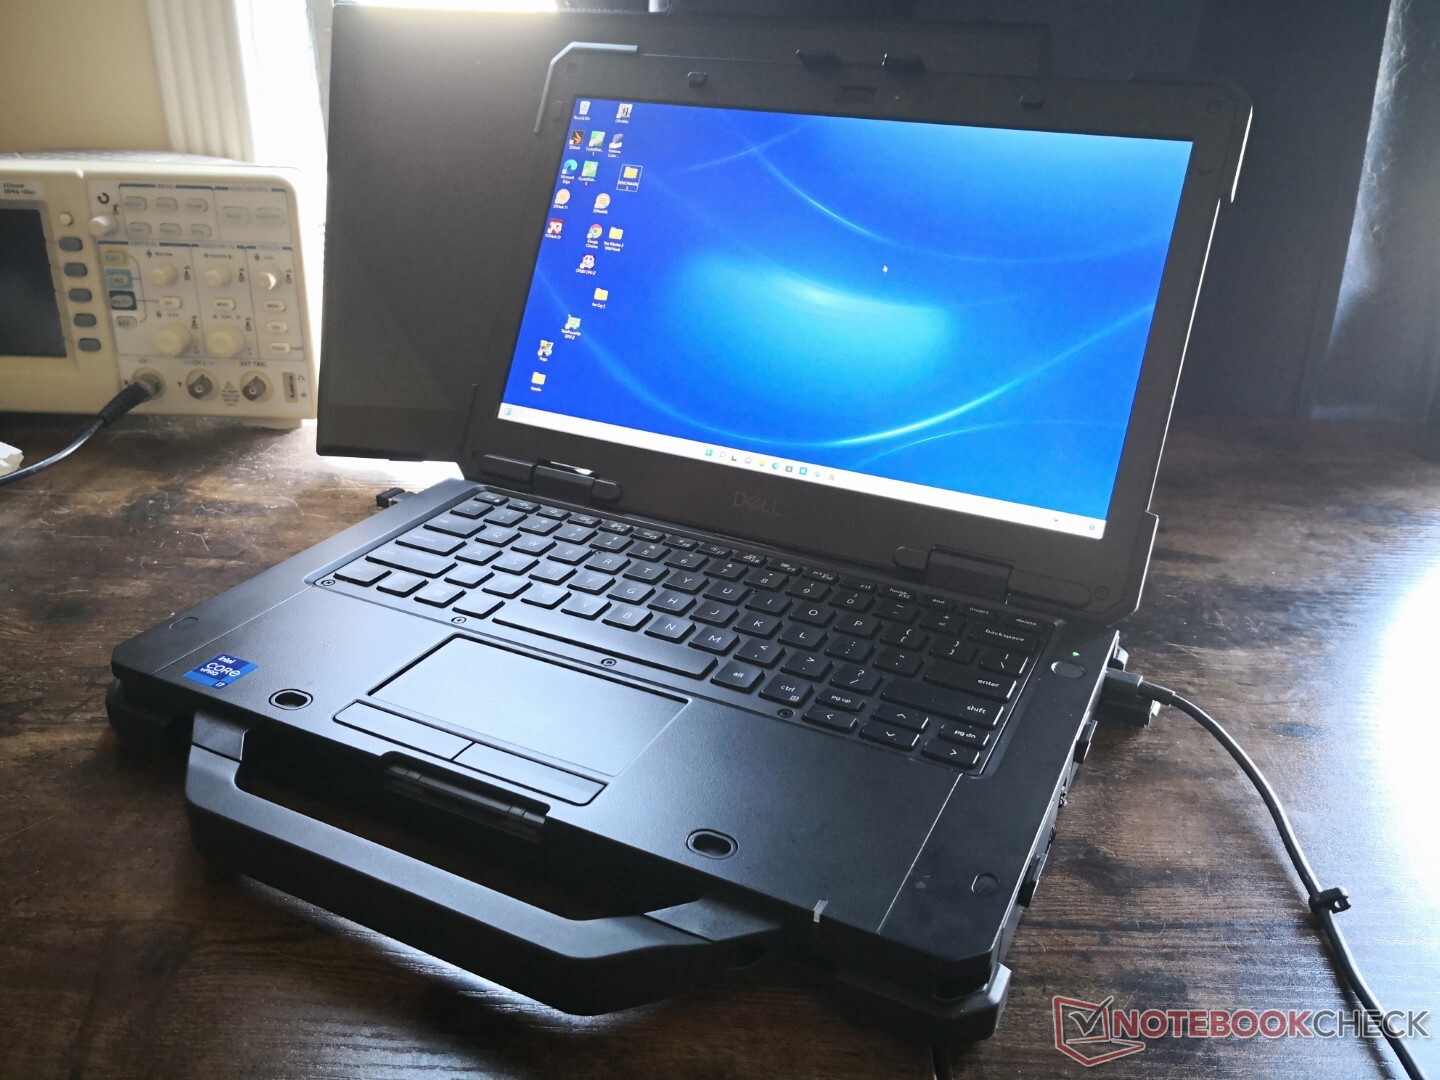
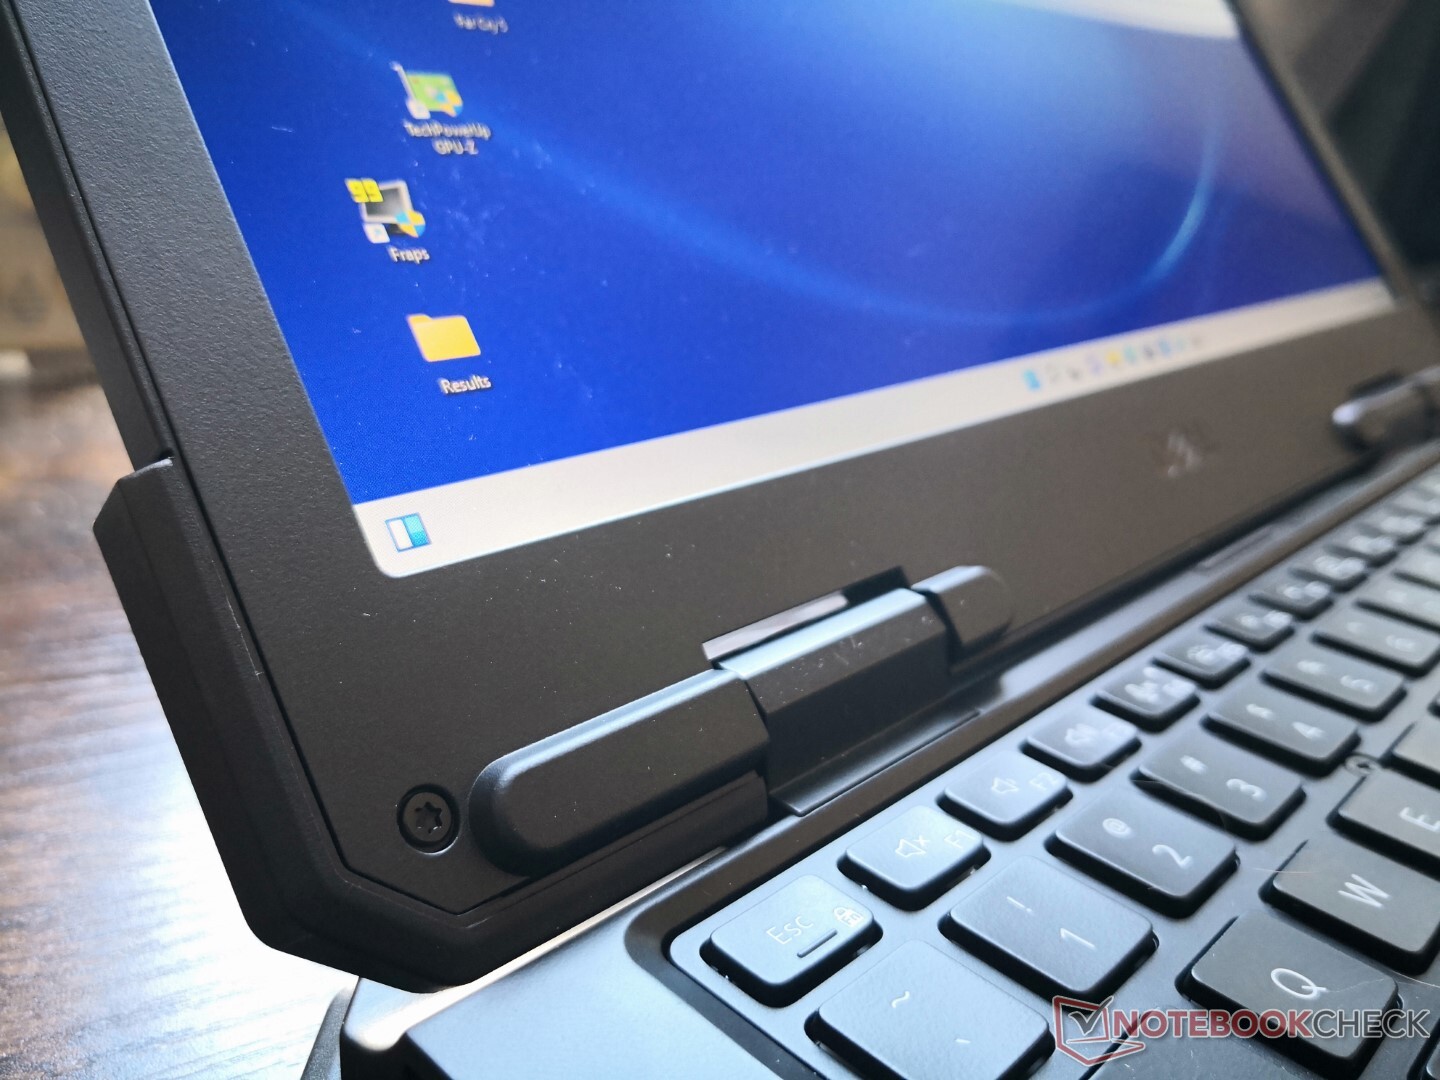
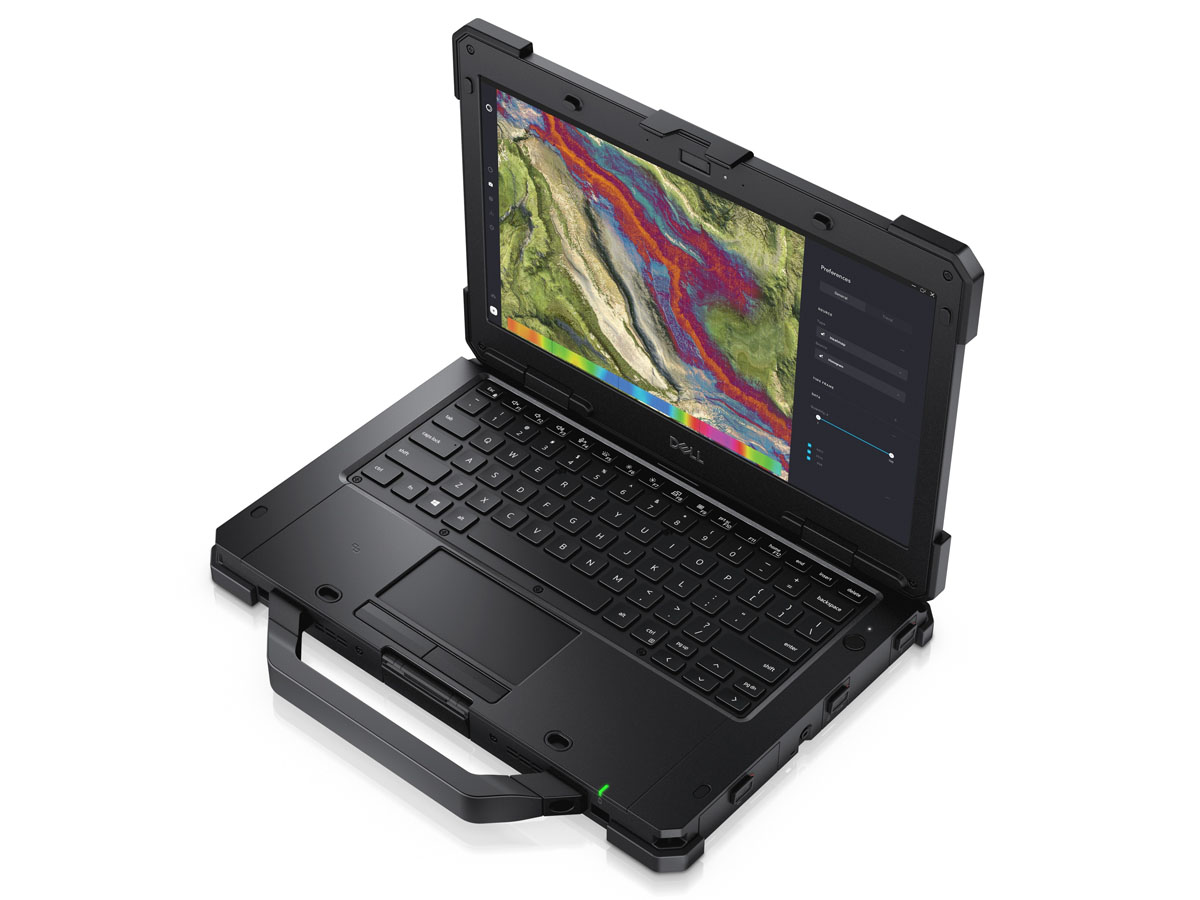
O Latitude 7330 Rugged Extreme é um dos poucos - se não apenas - portáteis robustos de 13,3 polegadas da Dell. Ele toma muito emprestado dos modelos robustos existentes de 14 e 15 polegadas Latitude, mas para um formato menor e mais compacto de 13 polegadas.
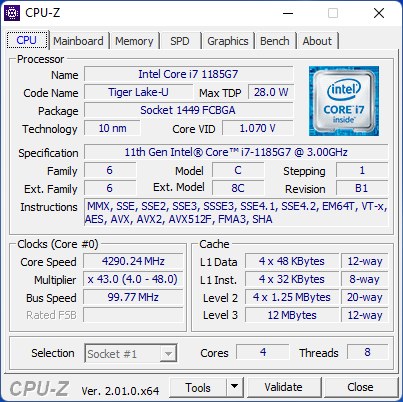
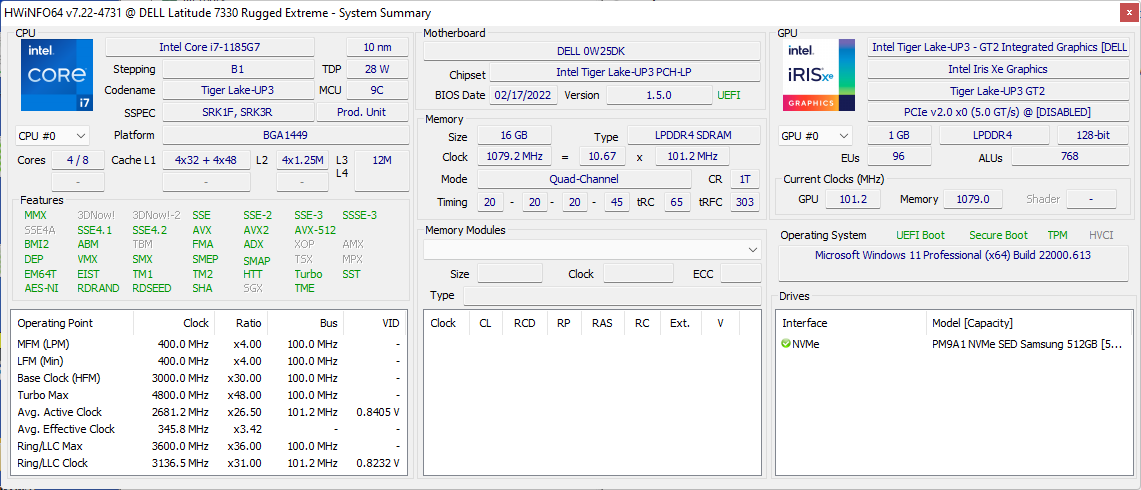
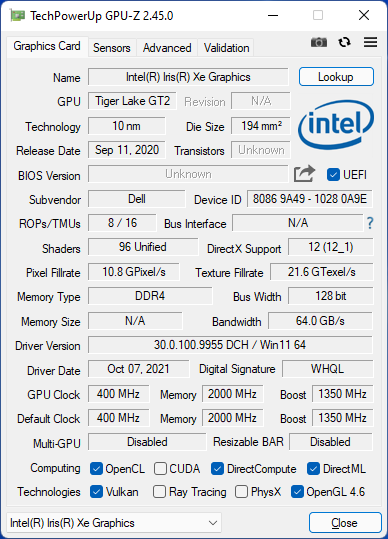
Como na maioria dos outros portáteis robustos, o Latitude 7330 Rugged Extreme está disponível em uma grande variedade de configurações, conforme detalhado na página do produto aqui. Nossa unidade específica vem com a CPU Core i7-1185G7 vPro, 16 GB LPDDR4x-4266 RAM e 512 GB Samsung PM9A1 NVMe SSD por cerca de $5300 USD. Todas as SKUs vêm com CPUs Intel série U da 11ª geração e o mesmo painel IPS de 1400-nit 1080p no momento.
Os concorrentes diretos incluem outros laptops robustos de 13,3 polegadas, como o Getac B360 ou alternativas de 14 polegadas como oDurabook S14I ouPanasonic Toughbook FZ-55 MK2.
Mais análises da Dell:
Possíveis concorrentes em comparação
Avaliação | Data | Modelo | Peso | Altura | Size | Resolução | Preço |
|---|---|---|---|---|---|---|---|
v (old) | 05/2022 | Dell Latitude 7330 Rugged Extreme i7-1185G7, Iris Xe G7 96EUs | 2.7 kg | 36.5 mm | 13.30" | 1920x1080 | |
| 84.3 % v6 (old) | 03/2019 | Dell Latitude 7424 Rugged Extreme i7-8650U, Radeon RX 540 | 3.5 kg | 59.3 mm | 14.00" | 1920x1080 | |
| 89.2 % v6 (old) | Dell Latitude 5420 Rugged-P85G i7-8650U, Radeon RX 540 | 2.8 kg | 32.9 mm | 14.00" | 1920x1080 | ||
| 82.4 % v7 (old) | 12/2021 | Acer Enduro Urban N3 EUN314 i7-1165G7, Iris Xe G7 96EUs | 1.8 kg | 21.95 mm | 14.00" | 1920x1080 | |
| 83.9 % v7 (old) | 09/2021 | Panasonic Toughbook FZ-55 MK2 i7-1185G7, Iris Xe G7 96EUs | 2.3 kg | 33 mm | 14.00" | 1920x1080 | |
v (old) | 04/2021 | Durabook S14I i7-1165G7, Iris Xe G7 96EUs | 3 kg | 38.1 mm | 14.00" | 1920x1080 |
Caso
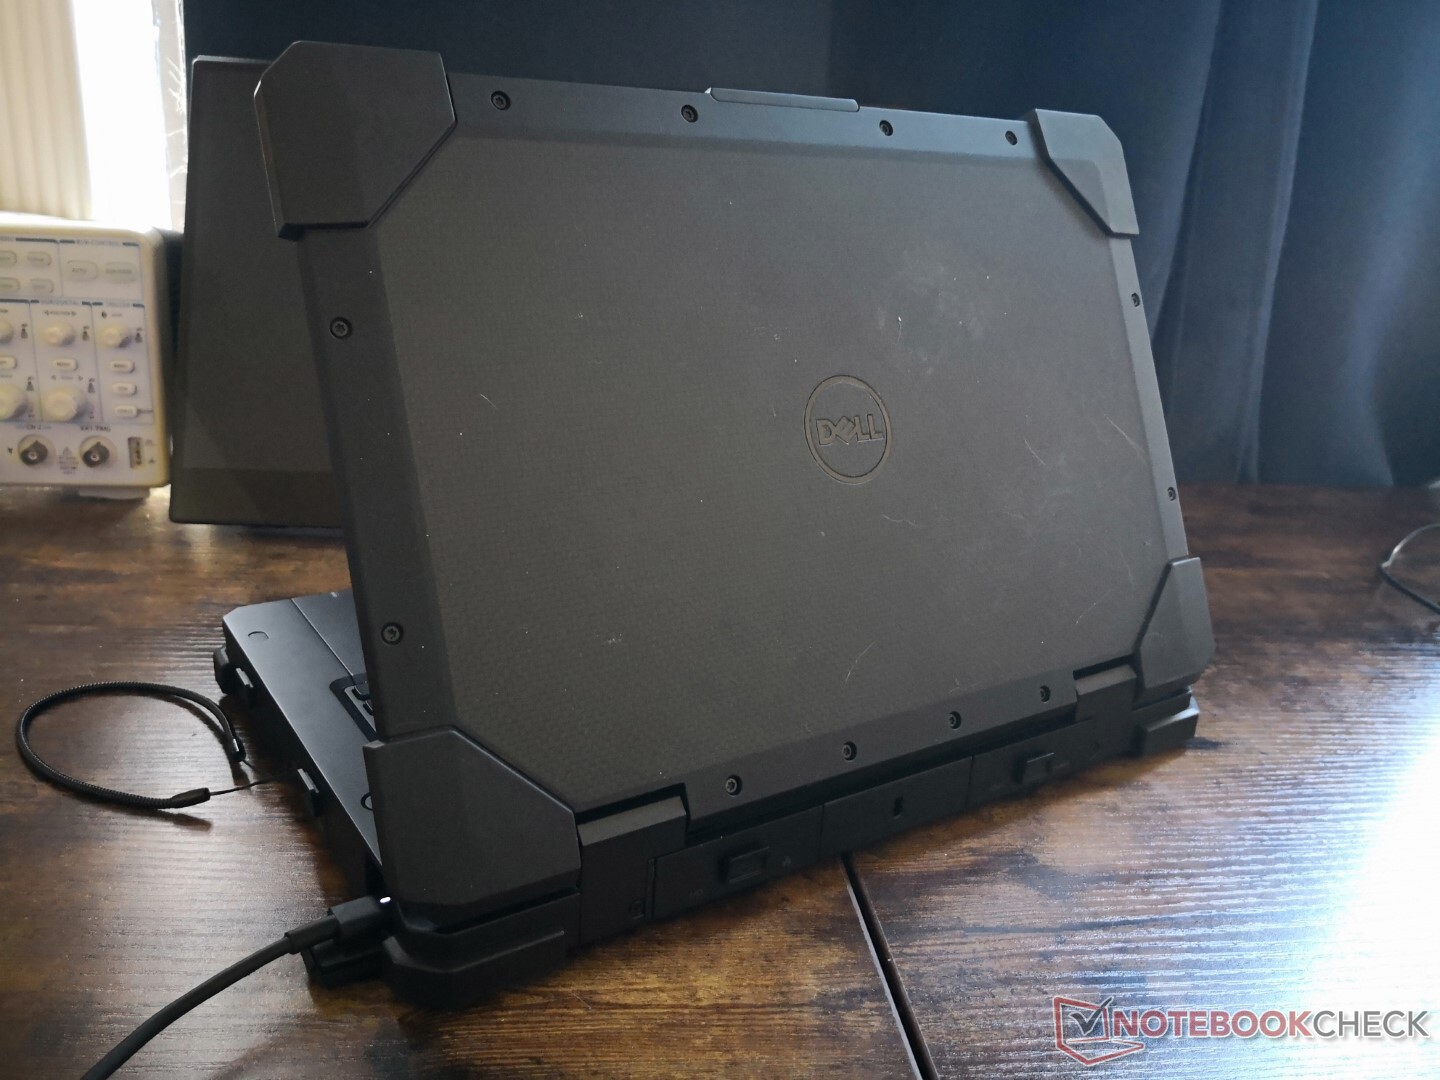
Em termos de tamanho e peso, o modelo Dell é visivelmente menor que o Getac B360 de 14 polegadas ou o Panasonic Toughbook FZ-55 MK2 e ainda assim é mais pesado que qualquer um dos modelos. A densidade absoluta do modelo Latitude 7330 Rugged Extreme não deve ser subestimada.
Conectividade
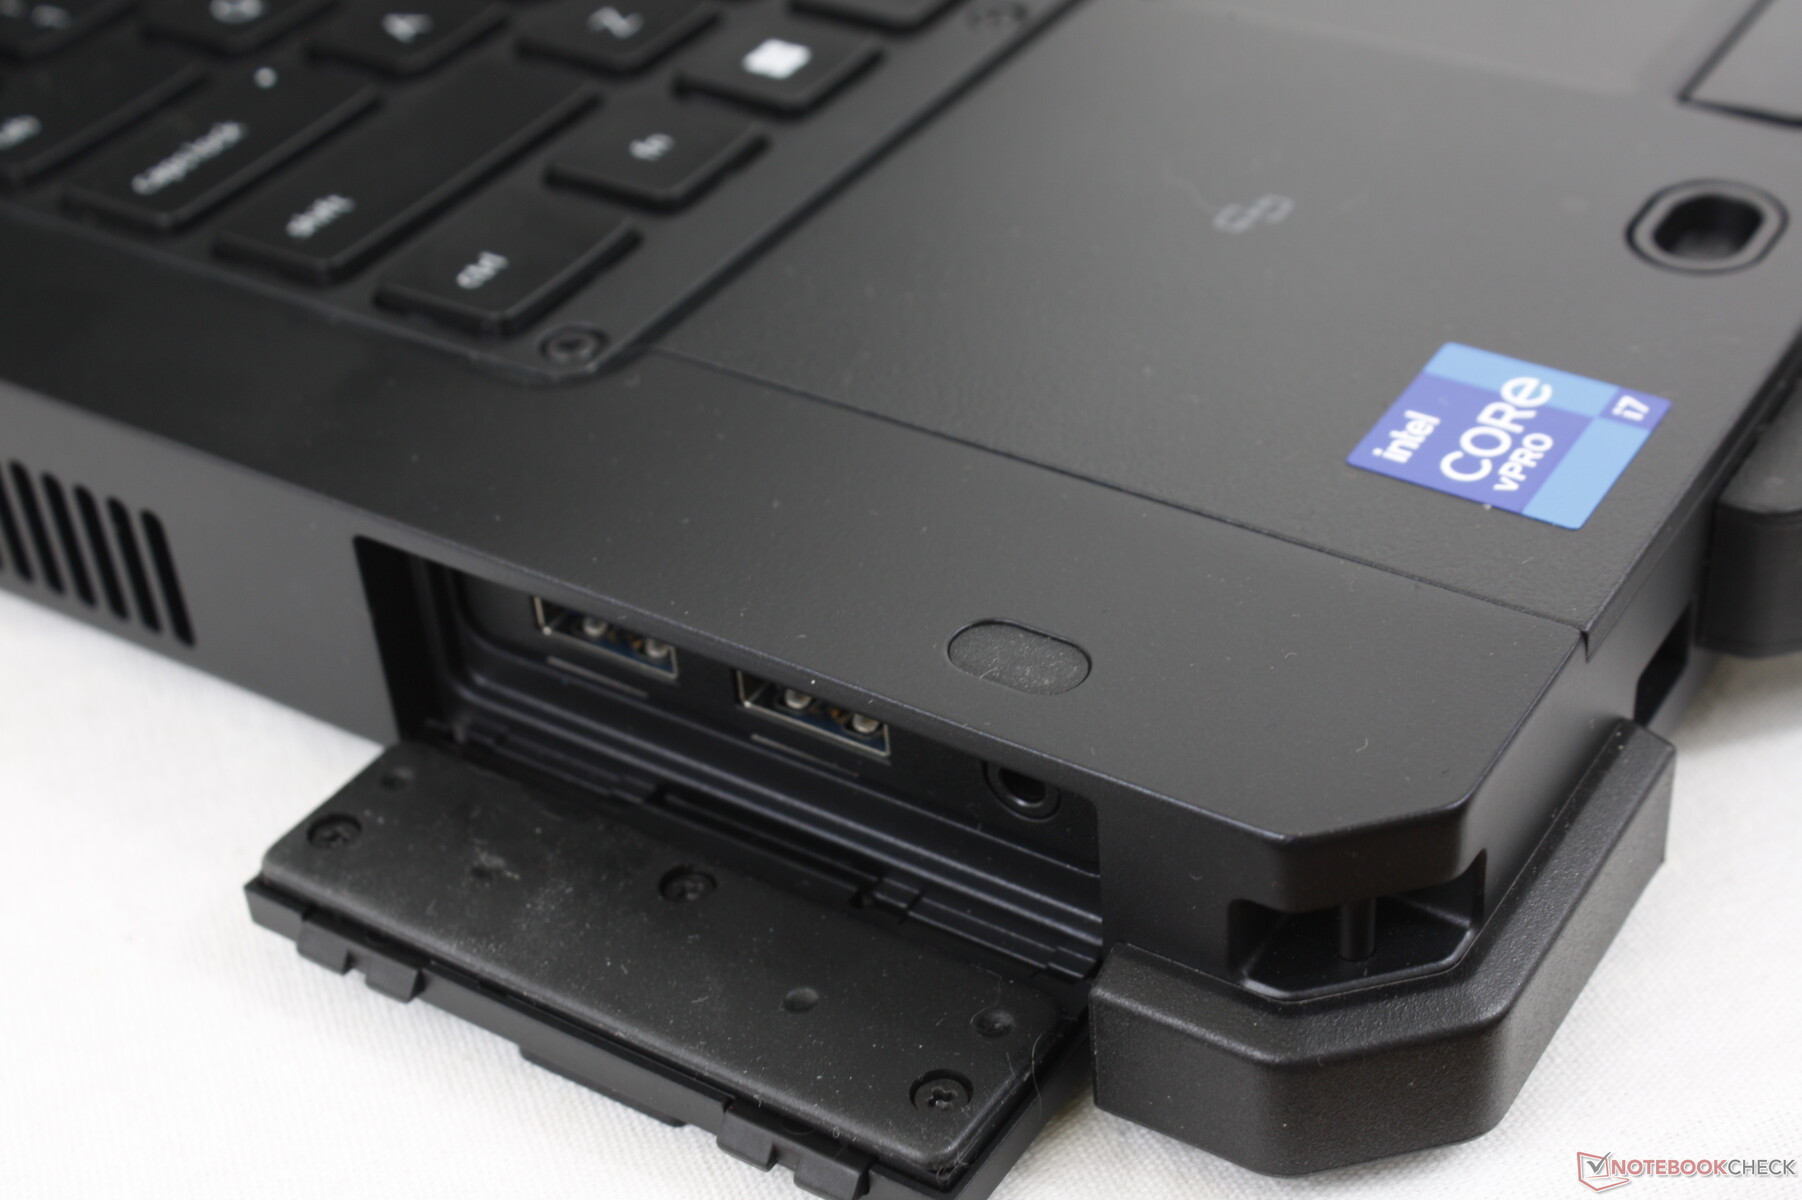
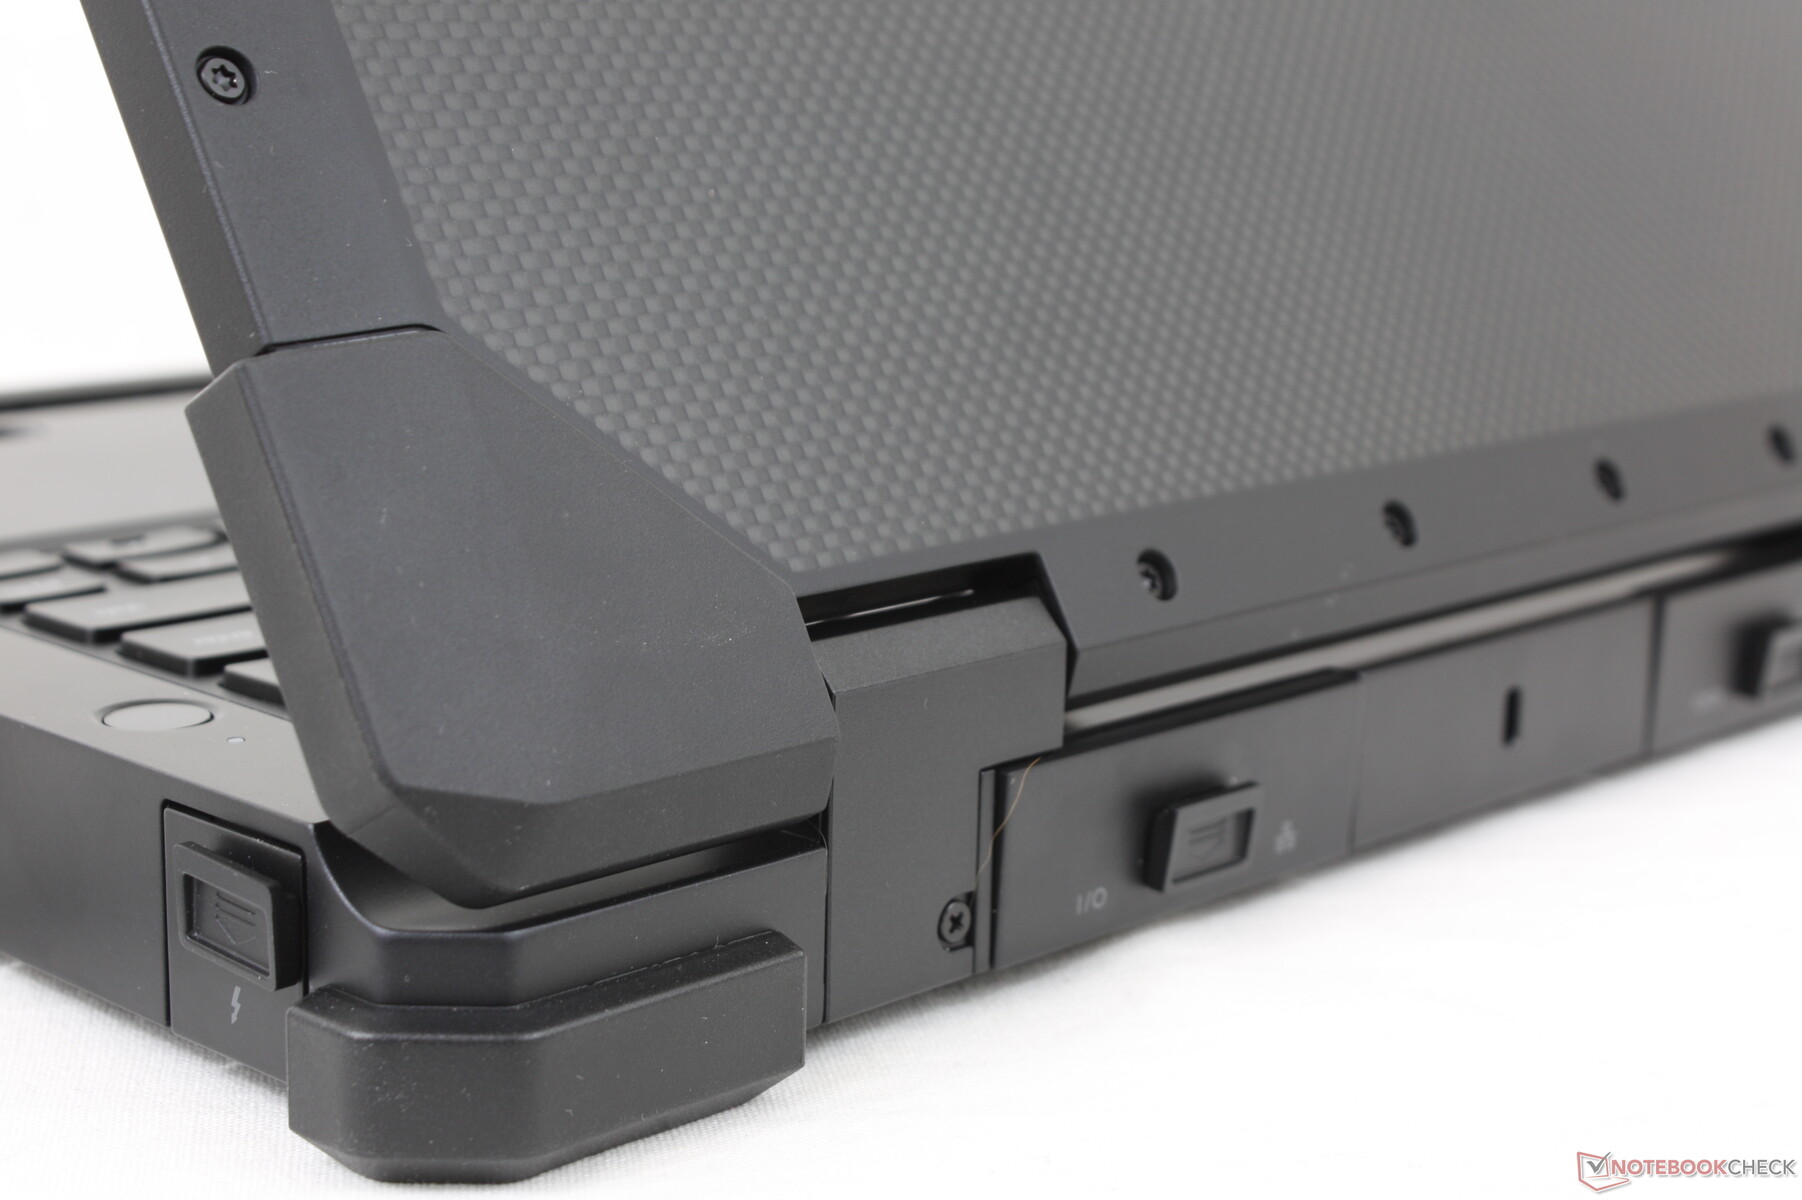
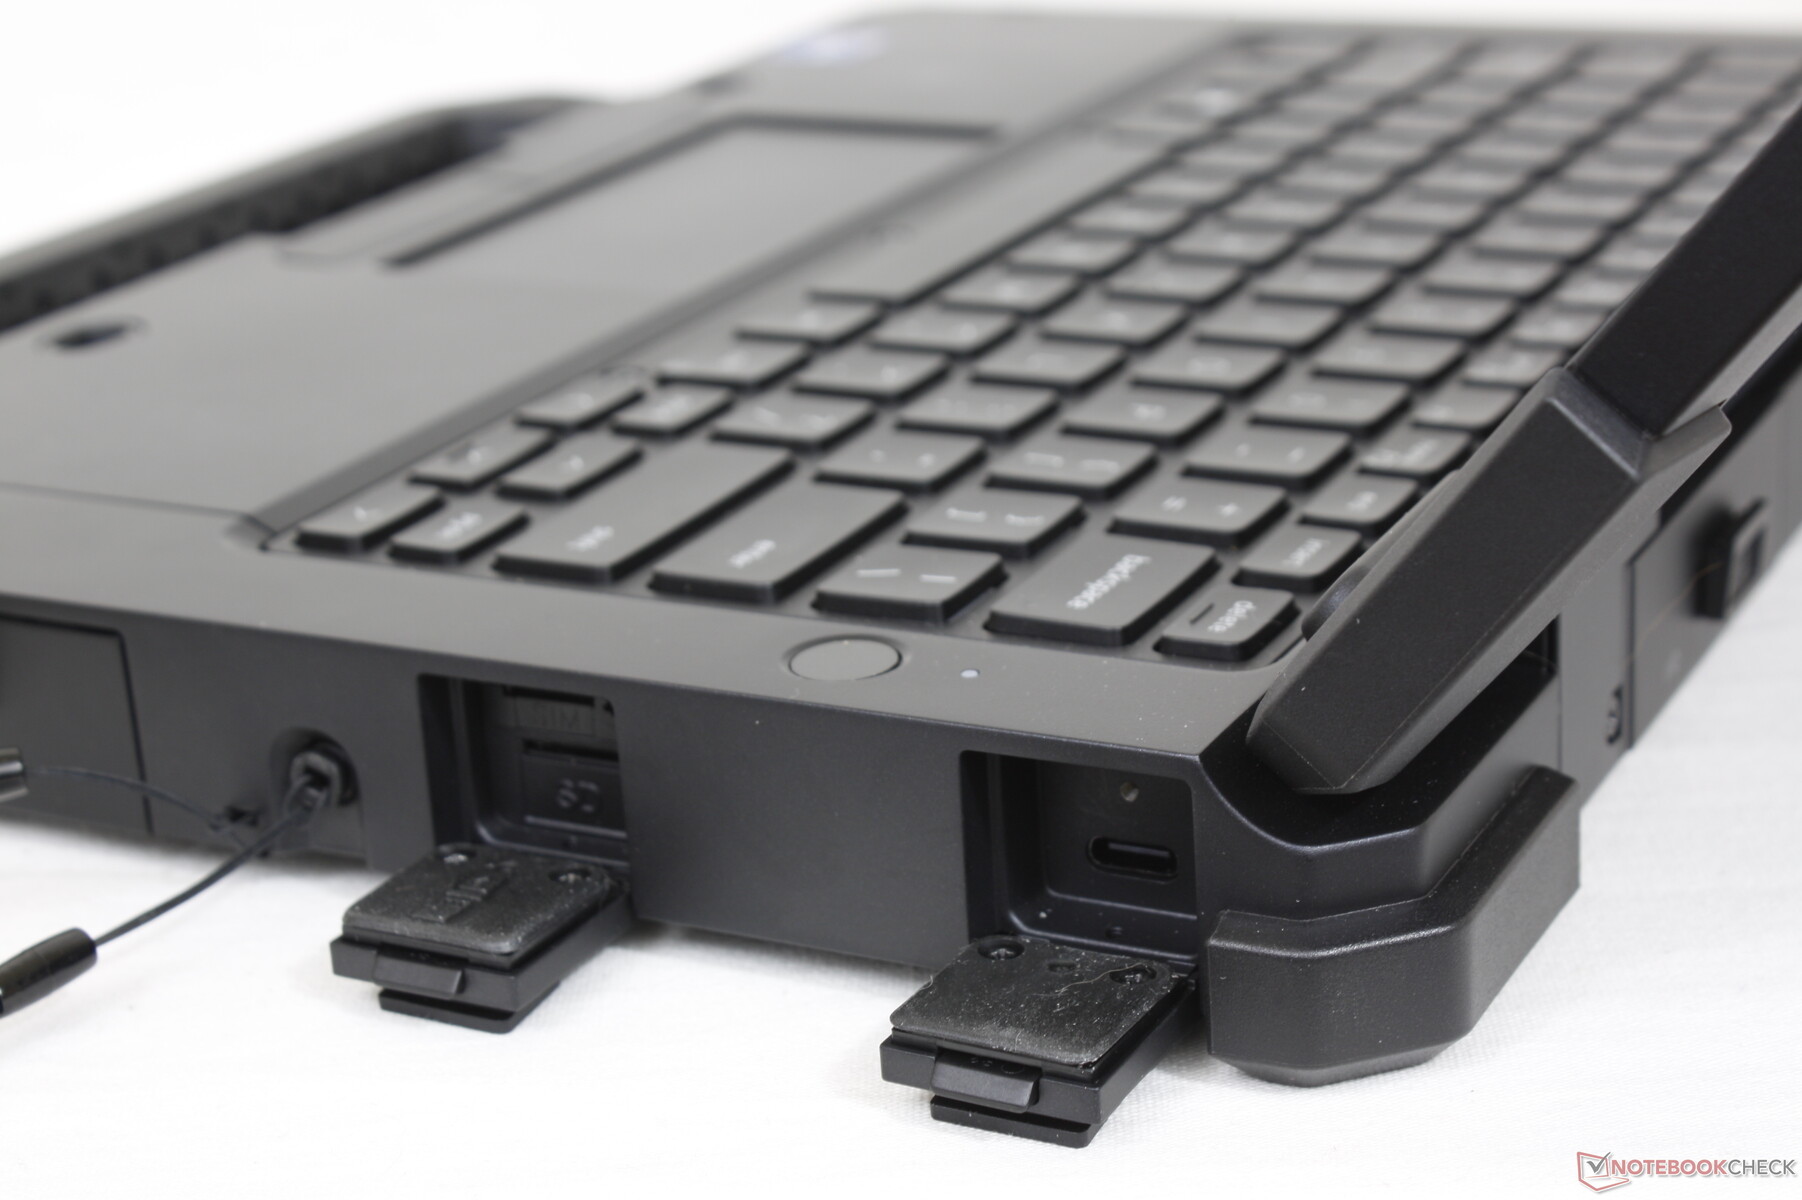
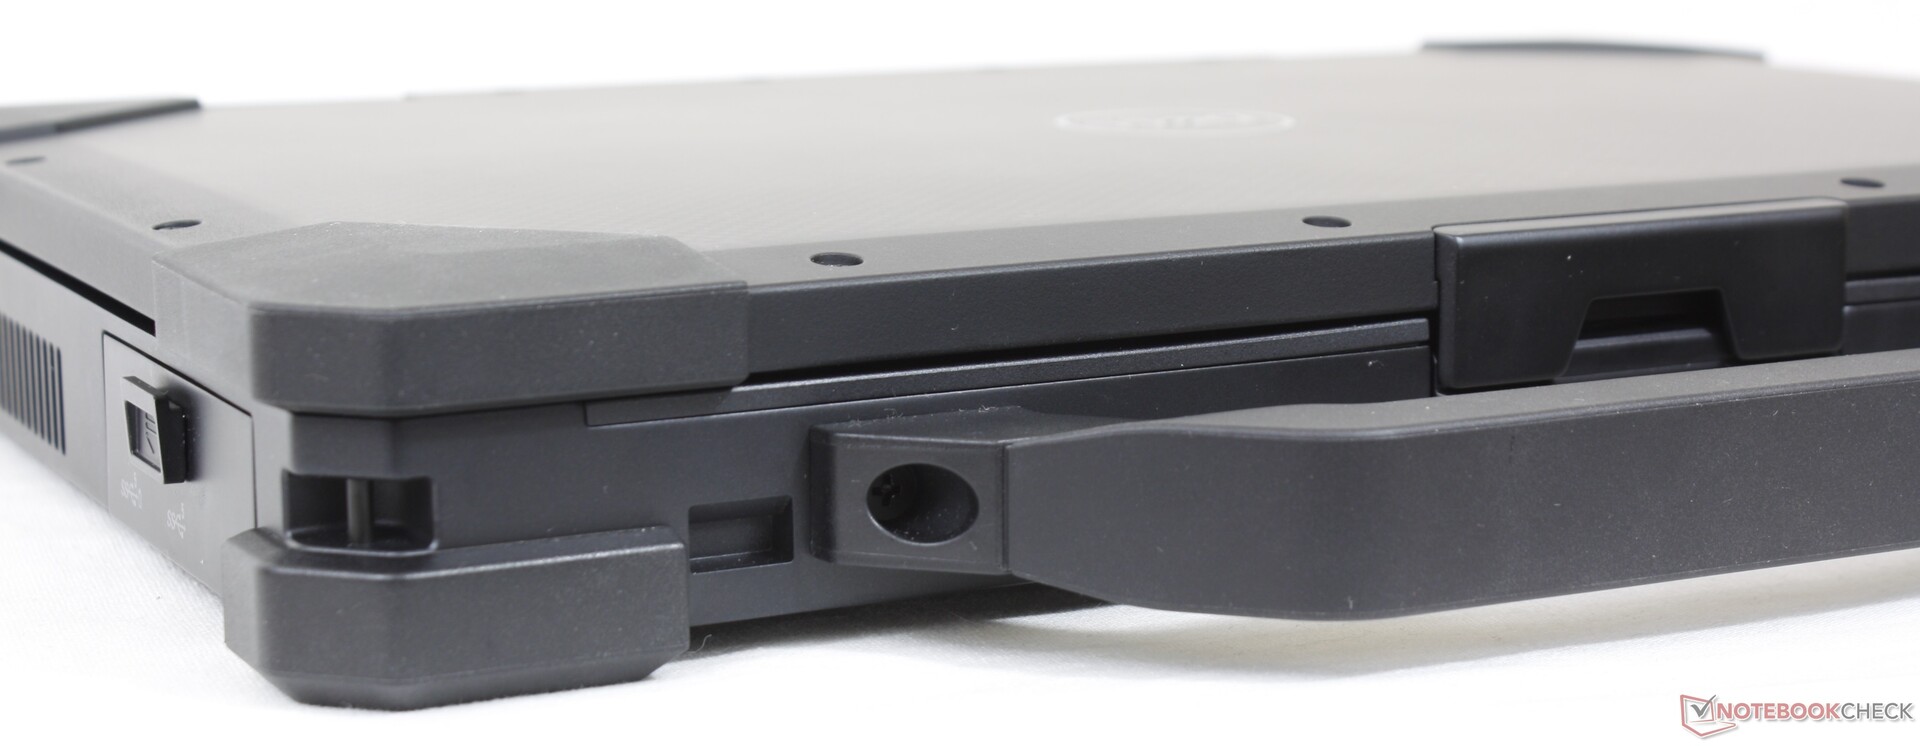
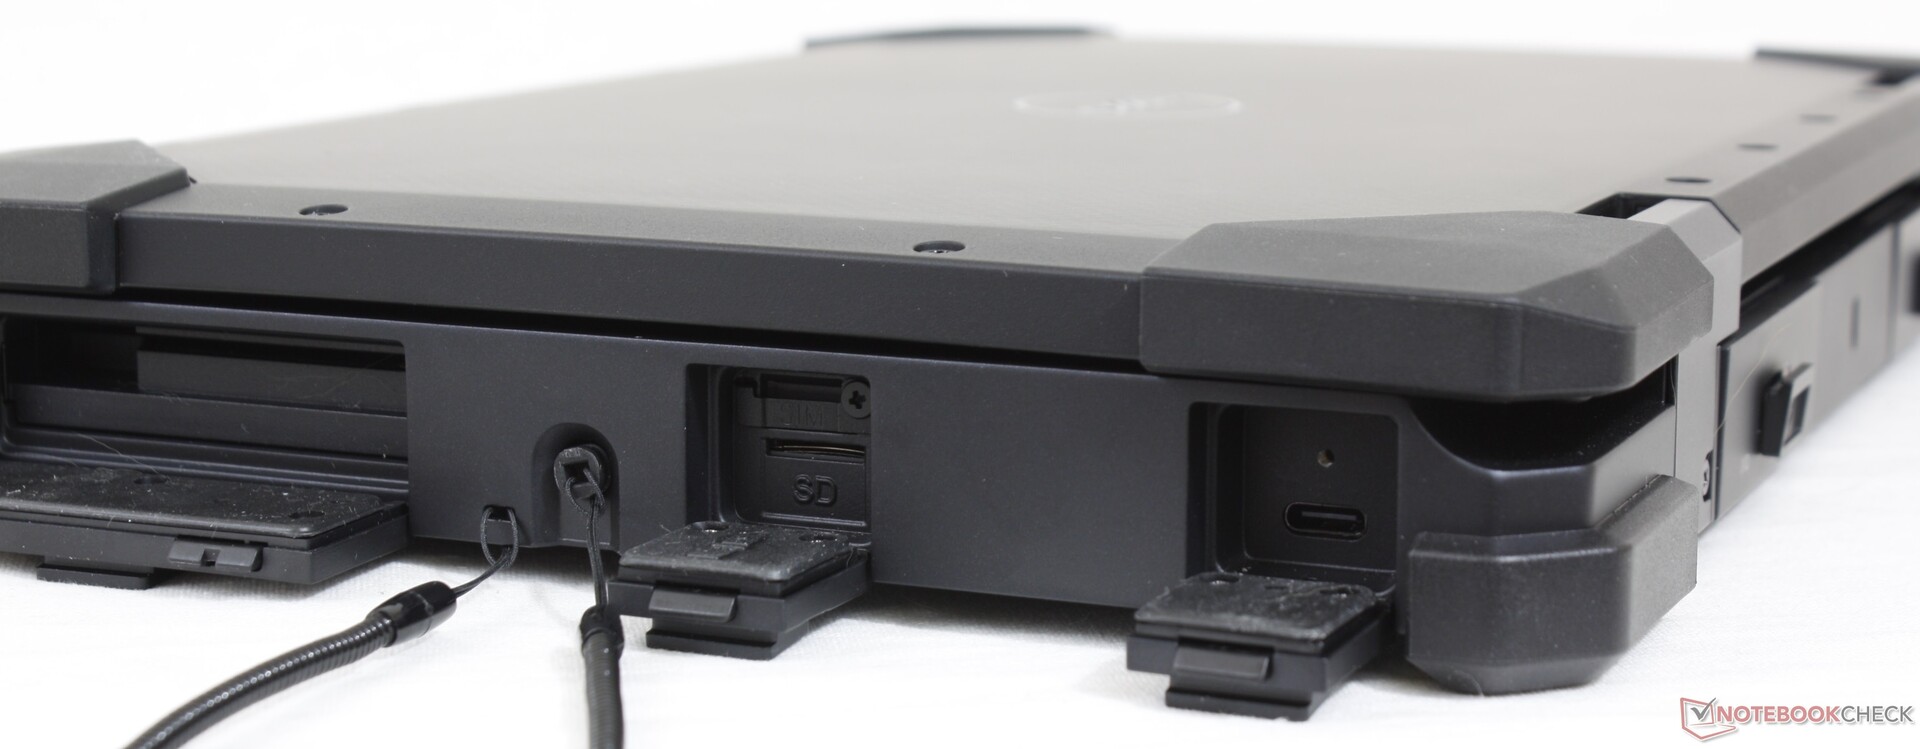
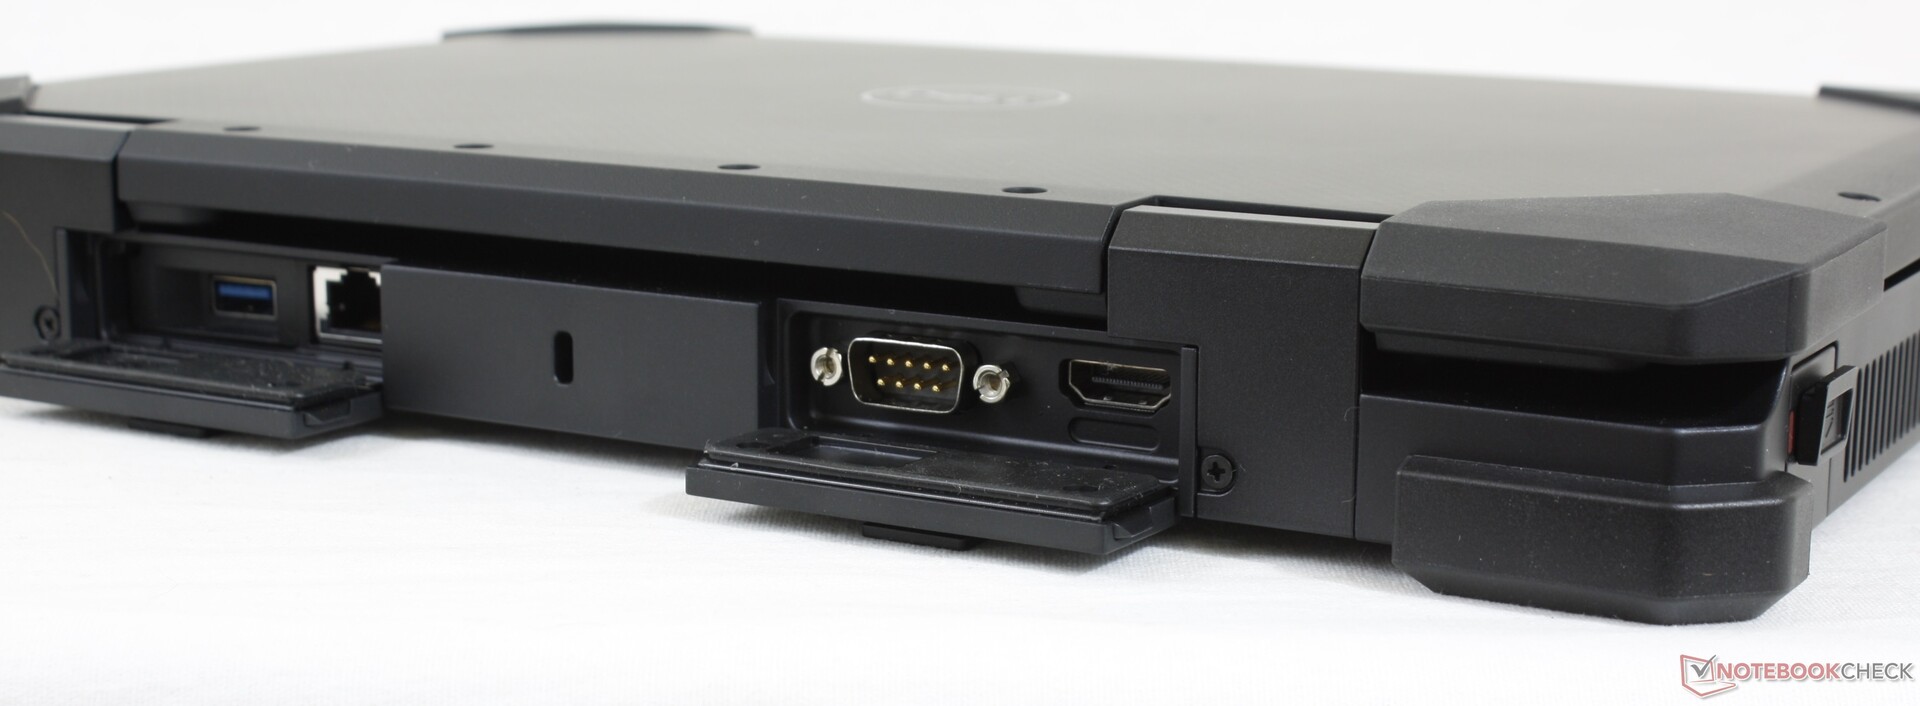
As opções de portas são abundantes com muitas que são opcionais, incluindo os leitores de Smart Card e Express Card. Ao contrário do Getac B360, no entanto, não há porta VGA, leitor de DVD ou caddy do compartimento de armazenamento.
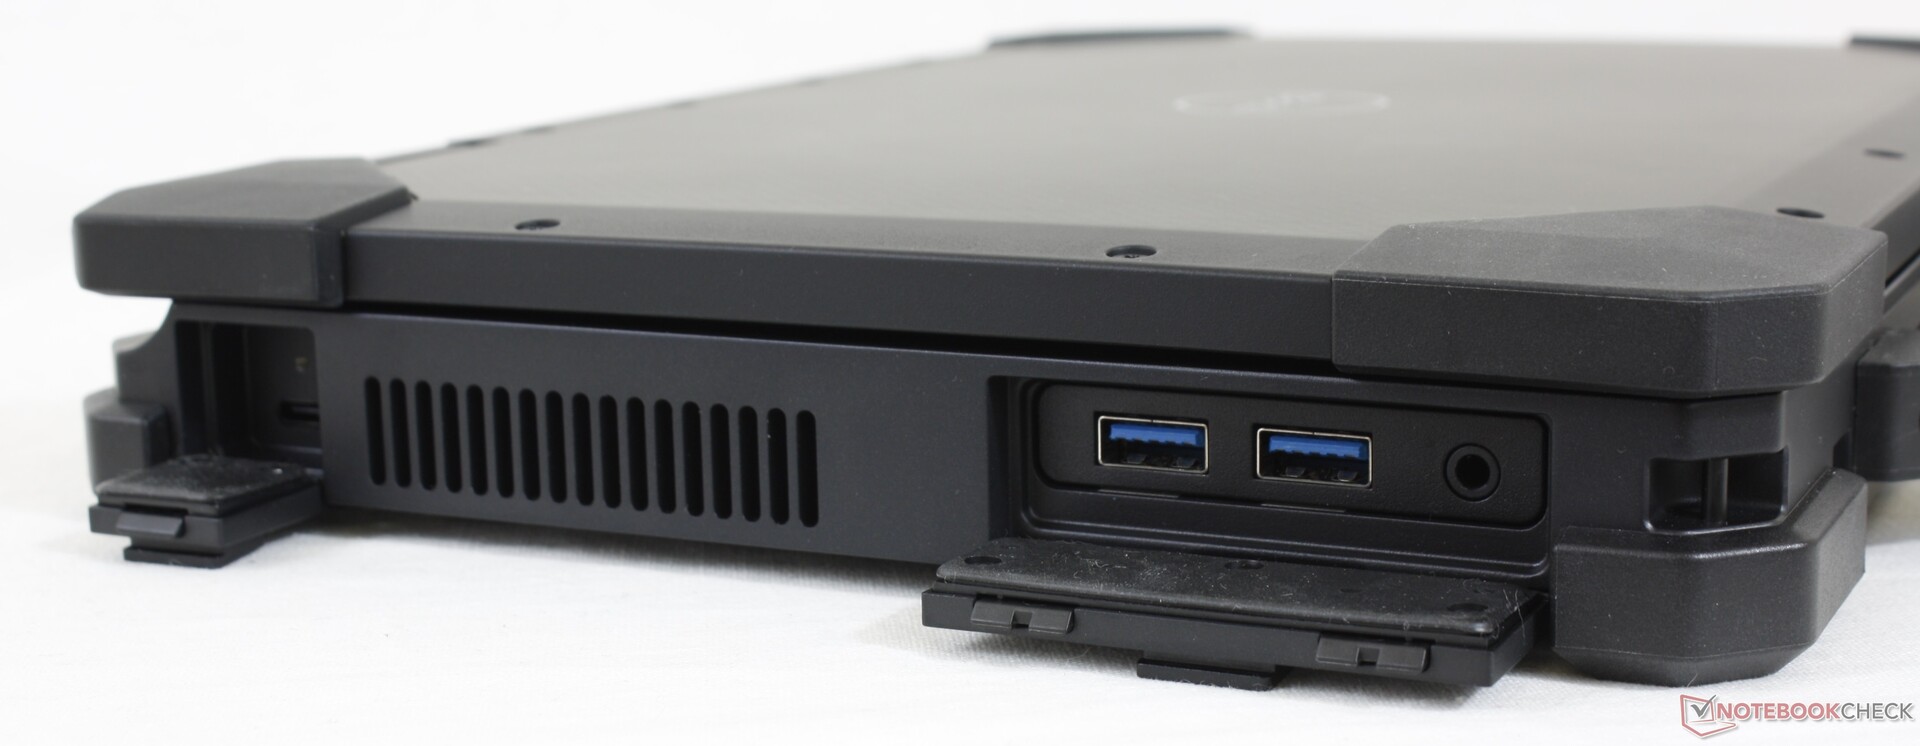
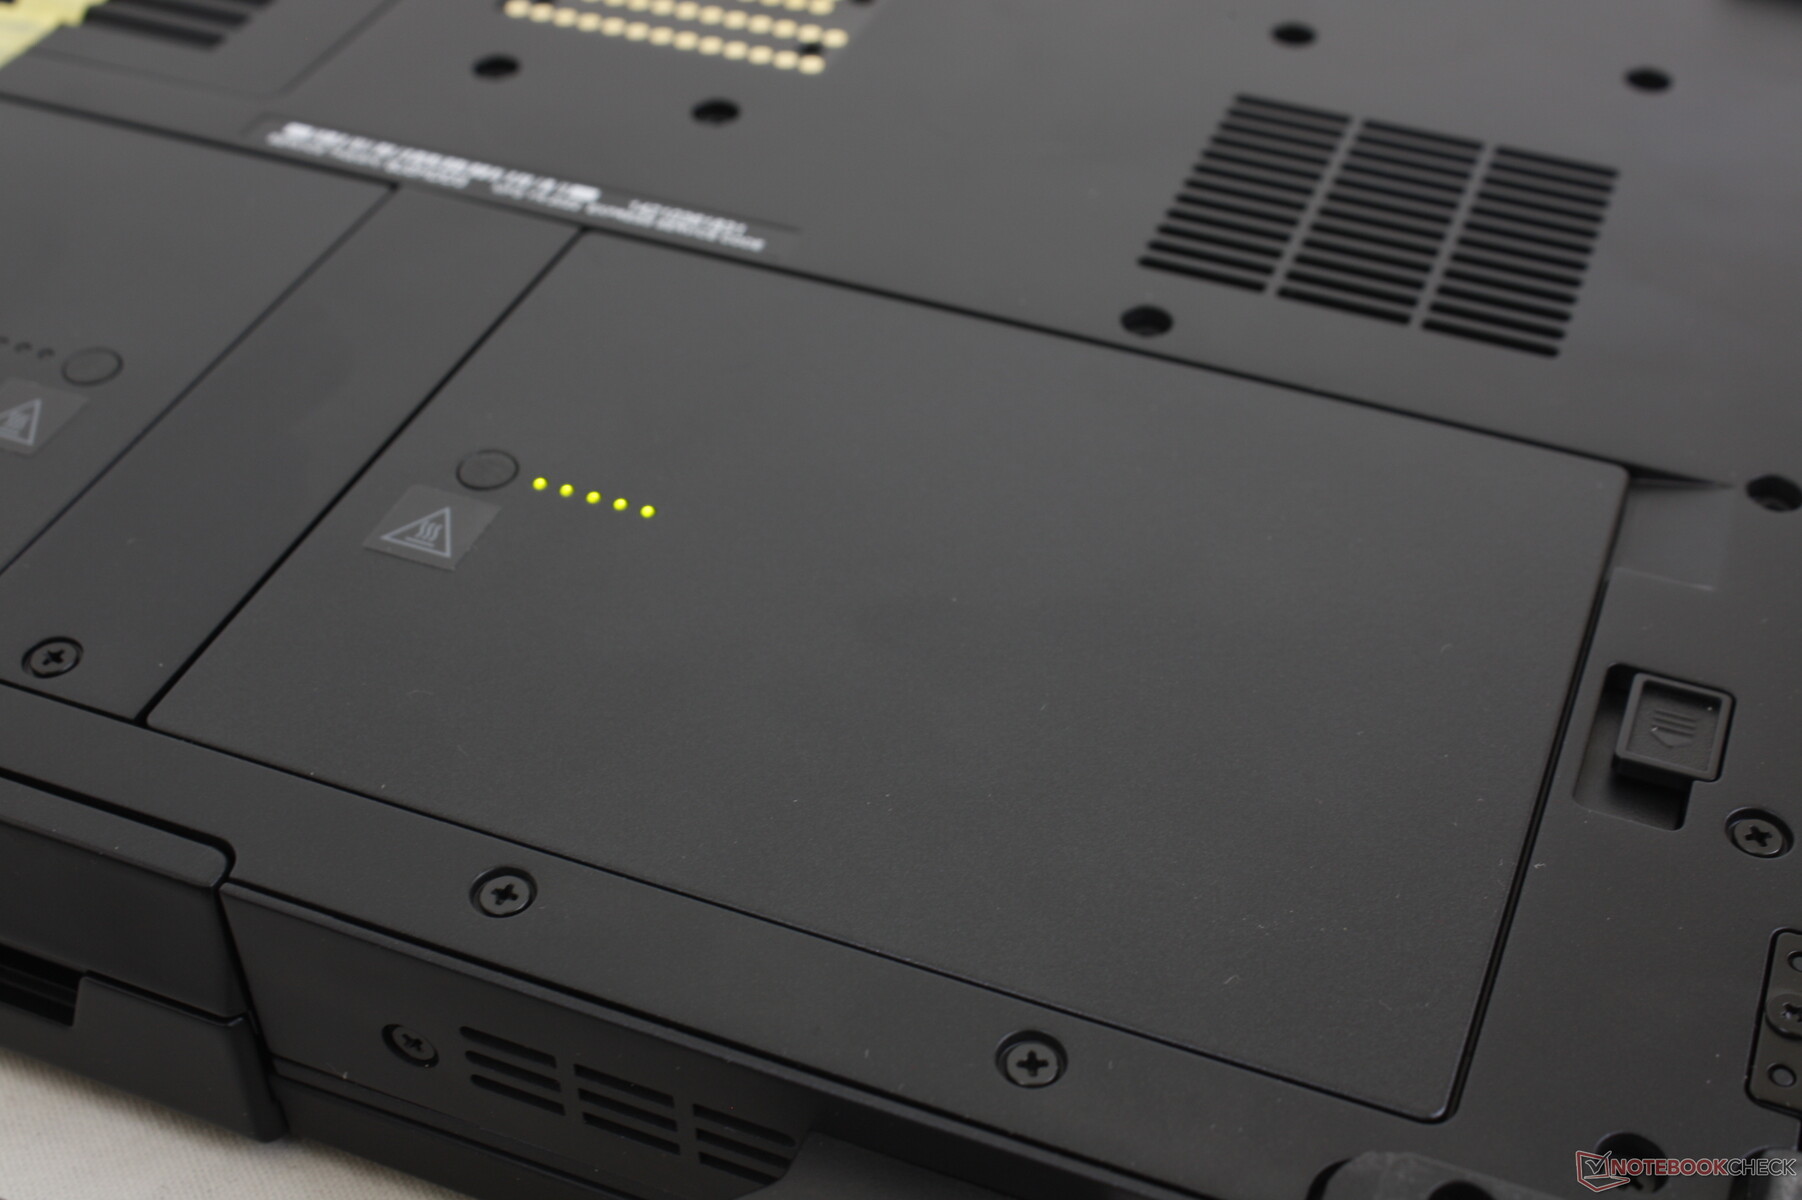
Leitor de cartões SD
As taxas de transferência do leitor MicroSD com mola integrada são significativamente mais rápidas do que na maioria dos outros dispositivos robustos. Tenha em mente que o cartão MicroSD deve ser inserido na unidade de cabeça para baixo.
O acesso ao leitor pode ser especialmente difícil para usuários com mãos maiores, uma vez que ele está encastrado atrás de uma tampa grossa ao longo da borda direita.
| SD Card Reader | |
| average JPG Copy Test (av. of 3 runs) | |
| Dell Latitude 5420 Rugged-P85G (Toshiba Exceria Pro SDXC 64 GB UHS-II) | |
| Dell Latitude 7424 Rugged Extreme (Toshiba Exceria Pro SDXC 64 GB UHS-II) | |
| Dell Latitude 7330 Rugged Extreme (AV Pro V60) | |
| Fujitsu LifeBook U7310 (Toshiba Exceria Pro SDXC 64 GB UHS-II) | |
| Lenovo ThinkPad P15s Gen1-20T4000JGE (Toshiba Exceria Pro M501 64 GB UHS-II) | |
| Panasonic Toughbook FZ-55 MK2 (AV Pro V60) | |
| Acer Enduro Urban N3 EUN314 (AV Pro V60) | |
| Durabook S14I (Angelbird 128GB AV Pro UHS-II) | |
| maximum AS SSD Seq Read Test (1GB) | |
| Dell Latitude 5420 Rugged-P85G (Toshiba Exceria Pro SDXC 64 GB UHS-II) | |
| Dell Latitude 7424 Rugged Extreme (Toshiba Exceria Pro SDXC 64 GB UHS-II) | |
| Dell Latitude 7330 Rugged Extreme (AV Pro V60) | |
| Panasonic Toughbook FZ-55 MK2 (AV Pro V60) | |
| Fujitsu LifeBook U7310 (Toshiba Exceria Pro SDXC 64 GB UHS-II) | |
| Lenovo ThinkPad P15s Gen1-20T4000JGE (Toshiba Exceria Pro M501 64 GB UHS-II) | |
| Durabook S14I (Angelbird 128GB AV Pro UHS-II) | |
| Acer Enduro Urban N3 EUN314 (AV Pro V60) | |
Comunicação
O Intel AX210 é opcional para conectividade Wi-Fi 6. Os usuários também podem configurar com o Qualcomm SDX55 ou Snapdragon X20 para conectividade WAN.
| Networking | |
| iperf3 transmit AX12 | |
| Acer Enduro Urban N3 EUN314 | |
| Panasonic Toughbook FZ-55 MK2 | |
| Durabook S14I | |
| Dell Latitude 7330 Rugged Extreme | |
| Dell Latitude 7424 Rugged Extreme | |
| Dell Latitude 5420 Rugged-P85G | |
| iperf3 receive AX12 | |
| Durabook S14I | |
| Acer Enduro Urban N3 EUN314 | |
| Panasonic Toughbook FZ-55 MK2 | |
| Dell Latitude 7330 Rugged Extreme | |
| Dell Latitude 5420 Rugged-P85G | |
| Dell Latitude 7424 Rugged Extreme | |
Webcam
Uma webcam de 2,1 MP com obturador de privacidade manual vem como padrão ao invés do habitual sensor de 1 MP. Windows Olá também é suportado.


Manutenção
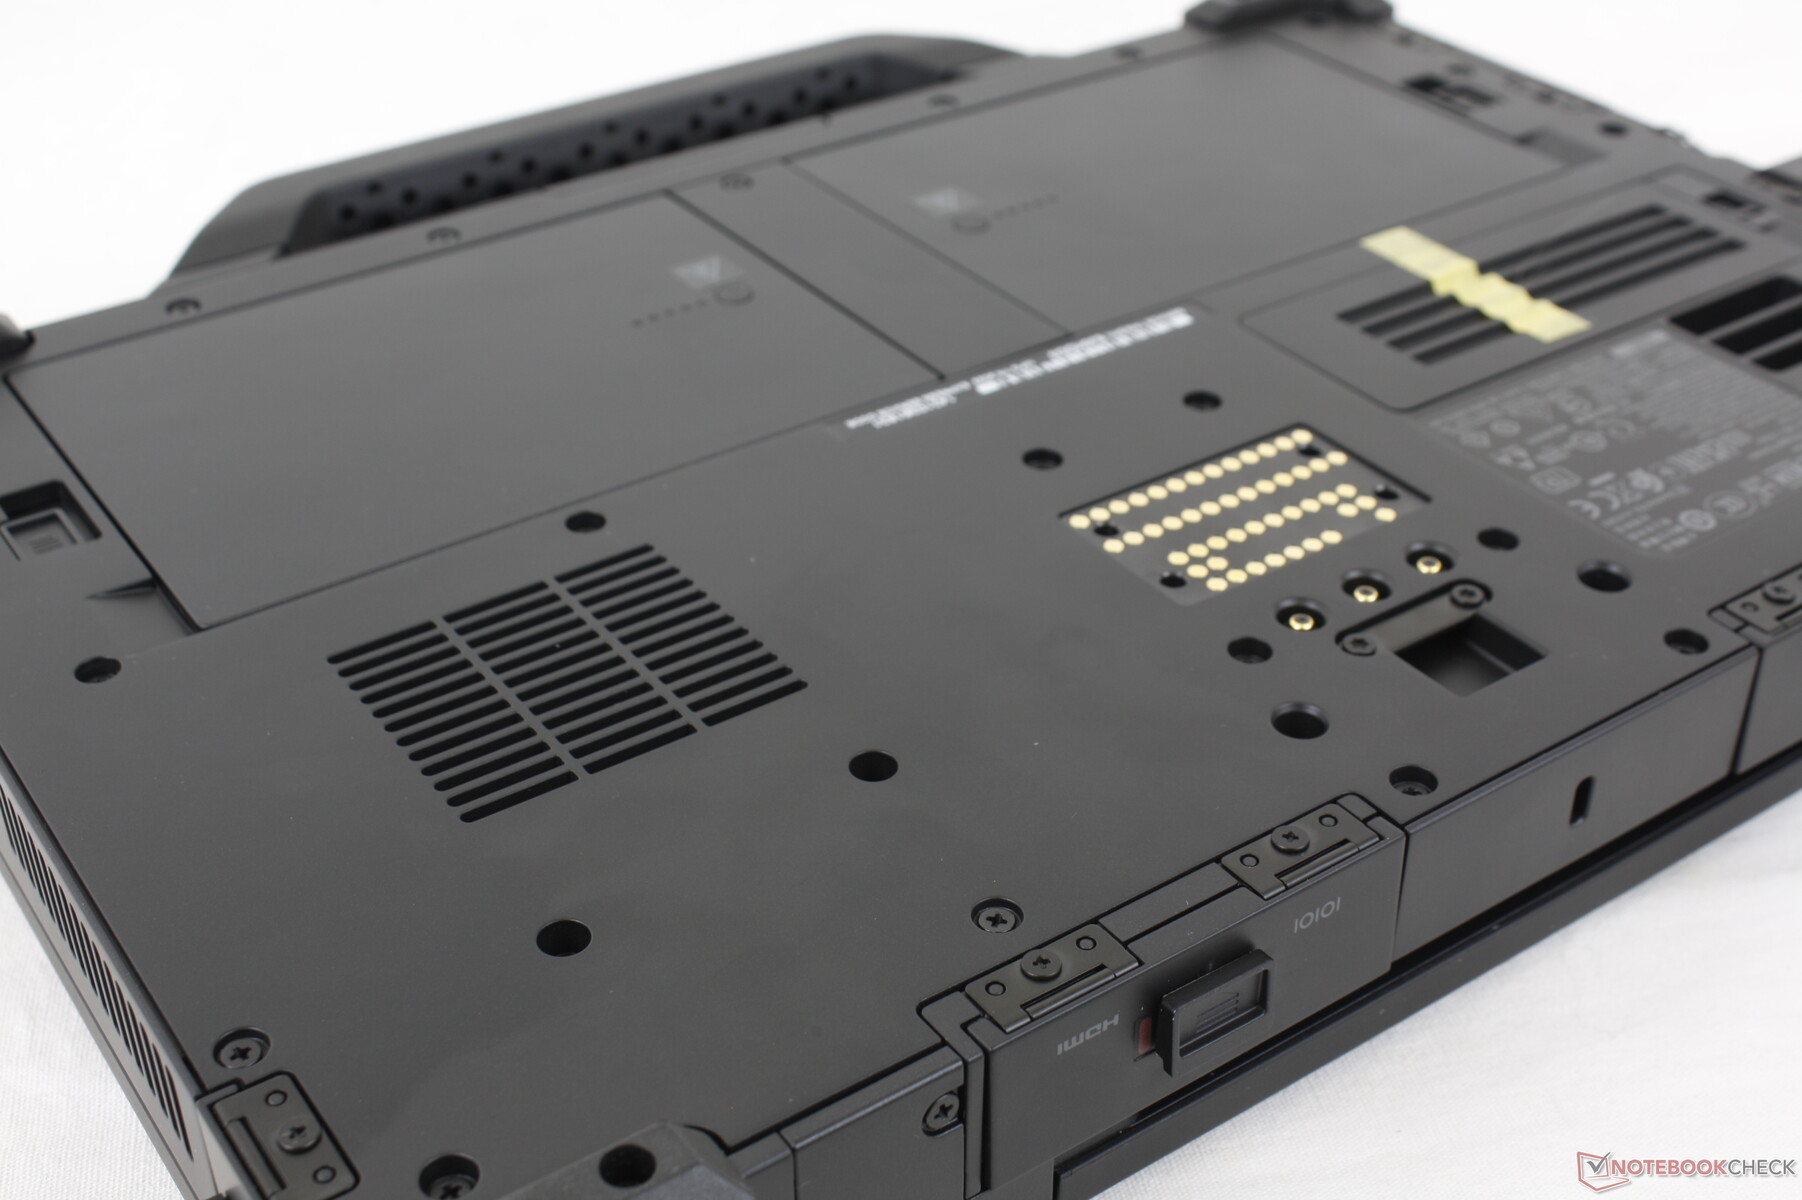
O painel inferior é relativamente fácil de remover desde que você tenha a paciência de desatarraxar suas duas dúzias mais os parafusos Philips. Haverá poucos motivos para fazer na maioria dos cenários, pois a RAM é soldada e o único compartimento de armazenamento já está acessível através de uma pequena escotilha.
Acessórios e Garantia
Acessórios opcionais estão disponíveis para explorar os pinos de acoplamento proprietários na parte inferior da unidade. Uma garantia limitada de três anos do fabricante vem como padrão.
Dispositivos de entrada
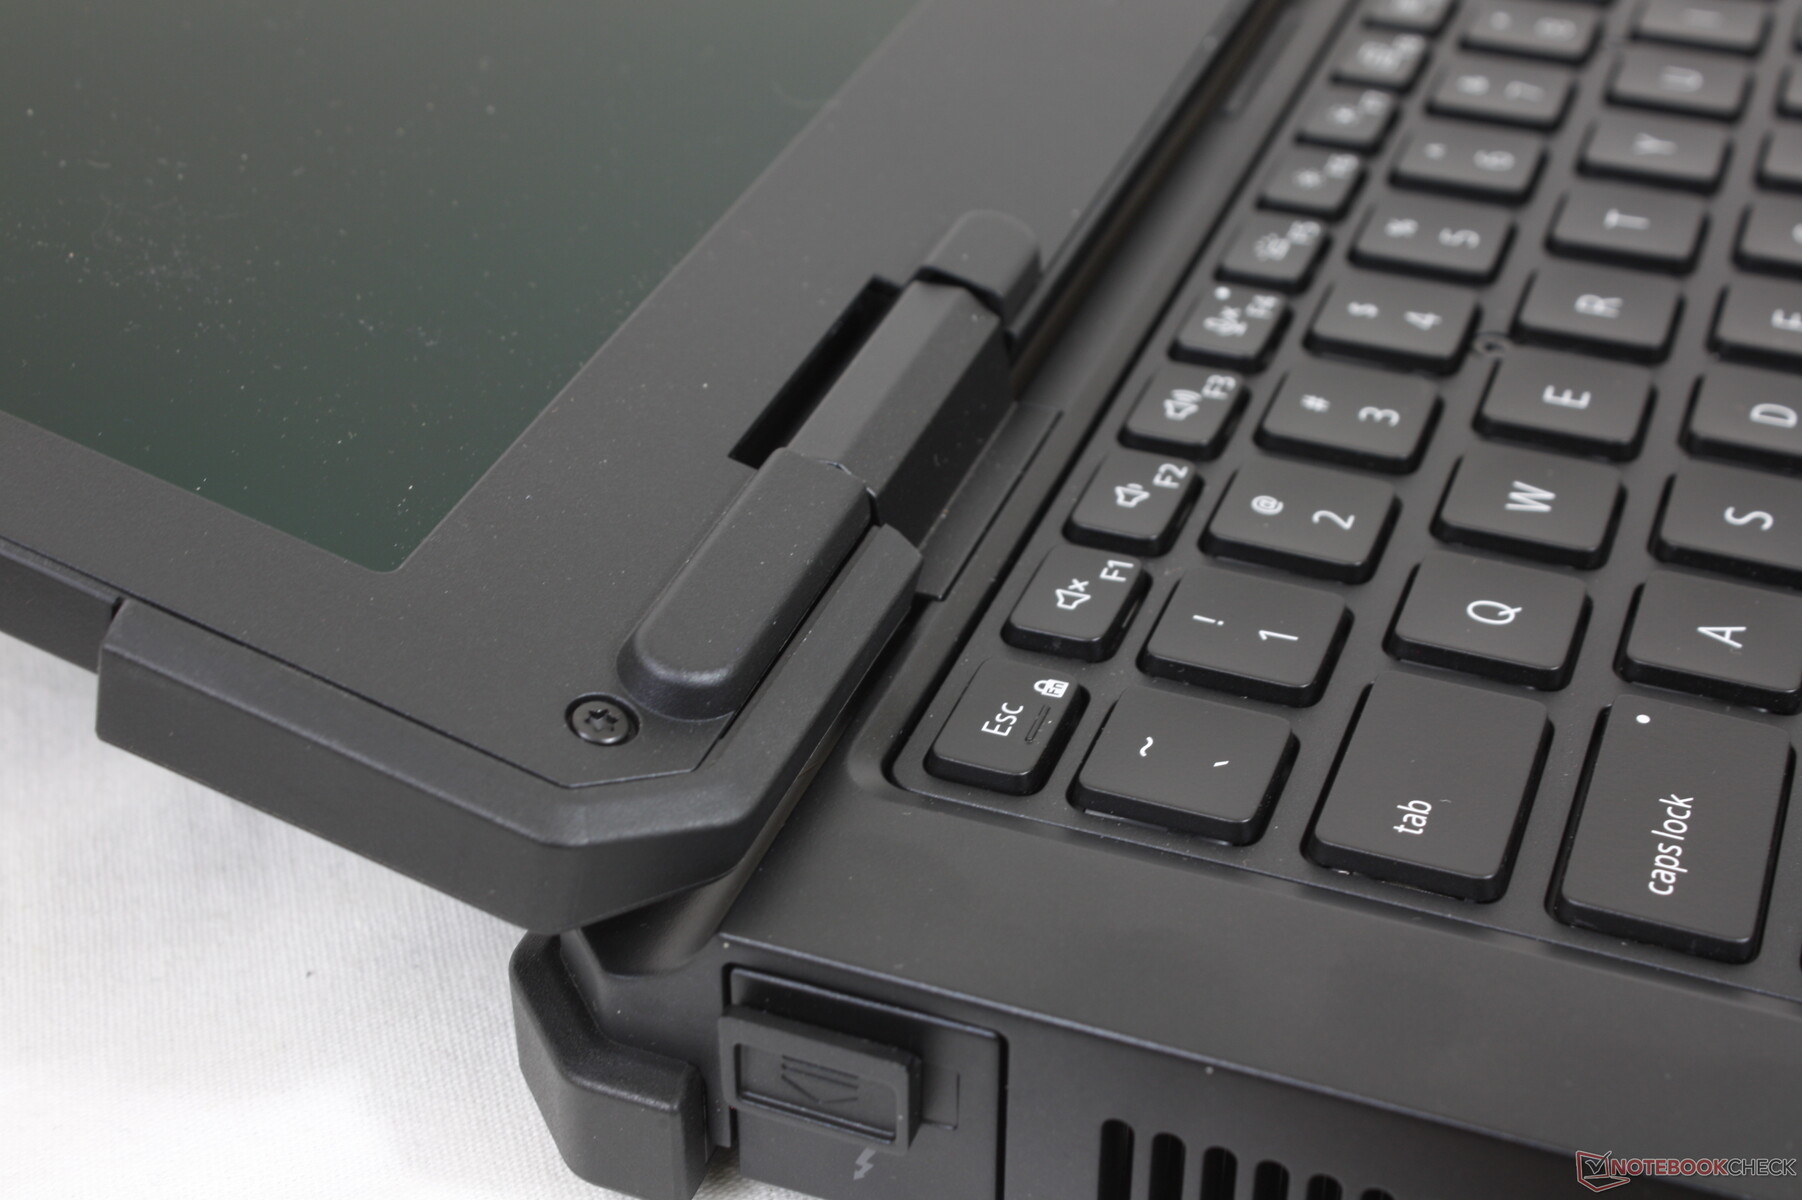
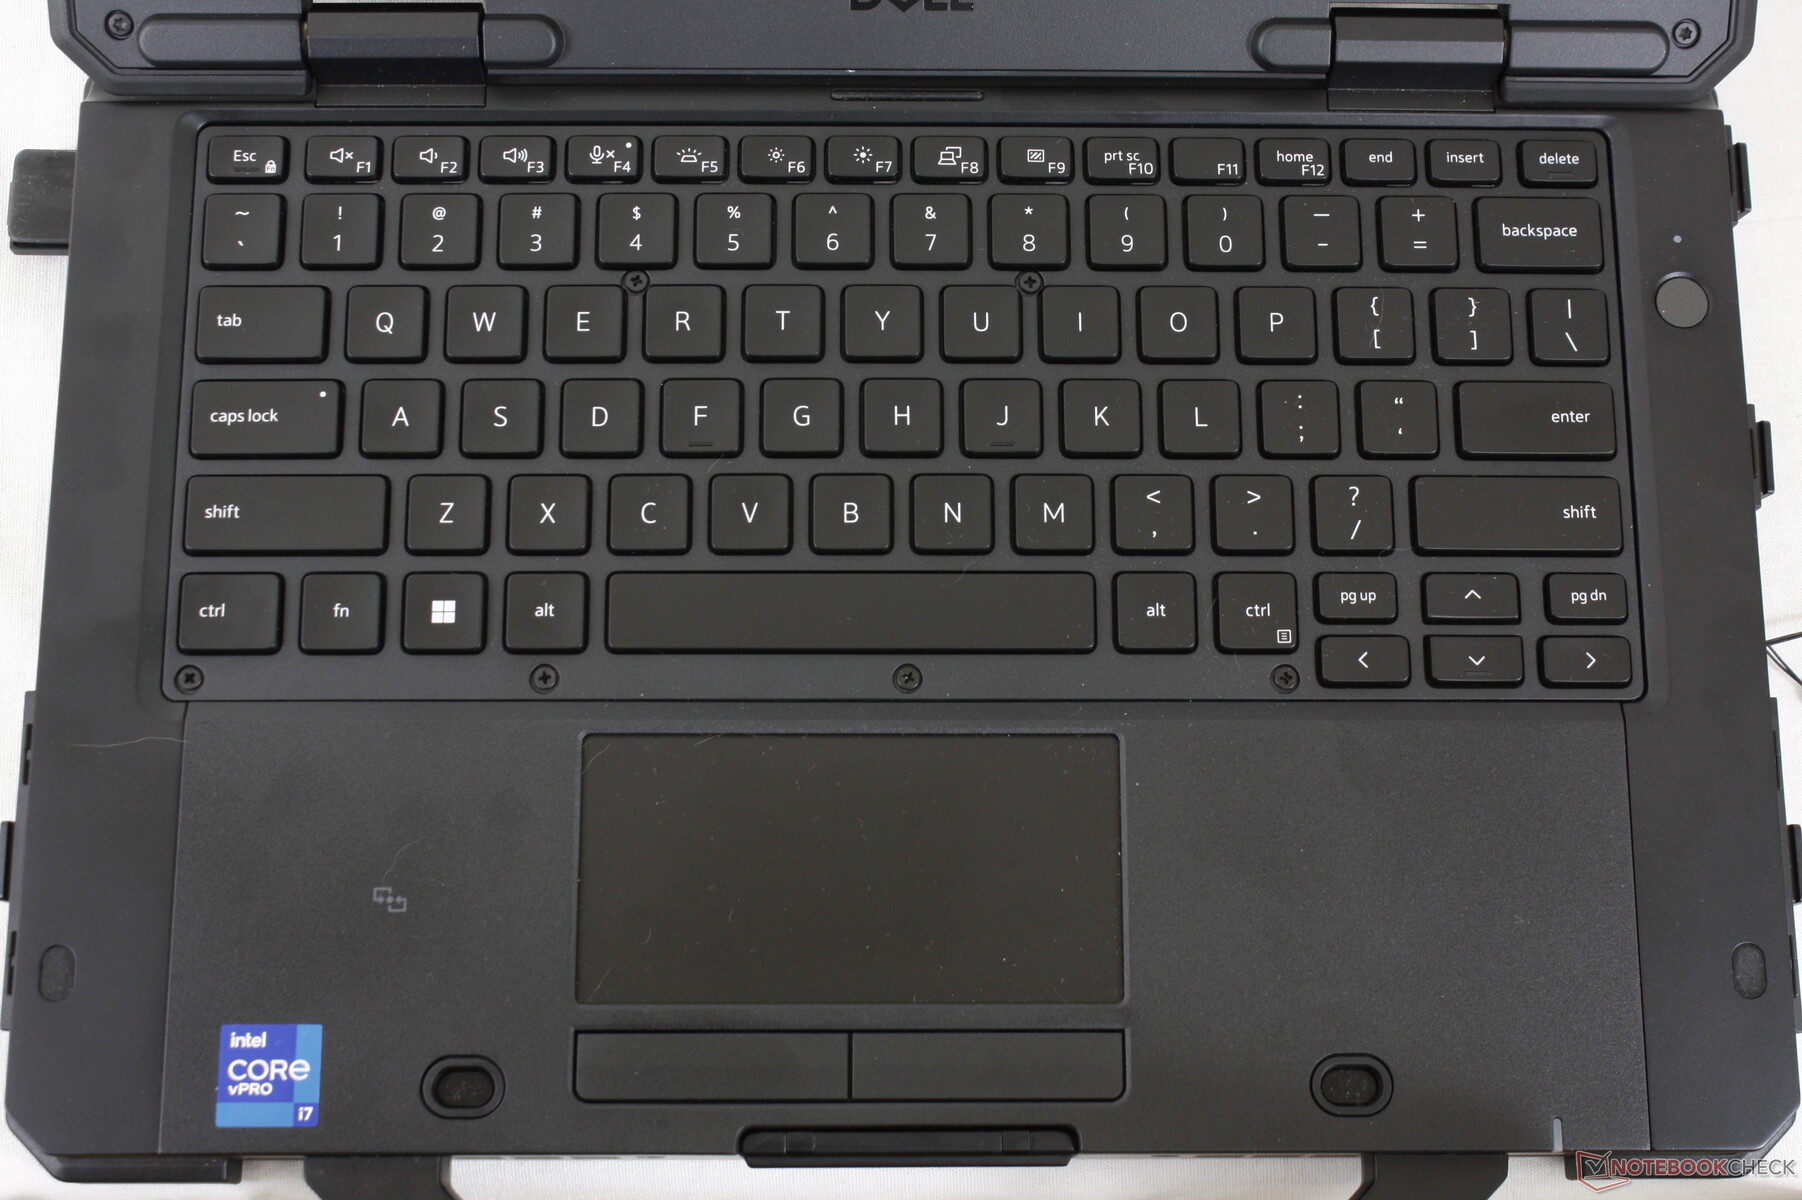
Teclado
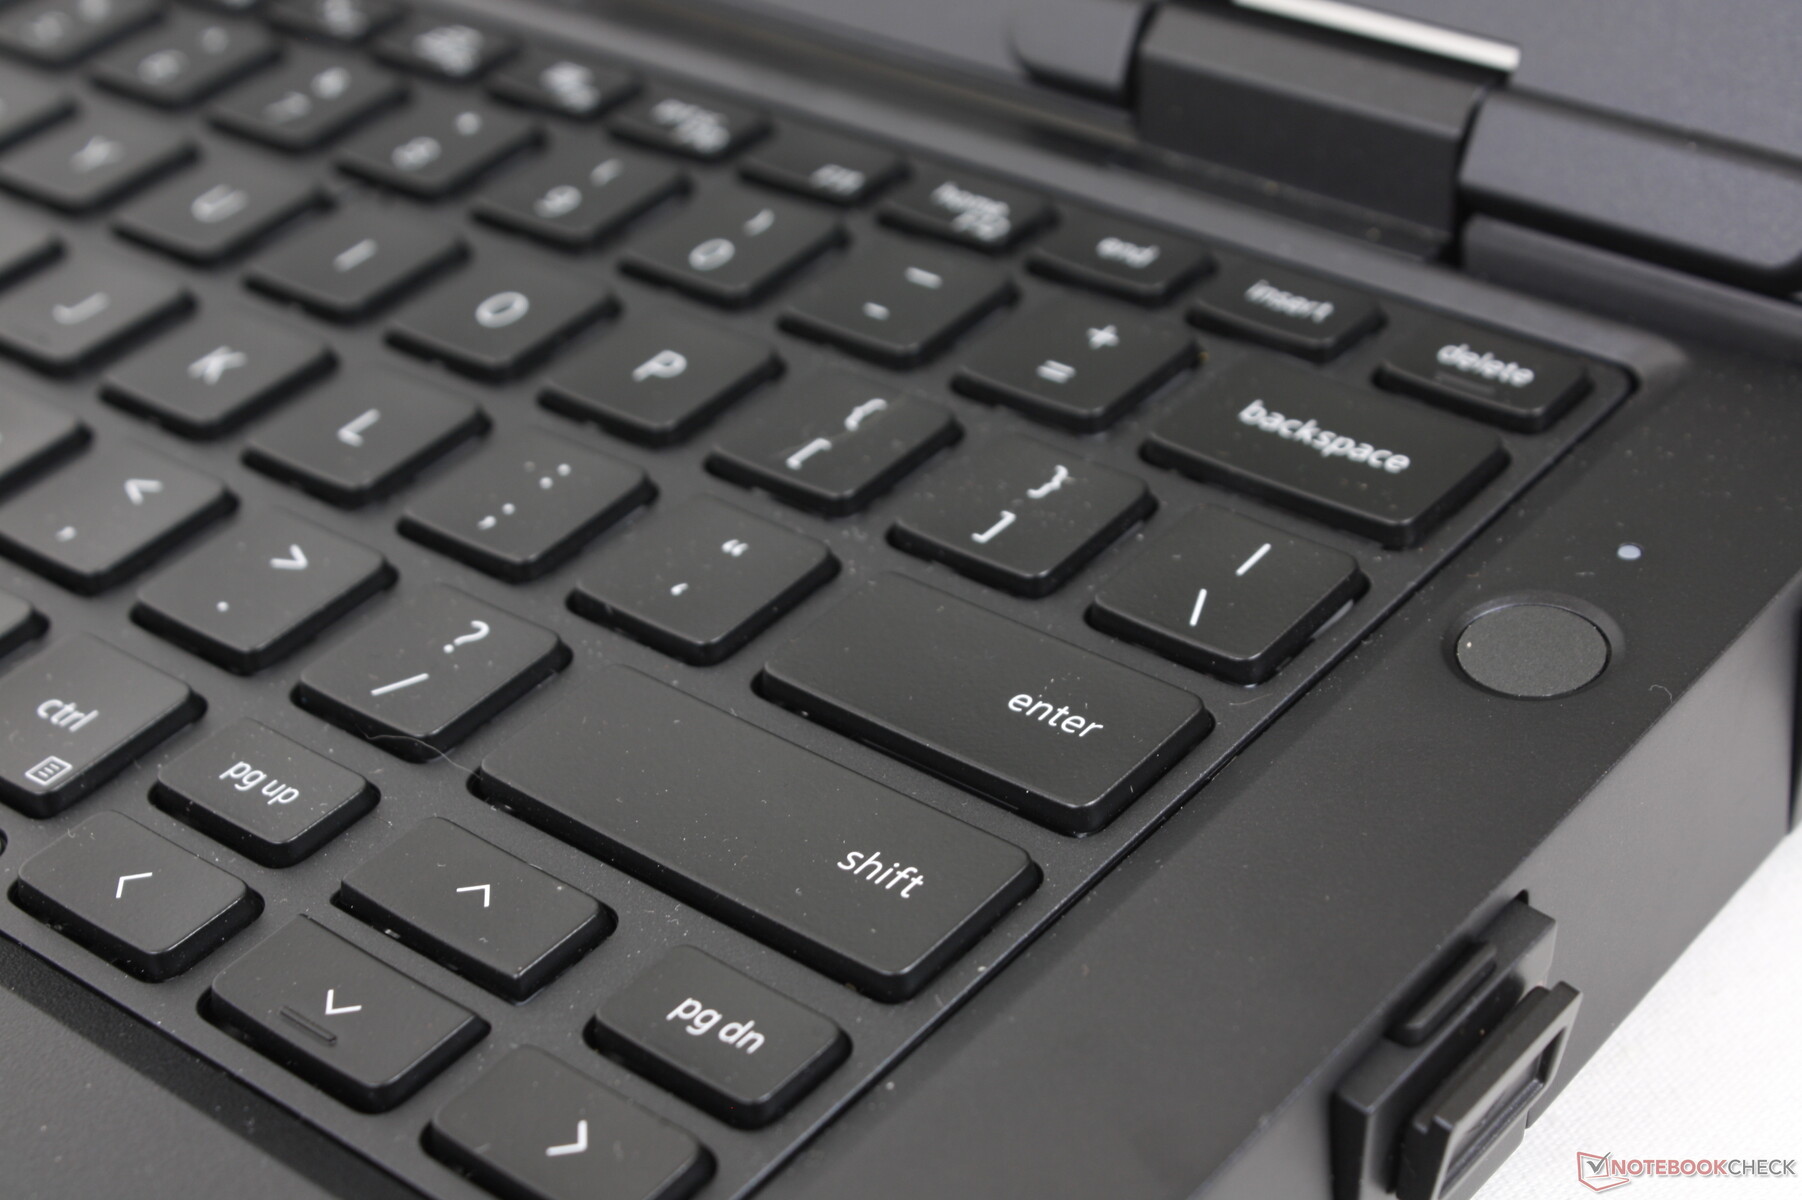
Quando comparado com o teclado da série Getac B360, o teclado da Dell é ligeiramente mais macio e silencioso, mas não necessariamente menos confortável de digitar. Os usuários podem preferir ter teclas mais silenciosas, dependendo do cenário de uso. No entanto, preferimos a luz de fundo vermelha no B360, pois é um pouco mais fácil para os olhos do que a luz de fundo branca da Dell.
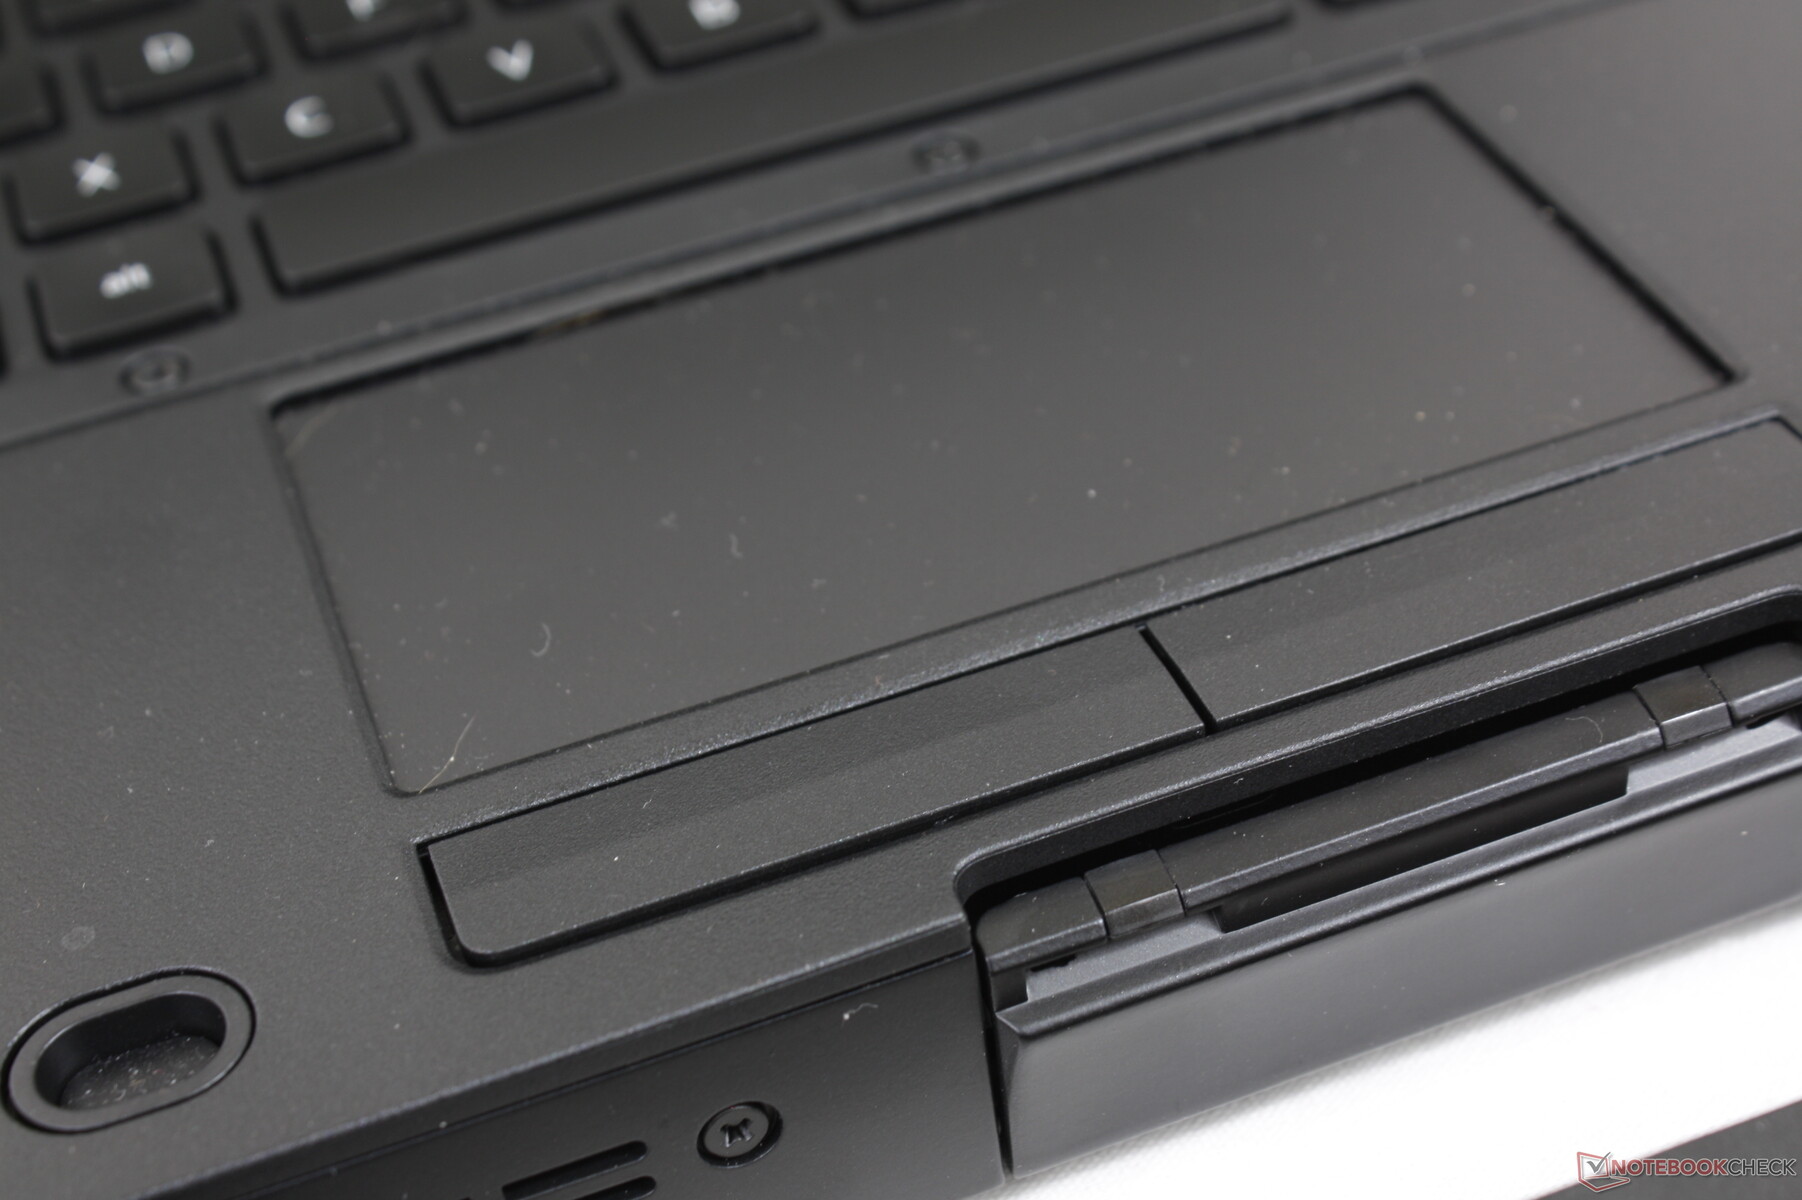
Touchpad
O trackpad é razoavelmente dimensionado em 10 x 5 cm contra 9,3 x 5,3 cm no Getac B360. Embora a tração seja suave, o controle do cursor é saltitante desde que o trackpad foi projetado para reconhecer também as entradas das luvas. Recomendamos pressionar mais firmemente na superfície do trackpad para reduzir os saltos.

Mostrar
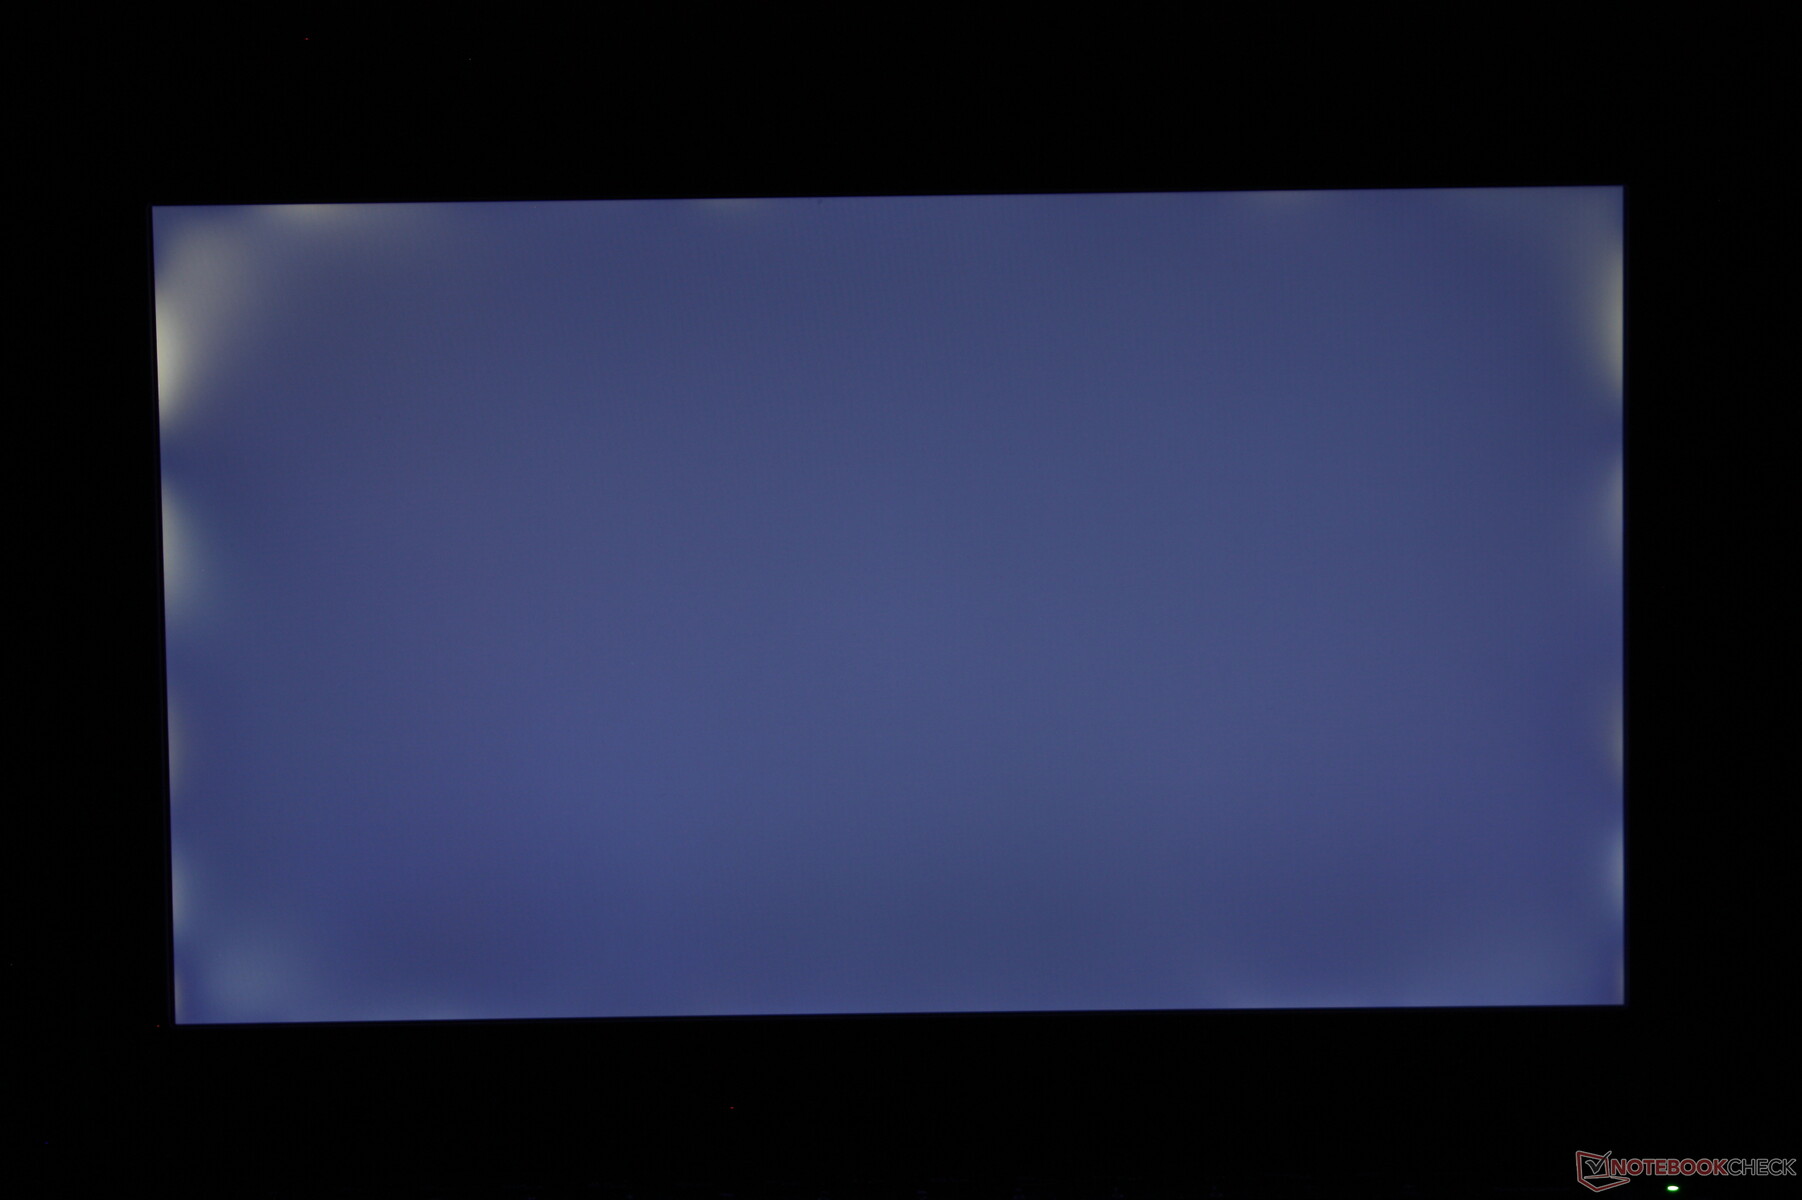
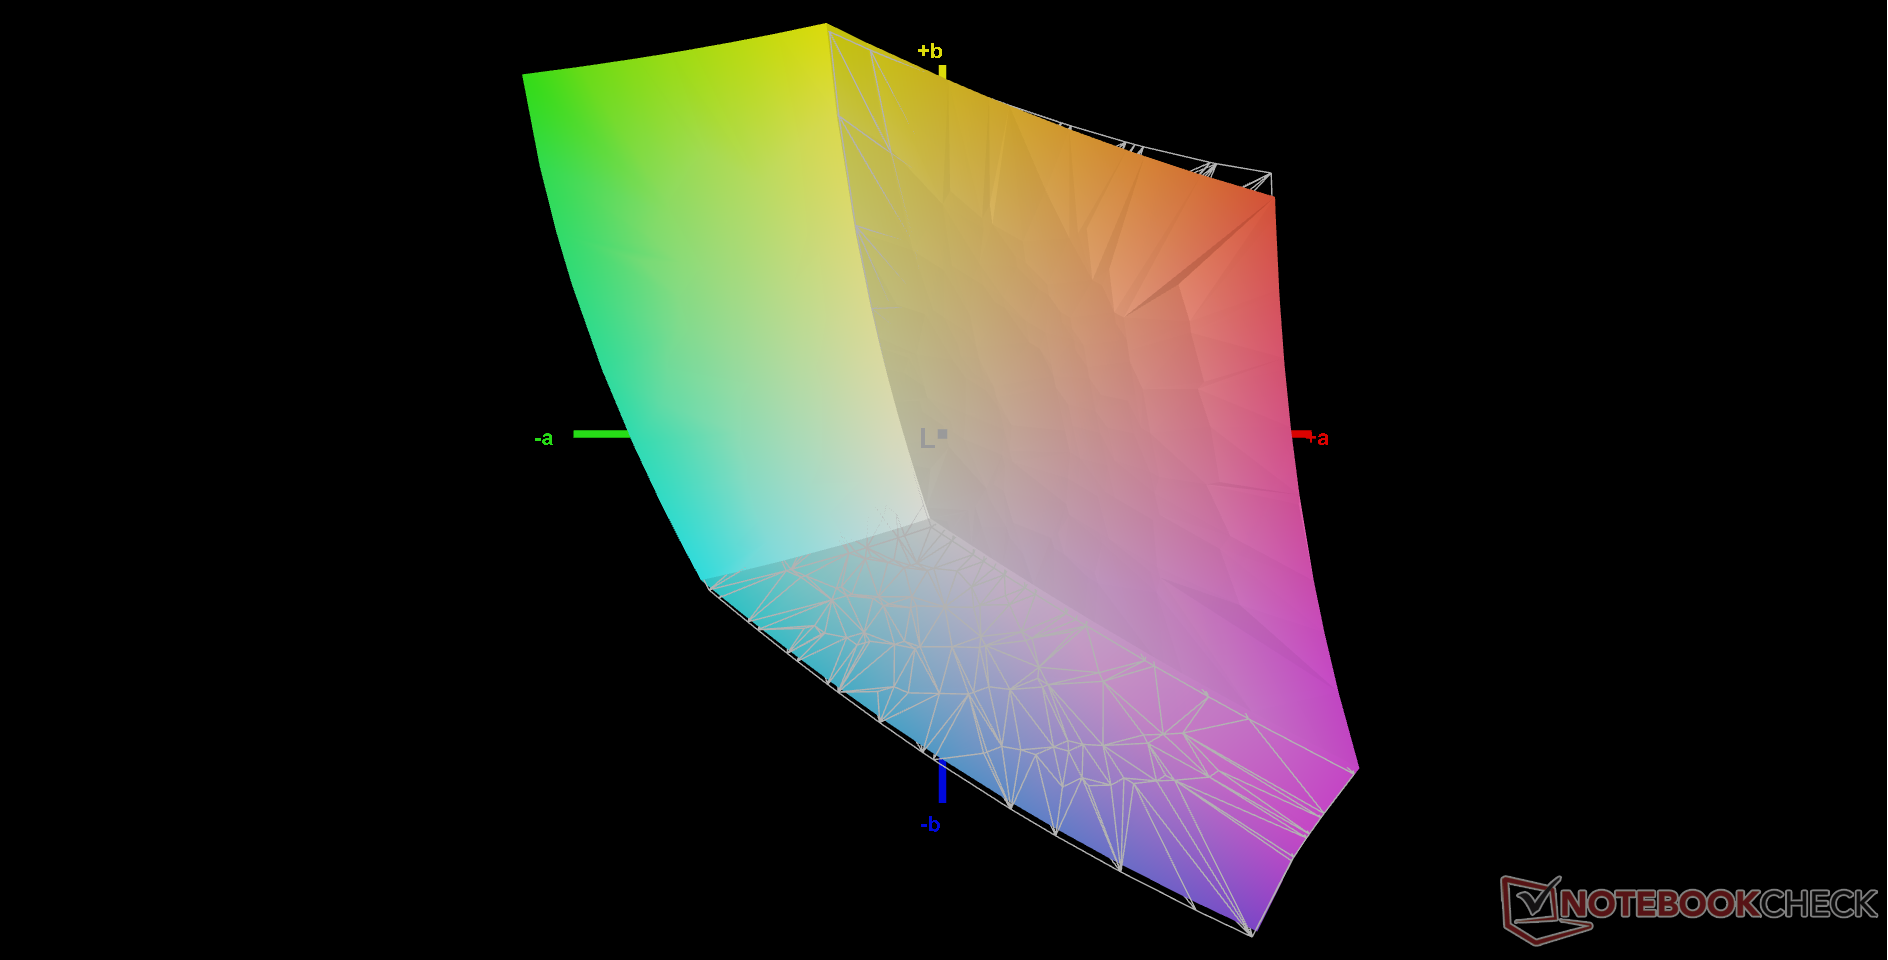
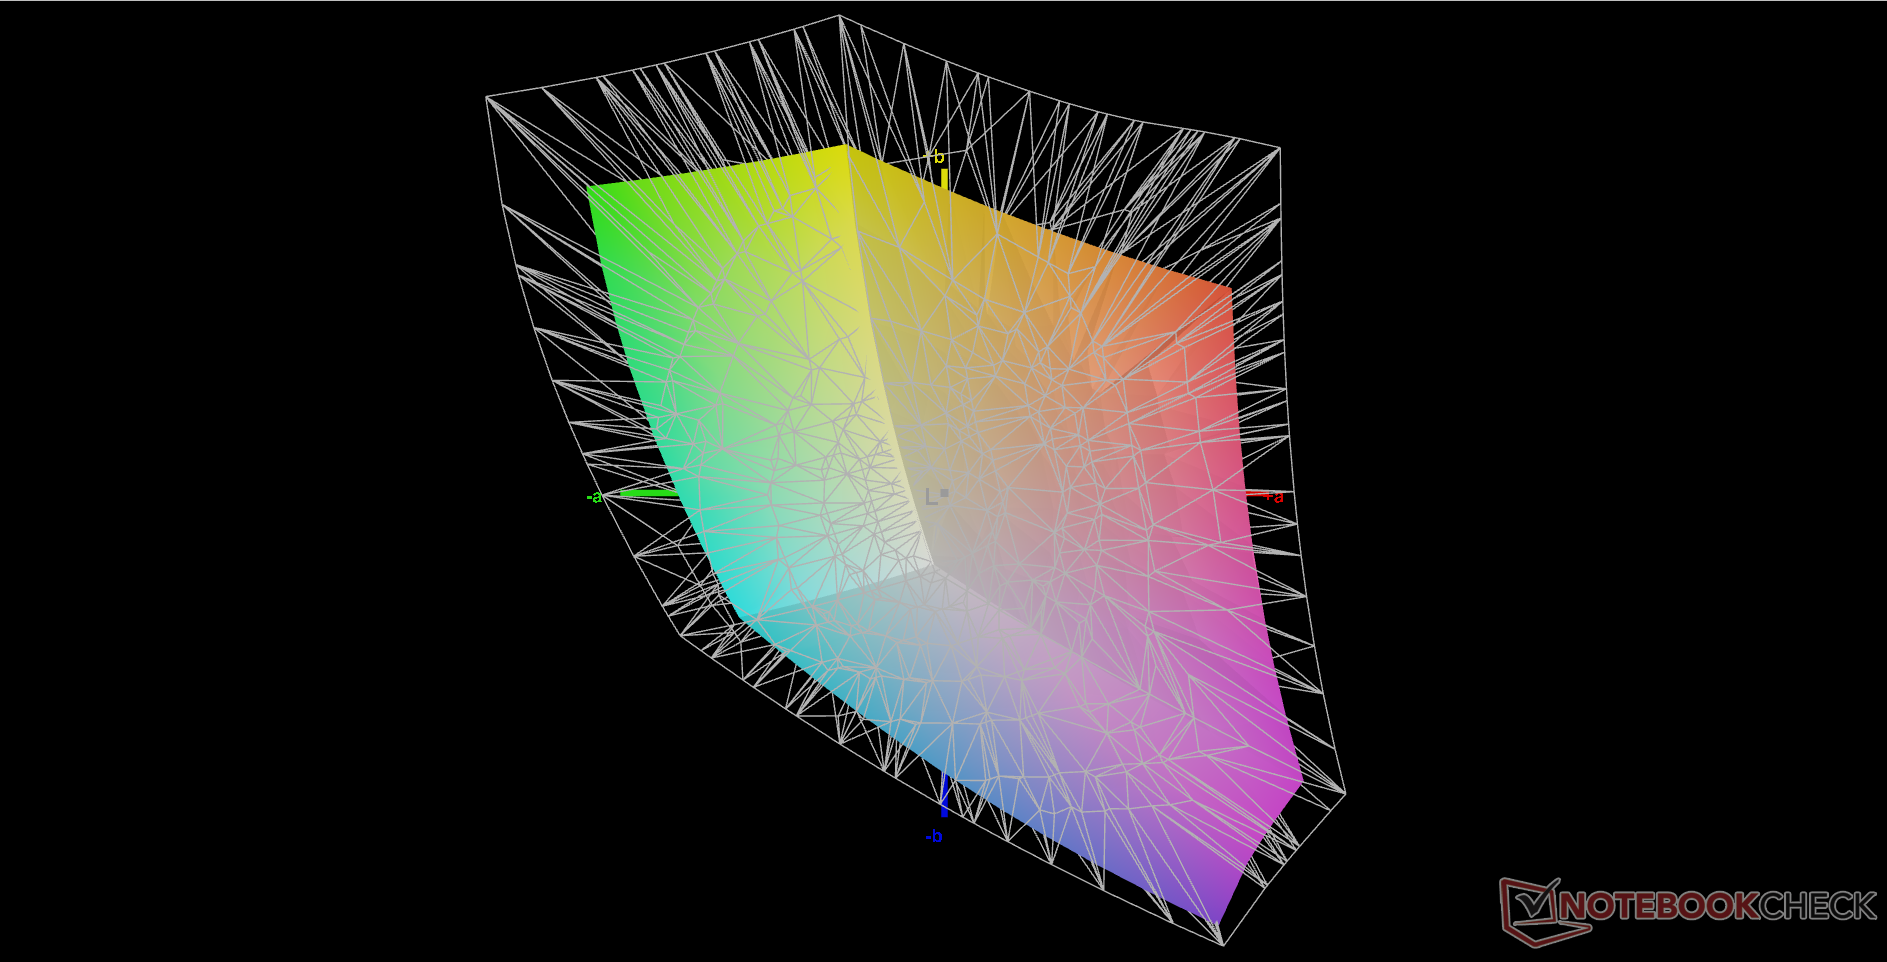
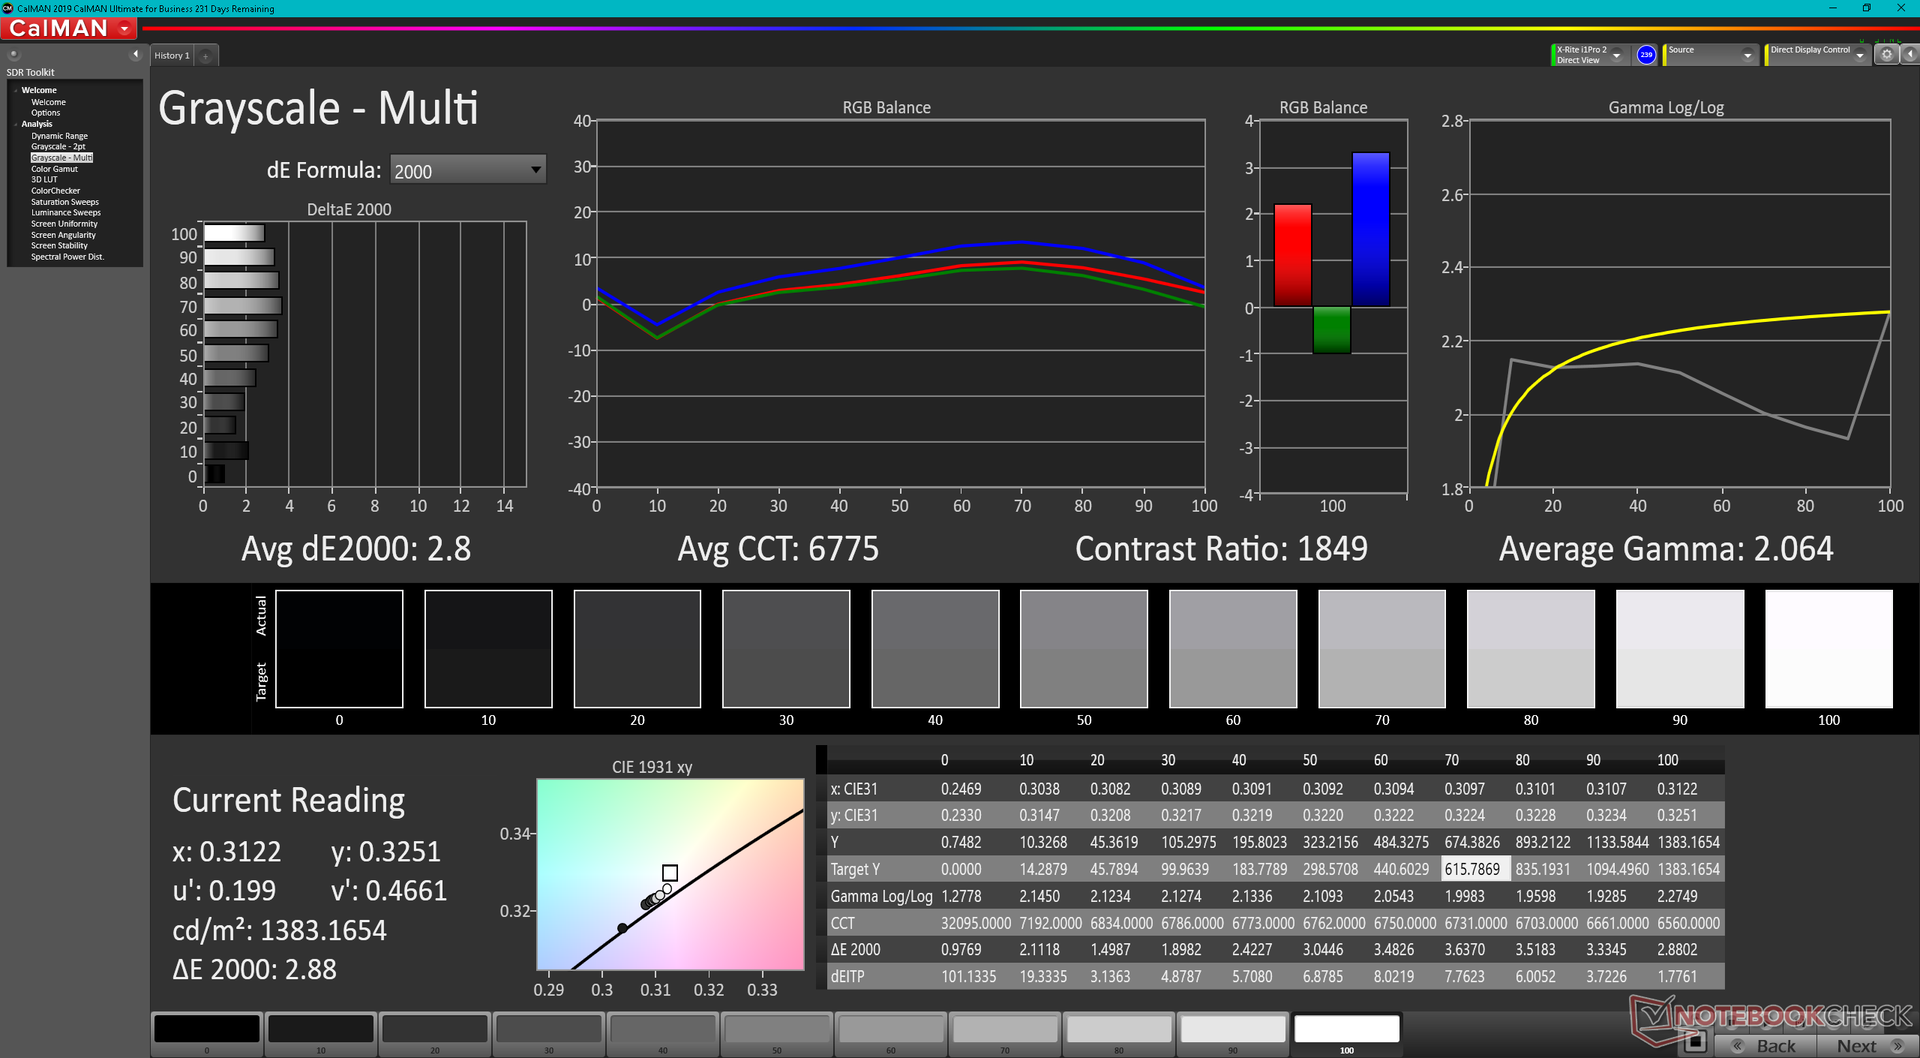
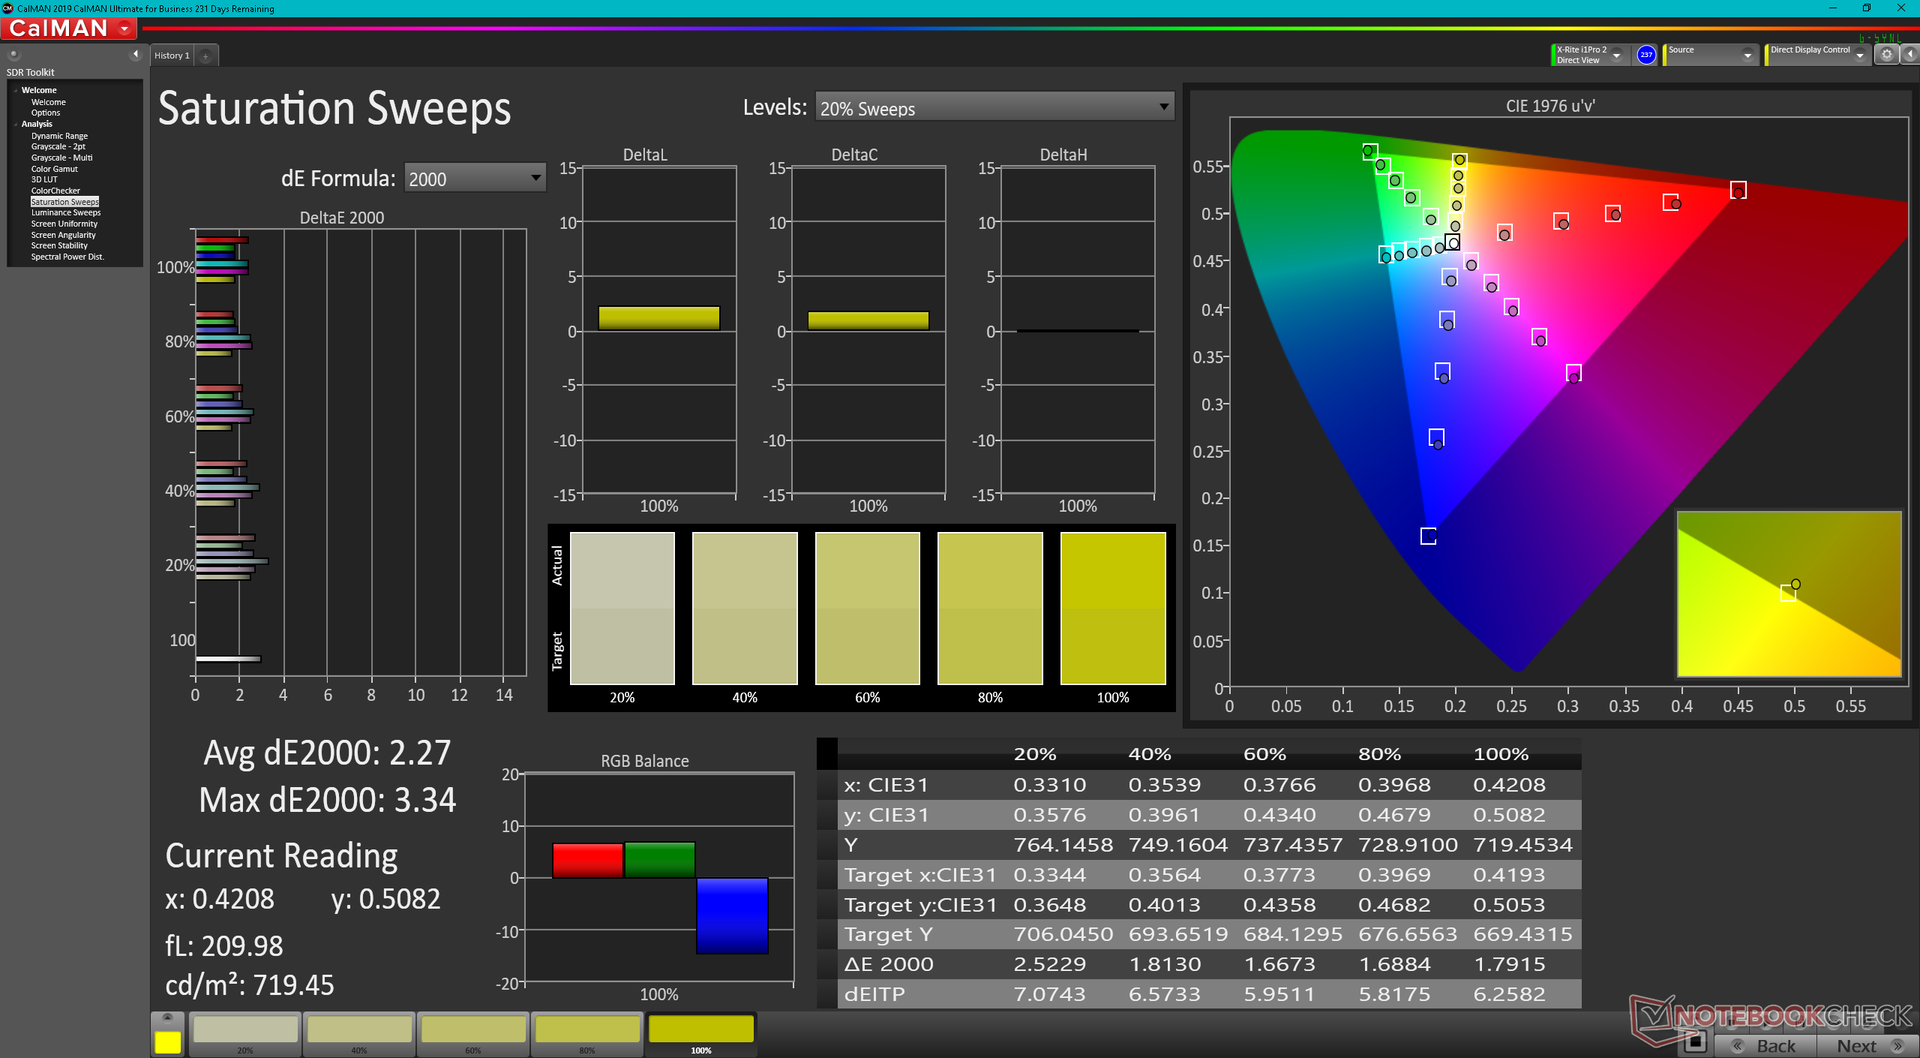
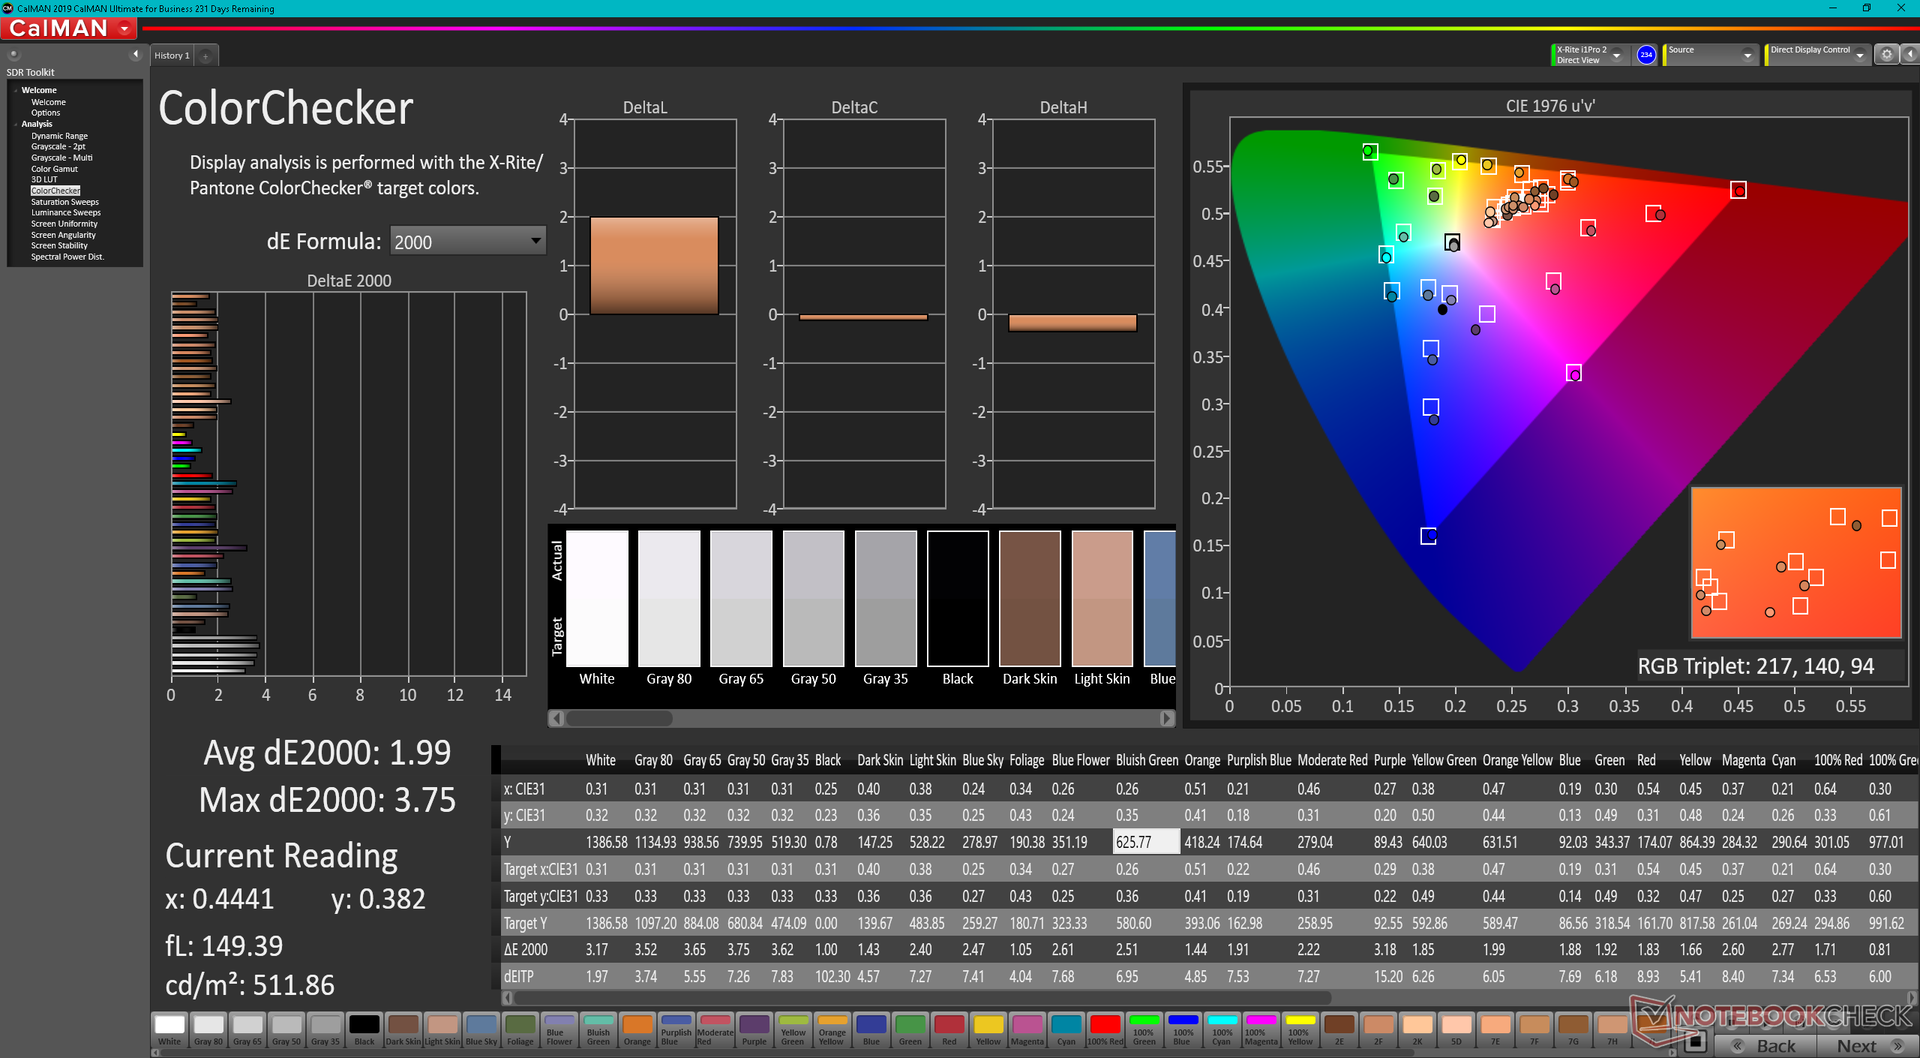
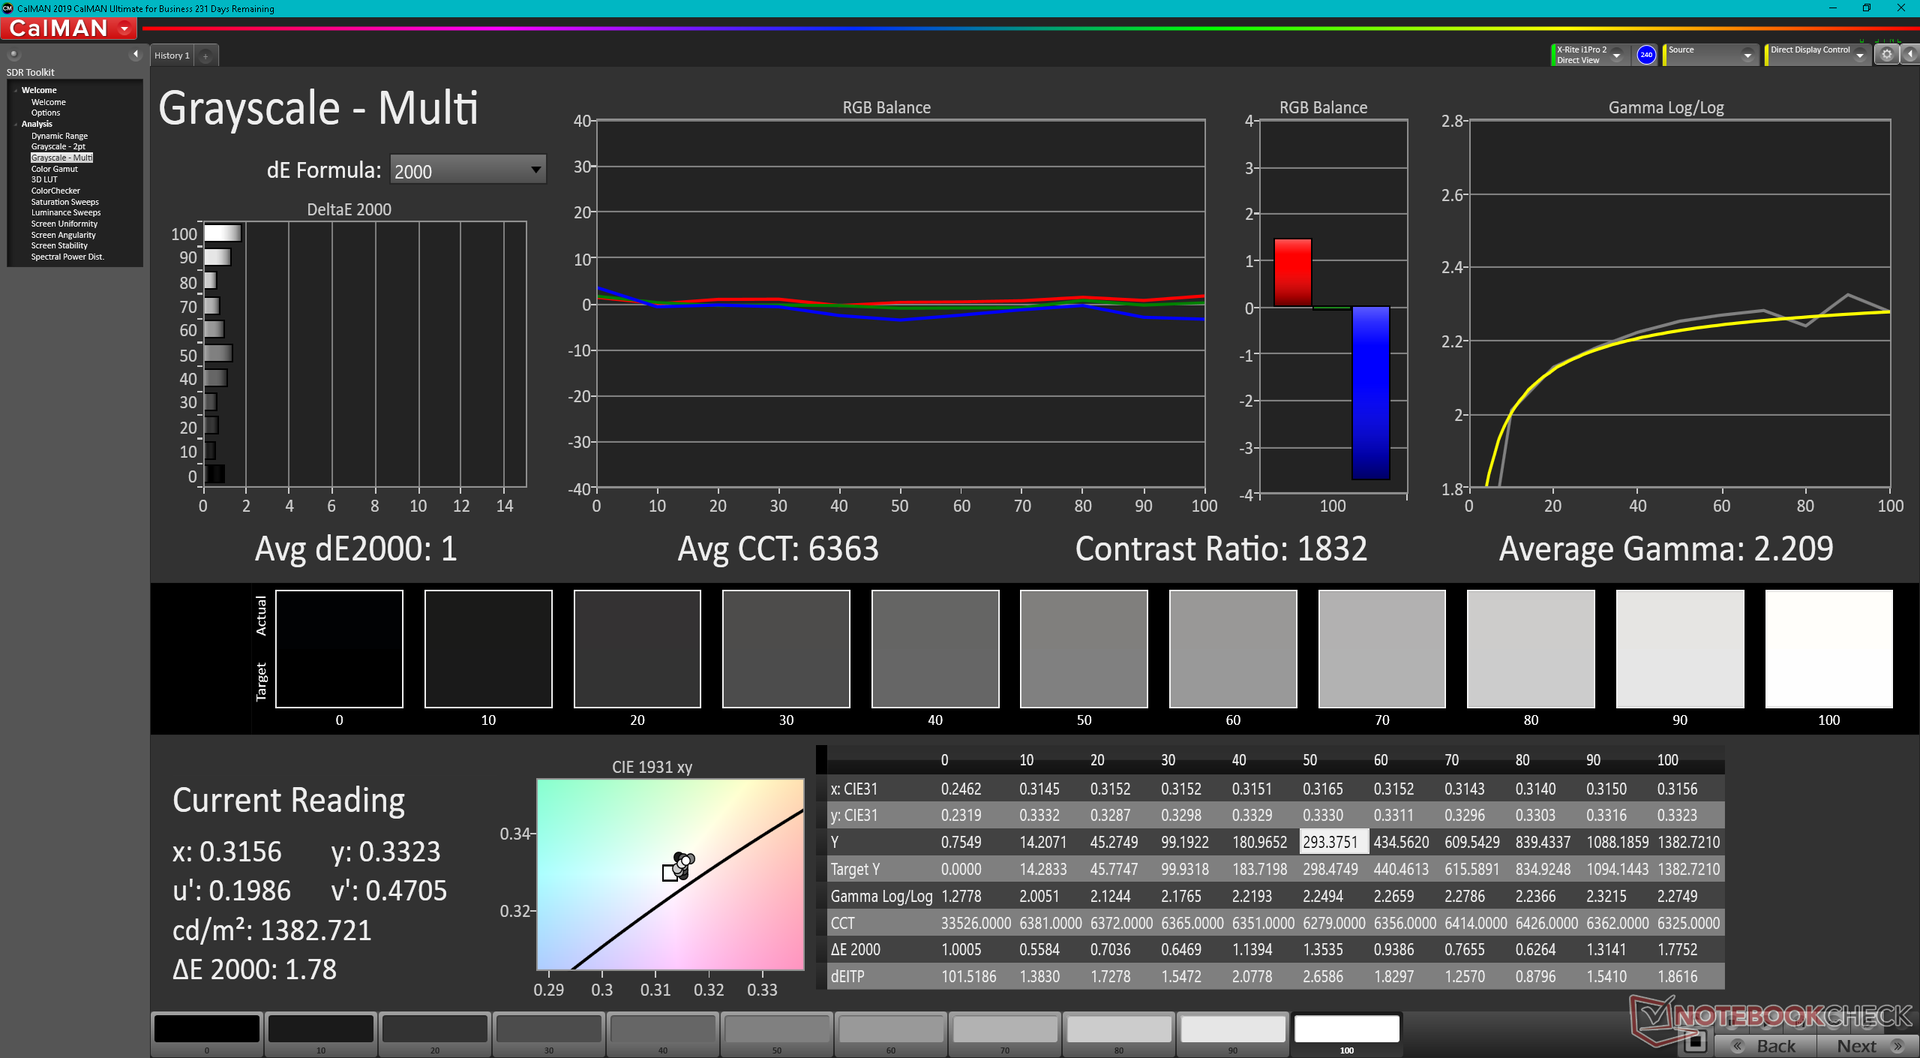
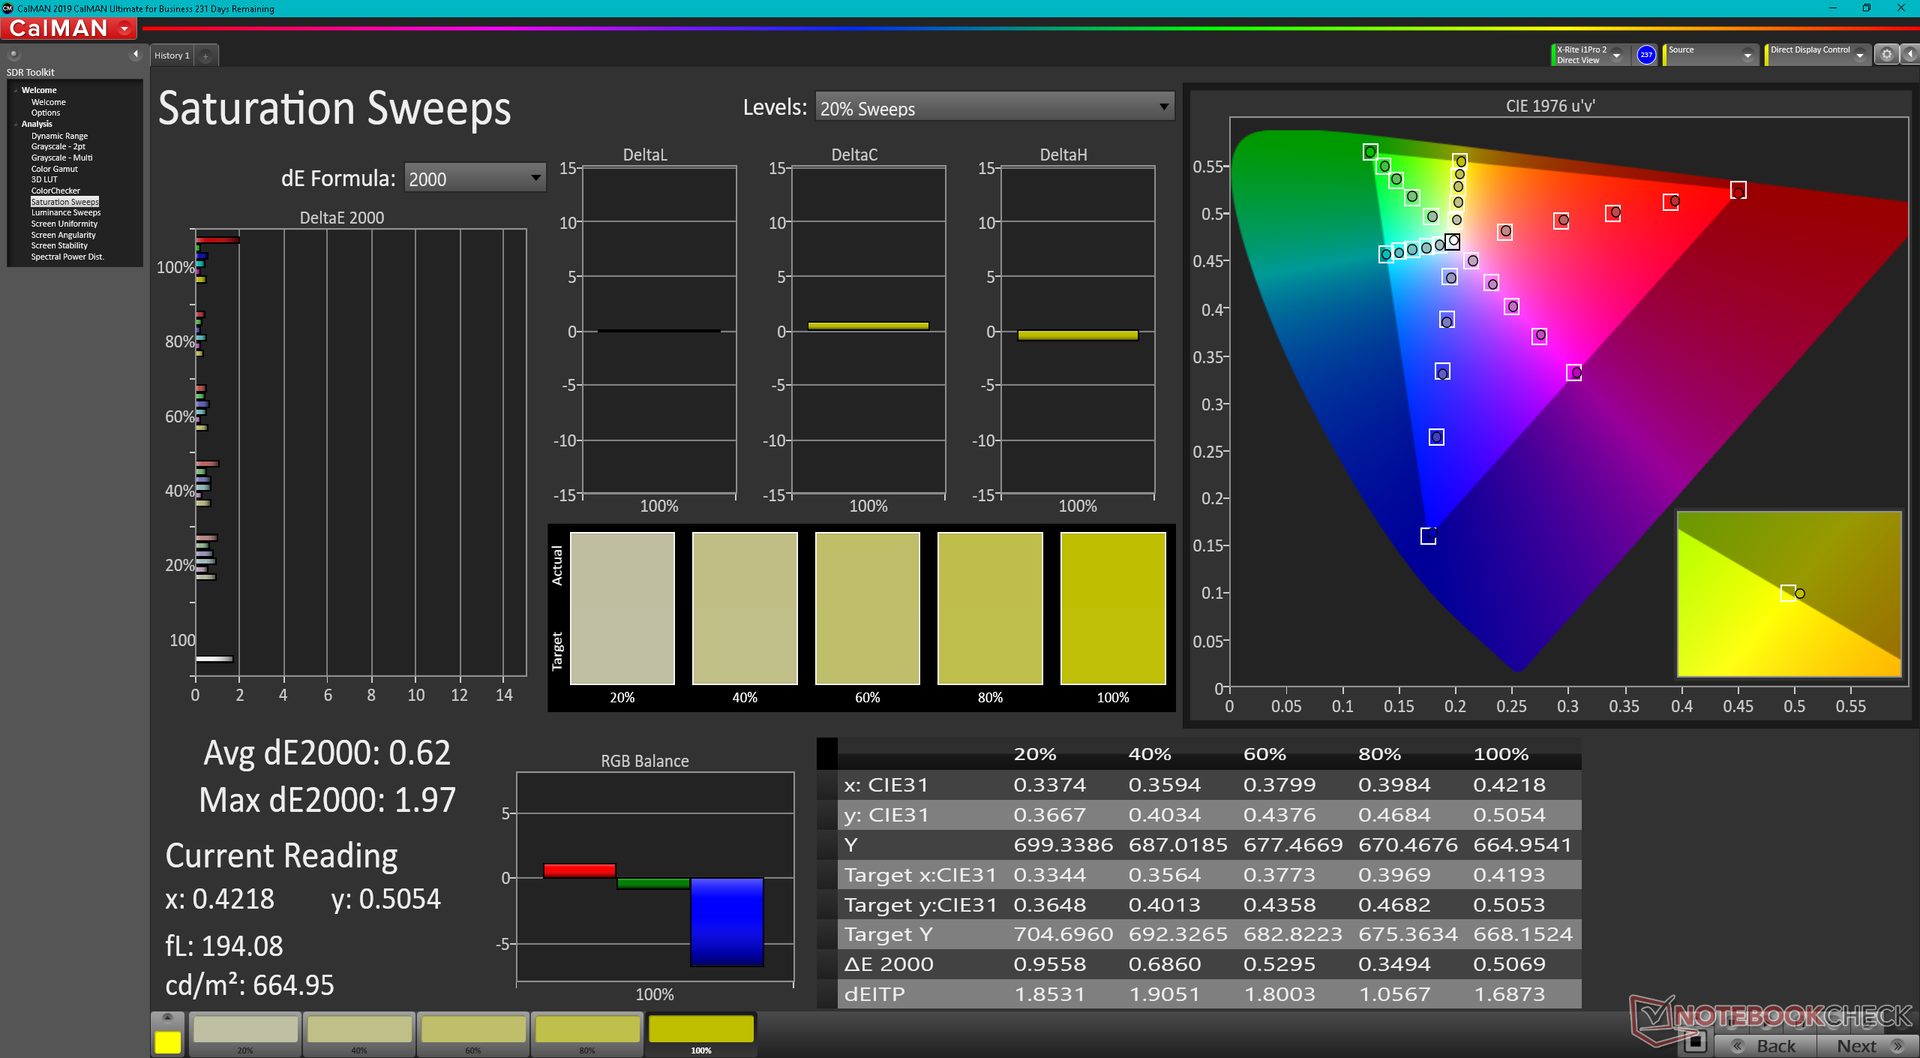
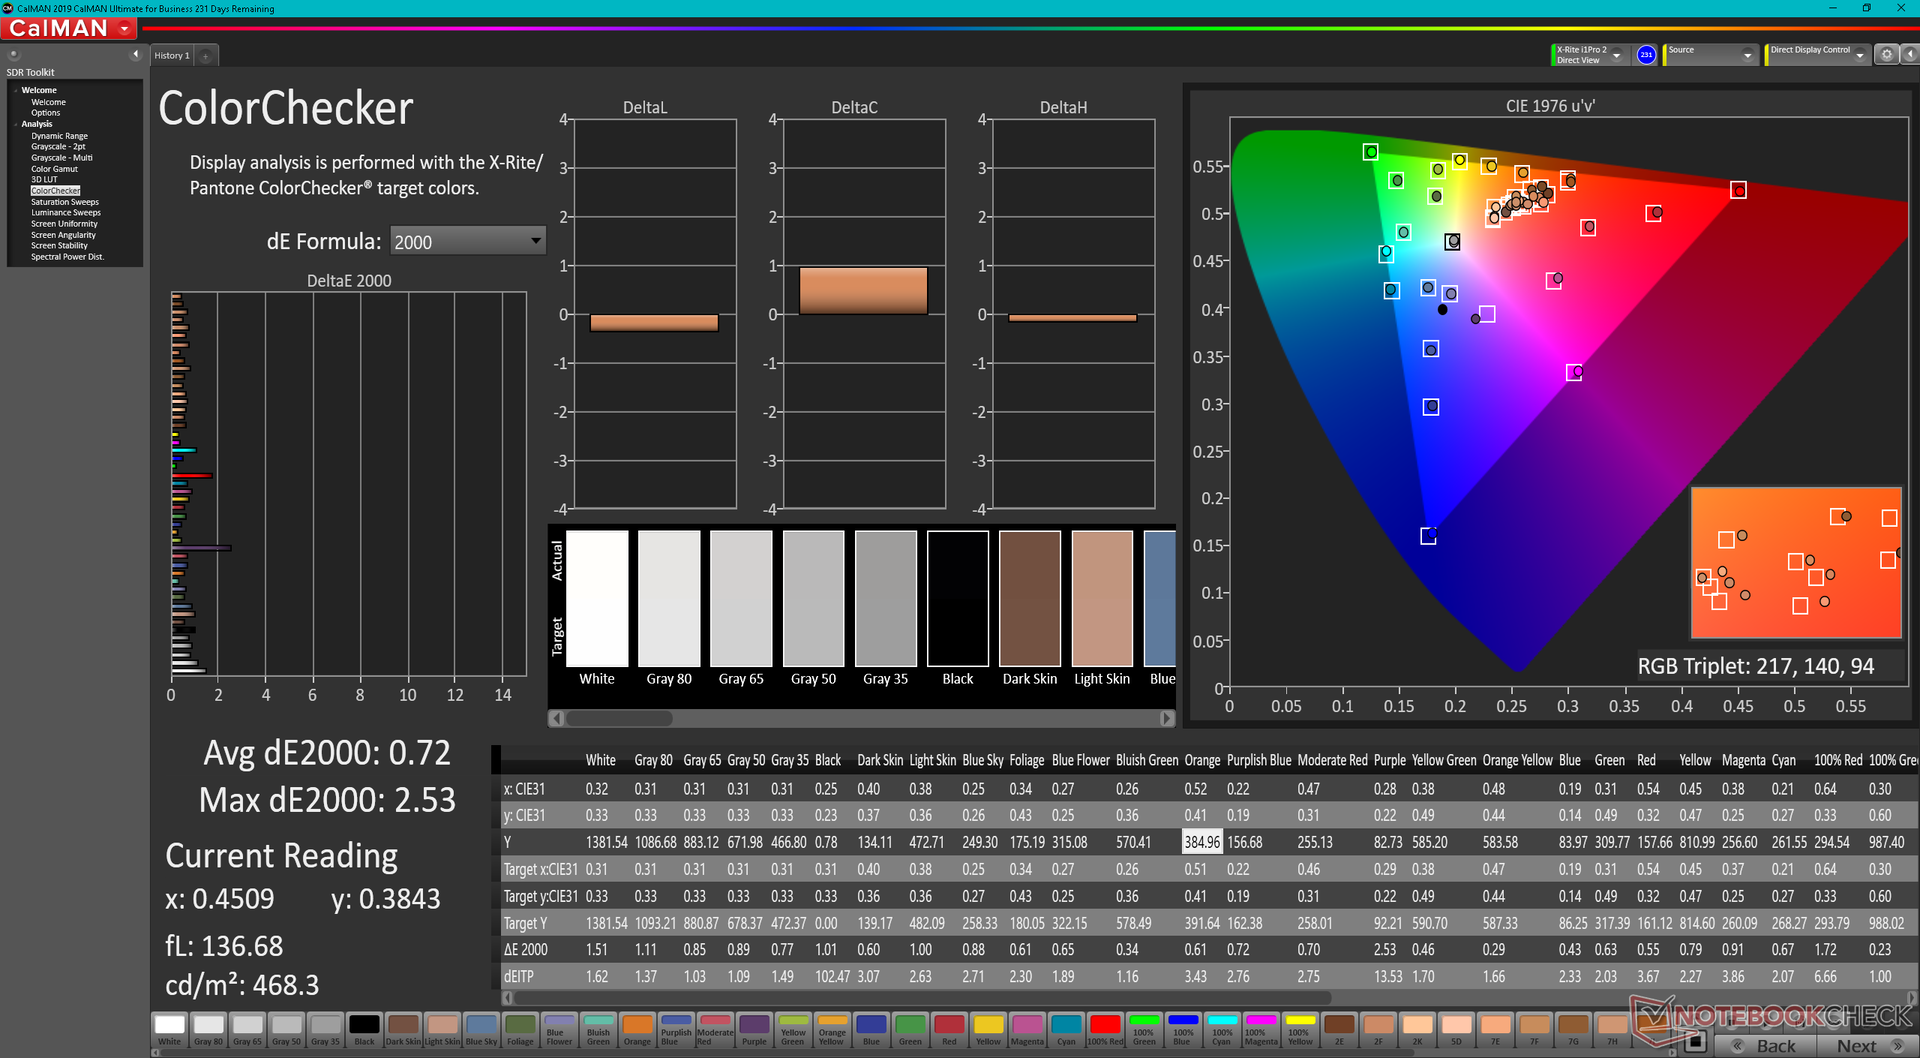
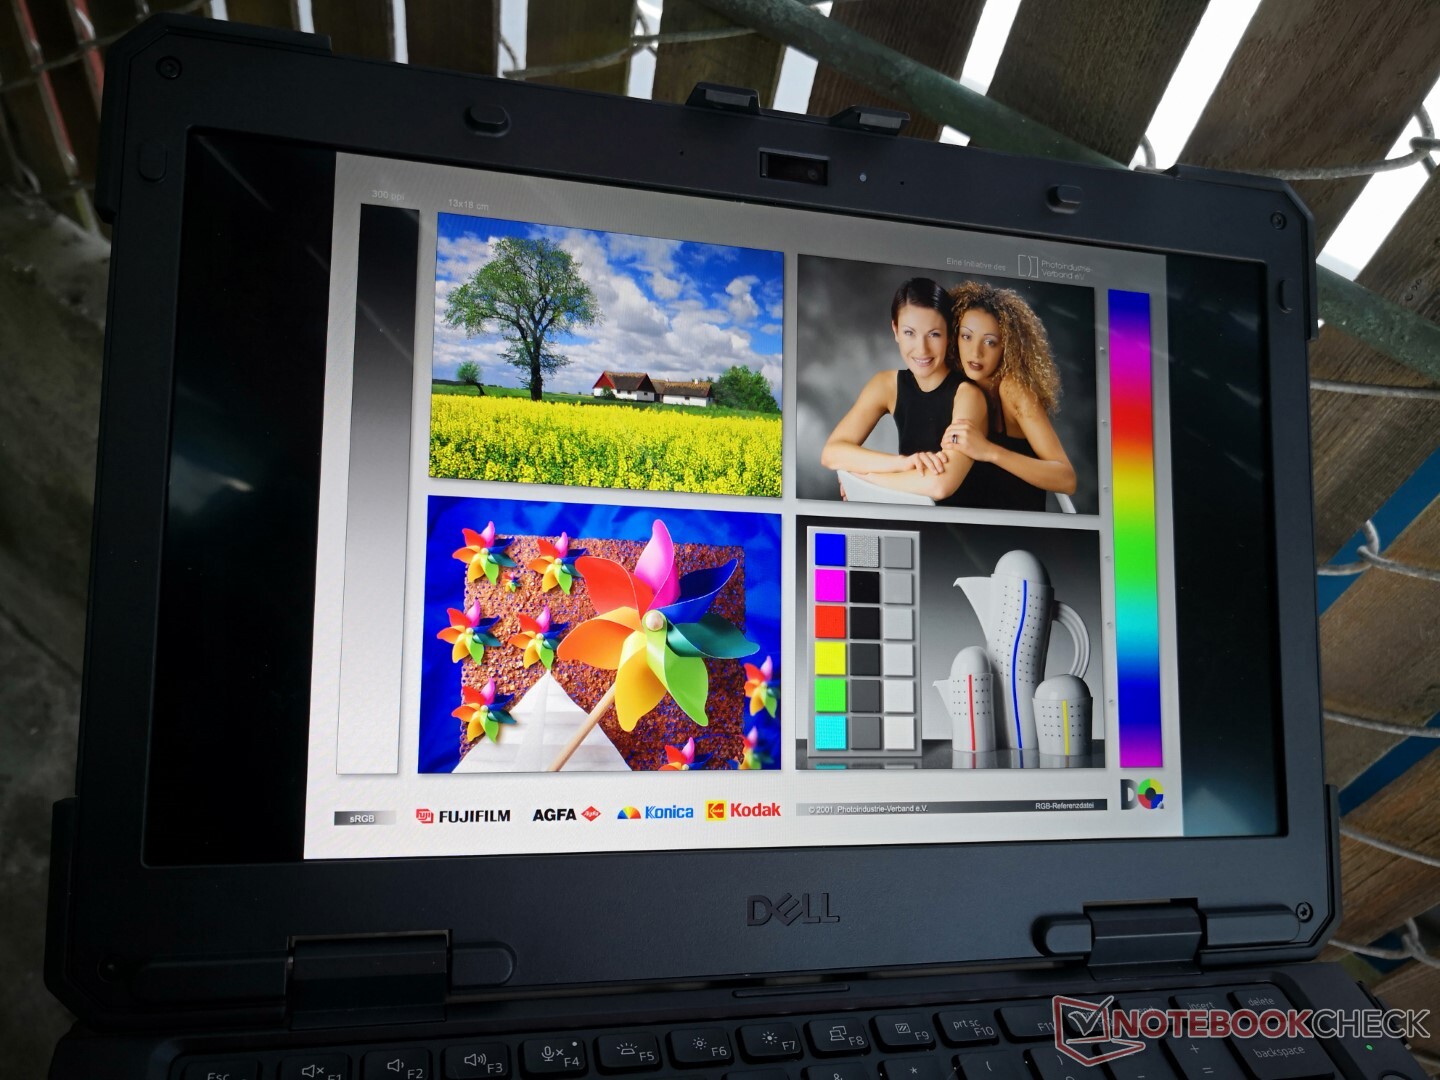
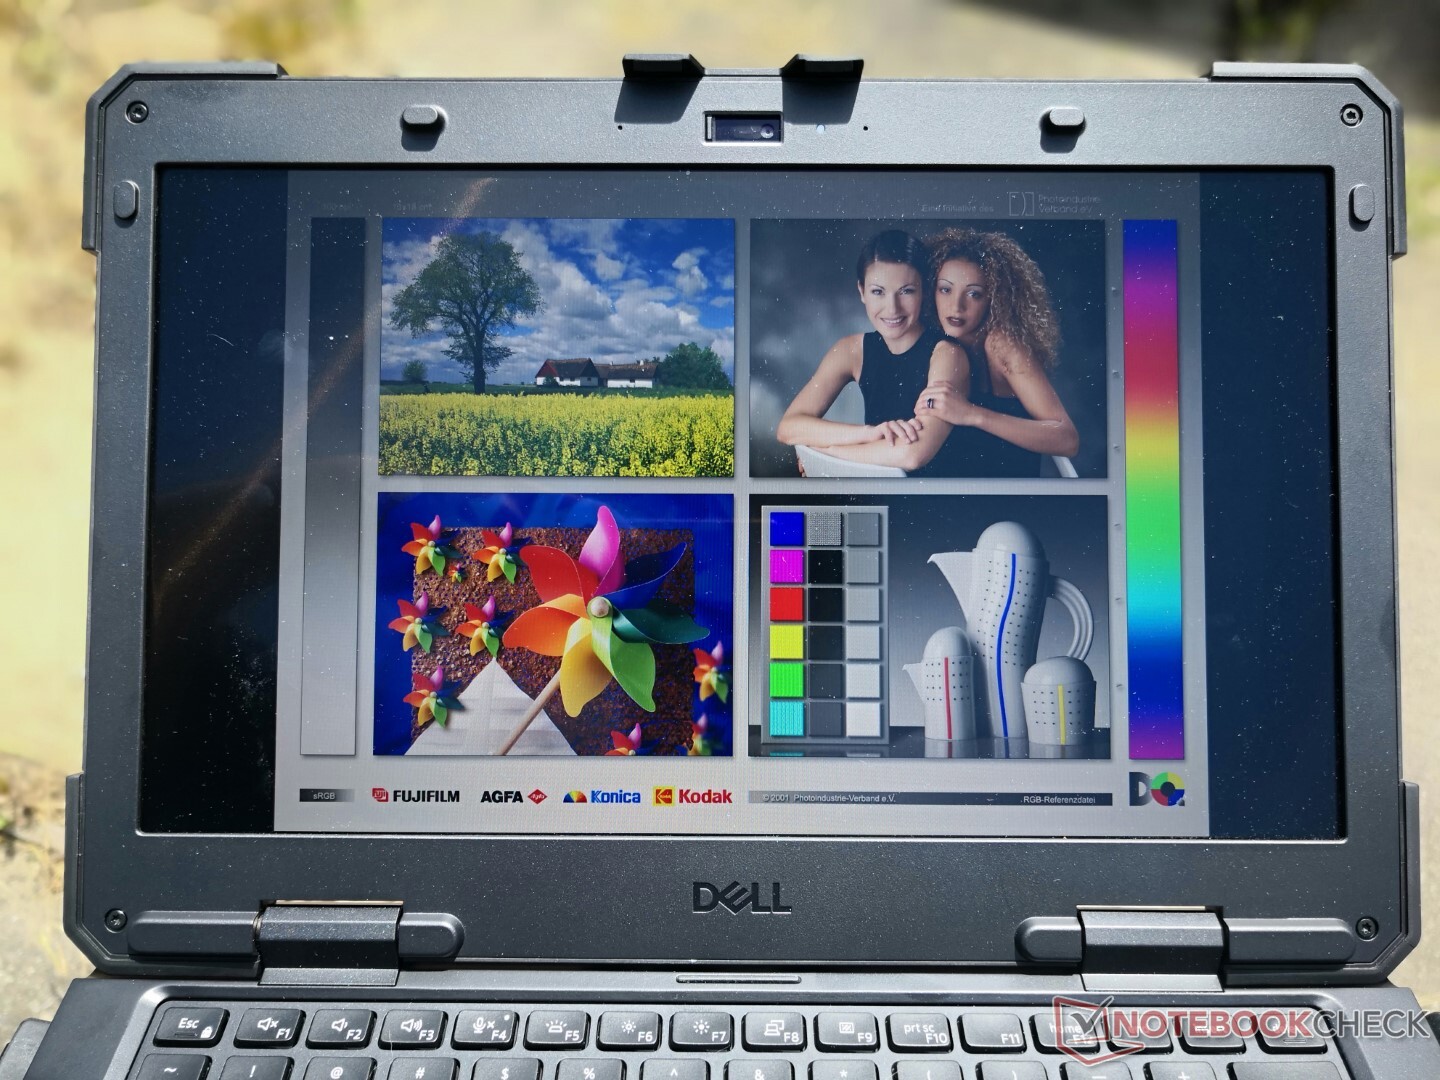
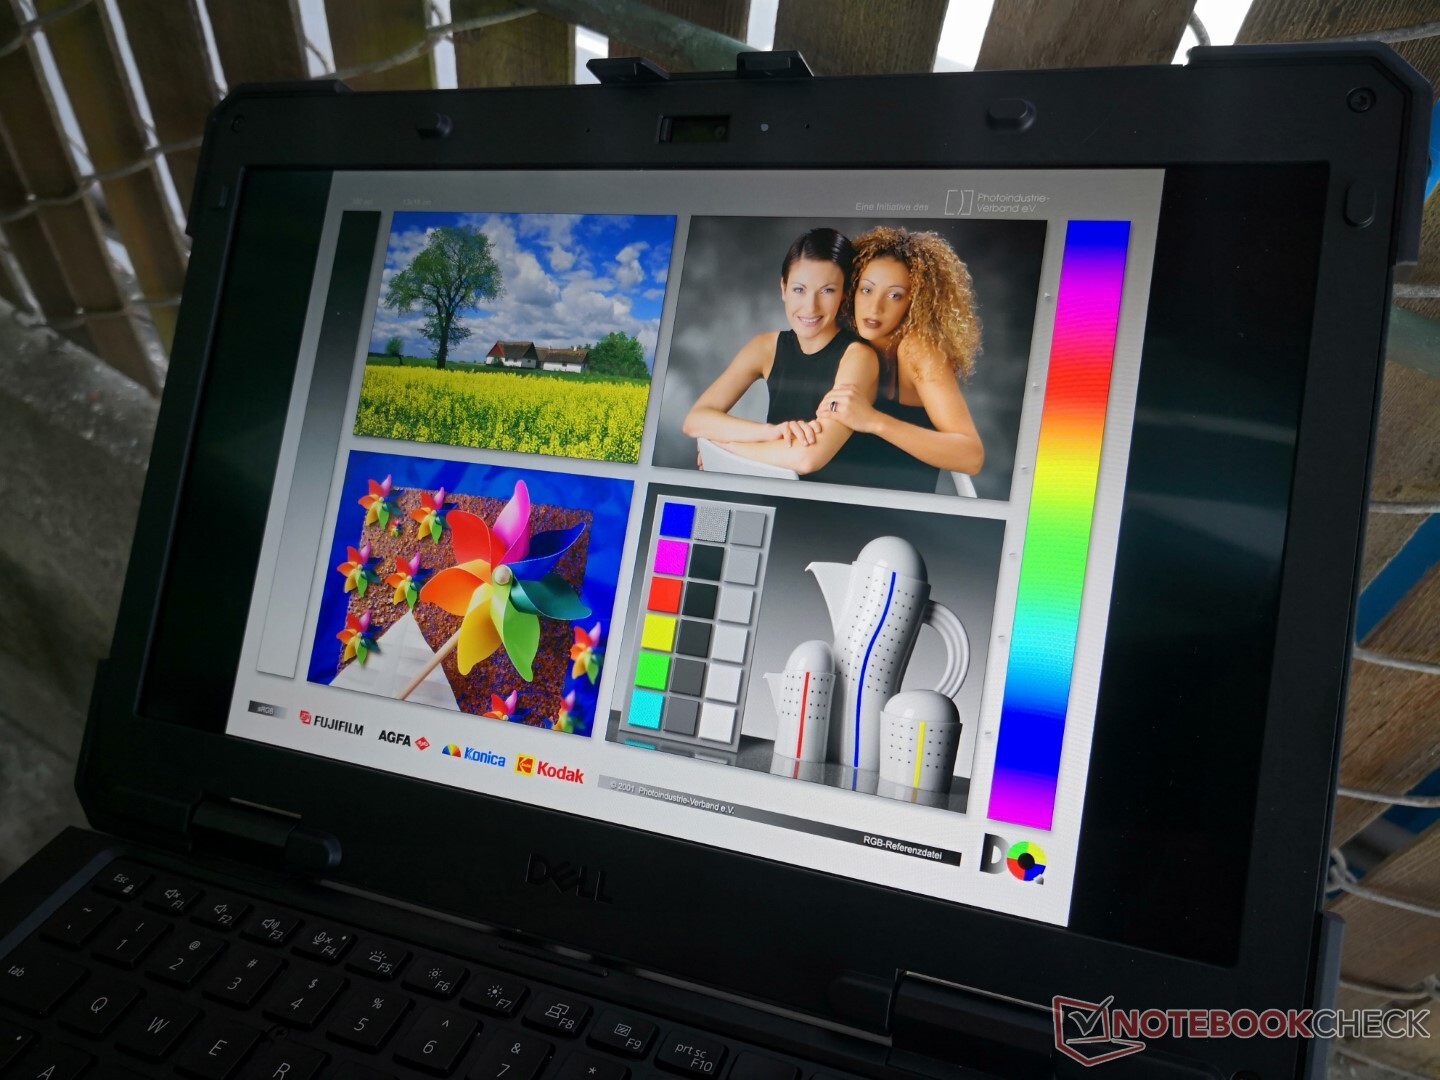
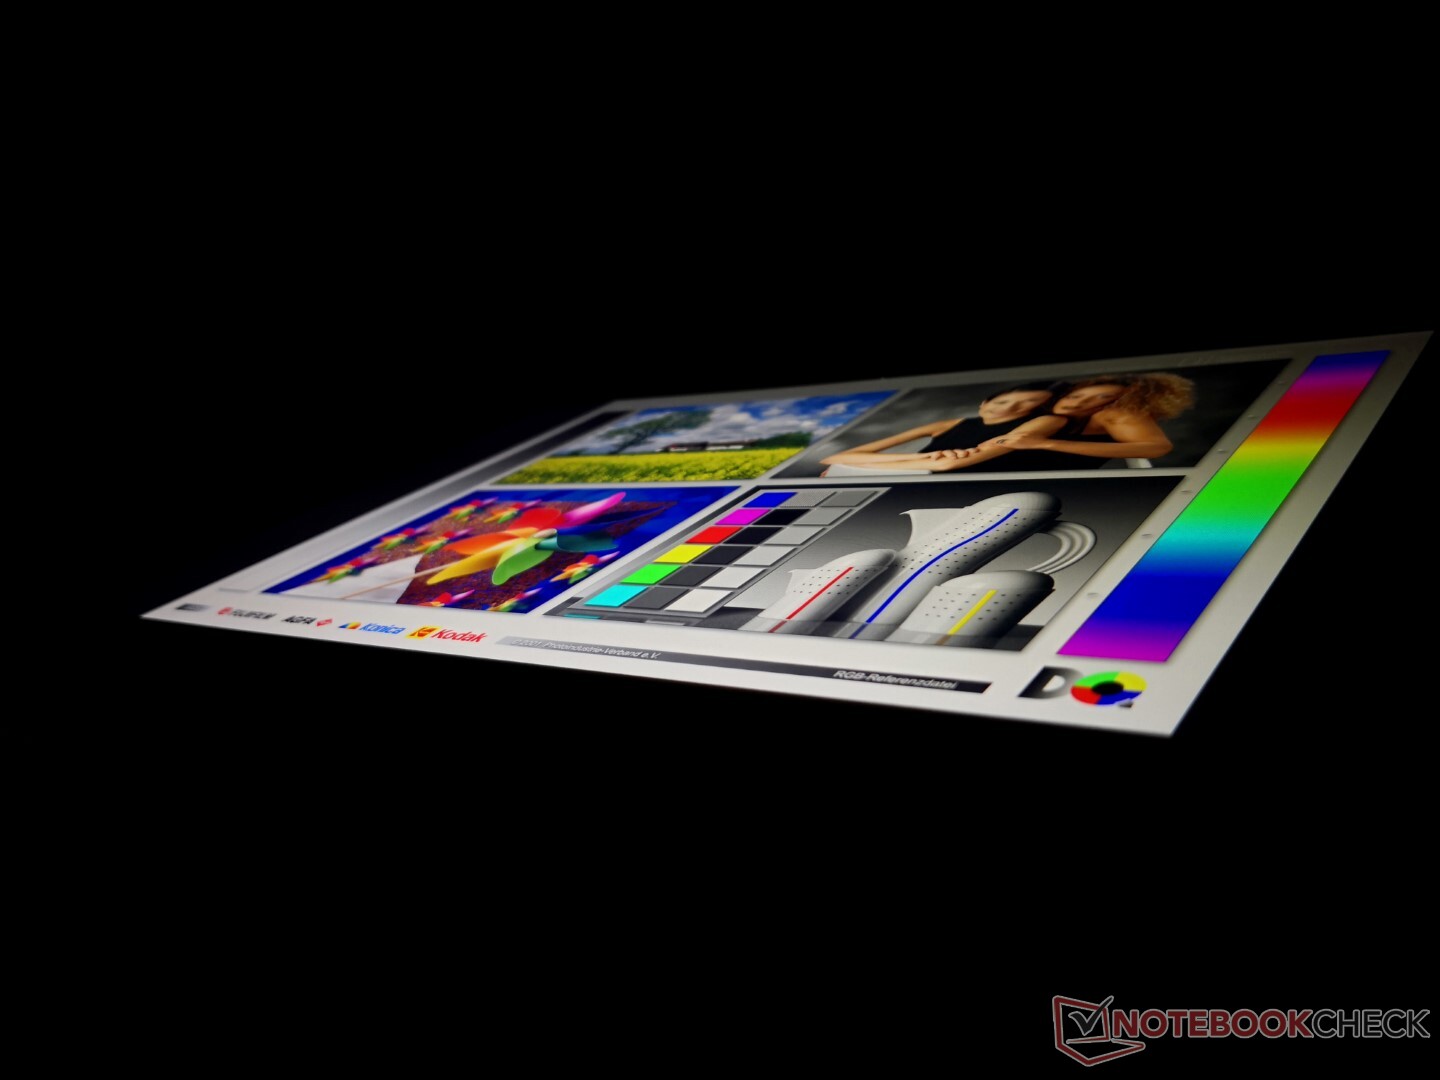
O Latitude 7330 Rugged Extreme utiliza o mesmo painel IPS 1080p Sharp LQ133M1 que foi encontrado no ano anterior 2016 XPS 13 9350 ouLatitude 13 7370. Embora isto possa parecer uma coisa ruim, este painel específico é melhor do que o painel médio na maioria dos outros portáteis robustos. O Panasonic Toughbook FZ-55 MK2, Durabook S14I, ou Getac B360, por exemplo, todos usam painéis com uma gama significativamente mais estreita e, portanto, com cores visivelmente mais rasas. Este é um dos poucos modelos robustos a oferecer um display de 1400-nit, contraste profundo de mais de 1500:1, e cobertura completa sRGB tudo em um. Também apreciamos a falta de PWM, ao contrário de muitos outros dispositivos robustos.
A desvantagem mais significativa para este painel é seu tempo de resposta muito lento, branco-preto e cinza-cinza, o que significa que o fantasma é muito perceptível. Isto, felizmente, não será um problema para aplicações mais lentas como navegadores ou editores de imagens.
| |||||||||||||||||||||||||
iluminação: 84 %
iluminação com acumulador: 1414.1 cd/m²
Contraste: 1704:1 (Preto: 0.83 cd/m²)
ΔE ColorChecker Calman: 1.99 | ∀{0.5-29.43 Ø4.71}
calibrated: 0.72
ΔE Greyscale Calman: 2.8 | ∀{0.09-98 Ø4.96}
69% AdobeRGB 1998 (Argyll 3D)
98.2% sRGB (Argyll 3D)
67.1% Display P3 (Argyll 3D)
Gamma: 2.06
CCT: 6775 K
| Dell Latitude 7330 Rugged Extreme Sharp LQ133M1, IPS, 1920x1080, 13.3" | Dell Latitude 7424 Rugged Extreme AU Optronics AUO523D, IPS, 1920x1080, 14" | Dell Latitude 5420 Rugged-P85G AU Optronics AUO523D, IPS, 1920x1080, 14" | Acer Enduro Urban N3 EUN314 XR140EA6T, IPS, 1920x1080, 14" | Panasonic Toughbook FZ-55 MK2 InfoVision M140NWF5 R3, IPS, 1920x1080, 14" | Durabook S14I KD140N0730A01, TN, 1920x1080, 14" | |
|---|---|---|---|---|---|---|
| Display | -2% | -7% | -5% | -48% | -34% | |
| Display P3 Coverage (%) | 67.1 | 65.3 -3% | 62.5 -7% | 63.5 -5% | 34.8 -48% | 43.55 -35% |
| sRGB Coverage (%) | 98.2 | 96.9 -1% | 92.4 -6% | 91.9 -6% | 52.2 -47% | 65.4 -33% |
| AdobeRGB 1998 Coverage (%) | 69 | 67.3 -2% | 64.2 -7% | 65.5 -5% | 36 -48% | 45 -35% |
| Response Times | 11% | 15% | 21% | 46% | 66% | |
| Response Time Grey 50% / Grey 80% * (ms) | 74.4 ? | 62.8 ? 16% | 68 ? 9% | 56 ? 25% | 28.4 ? 62% | 30.4 ? 59% |
| Response Time Black / White * (ms) | 42.4 ? | 40 ? 6% | 33.6 ? 21% | 35.2 ? 17% | 30 ? 29% | 11.8 ? 72% |
| PWM Frequency (Hz) | 763 | 735 ? | 1000 ? | 685 ? | 304.9 ? | |
| Screen | -71% | -75% | -97% | -99% | -232% | |
| Brightness middle (cd/m²) | 1414.1 | 844 -40% | 1111.7 -21% | 487.8 -66% | 1061.1 -25% | 1180.7 -17% |
| Brightness (cd/m²) | 1282 | 793 -38% | 1026 -20% | 464 -64% | 997 -22% | 1102 -14% |
| Brightness Distribution (%) | 84 | 88 5% | 80 -5% | 89 6% | 76 -10% | 89 6% |
| Black Level * (cd/m²) | 0.83 | 0.54 35% | 0.81 2% | 0.48 42% | 0.7 16% | 1.91 -130% |
| Contrast (:1) | 1704 | 1563 -8% | 1372 -19% | 1016 -40% | 1516 -11% | 618 -64% |
| Colorchecker dE 2000 * | 1.99 | 4.8 -141% | 3.83 -92% | 6.51 -227% | 4.64 -133% | 13.45 -576% |
| Colorchecker dE 2000 max. * | 3.75 | 11.88 -217% | 7.85 -109% | 11.36 -203% | 20.92 -458% | 22.52 -501% |
| Colorchecker dE 2000 calibrated * | 0.72 | 1.15 -60% | 2.98 -314% | 1.77 -146% | 2.52 -250% | 3.19 -343% |
| Greyscale dE 2000 * | 2.8 | 7.6 -171% | 5.6 -100% | 7.8 -179% | 2.8 -0% | 15.4 -450% |
| Gamma | 2.06 107% | 2.334 94% | 2.306 95% | 2.28 96% | 2.08 106% | 1.97 112% |
| CCT | 6775 96% | 6546 99% | 7676 85% | 8102 80% | 6364 102% | 21134 31% |
| Color Space (Percent of AdobeRGB 1998) (%) | 62 | 59 | 41.6 | |||
| Color Space (Percent of sRGB) (%) | 97 | 93 | 65.5 | |||
| Média Total (Programa/Configurações) | -21% /
-44% | -22% /
-48% | -27% /
-61% | -34% /
-68% | -67% /
-147% |
* ... menor é melhor
O painel já está bem calibrado fora da caixa e, portanto, a calibração do usuário final não é tão necessária. Calibrar nós mesmos o painel diminuiria ainda mais os valores médios da escala de cinza e da cor DeltaE de 2,8 e 1,99 para apenas 1,0 e 0,72, respectivamente.
Exibir tempos de resposta
| ↔ Tempo de resposta preto para branco | ||
|---|---|---|
| 42.4 ms ... ascensão ↗ e queda ↘ combinadas | ↗ 20.4 ms ascensão | 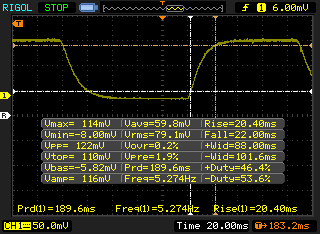 |
| ↘ 22 ms queda | ||
| A tela mostra taxas de resposta lentas em nossos testes e será insatisfatória para os jogadores. Em comparação, todos os dispositivos testados variam de 0.1 (mínimo) a 240 (máximo) ms. » 98 % de todos os dispositivos são melhores. Isso significa que o tempo de resposta medido é pior que a média de todos os dispositivos testados (19.8 ms). | ||
| ↔ Tempo de resposta 50% cinza a 80% cinza | ||
| 74.4 ms ... ascensão ↗ e queda ↘ combinadas | ↗ 37.6 ms ascensão | 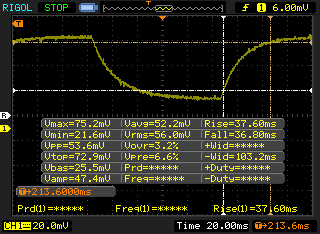 |
| ↘ 36.8 ms queda | ||
| A tela mostra taxas de resposta lentas em nossos testes e será insatisfatória para os jogadores. Em comparação, todos os dispositivos testados variam de 0.165 (mínimo) a 636 (máximo) ms. » 99 % de todos os dispositivos são melhores. Isso significa que o tempo de resposta medido é pior que a média de todos os dispositivos testados (31 ms). | ||
Cintilação da tela / PWM (modulação por largura de pulso)
| Tela tremeluzindo / PWM não detectado | 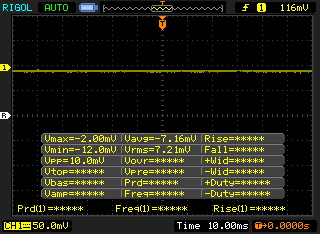 | ||
[pwm_comparison] Em comparação: 52 % de todos os dispositivos testados não usam PWM para escurecer a tela. Se PWM foi detectado, uma média de 7754 (mínimo: 5 - máximo: 343500) Hz foi medida. | |||
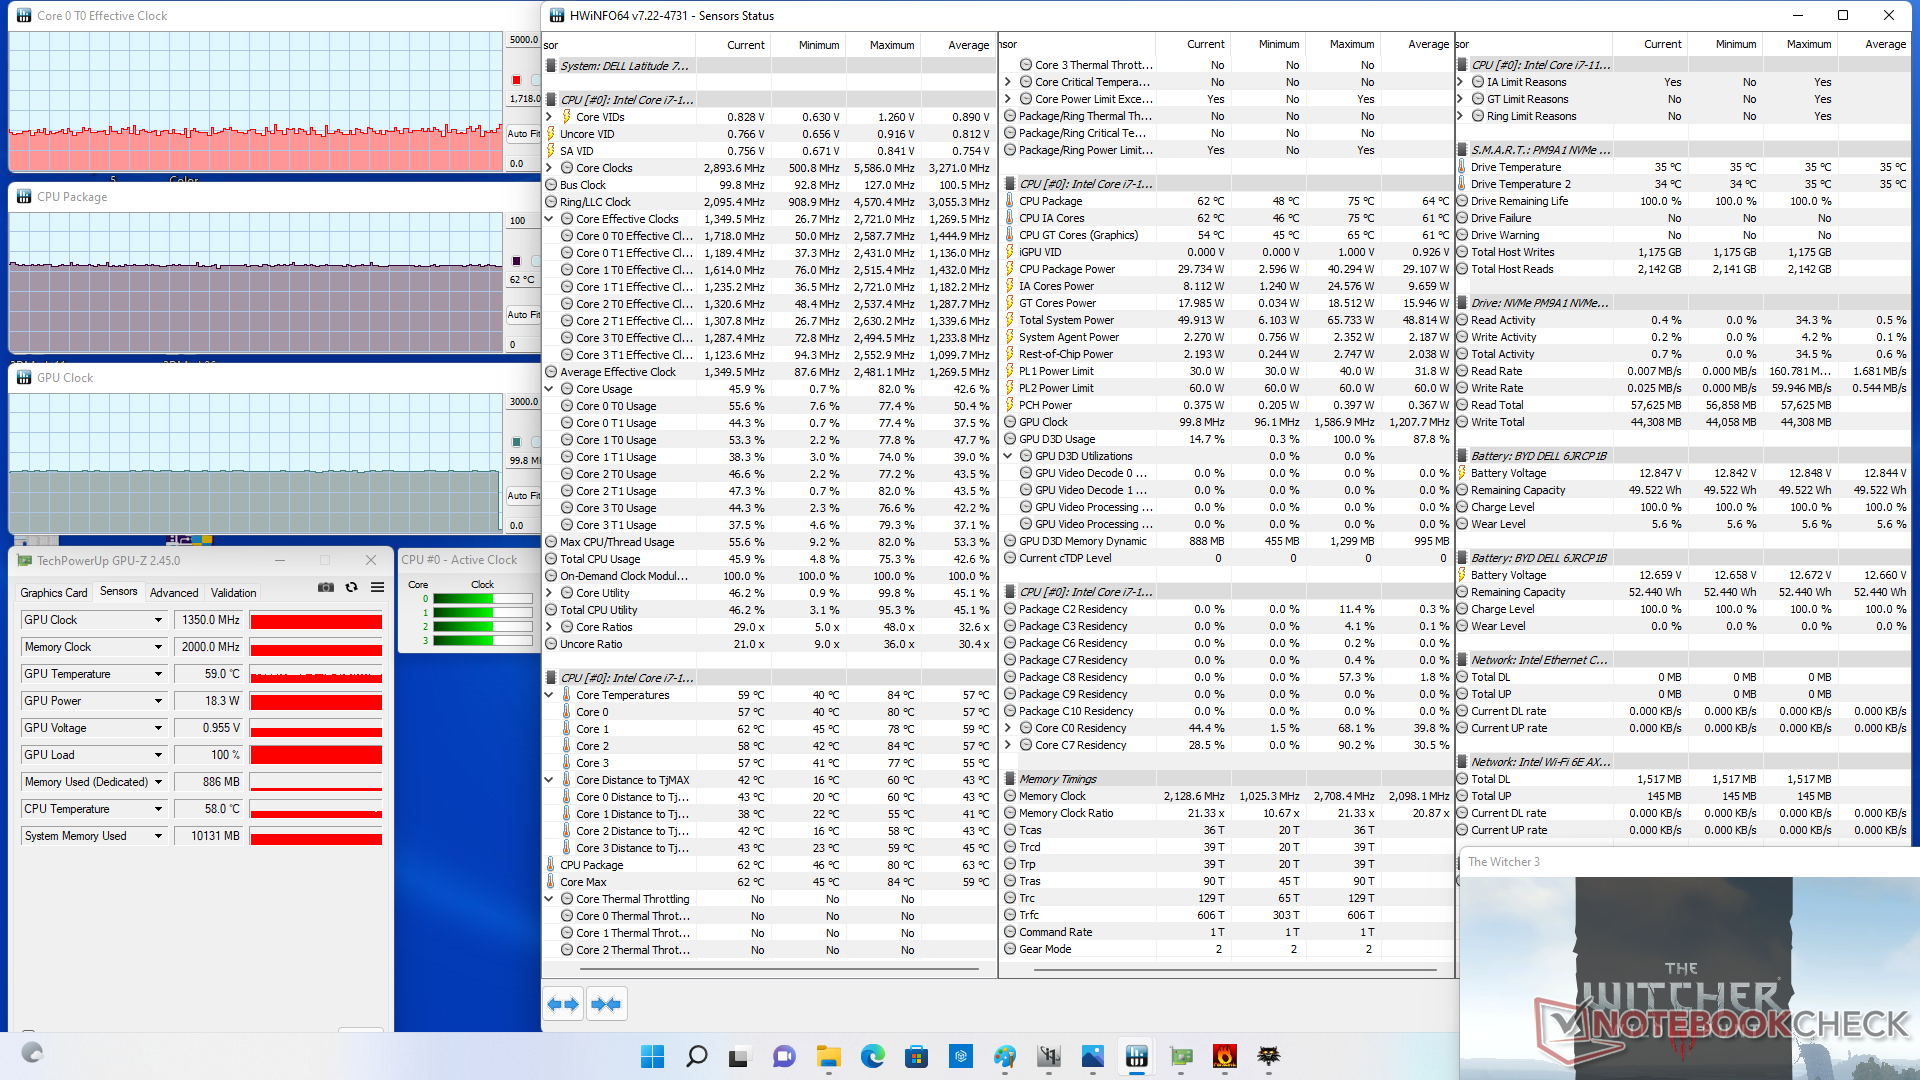
Desempenho
Condições de teste
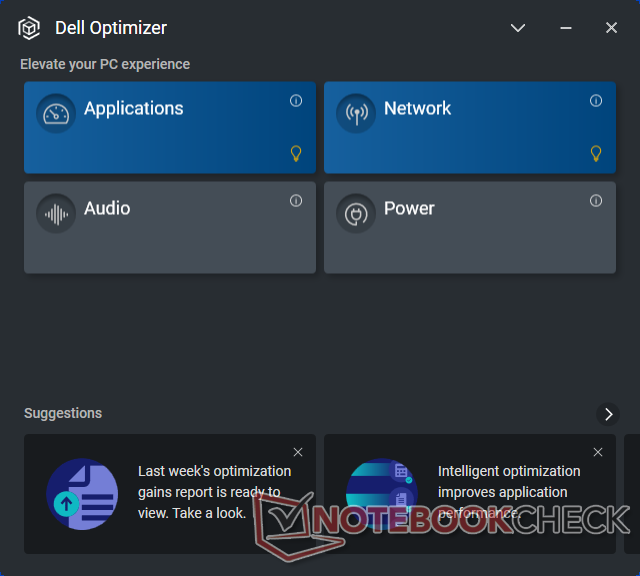
Nossa unidade foi ajustada para o modo Performance e Ultra Performance via Windows e Dell Power Manager, respectivamente, antes de executar quaisquer benchmarks abaixo. Recomendamos aos usuários que se familiarizem com os aplicativos Power Manager e Optimizer pré-instalados, pois algumas características do laptop só podem ser alternadas através destes softwares.

Processador
O desempenho bruto da CPU é excelente, com resultados que estão dentro de apenas alguns pontos percentuais da média Núcleo i7-1185G7 em nosso banco de dados. A sustentabilidade do desempenho também é boa, pois as pontuações não caem com o tempo ao executar o CineBench R15 xT em um loop
Tenha em mente que o Core i7-1185G7 tem um desempenho semelhante ao menos caro Núcleo i7-1165G7. Se a vPro não é importante, então o Core i7-1165G7 pode proporcionar essencialmente a mesma experiência.
Cinebench R15 Multi Loop
Cinebench R20: CPU (Multi Core) | CPU (Single Core)
Cinebench R23: Multi Core | Single Core
Blender: v2.79 BMW27 CPU
7-Zip 18.03: 7z b 4 | 7z b 4 -mmt1
Geekbench 5.5: Multi-Core | Single-Core
HWBOT x265 Benchmark v2.2: 4k Preset
LibreOffice : 20 Documents To PDF
R Benchmark 2.5: Overall mean
| Cinebench R15 / CPU Multi 64Bit | |
| Média Intel Core i7-1185G7 (617 - 1066, n=32) | |
| Acer Enduro Urban N3 EUN314 | |
| Dell Latitude 7330 Rugged Extreme | |
| Panasonic Toughbook FZ-55 MK2 | |
| Lenovo ThinkPad P15s Gen1-20T4000JGE | |
| Getac B360 | |
| Durabook S14I | |
| Fujitsu LifeBook U7310 | |
| Dell Latitude 7424 Rugged Extreme | |
| Dell Latitude 5420 Rugged-P85G | |
| Cinebench R15 / CPU Single 64Bit | |
| Dell Latitude 7330 Rugged Extreme | |
| Panasonic Toughbook FZ-55 MK2 | |
| Média Intel Core i7-1185G7 (168 - 230, n=27) | |
| Acer Enduro Urban N3 EUN314 | |
| Durabook S14I | |
| Lenovo ThinkPad P15s Gen1-20T4000JGE | |
| Getac B360 | |
| Fujitsu LifeBook U7310 | |
| Dell Latitude 5420 Rugged-P85G | |
| Dell Latitude 7424 Rugged Extreme | |
| Cinebench R20 / CPU (Multi Core) | |
| Dell Latitude 7330 Rugged Extreme | |
| Panasonic Toughbook FZ-55 MK2 | |
| Média Intel Core i7-1185G7 (1425 - 2493, n=28) | |
| Acer Enduro Urban N3 EUN314 | |
| Lenovo ThinkPad P15s Gen1-20T4000JGE | |
| Getac B360 | |
| Durabook S14I | |
| Fujitsu LifeBook U7310 | |
| Cinebench R20 / CPU (Single Core) | |
| Dell Latitude 7330 Rugged Extreme | |
| Média Intel Core i7-1185G7 (489 - 593, n=28) | |
| Acer Enduro Urban N3 EUN314 | |
| Panasonic Toughbook FZ-55 MK2 | |
| Durabook S14I | |
| Lenovo ThinkPad P15s Gen1-20T4000JGE | |
| Getac B360 | |
| Fujitsu LifeBook U7310 | |
| Cinebench R23 / Multi Core | |
| Dell Latitude 7330 Rugged Extreme | |
| Média Intel Core i7-1185G7 (3610 - 6383, n=24) | |
| Panasonic Toughbook FZ-55 MK2 | |
| Acer Enduro Urban N3 EUN314 | |
| Getac B360 | |
| Durabook S14I | |
| Cinebench R23 / Single Core | |
| Dell Latitude 7330 Rugged Extreme | |
| Média Intel Core i7-1185G7 (1251 - 1532, n=24) | |
| Panasonic Toughbook FZ-55 MK2 | |
| Acer Enduro Urban N3 EUN314 | |
| Durabook S14I | |
| Getac B360 | |
| Blender / v2.79 BMW27 CPU | |
| Fujitsu LifeBook U7310 | |
| Durabook S14I | |
| Lenovo ThinkPad P15s Gen1-20T4000JGE | |
| Getac B360 | |
| Média Intel Core i7-1185G7 (478 - 745, n=28) | |
| Panasonic Toughbook FZ-55 MK2 | |
| Acer Enduro Urban N3 EUN314 | |
| Dell Latitude 7330 Rugged Extreme | |
| 7-Zip 18.03 / 7z b 4 | |
| Acer Enduro Urban N3 EUN314 | |
| Dell Latitude 7330 Rugged Extreme | |
| Panasonic Toughbook FZ-55 MK2 | |
| Média Intel Core i7-1185G7 (18812 - 27693, n=27) | |
| Getac B360 | |
| Lenovo ThinkPad P15s Gen1-20T4000JGE | |
| Durabook S14I | |
| Fujitsu LifeBook U7310 | |
| 7-Zip 18.03 / 7z b 4 -mmt1 | |
| Dell Latitude 7330 Rugged Extreme | |
| Acer Enduro Urban N3 EUN314 | |
| Panasonic Toughbook FZ-55 MK2 | |
| Durabook S14I | |
| Média Intel Core i7-1185G7 (3678 - 5507, n=27) | |
| Lenovo ThinkPad P15s Gen1-20T4000JGE | |
| Getac B360 | |
| Fujitsu LifeBook U7310 | |
| Geekbench 5.5 / Multi-Core | |
| Dell Latitude 7330 Rugged Extreme | |
| Média Intel Core i7-1185G7 (4620 - 5944, n=21) | |
| Acer Enduro Urban N3 EUN314 | |
| Getac B360 | |
| Lenovo ThinkPad P15s Gen1-20T4000JGE | |
| Durabook S14I | |
| Fujitsu LifeBook U7310 | |
| Geekbench 5.5 / Single-Core | |
| Dell Latitude 7330 Rugged Extreme | |
| Acer Enduro Urban N3 EUN314 | |
| Média Intel Core i7-1185G7 (1398 - 1626, n=21) | |
| Durabook S14I | |
| Getac B360 | |
| Lenovo ThinkPad P15s Gen1-20T4000JGE | |
| Fujitsu LifeBook U7310 | |
| HWBOT x265 Benchmark v2.2 / 4k Preset | |
| Dell Latitude 7330 Rugged Extreme | |
| Panasonic Toughbook FZ-55 MK2 | |
| Acer Enduro Urban N3 EUN314 | |
| Média Intel Core i7-1185G7 (5.02 - 8.13, n=27) | |
| Getac B360 | |
| Lenovo ThinkPad P15s Gen1-20T4000JGE | |
| Durabook S14I | |
| Fujitsu LifeBook U7310 | |
| LibreOffice / 20 Documents To PDF | |
| Lenovo ThinkPad P15s Gen1-20T4000JGE | |
| Acer Enduro Urban N3 EUN314 | |
| Fujitsu LifeBook U7310 | |
| Média Intel Core i7-1185G7 (41.3 - 61.7, n=26) | |
| Dell Latitude 7330 Rugged Extreme | |
| Panasonic Toughbook FZ-55 MK2 | |
| Durabook S14I | |
| R Benchmark 2.5 / Overall mean | |
| Fujitsu LifeBook U7310 | |
| Getac B360 | |
| Lenovo ThinkPad P15s Gen1-20T4000JGE | |
| Durabook S14I | |
| Média Intel Core i7-1185G7 (0.55 - 0.615, n=27) | |
| Acer Enduro Urban N3 EUN314 | |
| Panasonic Toughbook FZ-55 MK2 | |
| Dell Latitude 7330 Rugged Extreme | |
* ... menor é melhor
AIDA64: FP32 Ray-Trace | FPU Julia | CPU SHA3 | CPU Queen | FPU SinJulia | FPU Mandel | CPU AES | CPU ZLib | FP64 Ray-Trace | CPU PhotoWorxx
| Performance rating | |
| Dell Latitude 7330 Rugged Extreme | |
| Acer Enduro Urban N3 EUN314 | |
| Média Intel Core i7-1185G7 | |
| Panasonic Toughbook FZ-55 MK2 | |
| Durabook S14I | |
| AIDA64 / FP32 Ray-Trace | |
| Dell Latitude 7330 Rugged Extreme | |
| Acer Enduro Urban N3 EUN314 | |
| Média Intel Core i7-1185G7 (5621 - 7453, n=20) | |
| Panasonic Toughbook FZ-55 MK2 | |
| Durabook S14I | |
| AIDA64 / FPU Julia | |
| Dell Latitude 7330 Rugged Extreme | |
| Acer Enduro Urban N3 EUN314 | |
| Panasonic Toughbook FZ-55 MK2 | |
| Média Intel Core i7-1185G7 (23248 - 32614, n=20) | |
| Durabook S14I | |
| AIDA64 / CPU SHA3 | |
| Dell Latitude 7330 Rugged Extreme | |
| Acer Enduro Urban N3 EUN314 | |
| Média Intel Core i7-1185G7 (1530 - 2209, n=20) | |
| Panasonic Toughbook FZ-55 MK2 | |
| Durabook S14I | |
| AIDA64 / CPU Queen | |
| Dell Latitude 7330 Rugged Extreme | |
| Acer Enduro Urban N3 EUN314 | |
| Durabook S14I | |
| Panasonic Toughbook FZ-55 MK2 | |
| Média Intel Core i7-1185G7 (44677 - 52815, n=20) | |
| AIDA64 / FPU SinJulia | |
| Dell Latitude 7330 Rugged Extreme | |
| Acer Enduro Urban N3 EUN314 | |
| Panasonic Toughbook FZ-55 MK2 | |
| Média Intel Core i7-1185G7 (3870 - 5027, n=20) | |
| Durabook S14I | |
| AIDA64 / FPU Mandel | |
| Dell Latitude 7330 Rugged Extreme | |
| Acer Enduro Urban N3 EUN314 | |
| Panasonic Toughbook FZ-55 MK2 | |
| Média Intel Core i7-1185G7 (14584 - 19594, n=20) | |
| Durabook S14I | |
| AIDA64 / CPU AES | |
| Dell Latitude 7330 Rugged Extreme | |
| Acer Enduro Urban N3 EUN314 | |
| Durabook S14I | |
| Média Intel Core i7-1185G7 (33002 - 76826, n=20) | |
| Panasonic Toughbook FZ-55 MK2 | |
| AIDA64 / CPU ZLib | |
| Dell Latitude 7330 Rugged Extreme | |
| Acer Enduro Urban N3 EUN314 | |
| Média Intel Core i7-1185G7 (258 - 412, n=22) | |
| Panasonic Toughbook FZ-55 MK2 | |
| Durabook S14I | |
| AIDA64 / FP64 Ray-Trace | |
| Dell Latitude 7330 Rugged Extreme | |
| Acer Enduro Urban N3 EUN314 | |
| Panasonic Toughbook FZ-55 MK2 | |
| Média Intel Core i7-1185G7 (2821 - 4094, n=20) | |
| Durabook S14I | |
| AIDA64 / CPU PhotoWorxx | |
| Dell Latitude 7330 Rugged Extreme | |
| Média Intel Core i7-1185G7 (22349 - 43701, n=20) | |
| Acer Enduro Urban N3 EUN314 | |
| Panasonic Toughbook FZ-55 MK2 | |
| Durabook S14I | |
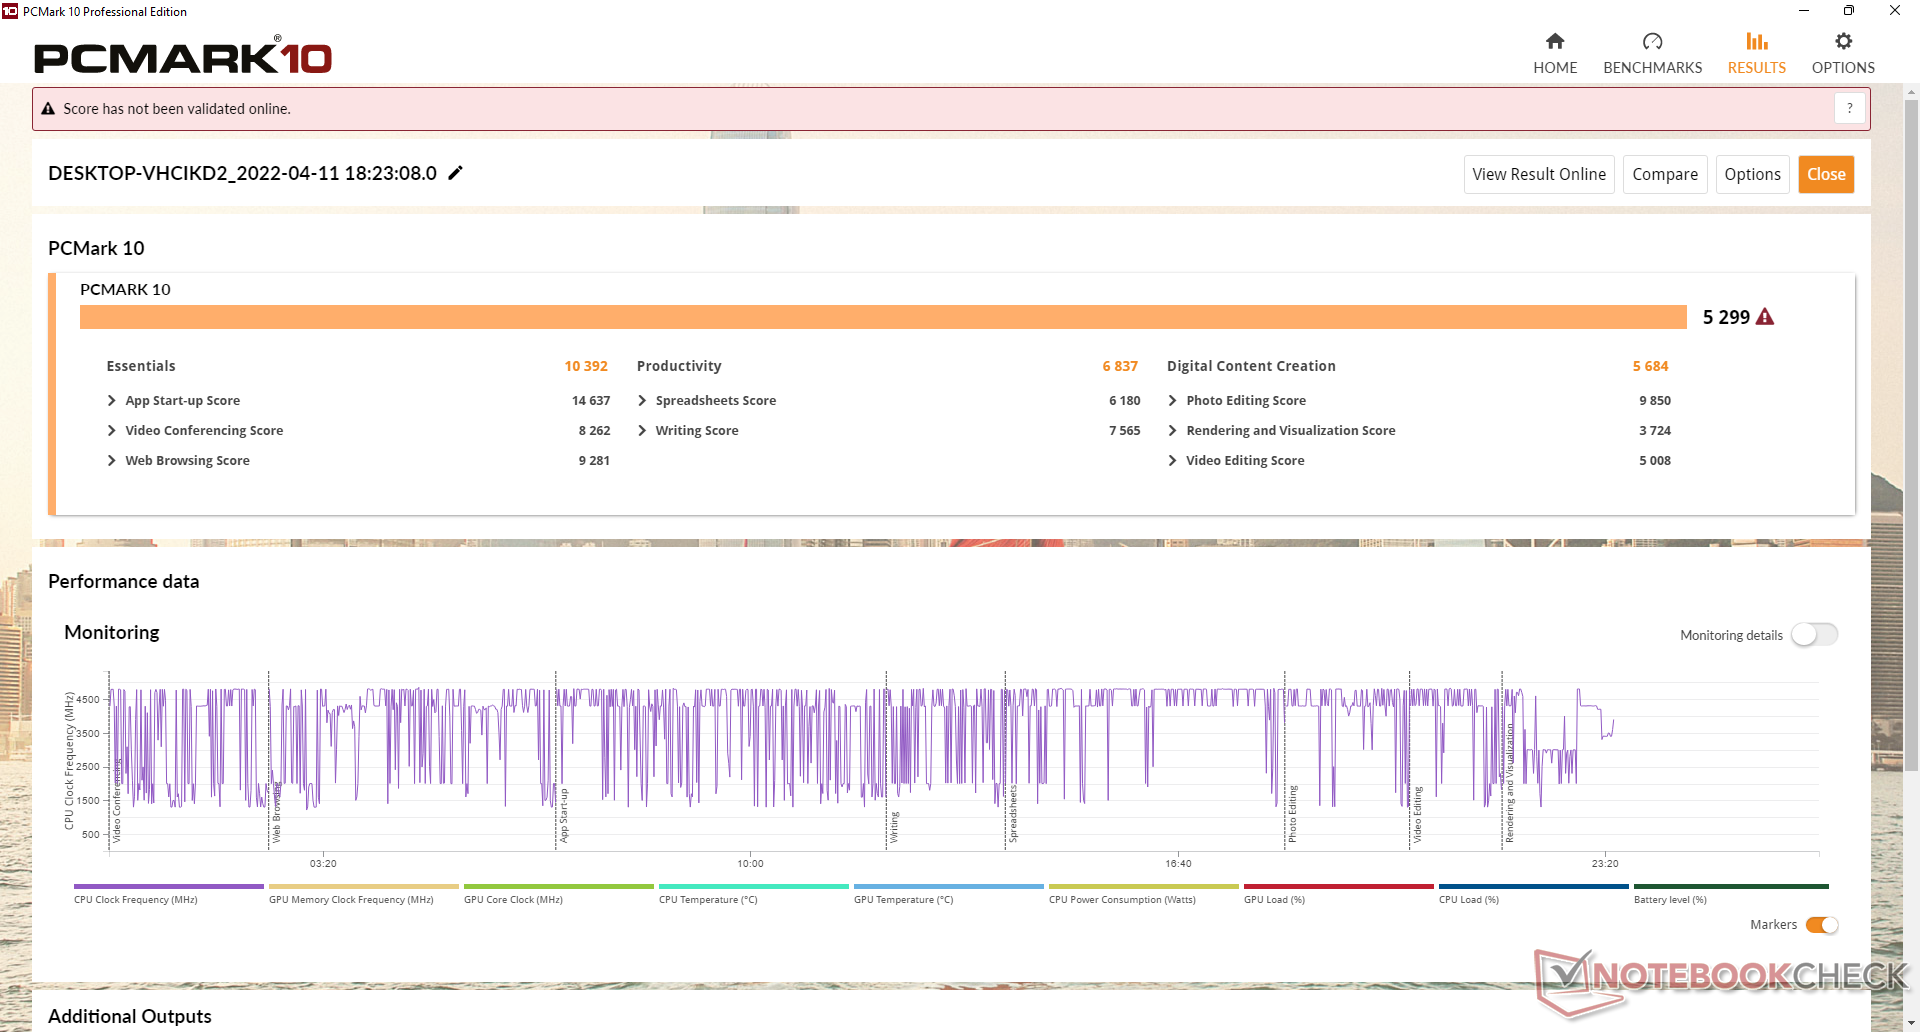
Desempenho do sistema
Os resultados da PCMark são consistentemente mais altos do que no Panasonic Toughbook FZ-55 MK2 que vem com o mesmo processador de nossa unidade Dell. É recomendado configurar com RAM de canal duplo se possível ou então o desempenho gráfico será prejudicado.
| PCMark 10 / Score | |
| Dell Latitude 7330 Rugged Extreme | |
| Panasonic Toughbook FZ-55 MK2 | |
| Durabook S14I | |
| Acer Enduro Urban N3 EUN314 | |
| Dell Latitude 7424 Rugged Extreme | |
| Dell Latitude 5420 Rugged-P85G | |
| PCMark 10 / Essentials | |
| Dell Latitude 7330 Rugged Extreme | |
| Panasonic Toughbook FZ-55 MK2 | |
| Durabook S14I | |
| Acer Enduro Urban N3 EUN314 | |
| Dell Latitude 7424 Rugged Extreme | |
| Dell Latitude 5420 Rugged-P85G | |
| PCMark 10 / Productivity | |
| Dell Latitude 7424 Rugged Extreme | |
| Dell Latitude 5420 Rugged-P85G | |
| Durabook S14I | |
| Dell Latitude 7330 Rugged Extreme | |
| Panasonic Toughbook FZ-55 MK2 | |
| Acer Enduro Urban N3 EUN314 | |
| PCMark 10 / Digital Content Creation | |
| Dell Latitude 7330 Rugged Extreme | |
| Panasonic Toughbook FZ-55 MK2 | |
| Acer Enduro Urban N3 EUN314 | |
| Durabook S14I | |
| Dell Latitude 5420 Rugged-P85G | |
| Dell Latitude 7424 Rugged Extreme | |
| PCMark 10 Score | 5299 pontos | |
Ajuda | ||
| AIDA64 / Memory Copy | |
| Dell Latitude 7330 Rugged Extreme | |
| Média Intel Core i7-1185G7 (36515 - 68450, n=20) | |
| Acer Enduro Urban N3 EUN314 | |
| Panasonic Toughbook FZ-55 MK2 | |
| Durabook S14I | |
| AIDA64 / Memory Read | |
| Dell Latitude 7330 Rugged Extreme | |
| Média Intel Core i7-1185G7 (38394 - 64291, n=20) | |
| Acer Enduro Urban N3 EUN314 | |
| Panasonic Toughbook FZ-55 MK2 | |
| Durabook S14I | |
| AIDA64 / Memory Write | |
| Dell Latitude 7330 Rugged Extreme | |
| Média Intel Core i7-1185G7 (37684 - 66873, n=20) | |
| Acer Enduro Urban N3 EUN314 | |
| Panasonic Toughbook FZ-55 MK2 | |
| Durabook S14I | |
| AIDA64 / Memory Latency | |
| Dell Latitude 7330 Rugged Extreme | |
| Média Intel Core i7-1185G7 (78.3 - 117, n=22) | |
| Acer Enduro Urban N3 EUN314 | |
| Panasonic Toughbook FZ-55 MK2 | |
| Durabook S14I | |
* ... menor é melhor
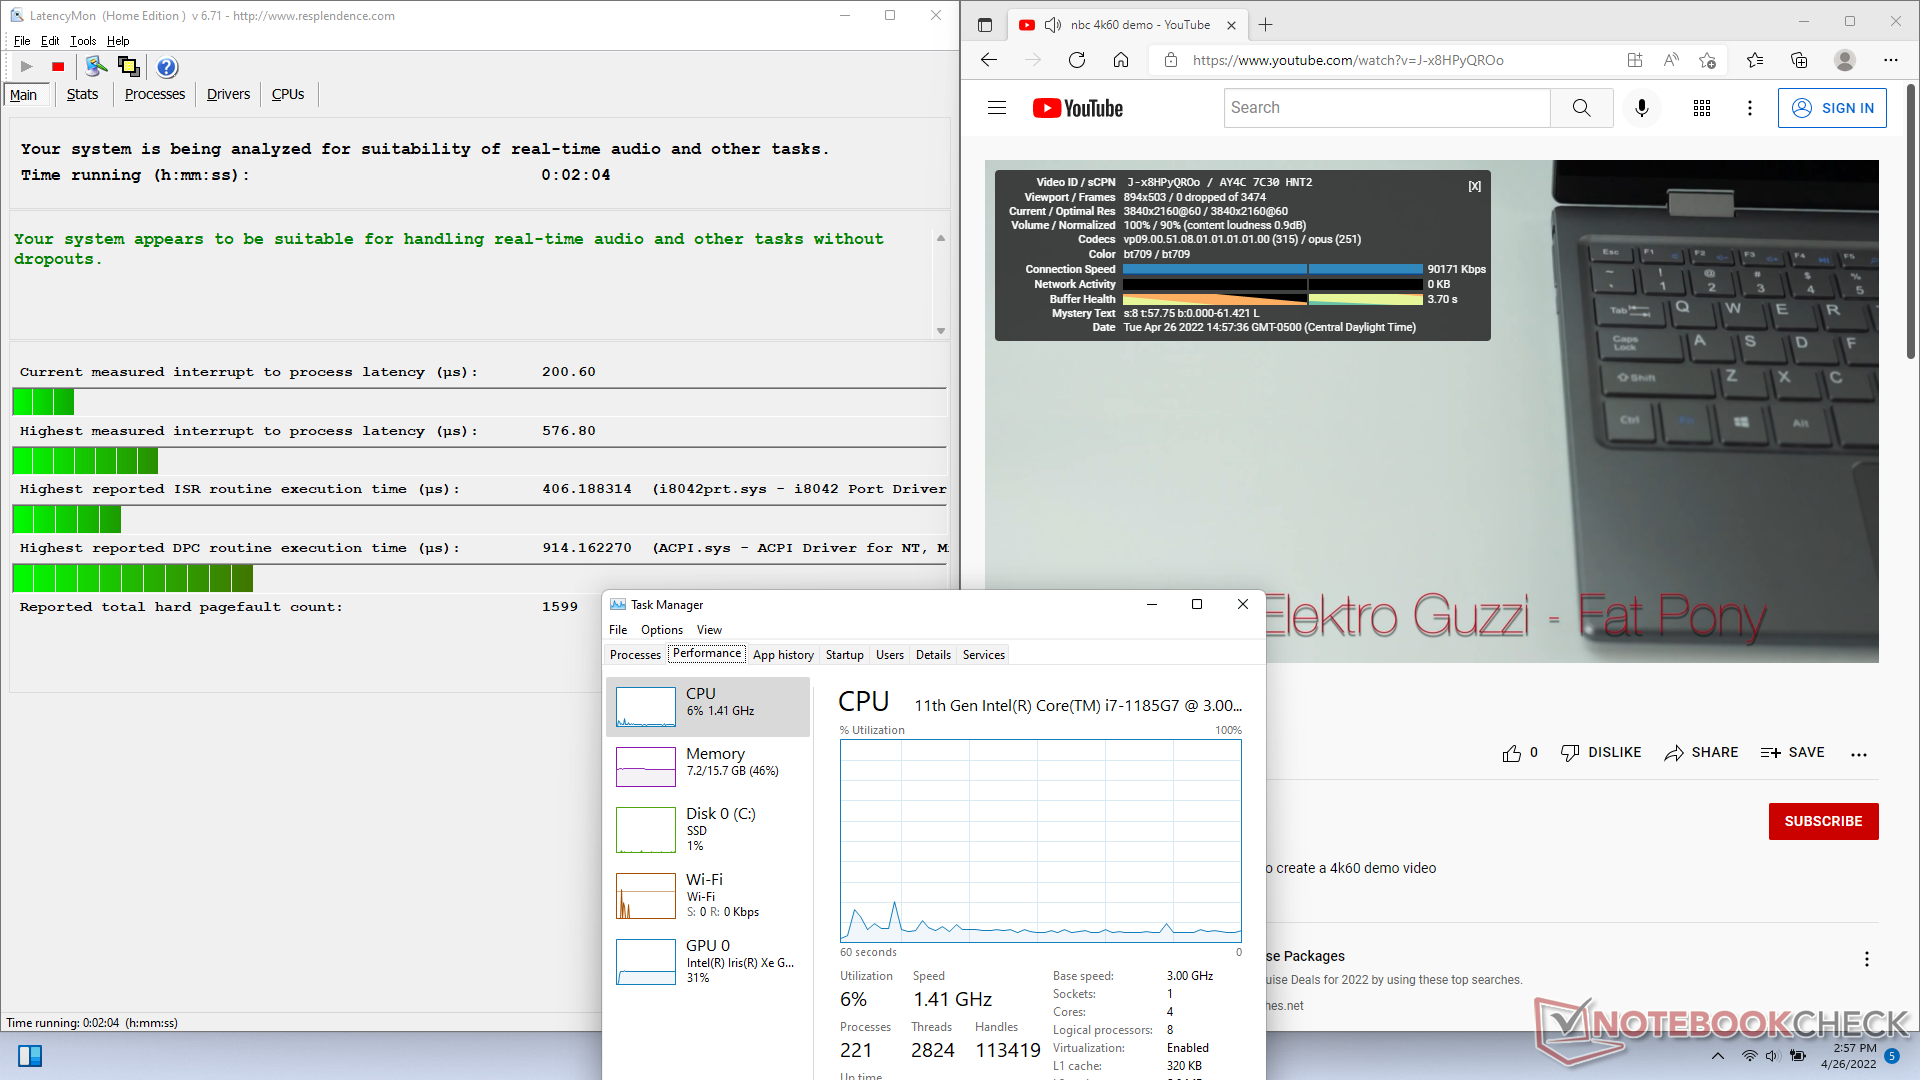
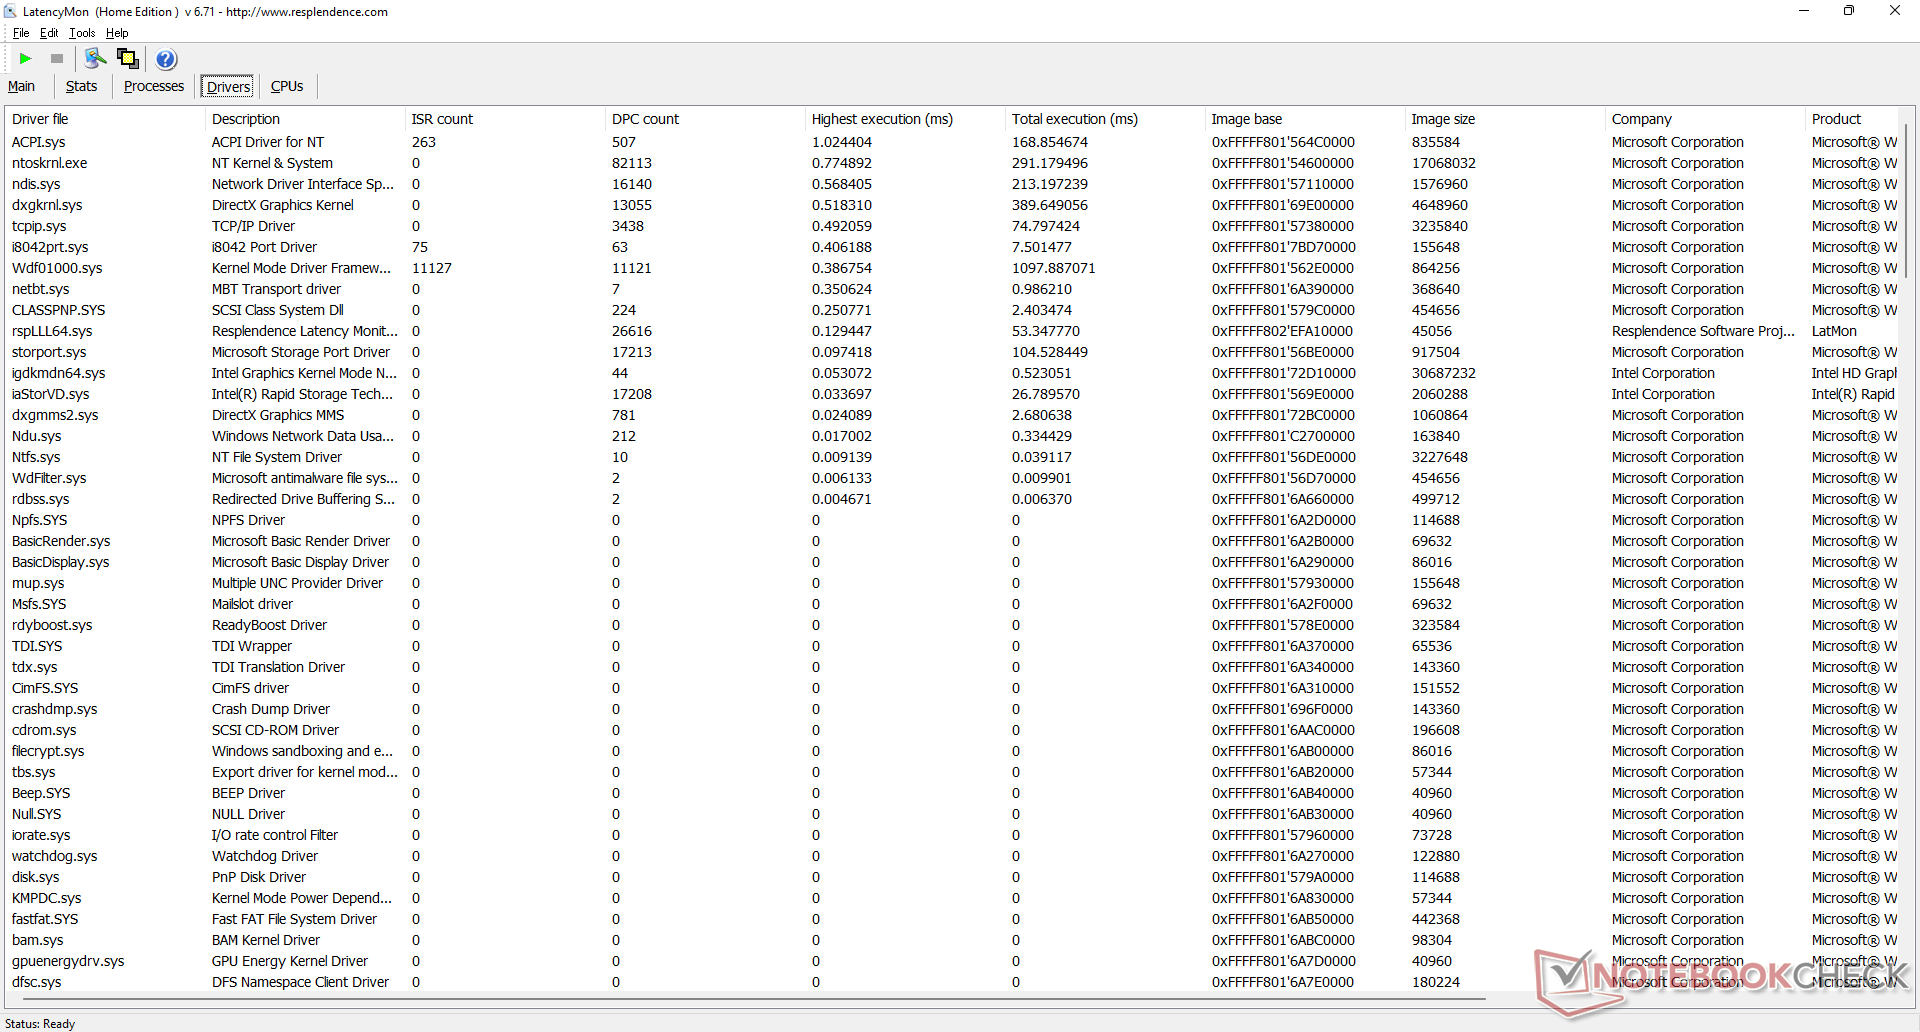
Latência do DPC
LatencyMon não revela problemas de latência ao abrir várias abas de nossa página inicial. a reprodução do vídeo 4K a 60 FPS também é suave, sem queda de quadros gravados.
| DPC Latencies / LatencyMon - interrupt to process latency (max), Web, Youtube, Prime95 | |
| Acer Enduro Urban N3 EUN314 | |
| Panasonic Toughbook FZ-55 MK2 | |
| Durabook S14I | |
| Dell Latitude 7330 Rugged Extreme | |
* ... menor é melhor
Dispositivos de armazenamento
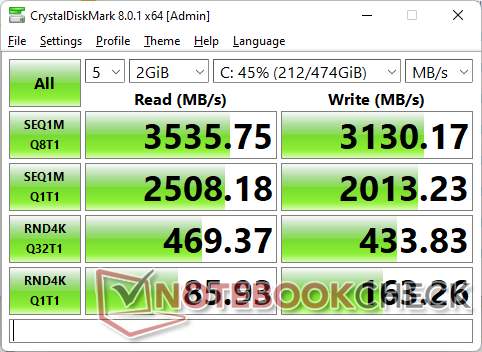
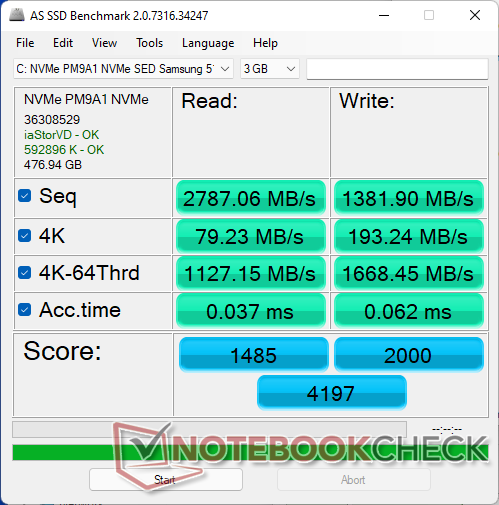
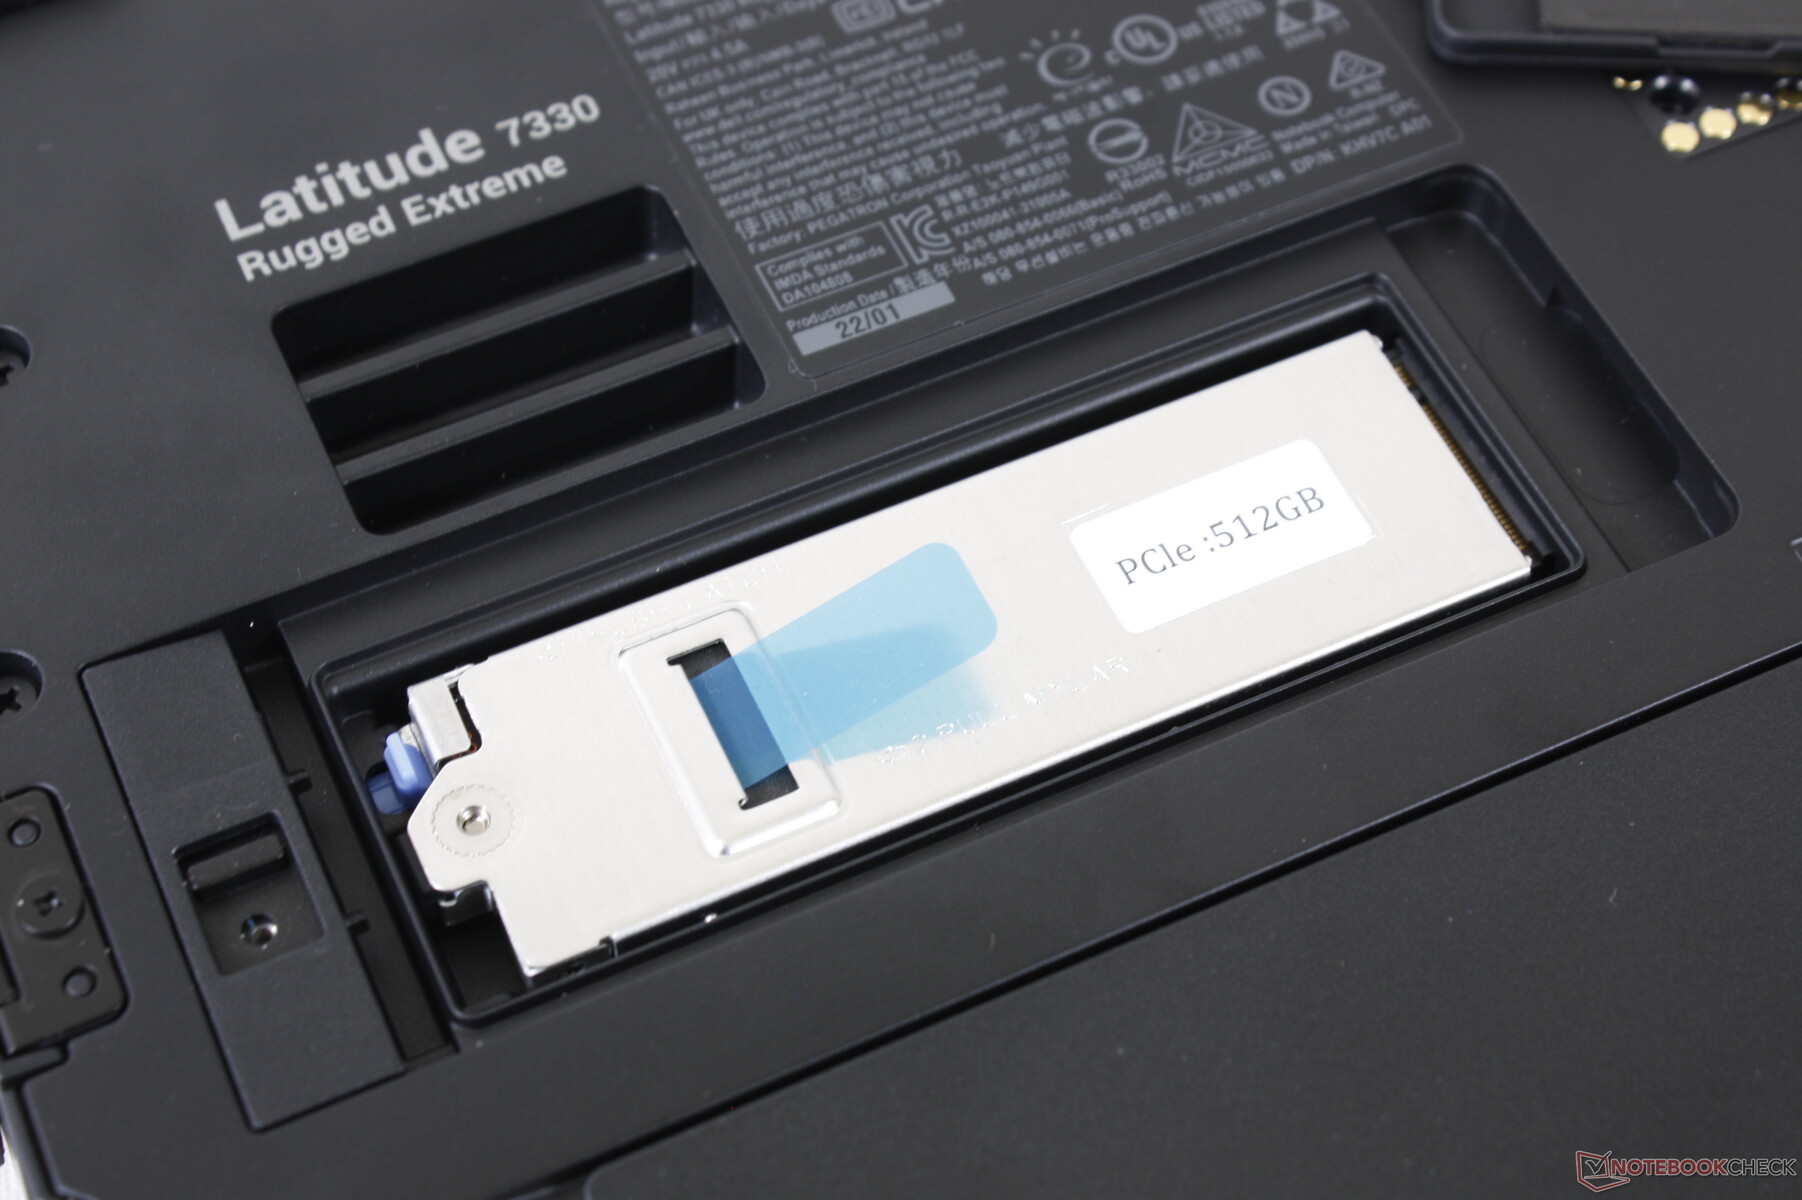
O sistema suporta apenas um drive interno M.2 2280 enquanto que os drives múltiplos no Getac B360 podem ser trocados rapidamente sem nenhuma ferramenta. Nossa unidade de teste particular é fornecida com um Samsung PM9A1 SED NVMe SSDmas opções padrão não autoencriptadas também estão disponíveis. O desempenho é excelente, sem estrangulamento de desempenho, mesmo que as taxas de transferência bruta não sejam tão rápidas como uma unidade de consumo padrão não-SED.

| Drive Performance rating - Percent | |
| Dell Latitude 7330 Rugged Extreme | |
| Acer Enduro Urban N3 EUN314 | |
| Durabook S14I | |
| Dell Latitude 5420 Rugged-P85G -8! | |
| Dell Latitude 7424 Rugged Extreme -8! | |
| Panasonic Toughbook FZ-55 MK2 | |
* ... menor é melhor
Disk Throttling: DiskSpd Read Loop, Queue Depth 8
Desempenho da GPU
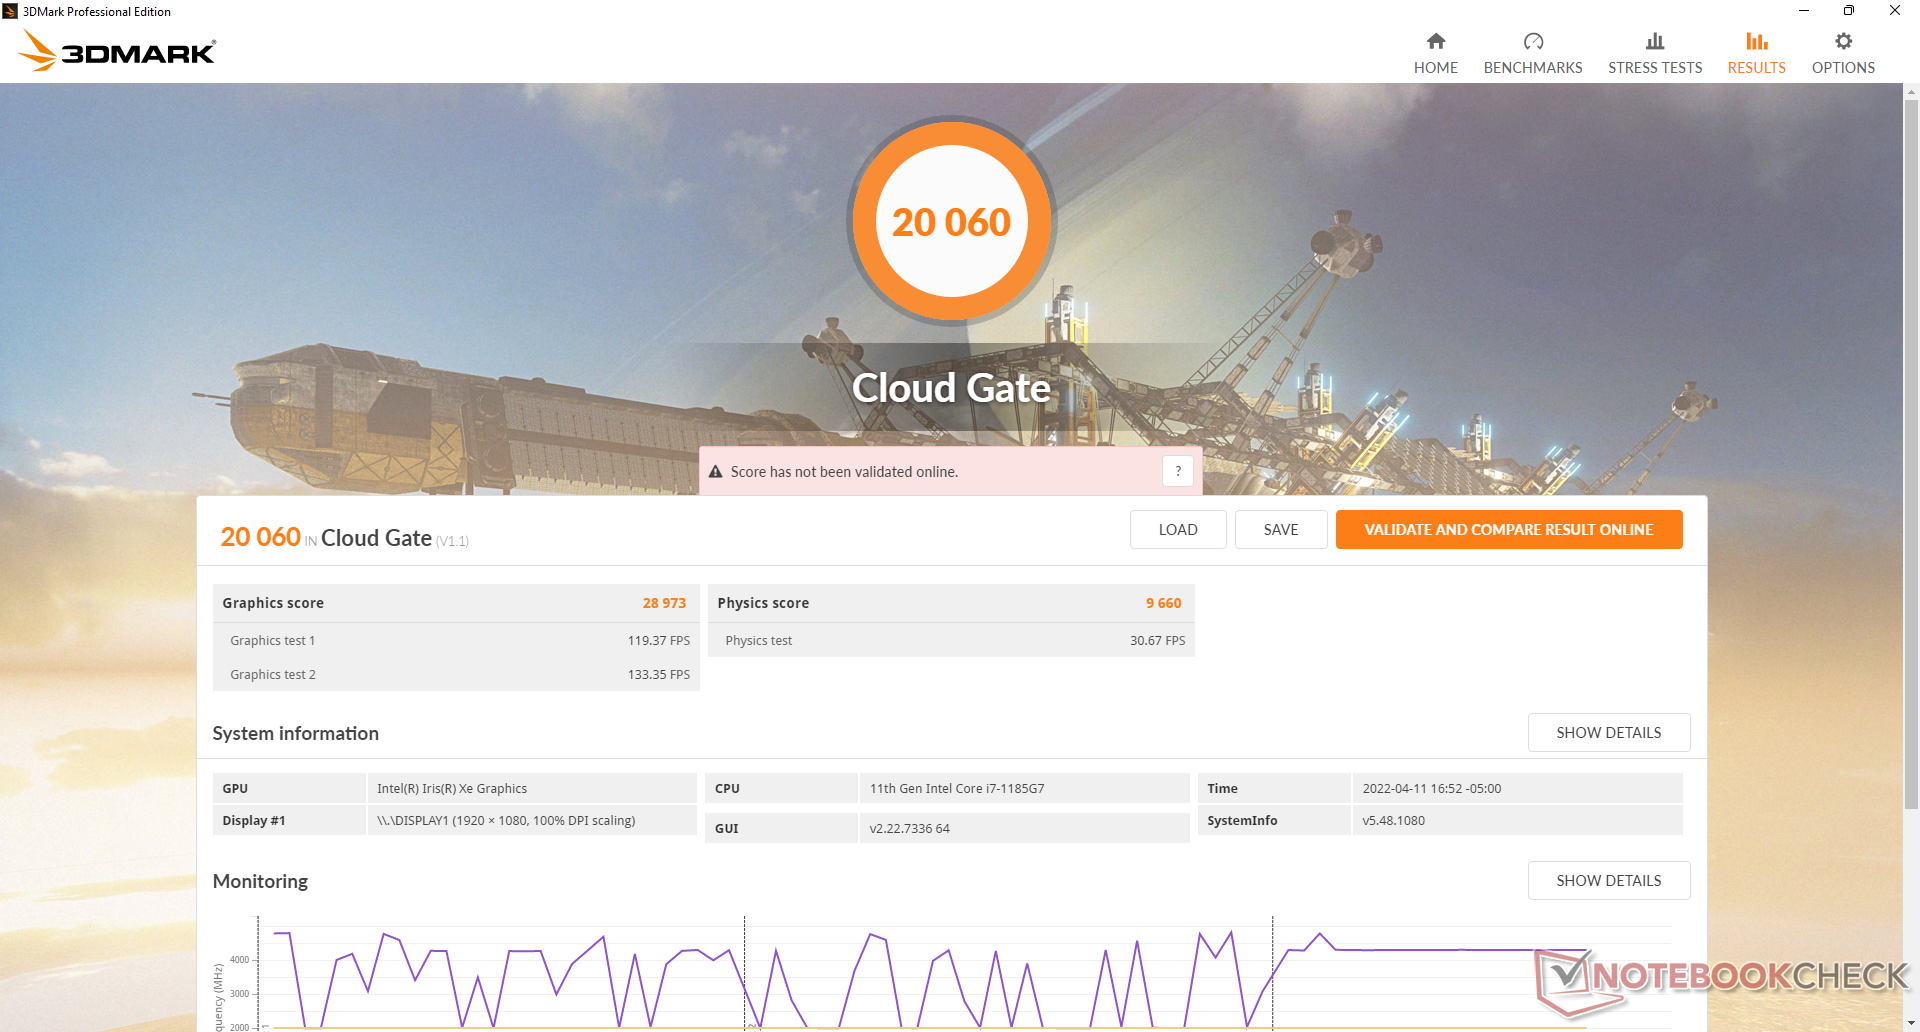
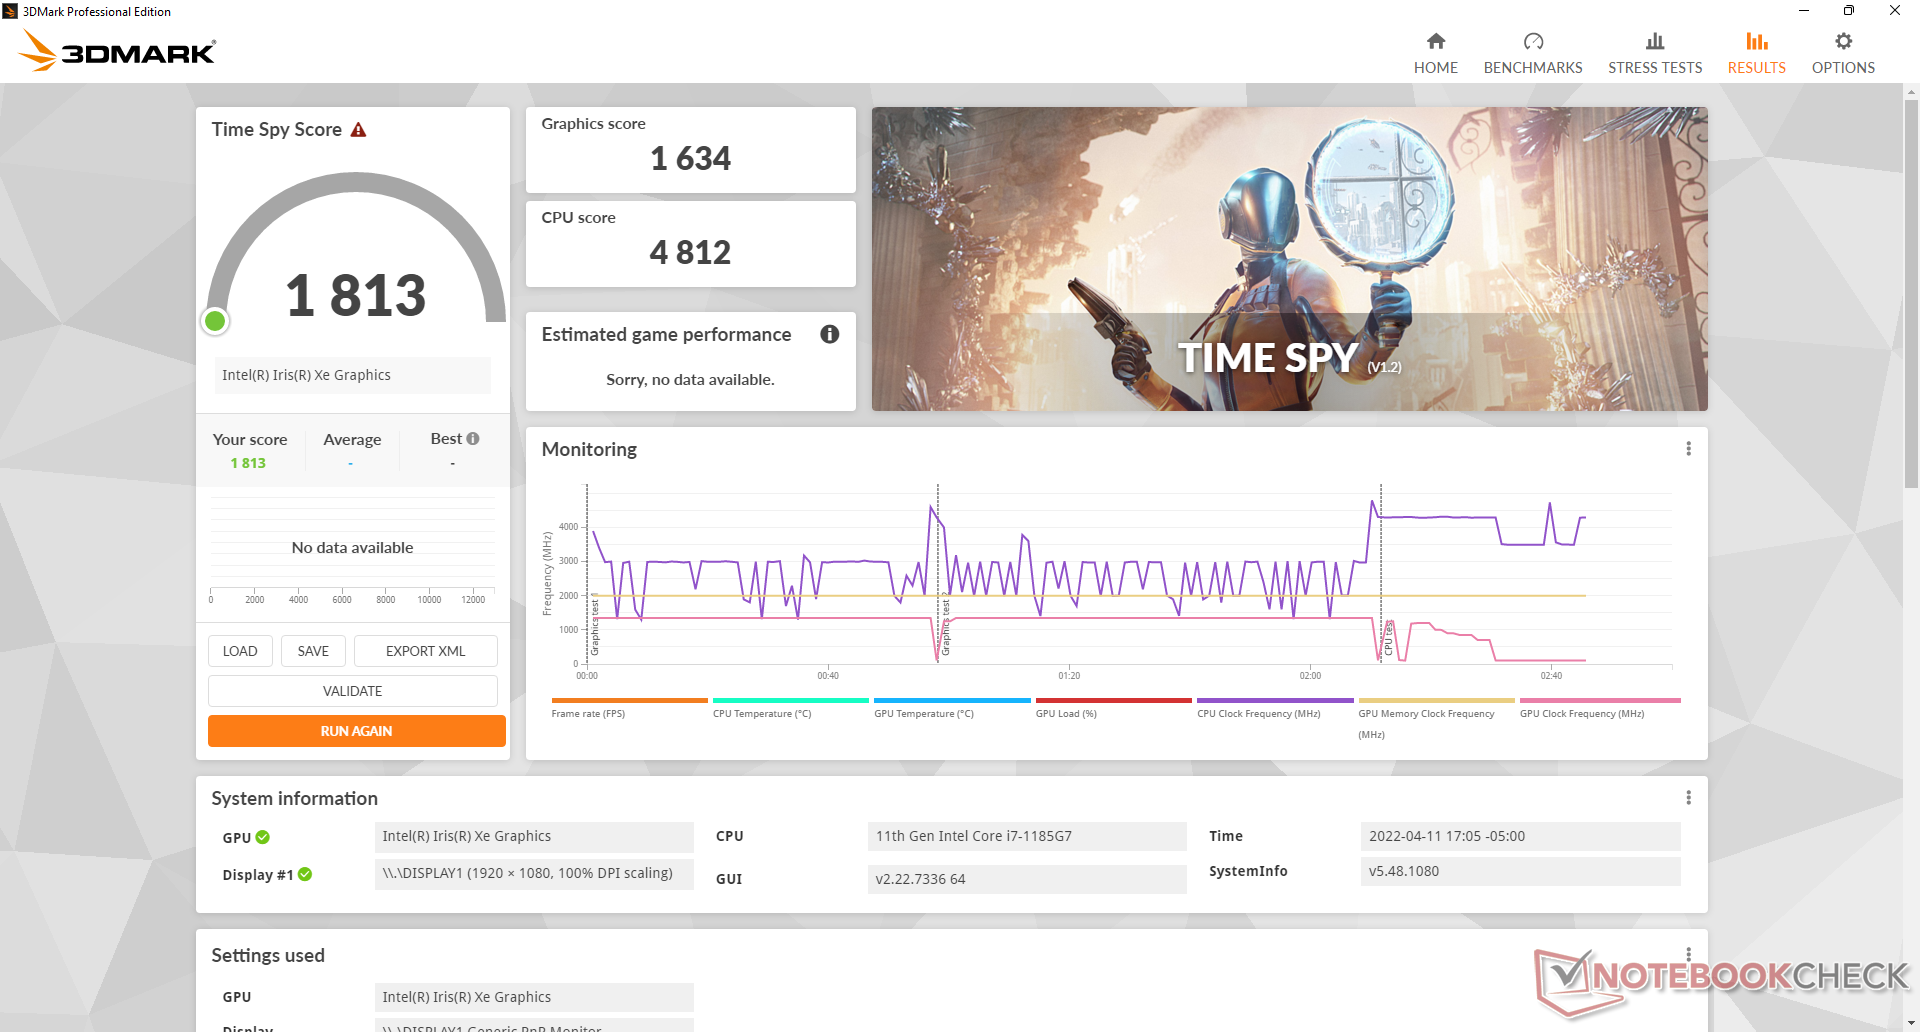
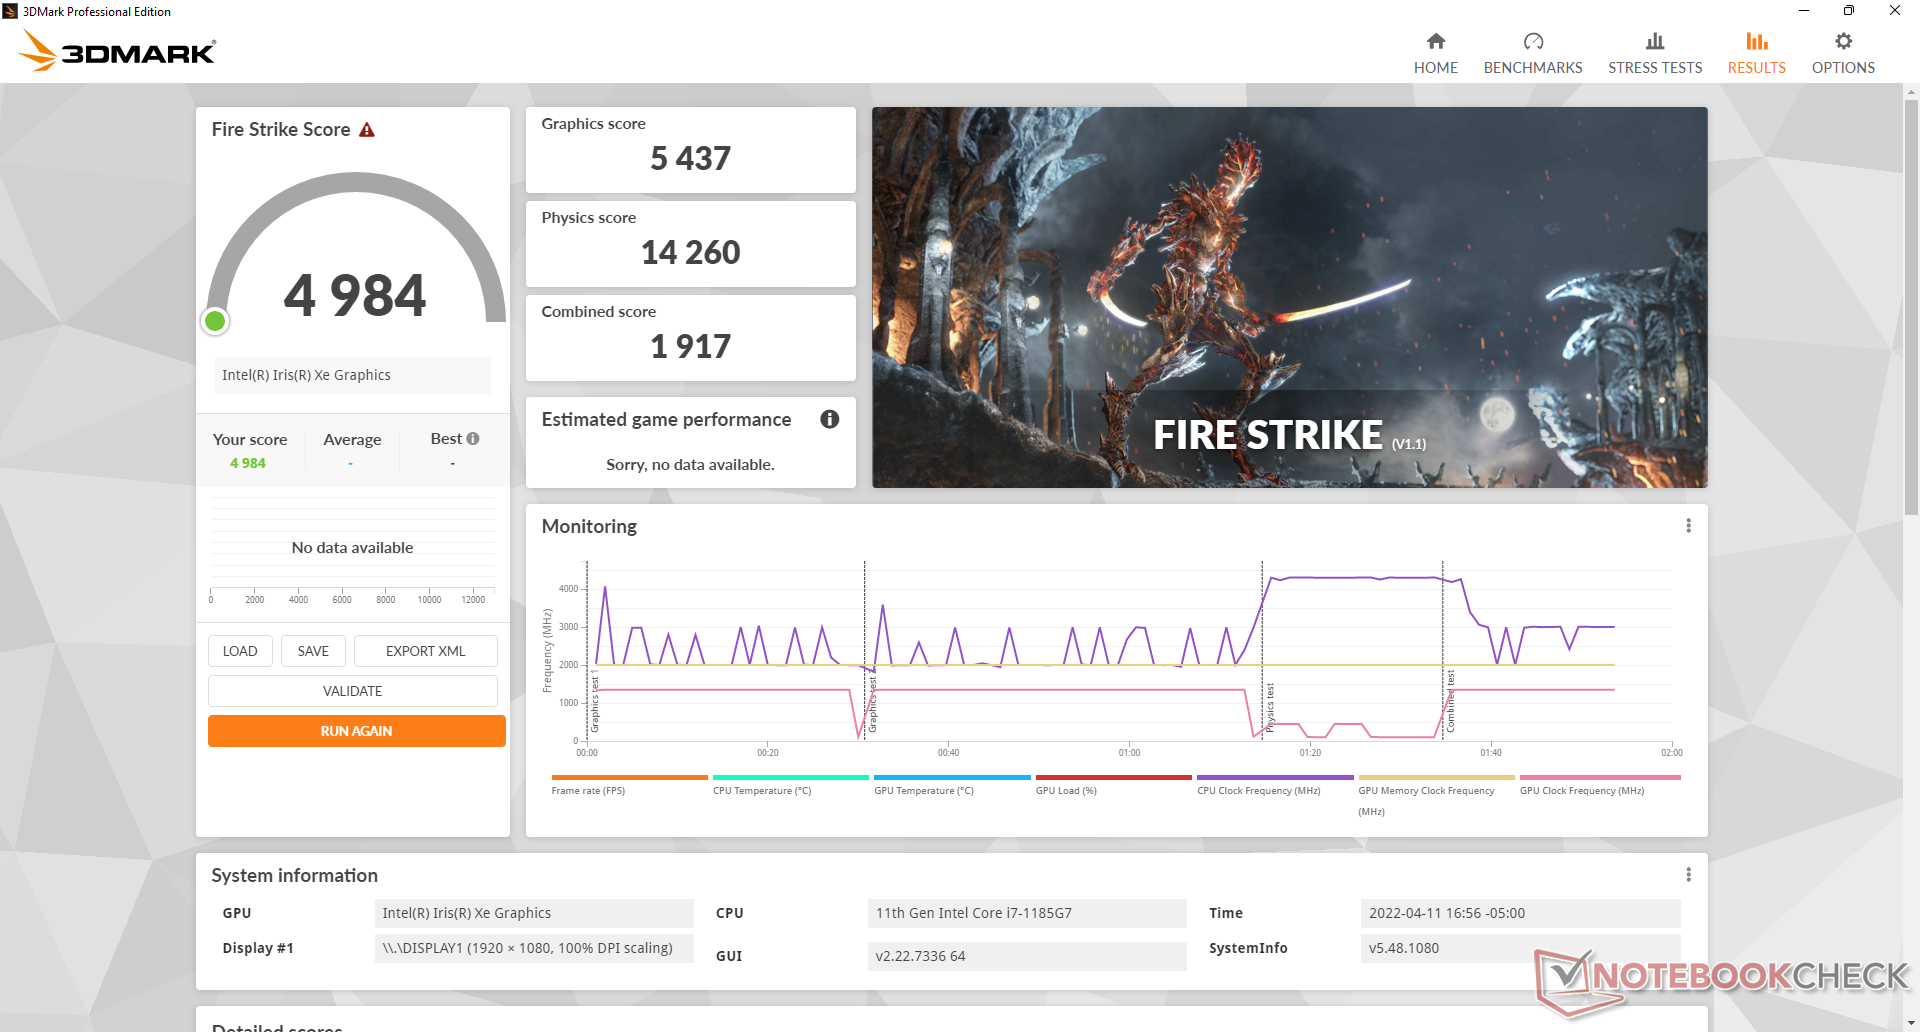
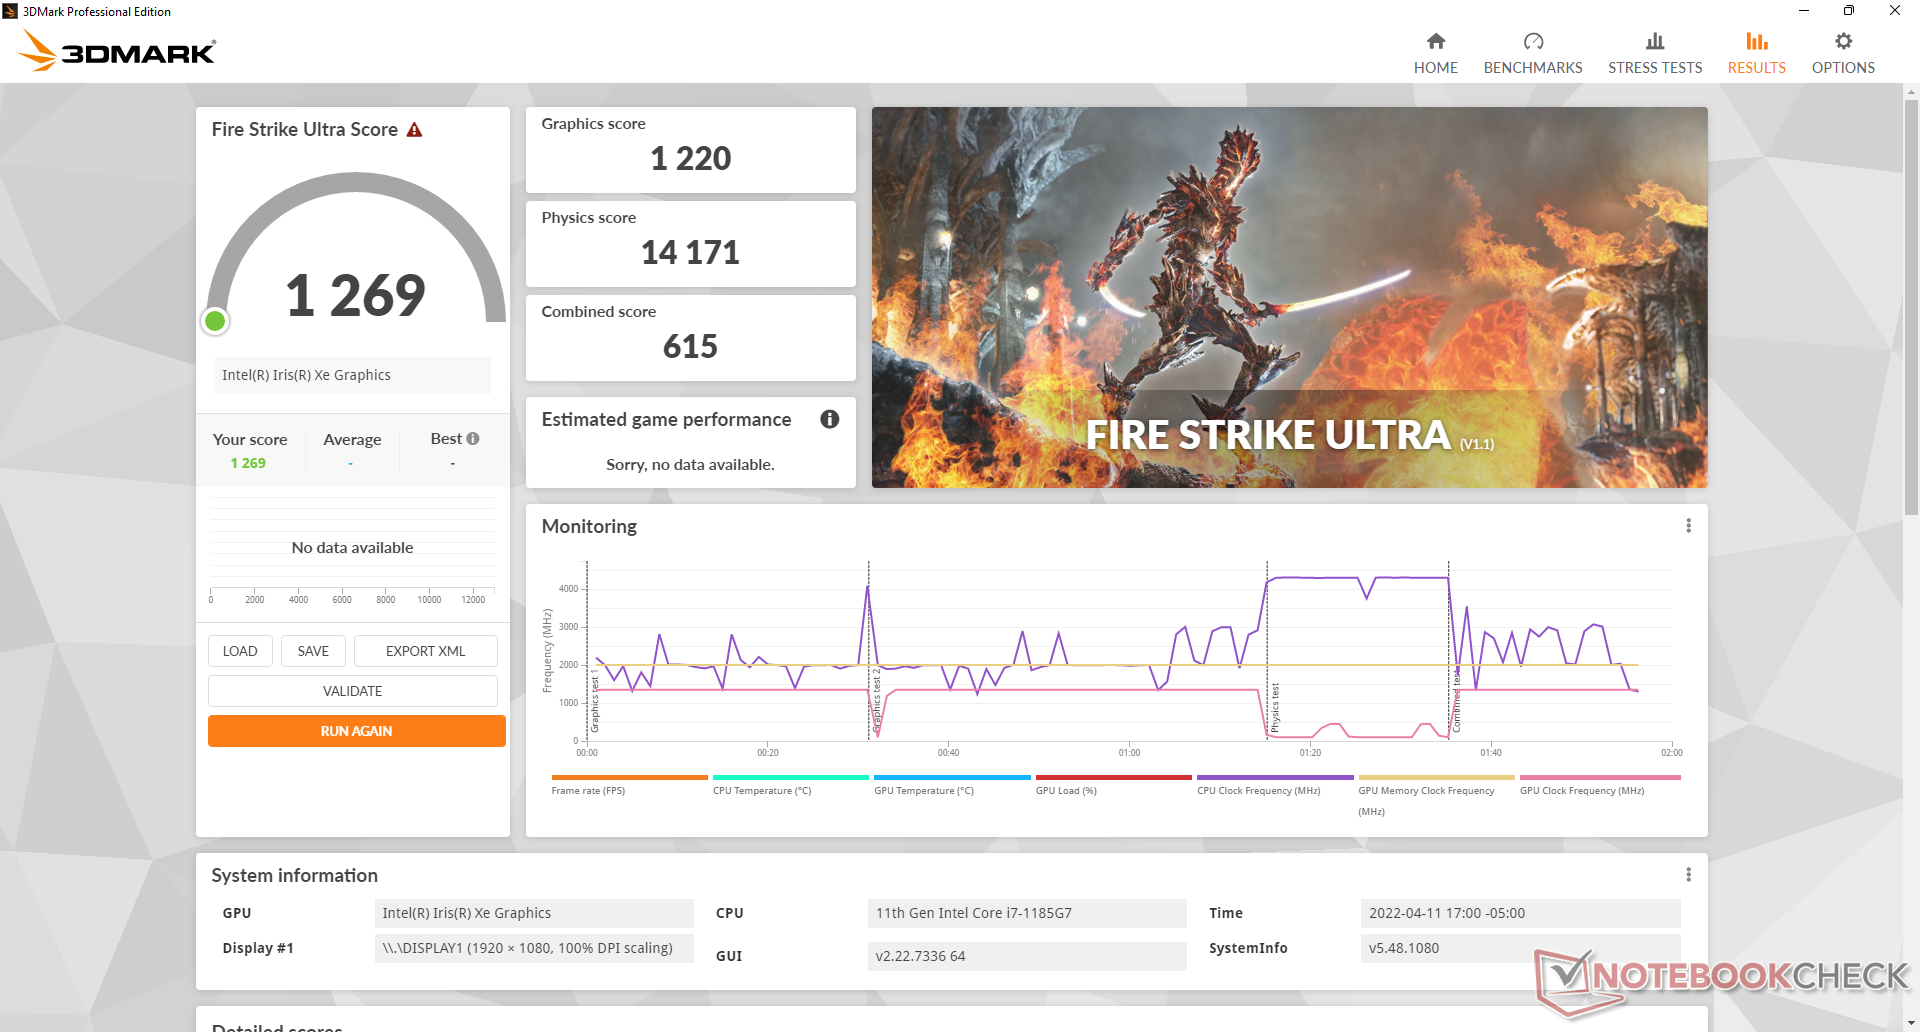
O desempenho gráfico é excelente, cerca de 10% a 15% mais rápido do que a média dos portáteis em nosso banco de dados equipados com o mesmo Iris Xe 96 EUs GPU. O desempenho é ainda mais rápido do que algumas GPUs discretas mais antigas, como a Radeon RX 540.
| 3DMark | |
| 1280x720 Cloud Gate Standard Graphics | |
| Dell Latitude 7330 Rugged Extreme | |
| Panasonic Toughbook FZ-55 MK2 | |
| Média Intel Iris Xe Graphics G7 96EUs (13162 - 39880, n=187) | |
| Acer Enduro Urban N3 EUN314 | |
| Dell Latitude 7424 Rugged Extreme | |
| Dell Latitude 5420 Rugged-P85G | |
| Durabook S14I | |
| 1920x1080 Fire Strike Graphics | |
| Dell Latitude 7330 Rugged Extreme | |
| Média Intel Iris Xe Graphics G7 96EUs (2286 - 6624, n=222) | |
| Acer Enduro Urban N3 EUN314 | |
| Panasonic Toughbook FZ-55 MK2 | |
| Dell Latitude 7424 Rugged Extreme | |
| Dell Latitude 5420 Rugged-P85G | |
| Durabook S14I | |
| 2560x1440 Time Spy Graphics | |
| Dell Latitude 7330 Rugged Extreme | |
| Acer Enduro Urban N3 EUN314 | |
| Média Intel Iris Xe Graphics G7 96EUs (707 - 1890, n=218) | |
| Panasonic Toughbook FZ-55 MK2 | |
| Durabook S14I | |
| Dell Latitude 5420 Rugged-P85G | |
| 2560x1440 Time Spy Score | |
| Dell Latitude 7330 Rugged Extreme | |
| Acer Enduro Urban N3 EUN314 | |
| Média Intel Iris Xe Graphics G7 96EUs (789 - 2159, n=215) | |
| Panasonic Toughbook FZ-55 MK2 | |
| Durabook S14I | |
| Dell Latitude 5420 Rugged-P85G | |
| 3DMark 11 - 1280x720 Performance GPU | |
| Acer Enduro Urban N3 EUN314 | |
| Dell Latitude 7330 Rugged Extreme | |
| Panasonic Toughbook FZ-55 MK2 | |
| Média Intel Iris Xe Graphics G7 96EUs (2867 - 7676, n=209) | |
| Durabook S14I | |
| Dell Latitude 5420 Rugged-P85G | |
| Dell Latitude 7424 Rugged Extreme | |
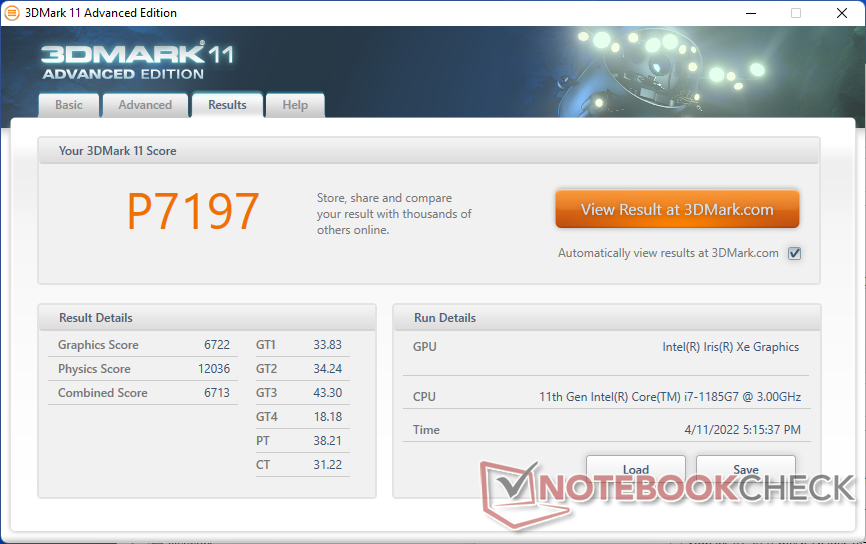
| 3DMark 11 Performance | 7197 pontos | |
| 3DMark Cloud Gate Standard Score | 20060 pontos | |
| 3DMark Fire Strike Score | 4984 pontos | |
| 3DMark Time Spy Score | 1813 pontos | |
Ajuda | ||
| Final Fantasy XV Benchmark | |
| 1280x720 Lite Quality | |
| Dell Latitude 7330 Rugged Extreme | |
| Panasonic Toughbook FZ-55 MK2 | |
| Acer Enduro Urban N3 EUN314 | |
| Média Intel Iris Xe Graphics G7 96EUs (14.9 - 56.5, n=189) | |
| Durabook S14I | |
| Getac B360 | |
| Dell Latitude 5420 Rugged-P85G | |
| 1920x1080 Standard Quality | |
| Dell Latitude 7330 Rugged Extreme | |
| Acer Enduro Urban N3 EUN314 | |
| Panasonic Toughbook FZ-55 MK2 | |
| Média Intel Iris Xe Graphics G7 96EUs (10.5 - 31.2, n=185) | |
| Durabook S14I | |
| Getac B360 | |
| Dell Latitude 5420 Rugged-P85G | |
| 1920x1080 High Quality | |
| Dell Latitude 7330 Rugged Extreme | |
| Média Intel Iris Xe Graphics G7 96EUs (8.15 - 27.8, n=178) | |
| Acer Enduro Urban N3 EUN314 | |
| Panasonic Toughbook FZ-55 MK2 | |
| Durabook S14I | |
| Getac B360 | |
| Dell Latitude 5420 Rugged-P85G | |
Witcher 3 FPS Chart
| baixo | média | alto | ultra | |
|---|---|---|---|---|
| The Witcher 3 (2015) | 99.3 | 65.3 | 34.3 | 15.8 |
| Dota 2 Reborn (2015) | 115.6 | 108.5 | 65 | 57.3 |
| Final Fantasy XV Benchmark (2018) | 46.8 | 26.2 | 26.2 | |
| X-Plane 11.11 (2018) | 27.5 | 25.3 | 22 |
Emissões
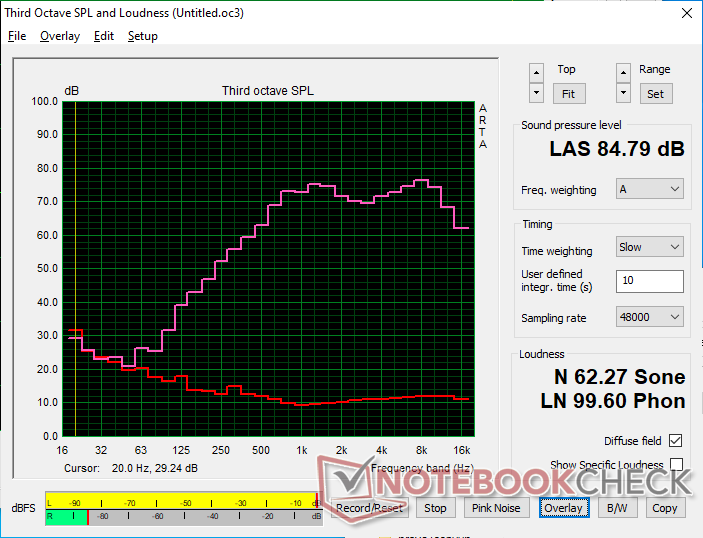
Ruído do sistema
O ruído do ventilador é silencioso já que o modelo está usando a mesma CPU da série U encontrada em laptops de consumo muito mais finos, como o Dell XPS 13. Somos capazes de gravar um máximo de apenas 36 dB(A) ao rodar o Prime95 para ser mais silencioso do que muitas outras alternativas robustas.
Barulho
| Ocioso |
| 23.1 / 23.1 / 23.1 dB |
| Carga |
| 28 / 36.2 dB |
 | ||
30 dB silencioso 40 dB(A) audível 50 dB(A) ruidosamente alto |
||
min: | ||
| Dell Latitude 7330 Rugged Extreme Iris Xe G7 96EUs, i7-1185G7 | Dell Latitude 7424 Rugged Extreme Radeon RX 540, i7-8650U, SK Hynix PC401 512GB M.2 (HFS512GD9TNG) | Dell Latitude 5420 Rugged-P85G Radeon RX 540, i7-8650U, SK hynix PC401 NVMe 500 GB | Acer Enduro Urban N3 EUN314 Iris Xe G7 96EUs, i7-1165G7, Samsung PM991 MZVLQ1T0HALB | Panasonic Toughbook FZ-55 MK2 Iris Xe G7 96EUs, i7-1185G7, Toshiba KIOXIA KBG4AZNV512G M.2 2280 OPAL | Durabook S14I Iris Xe G7 96EUs, i7-1165G7, UDinfo M2P M2P80DE512GBAEP | |
|---|---|---|---|---|---|---|
| Noise | -21% | -18% | -5% | -4% | -17% | |
| desligado / ambiente * (dB) | 22.9 | 28.6 -25% | 28.3 -24% | 23.8 -4% | 23.8 -4% | 25.2 -10% |
| Idle Minimum * (dB) | 23.1 | 28.6 -24% | 28.3 -23% | 24.1 -4% | 24 -4% | 25.2 -9% |
| Idle Average * (dB) | 23.1 | 28.6 -24% | 28.3 -23% | 24.1 -4% | 24 -4% | 25.2 -9% |
| Idle Maximum * (dB) | 23.1 | 28.6 -24% | 28.3 -23% | 24.1 -4% | 24 -4% | 34.5 -49% |
| Load Average * (dB) | 28 | 32.9 -18% | 29.9 -7% | 27.9 -0% | 26.7 5% | 34.5 -23% |
| Witcher 3 ultra * (dB) | 31.2 | 35.7 -14% | ||||
| Load Maximum * (dB) | 36.2 | 39 -8% | 38 -5% | 38.6 -7% | 41.7 -15% | 36.2 -0% |
* ... menor é melhor
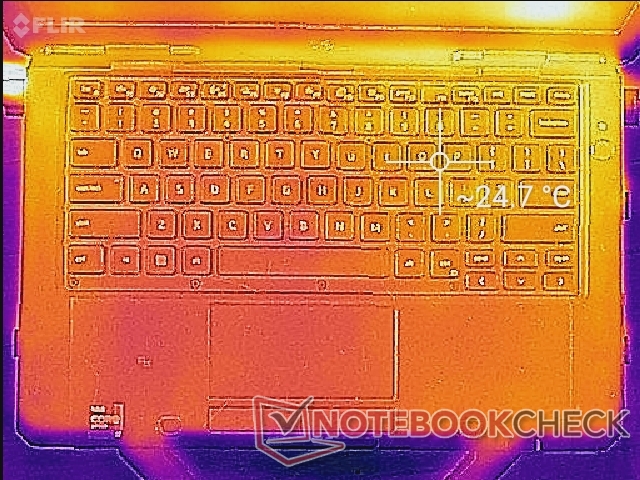
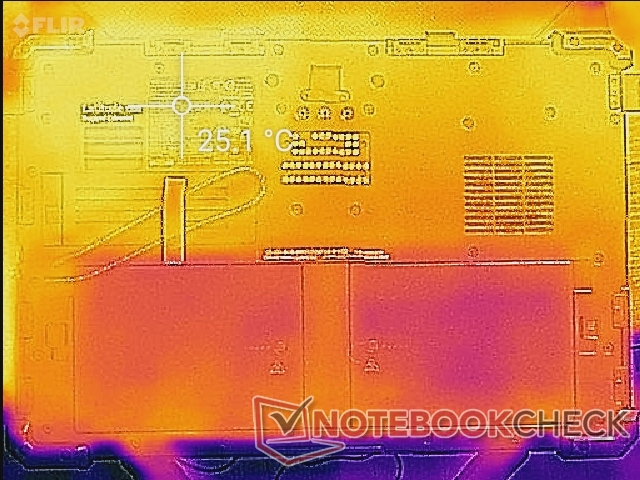
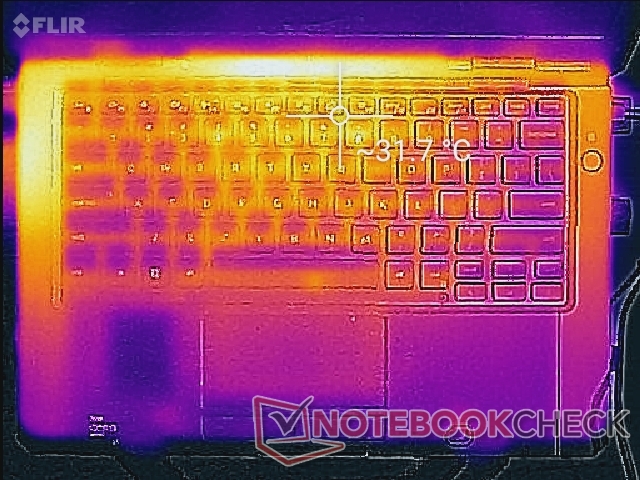
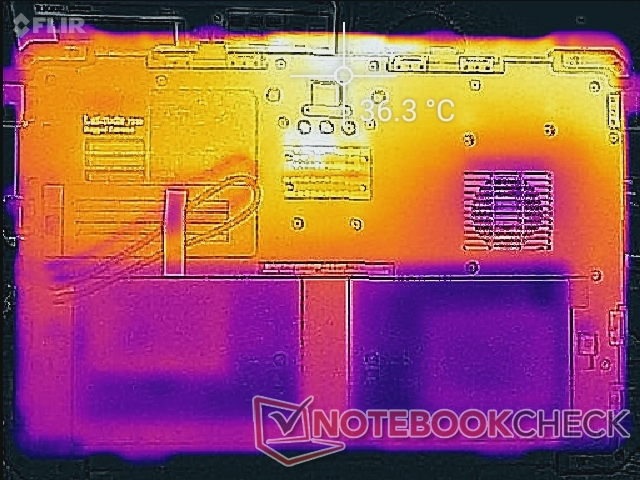
Temperatura
As temperaturas de superfície nunca são desconfortavelmente quentes, uma vez que você tem um chassi maior do que o habitual para uma CPU ULV série U. Somos capazes de registrar pontos quentes de apenas 31 C e 36 C nas superfícies superior e inferior, respectivamente, em comparação com 37 C e 46 C na Acer Enduro Urban N3.
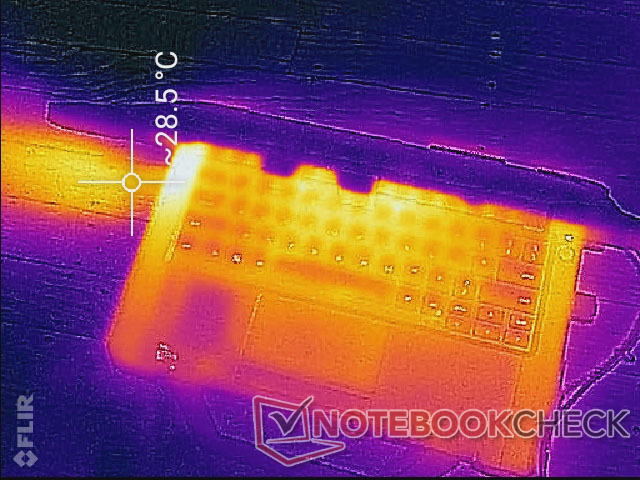
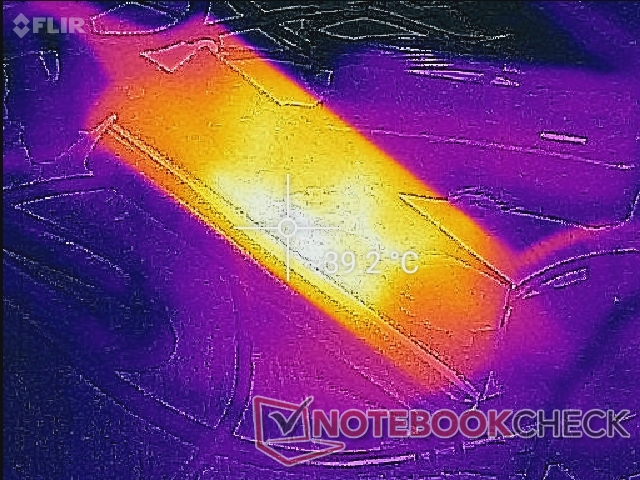
(+) A temperatura máxima no lado superior é 34.6 °C / 94 F, em comparação com a média de 37.5 °C / 100 F , variando de 24.7 a 57 °C para a classe .
(+) A parte inferior aquece até um máximo de 36.6 °C / 98 F, em comparação com a média de 48.1 °C / 119 F
(+) Em uso inativo, a temperatura média para o lado superior é 24.3 °C / 76 F, em comparação com a média do dispositivo de 31.9 °C / ### class_avg_f### F.
(+) Os apoios para as mãos e o touchpad são mais frios que a temperatura da pele, com um máximo de 26 °C / 78.8 F e, portanto, são frios ao toque.
(+) A temperatura média da área do apoio para as mãos de dispositivos semelhantes foi 29.5 °C / 85.1 F (+3.5 °C / 6.3 F).
| Dell Latitude 7330 Rugged Extreme Intel Core i7-1185G7, Intel Iris Xe Graphics G7 96EUs | Dell Latitude 7424 Rugged Extreme Intel Core i7-8650U, AMD Radeon RX 540 | Dell Latitude 5420 Rugged-P85G Intel Core i7-8650U, AMD Radeon RX 540 | Acer Enduro Urban N3 EUN314 Intel Core i7-1165G7, Intel Iris Xe Graphics G7 96EUs | Panasonic Toughbook FZ-55 MK2 Intel Core i7-1185G7, Intel Iris Xe Graphics G7 96EUs | Durabook S14I Intel Core i7-1165G7, Intel Iris Xe Graphics G7 96EUs | |
|---|---|---|---|---|---|---|
| Heat | -21% | -23% | -15% | -20% | -19% | |
| Maximum Upper Side * (°C) | 34.6 | 41.6 -20% | 42.2 -22% | 37.8 -9% | 36.2 -5% | 36.4 -5% |
| Maximum Bottom * (°C) | 36.6 | 47.6 -30% | 42 -15% | 45.8 -25% | 42.2 -15% | 38.6 -5% |
| Idle Upper Side * (°C) | 24.8 | 28.6 -15% | 31.6 -27% | 26.4 -6% | 31 -25% | 32.6 -31% |
| Idle Bottom * (°C) | 25.2 | 30.2 -20% | 31.8 -26% | 30.2 -20% | 34 -35% | 33.8 -34% |
* ... menor é melhor
Teste de estresse
Quando sob estresse Prime95, a CPU aumentaria para 3,7 GHz por alguns segundos e a uma temperatura central de 100 C. As taxas de relógio cairiam rapidamente e se estabilizariam em 2,8 GHz para manter uma temperatura central mais fria de 68 C. A execução deste mesmo teste no Panasonic Toughbook FZ-55 MK2 resultaria em taxas de relógio de CPU similares, mas uma temperatura central mais quente de 81 C.
Correr com a energia da bateria infelizmente limita o desempenho. Um teste 3DMark 11 com baterias retornaria pontuações de Física e Gráficos de 8010 e 3501 pontos, respectivamente, em comparação com 12036 e 6722 pontos quando em rede elétrica.
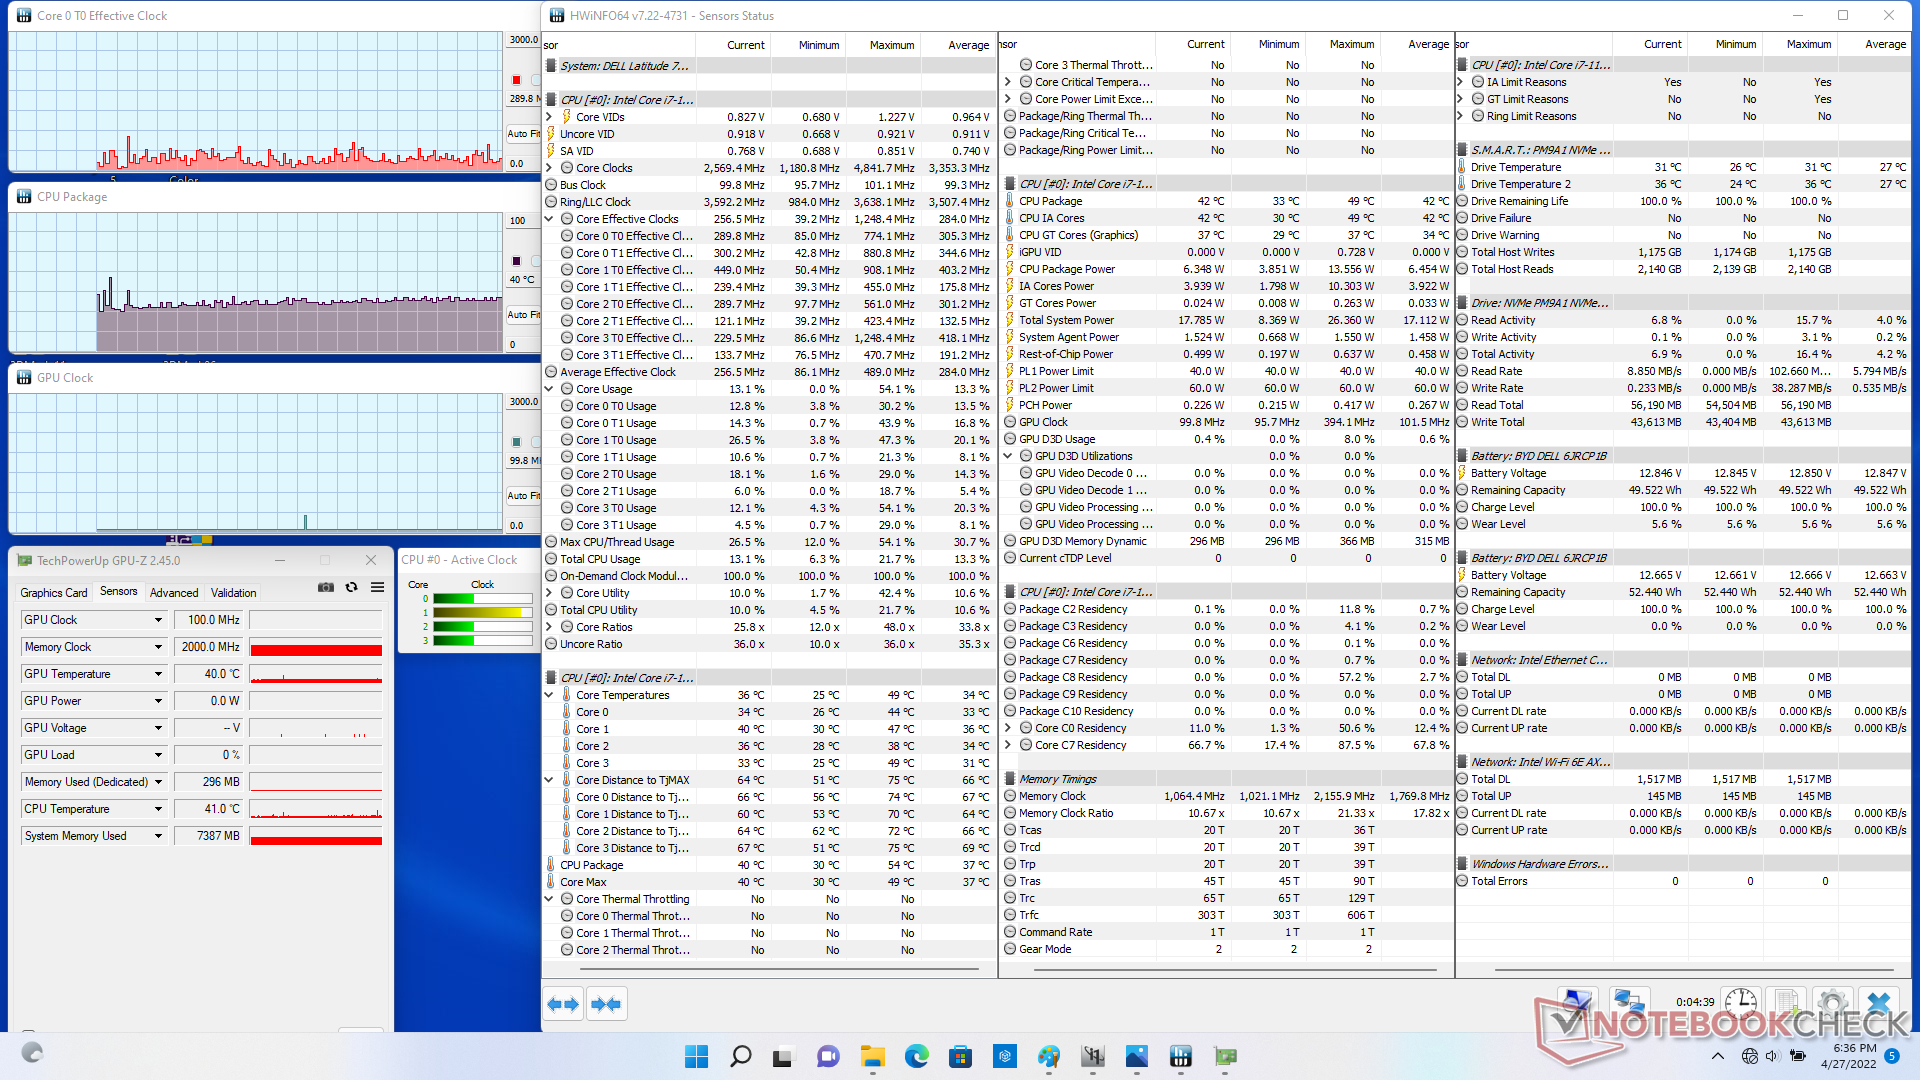
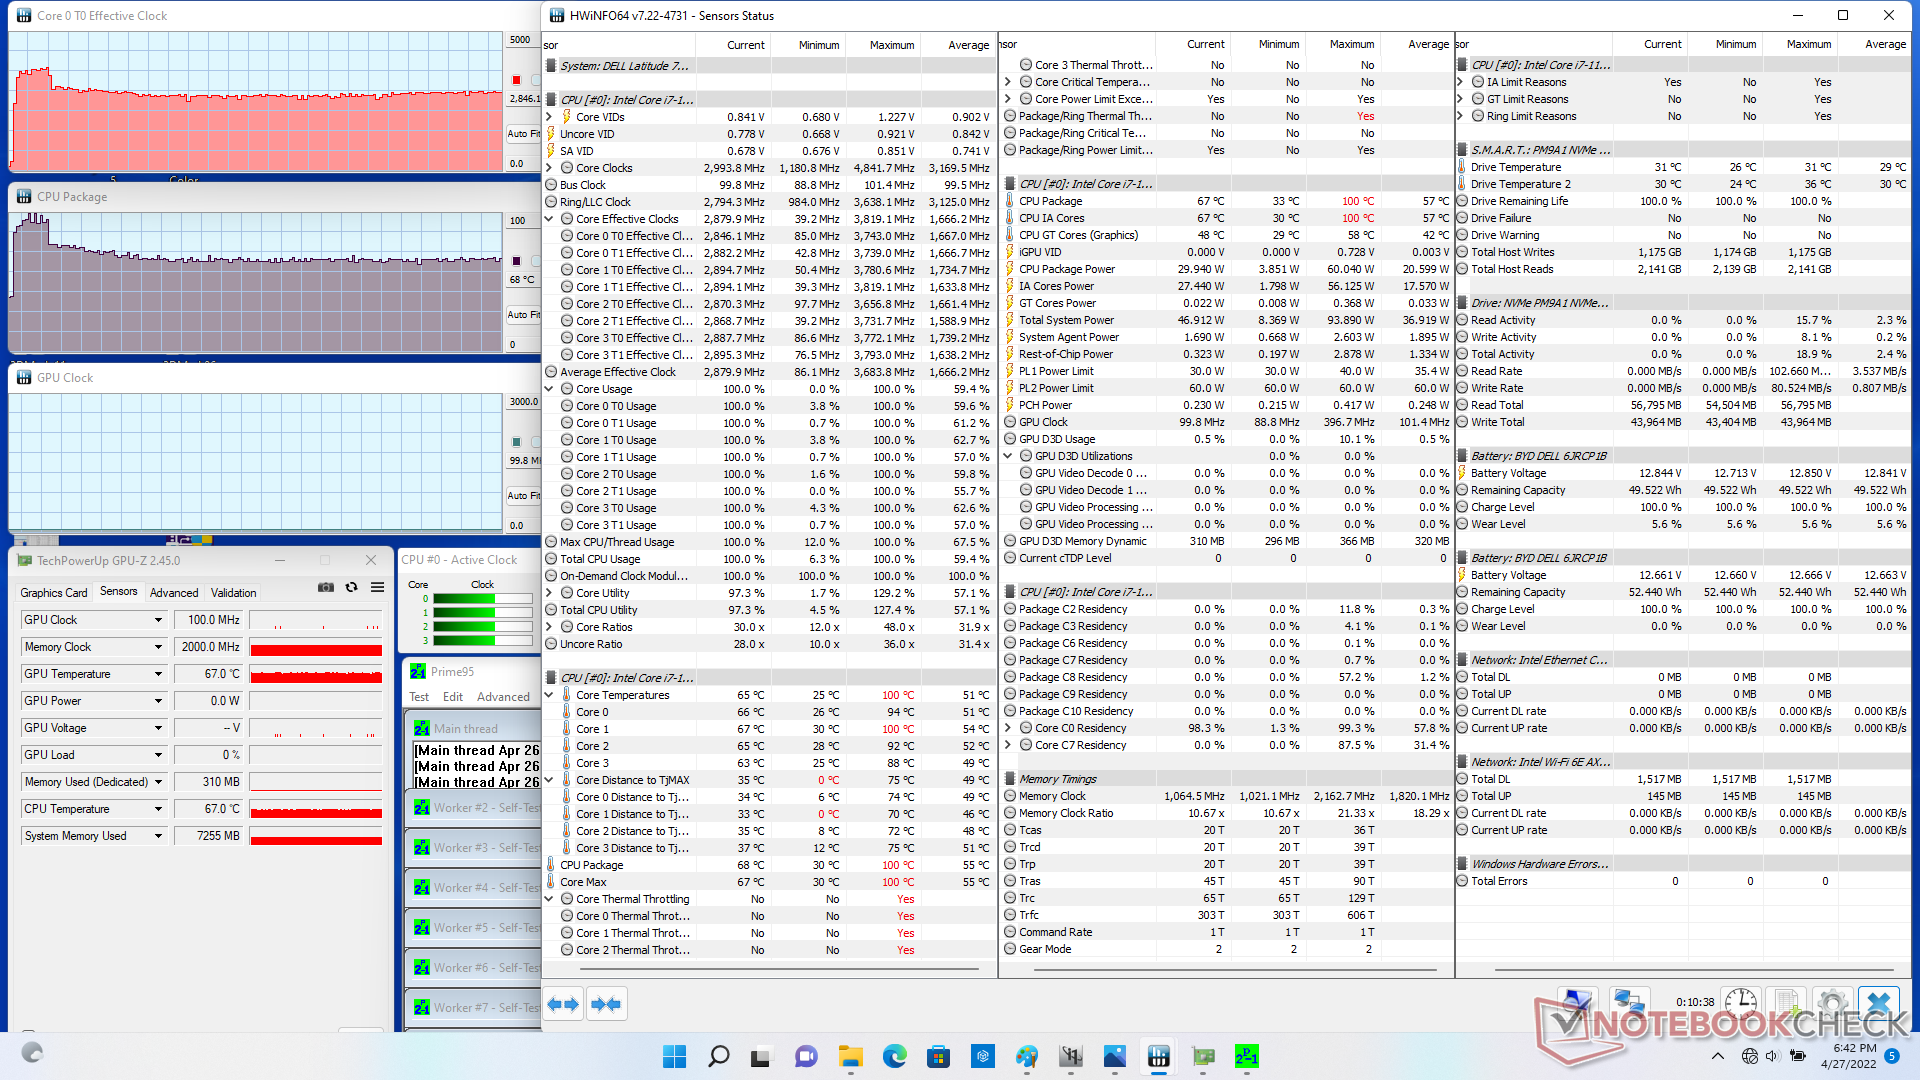
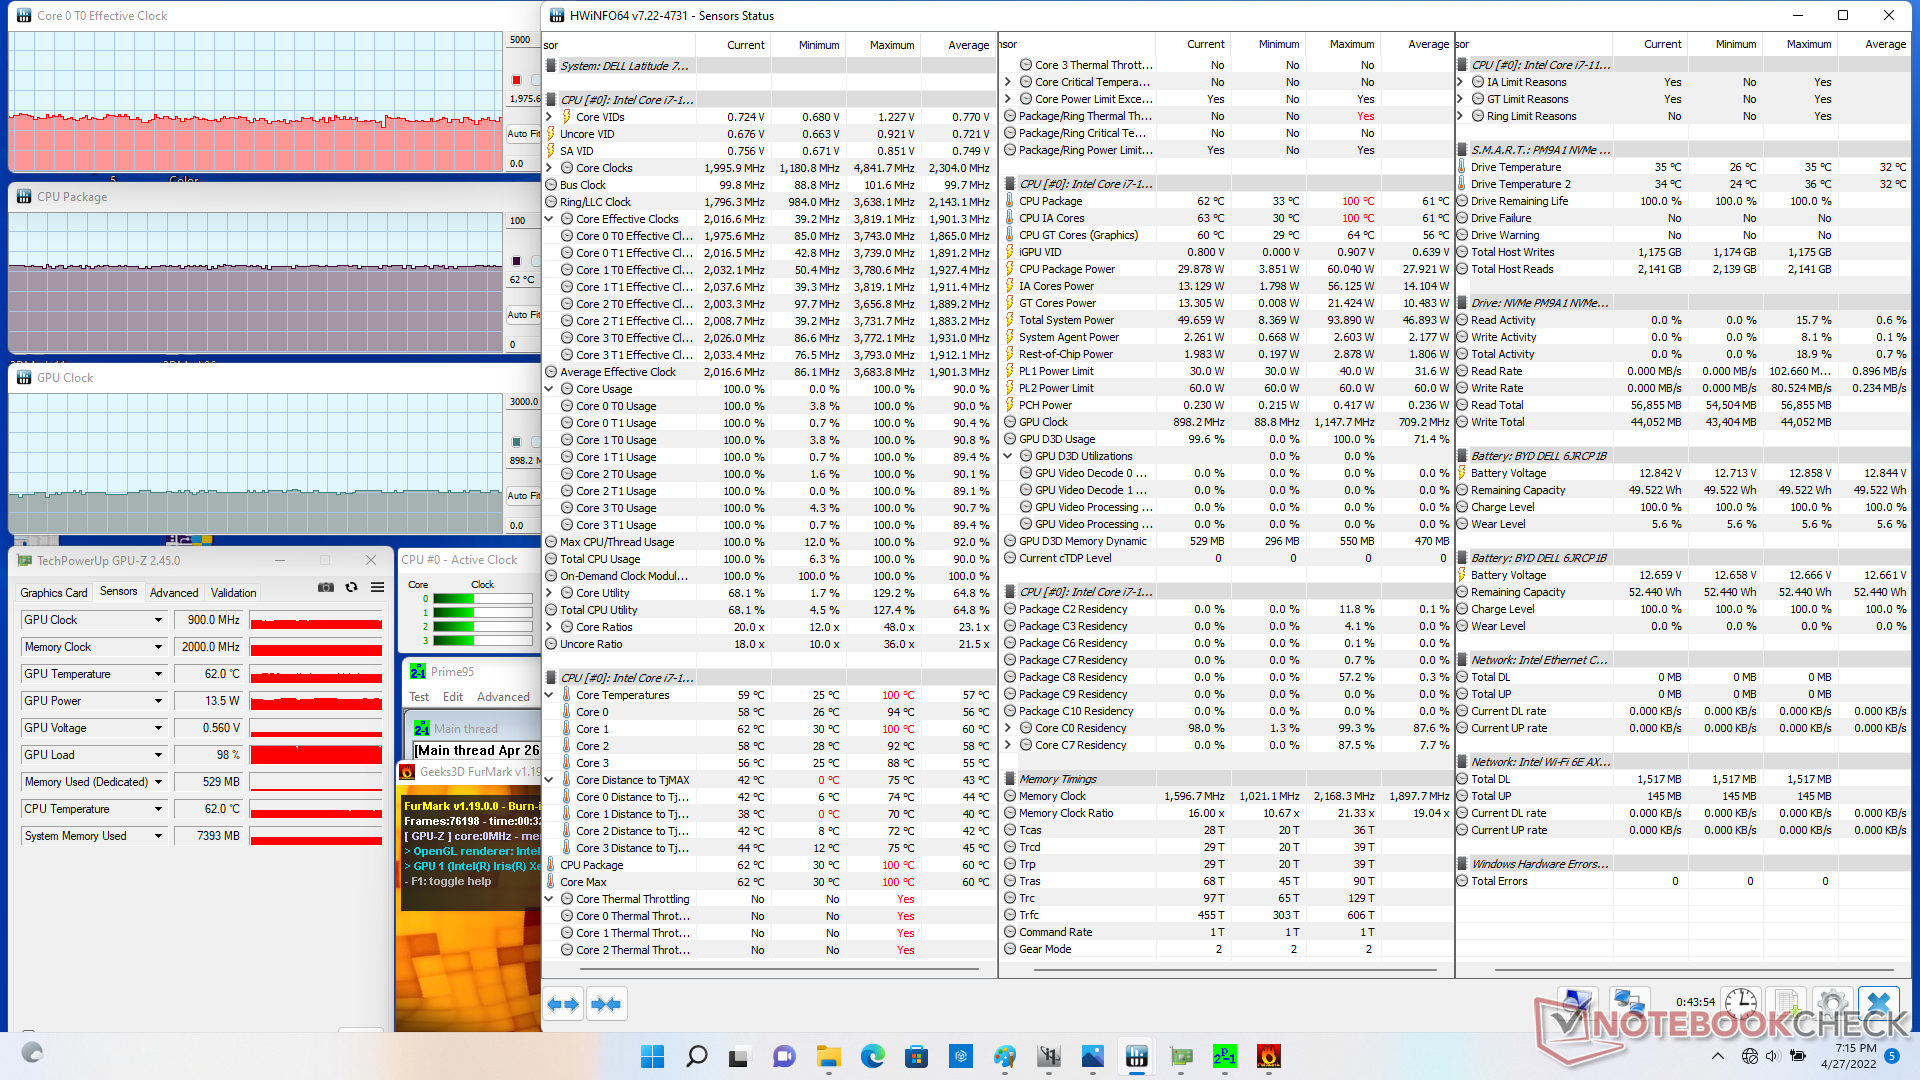
| Relógio CPU (GHz) | Relógio GPU (MHz) | Temperatura média da CPU (°C) | |
| System Idle | -- | -- | 40 |
| Prime95 Stress | 2.8 | -- | 68 |
| Prime95 + FurMark Stress | ~2.0 | 900 | 62 |
| Witcher 3 Estresse | ~1.7 | 1350 | 62 |
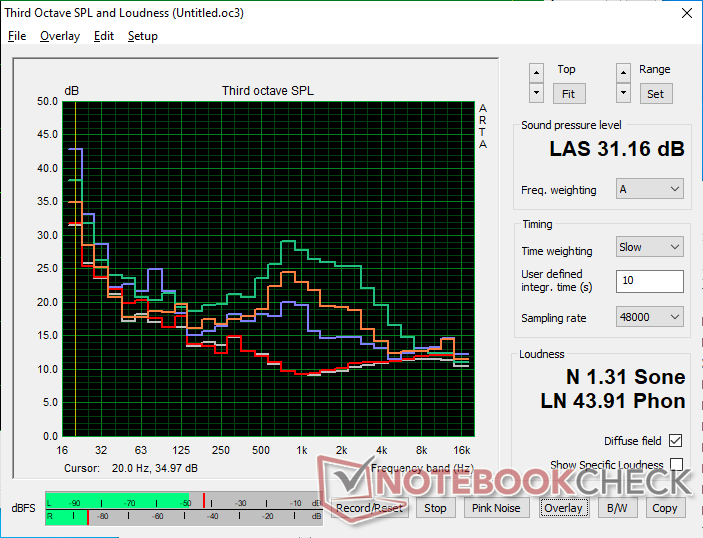
Oradores
Dell Latitude 7330 Rugged Extreme análise de áudio
(+) | os alto-falantes podem tocar relativamente alto (###valor### dB)
Graves 100 - 315Hz
(-) | quase nenhum baixo - em média 24.8% menor que a mediana
(±) | a linearidade dos graves é média (8.8% delta para a frequência anterior)
Médios 400 - 2.000 Hz
(+) | médios equilibrados - apenas 4.6% longe da mediana
(+) | médios são lineares (5.1% delta para frequência anterior)
Altos 2 - 16 kHz
(+) | agudos equilibrados - apenas 3.2% longe da mediana
(+) | os máximos são lineares (2.7% delta da frequência anterior)
Geral 100 - 16.000 Hz
(±) | a linearidade do som geral é média (16.5% diferença em relação à mediana)
Comparado com a mesma classe
» 28% de todos os dispositivos testados nesta classe foram melhores, 6% semelhantes, 66% piores
» O melhor teve um delta de 4%, a média foi 23%, o pior foi 134%
Comparado com todos os dispositivos testados
» 28% de todos os dispositivos testados foram melhores, 6% semelhantes, 66% piores
» O melhor teve um delta de 4%, a média foi 23%, o pior foi 134%
Apple MacBook Pro 16 2021 M1 Pro análise de áudio
(+) | os alto-falantes podem tocar relativamente alto (###valor### dB)
Graves 100 - 315Hz
(+) | bons graves - apenas 3.8% longe da mediana
(+) | o baixo é linear (5.2% delta para a frequência anterior)
Médios 400 - 2.000 Hz
(+) | médios equilibrados - apenas 1.3% longe da mediana
(+) | médios são lineares (2.1% delta para frequência anterior)
Altos 2 - 16 kHz
(+) | agudos equilibrados - apenas 1.9% longe da mediana
(+) | os máximos são lineares (2.7% delta da frequência anterior)
Geral 100 - 16.000 Hz
(+) | o som geral é linear (4.6% diferença em relação à mediana)
Comparado com a mesma classe
» 0% de todos os dispositivos testados nesta classe foram melhores, 0% semelhantes, 100% piores
» O melhor teve um delta de 5%, a média foi 17%, o pior foi 45%
Comparado com todos os dispositivos testados
» 0% de todos os dispositivos testados foram melhores, 0% semelhantes, 100% piores
» O melhor teve um delta de 4%, a média foi 23%, o pior foi 134%
Gestão de energia
Consumo de energia
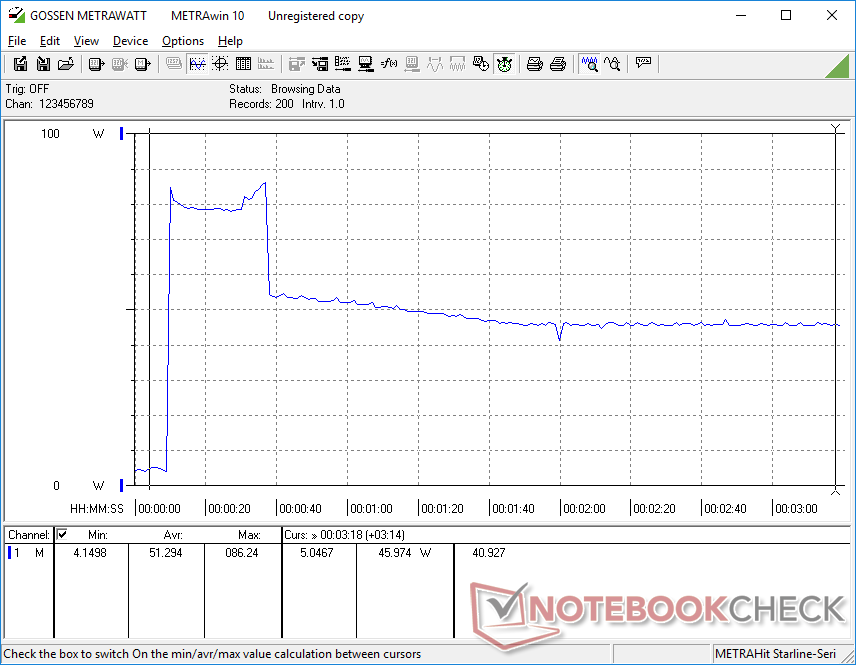
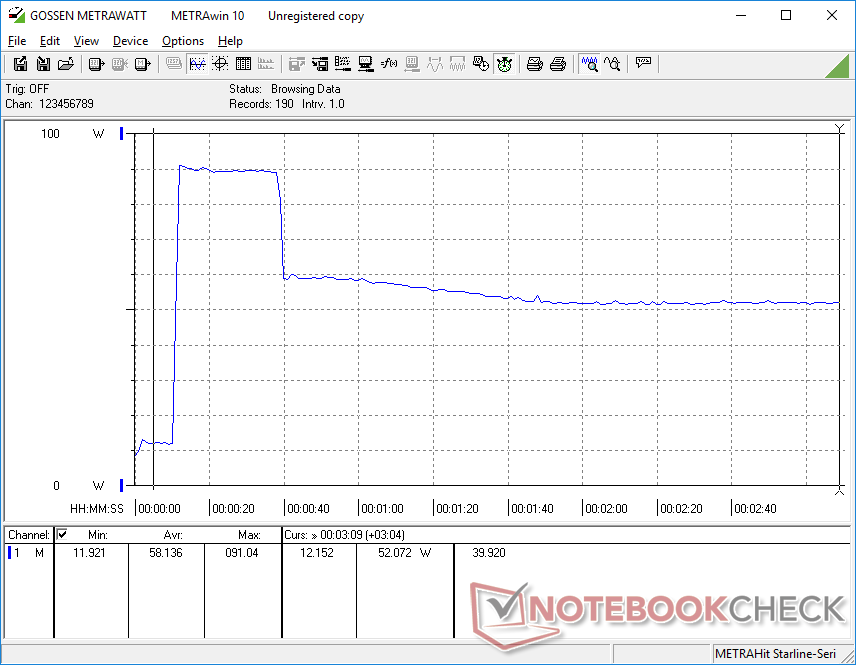
A manipulação na área de trabalho exige cerca de 4 W se no ajuste de brilho mais baixo ou até 12 W se o brilho for ajustado para o máximo. A execução de cargas mais altas equivalentes a jogos exigirá em torno de 45 W para ser apenas ligeiramente superior à maioria dos outros laptops rodando na mesma CPU Intel série U do 11º gênero. Note que o consumo de energia é significativamente menor do que nos portáteis mais antigos Dell Latitude 7424 Rugged Extreme alimentado pela GPU Radeon RX 540, embora nossa Latitude 7330 Rugged Extreme seja capaz de fornecer gráficos até 40 por cento mais rápidos
Somos capazes de gravar um desenho máximo de 91 W a partir do pequeno-médio (~13 x 6,5 x 2,3 cm) adaptador USB-C AC de 90 W ao executar simultaneamente Prime95+FurMark. Esta taxa é apenas temporária, como mostram nossas capturas de tela abaixo, provavelmente devido a limitações térmicas.
| desligado | |
| Ocioso | |
| Carga |
|
Key:
min: | |
| Dell Latitude 7330 Rugged Extreme i7-1185G7, Iris Xe G7 96EUs, , IPS, 1920x1080, 13.3" | Dell Latitude 7424 Rugged Extreme i7-8650U, Radeon RX 540, SK Hynix PC401 512GB M.2 (HFS512GD9TNG), IPS, 1920x1080, 14" | Dell Latitude 5420 Rugged-P85G i7-8650U, Radeon RX 540, SK hynix PC401 NVMe 500 GB, IPS, 1920x1080, 14" | Acer Enduro Urban N3 EUN314 i7-1165G7, Iris Xe G7 96EUs, Samsung PM991 MZVLQ1T0HALB, IPS, 1920x1080, 14" | Panasonic Toughbook FZ-55 MK2 i7-1185G7, Iris Xe G7 96EUs, Toshiba KIOXIA KBG4AZNV512G M.2 2280 OPAL, IPS, 1920x1080, 14" | Durabook S14I i7-1165G7, Iris Xe G7 96EUs, UDinfo M2P M2P80DE512GBAEP, TN, 1920x1080, 14" | |
|---|---|---|---|---|---|---|
| Power Consumption | -38% | -25% | 27% | 6% | -22% | |
| Idle Minimum * (Watt) | 4.1 | 6.5 -59% | 4.8 -17% | 3.8 7% | 3.5 15% | 6.8 -66% |
| Idle Average * (Watt) | 11.7 | 15.1 -29% | 13.6 -16% | 8 32% | 10.4 11% | 16.4 -40% |
| Idle Maximum * (Watt) | 11.8 | 16.1 -36% | 13.8 -17% | 8.7 26% | 10.5 11% | 16.9 -43% |
| Load Average * (Watt) | 48.5 | 70.5 -45% | 67.8 -40% | 34.6 29% | 45.4 6% | 39.2 19% |
| Witcher 3 ultra * (Watt) | 44.3 | 68.1 -54% | 69.1 -56% | 35.4 20% | 43 3% | |
| Load Maximum * (Watt) | 91 | 95.2 -5% | 93.5 -3% | 45.4 50% | 99.3 -9% | 73.1 20% |
* ... menor é melhor
Power Consumption Witcher 3 / Stresstest
Power Consumption external Monitor
Vida útil da bateria
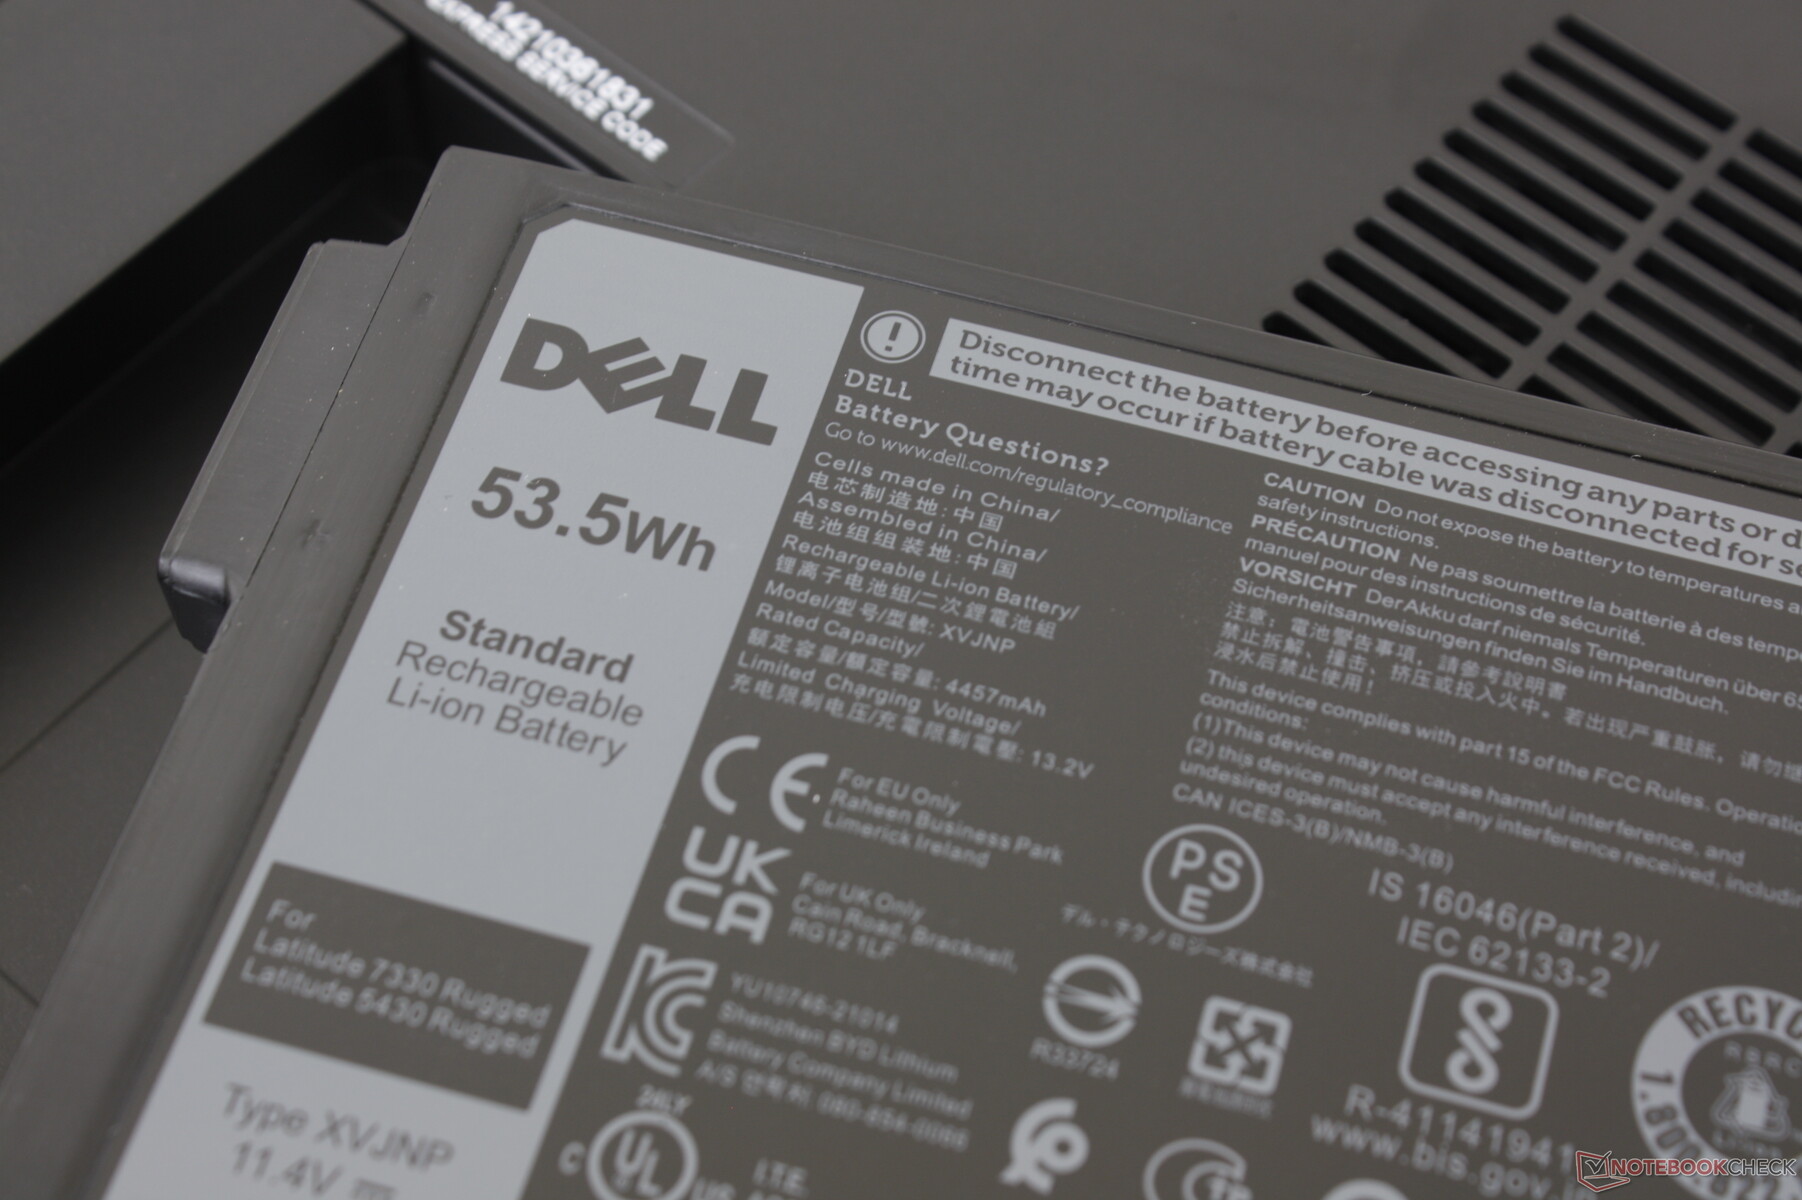
Esperar tempos de funcionamento WLAN no mundo real de quase 18 horas a 150-nit de brilho de tela quando ambas as baterias 53,5 Wh estiverem instaladas. Os usuários podem funcionar com apenas um conjunto de baterias para reduzir o peso, se desejado. No entanto, a carga de capacidade vazia a plena é relativamente lenta em mais de 3 horas, em comparação com a metade da carga da maioria dos Ultrabooks baseados no consumidor.
| Dell Latitude 7330 Rugged Extreme i7-1185G7, Iris Xe G7 96EUs, 107 Wh | Dell Latitude 7424 Rugged Extreme i7-8650U, Radeon RX 540, 102 Wh | Dell Latitude 5420 Rugged-P85G i7-8650U, Radeon RX 540, 102 Wh | Acer Enduro Urban N3 EUN314 i7-1165G7, Iris Xe G7 96EUs, 50.3 Wh | Panasonic Toughbook FZ-55 MK2 i7-1185G7, Iris Xe G7 96EUs, 71 Wh | Durabook S14I i7-1165G7, Iris Xe G7 96EUs, 50 Wh | |
|---|---|---|---|---|---|---|
| Duração da bateria | -35% | -10% | -64% | -24% | -69% | |
| WiFi v1.3 (h) | 18 | 11.7 -35% | 16.2 -10% | 6.4 -64% | 13.6 -24% | 5.5 -69% |
| Load (h) | 2.7 | 3.2 | ||||
| Reader / Idle (h) | 31.4 |
Pro
Contra
Veredicto
O Latitude 7330 Rugged Extreme serve como um padrão para o que outros laptops robustos devem ser. O desempenho da CPU é alto e desenfreado, os tempos de execução são muito longos, o adaptador USB-C AC é universal, o leitor de cartões SD é extremamente rápido e o ruído do ventilador é quase sempre silencioso. A GPU integrada em particular tornou obsoletas as GPUs discretas mais antigas como a Radeon RX 540.
Uma característica notável do modelo é sua tela sensível ao toque IPS de alta qualidade. É incomum encontrar um laptop robusto com cobertura sRGB completa, quase sem problemas de granulosidade, contraste relativamente profundo, falta de PWM, e cores bem calibradas logo de saída da caixa. Mesmo que a precisão das cores não seja uma prioridade, os usuários provavelmente ainda apreciarão o bom aspecto da tela, considerando a concorrência.
Os inconvenientes são em sua maioria menores. O slot MicroSD é de difícil acesso, o fantasma é predominante, e a luz de fundo do teclado é apenas branca, sem outras opções de cores. O modelo também é mais pesado que muitos laptops robustos de 14 polegadas e por isso os usuários não devem esperar que o Latitude 7330 Rugged Extreme seja mais leve só porque é um fator de forma menor. Gostaríamos muito de ver mais acessórios de troca a la Getac B360 para maior versatilidade.
Preço e Disponibilidade
Dell está enviando atualmente seu modelo Latitude 7330 Rugged Extreme em todas as configurações com um preço inicial de $4350 USD.
Price comparison

