Análise do HP Pavilion Plus 16: Laptop multimídia premium que poderia ter se beneficiado de uma RTX 4050
 em análise")
A HP lançou recentemente dois novos modelos Pavilion Plus como uma alternativa mais econômica para a série Envy. Analisamos anteriormente o Pavilion Plus 14 em ambas as versões Intel Raptor Lake e AMD Zen 4 da AMD. Agora, vamos dar uma olhada no Pavilion Plus 16 maior.
O Pavilion Plus 16 dispensa o painel OLED "IMAX Enhanced" do Pavilion Plus 14 e, em vez disso, oferece um processador da série H e gráficos Nvidia opcionais.
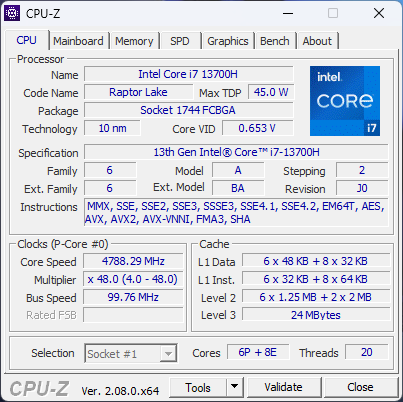
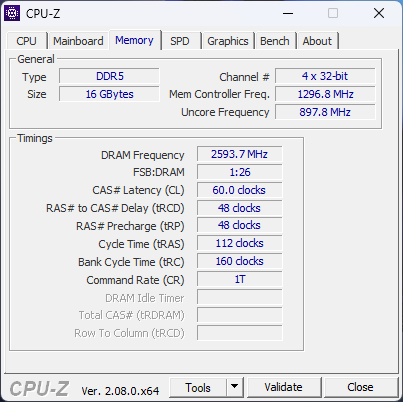
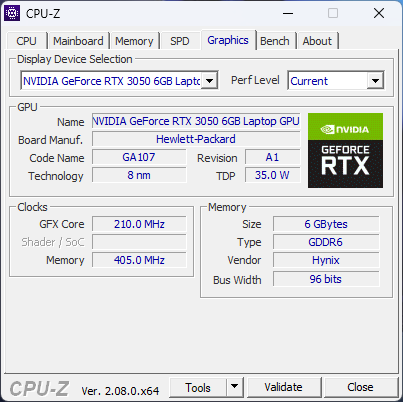
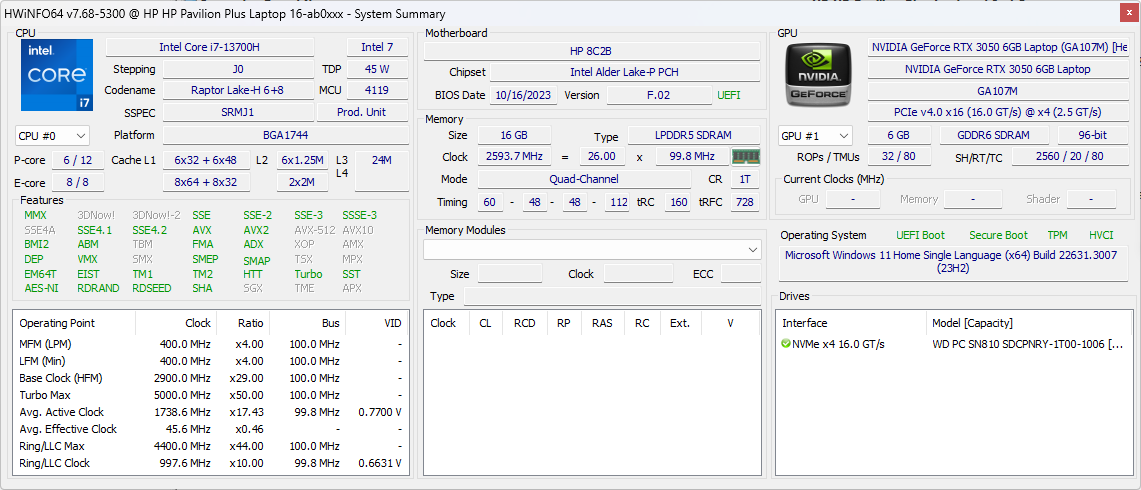
Nossa unidade Pavilion Plus 16 apresenta um processador Intel Core i7-13700H juntamente com 16 GB de RAM, SSD de 1 TB e uma tela IPS de 16 polegadas de 2560 x 1600 120 Hz. O Pavilion Plus 16 está entre os poucos laptops que contam com a tecnologia GPU para laptop Nvidia GeForce RTX 3050 6 GB. Essa configuração custará aos senhores ₹1.24.999 (US$1.350) na loja oficial da HP Índia.
Possíveis concorrentes em comparação
Avaliação | Data | Modelo | Peso | Altura | Size | Resolução | Preço |
|---|---|---|---|---|---|---|---|
| 88.7 % v7 (old) | 02/2024 | HP Pavilion Plus 16-ab0456tx i7-13700H, GeForce RTX 3050 6GB Laptop GPU | 1.9 kg | 19.9 mm | 16.00" | 2560x1600 | |
| 88.2 % v7 (old) | 01/2024 | Schenker Vision 14 M23 RTX 3050 i7-13700H, GeForce RTX 3050 6GB Laptop GPU | 1.3 kg | 16.6 mm | 14.00" | 2880x1800 | |
| 87.1 % v7 (old) | 08/2023 | Dell Inspiron 16 Plus 7630 i7-13700H, GeForce RTX 4060 Laptop GPU | 2.2 kg | 19.95 mm | 16.00" | 2560x1600 | |
| 85.6 % v7 (old) | 08/2023 | Asus VivoBook 14X K3405 i5-13500H, GeForce RTX 3050 4GB Laptop GPU | 1.4 kg | 18.9 mm | 14.00" | 2880x1800 | |
| 89.2 % v7 (old) | 04/2023 | Lenovo Slim Pro 7 14ARP8 R7 7735HS, GeForce RTX 3050 6GB Laptop GPU | 1.6 kg | 15.6 mm | 14.50" | 2560x1600 | |
| 87.6 % v7 (old) | 11/2023 | Asus VivoBook Pro 16 K6602VU i9-13900H, GeForce RTX 4050 Laptop GPU | 1.9 kg | 19 mm | 16.00" | 3200x2000 | |
| 89.4 % v7 (old) | 04/2023 | Samsung Galaxy Book3 Ultra 16 i7-13700H, GeForce RTX 4050 Laptop GPU | 1.8 kg | 16.5 mm | 16.00" | 2880x1800 |
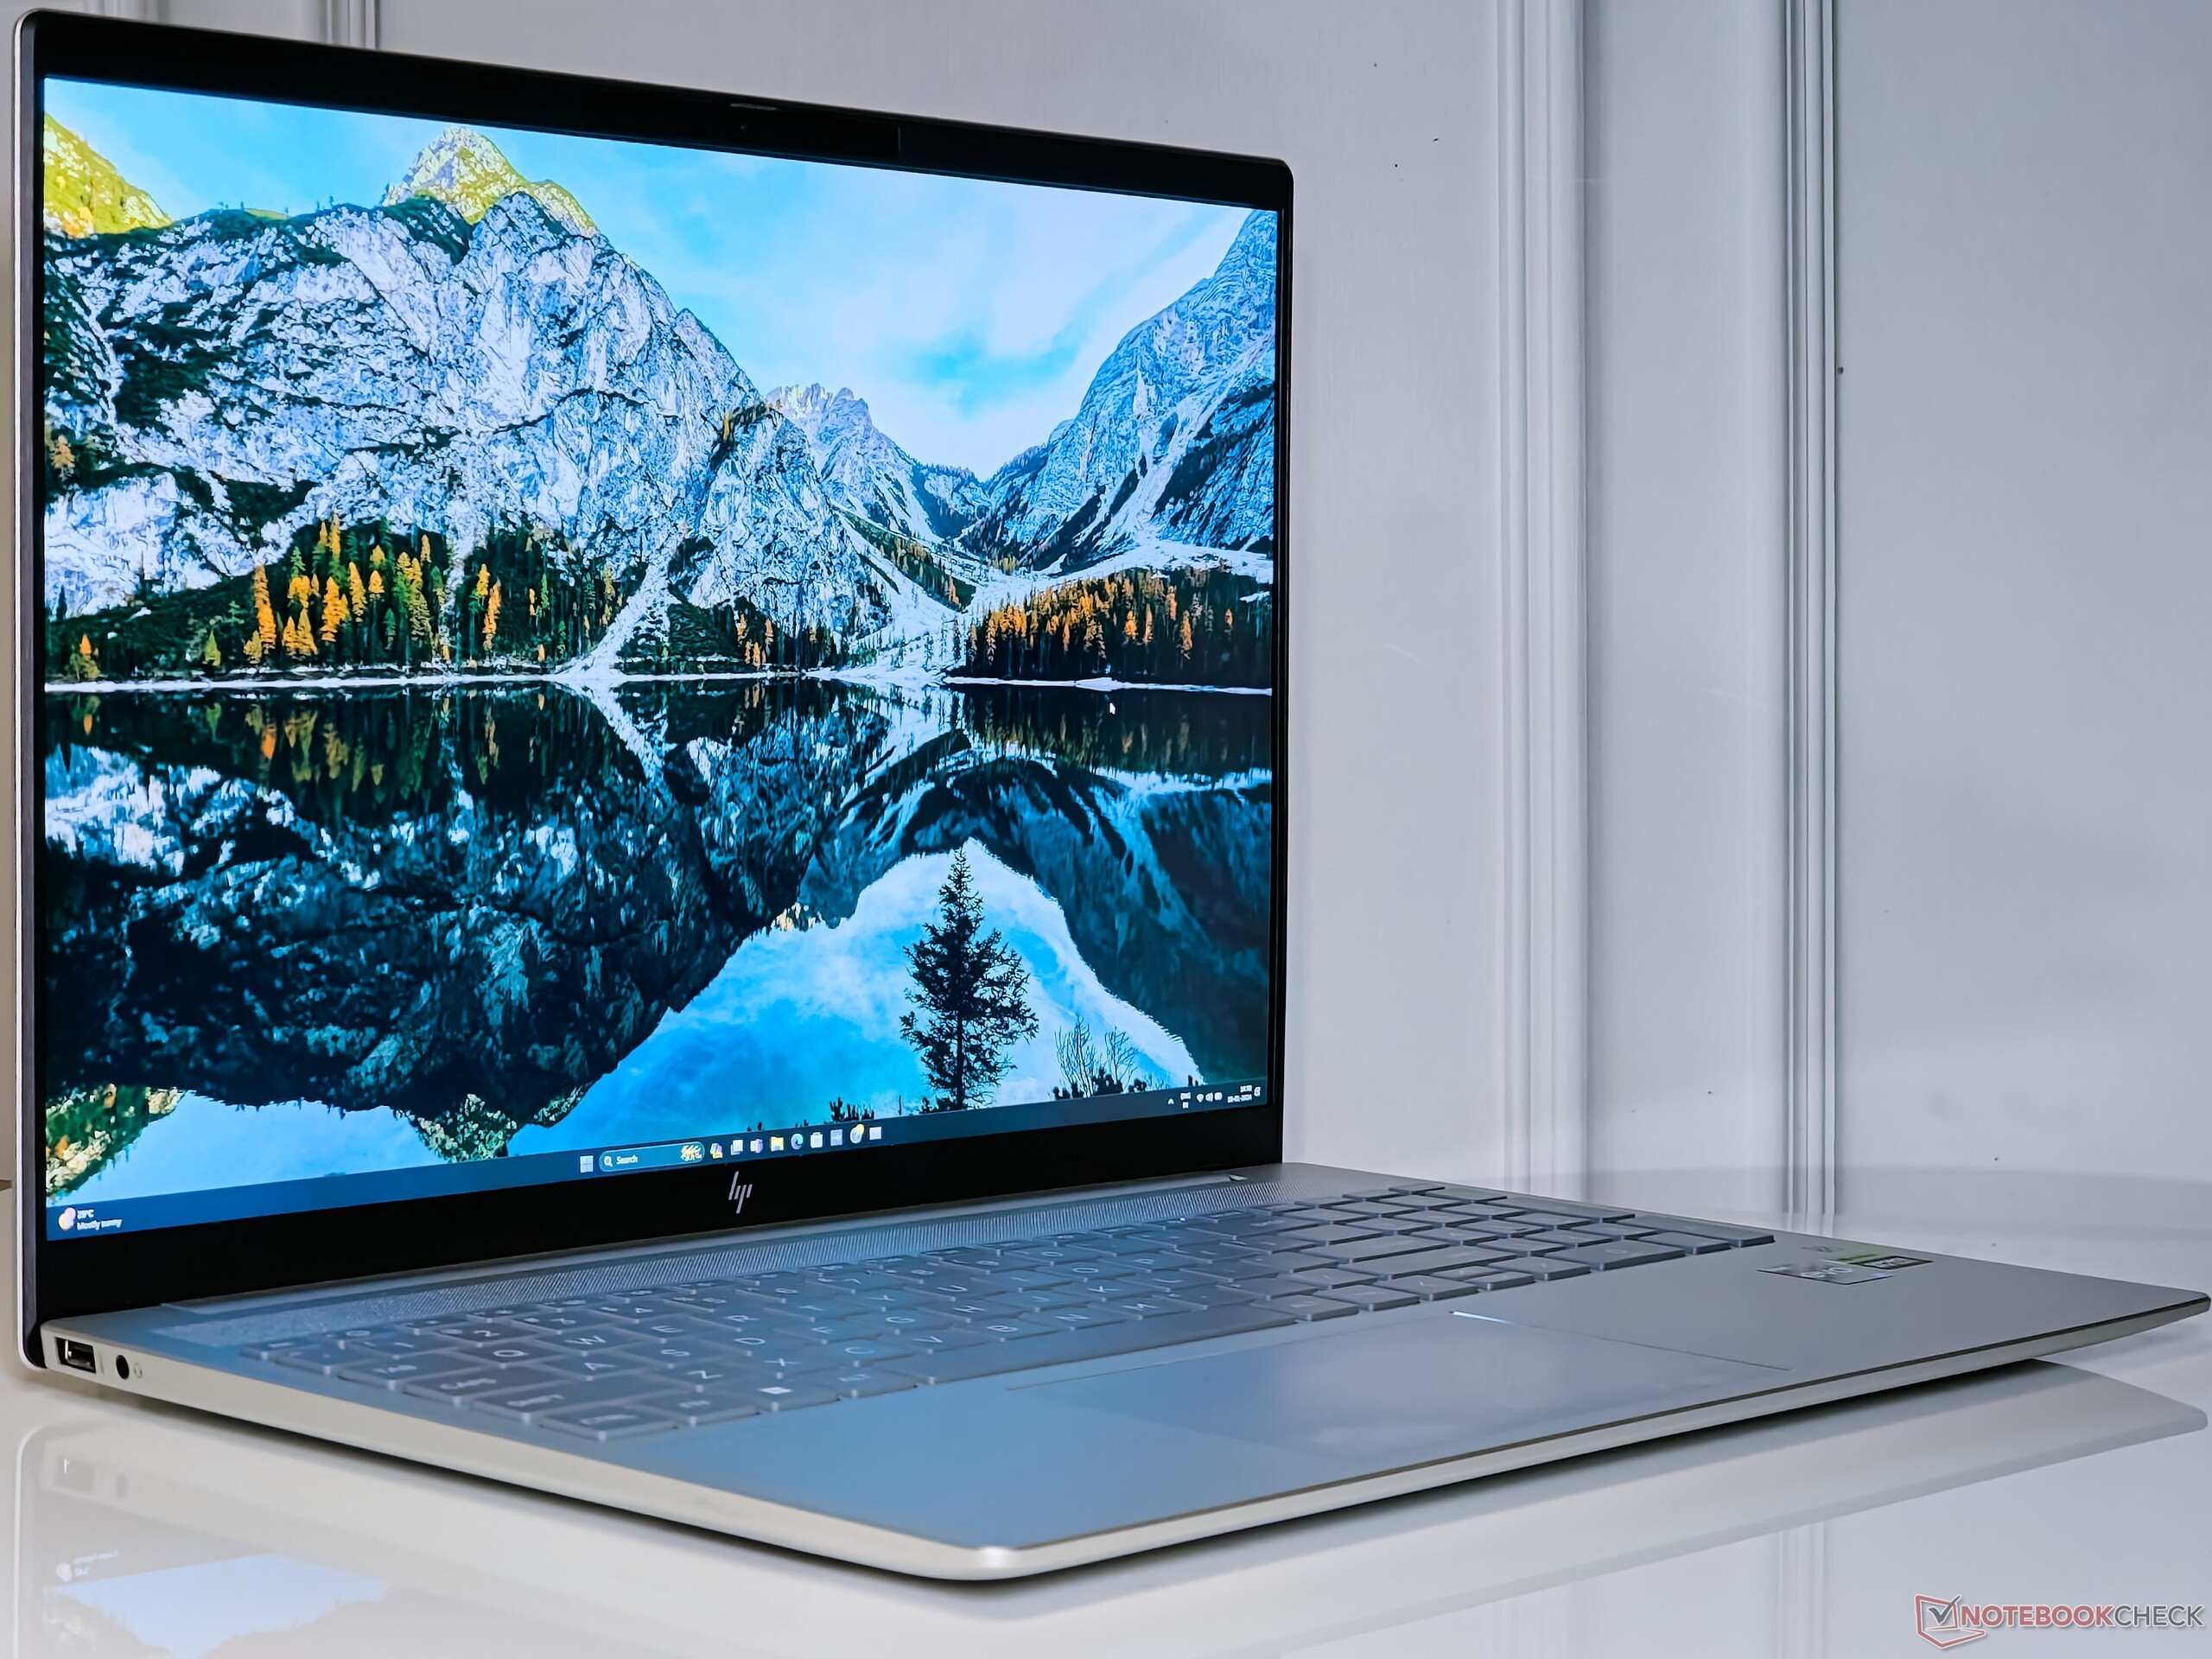
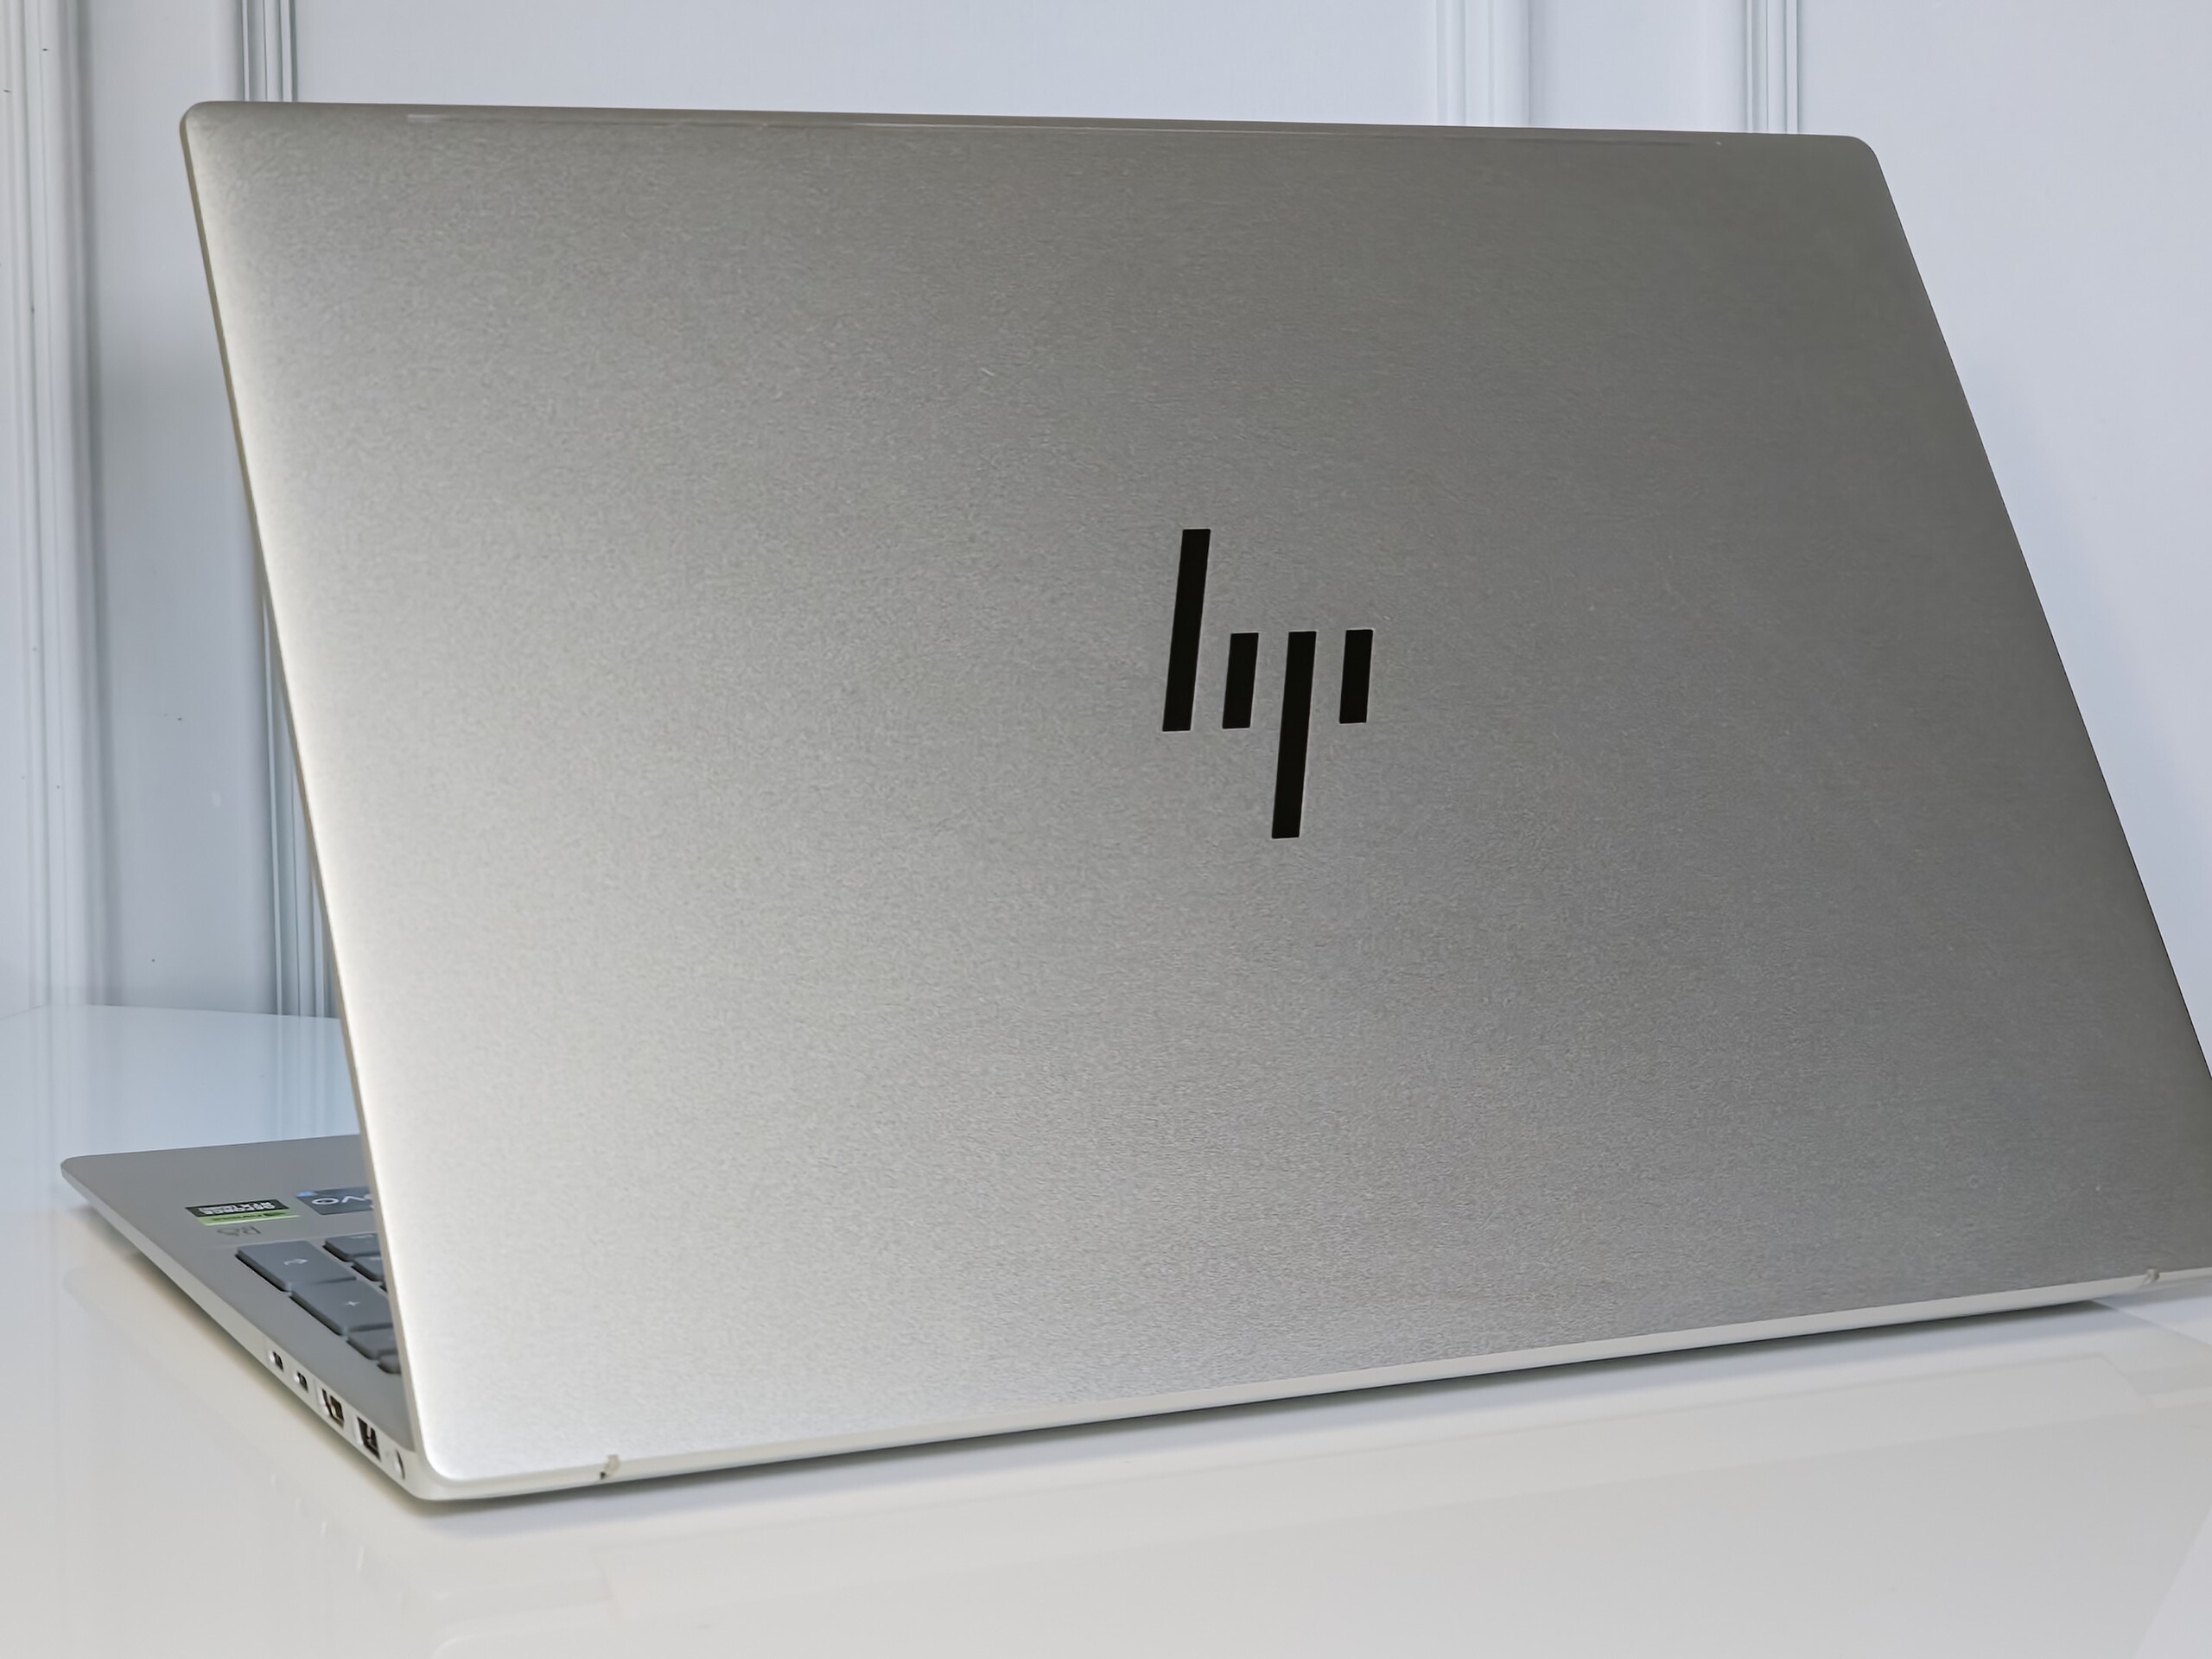
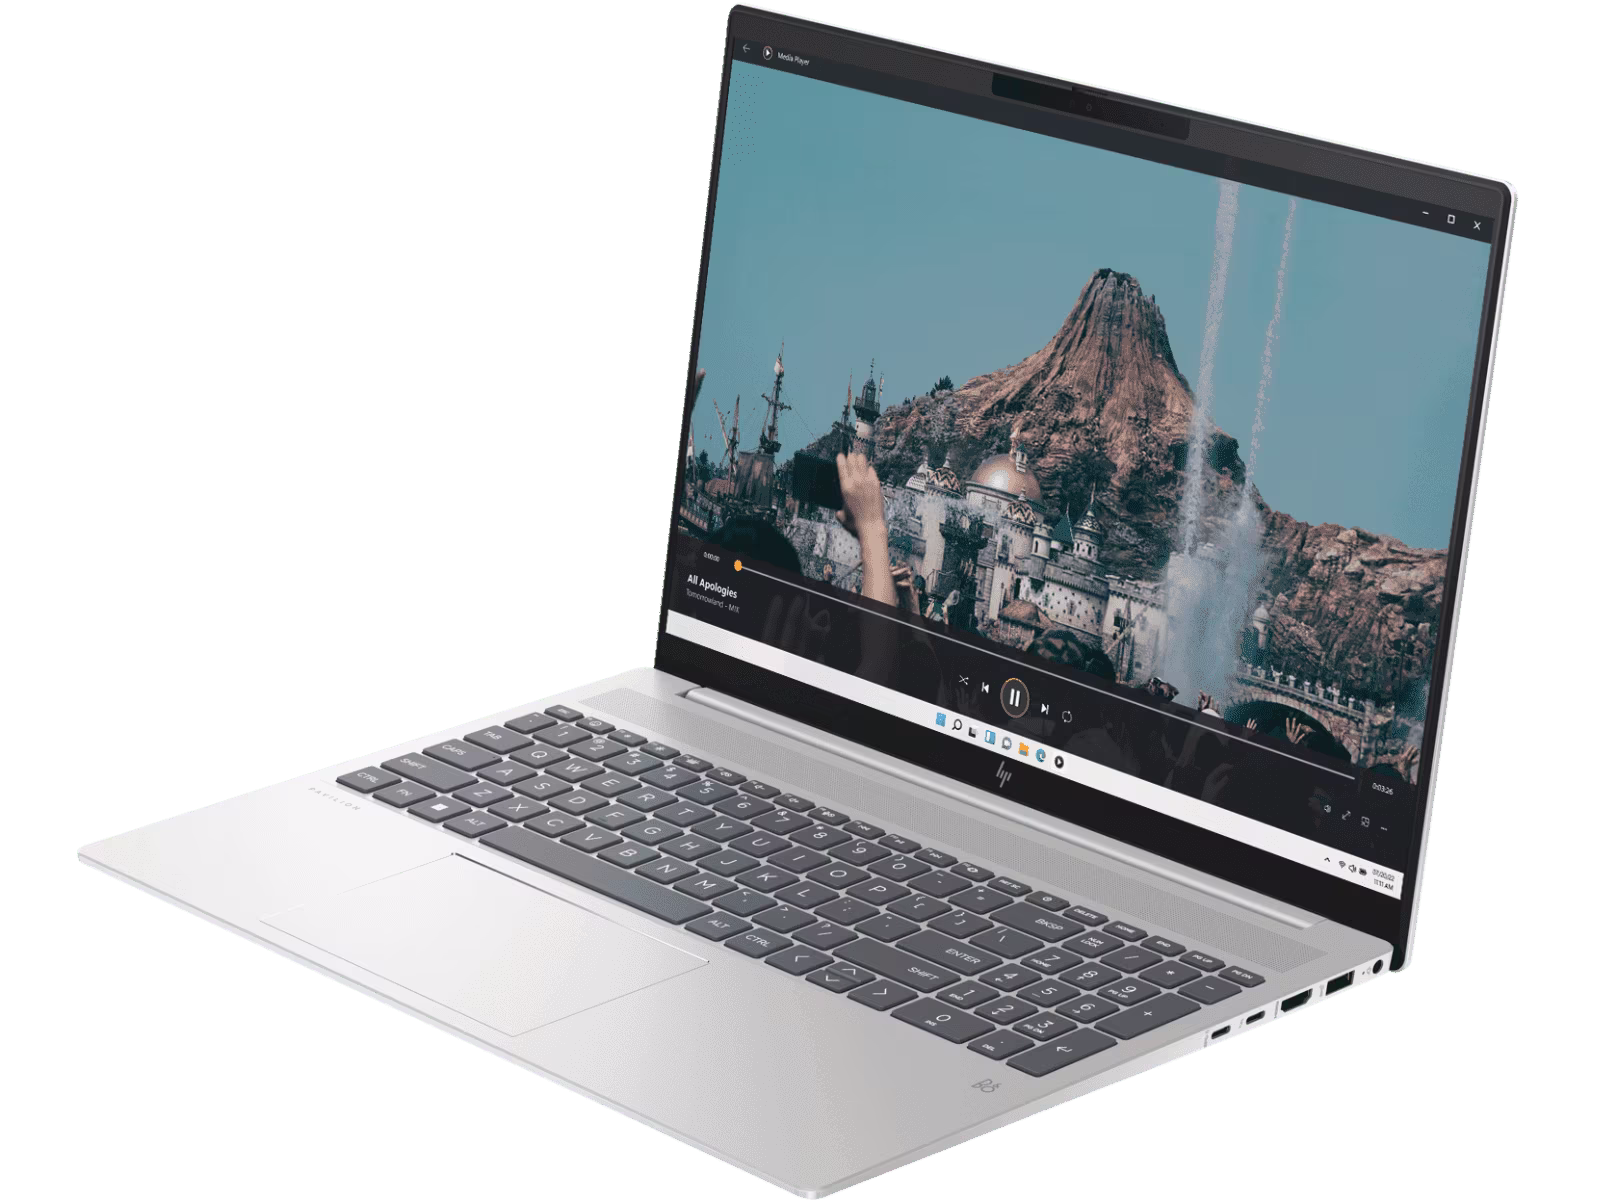
Chassi: Construção robusta, toda em metal
Semelhante ao Pavilion Plus 14, o Pavilion Plus 16 apresenta uma construção metálica Natural Silver para as tampas A, C e D, enquanto a tampa é feita de alumínio.
A qualidade geral da construção deixa pouco espaço para reclamações. Não notamos nenhuma flexão específica na tampa ou na plataforma do teclado.
A HP anuncia uma relação tela/corpo de 89,74%, mas o valor medido é de 83%. Com 1,9 kg, o peso do portátil é similar ao de outros portáteis multimídia de 16 polegadas em voga.
Conectividade: Taxa de transferência WLAN consistente
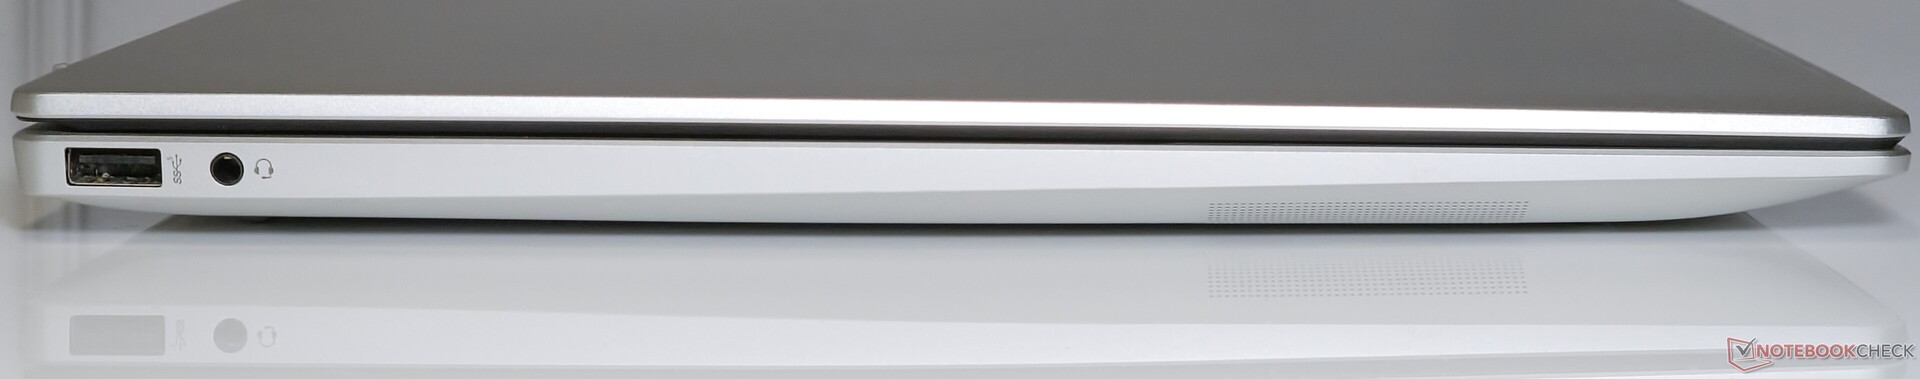
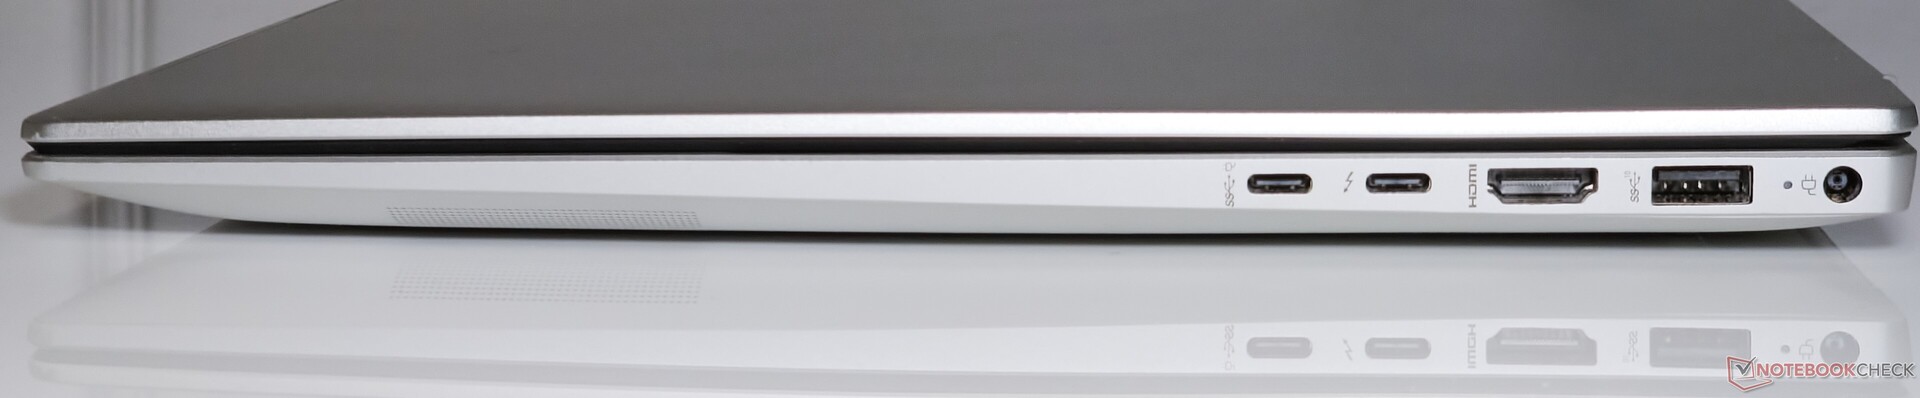
O Pavilion Plus 16 oferece uma seleção de portas decente que inclui portas USB Tipo A e USB Tipo C, inclusive Thunderbolt 4.
O posicionamento das portas é bom e não prejudica a conectividade de periféricos adjacentes, mas uma das portas Type-C poderia estar no lado esquerdo para uma distribuição mais uniforme.
Comunicação
O desempenho do iPerf3 do Pavilion Plus 16 na banda de 5 GHz é um pouco mais lento do que o observado no Asus VivoBook Pro 16 com a mesma placa WLAN Intel Wi-Fi 6E AX211.
O Pavilion compensa essa deficiência contra o VivoBook Pro 16 no desempenho de recepção de 6 GHz, mas não muito.
o desempenho do iPerf3 nas bandas de 5 GHz e 6 GHz é bastante consistente, sem nenhum problema, ao contrário do que vemos no Lenovo Slim Pro 7 com um chip MediaTek Wi-Fi 6E MT7922.
| Networking / iperf3 transmit AXE11000 | |
| Asus VivoBook 14X K3405 | |
| HP Pavilion Plus 16-ab0456tx | |
| Asus VivoBook Pro 16 K6602VU | |
| Samsung Galaxy Book3 Ultra 16 | |
| Média da turma Multimedia (606 - 1978, n=56, últimos 2 anos) | |
| Lenovo Slim Pro 7 14ARP8 | |
| Dell Inspiron 16 Plus 7630 | |
| Média Intel Wi-Fi 6E AX211 (64 - 1921, n=276) | |
| Networking / iperf3 receive AXE11000 | |
| Asus VivoBook 14X K3405 | |
| Asus VivoBook Pro 16 K6602VU | |
| HP Pavilion Plus 16-ab0456tx | |
| Samsung Galaxy Book3 Ultra 16 | |
| Lenovo Slim Pro 7 14ARP8 | |
| Média Intel Wi-Fi 6E AX211 (582 - 1890, n=276) | |
| Média da turma Multimedia (682 - 1818, n=56, últimos 2 anos) | |
| Dell Inspiron 16 Plus 7630 | |
| Networking / iperf3 transmit AXE11000 6GHz | |
| HP Pavilion Plus 16-ab0456tx | |
| Dell Inspiron 16 Plus 7630 | |
| Média da turma Multimedia (869 - 2373, n=23, últimos 2 anos) | |
| Asus VivoBook 14X K3405 | |
| Asus VivoBook Pro 16 K6602VU | |
| Média Intel Wi-Fi 6E AX211 (385 - 1851, n=226) | |
| Networking / iperf3 receive AXE11000 6GHz | |
| HP Pavilion Plus 16-ab0456tx | |
| Média da turma Multimedia (1212 - 2361, n=23, últimos 2 anos) | |
| Asus VivoBook Pro 16 K6602VU | |
| Asus VivoBook 14X K3405 | |
| Média Intel Wi-Fi 6E AX211 (700 - 1857, n=226) | |
| Dell Inspiron 16 Plus 7630 | |
Webcam
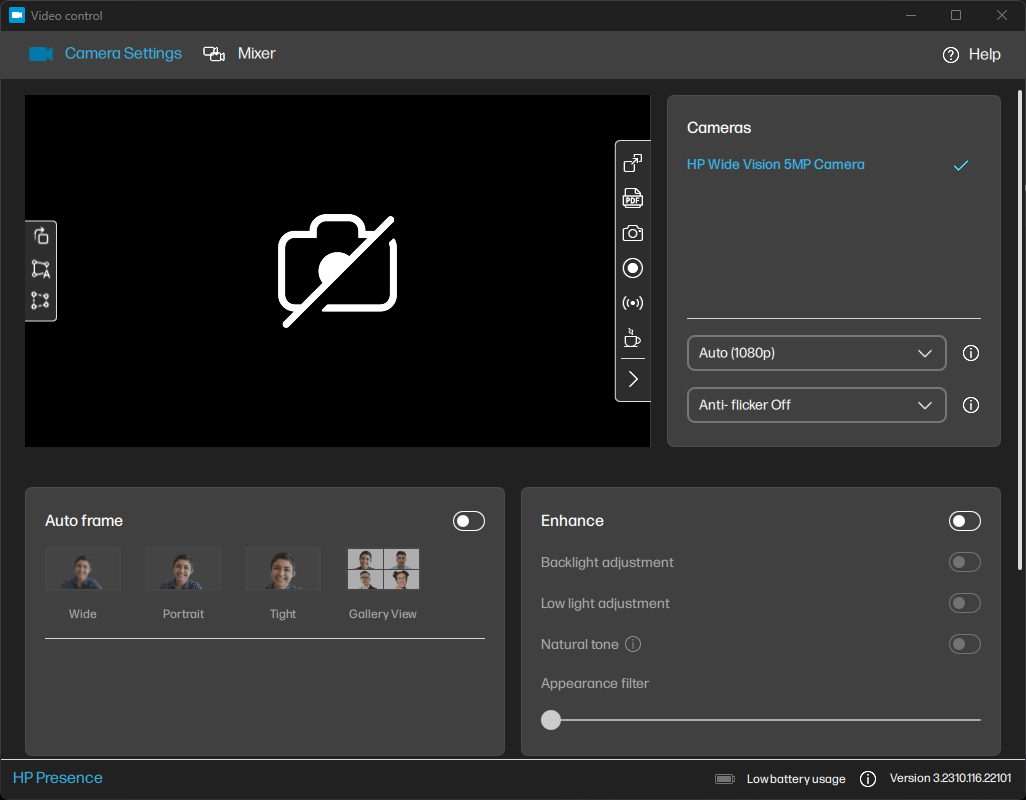
A webcam de 5 MP produz imagens decentes que são bastante úteis para videoconferências. Os detalhes são muito bem preservados para uma webcam de laptop, mas a câmera pode ter dificuldades com pouca luz.
A HP oferece alguns utilitários interessantes, como o HP Enhanced Lighting, que ilumina a tela ao redor do objeto, e um aplicativo Video Control que oferece opções adicionais de enquadramento e ajuste de imagem.


Segurança
A HP fornece uma câmera IR compatível com o Windows Hello para o Pavilion Plus 16, juntamente com um obturador de privacidade para a webcam. A câmera IR teve um desempenho razoavelmente rápido durante nosso tempo com o dispositivo.
Além disso, um módulo TPM 2.0 está presente para atender aos requisitos de segurança do Windows 11.
Acessórios e garantia
Não há nenhum acessório adicional na caixa além do adaptador de energia de 135 W e a documentação usual.
A HP oferece um ano de garantia para o Pavilion Plus 16 na Índia. Os compradores podem estender essa garantia por até mais três anos adquirindo os HP Care Packs elegíveis https://www.hp.com/in-en/shop/carepackfinder.
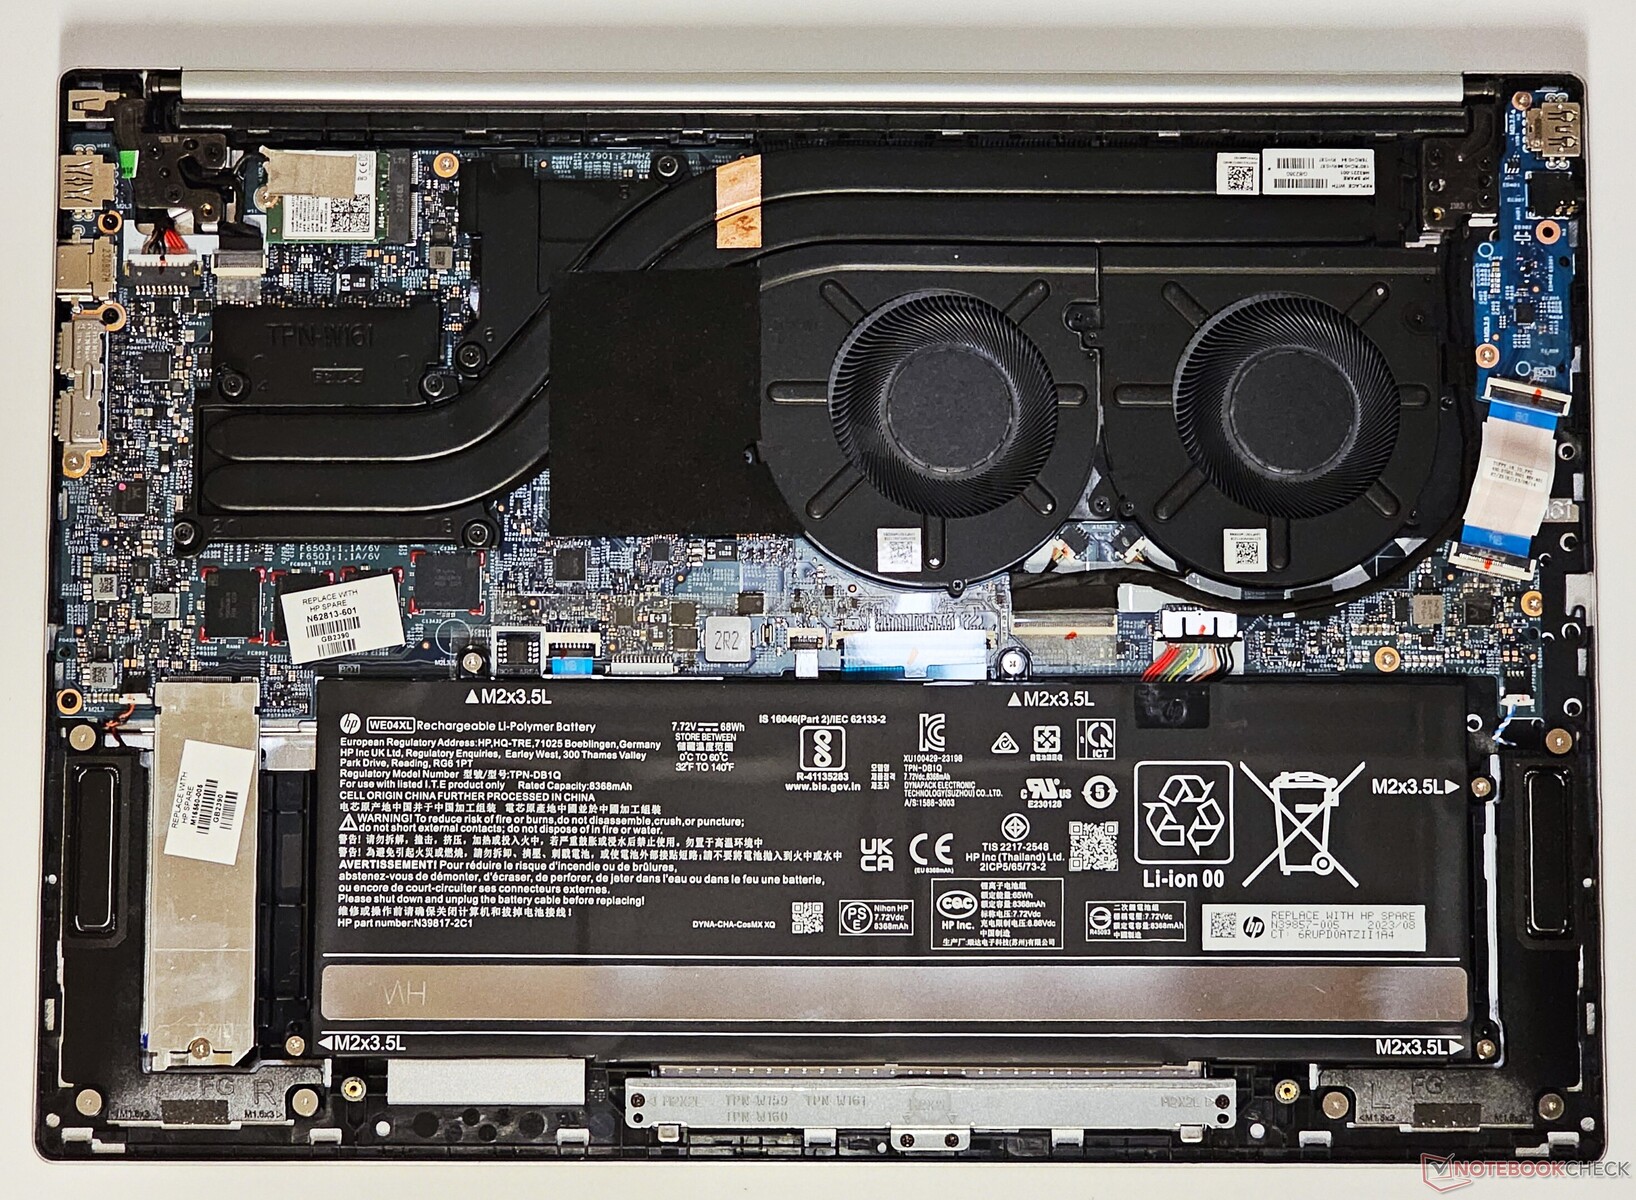
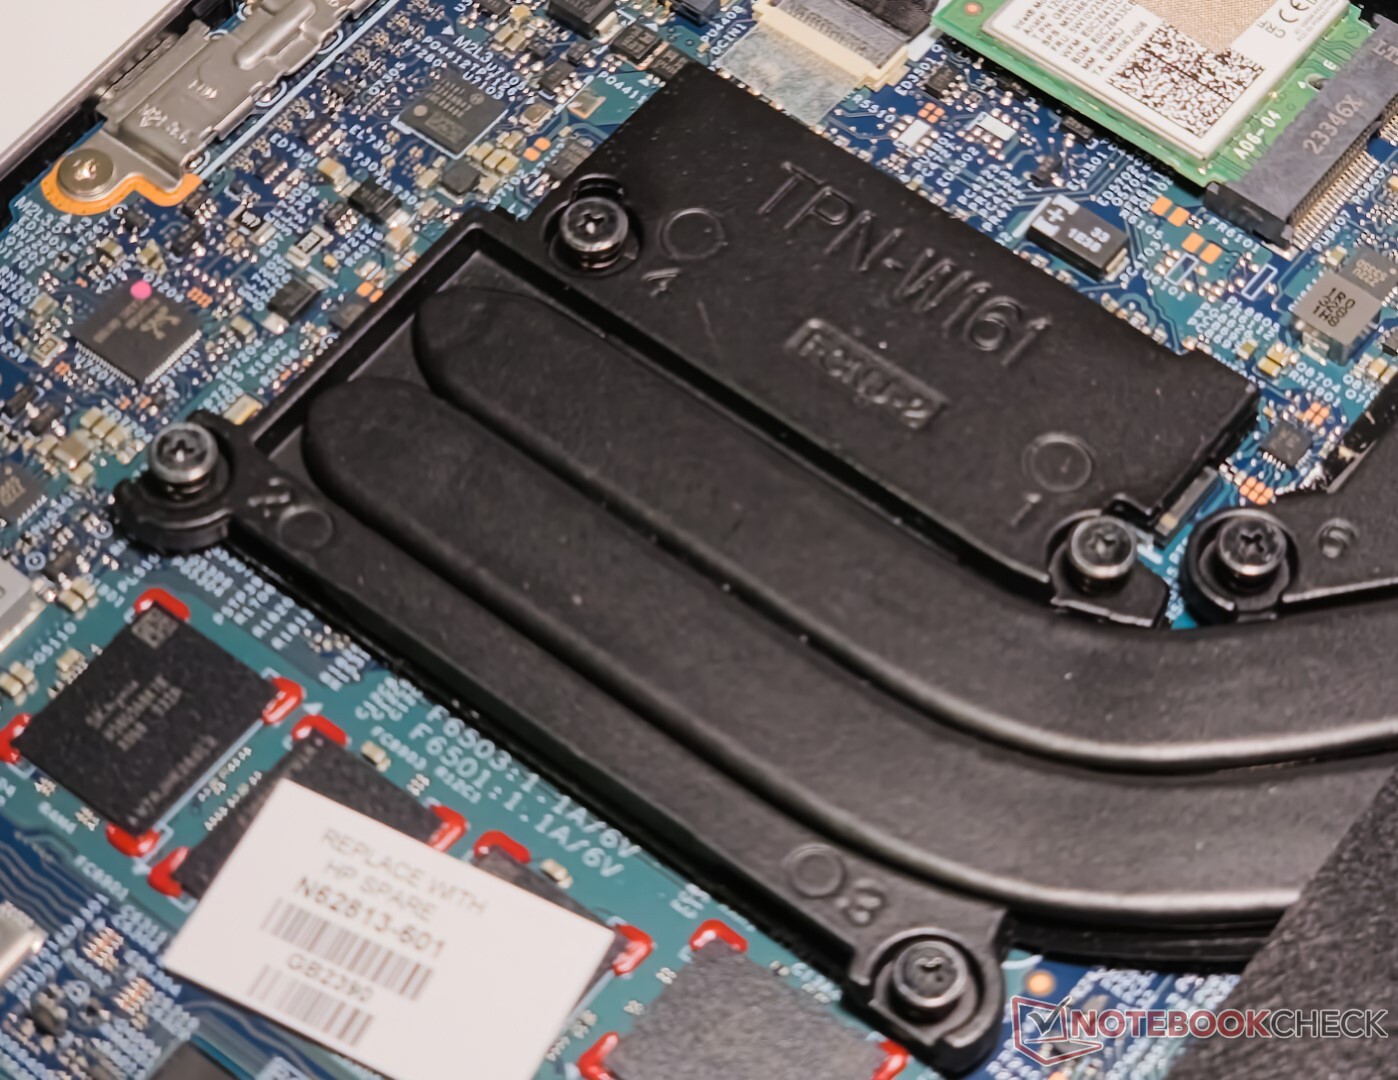
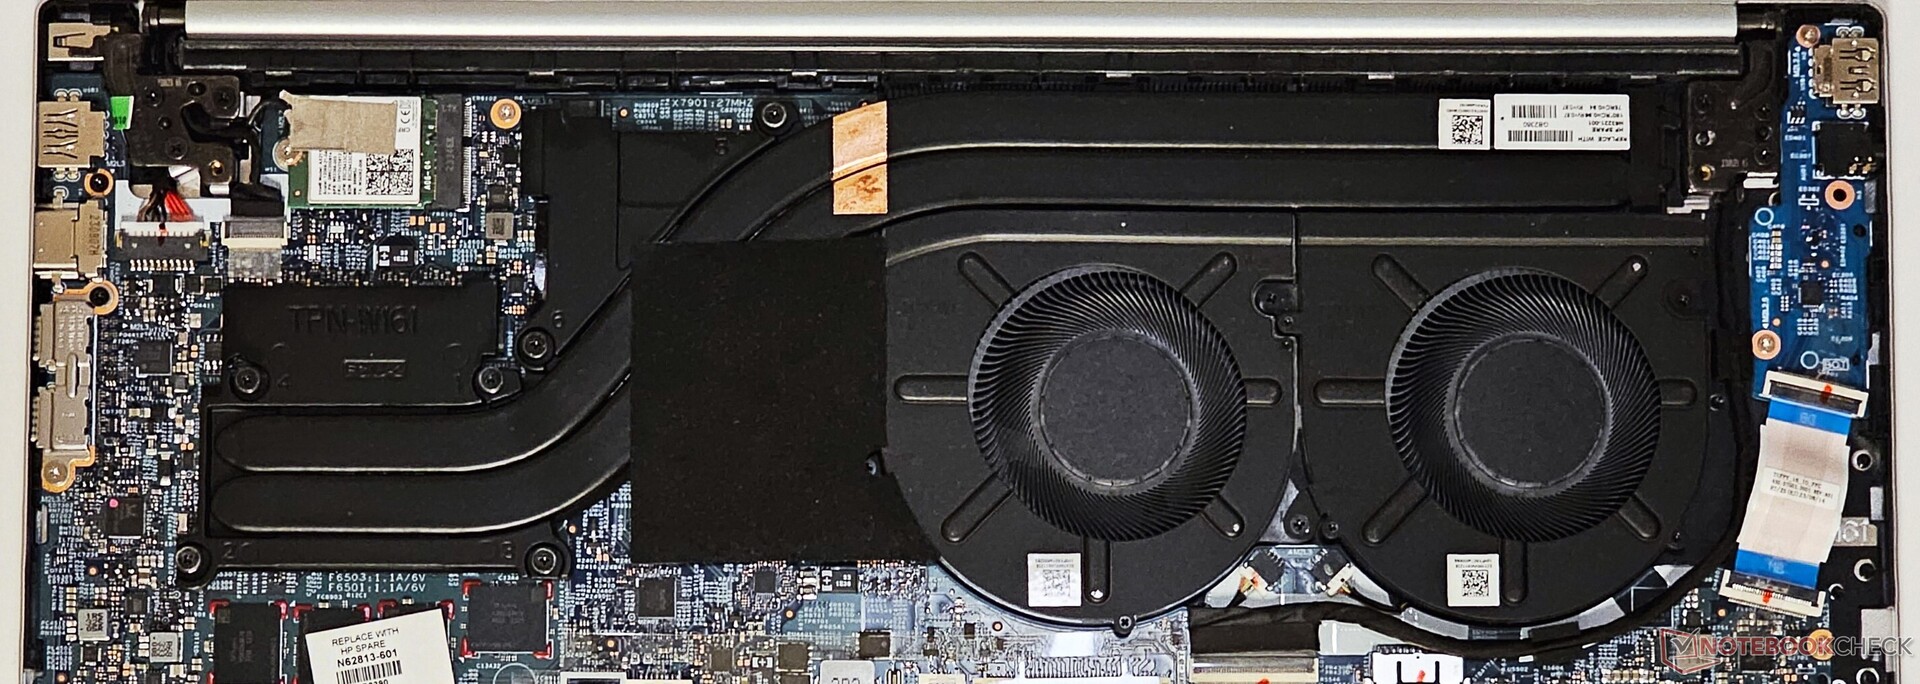
Manutenção
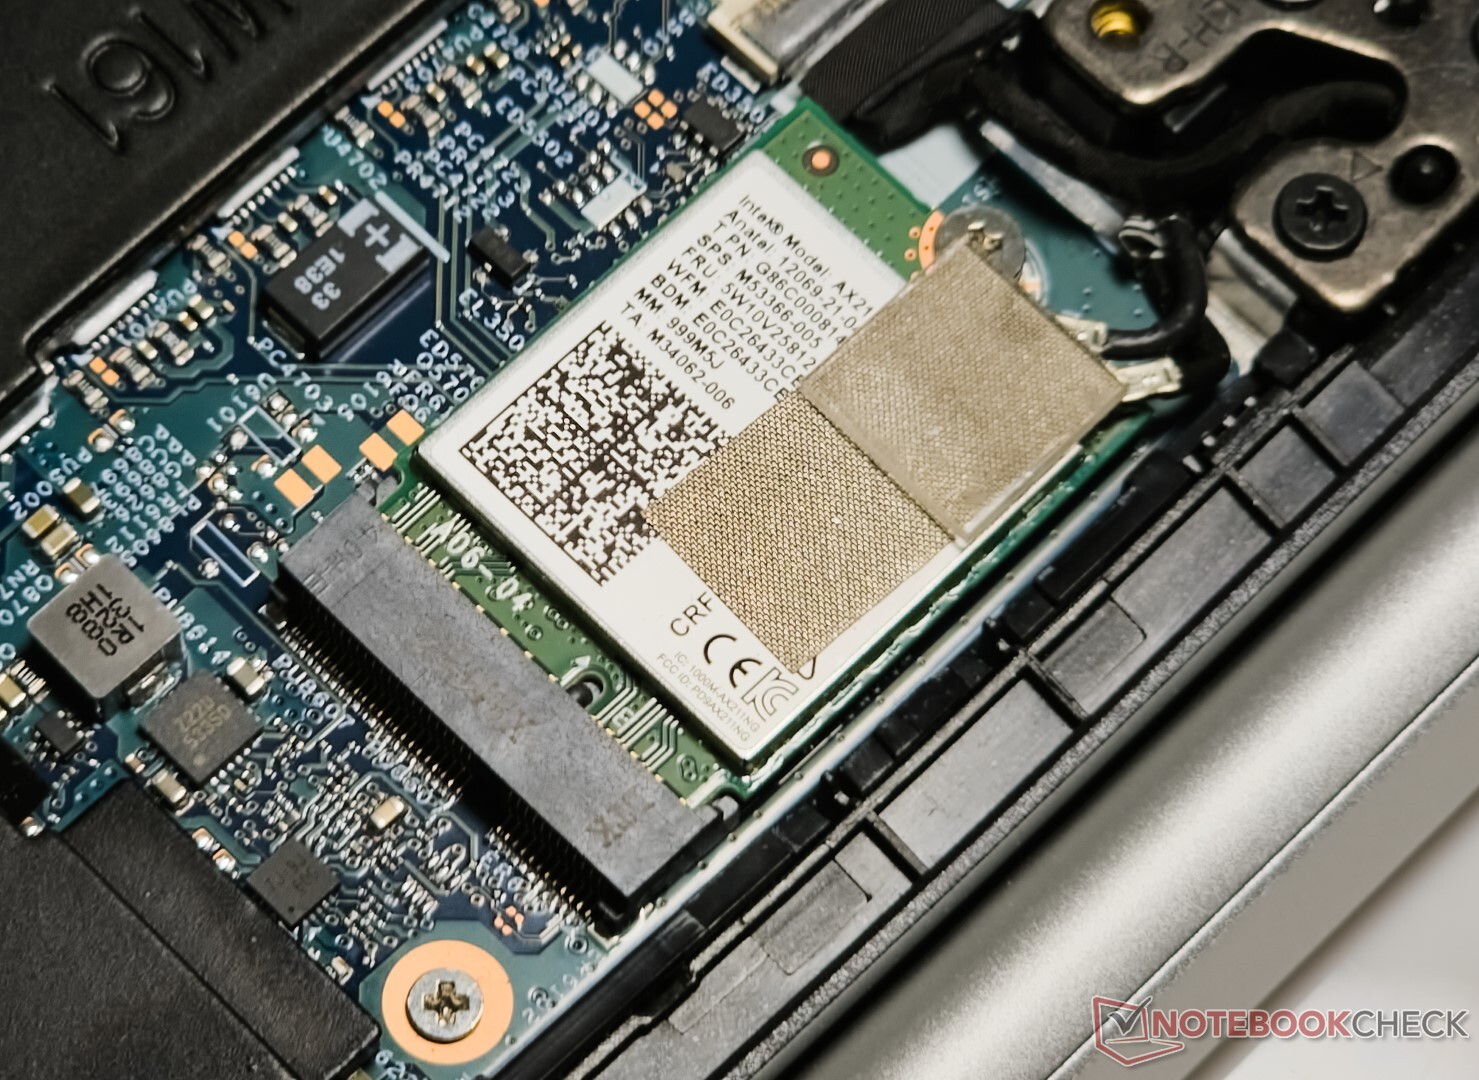
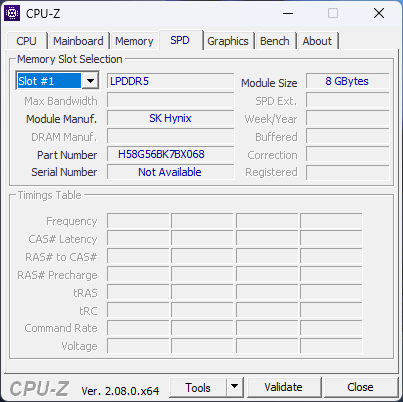
O painel inferior pode ser aberto após a remoção dos quatro parafusos PH0. A memória vem soldada, mas a placa WLAN, o SSD NVMe e a bateria podem ser substituídos, se necessário.
Dispositivos de entrada: Teclado numérico de tamanho normal com tato decente
Teclado
O teclado do Pavilion Plus 16 oferece uma experiência de digitação decente. As teclas cinza oferecem um bom contraste com a cor do chassi Natural Silver. O teclado numérico é espaçoso e é útil para processar números no Excel. No entanto, ele não tem um indicador Num Lock.
O botão liga/desliga está localizado ao lado da tecla Delete, o que pode confundir os usuários de primeira viagem. As teclas de seta superior e inferior também parecem apertadas. Uma luz de fundo branca de três estágios ajuda na legibilidade com pouca luz.
Touchpad
O touchpad de 12,5 cm x 8 cm parece espaçoso e oferece uma experiência de deslizamento suave com bom feedback. No entanto, o deslocamento não é tão profundo.
O touchpad inteiro funciona como o botão esquerdo do mouse. Os cliques no meio e na base do touchpad são mais responsivos do que os da parte superior.
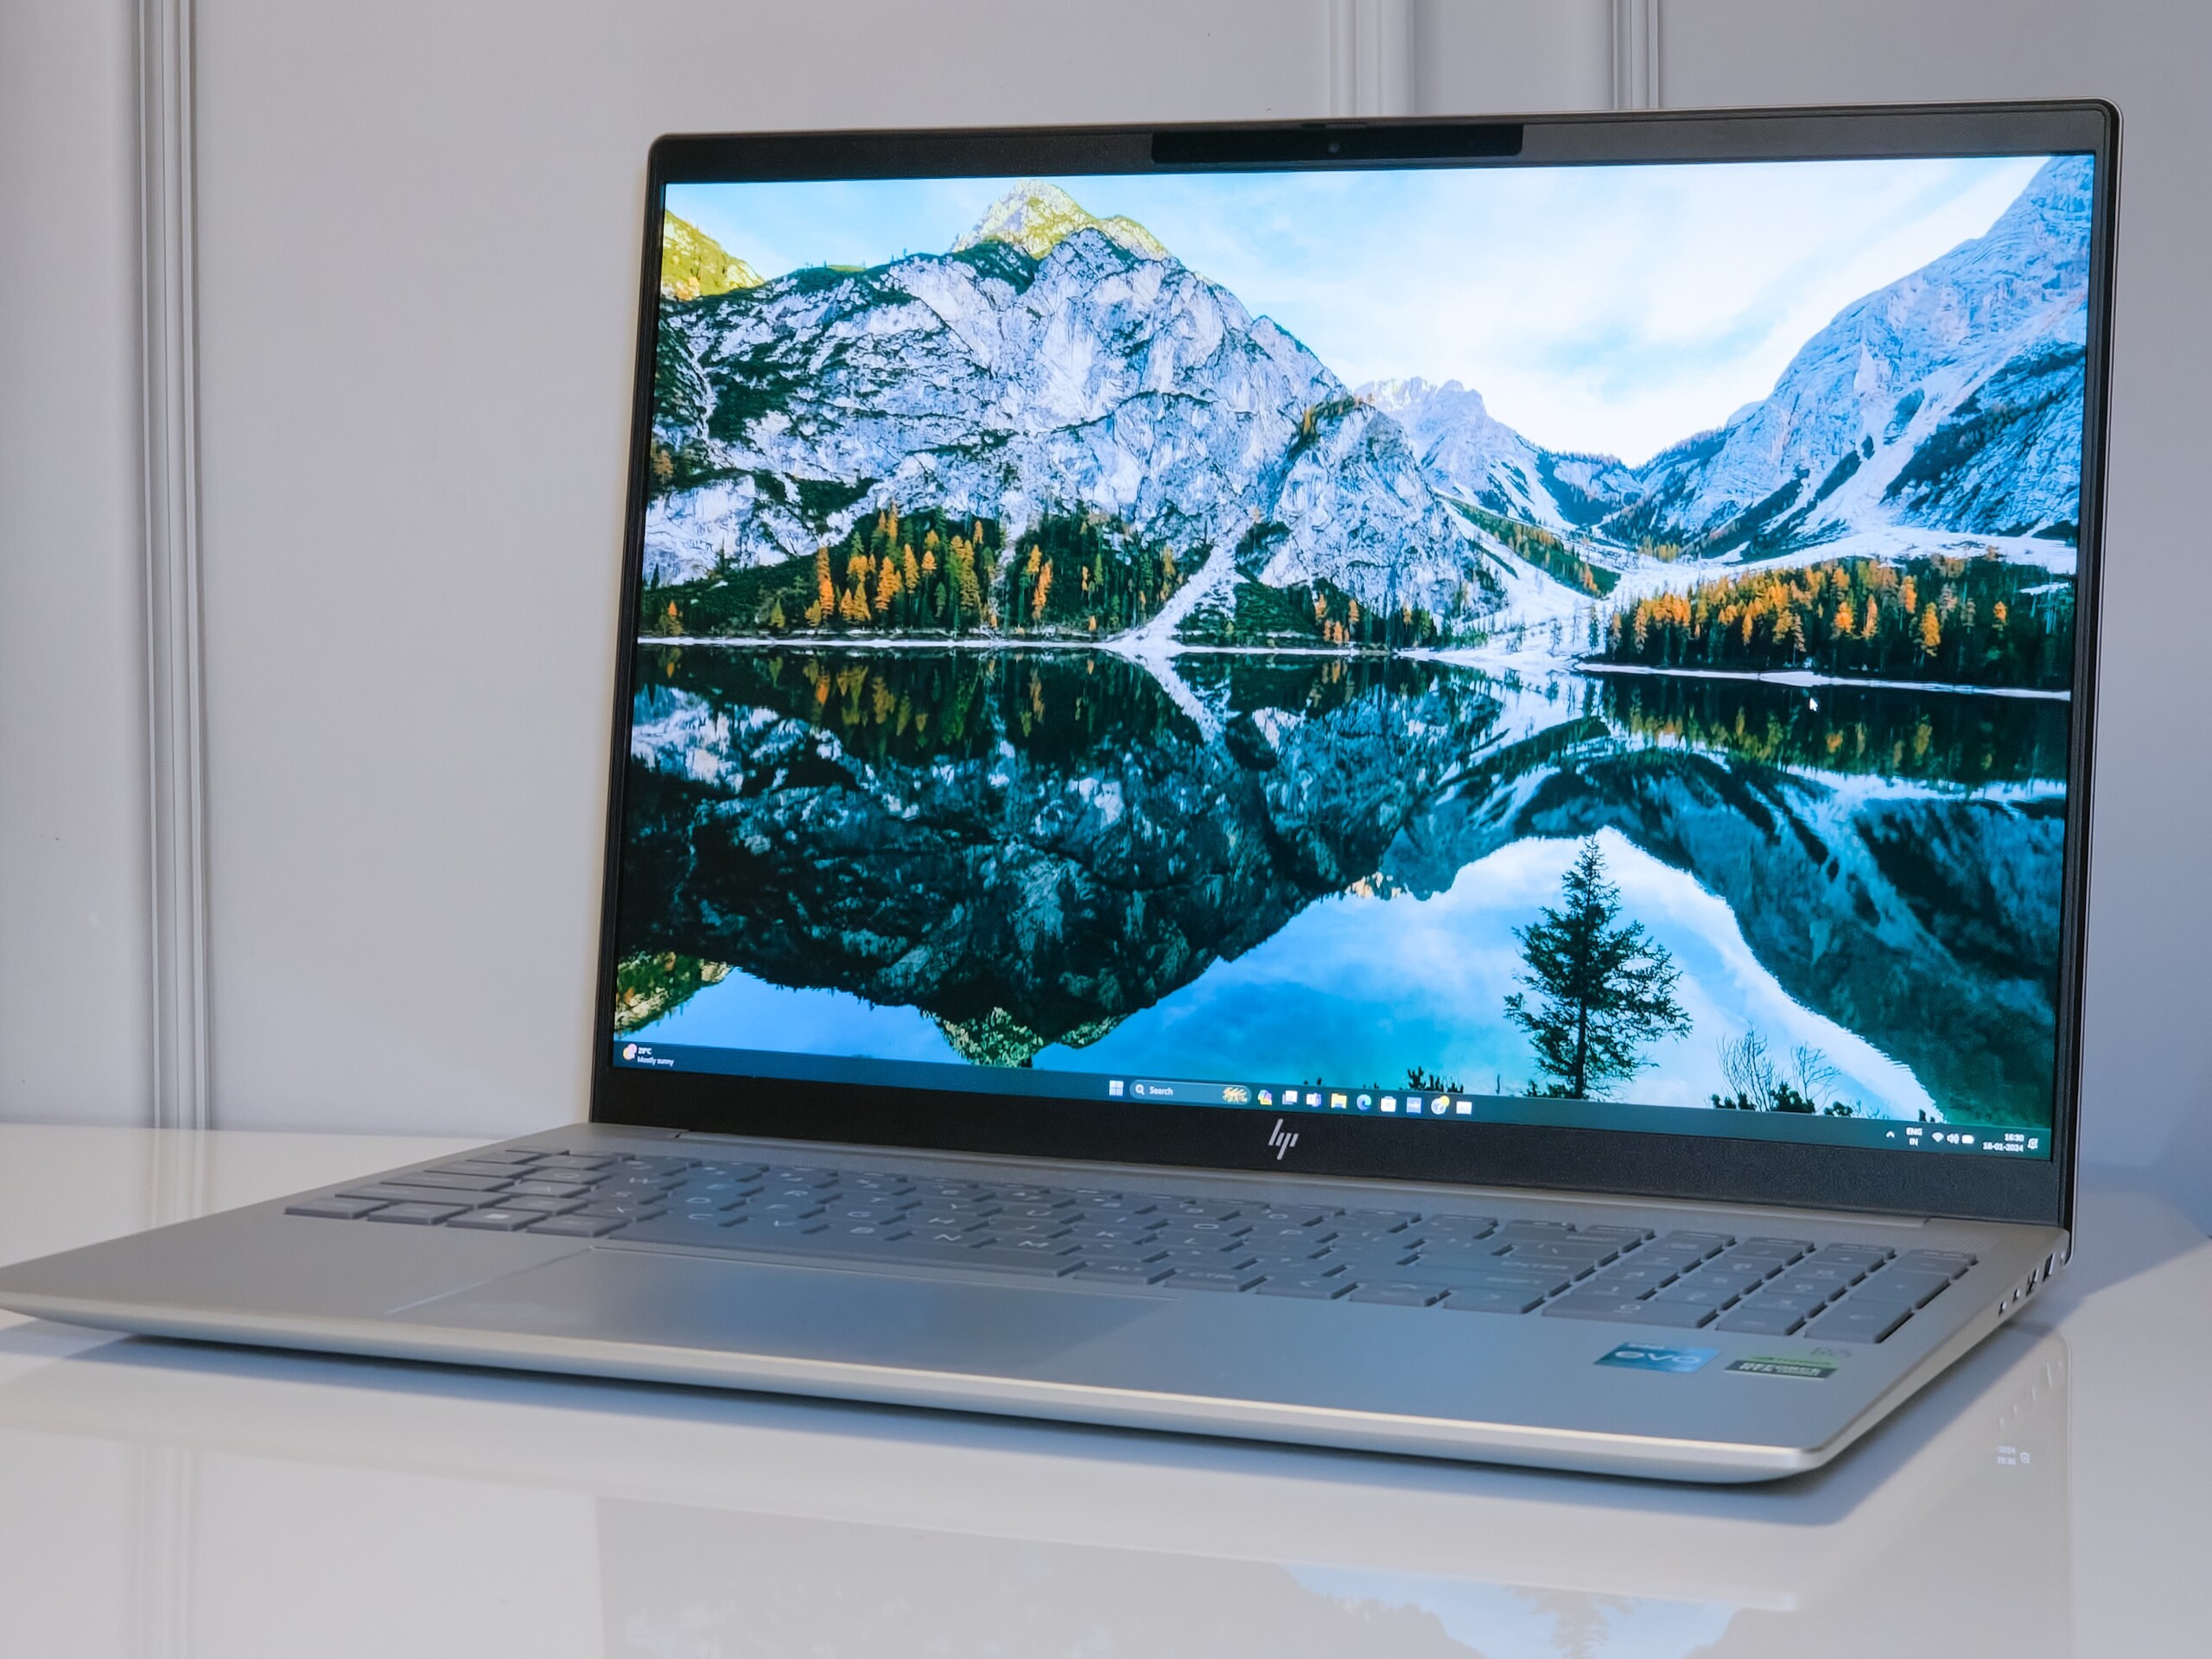
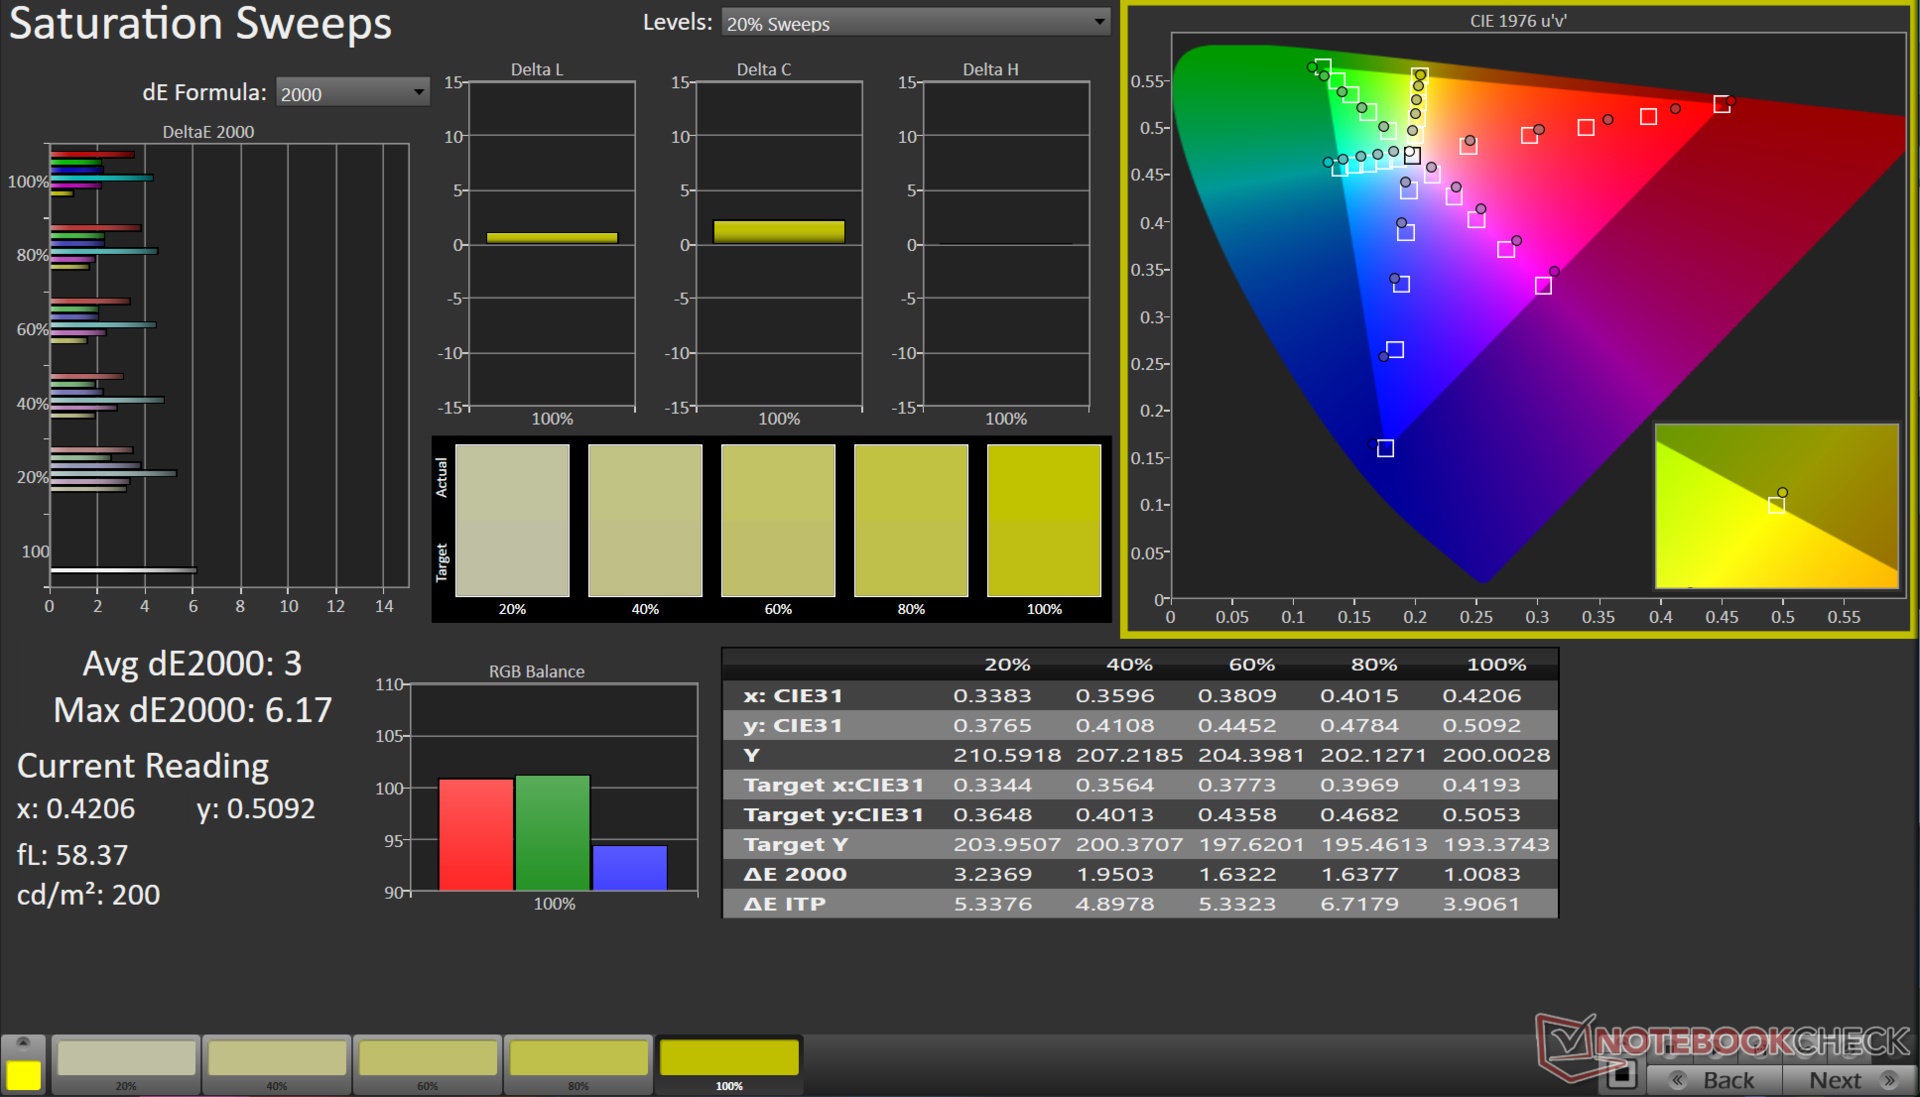
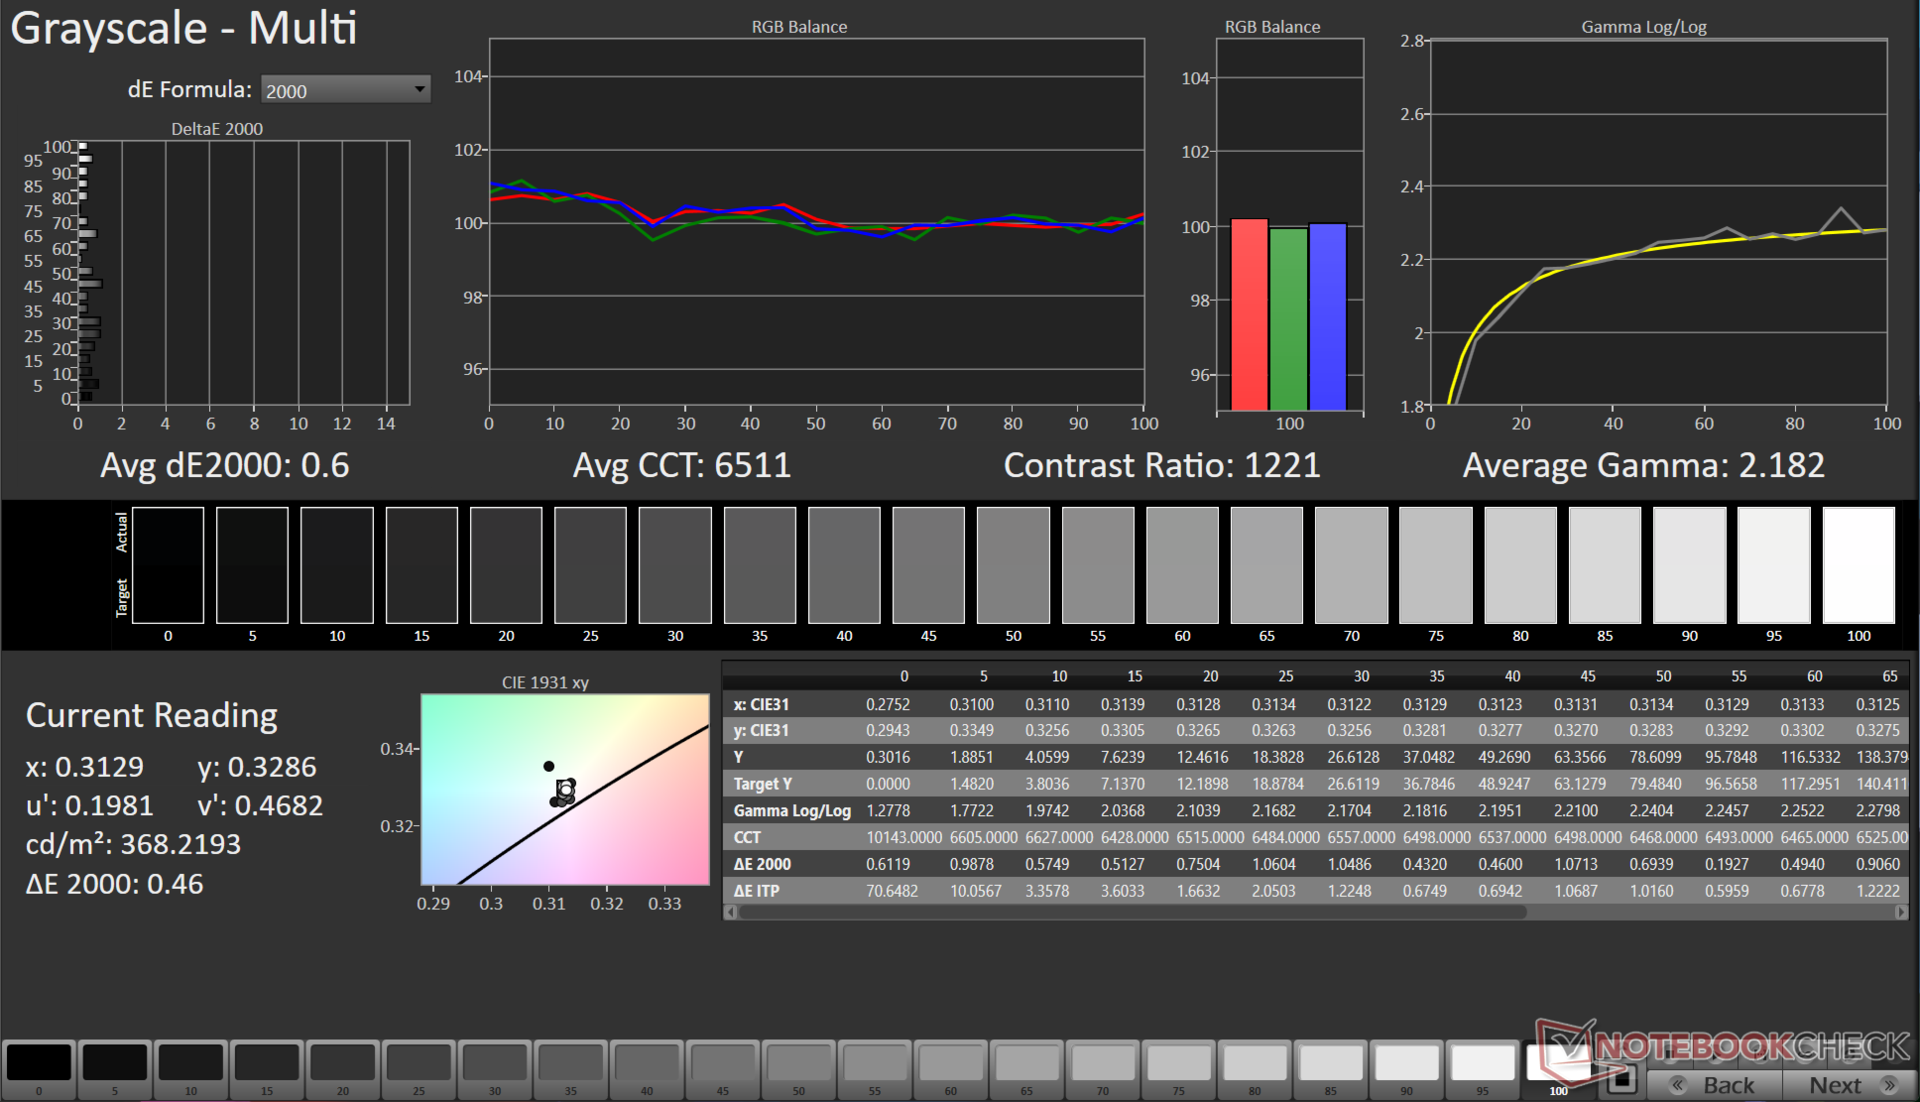
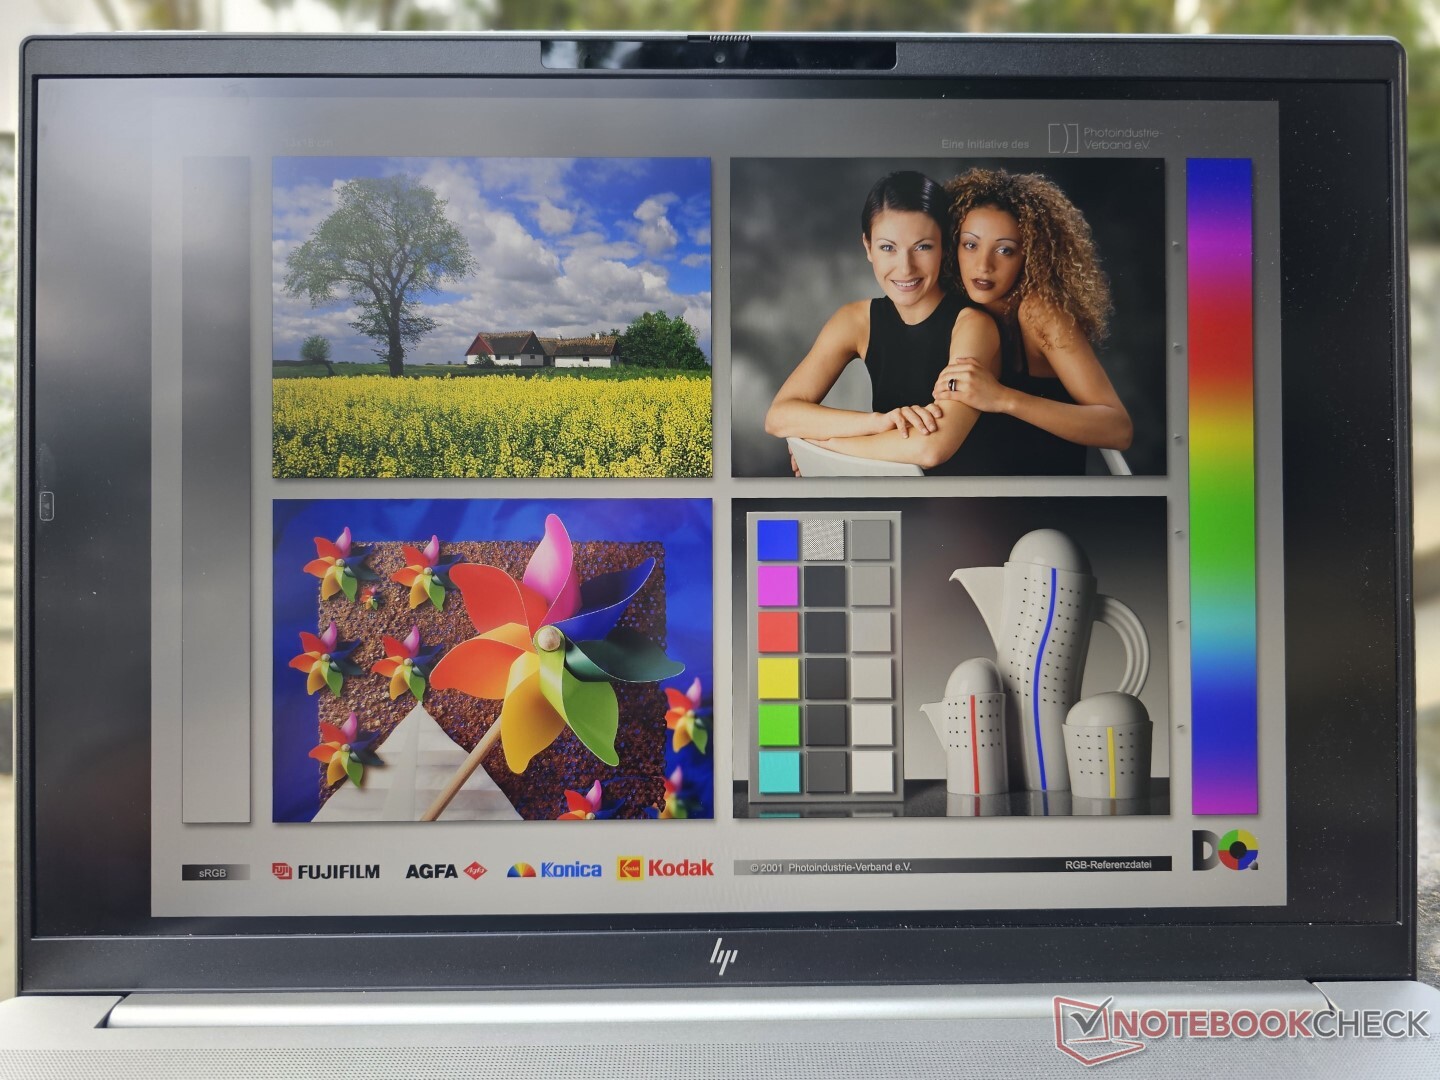
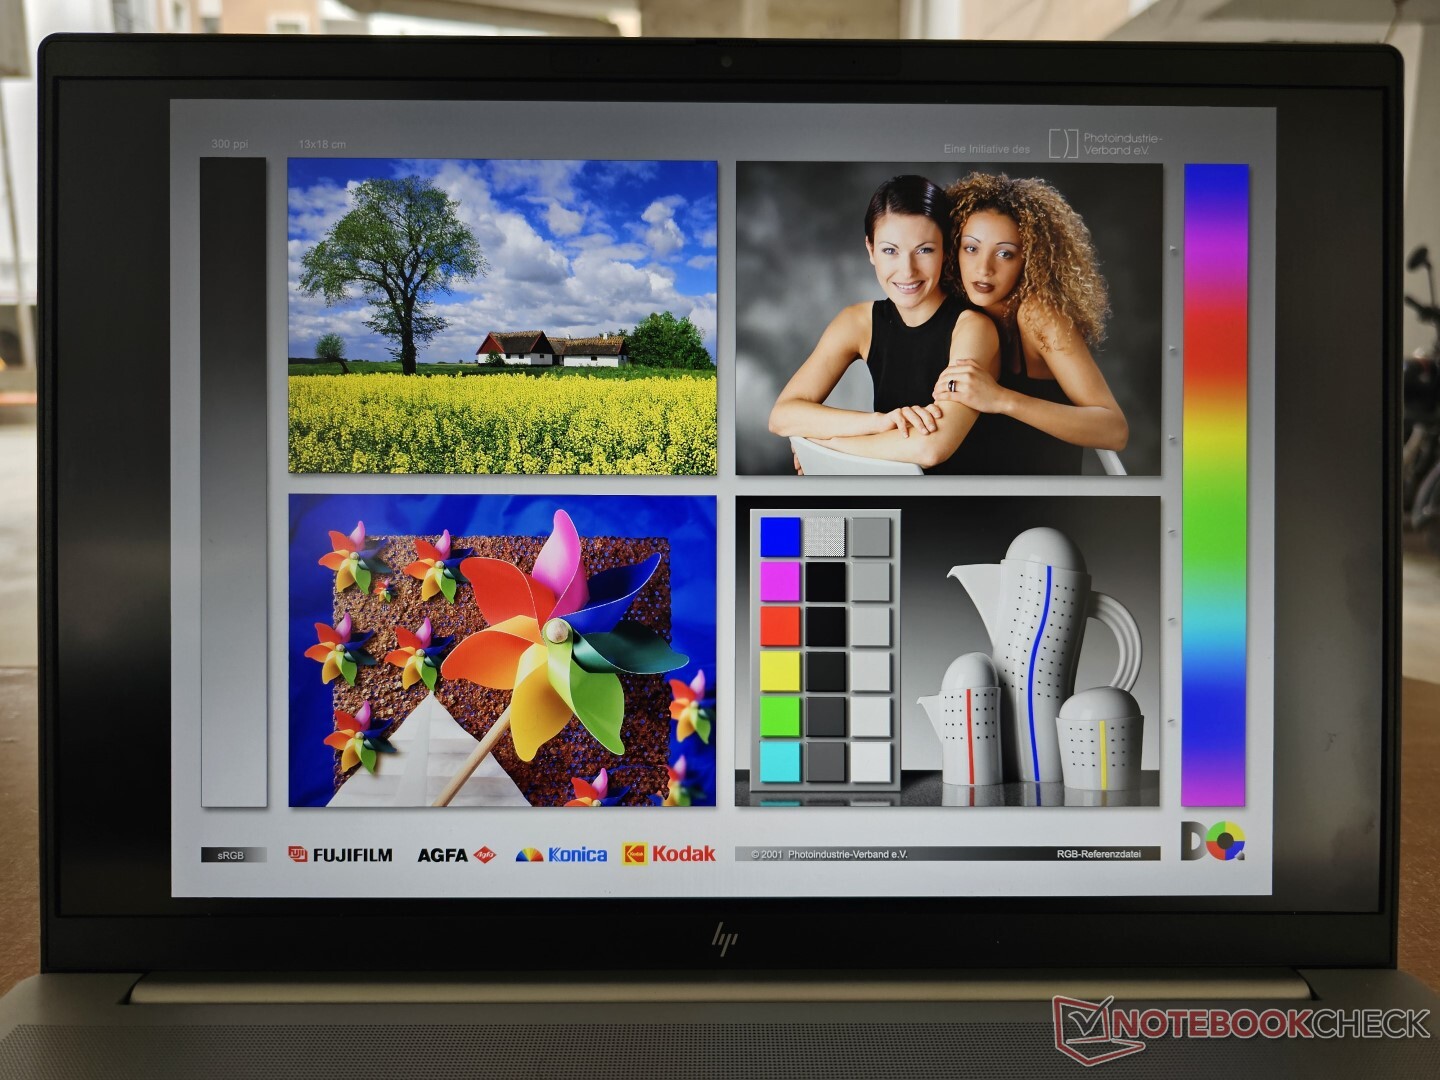
Tela: painel WQXGA de 120 Hz com um perfil de cores decente e sem PWM
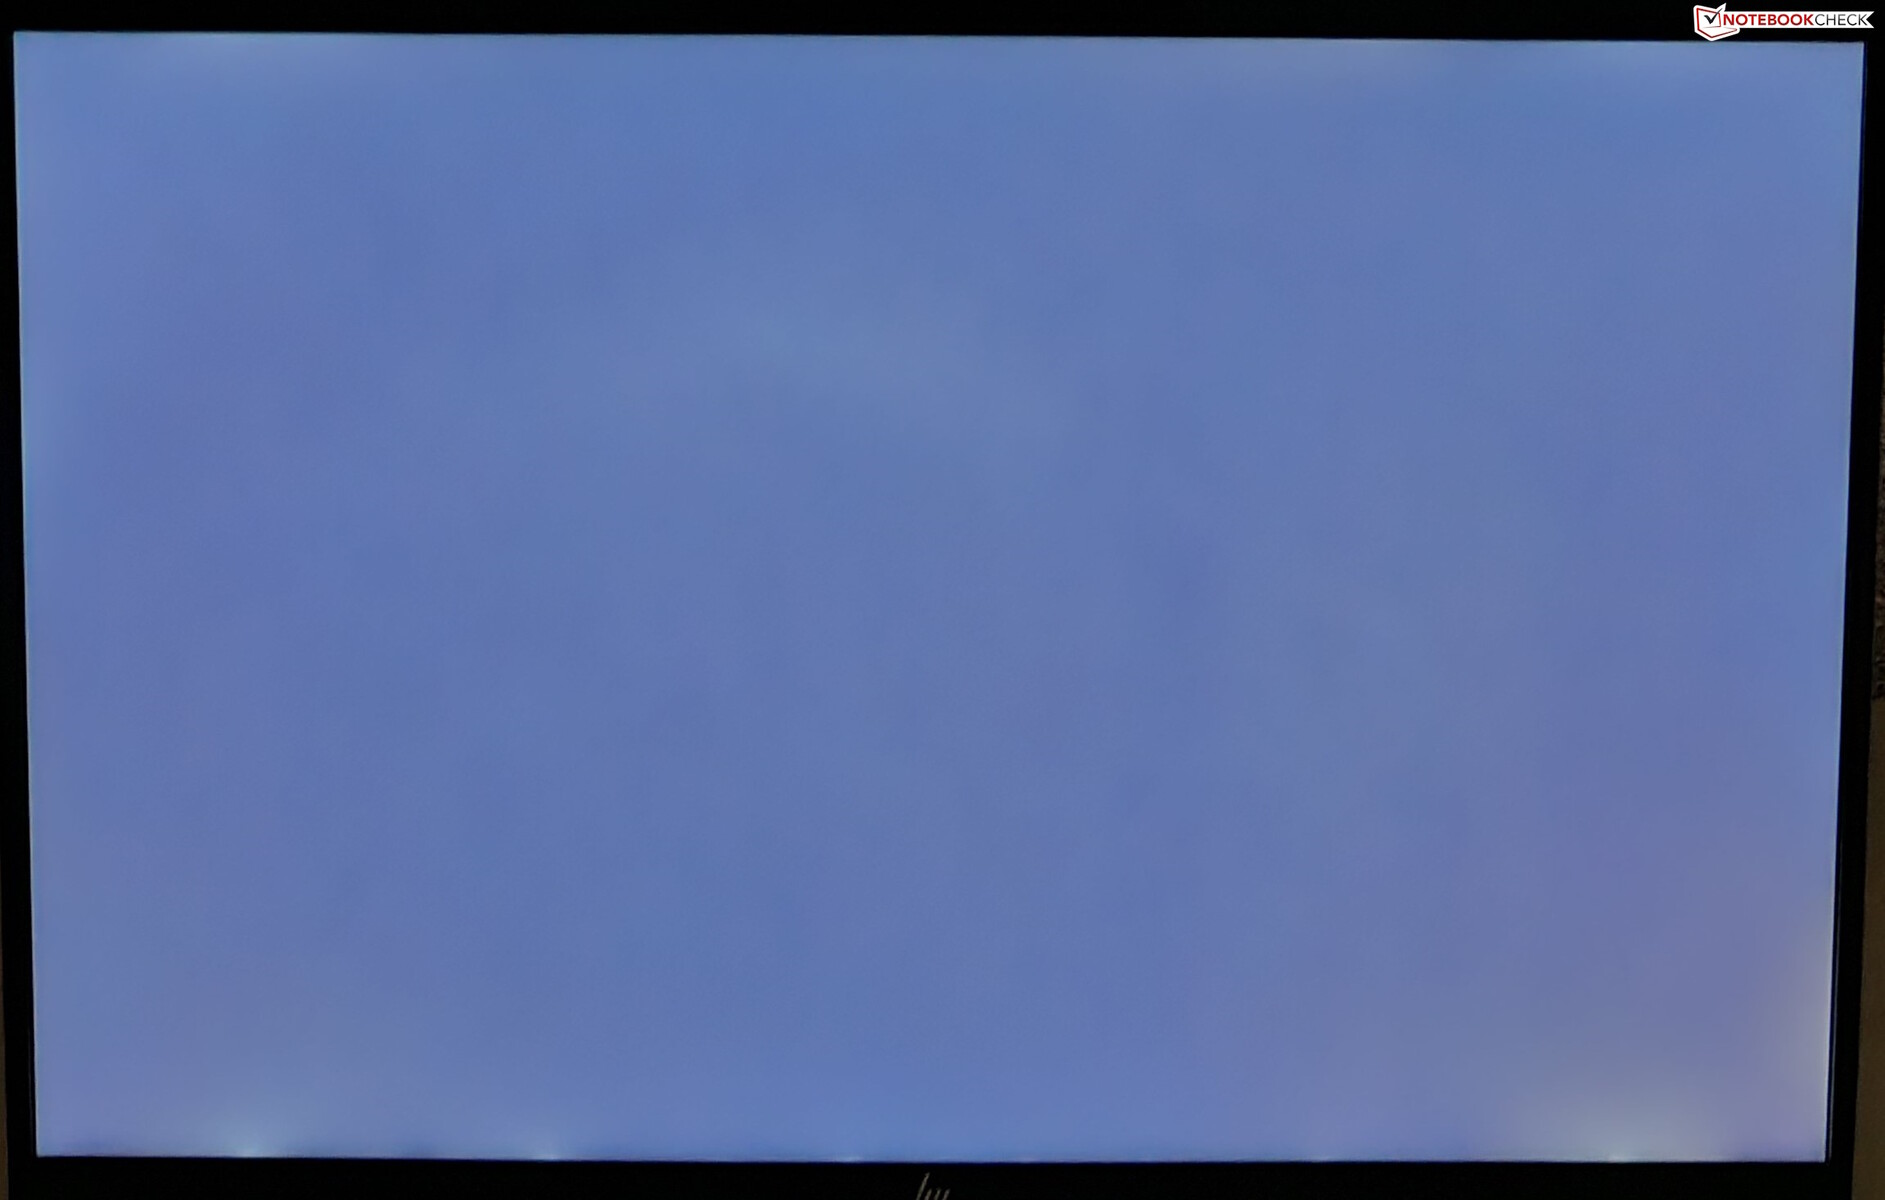
O Pavilion Plus 16 vem com um painel IPS WQXGA 16:10 2560 x 1600 de 16 polegadas com uma taxa de atualização de 120 Hz e um brilho nominal de 400 nits.
Medimos até 415 nits de brilho máximo, com uma média de 394 nits e uma boa distribuição de 90%. Por ser um painel IPS, a tela não é imune ao vazamento da luz de fundo, o que pode ser notado nos cantos inferiores sob exposição prolongada.
Em termos subjetivos, o Pavilion Plus 16 oferece uma boa experiência de visualização que deve ser adequada tanto para trabalho quanto para entretenimento.

| |||||||||||||||||||||||||
iluminação: 90 %
iluminação com acumulador: 401 cd/m²
Contraste: 1185:1 (Preto: 0.34 cd/m²)
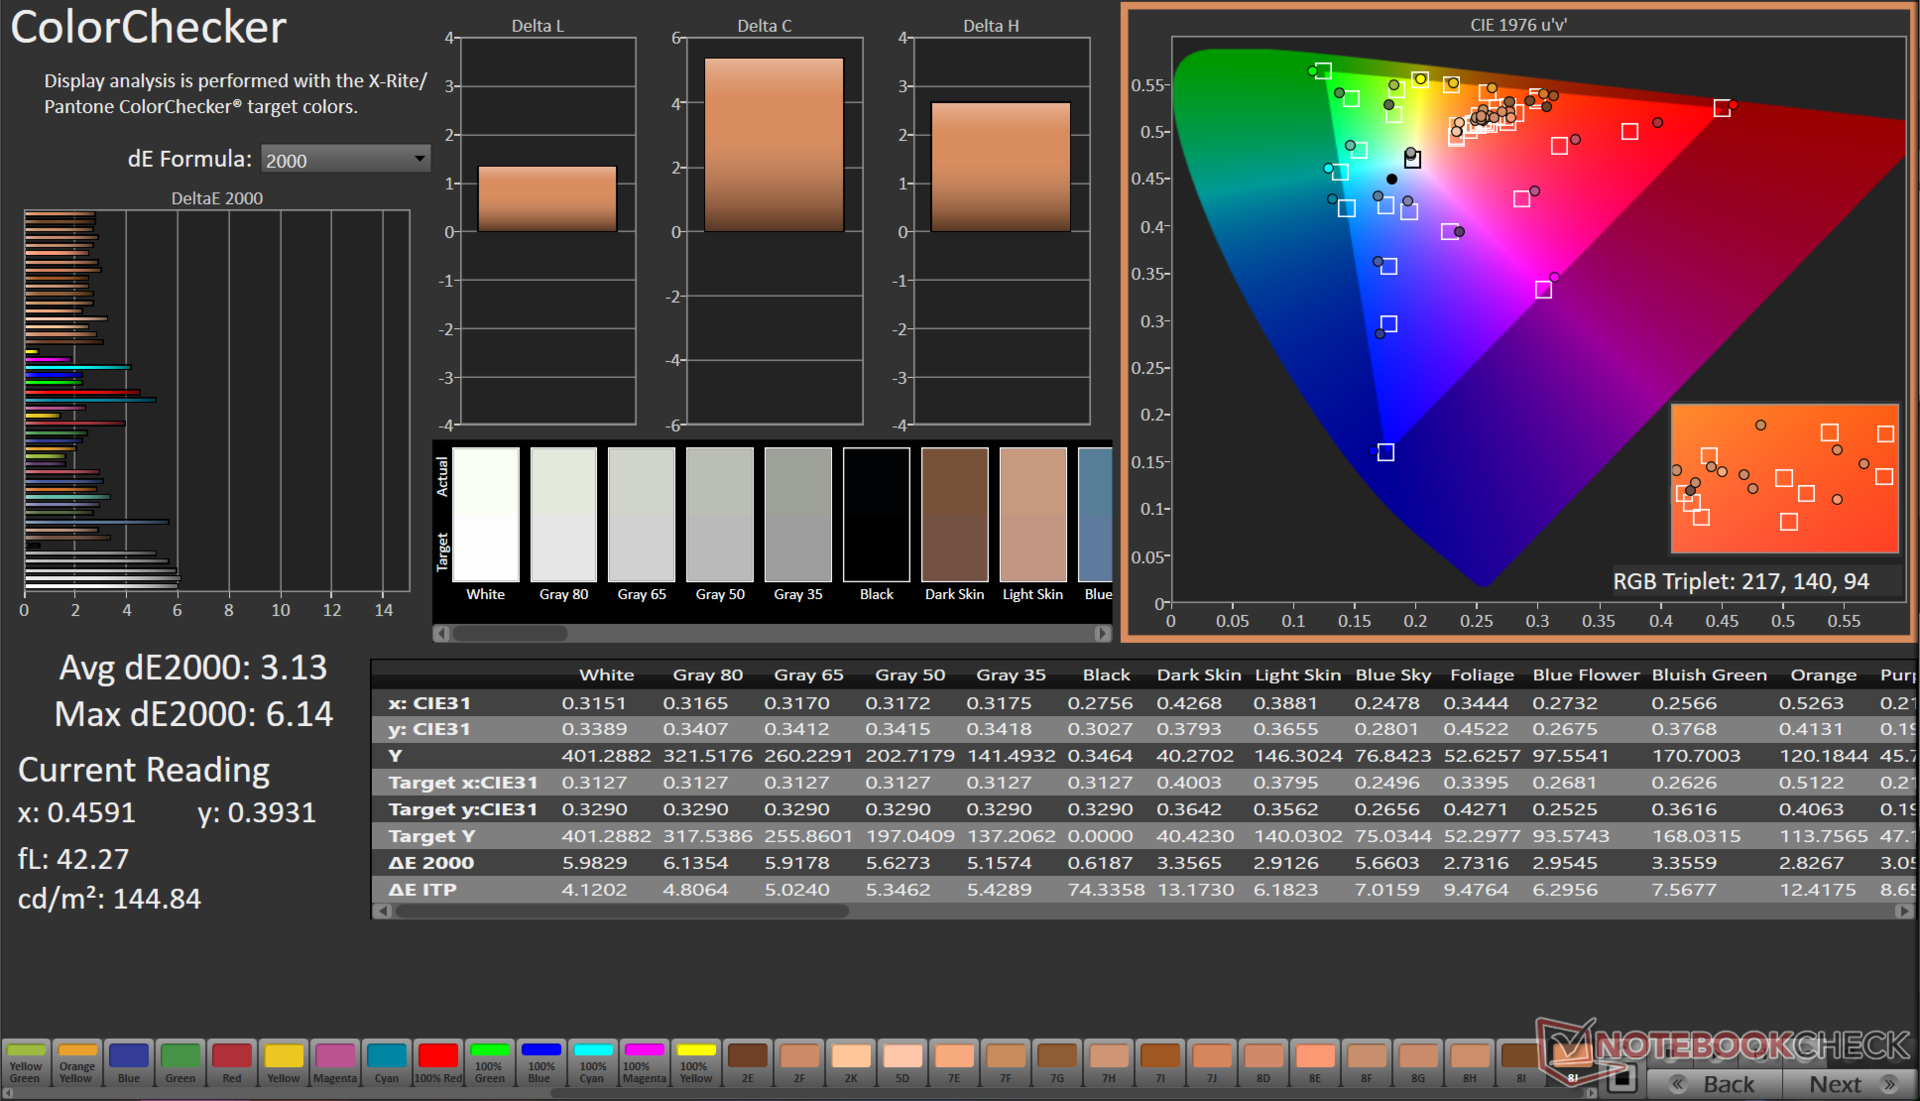
ΔE ColorChecker Calman: 3.13 | ∀{0.5-29.43 Ø4.71}
calibrated: 1.65
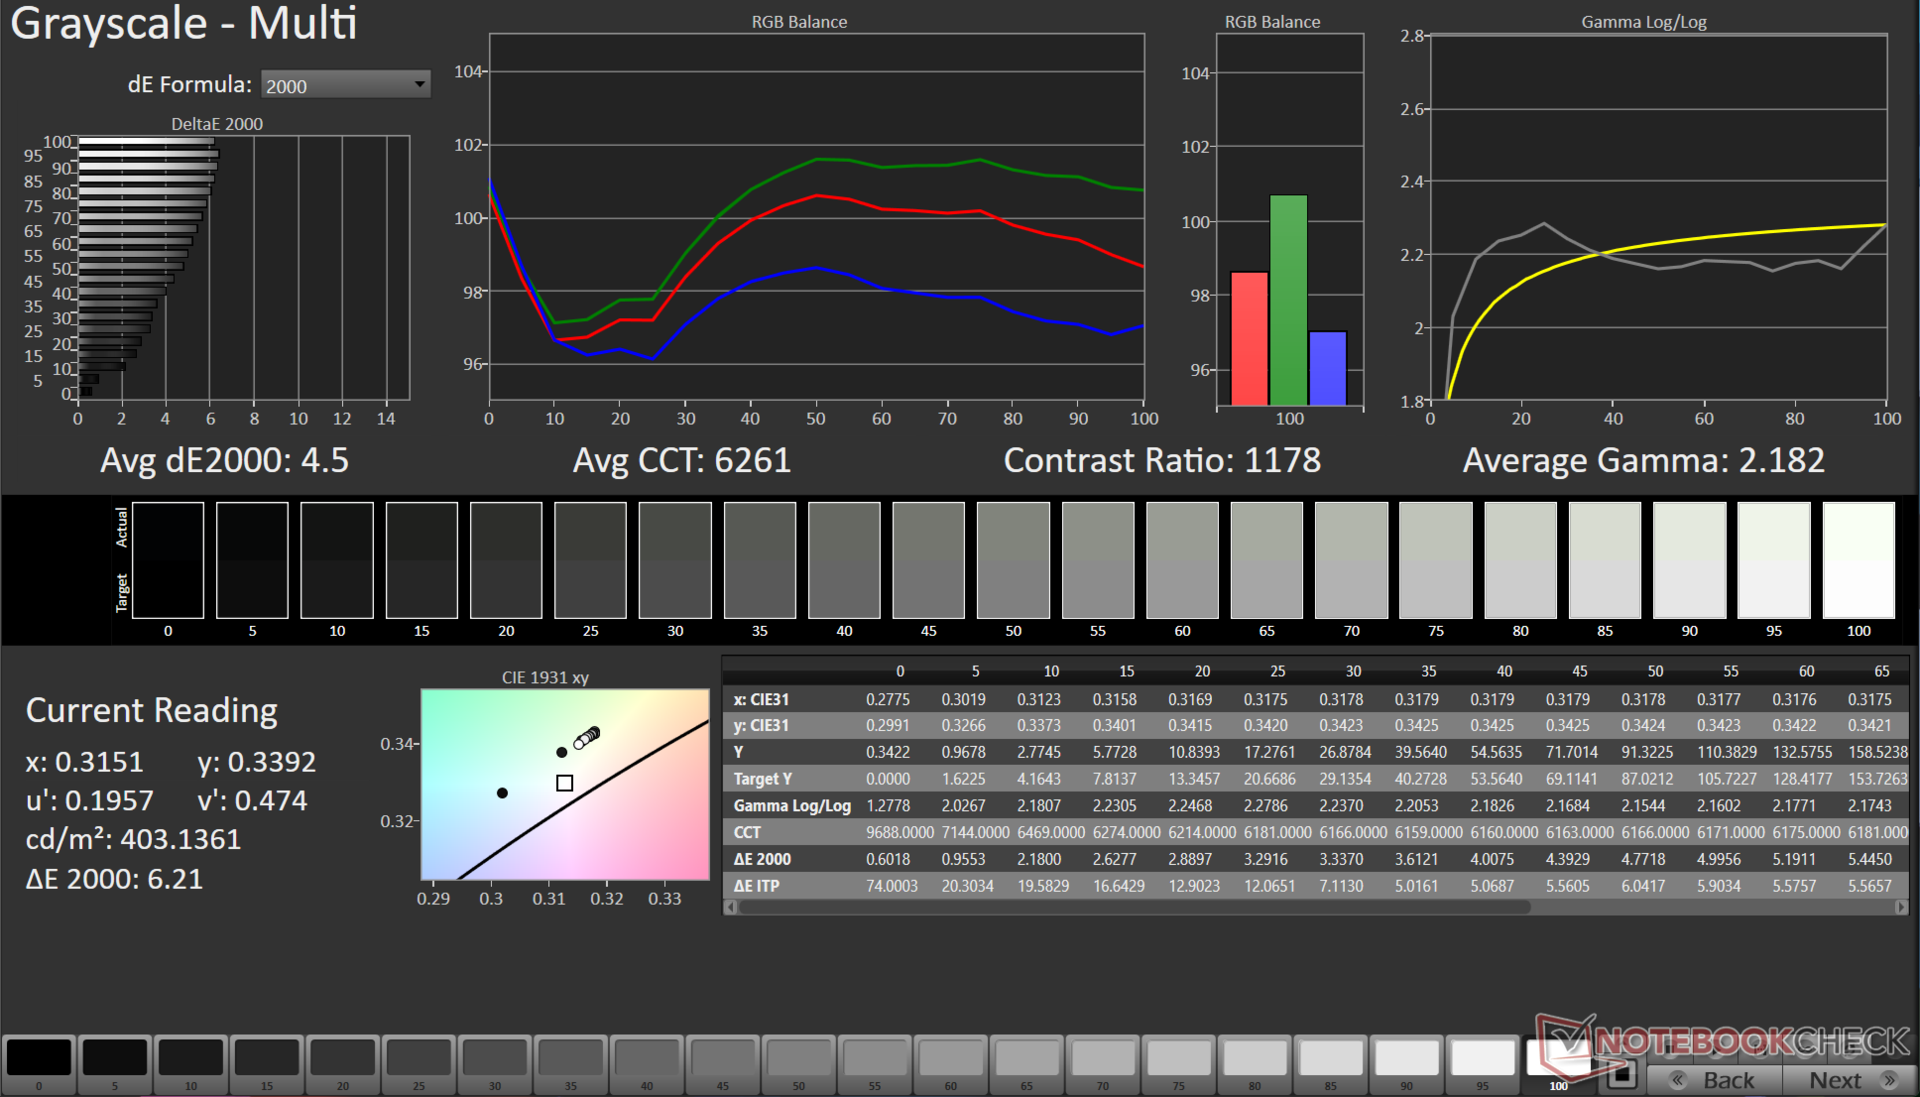
ΔE Greyscale Calman: 4.5 | ∀{0.09-98 Ø4.96}
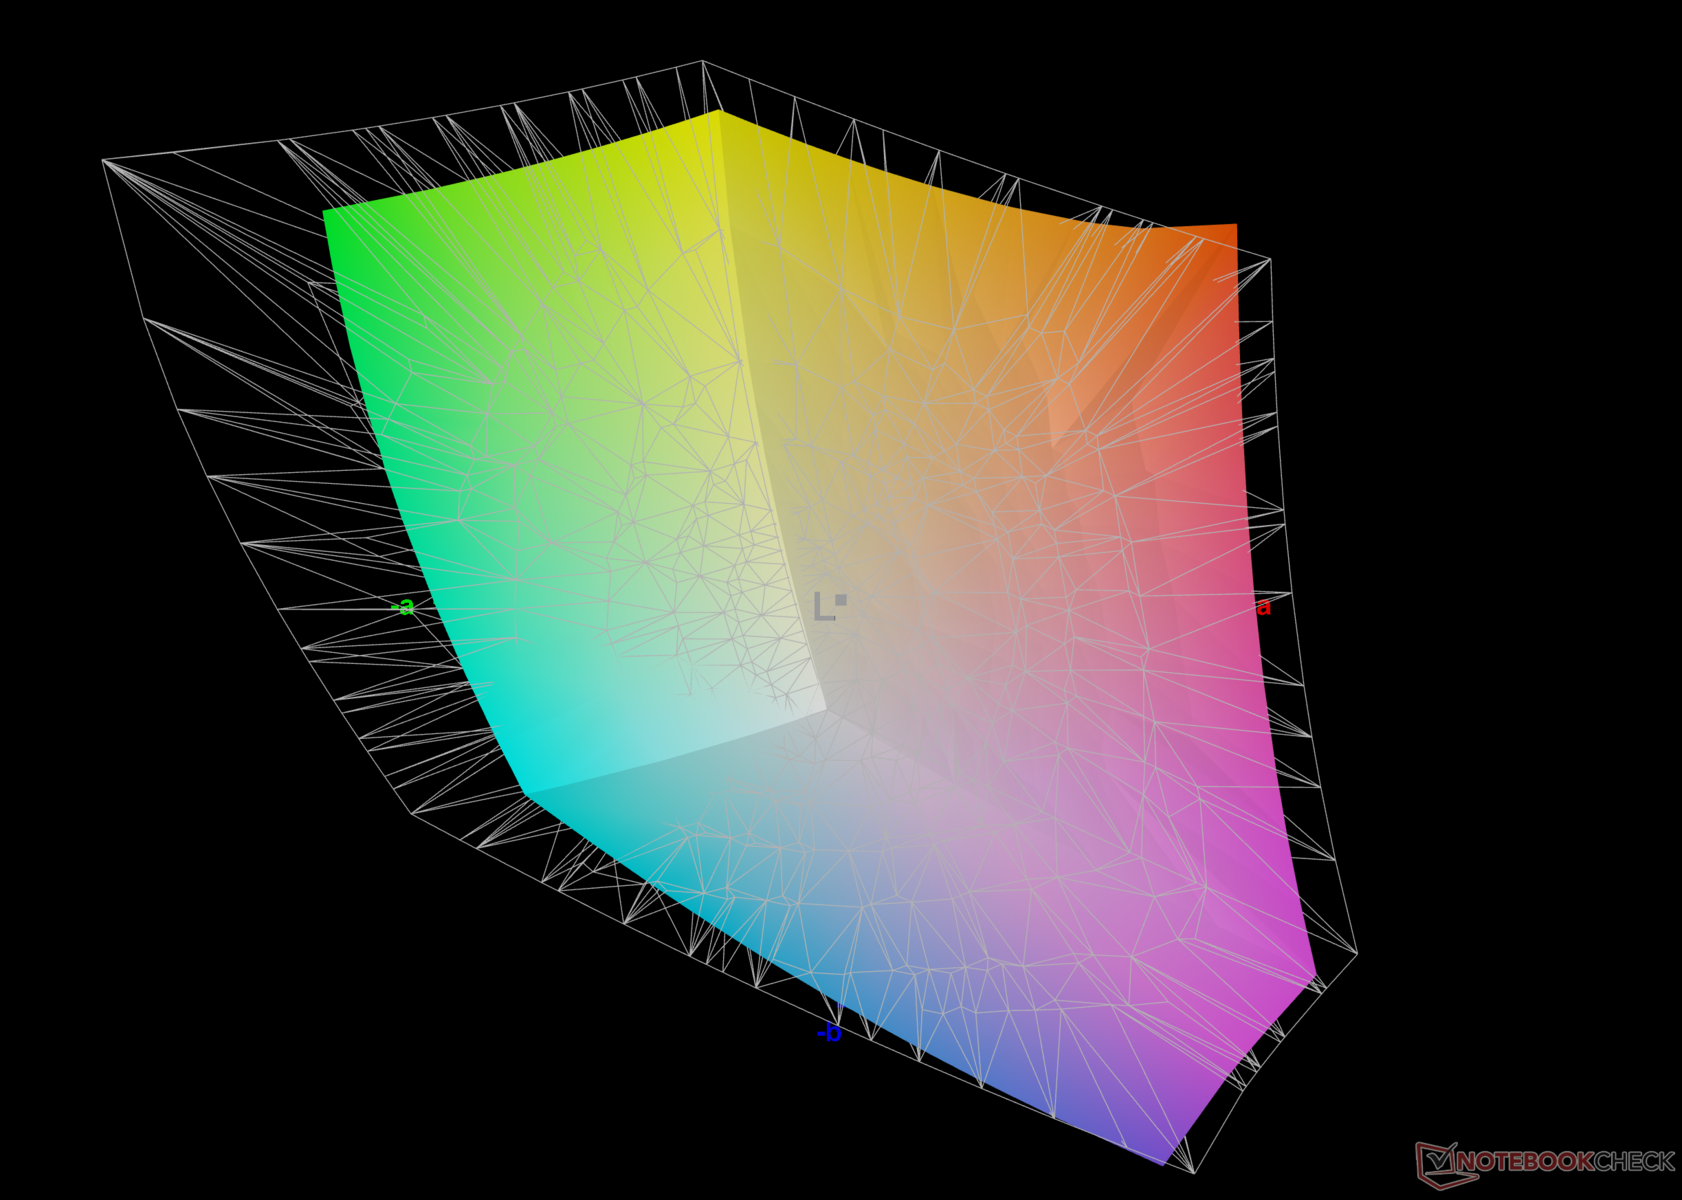
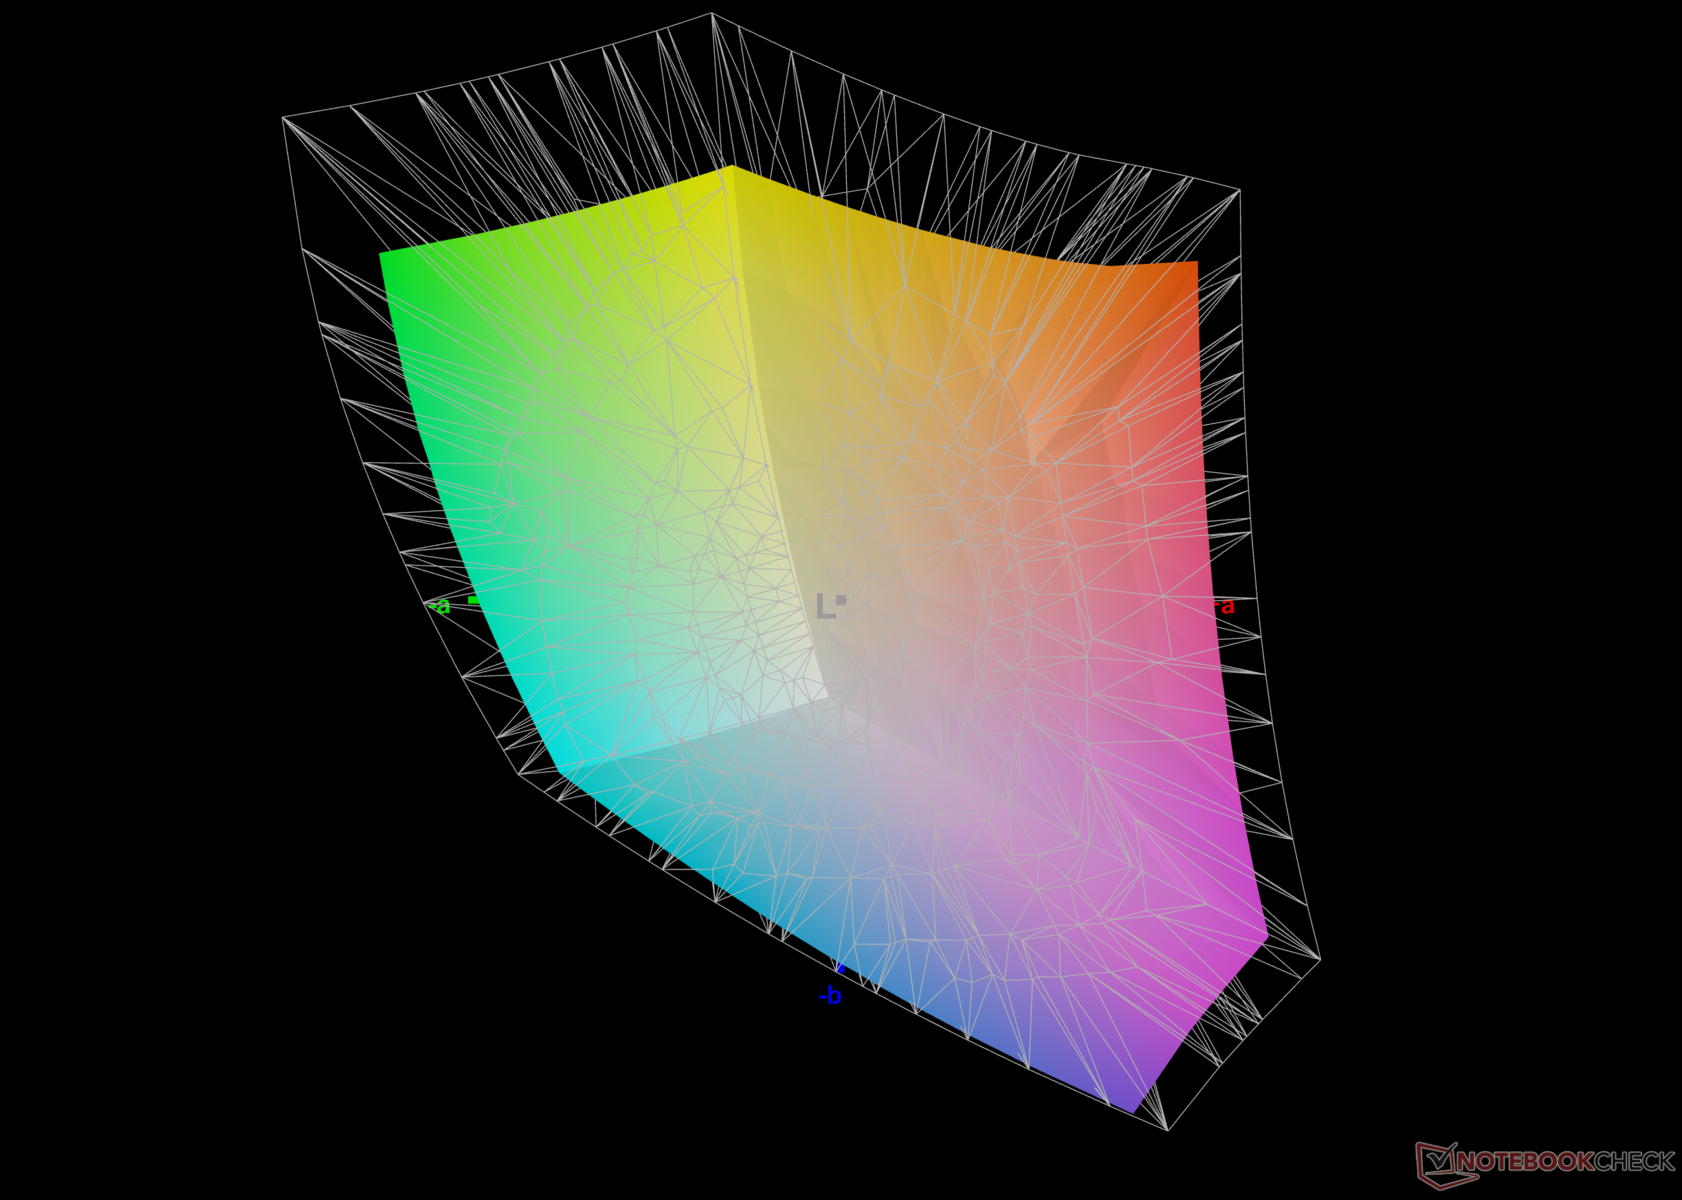
76.5% AdobeRGB 1998 (Argyll 3D)
99% sRGB (Argyll 3D)
74.6% Display P3 (Argyll 3D)
Gamma: 2.18
CCT: 6261 K
| HP Pavilion Plus 16-ab0456tx AU Optronics AUOFDA4, IPS, 2560x1600, 16" | Schenker Vision 14 2023 CSOT T3 MNE007ZA1-3, IPS, 2880x1800, 14" | Dell Inspiron 16 Plus 7630 LG Philips 160WQ2, IPS, 2560x1600, 16" | Asus VivoBook 14X K3405 Samsung ATNA40YK07-1, , 2880x1800, 14" | Lenovo Slim Pro 7 14ARP8 LEN89C1, IPS, 2560x1600, 14.5" | Asus VivoBook Pro 16 K6602VU Samsung ATNA60BX01-1, OLED, 3200x2000, 16" | Samsung Galaxy Book3 Ultra 16 Samsung ATNA60CL03-0, AMOLED, 2880x1800, 16" | |
|---|---|---|---|---|---|---|---|
| Display | 0% | -3% | 20% | -2% | 20% | 20% | |
| Display P3 Coverage (%) | 74.6 | 74.7 0% | 70.1 -6% | 99.9 34% | 72.9 -2% | 98.7 32% | 99.9 34% |
| sRGB Coverage (%) | 99 | 99.6 1% | 99.6 1% | 100 1% | 98.2 -1% | 99.7 1% | 100 1% |
| AdobeRGB 1998 Coverage (%) | 76.5 | 75.8 -1% | 72.3 -5% | 96.5 26% | 74.6 -2% | 96.5 26% | 96.3 26% |
| Response Times | -193% | -274% | -14% | -220% | -3% | 93% | |
| Response Time Grey 50% / Grey 80% * (ms) | 9.06 ? | 32.2 ? -255% | 35 ? -286% | 1.15 ? 87% | 31.8 ? -251% | 0.68 ? 92% | 0.49 ? 95% |
| Response Time Black / White * (ms) | 6.7 ? | 15.4 ? -130% | 24.2 ? -261% | 14.4 ? -115% | 19.3 ? -188% | 13.2 ? -97% | 0.65 ? 90% |
| PWM Frequency (Hz) | 90.02 ? | 240 ? | 240 ? | ||||
| Screen | 21% | 1% | 5% | 3% | -10% | 135% | |
| Brightness middle (cd/m²) | 403 | 402 0% | 299.4 -26% | 369 -8% | 344.7 -14% | 353 -12% | 400 -1% |
| Brightness (cd/m²) | 394 | 371 -6% | 290 -26% | 364 -8% | 334 -15% | 354 -10% | 399 1% |
| Brightness Distribution (%) | 90 | 86 -4% | 92 2% | 85 -6% | 92 2% | 98 9% | 93 3% |
| Black Level * (cd/m²) | 0.34 | 0.27 21% | 0.21 38% | 0.31 9% | 0.03 91% | ||
| Contrast (:1) | 1185 | 1489 26% | 1426 20% | 1112 -6% | 13333 1025% | ||
| Colorchecker dE 2000 * | 3.13 | 1.8 42% | 4.25 -36% | 2.85 9% | 3.01 4% | 4.23 -35% | 2.3 27% |
| Colorchecker dE 2000 max. * | 6.14 | 3.6 41% | 6.71 -9% | 4.22 31% | 6.3 -3% | 7.13 -16% | 4.15 32% |
| Colorchecker dE 2000 calibrated * | 1.65 | 1.5 9% | 0.52 68% | 2.18 -32% | 0.83 50% | 2.42 -47% | 1.66 -1% |
| Greyscale dE 2000 * | 4.5 | 1.8 60% | 5.5 -22% | 2.2 51% | 4.6 -2% | 2.5 44% | 2.7 40% |
| Gamma | 2.18 101% | 2.27 97% | 2.35 94% | 2.15 102% | 2.28 96% | 2.4 92% | 2.266 97% |
| CCT | 6261 104% | 6695 97% | 6368 102% | 6518 100% | 6420 101% | 6642 98% | 7047 92% |
| Média Total (Programa/Configurações) | -57% /
-14% | -92% /
-39% | 4% /
6% | -73% /
-30% | 2% /
-1% | 83% /
105% |
* ... menor é melhor
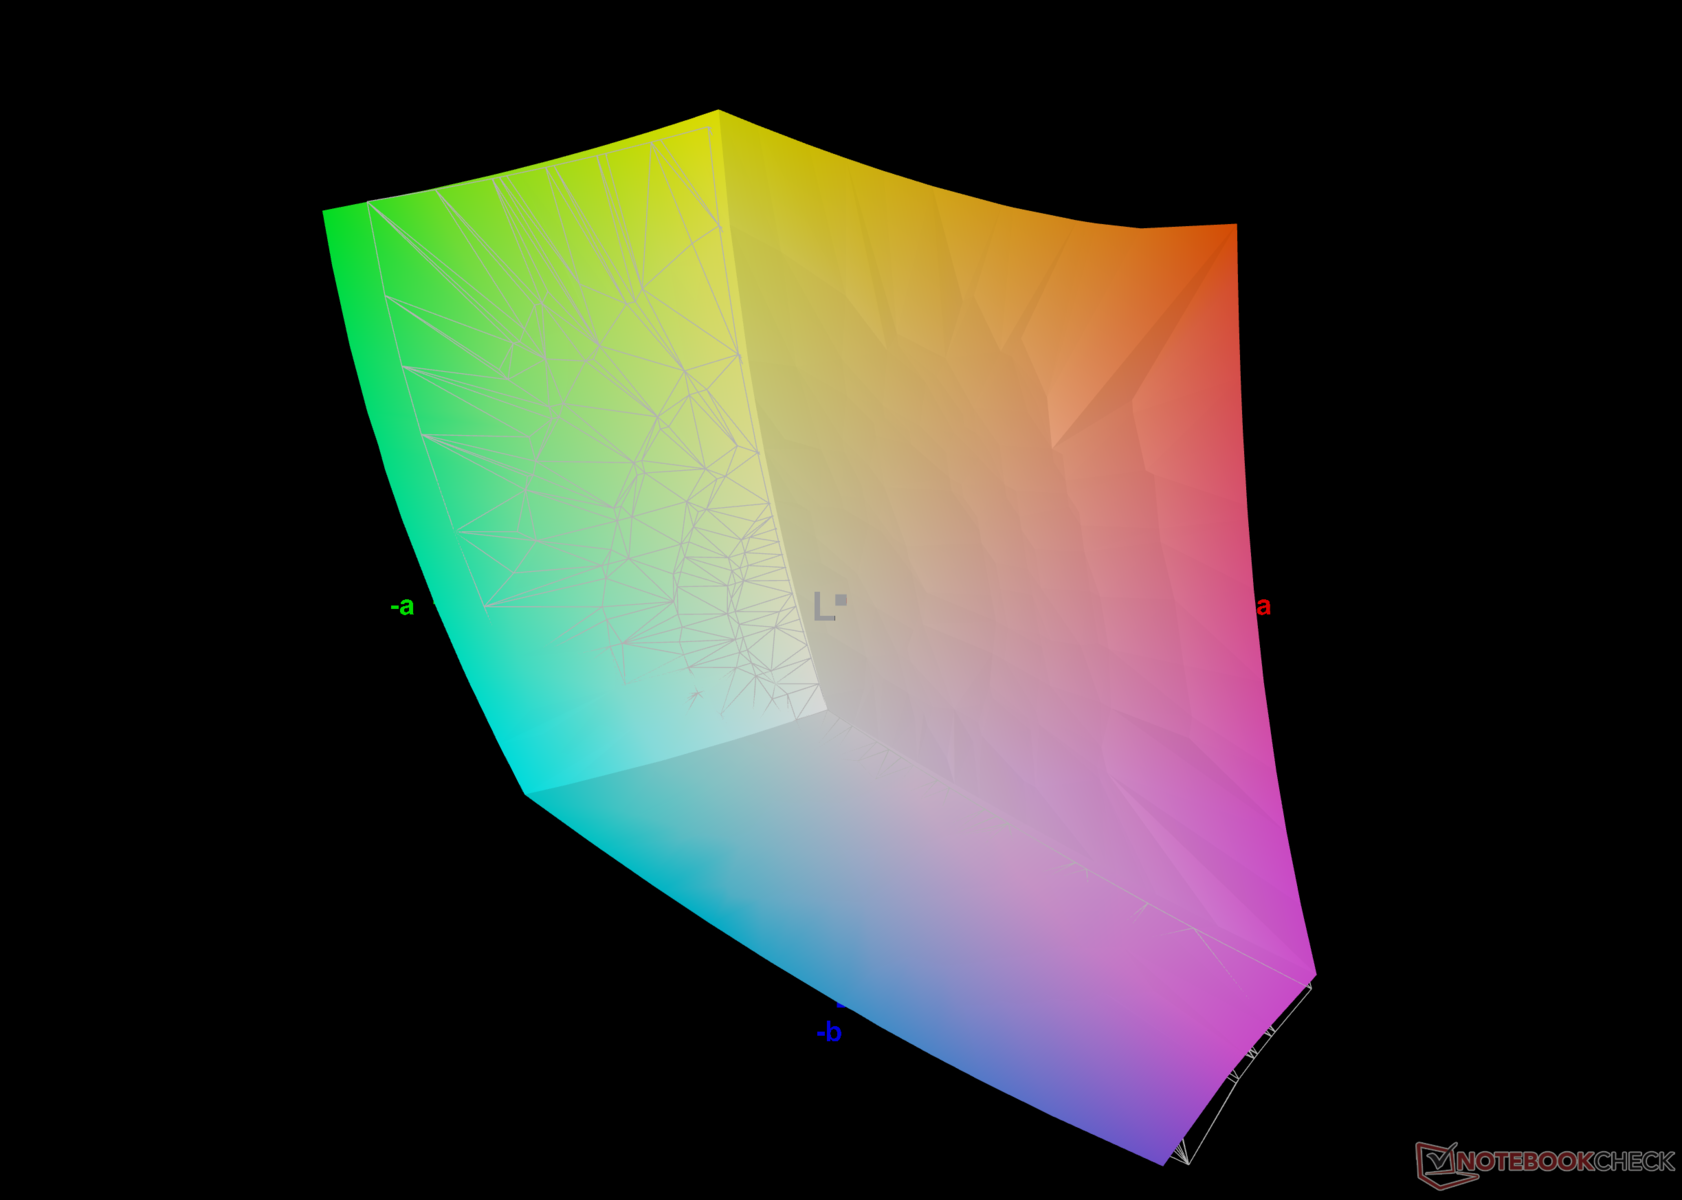
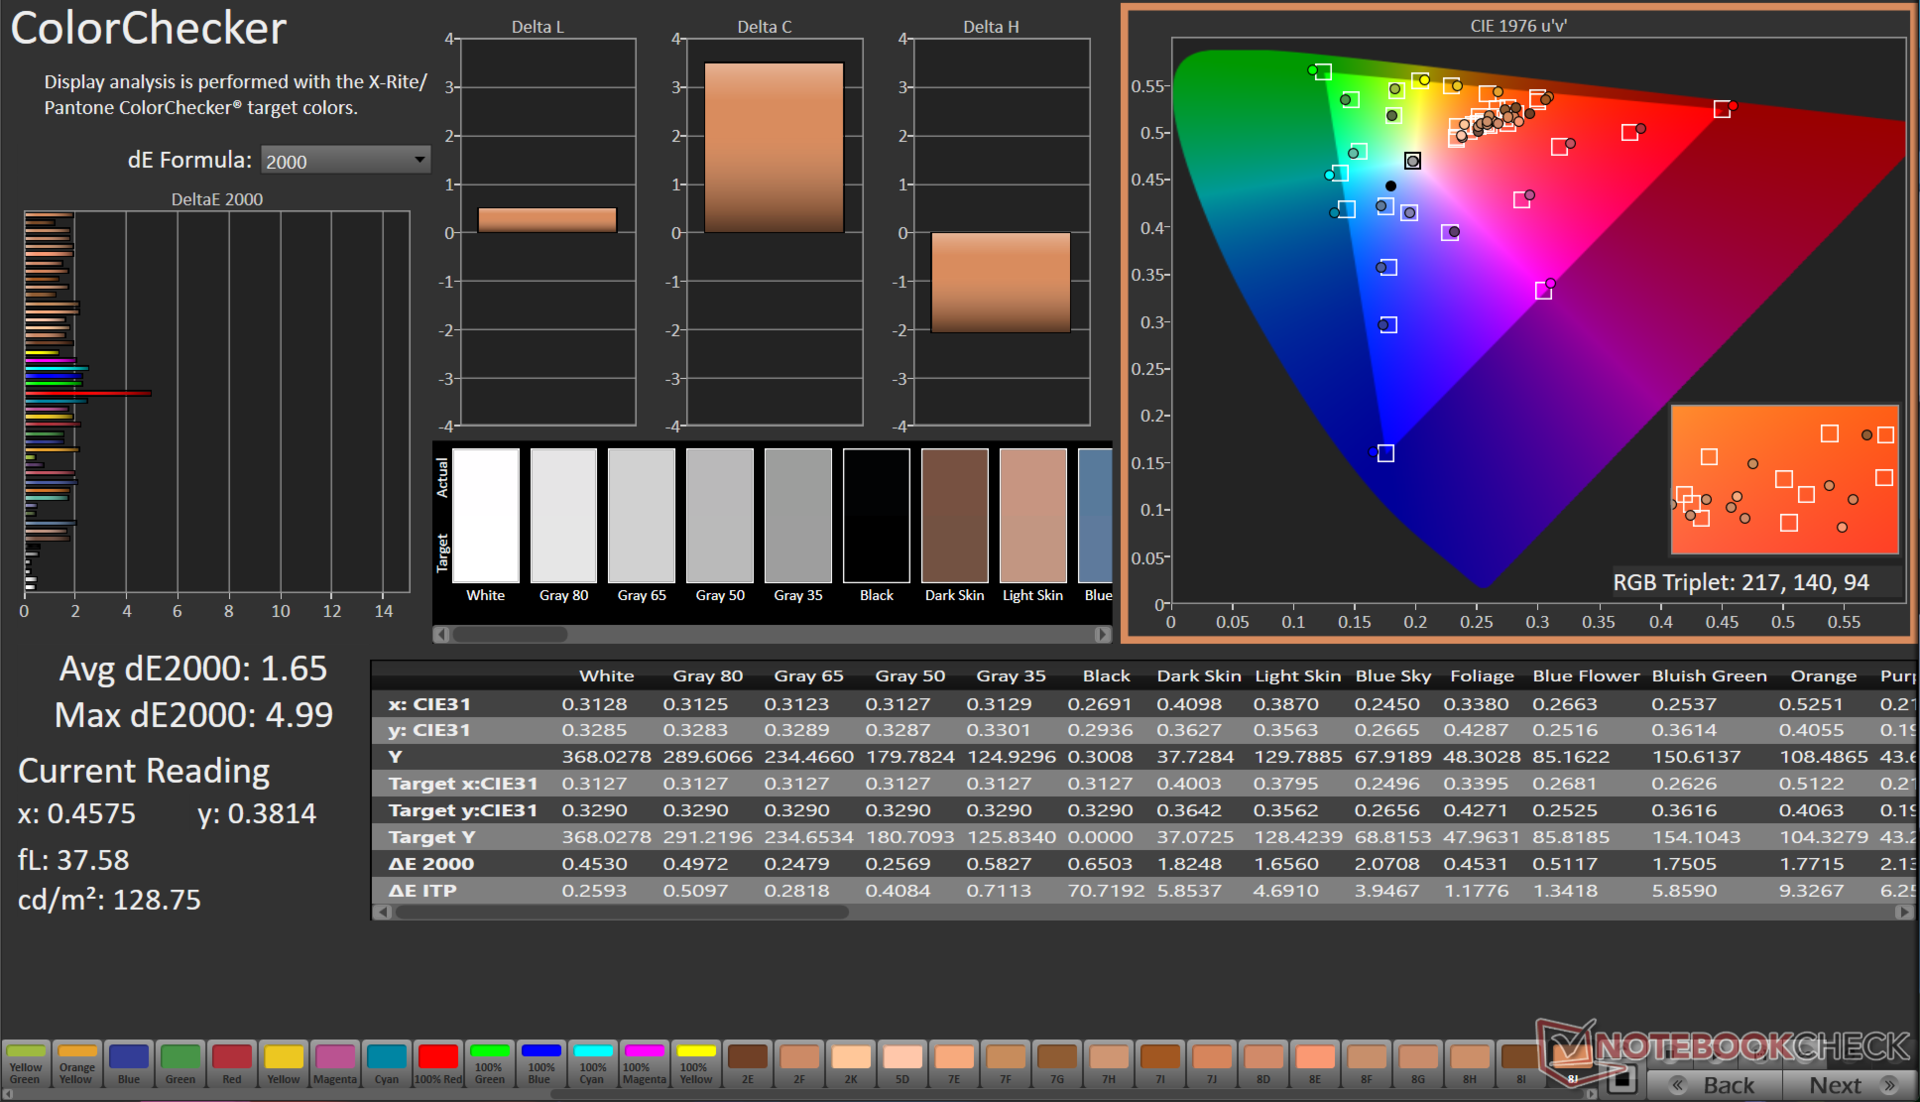
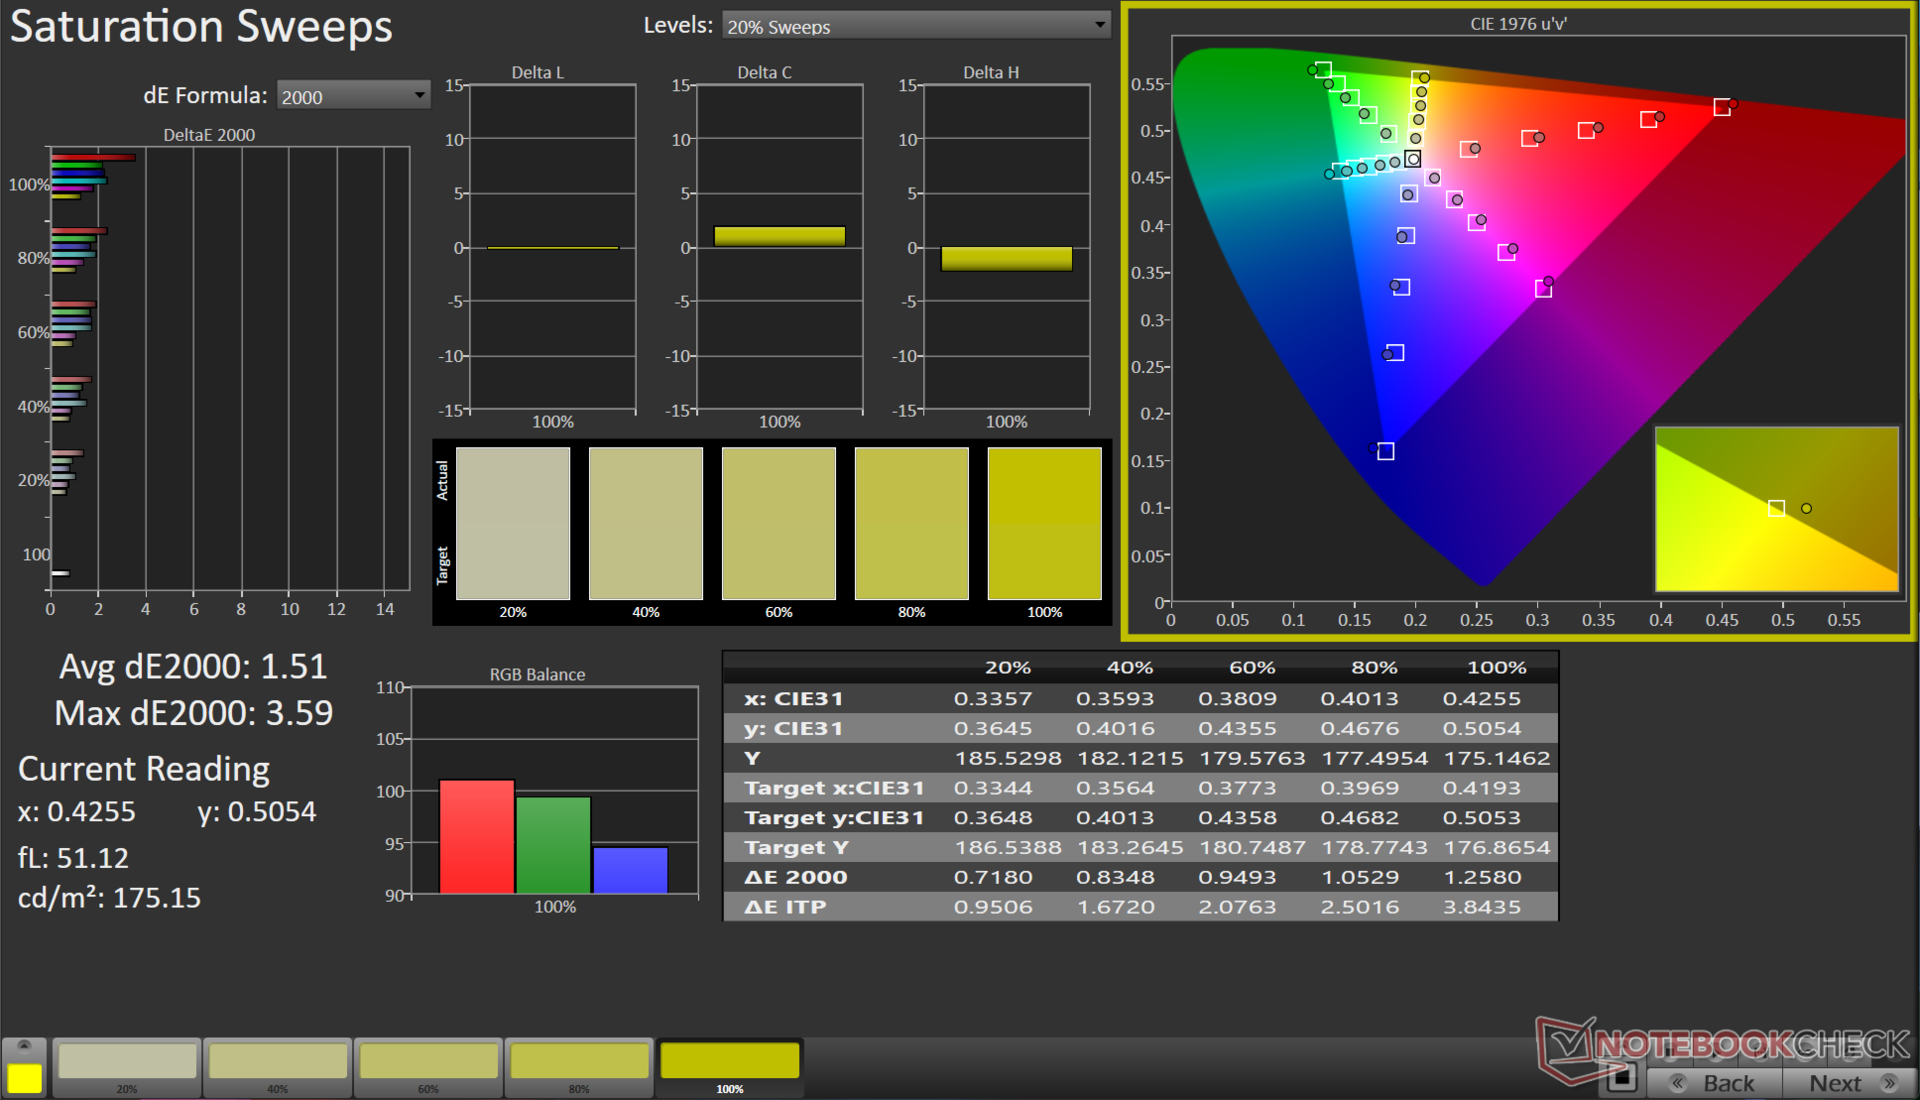
O painel cobre 99% do espaço de cores sRGB e oferece uma reprodução decente de Adobe RGB e Display P3. Isso faz com que o Pavilion Plus 16 seja adequado para o consumo geral de multimídia e também para fluxos de trabalho de edição básica, especialmente para conteúdo da Web.
Usando o espectrofotômetro X-Rite i1Basic Pro 3 e o software Calman Ultimate da Portrait Displays, conseguimos melhorar os valores médios de escala de cinza e ColorChecker Delta E 2000 de 4,5 para 0,6 e de 3,13 para 1,65, respectivamente.
Nosso arquivo calibrado pode ser baixado no link acima.
Exibir tempos de resposta
| ↔ Tempo de resposta preto para branco | ||
|---|---|---|
| 6.7 ms ... ascensão ↗ e queda ↘ combinadas | ↗ 3.6 ms ascensão | 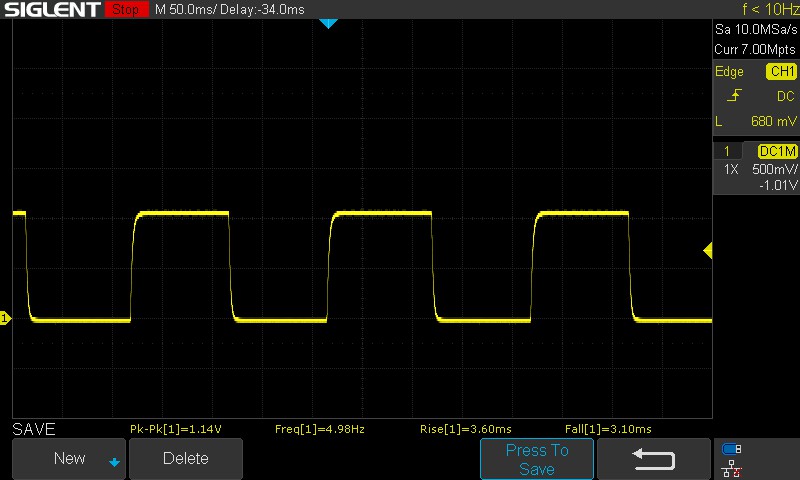 |
| ↘ 3.1 ms queda | ||
| A tela mostra taxas de resposta muito rápidas em nossos testes e deve ser muito adequada para jogos em ritmo acelerado. Em comparação, todos os dispositivos testados variam de 0.1 (mínimo) a 240 (máximo) ms. » 21 % de todos os dispositivos são melhores. Isso significa que o tempo de resposta medido é melhor que a média de todos os dispositivos testados (19.8 ms). | ||
| ↔ Tempo de resposta 50% cinza a 80% cinza | ||
| 9.06 ms ... ascensão ↗ e queda ↘ combinadas | ↗ 4.27 ms ascensão | 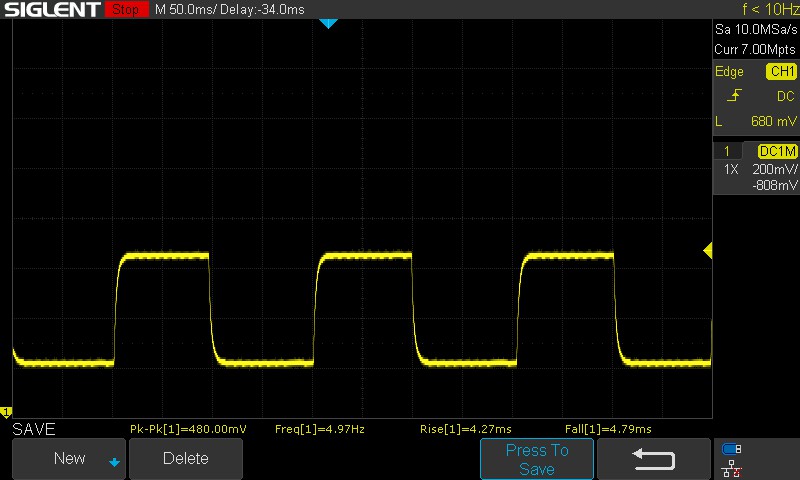 |
| ↘ 4.79 ms queda | ||
| A tela mostra taxas de resposta rápidas em nossos testes e deve ser adequada para jogos. Em comparação, todos os dispositivos testados variam de 0.165 (mínimo) a 636 (máximo) ms. » 23 % de todos os dispositivos são melhores. Isso significa que o tempo de resposta medido é melhor que a média de todos os dispositivos testados (31 ms). | ||
Cintilação da tela / PWM (modulação por largura de pulso)
| Tela tremeluzindo / PWM não detectado | ≤ 100 % configuração de brilho | 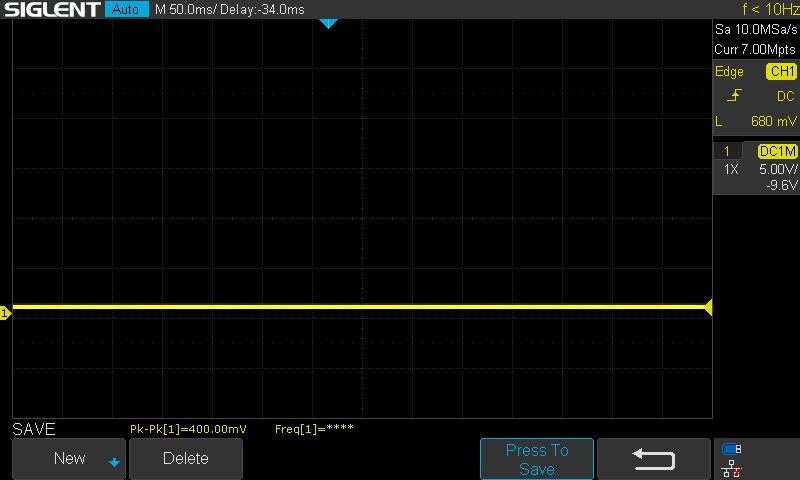 | |
[pwm_comparison] Em comparação: 52 % de todos os dispositivos testados não usam PWM para escurecer a tela. Se PWM foi detectado, uma média de 7757 (mínimo: 5 - máximo: 343500) Hz foi medida. | |||
Os tempos de resposta são decentes, já que o Pavilion Plus 16 não é voltado para o público de jogos. Não observamos nenhum PWM em todos os níveis de brilho testados, o que é bom.
Para obter mais informações, consulte nosso artigo "Por que o PWM é uma dor de cabeça". Nossa tabela de classificação de PWM PWM Ranking - Notebooks, Smartphones, and Tablets with PWM oferece uma visão geral do PWM medido nos dispositivos analisados.
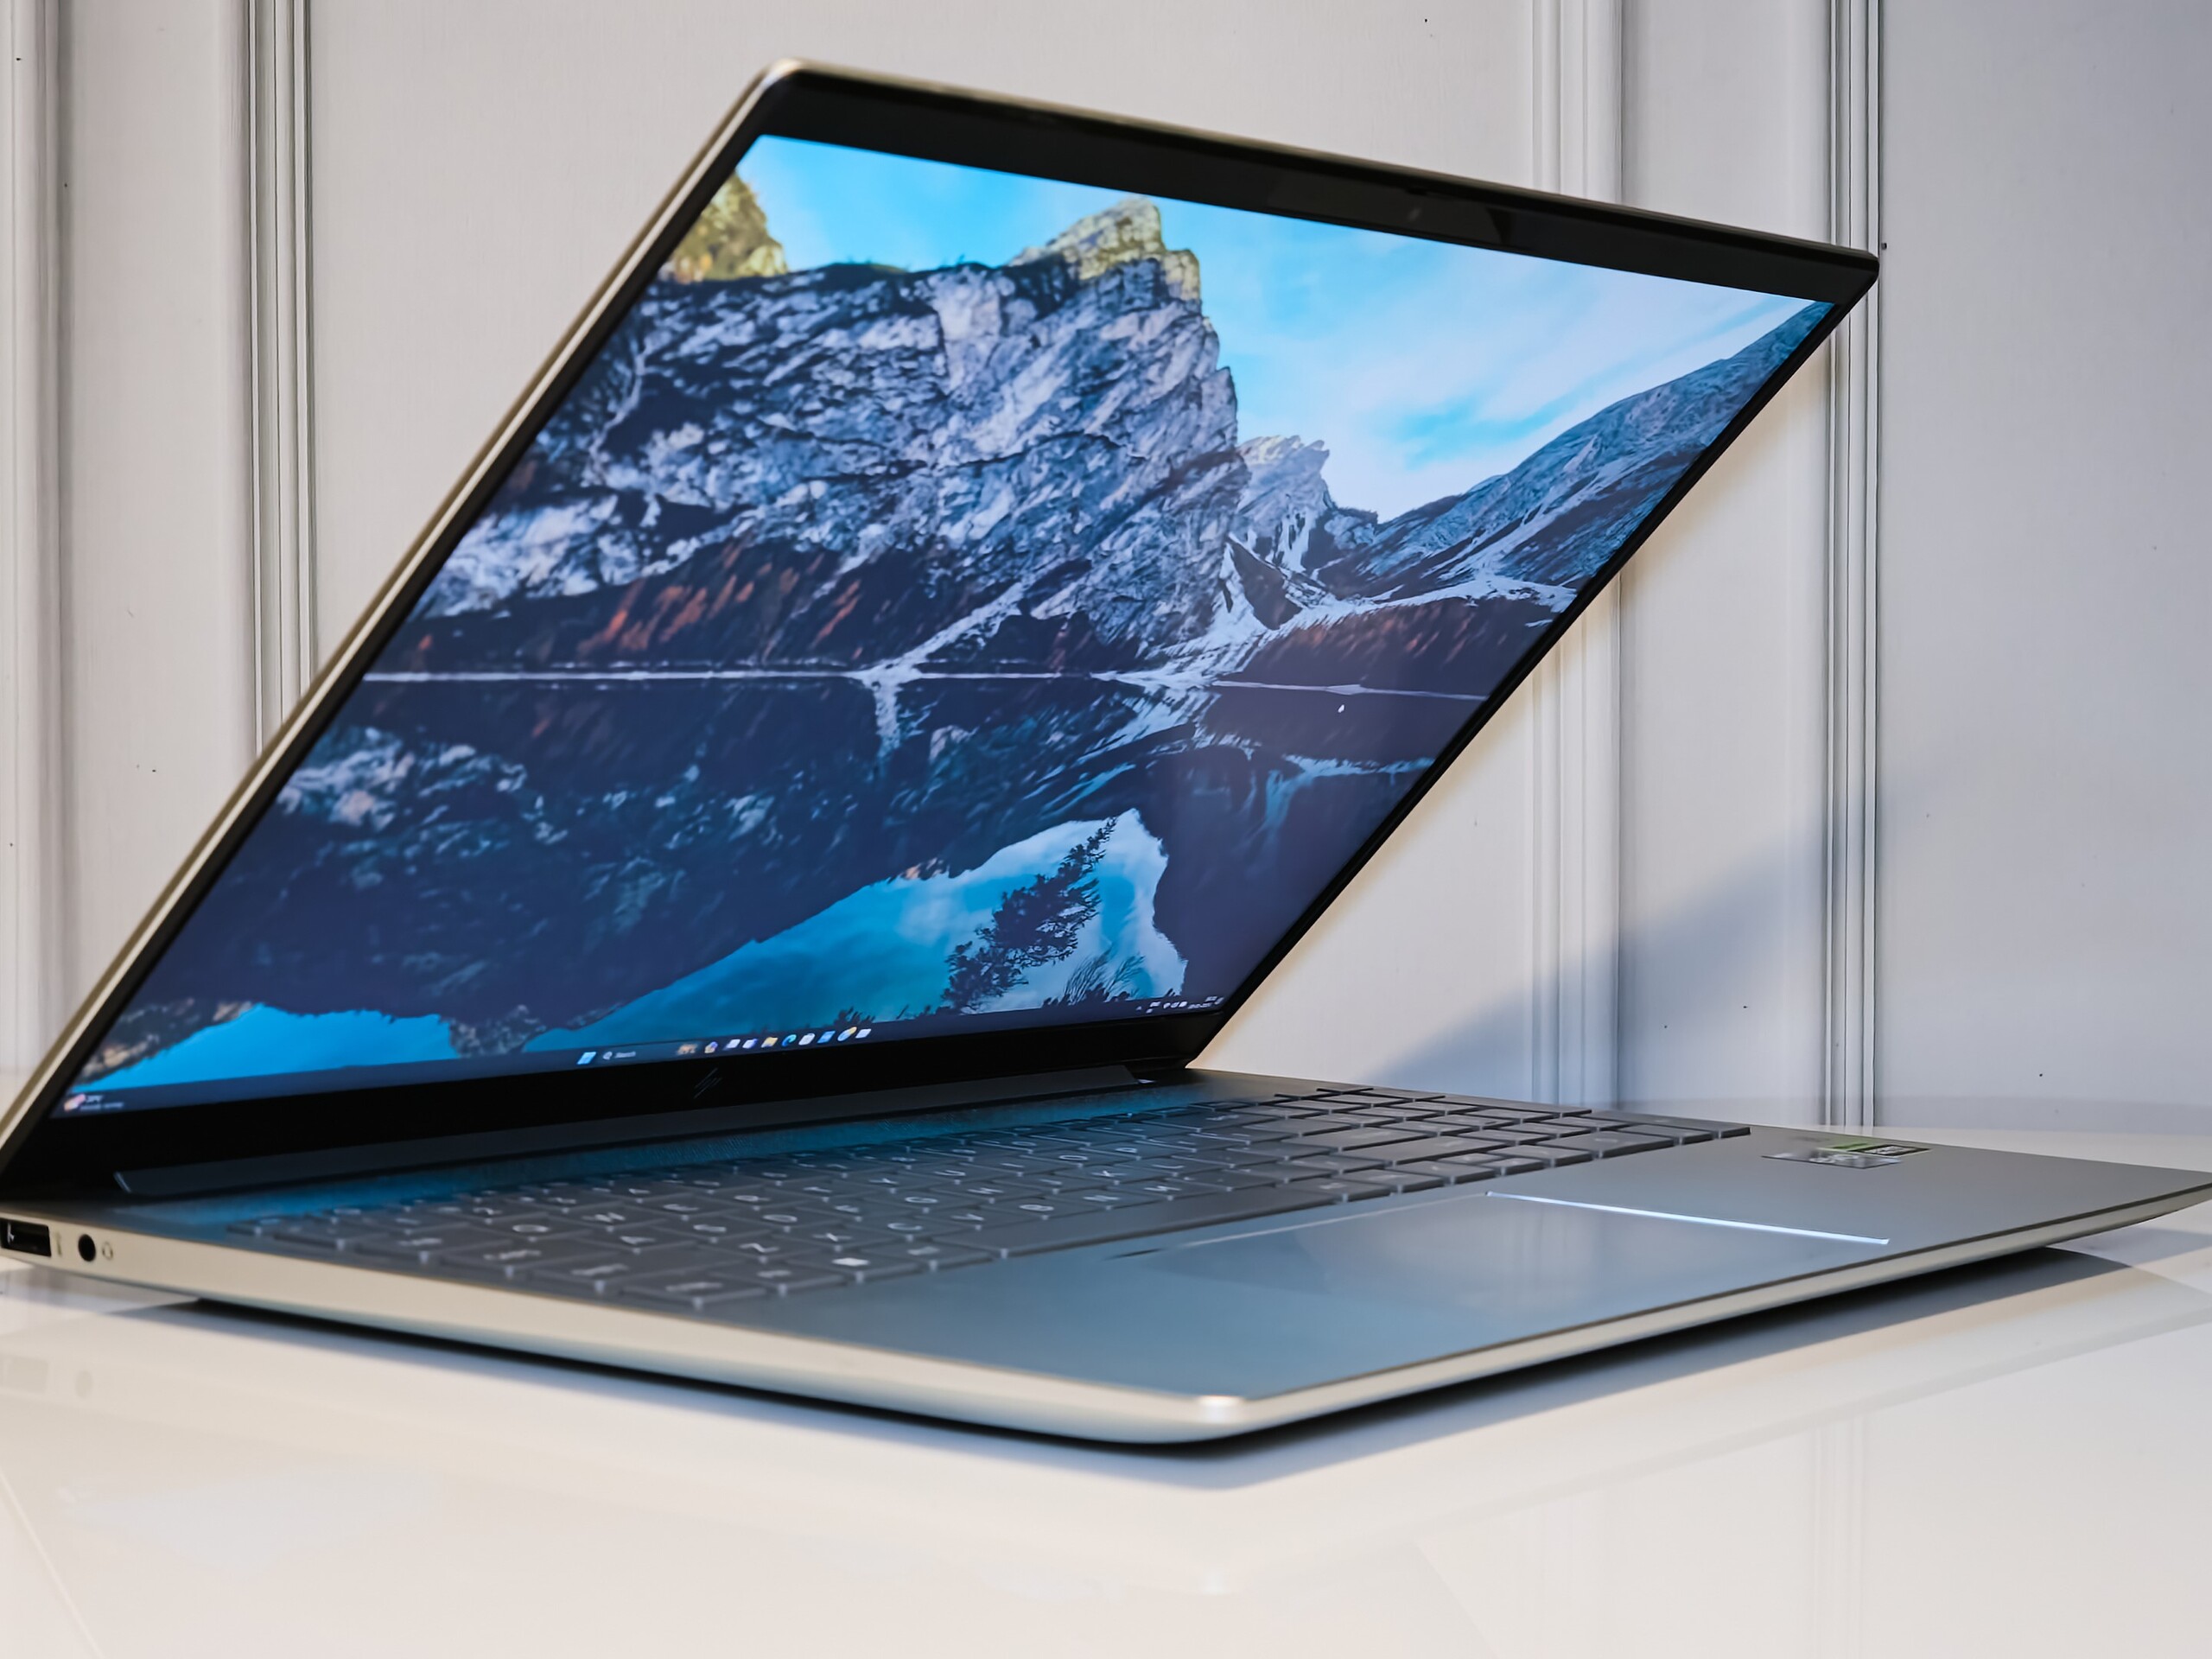
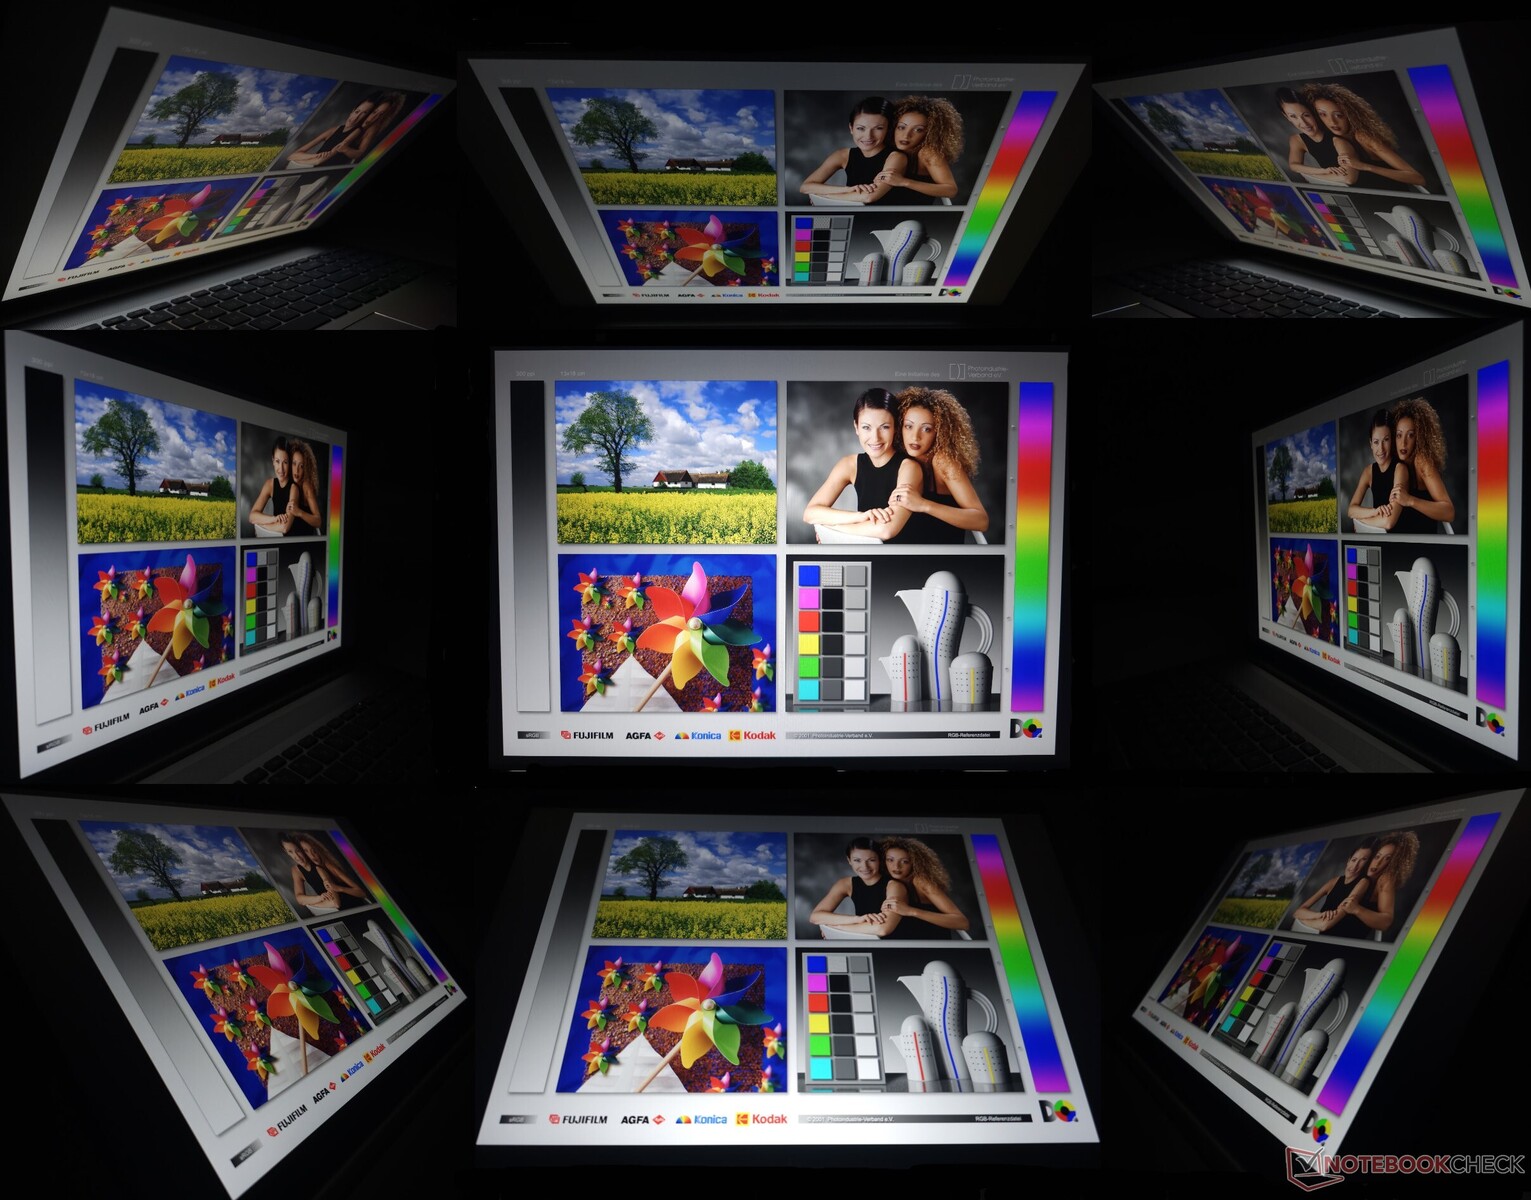
A visualização em ambientes externos geralmente é boa com o brilho máximo, desde que não haja luz solar direta incidindo sobre a tela. Os ângulos de visão são estáveis, mas observamos perda de informações de brilho e cor nos extremos.
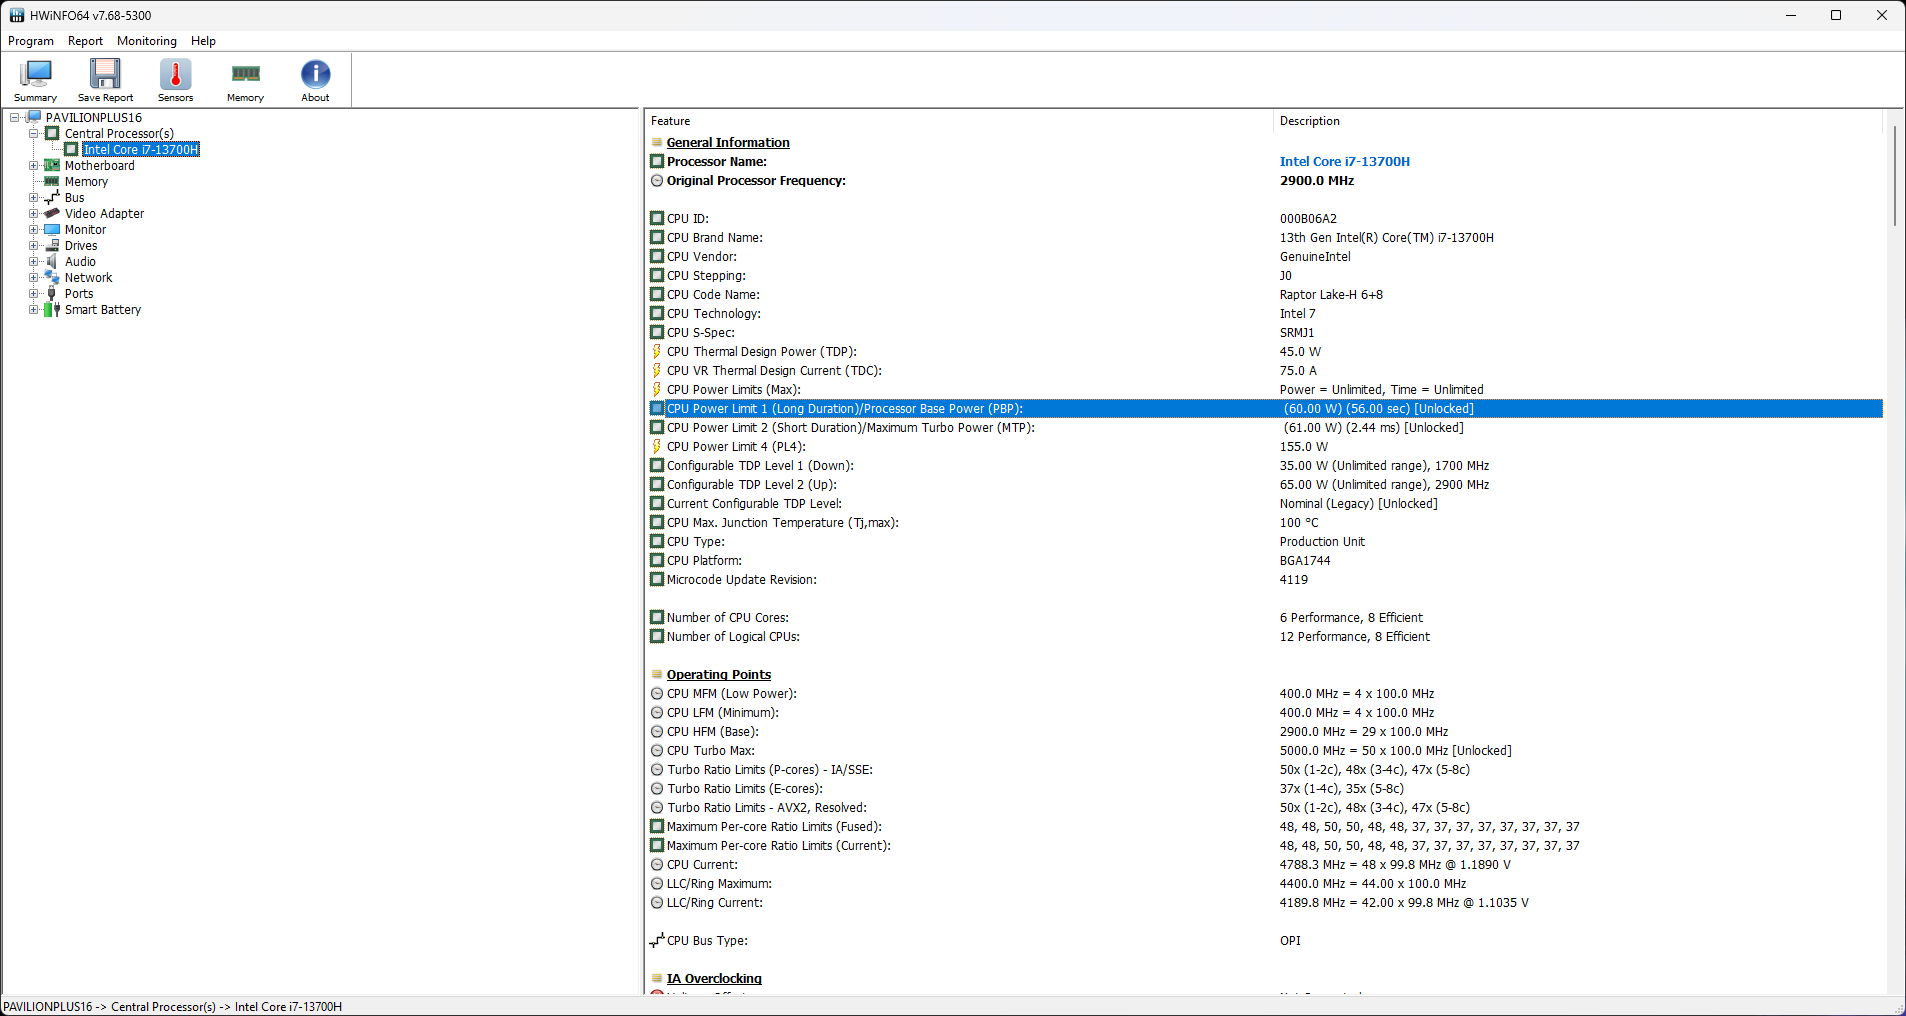
Desempenho: Core i7-13700H limitado pelo baixo PL2
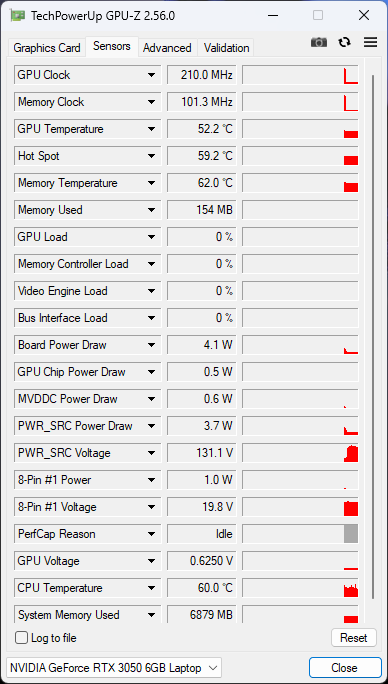
Dependendo da região, a HP oferece o Pavilion Plus 16 in Core i5-13500H e Core i7-13700H, juntamente com gráficos RTX 3050 de 6 GB opcionais.
Condições de teste
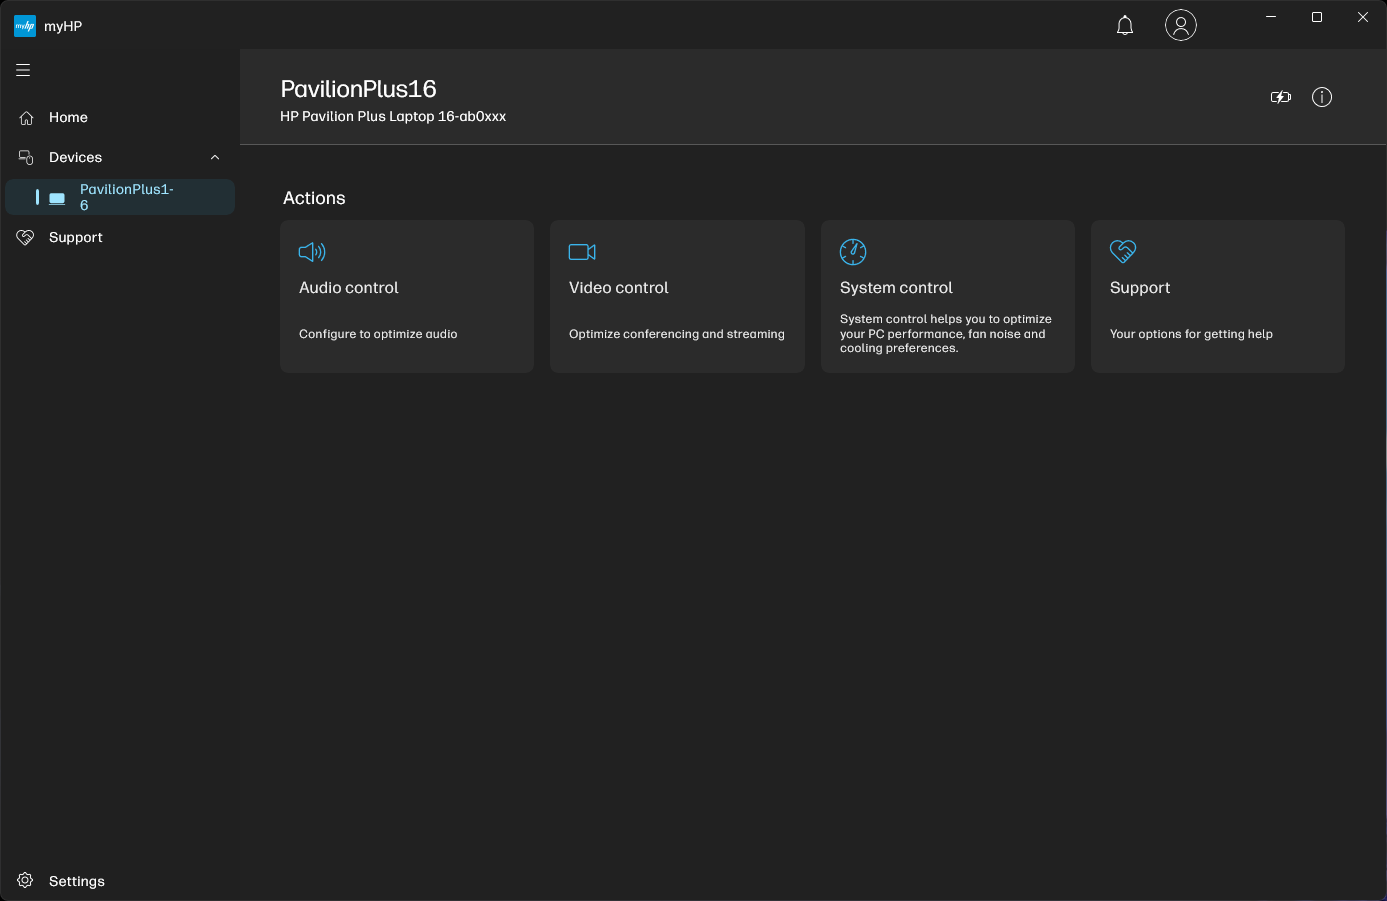
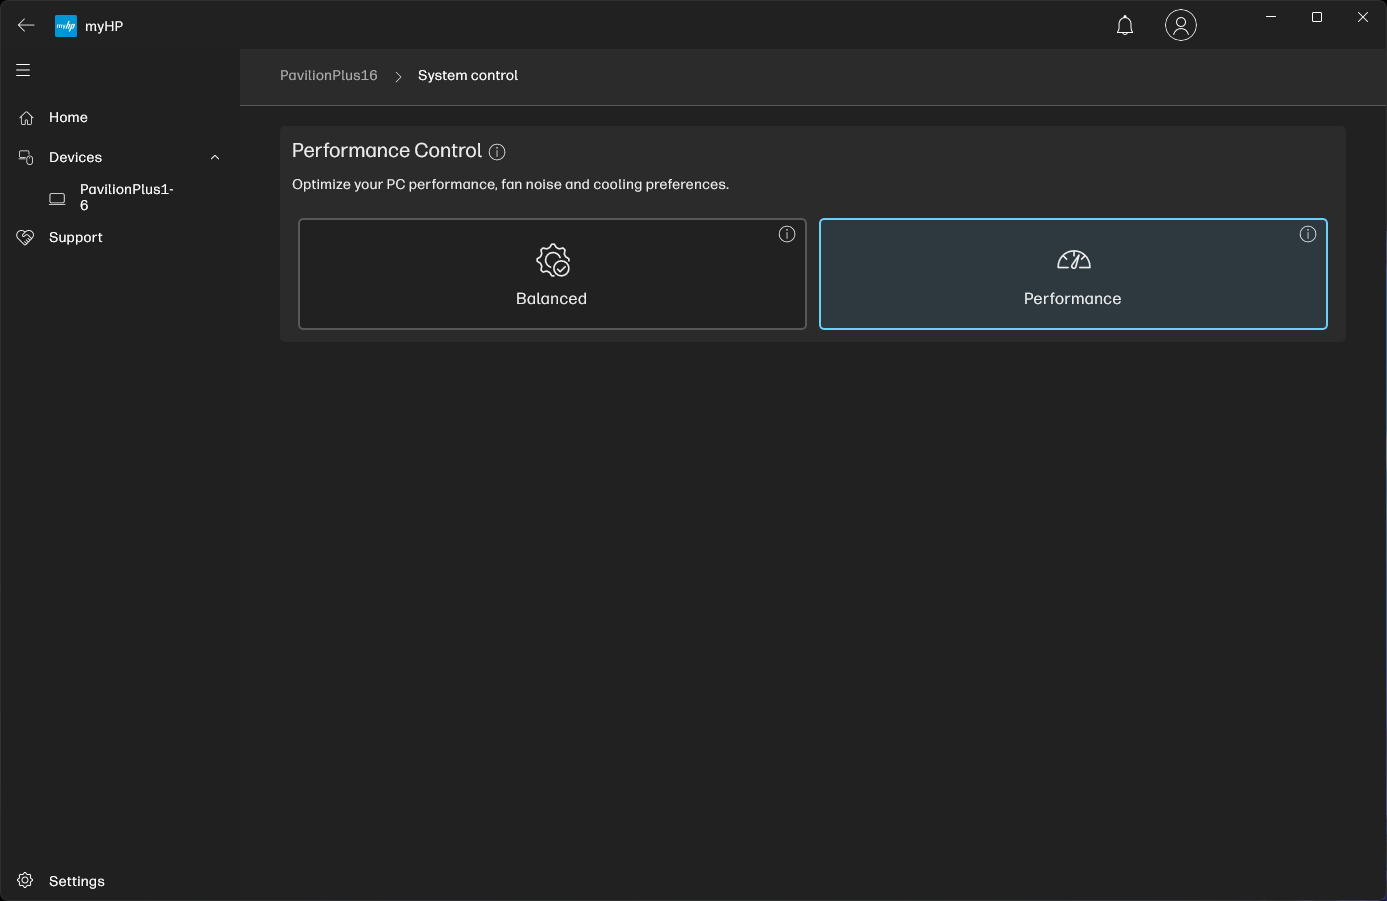
O aplicativo myHP permite que os usuários selecionem entre dois modos de operação: Balanceado e Desempenho. O modo balanceado usa um PL1 de 50 W, que aumenta para 60 W no modo de desempenho. O PL2 em ambos os modos é limitado a 61 W.
A GPU RTX 3050 de 6 GB é executada no modo MSHybrid/Optimus por padrão, sem possibilidade de troca de MUX.
Usamos o modo Performance para todos os benchmarks. O PL1/PL2 cai para 35 W / 35 W com a energia da bateria.
Processador
O Core i7-13700H do Pavilion Plus 16 é prejudicado por um baixo valor de PL2. Isso se torna particularmente aparente em benchmarks de vários núcleos, nos quais ele fica significativamente atrás de produtos como o Dell Inspiron 16 Plus 7630 que possui um Core i7-13700H com PL2 de 89 W.
Dito isso, o resfriamento do Pavilion Plus 16 parece ser muito eficaz para garantir um desempenho bem sustentado durante nosso teste de loop de vários núcleos Cinebench R15.
O Pavilion Plus 16 está no topo da maioria dos gráficos de núcleo único da CPU, mas o Schenker Vision 14 M23 está logo atrás do senhor nesses testes.
Cinebench R15 Multi Loop
Cinebench R23: Multi Core | Single Core
Cinebench R20: CPU (Multi Core) | CPU (Single Core)
Cinebench R15: CPU Multi 64Bit | CPU Single 64Bit
Blender: v2.79 BMW27 CPU
7-Zip 18.03: 7z b 4 | 7z b 4 -mmt1
Geekbench 6.7: Multi-Core | Single-Core
Geekbench 5.5: Multi-Core | Single-Core
HWBOT x265 Benchmark v2.2: 4k Preset
LibreOffice : 20 Documents To PDF
R Benchmark 2.5: Overall mean
| CPU Performance rating | |
| Média da turma Multimedia | |
| Dell Inspiron 16 Plus 7630 | |
| Média Intel Core i7-13700H | |
| HP Pavilion Plus 16-ab0456tx | |
| Asus VivoBook Pro 16 K6602VU | |
| Samsung Galaxy Book3 Ultra 16 -2! | |
| Schenker Vision 14 M23 RTX 3050 | |
| Asus VivoBook 14X K3405 -2! | |
| Lenovo Slim Pro 7 14ARP8 -2! | |
| Cinebench R23 / Multi Core | |
| Média da turma Multimedia (4861 - 33362, n=76, últimos 2 anos) | |
| Dell Inspiron 16 Plus 7630 | |
| Samsung Galaxy Book3 Ultra 16 | |
| Média Intel Core i7-13700H (5890 - 20034, n=29) | |
| Asus VivoBook Pro 16 K6602VU | |
| Asus VivoBook 14X K3405 | |
| Schenker Vision 14 M23 RTX 3050 | |
| Lenovo Slim Pro 7 14ARP8 | |
| HP Pavilion Plus 16-ab0456tx | |
| Cinebench R23 / Single Core | |
| Média da turma Multimedia (1128 - 2459, n=68, últimos 2 anos) | |
| HP Pavilion Plus 16-ab0456tx | |
| Schenker Vision 14 M23 RTX 3050 | |
| Dell Inspiron 16 Plus 7630 | |
| Média Intel Core i7-13700H (1323 - 1914, n=29) | |
| Asus VivoBook Pro 16 K6602VU | |
| Asus VivoBook 14X K3405 | |
| Samsung Galaxy Book3 Ultra 16 | |
| Lenovo Slim Pro 7 14ARP8 | |
| Cinebench R20 / CPU (Multi Core) | |
| Média da turma Multimedia (1887 - 12912, n=59, últimos 2 anos) | |
| Dell Inspiron 16 Plus 7630 | |
| Samsung Galaxy Book3 Ultra 16 | |
| Média Intel Core i7-13700H (2322 - 7674, n=29) | |
| HP Pavilion Plus 16-ab0456tx | |
| Asus VivoBook Pro 16 K6602VU | |
| Asus VivoBook 14X K3405 | |
| Schenker Vision 14 M23 RTX 3050 | |
| Lenovo Slim Pro 7 14ARP8 | |
| Cinebench R20 / CPU (Single Core) | |
| HP Pavilion Plus 16-ab0456tx | |
| Schenker Vision 14 M23 RTX 3050 | |
| Média da turma Multimedia (425 - 853, n=59, últimos 2 anos) | |
| Dell Inspiron 16 Plus 7630 | |
| Média Intel Core i7-13700H (508 - 741, n=29) | |
| Asus VivoBook Pro 16 K6602VU | |
| Asus VivoBook 14X K3405 | |
| Samsung Galaxy Book3 Ultra 16 | |
| Lenovo Slim Pro 7 14ARP8 | |
| Cinebench R15 / CPU Multi 64Bit | |
| Média da turma Multimedia (856 - 5224, n=63, últimos 2 anos) | |
| Samsung Galaxy Book3 Ultra 16 | |
| Asus VivoBook Pro 16 K6602VU | |
| Dell Inspiron 16 Plus 7630 | |
| Média Intel Core i7-13700H (905 - 2982, n=29) | |
| Asus VivoBook 14X K3405 | |
| HP Pavilion Plus 16-ab0456tx | |
| Lenovo Slim Pro 7 14ARP8 | |
| Schenker Vision 14 M23 RTX 3050 | |
| Cinebench R15 / CPU Single 64Bit | |
| Média da turma Multimedia (184.8 - 326, n=61, últimos 2 anos) | |
| HP Pavilion Plus 16-ab0456tx | |
| Schenker Vision 14 M23 RTX 3050 | |
| Dell Inspiron 16 Plus 7630 | |
| Média Intel Core i7-13700H (213 - 278, n=29) | |
| Asus VivoBook Pro 16 K6602VU | |
| Asus VivoBook 14X K3405 | |
| Samsung Galaxy Book3 Ultra 16 | |
| Lenovo Slim Pro 7 14ARP8 | |
| Blender / v2.79 BMW27 CPU | |
| Schenker Vision 14 M23 RTX 3050 | |
| Média da turma Multimedia (100 - 557, n=60, últimos 2 anos) | |
| Lenovo Slim Pro 7 14ARP8 | |
| Asus VivoBook 14X K3405 | |
| Média Intel Core i7-13700H (169 - 555, n=29) | |
| Samsung Galaxy Book3 Ultra 16 | |
| Dell Inspiron 16 Plus 7630 | |
| HP Pavilion Plus 16-ab0456tx | |
| Asus VivoBook Pro 16 K6602VU | |
| 7-Zip 18.03 / 7z b 4 | |
| Asus VivoBook Pro 16 K6602VU | |
| HP Pavilion Plus 16-ab0456tx | |
| Samsung Galaxy Book3 Ultra 16 | |
| Média Intel Core i7-13700H (27322 - 76344, n=29) | |
| Dell Inspiron 16 Plus 7630 | |
| Média da turma Multimedia (26062 - 130368, n=57, últimos 2 anos) | |
| Lenovo Slim Pro 7 14ARP8 | |
| Schenker Vision 14 M23 RTX 3050 | |
| Asus VivoBook 14X K3405 | |
| 7-Zip 18.03 / 7z b 4 -mmt1 | |
| Schenker Vision 14 M23 RTX 3050 | |
| HP Pavilion Plus 16-ab0456tx | |
| Média da turma Multimedia (3666 - 7545, n=58, últimos 2 anos) | |
| Média Intel Core i7-13700H (4825 - 6238, n=29) | |
| Asus VivoBook Pro 16 K6602VU | |
| Dell Inspiron 16 Plus 7630 | |
| Asus VivoBook 14X K3405 | |
| Samsung Galaxy Book3 Ultra 16 | |
| Lenovo Slim Pro 7 14ARP8 | |
| Geekbench 6.7 / Multi-Core | |
| Média da turma Multimedia (4983 - 29415, n=71, últimos 2 anos) | |
| Dell Inspiron 16 Plus 7630 | |
| HP Pavilion Plus 16-ab0456tx | |
| Schenker Vision 14 M23 RTX 3050 | |
| Média Intel Core i7-13700H (8415 - 13832, n=13) | |
| Asus VivoBook Pro 16 K6602VU | |
| Geekbench 6.7 / Single-Core | |
| Média da turma Multimedia (1534 - 4335, n=70, últimos 2 anos) | |
| Schenker Vision 14 M23 RTX 3050 | |
| Dell Inspiron 16 Plus 7630 | |
| HP Pavilion Plus 16-ab0456tx | |
| Média Intel Core i7-13700H (2316 - 2639, n=13) | |
| Asus VivoBook Pro 16 K6602VU | |
| Geekbench 5.5 / Multi-Core | |
| Média da turma Multimedia (4652 - 20422, n=58, últimos 2 anos) | |
| Dell Inspiron 16 Plus 7630 | |
| Média Intel Core i7-13700H (6165 - 14215, n=29) | |
| Samsung Galaxy Book3 Ultra 16 | |
| HP Pavilion Plus 16-ab0456tx | |
| Schenker Vision 14 M23 RTX 3050 | |
| Asus VivoBook Pro 16 K6602VU | |
| Asus VivoBook 14X K3405 | |
| Lenovo Slim Pro 7 14ARP8 | |
| Geekbench 5.5 / Single-Core | |
| Média da turma Multimedia (805 - 2974, n=58, últimos 2 anos) | |
| Dell Inspiron 16 Plus 7630 | |
| Schenker Vision 14 M23 RTX 3050 | |
| HP Pavilion Plus 16-ab0456tx | |
| Média Intel Core i7-13700H (1362 - 1919, n=29) | |
| Asus VivoBook Pro 16 K6602VU | |
| Samsung Galaxy Book3 Ultra 16 | |
| Asus VivoBook 14X K3405 | |
| Lenovo Slim Pro 7 14ARP8 | |
| HWBOT x265 Benchmark v2.2 / 4k Preset | |
| Média da turma Multimedia (5.26 - 36.1, n=58, últimos 2 anos) | |
| Samsung Galaxy Book3 Ultra 16 | |
| Asus VivoBook Pro 16 K6602VU | |
| Média Intel Core i7-13700H (6.72 - 21.2, n=29) | |
| HP Pavilion Plus 16-ab0456tx | |
| Lenovo Slim Pro 7 14ARP8 | |
| Dell Inspiron 16 Plus 7630 | |
| Asus VivoBook 14X K3405 | |
| Schenker Vision 14 M23 RTX 3050 | |
| LibreOffice / 20 Documents To PDF | |
| HP Pavilion Plus 16-ab0456tx | |
| Lenovo Slim Pro 7 14ARP8 | |
| Schenker Vision 14 M23 RTX 3050 | |
| Asus VivoBook Pro 16 K6602VU | |
| Média da turma Multimedia (23.9 - 146.7, n=59, últimos 2 anos) | |
| Samsung Galaxy Book3 Ultra 16 | |
| Média Intel Core i7-13700H (31.3 - 62.4, n=29) | |
| Asus VivoBook 14X K3405 | |
| Dell Inspiron 16 Plus 7630 | |
| R Benchmark 2.5 / Overall mean | |
| Lenovo Slim Pro 7 14ARP8 | |
| Asus VivoBook 14X K3405 | |
| Samsung Galaxy Book3 Ultra 16 | |
| Asus VivoBook Pro 16 K6602VU | |
| Média Intel Core i7-13700H (0.4308 - 0.607, n=29) | |
| Média da turma Multimedia (0.3604 - 0.947, n=58, últimos 2 anos) | |
| Schenker Vision 14 M23 RTX 3050 | |
| HP Pavilion Plus 16-ab0456tx | |
| Dell Inspiron 16 Plus 7630 | |
* ... menor é melhor
AIDA64: FP32 Ray-Trace | FPU Julia | CPU SHA3 | CPU Queen | FPU SinJulia | FPU Mandel | CPU AES | CPU ZLib | FP64 Ray-Trace | CPU PhotoWorxx
| Performance rating | |
| Média da turma Multimedia | |
| Asus VivoBook Pro 16 K6602VU | |
| Lenovo Slim Pro 7 14ARP8 | |
| HP Pavilion Plus 16-ab0456tx | |
| Samsung Galaxy Book3 Ultra 16 | |
| Média Intel Core i7-13700H | |
| Dell Inspiron 16 Plus 7630 | |
| Asus VivoBook 14X K3405 | |
| Schenker Vision 14 M23 RTX 3050 | |
| AIDA64 / FP32 Ray-Trace | |
| Média da turma Multimedia (2214 - 50388, n=55, últimos 2 anos) | |
| Lenovo Slim Pro 7 14ARP8 | |
| HP Pavilion Plus 16-ab0456tx | |
| Samsung Galaxy Book3 Ultra 16 | |
| Média Intel Core i7-13700H (4986 - 18908, n=29) | |
| Dell Inspiron 16 Plus 7630 | |
| Asus VivoBook Pro 16 K6602VU | |
| Asus VivoBook 14X K3405 | |
| Schenker Vision 14 M23 RTX 3050 | |
| AIDA64 / FPU Julia | |
| Lenovo Slim Pro 7 14ARP8 | |
| Média da turma Multimedia (12867 - 201874, n=56, últimos 2 anos) | |
| HP Pavilion Plus 16-ab0456tx | |
| Asus VivoBook Pro 16 K6602VU | |
| Média Intel Core i7-13700H (25360 - 92359, n=29) | |
| Samsung Galaxy Book3 Ultra 16 | |
| Dell Inspiron 16 Plus 7630 | |
| Asus VivoBook 14X K3405 | |
| Schenker Vision 14 M23 RTX 3050 | |
| AIDA64 / CPU SHA3 | |
| Média da turma Multimedia (626 - 8623, n=56, últimos 2 anos) | |
| Asus VivoBook 14X K3405 | |
| HP Pavilion Plus 16-ab0456tx | |
| Asus VivoBook Pro 16 K6602VU | |
| Samsung Galaxy Book3 Ultra 16 | |
| Média Intel Core i7-13700H (1339 - 4224, n=29) | |
| Lenovo Slim Pro 7 14ARP8 | |
| Dell Inspiron 16 Plus 7630 | |
| Schenker Vision 14 M23 RTX 3050 | |
| AIDA64 / CPU Queen | |
| Dell Inspiron 16 Plus 7630 | |
| Samsung Galaxy Book3 Ultra 16 | |
| HP Pavilion Plus 16-ab0456tx | |
| Média Intel Core i7-13700H (59324 - 107159, n=29) | |
| Asus VivoBook Pro 16 K6602VU | |
| Lenovo Slim Pro 7 14ARP8 | |
| Schenker Vision 14 M23 RTX 3050 | |
| Asus VivoBook 14X K3405 | |
| Média da turma Multimedia (13483 - 181505, n=43, últimos 2 anos) | |
| AIDA64 / FPU SinJulia | |
| Lenovo Slim Pro 7 14ARP8 | |
| HP Pavilion Plus 16-ab0456tx | |
| Samsung Galaxy Book3 Ultra 16 | |
| Média da turma Multimedia (886 - 28794, n=56, últimos 2 anos) | |
| Dell Inspiron 16 Plus 7630 | |
| Asus VivoBook Pro 16 K6602VU | |
| Média Intel Core i7-13700H (4800 - 11050, n=29) | |
| Schenker Vision 14 M23 RTX 3050 | |
| Asus VivoBook 14X K3405 | |
| AIDA64 / FPU Mandel | |
| Lenovo Slim Pro 7 14ARP8 | |
| Média da turma Multimedia (6395 - 105740, n=55, últimos 2 anos) | |
| HP Pavilion Plus 16-ab0456tx | |
| Samsung Galaxy Book3 Ultra 16 | |
| Média Intel Core i7-13700H (12321 - 45118, n=29) | |
| Asus VivoBook Pro 16 K6602VU | |
| Dell Inspiron 16 Plus 7630 | |
| Asus VivoBook 14X K3405 | |
| Schenker Vision 14 M23 RTX 3050 | |
| AIDA64 / CPU AES | |
| Asus VivoBook Pro 16 K6602VU | |
| Asus VivoBook 14X K3405 | |
| Média Intel Core i7-13700H (28769 - 151254, n=29) | |
| HP Pavilion Plus 16-ab0456tx | |
| Samsung Galaxy Book3 Ultra 16 | |
| Média da turma Multimedia (8171 - 126790, n=56, últimos 2 anos) | |
| Dell Inspiron 16 Plus 7630 | |
| Schenker Vision 14 M23 RTX 3050 | |
| Lenovo Slim Pro 7 14ARP8 | |
| AIDA64 / CPU ZLib | |
| Samsung Galaxy Book3 Ultra 16 | |
| Média da turma Multimedia (143.8 - 2022, n=56, últimos 2 anos) | |
| HP Pavilion Plus 16-ab0456tx | |
| Asus VivoBook Pro 16 K6602VU | |
| Média Intel Core i7-13700H (389 - 1215, n=29) | |
| Asus VivoBook 14X K3405 | |
| Dell Inspiron 16 Plus 7630 | |
| Schenker Vision 14 M23 RTX 3050 | |
| Lenovo Slim Pro 7 14ARP8 | |
| AIDA64 / FP64 Ray-Trace | |
| Média da turma Multimedia (1014 - 26875, n=56, últimos 2 anos) | |
| HP Pavilion Plus 16-ab0456tx | |
| Lenovo Slim Pro 7 14ARP8 | |
| Samsung Galaxy Book3 Ultra 16 | |
| Asus VivoBook Pro 16 K6602VU | |
| Média Intel Core i7-13700H (2540 - 10135, n=29) | |
| Dell Inspiron 16 Plus 7630 | |
| Asus VivoBook 14X K3405 | |
| Schenker Vision 14 M23 RTX 3050 | |
| AIDA64 / CPU PhotoWorxx | |
| Média da turma Multimedia (8187 - 88154, n=56, últimos 2 anos) | |
| Samsung Galaxy Book3 Ultra 16 | |
| Schenker Vision 14 M23 RTX 3050 | |
| HP Pavilion Plus 16-ab0456tx | |
| Média Intel Core i7-13700H (12872 - 52727, n=29) | |
| Asus VivoBook Pro 16 K6602VU | |
| Dell Inspiron 16 Plus 7630 | |
| Lenovo Slim Pro 7 14ARP8 | |
| Asus VivoBook 14X K3405 | |
Confira nosso site dedicado Intel Core i7-13700H para obter mais comparações de desempenho.
Desempenho do sistema
O Pavilion Plus 16 consegue, de alguma forma, superar o VivoBook Pro 16 com um Core i9-13900H e RTX 4050 nos testes gerais do CrossMark, mas perde para este último no PCMark 10 em 6%.
Por outro lado, o sistema parece bastante responsivo para a produtividade diária e as tarefas de navegação na Web.
CrossMark: Overall | Productivity | Creativity | Responsiveness
AIDA64: Memory Copy | Memory Read | Memory Write | Memory Latency
WebXPRT 3: Overall
WebXPRT 4: Overall
Mozilla Kraken 1.1: Total
| PCMark 10 / Score | |
| Média da turma Multimedia (4325 - 10386, n=54, últimos 2 anos) | |
| Dell Inspiron 16 Plus 7630 | |
| Asus VivoBook Pro 16 K6602VU | |
| Samsung Galaxy Book3 Ultra 16 | |
| Asus VivoBook 14X K3405 | |
| HP Pavilion Plus 16-ab0456tx | |
| Média Intel Core i7-13700H, NVIDIA GeForce RTX 3050 6GB Laptop GPU (6290 - 6597, n=2) | |
| Lenovo Slim Pro 7 14ARP8 | |
| Schenker Vision 14 M23 RTX 3050 | |
| PCMark 10 / Essentials | |
| Dell Inspiron 16 Plus 7630 | |
| Samsung Galaxy Book3 Ultra 16 | |
| Média da turma Multimedia (8025 - 11664, n=53, últimos 2 anos) | |
| Asus VivoBook Pro 16 K6602VU | |
| Asus VivoBook 14X K3405 | |
| HP Pavilion Plus 16-ab0456tx | |
| Média Intel Core i7-13700H, NVIDIA GeForce RTX 3050 6GB Laptop GPU (9943 - 10112, n=2) | |
| Lenovo Slim Pro 7 14ARP8 | |
| Schenker Vision 14 M23 RTX 3050 | |
| PCMark 10 / Productivity | |
| Média da turma Multimedia (7323 - 18233, n=53, últimos 2 anos) | |
| Dell Inspiron 16 Plus 7630 | |
| Asus VivoBook 14X K3405 | |
| Schenker Vision 14 M23 RTX 3050 | |
| Média Intel Core i7-13700H, NVIDIA GeForce RTX 3050 6GB Laptop GPU (8803 - 8950, n=2) | |
| HP Pavilion Plus 16-ab0456tx | |
| Asus VivoBook Pro 16 K6602VU | |
| Samsung Galaxy Book3 Ultra 16 | |
| Lenovo Slim Pro 7 14ARP8 | |
| PCMark 10 / Digital Content Creation | |
| Dell Inspiron 16 Plus 7630 | |
| Asus VivoBook Pro 16 K6602VU | |
| Média da turma Multimedia (3651 - 16240, n=53, últimos 2 anos) | |
| Samsung Galaxy Book3 Ultra 16 | |
| Lenovo Slim Pro 7 14ARP8 | |
| HP Pavilion Plus 16-ab0456tx | |
| Asus VivoBook 14X K3405 | |
| Média Intel Core i7-13700H, NVIDIA GeForce RTX 3050 6GB Laptop GPU (7590 - 8752, n=2) | |
| Schenker Vision 14 M23 RTX 3050 | |
| CrossMark / Overall | |
| Média da turma Multimedia (866 - 2728, n=62, últimos 2 anos) | |
| Dell Inspiron 16 Plus 7630 | |
| HP Pavilion Plus 16-ab0456tx | |
| Asus VivoBook Pro 16 K6602VU | |
| Asus VivoBook 14X K3405 | |
| Média Intel Core i7-13700H, NVIDIA GeForce RTX 3050 6GB Laptop GPU (1504 - 1752, n=2) | |
| Samsung Galaxy Book3 Ultra 16 | |
| Schenker Vision 14 M23 RTX 3050 | |
| Lenovo Slim Pro 7 14ARP8 | |
| CrossMark / Productivity | |
| Média da turma Multimedia (931 - 2489, n=62, últimos 2 anos) | |
| Dell Inspiron 16 Plus 7630 | |
| Asus VivoBook Pro 16 K6602VU | |
| HP Pavilion Plus 16-ab0456tx | |
| Asus VivoBook 14X K3405 | |
| Média Intel Core i7-13700H, NVIDIA GeForce RTX 3050 6GB Laptop GPU (1417 - 1657, n=2) | |
| Samsung Galaxy Book3 Ultra 16 | |
| Schenker Vision 14 M23 RTX 3050 | |
| Lenovo Slim Pro 7 14ARP8 | |
| CrossMark / Creativity | |
| Média da turma Multimedia (907 - 3465, n=62, últimos 2 anos) | |
| Dell Inspiron 16 Plus 7630 | |
| HP Pavilion Plus 16-ab0456tx | |
| Asus VivoBook Pro 16 K6602VU | |
| Média Intel Core i7-13700H, NVIDIA GeForce RTX 3050 6GB Laptop GPU (1711 - 1970, n=2) | |
| Schenker Vision 14 M23 RTX 3050 | |
| Asus VivoBook 14X K3405 | |
| Samsung Galaxy Book3 Ultra 16 | |
| Lenovo Slim Pro 7 14ARP8 | |
| CrossMark / Responsiveness | |
| Dell Inspiron 16 Plus 7630 | |
| Média da turma Multimedia (605 - 2024, n=62, últimos 2 anos) | |
| Asus VivoBook Pro 16 K6602VU | |
| Samsung Galaxy Book3 Ultra 16 | |
| Asus VivoBook 14X K3405 | |
| HP Pavilion Plus 16-ab0456tx | |
| Média Intel Core i7-13700H, NVIDIA GeForce RTX 3050 6GB Laptop GPU (1220 - 1458, n=2) | |
| Schenker Vision 14 M23 RTX 3050 | |
| Lenovo Slim Pro 7 14ARP8 | |
| AIDA64 / Memory Copy | |
| Média da turma Multimedia (11299 - 132135, n=56, últimos 2 anos) | |
| Samsung Galaxy Book3 Ultra 16 | |
| Schenker Vision 14 M23 RTX 3050 | |
| Média Intel Core i7-13700H, NVIDIA GeForce RTX 3050 6GB Laptop GPU (64356 - 65837, n=2) | |
| HP Pavilion Plus 16-ab0456tx | |
| Dell Inspiron 16 Plus 7630 | |
| Asus VivoBook Pro 16 K6602VU | |
| Lenovo Slim Pro 7 14ARP8 | |
| Asus VivoBook 14X K3405 | |
| AIDA64 / Memory Read | |
| Média da turma Multimedia (11624 - 174586, n=56, últimos 2 anos) | |
| Schenker Vision 14 M23 RTX 3050 | |
| Samsung Galaxy Book3 Ultra 16 | |
| Média Intel Core i7-13700H, NVIDIA GeForce RTX 3050 6GB Laptop GPU (65825 - 70861, n=2) | |
| Dell Inspiron 16 Plus 7630 | |
| Asus VivoBook Pro 16 K6602VU | |
| HP Pavilion Plus 16-ab0456tx | |
| Lenovo Slim Pro 7 14ARP8 | |
| Asus VivoBook 14X K3405 | |
| AIDA64 / Memory Write | |
| Samsung Galaxy Book3 Ultra 16 | |
| Média da turma Multimedia (11755 - 134998, n=56, últimos 2 anos) | |
| HP Pavilion Plus 16-ab0456tx | |
| Média Intel Core i7-13700H, NVIDIA GeForce RTX 3050 6GB Laptop GPU (68174 - 76930, n=2) | |
| Schenker Vision 14 M23 RTX 3050 | |
| Asus VivoBook Pro 16 K6602VU | |
| Dell Inspiron 16 Plus 7630 | |
| Lenovo Slim Pro 7 14ARP8 | |
| Asus VivoBook 14X K3405 | |
| AIDA64 / Memory Latency | |
| Média da turma Multimedia (7 - 535, n=55, últimos 2 anos) | |
| Lenovo Slim Pro 7 14ARP8 | |
| Samsung Galaxy Book3 Ultra 16 | |
| Dell Inspiron 16 Plus 7630 | |
| Asus VivoBook Pro 16 K6602VU | |
| HP Pavilion Plus 16-ab0456tx | |
| Asus VivoBook 14X K3405 | |
| Média Intel Core i7-13700H, NVIDIA GeForce RTX 3050 6GB Laptop GPU (85.7 - 89.7, n=2) | |
| Schenker Vision 14 M23 RTX 3050 | |
| WebXPRT 3 / Overall | |
| Média da turma Multimedia (136.4 - 596, n=65, últimos 2 anos) | |
| Dell Inspiron 16 Plus 7630 | |
| Schenker Vision 14 M23 RTX 3050 | |
| Média Intel Core i7-13700H, NVIDIA GeForce RTX 3050 6GB Laptop GPU (286 - 300, n=2) | |
| HP Pavilion Plus 16-ab0456tx | |
| Asus VivoBook 14X K3405 | |
| Lenovo Slim Pro 7 14ARP8 | |
| Samsung Galaxy Book3 Ultra 16 | |
| WebXPRT 4 / Overall | |
| Schenker Vision 14 M23 RTX 3050 | |
| Média Intel Core i7-13700H, NVIDIA GeForce RTX 3050 6GB Laptop GPU (273 - 325, n=2) | |
| Média da turma Multimedia (167.3 - 402, n=67, últimos 2 anos) | |
| Dell Inspiron 16 Plus 7630 | |
| HP Pavilion Plus 16-ab0456tx | |
| Asus VivoBook 14X K3405 | |
| Asus VivoBook Pro 16 K6602VU | |
| Samsung Galaxy Book3 Ultra 16 | |
| Lenovo Slim Pro 7 14ARP8 | |
| Mozilla Kraken 1.1 / Total | |
| Lenovo Slim Pro 7 14ARP8 | |
| Samsung Galaxy Book3 Ultra 16 | |
| Asus VivoBook 14X K3405 | |
| Asus VivoBook Pro 16 K6602VU | |
| Dell Inspiron 16 Plus 7630 | |
| Schenker Vision 14 M23 RTX 3050 | |
| Média Intel Core i7-13700H, NVIDIA GeForce RTX 3050 6GB Laptop GPU (490 - 496, n=2) | |
| HP Pavilion Plus 16-ab0456tx | |
| Média da turma Multimedia (228 - 835, n=68, últimos 2 anos) | |
* ... menor é melhor
| PCMark 8 Home Score Accelerated v2 | 5525 pontos | |
| PCMark 8 Work Score Accelerated v2 | 5653 pontos | |
| PCMark 10 Score | 6597 pontos | |
Ajuda | ||
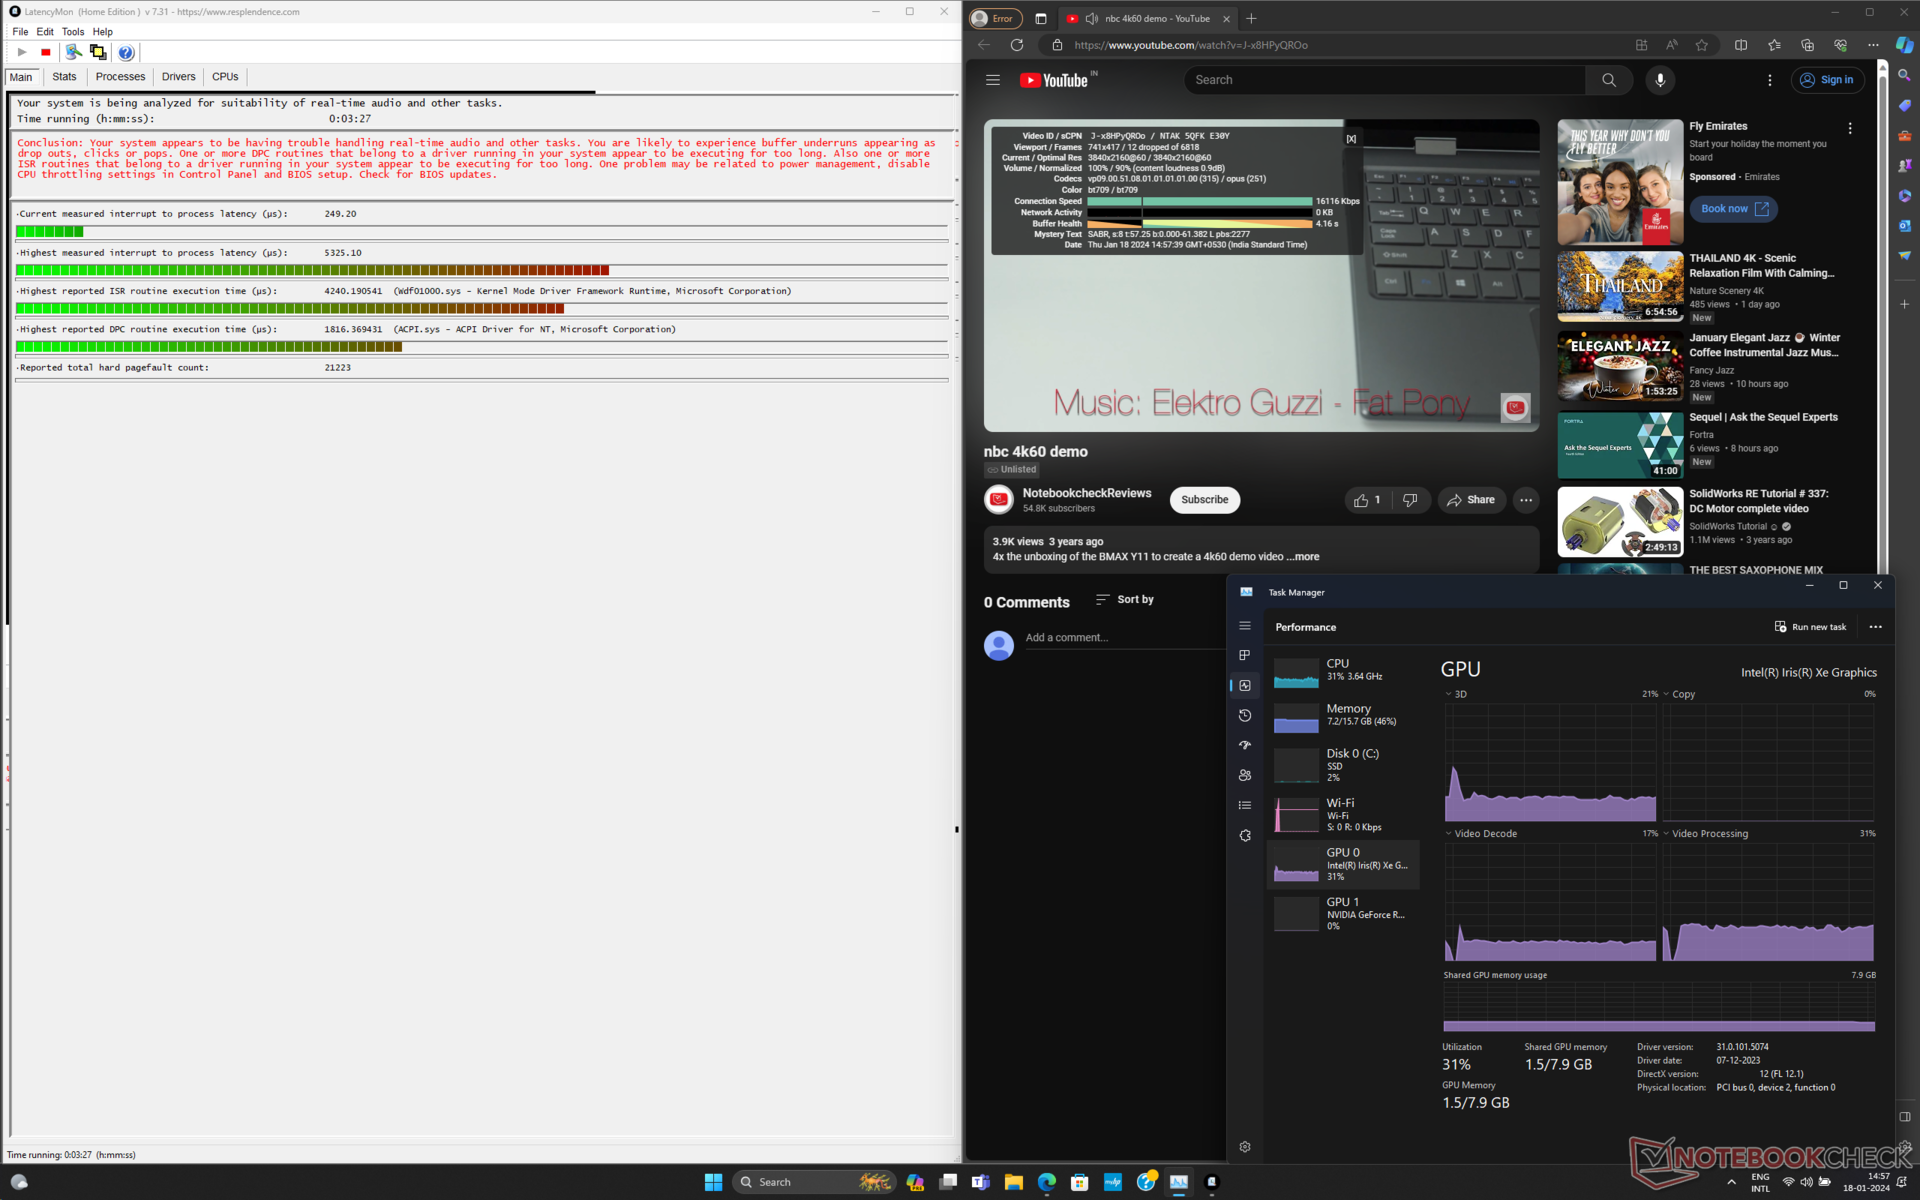
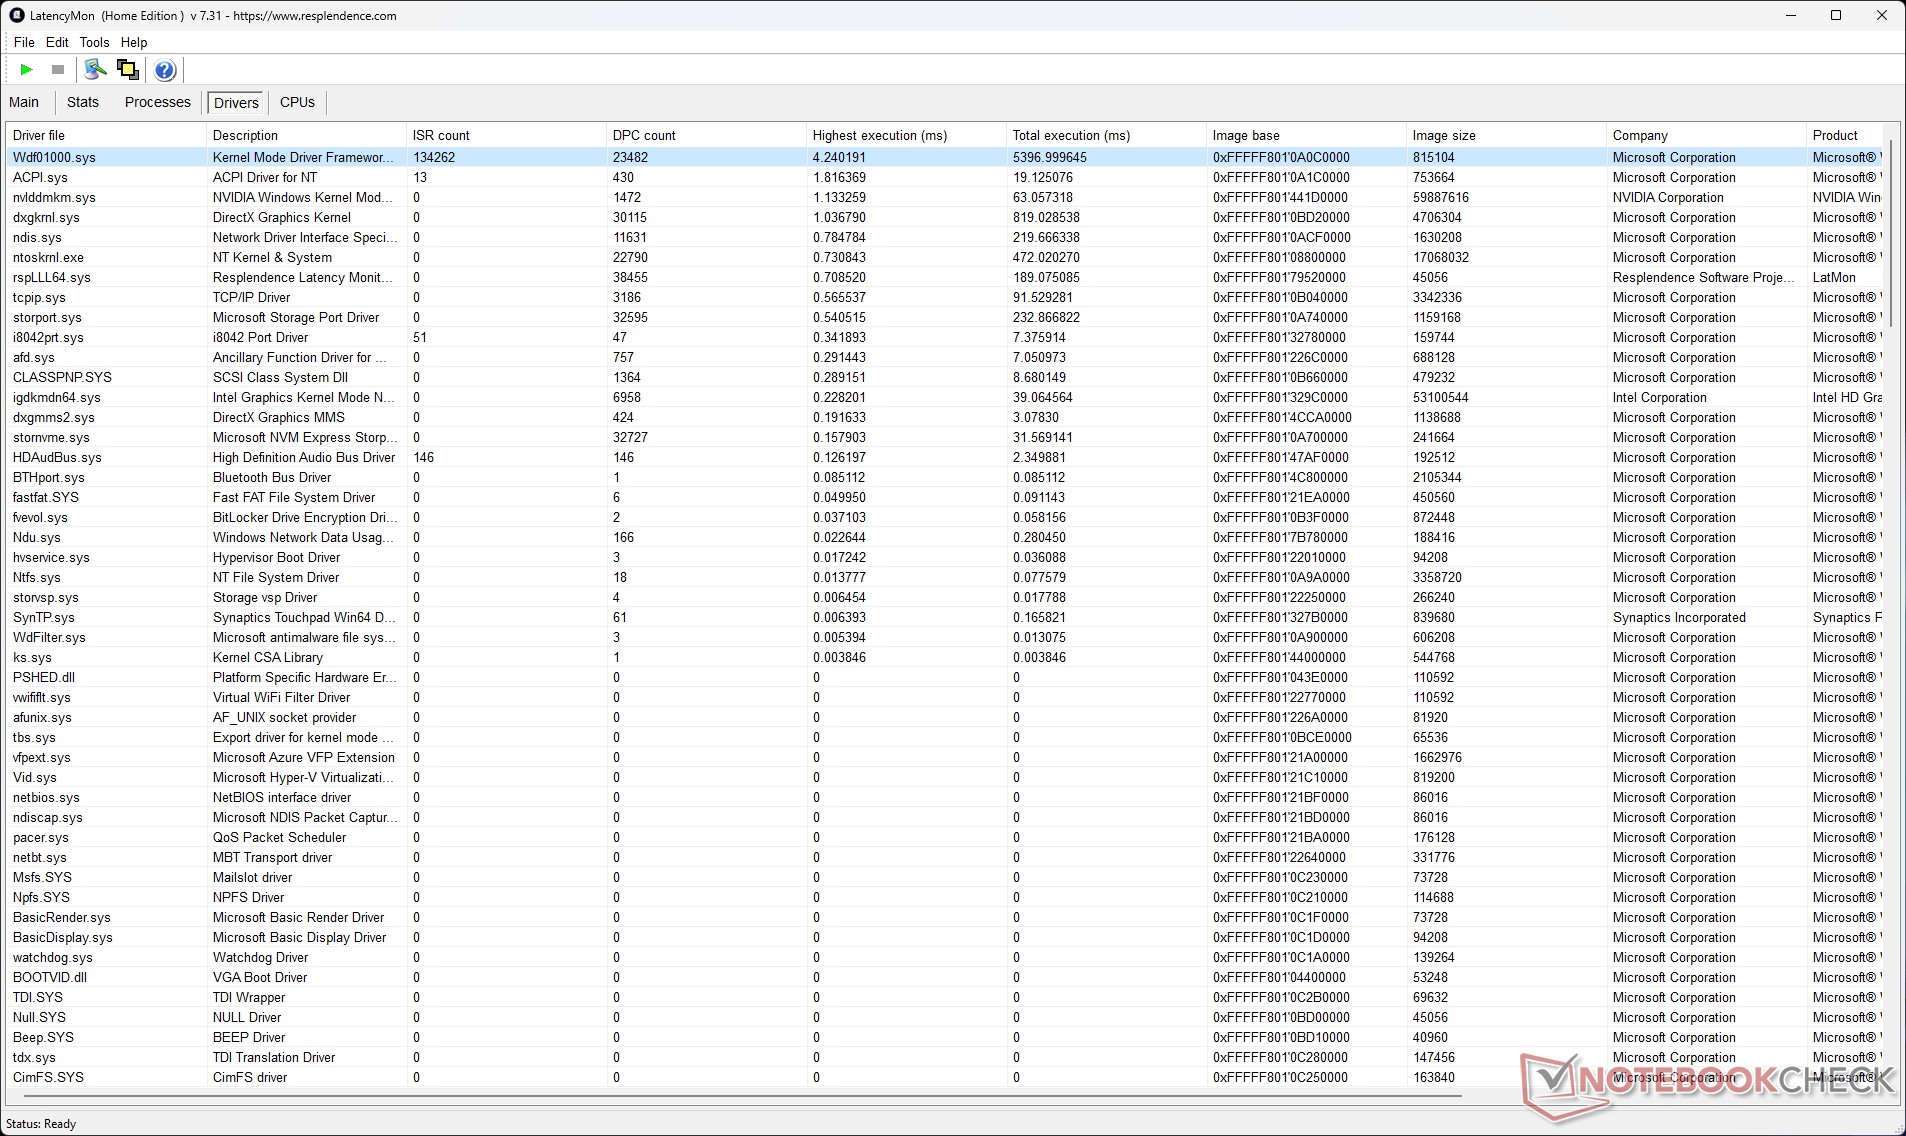
Latência DPC
A latência de interrupção para processamento medida pelo Pavilion Plus 16, de 5325,1 μs, é mais alta, o que pode ser uma preocupação para quem trabalha com fluxos de trabalho de áudio e vídeo em tempo real.
| DPC Latencies / LatencyMon - interrupt to process latency (max), Web, Youtube, Prime95 | |
| HP Pavilion Plus 16-ab0456tx | |
| Samsung Galaxy Book3 Ultra 16 | |
| Asus VivoBook Pro 16 K6602VU | |
| Schenker Vision 14 M23 RTX 3050 | |
| Lenovo Slim Pro 7 14ARP8 | |
| Asus VivoBook 14X K3405 | |
| Dell Inspiron 16 Plus 7630 | |
* ... menor é melhor
Nosso Classificação de latência DPC oferece mais comparações de latência entre os dispositivos analisados.
Dispositivos de armazenamento
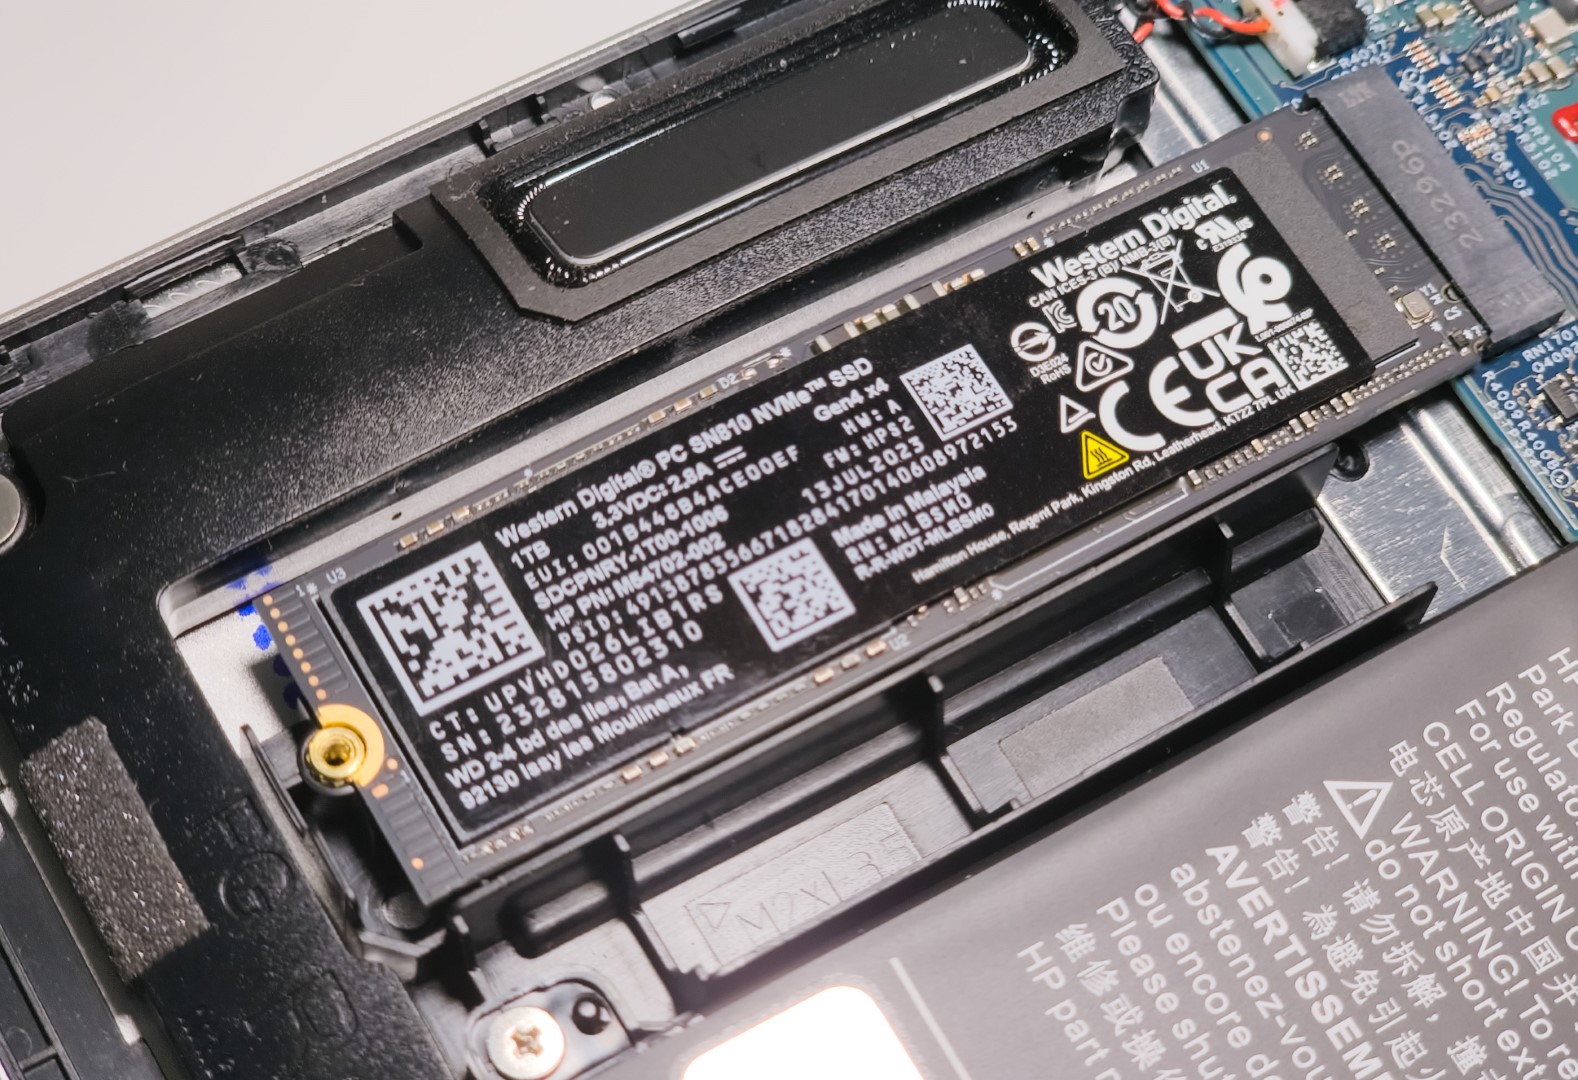
Uma unidade Western Digital PC SN810 1 TB NVMe vem instalada em nossa unidade Pavilion Plus 16. O desempenho cumulativo da unidade é cerca de 10% mais lento do que o Samsung 990 Pro no Schenker Vision 14 M23 e cerca de 16% mais lento do que o Samsung PM9A1 no Samsung Galaxy Book3 Ultra 16.
O desempenho inferior de leitura/gravação em 4K contribui principalmente para esse déficit de desempenho.
Infelizmente, apenas um SSD pode ser instalado no chassi. Também não há possibilidade de adicionar unidades de 2,5 polegadas.

* ... menor é melhor
Limitação de disco: Loop de leitura do DiskSpd, profundidade da fila 8
Embora a HP forneça uma capa térmica para a SSD, aparentemente ela não é suficiente para evitar que a unidade seja estrangulada após o 25º loop durante nosso teste de loop de leitura do DiskSpd com uma profundidade de fila de 8.
Mais benchmarks de armazenamento podem ser encontrados em nossa Página de comparação de SSDs.
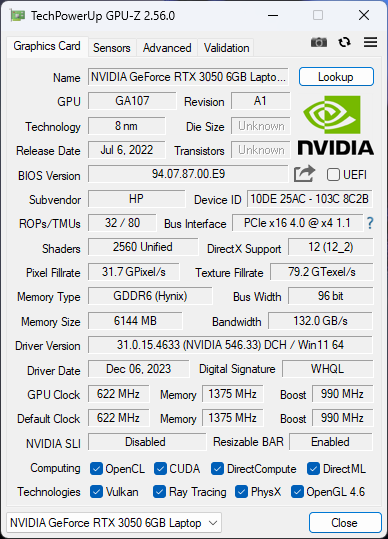
Desempenho da GPU
O Pavilion Plus 16 é o único outro notebook que testamos que apresenta a mais nova GPU para laptop RTX 3050 de 6 GB, além do Lenovo Slim Pro 7 e do Schenker Vision 14 M23.
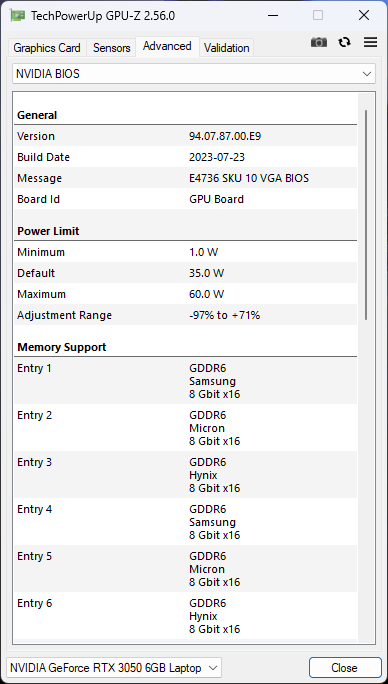
O RTX 3050 de 6 GB no notebook HP é classificado com um TGP de 60 W, enquanto o Schenker e o Lenovo apresentam implementações de 50 W e 63 W, respectivamente.
Assim, o Slim 7 Pro tem uma ligeira vantagem no desempenho cumulativo do 3DMark sobre o Pavilion Plus 16, enquanto o Vision 14 M23 fica atrás do HP em 5%.
| 3DMark 11 Performance | 17282 pontos | |
| 3DMark Ice Storm Standard Score | 82182 pontos | |
| 3DMark Cloud Gate Standard Score | 43015 pontos | |
| 3DMark Fire Strike Score | 10890 pontos | |
| 3DMark Fire Strike Extreme Score | 5641 pontos | |
Ajuda | ||
| Blender / v3.3 Classroom OPTIX/RTX | |
| Asus VivoBook 14X K3405 | |
| Schenker Vision 14 M23 RTX 3050 | |
| Média NVIDIA GeForce RTX 3050 4GB Laptop GPU (53 - 99, n=12) | |
| Lenovo Slim Pro 7 14ARP8 | |
| HP Pavilion Plus 16-ab0456tx | |
| Média da turma Multimedia (12 - 105, n=23, últimos 2 anos) | |
| Samsung Galaxy Book3 Ultra 16 | |
| Asus VivoBook Pro 16 K6602VU | |
| Dell Inspiron 16 Plus 7630 | |
| Blender / v3.3 Classroom CUDA | |
| Asus VivoBook 14X K3405 | |
| Asus VivoBook 14X K3405 | |
| Média NVIDIA GeForce RTX 3050 4GB Laptop GPU (97 - 152, n=13) | |
| Schenker Vision 14 M23 RTX 3050 | |
| Lenovo Slim Pro 7 14ARP8 | |
| HP Pavilion Plus 16-ab0456tx | |
| Samsung Galaxy Book3 Ultra 16 | |
| Média da turma Multimedia (20 - 186, n=23, últimos 2 anos) | |
| Asus VivoBook Pro 16 K6602VU | |
| Dell Inspiron 16 Plus 7630 | |
| Blender / v3.3 Classroom CPU | |
| Média NVIDIA GeForce RTX 3050 4GB Laptop GPU (388 - 937, n=11) | |
| Schenker Vision 14 M23 RTX 3050 | |
| Asus VivoBook 14X K3405 | |
| Lenovo Slim Pro 7 14ARP8 | |
| Dell Inspiron 16 Plus 7630 | |
| Média da turma Multimedia (134.5 - 1042, n=63, últimos 2 anos) | |
| Samsung Galaxy Book3 Ultra 16 | |
| HP Pavilion Plus 16-ab0456tx | |
| Asus VivoBook Pro 16 K6602VU | |
* ... menor é melhor
Desempenho em jogos
Vemos um benefício cumulativo de cerca de 10% em jogos de 1080p com a RTX 3050 de 6 GB em comparação com a RTX 3050 DE 4 GB média.
O RTX 3050 do Pavilion Plus 16 mostra bons ganhos no desempenho cumulativo de jogos em 1080p em relação ao Slim Pro 7 e ao Vision 14 M23, enquanto fica 25% atrás da GPU para laptop RTX 4050 de 65 W do VivoBook Pro 16.
Curiosamente, o Pavilion Plus 16 também é capaz de superar o Galaxy Book3 Ultra 16 com uma RTX 4050 em jogos em geral, mas isso se deve ao fraco desempenho deste último em Dota 2 Reborn e X-Plane 11.
A RTX 3050 de 6 GB pode reproduzir títulos mais antigos sem problemas a 1080p Ultra, mas os jogos AAA modernos têm dificuldades com qualquer coisa acima de 1080p High settings.
O gráfico Witcher 3 FPS
Não observamos nenhuma aceleração perceptível durante um teste de estresse com The Witcher 3 a 1080p Ultra, o que indica um resfriamento eficiente.
| baixo | média | alto | ultra | QHD | |
|---|---|---|---|---|---|
| GTA V (2015) | 177.9 | 172 | 123.3 | 62.7 | 42.7 |
| The Witcher 3 (2015) | 244 | 159.1 | 91.4 | 50.1 | 37 |
| Dota 2 Reborn (2015) | 155.2 | 131 | 124.2 | 116.9 | |
| Final Fantasy XV Benchmark (2018) | 128.2 | 70.9 | 52 | 37.4 | |
| X-Plane 11.11 (2018) | 140.6 | 117 | 97.3 | ||
| Far Cry 5 (2018) | 89 | 82 | 76 | 52 | |
| Strange Brigade (2018) | 256 | 112.8 | 91.9 | 80.5 | 57.1 |
| F1 22 (2022) | 150.2 | 145.3 | 109.5 | 34 | 20.1 |
| F1 23 (2023) | 150.1 | 141.2 | 97.5 | 26 | 14.3 |
| Cyberpunk 2077 (2023) | 67.6 | 52.1 | 43.2 | 36.9 | 21.3 |
| Assassin's Creed Mirage (2023) | 70 | 63 | 55 | 41 | 31 |
| Avatar Frontiers of Pandora (2023) | 39.5 | 36.3 | 31.5 | 23.4 | 15.1 |
Consulte nosso site dedicado à GPU para laptop Nvidia GeForce RTX 3050 6 GB para obter mais informações.
Emissões: Ruído tolerável do ventilador, mas altas temperaturas de superfície sob carga
Ruído do sistema
Medimos um nível de pressão sonora (SPL) de 42,1 dB(A) no modo Performance com carga máxima. Parece que a HP estabeleceu limites para que o ruído da ventoinha fique abaixo de 35 db(A) no modo balanceado e 45 dB(A) no modo de desempenho.
Barulho
| Ocioso |
| 22.22 / 22.22 / 22.22 dB |
| Carga |
| 42.03 / 42.1 dB |
 | ||
30 dB silencioso 40 dB(A) audível 50 dB(A) ruidosamente alto |
||
min: | ||
| Modo de desempenho | Idle dB(A) | Load average dB(A) | Load maximum dB(A) | The Witcher 3 1080p Ultra dB(A) |
|---|---|---|---|---|
| Equilibrado | 22.22 | 33.81 | 34.08 | 34.41 / 48 fps |
| Desempenho | 22.22 | 42.03 | 42.1 | 42.1 / 50 fps |
| HP Pavilion Plus 16-ab0456tx i7-13700H, GeForce RTX 3050 6GB Laptop GPU | Schenker Vision 14 M23 RTX 3050 i7-13700H, GeForce RTX 3050 6GB Laptop GPU | Dell Inspiron 16 Plus 7630 i7-13700H, GeForce RTX 4060 Laptop GPU | Asus VivoBook 14X K3405 i5-13500H, GeForce RTX 3050 4GB Laptop GPU | Lenovo Slim Pro 7 14ARP8 R7 7735HS, GeForce RTX 3050 6GB Laptop GPU | Asus VivoBook Pro 16 K6602VU i9-13900H, GeForce RTX 4050 Laptop GPU | Samsung Galaxy Book3 Ultra 16 i7-13700H, GeForce RTX 4050 Laptop GPU | |
|---|---|---|---|---|---|---|---|
| Noise | -10% | -7% | -10% | -4% | -14% | -9% | |
| desligado / ambiente * (dB) | 22.22 | 23.5 -6% | 23.2 -4% | 21.46 3% | 22.7 -2% | 20.96 6% | 25 -13% |
| Idle Minimum * (dB) | 22.22 | 23.5 -6% | 23.2 -4% | 22.08 1% | 22.8 -3% | 25.28 -14% | 26 -17% |
| Idle Average * (dB) | 22.22 | 23.5 -6% | 23.2 -4% | 22.08 1% | 22.8 -3% | 25.28 -14% | 27 -22% |
| Idle Maximum * (dB) | 22.22 | 26 -17% | 23.2 -4% | 22.08 1% | 22.8 -3% | 25.28 -14% | 28 -26% |
| Load Average * (dB) | 42.03 | 43.6 -4% | 35.1 16% | 52.98 -26% | 43.8 -4% | 51.88 -23% | 40 5% |
| Witcher 3 ultra * (dB) | 42.1 | 48.7 -16% | 52.5 -25% | 52.7 -25% | 43.8 -4% | 49 -16% | 39 7% |
| Load Maximum * (dB) | 42.1 | 49.1 -17% | 52.5 -25% | 52.67 -25% | 47.1 -12% | 51.8 -23% | 41 3% |
* ... menor é melhor
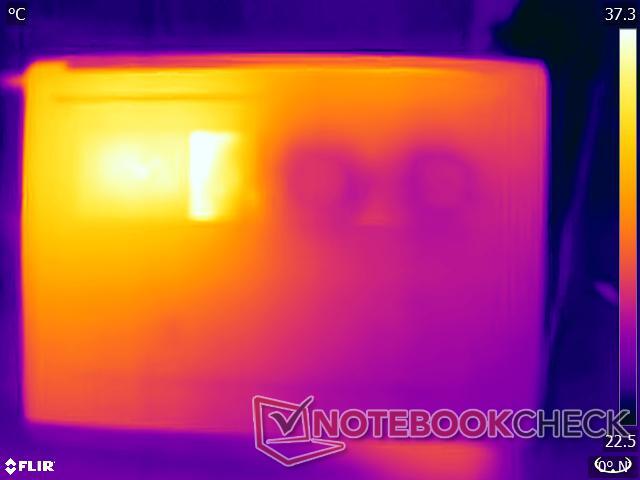
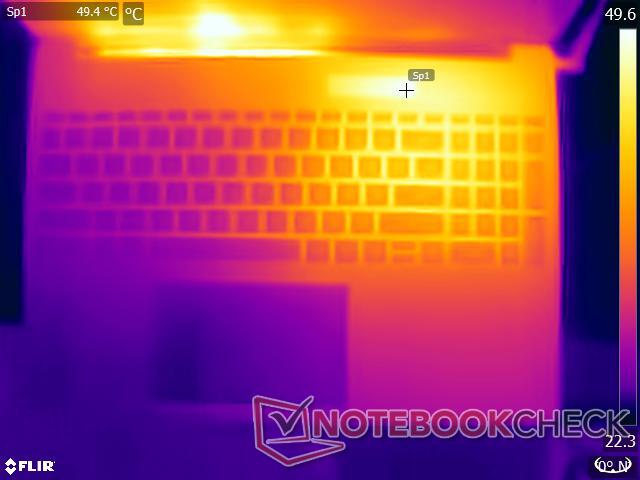
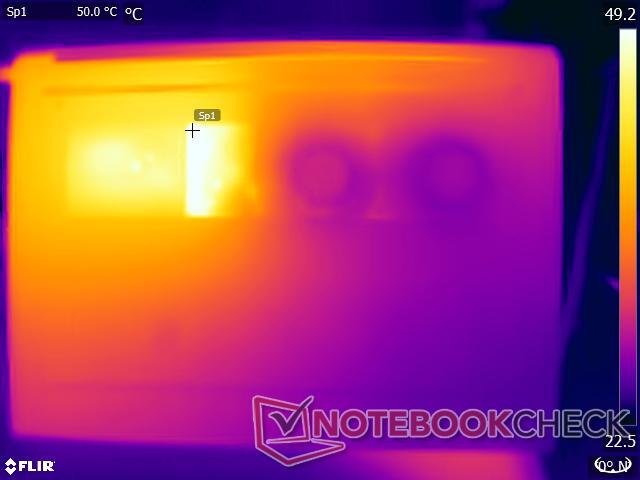
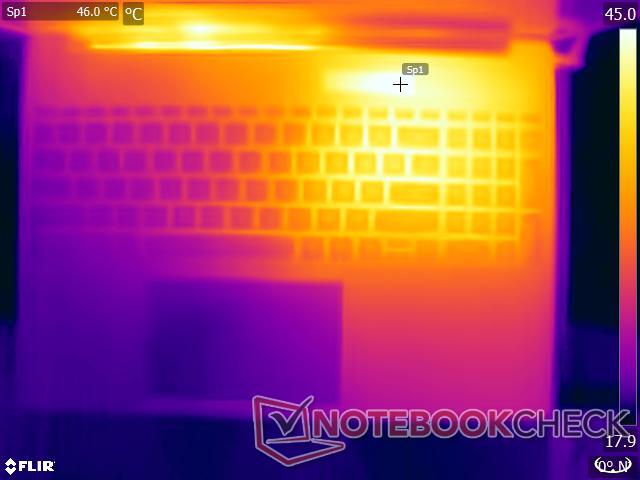
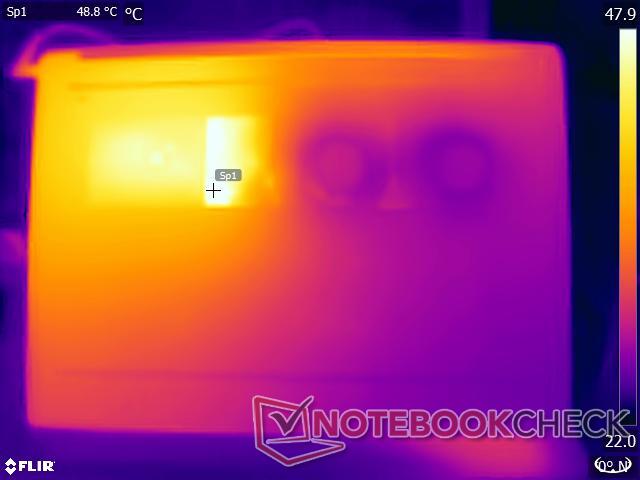
Temperatura
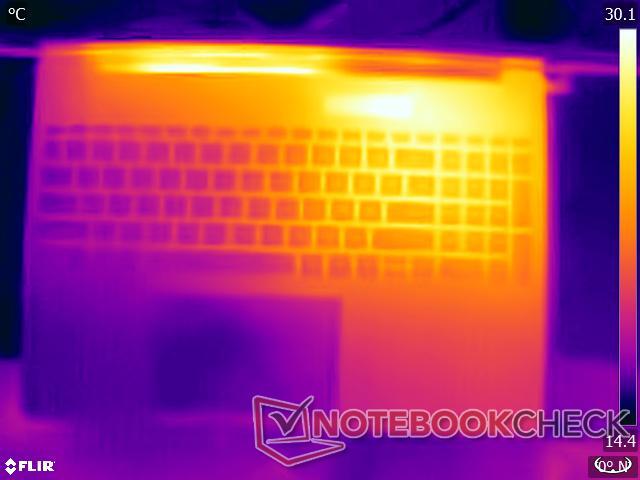
O Pavilion Plus 16 emprega um sistema de tubo de calor duplo com duas ventoinhas para resfriar a CPU e a GPU. Durante nossos testes de estresse, essa configuração foi levada ao limite com temperaturas de superfície que atingiram 49,6°C na parte superior e 45,8°C na parte inferior.
Embora o dispositivo possa ser usado confortavelmente no colo para tarefas leves, ele pode se tornar desconfortável sob cargas de trabalho pesadas.
(-) A temperatura máxima no lado superior é 49.6 °C / 121 F, em comparação com a média de 36.8 °C / 98 F , variando de 21 a 71 °C para a classe Multimedia.
(-) A parte inferior aquece até um máximo de 45.8 °C / 114 F, em comparação com a média de 39.1 °C / 102 F
(±) Em uso inativo, a temperatura média para o lado superior é 32.3 °C / 90 F, em comparação com a média do dispositivo de 31.3 °C / ### class_avg_f### F.
(-) Jogando The Witcher 3, a temperatura média para o lado superior é 39.7 °C / 103 F, em comparação com a média do dispositivo de 31.3 °C / ## #class_avg_f### F.
(+) Os apoios para as mãos e o touchpad estão atingindo a temperatura máxima da pele (35 °C / 95 F) e, portanto, não estão quentes.
(-) A temperatura média da área do apoio para as mãos de dispositivos semelhantes foi 28.7 °C / 83.7 F (-6.3 °C / -11.3 F).
| HP Pavilion Plus 16-ab0456tx Intel Core i7-13700H, NVIDIA GeForce RTX 3050 6GB Laptop GPU | Schenker Vision 14 M23 RTX 3050 Intel Core i7-13700H, NVIDIA GeForce RTX 3050 6GB Laptop GPU | Dell Inspiron 16 Plus 7630 Intel Core i7-13700H, NVIDIA GeForce RTX 4060 Laptop GPU | Asus VivoBook 14X K3405 Intel Core i5-13500H, NVIDIA GeForce RTX 3050 4GB Laptop GPU | Lenovo Slim Pro 7 14ARP8 AMD Ryzen 7 7735HS, NVIDIA GeForce RTX 3050 6GB Laptop GPU | Asus VivoBook Pro 16 K6602VU Intel Core i9-13900H, NVIDIA GeForce RTX 4050 Laptop GPU | Samsung Galaxy Book3 Ultra 16 Intel Core i7-13700H, NVIDIA GeForce RTX 4050 Laptop GPU | |
|---|---|---|---|---|---|---|---|
| Heat | 10% | 6% | -2% | 19% | -1% | 22% | |
| Maximum Upper Side * (°C) | 49.6 | 48.5 2% | 47.8 4% | 49.2 1% | 42.2 15% | 42.6 14% | 41 17% |
| Maximum Bottom * (°C) | 45.8 | 52.8 -15% | 42.2 8% | 54 -18% | 49 -7% | 48.4 -6% | 44 4% |
| Idle Upper Side * (°C) | 39.2 | 27.6 30% | 35.2 10% | 33.6 14% | 24.4 38% | 39.4 -1% | 23 41% |
| Idle Bottom * (°C) | 35.4 | 27 24% | 35 1% | 37.6 -6% | 25.2 29% | 39.8 -12% | 26 27% |
* ... menor é melhor
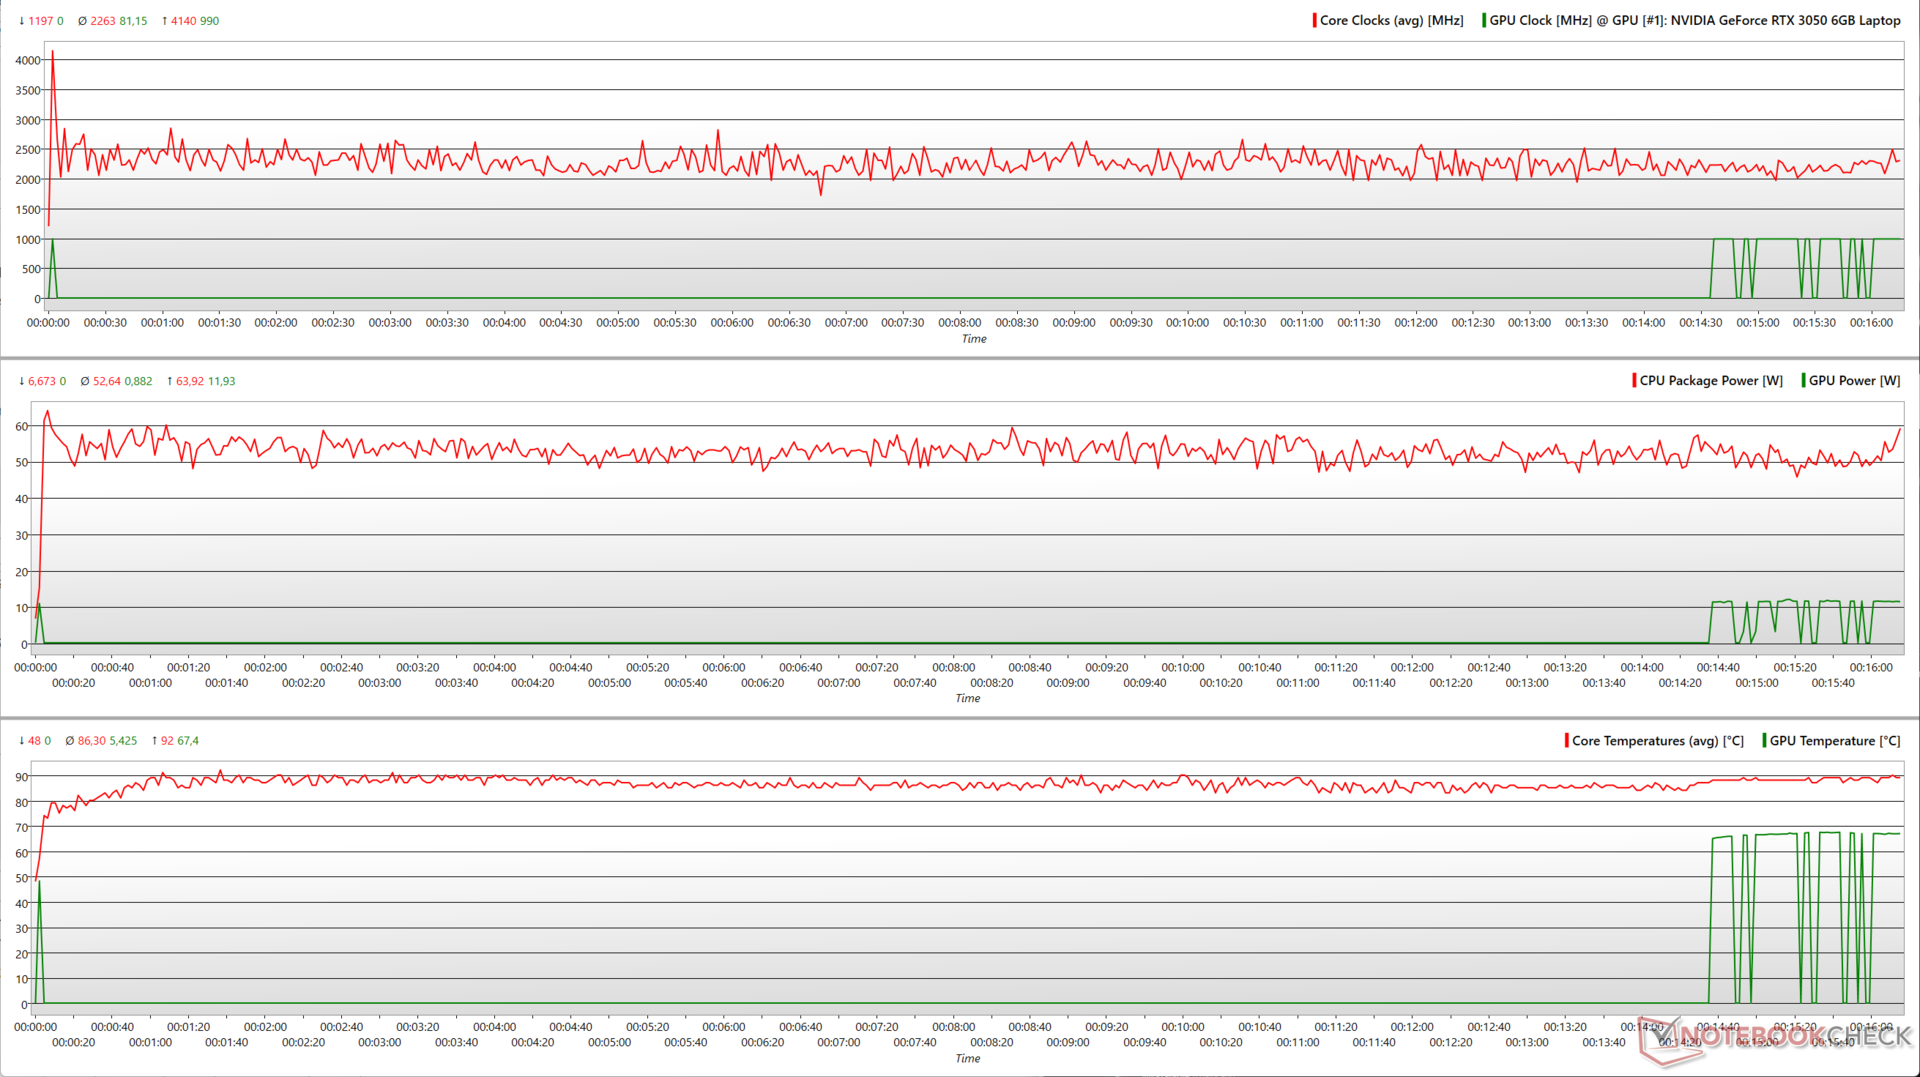
Teste de estresse
Durante um estresse de FFTs grandes no local do Prime95, o Core i7-13700H do Pavilion Plus 16 registra uma média de 2,2 GHz e consome uma média de 53 W de energia do pacote.
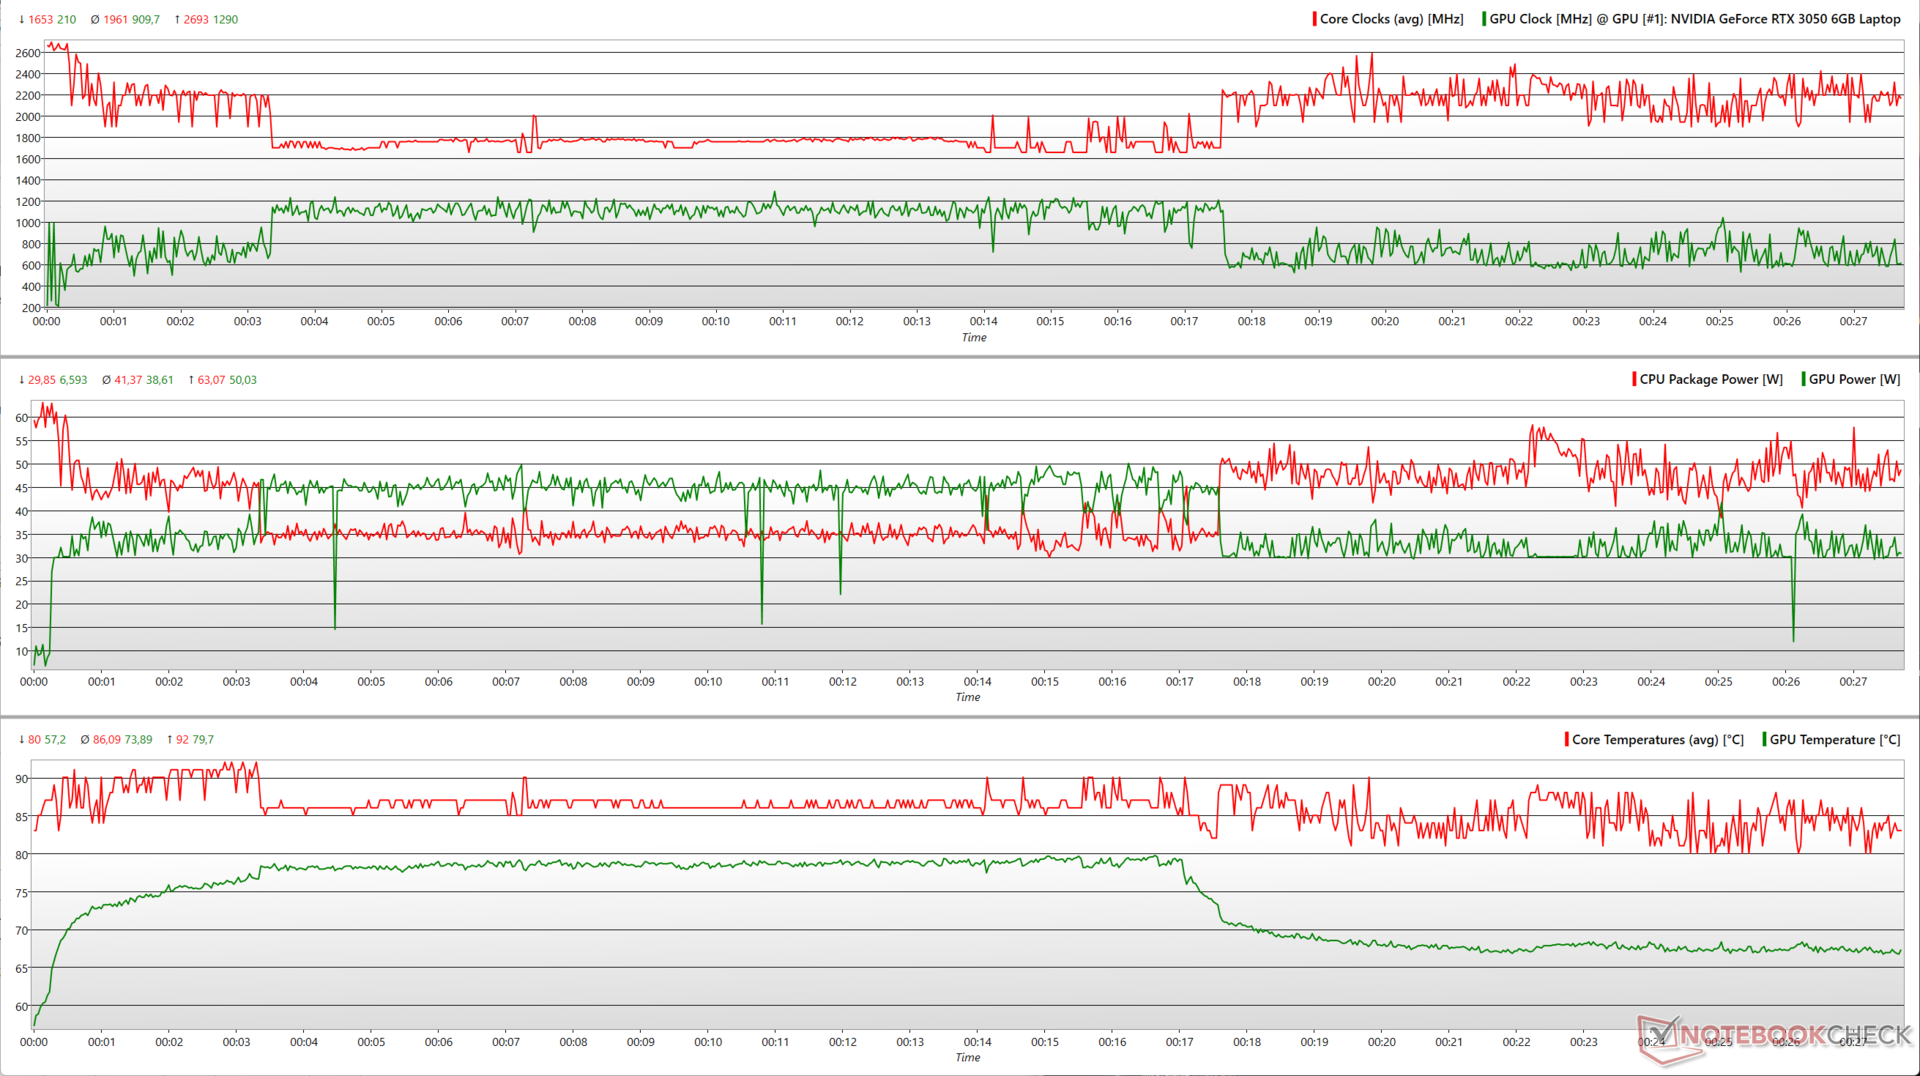
Ao adicionar o FurMark, o Core i7-13700H e a RTX 3050 competem por energia, o que resulta em aumento e queda intermitentes do clock da CPU e da GPU.
Em média, o Core i7-13700H pode atingir apenas 1,96 GHz, enquanto o RTX 3050 atinge 910 MHz, consumindo 41 W e 39 W em média, respectivamente.
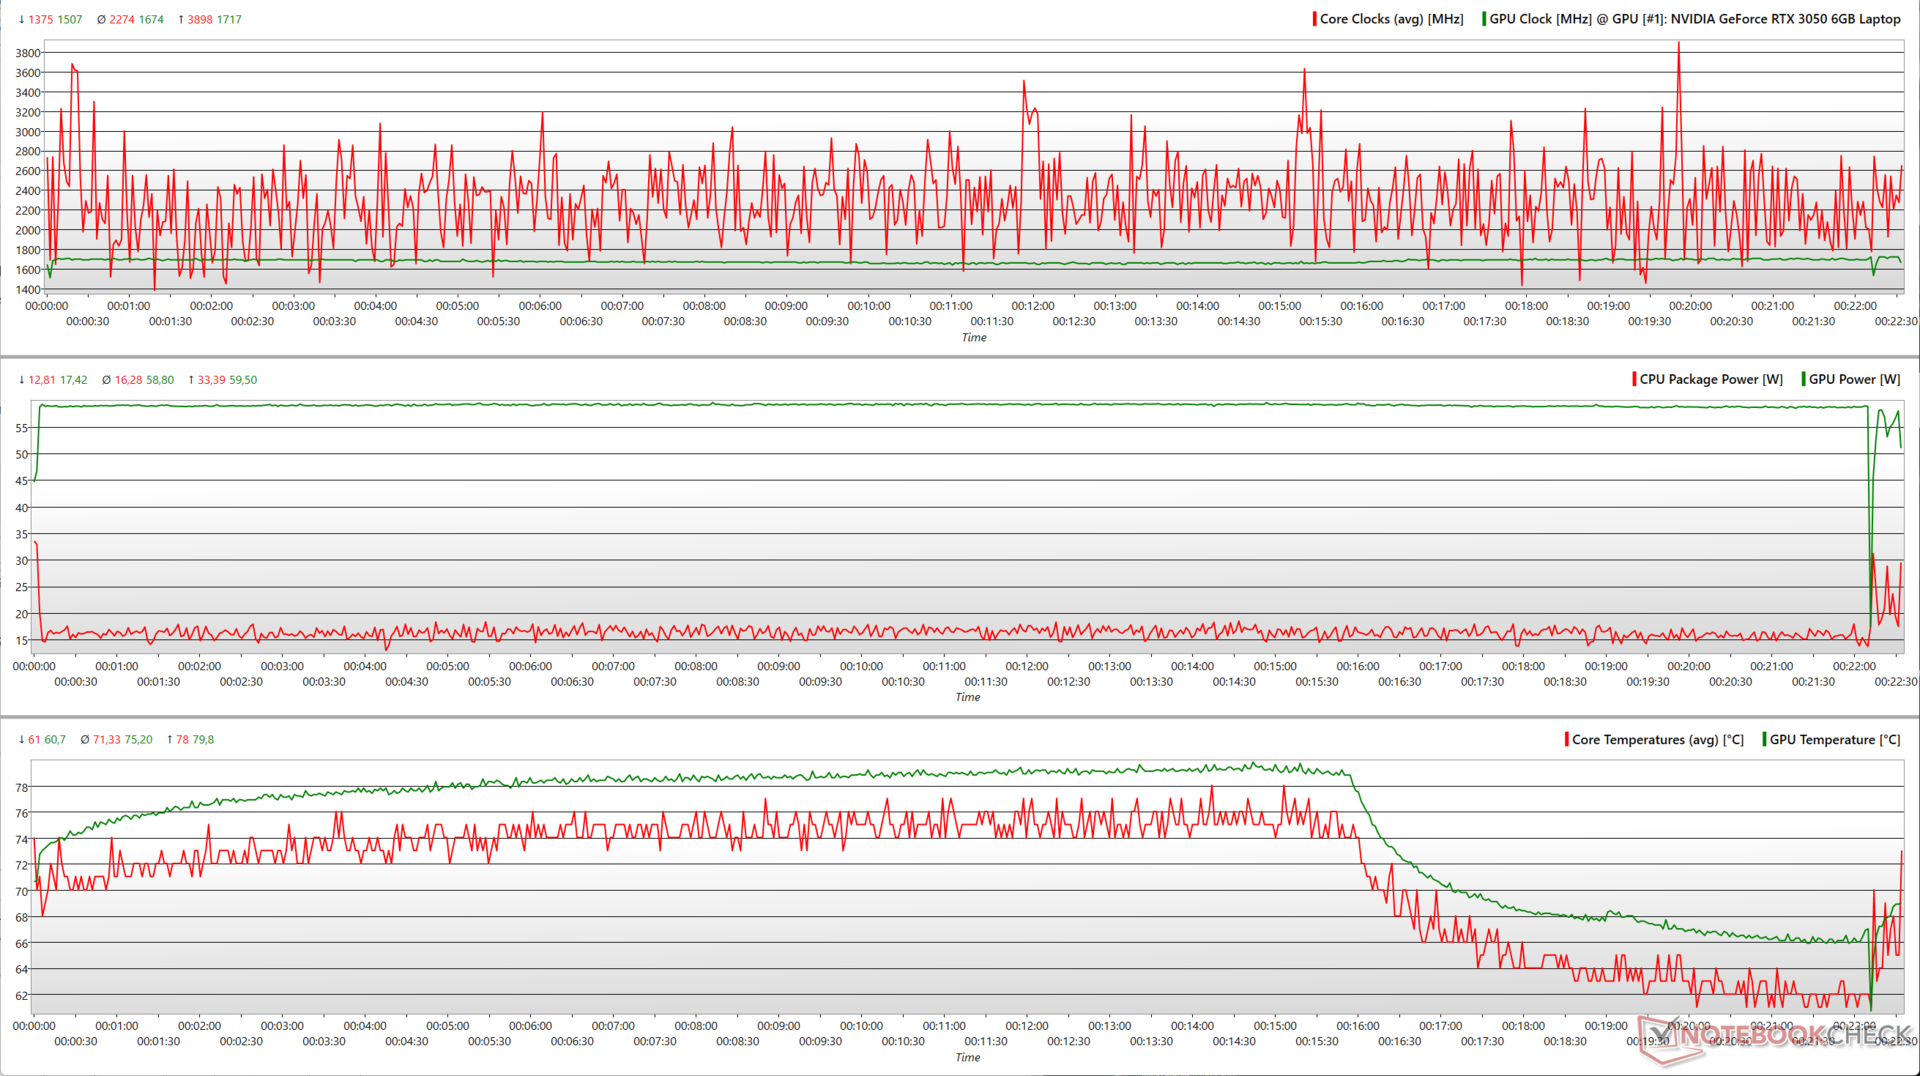
As coisas se tornam muito mais previsíveis com o Witcher 3 em 1080p Ultra. A RTX 3050 agora é capaz de utilizar quase que consistentemente seu TGP máximo próximo a 60 W.
É interessante notar que as temperaturas do núcleo começam a cair depois de um tempo, mesmo quando os clocks e a potência da CPU/GPU permanecem relativamente inalterados.
| Teste de estresse | CPU Clock (GHz) | GPU Clock (MHz) | Temperatura média da CPU (°C) | Temperatura média da GPU (°C) |
| Sistema ocioso | 3.74 | - | 52 | 31.1 |
| Prime95 | 2.1 | - | 86 | 67.4 |
| Prime95 + FurMark | 1.93 | 735 | 86 | 73.5 |
| O Witcher 3 1080p Ultra | 2.2 | 1.717 | 71 | 74.2 |
Alto-falantes
O Pavilion Plus 16 vem com um par de alto-falantes estéreo com uma saída razoavelmente alta de 74,2 dB(A), o que deve ser suficiente na maioria das salas de tamanho médio. Os graves são perceptíveis, mas não muito proeminentes. Entretanto, os médios e agudos são relativamente bem definidos.
No entanto, os usuários podem obter um áudio melhor por meio de alto-falantes externos ou Bluetooth 5.3.
HP Pavilion Plus 16-ab0456tx análise de áudio
(±) | o volume do alto-falante é médio, mas bom (###valor### dB)
Graves 100 - 315Hz
(±) | graves reduzidos - em média 14.7% menor que a mediana
(±) | a linearidade dos graves é média (7.8% delta para a frequência anterior)
Médios 400 - 2.000 Hz
(+) | médios equilibrados - apenas 3.4% longe da mediana
(+) | médios são lineares (4.2% delta para frequência anterior)
Altos 2 - 16 kHz
(+) | agudos equilibrados - apenas 4.6% longe da mediana
(+) | os máximos são lineares (4.8% delta da frequência anterior)
Geral 100 - 16.000 Hz
(±) | a linearidade do som geral é média (16.7% diferença em relação à mediana)
Comparado com a mesma classe
» 44% de todos os dispositivos testados nesta classe foram melhores, 8% semelhantes, 48% piores
» O melhor teve um delta de 5%, a média foi 17%, o pior foi 45%
Comparado com todos os dispositivos testados
» 29% de todos os dispositivos testados foram melhores, 7% semelhantes, 64% piores
» O melhor teve um delta de 4%, a média foi 23%, o pior foi 134%
Apple MacBook Pro 16 2021 M1 Pro análise de áudio
(+) | os alto-falantes podem tocar relativamente alto (###valor### dB)
Graves 100 - 315Hz
(+) | bons graves - apenas 3.8% longe da mediana
(+) | o baixo é linear (5.2% delta para a frequência anterior)
Médios 400 - 2.000 Hz
(+) | médios equilibrados - apenas 1.3% longe da mediana
(+) | médios são lineares (2.1% delta para frequência anterior)
Altos 2 - 16 kHz
(+) | agudos equilibrados - apenas 1.9% longe da mediana
(+) | os máximos são lineares (2.7% delta da frequência anterior)
Geral 100 - 16.000 Hz
(+) | o som geral é linear (4.6% diferença em relação à mediana)
Comparado com a mesma classe
» 0% de todos os dispositivos testados nesta classe foram melhores, 0% semelhantes, 100% piores
» O melhor teve um delta de 5%, a média foi 17%, o pior foi 45%
Comparado com todos os dispositivos testados
» 0% de todos os dispositivos testados foram melhores, 0% semelhantes, 100% piores
» O melhor teve um delta de 4%, a média foi 23%, o pior foi 134%
Gerenciamento de energia: Consumo de energia econômico e boa duração da bateria
Consumo de energia
O Pavilion Plus 16 consome relativamente menos energia para o hardware fornecido em geral. Enquanto o Schenker Vision 14 M23 e o Lenovo Slim Pro 7 são mais econômicos em carga média e o Witcher 3, o Pavilion Plus 16 é mais econômico em carga máxima.
O adaptador de energia de 135 W fornecido é mais do que adequado para alimentar o laptop sob estresse.
| desligado | |
| Ocioso | |
| Carga |
|
Key:
min: | |
| HP Pavilion Plus 16-ab0456tx i7-13700H, GeForce RTX 3050 6GB Laptop GPU, IPS, 2560x1600, 16" | Schenker Vision 14 M23 RTX 3050 i7-13700H, GeForce RTX 3050 6GB Laptop GPU, IPS, 2880x1800, 14" | Dell Inspiron 16 Plus 7630 i7-13700H, GeForce RTX 4060 Laptop GPU, IPS, 2560x1600, 16" | Asus VivoBook 14X K3405 i5-13500H, GeForce RTX 3050 4GB Laptop GPU, , 2880x1800, 14" | Lenovo Slim Pro 7 14ARP8 R7 7735HS, GeForce RTX 3050 6GB Laptop GPU, IPS, 2560x1600, 14.5" | Asus VivoBook Pro 16 K6602VU i9-13900H, GeForce RTX 4050 Laptop GPU, OLED, 3200x2000, 16" | Samsung Galaxy Book3 Ultra 16 i7-13700H, GeForce RTX 4050 Laptop GPU, AMOLED, 2880x1800, 16" | Média NVIDIA GeForce RTX 3050 6GB Laptop GPU | Média da turma Multimedia | |
|---|---|---|---|---|---|---|---|---|---|
| Power Consumption | -2% | -100% | 6% | -30% | -141% | 20% | -8% | -14% | |
| Idle Minimum * (Watt) | 3.3 | 5.2 -58% | 15.6 -373% | 4.96 -50% | 7.6 -130% | 21.06 -538% | 3 9% | 4.55 ? -38% | 5.72 ? -73% |
| Idle Average * (Watt) | 7.3 | 7.8 -7% | 17.7 -142% | 7.54 -3% | 12.2 -67% | 24.27 -232% | 5 32% | 8.63 ? -18% | 10.2 ? -40% |
| Idle Maximum * (Watt) | 14.24 | 9 37% | 20.6 -45% | 9.31 35% | 12.8 10% | 25.12 -76% | 11 23% | 11.7 ? 18% | 12.4 ? 13% |
| Load Average * (Watt) | 91.7 | 78.6 14% | 87.4 5% | 83.4 9% | 76.5 17% | 52.4 43% | 72 21% | 86.6 ? 6% | 65.5 ? 29% |
| Witcher 3 ultra * (Watt) | 96.2 | 86.8 10% | 121.7 -27% | 73.3 24% | 89.5 7% | 110.2 -15% | 69.7 28% | ||
| Load Maximum * (Watt) | 115.8 | 121.2 -5% | 138 -19% | 91.74 21% | 135.7 -17% | 146 -26% | 108 7% | 127.6 ? -10% | 114 ? 2% |
* ... menor é melhor
Power Consumption: The Witcher 3 / Stress test
Power Consumption: External monitor
Duração da bateria
Os componentes internos potentes, porém de baixa potência, ajudam na boa duração da bateria. Com 150 nits de brilho, a bateria de 68 WHr do Pavilion Plus 16 pode atingir quase 10,5 horas de navegação na Web e 12 horas de reprodução de vídeo em 1080p, o que é um tempo de execução impressionante.
| HP Pavilion Plus 16-ab0456tx i7-13700H, GeForce RTX 3050 6GB Laptop GPU, 68 Wh | Schenker Vision 14 M23 RTX 3050 i7-13700H, GeForce RTX 3050 6GB Laptop GPU, 99 Wh | Dell Inspiron 16 Plus 7630 i7-13700H, GeForce RTX 4060 Laptop GPU, 86 Wh | Asus VivoBook 14X K3405 i5-13500H, GeForce RTX 3050 4GB Laptop GPU, 63 Wh | Lenovo Slim Pro 7 14ARP8 R7 7735HS, GeForce RTX 3050 6GB Laptop GPU, 73 Wh | Asus VivoBook Pro 16 K6602VU i9-13900H, GeForce RTX 4050 Laptop GPU, 96 Wh | Samsung Galaxy Book3 Ultra 16 i7-13700H, GeForce RTX 4050 Laptop GPU, 76 Wh | Média da turma Multimedia | |
|---|---|---|---|---|---|---|---|---|
| Duração da bateria | 16% | -10% | -18% | 1% | -11% | 2% | 27% | |
| H.264 (h) | 12 | 10.4 -13% | 9.8 -18% | 13.4 12% | 16.4 ? 37% | |||
| WiFi v1.3 (h) | 10.4 | 12.1 16% | 9.4 -10% | 8.1 -22% | 10.5 1% | 10.1 -3% | 9.6 -8% | 12.2 ? 17% |
| Reader / Idle (h) | 17.6 | 18.2 | 24.9 ? | |||||
| Load (h) | 1.4 | 1.1 | 1.8 | 1.668 ? | ||||
| Witcher 3 ultra (h) | 1.3 |
Pro
Contra
Veredicto: Grande potencial prejudicado por compromissos
O HP Pavilion Plus 16 preenche a maioria dos requisitos que se espera de um laptop multimídia moderno para trabalho e entretenimento. O Pavilion Plus 16 apresenta uma construção totalmente em metal que exala uma sensação premium sem flexões desnecessárias e uma seleção de portas que abrange o essencial.
O painel de 2560 x 1600 120 Hz não conta com HDR nem com uma ampla cobertura Adobe RGB e Display P3, como visto no Pavilion Plus 142.8K OLED do Plus 14. No entanto, ele faz o básico com tempos de resposta decentes e nenhuma oscilação de PWM.
O HP Pavilion Plus 16 é um laptop capaz de oferecer multimídia e produtividade em todas as áreas, mas o preço pedido poderia ter incluído, no mínimo, uma RTX 4050."
As limitações de desempenho ficam evidentes quando o senhor começa a compará-lo com a concorrência. O PL2 de 60 W se mostra especialmente desvantajoso para o Pavilion Plus 16 em multi-core quando comparado ao Dell Inspiron 16 Plus 7630 e até mesmo o Samsung Galaxy Book3 Ultra 16que apresentam um Core i7-13700H de maior potência.
A HP poderia facilmente ter permitido 80 W PL2 ou mais em um perfil de energia adicional para maximizar o potencial do chip. No entanto, o subsistema de resfriamento já parece sobrecarregado com a configuração atual sob carga.
O Nvidia GeForce RTX 3050 6 GB fica aquém da geração Ada em termos de desempenho e eficiência energética. Embora os jogos em 1080p apresentem um aumento perceptível em relação ao RTX 3050 de 4 GB, os testes sintéticos não mostram um grande incentivo.
Por um preço de US$ 1.350 no site da HP, o Pavilion Plus 16 é US$ 100 mais caro que o Inspiron 16 Plus 7630, que oferece um RTX 4060 de 60 W e um Core i7-13700H de melhor desempenho. Dito isso, o Pavilion Plus 16 é mais barato do que o Inspiron 16 Plus 7630 no mercado indiano.
O Asus VivoBook Pro 16 com tela OLED de 3,2K, Core i9-13900H e até uma RTX 4060 é uma excelente alternativa para criadores iniciantes, desde que o plástico e o prêmio adicional de US$ 300 não o impeçam.
Preço e disponibilidade
O HP Pavilion Plus 16-ab0456tx testado pode ser adquirido no site oficial HP India por ₹1.24.999. O laptop também pode ser configurado no site da HP nos EUA por US$1.350.
A Amazon Índia oferece o Pavilion Plus 16 sem a dGPU RTX 3050 por ₹1.25.900.
HP Pavilion Plus 16-ab0456tx
- 02/07/2024 v7 (old)
Vaidyanathan Subramaniam
Transparência
A seleção dos dispositivos a serem analisados é feita pela nossa equipe editorial. A amostra de teste foi fornecida ao autor como empréstimo pelo fabricante ou varejista para fins desta revisão. O credor não teve influência nesta revisão, nem o fabricante recebeu uma cópia desta revisão antes da publicação. Não houve obrigação de publicar esta revisão. Como empresa de mídia independente, a Notebookcheck não está sujeita à autoridade de fabricantes, varejistas ou editores.
É assim que o Notebookcheck está testando
Todos os anos, o Notebookcheck analisa de forma independente centenas de laptops e smartphones usando procedimentos padronizados para garantir que todos os resultados sejam comparáveis. Desenvolvemos continuamente nossos métodos de teste há cerca de 20 anos e definimos padrões da indústria no processo. Em nossos laboratórios de teste, equipamentos de medição de alta qualidade são utilizados por técnicos e editores experientes. Esses testes envolvem um processo de validação em vários estágios. Nosso complexo sistema de classificação é baseado em centenas de medições e benchmarks bem fundamentados, o que mantém a objetividade.Price comparison

