Análise do Schenker Vision 16 2023: leve de 16 polegadas com muitas portas
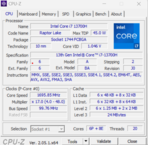
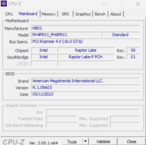
Além do Vision 16 Proa Schenker também oferece o Vision 16. O ultrabook de 16 polegadas, especialmente leve, oferece o mais novo chip Intel Raptor Lake Core i7-13700H. As GPUs dedicadas são reservadas para os modelos Pro. Enquanto o modelo do Vision 16 do ano passado pesava 1,45 kg, o novo modelo pesa 1,5 kg, o que ainda o torna um dos laptops de 16 polegadas mais leves do mercado.
Em vez da tela de 90 Hz do modelo do ano passado, o novo Vision 16 recebe o painel WQXGA de 240 Hz da variante Pro. O metal líquido para transferir o calor do Core i7-13700H ainda é utilizado, embora o sistema de resfriamento tenha sido reformulado para tornar o Vision 16 menos barulhento sob carga.
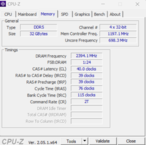
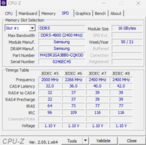
O Vision 16 está disponível a partir de €1.539. Esse modelo básico tem 16 GB de memória DDR5-4800 e um SSD M.2 de 500 GB da Samsung. Nosso modelo de análise está equipado com 32 GB de memória e um SSD M.2 Samsung 990 Pro de 1 TB. Com Windows, a versão analisada está disponível por aproximadamente € 1.660.
Possíveis concorrentes em comparação
Avaliação | Data | Modelo | Peso | Altura | Size | Resolução | Preço |
|---|---|---|---|---|---|---|---|
| 88.6 % v7 (old) | 08/2023 | Schenker Vision 16 PH6PRX1 i7-13700H, Iris Xe G7 96EUs | 1.5 kg | 17.1 mm | 16.00" | 2560x1600 | |
| 91.8 % v7 (old) | 06/2023 | Apple MacBook Air 15 2023 M2 16 GB M2, M2 10-Core GPU | 1.5 kg | 11.5 mm | 15.30" | 2880x1864 | |
| 86.6 % v7 (old) | 06/2023 | Acer Swift Go SFG16-71 i7-13700H, Iris Xe G7 96EUs | 1.6 kg | 19 mm | 16.00" | 3200x2000 | |
| 85 % v7 (old) | 08/2023 | LG Gram SuperSlim (2023) i7-1360P, Iris Xe G7 96EUs | 990 g | 10.9 mm | 15.60" | 1920x1080 | |
| 84.3 % v7 (old) | 04/2023 | Microsoft Surface Laptop 5 15, i7-1255U i7-1255U, Iris Xe G7 96EUs | 1.6 kg | 14.7 mm | 15.00" | 2496x1664 | |
| 83.2 % v7 (old) | 02/2023 | Asus VivoBook S15 M3502RA-L1029W R7 6800H, Radeon 680M | 1.9 kg | 18.8 mm | 15.60" | 1920x1080 |
Os Top 10
» Os Top 10 Portáteis Multimídia
» Os Top 10 Portáteis de Jogos
» Os Top 10 Portáteis Leves para Jogos
» Os Top 10 Portáteis Acessíveis de Escritório/Empresariais
» Os Top 10 Portáteis Premium de Escritório/Empresariais
» Os Top 10 dos Portáteis Workstation
» Os Top 10 Subportáteis
» Os Top 10 Ultrabooks
» Os Top 10 Conversíveis
» Os Top 10 Tablets
» Os Top 10 Smartphones
» A melhores Telas de Portáteis Analisadas Pela Notebookcheck
» Top 10 dos portáteis abaixo dos 500 Euros da Notebookcheck
» Top 10 dos Portáteis abaixo dos 300 Euros
Chassi - laptop de magnésio de 1,5 kg
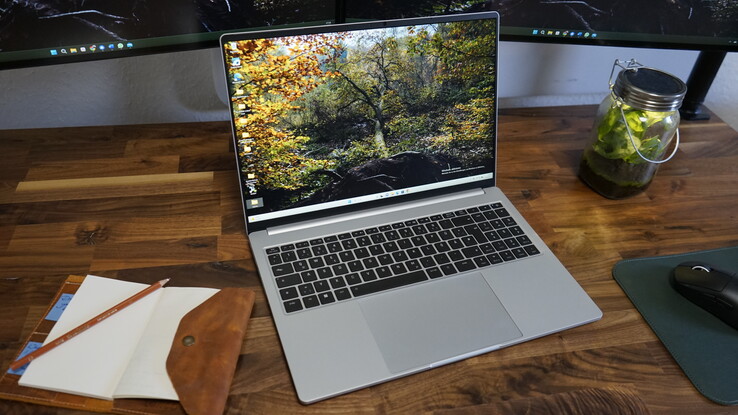
O chassi é idêntico ao do Vision 16 Pro e praticamente não mudou em relação ao modelo anterior. Estamos analisando a variação prateada, enquanto analisamos o Vision 16 Pro em preto. A versão prateada se destaca mais e nos lembra o MacBook Pro 16devido ao touchpad de grandes dimensões. O chassi de magnésio (base e tampa da tela) mantém o peso baixo, com apenas 1,5 kg. Há apenas uma leve folga no centro do teclado, mas, fora isso, o chassi é rígido. As dobradiças não são muito fortes e permitem uma boa quantidade de oscilação da tela.
Conectividade - Thunderbolt 4, leitor de cartão SD de tamanho normal e várias portas USB
As portas também são idênticas às do Vision 16 Pro. Dongles ou adaptadores não são necessários para esse ultrabook, graças à boa seleção de portas. Em comparação com um MacBook Air, o Vision 16 tem basicamente todas as portas de que a maioria das pessoas precisa. À esquerda, há um conector de áudio de 3,5 mm e um slot para cartão SD de tamanho normal. As duas portas USB A 3.2 Gen 1 tornam desnecessários os dongles para mouse ou teclado. A porta HDMI também é prática, embora seja apenas HDMI 2.0b, não HDMI 2.1. A porta Thunderbolt 4 à esquerda e a porta USB C à direita completam as opções de conectividade. Graças à porta de carregamento proprietária dedicada, nenhuma das outras portas é ocupada durante o carregamento. A única coisa que falta é um conector Ethernet.
Leitor de cartão SD
O Schenker Vision 16 tem um leitor de cartão SD, mas ele é bastante lento, como atestam as velocidades de gravação de 22,7 MB/s e de leitura de 27,7 MB/s que medimos com nosso cartão de referência (Angelbird AV Ori V60). Para usuários pesados, um leitor de cartão externo pode ser a melhor opção. Para uso casual, o leitor de cartão deve ser suficiente.
| SD Card Reader | |
| average JPG Copy Test (av. of 3 runs) | |
| MSI Stealth 16 Studio A13VG | |
| Dell XPS 15 9530 RTX 4070 (Toshiba Exceria Pro SDXC 64 GB UHS-II) | |
| Média da turma Office (22.4 - 198.5, n=29, últimos 2 anos) | |
| Schenker Vision 16 PH6PRX1 (AV Pro V60) | |
| Acer Swift Go SFG16-71 | |
| maximum AS SSD Seq Read Test (1GB) | |
| Dell XPS 15 9530 RTX 4070 (Toshiba Exceria Pro SDXC 64 GB UHS-II) | |
| MSI Stealth 16 Studio A13VG | |
| Média da turma Office (25 - 249, n=27, últimos 2 anos) | |
| Schenker Vision 16 PH6PRX1 (AV Pro V60) | |
| Acer Swift Go SFG16-71 | |
Comunicação
O módulo AX201 WiFi 6 do Vision 16 apresentou bons resultados ao receber dados, mas mostrou deficiências ao enviar dados. No entanto, a experiência pode variar, pois o mesmo módulo WLAN no quase idêntico Schenker Vision 16 Pro apresentou melhores resultados.
Webcam
A webcam FHD do Schenker Vision 16 pode criar imagens aceitáveis. Ela é suficiente para videoconferências, desde que as condições de iluminação não sejam ruins. A webcam de 2 megapixels permite o login biométrico via Windows Hello, graças ao sensor IR integrado.
Manutenção
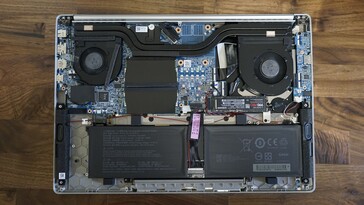
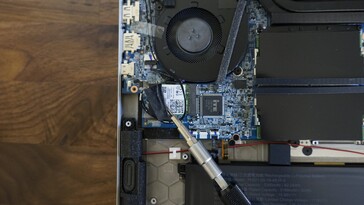
A tampa inferior do Schenker Vision 16 é fixada com um total de nove parafusos. Os quatro parafusos na parte frontal e o parafuso do meio na parte traseira são mais curtos do que os outros parafusos. O espaço interno é muito semelhante ao do Vision 16 Pro, exceto pela ausência da GPU, pela menor quantidade de heatpipes e pela ventoinha direita menor. O último aspecto será relevante para nossas medições de desempenho.
Os usuários do Vision 16 podem trocar os dois módulos de RAM, os módulos WiFi, o SSD M.2 e a bateria. Há também um segundo slot de SSD M.2 livre.
Garantia
A Schenker oferece uma garantia básica de 24 meses, que inclui o serviço de coleta e devolução, bem como um reparo rápido nos primeiros seis meses. À vontade, uma garantia de 36 meses pode ser selecionada e expandida com vários pacotes de garantia, como um reparo rápido durante todo o período de garantia.
Dispositivos de entrada - enorme clickpad de vidro, mas layout de teclado abaixo do ideal.
Os dispositivos de entrada do Vision 16 são sólidos. O touchpad é muito grande e preciso, mas há alguns pontos fracos no que diz respeito ao teclado.
Teclado
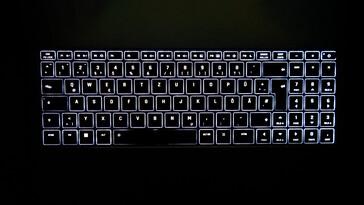
O teclado tem um bloco numérico dedicado com teclas de seta de tamanho normal, encurtando a tecla Shift direita e deslocando a tecla Enter adicional do bloco numérico. O bloco numérico é uma versão bastante compactada e não é muito útil para a entrada rápida de números. Isso levanta a questão de por que Schenker incluiu o bloco numérico, já que todo o teclado é deslocado para a esquerda por causa dele. Devido ao teclado deslocado e à tecla Shift direita mais curta, a digitação é afetada negativamente e o teclado requer um tempo maior para se acostumar.
Quanto às teclas em si, elas oferecem uma sensação de digitação muito boa e precisa, com um ruído de digitação sólido e não muito alto. Ele é retroiluminado com dois níveis de brilho e todas as teclas são iluminadas de maneira uniforme.
Touchpad
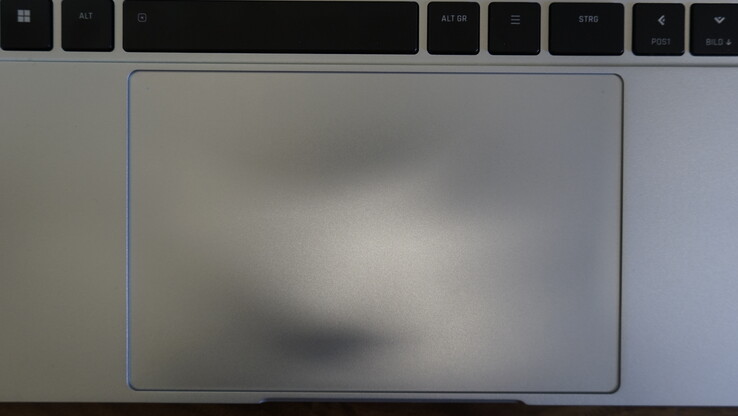
Um destaque do Vision 16 e da versão Pro é o grande clickpad de vidro (15,4 x 10 cm). O uso do trackpad é fácil e, graças à grande superfície, os gestos e o movimento do cursor são suaves. A precisão desse touchpad é muito boa. No entanto, poderia haver um pouco menos de ruído quando se trata do mecanismo de clique, e acertar a área do botão direito do mouse pode ser complicado.
Tela - tela IPS de 240 Hz no formato 16:10
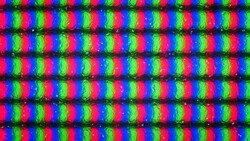
Um dos destaques do ultrabook Vision 16 2023 é o novo painel WQXGA (2.560 x 1.600), que era exclusivo da versão Pro no modelo do ano passado. Em vez de 90 Hz, o modelo deste ano do Vision 16 oferece uma taxa de atualização de 240 Hz - incomum para laptops de escritório.
Apesar de ambas as versões do Vision 16 usarem a mesma tela este ano, o Vision 16 superou ligeiramente o Vision 16 Pro em nossa análise. Atribuímos essas diferenças à variação normal de qualidade entre os painéis. O brilho da tela deve atingir 350 cd/m², de acordo com Schenker, o que nossas medições confirmam.
A alta frequência de 240 Hz cria uma experiência suave para o usuário. No entanto, as vantagens reais dessa suavidade durante os jogos são desperdiçadas no Vision 16, a menos que ele seja combinado com uma GPU Thunderbolt externa.
| |||||||||||||||||||||||||
iluminação: 93 %
iluminação com acumulador: 356 cd/m²
Contraste: 1271:1 (Preto: 0.28 cd/m²)
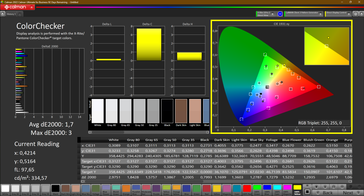
ΔE ColorChecker Calman: 1.7 | ∀{0.5-29.43 Ø4.77}
calibrated: 1
ΔE Greyscale Calman: 1.3 | ∀{0.09-98 Ø5}
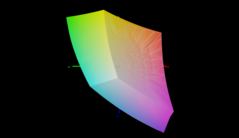
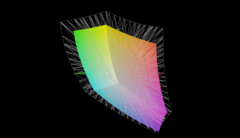
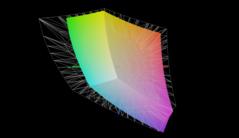
71.2% AdobeRGB 1998 (Argyll 3D)
99.3% sRGB (Argyll 3D)
70% Display P3 (Argyll 3D)
Gamma: 2.1
CCT: 6625 K
| Schenker Vision 16 PH6PRX1 BOE CQ NE160QDM-NZ1 , IPS, 2560x1600, 16" | Apple MacBook Air 15 2023 M2 16 GB IPS, 2880x1864, 15.3" | Acer Swift Go SFG16-71 Samsung SDC418D ATNA60BC03-0, OLED, 3200x2000, 16" | LG Gram SuperSlim (2023) Samsung ATNA56YX08-0, OLED, 1920x1080, 15.6" | Microsoft Surface Laptop 5 15, i7-1255U LQ150P1JX51, IPS, 2496x1664, 15" | Asus VivoBook S15 M3502RA-L1029W Samsung SDC4161, OLED, 1920x1080, 15.6" | |
|---|---|---|---|---|---|---|
| Display | 22% | 28% | 27% | -2% | 27% | |
| Display P3 Coverage (%) | 70 | 98.7 41% | 99.91 43% | 99.8 43% | 68.1 -3% | 99.9 43% |
| sRGB Coverage (%) | 99.3 | 99.9 1% | 100 1% | 100 1% | 97.3 -2% | 100 1% |
| AdobeRGB 1998 Coverage (%) | 71.2 | 87.9 23% | 98.87 39% | 98.09 38% | 70.3 -1% | 98.6 38% |
| Response Times | -149% | 79% | 79% | -318% | 84% | |
| Response Time Grey 50% / Grey 80% * (ms) | 11 ? | 28.8 ? -162% | 2 ? 82% | 2 ? 82% | 52.4 ? -376% | 0.74 93% |
| Response Time Black / White * (ms) | 8 ? | 18.9 ? -136% | 2 ? 75% | 2 ? 75% | 28.7 ? -259% | 2 ? 75% |
| PWM Frequency (Hz) | 227 ? | 22000 ? | 59 ? | |||
| Screen | 9% | -52% | -20% | 18% | -36% | |
| Brightness middle (cd/m²) | 356 | 517 45% | 370 4% | 395 11% | 397 12% | 378 6% |
| Brightness (cd/m²) | 349 | 501 44% | 371 6% | 392 12% | 399 14% | 378 8% |
| Brightness Distribution (%) | 93 | 93 0% | 98 5% | 97 4% | 85 -9% | 98 5% |
| Black Level * (cd/m²) | 0.28 | 0.39 -39% | 0.1 64% | 0.29 -4% | ||
| Contrast (:1) | 1271 | 1326 4% | 3950 211% | 1369 8% | ||
| Colorchecker dE 2000 * | 1.7 | 1.2 29% | 2.77 -63% | 2.2 -29% | 0.8 53% | 2.2 -29% |
| Colorchecker dE 2000 max. * | 3 | 2.5 17% | 4.08 -36% | 4.43 -48% | 1.4 53% | 4.87 -62% |
| Colorchecker dE 2000 calibrated * | 1 | 0.8 20% | 2.83 -183% | 4.65 -365% | 2.68 -168% | |
| Greyscale dE 2000 * | 1.3 | 1.8 -38% | 2.58 -98% | 1.78 -37% | 1.1 15% | 1.43 -10% |
| Gamma | 2.1 105% | 2.24 98% | 2.46 89% | 2.39 92% | 2.18 101% | 2.47 89% |
| CCT | 6625 98% | 6241 104% | 6284 103% | 6705 97% | 6464 101% | |
| Média Total (Programa/Configurações) | -39% /
-11% | 18% /
-10% | 29% /
4% | -101% /
-38% | 25% /
0% |
* ... menor é melhor
As medições do valor de preto chegaram a um sólido 0,28 cd/m², o que resulta em uma relação de contraste da tela de mais de 1.200:1. Ainda assim, a tela IPS não pode competir com os valores de preto profundo dos painéis OLED.
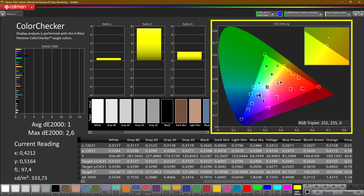
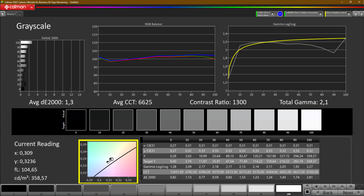
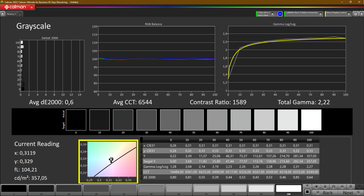
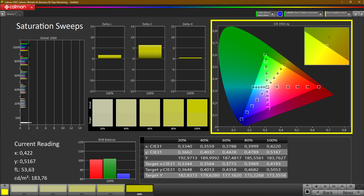
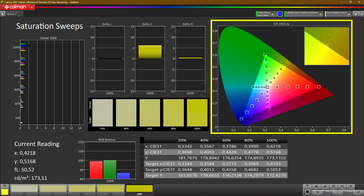
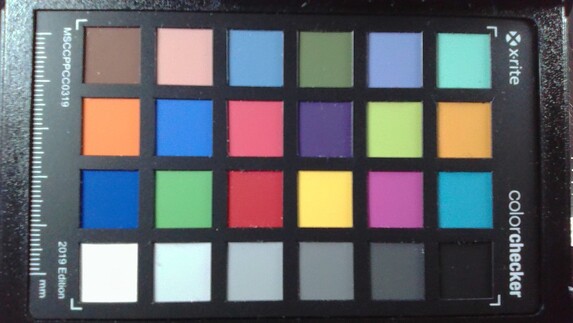
O valor deltaE da tela antes da calibração é de 1,7 e conseguimos melhorá-lo para 1,0. Em comparação, a tela do Vision 16 Pro tinha um deltaE de 3,4 antes da calibração. A diferença é especialmente perceptível em termos de escala de cinza. De fábrica, a versão Pro tinha um deltaE de escala de cinza de 4,9, enquanto nossa amostra de análise do Vision 16 tinha um deltaE de escala de cinza muito menor, de 1,3.
Não detectamos nenhuma tonalidade azul como na tela do Vision 16 Pro. Devido à boa calibração de fábrica, não usamos o perfil de cores Schenker no centro de controle. A diferença nas medições entre o Vision 16 e o Vision 16 Pro mostra que a qualidade da tela é boa. Como sempre, o perfil de cores que criamos para o Schenker Vision 16 está disponível para download gratuito na caixa cinza acima.
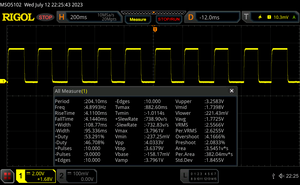
Exibir tempos de resposta
| ↔ Tempo de resposta preto para branco | ||
|---|---|---|
| 8 ms ... ascensão ↗ e queda ↘ combinadas | ↗ 4 ms ascensão | |
| ↘ 4 ms queda | ||
| A tela mostra taxas de resposta rápidas em nossos testes e deve ser adequada para jogos. Em comparação, todos os dispositivos testados variam de 0.1 (mínimo) a 240 (máximo) ms. » 21 % de todos os dispositivos são melhores. Isso significa que o tempo de resposta medido é melhor que a média de todos os dispositivos testados (20.2 ms). | ||
| ↔ Tempo de resposta 50% cinza a 80% cinza | ||
| 11 ms ... ascensão ↗ e queda ↘ combinadas | ↗ 5 ms ascensão | |
| ↘ 6 ms queda | ||
| A tela mostra boas taxas de resposta em nossos testes, mas pode ser muito lenta para jogadores competitivos. Em comparação, todos os dispositivos testados variam de 0.165 (mínimo) a 636 (máximo) ms. » 23 % de todos os dispositivos são melhores. Isso significa que o tempo de resposta medido é melhor que a média de todos os dispositivos testados (31.5 ms). | ||
Cintilação da tela / PWM (modulação por largura de pulso)
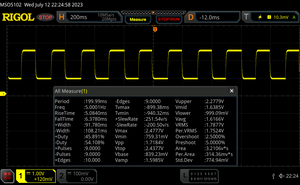
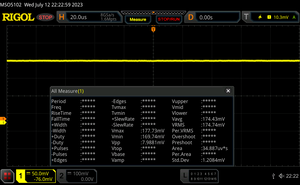
| Tela tremeluzindo / PWM não detectado | |||
[pwm_comparison] Em comparação: 53 % de todos os dispositivos testados não usam PWM para escurecer a tela. Se PWM foi detectado, uma média de 8070 (mínimo: 5 - máximo: 343500) Hz foi medida. | |||
Desempenho - O Core i7-13700H não pode ser executado em sua capacidade total
Em vez do modelo do ano passado Intel Core i7-12700H. o novo modelo do Vision 16 oferece o mais novoIntel Core i7-13700H. Enquanto o antecessor oferecia uma RTX 3050 Ti, o modelo deste ano contém apenas a GPU integrada do processador Intel. Também fazem parte do pacote 32 GB de RAM DDR5 e um SSD PCIe M.2 NVMe de 1 TB.
Condições de teste
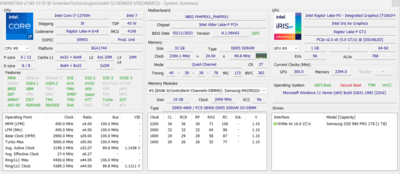
A Schenker oferece vários perfis no aplicativo Control Center, mas o perfil manual não está mais disponível, como acontecia com o antecessor. Portanto, os limites de TDP do processador não podem ser alterados pelo usuário. Todos os benchmarks de desempenho são feitos no modo "Enthusiast", com um TDP de 45 W. No modo "Quiet" do aplicativo Control Center da Schenker, o TDP é fixado em 15 W. Para o teste de bateria, usamos o modo "Balanced", que também tem um limite de TDP de 45 W.
| Entusiasta | Balanceado | Silencioso | |
|---|---|---|---|
| CPU PL1 (HWInfo) | 45 Watt | 45 Watt | 15 Watt |
| CPU PL2 (HWInfo) | 45 Watt | 45 Watt | 15 Watt |
Processador
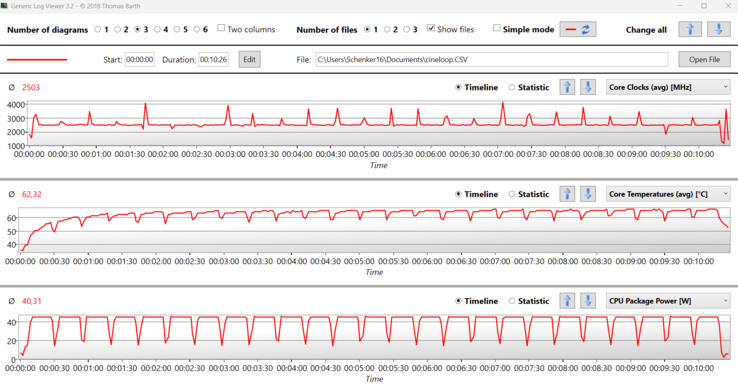
No Vision 16, o mesmo Core i7-13700Hda geração Raptor Lake da Intel é usado como no Vision 16 Pro. Como o limite de energia é bastante limitado, as temperaturas permanecem baixas, mas o desempenho é prejudicado e o processador é mais lento em comparação com o Vision 16 Pro. O desempenho de vários núcleos no loop do Cinebench R15 do Vision 16 é cerca de 15% pior do que o do Vision 16 Pro. Atribuímos esse resultado inferior ao pior sistema de resfriamento do Vision 16. Como medimos uma temperatura bastante baixa de 62 graus durante o loop do Cinebench, o processador tem espaço para apresentar um desempenho melhor. No modo de bateria, a CPU é limitada a 35 W, o que reduz o desempenho do núcleo múltiplo em 20%.
Cinebench R15 Multi sustained loop
Cinebench R23: Multi Core | Single Core
Cinebench R20: CPU (Multi Core) | CPU (Single Core)
Cinebench R15: CPU Multi 64Bit | CPU Single 64Bit
Blender: v2.79 BMW27 CPU
7-Zip 18.03: 7z b 4 | 7z b 4 -mmt1
Geekbench 5.5: Multi-Core | Single-Core
HWBOT x265 Benchmark v2.2: 4k Preset
LibreOffice : 20 Documents To PDF
R Benchmark 2.5: Overall mean
| CPU Performance rating | |
| Schenker VISION 16 Pro (M23) | |
| Média Intel Core i7-13700H | |
| Acer Swift Go SFG16-71 | |
| Schenker Vision 16 PH6PRX1 | |
| Asus VivoBook S15 M3502RA-L1029W | |
| LG Gram SuperSlim (2023) | |
| Média da turma Office | |
| Microsoft Surface Laptop 5 15, i7-1255U | |
| Apple MacBook Air 15 2023 M2 16 GB -5! | |
| Cinebench R23 / Multi Core | |
| Média Intel Core i7-13700H (5890 - 20034, n=29) | |
| Schenker VISION 16 Pro (M23) | |
| Acer Swift Go SFG16-71 | |
| Asus VivoBook S15 M3502RA-L1029W | |
| Schenker Vision 16 PH6PRX1 | |
| Média da turma Office (1577 - 22808, n=82, últimos 2 anos) | |
| LG Gram SuperSlim (2023) | |
| Microsoft Surface Laptop 5 15, i7-1255U | |
| Apple MacBook Air 15 2023 M2 16 GB | |
| Cinebench R23 / Single Core | |
| Acer Swift Go SFG16-71 | |
| Schenker VISION 16 Pro (M23) | |
| Schenker Vision 16 PH6PRX1 | |
| Média Intel Core i7-13700H (1323 - 1914, n=29) | |
| LG Gram SuperSlim (2023) | |
| Microsoft Surface Laptop 5 15, i7-1255U | |
| Média da turma Office (708 - 2130, n=82, últimos 2 anos) | |
| Apple MacBook Air 15 2023 M2 16 GB | |
| Asus VivoBook S15 M3502RA-L1029W | |
| Cinebench R20 / CPU (Multi Core) | |
| Média Intel Core i7-13700H (2322 - 7674, n=29) | |
| Schenker VISION 16 Pro (M23) | |
| Acer Swift Go SFG16-71 | |
| Asus VivoBook S15 M3502RA-L1029W | |
| Schenker Vision 16 PH6PRX1 | |
| Média da turma Office (590 - 8840, n=80, últimos 2 anos) | |
| LG Gram SuperSlim (2023) | |
| Microsoft Surface Laptop 5 15, i7-1255U | |
| Apple MacBook Air 15 2023 M2 16 GB | |
| Cinebench R20 / CPU (Single Core) | |
| Schenker VISION 16 Pro (M23) | |
| Acer Swift Go SFG16-71 | |
| Schenker Vision 16 PH6PRX1 | |
| Média Intel Core i7-13700H (508 - 741, n=29) | |
| LG Gram SuperSlim (2023) | |
| Microsoft Surface Laptop 5 15, i7-1255U | |
| Média da turma Office (285 - 815, n=80, últimos 2 anos) | |
| Asus VivoBook S15 M3502RA-L1029W | |
| Apple MacBook Air 15 2023 M2 16 GB | |
| Cinebench R15 / CPU Multi 64Bit | |
| Média Intel Core i7-13700H (905 - 2982, n=29) | |
| Acer Swift Go SFG16-71 | |
| Schenker VISION 16 Pro (M23) | |
| Asus VivoBook S15 M3502RA-L1029W | |
| Schenker Vision 16 PH6PRX1 | |
| Média da turma Office (246 - 3380, n=82, últimos 2 anos) | |
| LG Gram SuperSlim (2023) | |
| Microsoft Surface Laptop 5 15, i7-1255U | |
| Apple MacBook Air 15 2023 M2 16 GB | |
| Cinebench R15 / CPU Single 64Bit | |
| Schenker VISION 16 Pro (M23) | |
| Schenker Vision 16 PH6PRX1 | |
| Média Intel Core i7-13700H (213 - 278, n=29) | |
| Acer Swift Go SFG16-71 | |
| LG Gram SuperSlim (2023) | |
| Asus VivoBook S15 M3502RA-L1029W | |
| Média da turma Office (99.5 - 312, n=82, últimos 2 anos) | |
| Microsoft Surface Laptop 5 15, i7-1255U | |
| Apple MacBook Air 15 2023 M2 16 GB | |
| Blender / v2.79 BMW27 CPU | |
| Apple MacBook Air 15 2023 M2 16 GB | |
| Microsoft Surface Laptop 5 15, i7-1255U | |
| Média da turma Office (158 - 1956, n=83, últimos 2 anos) | |
| LG Gram SuperSlim (2023) | |
| Acer Swift Go SFG16-71 | |
| Asus VivoBook S15 M3502RA-L1029W | |
| Schenker Vision 16 PH6PRX1 | |
| Média Intel Core i7-13700H (169 - 555, n=29) | |
| Schenker VISION 16 Pro (M23) | |
| 7-Zip 18.03 / 7z b 4 | |
| Schenker VISION 16 Pro (M23) | |
| Média Intel Core i7-13700H (27322 - 76344, n=29) | |
| Asus VivoBook S15 M3502RA-L1029W | |
| Acer Swift Go SFG16-71 | |
| Schenker Vision 16 PH6PRX1 | |
| Média da turma Office (7532 - 76886, n=83, últimos 2 anos) | |
| LG Gram SuperSlim (2023) | |
| Microsoft Surface Laptop 5 15, i7-1255U | |
| 7-Zip 18.03 / 7z b 4 -mmt1 | |
| Schenker VISION 16 Pro (M23) | |
| Acer Swift Go SFG16-71 | |
| Schenker Vision 16 PH6PRX1 | |
| Média Intel Core i7-13700H (4825 - 6238, n=29) | |
| Asus VivoBook S15 M3502RA-L1029W | |
| LG Gram SuperSlim (2023) | |
| Média da turma Office (3046 - 6469, n=82, últimos 2 anos) | |
| Microsoft Surface Laptop 5 15, i7-1255U | |
| Geekbench 5.5 / Multi-Core | |
| Acer Swift Go SFG16-71 | |
| Schenker VISION 16 Pro (M23) | |
| Média Intel Core i7-13700H (6165 - 14215, n=29) | |
| LG Gram SuperSlim (2023) | |
| Asus VivoBook S15 M3502RA-L1029W | |
| Schenker Vision 16 PH6PRX1 | |
| Apple MacBook Air 15 2023 M2 16 GB | |
| Microsoft Surface Laptop 5 15, i7-1255U | |
| Média da turma Office (1719 - 16999, n=79, últimos 2 anos) | |
| Geekbench 5.5 / Single-Core | |
| Apple MacBook Air 15 2023 M2 16 GB | |
| Schenker VISION 16 Pro (M23) | |
| Acer Swift Go SFG16-71 | |
| LG Gram SuperSlim (2023) | |
| Schenker Vision 16 PH6PRX1 | |
| Média Intel Core i7-13700H (1362 - 1919, n=29) | |
| Média da turma Office (811 - 2128, n=79, últimos 2 anos) | |
| Microsoft Surface Laptop 5 15, i7-1255U | |
| Asus VivoBook S15 M3502RA-L1029W | |
| HWBOT x265 Benchmark v2.2 / 4k Preset | |
| Schenker VISION 16 Pro (M23) | |
| Média Intel Core i7-13700H (6.72 - 21.2, n=29) | |
| Acer Swift Go SFG16-71 | |
| Asus VivoBook S15 M3502RA-L1029W | |
| Schenker Vision 16 PH6PRX1 | |
| Média da turma Office (1.72 - 26, n=81, últimos 2 anos) | |
| LG Gram SuperSlim (2023) | |
| Microsoft Surface Laptop 5 15, i7-1255U | |
| LibreOffice / 20 Documents To PDF | |
| Média da turma Office (41.5 - 129.6, n=81, últimos 2 anos) | |
| Asus VivoBook S15 M3502RA-L1029W | |
| Média Intel Core i7-13700H (31.3 - 62.4, n=29) | |
| Schenker VISION 16 Pro (M23) | |
| Microsoft Surface Laptop 5 15, i7-1255U | |
| LG Gram SuperSlim (2023) | |
| Acer Swift Go SFG16-71 | |
| Schenker Vision 16 PH6PRX1 | |
| R Benchmark 2.5 / Overall mean | |
| Média da turma Office (0.4098 - 1.06, n=81, últimos 2 anos) | |
| Microsoft Surface Laptop 5 15, i7-1255U | |
| Asus VivoBook S15 M3502RA-L1029W | |
| LG Gram SuperSlim (2023) | |
| Média Intel Core i7-13700H (0.4308 - 0.607, n=29) | |
| Schenker Vision 16 PH6PRX1 | |
| Acer Swift Go SFG16-71 | |
| Schenker VISION 16 Pro (M23) | |
* ... menor é melhor
AIDA64: FP32 Ray-Trace | FPU Julia | CPU SHA3 | CPU Queen | FPU SinJulia | FPU Mandel | CPU AES | CPU ZLib | FP64 Ray-Trace | CPU PhotoWorxx
| Performance rating | |
| Asus VivoBook S15 M3502RA-L1029W | |
| Média Intel Core i7-13700H | |
| Acer Swift Go SFG16-71 | |
| Schenker Vision 16 PH6PRX1 | |
| Média da turma Office | |
| Microsoft Surface Laptop 5 15, i7-1255U | |
| LG Gram SuperSlim (2023) | |
| AIDA64 / FP32 Ray-Trace | |
| Asus VivoBook S15 M3502RA-L1029W | |
| Média Intel Core i7-13700H (4986 - 18908, n=29) | |
| Acer Swift Go SFG16-71 | |
| Média da turma Office (1685 - 31245, n=82, últimos 2 anos) | |
| Schenker Vision 16 PH6PRX1 | |
| LG Gram SuperSlim (2023) | |
| Microsoft Surface Laptop 5 15, i7-1255U | |
| AIDA64 / FPU Julia | |
| Asus VivoBook S15 M3502RA-L1029W | |
| Média Intel Core i7-13700H (25360 - 92359, n=29) | |
| Acer Swift Go SFG16-71 | |
| Schenker Vision 16 PH6PRX1 | |
| Média da turma Office (8977 - 125394, n=82, últimos 2 anos) | |
| Microsoft Surface Laptop 5 15, i7-1255U | |
| LG Gram SuperSlim (2023) | |
| AIDA64 / CPU SHA3 | |
| Média Intel Core i7-13700H (1339 - 4224, n=29) | |
| Asus VivoBook S15 M3502RA-L1029W | |
| Acer Swift Go SFG16-71 | |
| Schenker Vision 16 PH6PRX1 | |
| Média da turma Office (590 - 5755, n=82, últimos 2 anos) | |
| Microsoft Surface Laptop 5 15, i7-1255U | |
| LG Gram SuperSlim (2023) | |
| AIDA64 / CPU Queen | |
| Asus VivoBook S15 M3502RA-L1029W | |
| Acer Swift Go SFG16-71 | |
| Média Intel Core i7-13700H (59324 - 107159, n=29) | |
| Schenker Vision 16 PH6PRX1 | |
| LG Gram SuperSlim (2023) | |
| Média da turma Office (20636 - 115197, n=81, últimos 2 anos) | |
| Microsoft Surface Laptop 5 15, i7-1255U | |
| AIDA64 / FPU SinJulia | |
| Asus VivoBook S15 M3502RA-L1029W | |
| Média Intel Core i7-13700H (4800 - 11050, n=29) | |
| Acer Swift Go SFG16-71 | |
| Média da turma Office (1064 - 18321, n=82, últimos 2 anos) | |
| Schenker Vision 16 PH6PRX1 | |
| LG Gram SuperSlim (2023) | |
| Microsoft Surface Laptop 5 15, i7-1255U | |
| AIDA64 / FPU Mandel | |
| Asus VivoBook S15 M3502RA-L1029W | |
| Média Intel Core i7-13700H (12321 - 45118, n=29) | |
| Acer Swift Go SFG16-71 | |
| Schenker Vision 16 PH6PRX1 | |
| Média da turma Office (4415 - 66922, n=82, últimos 2 anos) | |
| Microsoft Surface Laptop 5 15, i7-1255U | |
| LG Gram SuperSlim (2023) | |
| AIDA64 / CPU AES | |
| Asus VivoBook S15 M3502RA-L1029W | |
| Média Intel Core i7-13700H (28769 - 151254, n=29) | |
| Acer Swift Go SFG16-71 | |
| Schenker Vision 16 PH6PRX1 | |
| Média da turma Office (5127 - 155900, n=82, últimos 2 anos) | |
| Microsoft Surface Laptop 5 15, i7-1255U | |
| LG Gram SuperSlim (2023) | |
| AIDA64 / CPU ZLib | |
| Média Intel Core i7-13700H (389 - 1215, n=29) | |
| Acer Swift Go SFG16-71 | |
| Schenker Vision 16 PH6PRX1 | |
| Asus VivoBook S15 M3502RA-L1029W | |
| Média da turma Office (138.6 - 1366, n=82, últimos 2 anos) | |
| Microsoft Surface Laptop 5 15, i7-1255U | |
| LG Gram SuperSlim (2023) | |
| AIDA64 / FP64 Ray-Trace | |
| Asus VivoBook S15 M3502RA-L1029W | |
| Média Intel Core i7-13700H (2540 - 10135, n=29) | |
| Acer Swift Go SFG16-71 | |
| Schenker Vision 16 PH6PRX1 | |
| Média da turma Office (859 - 17834, n=82, últimos 2 anos) | |
| Microsoft Surface Laptop 5 15, i7-1255U | |
| LG Gram SuperSlim (2023) | |
| AIDA64 / CPU PhotoWorxx | |
| Schenker Vision 16 PH6PRX1 | |
| Microsoft Surface Laptop 5 15, i7-1255U | |
| Acer Swift Go SFG16-71 | |
| Média Intel Core i7-13700H (12872 - 52727, n=29) | |
| LG Gram SuperSlim (2023) | |
| Média da turma Office (11090 - 65229, n=82, últimos 2 anos) | |
| Asus VivoBook S15 M3502RA-L1029W | |
Desempenho do sistema
A comparação direta com oAcer Swift Go SFG16-71mostra novamente que o Core i7-13700H no Vision 16 é limitado pelo baixo TDP. O desempenho do processador nos benchmarks sintéticos está um pouco abaixo da média, embora o desempenho subjetivo do ultrabook seja muito bom. Ao navegar na Web, assistir a vídeos em 4K no YouTube ou realizar multitarefas com programas do Office e navegar ao mesmo tempo, o Vision 16 não apresentou sinais de lentidão.
CrossMark: Overall | Productivity | Creativity | Responsiveness
| PCMark 10 / Score | |
| Asus VivoBook S15 M3502RA-L1029W | |
| Média da turma Office (2823 - 9298, n=71, últimos 2 anos) | |
| Acer Swift Go SFG16-71 | |
| Média Intel Core i7-13700H, Intel Iris Xe Graphics G7 96EUs (5531 - 6247, n=5) | |
| LG Gram SuperSlim (2023) | |
| Schenker Vision 16 PH6PRX1 | |
| Microsoft Surface Laptop 5 15, i7-1255U | |
| PCMark 10 / Essentials | |
| LG Gram SuperSlim (2023) | |
| Acer Swift Go SFG16-71 | |
| Média Intel Core i7-13700H, Intel Iris Xe Graphics G7 96EUs (9648 - 11401, n=5) | |
| Asus VivoBook S15 M3502RA-L1029W | |
| Microsoft Surface Laptop 5 15, i7-1255U | |
| Média da turma Office (6567 - 11594, n=71, últimos 2 anos) | |
| Schenker Vision 16 PH6PRX1 | |
| PCMark 10 / Productivity | |
| Asus VivoBook S15 M3502RA-L1029W | |
| Média da turma Office (3041 - 17243, n=71, últimos 2 anos) | |
| Acer Swift Go SFG16-71 | |
| Média Intel Core i7-13700H, Intel Iris Xe Graphics G7 96EUs (7072 - 7691, n=5) | |
| Microsoft Surface Laptop 5 15, i7-1255U | |
| Schenker Vision 16 PH6PRX1 | |
| LG Gram SuperSlim (2023) | |
| PCMark 10 / Digital Content Creation | |
| Asus VivoBook S15 M3502RA-L1029W | |
| Média da turma Office (2049 - 13541, n=71, últimos 2 anos) | |
| Acer Swift Go SFG16-71 | |
| Média Intel Core i7-13700H, Intel Iris Xe Graphics G7 96EUs (6413 - 7727, n=5) | |
| LG Gram SuperSlim (2023) | |
| Schenker Vision 16 PH6PRX1 | |
| Microsoft Surface Laptop 5 15, i7-1255U | |
| CrossMark / Overall | |
| Acer Swift Go SFG16-71 | |
| Schenker Vision 16 PH6PRX1 | |
| Média Intel Core i7-13700H, Intel Iris Xe Graphics G7 96EUs (1548 - 1868, n=5) | |
| LG Gram SuperSlim (2023) | |
| Asus VivoBook S15 M3502RA-L1029W | |
| Apple MacBook Air 15 2023 M2 16 GB | |
| Microsoft Surface Laptop 5 15, i7-1255U | |
| Média da turma Office (381 - 2010, n=81, últimos 2 anos) | |
| CrossMark / Productivity | |
| Acer Swift Go SFG16-71 | |
| Schenker Vision 16 PH6PRX1 | |
| Média Intel Core i7-13700H, Intel Iris Xe Graphics G7 96EUs (1500 - 1787, n=5) | |
| LG Gram SuperSlim (2023) | |
| Asus VivoBook S15 M3502RA-L1029W | |
| Microsoft Surface Laptop 5 15, i7-1255U | |
| Apple MacBook Air 15 2023 M2 16 GB | |
| Média da turma Office (464 - 1880, n=81, últimos 2 anos) | |
| CrossMark / Creativity | |
| Acer Swift Go SFG16-71 | |
| Apple MacBook Air 15 2023 M2 16 GB | |
| Média Intel Core i7-13700H, Intel Iris Xe Graphics G7 96EUs (1620 - 2009, n=5) | |
| Asus VivoBook S15 M3502RA-L1029W | |
| LG Gram SuperSlim (2023) | |
| Schenker Vision 16 PH6PRX1 | |
| Microsoft Surface Laptop 5 15, i7-1255U | |
| Média da turma Office (319 - 2361, n=81, últimos 2 anos) | |
| CrossMark / Responsiveness | |
| Acer Swift Go SFG16-71 | |
| LG Gram SuperSlim (2023) | |
| Schenker Vision 16 PH6PRX1 | |
| Média Intel Core i7-13700H, Intel Iris Xe Graphics G7 96EUs (1439 - 1715, n=5) | |
| Asus VivoBook S15 M3502RA-L1029W | |
| Microsoft Surface Laptop 5 15, i7-1255U | |
| Média da turma Office (360 - 1781, n=81, últimos 2 anos) | |
| Apple MacBook Air 15 2023 M2 16 GB | |
| PCMark 10 Score | 5531 pontos | |
Ajuda | ||
| AIDA64 / Memory Copy | |
| Schenker Vision 16 PH6PRX1 | |
| Média Intel Core i7-13700H (24334 - 78081, n=29) | |
| Média da turma Office (20075 - 109192, n=81, últimos 2 anos) | |
| AIDA64 / Memory Read | |
| Schenker Vision 16 PH6PRX1 | |
| Média Intel Core i7-13700H (23681 - 79656, n=29) | |
| Média da turma Office (10084 - 128030, n=82, últimos 2 anos) | |
| AIDA64 / Memory Write | |
| Média Intel Core i7-13700H (22986 - 99898, n=29) | |
| Schenker Vision 16 PH6PRX1 | |
| Média da turma Office (20073 - 119858, n=82, últimos 2 anos) | |
| AIDA64 / Memory Latency | |
| Média da turma Office (0 - 162.9, n=78, últimos 2 anos) | |
| Média Intel Core i7-13700H (82.4 - 136.8, n=29) | |
| Schenker Vision 16 PH6PRX1 | |
* ... menor é melhor
Latência DPC
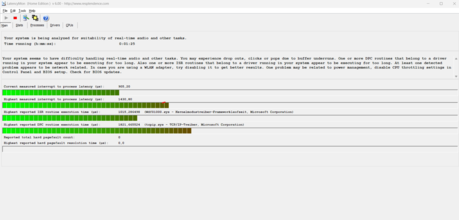
Nosso teste de latência padronizado (navegação na Web, Youtube 4K, carga da CPU) mostrou alguns problemas de latência DPC. O Vision 16 não é totalmente utilizável para áudio em tempo real em seu estado testado, mas as atualizações do BIOS podem resolver esse problema.
| DPC Latencies / LatencyMon - interrupt to process latency (max), Web, Youtube, Prime95 | |
| Acer Swift Go SFG16-71 | |
| LG Gram SuperSlim (2023) | |
| Schenker Vision 16 PH6PRX1 | |
| Microsoft Surface Laptop 5 15, i7-1255U | |
| Asus VivoBook S15 M3502RA-L1029W | |
* ... menor é melhor
Armazenamento em massa
No Schenker Vision 16, há dois slots PCIe 4.0 para SSDs. Em nossa amostra de análise, há um SSD Samsung 990 Pro M.2 de 1 TB. Os resultados de benchmark com o DiskSpd mostram pontos fracos claros em termos de velocidades de leitura e gravação da SSD. As medições da AS SSD mostram um quadro melhor, com velocidades mais adequadas para uma SSD de alto desempenho. A mesma SSD Samsung 990 Pro foi usada na amostra de análise do Vision 16 Pro e apresentou melhores resultados.
* ... menor é melhor
Sustained load Read: DiskSpd Read Loop, Queue Depth 8
Placa de vídeo
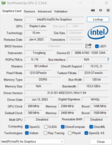
O Vision 16 de 2022 foi oferecido com a RTX 3050. O modelo deste ano tem apenas a Intel Iris Xe Graphics G7 integrada com 96 EUs. Tarefas cotidianas não são problema, mas não é adequado para jogos. A iGPU tem, pelo menos, um desempenho melhor do que a média da Intel Iris Xe Graphics G7 em 11% nos benchmarks sintéticos.
| 3DMark 11 Performance | 7613 pontos | |
| 3DMark Cloud Gate Standard Score | 21964 pontos | |
| 3DMark Fire Strike Score | 5433 pontos | |
| 3DMark Time Spy Score | 1953 pontos | |
Ajuda | ||
| Blender - v3.3 Classroom CPU | |
| Média Intel Iris Xe Graphics G7 96EUs (336 - 1259, n=109) | |
| Média da turma Office (245 - 3964, n=79, últimos 2 anos) | |
| Schenker Vision 16 PH6PRX1 | |
* ... menor é melhor
Desempenho em jogos
A Iris Xe Graphics G7 é a iGPU mais potente da Intel, mas o desempenho em jogos é bastante baixo. As iGPUs da AMD, como aRadeon 680Mou a Radeon 780Msão mais potentes. Desde que a resolução e a configuração gráfica sejam mantidas baixas, os jogos mais antigos ainda podem ser jogados. A tela de 240 Hz ainda é desperdiçada sem uma GPU externa, que pode ser conectada via Thunderbolt 4.
| The Witcher 3 - 1920x1080 Ultra Graphics & Postprocessing (HBAO+) | |
| Apple MacBook Air 15 2023 M2 16 GB | |
| Asus VivoBook S15 M3502RA-L1029W | |
| Schenker Vision 16 PH6PRX1 | |
| Acer Swift Go SFG16-71 | |
| Média da turma Office (3.8 - 32.5, n=17, últimos 2 anos) | |
| LG Gram SuperSlim (2023) | |
| Microsoft Surface Laptop 5 15, i7-1255U | |
| GTA V - 1920x1080 Highest AA:4xMSAA + FX AF:16x | |
| Asus VivoBook S15 M3502RA-L1029W | |
| Média da turma Office (3.98 - 47.8, n=72, últimos 2 anos) | |
| Acer Swift Go SFG16-71 | |
| Schenker Vision 16 PH6PRX1 | |
| Microsoft Surface Laptop 5 15, i7-1255U | |
| Final Fantasy XV Benchmark - 1920x1080 High Quality | |
| Asus VivoBook S15 M3502RA-L1029W | |
| Média da turma Office (6.45 - 55.4, n=76, últimos 2 anos) | |
| Schenker Vision 16 PH6PRX1 | |
| Acer Swift Go SFG16-71 | |
| LG Gram SuperSlim (2023) | |
| Microsoft Surface Laptop 5 15, i7-1255U | |
| Strange Brigade - 1920x1080 ultra AA:ultra AF:16 | |
| Asus VivoBook S15 M3502RA-L1029W | |
| Média da turma Office (12.9 - 99.5, n=55, últimos 2 anos) | |
| Acer Swift Go SFG16-71 | |
| Schenker Vision 16 PH6PRX1 | |
| Microsoft Surface Laptop 5 15, i7-1255U | |
| LG Gram SuperSlim (2023) | |
Witcher 3 FPS diagramm
| baixo | média | alto | ultra | QHD | 4K | |
|---|---|---|---|---|---|---|
| GTA V (2015) | 117.4 | 104.3 | 24.8 | 10.4 | 6.7 | |
| The Witcher 3 (2015) | 45 | 35 | 23 | 19 | ||
| Dota 2 Reborn (2015) | 95.5 | 70.8 | 61.3 | 52.4 | ||
| Final Fantasy XV Benchmark (2018) | 44 | 24 | 18 | 12 | 7 | |
| X-Plane 11.11 (2018) | 35 | 33 | 32 | 27 | ||
| Far Cry 5 (2018) | 52 | 28 | 26 | 24 | 17 | |
| Strange Brigade (2018) | 81.7 | 39.7 | 31.7 | 25.1 | ||
| F1 23 (2023) | 39.4 | 35.5 | 24.8 | 18.4 |
Emissões
Ruído
As emissões do Vision 16 são aceitáveis. Em marcha lenta, os ventiladores quase sempre funcionam e são audíveis em condições silenciosas. Sob carga máxima, medimos 45 dB(a), o que não será alcançado na maioria das aplicações. No uso diário, é mais provável que a ventoinha funcione a 33,8 dB(a), o que é bastante silencioso. No uso normal em escritório, o ultrabook quase nunca fica silencioso, mas o ruído da ventoinha tem uma frequência baixa e não incomoda. Os usuários mais sensíveis ainda podem ser incomodados por ele.
Barulho
| Ocioso |
| 25.5 / 28.7 / 29.1 dB |
| Carga |
| 33.8 / 44.9 dB |
 | ||
30 dB silencioso 40 dB(A) audível 50 dB(A) ruidosamente alto |
||
min: | ||
| Schenker Vision 16 PH6PRX1 Iris Xe G7 96EUs, i7-13700H, Samsung 990 Pro 1 TB | Apple MacBook Air 15 2023 M2 16 GB M2 10-Core GPU, M2, Apple SSD AP1024Z | Acer Swift Go SFG16-71 Iris Xe G7 96EUs, i7-13700H, Micron 2400 MTFDKBA1T0QFM | LG Gram SuperSlim (2023) Iris Xe G7 96EUs, i7-1360P, SK hynix PC801 HFS001TEJ9X101N | Microsoft Surface Laptop 5 15, i7-1255U Iris Xe G7 96EUs, i7-1255U, SK Hynix BC711 512GB HFM512GD3GX013N | Asus VivoBook S15 M3502RA-L1029W Radeon 680M, R7 6800H, WD PC SN735 SDBPNHH-512G | |
|---|---|---|---|---|---|---|
| Noise | -4% | 1% | 10% | -17% | ||
| desligado / ambiente * (dB) | 25.5 | 25.7 -1% | 25.2 1% | 23.3 9% | 26 -2% | |
| Idle Minimum * (dB) | 25.5 | 26.1 -2% | 25.2 1% | 23.3 9% | 26 -2% | |
| Idle Average * (dB) | 28.7 | 26.1 9% | 25.2 12% | 23.3 19% | 26 9% | |
| Idle Maximum * (dB) | 29.1 | 27.2 7% | 25.2 13% | 23.3 20% | 28.1 3% | |
| Load Average * (dB) | 33.8 | 44.2 -31% | 43.1 -28% | 35 -4% | 56.9 -68% | |
| Witcher 3 ultra * (dB) | 37.6 | 38.1 -1% | ||||
| Load Maximum * (dB) | 44.9 | 47.5 -6% | 43.3 4% | 38.1 15% | 62.6 -39% |
* ... menor é melhor
Calor
Apesar dos ventiladores bastante silenciosos, o Vision 16 permanece relativamente frio. As temperaturas do apoio para as mãos sob carga atingem 28,5 graus Celsius / 83 F no ponto de aquecimento acima do teclado. Sob carga, o ponto quente está localizado no centro do teclado, onde as temperaturas atingem 42 graus Celsius / 108 F, uma temperatura desconfortável. Mas essa temperatura máxima de carga normalmente não será atingida durante o uso diário.
Os dois ventiladores captam o ar pela parte inferior e o expelem pela parte posterior.
(±) A temperatura máxima no lado superior é 41.1 °C / 106 F, em comparação com a média de 34.3 °C / 94 F , variando de 21.2 a 62.5 °C para a classe Office.
(±) A parte inferior aquece até um máximo de 42 °C / 108 F, em comparação com a média de 36.8 °C / 98 F
(+) Em uso inativo, a temperatura média para o lado superior é 25.7 °C / 78 F, em comparação com a média do dispositivo de 29.5 °C / ### class_avg_f### F.
(+) Jogando The Witcher 3, a temperatura média para o lado superior é 28.8 °C / 84 F, em comparação com a média do dispositivo de 29.5 °C / ## #class_avg_f### F.
(+) Os apoios para as mãos e o touchpad são mais frios que a temperatura da pele, com um máximo de 28.2 °C / 82.8 F e, portanto, são frios ao toque.
(±) A temperatura média da área do apoio para as mãos de dispositivos semelhantes foi 27.5 °C / 81.5 F (-0.7 °C / -1.3 F).
| Schenker Vision 16 PH6PRX1 Intel Core i7-13700H, Intel Iris Xe Graphics G7 96EUs | Apple MacBook Air 15 2023 M2 16 GB Apple M2, Apple M2 10-Core GPU | Acer Swift Go SFG16-71 Intel Core i7-13700H, Intel Iris Xe Graphics G7 96EUs | LG Gram SuperSlim (2023) Intel Core i7-1360P, Intel Iris Xe Graphics G7 96EUs | Microsoft Surface Laptop 5 15, i7-1255U Intel Core i7-1255U, Intel Iris Xe Graphics G7 96EUs | Asus VivoBook S15 M3502RA-L1029W AMD Ryzen 7 6800H, AMD Radeon 680M | |
|---|---|---|---|---|---|---|
| Heat | 1% | -13% | -23% | 3% | -21% | |
| Maximum Upper Side * (°C) | 41.1 | 45.1 -10% | 44.4 -8% | 43.9 -7% | 44.6 -9% | 50.2 -22% |
| Maximum Bottom * (°C) | 42 | 42.5 -1% | 48 -14% | 50.4 -20% | 47.4 -13% | 50.2 -20% |
| Idle Upper Side * (°C) | 28.5 | 25.9 9% | 31.9 -12% | 35.8 -26% | 22.6 21% | 32.1 -13% |
| Idle Bottom * (°C) | 26.8 | 25.8 4% | 31.9 -19% | 37.5 -40% | 23.3 13% | 34.6 -29% |
* ... menor é melhor
Teste de estresse
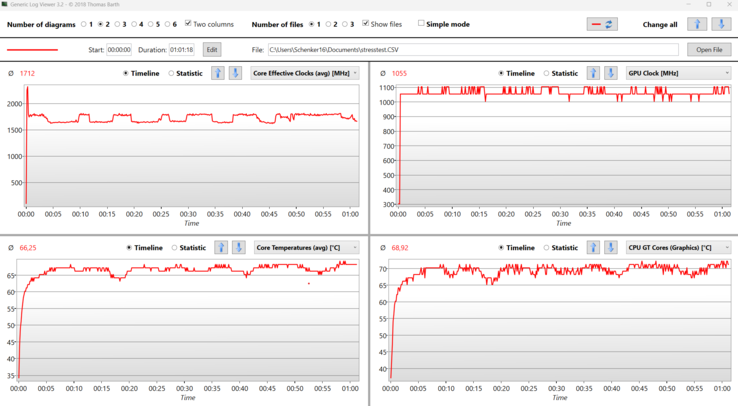
No início do teste de estresse (Prime95 e Furmark), a CPU atinge 2,5 GHz, mas rapidamente se estabiliza entre 1,6 e 1,7 GHz. Como no teste de loop do Witcher, o desempenho se estabiliza mais tarde durante o teste de estresse e permanece em 1,7 GHz. As temperaturas da CPU permanecem baixas, com uma temperatura média de 66 graus Celsius / 150 F, provavelmente devido ao baixo TDP.
Alto-falantes
O sistema de alto-falantes é idêntico ao do Vision 16 Pro e não sofreu alterações em relação ao antecessor. Os agudos são precisos, mas faltam os graves.
Schenker Vision 16 PH6PRX1 análise de áudio
(±) | o volume do alto-falante é médio, mas bom (###valor### dB)
Graves 100 - 315Hz
(-) | quase nenhum baixo - em média 15.5% menor que a mediana
(±) | a linearidade dos graves é média (11.9% delta para a frequência anterior)
Médios 400 - 2.000 Hz
(+) | médios equilibrados - apenas 3.6% longe da mediana
(+) | médios são lineares (3.2% delta para frequência anterior)
Altos 2 - 16 kHz
(+) | agudos equilibrados - apenas 2.9% longe da mediana
(+) | os máximos são lineares (3.9% delta da frequência anterior)
Geral 100 - 16.000 Hz
(+) | o som geral é linear (14.7% diferença em relação à mediana)
Comparado com a mesma classe
» 12% de todos os dispositivos testados nesta classe foram melhores, 4% semelhantes, 84% piores
» O melhor teve um delta de 7%, a média foi 21%, o pior foi 53%
Comparado com todos os dispositivos testados
» 19% de todos os dispositivos testados foram melhores, 4% semelhantes, 77% piores
» O melhor teve um delta de 4%, a média foi 24%, o pior foi 134%
Acer Swift Go SFG16-71 análise de áudio
(±) | o volume do alto-falante é médio, mas bom (###valor### dB)
Graves 100 - 315Hz
(-) | quase nenhum baixo - em média 18.1% menor que a mediana
(±) | a linearidade dos graves é média (10% delta para a frequência anterior)
Médios 400 - 2.000 Hz
(+) | médios equilibrados - apenas 1% longe da mediana
(+) | médios são lineares (4.9% delta para frequência anterior)
Altos 2 - 16 kHz
(+) | agudos equilibrados - apenas 2.4% longe da mediana
(+) | os máximos são lineares (6.6% delta da frequência anterior)
Geral 100 - 16.000 Hz
(+) | o som geral é linear (13% diferença em relação à mediana)
Comparado com a mesma classe
» 24% de todos os dispositivos testados nesta classe foram melhores, 5% semelhantes, 72% piores
» O melhor teve um delta de 5%, a média foi 17%, o pior foi 45%
Comparado com todos os dispositivos testados
» 12% de todos os dispositivos testados foram melhores, 2% semelhantes, 85% piores
» O melhor teve um delta de 4%, a média foi 24%, o pior foi 134%
Gerenciamento de energia - consome muita energia para um laptop de escritório
Consumo de energia
Para um ultrabook sem uma GPU dedicada, o uso de energia em marcha lenta é significativamente maior do que em dispositivos comparáveis. O consumo mais alto provavelmente se deve ao processador H da Intel, já que os laptops de escritório geralmente usam CPUs U/P. Os processadores AMD têm a vantagem nesse aspecto. OAsus VivoBook S15 é mais eficiente graças ao processador que consome menos energia, apesar da tela OLED. Sob carga, o consumo se normaliza e às vezes é menor em comparação com os outros notebooks.
| desligado | |
| Ocioso | |
| Carga |
|
Key:
min: | |
| Schenker Vision 16 PH6PRX1 i7-13700H, Iris Xe G7 96EUs, Samsung 990 Pro 1 TB, IPS, 2560x1600, 16" | Apple MacBook Air 15 2023 M2 16 GB M2, M2 10-Core GPU, Apple SSD AP1024Z, IPS, 2880x1864, 15.3" | Acer Swift Go SFG16-71 i7-13700H, Iris Xe G7 96EUs, Micron 2400 MTFDKBA1T0QFM, OLED, 3200x2000, 16" | LG Gram SuperSlim (2023) i7-1360P, Iris Xe G7 96EUs, SK hynix PC801 HFS001TEJ9X101N, OLED, 1920x1080, 15.6" | Microsoft Surface Laptop 5 15, i7-1255U i7-1255U, Iris Xe G7 96EUs, SK Hynix BC711 512GB HFM512GD3GX013N, IPS, 2496x1664, 15" | Asus VivoBook S15 M3502RA-L1029W R7 6800H, Radeon 680M, WD PC SN735 SDBPNHH-512G, OLED, 1920x1080, 15.6" | Média Intel Iris Xe Graphics G7 96EUs | Média da turma Office | |
|---|---|---|---|---|---|---|---|---|
| Power Consumption | 44% | 11% | 26% | 27% | 8% | 21% | 31% | |
| Idle Minimum * (Watt) | 6.3 | 2.2 65% | 5.8 8% | 4.2 33% | 3.8 40% | 4.4 30% | 5.51 ? 13% | 4.48 ? 29% |
| Idle Average * (Watt) | 14.4 | 10 31% | 6 58% | 8.9 38% | 8.2 43% | 5.1 65% | 8.66 ? 40% | 7.36 ? 49% |
| Idle Maximum * (Watt) | 16.2 | 10.1 38% | 6.9 57% | 10.3 36% | 8.4 48% | 9.3 43% | 10.9 ? 33% | 8.74 ? 46% |
| Load Average * (Watt) | 46.2 | 33.6 27% | 59 -28% | 47 -2% | 50.1 -8% | 67 -45% | 45.6 ? 1% | 42.5 ? 8% |
| Witcher 3 ultra * (Watt) | 49.4 | 27.8 44% | 61.1 -24% | 43.8 11% | 38.8 21% | 66.4 -34% | ||
| Load Maximum * (Watt) | 85.2 | 37.2 56% | 92 -8% | 49 42% | 69.6 18% | 93.5 -10% | 67.8 ? 20% | 64 ? 25% |
* ... menor é melhor
Power consumption Witcher 3 / stress test
Power consumption external monitor
Duração da bateria
A duração da bateria do Vision 16 não é boa, apesar da bateria de 80 Wh. Com o nosso teste de WiFi e 150 cd/m² de brilho da tela, o laptop funciona por quase exatamente oito horas. O processador H consome muita energia para um laptop de escritório. Em comparação com o Vision 16 pro com RTX 4070, a remoção da GPU dedicada não dá ao Vision 16 nenhuma vantagem no que diz respeito à duração da bateria.
Com o brilho máximo durante o script WiFi, a duração da bateria do Vision 16 é reduzida ainda mais para seis horas e trinta minutos.
| Schenker Vision 16 PH6PRX1 i7-13700H, Iris Xe G7 96EUs, 80 Wh | Apple MacBook Air 15 2023 M2 16 GB M2, M2 10-Core GPU, 66.5 Wh | Acer Swift Go SFG16-71 i7-13700H, Iris Xe G7 96EUs, 65 Wh | LG Gram SuperSlim (2023) i7-1360P, Iris Xe G7 96EUs, 60 Wh | Microsoft Surface Laptop 5 15, i7-1255U i7-1255U, Iris Xe G7 96EUs, 47.4 Wh | Asus VivoBook S15 M3502RA-L1029W R7 6800H, Radeon 680M, 70 Wh | Schenker VISION 16 Pro (M23) i7-13700H, GeForce RTX 4070 Laptop GPU, 80 Wh | Média da turma Office | |
|---|---|---|---|---|---|---|---|---|
| Duração da bateria | 68% | -13% | 40% | -2% | -9% | -26% | 15% | |
| WiFi v1.3 (h) | 8 | 16.6 108% | 7.8 -2% | 12.5 56% | 8.6 8% | 11.5 44% | 7.8 -2% | 12.6 ? 58% |
| Load (h) | 2.6 | 3.3 27% | 2 -23% | 3.2 23% | 2.3 -12% | 1 -62% | 1.3 -50% | 1.833 ? -29% |
| H.264 (h) | 16.8 | 14.7 | 9.7 | 12.8 | 7.8 | 15 ? | ||
| Reader / Idle (h) | 27.5 | 22.3 ? |
Pro
Contra
Veredicto - O Vision 16 tem uma sólida seleção de portas, mas um desempenho limitado do processador
A versão deste ano do Vision 16 contém as mais novas CPUs Intel Raptor Lake, um sistema de resfriamento aprimorado e uma tela mais rápida de 240 Hz. O TDP do processador é limitado a 45 W, mantendo as temperaturas baixas. Entretanto, isso também limita o desempenho do processador H da Intel. O chassi do Vision 16 é feito de magnésio e tem uma aparência premium. Isso permite que o laptop de 16 polegadas tenha um peso baixo de 1,5 kg, o que o torna um peso leve em sua categoria.
Diferentemente dos modelos anteriores, o TDP não pode mais ser controlado pelo usuário no Schenker Control Center. Como a CPU atinge apenas 70 graus Celsius durante o teste de estresse (Prime95 e FurMark), o dispositivo poderia ter um desempenho melhor. Um TDP personalizável poderia ter possibilitado um melhor desempenho.
O Vision 16 permanece bastante frio, exceto na área central do teclado. E mesmo sob carga, o ruído da ventoinha é suportável. Entretanto, as ventoinhas quase nunca ficam realmente silenciosas, elas sempre funcionam com um baixo nível de ruído, mesmo quando estão em marcha lenta. Considerando o fato de que o baixo TDP limita muito o chip Intel H, uma CPU da série P/U poderia ter sido a melhor opção para o Vision 16. O Core i7-13700H tem desvantagens no que diz respeito ao consumo de energia, portanto, o Schenker 16 consome mais do que os concorrentes comparáveis.
Em nossa análise, também encontramos problemas com o SSD M.2 interno e o leitor de cartão SD. Ambos são deficientes em sua velocidade.
O Schenker Vision 16 oferece um bom nível de desempenho, uma boa seleção de portas e capacidade de atualização, apesar do chassi leve e fino.
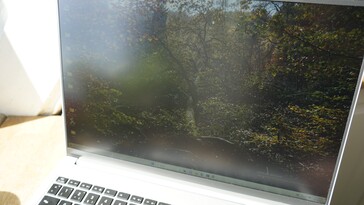
A nova tela IPS fosca é uma melhoria significativa e está bem calibrada, mesmo antes de nossa própria calibração, e é adequada para edição simples de fotos. Para um laptop de escritório, a taxa de atualização de 240 Hz é incomum. Ela cria uma experiência suave para o usuário, mas o laptop não é potente o suficiente para jogos, desperdiçando parte do potencial do painel. O painel não cobre uma gama de cores mais ampla e não tem suporte a HDR, mas não há PWM aqui.
Como uma alternativa ao Schenker Vision 16, o Vision 16 Pro é uma variação mais potente com velocidades de CPU mais rápidas, apesar do mesmo processador, e uma CPU RTX 4070 opcional. O Acer Swift Go 16 usa o mesmo processador, mas permite um TDP mais alto de 80 W. Além disso, a Acer usa uma tela OLED. No entanto, nenhum dos dois oferece o baixo peso do Vision 16.
Preços e disponibilidade
O novo Vision 16 2023 está disponível na Alemanha a partir de 1.424 euros na Bestware. Nossa configuração de análise com 32 GB de RAM e um SSD M.2 Samsung 990 Pro de 1 TB custa 1.661 euros.
Schenker Vision 16 PH6PRX1
- 08/30/2023 v7 (old)
Philip Macdonald
Transparência
A seleção dos dispositivos a serem analisados é feita pela nossa equipe editorial. A amostra de teste foi fornecida ao autor como empréstimo pelo fabricante ou varejista para fins desta revisão. O credor não teve influência nesta revisão, nem o fabricante recebeu uma cópia desta revisão antes da publicação. Não houve obrigação de publicar esta revisão. Como empresa de mídia independente, a Notebookcheck não está sujeita à autoridade de fabricantes, varejistas ou editores.
É assim que o Notebookcheck está testando
Todos os anos, o Notebookcheck analisa de forma independente centenas de laptops e smartphones usando procedimentos padronizados para garantir que todos os resultados sejam comparáveis. Desenvolvemos continuamente nossos métodos de teste há cerca de 20 anos e definimos padrões da indústria no processo. Em nossos laboratórios de teste, equipamentos de medição de alta qualidade são utilizados por técnicos e editores experientes. Esses testes envolvem um processo de validação em vários estágios. Nosso complexo sistema de classificação é baseado em centenas de medições e benchmarks bem fundamentados, o que mantém a objetividade.


