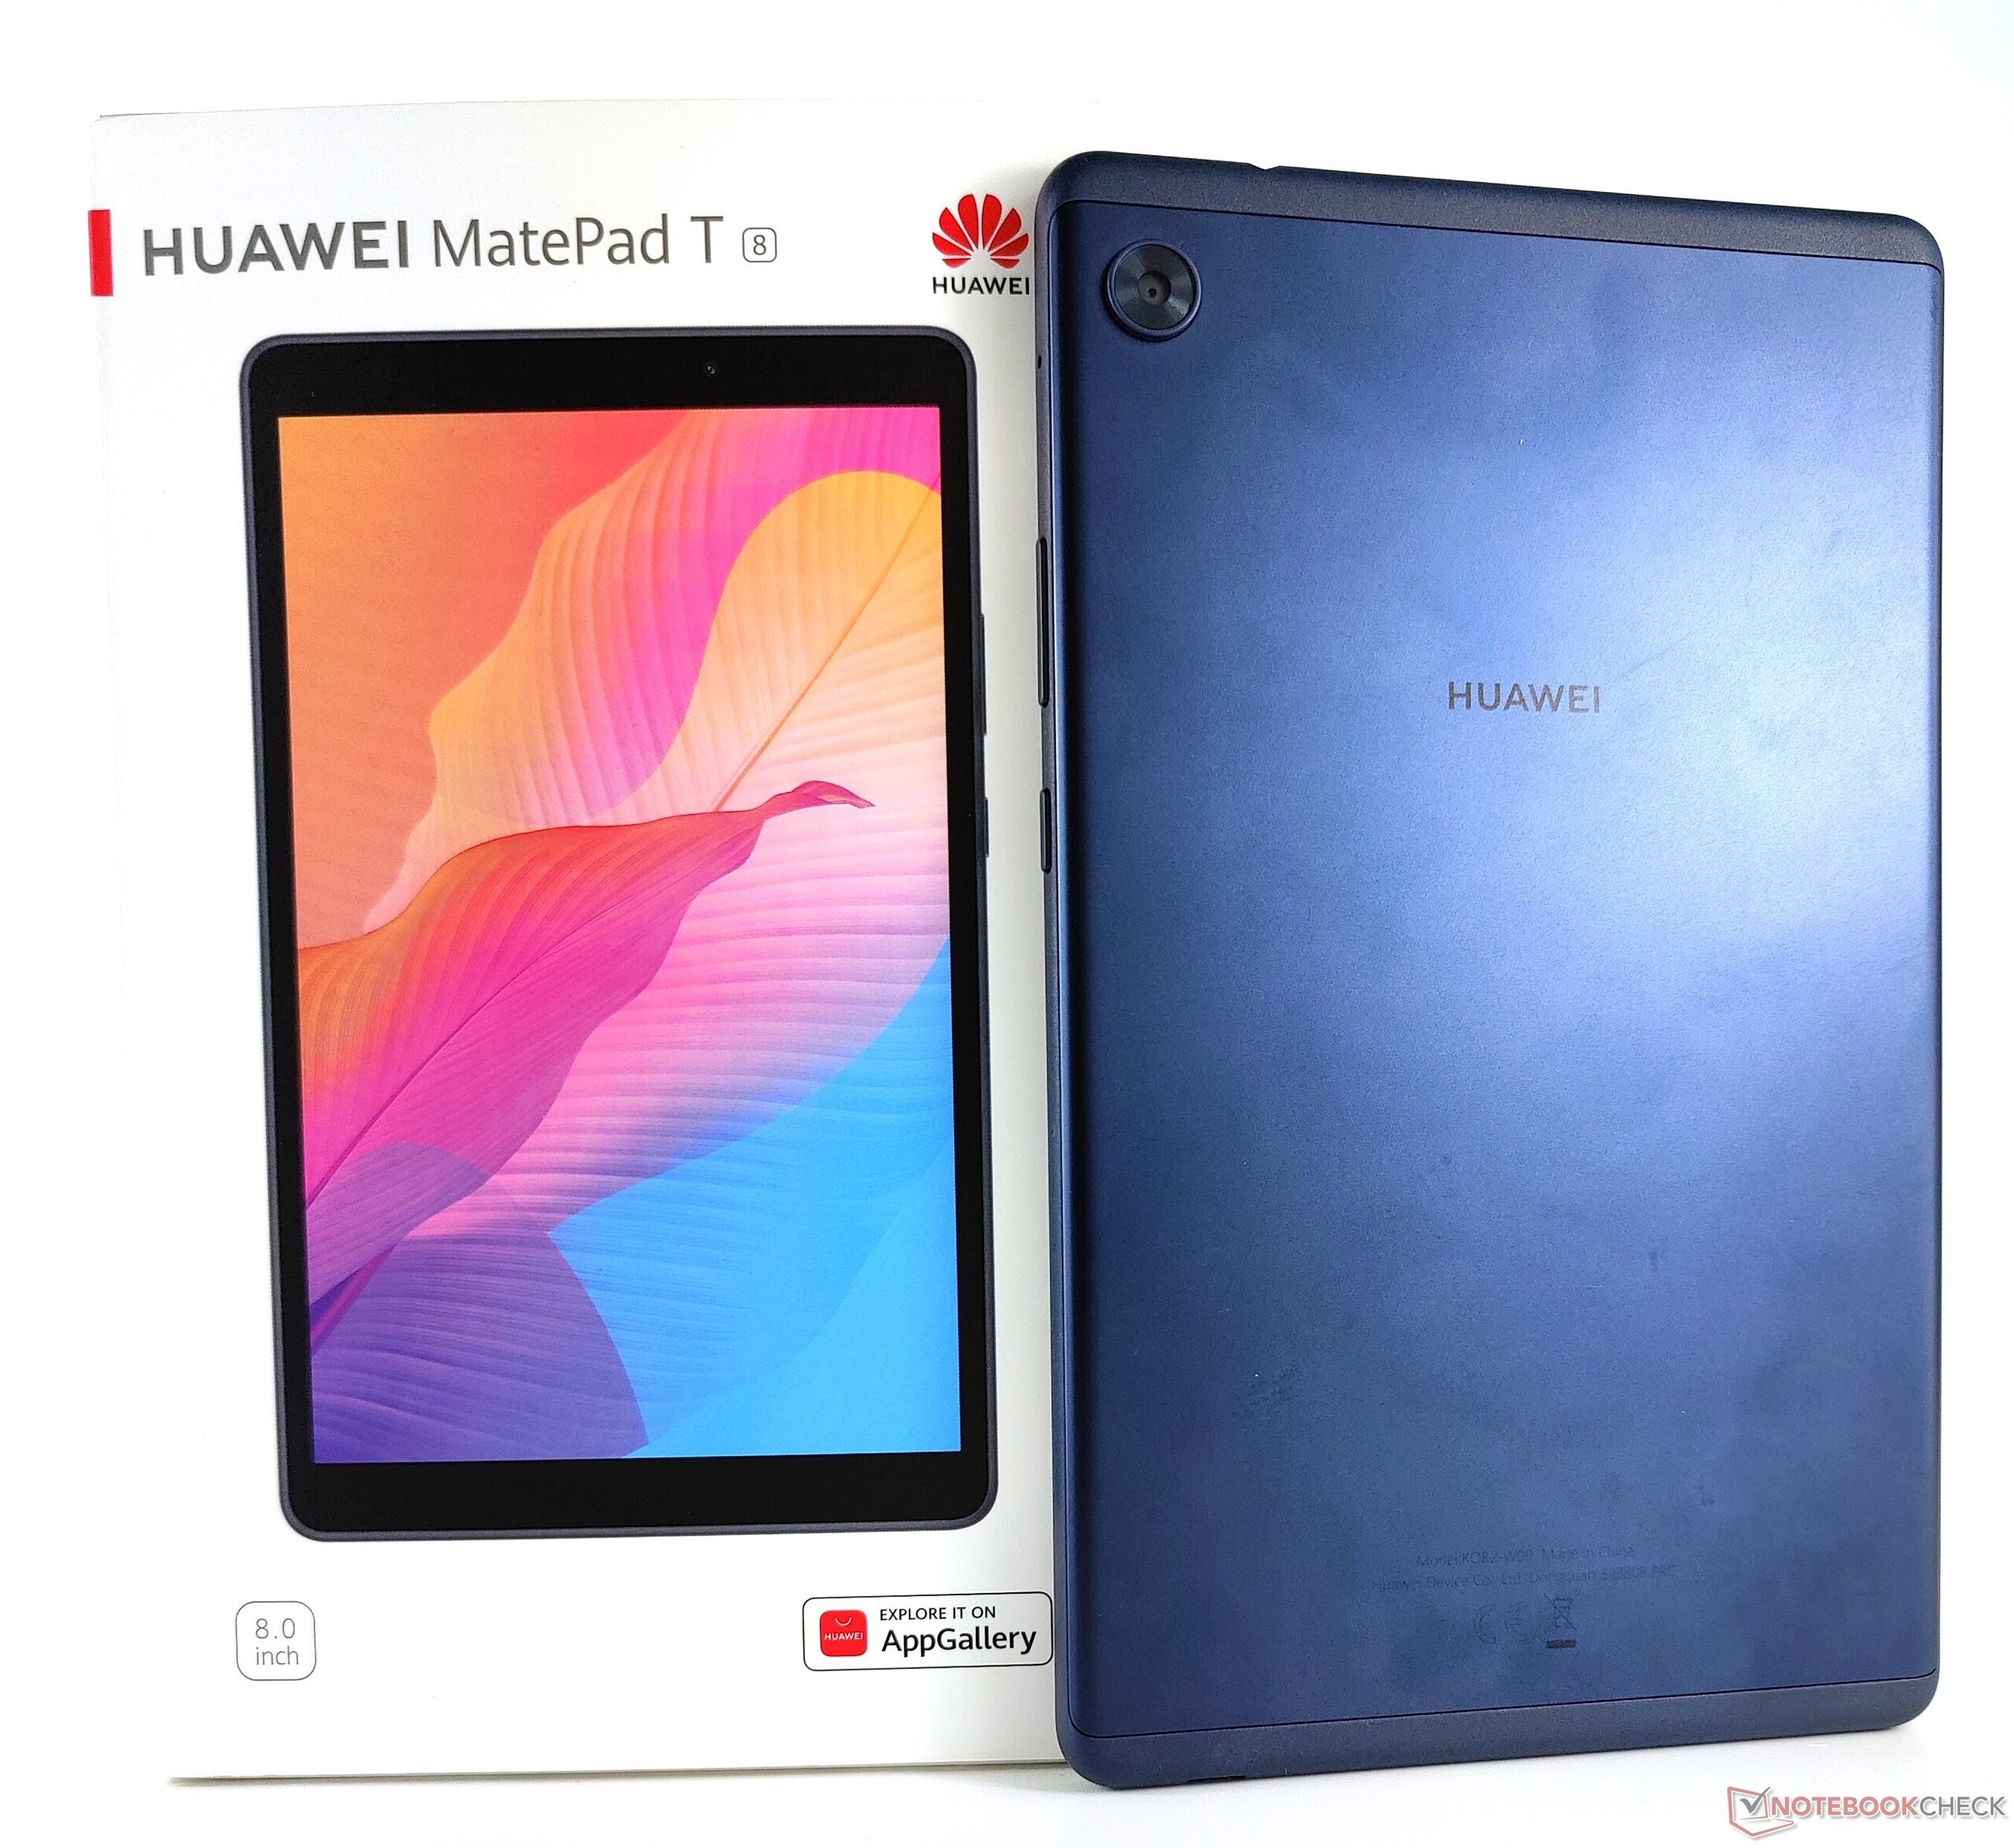
Análise do Tablet Huawei MatePad T8 - O tablet de 99 euros (~$ 117) vale a pena?
Avaliação | Data | Modelo | Peso | Altura | Size | Resolução | Preço |
|---|---|---|---|---|---|---|---|
| 80.5 % v7 (old) | 09/2020 | Huawei MatePad T8 Helio MT8768, PowerVR GE8320 | 310 g | 8.55 mm | 8.00" | 1280x800 | |
| 80.6 % v7 (old) | 08/2020 | Amazon Fire HD 8 Plus 2020 MT8168, Mali-G52 MP1 | 355 g | 9.7 mm | 8.00" | 1280x800 | |
| 80.8 % v7 (old) | 08/2020 | Amazon Fire HD 8 2020 MT8168, Mali-G52 MP1 | 355 g | 9.7 mm | 8.00" | 1280x800 | |
| 81 % v7 (old) | 01/2020 | Lenovo Tab M8 HD Helio A22 MT6762M, PowerVR GE8320 | 305 g | 8.2 mm | 8.00" | 1280x800 | |
| 79.6 % v7 (old) | 01/2020 | Samsung Galaxy Tab A 8.0 2019 Wifi SM-T290 SD 429, Adreno 504 | 345 g | 8 mm | 8.00" | 1280x800 |
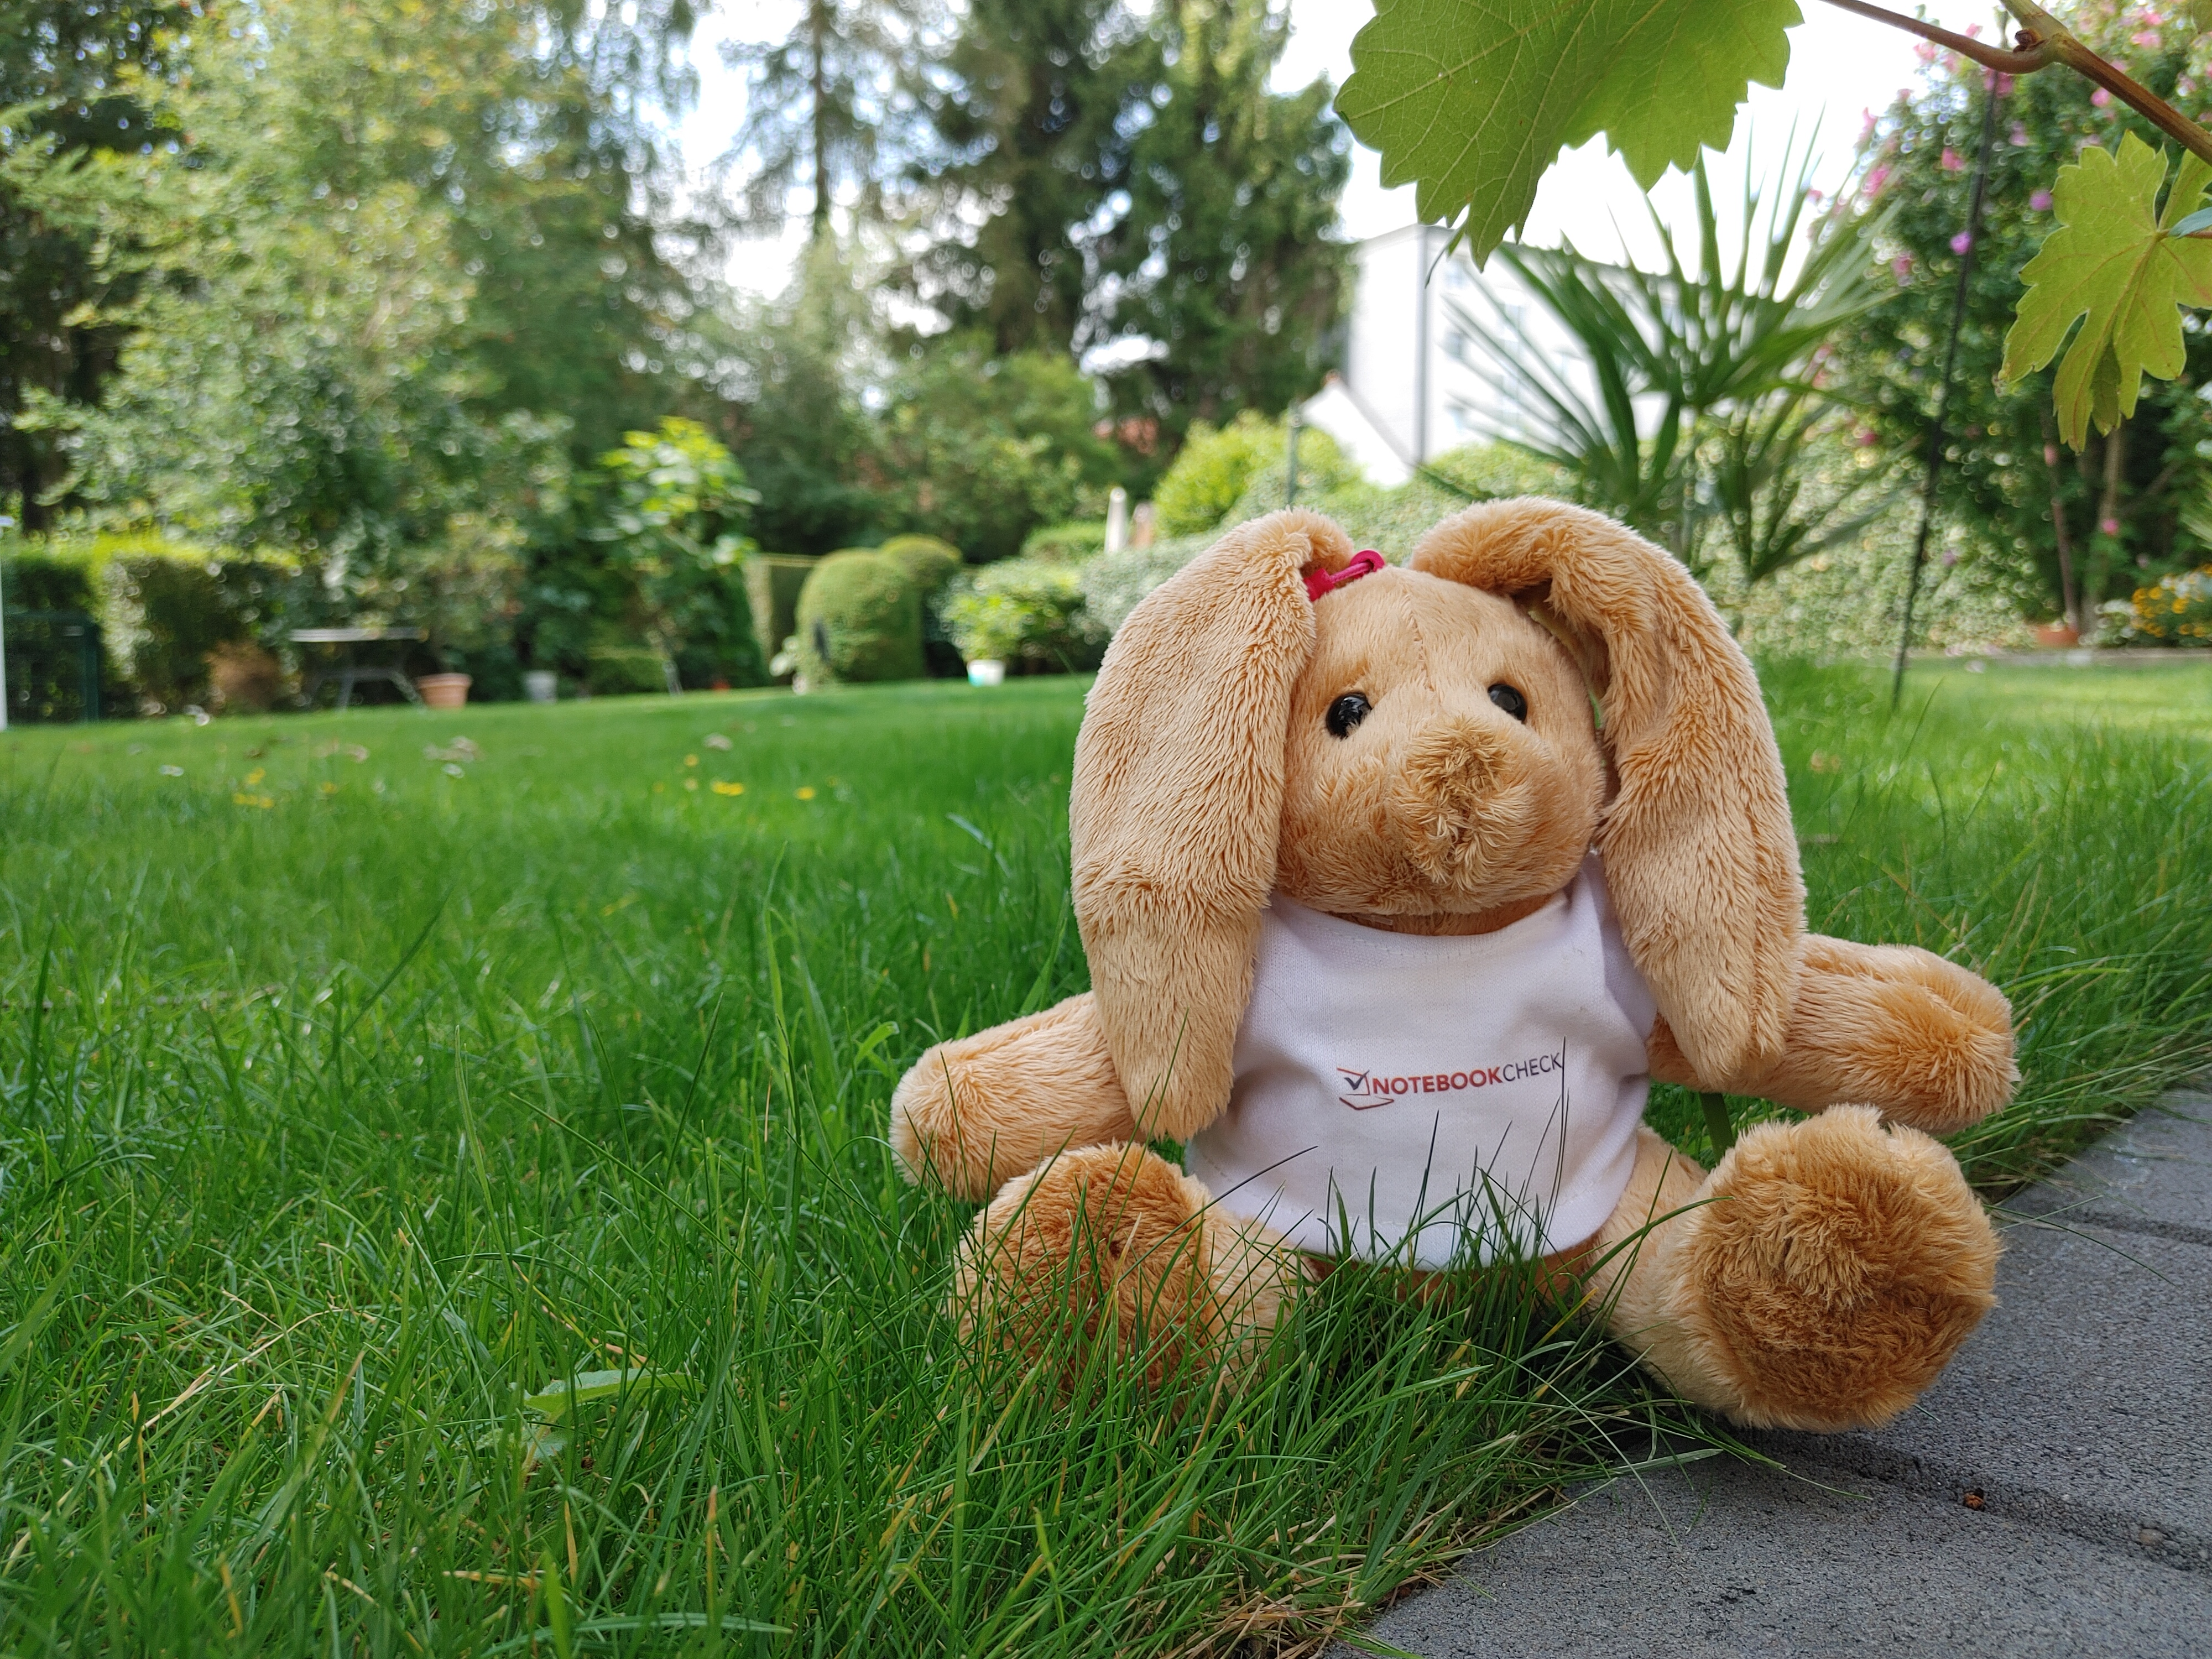
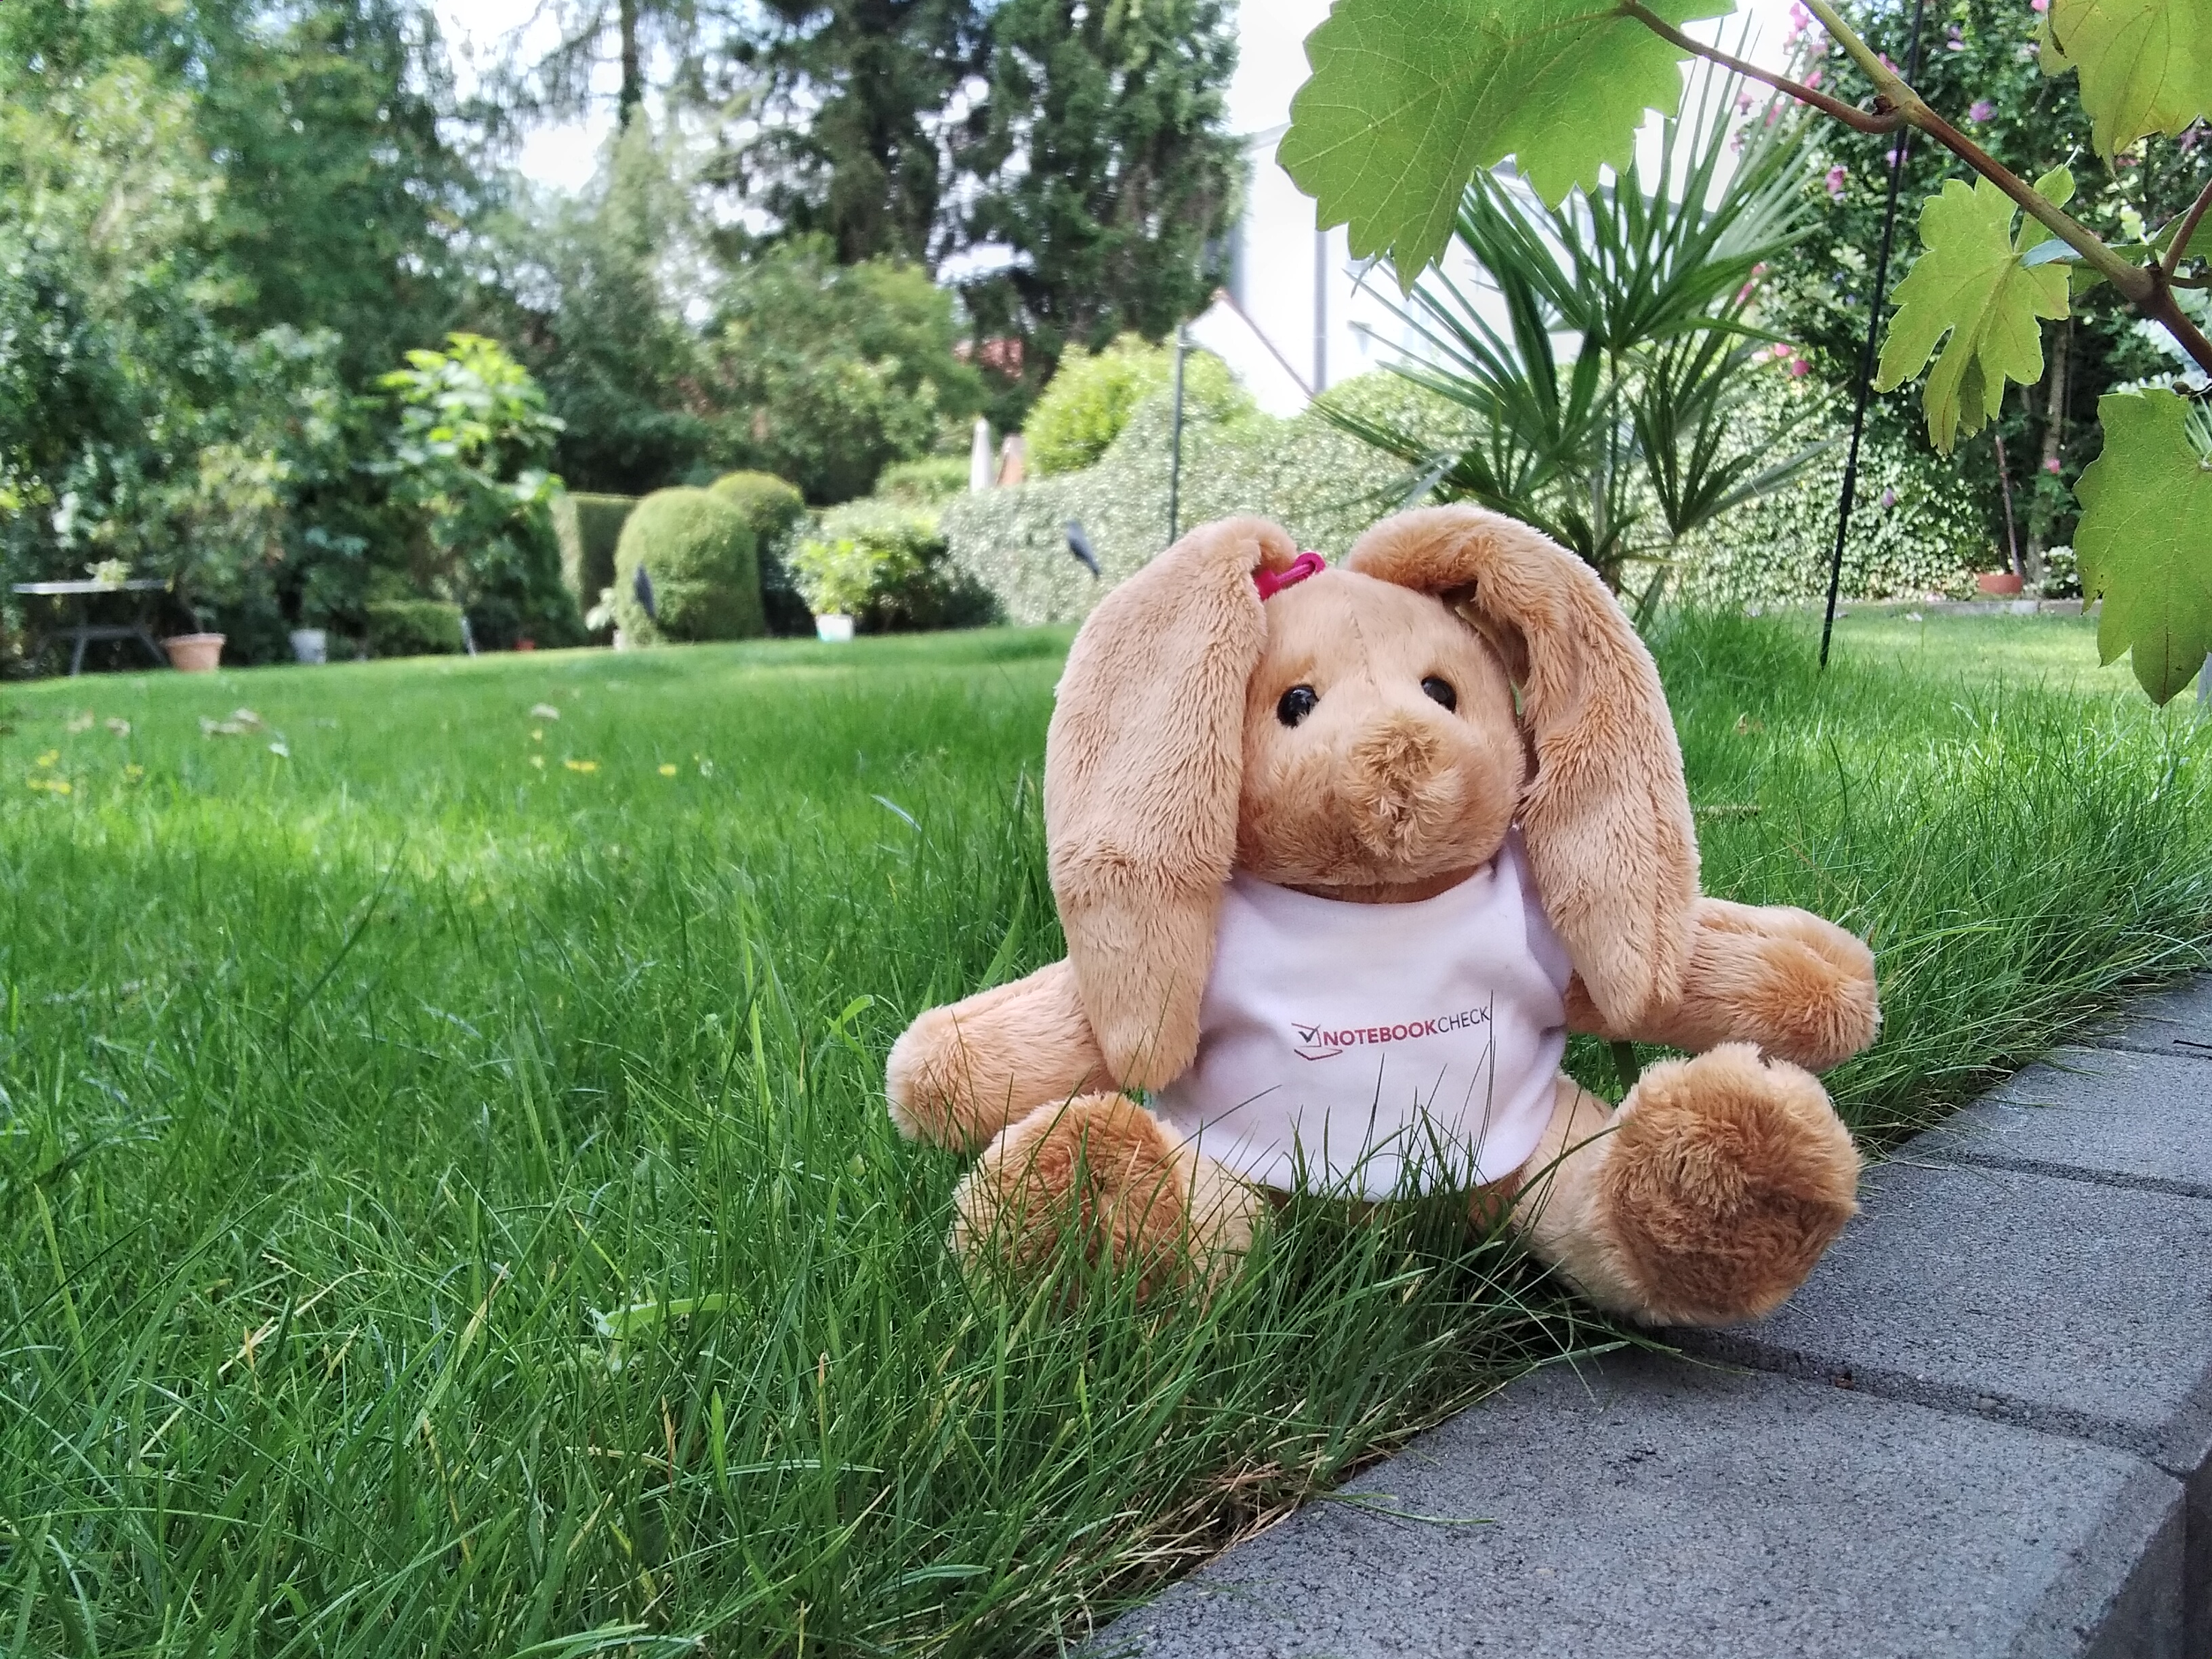
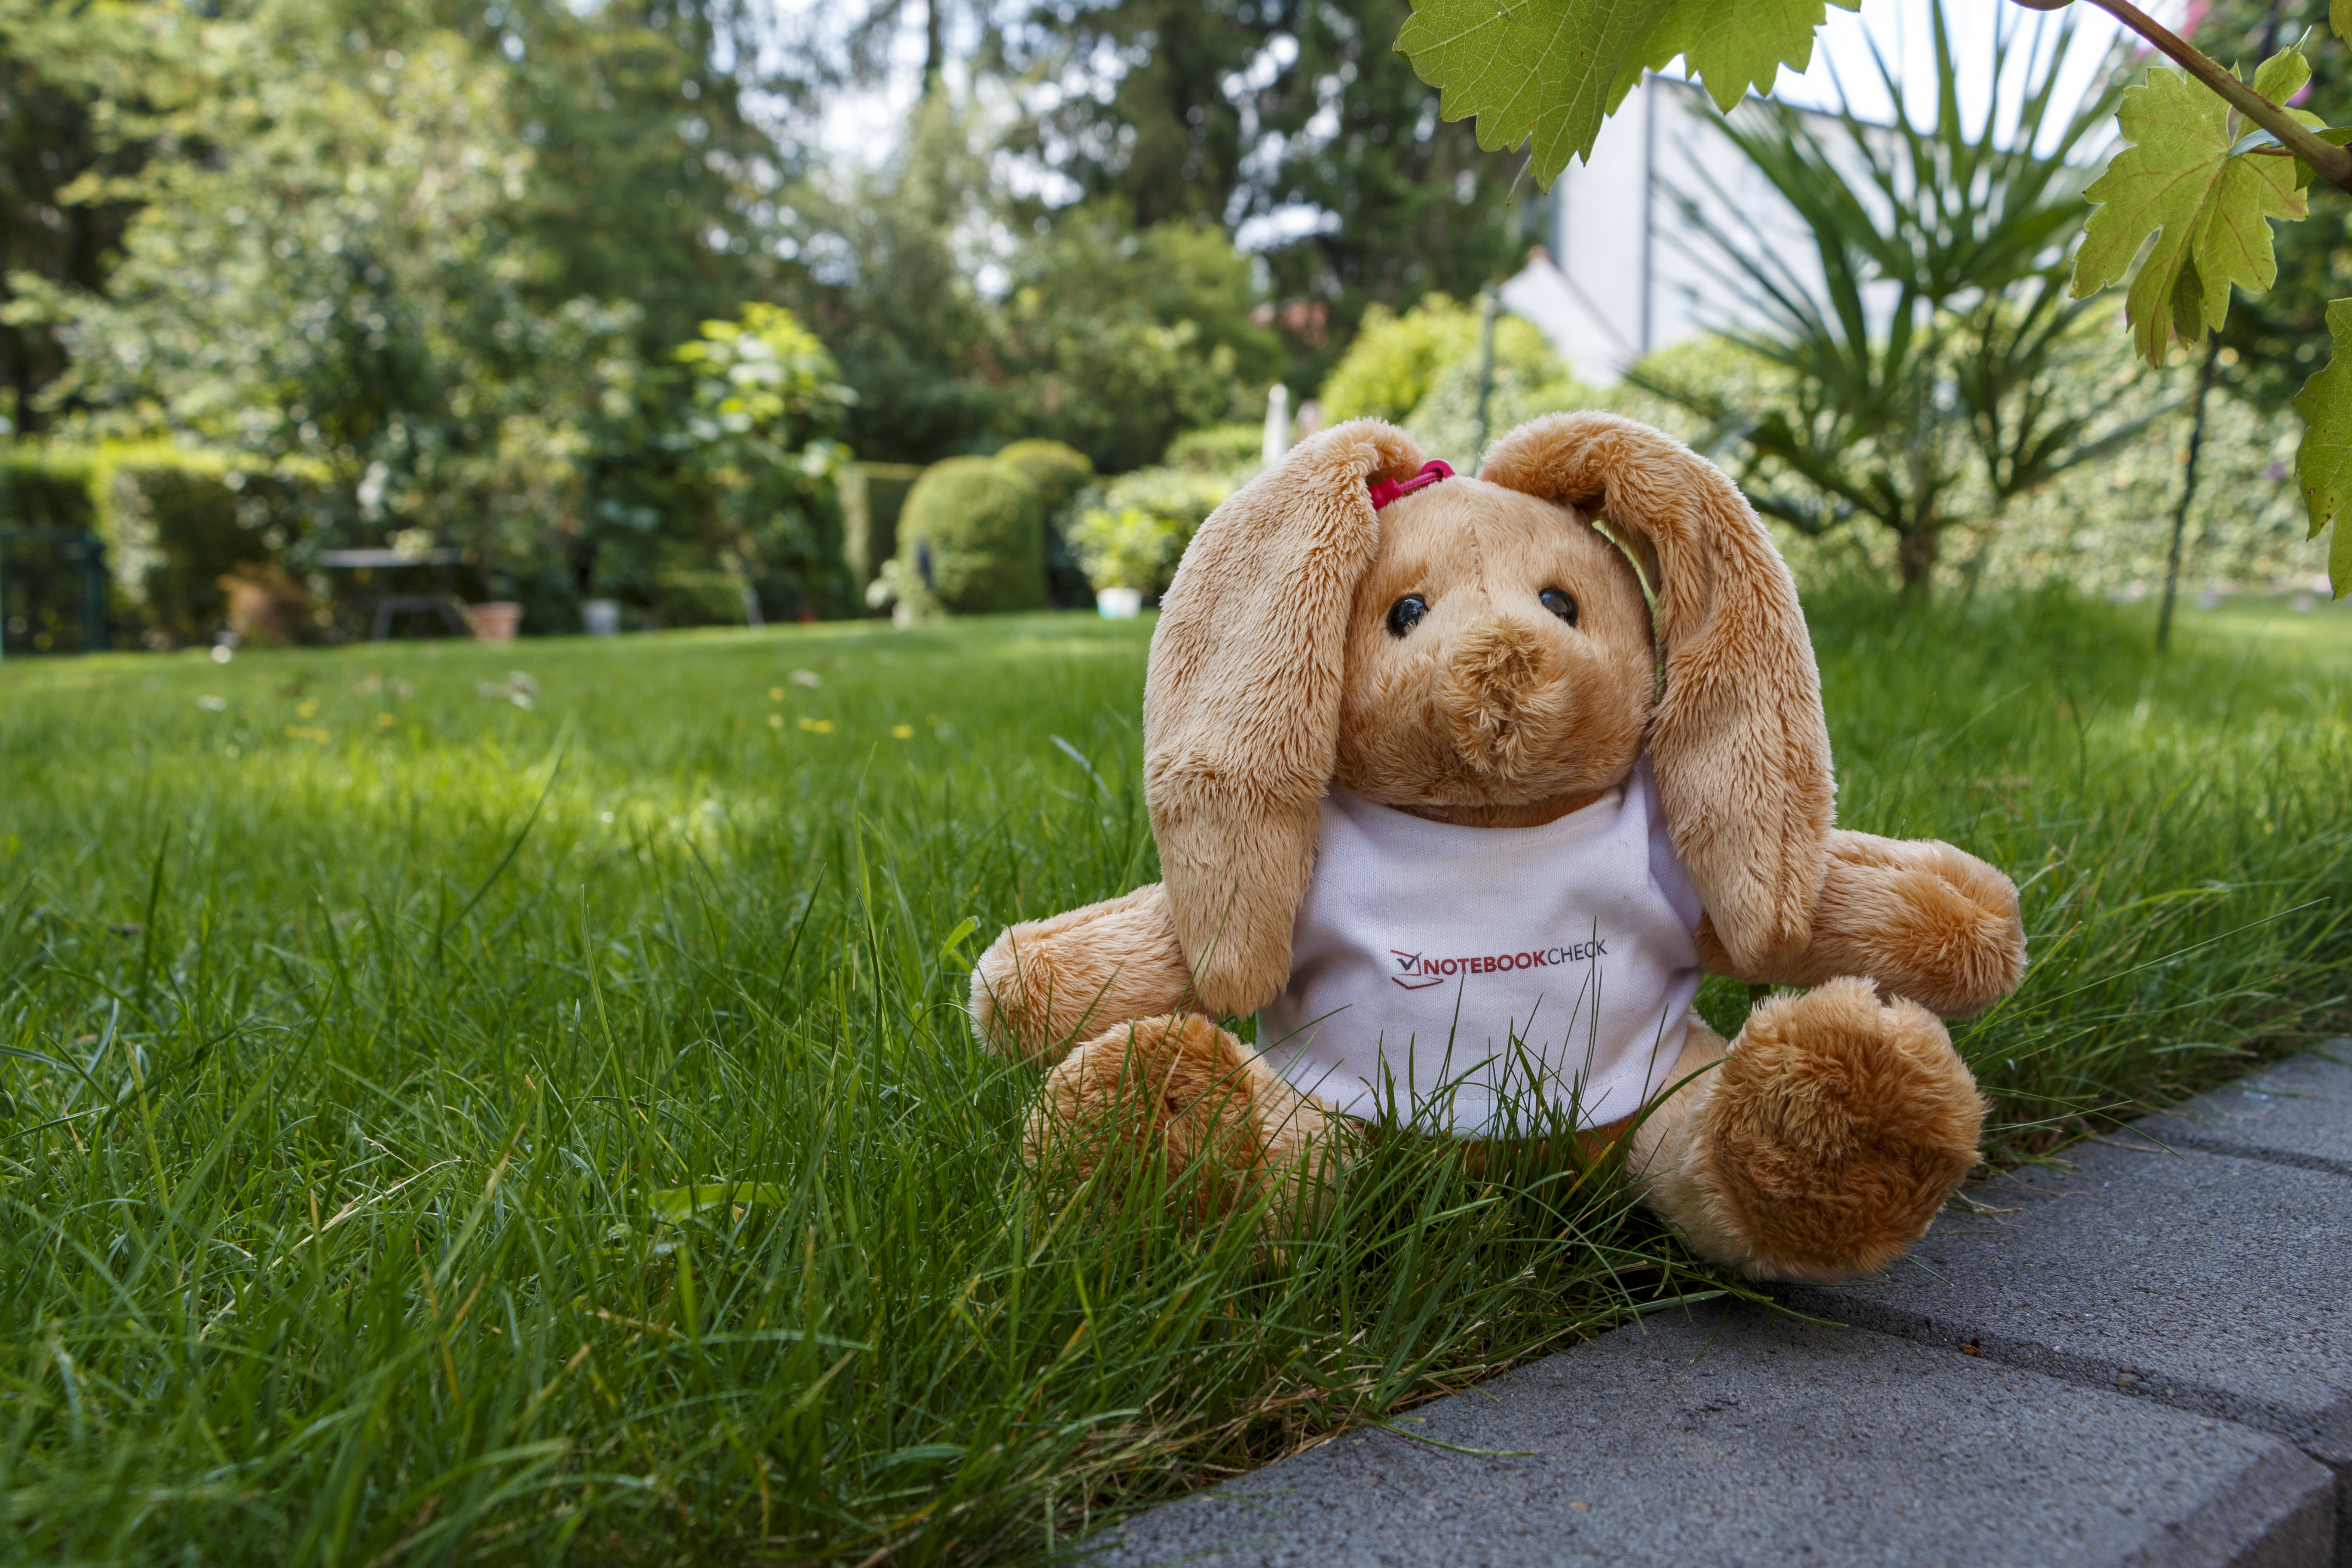
Comparação de imagens
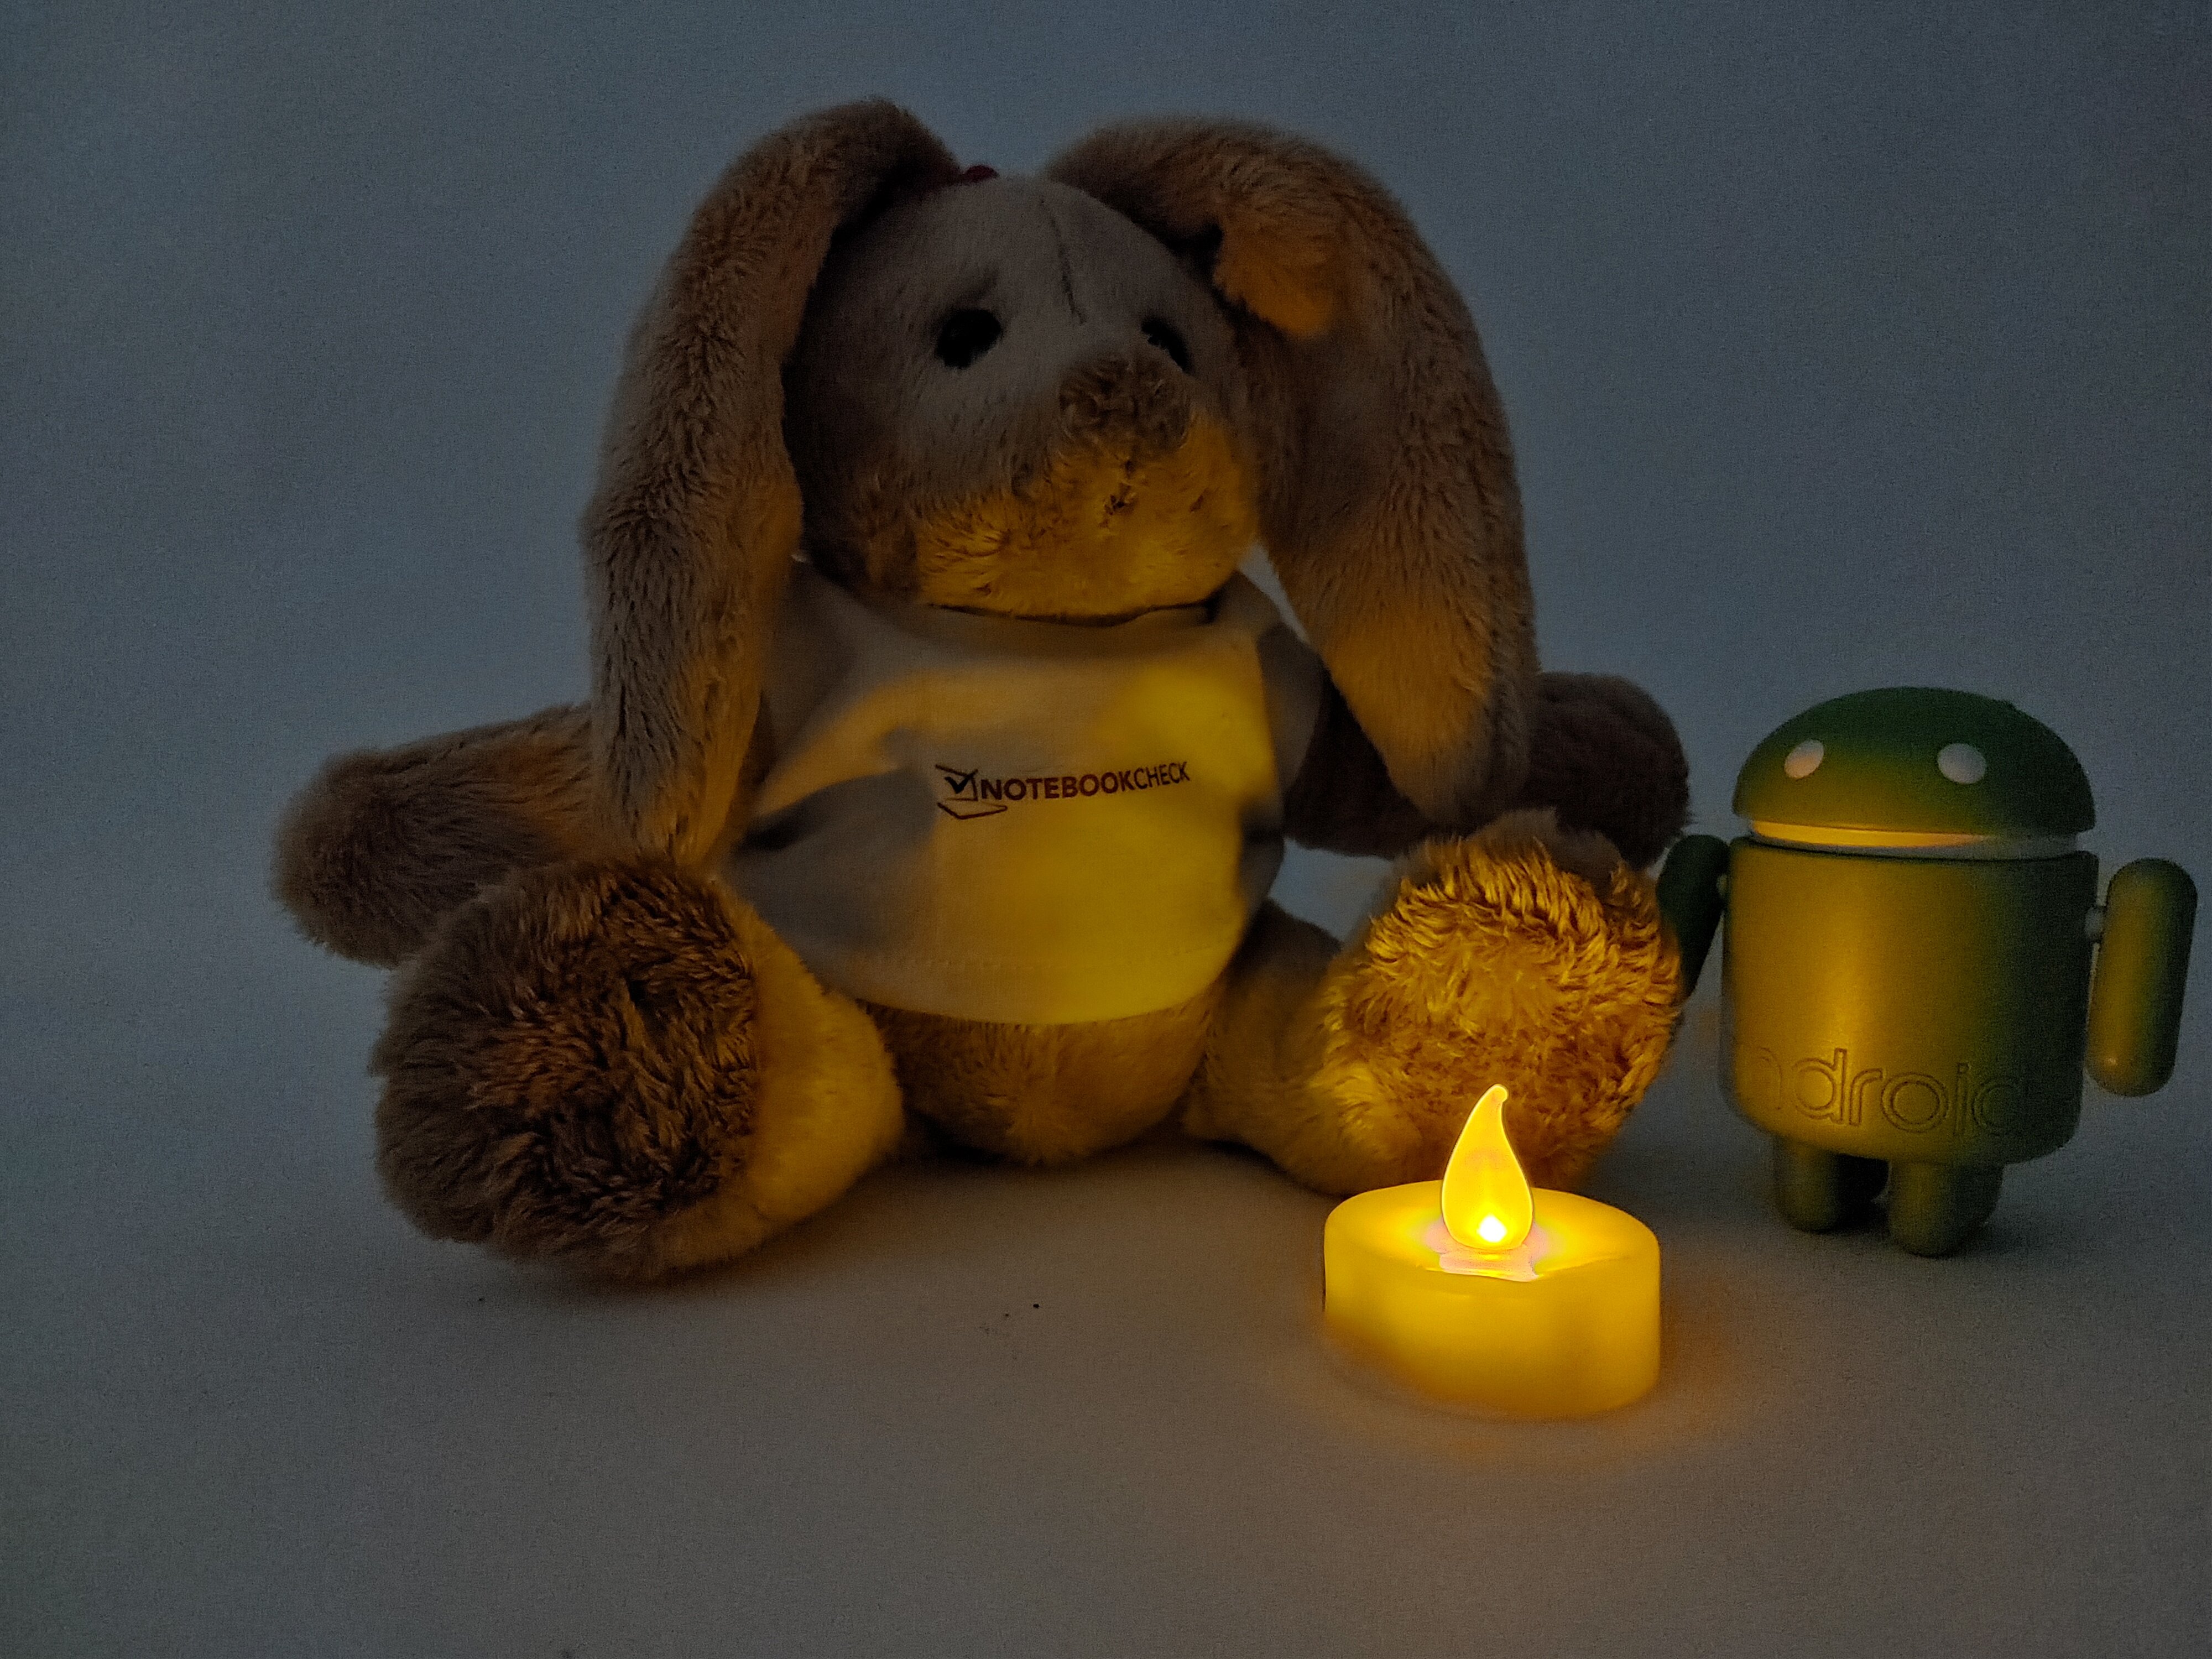
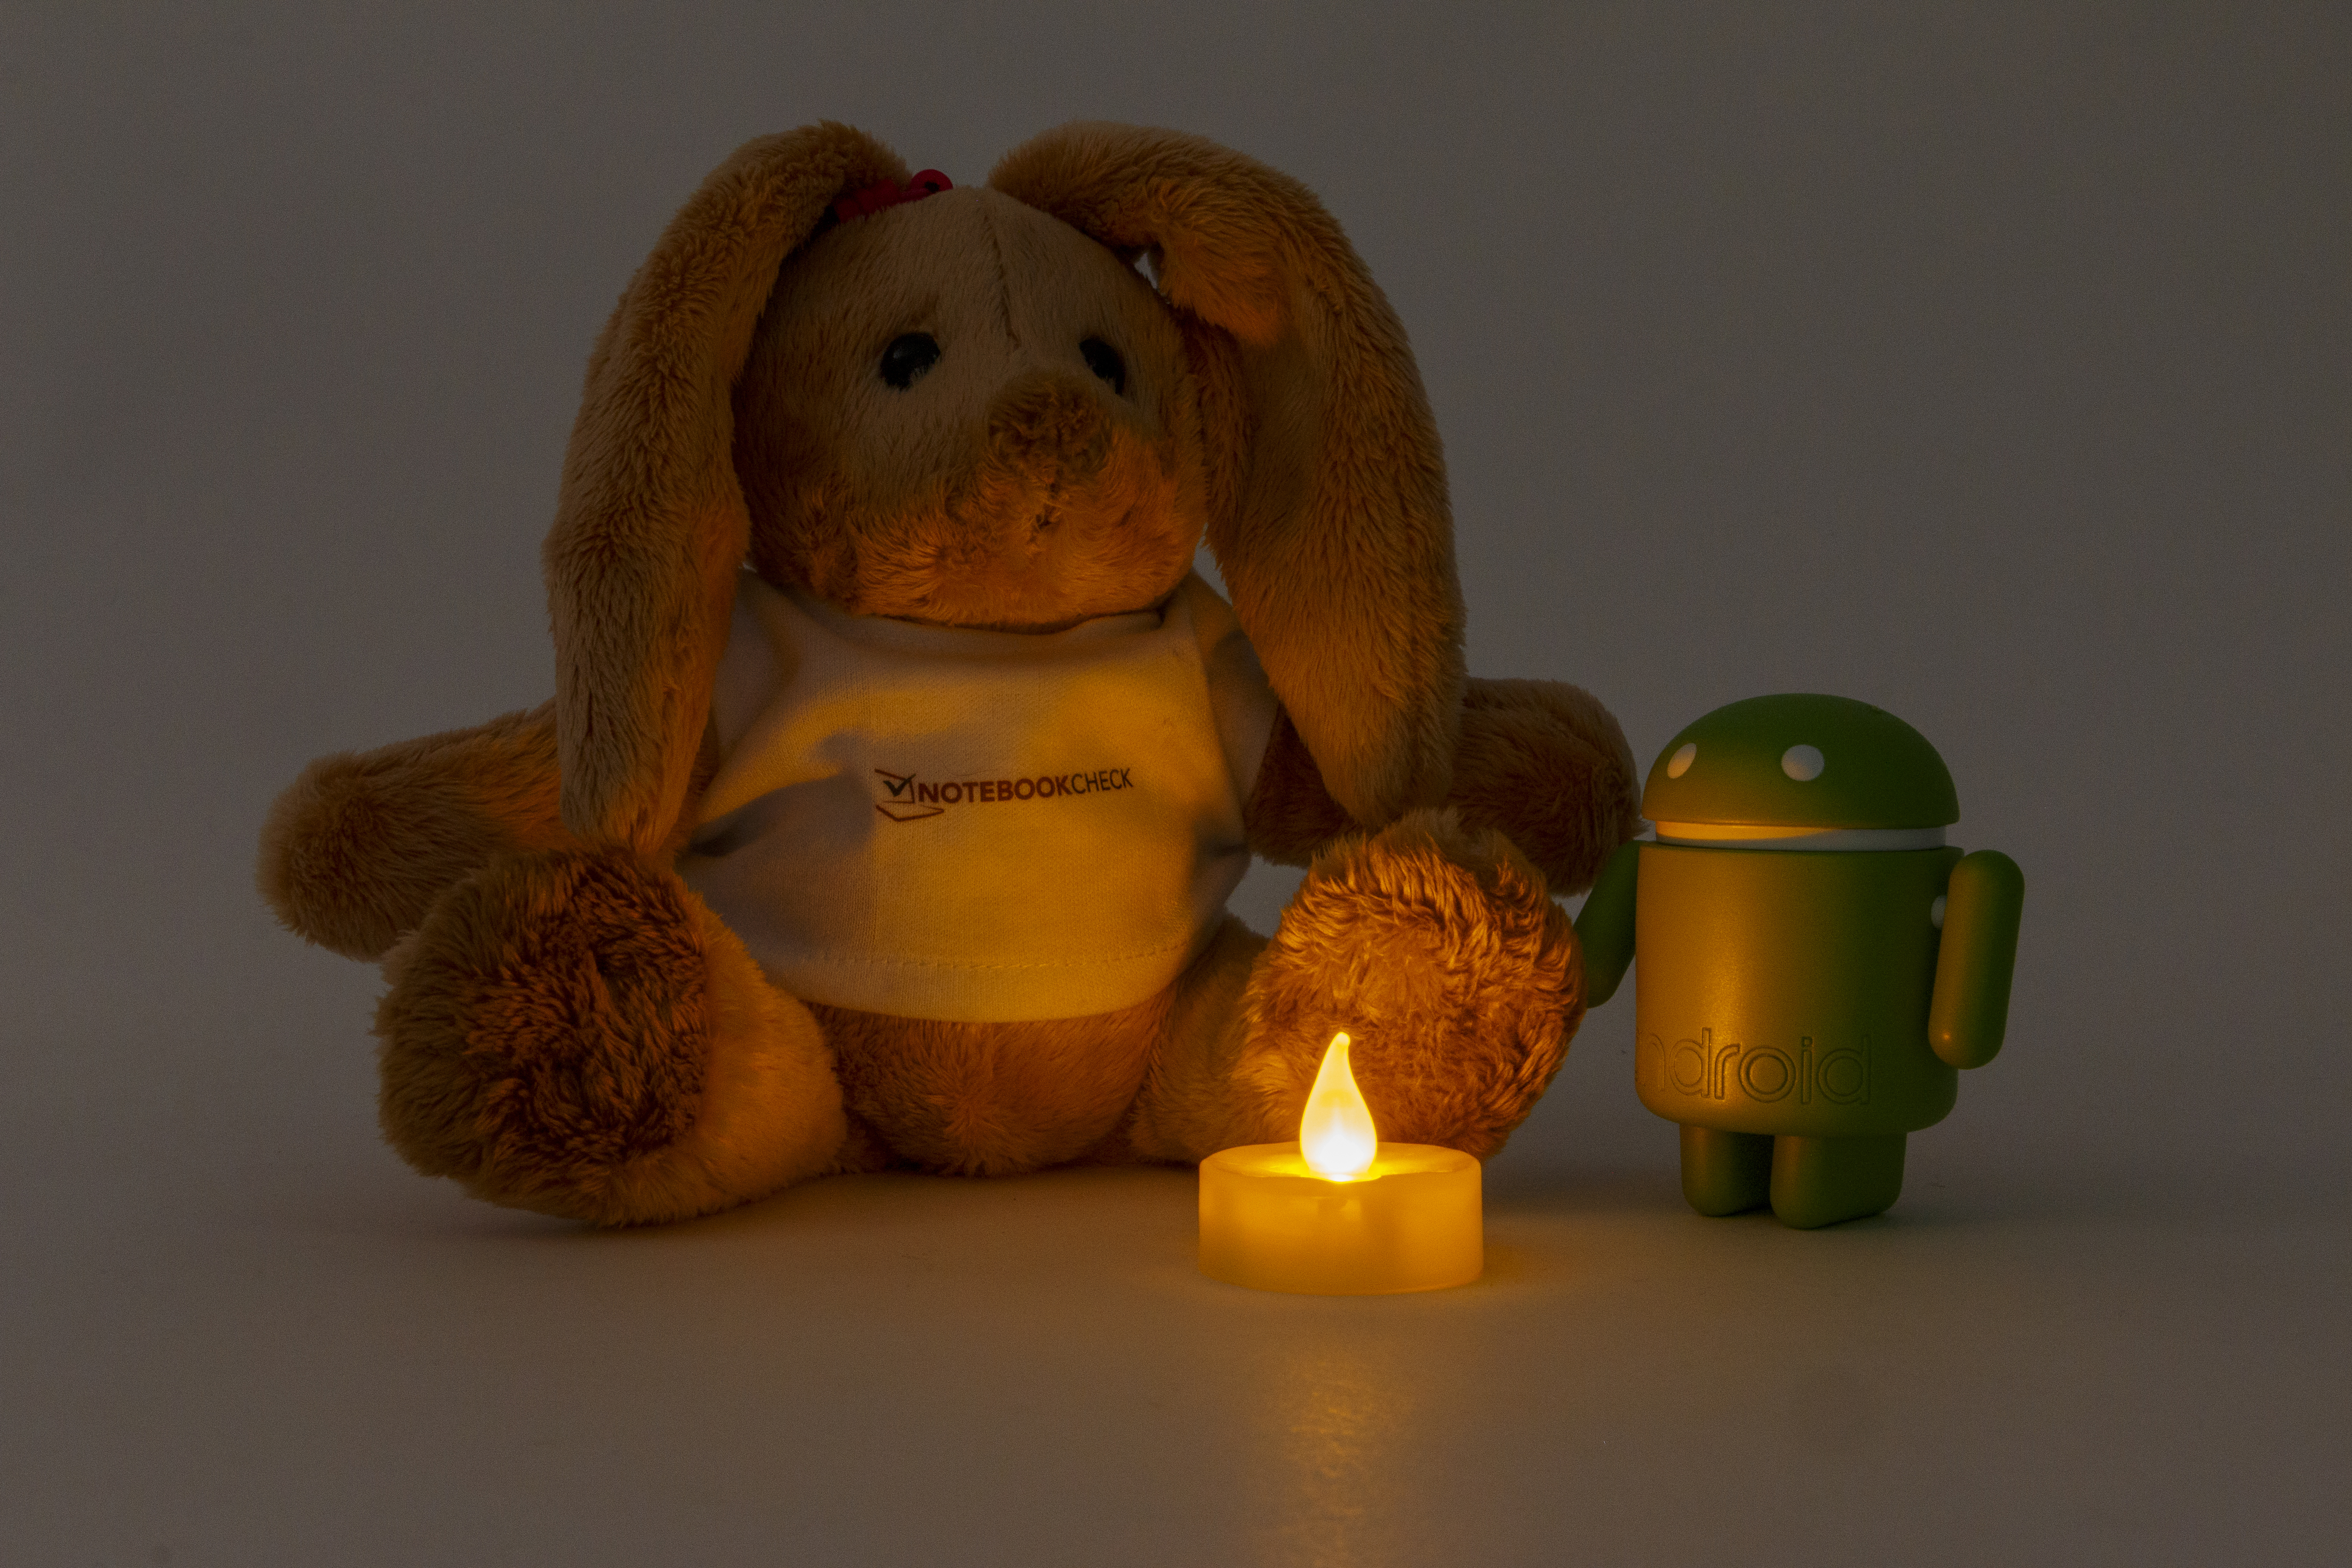
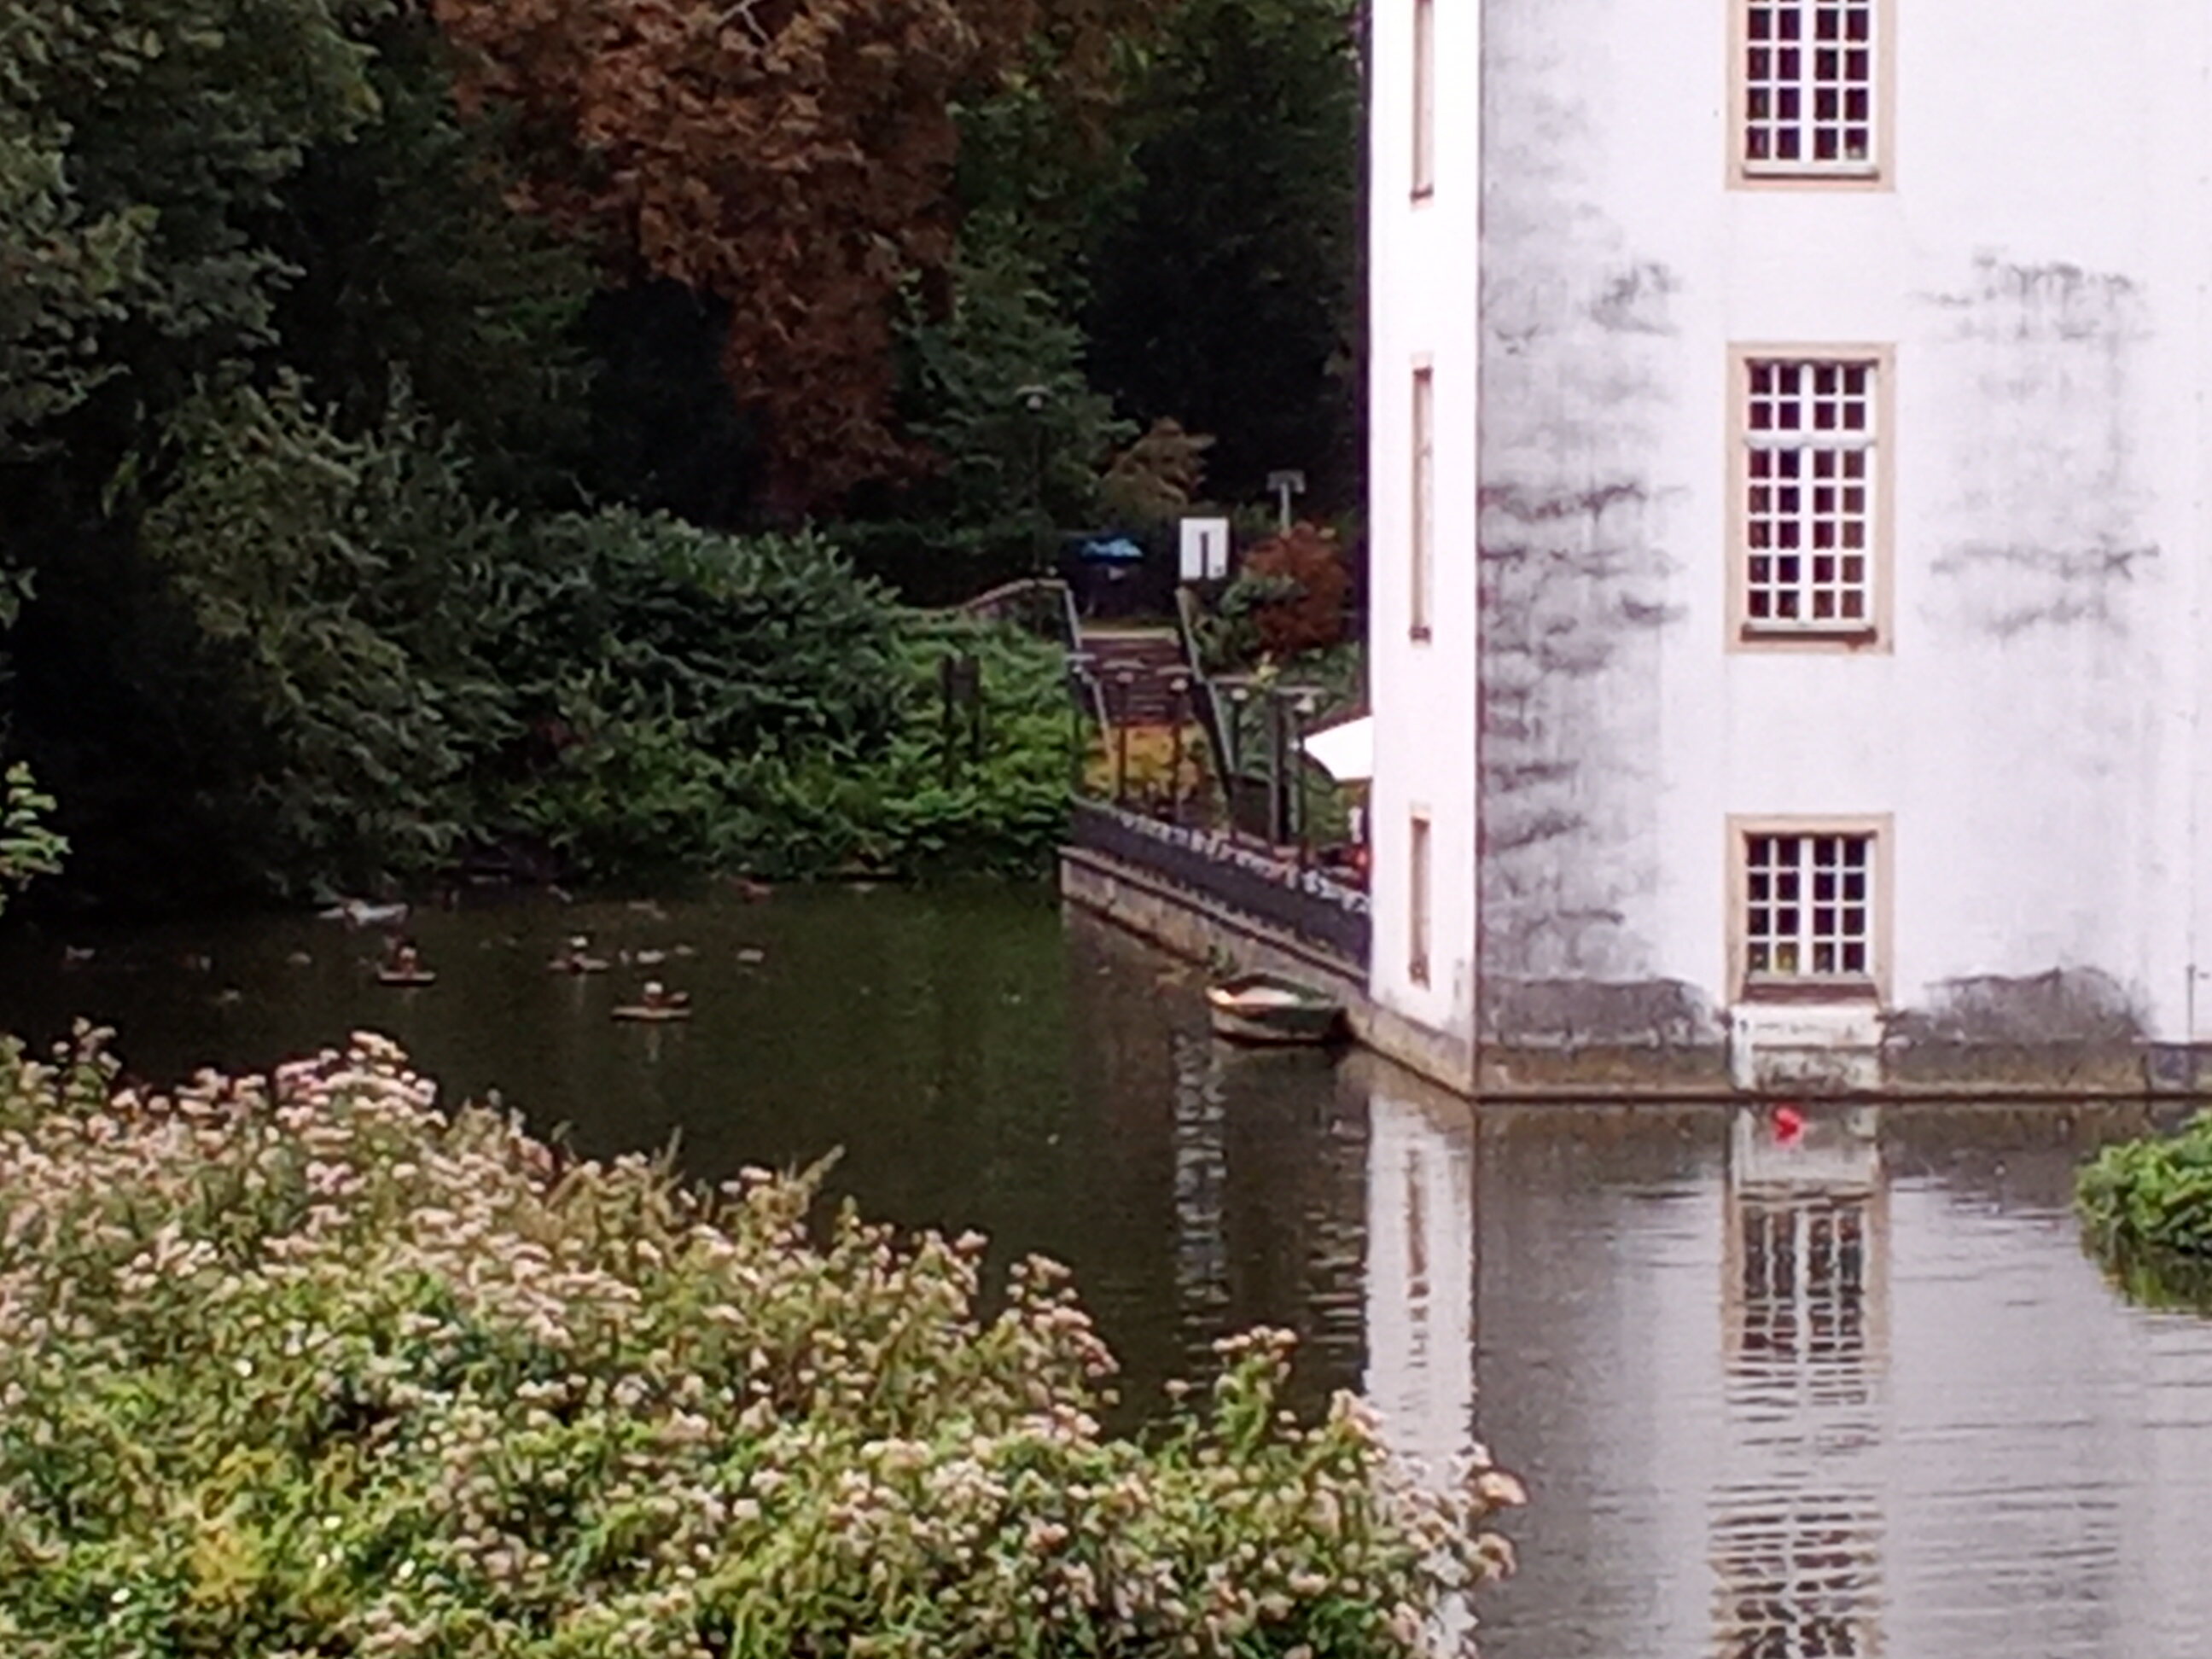
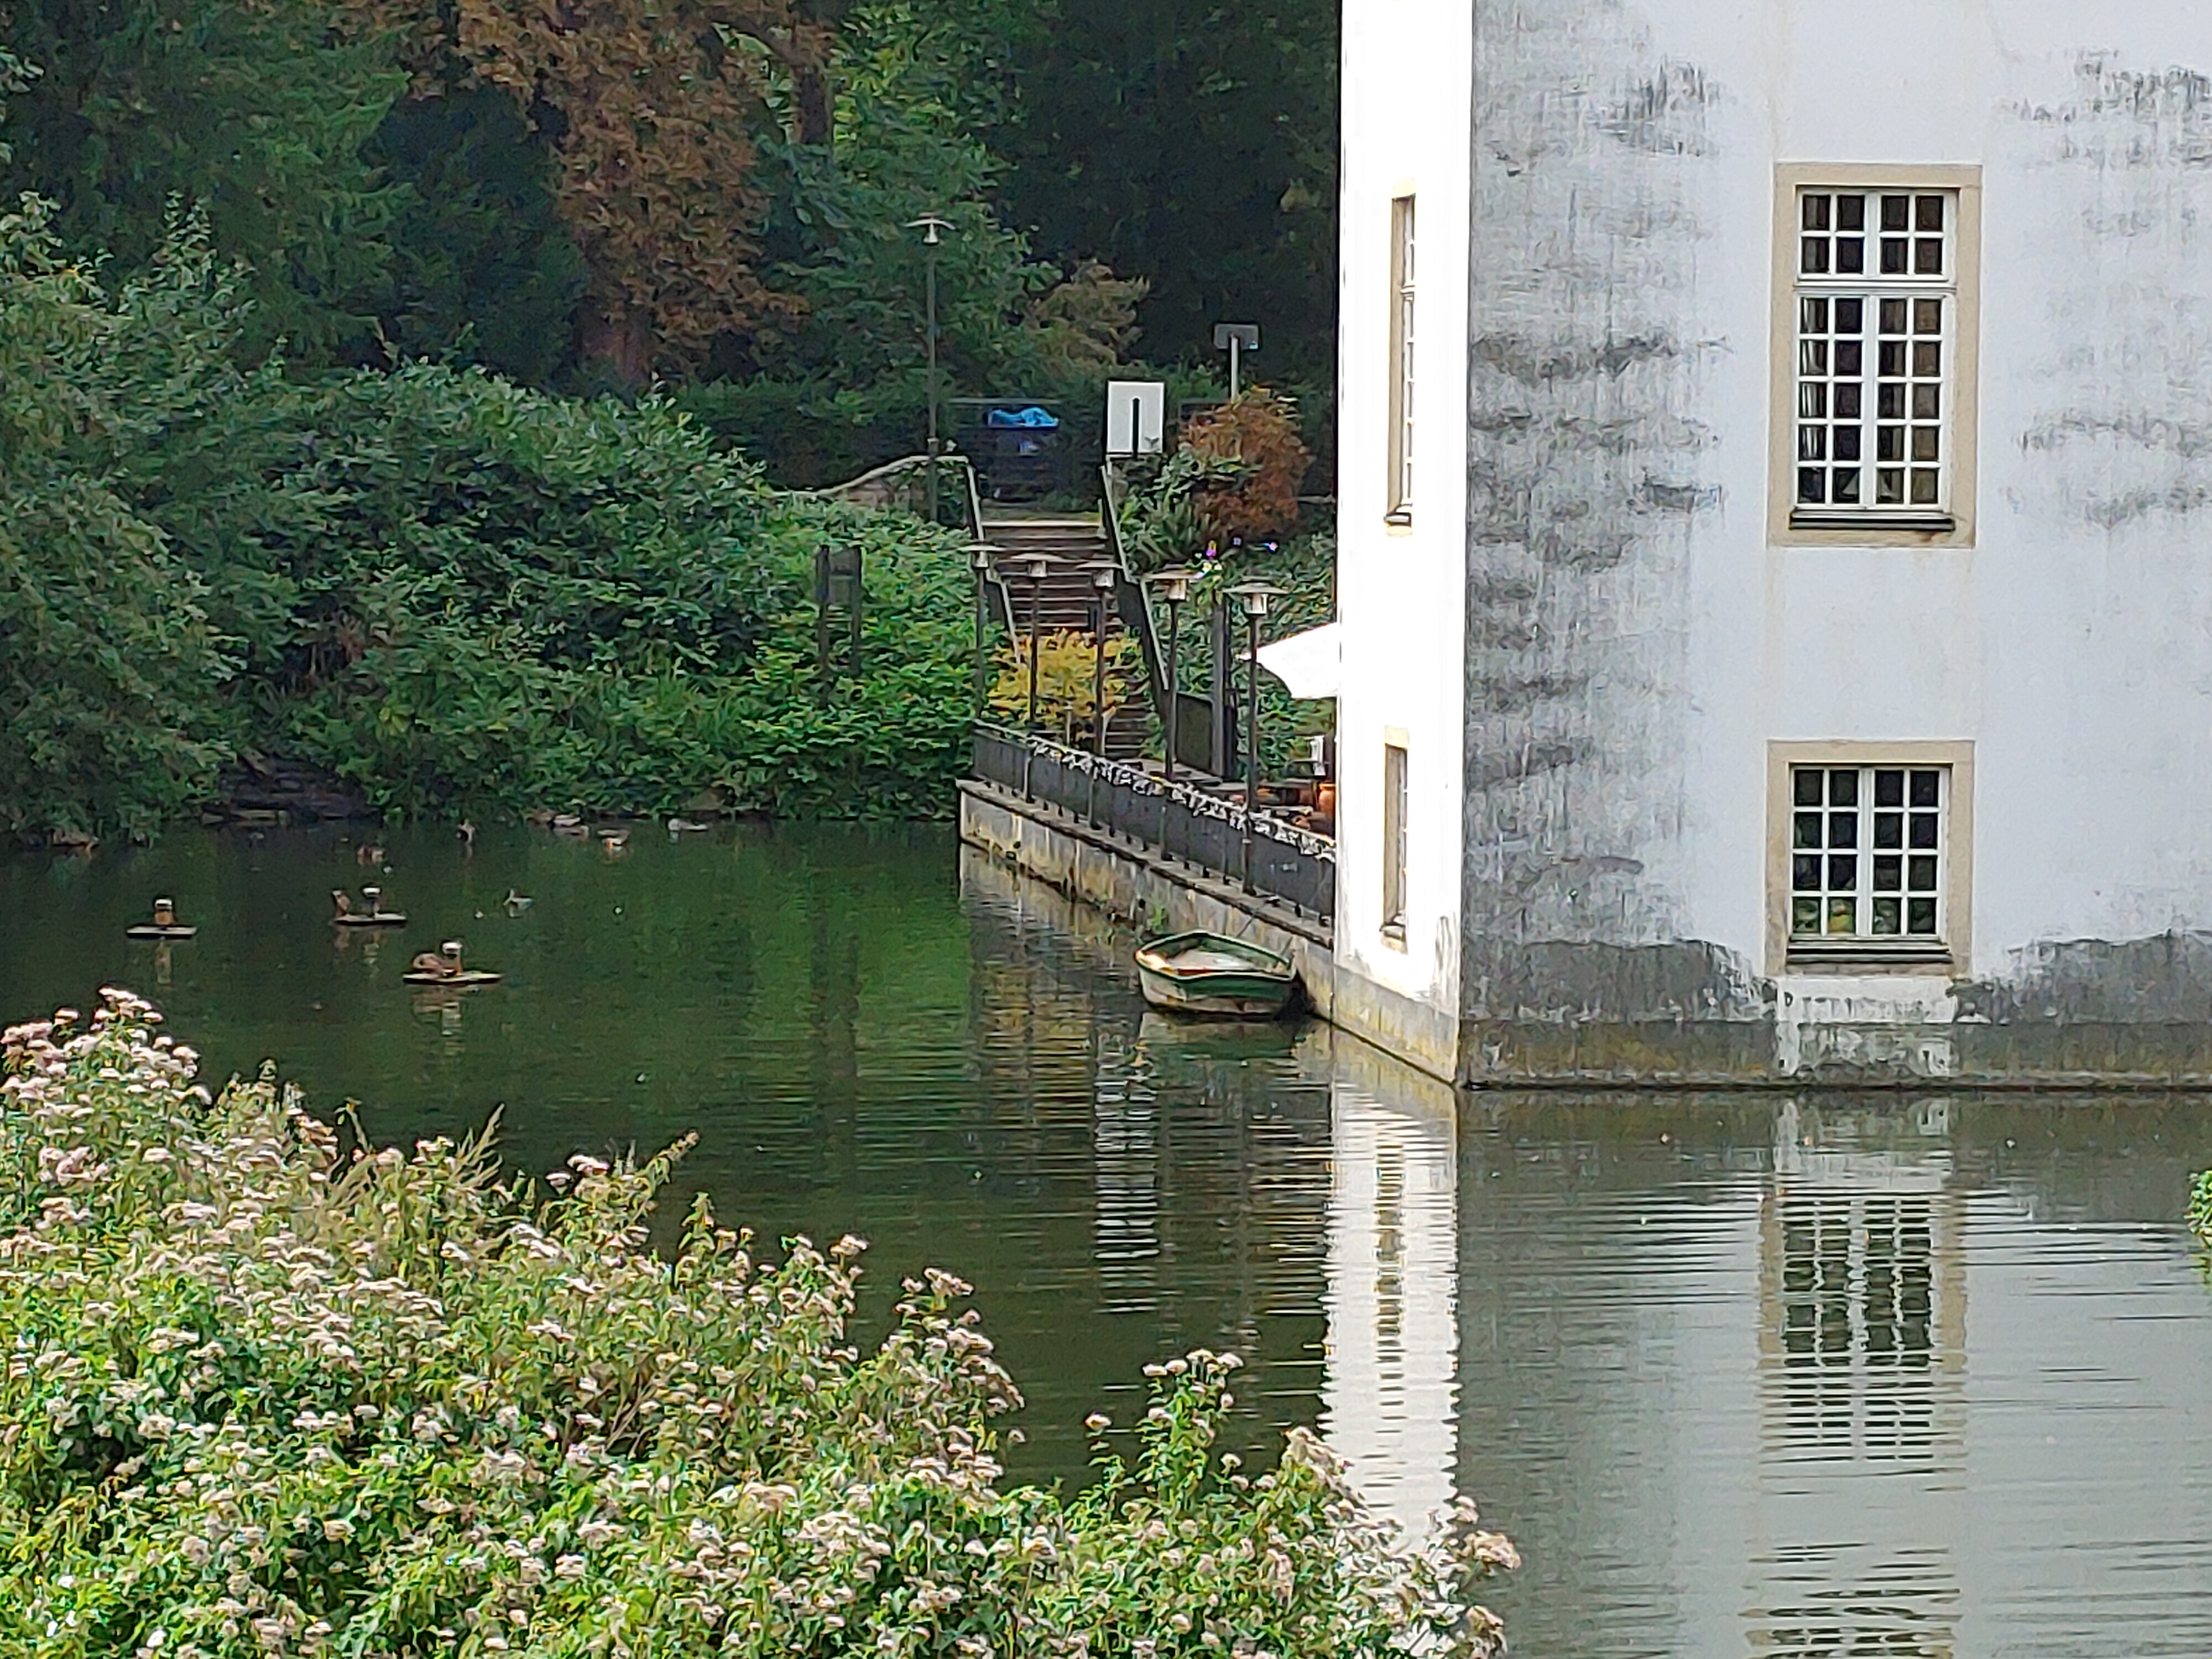
Escolha uma cena e navegue pela primeira imagem. Um clique muda a posição nas telas sensíveis ao toque. Um clique na imagem ampliada abre o original em uma nova janela. A primeira imagem mostra a fotografia em escala do dispositivo de teste.
Wide-angleLow-light photography4X zoomWide-angle


| |||||||||||||||||||||||||
iluminação: 92 %
iluminação com acumulador: 331 cd/m²
Contraste: 2069:1 (Preto: 0.16 cd/m²)
ΔE ColorChecker Calman: 4.1 | ∀{0.5-29.43 Ø4.71}
ΔE Greyscale Calman: 3.9 | ∀{0.09-98 Ø4.96}
85.1% sRGB (Calman 2D)
Gamma: 2.31
CCT: 7355 K
| Huawei MatePad T8 LCD, 1280x800, 8" | Amazon Fire HD 8 Plus 2020 IPS, 1280x800, 8" | Amazon Fire HD 8 2020 IPS, 1280x800, 8" | Lenovo Tab M8 HD IPS, 1280x800, 8" | Samsung Galaxy Tab A 8.0 2019 Wifi SM-T290 TFT, 1280x800, 8" | |
|---|---|---|---|---|---|
| Screen | 10% | 12% | -7% | -33% | |
| Brightness middle (cd/m²) | 331 | 490 48% | 501 51% | 379 15% | 377 14% |
| Brightness (cd/m²) | 326 | 447 37% | 463 42% | 346 6% | 372 14% |
| Brightness Distribution (%) | 92 | 88 -4% | 85 -8% | 88 -4% | 87 -5% |
| Black Level * (cd/m²) | 0.16 | 0.23 -44% | 0.25 -56% | 0.21 -31% | 0.29 -81% |
| Contrast (:1) | 2069 | 2130 3% | 2004 -3% | 1805 -13% | 1300 -37% |
| Colorchecker dE 2000 * | 4.1 | 4 2% | 3.6 12% | 3.8 7% | 6.1 -49% |
| Colorchecker dE 2000 max. * | 7.2 | 8.3 -15% | 8.4 -17% | 7.5 -4% | 10.9 -51% |
| Greyscale dE 2000 * | 3.9 | 2 49% | 1 74% | 5 -28% | 6.6 -69% |
| Gamma | 2.31 95% | 2.29 96% | 2.17 101% | 2.23 99% | 2.13 103% |
| CCT | 7355 88% | 6618 98% | 6473 100% | 7514 87% | 7861 83% |
* ... menor é melhor
Cintilação da tela / PWM (modulação por largura de pulso)
| Tela tremeluzindo / PWM não detectado |  | ||
[pwm_comparison] Em comparação: 52 % de todos os dispositivos testados não usam PWM para escurecer a tela. Se PWM foi detectado, uma média de 7757 (mínimo: 5 - máximo: 343500) Hz foi medida. | |||
Exibir tempos de resposta
| ↔ Tempo de resposta preto para branco | ||
|---|---|---|
| 31.6 ms ... ascensão ↗ e queda ↘ combinadas | ↗ 18.8 ms ascensão | 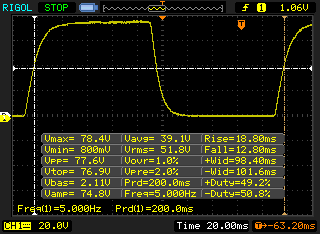 |
| ↘ 12.8 ms queda | ||
| A tela mostra taxas de resposta lentas em nossos testes e será insatisfatória para os jogadores. Em comparação, todos os dispositivos testados variam de 0.1 (mínimo) a 240 (máximo) ms. » 85 % de todos os dispositivos são melhores. Isso significa que o tempo de resposta medido é pior que a média de todos os dispositivos testados (19.8 ms). | ||
| ↔ Tempo de resposta 50% cinza a 80% cinza | ||
| 47.2 ms ... ascensão ↗ e queda ↘ combinadas | ↗ 21.2 ms ascensão | 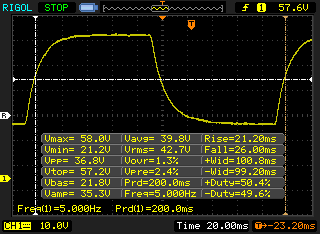 |
| ↘ 26 ms queda | ||
| A tela mostra taxas de resposta lentas em nossos testes e será insatisfatória para os jogadores. Em comparação, todos os dispositivos testados variam de 0.165 (mínimo) a 636 (máximo) ms. » 82 % de todos os dispositivos são melhores. Isso significa que o tempo de resposta medido é pior que a média de todos os dispositivos testados (31 ms). | ||
| Geekbench 4.4 | |
| 64 Bit Single-Core Score | |
| Média da turma Tablet (4231 - 9867, n=8, últimos 2 anos) | |
| Amazon Fire HD 8 2020 | |
| Huawei MatePad T8 | |
| Média Mediatek MT8768 (n=1) | |
| 64 Bit Multi-Core Score | |
| Média da turma Tablet (11144 - 28034, n=8, últimos 2 anos) | |
| Huawei MatePad T8 | |
| Média Mediatek MT8768 (n=1) | |
| Amazon Fire HD 8 2020 | |
| Compute RenderScript Score | |
| Média da turma Tablet (8856 - 22243, n=5, últimos 2 anos) | |
| Huawei MatePad T8 | |
| Média Mediatek MT8768 (n=1) | |
| Amazon Fire HD 8 2020 | |
| GFXBench 3.0 | |
| on screen Manhattan Onscreen OGL | |
| Média da turma Tablet (14 - 165, n=57, últimos 2 anos) | |
| Amazon Fire HD 8 2020 | |
| Huawei MatePad T8 | |
| Média Mediatek MT8768 (10 - 19, n=3) | |
| Lenovo Tab M8 HD | |
| Samsung Galaxy Tab A 8.0 2019 Wifi SM-T290 | |
| 1920x1080 1080p Manhattan Offscreen | |
| Média da turma Tablet (15 - 532, n=57, últimos 2 anos) | |
| Amazon Fire HD 8 2020 | |
| Média Mediatek MT8768 (10 - 12, n=3) | |
| Huawei MatePad T8 | |
| Lenovo Tab M8 HD | |
| Samsung Galaxy Tab A 8.0 2019 Wifi SM-T290 | |
| GFXBench 3.1 | |
| on screen Manhattan ES 3.1 Onscreen | |
| Média da turma Tablet (9.2 - 160, n=57, últimos 2 anos) | |
| Amazon Fire HD 8 2020 | |
| Huawei MatePad T8 | |
| Média Mediatek MT8768 (7 - 13, n=3) | |
| Lenovo Tab M8 HD | |
| Samsung Galaxy Tab A 8.0 2019 Wifi SM-T290 | |
| 1920x1080 Manhattan ES 3.1 Offscreen | |
| Média da turma Tablet (9.8 - 361, n=57, últimos 2 anos) | |
| Amazon Fire HD 8 2020 | |
| Média Mediatek MT8768 (6.9 - 8.3, n=3) | |
| Huawei MatePad T8 | |
| Lenovo Tab M8 HD | |
| Samsung Galaxy Tab A 8.0 2019 Wifi SM-T290 | |
| AnTuTu v8 - Total Score | |
| Huawei MatePad T8 | |
| Média Mediatek MT8768 (89714 - 91467, n=2) | |
| Amazon Fire HD 8 2020 | |
| Amazon Fire HD 8 Plus 2020 | |
| Lenovo Tab M8 HD | |
| Samsung Galaxy Tab A 8.0 2019 Wifi SM-T290 | |
| Jetstream 2 - 2.0 Total | |
| Média da turma Tablet (35.8 - 420, n=55, últimos 2 anos) | |
| Média Mediatek MT8768 (14 - 23.3, n=3) | |
| Samsung Galaxy Tab A 8.0 2019 Wifi SM-T290 (Chrome 79) | |
| Huawei MatePad T8 (Huawei Browser 10.1.4 ) | |
| Lenovo Tab M8 HD | |
| JetStream 1.1 - 1.1 Total | |
| Lenovo Tab M8 HD (Chrome 79) | |
| Samsung Galaxy Tab A 8.0 2019 Wifi SM-T290 (Chrome 79) | |
| Amazon Fire HD 8 2020 (Silk Browser) | |
| Amazon Fire HD 8 Plus 2020 (Silk Browser) | |
| Huawei MatePad T8 (Huawei Browser 10.1.4 ) | |
| Média Mediatek MT8768 (22.1 - 23, n=2) | |
| WebXPRT 3 - Overall | |
| Média da turma Tablet (168 - 520, n=10, últimos 2 anos) | |
| Lenovo Tab M8 HD (Chrome 79) | |
| Samsung Galaxy Tab A 8.0 2019 Wifi SM-T290 (Chrome 79) | |
| Média Mediatek MT8768 (24 - 39, n=4) | |
| Huawei MatePad T8 (Huawei Browser 10.1.4 ) | |
| Amazon Fire HD 8 2020 (Silk Browser) | |
| Amazon Fire HD 8 Plus 2020 (Silk Browser) | |
| Speedometer 2.0 - Result 2.0 | |
| Média da turma Tablet (6.8 - 790, n=33, últimos 2 anos) | |
| Lenovo Tab M8 HD (Chrome 79) | |
| Média Mediatek MT8768 (13.3 - 17.3, n=2) | |
| Samsung Galaxy Tab A 8.0 2019 Wifi SM-T290 (Chrome 79) | |
| Huawei MatePad T8 (Huawei Browser 10.1.4 ) | |
| Amazon Fire HD 8 2020 (Silk Browser) | |
| Octane V2 - Total Score | |
| Média da turma Tablet (1633 - 138481, n=71, últimos 2 anos) | |
| Média Mediatek MT8768 (4070 - 6281, n=3) | |
| Lenovo Tab M8 HD (Chrome 79) | |
| Samsung Galaxy Tab A 8.0 2019 Wifi SM-T290 (Chrome 79) | |
| Amazon Fire HD 8 Plus 2020 (Silk Browser) | |
| Huawei MatePad T8 (Huawei Browser 10.1.4 ) | |
| Amazon Fire HD 8 2020 (Silk Browser) | |
| Mozilla Kraken 1.1 - Total | |
| Huawei MatePad T8 (Huawei Browser 10.1.4 ) | |
| Amazon Fire HD 8 2020 (Silk Browser) | |
| Média Mediatek MT8768 (10163 - 12342, n=4) | |
| Amazon Fire HD 8 Plus 2020 (Silk Browser) | |
| Lenovo Tab M8 HD (Chrome 79) | |
| Samsung Galaxy Tab A 8.0 2019 Wifi SM-T290 (Chrome 79) | |
| Média da turma Tablet (243 - 16233, n=65, últimos 2 anos) | |
* ... menor é melhor
| Huawei MatePad T8 | Amazon Fire HD 8 Plus 2020 | Amazon Fire HD 8 2020 | Lenovo Tab M8 HD | Samsung Galaxy Tab A 8.0 2019 Wifi SM-T290 | Média 16 GB eMMC Flash | Média da turma Tablet | |
|---|---|---|---|---|---|---|---|
| AndroBench 3-5 | 15% | 16% | 12% | 17% | -41% | 1381% | |
| Sequential Read 256KB (MB/s) | 274.1 | 314.2 15% | 315 15% | 297.1 8% | 291.9 6% | 164.5 ? -40% | 2073 ? 656% |
| Sequential Write 256KB (MB/s) | 67.4 | 100.2 49% | 103.9 54% | 79.6 18% | 108.5 61% | 43 ? -36% | 1667 ? 2373% |
| Random Read 4KB (MB/s) | 57.5 | 69.1 20% | 67.6 18% | 77.4 35% | 57.8 1% | 21.7 ? -62% | 275 ? 378% |
| Random Write 4KB (MB/s) | 14.63 | 15.62 7% | 15.72 7% | 15.84 8% | 16.89 15% | 8.08 ? -45% | 324 ? 2115% |
| Sequential Read 256KB SDCard (MB/s) | 82.9 ? | 84.9 ? 2% | 84.1 ? 1% | 83.8 ? 1% | 87.1 ? 5% | 59.1 ? -29% | |
| Sequential Write 256KB SDCard (MB/s) | 62.4 ? | 61.5 ? -1% | 62 ? -1% | 64.3 ? 3% | 69.9 ? 12% | 39.8 ? -36% |
PUBG Mobile
Real Racing 3
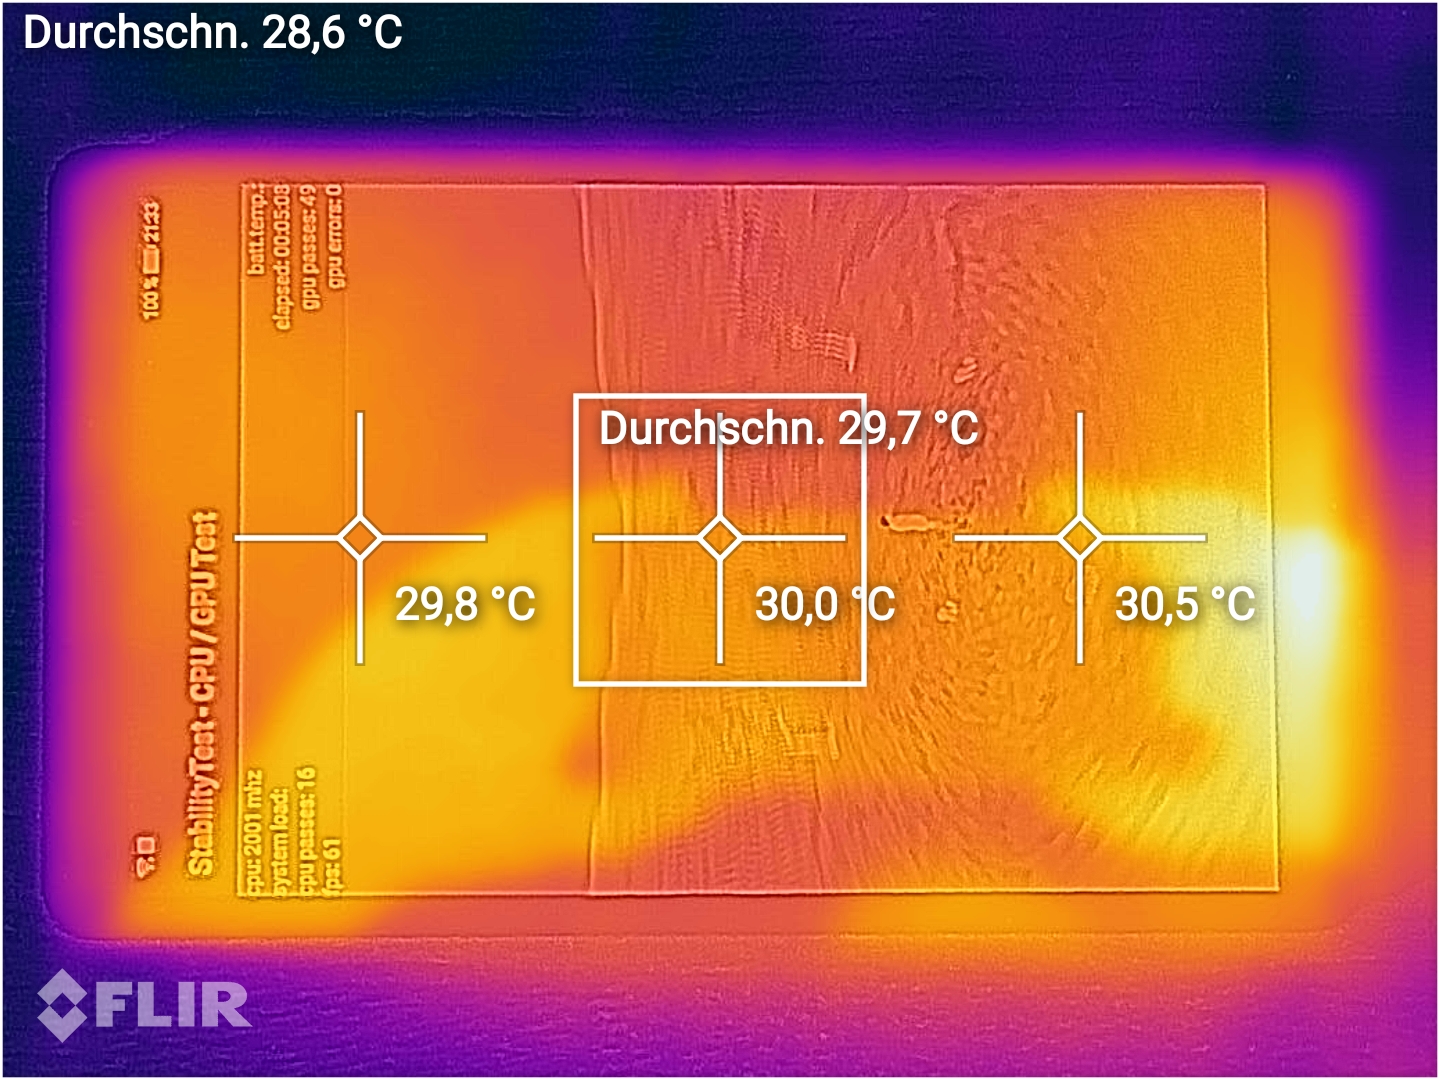
(+) A temperatura máxima no lado superior é 27.8 °C / 82 F, em comparação com a média de 33.7 °C / 93 F , variando de 20.7 a 53.2 °C para a classe Tablet.
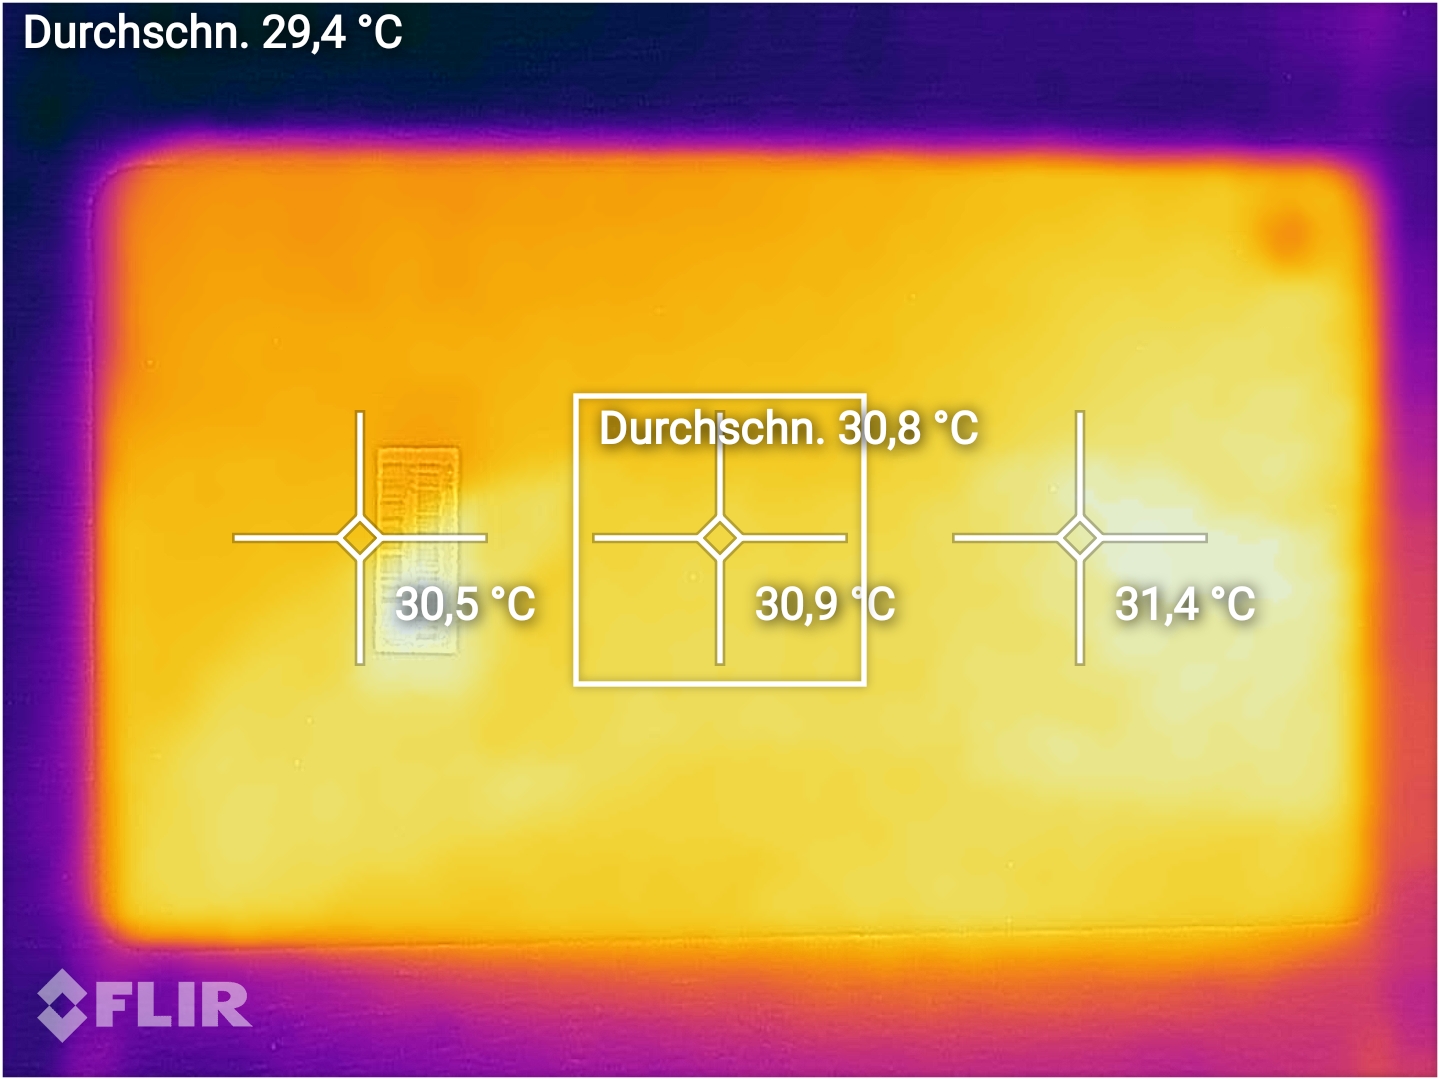
(+) A parte inferior aquece até um máximo de 26.7 °C / 80 F, em comparação com a média de 33.2 °C / 92 F
(+) Em uso inativo, a temperatura média para o lado superior é 24.9 °C / 77 F, em comparação com a média do dispositivo de 30 °C / ### class_avg_f### F.
Huawei MatePad T8 análise de áudio
(+) | os alto-falantes podem tocar relativamente alto (###valor### dB)
Graves 100 - 315Hz
(-) | quase nenhum baixo - em média 19.1% menor que a mediana
(+) | o baixo é linear (2.6% delta para a frequência anterior)
Médios 400 - 2.000 Hz
(±) | médios reduzidos - em média 5.6% menor que a mediana
(+) | médios são lineares (4.9% delta para frequência anterior)
Altos 2 - 16 kHz
(±) | máximos mais altos - em média 8.5% maior que a mediana
(+) | os máximos são lineares (5.3% delta da frequência anterior)
Geral 100 - 16.000 Hz
(±) | a linearidade do som geral é média (18% diferença em relação à mediana)
Comparado com a mesma classe
» 46% de todos os dispositivos testados nesta classe foram melhores, 7% semelhantes, 47% piores
» O melhor teve um delta de 7%, a média foi 20%, o pior foi 129%
Comparado com todos os dispositivos testados
» 38% de todos os dispositivos testados foram melhores, 8% semelhantes, 54% piores
» O melhor teve um delta de 4%, a média foi 23%, o pior foi 134%
Lenovo Tab M8 HD análise de áudio
(+) | os alto-falantes podem tocar relativamente alto (###valor### dB)
Graves 100 - 315Hz
(-) | quase nenhum baixo - em média 24.5% menor que a mediana
(±) | a linearidade dos graves é média (8.7% delta para a frequência anterior)
Médios 400 - 2.000 Hz
(±) | médios mais altos - em média 6.9% maior que a mediana
(+) | médios são lineares (6.1% delta para frequência anterior)
Altos 2 - 16 kHz
(±) | máximos mais altos - em média 12.3% maior que a mediana
(+) | os máximos são lineares (3.3% delta da frequência anterior)
Geral 100 - 16.000 Hz
(±) | a linearidade do som geral é média (27.7% diferença em relação à mediana)
Comparado com a mesma classe
» 87% de todos os dispositivos testados nesta classe foram melhores, 3% semelhantes, 11% piores
» O melhor teve um delta de 7%, a média foi 20%, o pior foi 129%
Comparado com todos os dispositivos testados
» 84% de todos os dispositivos testados foram melhores, 3% semelhantes, 13% piores
» O melhor teve um delta de 4%, a média foi 23%, o pior foi 134%
| desligado | |
| Ocioso | |
| Carga |
|
Key:
min: | |
| Huawei MatePad T8 5100 mAh | Amazon Fire HD 8 Plus 2020 4850 mAh | Amazon Fire HD 8 2020 4850 mAh | Lenovo Tab M8 HD 5100 mAh | Samsung Galaxy Tab A 8.0 2019 Wifi SM-T290 5100 mAh | |
|---|---|---|---|---|---|
| Power Consumption | -19% | -23% | 10% | -8% | |
| Idle Minimum * (Watt) | 0.68 | 0.74 -9% | 0.72 -6% | 0.66 3% | 0.62 9% |
| Idle Average * (Watt) | 2.24 | 2.81 -25% | 2.97 -33% | 2.15 4% | 2.68 -20% |
| Idle Maximum * (Watt) | 2.27 | 2.83 -25% | 2.99 -32% | 2.18 4% | 2.7 -19% |
| Load Average * (Watt) | 3.06 | 3.73 -22% | 4.02 -31% | 2.48 19% | 3.61 -18% |
| Load Maximum * (Watt) | 4.45 | 4.97 -12% | 5.1 -15% | 3.49 22% | 4 10% |
* ... menor é melhor
| Huawei MatePad T8 5100 mAh | Amazon Fire HD 8 Plus 2020 4850 mAh | Amazon Fire HD 8 2020 4850 mAh | Lenovo Tab M8 HD 5100 mAh | Samsung Galaxy Tab A 8.0 2019 Wifi SM-T290 5100 mAh | |
|---|---|---|---|---|---|
| Duração da bateria | -8% | -8% | 30% | -1% | |
| Reader / Idle (h) | 39.9 | 44.4 11% | 59.7 50% | 52.2 31% | |
| H.264 (h) | 19 | 15.8 -17% | 28.3 49% | 15.6 -18% | |
| WiFi v1.3 (h) | 15.8 | 14.5 -8% | 15 -5% | 18.7 18% | 13.9 -12% |
| Load (h) | 6 | 4.8 -20% | 6.2 3% | 5.7 -5% |
Pro
Contra
Veredicto para o MatePad T8 - As soluções alternativas da Huawei não compensam a perda de serviços do Google Play
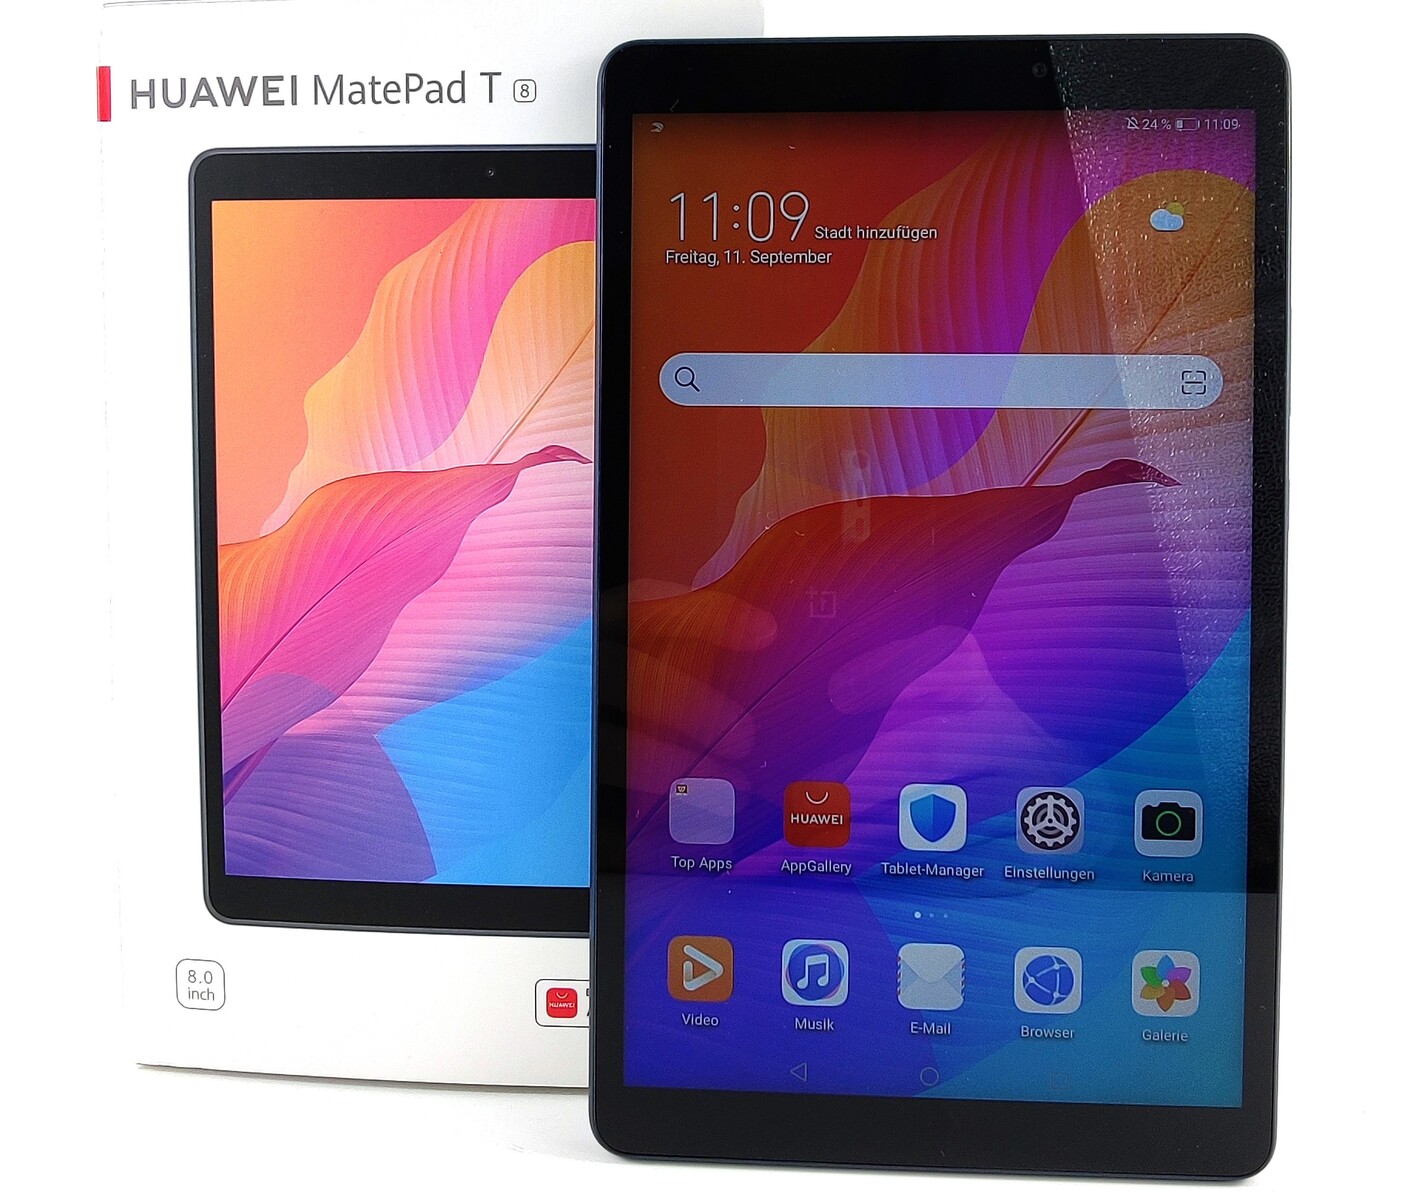
Quando se trata de desempenho, qualidade de construção e duração da bateria, o T8 é muito competitivo. O módulo Wi-Fi do Huawei atinge os melhores resultados em nosso teste de Wi-Fi. Por um pequeno acréscimo de 20 euros (~$ 23), os compradores podem obter uma versão com um modem LTE.
O painel IPS tem ângulos de visão relativamente estáveis e a reprodução de cores está em um bom nível para um tablet de 100 euros (~$ 118). No entanto, a tela não é brilhante o suficiente para uso externo em dias ensolarados. Se algum dispositivo deve ou não ser fornecido com 2 GB de RAM e 16 GB de memória eMMC em 2020 está em debate. Porém, em nossa opinião, o fato de que nenhum dispositivo deve vir com uma porta microUSB e um carregador de 5 watts não é mais discutível.
Por causa da situação com Google, é muito difícil chegar a qualquer tipo de conclusão sobre o MatePad T8 de baixo preço. Você pode assistir a vídeos do YouTube, navegar na web ou ler arquivos PDF com o T8. Os aplicativos que não requerem o uso do Google Play Services funcionarão bem. No entanto, se seus aplicativos favoritos dependem do Google Play Services, você está sem sorte. Além disso, o AppGallery da Huawei não apresenta uma ampla seleção de aplicativos.
A Huawei não consegue compensar a perda que muitos usuários terão devido ao fato de que seu tablet básico não oferece suporte ao Google Play Services. O T8 não oferece nenhum recurso matador que o diferencie da multidão.
Huawei MatePad T8
- 09/18/2020 v7 (old)
Marcus Herbrich