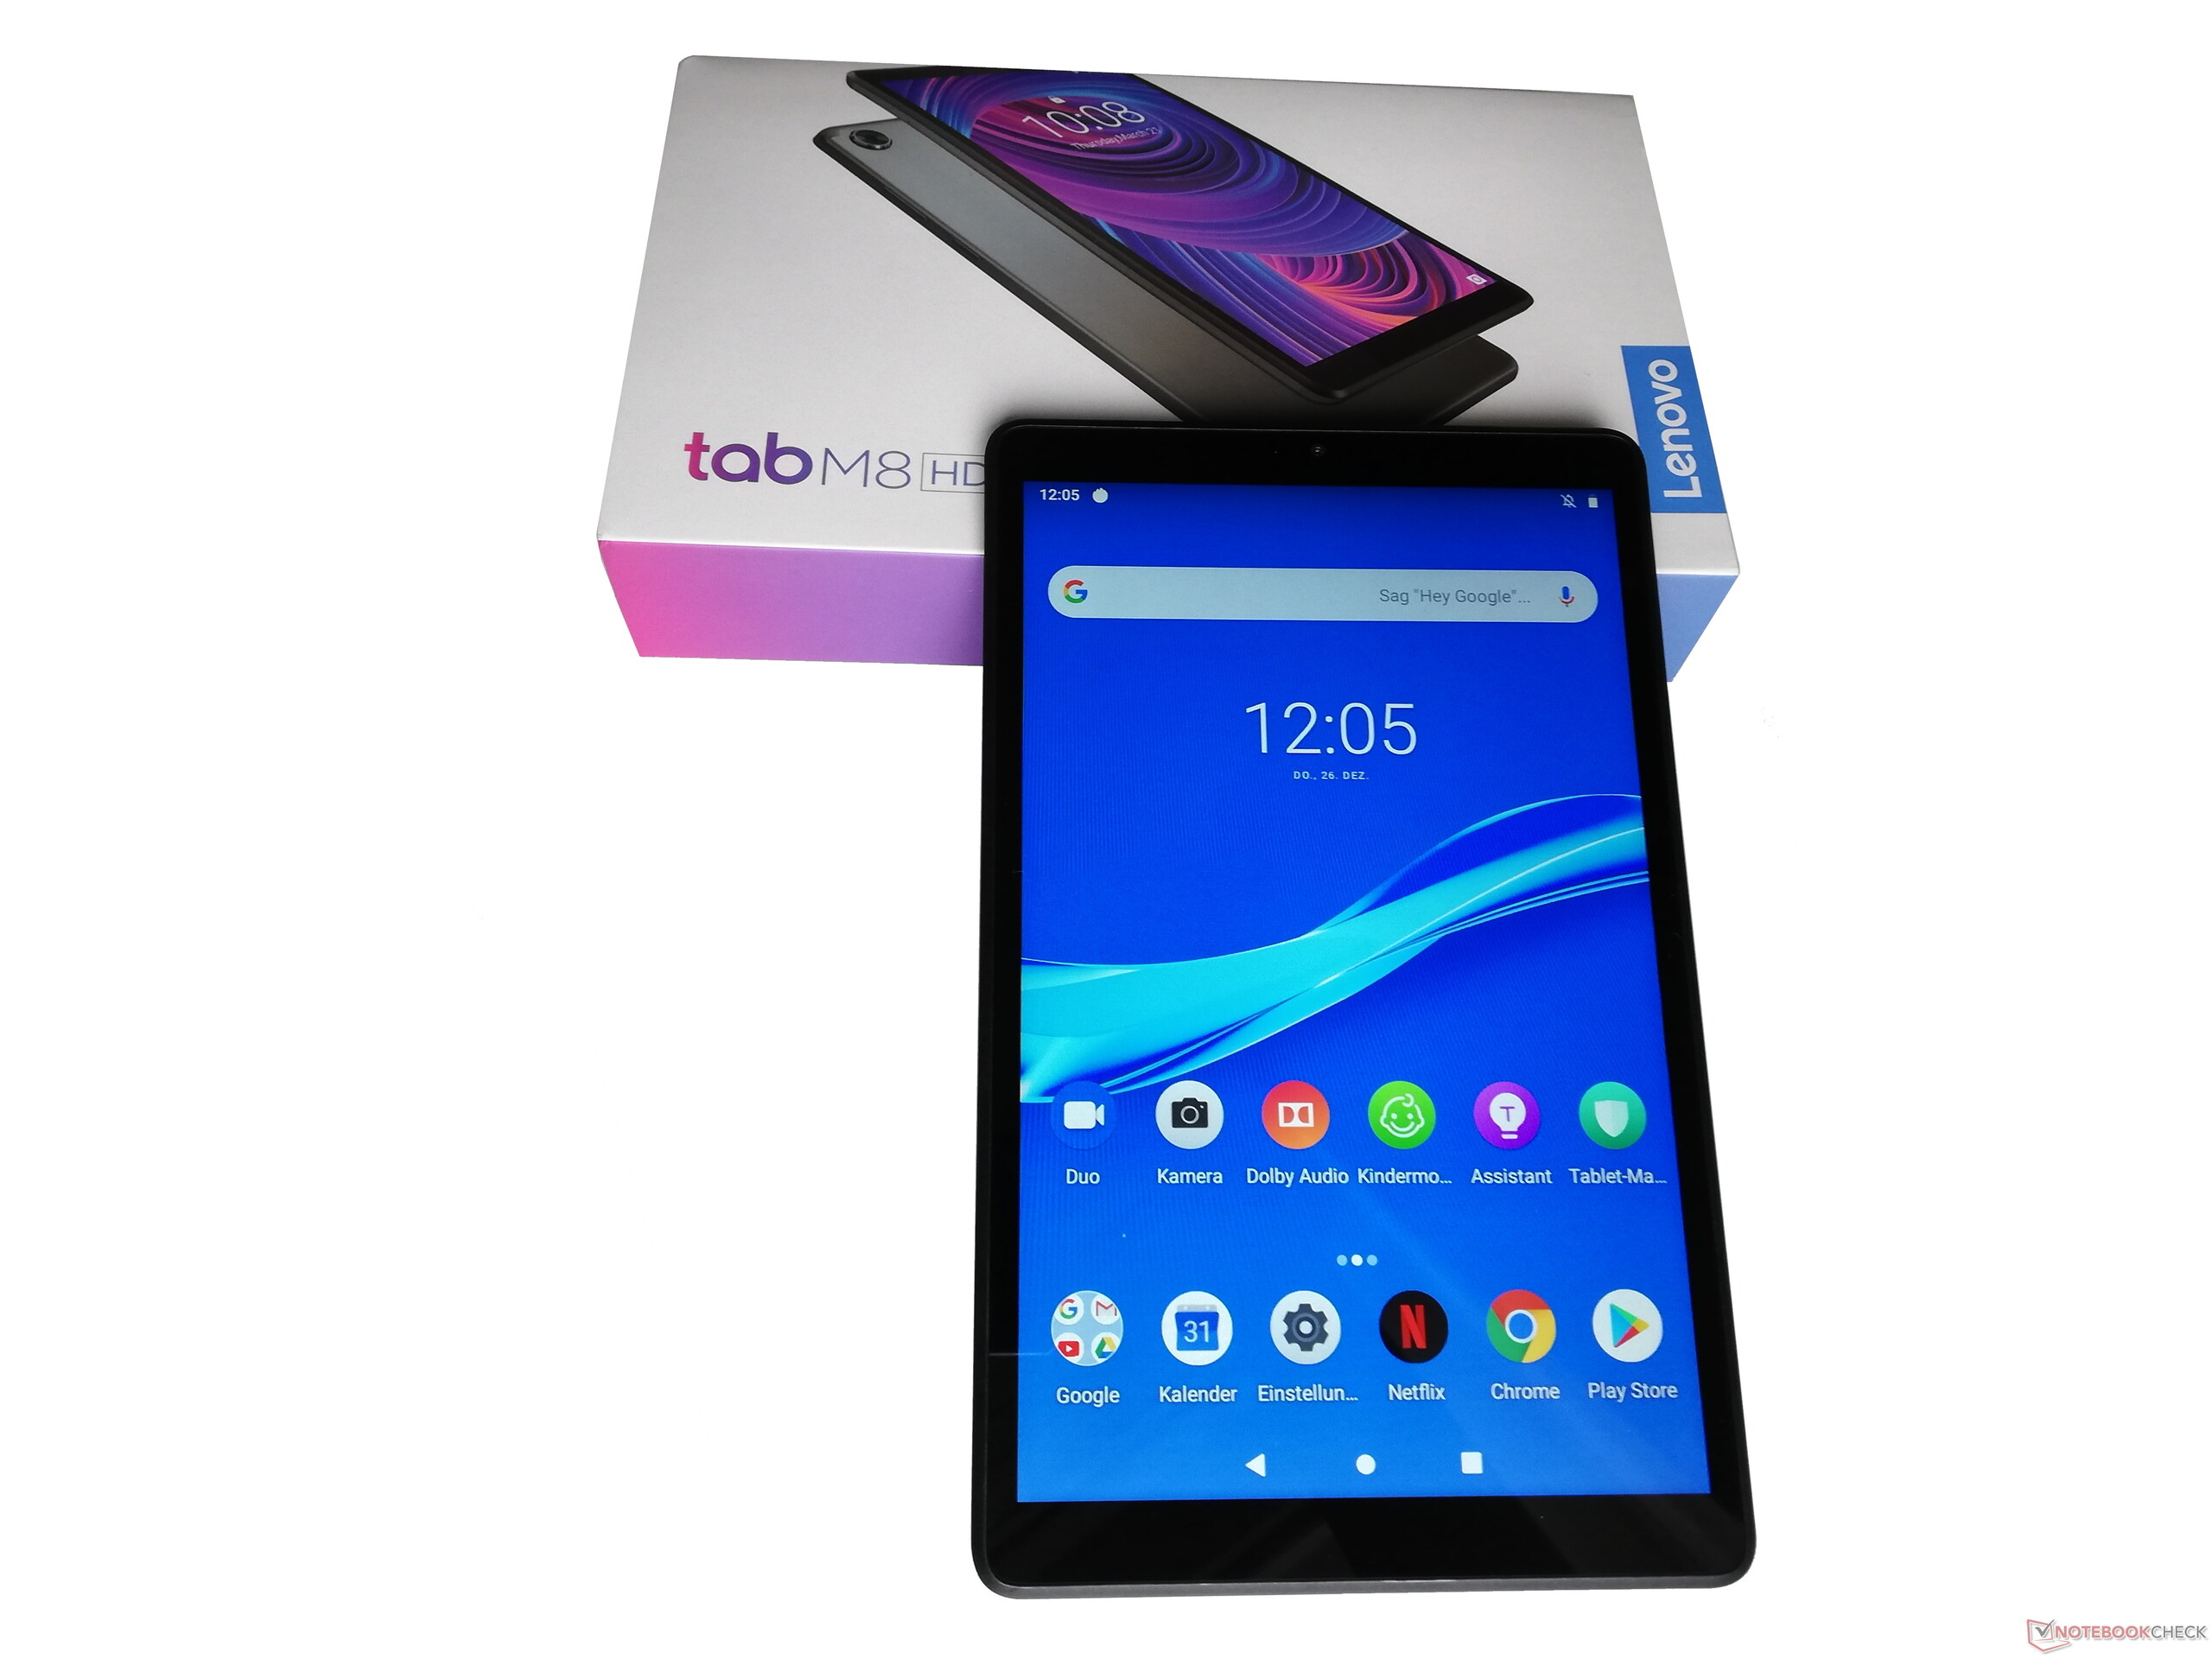
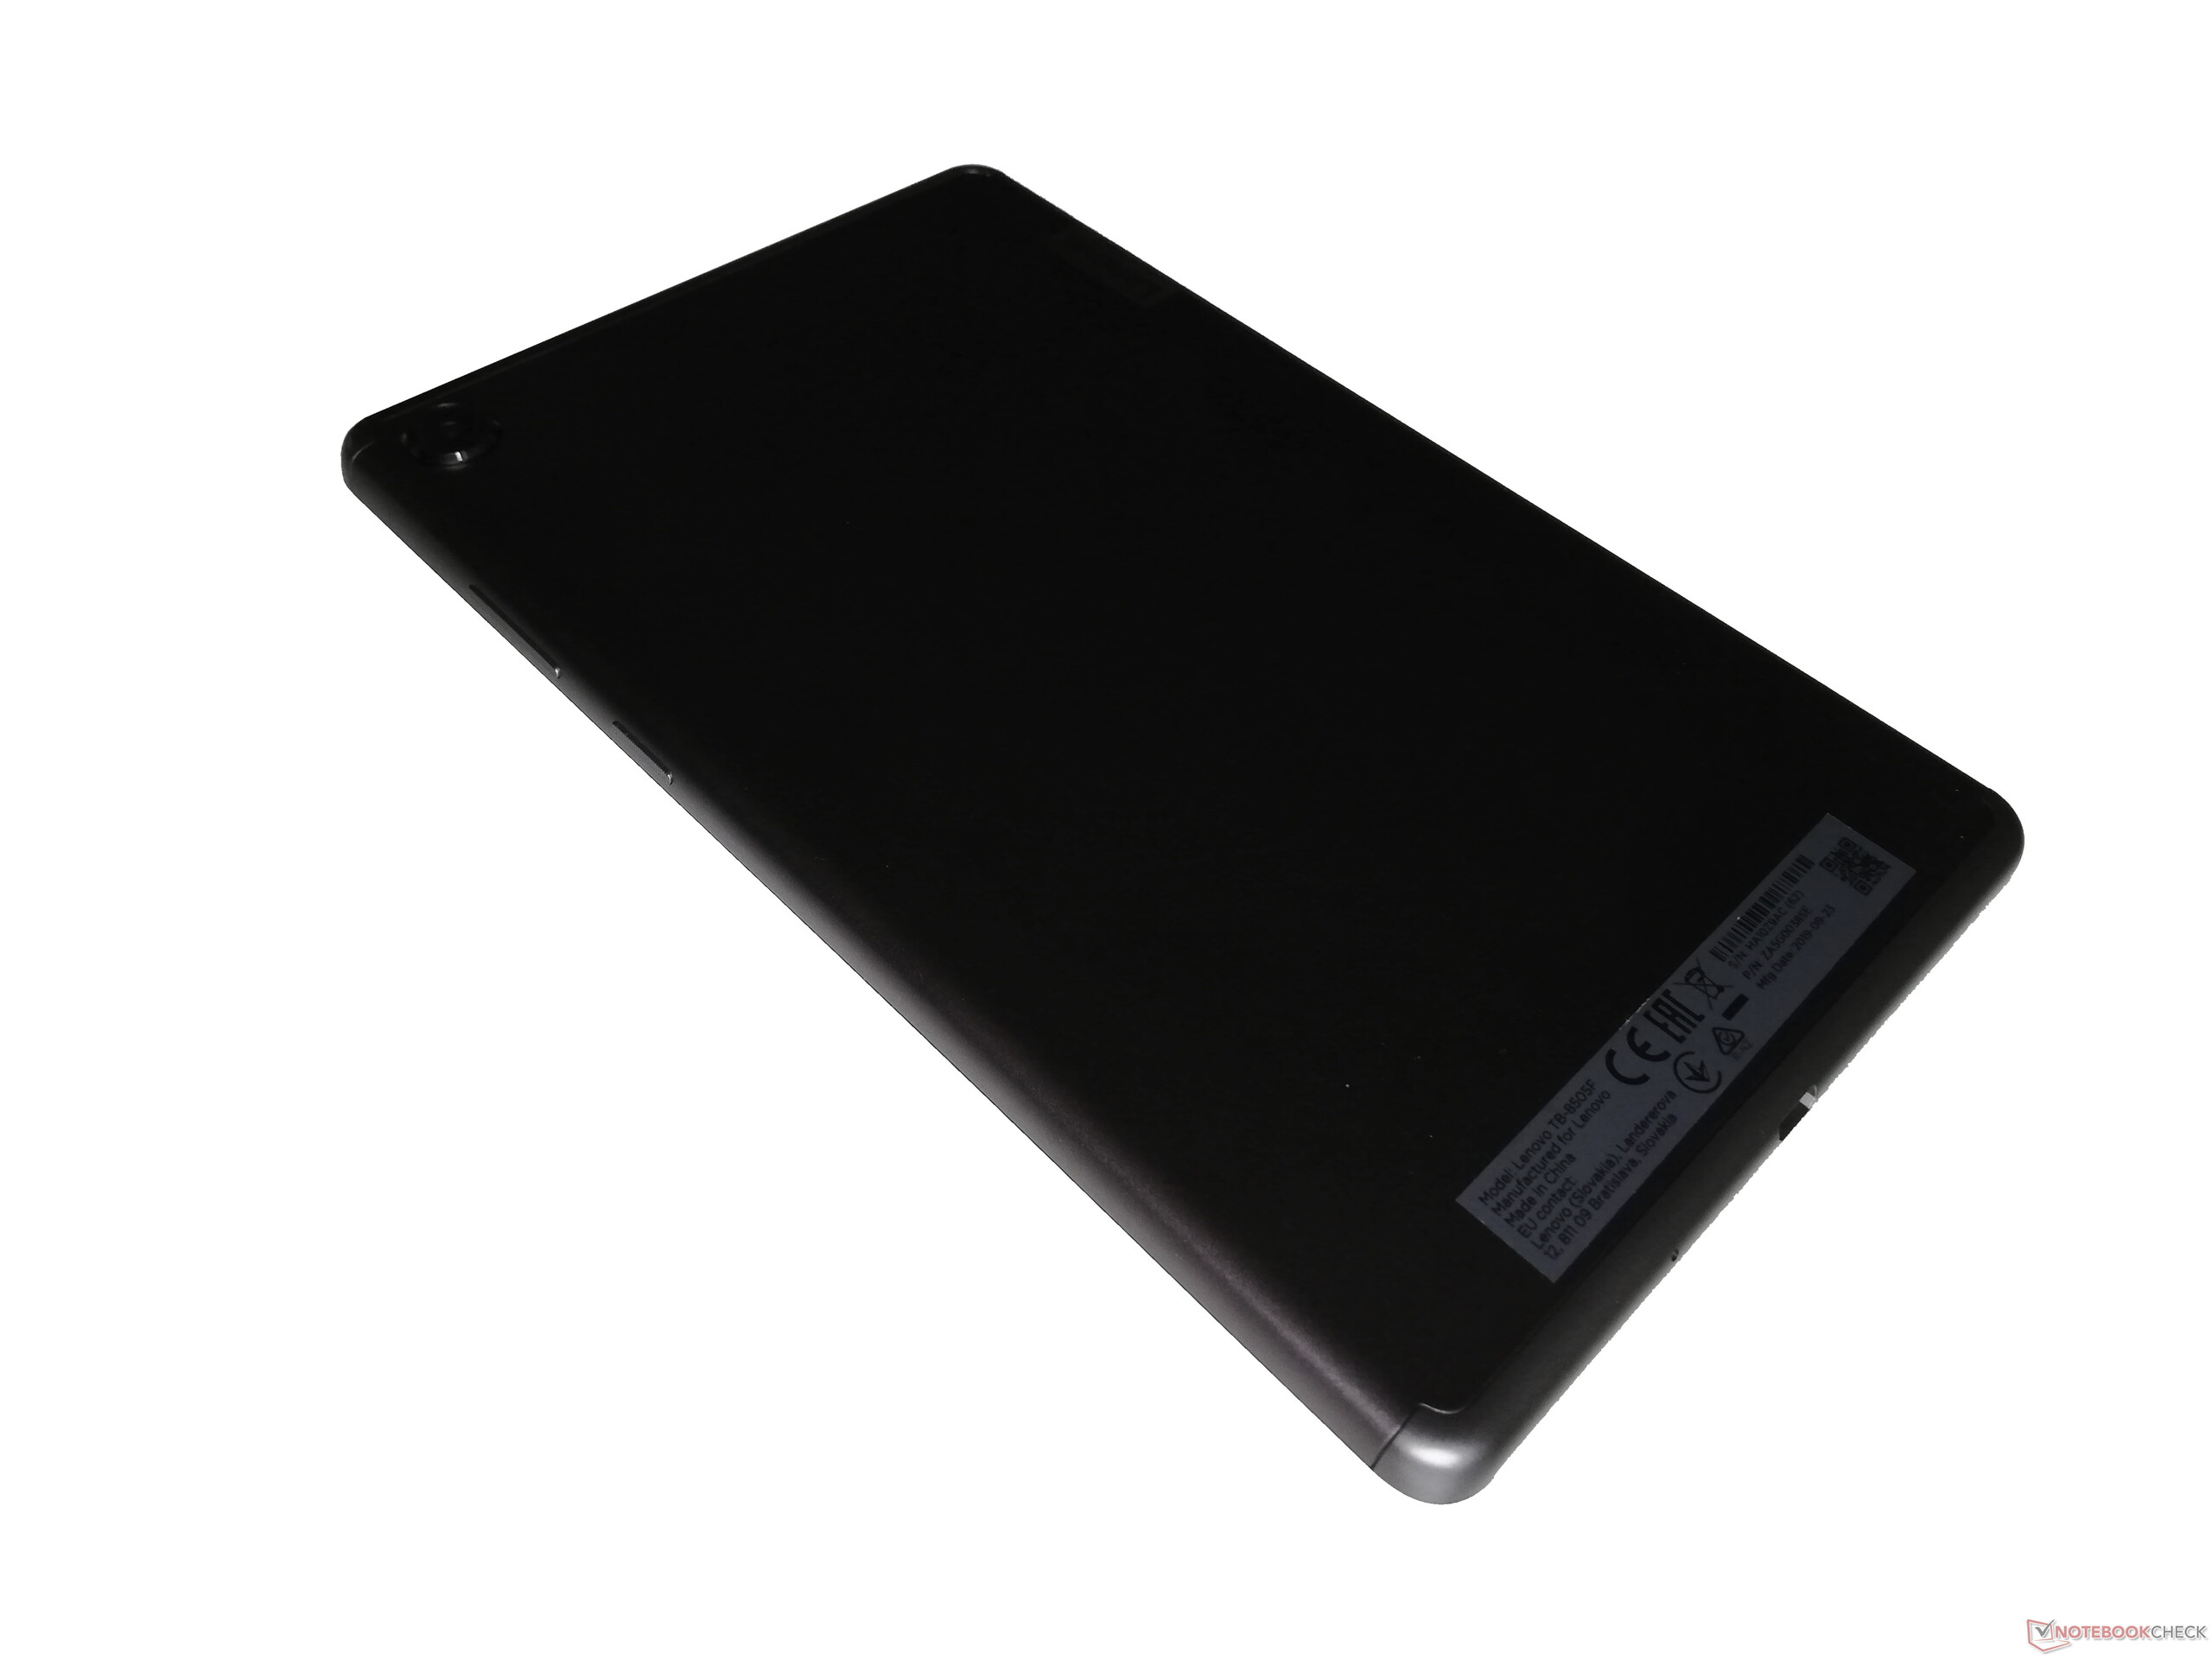
Breve Análise do Tablet Lenovo Tab M8 HD: Navegação e streaming por pouco dinheiro
Avaliação | Data | Modelo | Peso | Altura | Size | Resolução | Preço |
|---|---|---|---|---|---|---|---|
| 81 % v7 (old) | 01/2020 | Lenovo Tab M8 HD Helio A22 MT6762M, PowerVR GE8320 | 305 g | 8.2 mm | 8.00" | 1280x800 | |
| 76.5 % v7 (old) | 11/2018 | Amazon Fire HD 8 2018 MT8163 V/B 1.3 GHz, Mali-T720 | 363 g | 9.7 mm | 8.00" | 1280x800 | |
| 78.7 % v6 (old) | 03/2019 | Alldocube M8 T801 MT6797X, Mali-T880 MP4 | 345 g | 8.48 mm | 8.00" | 1920x1200 | |
| 83.3 % v7 (old) | 05/2018 | Huawei MediaPad M5 8.4 Kirin 960, Mali-G71 MP8 | 316 g | 7.3 mm | 8.40" | 2560x1600 | |
| 79.6 % v7 (old) | 01/2020 | Samsung Galaxy Tab A 8.0 2019 Wifi SM-T290 SD 429, Adreno 504 | 345 g | 8 mm | 8.00" | 1280x800 |
Comparação de imagens
Escolha uma cena e navegue pela primeira imagem. Um clique muda a posição nas telas sensíveis ao toque. Um clique na imagem ampliada abre o original em uma nova janela. A primeira imagem mostra a fotografia em escala do dispositivo de teste.
Scene 1Scene 2Scene 3


| |||||||||||||||||||||||||
iluminação: 88 %
iluminação com acumulador: 379 cd/m²
Contraste: 1805:1 (Preto: 0.21 cd/m²)
ΔE ColorChecker Calman: 3.8 | ∀{0.5-29.43 Ø4.71}
ΔE Greyscale Calman: 5 | ∀{0.09-98 Ø4.96}
85.5% sRGB (Calman 2D)
Gamma: 2.23
CCT: 7514 K
| Lenovo Tab M8 HD IPS, 1280x800, 8" | Amazon Fire HD 8 2018 IPS, 1280x800, 8" | Alldocube M8 T801 IPS, 1920x1200, 8" | Huawei MediaPad M5 8.4 IPS, 2560x1600, 8.4" | Samsung Galaxy Tab A 8.0 2019 Wifi SM-T290 TFT, 1280x800, 8" | |
|---|---|---|---|---|---|
| Screen | -81% | -48% | -49% | -25% | |
| Brightness middle (cd/m²) | 379 | 359 -5% | 317.5 -16% | 405 7% | 377 -1% |
| Brightness (cd/m²) | 346 | 358 3% | 320 -8% | 392 13% | 372 8% |
| Brightness Distribution (%) | 88 | 89 1% | 94 7% | 92 5% | 87 -1% |
| Black Level * (cd/m²) | 0.21 | 0.85 -305% | 0.5 -138% | 0.67 -219% | 0.29 -38% |
| Contrast (:1) | 1805 | 422 -77% | 635 -65% | 604 -67% | 1300 -28% |
| Colorchecker dE 2000 * | 3.8 | 6.8 -79% | 6.12 -61% | 5.78 -52% | 6.1 -61% |
| Colorchecker dE 2000 max. * | 7.5 | 17.3 -131% | 13.72 -83% | 9.82 -31% | 10.9 -45% |
| Greyscale dE 2000 * | 5 | 7.6 -52% | 5.8 -16% | 7.2 -44% | 6.6 -32% |
| Gamma | 2.23 99% | 2.19 100% | 2.12 104% | 2.278 97% | 2.13 103% |
| CCT | 7514 87% | 7160 91% | 7633 85% | 8405 77% | 7861 83% |
* ... menor é melhor
Cintilação da tela / PWM (modulação por largura de pulso)
| Tela tremeluzindo / PWM não detectado | 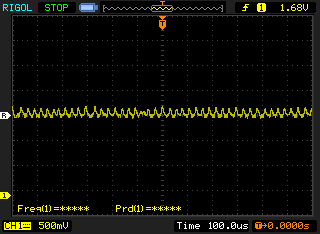 | ||
[pwm_comparison] Em comparação: 52 % de todos os dispositivos testados não usam PWM para escurecer a tela. Se PWM foi detectado, uma média de 7754 (mínimo: 5 - máximo: 343500) Hz foi medida. | |||
Exibir tempos de resposta
| ↔ Tempo de resposta preto para branco | ||
|---|---|---|
| 37.2 ms ... ascensão ↗ e queda ↘ combinadas | ↗ 19.6 ms ascensão | 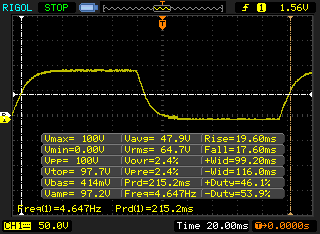 |
| ↘ 17.6 ms queda | ||
| A tela mostra taxas de resposta lentas em nossos testes e será insatisfatória para os jogadores. Em comparação, todos os dispositivos testados variam de 0.1 (mínimo) a 240 (máximo) ms. » 95 % de todos os dispositivos são melhores. Isso significa que o tempo de resposta medido é pior que a média de todos os dispositivos testados (19.8 ms). | ||
| ↔ Tempo de resposta 50% cinza a 80% cinza | ||
| 60 ms ... ascensão ↗ e queda ↘ combinadas | ↗ 27.6 ms ascensão | 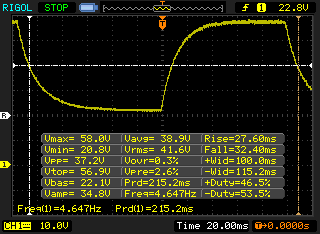 |
| ↘ 32.4 ms queda | ||
| A tela mostra taxas de resposta lentas em nossos testes e será insatisfatória para os jogadores. Em comparação, todos os dispositivos testados variam de 0.165 (mínimo) a 636 (máximo) ms. » 96 % de todos os dispositivos são melhores. Isso significa que o tempo de resposta medido é pior que a média de todos os dispositivos testados (31 ms). | ||
| JetStream 1.1 - 1.1 Total | |
| Huawei MediaPad M5 8.4 (Chrome 66) | |
| Alldocube M8 T801 (Chrome 72.0.3626.105) | |
| Lenovo Tab M8 HD (Chrome 79) | |
| Samsung Galaxy Tab A 8.0 2019 Wifi SM-T290 (Chrome 79) | |
| Média Mediatek Helio A22 MT6762M (23.6 - 25.7, n=2) | |
| Amazon Fire HD 8 2018 (Silk Browser 66.2.10.3359.126.10) | |
| WebXPRT 3 - Overall | |
| Média da turma Tablet (168 - 520, n=10, últimos 2 anos) | |
| Huawei MediaPad M5 8.4 (Chrome 66) | |
| Lenovo Tab M8 HD (Chrome 79) | |
| Samsung Galaxy Tab A 8.0 2019 Wifi SM-T290 (Chrome 79) | |
| Média Mediatek Helio A22 MT6762M (30 - 34, n=2) | |
| Amazon Fire HD 8 2018 (Silk Browser 66.2.10.3359.126.10) | |
| Speedometer 2.0 - Result 2.0 | |
| Média da turma Tablet (6.8 - 790, n=33, últimos 2 anos) | |
| Média Mediatek Helio A22 MT6762M (n=1) | |
| Lenovo Tab M8 HD (Chrome 79) | |
| Samsung Galaxy Tab A 8.0 2019 Wifi SM-T290 (Chrome 79) | |
| Octane V2 - Total Score | |
| Média da turma Tablet (1633 - 138481, n=71, últimos 2 anos) | |
| Huawei MediaPad M5 8.4 (Chrome 66) | |
| Alldocube M8 T801 (Chrome 72.0.3626.105) | |
| Lenovo Tab M8 HD (Chrome 79) | |
| Média Mediatek Helio A22 MT6762M (4332 - 4378, n=2) | |
| Samsung Galaxy Tab A 8.0 2019 Wifi SM-T290 (Chrome 79) | |
| Amazon Fire HD 8 2018 (Silk Browser 66.2.10.3359.126.10) | |
| Mozilla Kraken 1.1 - Total | |
| Amazon Fire HD 8 2018 (Silk Browser 66.2.10.3359.126.10) | |
| Lenovo Tab M8 HD (Chrome 79) | |
| Média Mediatek Helio A22 MT6762M (10740 - 10894, n=2) | |
| Samsung Galaxy Tab A 8.0 2019 Wifi SM-T290 (Chrome 79) | |
| Alldocube M8 T801 (Chrome 72.0.3626.105) | |
| Huawei MediaPad M5 8.4 (Chrome 66) | |
| Média da turma Tablet (243 - 16233, n=65, últimos 2 anos) | |
* ... menor é melhor
| Lenovo Tab M8 HD | Amazon Fire HD 8 2018 | Alldocube M8 T801 | Huawei MediaPad M5 8.4 | Samsung Galaxy Tab A 8.0 2019 Wifi SM-T290 | Média 32 GB eMMC Flash | Média da turma Tablet | |
|---|---|---|---|---|---|---|---|
| AndroBench 3-5 | -45% | -34% | 60% | 5% | -5% | 1198% | |
| Sequential Read 256KB (MB/s) | 297.1 | 158.5 -47% | 142.8 -52% | 268.6 -10% | 291.9 -2% | 242 ? -19% | 2073 ? 598% |
| Sequential Write 256KB (MB/s) | 79.6 | 41.89 -47% | 103 29% | 132.2 66% | 108.5 36% | 100.5 ? 26% | 1667 ? 1994% |
| Random Read 4KB (MB/s) | 77.4 | 26.98 -65% | 19.5 -75% | 62.8 -19% | 57.8 -25% | 43.1 ? -44% | 275 ? 255% |
| Random Write 4KB (MB/s) | 15.84 | 12.25 -23% | 10.01 -37% | 65.1 311% | 16.89 7% | 22.3 ? 41% | 324 ? 1945% |
| Sequential Read 256KB SDCard (MB/s) | 83.8 ? | 51.4 ? -39% | 84.9 ? 1% | 87.1 ? 4% | 71.8 ? -14% | ||
| Sequential Write 256KB SDCard (MB/s) | 64.3 ? | 34.03 ? -47% | 70.7 ? 10% | 69.9 ? 9% | 52.9 ? -18% |
Asphalt 9: Legends
Arena of Valor
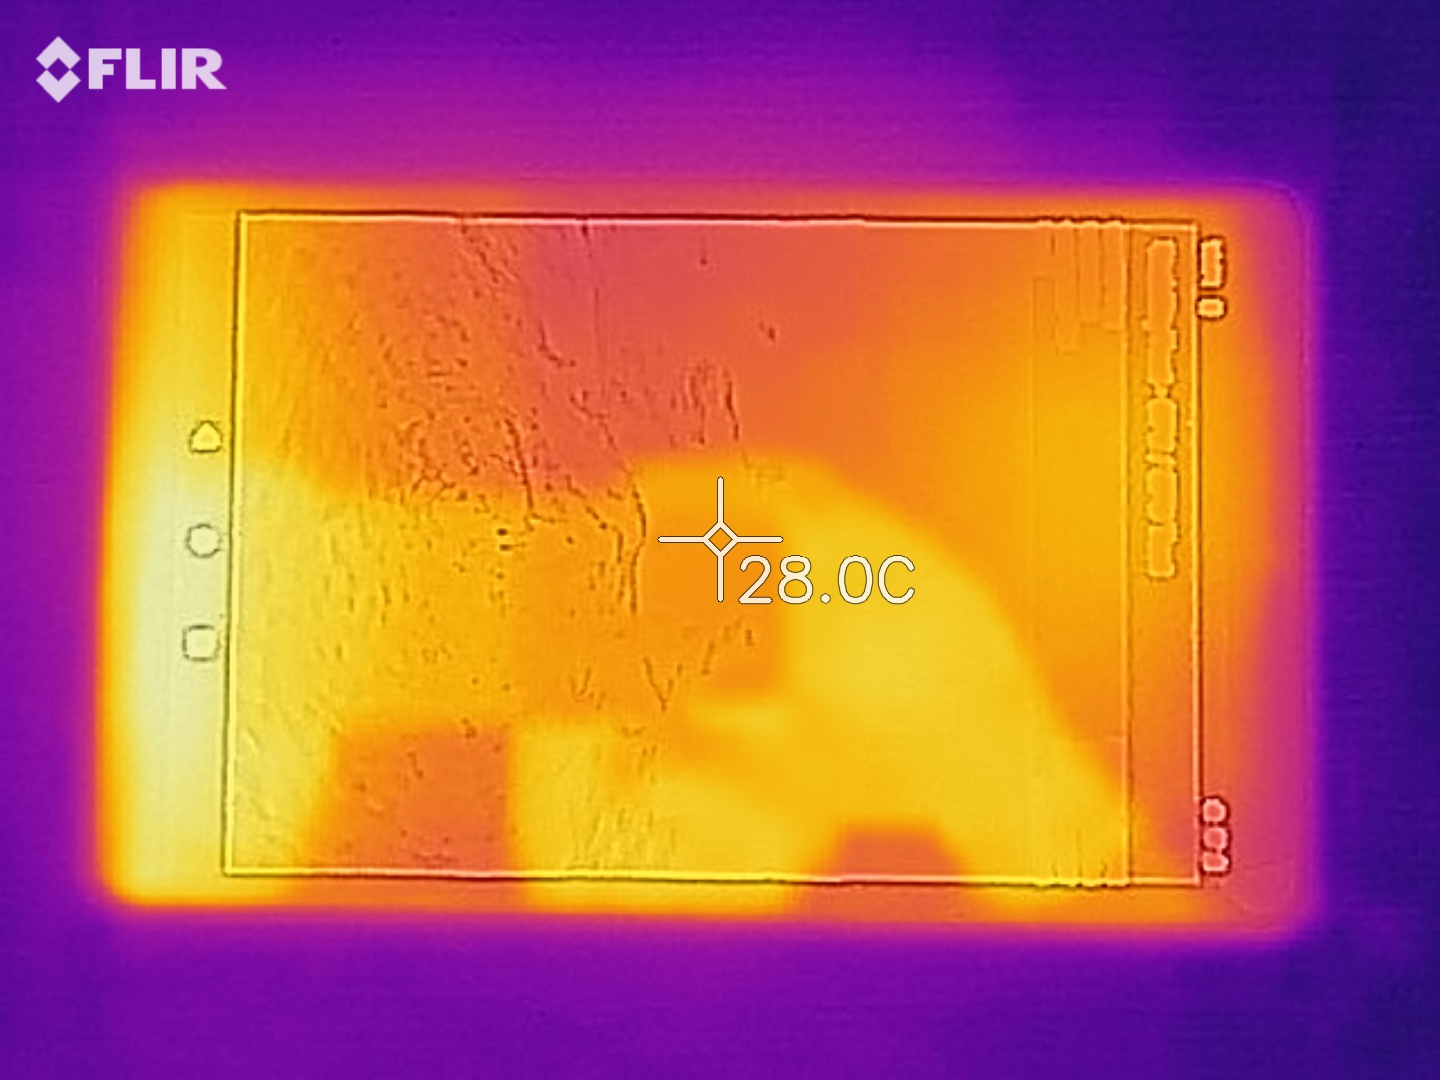
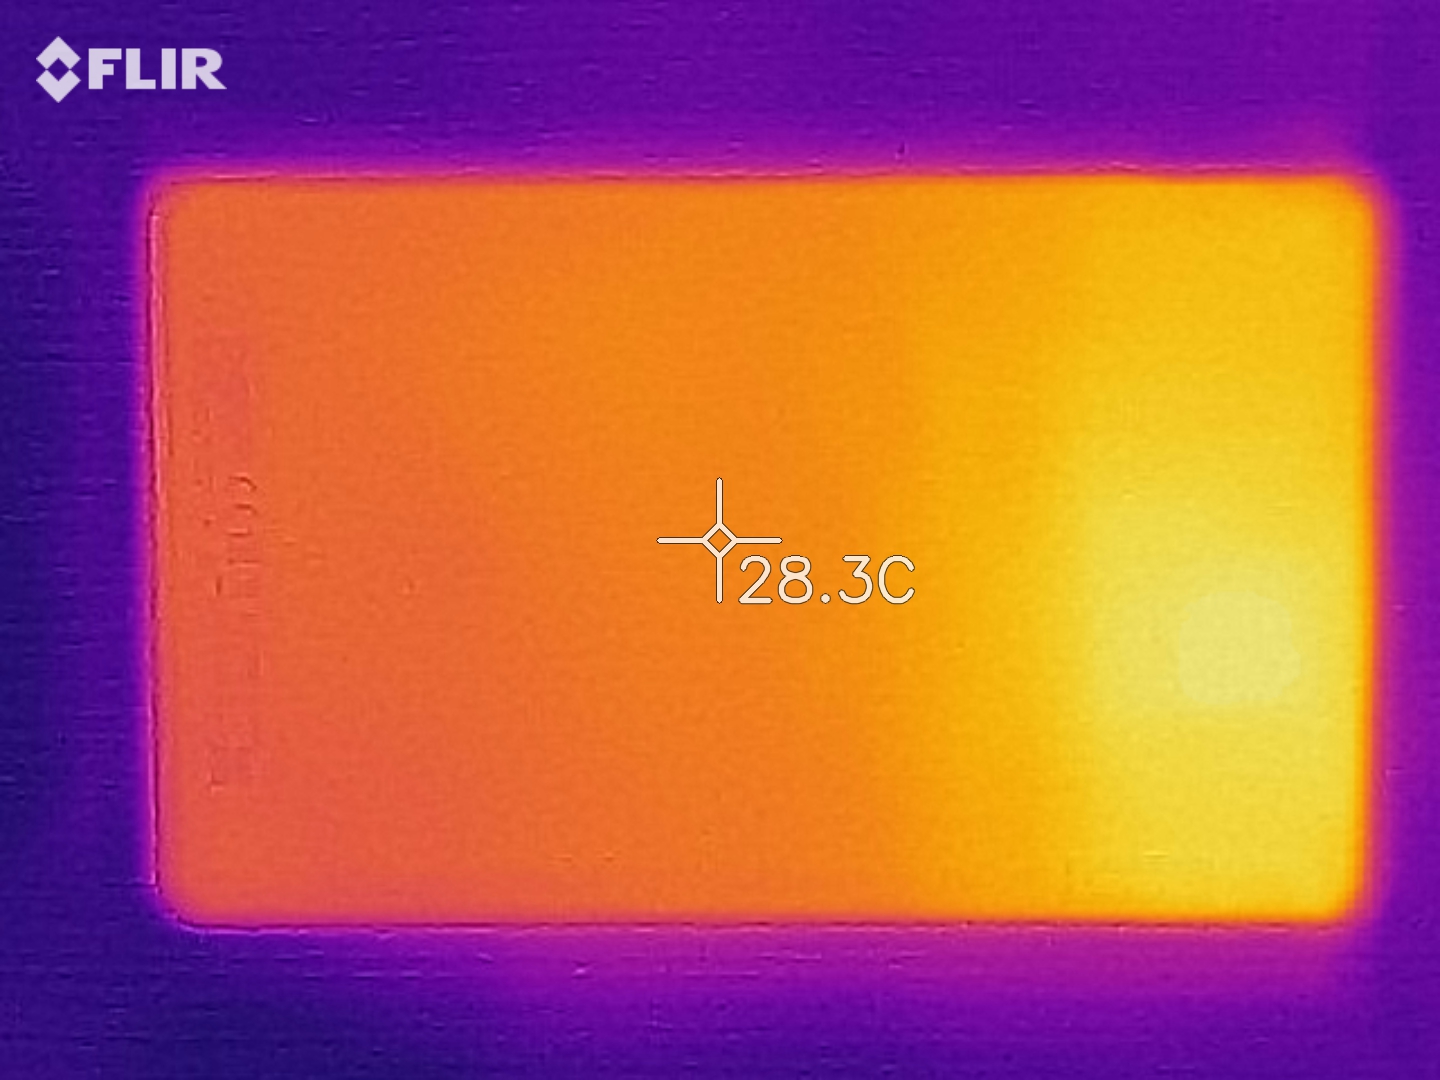
(+) A temperatura máxima no lado superior é 26.2 °C / 79 F, em comparação com a média de 33.7 °C / 93 F , variando de 20.7 a 53.2 °C para a classe Tablet.
(+) A parte inferior aquece até um máximo de 25.9 °C / 79 F, em comparação com a média de 33.2 °C / 92 F
(+) Em uso inativo, a temperatura média para o lado superior é 24 °C / 75 F, em comparação com a média do dispositivo de 30 °C / ### class_avg_f### F.
Lenovo Tab M8 HD análise de áudio
(+) | os alto-falantes podem tocar relativamente alto (###valor### dB)
Graves 100 - 315Hz
(-) | quase nenhum baixo - em média 24.5% menor que a mediana
(±) | a linearidade dos graves é média (8.7% delta para a frequência anterior)
Médios 400 - 2.000 Hz
(±) | médios mais altos - em média 6.9% maior que a mediana
(+) | médios são lineares (6.1% delta para frequência anterior)
Altos 2 - 16 kHz
(±) | máximos mais altos - em média 12.3% maior que a mediana
(+) | os máximos são lineares (3.3% delta da frequência anterior)
Geral 100 - 16.000 Hz
(±) | a linearidade do som geral é média (27.7% diferença em relação à mediana)
Comparado com a mesma classe
» 87% de todos os dispositivos testados nesta classe foram melhores, 3% semelhantes, 11% piores
» O melhor teve um delta de 7%, a média foi 20%, o pior foi 129%
Comparado com todos os dispositivos testados
» 84% de todos os dispositivos testados foram melhores, 3% semelhantes, 13% piores
» O melhor teve um delta de 4%, a média foi 23%, o pior foi 134%
Amazon Fire HD 8 2018 análise de áudio
(±) | o volume do alto-falante é médio, mas bom (###valor### dB)
Graves 100 - 315Hz
(-) | quase nenhum baixo - em média 17.4% menor que a mediana
(±) | a linearidade dos graves é média (9.5% delta para a frequência anterior)
Médios 400 - 2.000 Hz
(+) | médios equilibrados - apenas 3.7% longe da mediana
(+) | médios são lineares (4.4% delta para frequência anterior)
Altos 2 - 16 kHz
(±) | máximos mais altos - em média 5.2% maior que a mediana
(+) | os máximos são lineares (3.1% delta da frequência anterior)
Geral 100 - 16.000 Hz
(±) | a linearidade do som geral é média (19.1% diferença em relação à mediana)
Comparado com a mesma classe
» 53% de todos os dispositivos testados nesta classe foram melhores, 5% semelhantes, 42% piores
» O melhor teve um delta de 7%, a média foi 20%, o pior foi 129%
Comparado com todos os dispositivos testados
» 46% de todos os dispositivos testados foram melhores, 7% semelhantes, 47% piores
» O melhor teve um delta de 4%, a média foi 23%, o pior foi 134%
| desligado | |
| Ocioso | |
| Carga |
|
Key:
min: | |
| Lenovo Tab M8 HD 5100 mAh | Amazon Fire HD 8 2018 4750 mAh | Alldocube M8 T801 5500 mAh | Huawei MediaPad M5 8.4 5100 mAh | Samsung Galaxy Tab A 8.0 2019 Wifi SM-T290 5100 mAh | |
|---|---|---|---|---|---|
| Power Consumption | -72% | -213% | -142% | -21% | |
| Idle Minimum * (Watt) | 0.66 | 0.97 -47% | 3.4 -415% | 2.1 -218% | 0.62 6% |
| Idle Average * (Watt) | 2.15 | 3.26 -52% | 5.1 -137% | 3.74 -74% | 2.68 -25% |
| Idle Maximum * (Watt) | 2.18 | 3.37 -55% | 5.3 -143% | 4.33 -99% | 2.7 -24% |
| Load Average * (Watt) | 2.48 | 5.68 -129% | 6 -142% | 6.32 -155% | 3.61 -46% |
| Load Maximum * (Watt) | 3.49 | 6.21 -78% | 11.5 -230% | 9.13 -162% | 4 -15% |
* ... menor é melhor
| Lenovo Tab M8 HD 5100 mAh | Amazon Fire HD 8 2018 4750 mAh | Alldocube M8 T801 5500 mAh | Huawei MediaPad M5 8.4 5100 mAh | Samsung Galaxy Tab A 8.0 2019 Wifi SM-T290 5100 mAh | |
|---|---|---|---|---|---|
| Duração da bateria | -52% | -63% | -48% | -23% | |
| Reader / Idle (h) | 59.7 | 19.5 -67% | 19.2 -68% | 52.2 -13% | |
| H.264 (h) | 28.3 | 8.3 -71% | 11.7 -59% | 15.6 -45% | |
| WiFi v1.3 (h) | 18.7 | 8.2 -56% | 7 -63% | 10.5 -44% | 13.9 -26% |
| Load (h) | 6.2 | 5.3 -15% | 5 -19% | 5.7 -8% |
Pro
Contra
Verdict - good-quality Lenovo Tab M8
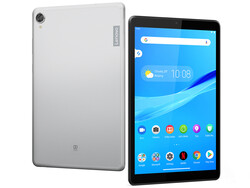
O Lenovo Tab M8 HD se apresentou como um tablet simples para navegar e assistir vídeos ocasionais. Sua duração da bateria é particularmente impressionante, assim como o design fino e o acabamento de alta qualidade. Nossa unidade de teste super com facilidade o Amazon Fire HD 8 nestas áreas. Seu desempenho é um pouco melhor do que o do tablet da Amazon também, embora o Tab M8 HD ainda não consiga acompanhar seus outros concorrentes.
O Tab M8 HD da Lenovo é uma boa alternativa no segmento de tablets acessíveis.
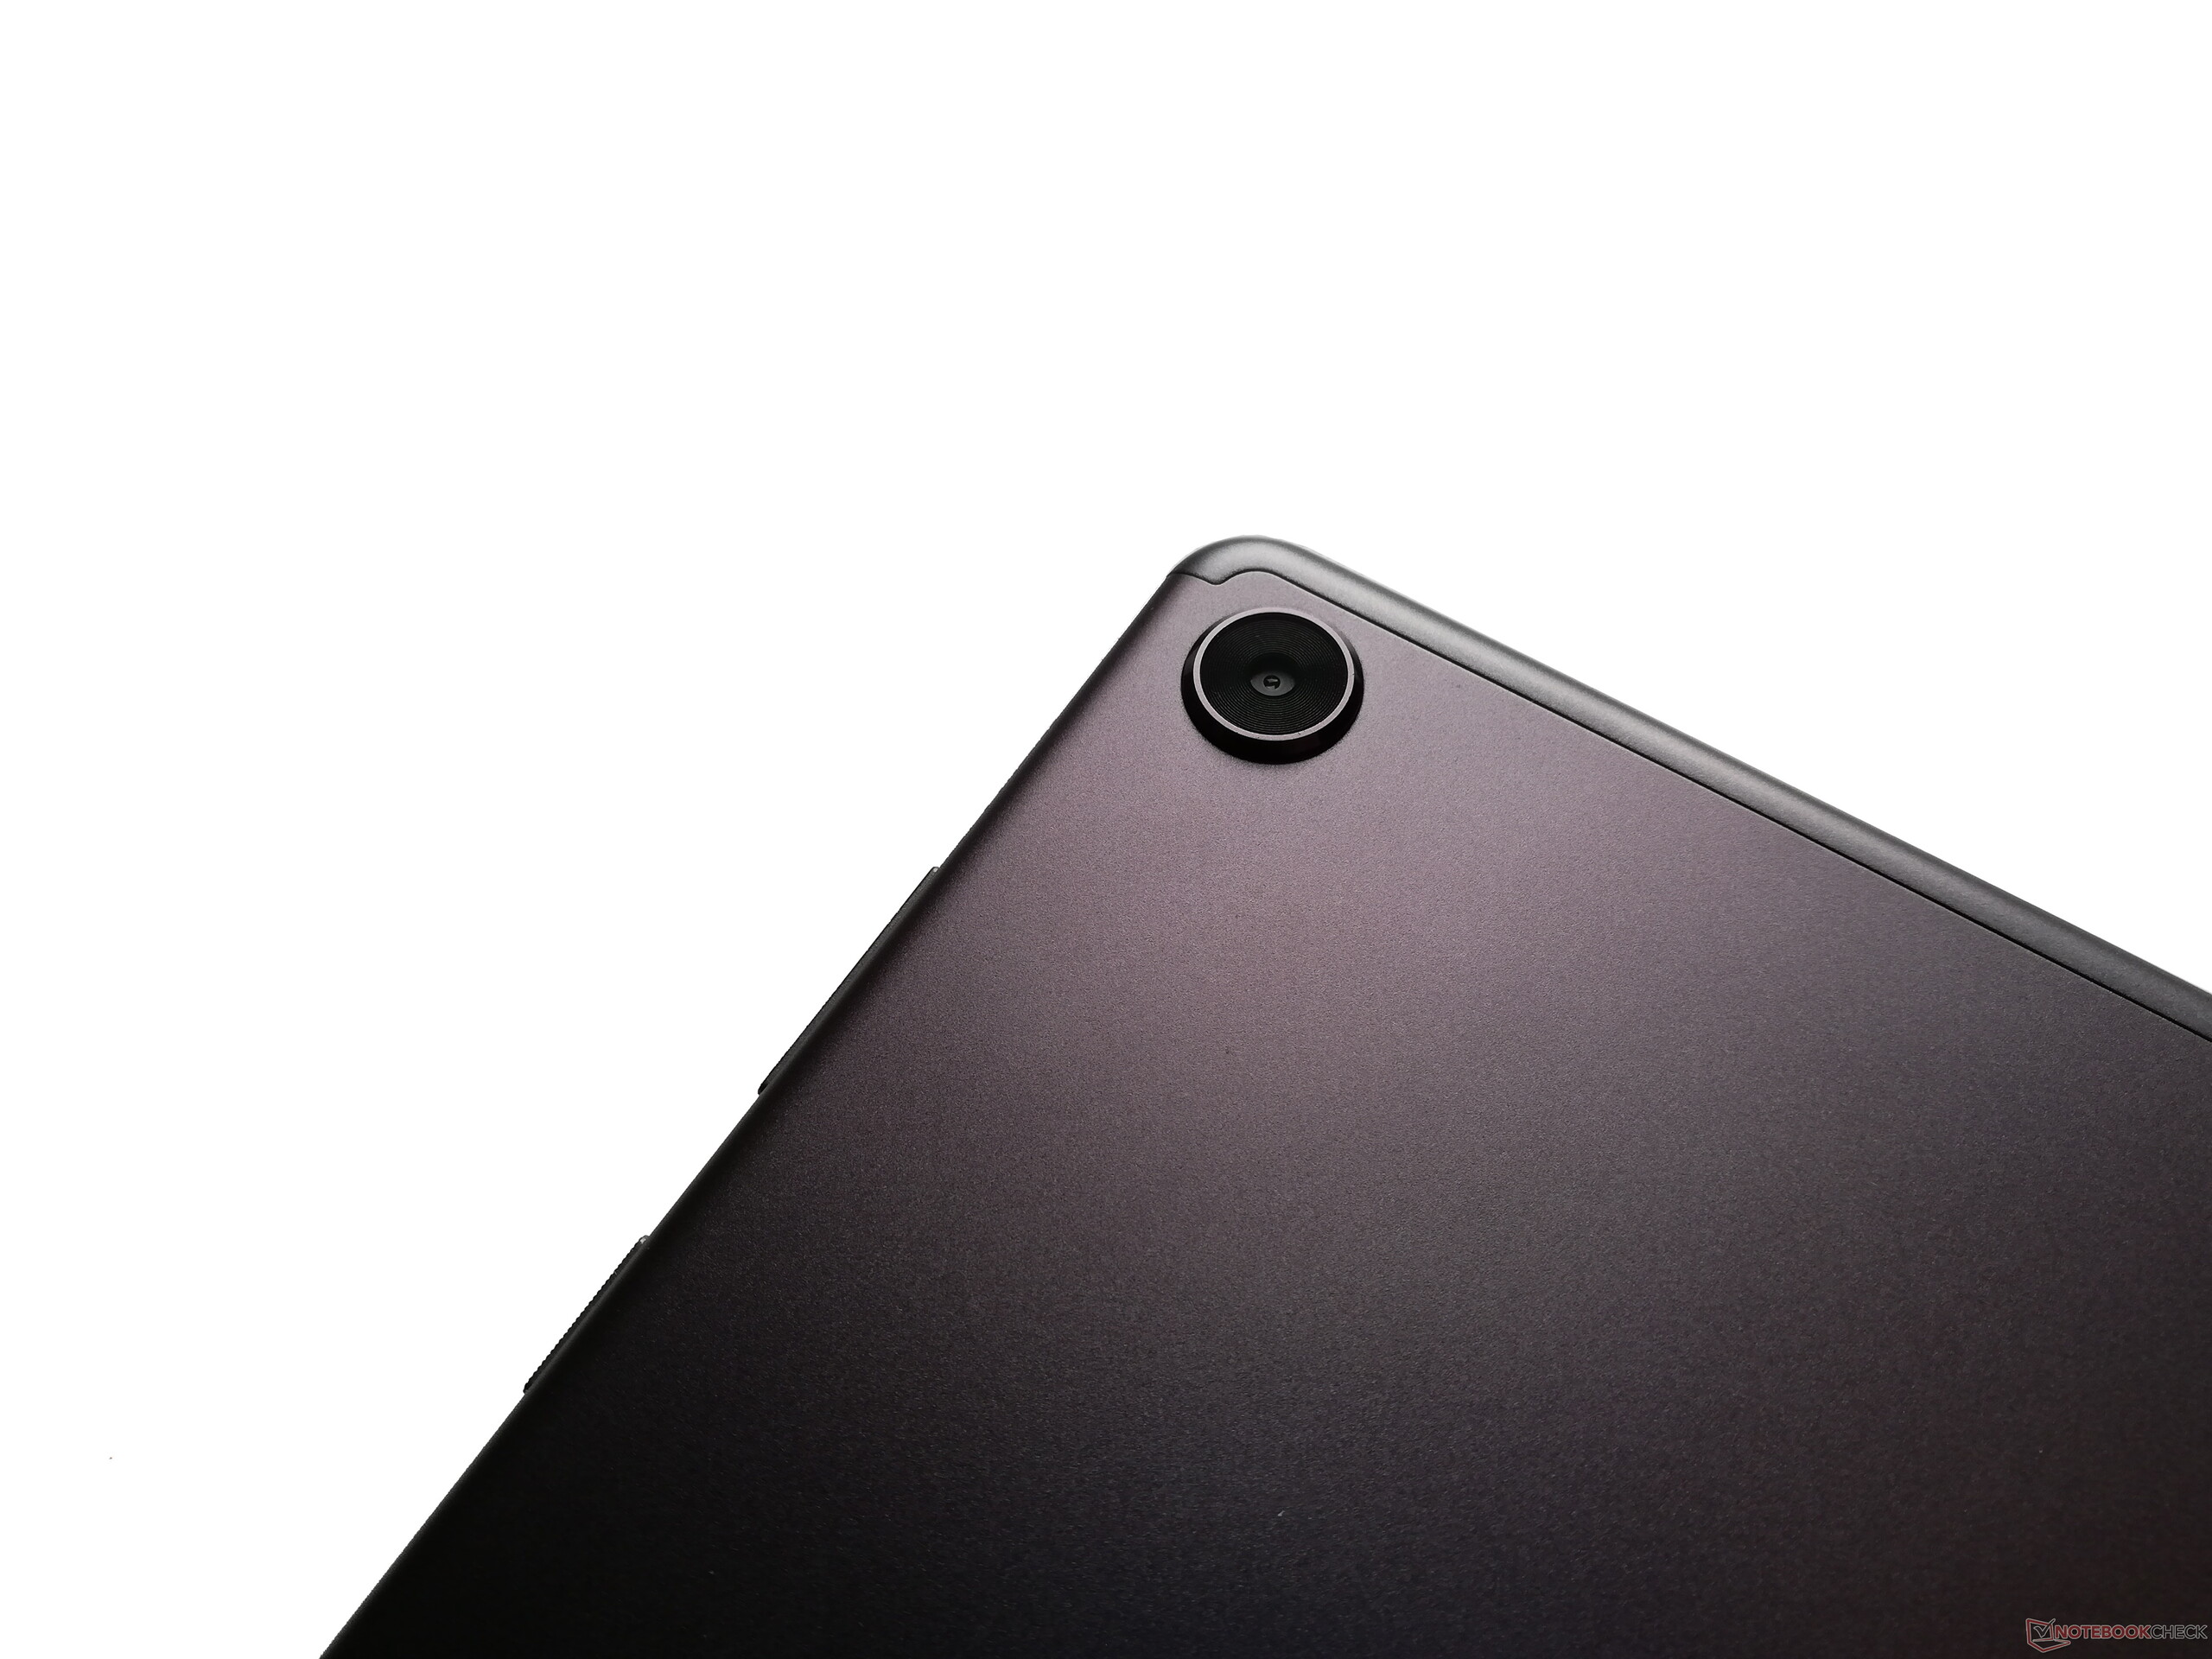
No entanto, não espere muito das câmeras do tablet. Seu armazenamento interno limitado também é um pouco decepcionante, embora esse problema possa ser resolvido formatando o cartão microSD como armazenamento interno. As opiniões podem diferir sobre a utilidade da ampla gama de software que a Lenovo incluiu neste tablet. O modo infantil definitivamente dá uma boa impressão e a gestão do tablet pode economizar tempo aos usuários menos experientes que procurarem no menu de configurações do Android. Usuários cujas expectativas não são particularmente altas ficarão muito satisfeitos com o Tab M8 HD.
Lenovo Tab M8 HD
- 01/06/2020 v7 (old)
Mike Wobker
Price comparison
