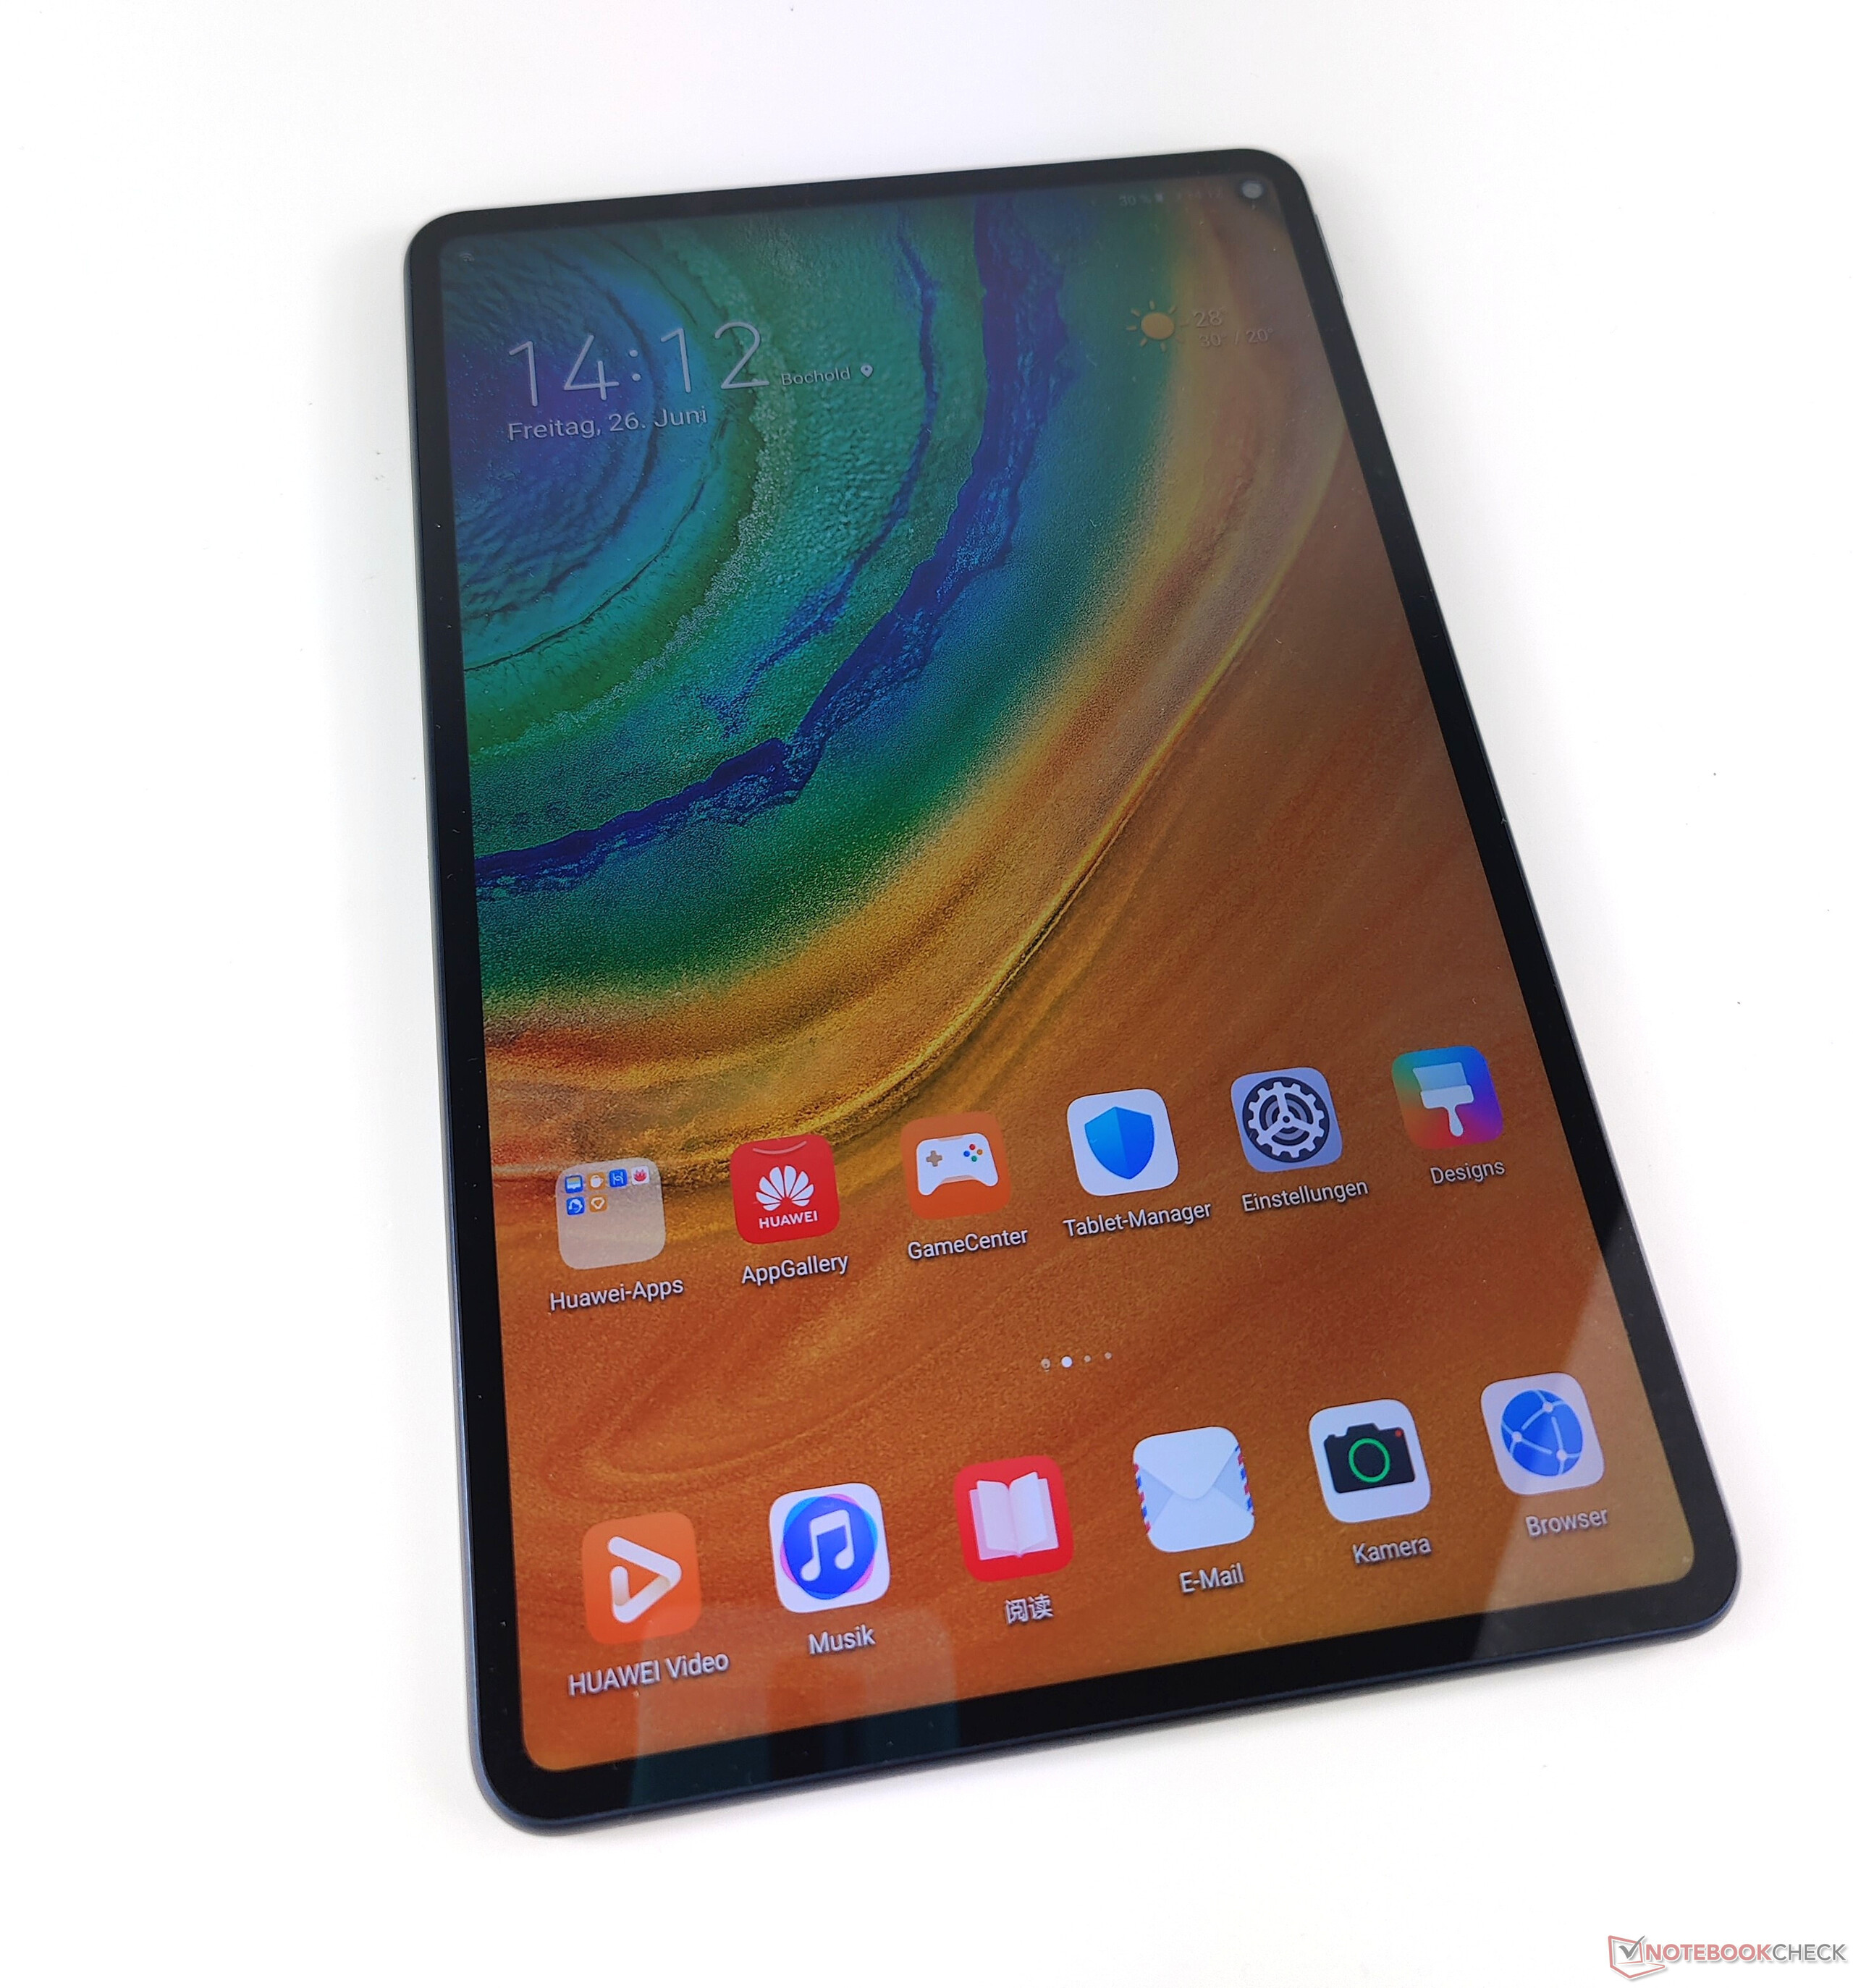
Breve Análise do Tablet Huawei MatePad Pro (5G) 10.8 - Uma alternativa Android para o Apple iPad Pro 11?
Avaliação | Data | Modelo | Peso | Altura | Size | Resolução | Preço |
|---|---|---|---|---|---|---|---|
| 88.4 % v7 (old) | 08/2020 | Huawei MatePad Pro 10.8 Kirin 990, Mali-G76 MP16 | 460 g | 7.2 mm | 10.80" | 2560x1600 | |
| 90.4 % v7 (old) | 04/2020 | Apple iPad Pro 11 2020 A12Z Bionic, A12Z Bionic GPU | 471 g | 5.9 mm | 11.00" | 2388x1668 | |
| 87.8 % v7 (old) | 10/2019 | Samsung Galaxy Tab S6 SM-T860 SD 855, Adreno 640 | 420 g | 5.7 mm | 10.50" | 2560x1600 | |
| 83.1 % v7 (old) | 06/2020 | Samsung Galaxy Tab S6 Lite Exynos 9611, Mali-G72 MP3 | 467 g | 7 mm | 10.40" | 2000x1200 |

| Networking | |
| iperf3 transmit AX12 | |
| Huawei MatePad Pro 10.8 | |
| Apple iPad Pro 11 2020 | |
| Samsung Galaxy Tab S6 SM-T860 | |
| Samsung Galaxy Tab S6 Lite | |
| iperf3 receive AX12 | |
| Huawei MatePad Pro 10.8 | |
| Samsung Galaxy Tab S6 SM-T860 | |
| Samsung Galaxy Tab S6 Lite | |
| Apple iPad Pro 11 2020 | |
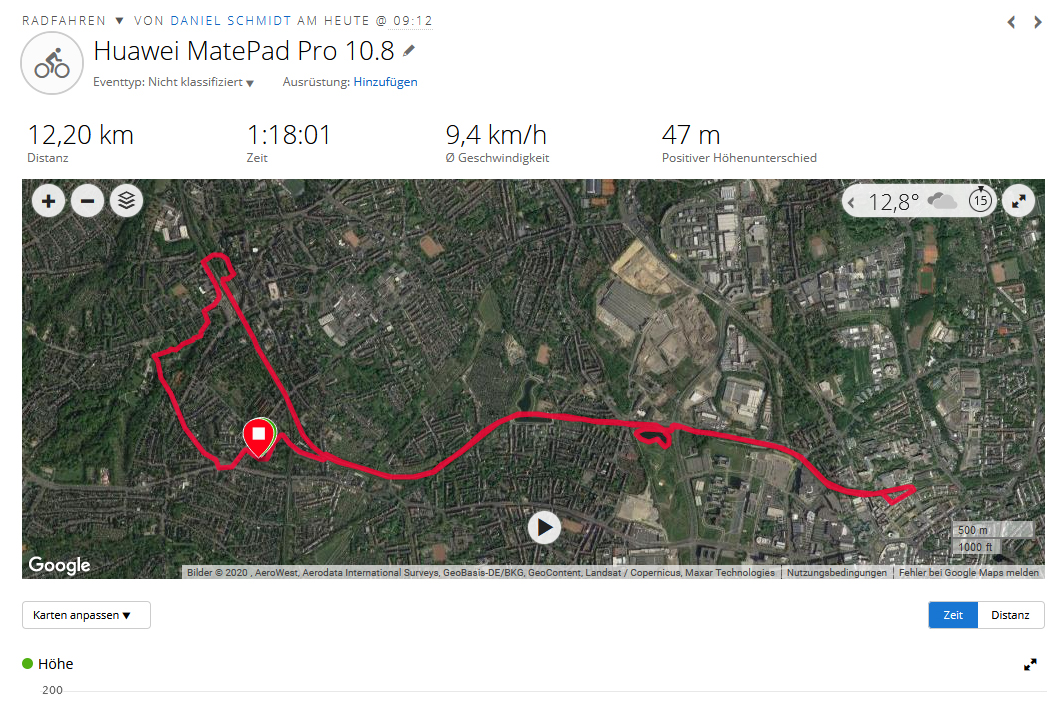
Comparação de imagens
Escolha uma cena e navegue pela primeira imagem. Um clique muda a posição nas telas sensíveis ao toque. Um clique na imagem ampliada abre o original em uma nova janela. A primeira imagem mostra a fotografia em escala do dispositivo de teste.
WideshotLowLightWideshot5x Zoom


| |||||||||||||||||||||||||
iluminação: 89 %
iluminação com acumulador: 606 cd/m²
Contraste: 1894:1 (Preto: 0.32 cd/m²)
ΔE ColorChecker Calman: 2.9 | ∀{0.5-29.43 Ø4.71}
ΔE Greyscale Calman: 4.3 | ∀{0.09-98 Ø4.96}
97.5% sRGB (Calman 2D)
Gamma: 2.22
CCT: 7272 K
| Huawei MatePad Pro 10.8 IPS, 2560x1600, 10.8" | Apple iPad Pro 11 2020 IPS, 2388x1668, 11" | Samsung Galaxy Tab S6 SM-T860 Super AMOLED, 2560x1600, 10.5" | Samsung Galaxy Tab S6 Lite TFT, 2000x1200, 10.4" | |
|---|---|---|---|---|
| Screen | 22% | 3% | -29% | |
| Brightness middle (cd/m²) | 606 | 617 2% | 446 -26% | 503 -17% |
| Brightness (cd/m²) | 579 | 585 1% | 445 -23% | 477 -18% |
| Brightness Distribution (%) | 89 | 84 -6% | 86 -3% | 91 2% |
| Black Level * (cd/m²) | 0.32 | 0.36 -13% | 0.29 9% | |
| Contrast (:1) | 1894 | 1714 -10% | 1734 -8% | |
| Colorchecker dE 2000 * | 2.9 | 0.94 68% | 2.7 7% | 4.4 -52% |
| Colorchecker dE 2000 max. * | 6 | 1.87 69% | 5.4 10% | 10.4 -73% |
| Greyscale dE 2000 * | 4.3 | 1.4 67% | 2.1 51% | 7.5 -74% |
| Gamma | 2.22 99% | 2.156 102% | 2.05 107% | 2.19 100% |
| CCT | 7272 89% | 6733 97% | 6468 100% | 7700 84% |
* ... menor é melhor
Cintilação da tela / PWM (modulação por largura de pulso)
| Tela tremeluzindo/PWM detectado | 23810 Hz | ≤ 38 % configuração de brilho | 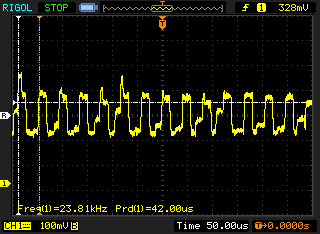 |
A luz de fundo da tela pisca em 23810 Hz (pior caso, por exemplo, utilizando PWM) Cintilação detectada em uma configuração de brilho de 38 % e abaixo. Não deve haver cintilação ou PWM acima desta configuração de brilho. A frequência de 23810 Hz é bastante alta, então a maioria dos usuários sensíveis ao PWM não deve notar nenhuma oscilação. [pwm_comparison] Em comparação: 52 % de todos os dispositivos testados não usam PWM para escurecer a tela. Se PWM foi detectado, uma média de 7757 (mínimo: 5 - máximo: 343500) Hz foi medida. | |||
Exibir tempos de resposta
| ↔ Tempo de resposta preto para branco | ||
|---|---|---|
| 19.2 ms ... ascensão ↗ e queda ↘ combinadas | ↗ 6.8 ms ascensão | 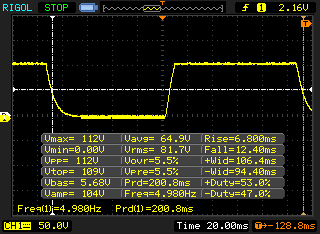 |
| ↘ 12.4 ms queda | ||
| A tela mostra boas taxas de resposta em nossos testes, mas pode ser muito lenta para jogadores competitivos. Em comparação, todos os dispositivos testados variam de 0.1 (mínimo) a 240 (máximo) ms. » 43 % de todos os dispositivos são melhores. Isso significa que o tempo de resposta medido é semelhante à média de todos os dispositivos testados (19.8 ms). | ||
| ↔ Tempo de resposta 50% cinza a 80% cinza | ||
| 44.4 ms ... ascensão ↗ e queda ↘ combinadas | ↗ 20 ms ascensão | 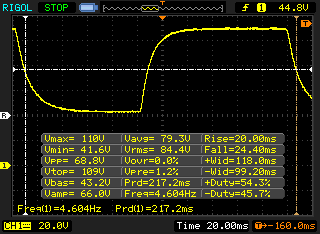 |
| ↘ 24.4 ms queda | ||
| A tela mostra taxas de resposta lentas em nossos testes e será insatisfatória para os jogadores. Em comparação, todos os dispositivos testados variam de 0.165 (mínimo) a 636 (máximo) ms. » 76 % de todos os dispositivos são melhores. Isso significa que o tempo de resposta medido é pior que a média de todos os dispositivos testados (31 ms). | ||
| AnTuTu v8 - Total Score | |
| Apple iPad Pro 11 2020 | |
| Xiaomi Mi 10 Pro | |
| Samsung Galaxy S20 Ultra | |
| Média HiSilicon Kirin 990 (409039 - 483224, n=2) | |
| Huawei MatePad Pro 10.8 | |
| Samsung Galaxy Tab S6 Lite | |
| Jetstream 2 - 2.0 Total | |
| Média da turma Tablet (35.8 - 420, n=55, últimos 2 anos) | |
| Apple iPad Pro 11 2020 (Safari 14.1) | |
| Apple iPad Pro 11 2020 (Chrome 80) | |
| Samsung Galaxy Tab S6 SM-T860 (Chrome 77.0.3865.116) | |
| Média HiSilicon Kirin 990 (55.1 - 65.9, n=2) | |
| Huawei MatePad Pro 10.8 (Huawei Browser V10.1.2) | |
| Samsung Galaxy Tab S6 Lite (Chrome 80.0.3987.99) | |
| JetStream 1.1 - 1.1 Total | |
| Apple iPad Pro 11 2020 (Chrome 80) | |
| Samsung Galaxy Tab S6 SM-T860 (Chrome 77.0.3865.116) | |
| Média HiSilicon Kirin 990 (101.2 - 115.5, n=2) | |
| Huawei MatePad Pro 10.8 (Huawei Browser V10.1.2) | |
| Samsung Galaxy Tab S6 Lite (Chrome 80.0.3987.99) | |
| WebXPRT 3 - Overall | |
| Média da turma Tablet (168 - 520, n=10, últimos 2 anos) | |
| Apple iPad Pro 11 2020 (Safari 14.1) | |
| Apple iPad Pro 11 2020 (Chrome 80) | |
| Média HiSilicon Kirin 990 (97 - 119, n=2) | |
| Samsung Galaxy Tab S6 SM-T860 (Chrome 77.0.3865.116) | |
| Huawei MatePad Pro 10.8 (Huawei Browser V10.1.2) | |
| Samsung Galaxy Tab S6 Lite (Chrome 80.0.3987.99) | |
| Speedometer 2.0 - Result 2.0 | |
| Média da turma Tablet (6.8 - 790, n=33, últimos 2 anos) | |
| Apple iPad Pro 11 2020 (Safari 14.1) | |
| Média HiSilicon Kirin 990 (63.9 - 74.1, n=2) | |
| Samsung Galaxy Tab S6 SM-T860 (Chrome 77.0.3865.116) | |
| Huawei MatePad Pro 10.8 (Huawei Browser V10.1.2) | |
| Samsung Galaxy Tab S6 Lite (Chrome 80.0.3987.99) | |
| Octane V2 - Total Score | |
| Média da turma Tablet (1633 - 138481, n=71, últimos 2 anos) | |
| Apple iPad Pro 11 2020 (Safari 14.1) | |
| Apple iPad Pro 11 2020 (Chrome 80) | |
| Samsung Galaxy Tab S6 SM-T860 (Chrome 77.0.3865.116) | |
| Média HiSilicon Kirin 990 (19885 - 23568, n=2) | |
| Huawei MatePad Pro 10.8 (Huawei Browser V10.1.2) | |
| Samsung Galaxy Tab S6 Lite (Chrome 80.0.3987.99) | |
| Mozilla Kraken 1.1 - Total | |
| Samsung Galaxy Tab S6 Lite (Chrome 80.0.3987.99) | |
| Huawei MatePad Pro 10.8 (Huawei Browser V10.1.2) | |
| Samsung Galaxy Tab S6 SM-T860 (Chrome 77.0.3865.116) | |
| Média HiSilicon Kirin 990 (1963 - 2345, n=2) | |
| Média da turma Tablet (243 - 16233, n=65, últimos 2 anos) | |
| Apple iPad Pro 11 2020 (Chrome 80) | |
* ... menor é melhor
| Huawei MatePad Pro 10.8 | Samsung Galaxy Tab S6 SM-T860 | Samsung Galaxy Tab S6 Lite | Média 256 GB UFS 3.0 Flash | Média da turma Tablet | |
|---|---|---|---|---|---|
| AndroBench 3-5 | -13% | -34% | -6% | 95% | |
| Sequential Read 256KB (MB/s) | 1789 | 1416 -21% | 483.7 -73% | 1547 ? -14% | 2073 ? 16% |
| Sequential Write 256KB (MB/s) | 399 | 522 31% | 219.3 -45% | 575 ? 44% | 1667 ? 318% |
| Random Read 4KB (MB/s) | 224.6 | 191.6 -15% | 119.8 -47% | 210 ? -7% | 275 ? 22% |
| Random Write 4KB (MB/s) | 262.4 | 170.2 -35% | 195.8 -25% | 188.5 ? -28% | 324 ? 23% |
| Sequential Read 256KB SDCard (MB/s) | 82.4 ? | 70.5 ? -14% | 78.3 ? -5% | 70.6 ? -14% | |
| Sequential Write 256KB SDCard (MB/s) | 71.7 ? | 54.5 ? -24% | 65.3 ? -9% | 59.8 ? -17% |
PUBG Compare
Real Racing 3
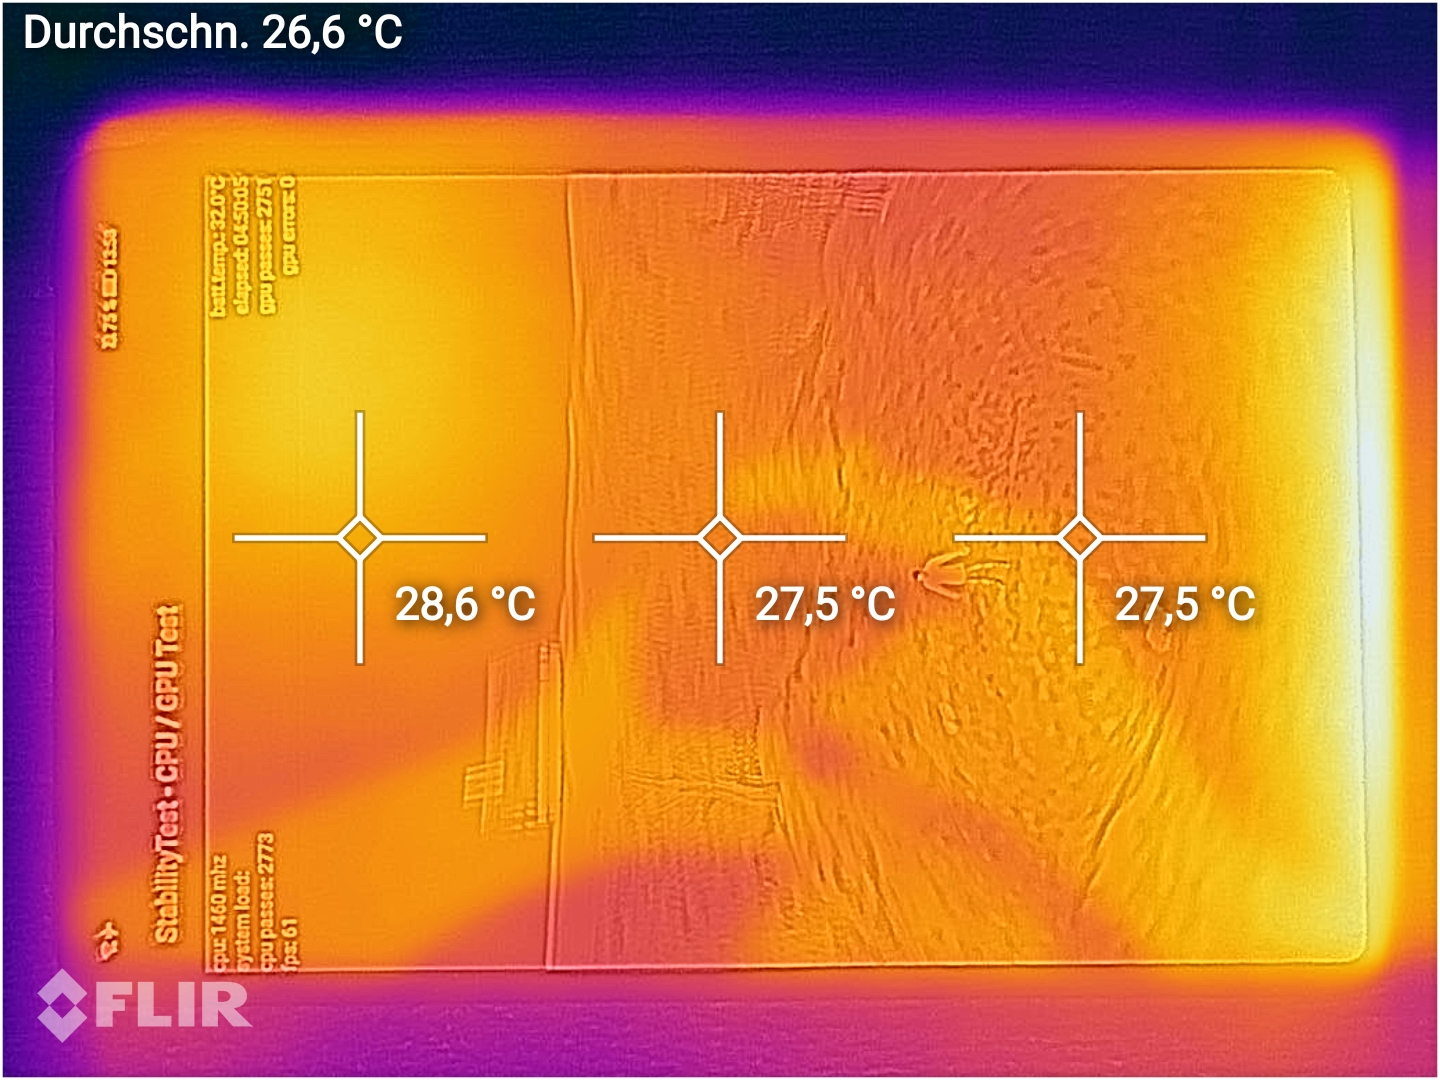
(+) A temperatura máxima no lado superior é 32.6 °C / 91 F, em comparação com a média de 33.7 °C / 93 F , variando de 20.7 a 53.2 °C para a classe Tablet.
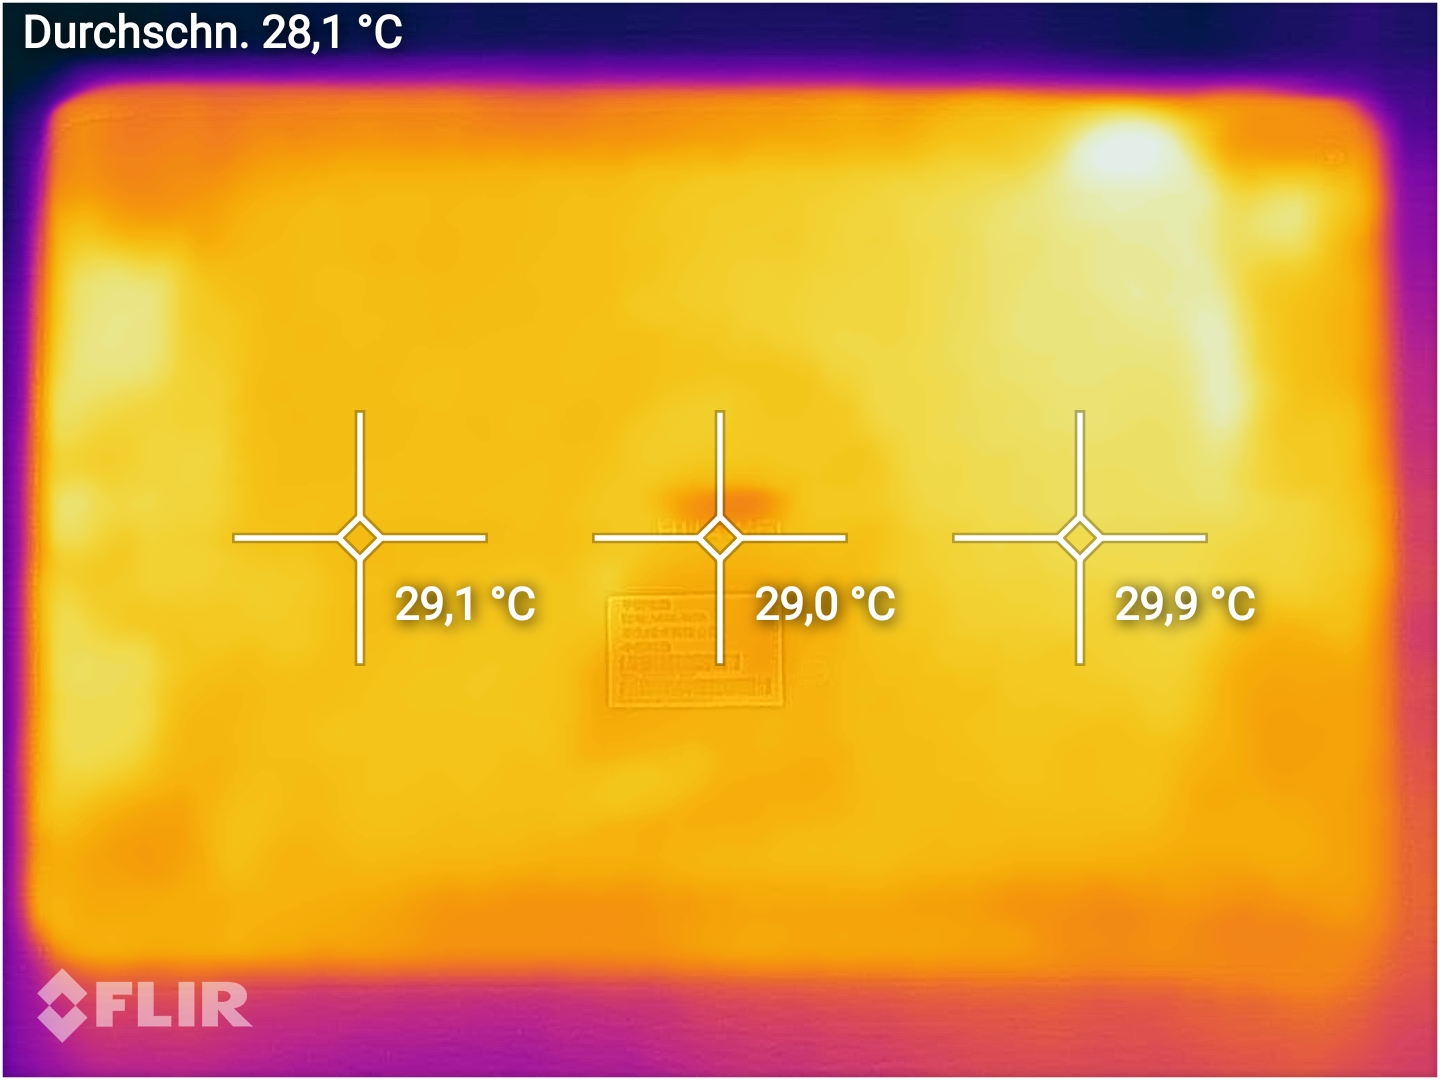
(+) A parte inferior aquece até um máximo de 29.6 °C / 85 F, em comparação com a média de 33.2 °C / 92 F
(+) Em uso inativo, a temperatura média para o lado superior é 28.3 °C / 83 F, em comparação com a média do dispositivo de 30 °C / ### class_avg_f### F.
Huawei MatePad Pro 10.8 análise de áudio
(+) | os alto-falantes podem tocar relativamente alto (###valor### dB)
Graves 100 - 315Hz
(±) | graves reduzidos - em média 10.9% menor que a mediana
(±) | a linearidade dos graves é média (11.9% delta para a frequência anterior)
Médios 400 - 2.000 Hz
(+) | médios equilibrados - apenas 2.6% longe da mediana
(+) | médios são lineares (3.3% delta para frequência anterior)
Altos 2 - 16 kHz
(+) | agudos equilibrados - apenas 2.2% longe da mediana
(+) | os máximos são lineares (3.8% delta da frequência anterior)
Geral 100 - 16.000 Hz
(+) | o som geral é linear (12.4% diferença em relação à mediana)
Comparado com a mesma classe
» 19% de todos os dispositivos testados nesta classe foram melhores, 4% semelhantes, 77% piores
» O melhor teve um delta de 7%, a média foi 20%, o pior foi 129%
Comparado com todos os dispositivos testados
» 11% de todos os dispositivos testados foram melhores, 2% semelhantes, 87% piores
» O melhor teve um delta de 4%, a média foi 23%, o pior foi 134%
Apple iPad Pro 11 2020 análise de áudio
(±) | o volume do alto-falante é médio, mas bom (###valor### dB)
Graves 100 - 315Hz
(±) | graves reduzidos - em média 6.3% menor que a mediana
(±) | a linearidade dos graves é média (7.6% delta para a frequência anterior)
Médios 400 - 2.000 Hz
(±) | médios mais altos - em média 6.4% maior que a mediana
(+) | médios são lineares (6% delta para frequência anterior)
Altos 2 - 16 kHz
(+) | agudos equilibrados - apenas 1.9% longe da mediana
(+) | os máximos são lineares (6.2% delta da frequência anterior)
Geral 100 - 16.000 Hz
(+) | o som geral é linear (13% diferença em relação à mediana)
Comparado com a mesma classe
» 23% de todos os dispositivos testados nesta classe foram melhores, 4% semelhantes, 74% piores
» O melhor teve um delta de 7%, a média foi 20%, o pior foi 129%
Comparado com todos os dispositivos testados
» 13% de todos os dispositivos testados foram melhores, 3% semelhantes, 85% piores
» O melhor teve um delta de 4%, a média foi 23%, o pior foi 134%
| desligado | |
| Ocioso | |
| Carga |
|
Key:
min: | |
| Huawei MatePad Pro 10.8 7250 mAh | Apple iPad Pro 11 2020 7538 mAh | Samsung Galaxy Tab S6 SM-T860 7040 mAh | Samsung Galaxy Tab S6 Lite 7040 mAh | |
|---|---|---|---|---|
| Power Consumption | -36% | 11% | 12% | |
| Idle Minimum * (Watt) | 1.98 | 1.3 34% | 1.96 1% | 1.21 39% |
| Idle Average * (Watt) | 5.66 | 3.5 38% | 2.8 51% | 4.24 25% |
| Idle Maximum * (Watt) | 5.69 | 5.6 2% | 2.82 50% | 4.34 24% |
| Load Average * (Watt) | 6.96 | 12.5 -80% | 5.31 24% | 6.99 -0% |
| Load Maximum * (Watt) | 6.98 | 19.2 -175% | 11.91 -71% | 8.79 -26% |
* ... menor é melhor
| Huawei MatePad Pro 10.8 7250 mAh | Apple iPad Pro 11 2020 7538 mAh | Samsung Galaxy Tab S6 SM-T860 7040 mAh | Samsung Galaxy Tab S6 Lite 7040 mAh | |
|---|---|---|---|---|
| Duração da bateria | -1% | -7% | 10% | |
| Reader / Idle (h) | 31.3 | 33.4 7% | 21.3 -32% | 35.3 13% |
| H.264 (h) | 15.2 | 15.6 3% | 14.5 -5% | 15.8 4% |
| WiFi v1.3 (h) | 14.9 | 15 1% | 9.3 -38% | 13.2 -11% |
| Load (h) | 3.9 | 3.3 -15% | 5.7 46% | 5.2 33% |
Pro
Contra
Veredicto - O MatePad Pro é um tablet de nicho premium
Um veredicto geral sobre o último tablet Huawei é quase impossível, dada a falta de serviços móveis do Google e a falta de uma certificação Widevine L1 - preferências individuais e comportamento de uso pessoal são essenciais aqui. Os amantes de multimídia precisam estar cientes de que a reprodução de conteúdo protegido por DRM é muito ruim. Esclareceremos se isso acaba afetando a versão alemã assim que o exemplar de teste com o software alemão chegar até nós.
A falta de serviços do Google torna muito difícil usar os aplicativos do Google e causa problemas com muitos aplicativos de terceiros. Aplicativos de fontes externas podem ser instalados, mas isso apresenta um risco de segurança para usuários inexperientes, e até mesmo usuários experientes às vezes não entenderão a maneira como os arquivos APK de fontes externas irão interagir com seu sistema.
Apesar disso, o MatePad Pro oferece um sistema de alto-falantes com bom som, longa duração e desempenho decente. Além disso, o tablet da Huawei tem uma construção muito boa e recursos raramente encontrados no mercado de tablets, como carregamento sem fio e carregamento sem fio reverso.
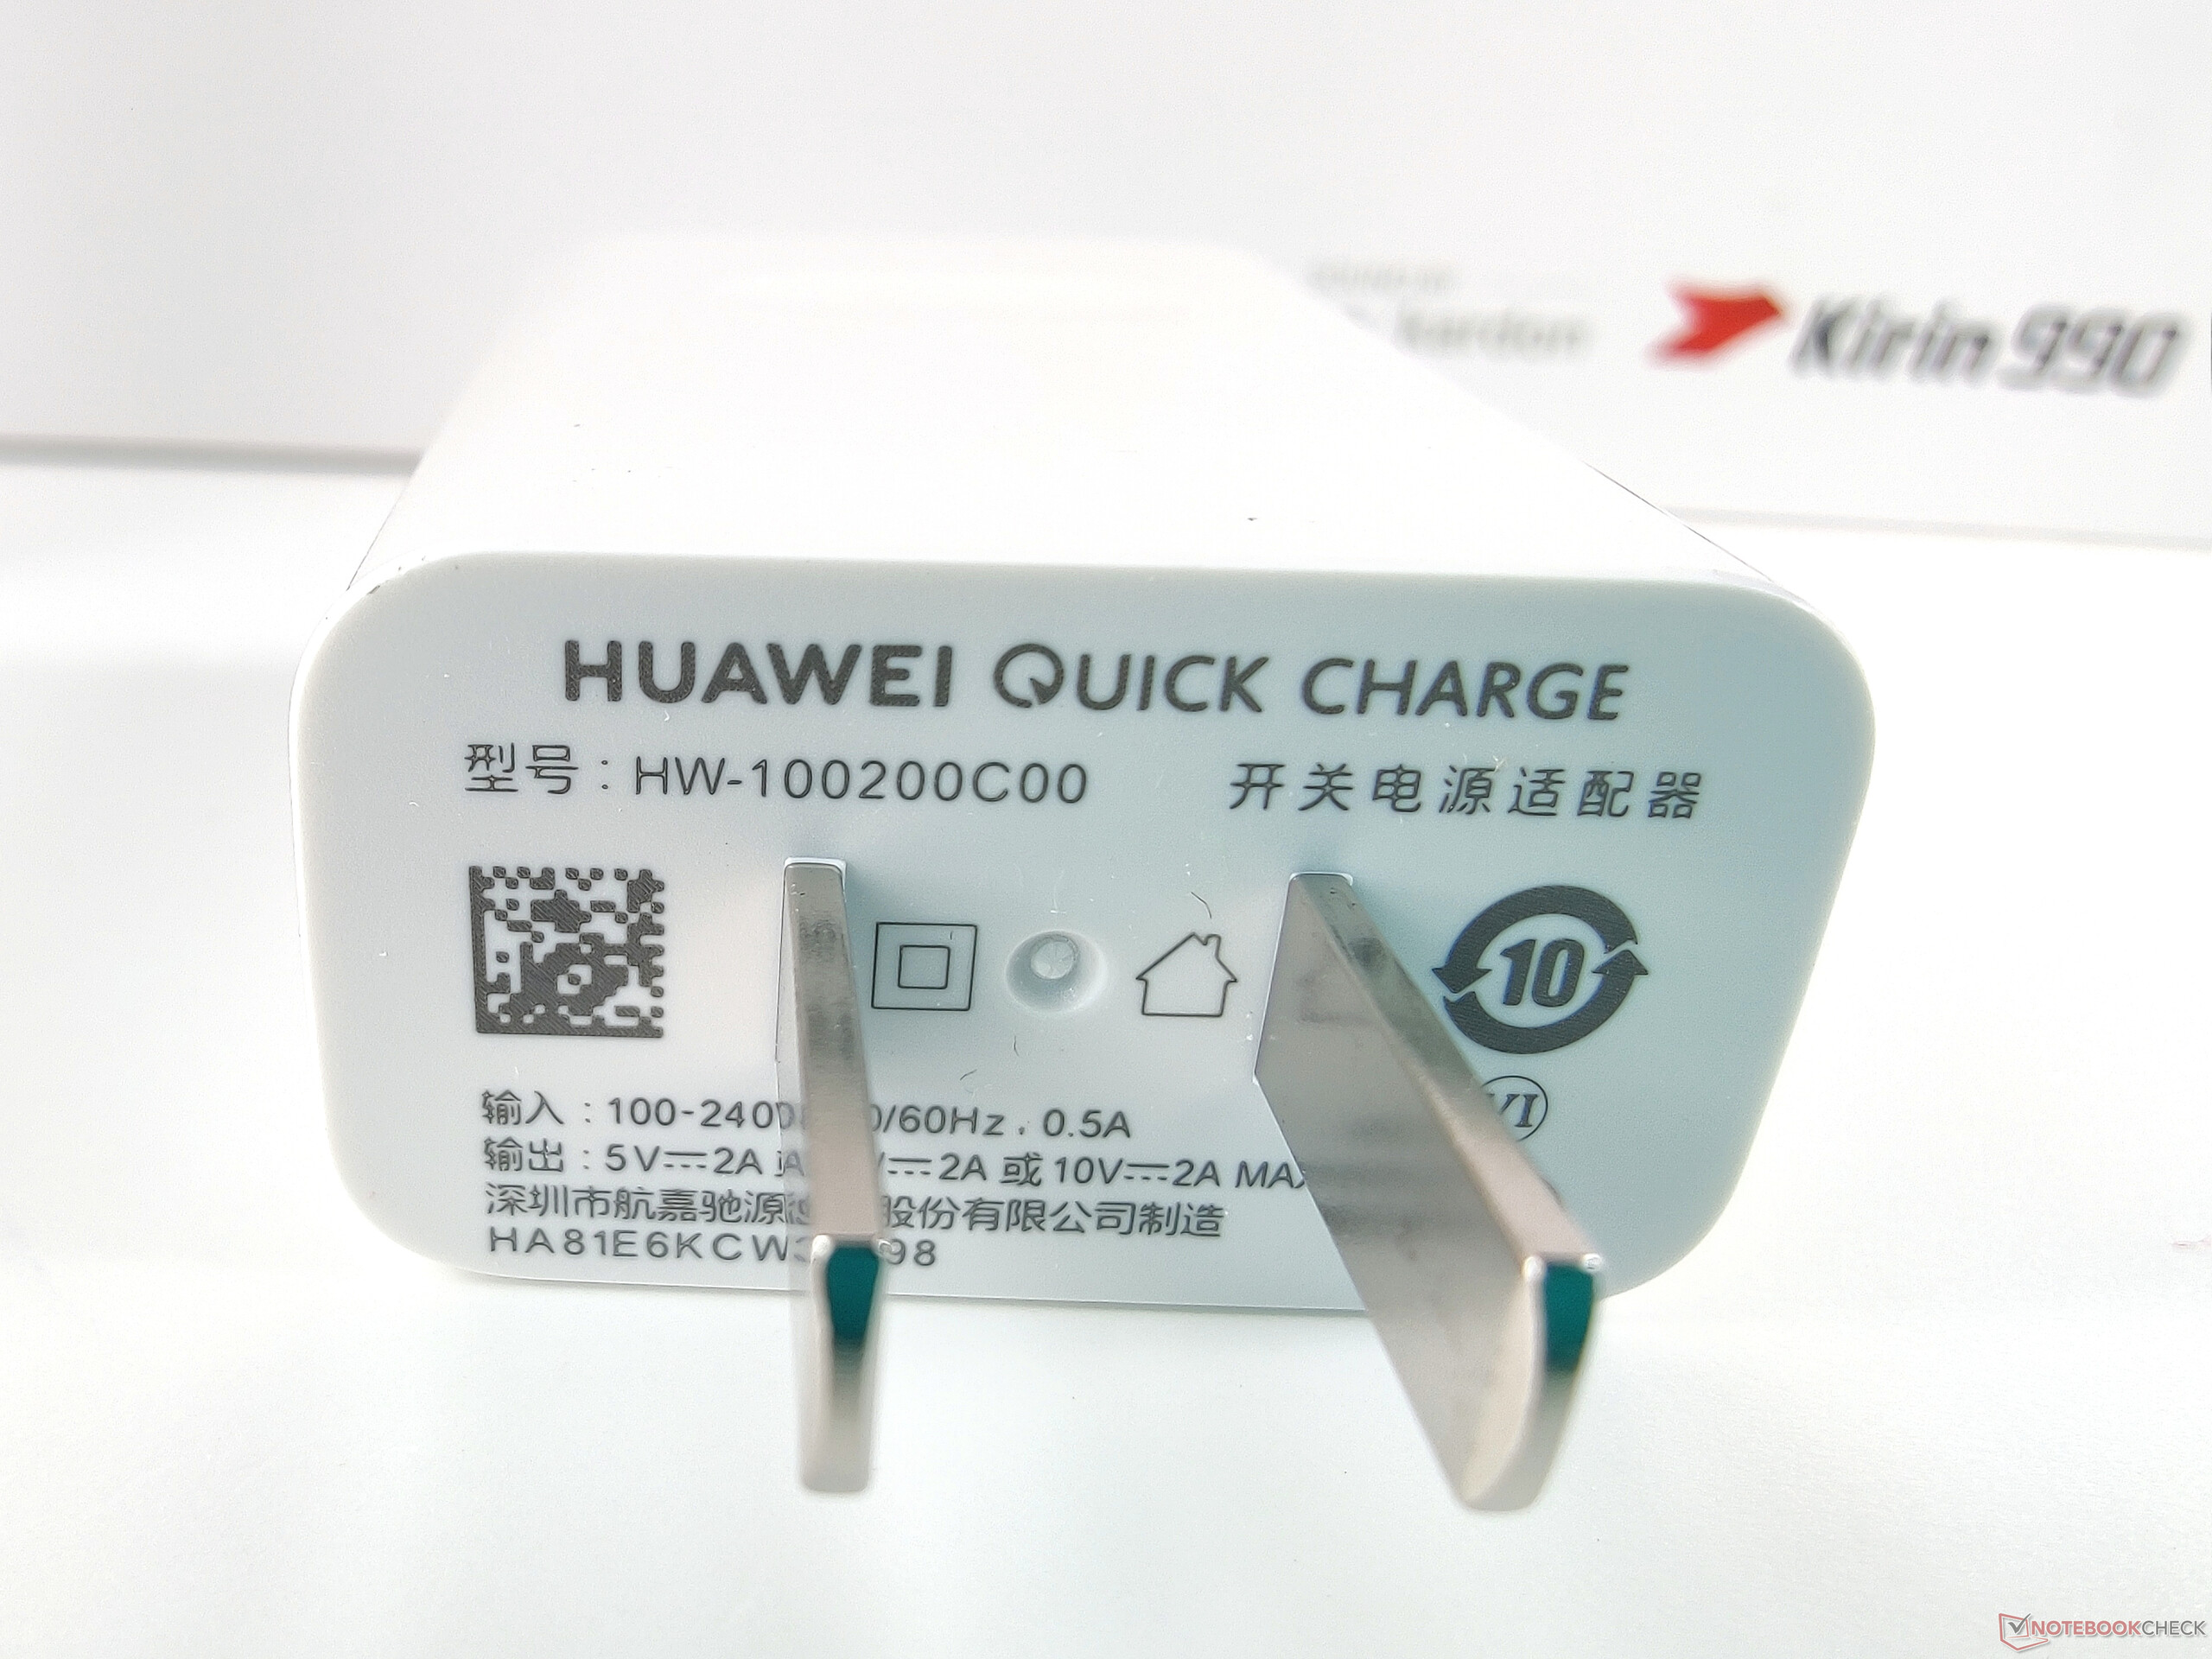
Mas o hardware do MatePad Pro não está isento de críticas. Dada a faixa de preço, o tablet deve vir com uma opção de desbloqueio biométrico seguro e uma fonte de alimentação de 40 watts suficientemente poderosa. Além disso, um tablet premium pode ter uma tela OLED ou uma tela IPS com uma alta taxa de atualização à la iPad Pro. A decisão de ir com a tecnologia LC e seus pontos fracos (turvação, ângulos de visão), em combinação com o buraco perfurado (que cria sombras), não vai deixar os fãs da tela felizes.
O MatePad Pro é um belo tablet, mas no geral não é recomendável para a maioria.
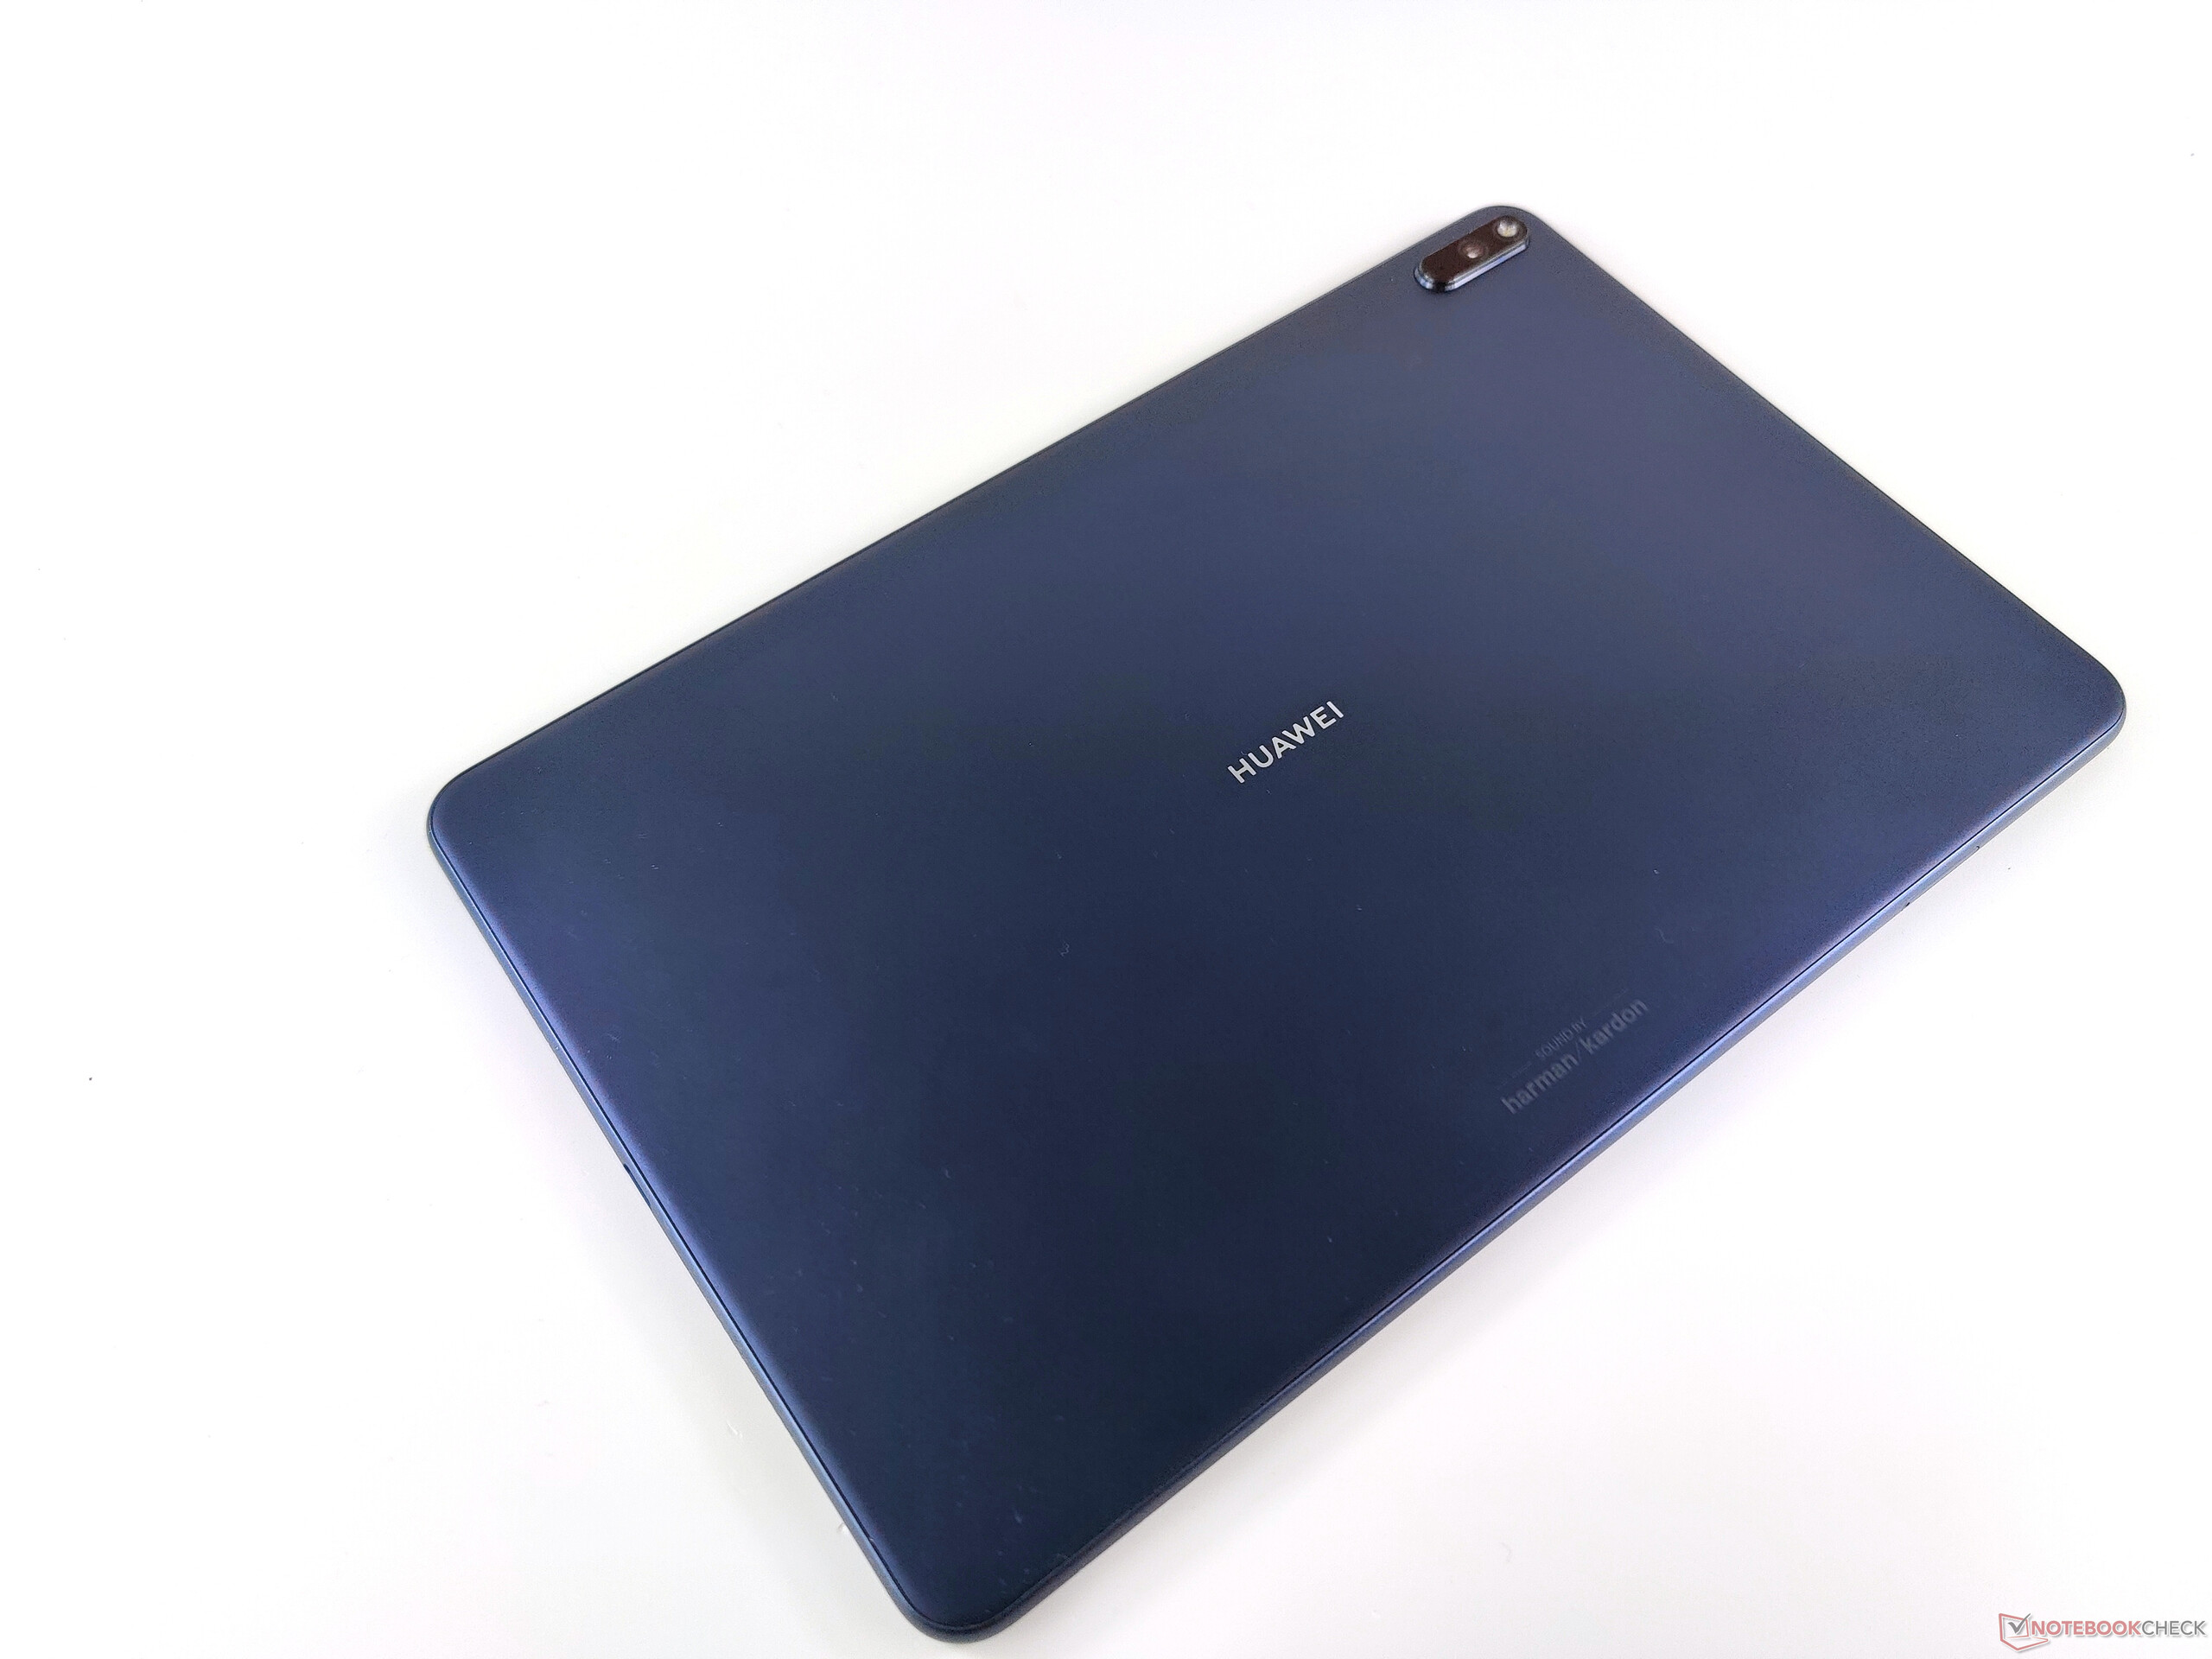
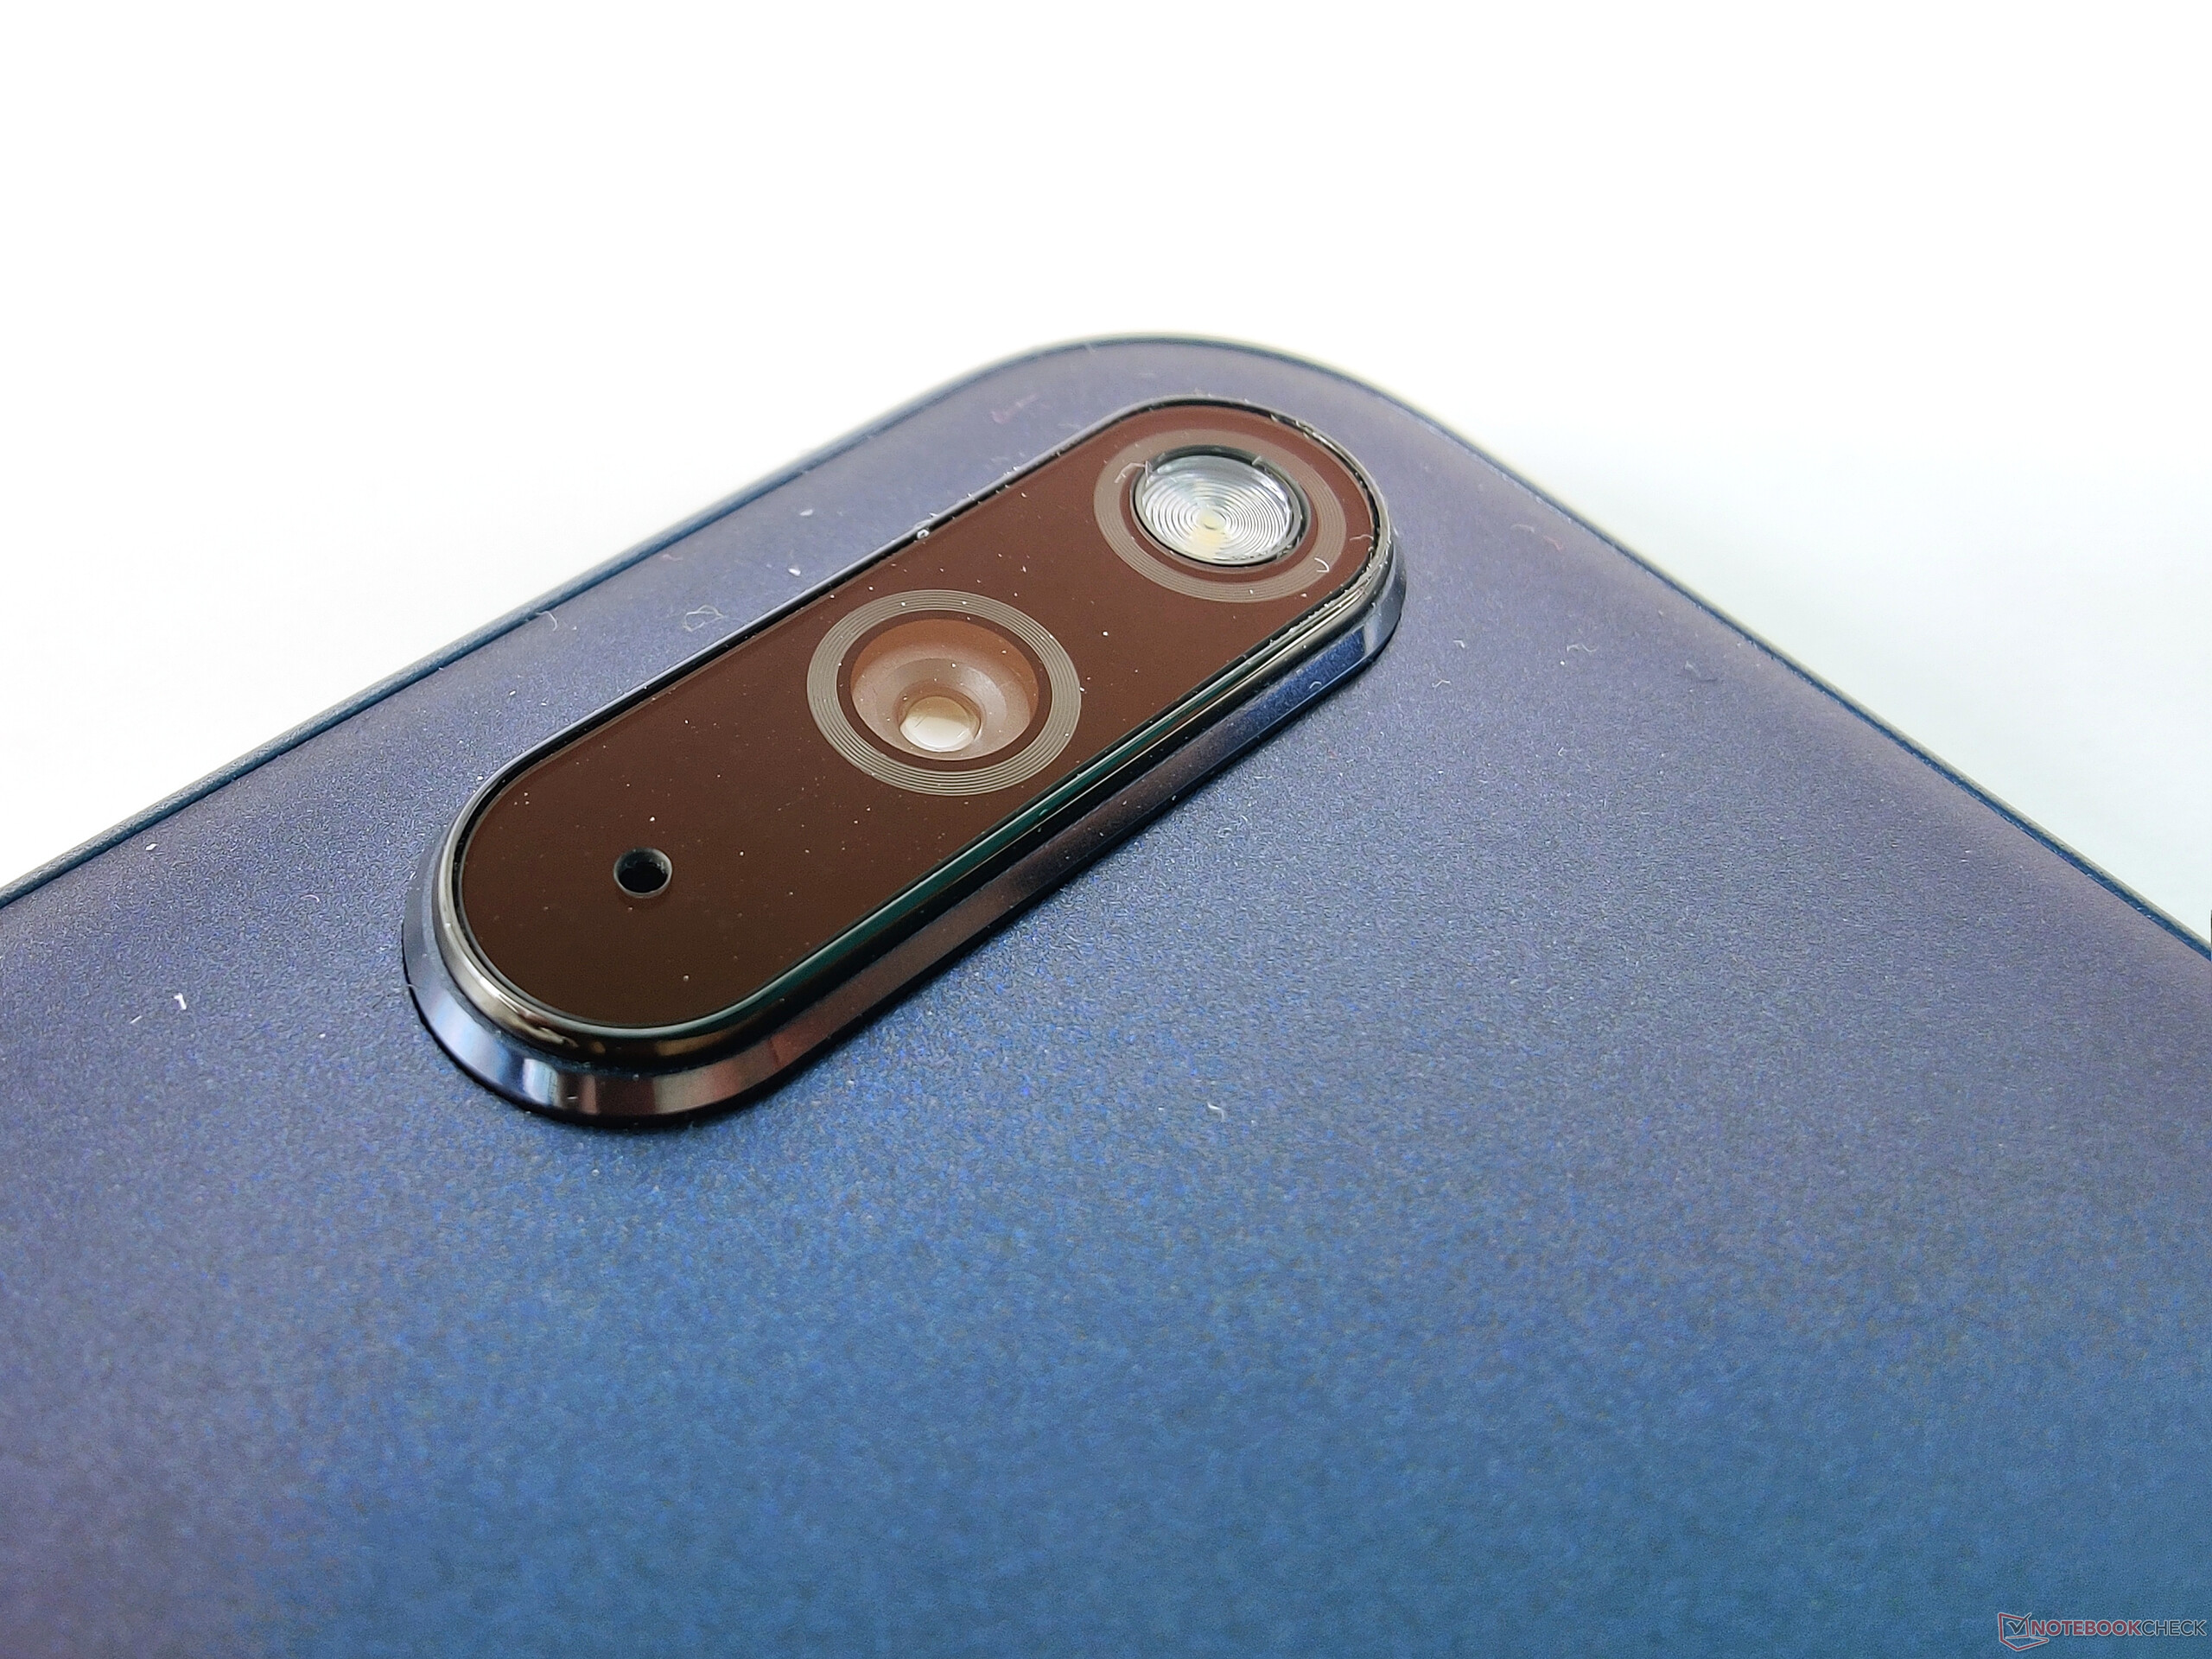
Huawei MatePad Pro 10.8
- 07/06/2020 v7 (old)
Marcus Herbrich