Análise do laptop Asus ZenBook 14X (2023): Ultrabook OLED em seu limite

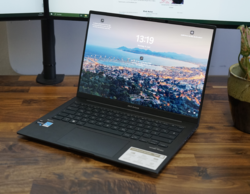
A Asus reformulou ligeiramente o Asus ZenBook 14X, de modo que agora ele se parece muito com o ultrabook compacto de 13 polegadas ZenBook S13. No entanto, o peso do modelo de 14 polegadas com seu chassi excepcionalmente bom é significativamente maior, 1,56 kg. Em troca, a Asus instala o muito mais potente Intel Core i9-13900H e, se necessário, um Nvidia GeForce RTX 3050. Como o antecessor, está instalada uma tela OLED de 2,8K, que foi atualizada de 90 Hz para 120 Hz.
Como não há muitos concorrentes com uma tela OLED no segmento de 14 polegadas, também incluímos concorrentes IPS para comparação. Interessante aqui é o tablet Asus ROG Flow Z13 GZ301V, que é equipado com o mesmo poderoso processador Intel Core i9.
Potenziali concorrenti a confronto
Avaliação | Data | Modelo | Peso | Altura | Size | Resolução | Preço |
|---|---|---|---|---|---|---|---|
| 88.5 % v7 (old) | 06/2023 | Asus ZenBook 14X UX3404VC i9-13900H, Iris Xe G7 96EUs | 1.6 kg | 16.9 mm | 14.50" | 2880x1800 | |
| 91.9 % v7 (old) | 06/2022 | Apple MacBook Pro 13 2022 M2 M2, M2 10-Core GPU | 1.4 kg | 15.6 mm | 13.30" | 2560x1600 | |
| 89.2 % v7 (old) | 04/2023 | Lenovo Slim Pro 7 14ARP8 R7 7735HS, GeForce RTX 3050 6GB Laptop GPU | 1.6 kg | 15.6 mm | 14.50" | 2560x1600 | |
| 89.1 % v7 (old) | 04/2023 | Asus ROG Flow Z13 GZ301V i9-13900H, GeForce RTX 4060 Laptop GPU | 1.6 kg | 14.2 mm | 13.40" | 2560x1600 | |
| 87.3 % v7 (old) | 09/2022 | Dell XPS 13 Plus 9320 i7-1280P OLED i7-1280P, Iris Xe G7 96EUs | 1.3 kg | 15.28 mm | 13.40" | 3456x2160 | |
| 87.2 % v7 (old) | 09/2022 | Dell Inspiron 14 Plus 7420 i7-12700H, GeForce RTX 3050 4GB Laptop GPU | 1.7 kg | 18.87 mm | 14.00" | 2240x1400 | |
| 86.6 % v7 (old) | 10/2022 | LG Gram 14Z90Q i5-1240P, Iris Xe G7 80EUs | 980 g | 16.8 mm | 14.00" | 1920x1200 |
Case - Não existe nada de mais alta qualidade do que isso
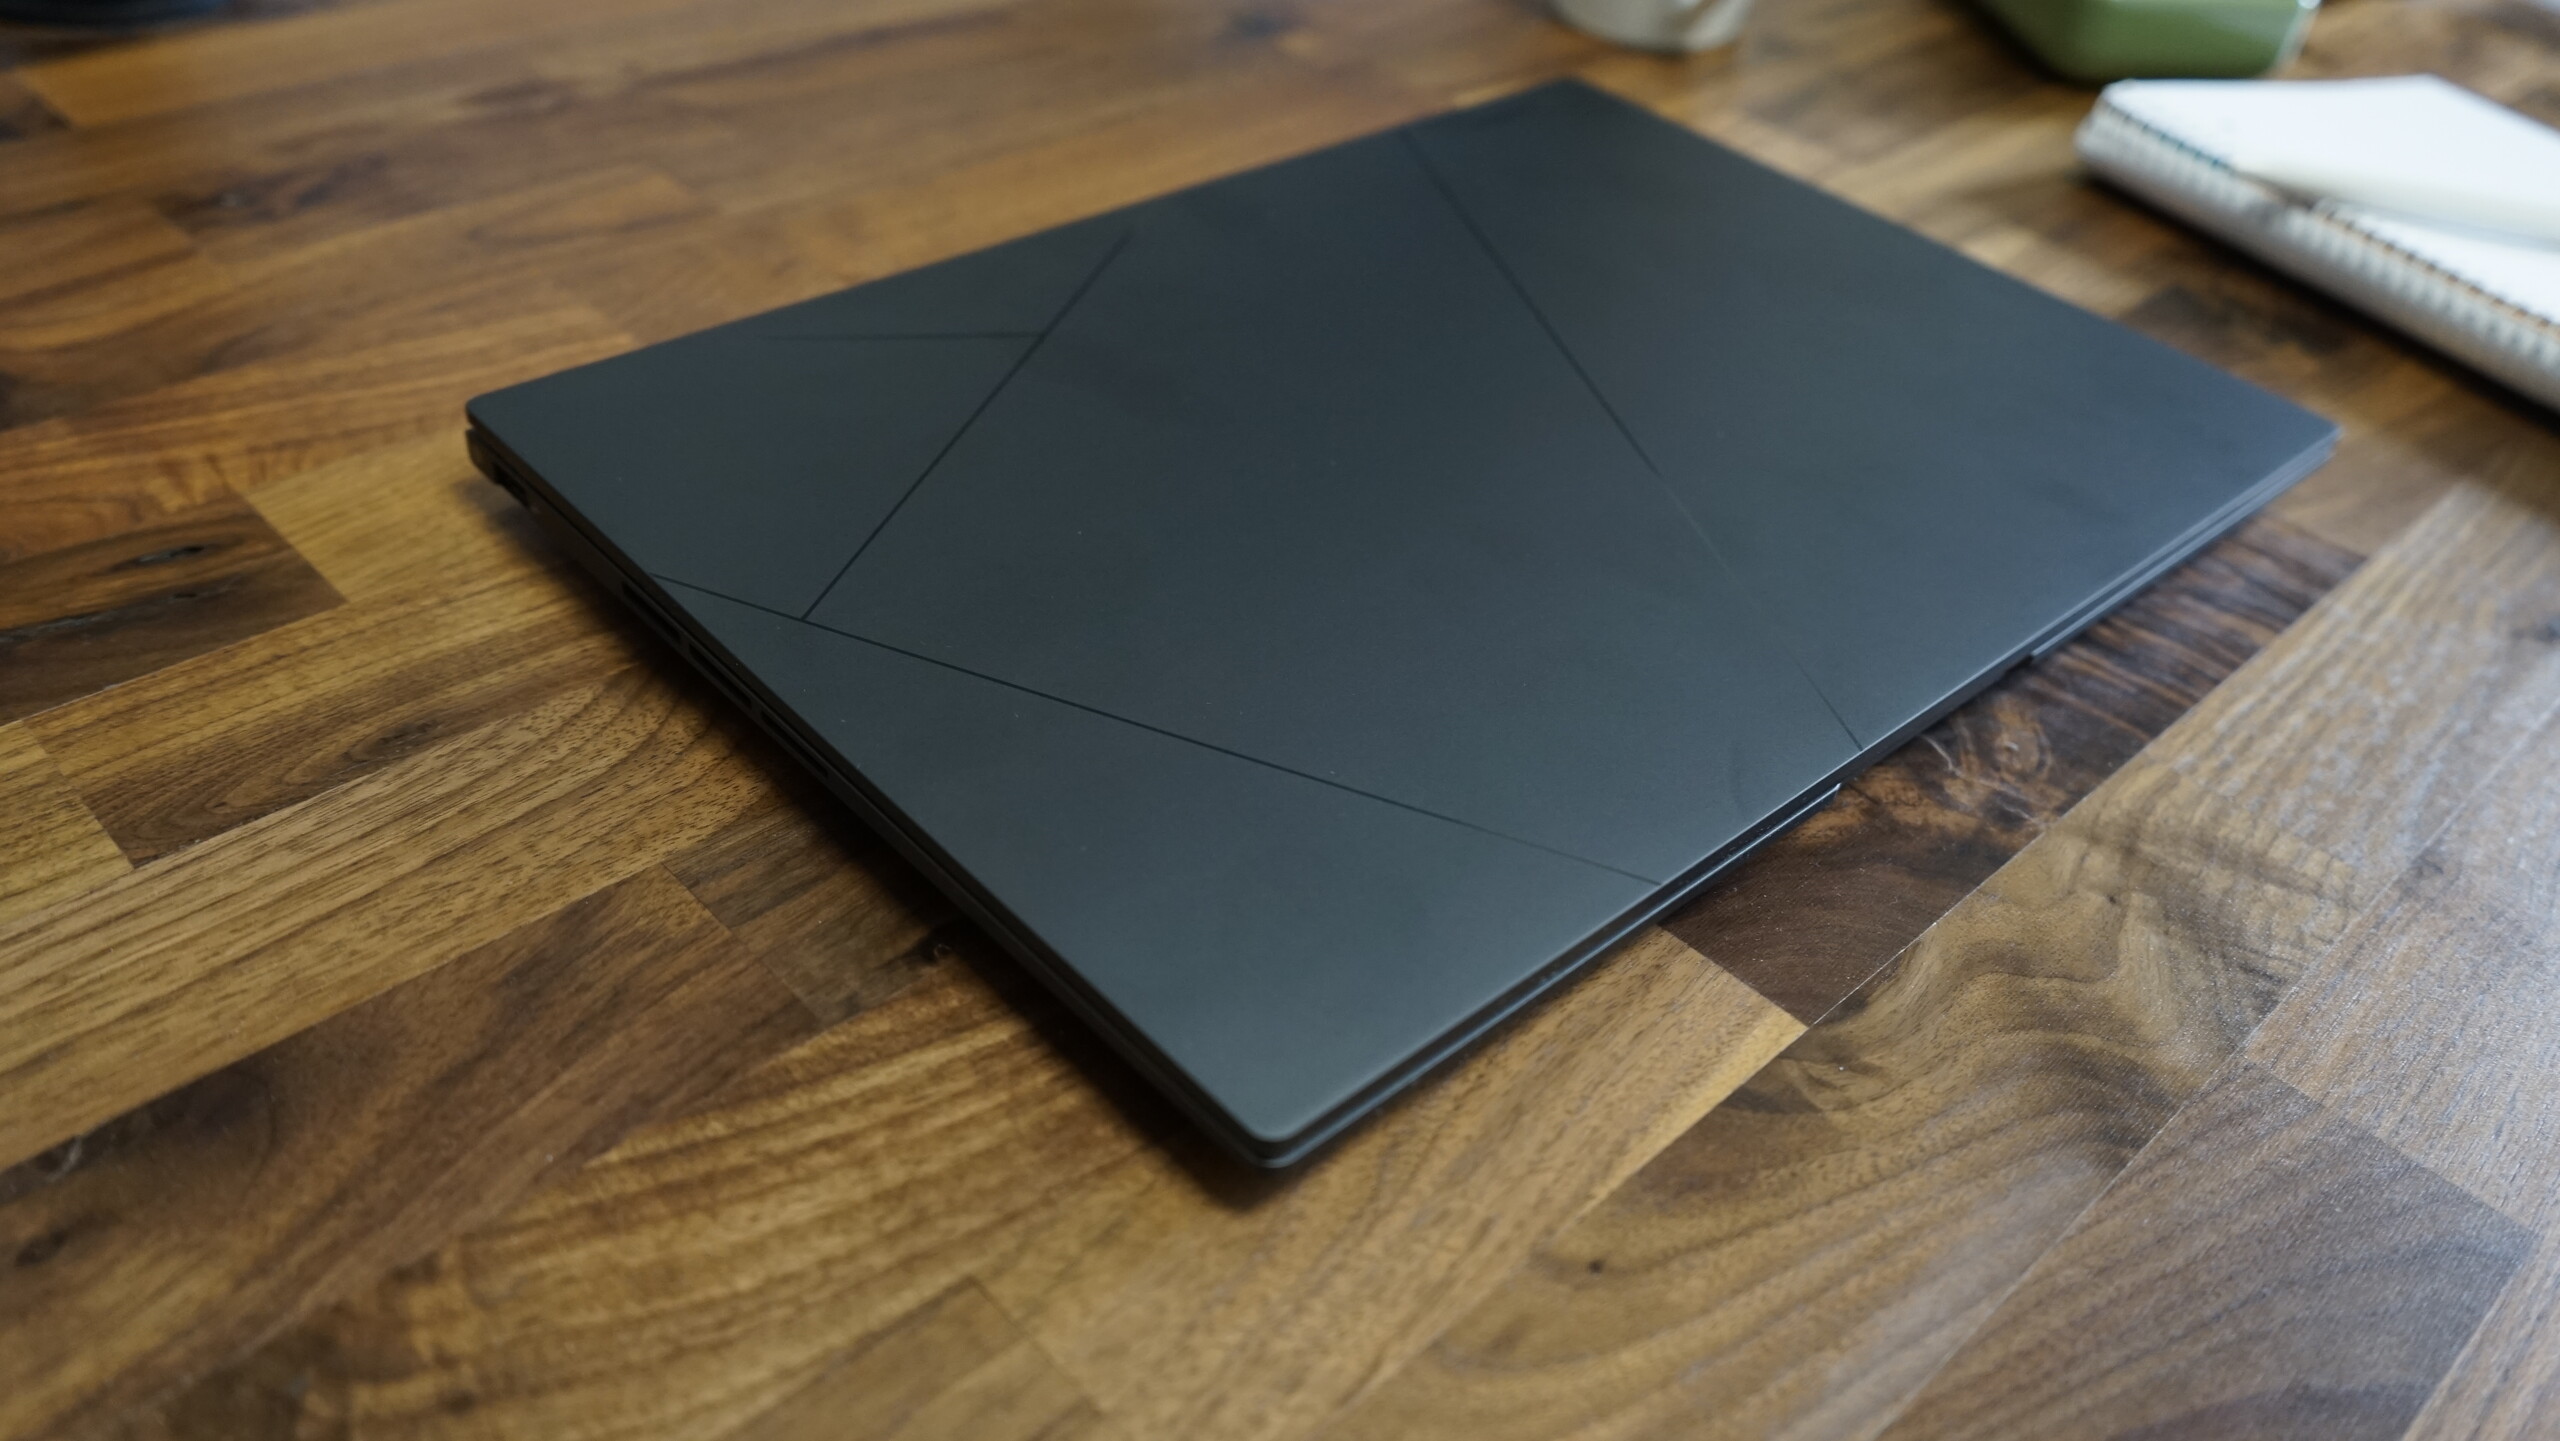
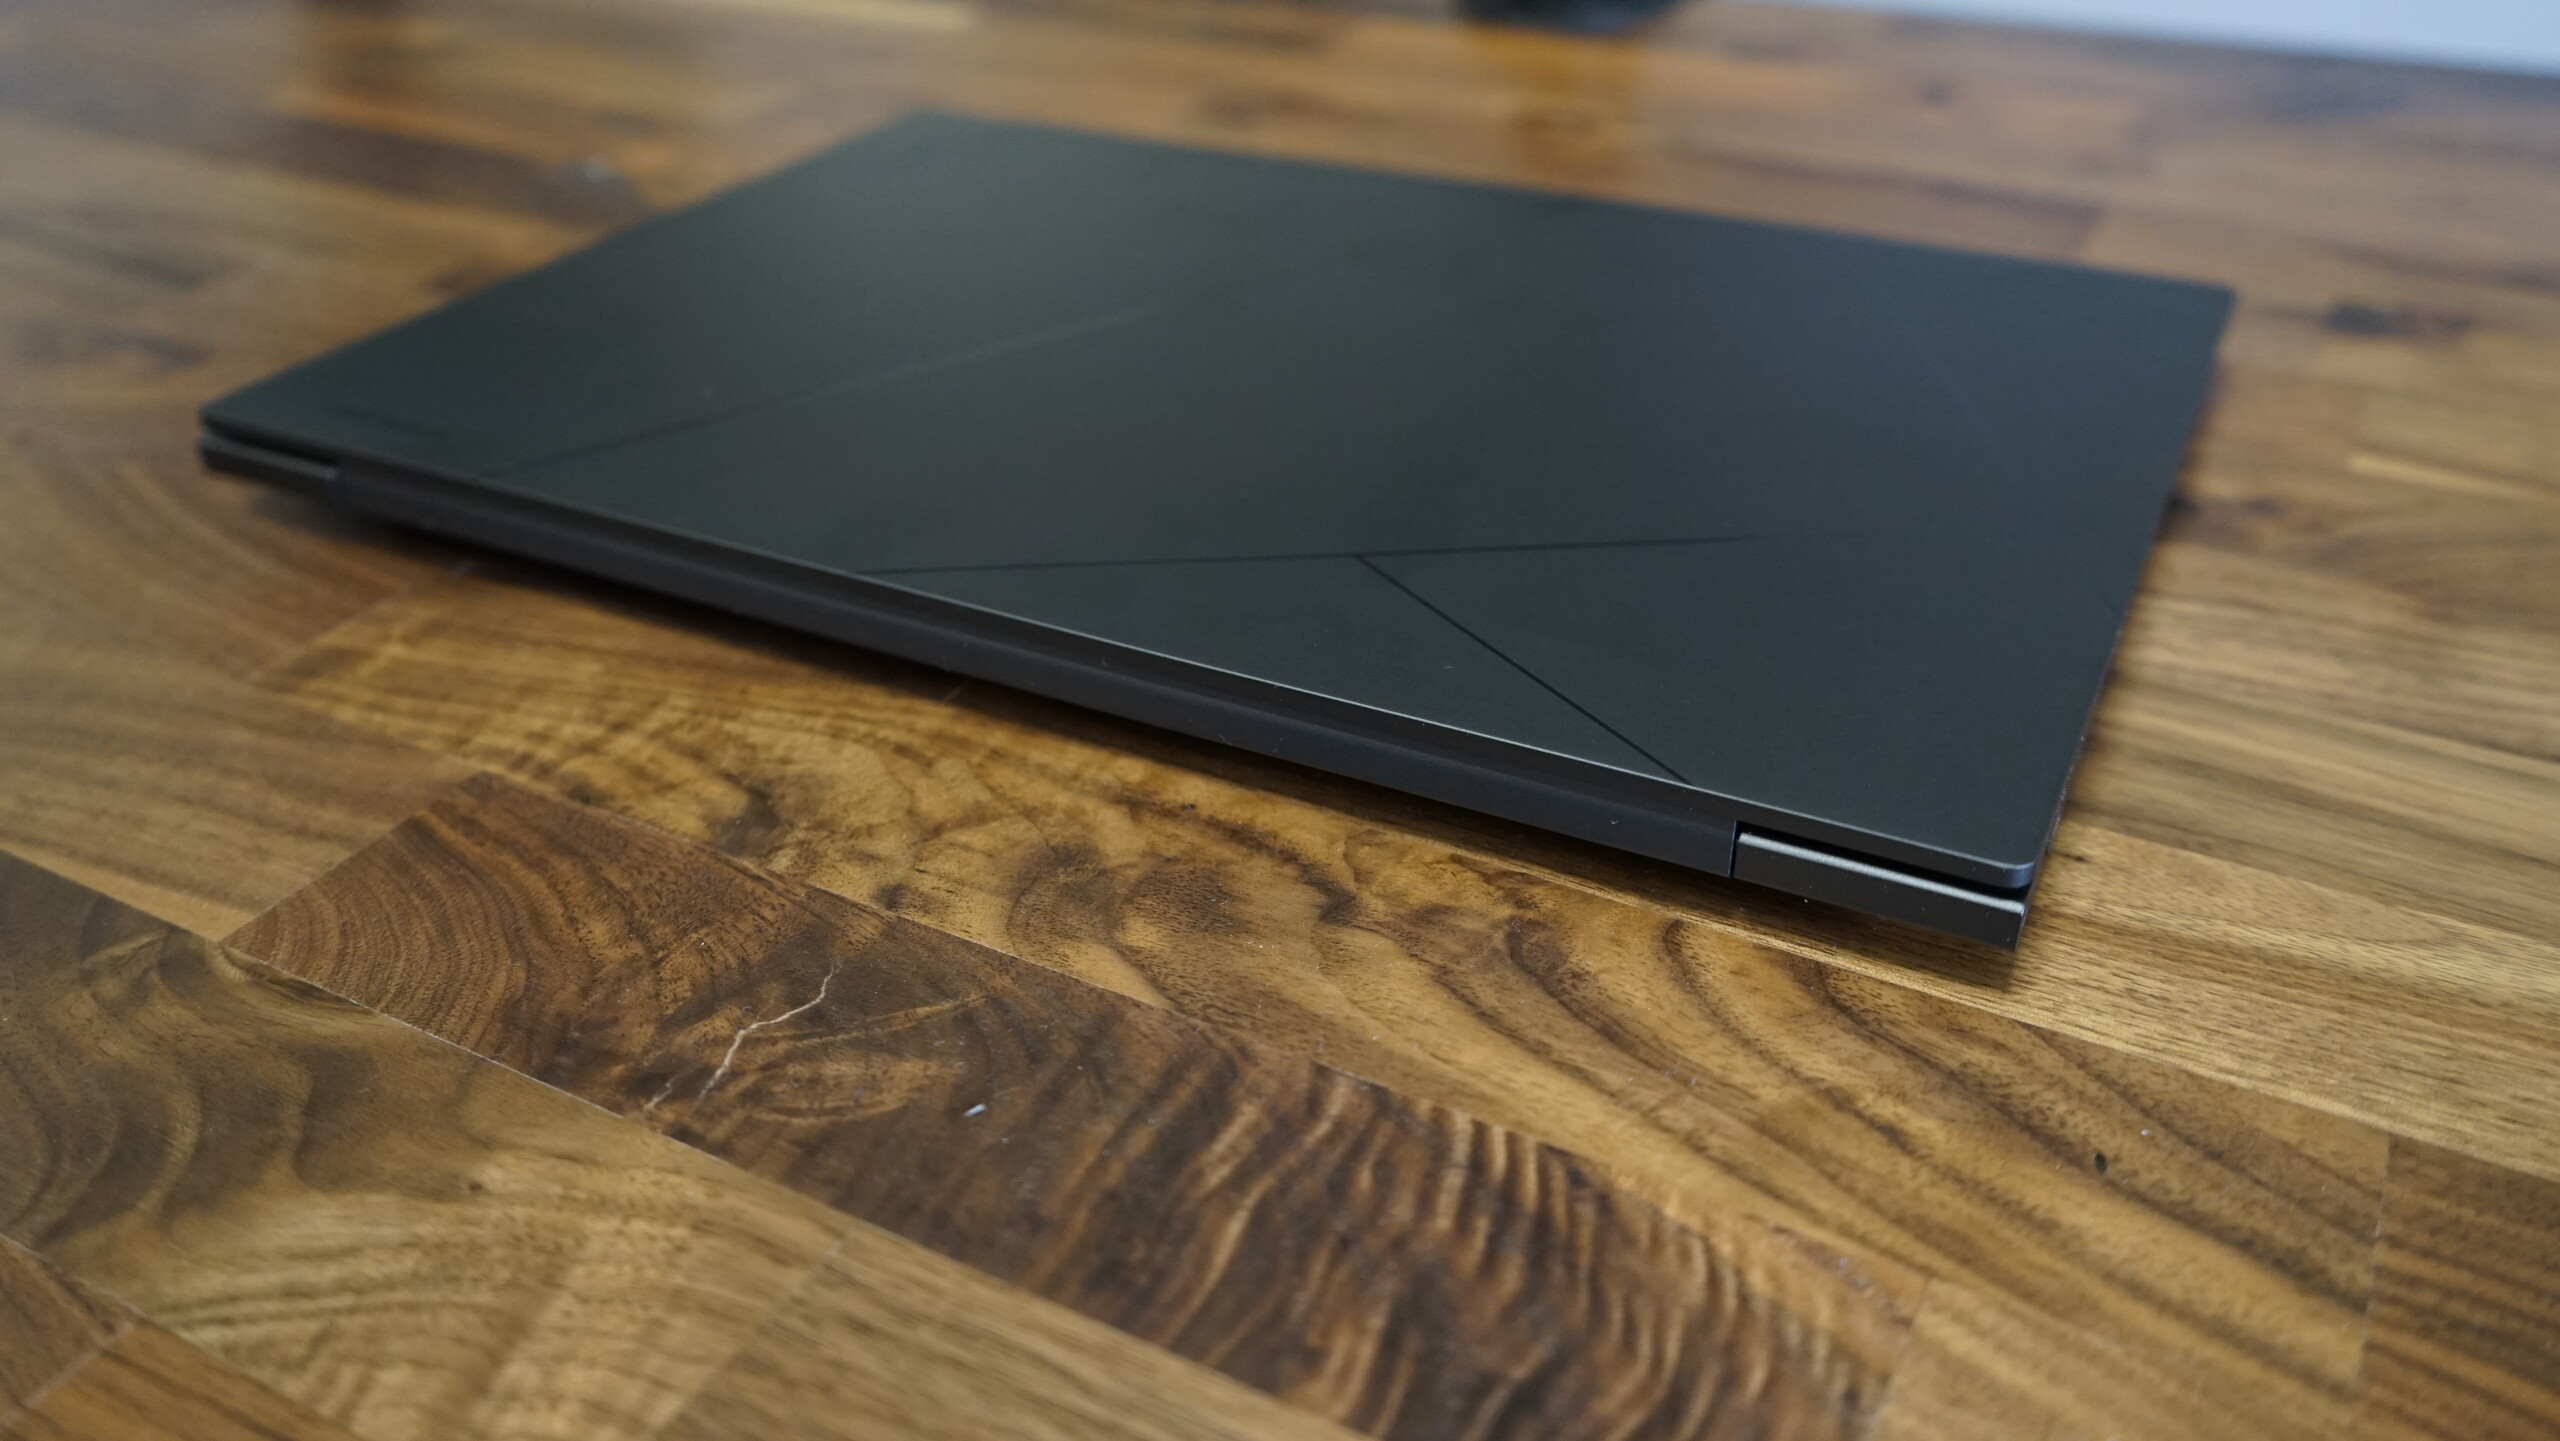
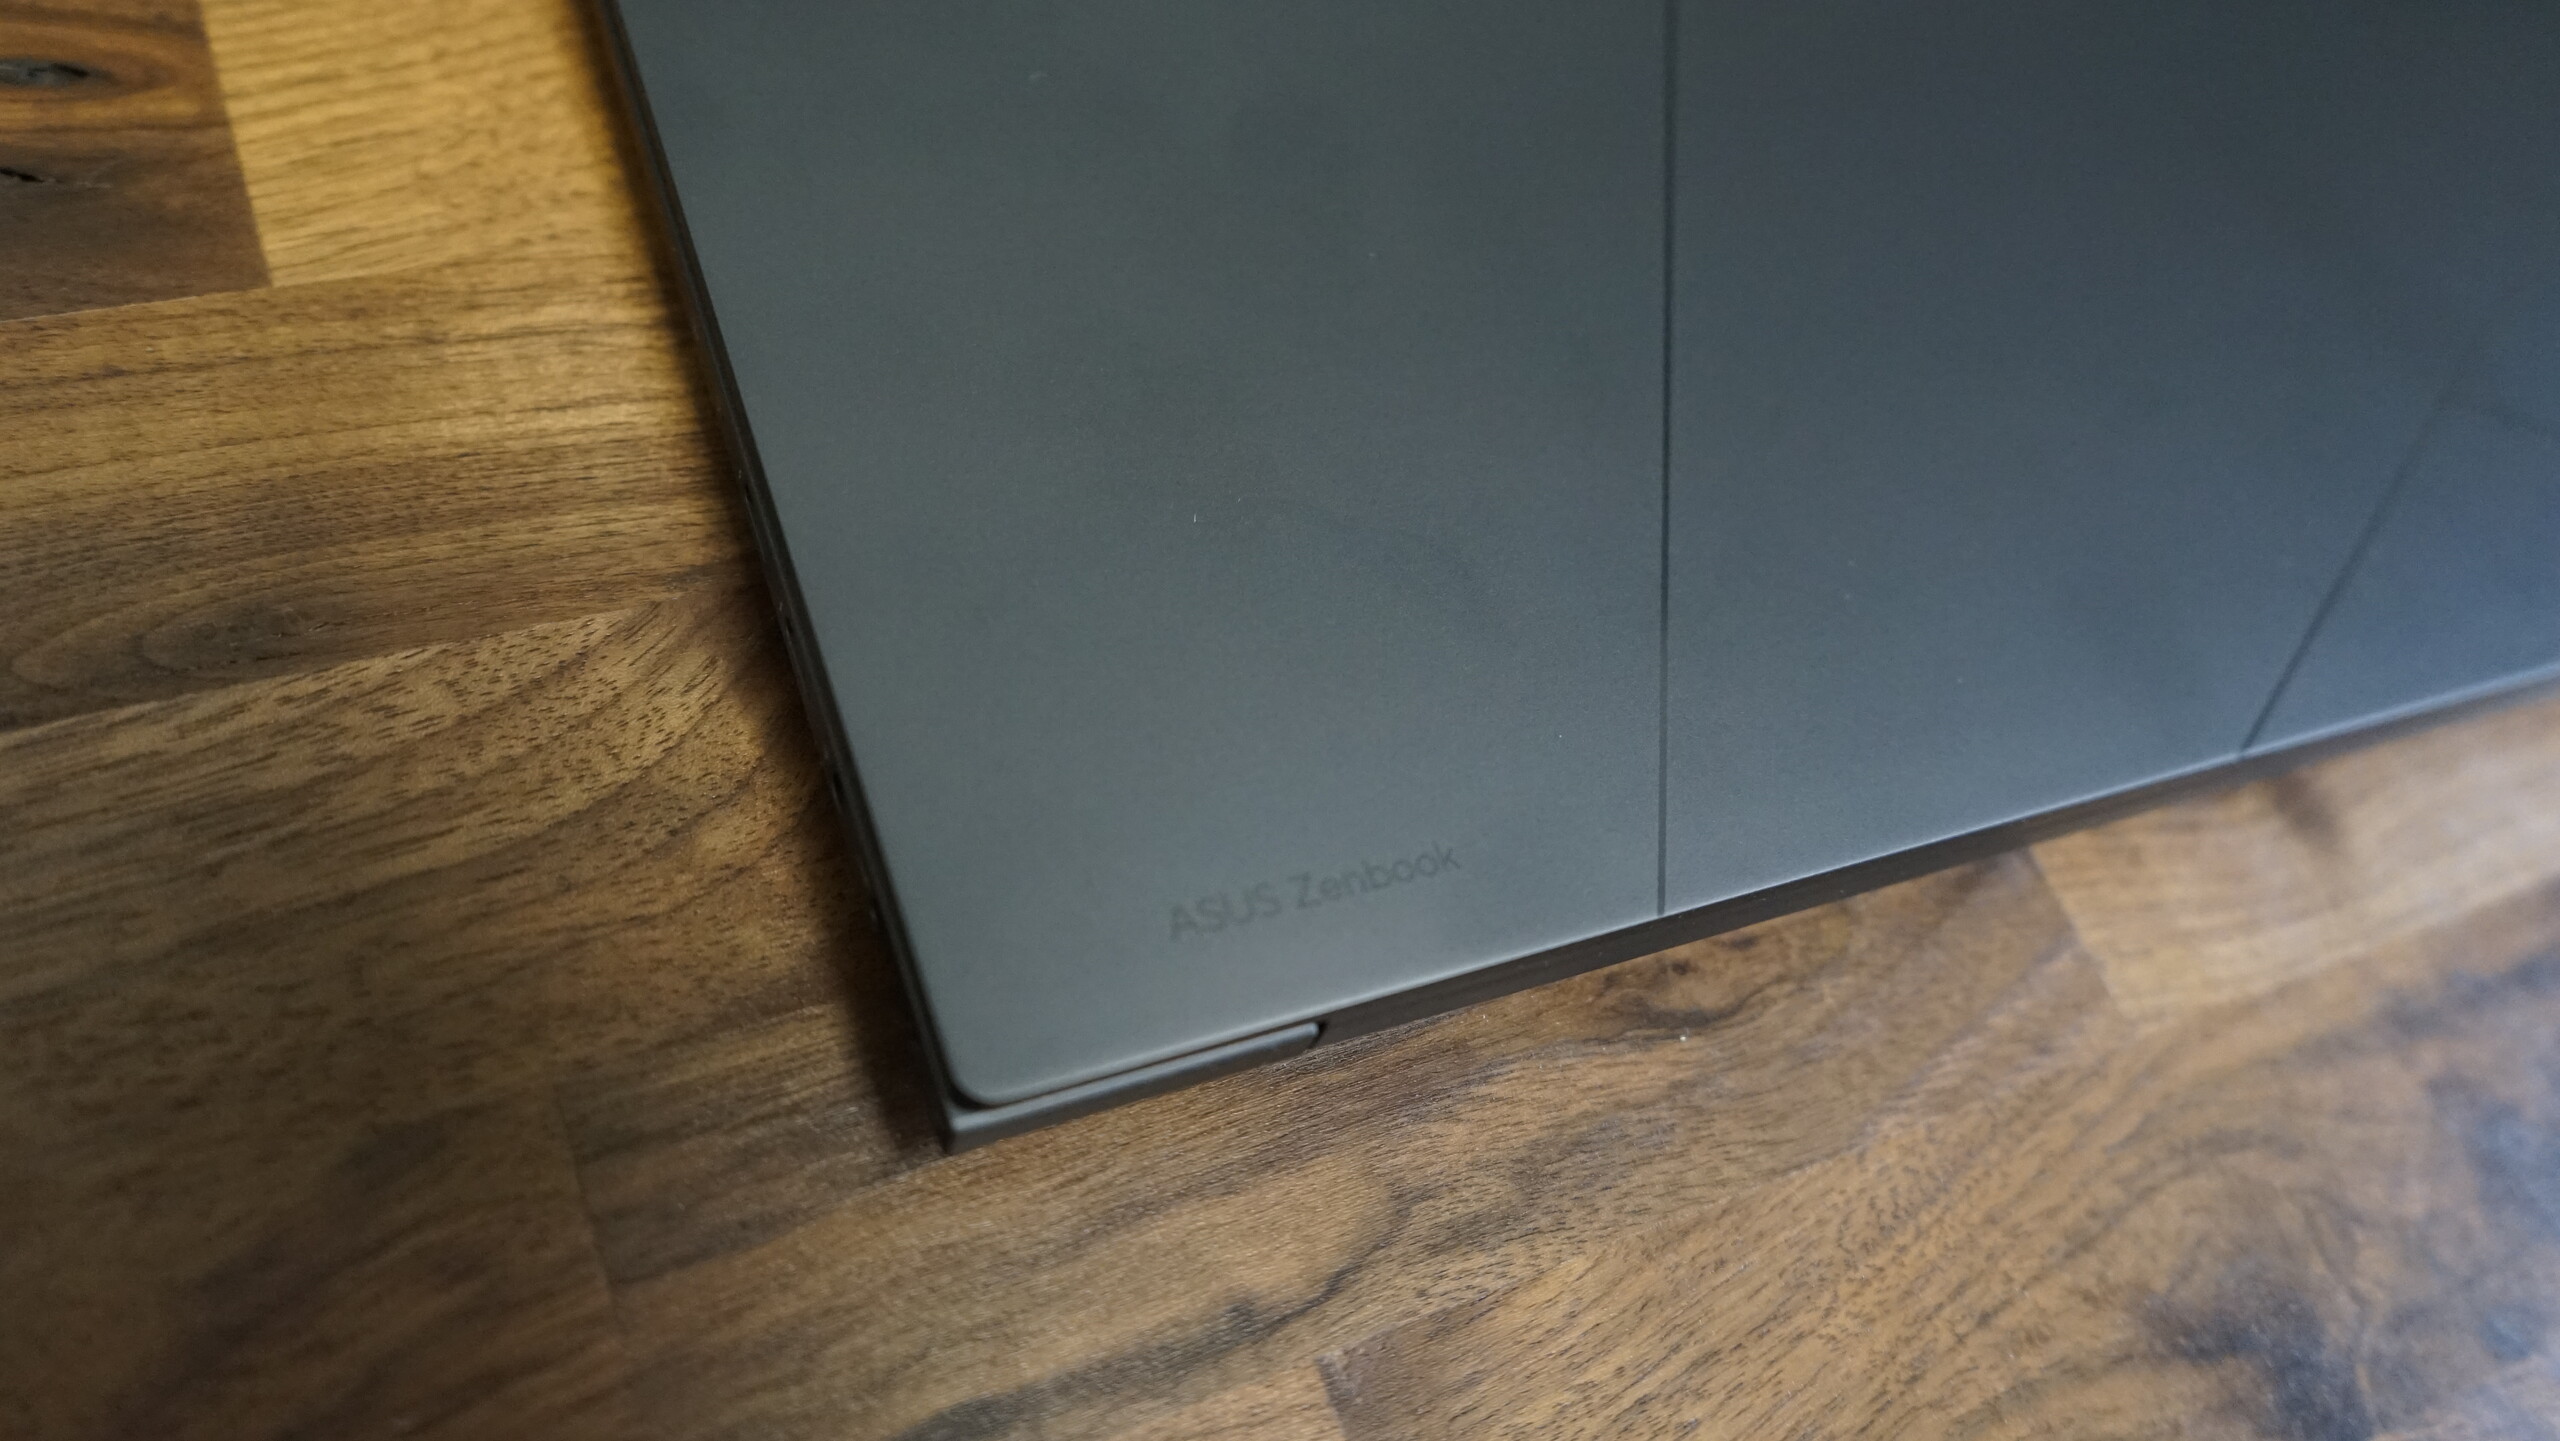
O gabinete do novo Asus ZenBook 14X se assemelha em grande parte ao antecessor, mas ainda é um pouco diferente no design. O chassi inteiro é feito de alumínio e, portanto, é particularmente robusto e resistente à torção, o que também se reflete no peso maior. A tampa não pode ser deformada sem força e apresenta o mesmo logotipo ProArt do ZenBook S 13 de 2023. O novo ZenBook está disponível em Sandstone Beige ou Inkwell Gray. A variante cinza da nossa análise parece elegante e de alta qualidade, mas as impressões digitais aparecem rapidamente
Quando fechada, a tampa é mantida magneticamente na base. As dobradiças, assim como o restante do gabinete, são de alta qualidade e firmes. No entanto, é possível abrir o laptop com uma só mão. Apesar das dobradiças apertadas, a tela não balança para frente e para trás ao digitar, pois a base é pesada e estável o suficiente.
O design robusto também se estende à área do teclado. Aqui, também, o ZenBook é extremamente resistente e a área do teclado não cede em lugar algum.
Ao contrário do ZenBook S 13 de 2023, o novo ZenBook 14X não usa o mecanismo ErgoLift, mas sim o design clássico. Os pés comparativamente grandes na parte inferior oferecem espaço suficiente para os ventiladores trabalharem sem restrições.
A versão anterior do ZenBook 14X pesava mais do que muitos outros subnotebooks, com 1,406 kg. O ZenBook 14X 2023 aumenta um pouco esse peso e agora pesa 1,56 kg. No campo de comparação, o Lenovo Slim Pro 7 14ARP8 e o Dell Inspiron 14 Plus 7420são ainda mais altos, e o Asus ROG Flow Z13 GZ301Vcom o mesmo processador Intel Core i9 pesa quase exatamente o mesmo, 1,551 kg. Com 16,9 mm, o ZenBook 14X fica no meio do campo e não está tão acima da média em termos de profundidade.
Equipamentos
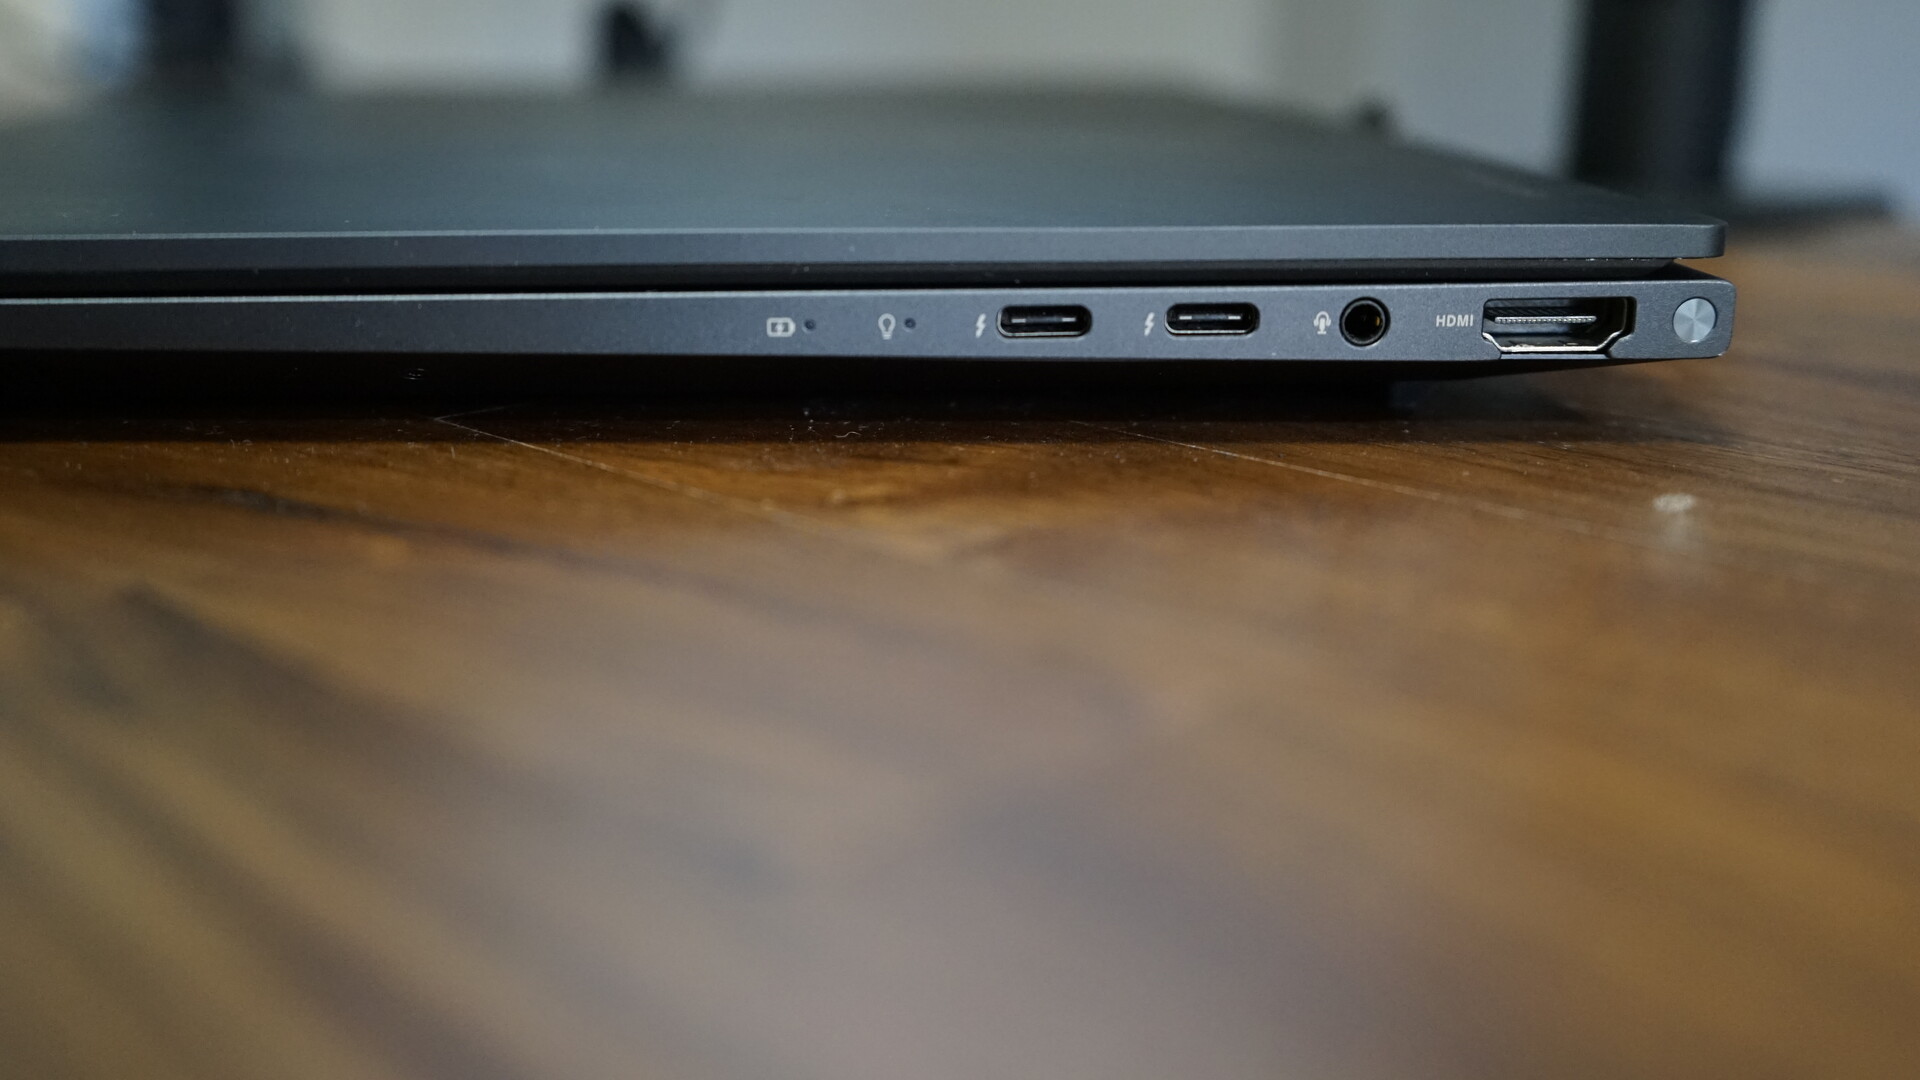
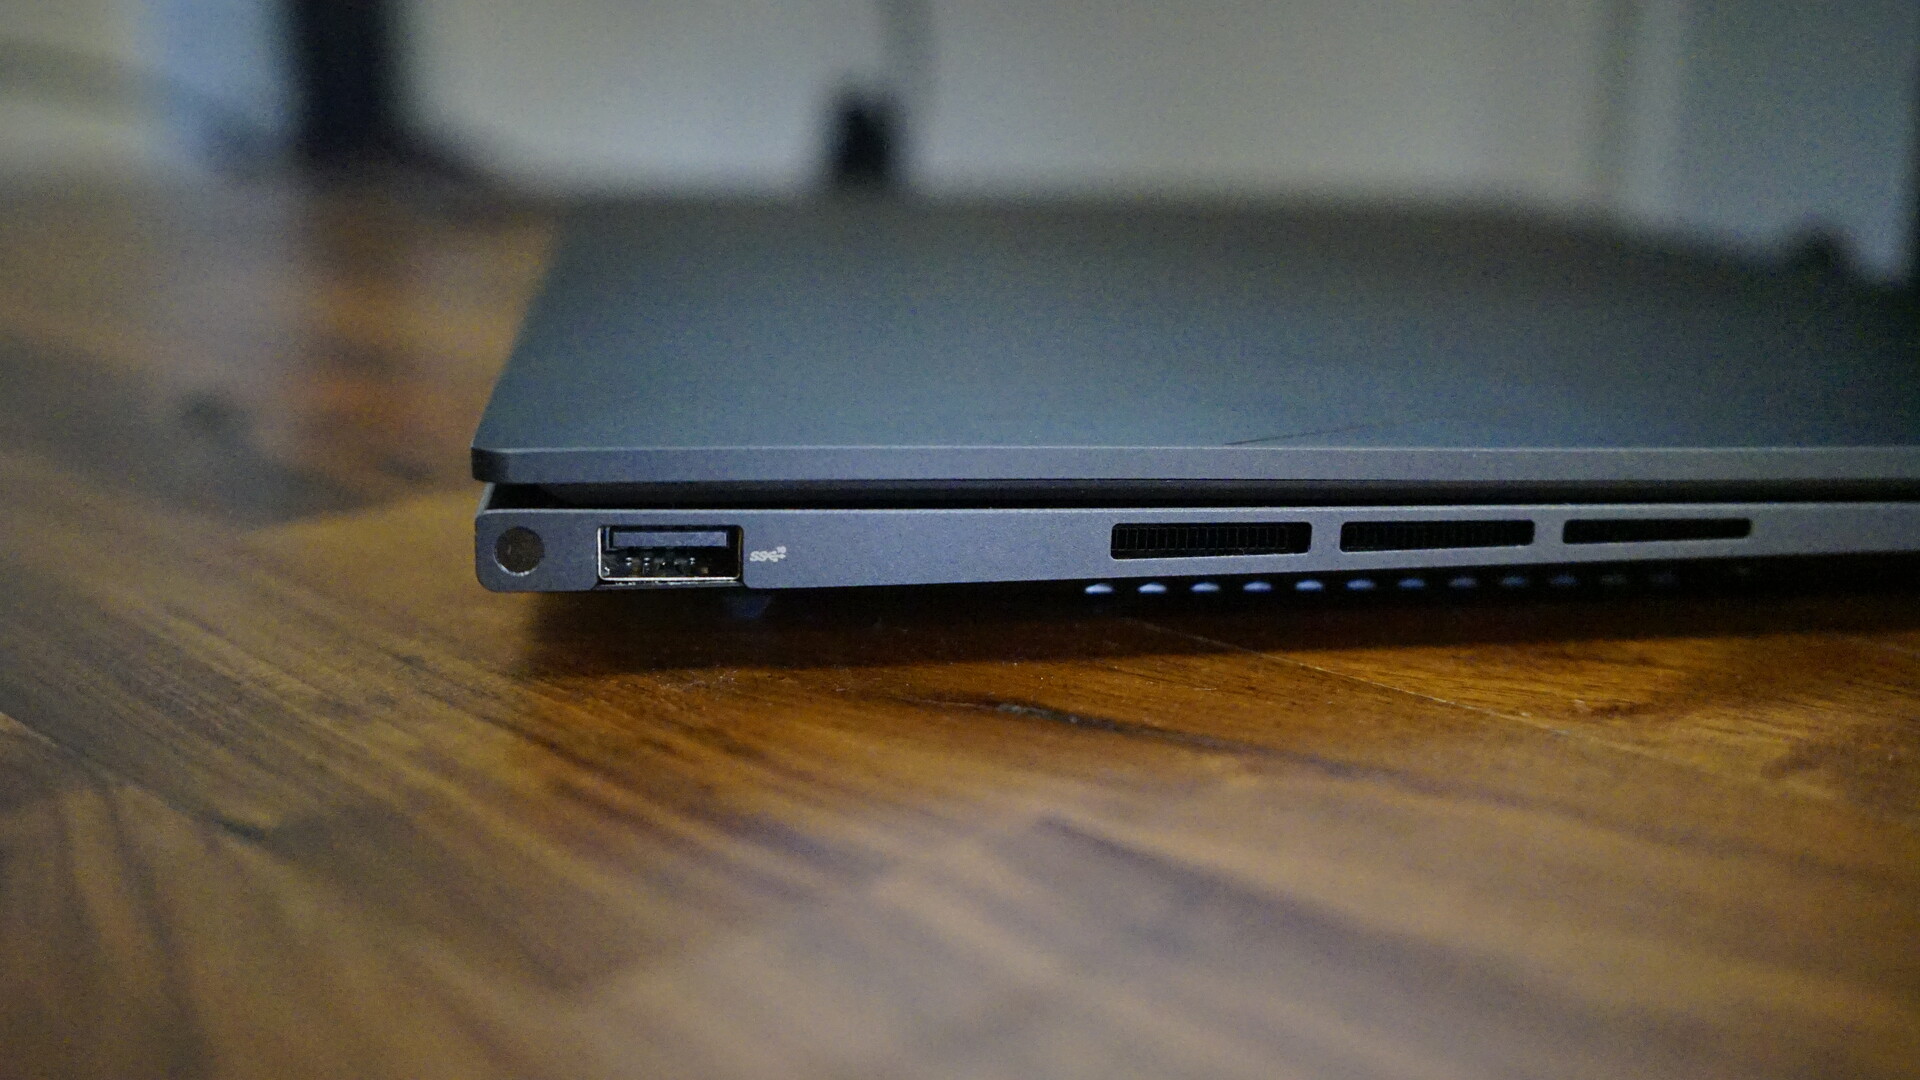
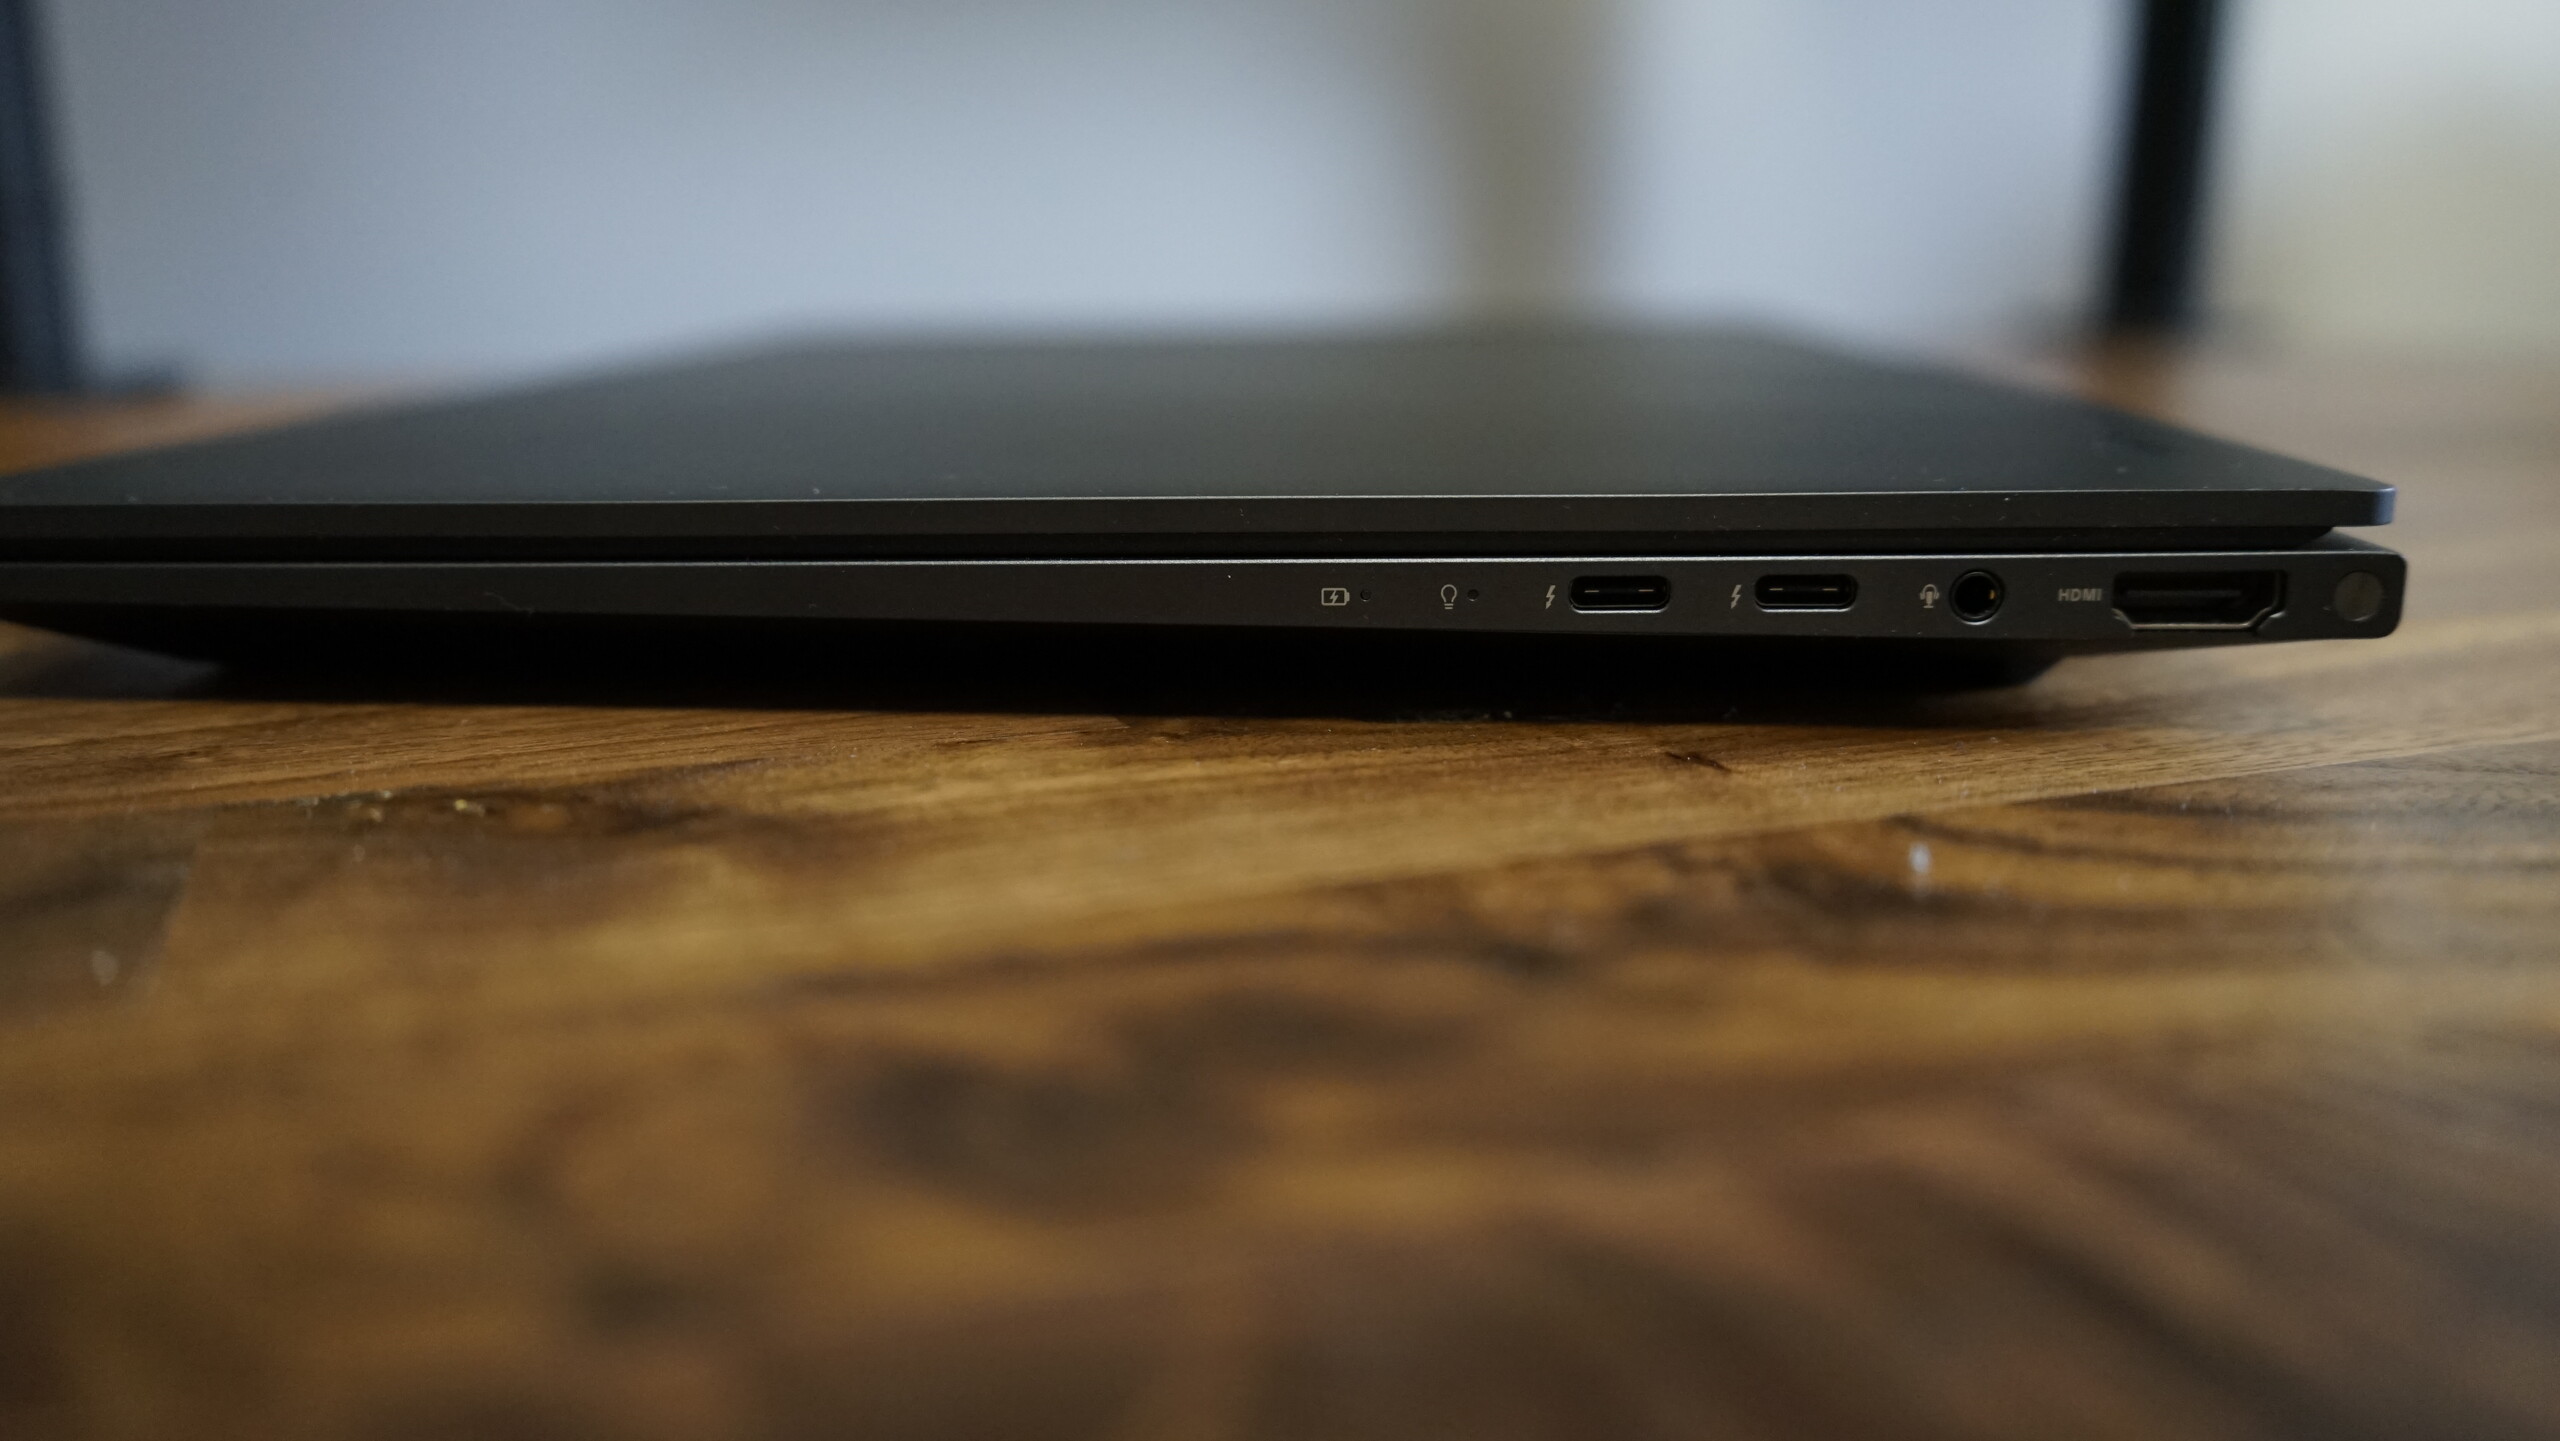
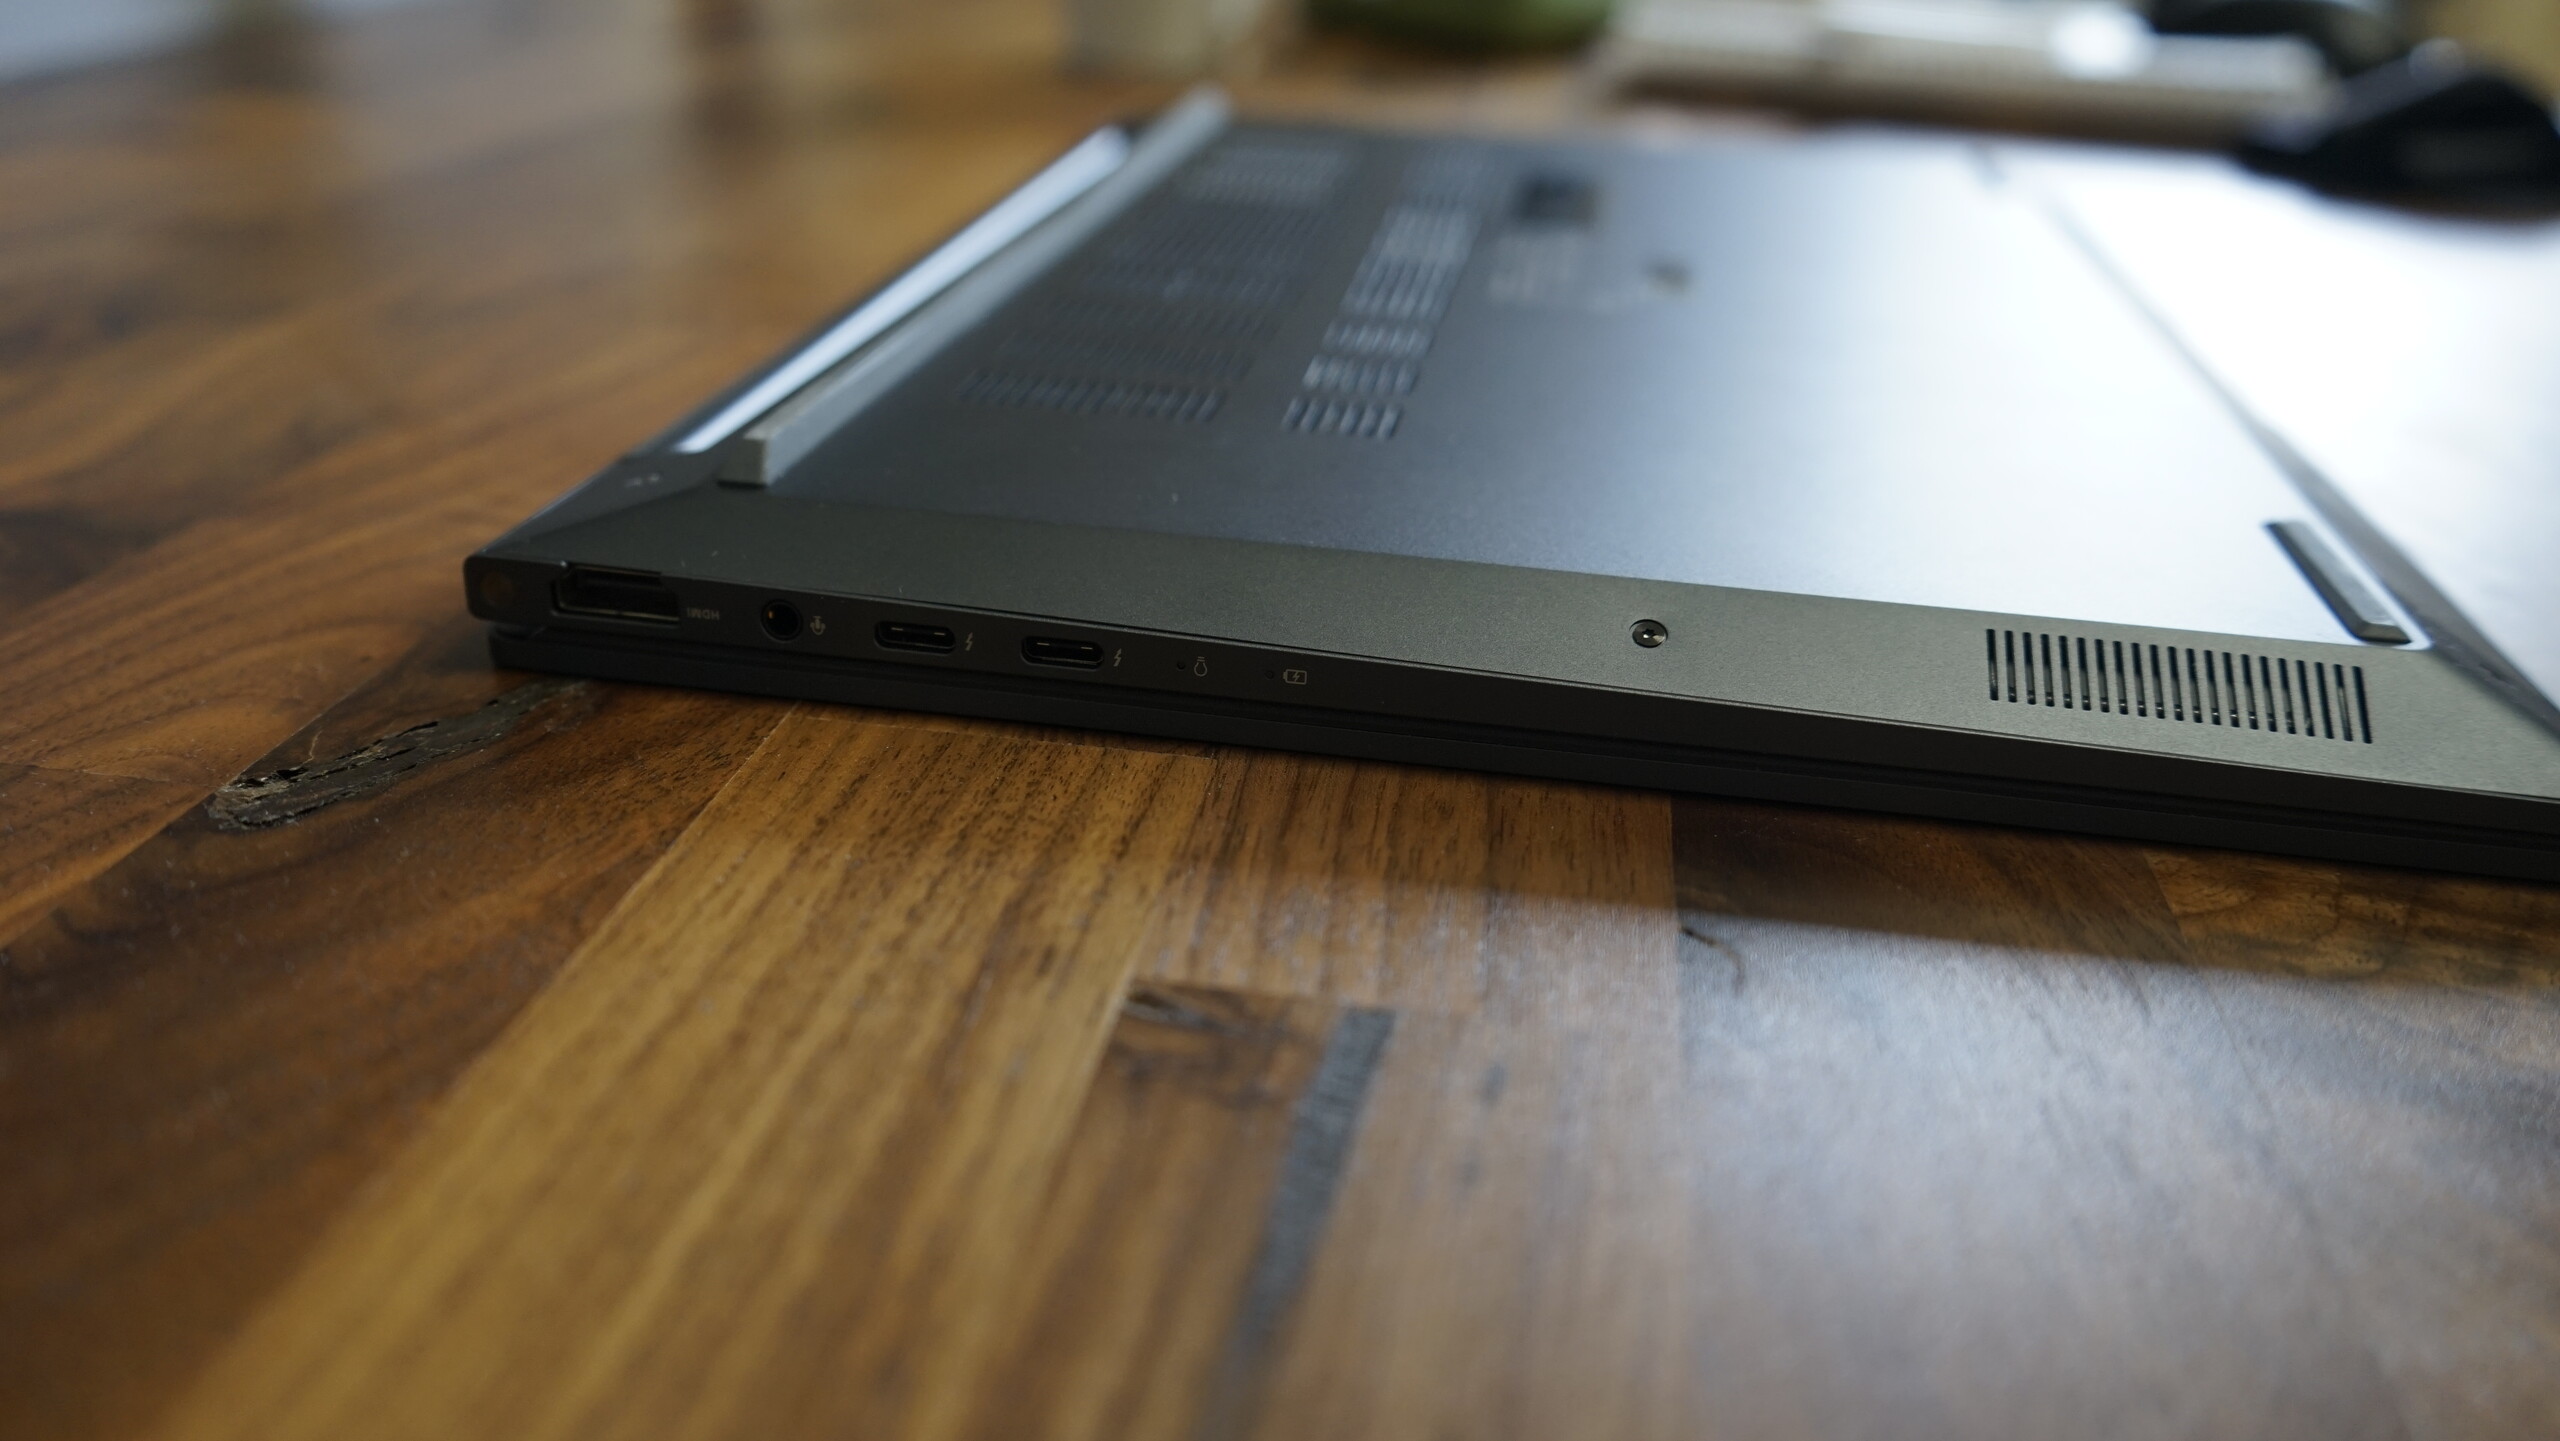
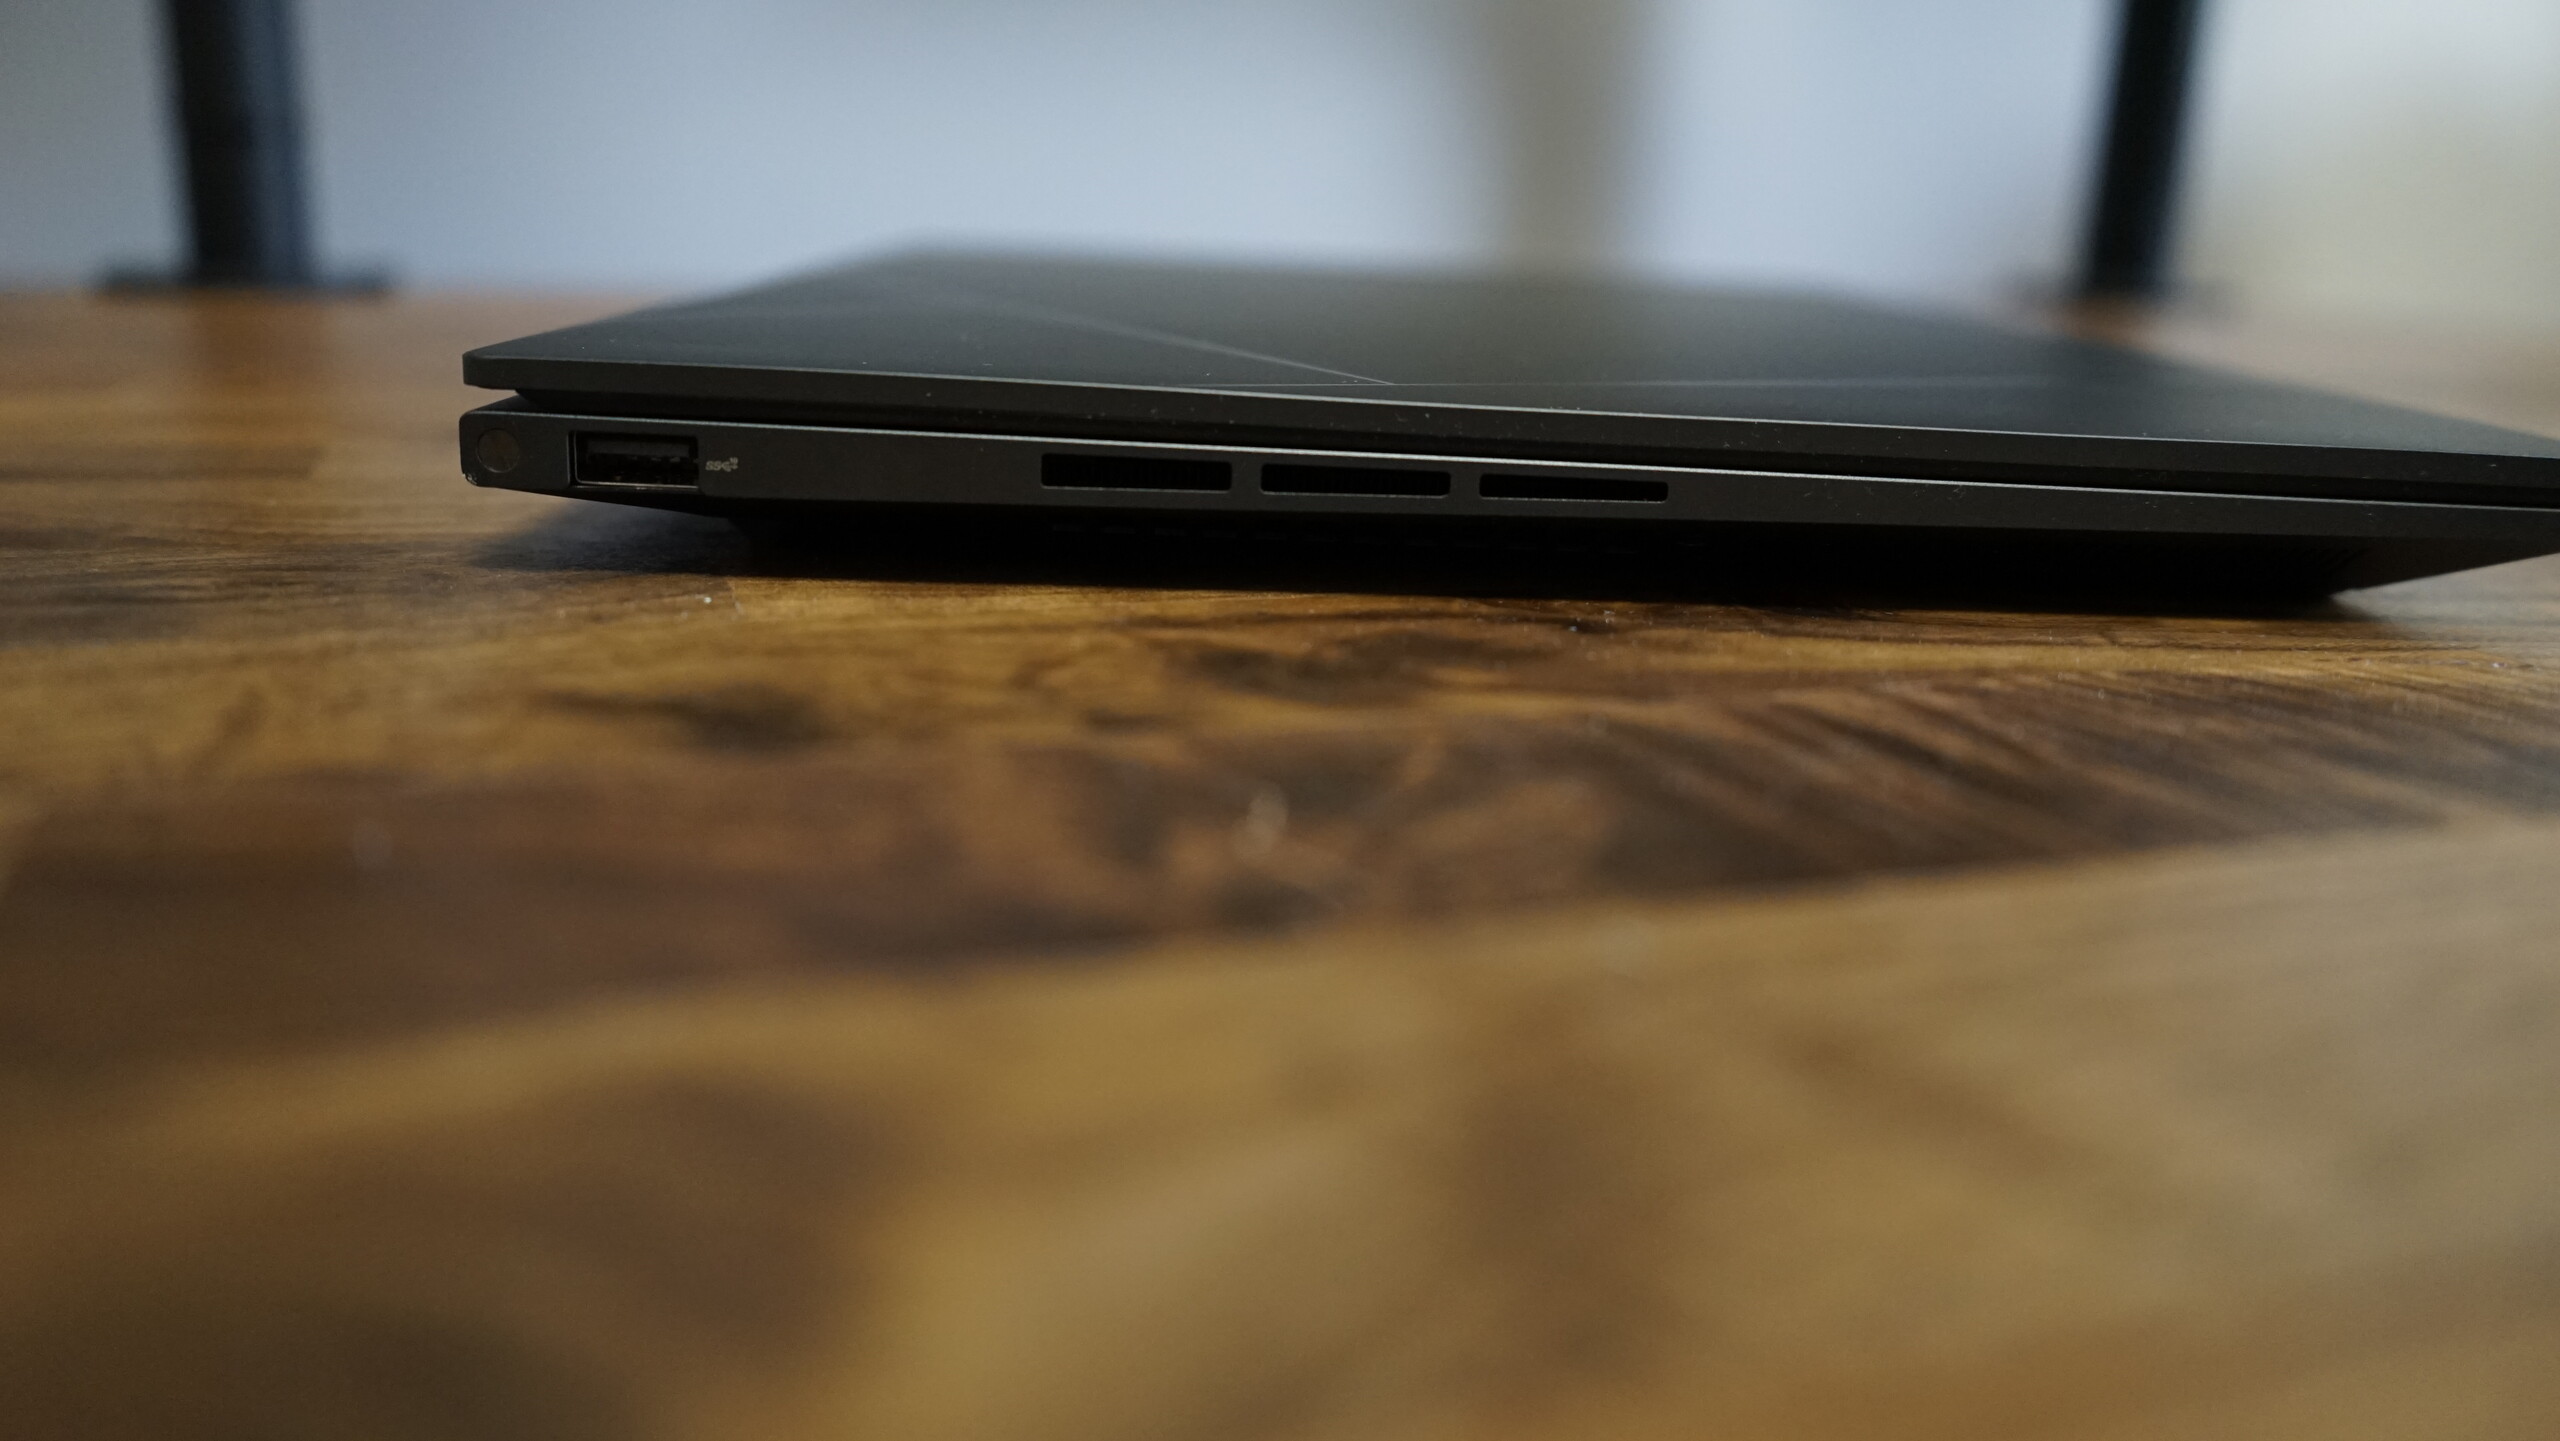
Em comparação com o antecessor, o leitor de microSD infelizmente não está mais disponível. A posição das outras portas também foi alterada. No lado esquerdo, agora há apenas uma porta USB 3.2 Gen 2 Tipo A. Todas as outras portas, ou seja, duas portas Thunderbolt, uma porta HDMI 2.1 e a porta combinada de áudio estão agora à direita. Ambas as portas Thunderbolt podem ser usadas para carregamento, portanto, teríamos preferido uma em cada lado.
Comunicação
O módulo Intel Wi-Fi 6E-AX211 instalado é substituível e oferece resultados sólidos, sem problemas de conectividade. Os resultados da placa estão acima da média para esse modelo. O módulo não só é compatível com o mais recente padrão Wi-Fi 6E WLAN, mas também com o Bluetooth 5.2.
Webcam
A Asus atualizou a webcam em relação ao modelo anterior e agora oferece Full HD em vez de 720p. O Windows Hello é possível graças ao sensor IR integrado para reconhecimento facial. Em comparação com o ano passado, a qualidade da imagem é significativamente melhor, mas os resultados dependem muito das condições de iluminação.


Acessórios
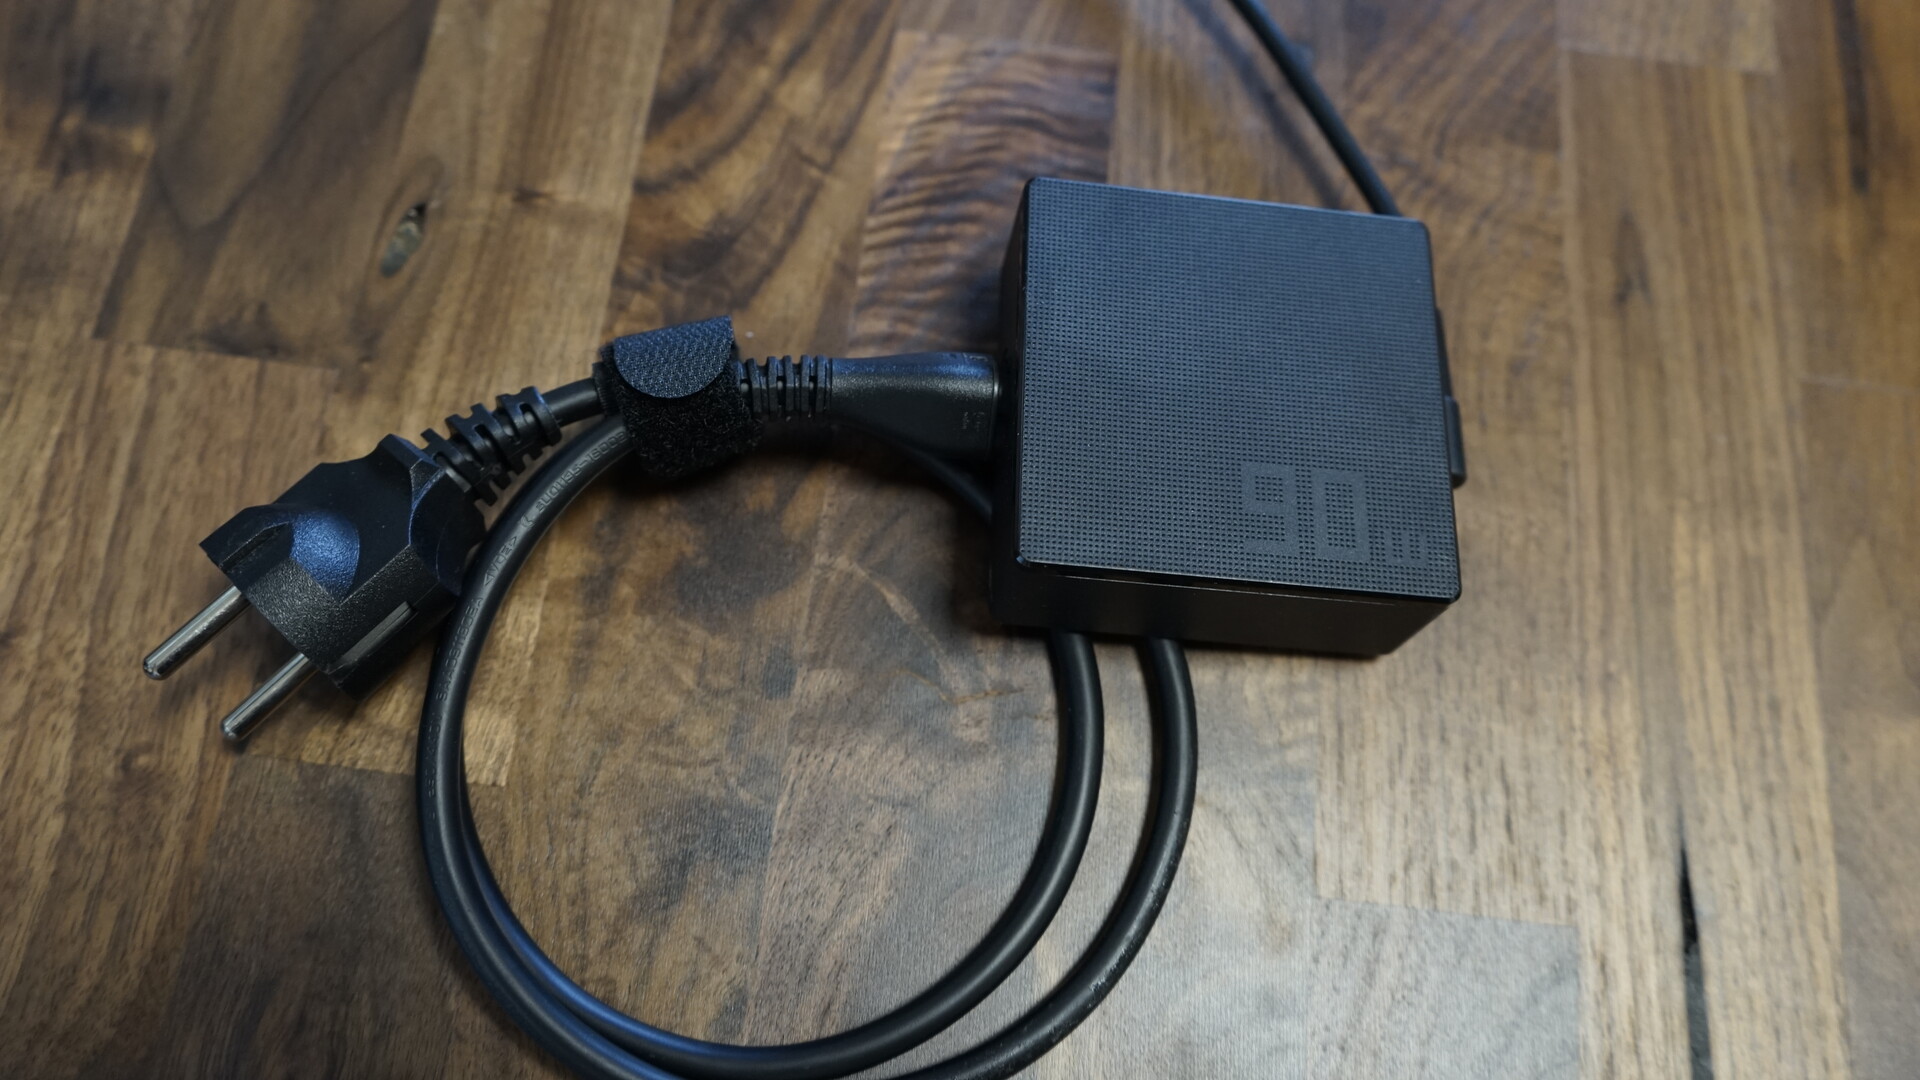
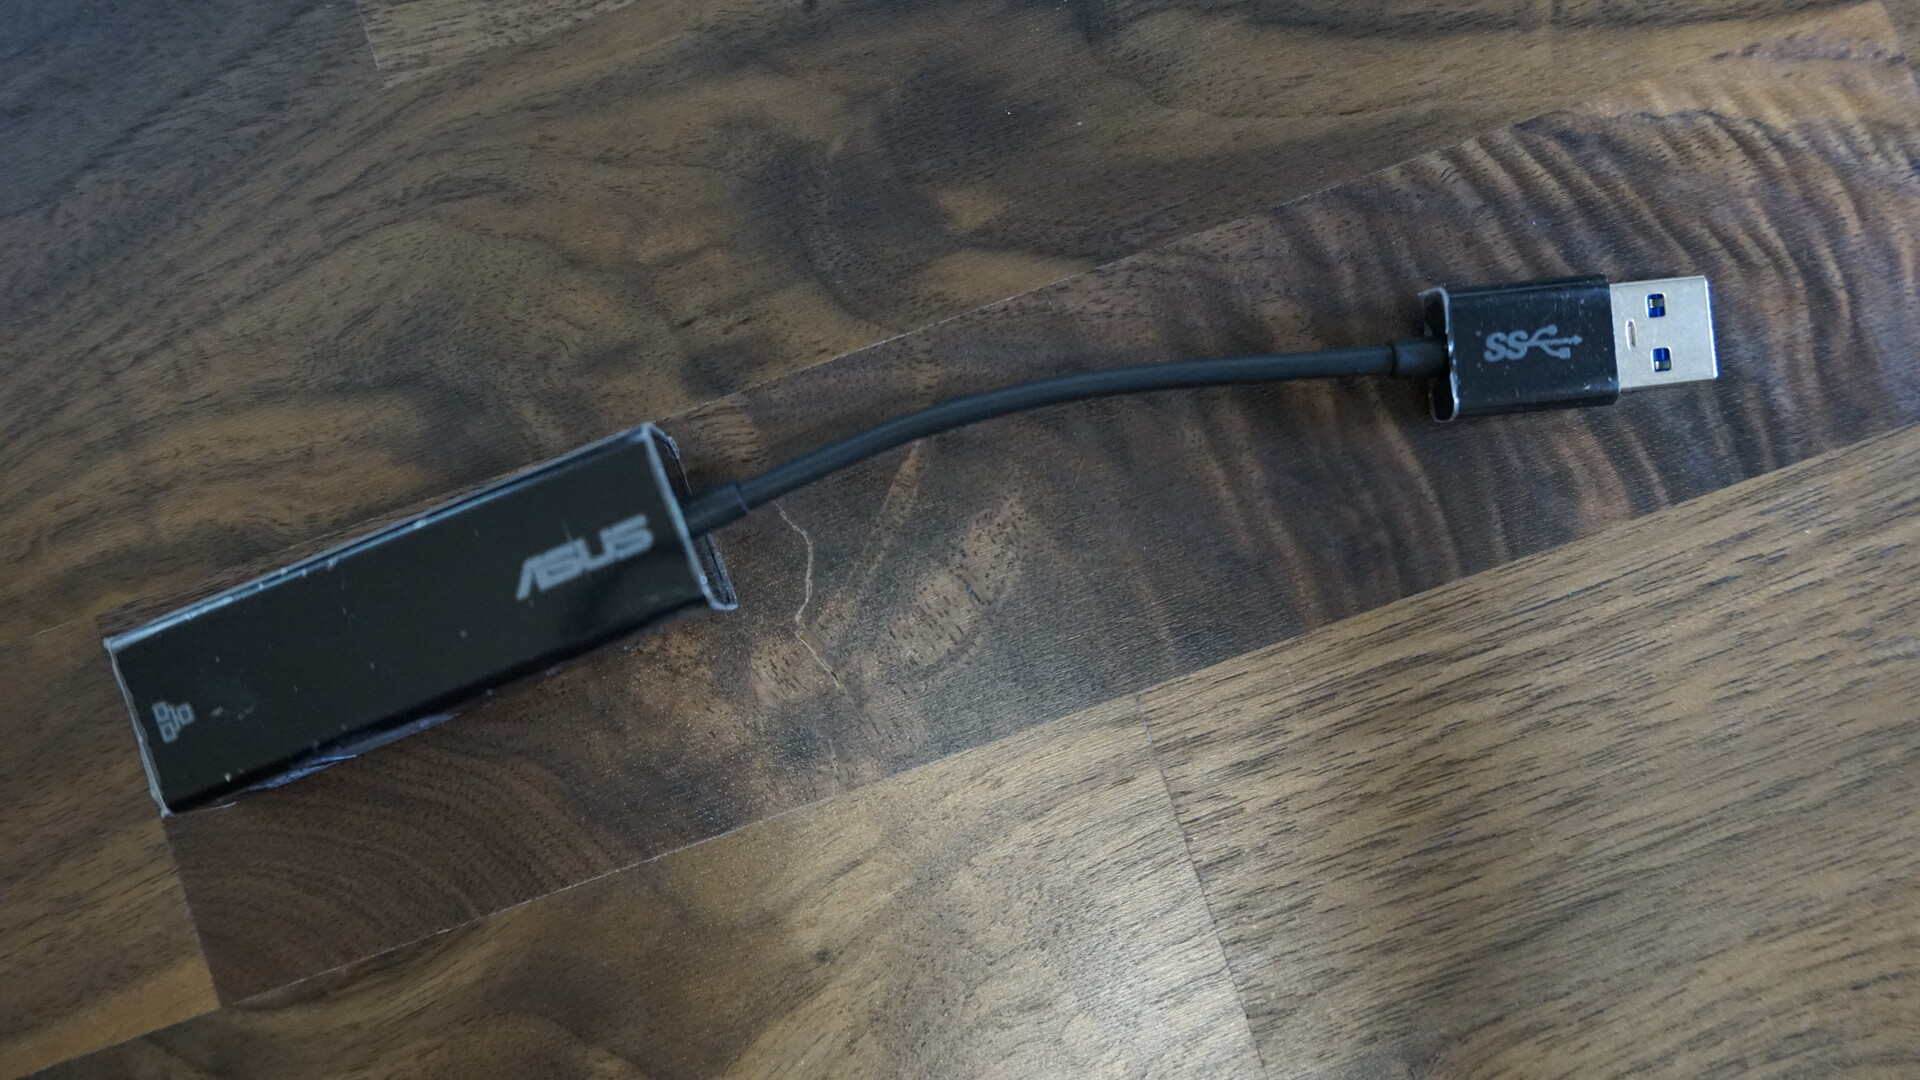
Os acessórios do Asus ZenBook 14X consistem em uma fonte de alimentação compacta de 90 watts, um adaptador Ethernet USB Tipo A e uma prática capa protetora. A capa protetora é feita de plástico com um revestimento interno de toque suave.
Manutenção
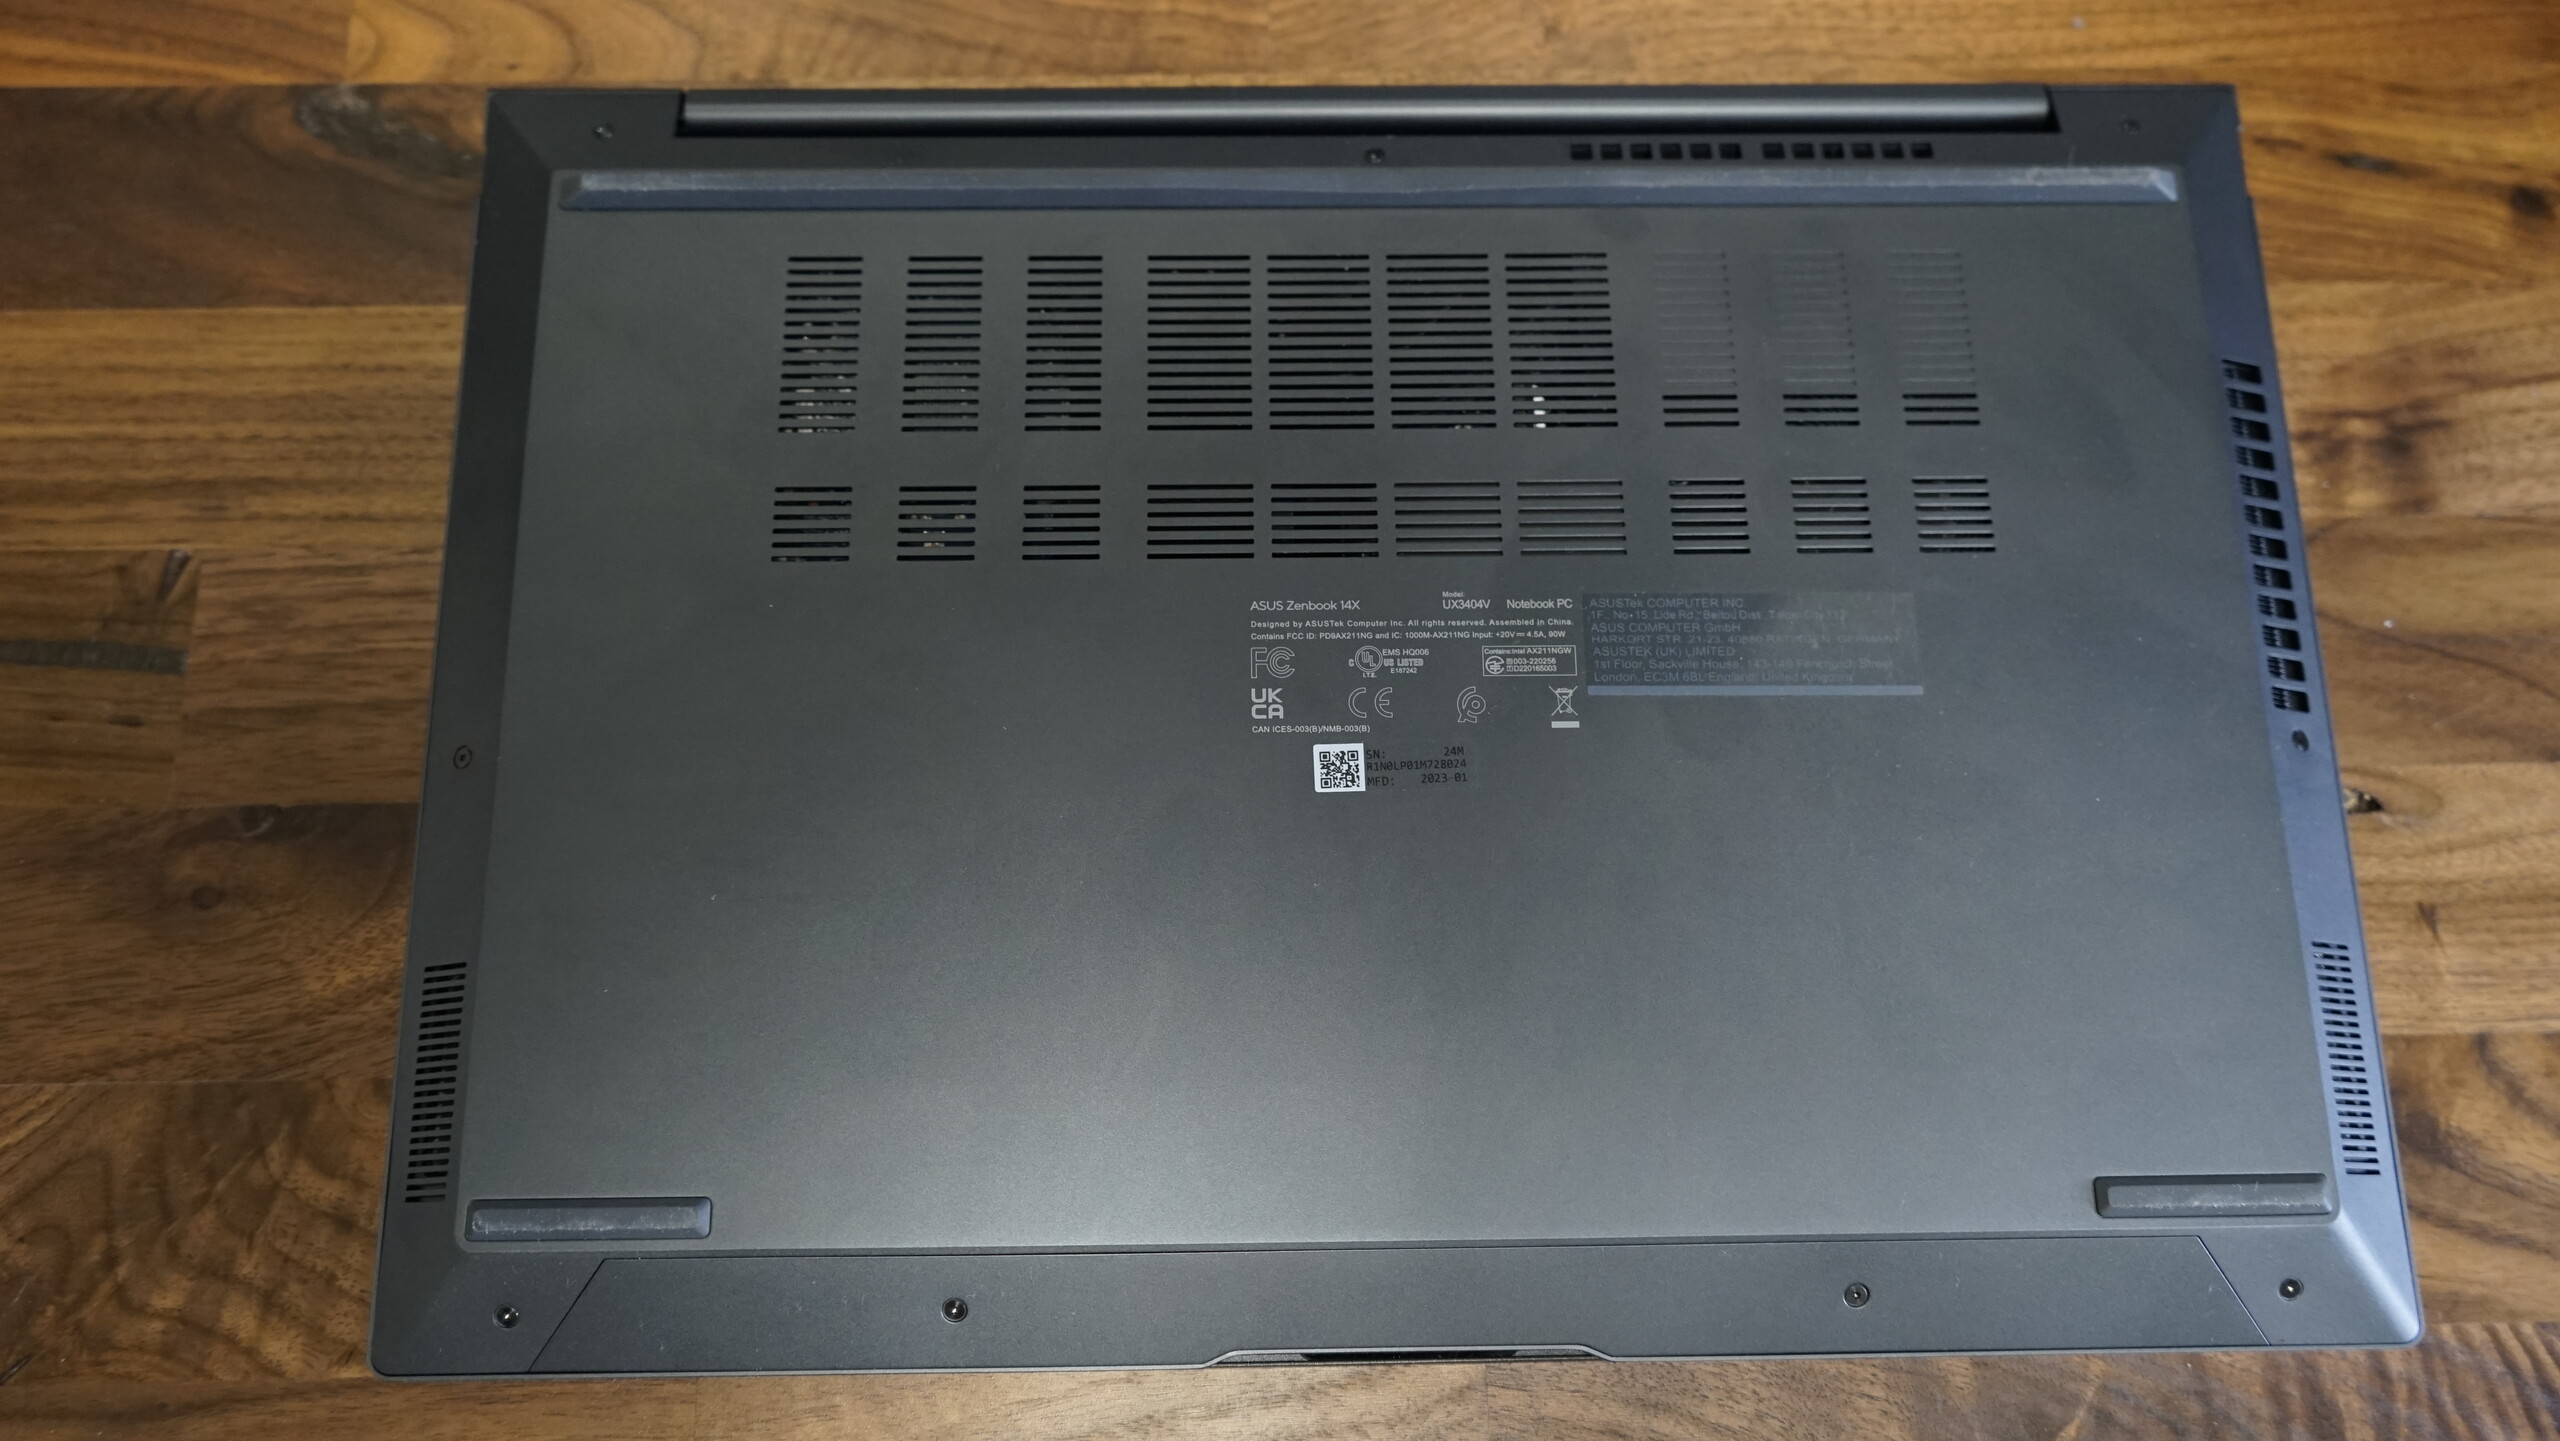
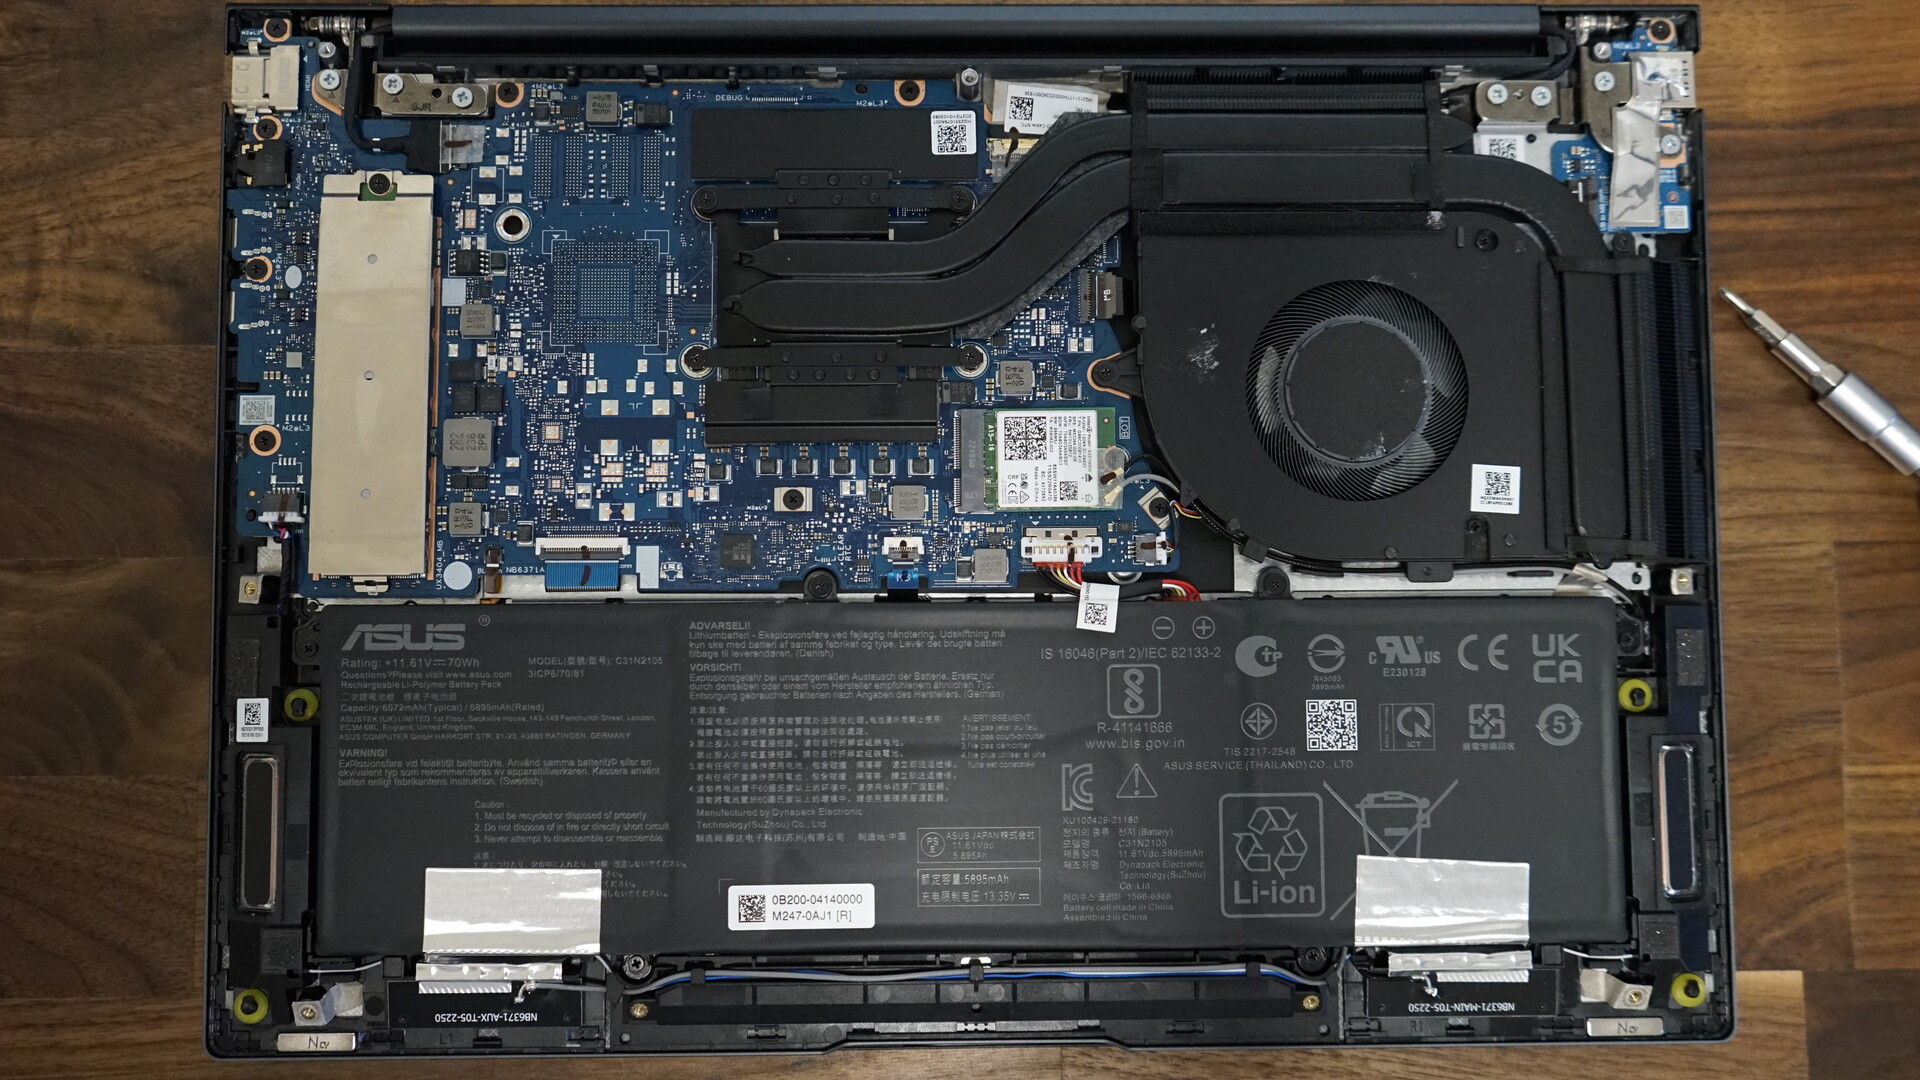
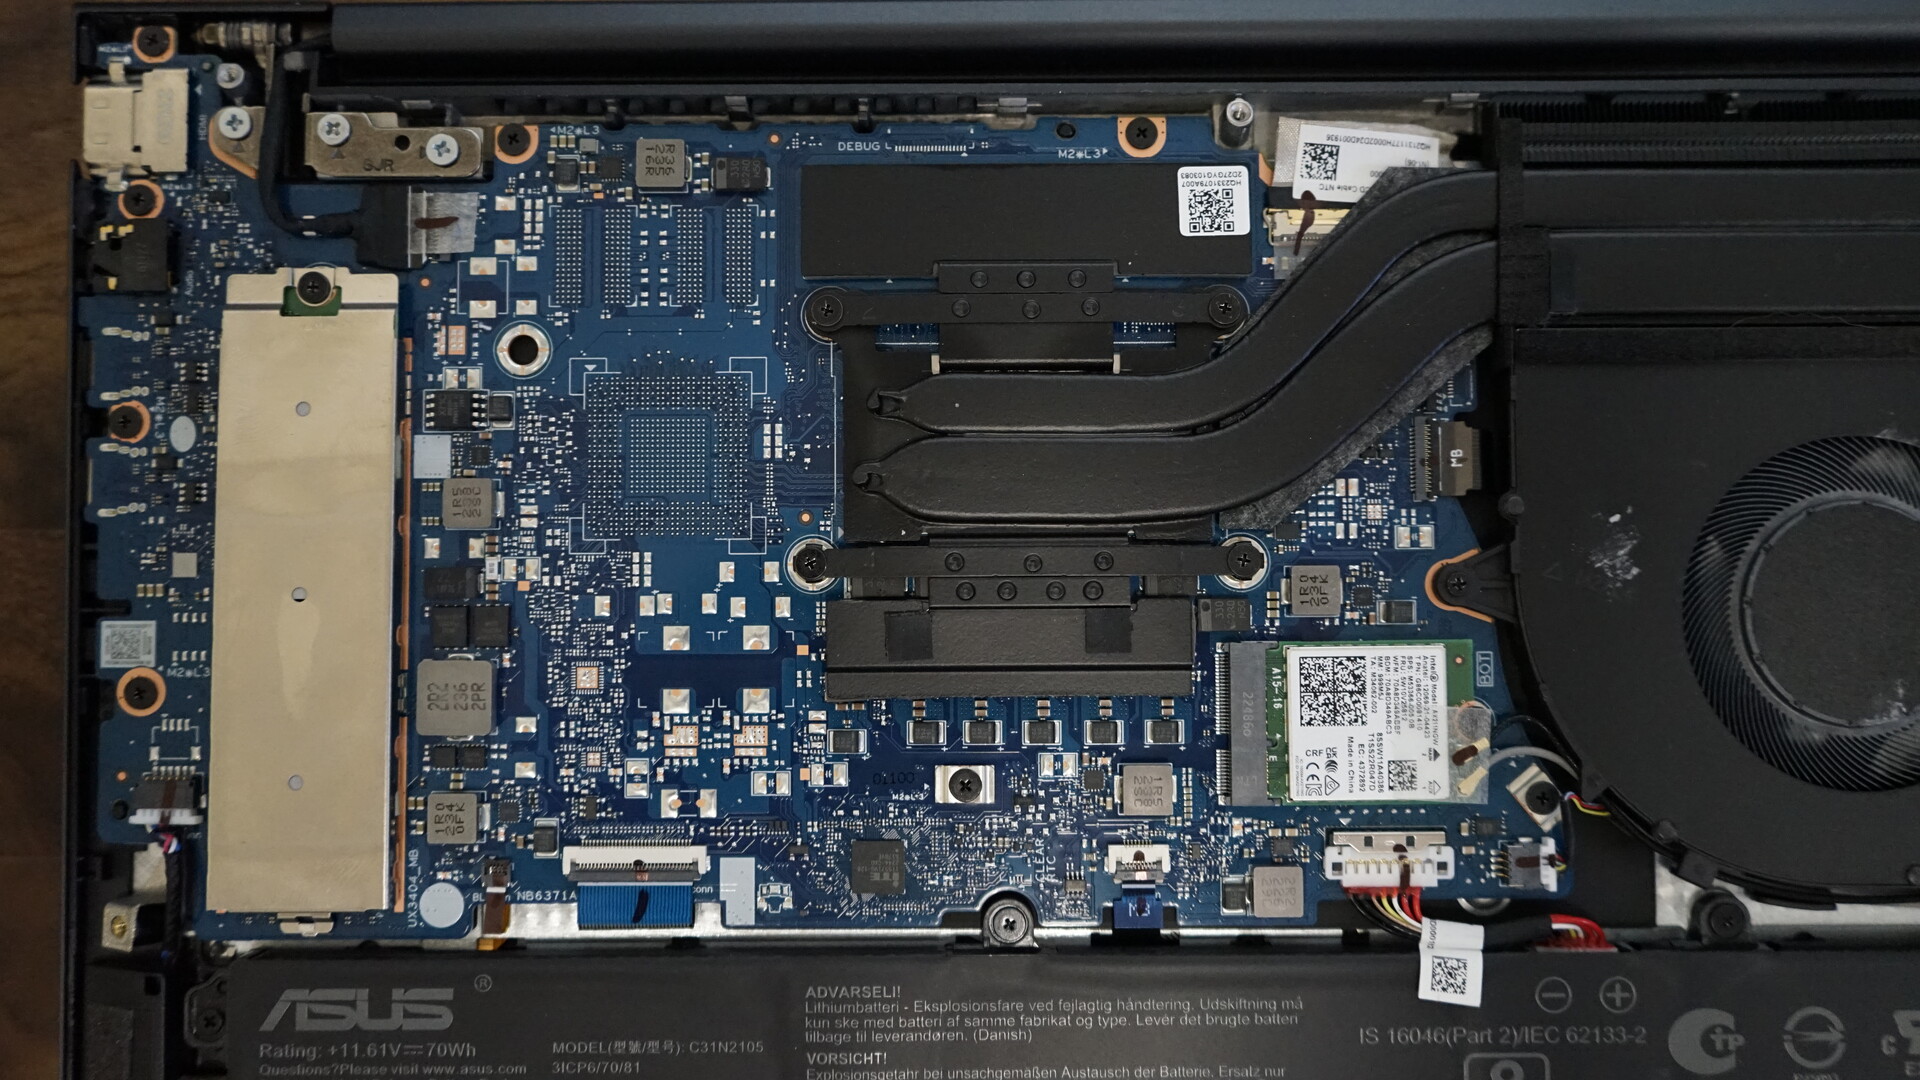
Abrir o ZenBook é relativamente fácil e apenas nove parafusos de fácil acesso precisam ser removidos da parte inferior. O módulo Wi-Fi, a bateria e o SSD são substituíveis, enquanto a RAM é soldada. A estrutura interna também revela a diferença no resfriamento em comparação com o antecessor, já que apenas uma ventoinha está instalada no modelo 2023.
Garantia
A Asus oferece uma garantia de dois anos para retirada e devolução na Alemanha. Isso pode ser diferente em outros países, portanto, os compradores interessados devem verificar antes de comprar.
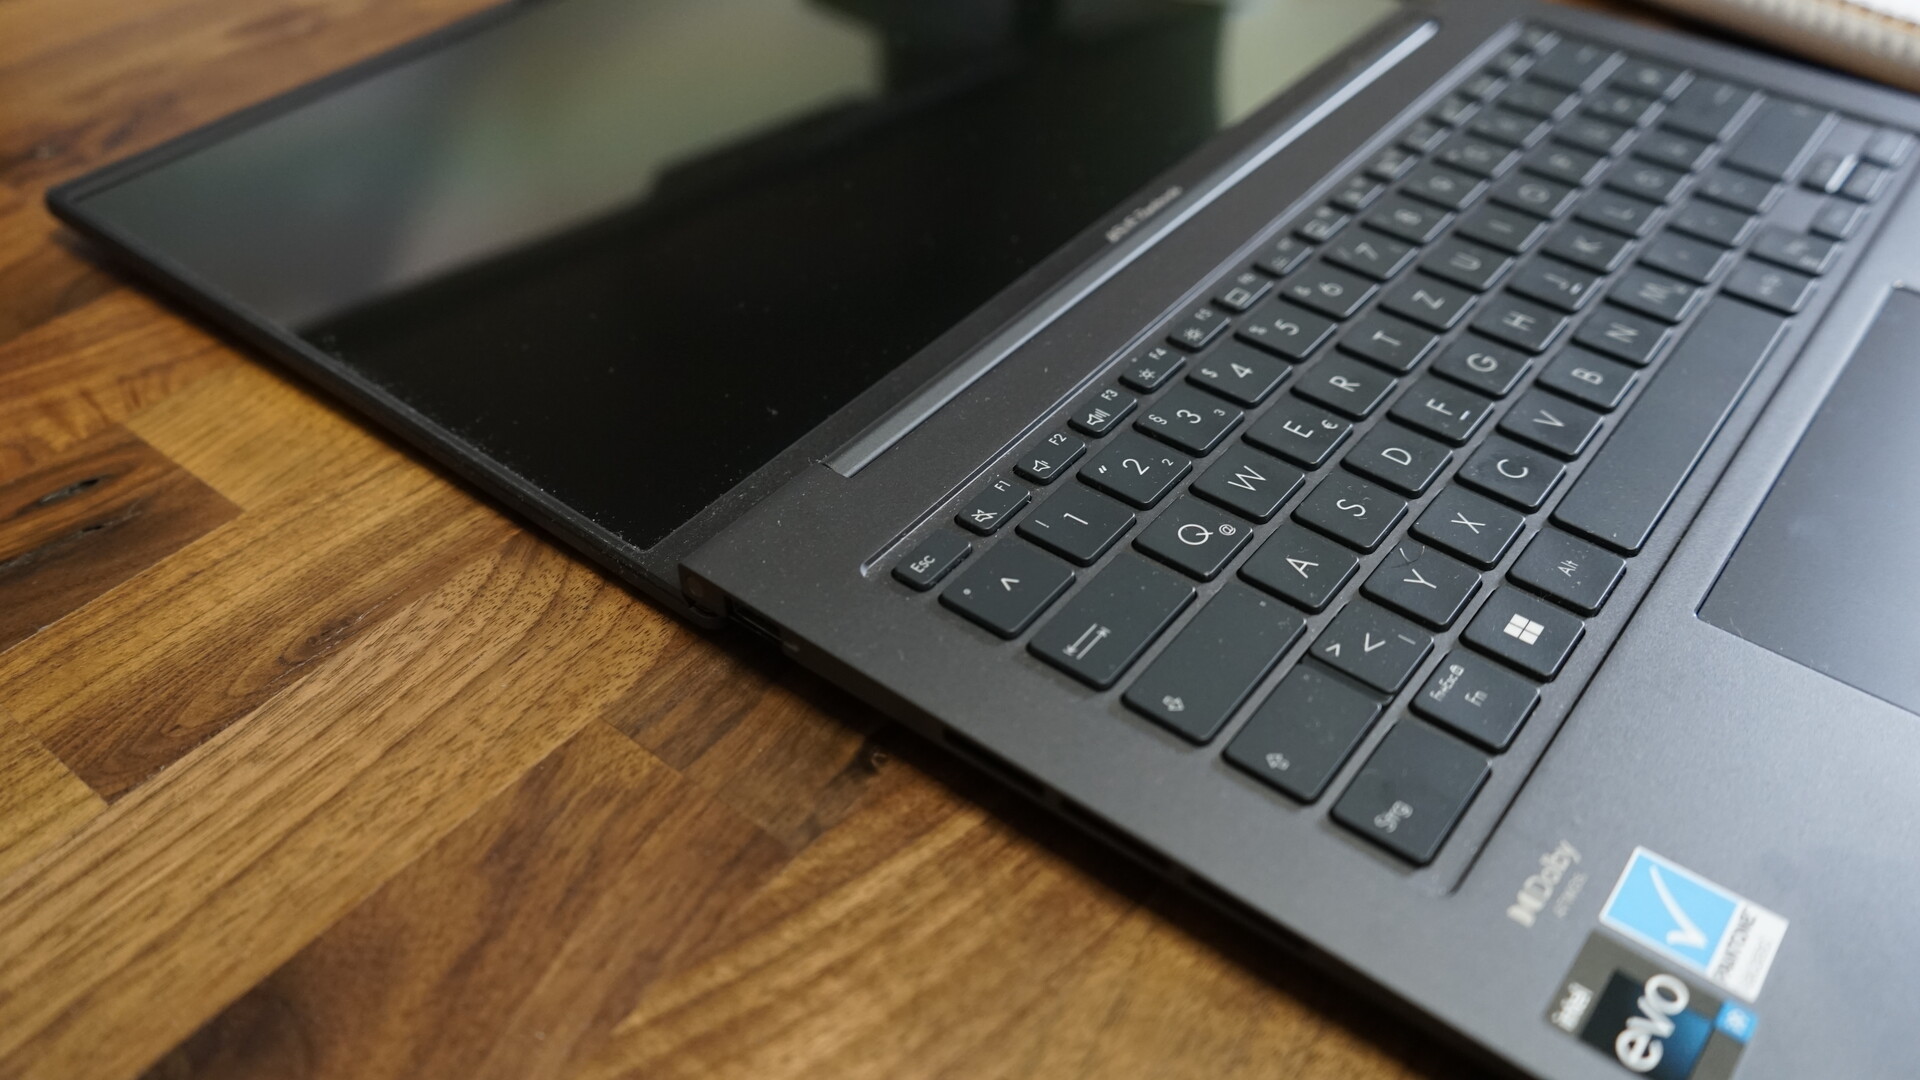
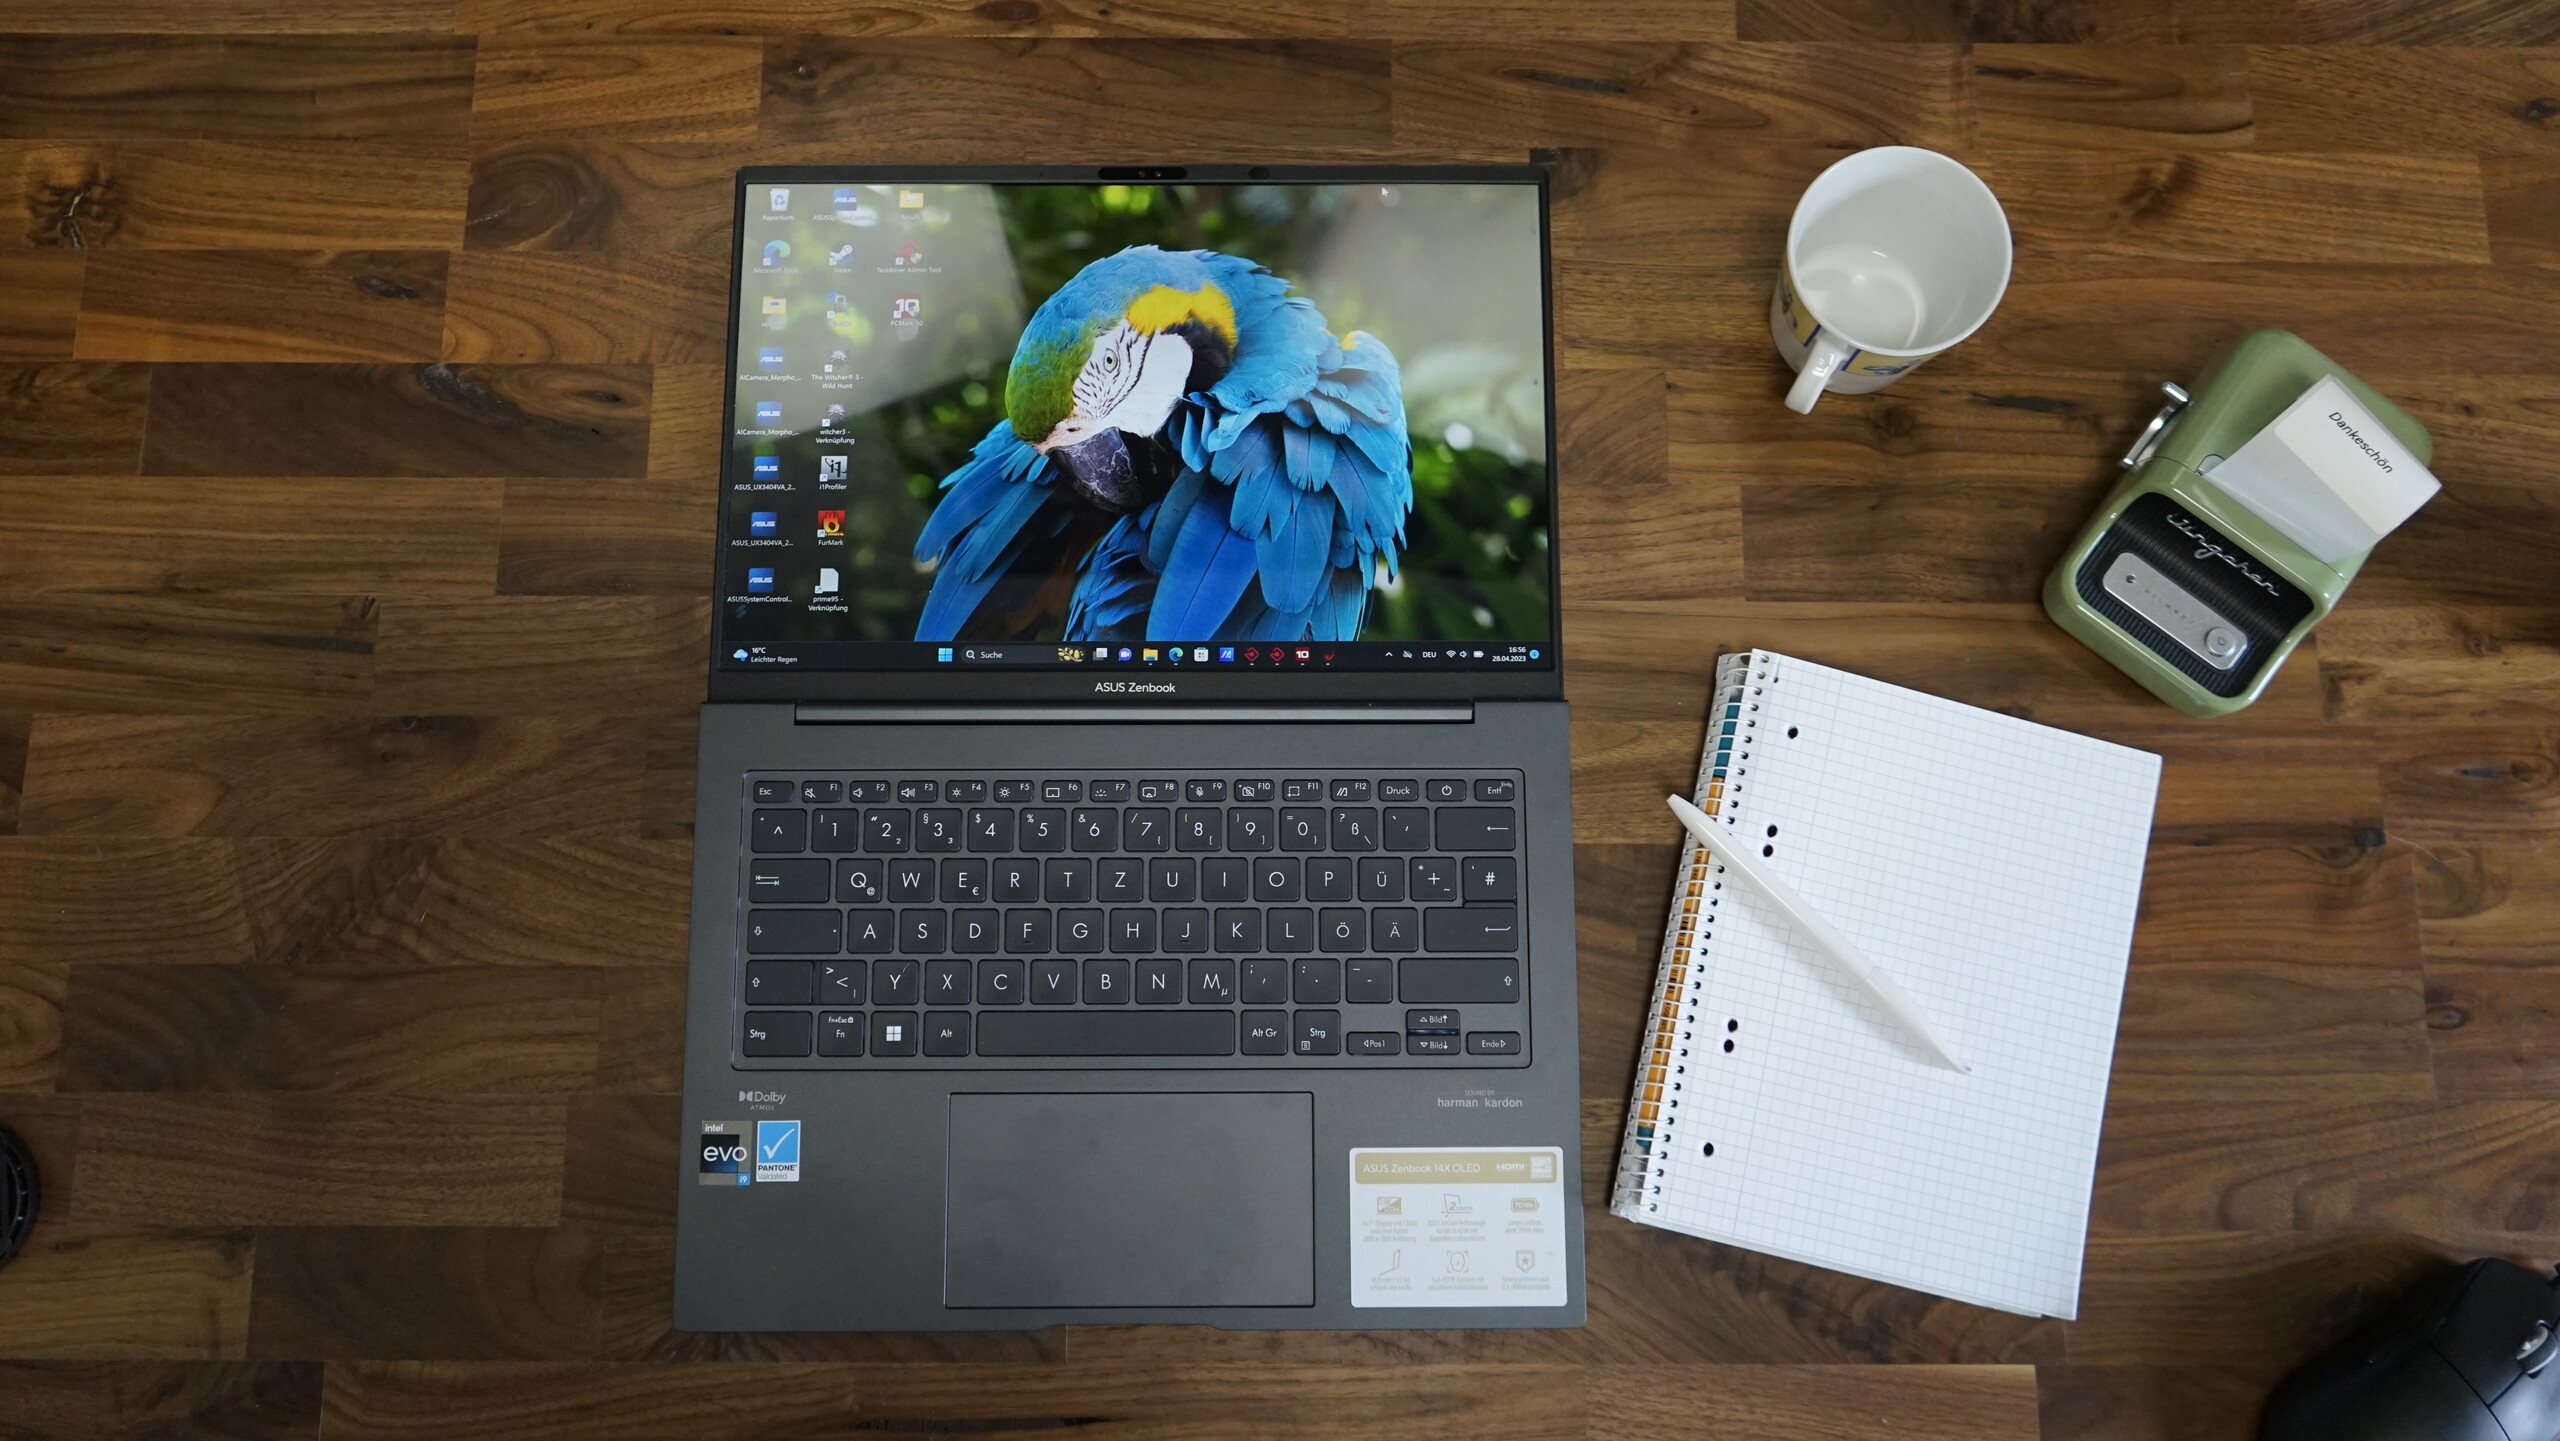
Dispositivos de entrada
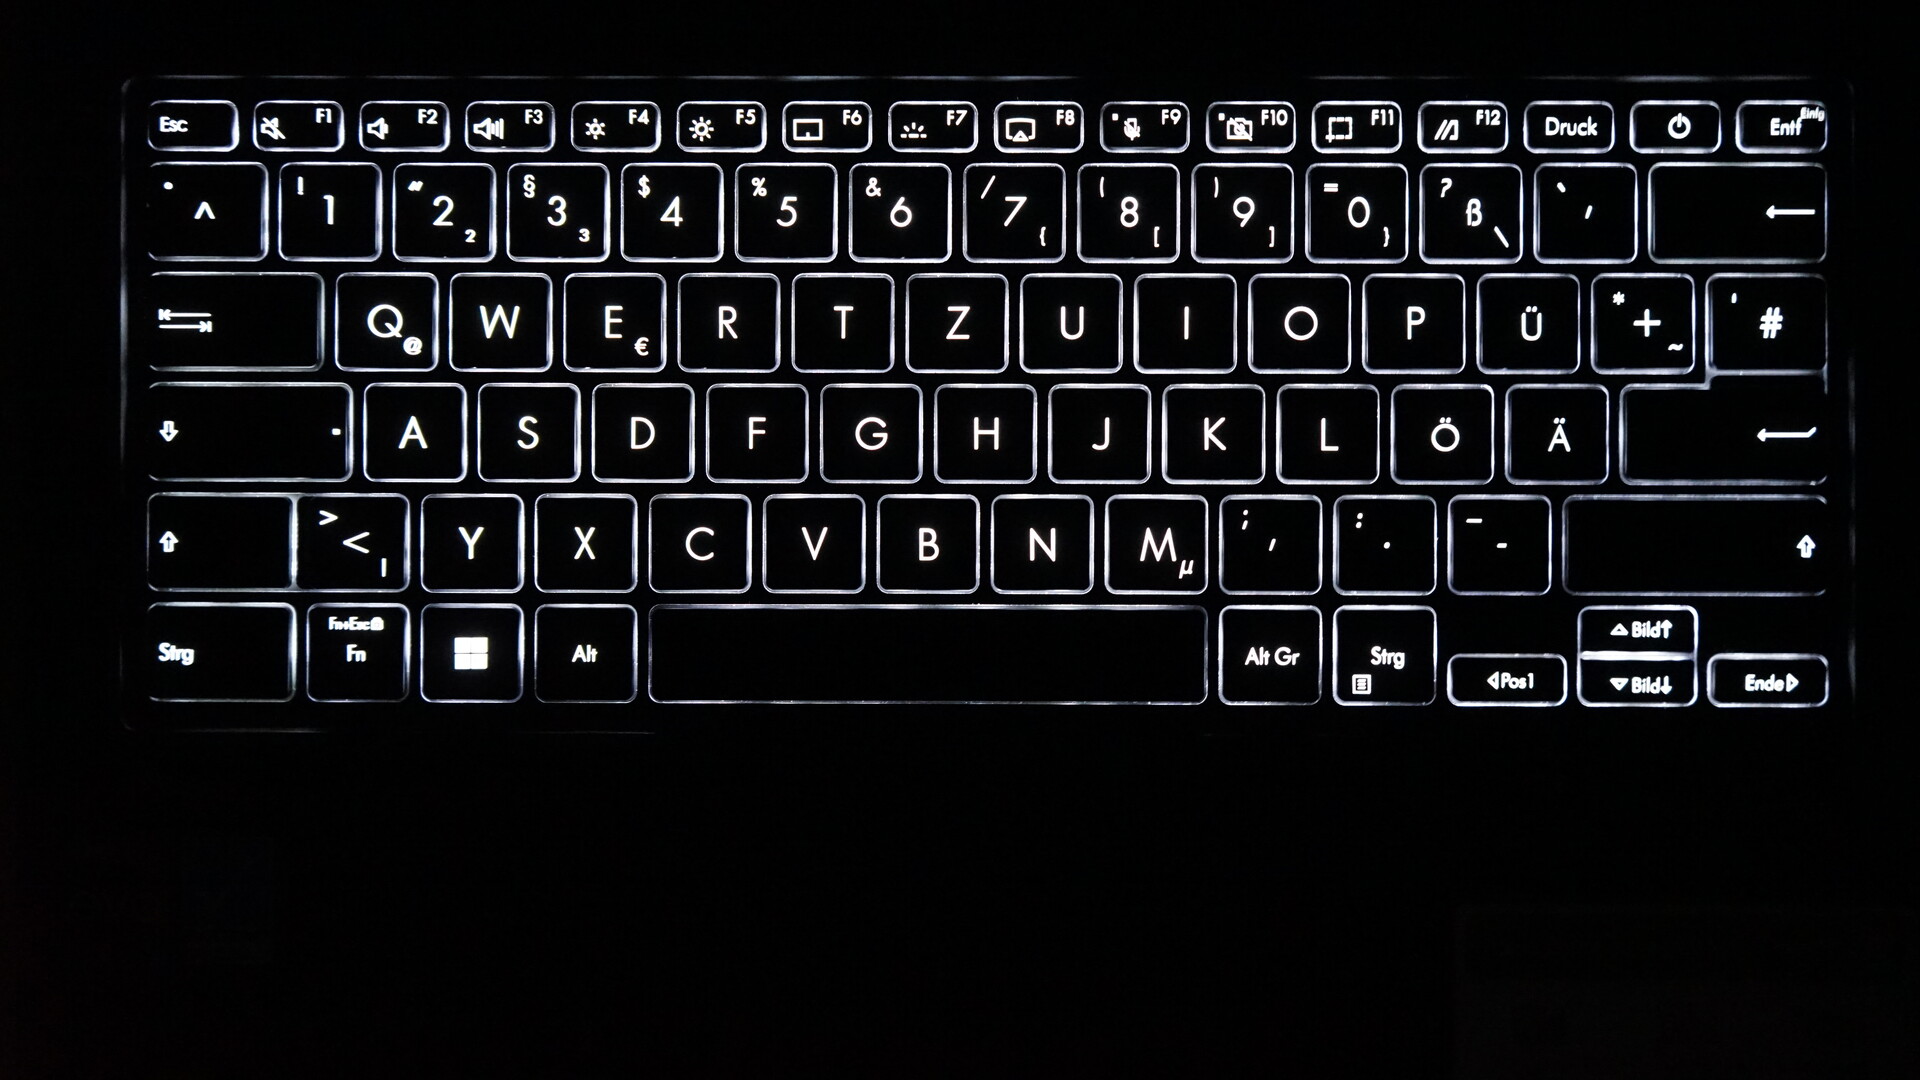
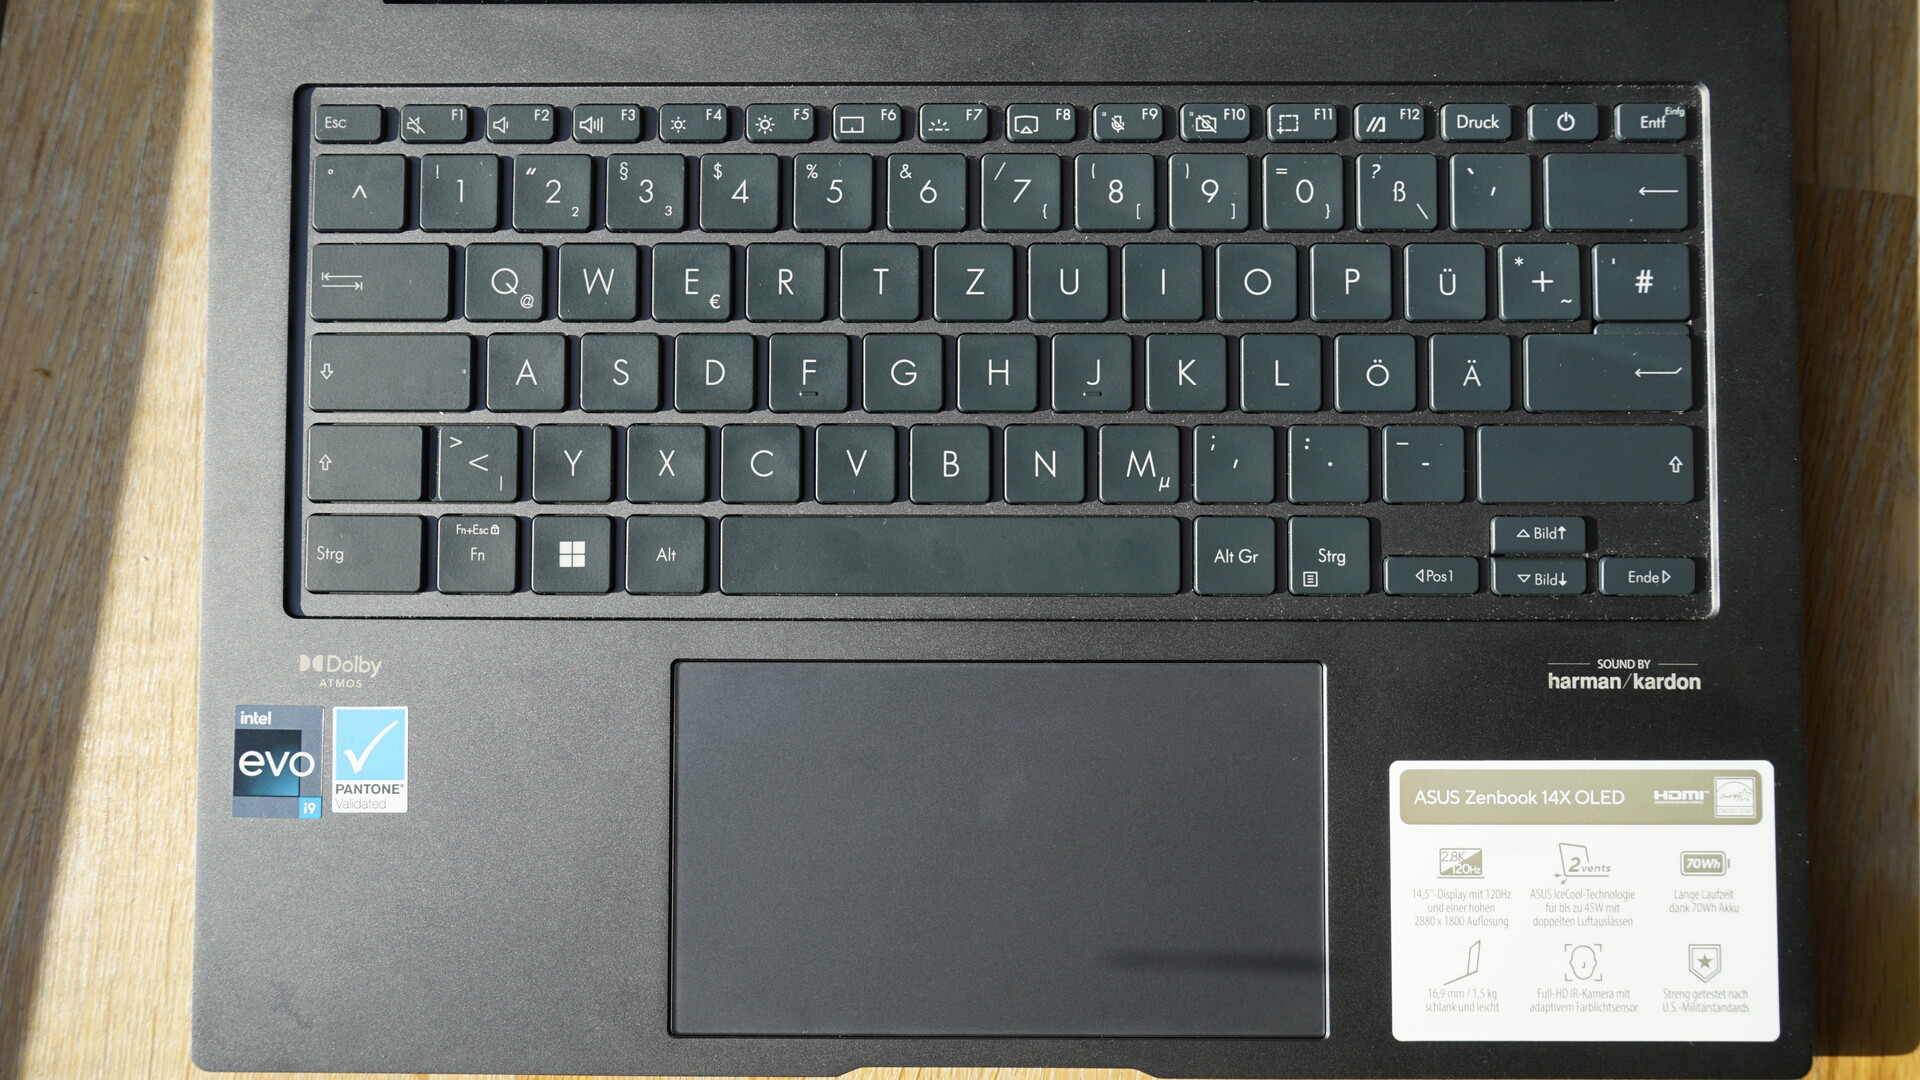
O teclado do modelo 2023 não tem as teclas de imagem dedicadas e a tecla de fim. Em vez disso, elas são encontradas como uma função secundária nas teclas de seta. As teclas em si são foscas e antiderrapantes, com um ponto de pressão muito claro, deslocamento sólido e um toque firme. Descreveríamos a sensação de digitação como muito nítida e o ruído de digitação é de moderado a silencioso. A luz de fundo branca tem três níveis e a luz é distribuída de maneira muito uniforme, de modo que trabalhar em ambientes mais escuros não é um problema. O espaçamento entre as teclas é de 2,5 mm, como no modelo anterior, o que proporciona uma sensação agradável de digitação sem limitações. A base robusta do ZenBook também é perceptível ao digitar, proporcionando uma superfície estável e inflexível
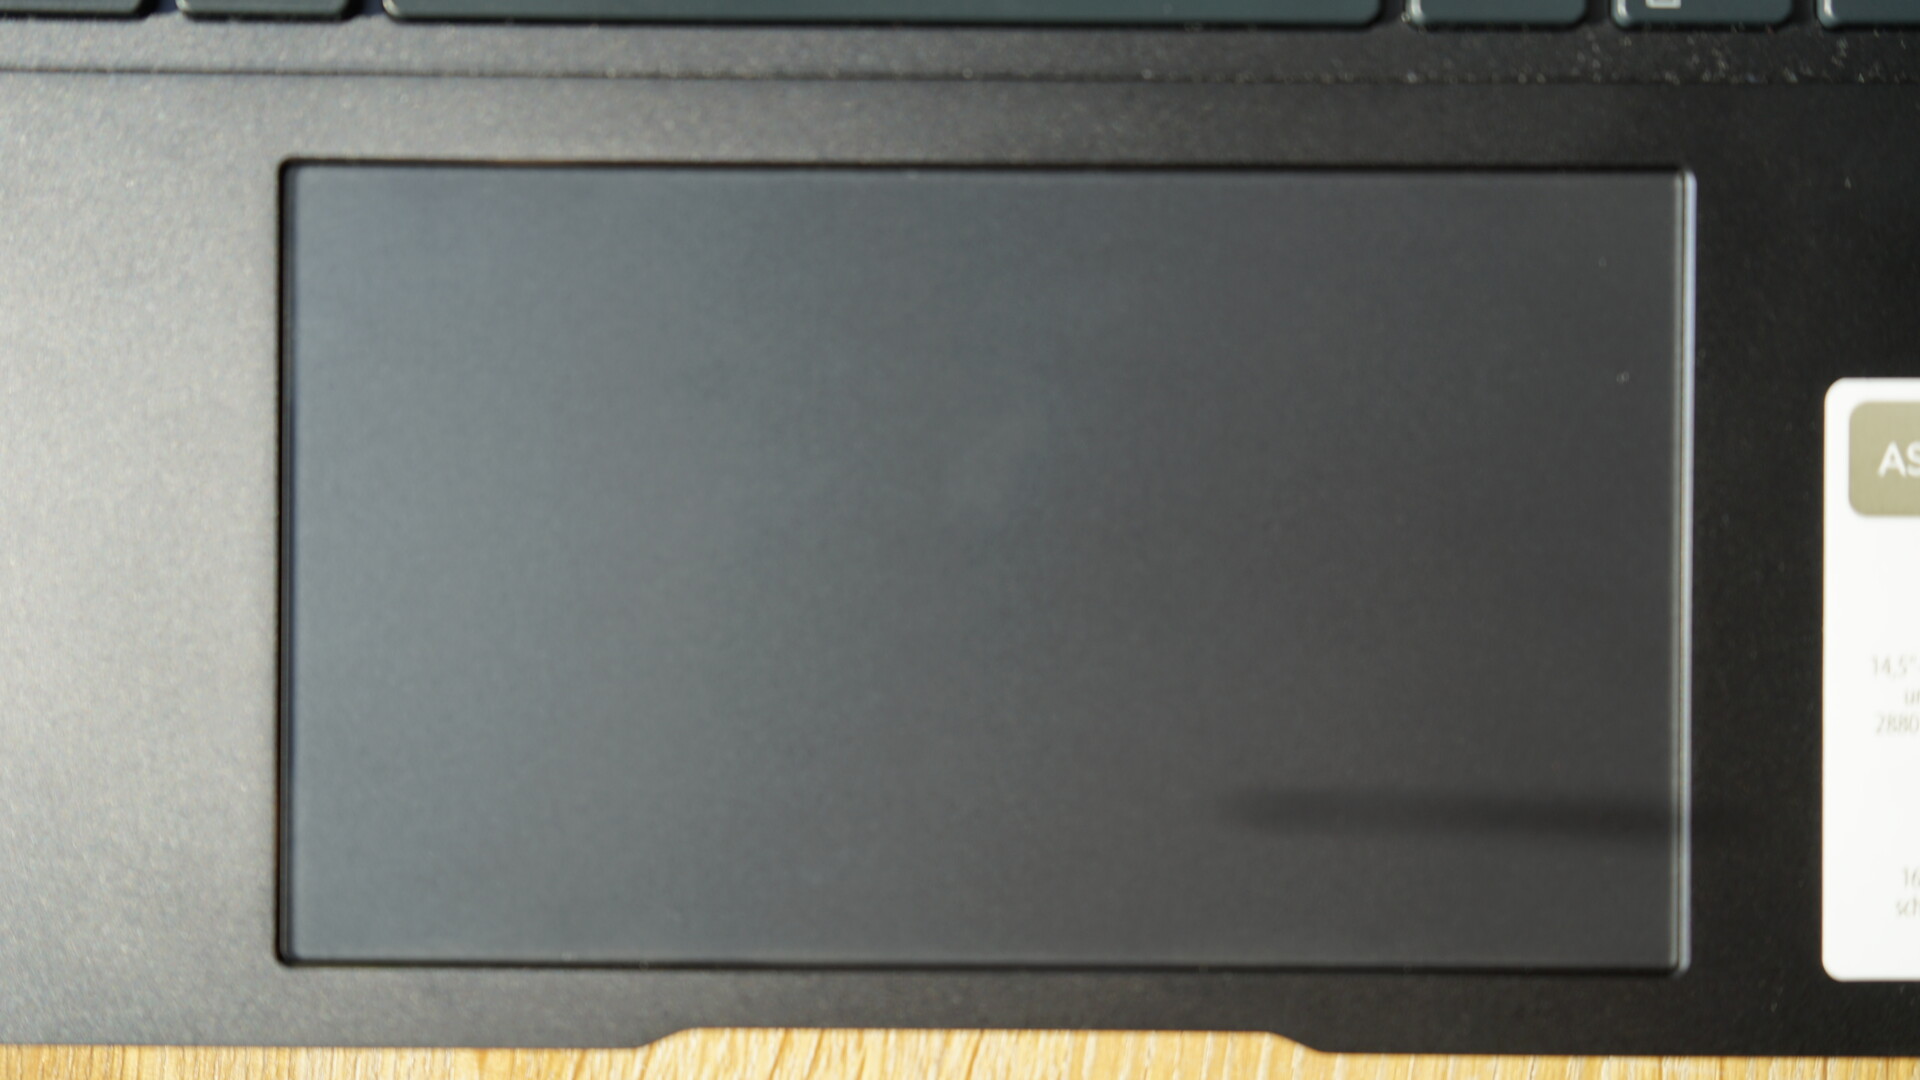
O clickpad mede 13 x 7,6 cm e, portanto, é grande o suficiente para movimentos do ponteiro e gestos com até quatro dedos. As propriedades de deslizamento são muito boas e os cliques em ambos os lados são estáveis e de alta qualidade, com um som de clique sólido. O teclado numérico, integrado ao touchpad do dispositivo do ano passado, não está mais disponível como tal em nosso dispositivo de análise.
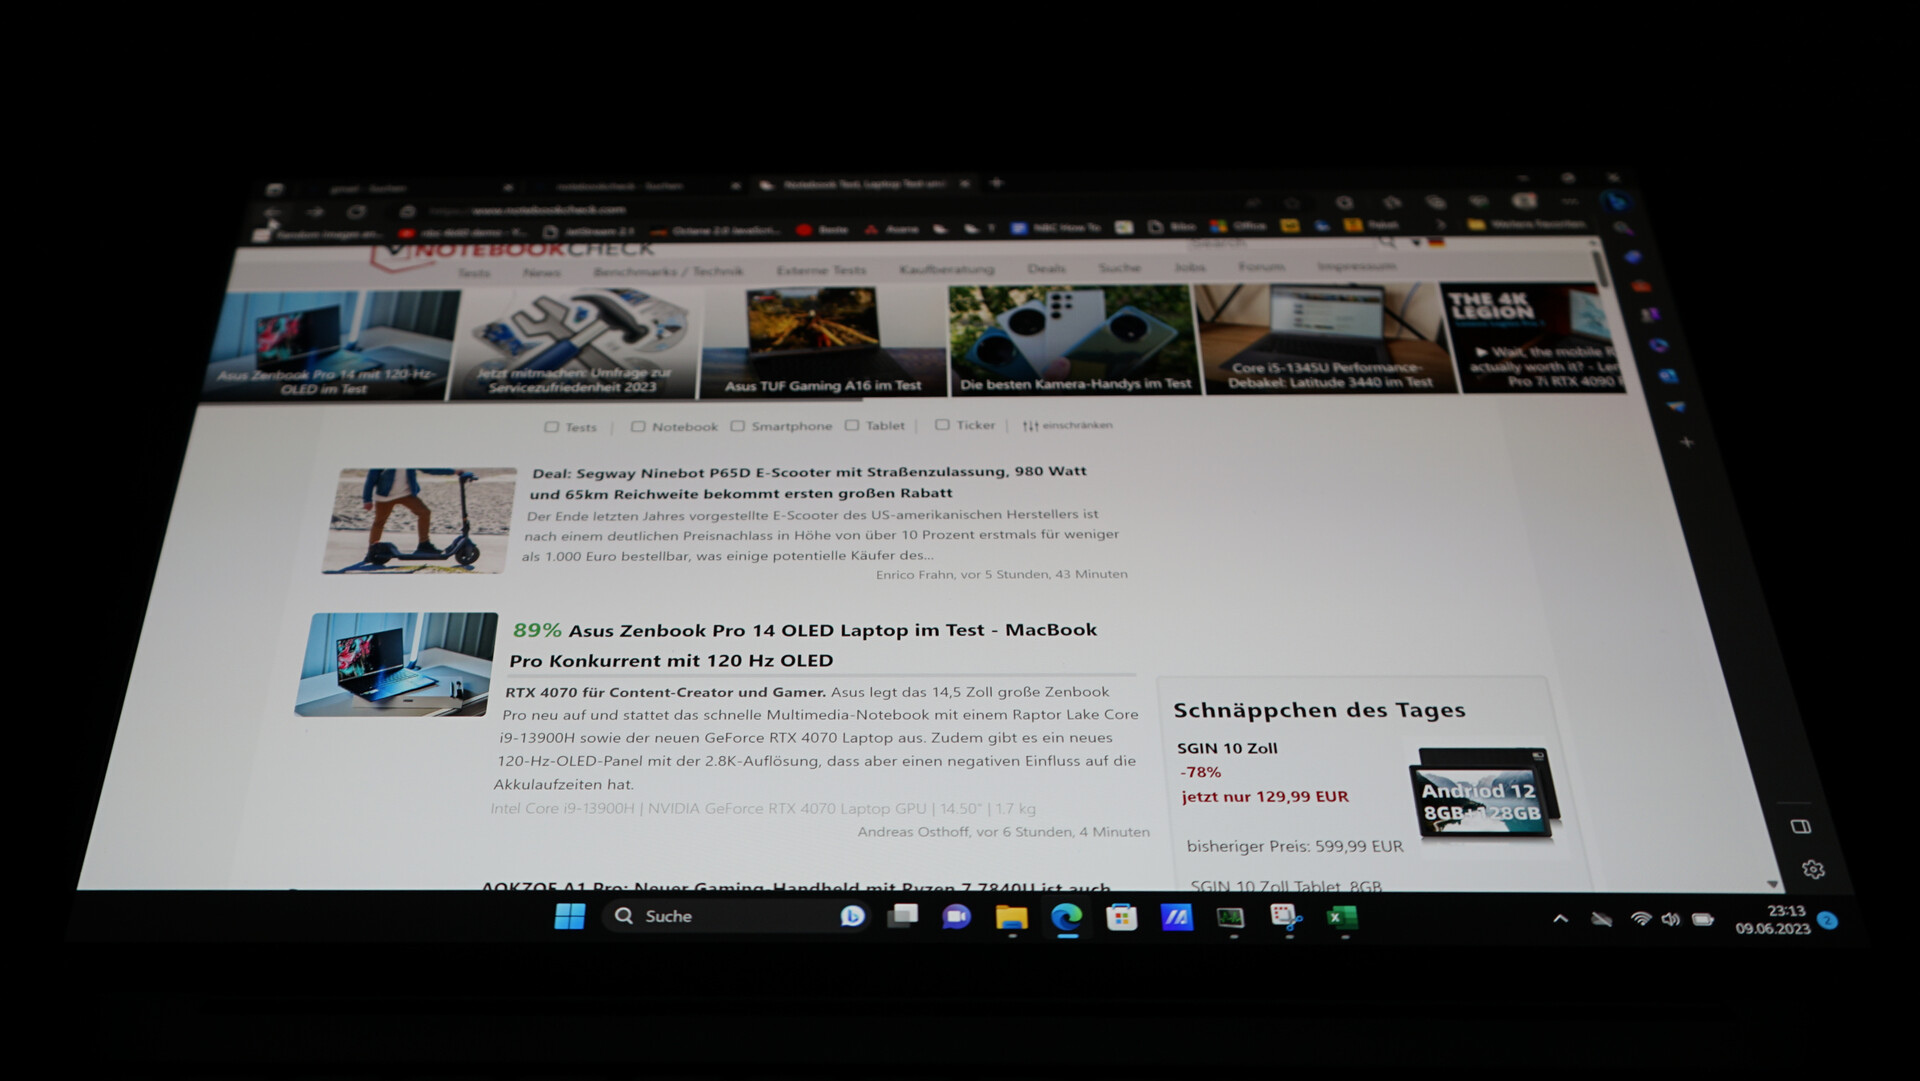
Tela - 2,8K e 120 Hz
A estrela do show no Asus ZenBook 14X é o painel OLED de 14 polegadas. A tela brilhante oferece uma resolução de 2.880x1.800 no formato 16:10, uma taxa de atualização de 120 Hz e um tempo de resposta de apenas 2 milissegundos. A variante que testamos é a variante sem toque. Como alternativa, a Asus também oferece a tela com a função de toque
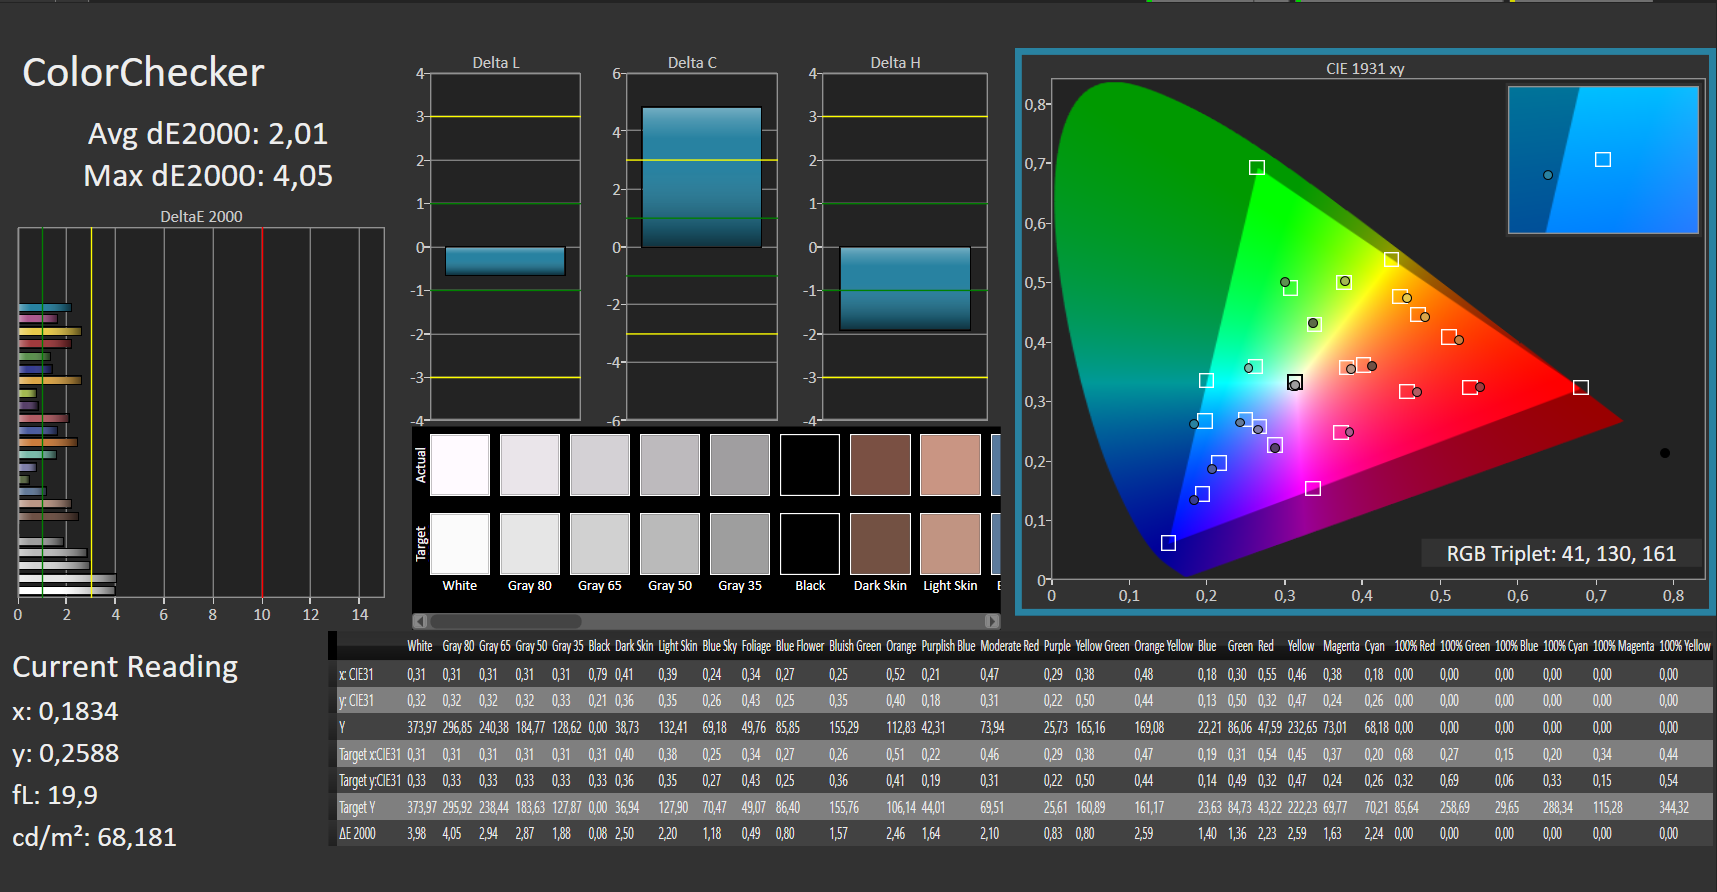
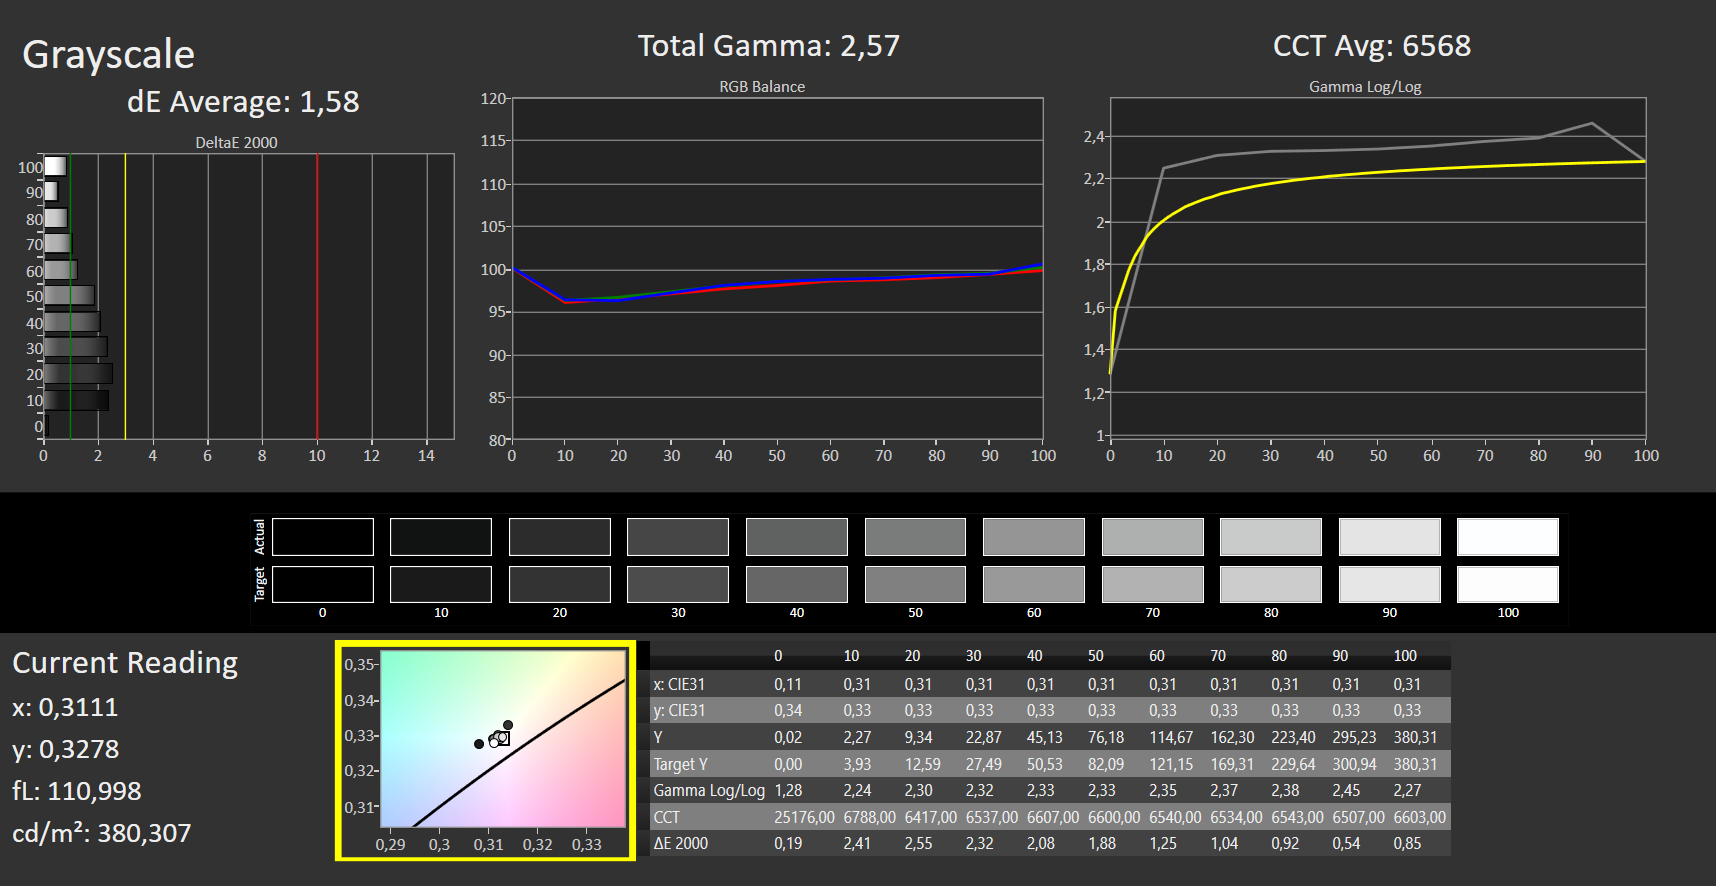
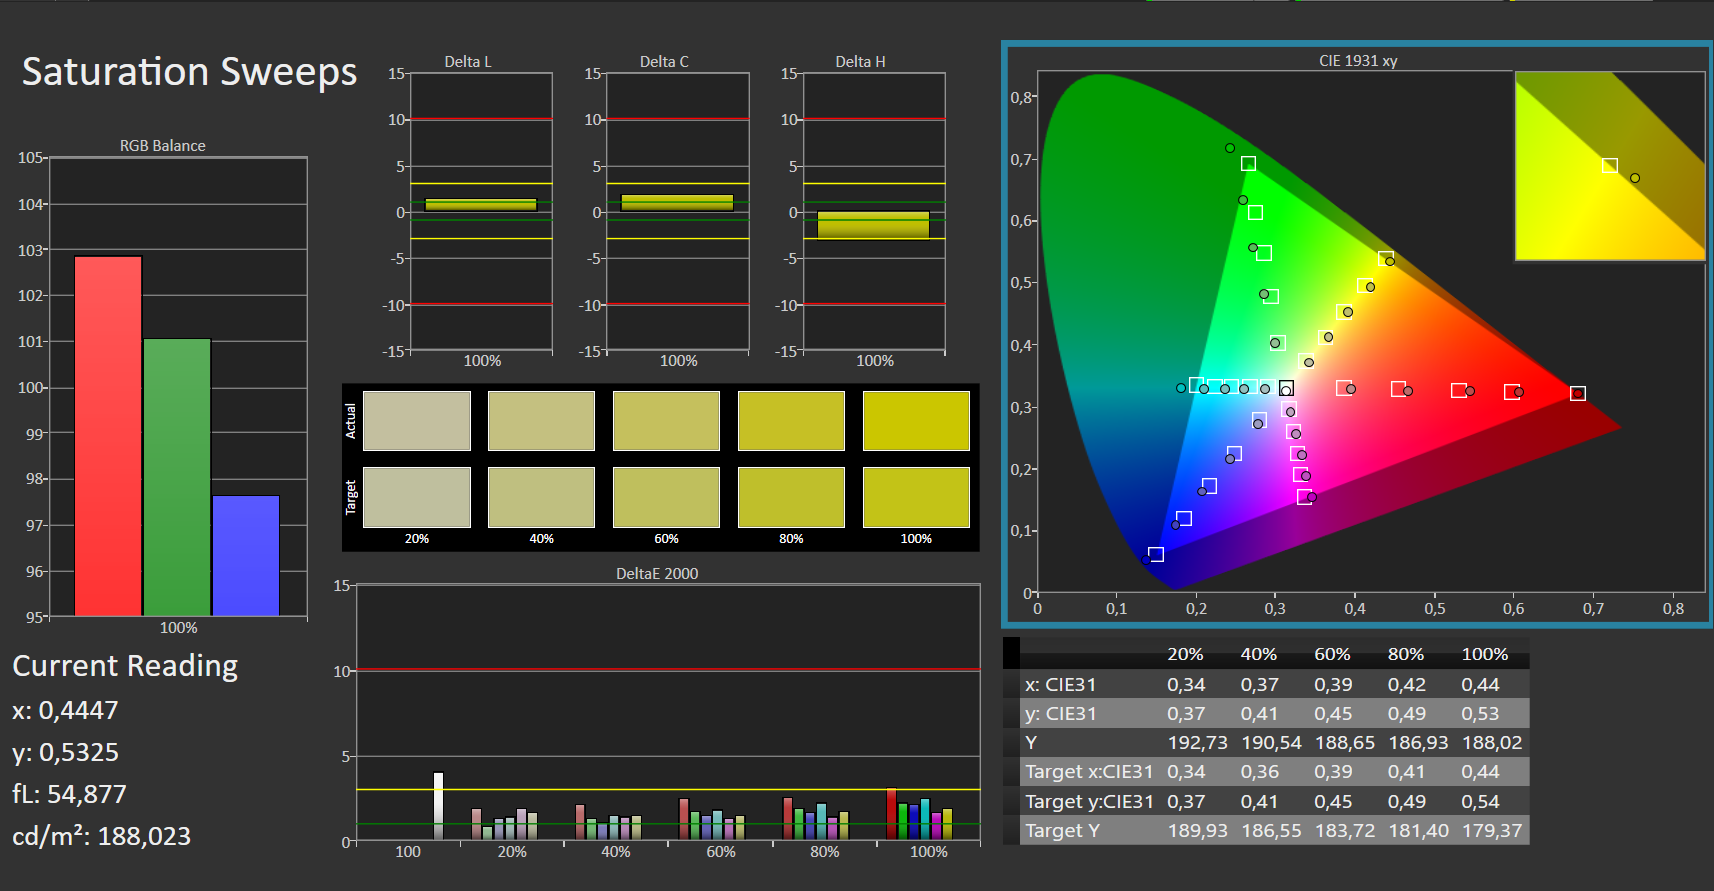
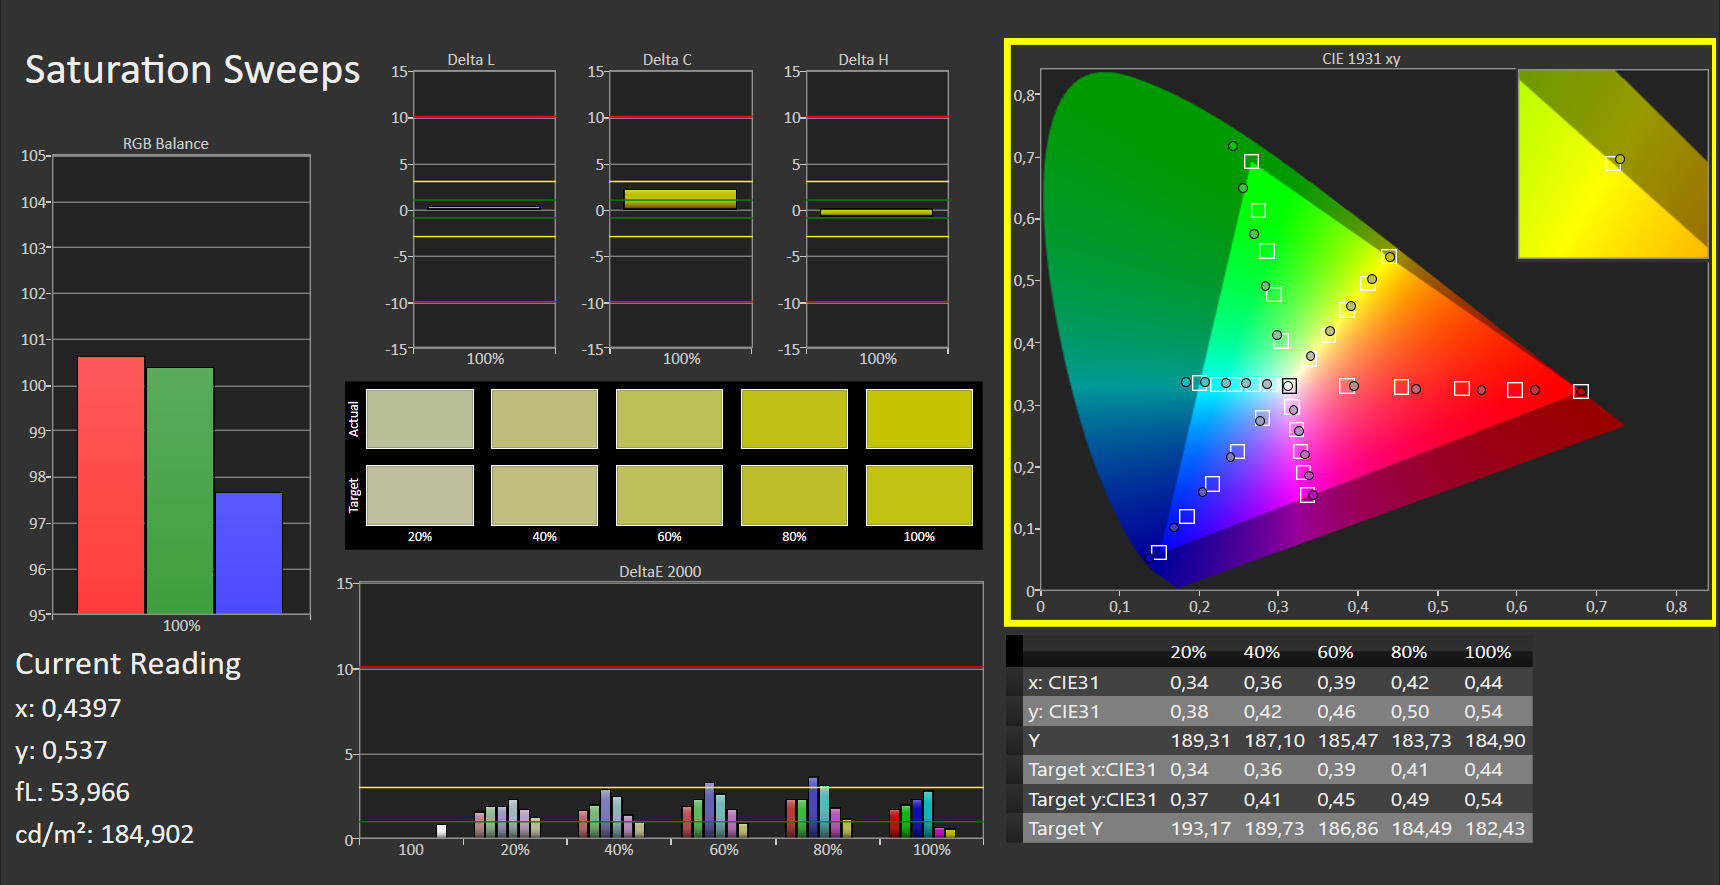
De acordo com a Asus, 100% da gama de cores DCI-P3 é um dado adquirido, mas nossas medições resultaram em "apenas" 99%. O espaço de cores sRGB, por outro lado, atinge 100% de cobertura e o espaço de cores AdobeRGB, 95%. De acordo com o fabricante, o brilho da tela é estimado em uma média de 400 nits. Medimos uma média de 376 cd/m2 e um máximo de 381 cd/m2, portanto não podemos confirmar totalmente a afirmação da Asus. Como de costume nos painéis OLED, a iluminação é distribuída de forma homogênea em 98%.
As configurações de brilho mais baixas reduzem o risco de queima em telas OLED, e a função de deslocamento de pixels é ativada por padrão por meio do aplicativo MyAsus. Assim, todos os pixels estão sempre minimamente em movimento, o que evita imagens estáticas. A configuração pode ser desativada pelo aplicativo, mas não notamos que o recurso estava ativado durante nossos testes.
| |||||||||||||||||||||||||
iluminação: 98 %
iluminação com acumulador: 376 cd/m²
Contraste: 37200:1 (Preto: 0.01 cd/m²)
ΔE ColorChecker Calman: 2.01 | ∀{0.5-29.43 Ø4.71}
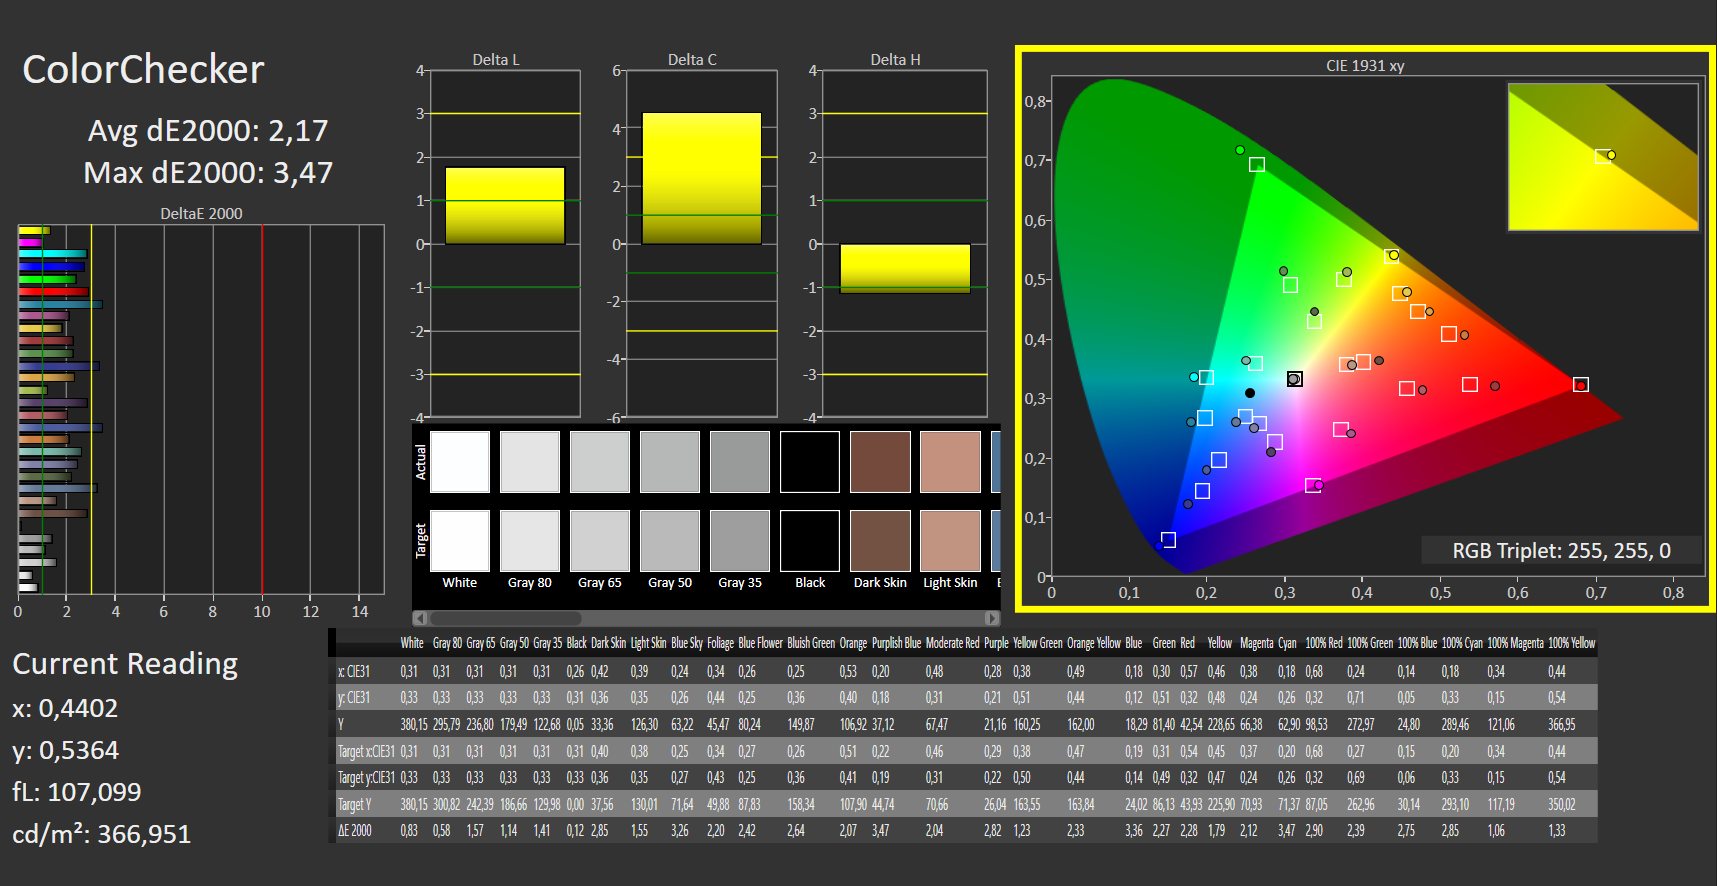
calibrated: 2.17
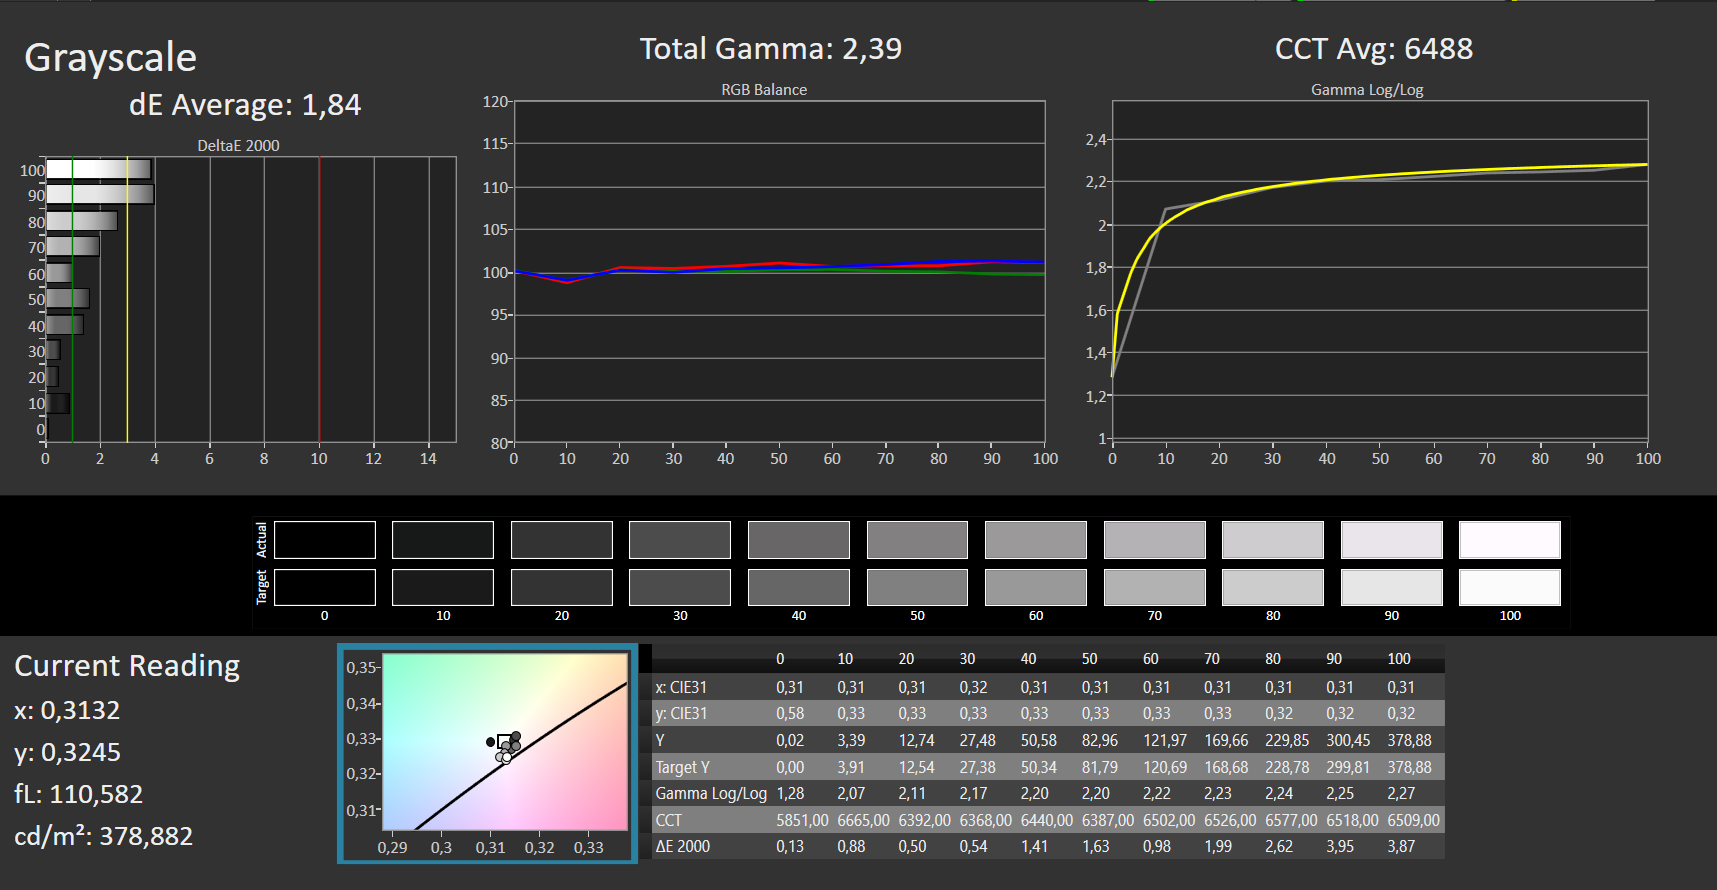
ΔE Greyscale Calman: 1.84 | ∀{0.09-98 Ø4.96}
95% AdobeRGB 1998 (Argyll 3D)
100% sRGB (Argyll 3D)
99% Display P3 (Argyll 3D)
Gamma: 2.39
CCT: 6488 K
| Asus ZenBook 14X UX3404VC Samsung, OLED, 2880x1800, 14.5" | Apple MacBook Pro 13 2022 M2 IPS, 2560x1600, 13.3" | Dell XPS 13 Plus 9320 i7-1280P OLED Samsung 134XK04, OLED, 3456x2160, 13.4" | Lenovo Slim Pro 7 14ARP8 LEN89C1, IPS, 2560x1600, 14.5" | LG Gram 14Z90Q LG LP140WU1-SPF1, IPS, 1920x1200, 14" | Dell Inspiron 14 Plus 7420 InfoVision 140NWHE, IPS, 2240x1400, 14" | Asus ROG Flow Z13 GZ301V TL134ADXP01-0, IPS, 2560x1600, 13.4" | |
|---|---|---|---|---|---|---|---|
| Display | -2% | 2% | -16% | -4% | -20% | -4% | |
| Display P3 Coverage (%) | 99 | 98.8 0% | 99.5 1% | 72.9 -26% | 98.4 -1% | 68.8 -31% | 97 -2% |
| sRGB Coverage (%) | 100 | 100 0% | 100 0% | 98.2 -2% | 99.9 0% | 99.3 -1% | 99.9 0% |
| AdobeRGB 1998 Coverage (%) | 95 | 87.9 -7% | 98.4 4% | 74.6 -21% | 85.9 -10% | 69.5 -27% | 85.3 -10% |
| Response Times | -1645% | -18% | -1178% | -1700% | -1290% | -225% | |
| Response Time Grey 50% / Grey 80% * (ms) | 2 ? | 42 ? -2000% | 2.6 ? -30% | 31.8 ? -1490% | 47.5 ? -2275% | 32.8 ? -1540% | 6.5 ? -225% |
| Response Time Black / White * (ms) | 2 ? | 27.8 ? -1290% | 2.1 ? -5% | 19.3 ? -865% | 24.5 ? -1125% | 22.8 ? -1040% | 6.5 ? -225% |
| PWM Frequency (Hz) | 250 ? | 117780 ? | 59.5 | ||||
| Screen | -319% | -13% | -368% | -324% | -334% | -482% | |
| Brightness middle (cd/m²) | 372 | 514 38% | 371.8 0% | 344.7 -7% | 341 -8% | 331.1 -11% | 537 44% |
| Brightness (cd/m²) | 376 | 497 32% | 374 -1% | 334 -11% | 305 -19% | 326 -13% | 511 36% |
| Brightness Distribution (%) | 98 | 93 -5% | 98 0% | 92 -6% | 87 -11% | 85 -13% | 88 -10% |
| Black Level * (cd/m²) | 0.01 | 0.31 -3000% | 0.31 -3000% | 0.26 -2500% | 0.29 -2800% | 0.45 -4400% | |
| Contrast (:1) | 37200 | 1658 -96% | 1112 -97% | 1312 -96% | 1142 -97% | 1193 -97% | |
| Colorchecker dE 2000 * | 2.01 | 1.1 45% | 2.37 -18% | 3.01 -50% | 3.11 -55% | 2.23 -11% | 1.49 26% |
| Colorchecker dE 2000 max. * | 4.05 | 2.3 43% | 6.1 -51% | 6.3 -56% | 8.29 -105% | 5.44 -34% | 3.68 9% |
| Colorchecker dE 2000 calibrated * | 2.17 | 0.6 72% | 0.83 62% | 0.83 62% | 0.63 71% | 1.12 48% | |
| Greyscale dE 2000 * | 1.84 | 1.8 2% | 2 -9% | 4.6 -150% | 5.3 -188% | 3.6 -96% | 1.66 10% |
| Gamma | 2.39 92% | 2.23 99% | 2.29 96% | 2.28 96% | 2.037 108% | 2.21 100% | 2.43 91% |
| CCT | 6488 100% | 6764 96% | 6261 104% | 6420 101% | 7571 86% | 6022 108% | 6772 96% |
| Média Total (Programa/Configurações) | -655% /
-440% | -10% /
-10% | -521% /
-409% | -676% /
-452% | -548% /
-403% | -237% /
-343% |
* ... menor é melhor
Como de costume com telas OLED, o contraste é excelente. O ZenBook 14X tem um preto intenso e as cores são vibrantes. A tela OLED também é claramente superior às telas IPS de dispositivos comparáveis em termos de tempo de resposta. As configurações da imagem e da tela podem ser ajustadas individualmente por meio do software MyAsus.

Nossas medições do DeltaE da escala de cinza e das cores produziram valores muito bons entre 1,8 e 2,0 antes da calibração. A calibração melhorou o DeltaE da escala de cinza para 1,6, enquanto o DeltaE das cores se deteriorou para 2,2. Esses resultados sugerem que a tela já está calibrada e que outras calibrações não oferecem nenhum valor agregado.
Exibir tempos de resposta
| ↔ Tempo de resposta preto para branco | ||
|---|---|---|
| 2 ms ... ascensão ↗ e queda ↘ combinadas | ↗ 1 ms ascensão |  |
| ↘ 1 ms queda | ||
| A tela mostra taxas de resposta muito rápidas em nossos testes e deve ser muito adequada para jogos em ritmo acelerado. Em comparação, todos os dispositivos testados variam de 0.1 (mínimo) a 240 (máximo) ms. » 11 % de todos os dispositivos são melhores. Isso significa que o tempo de resposta medido é melhor que a média de todos os dispositivos testados (19.8 ms). | ||
| ↔ Tempo de resposta 50% cinza a 80% cinza | ||
| 2 ms ... ascensão ↗ e queda ↘ combinadas | ↗ 1 ms ascensão |  |
| ↘ 1 ms queda | ||
| A tela mostra taxas de resposta muito rápidas em nossos testes e deve ser muito adequada para jogos em ritmo acelerado. Em comparação, todos os dispositivos testados variam de 0.165 (mínimo) a 636 (máximo) ms. » 10 % de todos os dispositivos são melhores. Isso significa que o tempo de resposta medido é melhor que a média de todos os dispositivos testados (31 ms). | ||
Cintilação da tela / PWM (modulação por largura de pulso)
| Tela tremeluzindo/PWM detectado | 250 Hz | ≤ 70 % configuração de brilho |  |
A luz de fundo da tela pisca em 250 Hz (pior caso, por exemplo, utilizando PWM) Cintilação detectada em uma configuração de brilho de 70 % e abaixo. Não deve haver cintilação ou PWM acima desta configuração de brilho. A frequência de 250 Hz é relativamente baixa, portanto, usuários sensíveis provavelmente notarão cintilação e sentirão fadiga ocular na configuração de brilho indicada e abaixo. [pwm_comparison] Em comparação: 52 % de todos os dispositivos testados não usam PWM para escurecer a tela. Se PWM foi detectado, uma média de 7754 (mínimo: 5 - máximo: 343500) Hz foi medida. | |||


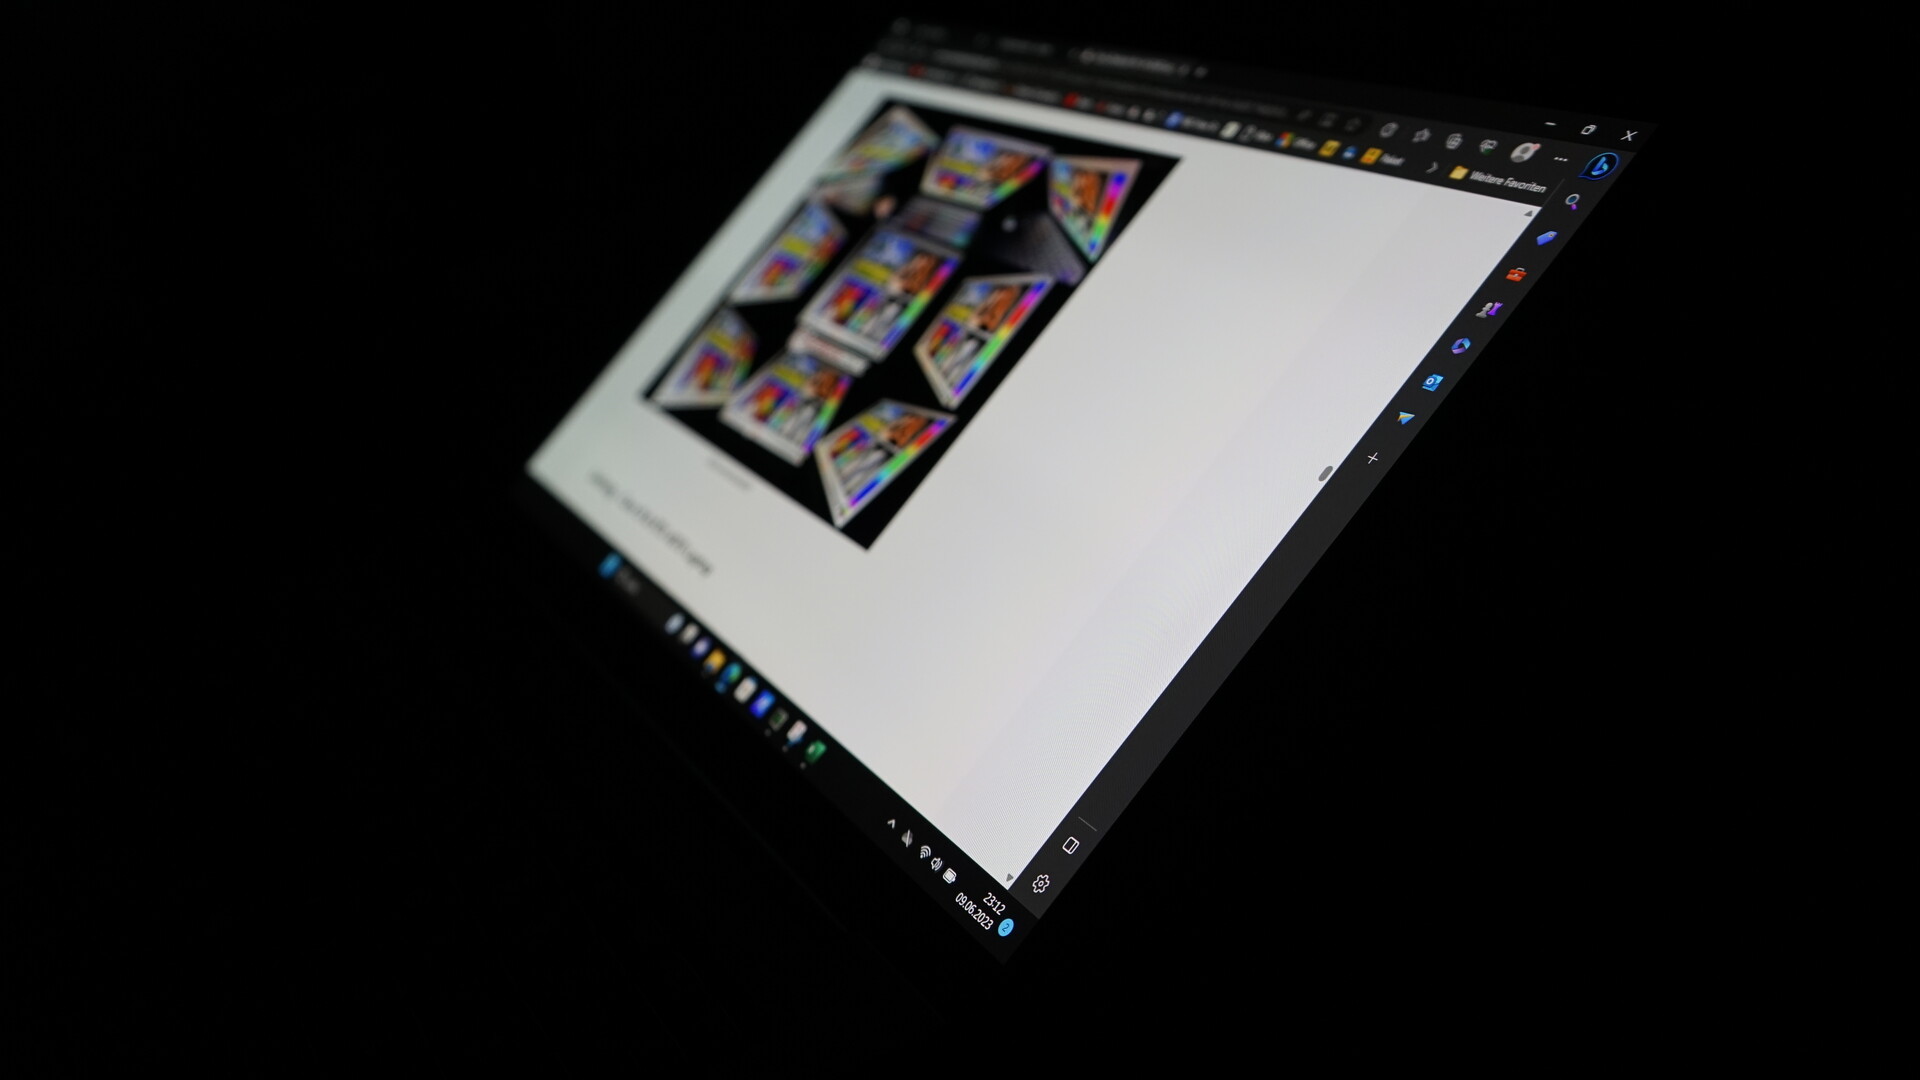
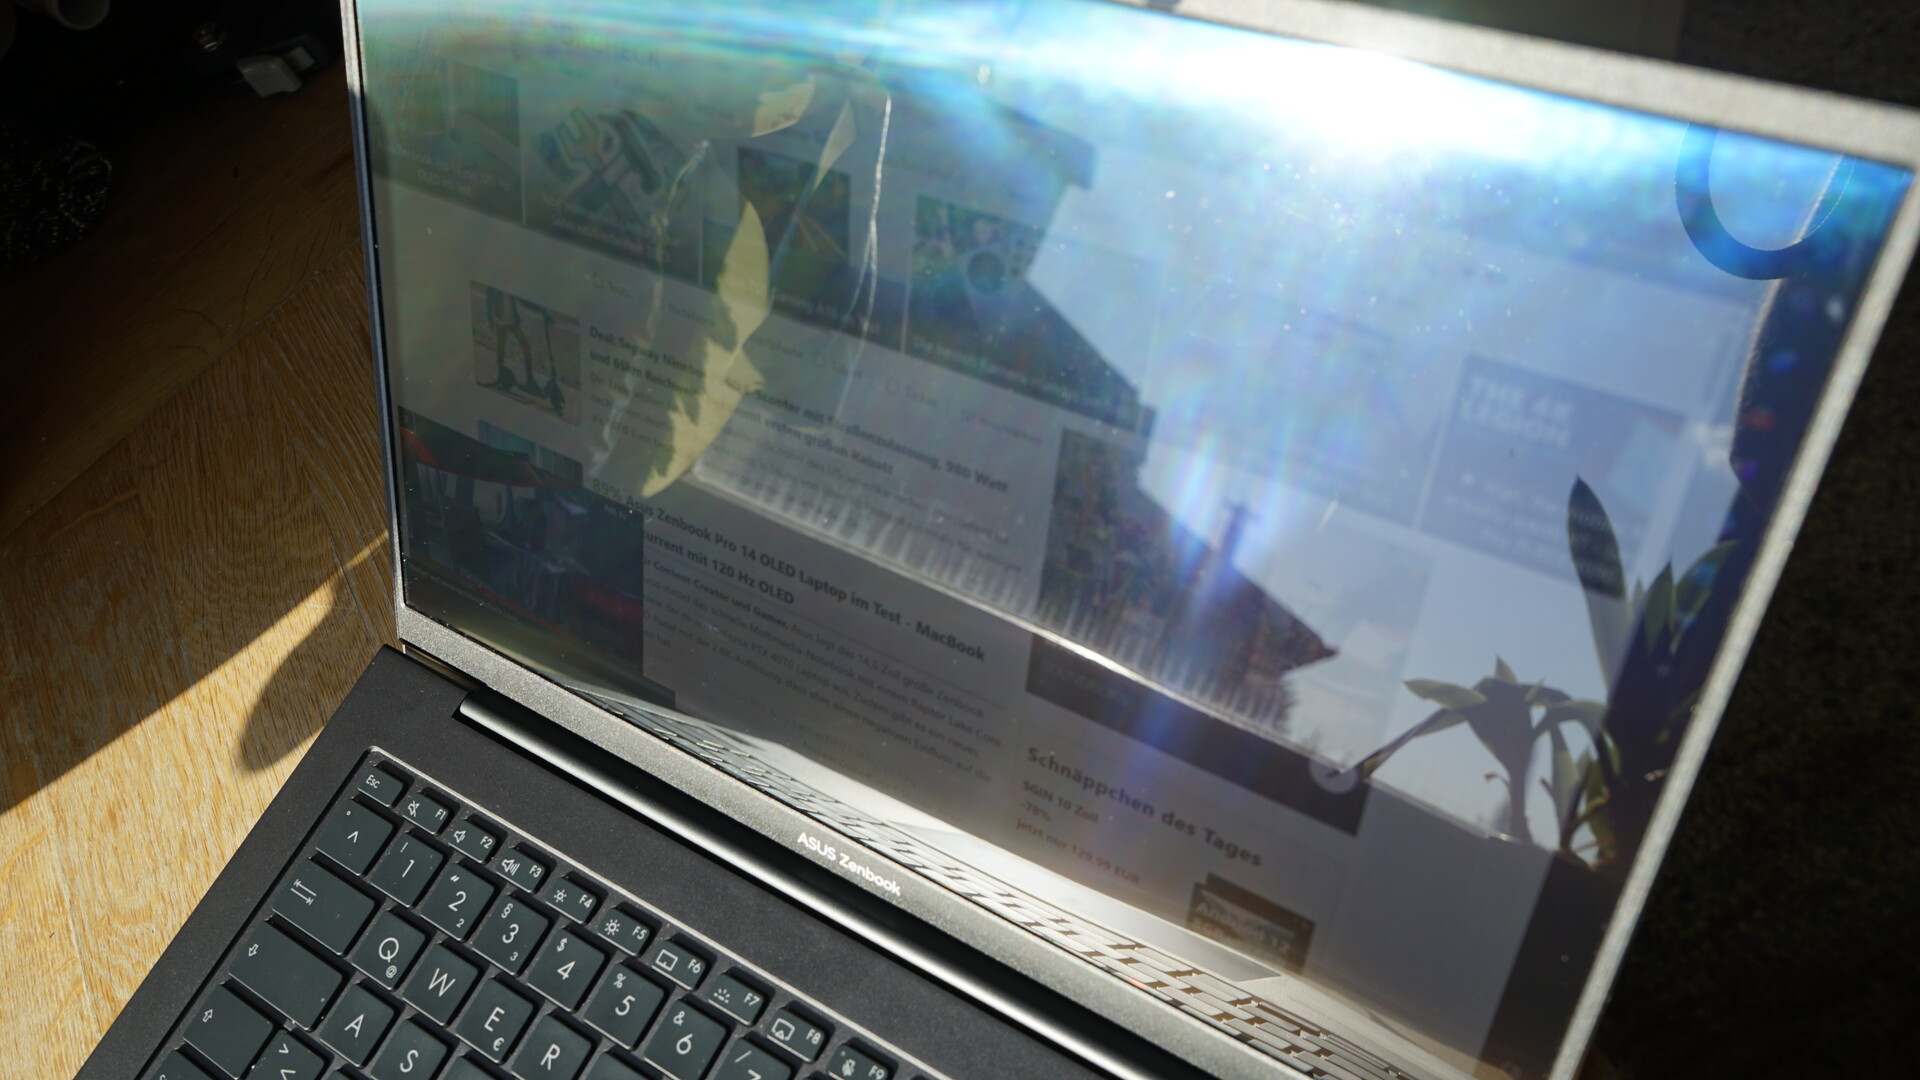
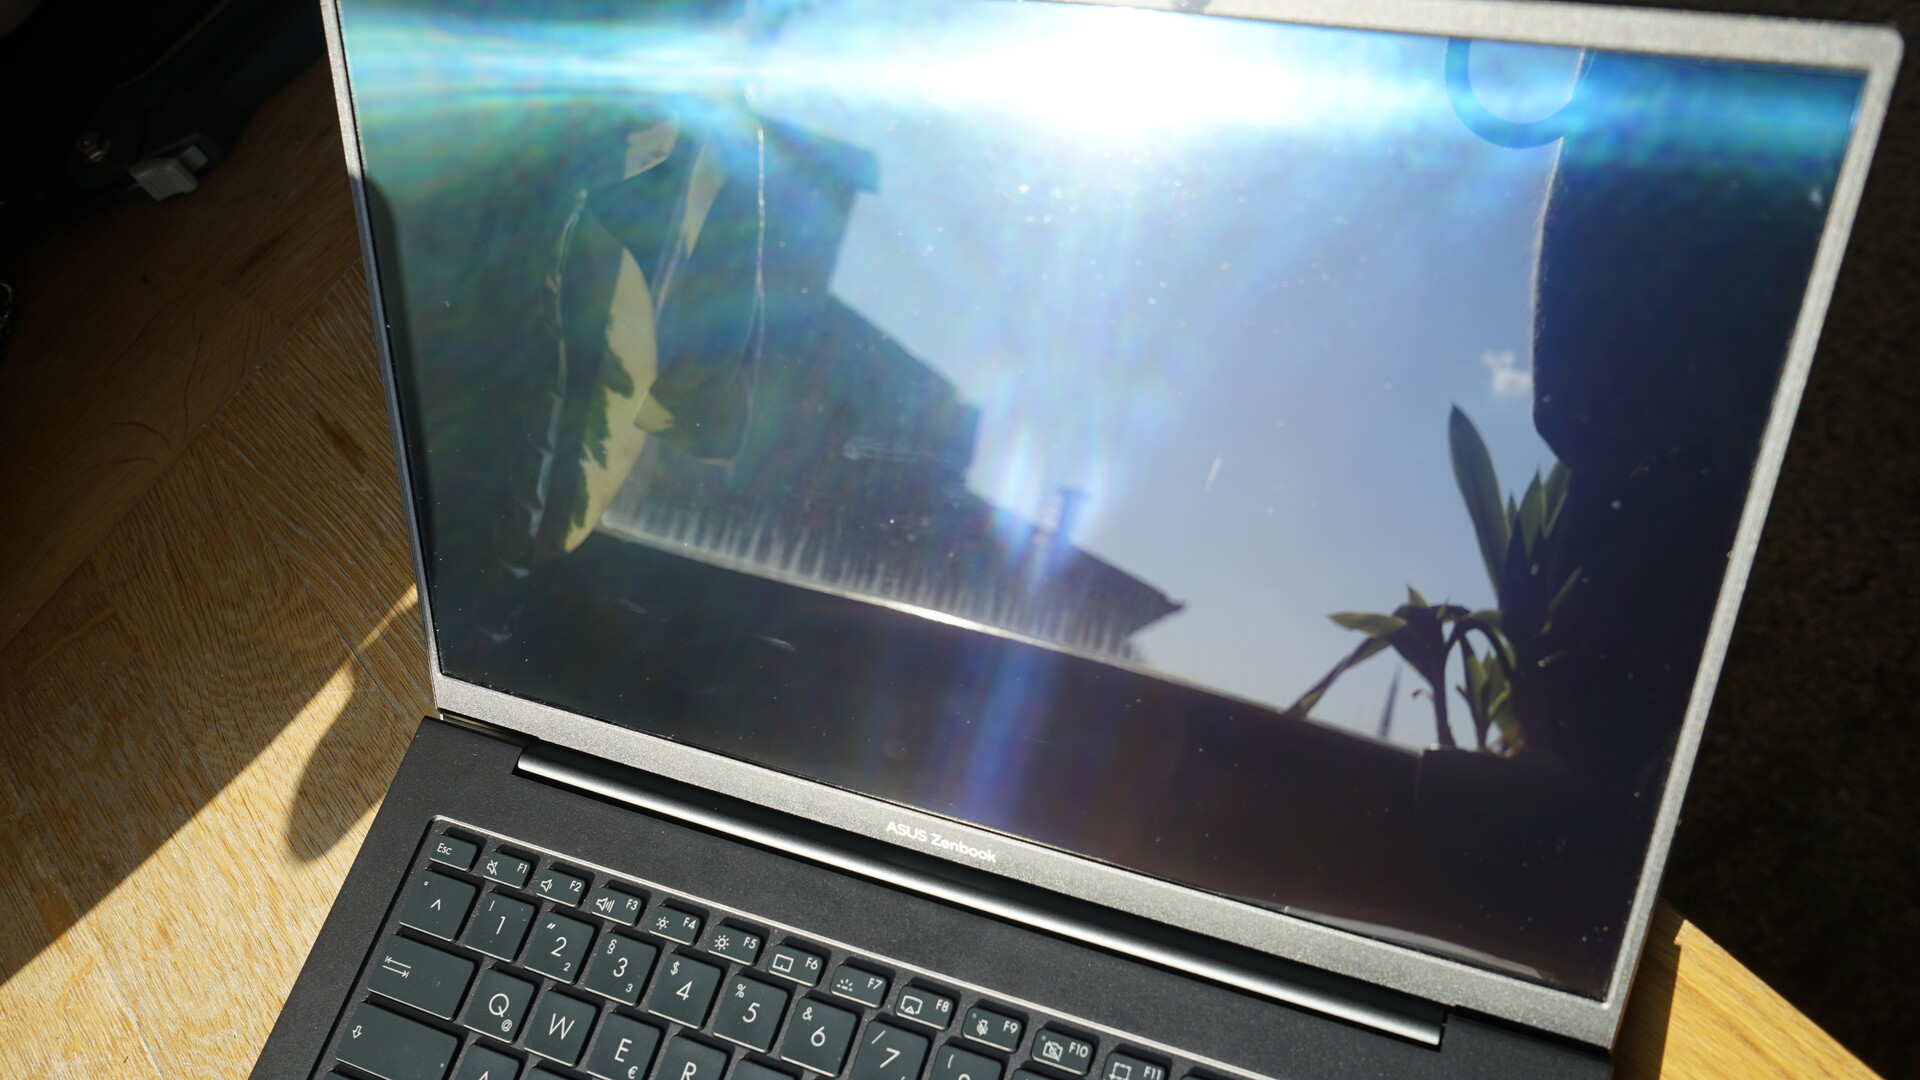
A tela OLED do Asus ZenBook 14X tem problemas com a luz solar direta. A tela tipo brilho dificilmente consegue lidar com isso e a visualização confortável da tela não é mais possível. O pico de brilho ligeiramente maior em comparação com o antecessor também não ajuda.
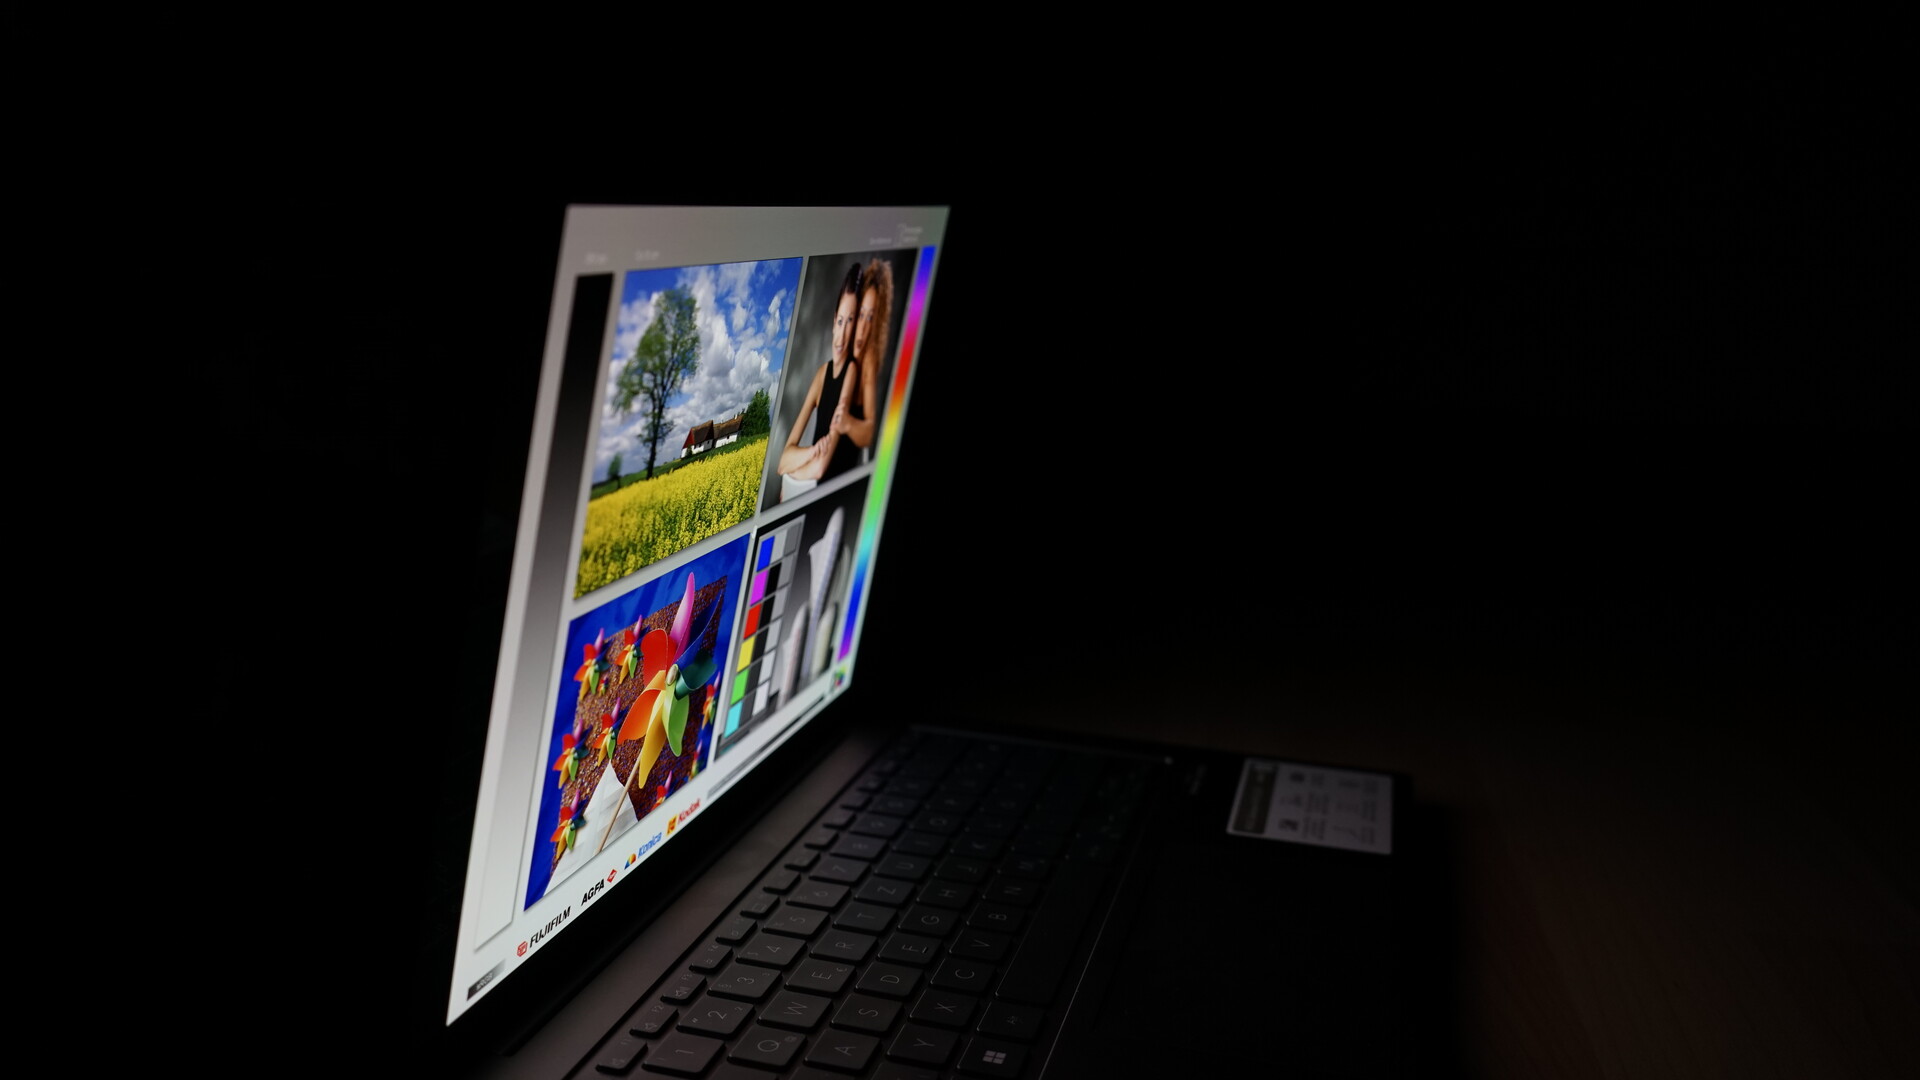
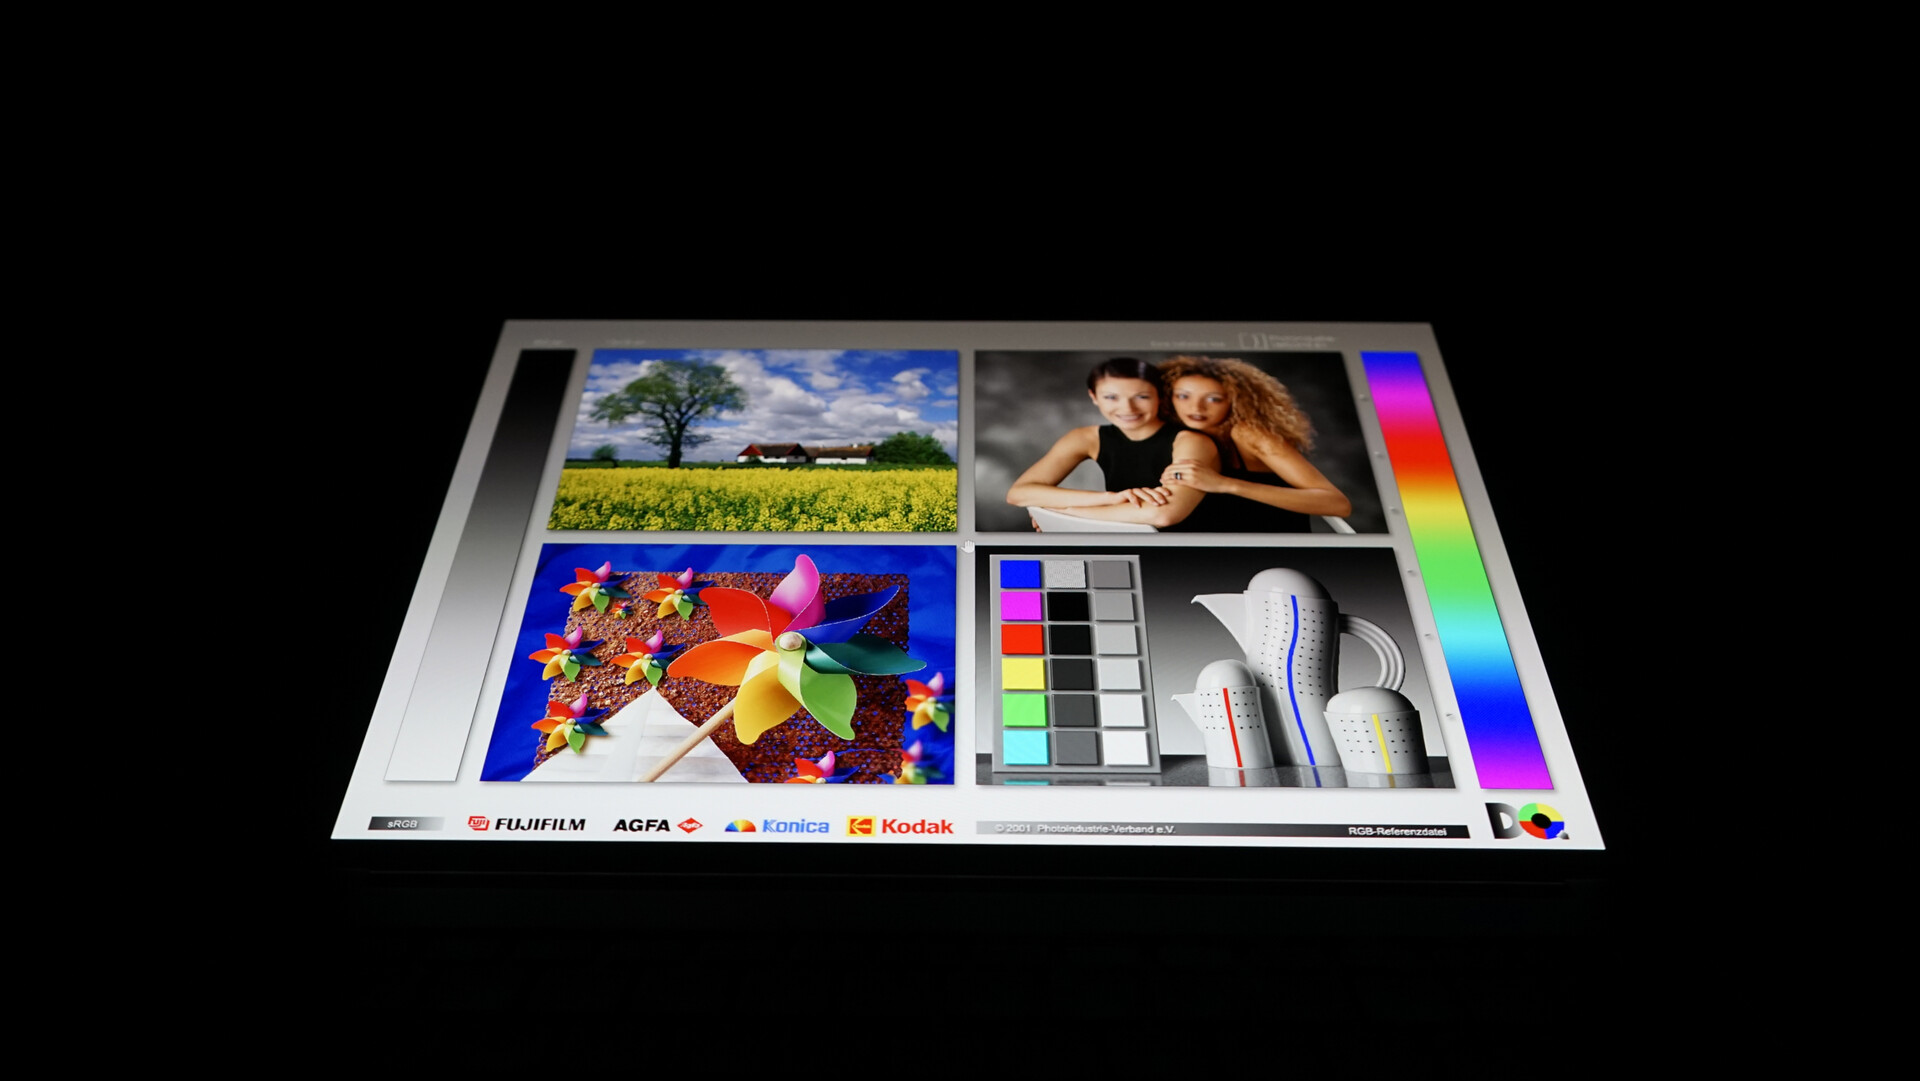
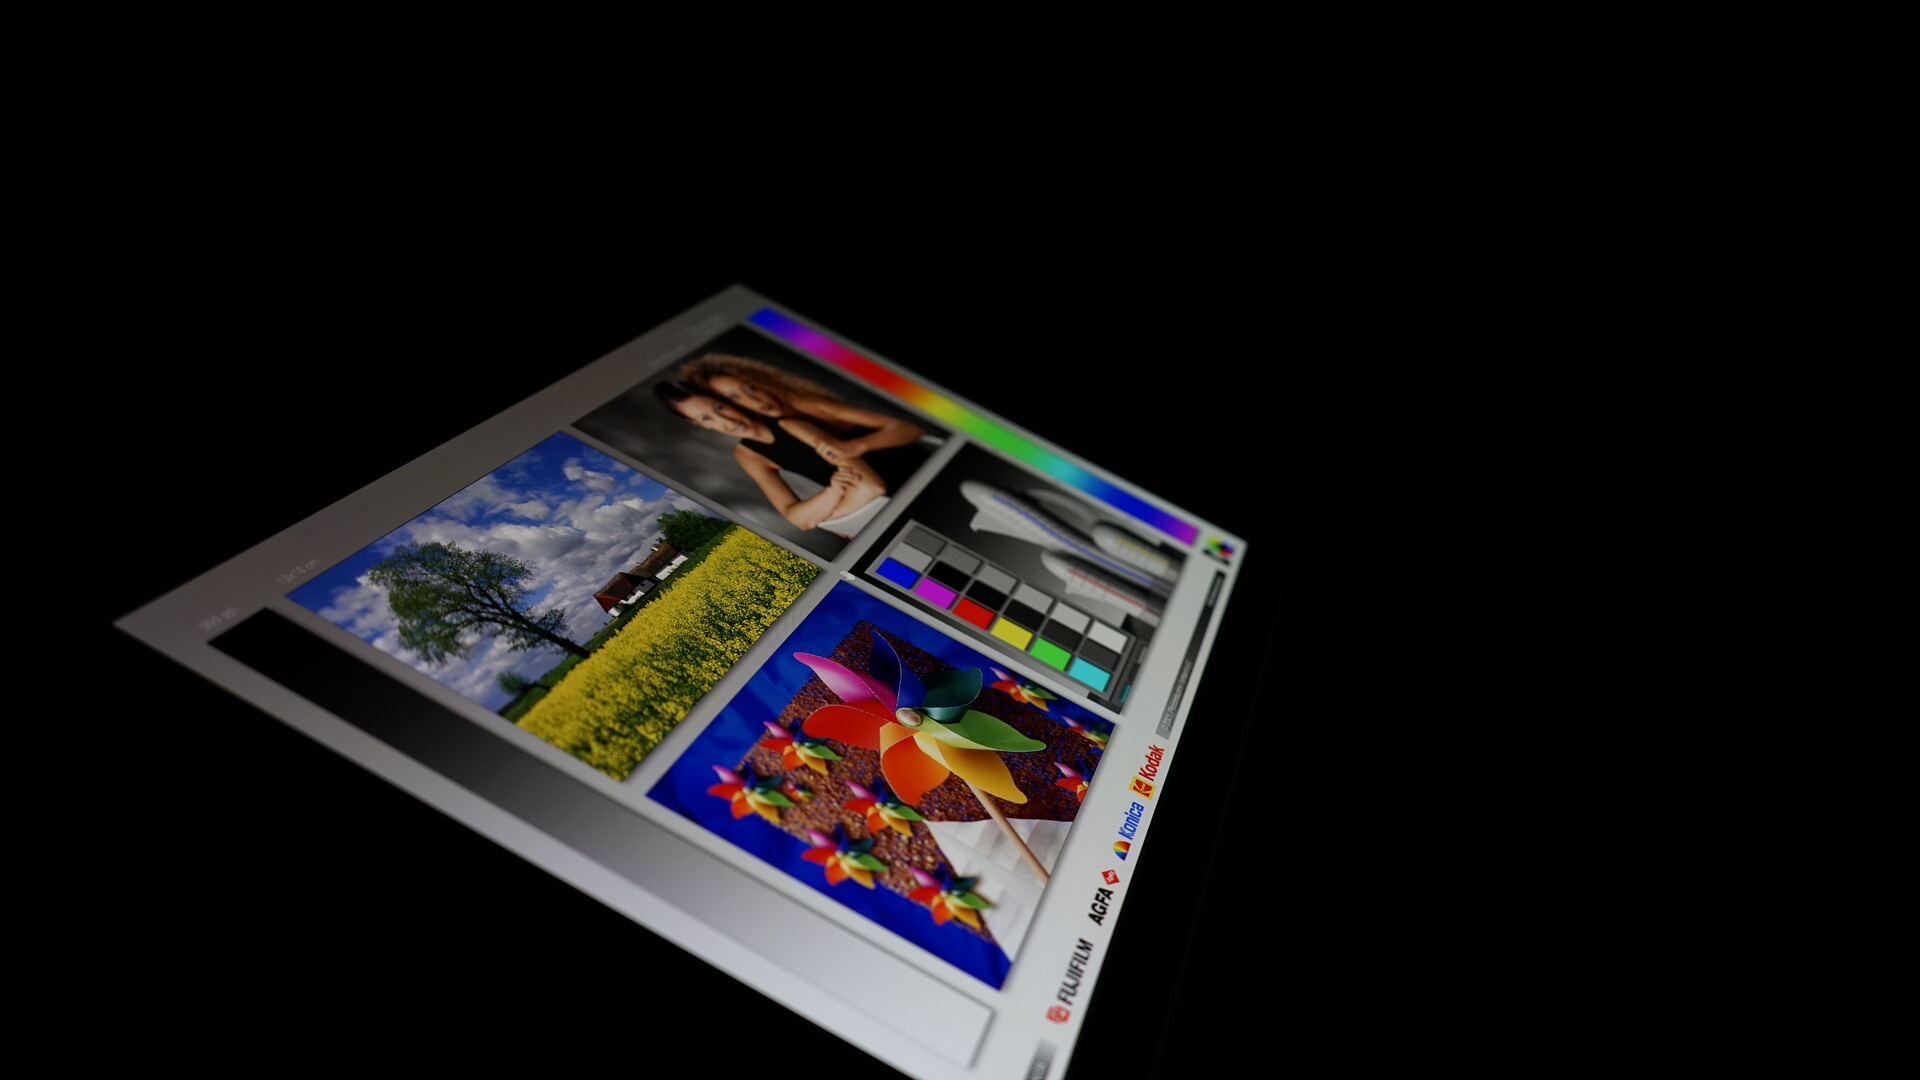
Como de costume com os painéis OLED, não há nada a criticar com relação à estabilidade do ângulo de visão. As cores e o brilho permanecem perfeitamente estáveis, mesmo em ângulos muito inclinados. Como de costume nos painéis OLED, uma certa tonalidade azul é visível em ângulos muito inclinados.

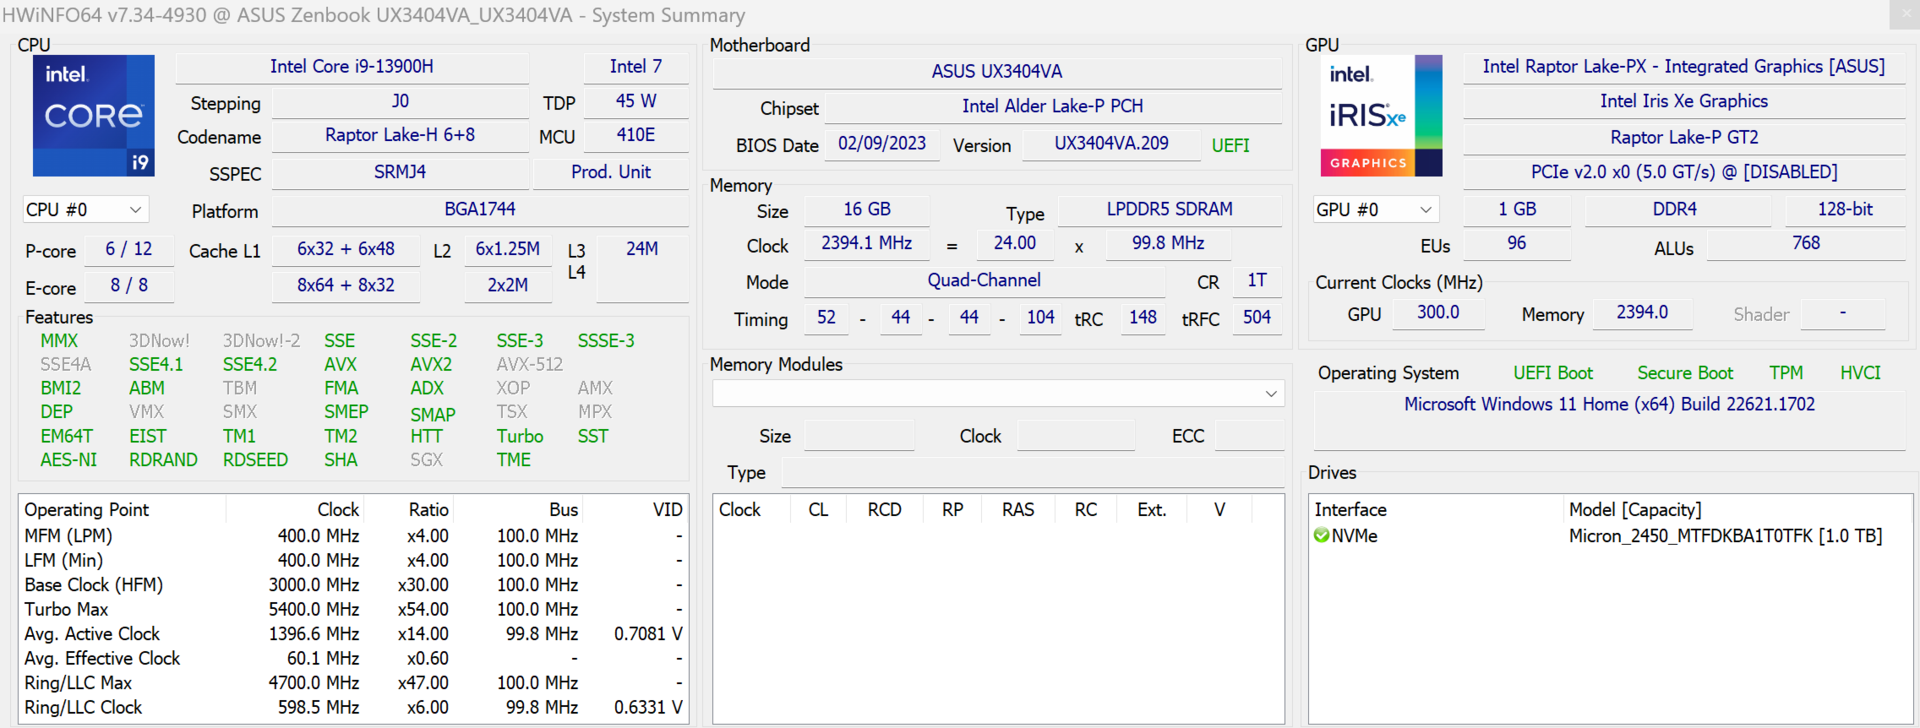
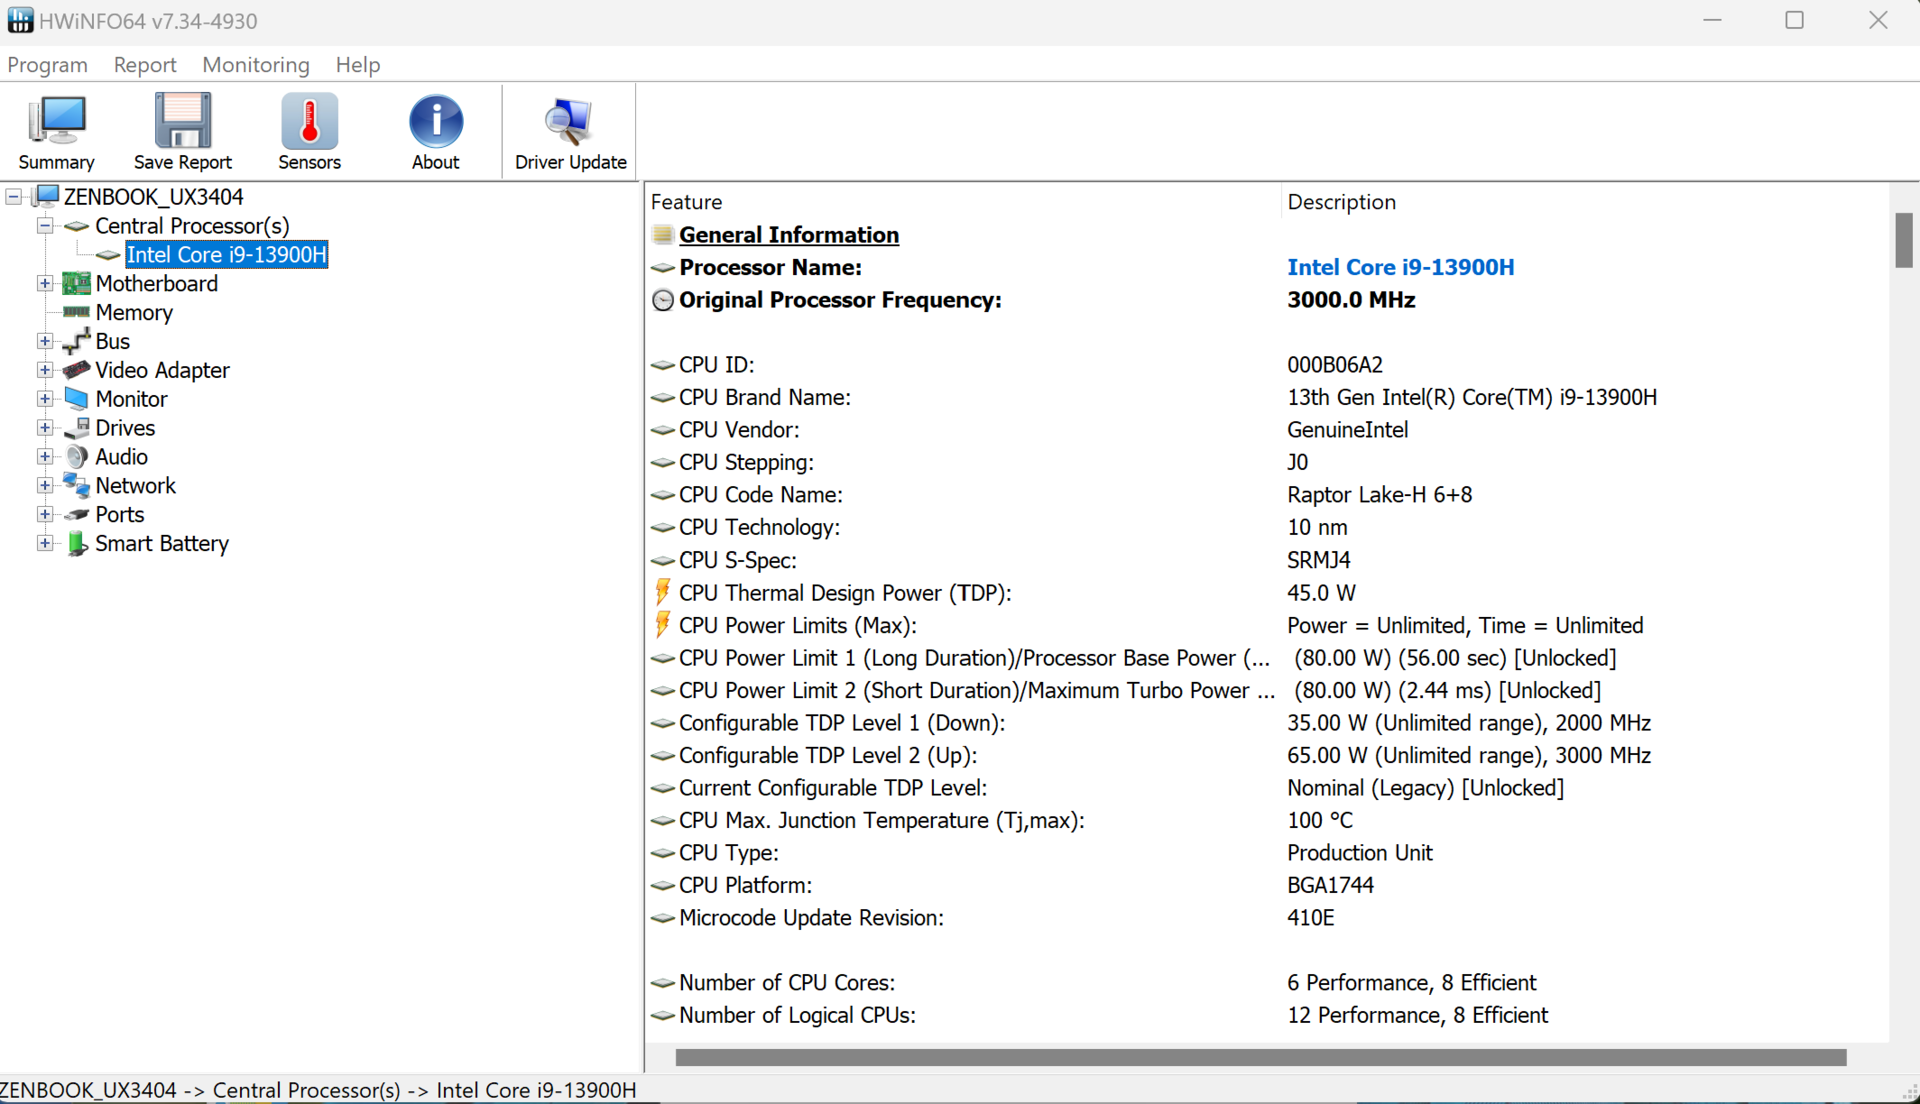
Desempenho - Intel i9-13900H potente
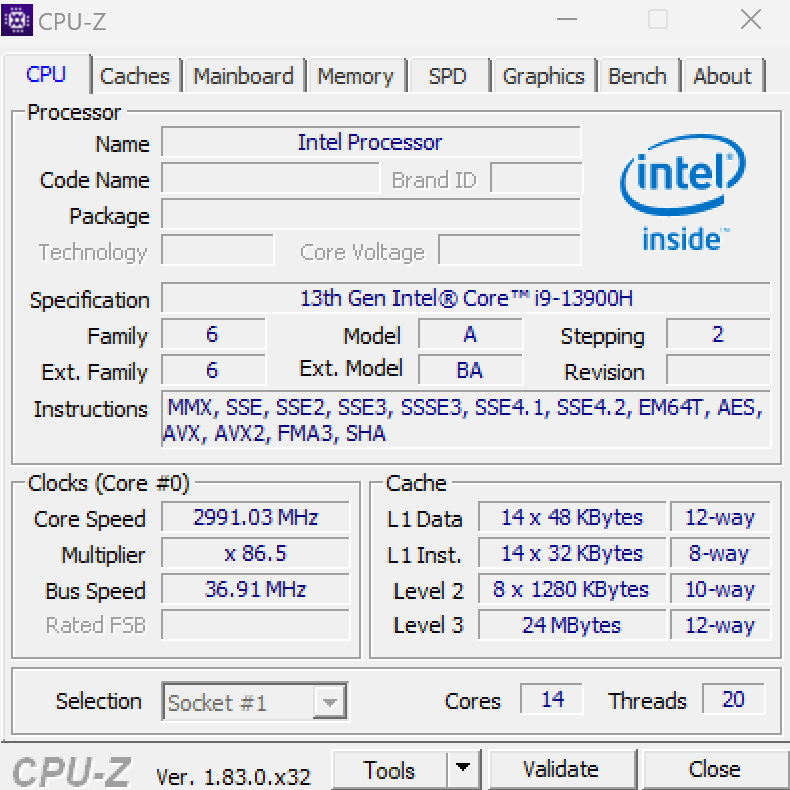
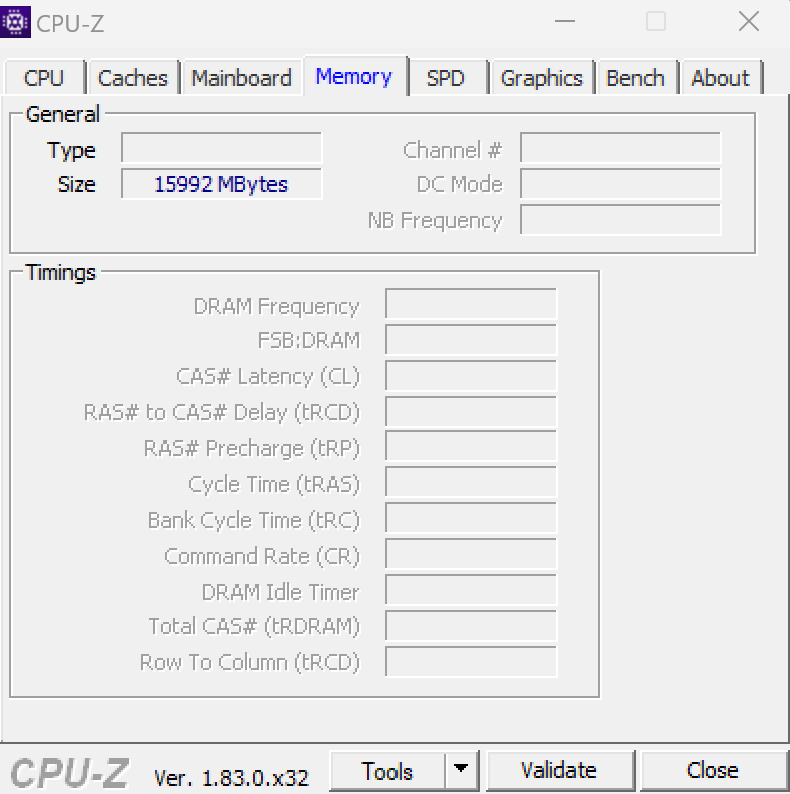
A Asus instala o processador Intel CoreIntel Core i9-13900Hno novo ZenBook 14X, que, com exceção do Asus ROG Flow Z13é encontrado apenas em notebooks maiores. Nosso modelo de teste é a variante sem uma placa gráfica dedicada. Portanto, apenas a placa gráfica interna Intel Iris X é usada aqui. Outros hardwares incluem 16 GB de RAM LPDDR5 (onboard) e um disco rígido M.2 NVME PCIe de 1 TB.
Condições de teste
Três perfis de desempenho diferentes podem ser selecionados para o ZenBook 14X por meio do aplicativo MyAsus: Silencioso, Padrão e Desempenho. O último só pode ser usado com a fonte de alimentação conectada. Os benchmarks foram executados no modo Desempenho , enquanto os testes de resistência da bateria foram realizados no modo Silencioso . O modo Desempenho foi usado para o teste de consumo máximo de energia, e as emissões de ruído foram verificadas em todos os três modos.
| Modo de desempenho | Modo padrão | Modo silencioso | |
|---|---|---|---|
| CPU PL1 (HWInfo) | 80 watts | 80 watts | 40 watts |
| CPU PL2 (HWInfo) | 80 watts | 80 watts | 80 watts |
Processador
O Intel Core i9-13900H é uma CPU móvel de ponta da série Raptor Lake H. A CPU combina 6 núcleos de desempenho com 8 núcleos de eficiência. Como os núcleos P suportam hyperthreading, o processador tem 20 threads. Enquanto os núcleos P têm clock de 2,6 a 5,4 GHz, os núcleos E têm clock entre 1,9 e 4,1 GHz
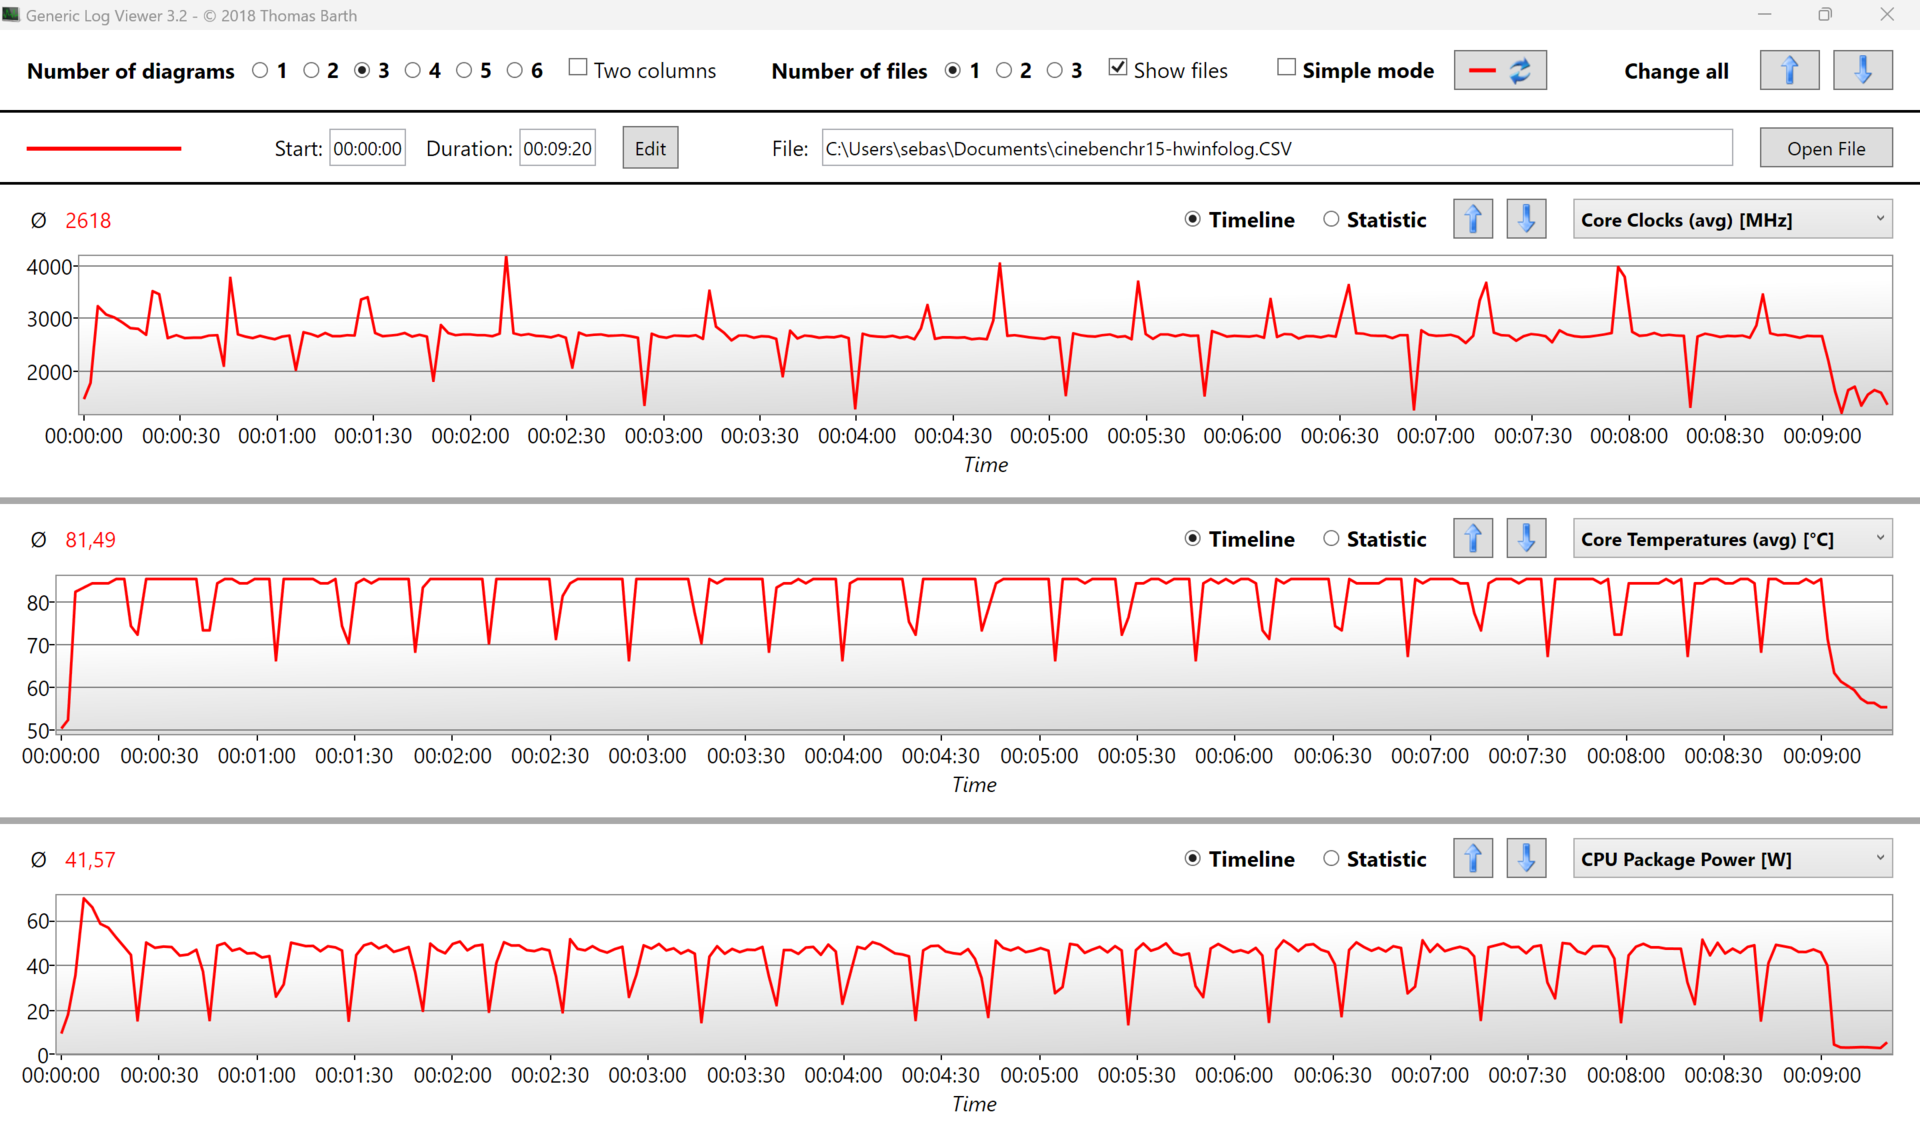
No loop do Cinebench, é possível observar uma queda acentuada na pontuação após a primeira execução, que então se estabiliza brevemente entre 2250 e 2300 pontos, mas cai novamente após a quinta execução e então se estabelece em torno de 2150 pontos. Para o formato pequeno do ZenBook, esse ainda seria um bom resultado se não fosse o Asus ROG Flow Z13, que tem um desempenho melhor como um tablet com o mesmo processador. Como o processador atinge rapidamente 99°C sob carga, pode-se presumir que a solução de ventilador único limita o desempenho aqui.
O processador pode consumir quase 80 watts por curtos períodos de tempo, mas a média fica em torno de 40 watts após a primeira execução. Após cerca de 10 minutos, no entanto, o consumo cai para cerca de 20 watts. Como resultado, a média é de 36 watts sob carga sustentada. O loop do Cinebench mostra que o processador Intel também é capaz de manter o alto desempenho sob carga contínua.
Cinebench R15 Multi Sustained Load
Cinebench R23: Multi Core | Single Core
Cinebench R20: CPU (Multi Core) | CPU (Single Core)
Cinebench R15: CPU Multi 64Bit | CPU Single 64Bit
Blender: v2.79 BMW27 CPU
7-Zip 18.03: 7z b 4 | 7z b 4 -mmt1
Geekbench 5.5: Multi-Core | Single-Core
HWBOT x265 Benchmark v2.2: 4k Preset
LibreOffice : 20 Documents To PDF
R Benchmark 2.5: Overall mean
| CPU Performance rating | |
| Asus ROG Flow Z13 GZ301V | |
| Média Intel Core i9-13900H | |
| Asus ZenBook 14X UX3404VC | |
| Dell Inspiron 14 Plus 7420 | |
| Dell XPS 13 Plus 9320 i7-1280P OLED | |
| Média da turma Subnotebook | |
| Lenovo Slim Pro 7 14ARP8 | |
| Apple MacBook Pro 13 2022 M2 -5! | |
| LG Gram 14Z90Q | |
| Cinebench R23 / Multi Core | |
| Asus ROG Flow Z13 GZ301V | |
| Média Intel Core i9-13900H (11997 - 20385, n=28) | |
| Asus ZenBook 14X UX3404VC | |
| Dell Inspiron 14 Plus 7420 | |
| Lenovo Slim Pro 7 14ARP8 | |
| Média da turma Subnotebook (1555 - 21812, n=59, últimos 2 anos) | |
| Dell XPS 13 Plus 9320 i7-1280P OLED | |
| Apple MacBook Pro 13 2022 M2 | |
| LG Gram 14Z90Q | |
| Cinebench R23 / Single Core | |
| Asus ROG Flow Z13 GZ301V | |
| Asus ZenBook 14X UX3404VC | |
| Média Intel Core i9-13900H (1297 - 2054, n=26) | |
| Dell Inspiron 14 Plus 7420 | |
| Média da turma Subnotebook (358 - 2213, n=60, últimos 2 anos) | |
| Dell XPS 13 Plus 9320 i7-1280P OLED | |
| Apple MacBook Pro 13 2022 M2 | |
| Lenovo Slim Pro 7 14ARP8 | |
| LG Gram 14Z90Q | |
| Cinebench R20 / CPU (Multi Core) | |
| Asus ROG Flow Z13 GZ301V | |
| Média Intel Core i9-13900H (4935 - 7716, n=25) | |
| Asus ZenBook 14X UX3404VC | |
| Dell Inspiron 14 Plus 7420 | |
| Lenovo Slim Pro 7 14ARP8 | |
| Média da turma Subnotebook (579 - 8541, n=56, últimos 2 anos) | |
| Dell XPS 13 Plus 9320 i7-1280P OLED | |
| Apple MacBook Pro 13 2022 M2 | |
| LG Gram 14Z90Q | |
| Cinebench R20 / CPU (Single Core) | |
| Asus ROG Flow Z13 GZ301V | |
| Asus ZenBook 14X UX3404VC | |
| Média Intel Core i9-13900H (428 - 792, n=25) | |
| Dell Inspiron 14 Plus 7420 | |
| Média da turma Subnotebook (128 - 832, n=56, últimos 2 anos) | |
| Dell XPS 13 Plus 9320 i7-1280P OLED | |
| Lenovo Slim Pro 7 14ARP8 | |
| LG Gram 14Z90Q | |
| Apple MacBook Pro 13 2022 M2 | |
| Cinebench R15 / CPU Multi 64Bit | |
| Asus ROG Flow Z13 GZ301V | |
| Média Intel Core i9-13900H (2061 - 3100, n=26) | |
| Asus ZenBook 14X UX3404VC | |
| Dell Inspiron 14 Plus 7420 | |
| Lenovo Slim Pro 7 14ARP8 | |
| Média da turma Subnotebook (327 - 3345, n=56, últimos 2 anos) | |
| Dell XPS 13 Plus 9320 i7-1280P OLED | |
| Apple MacBook Pro 13 2022 M2 | |
| LG Gram 14Z90Q | |
| Cinebench R15 / CPU Single 64Bit | |
| Asus ROG Flow Z13 GZ301V | |
| Média Intel Core i9-13900H (211 - 297, n=26) | |
| Asus ZenBook 14X UX3404VC | |
| Média da turma Subnotebook (72.4 - 322, n=56, últimos 2 anos) | |
| Dell Inspiron 14 Plus 7420 | |
| Dell XPS 13 Plus 9320 i7-1280P OLED | |
| Apple MacBook Pro 13 2022 M2 | |
| Lenovo Slim Pro 7 14ARP8 | |
| LG Gram 14Z90Q | |
| Blender / v2.79 BMW27 CPU | |
| Apple MacBook Pro 13 2022 M2 | |
| LG Gram 14Z90Q | |
| Média da turma Subnotebook (159 - 2271, n=57, últimos 2 anos) | |
| Dell XPS 13 Plus 9320 i7-1280P OLED | |
| Dell Inspiron 14 Plus 7420 | |
| Lenovo Slim Pro 7 14ARP8 | |
| Asus ZenBook 14X UX3404VC | |
| Média Intel Core i9-13900H (166 - 268, n=24) | |
| Asus ROG Flow Z13 GZ301V | |
| 7-Zip 18.03 / 7z b 4 | |
| Asus ROG Flow Z13 GZ301V | |
| Média Intel Core i9-13900H (45045 - 79032, n=25) | |
| Asus ZenBook 14X UX3404VC | |
| Dell Inspiron 14 Plus 7420 | |
| Lenovo Slim Pro 7 14ARP8 | |
| Dell XPS 13 Plus 9320 i7-1280P OLED | |
| Média da turma Subnotebook (11668 - 77867, n=56, últimos 2 anos) | |
| LG Gram 14Z90Q | |
| 7-Zip 18.03 / 7z b 4 -mmt1 | |
| Asus ROG Flow Z13 GZ301V | |
| Asus ZenBook 14X UX3404VC | |
| Média Intel Core i9-13900H (3665 - 6600, n=25) | |
| Dell Inspiron 14 Plus 7420 | |
| Média da turma Subnotebook (2643 - 6699, n=58, últimos 2 anos) | |
| Dell XPS 13 Plus 9320 i7-1280P OLED | |
| Lenovo Slim Pro 7 14ARP8 | |
| LG Gram 14Z90Q | |
| Geekbench 5.5 / Multi-Core | |
| Asus ROG Flow Z13 GZ301V | |
| Média Intel Core i9-13900H (9094 - 15410, n=26) | |
| Asus ZenBook 14X UX3404VC | |
| Dell Inspiron 14 Plus 7420 | |
| Dell XPS 13 Plus 9320 i7-1280P OLED | |
| Média da turma Subnotebook (2557 - 17218, n=48, últimos 2 anos) | |
| Lenovo Slim Pro 7 14ARP8 | |
| Apple MacBook Pro 13 2022 M2 | |
| LG Gram 14Z90Q | |
| Geekbench 5.5 / Single-Core | |
| Asus ROG Flow Z13 GZ301V | |
| Asus ZenBook 14X UX3404VC | |
| Apple MacBook Pro 13 2022 M2 | |
| Média da turma Subnotebook (726 - 2224, n=48, últimos 2 anos) | |
| Média Intel Core i9-13900H (1140 - 2043, n=26) | |
| Dell XPS 13 Plus 9320 i7-1280P OLED | |
| Dell Inspiron 14 Plus 7420 | |
| LG Gram 14Z90Q | |
| Lenovo Slim Pro 7 14ARP8 | |
| HWBOT x265 Benchmark v2.2 / 4k Preset | |
| Asus ROG Flow Z13 GZ301V | |
| Média Intel Core i9-13900H (14.1 - 22.3, n=25) | |
| Asus ZenBook 14X UX3404VC | |
| Lenovo Slim Pro 7 14ARP8 | |
| Dell Inspiron 14 Plus 7420 | |
| Dell XPS 13 Plus 9320 i7-1280P OLED | |
| Média da turma Subnotebook (0.97 - 25.1, n=56, últimos 2 anos) | |
| LG Gram 14Z90Q | |
| LibreOffice / 20 Documents To PDF | |
| Lenovo Slim Pro 7 14ARP8 | |
| Média da turma Subnotebook (39.9 - 220, n=55, últimos 2 anos) | |
| LG Gram 14Z90Q | |
| Dell XPS 13 Plus 9320 i7-1280P OLED | |
| Dell Inspiron 14 Plus 7420 | |
| Asus ZenBook 14X UX3404VC | |
| Média Intel Core i9-13900H (34.4 - 82.8, n=25) | |
| Asus ROG Flow Z13 GZ301V | |
| R Benchmark 2.5 / Overall mean | |
| Lenovo Slim Pro 7 14ARP8 | |
| LG Gram 14Z90Q | |
| Média da turma Subnotebook (0.4024 - 1.456, n=57, últimos 2 anos) | |
| Dell XPS 13 Plus 9320 i7-1280P OLED | |
| Dell Inspiron 14 Plus 7420 | |
| Média Intel Core i9-13900H (0.4052 - 0.723, n=25) | |
| Asus ZenBook 14X UX3404VC | |
| Asus ROG Flow Z13 GZ301V | |
* ... menor é melhor
AIDA64: FP32 Ray-Trace | FPU Julia | CPU SHA3 | CPU Queen | FPU SinJulia | FPU Mandel | CPU AES | CPU ZLib | FP64 Ray-Trace | CPU PhotoWorxx
| Performance rating | |
| Asus ROG Flow Z13 GZ301V | |
| Média Intel Core i9-13900H | |
| Lenovo Slim Pro 7 14ARP8 | |
| Asus ZenBook 14X UX3404VC | |
| Dell Inspiron 14 Plus 7420 | |
| Média da turma Subnotebook | |
| Dell XPS 13 Plus 9320 i7-1280P OLED | |
| LG Gram 14Z90Q | |
| AIDA64 / FP32 Ray-Trace | |
| Asus ROG Flow Z13 GZ301V | |
| Lenovo Slim Pro 7 14ARP8 | |
| Média Intel Core i9-13900H (6788 - 19557, n=25) | |
| Asus ZenBook 14X UX3404VC | |
| Média da turma Subnotebook (1135 - 32888, n=57, últimos 2 anos) | |
| Dell Inspiron 14 Plus 7420 | |
| Dell XPS 13 Plus 9320 i7-1280P OLED | |
| LG Gram 14Z90Q | |
| AIDA64 / FPU Julia | |
| Lenovo Slim Pro 7 14ARP8 | |
| Asus ROG Flow Z13 GZ301V | |
| Média Intel Core i9-13900H (22551 - 95579, n=25) | |
| Asus ZenBook 14X UX3404VC | |
| Média da turma Subnotebook (5218 - 123315, n=57, últimos 2 anos) | |
| Dell Inspiron 14 Plus 7420 | |
| Dell XPS 13 Plus 9320 i7-1280P OLED | |
| LG Gram 14Z90Q | |
| AIDA64 / CPU SHA3 | |
| Média Intel Core i9-13900H (2491 - 4270, n=25) | |
| Asus ROG Flow Z13 GZ301V | |
| Asus ZenBook 14X UX3404VC | |
| Lenovo Slim Pro 7 14ARP8 | |
| Média da turma Subnotebook (444 - 5287, n=57, últimos 2 anos) | |
| Dell Inspiron 14 Plus 7420 | |
| Dell XPS 13 Plus 9320 i7-1280P OLED | |
| LG Gram 14Z90Q | |
| AIDA64 / CPU Queen | |
| Asus ROG Flow Z13 GZ301V | |
| Asus ZenBook 14X UX3404VC | |
| Média Intel Core i9-13900H (65121 - 120936, n=25) | |
| Dell Inspiron 14 Plus 7420 | |
| Dell XPS 13 Plus 9320 i7-1280P OLED | |
| Lenovo Slim Pro 7 14ARP8 | |
| LG Gram 14Z90Q | |
| Média da turma Subnotebook (10579 - 95002, n=48, últimos 2 anos) | |
| AIDA64 / FPU SinJulia | |
| Lenovo Slim Pro 7 14ARP8 | |
| Asus ROG Flow Z13 GZ301V | |
| Média Intel Core i9-13900H (6108 - 11631, n=25) | |
| Asus ZenBook 14X UX3404VC | |
| Dell Inspiron 14 Plus 7420 | |
| Dell XPS 13 Plus 9320 i7-1280P OLED | |
| Média da turma Subnotebook (744 - 18418, n=57, últimos 2 anos) | |
| LG Gram 14Z90Q | |
| AIDA64 / FPU Mandel | |
| Lenovo Slim Pro 7 14ARP8 | |
| Asus ROG Flow Z13 GZ301V | |
| Média Intel Core i9-13900H (11283 - 48474, n=25) | |
| Asus ZenBook 14X UX3404VC | |
| Média da turma Subnotebook (3341 - 65433, n=57, últimos 2 anos) | |
| Dell Inspiron 14 Plus 7420 | |
| Dell XPS 13 Plus 9320 i7-1280P OLED | |
| LG Gram 14Z90Q | |
| AIDA64 / CPU AES | |
| Média Intel Core i9-13900H (3691 - 149377, n=25) | |
| Asus ROG Flow Z13 GZ301V | |
| Asus ZenBook 14X UX3404VC | |
| Dell Inspiron 14 Plus 7420 | |
| Dell XPS 13 Plus 9320 i7-1280P OLED | |
| Média da turma Subnotebook (638 - 96917, n=57, últimos 2 anos) | |
| Lenovo Slim Pro 7 14ARP8 | |
| LG Gram 14Z90Q | |
| AIDA64 / CPU ZLib | |
| Asus ROG Flow Z13 GZ301V | |
| Média Intel Core i9-13900H (789 - 1254, n=25) | |
| Asus ZenBook 14X UX3404VC | |
| Dell Inspiron 14 Plus 7420 | |
| Lenovo Slim Pro 7 14ARP8 | |
| Média da turma Subnotebook (164.9 - 1379, n=57, últimos 2 anos) | |
| Dell XPS 13 Plus 9320 i7-1280P OLED | |
| LG Gram 14Z90Q | |
| AIDA64 / FP64 Ray-Trace | |
| Asus ROG Flow Z13 GZ301V | |
| Média Intel Core i9-13900H (3655 - 10716, n=25) | |
| Lenovo Slim Pro 7 14ARP8 | |
| Asus ZenBook 14X UX3404VC | |
| Média da turma Subnotebook (610 - 17495, n=57, últimos 2 anos) | |
| Dell Inspiron 14 Plus 7420 | |
| Dell XPS 13 Plus 9320 i7-1280P OLED | |
| LG Gram 14Z90Q | |
| AIDA64 / CPU PhotoWorxx | |
| Média da turma Subnotebook (6569 - 85600, n=57, últimos 2 anos) | |
| Dell XPS 13 Plus 9320 i7-1280P OLED | |
| Asus ROG Flow Z13 GZ301V | |
| Asus ZenBook 14X UX3404VC | |
| Média Intel Core i9-13900H (10871 - 50488, n=25) | |
| Dell Inspiron 14 Plus 7420 | |
| Lenovo Slim Pro 7 14ARP8 | |
| LG Gram 14Z90Q | |
Desempenho do sistema
Nossa impressão subjetiva de desempenho do ZenBook 14X é muito boa e não registramos nenhuma limitação ou atraso perceptível em nossos testes. Os resultados nos benchmarks sintéticos estão na faixa da média, mas, em comparação com a variante AMD do ZenBook do ano passado, o resultado aqui é muito melhor.
CrossMark: Overall | Productivity | Creativity | Responsiveness
| PCMark 10 / Score | |
| Asus ROG Flow Z13 GZ301V | |
| Média da turma Subnotebook (4920 - 9939, n=45, últimos 2 anos) | |
| Dell Inspiron 14 Plus 7420 | |
| Lenovo Slim Pro 7 14ARP8 | |
| Asus ZenBook 14X UX3404VC | |
| Média Intel Core i9-13900H, Intel Iris Xe Graphics G7 96EUs (5944 - 6802, n=8) | |
| Dell XPS 13 Plus 9320 i7-1280P OLED | |
| LG Gram 14Z90Q | |
| PCMark 10 / Essentials | |
| Asus ROG Flow Z13 GZ301V | |
| Média Intel Core i9-13900H, Intel Iris Xe Graphics G7 96EUs (10347 - 12286, n=8) | |
| Asus ZenBook 14X UX3404VC | |
| Dell XPS 13 Plus 9320 i7-1280P OLED | |
| Média da turma Subnotebook (8552 - 11646, n=45, últimos 2 anos) | |
| Dell Inspiron 14 Plus 7420 | |
| Lenovo Slim Pro 7 14ARP8 | |
| LG Gram 14Z90Q | |
| PCMark 10 / Productivity | |
| Asus ROG Flow Z13 GZ301V | |
| Média da turma Subnotebook (5435 - 16606, n=45, últimos 2 anos) | |
| Dell Inspiron 14 Plus 7420 | |
| Lenovo Slim Pro 7 14ARP8 | |
| Asus ZenBook 14X UX3404VC | |
| Média Intel Core i9-13900H, Intel Iris Xe Graphics G7 96EUs (7319 - 8526, n=8) | |
| Dell XPS 13 Plus 9320 i7-1280P OLED | |
| LG Gram 14Z90Q | |
| PCMark 10 / Digital Content Creation | |
| Asus ROG Flow Z13 GZ301V | |
| Média da turma Subnotebook (5722 - 13779, n=45, últimos 2 anos) | |
| Lenovo Slim Pro 7 14ARP8 | |
| Dell Inspiron 14 Plus 7420 | |
| Média Intel Core i9-13900H, Intel Iris Xe Graphics G7 96EUs (7527 - 8155, n=8) | |
| Asus ZenBook 14X UX3404VC | |
| Dell XPS 13 Plus 9320 i7-1280P OLED | |
| LG Gram 14Z90Q | |
| CrossMark / Overall | |
| Asus ROG Flow Z13 GZ301V | |
| Média Intel Core i9-13900H, Intel Iris Xe Graphics G7 96EUs (1766 - 2146, n=7) | |
| Asus ZenBook 14X UX3404VC | |
| Dell XPS 13 Plus 9320 i7-1280P OLED | |
| Dell Inspiron 14 Plus 7420 | |
| Média da turma Subnotebook (365 - 2356, n=59, últimos 2 anos) | |
| Apple MacBook Pro 13 2022 M2 | |
| Lenovo Slim Pro 7 14ARP8 | |
| CrossMark / Productivity | |
| Asus ROG Flow Z13 GZ301V | |
| Média Intel Core i9-13900H, Intel Iris Xe Graphics G7 96EUs (1684 - 2064, n=7) | |
| Asus ZenBook 14X UX3404VC | |
| Dell XPS 13 Plus 9320 i7-1280P OLED | |
| Dell Inspiron 14 Plus 7420 | |
| Média da turma Subnotebook (364 - 2277, n=59, últimos 2 anos) | |
| Apple MacBook Pro 13 2022 M2 | |
| Lenovo Slim Pro 7 14ARP8 | |
| CrossMark / Creativity | |
| Asus ROG Flow Z13 GZ301V | |
| Asus ZenBook 14X UX3404VC | |
| Média Intel Core i9-13900H, Intel Iris Xe Graphics G7 96EUs (1789 - 2224, n=7) | |
| Dell XPS 13 Plus 9320 i7-1280P OLED | |
| Dell Inspiron 14 Plus 7420 | |
| Média da turma Subnotebook (372 - 2743, n=59, últimos 2 anos) | |
| Apple MacBook Pro 13 2022 M2 | |
| Lenovo Slim Pro 7 14ARP8 | |
| CrossMark / Responsiveness | |
| Média Intel Core i9-13900H, Intel Iris Xe Graphics G7 96EUs (1474 - 2171, n=7) | |
| Asus ROG Flow Z13 GZ301V | |
| Asus ZenBook 14X UX3404VC | |
| Dell XPS 13 Plus 9320 i7-1280P OLED | |
| Dell Inspiron 14 Plus 7420 | |
| Média da turma Subnotebook (312 - 1854, n=59, últimos 2 anos) | |
| Lenovo Slim Pro 7 14ARP8 | |
| Apple MacBook Pro 13 2022 M2 | |
| PCMark 10 Score | 6330 pontos | |
Ajuda | ||
| AIDA64 / Memory Copy | |
| Média da turma Subnotebook (14554 - 131023, n=57, últimos 2 anos) | |
| Asus ZenBook 14X UX3404VC | |
| Média Intel Core i9-13900H (37448 - 74486, n=25) | |
| AIDA64 / Memory Read | |
| Média da turma Subnotebook (15948 - 127174, n=57, últimos 2 anos) | |
| Média Intel Core i9-13900H (41599 - 75433, n=25) | |
| Asus ZenBook 14X UX3404VC | |
| AIDA64 / Memory Write | |
| Média da turma Subnotebook (15709 - 135141, n=57, últimos 2 anos) | |
| Asus ZenBook 14X UX3404VC | |
| Média Intel Core i9-13900H (36152 - 88505, n=25) | |
| AIDA64 / Memory Latency | |
| Média da turma Subnotebook (6.1 - 159.9, n=55, últimos 2 anos) | |
| Asus ZenBook 14X UX3404VC | |
| Média Intel Core i9-13900H (75.8 - 102.3, n=25) | |
* ... menor é melhor
Latência DPC
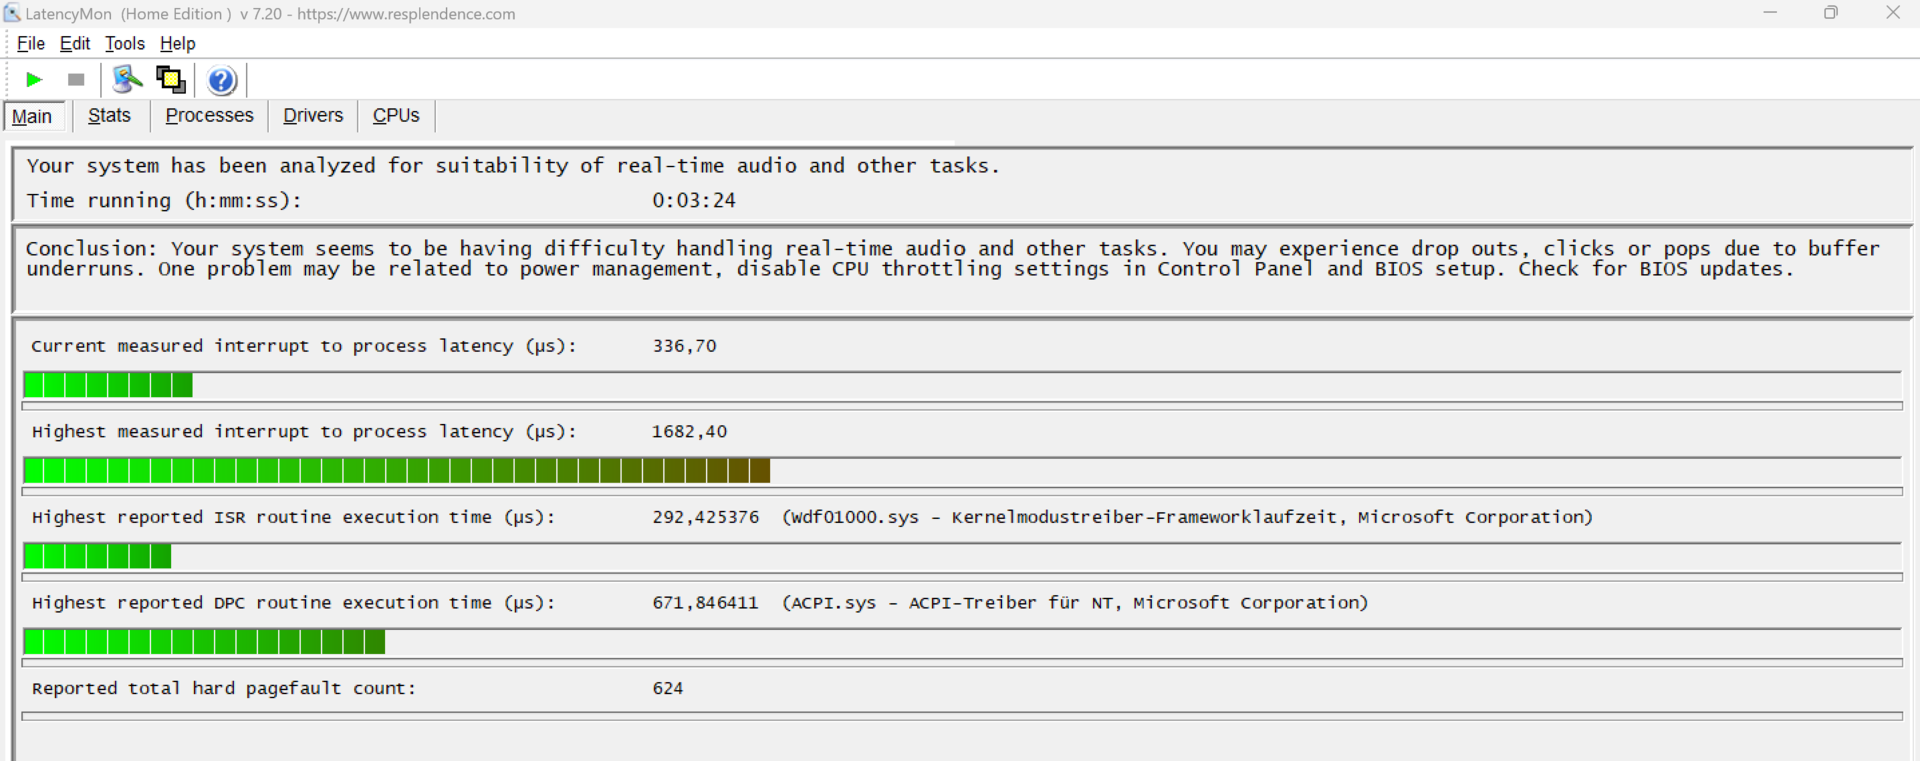
Nosso teste de latência padronizado (navegação na Web, reprodução em 4K no YouTube, carga da CPU) revelou anomalias. Portanto, o sistema não é adequado para edição de vídeo e áudio em tempo real sem limitações. Isso pode mudar com as próximas versões do BIOS e drivers de dispositivo.
| DPC Latencies / LatencyMon - interrupt to process latency (max), Web, Youtube, Prime95 | |
| Asus ROG Flow Z13 GZ301V | |
| Asus ZenBook 14X UX3404VC | |
| Lenovo Slim Pro 7 14ARP8 | |
| LG Gram 14Z90Q | |
| Dell Inspiron 14 Plus 7420 | |
| Dell XPS 13 Plus 9320 i7-1280P OLED | |
* ... menor é melhor
Dispositivos de armazenamento
A Asus instala um SSD Micron 2450 PCIe 4.0 com uma capacidade de armazenamento de 1 TB no ZenBook 14X. 862 GB dessa capacidade estão disponíveis ao ligar pela primeira vez. O SSD tem um bom desempenho em comparação com a média dos subnotebooks, mas nossa tabela de benchmark mostra claras desvantagens em relação a dispositivos comparáveis.

* ... menor é melhor
Sustained Read Performance: DiskSpd Read Loop, Queue Depth 8
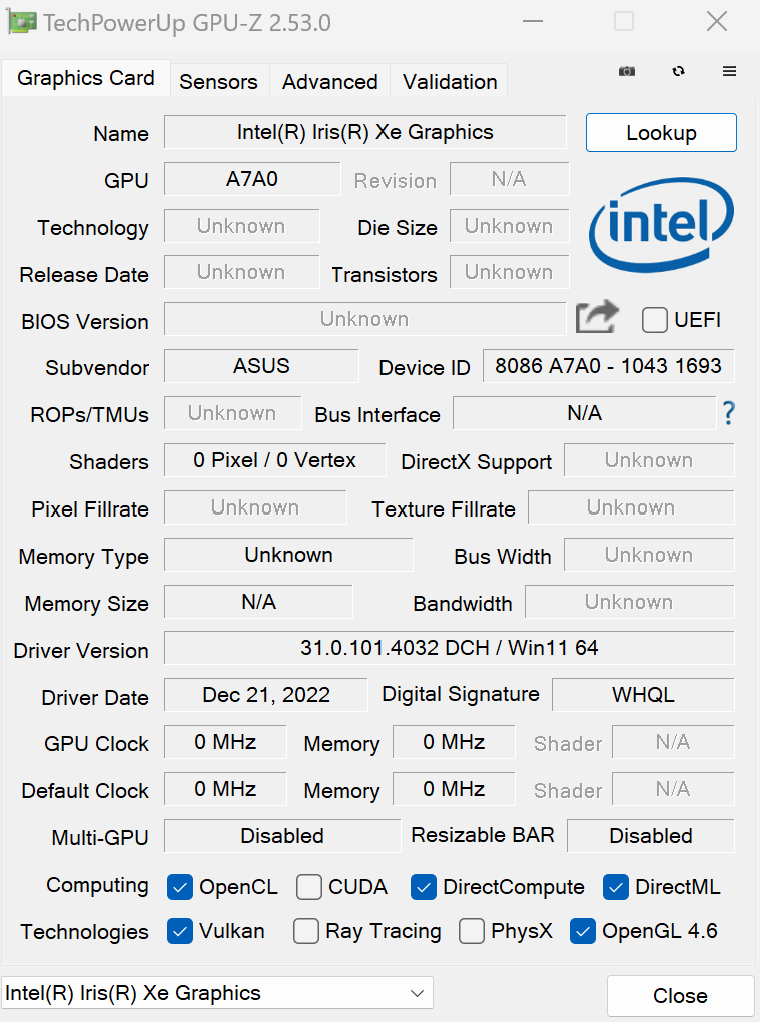
Placa gráfica
O Asus ZenBook 14X usa a conhecida placa gráfica integrada Iris XE Graphics G7 da Intel na versão mais rápida com 96 EUs e uma velocidade de clock máxima de 1.300 MHz. A iGPU é facilmente suficiente para as tarefas cotidianas, mas é preciso fazer concessões claras para serviços mais exigentes, como jogos. O antecessor baseado na AMD tem um desempenho melhor aqui graças à Radeon RX Vega 8 da AMD.
Vale a pena observar, no entanto, que a iGPU no novo Asus ZenBook 14X tem um desempenho 14% melhor do que a Intel Iris Xe Graphics G7.
| 3DMark Cloud Gate Standard Score | 22427 pontos | |
| 3DMark Fire Strike Score | 5160 pontos | |
Ajuda | ||
| Blender - v3.3 Classroom CPU | |
| Média Intel Iris Xe Graphics G7 96EUs (336 - 1259, n=109) | |
| Média da turma Subnotebook (241 - 861, n=59, últimos 2 anos) | |
| Asus ZenBook 14X UX3404VC | |
* ... menor é melhor
Desempenho em jogos
Conforme mencionado anteriormente, o desempenho em jogos da iGPU da Intel continua medíocre. A AMD claramente tem a vantagem aqui com aRadeon 680M e o 780Mos jogos mais antigos podem ser jogados em resoluções mais baixas e configurações gráficas reduzidas, mas o potencial da tela de 120 Hz do Asus ZenBook 14X não está esgotado aqui. Se quiser mais desempenho, você pode equipar o ZenBook com uma placa de vídeo dedicada Nvidia GeForce RTX 3050, que torna a maioria dos jogos jogáveis, pelo menos em configurações gráficas mais baixas.
| The Witcher 3 - 1920x1080 Ultra Graphics & Postprocessing (HBAO+) | |
| Asus ROG Flow Z13 GZ301V | |
| Lenovo Slim Pro 7 14ARP8 | |
| Dell Inspiron 14 Plus 7420 | |
| Média da turma Subnotebook (13.9 - 34.6, n=12, últimos 2 anos) | |
| Asus ZenBook 14X UX3404VC | |
| Dell XPS 13 Plus 9320 i7-1280P OLED | |
| LG Gram 14Z90Q | |
| GTA V - 1920x1080 Highest AA:4xMSAA + FX AF:16x | |
| Asus ROG Flow Z13 GZ301V | |
| Lenovo Slim Pro 7 14ARP8 | |
| Dell Inspiron 14 Plus 7420 | |
| Média da turma Subnotebook (10.7 - 43.7, n=55, últimos 2 anos) | |
| Dell XPS 13 Plus 9320 i7-1280P OLED | |
| Asus ZenBook 14X UX3404VC | |
| Final Fantasy XV Benchmark - 1920x1080 High Quality | |
| Asus ROG Flow Z13 GZ301V | |
| Lenovo Slim Pro 7 14ARP8 | |
| Dell Inspiron 14 Plus 7420 | |
| Média da turma Subnotebook (11.6 - 54.5, n=53, últimos 2 anos) | |
| Dell XPS 13 Plus 9320 i7-1280P OLED | |
| LG Gram 14Z90Q | |
| Strange Brigade - 1920x1080 ultra AA:ultra AF:16 | |
| Asus ROG Flow Z13 GZ301V | |
| Dell Inspiron 14 Plus 7420 | |
| Média da turma Subnotebook (19 - 101.3, n=49, últimos 2 anos) | |
| Dell XPS 13 Plus 9320 i7-1280P OLED | |
| Asus ZenBook 14X UX3404VC | |
| Asus ZenBook 14X UX3404VC | |
| Dota 2 Reborn - 1920x1080 ultra (3/3) best looking | |
| Asus ROG Flow Z13 GZ301V | |
| Dell Inspiron 14 Plus 7420 | |
| Lenovo Slim Pro 7 14ARP8 | |
| Média da turma Subnotebook (13 - 97, n=60, últimos 2 anos) | |
| Asus ZenBook 14X UX3404VC | |
| Dell XPS 13 Plus 9320 i7-1280P OLED | |
| LG Gram 14Z90Q | |
A iGPU no ZenBook 14X funciona de forma estável no teste Witcher. Executando Witcher 3 (em um loop) nas configurações Ultra e na resolução FHD resultou em uma média de 17 fps.
Witcher 3 FPS chart
| baixo | média | alto | ultra | QHD | |
|---|---|---|---|---|---|
| GTA V (2015) | 116.7 | 103.9 | 25.2 | 10.6 | 6.79 |
| The Witcher 3 (2015) | 87 | 59 | 33 | 17 | |
| Dota 2 Reborn (2015) | 126.5 | 94.1 | 74.9 | 68.3 | |
| X-Plane 11.11 (2018) | 50.8 | 41.8 | 34.5 | ||
| Far Cry 5 (2018) | 55 | 30 | 28 | 26 | 17 |
| Strange Brigade (2018) | 99.7 | 42.5 | 34 | 27.2 | 19.6 |
| F1 22 (2022) | 52.8 | 48.7 | 34.1 | 26.1 | 18.7 |
Emissões
Ruído - Inconscientemente silencioso
Com um máximo de 45,5 dB(A), o ZenBook 14X é definitivamente um dos subnotebooks mais silenciosos do mercado. As ventoinhas são quase inaudíveis no uso diário e o dispositivo permanece abaixo de 40 dB(A) em média, mesmo sob carga. Entretanto, como apenas uma ventoinha está instalada (em comparação com o modelo do ano passado), o sistema de resfriamento é um pouco mais fraco e isso limita o Intel Core i9-13900H. No modo Performance , a ventoinha também gira com mais frequência durante as tarefas normais de escritório e nunca fica completamente silenciosa no modo Standard
Por outro lado, o modo Silencioso pode ser ativado para uma pequena queda no desempenho, em que o subnotebook quase não é ouvido.
Barulho
| Ocioso |
| 25.2 / 25.2 / 26.5 dB |
| Carga |
| 39.8 / 45.5 dB |
 | ||
30 dB silencioso 40 dB(A) audível 50 dB(A) ruidosamente alto |
||
min: | ||
| Asus ZenBook 14X UX3404VC Iris Xe G7 96EUs, i9-13900H, Micron 2450 1TB MTFDKBA1T0TFK | Apple MacBook Pro 13 2022 M2 M2 10-Core GPU, M2, Apple SSD AP1024Z | Dell XPS 13 Plus 9320 i7-1280P OLED Iris Xe G7 96EUs, i7-1280P, WDC PC SN810 512GB | Lenovo Slim Pro 7 14ARP8 GeForce RTX 3050 6GB Laptop GPU, R7 7735HS, SK hynix PC801 HFS512GEJ9X115N | LG Gram 14Z90Q Iris Xe G7 80EUs, i5-1240P, Samsung PM9A1 MZVL2512HCJQ | Dell Inspiron 14 Plus 7420 GeForce RTX 3050 4GB Laptop GPU, i7-12700H, SK Hynix BC711 512GB HFM512GD3GX013N | Asus ROG Flow Z13 GZ301V GeForce RTX 4060 Laptop GPU, i9-13900H, WD PC SN740 SDDPTQD-1T00 | |
|---|---|---|---|---|---|---|---|
| Noise | 10% | 10% | 5% | 3% | 1% | 5% | |
| desligado / ambiente * (dB) | 25.2 | 23.9 5% | 23.4 7% | 22.7 10% | 25 1% | 23.2 8% | 24 5% |
| Idle Minimum * (dB) | 25.2 | 23.9 5% | 23.4 7% | 22.8 10% | 26 -3% | 23.2 8% | 24 5% |
| Idle Average * (dB) | 25.2 | 23.9 5% | 23.4 7% | 22.8 10% | 27 -7% | 23.2 8% | 24 5% |
| Idle Maximum * (dB) | 26.5 | 23.9 10% | 23.4 12% | 22.8 14% | 28 -6% | 23.2 12% | 24 9% |
| Load Average * (dB) | 39.8 | 23.9 40% | 35 12% | 43.8 -10% | 35 12% | 47.5 -19% | 38.61 3% |
| Load Maximum * (dB) | 45.5 | 49 -8% | 39.9 12% | 47.1 -4% | 36 21% | 51.7 -14% | 43.59 4% |
| Witcher 3 ultra * (dB) | 34.6 | 41.6 | 43.8 | 36 | 51.7 | 41.24 |
* ... menor é melhor
Temperatura
No uso diário (escritório, Internet), as temperaturas permanecem dentro de uma faixa discreta e somente a área central acima do teclado fica um pouco mais quente sob carga. O ventilador único aspira o ar da parte inferior e expele o calor residual no lado esquerdo e na parte traseira. Dessa forma, o apoio para as mãos sempre permanece frio, enquanto o teclado fica em torno de 31 °C, o que não se mostrou desconfortável.
(+) A temperatura máxima no lado superior é 38.9 °C / 102 F, em comparação com a média de 35.9 °C / 97 F , variando de 21.4 a 59 °C para a classe Subnotebook.
(±) A parte inferior aquece até um máximo de 43.4 °C / 110 F, em comparação com a média de 39.2 °C / 103 F
(+) Em uso inativo, a temperatura média para o lado superior é 31.1 °C / 88 F, em comparação com a média do dispositivo de 30.8 °C / ### class_avg_f### F.
(±) Jogando The Witcher 3, a temperatura média para o lado superior é 32.7 °C / 91 F, em comparação com a média do dispositivo de 30.8 °C / ## #class_avg_f### F.
(+) Os apoios para as mãos e o touchpad estão atingindo a temperatura máxima da pele (33.9 °C / 93 F) e, portanto, não estão quentes.
(-) A temperatura média da área do apoio para as mãos de dispositivos semelhantes foi 28.2 °C / 82.8 F (-5.7 °C / -10.2 F).
| Asus ZenBook 14X UX3404VC Intel Core i9-13900H, Intel Iris Xe Graphics G7 96EUs | Apple MacBook Pro 13 2022 M2 Apple M2, Apple M2 10-Core GPU | Lenovo Slim Pro 7 14ARP8 AMD Ryzen 7 7735HS, NVIDIA GeForce RTX 3050 6GB Laptop GPU | LG Gram 14Z90Q Intel Core i5-1240P, Intel Iris Xe Graphics G7 80EUs | Dell Inspiron 14 Plus 7420 Intel Core i7-12700H, NVIDIA GeForce RTX 3050 4GB Laptop GPU | Asus ROG Flow Z13 GZ301V Intel Core i9-13900H, NVIDIA GeForce RTX 4060 Laptop GPU | |
|---|---|---|---|---|---|---|
| Heat | 10% | 9% | 6% | 12% | 5% | |
| Maximum Upper Side * (°C) | 38.9 | 45.1 -16% | 42.2 -8% | 43 -11% | 40 -3% | 42 -8% |
| Maximum Bottom * (°C) | 43.4 | 43 1% | 49 -13% | 45 -4% | 36.4 16% | 47 -8% |
| Idle Upper Side * (°C) | 33.5 | 25.2 25% | 24.4 27% | 27 19% | 27 19% | 27 19% |
| Idle Bottom * (°C) | 35.3 | 25.4 28% | 25.2 29% | 28 21% | 29.2 17% | 30 15% |
* ... menor é melhor
Teste de estresse - Taxa de clock muito baixa
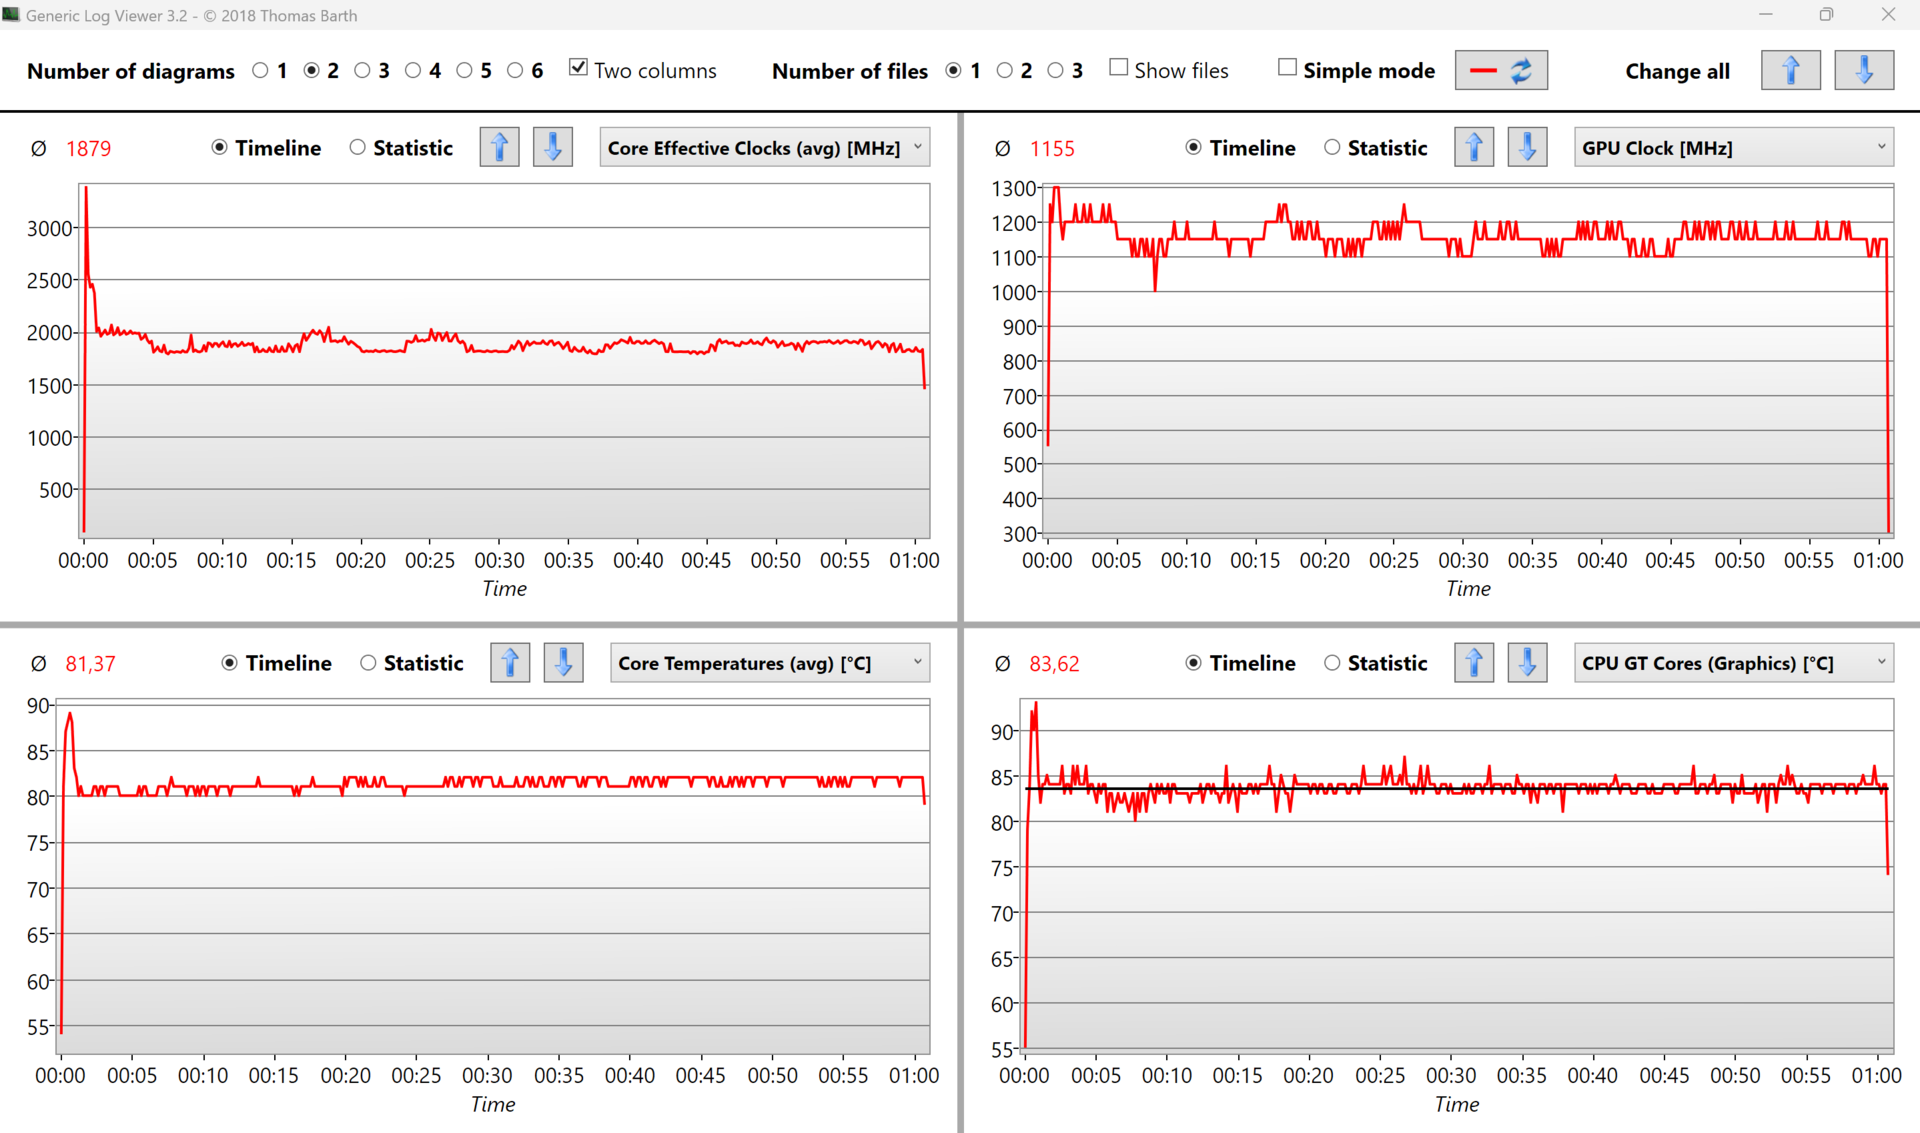
No início do teste de estresse (Prime95 e Furmark), a CPU atingiu brevemente o clock de 3,5 GHz e a iGPU de 1,3 GHz. No entanto, as taxas de clock caem logo em seguida, de modo que a CPU se estabelece em 1,9 GHz e a iGPU em 1,2 GHz. O teste de estresse representa um cenário extremo no qual verificamos se o sistema pode permanecer estável sob carga total.
Alto-falantes
Para um laptop com Windows, os alto-falantes têm um bom desempenho: os graves e os agudos são perceptíveis. Os alto-falantes estão localizados sob o apoio para as mãos e disparam para baixo, usando a superfície como um refletor. Se o laptop for colocado sobre um tecido ou um mouse pad, por exemplo, a qualidade do som se deteriora significativamente.
O microfone de matriz dupla funciona bem e grava vozes sem ruído, portanto, a qualidade é suficiente para chamadas de vídeo e conferências. O ruído de digitação do teclado é audível durante as gravações de áudio, mas não incomoda.
Asus ZenBook 14X UX3404VC análise de áudio
(+) | os alto-falantes podem tocar relativamente alto (###valor### dB)
Graves 100 - 315Hz
(-) | quase nenhum baixo - em média 16.3% menor que a mediana
(-) | graves não são lineares (15.8% delta para frequência anterior)
Médios 400 - 2.000 Hz
(+) | médios equilibrados - apenas 1.2% longe da mediana
(+) | médios são lineares (3.1% delta para frequência anterior)
Altos 2 - 16 kHz
(+) | agudos equilibrados - apenas 4.1% longe da mediana
(+) | os máximos são lineares (3.4% delta da frequência anterior)
Geral 100 - 16.000 Hz
(+) | o som geral é linear (11.3% diferença em relação à mediana)
Comparado com a mesma classe
» 12% de todos os dispositivos testados nesta classe foram melhores, 2% semelhantes, 86% piores
» O melhor teve um delta de 5%, a média foi 18%, o pior foi 53%
Comparado com todos os dispositivos testados
» 7% de todos os dispositivos testados foram melhores, 2% semelhantes, 91% piores
» O melhor teve um delta de 4%, a média foi 23%, o pior foi 134%
Apple MacBook Pro 16 2021 M1 Pro análise de áudio
(+) | os alto-falantes podem tocar relativamente alto (###valor### dB)
Graves 100 - 315Hz
(+) | bons graves - apenas 3.8% longe da mediana
(+) | o baixo é linear (5.2% delta para a frequência anterior)
Médios 400 - 2.000 Hz
(+) | médios equilibrados - apenas 1.3% longe da mediana
(+) | médios são lineares (2.1% delta para frequência anterior)
Altos 2 - 16 kHz
(+) | agudos equilibrados - apenas 1.9% longe da mediana
(+) | os máximos são lineares (2.7% delta da frequência anterior)
Geral 100 - 16.000 Hz
(+) | o som geral é linear (4.6% diferença em relação à mediana)
Comparado com a mesma classe
» 0% de todos os dispositivos testados nesta classe foram melhores, 0% semelhantes, 100% piores
» O melhor teve um delta de 5%, a média foi 17%, o pior foi 45%
Comparado com todos os dispositivos testados
» 0% de todos os dispositivos testados foram melhores, 0% semelhantes, 100% piores
» O melhor teve um delta de 4%, a média foi 23%, o pior foi 134%
Gerenciamento de energia
Consumo de energia
Quando em marcha lenta, o novo modelo é tão econômico quanto o antecessor da AMD; o consumo máximo de energia em marcha lenta é de pouco menos de 12 watts. Isso está dentro dos limites dos modelos com tela OLED, mas o consumo de watts aumenta na presença de conteúdo de imagem mais brilhante.
Sob carga máxima de jogos com Witcher 3 Ultra, medimos um pouco menos de 43 watts, 6 watts a menos do que o comparável Dell XPS 13 Plus 9320 OLED com a mesma iGPU. No entanto, o teste de estresse do Prime95 e Furmark mostra que a fonte de alimentação de 90 watts é muito apertada, pois medimos brevemente 95 watts no início. Ainda assim, essa fase não dura muito e o consumo de energia se estabiliza em 65 watts e depois em 45 watts, de modo que a fonte de alimentação mais fraca não deve ser um grande problema. No entanto, a fonte de alimentação de 100 watts do modelo anterior teria sido a melhor opção.
| desligado | |
| Ocioso | |
| Carga |
|
Key:
min: | |
| Asus ZenBook 14X UX3404VC i9-13900H, Iris Xe G7 96EUs, Micron 2450 1TB MTFDKBA1T0TFK, OLED, 2880x1800, 14.5" | Apple MacBook Pro 13 2022 M2 M2, M2 10-Core GPU, Apple SSD AP1024Z, IPS, 2560x1600, 13.3" | Lenovo Slim Pro 7 14ARP8 R7 7735HS, GeForce RTX 3050 6GB Laptop GPU, SK hynix PC801 HFS512GEJ9X115N, IPS, 2560x1600, 14.5" | Asus ROG Flow Z13 GZ301V i9-13900H, GeForce RTX 4060 Laptop GPU, WD PC SN740 SDDPTQD-1T00, IPS, 2560x1600, 13.4" | Dell XPS 13 Plus 9320 i7-1280P OLED i7-1280P, Iris Xe G7 96EUs, WDC PC SN810 512GB, OLED, 3456x2160, 13.4" | Dell Inspiron 14 Plus 7420 i7-12700H, GeForce RTX 3050 4GB Laptop GPU, SK Hynix BC711 512GB HFM512GD3GX013N, IPS, 2240x1400, 14" | LG Gram 14Z90Q i5-1240P, Iris Xe G7 80EUs, Samsung PM9A1 MZVL2512HCJQ, IPS, 1920x1200, 14" | Média Intel Iris Xe Graphics G7 96EUs | Média da turma Subnotebook | |
|---|---|---|---|---|---|---|---|---|---|
| Power Consumption | 33% | -56% | -65% | -7% | -72% | 20% | 3% | 23% | |
| Idle Minimum * (Watt) | 6 | 1.77 70% | 7.6 -27% | 8.5 -42% | 6.5 -8% | 6.3 -5% | 3 50% | 5.51 ? 8% | 3.73 ? 38% |
| Idle Average * (Watt) | 7 | 6.7 4% | 12.2 -74% | 12.4 -77% | 7.8 -11% | 10.3 -47% | 6 14% | 8.66 ? -24% | 6.51 ? 7% |
| Idle Maximum * (Watt) | 11.8 | 6.9 42% | 12.8 -8% | 13.3 -13% | 13 -10% | 20 -69% | 12 -2% | 10.9 ? 8% | 7.88 ? 33% |
| Load Average * (Watt) | 44 | 30.9 30% | 76.5 -74% | 93 -111% | 56.6 -29% | 106.2 -141% | 40 9% | 45.6 ? -4% | 42.3 ? 4% |
| Witcher 3 ultra * (Watt) | 42.6 | 38.9 9% | 89.5 -110% | 87.8 -106% | 49.2 -15% | 96.1 -126% | 36.5 14% | ||
| Load Maximum * (Watt) | 95 | 56 41% | 135.7 -43% | 135 -42% | 63 34% | 136.5 -44% | 63 34% | 67.8 ? 29% | 64.8 ? 32% |
* ... menor é melhor
Power consumption Witcher 3 / Stress test
Power consumption with an external monitor
Prazo de validade
A duração da bateria do Asus ZenBook 14X é muito boa, considerando o processador Intel Core i9 de última geração. Em nosso teste de WLAN, o notebook de 14 polegadas alcançou um tempo de execução de exatamente 10 horas. Esse teste usa um script para medir a carga ao acessar sites
O Apple MacBook Pro 13 2022 M2, o Lenovo Slim Pro 7 14ARP8 e o LG Gram 14Z90Q apresentam melhor desempenho em nossa tabela de benchmark, mas não têm telas OLED. Em comparação com o Dell XPS 13 Plus 9320 com sua tela OLED, o bom desempenho da bateria do ZenBook é claramente perceptível, pois o modelo da Dell dura apenas cerca de 5:30 horas.
| Asus ZenBook 14X UX3404VC i9-13900H, Iris Xe G7 96EUs, 70 Wh | Apple MacBook Pro 13 2022 M2 M2, M2 10-Core GPU, 58.2 Wh | Dell XPS 13 Plus 9320 i7-1280P OLED i7-1280P, Iris Xe G7 96EUs, 55 Wh | Lenovo Slim Pro 7 14ARP8 R7 7735HS, GeForce RTX 3050 6GB Laptop GPU, 73 Wh | LG Gram 14Z90Q i5-1240P, Iris Xe G7 80EUs, 72 Wh | Dell Inspiron 14 Plus 7420 i7-12700H, GeForce RTX 3050 4GB Laptop GPU, 64 Wh | Asus ROG Flow Z13 GZ301V i9-13900H, GeForce RTX 4060 Laptop GPU, 56 Wh | Média da turma Subnotebook | |
|---|---|---|---|---|---|---|---|---|
| Duração da bateria | 91% | -42% | 5% | 49% | -36% | -46% | 40% | |
| Reader / Idle (h) | 17.6 | 28.9 64% | 11.9 -32% | 28.6 ? 63% | ||||
| WiFi v1.3 (h) | 10 | 19.1 91% | 5.8 -42% | 10.5 5% | 11.9 19% | 7.2 -28% | 5 -50% | 14 ? 40% |
| Load (h) | 1.7 | 2.8 65% | 0.9 -47% | 1 -41% | 1.998 ? 18% | |||
| H.264 (h) | 19.2 | 4.7 | 15.3 ? | |||||
| Witcher 3 ultra (h) | 0.8 |
Pro
Contra
Veredicto - O novo processador não consegue abrir totalmente suas asas
O ZenBook 14X é um laptop muito sólido no geral, que só é prejudicado pelo desempenho um tanto decepcionante do processador. Definitivamente, ele teria se beneficiado de um ventilador adicional, como no modelo do ano passado. Por outro lado, a tela OLED de 120 Hz, os tempos de resposta rápidos e a duração da bateria acima da média são pontos muito positivos. Apesar do Intel Core i9-13900H instalado, medimos exatamente 10 horas em nosso teste de WLAN. Os valores DeltaE da tela estão abaixo de 3 e, portanto, o subnotebook é adequado para edição de fotos e vídeos.
A qualidade do chassi de alumínio também é excelente e garante estabilidade acima da média, o que também é perceptível ao digitar. A variedade de portas é sólida, mas inferior à do antecessor, pois o leitor microSD foi omitido. O posicionamento das portas também não é o ideal.
O novo ZenBook 14X da Asus é um equipamento robusto e versátil com uma duração de bateria muito boa, uma excelente tela OLED e um desempenho sólido.
O ruído do ventilador é moderado e o dispositivo permanece praticamente inaudível durante as tarefas normais de escritório, graças à opção do modo Silencioso no aplicativo MyAsus.
O preço da configuração básica aumentou em comparação com o antecessor, tanto na versão AMD quanto na versão Intel. Nossa variante analisada, sem uma placa de vídeo dedicada, custa EUR 1.699 (~US$ 1.850). Se, em vez disso, você quiser a Nvidia GeForce RTX 3050, terá que desembolsar mais 400 euros (US$ 440).
Se uma tela OLED não tiver um papel importante na escolha do notebook, há dois dispositivos de 14 polegadas mais baratos, como o Lenovo Slim Pro 7 14ARP8 e o Dell Inspiron 14 Plus 7420, que oferecem melhor desempenho gráfico graças à AMD Radeon 680M no Lenovo ou à RTX 3050 no Dell.
Preço e disponibilidade
Nos EUA, a configuração básica do Asus Zenbook 14X UX3404 custa US$ 1.799,00 na loja virtual da Asus.
Asus ZenBook 14X UX3404VC
- 06/01/2023 v7 (old)
Philip Macdonald
Transparência
A seleção dos dispositivos a serem analisados é feita pela nossa equipe editorial. A amostra de teste foi fornecida ao autor como empréstimo pelo fabricante ou varejista para fins desta revisão. O credor não teve influência nesta revisão, nem o fabricante recebeu uma cópia desta revisão antes da publicação. Não houve obrigação de publicar esta revisão. Como empresa de mídia independente, a Notebookcheck não está sujeita à autoridade de fabricantes, varejistas ou editores.
É assim que o Notebookcheck está testando
Todos os anos, o Notebookcheck analisa de forma independente centenas de laptops e smartphones usando procedimentos padronizados para garantir que todos os resultados sejam comparáveis. Desenvolvemos continuamente nossos métodos de teste há cerca de 20 anos e definimos padrões da indústria no processo. Em nossos laboratórios de teste, equipamentos de medição de alta qualidade são utilizados por técnicos e editores experientes. Esses testes envolvem um processo de validação em vários estágios. Nosso complexo sistema de classificação é baseado em centenas de medições e benchmarks bem fundamentados, o que mantém a objetividade.Price comparison

