Revisão do laptop Dell Inspiron 14 Plus 7420: Para usuários de energia com um orçamento
A Dell introduziu três modelos separados Inspiron 14 7420 de 14 polegadas para 2022: o Inspiron 14 7420 padrão, Inspiron 14 7420 2 em 1 e Inspiron 14 7420 Plus. Esta revisão se concentra no modelo Plus que transporta processadores Core H muito mais rápidos e gráficos discretos da Nvidia GeForce RTX projetados para usuários de energia insatisfeitos com os Ultrabooks habituais da série Core-U.
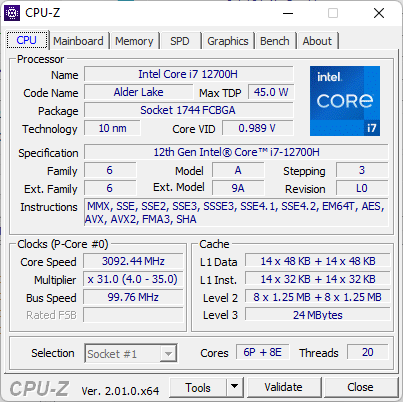
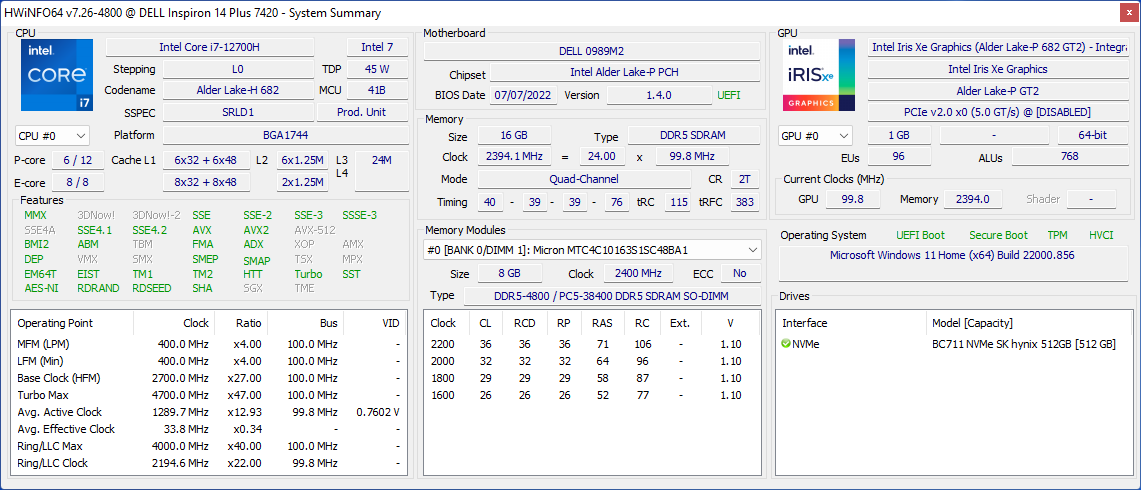
Nossa unidade de revisão específica vem com a CPU Alder Lake-H Core i7-12700H e GeForce RTX 3050 GPU por aproximadamente US$1400 dólares de varejo. Outras SKUs com o Core i5-12500H, RTX 3050 Ti ou gráficos integrados, e bateria menor de 54 Wh estão planejadas, mas todas as configurações vêm com o mesmo painel de resolução de 2,2K 2240 x 1400.
Os concorrentes incluem outros laptops de 14 polegadas de alto desempenho como o Asus VivoBook Pro 14, HP Pavilion 14 Plus, Schenker Vision 14, HP Envy 14, ou o Lenovo IdeaPad 5 Pro 14. A Razer Blade 14 e Asus Zephyrus G14 também podem ser consideradas alternativas, mas são significativamente mais caras.
Mais análises da Dell:
Possible competitors in comparison
Avaliação | Data | Modelo | Peso | Altura | Size | Resolução | Preço |
|---|---|---|---|---|---|---|---|
| 87.2 % v7 (old) | 09/2022 | Dell Inspiron 14 Plus 7420 i7-12700H, GeForce RTX 3050 4GB Laptop GPU | 1.7 kg | 18.87 mm | 14.00" | 2240x1400 | |
| 86.3 % v7 (old) | 07/2022 | Asus Vivobook Pro 14 M3401QC-KM007T R5 5600H, GeForce RTX 3050 4GB Laptop GPU | 1.5 kg | 19 mm | 14.00" | 2880x1800 | |
| 83.7 % v7 (old) | 06/2022 | Dell Inspiron 14 7420 2-in-1 i7-1255U, Iris Xe G7 96EUs | 1.6 kg | 17.86 mm | 14.00" | 1920x1200 | |
| 87.7 % v7 (old) | 01/2022 | Schenker Vision 14 i7-11370H, GeForce RTX 3050 Ti Laptop GPU | 1.1 kg | 15.6 mm | 14.00" | 2880x1800 | |
v (old) | 10/2021 | Asus Zenbook 14X UX5400E i7-1165G7, GeForce MX450 | 1.4 kg | 16.9 mm | 14.00" | 2880x1800 | |
| 82.3 % v7 (old) | 07/2021 | MSI Summit E14 A11SCS i7-1185G7, GeForce GTX 1650 Ti Max-Q | 1.3 kg | 16 mm | 14.00" | 3840x2160 | |
| 86.5 % v7 (old) | 02/2021 | HP Envy 14-eb0010nr i5-1135G7, GeForce GTX 1650 Ti Max-Q | 1.6 kg | 17.9 mm | 14.00" | 1920x1200 |
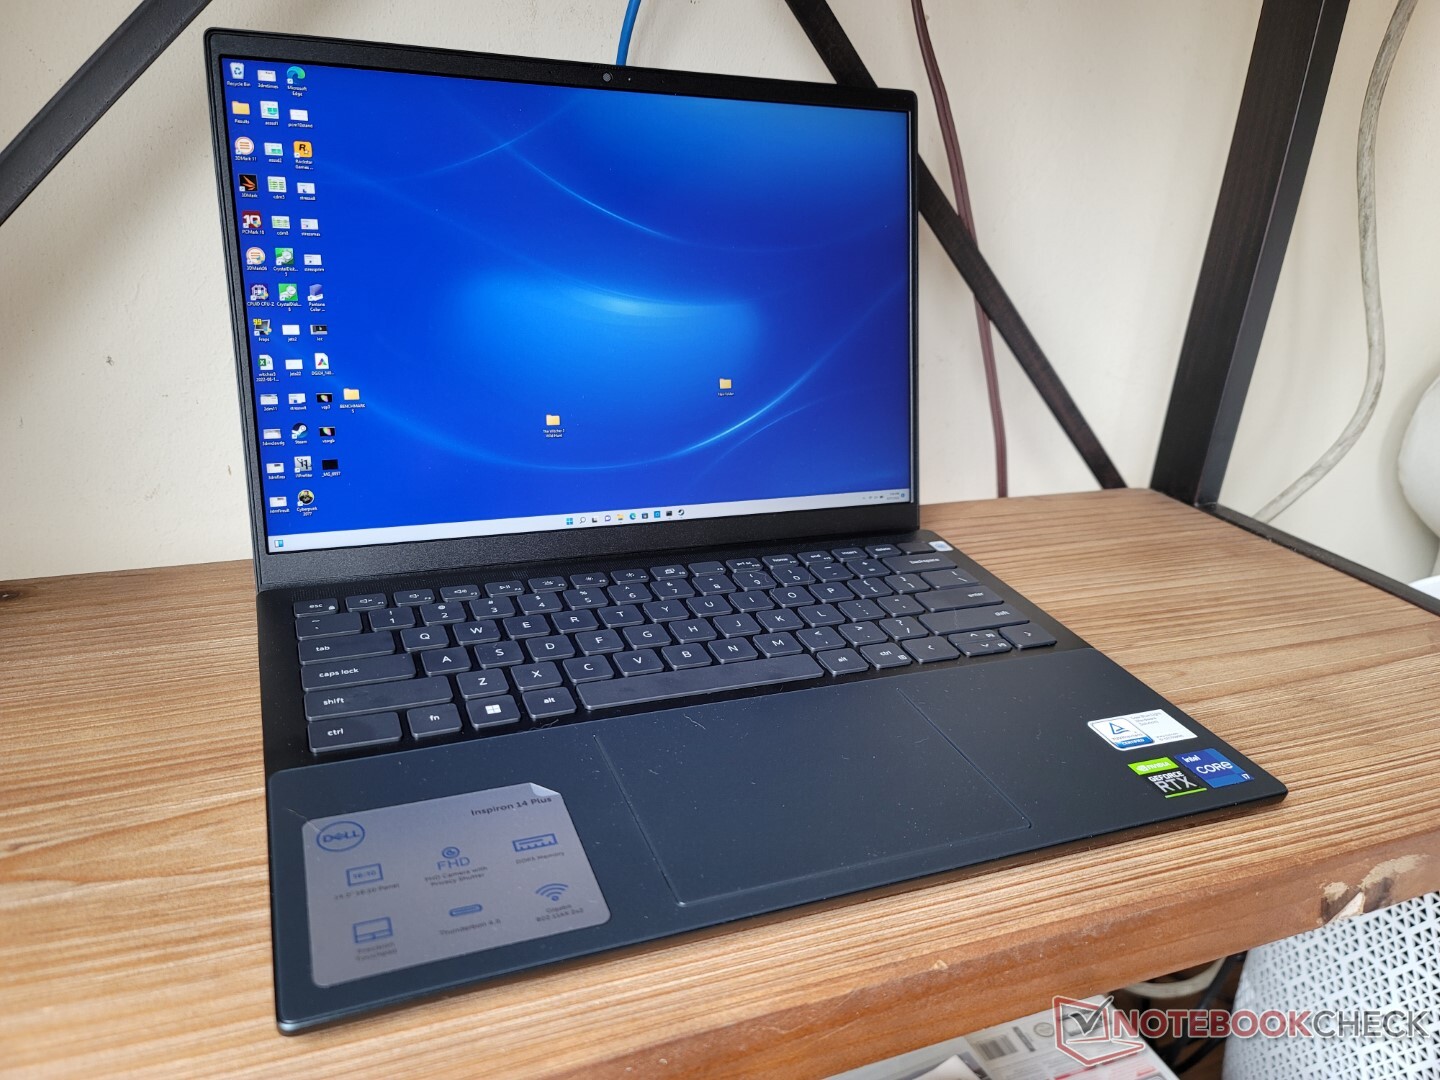
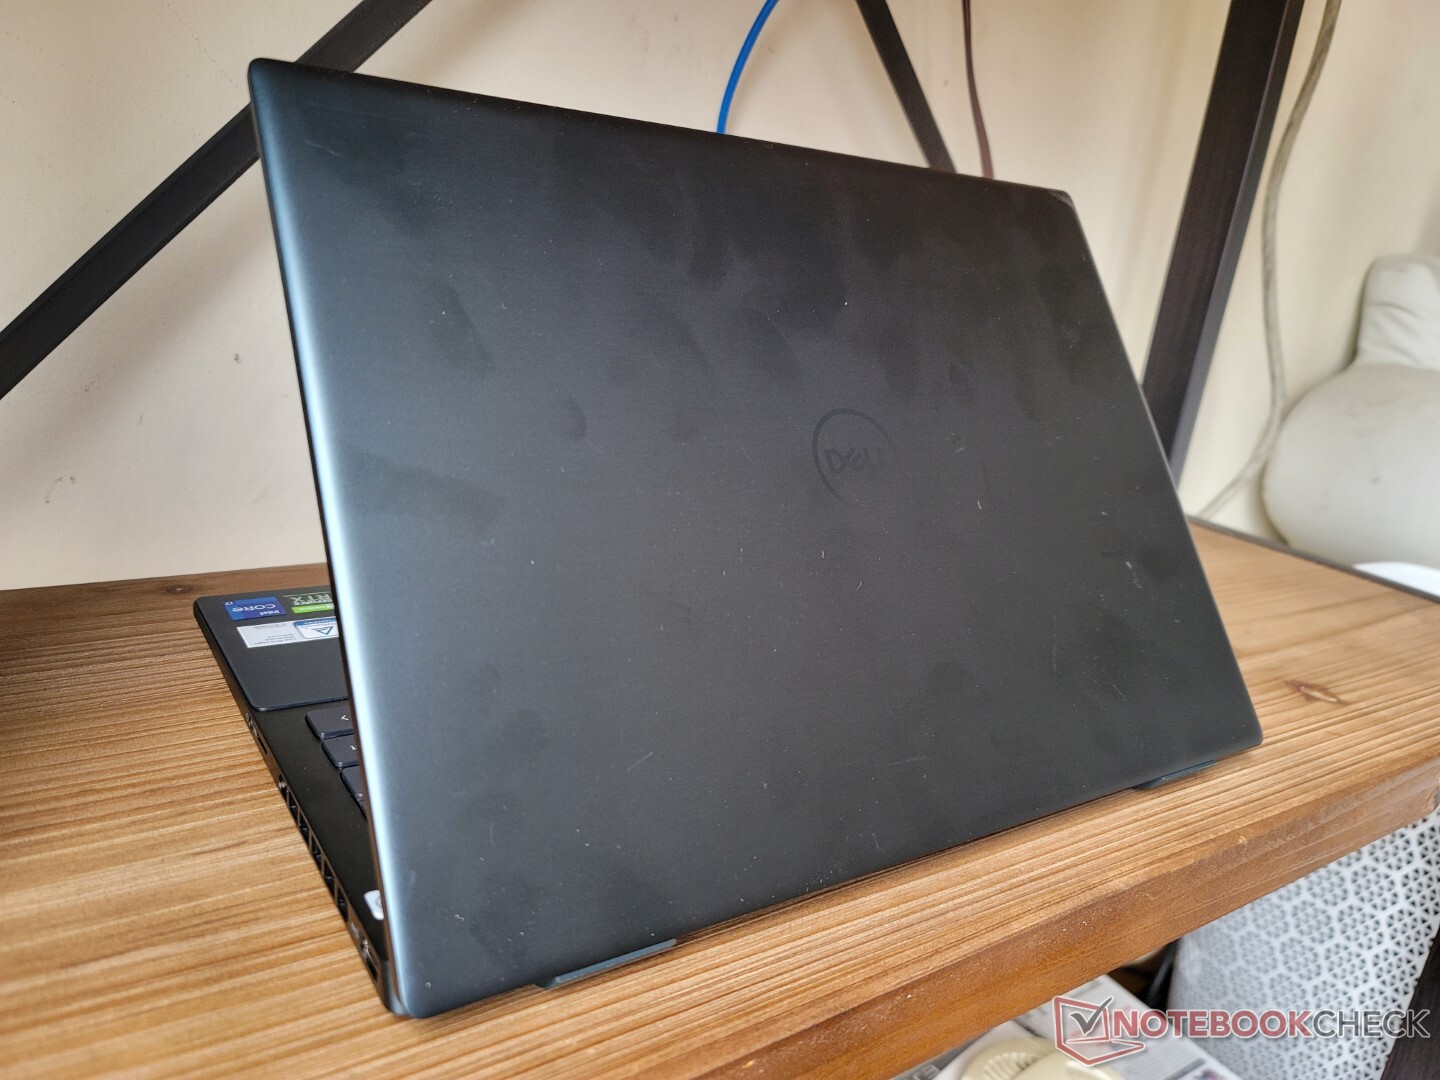
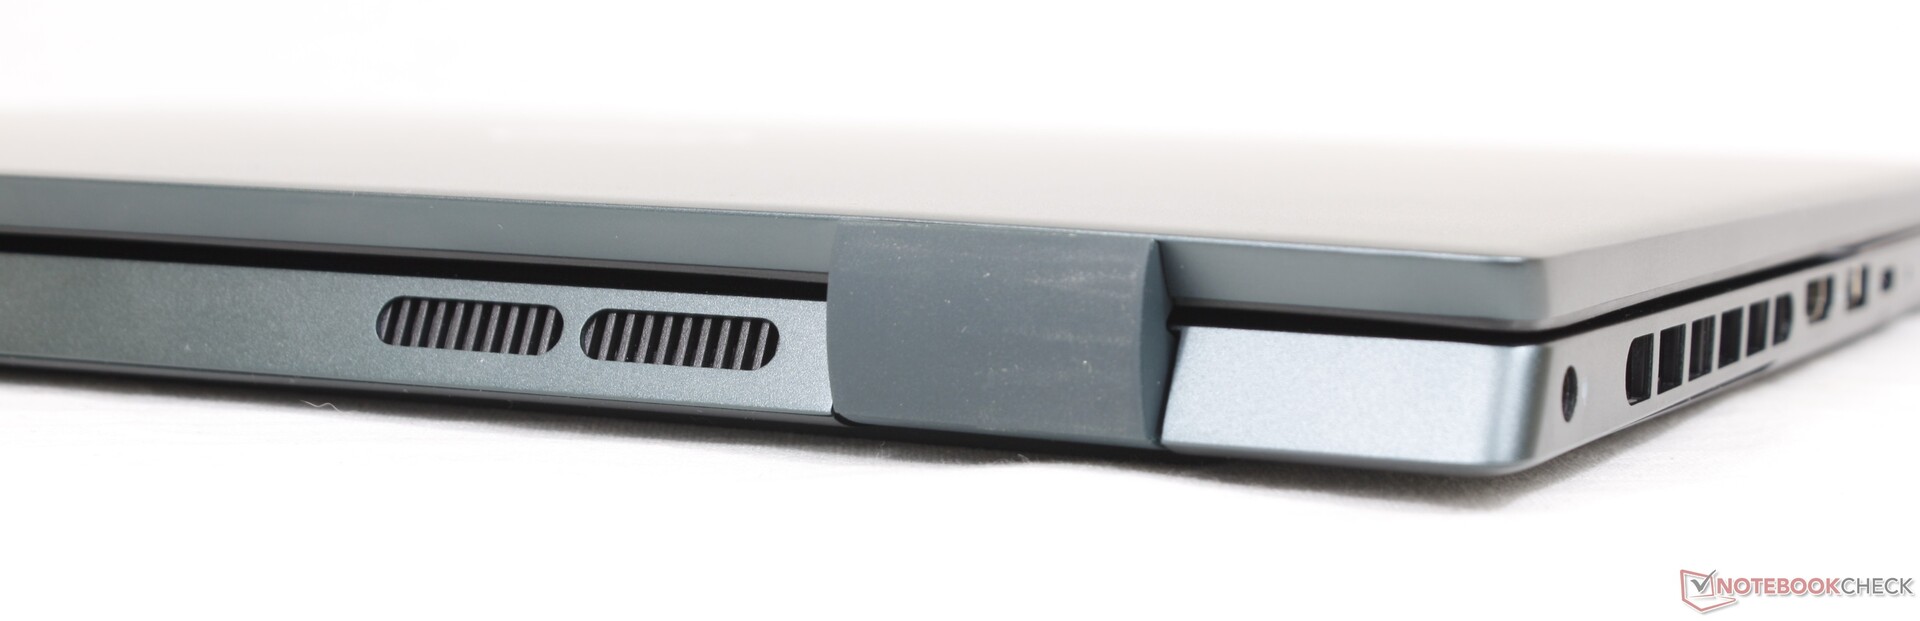
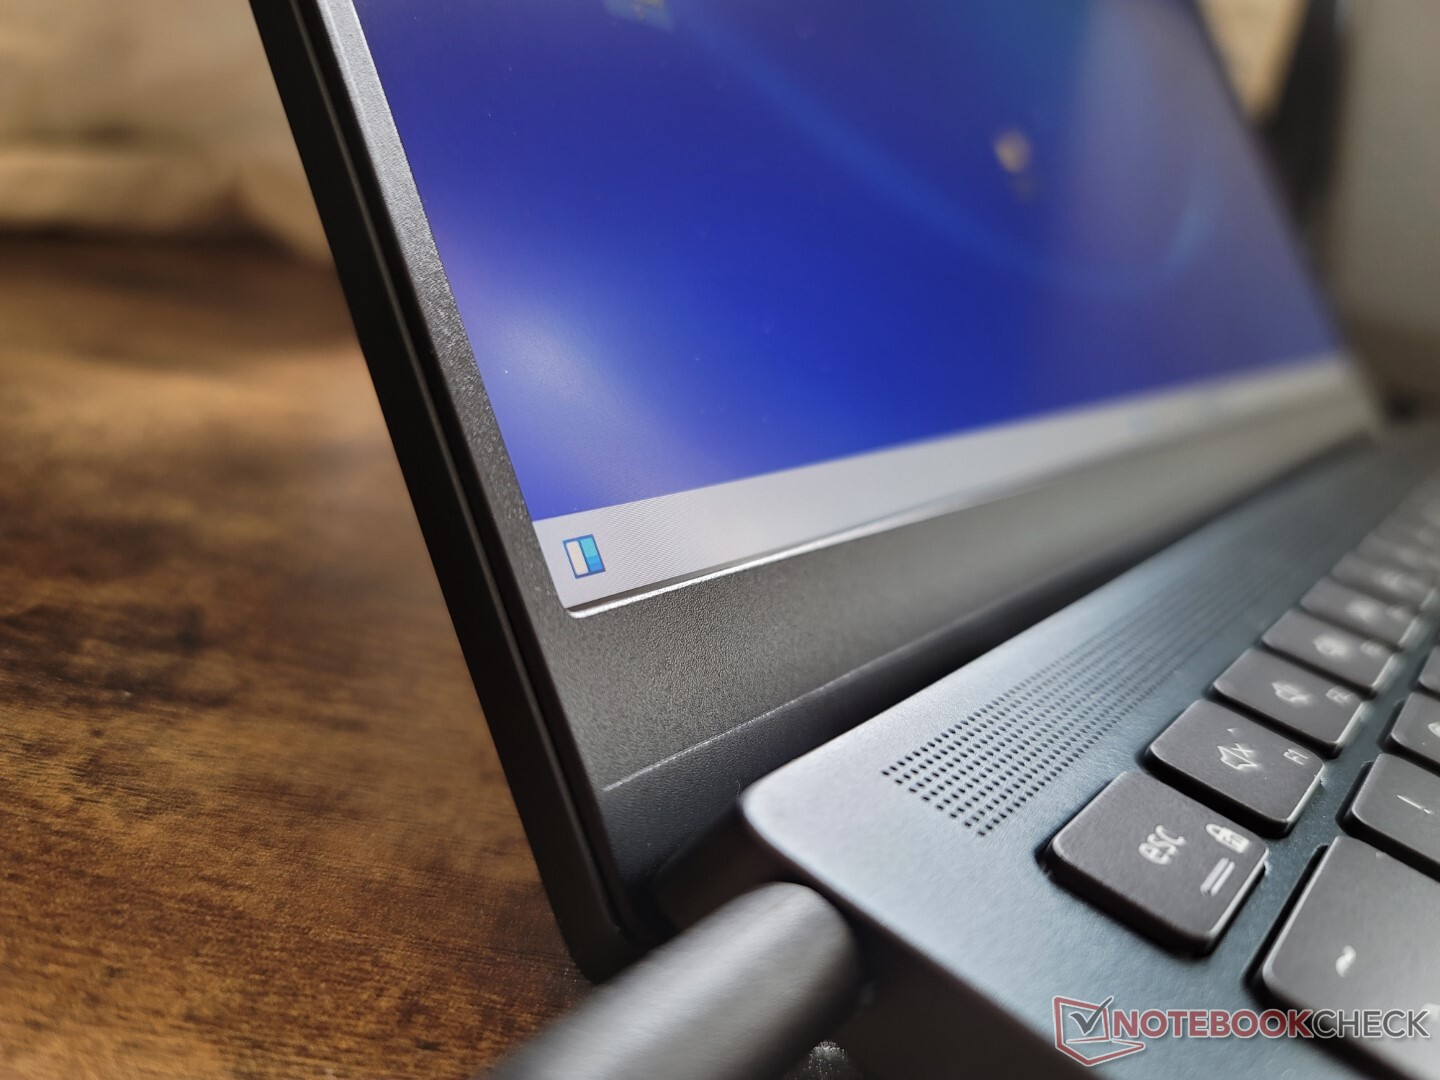
Estojo - A Miniature Inspiron 16 7620
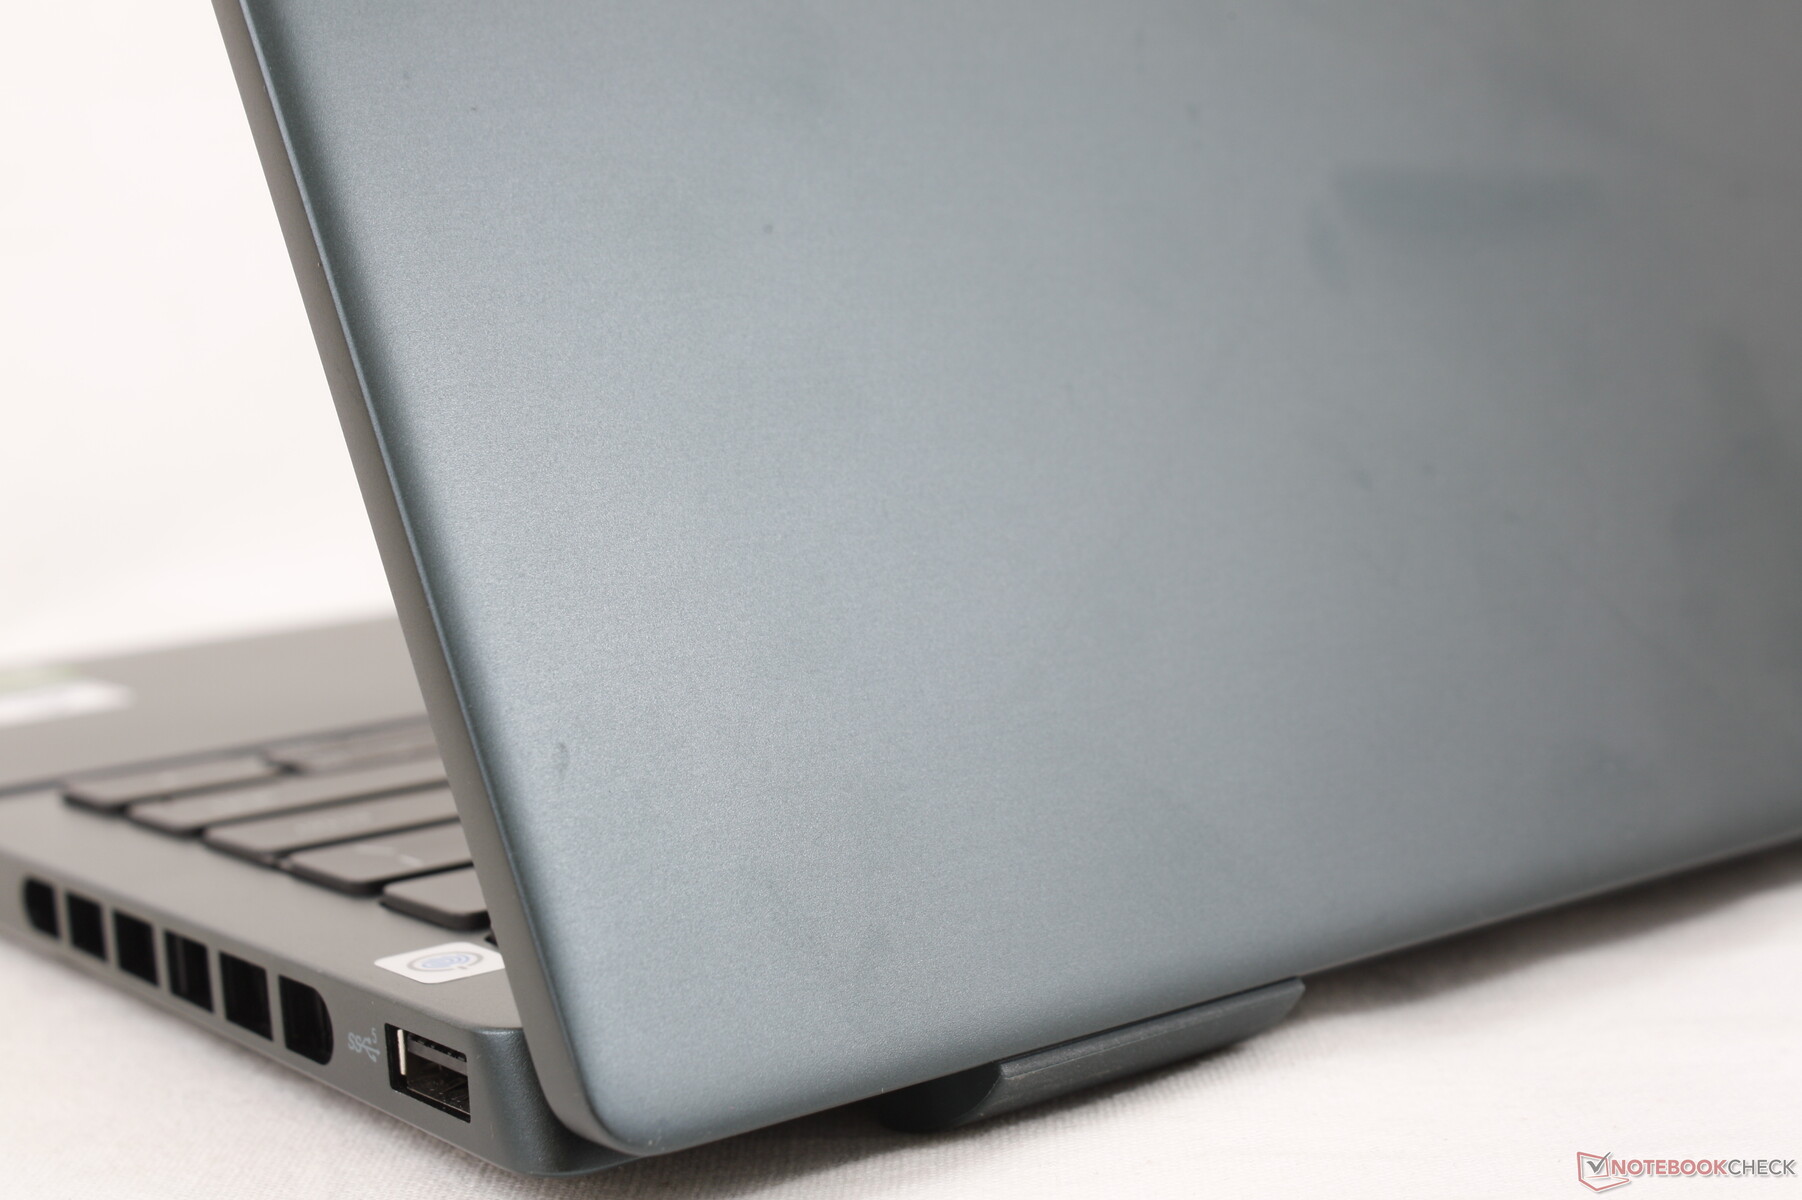
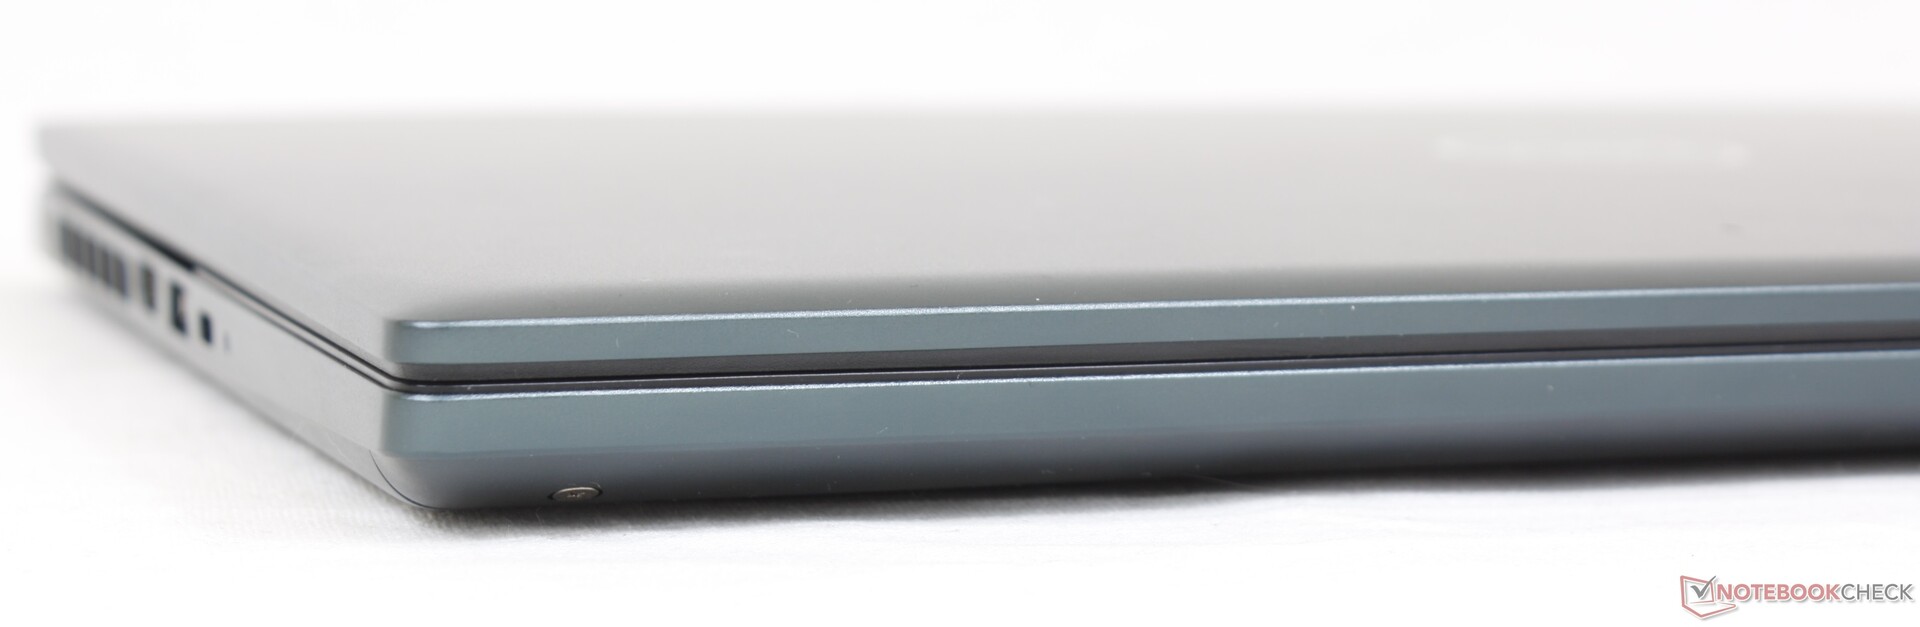
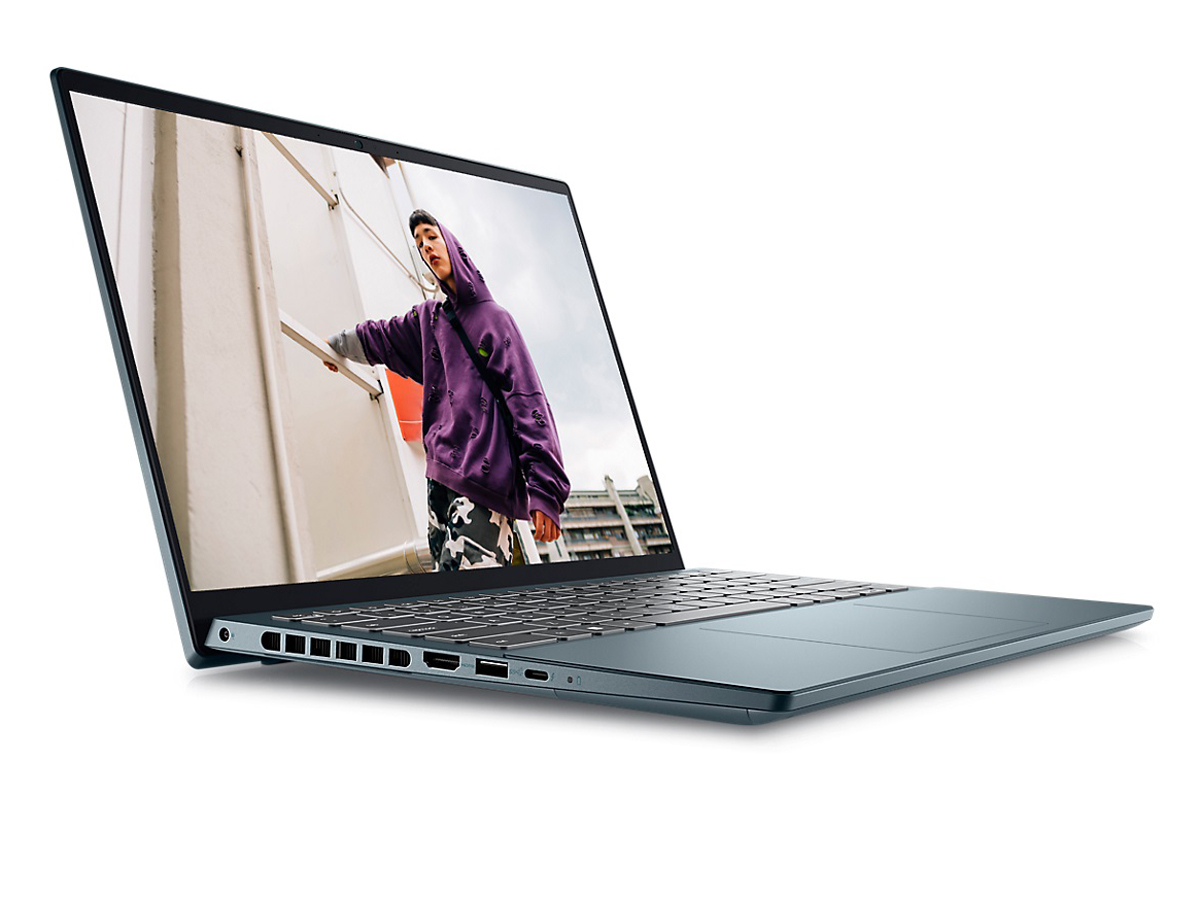
O chassi pode ser melhor descrito como uma versão menor do Inspiron 16 7620 Plus já que ambos compartilham a mesma linguagem de design visual. Os materiais usados para o chassi metálico e a camada de Mylar sobre o clickpad e os apoios para as palmas são similares ao Inspiron maior como resultado. É uma sensação mate suave de cima para baixo que quase imita a tampa externa lisa de metal de um XPS 15
O aspecto mais fraco do esqueleto talvez seja a tampa, pois ela se torce com bastante facilidade. Pequenos rangidos são audíveis quando se torce a base e a aplicação de pressão sobre o centro do teclado também empena levemente sua superfície. Embora este modelo seja comercializado quase tanto quanto um Dell XPS 15, não espere que ele seja construído tão fortemente quanto um.
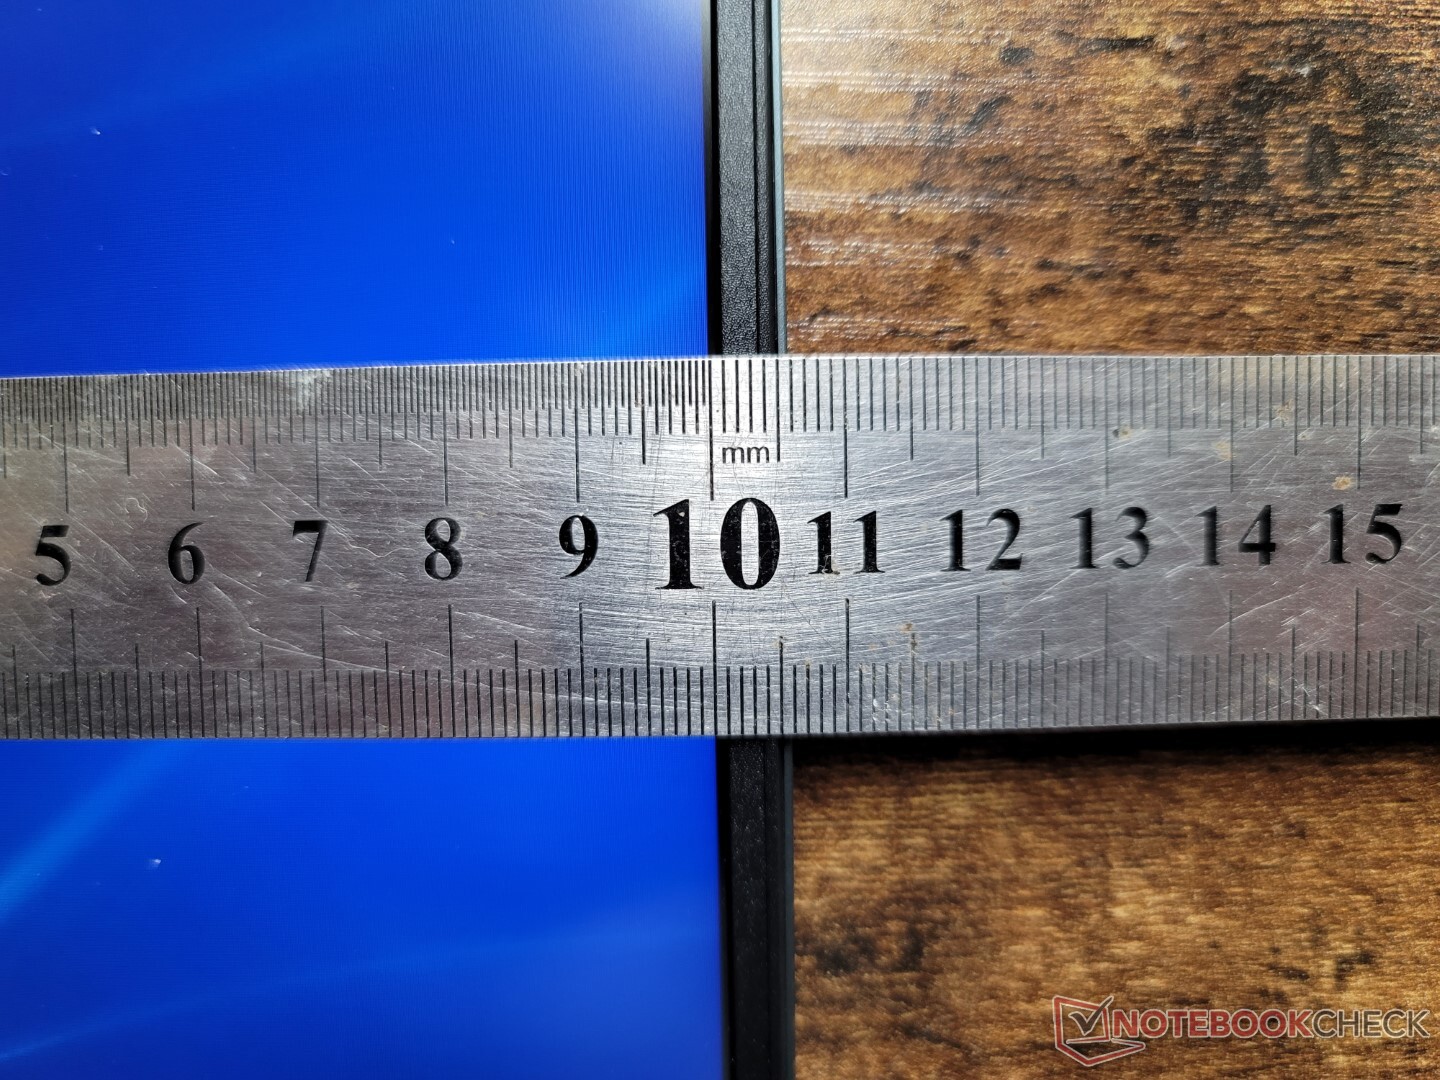
Pode-se esperar que o Inspiron 14 Plus 7620 seja maior e mais pesado que o Inspiron 14 7620 2 em 1, mas esse não é realmente o caso. Sua pegada é idêntica à versão 2-em-1, sendo apenas um cabelo mais grosso e mais pesado, apesar do hardware significativamente mais potente no interior. No entanto, ainda é mais pesado e maior do que a maioria dos outros laptops de 14 polegadas como o HP Envy 14,Asus Zenbook 14Xou Schenker Vision 14, todas elas com gráficos discretos da Nvidia.
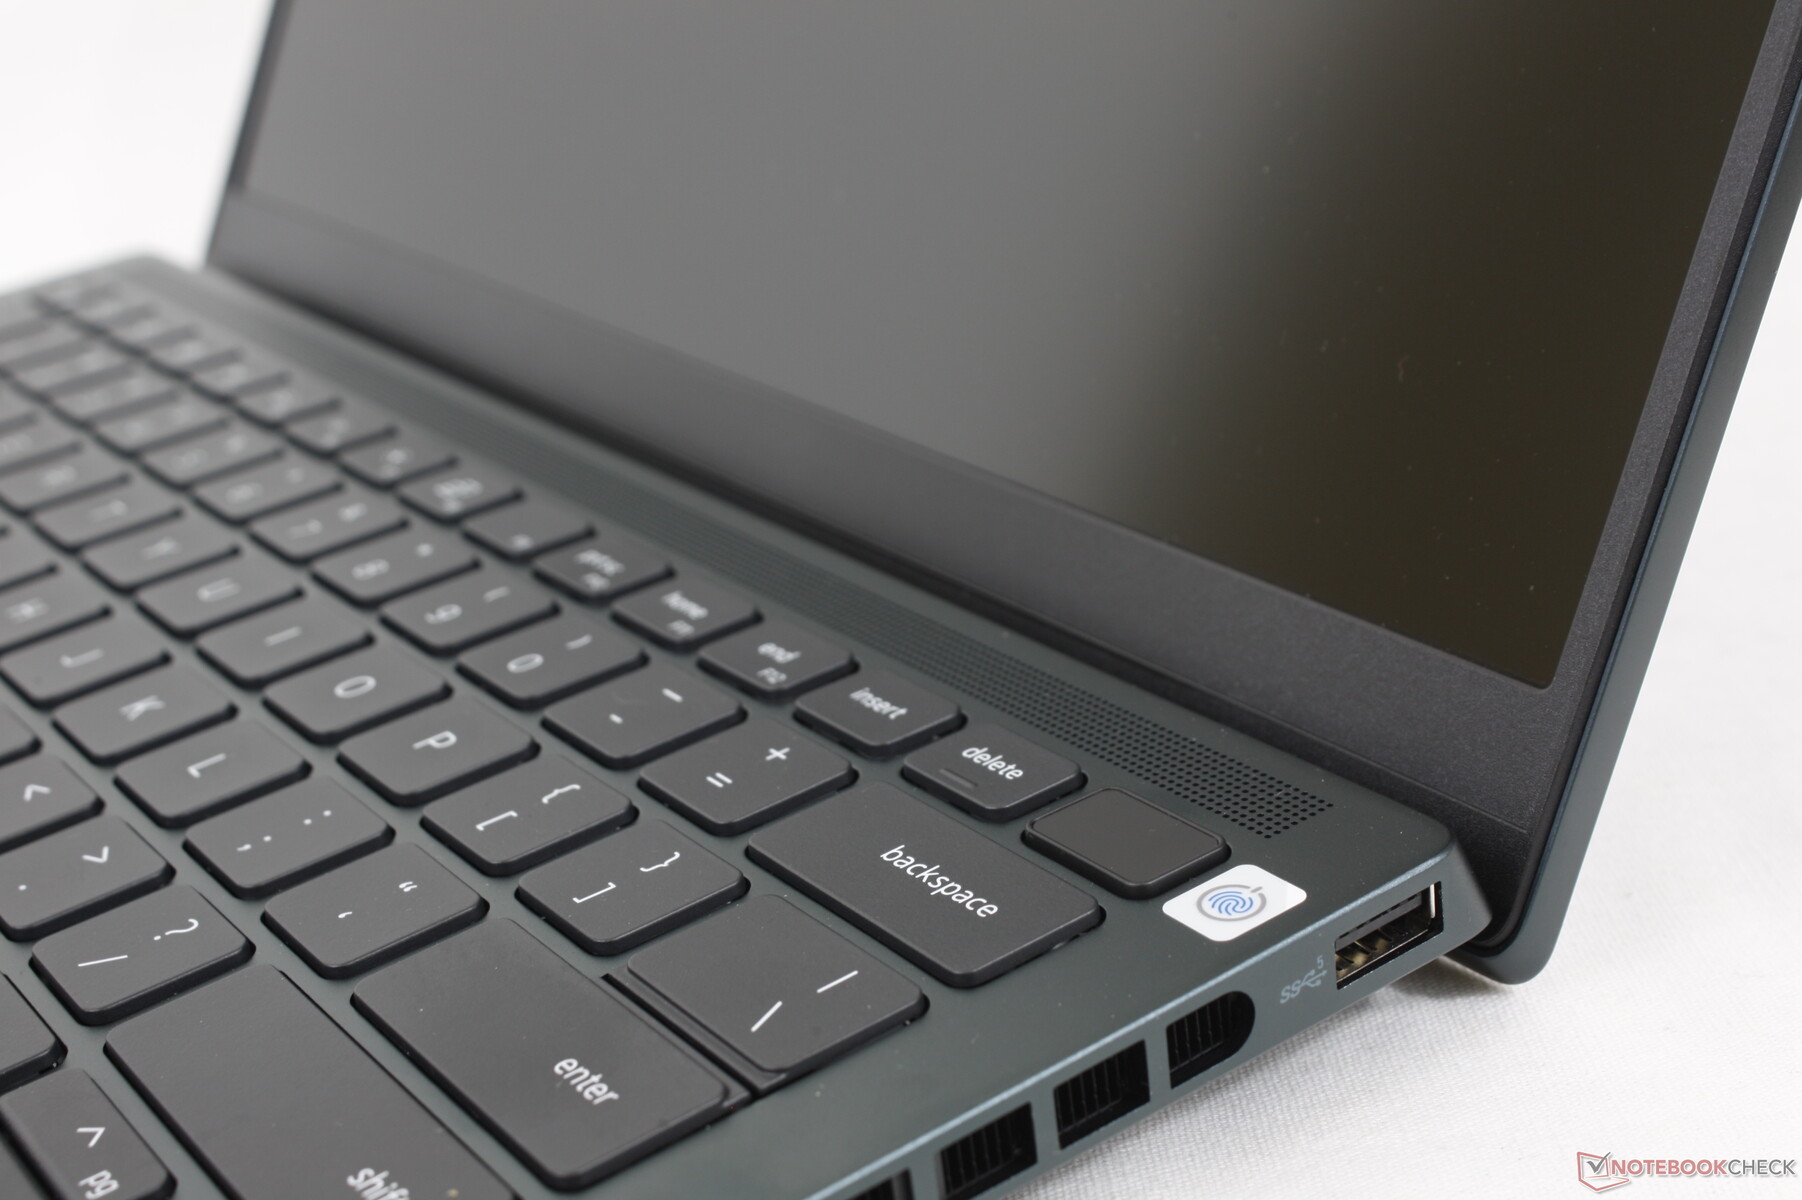
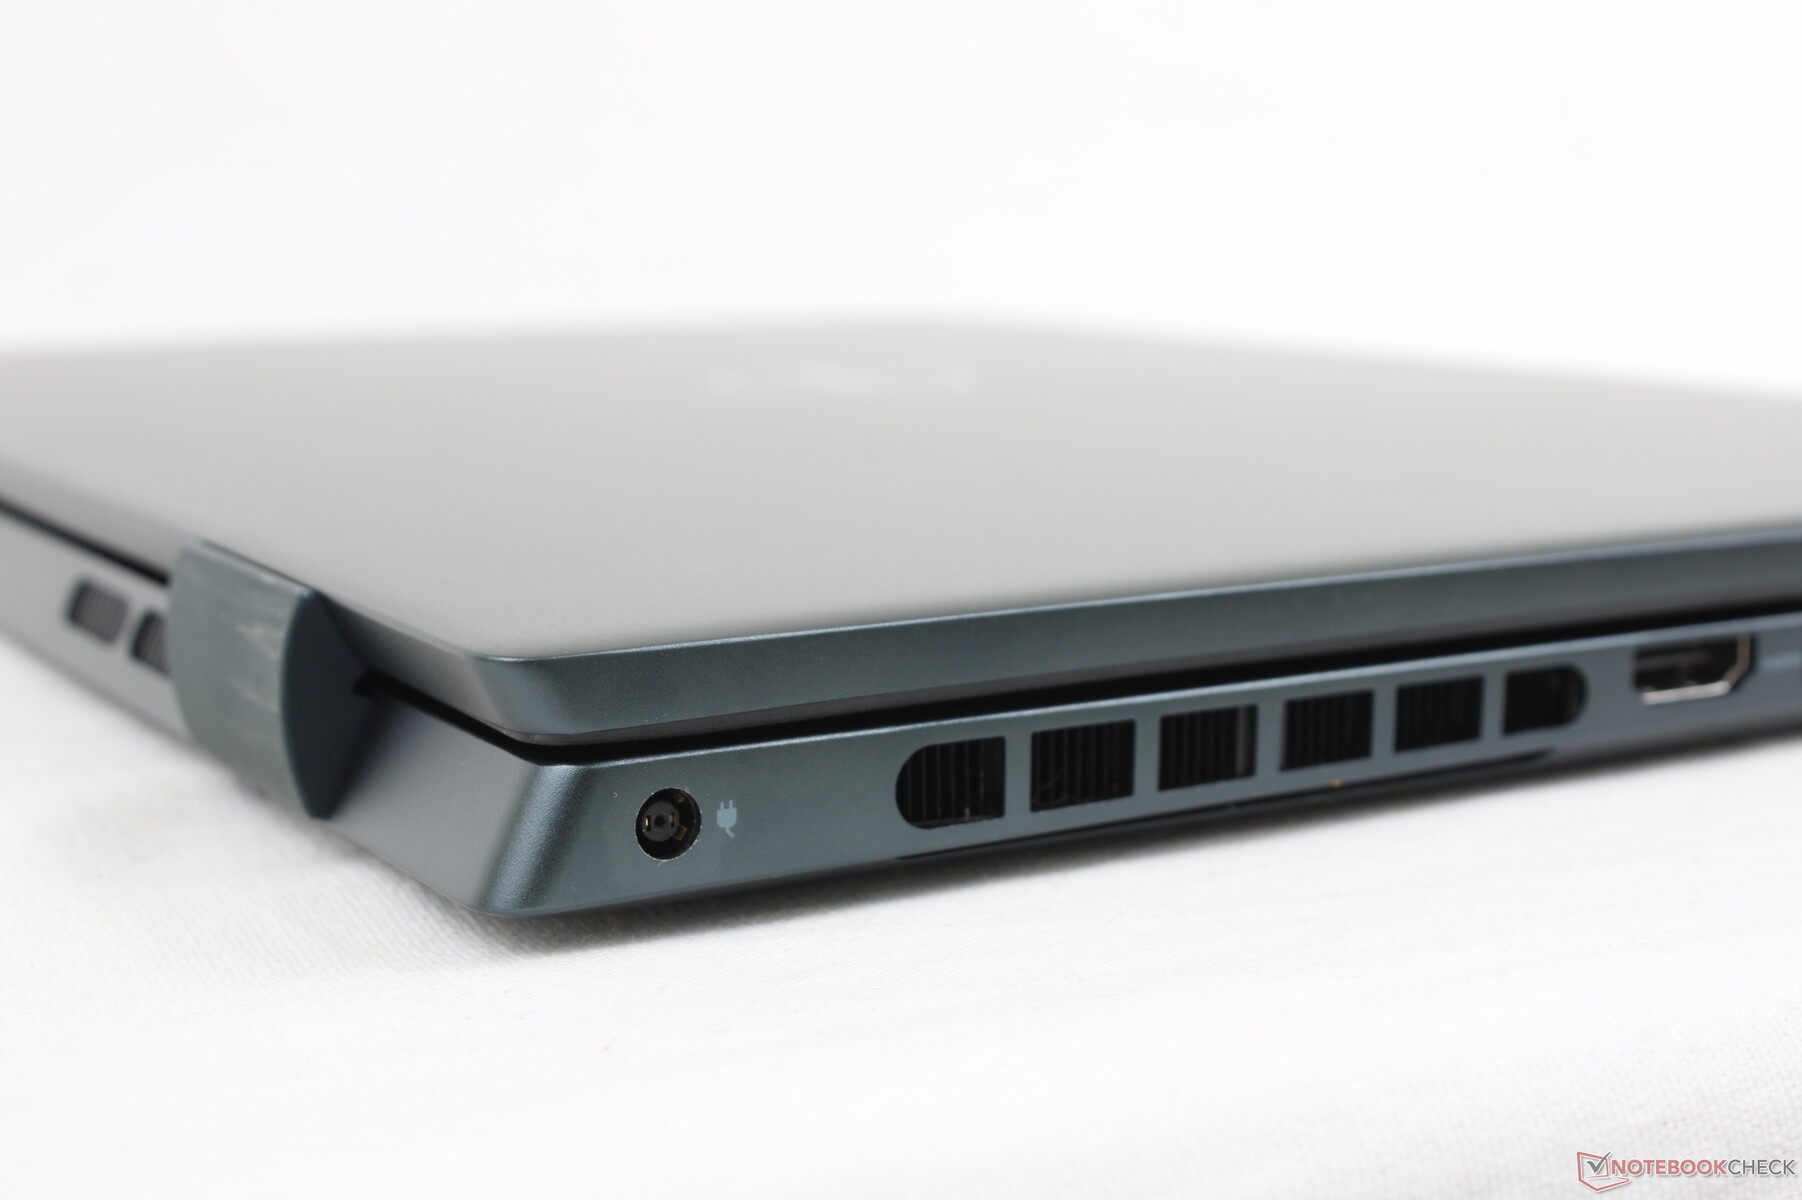
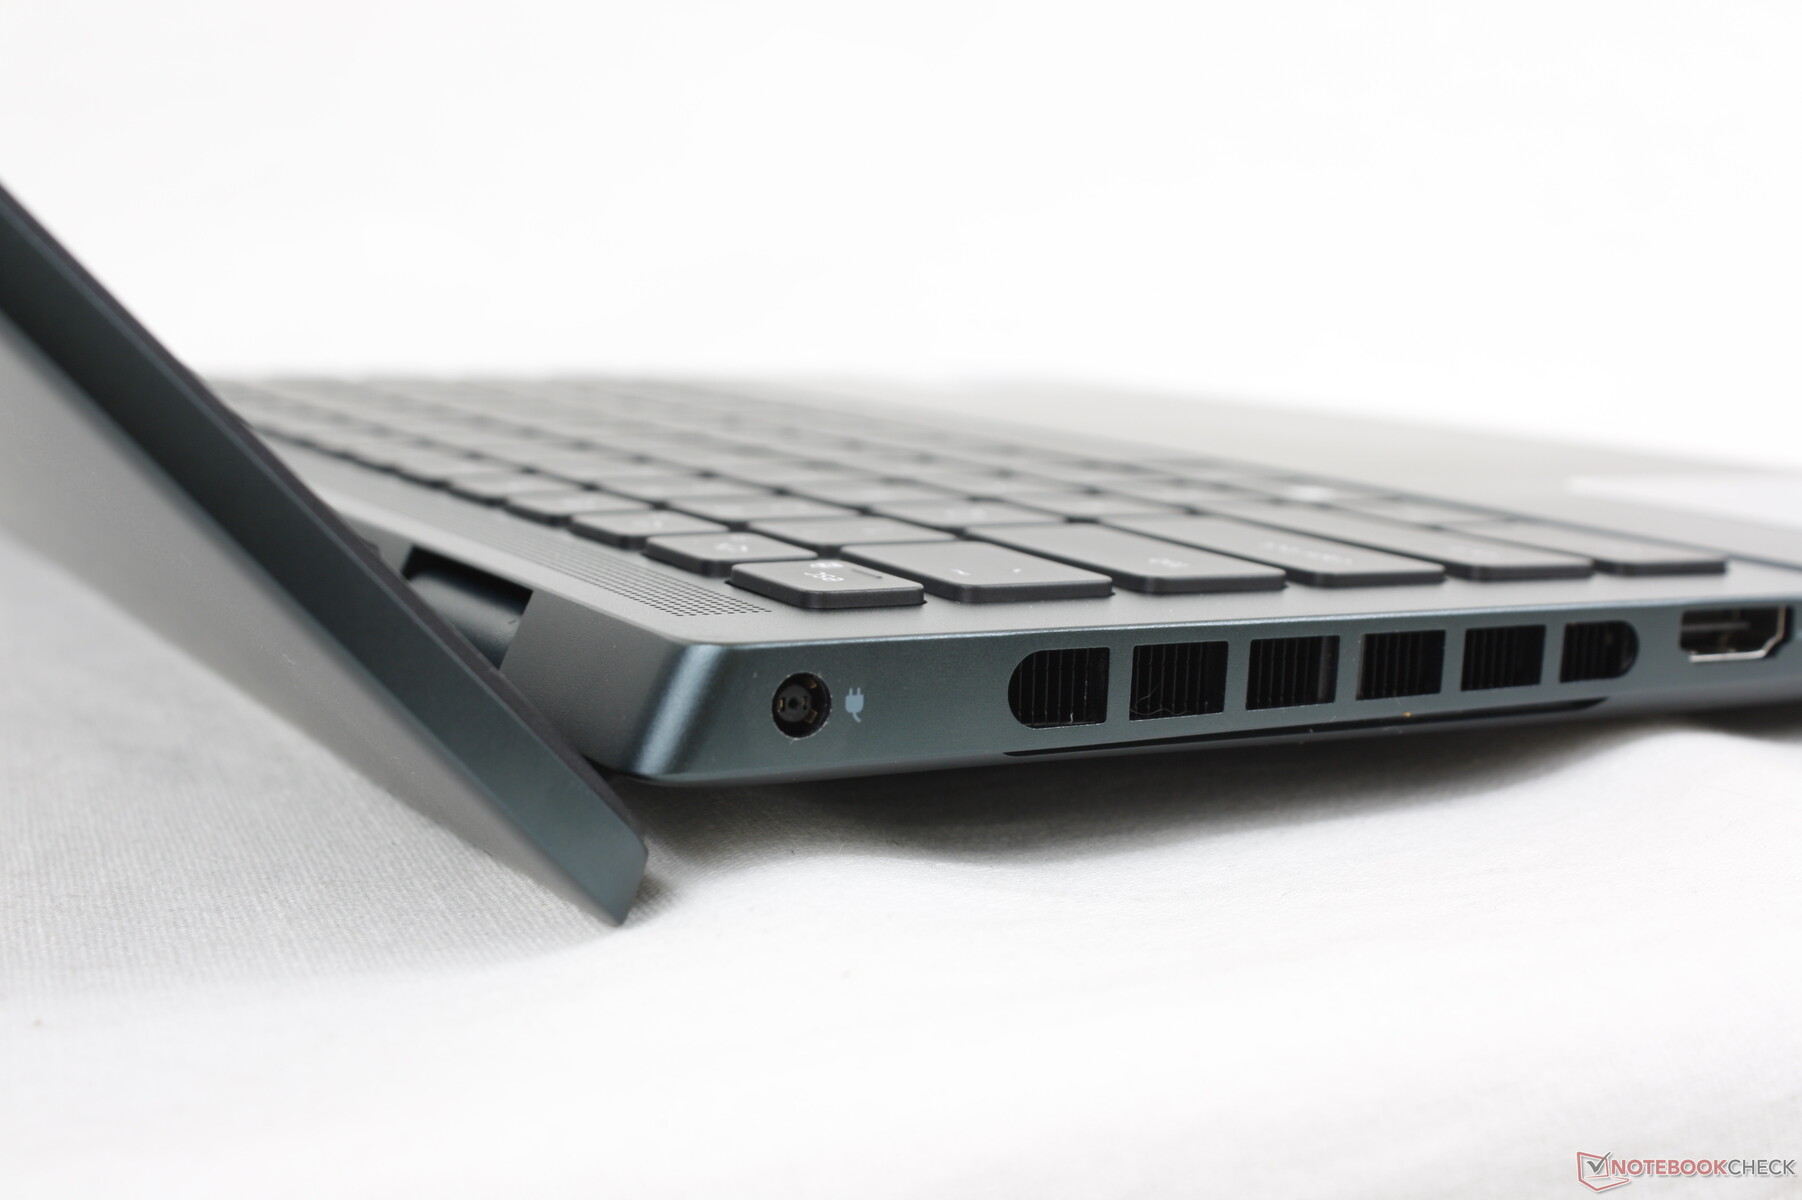
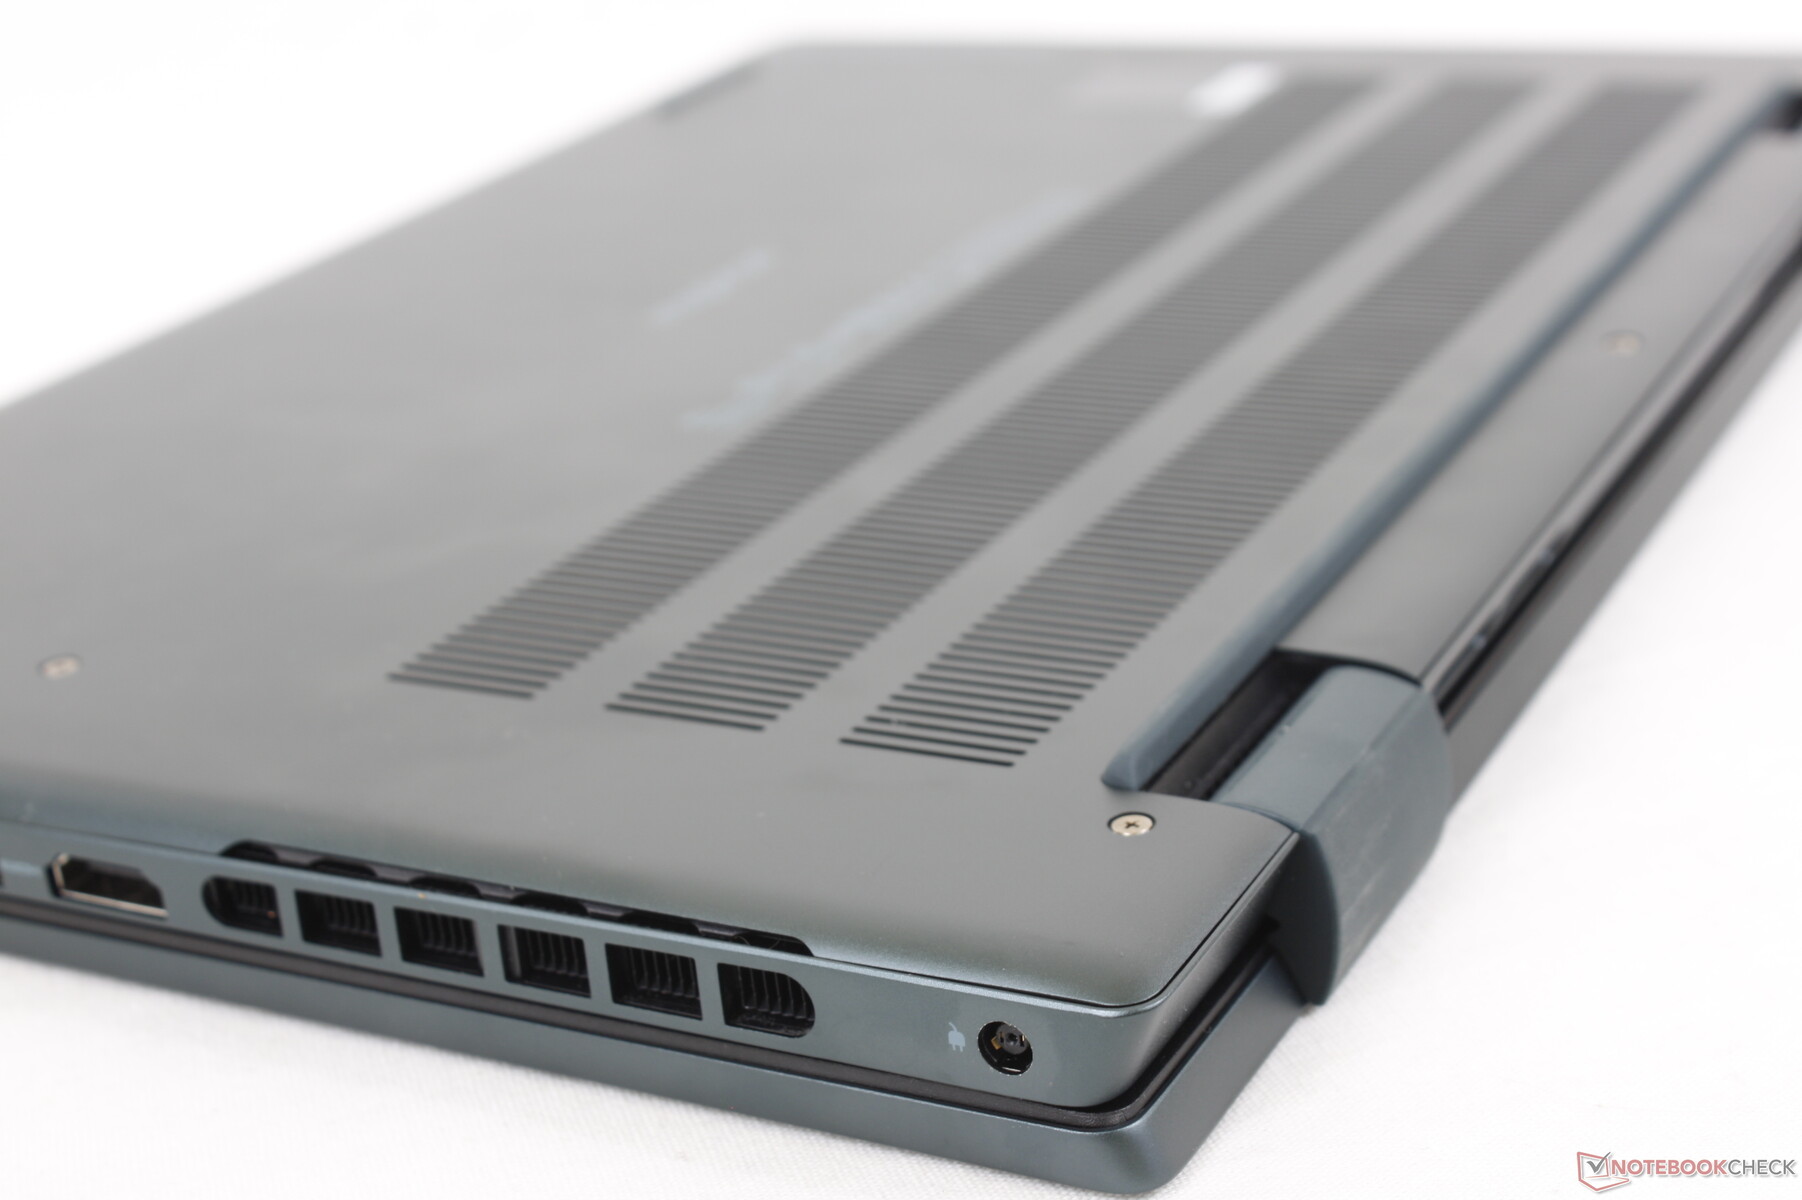
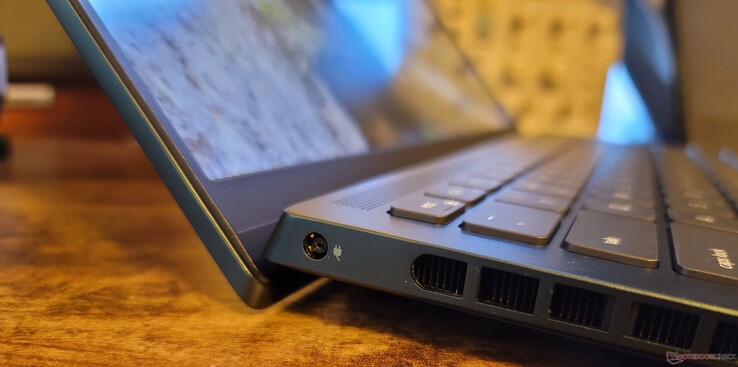
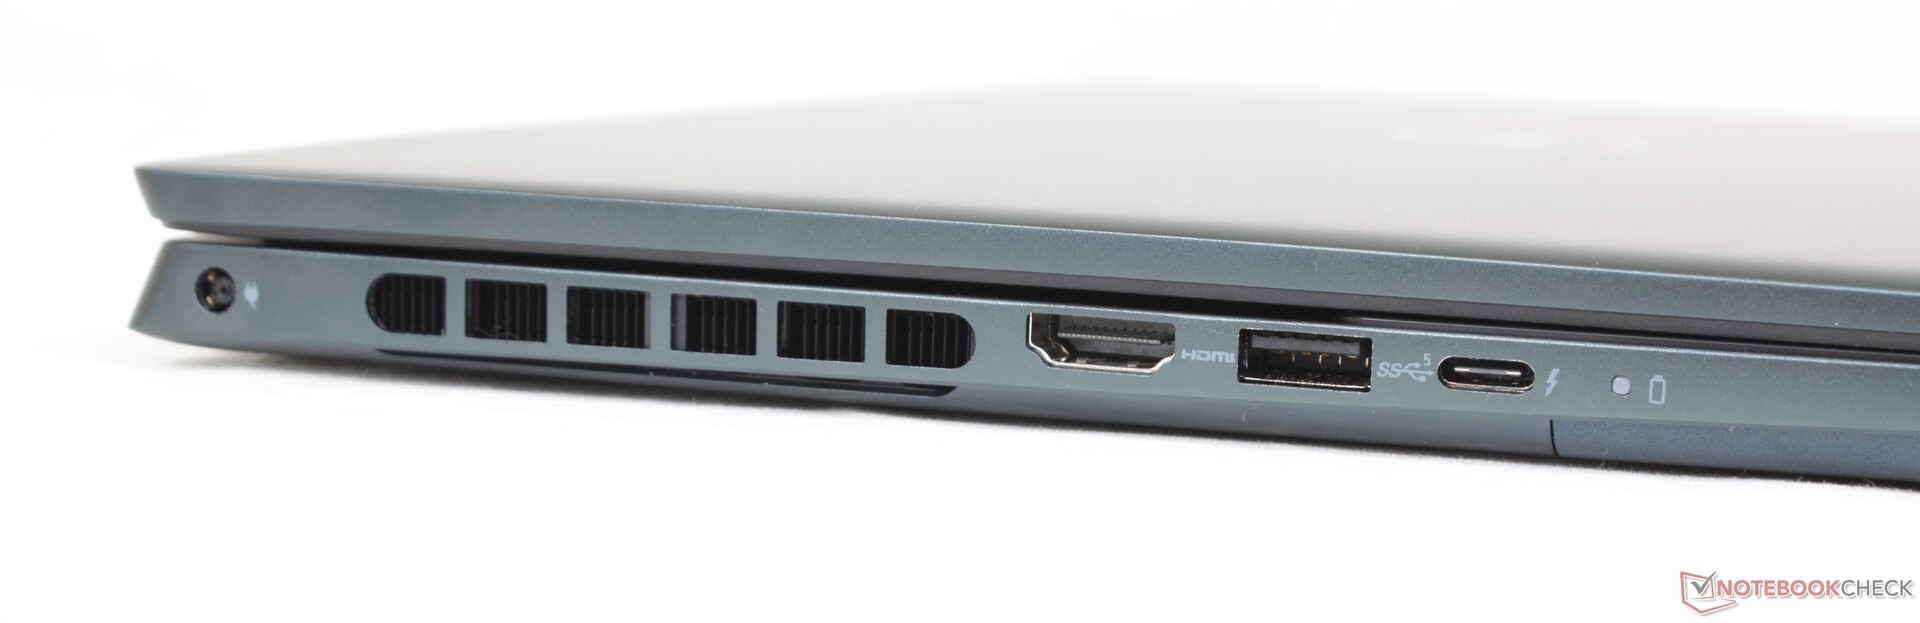
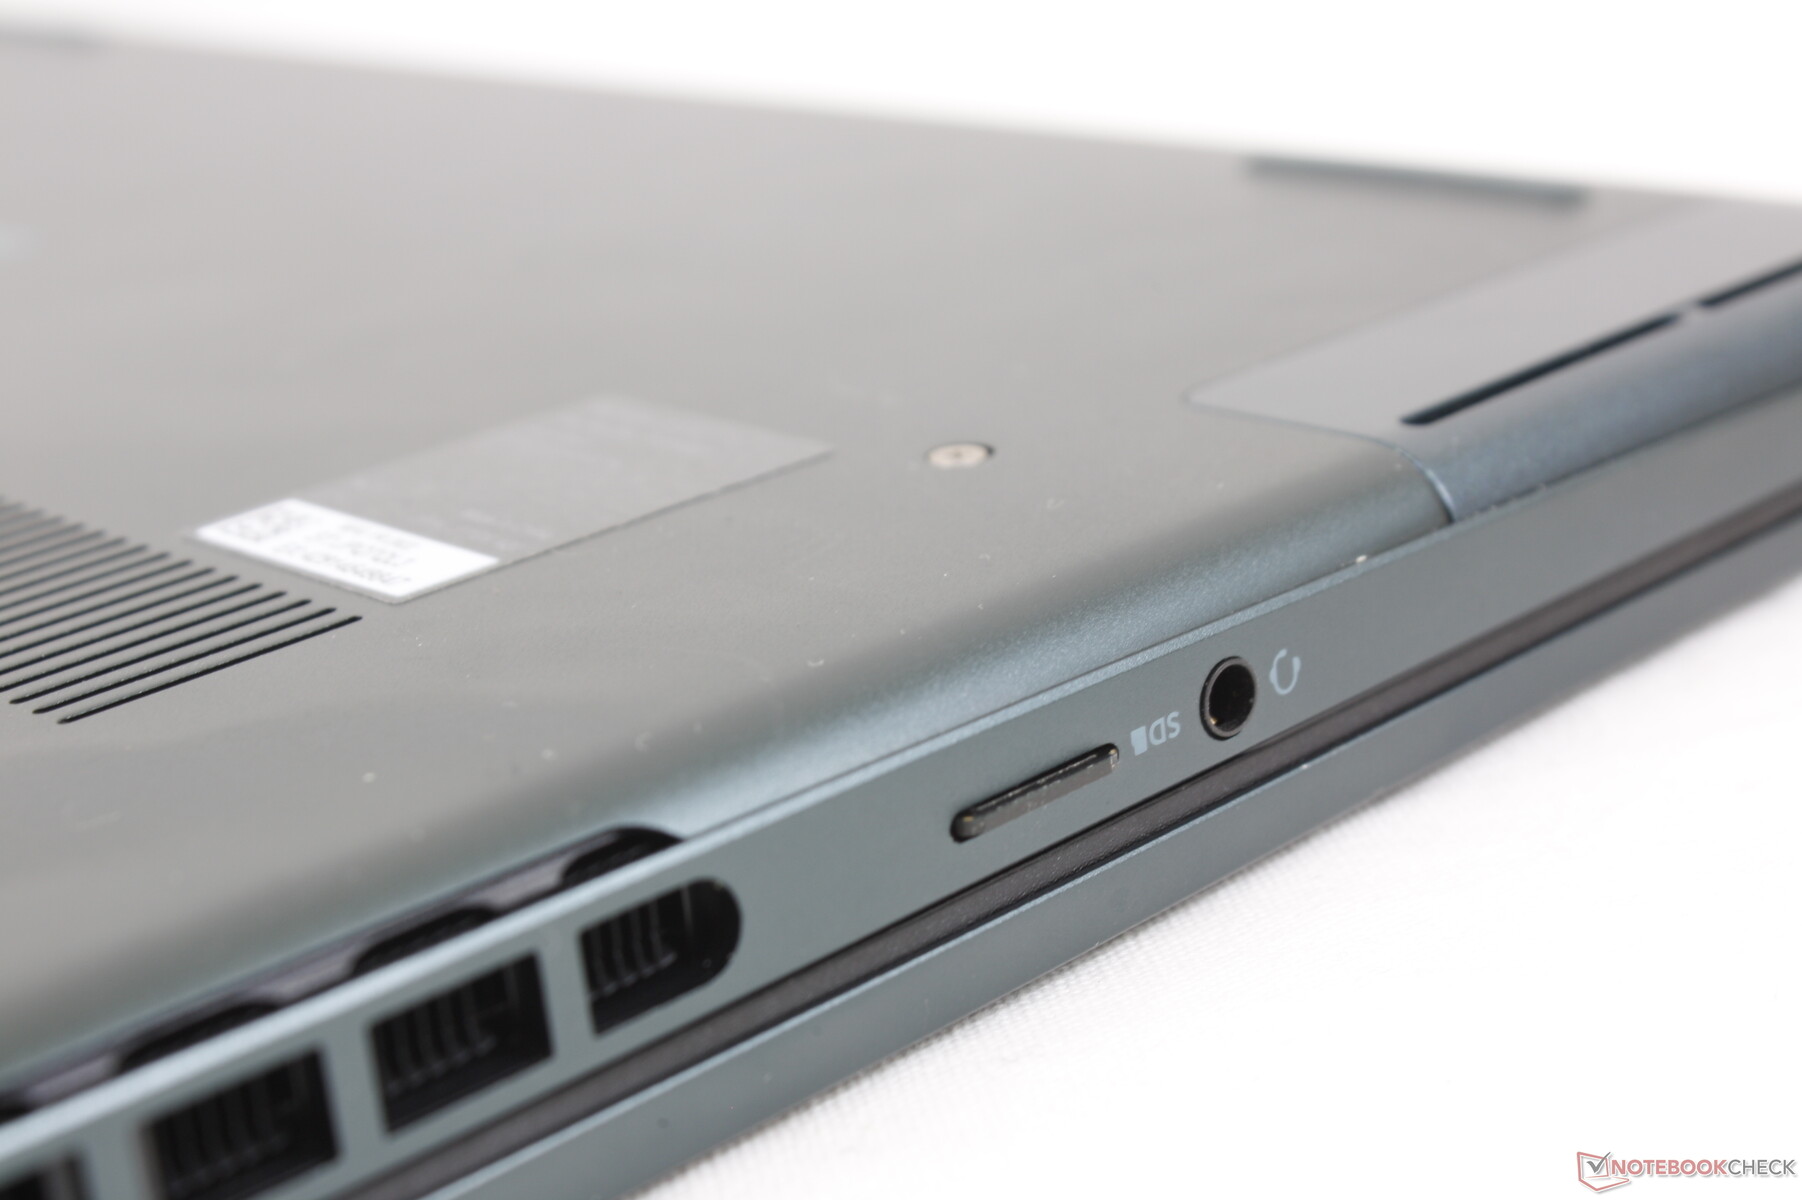
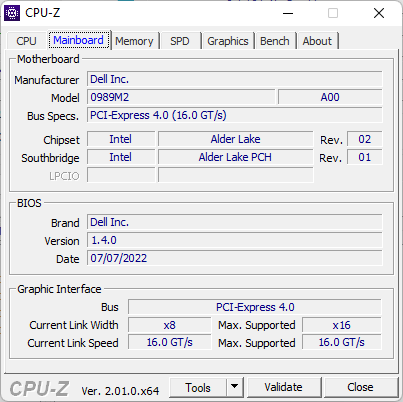
Conectividade - Suporte Thunderbolt 4
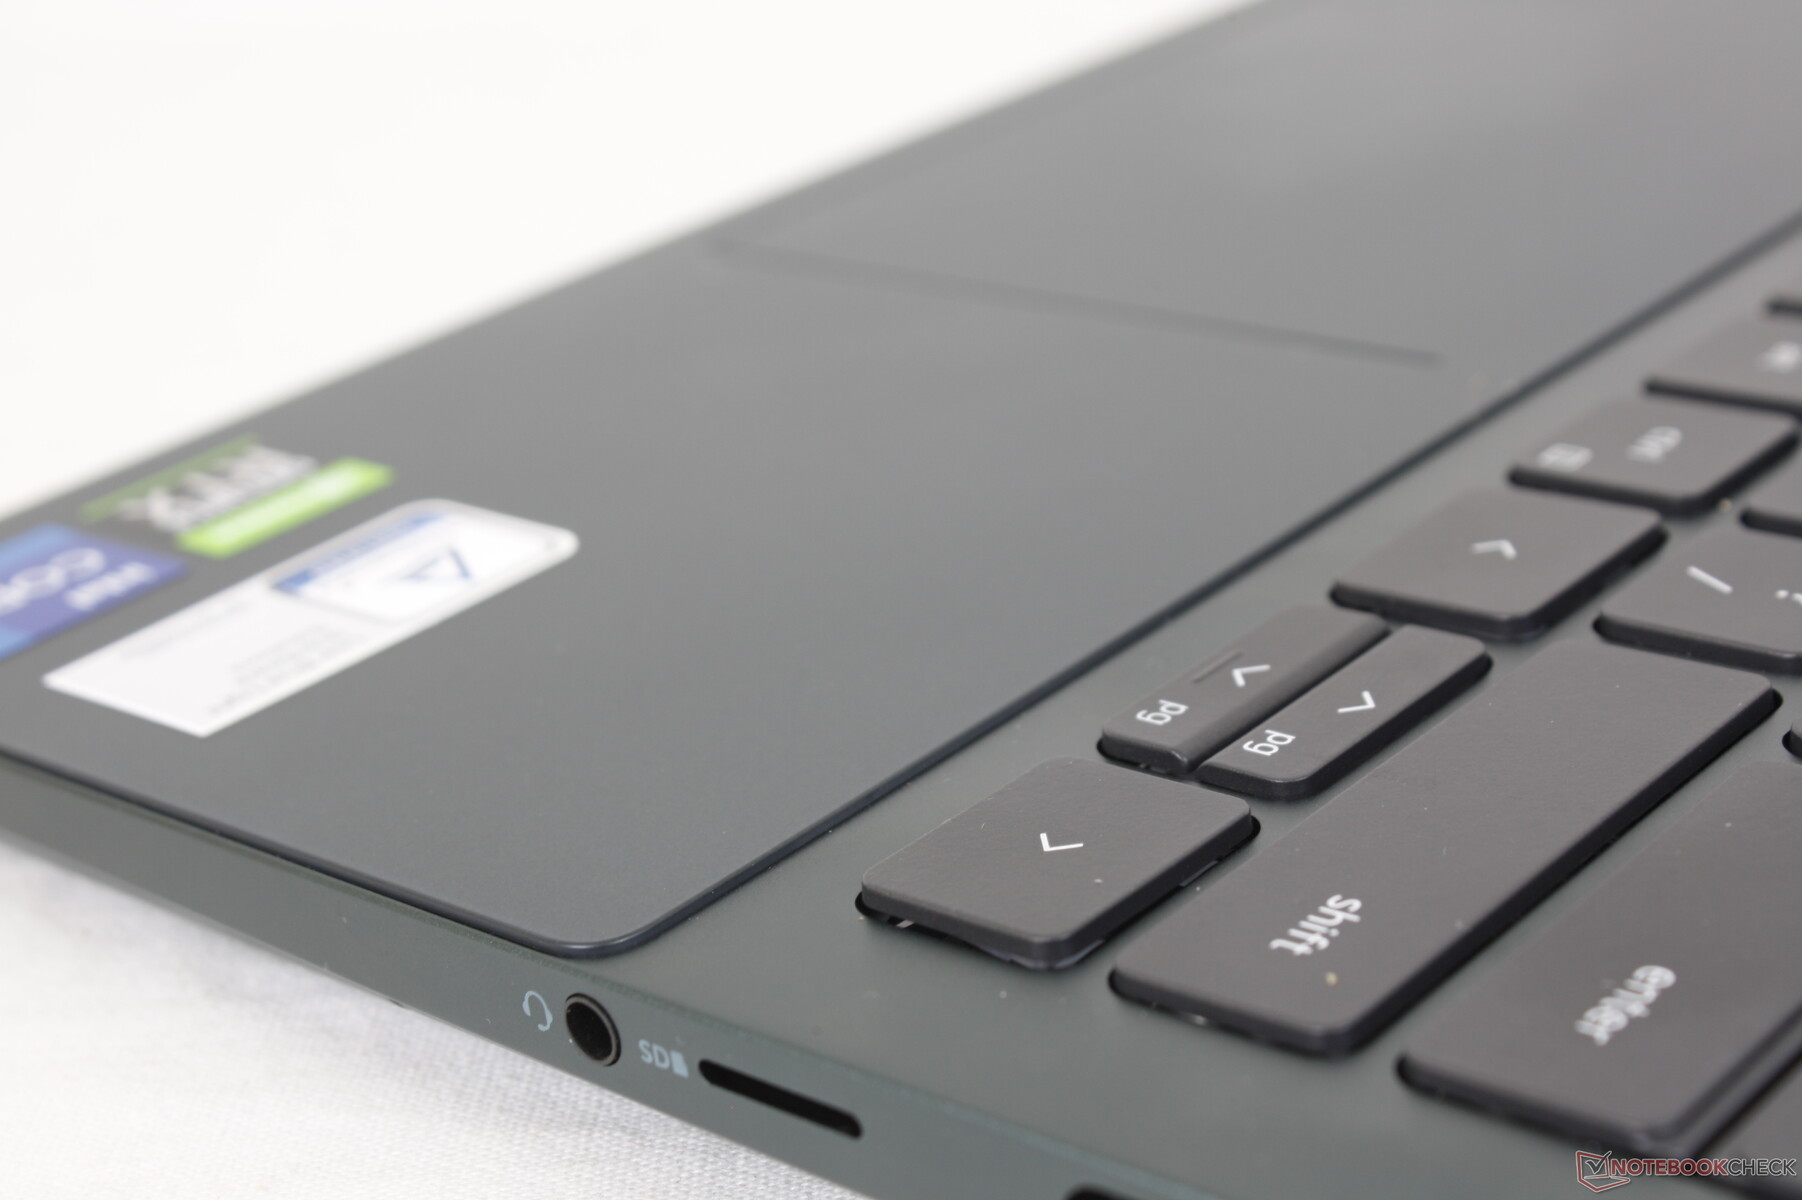
As opções de porta são idênticas ao Inspiron 16 Plus 7620, embora o leitor SD completo tenha sido trocado por um leitor microSD menor. Agradecemos o apoio ao Thunderbolt 4, pois nem o concorrente HP Pavilion Mais 14 nem Asus Vivobook Pro 14 OLED suportam Thunderbolt, apesar de possuírem portas USB-C.
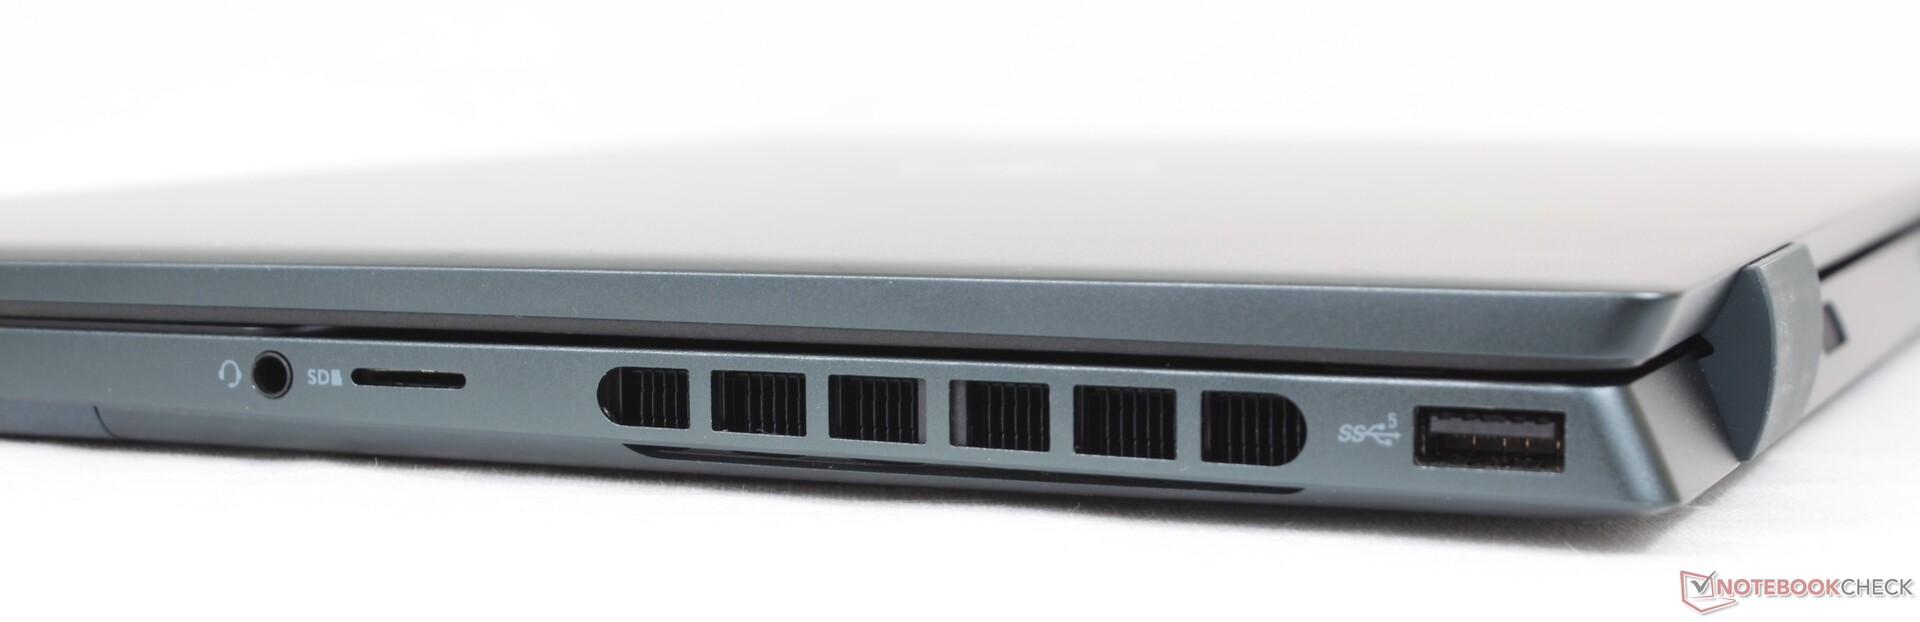
Leitor de cartões SD
As taxas de transferência do leitor MicroSD com mola integrada são lentas, muito parecidas com o que observamos no Inspiron 14 7420 2 em 1. A transferência de 1 GB de fotos de nossa placa de teste UHS-II para a área de trabalho leva cerca de 45 segundos.
| SD Card Reader | |
| average JPG Copy Test (av. of 3 runs) | |
| MSI Summit E14 A11SCS (AV Pro V60) | |
| Schenker Vision 14 (Angelbird AV Pro V60) | |
| HP Envy 14-eb0010nr (Toshiba Exceria Pro M501 microSDXC 32GB) | |
| Asus Zenbook 14X UX5400E (AV Pro SD microSD 128 GB V60) | |
| Asus Vivobook Pro 14 M3401QC-KM007T (AV Pro SD microSD 128 GB V60) | |
| Dell Inspiron 14 Plus 7420 (AV PRO microSD 128 GB V60) | |
| Dell Inspiron 14 7420 2-in-1 (Toshiba Exceria Pro SDXC 64 GB UHS-II) | |
| maximum AS SSD Seq Read Test (1GB) | |
| MSI Summit E14 A11SCS (AV Pro V60) | |
| Schenker Vision 14 (Angelbird AV Pro V60) | |
| HP Envy 14-eb0010nr (Toshiba Exceria Pro M501 microSDXC 32GB) | |
| Asus Zenbook 14X UX5400E (AV Pro SD microSD 128 GB V60) | |
| Asus Vivobook Pro 14 M3401QC-KM007T (AV Pro SD microSD 128 GB V60) | |
| Dell Inspiron 14 Plus 7420 (AV PRO microSD 128 GB V60) | |
| Dell Inspiron 14 7420 2-in-1 (Toshiba Exceria Pro SDXC 64 GB UHS-II) | |
Comunicação
Um Intel AX211 vem como padrão para conectividade Wi-Fi 6E e Bluetooth 5.2. Embora não tenhamos tido problemas quando emparelhados com nossa rede de 6 GHz, as taxas de transmissão seriam um pouco mais instáveis do que as taxas de recepção, como mostra o gráfico abaixo.
| Networking | |
| iperf3 transmit AX12 | |
| Schenker Vision 14 | |
| HP Envy 14-eb0010nr | |
| MSI Summit E14 A11SCS | |
| Asus Zenbook 14X UX5400E | |
| iperf3 receive AX12 | |
| Schenker Vision 14 | |
| MSI Summit E14 A11SCS | |
| HP Envy 14-eb0010nr | |
| Asus Zenbook 14X UX5400E | |
| iperf3 receive AXE11000 6GHz | |
| Dell Inspiron 14 Plus 7420 | |
| Dell Inspiron 14 7420 2-in-1 | |
| Asus Vivobook Pro 14 M3401QC-KM007T | |
| iperf3 transmit AXE11000 6GHz | |
| Dell Inspiron 14 Plus 7420 | |
| Dell Inspiron 14 7420 2-in-1 | |
| Asus Vivobook Pro 14 M3401QC-KM007T | |
Webcam
a webcam de 2 MP oferece uma qualidade de imagem similar à da webcam de 2 MP no Inspiron 14 7420 2 em 1 padrão. Um obturador de privacidade física vem padrão enquanto o Windows Hello e IR não são suportados.


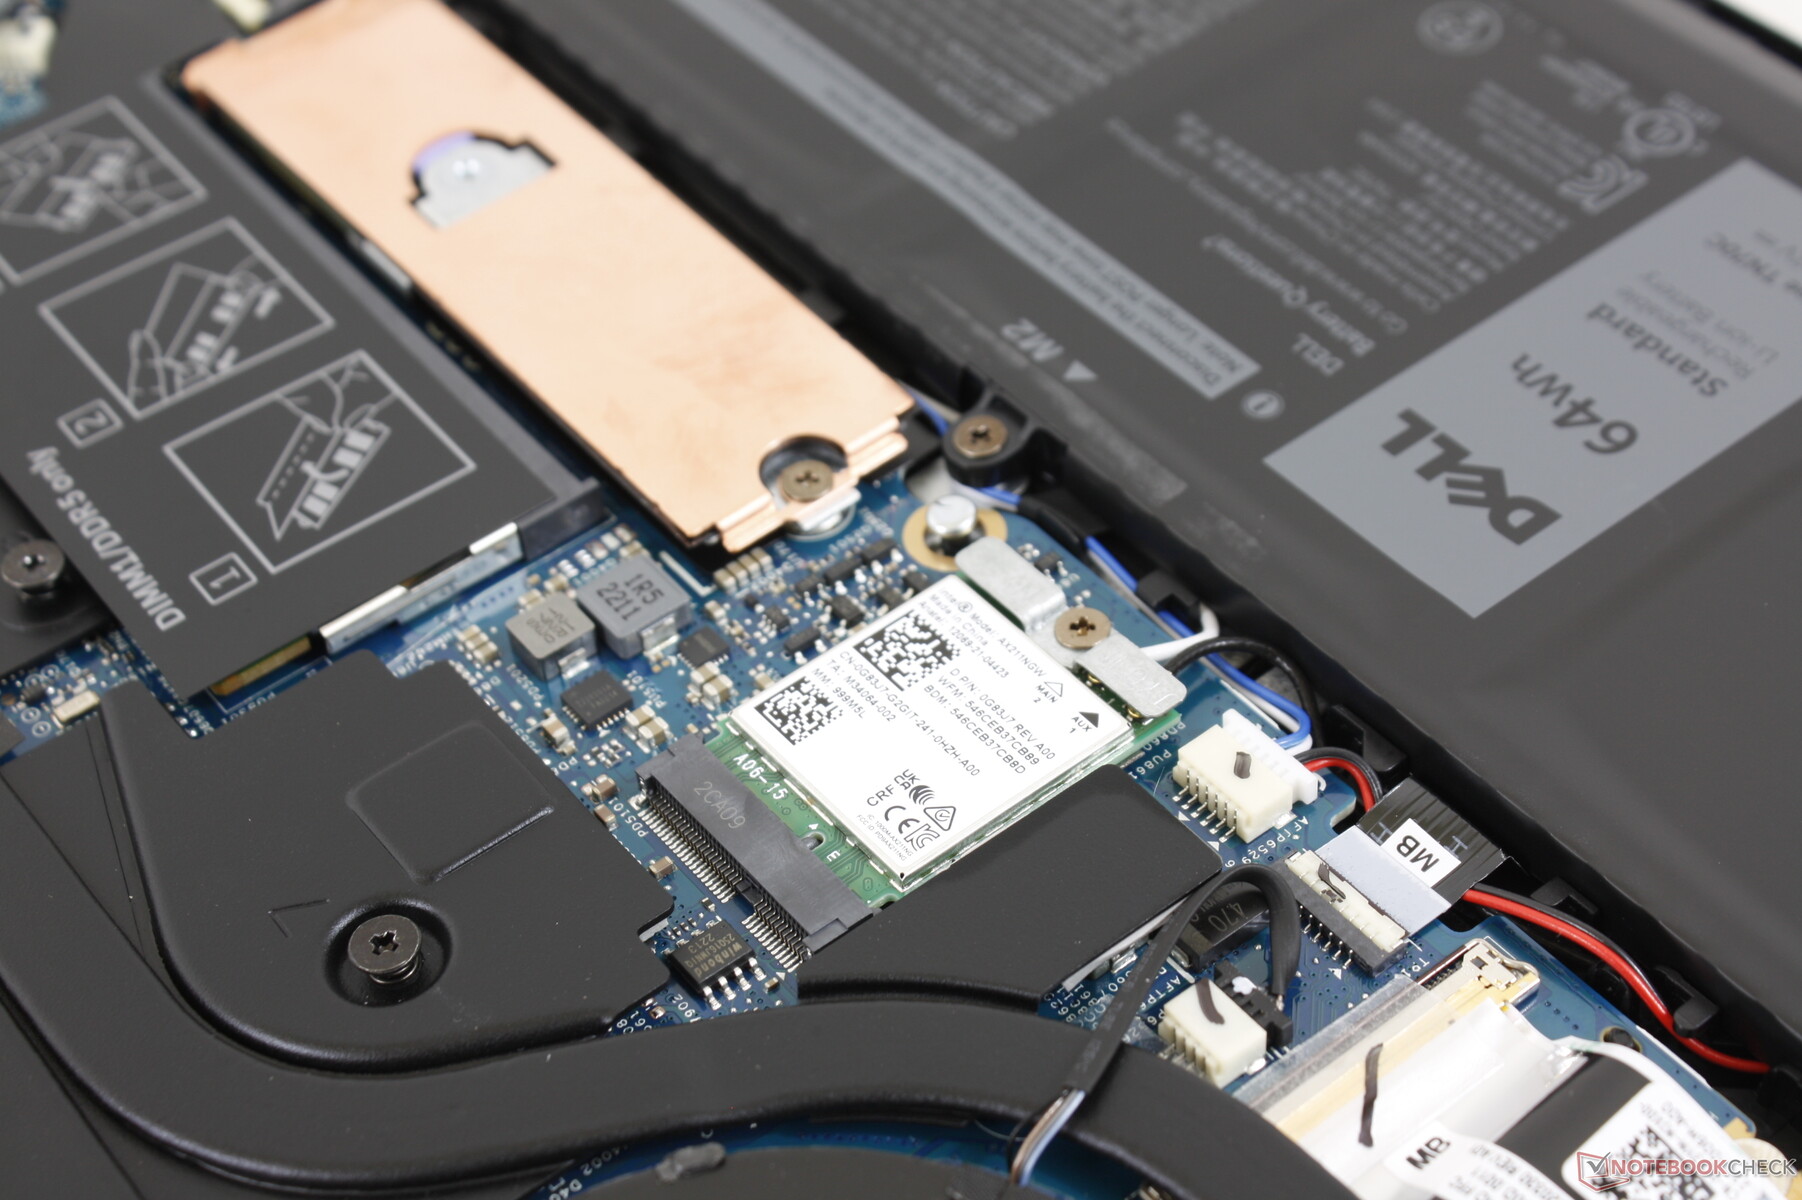
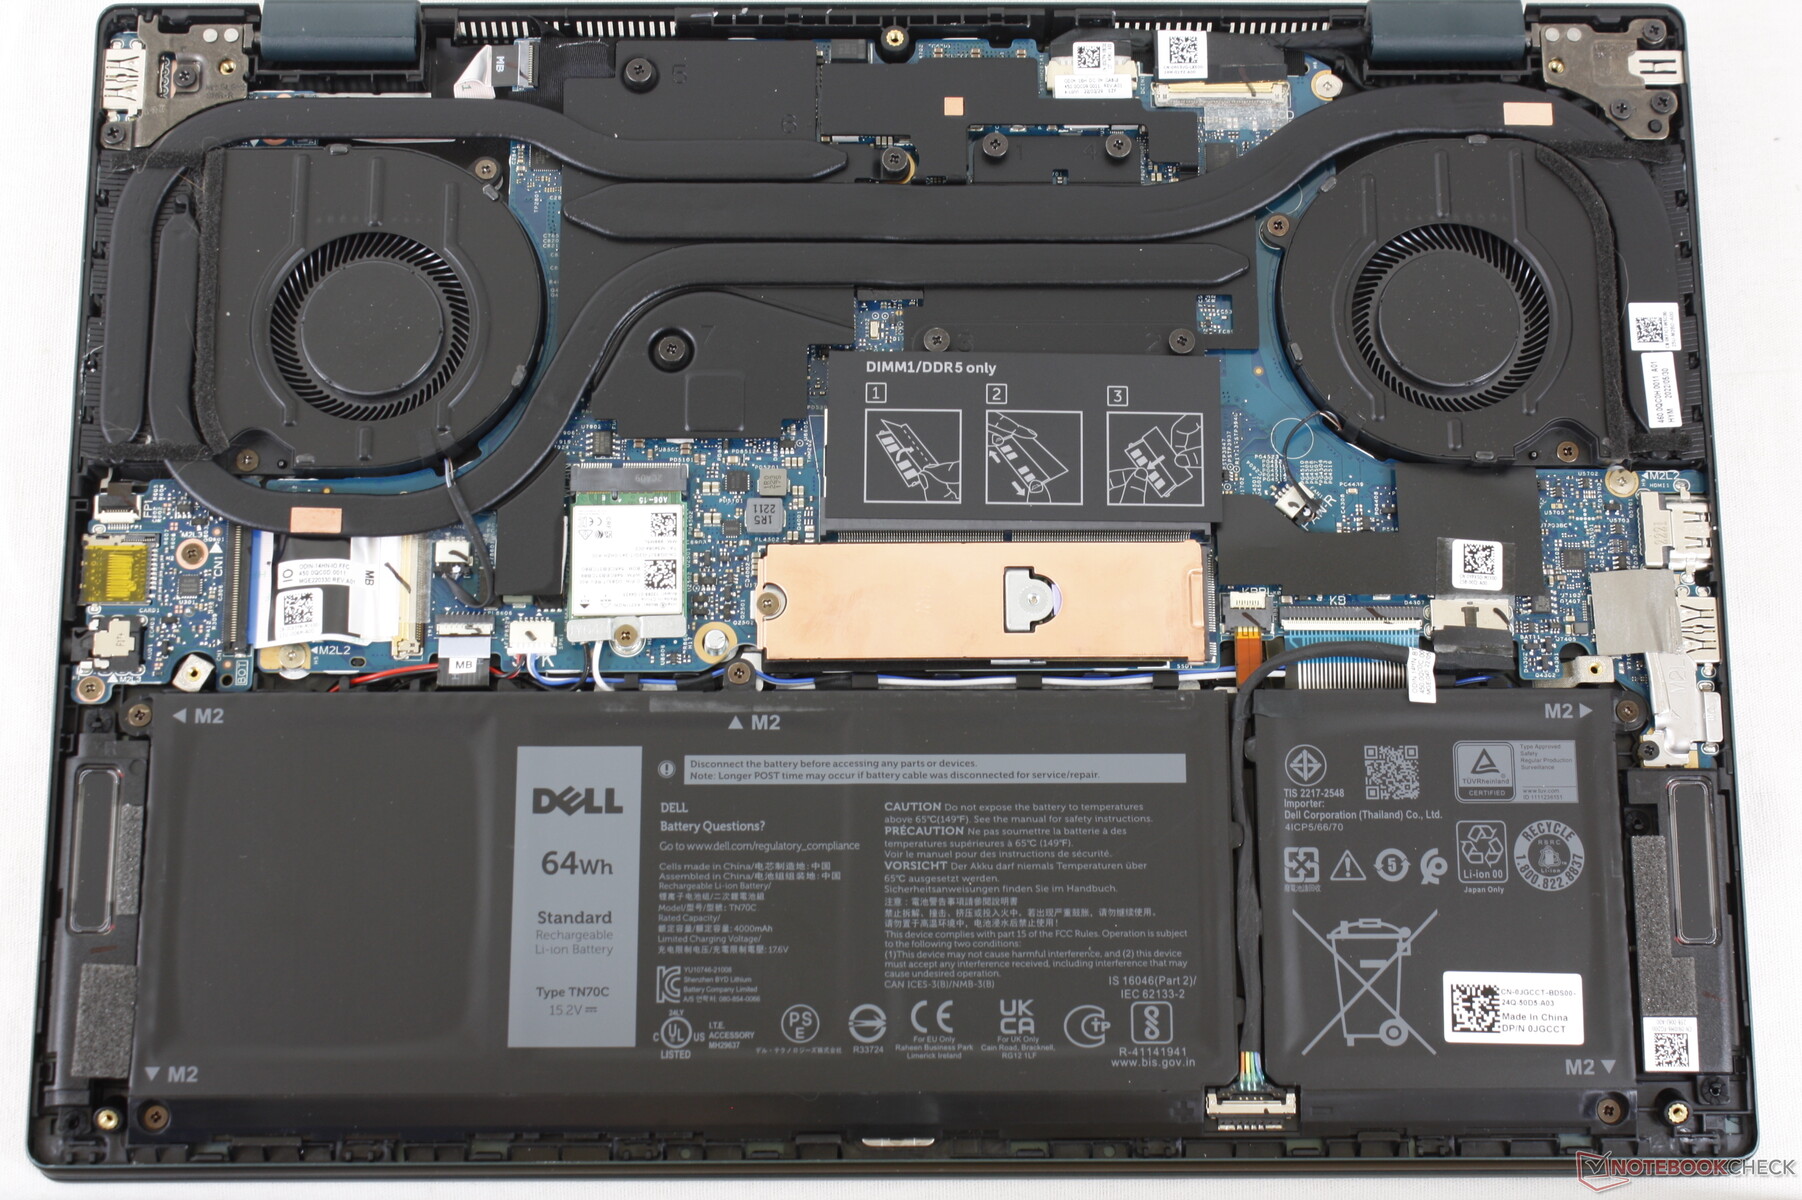
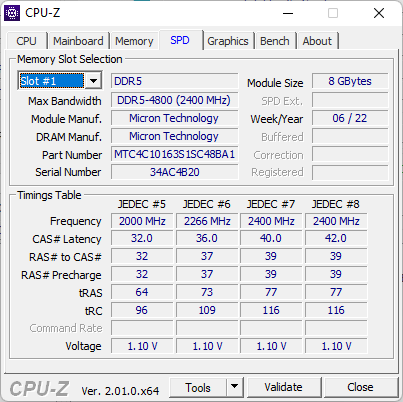
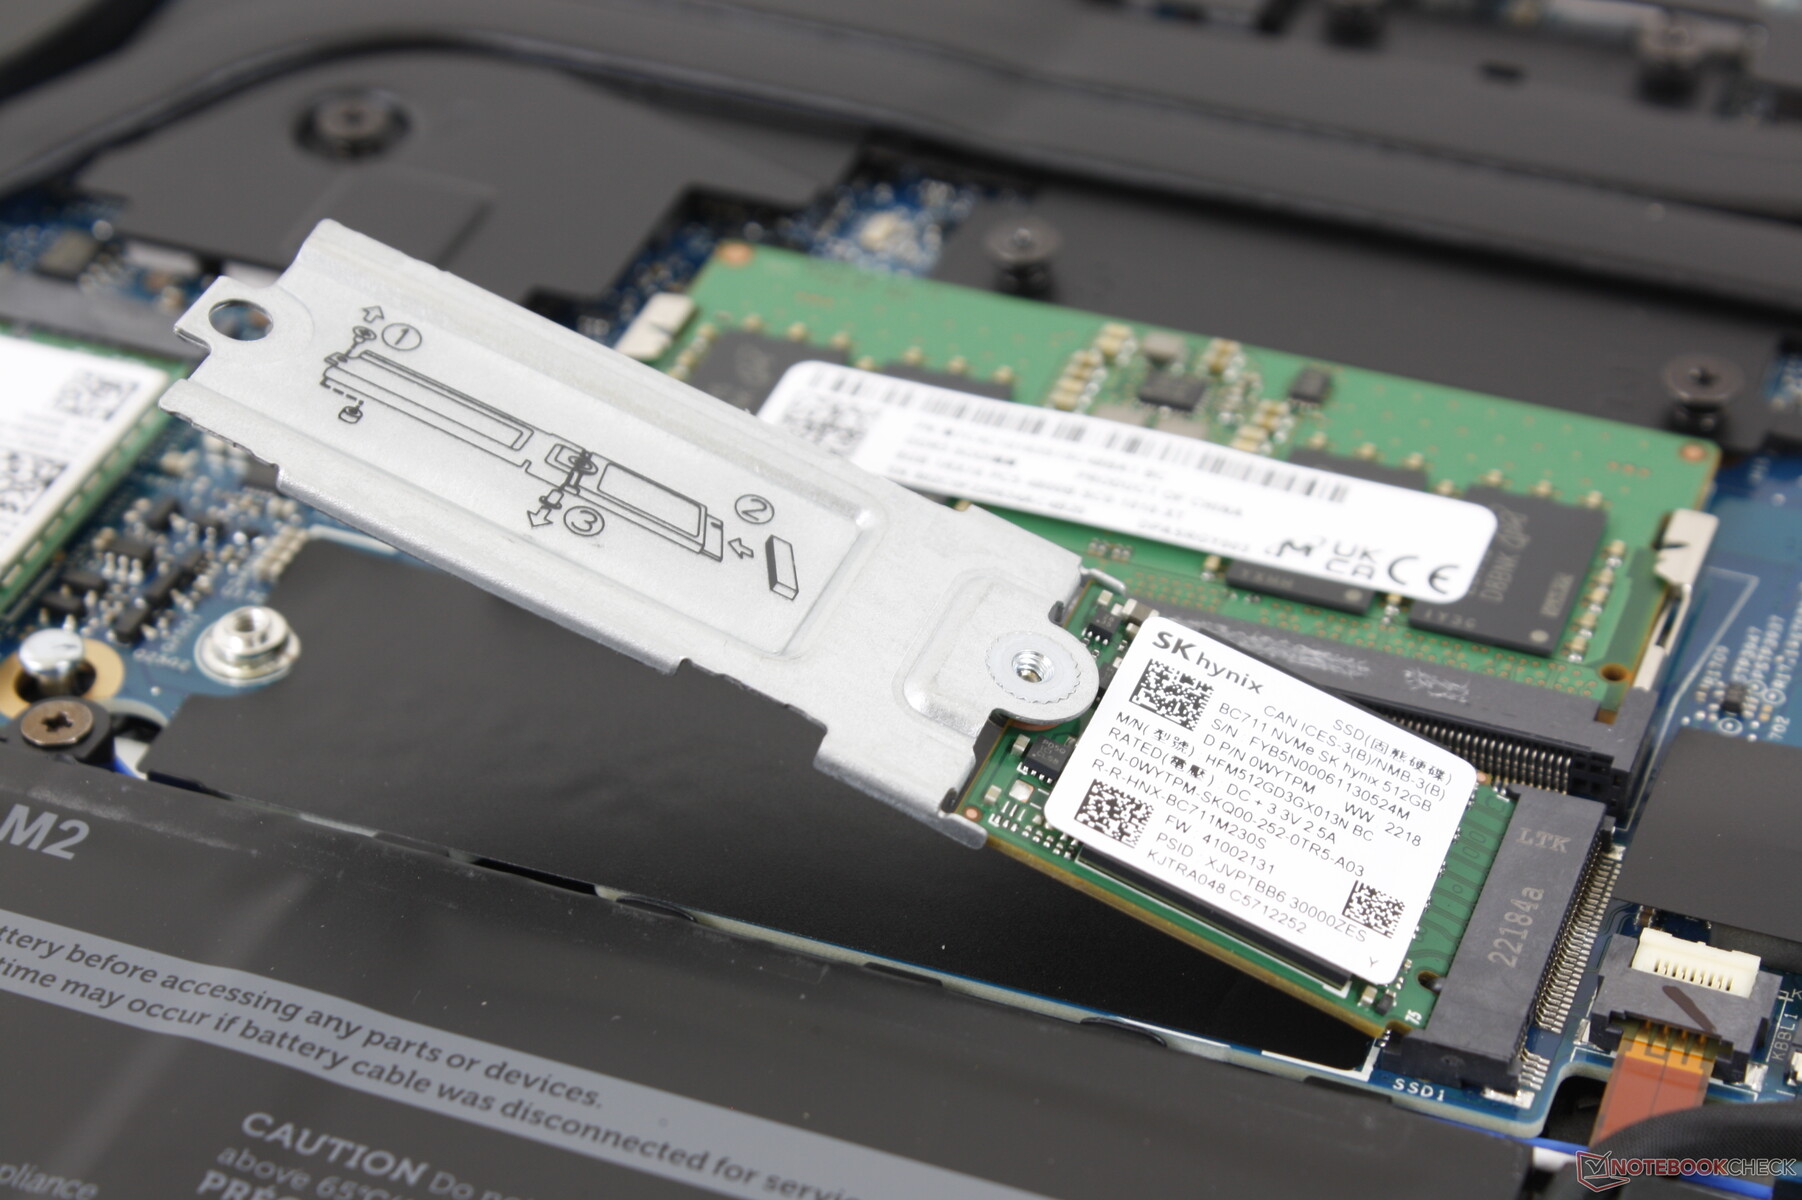
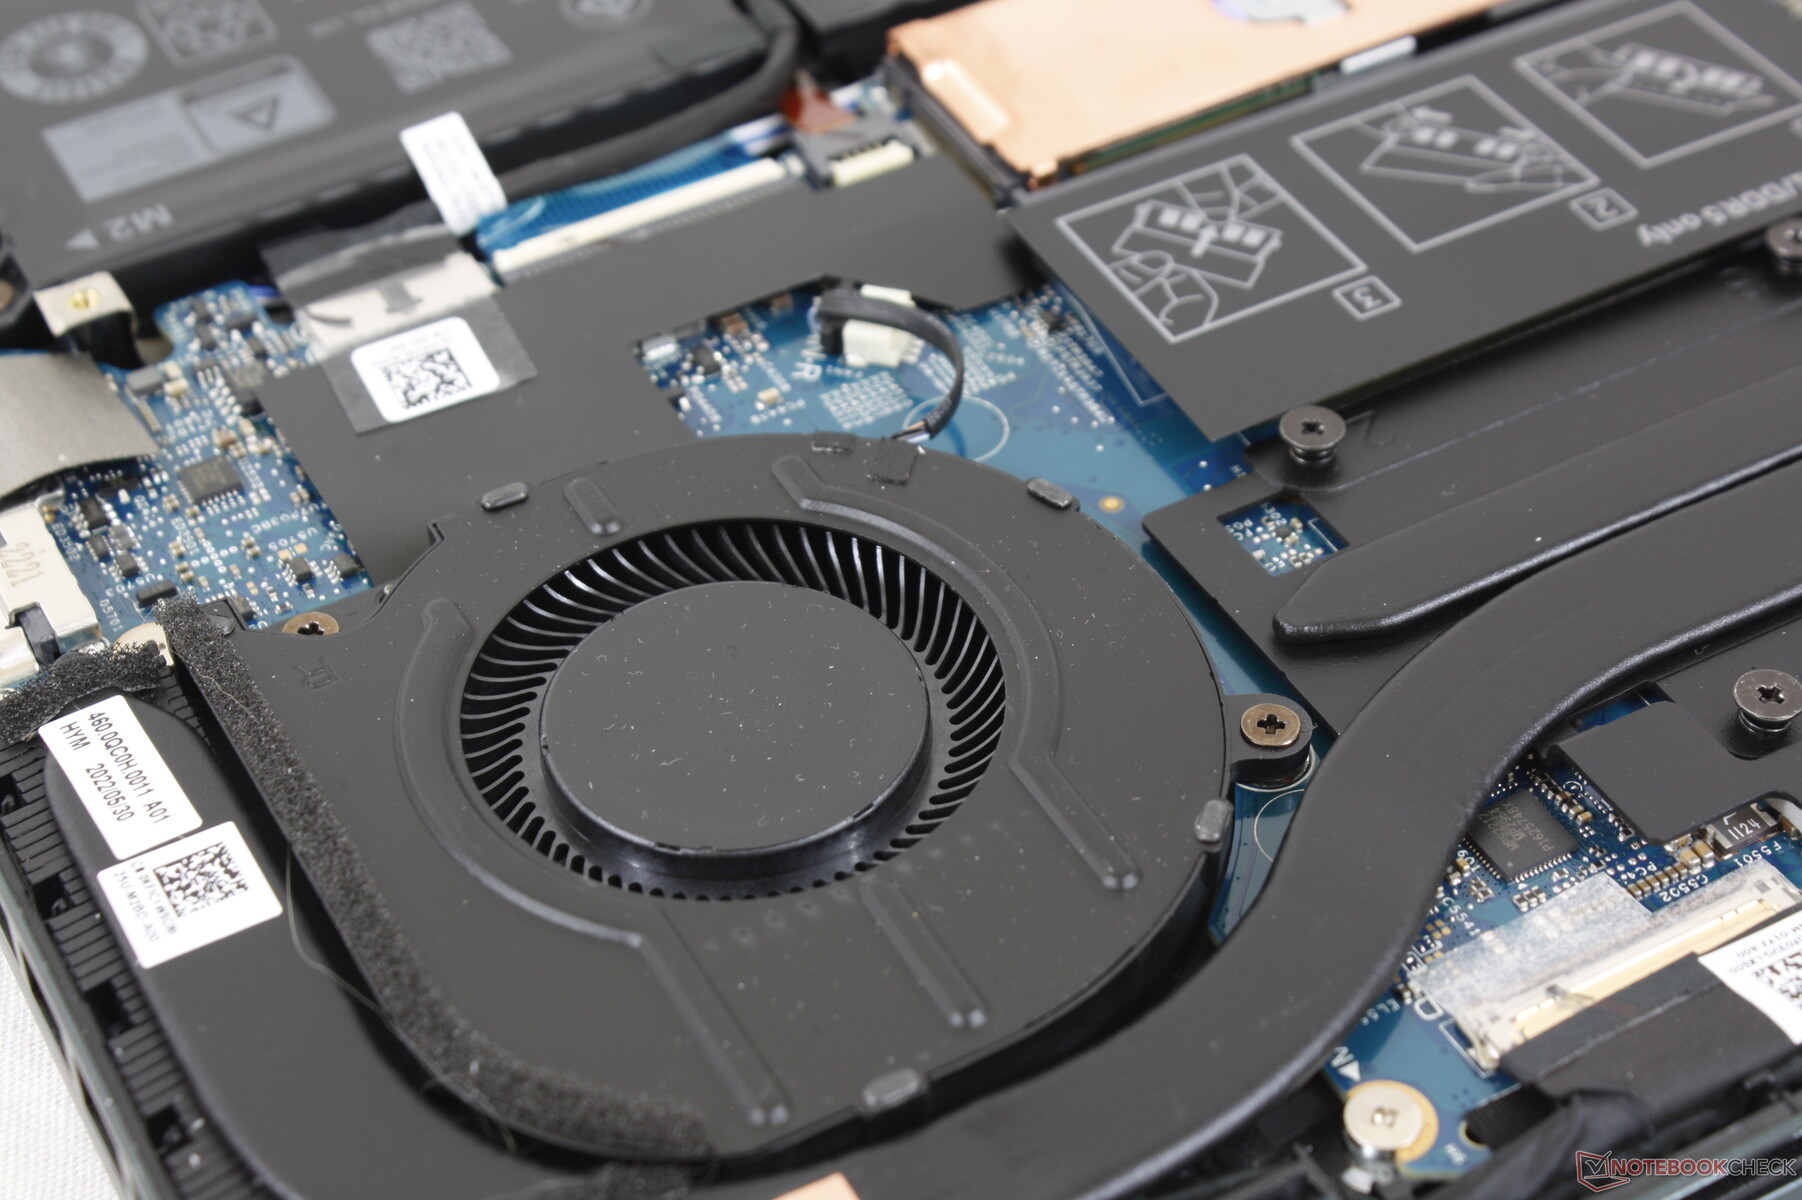
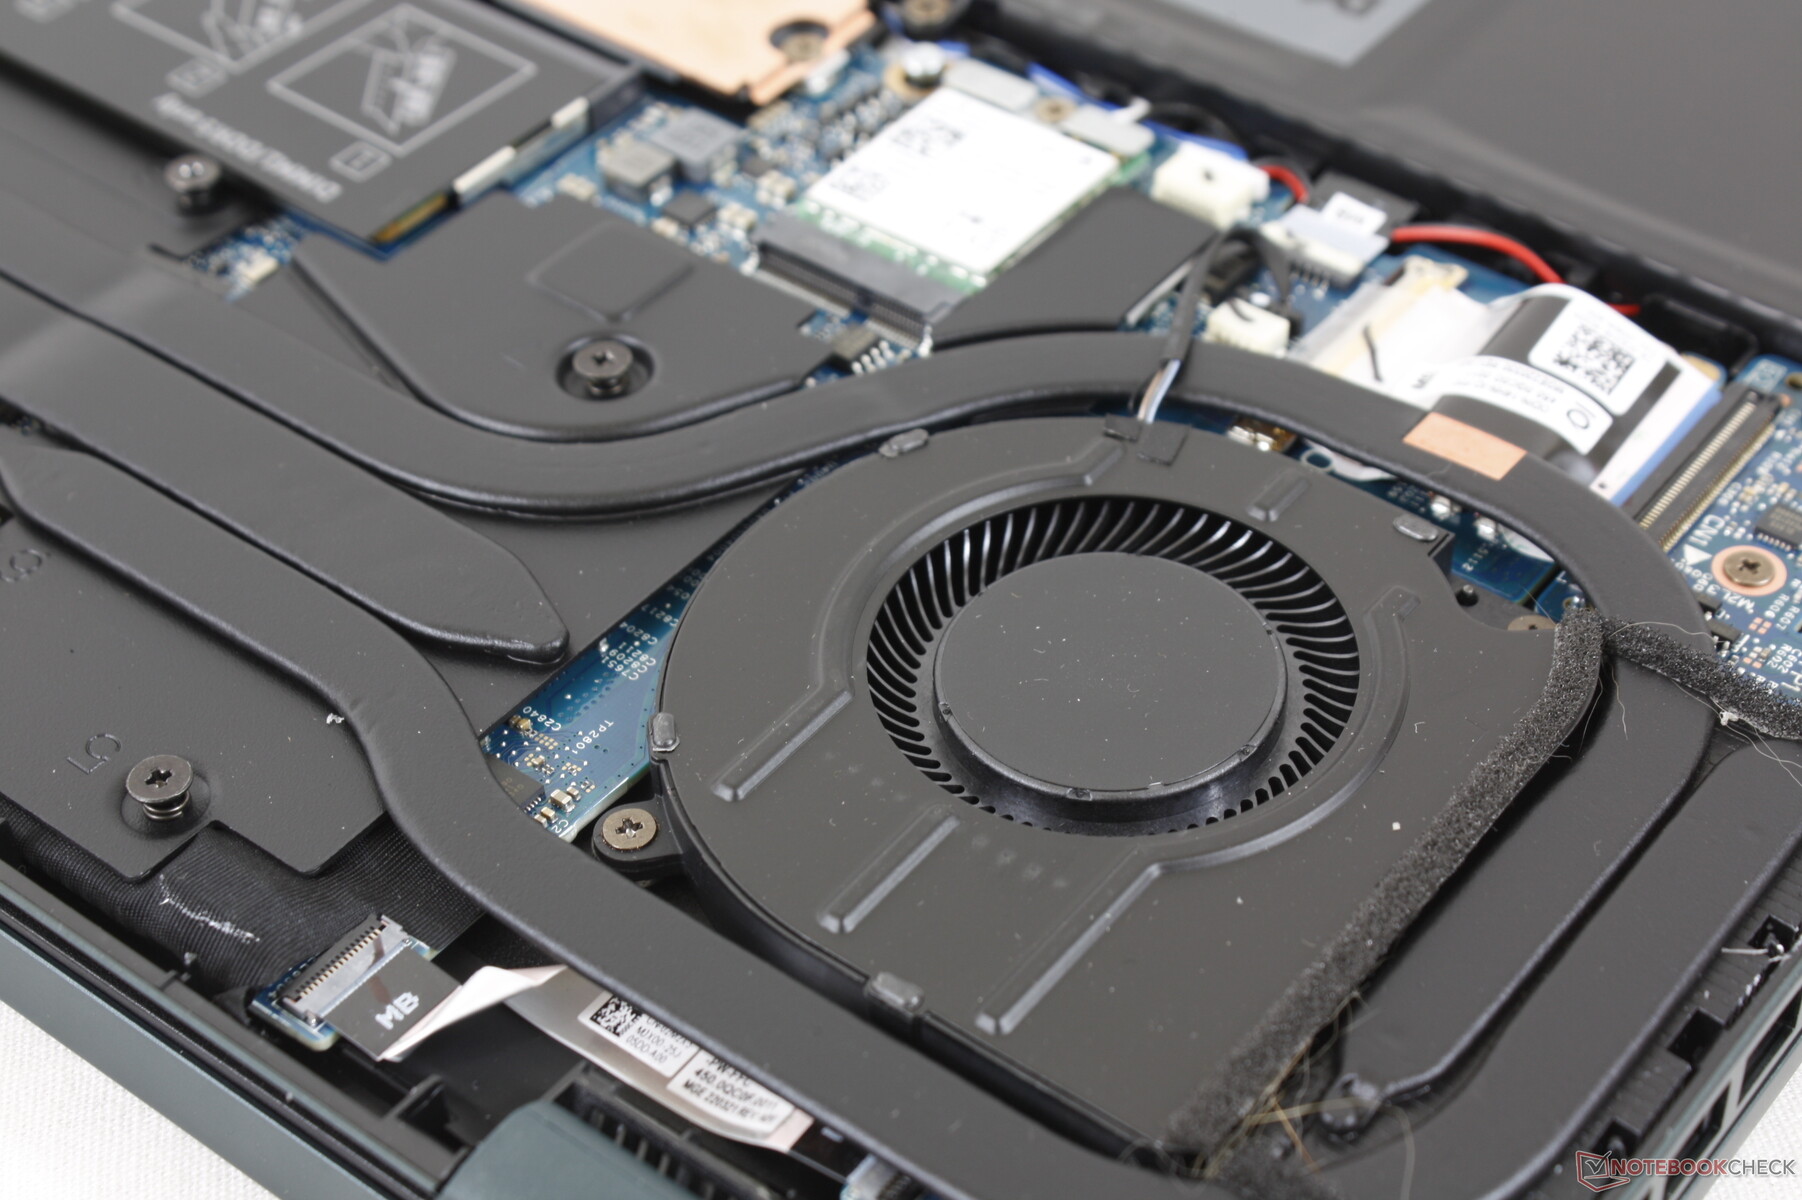
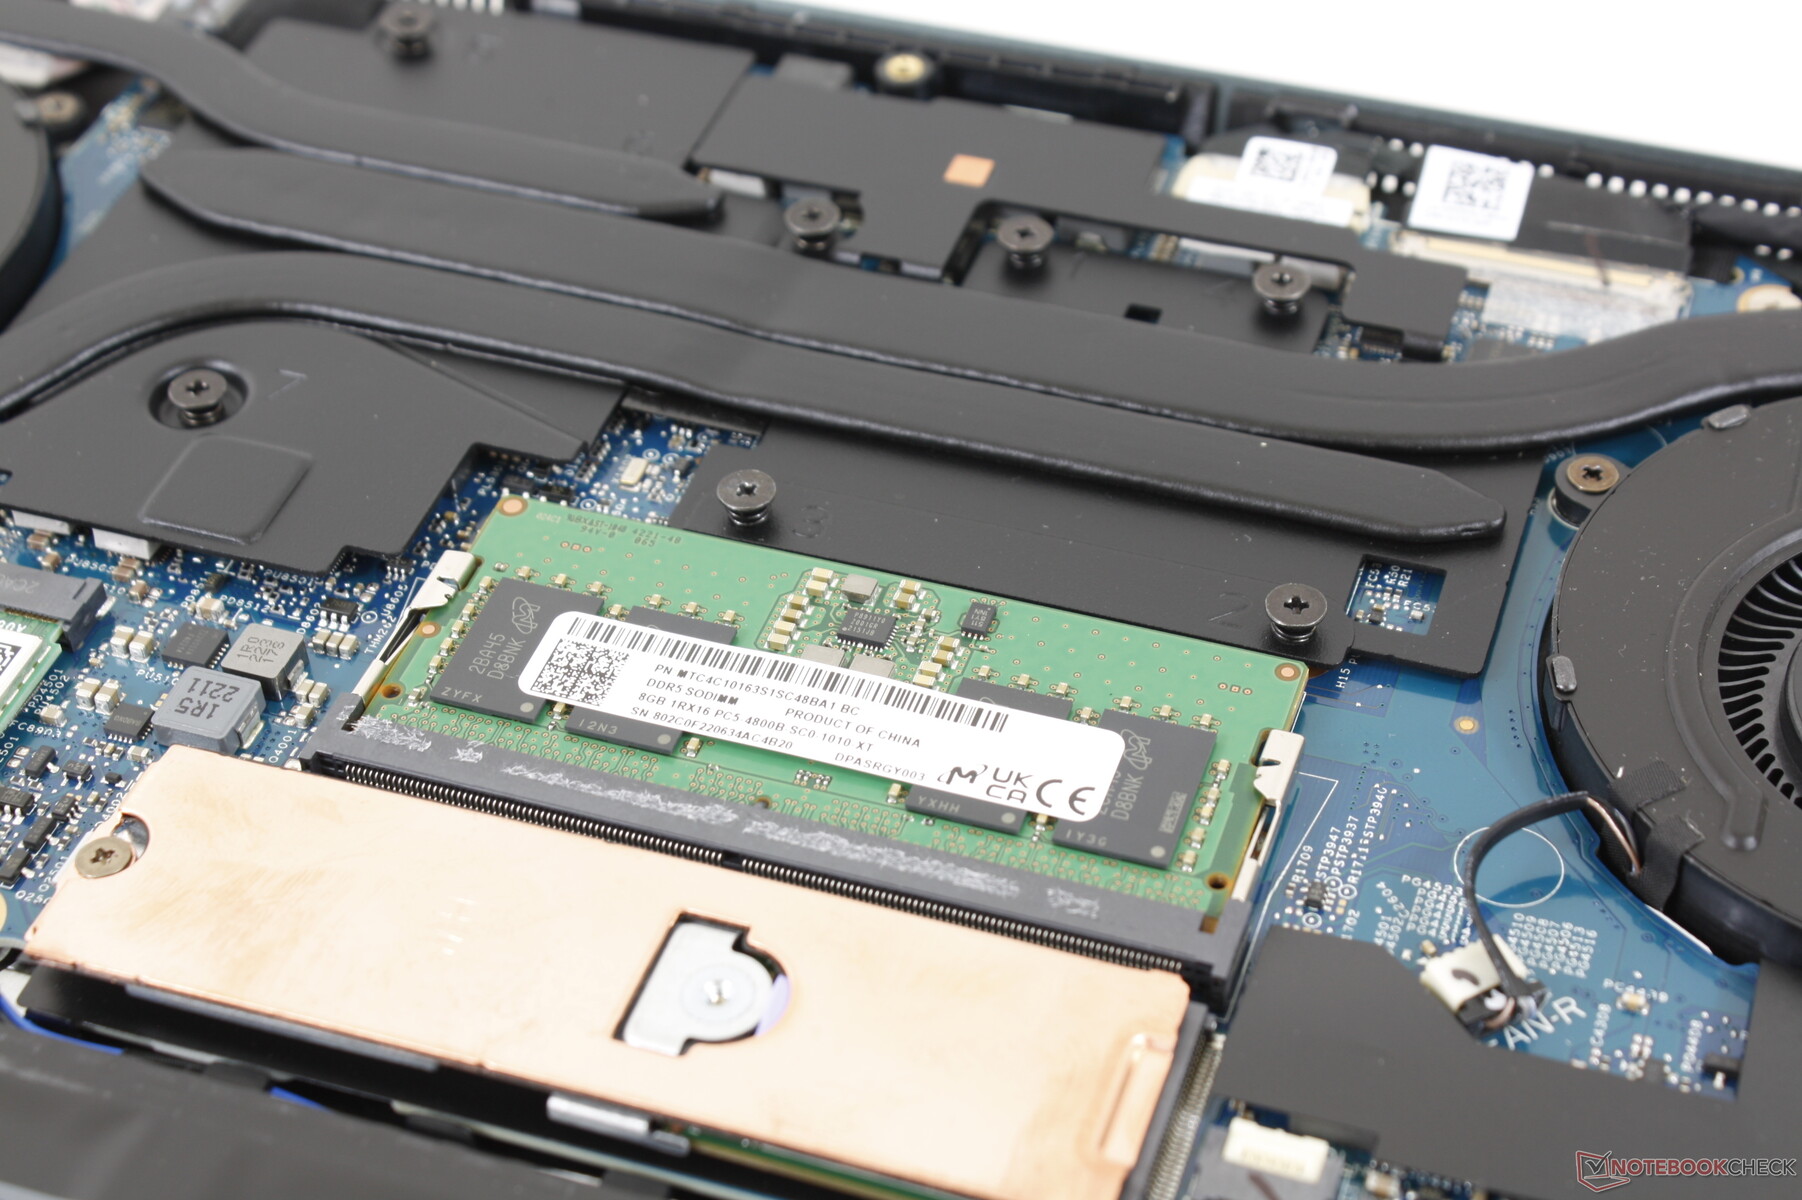
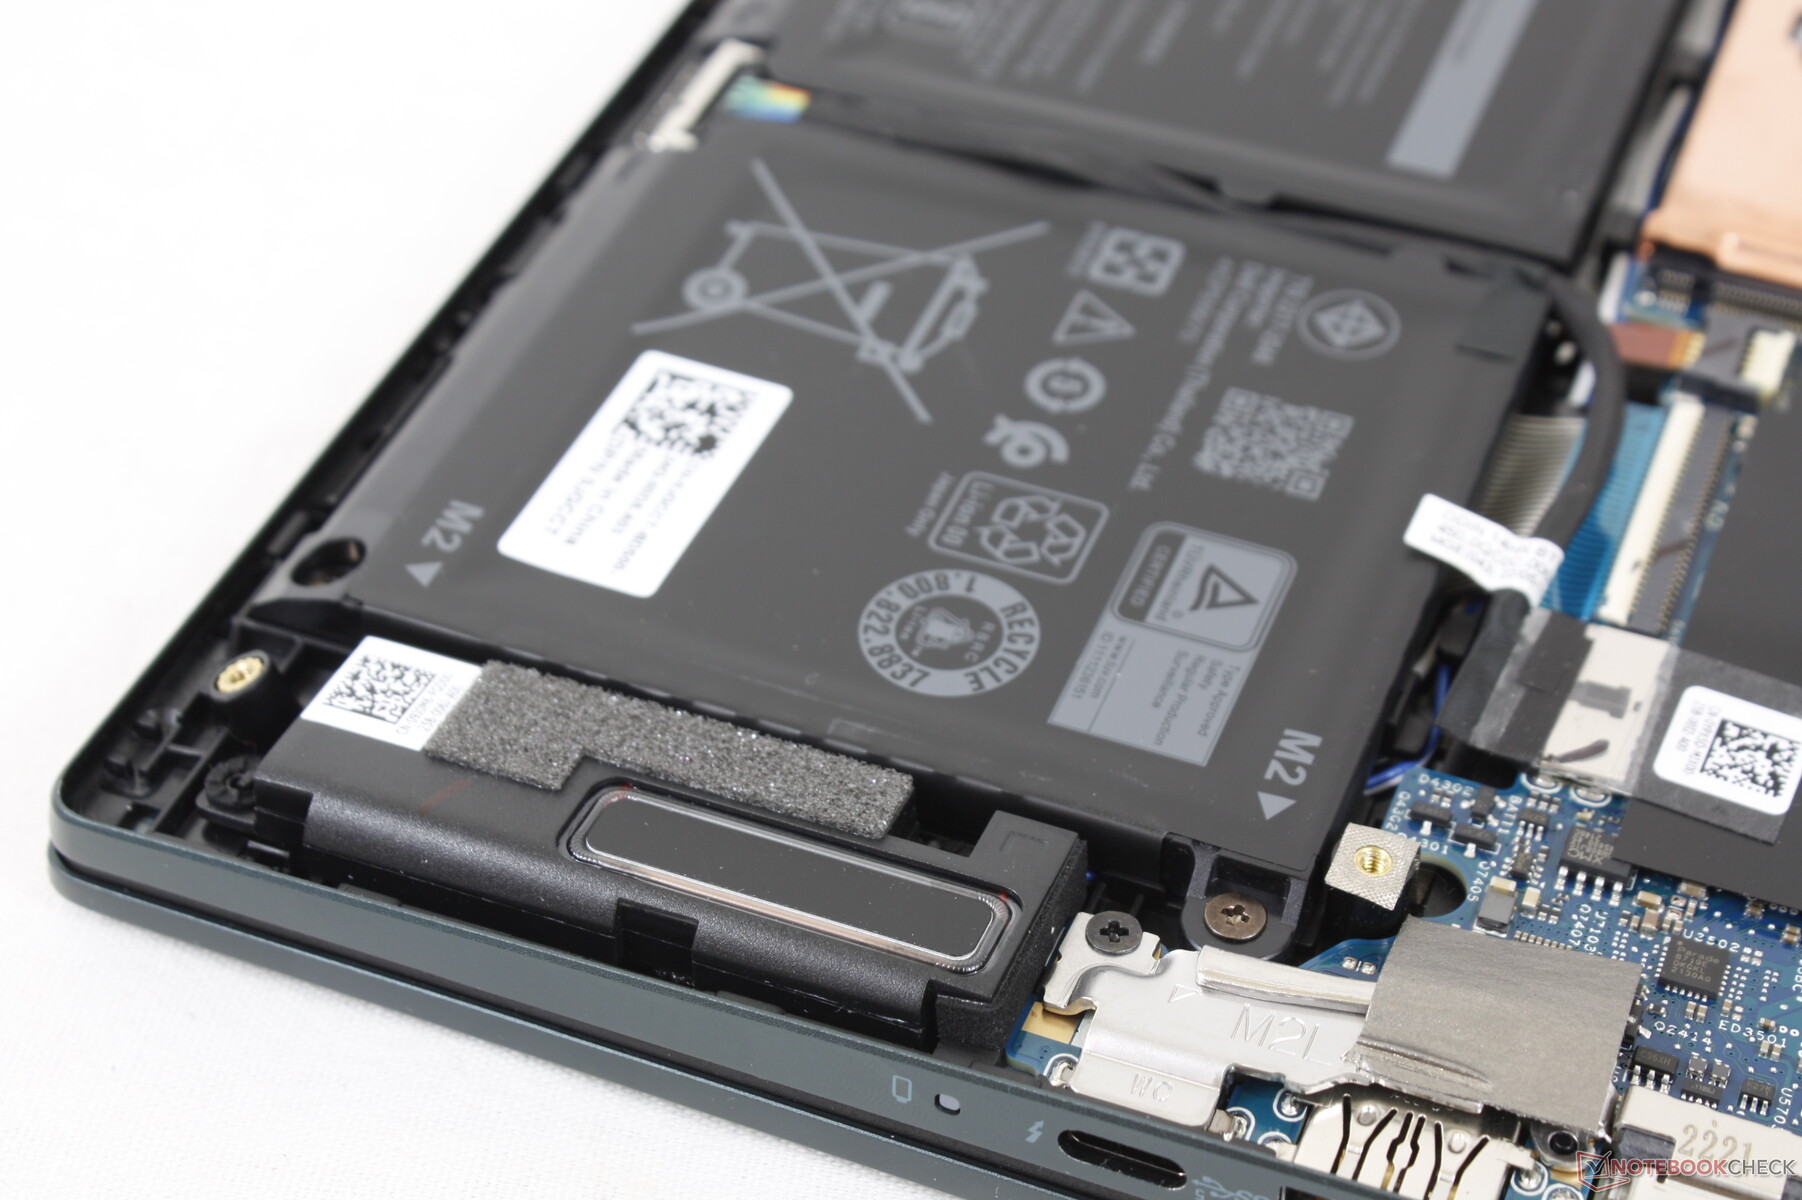
Manutenção
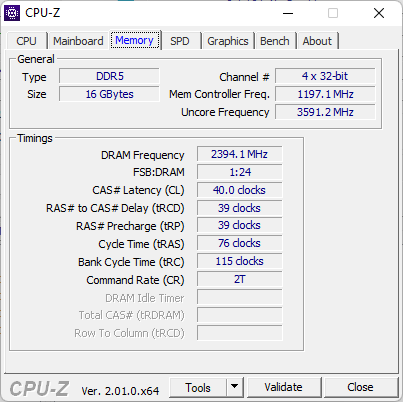
O painel inferior se solta com bastante facilidade com uma chave de fenda Philips e uma borda de plástico afiada. Uma vez dentro, os usuários podem reparar a bateria, 1x M.2 2280 slot de armazenamento, 1x slot DDR5 SODIMM, e módulo M.2 WLAN. Note que 8 GB de RAM vêm soldados em todas as SKUs, o que significa que os usuários podem adicionar apenas um único módulo para uma capacidade máxima de RAM de 40 GB.
Acessórios e Garantia
Não há extras na caixa além do adaptador AC e da papelada. A habitual garantia limitada de um ano aplica-se se comprada nos EUA.
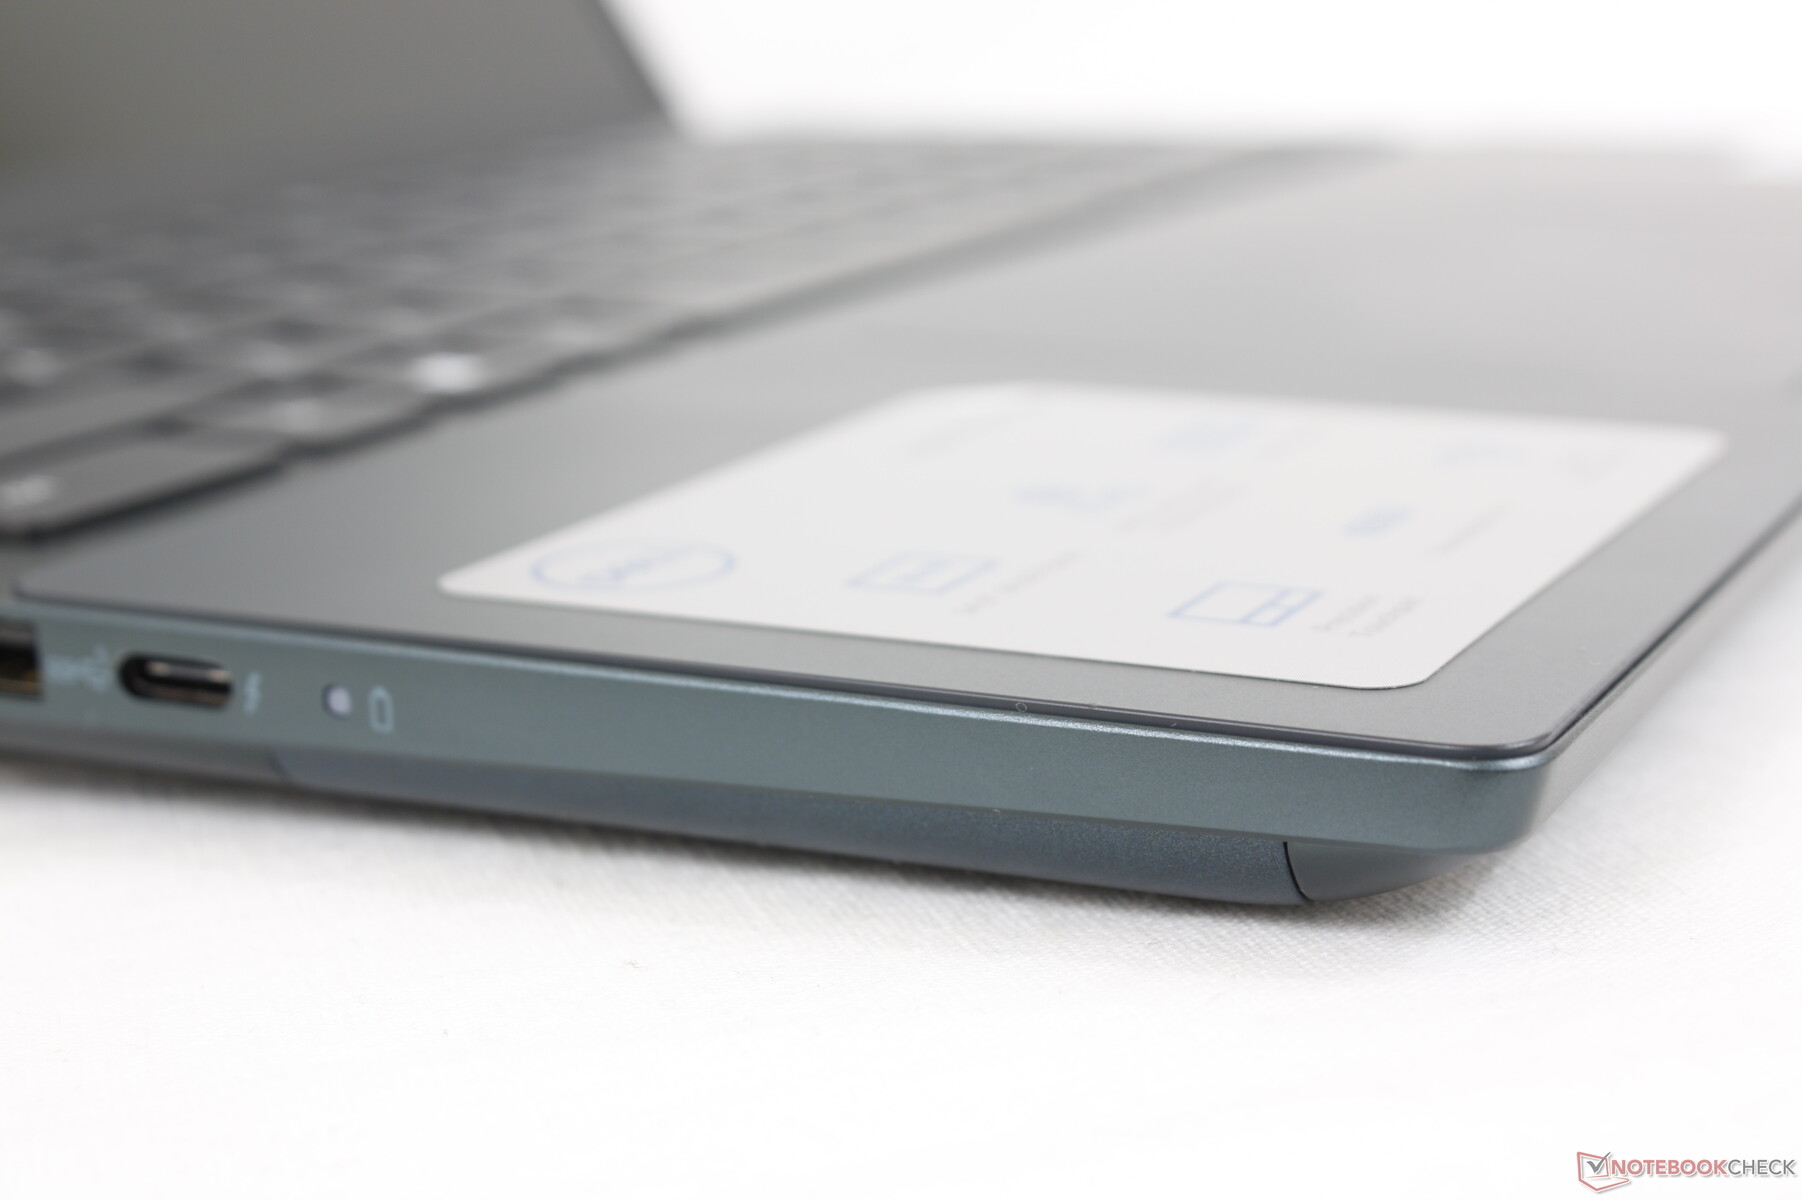
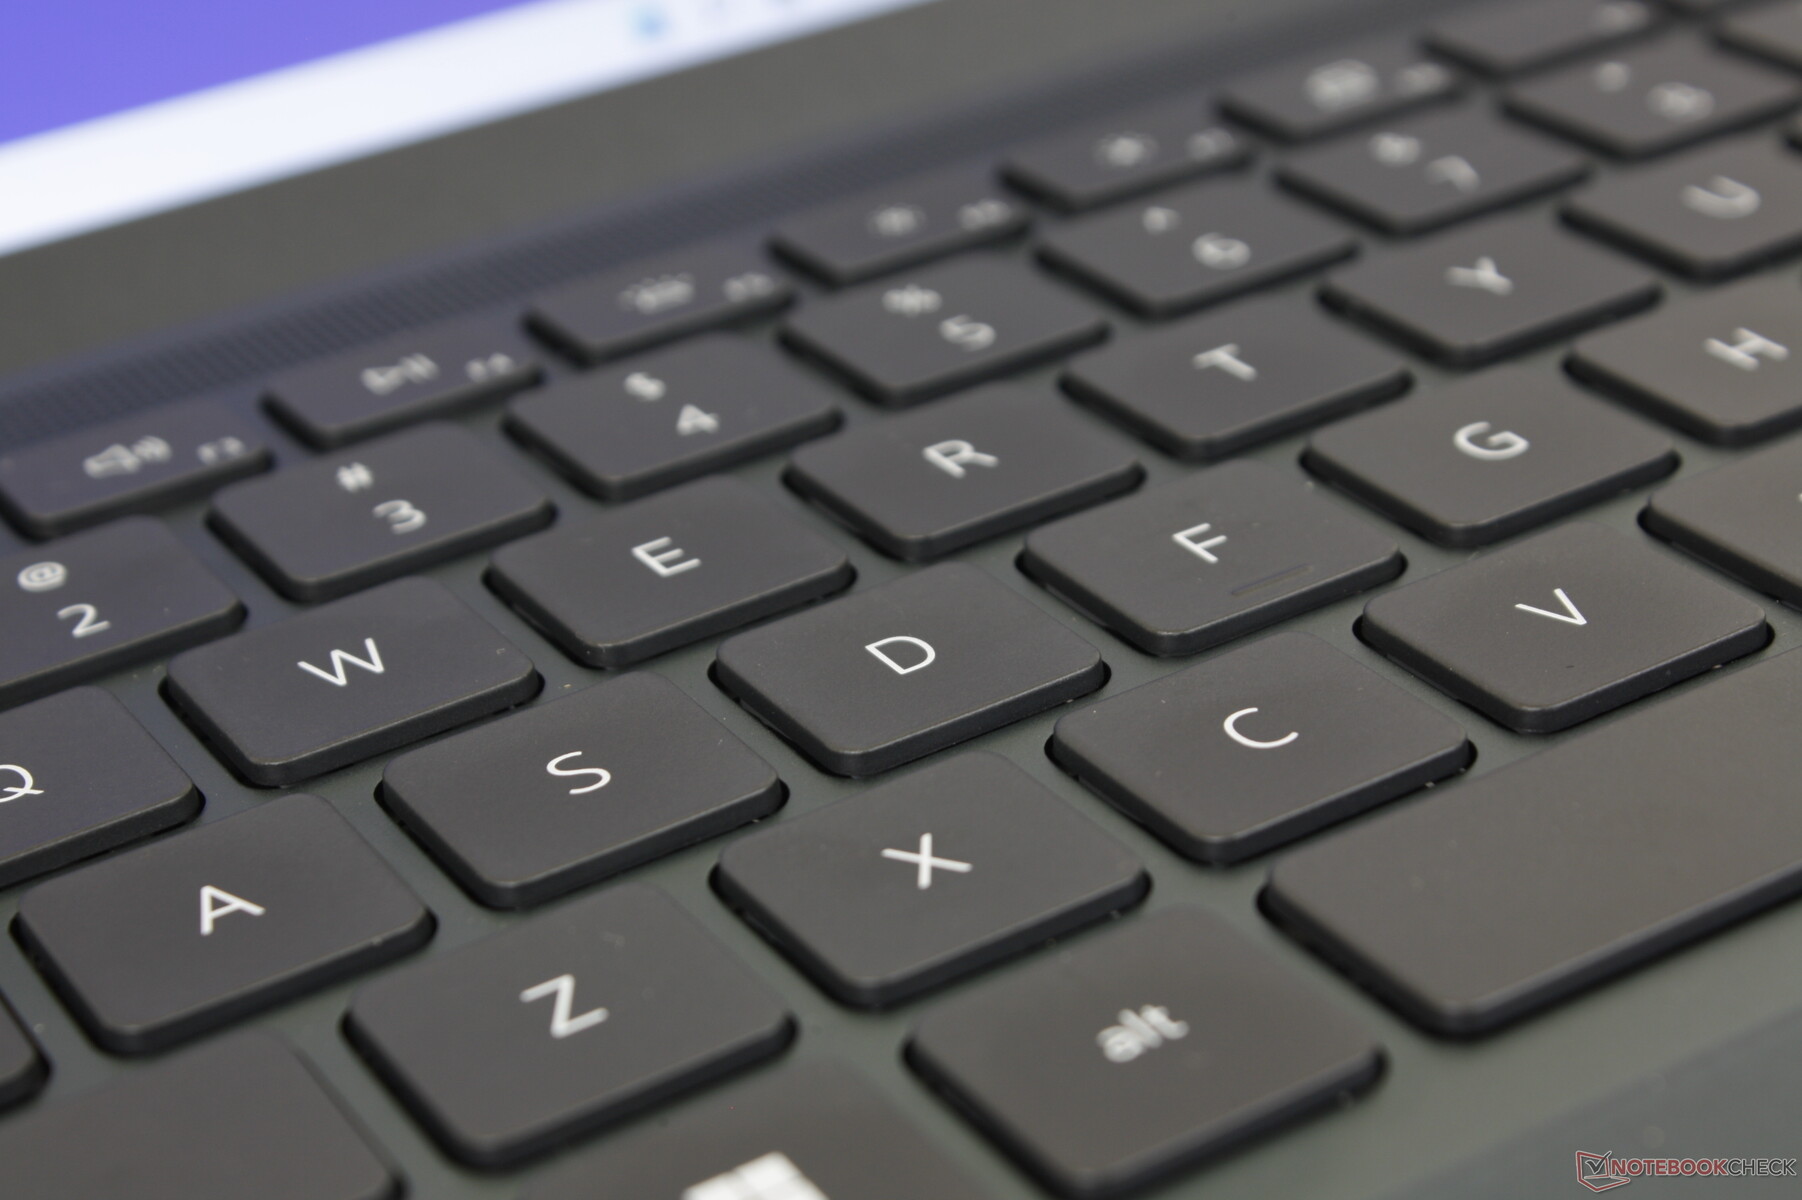
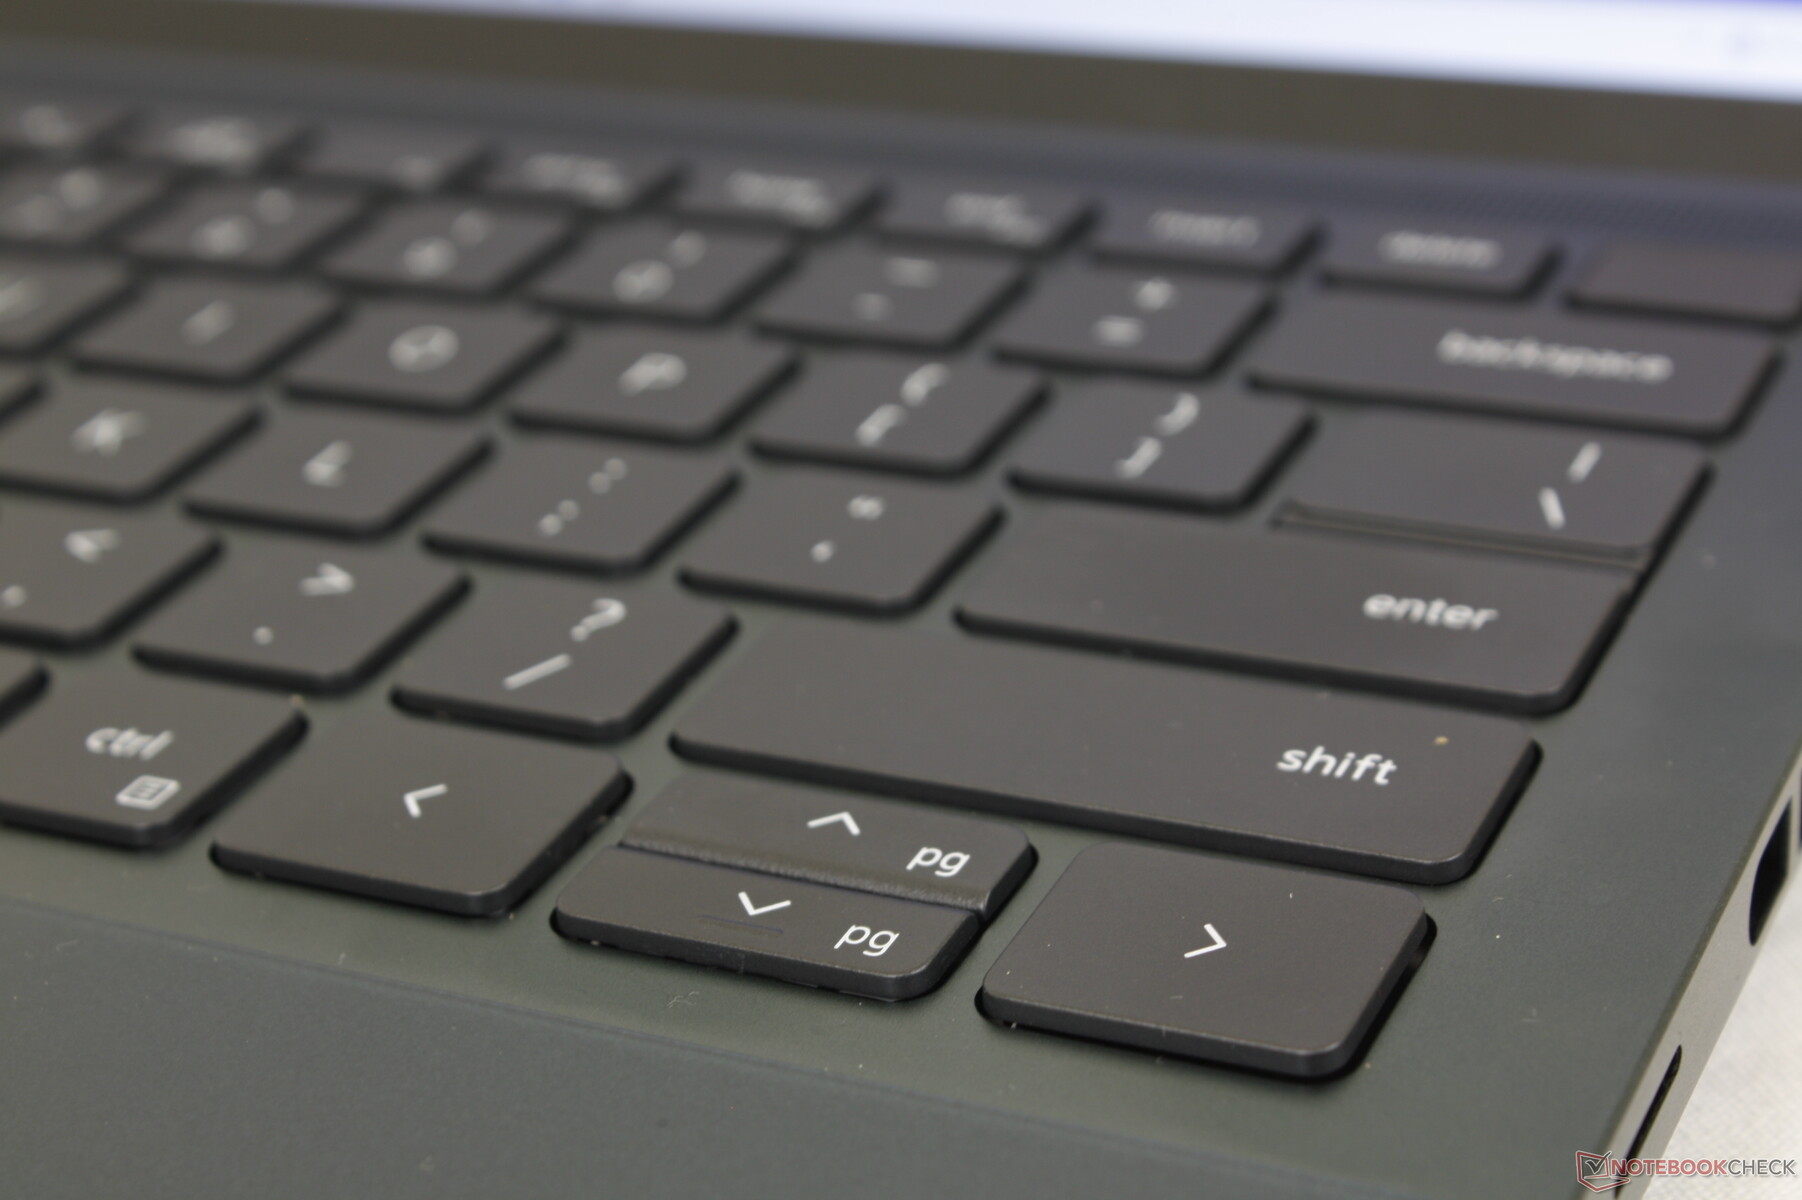
Dispositivos de entrada - Já estive aqui, já vi isso
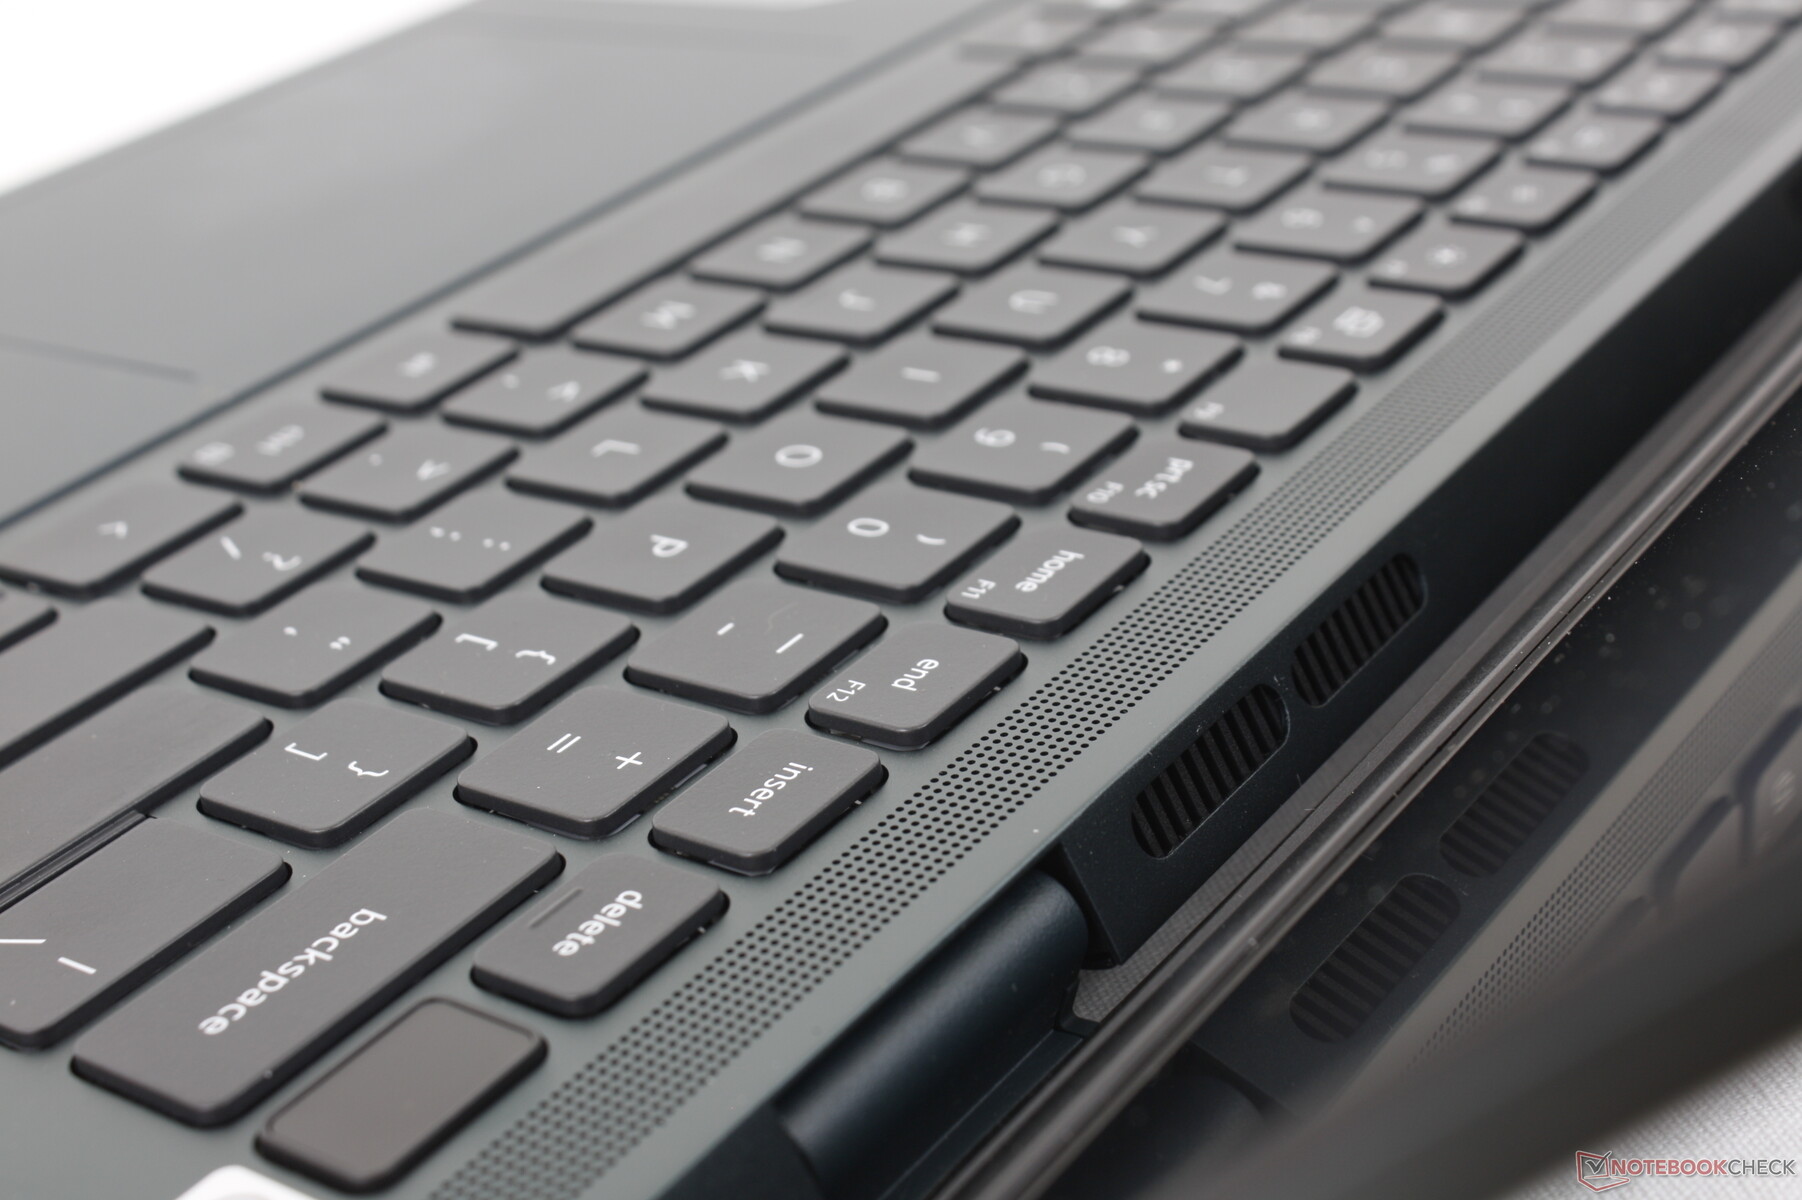
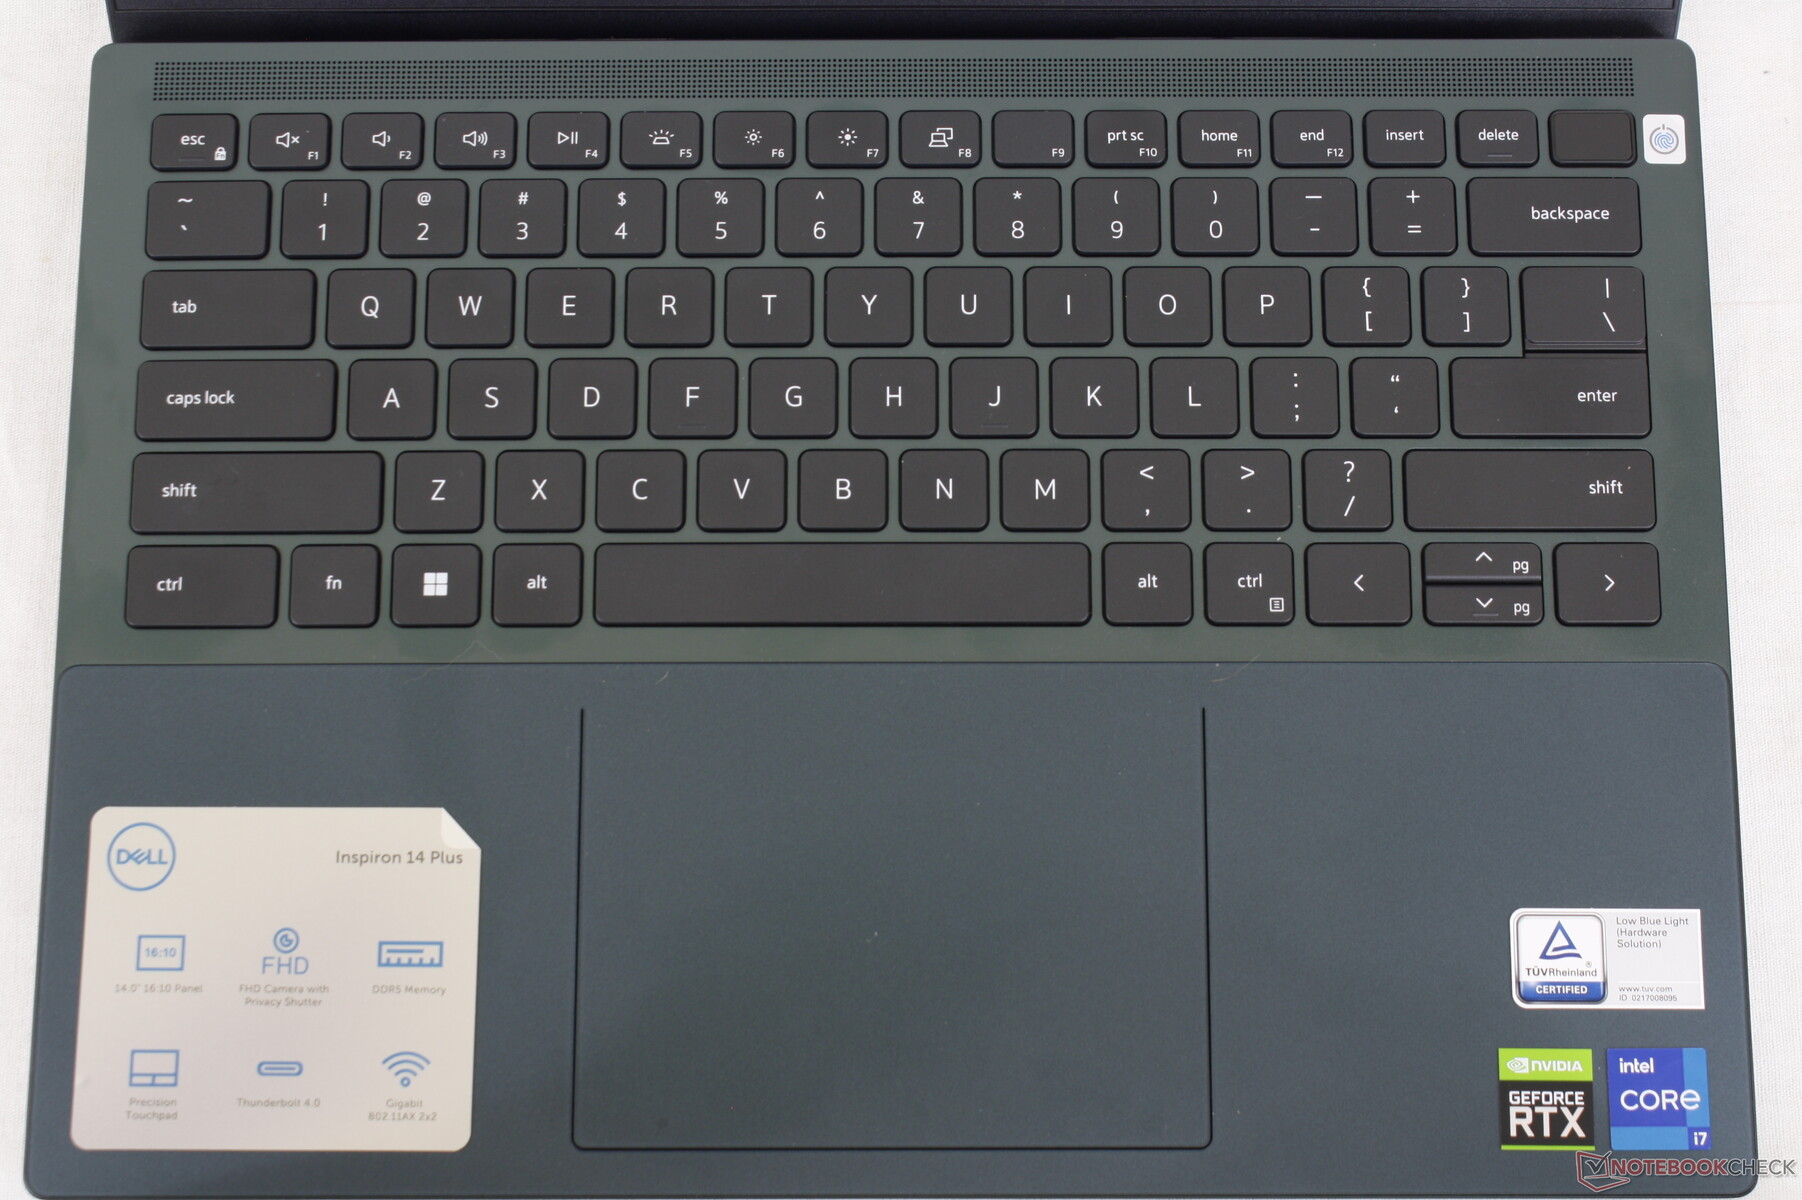
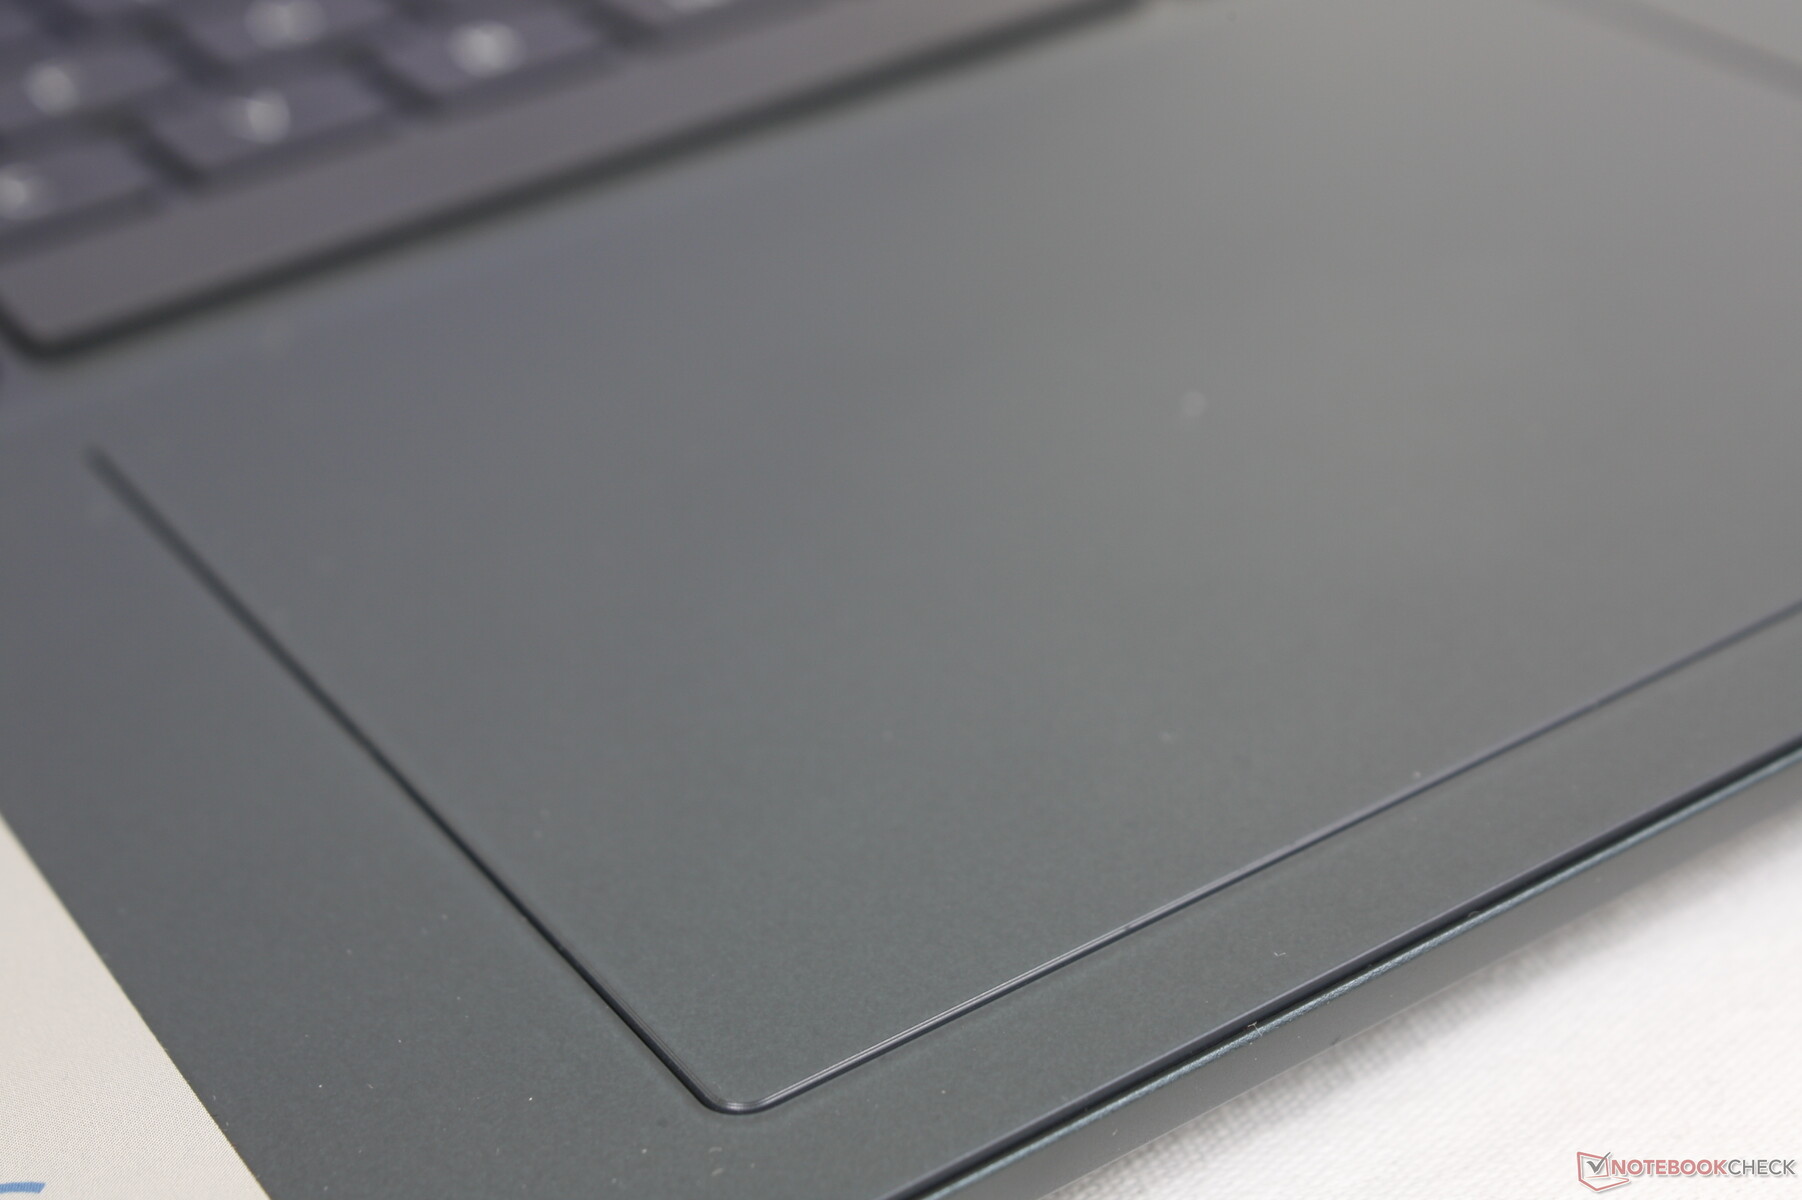
Teclado e Touchpad
A experiência de digitação é a mesma que na Inspiron 16 Plus 7620,Inspiron 16 7620 2 em 1ou Inspiron 14 7420 2 em 1 já que todos os quatro modelos compartilham as mesmas teclas de teclado e clickpad Mylar. Mesmo os símbolos das teclas primária e secundária e o tamanho do clickpad (11,5 x 8 cm)são idênticos entre os modelos, independentemente de qualquer diferença no tamanho da tela. Em resumo, as teclas têm feedback adequado e clatter moderado, exceto para a tecla Space, que parece um pouco rasa demais. Da mesma forma, a superfície do clickpad funciona de forma confiável para o controle padrão do cursor enquanto suas teclas integradas são muito macias e esponjosas ao arrastar e soltar.
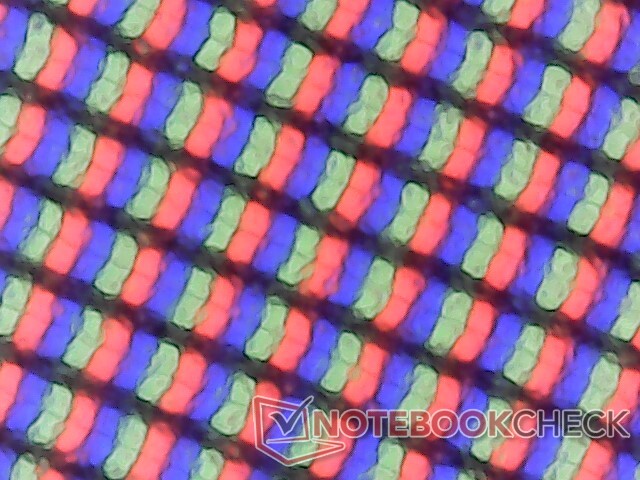
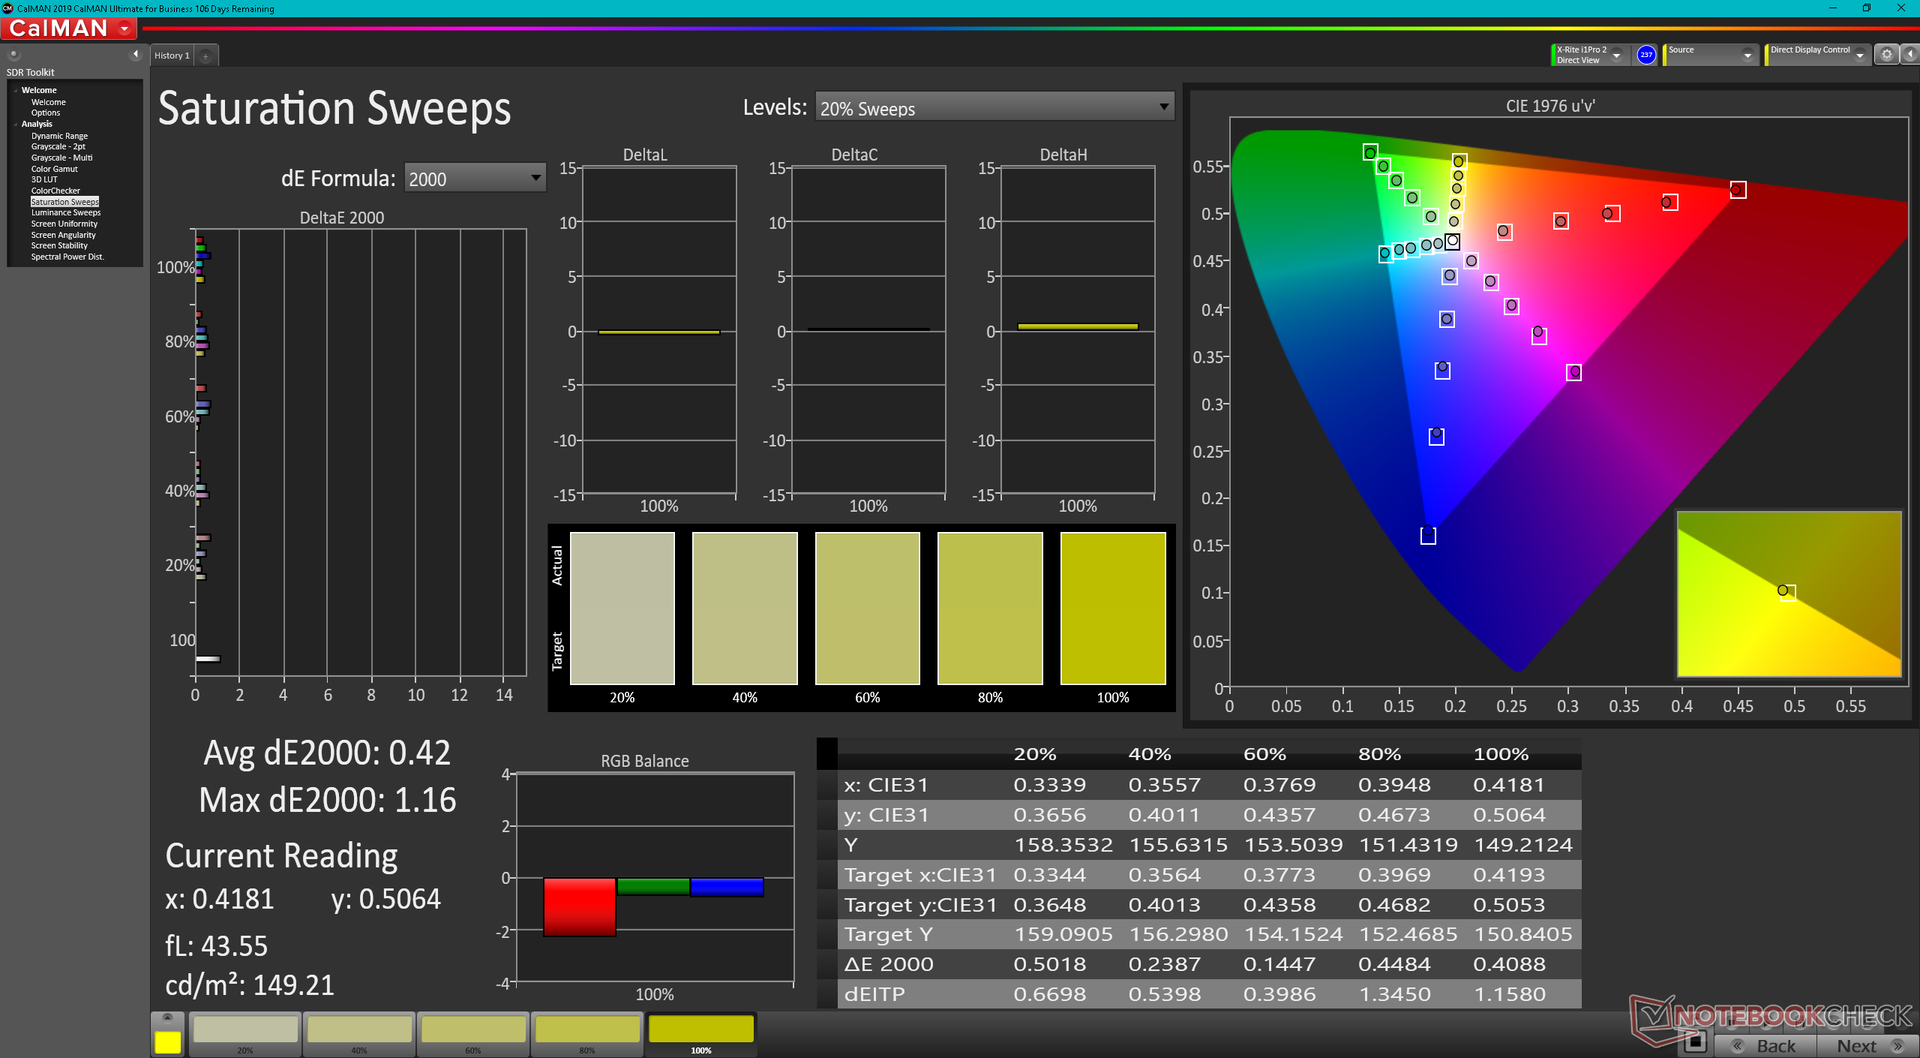
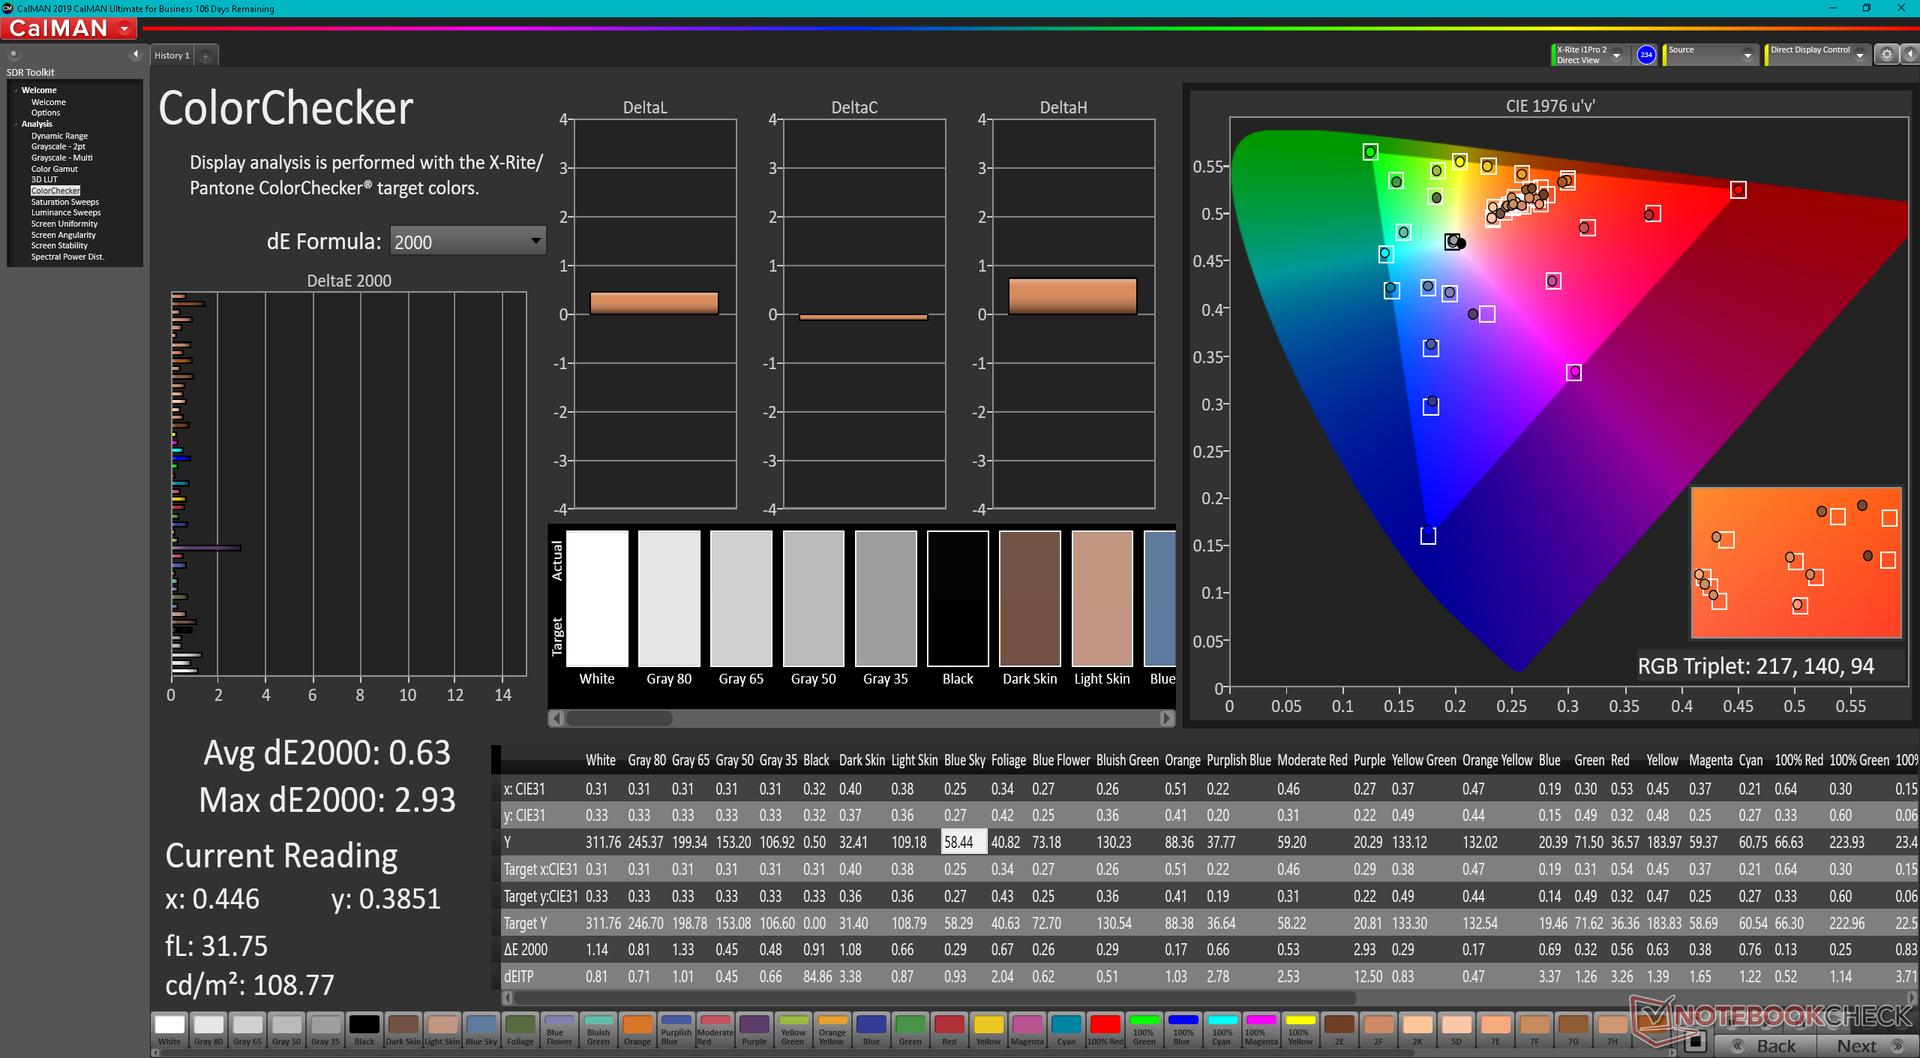
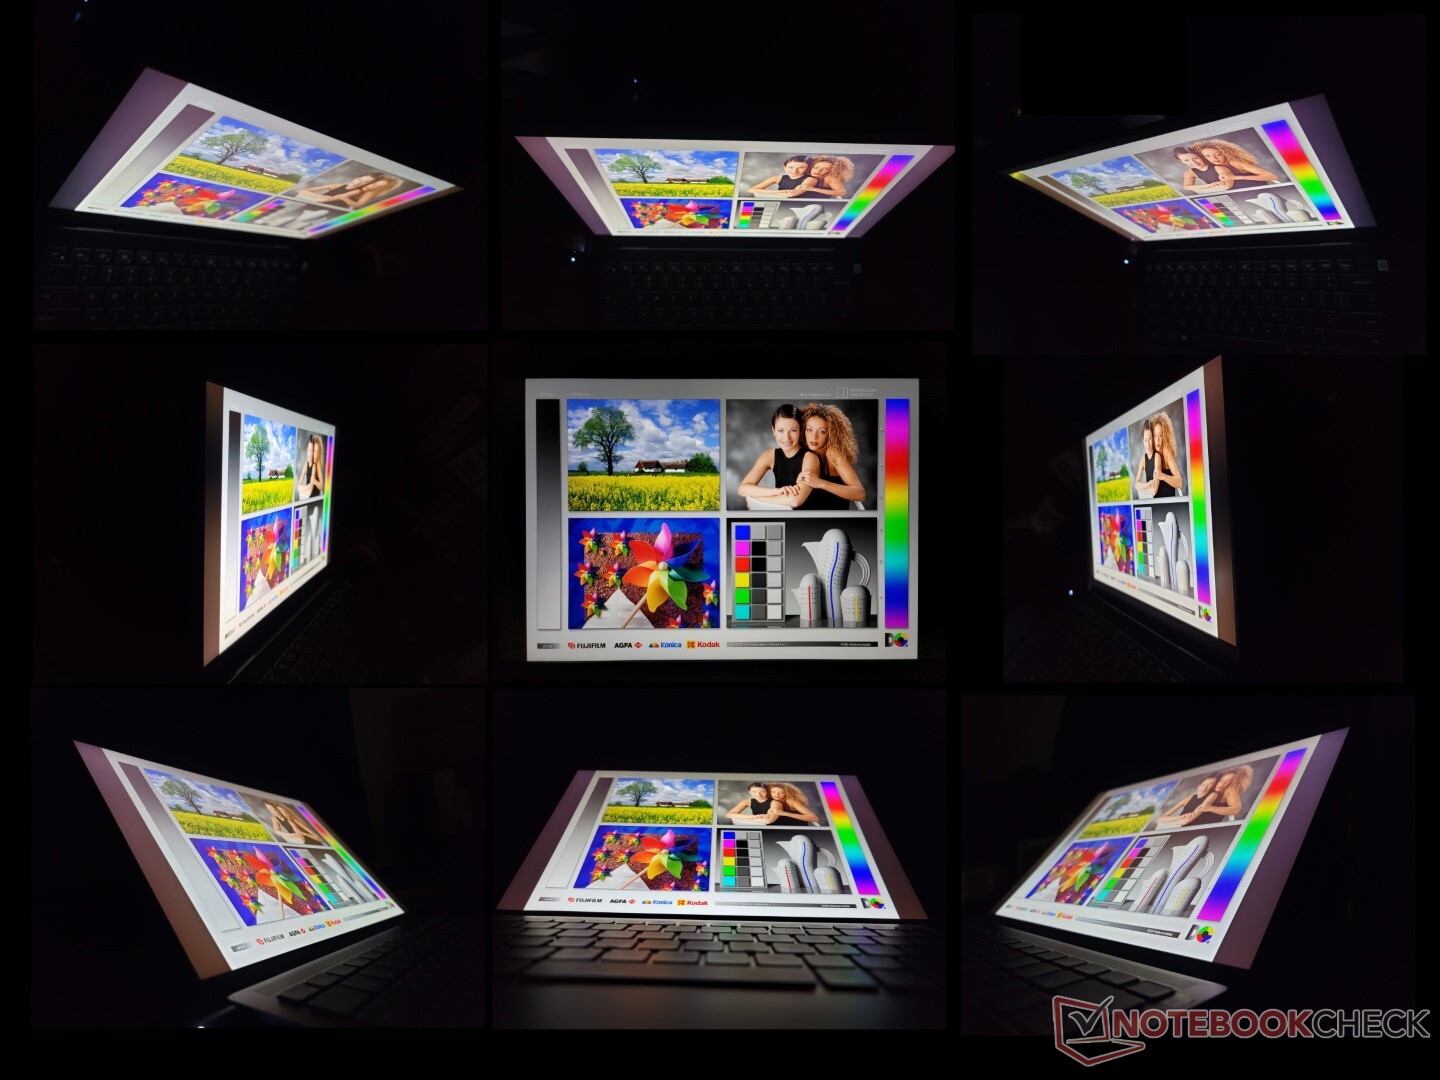
Visor - Cobertura total sRGB e 60 Hz
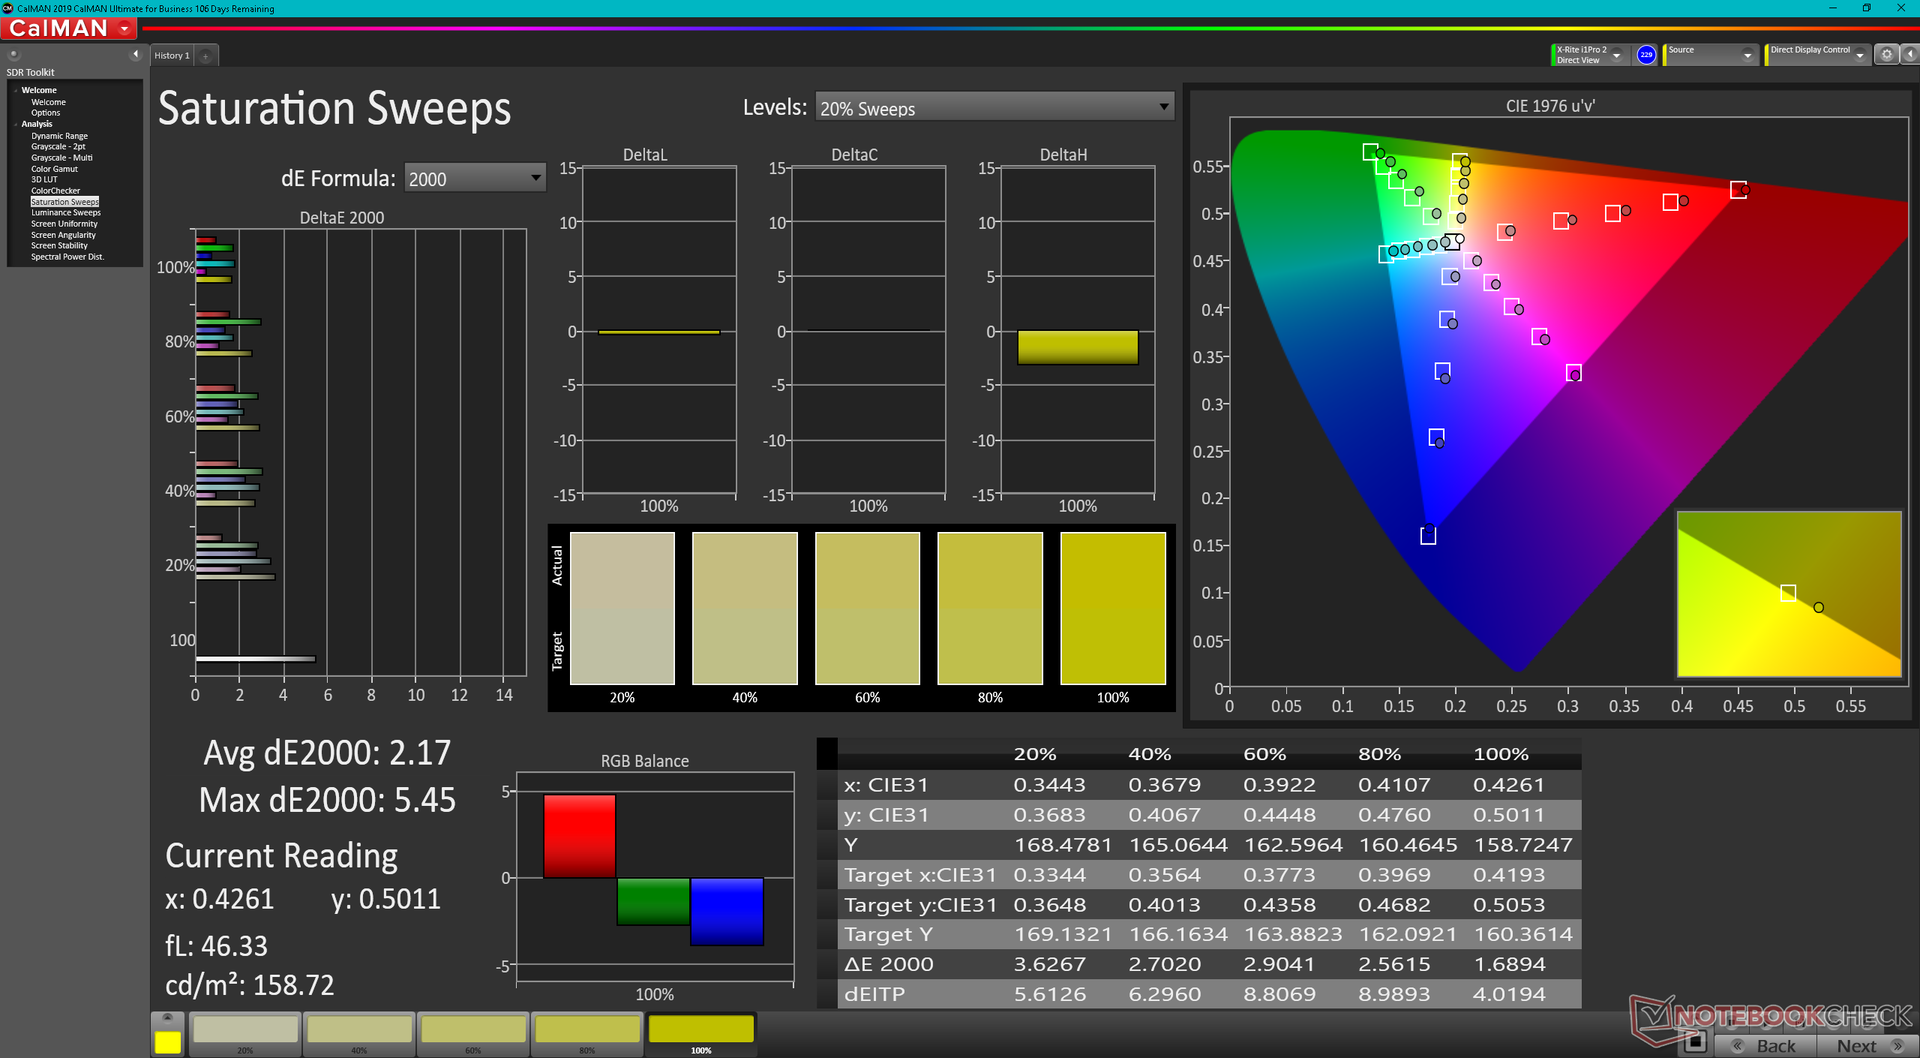
Enquanto outros laptops de 14 polegadas normalmente visam resoluções nativas de 1200p, 1800p ou 2160p, o Inspiron 14 Plus 7420 vem com um painel de 2,2K ou 2240 x 1400 relativamente incomum. Os atributos principais são sólidos, incluindo a cobertura sRGB completa, ~1000:1 de contraste, e tempos de resposta decentes para sua classe de tamanho. É uma chatice que as opções OLED ou brilhantes não estejam disponíveis para aumentar ainda mais as cores ou a nitidez.
| |||||||||||||||||||||||||
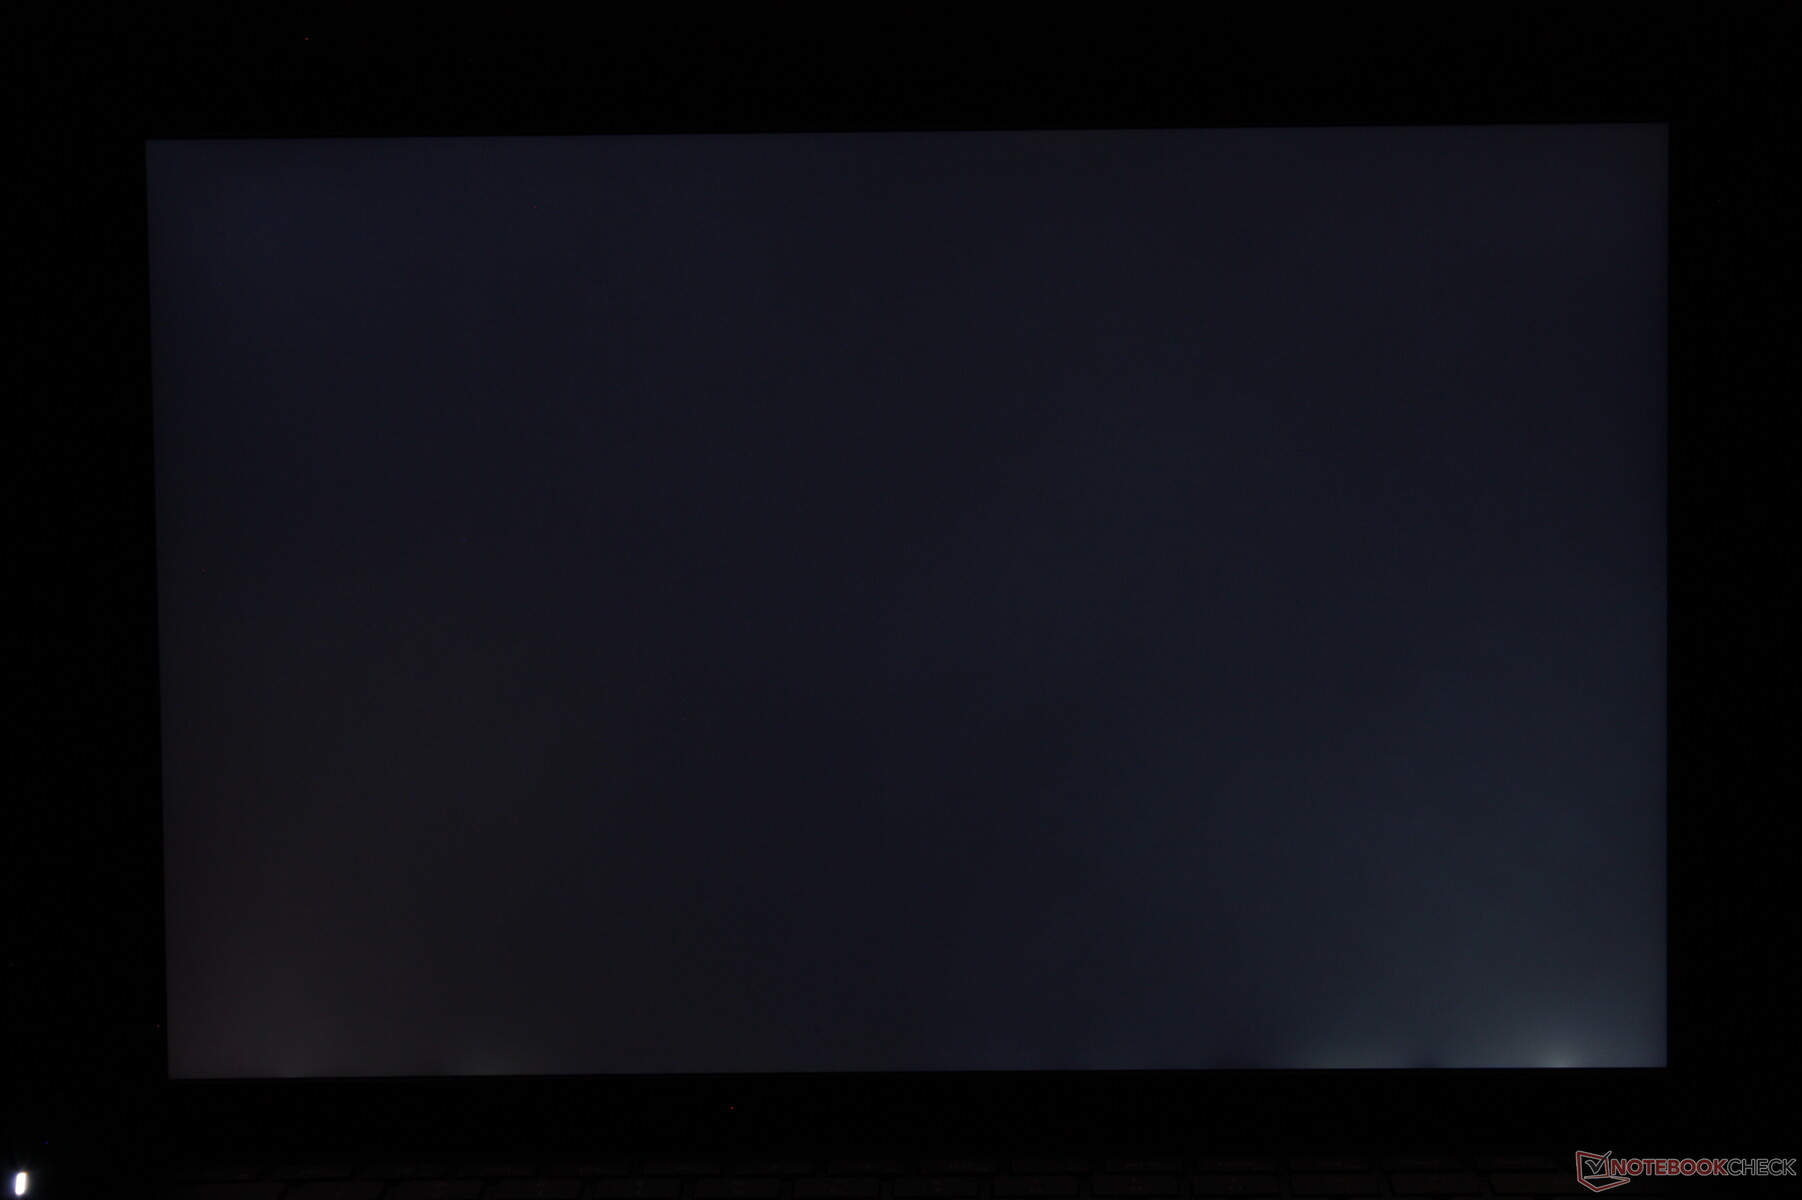
iluminação: 85 %
iluminação com acumulador: 331.1 cd/m²
Contraste: 1142:1 (Preto: 0.29 cd/m²)
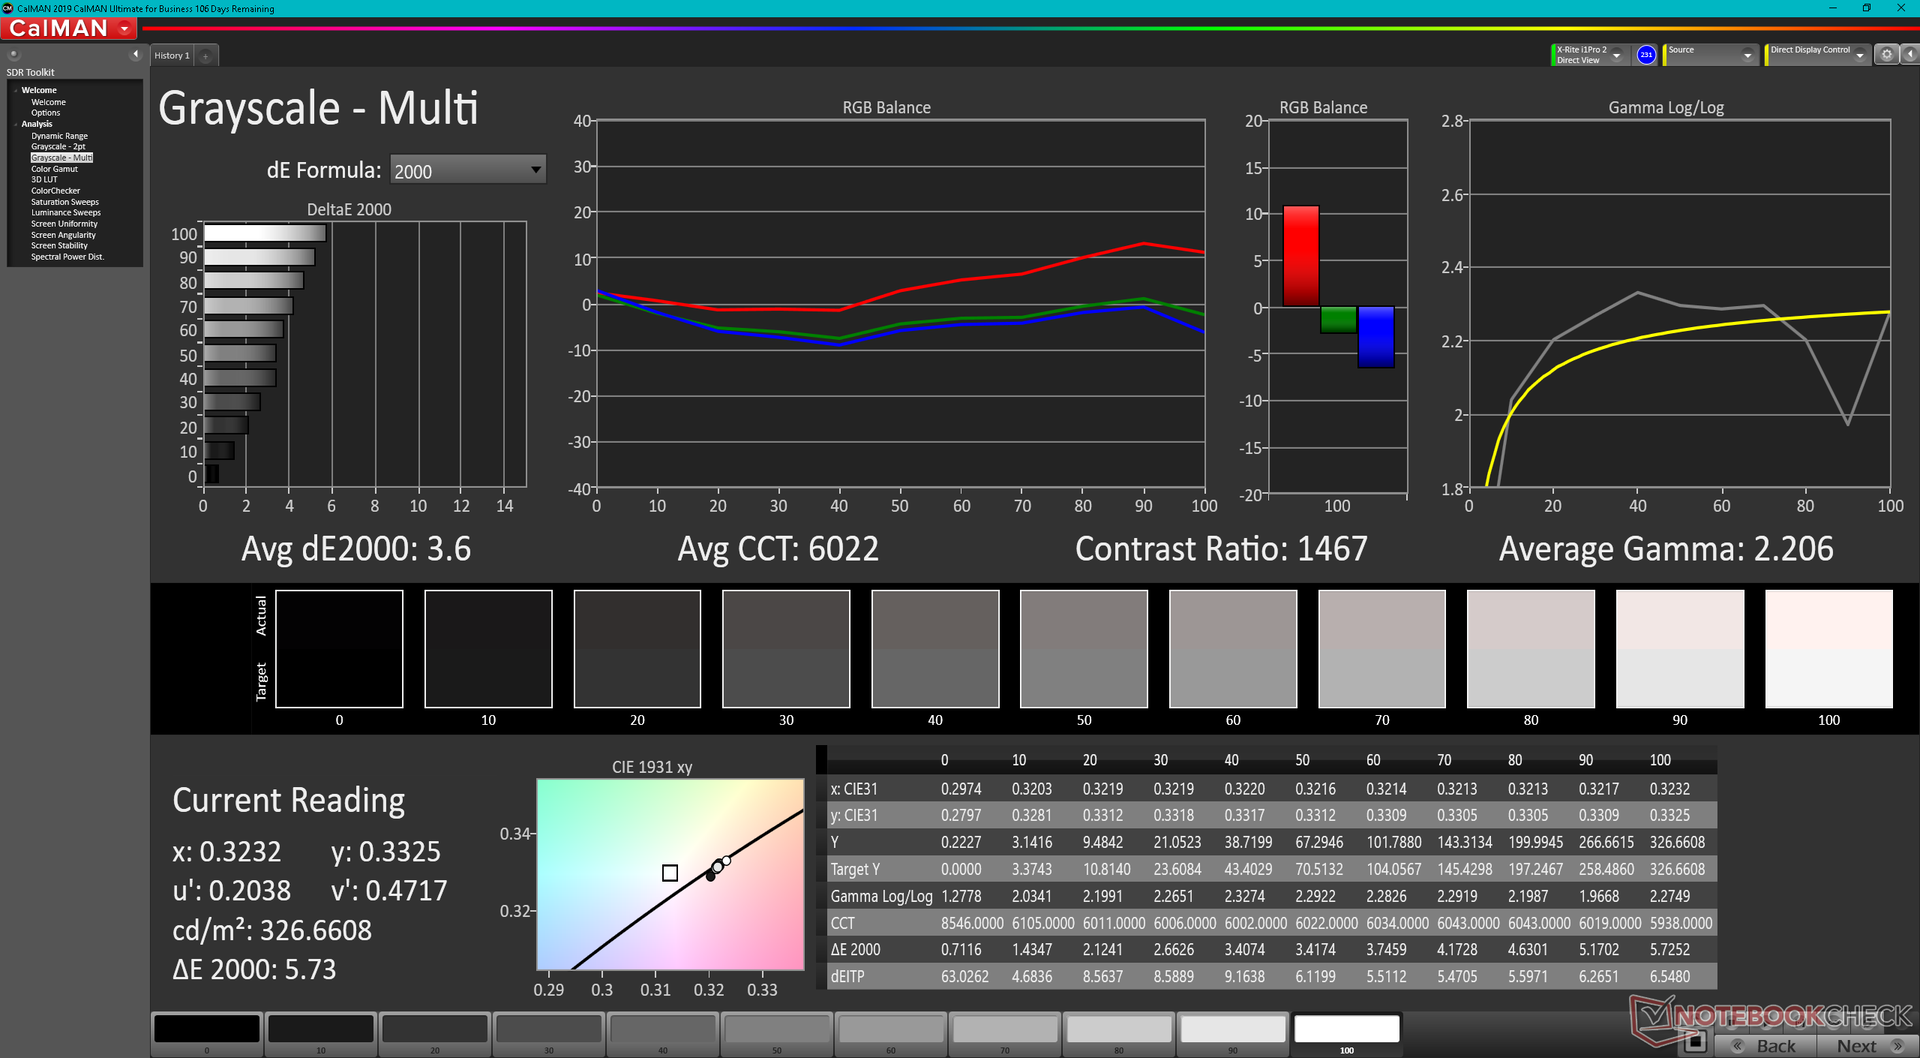
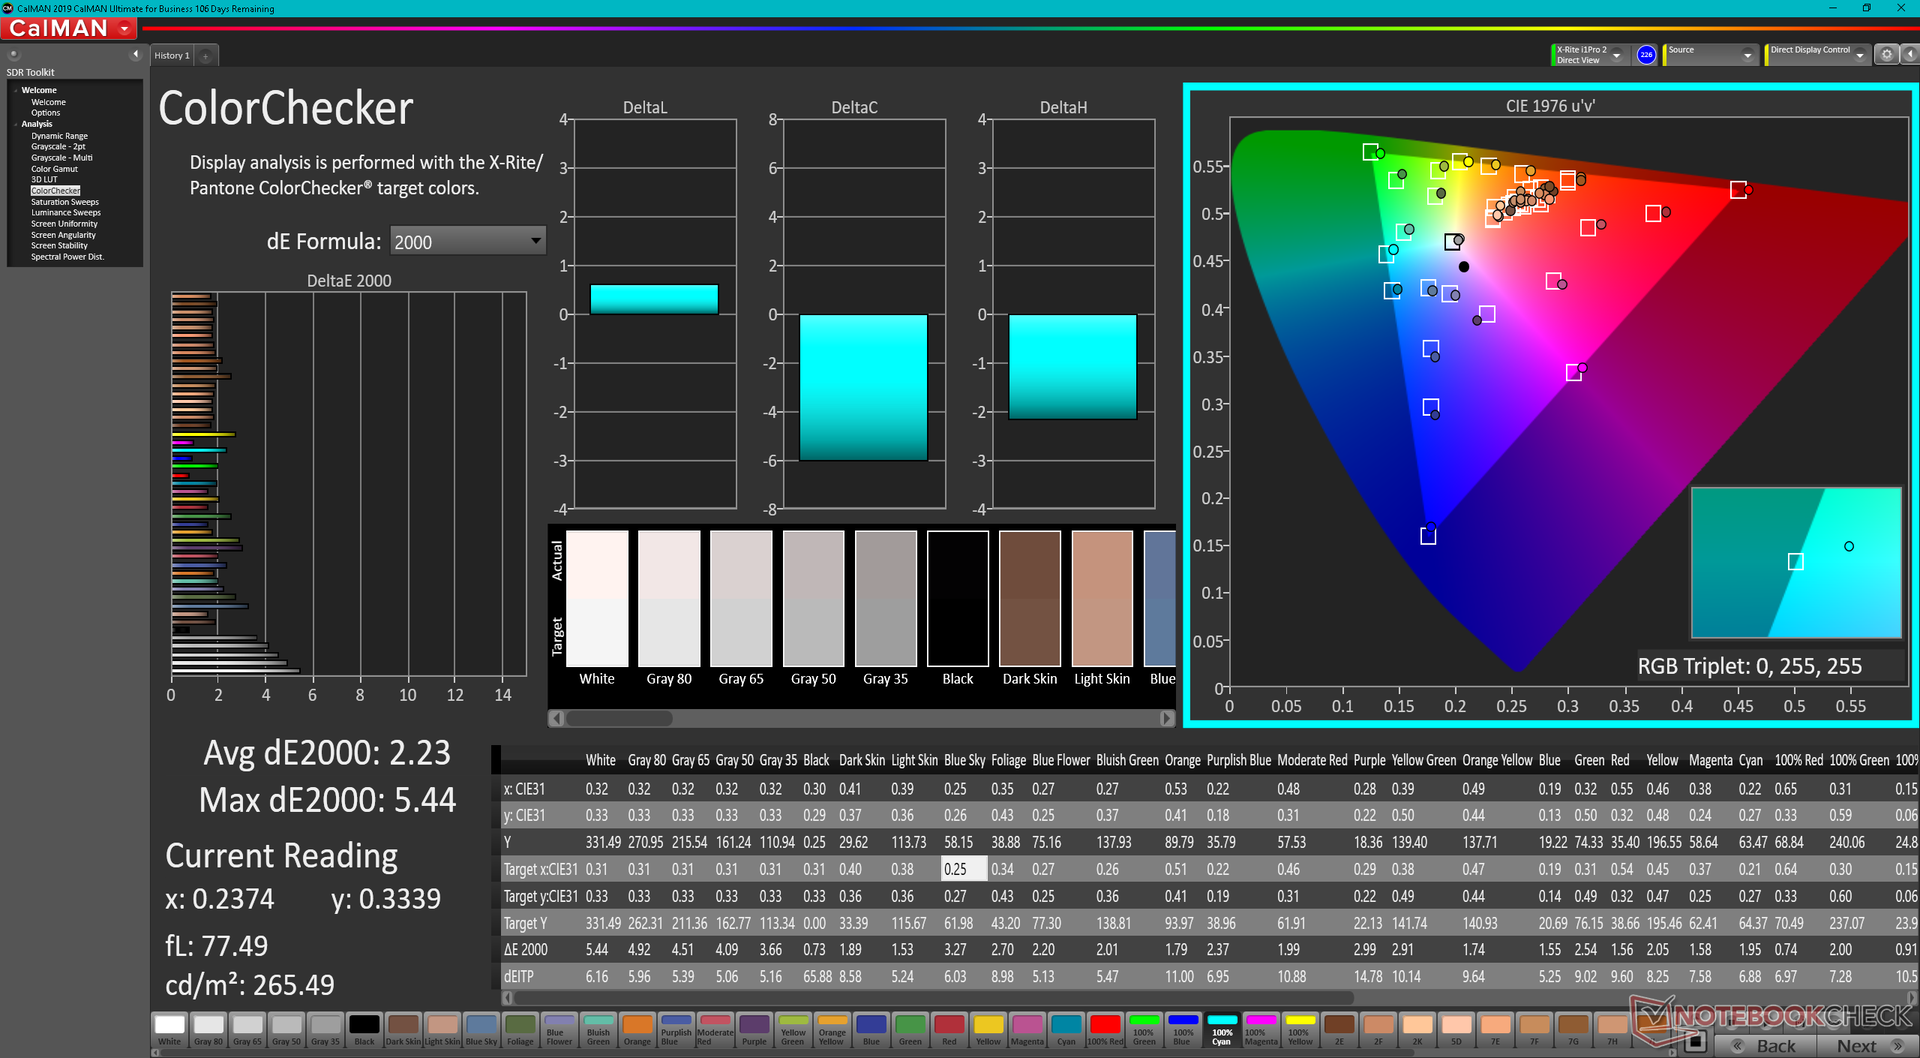
ΔE ColorChecker Calman: 2.23 | ∀{0.5-29.43 Ø4.71}
calibrated: 0.63
ΔE Greyscale Calman: 3.6 | ∀{0.09-98 Ø4.96}
69.5% AdobeRGB 1998 (Argyll 3D)
99.3% sRGB (Argyll 3D)
68.8% Display P3 (Argyll 3D)
Gamma: 2.21
CCT: 6022 K
| Dell Inspiron 14 Plus 7420 InfoVision 140NWHE, IPS, 2240x1400, 14" | Asus Vivobook Pro 14 M3401QC-KM007T SAMSUNG: SDC4171, OLED, 2880x1800, 14" | Dell Inspiron 14 7420 2-in-1 BOE NV14N42, IPS, 1920x1200, 14" | Schenker Vision 14 MNE007ZA1, IPS, 2880x1800, 14" | Asus Zenbook 14X UX5400E Samsung SDC4154, OLED, 2880x1800, 14" | MSI Summit E14 A11SCS AU Optronics AUO123B, IPS, 3840x2160, 14" | HP Envy 14-eb0010nr AU Optronics AUOF392, IPS, 1920x1200, 14" | |
|---|---|---|---|---|---|---|---|
| Display | 27% | -43% | 5% | 28% | 24% | 8% | |
| Display P3 Coverage (%) | 68.8 | 99.41 44% | 38.6 -44% | 74.3 8% | 100 45% | 87.5 27% | 77.1 12% |
| sRGB Coverage (%) | 99.3 | 99.94 1% | 56.2 -43% | 97.6 -2% | 100 1% | 100 1% | 99.8 1% |
| AdobeRGB 1998 Coverage (%) | 69.5 | 94.79 36% | 39.9 -43% | 75.7 9% | 96 38% | 99.4 43% | 76.7 10% |
| Response Times | 89% | 13% | -2% | 93% | -47% | -95% | |
| Response Time Grey 50% / Grey 80% * (ms) | 32.8 ? | 3 ? 91% | 27.2 ? 17% | 40.4 ? -23% | 2 ? 94% | 52 ? -59% | 61.2 ? -87% |
| Response Time Black / White * (ms) | 22.8 ? | 3 ? 87% | 20.8 ? 9% | 18.4 ? 19% | 2 ? 91% | 30.8 ? -35% | 46 ? -102% |
| PWM Frequency (Hz) | 360 | ||||||
| Screen | 41% | -113% | -8% | 13% | -70% | -8% | |
| Brightness middle (cd/m²) | 331.1 | 384 16% | 269.4 -19% | 407 23% | 379 14% | 593.3 79% | 412 24% |
| Brightness (cd/m²) | 326 | 385 18% | 260 -20% | 407 25% | 381 17% | 571 75% | 392 20% |
| Brightness Distribution (%) | 85 | 98 15% | 89 5% | 94 11% | 93 9% | 87 2% | 81 -5% |
| Black Level * (cd/m²) | 0.29 | 0.07 76% | 0.41 -41% | 0.25 14% | 0.1 66% | 0.53 -83% | 0.32 -10% |
| Contrast (:1) | 1142 | 5486 380% | 657 -42% | 1628 43% | 3790 232% | 1119 -2% | 1288 13% |
| Colorchecker dE 2000 * | 2.23 | 1.75 22% | 6.53 -193% | 2.6 -17% | 2.3 -3% | 4.42 -98% | 1.88 16% |
| Colorchecker dE 2000 max. * | 5.44 | 3.41 37% | 19.76 -263% | 4.4 19% | 4.16 24% | 7.16 -32% | 3.06 44% |
| Colorchecker dE 2000 calibrated * | 0.63 | 2.32 -268% | 3.13 -397% | 2 -217% | 2.42 -284% | 4.3 -583% | 1.96 -211% |
| Greyscale dE 2000 * | 3.6 | 1.06 71% | 5.4 -50% | 2.7 25% | 2.12 41% | 3.2 11% | 2.2 39% |
| Gamma | 2.21 100% | 2.39 92% | 2.05 107% | 2.18 101% | 2.42 91% | 2.04 108% | 2.1 105% |
| CCT | 6022 108% | 6440 101% | 6007 108% | 6316 103% | 6737 96% | 6650 98% | |
| Color Space (Percent of AdobeRGB 1998) (%) | 68.7 | ||||||
| Color Space (Percent of sRGB) (%) | 99.8 | ||||||
| Média Total (Programa/Configurações) | 52% /
45% | -48% /
-80% | -2% /
-5% | 45% /
28% | -31% /
-47% | -32% /
-17% |
* ... menor é melhor
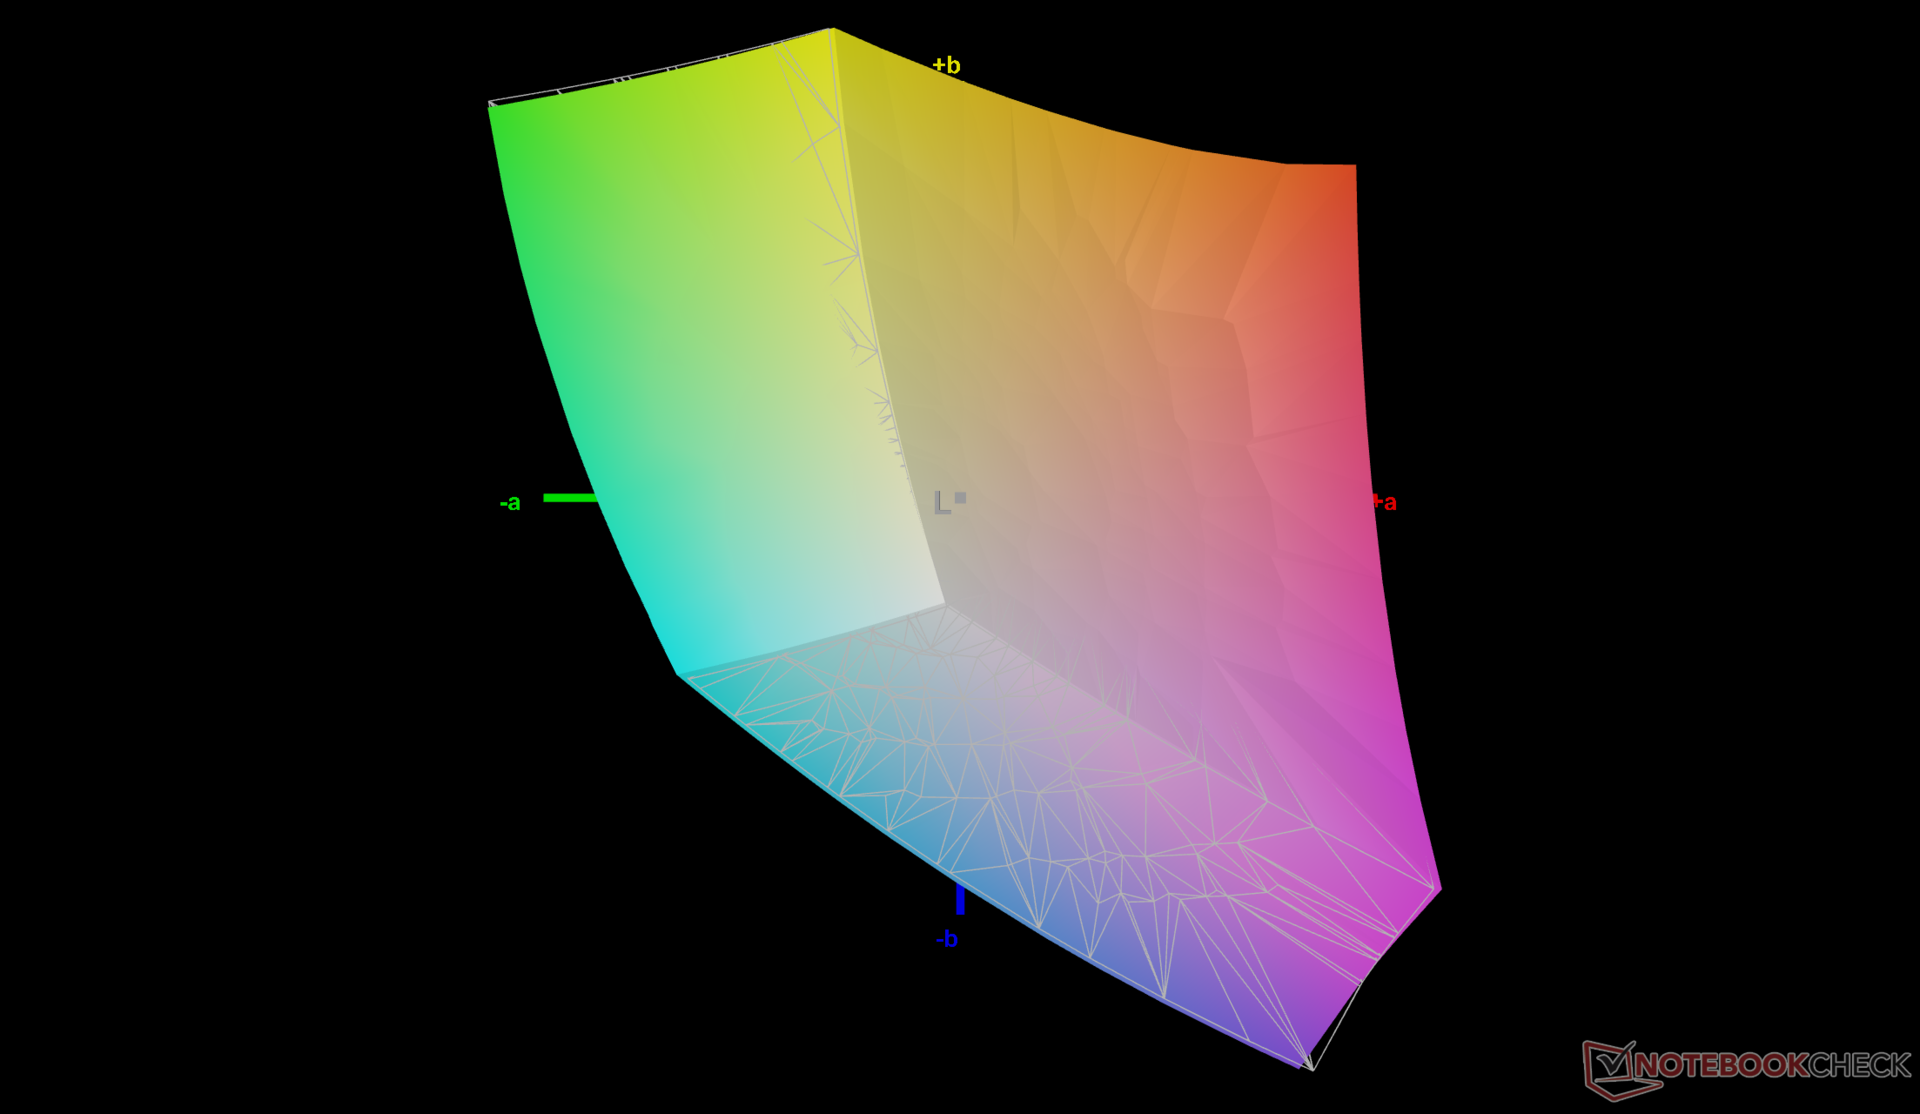
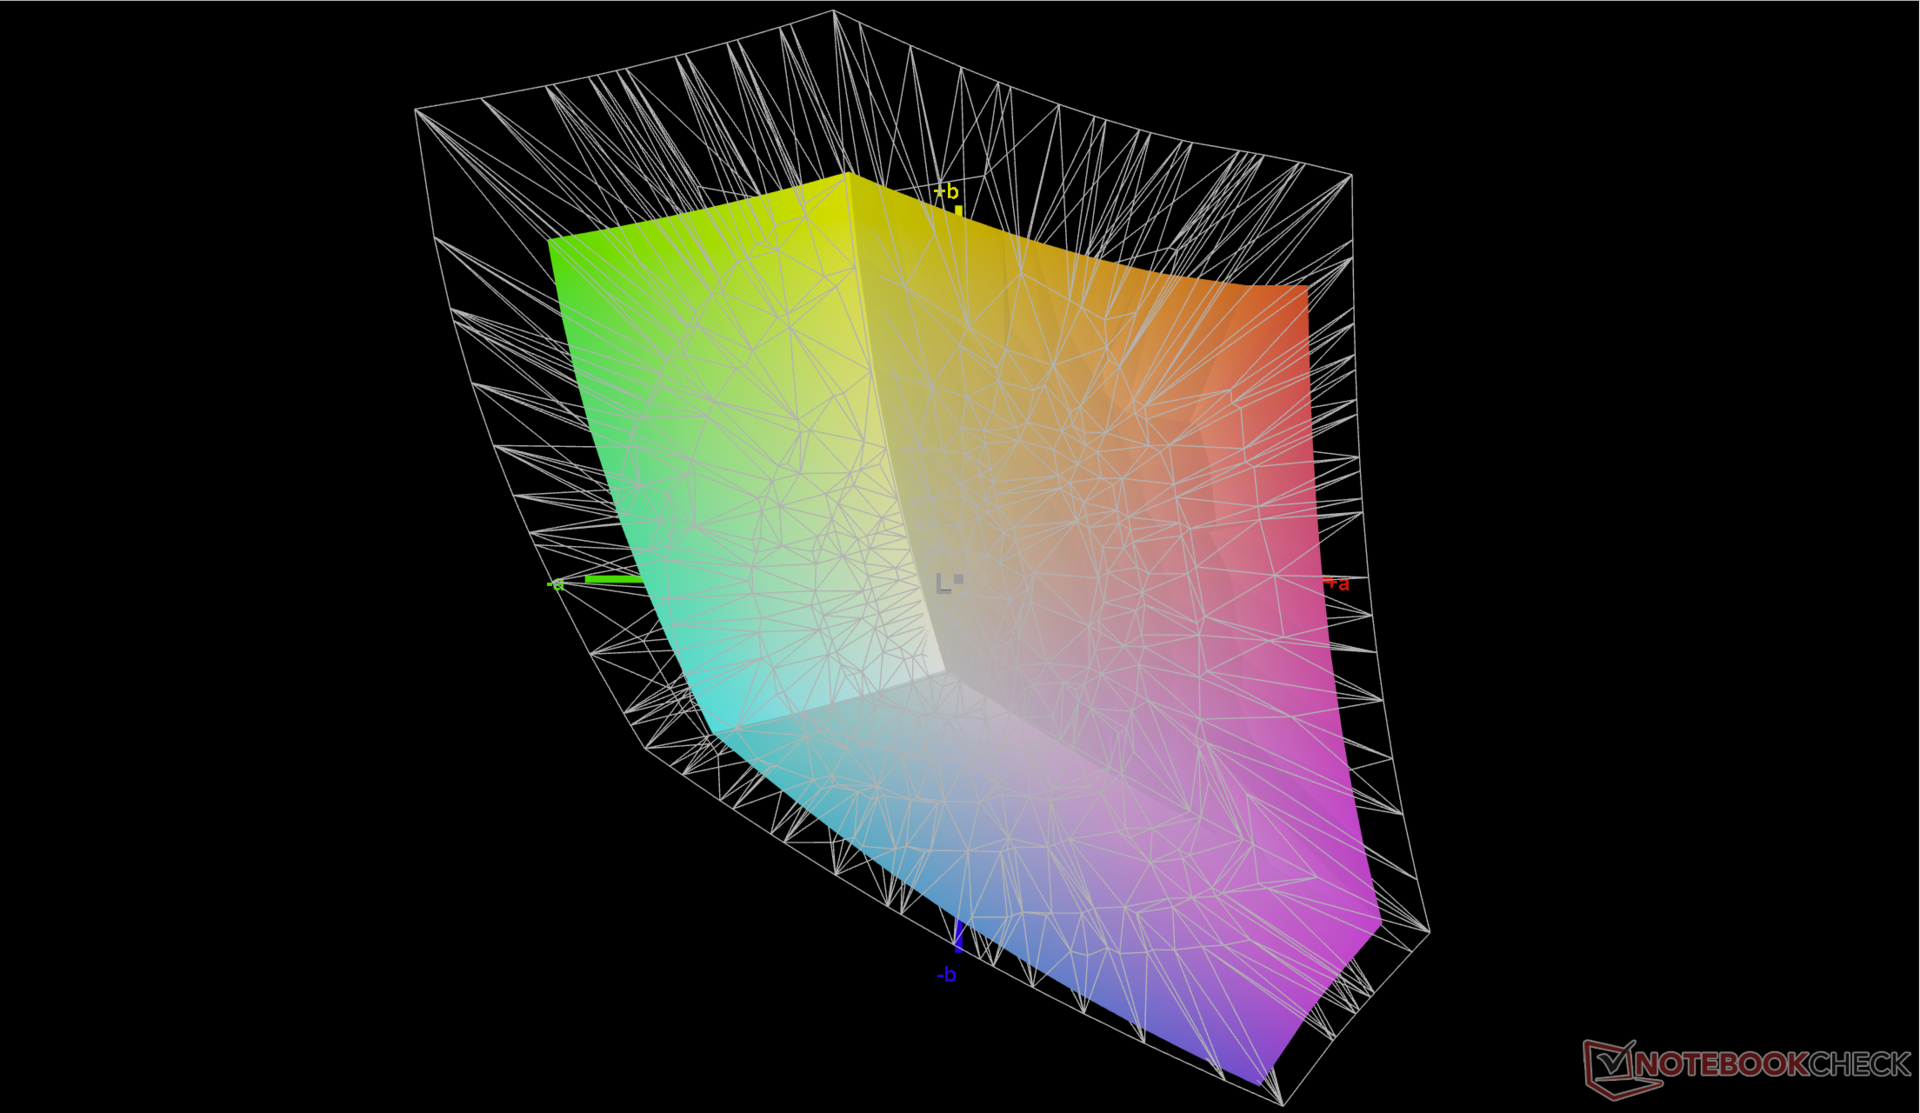
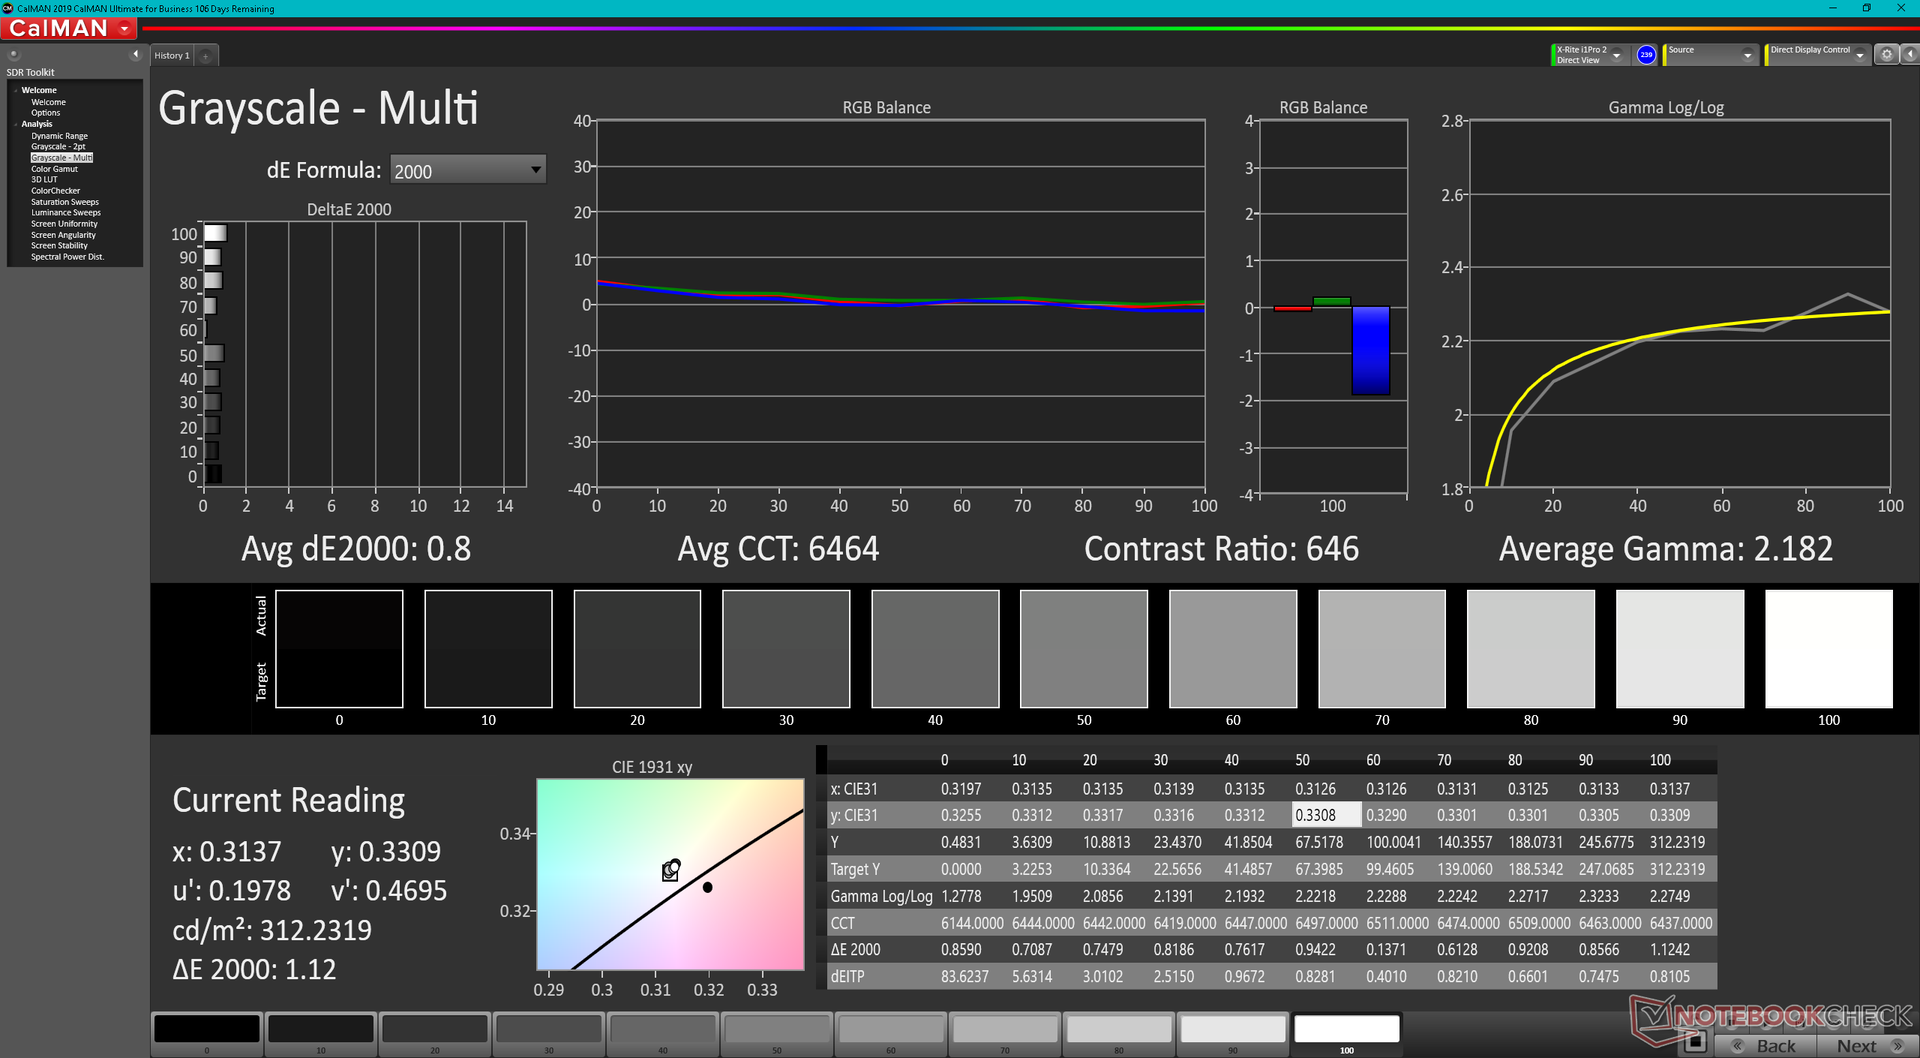
O display não é calibrado na fábrica e, portanto, suas cores não são tão precisas quanto poderiam ser. A temperatura da cor, em particular, é muito quente em torno de 6000 em comparação com o objetivo de 6500 da norma sRGB. Após uma calibração adequada com nosso colorímetro X-Rite, os valores médios de escala de cinza e DeltaE de cor melhorariam de 3,6 e 2,23 para apenas 0,8 e 0,63, respectivamente. Recomendamos uma calibração do usuário final para explorar totalmente a cobertura 100% sRGB do painel.
Exibir tempos de resposta
| ↔ Tempo de resposta preto para branco | ||
|---|---|---|
| 22.8 ms ... ascensão ↗ e queda ↘ combinadas | ↗ 12 ms ascensão | 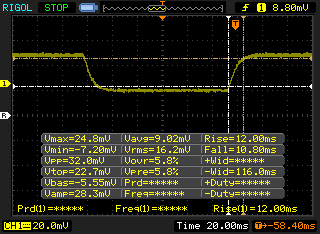 |
| ↘ 10.8 ms queda | ||
| A tela mostra boas taxas de resposta em nossos testes, mas pode ser muito lenta para jogadores competitivos. Em comparação, todos os dispositivos testados variam de 0.1 (mínimo) a 240 (máximo) ms. » 51 % de todos os dispositivos são melhores. Isso significa que o tempo de resposta medido é pior que a média de todos os dispositivos testados (19.8 ms). | ||
| ↔ Tempo de resposta 50% cinza a 80% cinza | ||
| 32.8 ms ... ascensão ↗ e queda ↘ combinadas | ↗ 16 ms ascensão | 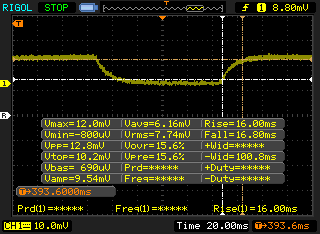 |
| ↘ 16.8 ms queda | ||
| A tela mostra taxas de resposta lentas em nossos testes e será insatisfatória para os jogadores. Em comparação, todos os dispositivos testados variam de 0.165 (mínimo) a 636 (máximo) ms. » 45 % de todos os dispositivos são melhores. Isso significa que o tempo de resposta medido é semelhante à média de todos os dispositivos testados (31 ms). | ||
Cintilação da tela / PWM (modulação por largura de pulso)
| Tela tremeluzindo / PWM não detectado | 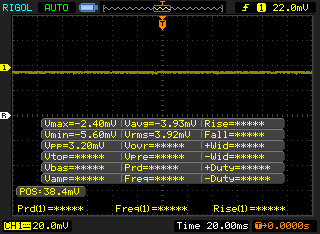 | ||
[pwm_comparison] Em comparação: 52 % de todos os dispositivos testados não usam PWM para escurecer a tela. Se PWM foi detectado, uma média de 7757 (mínimo: 5 - máximo: 343500) Hz foi medida. | |||
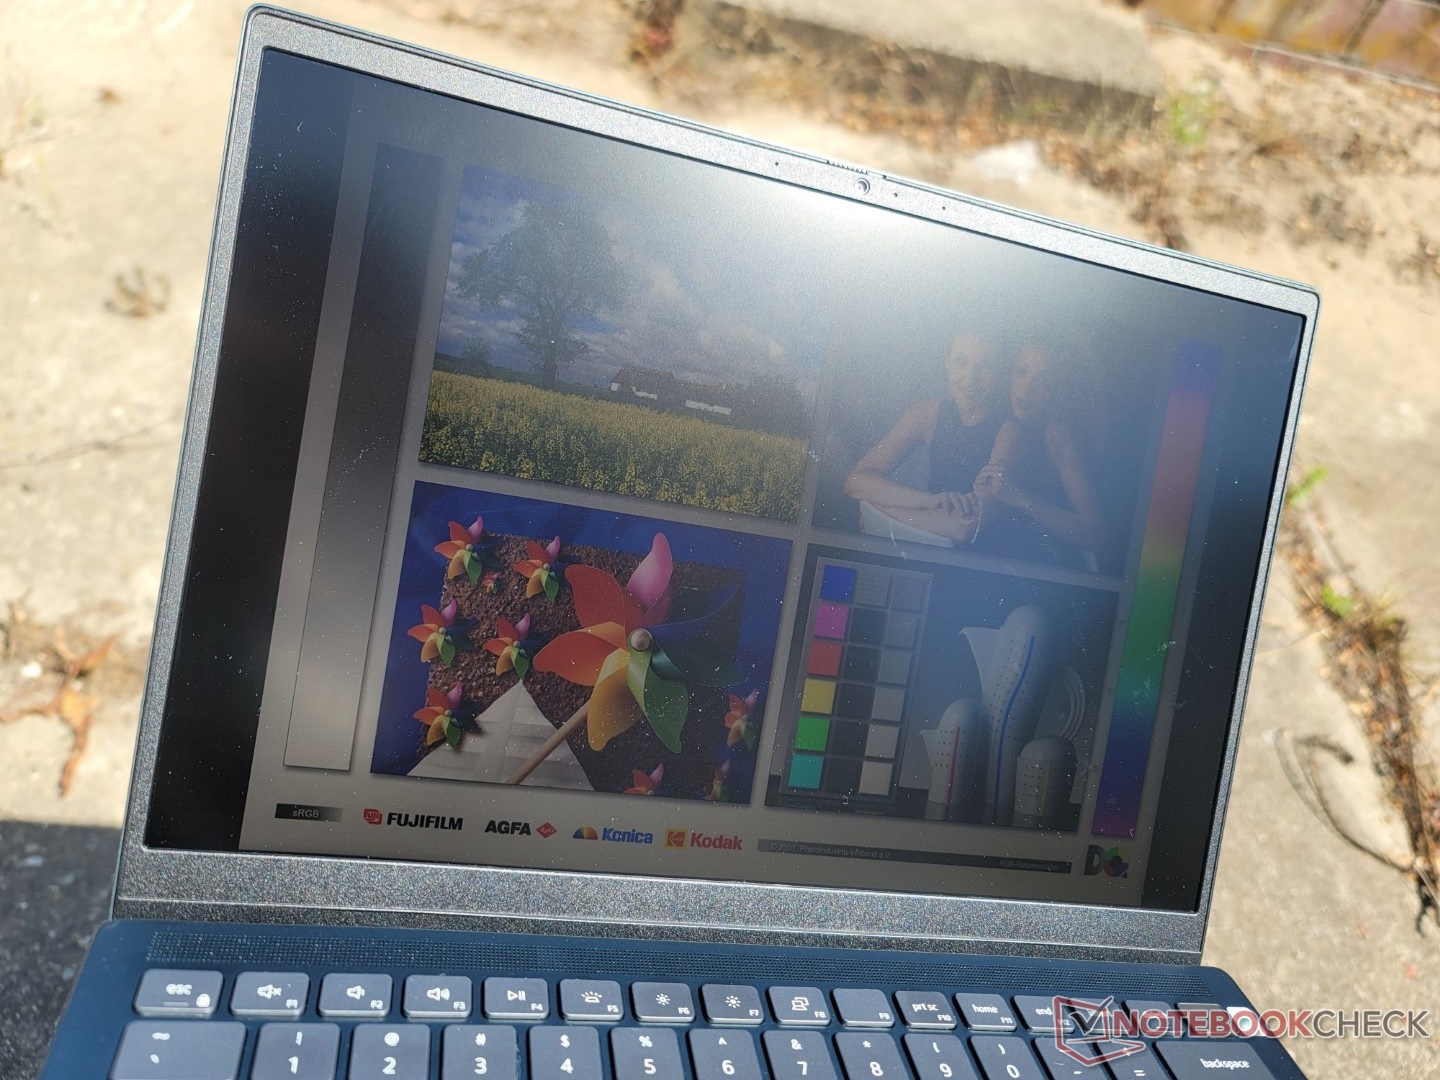
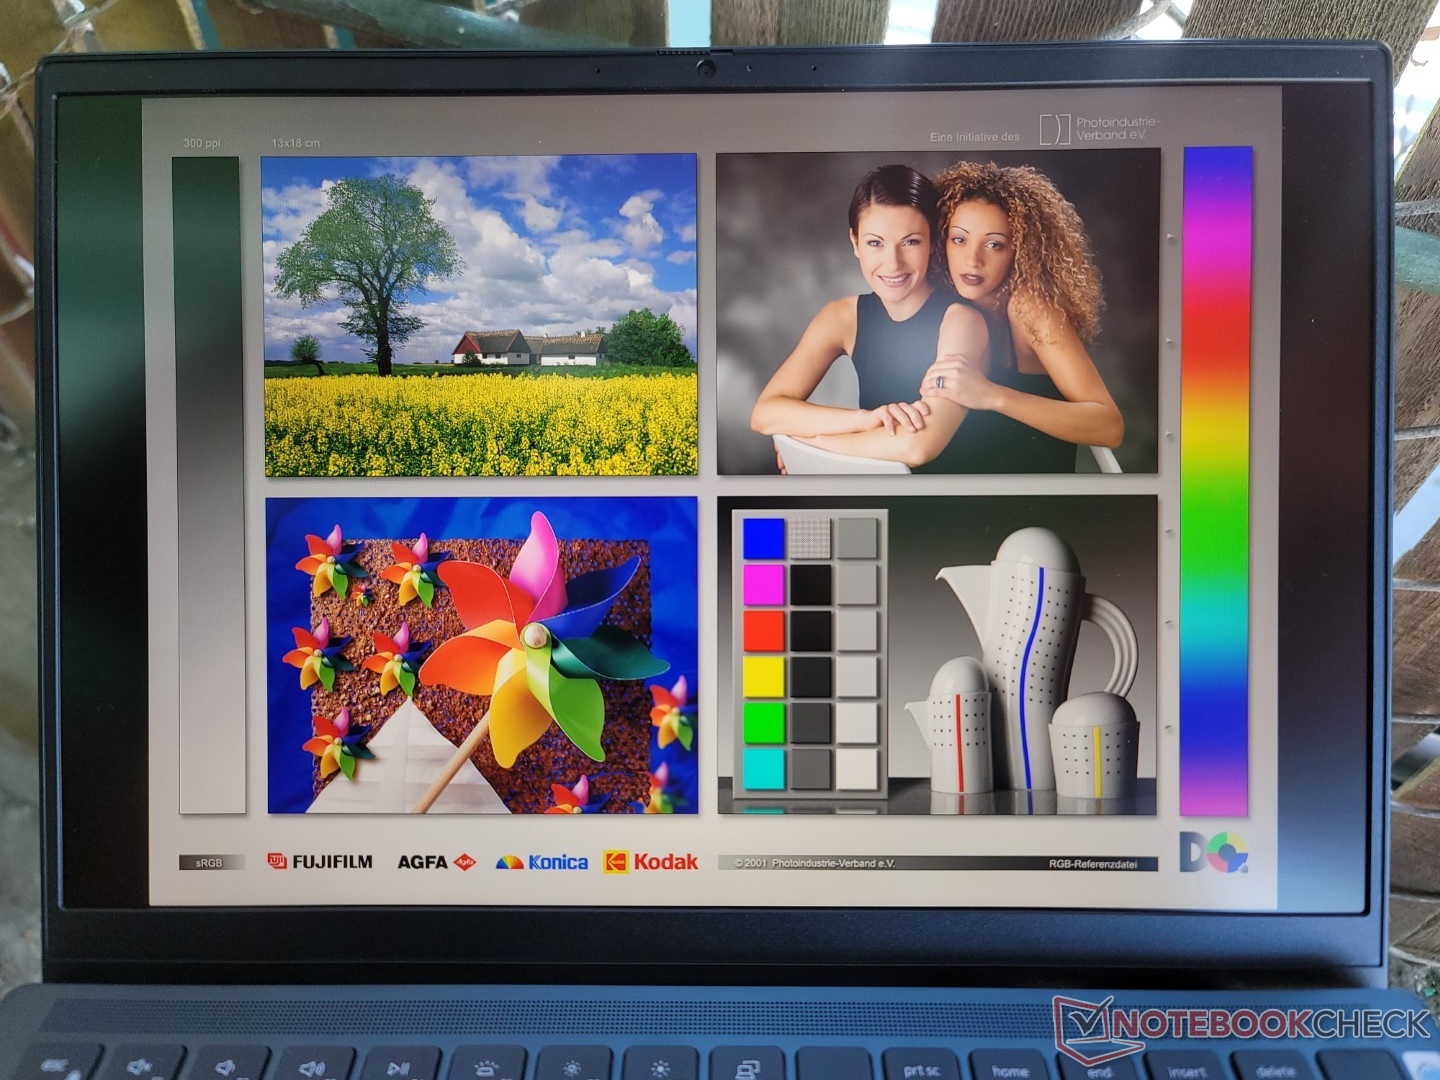
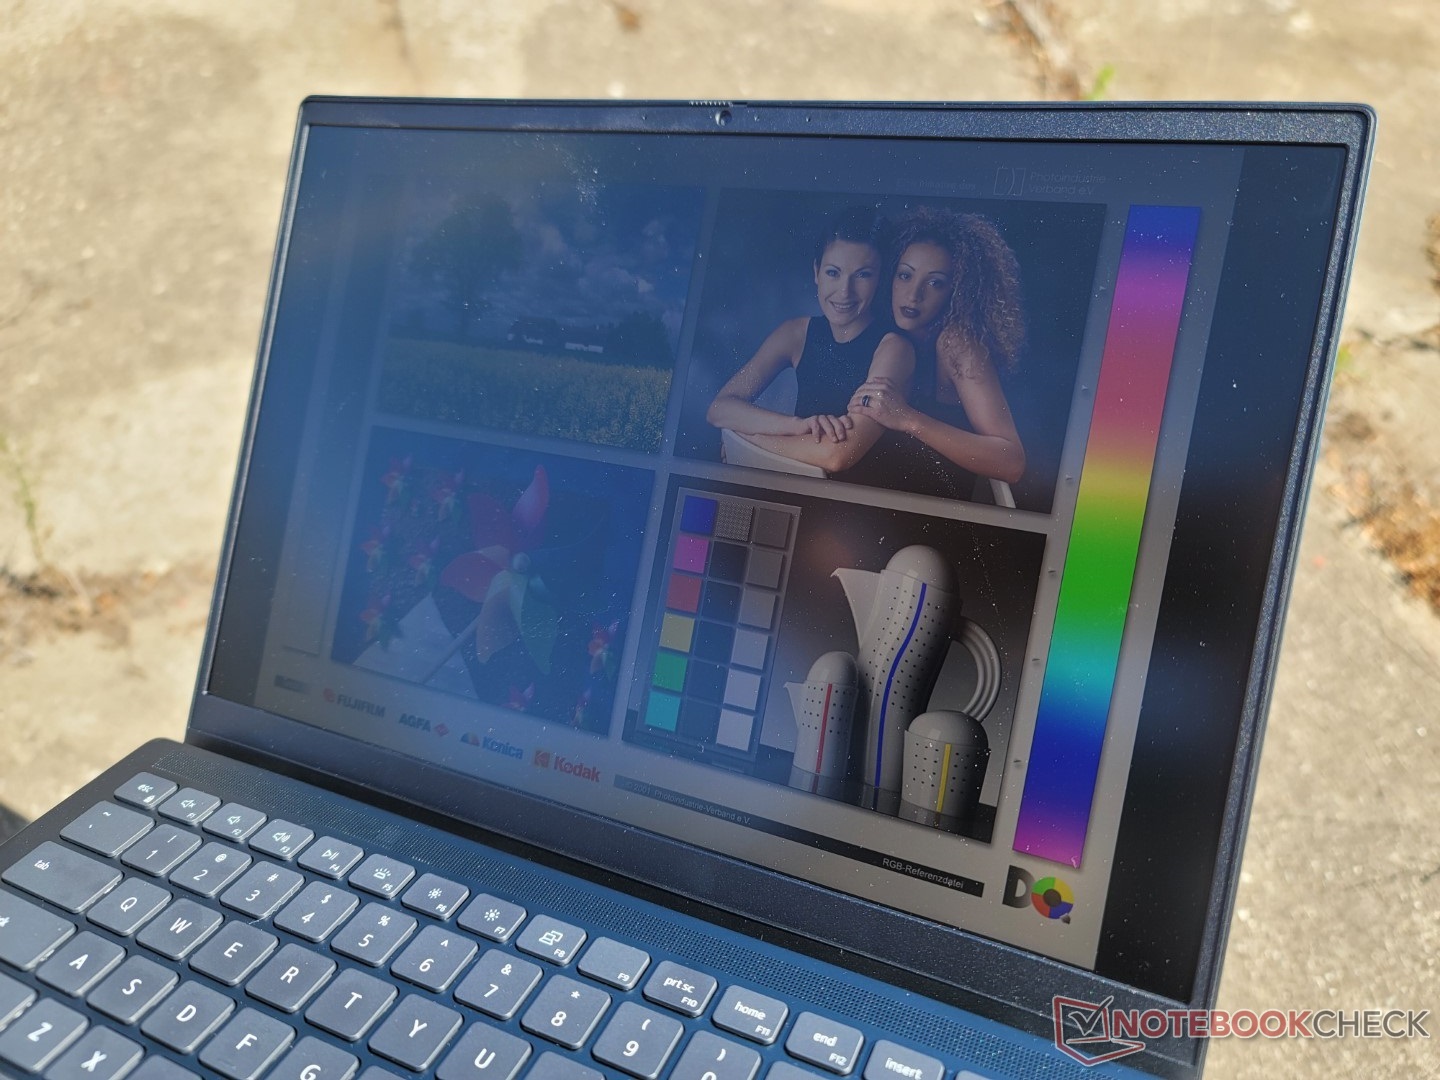
A visibilidade ao ar livre é abaixo do esperado, já que o visor tem em média apenas 300 lêndeas em sua configuração máxima. Você vai querer trabalhar sob a sombra sempre que possível se ao ar livre ou se a tela for lavada sob uma iluminação ambiente mais brilhante. OCúpula MSI E14 carrega uma tela significativamente mais brilhante enquanto ainda oferece opções discretas de GPU em comparação.
Desempenho - Supercharged 14-incher
Condições de teste
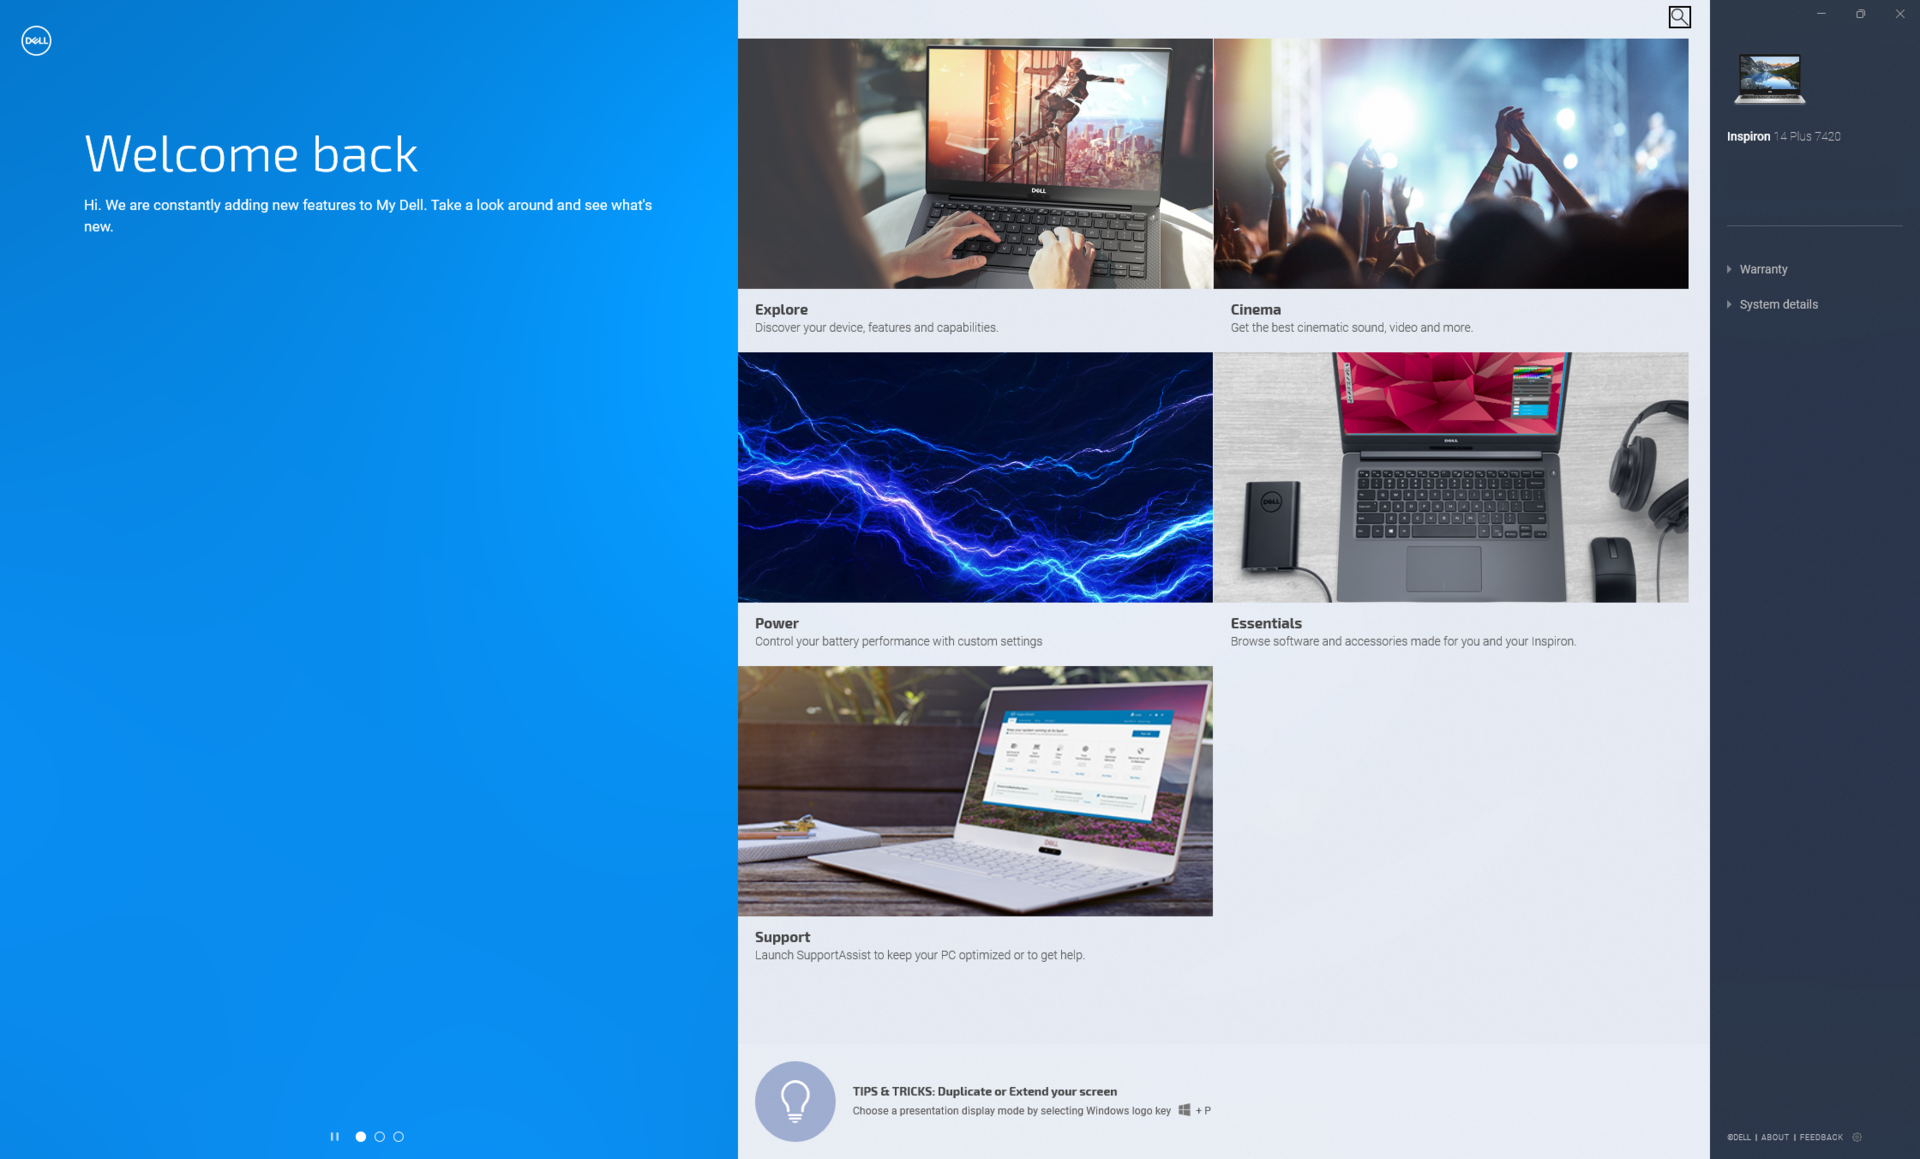
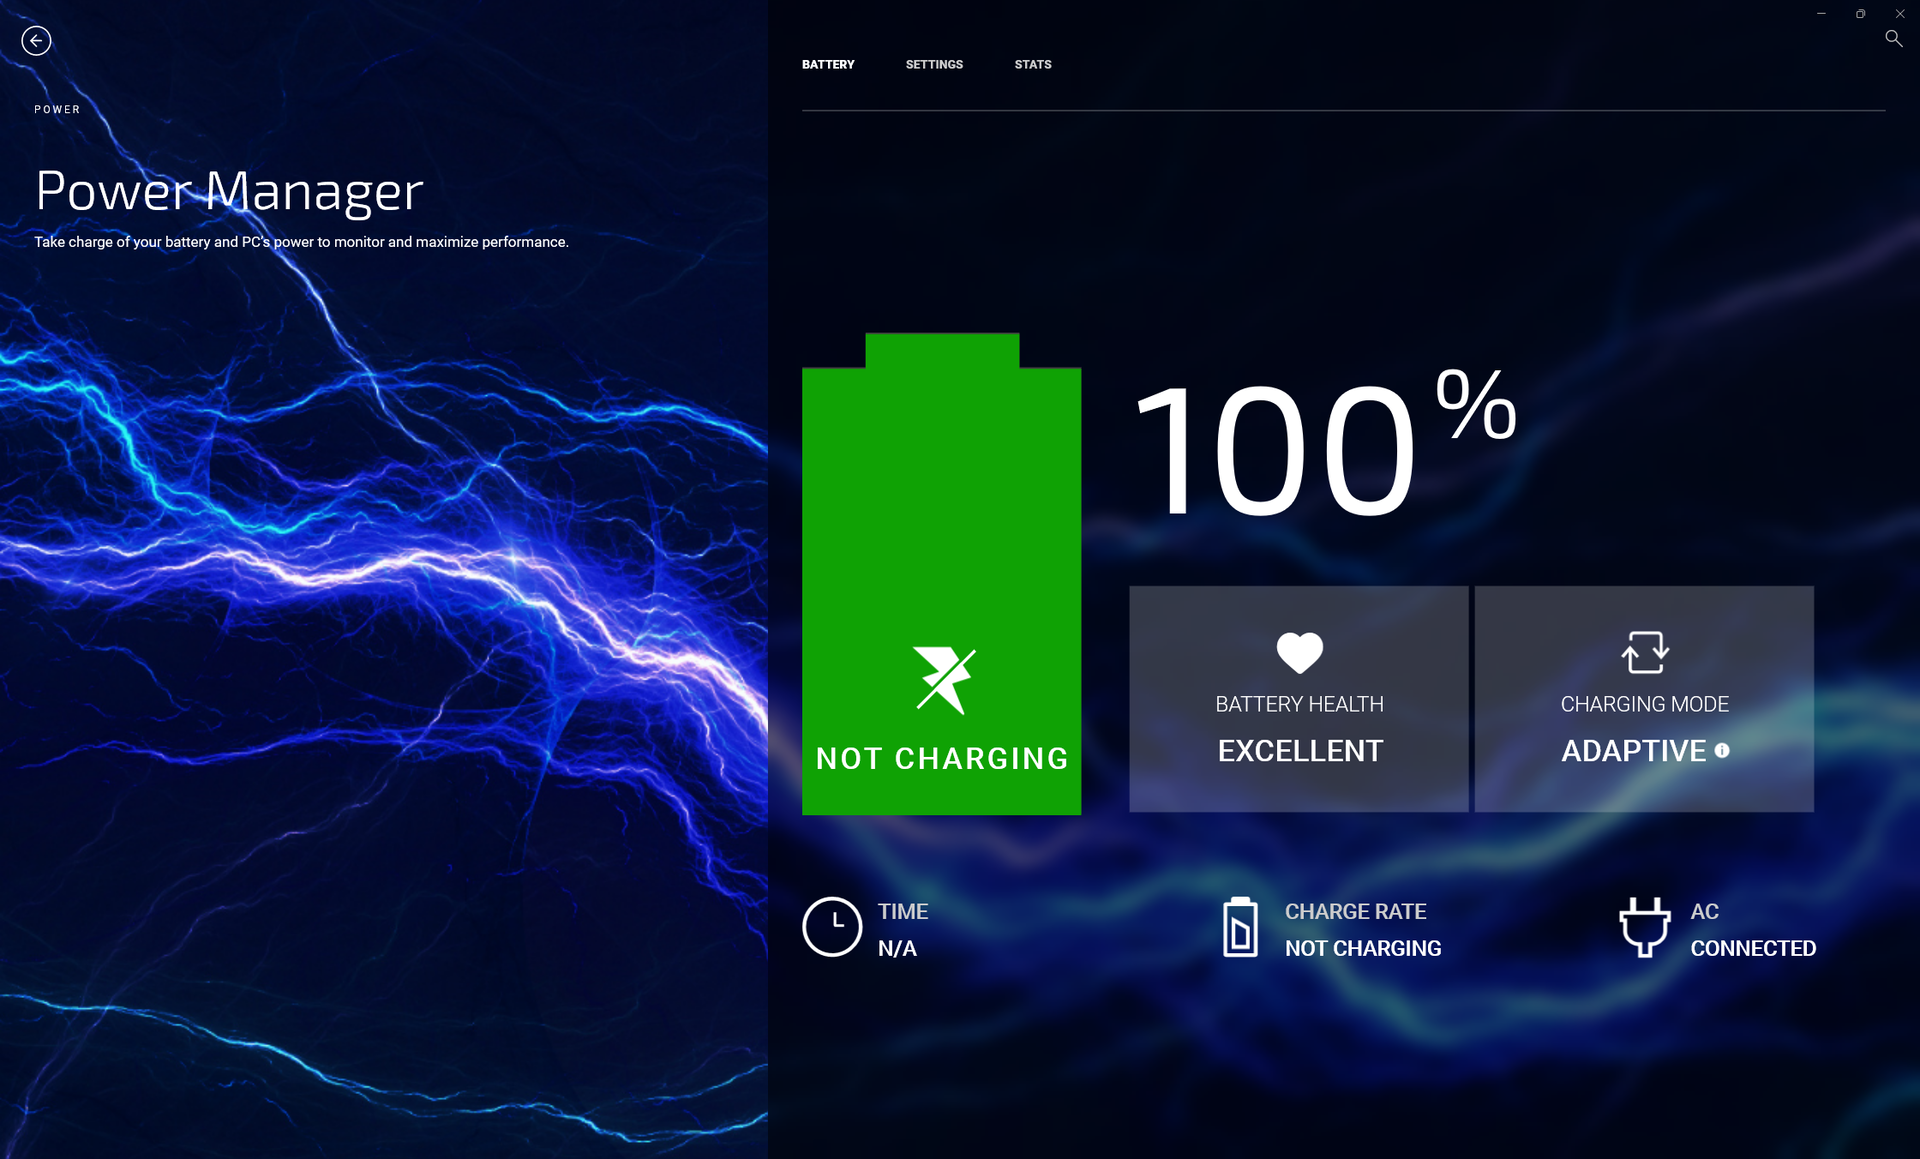
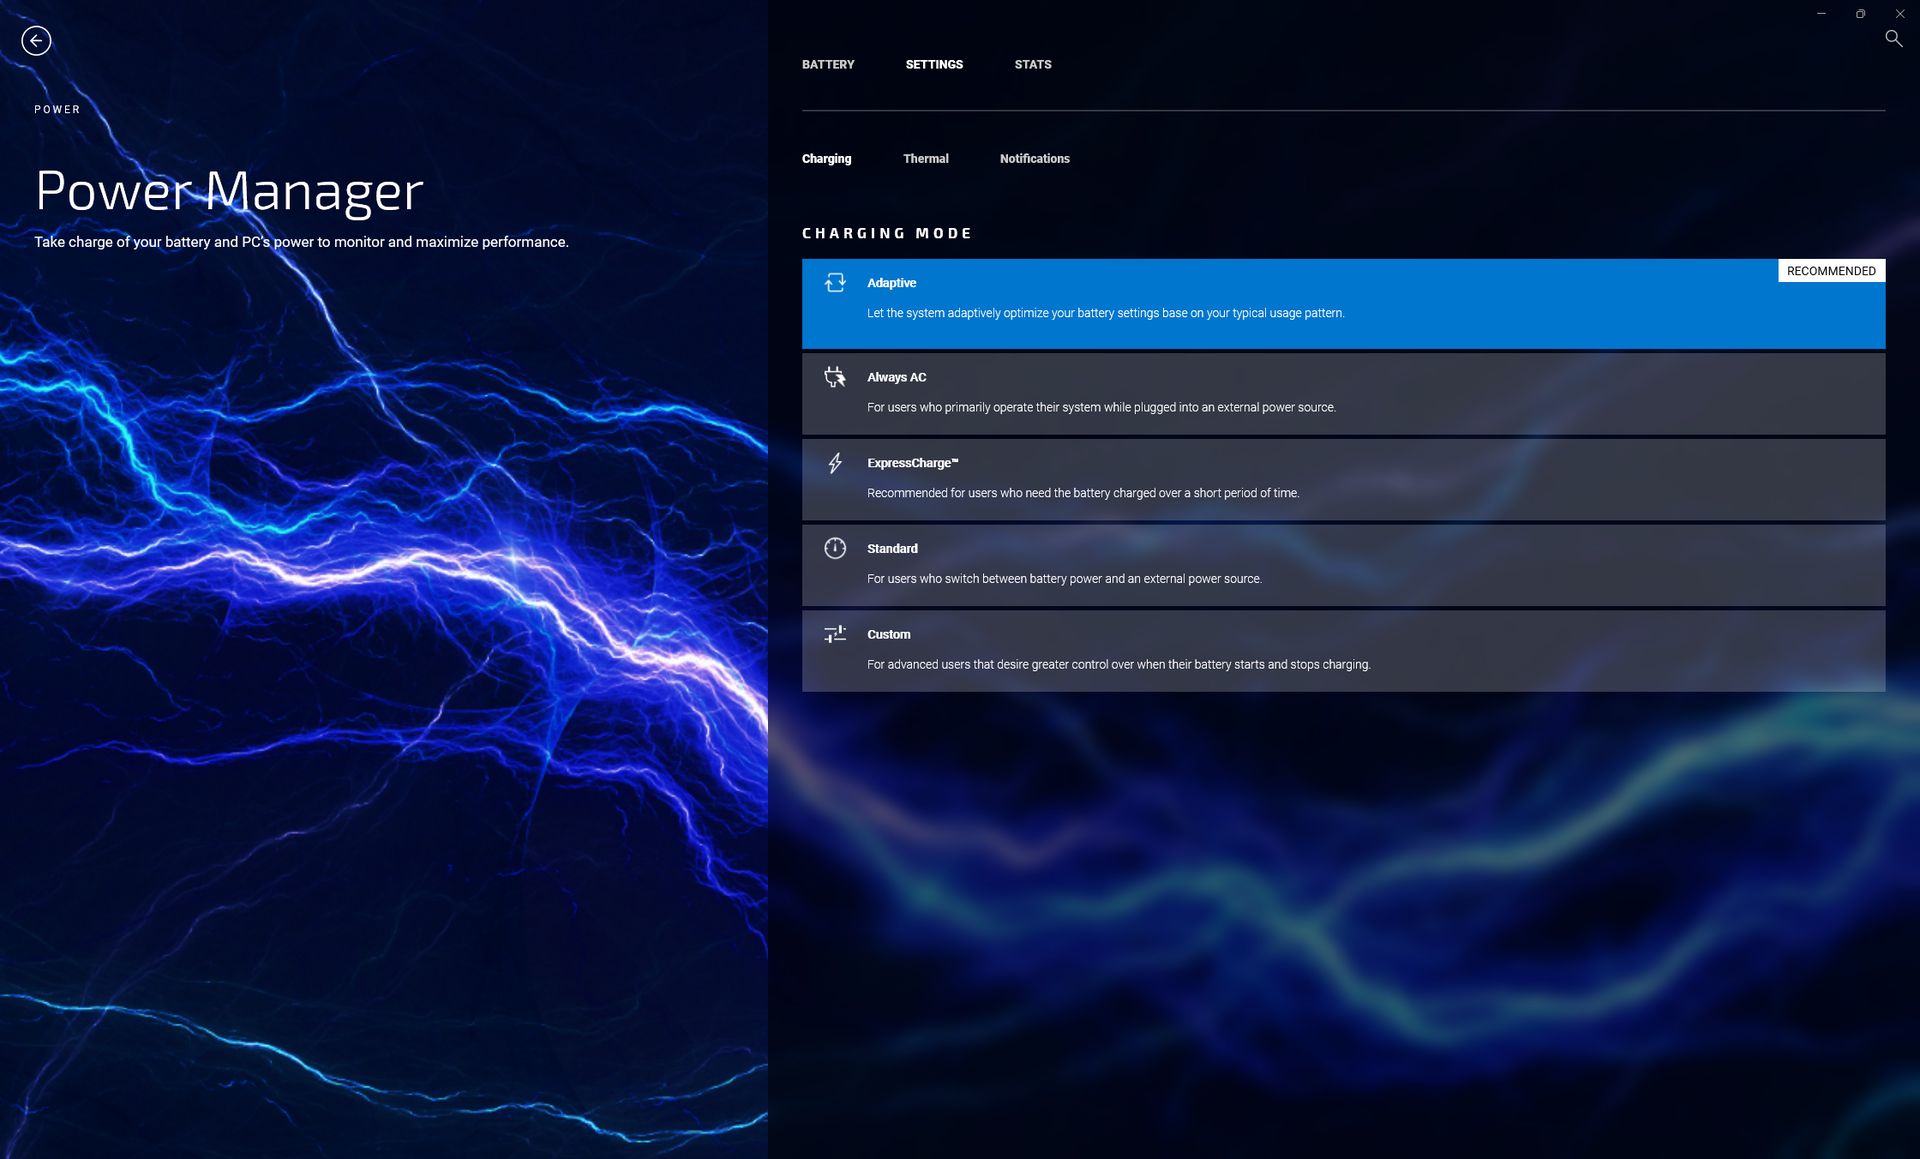
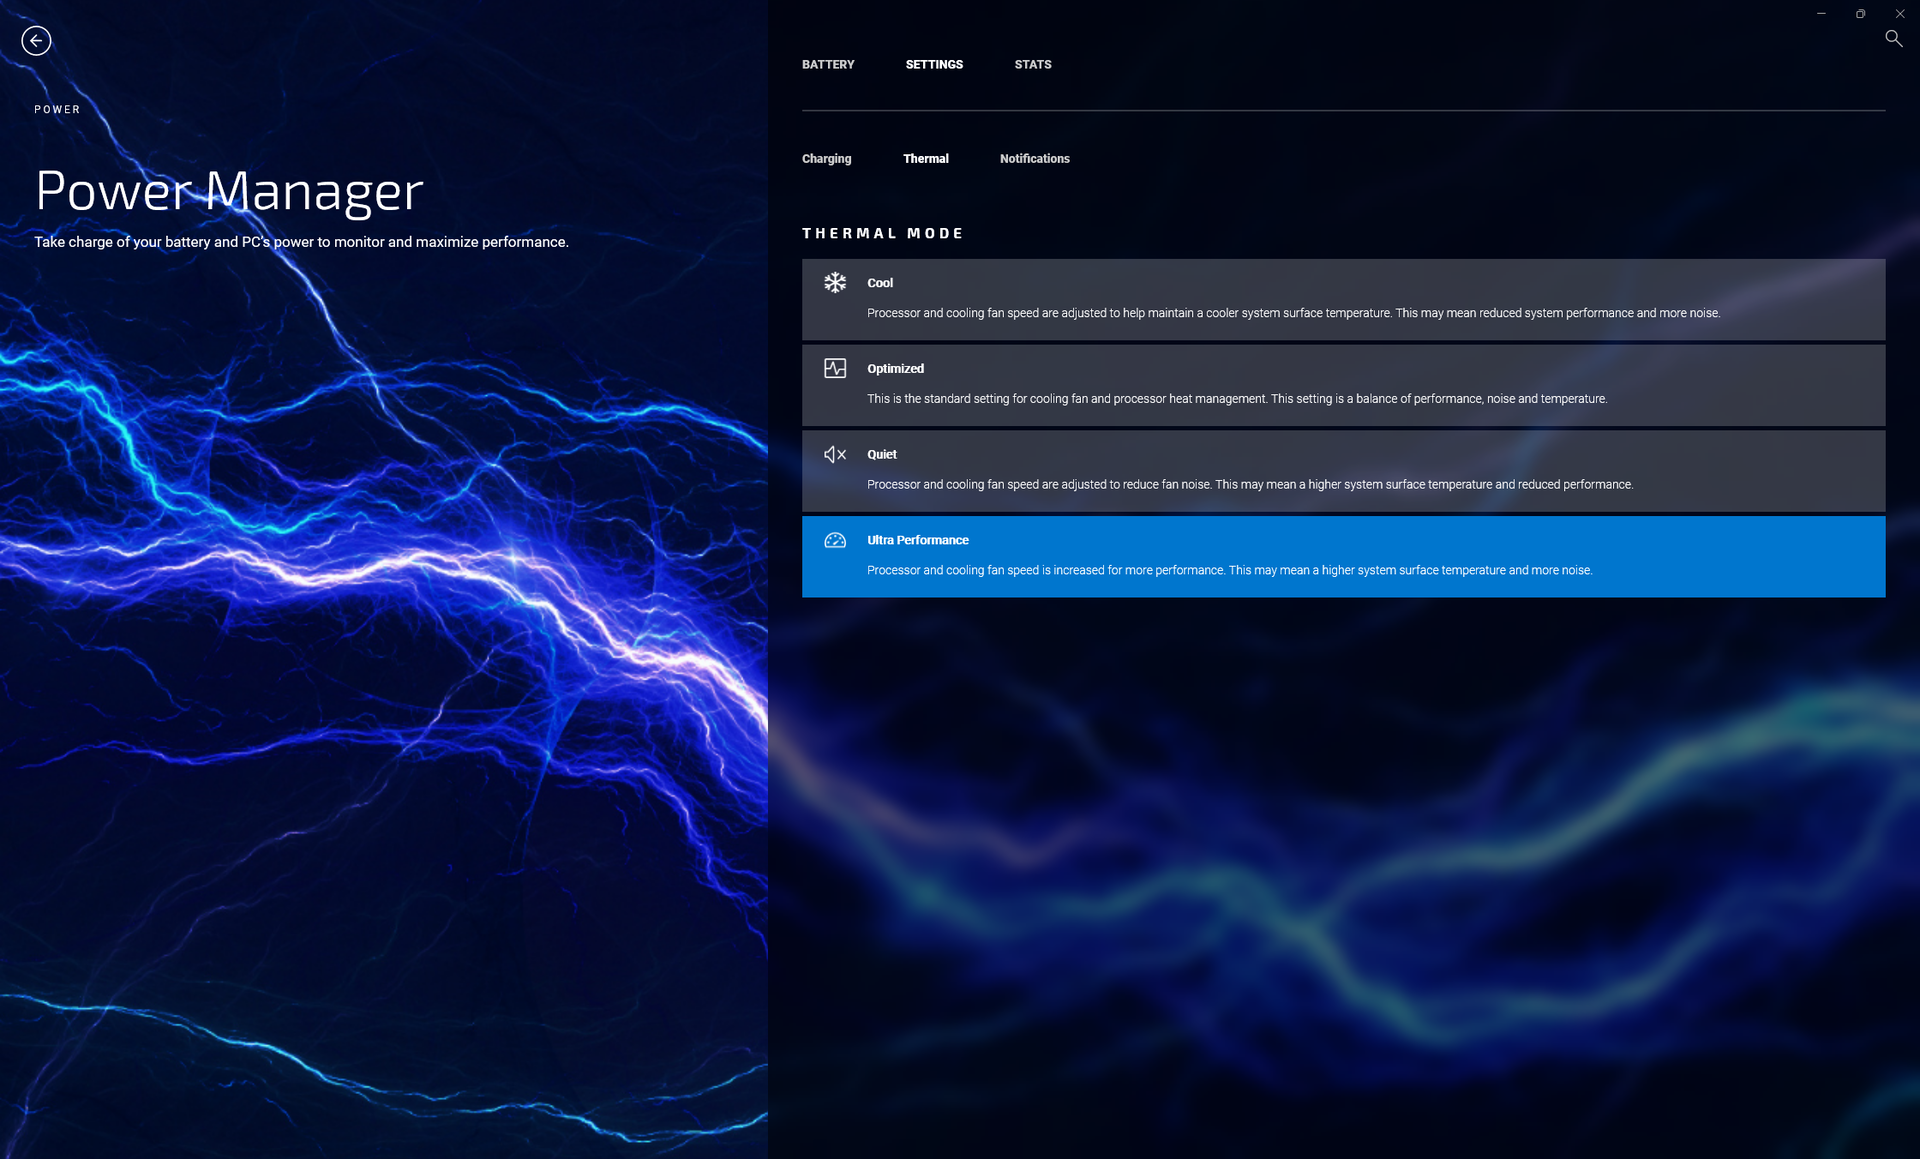
Definimos nossa unidade modo Ultra Performance através do software My Dell antes de executar quaisquer benchmarks abaixo. É recomendado que os proprietários se familiarizem com o My Dell, pois ele serve como um portal para suporte de garantia, comportamento de carga da bateria, desempenho do sistema e muito mais, conforme mostrado pelas capturas de tela abaixo
O padrão Optimus é suportado para comutar entre as GPUs integradas e discretas GeForce RTX 3050. Otimus avançado, MUX, e WhisperMode não são suportados.
Processador
O desempenho da CPU pode ser analisado de uma perspectiva de copo meio cheio ou copo meio vazio. Do ponto de vista pessimista, os 45 W Núcleo i7-12700H na Dell é um pouco decepcionante, pois seu desempenho multi-tarefa é cerca de 10% mais lento do que o de outros laptops equipados com o mesmo processador. Do ponto de vista otimista, a Dell é significativamente mais rápida do que a maioria dos outros laptops de 14 polegadas, onde as CPUs de 15 W, 25 W, ou 35 W são mais comuns. Este é um dos laptops menores que você pode obter com o Core i7-12700H, mas o lado negativo é que seu desempenho do Turbo Boost é subseqüentemente mais limitado quando comparado a laptops maiores com a mesma opção de processador. Afinal de contas, o Core i7-12700H é freqüentemente encontrado também em laptops de pleno direito para jogos. O Lenovo de 16 polegadas Legion Slim 7 com a mesma CPU, por exemplo, oferece um desempenho 30% mais rápido do que nosso Inspiron 14 Plus
O desempenho limitado do Turbo Boost de nossa CPU pode ser demonstrado executando o CineBench R15 xT em um loop. Como mostra o gráfico abaixo, nossa pontuação inicial de 2410 pontos diminuiria em 21% pelo terceiro ou quarto loop para representar uma notável queda de desempenho.
Cinebench R15 Multi Loop
Cinebench R23: Multi Core | Single Core
Cinebench R15: CPU Multi 64Bit | CPU Single 64Bit
Blender: v2.79 BMW27 CPU
7-Zip 18.03: 7z b 4 | 7z b 4 -mmt1
Geekbench 5.5: Multi-Core | Single-Core
HWBOT x265 Benchmark v2.2: 4k Preset
LibreOffice : 20 Documents To PDF
R Benchmark 2.5: Overall mean
* ... menor é melhor
AIDA64: FP32 Ray-Trace | FPU Julia | CPU SHA3 | CPU Queen | FPU SinJulia | FPU Mandel | CPU AES | CPU ZLib | FP64 Ray-Trace | CPU PhotoWorxx
| Performance rating | |
| Média Intel Core i7-12700H | |
| Dell Inspiron 14 Plus 7420 | |
| Asus Vivobook Pro 14 M3401QC-KM007T | |
| Schenker Vision 14 | |
| Asus Zenbook 14X UX5400E | |
| MSI Summit E14 A11SCS | |
| Dell Inspiron 14 7420 2-in-1 | |
| AIDA64 / FP32 Ray-Trace | |
| Dell Inspiron 14 Plus 7420 | |
| Média Intel Core i7-12700H (2585 - 17957, n=64) | |
| Asus Vivobook Pro 14 M3401QC-KM007T | |
| Schenker Vision 14 | |
| Asus Zenbook 14X UX5400E | |
| MSI Summit E14 A11SCS | |
| Dell Inspiron 14 7420 2-in-1 | |
| AIDA64 / FPU Julia | |
| Asus Vivobook Pro 14 M3401QC-KM007T | |
| Dell Inspiron 14 Plus 7420 | |
| Média Intel Core i7-12700H (12439 - 90760, n=64) | |
| Schenker Vision 14 | |
| Asus Zenbook 14X UX5400E | |
| MSI Summit E14 A11SCS | |
| Dell Inspiron 14 7420 2-in-1 | |
| AIDA64 / CPU SHA3 | |
| Média Intel Core i7-12700H (833 - 4242, n=64) | |
| Dell Inspiron 14 Plus 7420 | |
| Schenker Vision 14 | |
| Asus Vivobook Pro 14 M3401QC-KM007T | |
| Asus Zenbook 14X UX5400E | |
| MSI Summit E14 A11SCS | |
| Dell Inspiron 14 7420 2-in-1 | |
| AIDA64 / CPU Queen | |
| Média Intel Core i7-12700H (57923 - 103202, n=63) | |
| Dell Inspiron 14 Plus 7420 | |
| Asus Vivobook Pro 14 M3401QC-KM007T | |
| Dell Inspiron 14 7420 2-in-1 | |
| Schenker Vision 14 | |
| Asus Zenbook 14X UX5400E | |
| MSI Summit E14 A11SCS | |
| AIDA64 / FPU SinJulia | |
| Média Intel Core i7-12700H (3249 - 9939, n=64) | |
| Asus Vivobook Pro 14 M3401QC-KM007T | |
| Dell Inspiron 14 Plus 7420 | |
| Schenker Vision 14 | |
| Asus Zenbook 14X UX5400E | |
| MSI Summit E14 A11SCS | |
| Dell Inspiron 14 7420 2-in-1 | |
| AIDA64 / FPU Mandel | |
| Asus Vivobook Pro 14 M3401QC-KM007T | |
| Dell Inspiron 14 Plus 7420 | |
| Média Intel Core i7-12700H (7135 - 44760, n=64) | |
| Schenker Vision 14 | |
| MSI Summit E14 A11SCS | |
| Asus Zenbook 14X UX5400E | |
| Dell Inspiron 14 7420 2-in-1 | |
| AIDA64 / CPU AES | |
| Asus Vivobook Pro 14 M3401QC-KM007T | |
| Média Intel Core i7-12700H (31839 - 144360, n=64) | |
| Schenker Vision 14 | |
| Asus Zenbook 14X UX5400E | |
| Dell Inspiron 14 Plus 7420 | |
| MSI Summit E14 A11SCS | |
| Dell Inspiron 14 7420 2-in-1 | |
| AIDA64 / CPU ZLib | |
| Média Intel Core i7-12700H (305 - 1171, n=64) | |
| Dell Inspiron 14 Plus 7420 | |
| Asus Vivobook Pro 14 M3401QC-KM007T | |
| Dell Inspiron 14 7420 2-in-1 | |
| Schenker Vision 14 | |
| Asus Zenbook 14X UX5400E | |
| MSI Summit E14 A11SCS | |
| AIDA64 / FP64 Ray-Trace | |
| Dell Inspiron 14 Plus 7420 | |
| Média Intel Core i7-12700H (1437 - 9692, n=64) | |
| Asus Vivobook Pro 14 M3401QC-KM007T | |
| Schenker Vision 14 | |
| Asus Zenbook 14X UX5400E | |
| MSI Summit E14 A11SCS | |
| Dell Inspiron 14 7420 2-in-1 | |
| AIDA64 / CPU PhotoWorxx | |
| MSI Summit E14 A11SCS | |
| Dell Inspiron 14 Plus 7420 | |
| Média Intel Core i7-12700H (12863 - 52207, n=64) | |
| Asus Zenbook 14X UX5400E | |
| Schenker Vision 14 | |
| Dell Inspiron 14 7420 2-in-1 | |
| Asus Vivobook Pro 14 M3401QC-KM007T | |
Desempenho do sistema
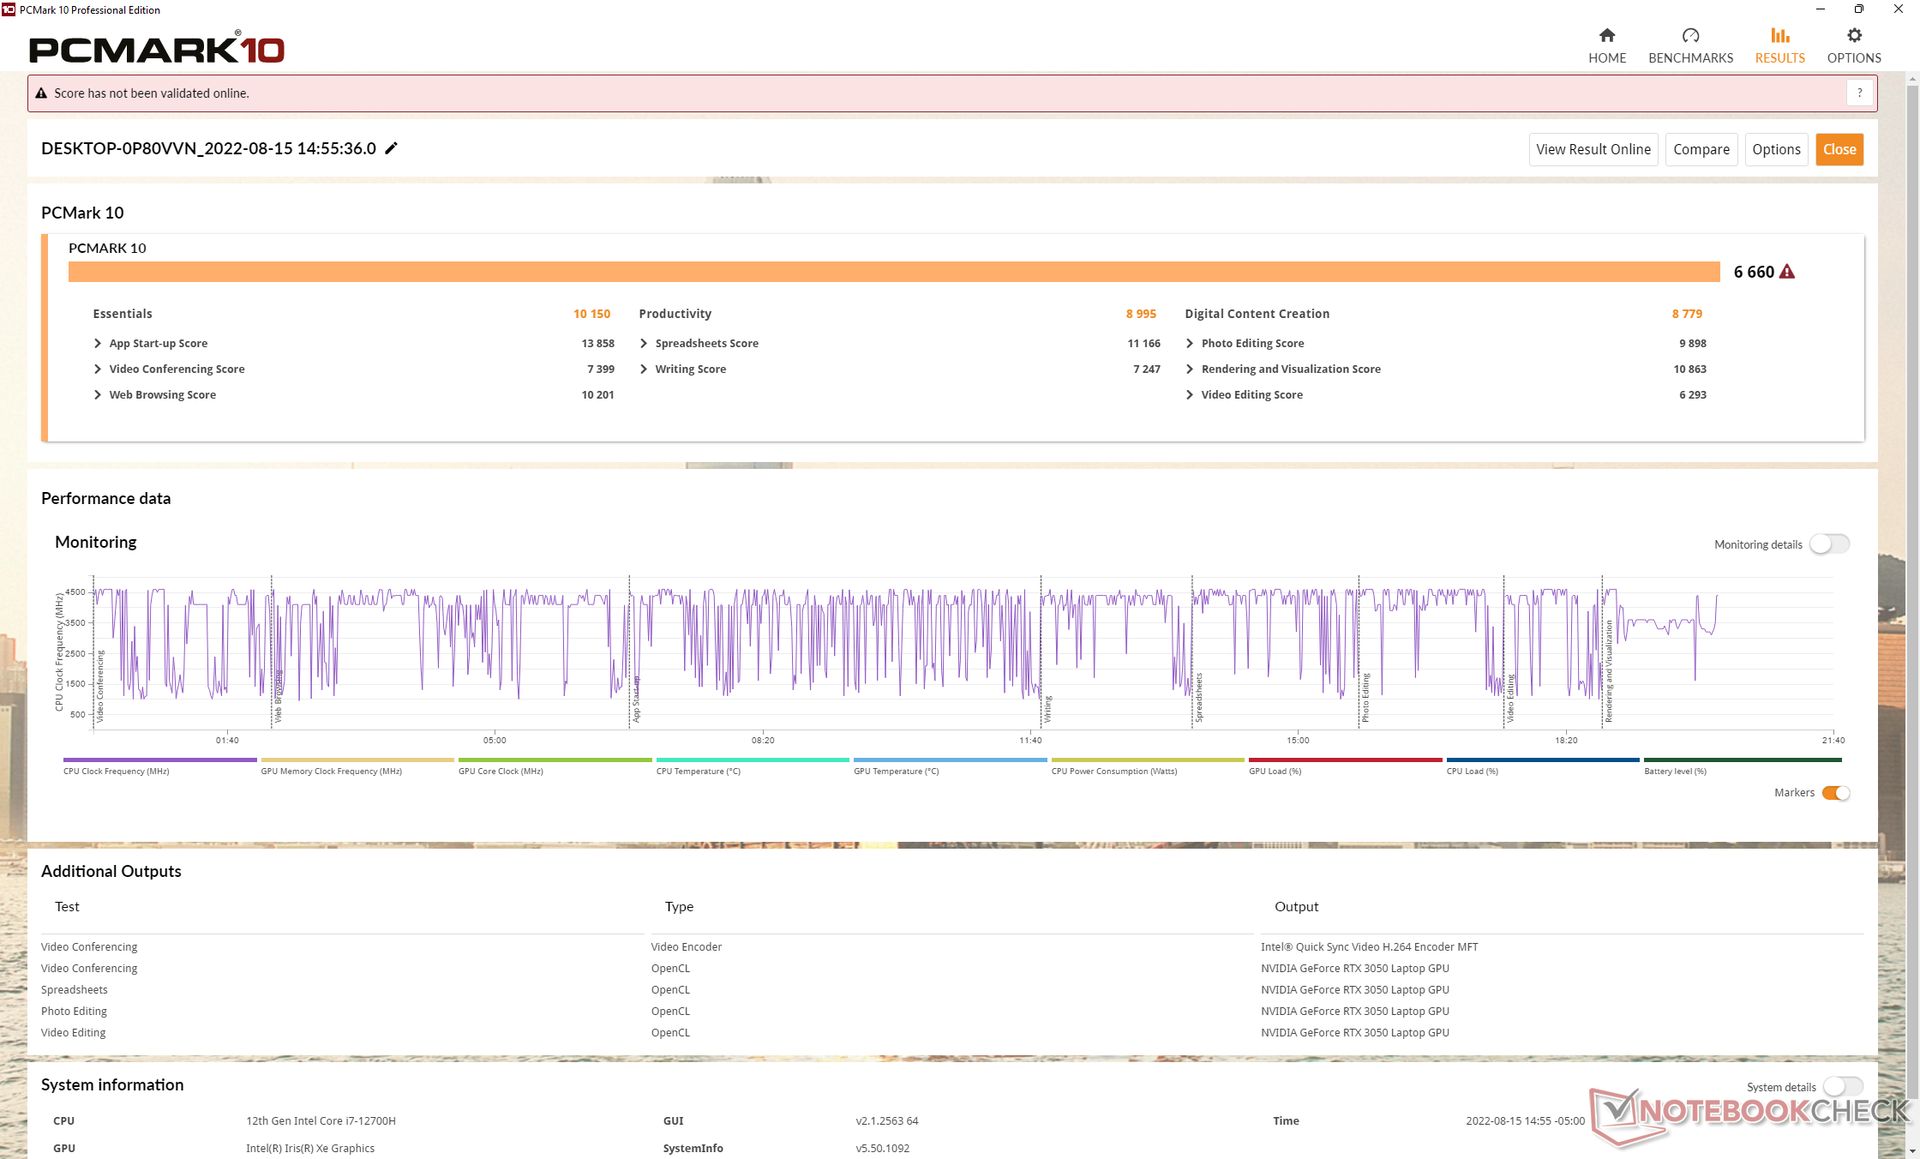
Os resultados do PCMark 10 são excelentes e superiores até aos da concorrência, como o Schenker Vision 14 com gráficos RTX 3050 Ti mais rápidos ou oAsus Vivobook Pro 14 com a CPU AMD Ryzen 5600H. Não há dúvida de que o Core i7-12700H está desempenhando um grande papel no aumento do desempenho geral do Inspiron 14 Plus 7420 sobre a maioria dos outros laptops multimídia de 14 polegadas.
CrossMark: Overall | Productivity | Creativity | Responsiveness
| PCMark 10 / Score | |
| Média Intel Core i7-12700H, NVIDIA GeForce RTX 3050 4GB Laptop GPU (6660 - 6879, n=3) | |
| Dell Inspiron 14 Plus 7420 | |
| Schenker Vision 14 | |
| Asus Vivobook Pro 14 M3401QC-KM007T | |
| HP Envy 14-eb0010nr | |
| MSI Summit E14 A11SCS | |
| Dell Inspiron 14 7420 2-in-1 | |
| Asus Zenbook 14X UX5400E | |
| PCMark 10 / Essentials | |
| Média Intel Core i7-12700H, NVIDIA GeForce RTX 3050 4GB Laptop GPU (10150 - 10369, n=3) | |
| Dell Inspiron 14 7420 2-in-1 | |
| Dell Inspiron 14 Plus 7420 | |
| Asus Vivobook Pro 14 M3401QC-KM007T | |
| Schenker Vision 14 | |
| HP Envy 14-eb0010nr | |
| MSI Summit E14 A11SCS | |
| Asus Zenbook 14X UX5400E | |
| PCMark 10 / Productivity | |
| Média Intel Core i7-12700H, NVIDIA GeForce RTX 3050 4GB Laptop GPU (8995 - 9397, n=3) | |
| Dell Inspiron 14 Plus 7420 | |
| Schenker Vision 14 | |
| Asus Zenbook 14X UX5400E | |
| HP Envy 14-eb0010nr | |
| MSI Summit E14 A11SCS | |
| Asus Vivobook Pro 14 M3401QC-KM007T | |
| Dell Inspiron 14 7420 2-in-1 | |
| PCMark 10 / Digital Content Creation | |
| Média Intel Core i7-12700H, NVIDIA GeForce RTX 3050 4GB Laptop GPU (8779 - 9203, n=3) | |
| Dell Inspiron 14 Plus 7420 | |
| Asus Vivobook Pro 14 M3401QC-KM007T | |
| Schenker Vision 14 | |
| Dell Inspiron 14 7420 2-in-1 | |
| HP Envy 14-eb0010nr | |
| MSI Summit E14 A11SCS | |
| Asus Zenbook 14X UX5400E | |
| CrossMark / Overall | |
| Média Intel Core i7-12700H, NVIDIA GeForce RTX 3050 4GB Laptop GPU (1717 - 1857, n=3) | |
| Dell Inspiron 14 Plus 7420 | |
| Schenker Vision 14 | |
| Dell Inspiron 14 7420 2-in-1 | |
| Asus Vivobook Pro 14 M3401QC-KM007T | |
| CrossMark / Productivity | |
| Média Intel Core i7-12700H, NVIDIA GeForce RTX 3050 4GB Laptop GPU (1620 - 1735, n=3) | |
| Dell Inspiron 14 Plus 7420 | |
| Schenker Vision 14 | |
| Dell Inspiron 14 7420 2-in-1 | |
| Asus Vivobook Pro 14 M3401QC-KM007T | |
| CrossMark / Creativity | |
| Média Intel Core i7-12700H, NVIDIA GeForce RTX 3050 4GB Laptop GPU (1911 - 2067, n=3) | |
| Dell Inspiron 14 Plus 7420 | |
| Dell Inspiron 14 7420 2-in-1 | |
| Schenker Vision 14 | |
| Asus Vivobook Pro 14 M3401QC-KM007T | |
| CrossMark / Responsiveness | |
| Média Intel Core i7-12700H, NVIDIA GeForce RTX 3050 4GB Laptop GPU (1481 - 1651, n=3) | |
| Schenker Vision 14 | |
| Dell Inspiron 14 Plus 7420 | |
| Dell Inspiron 14 7420 2-in-1 | |
| Asus Vivobook Pro 14 M3401QC-KM007T | |
| PCMark 10 Score | 6660 pontos | |
Ajuda | ||
| AIDA64 / Memory Copy | |
| MSI Summit E14 A11SCS | |
| Asus Zenbook 14X UX5400E | |
| Dell Inspiron 14 Plus 7420 | |
| Média Intel Core i7-12700H (25615 - 80511, n=64) | |
| Schenker Vision 14 | |
| Dell Inspiron 14 7420 2-in-1 | |
| Asus Vivobook Pro 14 M3401QC-KM007T | |
| AIDA64 / Memory Read | |
| Dell Inspiron 14 Plus 7420 | |
| MSI Summit E14 A11SCS | |
| Asus Zenbook 14X UX5400E | |
| Média Intel Core i7-12700H (25586 - 79442, n=64) | |
| Schenker Vision 14 | |
| Asus Vivobook Pro 14 M3401QC-KM007T | |
| Dell Inspiron 14 7420 2-in-1 | |
| AIDA64 / Memory Write | |
| Asus Zenbook 14X UX5400E | |
| MSI Summit E14 A11SCS | |
| Dell Inspiron 14 Plus 7420 | |
| Média Intel Core i7-12700H (23679 - 88660, n=64) | |
| Schenker Vision 14 | |
| Dell Inspiron 14 7420 2-in-1 | |
| Asus Vivobook Pro 14 M3401QC-KM007T | |
| AIDA64 / Memory Latency | |
| Dell Inspiron 14 Plus 7420 | |
| Asus Zenbook 14X UX5400E | |
| MSI Summit E14 A11SCS | |
| Asus Vivobook Pro 14 M3401QC-KM007T | |
| Média Intel Core i7-12700H (76.2 - 133.9, n=62) | |
| Schenker Vision 14 | |
| Dell Inspiron 14 7420 2-in-1 | |
* ... menor é melhor
Latência do DPC
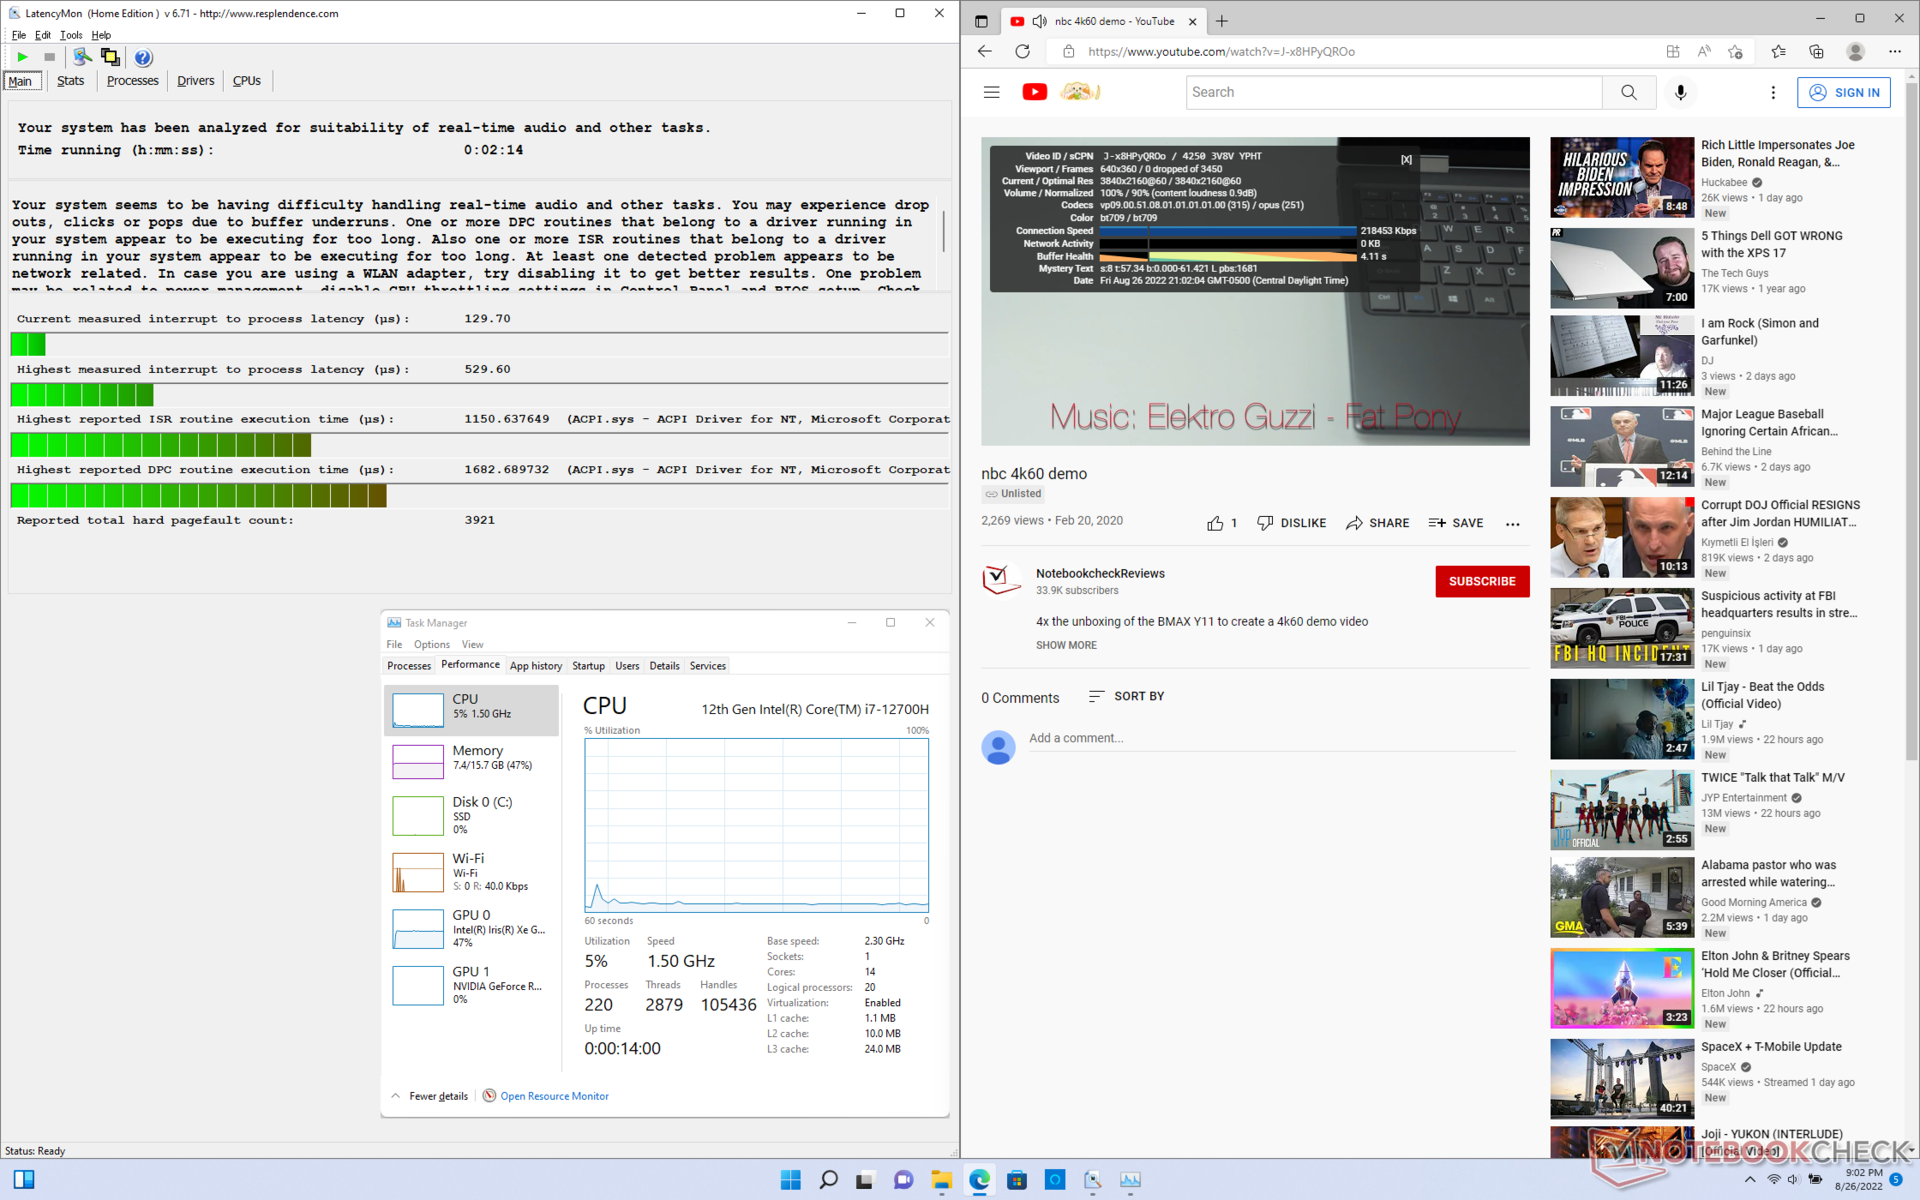
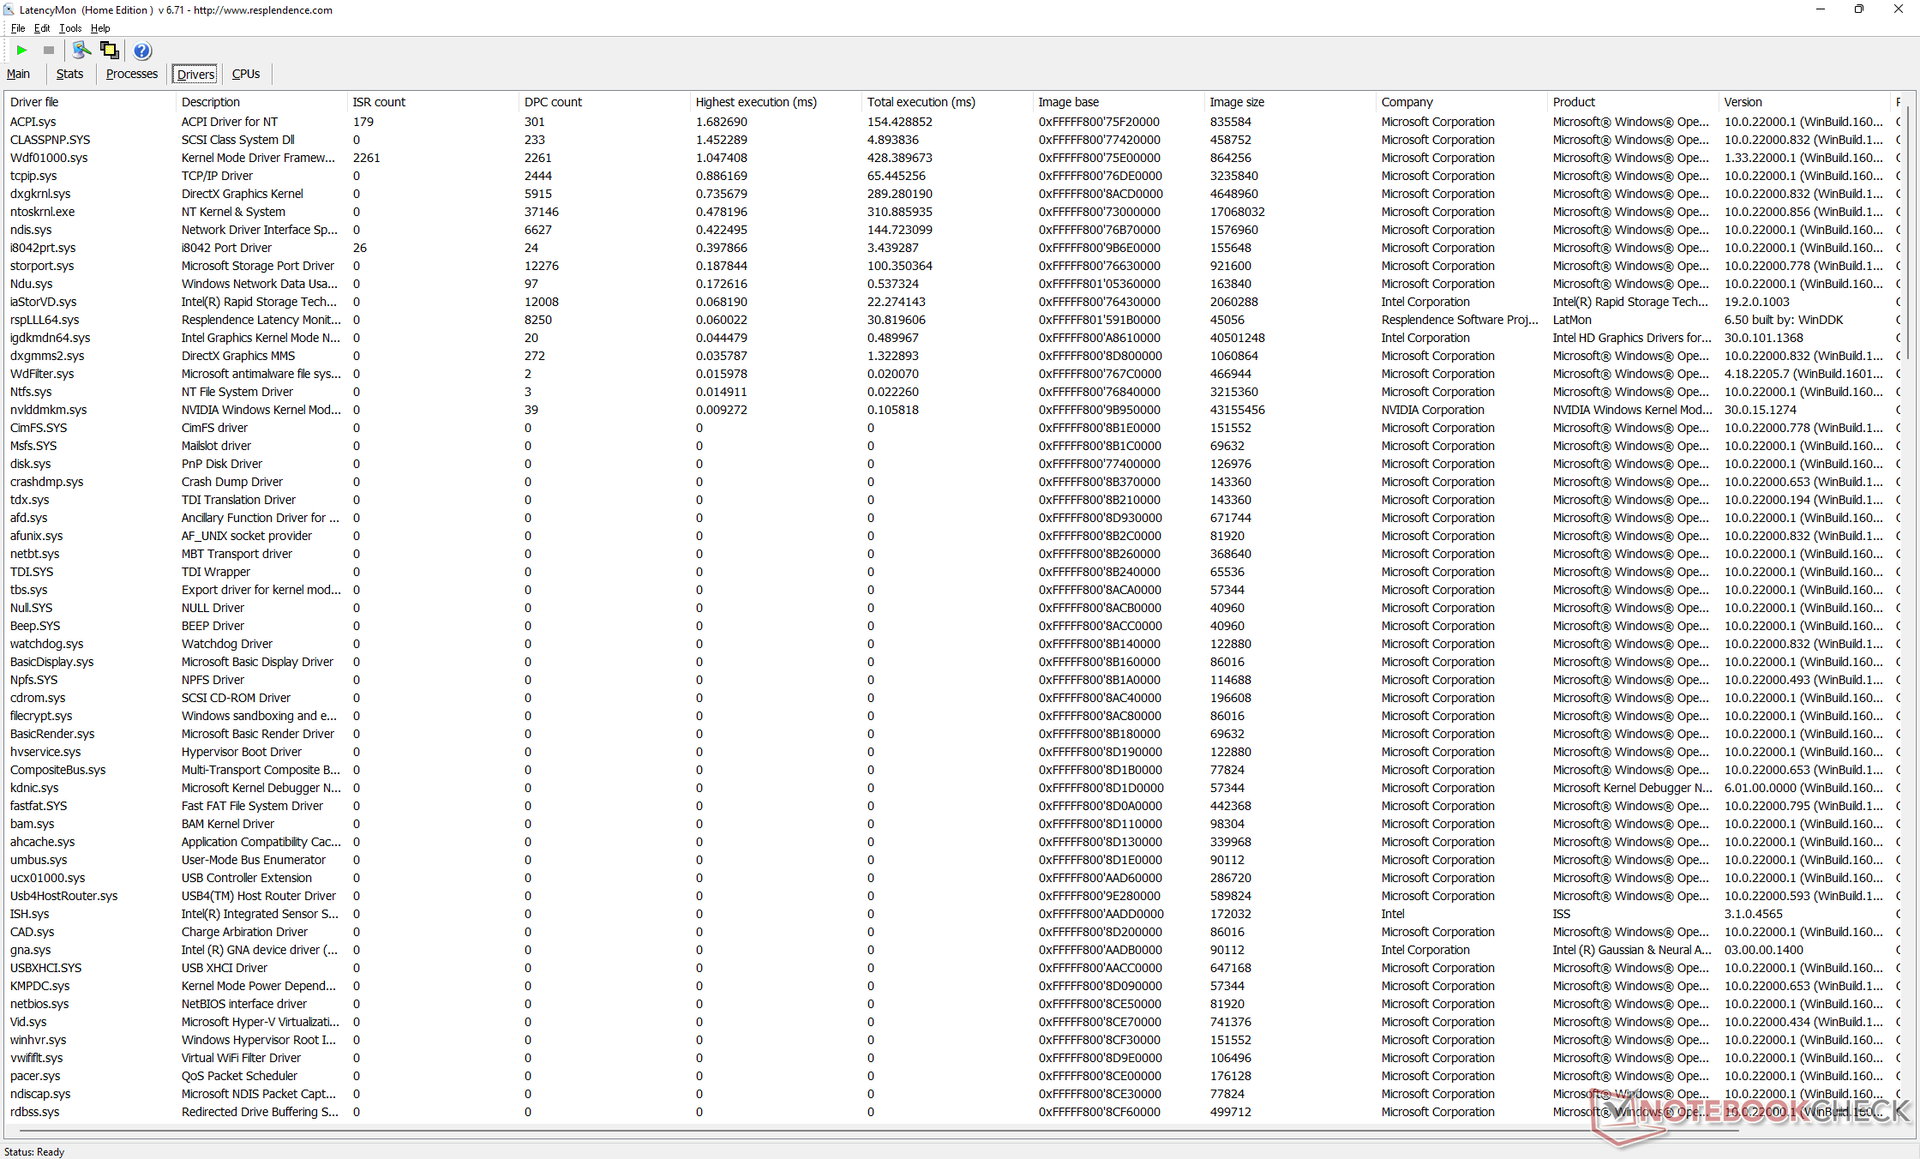
LatencyMon mostra pequenos problemas de DPC ao abrir várias abas do navegador em nossa página inicial. a reprodução de vídeo de 4K a 60 FPS é de outra forma suave e sem qualquer queda de quadros.
| DPC Latencies / LatencyMon - interrupt to process latency (max), Web, Youtube, Prime95 | |
| HP Envy 14-eb0010nr | |
| Schenker Vision 14 | |
| MSI Summit E14 A11SCS | |
| Asus Vivobook Pro 14 M3401QC-KM007T | |
| Asus Zenbook 14X UX5400E | |
| Dell Inspiron 14 7420 2-in-1 | |
| Dell Inspiron 14 Plus 7420 | |
* ... menor é melhor
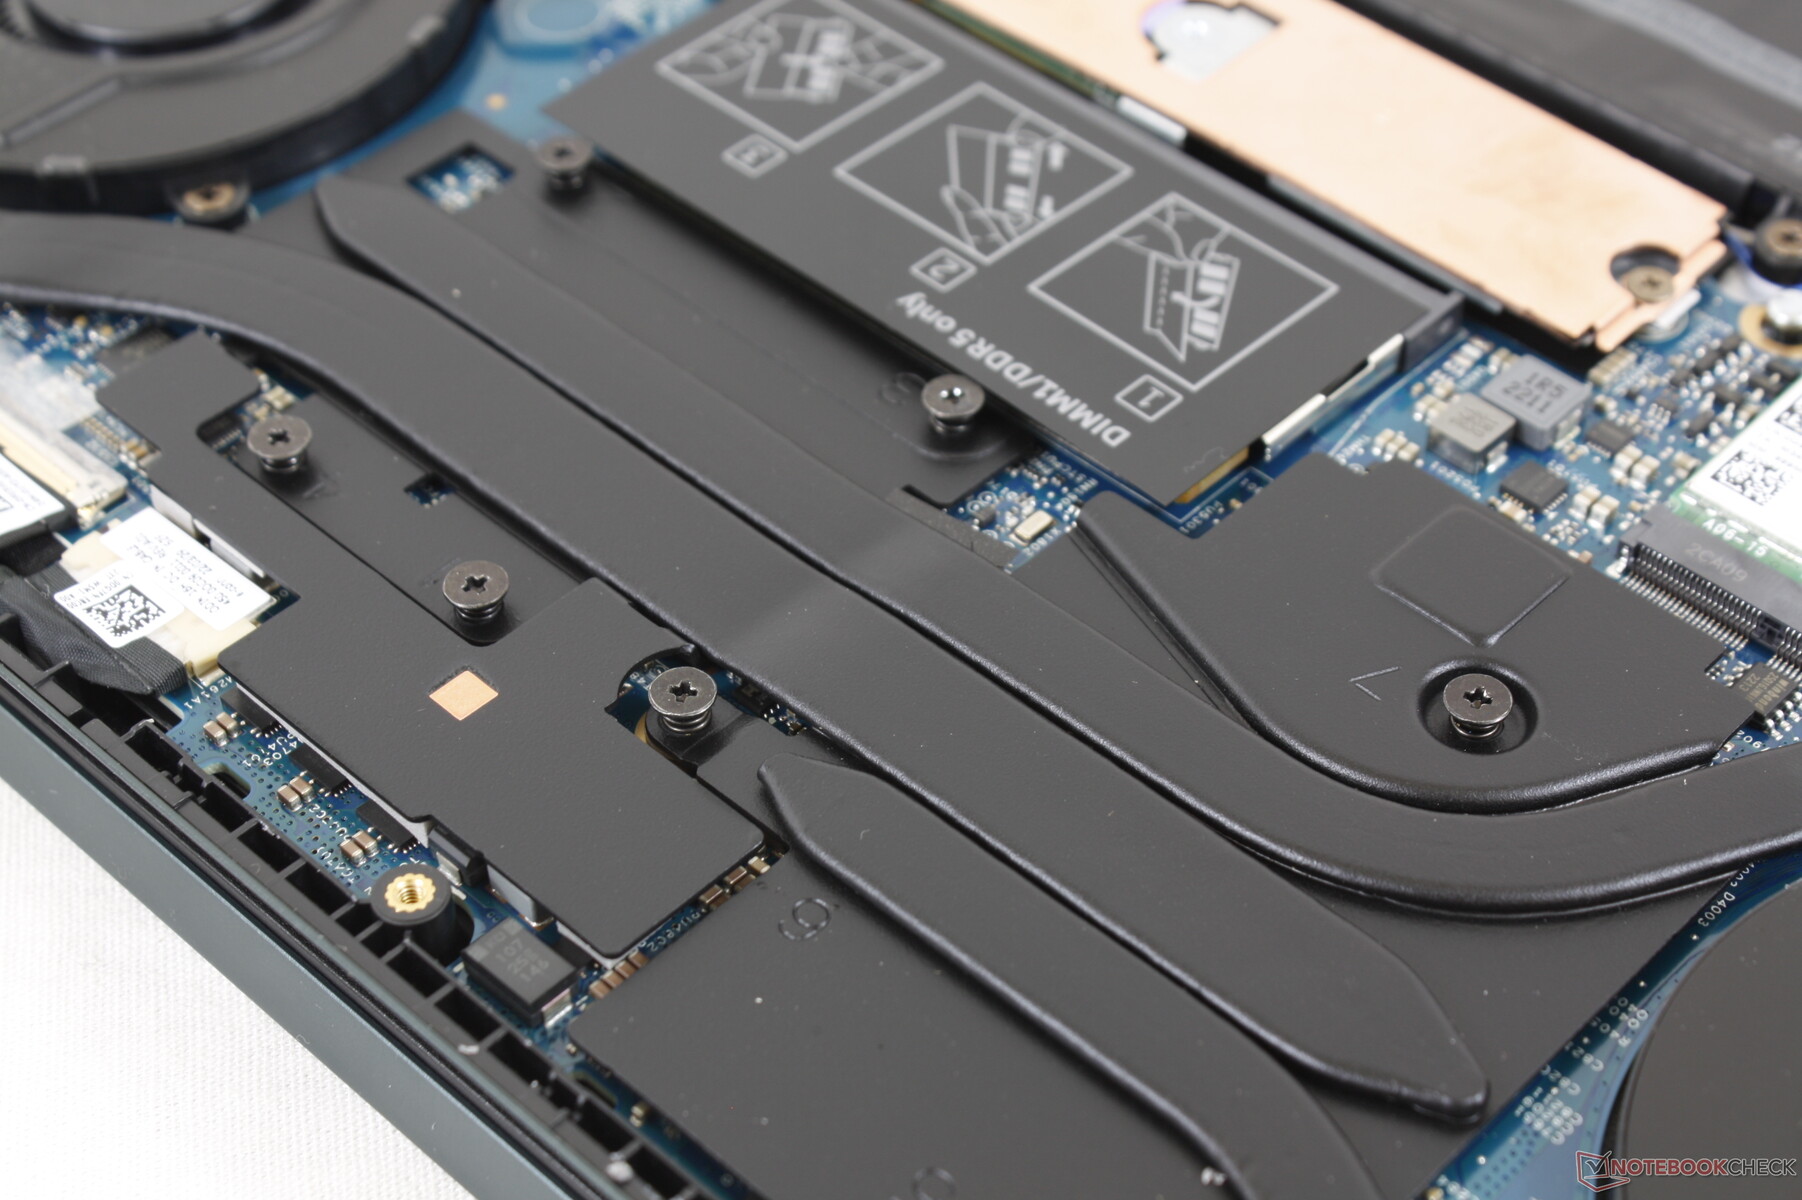
Dispositivos de Armazenamento - Espalhador de Calor Incluído
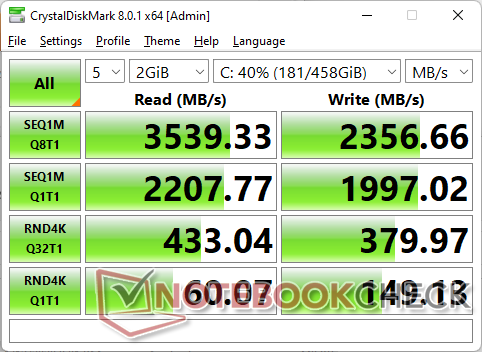
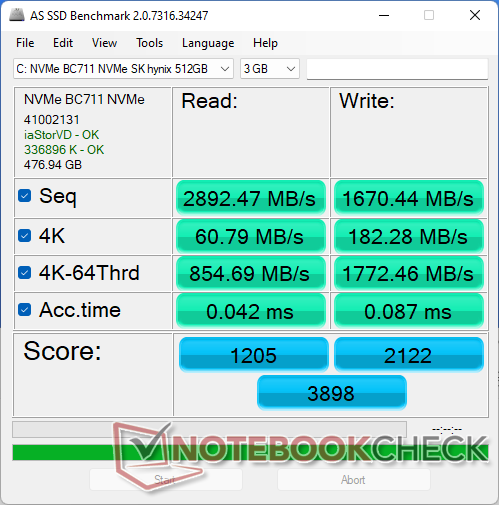
Nossa unidade é embarcada com uma capacidade de 512 GB SK Hynix BC711 PCIe3 NVMe SSD oferecendo taxas de leitura seqüencial de até 3600 MB/s. A unidade não exibiria problemas de estrangulamento de desempenho ao executar o DiskSpd em loop, pois vem com seu próprio espalhador de calor pré-instalado. Em comparação, a maioria dos outros OEMs não inclui um com seu orçamento ou mesmo modelos de laptop de médio porte. No entanto, teria sido bom ver opções mais rápidas de PCIe4 no Inspiron 14 Plus 7420.

* ... menor é melhor
Disk Throttling: DiskSpd Read Loop, Queue Depth 8
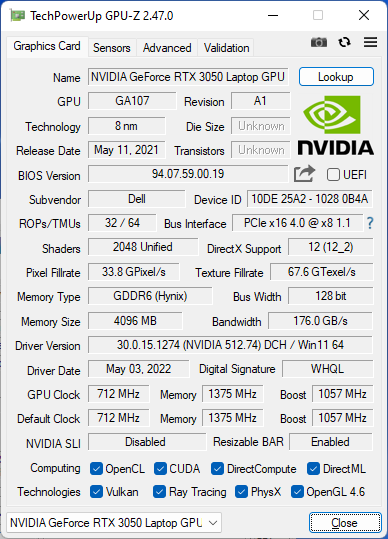
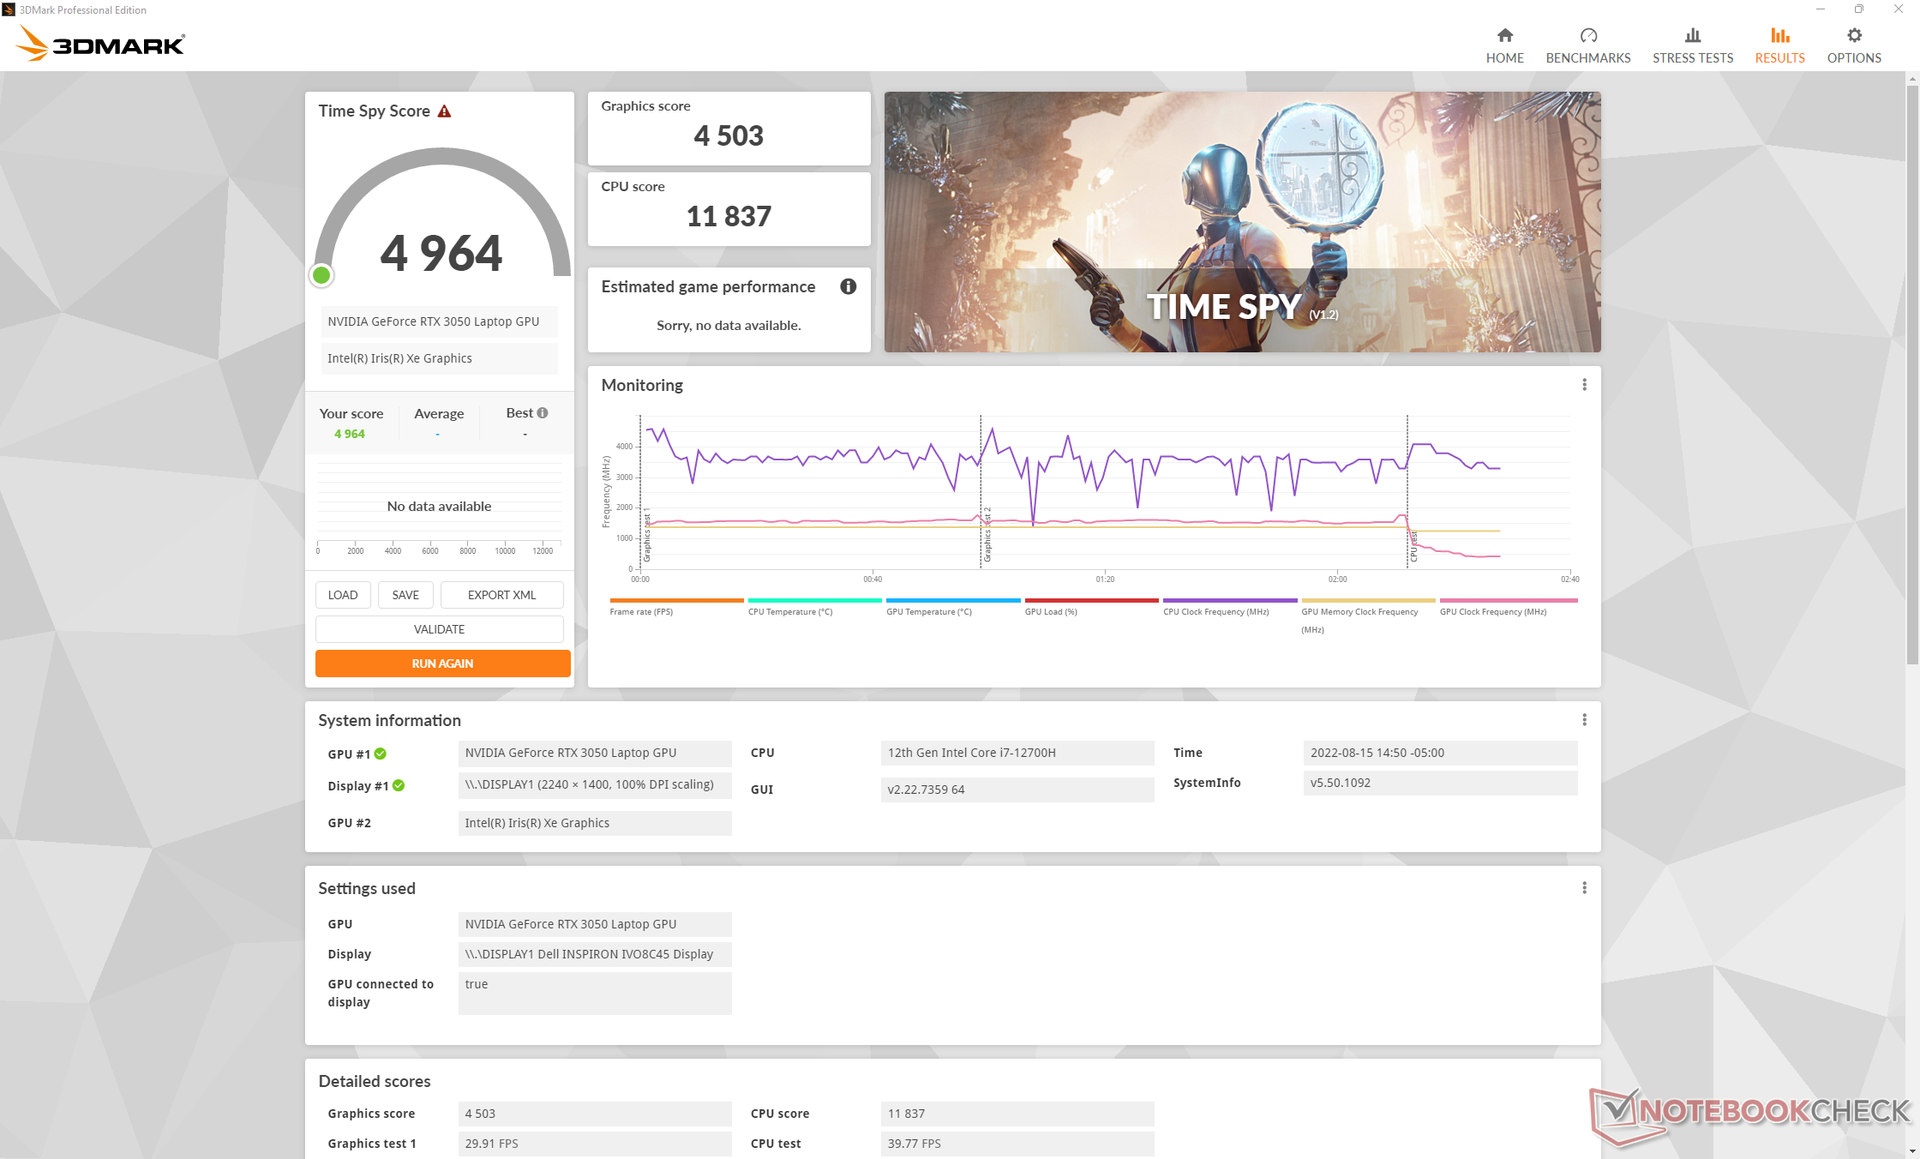
GPU Performance - Rápido para o tamanho e preço
O desempenho gráfico é onde esperamos que seja relativo a outros laptops com o mesmo GeForce RTX 3050 GPU. Na verdade, os resultados estão praticamente no mesmo nível do RTX 3050 Ti, como encontrado no Schenker Vision 14 ouAsus ROG Flow Z13. A Dell pode introduzir SKUs com o RTX 3050 Ti em um futuro próximo, mas não o recomendamos, pois provavelmente será apenas marginalmente mais rápido que nossa base RTX 3050 SKU na melhor das hipóteses.
Os usuários que atualizarem a partir do muito mais antigo GTX 1650 Ti Max-Q verão melhorias significativas de cerca de 50 por cento
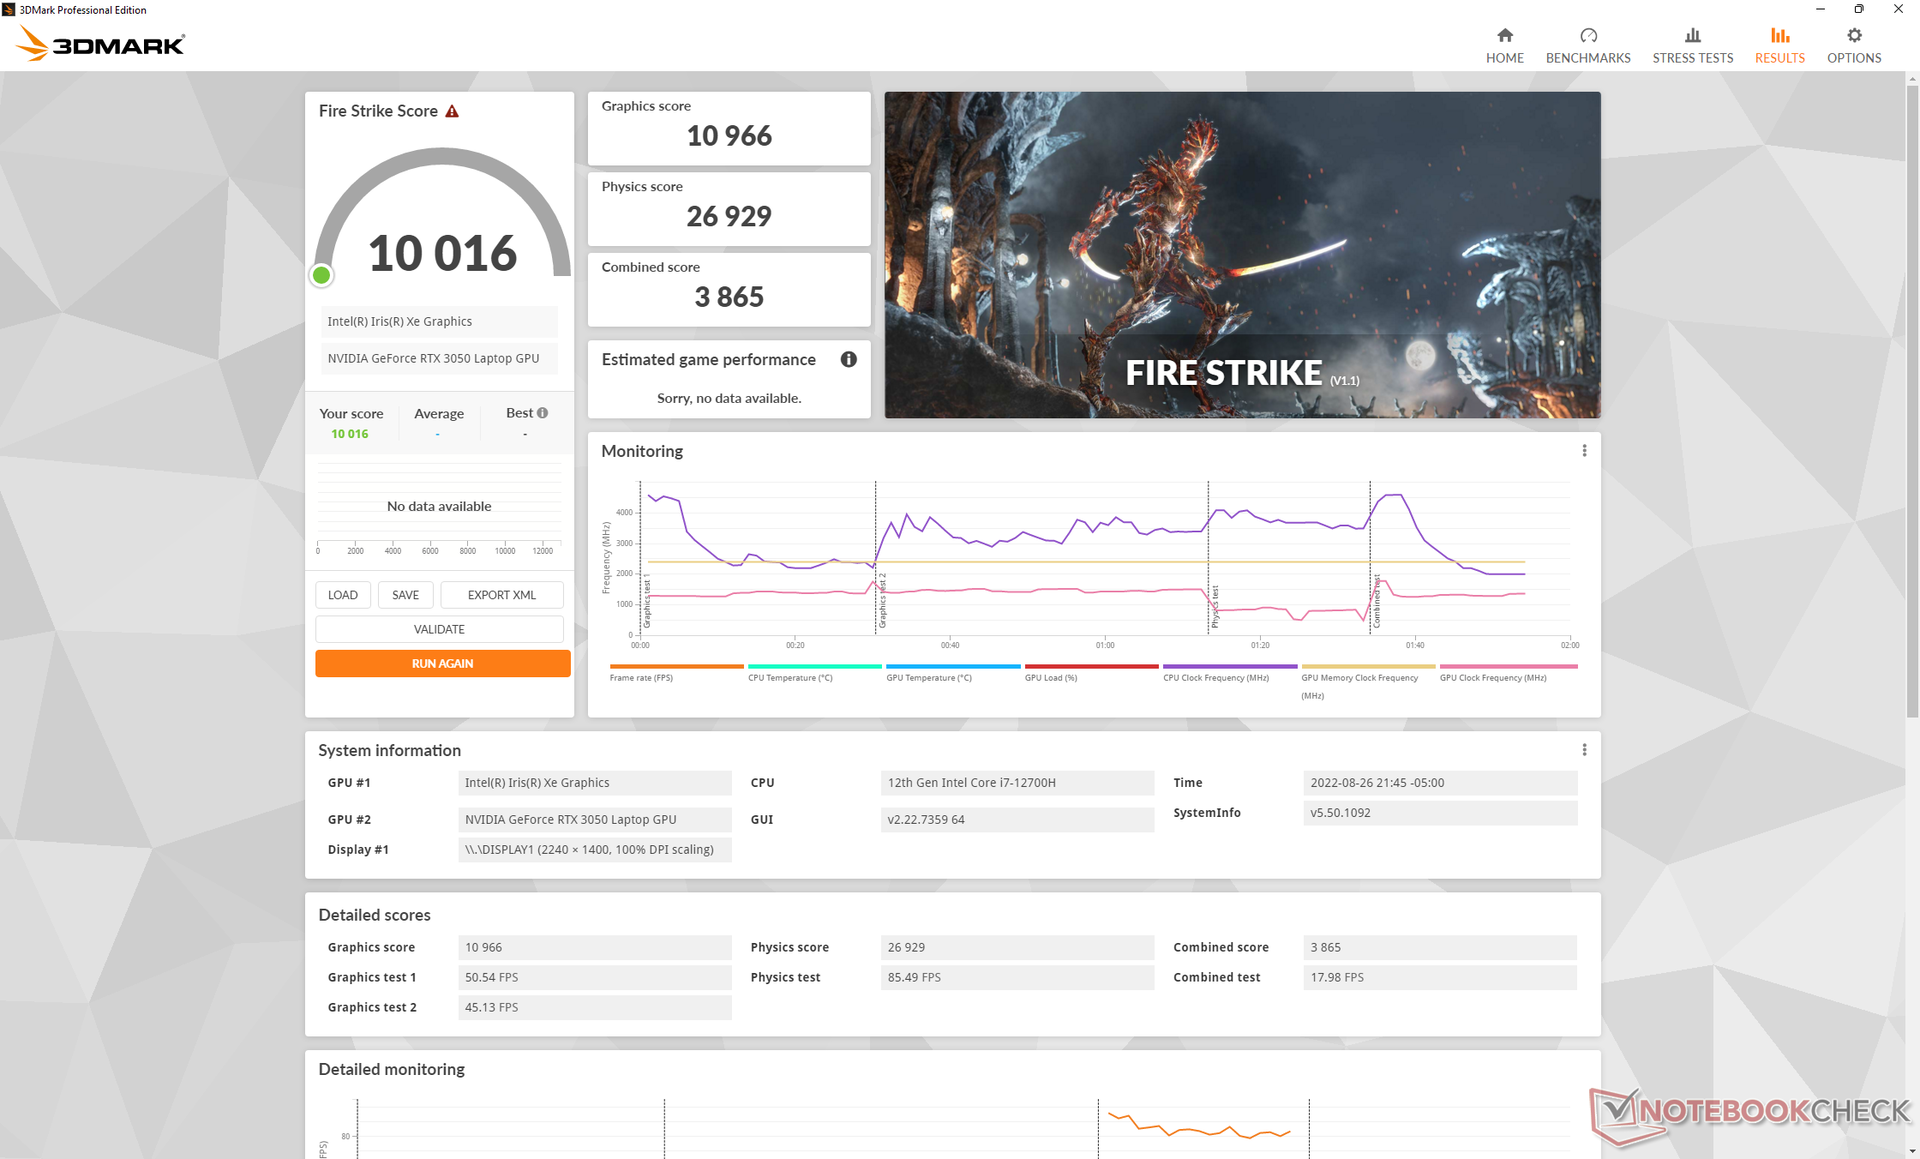
.Tenha em mente que o desempenho gráfico é reduzido se for executado no modo Dell Optimized em vez do modo Dell Ultra Performance. Um teste Fire Strike no modo Otimizado retornaria uma pontuação gráfica de 10966 pontos em comparação a 12125 pontos quando no modo Ultra Performance
.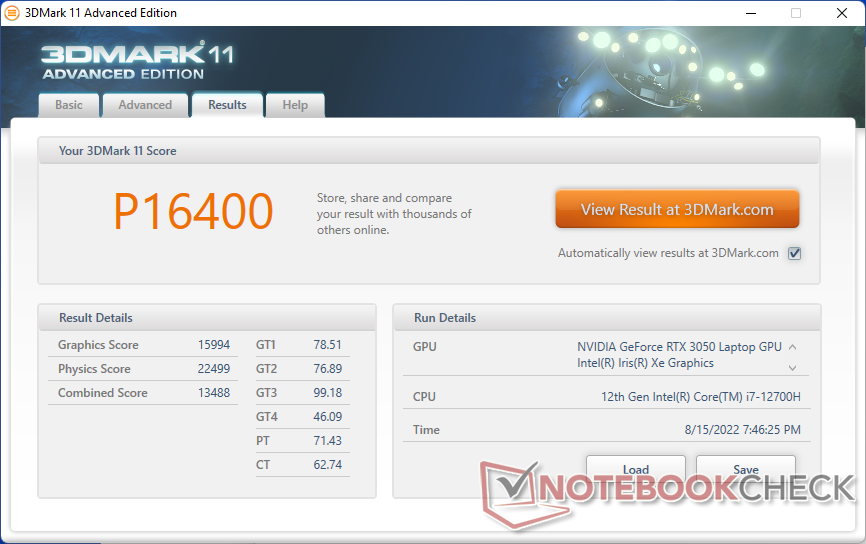
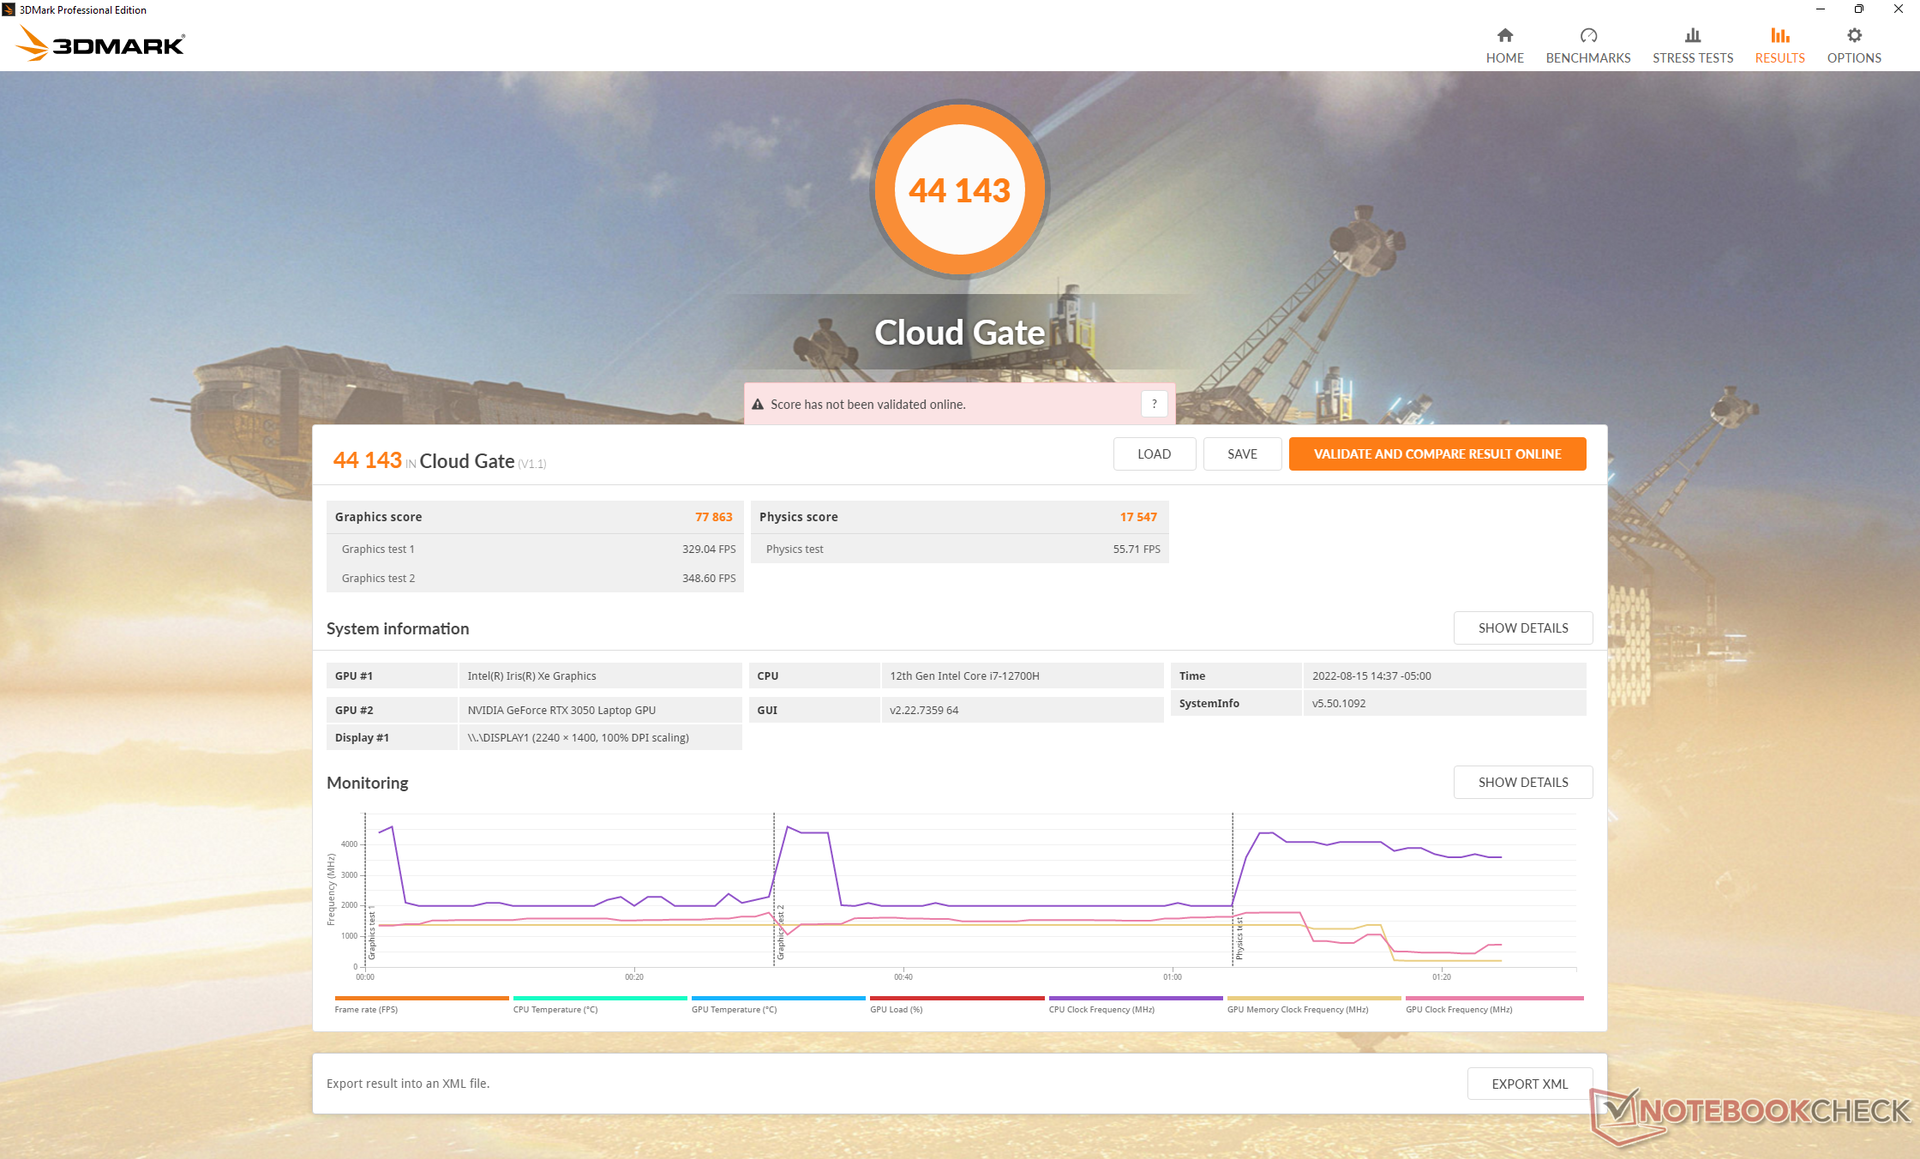

| 3DMark 11 Performance | 16400 pontos | |
| 3DMark Cloud Gate Standard Score | 44143 pontos | |
| 3DMark Fire Strike Score | 11060 pontos | |
| 3DMark Time Spy Score | 4964 pontos | |
Ajuda | ||
Witcher 3 FPS Chart
| baixo | média | alto | ultra | |
|---|---|---|---|---|
| GTA V (2015) | 181.8 | 161.4 | 111.5 | 61.8 |
| The Witcher 3 (2015) | 222.2 | 150.4 | 83.5 | 46 |
| Dota 2 Reborn (2015) | 174.4 | 158.7 | 145 | 134.4 |
| Final Fantasy XV Benchmark (2018) | 113.5 | 66.1 | 47.4 | |
| X-Plane 11.11 (2018) | 137.8 | 117.2 | 94.4 | |
| Strange Brigade (2018) | 263 | 118.2 | 94.7 | 82.4 |
| Cyberpunk 2077 1.6 (2022) | 68.6 | 55 | 41 | 33.8 |
Emissões - Alto Como um Jogador
Ruído do sistema
Os ventiladores gêmeos do sistema são sensíveis a cargas elevadas. Ao iniciar o 3DMark 06, por exemplo, o ruído dos ventiladores se intensificaria rapidamente antes de se estabilizar em torno de 47 dB(A) no final da primeira cena de referência, em comparação com 43 dB(A) no Schenker Vision 14 ou 35 dB(A) no HP Envy 14 cada um com gráficos discretos GeForce
A execução de jogos no modo Ultra Performance resultaria em um ruído do ventilador de quase 52 dB(A) que é comparável a muitos laptops de jogos dedicados com gráficos mais rápidos. O ruído do ventilador cairia para 48 dB(A) se os jogos no modo Dell Optimized em vez disso, mas isso implica um pequeno corte no desempenho gráfico, como mencionado acima. Assim, os usuários devem suportar o máximo de RPMs dos ventiladores se desejarem apertar o envelope de energia completo de 50 W da GPU GeForce
Felizmente, os ventiladores são bastante silenciosos a 26,5 dB(A) contra um fundo silencioso de 23,2 dB(A) durante tarefas mais mundanas como navegação na web ou streaming de vídeo. Somente quando cargas mais altas são introduzidas é que elas começarão a subir muito rapidamente.
Barulho
| Ocioso |
| 23.2 / 23.2 / 23.2 dB |
| Carga |
| 47.5 / 51.7 dB |
 | ||
30 dB silencioso 40 dB(A) audível 50 dB(A) ruidosamente alto |
||
min: | ||
| Dell Inspiron 14 Plus 7420 GeForce RTX 3050 4GB Laptop GPU, i7-12700H, SK Hynix BC711 512GB HFM512GD3GX013N | Asus Vivobook Pro 14 M3401QC-KM007T GeForce RTX 3050 4GB Laptop GPU, R5 5600H, Intel SSD 670p SSDPEKNU512GZ | Dell Inspiron 14 7420 2-in-1 Iris Xe G7 96EUs, i7-1255U, WDC PC SN530 SDBPMPZ-512G | Schenker Vision 14 GeForce RTX 3050 Ti Laptop GPU, i7-11370H, Samsung SSD 980 Pro 1TB MZ-V8P1T0BW | Asus Zenbook 14X UX5400E GeForce MX450, i7-1165G7, SK Hynix HFM001TD3JX013N | HP Envy 14-eb0010nr GeForce GTX 1650 Ti Max-Q, i5-1135G7, Samsung SSD PM981a MZVLB256HBHQ | |
|---|---|---|---|---|---|---|
| Noise | -14% | 7% | 0% | -0% | 3% | |
| desligado / ambiente * (dB) | 23.2 | 25.4 -9% | 23.1 -0% | 24.3 -5% | 26 -12% | 25.9 -12% |
| Idle Minimum * (dB) | 23.2 | 25.4 -9% | 24.7 -6% | 24.3 -5% | 26 -12% | 26 -12% |
| Idle Average * (dB) | 23.2 | 25.4 -9% | 24.7 -6% | 24.3 -5% | 26 -12% | 26 -12% |
| Idle Maximum * (dB) | 23.2 | 30.9 -33% | 24.7 -6% | 25.9 -12% | 26.3 -13% | 26 -12% |
| Load Average * (dB) | 47.5 | 56 -18% | 27.7 42% | 43.3 9% | 37.1 22% | 34.9 27% |
| Witcher 3 ultra * (dB) | 51.7 | 45.1 13% | 44.6 14% | 34.5 33% | ||
| Load Maximum * (dB) | 51.7 | 56 -8% | 45.1 13% | 49.5 4% | 38 26% | 48.7 6% |
* ... menor é melhor
Temperatura
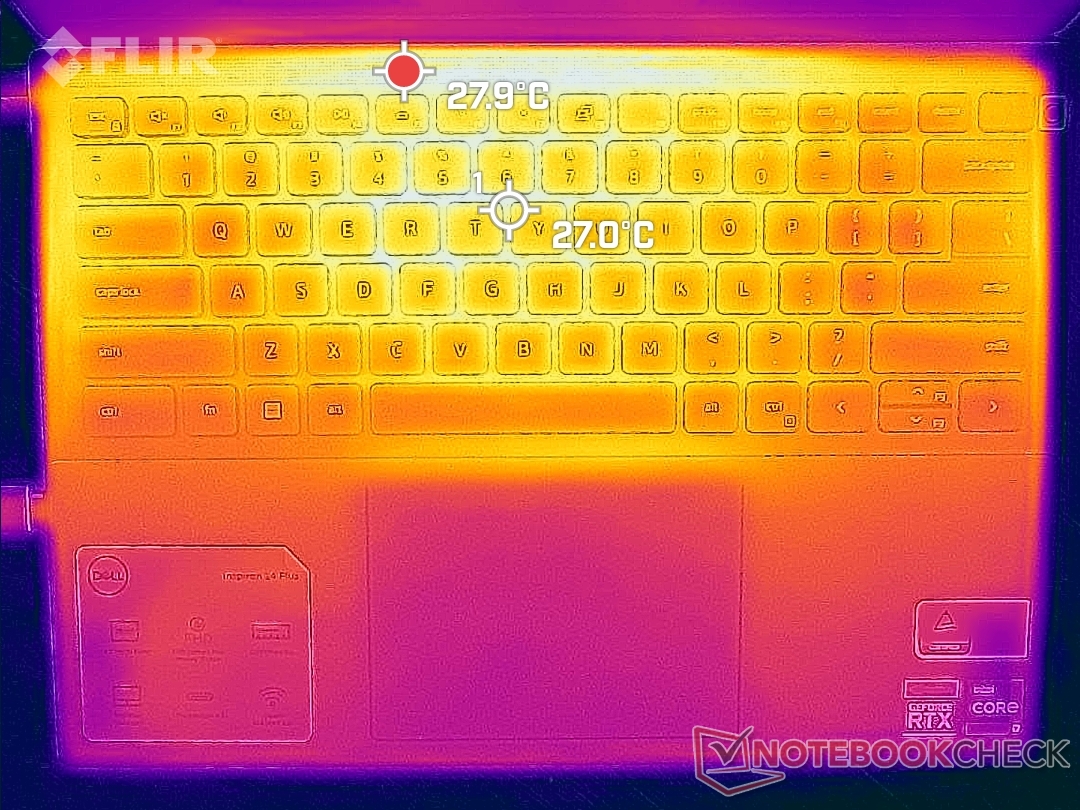
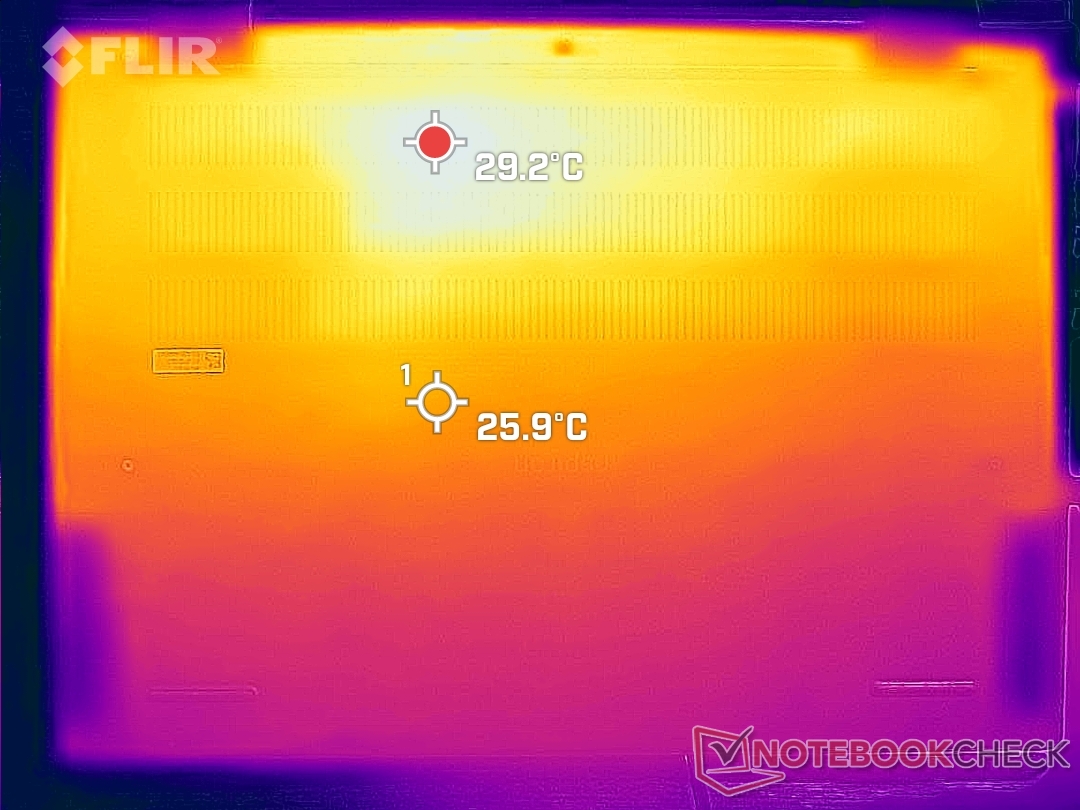
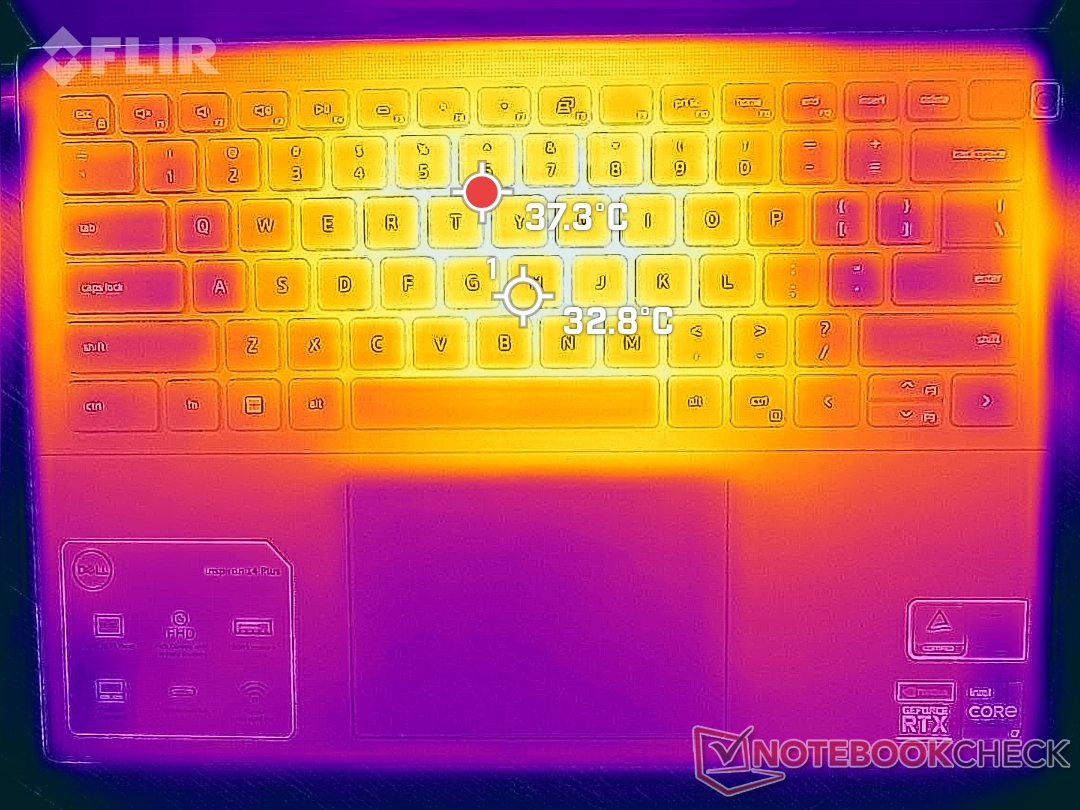
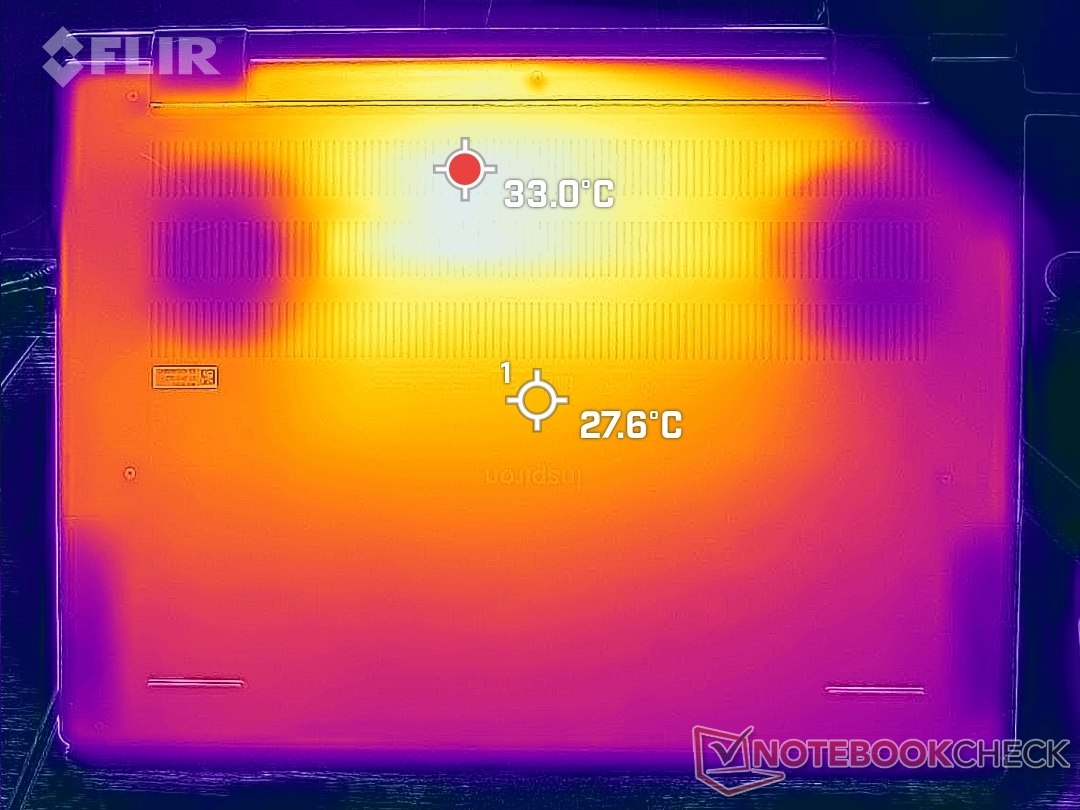
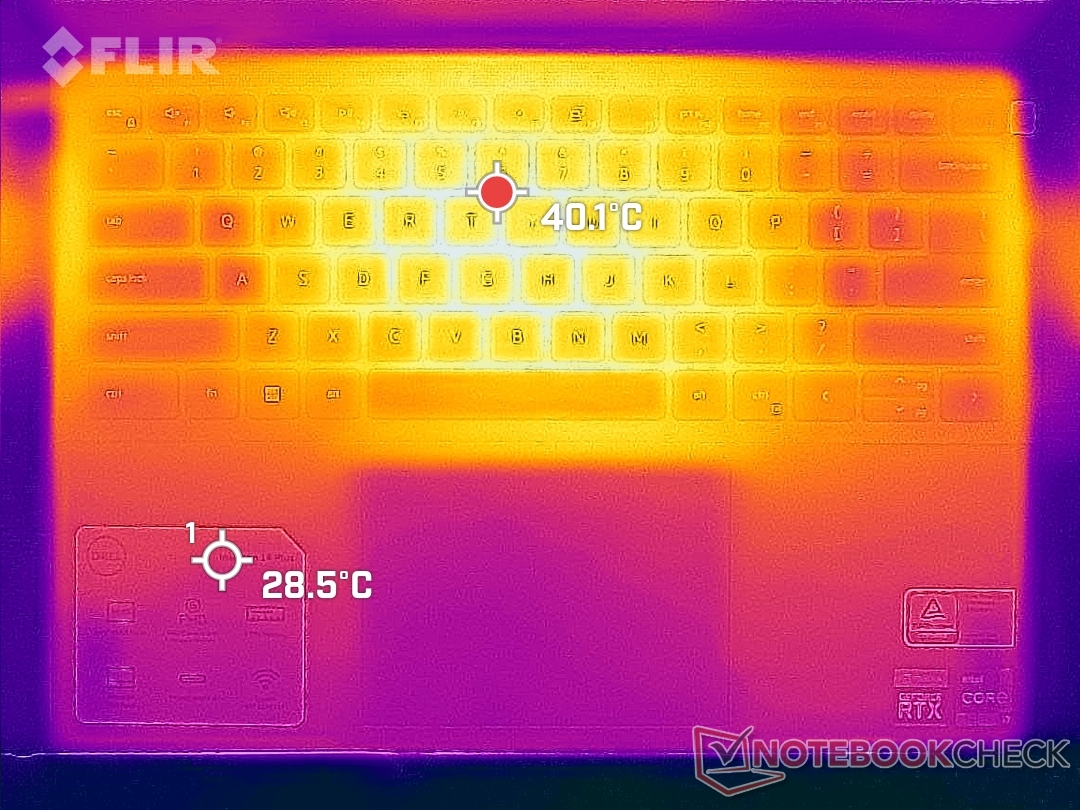
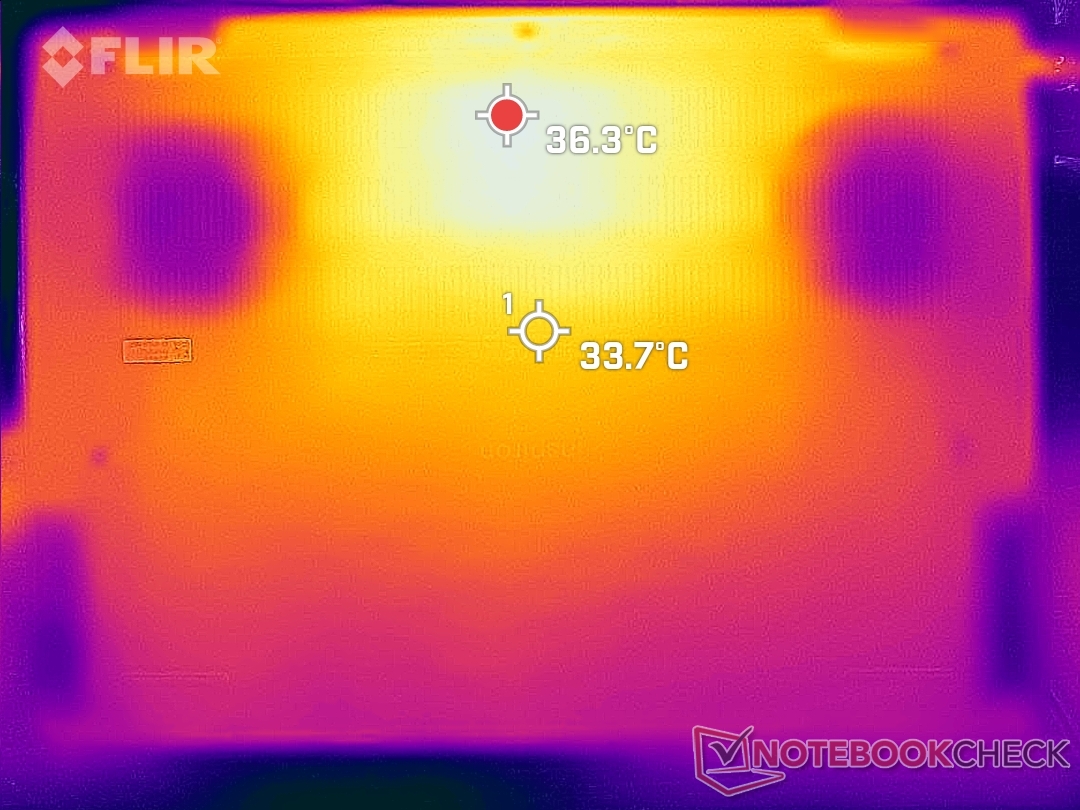
As temperaturas de superfície quando ociosas são quentes em torno de 28 C tanto na parte superior quanto na inferior, o que é semelhante a outros laptops multimídia finos com gráficos discretos como oAsus Vivobook Pro 14 ou Schenker Vision 14. Ao jogar, os pontos quentes podem chegar a pouco mais de 40 C perto do centro do teclado e da parte traseira do chassi, enquanto os descansos da pam permanecem mais confortáveis na faixa sub 30 C. Os pontos quentes aqui são geralmente mais frios do que nos Asus ou Schenker acima mencionados, que podem chegar a 45 C a 55 C.
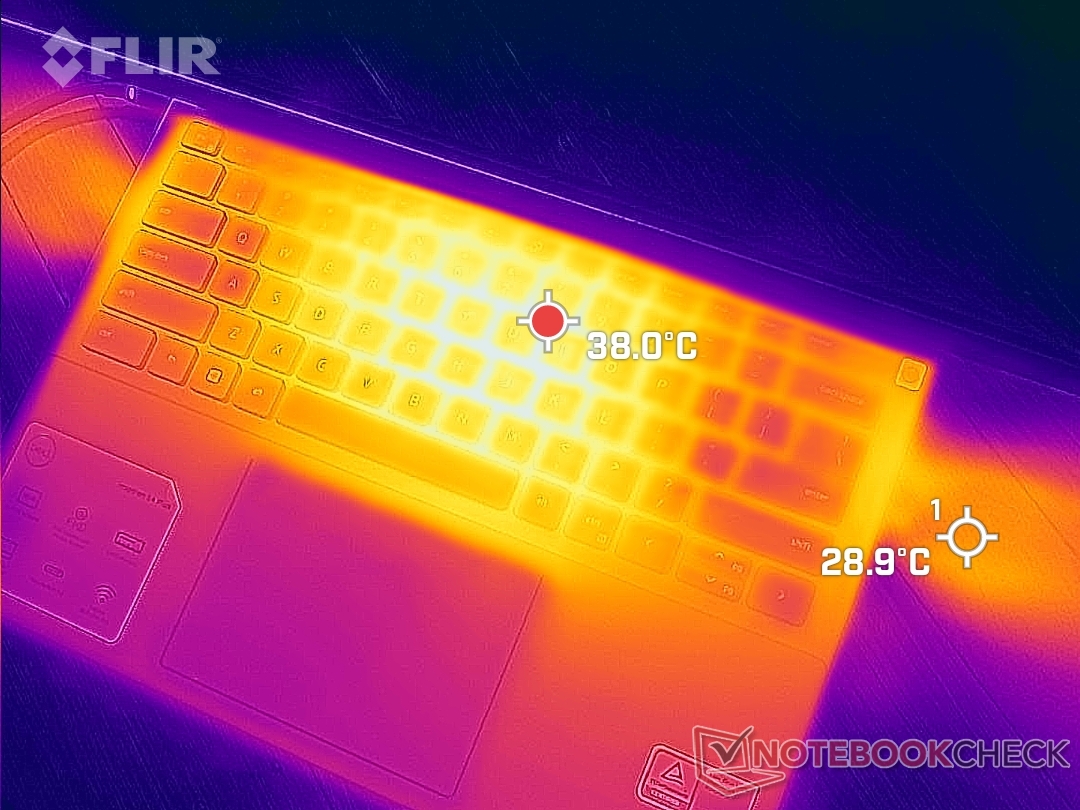
(±) A temperatura máxima no lado superior é 40 °C / 104 F, em comparação com a média de 36.8 °C / 98 F , variando de 21 a 71 °C para a classe Multimedia.
(+) A parte inferior aquece até um máximo de 36.4 °C / 98 F, em comparação com a média de 39.1 °C / 102 F
(+) Em uso inativo, a temperatura média para o lado superior é 24.2 °C / 76 F, em comparação com a média do dispositivo de 31.3 °C / ### class_avg_f### F.
(+) Jogando The Witcher 3, a temperatura média para o lado superior é 28.6 °C / 83 F, em comparação com a média do dispositivo de 31.3 °C / ## #class_avg_f### F.
(+) Os apoios para as mãos e o touchpad são mais frios que a temperatura da pele, com um máximo de 29.4 °C / 84.9 F e, portanto, são frios ao toque.
(±) A temperatura média da área do apoio para as mãos de dispositivos semelhantes foi 28.7 °C / 83.7 F (-0.7 °C / -1.2 F).
| Dell Inspiron 14 Plus 7420 Intel Core i7-12700H, NVIDIA GeForce RTX 3050 4GB Laptop GPU | Asus Vivobook Pro 14 M3401QC-KM007T AMD Ryzen 5 5600H, NVIDIA GeForce RTX 3050 4GB Laptop GPU | Dell Inspiron 14 7420 2-in-1 Intel Core i7-1255U, Intel Iris Xe Graphics G7 96EUs | Schenker Vision 14 Intel Core i7-11370H, NVIDIA GeForce RTX 3050 Ti Laptop GPU | Asus Zenbook 14X UX5400E Intel Core i7-1165G7, NVIDIA GeForce MX450 | MSI Summit E14 A11SCS Intel Core i7-1185G7, NVIDIA GeForce GTX 1650 Ti Max-Q | HP Envy 14-eb0010nr Intel Core i5-1135G7, NVIDIA GeForce GTX 1650 Ti Max-Q | |
|---|---|---|---|---|---|---|---|
| Heat | -25% | -5% | -23% | -17% | -33% | -19% | |
| Maximum Upper Side * (°C) | 40 | 42.3 -6% | 38.2 4% | 49.7 -24% | 42.4 -6% | 49.4 -23% | 41.2 -3% |
| Maximum Bottom * (°C) | 36.4 | 49.6 -36% | 45.6 -25% | 56 -54% | 47.7 -31% | 60.6 -66% | 45.6 -25% |
| Idle Upper Side * (°C) | 27 | 34.2 -27% | 27.4 -1% | 28.8 -7% | 32.3 -20% | 30.6 -13% | 31.8 -18% |
| Idle Bottom * (°C) | 29.2 | 37.9 -30% | 28.4 3% | 30.6 -5% | 31.9 -9% | 37.4 -28% | 37.8 -29% |
* ... menor é melhor
Teste de estresse
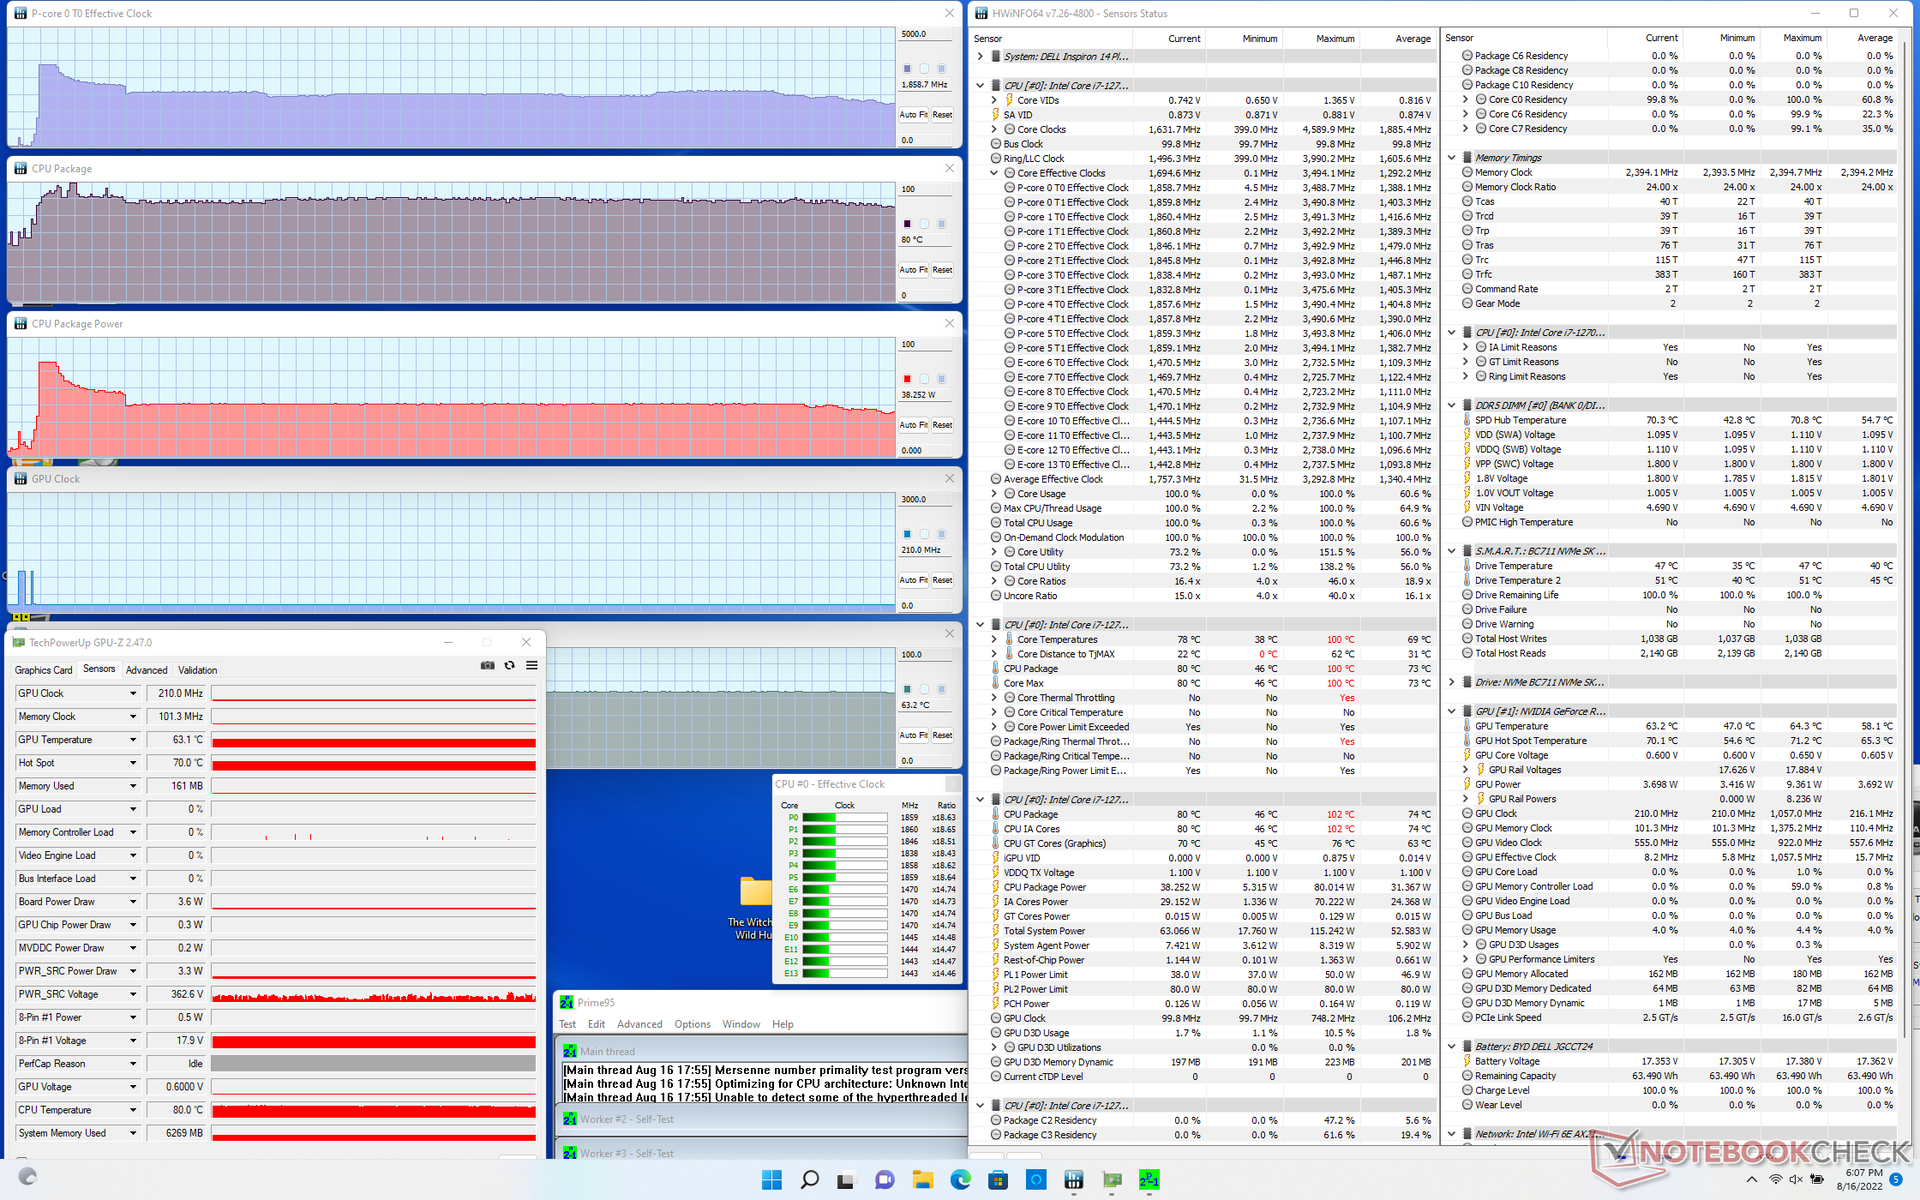
Correndo Prime95 para enfatizar a CPU, a taxa de clock, a temperatura e o consumo de energia da placa aumentariam para 3,5 GHz, 100 C e 80 W, respectivamente, por cerca de 10 segundos ou mais. Depois disso, as taxas de clock, temperatura e consumo de energia da placa diminuiriam constantemente antes de estabilizarem em 1,9 GHz, 80 C e 38 W, respectivamente, a fim de manter as temperaturas sob controle. A queda de desempenho é relativamente acentuada, pois o HP Pavilion Mais 14 com a mesma CPU é capaz de manter uma faixa mais rápida de 2,2 a 2,9 GHz quando submetida ao mesmo teste.
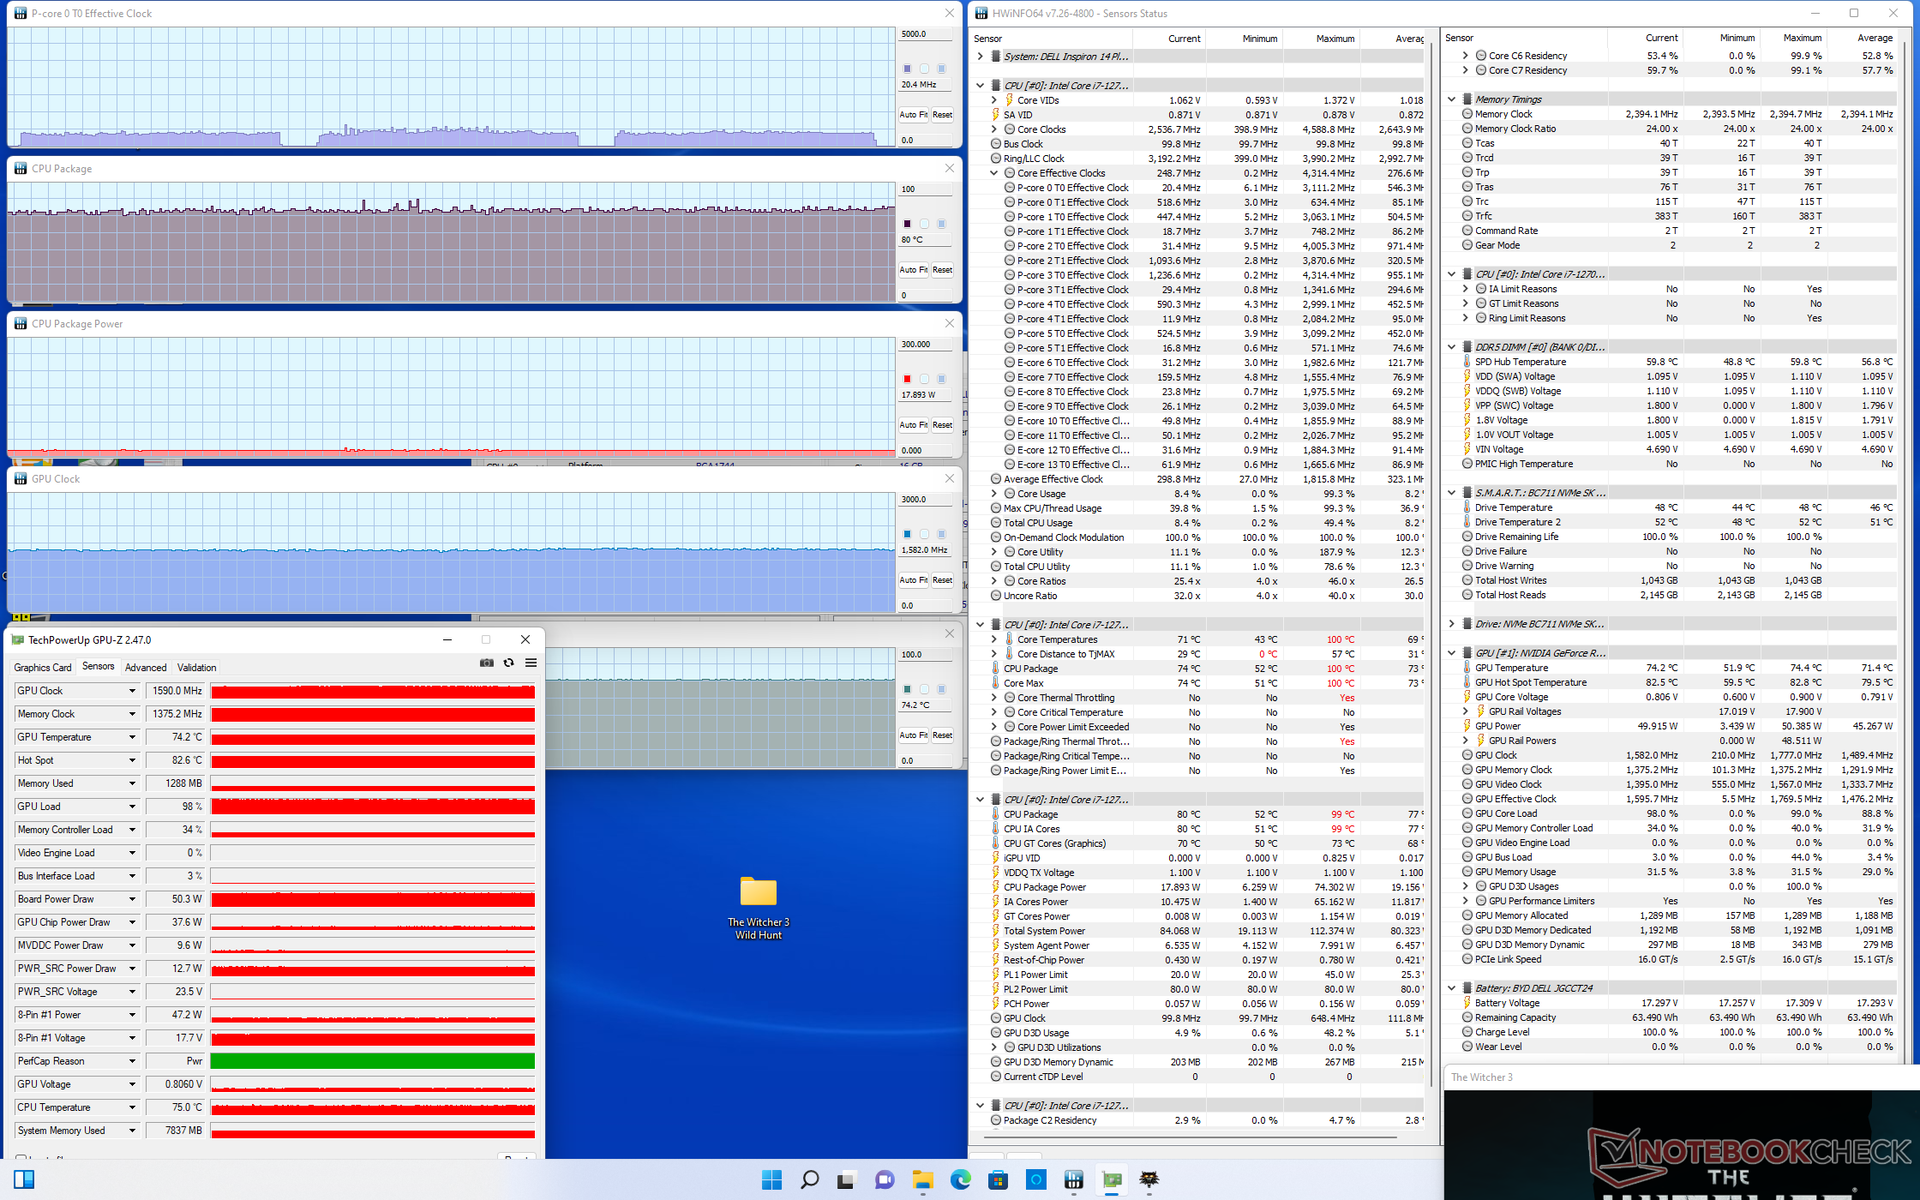
Rodando Witcher 3 mostra a GPU GeForce estabilizando em 1590 MHz, 74 C e 50 W. Em comparação, o RTX 3050 Ti no Inspiron 16 Plus maior estabilizaria em 1627 MHz, 84 C e 63 W. As temperaturas do núcleo são sem surpresas, já que este é um dos poucos laptops de 14 polegadas a vir tanto com uma CPU da série H do núcleo quanto com uma GPU RTX GeForce. A mudança do perfil de potência de Ultra Performance para Optimized fará com que o consumo de energia da GPU caia para cerca de 45 W ou menos.
Funcionando com bateria limita o desempenho. Um teste Fire Strike em baterias retornaria pontuações de Física e Gráficos de apenas 9493 e 7637 pontos, respectivamente, em comparação com 26940 e 12125 pontos quando em rede elétrica.
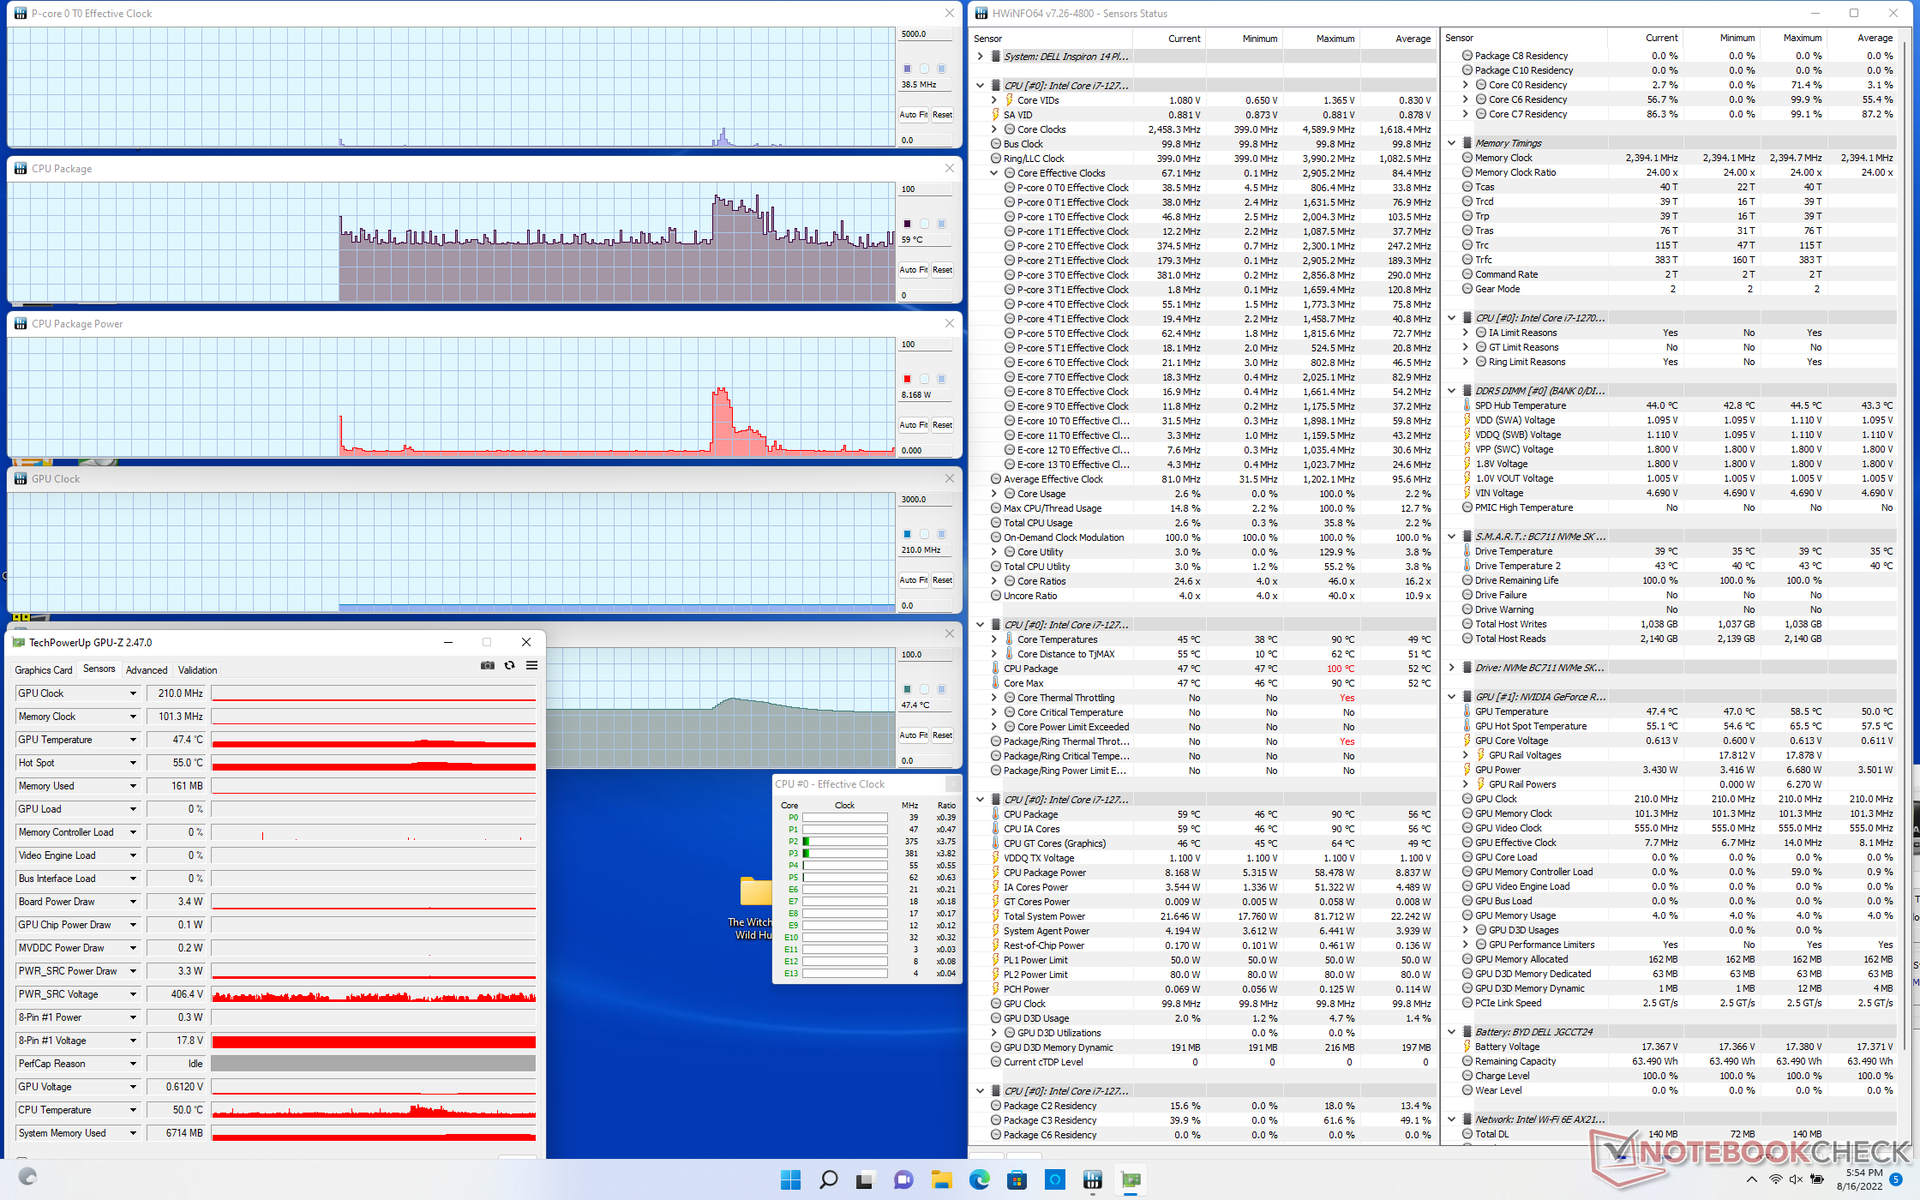
| Relógio CPU (GHz) | Relógio GPU (MHz) | Temperatura média da CPU (°C) | Temperatura média da GPU (°C) | |
| System Idle | -- | -- | 59 | 47 |
| Prime95 Stress | 1.9 | -- | 80 | 63 |
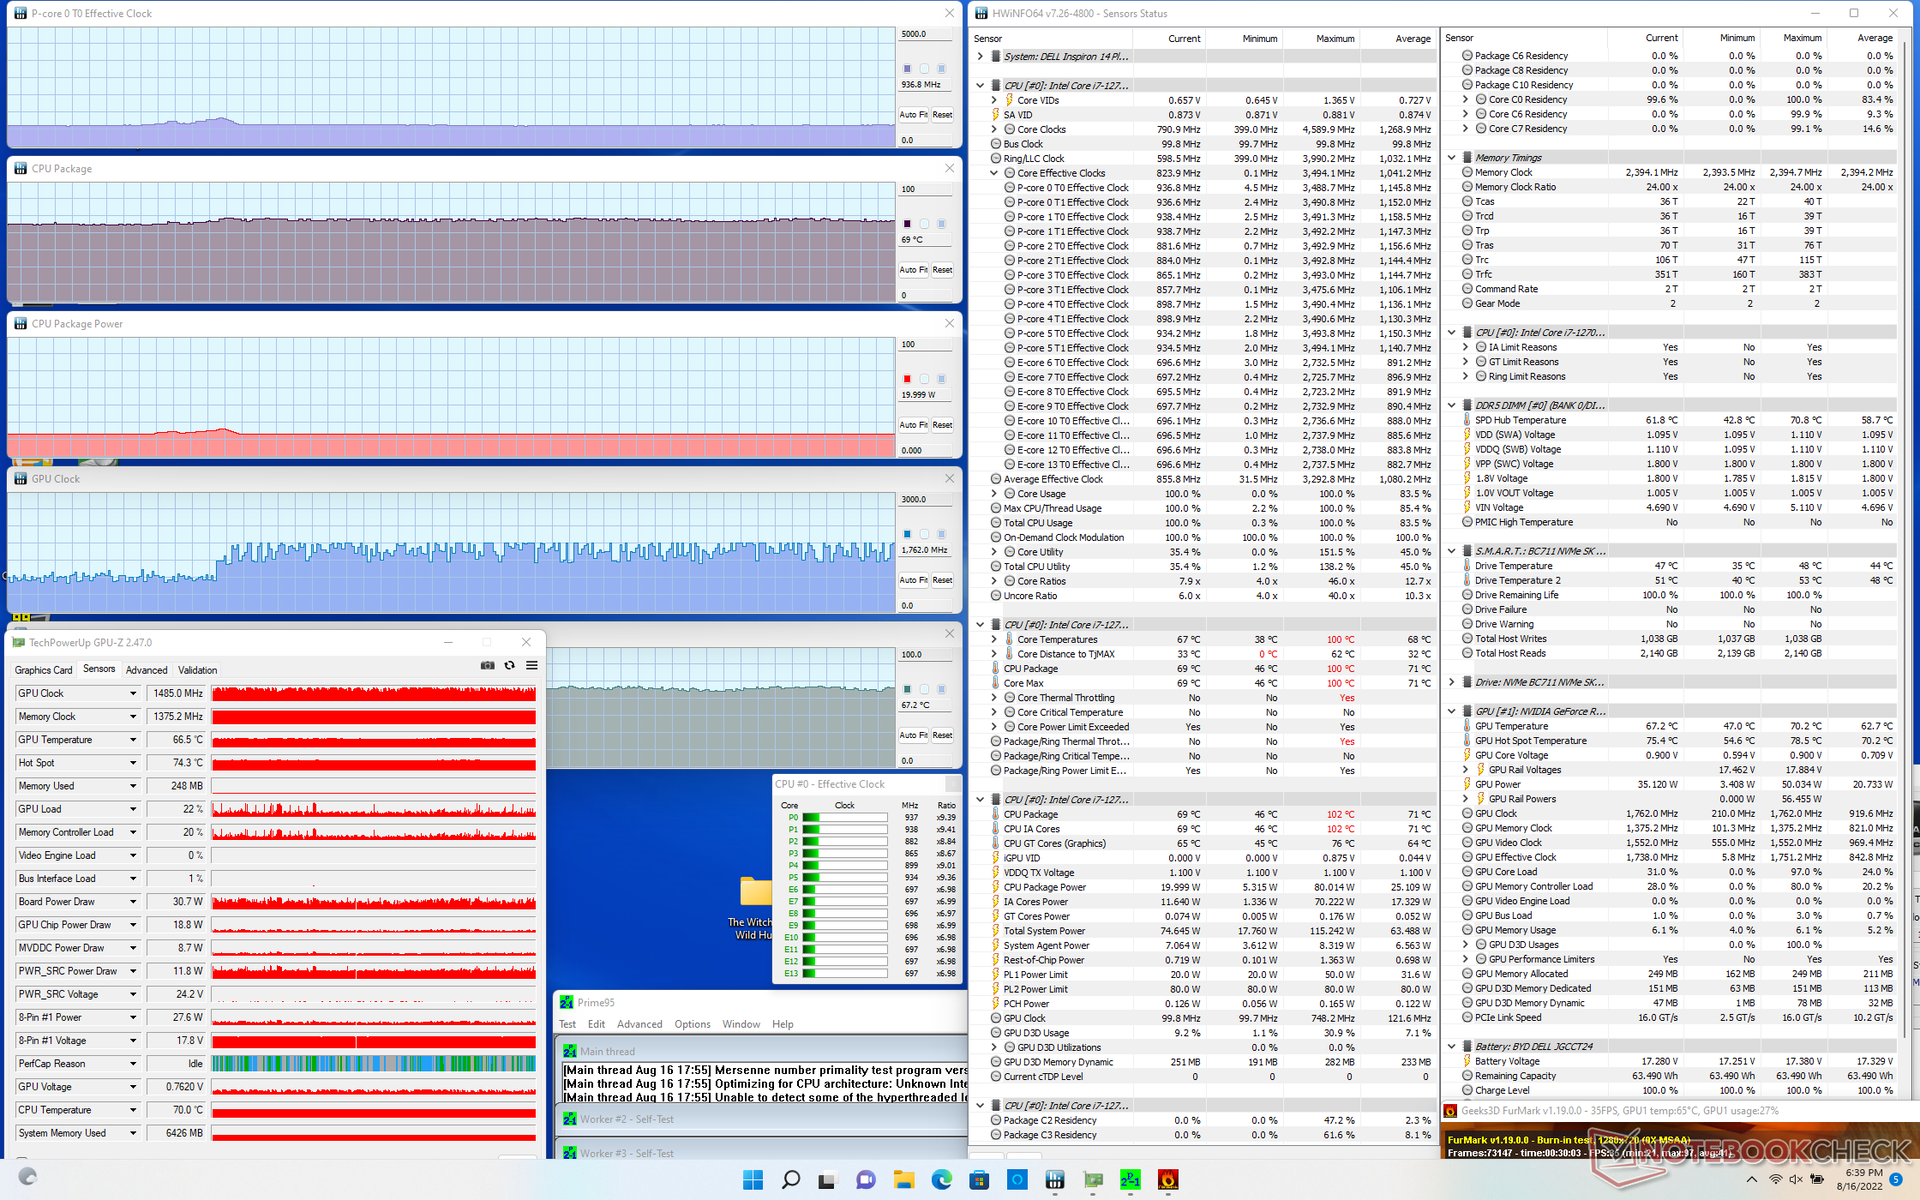
| Prime95 + FurMark Stress | 0.9 | ~1485 | 69 | 67 |
| Witcher 3 Estresse | ~1.1 | 1590 | 80 | 74 |
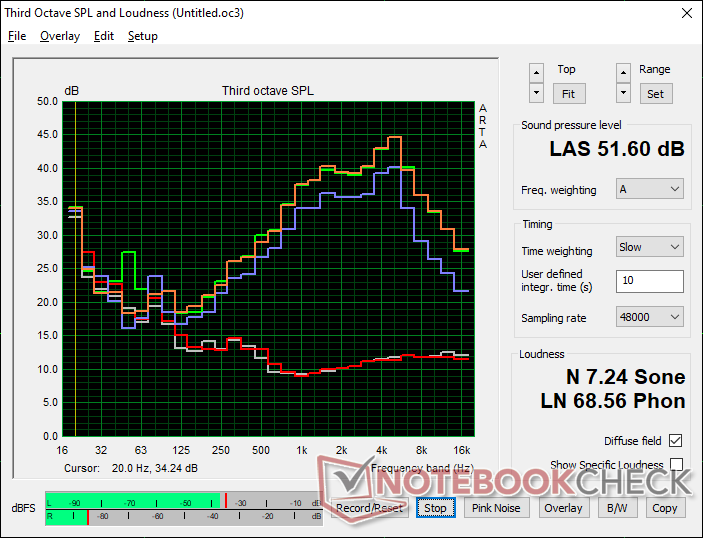
Oradores
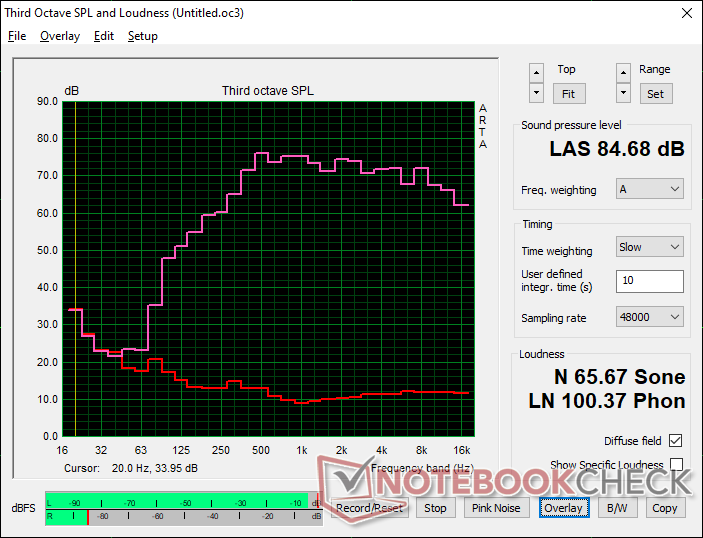
Dell Inspiron 14 Plus 7420 análise de áudio
(+) | os alto-falantes podem tocar relativamente alto (###valor### dB)
Graves 100 - 315Hz
(±) | graves reduzidos - em média 14.7% menor que a mediana
(±) | a linearidade dos graves é média (8.3% delta para a frequência anterior)
Médios 400 - 2.000 Hz
(+) | médios equilibrados - apenas 2.6% longe da mediana
(+) | médios são lineares (4.8% delta para frequência anterior)
Altos 2 - 16 kHz
(+) | agudos equilibrados - apenas 1.8% longe da mediana
(+) | os máximos são lineares (4.4% delta da frequência anterior)
Geral 100 - 16.000 Hz
(+) | o som geral é linear (10.4% diferença em relação à mediana)
Comparado com a mesma classe
» 15% de todos os dispositivos testados nesta classe foram melhores, 1% semelhantes, 84% piores
» O melhor teve um delta de 5%, a média foi 17%, o pior foi 45%
Comparado com todos os dispositivos testados
» 5% de todos os dispositivos testados foram melhores, 1% semelhantes, 93% piores
» O melhor teve um delta de 4%, a média foi 23%, o pior foi 134%
Apple MacBook Pro 16 2021 M1 Pro análise de áudio
(+) | os alto-falantes podem tocar relativamente alto (###valor### dB)
Graves 100 - 315Hz
(+) | bons graves - apenas 3.8% longe da mediana
(+) | o baixo é linear (5.2% delta para a frequência anterior)
Médios 400 - 2.000 Hz
(+) | médios equilibrados - apenas 1.3% longe da mediana
(+) | médios são lineares (2.1% delta para frequência anterior)
Altos 2 - 16 kHz
(+) | agudos equilibrados - apenas 1.9% longe da mediana
(+) | os máximos são lineares (2.7% delta da frequência anterior)
Geral 100 - 16.000 Hz
(+) | o som geral é linear (4.6% diferença em relação à mediana)
Comparado com a mesma classe
» 0% de todos os dispositivos testados nesta classe foram melhores, 0% semelhantes, 100% piores
» O melhor teve um delta de 5%, a média foi 17%, o pior foi 45%
Comparado com todos os dispositivos testados
» 0% de todos os dispositivos testados foram melhores, 0% semelhantes, 100% piores
» O melhor teve um delta de 4%, a média foi 23%, o pior foi 134%
Gestão de Energia - Pequena Máquina Exigente
Consumo de energia
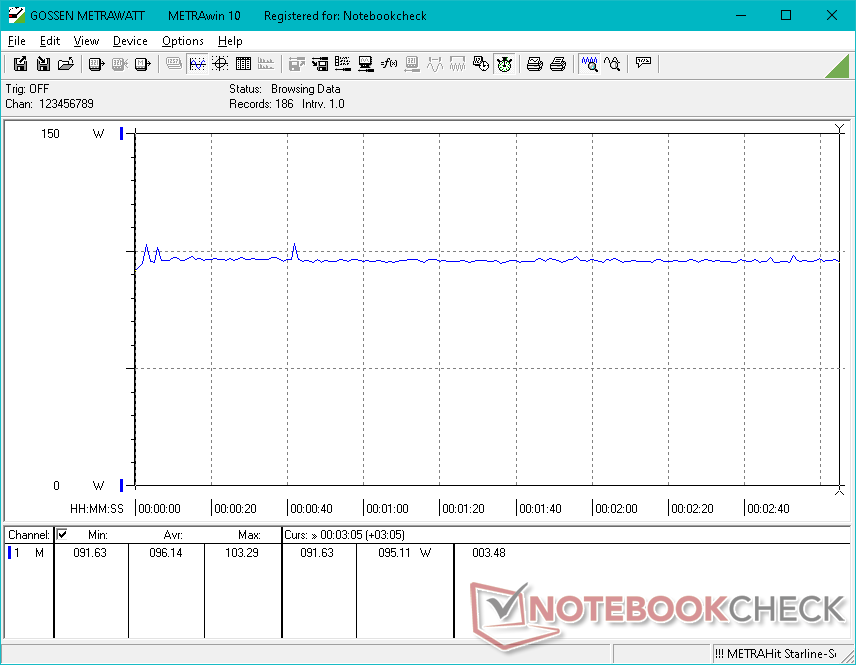
O consumo de energia no modo Power Saver varia entre 6 W se no ajuste de brilho mínimo a 10 W se no ajuste máximo. A mudança do perfil de potência para o modo Ultra Performance com a GPU Nvidia ativa eleva o consumo de energia ociosa para 20 W que é cerca do dobro da maioria dos laptops mais lentos de 14 polegadas alimentados por CPUs da série U
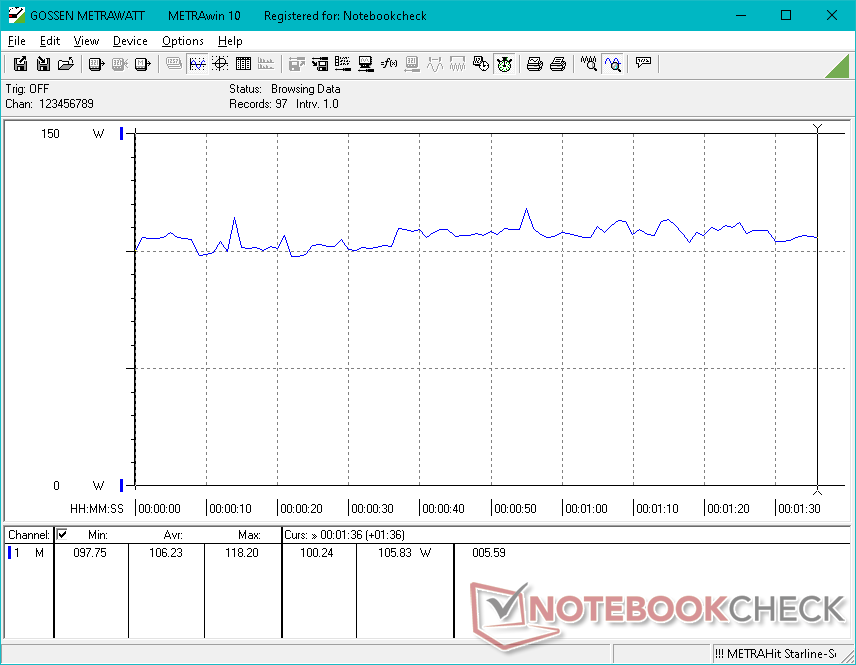
Os jogos exigem entre 96 W e 106 W em comparação a apenas 40 W ou 50 W em alternativas tradicionais alimentadas pela série U. Sabe-se que a série H do 12º gênero da Intel é muito exigente, além de uma GPU discreta já exigente. Assim, não é de se admirar que o Inspiron 14 Plus funcione tanto mais alto quanto mais quente que o laptop médio de 14 polegadas
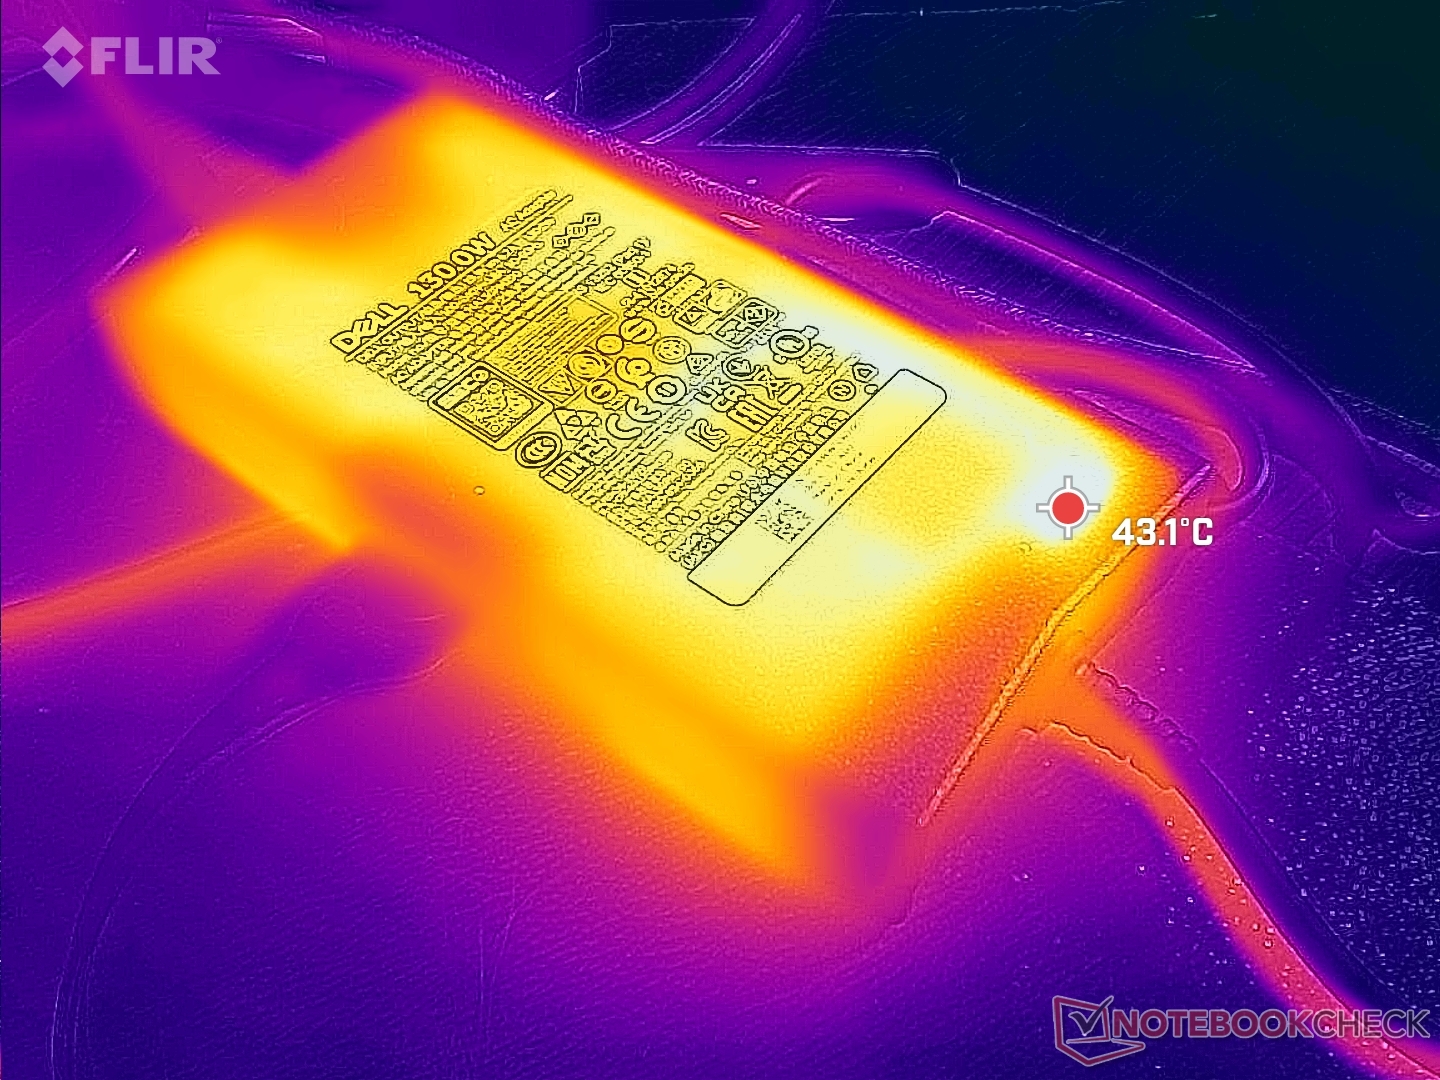
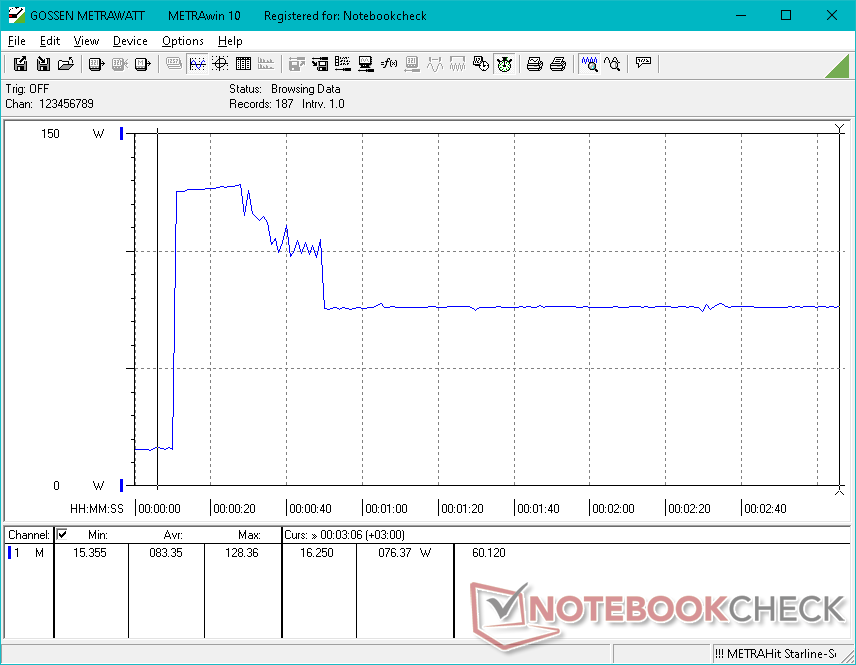
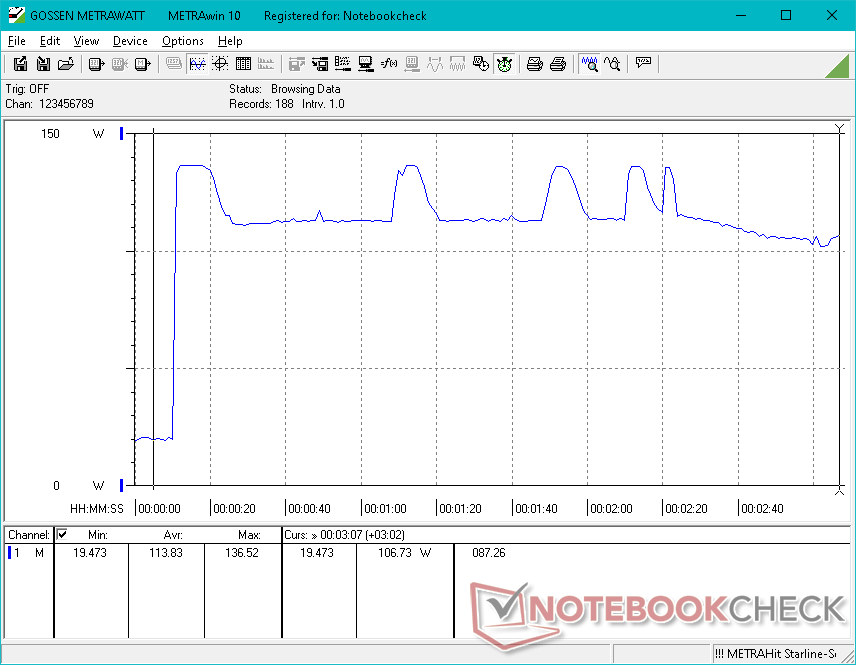
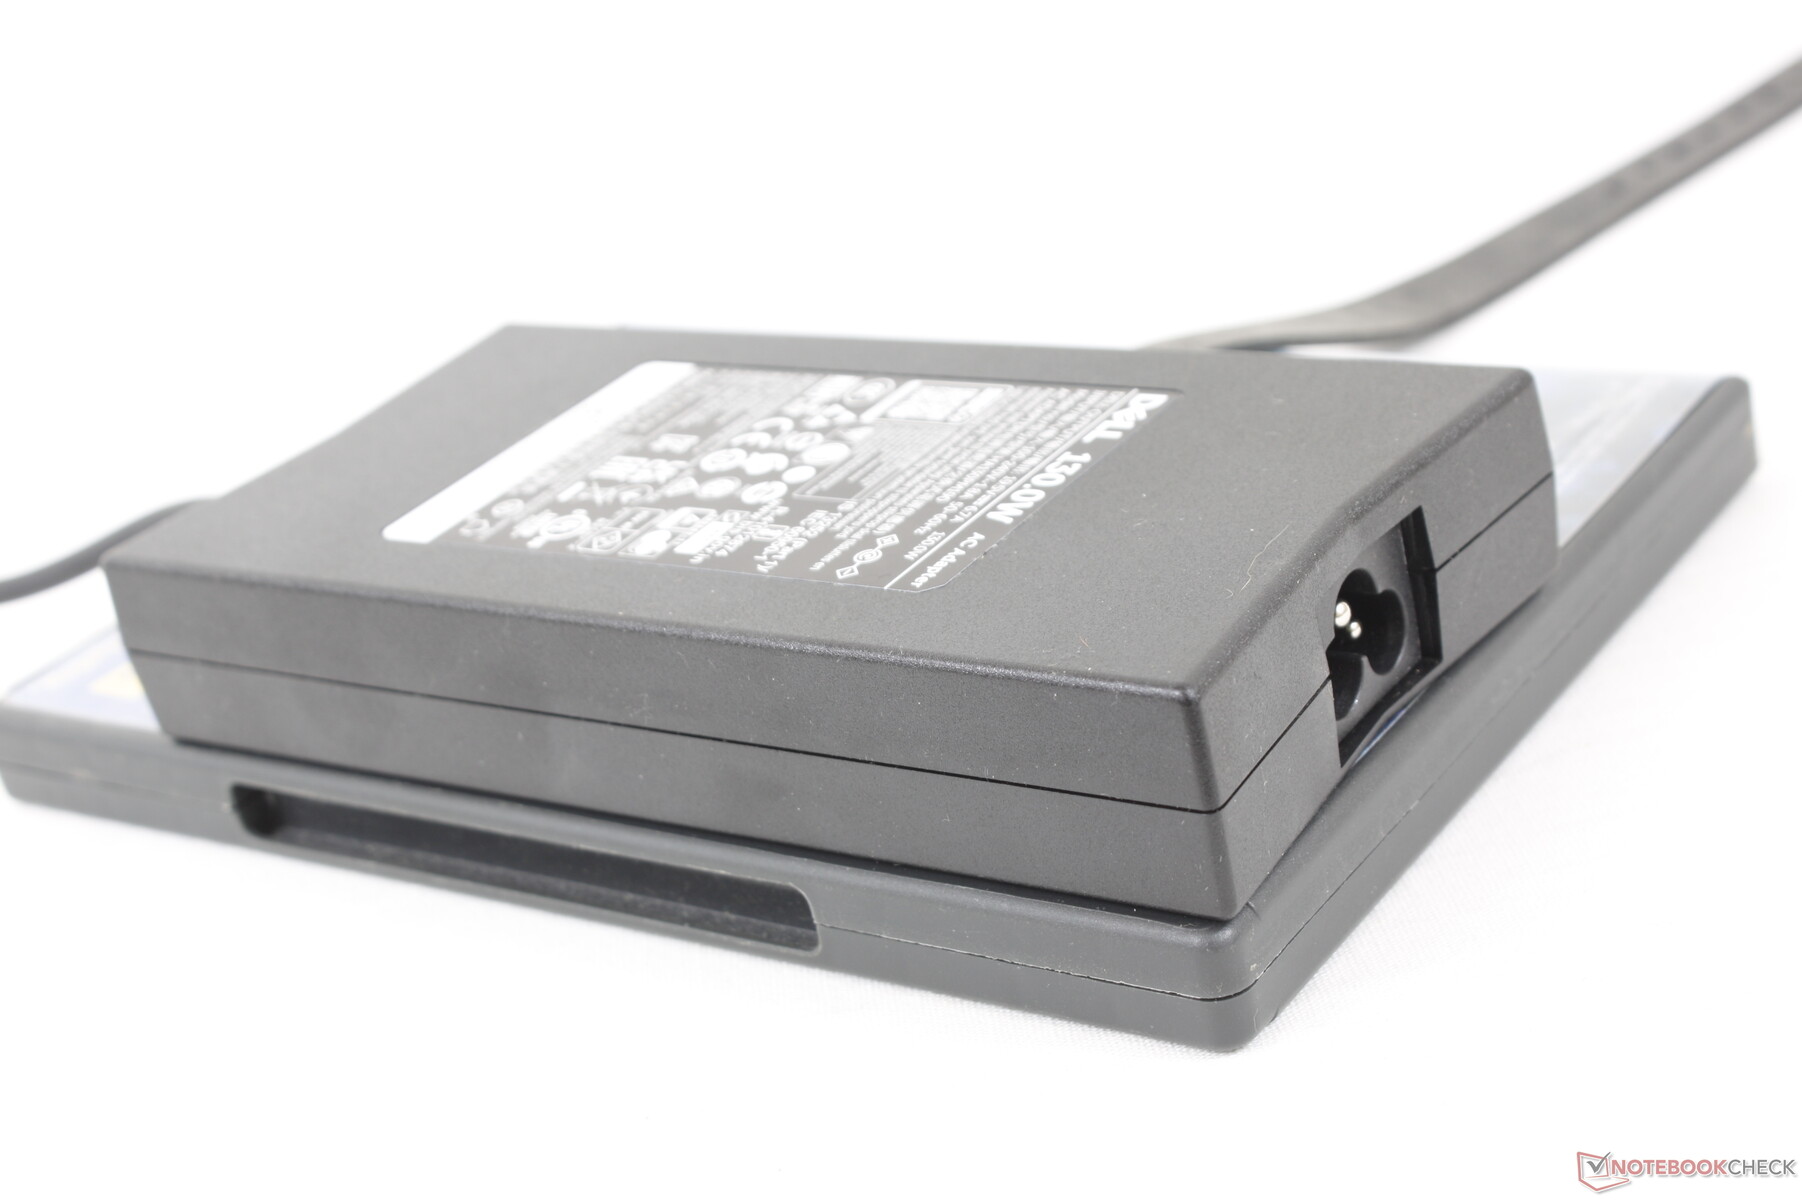
Somos capazes de registrar um consumo máximo de 137 W do adaptador AC de 130 W quando rodamos simultaneamente Prime95 e FurMark. O consumo tende a girar entre 110 W e 137 W, como mostra nossa captura de tela abaixo. Espere uma taxa de carga mais lenta se estiver executando tais cargas tributárias.
| desligado | |
| Ocioso | |
| Carga |
|
Key:
min: | |
| Dell Inspiron 14 Plus 7420 i7-12700H, GeForce RTX 3050 4GB Laptop GPU, SK Hynix BC711 512GB HFM512GD3GX013N, IPS, 2240x1400, 14" | Asus Vivobook Pro 14 M3401QC-KM007T R5 5600H, GeForce RTX 3050 4GB Laptop GPU, Intel SSD 670p SSDPEKNU512GZ, OLED, 2880x1800, 14" | Dell Inspiron 14 7420 2-in-1 i7-1255U, Iris Xe G7 96EUs, WDC PC SN530 SDBPMPZ-512G, IPS, 1920x1200, 14" | Schenker Vision 14 i7-11370H, GeForce RTX 3050 Ti Laptop GPU, Samsung SSD 980 Pro 1TB MZ-V8P1T0BW, IPS, 2880x1800, 14" | Asus Zenbook 14X UX5400E i7-1165G7, GeForce MX450, SK Hynix HFM001TD3JX013N, OLED, 2880x1800, 14" | MSI Summit E14 A11SCS i7-1185G7, GeForce GTX 1650 Ti Max-Q, Phison 1TB SM2801T24GKBB4S-E162, IPS, 3840x2160, 14" | HP Envy 14-eb0010nr i5-1135G7, GeForce GTX 1650 Ti Max-Q, Samsung SSD PM981a MZVLB256HBHQ, IPS, 1920x1200, 14" | |
|---|---|---|---|---|---|---|---|
| Power Consumption | 22% | 44% | 8% | 24% | -10% | 5% | |
| Idle Minimum * (Watt) | 6.3 | 6.6 -5% | 5.2 17% | 6.7 -6% | 7.2 -14% | 9.9 -57% | 4.2 33% |
| Idle Average * (Watt) | 10.3 | 9.6 7% | 8.2 20% | 12.6 -22% | 10.4 -1% | 17.4 -69% | 18.3 -78% |
| Idle Maximum * (Watt) | 20 | 7.3 63% | 9.9 50% | 15.4 23% | 11 45% | 22.5 -13% | 19.2 4% |
| Load Average * (Watt) | 106.2 | 73 31% | 44.4 58% | 85.7 19% | 61.7 42% | 85.6 19% | 72.9 31% |
| Witcher 3 ultra * (Watt) | 96.1 | 74.4 23% | 35 64% | 83 14% | 53.6 44% | 70.9 26% | 61.5 36% |
| Load Maximum * (Watt) | 136.5 | 119 13% | 62.5 54% | 110.9 19% | 96 30% | 91.1 33% | 127.8 6% |
* ... menor é melhor
Power Consumption Witcher 3 / Stresstest
Power Consumption external Monitor
Vida útil da bateria
Os tempos de execução são melhores do que o esperado em mais de 7 horas de uso da WLAN no mundo real, o que está muito próximo do que registramos no Inspiron 14 7420 2 em 1 mais lento, sem nenhum gráfico dedicado. Entretanto, observe que nossos resultados refletem apenas a configuração 64 Wh e não a configuração 54 Wh menor, que deveria ter uma vida útil ligeiramente mais curta da bateria.
O carregamento da capacidade vazia à plena com o adaptador AC de barril incluído leva cerca de 2 horas. O carregamento através de adaptadores USB-C AC de terceiros é suportado.
| Dell Inspiron 14 Plus 7420 i7-12700H, GeForce RTX 3050 4GB Laptop GPU, 64 Wh | Asus Vivobook Pro 14 M3401QC-KM007T R5 5600H, GeForce RTX 3050 4GB Laptop GPU, 63 Wh | Dell Inspiron 14 7420 2-in-1 i7-1255U, Iris Xe G7 96EUs, 54 Wh | Schenker Vision 14 i7-11370H, GeForce RTX 3050 Ti Laptop GPU, 53 Wh | Asus Zenbook 14X UX5400E i7-1165G7, GeForce MX450, 63 Wh | MSI Summit E14 A11SCS i7-1185G7, GeForce GTX 1650 Ti Max-Q, 52 Wh | HP Envy 14-eb0010nr i5-1135G7, GeForce GTX 1650 Ti Max-Q, 63.3 Wh | |
|---|---|---|---|---|---|---|---|
| Duração da bateria | 47% | 58% | 16% | 65% | -24% | 83% | |
| Reader / Idle (h) | 11.9 | 11.5 -3% | 15.9 34% | 34 186% | 6.6 -45% | 27.7 133% | |
| WiFi v1.3 (h) | 7.2 | 9.5 32% | 7.6 6% | 5.5 -24% | 5.4 -25% | 4.5 -37% | 10.8 50% |
| Load (h) | 0.9 | 1.9 111% | 2.1 133% | 1.4 56% | 1.2 33% | 1 11% | 1.5 67% |
| H.264 (h) | 6.8 |
Pro
Contra
Veredicto - Desempenho de tamanho superior, Peso de tamanho superior
Se você estiver procurando maximizar o desempenho da CPU e da GPU em seu próximo laptop de 14 polegadas, então considere o preço Lâmina Razer 14 ou Asus Zephyrus G14. Se você está procurando um Ultrabook fino e leve de 14 polegadas, então o Asus Zenbook 14 ou LG Gram 14 podem ser melhores opções. Para o melhor dos dois mundos, no entanto, o Dell Inspiron 14 Plus 7420 tem uma linha tênue entre desempenho extremo e portabilidade, mantendo os preços em níveis razoáveis. Viajantes frequentes que confiam no desempenho além do que a série Core U e as séries gráficas integradas podem oferecer, encontrarão na Dell uma solução sólida.
Empacotar essa potência em um chassi de 14 polegadas tem os inconvenientes habituais: temperaturas mais quentes, ruído mais alto do ventilador, peso mais pesado e maior consumo de energia do que a maioria dos outros laptops da categoria de 14 polegadas. Destas quatro desvantagens, acreditamos que o peso poderia ser melhorado ao máximo como o da concorrência.Asus Vivobook Pro 14 é fornecido com CPUs da série AMD H e o mesmo GeForce RTX 3050 GPU enquanto pesa algumas centenas de gramas mais leve. Os ventiladores são pelo menos excelentes para se manterem silenciosos durante cargas de processamento mais baixas e, portanto, só são barulhentos quando executam aplicações exigentes.
O Inspiron 14 Plus 7420 pode ser pesado, mas fará o trabalho em velocidades mais rápidas do que seu típico Ultrabook.
Outros inconvenientes incluem o clickpad esponjoso e a tampa flexível. Para um laptop tão pesado de 14 polegadas, uma tampa mais rígida teria sido apreciada. A vantagem de desempenho sobre a maioria dos laptops de 14 polegadas nesta faixa de preço é, de outra forma, o principal destaque do sistema.
Preço e Disponibilidade
A concha do Inspiron 14 Plus 7420 está agora sendo enviada em Amazon e Newegg Por $1300 e $1400 USD, respectivamente. No entanto, as configurações estão atualmente limitadas apenas a gráficos integrados. Recomendamos comprar diretamente da Dell se você quiser o SKU GeForce RTX 3050 SKU.
Dell Inspiron 14 Plus 7420
- 08/30/2022 v7 (old)
Allen Ngo
Price comparison

