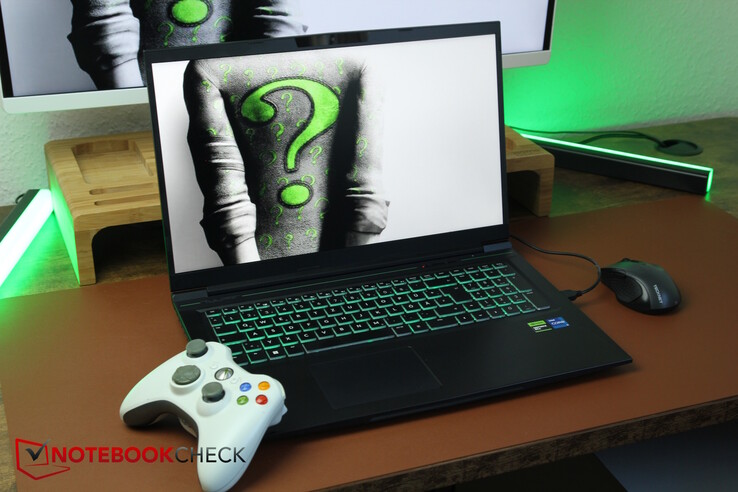
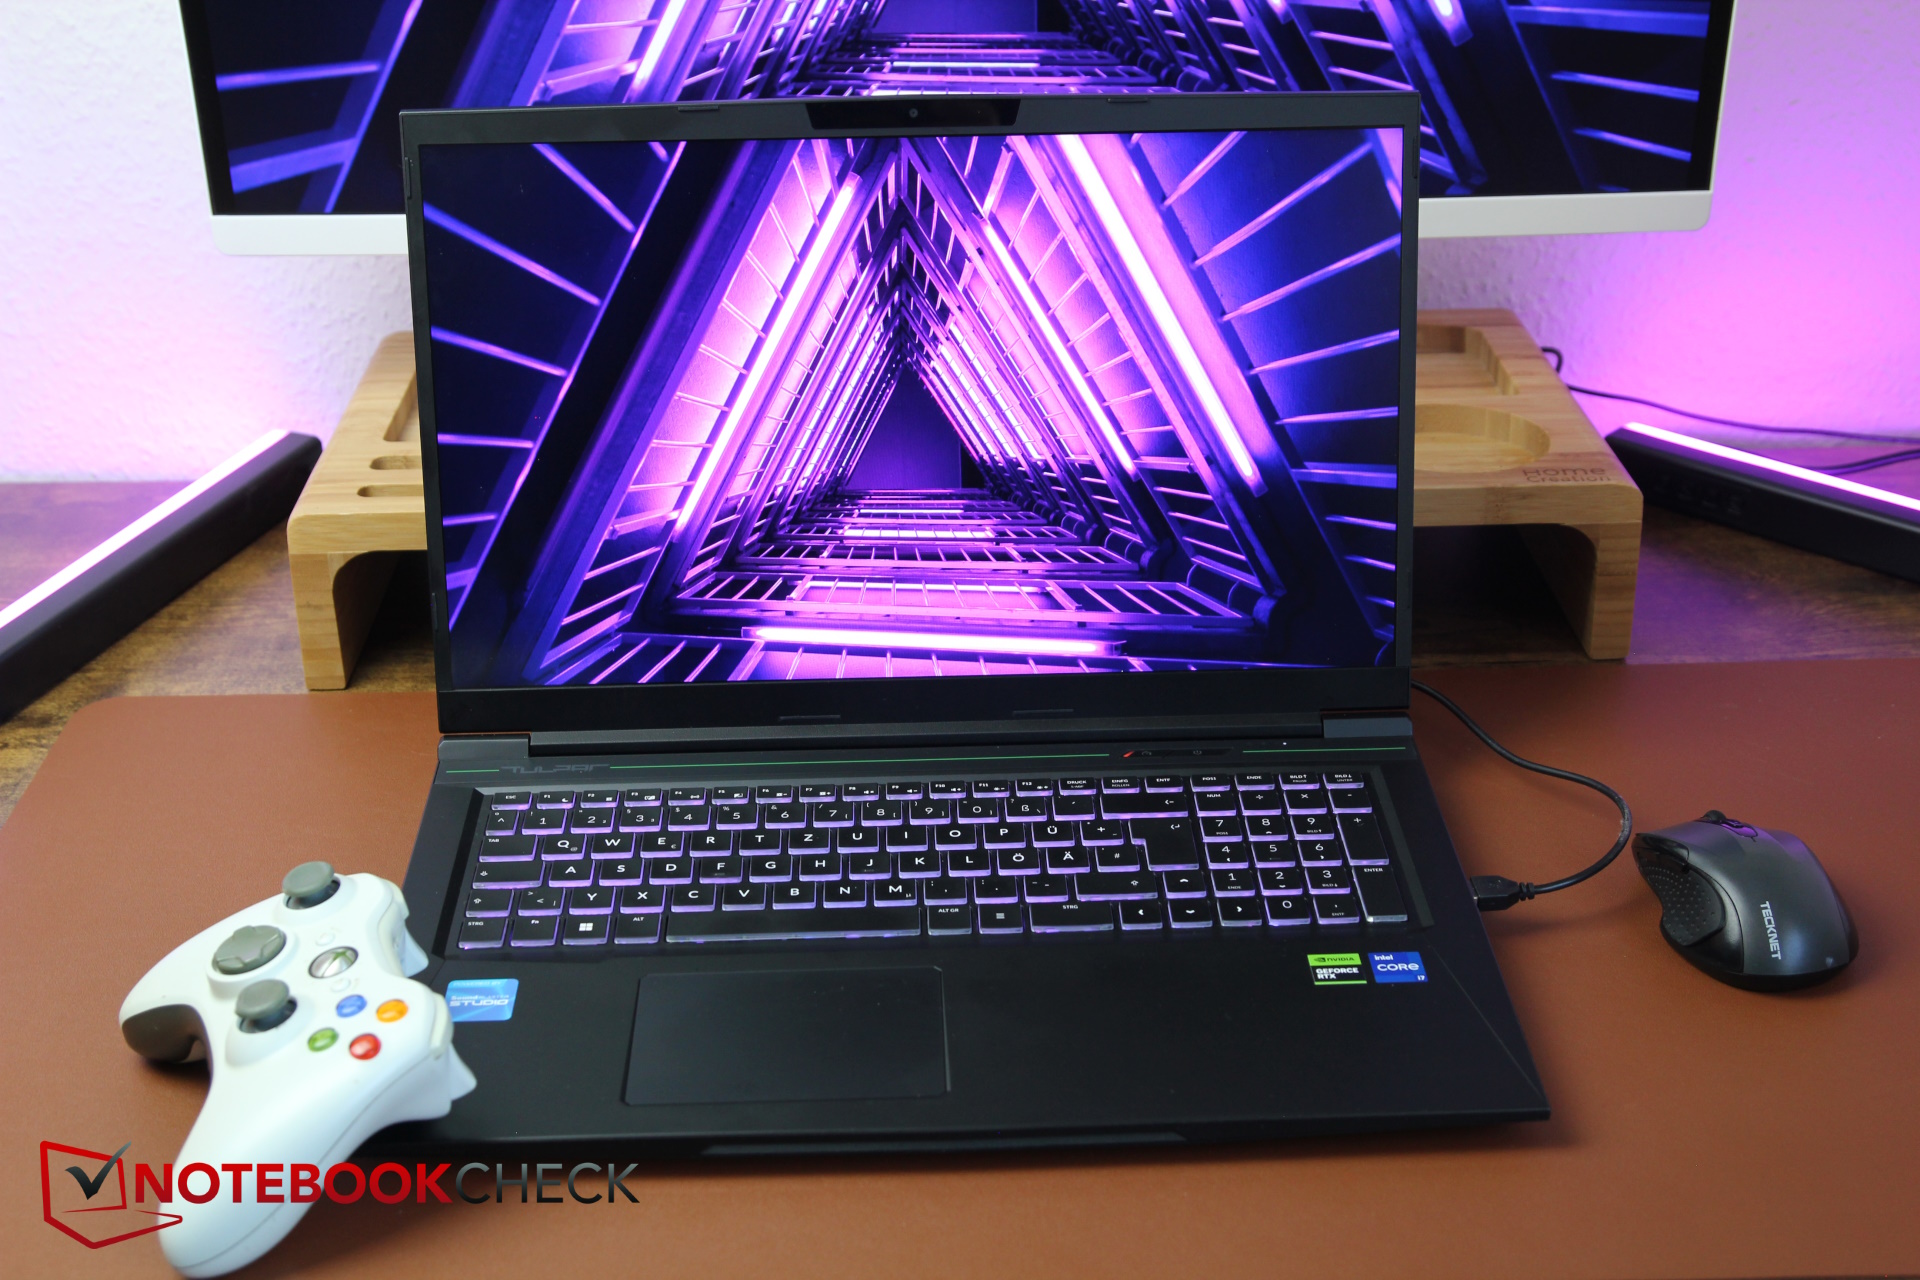
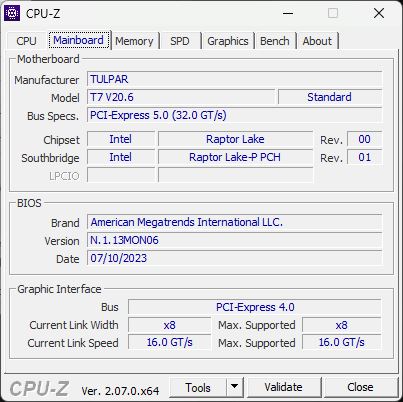
Análise do laptop Tulpar T7 V20.6 (Tongfang GM7PG0R): Atualmente, um dos mais baratos para gamers de RTX 4060
A empresa originalmente turca - que tecnicamente comercializa sob o nome Monster Notebook - mudou seu nome de marca para Tulpar Notebook para o mercado europeu em 2022. A Tulpar tem sua sede na região DACH no centro de Berlim, na Alexanderplatz, onde o senhor pode experimentar vários produtos e fazer a manutenção do seu dispositivo - falaremos mais sobre isso depois.
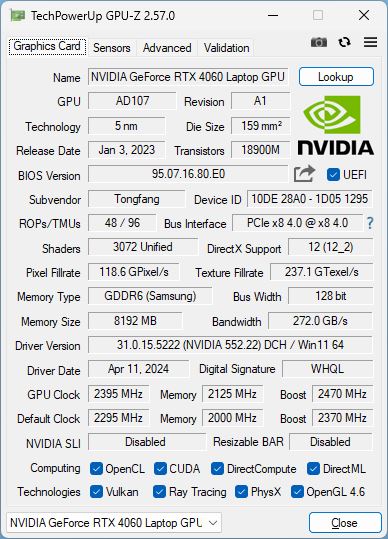
Os laptops da Tulpar têm recebido um interesse crescente ultimamente, o que significa que finalmente temos a chance de testar nosso primeiro laptop Tulpar. "A série A inclui modelos básicos mais econômicos para jogadores ocasionais. A série T é destinada a jogadores frequentes com altas exigências", diz o site do fabricante. Estamos testando o T7, um modelo para jogadores pesados com altas exigências, mas, embora as "séries de notebooks A e T tenham sido projetadas de acordo com os mais recentes padrões tecnológicos", atualmente existem apenas dois modelos do T6 com a mais recente CPU Gen14 da Intel. Nosso T7 ainda está equipado com um i7-13700H da última geração da Intel. Além disso, há uma RTX 4060 dentro do gabinete Tonfang GM7PG0R.
O apelo atual de um laptop Tulpar é, acima de tudo, seu baixo preço. Preço baixo? No site, o modelo com 1 TB de armazenamento custa cerca de US$ 1.800! Mas, ao mesmo tempo, o senhor também pode adquirir o laptop T7 de alguns varejistas on-line que exigem muito menos por ele.
Cada vez menos gamers de 17 polegadas estão sendo lançados este ano devido ao aumento dos modelos de 18 polegadas. Como resultado, compararemos o T7 com outros notebooks gamers de médio e baixo custo do ano passado, como o XMG Apex 17, Acer Nitro 17, Medion Erazer Defender P40 e o MSI Katana 17. Além disso, estaremos lançando o Lenovo Legion 5i 16 G9 de 16 polegadas com uma CPU atual no ringue para ver o quanto a tecnologia mais recente pode avançar.
Possíveis concorrentes em comparação
Avaliação | Data | Modelo | Peso | Altura | Size | Resolução | Preço |
|---|---|---|---|---|---|---|---|
| 86.3 % v7 (old) | 05/2024 | Tulpar T7 V20.6 i7-13700H, GeForce RTX 4060 Laptop GPU | 2.6 kg | 30.05 mm | 17.30" | 1920x1080 | |
| 87.1 % v7 (old) | 10/2023 | Schenker XMG Apex 17 (Late 23) R7 7840HS, GeForce RTX 4060 Laptop GPU | 2.5 kg | 24.9 mm | 17.30" | 2560x1440 | |
| 87.2 % v7 (old) | 07/2023 | Acer Nitro 17 AN17-51-71ER i7-13700H, GeForce RTX 4060 Laptop GPU | 3 kg | 30.3 mm | 17.30" | 2560x1440 | |
| 84.6 % v7 (old) | 05/2023 | Medion Erazer Defender P40 i7-13700HX, GeForce RTX 4060 Laptop GPU | 2.9 kg | 33 mm | 17.30" | 2560x1440 | |
| 82.1 % v7 (old) | 02/2023 | MSI Katana 17 B13VFK i7-13620H, GeForce RTX 4060 Laptop GPU | 2.8 kg | 25.2 mm | 17.30" | 1920x1080 | |
| 89.1 % v7 (old) | 02/2024 | Lenovo Legion 5 16IRX G9 i7-14650HX, GeForce RTX 4060 Laptop GPU | 2.4 kg | 25.2 mm | 16.00" | 2560x1600 |
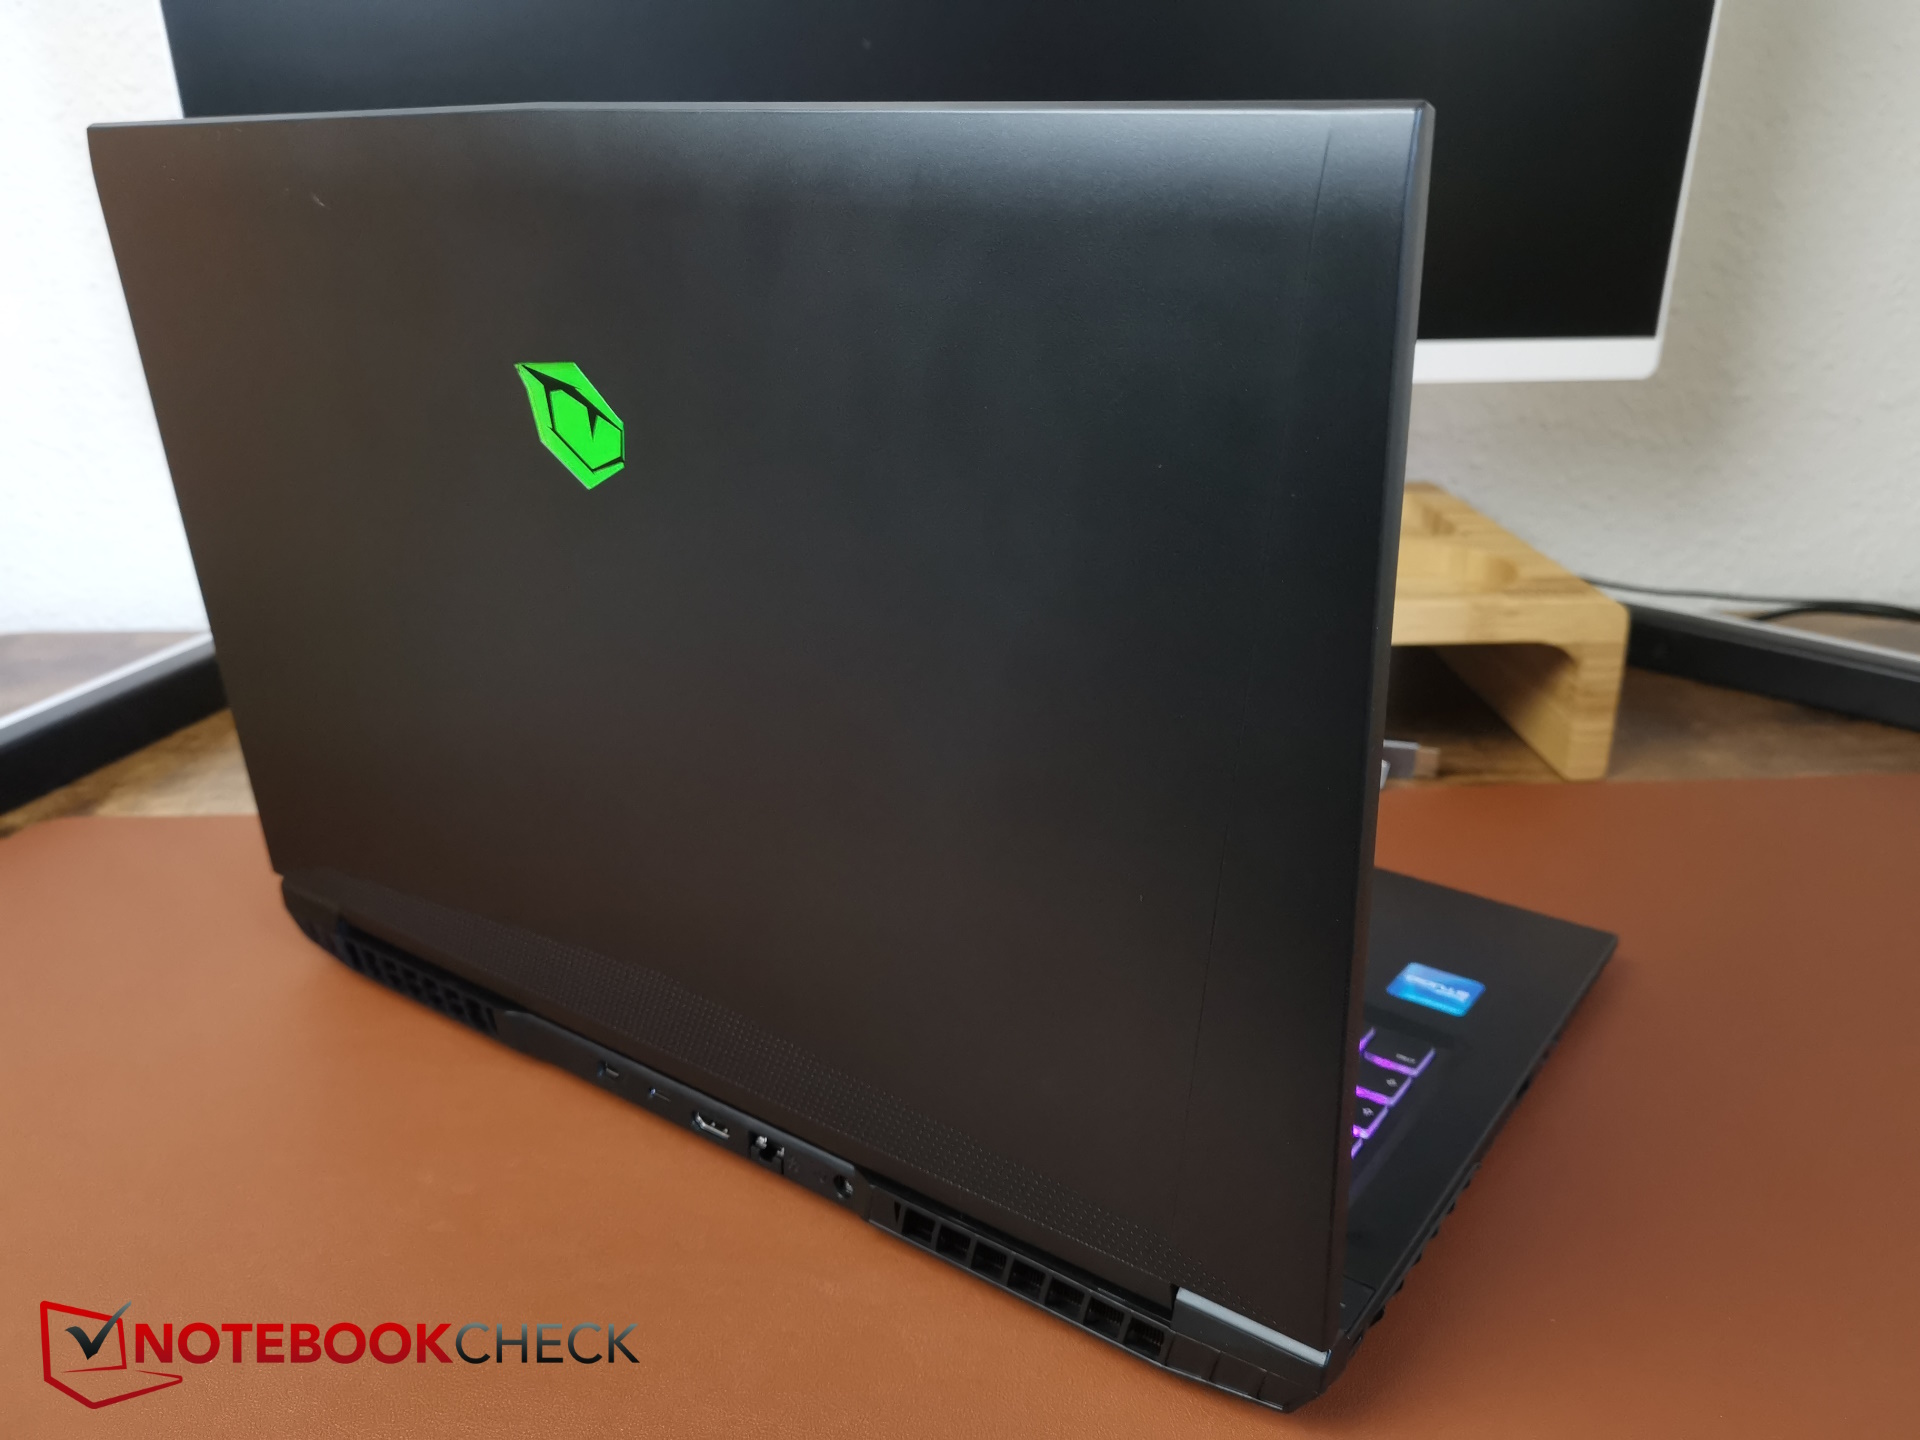
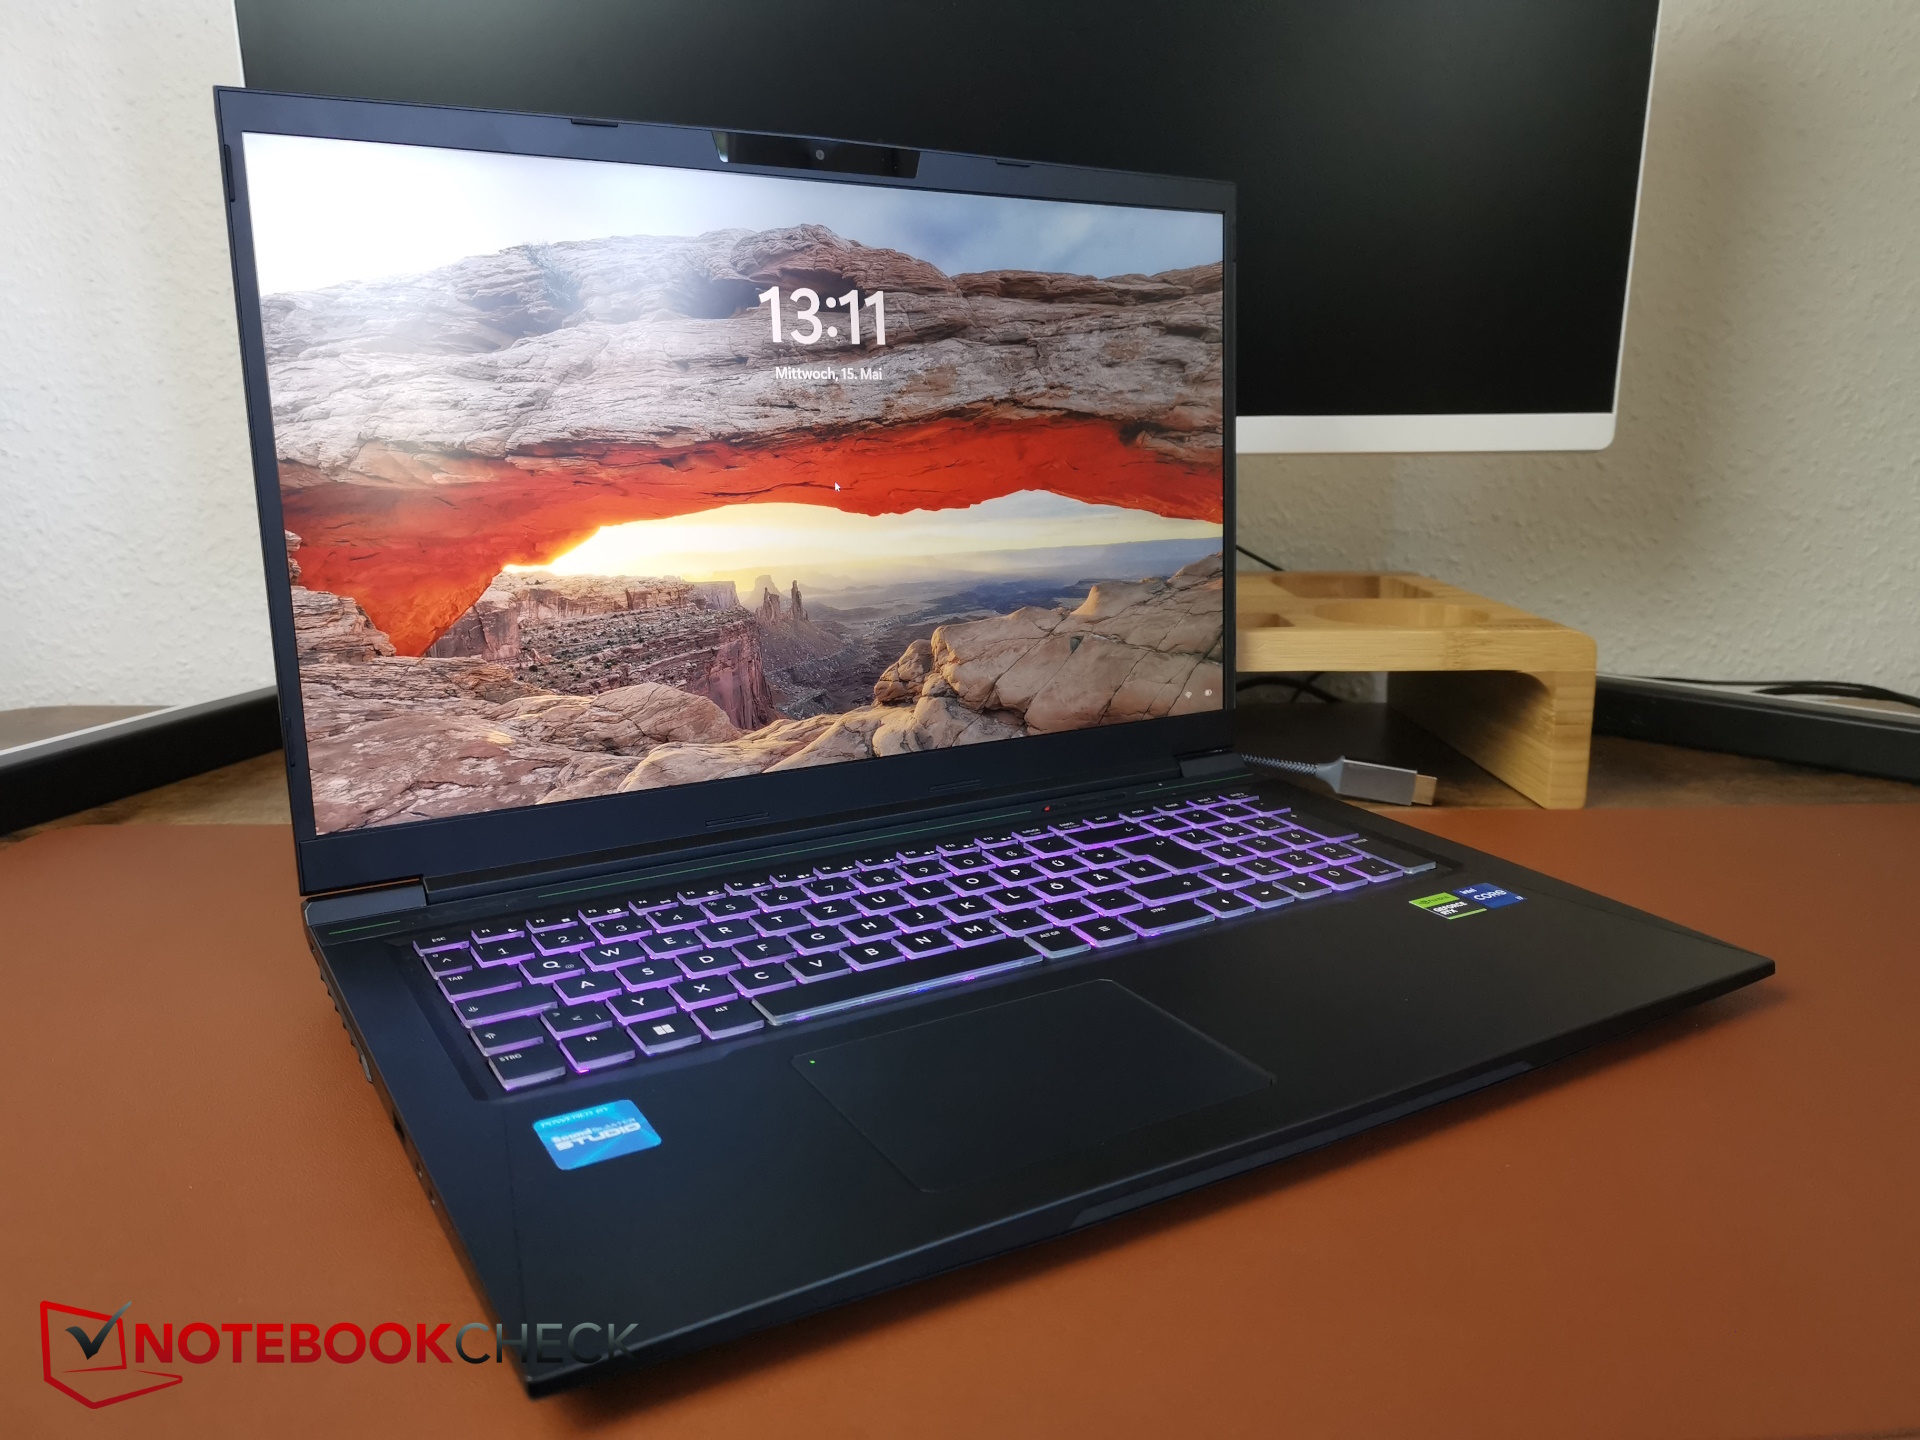
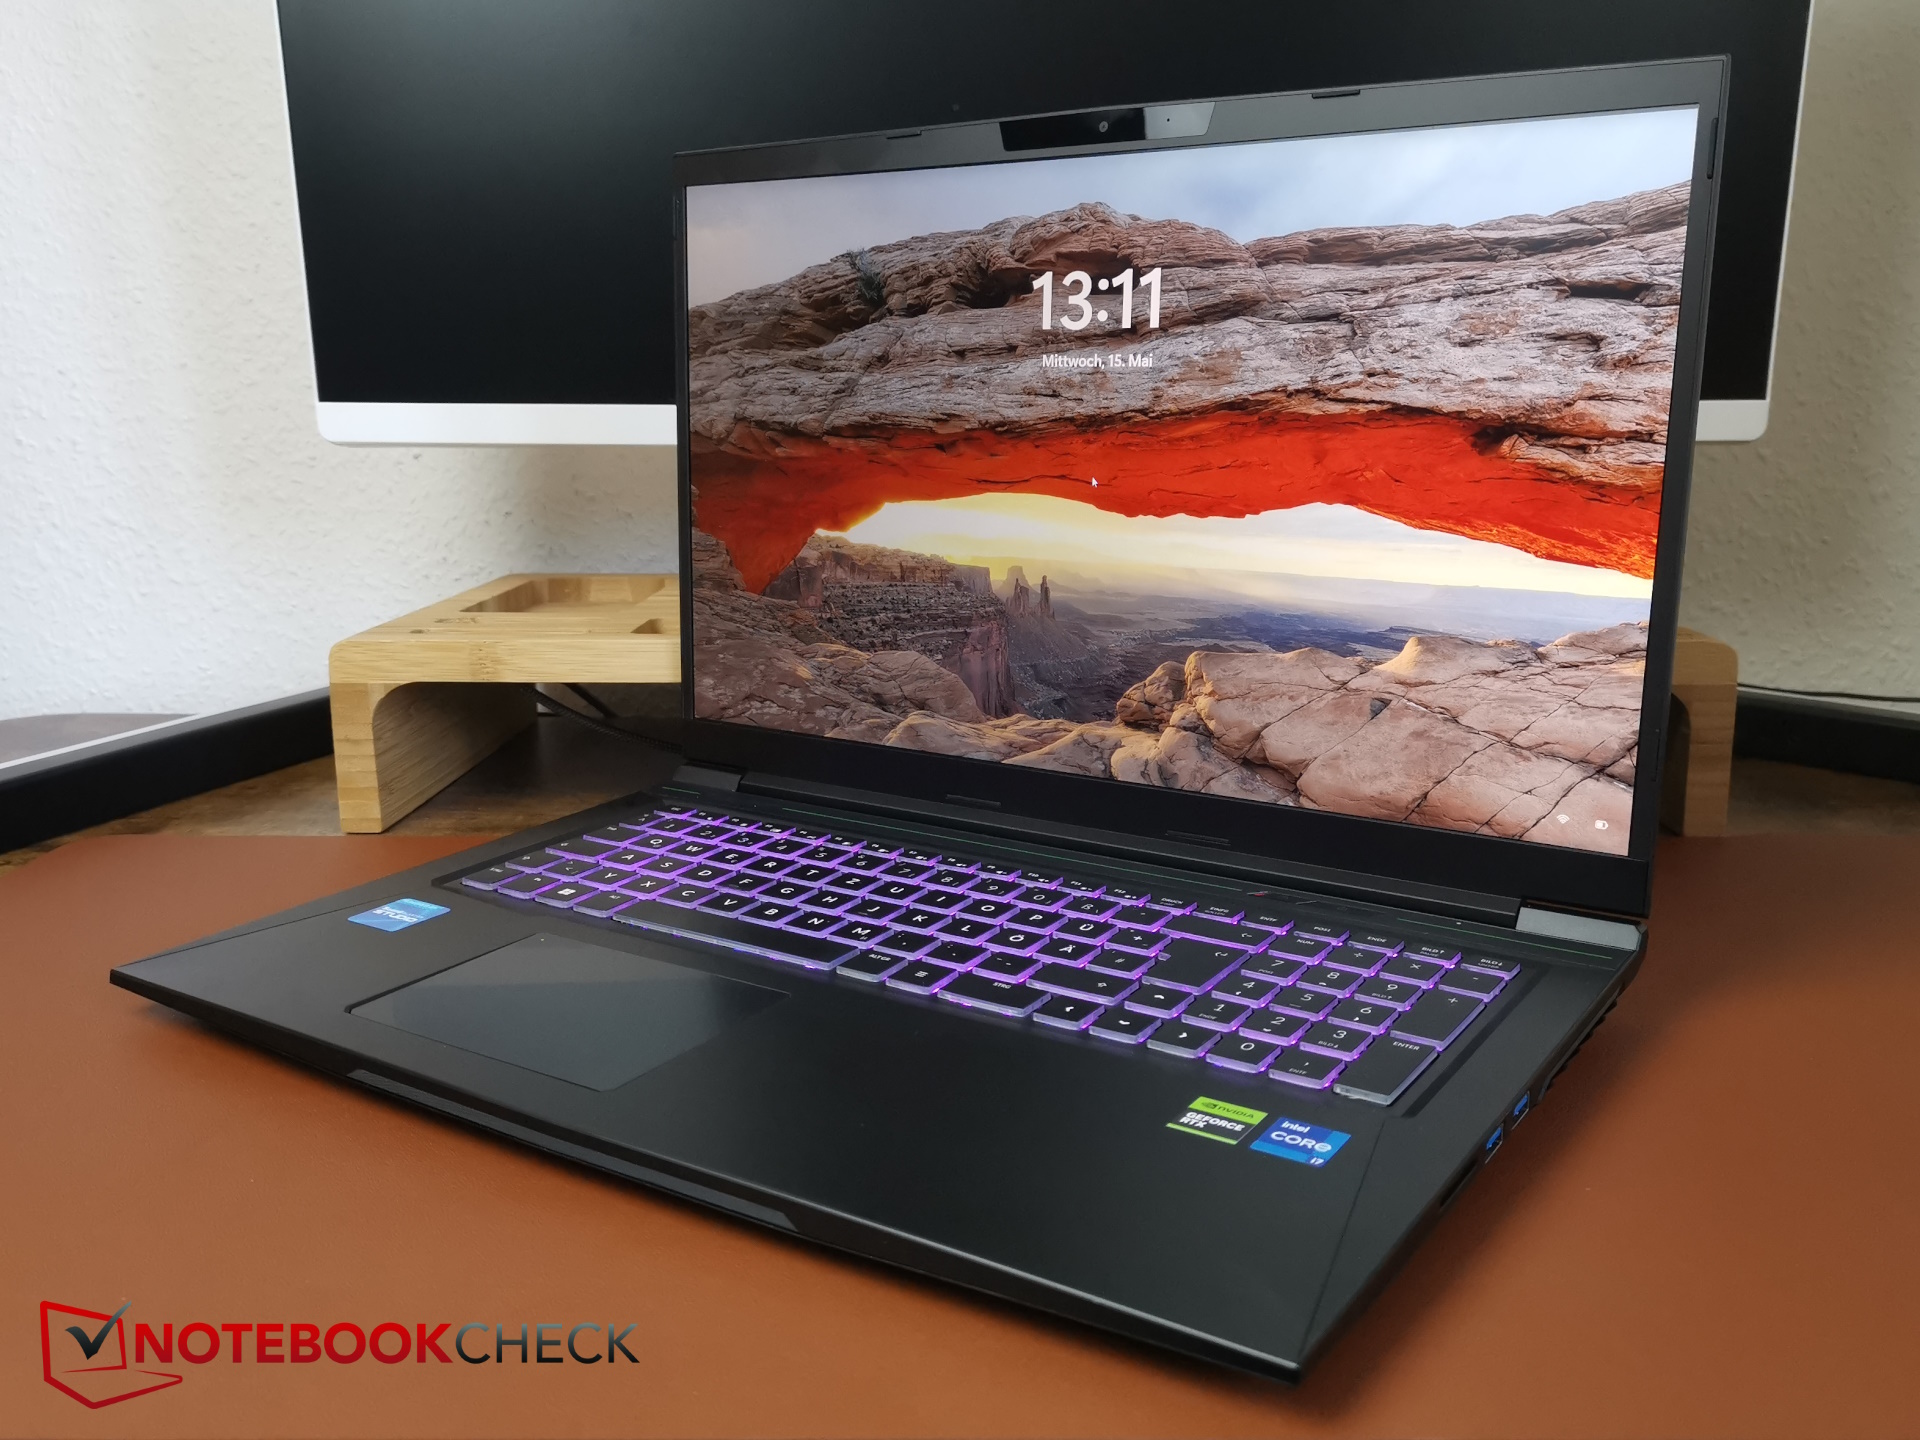
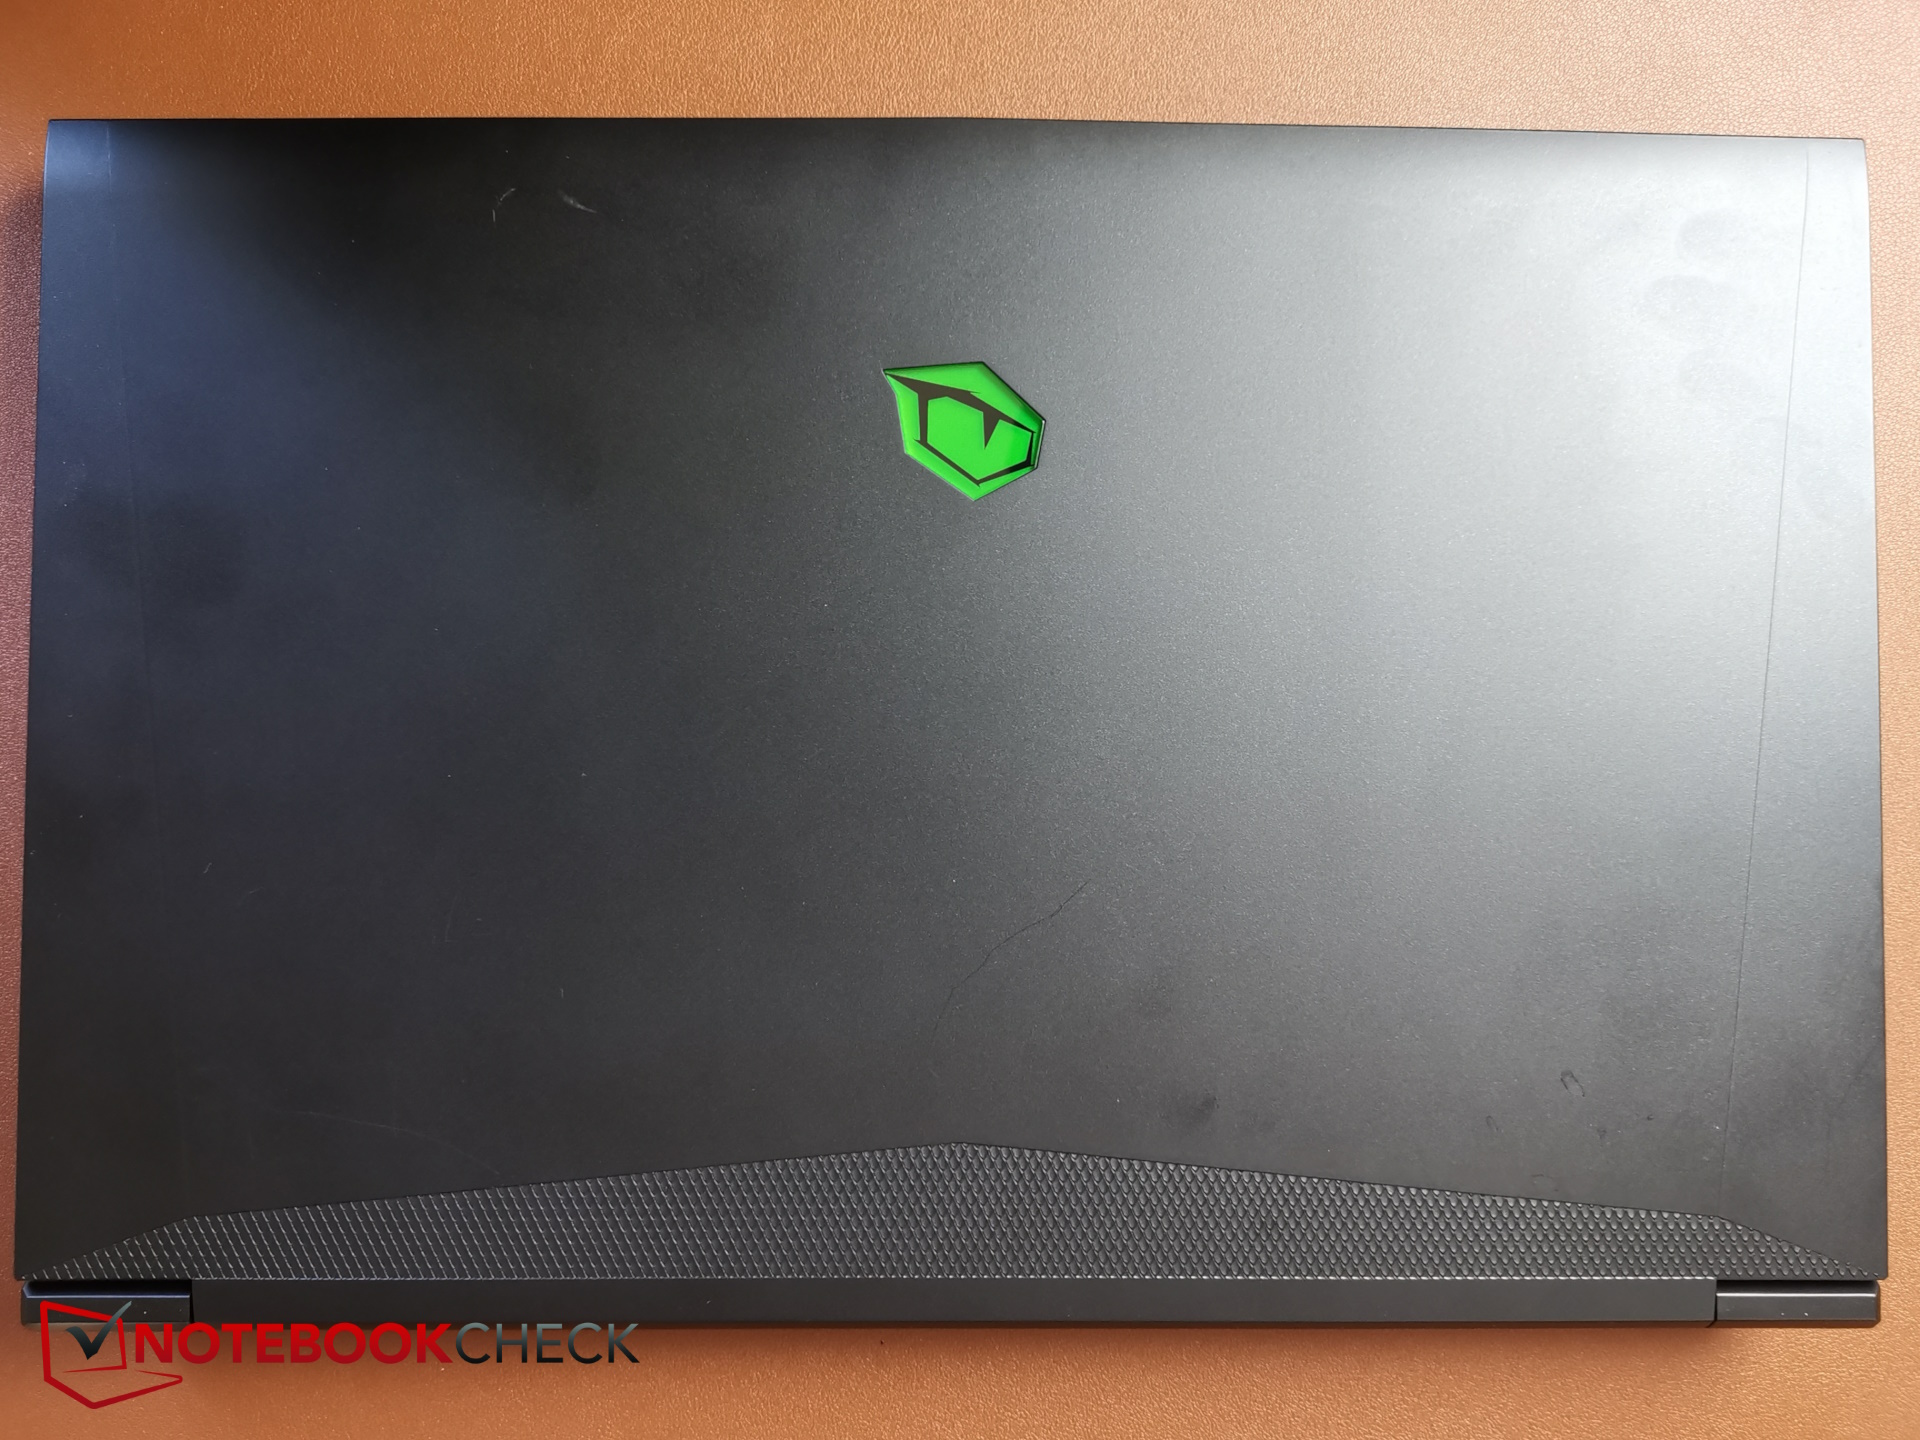
Caso - Um Tongfang com um olho verde de jogador
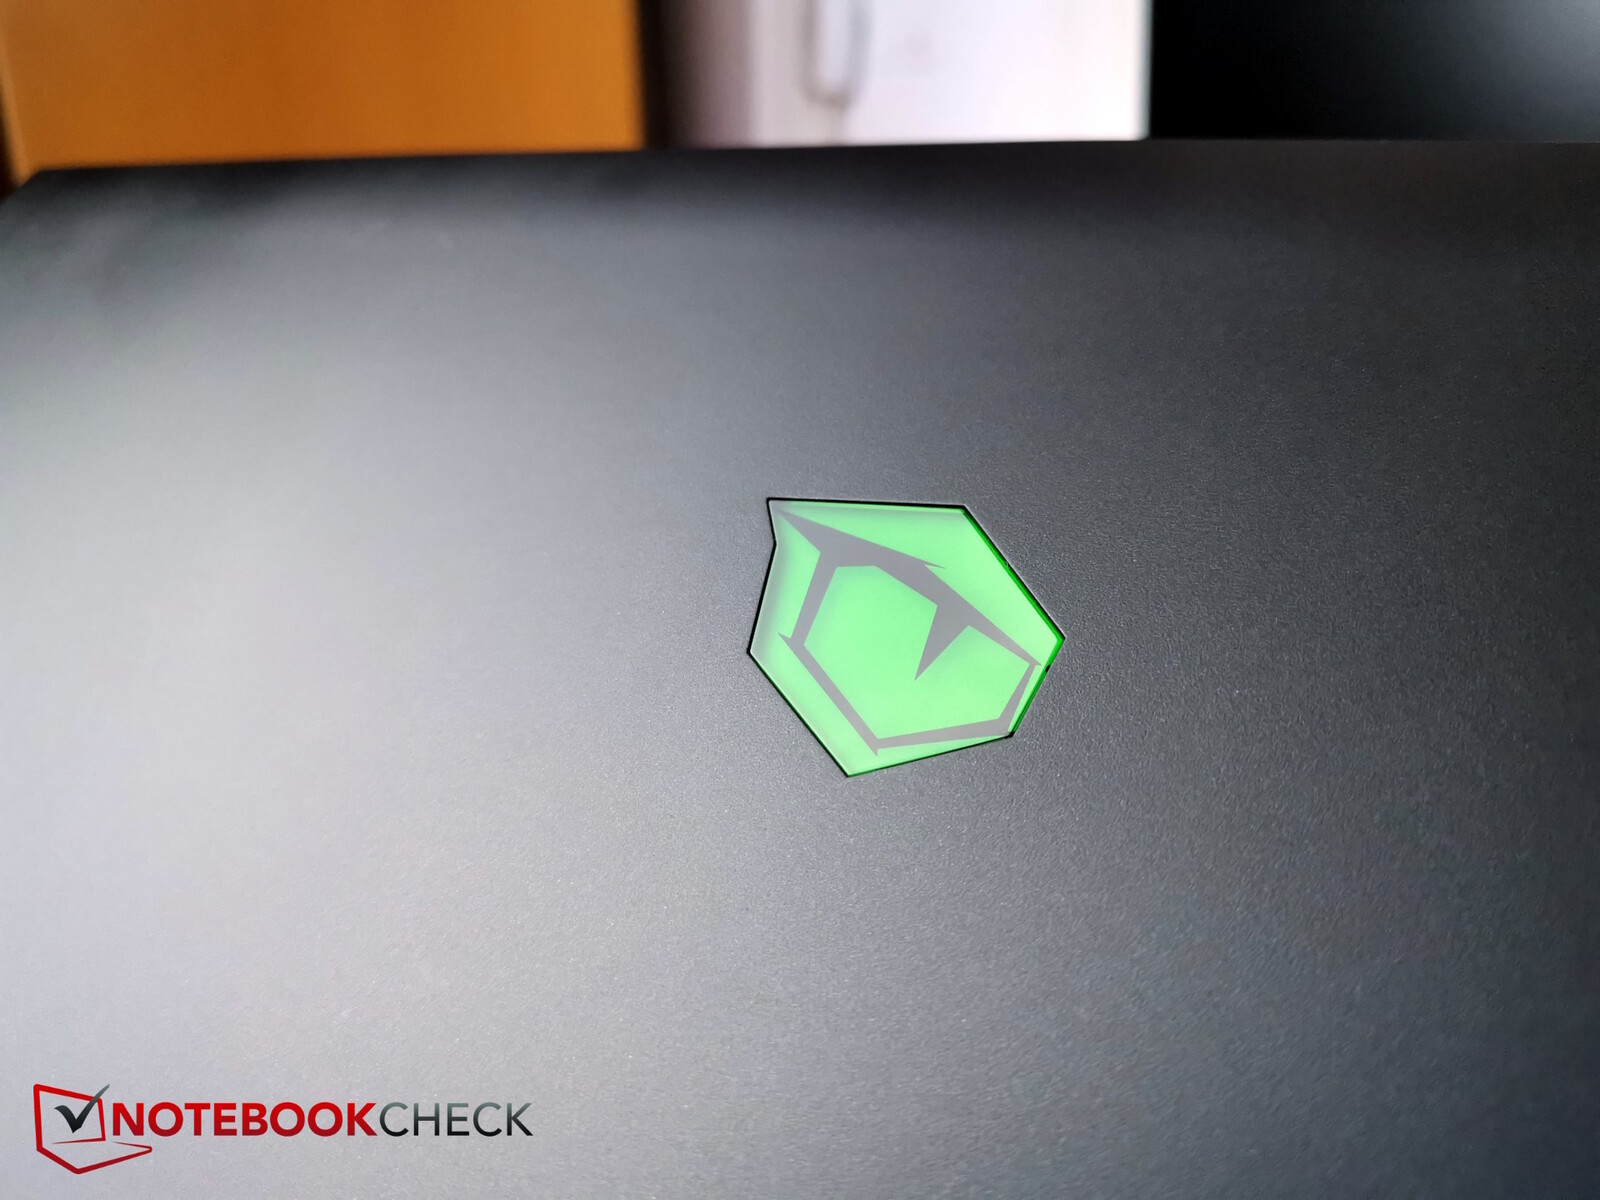
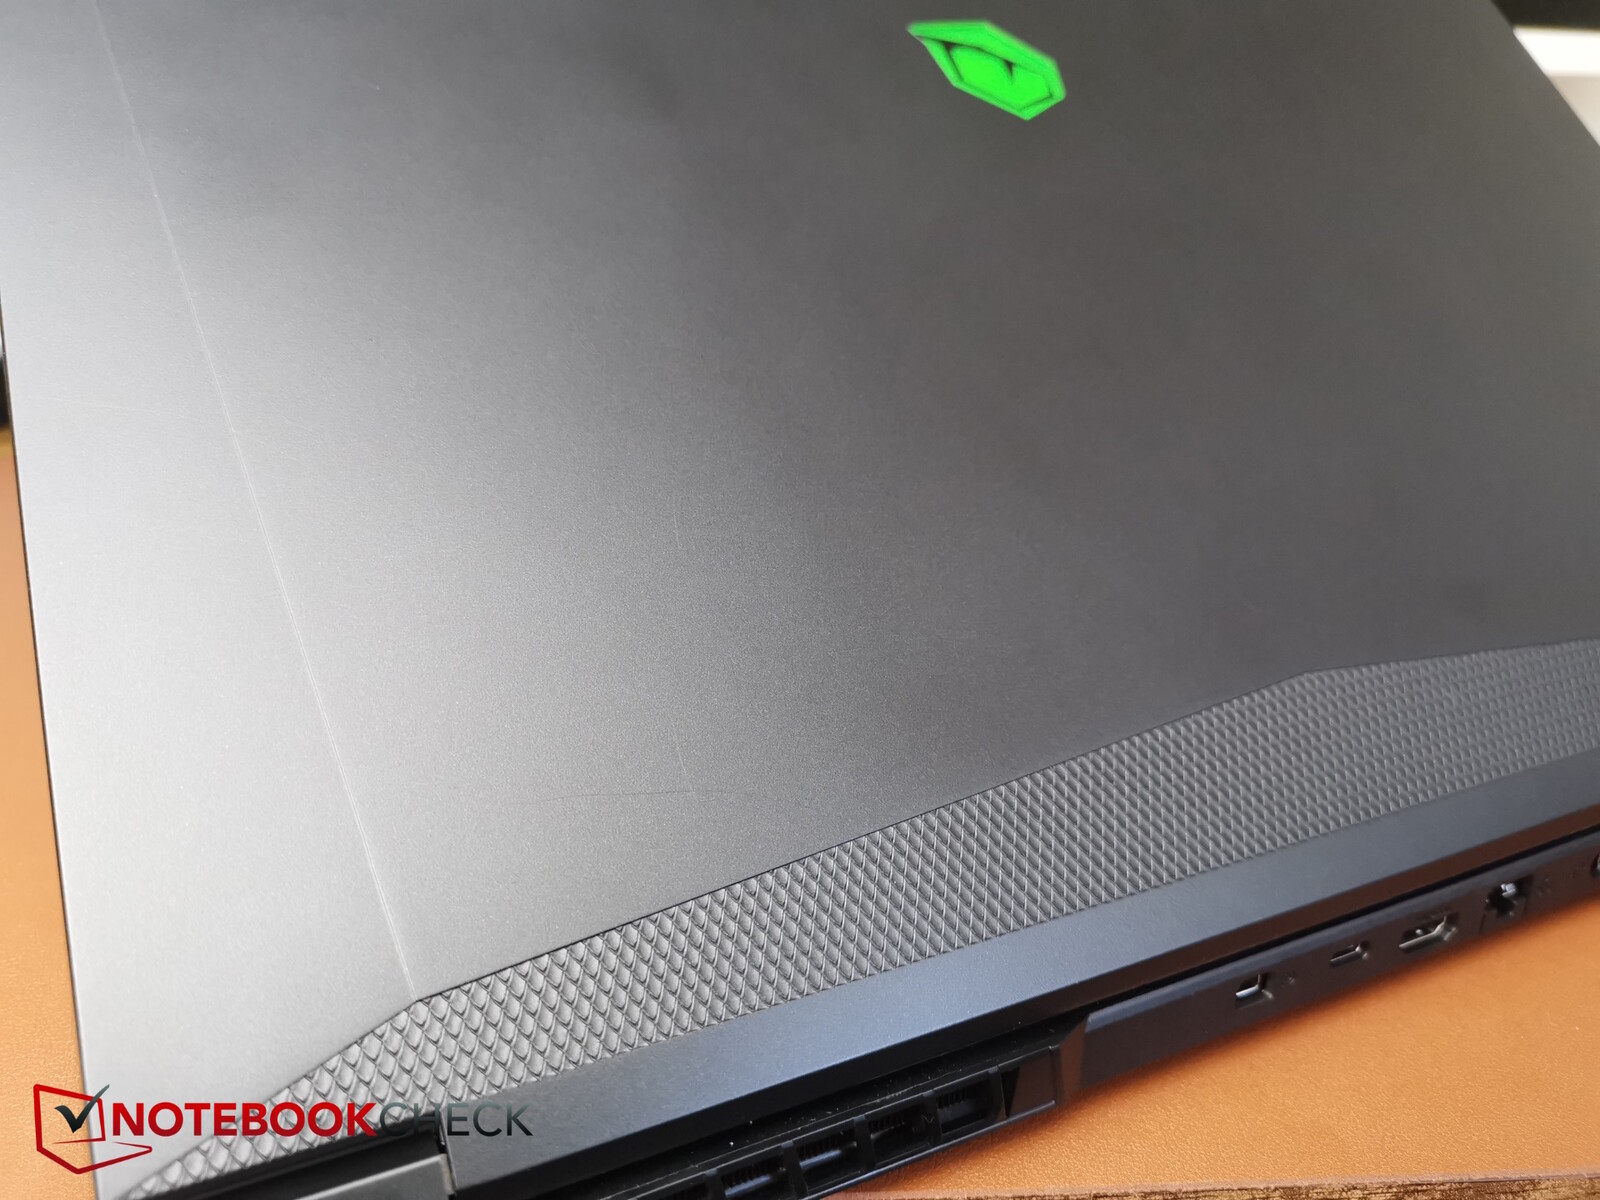
A capa do Tongfang é totalmente feita de plástico preto. O logotipo verde na parte frontal, a faixa larga com padrão de favo de mel embaixo e a marca Tulpar com uma faixa verde na base, acima do teclado, dão destaque ao dispositivo. A superfície levemente texturizada atrai marcas de gordura e de impressões digitais.
Em nossos testes de torção, a base pode ser dobrada com bastante facilidade e as bordas laterais, em particular, fizeram ruídos mais fortes de rachaduras. Fora isso, a base é suficientemente estável, e o mesmo pode ser dito sobre a tela. As dobradiças seguram bem a tela no lugar, mas não conseguem evitar um certo balanço ao ajustar o ângulo de abertura. Esse ângulo é de cerca de 145 graus.
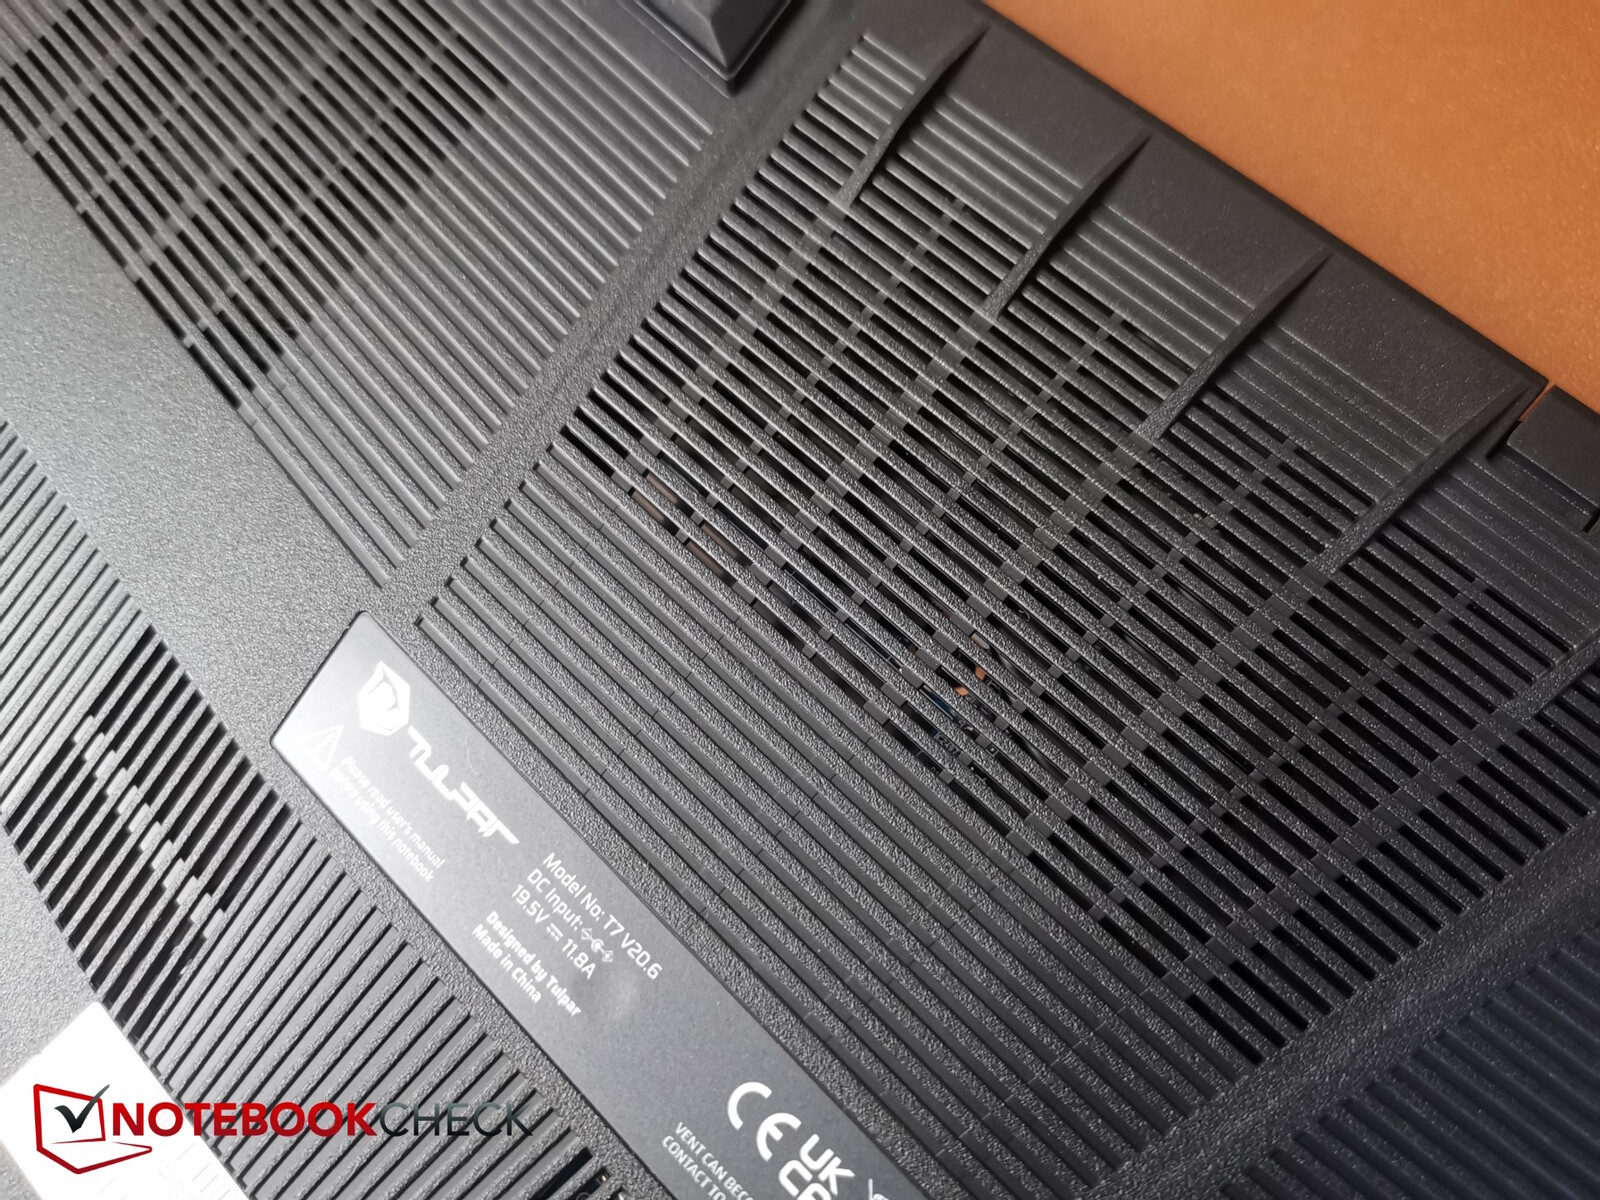
Observamos apenas algumas pequenas lacunas ao longo da borda frontal, onde a base encontra a placa inferior, que é ligeiramente curvada. A parte inferior é feita de um plástico um pouco mais macio e o plástico pode ser facilmente pressionado contra os elementos internos de resfriamento - especialmente os tubos de calor - do lado de fora, principalmente nas grades de ar, que são ainda mais macias devido às suas fendas. Entretanto, isso não deve acontecer normalmente graças aos quatro pés de borracha.
Em suma, a qualidade de construção é boa, mas definitivamente existem dispositivos mais estáveis e de melhor qualidade no mercado.
Dentro do campo de comparação, o T7 tem tamanho e peso médios. Ele tem aproximadamente o mesmo tamanho do Medion ou do XMG, enquanto o Nitro e o Katana são maiores. Seu peso de 2,6 kg só é superado pelo Schenker, enquanto o restante dos dispositivos de comparação é mais pesado, especialmente o Nitro, que pesa cerca de 3 kg.
Com uma espessura máxima de 30 mm, o T7 não parece muito fino, mas o Acer Nitro tem a mesma espessura e o Medion tem até 3 mm a mais em suas nervuras (de resfriamento), especialmente porque o T7 é mais fino do que o valor máximo especificado na maioria dos lugares. O Katana e o XMG são mais finos.
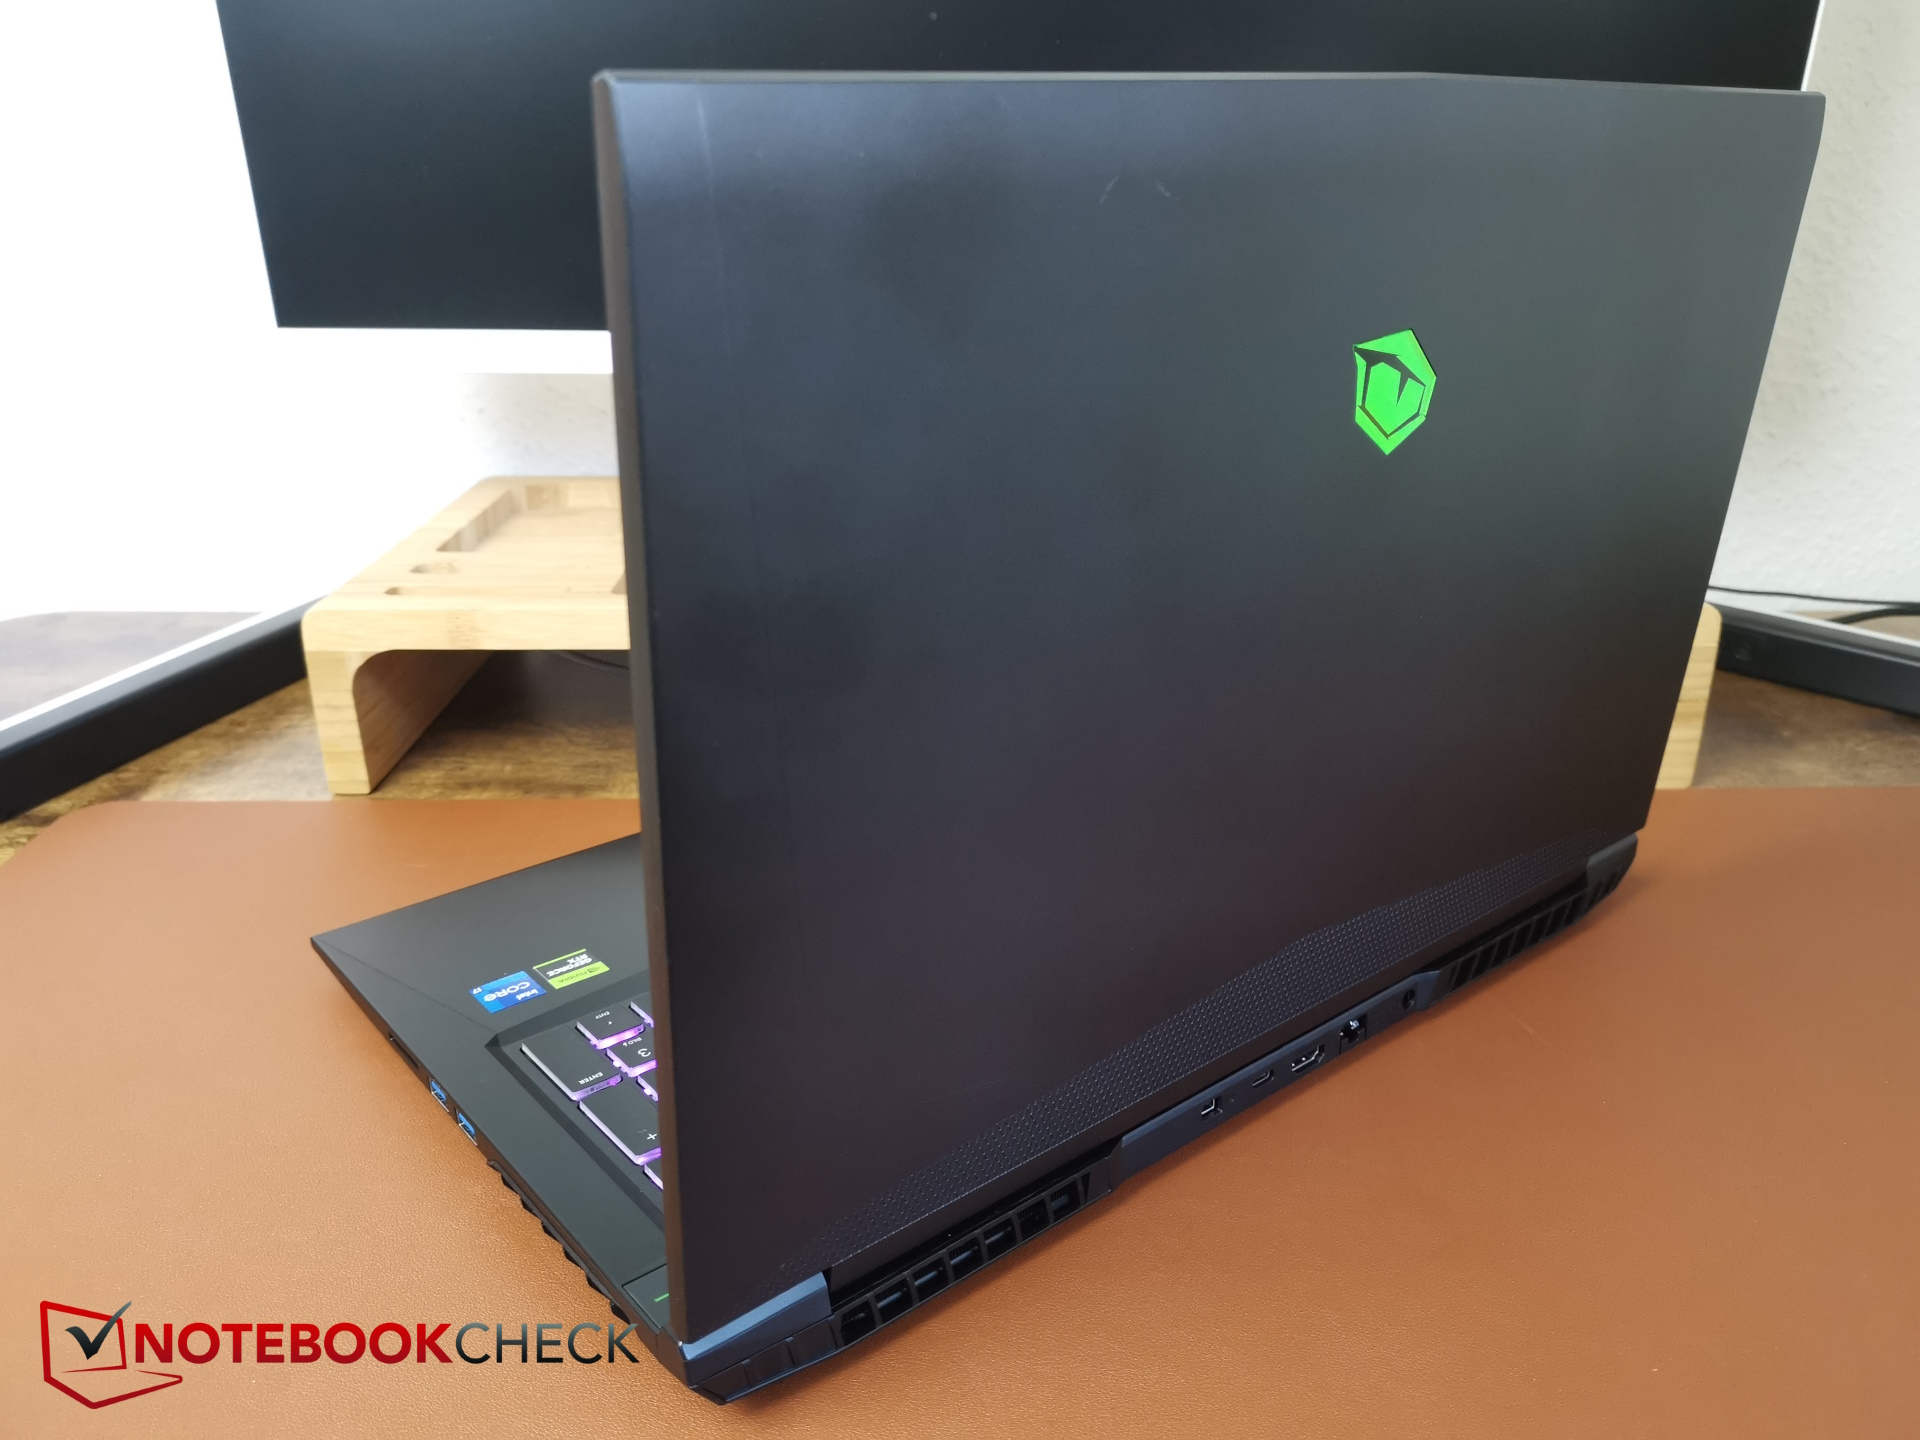
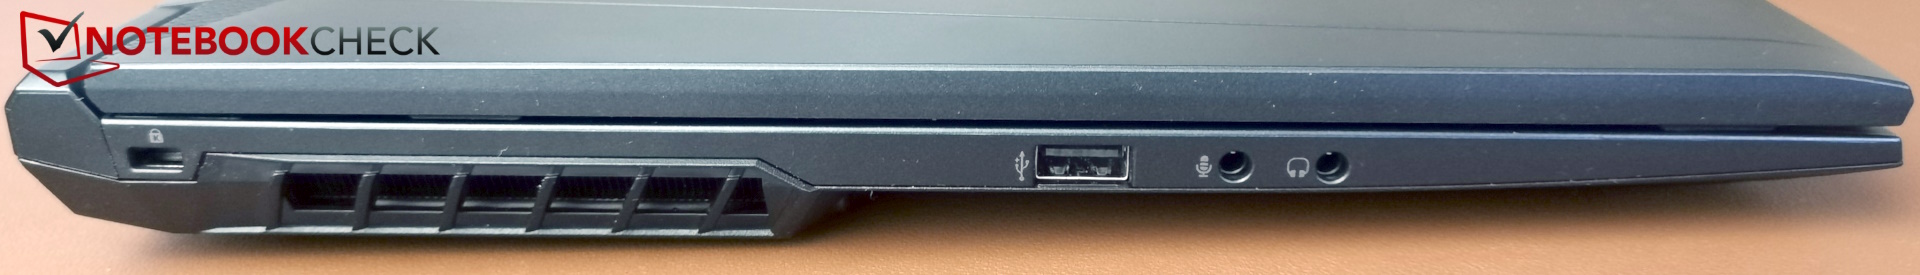
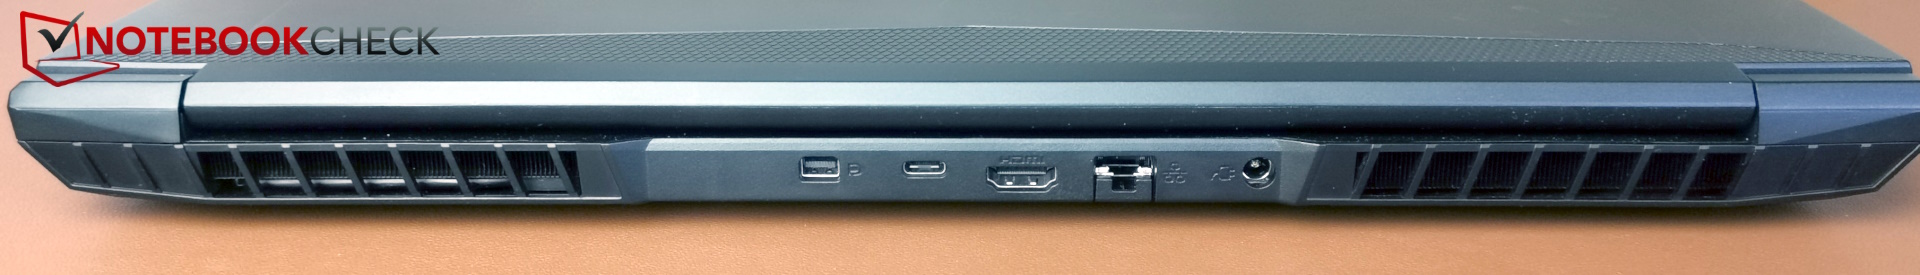
Conectividade - Sem Thunderbolt, mas com USB 2.0
O gamer Tulpar apresenta todas as opções de conectividade mais necessárias e um grande ponto positivo é sua porta MiniDP dedicada na parte traseira, que pode ser especialmente importante para fones de ouvido VR. Por sua vez, sua porta USB-C infelizmente não é compatível com Thunderbolt e uma de suas três portas USB-A (à esquerda) ainda é do tipo 2.0. Mesmo assim, ele pelo menos tem um leitor de cartão SD de tamanho normal e duas portas de áudio separadas.
Seu layout é bom, pelo menos as conexões estão bem distribuídas em ambos os lados e na parte traseira. Acima de tudo, os cabos potencialmente rígidos e grossos, como LAN, HDMI, MiniDP e energia, saem pela parte traseira, portanto, o senhor só terá que lidar com dispositivos USB nas laterais. No lado direito, as duas portas USB-A poderiam estar um pouco mais afastadas, mas, fora isso, a distribuição do laptop é boa.
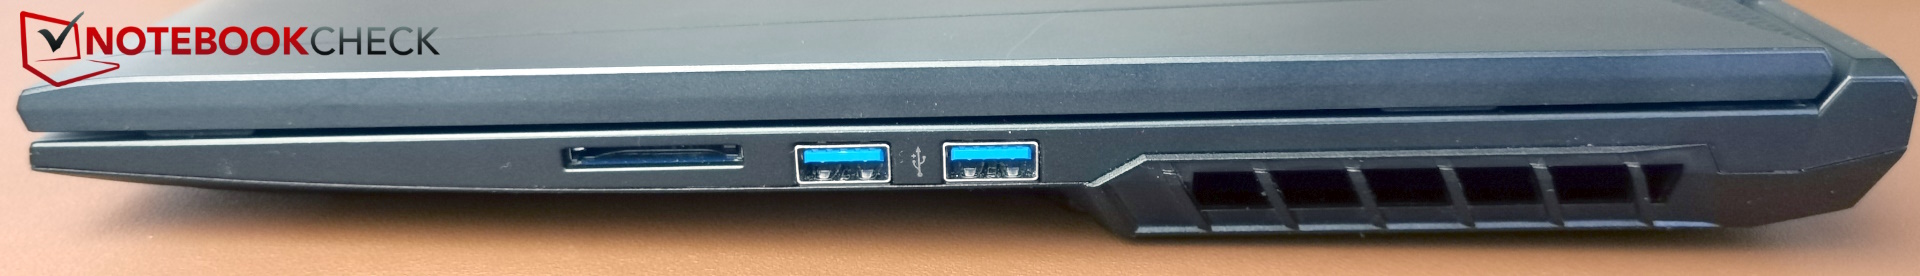
Leitor de cartão SD
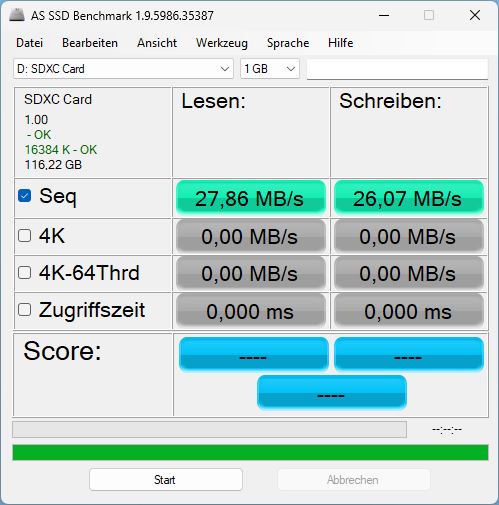
Gostamos do fato de o laptop ser equipado com um leitor de cartão SD de tamanho normal. Menos impressionante é a lentidão da velocidade do leitor de cartão. Não há mecanismo de travamento e os cartões ficam meio para fora.
Medimos taxas sequenciais de leitura e gravação de apenas cerca de 27 MB/s, o que é tudo menos a velocidade do nosso cartão de referência AV PRO MicroSD 128 GB V60. A cópia de 1 GB de material de imagem do cartão para a área de trabalho leva impressionantes 48 segundos! A concorrência é muito mais rápida, embora o Legion 5 e o XMG não sejam decisivos.
| SD Card Reader | |
| average JPG Copy Test (av. of 3 runs) | |
| Média da turma Gaming (20.9 - 210, n=54, últimos 2 anos) | |
| Medion Erazer Defender P40 (AV PRO microSD 128 GB V60) | |
| Acer Nitro 17 AN17-51-71ER | |
| Schenker XMG Apex 17 (Late 23) (AV PRO microSD 128 GB V60) | |
| Lenovo Legion 5 16IRX G9 | |
| Tulpar T7 V20.6 | |
| maximum AS SSD Seq Read Test (1GB) | |
| Média da turma Gaming (25.5 - 261, n=51, últimos 2 anos) | |
| Medion Erazer Defender P40 (AV PRO microSD 128 GB V60) | |
| Acer Nitro 17 AN17-51-71ER | |
| Schenker XMG Apex 17 (Late 23) (AV PRO microSD 128 GB V60) | |
| Lenovo Legion 5 16IRX G9 | |
| Tulpar T7 V20.6 | |
Comunicação
O dispositivo tem uma conexão LAN RJ45. Para a WLAN, a Tulpar instalou o módulo Intel Wi-Fi 6 AX201, que é compatível com o Wi-Fi 6, mas não com o Wi-Fi 6E.
Suas taxas de transmissão são altas e muito constantes ao enviar e receber.
Webcam
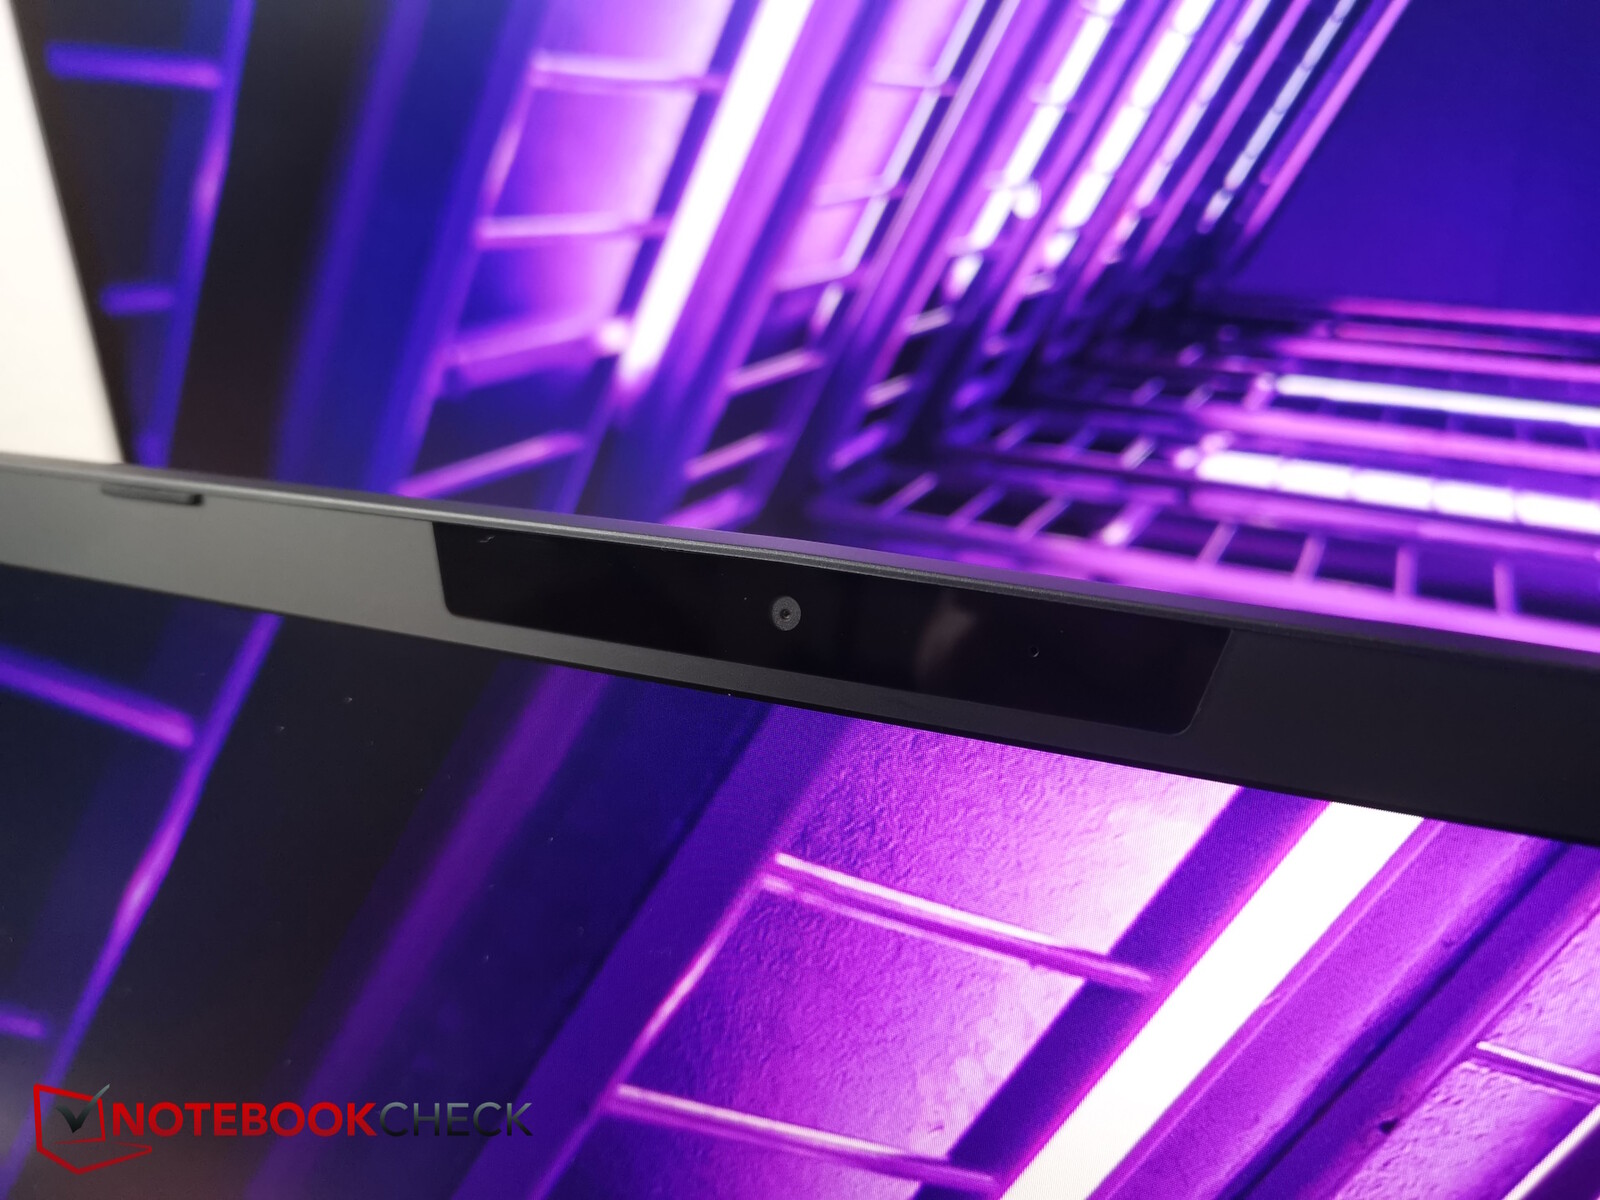
Enquanto pelo menos o XMG e o Legion 5 já contam com webcams Full HD, o Tulpar, como os outros concorrentes, ainda tem uma câmera de 720p.
Ela também tem que lidar com desvios de cor bastante altos e pouca nitidez, o que faz com que não transmita uma imagem muito boa do usuário.


Segurança
Há um slot Kensington disponível e o TPM está integrado à CPU Intel. Não há recursos de segurança adicionais, como um sensor de impressão digital ou uma cobertura para a webcam.
Acessórios e garantia
O laptop econômico da Tulpar não vem com nenhum acessório extra. No entanto, há a promessa de manutenção gratuita anual vitalícia, além de uma garantia legal de 12 meses. Isso inclui a limpeza das ventoinhas, a substituição da pasta térmica da CPU e da GPU e a remoção da poeira do gabinete. Mas tenha cuidado: Se o cliente fizer algo por conta própria (por exemplo, trocar a pasta térmica), a manutenção gratuita expira, portanto, é melhor ler os termos e condições exatos no site da Tulpar.
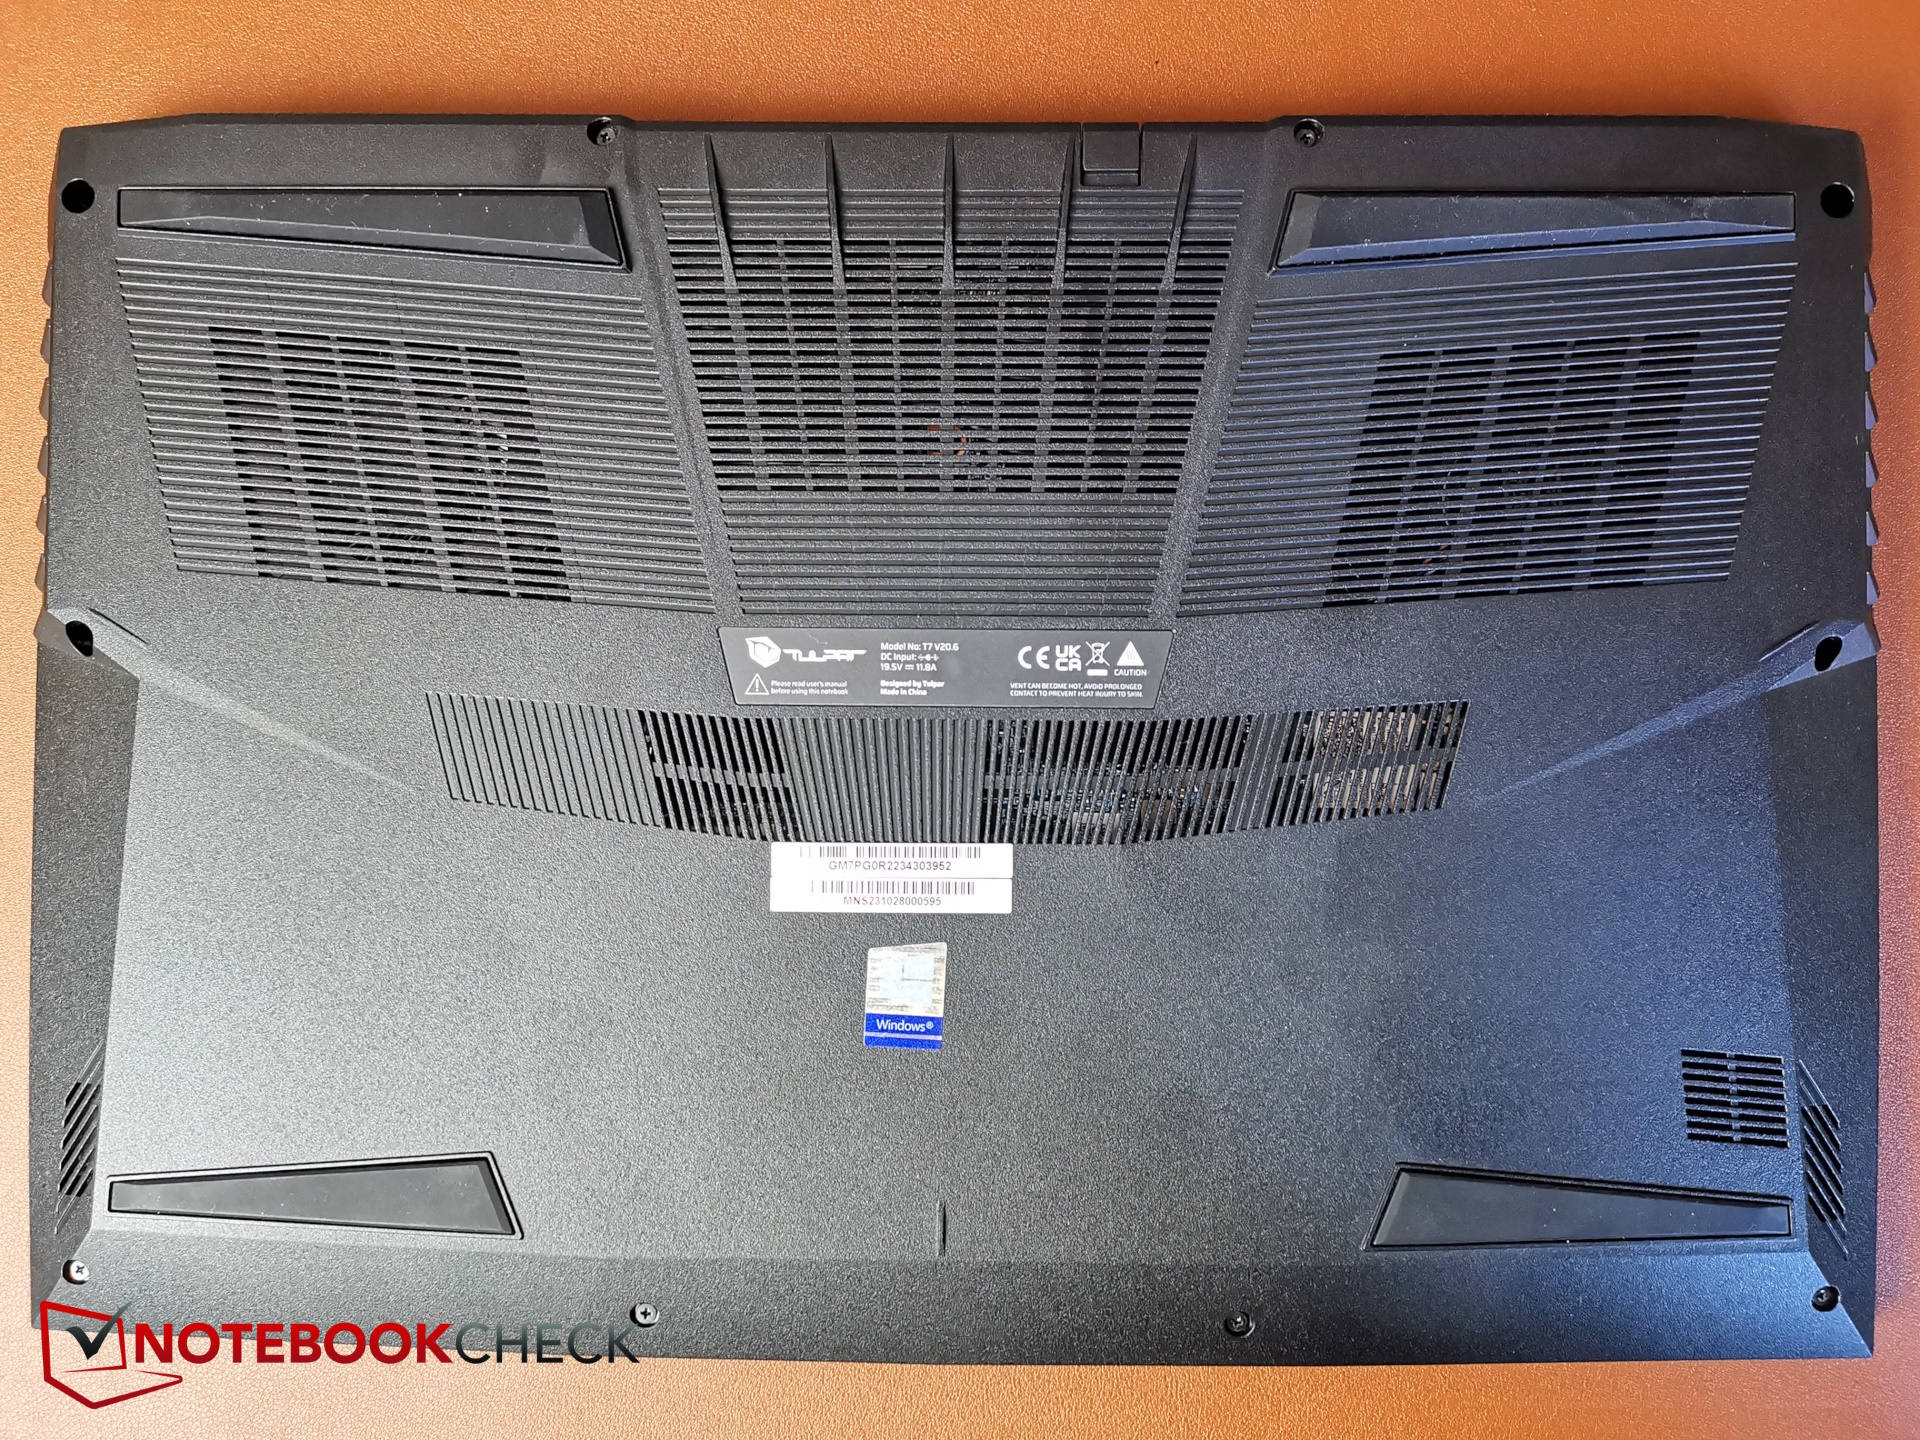
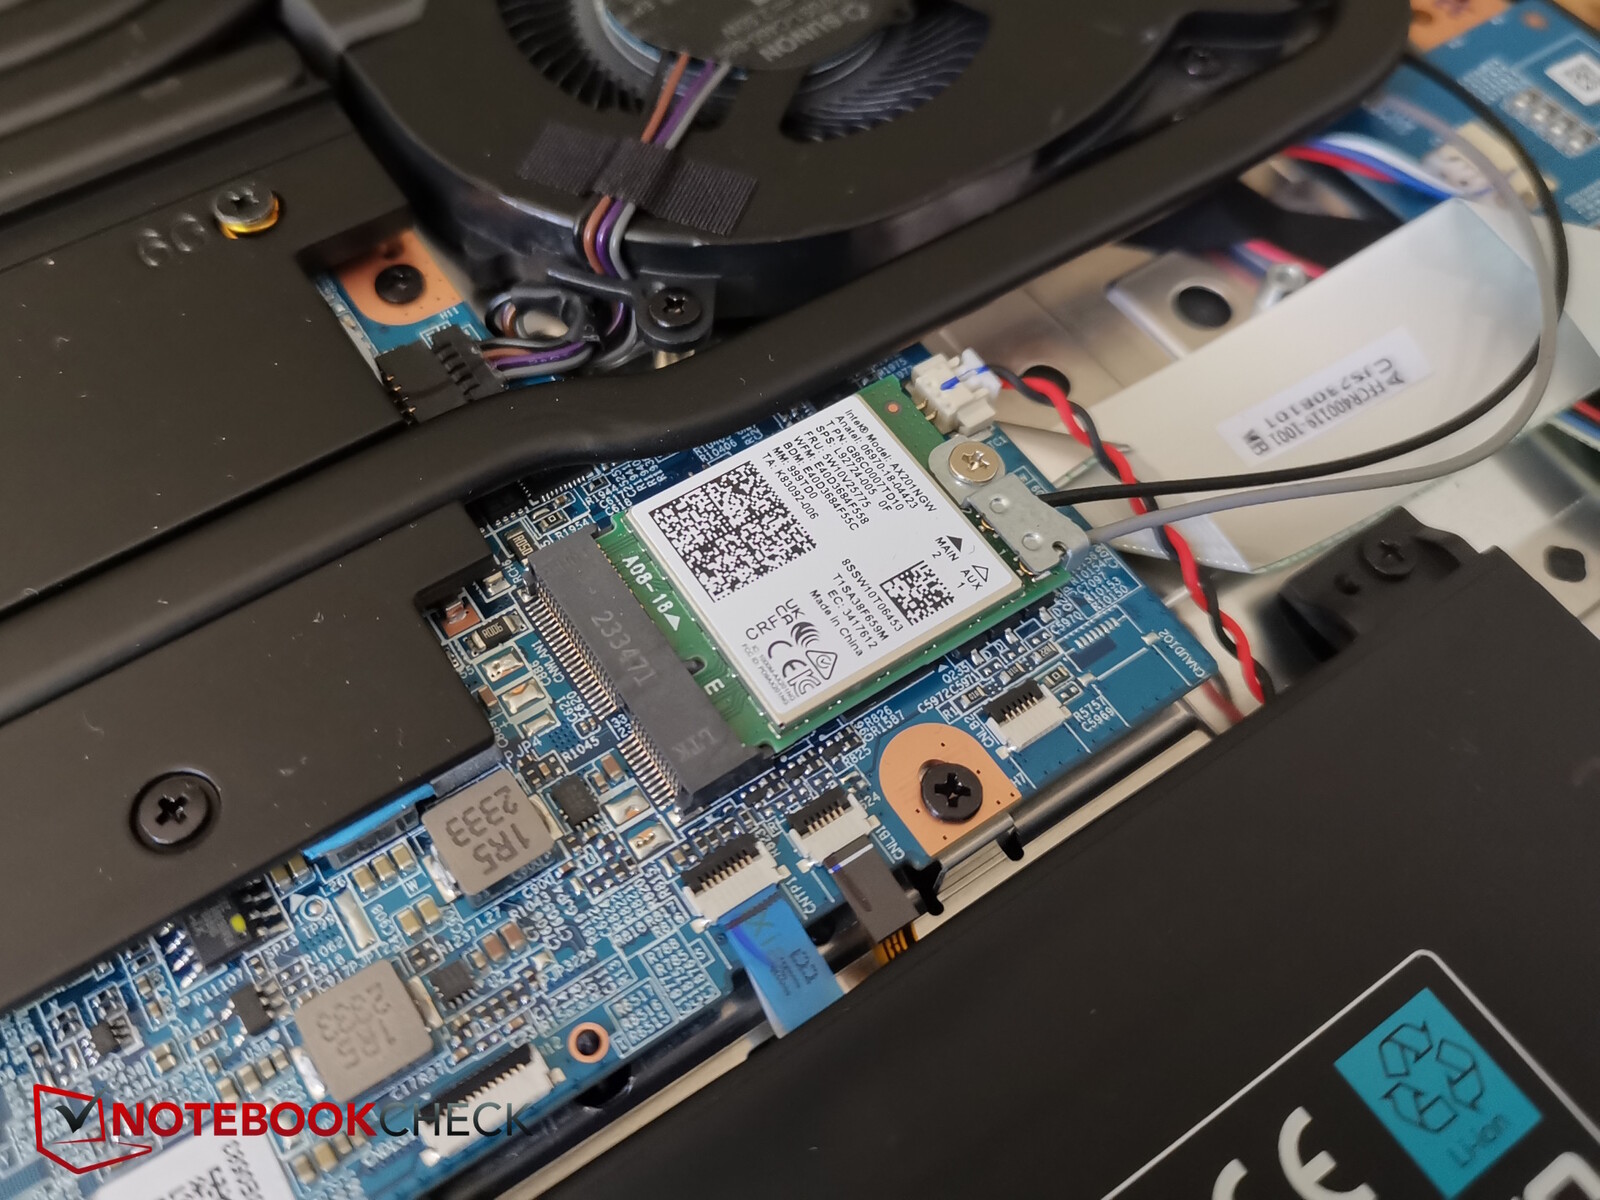
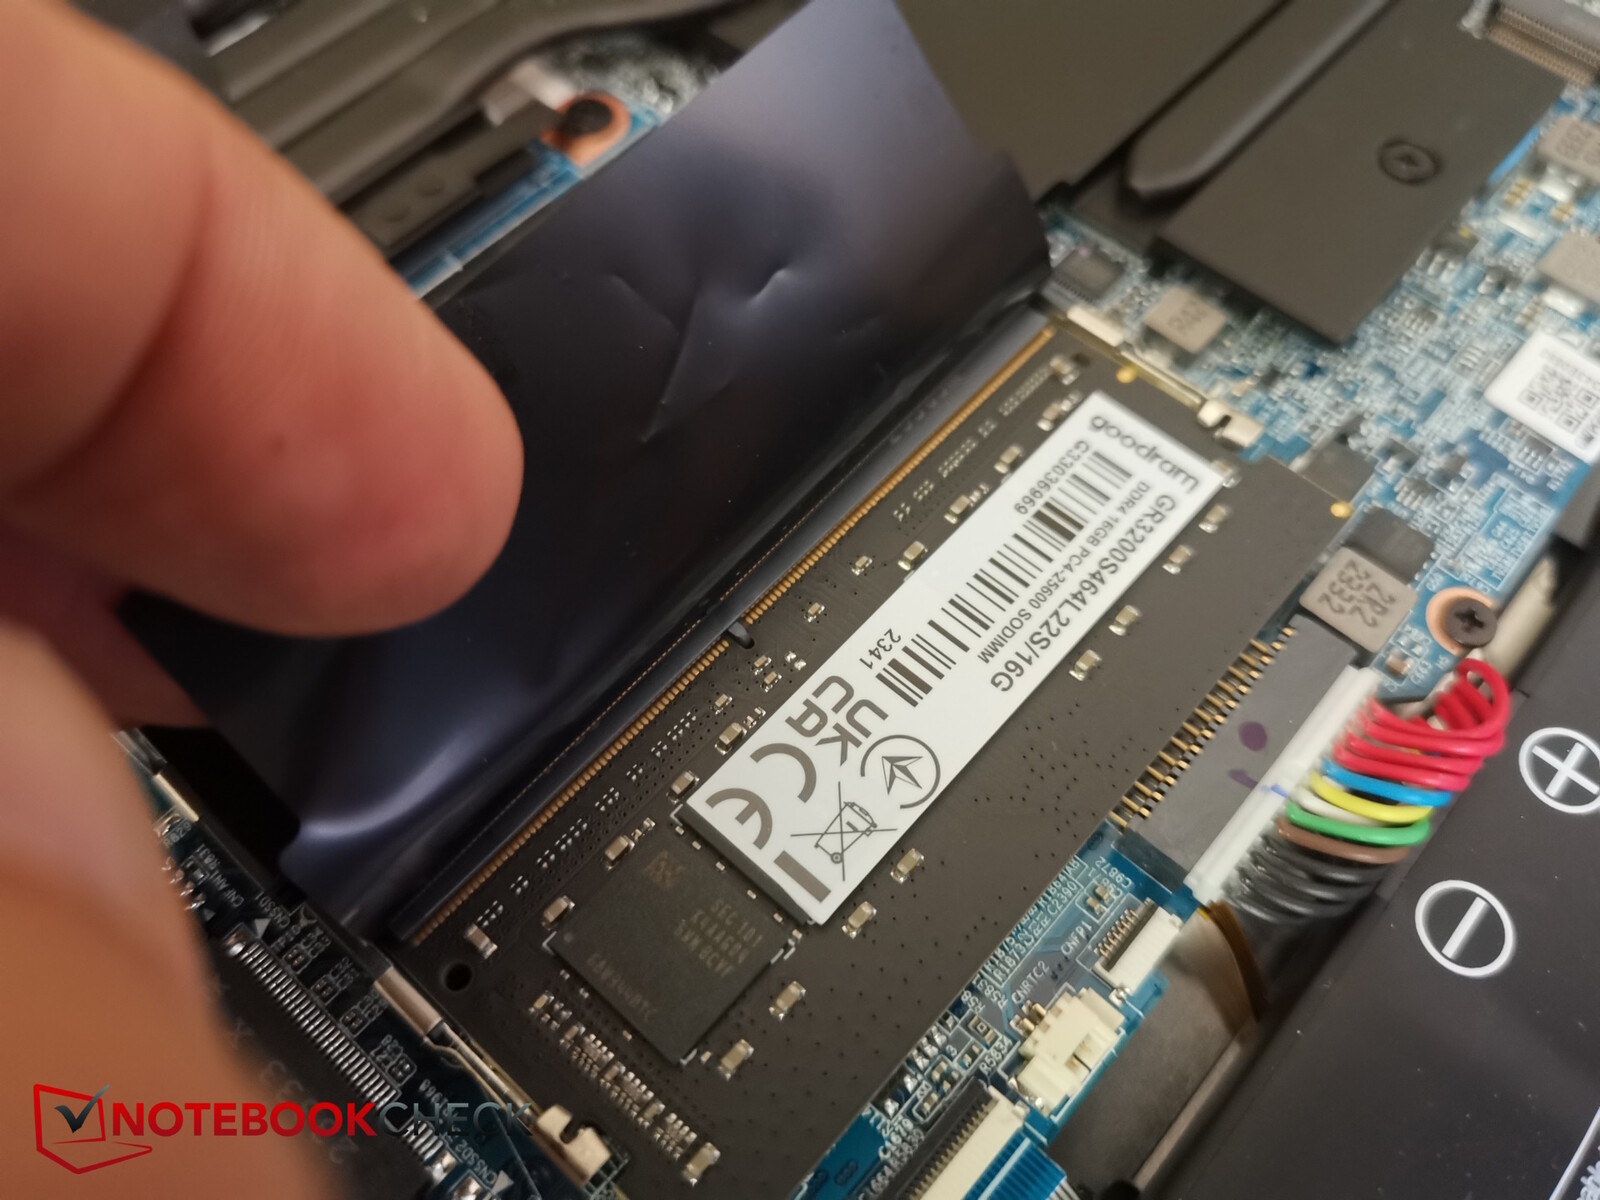
Manutenção
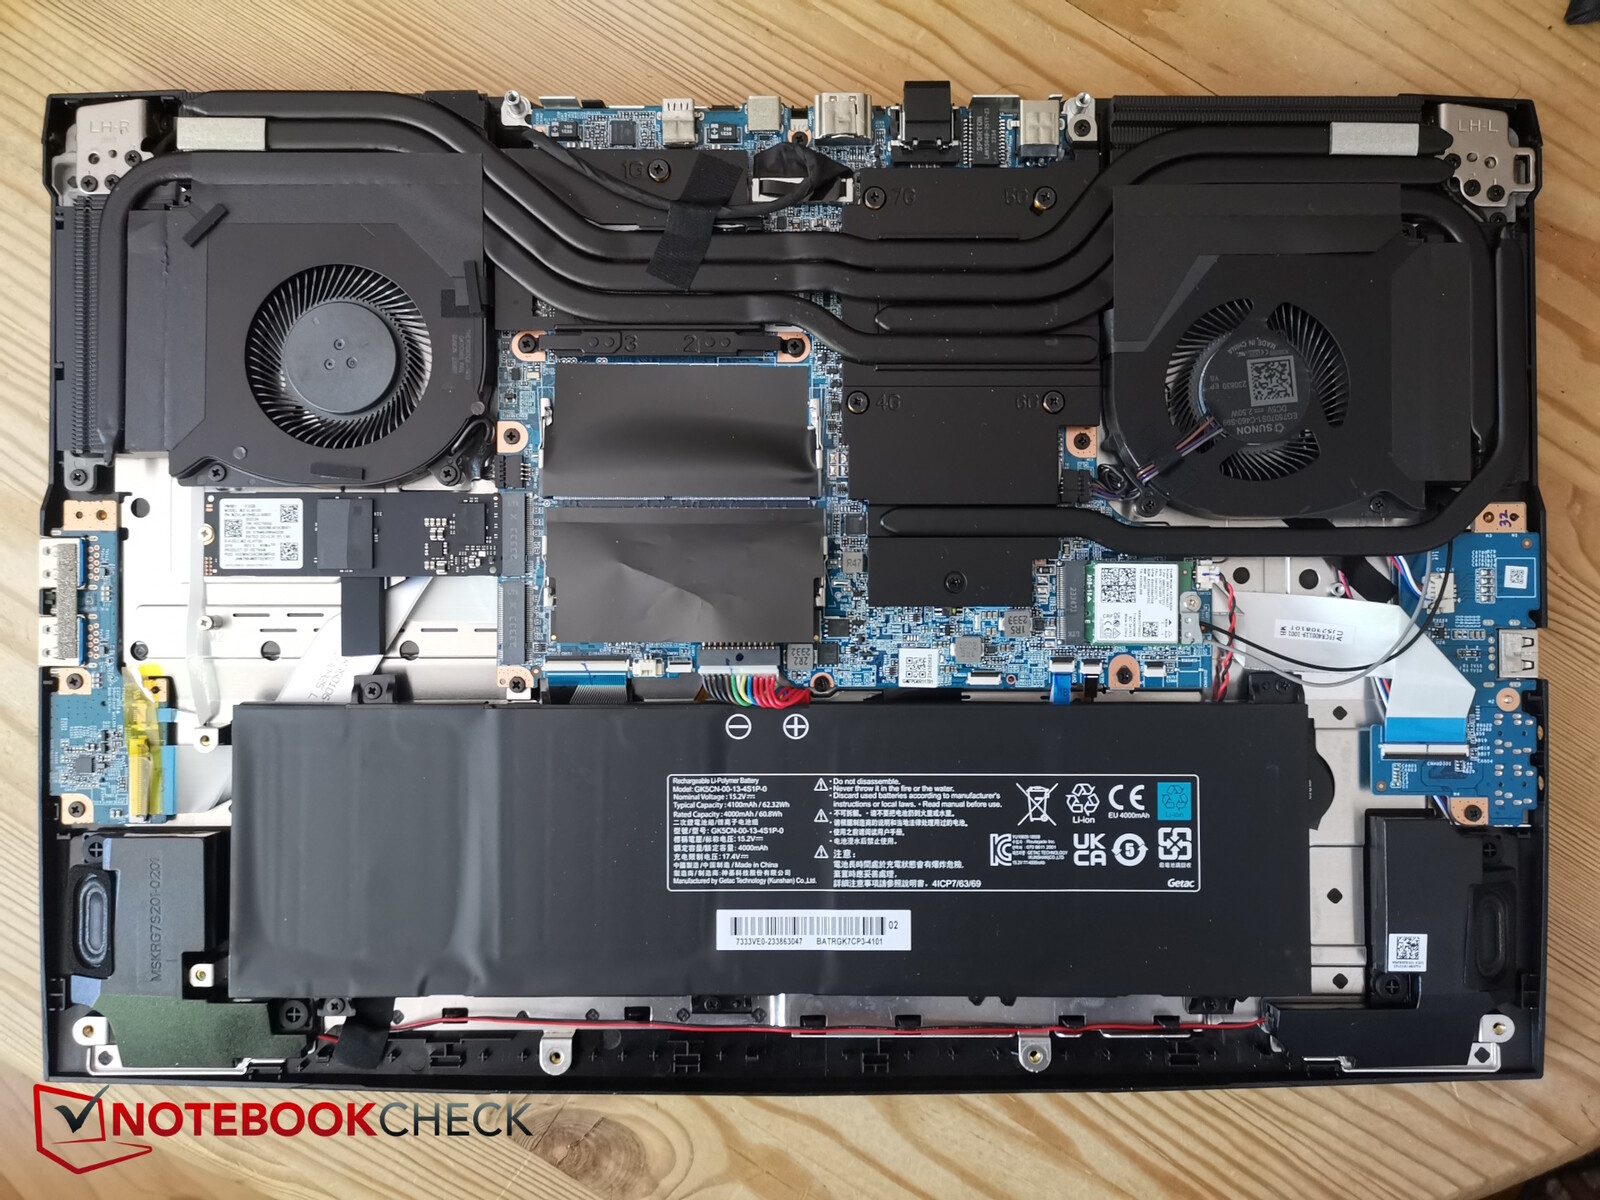
A parte inferior do gabinete é mantida no lugar por 10 parafusos Phillips do mesmo comprimento e vários clipes de plástico. Como resultado, o senhor deve ter cuidado ao alavancá-lo, mas, em geral, é muito fácil de abrir. Não há parafusos ocultos.
No interior, o senhor terá acesso ao sistema de resfriamento, aos dois slots de RAM (apenas um ocupado), aos dois slots de SSD M.2 (um livre), ao módulo Wi-Fi e à bateria.
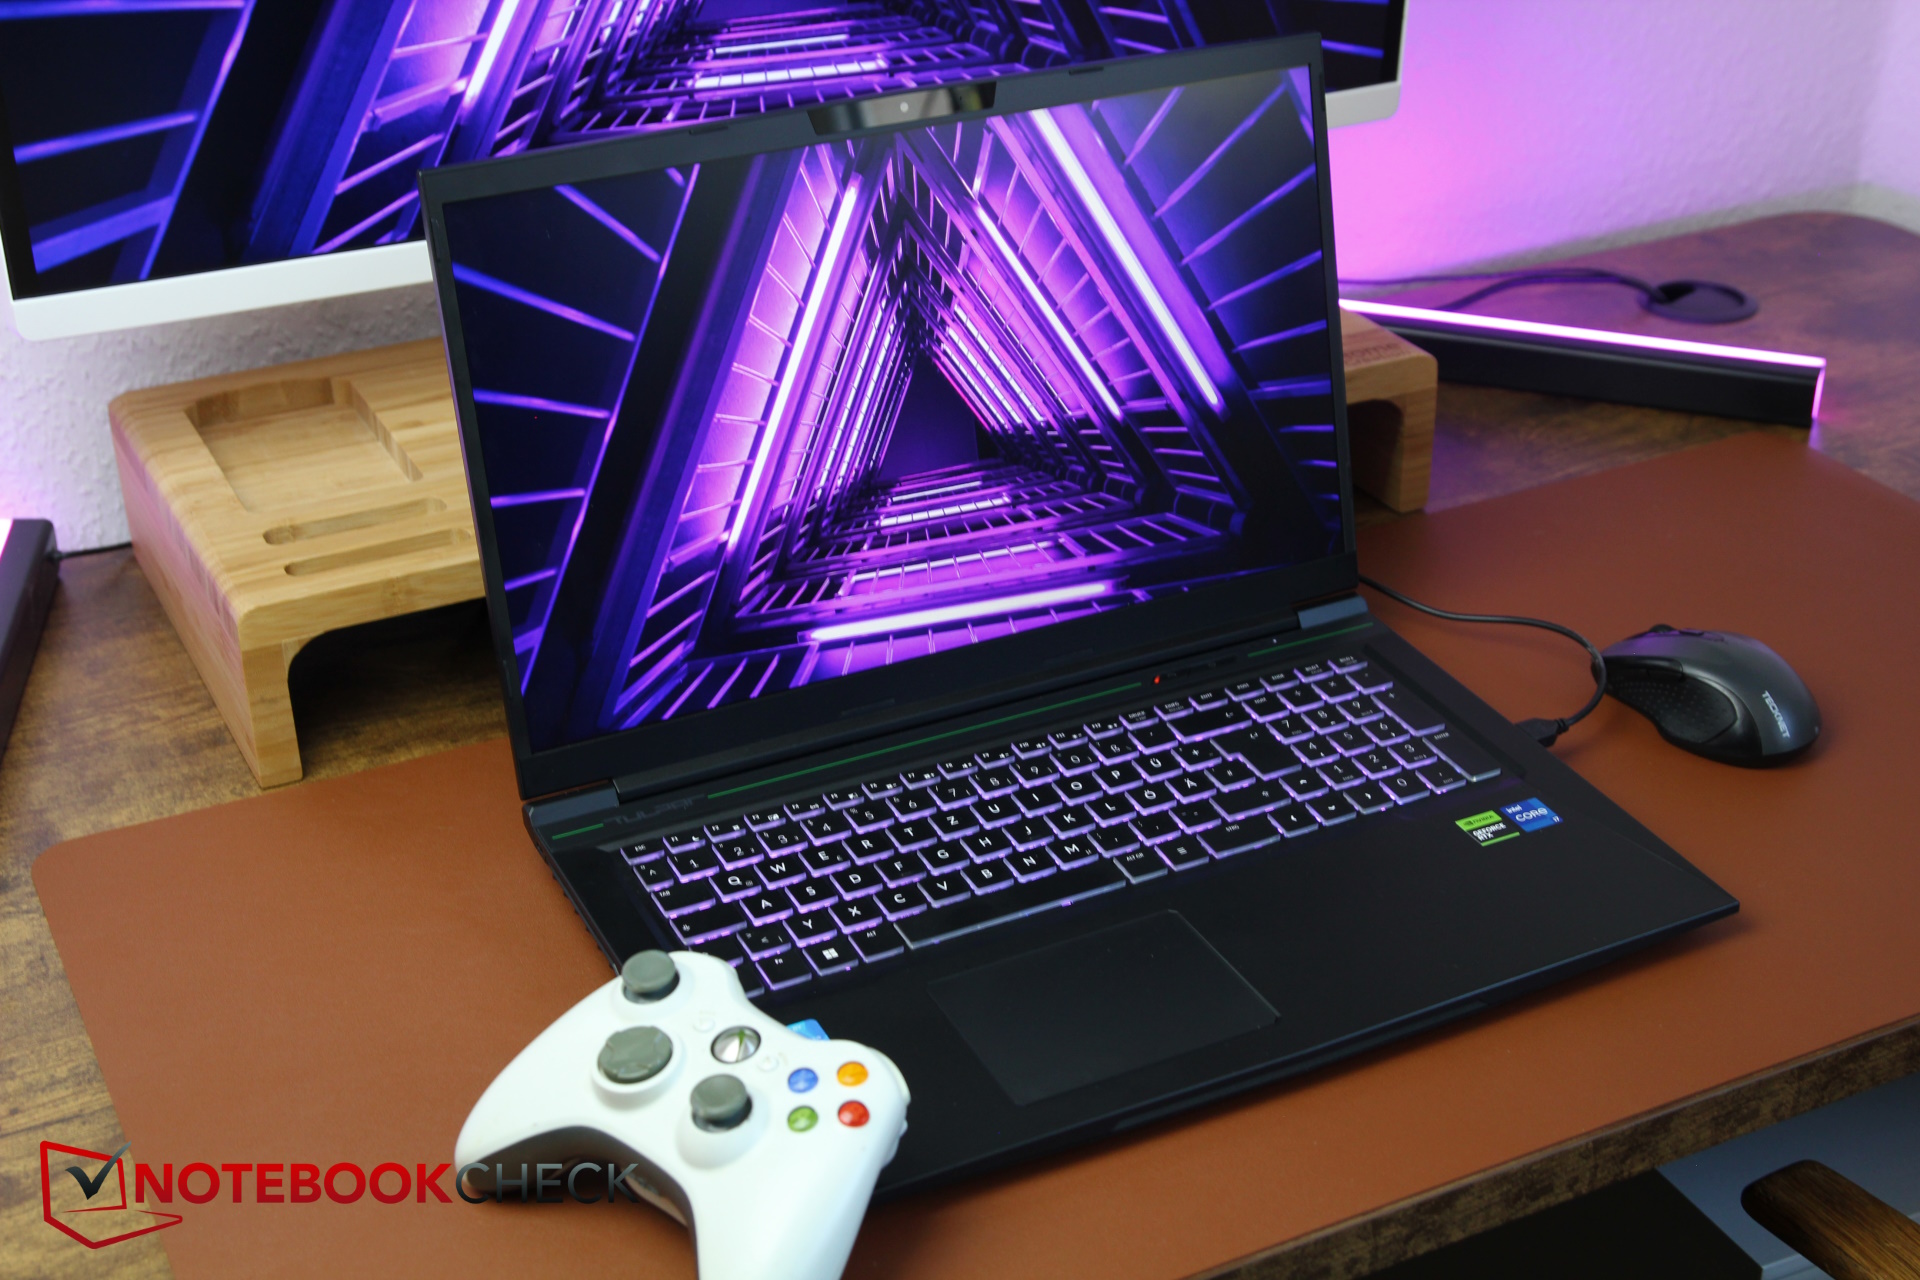
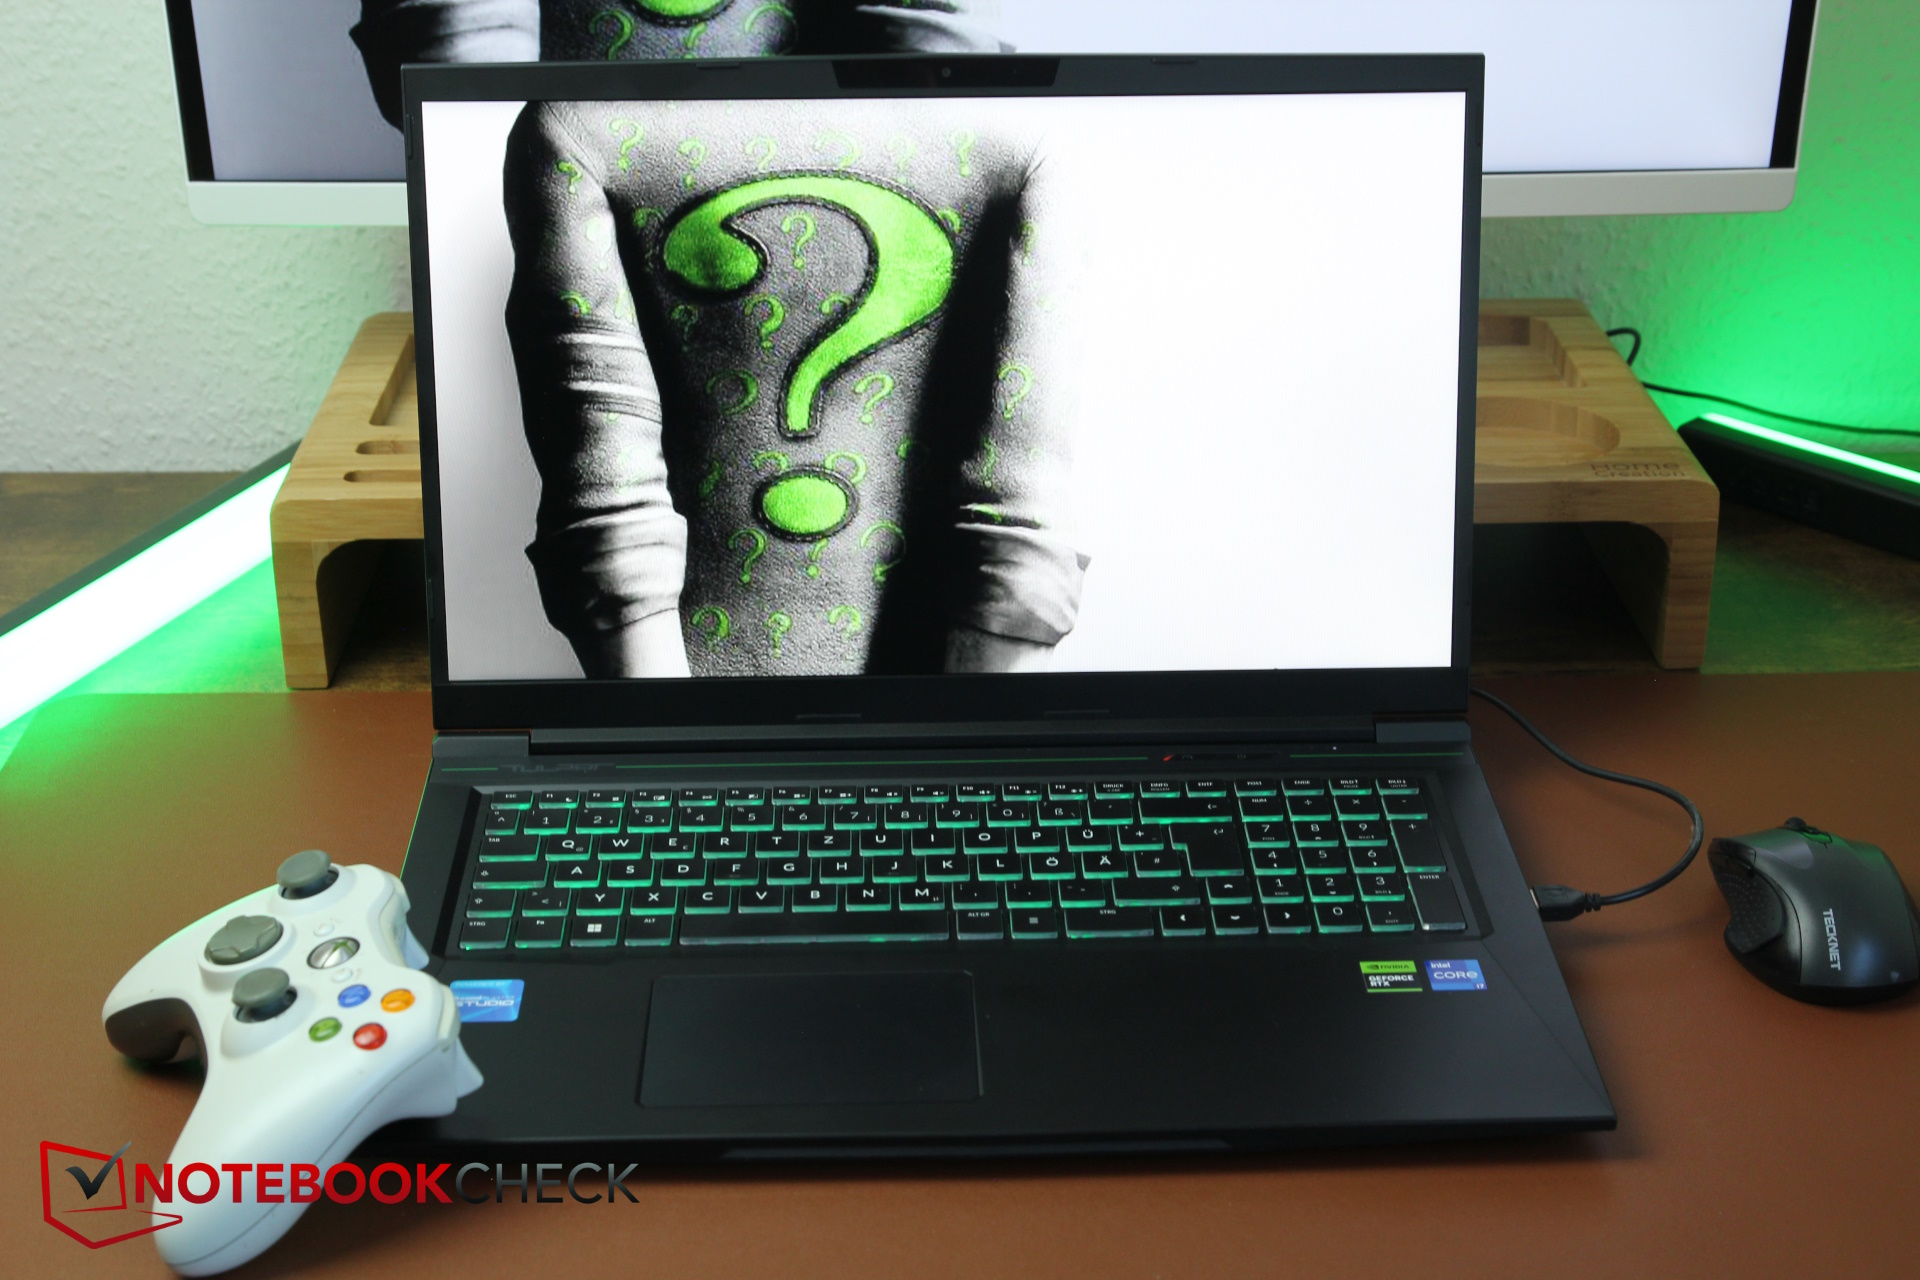
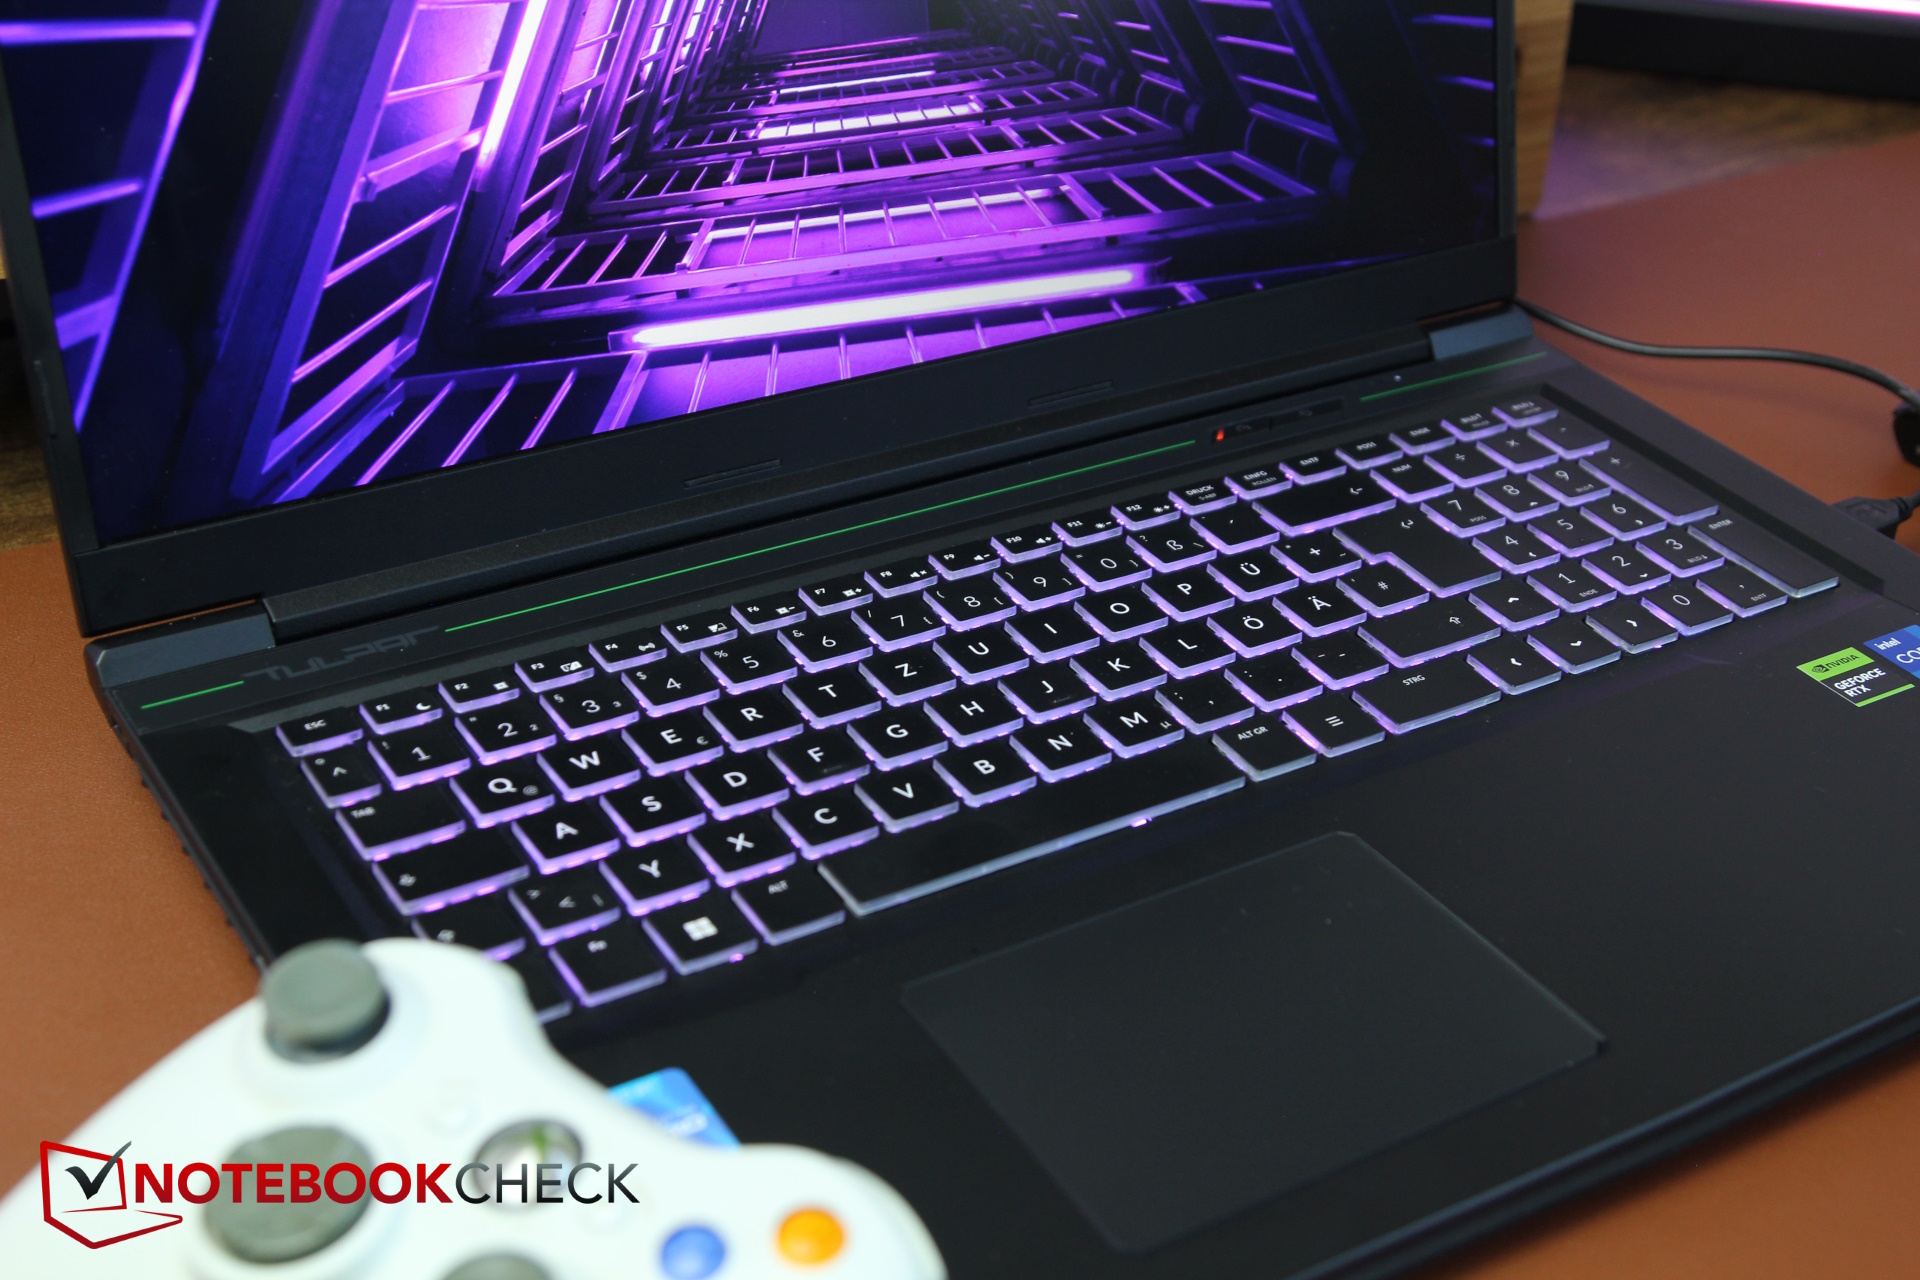
Dispositivos de entrada - O teclado é melhor do que o esperado
Teclado
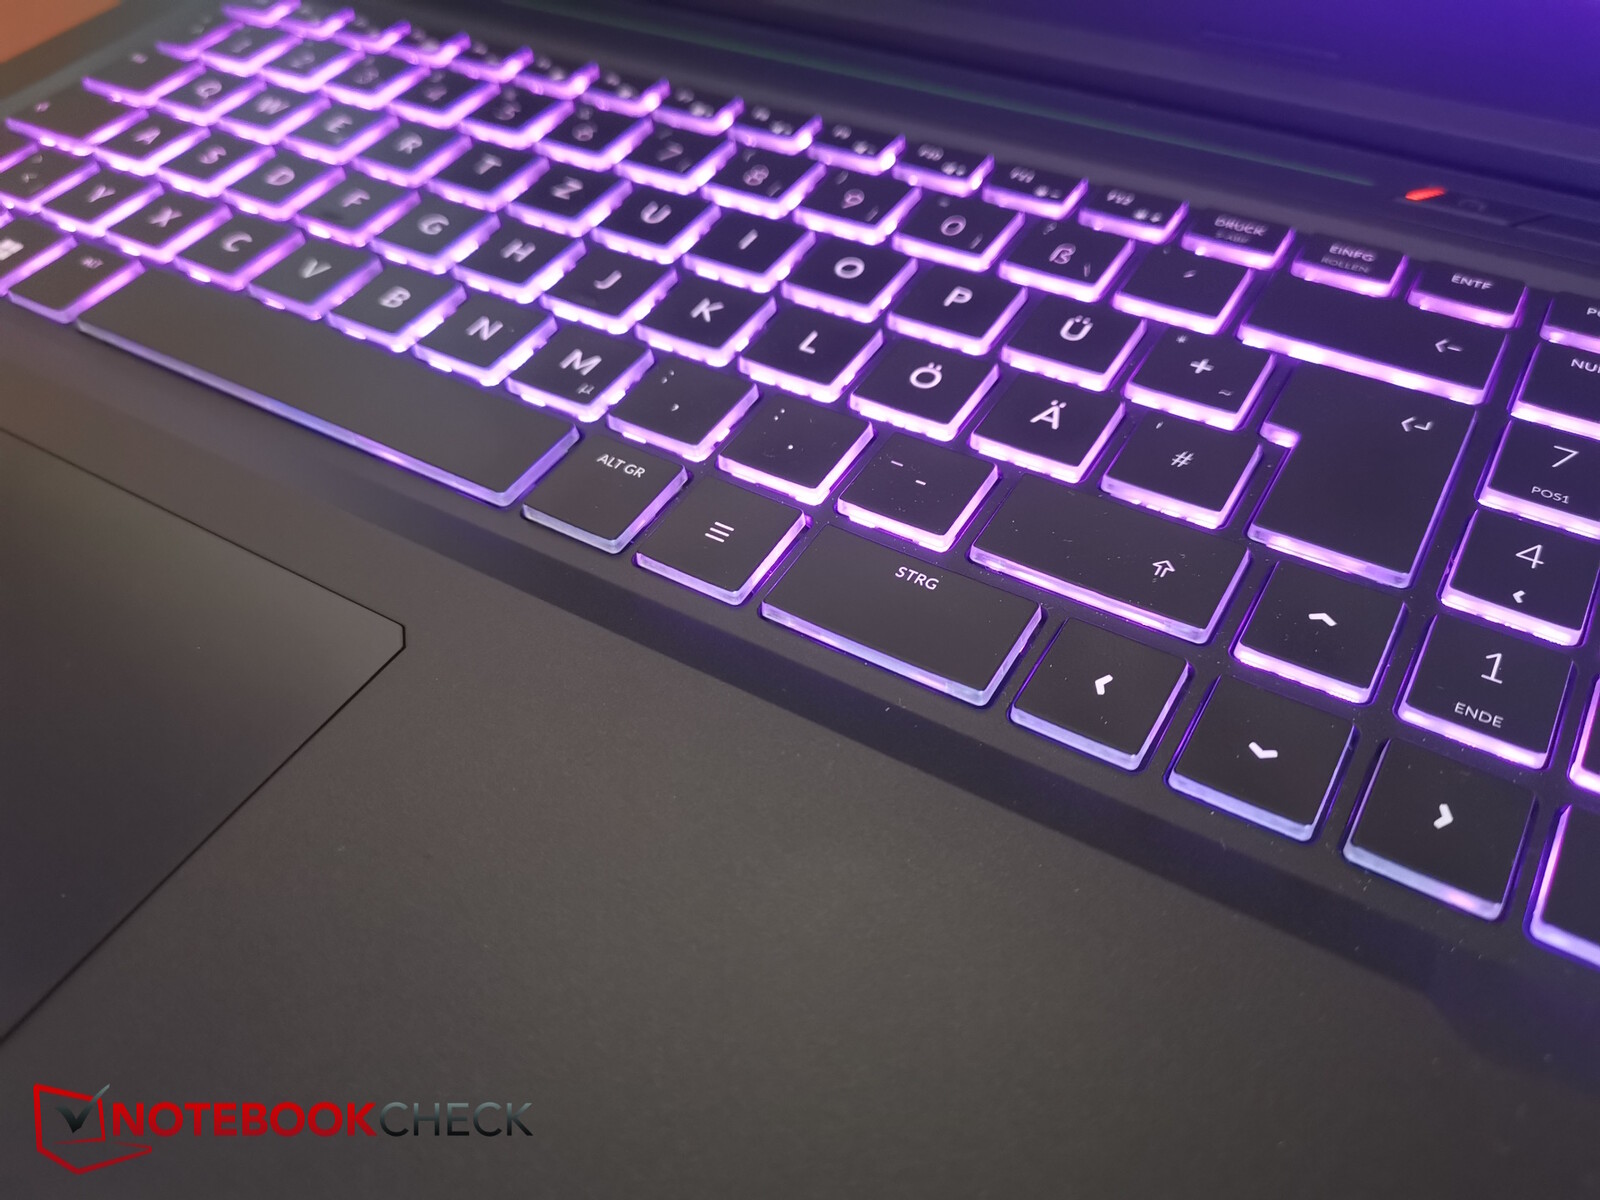
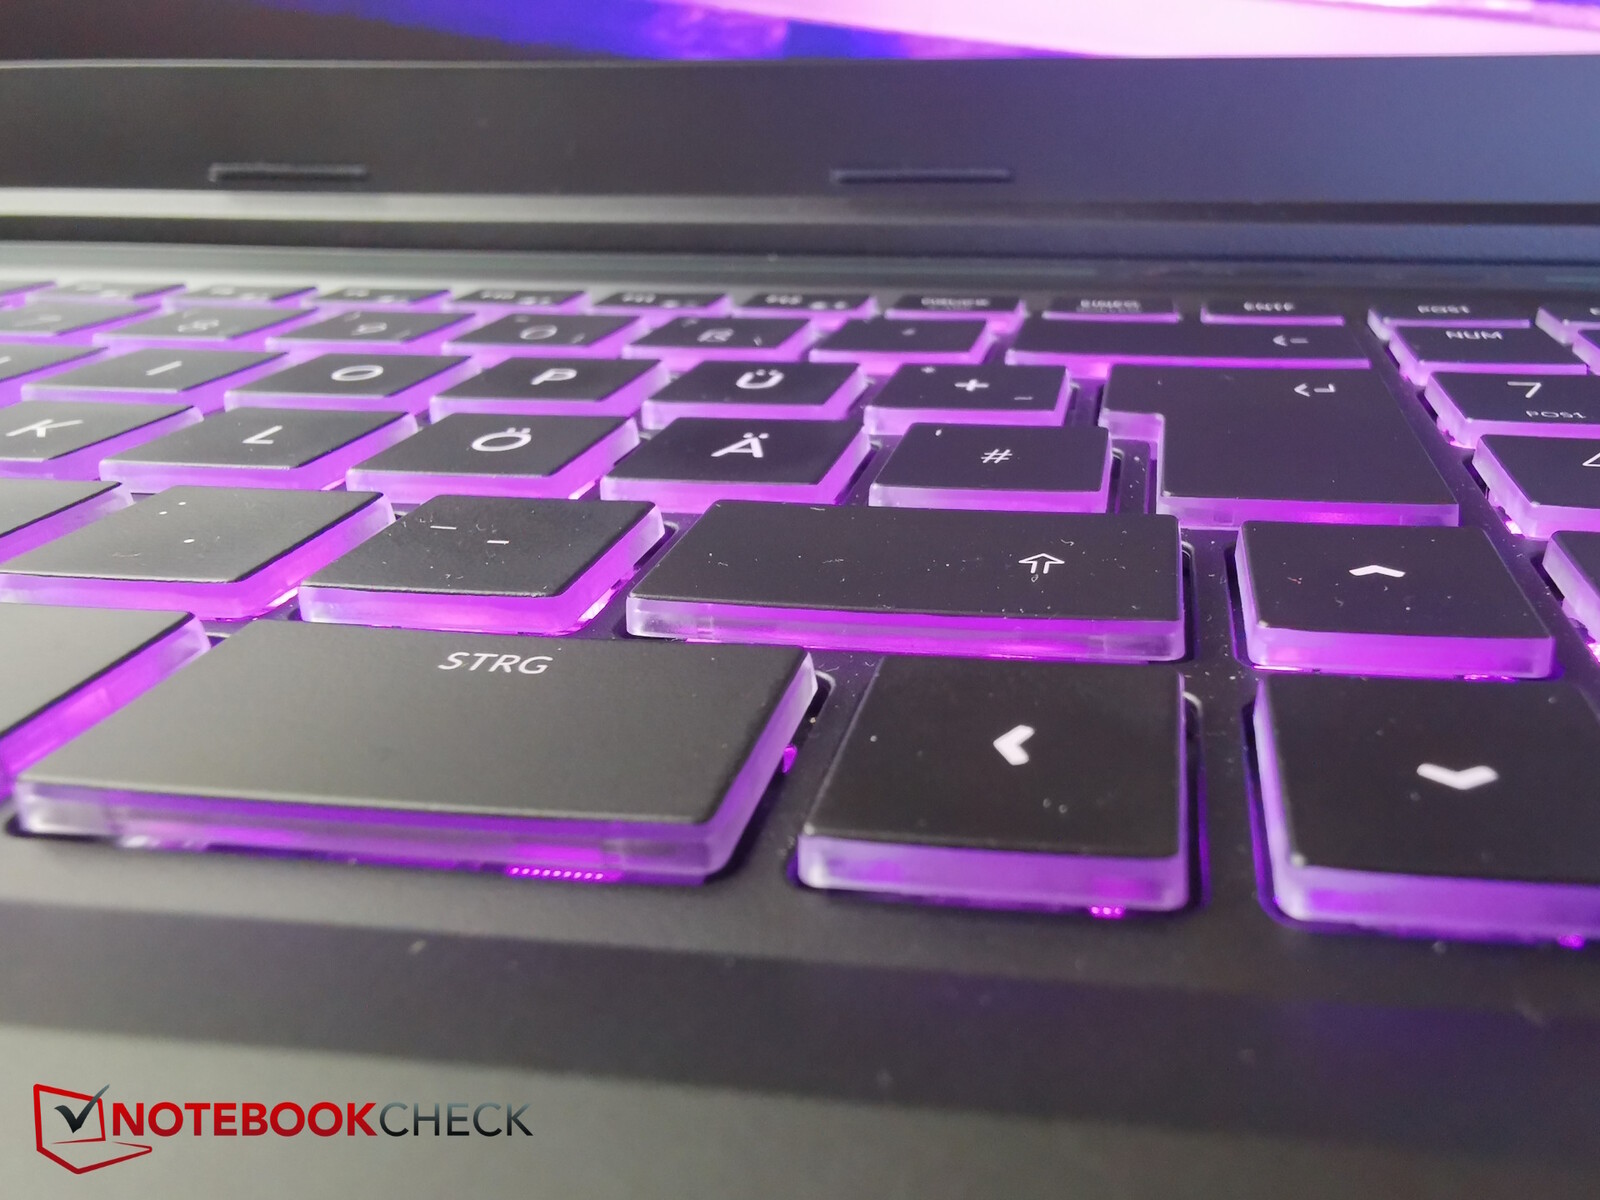
O teclado tem um layout padrão; tudo está distribuído em seis linhas e nada se desvia para a parte superior ou inferior do dispositivo. Há um teclado numérico no lado direito. A base do teclado retroiluminado de três níveis (1 zona) é ligeiramente rebaixada e as teclas medem 1,5 x 1,5 cm. A trajetória da pressão é um pouco mais longa e suave do que em muitos outros laptops, mas o feedback é suficientemente nítido. Como resultado, o teclado parece menos plano do que alguns de seus concorrentes e a digitação é bastante confortável e rápida. O ruído de digitação é de moderado a médio e a rotulagem das teclas é fácil de ler.
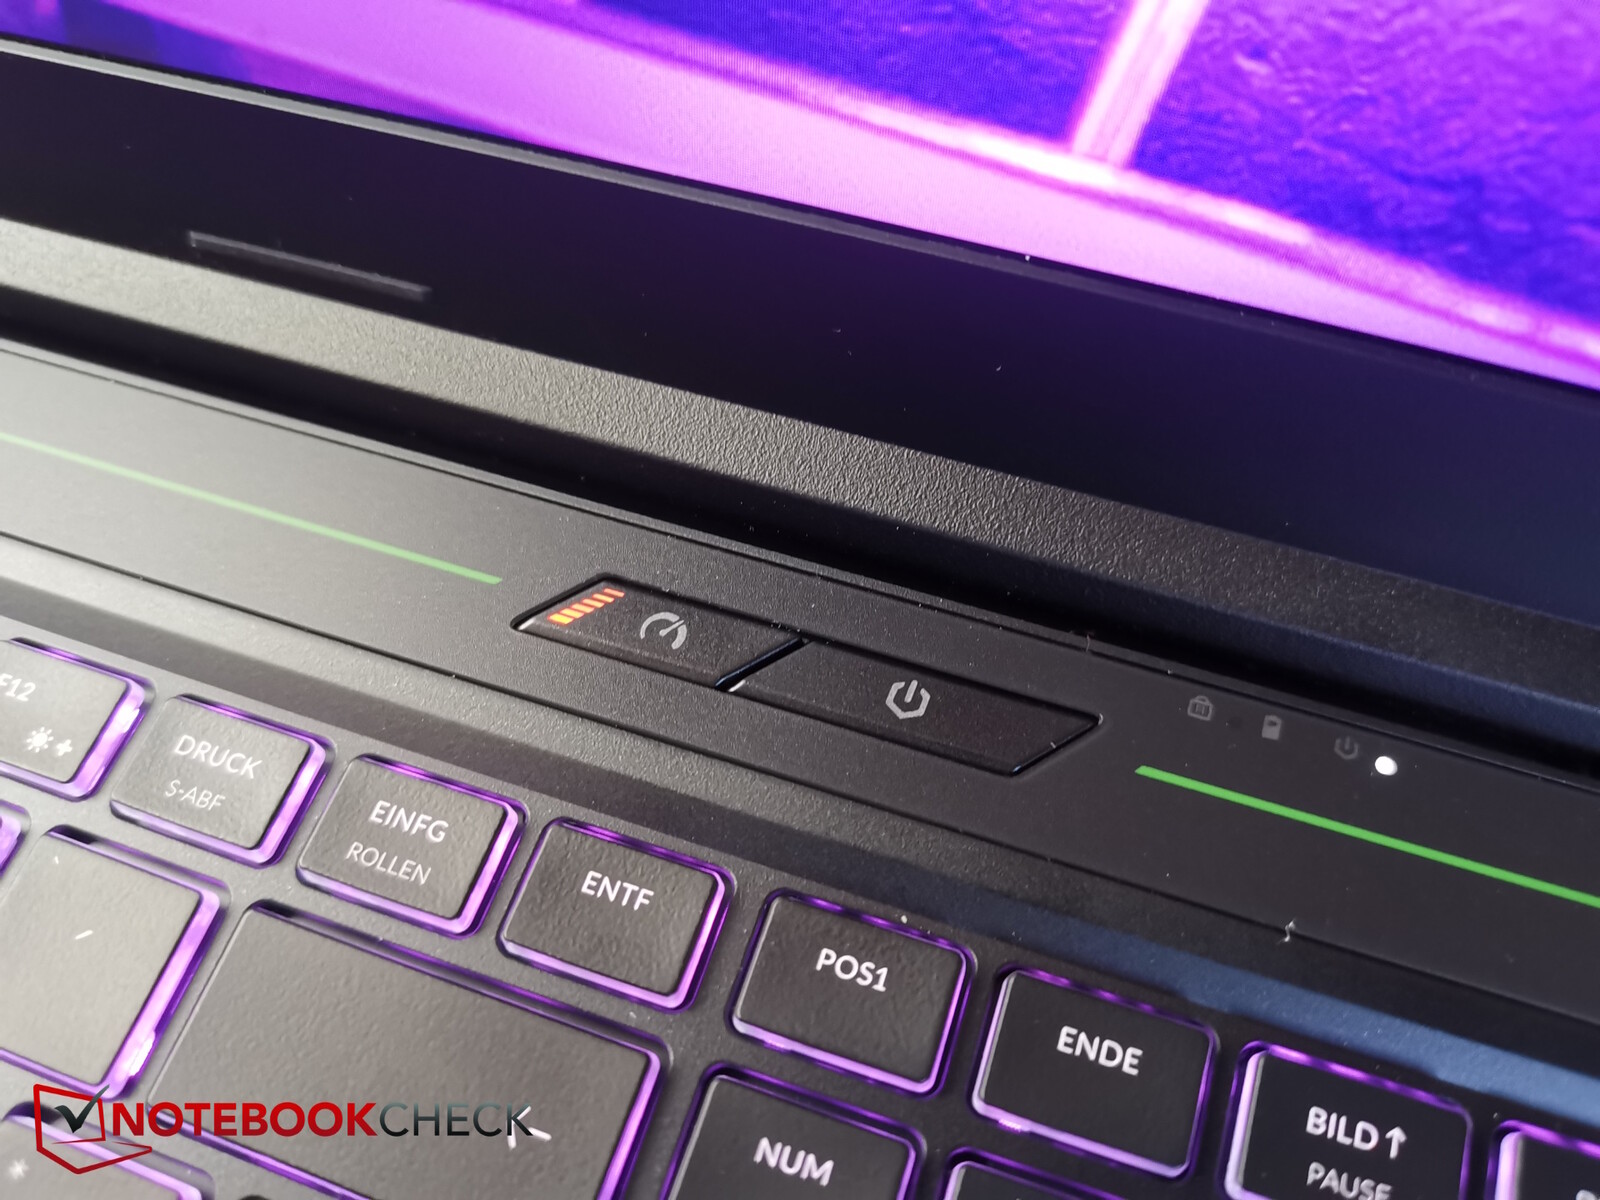
Há um botão de energia separado acima do restante do teclado e, ao lado dele, há outro botão para alternar entre os perfis de desempenho. Infelizmente, eles têm nomes diferentes em comparação com o que está listado na Central de controle, mas controlam exatamente esses perfis. O Office é balanceado, o gaming é entusiasta e o turbo é, na verdade, chamado de overboost. Um pequeno LED no botão mostra qual modo está em uso (desligado = escritório, laranja = jogos, laranja mais claro = turbo).
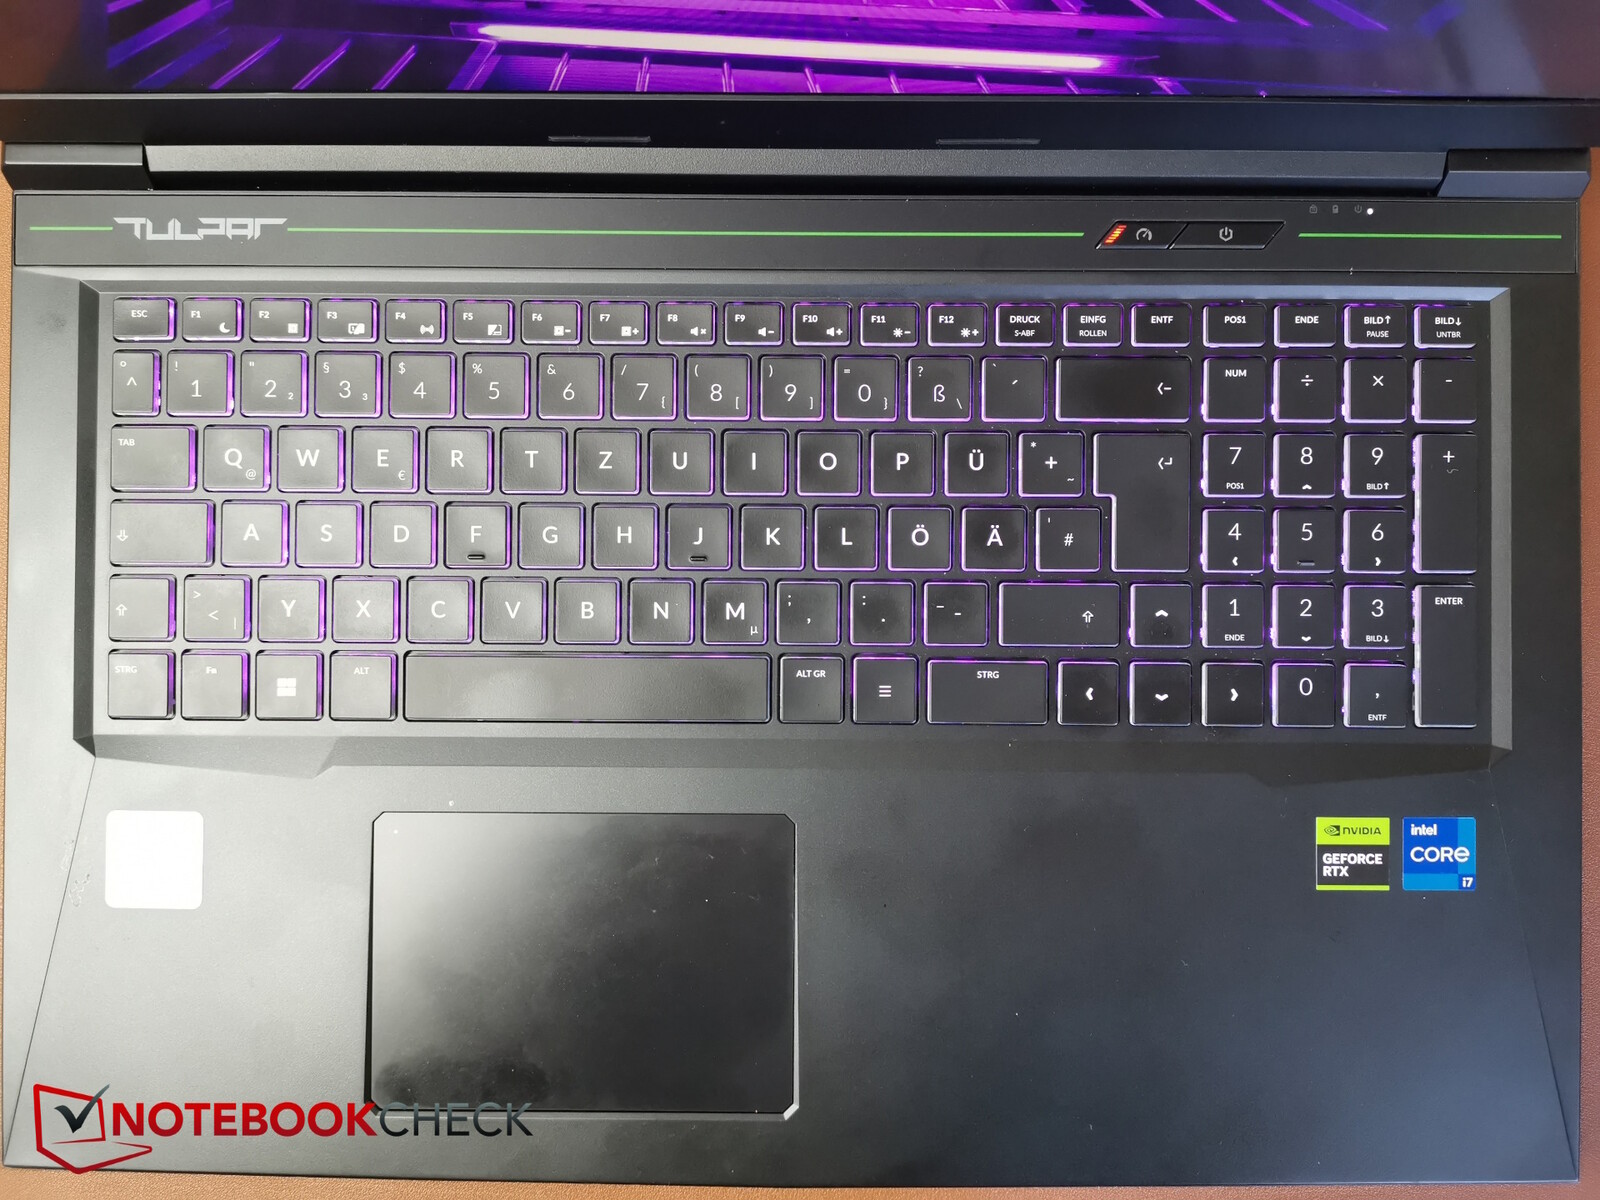
Touchpad
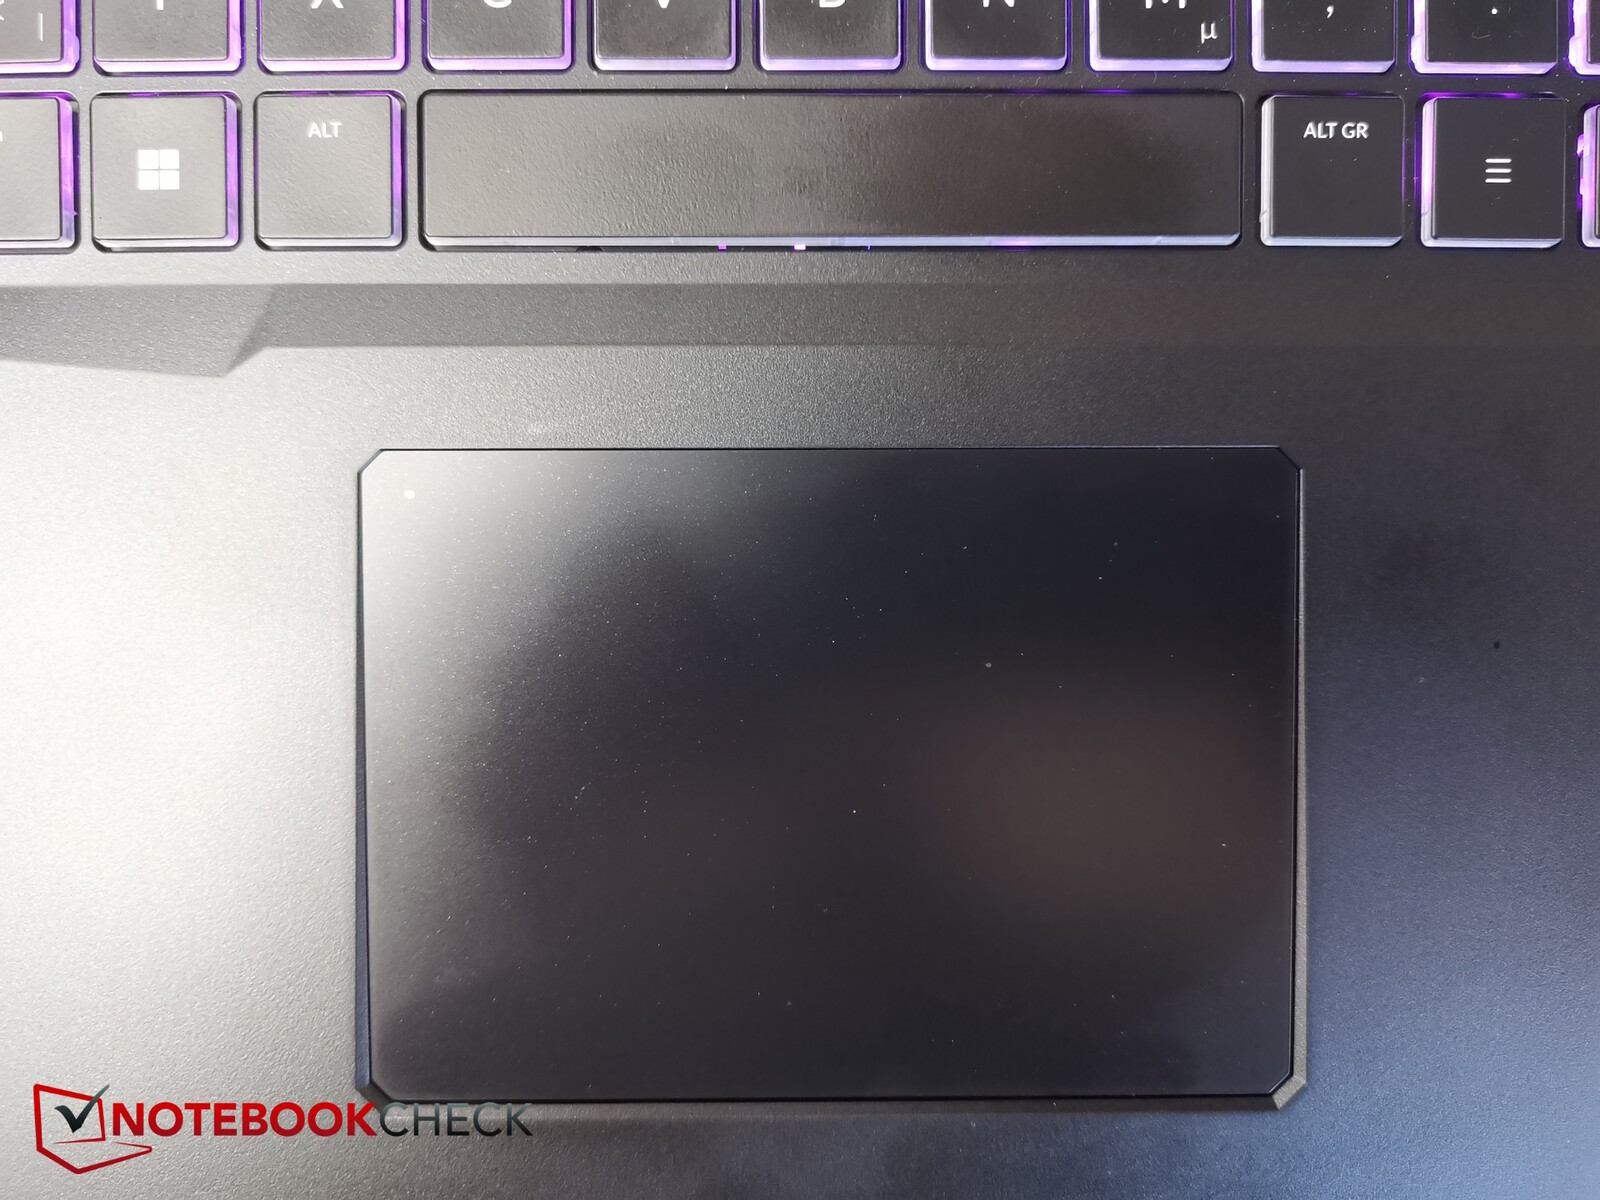
O Tulpar é claramente voltado para os jogadores e seu touchpad relativamente pequeno (aprox. 10,6 x 7,35 cm) torna isso óbvio, apesar de o laptop ser um modelo de 17 polegadas. Como resultado do teclado numérico, ele não está totalmente centralizado - em vez disso, fica ligeiramente à esquerda, o que significa que está logo abaixo da barra de espaço.
Sua superfície só é agradável e lisa em condições ideais - em outras palavras, assim que as mãos estiverem um pouco úmidas, elas ficarão presas na superfície. É possível (des)ativar o touchpad tocando duas vezes na parte superior esquerda e um pequeno LED mostra o status atual.
Os ruídos de clique são um pouco mais altos e não dão ao dispositivo uma sensação de alta qualidade, mas são aceitáveis. No geral, o touchpad responde muito bem, proporcionando um desempenho total sólido. De qualquer forma, os jogadores provavelmente usarão um mouse.
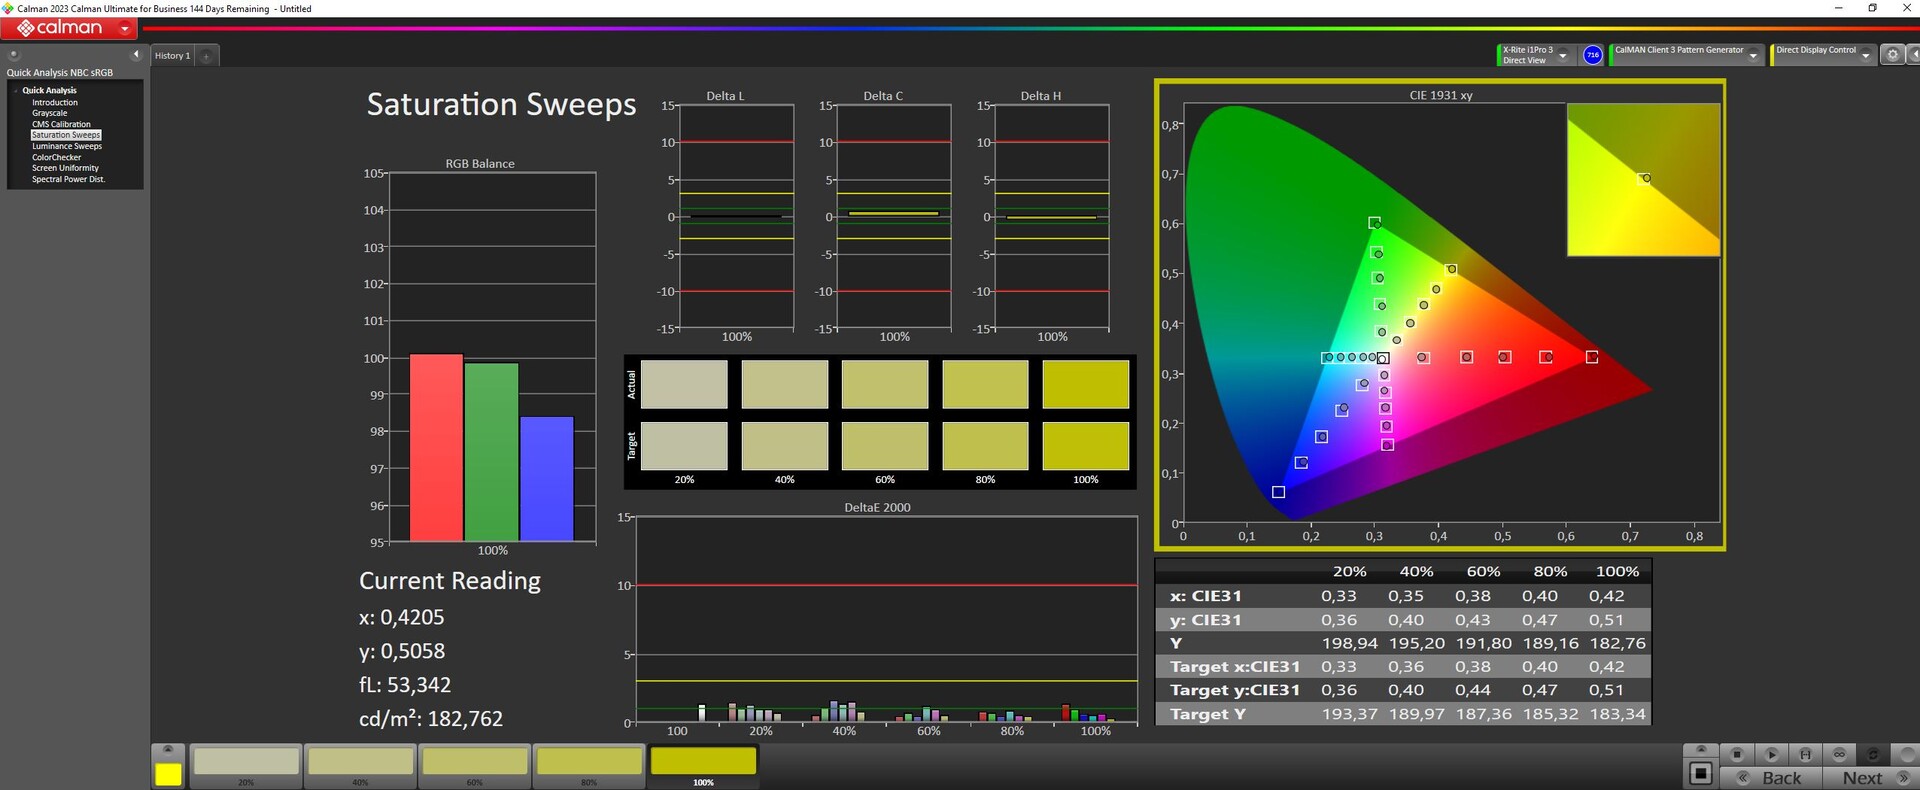
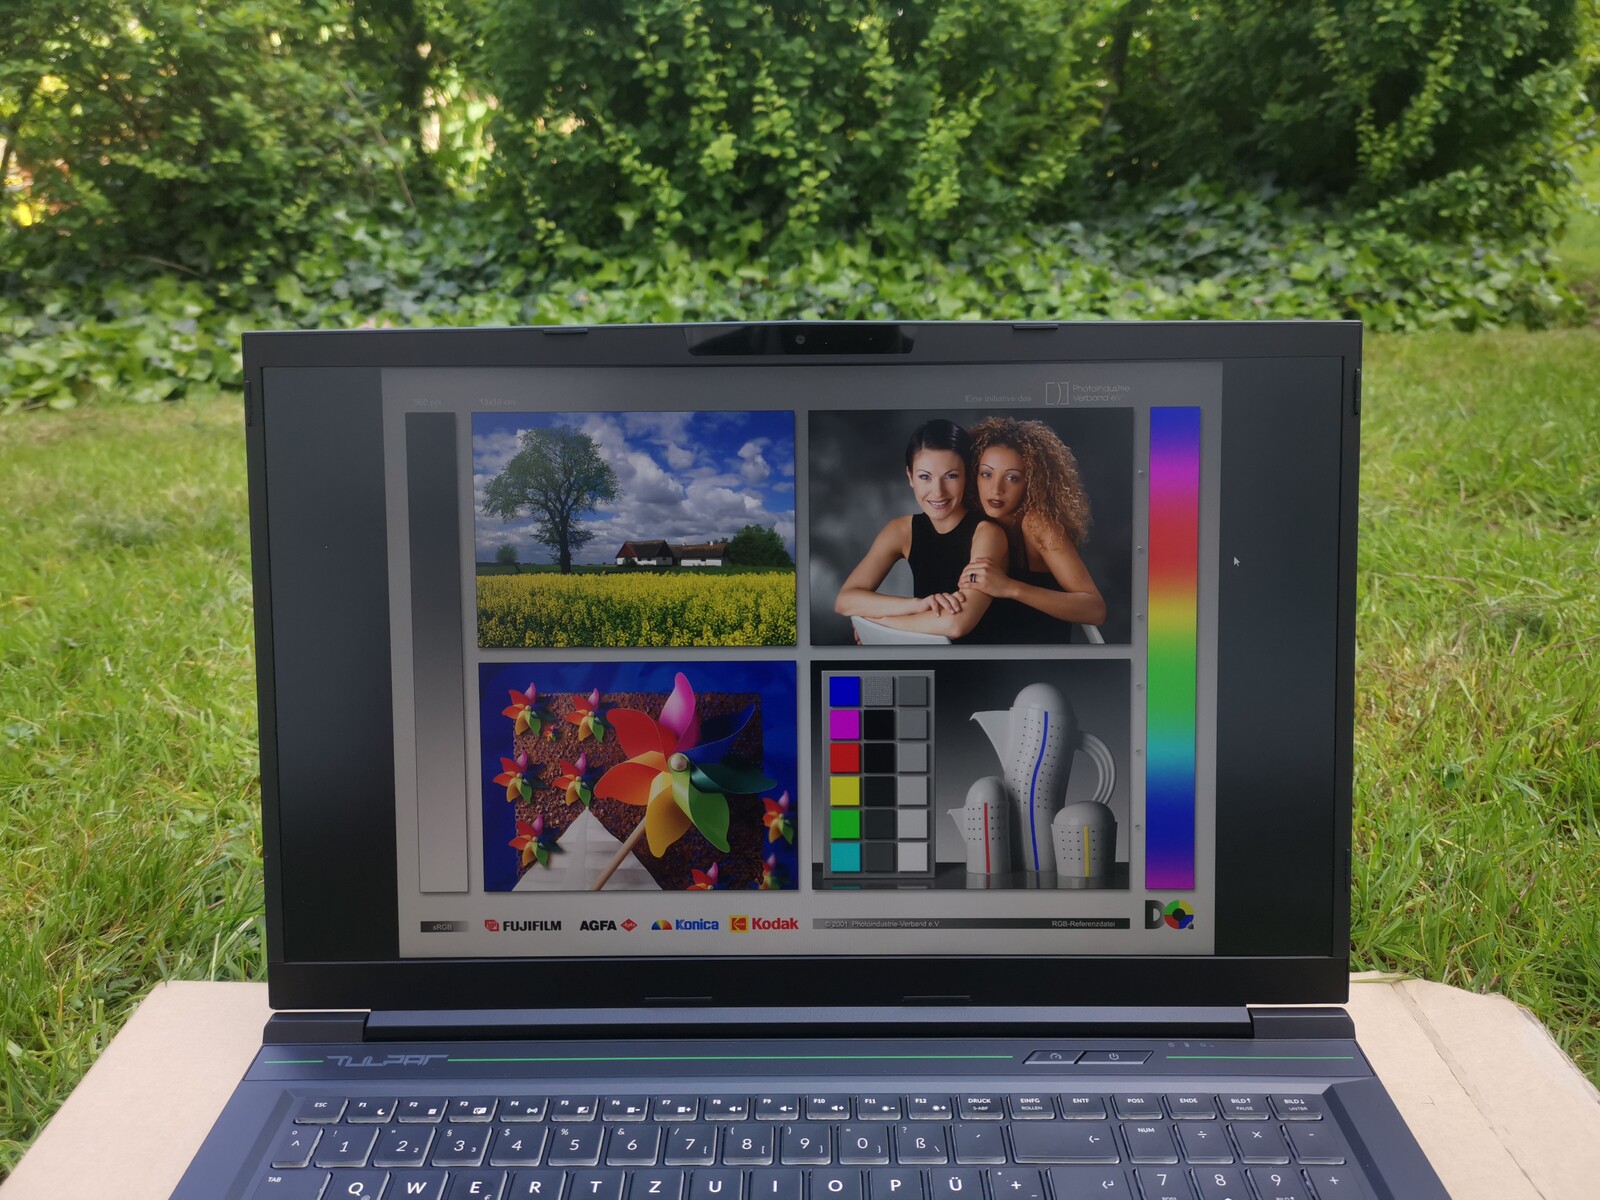
Tela - Full HD decente de 2019
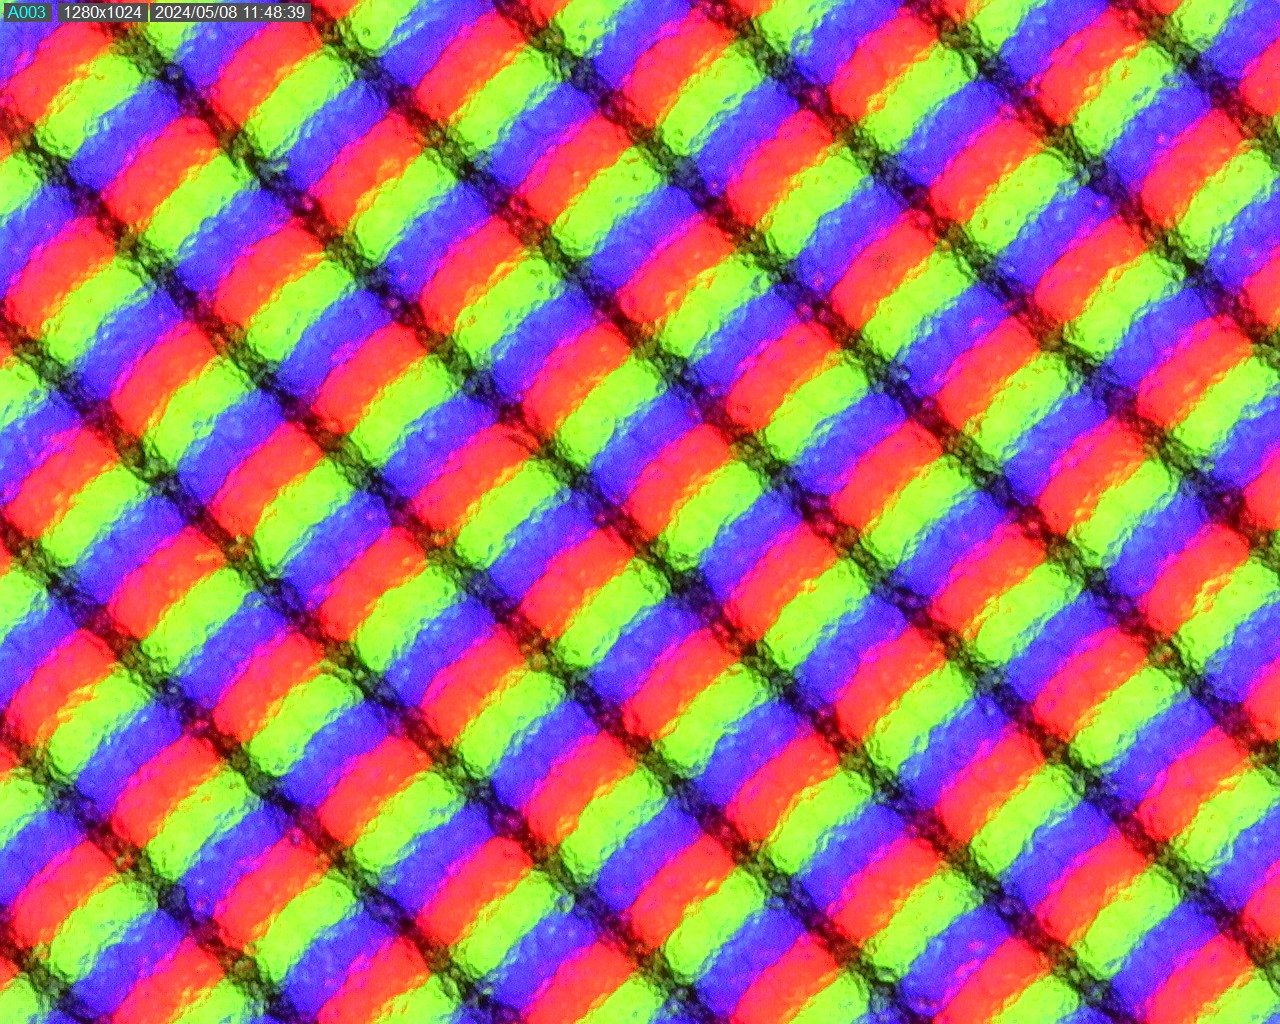
A tela IPS Full HD fosca da Chi Mei já é uma velha conhecida, pois também está presente em vários notebooks mais baratos da série G da MSI, incluindo o MSI GP75 Leopard 9SD (2019) que testamos anteriormente, bem como o MSI GT76 9SG (2019) e o MSI GE75 9SG. É claro que, neste caso, a idade não é realmente um sinal de qualidade. Com exceção do Katana, nenhum dos concorrentes conta com Full HD de 17 polegadas, mas sim com telas de resolução mais alta, com 2.560 x 1.440 pixels.
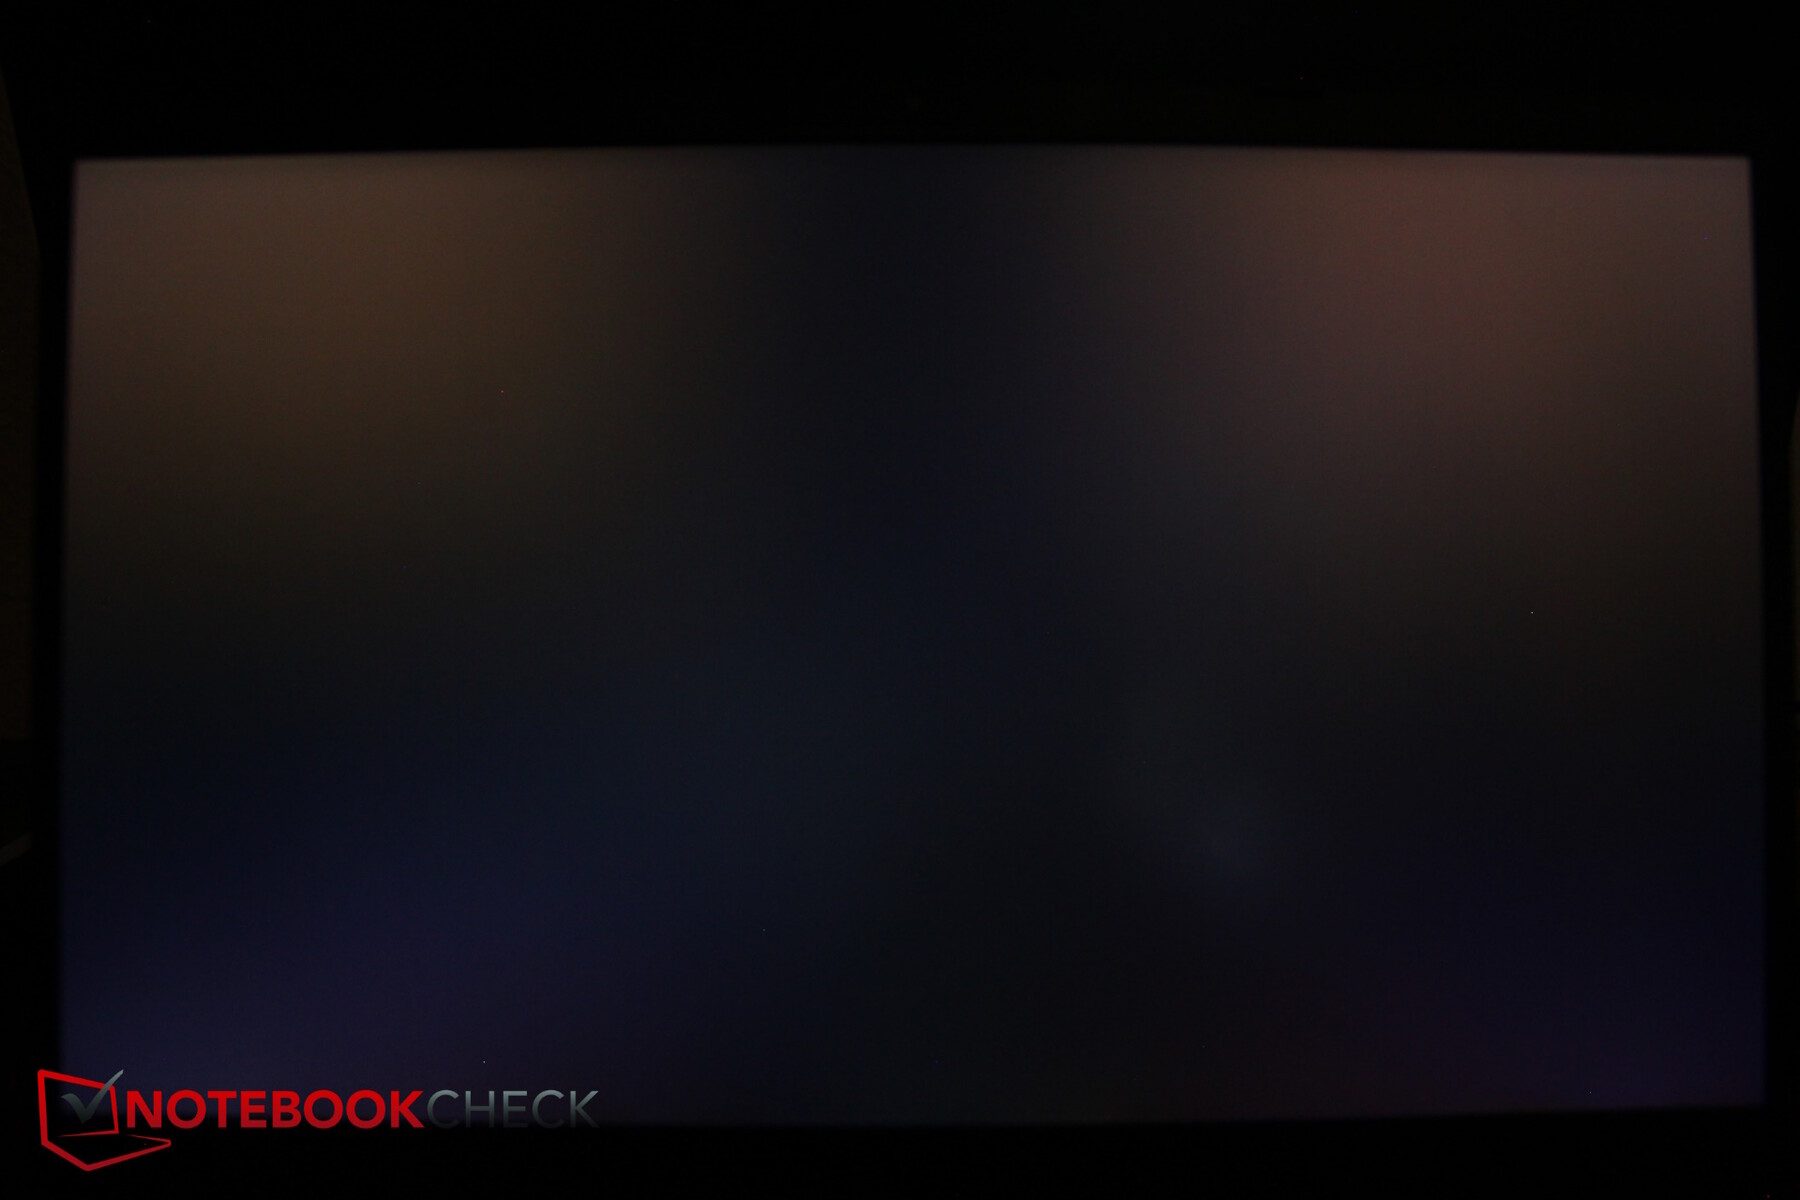
Mesmo assim, o painel não é necessariamente ruim. Seu brilho médio de cerca de 350 nits é bom, mas sua iluminação poderia ser mais uniforme. Por sua vez, o contraste é maior do que o dos dispositivos de comparação graças ao valor de preto, o que é bom para um dispositivo econômico. O sangramento da luz de fundo é quase imperceptível e definitivamente não deve atrapalhar o senhor.
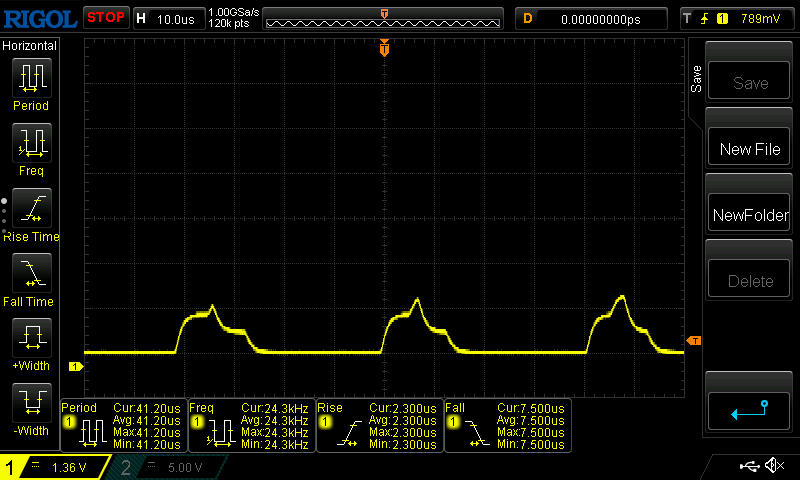
A tela pisca em níveis de brilho abaixo de 25%, no entanto, em uma alta frequência de 25 kHz a 42 kHz, o que significa que mesmo os usuários sensíveis não devem ter problemas com isso. O tempo de resposta é de aproximadamente 11 (preto para branco) a 15 ms (cinza para cinza).
| |||||||||||||||||||||||||
iluminação: 83 %
iluminação com acumulador: 373 cd/m²
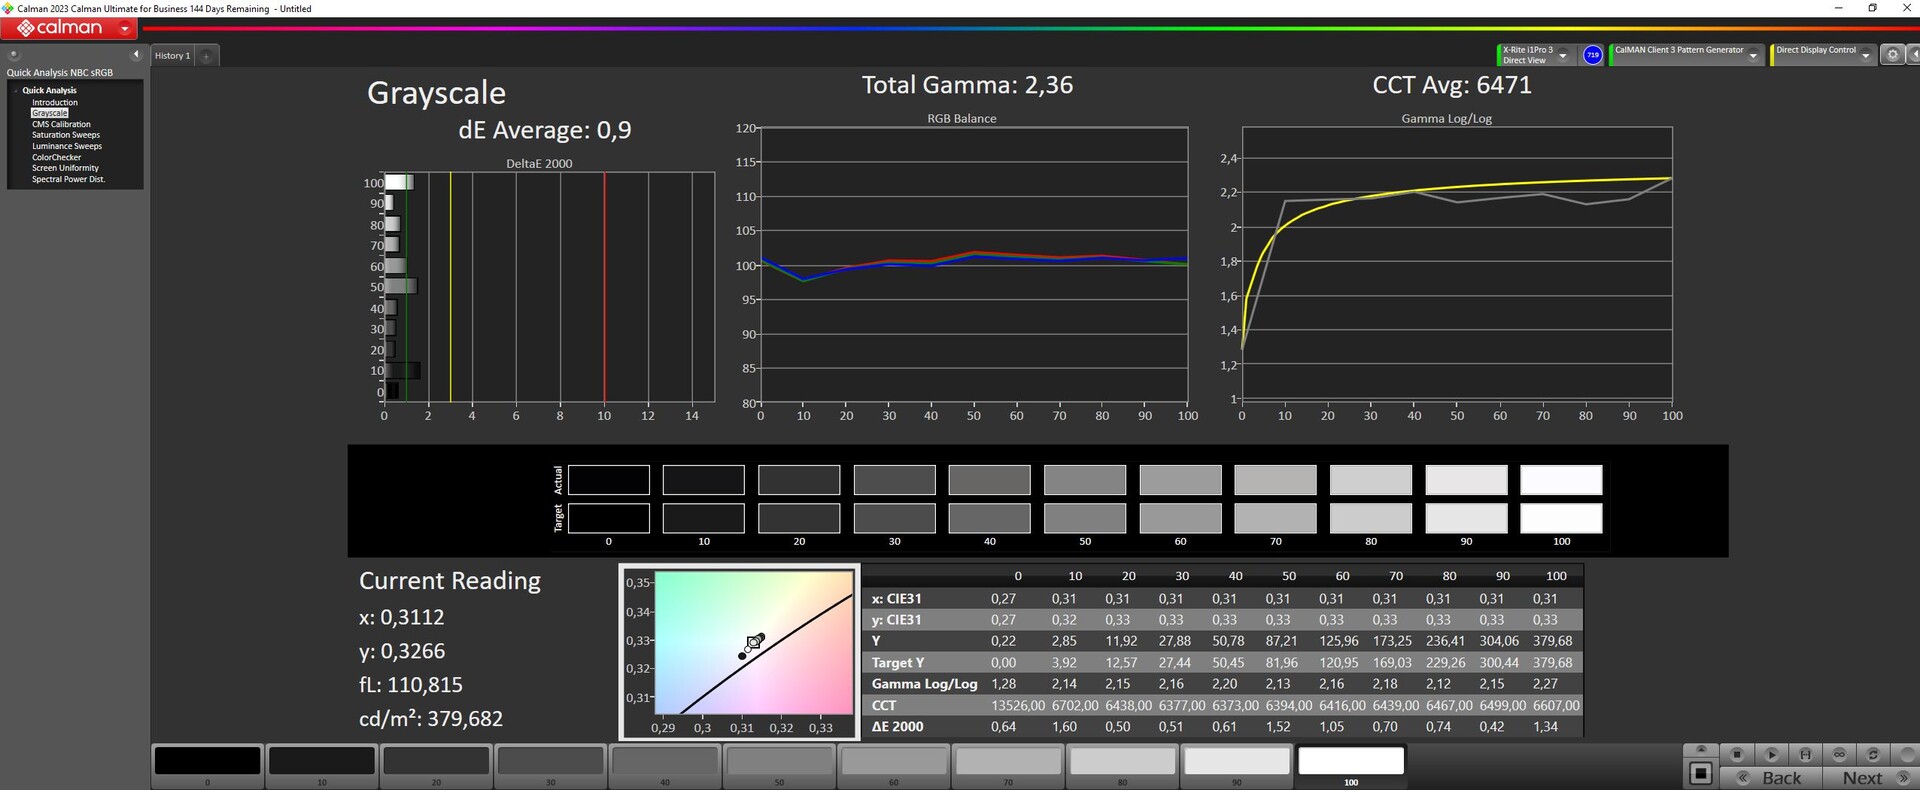
Contraste: 1639:1 (Preto: 0.23 cd/m²)
ΔE ColorChecker Calman: 0.83 | ∀{0.5-29.43 Ø4.71}
calibrated: 0.83
ΔE Greyscale Calman: 0.9 | ∀{0.09-98 Ø4.96}
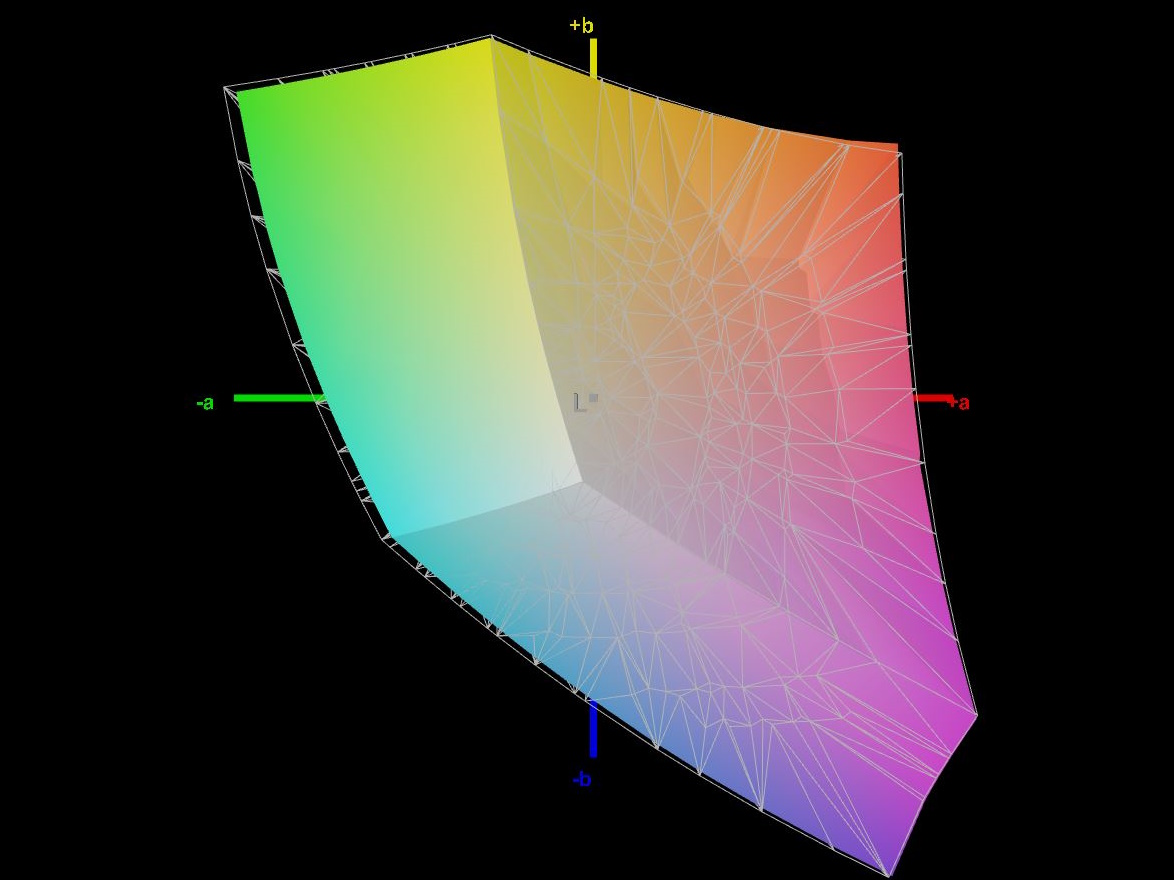
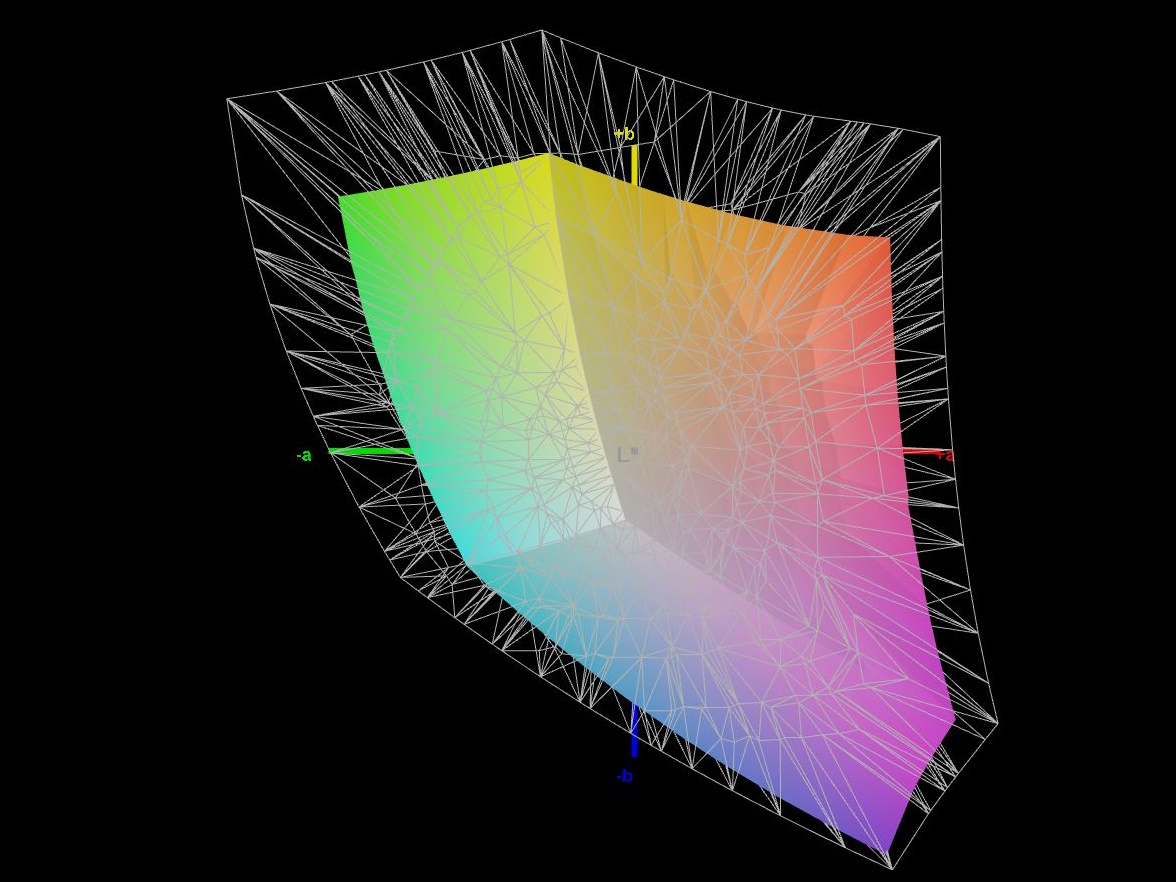
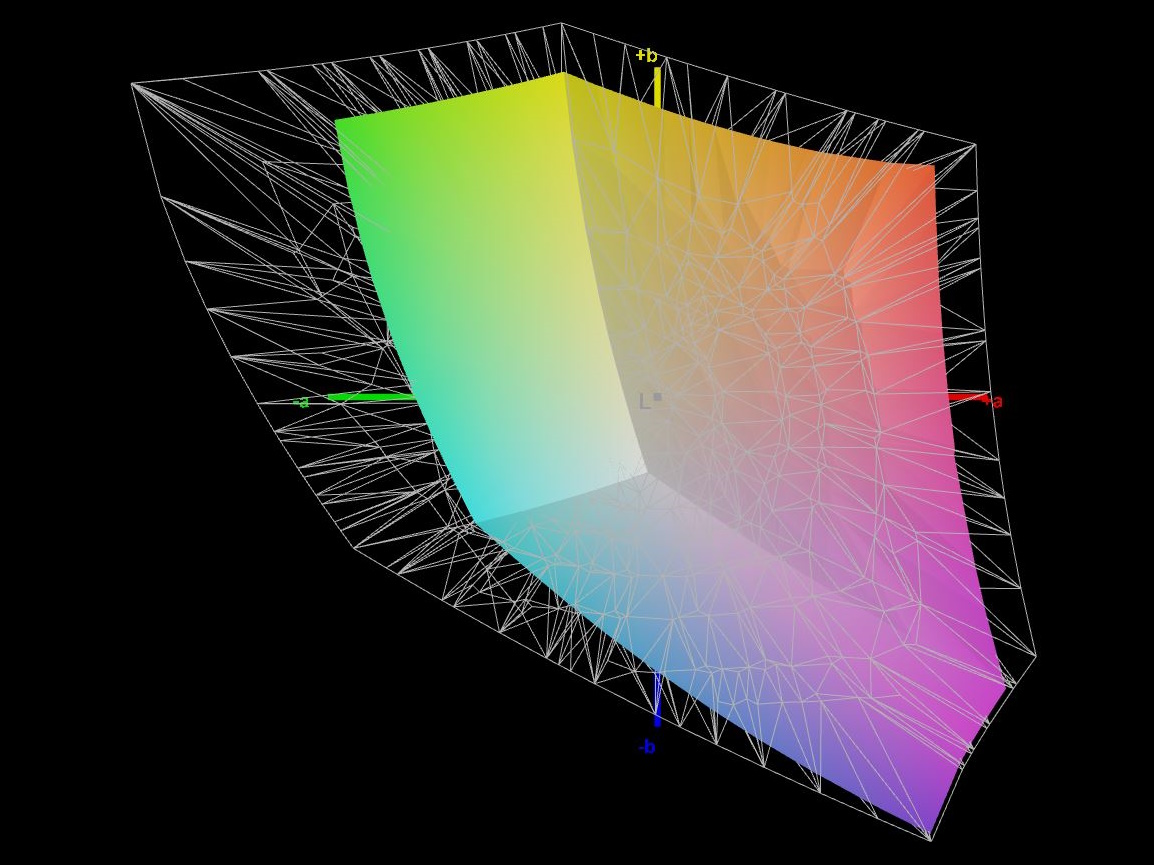
66.1% AdobeRGB 1998 (Argyll 3D)
96.2% sRGB (Argyll 3D)
64.2% Display P3 (Argyll 3D)
Gamma: 2.36
CCT: 6471 K
| Tulpar T7 V20.6 Chi Mei CMN175C (CMN N173HCE-G33), IPS, 1920x1080, 17.3" | Schenker XMG Apex 17 (Late 23) BOE CQ NE173QHM-NZ3, IPS, 2560x1440, 17.3" | Acer Nitro 17 AN17-51-71ER BOE0B7C NE173QHM-NY6, , 2560x1440, 17.3" | Medion Erazer Defender P40 BOE CQ NE173QHM-NZ3, IPS, 2560x1440, 17.3" | MSI Katana 17 B13VFK B173HAN04.9, IPS LED, 1920x1080, 17.3" | Lenovo Legion 5 16IRX G9 NE160QDM-NZ3, IPS, 2560x1600, 16" | |
|---|---|---|---|---|---|---|
| Display | 4% | 29% | 5% | -36% | 10% | |
| Display P3 Coverage (%) | 64.2 | 68.1 6% | 98.3 53% | 68.3 6% | 40.8 -36% | 72.4 13% |
| sRGB Coverage (%) | 96.2 | 97.7 2% | 100 4% | 98.1 2% | 61 -37% | 100 4% |
| AdobeRGB 1998 Coverage (%) | 66.1 | 69.5 5% | 85.7 30% | 69.8 6% | 42.2 -36% | 74.1 12% |
| Response Times | 19% | 14% | 12% | -129% | 19% | |
| Response Time Grey 50% / Grey 80% * (ms) | 14.7 ? | 13.5 ? 8% | 14.8 ? -1% | 14.6 ? 1% | 33 ? -124% | 12.5 ? 15% |
| Response Time Black / White * (ms) | 11.1 ? | 7.9 ? 29% | 8 ? 28% | 8.7 ? 22% | 26 ? -134% | 8.7 ? 22% |
| PWM Frequency (Hz) | 25000 | |||||
| PWM Amplitude * (%) | 27 | |||||
| Screen | -55% | -153% | -32% | -222% | -9% | |
| Brightness middle (cd/m²) | 377 | 403 7% | 361 -4% | 364 -3% | 267 -29% | 526 40% |
| Brightness (cd/m²) | 353 | 381 8% | 326 -8% | 343 -3% | 256 -27% | 500 42% |
| Brightness Distribution (%) | 83 | 90 8% | 87 5% | 86 4% | 93 12% | 87 5% |
| Black Level * (cd/m²) | 0.23 | 0.37 -61% | 0.6 -161% | 0.28 -22% | 0.21 9% | 0.33 -43% |
| Contrast (:1) | 1639 | 1089 -34% | 602 -63% | 1300 -21% | 1271 -22% | 1594 -3% |
| Colorchecker dE 2000 * | 0.83 | 2.22 -167% | 3.83 -361% | 1.67 -101% | 4.7 -466% | 1.2 -45% |
| Colorchecker dE 2000 max. * | 1.92 | 3.76 -96% | 5.71 -197% | 2.78 -45% | 20.4 -963% | 2.1 -9% |
| Colorchecker dE 2000 calibrated * | 0.83 | 1.22 -47% | 3.48 -319% | 1.14 -37% | 4.5 -442% | 1 -20% |
| Greyscale dE 2000 * | 0.9 | 1.9 -111% | 3.29 -266% | 1.4 -56% | 1.5 -67% | 1.3 -44% |
| Gamma | 2.36 93% | 2.046 108% | 2.29 96% | 2.091 105% | 2.12 104% | 2.23 99% |
| CCT | 6471 100% | 6656 98% | 6679 97% | 6568 99% | 6552 99% | 6391 102% |
| Média Total (Programa/Configurações) | -11% /
-32% | -37% /
-90% | -5% /
-18% | -129% /
-169% | 7% /
-1% |
* ... menor é melhor
O painel um tanto desatualizado não consegue acompanhar os monitores atuais no que se refere à cobertura do espaço de cores. Se o senhor estiver procurando mais cobertura de espaço de cores do que sRGB, deve procurar outro produto.
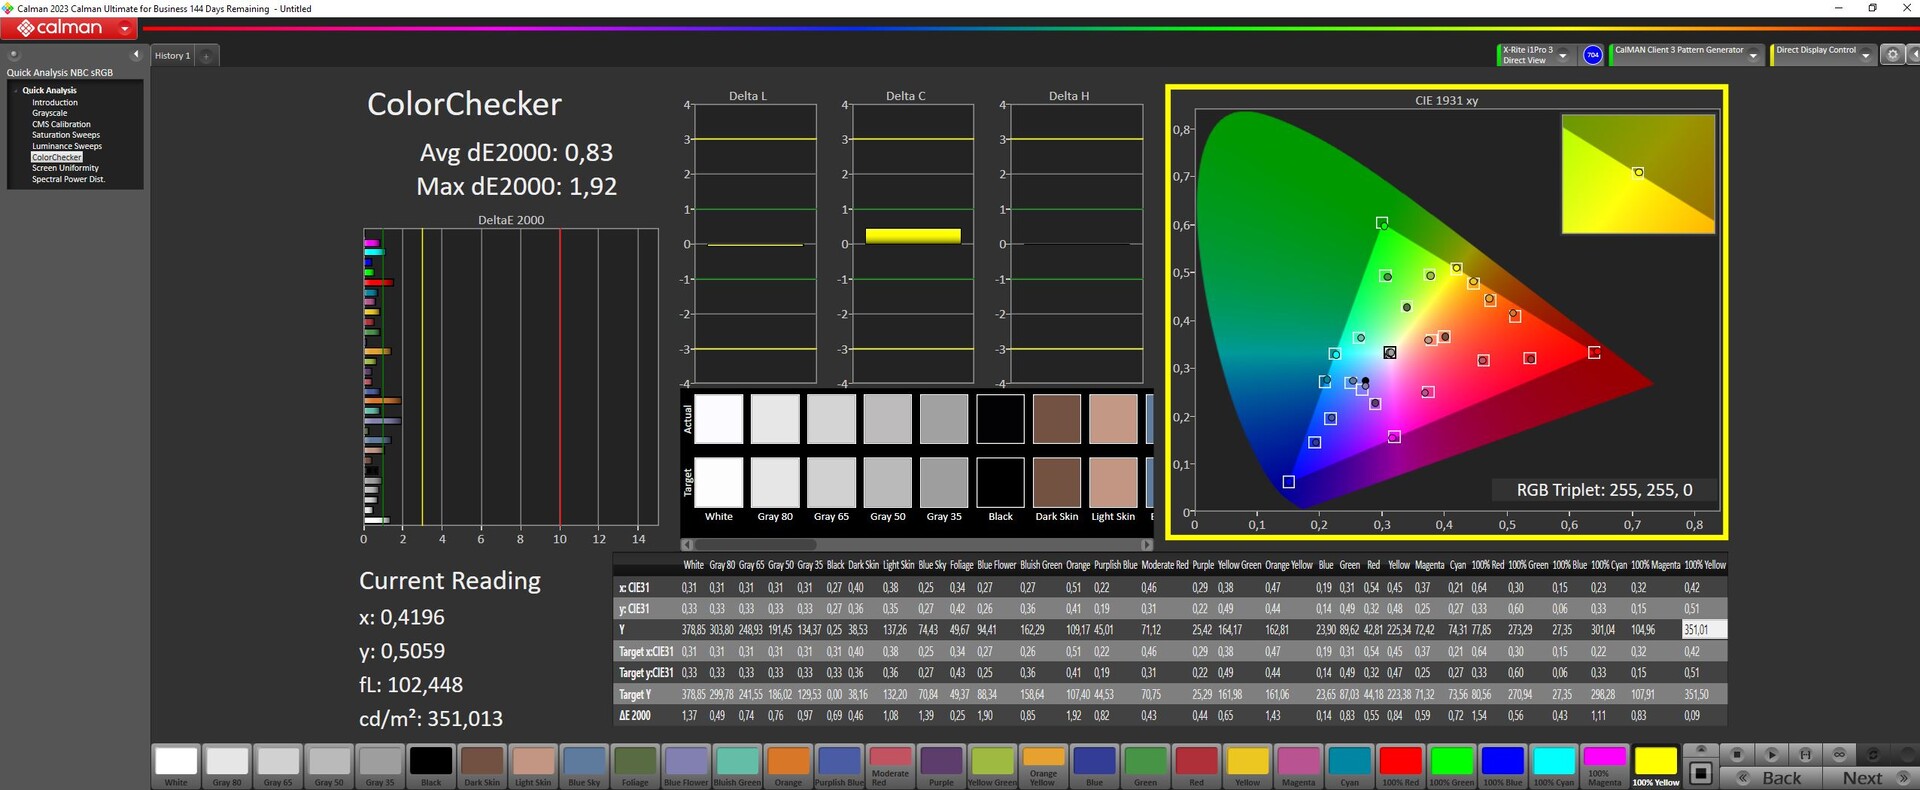
O painel é surpreendentemente bem calibrado assim que sai da caixa, especialmente nessa classe de preço. Seus valores médios de escala de cinza e ColorChecker DeltaE são de apenas 0,9 e 0,83 (medidos em relação ao sRGB), portanto, os usuários não precisarão calibrar a tela ainda mais.
Exibir tempos de resposta
| ↔ Tempo de resposta preto para branco | ||
|---|---|---|
| 11.1 ms ... ascensão ↗ e queda ↘ combinadas | ↗ 5.7 ms ascensão | |
| ↘ 5.4 ms queda | ||
| A tela mostra boas taxas de resposta em nossos testes, mas pode ser muito lenta para jogadores competitivos. Em comparação, todos os dispositivos testados variam de 0.1 (mínimo) a 240 (máximo) ms. » 30 % de todos os dispositivos são melhores. Isso significa que o tempo de resposta medido é melhor que a média de todos os dispositivos testados (19.8 ms). | ||
| ↔ Tempo de resposta 50% cinza a 80% cinza | ||
| 14.7 ms ... ascensão ↗ e queda ↘ combinadas | ↗ 6.8 ms ascensão | |
| ↘ 7.9 ms queda | ||
| A tela mostra boas taxas de resposta em nossos testes, mas pode ser muito lenta para jogadores competitivos. Em comparação, todos os dispositivos testados variam de 0.165 (mínimo) a 636 (máximo) ms. » 29 % de todos os dispositivos são melhores. Isso significa que o tempo de resposta medido é melhor que a média de todos os dispositivos testados (31 ms). | ||
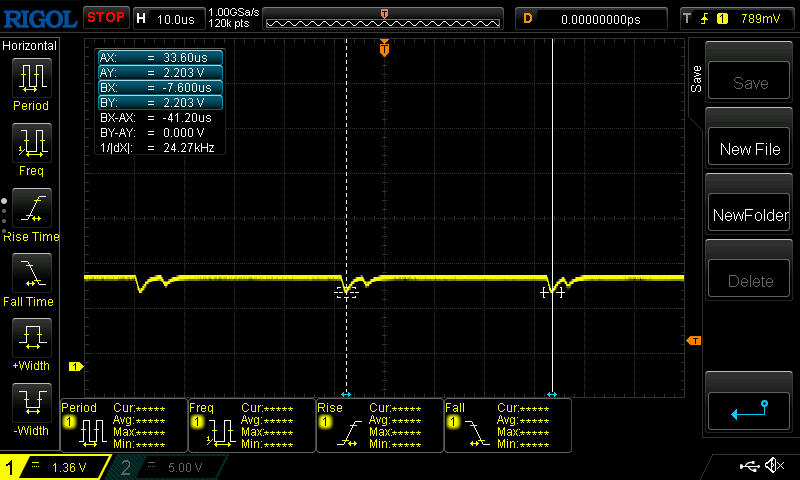
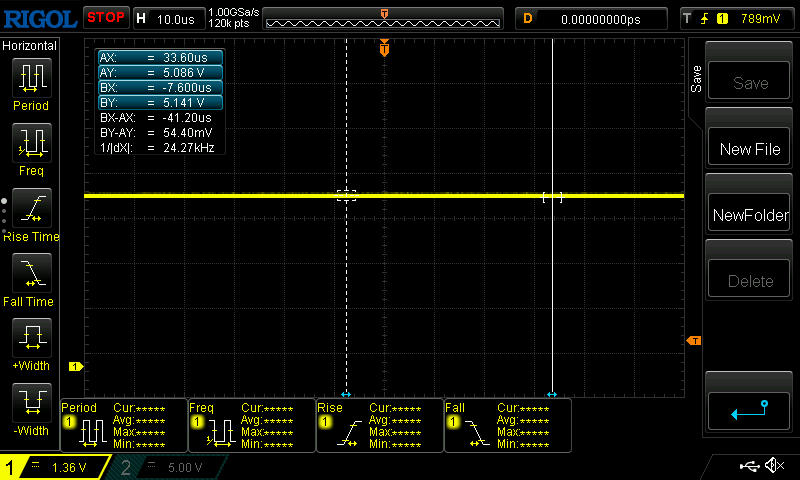
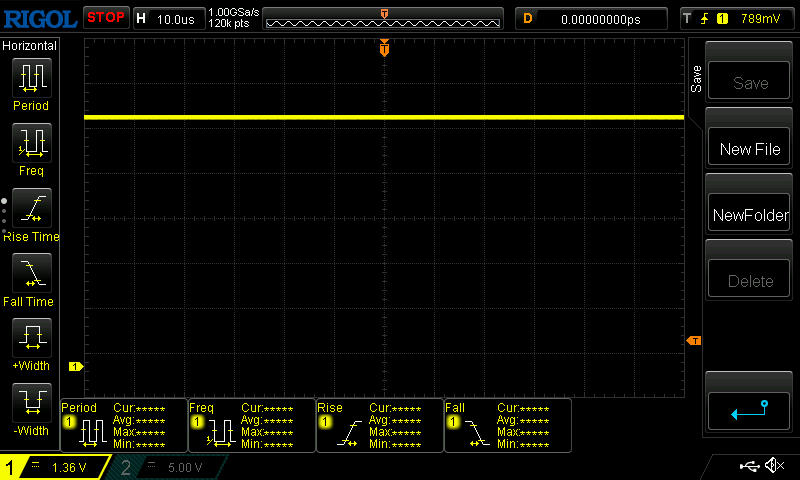
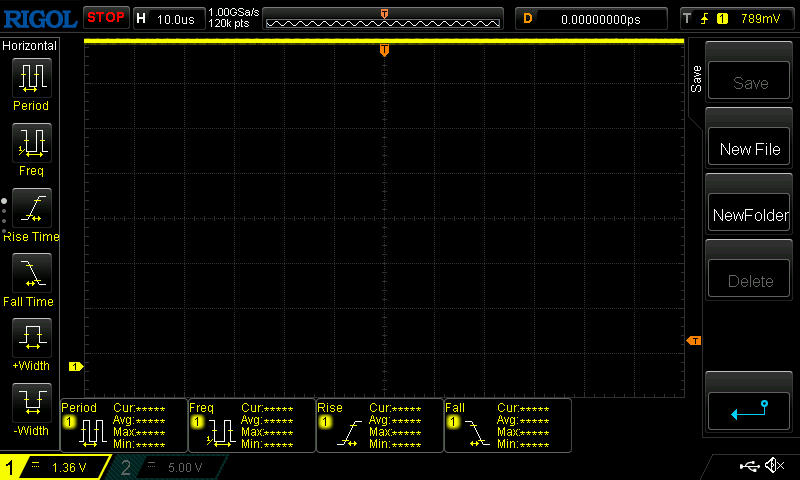
Cintilação da tela / PWM (modulação por largura de pulso)
| Tela tremeluzindo/PWM detectado | 25000 Hz Amplitude: 27 % | 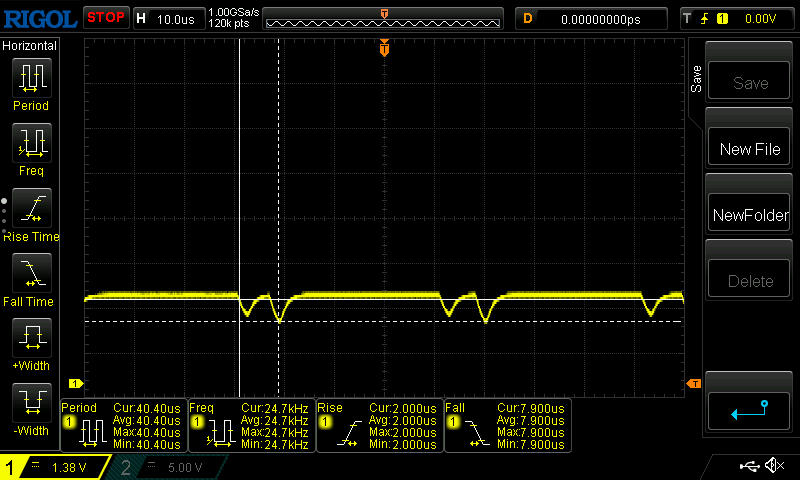 | |
A luz de fundo da tela pisca em 25000 Hz (pior caso, por exemplo, utilizando PWM) . A frequência de 25000 Hz é bastante alta, então a maioria dos usuários sensíveis ao PWM não deve notar nenhuma oscilação. [pwm_comparison] Em comparação: 52 % de todos os dispositivos testados não usam PWM para escurecer a tela. Se PWM foi detectado, uma média de 7747 (mínimo: 5 - máximo: 343500) Hz foi medida. | |||
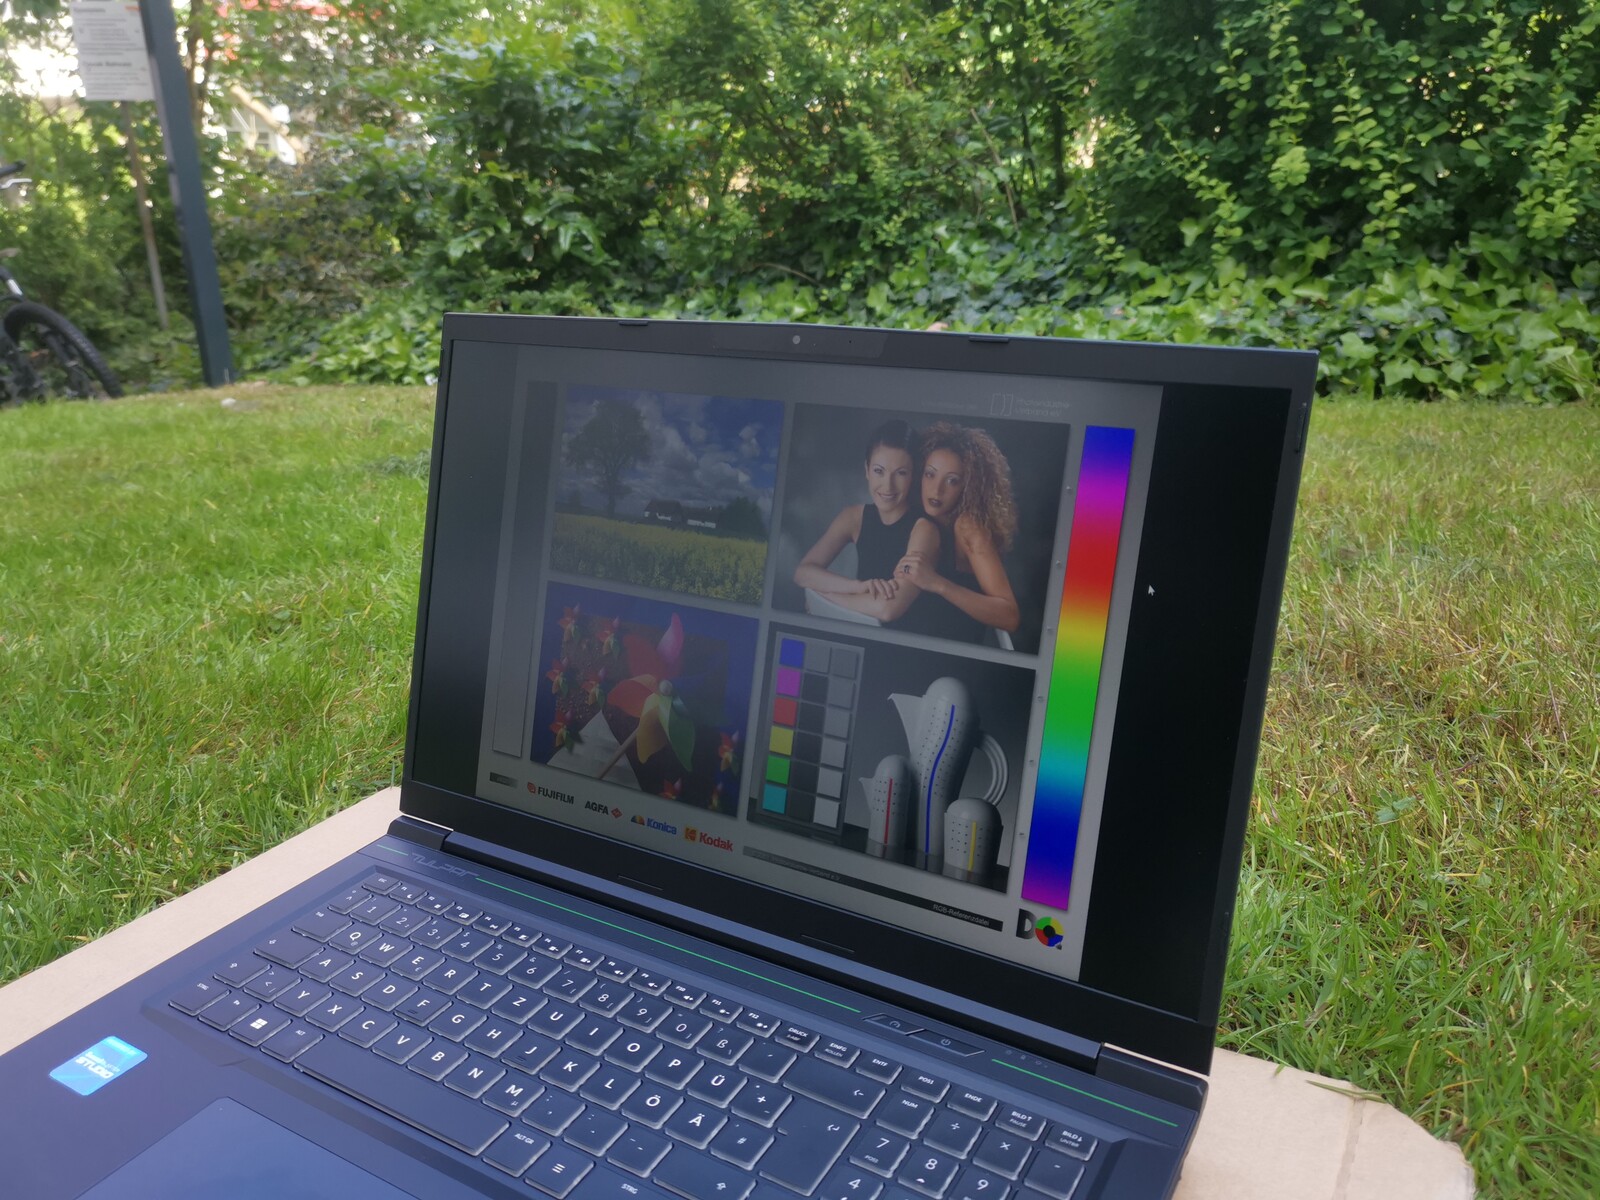
Na parte externa, a superfície fosca da tela evita a maioria dos reflexos. Na sombra, o senhor pode trabalhar bem quando olha diretamente para o T7 - seu brilho de 350 nits é suficiente para fazer isso. O senhor deve apenas evitar a luz solar direta e os ângulos de visão inclinados.

Desempenho - A Intel Gen13 não é novidade
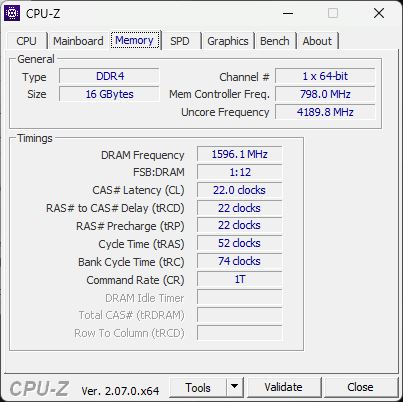
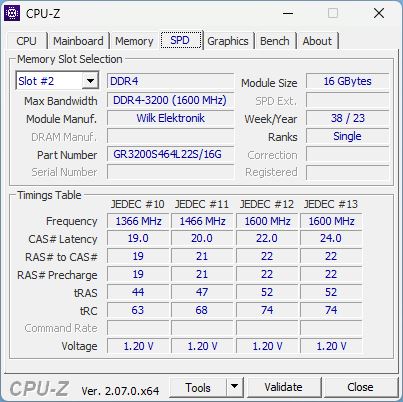
Há várias configurações do Tulpar T7 disponíveis, todas com a RTX 4060. Nosso T7 20.6 está equipado com a CPU Raptor Lake i7-13700Henquanto os modelos em torno do T7 20.7 ainda usam uma CPU Alder Lake de 12ª geração, apesar do "número" supostamente maior no nome. Há também diferentes configurações de RAM e SSD, que geralmente são seguidas por um número, por exemplo, o T7 20.6.1 (SSD de 1 TB) versus o T7 20.2 (SSD de 500 GB) - ambos os modelos têm 32 GB de RAM. A configuração de memória e armazenamento do nosso dispositivo de teste (16 GB de RAM e 500 GB de SSD) não pode ser encontrada no site da Tulpar ou nos portais de comparação.
O Tulpar T7 é claramente voltado para os gamers com um orçamento mais apertado. Sua CPU Intel Gen13 e a RTX 4060 prometem bom desempenho em jogos a um preço baixo. Os criadores de conteúdo, por outro lado, não são diretamente atendidos por seu design óbvio para jogadores, gabinete espesso, touchpad pequeno e tela decente que não é a mais adequada para edição.
Condições de teste
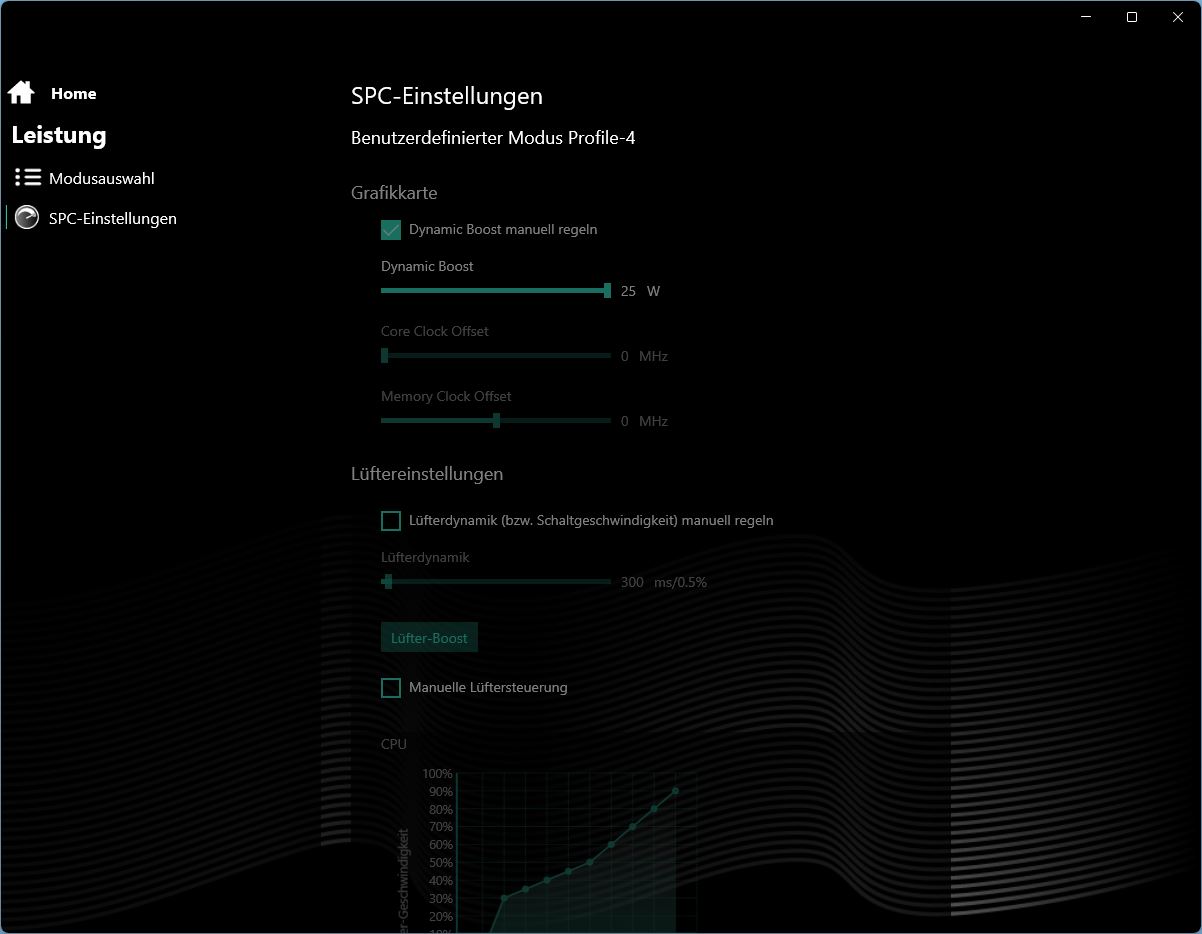
A Tulpar conta com uma Central de Controle genérica e ligeiramente adaptada, cujo design é exatamente igual ao usado nos modelos XMG da Schenker e de alguns outros. Ela é simples, mas clara e oferece várias opções de configuração.
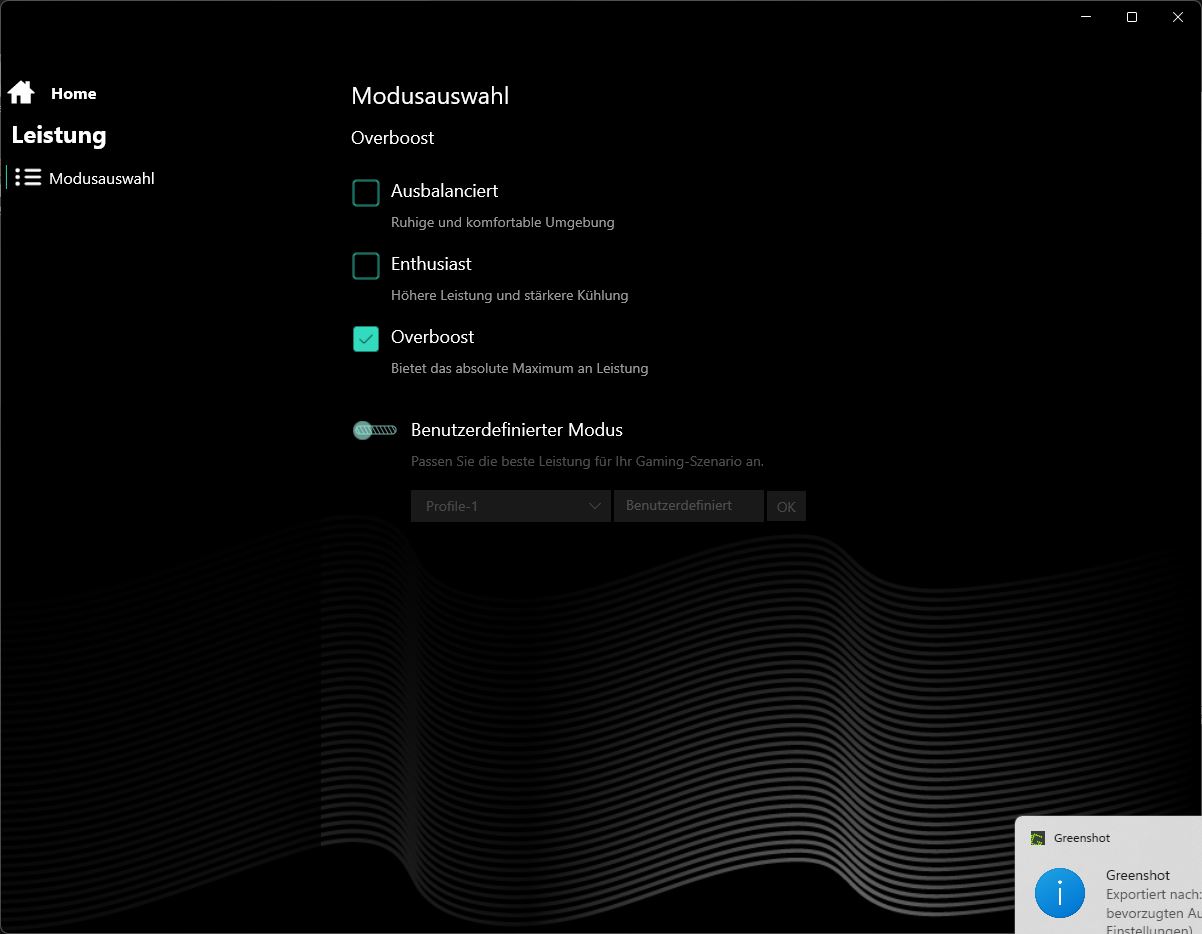
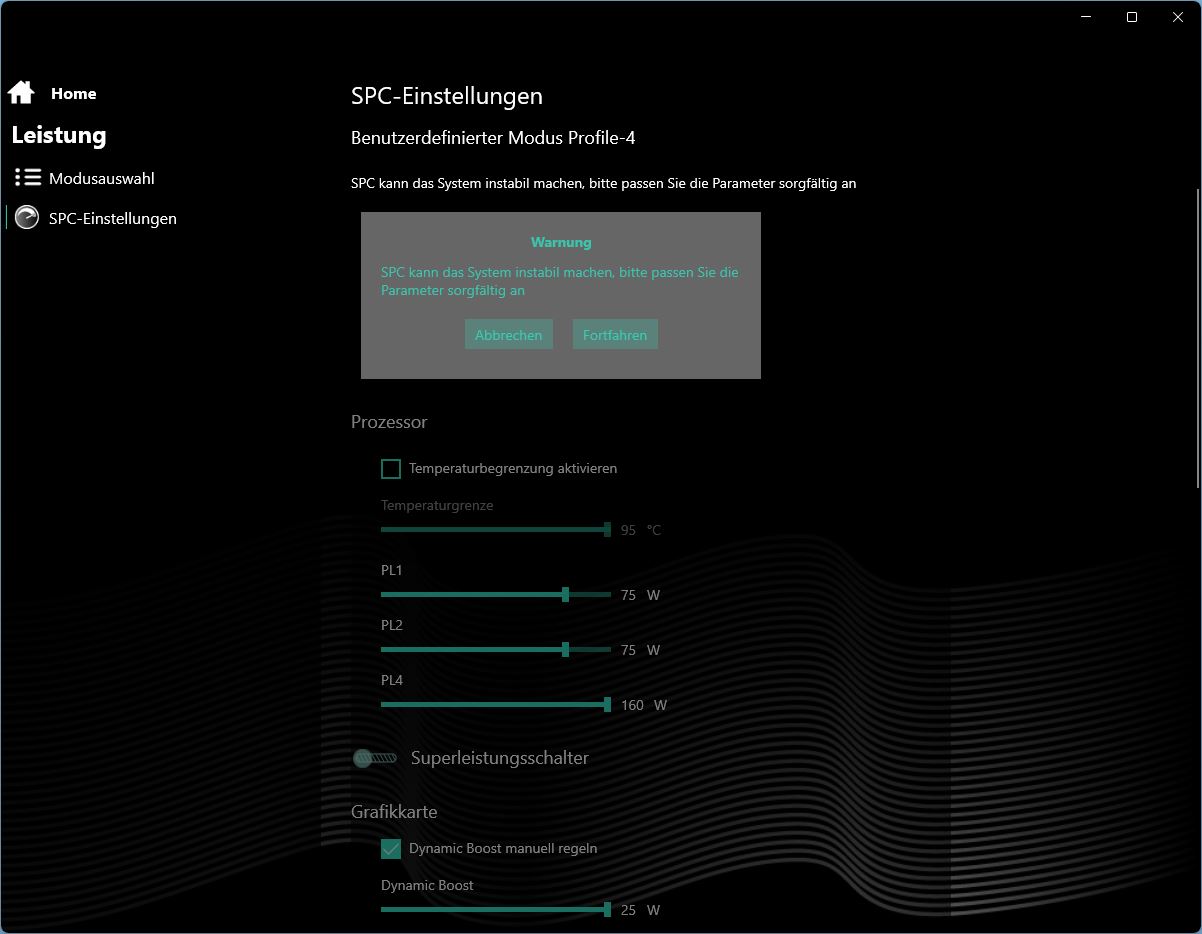
A guia de desempenho oferece três perfis padrão(balanceado, entusiasta, overboost), bem como um modo manual com todos os tipos de opções de personalização. Realizamos nossos benchmarks de desempenho usando o modo overboost, salvo indicação em contrário.
Além dos perfis de desempenho, há também um interruptor MUX, configurações gerais, opções de tela, configurações de iluminação do teclado e configurações de bateria.
Uma palavra sobre o modo de bateria: Embora o desempenho do laptop seja, obviamente, muito reduzido, o modo de energia definido não muda visualmente, portanto, se o senhor tiver ativado o modo overboost anteriormente e desconectar o plugue de energia, ele ainda estará ativo no Control Center. Isso sugere que o usuário também tem a opção de escolher entre vários modos de energia quando estiver longe de uma tomada. No entanto, é bem provável que não seja esse o caso, pois os resultados do modo de bateria foram sempre os mesmos (dentro da tolerância), independentemente do modo de energia selecionado.
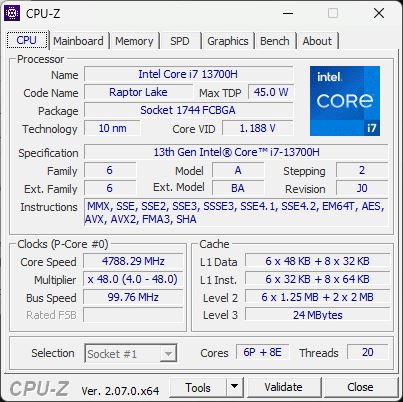
Processador
O Intel Gen13 Core i7-13700H Que foi encontrada em muitos computadores para jogos dos principais fabricantes no ano passado, é usada nesse laptop para jogos. Atualmente, a Gen14 mais recente está disponível apenas na série T6 da Tulpar. Entretanto, como a Gen14 não oferece praticamente nenhuma vantagem de velocidade, a vantagem dos laptops mais novos provavelmente será pequena, na melhor das hipóteses.
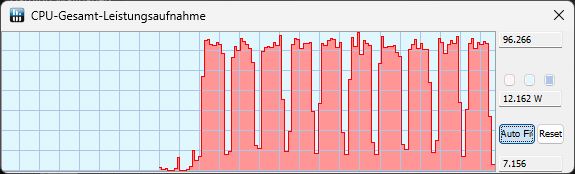
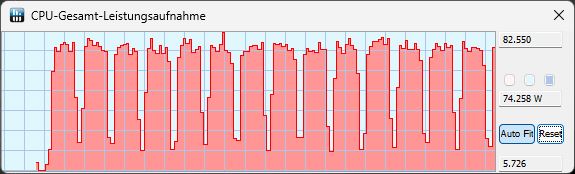
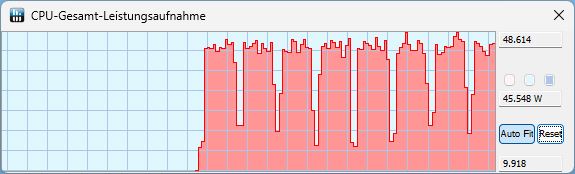
Nosso Tulpar teve um bom desempenho durante o loop do Cinebench R15, oferecendo um desempenho alto e, acima de tudo, muito constante, sem nenhuma queda após as primeiras execuções. No modo overboost, ele apresentou um TDP bastante constante de 95 a 96 watts, no modo entusiasta ainda foi de 82 watts e no modo balanceado observamos apenas 48 watts. No modo de bateria, ele é automaticamente definido como balanceado. Nesse caso, o desempenho da CPU cai em cerca de 27%.
Em geral e em todos os benchmarks, o T7 estava praticamente no mesmo nível de desempenho que o laptop médio equipado com a mesma CPU em nosso banco de dados. Ele foi ainda mais rápido em muitos testes, mas suas pontuações multi-thread excepcionalmente baixas no Geekbench prejudicam um pouco sua pontuação geral. Durante os testes do Cinebench, ele foi cerca de 11% mais rápido do que o i7-13700H médio.
Isso o colocou bem no meio dos dispositivos de comparação em termos de desempenho - somente o Legion 5 foi visivelmente mais rápido e todos os outros concorrentes ficaram a poucos pontos percentuais do nosso dispositivo de teste.
Suas pontuações excepcionalmente baixas de vários núcleos nos testes do Geekbench são bastante interessantes. Suas pontuações permaneceram muito baixas mesmo após várias repetições(overboost, dGPU e modo híbrido testados). Nos testes do Cinebench, no entanto, suas pontuações multithread foram de normais a boas.
| Perfil de desempenho/valor de medição | CB15 multi score | TDP (em watts) |
|---|---|---|
| Turbo | 2.763 | 95 |
| Entusiasta | 2.538 | 82 |
| Balanceado | 1.990 | 48 |
| Bateria | 1.760 | 35 |
Cinebench R15 Multi continuous test
Cinebench R23: Multi Core | Single Core
Cinebench R20: CPU (Multi Core) | CPU (Single Core)
Cinebench R15: CPU Multi 64Bit | CPU Single 64Bit
Blender: v2.79 BMW27 CPU
7-Zip 18.03: 7z b 4 | 7z b 4 -mmt1
Geekbench 6.7: Multi-Core | Single-Core
Geekbench 5.5: Multi-Core | Single-Core
HWBOT x265 Benchmark v2.2: 4k Preset
LibreOffice : 20 Documents To PDF
R Benchmark 2.5: Overall mean
| CPU Performance rating | |
| Média da turma Gaming | |
| Lenovo Legion 5 16IRX G9 | |
| Schenker XMG Apex 17 (Late 23) | |
| Medion Erazer Defender P40 -2! | |
| Tulpar T7 V20.6 | |
| Média Intel Core i7-13700H | |
| Acer Nitro 17 AN17-51-71ER -2! | |
| MSI Katana 17 B13VFK -2! | |
| Cinebench R23 / Multi Core | |
| Média da turma Gaming (10488 - 42661, n=107, últimos 2 anos) | |
| Lenovo Legion 5 16IRX G9 | |
| Medion Erazer Defender P40 | |
| Acer Nitro 17 AN17-51-71ER | |
| Tulpar T7 V20.6 | |
| Schenker XMG Apex 17 (Late 23) | |
| MSI Katana 17 B13VFK | |
| Média Intel Core i7-13700H (5890 - 20034, n=29) | |
| Cinebench R23 / Single Core | |
| Média da turma Gaming (1166 - 2415, n=107, últimos 2 anos) | |
| Lenovo Legion 5 16IRX G9 | |
| Tulpar T7 V20.6 | |
| MSI Katana 17 B13VFK | |
| Média Intel Core i7-13700H (1323 - 1914, n=29) | |
| Schenker XMG Apex 17 (Late 23) | |
| Medion Erazer Defender P40 | |
| Acer Nitro 17 AN17-51-71ER | |
| Cinebench R20 / CPU (Multi Core) | |
| Média da turma Gaming (4029 - 16433, n=106, últimos 2 anos) | |
| Lenovo Legion 5 16IRX G9 | |
| Medion Erazer Defender P40 | |
| Acer Nitro 17 AN17-51-71ER | |
| Tulpar T7 V20.6 | |
| Schenker XMG Apex 17 (Late 23) | |
| MSI Katana 17 B13VFK | |
| Média Intel Core i7-13700H (2322 - 7674, n=29) | |
| Cinebench R20 / CPU (Single Core) | |
| Média da turma Gaming (442 - 913, n=106, últimos 2 anos) | |
| Lenovo Legion 5 16IRX G9 | |
| Tulpar T7 V20.6 | |
| Média Intel Core i7-13700H (508 - 741, n=29) | |
| MSI Katana 17 B13VFK | |
| Schenker XMG Apex 17 (Late 23) | |
| Medion Erazer Defender P40 | |
| Acer Nitro 17 AN17-51-71ER | |
| Cinebench R15 / CPU Multi 64Bit | |
| Média da turma Gaming (1578 - 6330, n=105, últimos 2 anos) | |
| Lenovo Legion 5 16IRX G9 | |
| Medion Erazer Defender P40 | |
| Acer Nitro 17 AN17-51-71ER | |
| Tulpar T7 V20.6 | |
| Schenker XMG Apex 17 (Late 23) | |
| Média Intel Core i7-13700H (905 - 2982, n=29) | |
| MSI Katana 17 B13VFK | |
| Cinebench R15 / CPU Single 64Bit | |
| Média da turma Gaming (188.8 - 350, n=106, últimos 2 anos) | |
| Lenovo Legion 5 16IRX G9 | |
| Tulpar T7 V20.6 | |
| Schenker XMG Apex 17 (Late 23) | |
| Média Intel Core i7-13700H (213 - 278, n=29) | |
| MSI Katana 17 B13VFK | |
| Medion Erazer Defender P40 | |
| Acer Nitro 17 AN17-51-71ER | |
| Blender / v2.79 BMW27 CPU | |
| Média Intel Core i7-13700H (169 - 555, n=29) | |
| MSI Katana 17 B13VFK | |
| Schenker XMG Apex 17 (Late 23) | |
| Medion Erazer Defender P40 | |
| Acer Nitro 17 AN17-51-71ER | |
| Tulpar T7 V20.6 | |
| Média da turma Gaming (79 - 330, n=104, últimos 2 anos) | |
| Lenovo Legion 5 16IRX G9 | |
| 7-Zip 18.03 / 7z b 4 | |
| Lenovo Legion 5 16IRX G9 | |
| Média da turma Gaming (33491 - 148086, n=105, últimos 2 anos) | |
| Medion Erazer Defender P40 | |
| Acer Nitro 17 AN17-51-71ER | |
| Schenker XMG Apex 17 (Late 23) | |
| MSI Katana 17 B13VFK | |
| Média Intel Core i7-13700H (27322 - 76344, n=29) | |
| Tulpar T7 V20.6 | |
| 7-Zip 18.03 / 7z b 4 -mmt1 | |
| Schenker XMG Apex 17 (Late 23) | |
| Lenovo Legion 5 16IRX G9 | |
| Média da turma Gaming (4199 - 7436, n=105, últimos 2 anos) | |
| Tulpar T7 V20.6 | |
| Média Intel Core i7-13700H (4825 - 6238, n=29) | |
| MSI Katana 17 B13VFK | |
| Medion Erazer Defender P40 | |
| Acer Nitro 17 AN17-51-71ER | |
| Geekbench 6.7 / Multi-Core | |
| Lenovo Legion 5 16IRX G9 | |
| Média da turma Gaming (6625 - 22850, n=106, últimos 2 anos) | |
| Schenker XMG Apex 17 (Late 23) | |
| Média Intel Core i7-13700H (8415 - 13832, n=13) | |
| Tulpar T7 V20.6 | |
| Geekbench 6.7 / Single-Core | |
| Média da turma Gaming (1490 - 3259, n=106, últimos 2 anos) | |
| Lenovo Legion 5 16IRX G9 | |
| Schenker XMG Apex 17 (Late 23) | |
| Tulpar T7 V20.6 | |
| Média Intel Core i7-13700H (2316 - 2639, n=13) | |
| Geekbench 5.5 / Multi-Core | |
| Média da turma Gaming (6460 - 28263, n=105, últimos 2 anos) | |
| Lenovo Legion 5 16IRX G9 | |
| Medion Erazer Defender P40 | |
| Acer Nitro 17 AN17-51-71ER | |
| Schenker XMG Apex 17 (Late 23) | |
| Média Intel Core i7-13700H (6165 - 14215, n=29) | |
| MSI Katana 17 B13VFK | |
| Tulpar T7 V20.6 | |
| Geekbench 5.5 / Single-Core | |
| Média da turma Gaming (986 - 2474, n=105, últimos 2 anos) | |
| Schenker XMG Apex 17 (Late 23) | |
| Lenovo Legion 5 16IRX G9 | |
| Média Intel Core i7-13700H (1362 - 1919, n=29) | |
| MSI Katana 17 B13VFK | |
| Tulpar T7 V20.6 | |
| Medion Erazer Defender P40 | |
| Acer Nitro 17 AN17-51-71ER | |
| HWBOT x265 Benchmark v2.2 / 4k Preset | |
| Média da turma Gaming (11.5 - 44.4, n=105, últimos 2 anos) | |
| Lenovo Legion 5 16IRX G9 | |
| Medion Erazer Defender P40 | |
| Schenker XMG Apex 17 (Late 23) | |
| Acer Nitro 17 AN17-51-71ER | |
| Tulpar T7 V20.6 | |
| MSI Katana 17 B13VFK | |
| Média Intel Core i7-13700H (6.72 - 21.2, n=29) | |
| LibreOffice / 20 Documents To PDF | |
| MSI Katana 17 B13VFK | |
| Acer Nitro 17 AN17-51-71ER | |
| Tulpar T7 V20.6 | |
| Medion Erazer Defender P40 | |
| Média da turma Gaming (33.2 - 88.8, n=105, últimos 2 anos) | |
| Média Intel Core i7-13700H (31.3 - 62.4, n=29) | |
| Schenker XMG Apex 17 (Late 23) | |
| Lenovo Legion 5 16IRX G9 | |
| R Benchmark 2.5 / Overall mean | |
| Acer Nitro 17 AN17-51-71ER | |
| Medion Erazer Defender P40 | |
| Média Intel Core i7-13700H (0.4308 - 0.607, n=29) | |
| Tulpar T7 V20.6 | |
| MSI Katana 17 B13VFK | |
| Schenker XMG Apex 17 (Late 23) | |
| Média da turma Gaming (0.3439 - 0.759, n=106, últimos 2 anos) | |
| Lenovo Legion 5 16IRX G9 | |
* ... menor é melhor
AIDA64: FP32 Ray-Trace | FPU Julia | CPU SHA3 | CPU Queen | FPU SinJulia | FPU Mandel | CPU AES | CPU ZLib | FP64 Ray-Trace | CPU PhotoWorxx
| Performance rating | |
| Média da turma Gaming | |
| Schenker XMG Apex 17 (Late 23) | |
| Acer Nitro 17 AN17-51-71ER | |
| Lenovo Legion 5 16IRX G9 | |
| Medion Erazer Defender P40 | |
| Tulpar T7 V20.6 | |
| Média Intel Core i7-13700H | |
| MSI Katana 17 B13VFK | |
| AIDA64 / FP32 Ray-Trace | |
| Média da turma Gaming (10227 - 85542, n=105, últimos 2 anos) | |
| Schenker XMG Apex 17 (Late 23) | |
| Lenovo Legion 5 16IRX G9 | |
| Acer Nitro 17 AN17-51-71ER | |
| Tulpar T7 V20.6 | |
| Medion Erazer Defender P40 | |
| Média Intel Core i7-13700H (4986 - 18908, n=29) | |
| MSI Katana 17 B13VFK | |
| AIDA64 / FPU Julia | |
| Média da turma Gaming (51376 - 238426, n=105, últimos 2 anos) | |
| Schenker XMG Apex 17 (Late 23) | |
| Lenovo Legion 5 16IRX G9 | |
| Tulpar T7 V20.6 | |
| Acer Nitro 17 AN17-51-71ER | |
| Medion Erazer Defender P40 | |
| Média Intel Core i7-13700H (25360 - 92359, n=29) | |
| MSI Katana 17 B13VFK | |
| AIDA64 / CPU SHA3 | |
| Média da turma Gaming (2180 - 10115, n=105, últimos 2 anos) | |
| Schenker XMG Apex 17 (Late 23) | |
| Acer Nitro 17 AN17-51-71ER | |
| Lenovo Legion 5 16IRX G9 | |
| Tulpar T7 V20.6 | |
| Medion Erazer Defender P40 | |
| Média Intel Core i7-13700H (1339 - 4224, n=29) | |
| MSI Katana 17 B13VFK | |
| AIDA64 / CPU Queen | |
| Média da turma Gaming (49785 - 173351, n=90, últimos 2 anos) | |
| Schenker XMG Apex 17 (Late 23) | |
| Medion Erazer Defender P40 | |
| Tulpar T7 V20.6 | |
| Lenovo Legion 5 16IRX G9 | |
| Acer Nitro 17 AN17-51-71ER | |
| Média Intel Core i7-13700H (59324 - 107159, n=29) | |
| MSI Katana 17 B13VFK | |
| AIDA64 / FPU SinJulia | |
| Schenker XMG Apex 17 (Late 23) | |
| Média da turma Gaming (4424 - 33636, n=105, últimos 2 anos) | |
| Lenovo Legion 5 16IRX G9 | |
| Tulpar T7 V20.6 | |
| Acer Nitro 17 AN17-51-71ER | |
| Medion Erazer Defender P40 | |
| Média Intel Core i7-13700H (4800 - 11050, n=29) | |
| MSI Katana 17 B13VFK | |
| AIDA64 / FPU Mandel | |
| Média da turma Gaming (25115 - 128721, n=105, últimos 2 anos) | |
| Schenker XMG Apex 17 (Late 23) | |
| Lenovo Legion 5 16IRX G9 | |
| Acer Nitro 17 AN17-51-71ER | |
| Tulpar T7 V20.6 | |
| Medion Erazer Defender P40 | |
| Média Intel Core i7-13700H (12321 - 45118, n=29) | |
| MSI Katana 17 B13VFK | |
| AIDA64 / CPU AES | |
| Schenker XMG Apex 17 (Late 23) | |
| Acer Nitro 17 AN17-51-71ER | |
| Média da turma Gaming (39258 - 247074, n=105, últimos 2 anos) | |
| Lenovo Legion 5 16IRX G9 | |
| Tulpar T7 V20.6 | |
| Média Intel Core i7-13700H (28769 - 151254, n=29) | |
| Medion Erazer Defender P40 | |
| MSI Katana 17 B13VFK | |
| AIDA64 / CPU ZLib | |
| Média da turma Gaming (574 - 2531, n=105, últimos 2 anos) | |
| Lenovo Legion 5 16IRX G9 | |
| Acer Nitro 17 AN17-51-71ER | |
| Tulpar T7 V20.6 | |
| Schenker XMG Apex 17 (Late 23) | |
| Medion Erazer Defender P40 | |
| Média Intel Core i7-13700H (389 - 1215, n=29) | |
| MSI Katana 17 B13VFK | |
| AIDA64 / FP64 Ray-Trace | |
| Média da turma Gaming (5509 - 45446, n=105, últimos 2 anos) | |
| Schenker XMG Apex 17 (Late 23) | |
| Lenovo Legion 5 16IRX G9 | |
| Acer Nitro 17 AN17-51-71ER | |
| Tulpar T7 V20.6 | |
| Medion Erazer Defender P40 | |
| Média Intel Core i7-13700H (2540 - 10135, n=29) | |
| MSI Katana 17 B13VFK | |
| AIDA64 / CPU PhotoWorxx | |
| Média da turma Gaming (12271 - 89891, n=105, últimos 2 anos) | |
| Média Intel Core i7-13700H (12872 - 52727, n=29) | |
| Acer Nitro 17 AN17-51-71ER | |
| Schenker XMG Apex 17 (Late 23) | |
| Medion Erazer Defender P40 | |
| MSI Katana 17 B13VFK | |
| Lenovo Legion 5 16IRX G9 | |
| Tulpar T7 V20.6 | |
Desempenho do sistema
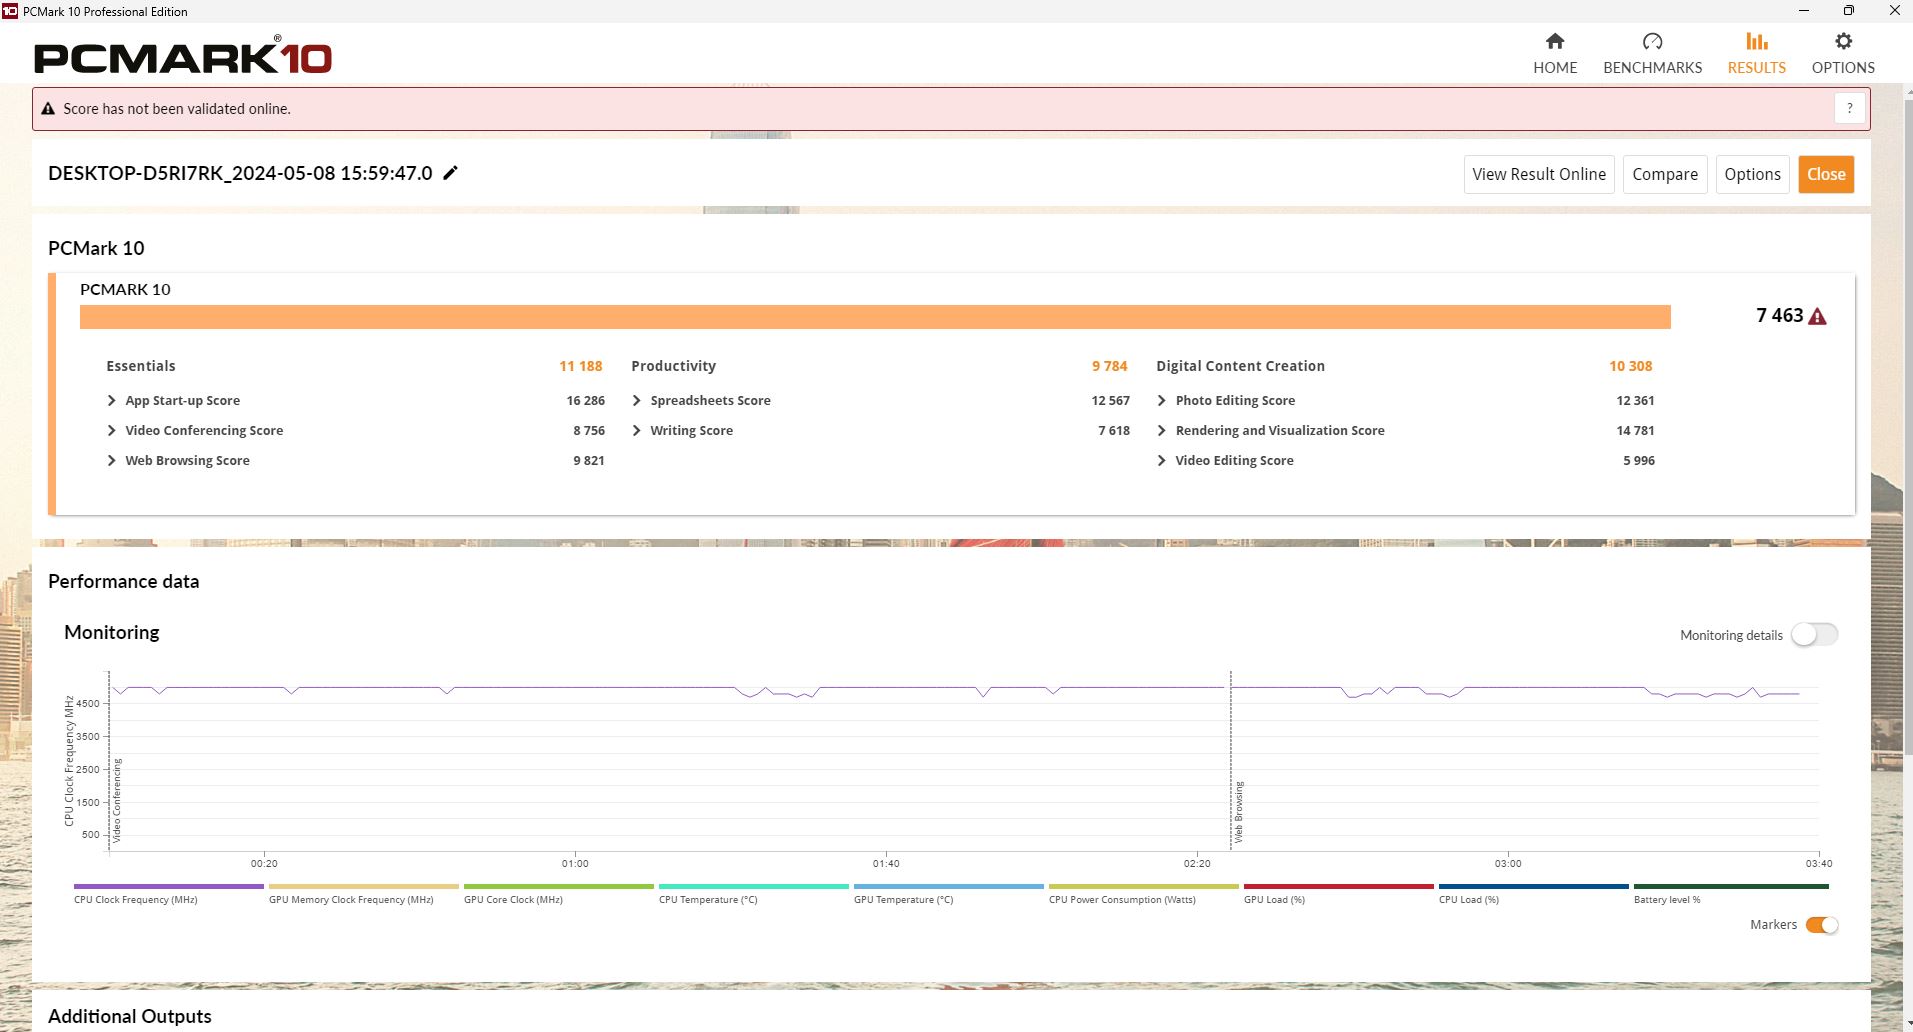
No que diz respeito ao desempenho do sistema, o T7 está na faixa intermediária superior. Durante o PCMark 10, ele atingiu o nível médio exato para essa combinação de hardware. Seus resultados no CrossMark são um pouco baixos.
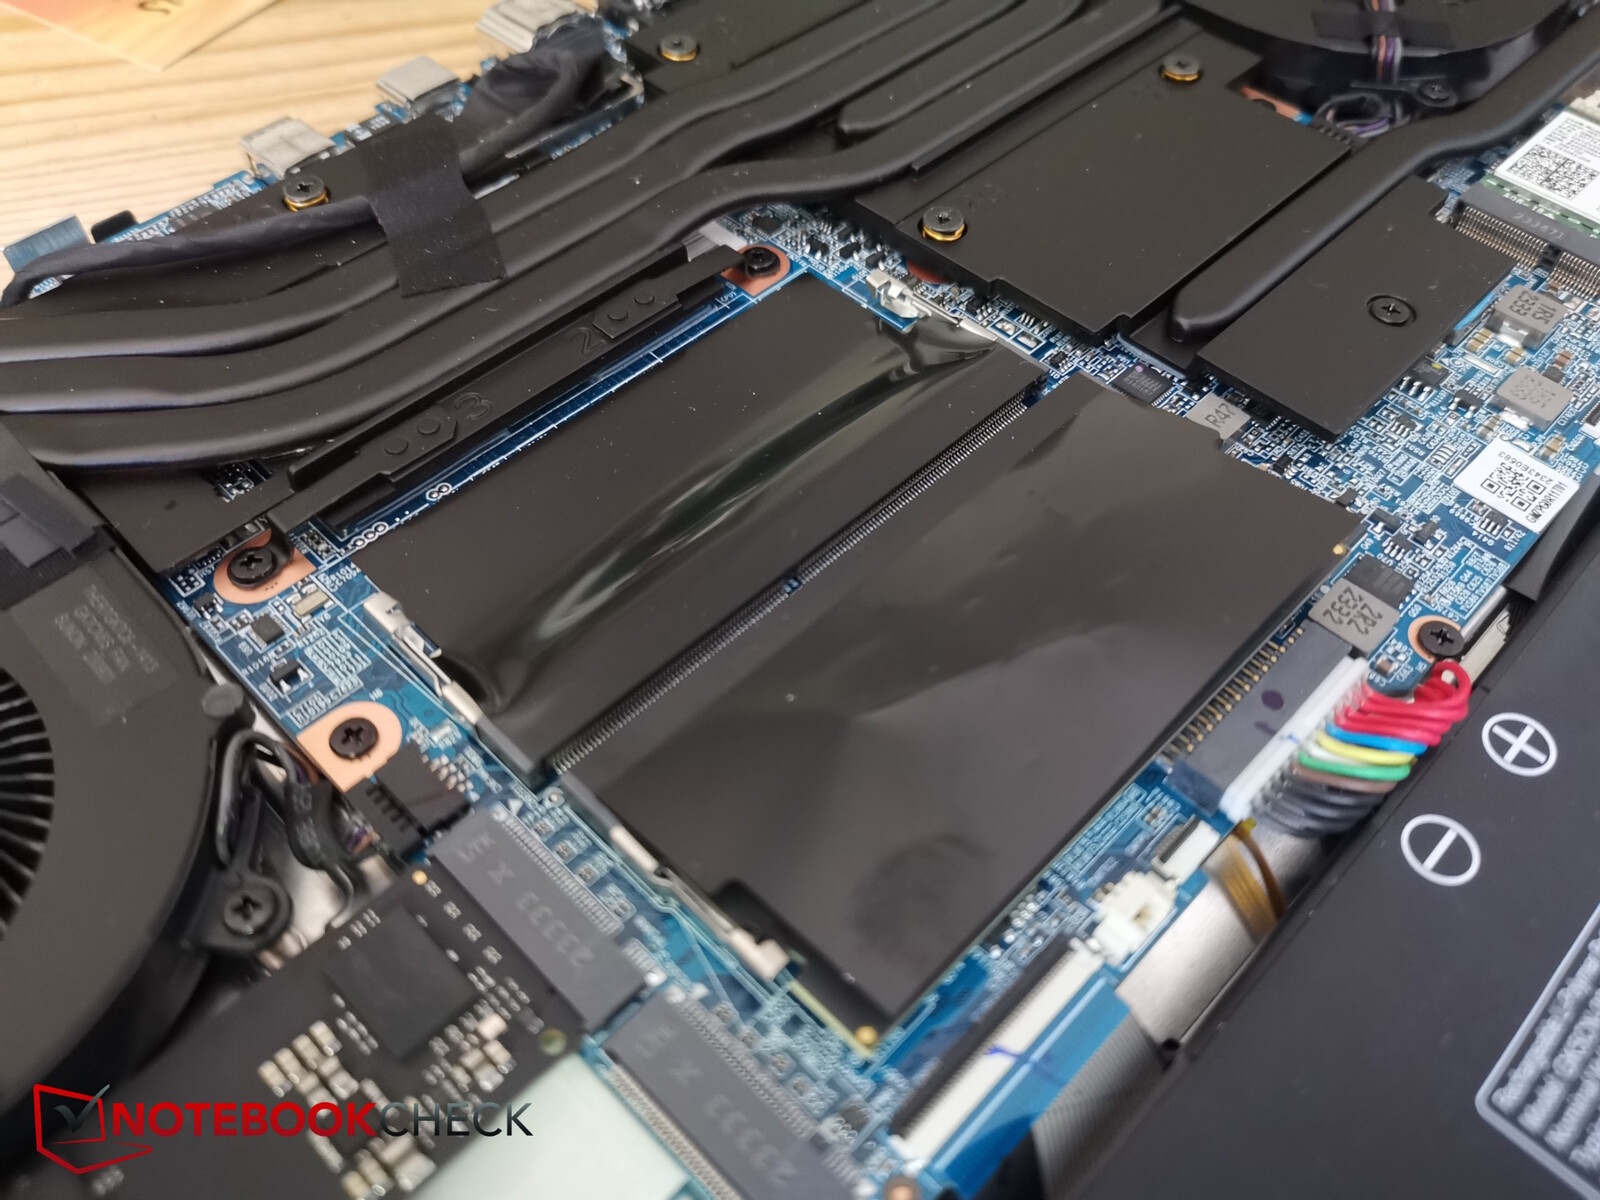
O fato de apenas um slot de RAM estar ocupado não é o melhor, pelo menos em nossa configuração do T7. O teste de memória AIDA abaixo mostra a desvantagem da RAM de canal único. Para o canal duplo, o senhor teria que inserir outra barra, pois um slot ainda está livre.
CrossMark: Overall | Productivity | Creativity | Responsiveness
WebXPRT 3: Overall
WebXPRT 4: Overall
Mozilla Kraken 1.1: Total
| PCMark 10 / Score | |
| Média da turma Gaming (5828 - 12414, n=93, últimos 2 anos) | |
| Schenker XMG Apex 17 (Late 23) | |
| Lenovo Legion 5 16IRX G9 | |
| Tulpar T7 V20.6 | |
| Média Intel Core i7-13700H, NVIDIA GeForce RTX 4060 Laptop GPU (7157 - 7661, n=5) | |
| MSI Katana 17 B13VFK | |
| Acer Nitro 17 AN17-51-71ER | |
| Medion Erazer Defender P40 | |
| PCMark 10 / Essentials | |
| Tulpar T7 V20.6 | |
| MSI Katana 17 B13VFK | |
| Lenovo Legion 5 16IRX G9 | |
| Média Intel Core i7-13700H, NVIDIA GeForce RTX 4060 Laptop GPU (10179 - 11200, n=5) | |
| Schenker XMG Apex 17 (Late 23) | |
| Média da turma Gaming (8810 - 11935, n=97, últimos 2 anos) | |
| Acer Nitro 17 AN17-51-71ER | |
| Medion Erazer Defender P40 | |
| PCMark 10 / Productivity | |
| Média da turma Gaming (6845 - 25323, n=95, últimos 2 anos) | |
| Schenker XMG Apex 17 (Late 23) | |
| Tulpar T7 V20.6 | |
| Medion Erazer Defender P40 | |
| Média Intel Core i7-13700H, NVIDIA GeForce RTX 4060 Laptop GPU (8238 - 10249, n=5) | |
| MSI Katana 17 B13VFK | |
| Lenovo Legion 5 16IRX G9 | |
| Acer Nitro 17 AN17-51-71ER | |
| PCMark 10 / Digital Content Creation | |
| Média da turma Gaming (7602 - 19954, n=95, últimos 2 anos) | |
| Schenker XMG Apex 17 (Late 23) | |
| Lenovo Legion 5 16IRX G9 | |
| Acer Nitro 17 AN17-51-71ER | |
| Média Intel Core i7-13700H, NVIDIA GeForce RTX 4060 Laptop GPU (10308 - 11862, n=5) | |
| Tulpar T7 V20.6 | |
| MSI Katana 17 B13VFK | |
| Medion Erazer Defender P40 | |
| CrossMark / Overall | |
| Lenovo Legion 5 16IRX G9 | |
| Média da turma Gaming (1366 - 2409, n=94, últimos 2 anos) | |
| MSI Katana 17 B13VFK | |
| Schenker XMG Apex 17 (Late 23) | |
| Medion Erazer Defender P40 | |
| Tulpar T7 V20.6 | |
| Média Intel Core i7-13700H, NVIDIA GeForce RTX 4060 Laptop GPU (1629 - 1849, n=5) | |
| Acer Nitro 17 AN17-51-71ER | |
| CrossMark / Productivity | |
| Lenovo Legion 5 16IRX G9 | |
| Média da turma Gaming (1386 - 2254, n=94, últimos 2 anos) | |
| MSI Katana 17 B13VFK | |
| Schenker XMG Apex 17 (Late 23) | |
| Tulpar T7 V20.6 | |
| Medion Erazer Defender P40 | |
| Média Intel Core i7-13700H, NVIDIA GeForce RTX 4060 Laptop GPU (1561 - 1743, n=5) | |
| Acer Nitro 17 AN17-51-71ER | |
| CrossMark / Creativity | |
| Lenovo Legion 5 16IRX G9 | |
| Média da turma Gaming (1343 - 2786, n=94, últimos 2 anos) | |
| MSI Katana 17 B13VFK | |
| Medion Erazer Defender P40 | |
| Schenker XMG Apex 17 (Late 23) | |
| Média Intel Core i7-13700H, NVIDIA GeForce RTX 4060 Laptop GPU (1691 - 2064, n=5) | |
| Tulpar T7 V20.6 | |
| Acer Nitro 17 AN17-51-71ER | |
| CrossMark / Responsiveness | |
| Lenovo Legion 5 16IRX G9 | |
| MSI Katana 17 B13VFK | |
| Média da turma Gaming (1226 - 2334, n=94, últimos 2 anos) | |
| Schenker XMG Apex 17 (Late 23) | |
| Acer Nitro 17 AN17-51-71ER | |
| Medion Erazer Defender P40 | |
| Média Intel Core i7-13700H, NVIDIA GeForce RTX 4060 Laptop GPU (1381 - 1656, n=5) | |
| Tulpar T7 V20.6 | |
| WebXPRT 3 / Overall | |
| Média da turma Gaming (220 - 532, n=98, últimos 2 anos) | |
| Lenovo Legion 5 16IRX G9 | |
| Schenker XMG Apex 17 (Late 23) | |
| Tulpar T7 V20.6 | |
| MSI Katana 17 B13VFK | |
| Medion Erazer Defender P40 | |
| Média Intel Core i7-13700H, NVIDIA GeForce RTX 4060 Laptop GPU (215 - 314, n=4) | |
| Acer Nitro 17 AN17-51-71ER | |
| WebXPRT 4 / Overall | |
| Média da turma Gaming (165 - 354, n=98, últimos 2 anos) | |
| Lenovo Legion 5 16IRX G9 | |
| Tulpar T7 V20.6 | |
| MSI Katana 17 B13VFK | |
| Média Intel Core i7-13700H, NVIDIA GeForce RTX 4060 Laptop GPU (228 - 274, n=4) | |
| Medion Erazer Defender P40 | |
| Schenker XMG Apex 17 (Late 23) | |
| Acer Nitro 17 AN17-51-71ER | |
| Mozilla Kraken 1.1 / Total | |
| Acer Nitro 17 AN17-51-71ER | |
| Medion Erazer Defender P40 | |
| MSI Katana 17 B13VFK | |
| Schenker XMG Apex 17 (Late 23) | |
| Média Intel Core i7-13700H, NVIDIA GeForce RTX 4060 Laptop GPU (495 - 570, n=4) | |
| Tulpar T7 V20.6 | |
| Lenovo Legion 5 16IRX G9 | |
| Média da turma Gaming (391 - 590, n=100, últimos 2 anos) | |
* ... menor é melhor
| PCMark 10 Score | 7463 pontos | |
Ajuda | ||
| AIDA64 / Memory Copy | |
| Média da turma Gaming (21750 - 129946, n=105, últimos 2 anos) | |
| Schenker XMG Apex 17 (Late 23) | |
| Média Intel Core i7-13700H (24334 - 78081, n=29) | |
| Lenovo Legion 5 16IRX G9 | |
| Acer Nitro 17 AN17-51-71ER | |
| Medion Erazer Defender P40 | |
| MSI Katana 17 B13VFK | |
| Tulpar T7 V20.6 | |
| AIDA64 / Memory Read | |
| Média da turma Gaming (22956 - 118858, n=105, últimos 2 anos) | |
| Lenovo Legion 5 16IRX G9 | |
| Medion Erazer Defender P40 | |
| Acer Nitro 17 AN17-51-71ER | |
| Média Intel Core i7-13700H (23681 - 79656, n=29) | |
| Schenker XMG Apex 17 (Late 23) | |
| MSI Katana 17 B13VFK | |
| Tulpar T7 V20.6 | |
| AIDA64 / Memory Write | |
| Schenker XMG Apex 17 (Late 23) | |
| Média da turma Gaming (22297 - 135096, n=105, últimos 2 anos) | |
| Média Intel Core i7-13700H (22986 - 99898, n=29) | |
| Acer Nitro 17 AN17-51-71ER | |
| Medion Erazer Defender P40 | |
| Lenovo Legion 5 16IRX G9 | |
| MSI Katana 17 B13VFK | |
| Tulpar T7 V20.6 | |
| AIDA64 / Memory Latency | |
| Acer Nitro 17 AN17-51-71ER | |
| Média da turma Gaming (75.3 - 259, n=105, últimos 2 anos) | |
| MSI Katana 17 B13VFK | |
| Média Intel Core i7-13700H (82.4 - 136.8, n=29) | |
| Medion Erazer Defender P40 | |
| Lenovo Legion 5 16IRX G9 | |
| Tulpar T7 V20.6 | |
| Schenker XMG Apex 17 (Late 23) | |
* ... menor é melhor
Latências de DPC
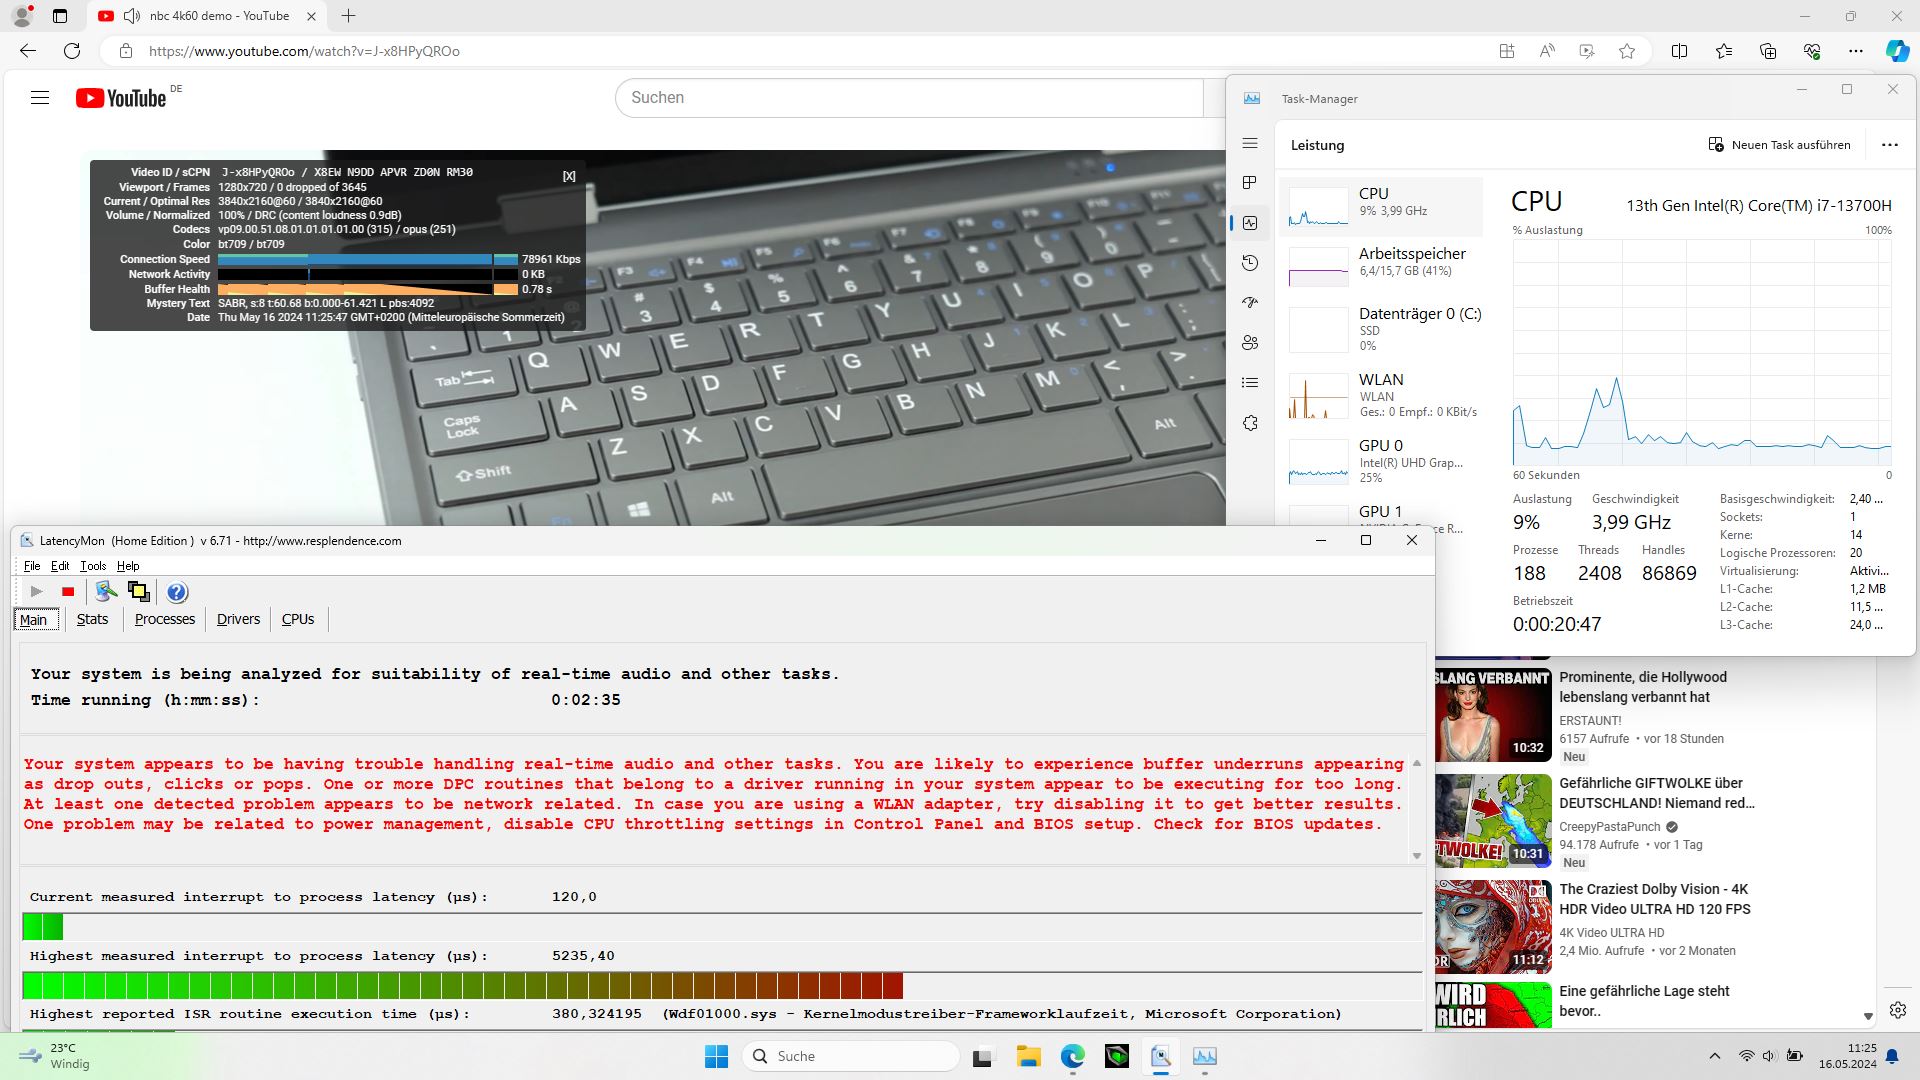
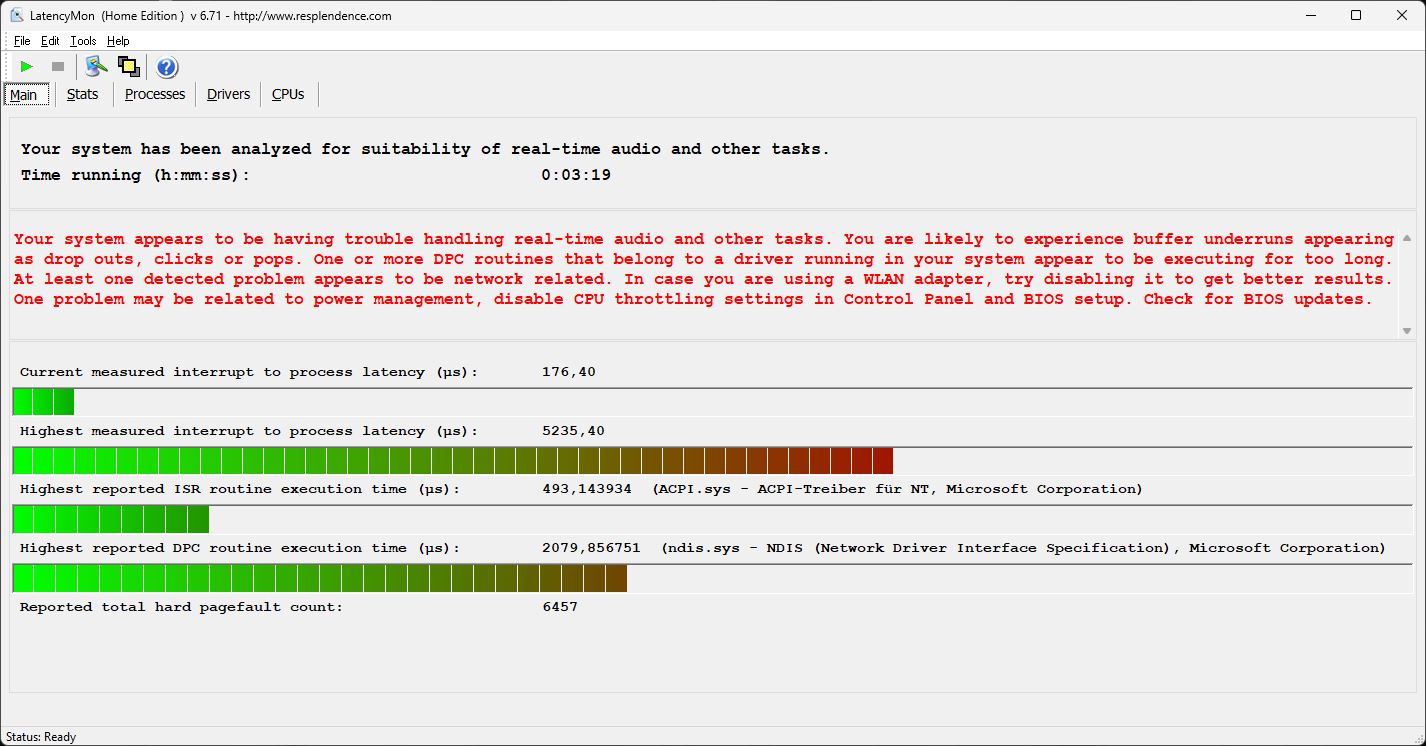
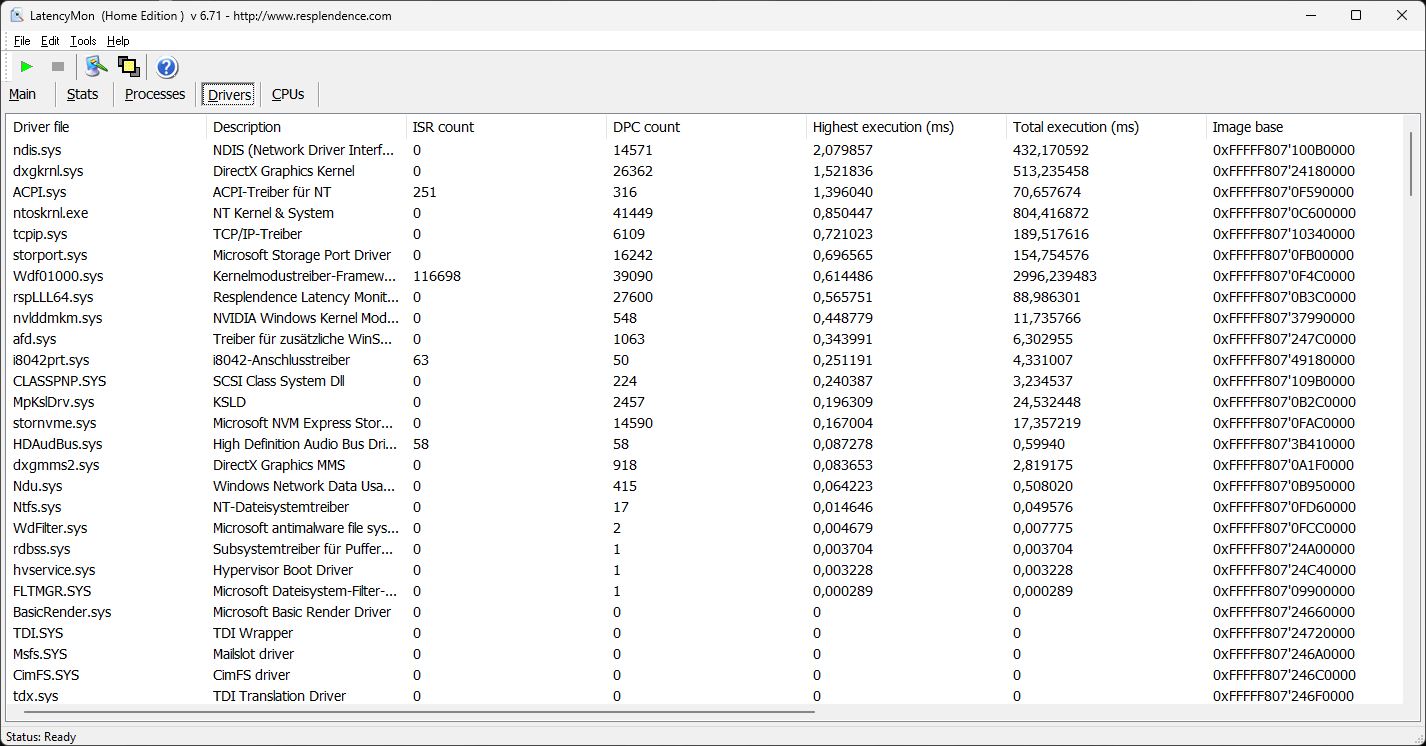
Infelizmente, já notamos os primeiros problemas de latência ao mover a janela do software LatencyMon. Abrir o navegador aumentou ainda mais o valor da latência, enquanto abrir várias guias depois não aumentou. Até esse ponto, o valor de cerca de 500 μs que medimos ainda está dentro de uma faixa tolerável.
Entretanto, ao reproduzir nosso vídeo 4K/60fps do YouTube, o valor do atraso subiu para mais de 5.000 μs! Mesmo assim, não houve queda de quadros. No entanto, o valor ainda é claramente muito alto.
| DPC Latencies / LatencyMon - interrupt to process latency (max), Web, Youtube, Prime95 | |
| Tulpar T7 V20.6 | |
| Medion Erazer Defender P40 | |
| MSI Katana 17 B13VFK | |
| Lenovo Legion 5 16IRX G9 | |
| Acer Nitro 17 AN17-51-71ER | |
| Schenker XMG Apex 17 (Late 23) | |
* ... menor é melhor
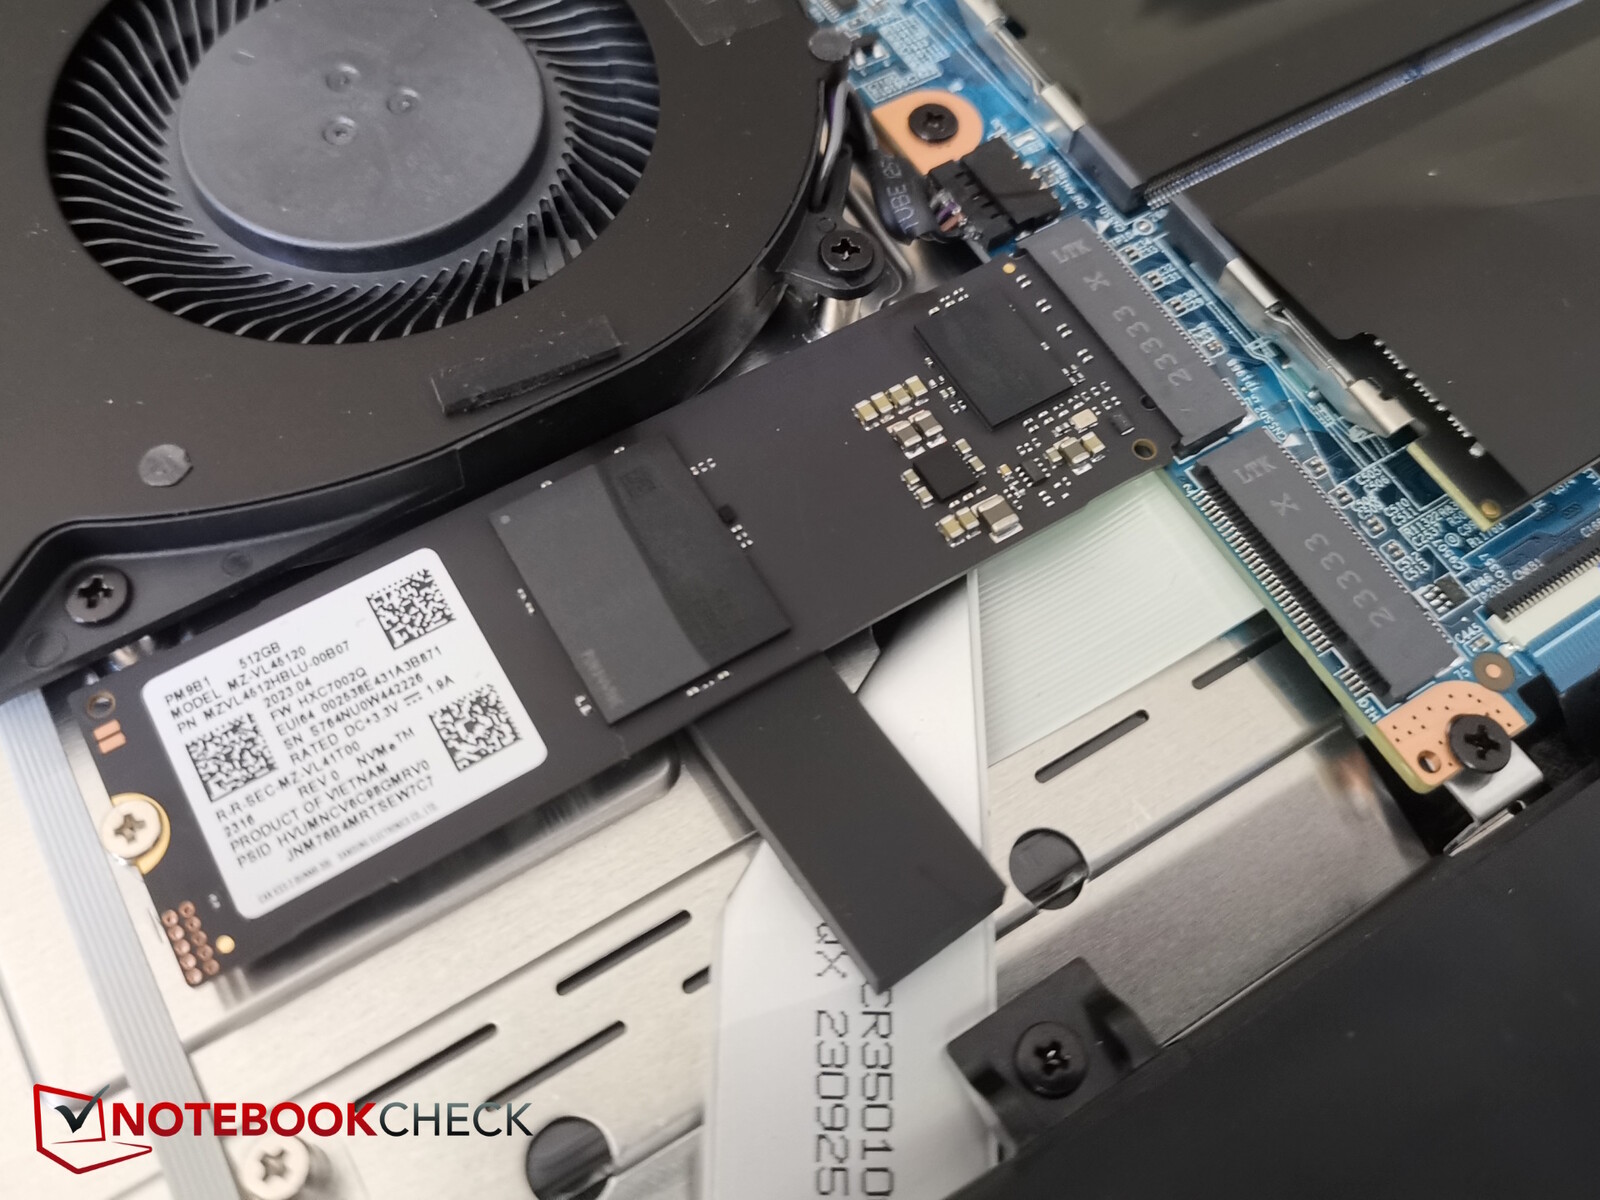
Dispositivos de armazenamento
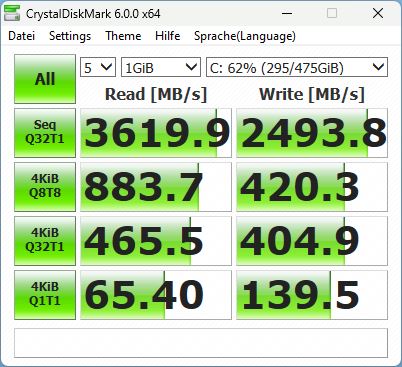
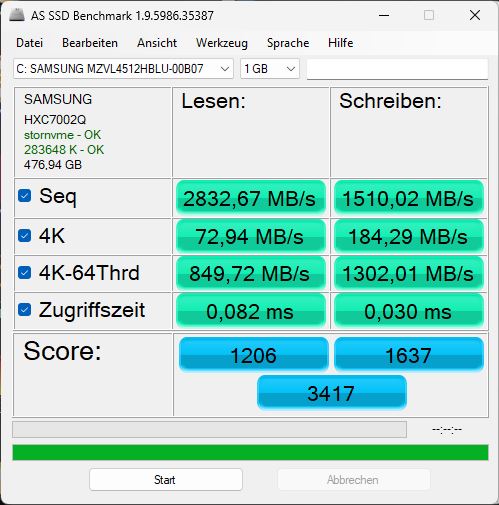
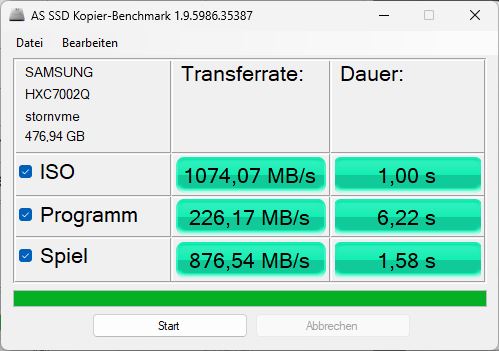
O SSD NVMe da Samsung instalado com apenas 500 GB de armazenamento é um pouco mais antigo e, como resultado, não é particularmente rápido, também porque tem um desempenho ligeiramente inferior dentro do T7. A concorrência é claramente mais rápida nesse aspecto. Definitivamente, o senhor deve optar por uma configuração do T7 com 1 TB de armazenamento. No entanto, não é preciso se preocupar, pois a velocidade deve ser suficiente para o trabalho diário e para jogos, e ele também teve um desempenho um pouco melhor no teste Crystaldiskmark. Afinal, seu desempenho permaneceu constante por um longo período de tempo.

* ... menor é melhor
Reading continuous performance: DiskSpd Read Loop, Queue Depth 8
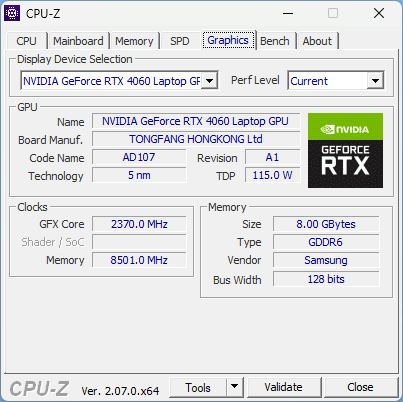
Placa de vídeo
Todos os modelos T7 são equipados com uma Nvidia Geforce RTX 4060. A Tulpar não forneceu nenhuma informação sobre seu desempenho, mas o painel de controle da Nvidia indica 140 watts. A RTX 4060 deve ser capaz de executar quase todos os jogos atuais em Full HD com detalhes médios a altos, o que é compatível com a tela instalada.
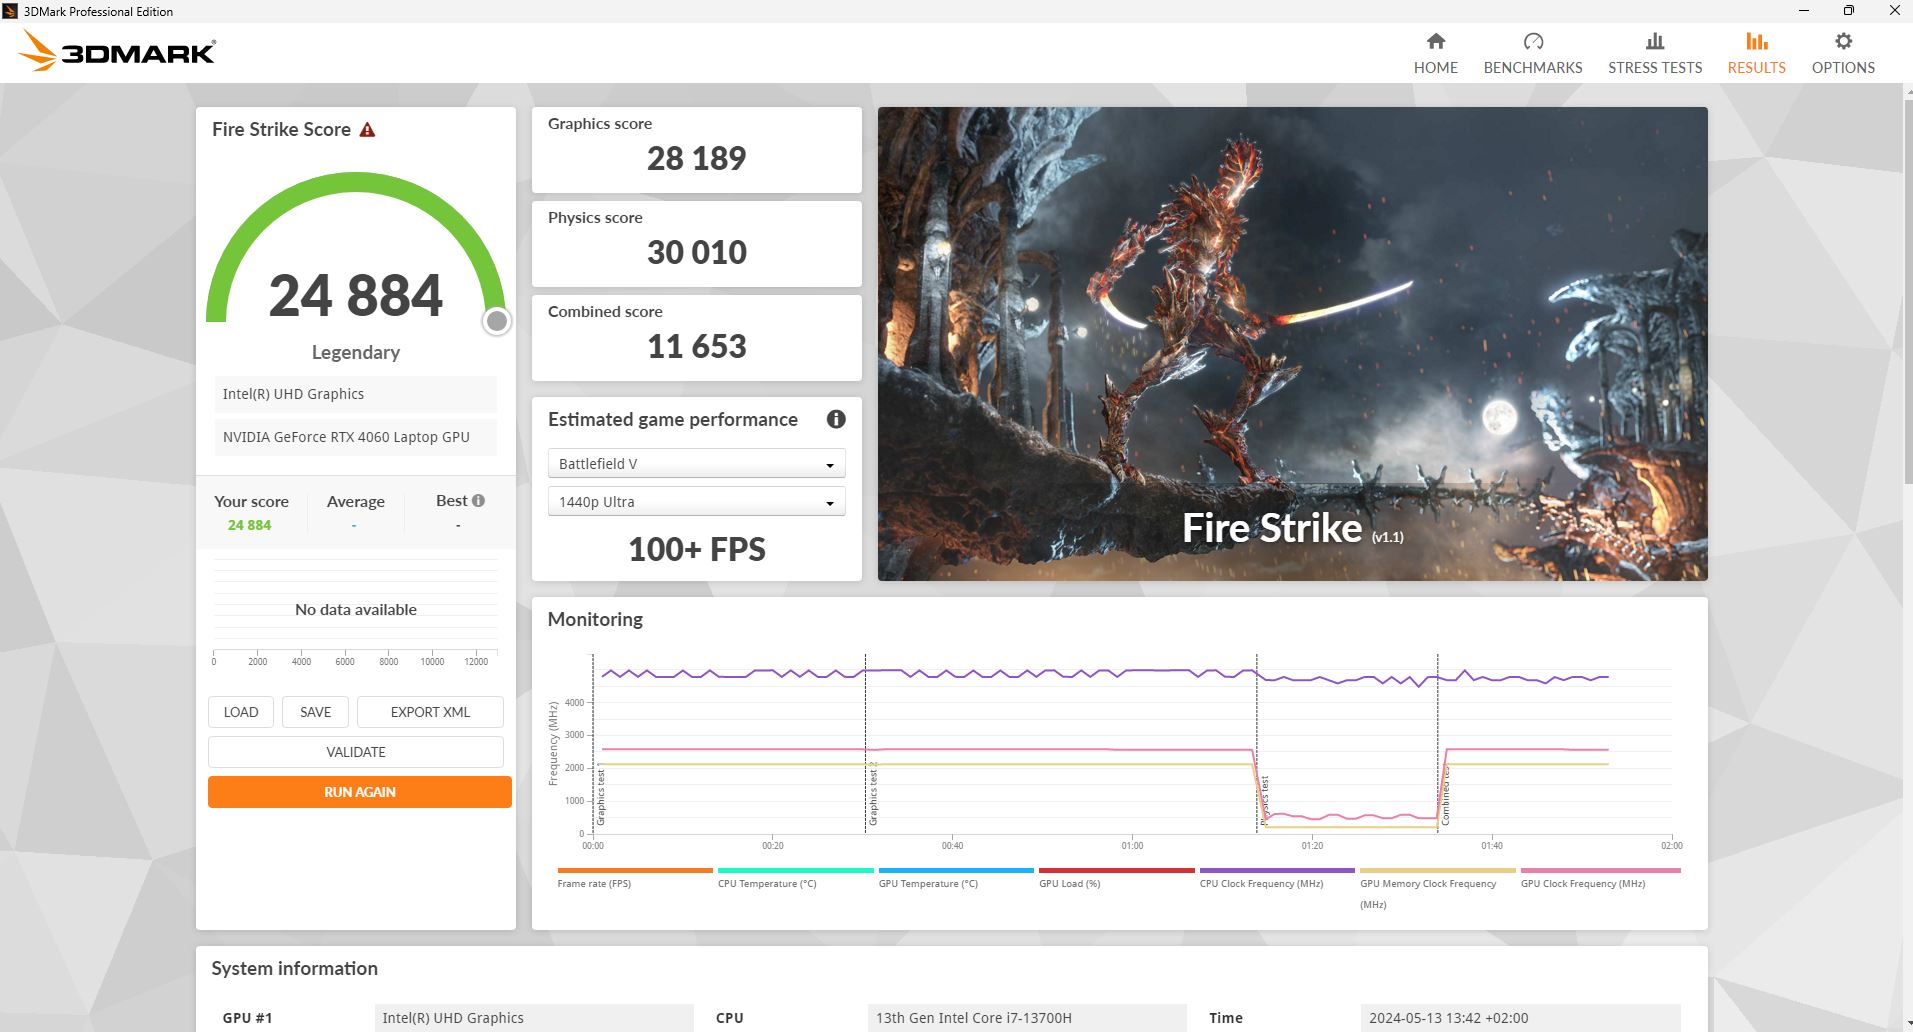
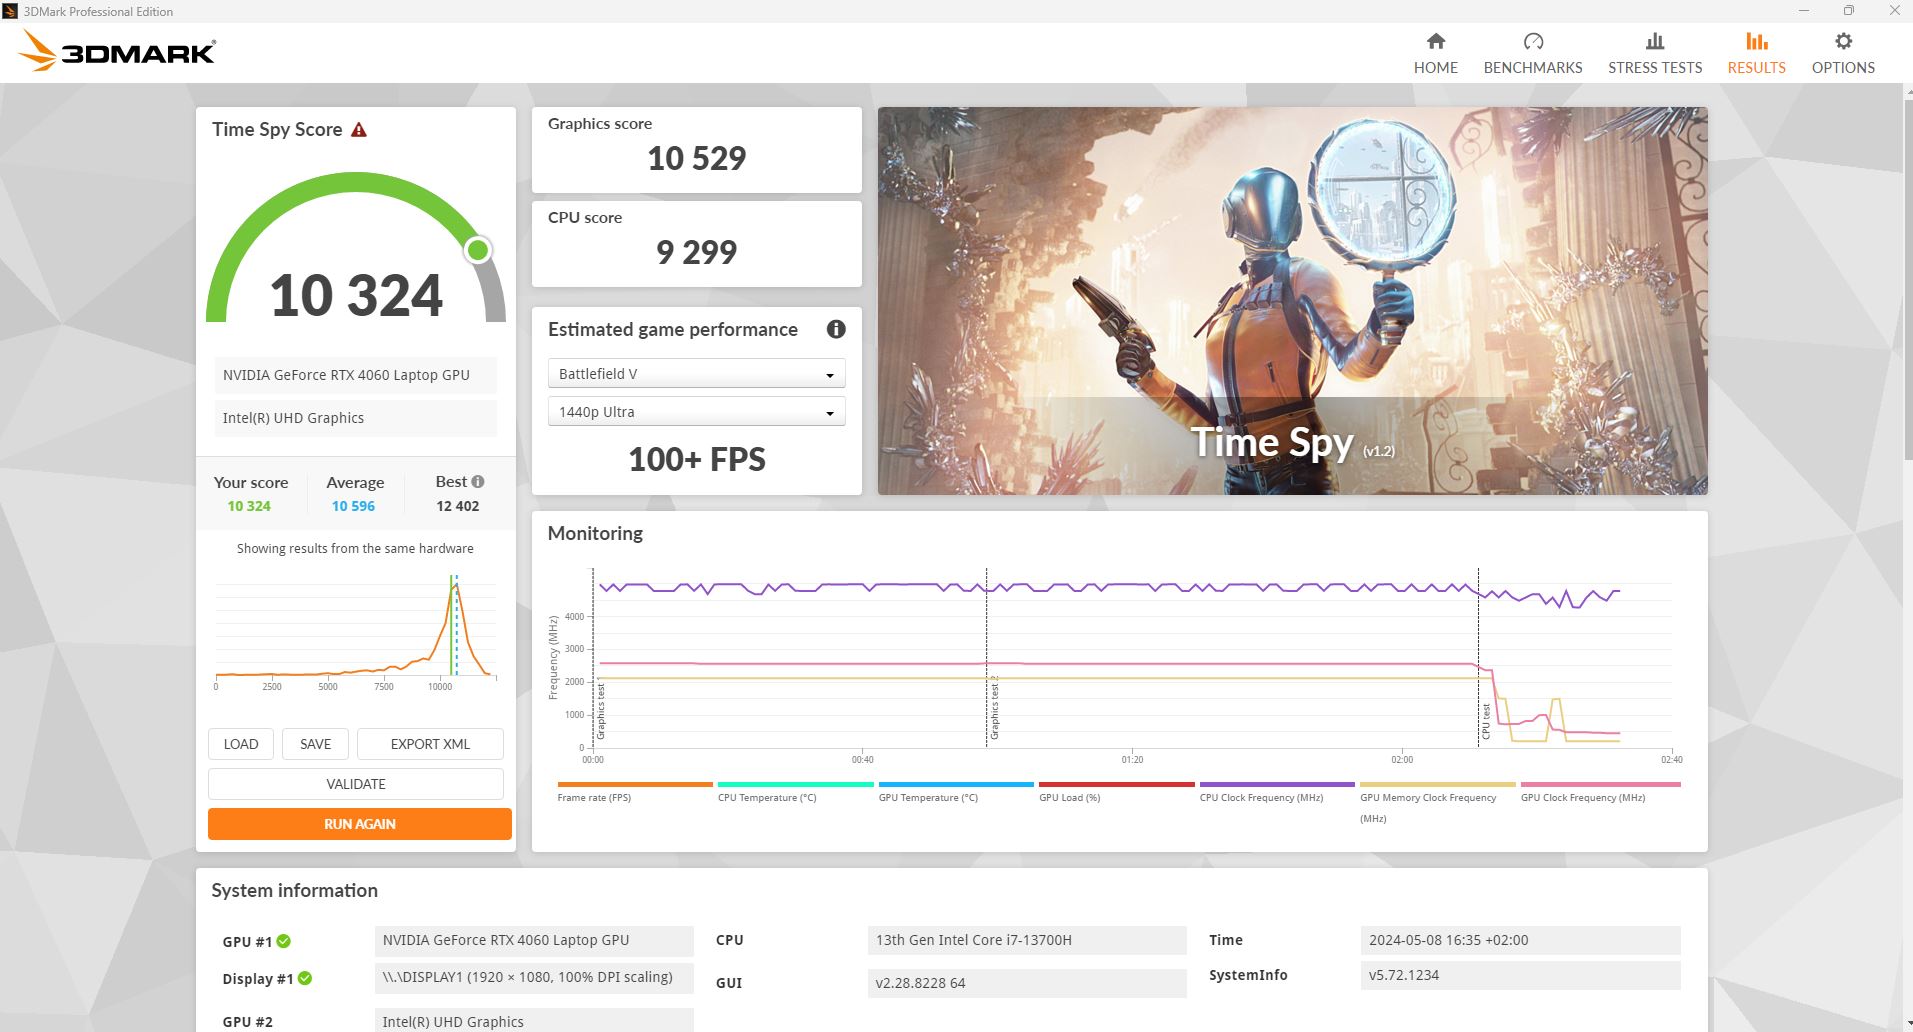
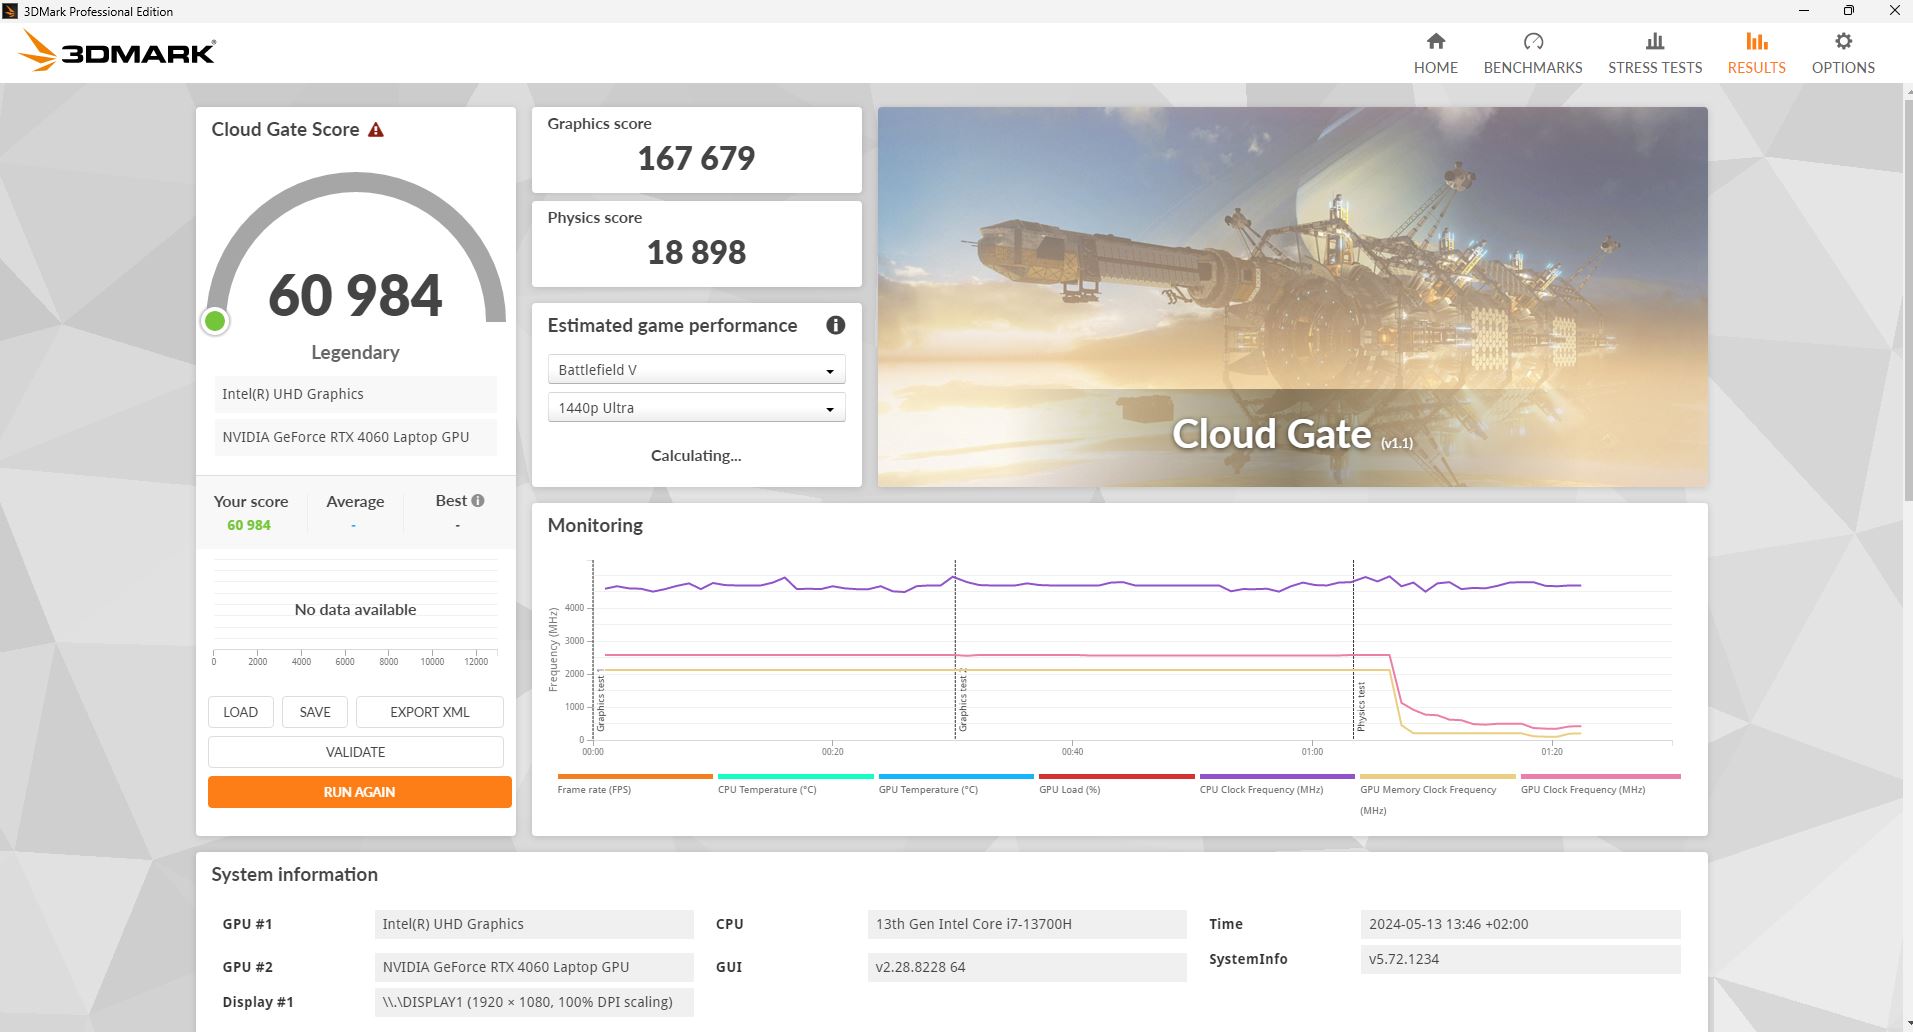
Nos testes sintéticos do 3DMark, seu desempenho 3D foi muito bom e cerca de 10% melhor do que o de um laptop comum com a mesma GPU.
Uma execução repetida do Fire Strike no modo de bateria resultou em uma perda de desempenho 3D de cerca de 85%, o que é uma queda enorme! Aparentemente, apenas a GPU integrada está funcionando aqui. Se o Optimus for desativado (apenas a dGPU ativa), sua pontuação aumentará significativamente e a perda de desempenho será minimizada para cerca de 56%.
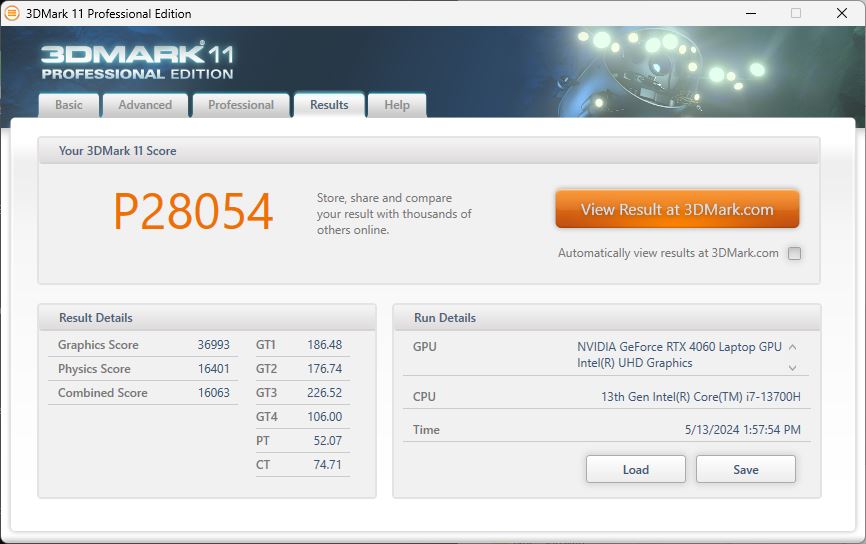
| 3DMark 11 Performance | 28054 pontos | |
| 3DMark Cloud Gate Standard Score | 60984 pontos | |
| 3DMark Fire Strike Score | 24884 pontos | |
| 3DMark Time Spy Score | 10324 pontos | |
Ajuda | ||
* ... menor é melhor
Desempenho em jogos
Infelizmente, o laptop Tulpar não conseguiu manter seus bons resultados no 3DMark na comparação de jogos, pois frequentemente perdia para a concorrência e acabava na parte inferior da classificação. O XMG estava em um nível semelhante, mas muitos de seus concorrentes eram 10% mais rápidos.
Ao executar o jogo atual Skull & Bones, o T7 ainda atinge uma média de 65 fps jogáveis em Full HD e com ultra detalhes.
| Performance rating - Percent | |
| Média da turma Gaming | |
| Lenovo Legion 5 16IRX G9 | |
| MSI Katana 17 B13VFK | |
| Acer Nitro 17 AN17-51-71ER | |
| Medion Erazer Defender P40 | |
| Schenker XMG Apex 17 (Late 23) -1! | |
| Tulpar T7 V20.6 | |
| The Witcher 3 - 1920x1080 Ultra Graphics & Postprocessing (HBAO+) | |
| Média da turma Gaming (104.7 - 240, n=6, últimos 2 anos) | |
| Acer Nitro 17 AN17-51-71ER | |
| MSI Katana 17 B13VFK | |
| Schenker XMG Apex 17 (Late 23) | |
| Medion Erazer Defender P40 | |
| Tulpar T7 V20.6 | |
| Lenovo Legion 5 16IRX G9 | |
| GTA V - 1920x1080 Highest AA:4xMSAA + FX AF:16x | |
| Média da turma Gaming (48.3 - 186.9, n=93, últimos 2 anos) | |
| Lenovo Legion 5 16IRX G9 | |
| Acer Nitro 17 AN17-51-71ER | |
| Medion Erazer Defender P40 | |
| MSI Katana 17 B13VFK | |
| Tulpar T7 V20.6 | |
| Final Fantasy XV Benchmark - 1920x1080 High Quality | |
| Média da turma Gaming (41 - 215, n=95, últimos 2 anos) | |
| Lenovo Legion 5 16IRX G9 | |
| Schenker XMG Apex 17 (Late 23) | |
| Acer Nitro 17 AN17-51-71ER | |
| Medion Erazer Defender P40 | |
| MSI Katana 17 B13VFK | |
| Tulpar T7 V20.6 | |
| Strange Brigade - 1920x1080 ultra AA:ultra AF:16 | |
| Média da turma Gaming (76.3 - 456, n=86, últimos 2 anos) | |
| Lenovo Legion 5 16IRX G9 | |
| Tulpar T7 V20.6 | |
| Acer Nitro 17 AN17-51-71ER | |
| Schenker XMG Apex 17 (Late 23) | |
| Medion Erazer Defender P40 | |
| MSI Katana 17 B13VFK | |
| Dota 2 Reborn - 1920x1080 ultra (3/3) best looking | |
| Lenovo Legion 5 16IRX G9 | |
| MSI Katana 17 B13VFK | |
| Média da turma Gaming (84.8 - 248, n=107, últimos 2 anos) | |
| Medion Erazer Defender P40 | |
| Schenker XMG Apex 17 (Late 23) | |
| Acer Nitro 17 AN17-51-71ER | |
| Tulpar T7 V20.6 | |
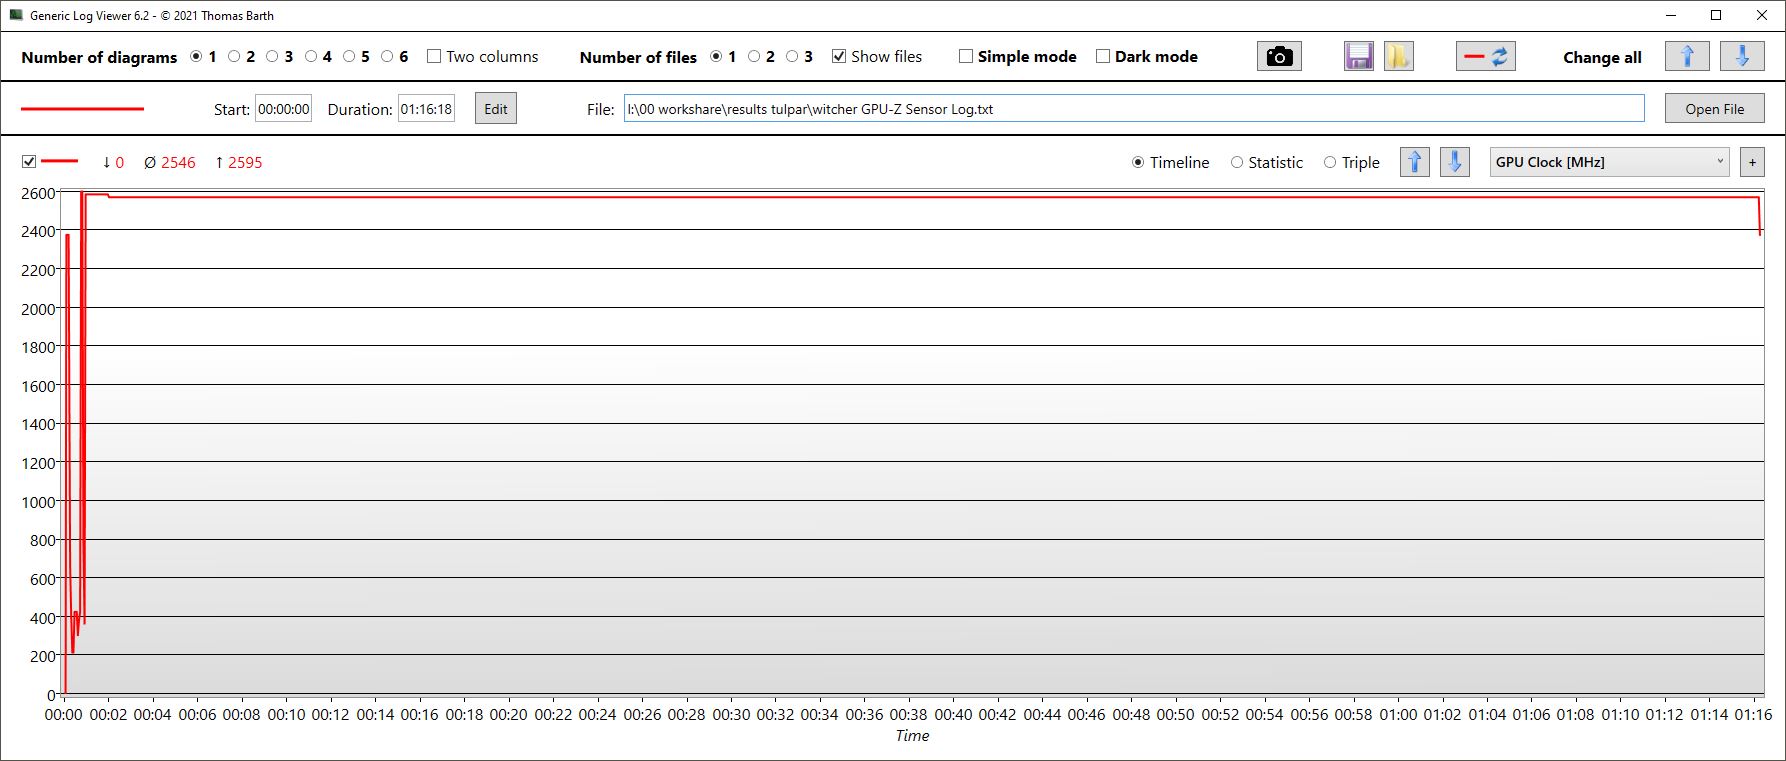
O gráfico do Witcher 3 o gráfico segue a curva dia/noite habitual e, fora isso, seu desempenho é muito consistente. O T7 não é tão rápido quanto alguns de seus concorrentes, mas a diferença não é muito grande.
A taxa de clock da GPU é constante em torno de 2,6 GHz, enquanto o clock da memória é de 2,1 GHz. A GPU aquece até 72 °C e até um máximo de 75,5 °C. O consumo da placa de vídeo é de cerca de 97 watts, o que ainda está longe dos 140 watts possíveis.
No modo entusiasta, sua taxa de clock cai de 100 a 150 MHz, mas a evolução da temperatura é semelhante. Seu consumo de energia é de cerca de 94 watts.
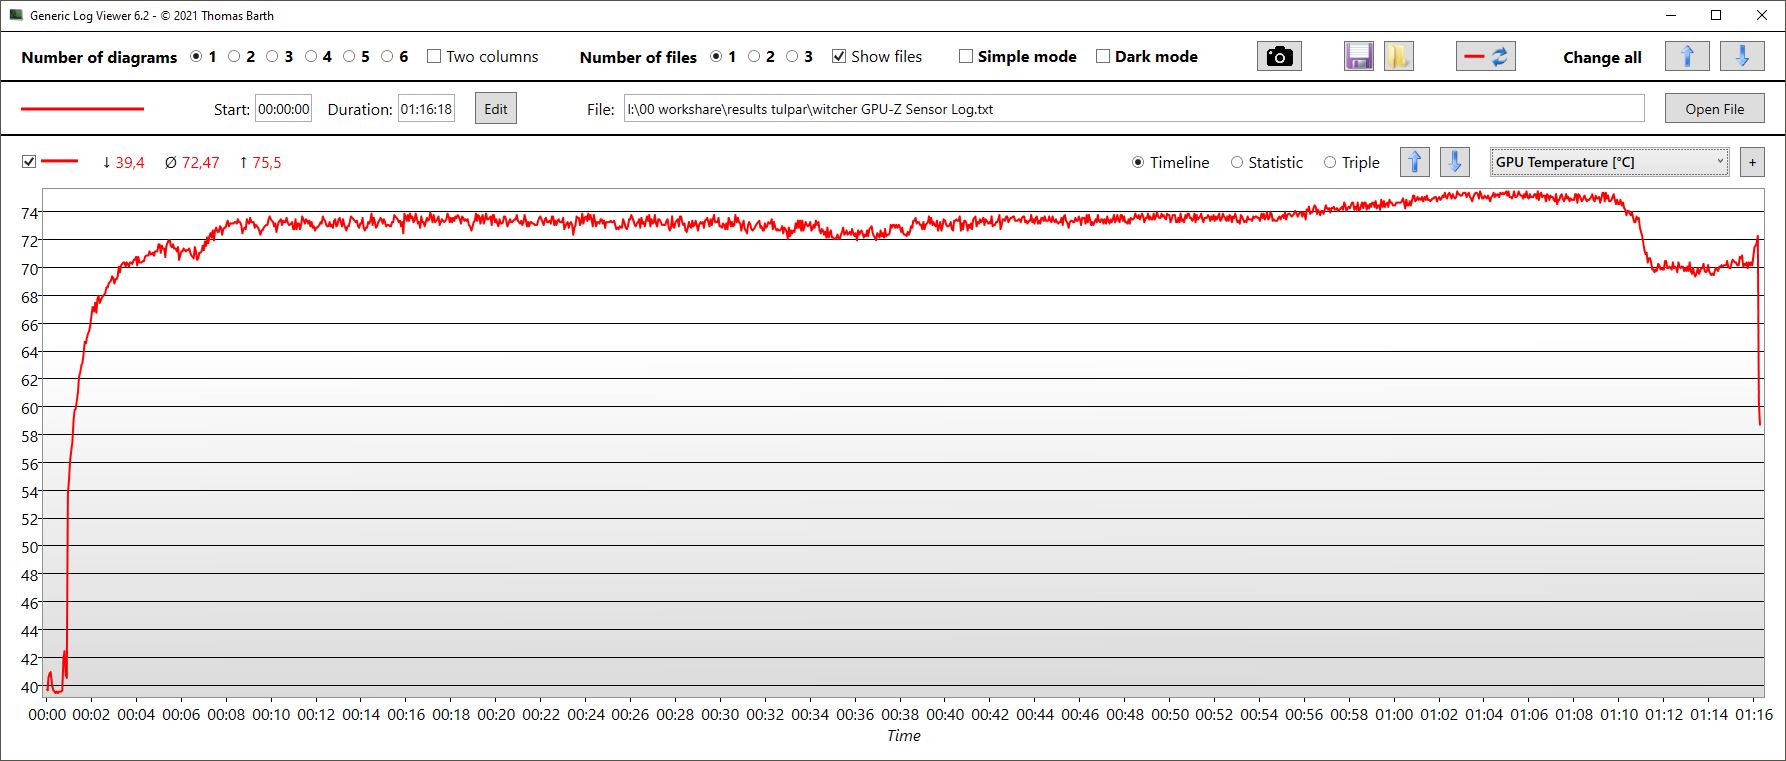
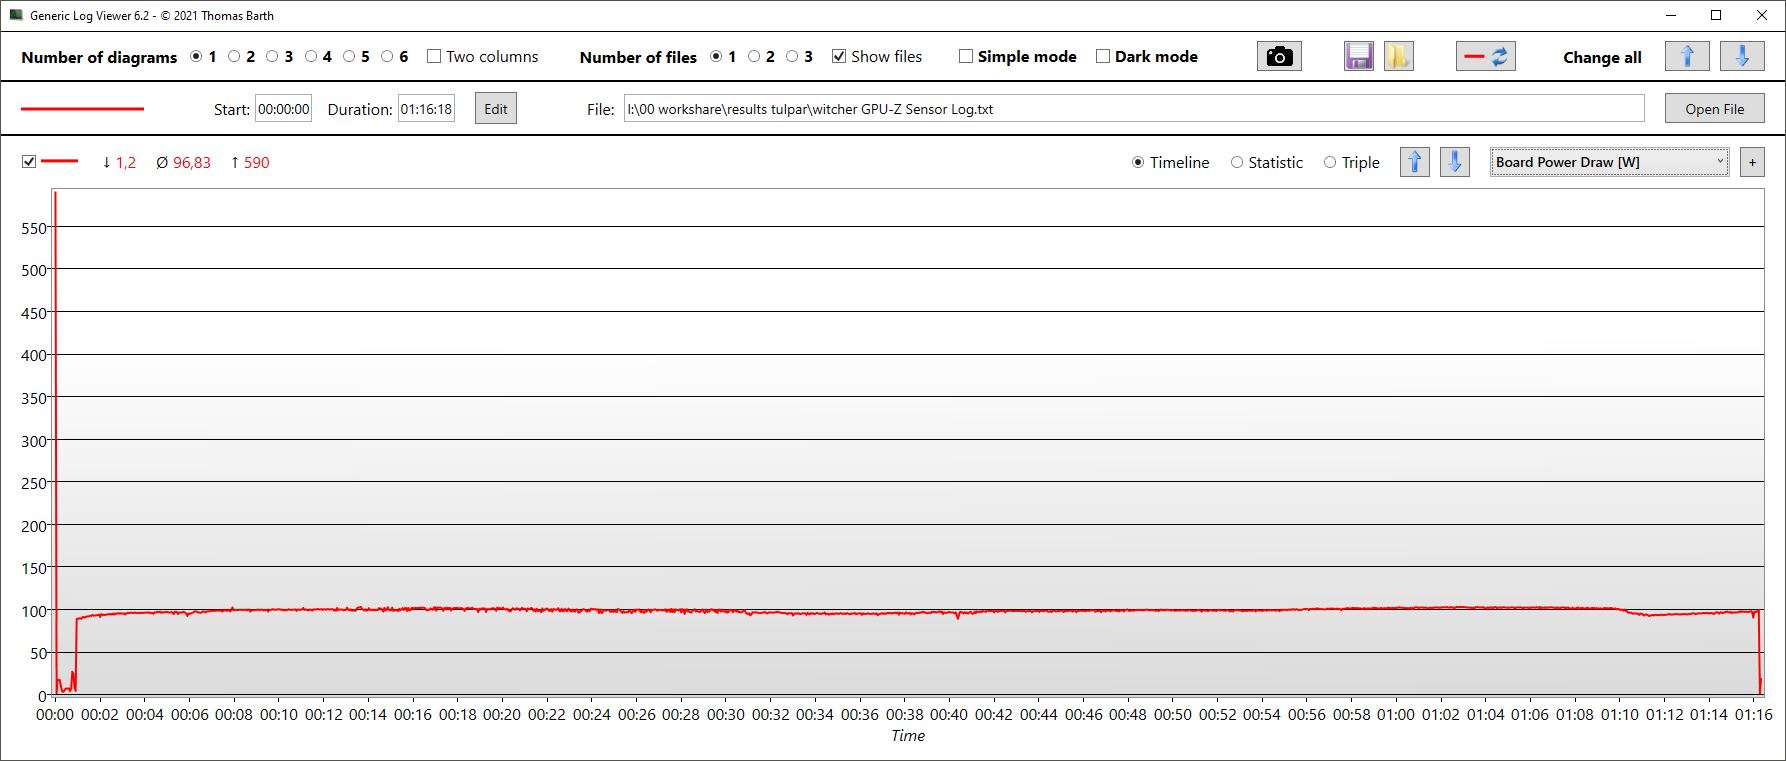
| Modo de desempenho/valor de medição | Witcher 3 fps | Relógio da GPU (em GHz) | Temperatura da GPU (em °C) | Consumo de energia da GPU (em watts) |
|---|---|---|---|---|
| Overboost | 97 | 2.6 | 73 | 97 |
| Entusiasta | 90 | 2.45 | 72 | 94 |
| Balanceado | 64 | 1.7 | 57 | 49 |
Witcher 3 FPS diagram
| baixo | média | alto | ultra | |
|---|---|---|---|---|
| GTA V (2015) | 178.3 | 172.1 | 163 | 97.8 |
| The Witcher 3 (2015) | 339 | 287 | 198 | 99.6 |
| Dota 2 Reborn (2015) | 148 | 130 | 124 | 115 |
| Final Fantasy XV Benchmark (2018) | 149.5 | 125.8 | 93.3 | |
| X-Plane 11.11 (2018) | 141.69 | 126.82 | 99.32 | |
| Far Cry 5 (2018) | 135 | 113 | 109 | 103 |
| Strange Brigade (2018) | 432 | 291 | 230 | 198.7 |
| Skull & Bones (2024) | 82 | 82 | 78 | 65 |
Emissões - Valores moderados
Emissões de ruído
Quando em marcha lenta no desktop, as ventoinhas do laptop geralmente estão desligadas. Isso também se aplica ao modo overdrive, mas ao usá-lo, os ventiladores às vezes aumentam brevemente até 40 dB. Esse último também pode ser alcançado ao realizar tarefas menos exigentes fora do modo inativo.
No teste 3DMark06, o ruído das ventoinhas aumentou lentamente até 40 dB. No entanto, elas voltaram a ficar mais silenciosas no decorrer da execução e, no final, as ventoinhas zumbiram a 38 dB razoavelmente constantes. Os 40 dB que medimos devem, portanto, ser entendidos como o valor máximo dos ventiladores sob carga média.
Durante o Witcher 3, as ventoinhas oscilaram constantemente entre 47,5 dB e pouco menos de 50 dB. Esses são valores típicos para um jogador, mas os concorrentes representados neste teste são ainda mais barulhentos quando jogam. De modo geral, o T7 tem um desempenho muito bom em termos de ruído, mas não consegue atingir o desempenho dos outros dispositivos de comparação.
Barulho
| Ocioso |
| 23 / 23 / 30.84 dB |
| Carga |
| 40.14 / 50.69 dB |
 | ||
30 dB silencioso 40 dB(A) audível 50 dB(A) ruidosamente alto |
||
min: | ||
| Tulpar T7 V20.6 GeForce RTX 4060 Laptop GPU, i7-13700H, Samsung PM9B1 512GB MZVL4512HBLU | Schenker XMG Apex 17 (Late 23) GeForce RTX 4060 Laptop GPU, R7 7840HS, Samsung 990 Pro 1 TB | Acer Nitro 17 AN17-51-71ER GeForce RTX 4060 Laptop GPU, i7-13700H, Samsung PM9A1 MZVL21T0HCLR | Medion Erazer Defender P40 GeForce RTX 4060 Laptop GPU, i7-13700HX, Phison PS5021-E21 1TB | MSI Katana 17 B13VFK GeForce RTX 4060 Laptop GPU, i7-13620H, Micron 2400 MTFDKBA1T0QFM | Lenovo Legion 5 16IRX G9 GeForce RTX 4060 Laptop GPU, i7-14650HX, Samsung PM9A1 MZVL21T0HCLR | |
|---|---|---|---|---|---|---|
| Noise | -6% | -3% | -16% | -14% | -9% | |
| desligado / ambiente * (dB) | 23 | 24 -4% | 24 -4% | 25 -9% | 24.5 -7% | 24 -4% |
| Idle Minimum * (dB) | 23 | 25 -9% | 24 -4% | 26 -13% | 24.5 -7% | 24 -4% |
| Idle Average * (dB) | 23 | 29 -26% | 24 -4% | 27 -17% | 24.5 -7% | 28.8 -25% |
| Idle Maximum * (dB) | 30.84 | 33 -7% | 32.32 -5% | 32 -4% | 40 -30% | 32 -4% |
| Load Average * (dB) | 40.14 | 37 8% | 35.18 12% | 53 -32% | 48.3 -20% | 45.5 -13% |
| Witcher 3 ultra * (dB) | 50.69 | 50 1% | 54.78 -8% | 56 -10% | 56 -10% | 53.1 -5% |
| Load Maximum * (dB) | 50.69 | 54 -7% | 54.78 -8% | 64 -26% | 59.1 -17% | 55.7 -10% |
* ... menor é melhor
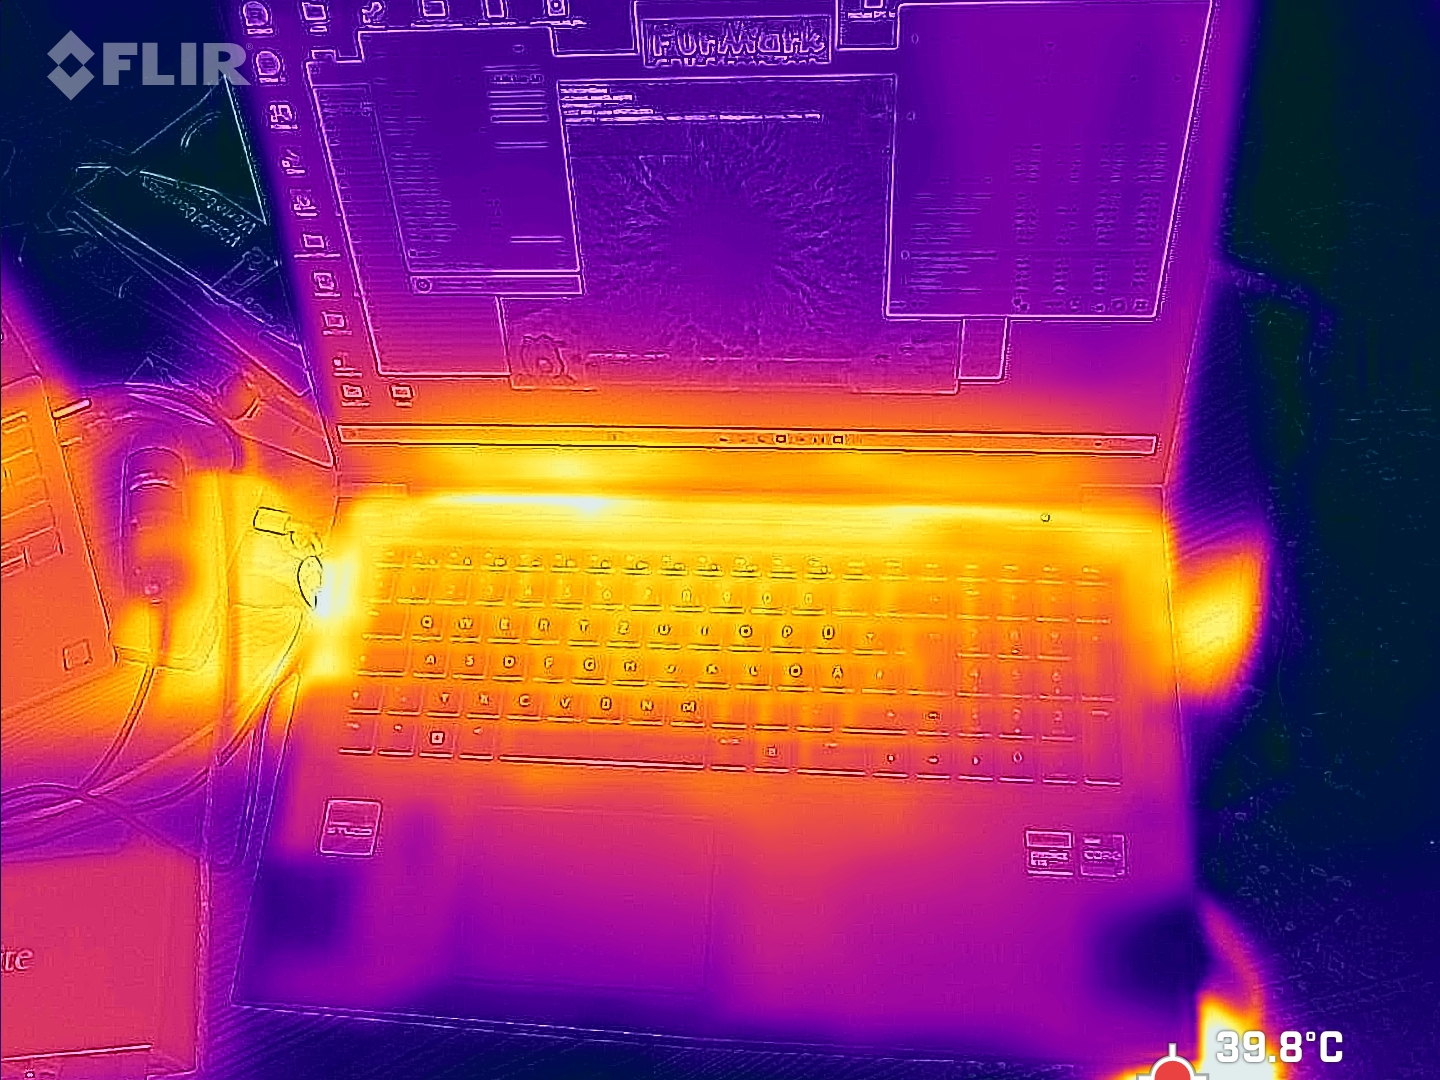
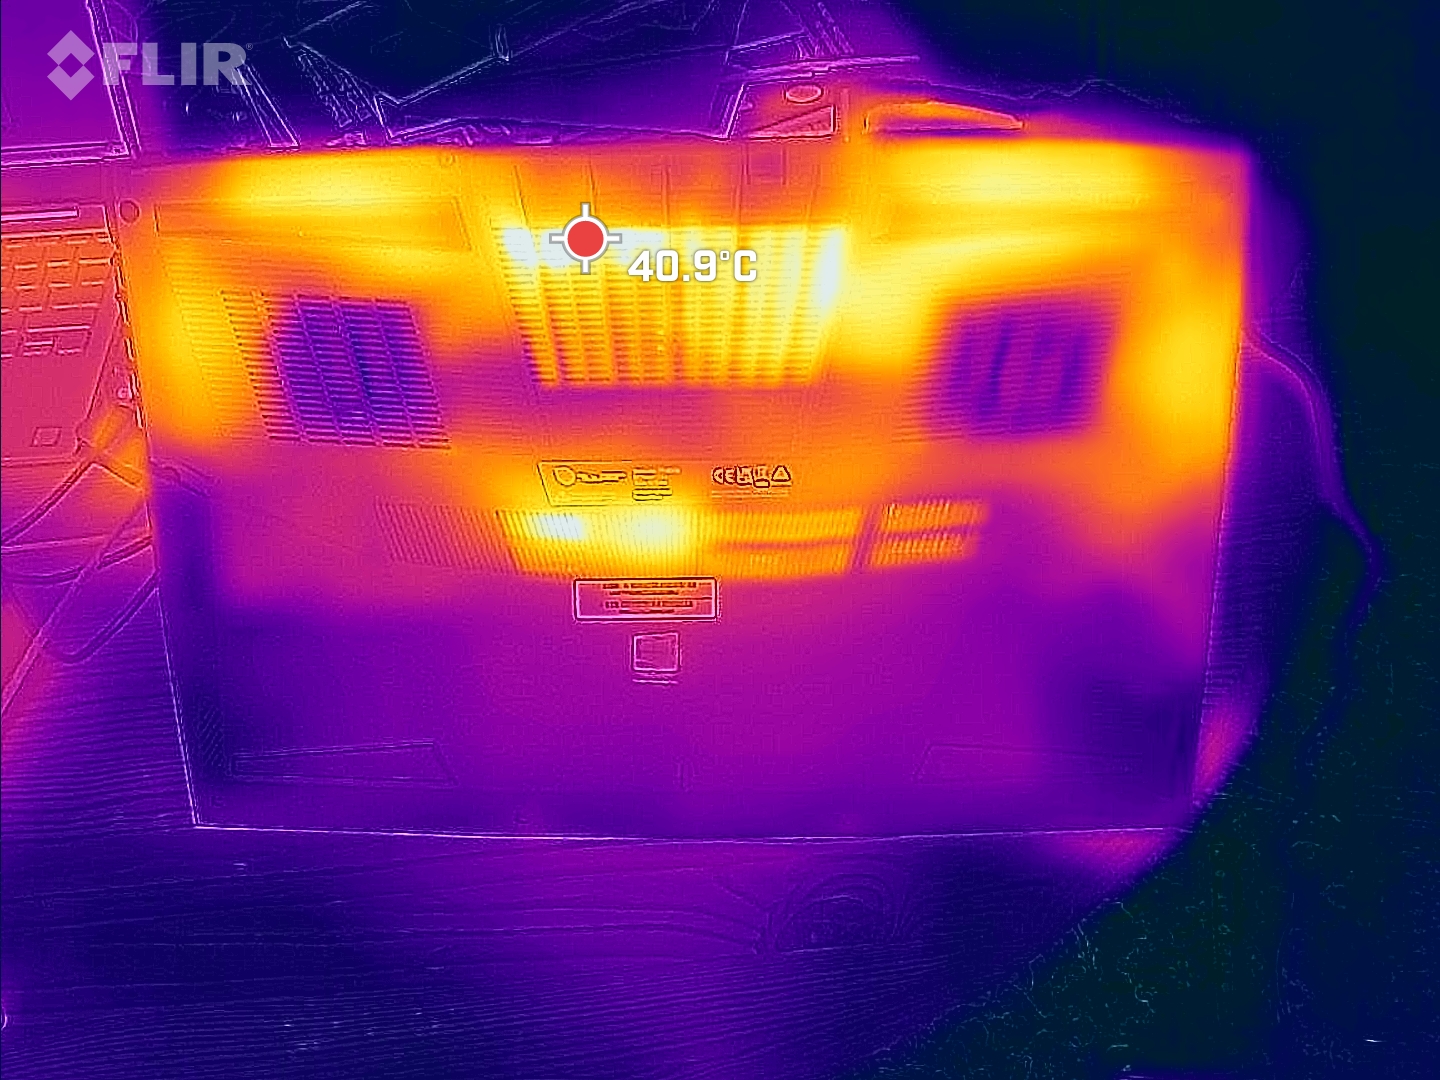
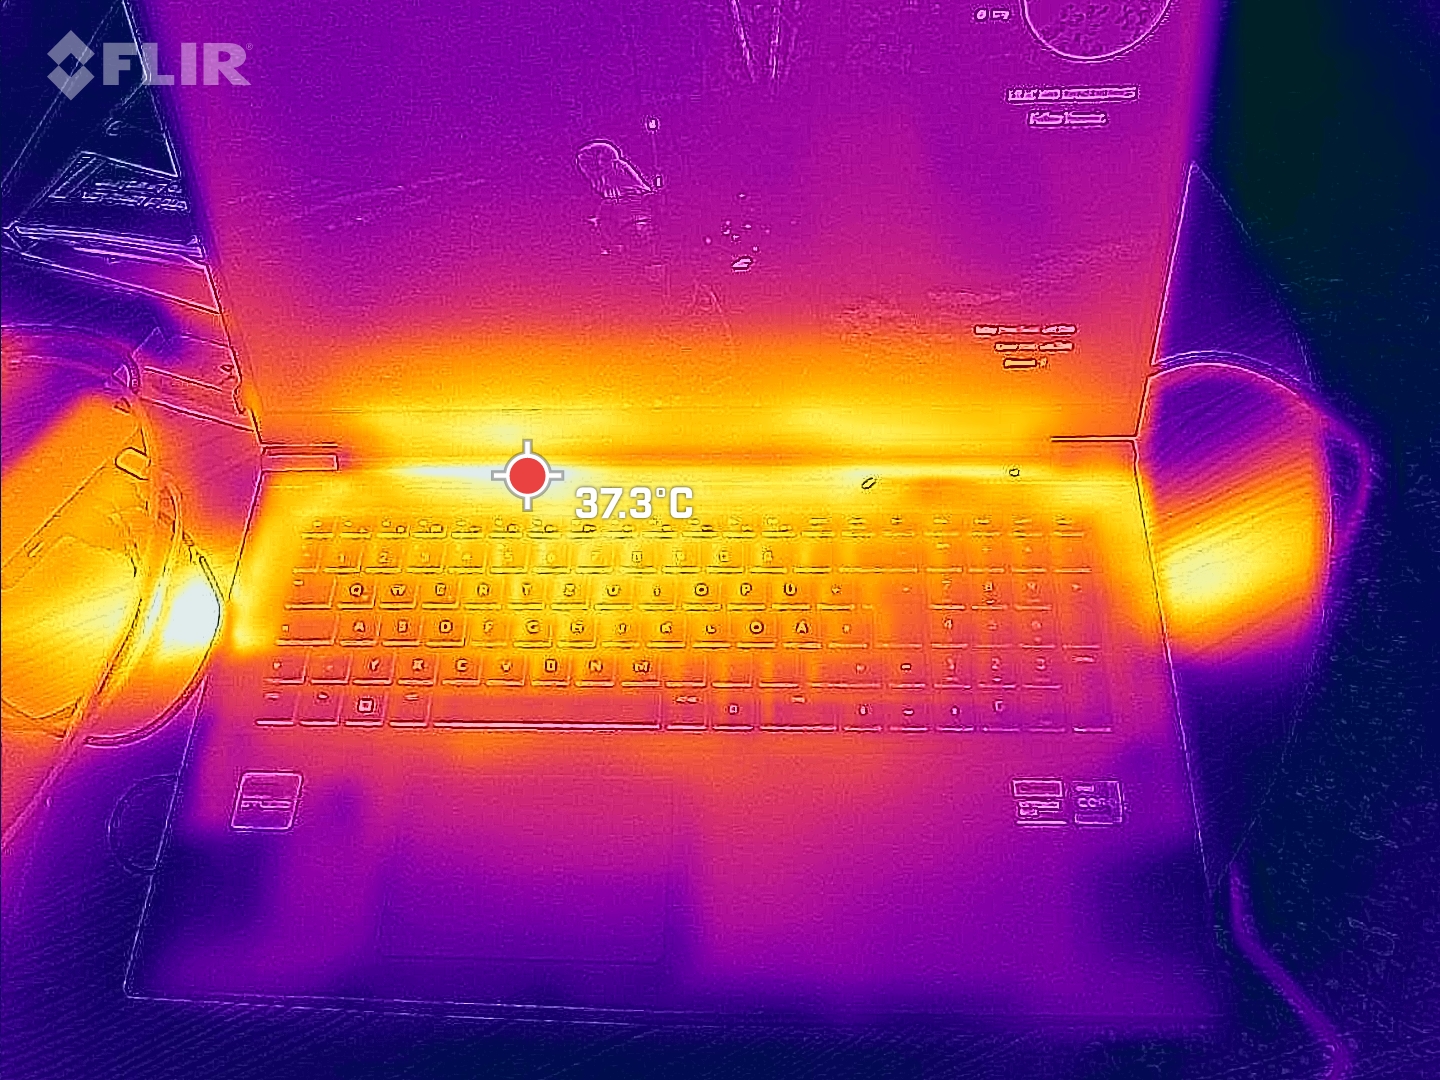
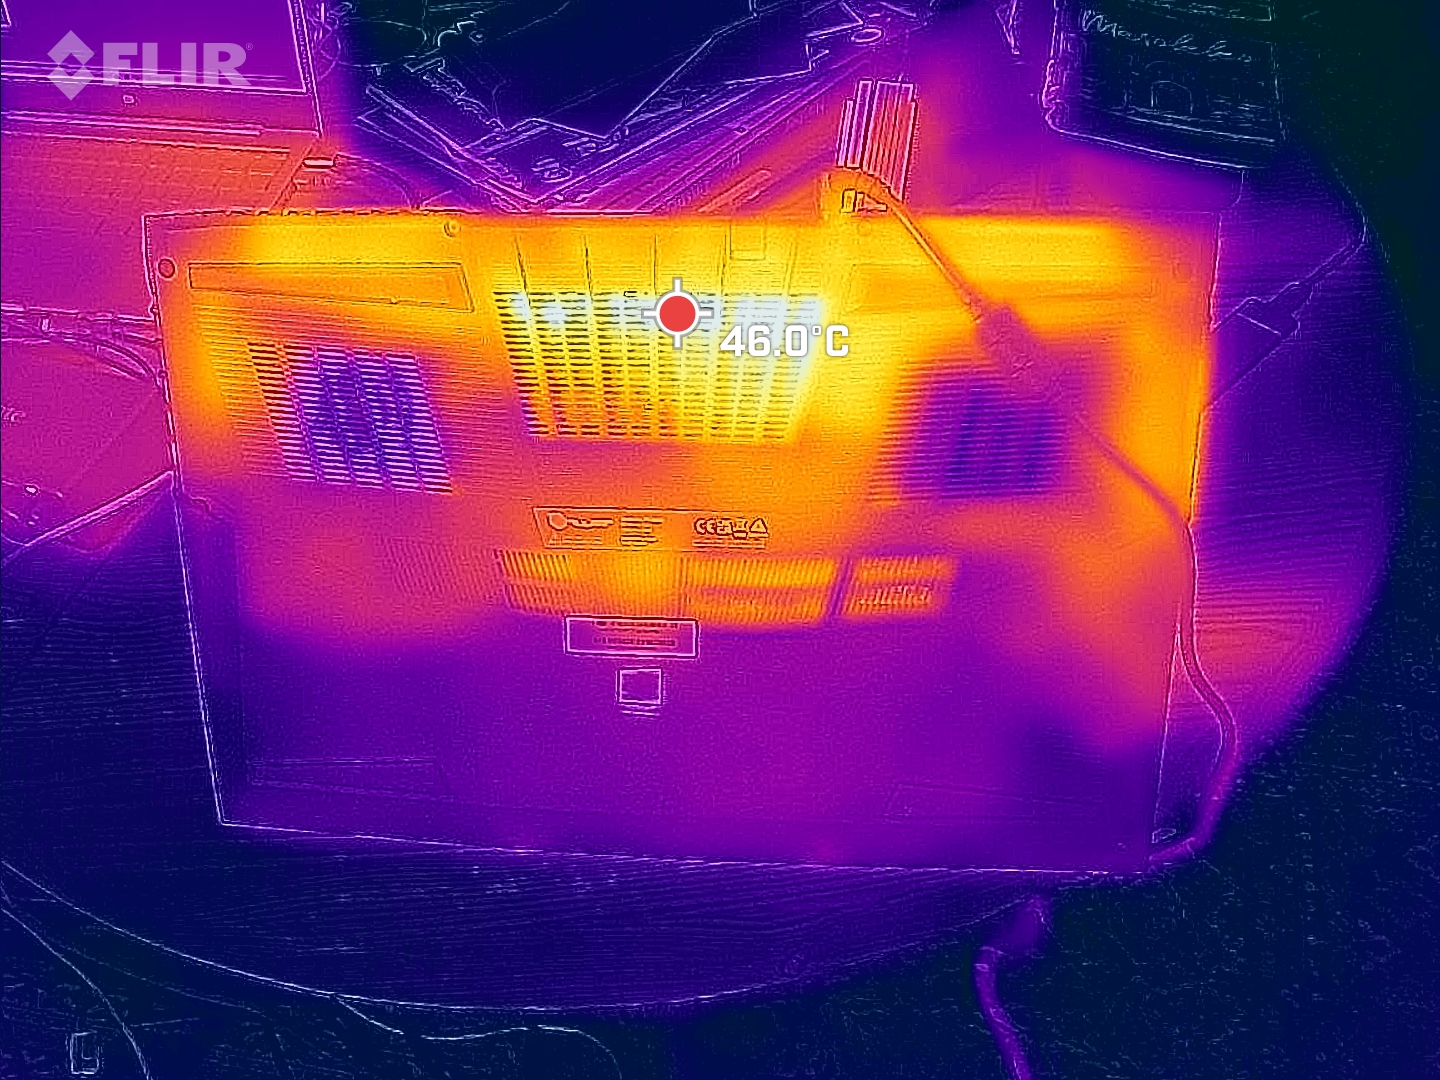
Temperatura
As temperaturas da superfície do T7 também permaneceram moderadas, com seus pontos quentes aquecendo apenas até 44 °C durante o teste de estresse.
Quando executamos o mesmo teste de estresse no modo balanceado, medimos temperaturas médias de superfície de apenas 32 °C na parte superior e 33 °C na parte inferior.
(+) A temperatura máxima no lado superior é 38 °C / 100 F, em comparação com a média de 40.4 °C / 105 F , variando de 21.2 a 68.8 °C para a classe Gaming.
(±) A parte inferior aquece até um máximo de 44 °C / 111 F, em comparação com a média de 43.2 °C / 110 F
(+) Em uso inativo, a temperatura média para o lado superior é 30 °C / 86 F, em comparação com a média do dispositivo de 33.9 °C / ### class_avg_f### F.
(±) Jogando The Witcher 3, a temperatura média para o lado superior é 34.3 °C / 94 F, em comparação com a média do dispositivo de 33.9 °C / ## #class_avg_f### F.
(+) Os apoios para as mãos e o touchpad estão atingindo a temperatura máxima da pele (35 °C / 95 F) e, portanto, não estão quentes.
(-) A temperatura média da área do apoio para as mãos de dispositivos semelhantes foi 28.8 °C / 83.8 F (-6.2 °C / -11.2 F).
| Tulpar T7 V20.6 Intel Core i7-13700H, NVIDIA GeForce RTX 4060 Laptop GPU | Schenker XMG Apex 17 (Late 23) AMD Ryzen 7 7840HS, NVIDIA GeForce RTX 4060 Laptop GPU | Acer Nitro 17 AN17-51-71ER Intel Core i7-13700H, NVIDIA GeForce RTX 4060 Laptop GPU | Medion Erazer Defender P40 Intel Core i7-13700HX, NVIDIA GeForce RTX 4060 Laptop GPU | MSI Katana 17 B13VFK Intel Core i7-13620H, NVIDIA GeForce RTX 4060 Laptop GPU | Lenovo Legion 5 16IRX G9 Intel Core i7-14650HX, NVIDIA GeForce RTX 4060 Laptop GPU | |
|---|---|---|---|---|---|---|
| Heat | -16% | -11% | 2% | -4% | -2% | |
| Maximum Upper Side * (°C) | 38 | 51 -34% | 46 -21% | 42 -11% | 41.6 -9% | 40.4 -6% |
| Maximum Bottom * (°C) | 44 | 54 -23% | 51 -16% | 45 -2% | 43.1 2% | 43.8 -0% |
| Idle Upper Side * (°C) | 32 | 33 -3% | 34 -6% | 28 12% | 32 -0% | 30.3 5% |
| Idle Bottom * (°C) | 33 | 34 -3% | 33 -0% | 30 9% | 35.8 -8% | 35.3 -7% |
* ... menor é melhor
Teste de estresse
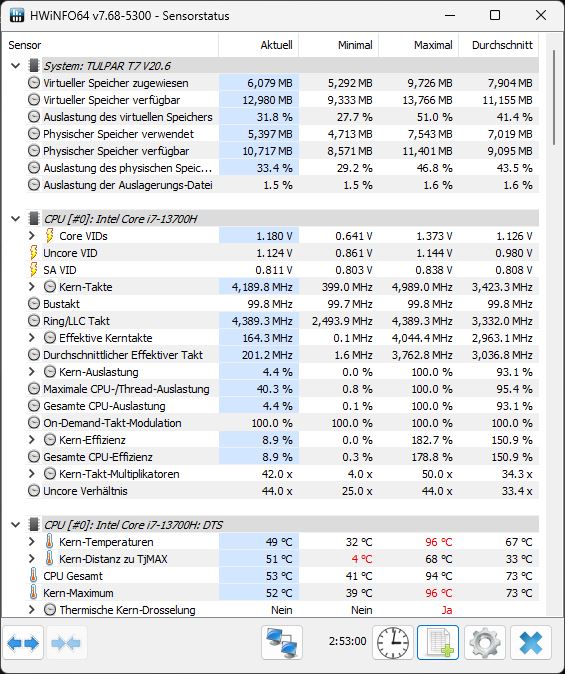
No teste de estresse, os núcleos atingiram cerca de 3,5 - 3,7 GHz no início e permaneceram nessa faixa até o final do teste de uma hora. A temperatura média do núcleo foi de 78 °C e não ultrapassou 85 °C. O consumo de energia da CPU oscilou entre 60 e 80 watts, com uma média de 67 watts.
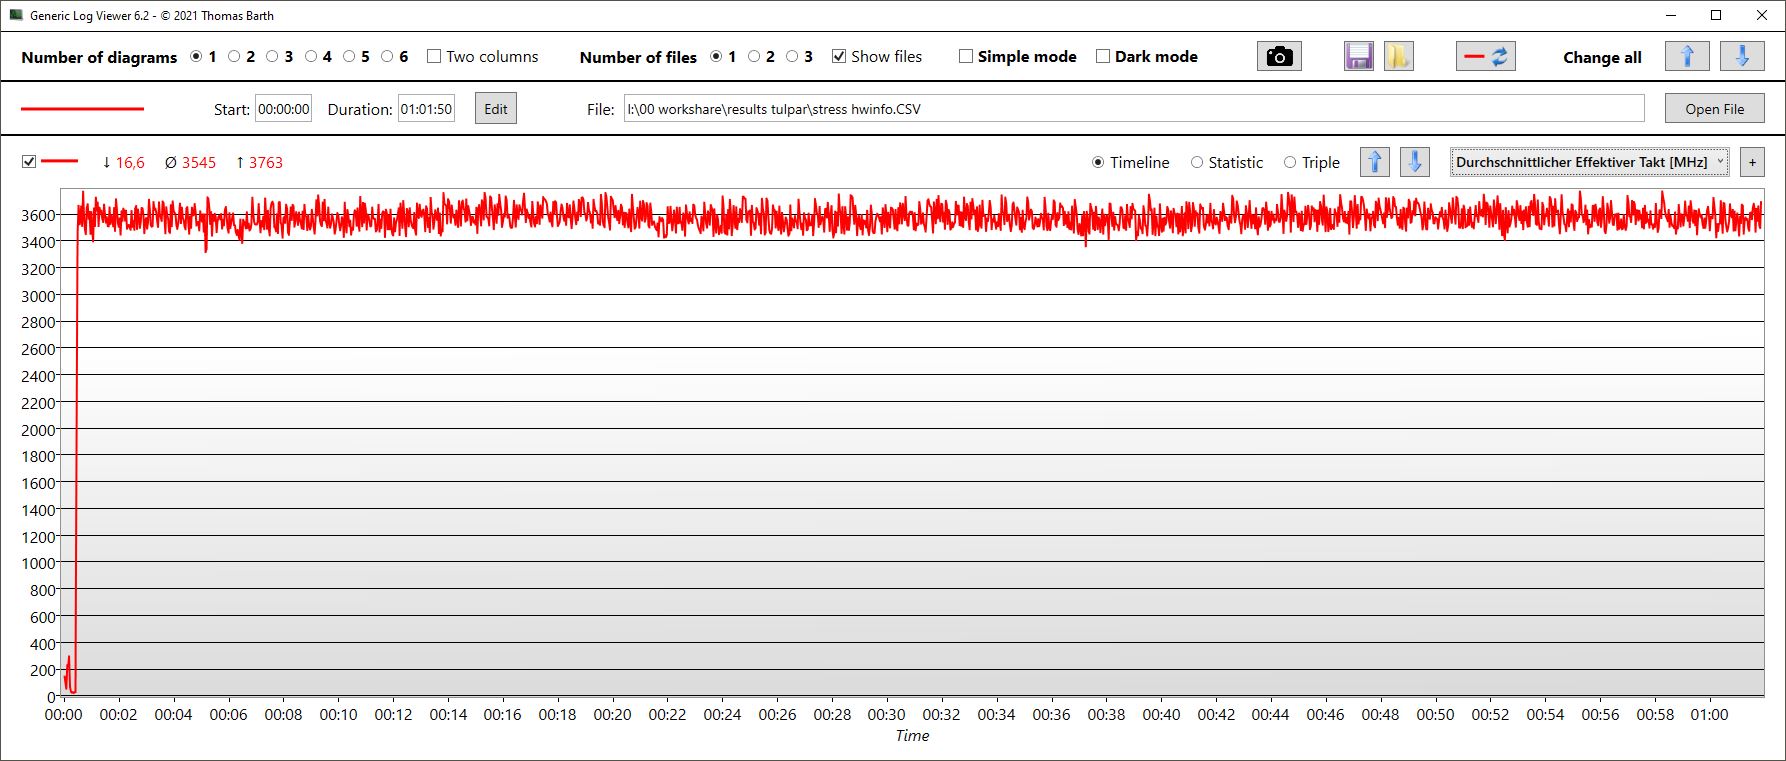
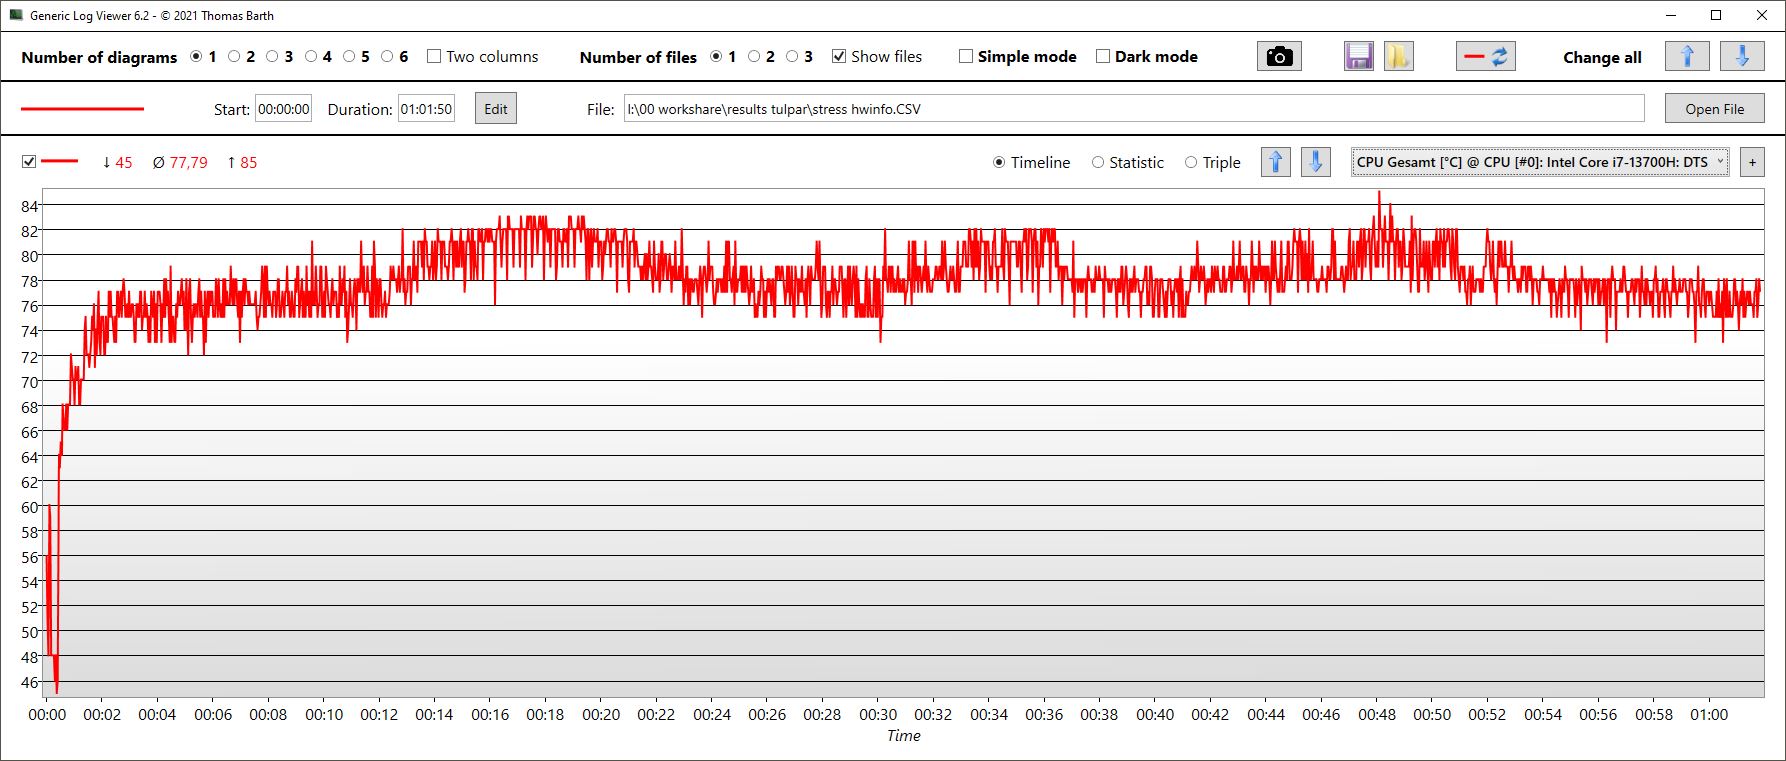
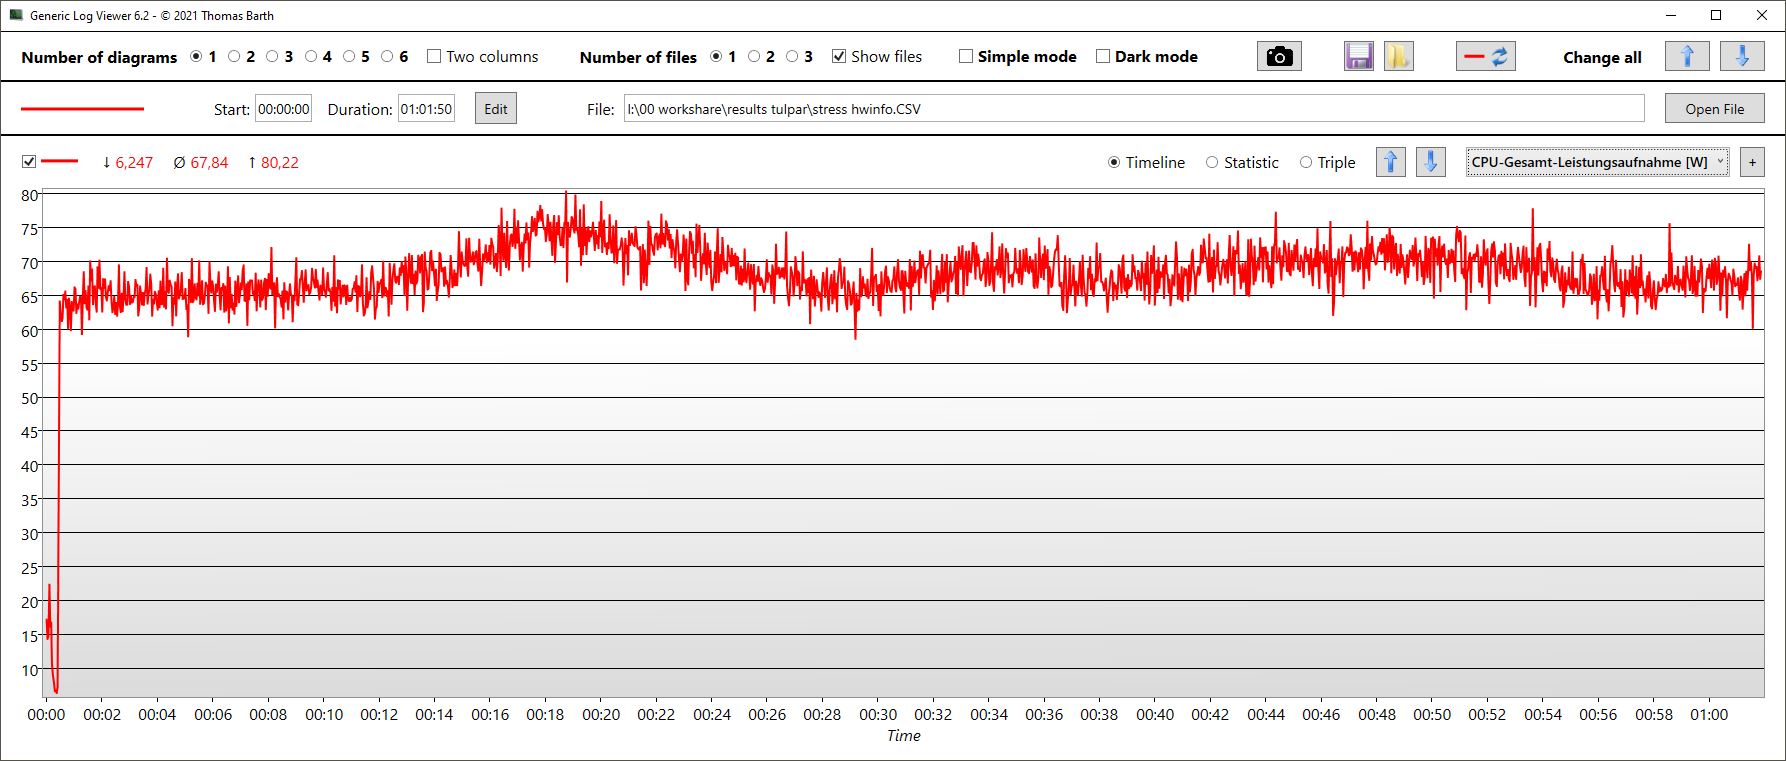
| Relógio da CPU (GHz) | Relógio da GPU (MHz) | Temperatura média da CPU (°C) | Temperatura média da GPU (°C) | |
| Sistema inativo | 4,2 | / | 41 | / |
| Prime95 + FurMark stress | 3.5 | 1,264 | 80 | 54 |
| Witcher 3 estresse | 0,64 | 2.600 | 77 | 71 |
Alto-falantes
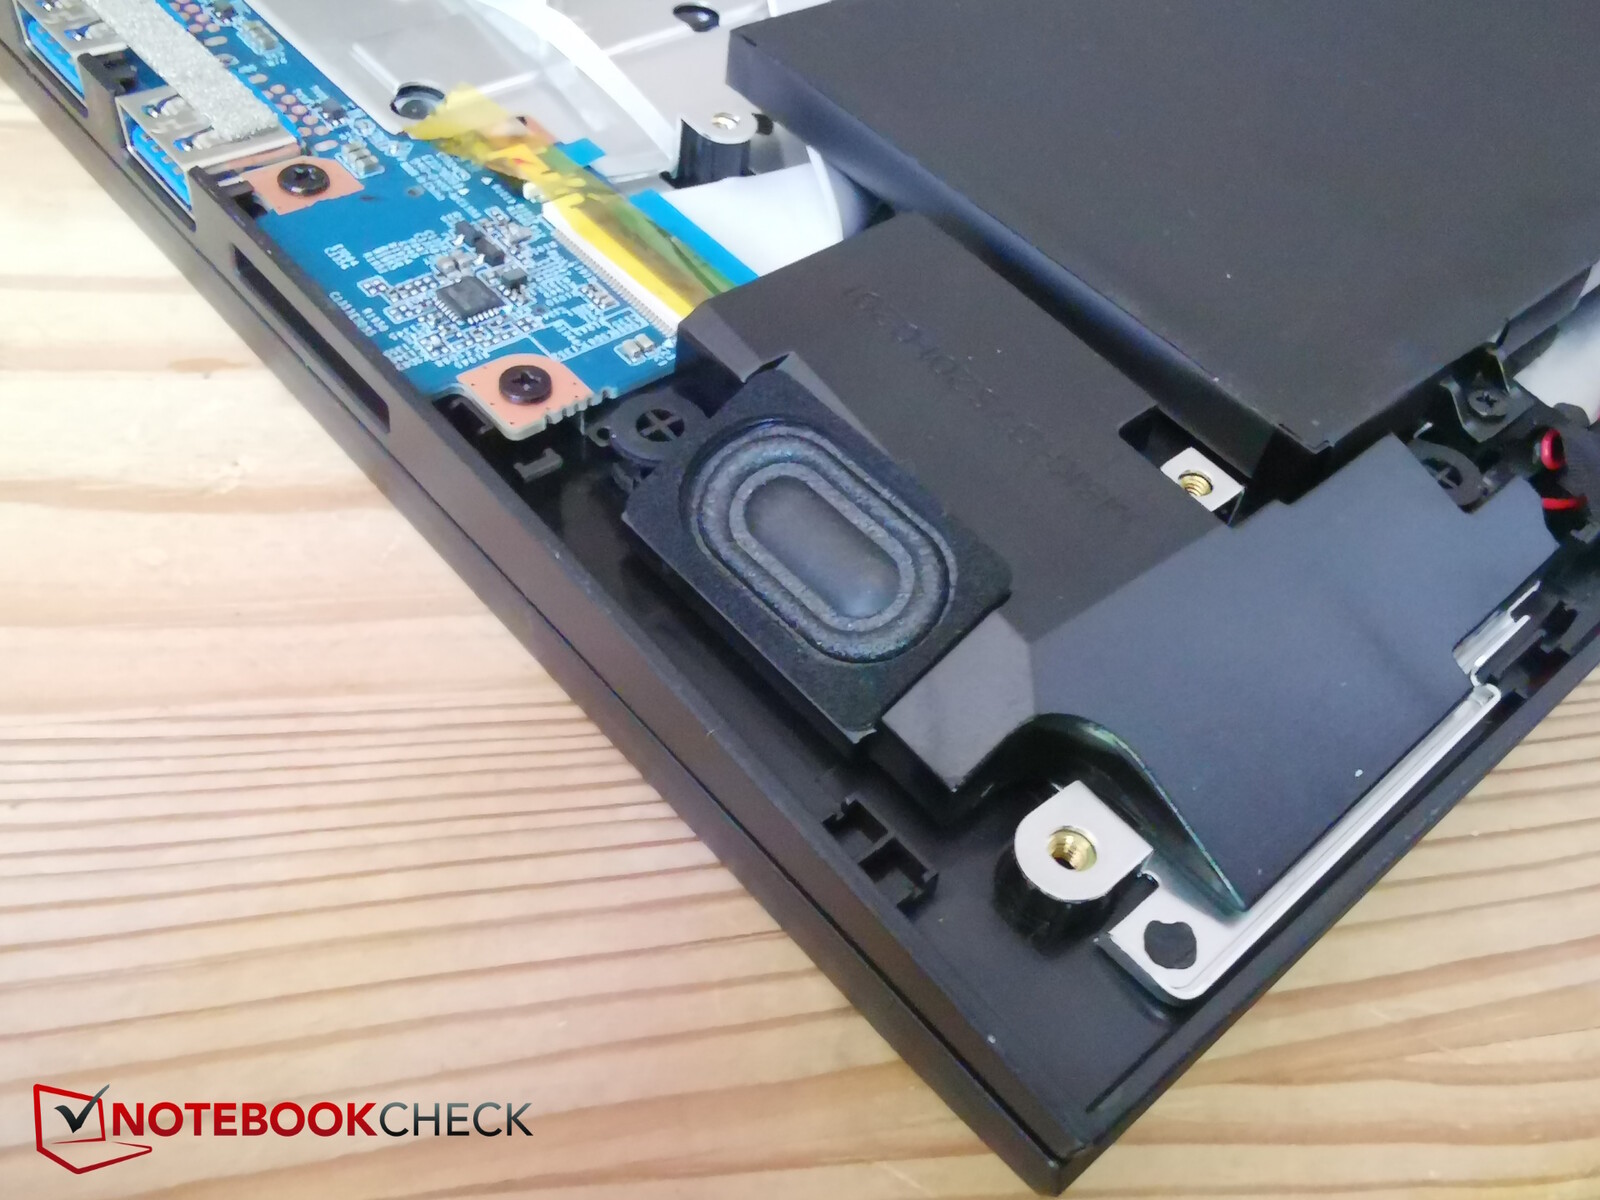
Os alto-falantes estéreo estão alojados nos cantos frontais do laptop; eles são bem pequenos e irradiam para baixo. Portanto, eles poderiam ser mais altos e não têm graves. Pelo menos os médios e agudos são equilibrados.
Uma entrada de microfone e uma saída de fone de ouvido, ambas de 3,5 mm, estão disponíveis para conectar dispositivos de áudio analógicos.
Tulpar T7 V20.6 análise de áudio
(±) | o volume do alto-falante é médio, mas bom (###valor### dB)
Graves 100 - 315Hz
(-) | quase nenhum baixo - em média 20.7% menor que a mediana
(±) | a linearidade dos graves é média (12% delta para a frequência anterior)
Médios 400 - 2.000 Hz
(+) | médios equilibrados - apenas 4.8% longe da mediana
(+) | médios são lineares (6.5% delta para frequência anterior)
Altos 2 - 16 kHz
(+) | agudos equilibrados - apenas 2.7% longe da mediana
(+) | os máximos são lineares (5.7% delta da frequência anterior)
Geral 100 - 16.000 Hz
(±) | a linearidade do som geral é média (17% diferença em relação à mediana)
Comparado com a mesma classe
» 45% de todos os dispositivos testados nesta classe foram melhores, 12% semelhantes, 43% piores
» O melhor teve um delta de 6%, a média foi 18%, o pior foi 132%
Comparado com todos os dispositivos testados
» 31% de todos os dispositivos testados foram melhores, 8% semelhantes, 62% piores
» O melhor teve um delta de 4%, a média foi 23%, o pior foi 134%
Lenovo Legion 5 16IRX G9 análise de áudio
(+) | os alto-falantes podem tocar relativamente alto (###valor### dB)
Graves 100 - 315Hz
(-) | quase nenhum baixo - em média 25.7% menor que a mediana
(±) | a linearidade dos graves é média (8.3% delta para a frequência anterior)
Médios 400 - 2.000 Hz
(+) | médios equilibrados - apenas 4.3% longe da mediana
(+) | médios são lineares (5.2% delta para frequência anterior)
Altos 2 - 16 kHz
(+) | agudos equilibrados - apenas 1.9% longe da mediana
(+) | os máximos são lineares (2.1% delta da frequência anterior)
Geral 100 - 16.000 Hz
(±) | a linearidade do som geral é média (16.1% diferença em relação à mediana)
Comparado com a mesma classe
» 39% de todos os dispositivos testados nesta classe foram melhores, 6% semelhantes, 54% piores
» O melhor teve um delta de 6%, a média foi 18%, o pior foi 132%
Comparado com todos os dispositivos testados
» 26% de todos os dispositivos testados foram melhores, 5% semelhantes, 69% piores
» O melhor teve um delta de 4%, a média foi 23%, o pior foi 134%
Gerenciamento de energia - A eficiência do ano passado
Consumo de energia
O T7 não é particularmente econômico. Já existem concorrentes mais econômicos quando o laptop está ocioso, mesmo que a diferença não seja muito grande. Ao executar o Witcher 3, o consumo é muito alto, especialmente quando se considera o desempenho ligeiramente baixo. Embora o Medion e o Lenovo consumam um pouco mais, o XMG e o Acer são um pouco mais econômicos e oferecem um desempenho ligeiramente melhor.
Se o senhor conectar um monitor externo via HDMI, a dGPU do laptop estará ativa, resultando no aumento do consumo ocioso em cerca de 5 watts, por exemplo (veja o gráfico abaixo).
| desligado | |
| Ocioso | |
| Carga |
|
Key:
min: | |
| Tulpar T7 V20.6 i7-13700H, GeForce RTX 4060 Laptop GPU, Samsung PM9B1 512GB MZVL4512HBLU, IPS, 1920x1080, 17.3" | Schenker XMG Apex 17 (Late 23) R7 7840HS, GeForce RTX 4060 Laptop GPU, Samsung 990 Pro 1 TB, IPS, 2560x1440, 17.3" | Acer Nitro 17 AN17-51-71ER i7-13700H, GeForce RTX 4060 Laptop GPU, Samsung PM9A1 MZVL21T0HCLR, , 2560x1440, 17.3" | Medion Erazer Defender P40 i7-13700HX, GeForce RTX 4060 Laptop GPU, Phison PS5021-E21 1TB, IPS, 2560x1440, 17.3" | MSI Katana 17 B13VFK i7-13620H, GeForce RTX 4060 Laptop GPU, Micron 2400 MTFDKBA1T0QFM, IPS LED, 1920x1080, 17.3" | Lenovo Legion 5 16IRX G9 i7-14650HX, GeForce RTX 4060 Laptop GPU, Samsung PM9A1 MZVL21T0HCLR, IPS, 2560x1600, 16" | Média NVIDIA GeForce RTX 4060 Laptop GPU | Média da turma Gaming | |
|---|---|---|---|---|---|---|---|---|
| Power Consumption | 16% | 9% | -2% | 3% | -21% | -5% | -24% | |
| Idle Minimum * (Watt) | 12 | 9 25% | 8.3 31% | 8 33% | 12.2 -2% | 15.4 -28% | 11.5 ? 4% | 13 ? -8% |
| Idle Average * (Watt) | 17 | 12 29% | 13.5 21% | 12 29% | 14.9 12% | 19.7 -16% | 16 ? 6% | 18.7 ? -10% |
| Idle Maximum * (Watt) | 17.5 | 14 20% | 14.8 15% | 18 -3% | 15.8 10% | 20.7 -18% | 20.3 ? -16% | 24.3 ? -39% |
| Load Average * (Watt) | 78.5 | 67 15% | 77 2% | 101 -29% | 85.22 -9% | 102.6 -31% | 92.9 ? -18% | 110.2 ? -40% |
| Witcher 3 ultra * (Watt) | 169 | 147.6 13% | 154 9% | 180.8 -7% | 151.1 11% | 191.3 -13% | ||
| Load Maximum * (Watt) | 209 | 223 -7% | 263 -26% | 284 -36% | 212.8 -2% | 246.6 -18% | 210 ? -0% | 258 ? -23% |
* ... menor é melhor
Power consumption Witcher 3 / stress test
Power consumption with external monitor
Tempos de execução
A Tulpar instalou uma bateria de 62 Wh no gabinete de 17 polegadas. Em relação ao tamanho do laptop, isso não é muito para um jogador e o senhor pode perceber claramente que o fabricante economizou um pouco de dinheiro - embora o XMG Apex esteja equipado com a mesma bateria e o MSI Katana tenha que se contentar com apenas 54 Wh. Os outros três concorrentes estão equipados com baterias maiores, que variam entre 73 e 90 Wh.
Como resultado, o T7 alcançou uma duração de cerca de 3,5 horas durante o teste WLAN e o teste de vídeo com um brilho reduzido de 150 nits. Apenas o Katana teve um desempenho pior, enquanto o restante dos dispositivos de comparação aguentou muito mais, como, por exemplo, o Apex, apesar de estar equipado com a mesma bateria. Talvez isso se deva ao fato de ele ter implementado medidas de economia de energia melhores.
| Tulpar T7 V20.6 i7-13700H, GeForce RTX 4060 Laptop GPU, 62.32 Wh | Schenker XMG Apex 17 (Late 23) R7 7840HS, GeForce RTX 4060 Laptop GPU, 62.32 Wh | Acer Nitro 17 AN17-51-71ER i7-13700H, GeForce RTX 4060 Laptop GPU, 90 Wh | Medion Erazer Defender P40 i7-13700HX, GeForce RTX 4060 Laptop GPU, 73 Wh | MSI Katana 17 B13VFK i7-13620H, GeForce RTX 4060 Laptop GPU, 53.5 Wh | Lenovo Legion 5 16IRX G9 i7-14650HX, GeForce RTX 4060 Laptop GPU, 80 Wh | Média da turma Gaming | |
|---|---|---|---|---|---|---|---|
| Duração da bateria | 46% | 110% | 39% | -25% | 74% | 79% | |
| H.264 (h) | 3.7 | 6.9 86% | 6.9 86% | 5.7 54% | 9.6 159% | 8.64 ? 134% | |
| WiFi v1.3 (h) | 3.5 | 5.1 46% | 8.2 134% | 6.2 77% | 2.9 -17% | 7.4 111% | 7.11 ? 103% |
| Load (h) | 1.5 | 1.6 7% | 1.3 -13% | 1 -33% | 0.8 -47% | 1.502 ? 0% | |
| Reader / Idle (h) | 7.8 | 8.8 | 8.71 ? | ||||
| Witcher 3 ultra (h) | 2.5 |
Pro
Contra
Veredicto - Acessível, sólido, mas com a competência essencial!

Além de seu preço atraente, gostamos especialmente do teclado do Tulpar T7, da WLAN rápida e, é claro, de sua manutenção vitalícia, anual e gratuita. Além disso, o T7 permanece bastante frio sob estresse.
No entanto, isso tem seu preço, pois o gamer econômico infelizmente não aproveita toda a sua potência ao jogar. É claro que o senhor pode perdoar um laptop para jogos barato por uma webcam fraca ou por não suportar Thunderbolt. Mas, por sua vez, ele deve cumprir sua disciplina principal, ou seja, os jogos. E o laptop Tulpar simplesmente não faz isso. Infelizmente, o fato de o fabricante ter nos enviado uma configuração com 16 GB de RAM de canal único, embora existam vários SKUs com 32 GB (esperamos que de canal duplo?), teve um efeito negativo em nossos resultados de benchmark. Como resultado, o T7 fica atrás da concorrência quando se trata de jogos - embora certamente não devesse. A duração da bateria também pode decepcionar alguns usuários, mesmo que isso não seja muito importante para um jogador de 17 polegadas.
O Tulpar T7 é um laptop para jogos acessível com uma promessa generosa de manutenção gratuita anual e vitalícia. O senhor deve apenas certificar-se de selecionar uma configuração com RAM de canal duplo, pois, caso contrário, o desempenho não conseguirá acompanhar a concorrência.
Se o senhor levar em conta apenas o MRSP, há muitas alternativas. No entanto, o T7 com uma RTX 4060 está atualmente disponível a um preço particularmente baixo, abaixo de US$ 1.000 em alguns casos. Se o senhor estiver preparado para gastar mais, então o Lenovo Legion 5 pode muito bem ser uma alternativa melhor em muitas áreas.
Preço e disponibilidade
Atualmente, o Tulpar T7 ainda não está disponível nos EUA. Aparentemente, o fabricante está pronto para lançar seus produtos nos Estados Unidos ainda este ano.
Tulpar T7 V20.6
- 05/24/2024 v7 (old)
Christian Hintze
Transparência
A seleção dos dispositivos a serem analisados é feita pela nossa equipe editorial. A amostra de teste foi fornecida ao autor como empréstimo pelo fabricante ou varejista para fins desta revisão. O credor não teve influência nesta revisão, nem o fabricante recebeu uma cópia desta revisão antes da publicação. Não houve obrigação de publicar esta revisão. Como empresa de mídia independente, a Notebookcheck não está sujeita à autoridade de fabricantes, varejistas ou editores.
É assim que o Notebookcheck está testando
Todos os anos, o Notebookcheck analisa de forma independente centenas de laptops e smartphones usando procedimentos padronizados para garantir que todos os resultados sejam comparáveis. Desenvolvemos continuamente nossos métodos de teste há cerca de 20 anos e definimos padrões da indústria no processo. Em nossos laboratórios de teste, equipamentos de medição de alta qualidade são utilizados por técnicos e editores experientes. Esses testes envolvem um processo de validação em vários estágios. Nosso complexo sistema de classificação é baseado em centenas de medições e benchmarks bem fundamentados, o que mantém a objetividade.Price comparison

