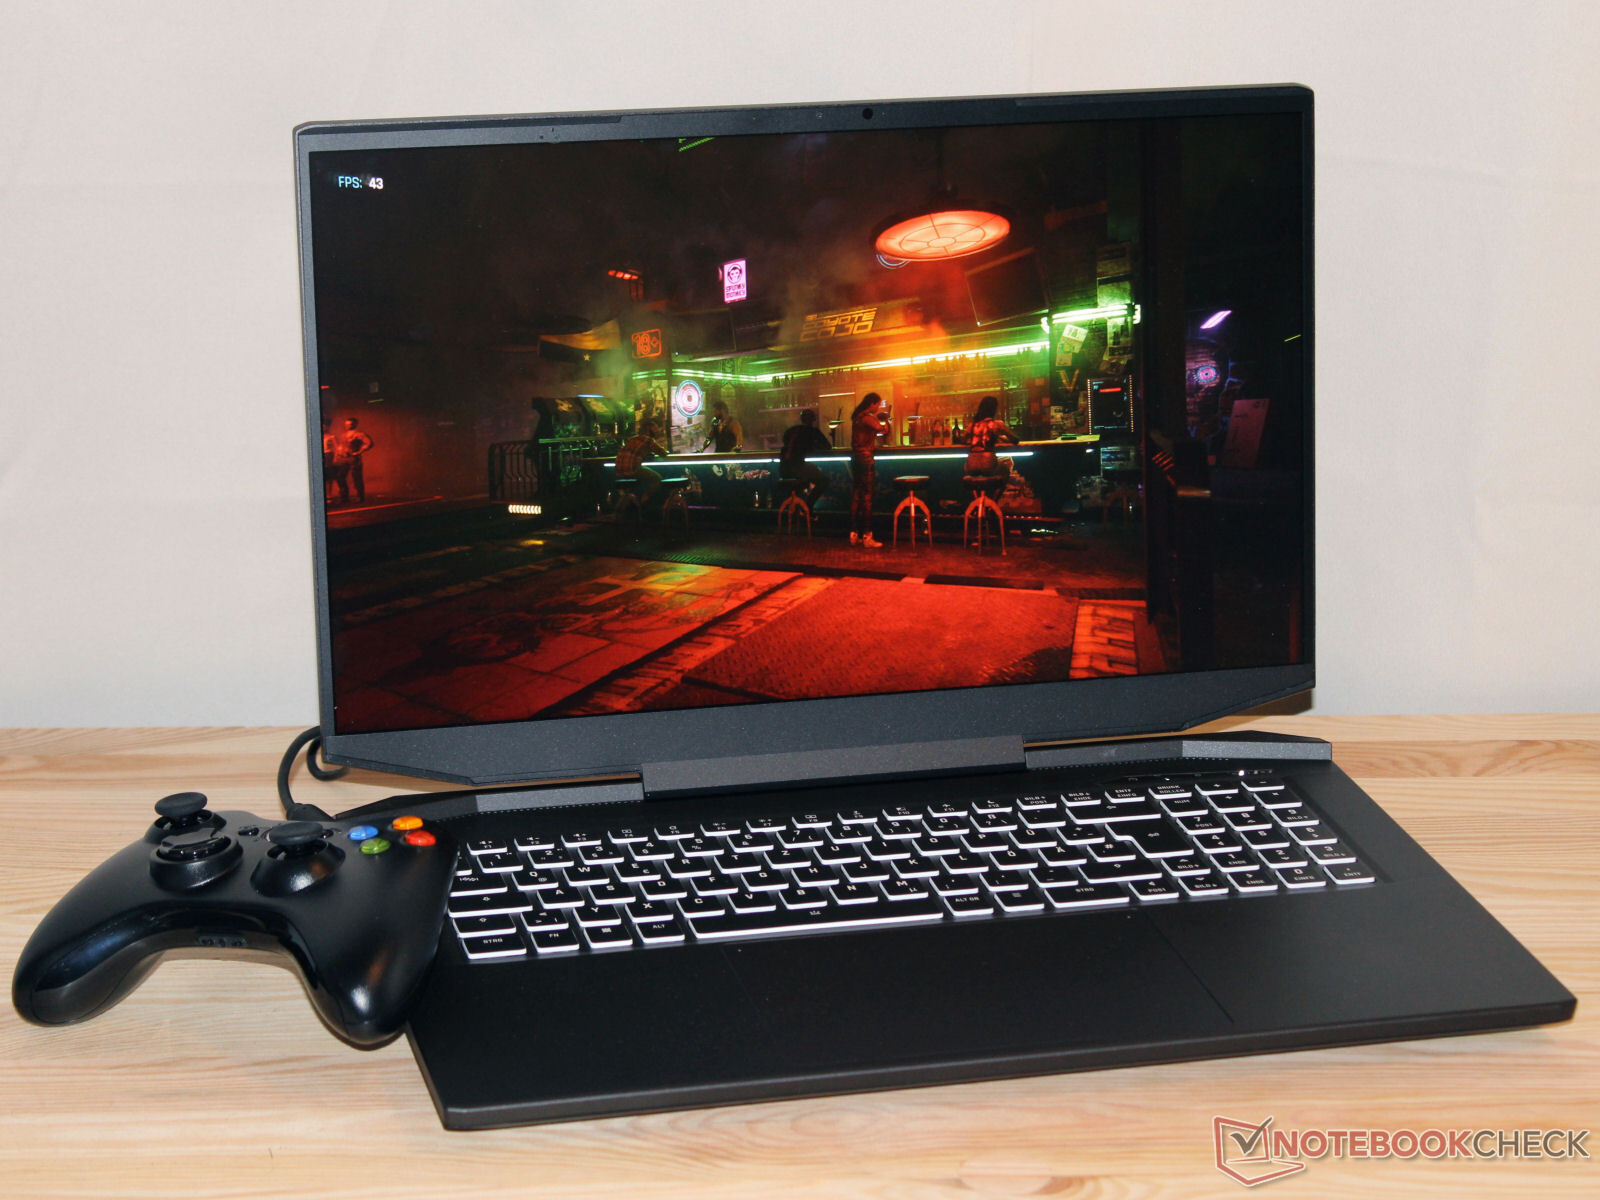
Análise do XMG Apex 17 (late 23): um laptop para jogos QHD com uma RTX 4060
O XMG Apex 17 (late 23) é um laptop para jogos QHD de médio porte baseado em um barebone TongFang (GM7XG0) e está disponível nessa variante por pouco menos de 1.800 euros. O pacote consiste em um processador Ryzen 7 7840HS, GeForce RTX 4060 (como alternativa: RTX 4050), 32 GB de RAM e um SSD de 1 TB. A concorrência pode ser encontrada na forma doAcer Nitro 17 AN17-51e oAlienware m16 R1, oLenovo Legion Pro 5 16IRX8, oMSI Katana 17 B13VFKe oMedion Erazer Defender P40.
Possíveis concorrentes em comparação
Avaliação | Data | Modelo | Peso | Altura | Size | Resolução | Preço |
|---|---|---|---|---|---|---|---|
| 87.1 % v7 (old) | 10/2023 | Schenker XMG Apex 17 (Late 23) R7 7840HS, GeForce RTX 4060 Laptop GPU | 2.5 kg | 24.9 mm | 17.30" | 2560x1440 | |
| 88.3 % v7 (old) | 09/2023 | Alienware m16 R1 Intel i7-13700HX, GeForce RTX 4060 Laptop GPU | 3 kg | 25.4 mm | 16.00" | 2560x1600 | |
| 87.9 % v7 (old) | 05/2023 | Lenovo Legion Pro 5 16IRX8 i7-13700HX, GeForce RTX 4060 Laptop GPU | 2.5 kg | 26.8 mm | 16.00" | 2560x1600 | |
| 87.2 % v7 (old) | 07/2023 | Acer Nitro 17 AN17-51-71ER i7-13700H, GeForce RTX 4060 Laptop GPU | 3 kg | 30.3 mm | 17.30" | 2560x1440 | |
| 84.6 % v7 (old) | 05/2023 | Medion Erazer Defender P40 i7-13700HX, GeForce RTX 4060 Laptop GPU | 2.9 kg | 33 mm | 17.30" | 2560x1440 | |
| 82.1 % v7 (old) | 02/2023 | MSI Katana 17 B13VFK i7-13620H, GeForce RTX 4060 Laptop GPU | 2.8 kg | 25.2 mm | 17.30" | 1920x1080 |
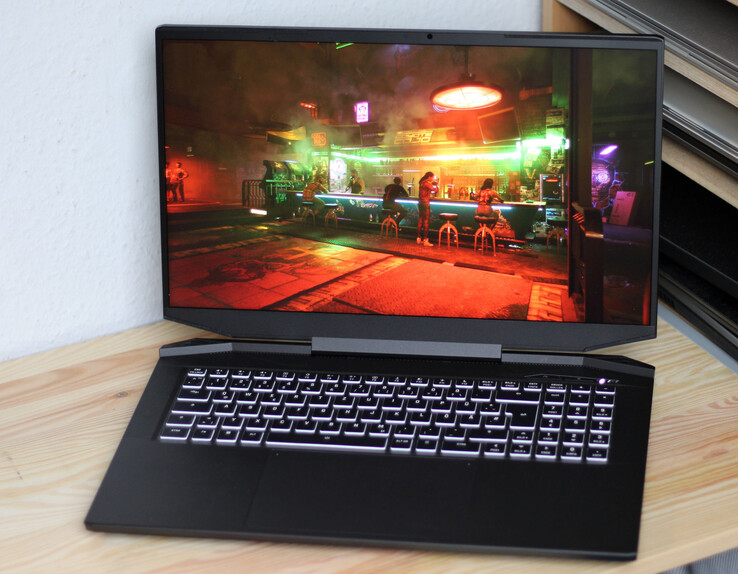
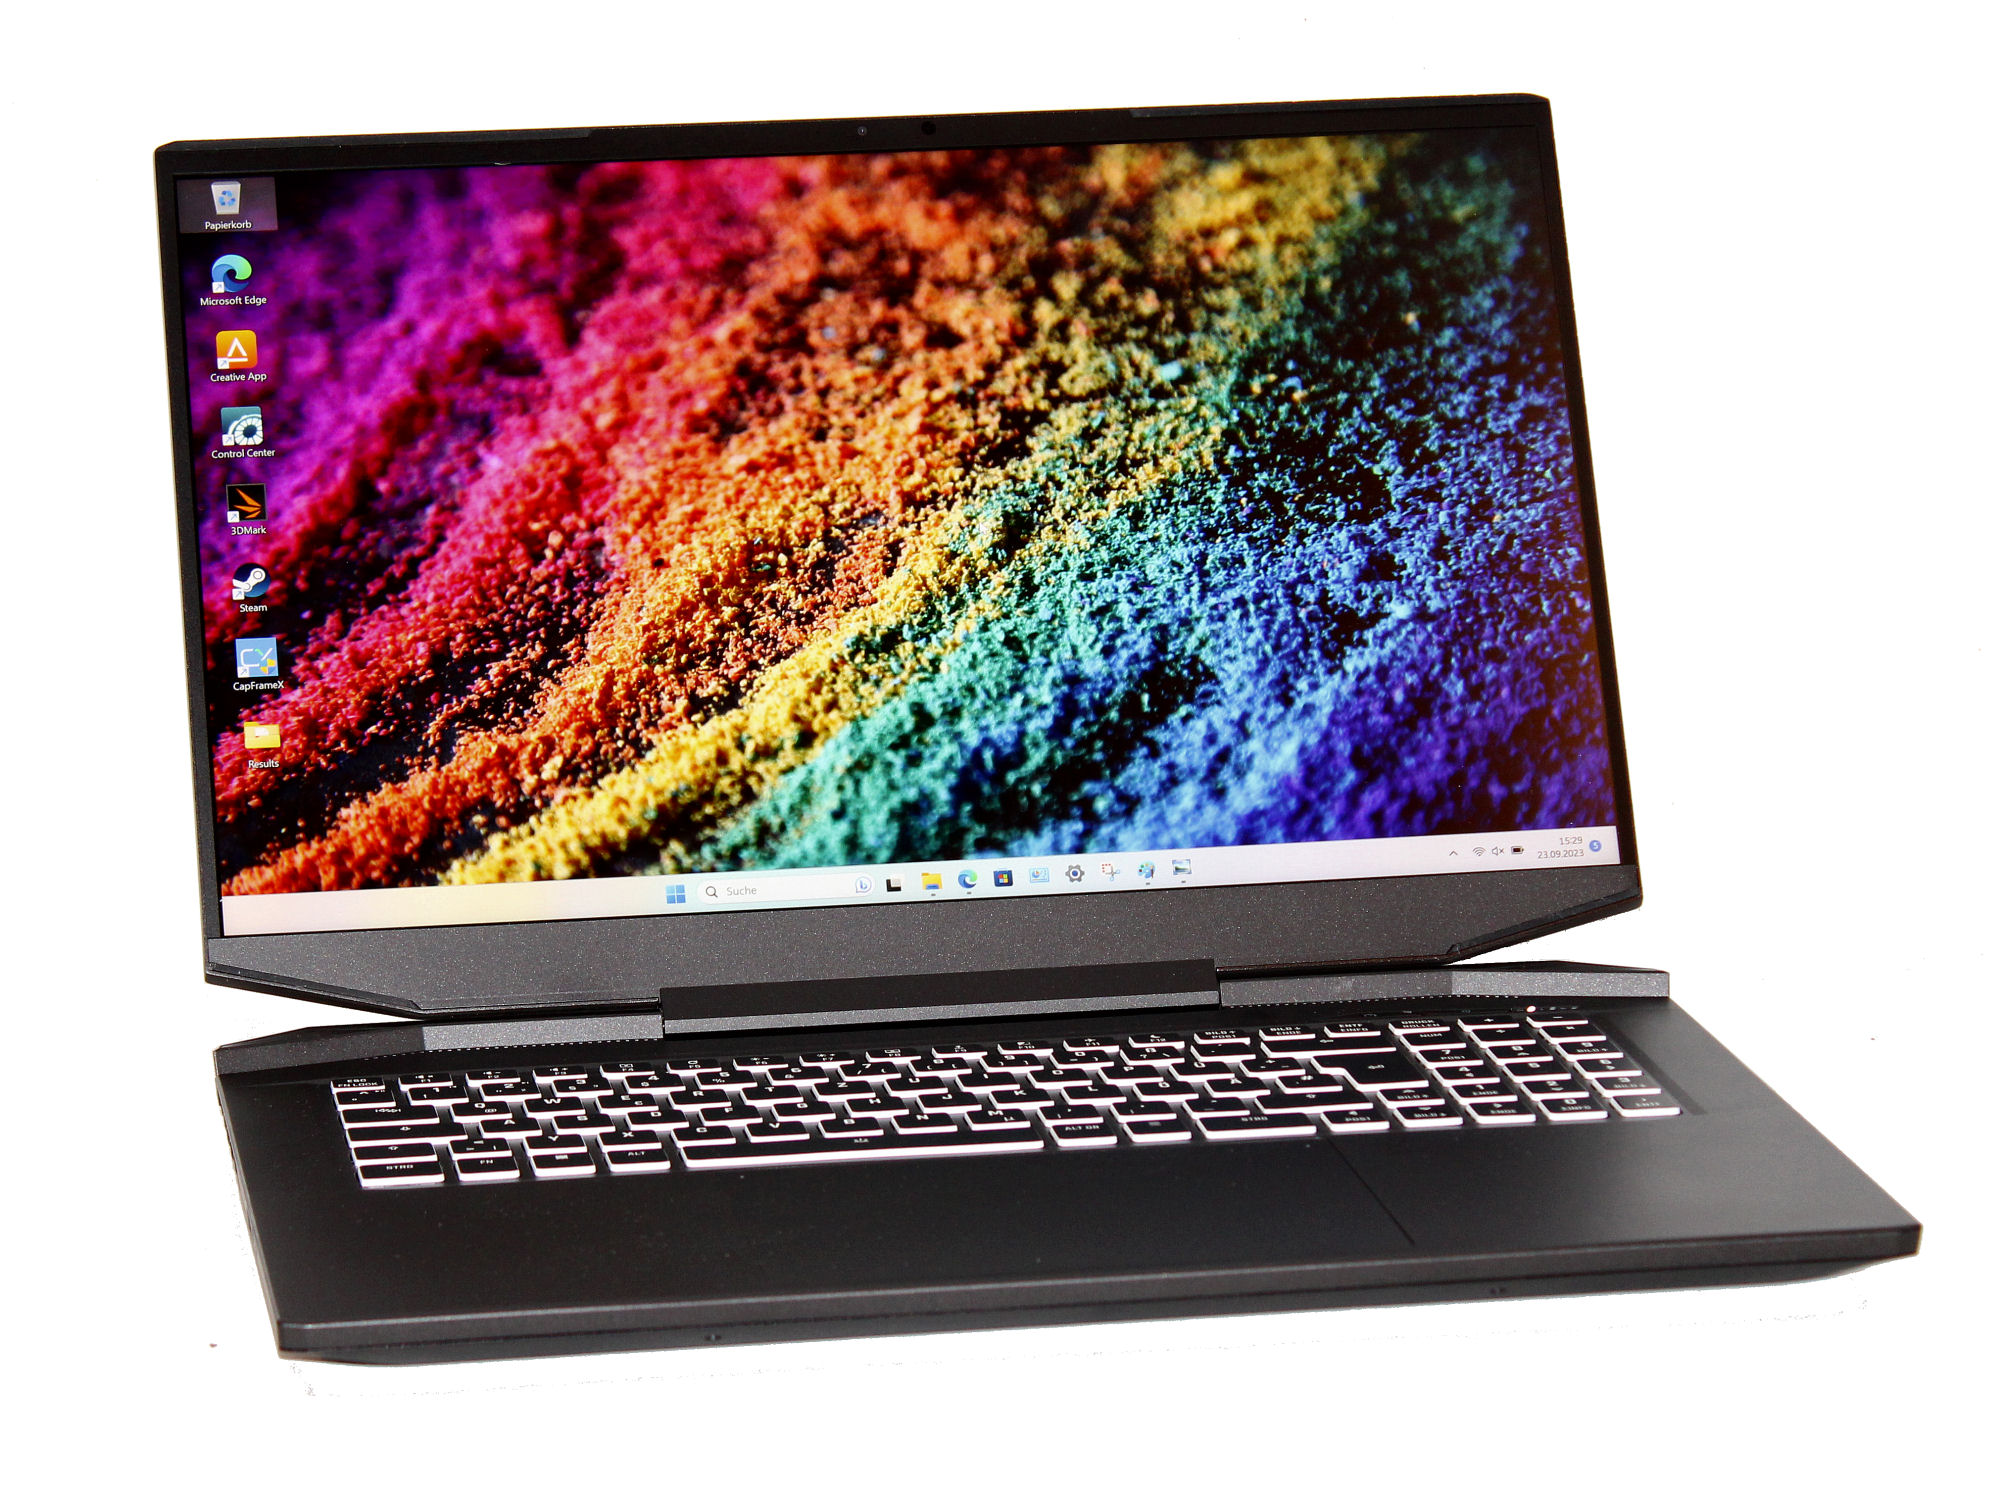
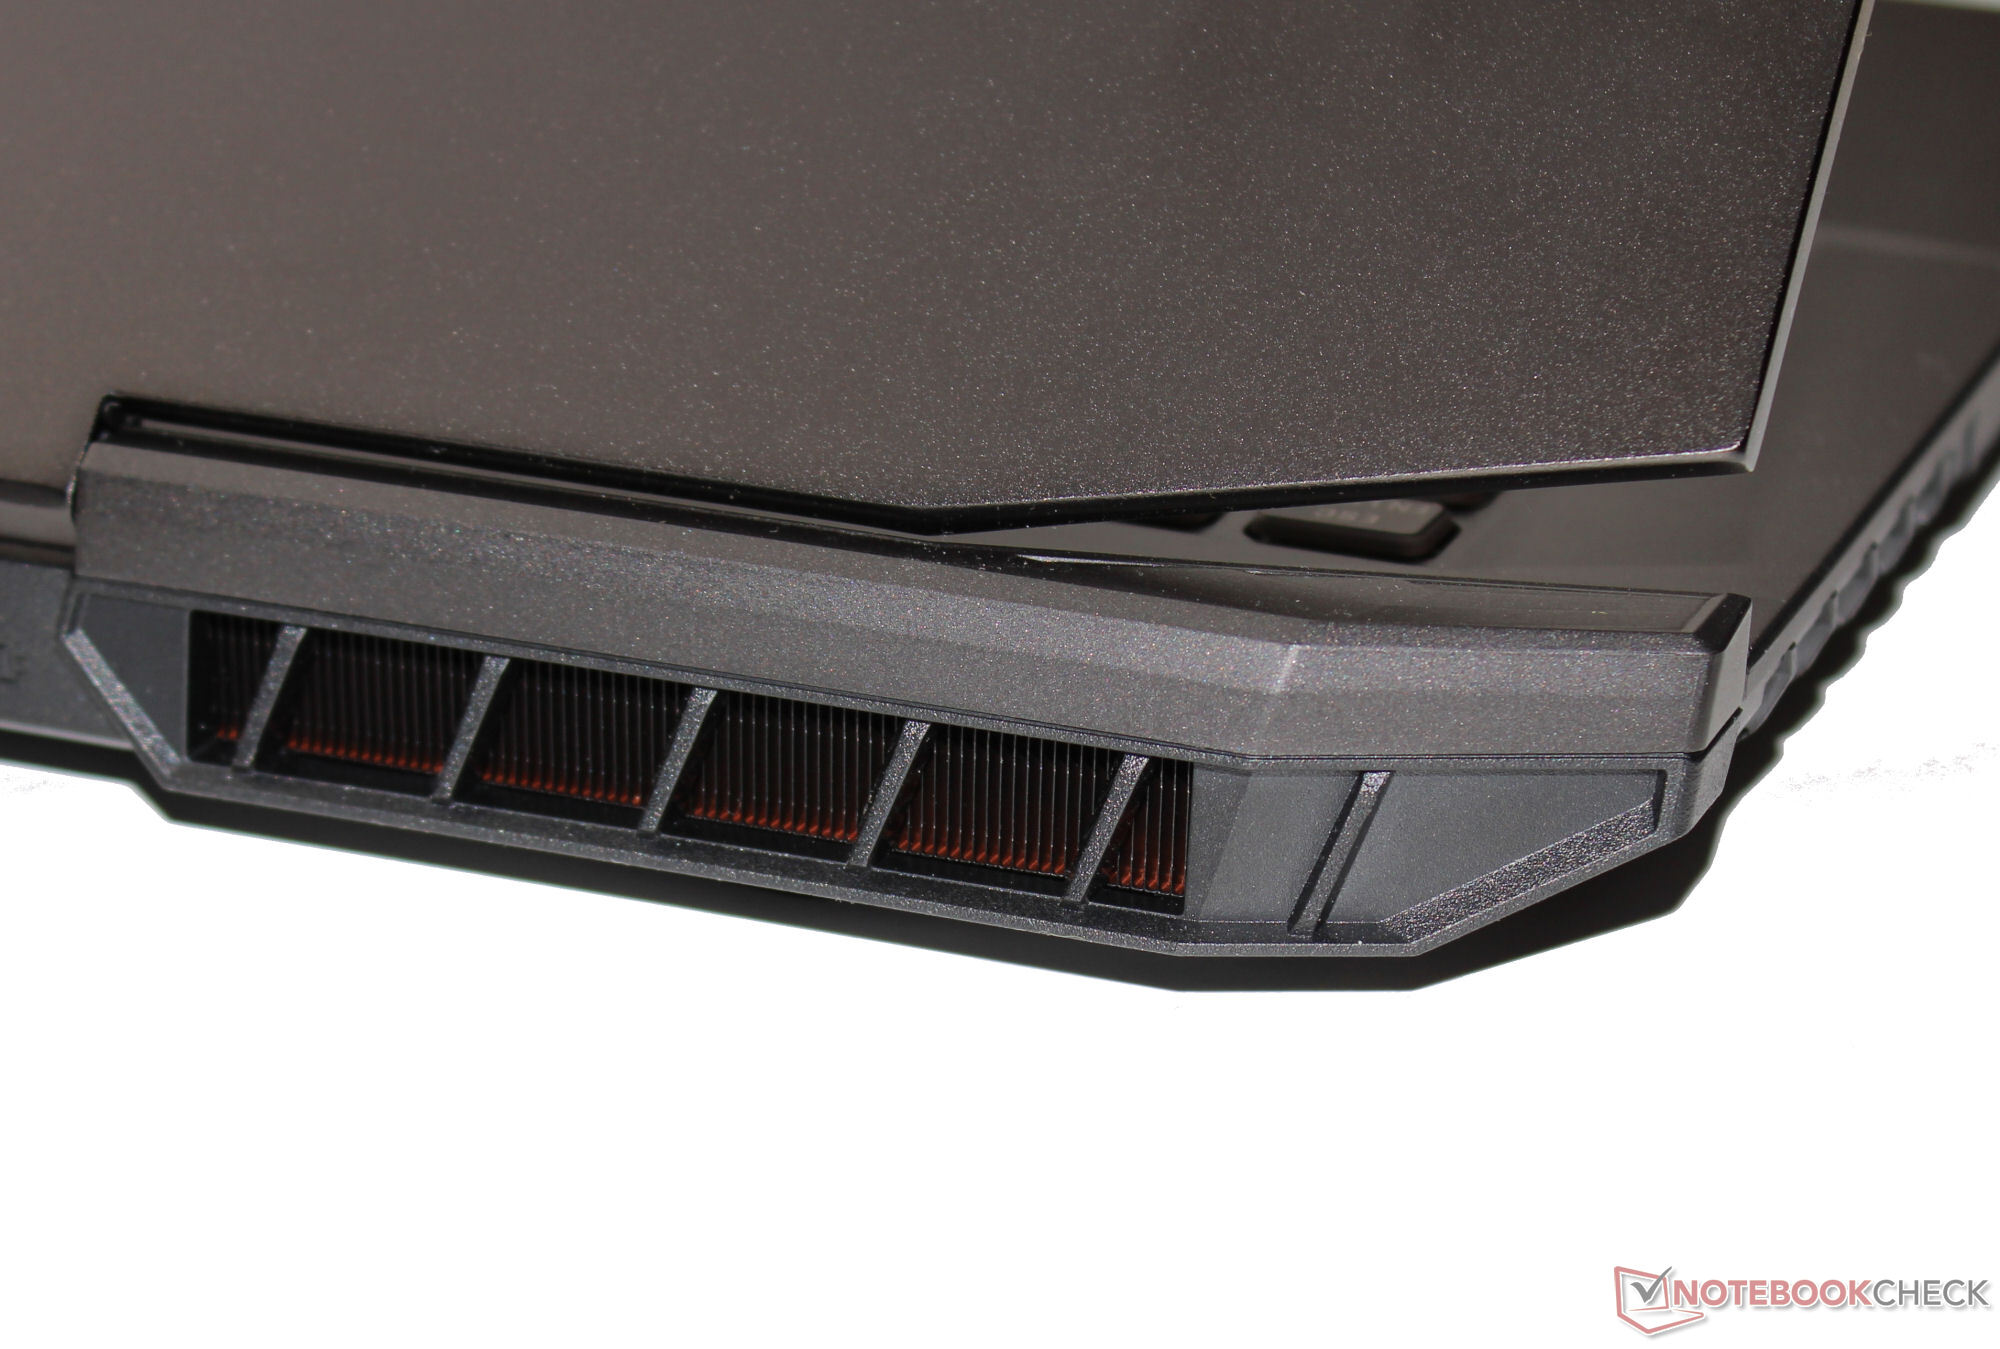
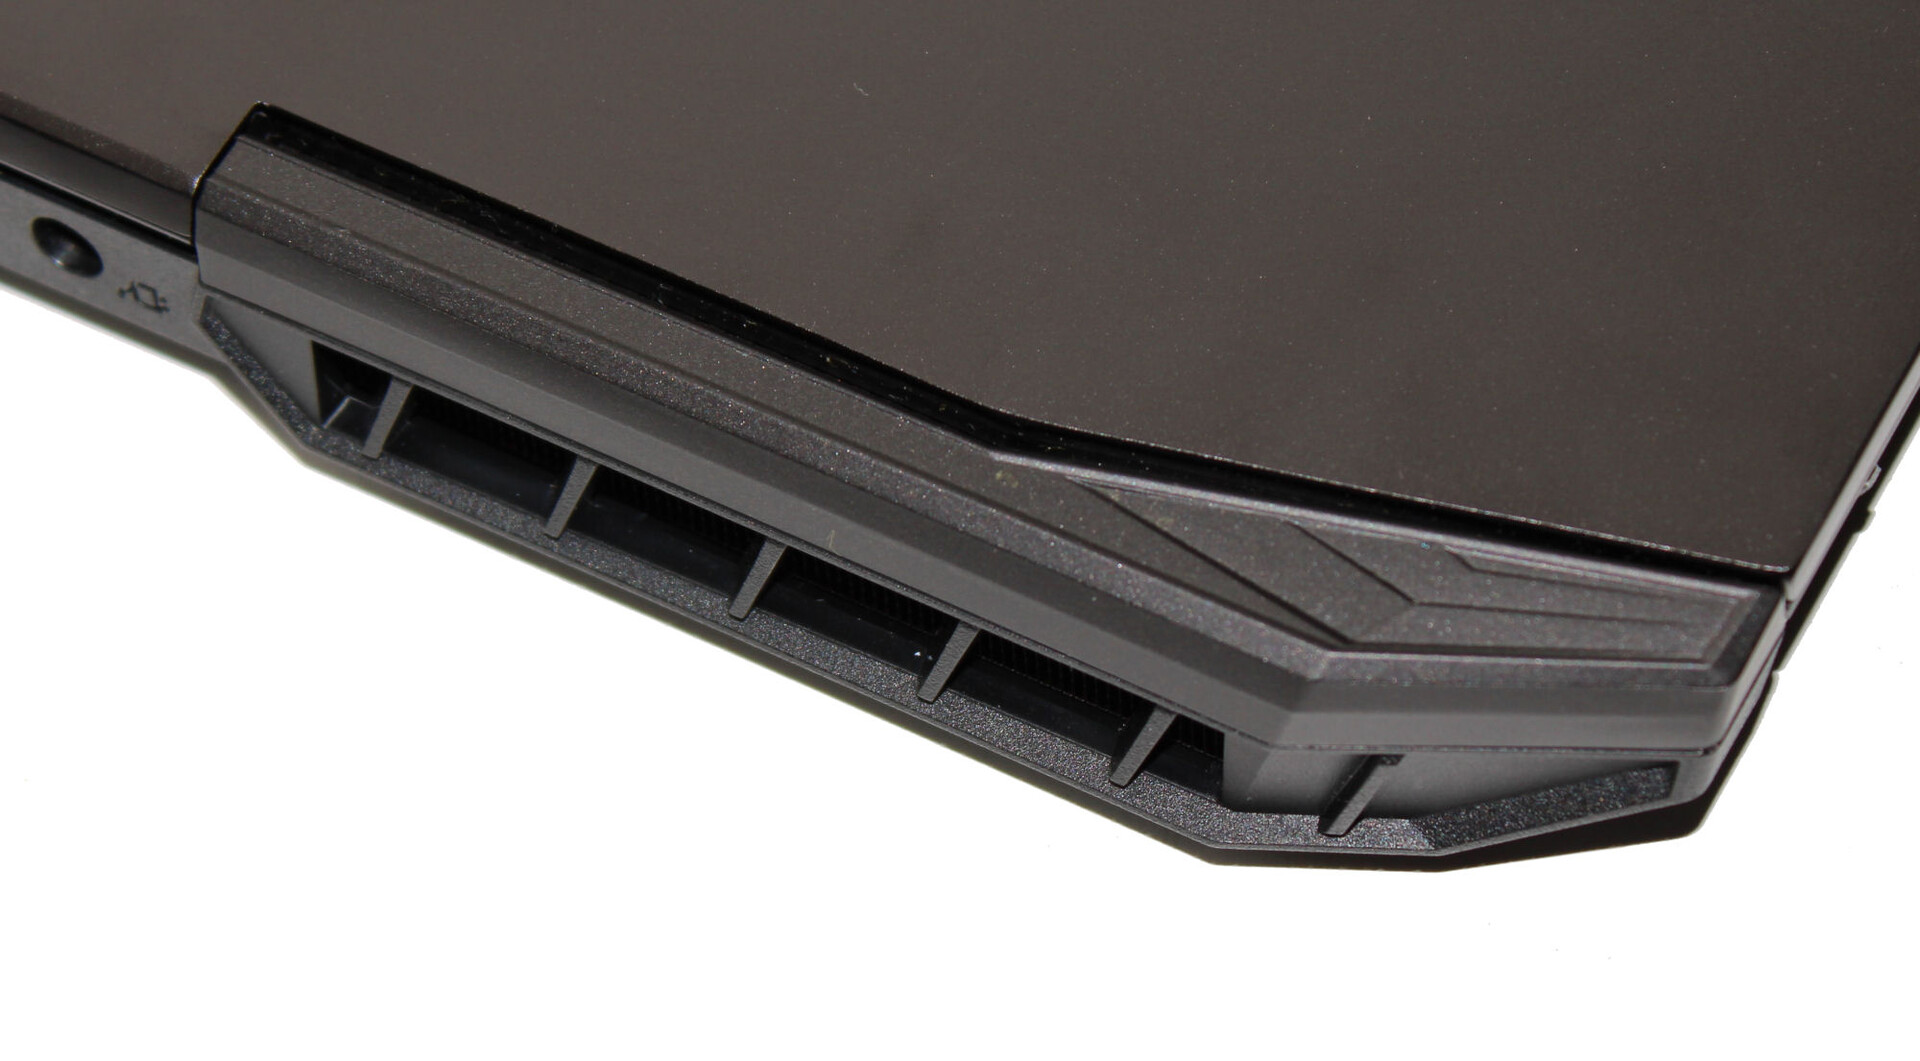
Gabinete - A parte traseira do gabinete é feita de alumínio
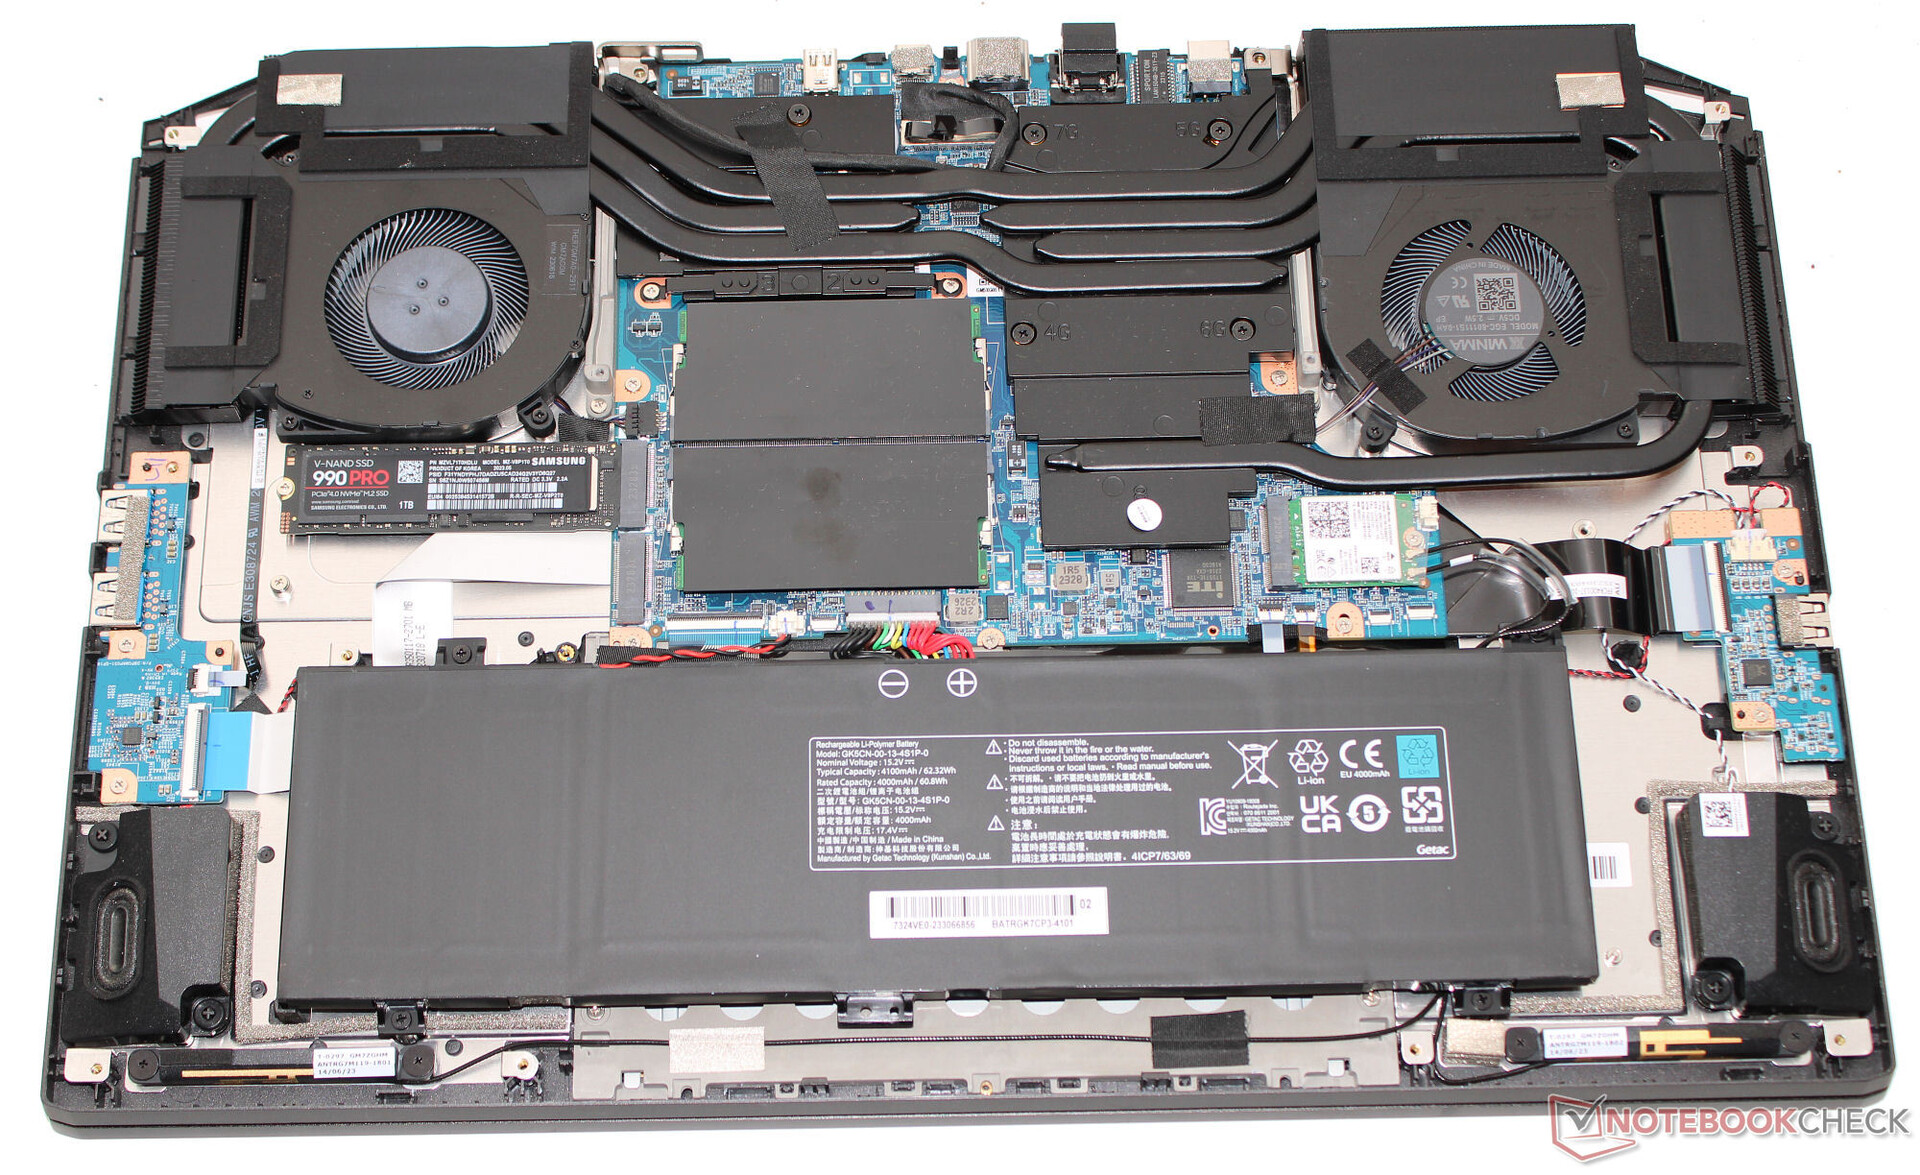
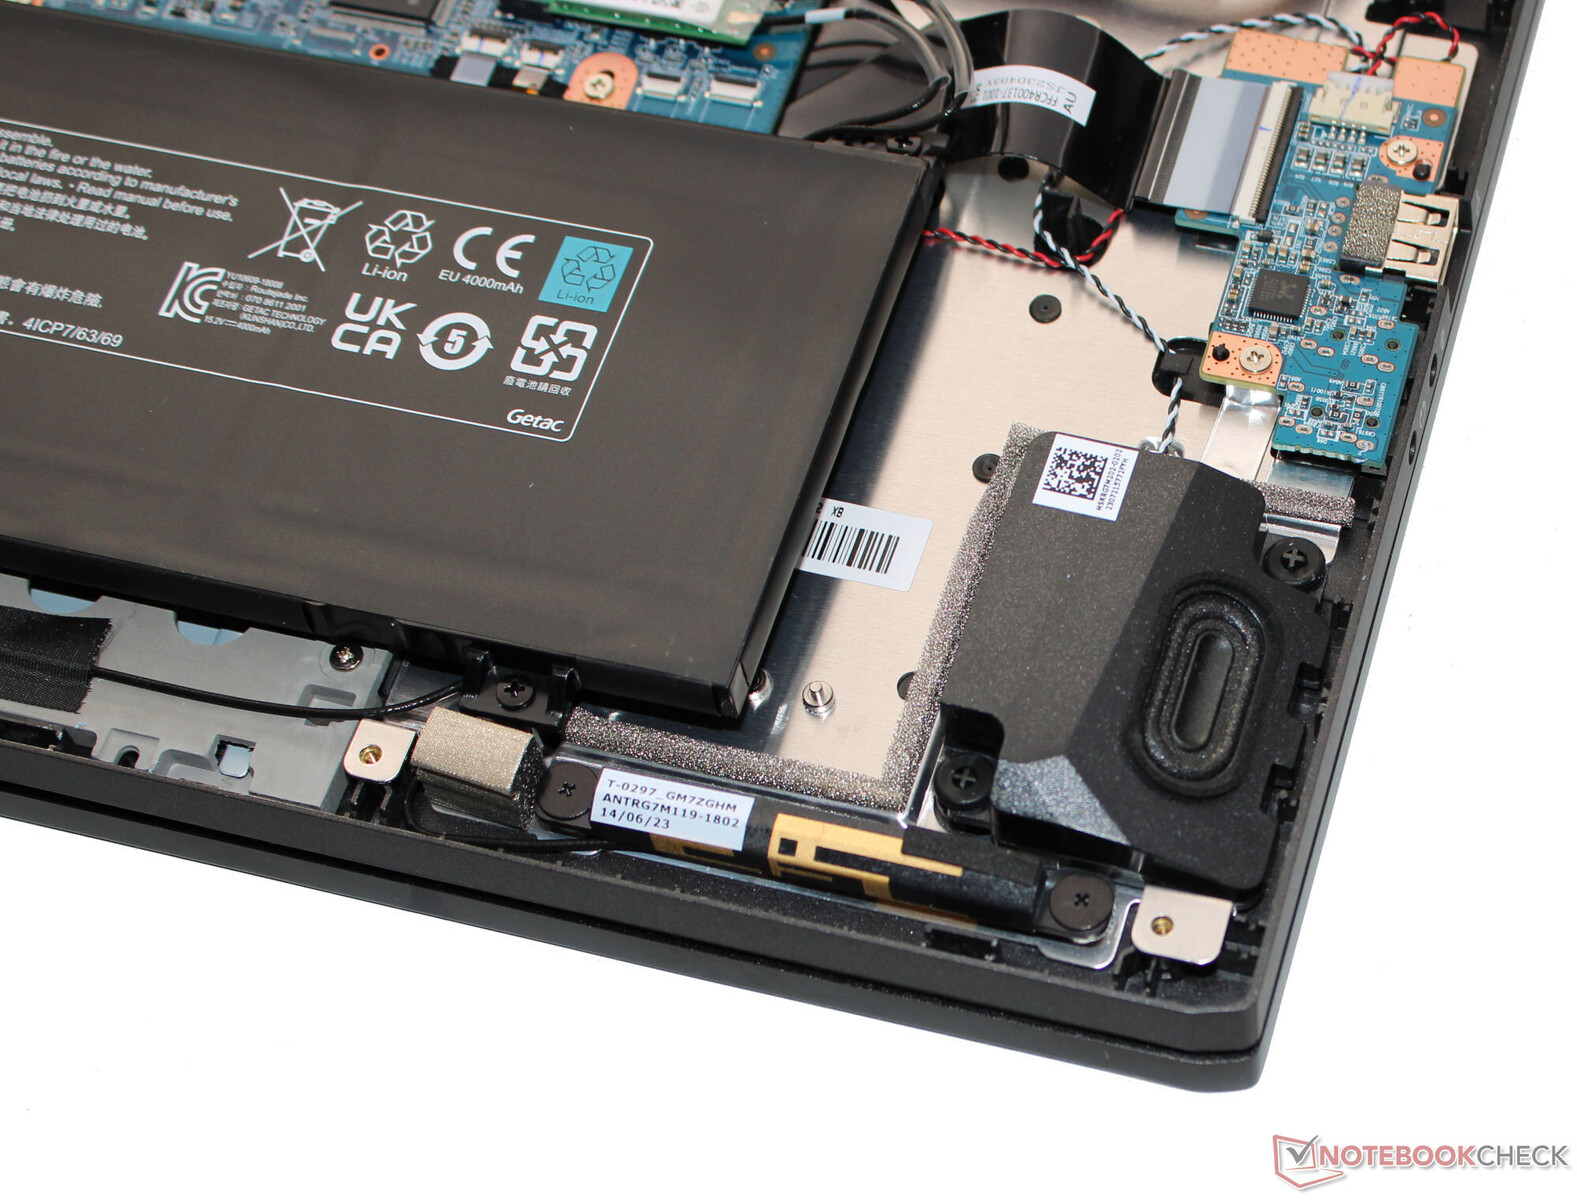
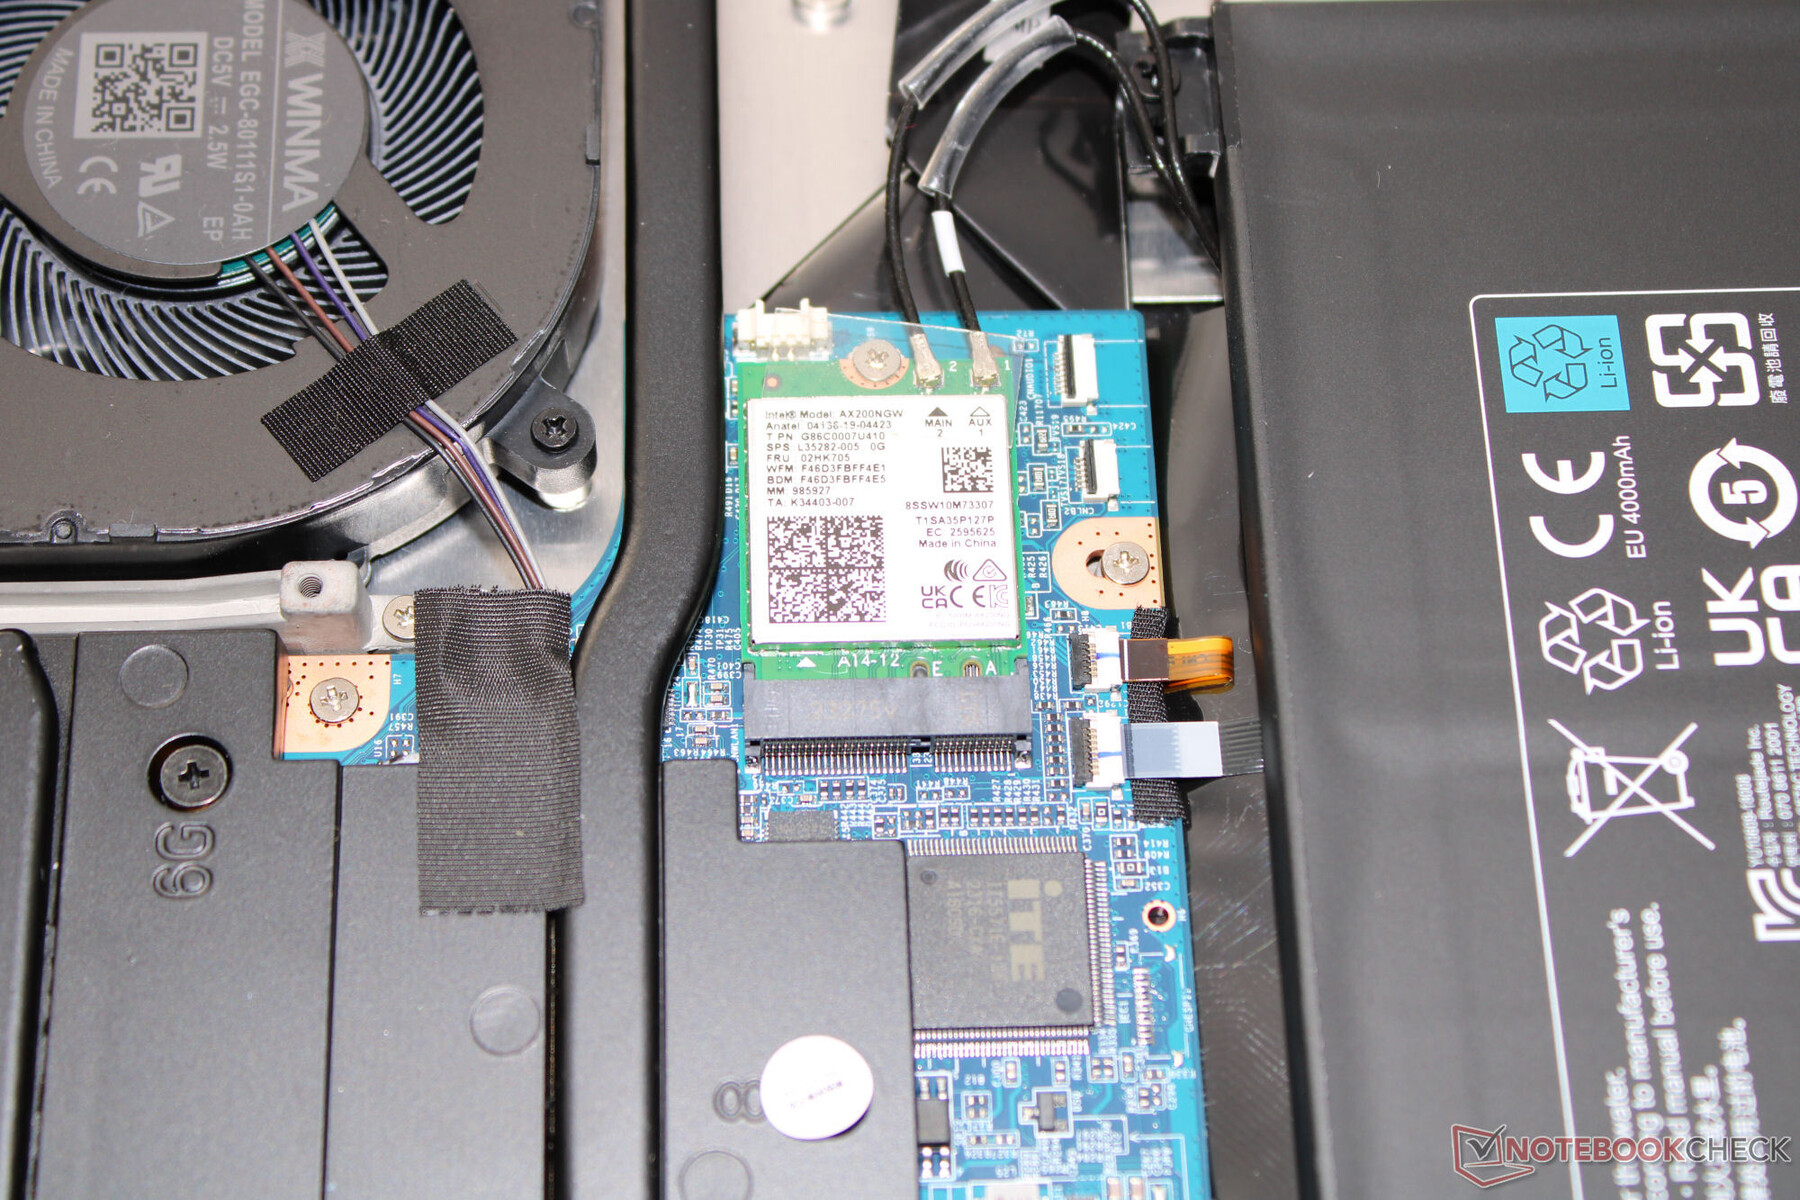
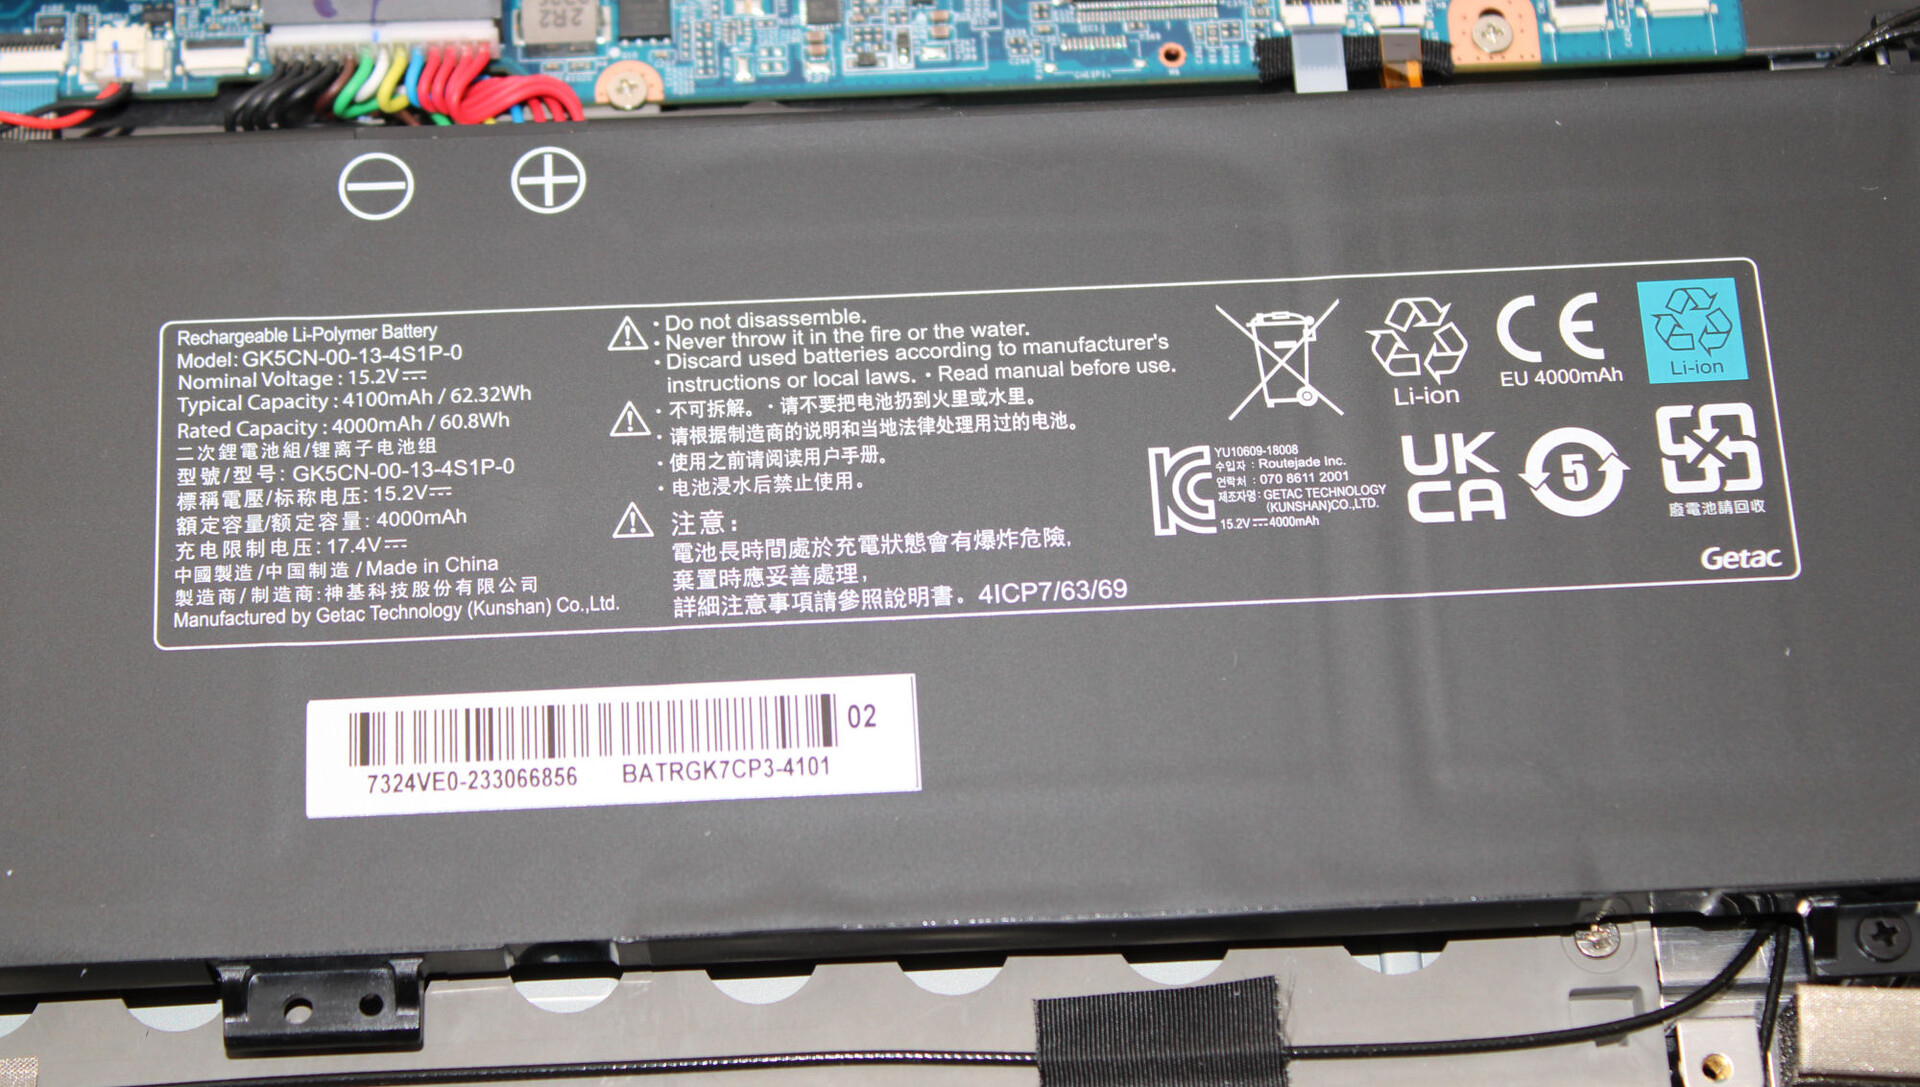
O gabinete preto fosco tem superfícies lisas (exceto a unidade de base) e nenhum recurso de design chamativo. Os elementos de luz LED não estão presentes, com exceção da iluminação das teclas. A Schenker optou por uma mistura de materiais: A parte traseira da tampa de alumínio também é complementada por componentes de plástico. Após a desmontagem da unidade básica, a bateria (parafusada, não colada) e o hardware usual ficam expostos.
As falhas de fabricação não são perceptíveis e as dimensões do espaço são boas. A tampa e a unidade da base podem ser ligeiramente torcidas, mas tudo dentro de uma faixa aceitável. Qualquer pressão exercida sobre a tampa não causa distorções na imagem. As dobradiças mantêm a tampa firmemente no lugar, mas oscilam um pouco. O ângulo máximo de abertura é de 140 graus. É possível abrir o laptop com uma só mão.
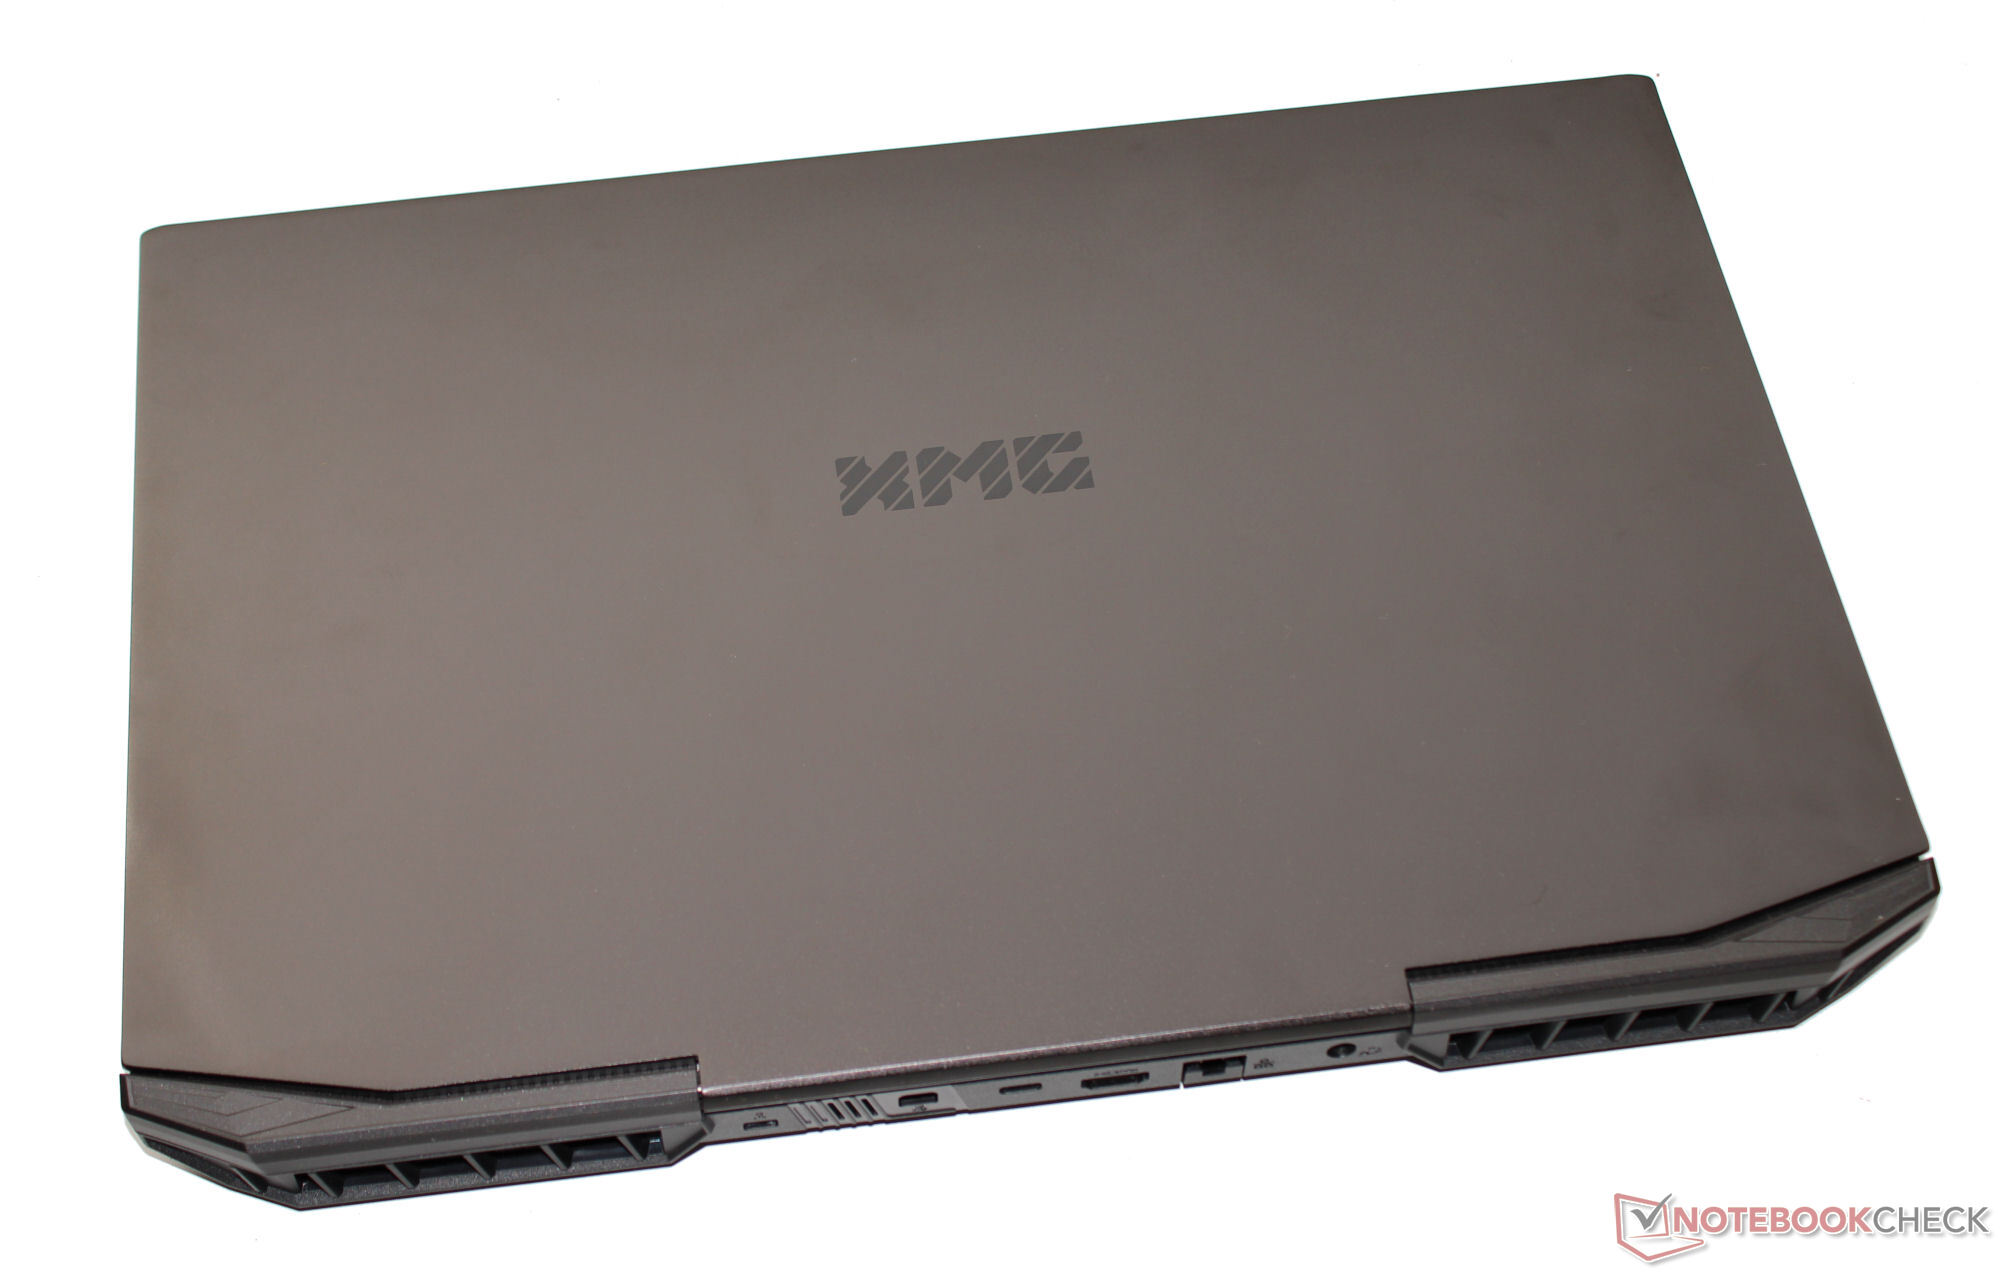
O computador XMG é o mais leve e compacto entre os laptops de 17,3 polegadas da concorrência. Com cerca de 2,5 kg, ele geralmente pertence aos representantes mais leves de seu tipo.
Recursos - O laptop XMG vem sem Thunderbolt
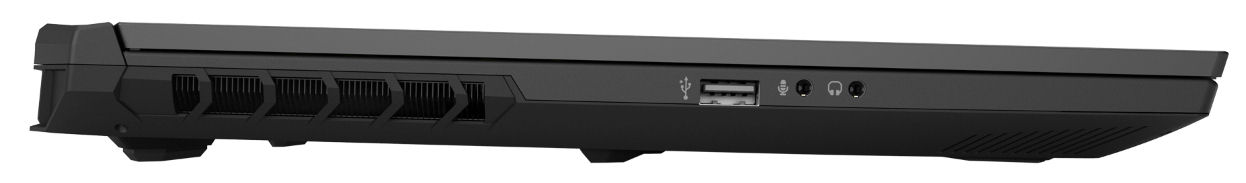
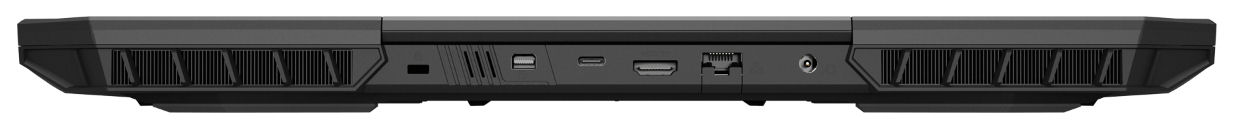
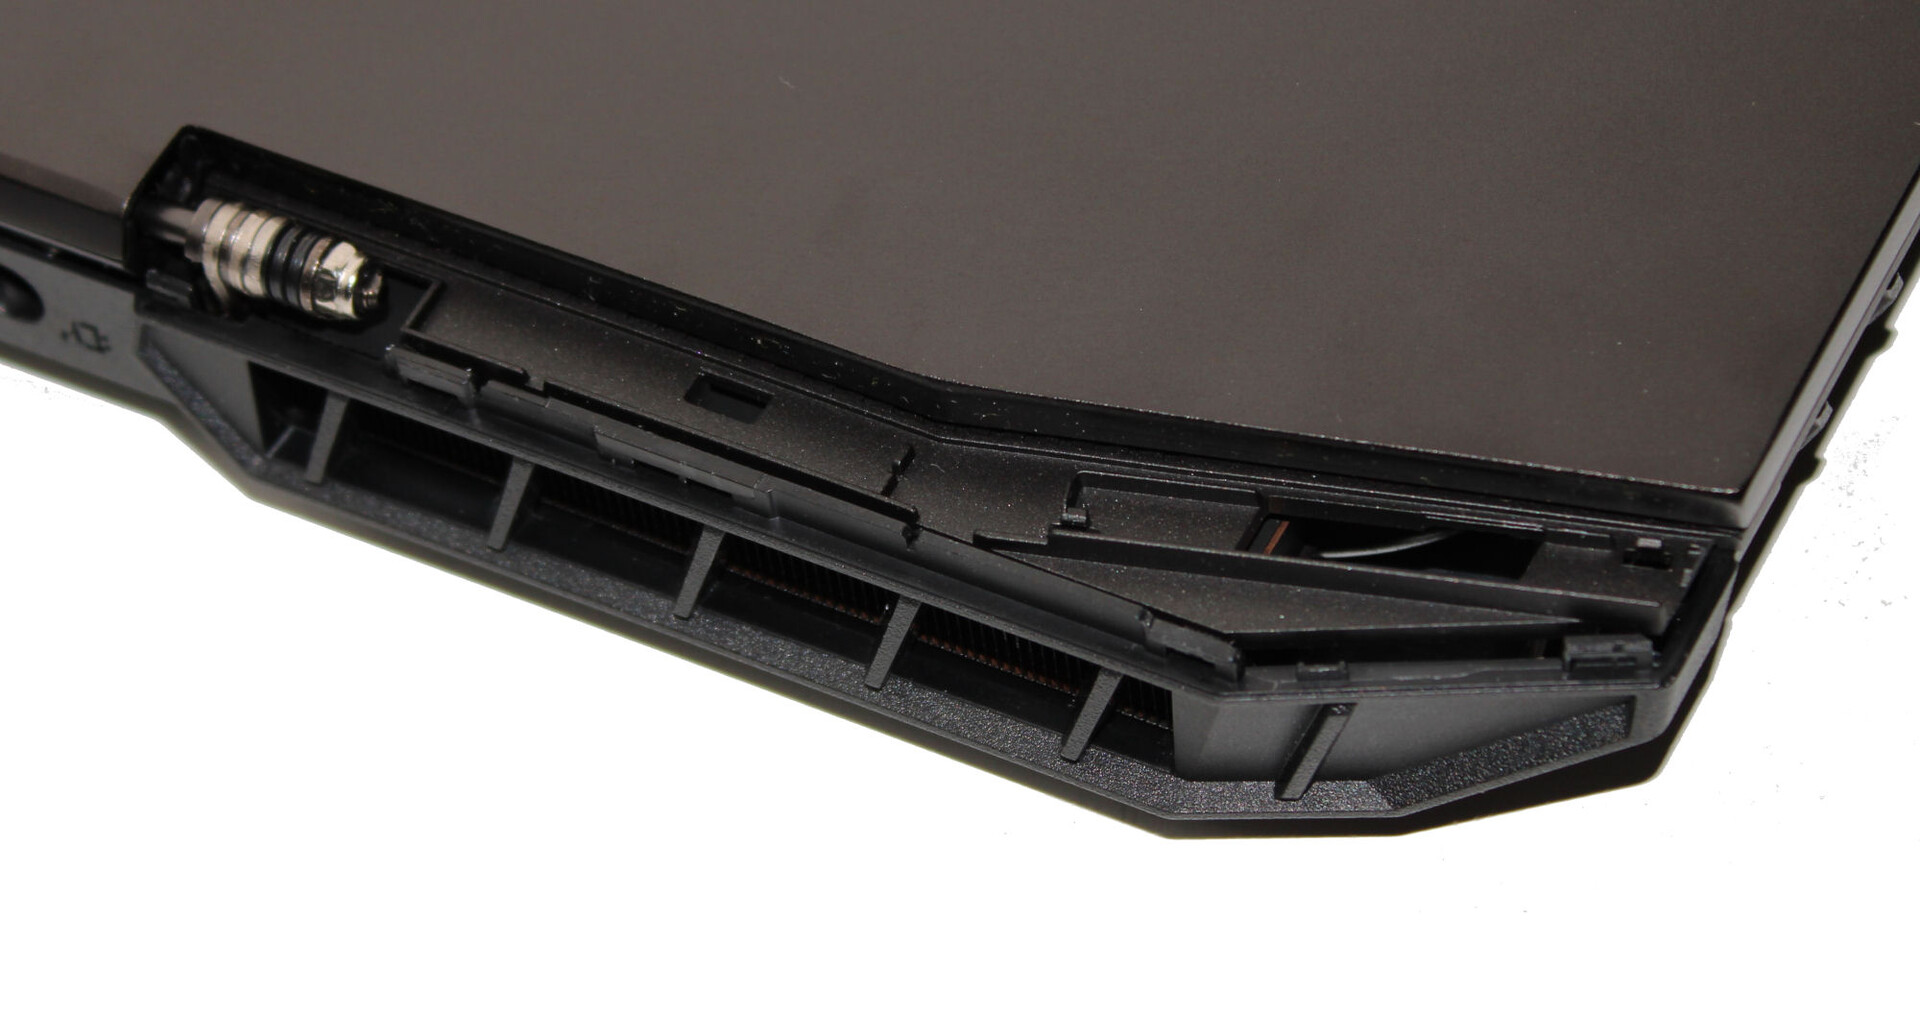
O Apex tem três portas USB-A (1x USB 2.0, 2x USB 3.2 Gen 1) e uma porta USB-C (USB 3.2 Gen 2) prontas para uso. A última não pode emitir um sinal Displayport nem oferece suporte ao Power Delivery. Duas saídas de vídeo (HDMI 2.1, DP 1.4a), conectores de áudio e uma porta Gigabit Ethernet completam o pacote.
As saídas de vídeo, o conector de alimentação e a porta LAN podem ser encontrados na parte traseira do dispositivo. Seus cabos correspondentes são instalados na parte traseira e, portanto, não atrapalham.
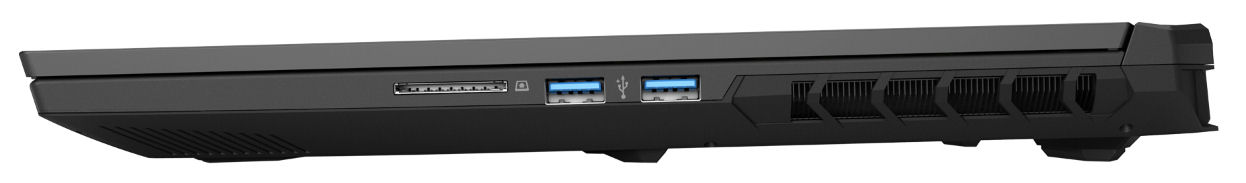
Leitor de cartão SD
Com uma velocidade máxima de transferência de 35 MB/s (transferência de 250 arquivos de imagem jpg, com cerca de 5 MB cada) e 36 MB/s (cópia de grandes blocos de dados), o leitor de cartão de memória (cartão de referência: AV PRO microSD 128 GB V60) pertence aos modelos lentos. Nesse aspecto, a concorrência oferece mais.
| SD Card Reader | |
| average JPG Copy Test (av. of 3 runs) | |
| Alienware m16 R1 Intel (AV PRO microSD 128 GB V60) | |
| Média da turma Gaming (20.9 - 210, n=54, últimos 2 anos) | |
| Medion Erazer Defender P40 (AV PRO microSD 128 GB V60) | |
| Acer Nitro 17 AN17-51-71ER | |
| Schenker XMG Apex 17 (Late 23) (AV PRO microSD 128 GB V60) | |
| maximum AS SSD Seq Read Test (1GB) | |
| Alienware m16 R1 Intel (AV PRO microSD 128 GB V60) | |
| Média da turma Gaming (25.5 - 261, n=51, últimos 2 anos) | |
| Medion Erazer Defender P40 (AV PRO microSD 128 GB V60) | |
| Acer Nitro 17 AN17-51-71ER | |
| Schenker XMG Apex 17 (Late 23) (AV PRO microSD 128 GB V60) | |
Comunicação
Em condições ideais (sem dispositivos Wi-Fi por perto, uma distância curta entre o laptop e o PC servidor), é possível obter velocidades de dados Wi-Fi de boas a muito boas. O laptop Schenker usa um chip Wi-Fi 6E (Intel AX200). Um controlador Realtek (RTL8168/8111; 1 GBit/s) cuida das conexões com fio.
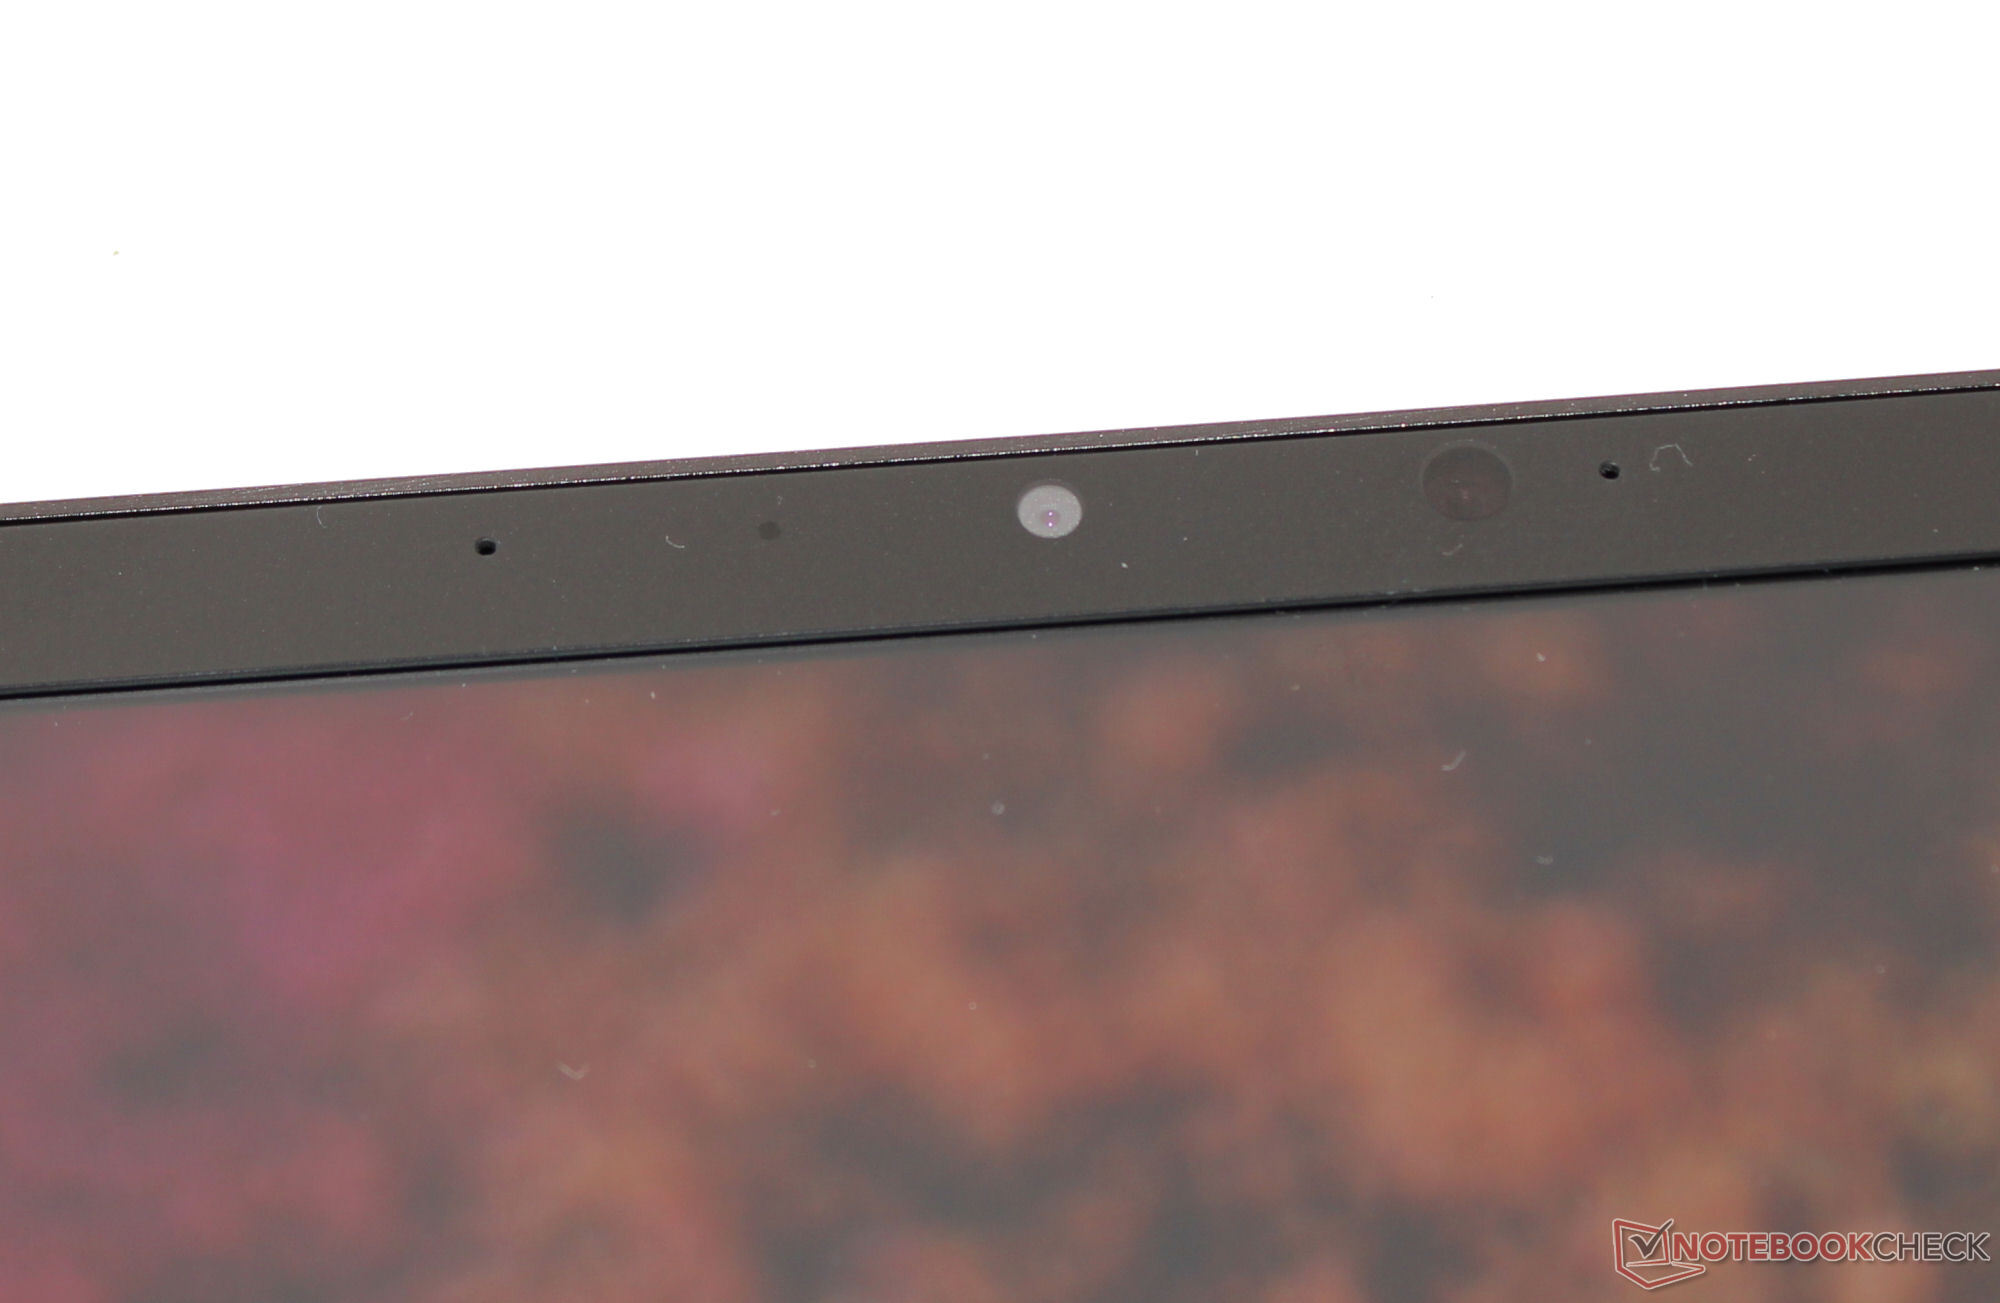
Webcam
Em termos de qualidade, a webcam oferece (2,1 MP, máx. 1.920 x 1.080 pixels) o padrão. Um desvio de cor de cerca de 8,7 (meta: DeltaE < 3) é bastante razoável. A câmera não oferece um obturador mecânico.

 GeForce RTX 4060 Laptop GPU, R7 7840HS, Samsung 990 Pro 1 TB")
 GeForce RTX 4060 Laptop GPU, R7 7840HS, Samsung 990 Pro 1 TB")
Acessórios
Além dos documentos habituais, o laptop vem com um pendrive USB (drivers, software), um chaveiro que inclui um abridor de garrafas e um mousepad grande.
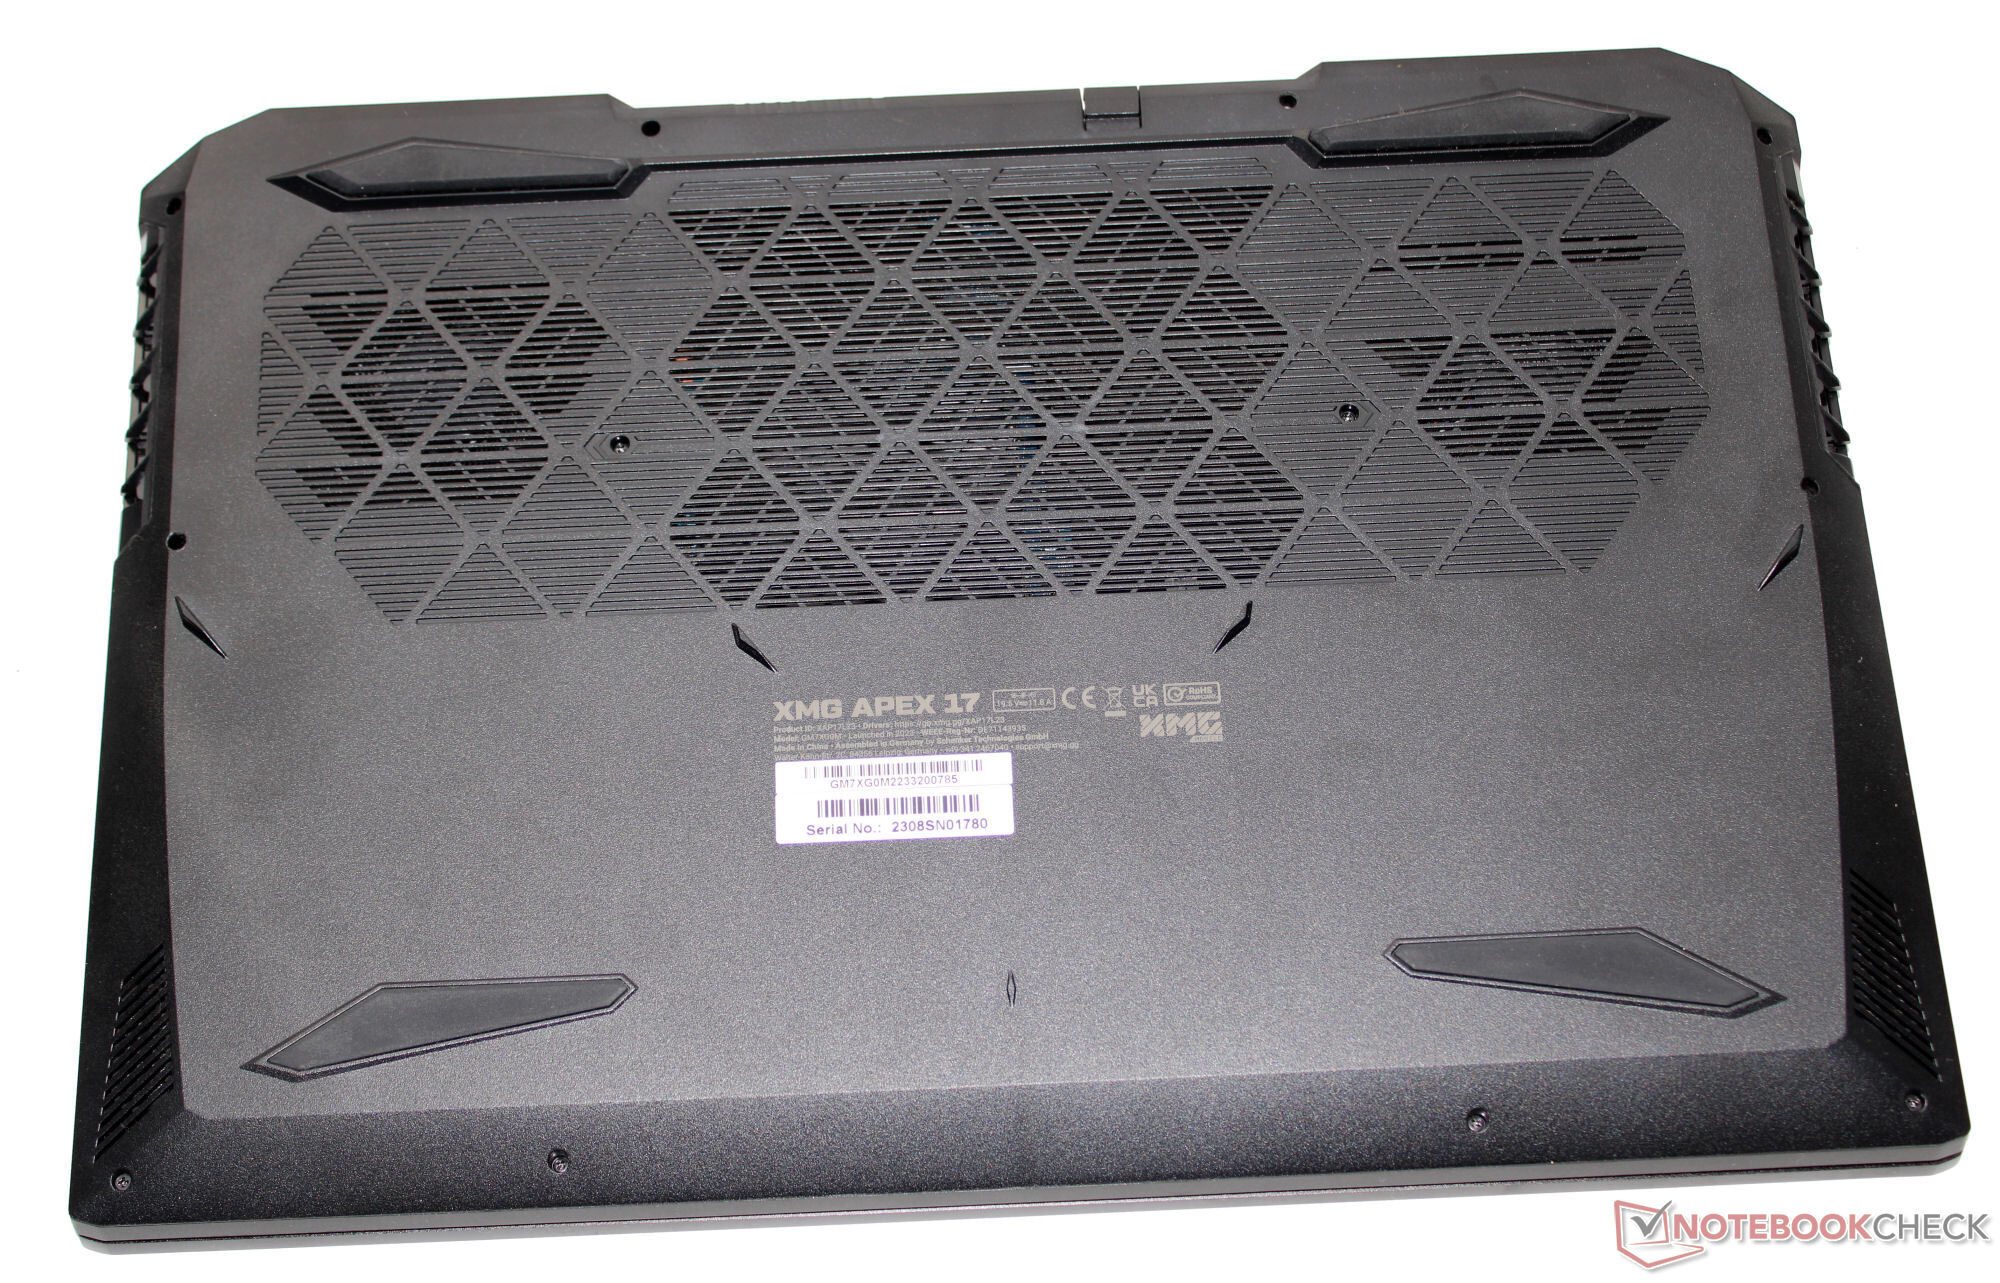
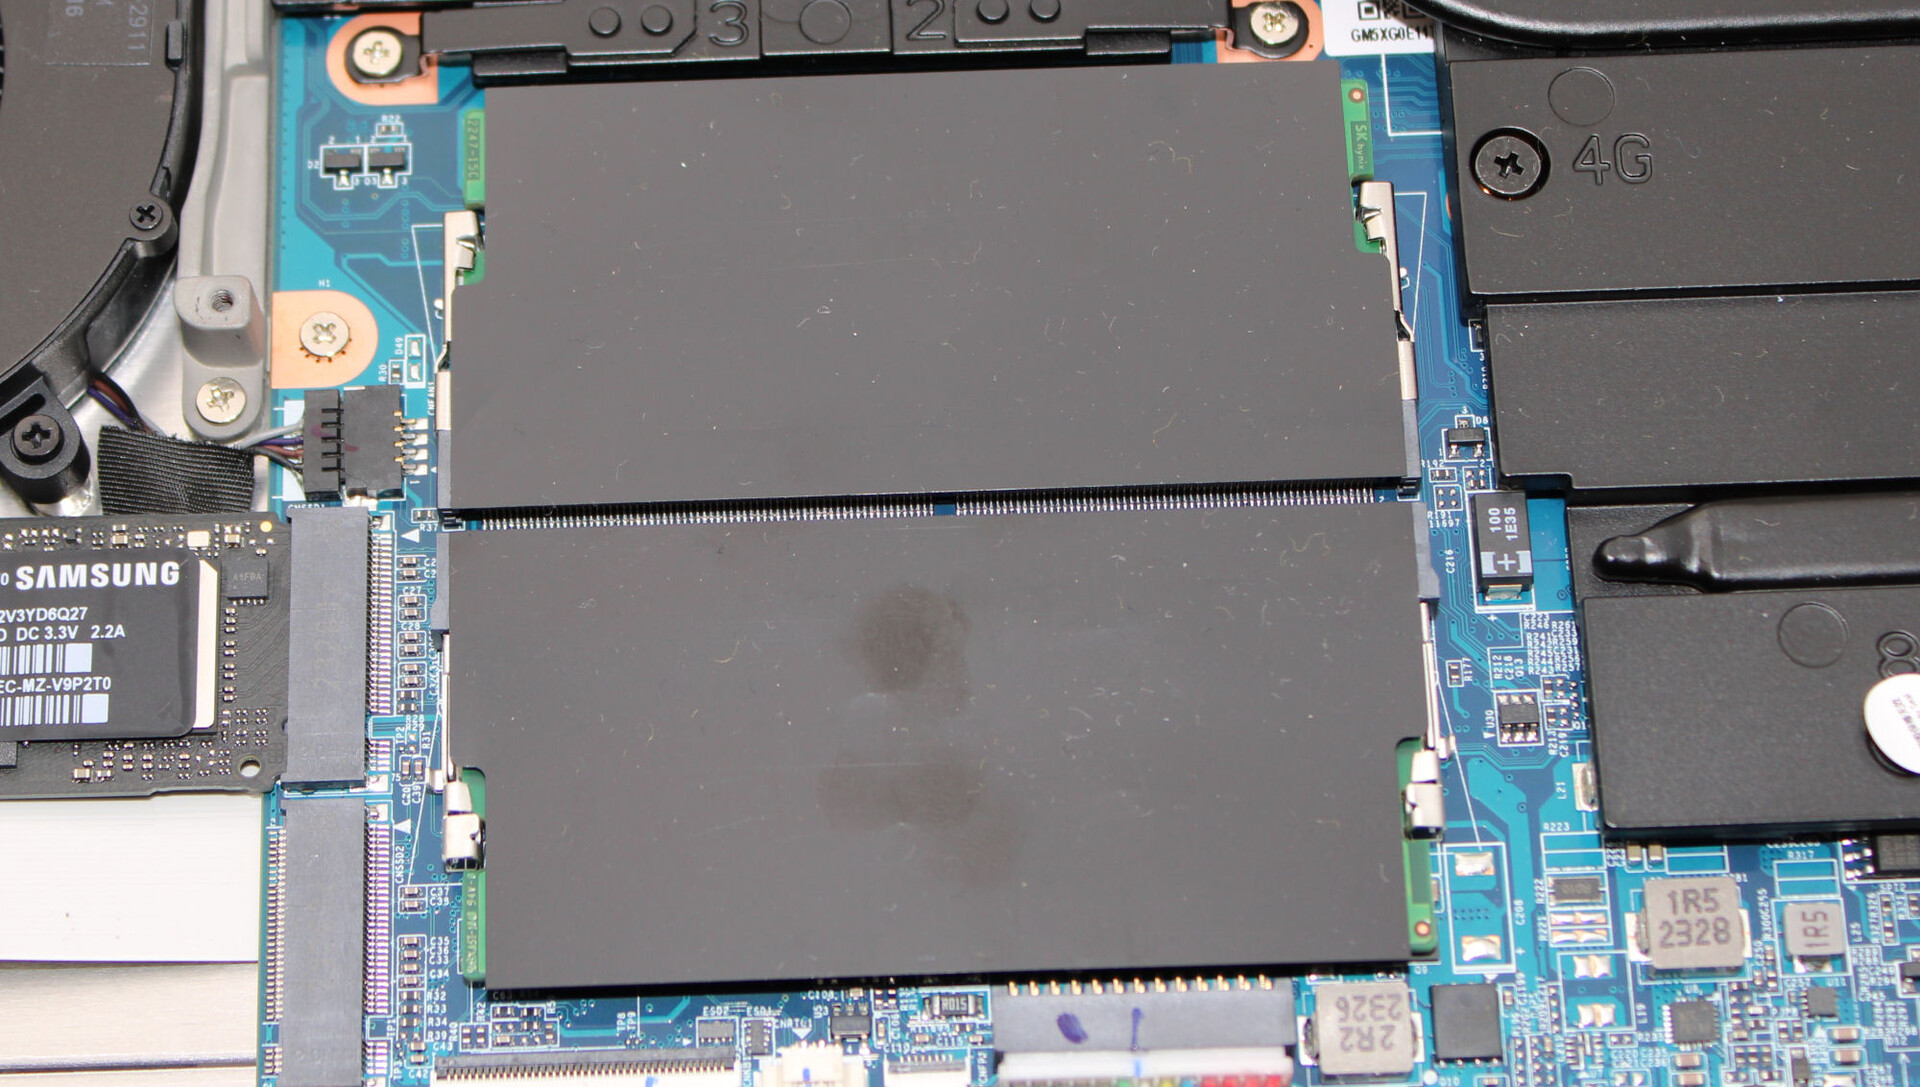
Manutenção
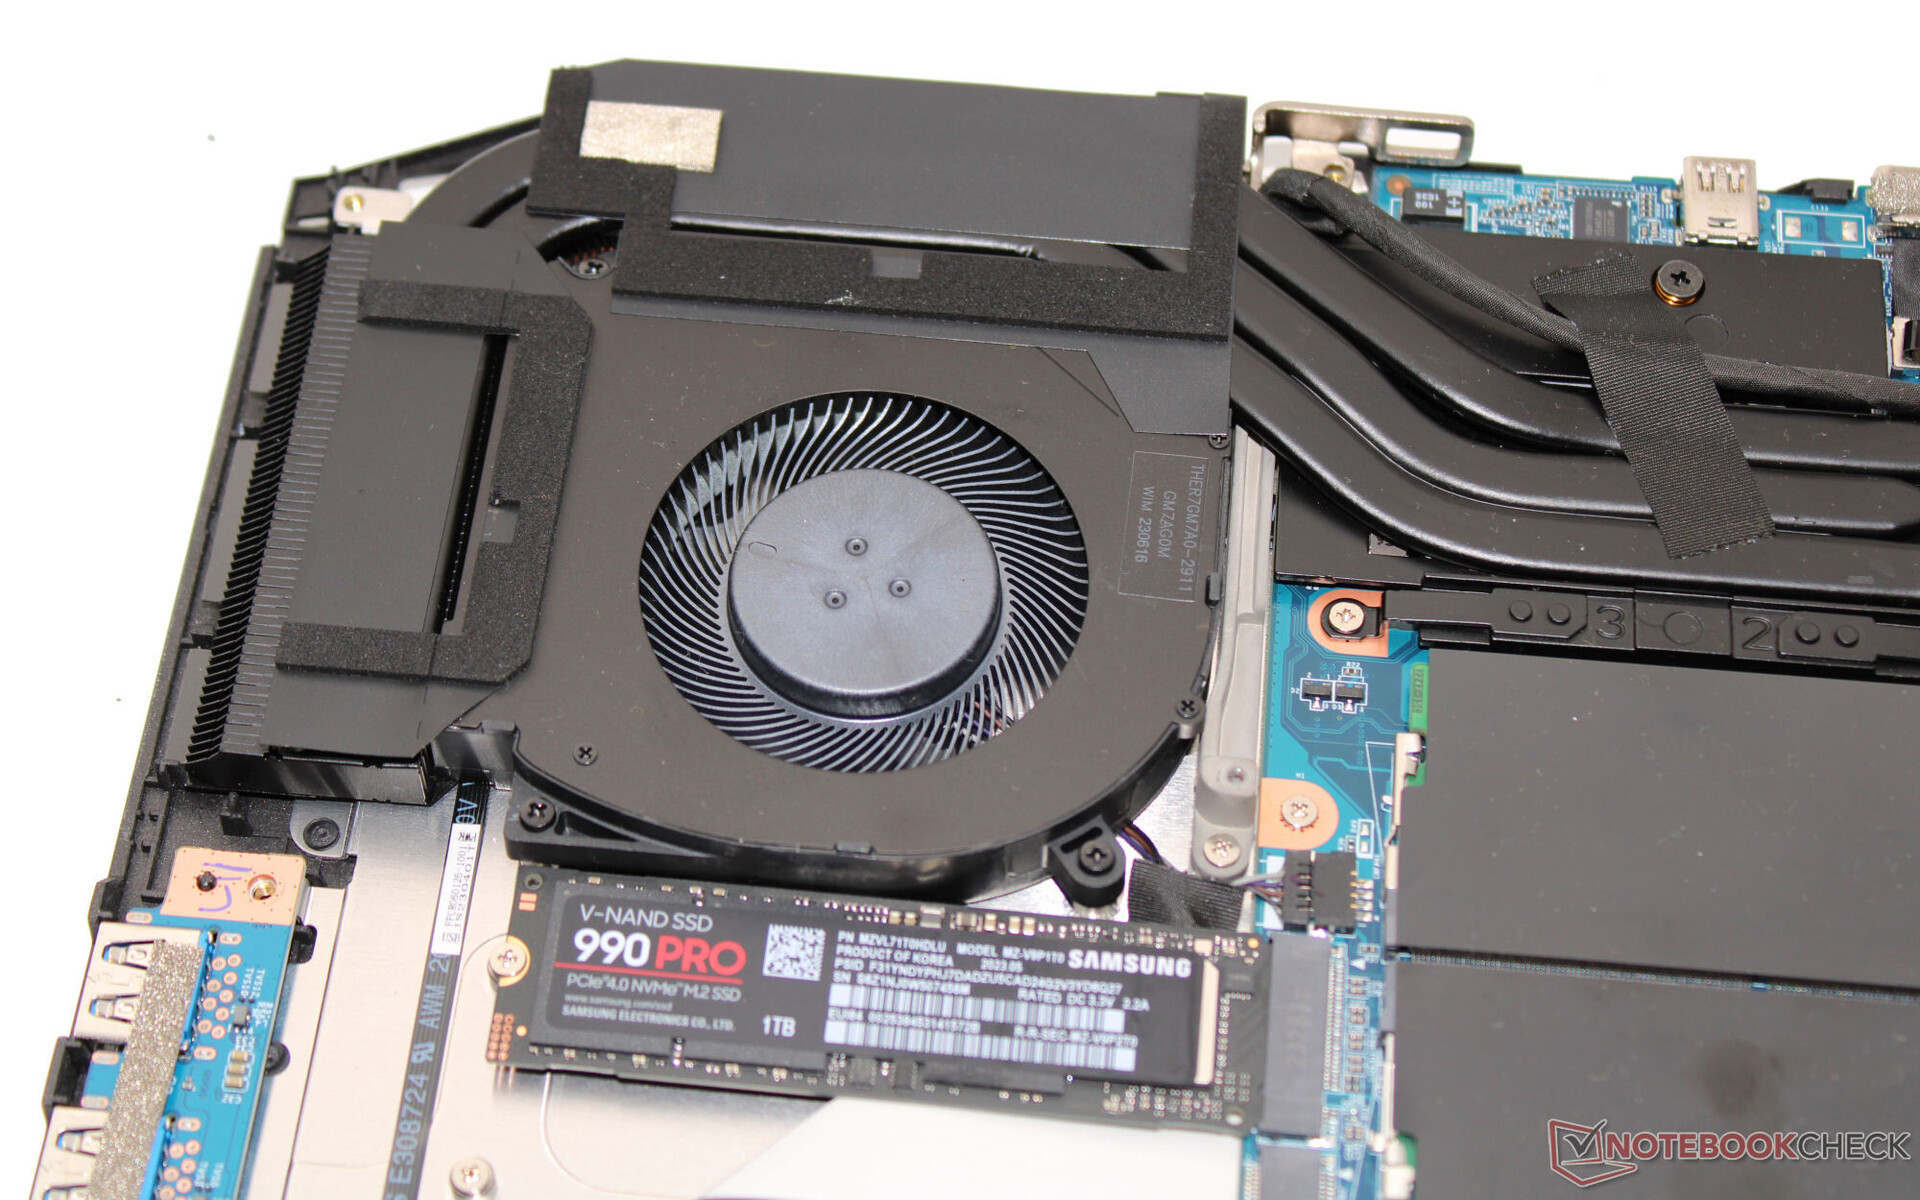
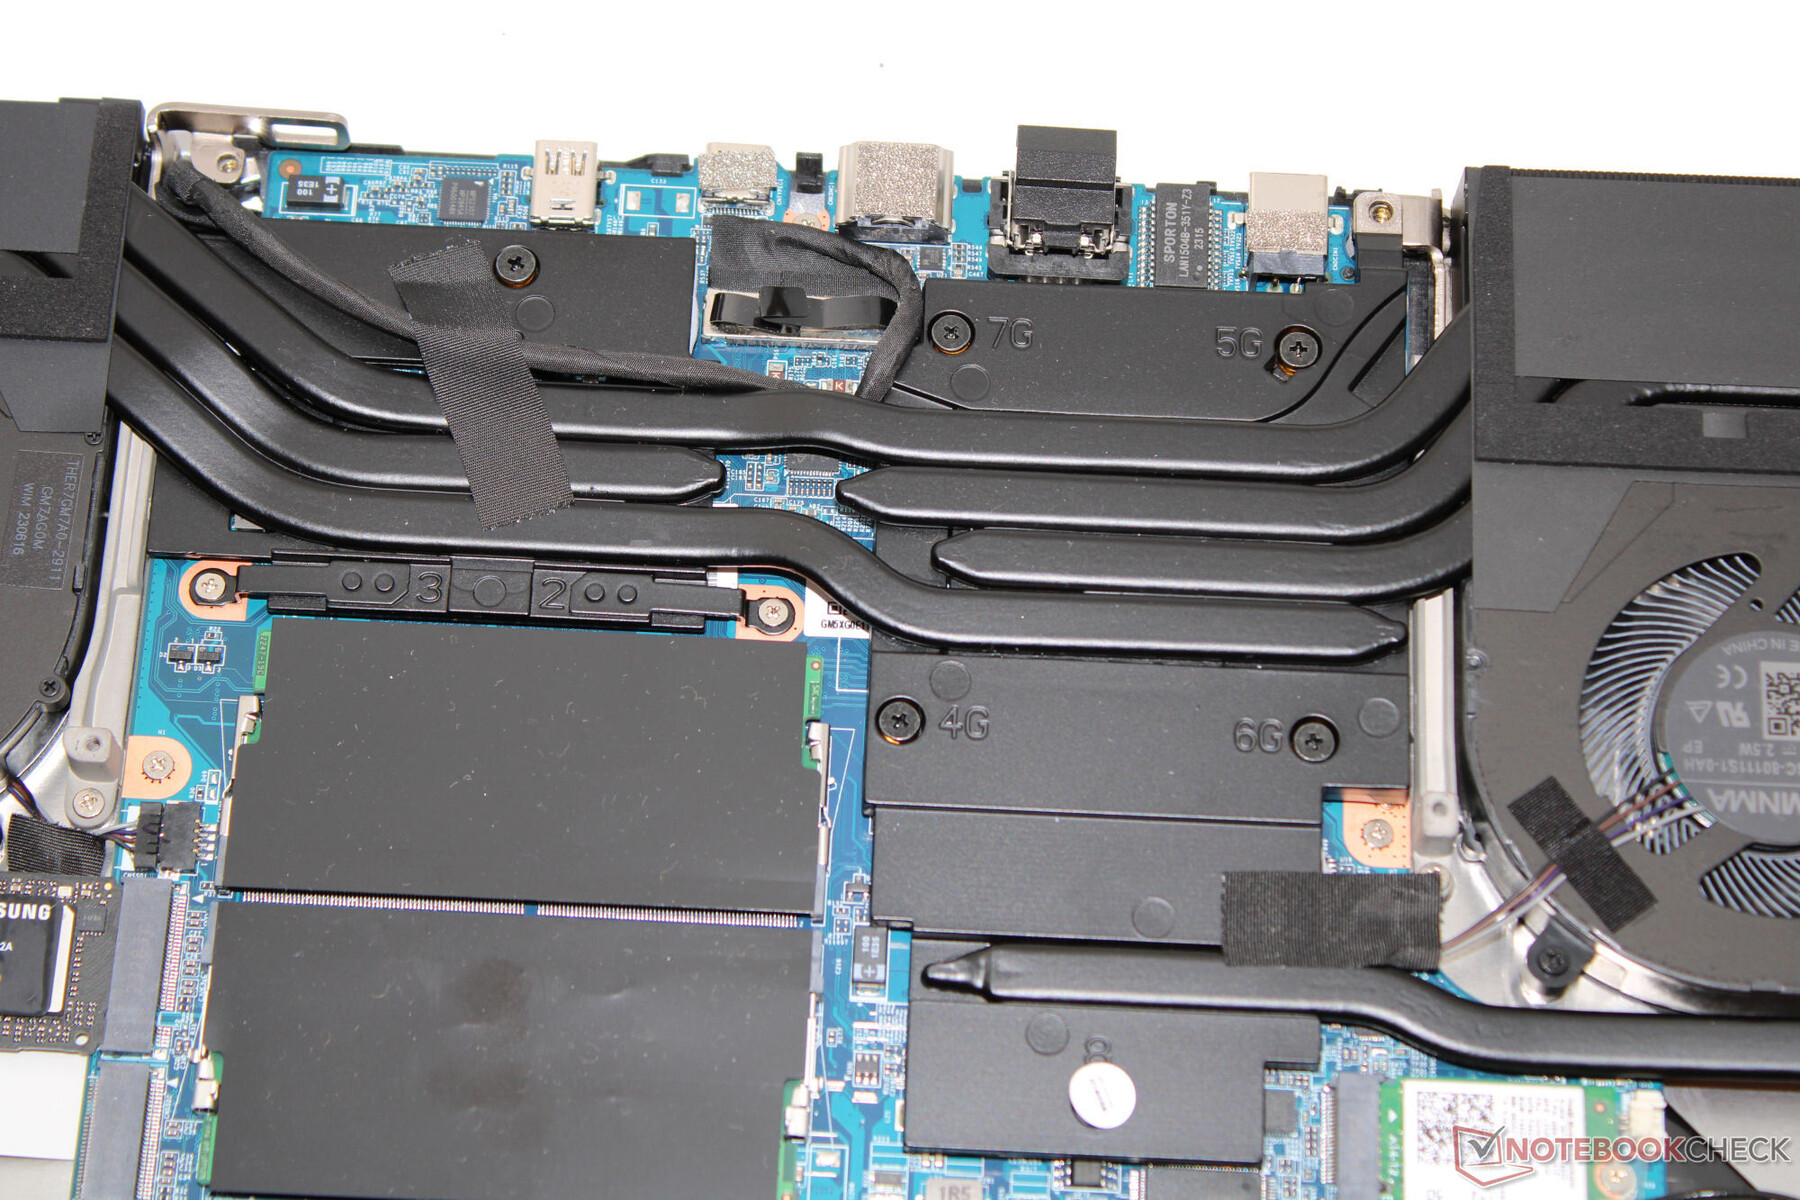
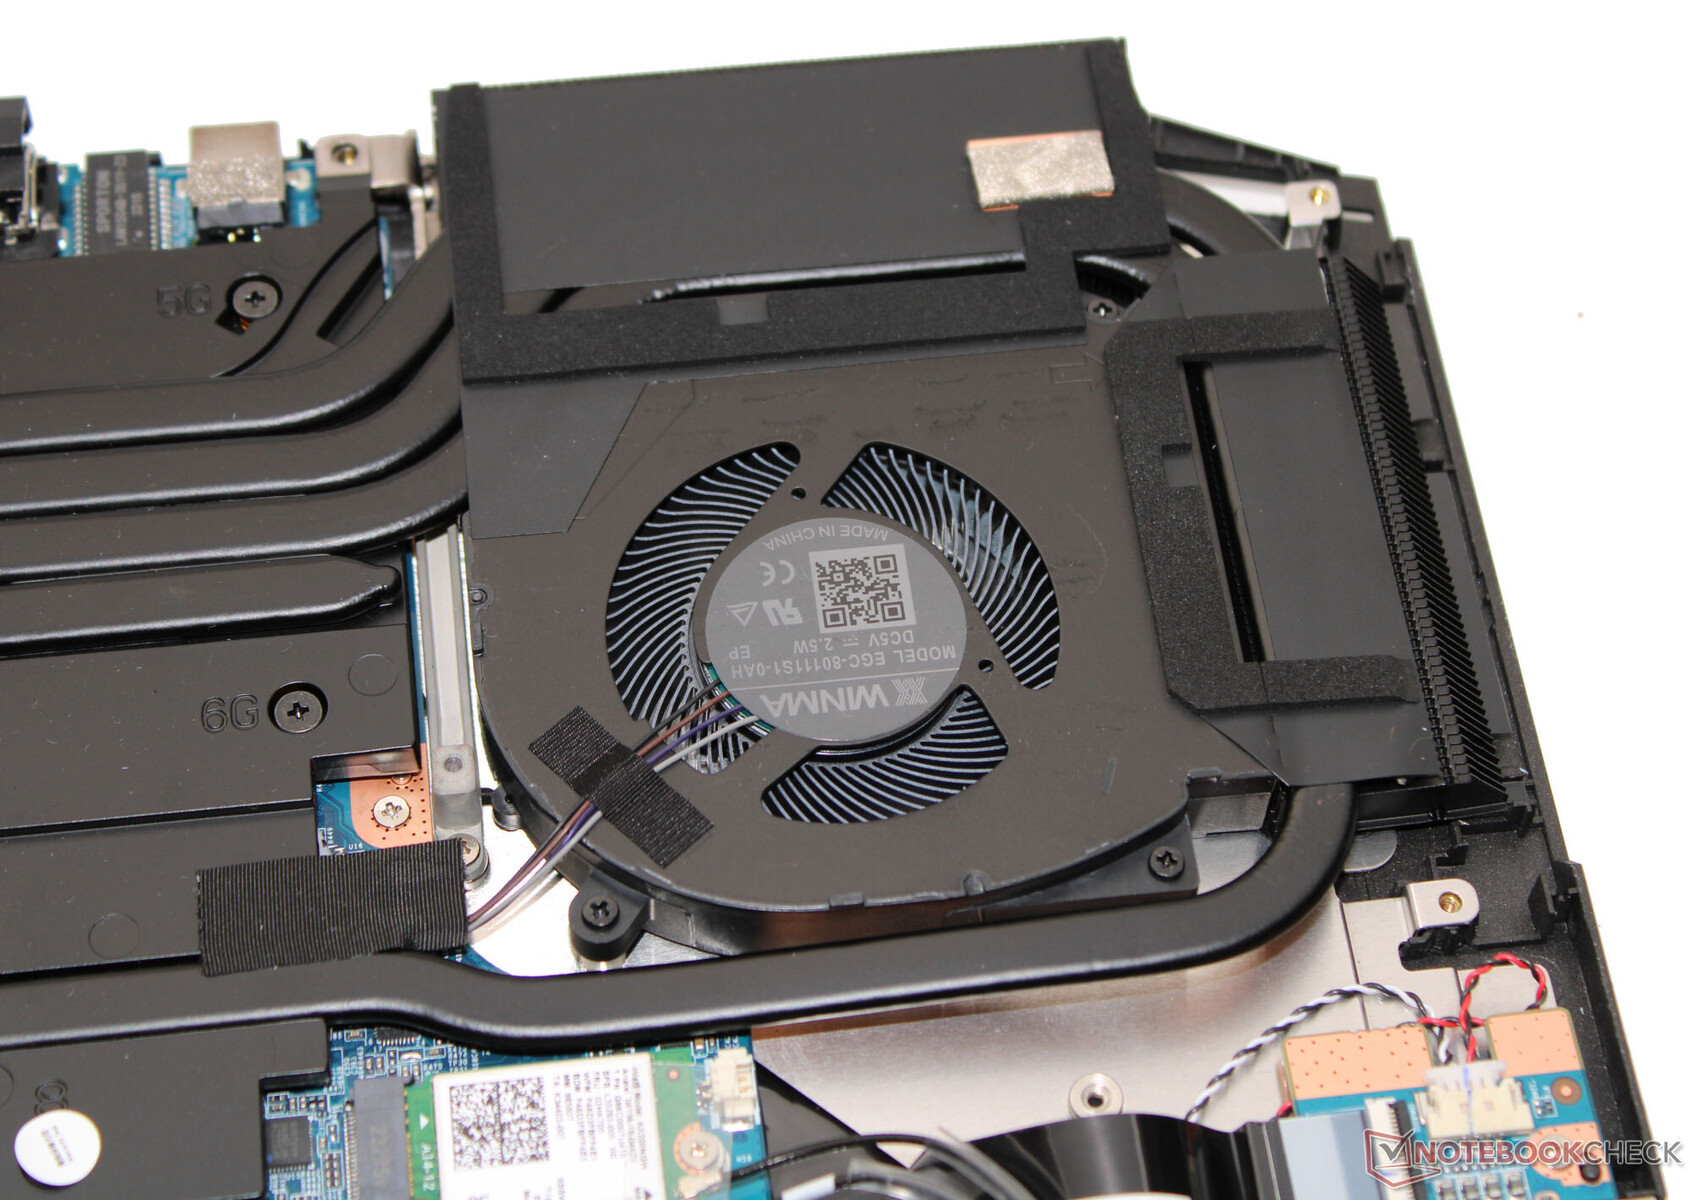
Após a desmontagem da placa de base, o hardware fica acessível. A primeira etapa dessa jornada é apresentada pela remoção das tampas das dobradiças (acima das saídas de ar). Elas são apenas encaixadas e não parafusadas. Em seguida, a remoção de todos os parafusos na parte inferior do dispositivo significa que a base pode ser separada do restante do dispositivo usando uma espátula fina ou um plectro. Isso permite o acesso aos bancos de memória (ambos ocupados), ao SSD (PCIe 4, M.2 2280), ao segundo slot de SSD (PCIe 4, M.2 2280), ao módulo Wi-Fi, à bateria do BIOS, aos ventiladores e à bateria.
Garantia
A garantia básica é de dois anos, incluindo um serviço de coleta e seis meses de reparo rápido (reparo em 48 horas). Na Alemanha, o preço pedido para uma garantia de 36 meses é de 80 a 119 euros, dependendo do período de reparo rápido selecionado.
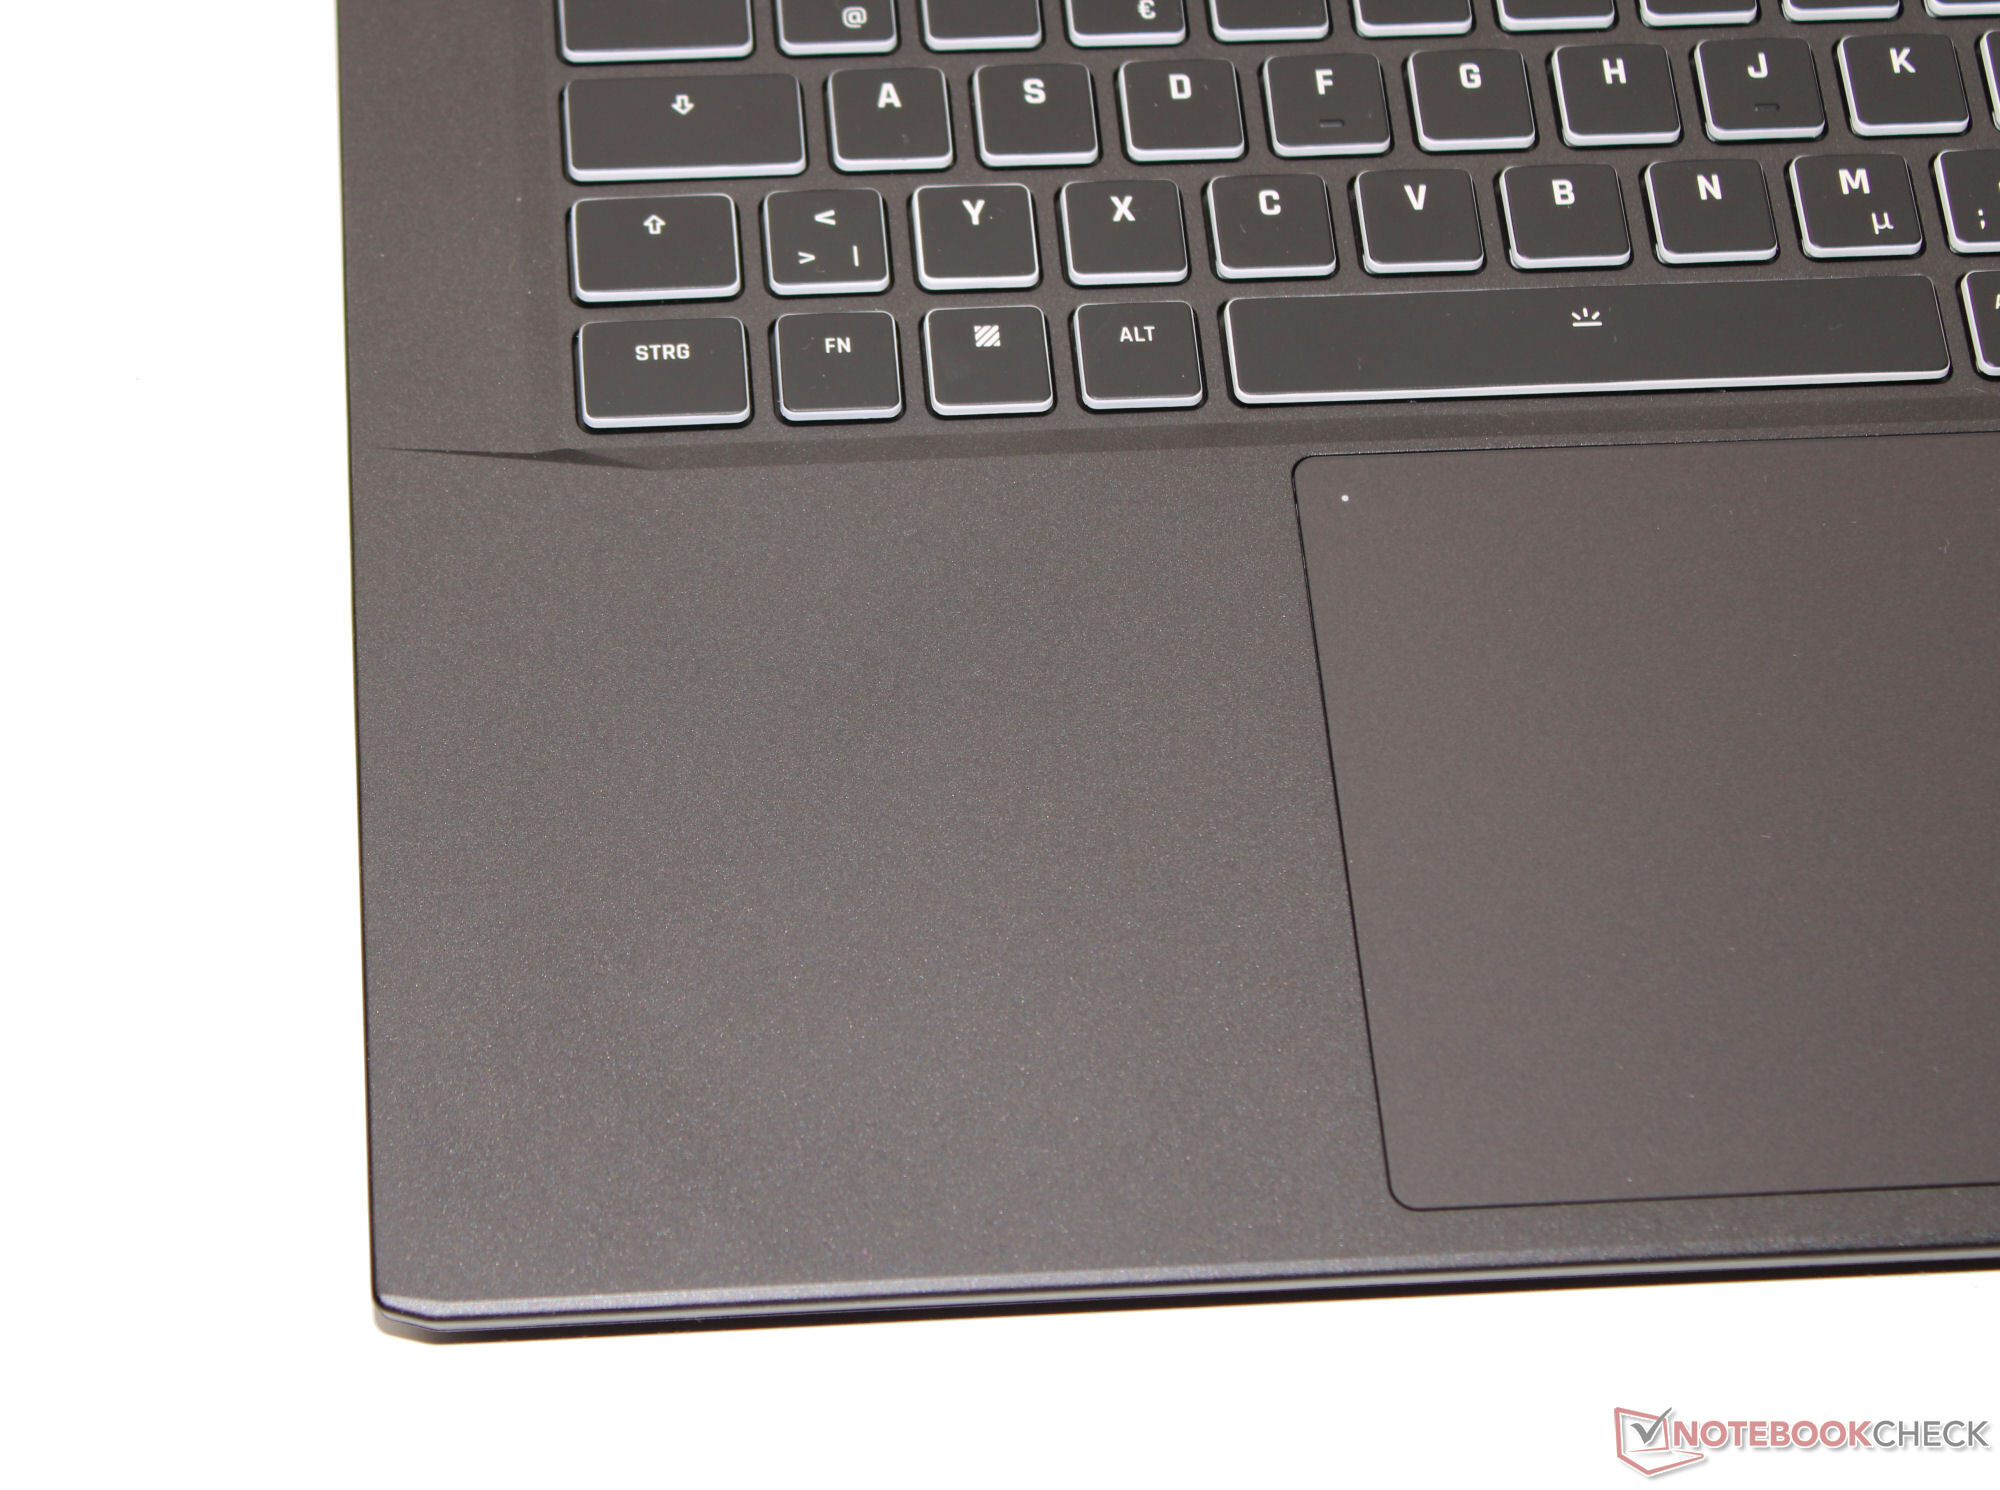
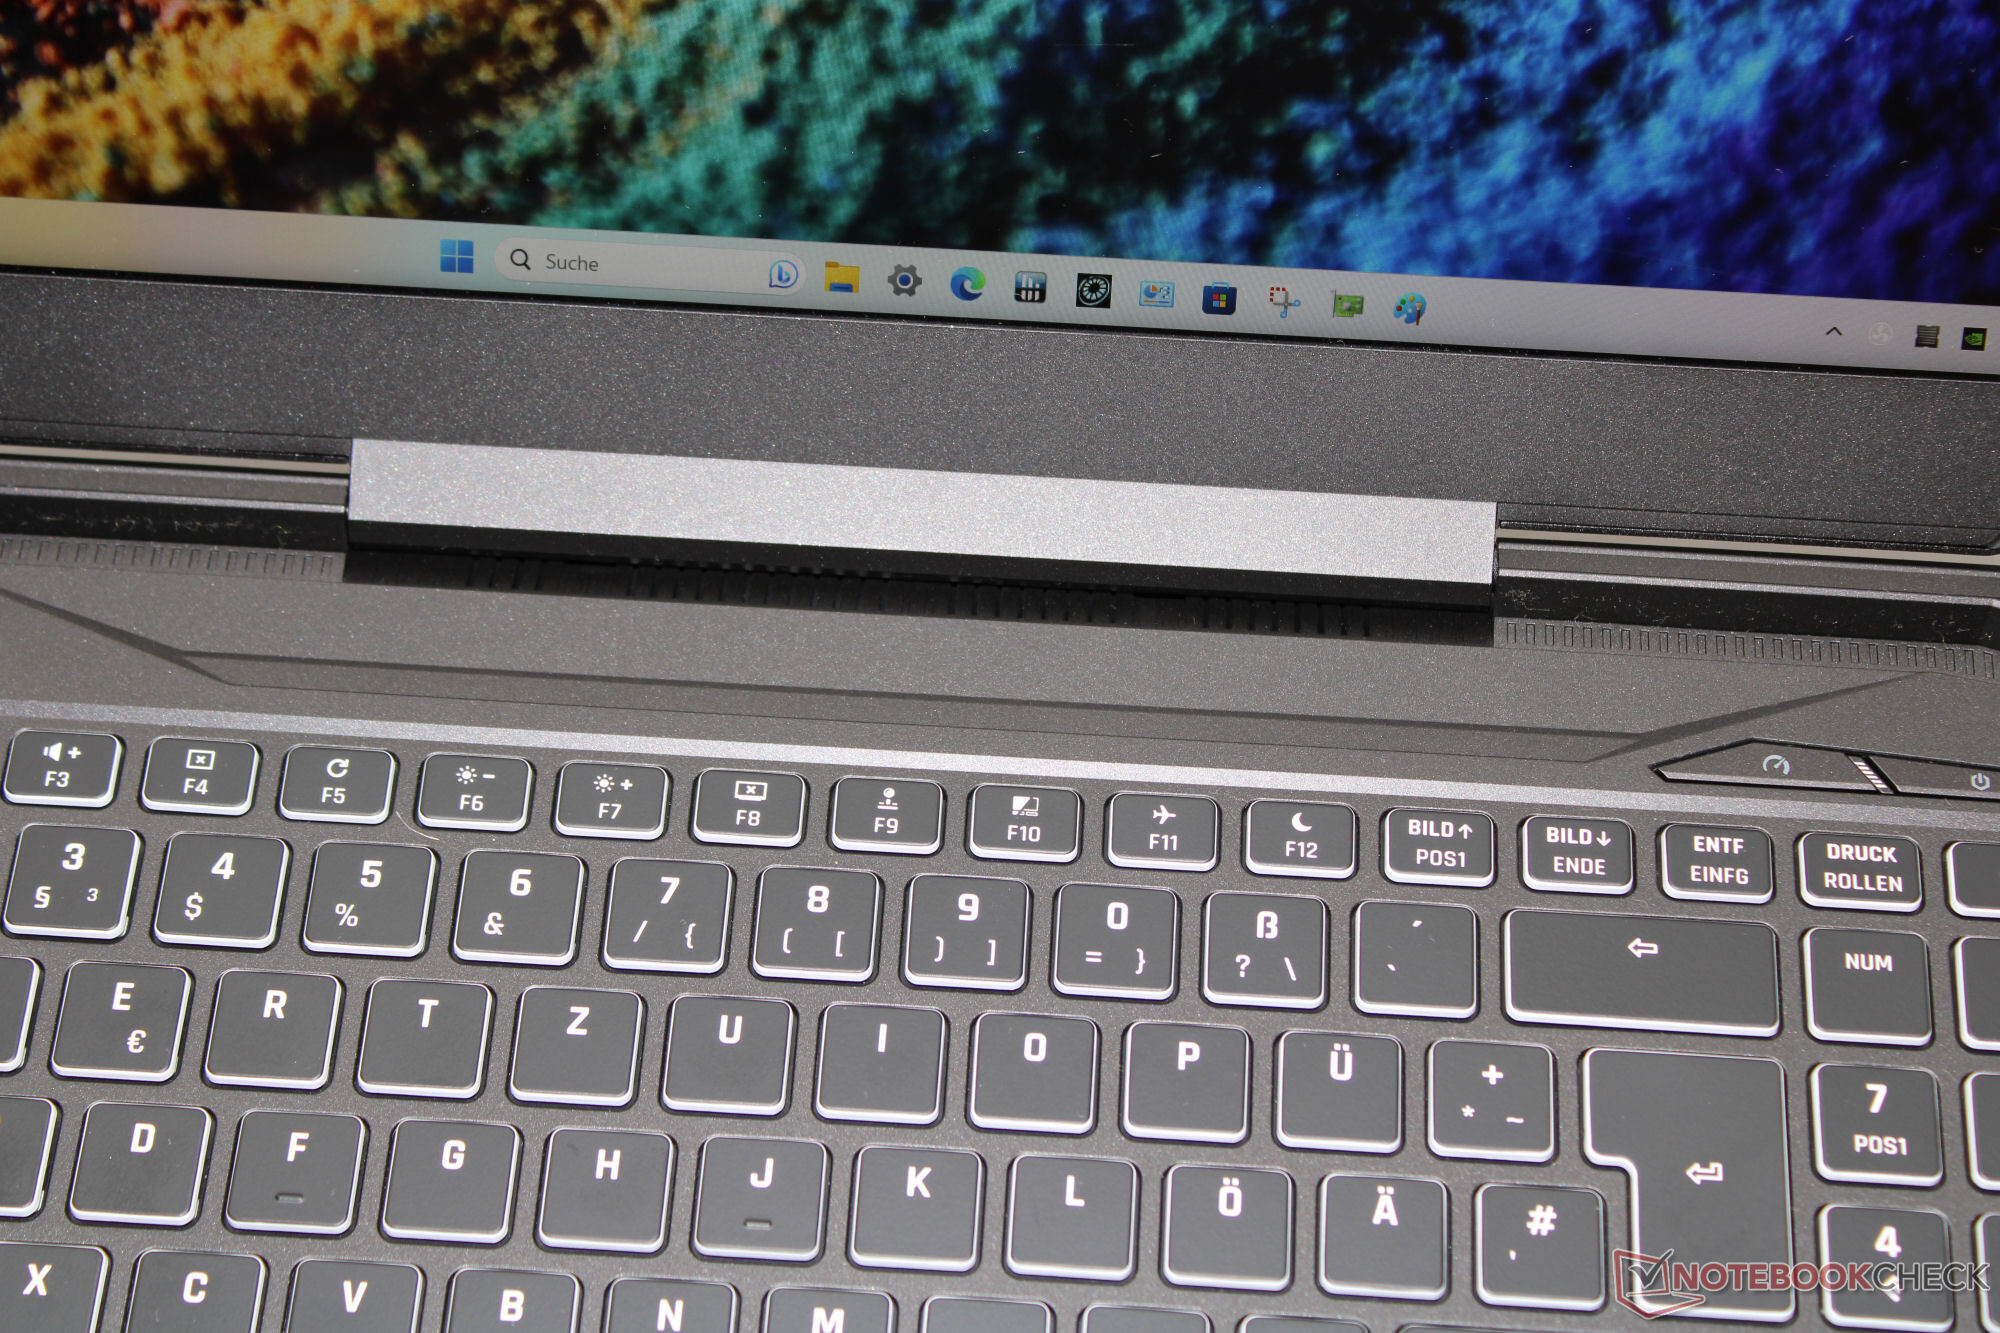
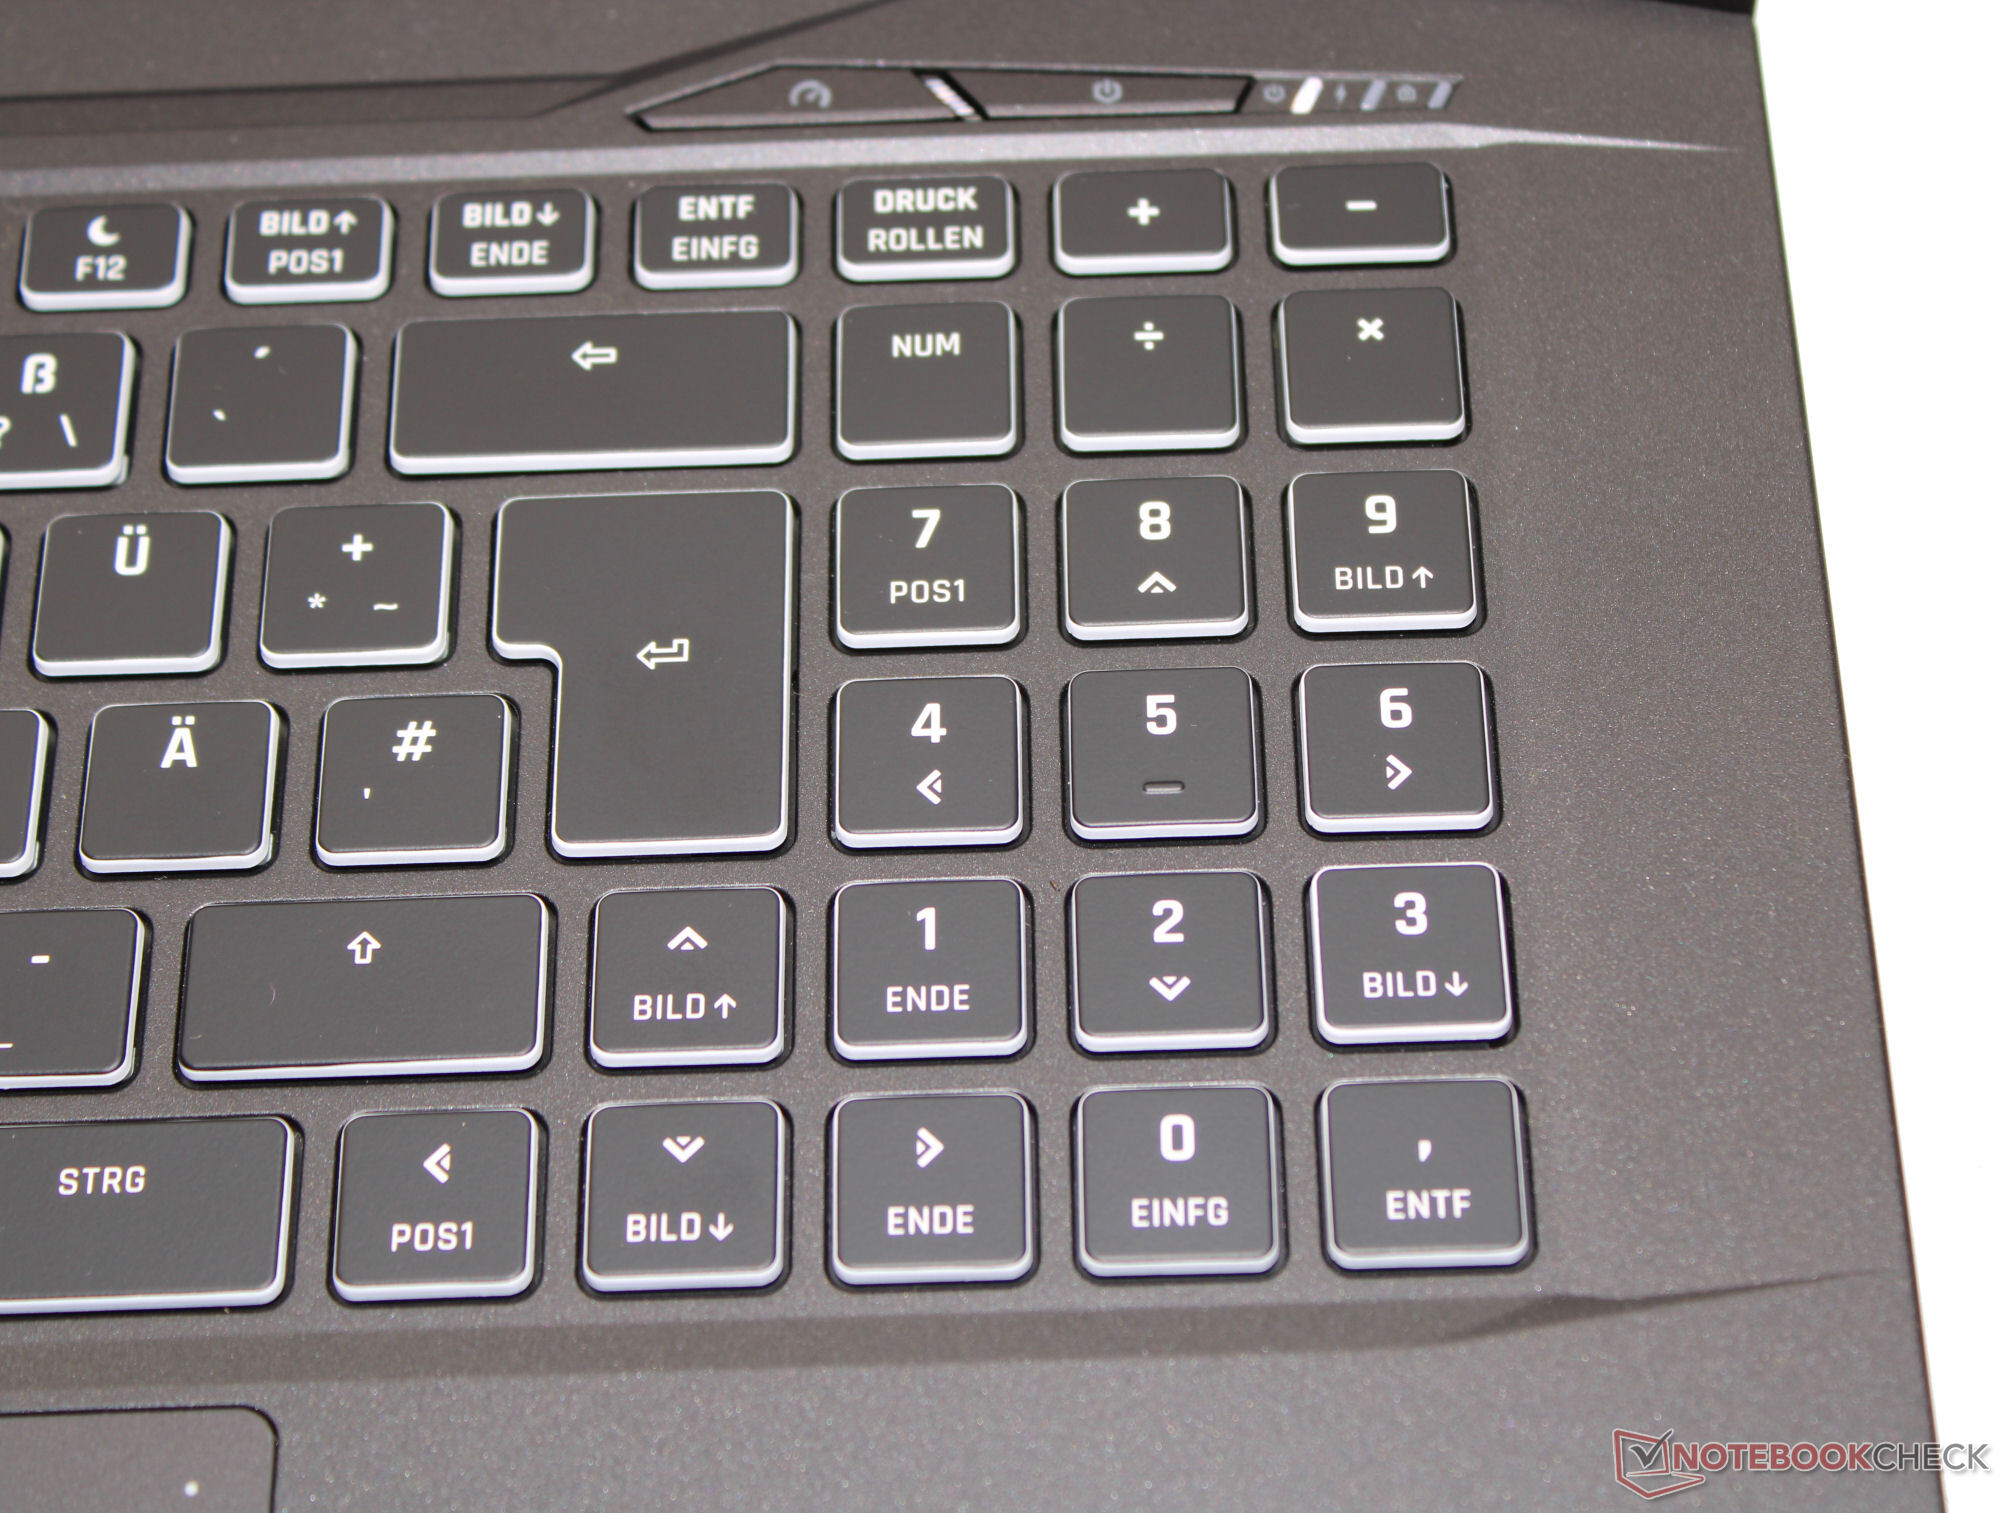
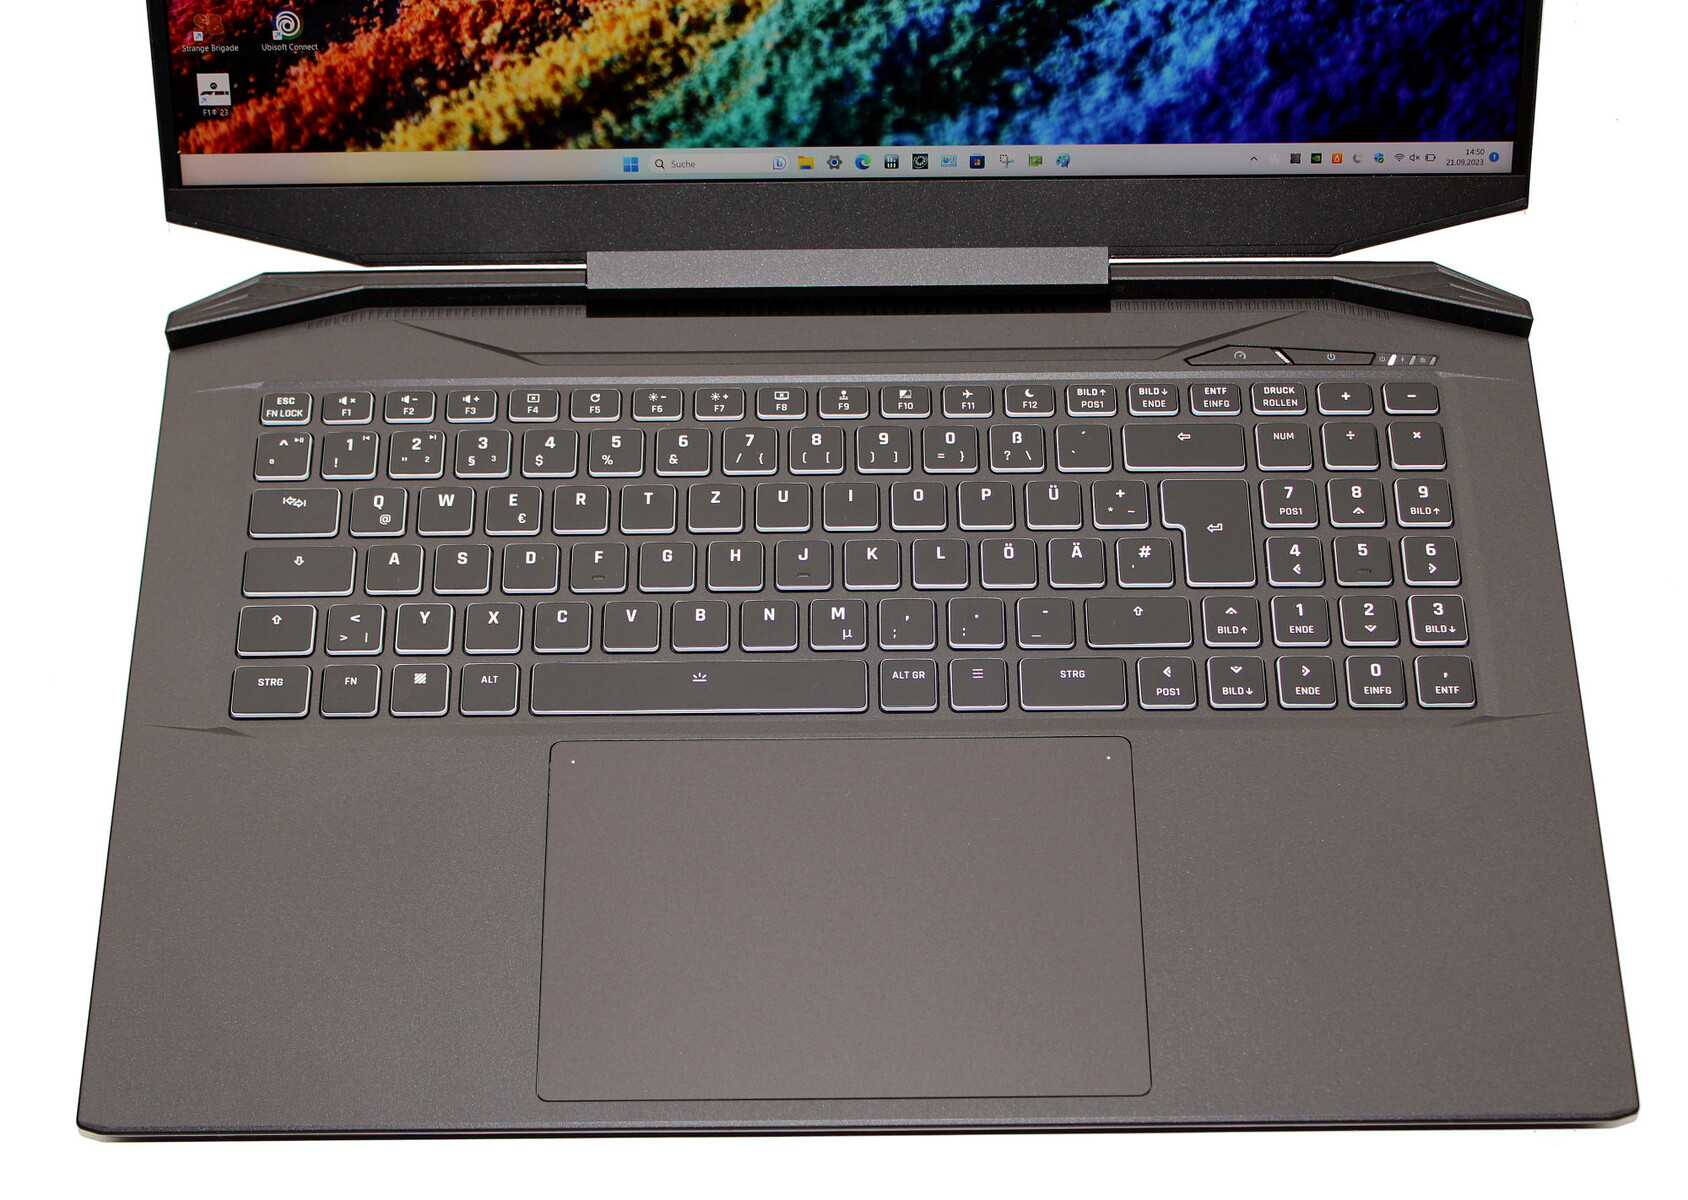
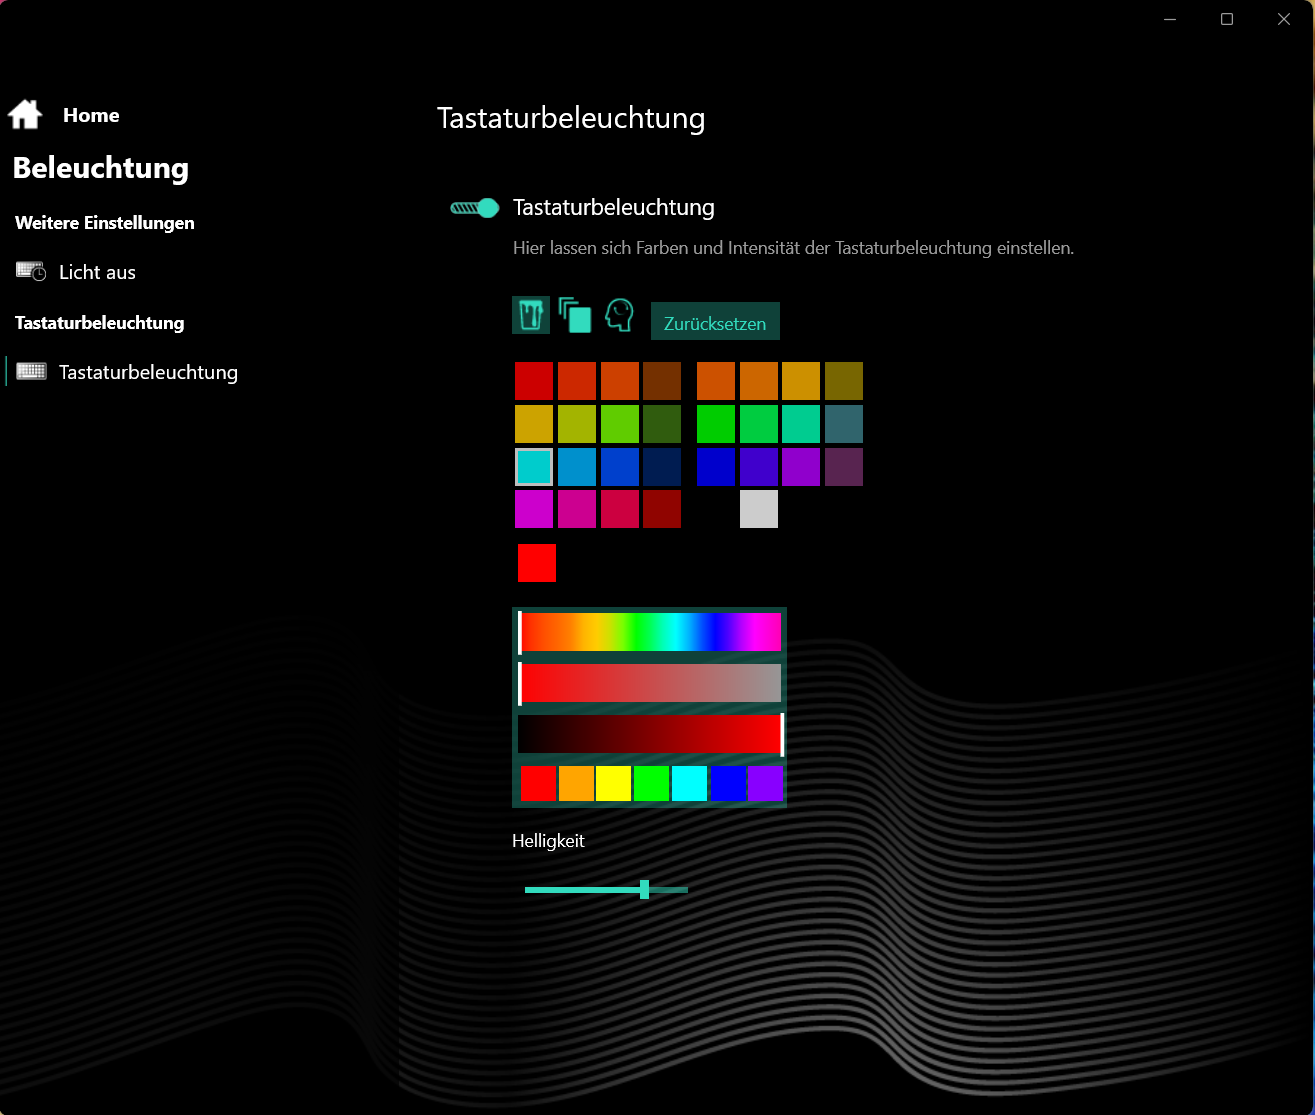
Dispositivos de entrada - O Apex 17 tem iluminação RGB nas teclas
Teclado
As teclas planas e suaves do teclado chiclet retroiluminado (RGB) têm um deslocamento médio, além de terem um ponto de pressão distinto e uma boa resistência. Ao digitar, o teclado não cede. Em suma, você tem um teclado adequado para o uso diário.
Touchpad
Um mouse substituto é fornecido pelo Clickpad (cerca de 15,4 x 10 cm) que tem um curso curto e um ponto de pressão claro. Um toque no LED no canto superior esquerdo liga ou desliga o pad inteiro. Um toque no LED no canto superior direito liga ou desliga o lado direito do mousepad.
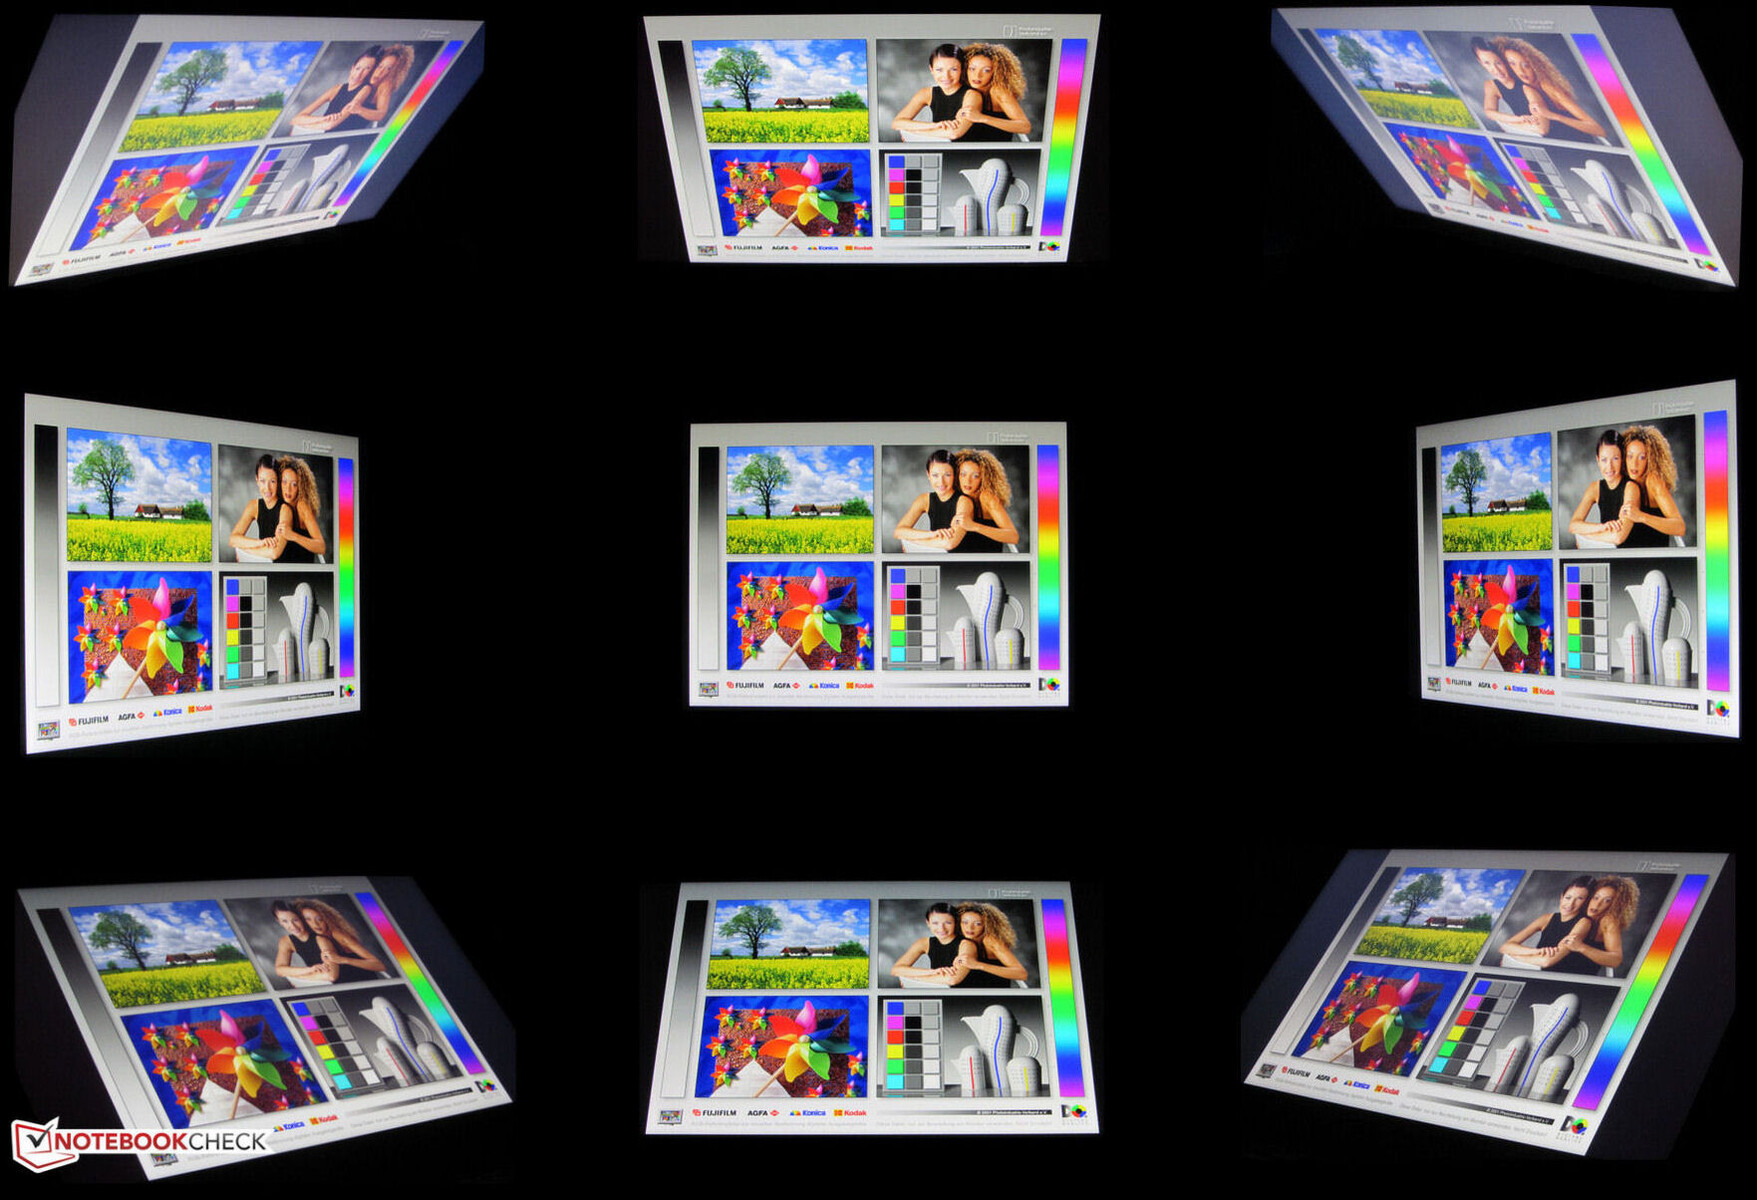
Tela - Um painel QHD com cobertura sRGB
O painel responsivo de 240 Hz com proporção de 16:9 não apresenta oscilação de PWM, independentemente da configuração de brilho. O brilho e o contraste da tela fosca de 17,3 polegadas (2.560 x 1.440 pixels) atingem suas respectivas metas (> 300 cd/m² e 1.000:1).
Além da tela QHD do dispositivo analisado, a Schenker oferece o Apex 17 com um painel alternativo FHD (1.920 x 1.080 pixels, 144 Hz, IPS).
| |||||||||||||||||||||||||
iluminação: 90 %
iluminação com acumulador: 403 cd/m²
Contraste: 1089:1 (Preto: 0.37 cd/m²)
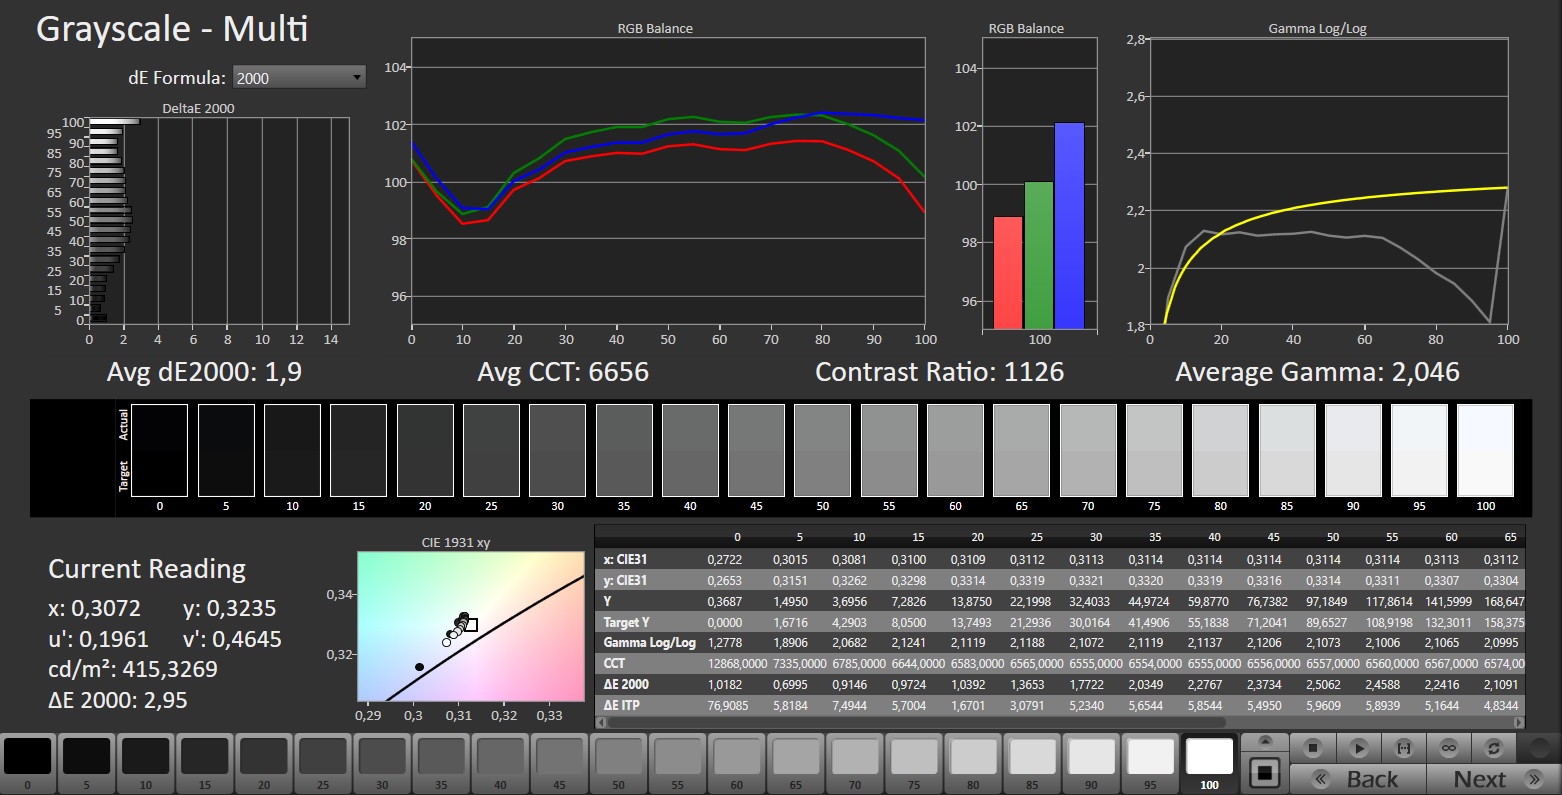
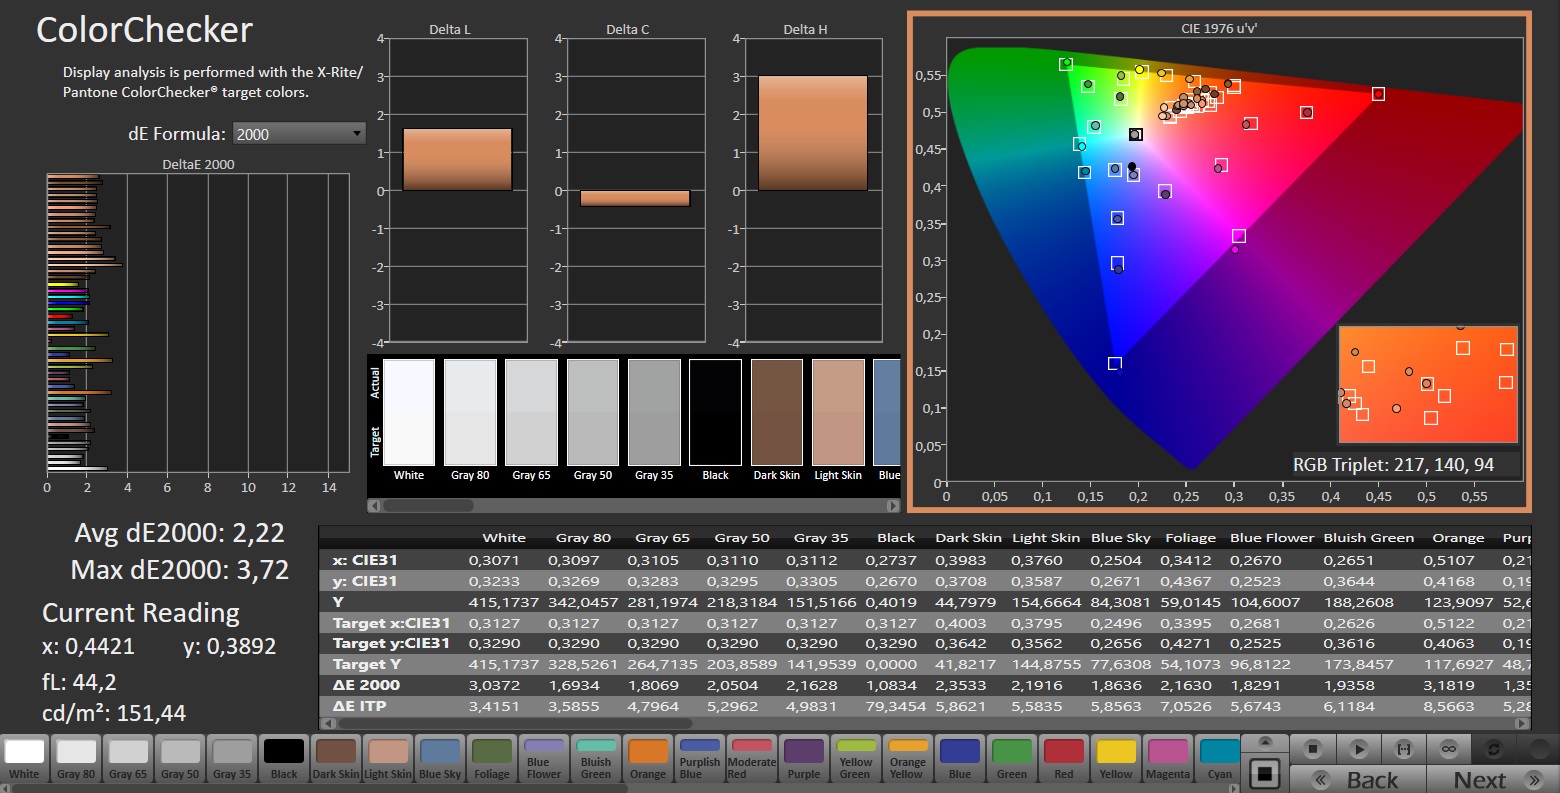
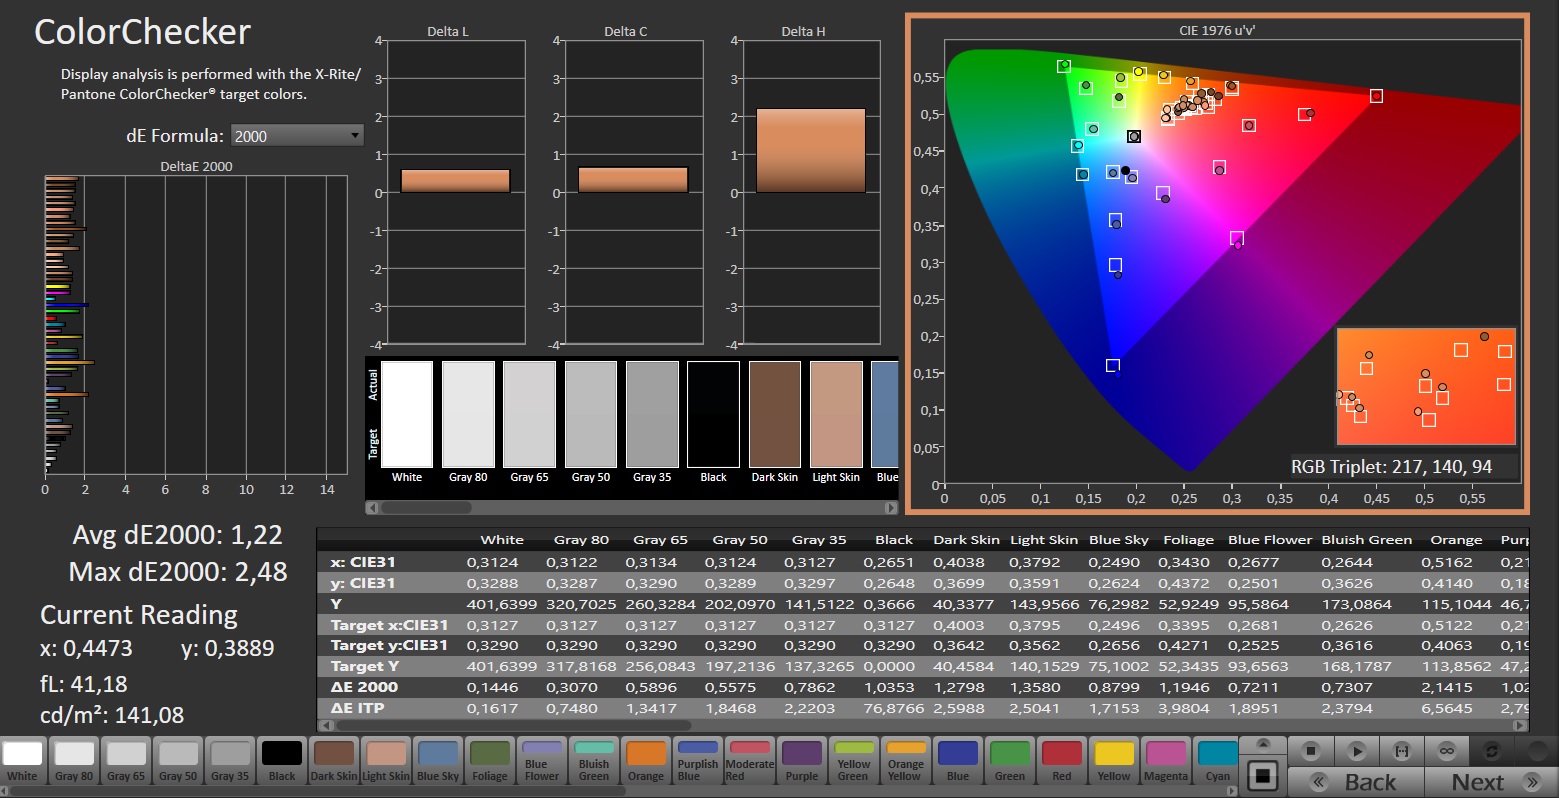
ΔE ColorChecker Calman: 2.22 | ∀{0.5-29.43 Ø4.71}
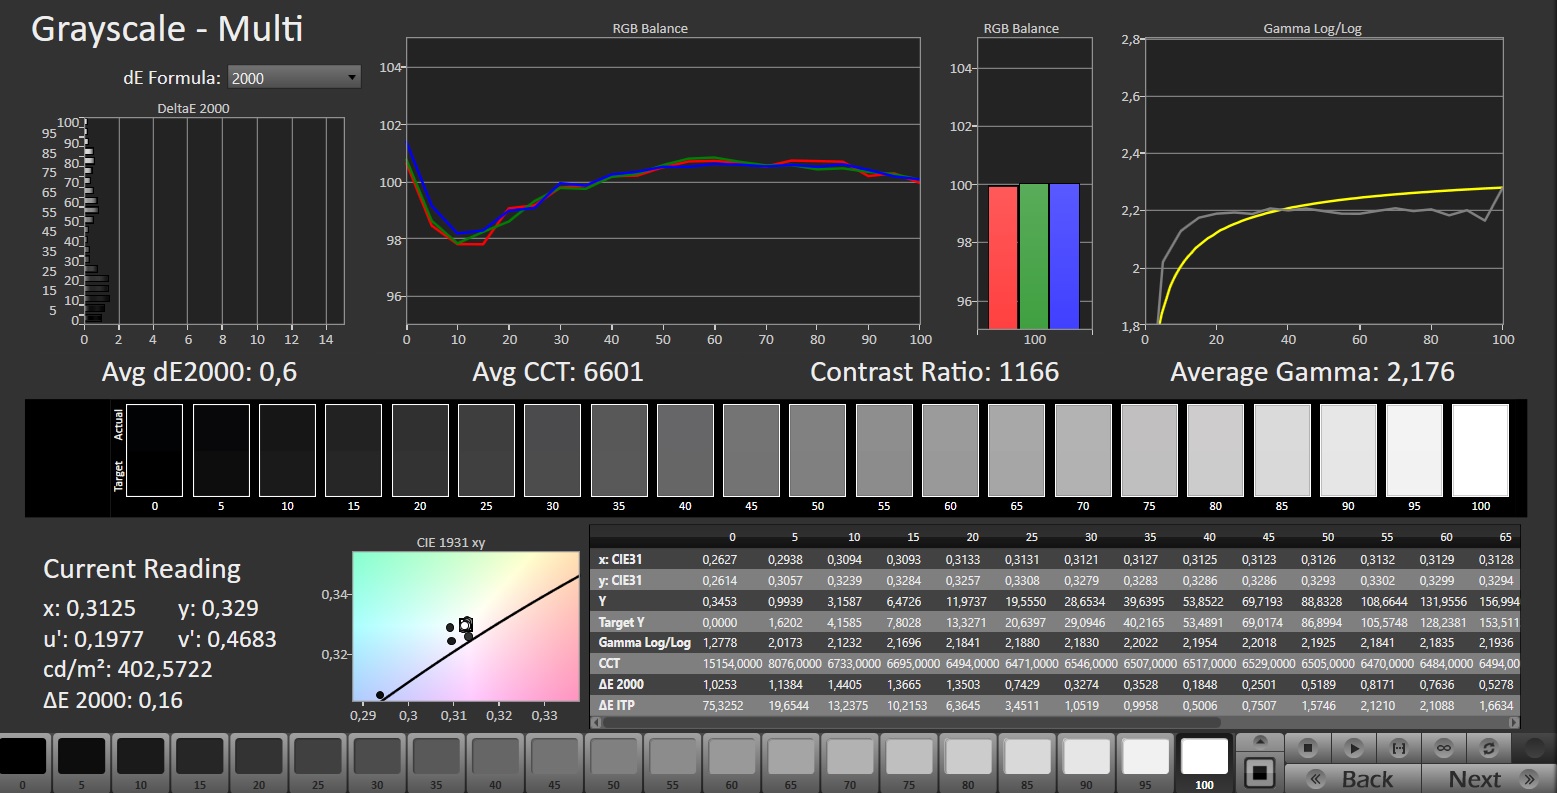
calibrated: 1.22
ΔE Greyscale Calman: 1.9 | ∀{0.09-98 Ø4.96}
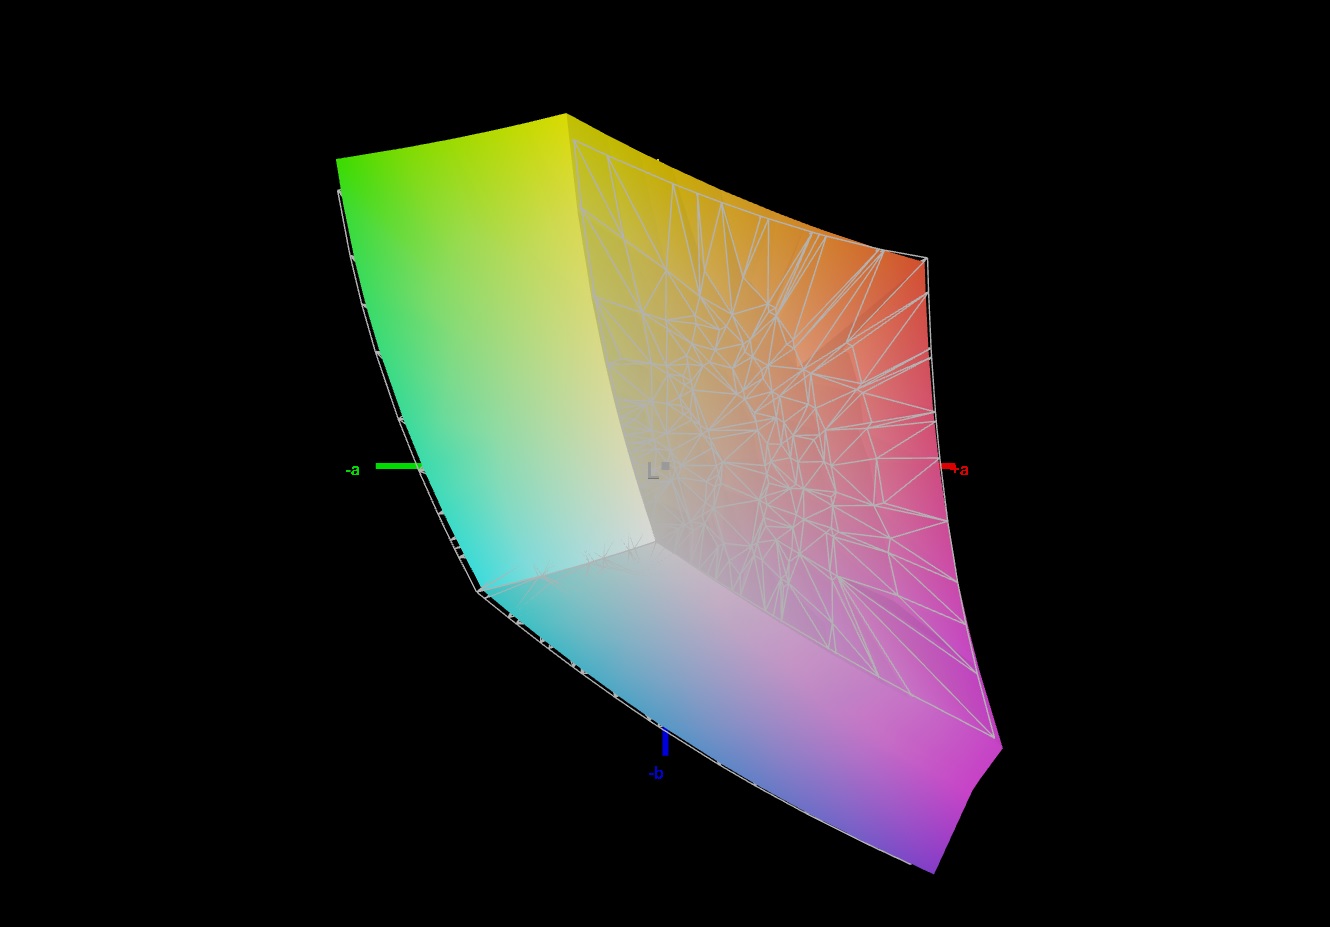
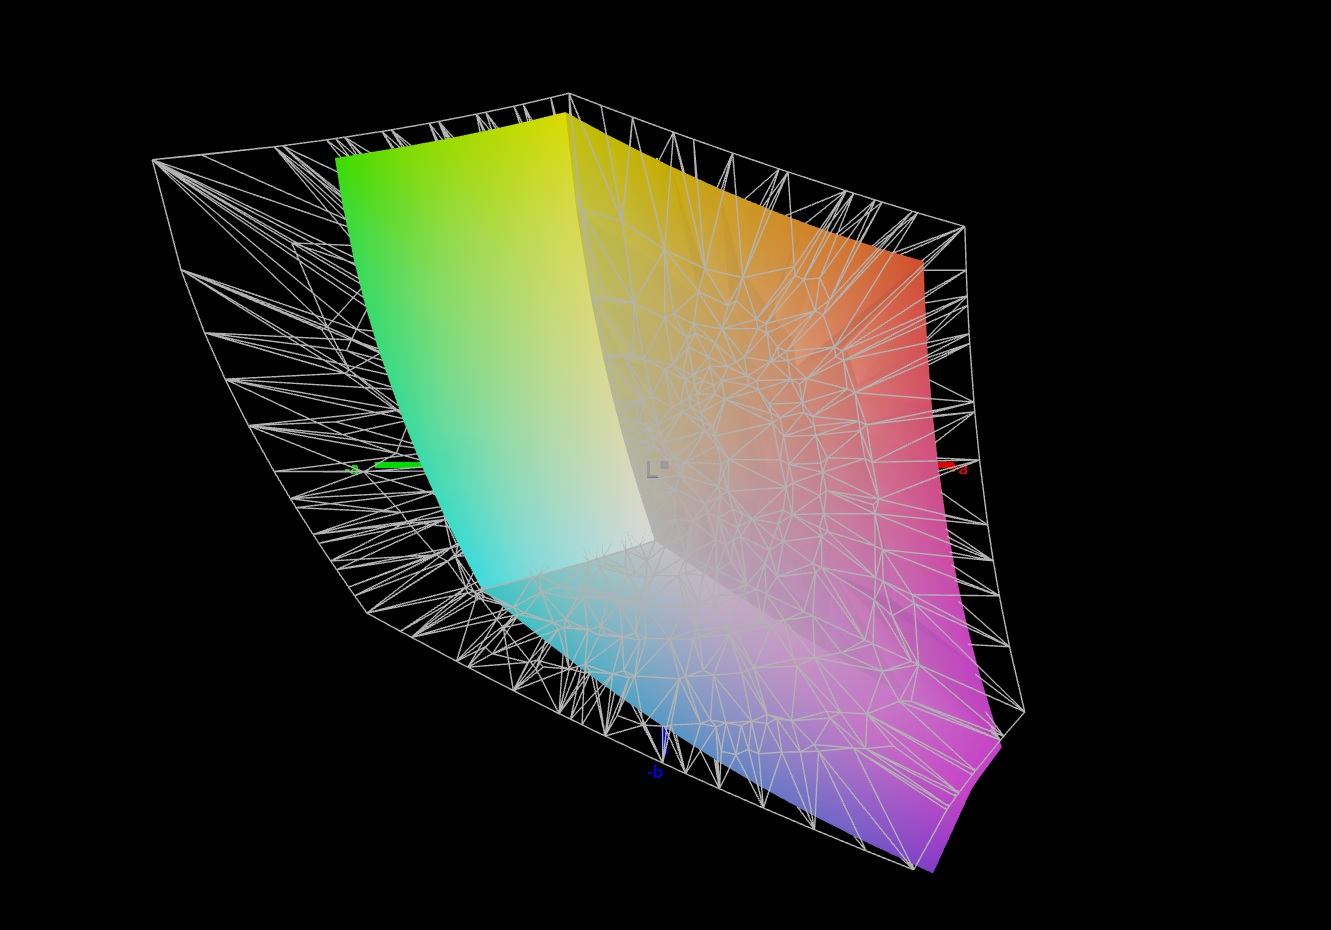
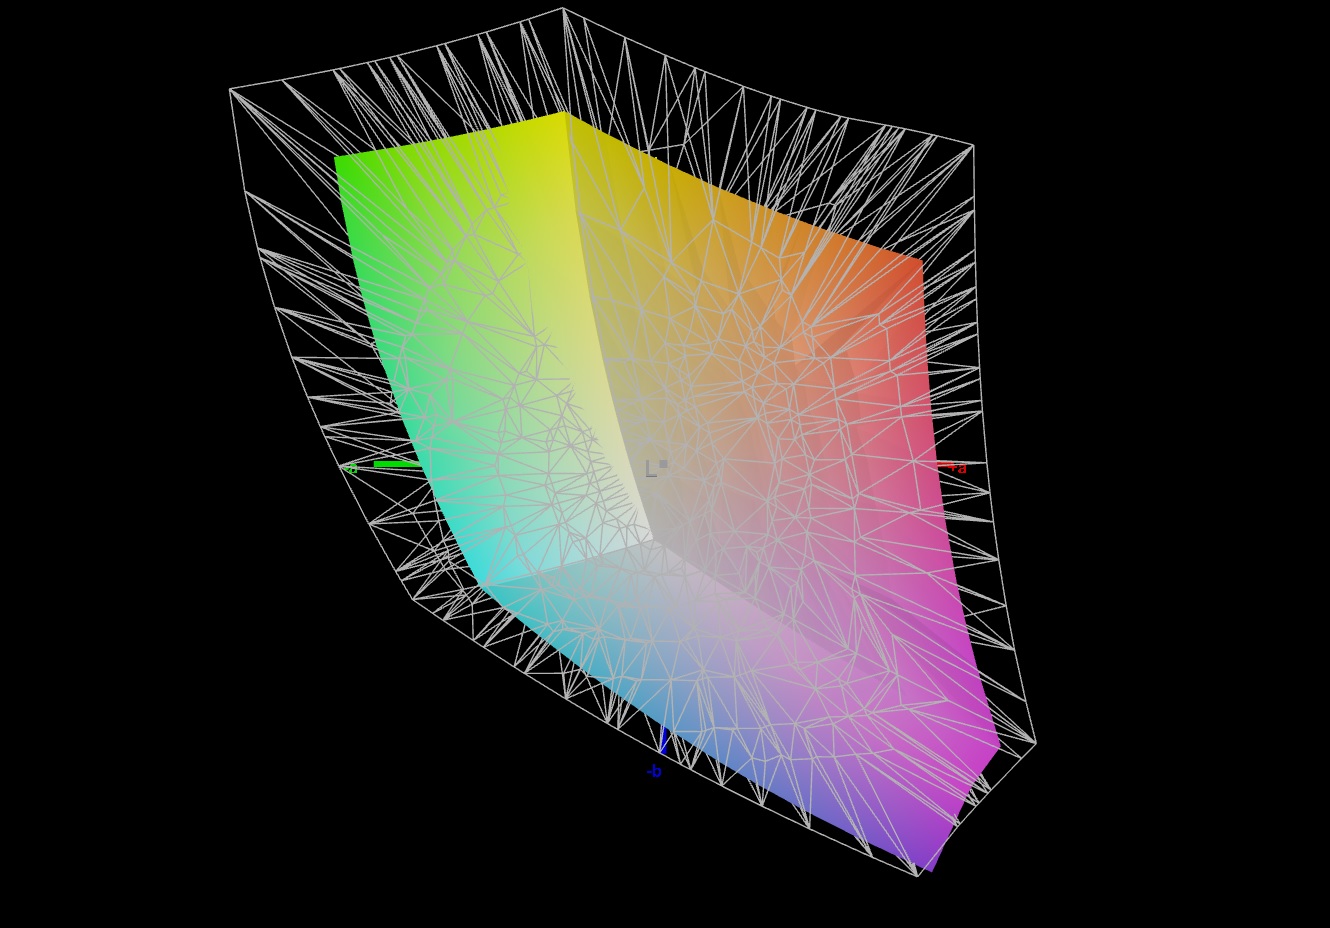
69.5% AdobeRGB 1998 (Argyll 3D)
97.7% sRGB (Argyll 3D)
68.1% Display P3 (Argyll 3D)
Gamma: 2.046
CCT: 6656 K
| Schenker XMG Apex 17 (Late 23) BOE CQ NE173QHM-NZ3, IPS, 2560x1440, 17.3" | Alienware m16 R1 Intel BOE NE16NYB, IPS, 2560x1600, 16" | Lenovo Legion Pro 5 16IRX8 AU Optronics B160QAN03.1, IPS, 2560x1600, 16" | Acer Nitro 17 AN17-51-71ER BOE0B7C NE173QHM-NY6, , 2560x1440, 17.3" | Medion Erazer Defender P40 BOE CQ NE173QHM-NZ3, IPS, 2560x1440, 17.3" | MSI Katana 17 B13VFK B173HAN04.9, IPS LED, 1920x1080, 17.3" | |
|---|---|---|---|---|---|---|
| Display | -0% | 4% | 23% | 0% | -39% | |
| Display P3 Coverage (%) | 68.1 | 67.7 -1% | 71.2 5% | 98.3 44% | 68.3 0% | 40.8 -40% |
| sRGB Coverage (%) | 97.7 | 97.2 -1% | 98.8 1% | 100 2% | 98.1 0% | 61 -38% |
| AdobeRGB 1998 Coverage (%) | 69.5 | 70 1% | 73.3 5% | 85.7 23% | 69.8 0% | 42.2 -39% |
| Response Times | 39% | -20% | -6% | -9% | -187% | |
| Response Time Grey 50% / Grey 80% * (ms) | 13.5 ? | 4 ? 70% | 14.5 ? -7% | 14.8 ? -10% | 14.6 ? -8% | 33 ? -144% |
| Response Time Black / White * (ms) | 7.9 ? | 7.3 ? 8% | 10.4 ? -32% | 8 ? -1% | 8.7 ? -10% | 26 ? -229% |
| PWM Frequency (Hz) | ||||||
| Screen | -12% | 11% | -57% | 11% | -90% | |
| Brightness middle (cd/m²) | 403 | 306 -24% | 405.7 1% | 361 -10% | 364 -10% | 267 -34% |
| Brightness (cd/m²) | 381 | 302 -21% | 368 -3% | 326 -14% | 343 -10% | 256 -33% |
| Brightness Distribution (%) | 90 | 89 -1% | 87 -3% | 87 -3% | 86 -4% | 93 3% |
| Black Level * (cd/m²) | 0.37 | 0.3 19% | 0.38 -3% | 0.6 -62% | 0.28 24% | 0.21 43% |
| Contrast (:1) | 1089 | 1020 -6% | 1068 -2% | 602 -45% | 1300 19% | 1271 17% |
| Colorchecker dE 2000 * | 2.22 | 2.57 -16% | 1.65 26% | 3.83 -73% | 1.67 25% | 4.7 -112% |
| Colorchecker dE 2000 max. * | 3.76 | 4.26 -13% | 4.2 -12% | 5.71 -52% | 2.78 26% | 20.4 -443% |
| Colorchecker dE 2000 calibrated * | 1.22 | 0.85 30% | 0.53 57% | 3.48 -185% | 1.14 7% | 4.5 -269% |
| Greyscale dE 2000 * | 1.9 | 3.3 -74% | 1.2 37% | 3.29 -73% | 1.4 26% | 1.5 21% |
| Gamma | 2.046 108% | 1.997 110% | 2.3 96% | 2.29 96% | 2.091 105% | 2.12 104% |
| CCT | 6656 98% | 6895 94% | 6453 101% | 6679 97% | 6568 99% | 6552 99% |
| Média Total (Programa/Configurações) | 9% /
-2% | -2% /
5% | -13% /
-33% | 1% /
6% | -105% /
-93% |
* ... menor é melhor
Logo que sai da caixa, a tela demonstra boa reprodução de cores. Com um desvio de cerca de 2,2, o valor-alvo (DeltaE < 3) é alcançado. Uma calibração reduz o desvio para 1,2 e garante escalas de cinza equilibradas. O painel cobre quase totalmente o espaço de cores sRGB, mas não os espaços de cores AdobeRGB e DCI P3. A maioria das telas dos dispositivos concorrentes apresenta um quadro semelhante. Somente oNitro 17cobre o espaço de cores P3.

Exibir tempos de resposta
| ↔ Tempo de resposta preto para branco | ||
|---|---|---|
| 7.9 ms ... ascensão ↗ e queda ↘ combinadas | ↗ 3 ms ascensão | 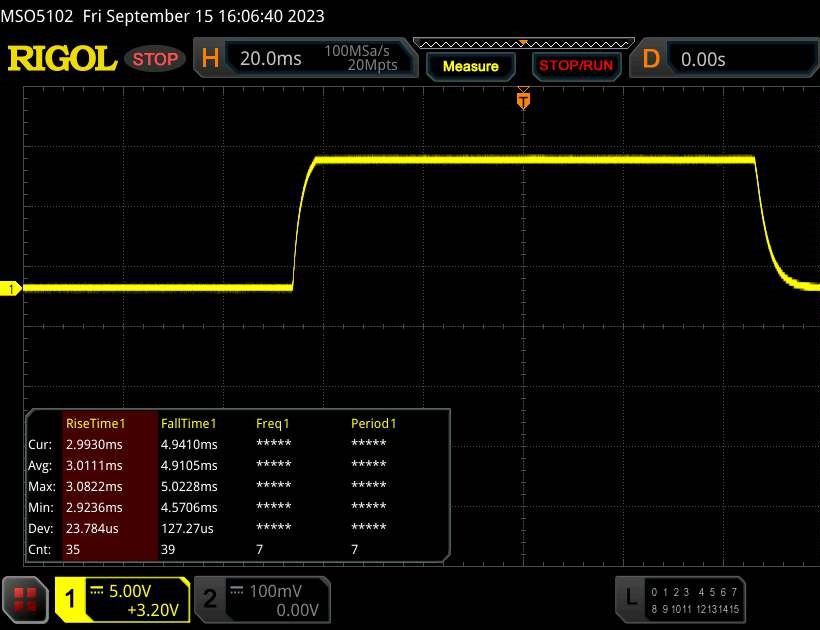 |
| ↘ 4.9 ms queda | ||
| A tela mostra taxas de resposta muito rápidas em nossos testes e deve ser muito adequada para jogos em ritmo acelerado. Em comparação, todos os dispositivos testados variam de 0.1 (mínimo) a 240 (máximo) ms. » 22 % de todos os dispositivos são melhores. Isso significa que o tempo de resposta medido é melhor que a média de todos os dispositivos testados (19.8 ms). | ||
| ↔ Tempo de resposta 50% cinza a 80% cinza | ||
| 13.5 ms ... ascensão ↗ e queda ↘ combinadas | ↗ 6.4 ms ascensão | 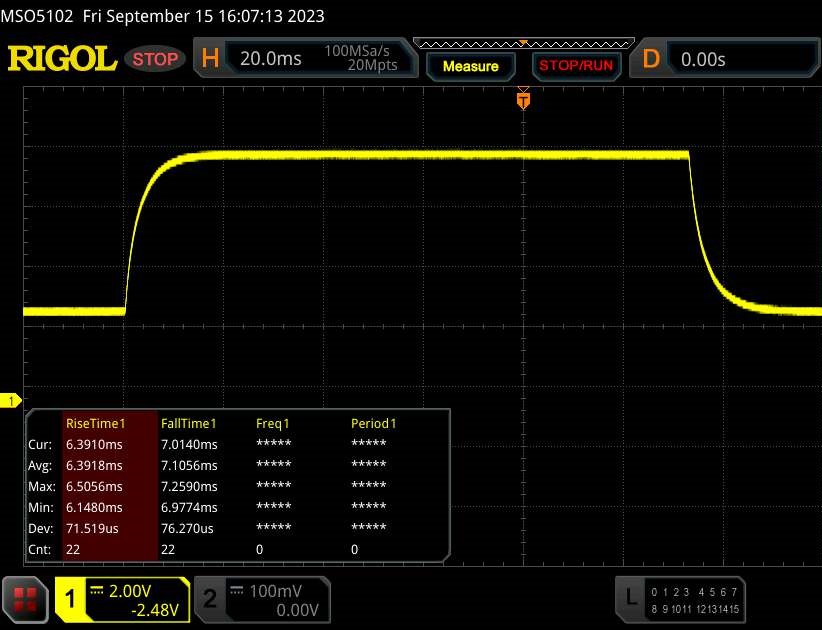 |
| ↘ 7.1 ms queda | ||
| A tela mostra boas taxas de resposta em nossos testes, mas pode ser muito lenta para jogadores competitivos. Em comparação, todos os dispositivos testados variam de 0.165 (mínimo) a 636 (máximo) ms. » 27 % de todos os dispositivos são melhores. Isso significa que o tempo de resposta medido é melhor que a média de todos os dispositivos testados (31 ms). | ||
Cintilação da tela / PWM (modulação por largura de pulso)
| Tela tremeluzindo / PWM não detectado | 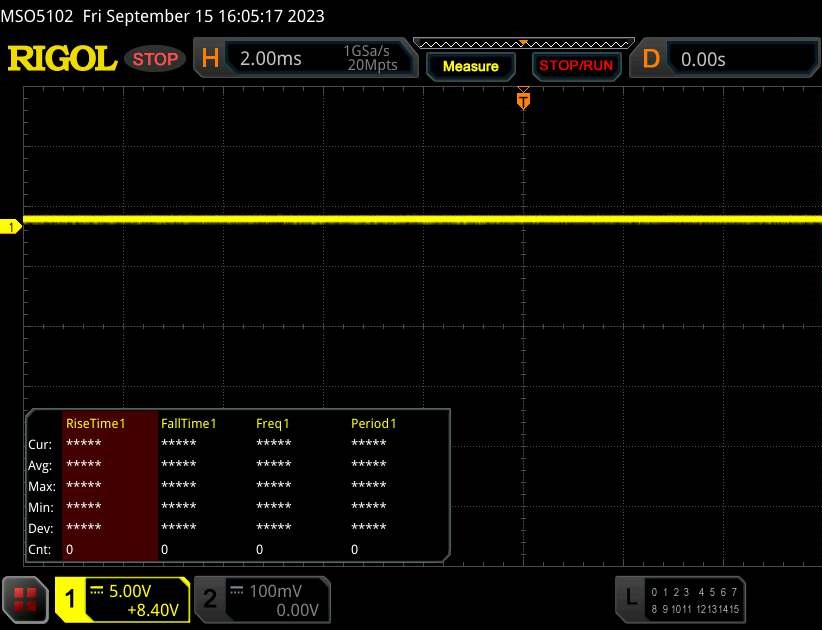 | ||
[pwm_comparison] Em comparação: 52 % de todos os dispositivos testados não usam PWM para escurecer a tela. Se PWM foi detectado, uma média de 7754 (mínimo: 5 - máximo: 343500) Hz foi medida. | |||
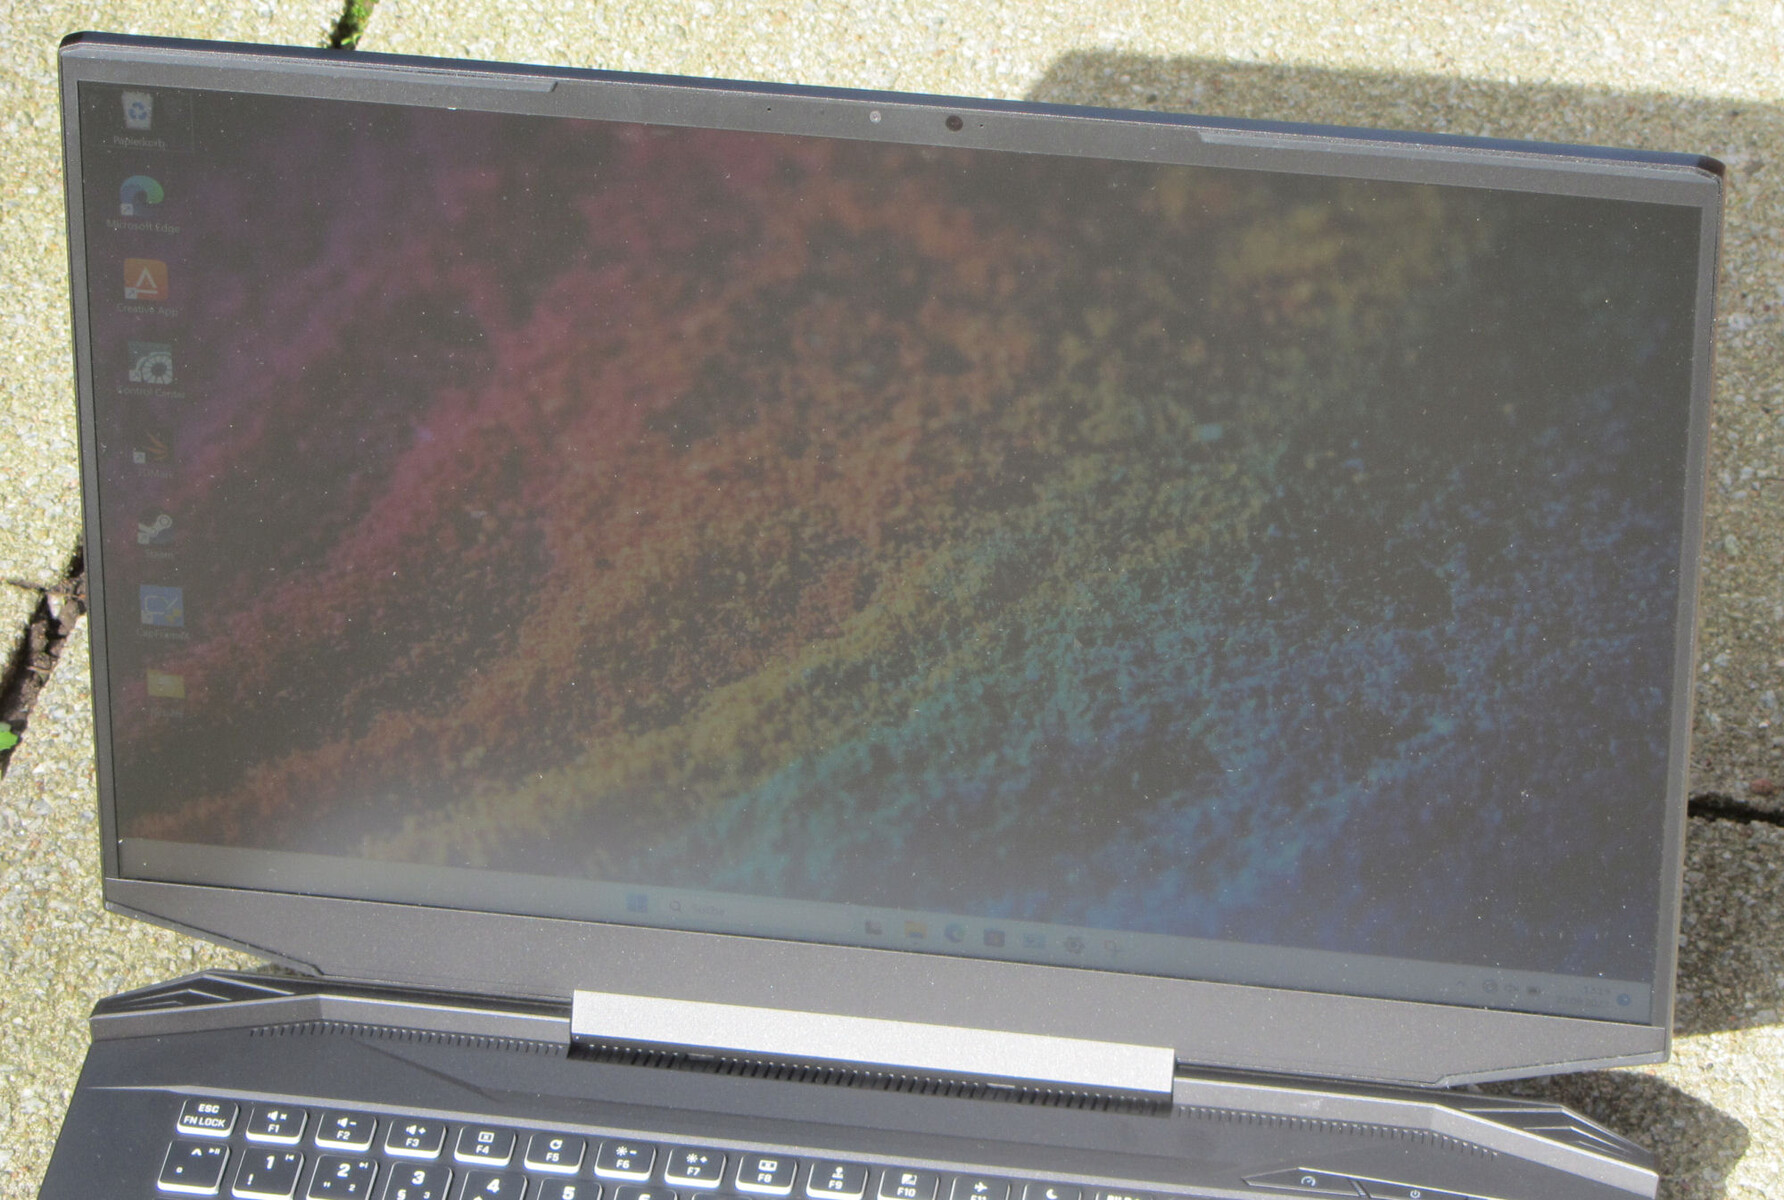
O painel IPS tem boa estabilidade do ângulo de visão e é legível em qualquer posição. Em ambientes externos, a tela é legível, desde que a luz do sol não seja muito forte.
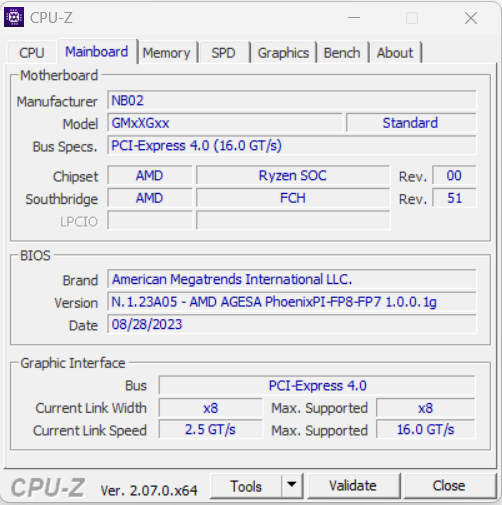
Desempenho - Phoenix e Ada Lovelace alimentam o laptop Schenker
O Schenker Apex 17 é um laptop para jogos QHD de médio porte, cujo poder computacional é fornecido pela Phoenix e Ada Lovelace. O laptop pode ser configurado de forma personalizada e adquirido no Bestware.com. Nosso dispositivo de análise pode ser adquirido por 1.750 euros, com preços a partir de cerca de 1.200 euros.
Condições de teste
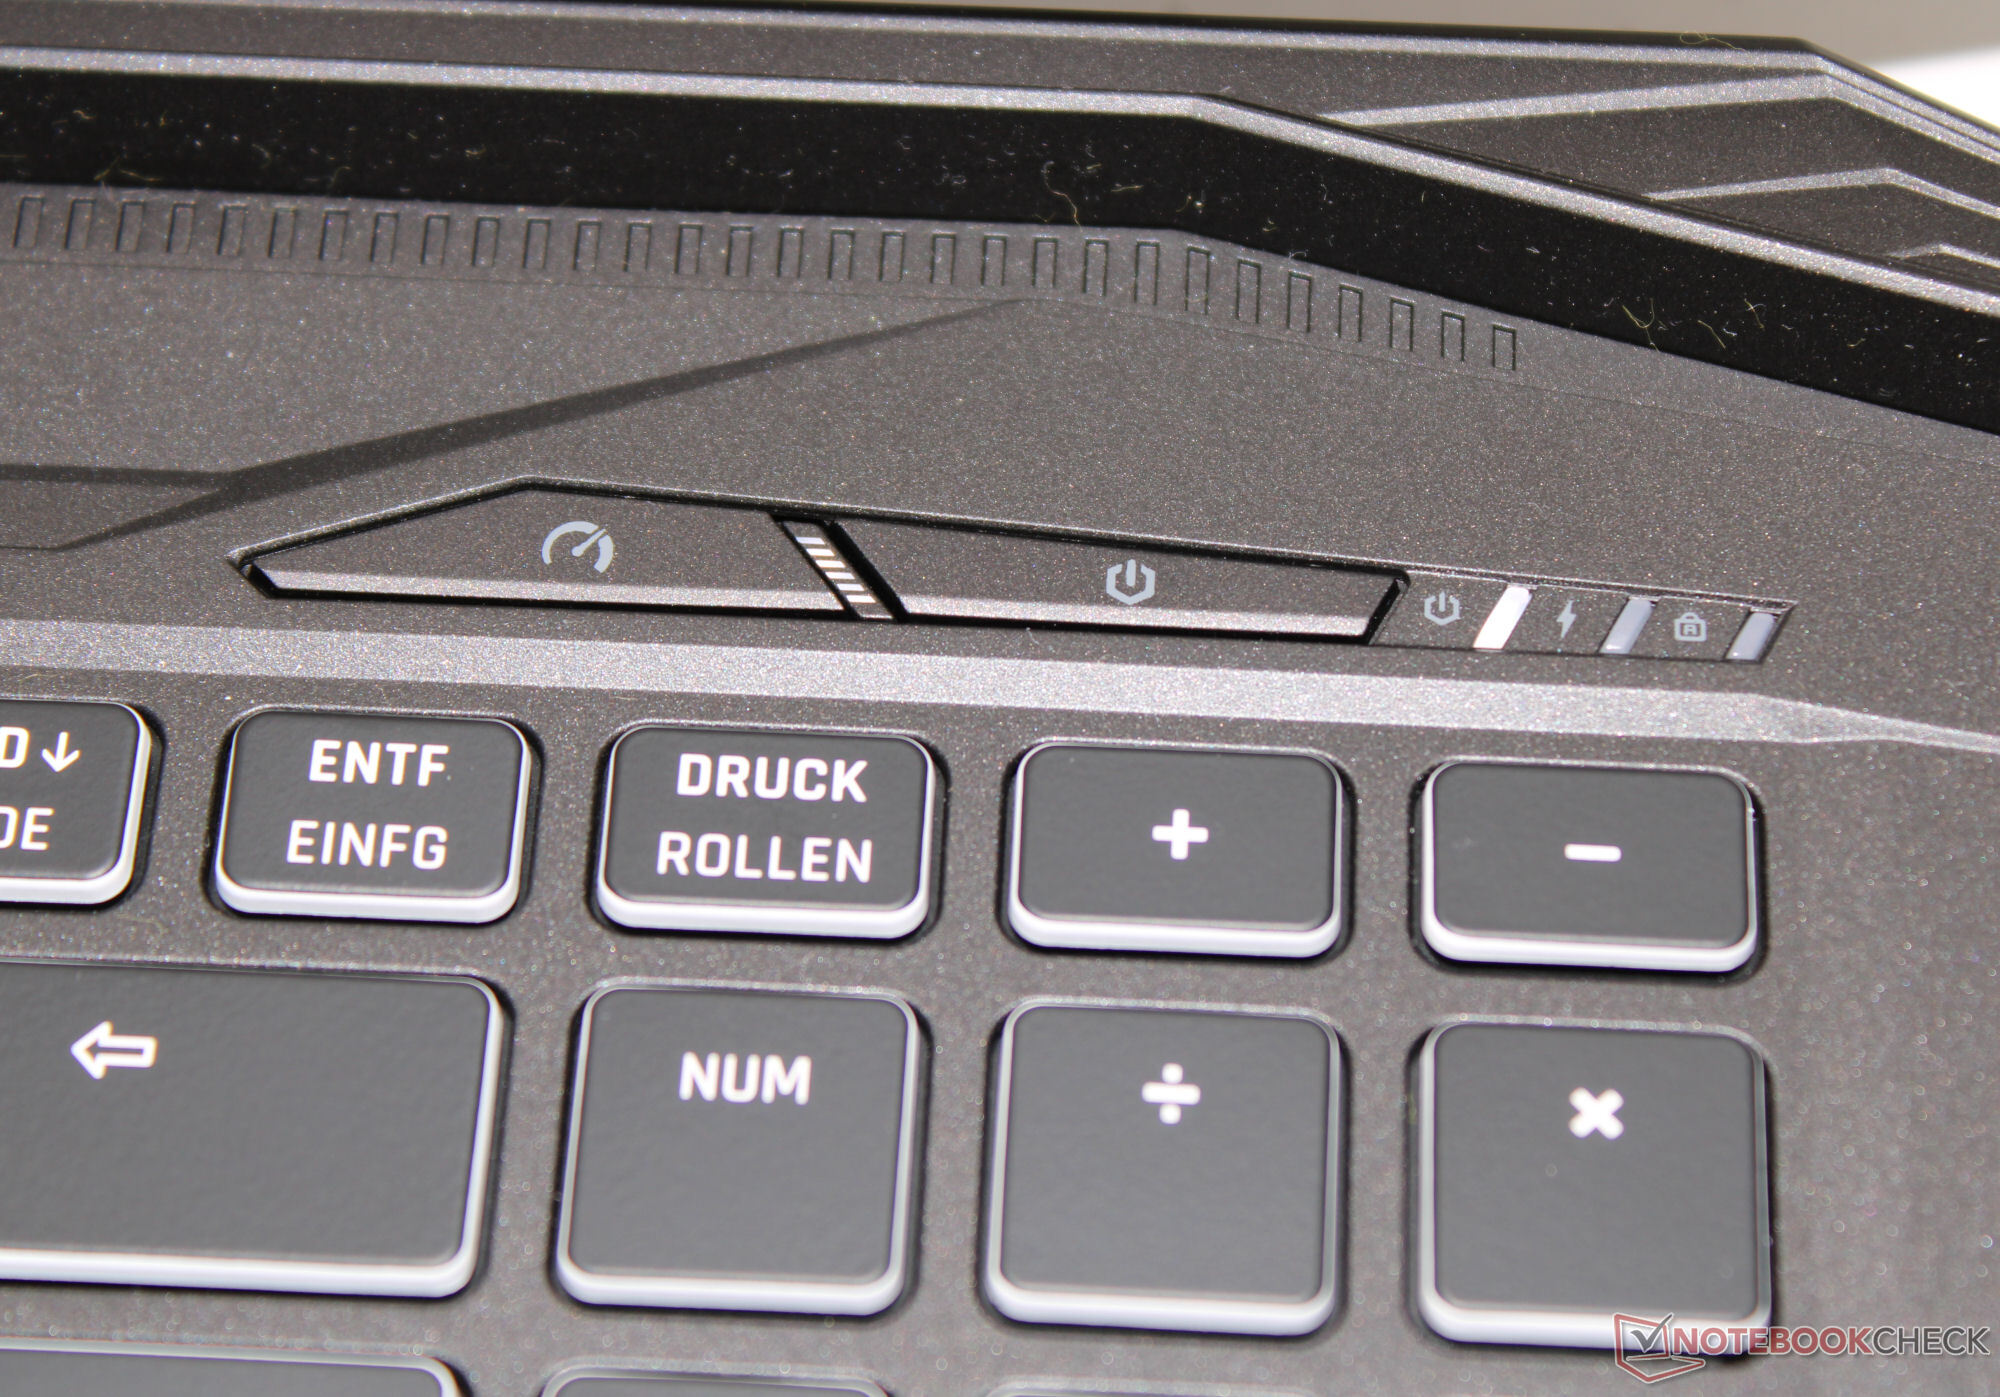
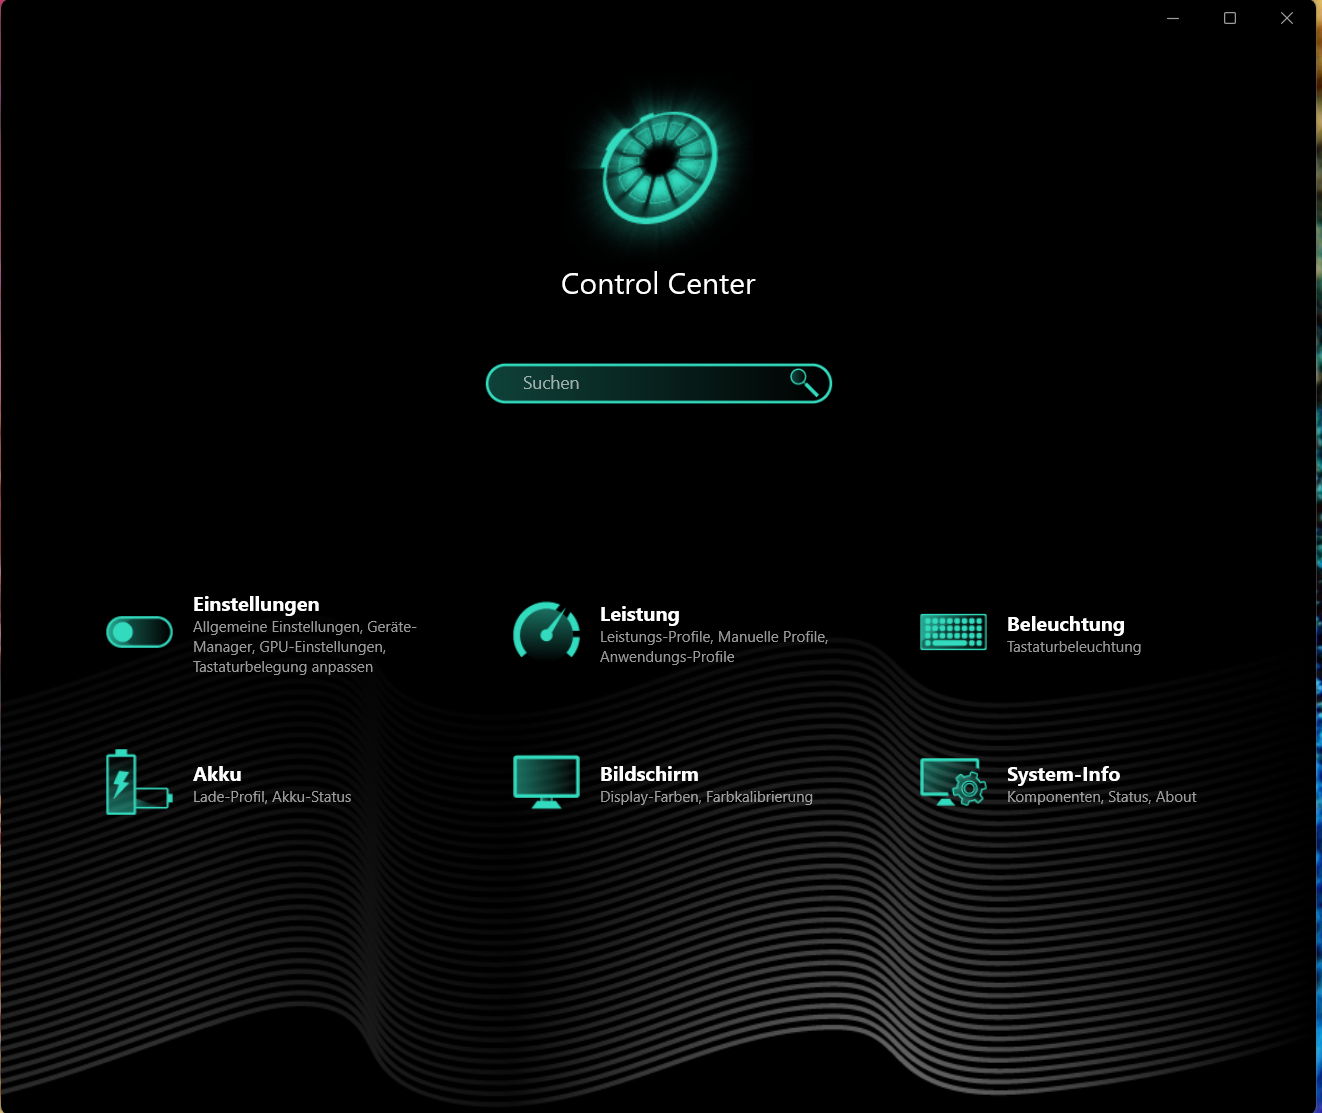
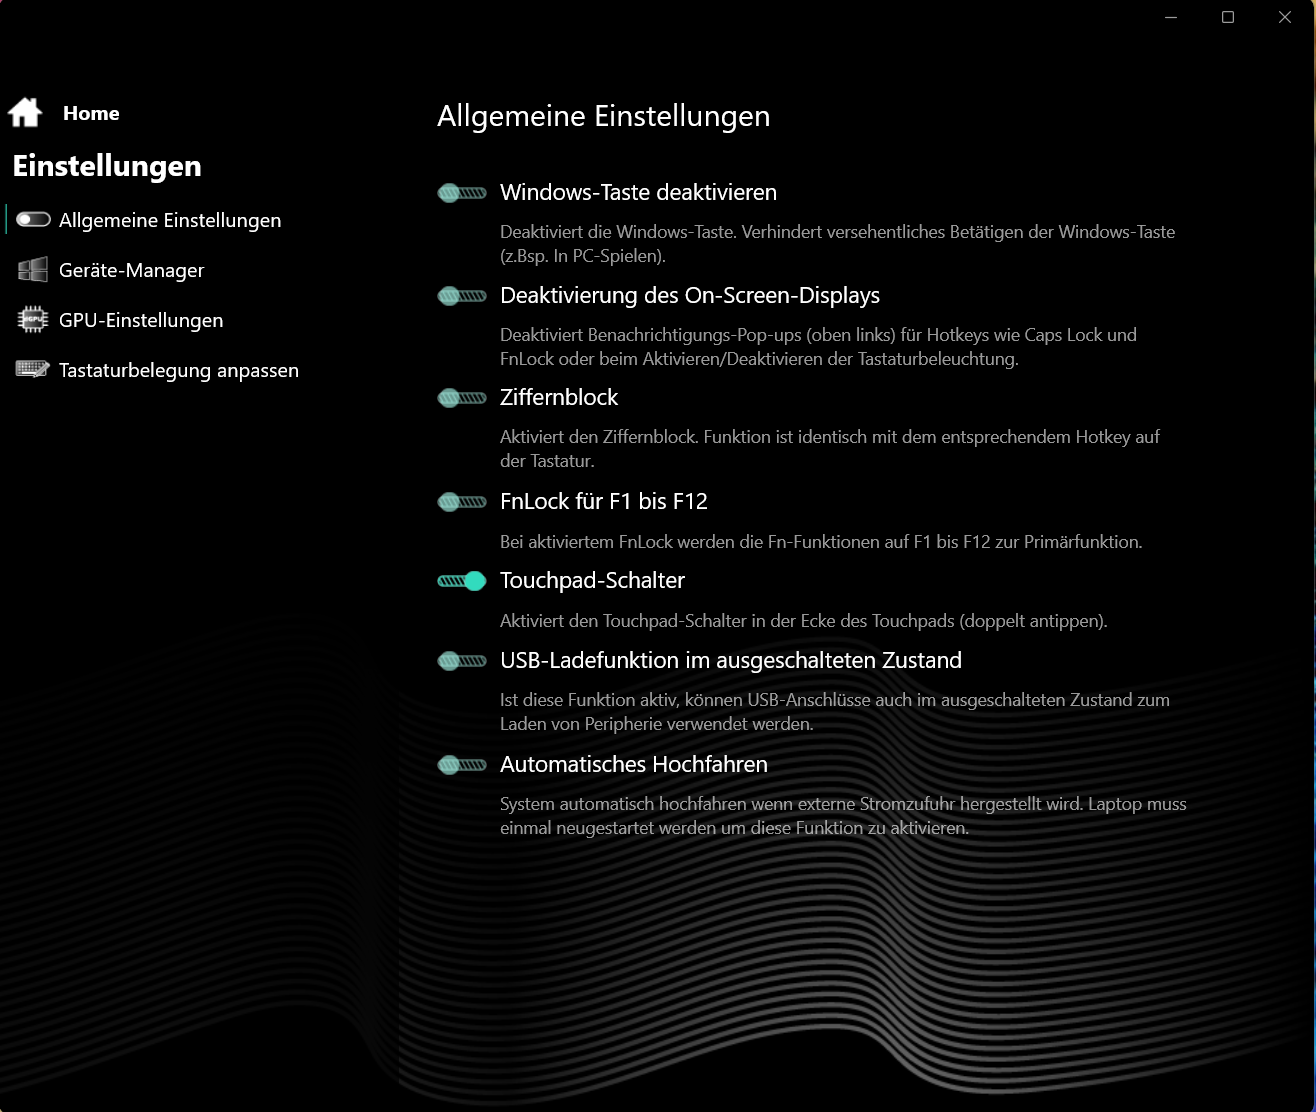
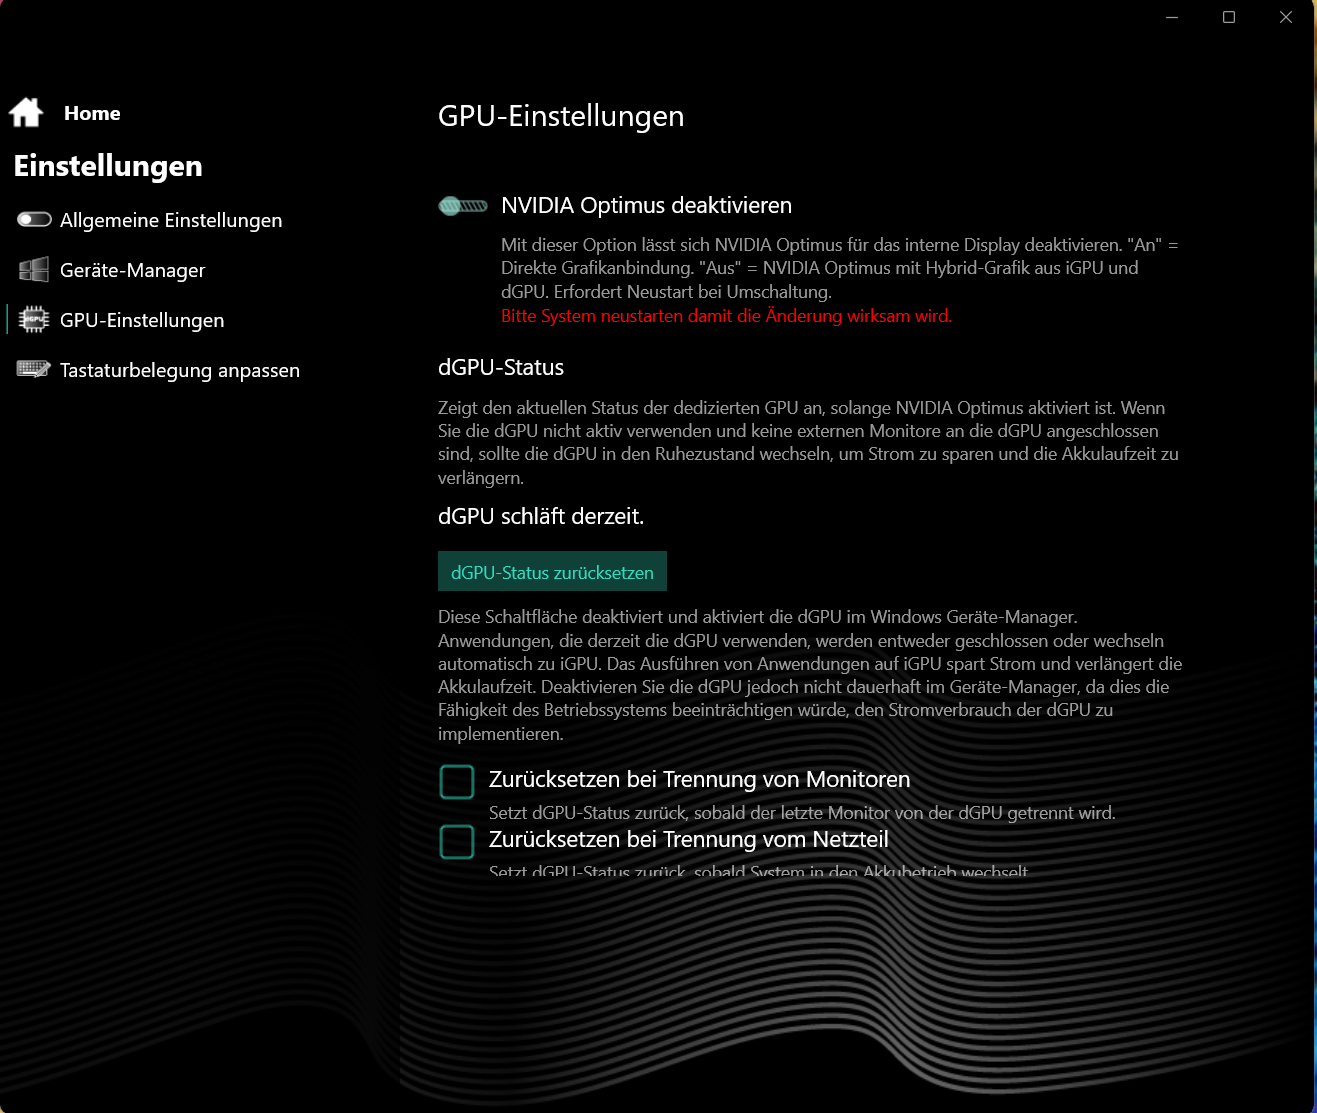
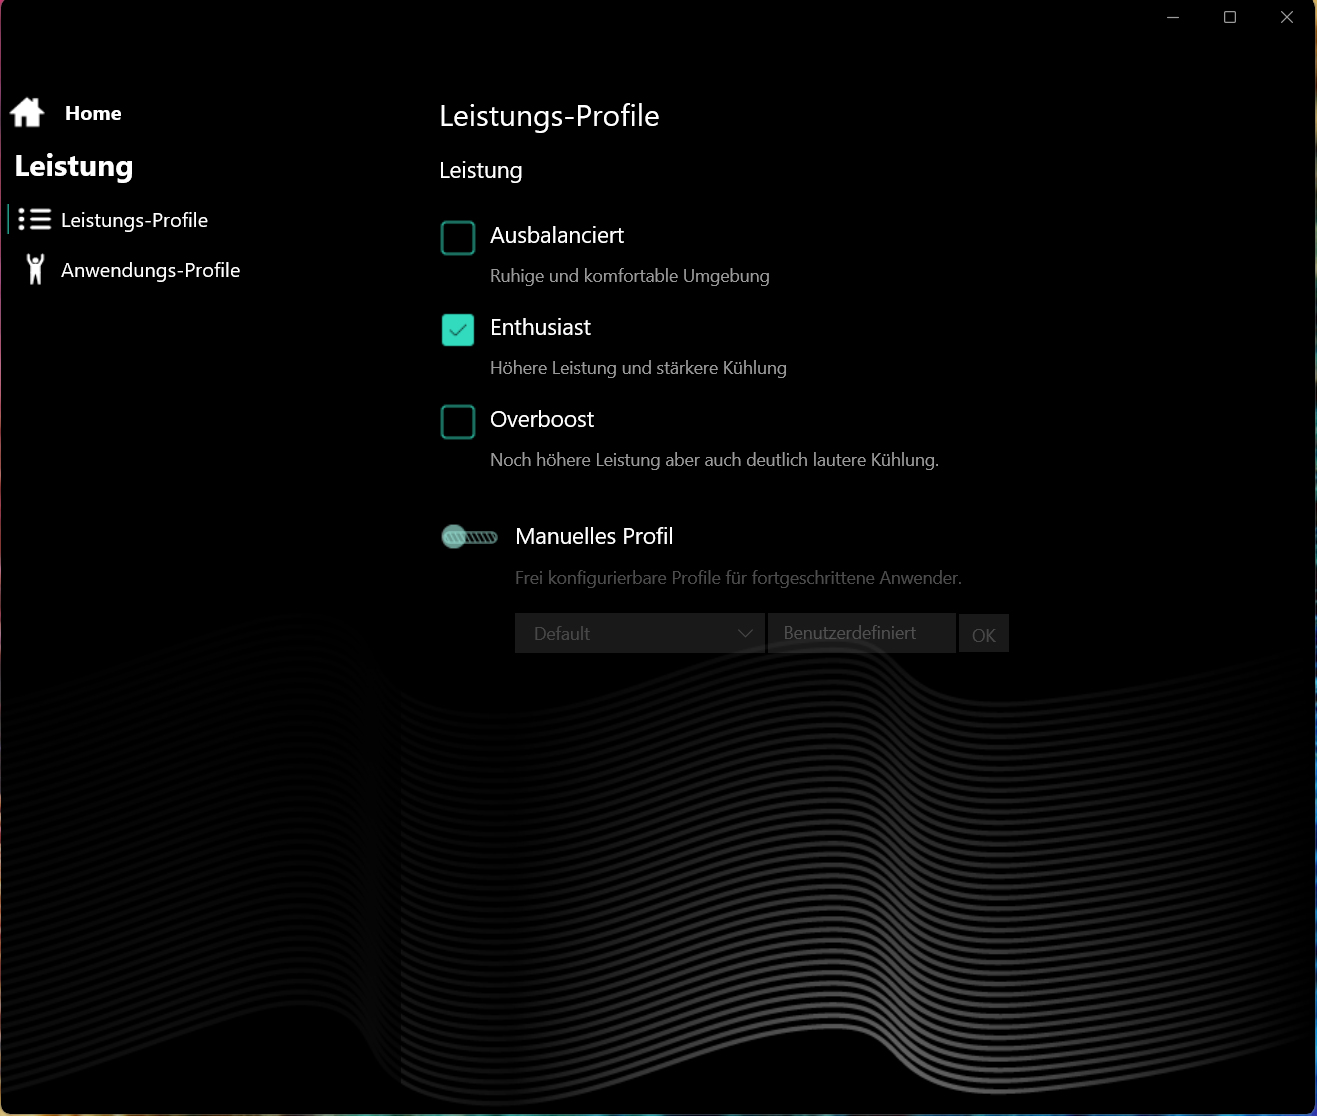
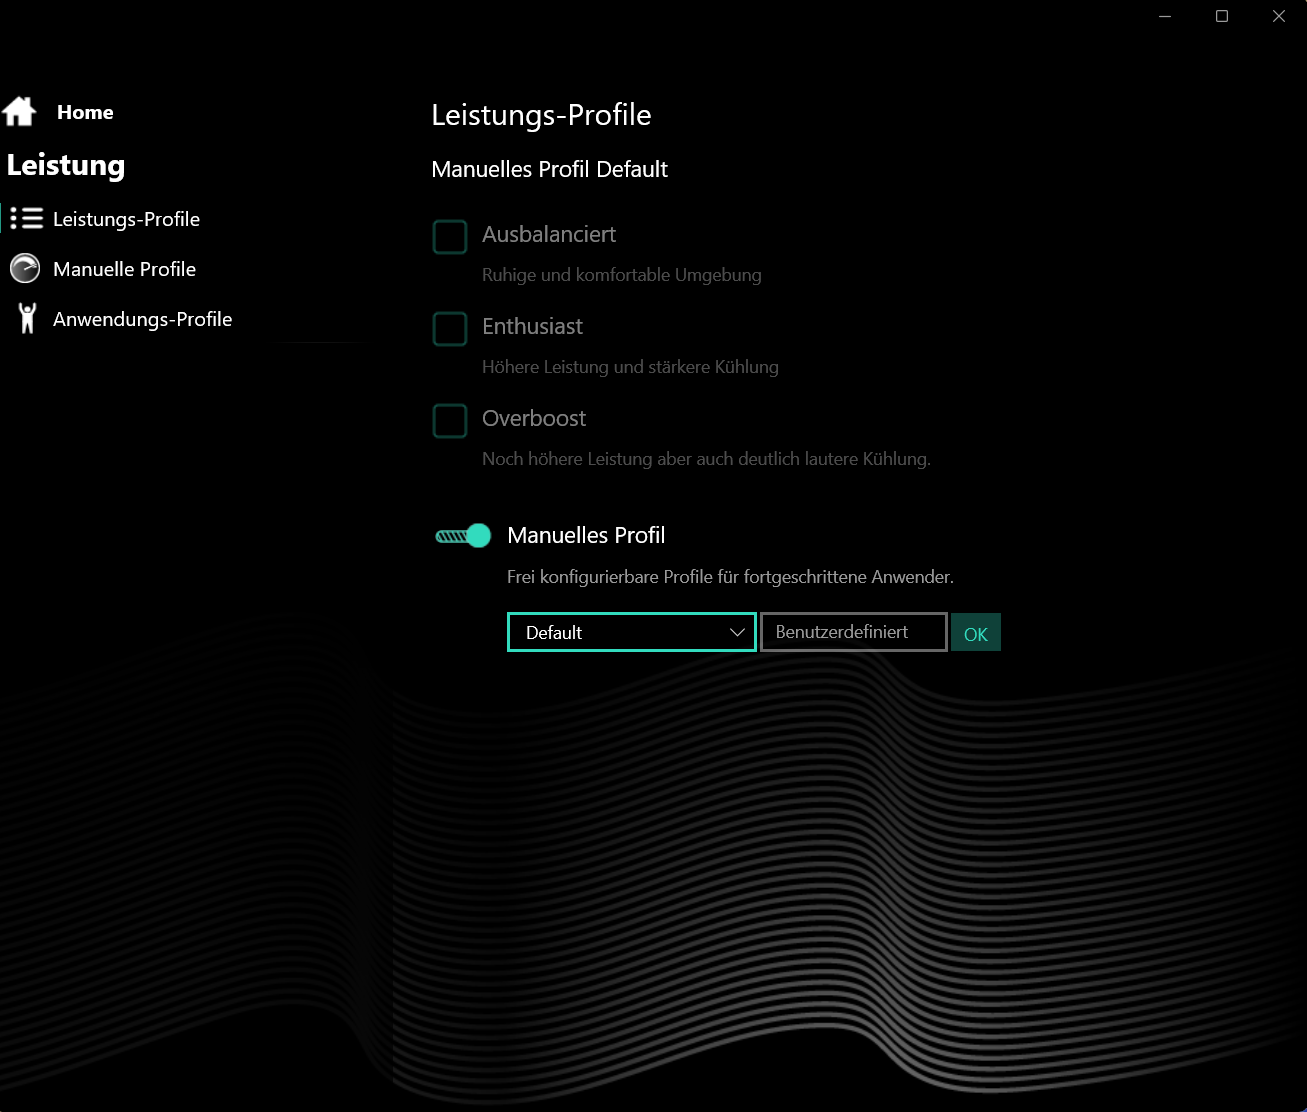
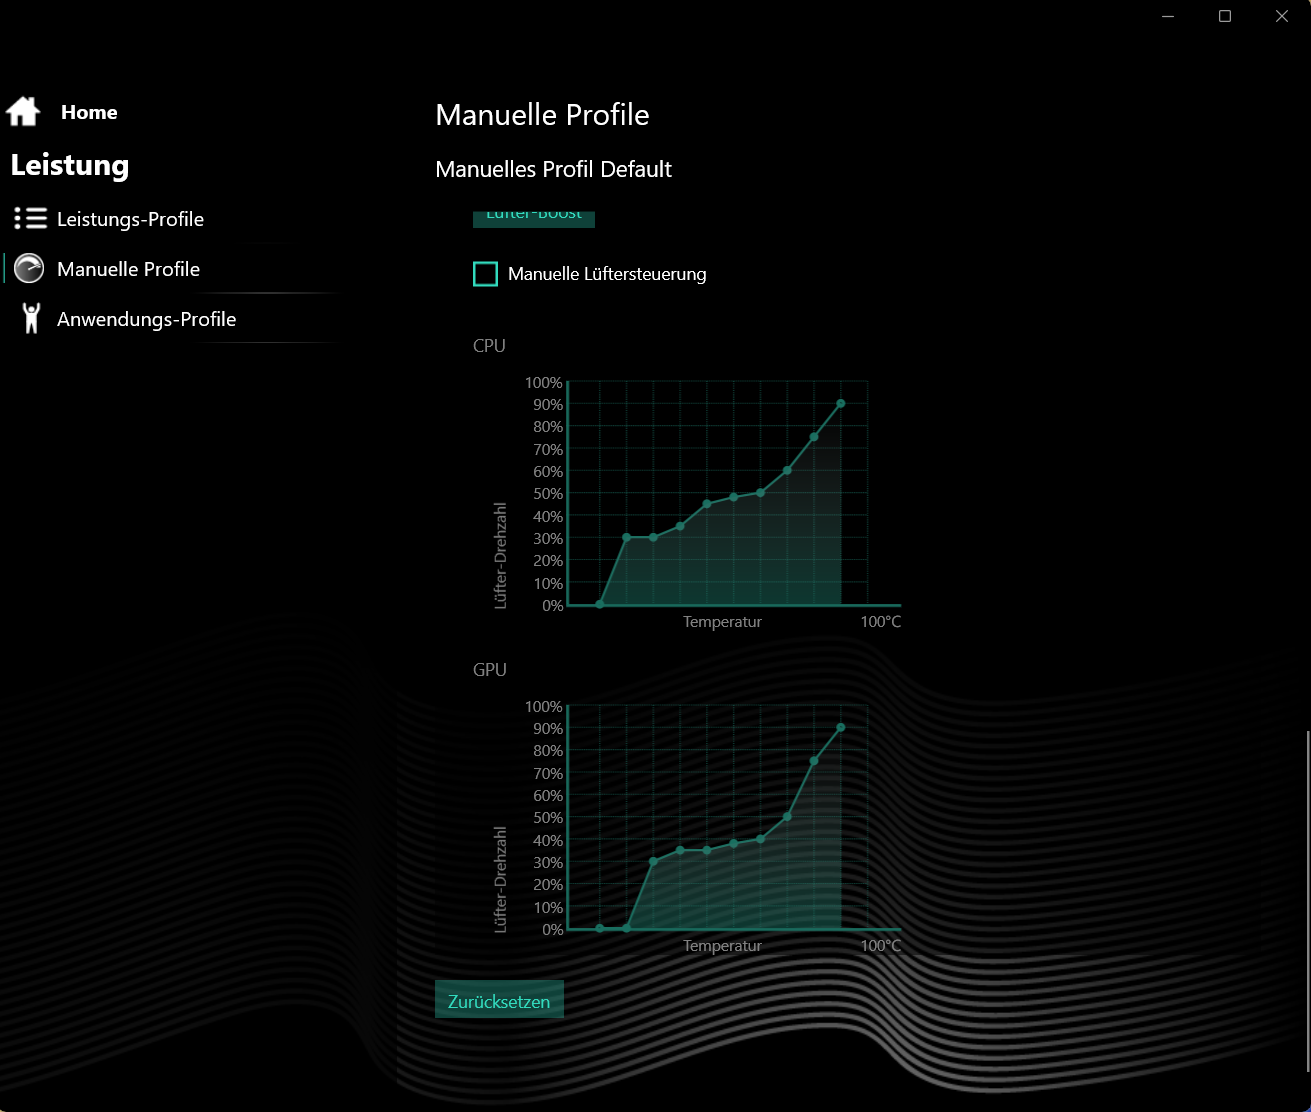
O Apex oferece três modos de desempenho específicos do fabricante (consulte a tabela), entre os quais você pode alternar por meio de uma tecla separada (ao lado do botão liga/desliga). Um LED de status indica qual modo está ativo. Usamos os modos "enthusiast" (benchmarks) e "balanced" (testes de bateria). O modo Optimus estava ativo.
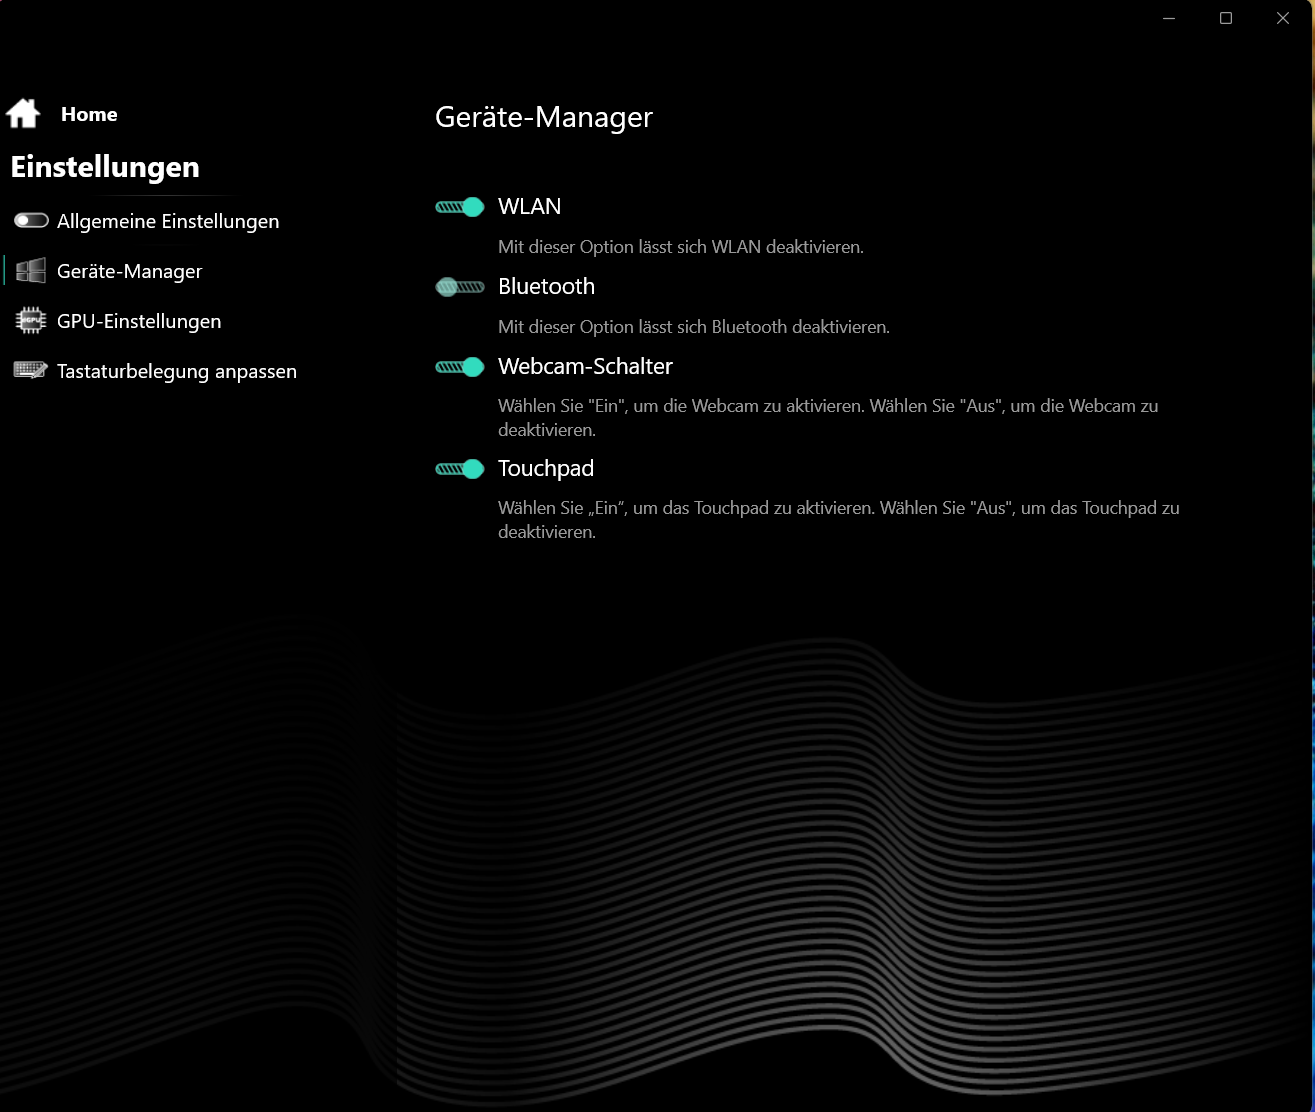
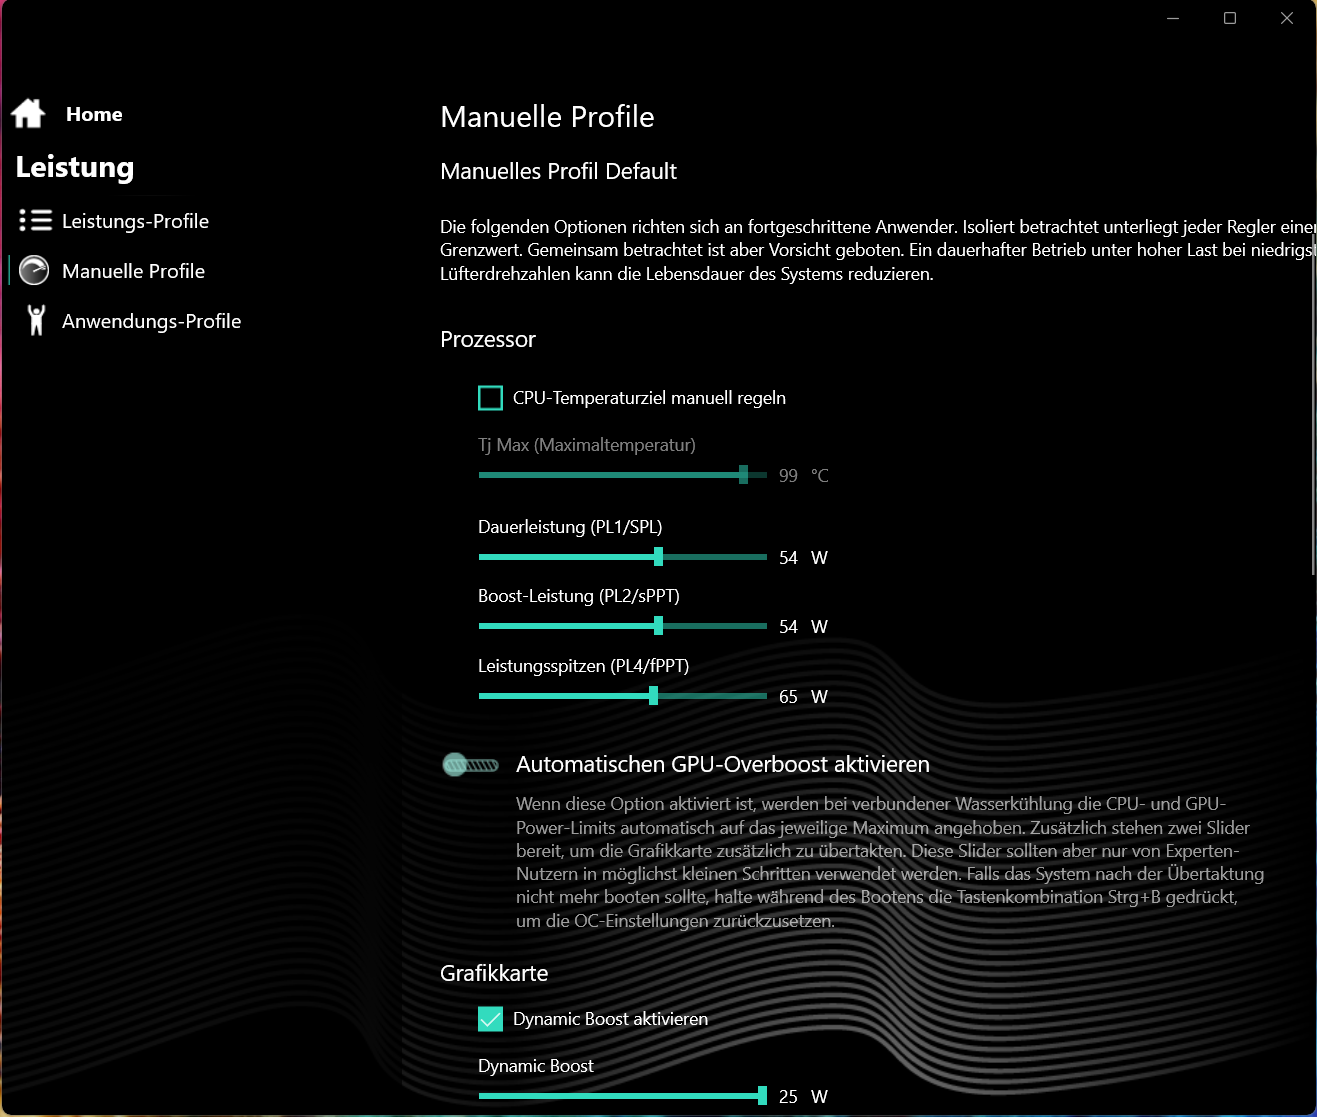
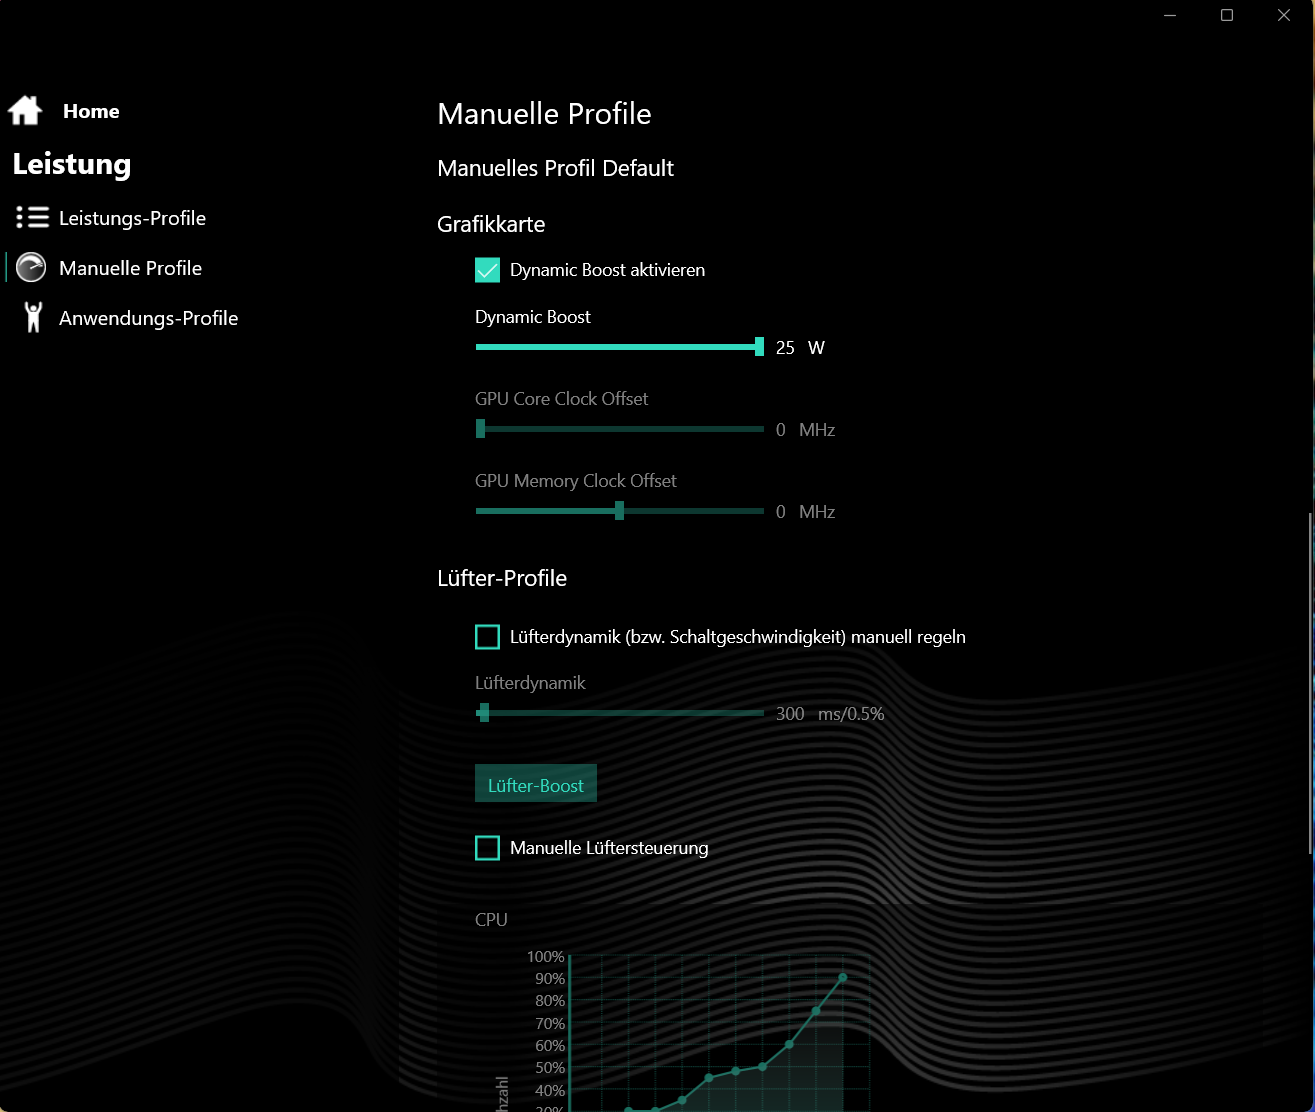
O Control Center pré-instalado permite perfis individuais: Isso possibilita o ajuste, por exemplo, dos limites de energia da CPU, do TGP da GPU e/ou do controle da ventoinha.
| Entusiasta | Overboost | Balanceado | |
|---|---|---|---|
| Limite de potência 1 (HWInfo) | 54 watts | 80 watts | 35 watts |
| Limite de potência 2 (HWInfo) | 65 watts | 80 watts | 65 watts |
| Ruído (Witcher 3) | ~50 dB(A) | ~54 dB(A) | ~34 dB(A) |
| Desempenho (Witcher 3) | ~102 fps | ~105 fps | ~60 fps |
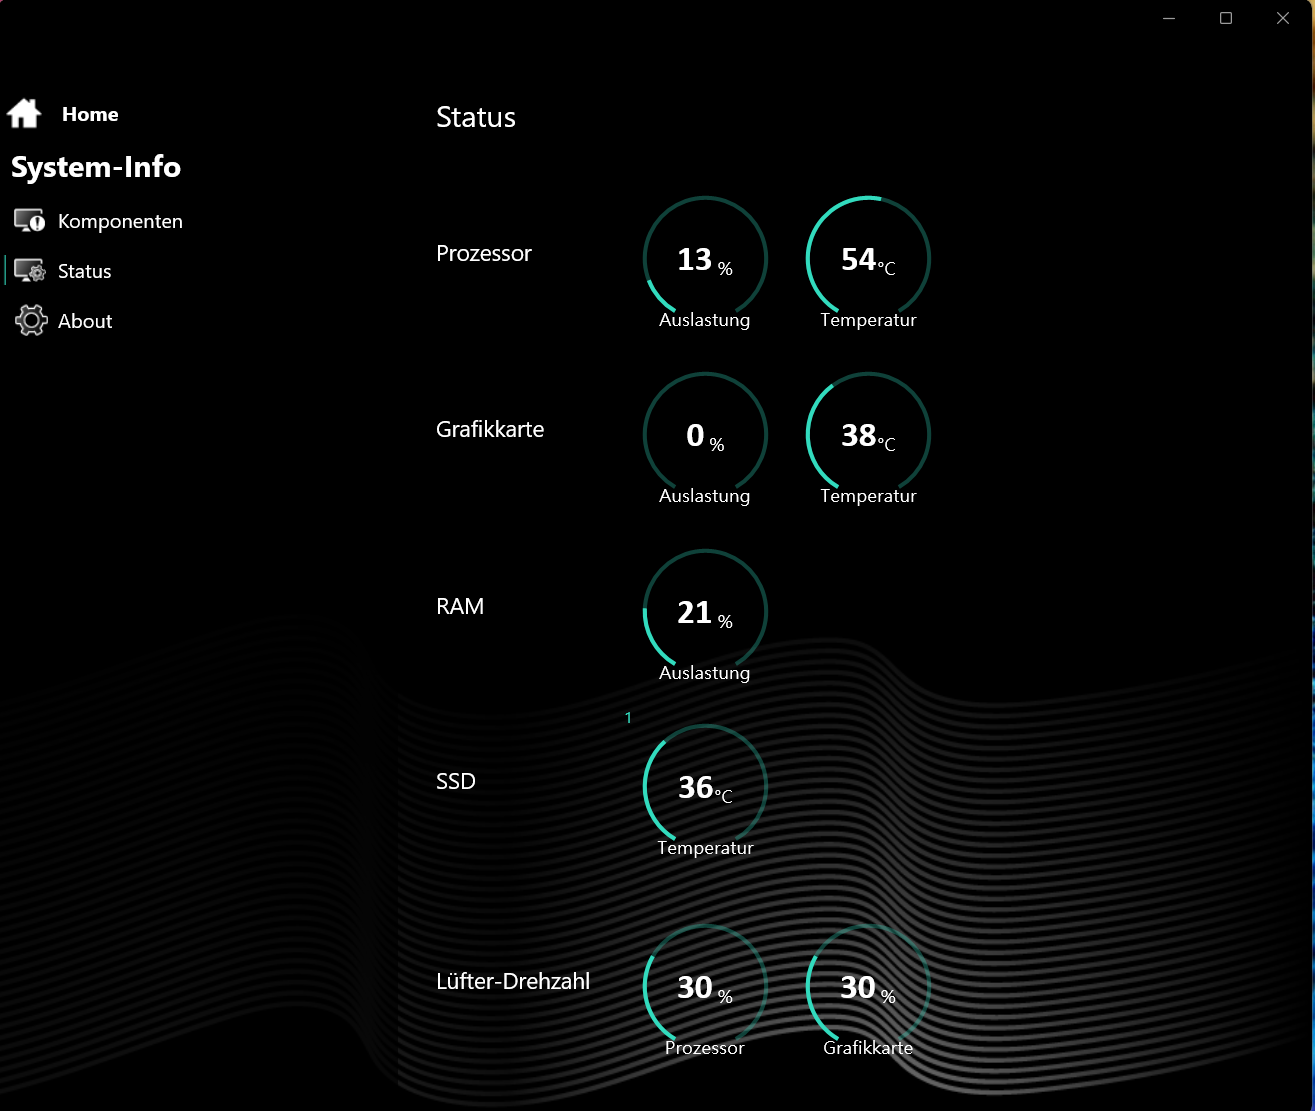
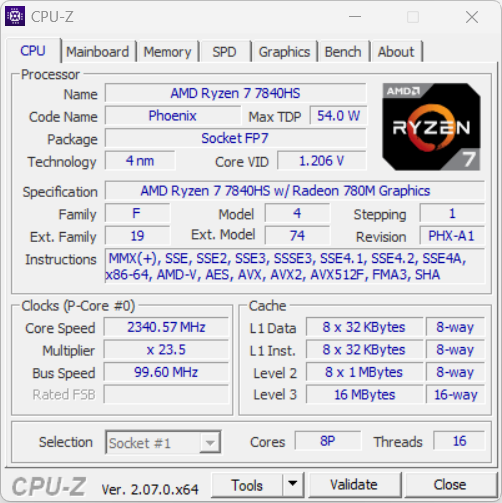
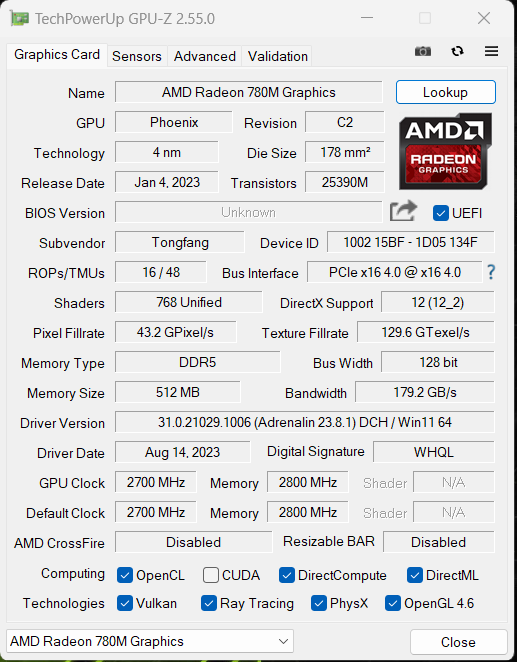
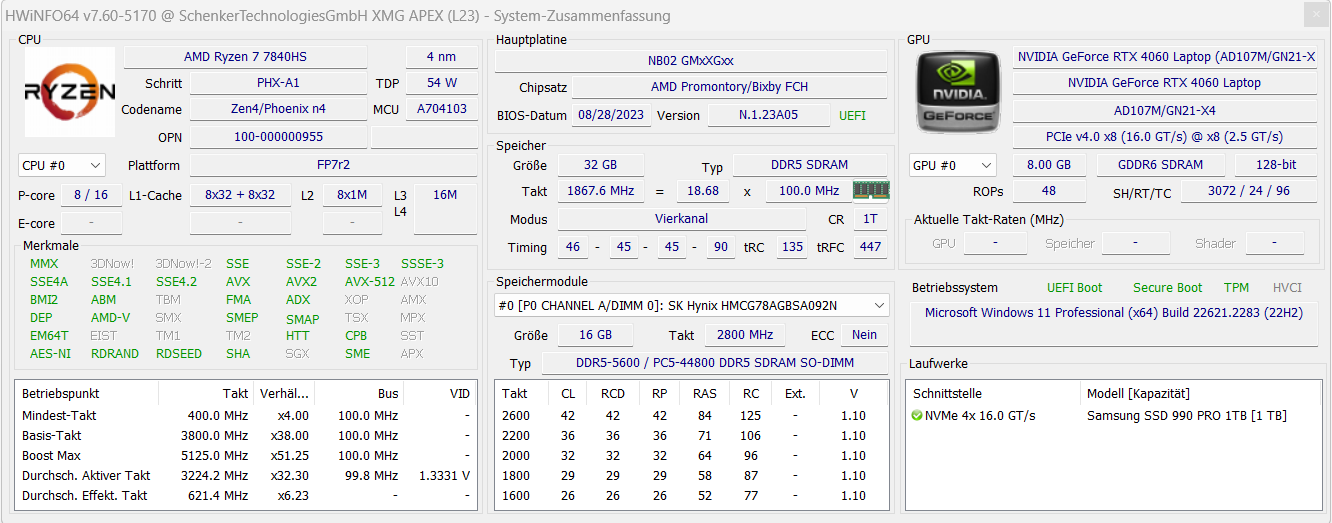
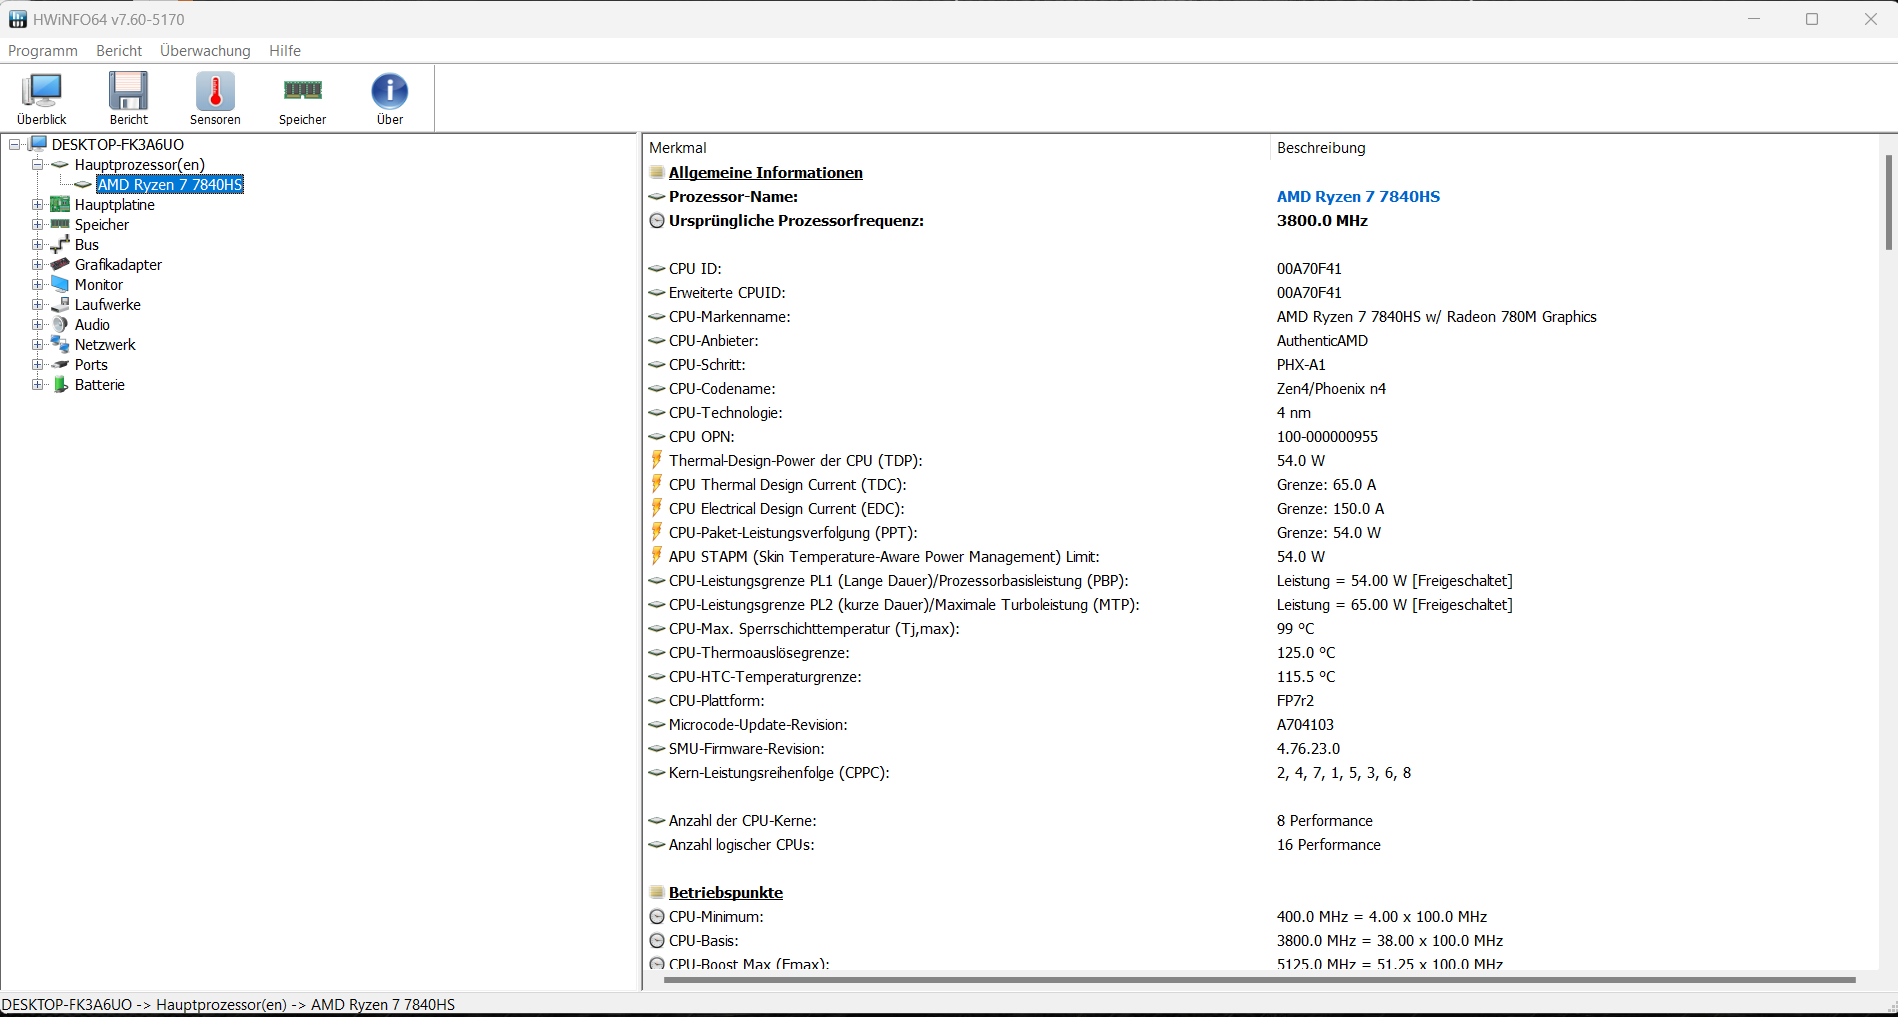
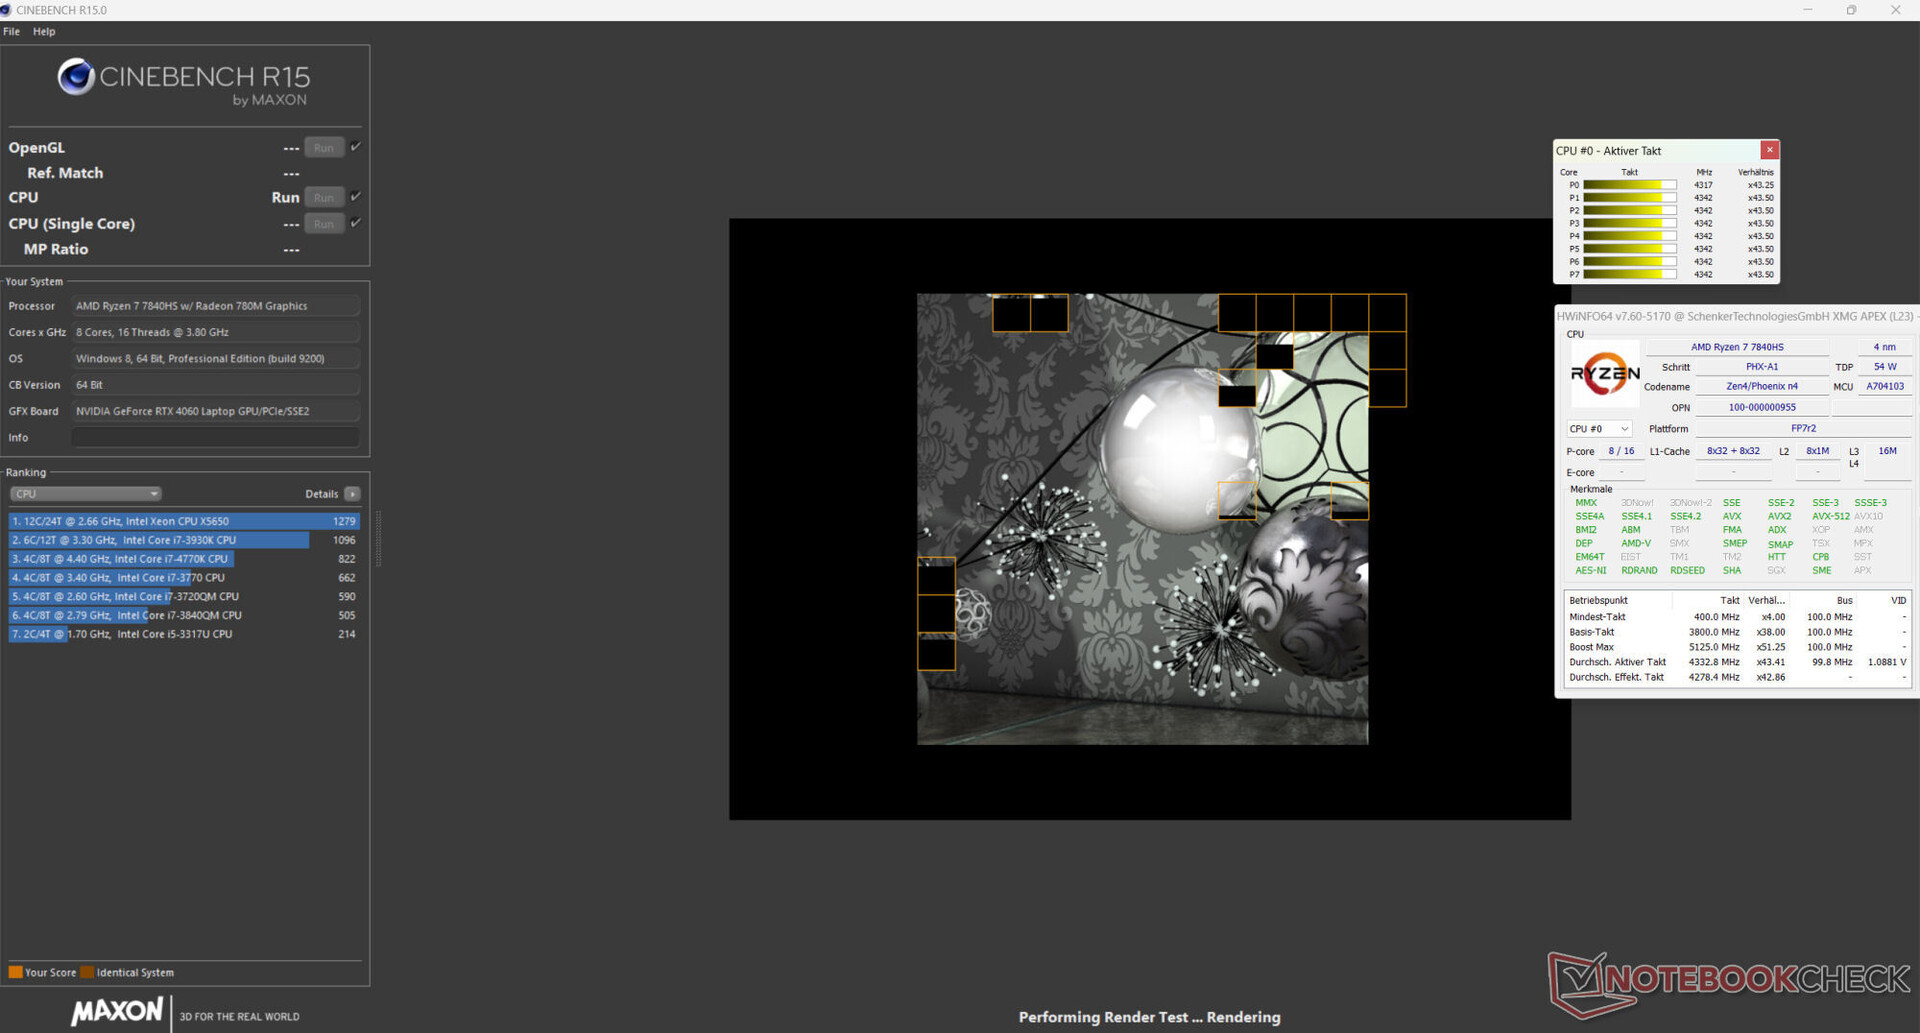
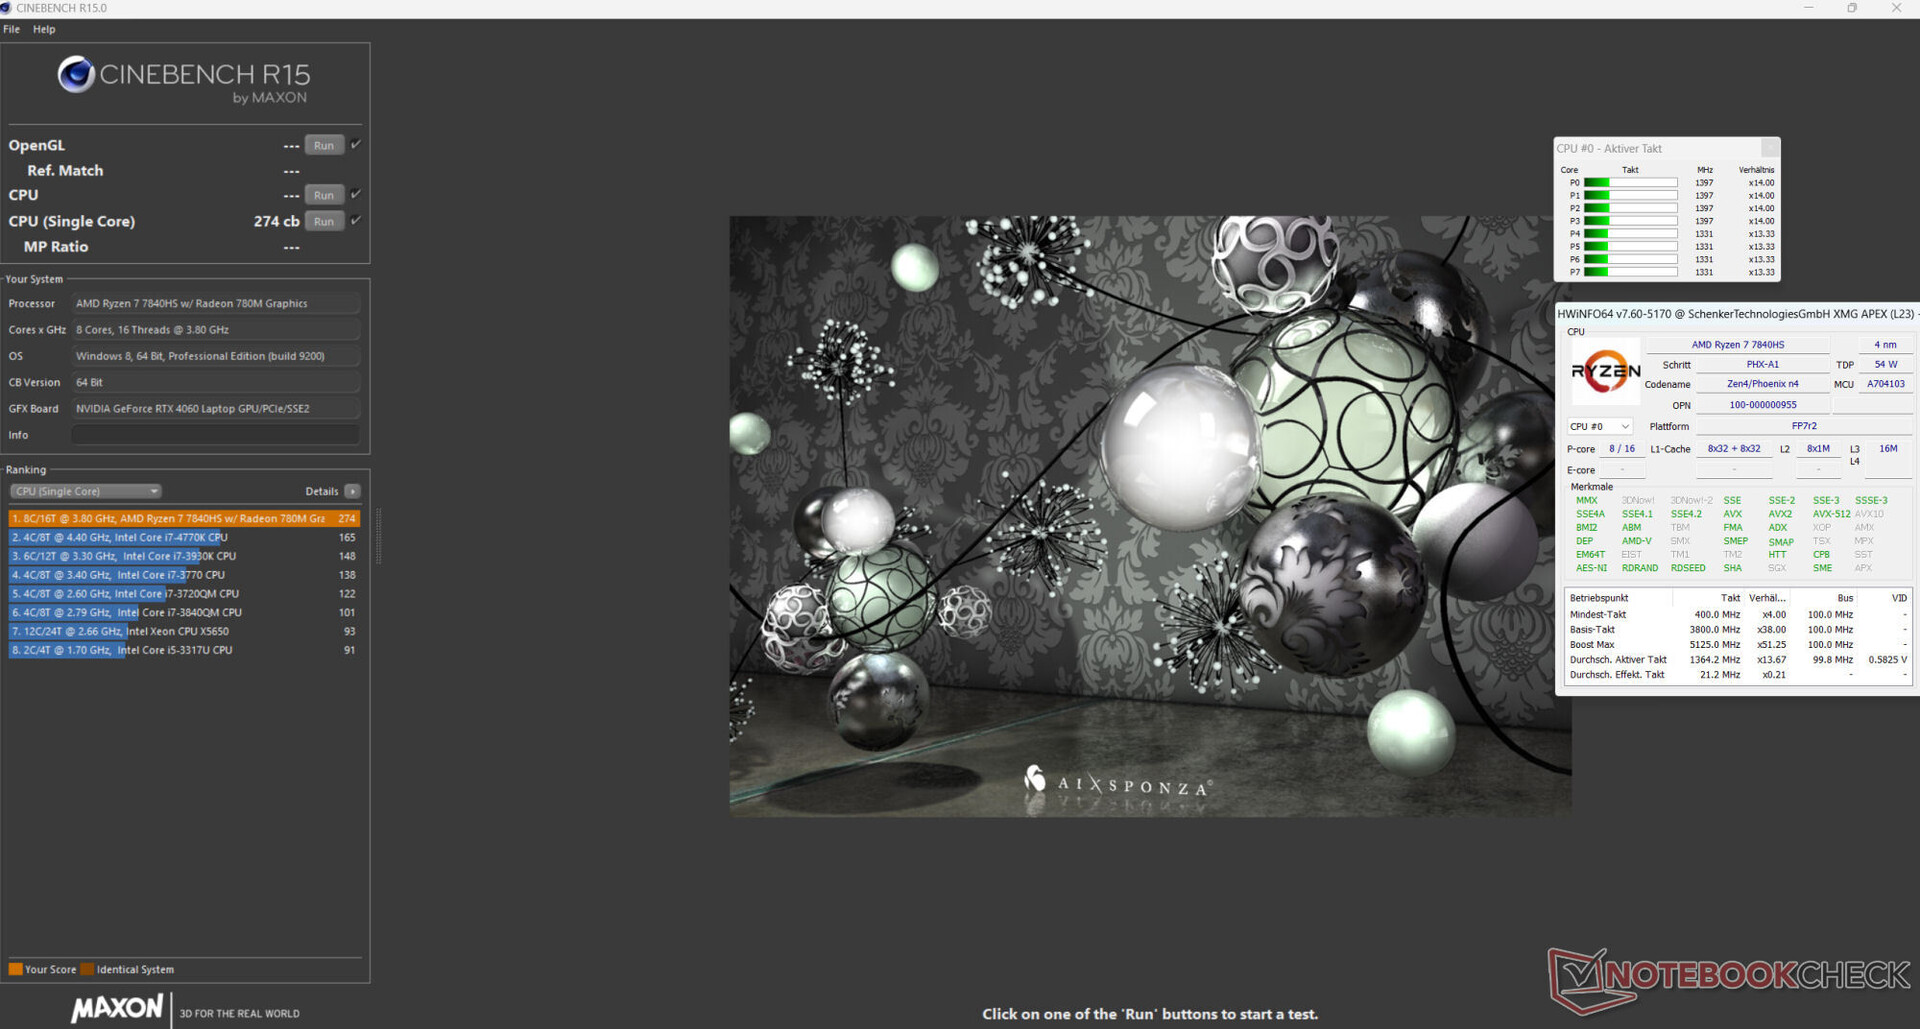
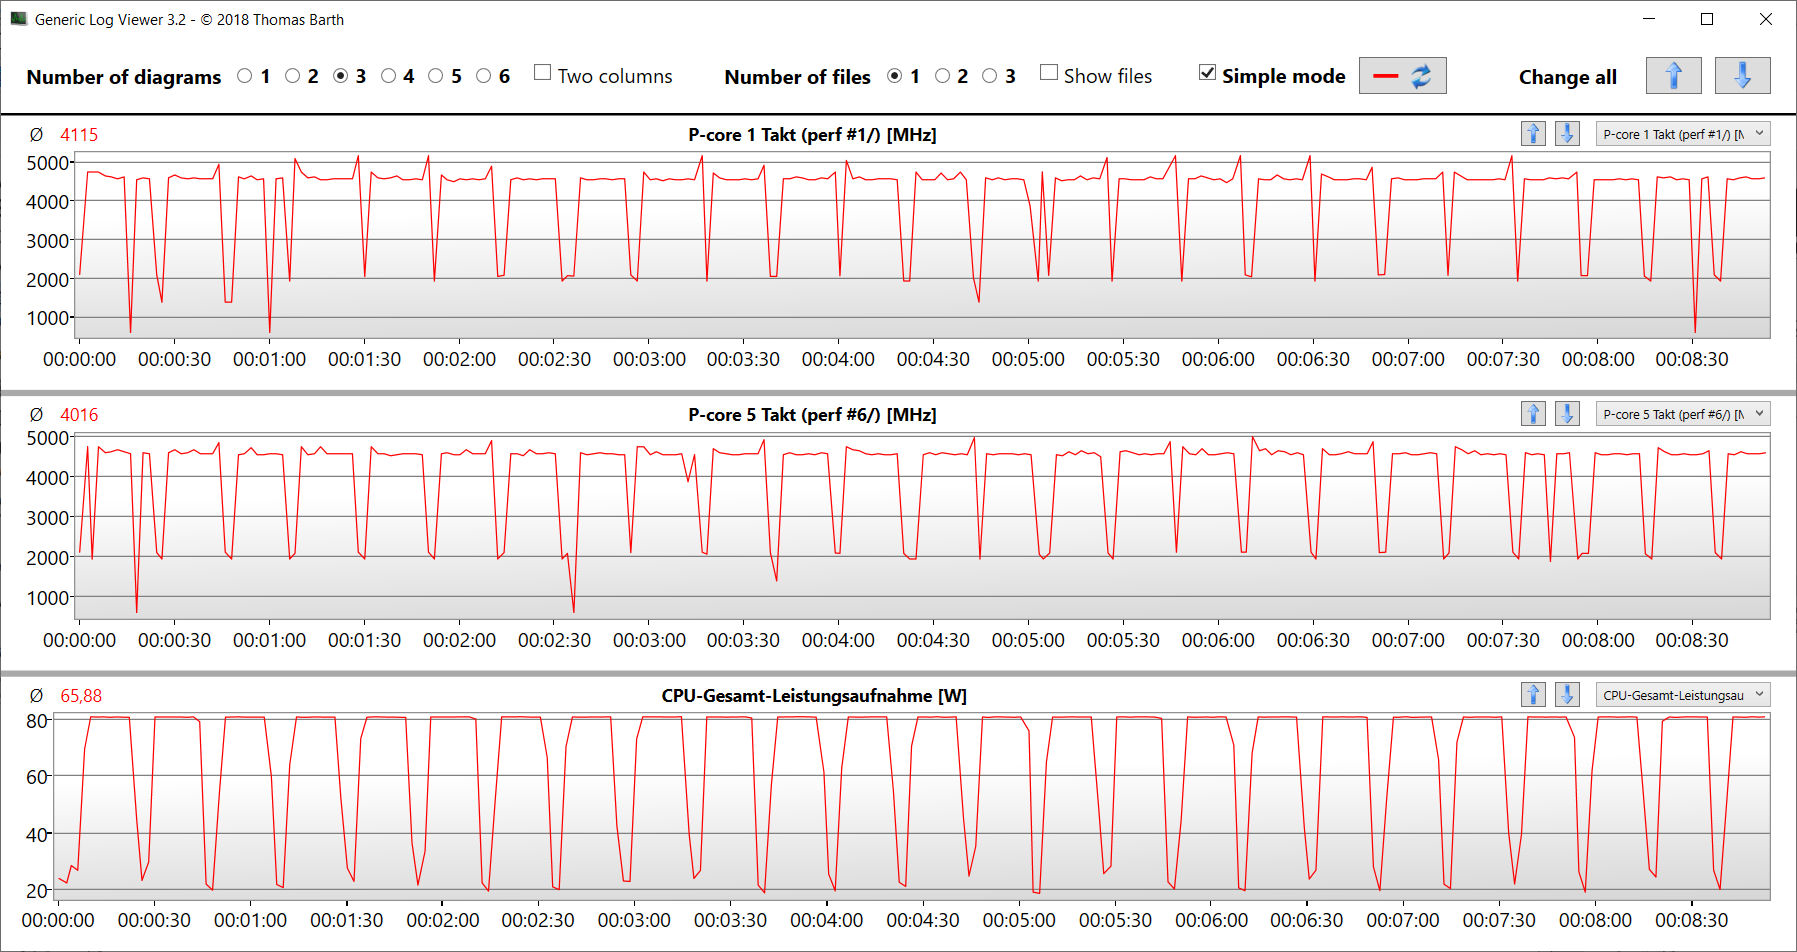
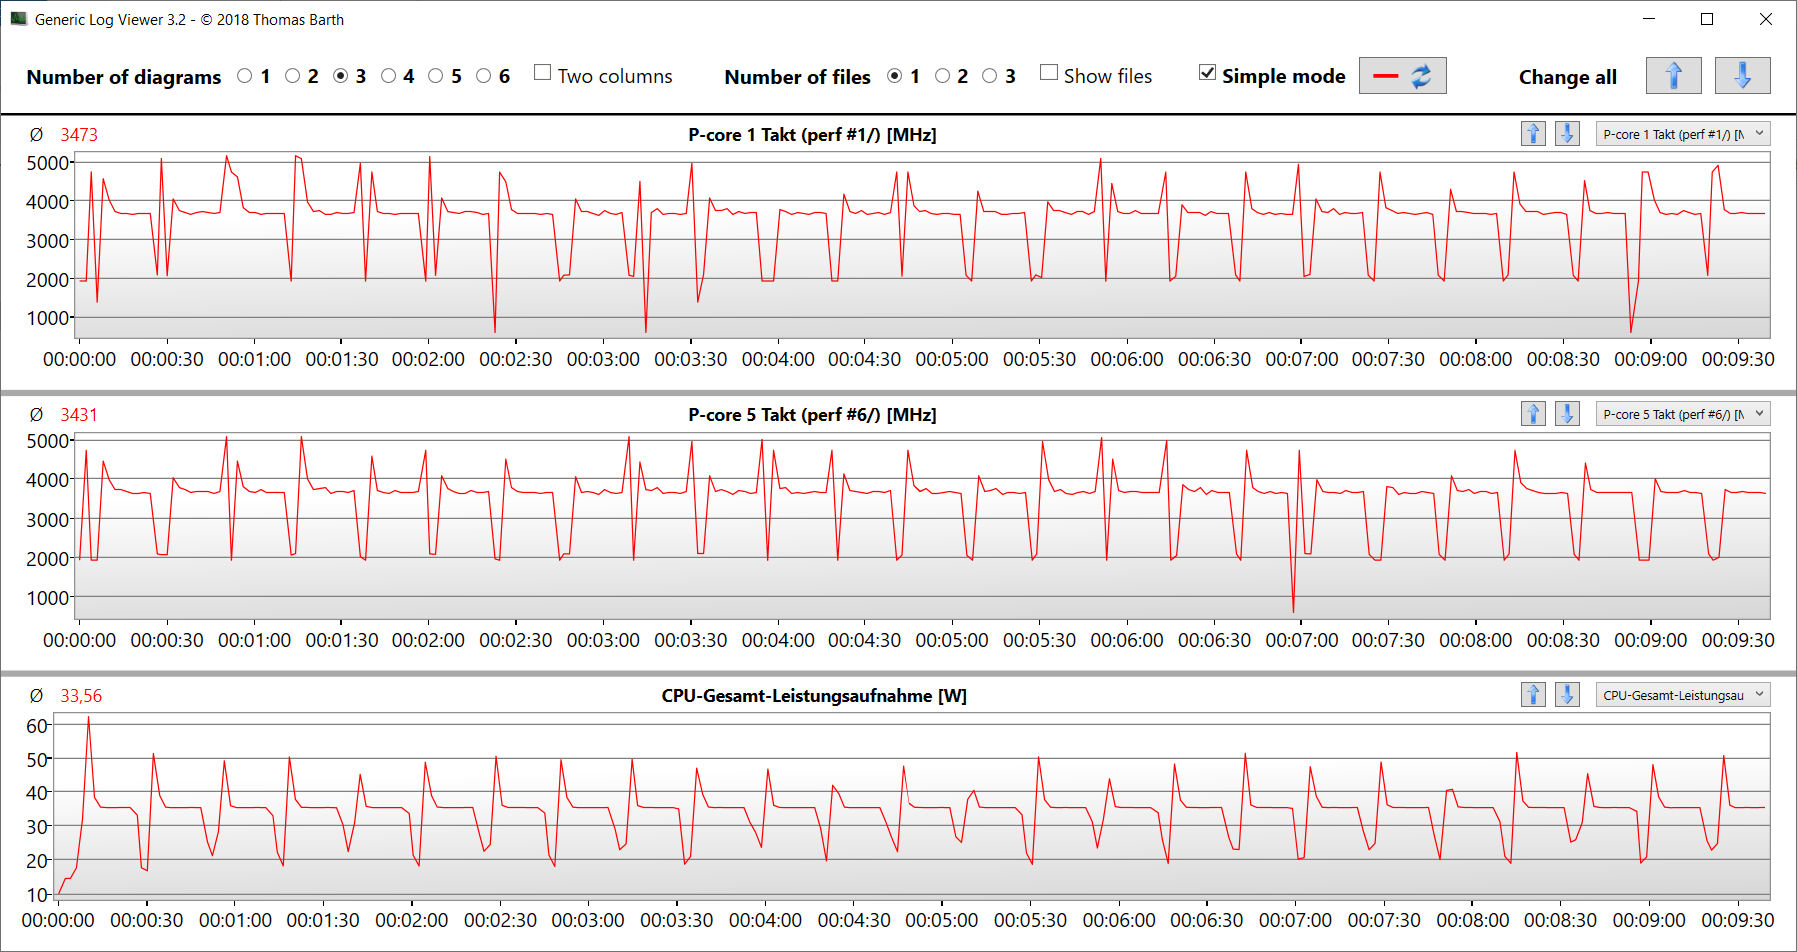
Processador
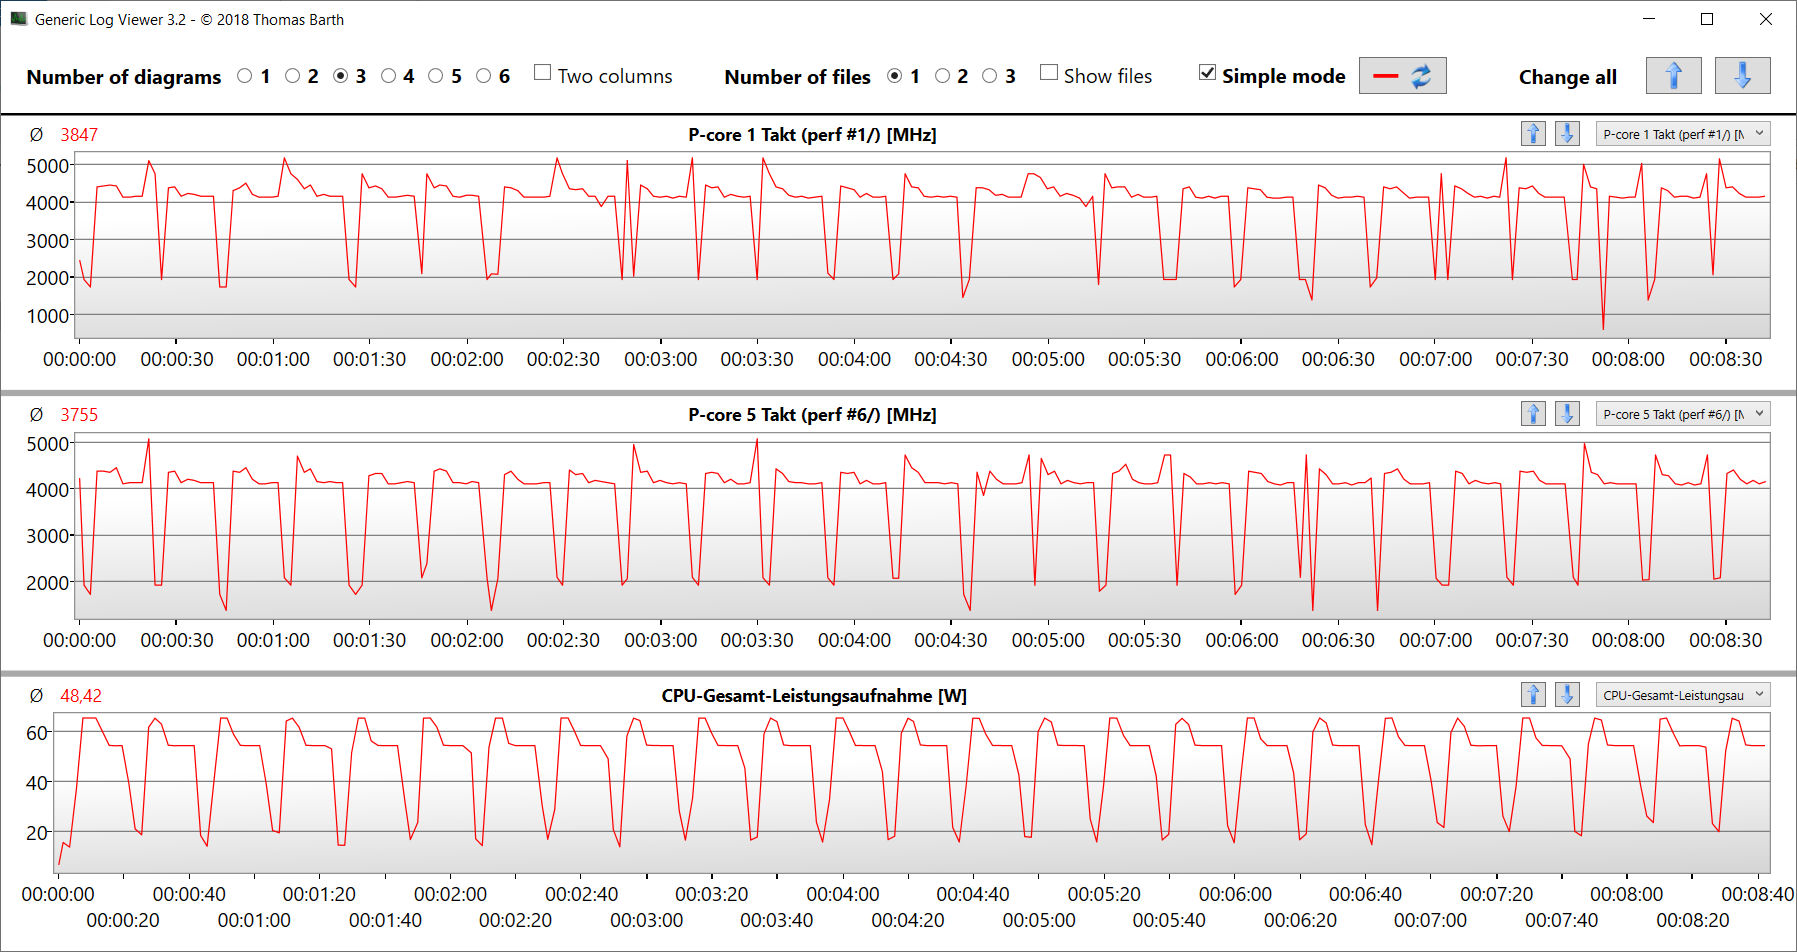
ORyzen 7 7840HSaPU (Phoenix, Zen 4) oferece 8 núcleos de CPU com um total de 16 threads a uma velocidade de clock máxima de 5,1 GHz (um núcleo). A CPU reconhece a carga contínua de vários threads (loop CB15) com uma velocidade turbo consistentemente alta, independentemente do modo de desempenho selecionado.
Em operação na rede elétrica, os resultados de benchmark estão em torno da média da CPU. No modo de bateria, o desempenho single-thread mais relevante (216 pontos) cai menos do que o desempenho multi-thread (1.715 pontos).
Observação: Informações mais detalhadas sobre a arquitetura Zen 4 podem ser encontradas neste artigo de análise do site Análise do AMD Ryzen 9 7940HS - O Zen4 Phoenix é idealmente tão eficiente quanto Apple .
Cinebench R15 Multi Continuous Test
* ... menor é melhor
AIDA64: FP32 Ray-Trace | FPU Julia | CPU SHA3 | CPU Queen | FPU SinJulia | FPU Mandel | CPU AES | CPU ZLib | FP64 Ray-Trace | CPU PhotoWorxx
| Performance rating | |
| Média da turma Gaming | |
| Schenker XMG Apex 17 (Late 23) | |
| Média AMD Ryzen 7 7840HS | |
| Alienware m16 R1 Intel | |
| Lenovo Legion Pro 5 16IRX8 | |
| Acer Nitro 17 AN17-51-71ER | |
| Medion Erazer Defender P40 | |
| MSI Katana 17 B13VFK | |
| AIDA64 / FP32 Ray-Trace | |
| Média da turma Gaming (10227 - 85542, n=105, últimos 2 anos) | |
| Média AMD Ryzen 7 7840HS (22845 - 28921, n=21) | |
| Schenker XMG Apex 17 (Late 23) | |
| Lenovo Legion Pro 5 16IRX8 | |
| Alienware m16 R1 Intel | |
| Acer Nitro 17 AN17-51-71ER | |
| Medion Erazer Defender P40 | |
| MSI Katana 17 B13VFK | |
| AIDA64 / FPU Julia | |
| Média da turma Gaming (51376 - 238426, n=105, últimos 2 anos) | |
| Média AMD Ryzen 7 7840HS (97164 - 123167, n=21) | |
| Schenker XMG Apex 17 (Late 23) | |
| Lenovo Legion Pro 5 16IRX8 | |
| Alienware m16 R1 Intel | |
| Acer Nitro 17 AN17-51-71ER | |
| Medion Erazer Defender P40 | |
| MSI Katana 17 B13VFK | |
| AIDA64 / CPU SHA3 | |
| Média da turma Gaming (2180 - 10115, n=105, últimos 2 anos) | |
| Alienware m16 R1 Intel | |
| Média AMD Ryzen 7 7840HS (4293 - 5155, n=21) | |
| Lenovo Legion Pro 5 16IRX8 | |
| Schenker XMG Apex 17 (Late 23) | |
| Acer Nitro 17 AN17-51-71ER | |
| Medion Erazer Defender P40 | |
| MSI Katana 17 B13VFK | |
| AIDA64 / CPU Queen | |
| Média da turma Gaming (49785 - 173351, n=90, últimos 2 anos) | |
| Média AMD Ryzen 7 7840HS (102271 - 125820, n=21) | |
| Schenker XMG Apex 17 (Late 23) | |
| Alienware m16 R1 Intel | |
| Lenovo Legion Pro 5 16IRX8 | |
| Medion Erazer Defender P40 | |
| Acer Nitro 17 AN17-51-71ER | |
| MSI Katana 17 B13VFK | |
| AIDA64 / FPU SinJulia | |
| Média AMD Ryzen 7 7840HS (13767 - 15525, n=21) | |
| Schenker XMG Apex 17 (Late 23) | |
| Média da turma Gaming (4424 - 33636, n=105, últimos 2 anos) | |
| Alienware m16 R1 Intel | |
| Lenovo Legion Pro 5 16IRX8 | |
| Acer Nitro 17 AN17-51-71ER | |
| Medion Erazer Defender P40 | |
| MSI Katana 17 B13VFK | |
| AIDA64 / FPU Mandel | |
| Média da turma Gaming (25115 - 128721, n=105, últimos 2 anos) | |
| Média AMD Ryzen 7 7840HS (52084 - 65812, n=21) | |
| Schenker XMG Apex 17 (Late 23) | |
| Lenovo Legion Pro 5 16IRX8 | |
| Alienware m16 R1 Intel | |
| Acer Nitro 17 AN17-51-71ER | |
| Medion Erazer Defender P40 | |
| MSI Katana 17 B13VFK | |
| AIDA64 / CPU AES | |
| Alienware m16 R1 Intel | |
| Schenker XMG Apex 17 (Late 23) | |
| Acer Nitro 17 AN17-51-71ER | |
| Média AMD Ryzen 7 7840HS (67389 - 177158, n=21) | |
| Média da turma Gaming (39258 - 247074, n=105, últimos 2 anos) | |
| Lenovo Legion Pro 5 16IRX8 | |
| Medion Erazer Defender P40 | |
| MSI Katana 17 B13VFK | |
| AIDA64 / CPU ZLib | |
| Média da turma Gaming (574 - 2531, n=105, últimos 2 anos) | |
| Alienware m16 R1 Intel | |
| Lenovo Legion Pro 5 16IRX8 | |
| Acer Nitro 17 AN17-51-71ER | |
| Média AMD Ryzen 7 7840HS (944 - 1123, n=21) | |
| Schenker XMG Apex 17 (Late 23) | |
| Medion Erazer Defender P40 | |
| MSI Katana 17 B13VFK | |
| AIDA64 / FP64 Ray-Trace | |
| Média da turma Gaming (5509 - 45446, n=105, últimos 2 anos) | |
| Média AMD Ryzen 7 7840HS (12248 - 15599, n=21) | |
| Schenker XMG Apex 17 (Late 23) | |
| Lenovo Legion Pro 5 16IRX8 | |
| Alienware m16 R1 Intel | |
| Acer Nitro 17 AN17-51-71ER | |
| Medion Erazer Defender P40 | |
| MSI Katana 17 B13VFK | |
| AIDA64 / CPU PhotoWorxx | |
| Média da turma Gaming (12271 - 89891, n=105, últimos 2 anos) | |
| Acer Nitro 17 AN17-51-71ER | |
| Média AMD Ryzen 7 7840HS (17615 - 41516, n=21) | |
| Lenovo Legion Pro 5 16IRX8 | |
| Schenker XMG Apex 17 (Late 23) | |
| Medion Erazer Defender P40 | |
| Alienware m16 R1 Intel | |
| MSI Katana 17 B13VFK | |
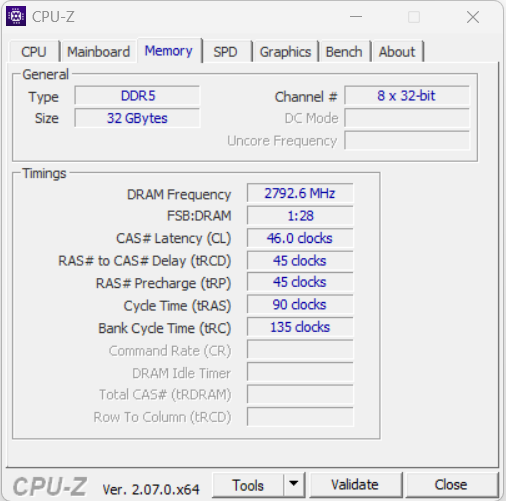
Desempenho do sistema
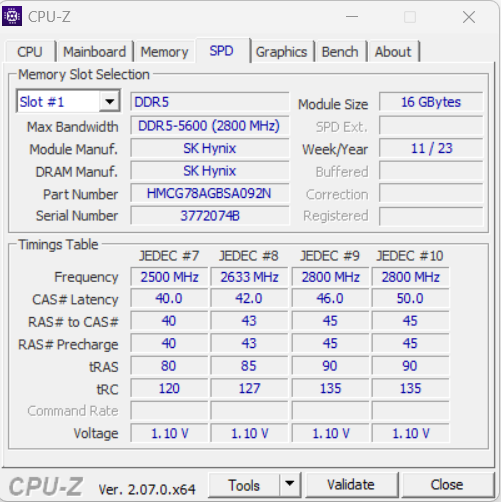
O sistema de funcionamento suave foi projetado para lidar com cenários de casos de uso que exigem muito desempenho, como renderização e jogos - os bons resultados do PC Mark confirmam isso. As taxas de transferência da RAM estão em um nível normal para a RAM DDR5 5600.
CrossMark: Overall | Productivity | Creativity | Responsiveness
| PCMark 10 / Score | |
| Média da turma Gaming (5828 - 12414, n=93, últimos 2 anos) | |
| Schenker XMG Apex 17 (Late 23) | |
| Média AMD Ryzen 7 7840HS, NVIDIA GeForce RTX 4060 Laptop GPU (7502 - 7946, n=4) | |
| Lenovo Legion Pro 5 16IRX8 | |
| Alienware m16 R1 Intel | |
| MSI Katana 17 B13VFK | |
| Acer Nitro 17 AN17-51-71ER | |
| Medion Erazer Defender P40 | |
| PCMark 10 / Essentials | |
| Lenovo Legion Pro 5 16IRX8 | |
| Média AMD Ryzen 7 7840HS, NVIDIA GeForce RTX 4060 Laptop GPU (10441 - 11169, n=4) | |
| MSI Katana 17 B13VFK | |
| Alienware m16 R1 Intel | |
| Schenker XMG Apex 17 (Late 23) | |
| Média da turma Gaming (8810 - 11935, n=97, últimos 2 anos) | |
| Acer Nitro 17 AN17-51-71ER | |
| Medion Erazer Defender P40 | |
| PCMark 10 / Productivity | |
| Média da turma Gaming (6845 - 25323, n=95, últimos 2 anos) | |
| Schenker XMG Apex 17 (Late 23) | |
| Média AMD Ryzen 7 7840HS, NVIDIA GeForce RTX 4060 Laptop GPU (9575 - 10273, n=4) | |
| Medion Erazer Defender P40 | |
| Alienware m16 R1 Intel | |
| MSI Katana 17 B13VFK | |
| Lenovo Legion Pro 5 16IRX8 | |
| Acer Nitro 17 AN17-51-71ER | |
| PCMark 10 / Digital Content Creation | |
| Média da turma Gaming (7602 - 19954, n=95, últimos 2 anos) | |
| Lenovo Legion Pro 5 16IRX8 | |
| Schenker XMG Apex 17 (Late 23) | |
| Média AMD Ryzen 7 7840HS, NVIDIA GeForce RTX 4060 Laptop GPU (11464 - 12418, n=4) | |
| Acer Nitro 17 AN17-51-71ER | |
| Alienware m16 R1 Intel | |
| MSI Katana 17 B13VFK | |
| Medion Erazer Defender P40 | |
| CrossMark / Overall | |
| Alienware m16 R1 Intel | |
| Média da turma Gaming (1366 - 2409, n=94, últimos 2 anos) | |
| MSI Katana 17 B13VFK | |
| Média AMD Ryzen 7 7840HS, NVIDIA GeForce RTX 4060 Laptop GPU (1800 - 1866, n=3) | |
| Schenker XMG Apex 17 (Late 23) | |
| Medion Erazer Defender P40 | |
| Lenovo Legion Pro 5 16IRX8 | |
| Acer Nitro 17 AN17-51-71ER | |
| CrossMark / Productivity | |
| Alienware m16 R1 Intel | |
| Média da turma Gaming (1386 - 2254, n=94, últimos 2 anos) | |
| Média AMD Ryzen 7 7840HS, NVIDIA GeForce RTX 4060 Laptop GPU (1743 - 1821, n=3) | |
| MSI Katana 17 B13VFK | |
| Schenker XMG Apex 17 (Late 23) | |
| Medion Erazer Defender P40 | |
| Lenovo Legion Pro 5 16IRX8 | |
| Acer Nitro 17 AN17-51-71ER | |
| CrossMark / Creativity | |
| Média da turma Gaming (1343 - 2786, n=94, últimos 2 anos) | |
| Alienware m16 R1 Intel | |
| MSI Katana 17 B13VFK | |
| Medion Erazer Defender P40 | |
| Média AMD Ryzen 7 7840HS, NVIDIA GeForce RTX 4060 Laptop GPU (1908 - 1966, n=3) | |
| Schenker XMG Apex 17 (Late 23) | |
| Lenovo Legion Pro 5 16IRX8 | |
| Acer Nitro 17 AN17-51-71ER | |
| CrossMark / Responsiveness | |
| Alienware m16 R1 Intel | |
| MSI Katana 17 B13VFK | |
| Média da turma Gaming (1226 - 2334, n=94, últimos 2 anos) | |
| Schenker XMG Apex 17 (Late 23) | |
| Lenovo Legion Pro 5 16IRX8 | |
| Média AMD Ryzen 7 7840HS, NVIDIA GeForce RTX 4060 Laptop GPU (1522 - 1776, n=3) | |
| Acer Nitro 17 AN17-51-71ER | |
| Medion Erazer Defender P40 | |
| PCMark 10 Score | 7854 pontos | |
Ajuda | ||
| AIDA64 / Memory Copy | |
| Média da turma Gaming (21750 - 129946, n=105, últimos 2 anos) | |
| Schenker XMG Apex 17 (Late 23) | |
| Média AMD Ryzen 7 7840HS (30937 - 72158, n=21) | |
| Lenovo Legion Pro 5 16IRX8 | |
| Acer Nitro 17 AN17-51-71ER | |
| Medion Erazer Defender P40 | |
| Alienware m16 R1 Intel | |
| MSI Katana 17 B13VFK | |
| AIDA64 / Memory Read | |
| Média da turma Gaming (22956 - 118858, n=105, últimos 2 anos) | |
| Lenovo Legion Pro 5 16IRX8 | |
| Medion Erazer Defender P40 | |
| Alienware m16 R1 Intel | |
| Acer Nitro 17 AN17-51-71ER | |
| Schenker XMG Apex 17 (Late 23) | |
| MSI Katana 17 B13VFK | |
| Média AMD Ryzen 7 7840HS (30497 - 62147, n=21) | |
| AIDA64 / Memory Write | |
| Schenker XMG Apex 17 (Late 23) | |
| Média AMD Ryzen 7 7840HS (34590 - 93323, n=21) | |
| Média da turma Gaming (22297 - 135096, n=105, últimos 2 anos) | |
| Lenovo Legion Pro 5 16IRX8 | |
| Acer Nitro 17 AN17-51-71ER | |
| Alienware m16 R1 Intel | |
| Medion Erazer Defender P40 | |
| MSI Katana 17 B13VFK | |
| AIDA64 / Memory Latency | |
| Acer Nitro 17 AN17-51-71ER | |
| Média da turma Gaming (75.3 - 259, n=105, últimos 2 anos) | |
| MSI Katana 17 B13VFK | |
| Medion Erazer Defender P40 | |
| Média AMD Ryzen 7 7840HS (85.1 - 112, n=21) | |
| Alienware m16 R1 Intel | |
| Schenker XMG Apex 17 (Late 23) | |
| Lenovo Legion Pro 5 16IRX8 | |
* ... menor é melhor
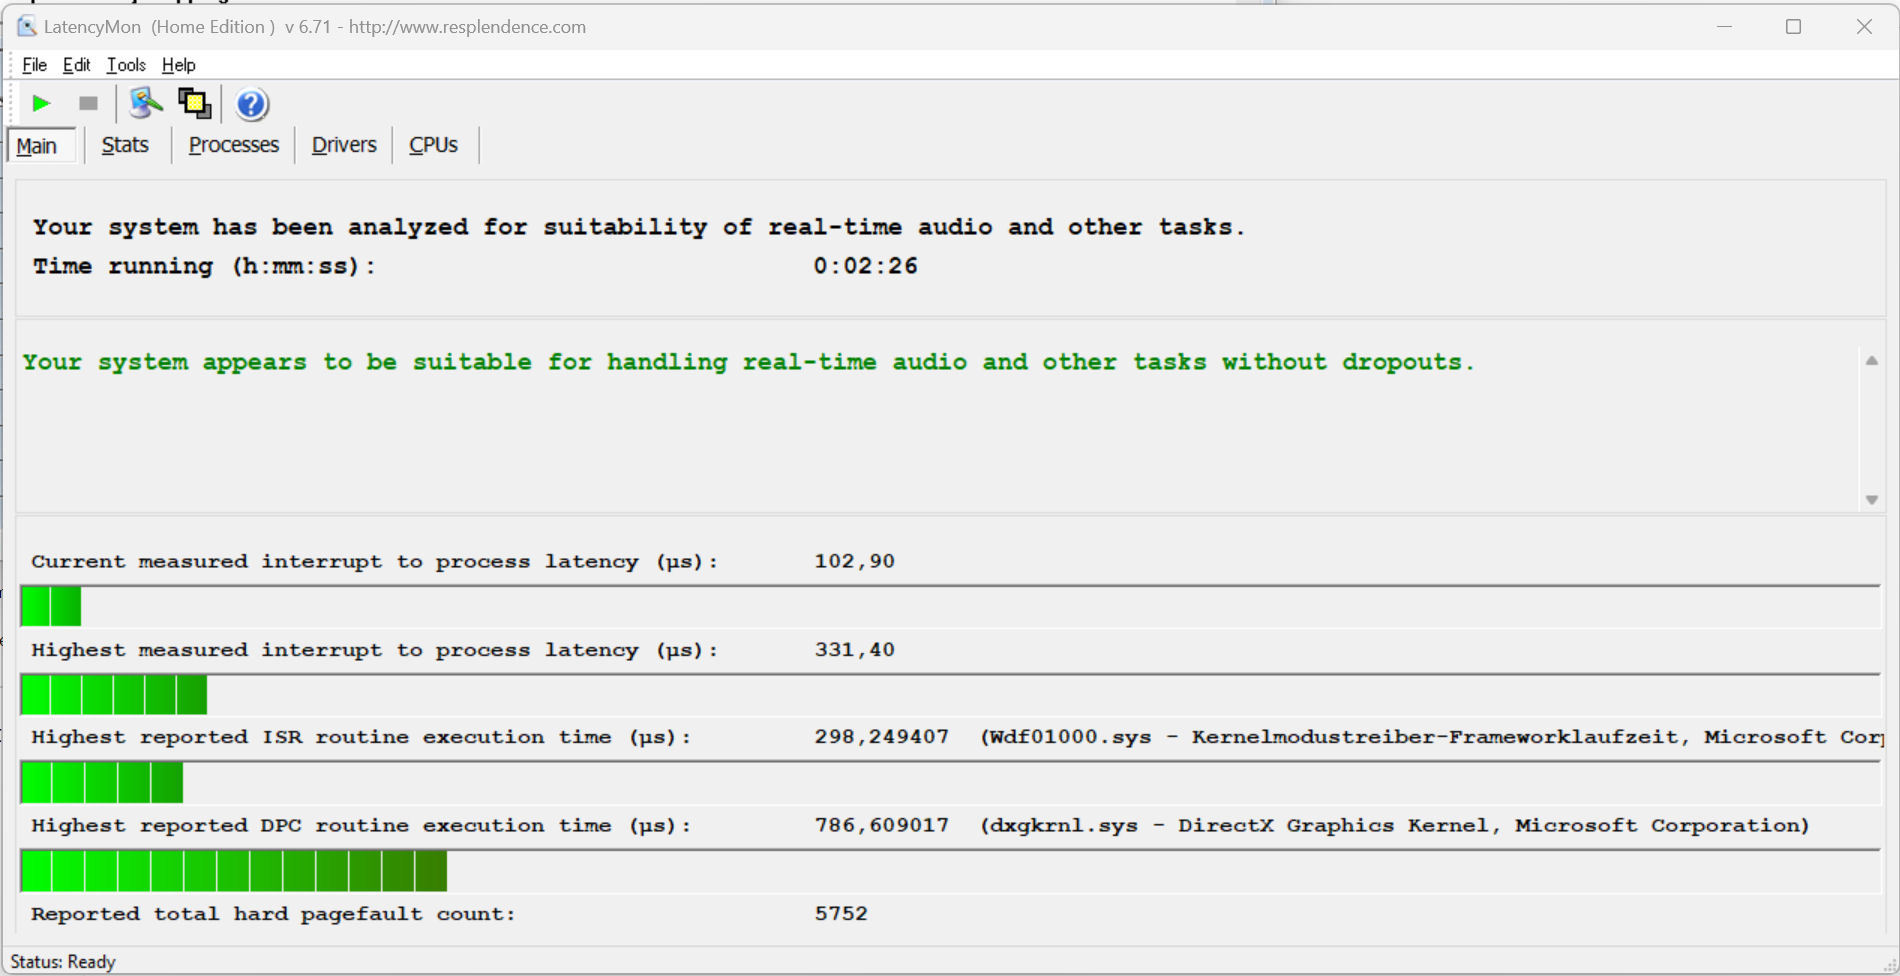
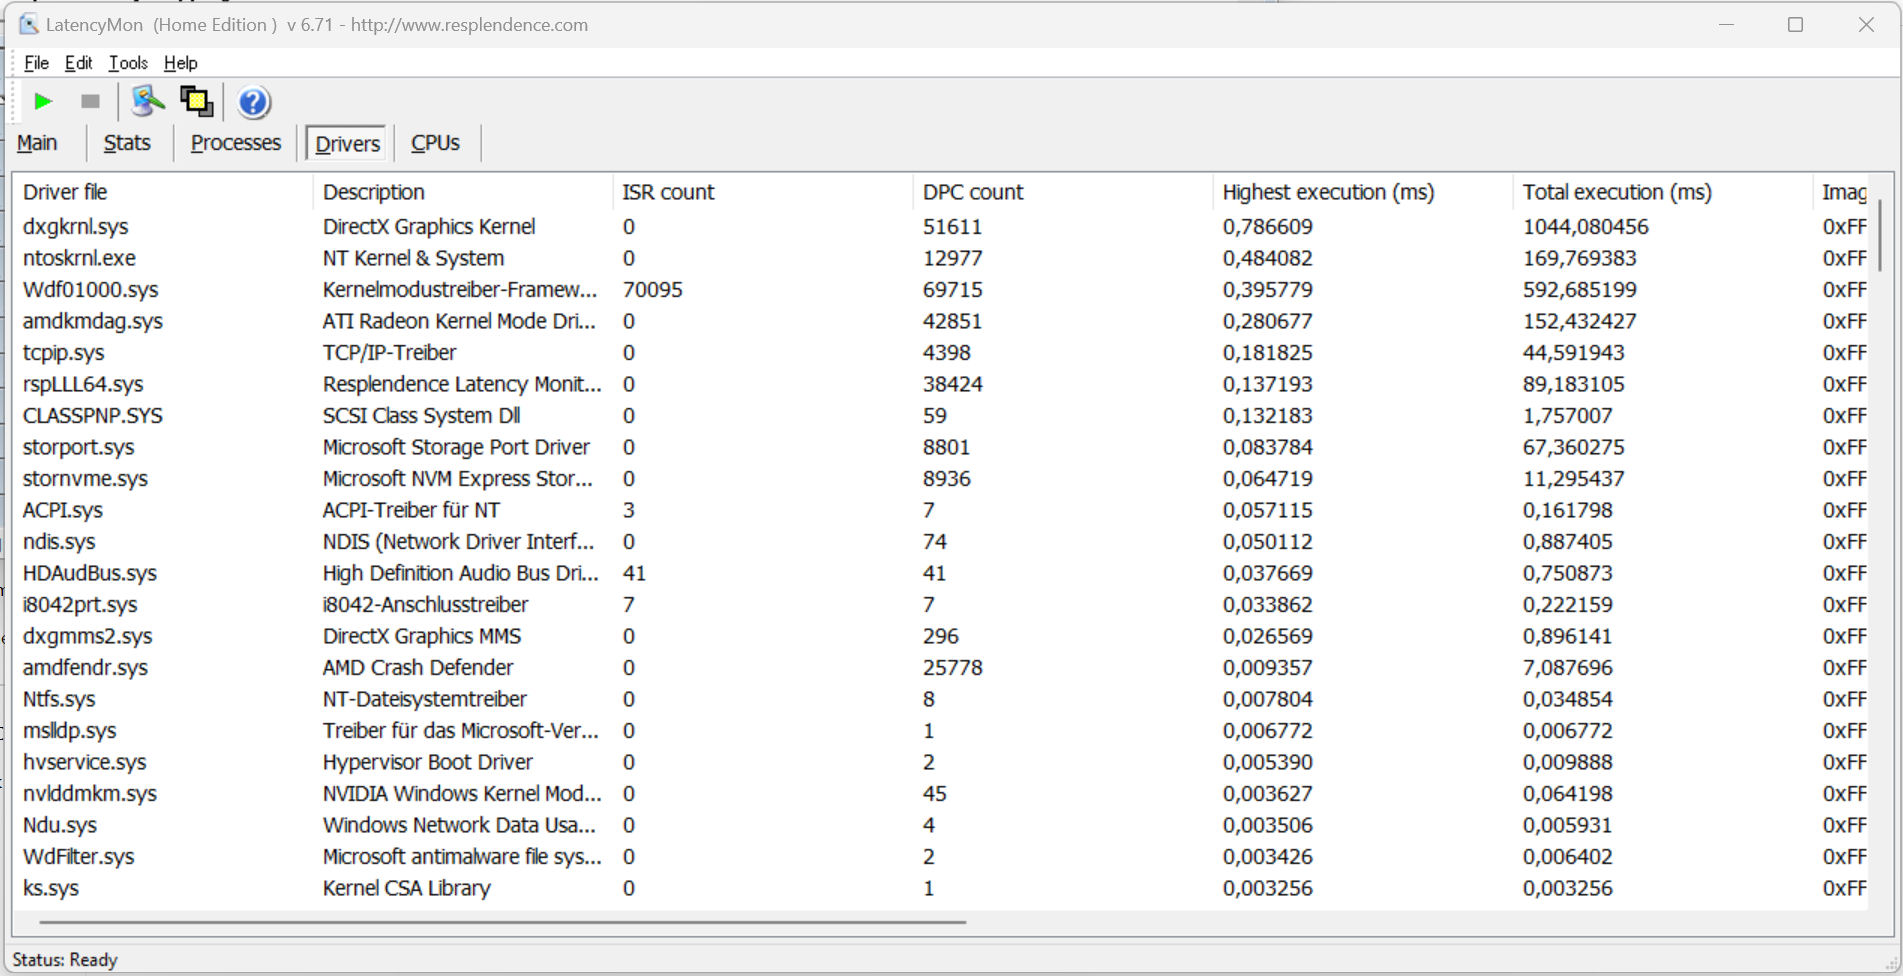
Latências de DPC
O teste padronizado do Latency Monitor (navegação na Internet, reprodução de vídeo 4k, alta carga do Prime95) não revelou nenhuma anormalidade. O sistema parece ser adequado para edição de vídeo e áudio em tempo real. Futuras atualizações de software poderão melhorar ou piorar essa área de desempenho.
| DPC Latencies / LatencyMon - interrupt to process latency (max), Web, Youtube, Prime95 | |
| Medion Erazer Defender P40 | |
| Alienware m16 R1 Intel | |
| MSI Katana 17 B13VFK | |
| Acer Nitro 17 AN17-51-71ER | |
| Lenovo Legion Pro 5 16IRX8 | |
| Schenker XMG Apex 17 (Late 23) | |
* ... menor é melhor
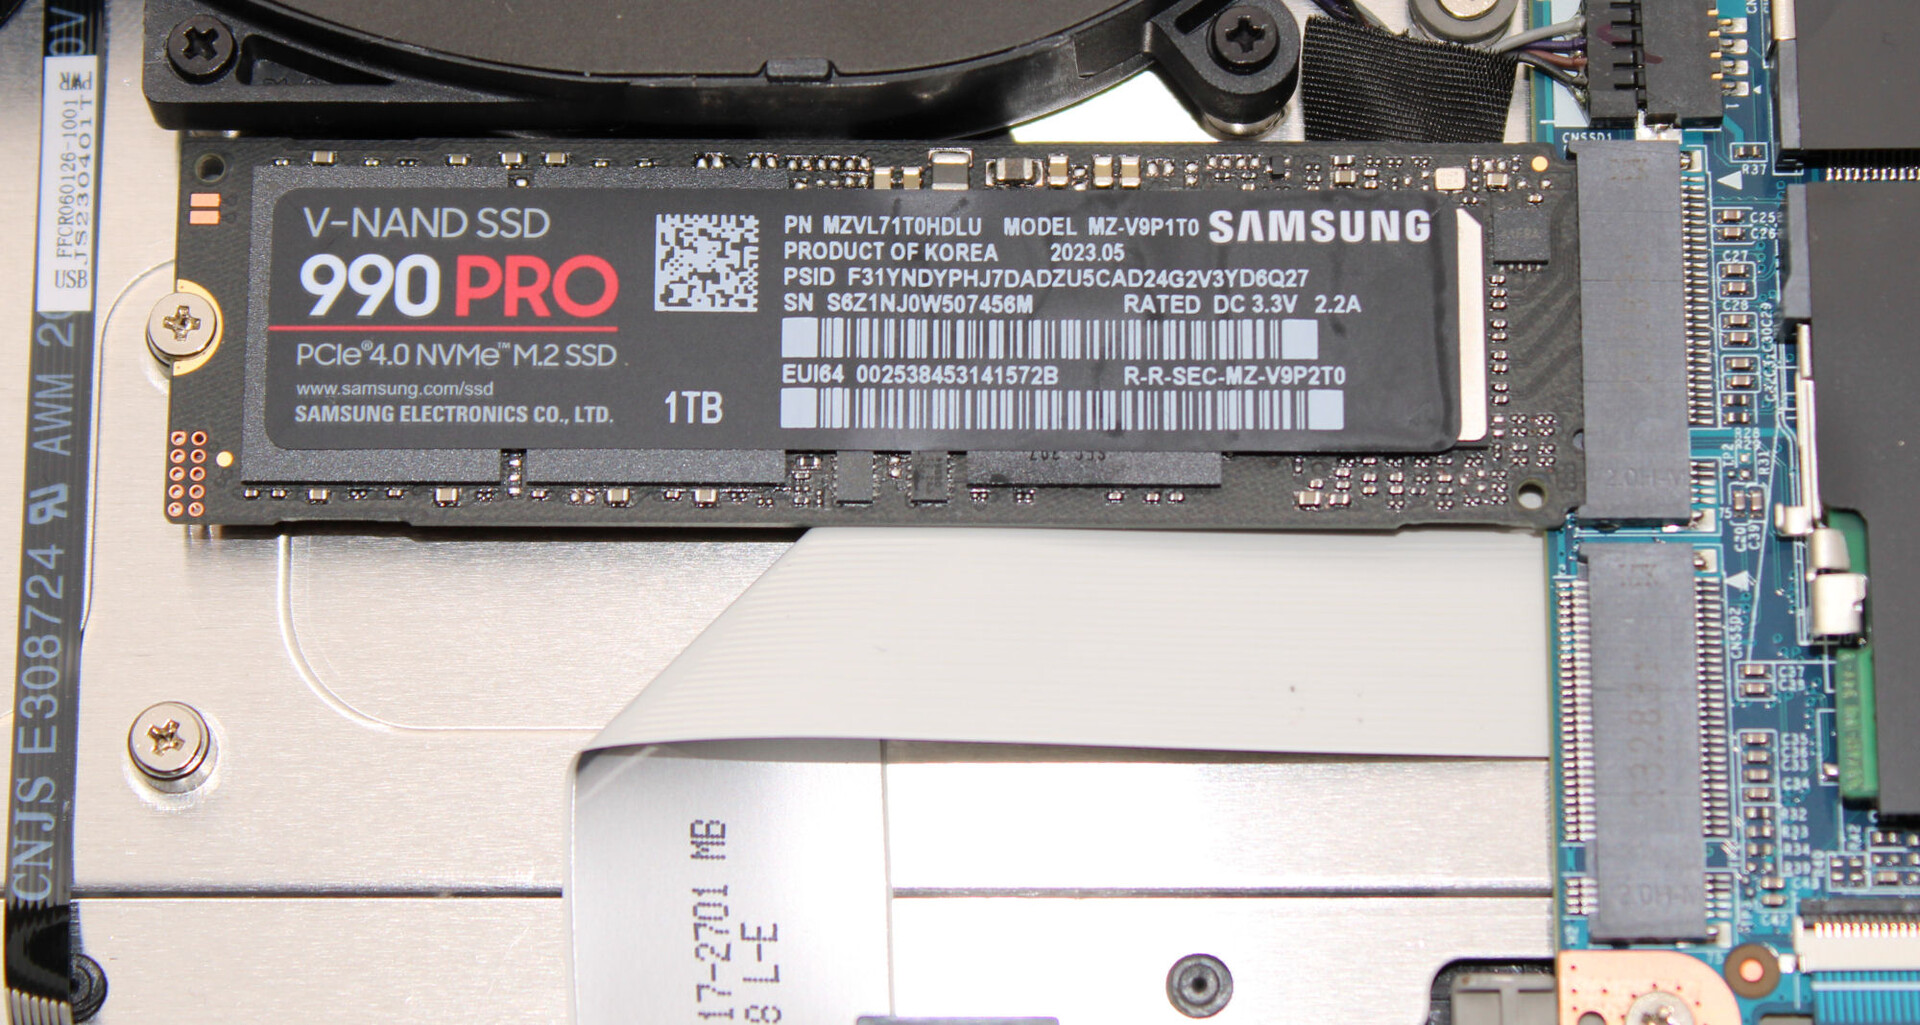
Armazenamento em massa
O Apex pode acomodar um total de dois SSDs PCIe 4 no formato M.2 2280. Há suporte para RAID-0/1. O dispositivo de análise que nos foi fornecido tem um SSD Samsung de 1 TB (PCIe 4, M.2 2280) integrado que oferece excelentes velocidades de transferência. Pontos positivos: Não houve estrangulamento relacionado à temperatura.

* ... menor é melhor
Continuous Performance Read: DiskSpd Read Loop, Queue Depth 8
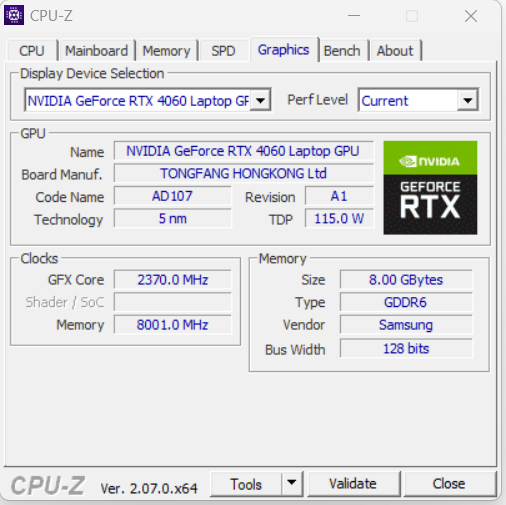
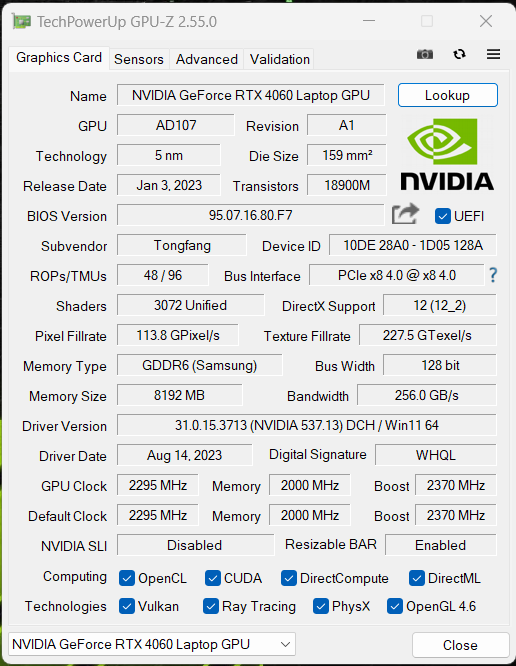
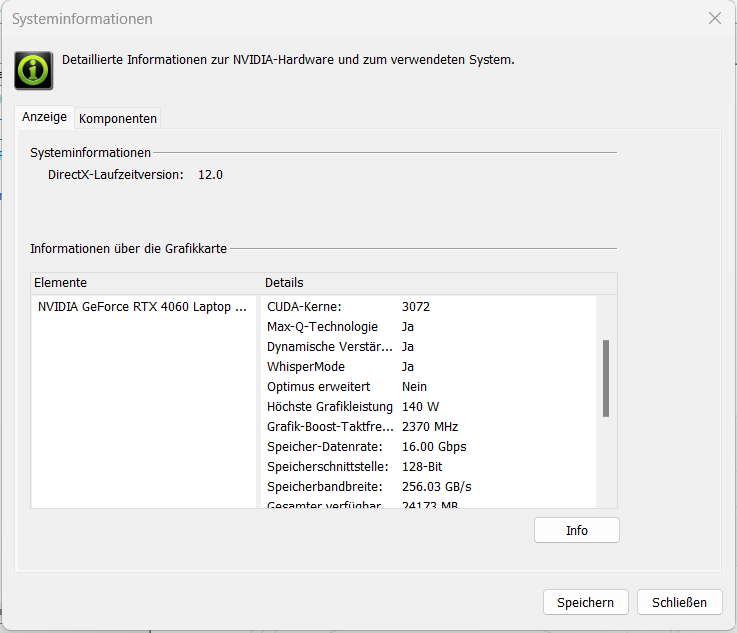
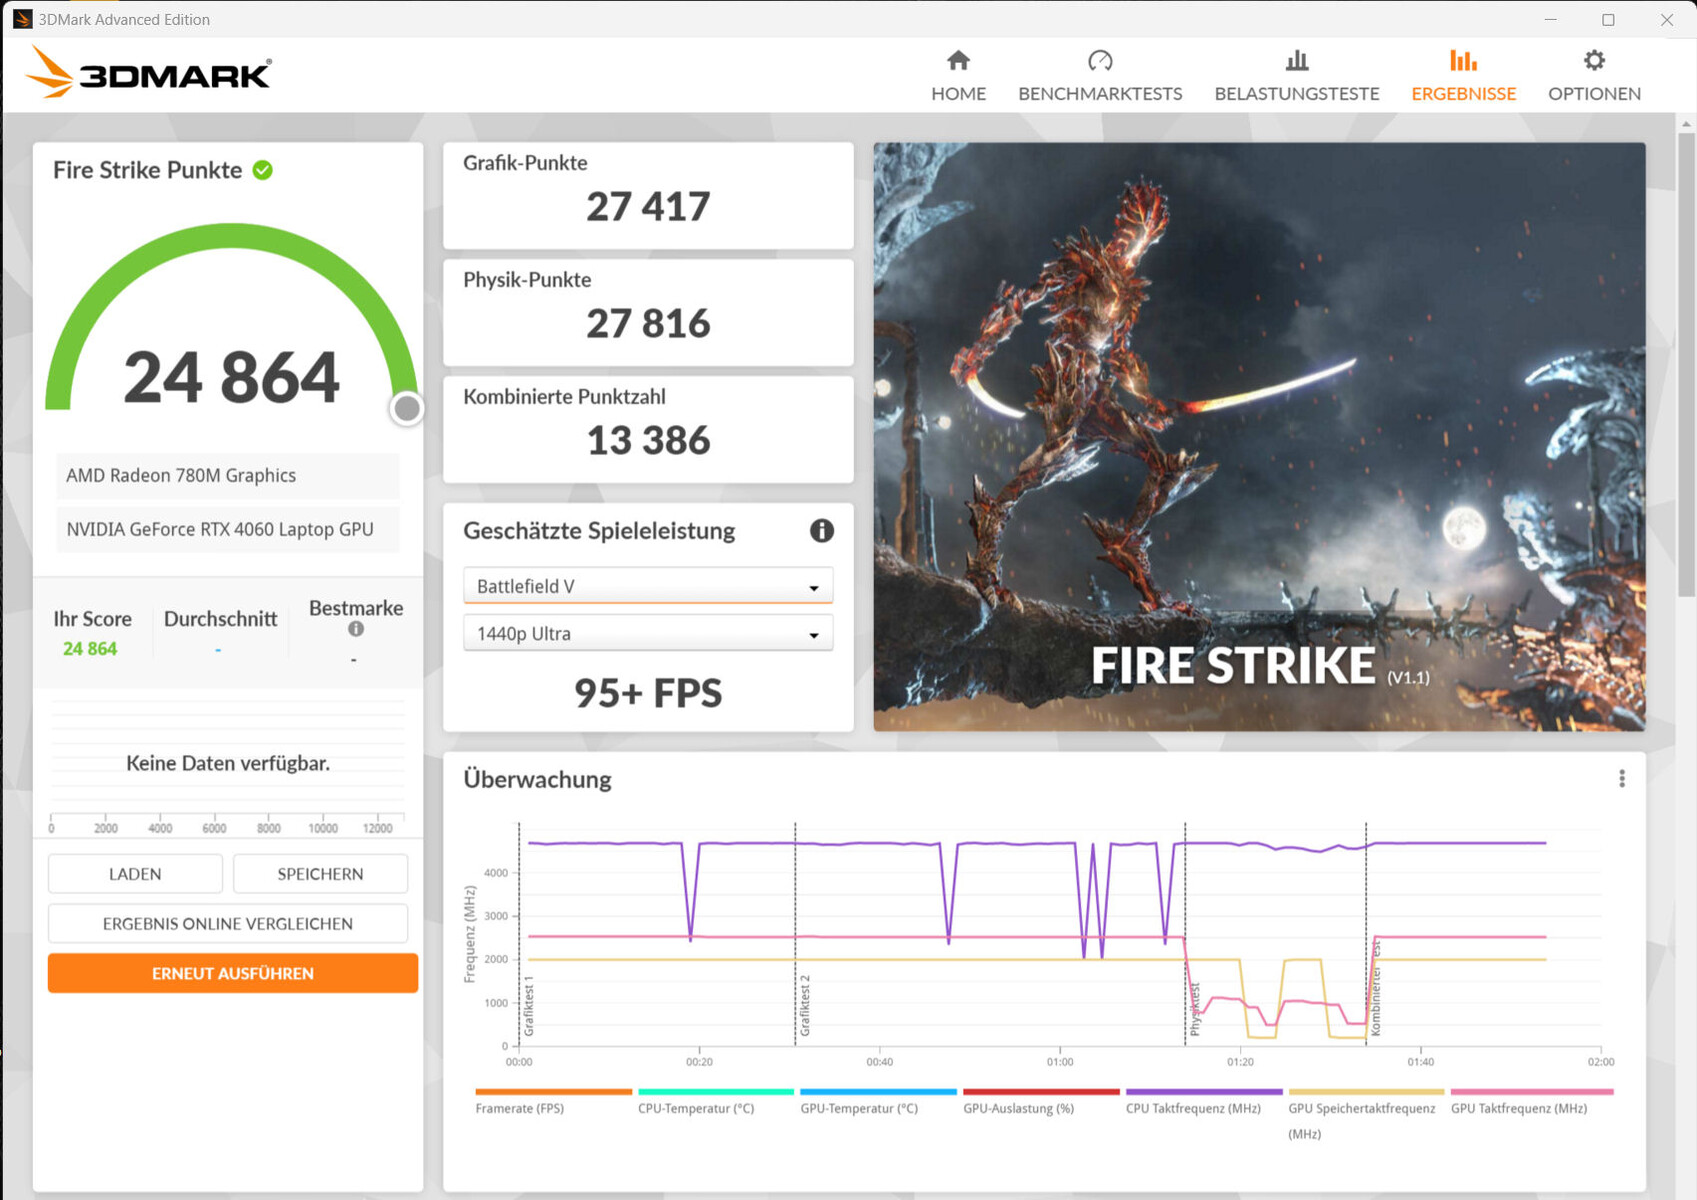
Placa de vídeo
AGeForce RTX 4060 oferece 3.072 shaders, um barramento de 128 bits de largura e uma rápida RAM GDDR6 (8.192 MB). A Schenker definiu o TGP máximo em um valor de 140 watts (115 watts + 25 watts de aumento dinâmico) - não é possível fazer mais. De acordo com o teste Witcher 3, o TGP não está no limite máximo.
Os resultados do benchmark são mais altos do que a média anterior da RTX 4060. O modo dGPU não resulta em nenhum aumento no desempenho. A alternância entre dGPU e Optimus requer uma reinicialização - o Optimus avançado não é compatível.
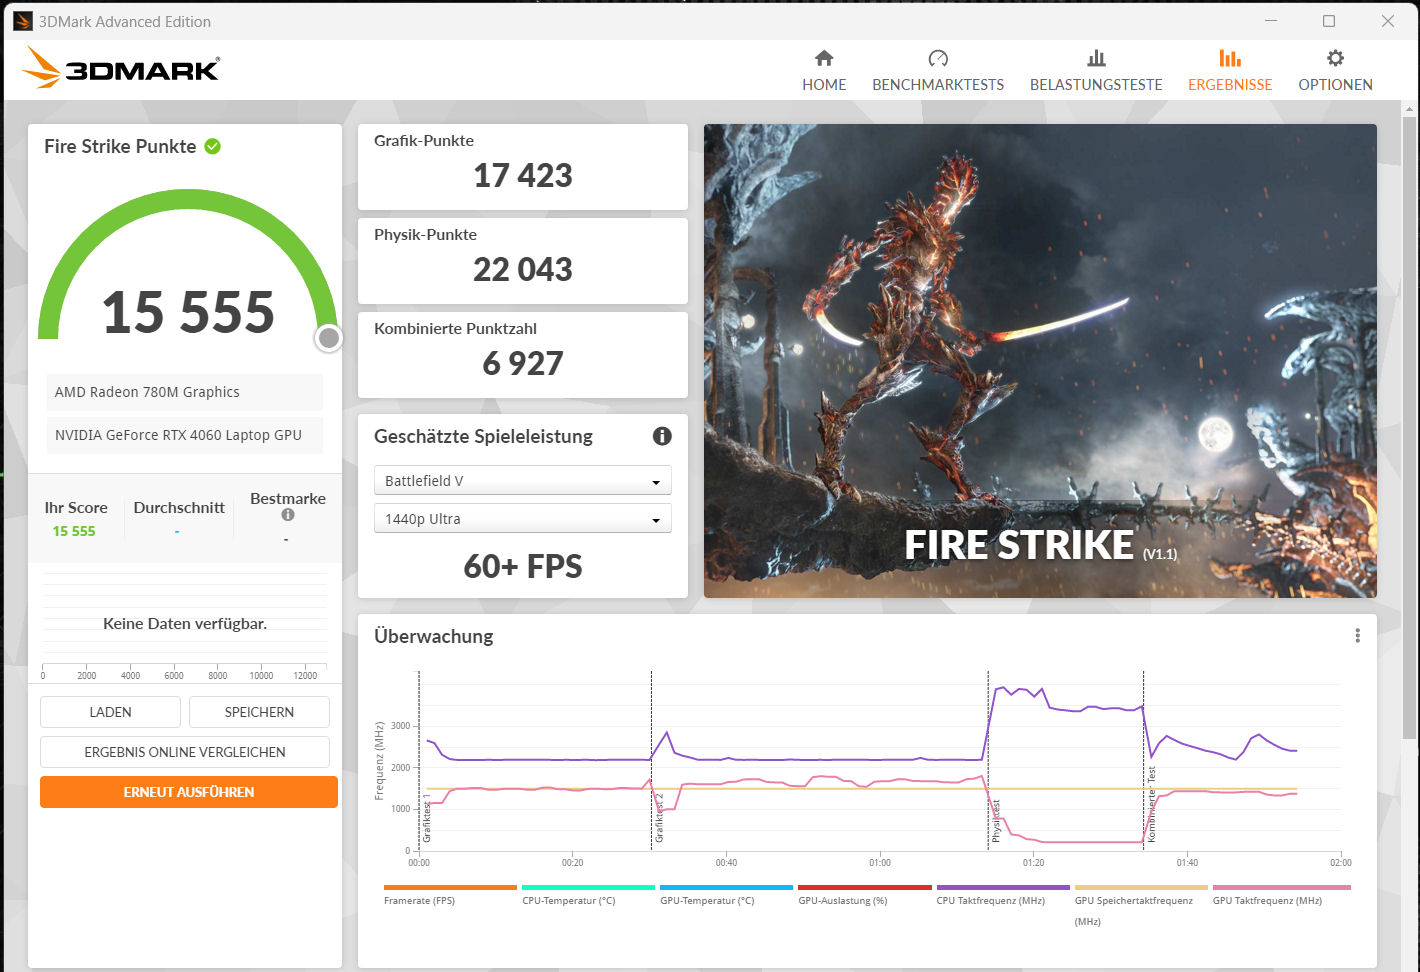
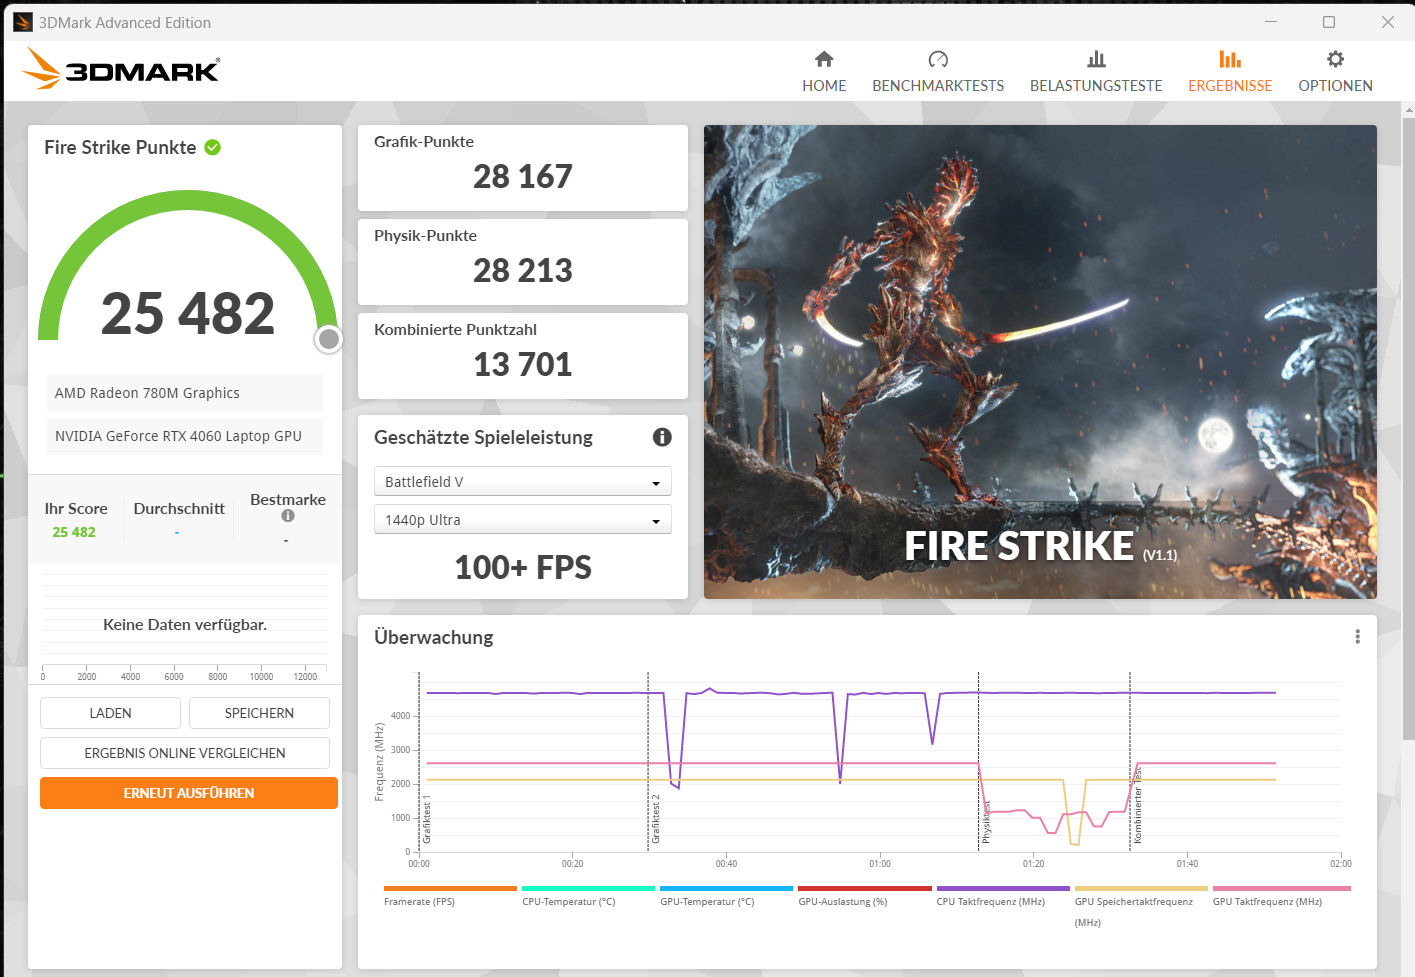
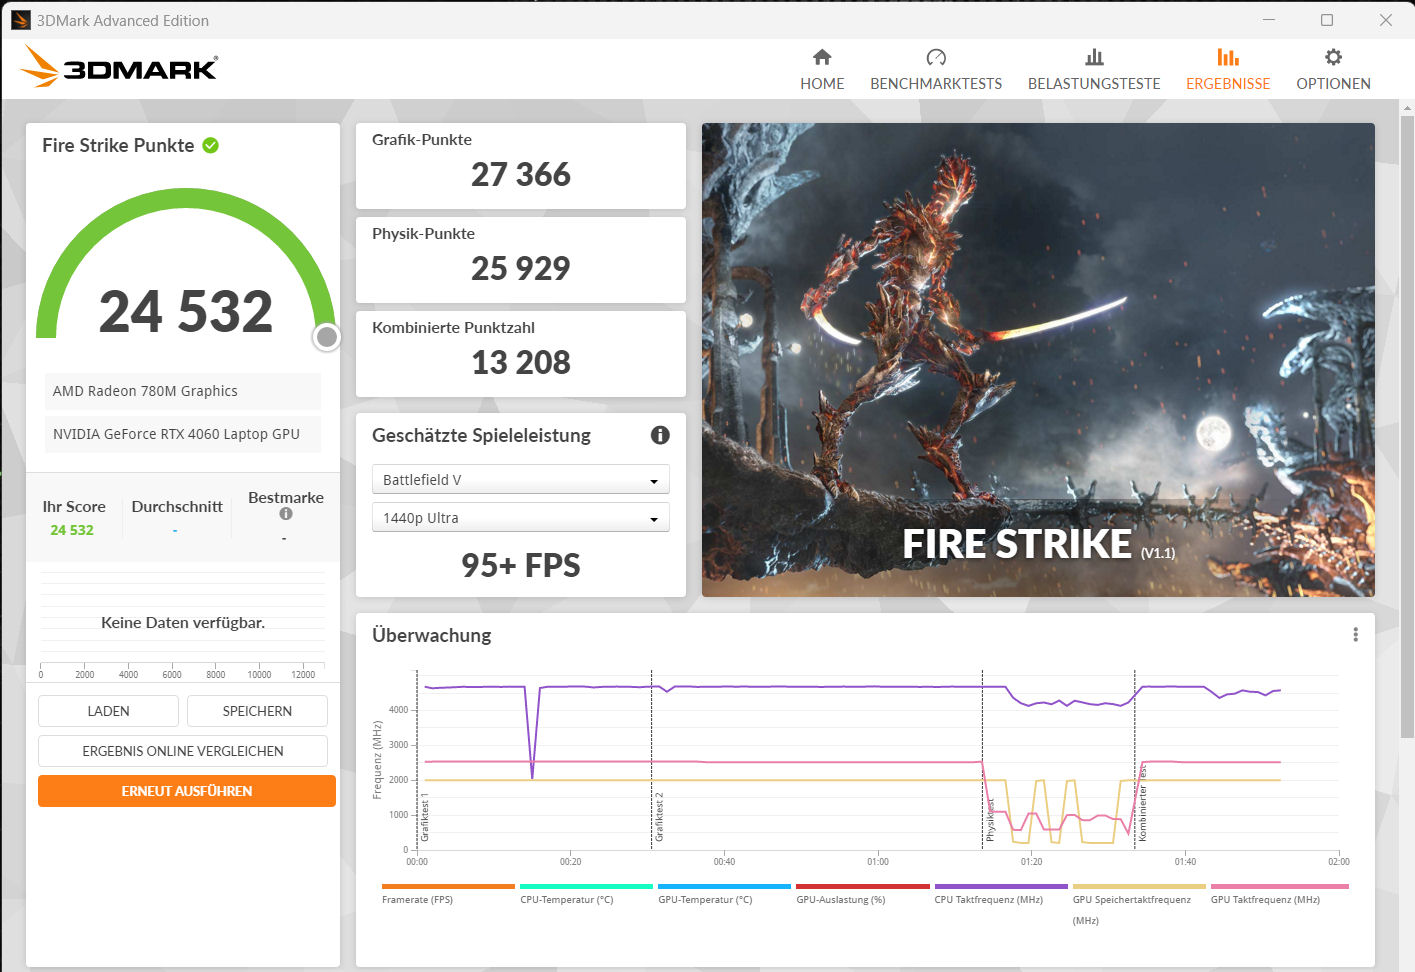
| 3DMark 06 Standard Score | 49011 pontos | |
| 3DMark 11 Performance | 32639 pontos | |
| 3DMark Cloud Gate Standard Score | 64881 pontos | |
| 3DMark Fire Strike Score | 24864 pontos | |
| 3DMark Time Spy Score | 10640 pontos | |
Ajuda | ||
* ... menor é melhor
Desempenho em jogos
O computador Schenker foi projetado para jogos QHD em configurações altas ou máximas. Resoluções mais altas podem ser usadas em configurações às vezes reduzidas quando conectadas a um monitor apropriado. É possível atingir taxas de quadros típicas da média da RTX 4060. Em geral, o modo dGP não resulta em um aumento no desempenho. Somente no jogo "X Plane 11" foi registrado um aumento de 10 a 20% na taxa de quadros.
| The Witcher 3 - 1920x1080 Ultra Graphics & Postprocessing (HBAO+) | |
| Média da turma Gaming (104.7 - 240, n=7, últimos 2 anos) | |
| Lenovo Legion Pro 5 16IRX8 | |
| Alienware m16 R1 Intel | |
| Acer Nitro 17 AN17-51-71ER | |
| MSI Katana 17 B13VFK | |
| Schenker XMG Apex 17 (Late 23) | |
| Medion Erazer Defender P40 | |
| Média NVIDIA GeForce RTX 4060 Laptop GPU (77 - 159.7, n=42) | |
| Cyberpunk 2077 1.6 - 1920x1080 Ultra Preset | |
| Lenovo Legion Pro 5 16IRX8 | |
| Alienware m16 R1 Intel | |
| Schenker XMG Apex 17 (Late 23) | |
| Acer Nitro 17 AN17-51-71ER | |
| Média NVIDIA GeForce RTX 4060 Laptop GPU (57.9 - 93.2, n=18) | |
| MSI Katana 17 B13VFK | |
| Ratchet & Clank Rift Apart | |
| 1920x1080 Very High Preset AA:T | |
| Alienware m16 R1 Intel | |
| Schenker XMG Apex 17 (Late 23) | |
| Média NVIDIA GeForce RTX 4060 Laptop GPU (51.6 - 54.8, n=4) | |
| 2560x1440 Very High Preset AA:T | |
| Alienware m16 R1 Intel | |
| Média NVIDIA GeForce RTX 4060 Laptop GPU (45.6 - 46.6, n=3) | |
| Schenker XMG Apex 17 (Late 23) | |
| 1920x1080 Very High Preset + Very High Raytracing AA:T | |
| Alienware m16 R1 Intel | |
| Média NVIDIA GeForce RTX 4060 Laptop GPU (39.1 - 44.5, n=3) | |
| Schenker XMG Apex 17 (Late 23) | |
| Atlas Fallen | |
| 1920x1080 High Preset | |
| Schenker XMG Apex 17 (Late 23) | |
| Alienware m16 R1 Intel | |
| Média NVIDIA GeForce RTX 4060 Laptop GPU (88.8 - 133.3, n=3) | |
| 2560x1440 Very High Preset | |
| Alienware m16 R1 Intel | |
| Schenker XMG Apex 17 (Late 23) | |
| Média NVIDIA GeForce RTX 4060 Laptop GPU (75 - 79.2, n=3) | |
| Immortals of Aveum | |
| 1920x1080 Ultra AF:16x | |
| Alienware m16 R1 Intel | |
| Schenker XMG Apex 17 (Late 23) | |
| Média NVIDIA GeForce RTX 4060 Laptop GPU (33 - 48.9, n=4) | |
| 2560x1440 Ultra AF:16x | |
| Alienware m16 R1 Intel | |
| Schenker XMG Apex 17 (Late 23) | |
| Média NVIDIA GeForce RTX 4060 Laptop GPU (20.5 - 32.8, n=4) | |
| Armored Core 6 | |
| 1920x1080 Maximum Preset | |
| Schenker XMG Apex 17 (Late 23) | |
| Média NVIDIA GeForce RTX 4060 Laptop GPU (95.6 - 100.8, n=3) | |
| Média da turma Gaming (n=1últimos 2 anos) | |
| 2560x1440 Maximum Preset | |
| Schenker XMG Apex 17 (Late 23) | |
| Média NVIDIA GeForce RTX 4060 Laptop GPU (73.2 - 74.6, n=3) | |
| Média da turma Gaming (n=1últimos 2 anos) | |
| Starfield | |
| 1920x1080 Ultra Preset | |
| Média da turma Gaming (n=1últimos 2 anos) | |
| Média NVIDIA GeForce RTX 4060 Laptop GPU (39.7 - 41, n=3) | |
| Schenker XMG Apex 17 (Late 23) | |
| 2560x1440 Ultra Preset | |
| Média da turma Gaming (n=1últimos 2 anos) | |
| Schenker XMG Apex 17 (Late 23) | |
| Média NVIDIA GeForce RTX 4060 Laptop GPU (32.5 - 32.6, n=2) | |
| Lies of P | |
| 1920x1080 Best Preset | |
| Schenker XMG Apex 17 (Late 23) | |
| Média NVIDIA GeForce RTX 4060 Laptop GPU (106.2 - 126.6, n=3) | |
| 2560x1440 Best Preset | |
| Schenker XMG Apex 17 (Late 23) | |
| Média NVIDIA GeForce RTX 4060 Laptop GPU (83.6 - 85.6, n=2) | |
Para verificar se as taxas de quadros permaneceram consistentes em um período mais longo, executamos o jogo "The Witcher 3" por cerca de 60 minutos com resolução Full HD e configurações de qualidade máxima. O personagem do jogo não foi movido. Não notamos nenhuma queda na taxa de quadros.
Witcher 3 FPS diagram
| baixo | média | alto | ultra | QHD | |
|---|---|---|---|---|---|
| The Witcher 3 (2015) | 401.8 | 316.1 | 198.2 | 103.4 | 76.3 |
| Dota 2 Reborn (2015) | 169.4 | 154.1 | 147.6 | 139.8 | |
| Final Fantasy XV Benchmark (2018) | 223 | 148.4 | 103.4 | 76.8 | |
| X-Plane 11.11 (2018) | 127.3 | 110.9 | 88.2 | ||
| Far Cry 5 (2018) | 163 | 145 | 139 | 130 | 106 |
| Strange Brigade (2018) | 399 | 279 | 221 | 190.1 | 126.9 |
| Gears Tactics (2020) | 320.2 | 255 | 180.5 | 125.9 | 85.8 |
| GRID Legends (2022) | 152.8 | 141.6 | 132.4 | 120.6 | 103.2 |
| Cyberpunk 2077 1.6 (2022) | 129.9 | 101 | 87.5 | 79.8 | 49.1 |
| Spider-Man Miles Morales (2022) | 123.7 | 115.9 | 110.3 | 103.8 | 77.8 |
| F1 23 (2023) | 249 | 244 | 186.2 | 60.1 | 37.8 |
| Ratchet & Clank Rift Apart (2023) | 85.4 | 74.7 | 60.6 | 54.6 | 45.6 |
| Atlas Fallen (2023) | 146 | 143.2 | 133.3 | 112.6 | 79.1 |
| Immortals of Aveum (2023) | 65.7 | 53.1 | 44 | 30.2 | |
| Armored Core 6 (2023) | 111.1 | 108.7 | 109.4 | 100.8 | 74.6 |
| Starfield (2023) | 70.3 | 62.5 | 47.1 | 39.7 | 32.6 |
| The Crew Motorfest (2023) | 60 | 60 | 60 | 60 | 54 |
| Lies of P (2023) | 186.6 | 163.8 | 141.9 | 126.6 | 85.6 |
Emissões - O laptop para jogos pode funcionar silenciosamente
Emissões de ruído
Em geral, classificamos o Apex como tendo níveis de ruído baixos a moderados. No uso diário (escritório, Internet, banco, etc.), as ventoinhas geralmente giram lentamente ou ficam paradas. Elas também ficam baixas sob carga média. Isso é diferente na área de jogos: Os níveis de pressão sonora podem chegar a 54 dB(A) ("overboost"). No modo "entusiasta", a 50 dB(A), os níveis de ruído podem ser descritos como bastante baixos. O modo "balanceado" é consideravelmente mais silencioso: no entanto, um nível de 34 dB(A) resulta em uma perda significativa no desempenho da GPU.
Os ventiladores emitem principalmente um ruído sonoro. Os ruídos incômodos de fundo são imperceptíveis.
Barulho
| Ocioso |
| 25 / 29 / 33 dB |
| Carga |
| 37 / 54 dB |
 | ||
30 dB silencioso 40 dB(A) audível 50 dB(A) ruidosamente alto |
||
min: | ||
| Schenker XMG Apex 17 (Late 23) R7 7840HS, GeForce RTX 4060 Laptop GPU | Alienware m16 R1 Intel i7-13700HX, GeForce RTX 4060 Laptop GPU | Lenovo Legion Pro 5 16IRX8 i7-13700HX, GeForce RTX 4060 Laptop GPU | Acer Nitro 17 AN17-51-71ER i7-13700H, GeForce RTX 4060 Laptop GPU | Medion Erazer Defender P40 i7-13700HX, GeForce RTX 4060 Laptop GPU | MSI Katana 17 B13VFK i7-13620H, GeForce RTX 4060 Laptop GPU | |
|---|---|---|---|---|---|---|
| Noise | -2% | 9% | 2% | -10% | -8% | |
| desligado / ambiente * (dB) | 24 | 25 -4% | 23 4% | 24 -0% | 25 -4% | 24.5 -2% |
| Idle Minimum * (dB) | 25 | 25 -0% | 23.1 8% | 24 4% | 26 -4% | 24.5 2% |
| Idle Average * (dB) | 29 | 26 10% | 23.1 20% | 24 17% | 27 7% | 24.5 16% |
| Idle Maximum * (dB) | 33 | 27 18% | 26.6 19% | 32.32 2% | 32 3% | 40 -21% |
| Load Average * (dB) | 37 | 52 -41% | 34.7 6% | 35.18 5% | 53 -43% | 48.3 -31% |
| Witcher 3 ultra * (dB) | 50 | 51 -2% | 47.6 5% | 54.78 -10% | 56 -12% | 56 -12% |
| Load Maximum * (dB) | 54 | 53 2% | 54.8 -1% | 54.78 -1% | 64 -19% | 59.1 -9% |
* ... menor é melhor
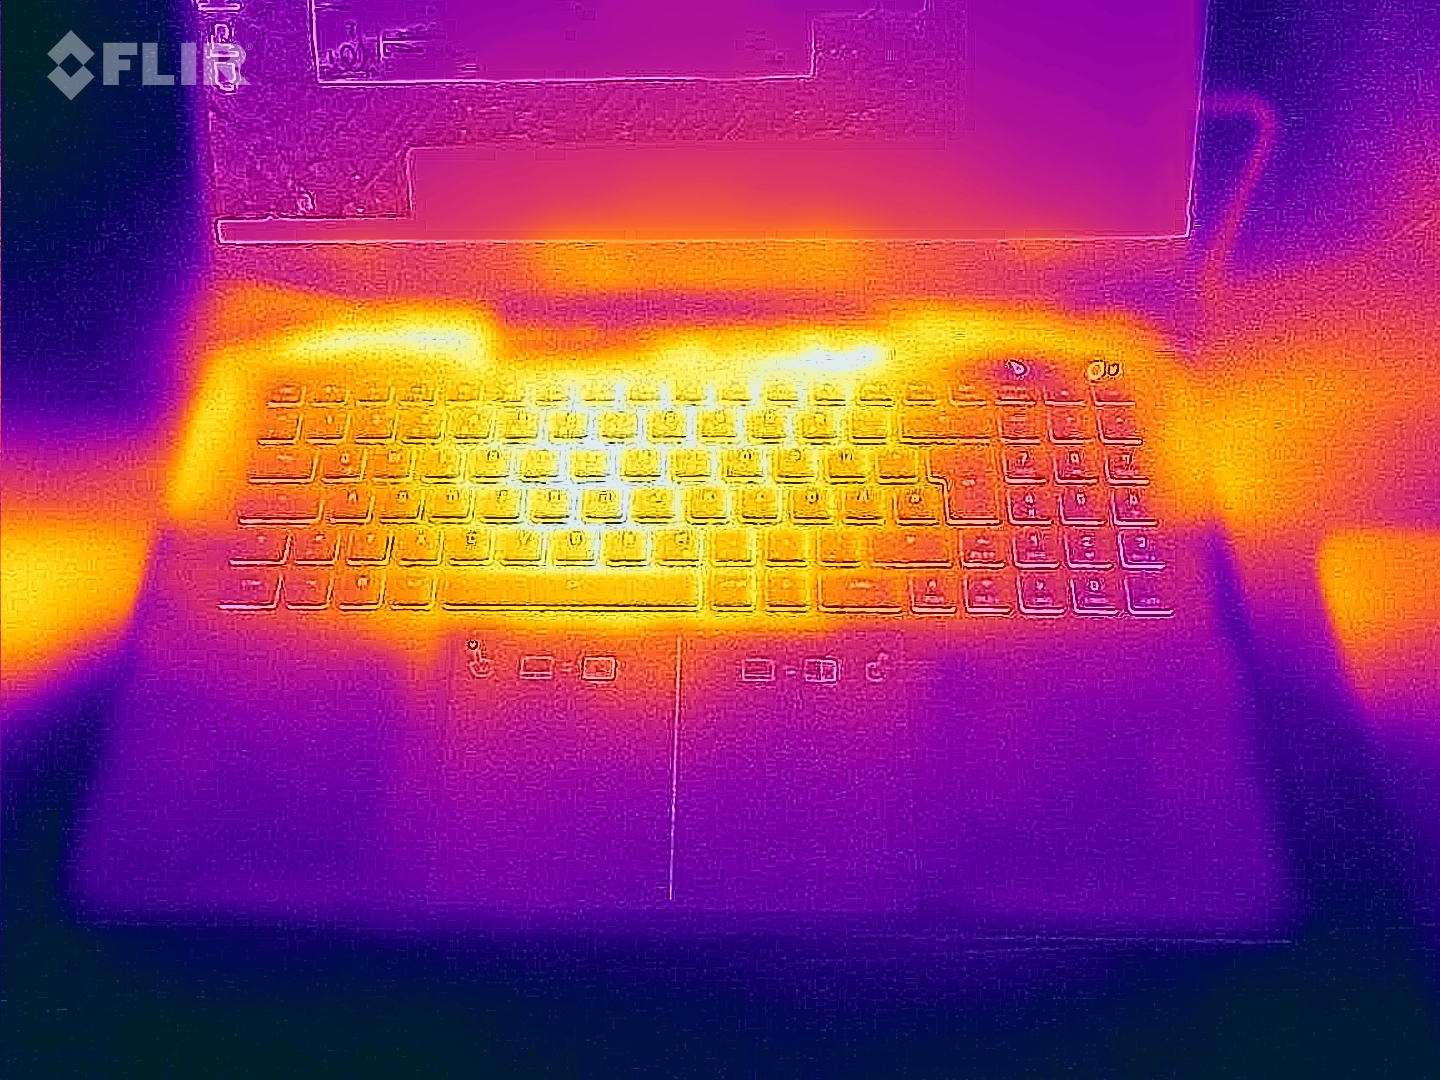
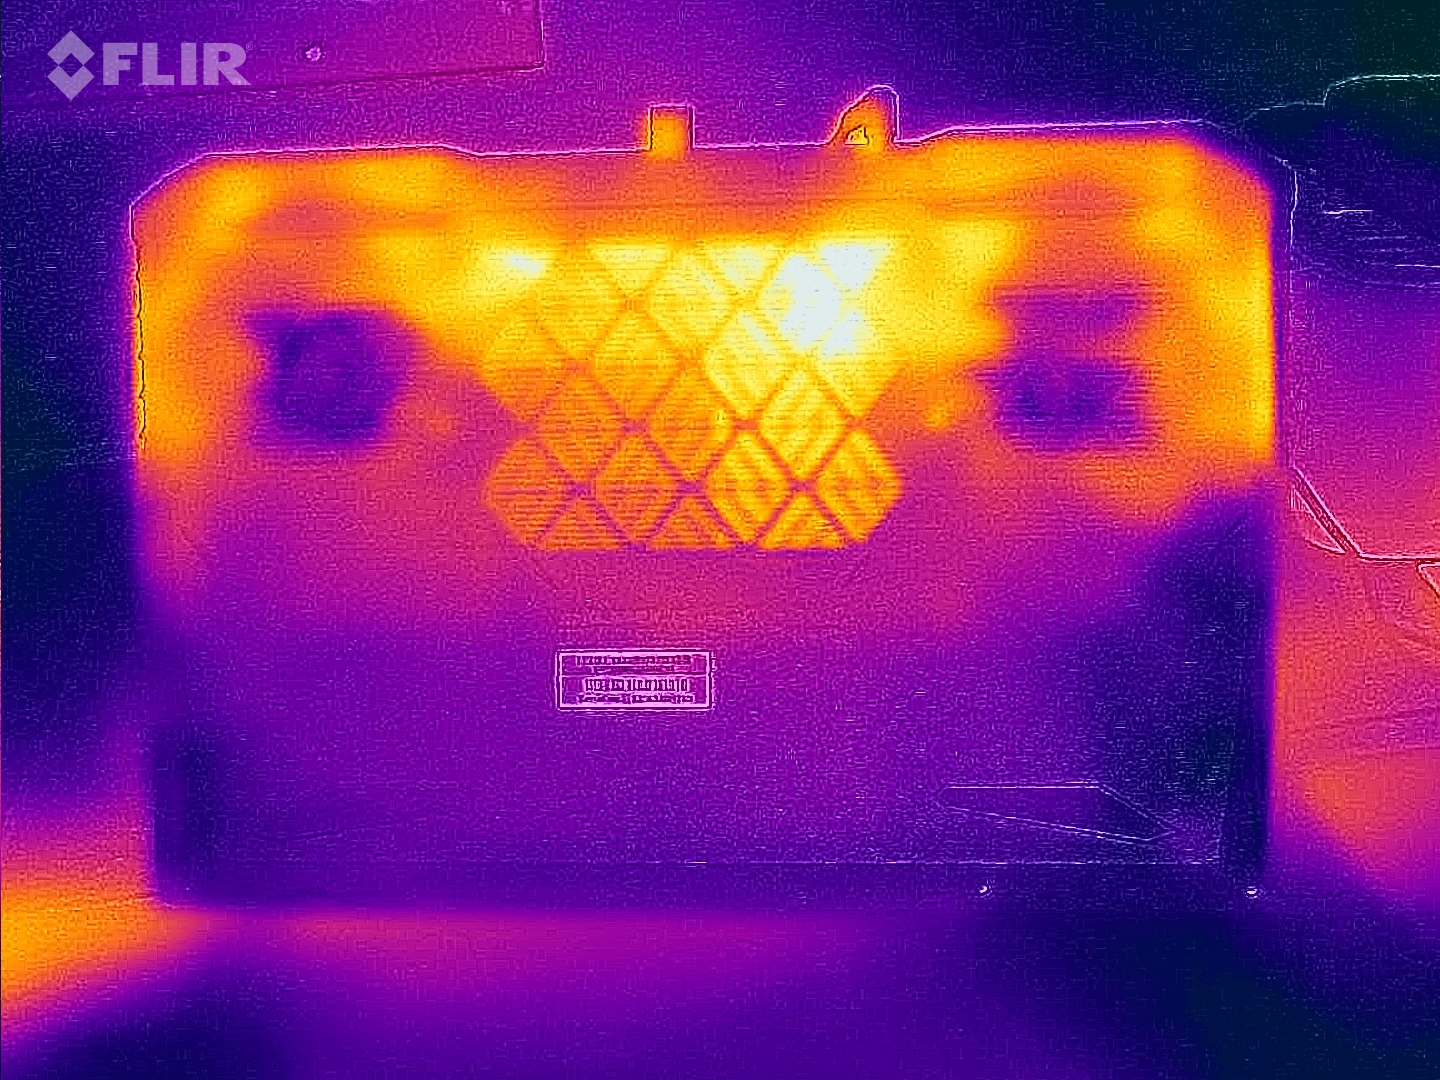
Temperatura
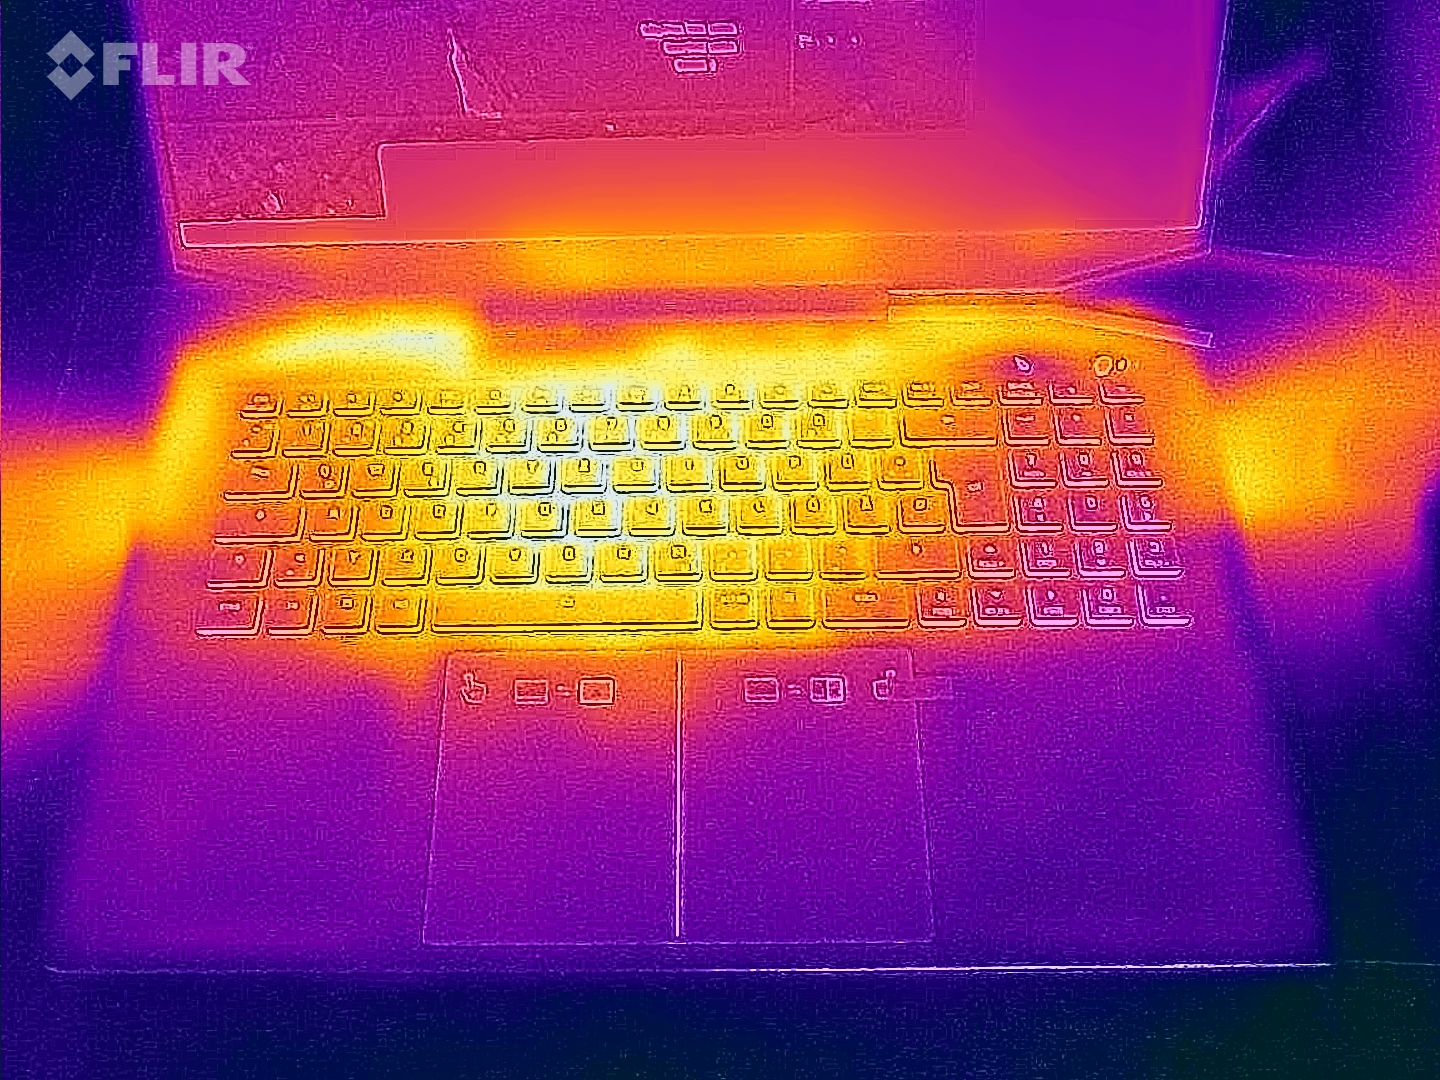
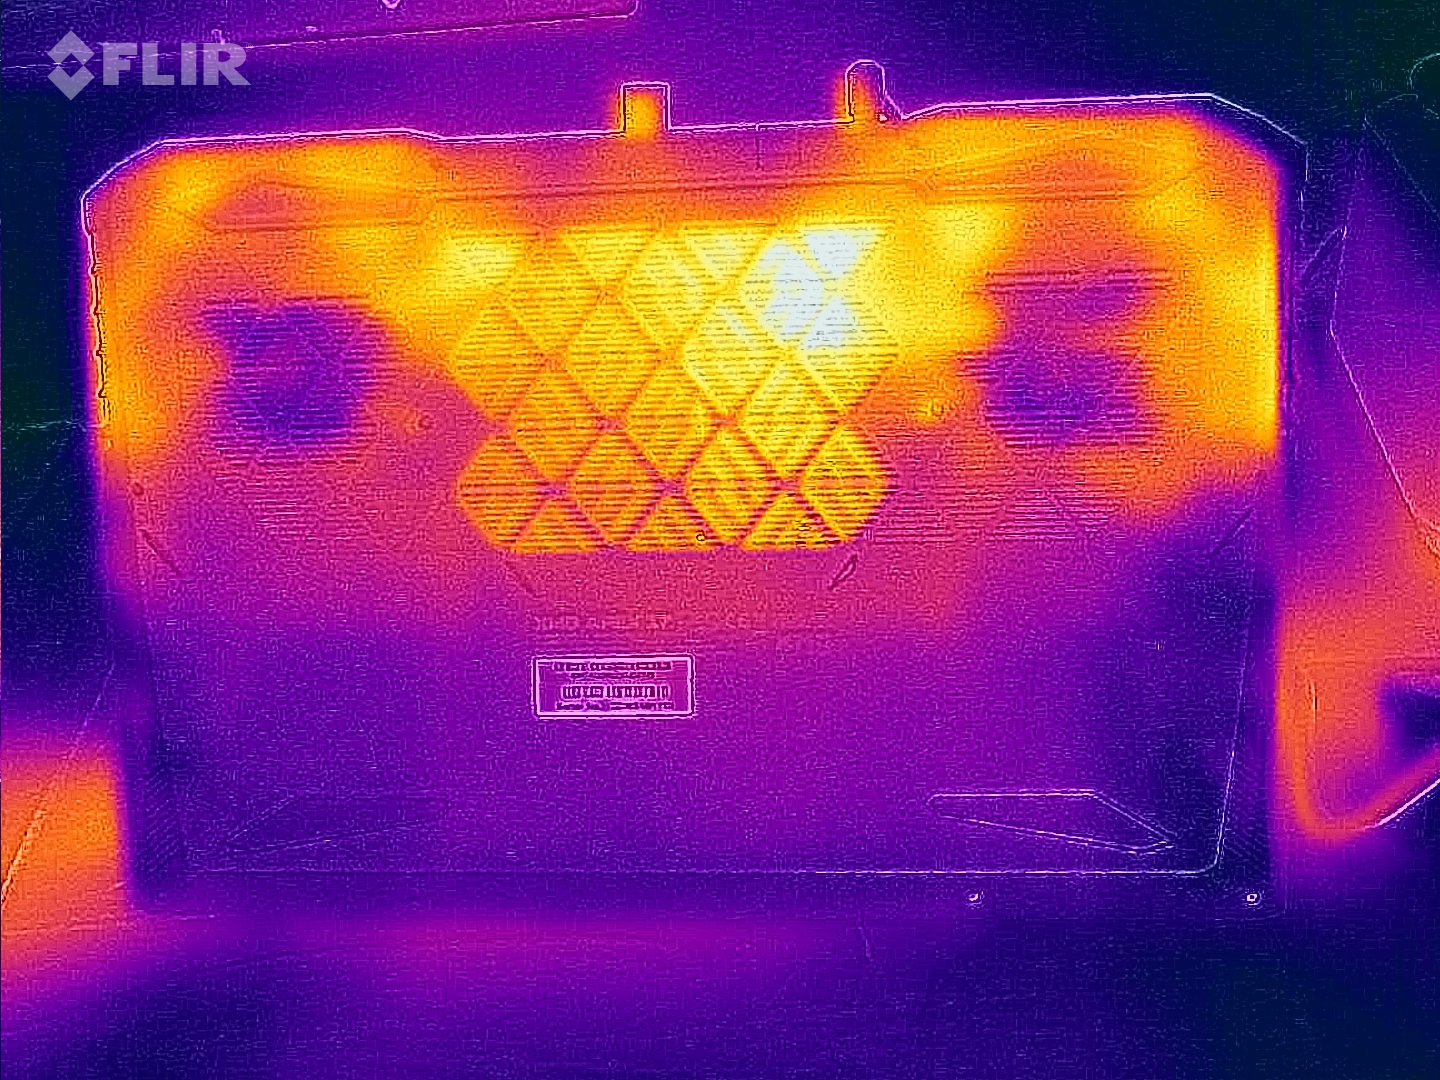
O teste de estresse e o teste Witcher 3 fizeram com que o laptop esquentasse visivelmente em determinados locais. Entretanto, tudo ainda está com dimensões aceitáveis. No uso diário (escritório, Internet), as temperaturas do gabinete permanecem na zona verde.
(-) A temperatura máxima no lado superior é 51 °C / 124 F, em comparação com a média de 40.4 °C / 105 F , variando de 21.2 a 68.8 °C para a classe Gaming.
(-) A parte inferior aquece até um máximo de 54 °C / 129 F, em comparação com a média de 43.2 °C / 110 F
(+) Em uso inativo, a temperatura média para o lado superior é 30.3 °C / 87 F, em comparação com a média do dispositivo de 33.9 °C / ### class_avg_f### F.
(-) Jogando The Witcher 3, a temperatura média para o lado superior é 38.2 °C / 101 F, em comparação com a média do dispositivo de 33.9 °C / ## #class_avg_f### F.
(+) Os apoios para as mãos e o touchpad são mais frios que a temperatura da pele, com um máximo de 31 °C / 87.8 F e, portanto, são frios ao toque.
(-) A temperatura média da área do apoio para as mãos de dispositivos semelhantes foi 28.8 °C / 83.8 F (-2.2 °C / -4 F).
| Schenker XMG Apex 17 (Late 23) AMD Ryzen 7 7840HS, NVIDIA GeForce RTX 4060 Laptop GPU | Alienware m16 R1 Intel Intel Core i7-13700HX, NVIDIA GeForce RTX 4060 Laptop GPU | Lenovo Legion Pro 5 16IRX8 Intel Core i7-13700HX, NVIDIA GeForce RTX 4060 Laptop GPU | Acer Nitro 17 AN17-51-71ER Intel Core i7-13700H, NVIDIA GeForce RTX 4060 Laptop GPU | Medion Erazer Defender P40 Intel Core i7-13700HX, NVIDIA GeForce RTX 4060 Laptop GPU | MSI Katana 17 B13VFK Intel Core i7-13620H, NVIDIA GeForce RTX 4060 Laptop GPU | |
|---|---|---|---|---|---|---|
| Heat | -5% | 8% | 4% | 16% | 9% | |
| Maximum Upper Side * (°C) | 51 | 49 4% | 42.8 16% | 46 10% | 42 18% | 41.6 18% |
| Maximum Bottom * (°C) | 54 | 48 11% | 50 7% | 51 6% | 45 17% | 43.1 20% |
| Idle Upper Side * (°C) | 33 | 40 -21% | 29.6 10% | 34 -3% | 28 15% | 32 3% |
| Idle Bottom * (°C) | 34 | 39 -15% | 34 -0% | 33 3% | 30 12% | 35.8 -5% |
* ... menor é melhor
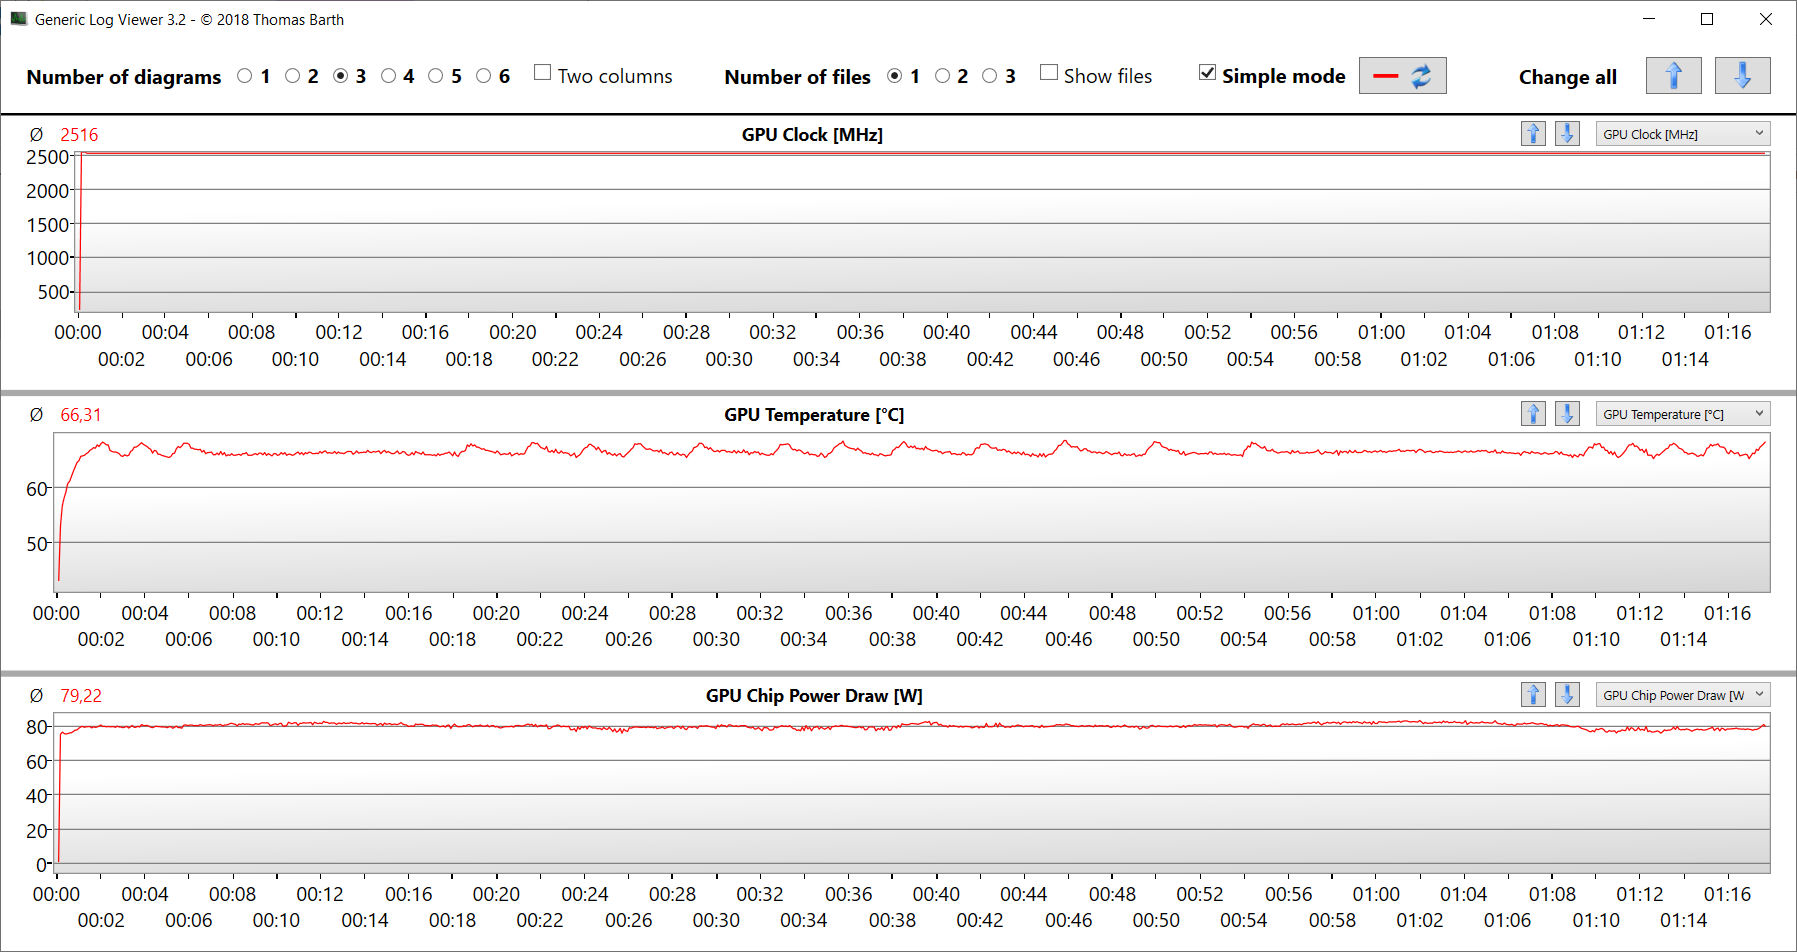
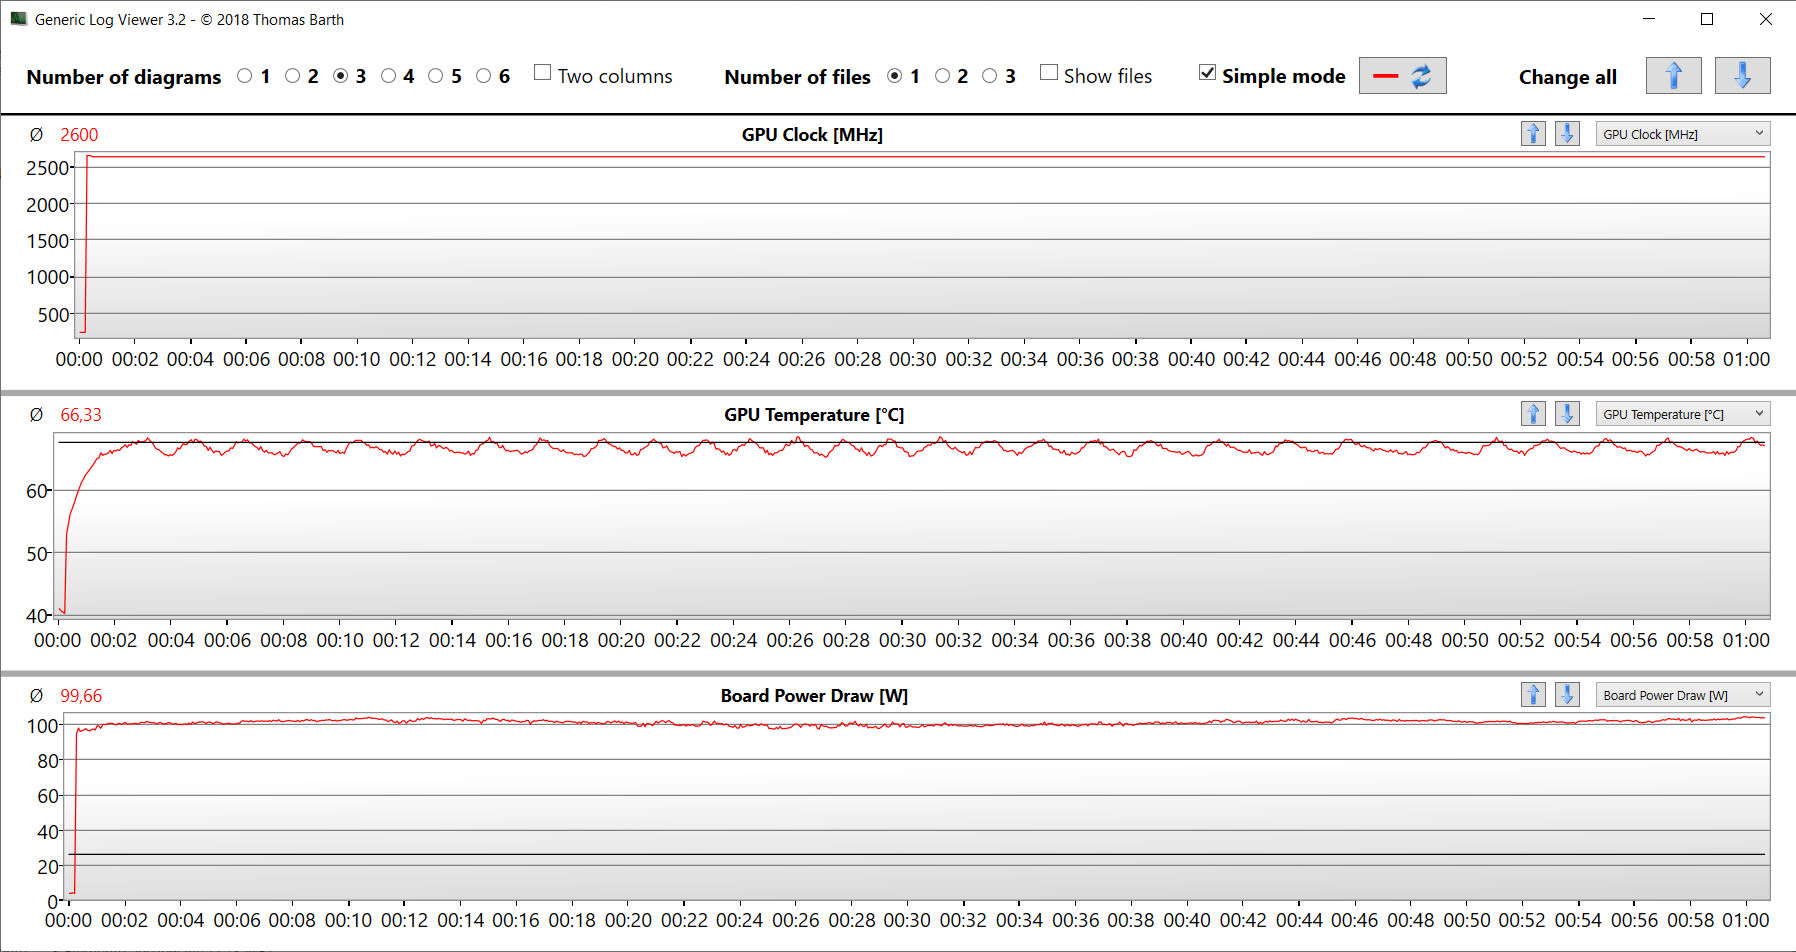
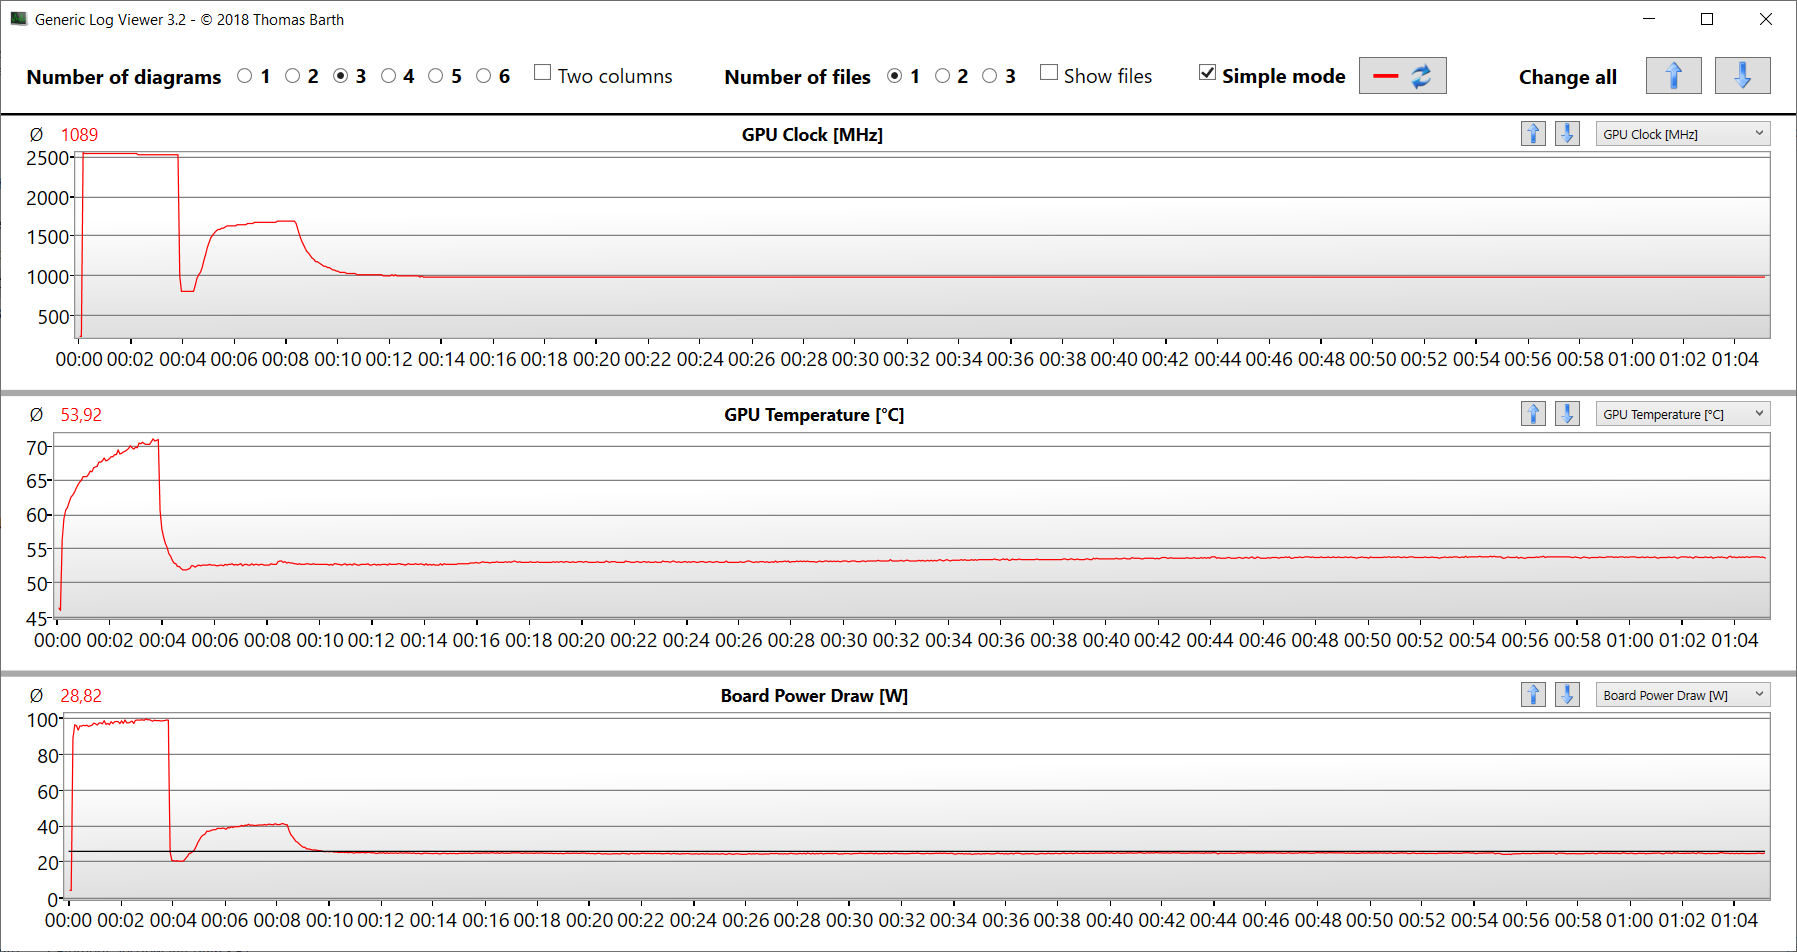
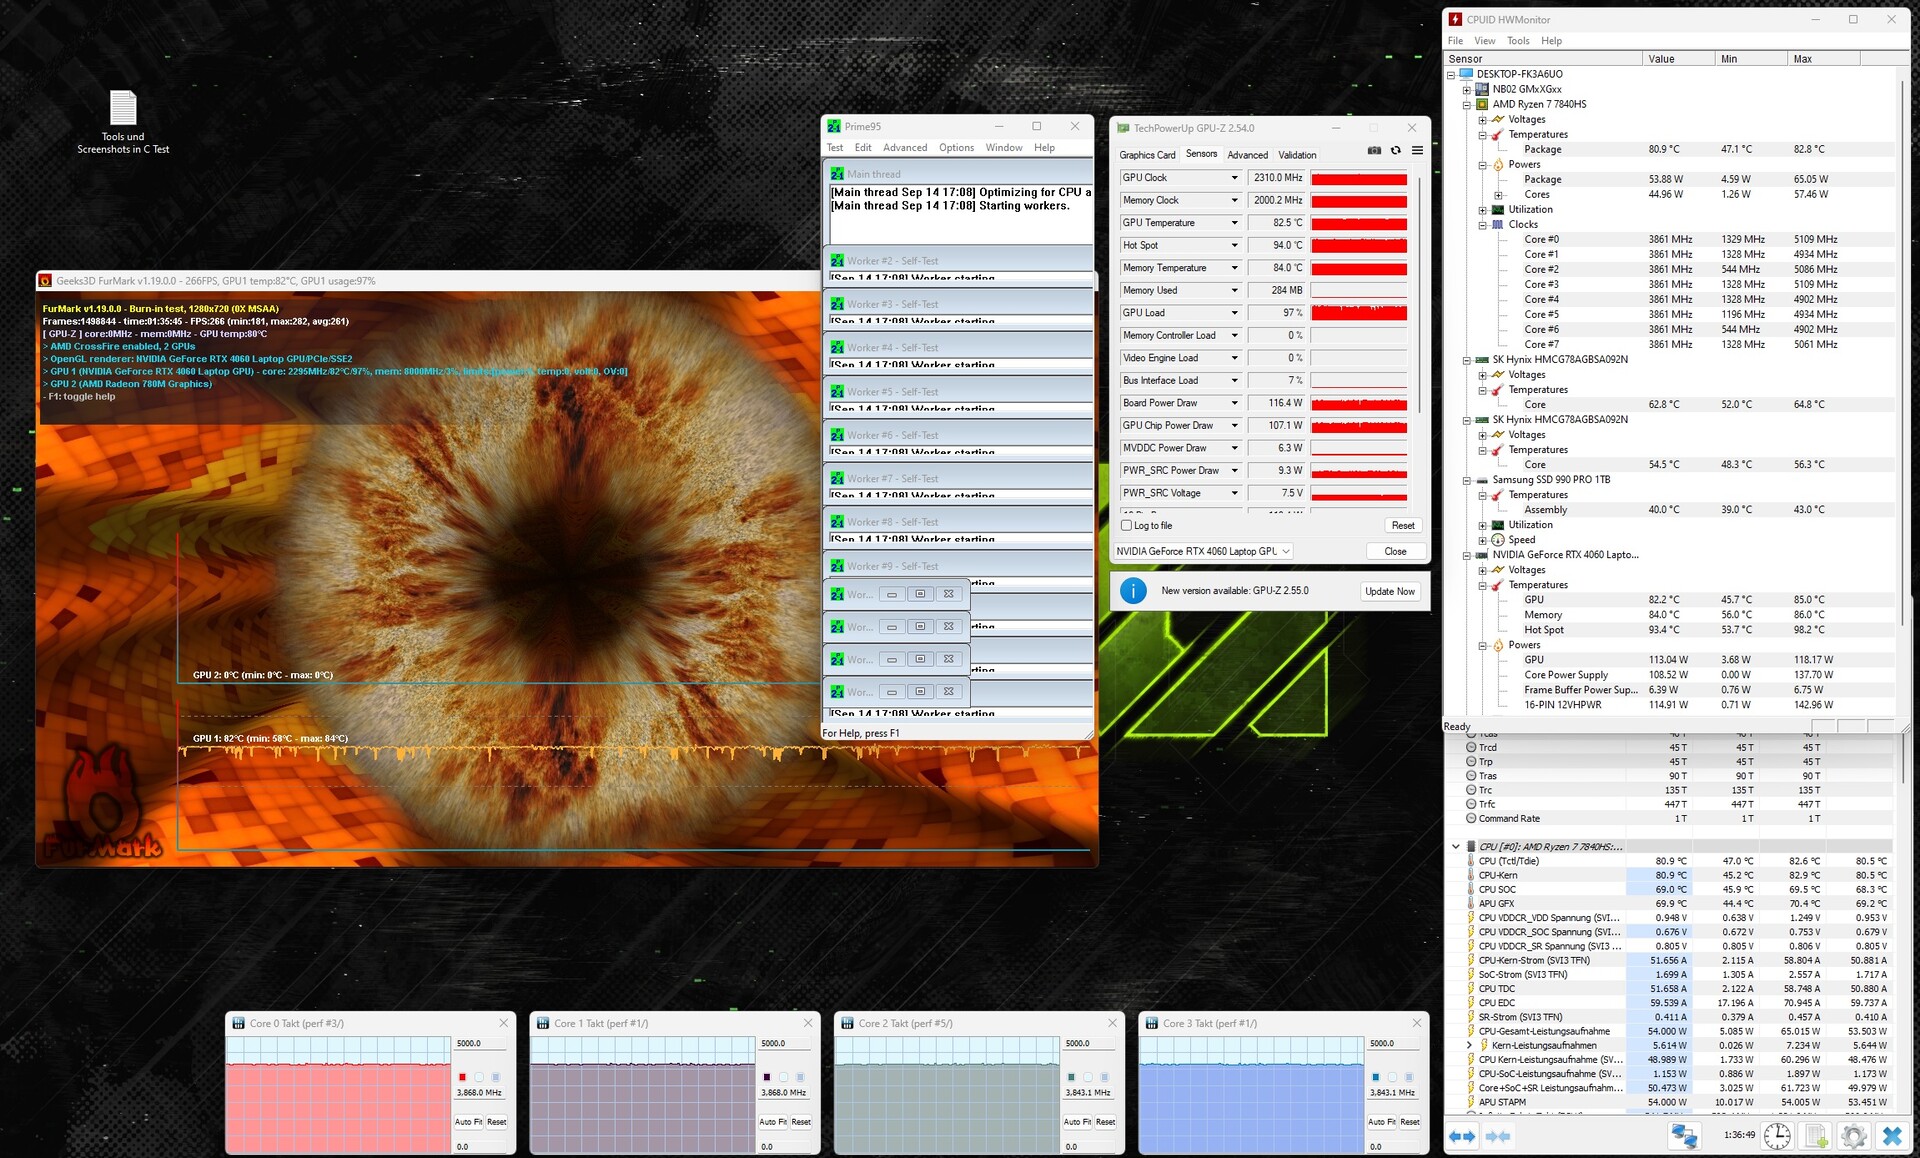
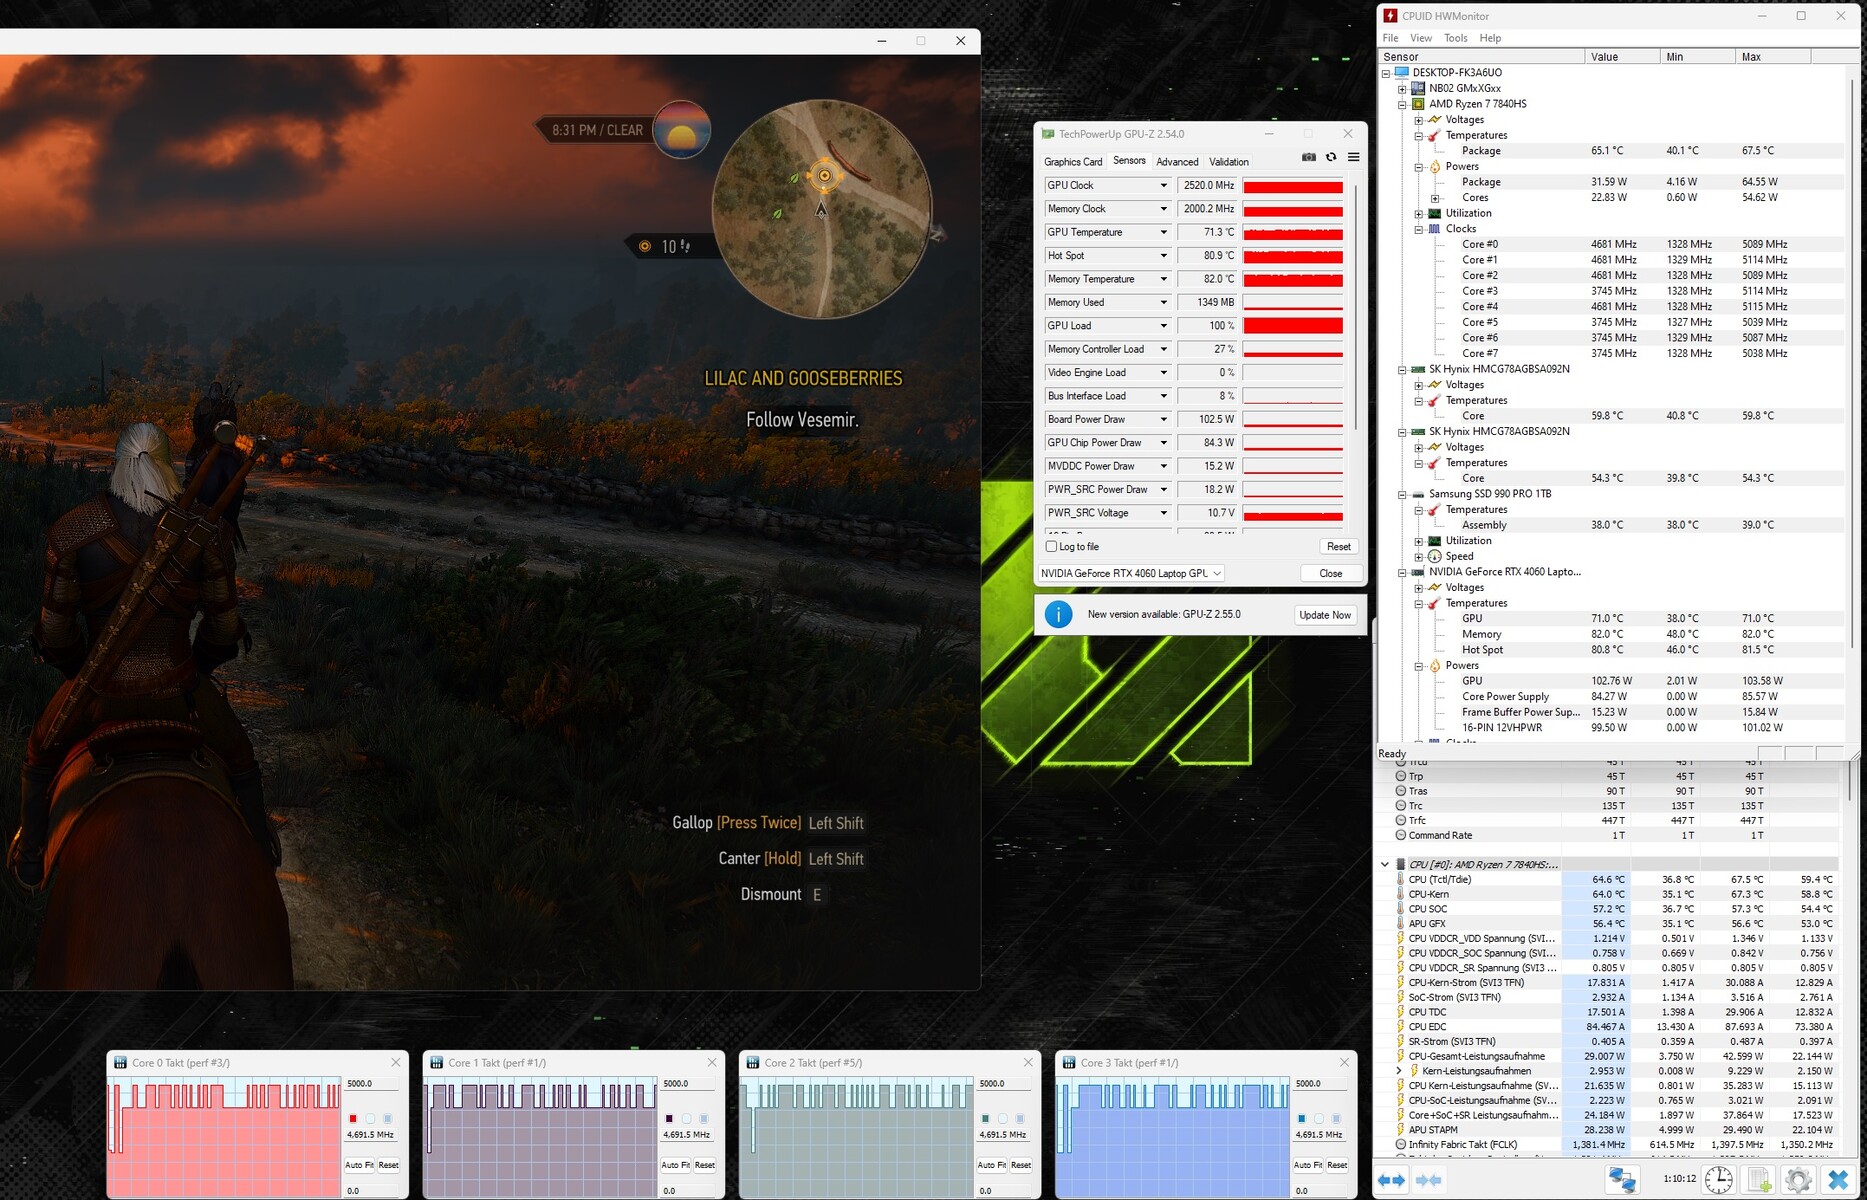
Teste de estresse
O teste de estresse (Prime95 e Furmark em operação contínua) representa um cenário extremo que nos permite verificar a estabilidade do sistema sob carga total. A CPU foi executada durante todo o teste com velocidades de clock de 3,8 a 3,9 GHz e os núcleos gráficos operaram de 2,2 a 2,4 GHz.
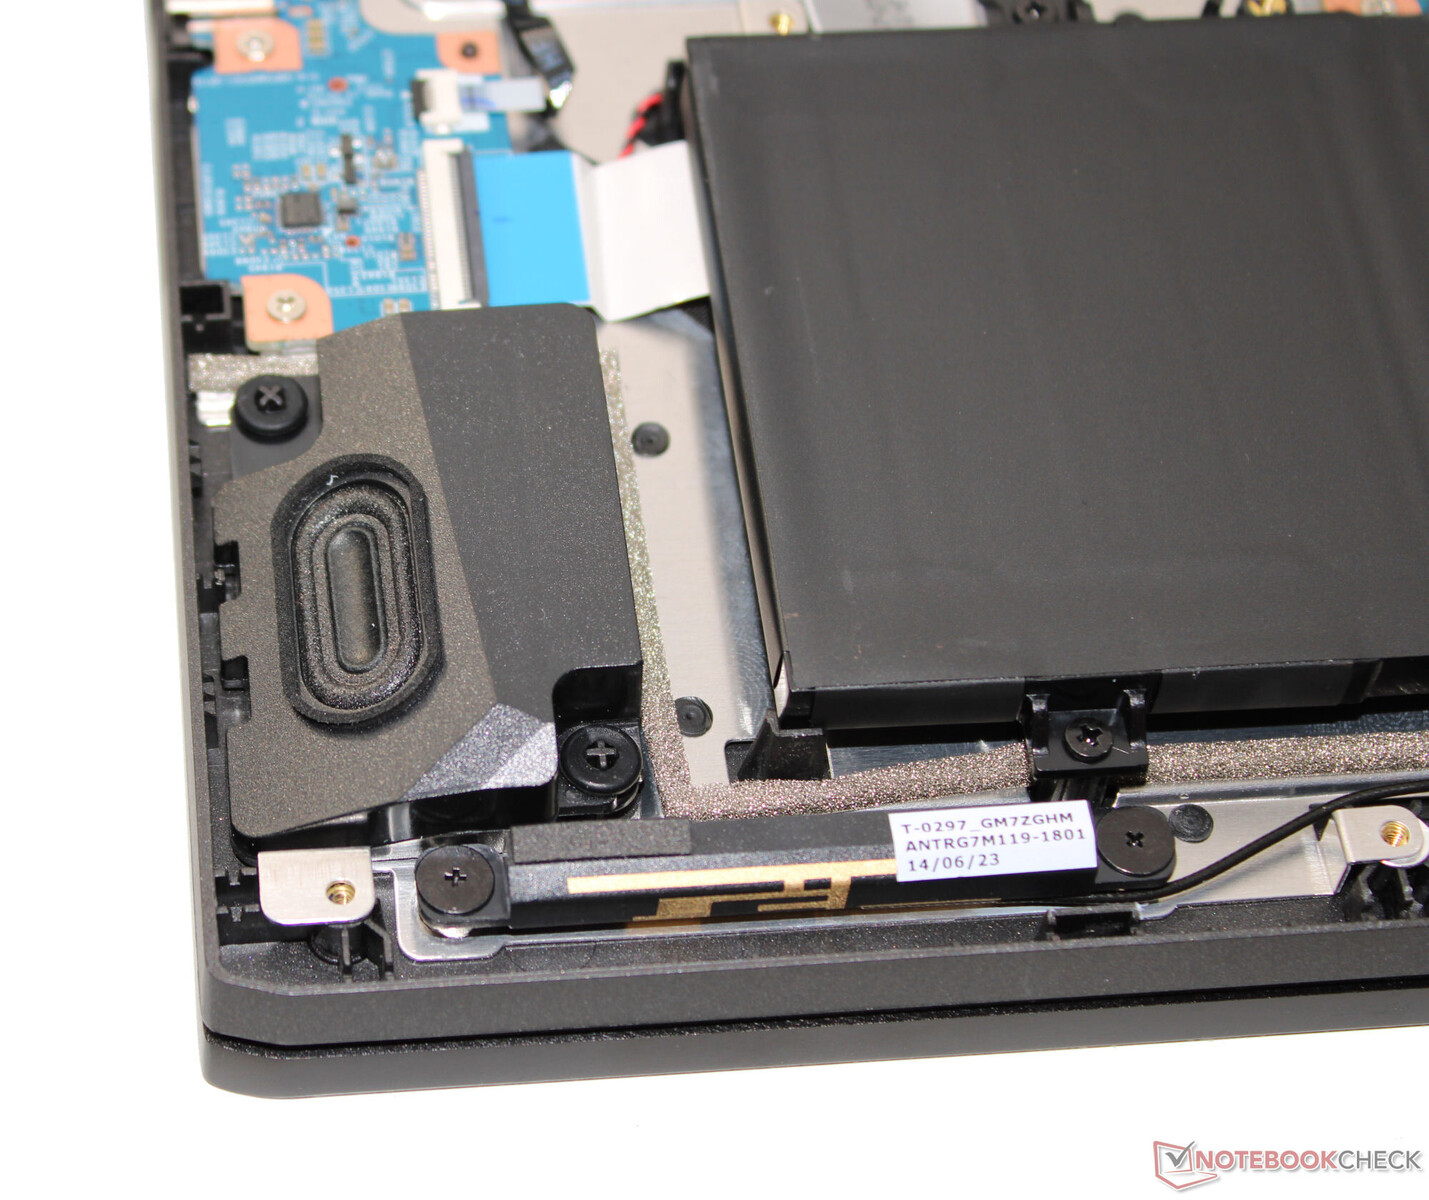
Alto-falantes
Os alto-falantes estéreo produzem um som decente, mas não têm graves. Para uma melhor experiência sonora, recomendamos o uso de fones de ouvido ou alto-falantes externos.
Schenker XMG Apex 17 (Late 23) análise de áudio
(±) | o volume do alto-falante é médio, mas bom (###valor### dB)
Graves 100 - 315Hz
(-) | quase nenhum baixo - em média 29% menor que a mediana
(±) | a linearidade dos graves é média (10.4% delta para a frequência anterior)
Médios 400 - 2.000 Hz
(+) | médios equilibrados - apenas 2.7% longe da mediana
(+) | médios são lineares (4.7% delta para frequência anterior)
Altos 2 - 16 kHz
(+) | agudos equilibrados - apenas 2.1% longe da mediana
(+) | os máximos são lineares (4.9% delta da frequência anterior)
Geral 100 - 16.000 Hz
(±) | a linearidade do som geral é média (18.3% diferença em relação à mediana)
Comparado com a mesma classe
» 58% de todos os dispositivos testados nesta classe foram melhores, 9% semelhantes, 33% piores
» O melhor teve um delta de 6%, a média foi 18%, o pior foi 132%
Comparado com todos os dispositivos testados
» 40% de todos os dispositivos testados foram melhores, 8% semelhantes, 52% piores
» O melhor teve um delta de 4%, a média foi 23%, o pior foi 134%
Alienware m16 R1 Intel análise de áudio
(+) | os alto-falantes podem tocar relativamente alto (###valor### dB)
Graves 100 - 315Hz
(-) | quase nenhum baixo - em média 24% menor que a mediana
(±) | a linearidade dos graves é média (13.5% delta para a frequência anterior)
Médios 400 - 2.000 Hz
(+) | médios equilibrados - apenas 1.4% longe da mediana
(+) | médios são lineares (3.3% delta para frequência anterior)
Altos 2 - 16 kHz
(+) | agudos equilibrados - apenas 3.5% longe da mediana
(+) | os máximos são lineares (4.6% delta da frequência anterior)
Geral 100 - 16.000 Hz
(+) | o som geral é linear (13.4% diferença em relação à mediana)
Comparado com a mesma classe
» 19% de todos os dispositivos testados nesta classe foram melhores, 7% semelhantes, 74% piores
» O melhor teve um delta de 6%, a média foi 18%, o pior foi 132%
Comparado com todos os dispositivos testados
» 14% de todos os dispositivos testados foram melhores, 4% semelhantes, 82% piores
» O melhor teve um delta de 4%, a média foi 23%, o pior foi 134%
Gerenciamento de energia - O Schenker XMG oferece uma boa duração da bateria
Consumo de energia
Digno de elogios: Entre seus dispositivos de comparação, o Apex 17 é o laptop mais econômico. Em suma, os concorrentes têm requisitos de energia muito maiores. O teste de estresse e o site Witcher 3 foram executados com consumo de energia consistente. A PSU (230 watts) tem o tamanho adequado.
| desligado | |
| Ocioso | |
| Carga |
|
Key:
min: | |
| Schenker XMG Apex 17 (Late 23) R7 7840HS, GeForce RTX 4060 Laptop GPU | Alienware m16 R1 Intel i7-13700HX, GeForce RTX 4060 Laptop GPU | Lenovo Legion Pro 5 16IRX8 i7-13700HX, GeForce RTX 4060 Laptop GPU | Acer Nitro 17 AN17-51-71ER i7-13700H, GeForce RTX 4060 Laptop GPU | Medion Erazer Defender P40 i7-13700HX, GeForce RTX 4060 Laptop GPU | MSI Katana 17 B13VFK i7-13620H, GeForce RTX 4060 Laptop GPU | Média NVIDIA GeForce RTX 4060 Laptop GPU | Média da turma Gaming | |
|---|---|---|---|---|---|---|---|---|
| Power Consumption | -38% | -90% | -8% | -20% | -16% | -28% | -52% | |
| Idle Minimum * (Watt) | 9 | 10 -11% | 24.5 -172% | 8.3 8% | 8 11% | 12.2 -36% | 11.5 ? -28% | 13 ? -44% |
| Idle Average * (Watt) | 12 | 14 -17% | 29.2 -143% | 13.5 -13% | 12 -0% | 14.9 -24% | 16 ? -33% | 19 ? -58% |
| Idle Maximum * (Watt) | 14 | 21 -50% | 34.3 -145% | 14.8 -6% | 18 -29% | 15.8 -13% | 20.3 ? -45% | 24.6 ? -76% |
| Load Average * (Watt) | 67 | 119 -78% | 98.7 -47% | 77 -15% | 101 -51% | 85.22 -27% | 92.9 ? -39% | 110.7 ? -65% |
| Witcher 3 ultra * (Watt) | 147.6 | 186.7 -26% | 178.6 -21% | 154 -4% | 180.8 -22% | 151.1 -2% | ||
| Load Maximum * (Watt) | 223 | 323 -45% | 249.6 -12% | 263 -18% | 284 -27% | 212.8 5% | 210 ? 6% | 259 ? -16% |
* ... menor é melhor
Power consumption Witcher 3 / stress test
Power consumption with an external monitor
Duração da bateria
No teste de Wi-Fi (usando um script para carregar sites) e no teste de vídeo (curta-metragem Big Buck Bunny (codificação H.264, FHD)), o dispositivo de 17,3 polegadas alcançou tempos de execução de 5,06 e 6,51 horas, respectivamente. Durante os testes, as funções de economia de energia do laptop foram desativadas e o brilho da tela foi definido para cerca de 150 cd/m². Além disso, o teste de vídeo foi realizado com os módulos de rádio desligados.
Embora o Apex tenha uma capacidade de bateria relativamente baixa, ele consegue tempos de execução muito respeitáveis. O computador deixa alguns dos concorrentes com baterias maiores em seu rastro.
| Schenker XMG Apex 17 (Late 23) R7 7840HS, GeForce RTX 4060 Laptop GPU, 62.32 Wh | Alienware m16 R1 Intel i7-13700HX, GeForce RTX 4060 Laptop GPU, 86 Wh | Lenovo Legion Pro 5 16IRX8 i7-13700HX, GeForce RTX 4060 Laptop GPU, 80 Wh | Acer Nitro 17 AN17-51-71ER i7-13700H, GeForce RTX 4060 Laptop GPU, 90 Wh | Medion Erazer Defender P40 i7-13700HX, GeForce RTX 4060 Laptop GPU, 73 Wh | MSI Katana 17 B13VFK i7-13620H, GeForce RTX 4060 Laptop GPU, 53.5 Wh | Média da turma Gaming | |
|---|---|---|---|---|---|---|---|
| Duração da bateria | -20% | -34% | 31% | -0% | -40% | 15% | |
| Reader / Idle (h) | 7.8 | 6.4 -18% | 6.7 -14% | 8.8 13% | 8.27 ? 6% | ||
| H.264 (h) | 6.9 | 5.6 -19% | 6.9 0% | 5.7 -17% | 8.32 ? 21% | ||
| WiFi v1.3 (h) | 5.1 | 4.8 -6% | 3.4 -33% | 8.2 61% | 6.2 22% | 2.9 -43% | 7.11 ? 39% |
| Load (h) | 1.6 | 1 -37% | 0.7 -56% | 1.3 -19% | 1 -37% | 1.502 ? -6% | |
| Witcher 3 ultra (h) | 2.5 |
Pro
Contra
Veredicto - Uma máquina de jogos modesta e de médio porte
O Apex 17 cumpre as tarefas a que se destina (jogos em QHD, renderização, edição de vídeo) sem dificuldade - ORyzen 7 7840HSe a GeForce RTX 4060 tornam isso possível. Ambos os chips podem ser executados em velocidades de clock consistentemente altas.
Com o XMG Apex 17 (late 23), a Schenker forneceu um laptop QHD de médio porte bem completo.
O computador não produz muito ruído no uso diário, mas, ao jogar, é possível chegar a um meio-termo entre desempenho e ruído selecionando o perfil apropriado. A duração real da bateria de cerca de 5 a 7 horas, quando medida em relação à capacidade da bateria, é perfeitamente aceitável. A bateria não pode ser carregada pela porta USB-C (USB 3.2 Gen 2).
O laptop oferece espaço para dois SSDs PCIe 4 (M.2 2280). Há suporte para RAID 0/1. A loja on-line da Schenker permite que você selecione seu SSD ou SSDs preferidos. O dispositivo de análise está equipado com um SSD PCIe 4 (1 TB) incrivelmente rápido. No geral, a tela QHD instalada (17,3 polegadas, 2.560 x 1.440 pixels, sRGB, IPS, 240 Hz) causou uma boa impressão. Como alternativa, está disponível um painel FHD mais barato.
OMedion Erazer Defender P40 seria uma alternativa com desempenho e especificações comparáveis. Ao contrário do Apex, o P40 tem uma porta Thunderbolt 4 integrada.
Em breve, a Notebookcheck.com publicará uma análise do modelo irmão de 15,6 polegadas, o XMG Apex 15 (final de 23) em uma variante com um Ryzen 7 7840HS e um GeForce RTX 4050.
Preço e disponibilidade
Uma variante semelhante ao nosso dispositivo de análise (16 em vez de 32 GB de RAM) está disponível por 1.739 euros na Notebooksbilliger.de. Eles também oferecem um modelo mais barato, de nível básico, com um GeForce RTX 4050 por 1.399 euros. Como alternativa, é possível configurar seu próprio dispositivo de forma personalizada na loja on-line da Schenker.
Schenker XMG Apex 17 (Late 23)
- 10/04/2023 v7 (old)
Sascha Mölck
Transparência
A seleção dos dispositivos a serem analisados é feita pela nossa equipe editorial. A amostra de teste foi fornecida ao autor como empréstimo pelo fabricante ou varejista para fins desta revisão. O credor não teve influência nesta revisão, nem o fabricante recebeu uma cópia desta revisão antes da publicação. Não houve obrigação de publicar esta revisão. Como empresa de mídia independente, a Notebookcheck não está sujeita à autoridade de fabricantes, varejistas ou editores.
É assim que o Notebookcheck está testando
Todos os anos, o Notebookcheck analisa de forma independente centenas de laptops e smartphones usando procedimentos padronizados para garantir que todos os resultados sejam comparáveis. Desenvolvemos continuamente nossos métodos de teste há cerca de 20 anos e definimos padrões da indústria no processo. Em nossos laboratórios de teste, equipamentos de medição de alta qualidade são utilizados por técnicos e editores experientes. Esses testes envolvem um processo de validação em vários estágios. Nosso complexo sistema de classificação é baseado em centenas de medições e benchmarks bem fundamentados, o que mantém a objetividade.Price comparison

