Análise do mini PC GMK NucBox K2 Ryzen 7 7735HS: Otimizado para alto desempenho por dólar

O NucBox K2 é o mais recente minicomputador da GMKtec para ambientes domésticos e de escritório. Embora seu nome possa sugerir que ele substitui diretamente o NucBox K1o NucBox K2 está em sua própria categoria, pois o K1 é voltado para um subconjunto diferente de usuários de mini PCs.
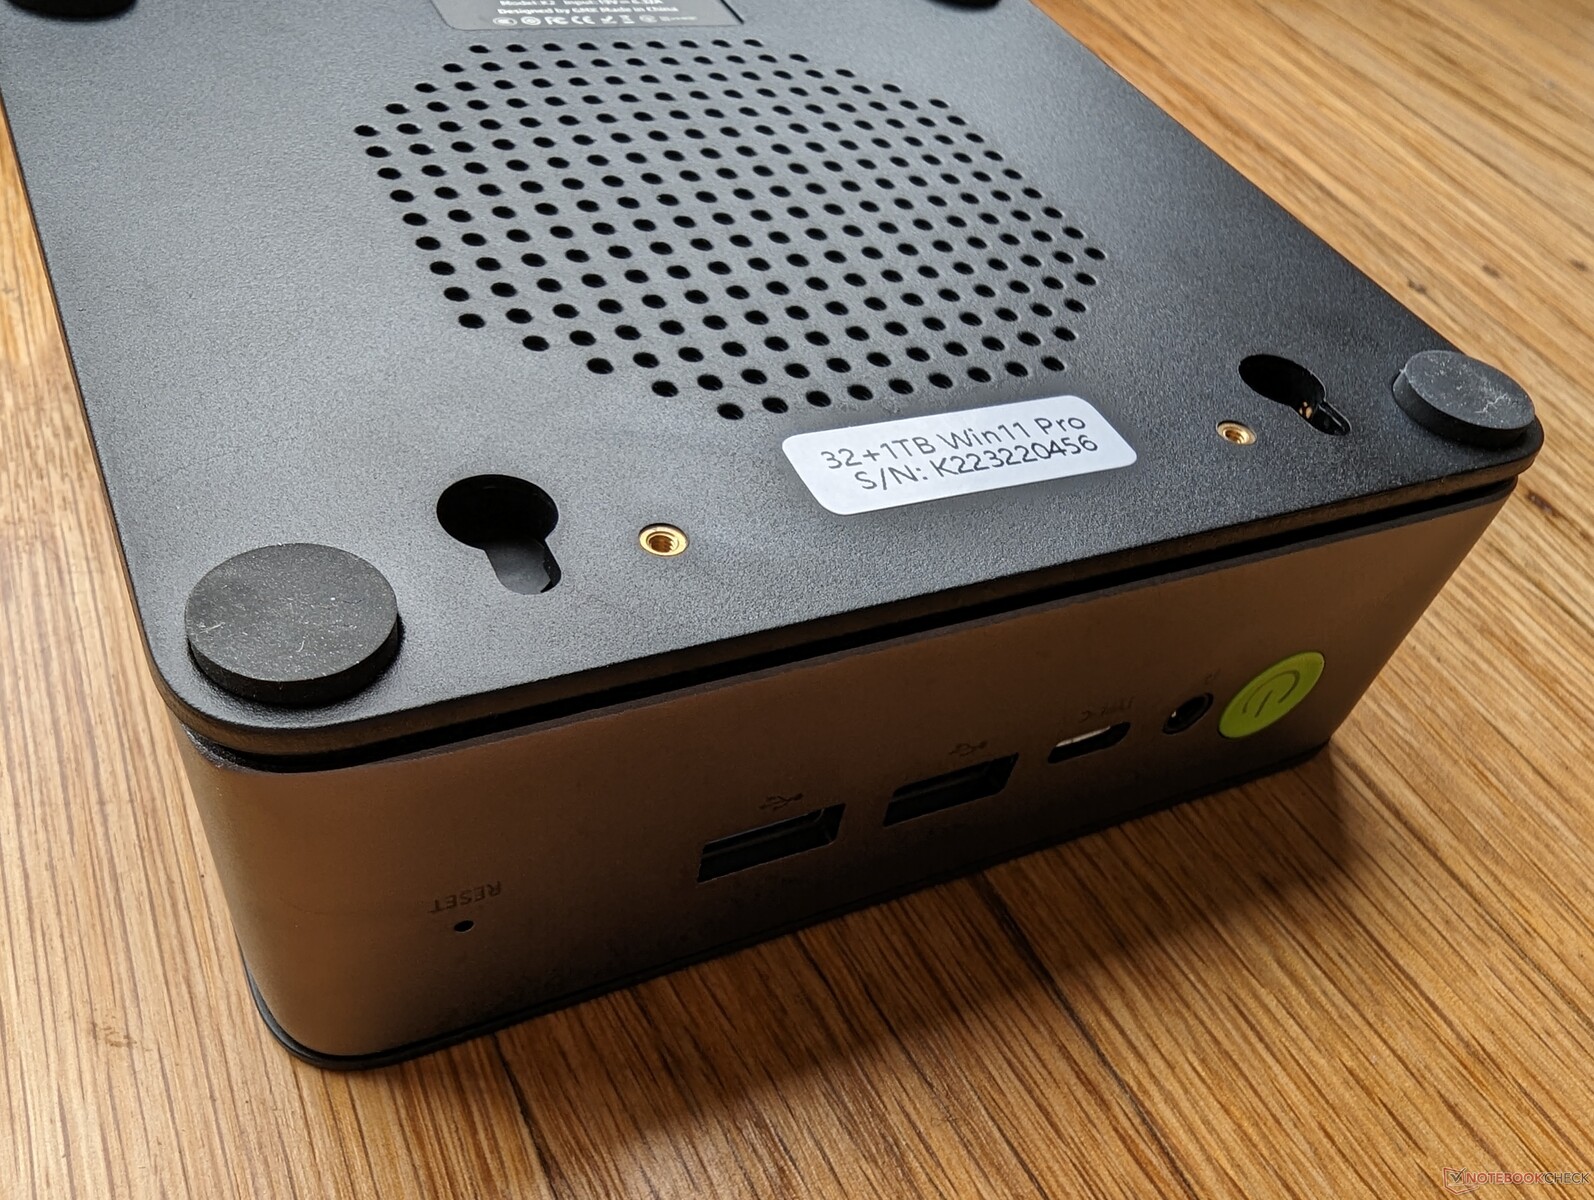
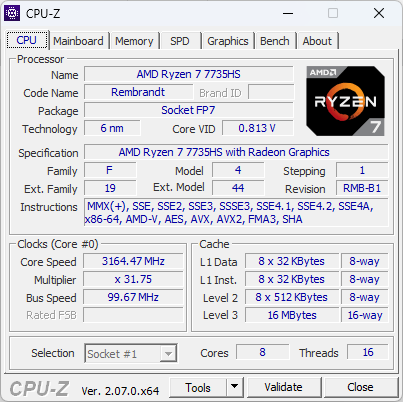
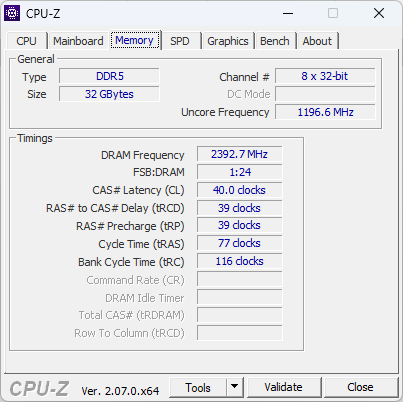
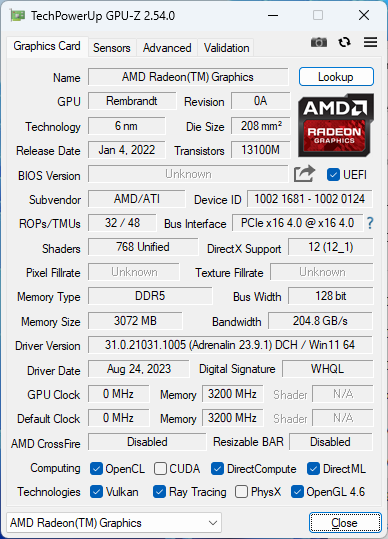
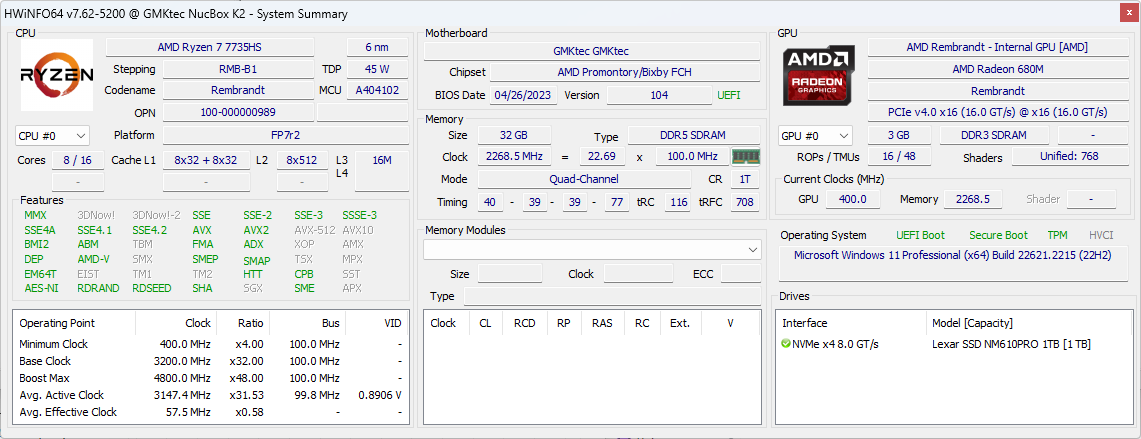
Nossa unidade de análise vem configurada com a CPU Zen 3+ AMD Ryzen 7 7735HS, GPU Radeon 680M integrada, SSD PCIe3 de 1 TB e 32 GB de RAM por aproximadamente US$ 580 ou apenas US$ 480 quando estiver à venda. SKUs com metade da RAM e do armazenamento também estão disponíveis e há até mesmo um com o Zen 4 Ryzen 9 7940HS mais rápido por pouco menos de US$ 800. No momento, não há opções de barebone.
As alternativas ao NucBox 2 incluem outros mini PCs com gráficos integrados, como o Lenovo IdeaCentre Mini, Geekom Mini iT13, Trigkey Speed Sou Intel NUC 13 Pro.
Mais análises do GMK:
Possíveis concorrentes em comparação
Avaliação | Data | Modelo | Peso | Altura | Size | Resolução | Preço |
|---|---|---|---|---|---|---|---|
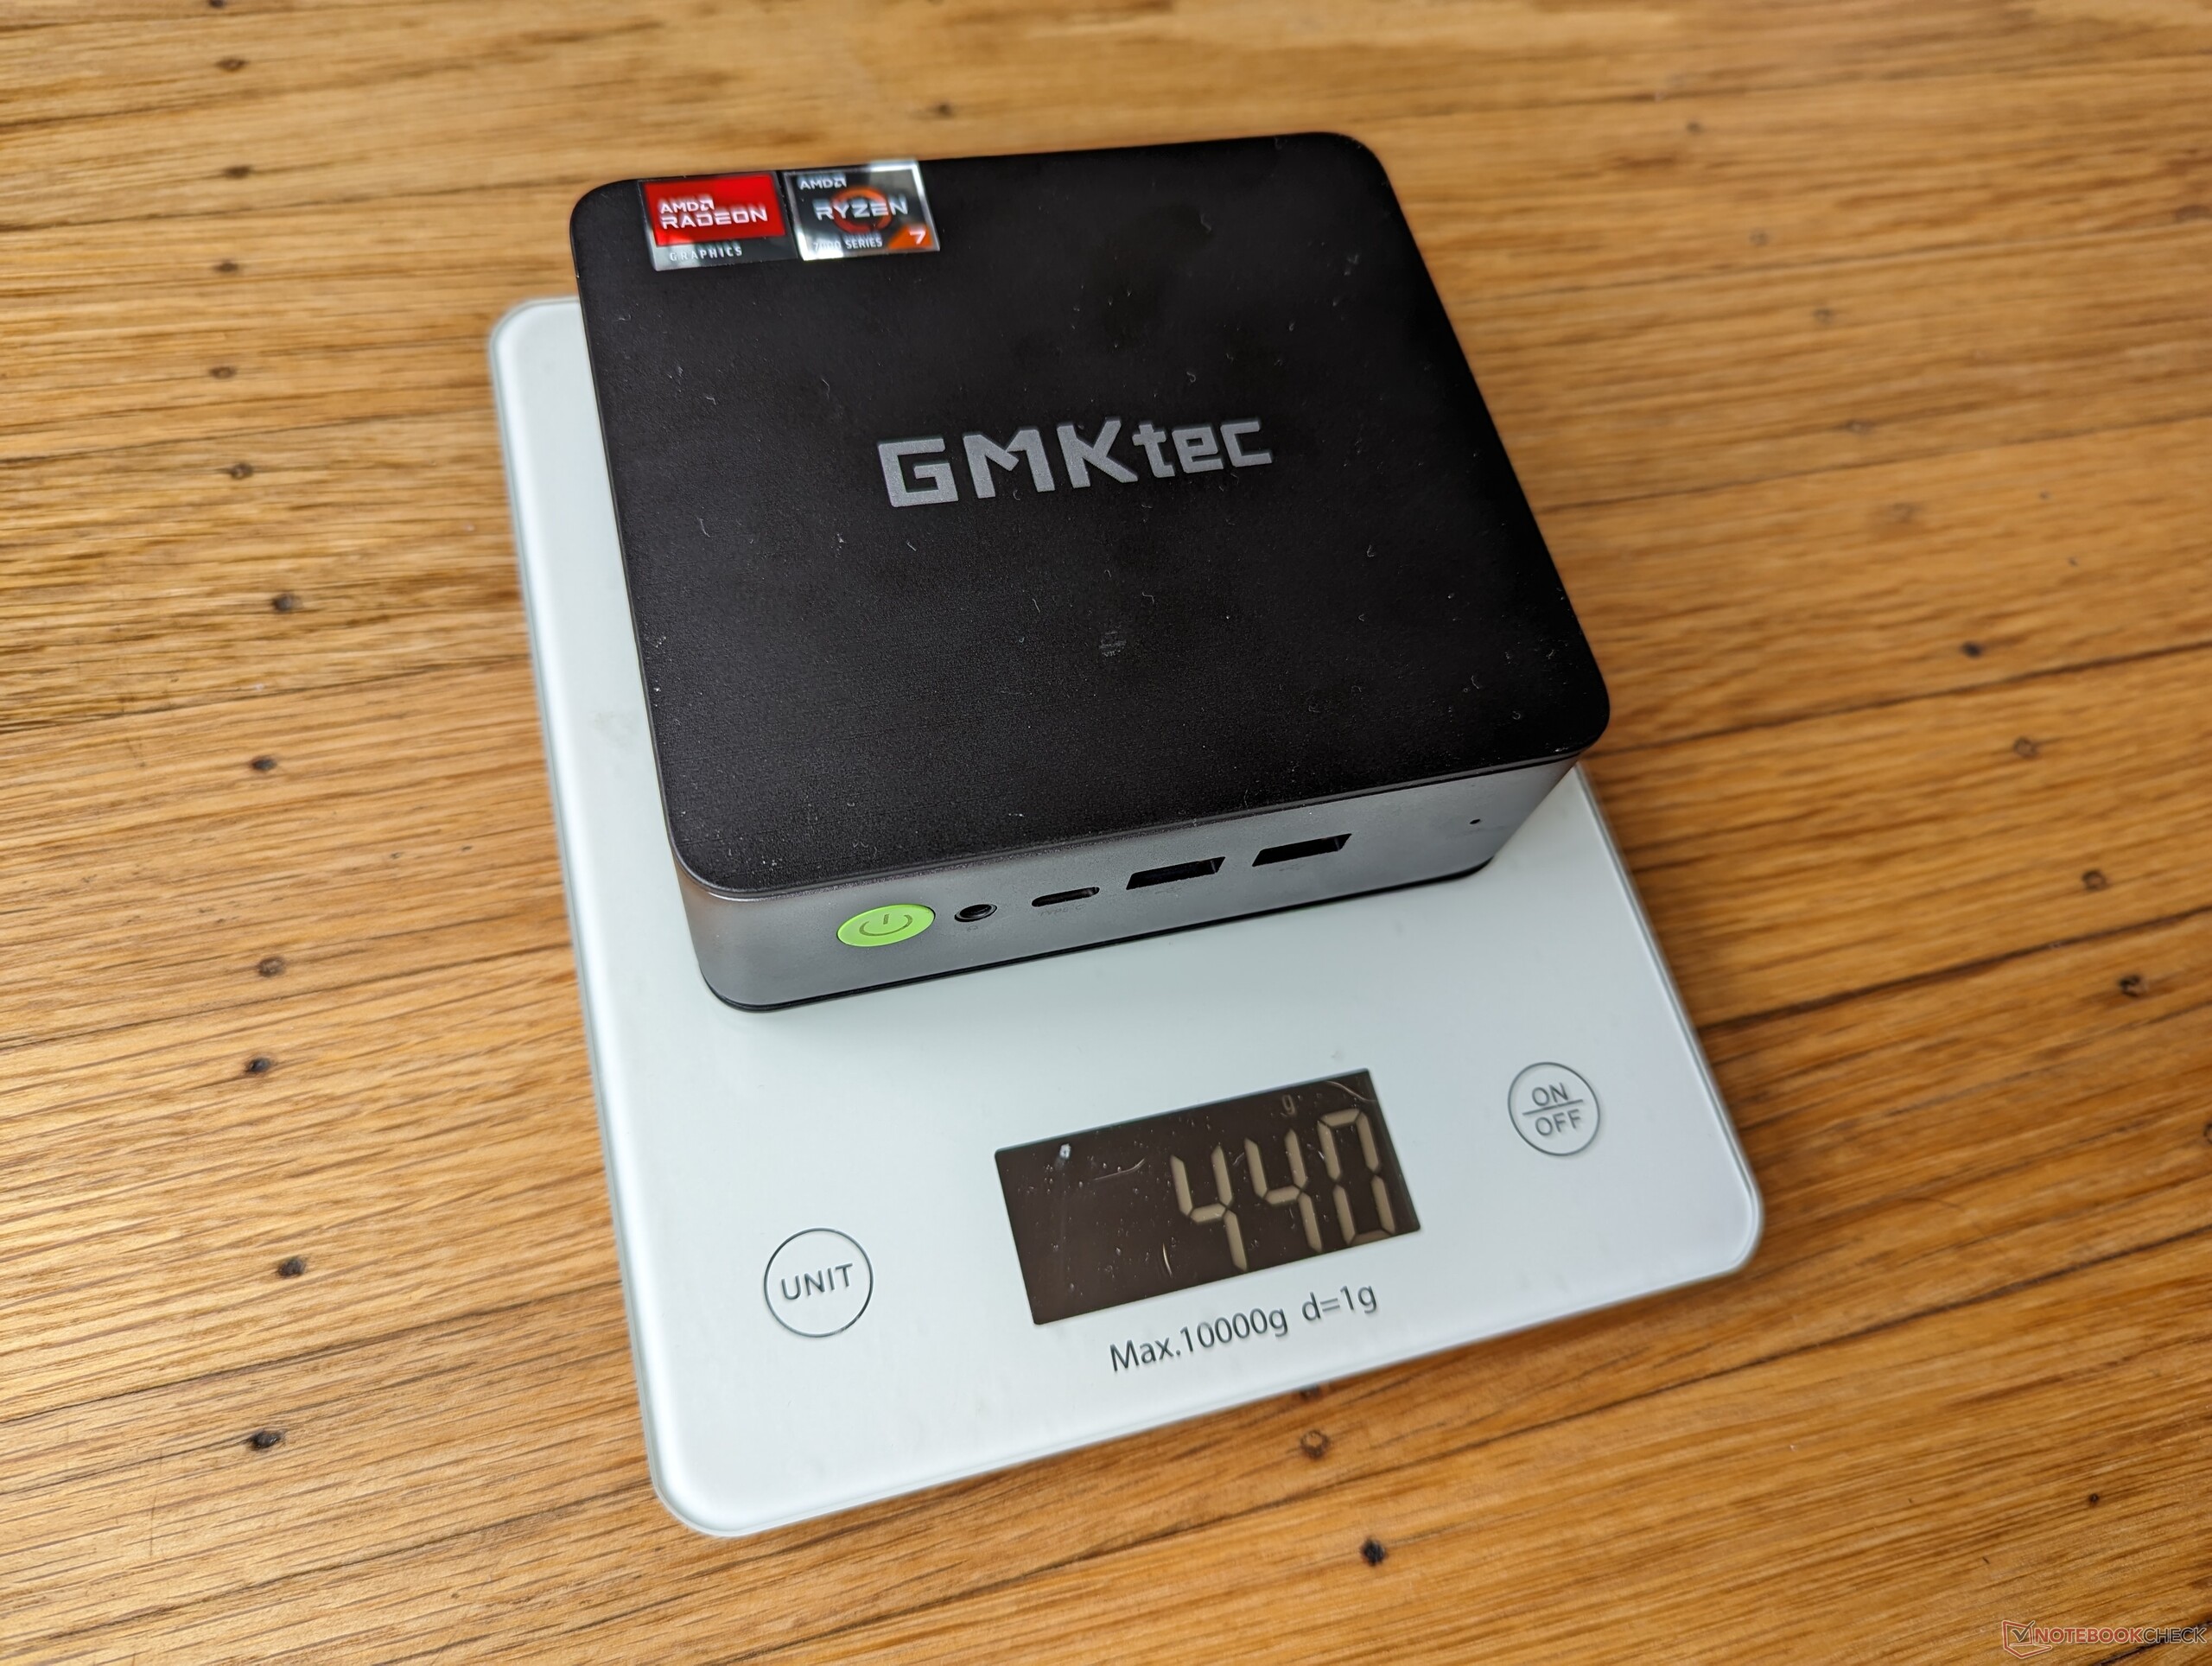
| 83 % v7 (old) | 09/2023 | GMK NucBox K2 R7 7735HS, Radeon 680M | 440 g | 43.2 mm | x | ||
| 86.6 % v7 (old) | 09/2023 | Beelink SER7 R7 7840HS, Radeon 780M | 640 g | 49 mm | x | ||
| 73.5 % v7 (old) | 09/2023 | Blackview MP80 N95, UHD Graphics 24EUs (Alder Lake-N) | 214 g | 37 mm | x | ||
| 83.1 % v7 (old) | 08/2023 | Intel NUC 13 Pro Desk Edition Kit i7-1360P, Iris Xe G7 96EUs | 558 g | 37 mm | x | ||
| 80.6 % v7 (old) | 07/2023 | Geekom Mini IT11, i7-11390H i7-11390H, Iris Xe G7 96EUs | 536 g | 48 mm | x | ||
v (old) | Trigkey Speed S i5-11320H, Iris Xe G7 96EUs | 415 g | 40.7 mm | x |
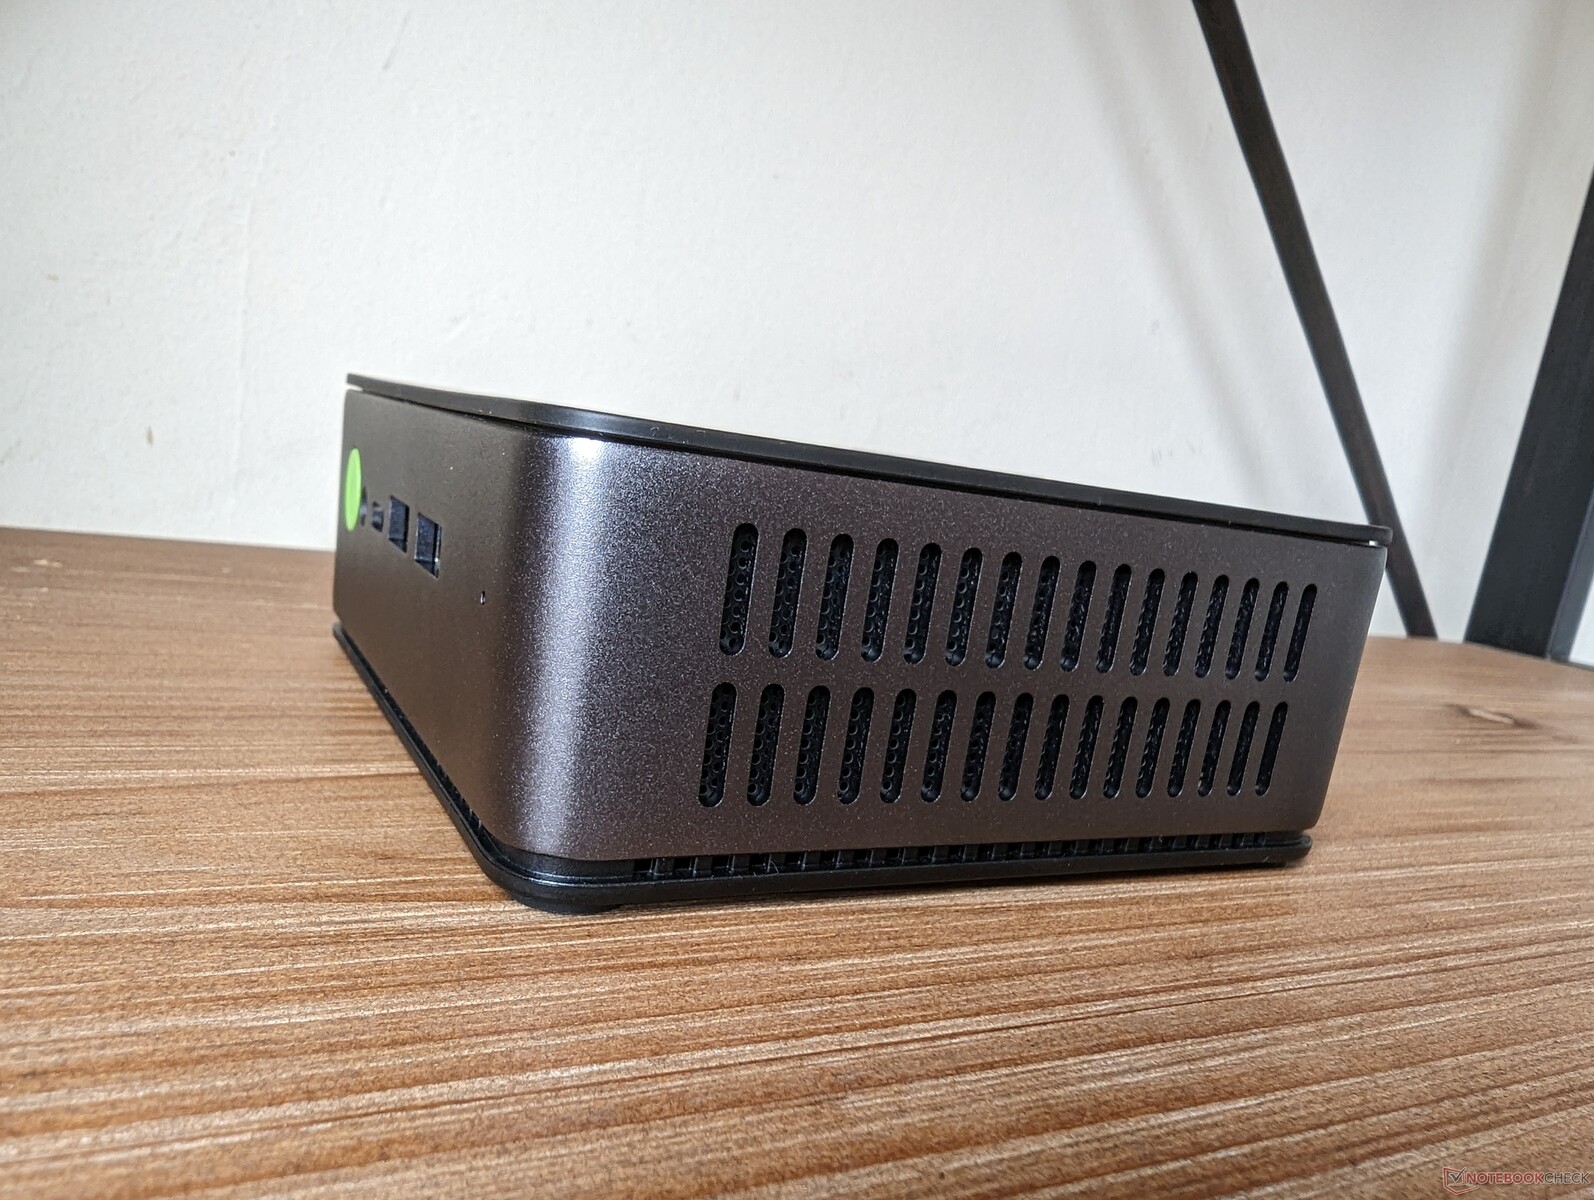
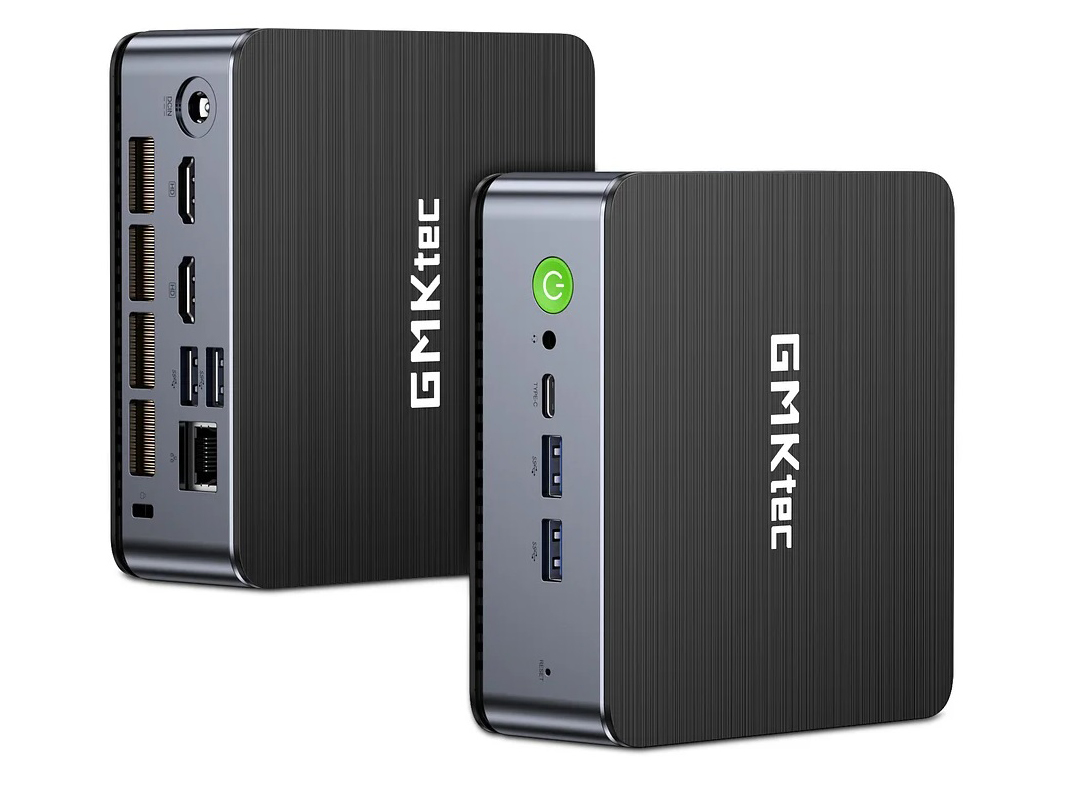
Caso - Mantendo a simplicidade
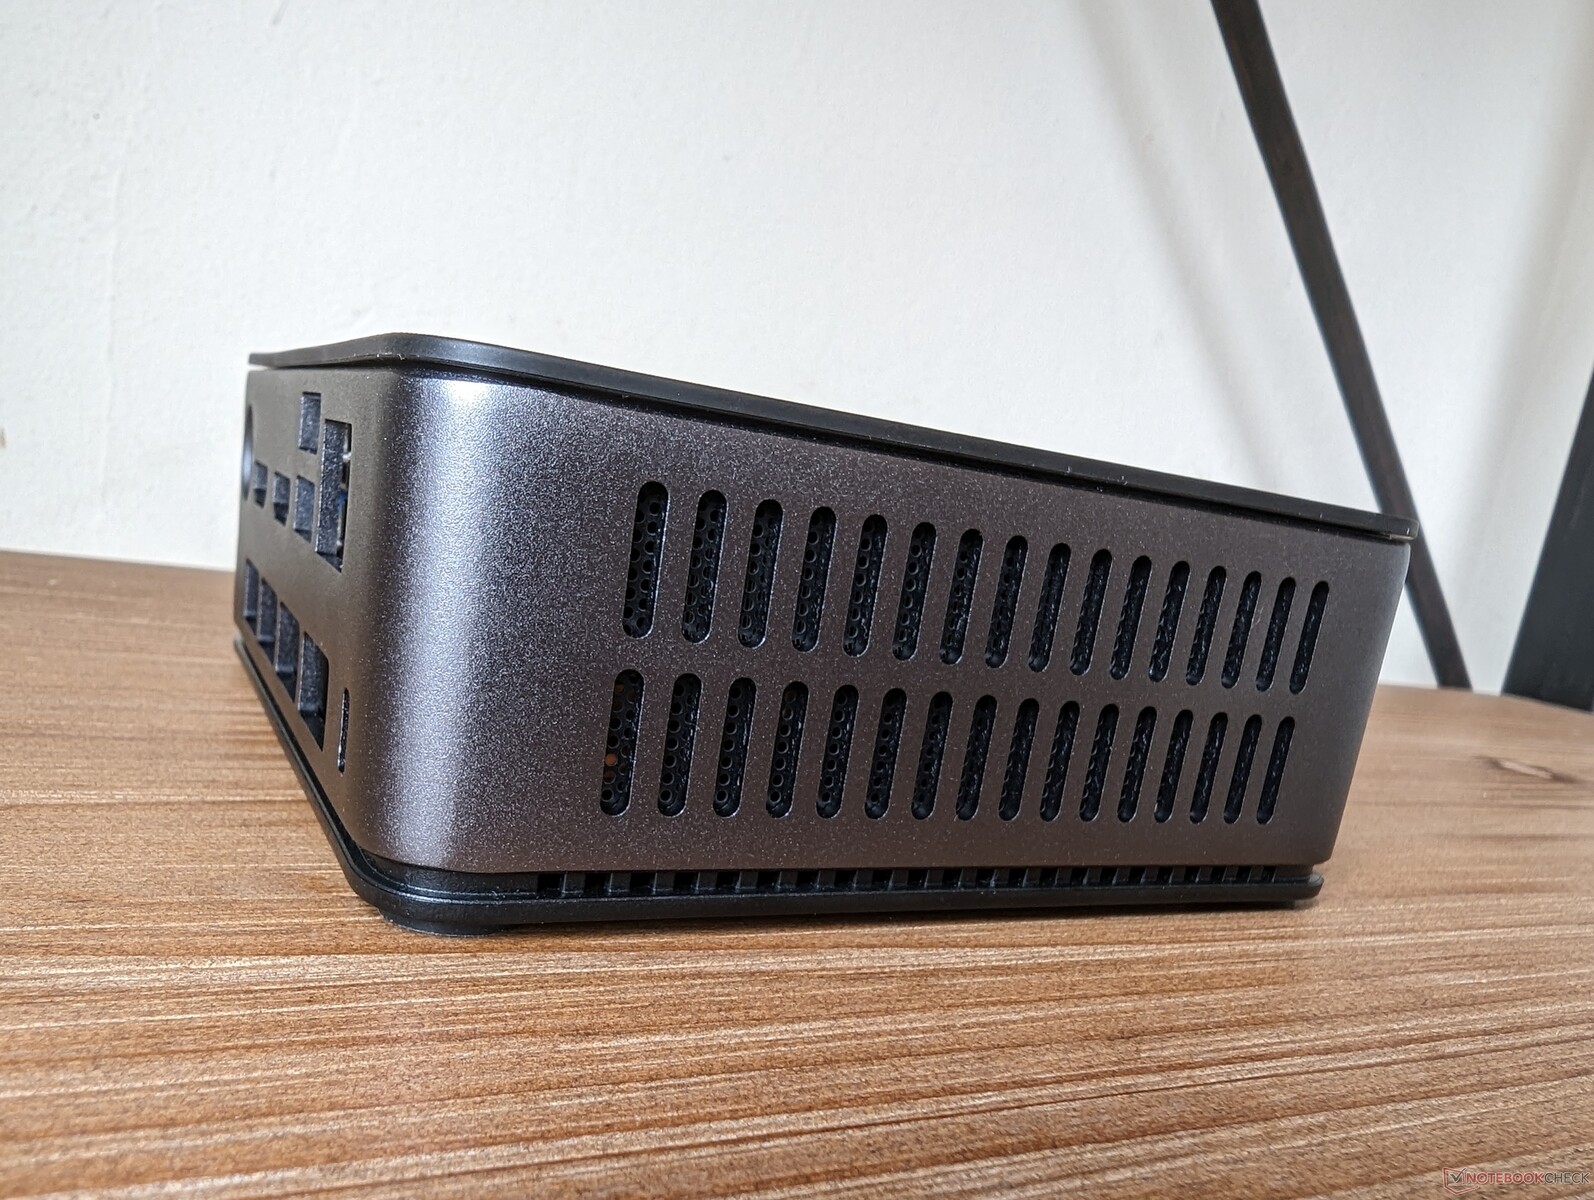
O NucBox K2 é visivelmente mais leve do que muitos outros minicomputadores de tamanho semelhante, incluindo o Intel NUC 13 Pro e o Geekom Mini IT11. A desvantagem, entretanto, é que o K2 utiliza mais plástico nas superfícies superior e inferior, enquanto apenas as laterais e as bordas são de metal. Seu design totalmente fosco é definitivamente mais sutil do que o de mini PCs como o Beelink SER7 em que sua aparência cromada e brilhante chama a atenção. Mesmo assim, a rigidez do chassi é muito boa e não há problemas de qualidade de construção em nossa unidade específica.
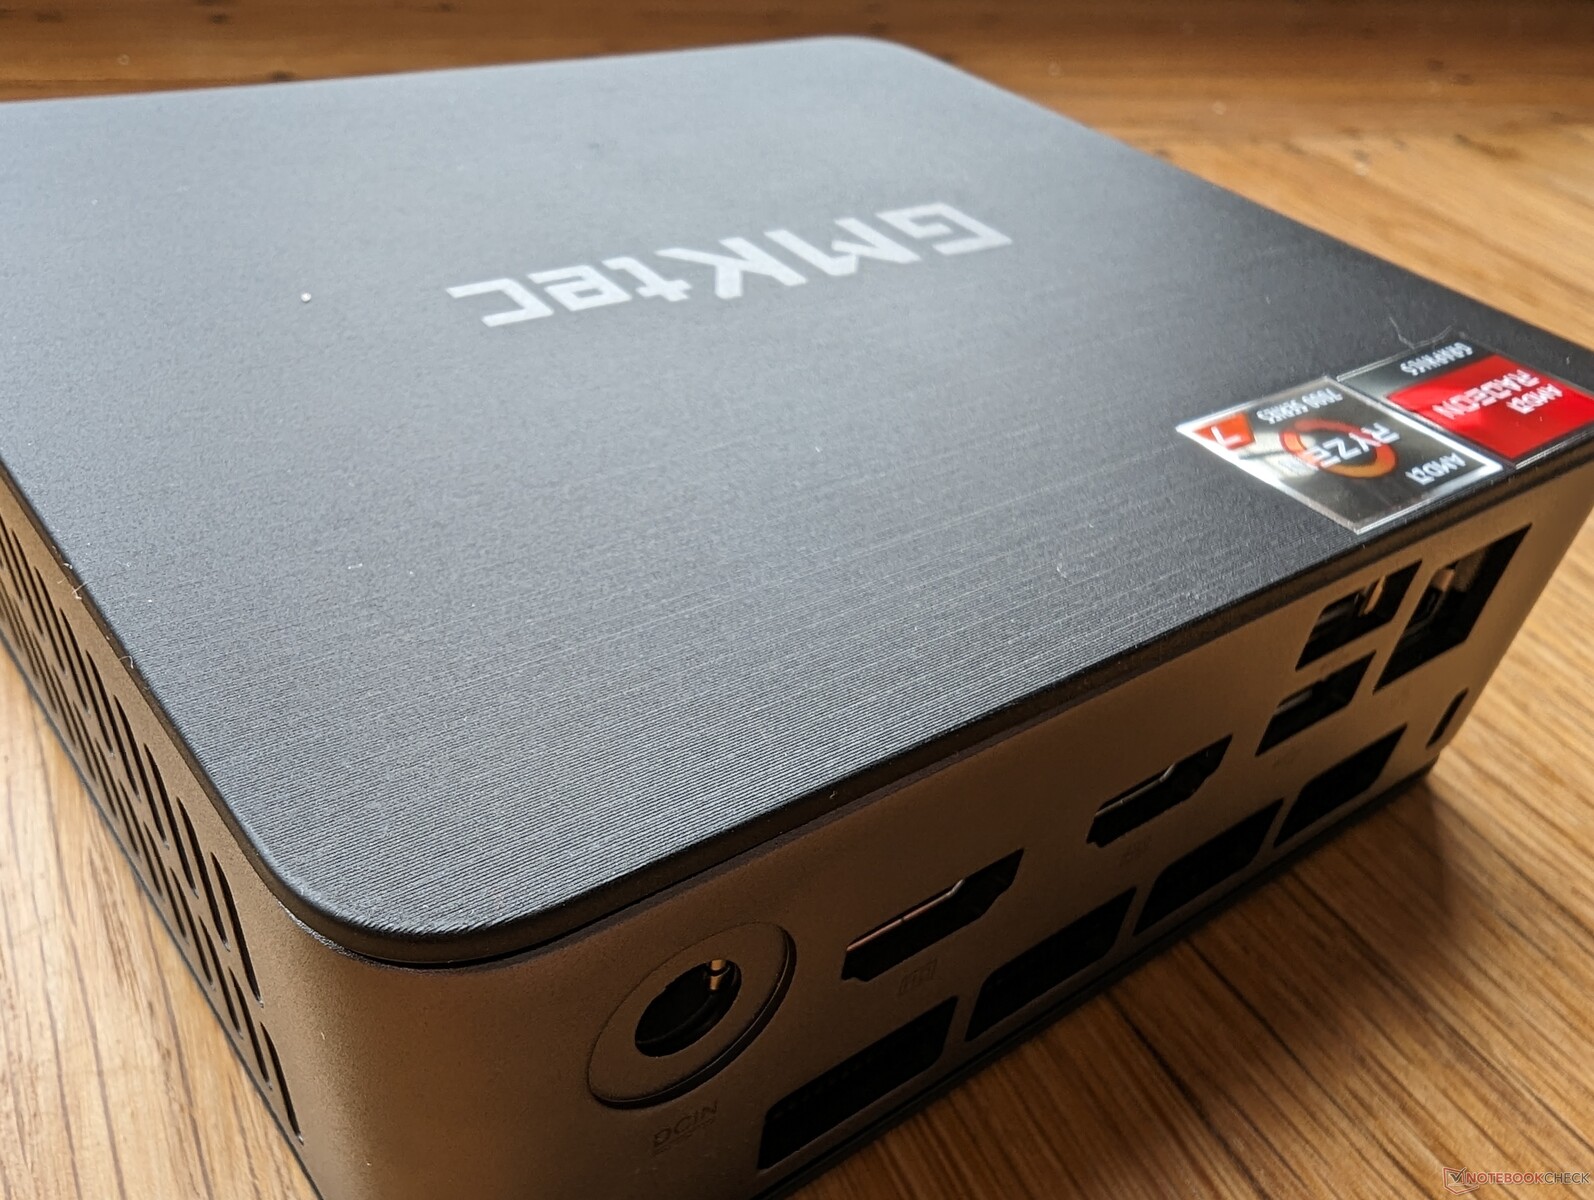
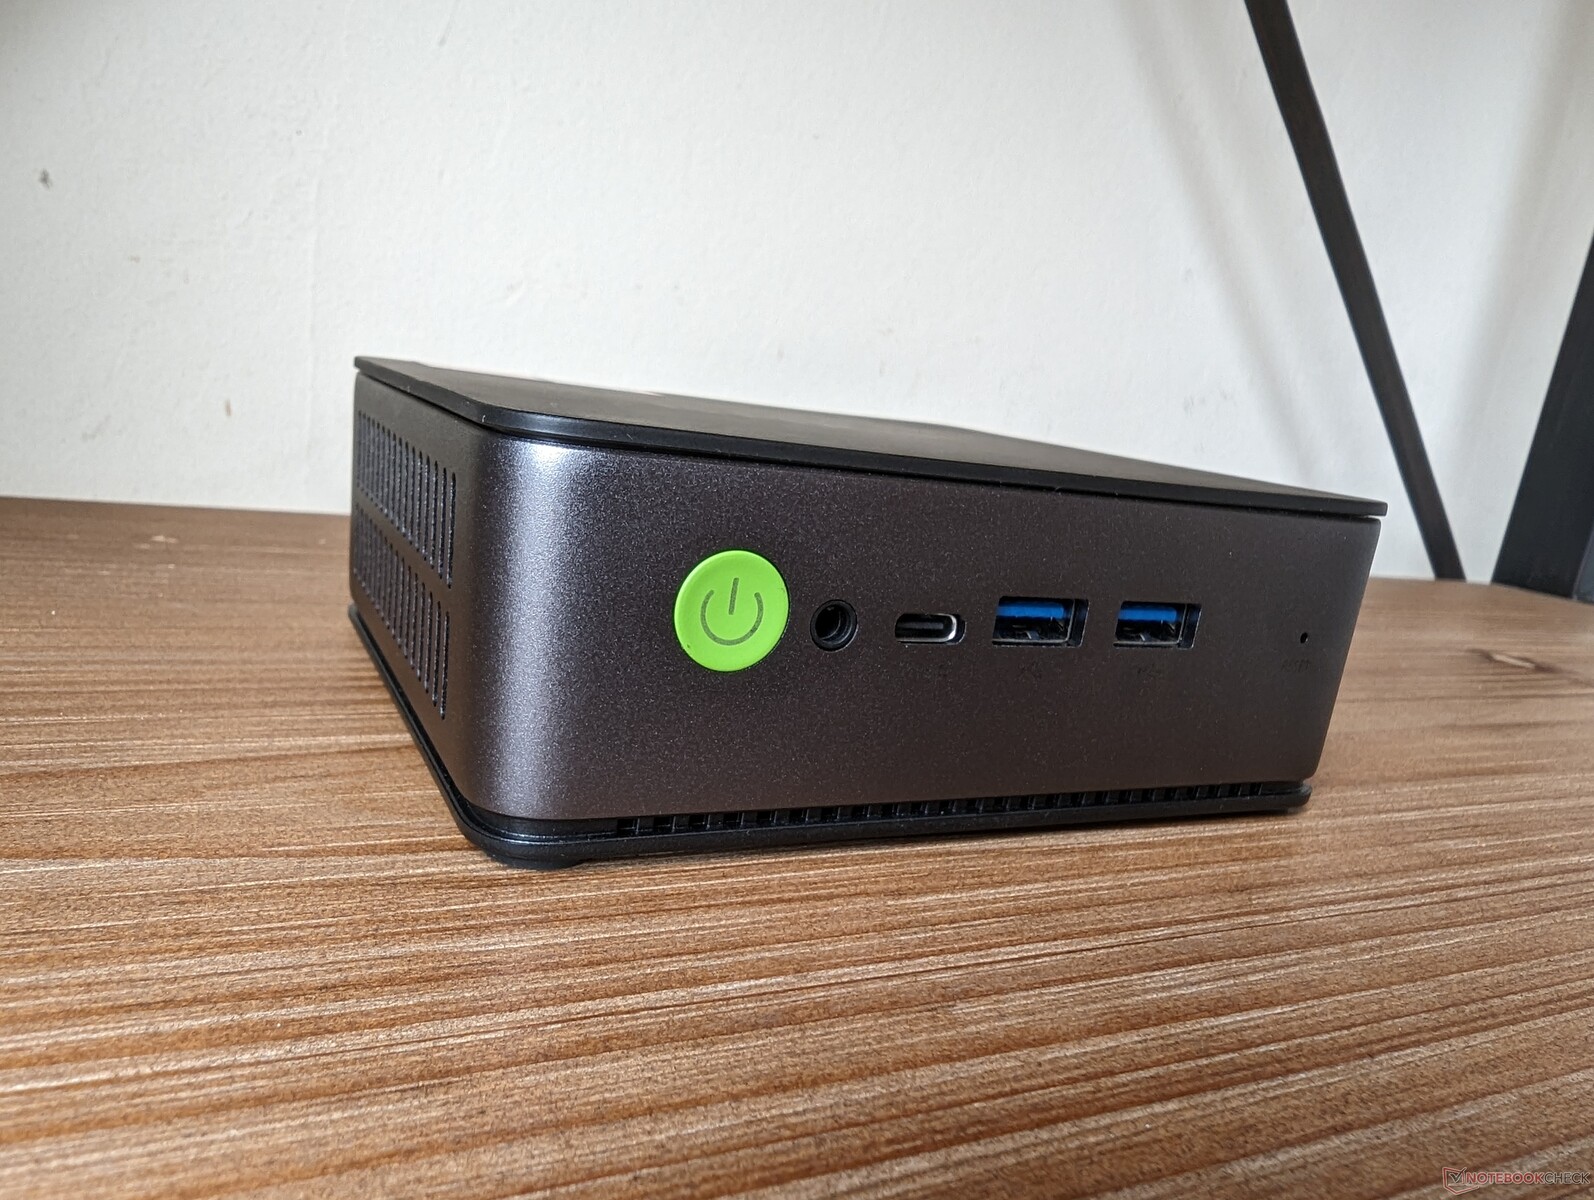
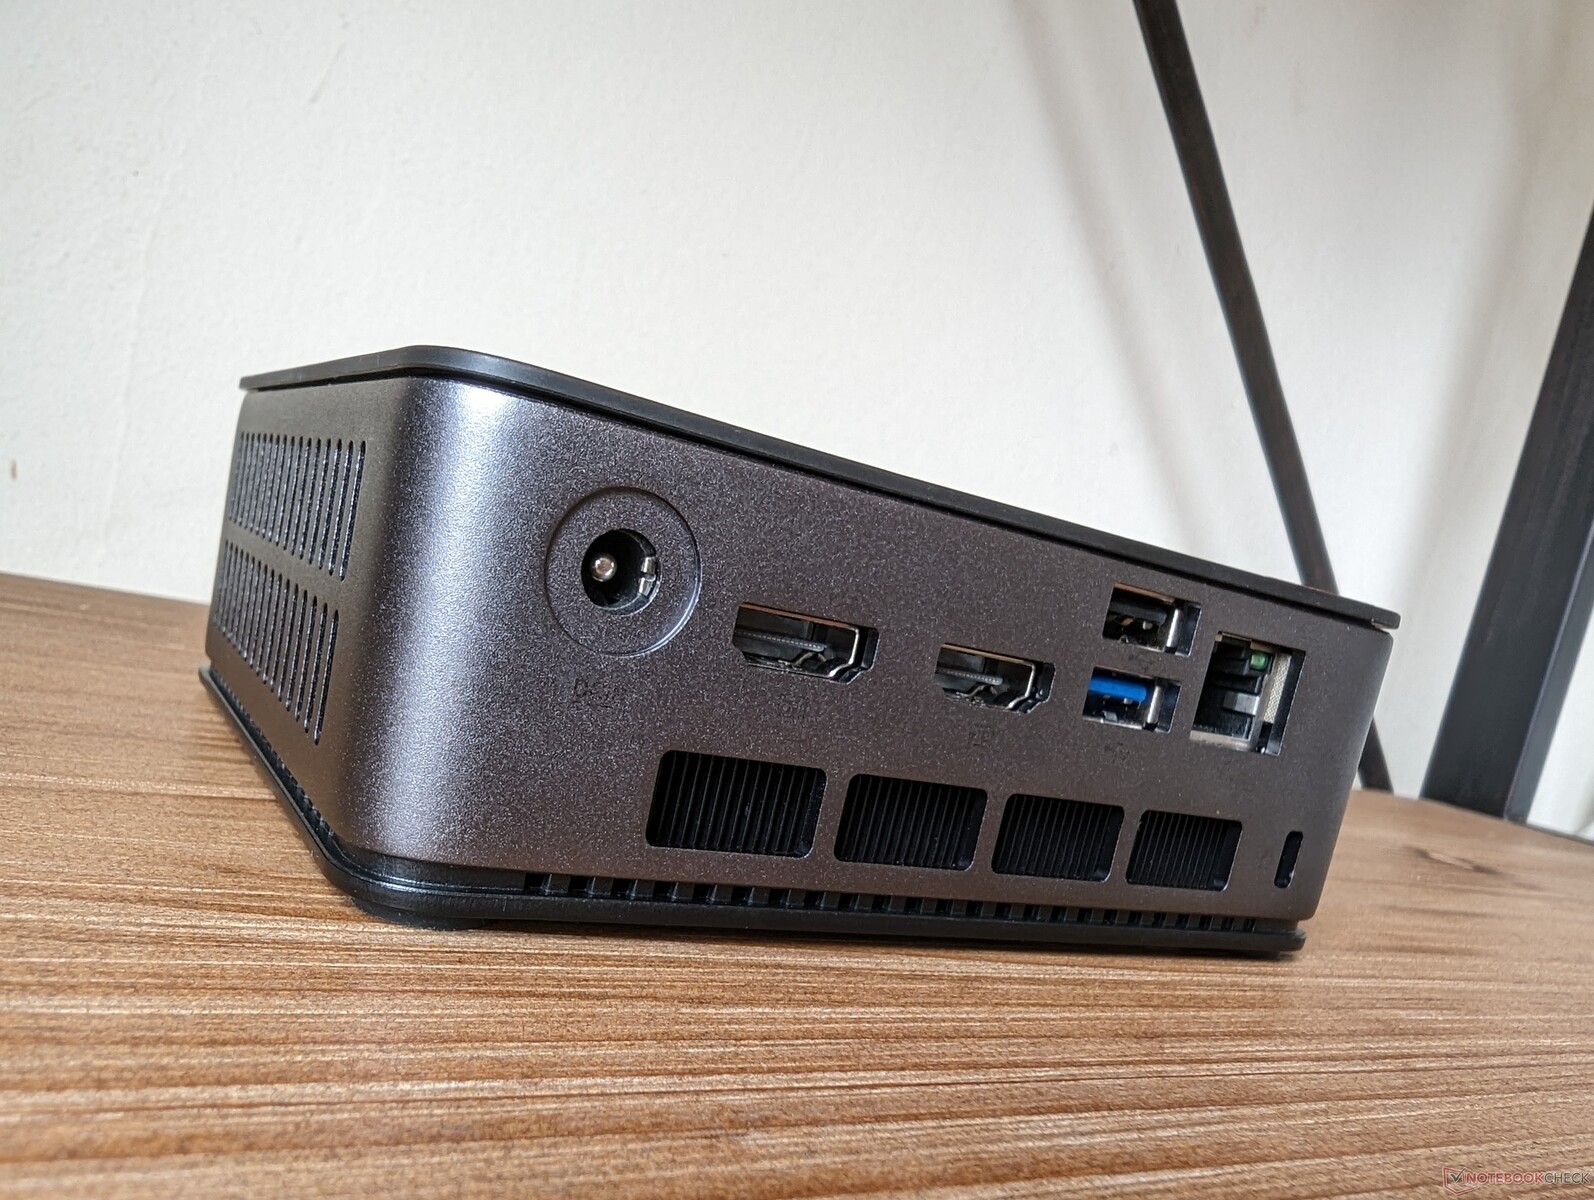
Conectividade
A porta mais notável do NucBox 2 é, sem dúvida, a porta USB 4. Essa porta versátil pode ser usada para GPUs externas, monitores externos, estações de acoplamento e até mesmo adaptadores CA de terceiros, caso você perca o bloco de alimentação proprietário que acompanha a caixa. Infelizmente, há apenas uma porta USB-C, ao contrário do Beelink SER7, que integra três portas USB-C.
Comunicação
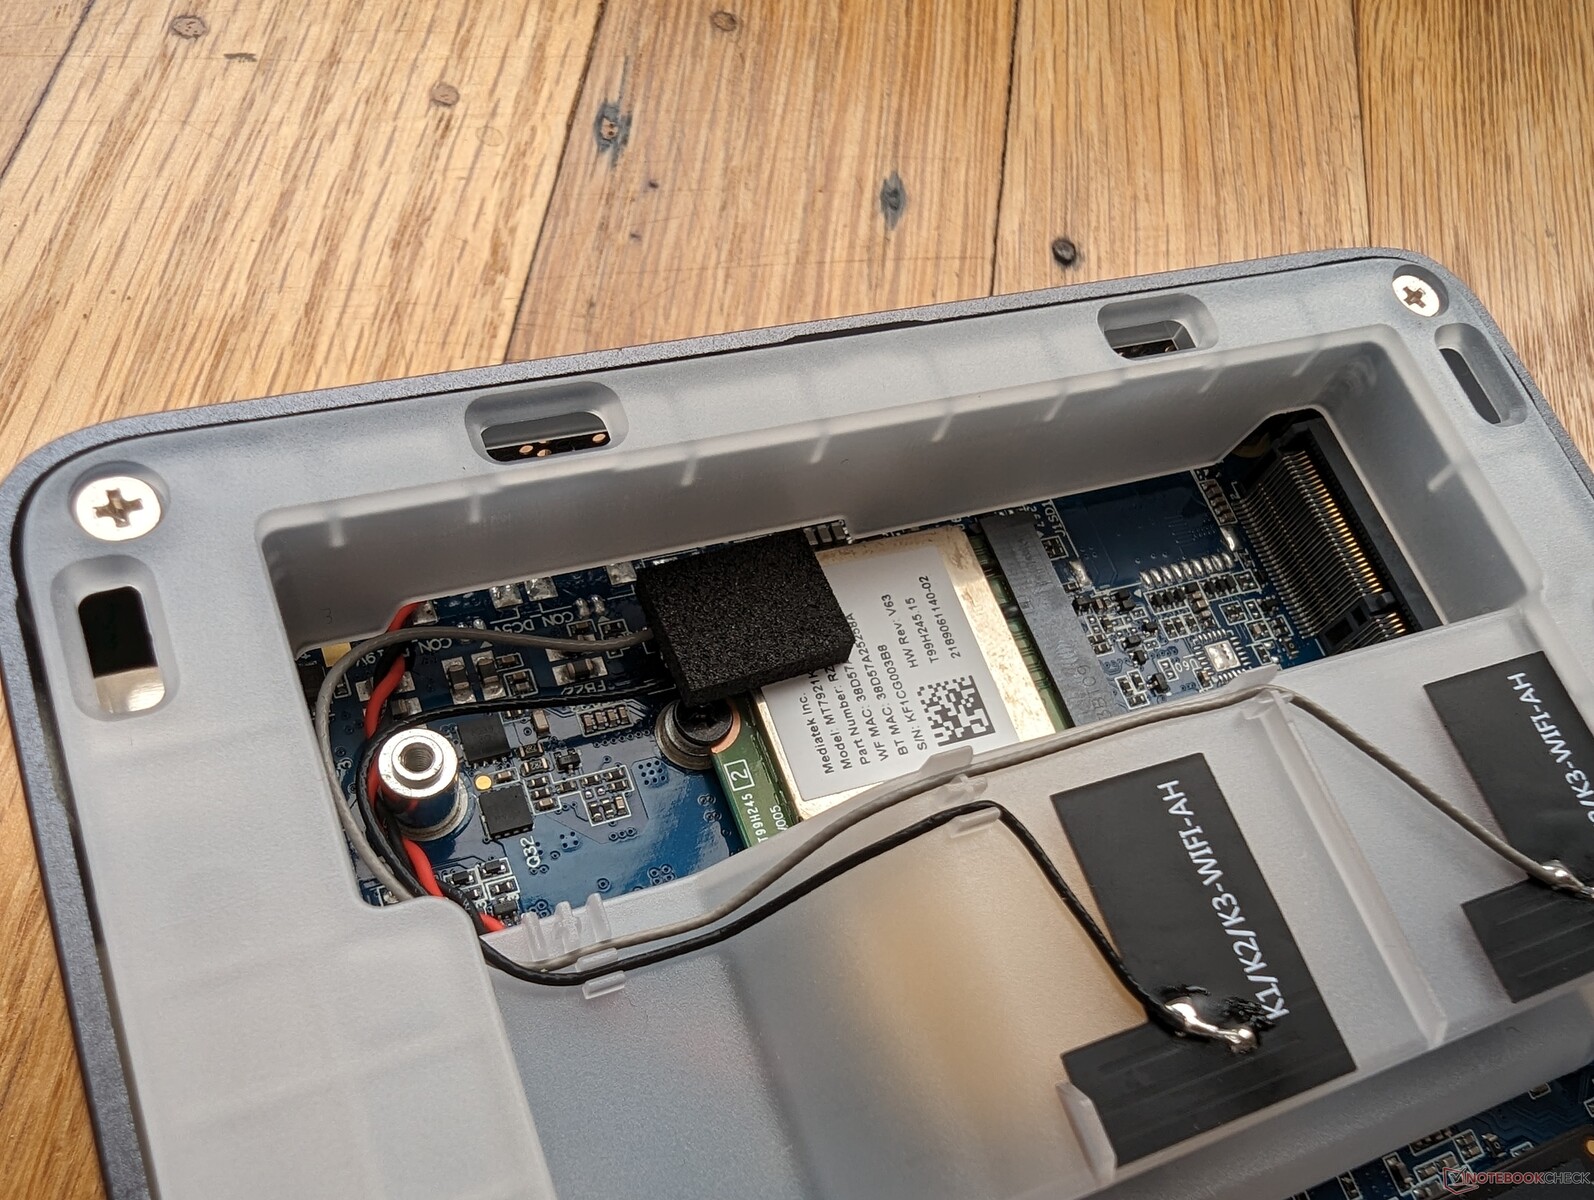
Um MediaTek RZ608 é padrão para suporte a Wi-Fi 6 e Wi-Fi 6E. Embora a conexão seja confiável, o desempenho é mais lento do que o esperado quando emparelhado com nossa rede de 6 GHz, conforme mostrado abaixo. Isso sugere que as antenas sem fio podem estar fracas.
O Bluetooth também é problemático. Nosso mouse Bluetooth não conseguia se reconectar todas as vezes, embora funcionasse perfeitamente em outros dispositivos.
| Networking | |
| iperf3 transmit AX12 | |
| GMK NucBox 2 | |
| iperf3 receive AX12 | |
| GMK NucBox 2 | |
| iperf3 transmit AXE11000 | |
| Beelink SER7 | |
| Intel NUC 13 Pro Desk Edition Kit | |
| Trigkey Speed S | |
| GMK NucBox K2 | |
| Geekom Mini IT11, i7-11390H | |
| iperf3 receive AXE11000 | |
| Beelink SER7 | |
| Trigkey Speed S | |
| Intel NUC 13 Pro Desk Edition Kit | |
| Geekom Mini IT11, i7-11390H | |
| GMK NucBox K2 | |
| iperf3 transmit AXE11000 6GHz | |
| Intel NUC 13 Pro Desk Edition Kit | |
| GMK NucBox K2 | |
| iperf3 receive AXE11000 6GHz | |
| Intel NUC 13 Pro Desk Edition Kit | |
| GMK NucBox K2 | |
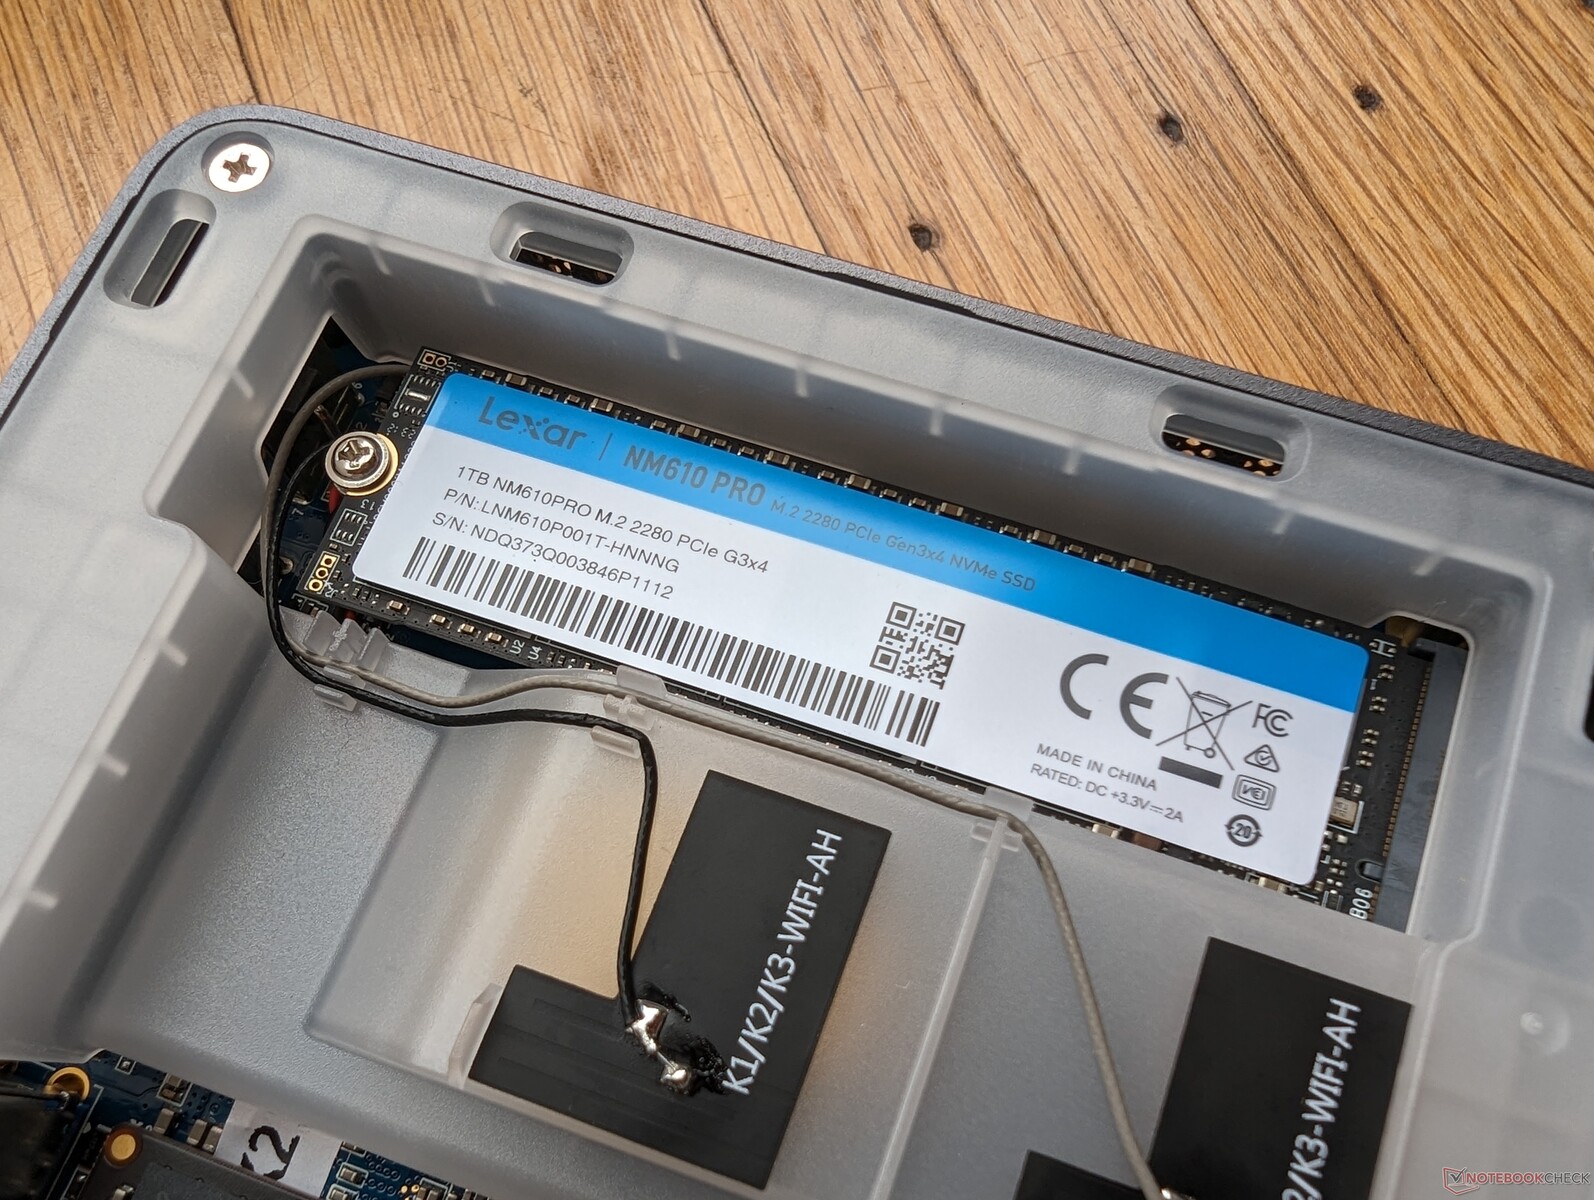
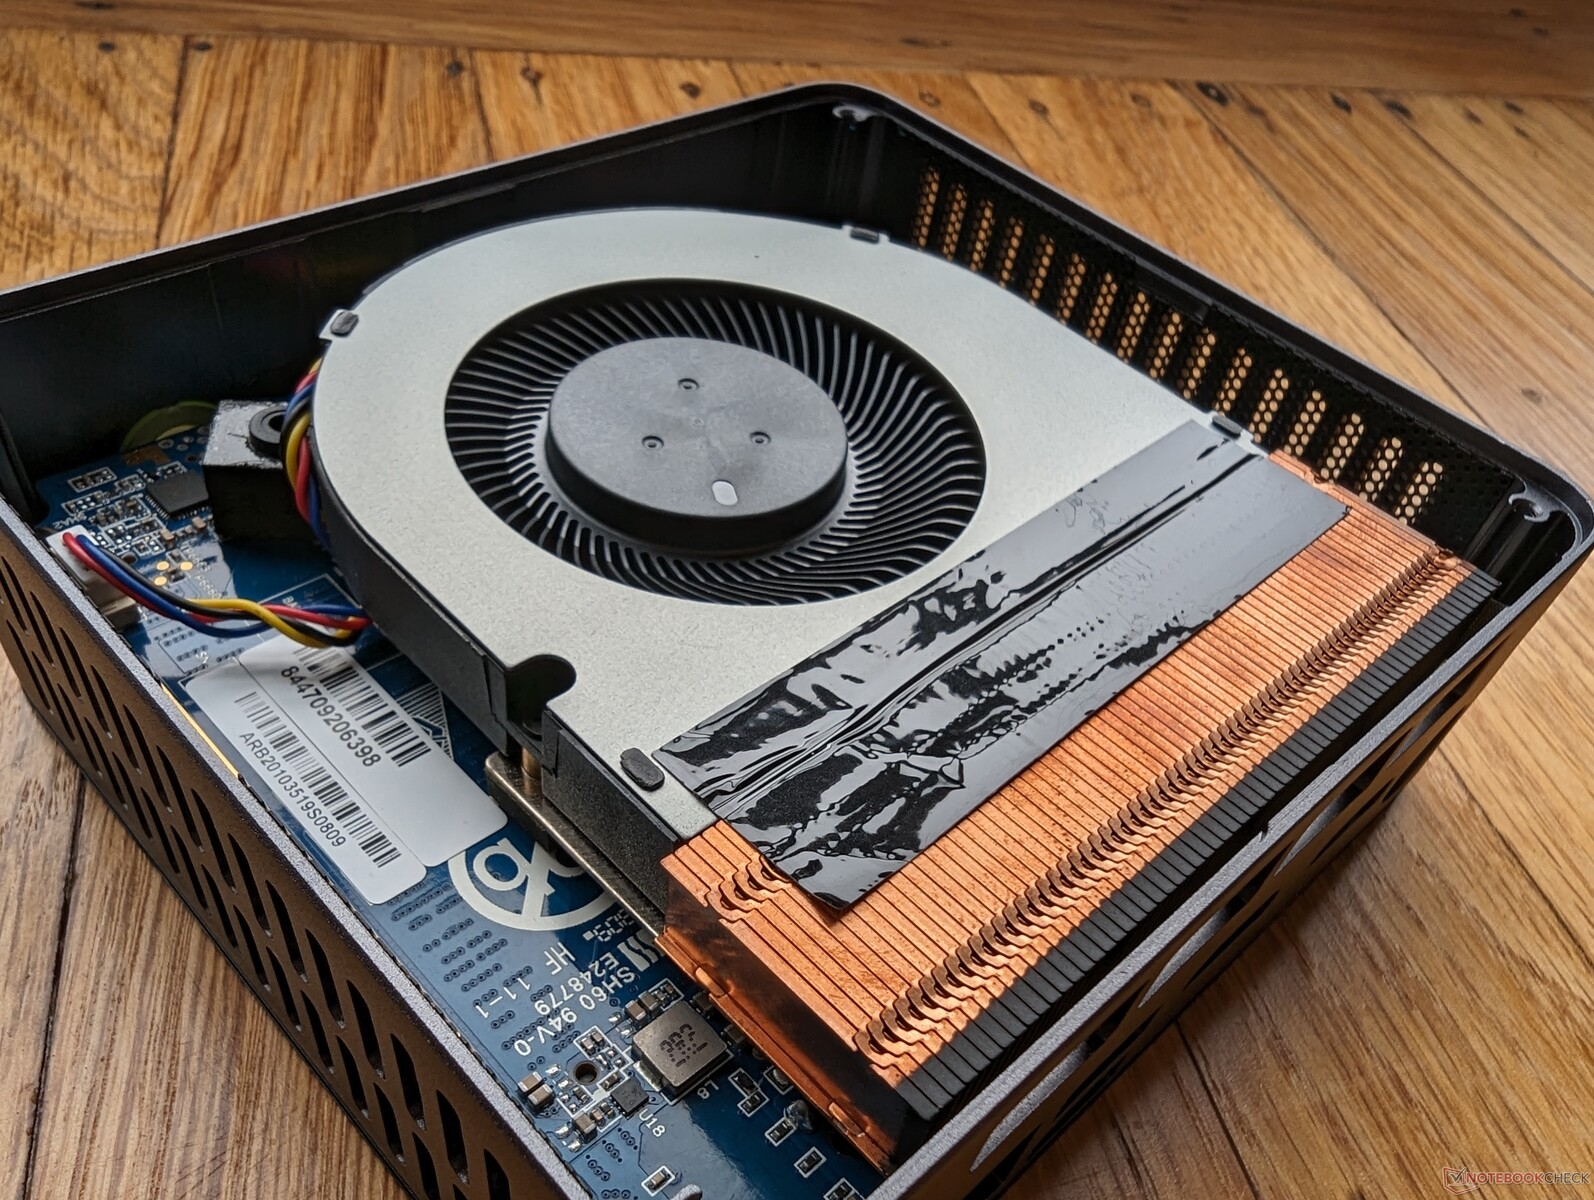
Manutenção
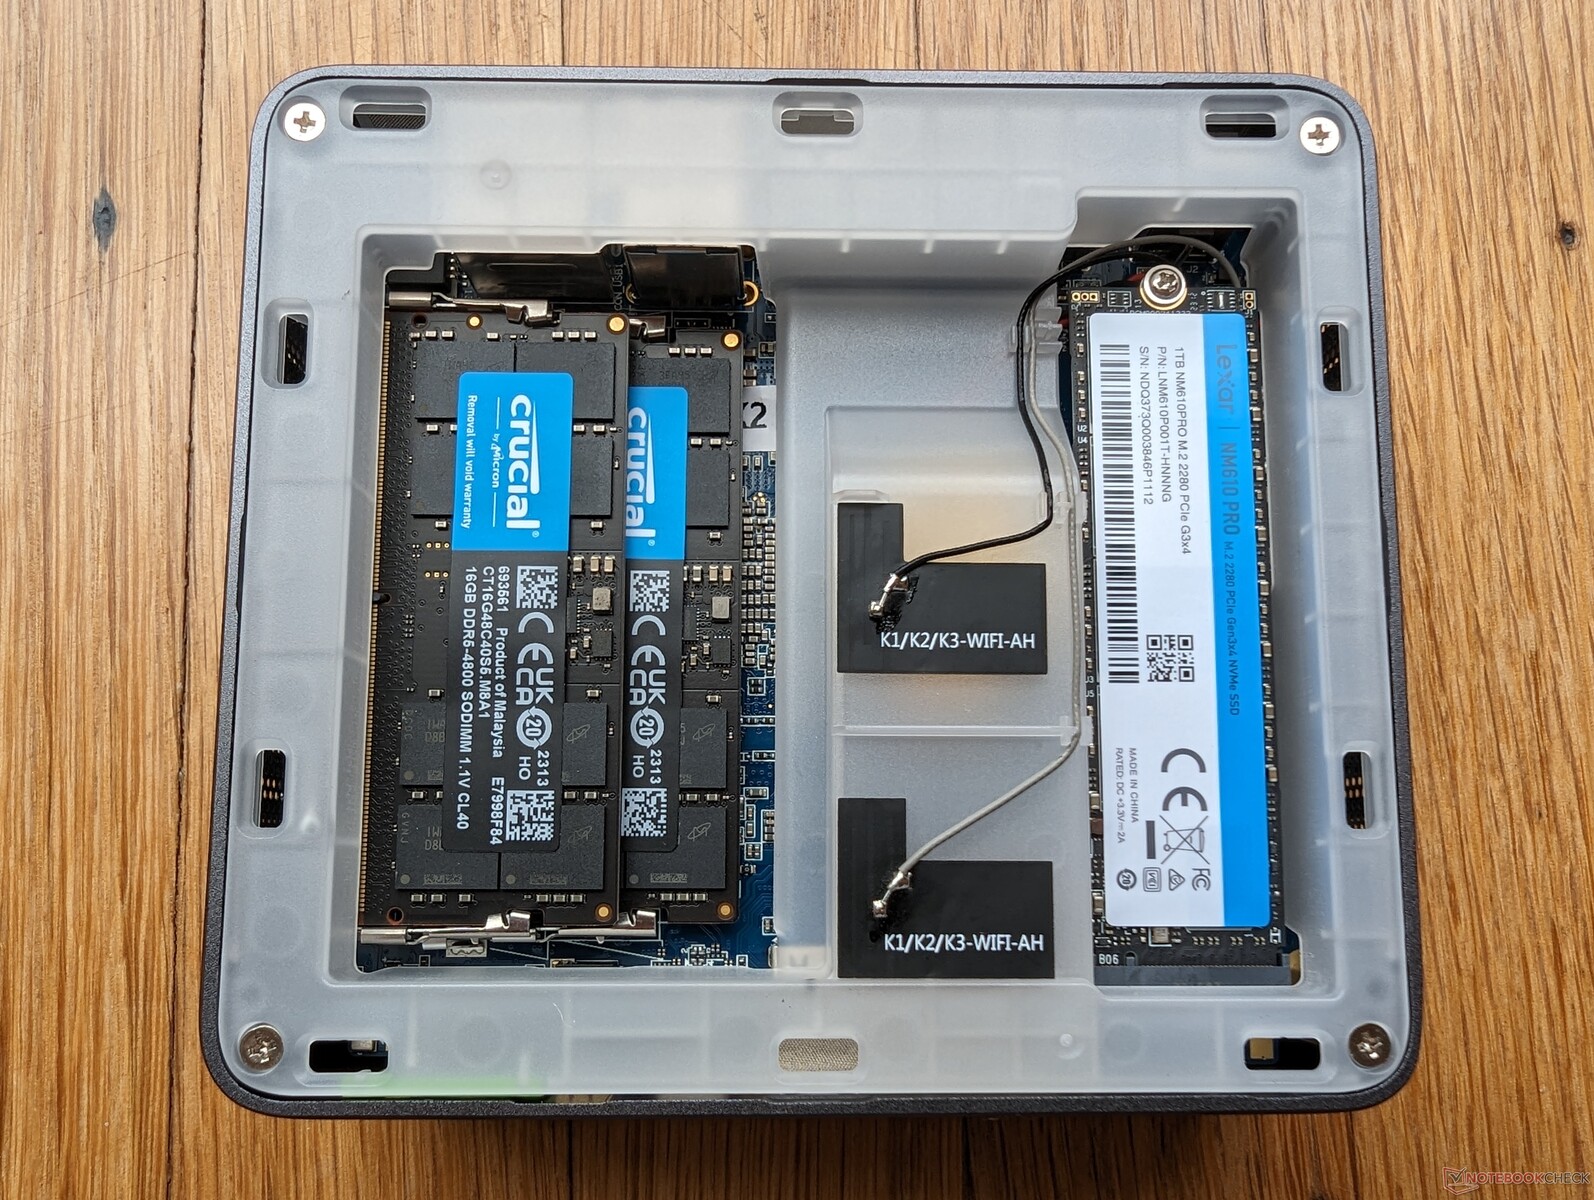
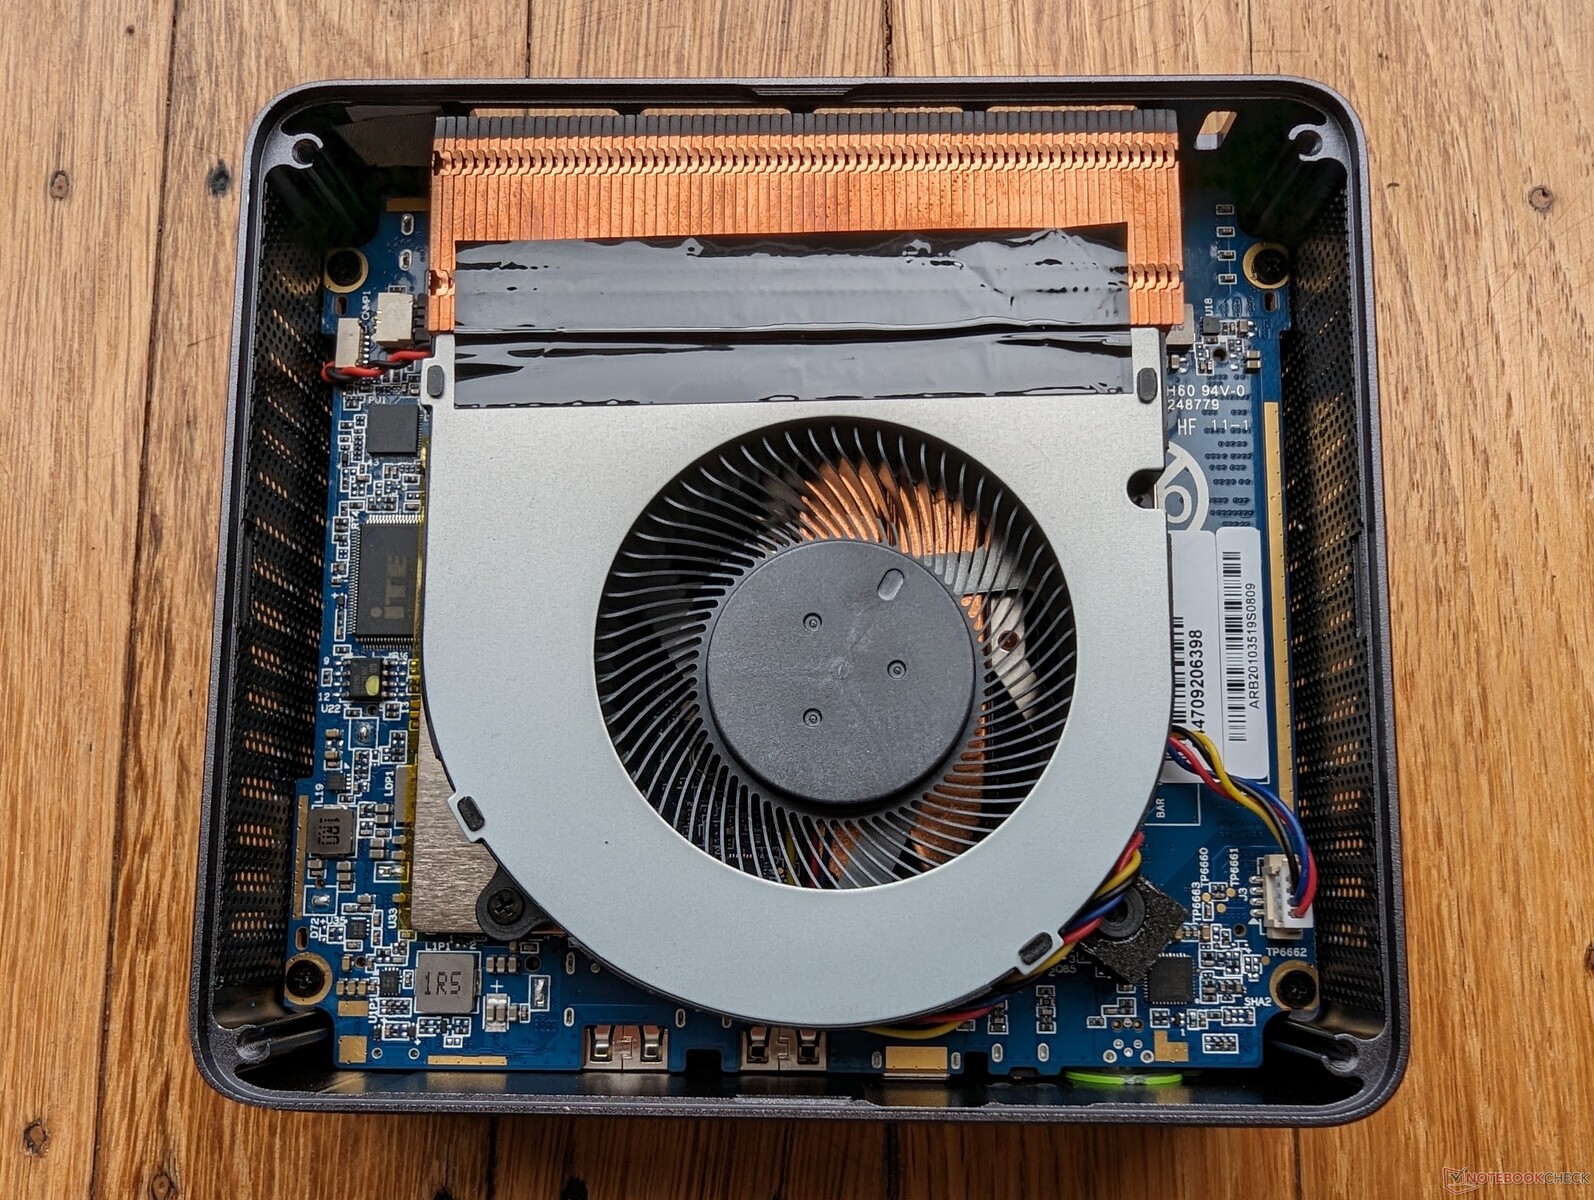
O NucBox K2 é um dos minicomputadores de mais fácil manutenção, especialmente depois de ter analisado o Beelink SER7. O painel superior de plástico é removido em segundos, sem necessidade de ferramentas, para acesso direto aos dois slots SODIMM, ao SSD M.2 e ao módulo WLAN. Até mesmo a ventoinha do sistema pode ser facilmente acessada virando a unidade de cabeça para baixo, removendo os quatro pés de borracha e desparafusando os quatro parafusos.
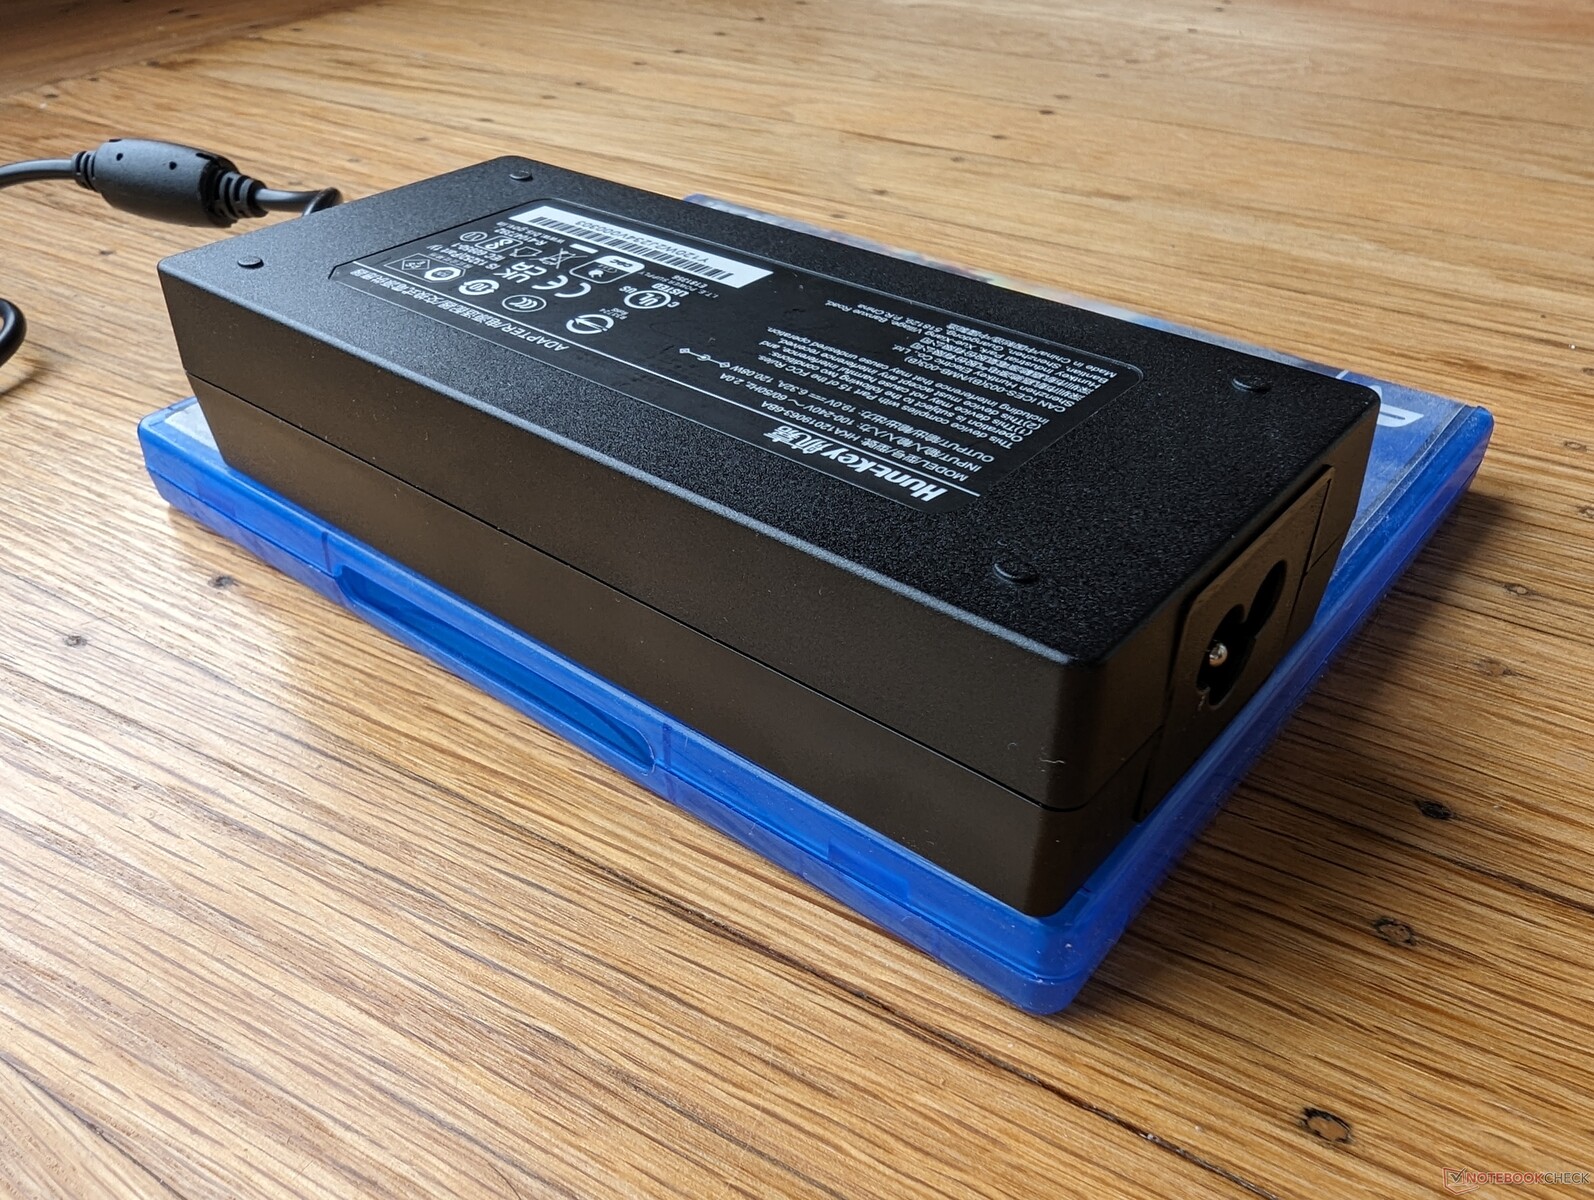
Acessórios e garantia
A caixa de varejo inclui o manual, o adaptador CA, o cabo HDMI e o suporte de montagem VESA removível. A garantia padrão limitada de um ano do fabricante se aplica se for comprada nos EUA.
Desempenho - O Zen 3+ ainda é potente
Condições de teste
Colocamos o Windows no modo Desempenho antes de executar os benchmarks abaixo. O GMK não inclui aplicativos de centro de controle ou bloatware pré-instalados.
Processador
ORyzen 7 7735HS é essencialmente uma nova marca da última geração do Ryzen 7 6800H especialmente porque ambos são baseados na arquitetura Zen 3+. Isso não quer dizer que a CPU seja lenta, mas os usuários que quiserem ter a mais recente tecnologia Zen 4 terão que procurar a configuração mais avançada com o Ryzen 9 7940HS que pode oferecer um desempenho multi-thread até 45% a 50% mais rápido em relação à nossa unidade Ryzen 7.
O desempenho geral é cerca de 30% mais lento do que a 12ª geração do Core i7-12700H comumente encontrado em laptops para jogos de alto desempenho e mini PCs como o Intel NUC 12 Serpent Canyon.
Cinebench R15 Multi Loop
Cinebench R23: Multi Core | Single Core
Cinebench R20: CPU (Multi Core) | CPU (Single Core)
Cinebench R15: CPU Multi 64Bit | CPU Single 64Bit
Blender: v2.79 BMW27 CPU
7-Zip 18.03: 7z b 4 | 7z b 4 -mmt1
Geekbench 5.5: Multi-Core | Single-Core
HWBOT x265 Benchmark v2.2: 4k Preset
LibreOffice : 20 Documents To PDF
R Benchmark 2.5: Overall mean
| Cinebench R20 / CPU (Single Core) | |
| Intel NUC 13 Pro Desk Edition Kit | |
| Minisforum Venus Series UM790 Pro | |
| Beelink SER7 | |
| Intel NUC 12, NUC12SNKi72_Serpent Canyon | |
| Minisforum Venus Series NPB5 | |
| Beelink GTR6 | |
| Geekom Mini IT11, i7-11390H | |
| Média AMD Ryzen 7 7735HS (502 - 613, n=15) | |
| Minisforum Mercury Series EM680 | |
| GMK NucBox K2 | |
| Beelink SER6 Pro | |
| Trigkey Speed S | |
| Beelink SER Pro Ryzen 5 5600H | |
| GMK NucBox 2 | |
| HWBOT x265 Benchmark v2.2 / 4k Preset | |
| Minisforum Venus Series UM790 Pro | |
| Beelink SER7 | |
| Intel NUC 12, NUC12SNKi72_Serpent Canyon | |
| Média AMD Ryzen 7 7735HS (10.8 - 17.9, n=15) | |
| Beelink GTR6 | |
| GMK NucBox K2 | |
| Beelink SER6 Pro | |
| Minisforum Venus Series NPB5 | |
| Intel NUC 13 Pro Desk Edition Kit | |
| Minisforum Mercury Series EM680 | |
| Beelink SER Pro Ryzen 5 5600H | |
| Geekom Mini IT11, i7-11390H | |
| Trigkey Speed S | |
| GMK NucBox 2 | |
| LibreOffice / 20 Documents To PDF | |
| GMK NucBox 2 | |
| Minisforum Mercury Series EM680 | |
| Média AMD Ryzen 7 7735HS (44.3 - 63.9, n=15) | |
| Beelink SER Pro Ryzen 5 5600H | |
| Beelink SER6 Pro | |
| Geekom Mini IT11, i7-11390H | |
| Intel NUC 13 Pro Desk Edition Kit | |
| Minisforum Venus Series UM790 Pro | |
| Beelink GTR6 | |
| GMK NucBox K2 | |
| Intel NUC 12, NUC12SNKi72_Serpent Canyon | |
| Trigkey Speed S | |
| Minisforum Venus Series NPB5 | |
| Beelink SER7 | |
Cinebench R23: Multi Core | Single Core
Cinebench R20: CPU (Multi Core) | CPU (Single Core)
Cinebench R15: CPU Multi 64Bit | CPU Single 64Bit
Blender: v2.79 BMW27 CPU
7-Zip 18.03: 7z b 4 | 7z b 4 -mmt1
Geekbench 5.5: Multi-Core | Single-Core
HWBOT x265 Benchmark v2.2: 4k Preset
LibreOffice : 20 Documents To PDF
R Benchmark 2.5: Overall mean
* ... menor é melhor
AIDA64: FP32 Ray-Trace | FPU Julia | CPU SHA3 | CPU Queen | FPU SinJulia | FPU Mandel | CPU AES | CPU ZLib | FP64 Ray-Trace | CPU PhotoWorxx
| Performance rating | |
| Beelink SER7 | |
| Média AMD Ryzen 7 7735HS | |
| GMK NucBox K2 | |
| Intel NUC 13 Pro Desk Edition Kit | |
| Trigkey Speed S | |
| Geekom Mini IT11, i7-11390H | |
| Blackview MP80 | |
| AIDA64 / FP32 Ray-Trace | |
| Beelink SER7 | |
| Média AMD Ryzen 7 7735HS (11831 - 17161, n=16) | |
| GMK NucBox K2 | |
| Intel NUC 13 Pro Desk Edition Kit | |
| Trigkey Speed S | |
| Geekom Mini IT11, i7-11390H | |
| Blackview MP80 | |
| AIDA64 / FPU Julia | |
| Beelink SER7 | |
| Média AMD Ryzen 7 7735HS (75370 - 105483, n=16) | |
| GMK NucBox K2 | |
| Intel NUC 13 Pro Desk Edition Kit | |
| Trigkey Speed S | |
| Geekom Mini IT11, i7-11390H | |
| Blackview MP80 | |
| AIDA64 / CPU SHA3 | |
| Beelink SER7 | |
| Média AMD Ryzen 7 7735HS (2499 - 3494, n=16) | |
| GMK NucBox K2 | |
| Intel NUC 13 Pro Desk Edition Kit | |
| Trigkey Speed S | |
| Geekom Mini IT11, i7-11390H | |
| Blackview MP80 | |
| AIDA64 / CPU Queen | |
| Beelink SER7 | |
| Média AMD Ryzen 7 7735HS (87486 - 108729, n=15) | |
| GMK NucBox K2 | |
| Intel NUC 13 Pro Desk Edition Kit | |
| Geekom Mini IT11, i7-11390H | |
| Trigkey Speed S | |
| Blackview MP80 | |
| AIDA64 / FPU SinJulia | |
| Beelink SER7 | |
| Média AMD Ryzen 7 7735HS (11233 - 13097, n=16) | |
| GMK NucBox K2 | |
| Intel NUC 13 Pro Desk Edition Kit | |
| Trigkey Speed S | |
| Geekom Mini IT11, i7-11390H | |
| Blackview MP80 | |
| AIDA64 / FPU Mandel | |
| Beelink SER7 | |
| Média AMD Ryzen 7 7735HS (41400 - 58232, n=16) | |
| GMK NucBox K2 | |
| Intel NUC 13 Pro Desk Edition Kit | |
| Trigkey Speed S | |
| Geekom Mini IT11, i7-11390H | |
| Blackview MP80 | |
| AIDA64 / CPU AES | |
| Beelink SER7 | |
| GMK NucBox K2 | |
| Média AMD Ryzen 7 7735HS (44013 - 137629, n=16) | |
| Trigkey Speed S | |
| Geekom Mini IT11, i7-11390H | |
| Intel NUC 13 Pro Desk Edition Kit | |
| Blackview MP80 | |
| AIDA64 / CPU ZLib | |
| Beelink SER7 | |
| Média AMD Ryzen 7 7735HS (651 - 906, n=16) | |
| Intel NUC 13 Pro Desk Edition Kit | |
| GMK NucBox K2 | |
| Geekom Mini IT11, i7-11390H | |
| Trigkey Speed S | |
| Blackview MP80 | |
| AIDA64 / FP64 Ray-Trace | |
| Beelink SER7 | |
| Média AMD Ryzen 7 7735HS (1459 - 9094, n=16) | |
| GMK NucBox K2 | |
| Intel NUC 13 Pro Desk Edition Kit | |
| Trigkey Speed S | |
| Geekom Mini IT11, i7-11390H | |
| Blackview MP80 | |
| AIDA64 / CPU PhotoWorxx | |
| Beelink SER7 | |
| GMK NucBox K2 | |
| Intel NUC 13 Pro Desk Edition Kit | |
| Média AMD Ryzen 7 7735HS (17524 - 30542, n=16) | |
| Trigkey Speed S | |
| Geekom Mini IT11, i7-11390H | |
| Blackview MP80 | |
Desempenho do sistema
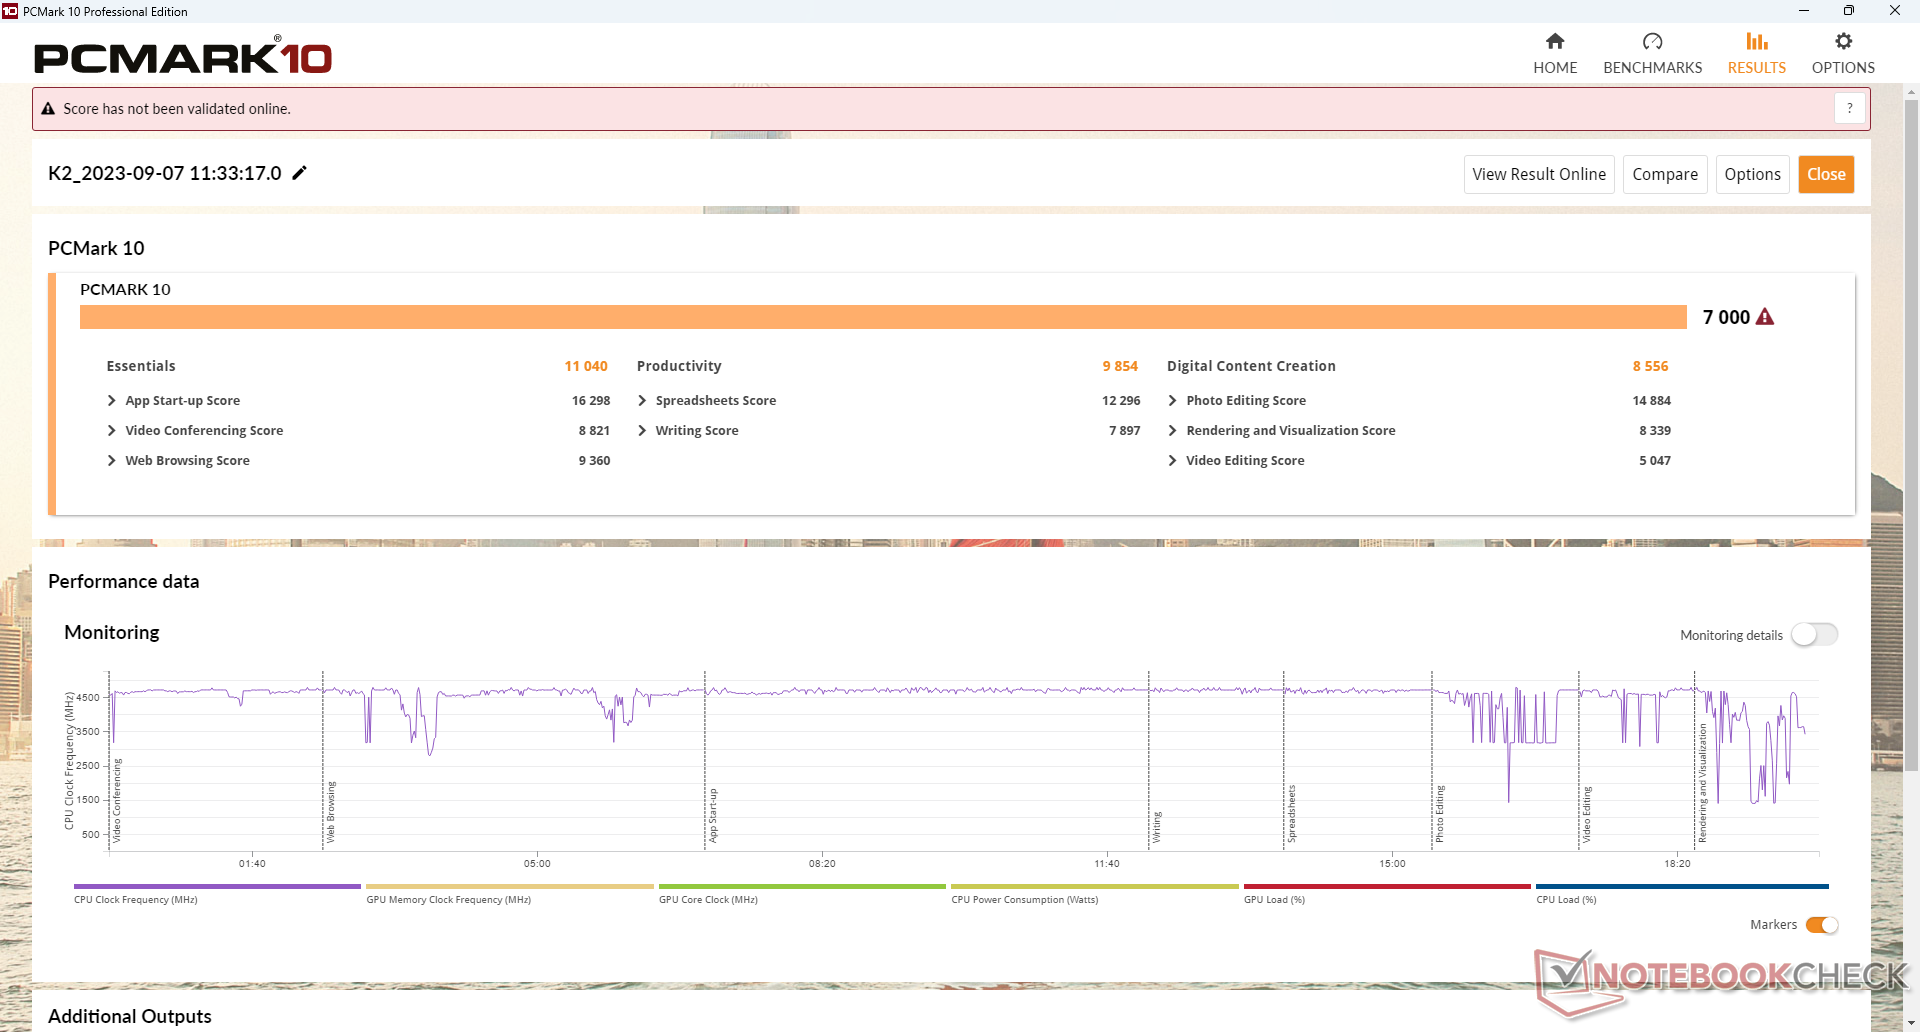
As pontuações no PCMark são excelentes, com resultados mais rápidos do que a maioria dos outros mini PCs equipados com CPUs Intel de 12ª geração ou mais antigas. Sua pontuação em Digital Content Creation é particularmente notável, já que a Radeon 680M pode dar voltas em torno da série Iris Xe.
CrossMark: Overall | Productivity | Creativity | Responsiveness
| PCMark 10 / Score | |
| Beelink SER7 | |
| GMK NucBox K2 | |
| Média AMD Ryzen 7 7735HS (5722 - 7916, n=16) | |
| Intel NUC 13 Pro Desk Edition Kit | |
| Trigkey Speed S | |
| Geekom Mini IT11, i7-11390H | |
| GMK NucBox 2 | |
| PCMark 10 / Essentials | |
| GMK NucBox K2 | |
| Intel NUC 13 Pro Desk Edition Kit | |
| Beelink SER7 | |
| Trigkey Speed S | |
| Média AMD Ryzen 7 7735HS (8648 - 11124, n=16) | |
| Geekom Mini IT11, i7-11390H | |
| GMK NucBox 2 | |
| PCMark 10 / Productivity | |
| Beelink SER7 | |
| GMK NucBox K2 | |
| Média AMD Ryzen 7 7735HS (8077 - 12153, n=16) | |
| Trigkey Speed S | |
| Geekom Mini IT11, i7-11390H | |
| Intel NUC 13 Pro Desk Edition Kit | |
| GMK NucBox 2 | |
| PCMark 10 / Digital Content Creation | |
| Média AMD Ryzen 7 7735HS (5798 - 12699, n=16) | |
| Beelink SER7 | |
| GMK NucBox K2 | |
| Intel NUC 13 Pro Desk Edition Kit | |
| Trigkey Speed S | |
| Geekom Mini IT11, i7-11390H | |
| GMK NucBox 2 | |
| CrossMark / Overall | |
| Beelink SER7 | |
| GMK NucBox K2 | |
| Intel NUC 13 Pro Desk Edition Kit | |
| Média AMD Ryzen 7 7735HS (1280 - 1758, n=13) | |
| Geekom Mini IT11, i7-11390H | |
| Trigkey Speed S | |
| CrossMark / Productivity | |
| GMK NucBox K2 | |
| Beelink SER7 | |
| Média AMD Ryzen 7 7735HS (1308 - 1730, n=13) | |
| Intel NUC 13 Pro Desk Edition Kit | |
| Geekom Mini IT11, i7-11390H | |
| Trigkey Speed S | |
| CrossMark / Creativity | |
| Beelink SER7 | |
| Intel NUC 13 Pro Desk Edition Kit | |
| GMK NucBox K2 | |
| Média AMD Ryzen 7 7735HS (1273 - 1986, n=13) | |
| Geekom Mini IT11, i7-11390H | |
| Trigkey Speed S | |
| CrossMark / Responsiveness | |
| GMK NucBox K2 | |
| Trigkey Speed S | |
| Geekom Mini IT11, i7-11390H | |
| Média AMD Ryzen 7 7735HS (1108 - 1704, n=13) | |
| Intel NUC 13 Pro Desk Edition Kit | |
| Beelink SER7 | |
| PCMark 10 Score | 7000 pontos | |
Ajuda | ||
| AIDA64 / Memory Copy | |
| Beelink SER7 | |
| GMK NucBox K2 | |
| GMK NucBox 2 | |
| Média AMD Ryzen 7 7735HS (30324 - 52012, n=16) | |
| Intel NUC 13 Pro Desk Edition Kit | |
| Geekom Mini IT11, i7-11390H | |
| Trigkey Speed S | |
| AIDA64 / Memory Read | |
| Beelink SER7 | |
| GMK NucBox K2 | |
| Geekom Mini IT11, i7-11390H | |
| Média AMD Ryzen 7 7735HS (33938 - 51856, n=16) | |
| Trigkey Speed S | |
| Intel NUC 13 Pro Desk Edition Kit | |
| GMK NucBox 2 | |
| AIDA64 / Memory Write | |
| Beelink SER7 | |
| GMK NucBox K2 | |
| GMK NucBox 2 | |
| Média AMD Ryzen 7 7735HS (33175 - 55284, n=16) | |
| Geekom Mini IT11, i7-11390H | |
| Trigkey Speed S | |
| Intel NUC 13 Pro Desk Edition Kit | |
| AIDA64 / Memory Latency | |
| Intel NUC 13 Pro Desk Edition Kit | |
| Média AMD Ryzen 7 7735HS (78.2 - 109.8, n=16) | |
| Beelink SER7 | |
| GMK NucBox K2 | |
| Trigkey Speed S | |
| Geekom Mini IT11, i7-11390H | |
| GMK NucBox 2 | |
* ... menor é melhor
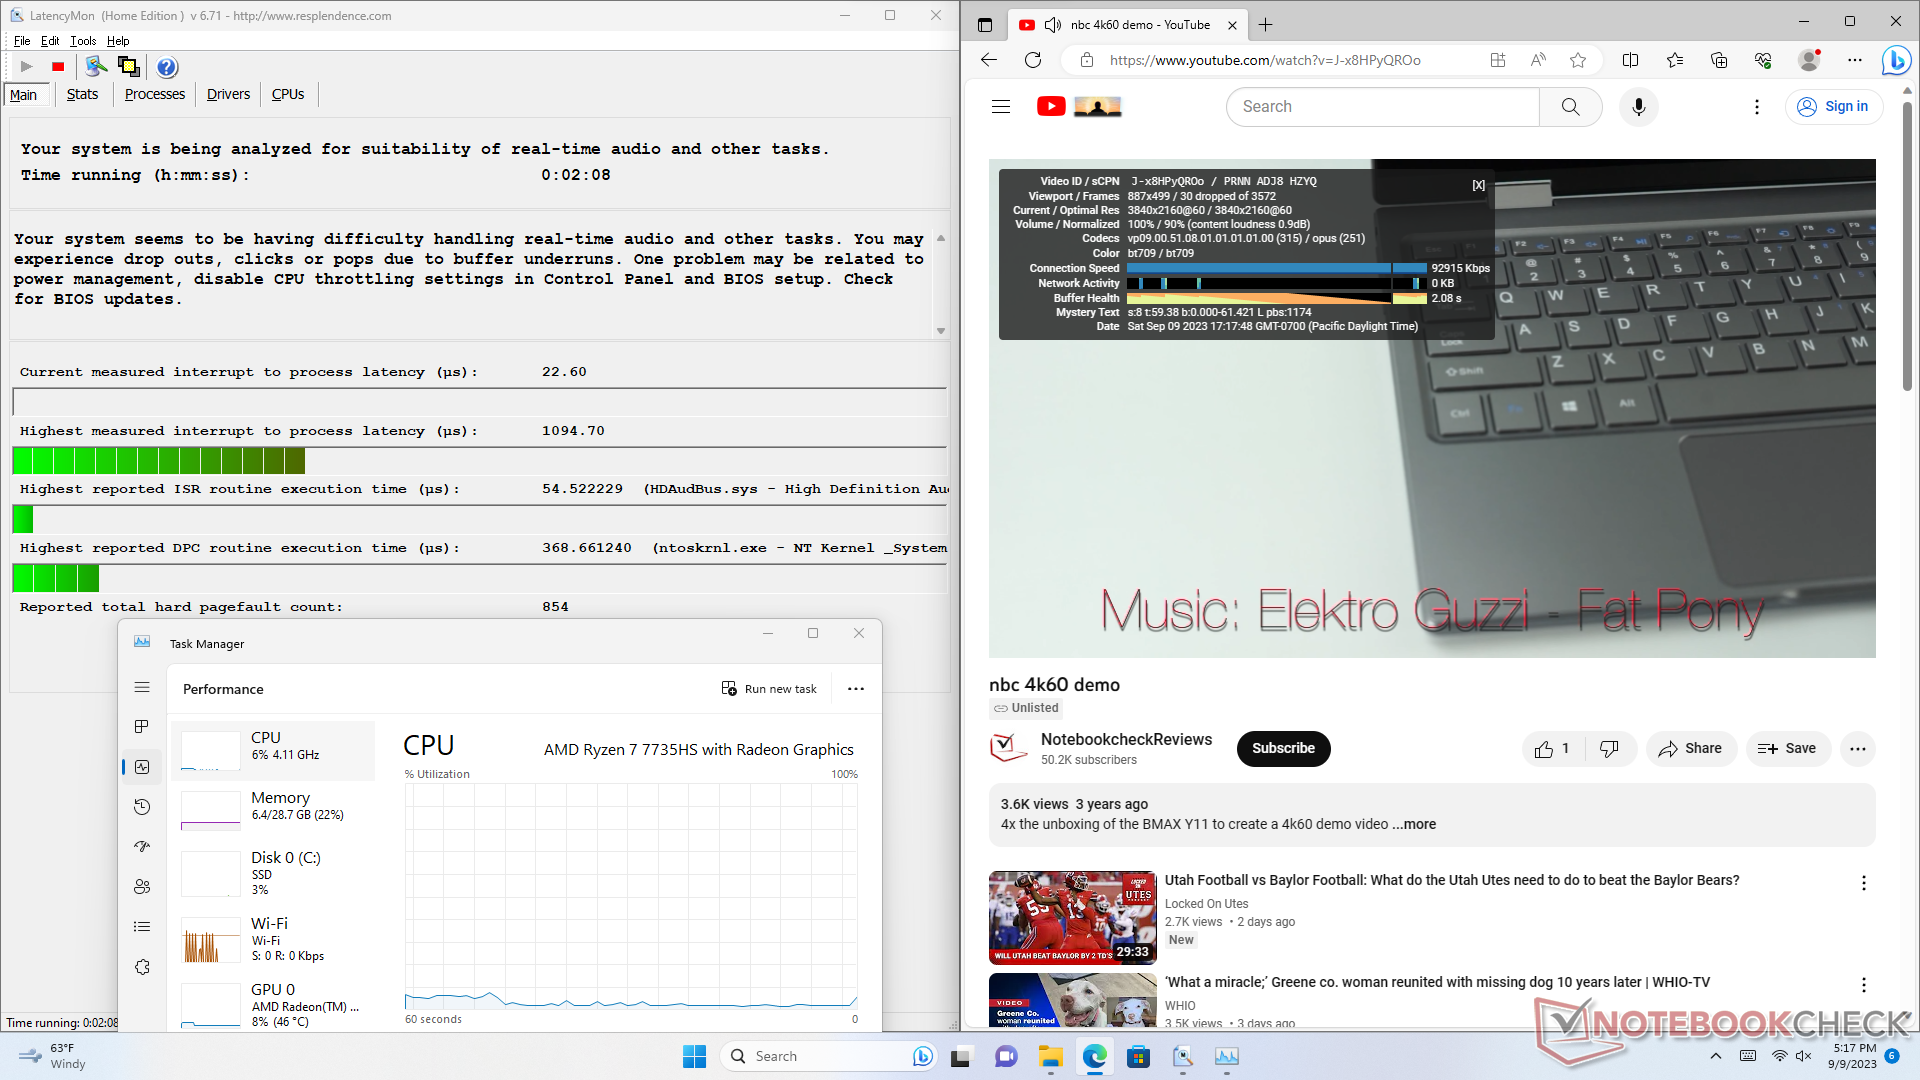
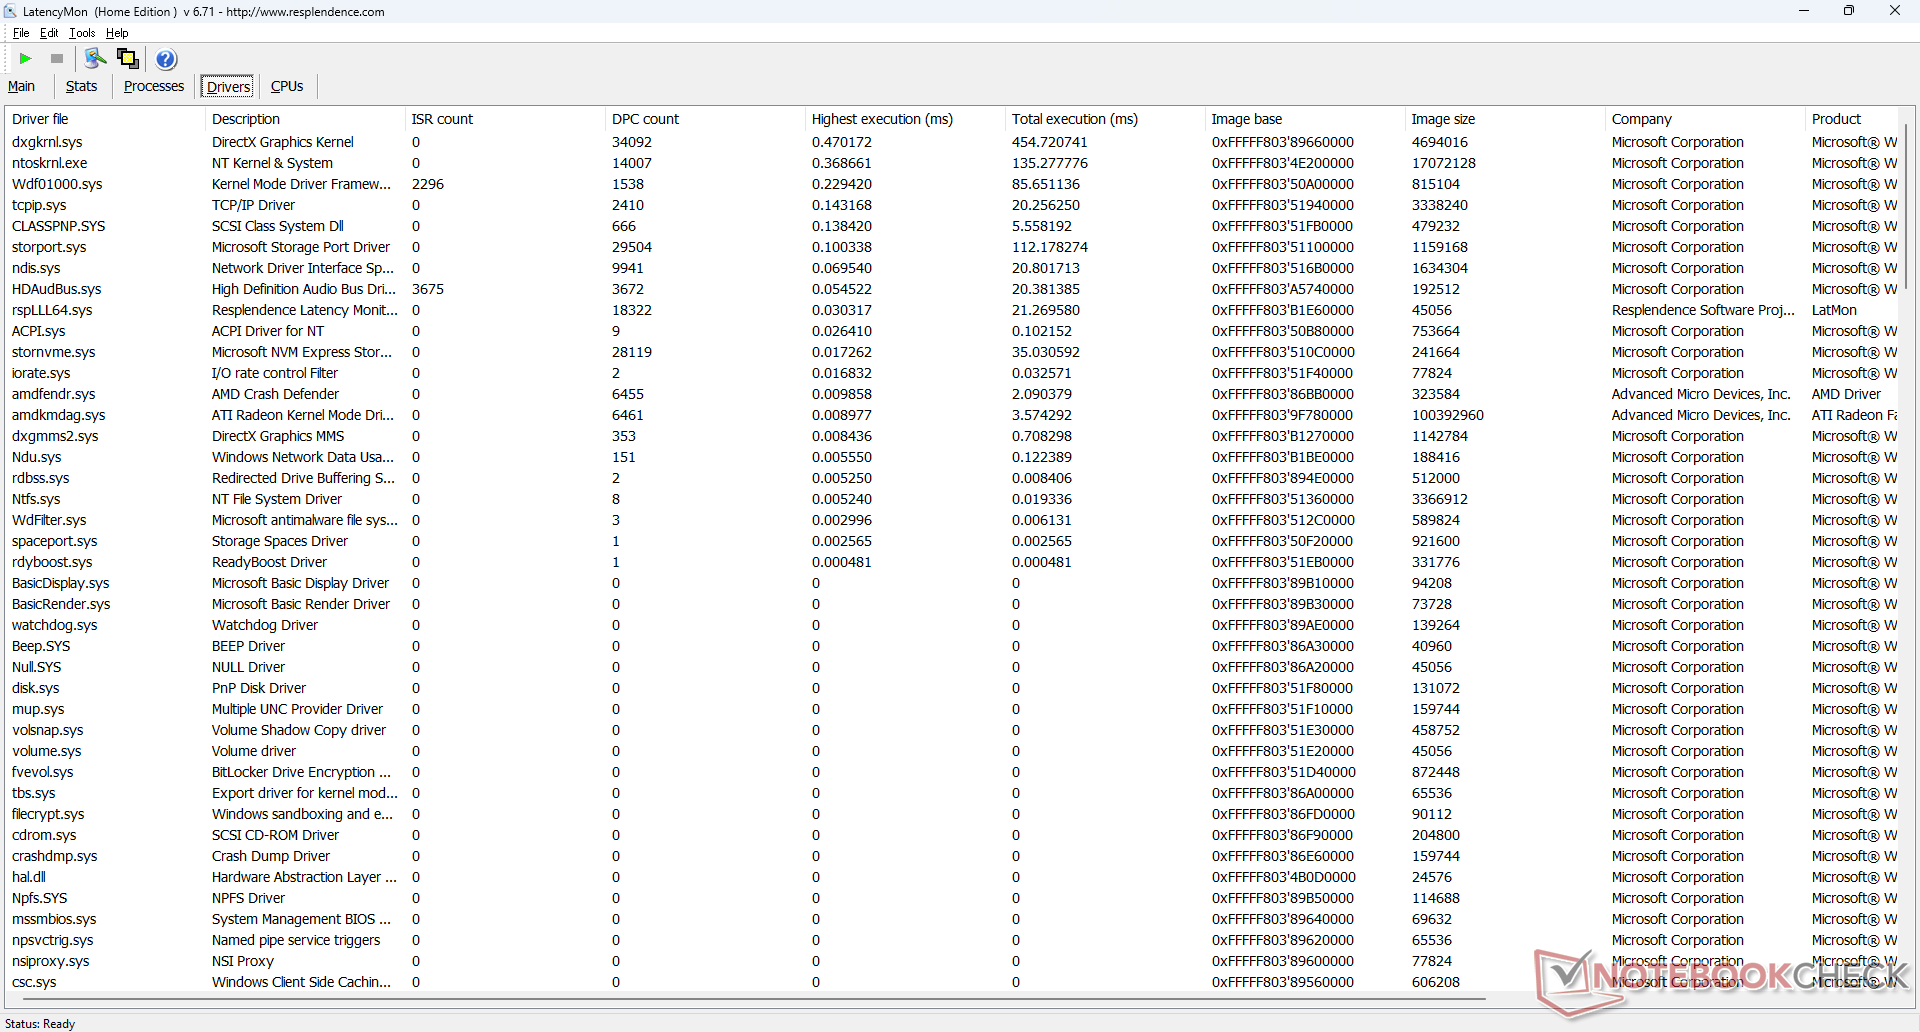
Latência DPC
O LatencyMon revela pequenos problemas de DPC ao abrir várias guias do navegador em nossa página inicial. a reprodução de vídeo 4K a 60 FPS apresenta problemas, pois conseguimos registrar 30 quadros perdidos em um período de um minuto. A gagueira sugere um possível problema de driver da AMD que deve ser resolvido.
| DPC Latencies / LatencyMon - interrupt to process latency (max), Web, Youtube, Prime95 | |
| Trigkey Speed S | |
| GMK NucBox K2 | |
| Intel NUC 13 Pro Desk Edition Kit | |
| GMK NucBox 2 | |
| Beelink SER7 | |
| Geekom Mini IT11, i7-11390H | |
* ... menor é melhor
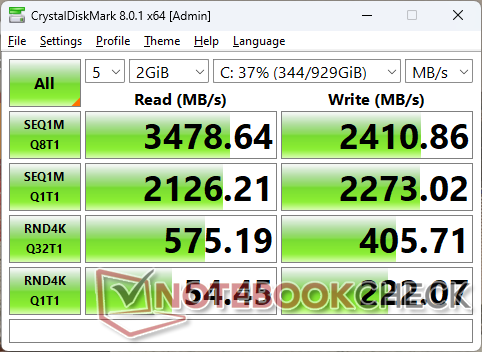
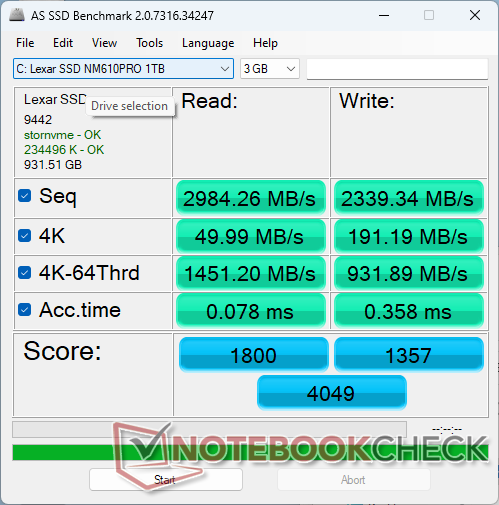
Dispositivos de armazenamento
O modelo é fornecido com um PCIe3 x4 de médio porte Lexar NM610 Pro que oferece taxas de transferência máximas mais rápidas do que a versão normal do NM610 não Pro (3300 MB/s vs. 2100 MB/s). Modelos PCIe4 mais caros, como o Samsung PM9A1, são compatíveis com até duas vezes o desempenho, mas a limitação pode ser um problema, pois não há resfriamento adicional para a unidade.

| Drive Performance rating - Percent | |
| Intel NUC 13 Pro Desk Edition Kit | |
| Beelink SER7 | |
| GMK NucBox K2 | |
| Trigkey Speed S | |
| Geekom Mini IT11, i7-11390H | |
| GMK NucBox 2 | |
* ... menor é melhor
Disk Throttling: DiskSpd Read Loop, Queue Depth 8
Desempenho da GPU
A Radeon 680M ainda é uma das GPUs integradas mais rápidas do mercado, embora já tenha quase dois anos de idade. A GPU é potente o suficiente para reproduzir títulos 3D modernos em 1080p nativo, desde que as configurações sejam ajustadas para um nível mais baixo. Recomendamos conectar um monitor compatível com FreeSync se você for jogar no NucBox K2 com frequência, pois a Radeon 680M tende a oscilar entre 45 e 60 FPS.
Espera-se que a atualização para a configuração do Ryzen 9 7940HS com a Radeon 780M aumente o desempenho gráfico em cerca de 10 a 20%, com base em nosso tempo com o Beelink SER7.
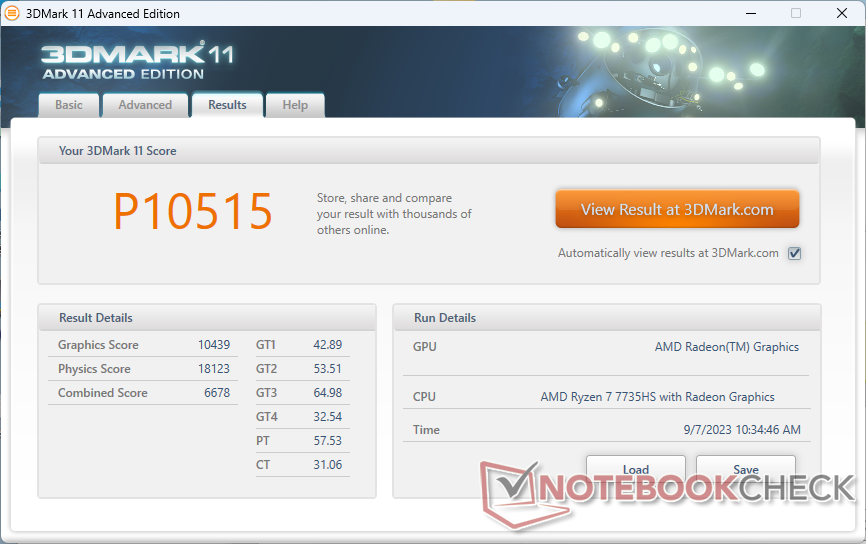
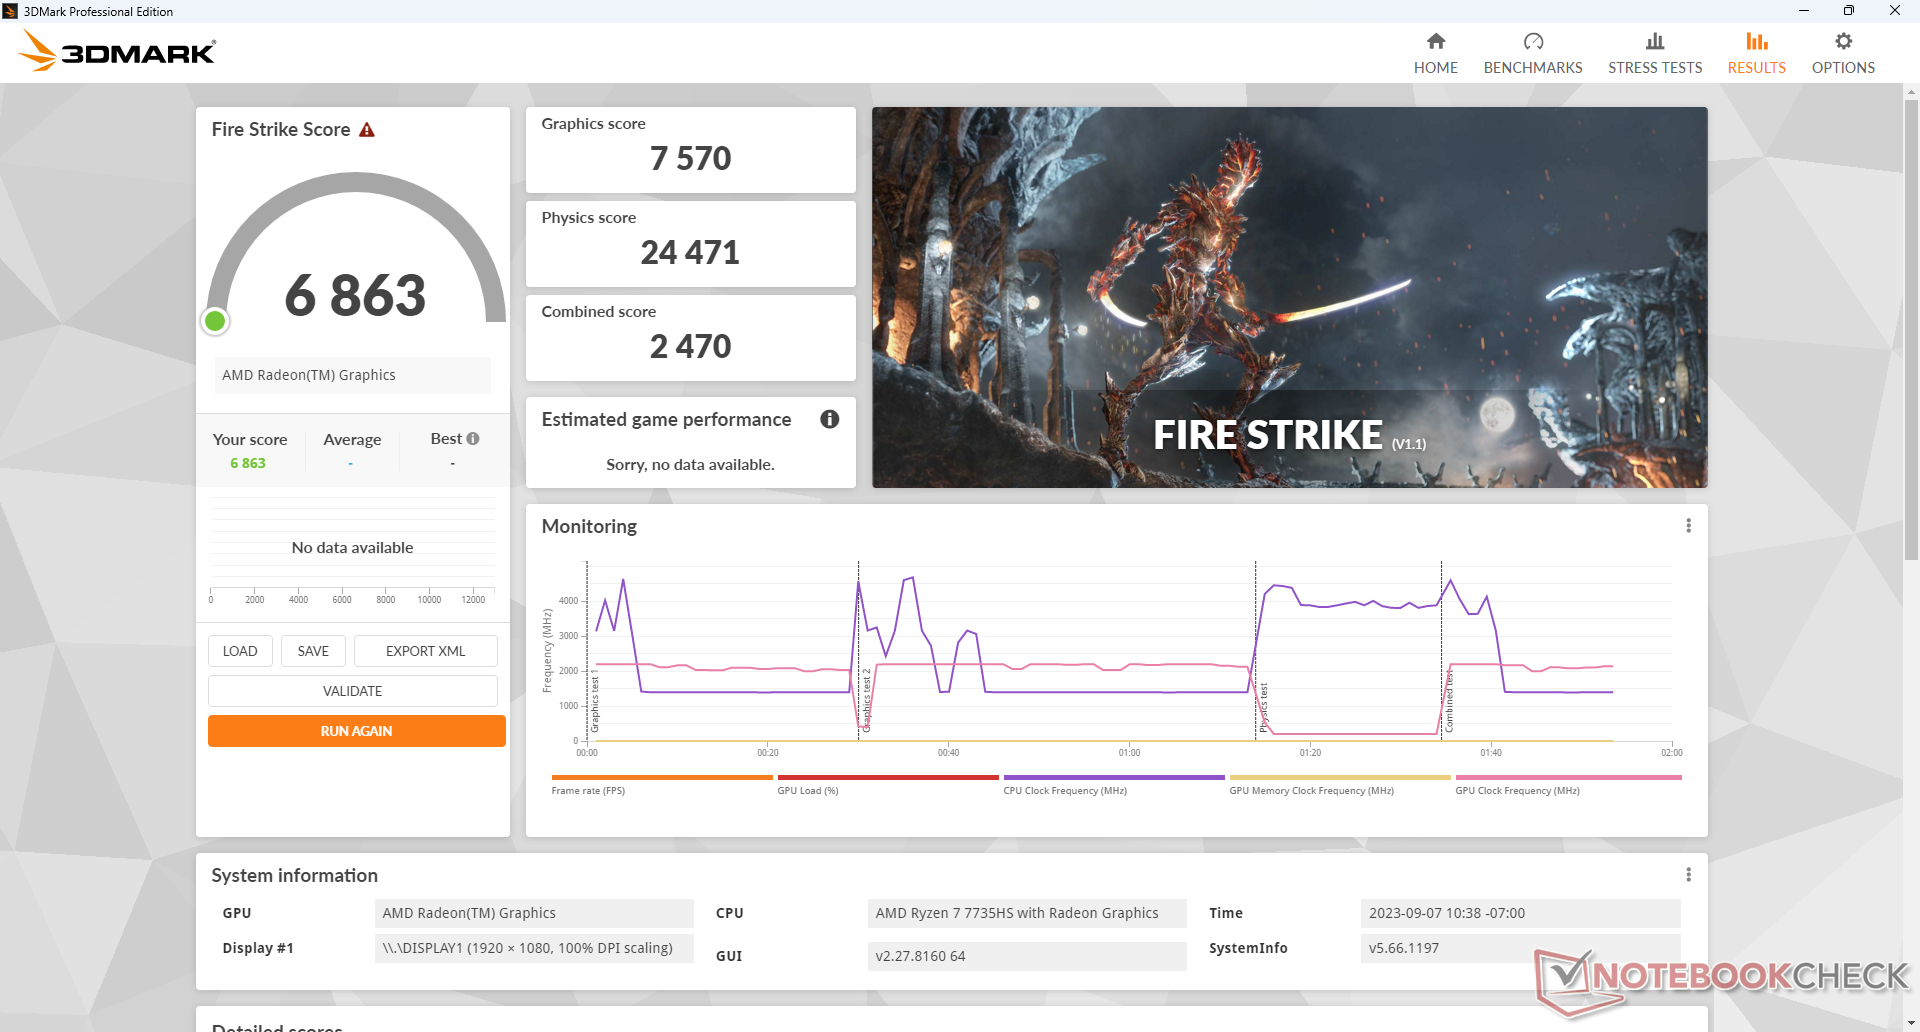
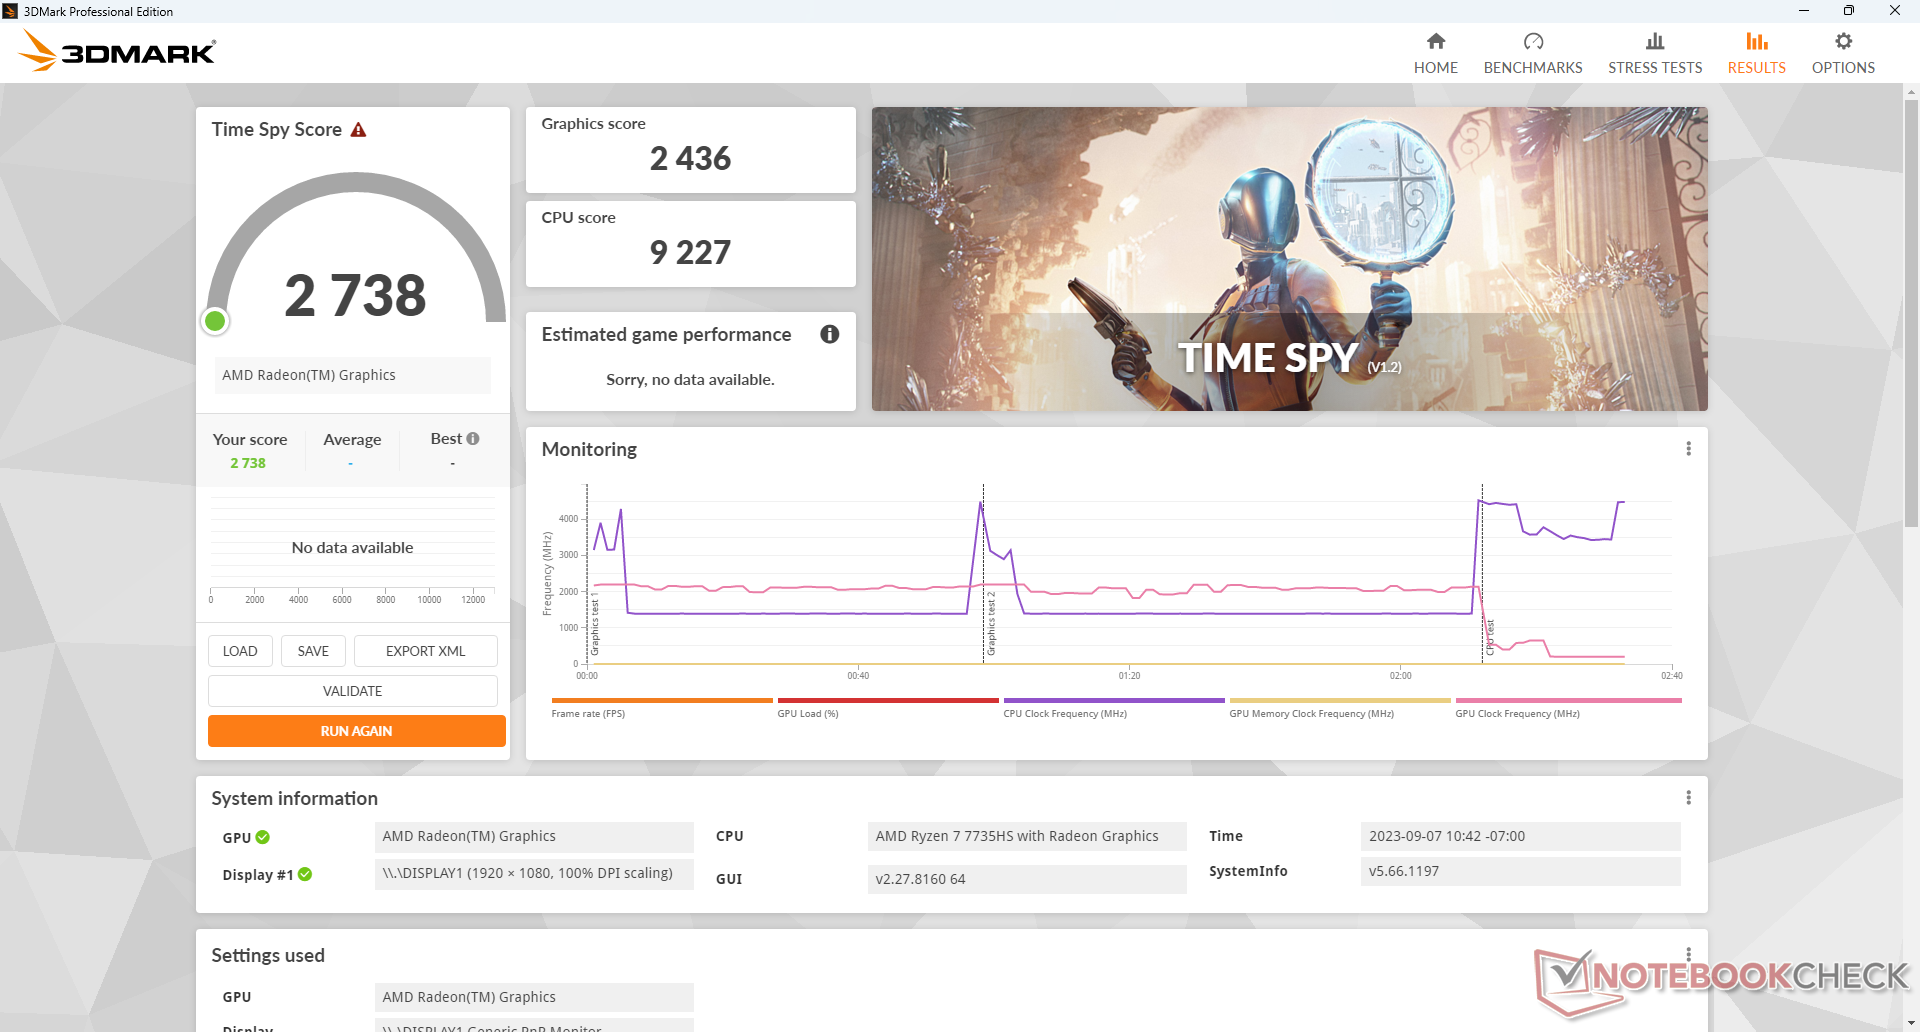
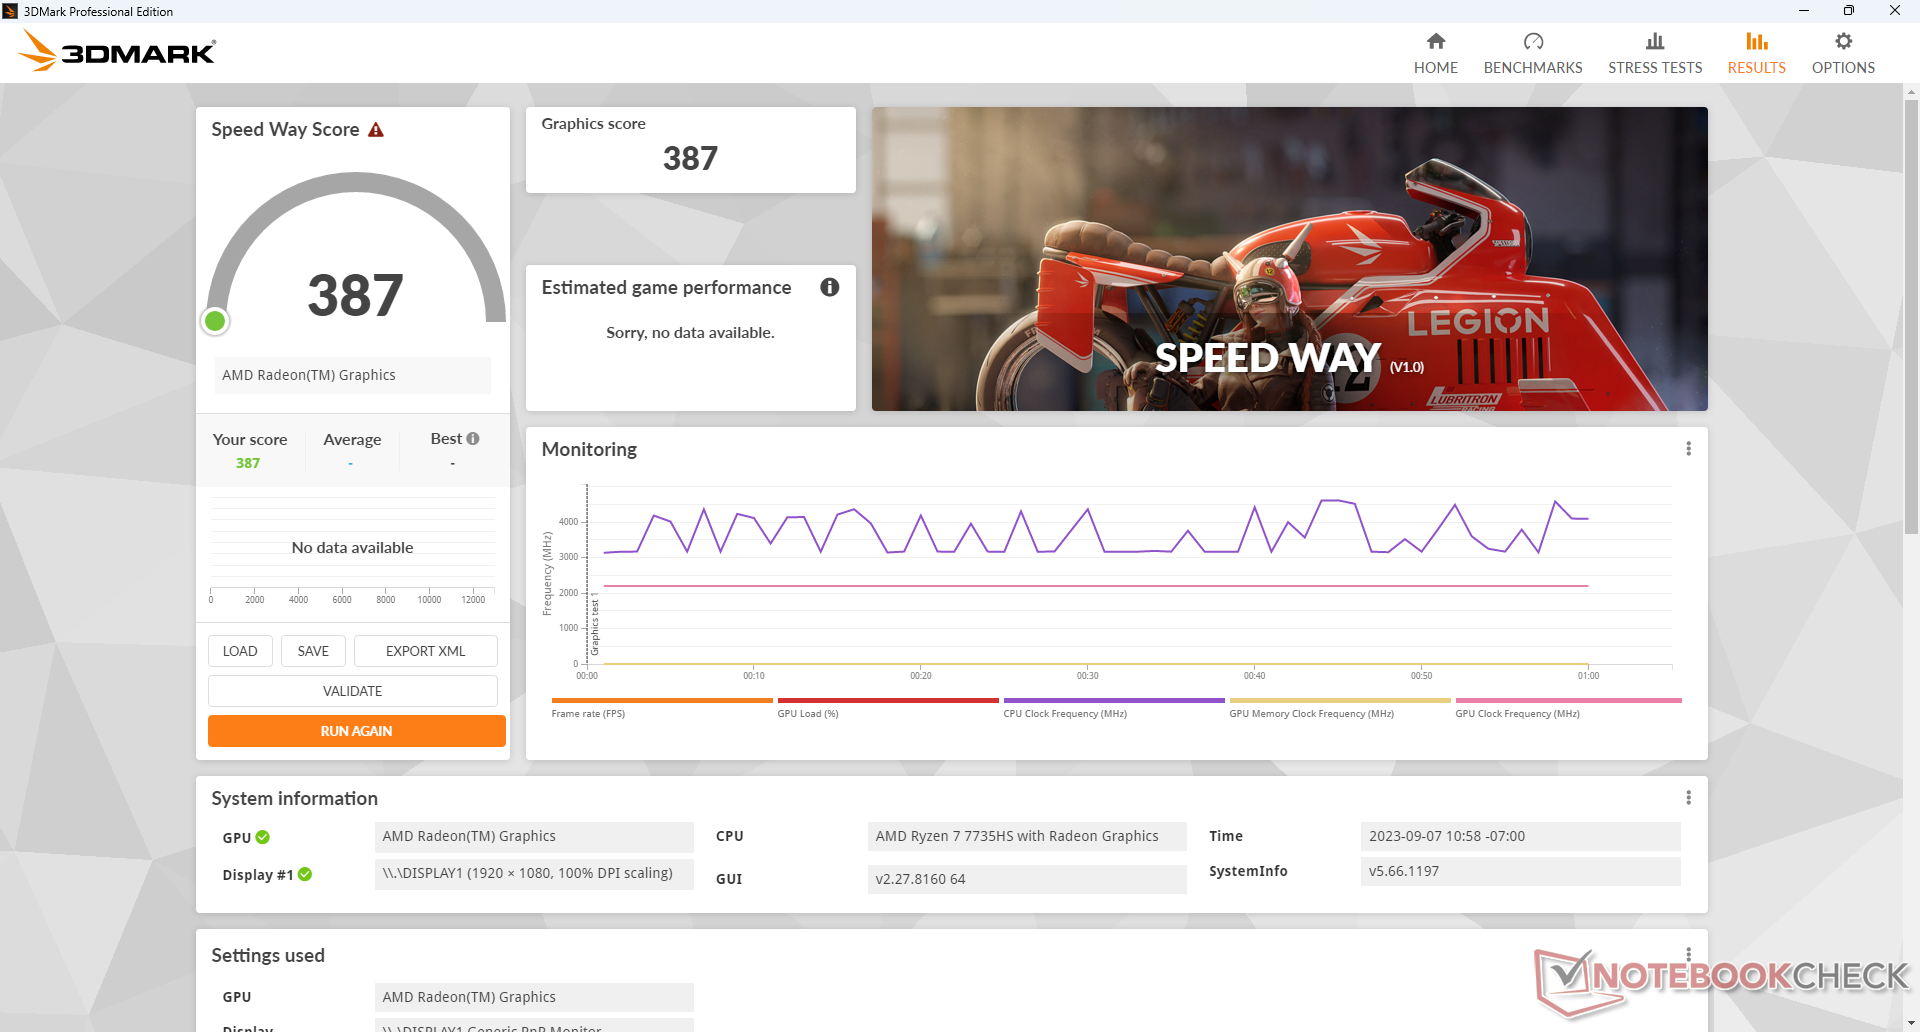
| 3DMark 11 Performance | 10515 pontos | |
| 3DMark Fire Strike Score | 6863 pontos | |
| 3DMark Time Spy Score | 2738 pontos | |
Ajuda | ||
* ... menor é melhor
As taxas de quadros quando em marcha lenta no Witcher 3 são geralmente consistentes, mas não sem alguns altos e baixos, como mostra o gráfico abaixo. Felizmente, as flutuações não são extremas o suficiente para causar preocupação durante os jogos.
Witcher 3 FPS Chart
| baixo | média | alto | ultra | |
|---|---|---|---|---|
| GTA V (2015) | 152.3 | 139.1 | 51.9 | 24 |
| The Witcher 3 (2015) | 121.6 | 75.9 | 37.9 | 22.7 |
| Dota 2 Reborn (2015) | 141.2 | 113.5 | 84.2 | 73.7 |
| Final Fantasy XV Benchmark (2018) | 63.4 | 33 | 24.8 | |
| X-Plane 11.11 (2018) | 66.7 | 52.8 | 42.4 | |
| Far Cry 5 (2018) | 69 | 41 | 38 | 36 |
| Strange Brigade (2018) | 147.3 | 56 | 45.9 | 42.5 |
| Cyberpunk 2077 1.6 (2022) | 35.8 | 27.4 | 21 | 19.2 |
| Tiny Tina's Wonderlands (2022) | 61 | 45.1 | 31.2 | 24.4 |
| F1 22 (2022) | 82.6 | 74.1 | 54.7 | 13.9 |
Emissões
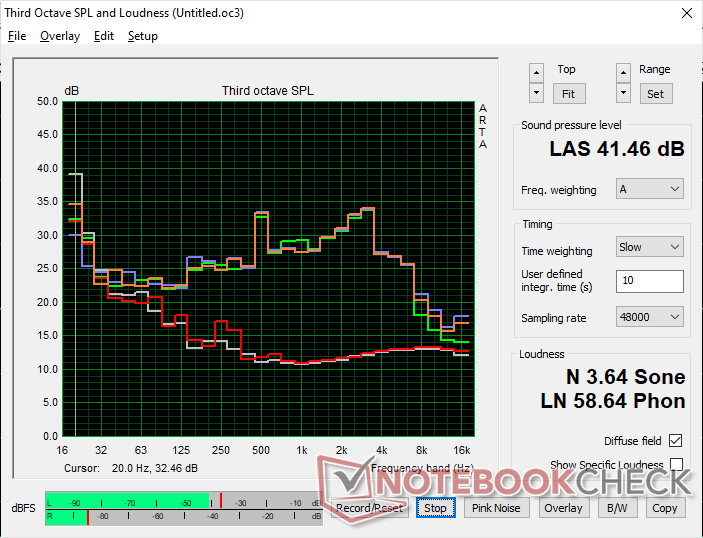
Ruído do sistema
O ruído do ventilador é um ponto fraco do NucBox K2. O ventilador interno pulsa com bastante frequência, de silencioso a 36 dB(A), mesmo durante cargas baixas, como navegação ou streaming de vídeo. Conseguimos atingir um ruído máximo de quase 42 dB(A) rapidamente na metade da primeira cena de benchmark do 3DMark 06.
Barulho
| Ocioso |
| 24.4 / 24.4 / 36.8 dB |
| Carga |
| 41.6 / 41.6 dB |
 | ||
30 dB silencioso 40 dB(A) audível 50 dB(A) ruidosamente alto |
||
min: | ||
| GMK NucBox K2 Radeon 680M, R7 7735HS, Lexar NM610 Pro NM610P001T-HNNNG | GMK NucBox 2 Iris Plus Graphics 655, i5-8259U, Netac S930E8/256GPN | Beelink SER7 Radeon 780M, R7 7840HS, Crucial P3 Plus CT1000P3PSSD8 | Intel NUC 13 Pro Desk Edition Kit Iris Xe G7 96EUs, i7-1360P, Samsung PM9A1 MZVL2512HCJQ | Geekom Mini IT11, i7-11390H Iris Xe G7 96EUs, i7-11390H, Lexar 1024GB LNM6A1X001T-HNNNG | Trigkey Speed S Iris Xe G7 96EUs, i5-11320H, Intel SSD 670p SSDPEKNU512GZ | |
|---|---|---|---|---|---|---|
| Noise | 8% | 6% | -3% | 2% | 13% | |
| desligado / ambiente * (dB) | 24.1 | 25.6 -6% | 24.5 -2% | 25.2 -5% | 29.7 -23% | 23.5 2% |
| Idle Minimum * (dB) | 24.4 | 25.7 -5% | 25.1 -3% | 28.1 -15% | 30.2 -24% | 24.1 1% |
| Idle Average * (dB) | 24.4 | 25.7 -5% | 25.1 -3% | 28.2 -16% | 30.2 -24% | 24.1 1% |
| Idle Maximum * (dB) | 36.8 | 25.7 30% | 25.1 32% | 28.3 23% | 30.2 18% | 26.6 28% |
| Load Average * (dB) | 41.6 | 35.3 15% | 35.9 14% | 42 -1% | 30.6 26% | 30.4 27% |
| Witcher 3 ultra * (dB) | 41.7 | 35.6 15% | 30.5 27% | 30.4 27% | ||
| Load Maximum * (dB) | 41.6 | 35.1 16% | 45.4 -9% | 42.1 -1% | 36.4 13% | 38.1 8% |
* ... menor é melhor
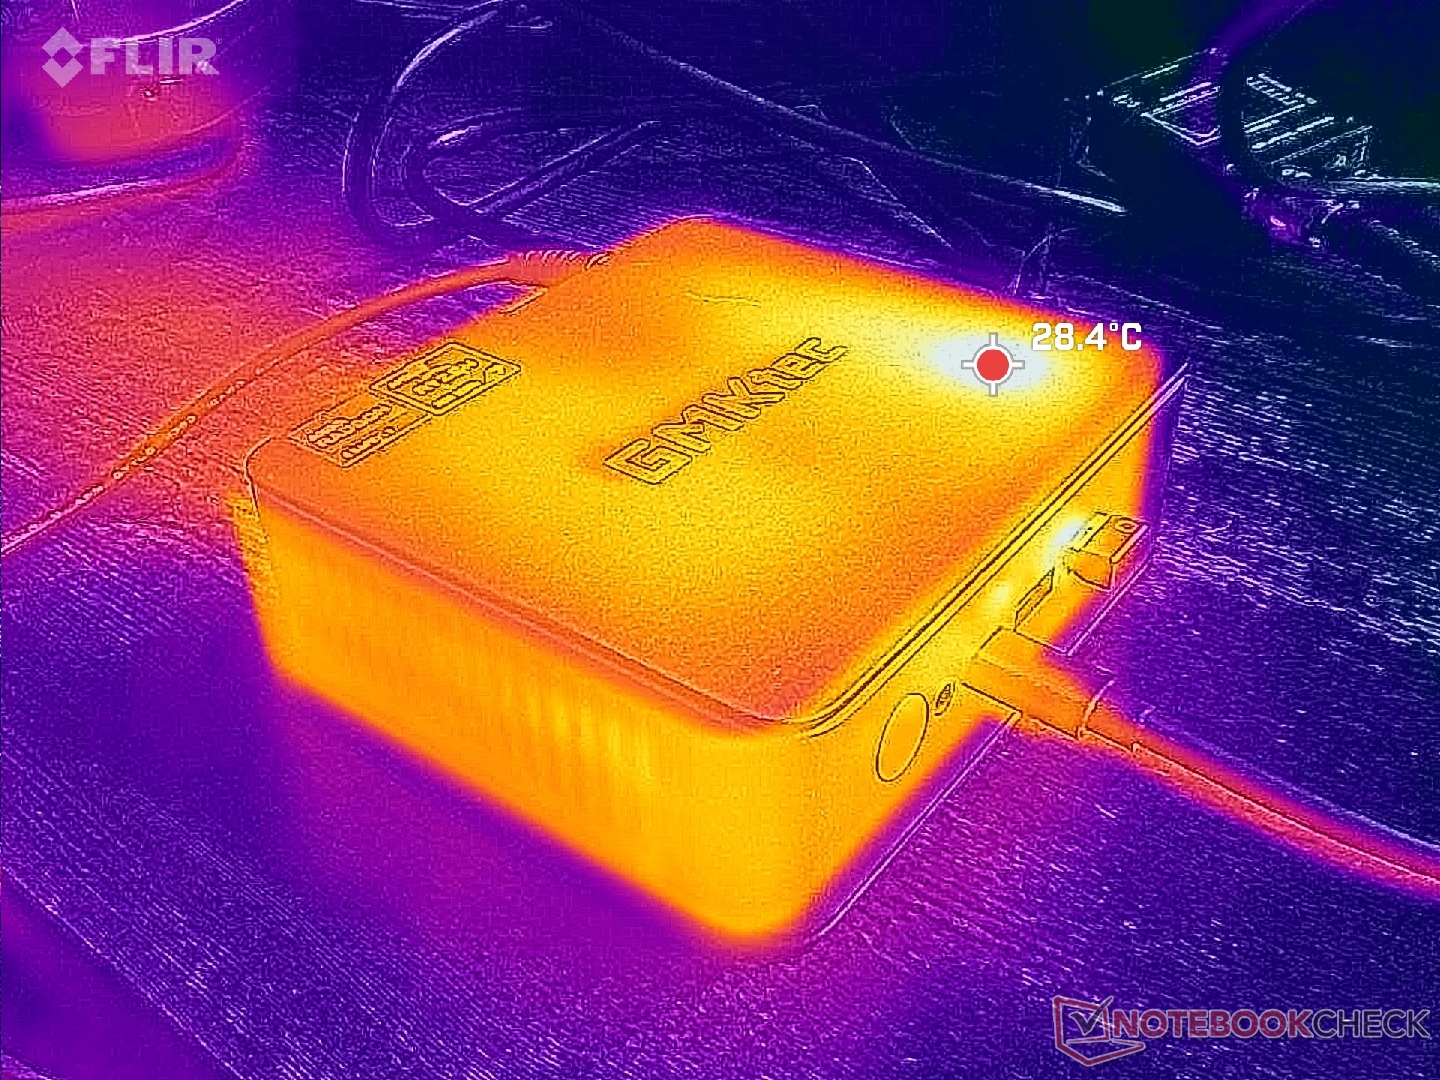
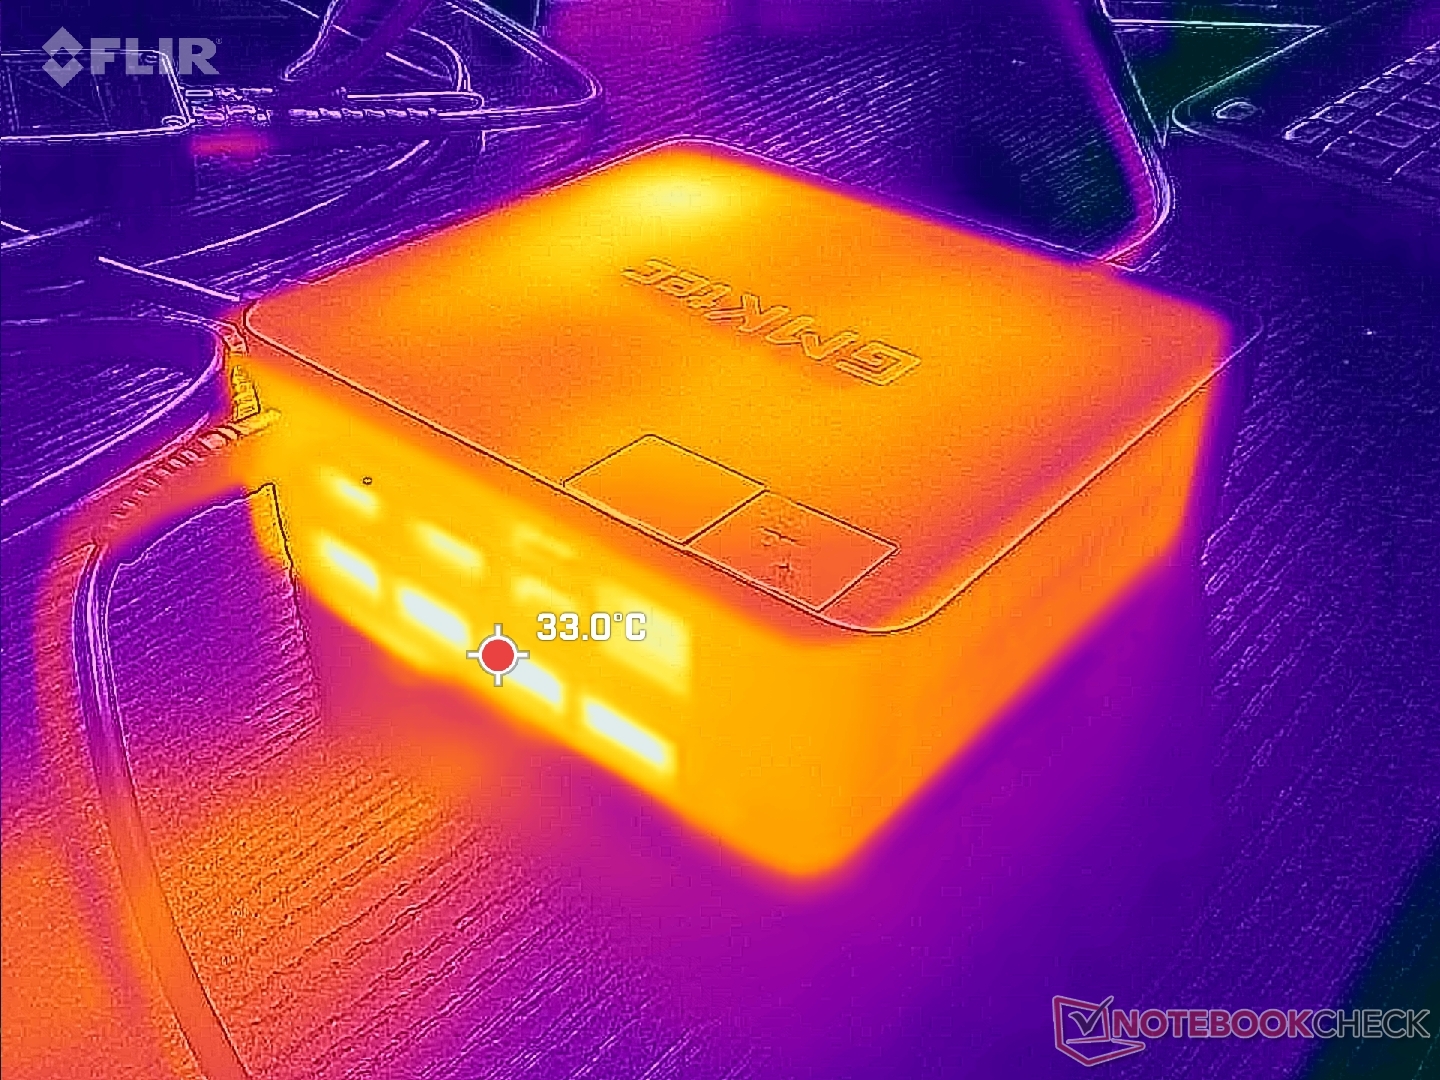
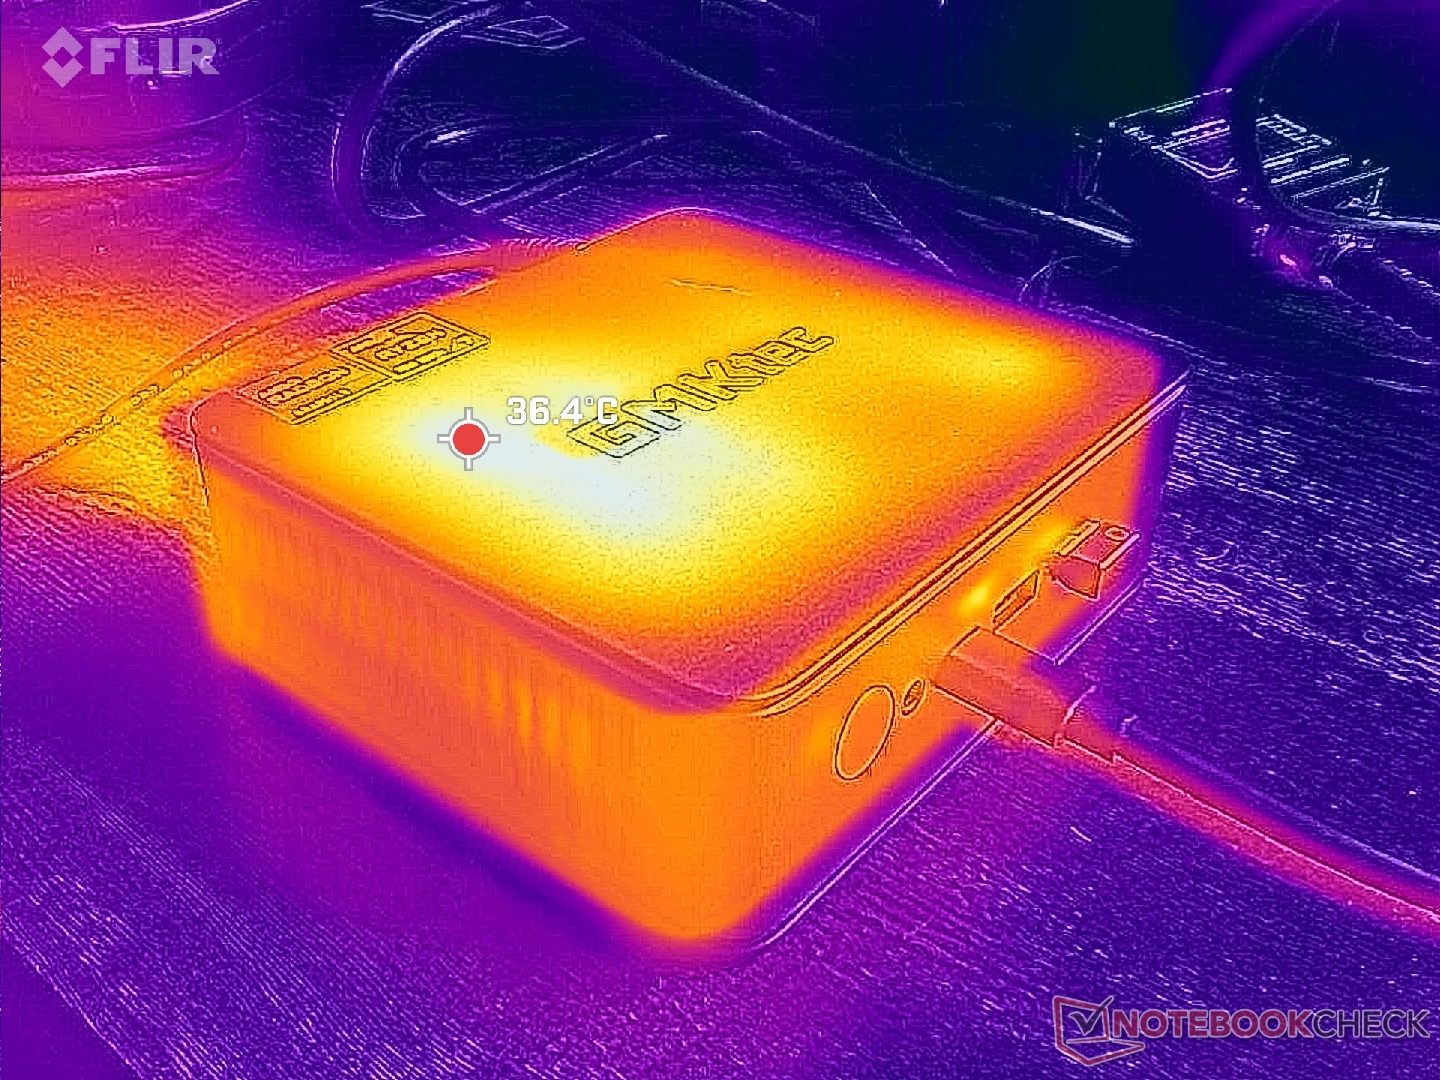
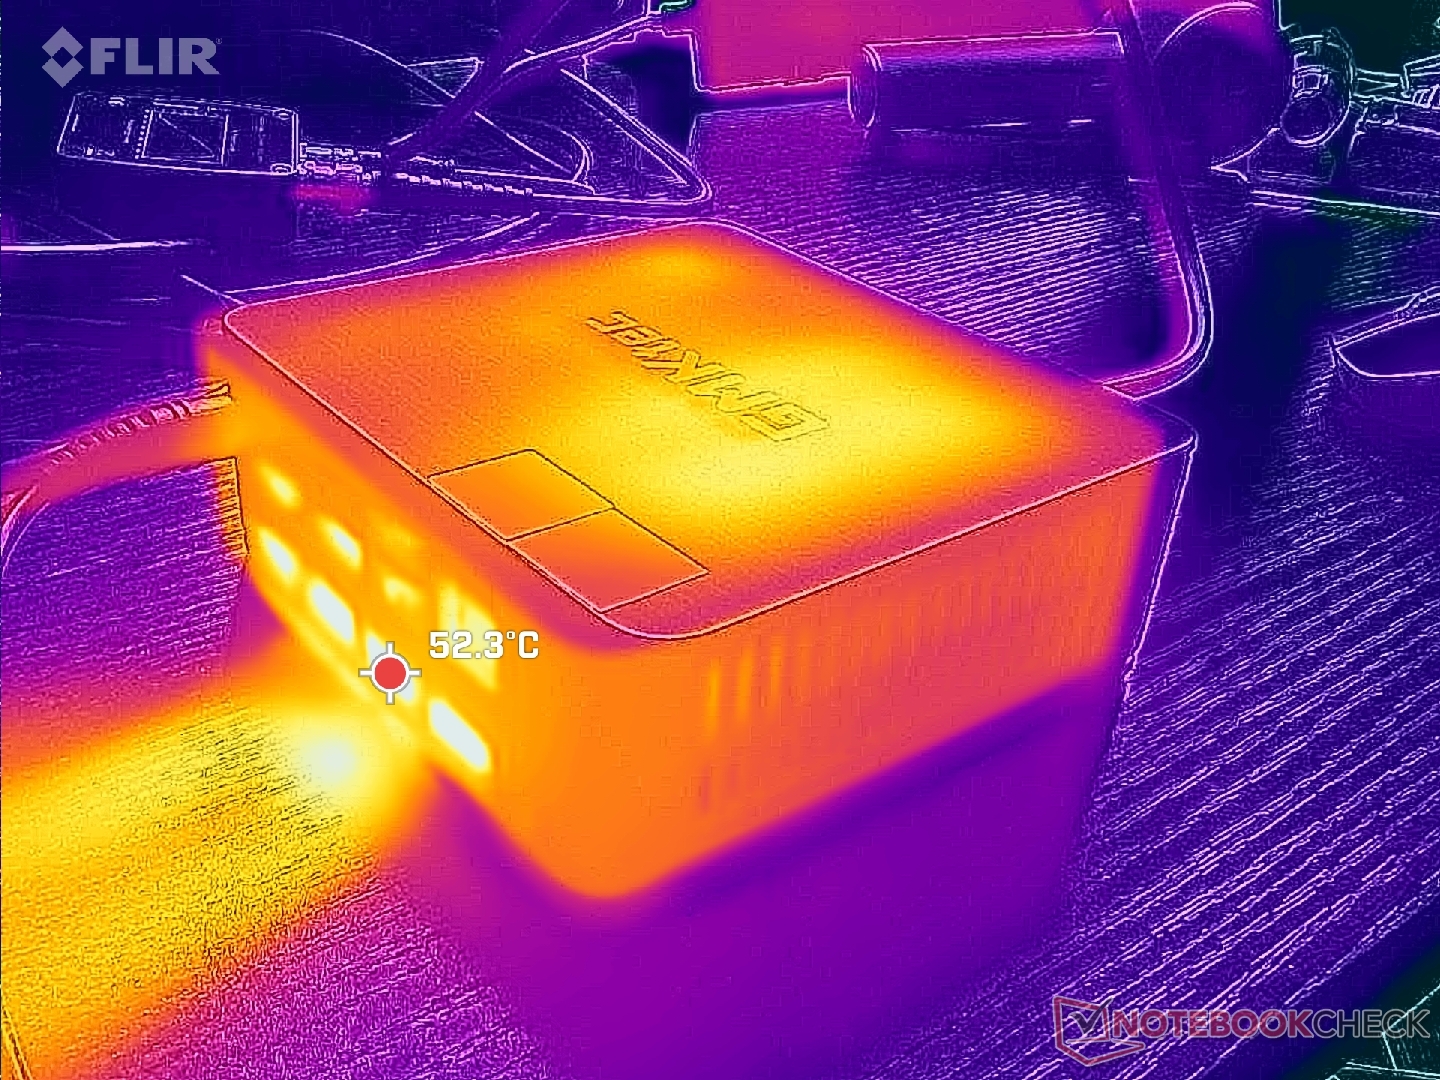
Temperatura
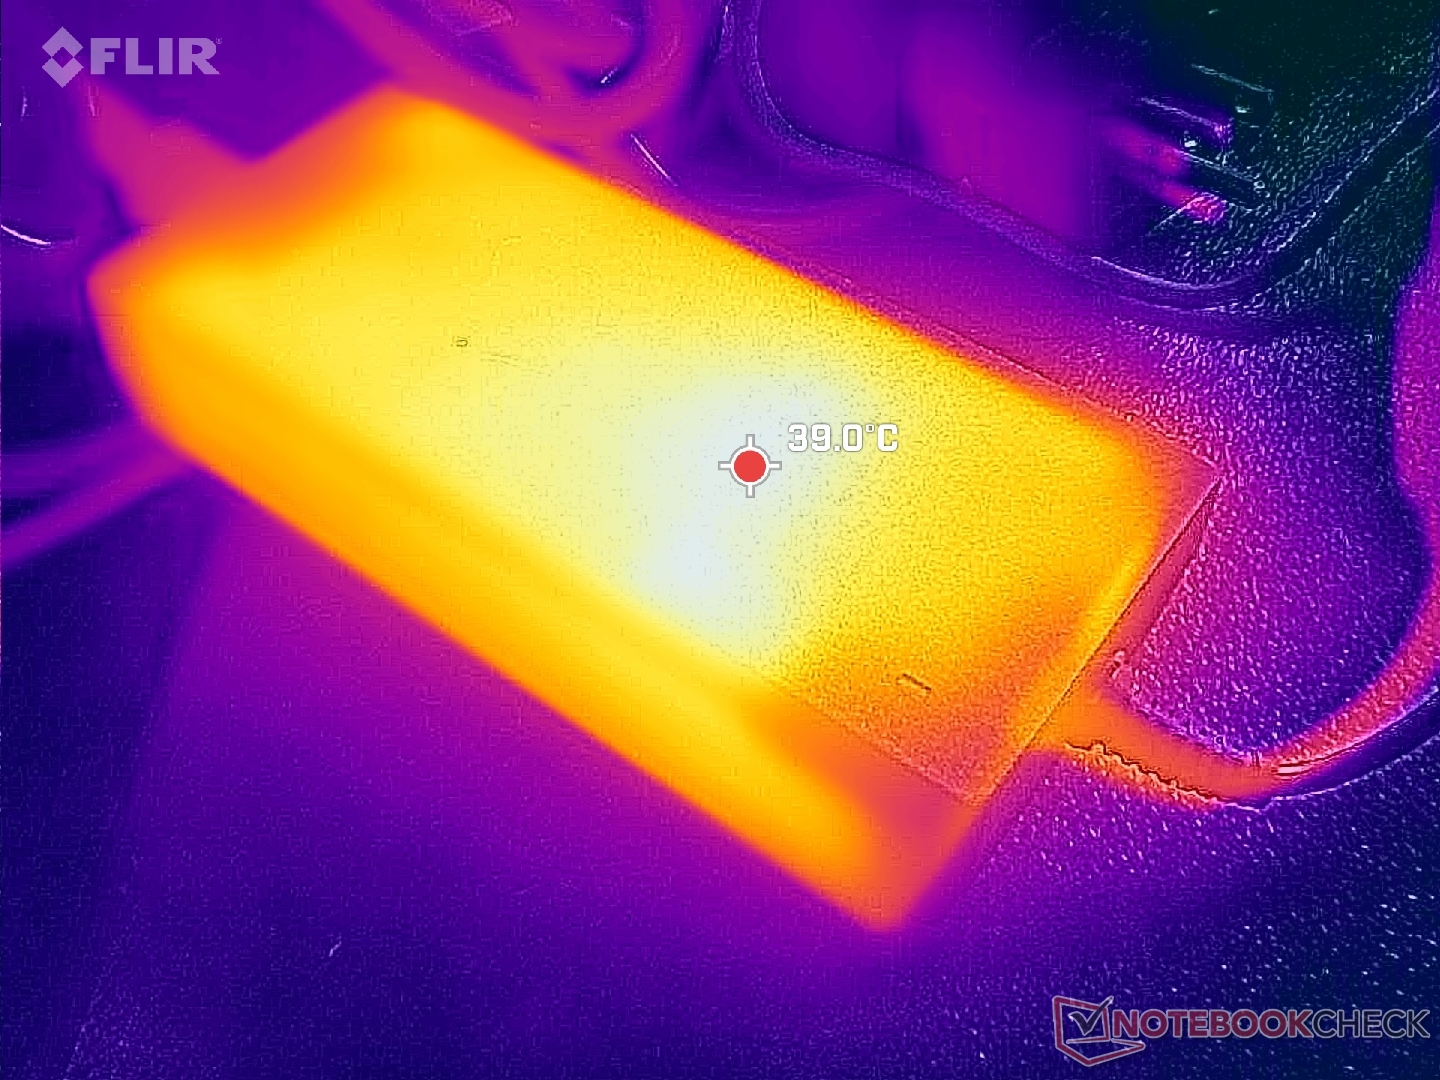
As temperaturas da superfície na parte superior da unidade podem chegar a mais de 36 °C ao executar cargas exigentes, como jogos. O calor residual escapa pela parte traseira, conforme mostram os mapas de temperatura abaixo.
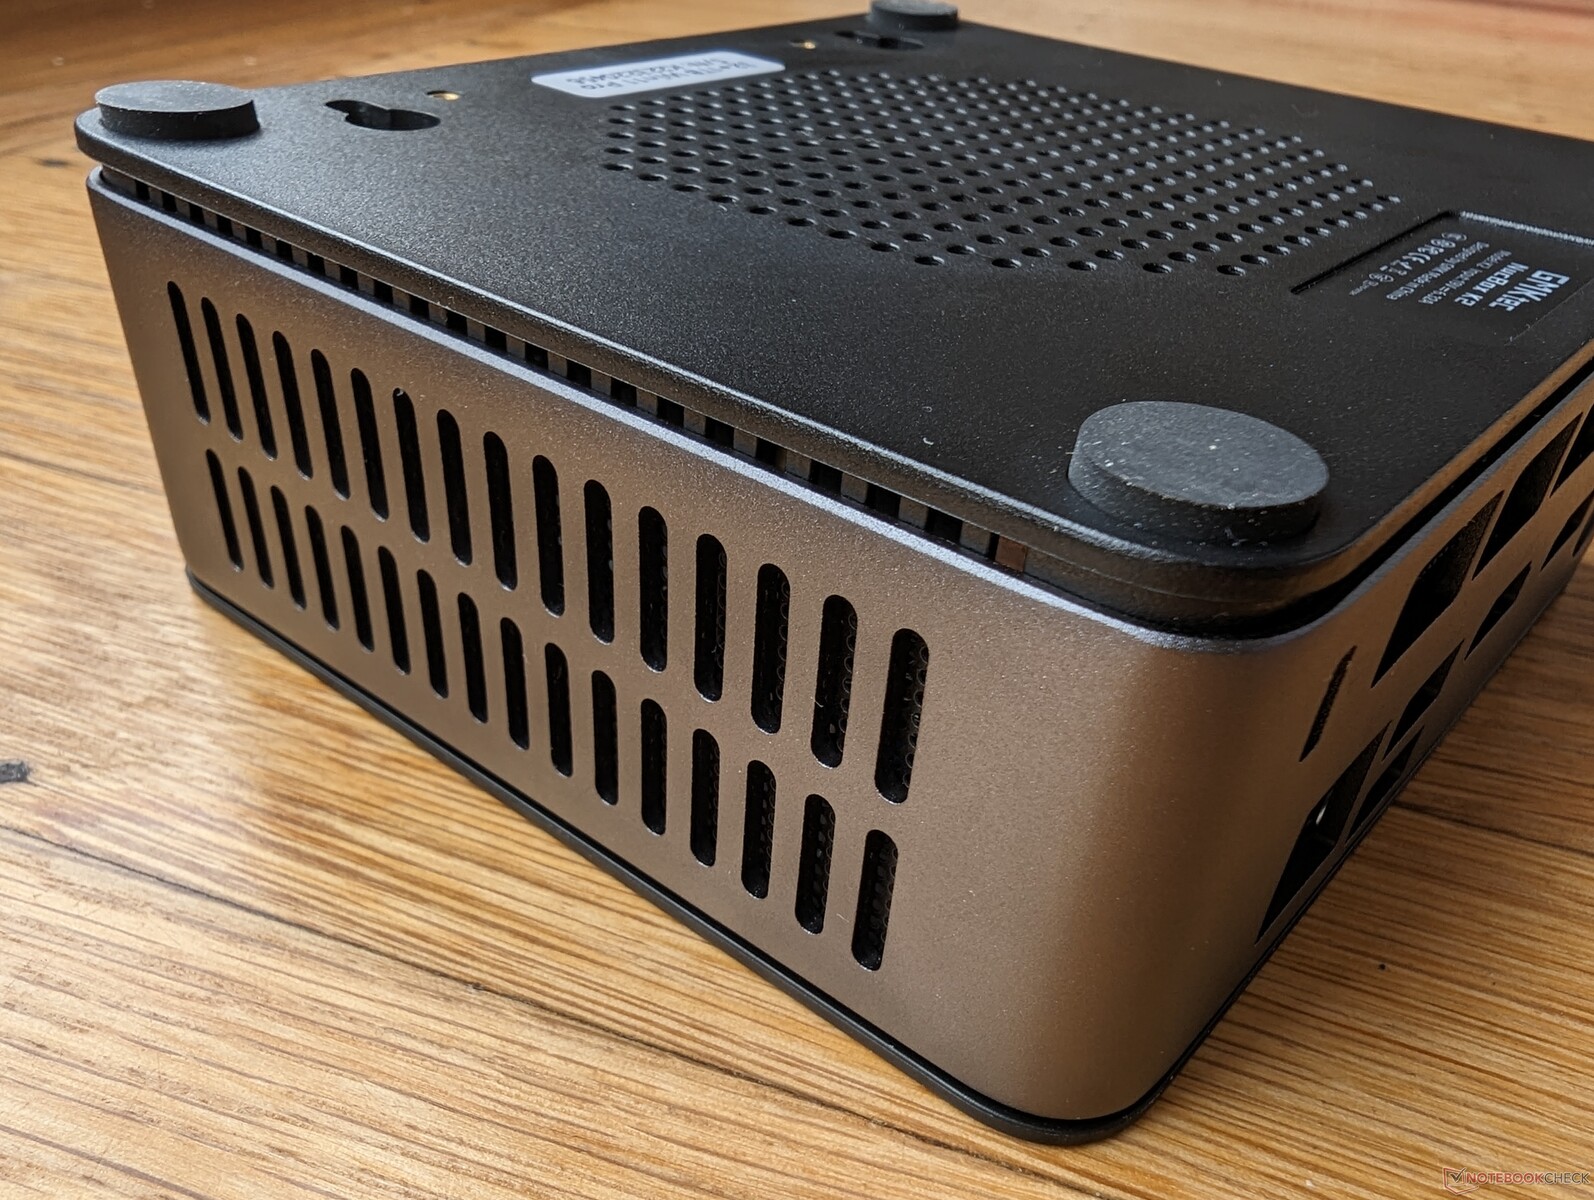
É seguro posicionar a unidade verticalmente em vez de horizontalmente, pois o design do NucBox 2 inclui grades de ventilação adicionais na placa inferior.
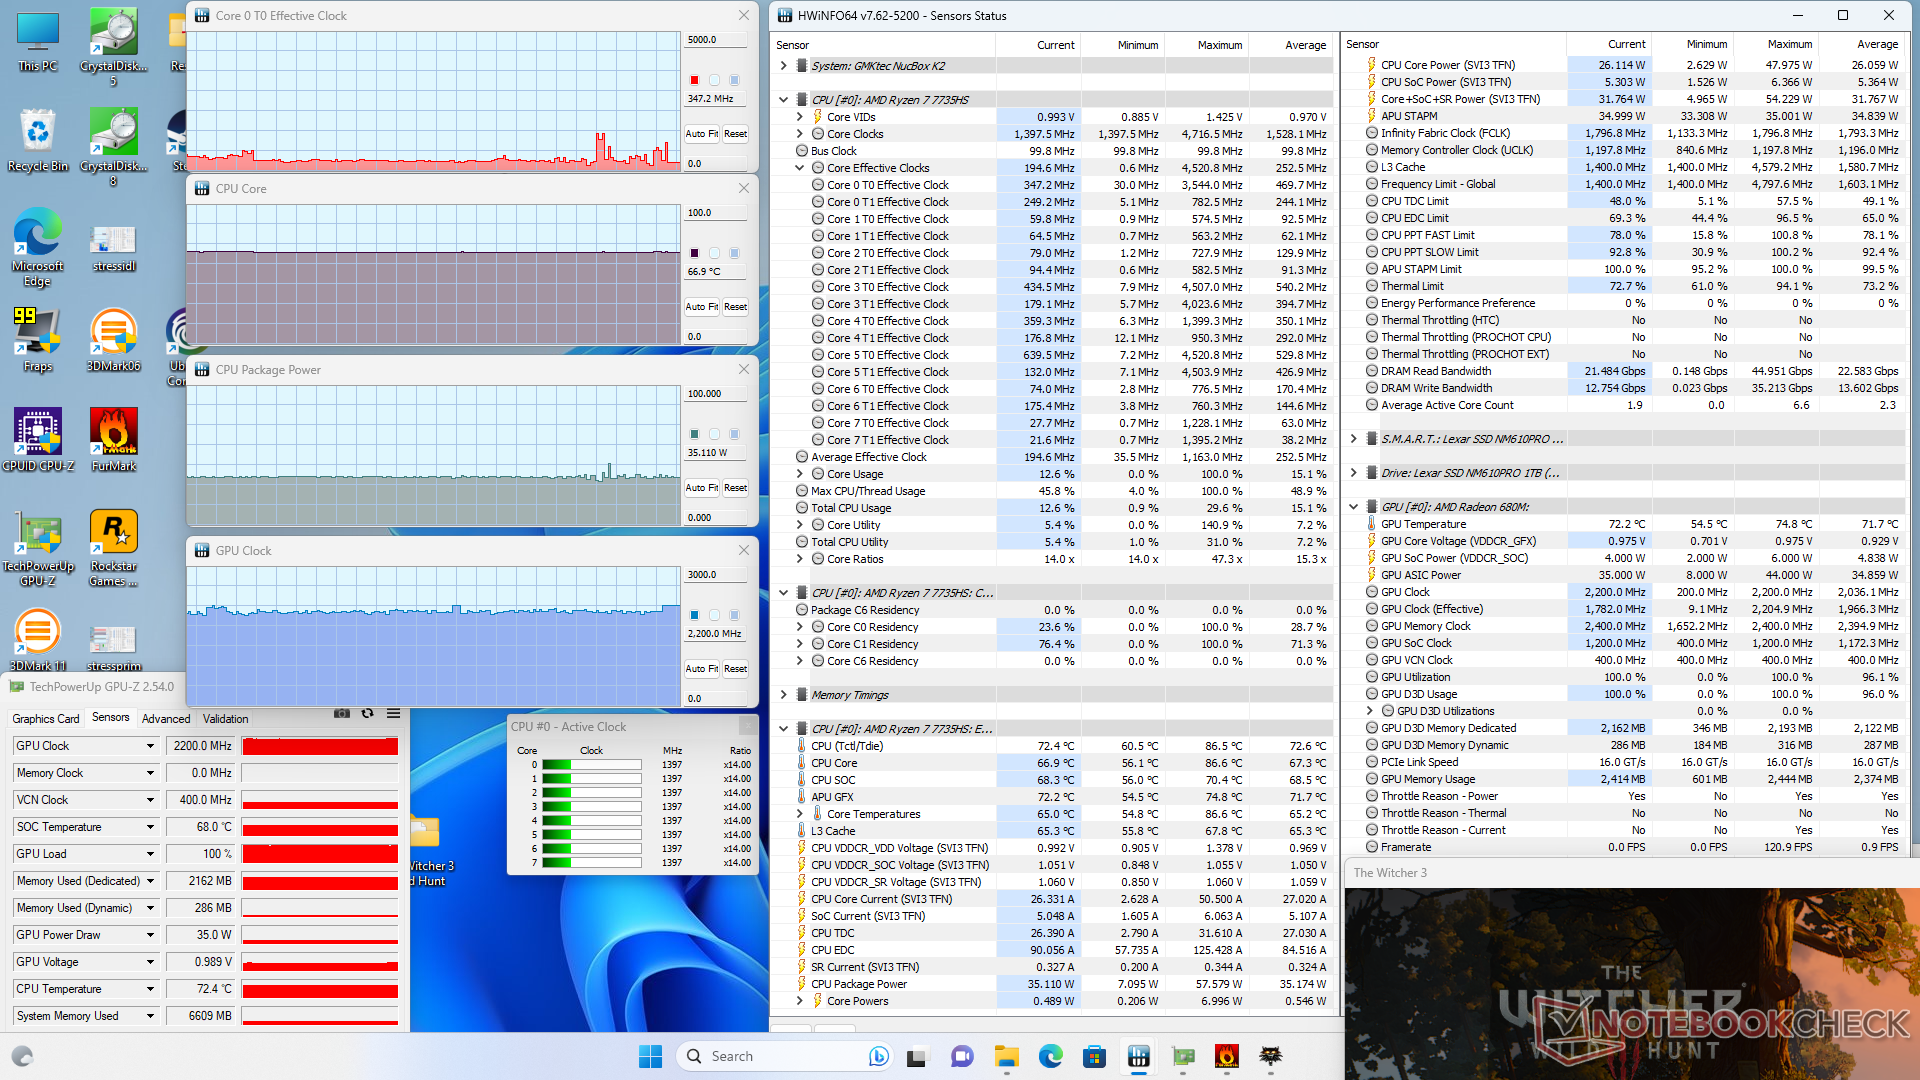
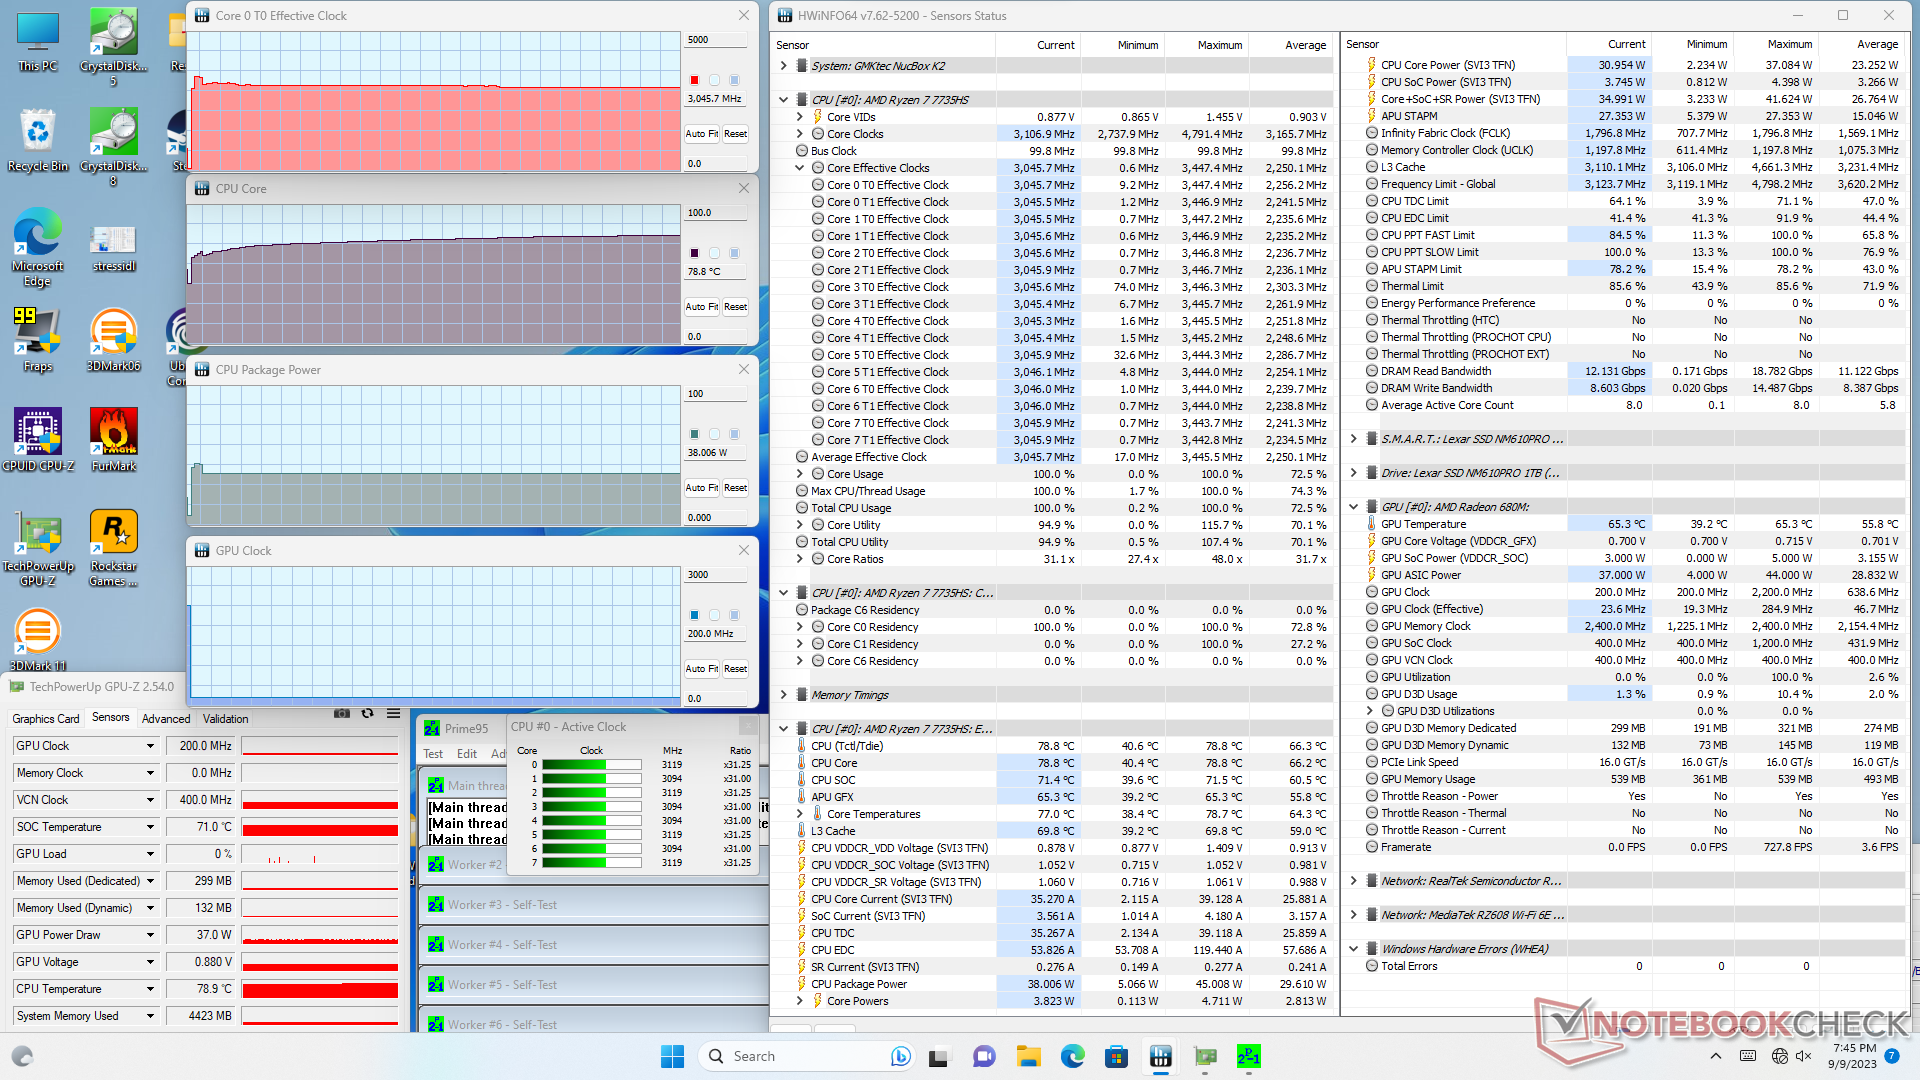
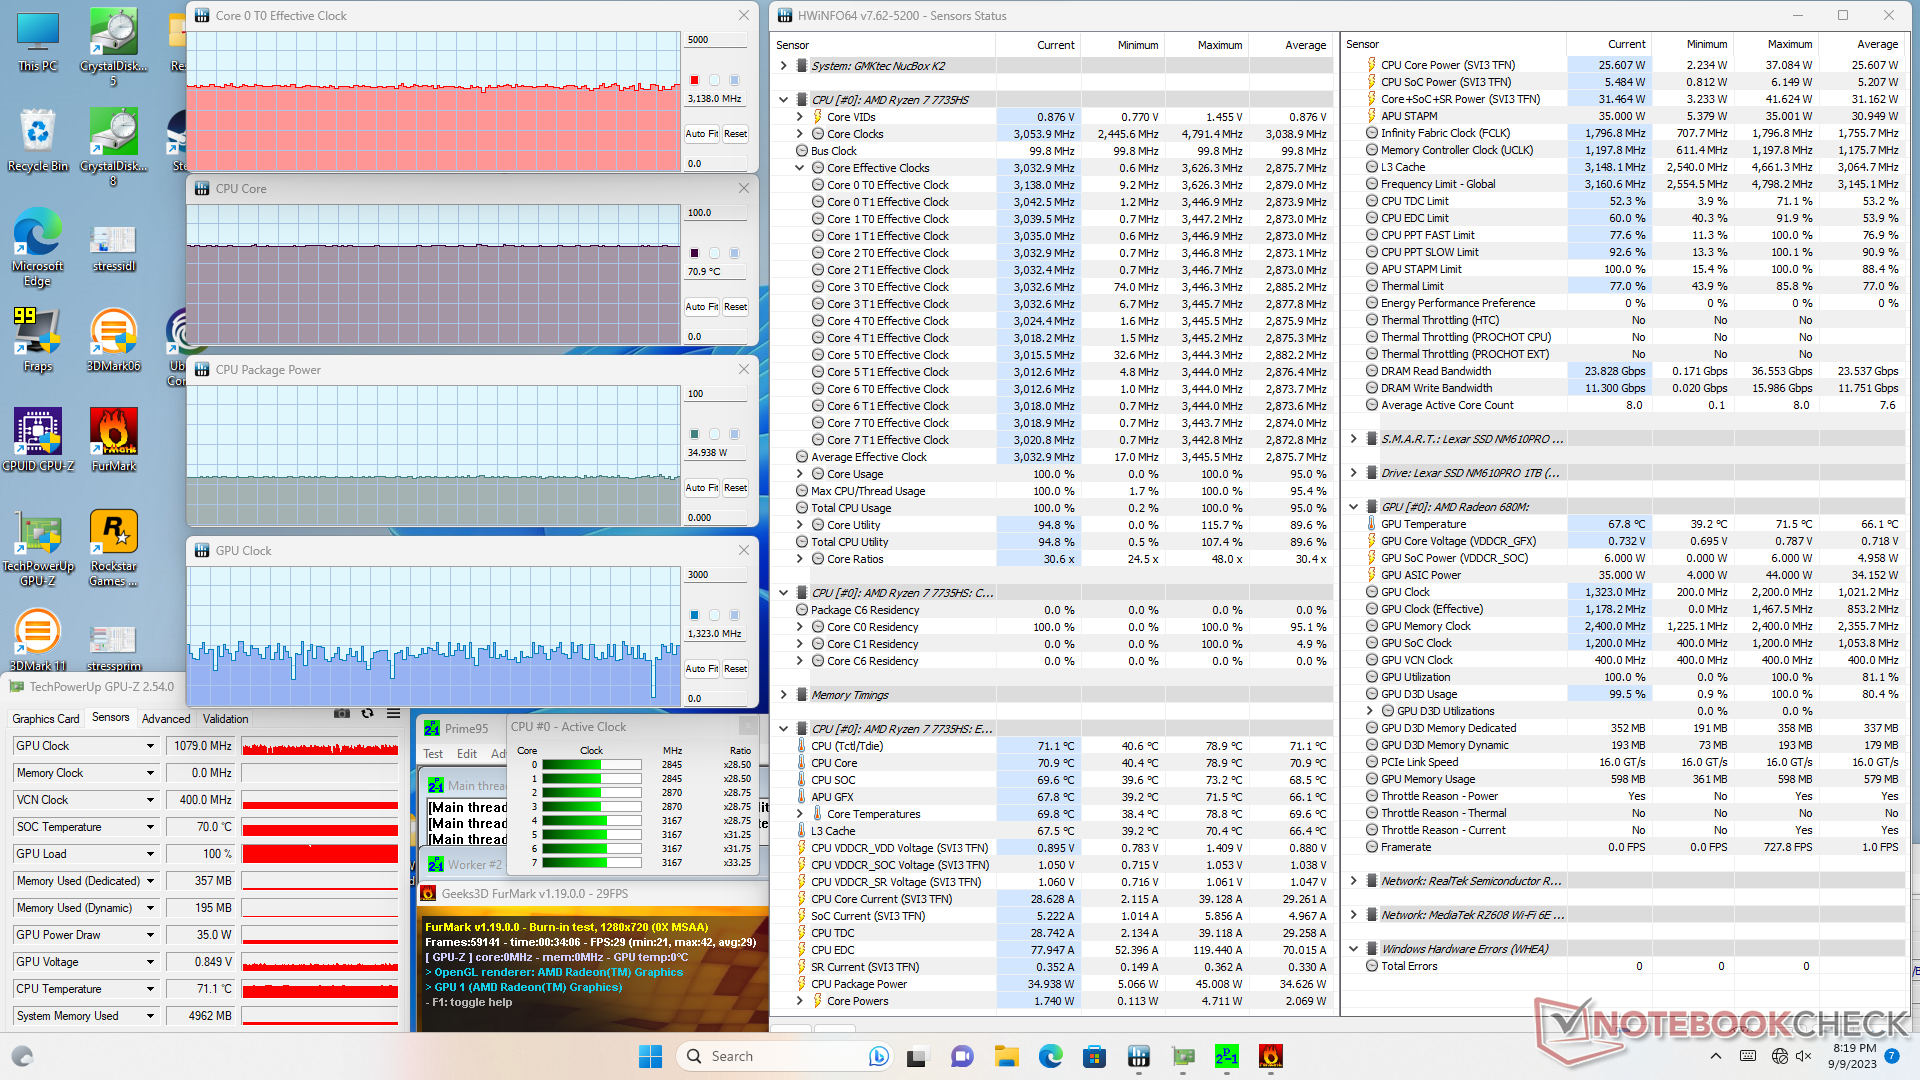
Teste de estresse
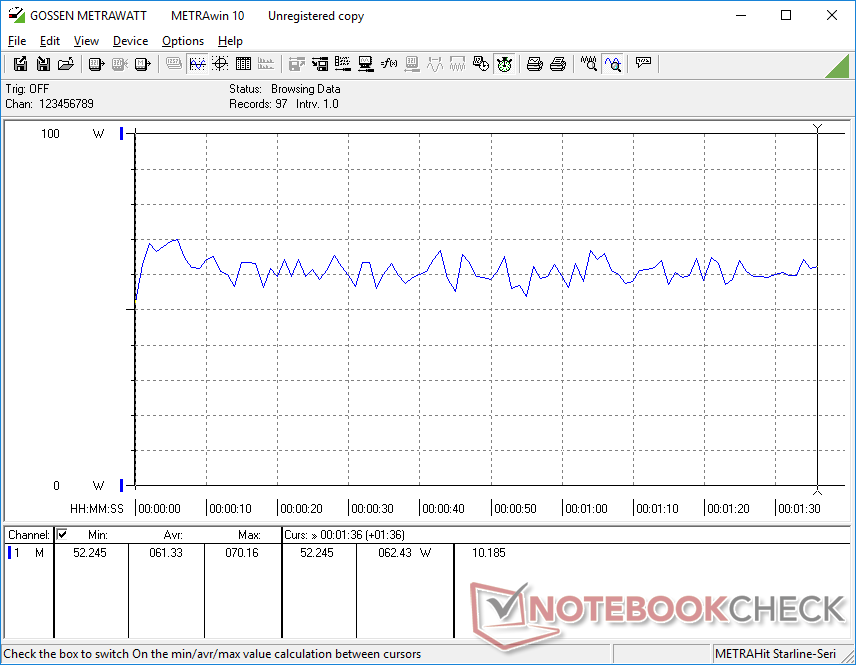
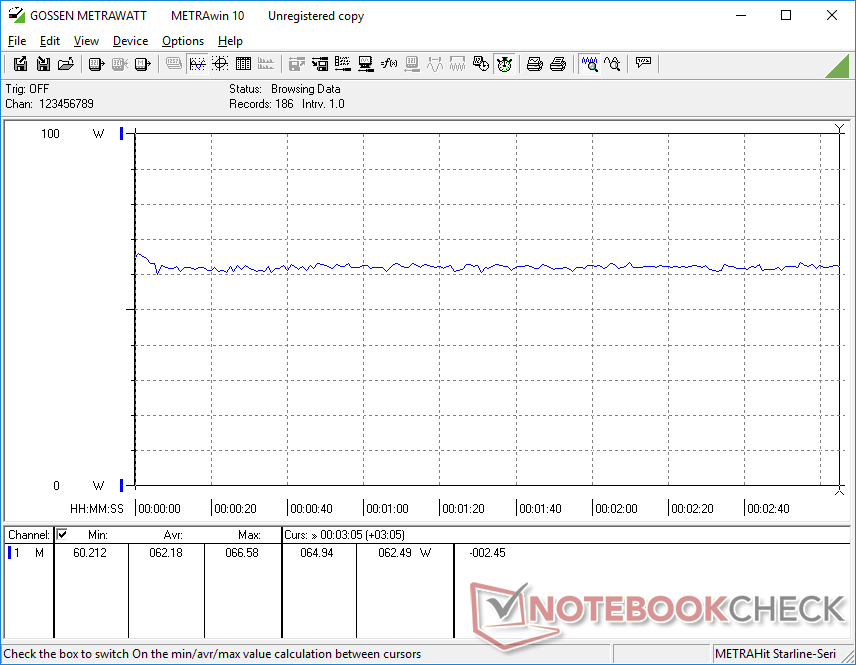
Ao executar o Prime95 para estressar a CPU, as taxas de clock e o consumo de energia da placa aumentavam para 3,5 GHz e 45 W, respectivamente. No entanto, após alguns segundos, esse valor cairia para 3,1 GHz e 38 W, o que sugere que o potencial do turbo boost é limitado.
A temperatura do núcleo durante a execução Witcher 3 se estabilizaria em 67 °C, em comparação com 64 °C no Beelink SER7 mais caro. A temperatura do núcleo só atinge 70 °C ou mais quando são executadas cargas exigentes por períodos prolongados.
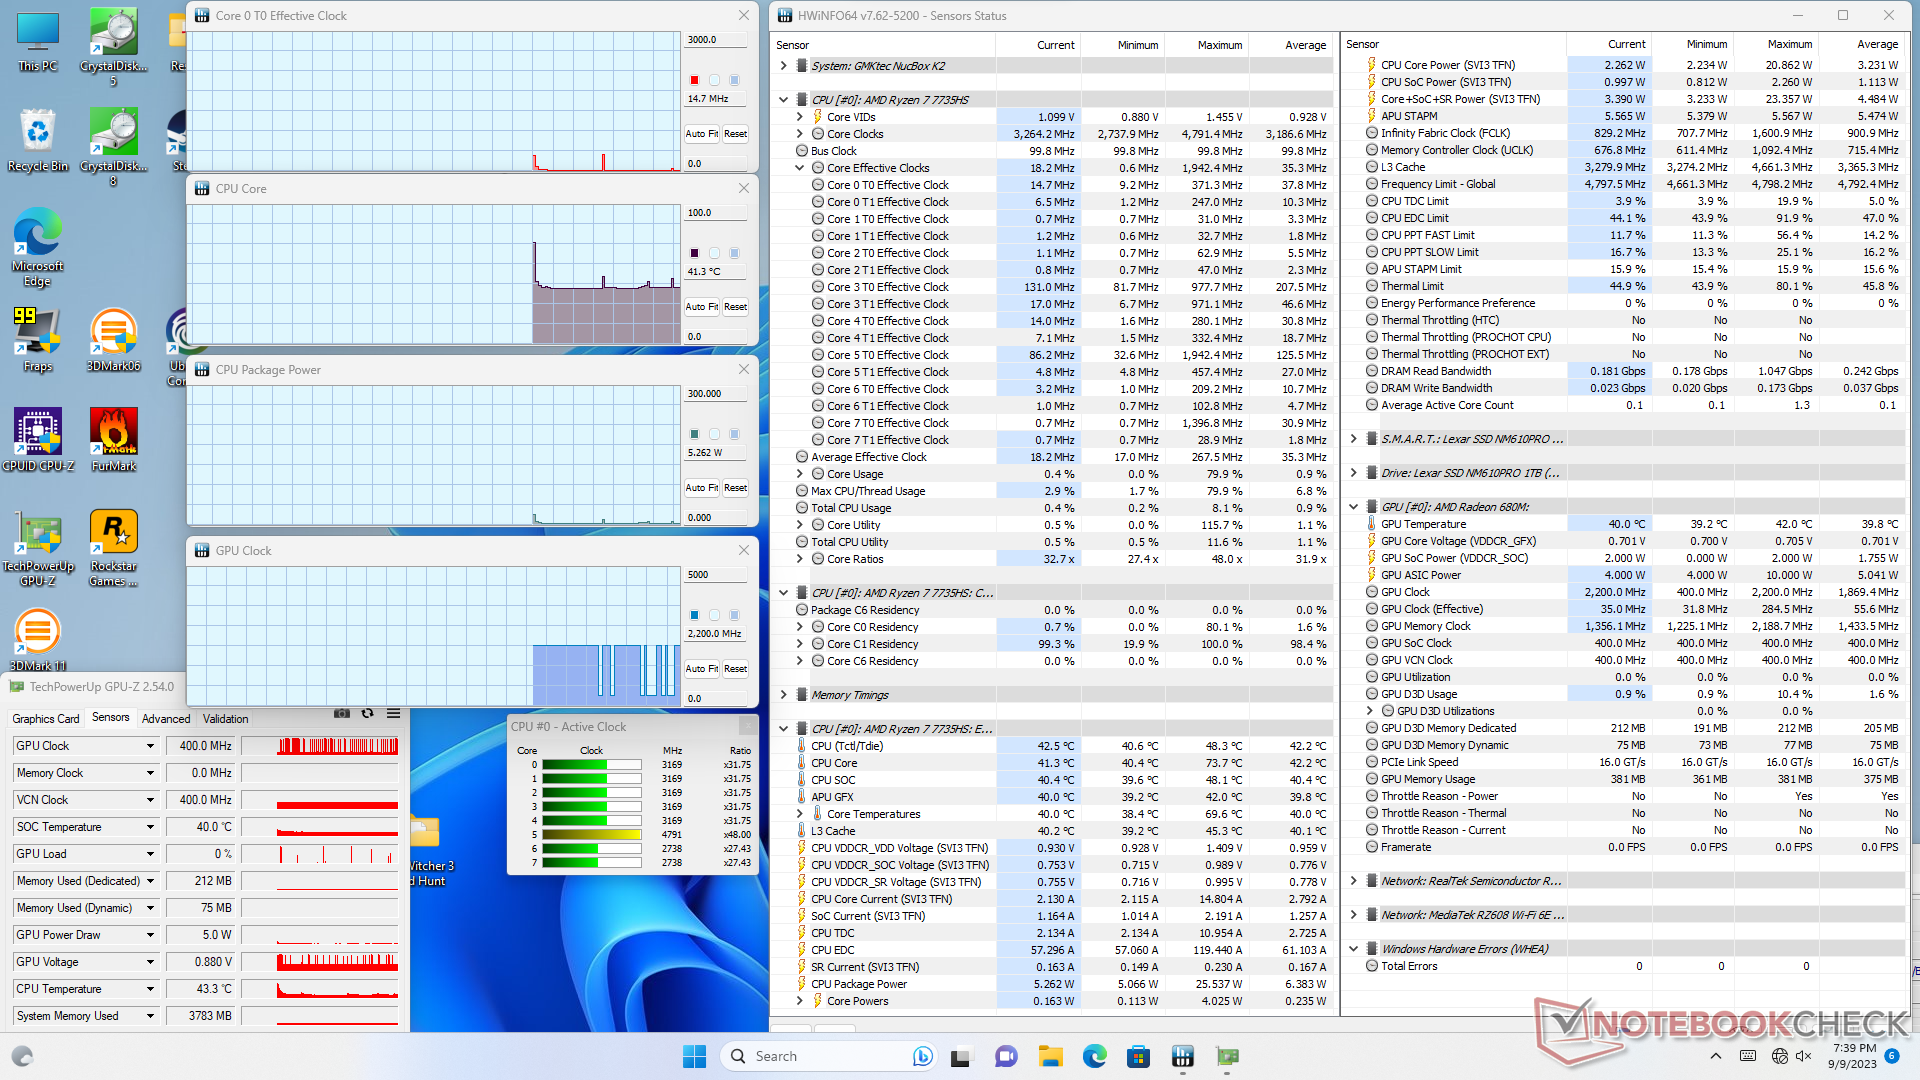
| Clock da CPU (GHz) | Clock da GPU (MHz) | Temperatura média da CPU (°C) | |
| Sistema ocioso | -- | -- | 41 |
| Estresse doPrime95 | 3.0 | -- | 79 |
| EstressePrime95 + FurMark | 3.1 | ~1323 | 71 |
| Witcher 3 Estresse | 0,4 | 2000 - 2200 | 67 |
Gerenciamento de energia - um pouco mais de sede
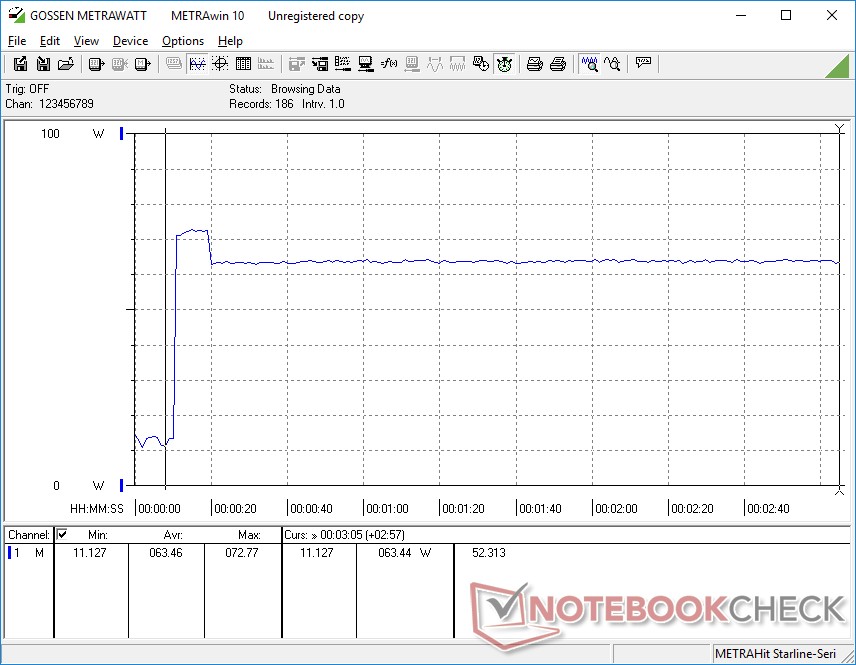
Consumo de energia
O sistema é mais exigente do que outros mini PCs alimentados por CPUs mais antigas, como o NucBox 2 ou oTrigkey Speed S. Entretanto, as vantagens de desempenho mais do que compensam o maior consumo de energia. Por exemplo, nosso NucBox K2 consumiria quase 30% mais energia do que o Trigkey Speed S ao executar jogos, mas o desempenho seria 60% a 70% mais rápido e valeria a pena o aumento no consumo.

| desligado | |
| Ocioso | |
| Carga |
|
Key:
min: | |
| GMK NucBox K2 R7 7735HS, Radeon 680M, Lexar NM610 Pro NM610P001T-HNNNG, , x, | GMK NucBox 2 i5-8259U, Iris Plus Graphics 655, Netac S930E8/256GPN, , x, | Beelink SER7 R7 7840HS, Radeon 780M, Crucial P3 Plus CT1000P3PSSD8, , x, | Intel NUC 13 Pro Desk Edition Kit i7-1360P, Iris Xe G7 96EUs, Samsung PM9A1 MZVL2512HCJQ, , x, | Geekom Mini IT11, i7-11390H i7-11390H, Iris Xe G7 96EUs, Lexar 1024GB LNM6A1X001T-HNNNG, , x, | Trigkey Speed S i5-11320H, Iris Xe G7 96EUs, Intel SSD 670p SSDPEKNU512GZ, , x, | |
|---|---|---|---|---|---|---|
| Power Consumption | 26% | -6% | -2% | 22% | 20% | |
| Idle Minimum * (Watt) | 7.3 | 6.1 16% | 6.7 8% | 7 4% | 7.3 -0% | 6.7 8% |
| Idle Average * (Watt) | 9.8 | 6.8 31% | 7.3 26% | 9.2 6% | 7.8 20% | 8 18% |
| Idle Maximum * (Watt) | 10.5 | 7.3 30% | 11.6 -10% | 11.8 -12% | 8.4 20% | 8.1 23% |
| Load Average * (Watt) | 61.3 | 46.3 24% | 64.1 -5% | 45 27% | 28.7 53% | 47.6 22% |
| Witcher 3 ultra * (Watt) | 62.2 | 75.8 -22% | 47.5 24% | |||
| Load Maximum * (Watt) | 72.8 | 50.7 30% | 94.8 -30% | 97.2 -34% | 61.1 16% | 56.3 23% |
* ... menor é melhor
Power Consumption Witcher 3 / Stresstest
Power Consumption external Monitor
Pro
Contra
Veredicto - Muito desempenho por pouco dinheiro
O GMKtec NucBox K2 tem todos os principais recursos que os usuários domésticos ou de escritório podem apreciar sem muitos extras chamativos. A facilidade de acesso e manutenção, a rápida CPU Zen 3+ e a GPU integrada, além da porta USB4 em particular, são todos os destaques do modelo. O fato de a nossa configuração poder ser encontrada por apenas US$ 480 o torna extremamente atraente, pois você está comprometendo muito pouco o desempenho e os recursos.
No entanto, há alguns cortes e algumas questões que merecem ser mencionadas. Em primeiro lugar, o sistema suporta apenas um SSD interno, ao contrário da maioria dos outros mini PCs que podem suportar dois. Em segundo lugar, a única porta USB-C pode parecer limitante se você pretende conectar vários dispositivos USB-C. E, por fim, recomendamos que você verifique novamente a funcionalidade do Bluetooth e quaisquer problemas de salto de quadros, pois tivemos ambos em nossa unidade de análise.
O NucBox K2 está acima de seu peso e de sua categoria de preço. No entanto, talvez você tenha que lidar com algumas desvantagens específicas.
Também gostaríamos de ver melhorias na intensidade do sinal WLAN e no comportamento da ventoinha do sistema. Nossa conexão Wi-Fi 6E é mais lenta do que o esperado e o ventilador pulsante é muito perceptível. No entanto, se você conseguir encontrar o modelo por menos de US$ 500, talvez valha a pena aceitar essas desvantagens.
Preço e disponibilidade
A Amazon agora está enviando o GMKtec NucBox K2, conforme analisado, por US$ 580 ou US$ 480 após a aplicação do código de cupom atual.
GMK NucBox K2
- 09/12/2023 v7 (old)
Allen Ngo
Transparência
A seleção dos dispositivos a serem analisados é feita pela nossa equipe editorial. A amostra de teste foi fornecida ao autor como empréstimo pelo fabricante ou varejista para fins desta revisão. O credor não teve influência nesta revisão, nem o fabricante recebeu uma cópia desta revisão antes da publicação. Não houve obrigação de publicar esta revisão. Como empresa de mídia independente, a Notebookcheck não está sujeita à autoridade de fabricantes, varejistas ou editores.
É assim que o Notebookcheck está testando
Todos os anos, o Notebookcheck analisa de forma independente centenas de laptops e smartphones usando procedimentos padronizados para garantir que todos os resultados sejam comparáveis. Desenvolvemos continuamente nossos métodos de teste há cerca de 20 anos e definimos padrões da indústria no processo. Em nossos laboratórios de teste, equipamentos de medição de alta qualidade são utilizados por técnicos e editores experientes. Esses testes envolvem um processo de validação em vários estágios. Nosso complexo sistema de classificação é baseado em centenas de medições e benchmarks bem fundamentados, o que mantém a objetividade.Price comparison

