Análises para AMD Ryzen 7 6800H processador
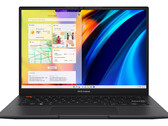
Asus VivoBook S15 revisão de laptop: iGPU proporciona aumento de desempenho
Mesmo sem um GPU dedicado, o VivoBook S15 consegue oferecer performance rivalizando a de alguns laptops para jogos de nível básico. Graças ao visor OLED, ele é particularmente bem equipado para lidar com trabalhos de edição de fotos e vídeos. A máquina também é capaz de oferecer um desempenho surpreendentemente bom em outras áreas.
AMD Ryzen 7 6800H, Radeon 680M, 15.6", 1.9 kgRevisão do Beelink SER6 Pro: O AMD Radeon 680M é impressionante em um mini PC
Por cerca de $650 USD completos com armazenamento e 32 GB de RAM, o Beelink SER6 Pro oferece algum desempenho sério por dólar quando comparado com os mini PCs concorrentes. Sua GPU em particular é uma das mais rápidas entre todas as soluções integradas.
AMD Ryzen 7 6800H, Radeon 680M, 511 gSchenker XMG Core 15 M22 em revisão: Jogo de médio alcance com conexão de água
O Schenker XMG Core 15 é um laptop compacto de médio alcance com resfriamento externo por água e uma longa duração da bateria para a classe. Além disso, o jogador também pode operar silenciosamente com resfriamento a ar, tem um RTX 3060 com TGP de 140 W e um display WQHD 165 Hz responsivo.
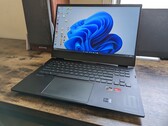
AMD Ryzen 7 6800H, NVIDIA GeForce RTX 3060 Laptop GPU, 15.6", 2.1 kgRadeon RX 6650M estreia de desempenho: Revisão do laptop HP Omen 16 2022
O Omen 16 é um dos poucos laptops para jogos de 16 polegadas a oferecer todas as configurações-AMD, incluindo até mesmo a GPU Radeon RX 6650M raramente comparada. O desempenho geral é competitivo em relação às principais opções da Nvidia, desde que você mantenha suas expectativas sob controle.
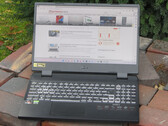
AMD Ryzen 7 6800H, Radeon RX 6650M, 16.1", 2.4 kgRevisão Acer Nitro 5 AN515-46: jogos FHD poderosos com USB 4
A Nitro 5 se destaca com seu excelente desempenho em jogos e temperaturas comparativamente baixas. O notebook cabe em dois SSDs PCIe-4 e possui uma porta USB 4.
AMD Ryzen 7 6800H, NVIDIA GeForce RTX 3070 Ti Laptop GPU, 15.6", 2.5 kgLenovo Legion 5 Pro 16ARH7H RTX 3070 Ti: NVIDIA GeForce RTX 3070 Ti Laptop GPU, 16.00", 2.6 kg
ánalise » Lenovo Legion 5 Pro Gen 7 revisão laptop: Ryzen 7 6800H ou Ryzen 9 6900HX?
Alienware m15 R7, 6800H RTX 3060: NVIDIA GeForce RTX 3060 Laptop GPU, 15.60", 2.7 kg
ánalise externa » Alienware m15 R7, 6800H RTX 3060
HP Omen 16-n0005ns: NVIDIA GeForce RTX 3060 Laptop GPU, 16.10", 2.3 kg
ánalise externa » HP Omen 16-n0005ns
Lenovo Legion 5 Pro 16ARH7H, R7 6800H RTX 3070: NVIDIA GeForce RTX 3070 Laptop GPU, 16.00", 2.5 kg
ánalise externa » Lenovo Legion 5 Pro 16ARH7H, R7 6800H RTX 3070
Asus VivoBook S14 OLED M3402RA: AMD Radeon 680M, 14.00", 1.4 kg
ánalise externa » Asus VivoBook S14 OLED M3402RA
HP Victus 16-e1021ns: NVIDIA GeForce RTX 3050 4GB Laptop GPU, 16.10", 2.5 kg
ánalise externa » HP Victus 16-e1021ns
Asus TUF Gaming A15 FA507RR-HQ008: NVIDIA GeForce RTX 3070 Laptop GPU, 15.60", 2.2 kg
ánalise externa » Asus TUF Gaming A15 FA507RR-HQ008
Origin PC EVO16-S, R7 6800H RX 6650M XT: AMD Radeon RX 6650M XT, 16.10", 2.3 kg
ánalise externa » Origin PC EVO16-S, R7 6800H RX 6650M XT
HP Omen 16-n0033dx: AMD Radeon RX 6650M, 16.10", 2.4 kg
ánalise externa » HP Omen 16-n0033dx
ADATA XPG Xenia 16 RX, R7 6800H RX 6650M XT: AMD Radeon RX 6650M XT, 16.10", 2.4 kg
ánalise externa » ADATA XPG Xenia 16 RX, R7 6800H RX 6650M XT
Acer Nitro 5 AN515-46-R74X: NVIDIA GeForce RTX 3060 Laptop GPU, 15.60", 2.5 kg
ánalise externa » Acer Nitro 5 AN515-46-R74X
Asus Vivobook S 16X M5602, R7 6800H: AMD Radeon 680M, 16.00", 1.9 kg
ánalise externa » Asus Vivobook S 16X M5602, R7 6800H
Asus TUF Gaming A17 FA707RE-HX030W: NVIDIA GeForce RTX 3050 Ti Laptop GPU, 17.30", 2.6 kg
ánalise externa » Asus TUF Gaming A17 FA707RE-HX030W
Asus Vivobook Pro 14 M6400, 6800H RTX 3050: NVIDIA GeForce RTX 3050 4GB Laptop GPU, 14.00", 1.5 kg
ánalise externa » Asus Vivobook Pro 14 M6400, 6800H RTX 3050
Asus TUF Gaming A15 FA507RM-ES73: NVIDIA GeForce RTX 3060 Laptop GPU, 15.60", 2.2 kg
ánalise externa » Asus TUF Gaming A15 FA507RM-ES73
Lenovo Legion 5 Pro 16ARH7H RTX 3070 Ti: NVIDIA GeForce RTX 3070 Ti Laptop GPU, 16.00", 2.6 kg
ánalise externa » Lenovo Legion 5 Pro 16ARH7H RTX 3070 Ti
Asus ROG Strix G15 G513RM-HQ261: NVIDIA GeForce RTX 3060 Laptop GPU, 15.60", 2.3 kg
ánalise externa » Asus ROG Strix G15 G513RM-HQ261
HP Omen 16-n0000ns: NVIDIA GeForce RTX 3050 Ti Laptop GPU, 16.10", 2.3 kg
ánalise externa » HP Omen 16-n0000ns
Acer Nitro 5 AN517-42-R5A1: NVIDIA GeForce RTX 3060 Laptop GPU, 17.30", 3 kg
ánalise externa » Acer Nitro 5 AN517-42-R5A1
Lenovo Ideapad Gaming 3 15ARH7-82SB0073GE: NVIDIA GeForce RTX 3050 Ti Laptop GPU, 15.60", 2.3 kg
ánalise externa » Lenovo Ideapad Gaming 3 15ARH7-82SB0073GE
Asus TUF Gaming A15 FA507RM-HN003: NVIDIA GeForce RTX 3060 Laptop GPU, 15.60", 2.2 kg
ánalise externa » Asus TUF Gaming A15 FA507RM-HN003
Lenovo Legion 7 16ARHA7-82UH0008GE: AMD Radeon RX 6850M XT, 16.00", 2.5 kg
ánalise externa » Lenovo Legion 7 16ARHA7-82UH0008GE
Acer Nitro 5 AN515-46-R606: NVIDIA GeForce RTX 3070 Ti Laptop GPU, 15.60", 2.5 kg
ánalise externa » Acer Nitro 5 AN515-46-R606
HP Victus 16-e1007ns: NVIDIA GeForce RTX 3050 4GB Laptop GPU, 16.10", 2.5 kg
ánalise externa » HP Victus 16-e1007ns
Asus TUF Gaming A15 FA507RR-HN003: NVIDIA GeForce RTX 3070 Laptop GPU, 15.60", 2.2 kg
ánalise externa » Asus TUF Gaming A15 FA507RR-HN003
Lenovo Legion 5 15ARH7H-82RD001LGE: NVIDIA GeForce RTX 3060 Laptop GPU, 15.60", 2.4 kg
ánalise externa » Lenovo Legion 5 15ARH7H-82RD001LGE
Lenovo Legion 5 Pro 16 G7 AMD 82RG001GUS: NVIDIA GeForce RTX 3060 Laptop GPU, 16.00", 2.5 kg
ánalise externa » Lenovo Legion 5 Pro 16 G7 AMD 82RG001GUS
HP Victus 16-e1085cl: NVIDIA GeForce RTX 3050 Ti Laptop GPU, 16.10", 2.5 kg
ánalise externa » HP Victus 16-e1085cl
Xiaomi RedmiBook Pro 15 2022, R7 6800H: AMD Radeon 680M, 15.60", 1.8 kg
ánalise externa » Xiaomi RedmiBook Pro 15 2022, R7 6800H
HP Omen 16-n0023dx: NVIDIA GeForce RTX 3060 Laptop GPU, 16.10", 2.4 kg
ánalise externa » HP Omen 16-n0023dx
Asus TUF Gaming A15 FA507RR-HQ083W: NVIDIA GeForce RTX 3060 Ti, 16.00", 2.2 kg
ánalise externa » Asus TUF Gaming A15 FA507RR-HQ083W
Lenovo Legion 7 16ARHA7-82UH0006GE: AMD Radeon RX 6700M, 16.00", 2.5 kg
ánalise externa » Lenovo Legion 7 16ARHA7-82UH0006GE
Asus ROG Strix G15 G513RM-HQ003W: NVIDIA GeForce RTX 3060 Laptop GPU, 15.60", 2.3 kg
ánalise externa » Asus ROG Strix G15 G513RM-HQ003W
Asus TUF Gaming A15 FA507RM-HQ028W: NVIDIA GeForce RTX 3060 Laptop GPU, 15.60", 2.2 kg
ánalise externa » Asus TUF Gaming A15 FA507RM-HQ028W
Asus TUF Gaming A15 FA507RR-HQ007W: NVIDIA GeForce RTX 3070 Laptop GPU, 15.60", 2.2 kg
ánalise externa » Asus TUF Gaming A15 FA507RR-HQ007W
Asus TUF Gaming A17 FA707RR: NVIDIA GeForce RTX 3070 Laptop GPU, 17.30", 2.6 kg
ánalise externa » Asus TUF Gaming A17 FA707RR
Asus ROG Strix G17 G713RM-KH093W: NVIDIA GeForce RTX 3060 Laptop GPU, 17.30", 2.8 kg
ánalise externa » Asus ROG Strix G17 G713RM-KH093W
Asus ROG Strix G15 G513RC: NVIDIA GeForce RTX 3050 4GB Laptop GPU, 15.60", 2.1 kg
ánalise externa » Asus ROG Strix G15 G513RC
Acer Nitro 5 AN515-58, R7 6800H RTX 3060: NVIDIA GeForce RTX 3060 Laptop GPU, 15.60", 2 kg
ánalise externa » Acer Nitro 5 AN515-58, R7 6800H RTX 3060
Asus VivoBook S15 M3502RA-L1029W: AMD Radeon 680M, 15.60", 1.9 kg
» Multimídia sem GPU dedicado: Asus VivoBook S15 oferece ótima performance gráfica
Lenovo Legion 5 Pro 16ARH7H RTX 3070 Ti: NVIDIA GeForce RTX 3070 Ti Laptop GPU, 16.00", 2.6 kg
» O Ryzen 9 6900HX é um desperdício de dinheiro quando comparado com o Ryzen 7 6800H e as referências são a prova