Revisão do mini PC Beelink SER5 Pro 5600H: NUC 11 velocidades com AMD Ryzen
")
Muito como a Zotac e sua notoriamente grande seleção de mini PCs ZBox, a Beelink está procurando fazer o mesmo lançando novos modelos a cada poucos meses equipados com processadores cada vez mais rápidos. O Beelink SER4 lançado no início deste ano com o processador Zen 2 Ryzen 7 4800U, mas agora o SER5 chegou ao mercado com um Zen 3 ainda mais rápido Ryzen 5 5600H tudo isso mantendo os preços bem abaixo de US$ 500 USD
Os concorrentes neste espaço incluem outros mini PCs ou HTPCs sem gráficos discretos, tais como o Ace Magician TK11, Geekom MiniAir 11, Zotac ZBox PI336e a maioria Modelos Intel NUC
Mais revisões Beelink:
Possíveis concorrentes em comparação
Avaliação | Data | Modelo | Peso | Altura | Size | Resolução | Preço |
|---|---|---|---|---|---|---|---|
v (old) | 10/2022 | Beelink SER Pro Ryzen 5 5600H R5 5600H, Vega 7 | 498 g | 42 mm | x | ||
v (old) | 09/2022 | Beelink SEi11 Pro i5-11320H, Iris Xe G7 96EUs | 440 g | 40 mm | x | ||
v (old) | 01/2022 | Beelink GTR5 R9 5900HX, Vega 8 | 686 g | 39 mm | x | ||
v (old) | 04/2021 | Intel NUC11TNKi5 i5-1135G7, Iris Xe G7 80EUs | 504 g | 37 mm | x | ||
v (old) | Intel NUC10i7FNH i7-10710U, UHD Graphics 620 | 697 g | 51 mm | 0.00" | 0x0 | ||
v (old) | 07/2022 | Zotac ZBOX PI336 pico Celeron N6211, UHD Graphics (Elkhart Lake 16 EU) | 293 g | 20.7 mm | x |
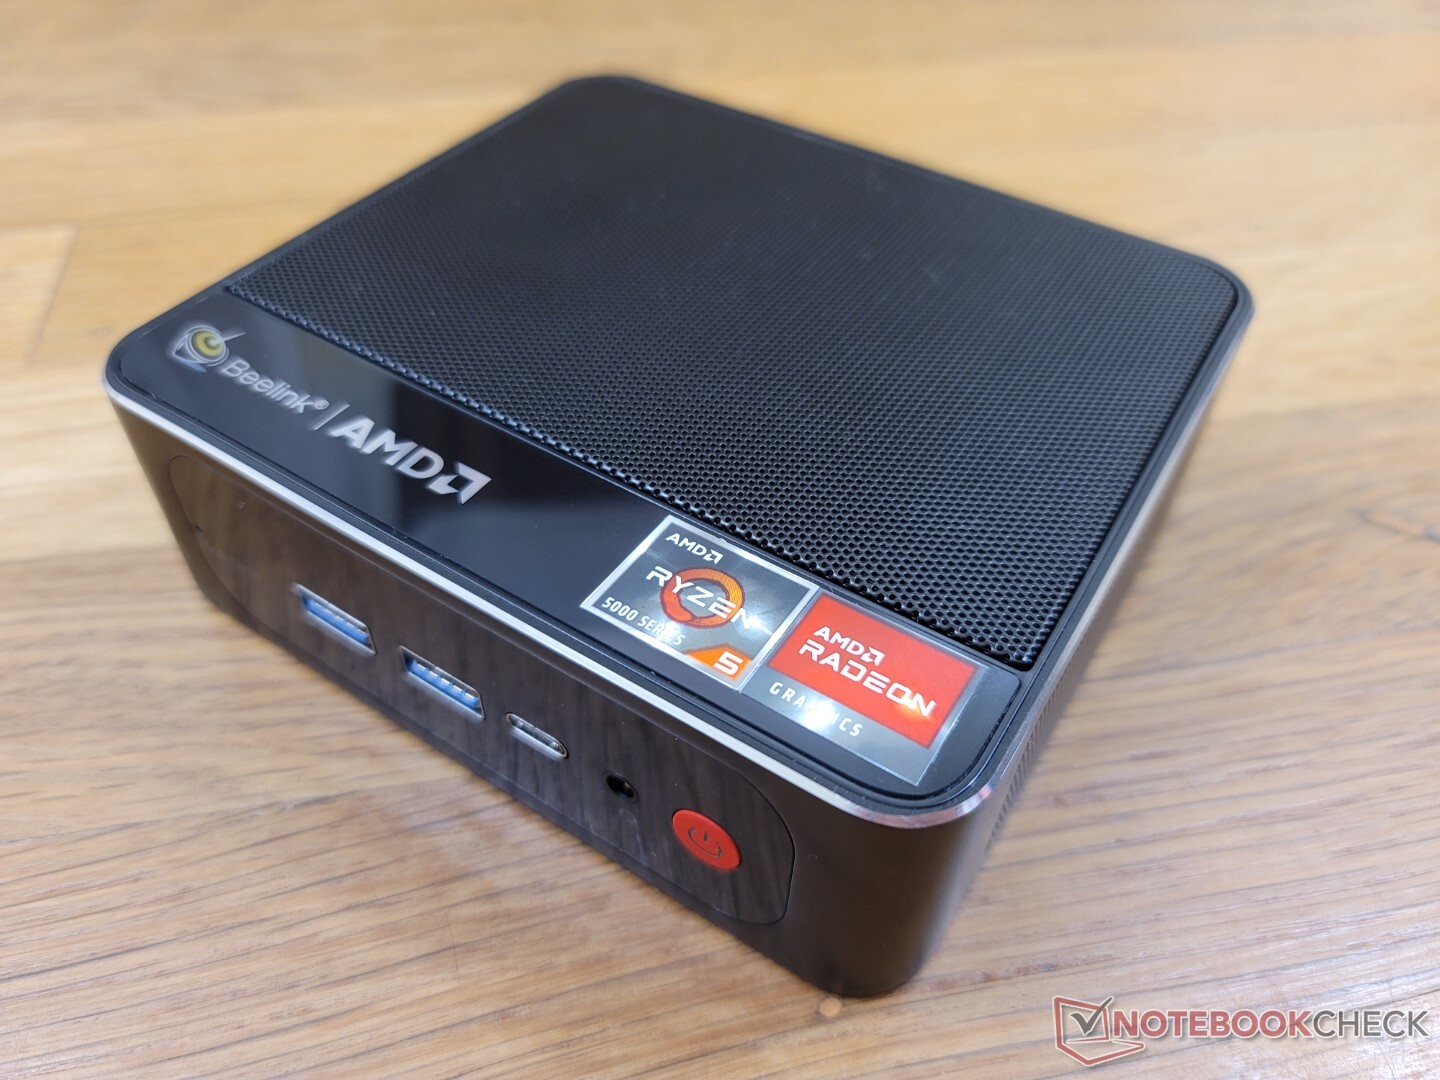
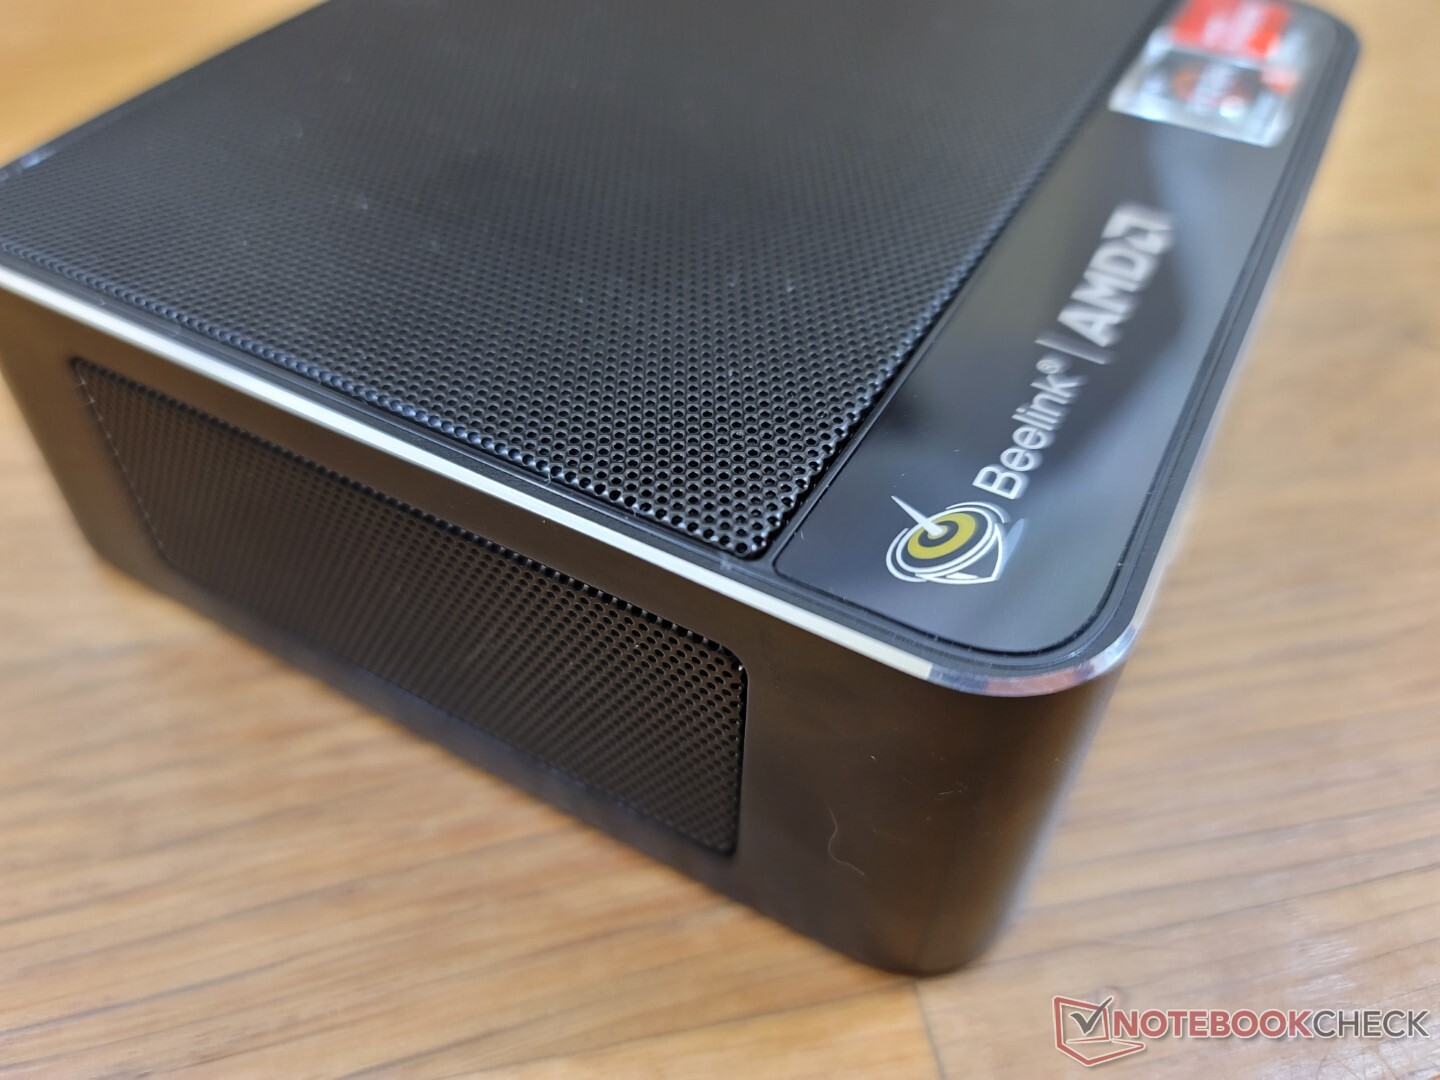
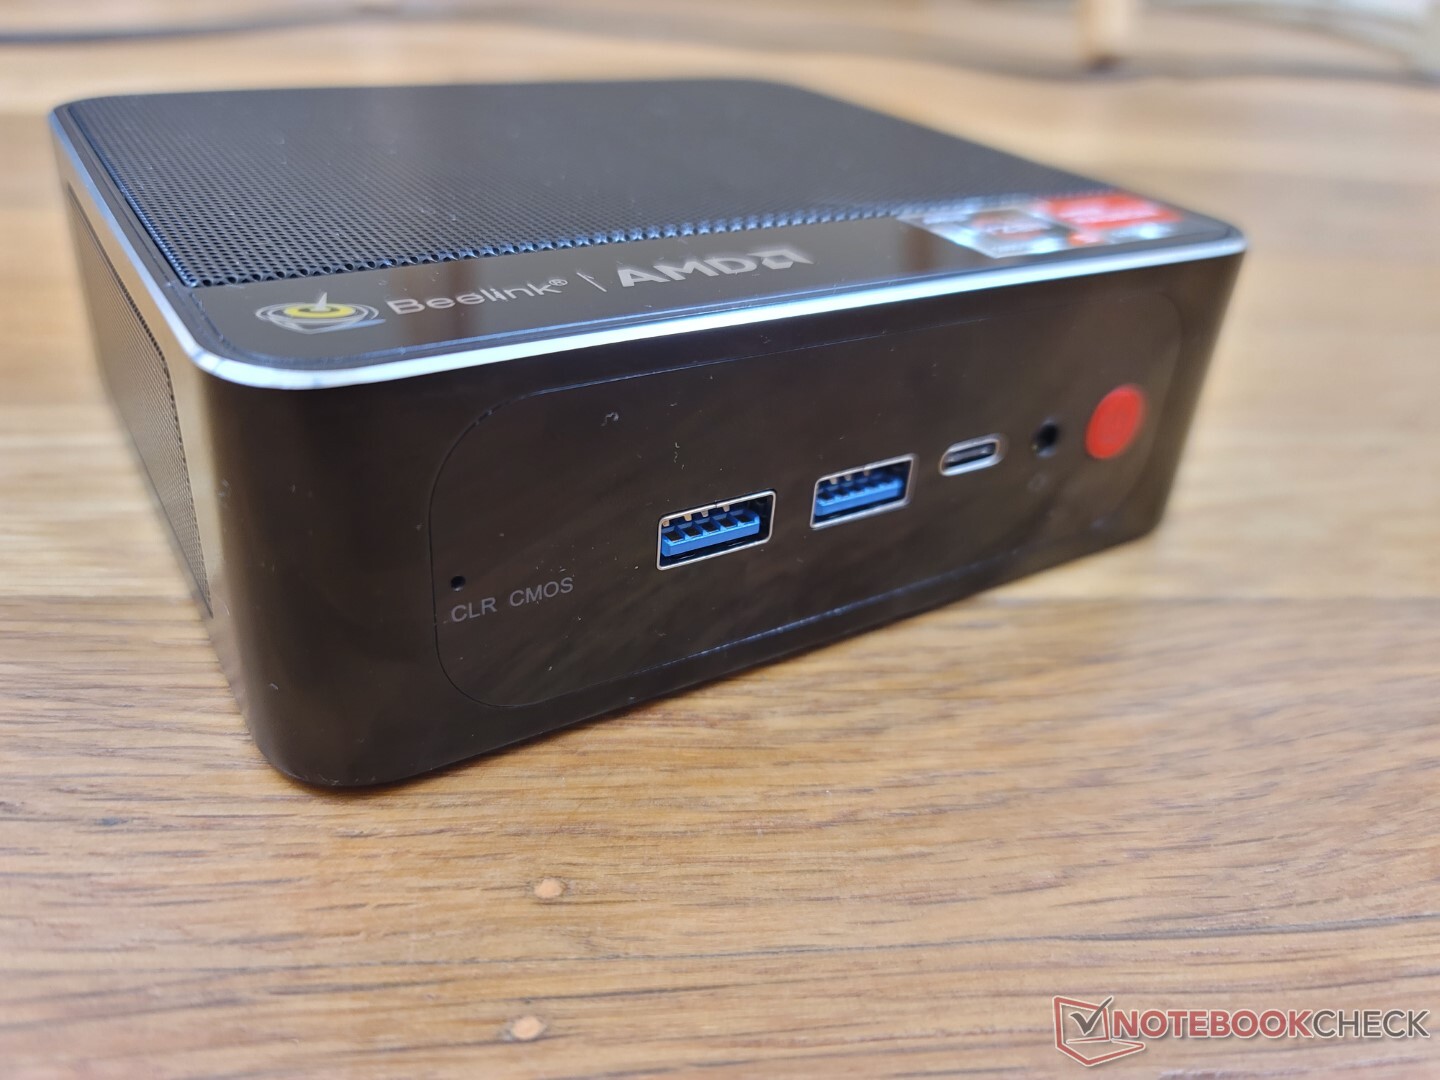
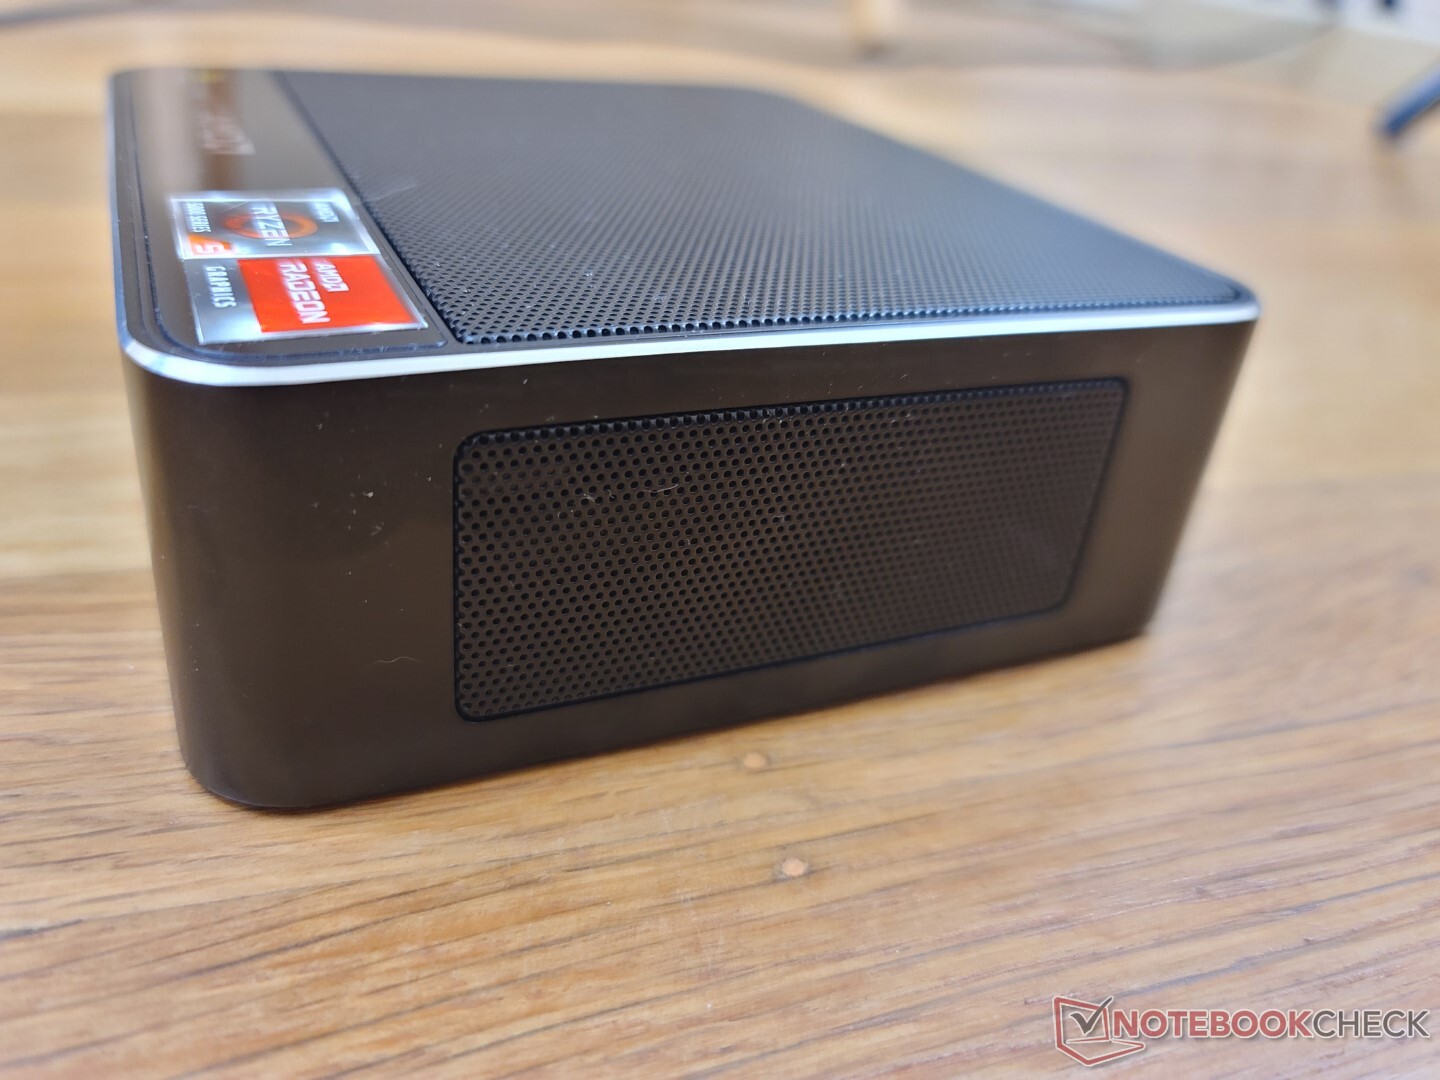
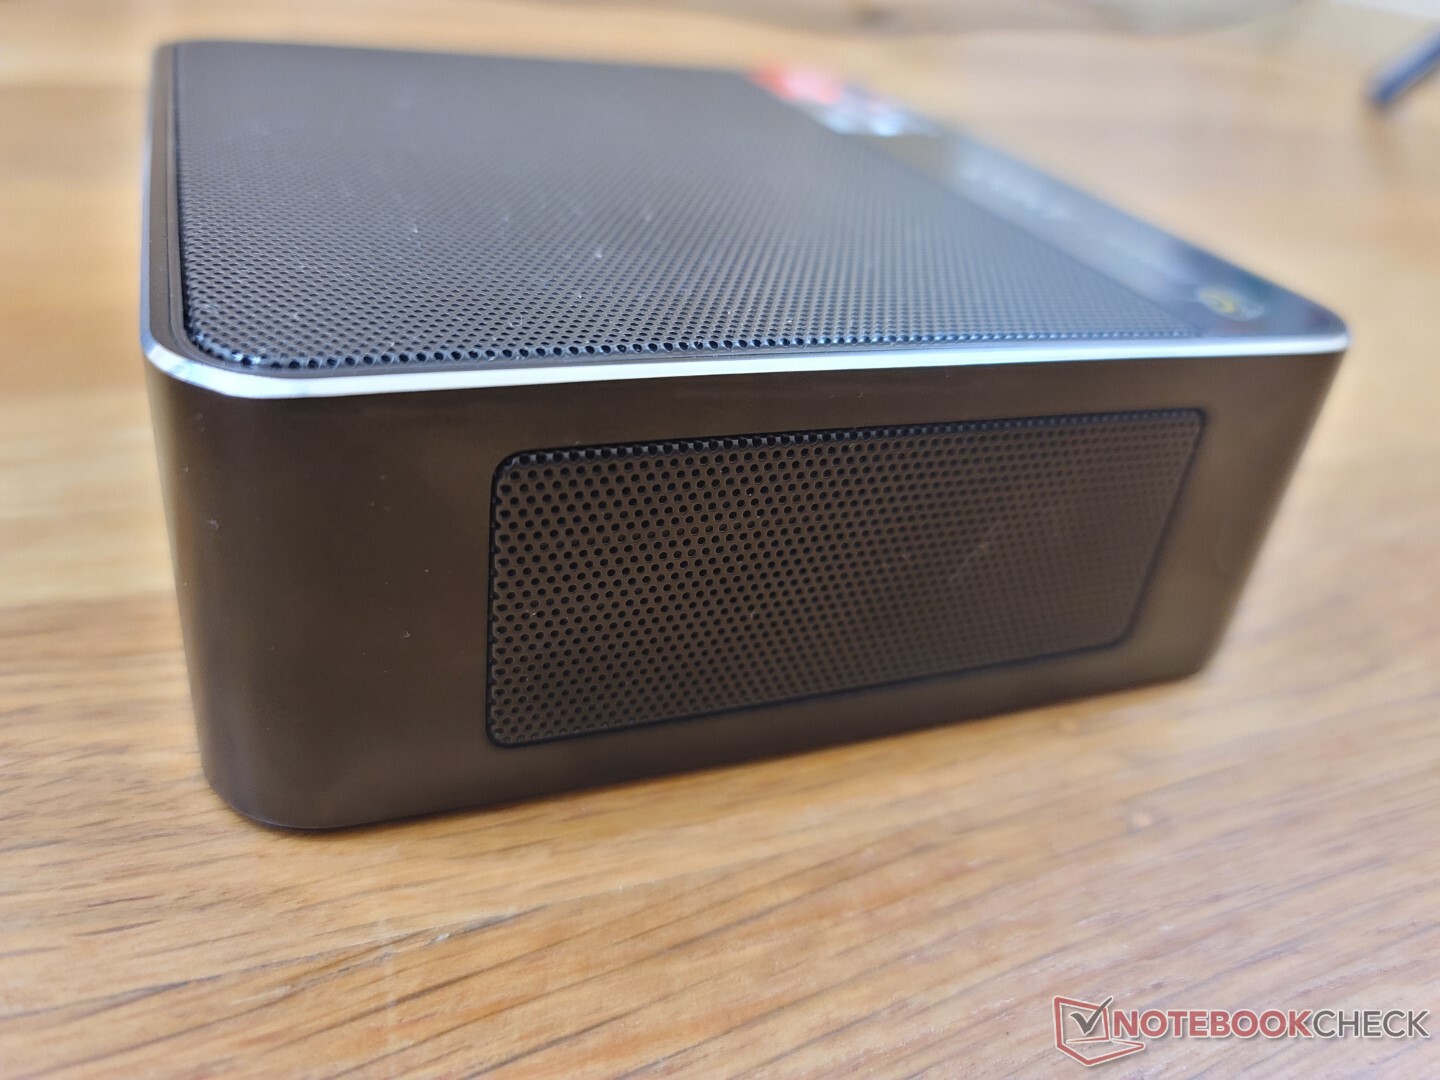
Caso
Tanto o SER4 quanto o SER5 utilizam o mesmo esqueleto de chassi, embora com marcas e núcleos superficiais ligeiramente diferentes. Na SER5, as grelhas de ventilação na lateral são pretas em vez de vermelhas
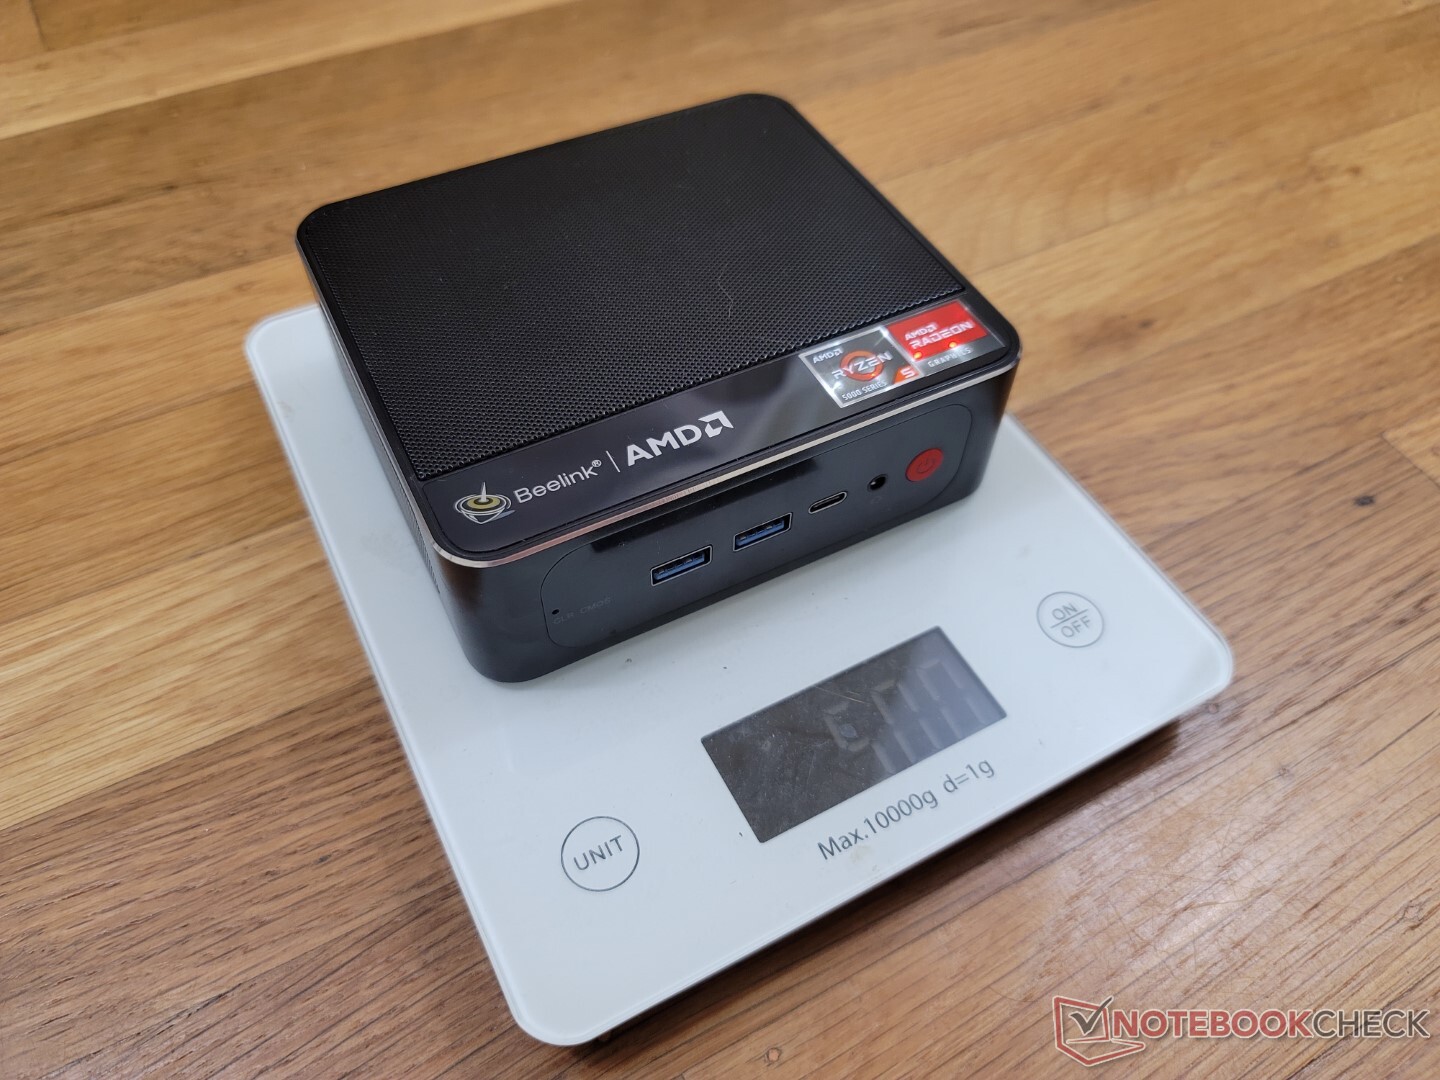
Em termos de tamanho, a SER5 é apenas ligeiramente mais espessa que a Intel NUC 11TNK. No entanto, é igualmente pesada, com cerca de meio quilo.
Conectividade
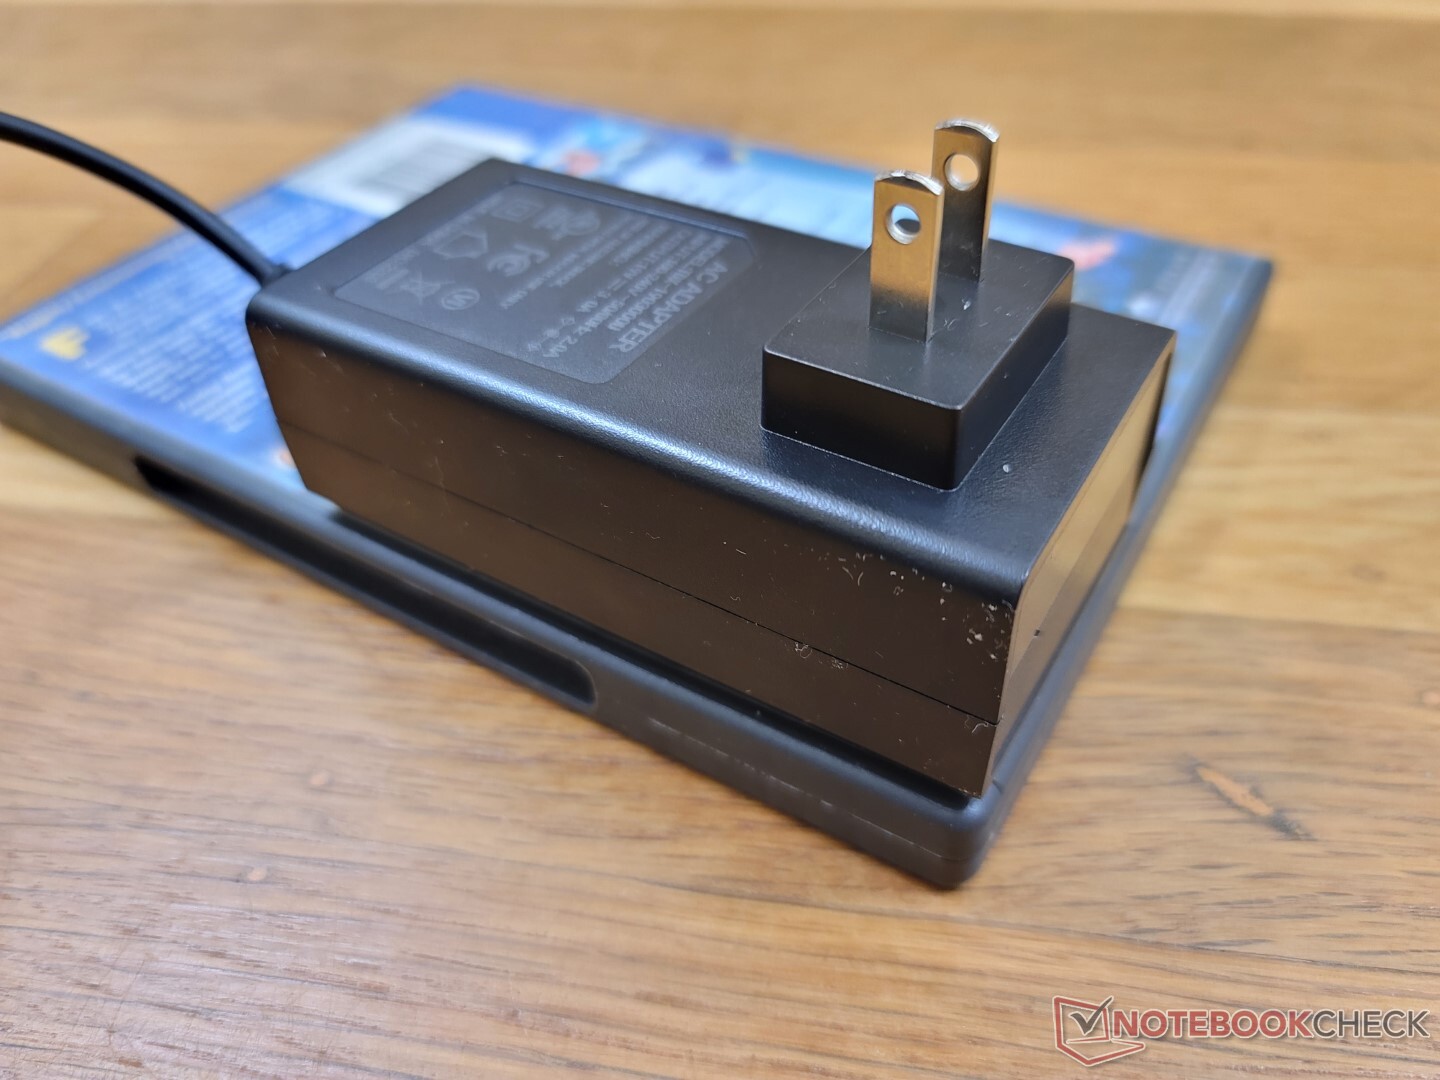
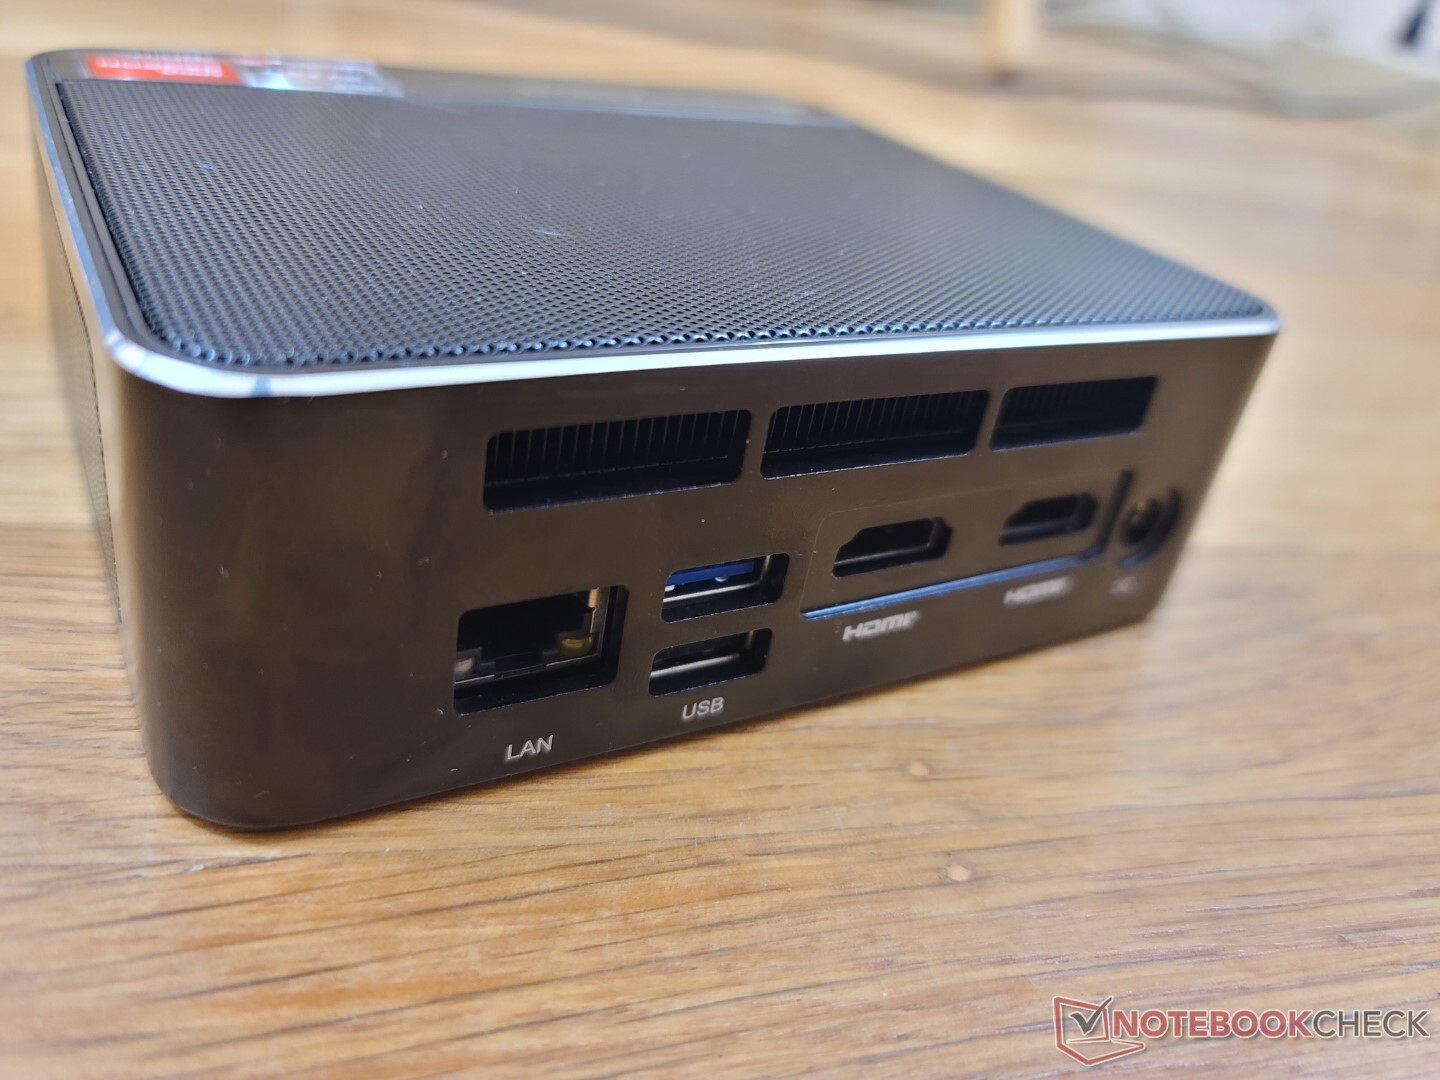
As opções de porto são as mesmas que no SER4. É decepcionante que a Beelink ainda não tenha mudado para os adaptadores USB-C AC, pois o SER5 depende de um adaptador de barril AC proprietário. A única porta USB-C frontal suporta DisplayPort 1.4, mas não PD-in.
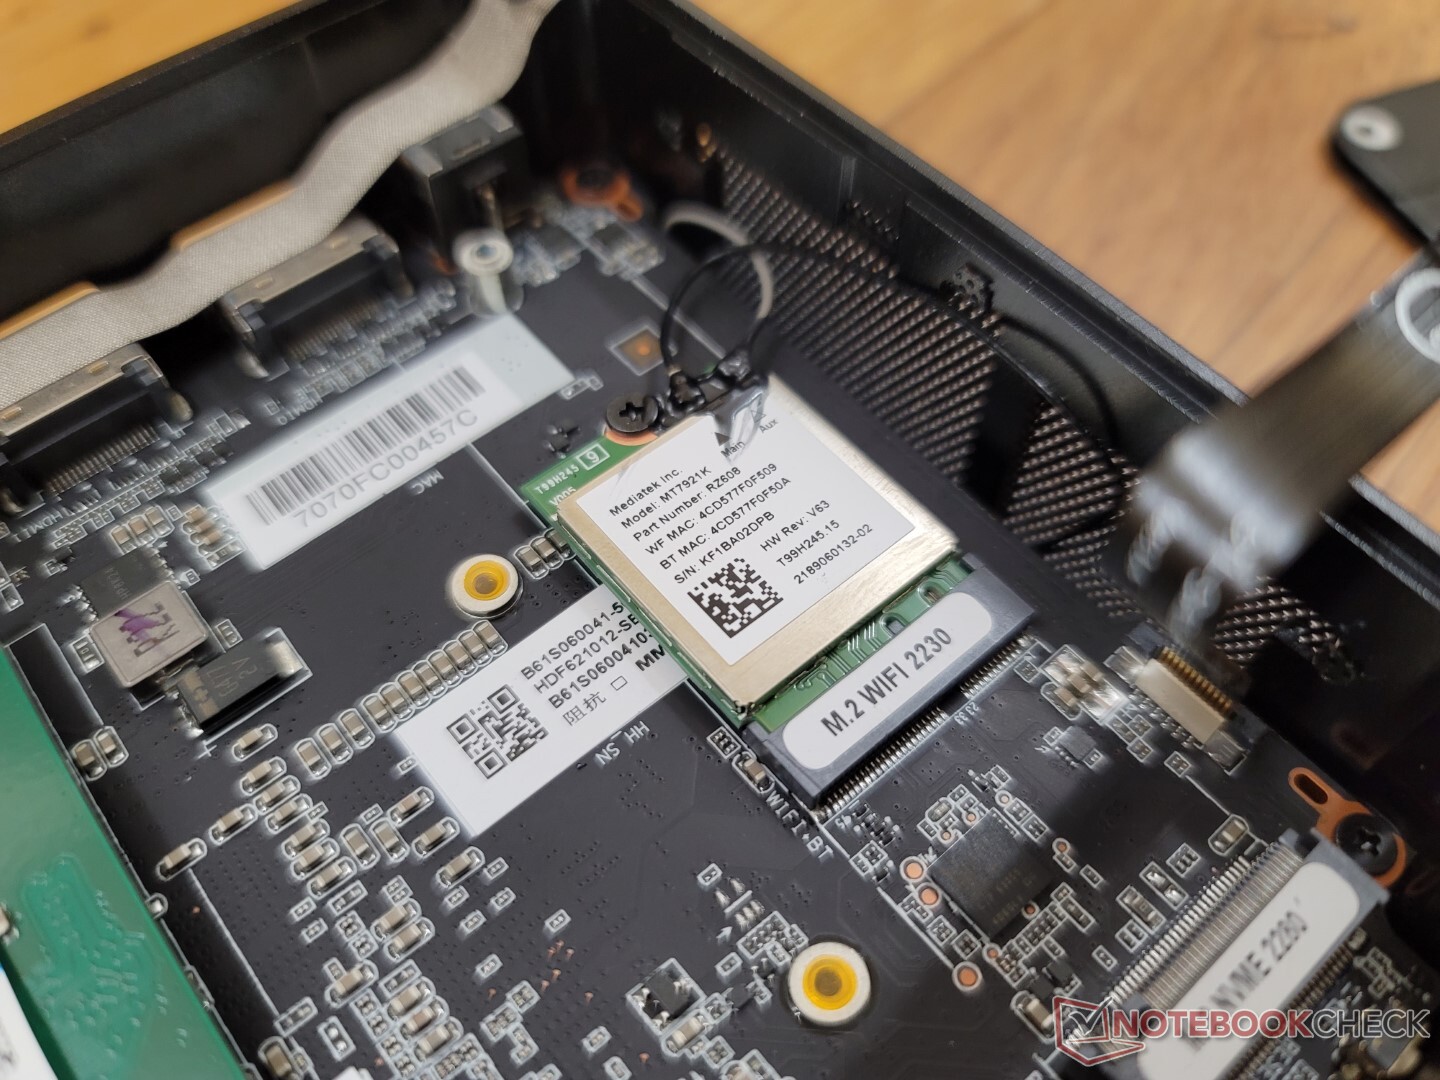
Comunicação
Um MediaTek RZ608 vem como padrão para suporte a Wi-Fi 6E, como não Beelink SEi11 Pro. No entanto, o desempenho ainda está faltando quando comparado com a série comum Intel AX200/210, como mostram os gráficos abaixo.
| Networking | |
| iperf3 transmit AX12 | |
| Intel NUC11TNKi5 | |
| Beelink GTR5 | |
| iperf3 receive AX12 | |
| Intel NUC11TNKi5 | |
| Beelink GTR5 | |
| iperf3 receive AXE11000 6GHz | |
| Zotac ZBOX PI336 pico | |
| Beelink SER Pro Ryzen 5 5600H | |
| Beelink SEi11 Pro | |
| iperf3 transmit AXE11000 6GHz | |
| Zotac ZBOX PI336 pico | |
| Beelink SER Pro Ryzen 5 5600H | |
| Beelink SEi11 Pro | |
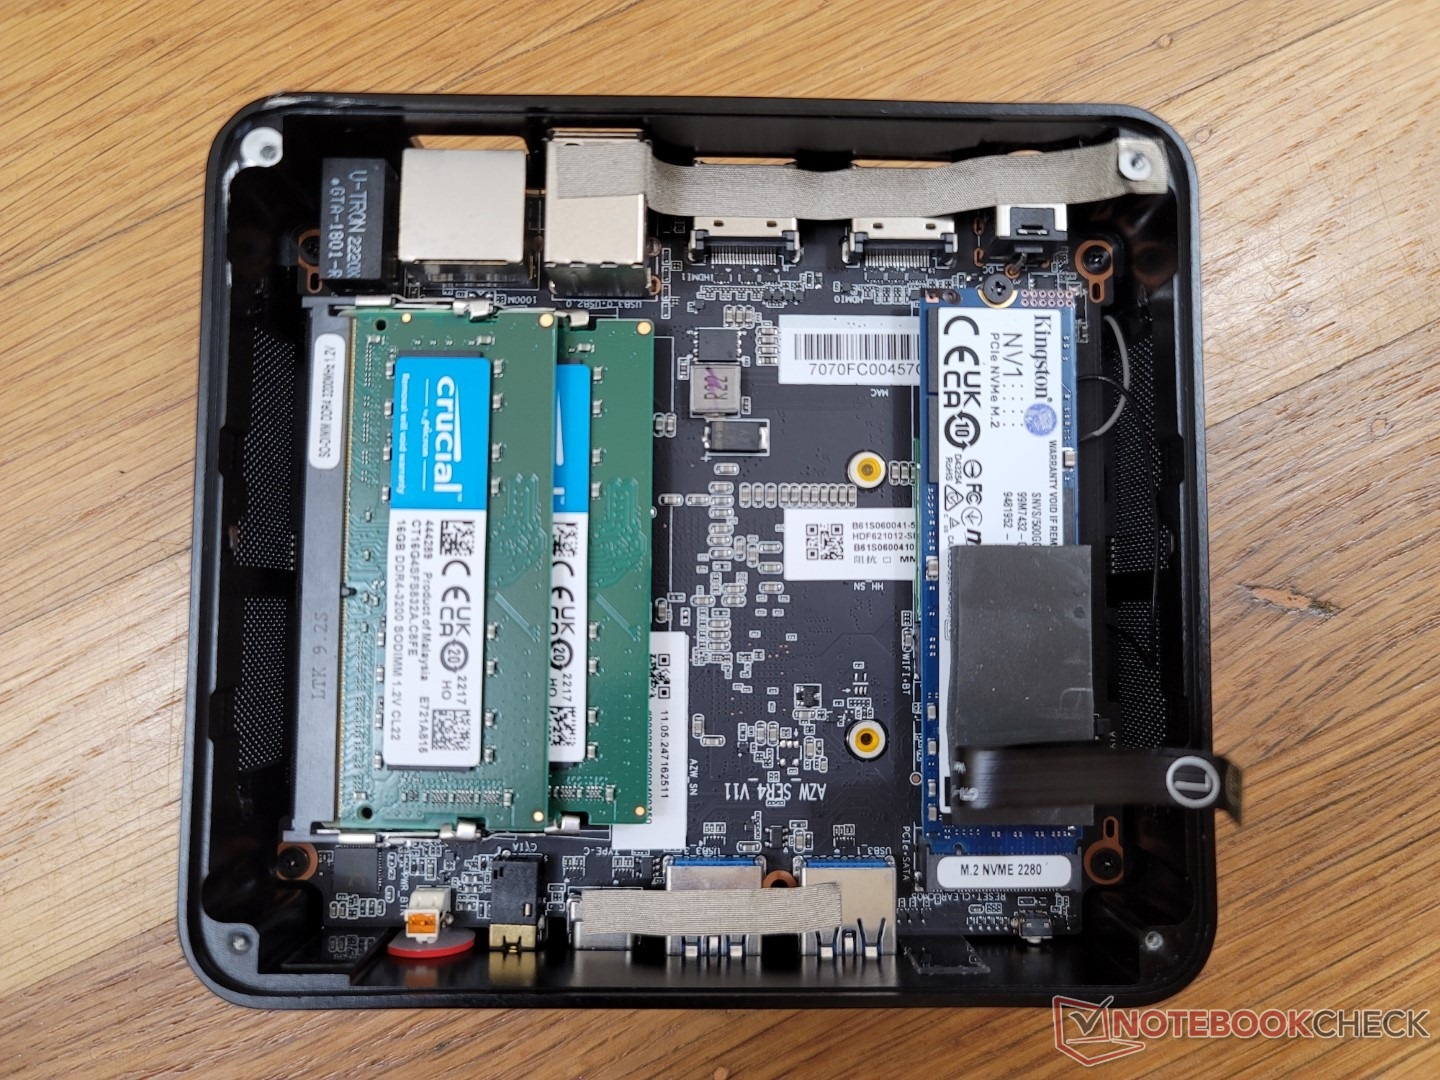
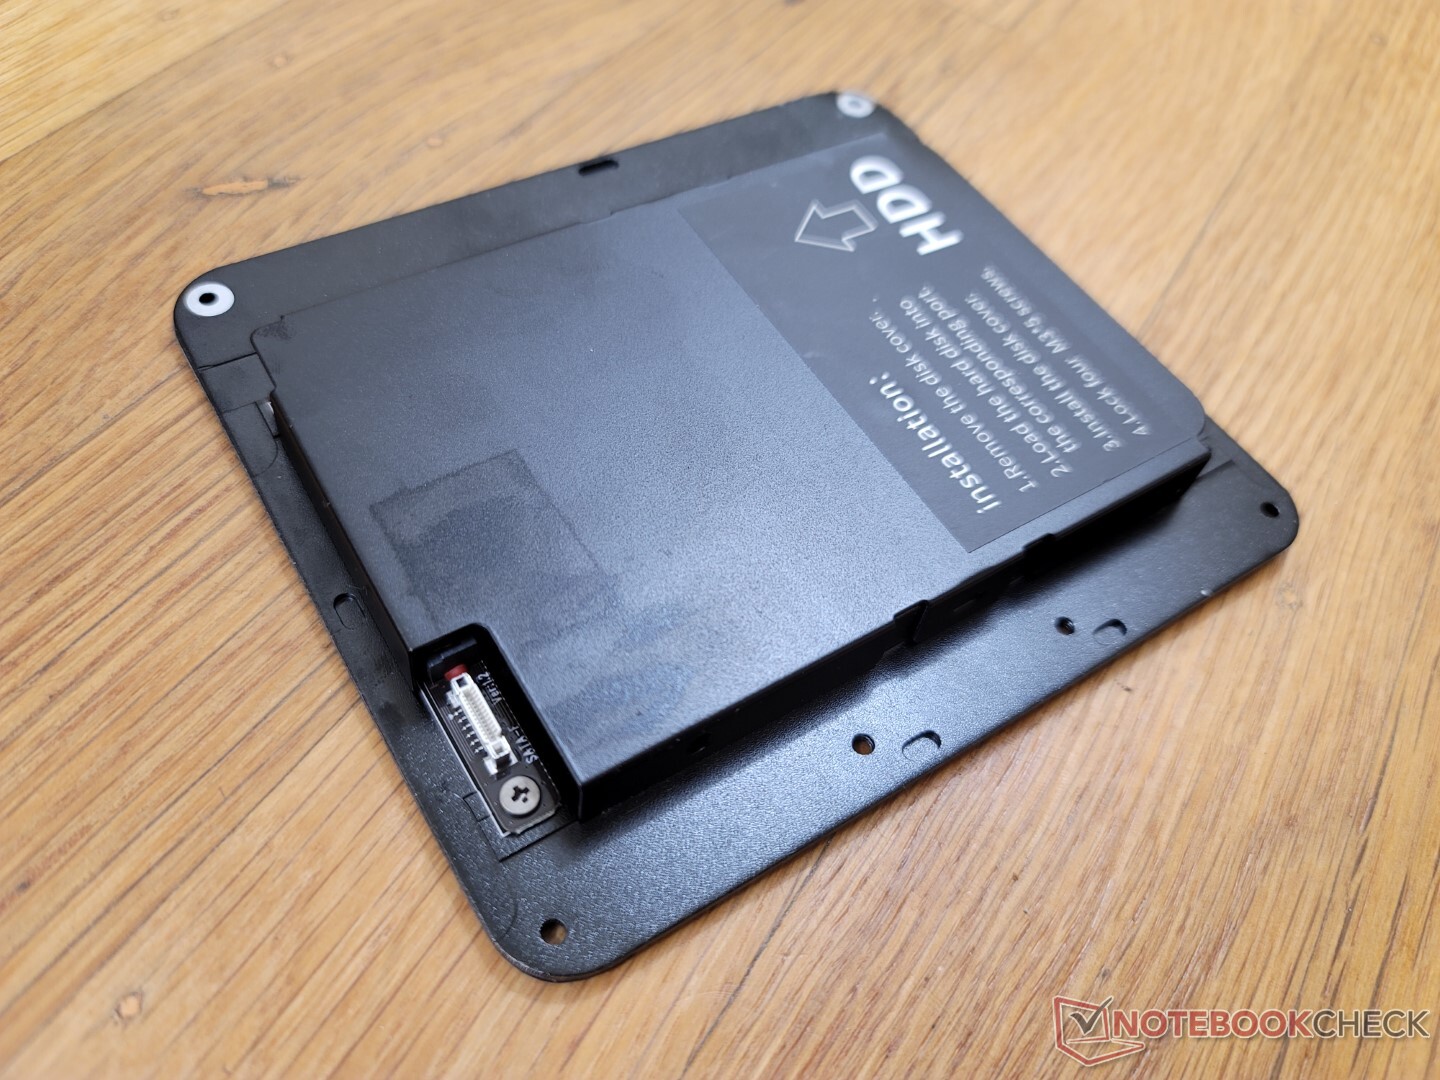
Manutenção
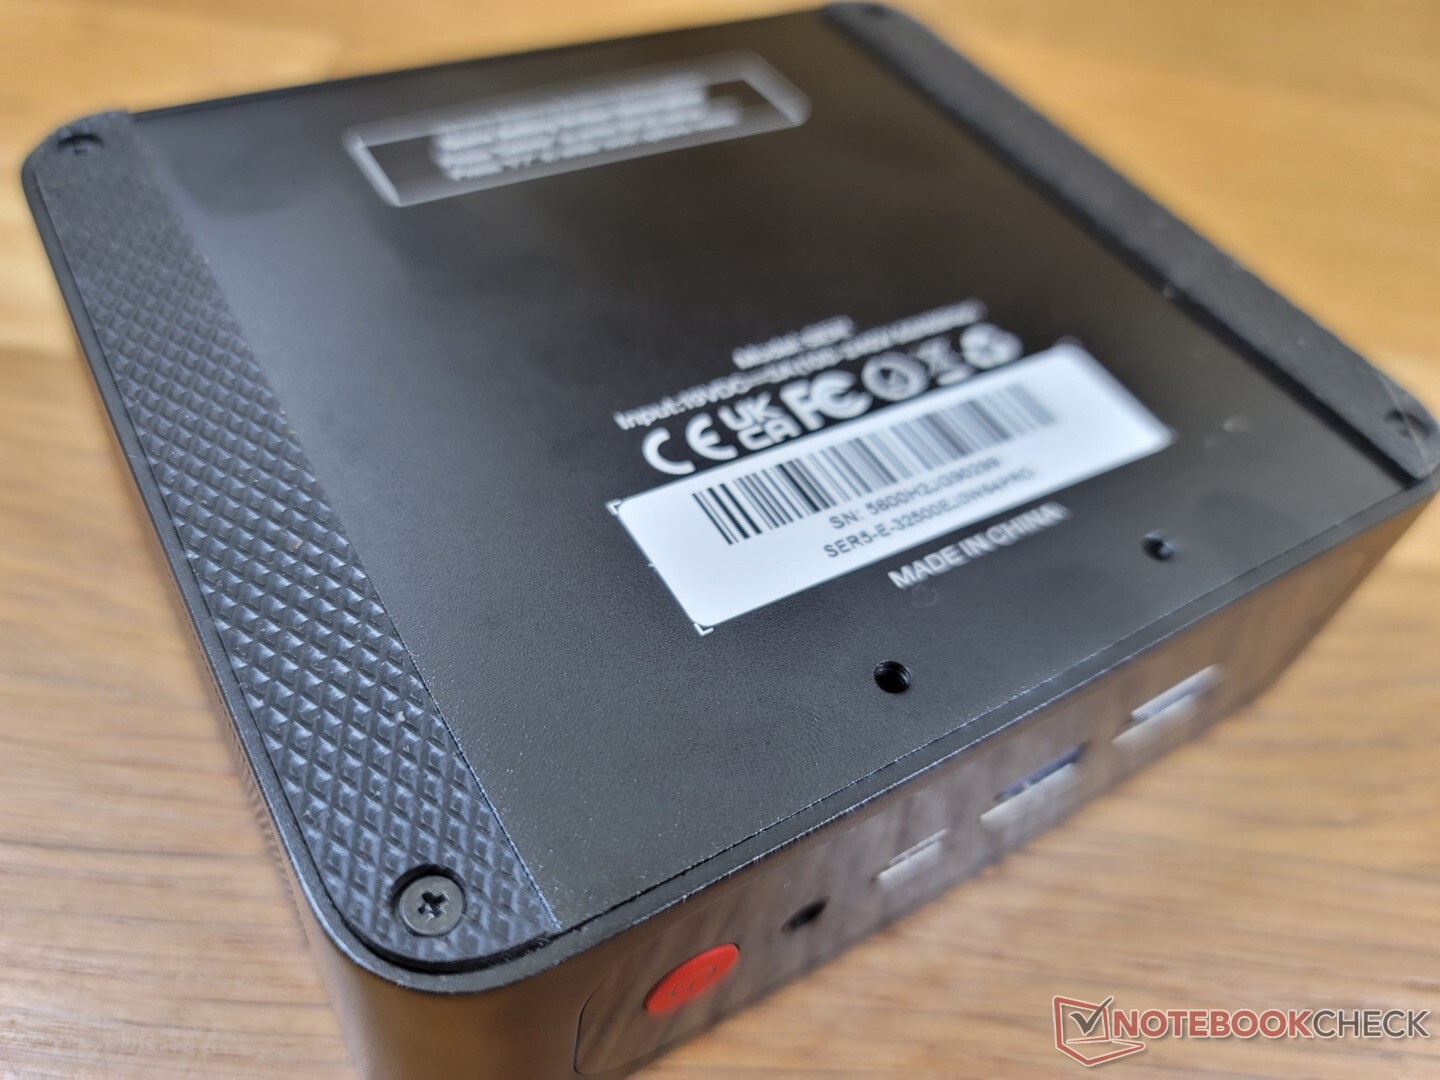
O painel inferior é fixado por quatro parafusos Philips. Estes parafusos são muito menores que os parafusos de torção manual em um NUC da Intel e exigirão uma chave de fenda para serem removidos. Tenha em mente que estes parafusos também são bastante macios e podem ser facilmente removidos se não forem cuidadosos.
Acessórios e Garantia
A caixa de varejo inclui um suporte de montagem VESA removível, parafusos extras, manual do usuário, dois cabos HDMI, e o adaptador AC.
A garantia padrão limitada de um ano do fabricante se aplica se comprada nos EUA.
Desempenho
Condições de teste
Configuramos nossa unidade para o modo Performance via Windows antes de executar quaisquer benchmarks abaixo.
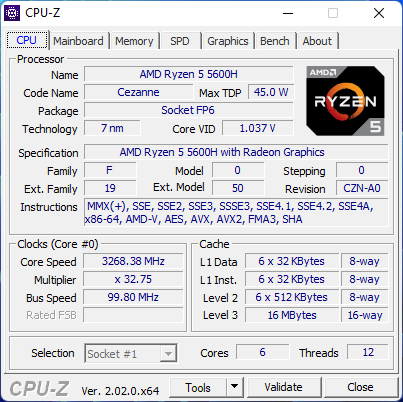
Processador
O desempenho multi-linhas é cerca de 15% mais lento do que a média dos PCs em nosso banco de dados equipados com o mesmo Ryzen 5 5600H CPU. Mesmo assim, o desempenho geral ainda é muito mais rápido do que o comum Núcleo i7-1165G7 como encontrado em muitos Ultrabooks e nos NUCs da Intel.
Cinebench R15 Multi Loop
Cinebench R23: Multi Core | Single Core
Cinebench R15: CPU Multi 64Bit | CPU Single 64Bit
Blender: v2.79 BMW27 CPU
7-Zip 18.03: 7z b 4 | 7z b 4 -mmt1
Geekbench 5.5: Multi-Core | Single-Core
HWBOT x265 Benchmark v2.2: 4k Preset
LibreOffice : 20 Documents To PDF
R Benchmark 2.5: Overall mean
| Cinebench R20 / CPU (Multi Core) | |
| HP Envy 16 h0112nr | |
| Schenker XMG Apex 15 NH57E PS | |
| Honor MagicBook 14 2022 | |
| Beelink GTR5 | |
| Média AMD Ryzen 5 5600H (3074 - 4059, n=16) | |
| Beelink SER4 | |
| Beelink SER Pro Ryzen 5 5600H | |
| Intel NUC10i7FNH | |
| Beelink SEi11 Pro | |
| Framework Laptop 13.5 | |
| Intel NUC11TNKi5 | |
| Zotac ZBOX PI336 pico | |
| Cinebench R20 / CPU (Single Core) | |
| HP Envy 16 h0112nr | |
| Honor MagicBook 14 2022 | |
| Framework Laptop 13.5 | |
| Beelink GTR5 | |
| Beelink SEi11 Pro | |
| Schenker XMG Apex 15 NH57E PS | |
| Média AMD Ryzen 5 5600H (527 - 538, n=15) | |
| Beelink SER Pro Ryzen 5 5600H | |
| Intel NUC11TNKi5 | |
| Beelink SER4 | |
| Intel NUC10i7FNH | |
| Zotac ZBOX PI336 pico | |
| Cinebench R23 / Single Core | |
| HP Envy 16 h0112nr | |
| Honor MagicBook 14 2022 | |
| Framework Laptop 13.5 | |
| Beelink GTR5 | |
| Beelink SEi11 Pro | |
| Schenker XMG Apex 15 NH57E PS | |
| Intel NUC11TNKi5 | |
| Beelink SER Pro Ryzen 5 5600H | |
| Média AMD Ryzen 5 5600H (1316 - 1381, n=13) | |
| Beelink SER4 | |
| Zotac ZBOX PI336 pico | |
| Cinebench R15 / CPU Multi 64Bit | |
| HP Envy 16 h0112nr | |
| Honor MagicBook 14 2022 | |
| Honor MagicBook 14 2022 | |
| Schenker XMG Apex 15 NH57E PS | |
| Beelink GTR5 | |
| Média AMD Ryzen 5 5600H (1319 - 1723, n=16) | |
| Beelink SER4 | |
| Beelink SER Pro Ryzen 5 5600H | |
| Intel NUC10i7FNH | |
| Beelink SEi11 Pro | |
| Framework Laptop 13.5 | |
| Intel NUC11TNKi5 | |
| Zotac ZBOX PI336 pico | |
| Cinebench R15 / CPU Single 64Bit | |
| HP Envy 16 h0112nr | |
| Beelink GTR5 | |
| Honor MagicBook 14 2022 | |
| Schenker XMG Apex 15 NH57E PS | |
| Framework Laptop 13.5 | |
| Média AMD Ryzen 5 5600H (218 - 225, n=14) | |
| Beelink SER Pro Ryzen 5 5600H | |
| Beelink SEi11 Pro | |
| Intel NUC11TNKi5 | |
| Intel NUC10i7FNH | |
| Beelink SER4 | |
| Zotac ZBOX PI336 pico | |
| Blender / v2.79 BMW27 CPU | |
| Zotac ZBOX PI336 pico | |
| Intel NUC11TNKi5 | |
| Framework Laptop 13.5 | |
| Beelink SEi11 Pro | |
| Intel NUC10i7FNH | |
| Beelink SER Pro Ryzen 5 5600H | |
| Beelink SER4 | |
| Média AMD Ryzen 5 5600H (300 - 384, n=14) | |
| Honor MagicBook 14 2022 | |
| Beelink GTR5 | |
| HP Envy 16 h0112nr | |
| Schenker XMG Apex 15 NH57E PS | |
| 7-Zip 18.03 / 7z b 4 | |
| Schenker XMG Apex 15 NH57E PS | |
| Beelink GTR5 | |
| HP Envy 16 h0112nr | |
| Honor MagicBook 14 2022 | |
| Média AMD Ryzen 5 5600H (36315 - 46562, n=14) | |
| Beelink SER4 | |
| Beelink SER Pro Ryzen 5 5600H | |
| Intel NUC10i7FNH | |
| Beelink SEi11 Pro | |
| Framework Laptop 13.5 | |
| Intel NUC11TNKi5 | |
| Zotac ZBOX PI336 pico | |
| 7-Zip 18.03 / 7z b 4 -mmt1 | |
| Beelink GTR5 | |
| HP Envy 16 h0112nr | |
| Schenker XMG Apex 15 NH57E PS | |
| Framework Laptop 13.5 | |
| Beelink SER Pro Ryzen 5 5600H | |
| Média AMD Ryzen 5 5600H (5213 - 5446, n=14) | |
| Honor MagicBook 14 2022 | |
| Beelink SEi11 Pro | |
| Intel NUC11TNKi5 | |
| Intel NUC10i7FNH | |
| Beelink SER4 | |
| Zotac ZBOX PI336 pico | |
| Geekbench 5.5 / Multi-Core | |
| HP Envy 16 h0112nr | |
| Honor MagicBook 14 2022 | |
| Schenker XMG Apex 15 NH57E PS | |
| Beelink GTR5 | |
| Média AMD Ryzen 5 5600H (4990 - 7253, n=14) | |
| Beelink SER4 | |
| Beelink SER Pro Ryzen 5 5600H | |
| Intel NUC10i7FNH | |
| Beelink SEi11 Pro | |
| Intel NUC11TNKi5 | |
| Zotac ZBOX PI336 pico | |
| Geekbench 5.5 / Single-Core | |
| HP Envy 16 h0112nr | |
| Honor MagicBook 14 2022 | |
| Beelink GTR5 | |
| Beelink SEi11 Pro | |
| Schenker XMG Apex 15 NH57E PS | |
| Beelink SER Pro Ryzen 5 5600H | |
| Média AMD Ryzen 5 5600H (1365 - 1445, n=14) | |
| Intel NUC11TNKi5 | |
| Intel NUC10i7FNH | |
| Beelink SER4 | |
| Zotac ZBOX PI336 pico | |
| HWBOT x265 Benchmark v2.2 / 4k Preset | |
| Schenker XMG Apex 15 NH57E PS | |
| HP Envy 16 h0112nr | |
| Beelink GTR5 | |
| Honor MagicBook 14 2022 | |
| Média AMD Ryzen 5 5600H (9.92 - 13.3, n=14) | |
| Beelink SER Pro Ryzen 5 5600H | |
| Beelink SER4 | |
| Intel NUC10i7FNH | |
| Beelink SEi11 Pro | |
| Framework Laptop 13.5 | |
| Intel NUC11TNKi5 | |
| Zotac ZBOX PI336 pico | |
| LibreOffice / 20 Documents To PDF | |
| Zotac ZBOX PI336 pico | |
| Beelink SER4 | |
| Média AMD Ryzen 5 5600H (52.2 - 81.5, n=14) | |
| Schenker XMG Apex 15 NH57E PS | |
| Beelink SER Pro Ryzen 5 5600H | |
| Intel NUC11TNKi5 | |
| Beelink GTR5 | |
| Beelink SEi11 Pro | |
| HP Envy 16 h0112nr | |
| Framework Laptop 13.5 | |
| Honor MagicBook 14 2022 | |
| R Benchmark 2.5 / Overall mean | |
| Zotac ZBOX PI336 pico | |
| Intel NUC10i7FNH | |
| Intel NUC11TNKi5 | |
| Beelink SEi11 Pro | |
| Beelink SER4 | |
| Framework Laptop 13.5 | |
| Média AMD Ryzen 5 5600H (0.526 - 0.596, n=14) | |
| Beelink SER Pro Ryzen 5 5600H | |
| Schenker XMG Apex 15 NH57E PS | |
| Honor MagicBook 14 2022 | |
| Beelink GTR5 | |
| HP Envy 16 h0112nr | |
* ... menor é melhor
AIDA64: FP32 Ray-Trace | FPU Julia | CPU SHA3 | CPU Queen | FPU SinJulia | FPU Mandel | CPU AES | CPU ZLib | FP64 Ray-Trace | CPU PhotoWorxx
| Performance rating | |
| Beelink GTR5 | |
| Beelink SER Pro Ryzen 5 5600H | |
| Beelink SEi11 Pro | |
| Intel NUC11TNKi5 | |
| Zotac ZBOX PI336 pico | |
| AIDA64 / FP32 Ray-Trace | |
| Beelink GTR5 | |
| Beelink SER Pro Ryzen 5 5600H | |
| Beelink SEi11 Pro | |
| Intel NUC11TNKi5 | |
| Zotac ZBOX PI336 pico | |
| AIDA64 / FPU Julia | |
| Beelink GTR5 | |
| Beelink SER Pro Ryzen 5 5600H | |
| Beelink SEi11 Pro | |
| Intel NUC11TNKi5 | |
| Zotac ZBOX PI336 pico | |
| AIDA64 / CPU SHA3 | |
| Beelink GTR5 | |
| Beelink SER Pro Ryzen 5 5600H | |
| Beelink SEi11 Pro | |
| Intel NUC11TNKi5 | |
| Zotac ZBOX PI336 pico | |
| AIDA64 / CPU Queen | |
| Beelink GTR5 | |
| Beelink SER Pro Ryzen 5 5600H | |
| Beelink SEi11 Pro | |
| Intel NUC11TNKi5 | |
| Zotac ZBOX PI336 pico | |
| AIDA64 / FPU SinJulia | |
| Beelink GTR5 | |
| Beelink SER Pro Ryzen 5 5600H | |
| Beelink SEi11 Pro | |
| Intel NUC11TNKi5 | |
| Zotac ZBOX PI336 pico | |
| AIDA64 / FPU Mandel | |
| Beelink GTR5 | |
| Beelink SER Pro Ryzen 5 5600H | |
| Beelink SEi11 Pro | |
| Intel NUC11TNKi5 | |
| Zotac ZBOX PI336 pico | |
| AIDA64 / CPU AES | |
| Beelink GTR5 | |
| Beelink SER Pro Ryzen 5 5600H | |
| Beelink SEi11 Pro | |
| Intel NUC11TNKi5 | |
| Zotac ZBOX PI336 pico | |
| AIDA64 / CPU ZLib | |
| Beelink GTR5 | |
| Beelink SER Pro Ryzen 5 5600H | |
| Intel NUC11TNKi5 | |
| Beelink SEi11 Pro | |
| Zotac ZBOX PI336 pico | |
| AIDA64 / FP64 Ray-Trace | |
| Beelink GTR5 | |
| Beelink SER Pro Ryzen 5 5600H | |
| Beelink SEi11 Pro | |
| Intel NUC11TNKi5 | |
| Zotac ZBOX PI336 pico | |
| AIDA64 / CPU PhotoWorxx | |
| Beelink SEi11 Pro | |
| Beelink GTR5 | |
| Beelink SER Pro Ryzen 5 5600H | |
| Intel NUC11TNKi5 | |
| Zotac ZBOX PI336 pico | |
Desempenho do sistema
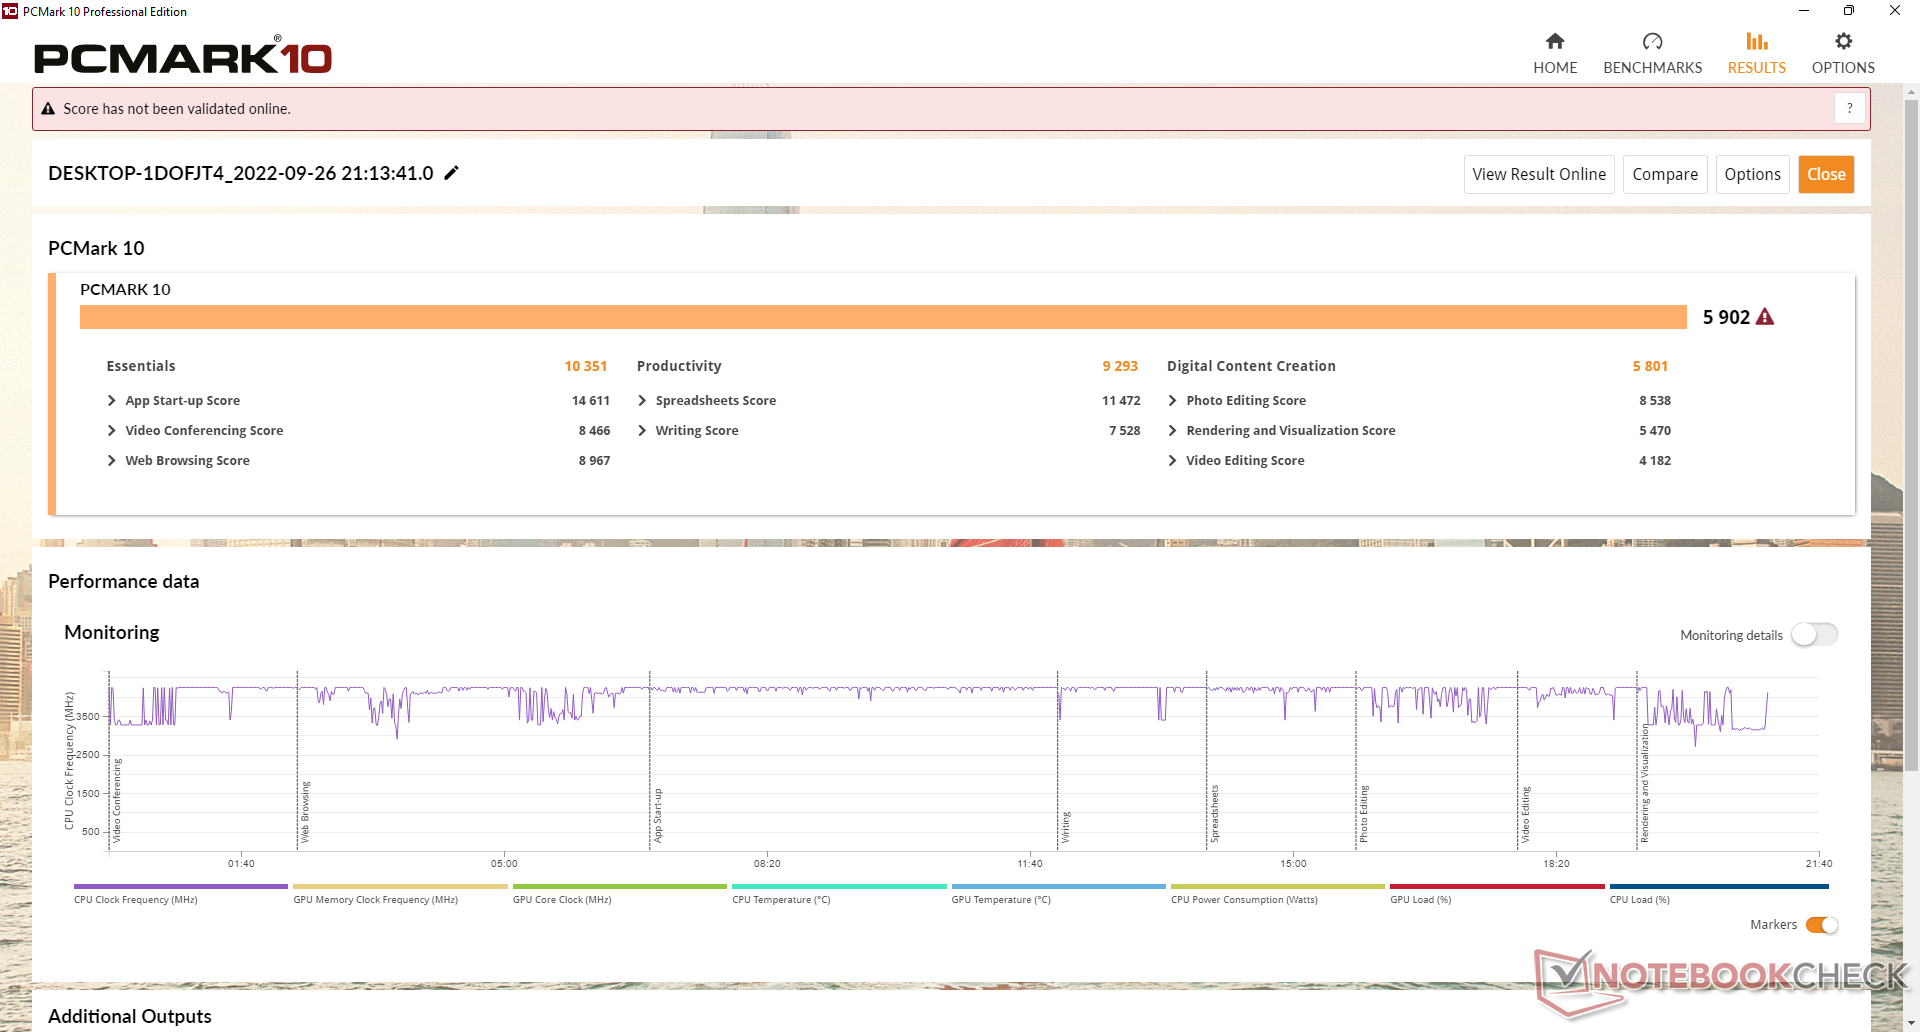
Os resultados do PCMark 10 estão onde esperamos que estejam quando comparados com outros laptops ou mini PCs Ryzen 5 5600H, exceto no sub-teste de Criação de Conteúdo Digital, onde o desempenho da GPU é mais importante. Isto porque muitos laptops com este mesmo processador normalmente são enviados com gráficos discretos mais rápidos.
CrossMark: Overall | Productivity | Creativity | Responsiveness
| PCMark 10 / Score | |
| Beelink GTR5 | |
| Média AMD Ryzen 5 5600H (5309 - 7091, n=14) | |
| Beelink SER Pro Ryzen 5 5600H | |
| Beelink SEi11 Pro | |
| Intel NUC11TNKi5 | |
| Intel NUC10i7FNH | |
| PCMark 10 / Essentials | |
| Beelink GTR5 | |
| Beelink SER Pro Ryzen 5 5600H | |
| Beelink SEi11 Pro | |
| Média AMD Ryzen 5 5600H (9326 - 10506, n=14) | |
| Intel NUC10i7FNH | |
| Intel NUC11TNKi5 | |
| PCMark 10 / Productivity | |
| Beelink GTR5 | |
| Beelink SER Pro Ryzen 5 5600H | |
| Média AMD Ryzen 5 5600H (7975 - 9642, n=14) | |
| Beelink SEi11 Pro | |
| Intel NUC10i7FNH | |
| Intel NUC11TNKi5 | |
| PCMark 10 / Digital Content Creation | |
| Média AMD Ryzen 5 5600H (4921 - 9907, n=14) | |
| Beelink GTR5 | |
| Beelink SER Pro Ryzen 5 5600H | |
| Beelink SEi11 Pro | |
| Intel NUC11TNKi5 | |
| Intel NUC10i7FNH | |
| CrossMark / Overall | |
| Beelink GTR5 | |
| Beelink SEi11 Pro | |
| Beelink SER Pro Ryzen 5 5600H | |
| Média AMD Ryzen 5 5600H (1157 - 1353, n=7) | |
| CrossMark / Productivity | |
| Beelink GTR5 | |
| Beelink SEi11 Pro | |
| Beelink SER Pro Ryzen 5 5600H | |
| Média AMD Ryzen 5 5600H (1217 - 1384, n=7) | |
| CrossMark / Creativity | |
| Beelink GTR5 | |
| Média AMD Ryzen 5 5600H (1184 - 1377, n=7) | |
| Beelink SER Pro Ryzen 5 5600H | |
| Beelink SEi11 Pro | |
| CrossMark / Responsiveness | |
| Beelink SEi11 Pro | |
| Beelink GTR5 | |
| Beelink SER Pro Ryzen 5 5600H | |
| Média AMD Ryzen 5 5600H (926 - 1225, n=7) | |
| PCMark 10 Score | 5902 pontos | |
Ajuda | ||
| AIDA64 / Memory Copy | |
| Beelink GTR5 | |
| Beelink SER Pro Ryzen 5 5600H | |
| Beelink SEi11 Pro | |
| Média AMD Ryzen 5 5600H (20549 - 42141, n=14) | |
| Intel NUC11TNKi5 | |
| Zotac ZBOX PI336 pico | |
| AIDA64 / Memory Read | |
| Beelink SER Pro Ryzen 5 5600H | |
| Beelink GTR5 | |
| Beelink SEi11 Pro | |
| Média AMD Ryzen 5 5600H (22917 - 47595, n=14) | |
| Intel NUC11TNKi5 | |
| Zotac ZBOX PI336 pico | |
| AIDA64 / Memory Write | |
| Beelink SEi11 Pro | |
| Beelink SER Pro Ryzen 5 5600H | |
| Beelink GTR5 | |
| Média AMD Ryzen 5 5600H (20226 - 44872, n=14) | |
| Intel NUC11TNKi5 | |
| Zotac ZBOX PI336 pico | |
| AIDA64 / Memory Latency | |
| Intel NUC11TNKi5 | |
| Beelink SEi11 Pro | |
| Beelink SER Pro Ryzen 5 5600H | |
| Beelink GTR5 | |
| Média AMD Ryzen 5 5600H (75 - 89.1, n=14) | |
| Zotac ZBOX PI336 pico | |
* ... menor é melhor
Latência do DPC
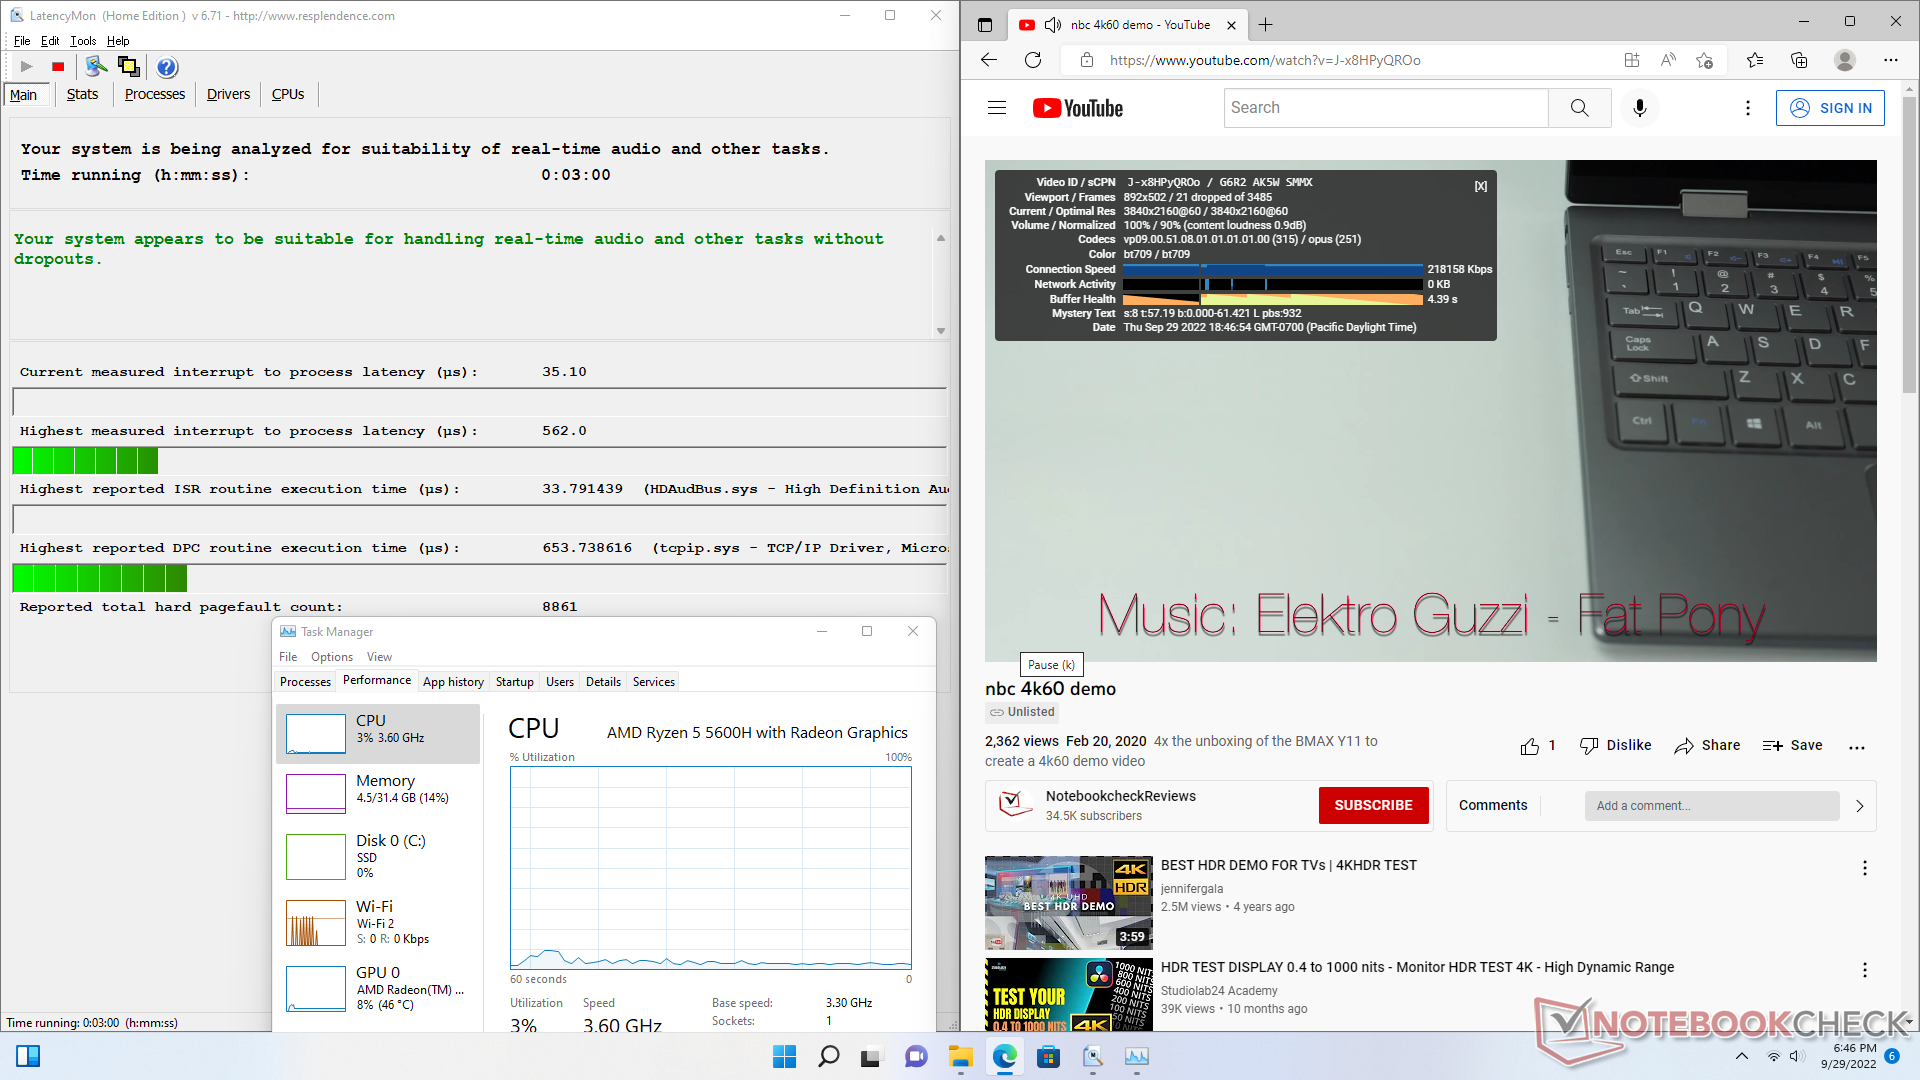
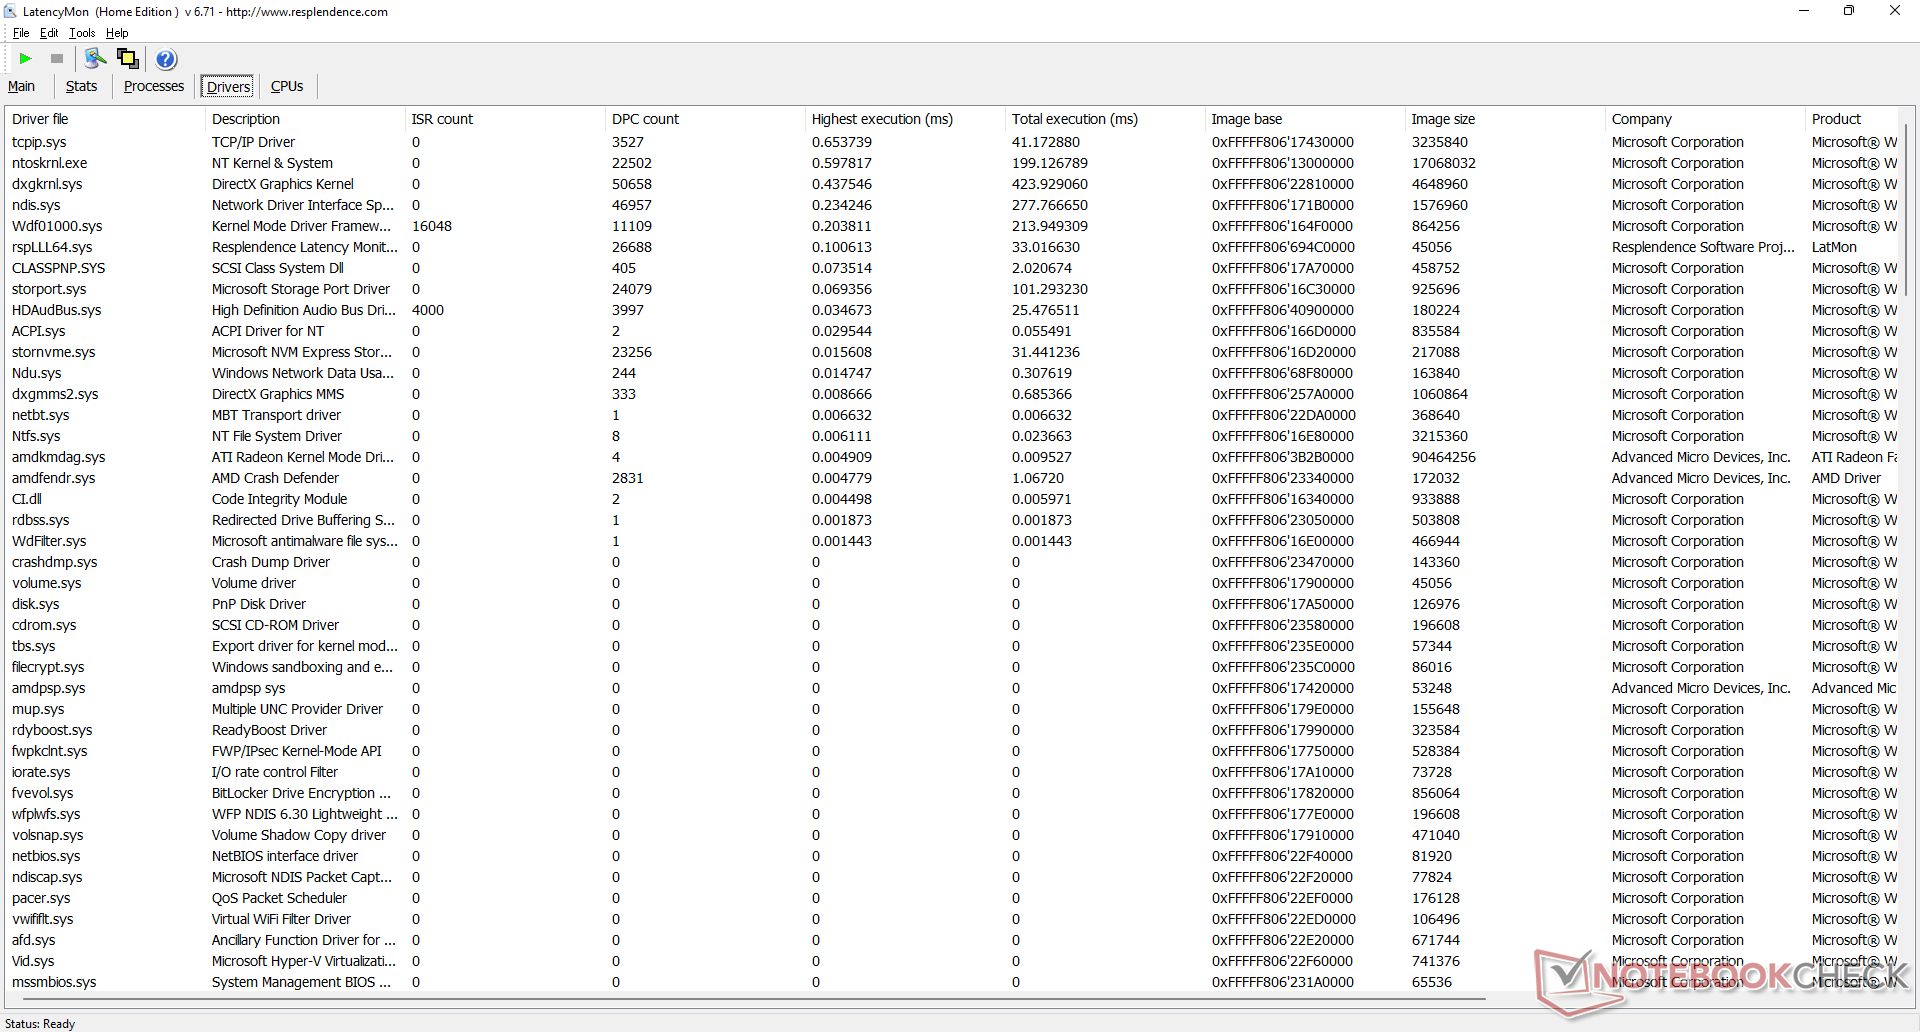
A LatencyMon não mostra grandes problemas de DPC ao abrir várias abas do navegador em nossa página inicial. Infelizmente, a reprodução do vídeo de 4K a 60 FPS é imperfeita, com 21 quadros descartados durante nosso vídeo de minutos.
| DPC Latencies / LatencyMon - interrupt to process latency (max), Web, Youtube, Prime95 | |
| Zotac ZBOX PI336 pico | |
| Beelink SER Pro Ryzen 5 5600H | |
| Intel NUC11TNKi5 | |
| Beelink SEi11 Pro | |
| Beelink GTR5 | |
* ... menor é melhor
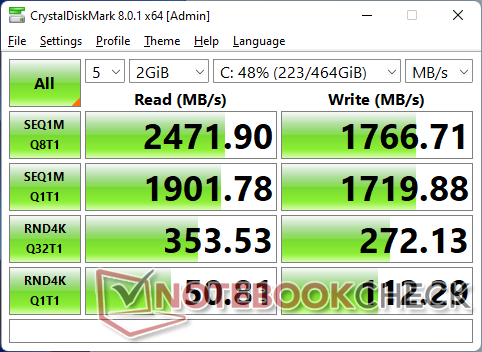
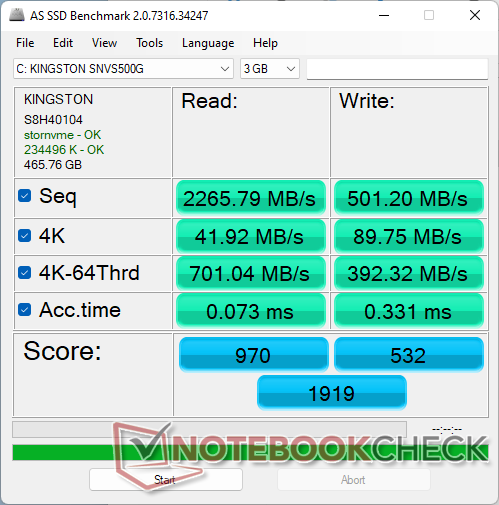
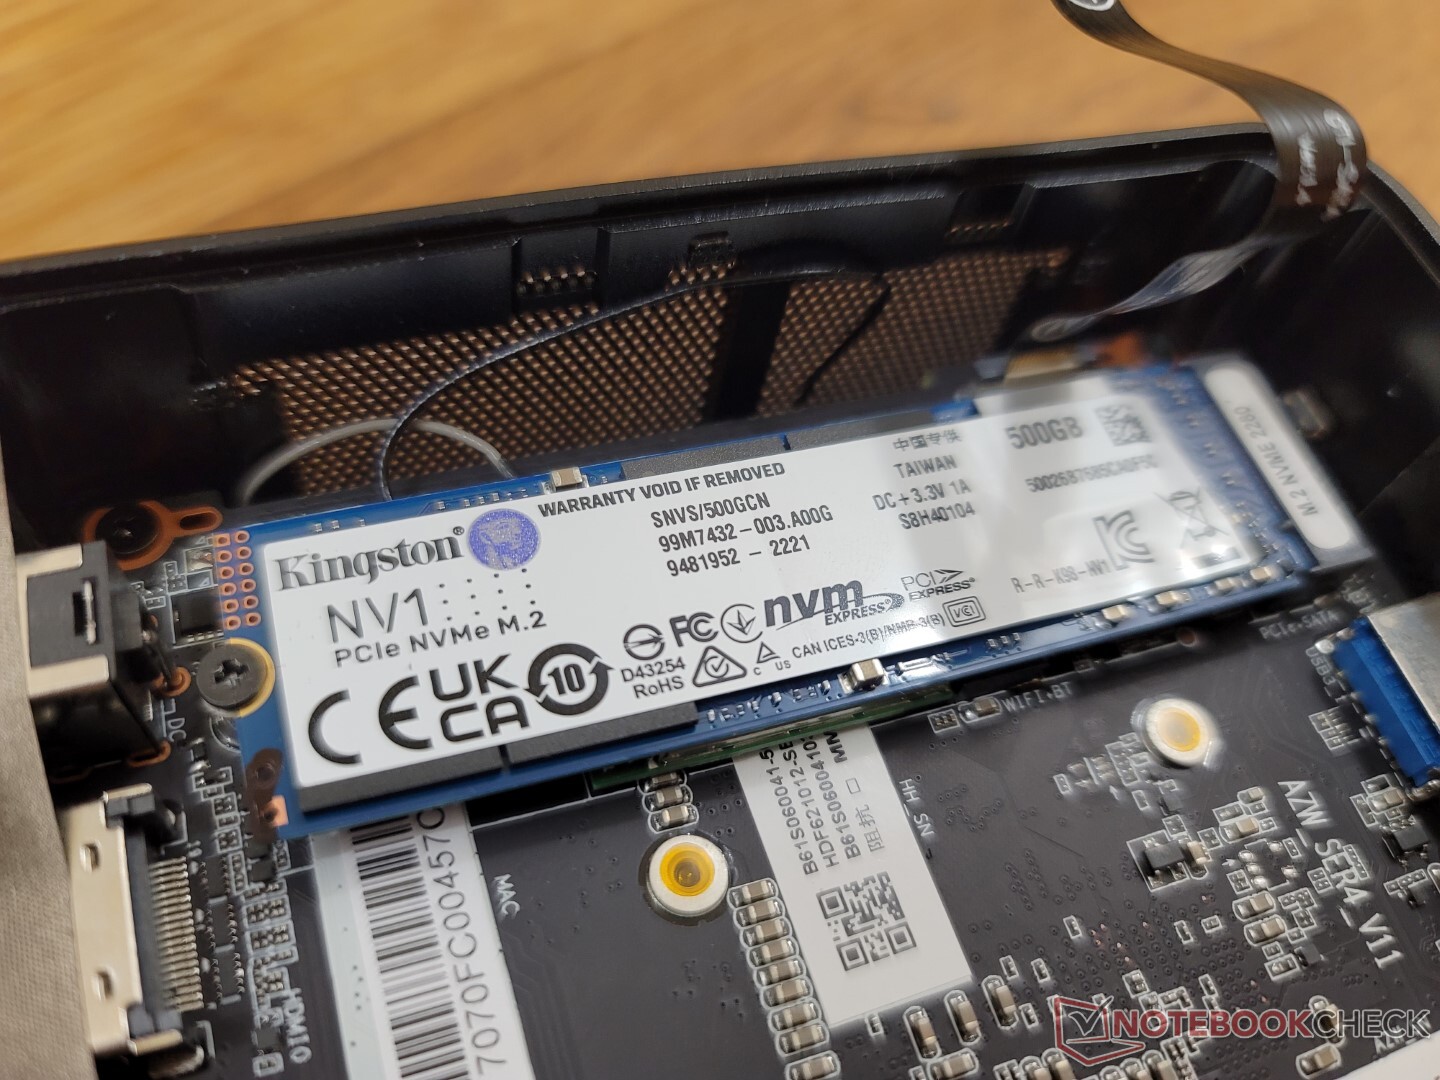
Dispositivos de armazenamento
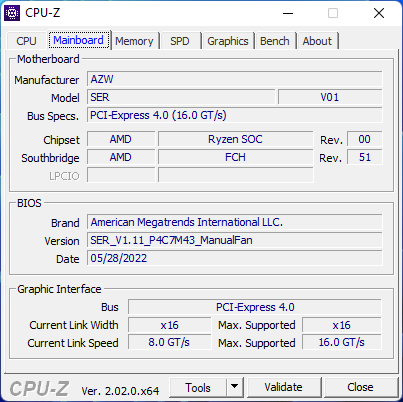
As velocidades do NVMe são limitadas à PCIe3 x4, enquanto a maioria dos modelos mais novos da Intel NUC suportam totalmente a PCIe4 x4. No entanto, a PCIe3 é mais do que suficiente para a maioria dos usuários e, portanto, o canto de corte aqui não é significativo. Nossa linha média de 500 GB Kingston NV1 SSD é capaz de manter suas taxas máximas de leitura de ~2500 MB/s sem nenhum problema térmico.

| Drive Performance rating - Percent | |
| Beelink SER Pro Ryzen 5 5600H -11! | |
| Beelink GTR5 | |
| Beelink SEi11 Pro | |
| Intel NUC10i7FNH | |
| Intel NUC11TNKi5 | |
| Zotac ZBOX PI336 pico | |
* ... menor é melhor
Disk Throttling: DiskSpd Read Loop, Queue Depth 8
Desempenho da GPU
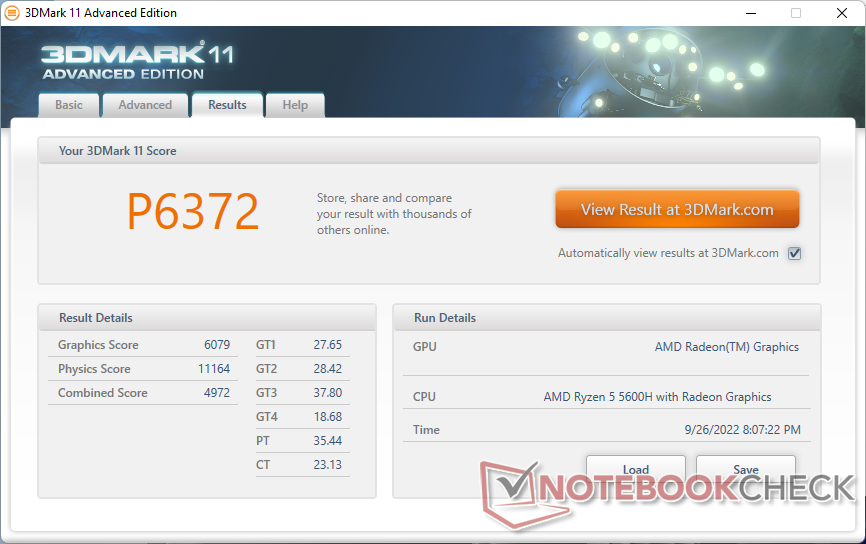
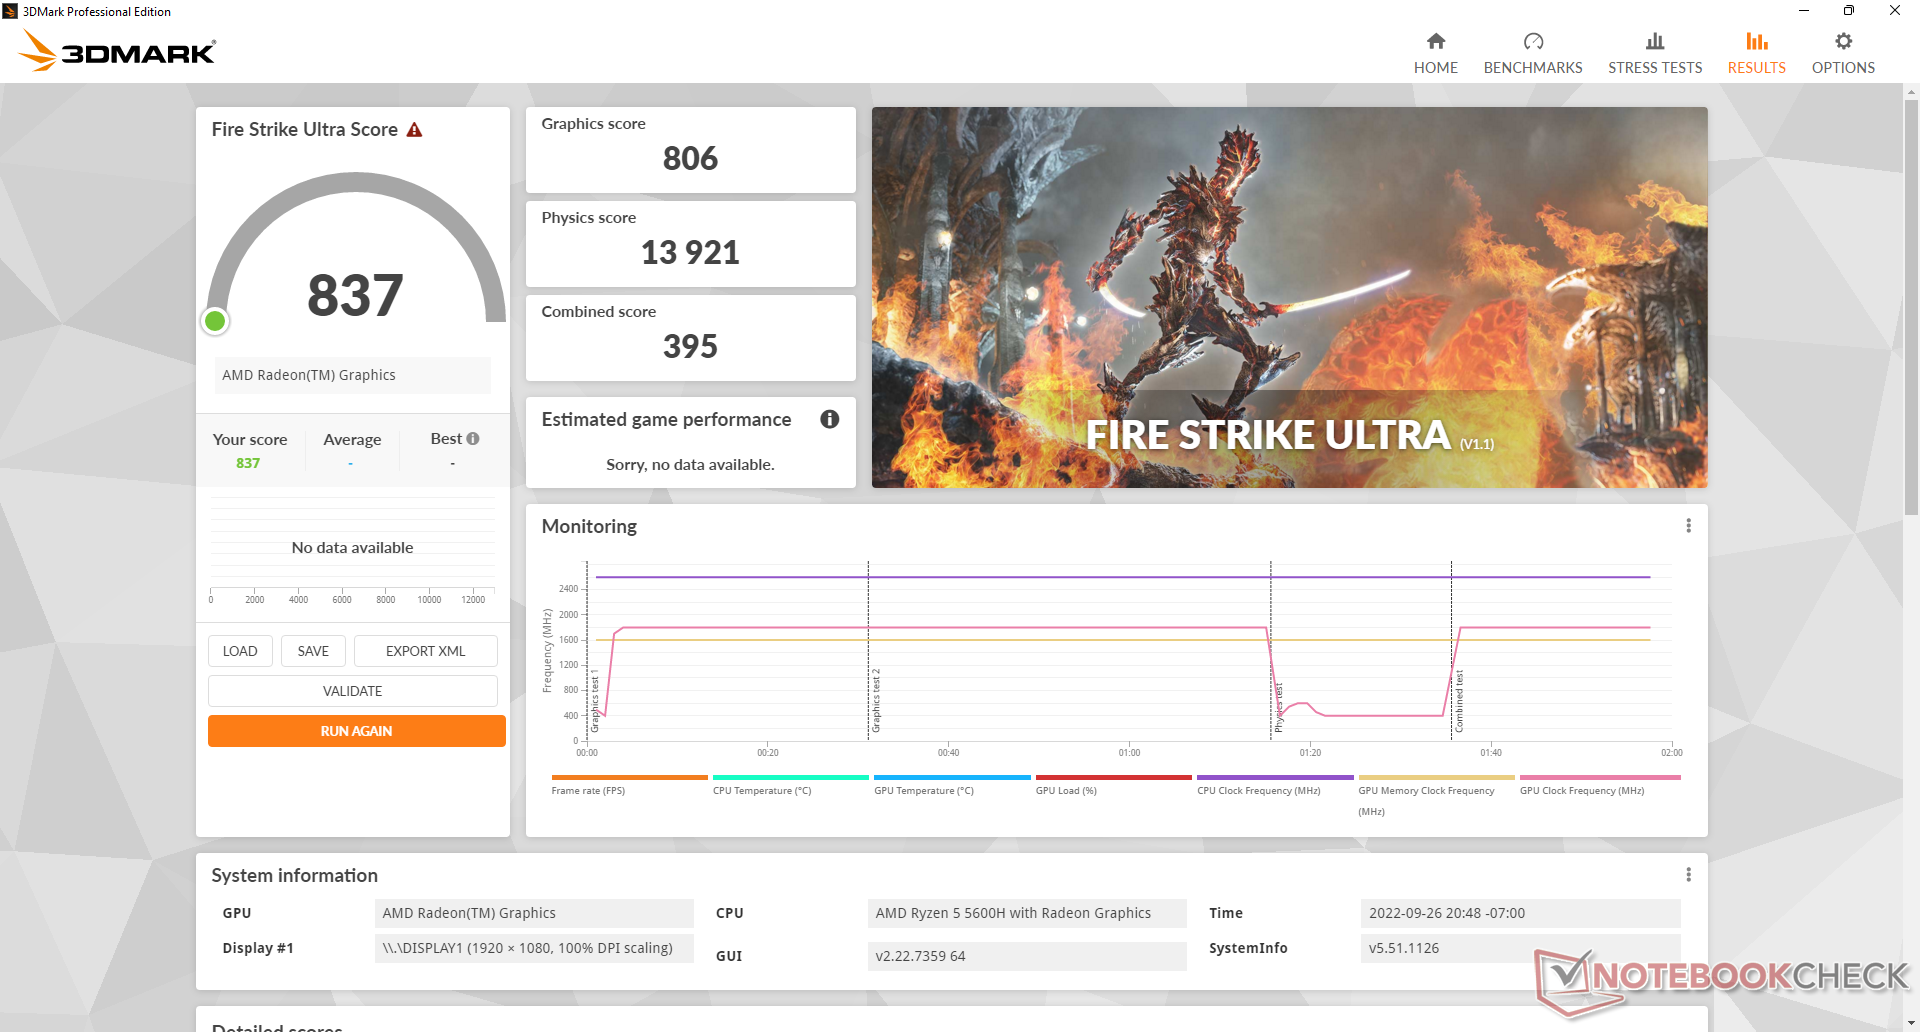
O desempenho gráfico é muito mais rápido do que a maioria dos outros laptops ou mini PCs com os mesmos integrados Radeon RX Vega 7 GPU em 30 a 35 por cento porque tais produtos normalmente emparelham a GPU com CPUs Ryzen série U mais lentas ou somente RAM de canal único. O Ryzen 5 5600H é menos um gargalo para a GPU e, como resultado, as taxas de quadros se beneficiam. No entanto, ainda não é uma máquina de jogos.
O Iris Xe 96 EUs comumente encontrado na maioria dos laptops ou mini PCs Intel Core i7 do 11º gênero ainda é cerca de 10 a 15% mais rápido.
| 3DMark 11 - 1280x720 Performance GPU | |
| Intel NUC11PHKi7C | |
| Honor MagicBook 14 2022 | |
| Lenovo Yoga 7-14ARB G7 | |
| Beelink GTR5 | |
| Beelink SEi11 Pro | |
| Beelink SER Pro Ryzen 5 5600H | |
| Beelink SER4 | |
| Intel NUC11TNKi5 | |
| Média AMD Radeon RX Vega 7 (3353 - 6249, n=62) | |
| Intel NUC10i7FNH | |
| Zotac ZBOX PI336 pico | |
| 3DMark 11 Performance | 6372 pontos | |
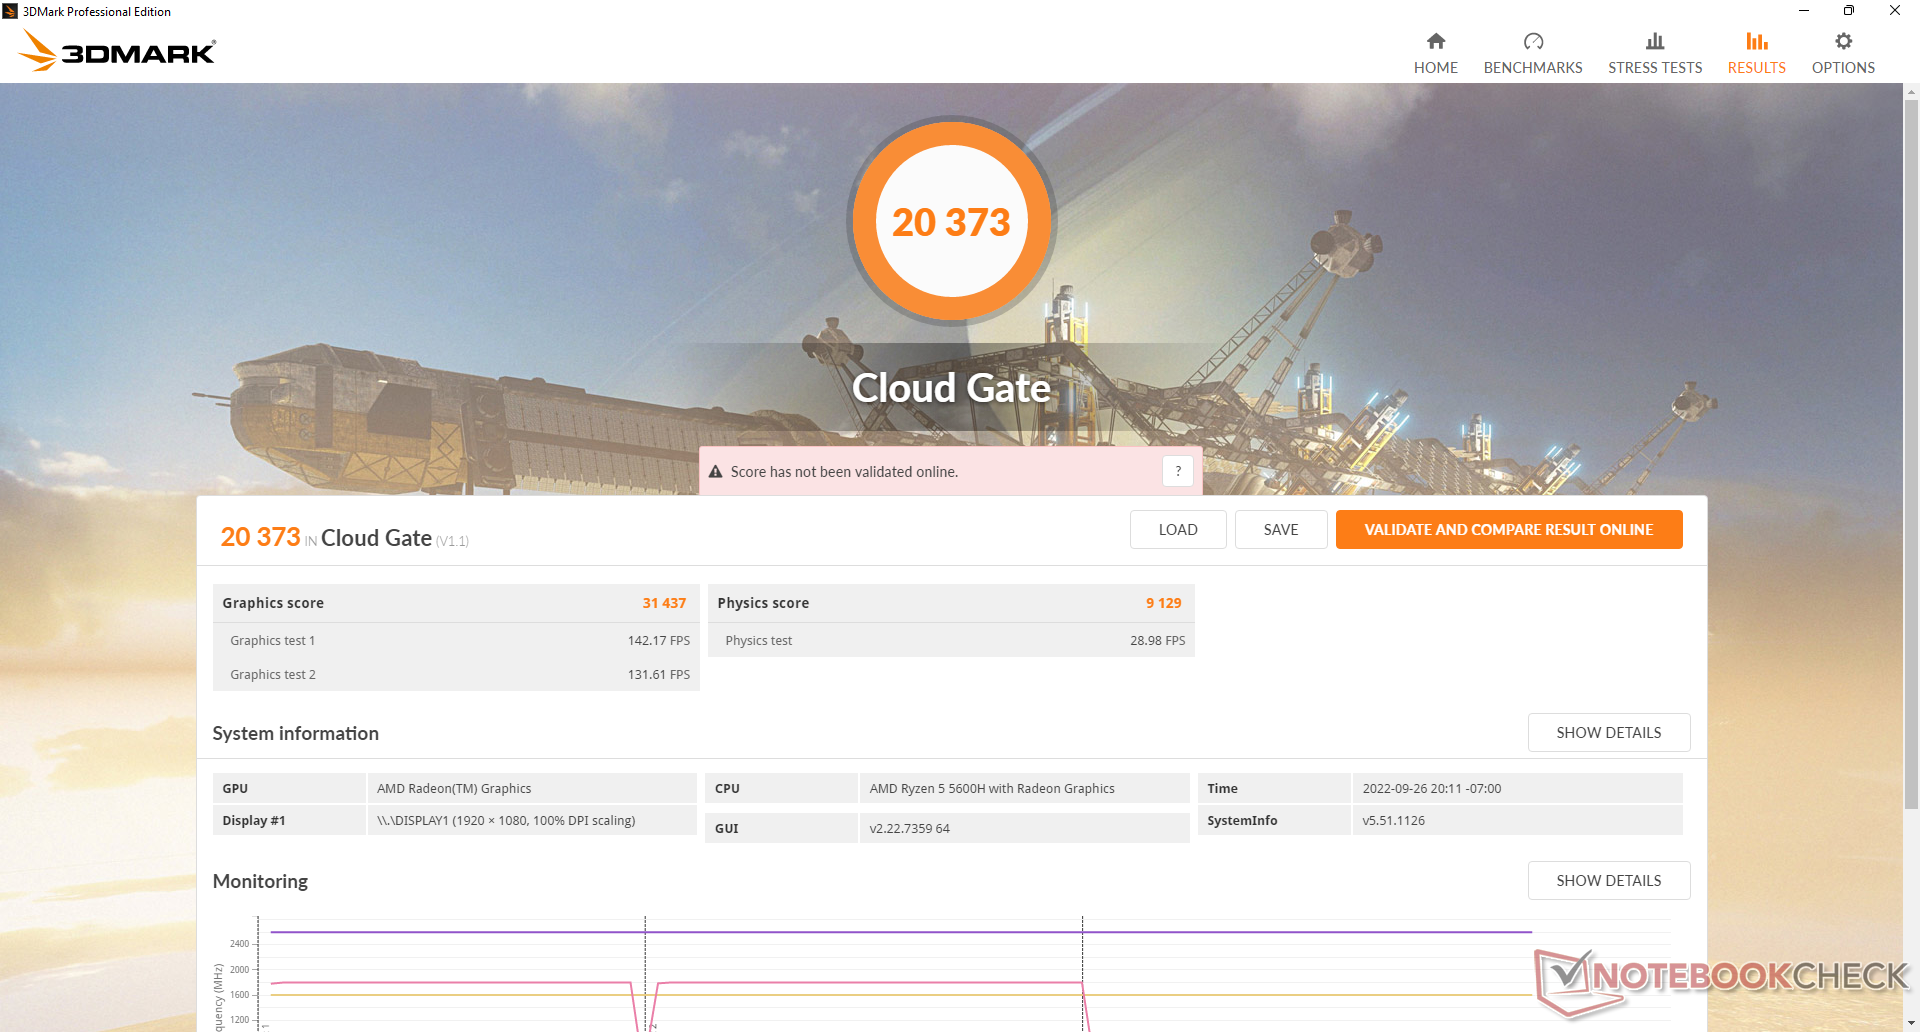
| 3DMark Cloud Gate Standard Score | 20373 pontos | |
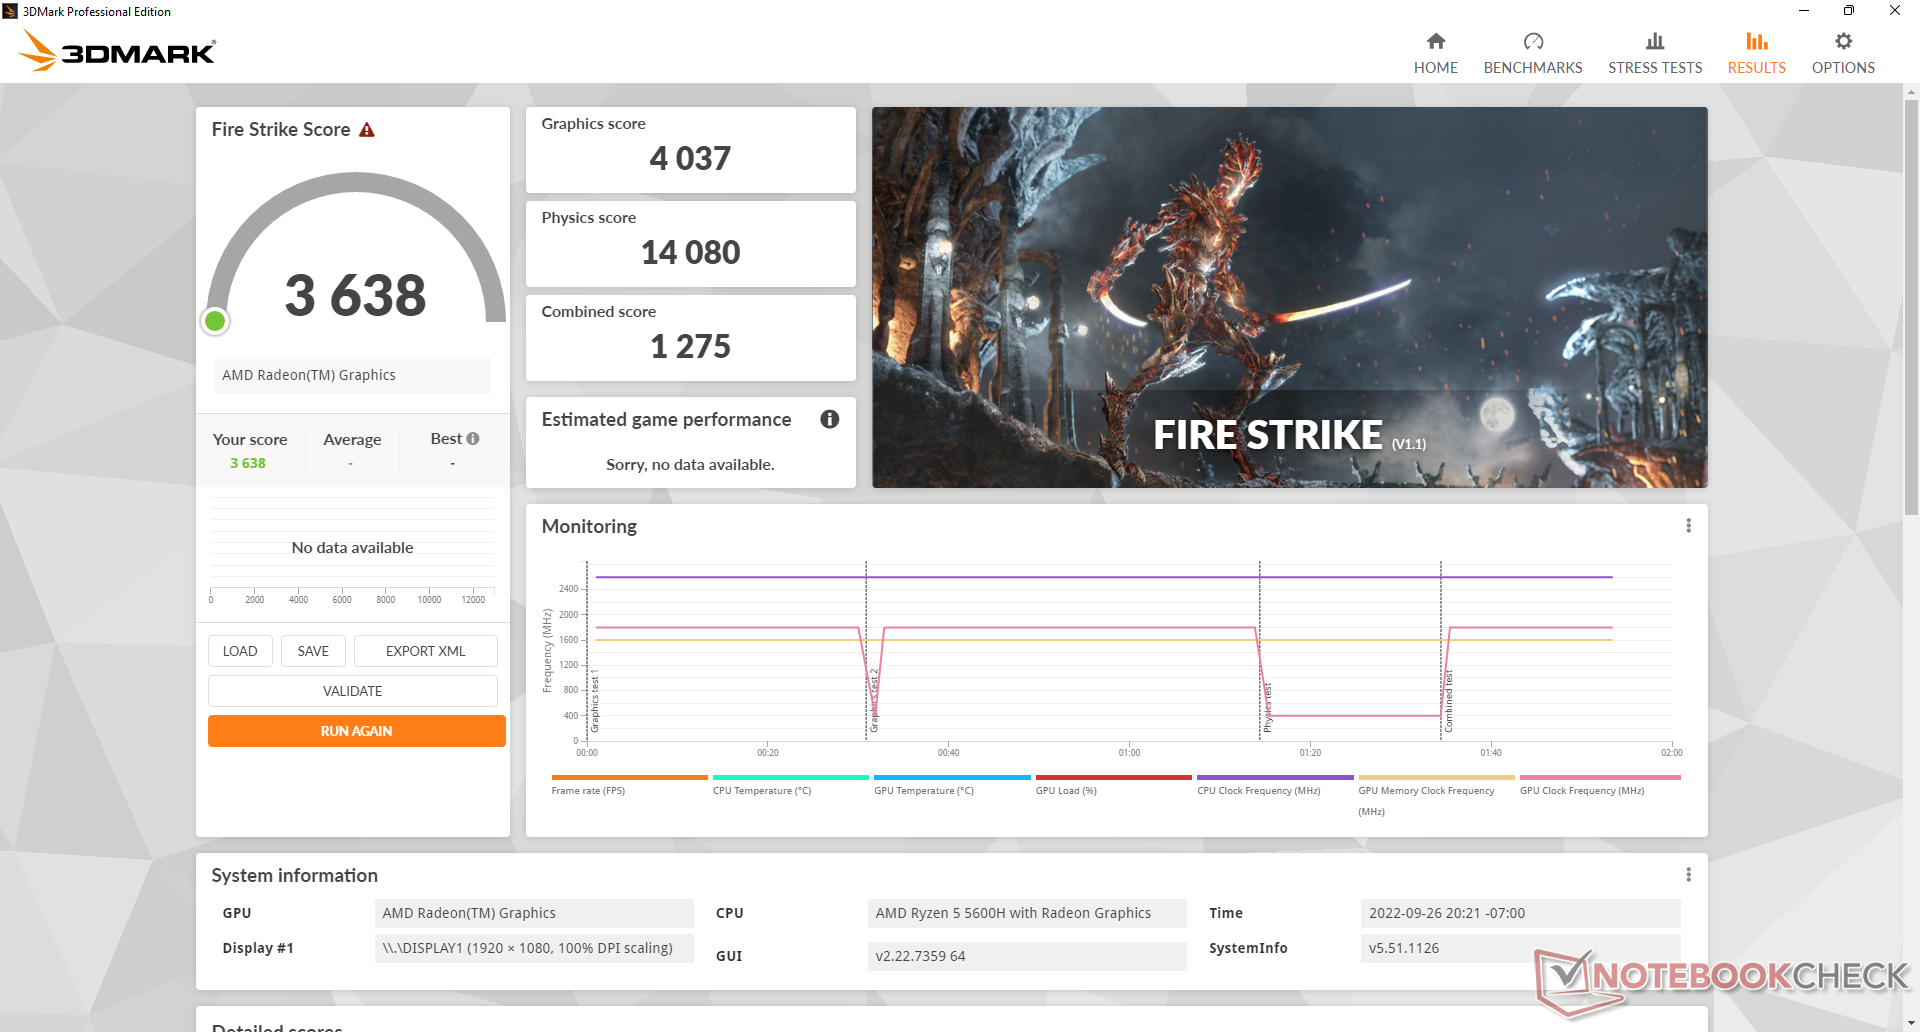
| 3DMark Fire Strike Score | 3638 pontos | |
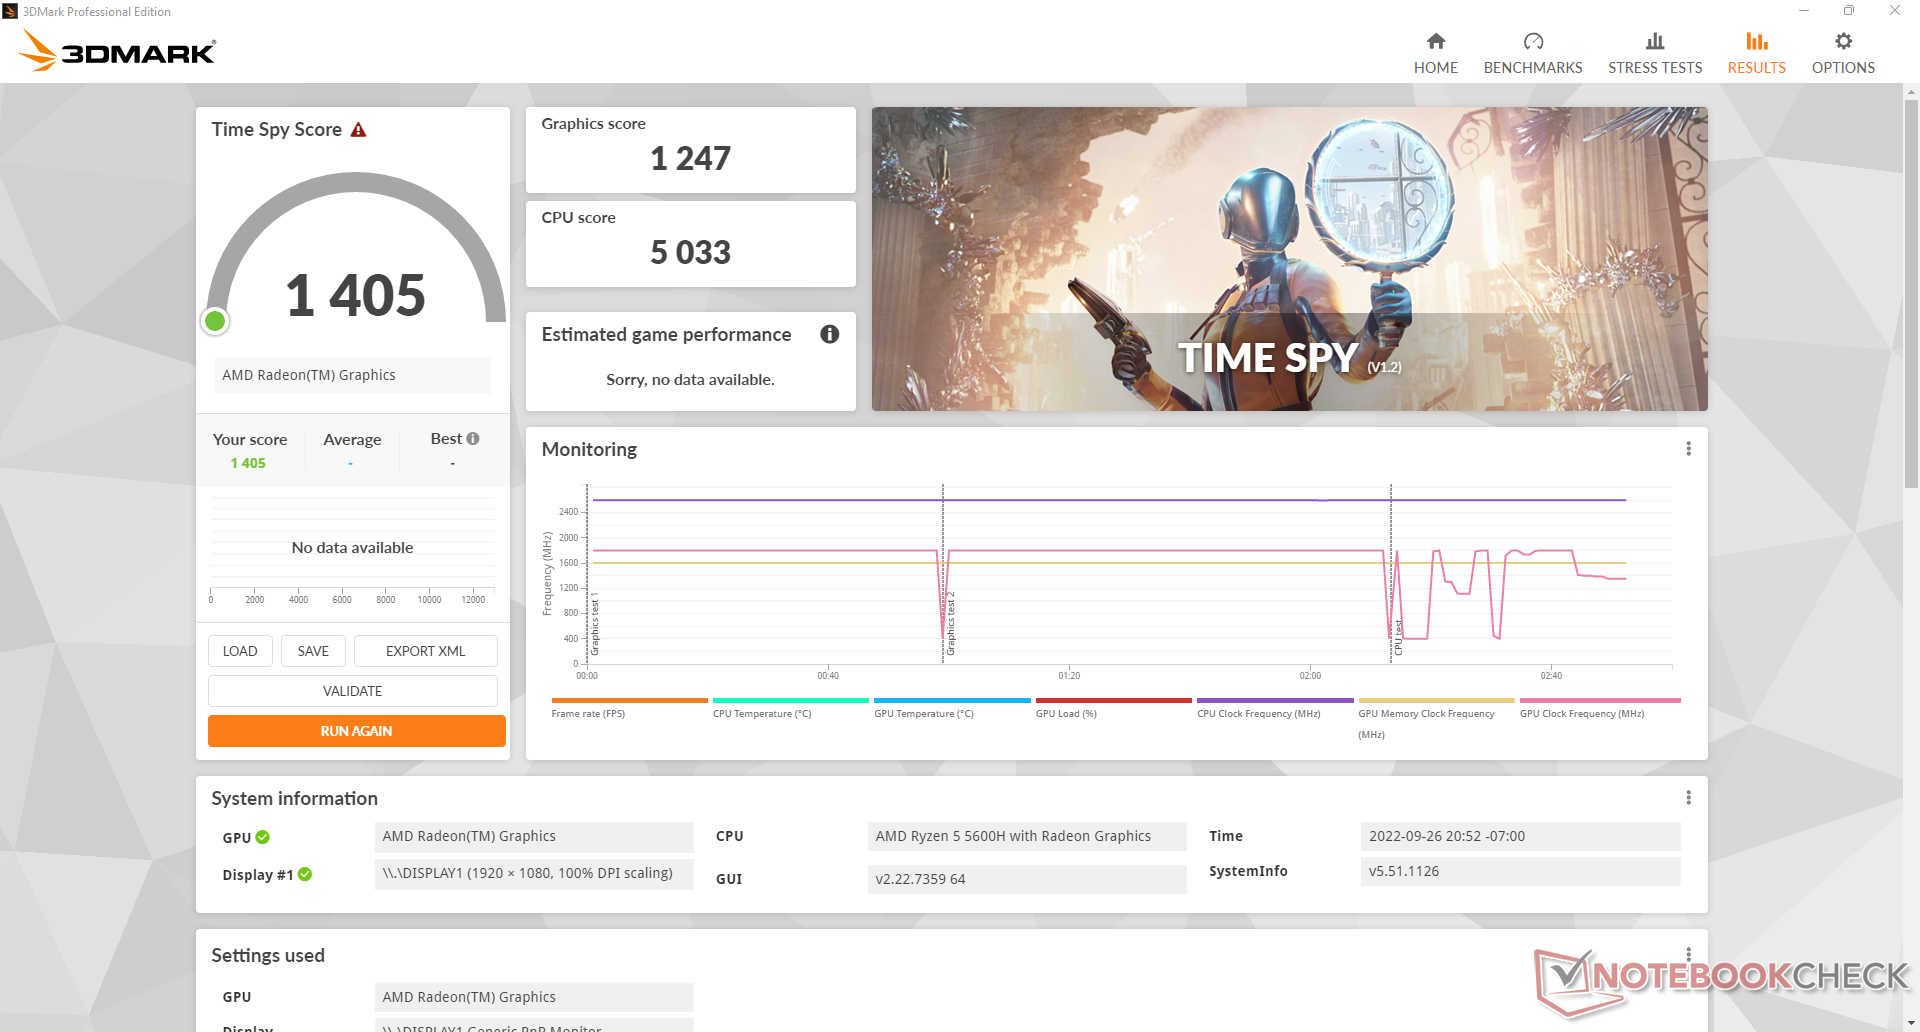
| 3DMark Time Spy Score | 1405 pontos | |
Ajuda | ||
| Blender - v3.3 Classroom CPU | |
| Beelink SER Pro Ryzen 5 5600H | |
| Média da turma Mini PC (132 - 4571, n=83, últimos 2 anos) | |
* ... menor é melhor
| The Witcher 3 | |
| 1024x768 Low Graphics & Postprocessing | |
| Intel NUC11PHKi7C | |
| Honor MagicBook 14 2022 | |
| Lenovo Yoga 7-14ARB G7 | |
| Beelink SEi11 Pro | |
| Beelink GTR5 | |
| Beelink SER Pro Ryzen 5 5600H | |
| Beelink SER4 | |
| Intel NUC11TNKi5 | |
| Média AMD Radeon RX Vega 7 (25.5 - 105.8, n=53) | |
| 1366x768 Medium Graphics & Postprocessing | |
| Intel NUC11PHKi7C | |
| Honor MagicBook 14 2022 | |
| Lenovo Yoga 7-14ARB G7 | |
| Beelink GTR5 | |
| Beelink SEi11 Pro | |
| Beelink SER Pro Ryzen 5 5600H | |
| Beelink SER4 | |
| Média AMD Radeon RX Vega 7 (9.74 - 81.3, n=39) | |
| 1920x1080 High Graphics & Postprocessing (Nvidia HairWorks Off) | |
| Intel NUC11PHKi7C | |
| Honor MagicBook 14 2022 | |
| Lenovo Yoga 7-14ARB G7 | |
| Beelink SEi11 Pro | |
| Beelink GTR5 | |
| Beelink SER Pro Ryzen 5 5600H | |
| Beelink SER4 | |
| Média AMD Radeon RX Vega 7 (8.96 - 26.2, n=52) | |
| 1920x1080 Ultra Graphics & Postprocessing (HBAO+) | |
| Intel NUC11PHKi7C | |
| Honor MagicBook 14 2022 | |
| Lenovo Yoga 7-14ARB G7 | |
| Beelink GTR5 | |
| Beelink SER Pro Ryzen 5 5600H | |
| Beelink SER4 | |
| Beelink SEi11 Pro | |
| Média AMD Radeon RX Vega 7 (6.5 - 15.8, n=44) | |
Infelizmente, as taxas de moldura não são tão estáveis quanto esperávamos. Quando ociosos em Witcher 3 em configurações baixas de 720p, como taxas de quadros às vezes cairiam para 60 FPS ou mesmo 19 FPS, aparentemente sem nenhuma razão, como mostra o gráfico abaixo. O mau manejo da atividade de fundo é provavelmente o responsável pela interrupção das taxas de quadros.
Witcher 3 FPS Chart
| baixo | média | alto | ultra | |
|---|---|---|---|---|
| GTA V (2015) | 132.9 | 117.6 | 32.2 | 14.5 |
| The Witcher 3 (2015) | 79.2 | 48.7 | 25.1 | 15.8 |
| Dota 2 Reborn (2015) | 137.5 | 103.1 | 59.3 | 56.3 |
| Final Fantasy XV Benchmark (2018) | 41.1 | 20.3 | 14.3 | |
| X-Plane 11.11 (2018) | 53.4 | 40.3 | 35.7 | |
| Strange Brigade (2018) | 95.3 | 36 | 30.1 | 25.5 |
| Cyberpunk 2077 1.6 (2022) | 20.9 | 16.2 | 11.4 |
Emissões
Ruído do sistema
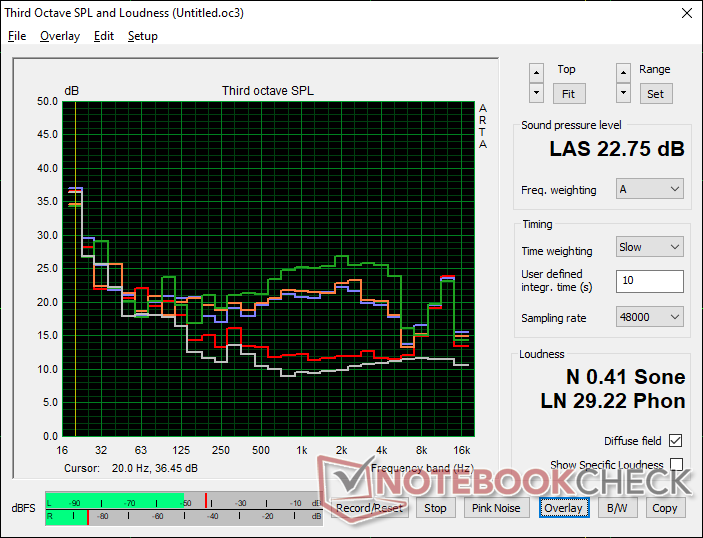
Nossa unidade de teste sofre de ruído eletrônico ou choro de bobina. Assim, somos capazes de registrar um ruído de 26,1 dB(A) contra um fundo silencioso de 22,8 dB(A), mesmo quando ociosos na área de trabalho sem aplicações em execução. O ruído do ventilador oscilaria em torno da faixa de 28,7 dB(A) durante cargas típicas como navegação na web ou transmissão de vídeo, que é mais silenciosa do que a NUC11TNK.
O ruído dos ventiladores varia entre 32 e 37 dB(A) quando se executa cargas mais exigentes como jogos, que é novamente mais silencioso do que a NUC11TNK e o mais rápido Beelink GTR5. Este é um mini PC silencioso em relação ao desempenho que você obtém.
Barulho
| Ocioso |
| 26.1 / 26.1 / 28.7 dB |
| Carga |
| 32.3 / 36.4 dB |
 | ||
30 dB silencioso 40 dB(A) audível 50 dB(A) ruidosamente alto |
||
min: | ||
| Beelink SER Pro Ryzen 5 5600H Vega 7, R5 5600H, Kingston NV1 SNVS/500GCN | Beelink SEi11 Pro Iris Xe G7 96EUs, i5-11320H, Kingston NV1 SNVS/500GCN | Beelink GTR5 Vega 8, R9 5900HX, Kingston NV1 SNVS/500GCN | Intel NUC11TNKi5 Iris Xe G7 80EUs, i5-1135G7, Transcend M.2 SSD 430S TS512GMTS430S | Beelink SEi8 Iris Plus Graphics 655, i3-8109U, Intel SSD 660p SSDPEKNW512G8 | Beelink SER4 Vega 8, R7 4800U, Intel SSD 660p SSDPEKNW512G8 | |
|---|---|---|---|---|---|---|
| Noise | 1% | -24% | -23% | -7% | -18% | |
| desligado / ambiente * (dB) | 22.8 | 22.8 -0% | 23.1 -1% | 24.8 -9% | 24.5 -7% | 23.4 -3% |
| Idle Minimum * (dB) | 26.1 | 24.7 5% | 34.2 -31% | 35.6 -36% | 26.5 -2% | 33.2 -27% |
| Idle Average * (dB) | 26.1 | 24.7 5% | 34.2 -31% | 35.6 -36% | 26.5 -2% | 33.2 -27% |
| Idle Maximum * (dB) | 28.7 | 25.3 12% | 34.2 -19% | 35.6 -24% | 31.1 -8% | 33.2 -16% |
| Load Average * (dB) | 32.3 | 33.2 -3% | 44.6 -38% | 36.2 -12% | 37.7 -17% | 38.6 -20% |
| Witcher 3 ultra * (dB) | 32.8 | 34.5 -5% | 41.4 -26% | 38 -16% | 39.2 -20% | |
| Load Maximum * (dB) | 36.4 | 37.8 -4% | 45.1 -24% | 47.6 -31% | 37.5 -3% | 40.8 -12% |
* ... menor é melhor
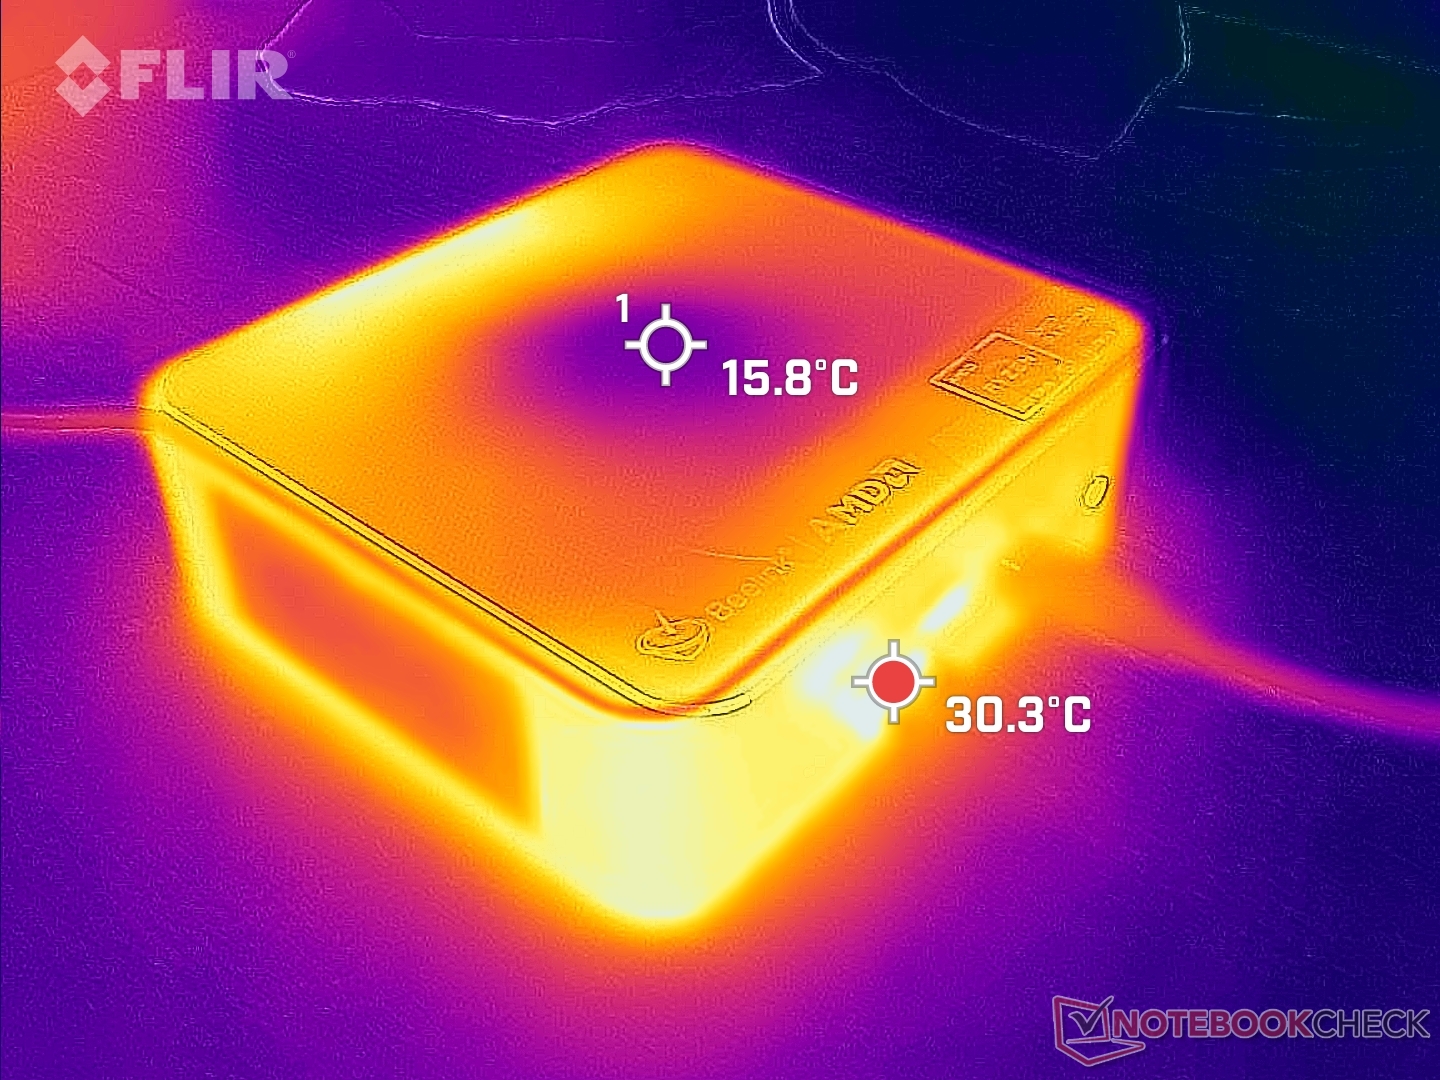
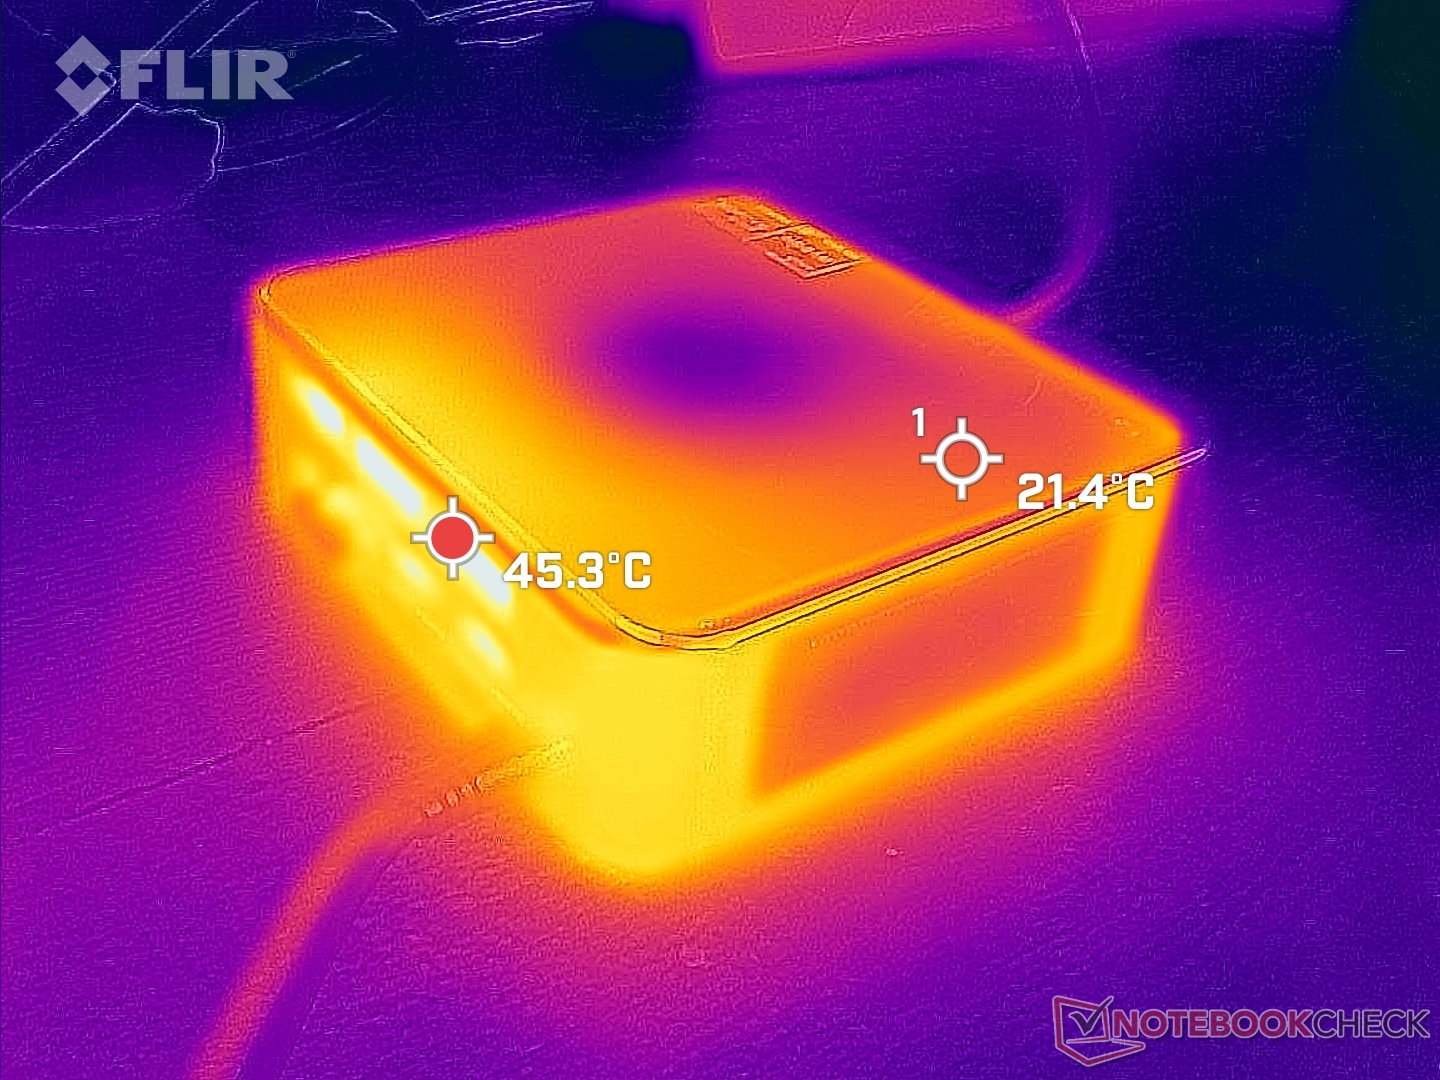
Temperatura
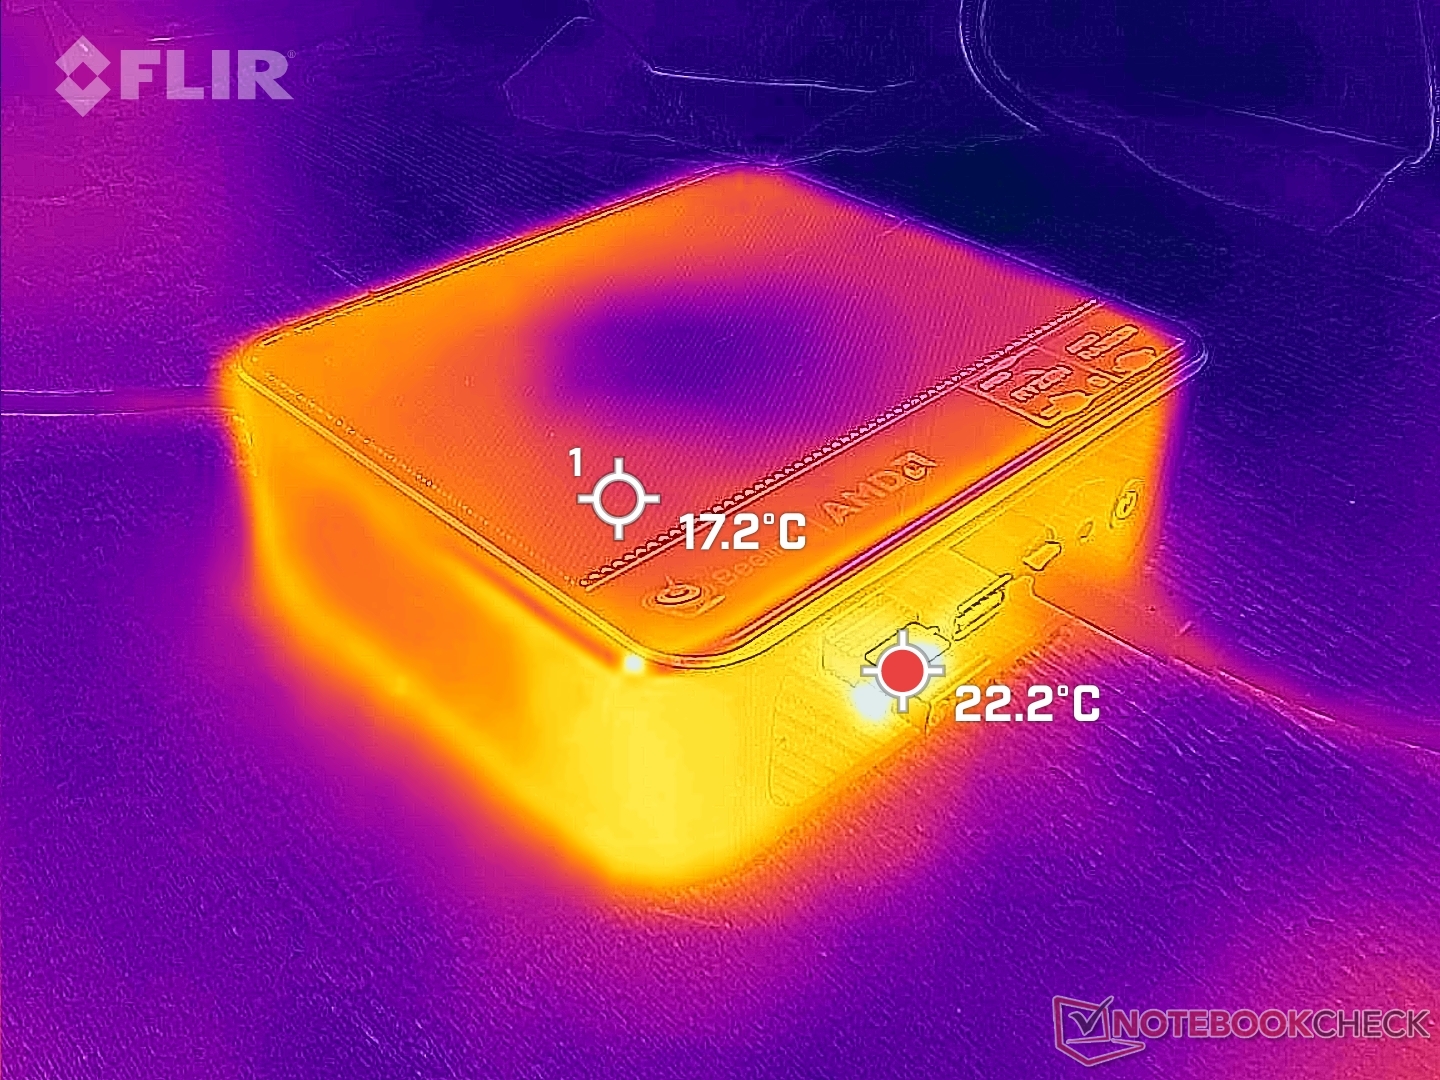
O ar frio entra pela parte superior e o calor residual sai pela parte posterior. Você vai querer manter a parte superior livre de quaisquer livros, papéis ou outras obstruções para um resfriamento ideal como resultado.

Teste de estresse
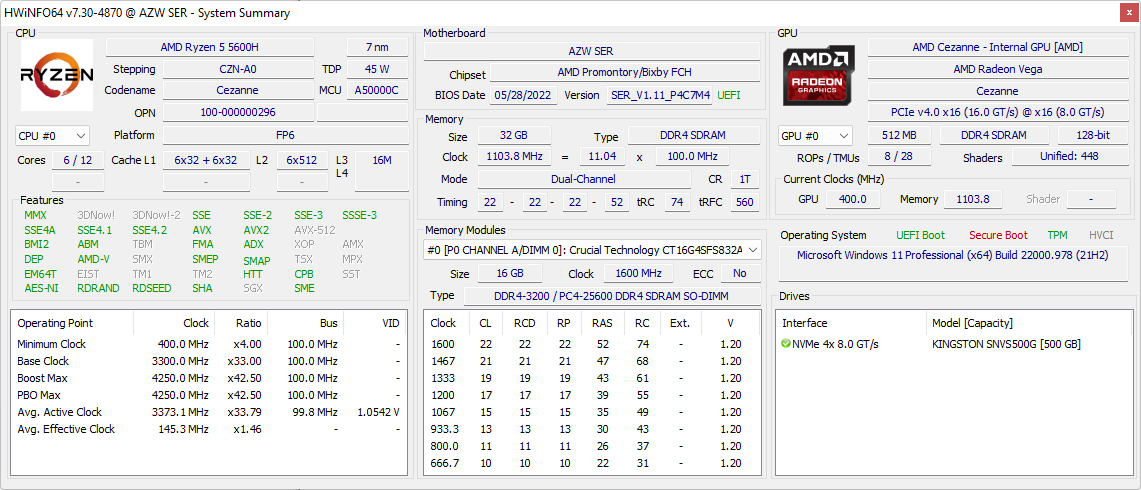
As taxas de relógio da CPU e o consumo de energia da placa estabilizariam em 3,0 GHz e 35 W, respectivamente, ao iniciar o Prime95. 35 W está na parte inferior do espectro para o Ryzen 5 5600H e, portanto, é um pouco decepcionante não ver metas mais altas de TDP no SER5. A temperatura central já é bastante alta a 85 C, o que pode explicar a baixa classificação de 35 W.
Rodando Witcher 3 resultaria em uma temperatura central de 75 C em comparação com 57 C no Intel NUC11PAQ. O sistema Beelink funciona um pouco mais quente do que a Intel na maioria das condições.
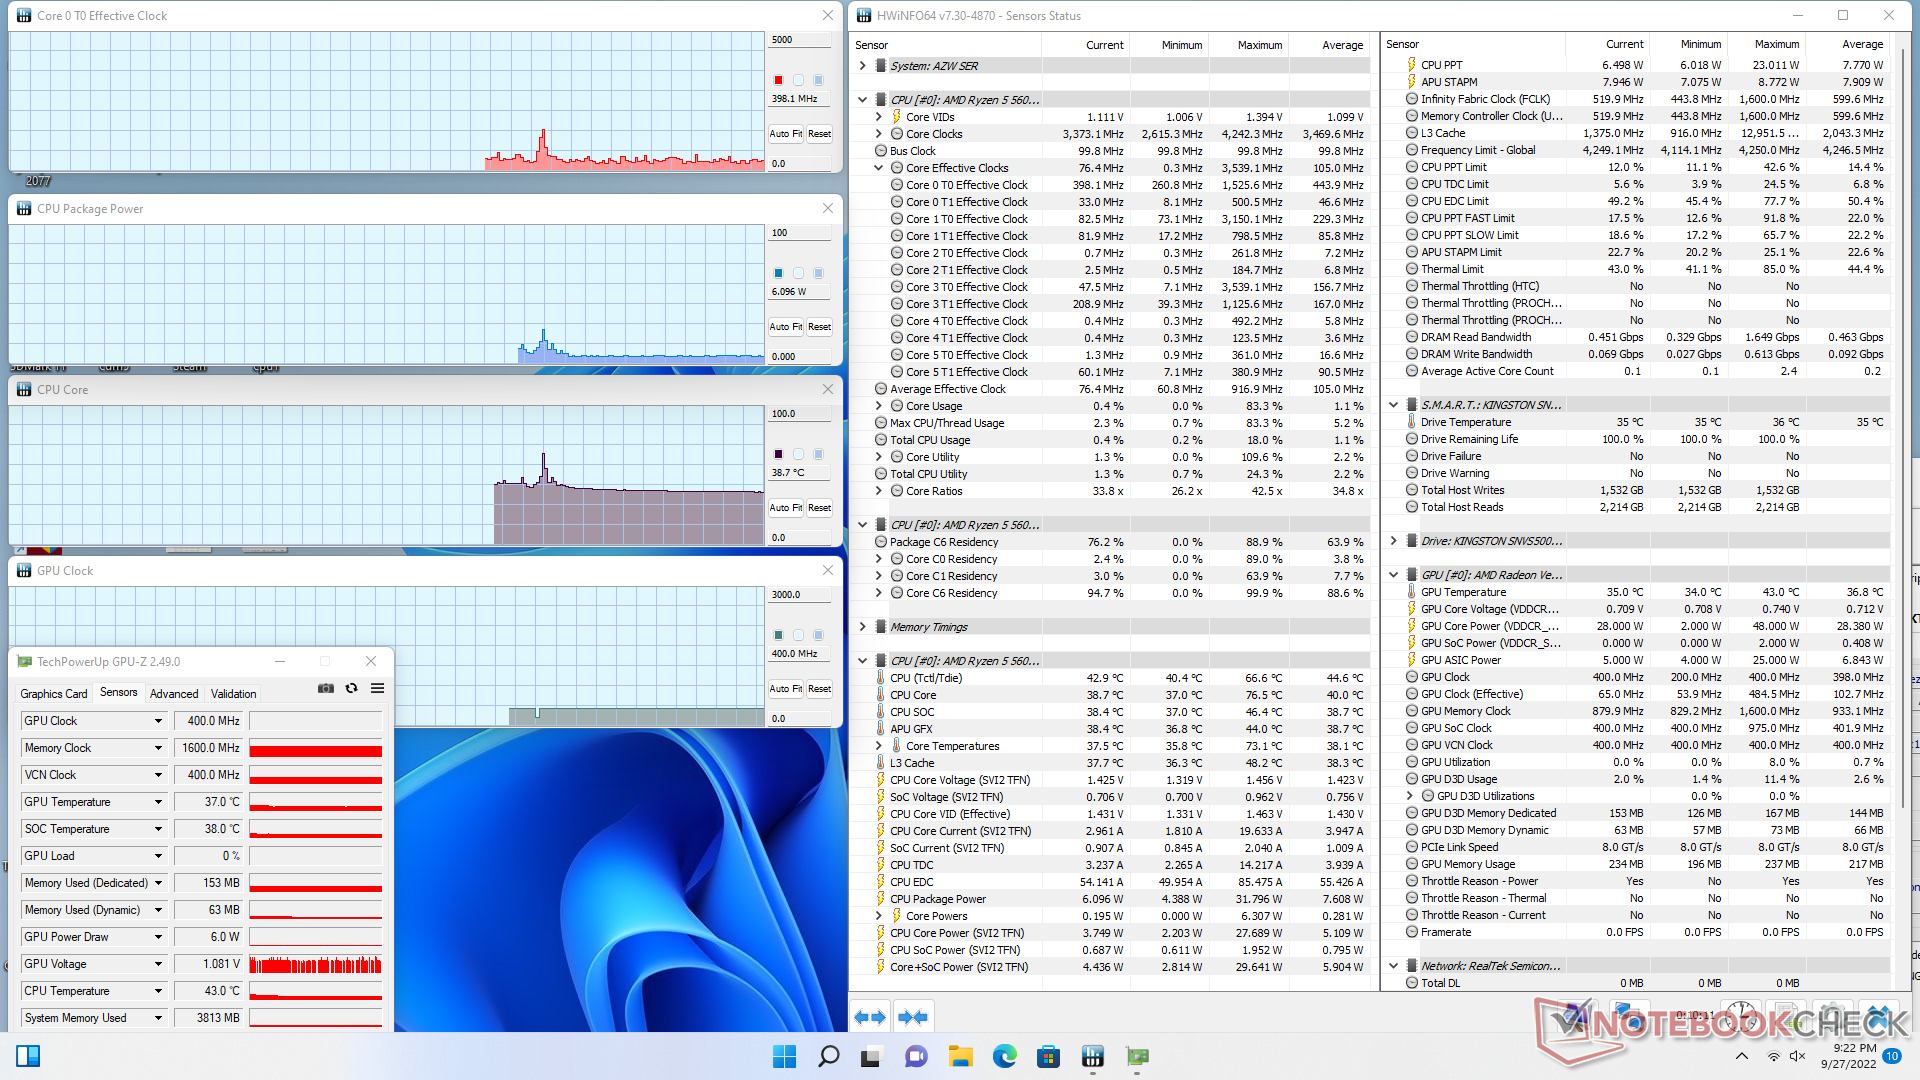
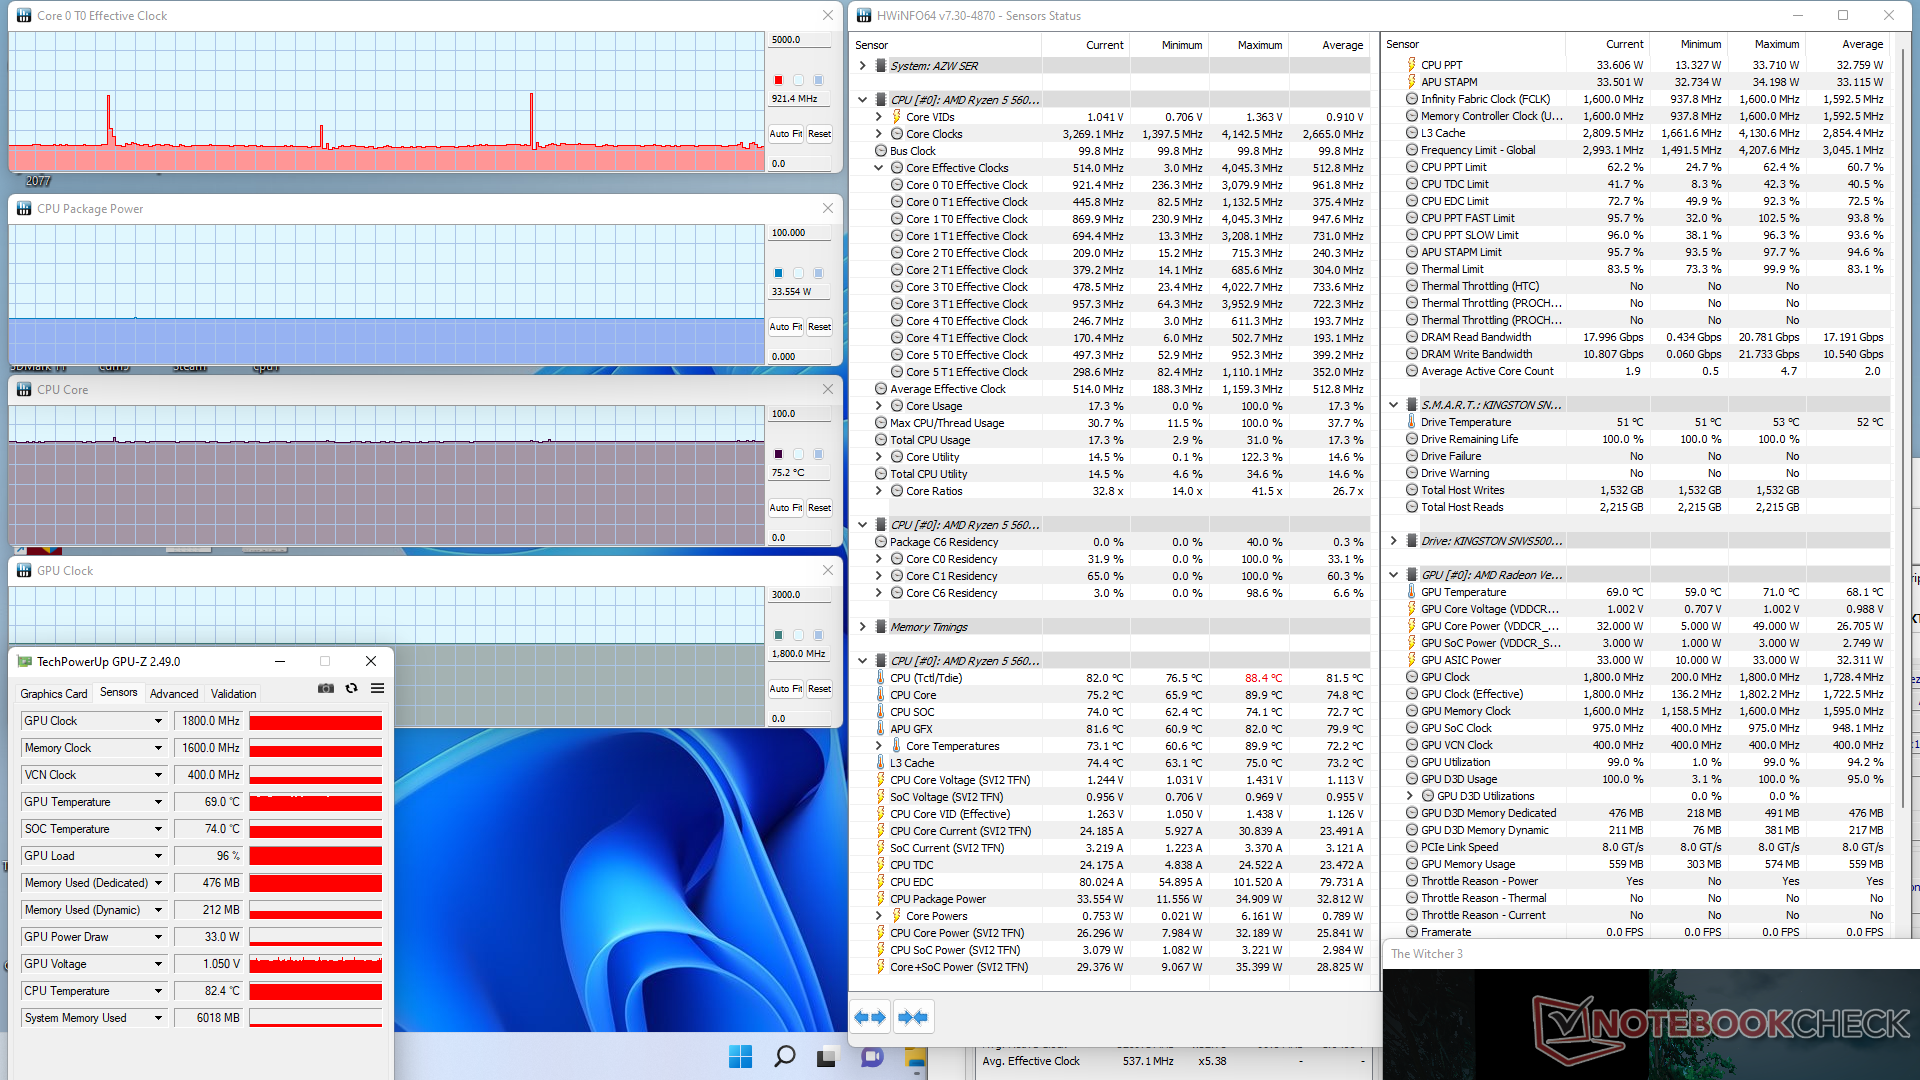
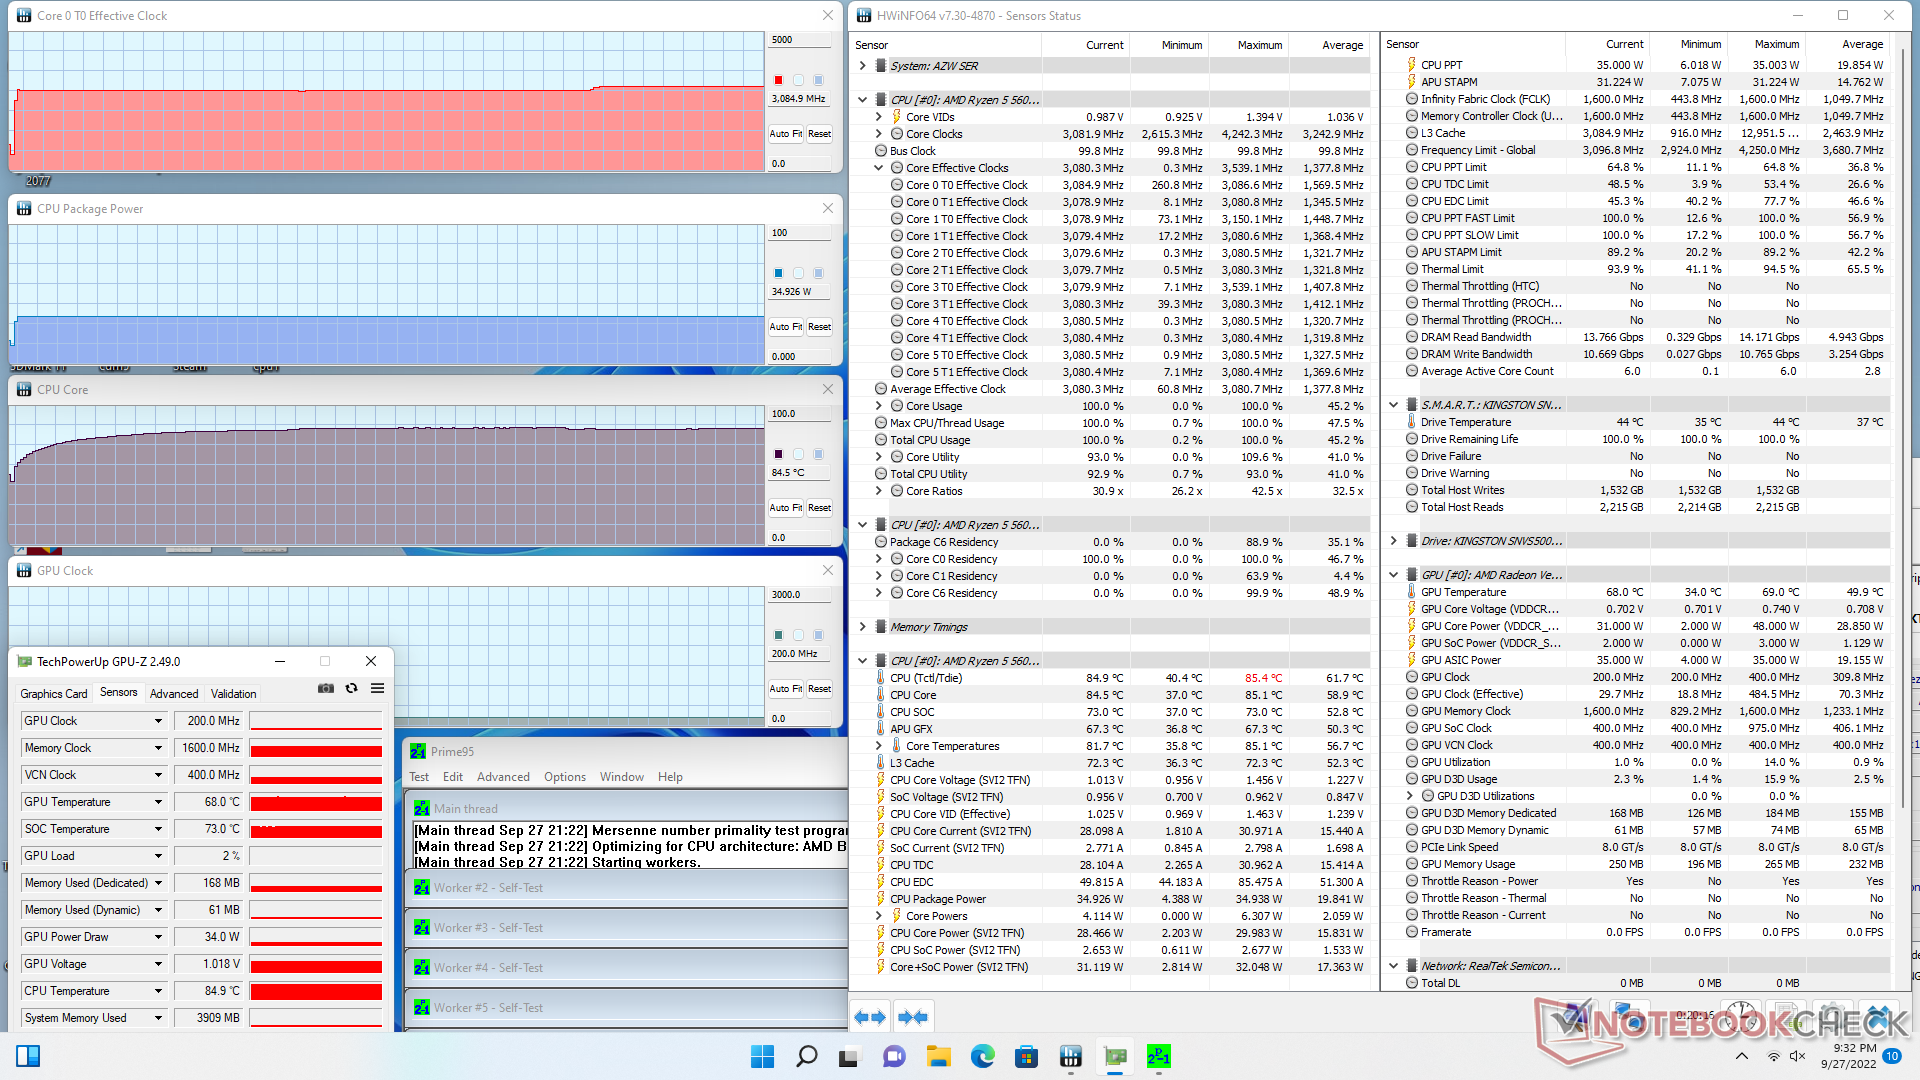
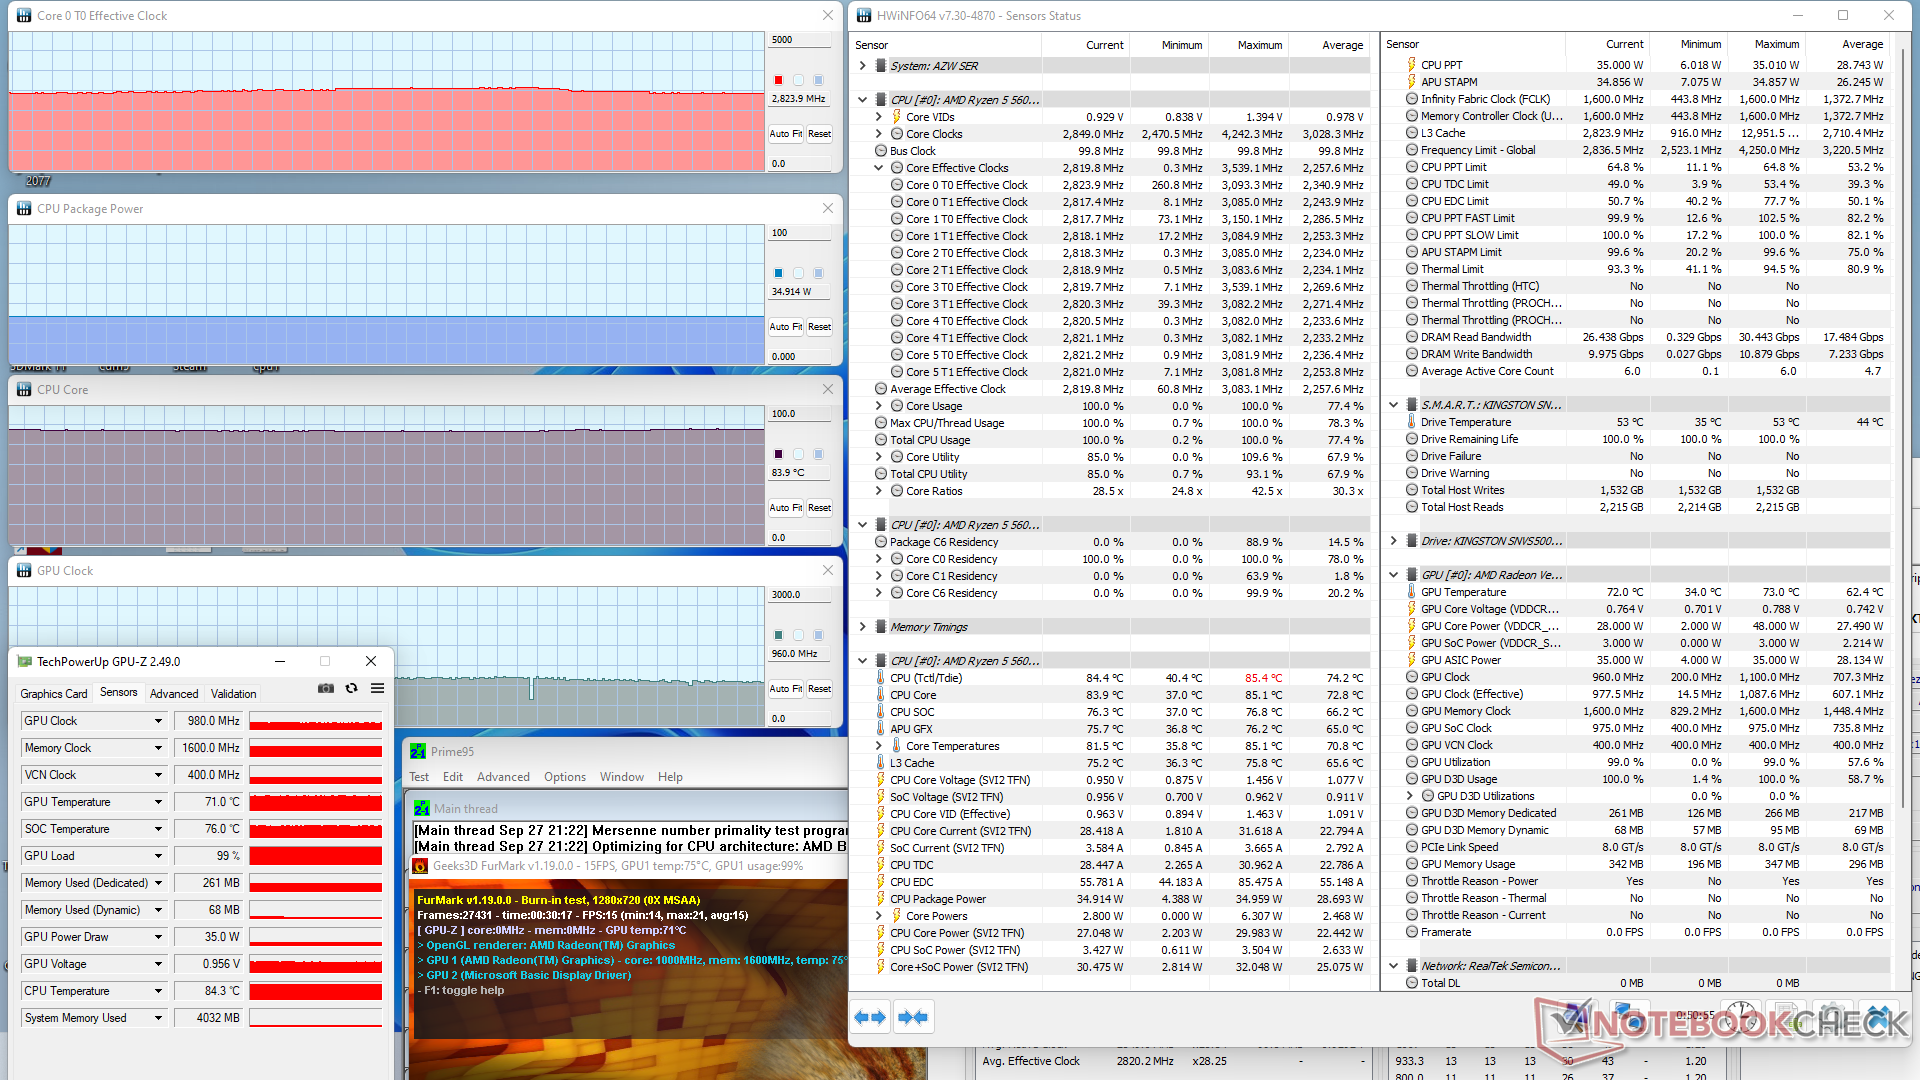
| Relógio CPU (GHz) | Relógio GPU (MHz) | Temperatura média da CPU (°C) | |
| System Idle | -- | -- | 39 |
| Prime95 Stress | 3.0 | -- | 85 |
| Prime95 + FurMark Stress | 2.8 | 980 | 84 |
| Witcher 3 Estresse | ~0.9 | 1800 | 75 |
Gestão de energia
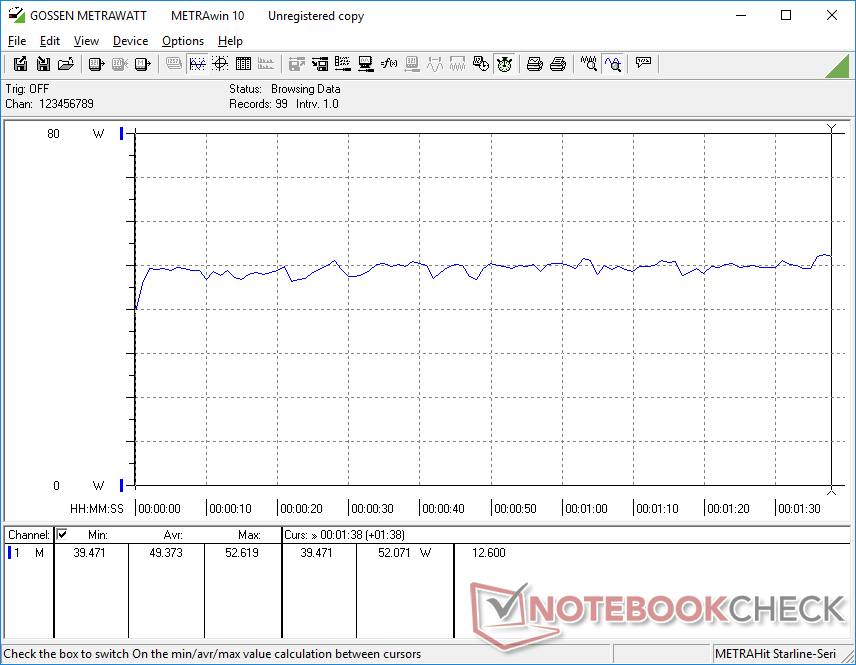
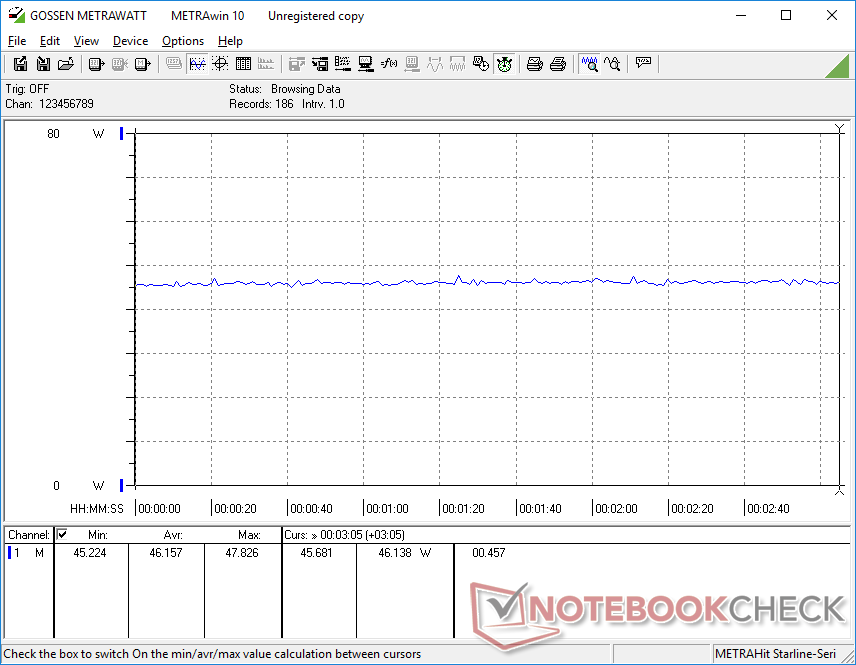
Consumo de energia
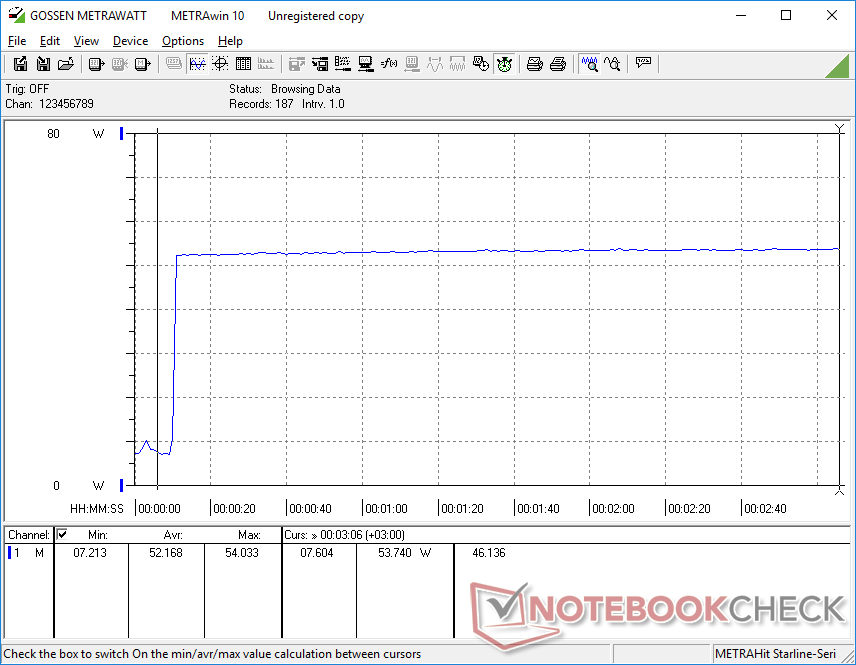
O consumo de energia é geralmente maior do que os modelos que funcionam com as CPUs Ryzen série U ou Core U, uma vez que nossas CPUs Ryzen série H visam níveis de TDP comparativamente mais altos. A Intel NUC11 com o Núcleo i5-1135G7por exemplo, exigiria entre 40 e 44 W quando se joga, em comparação com 46 a 50 W em nosso Beelink. O desempenho por watt ainda é melhor com o Ryzen 5 5600H, especialmente em termos de desempenho de CPU multi-thread
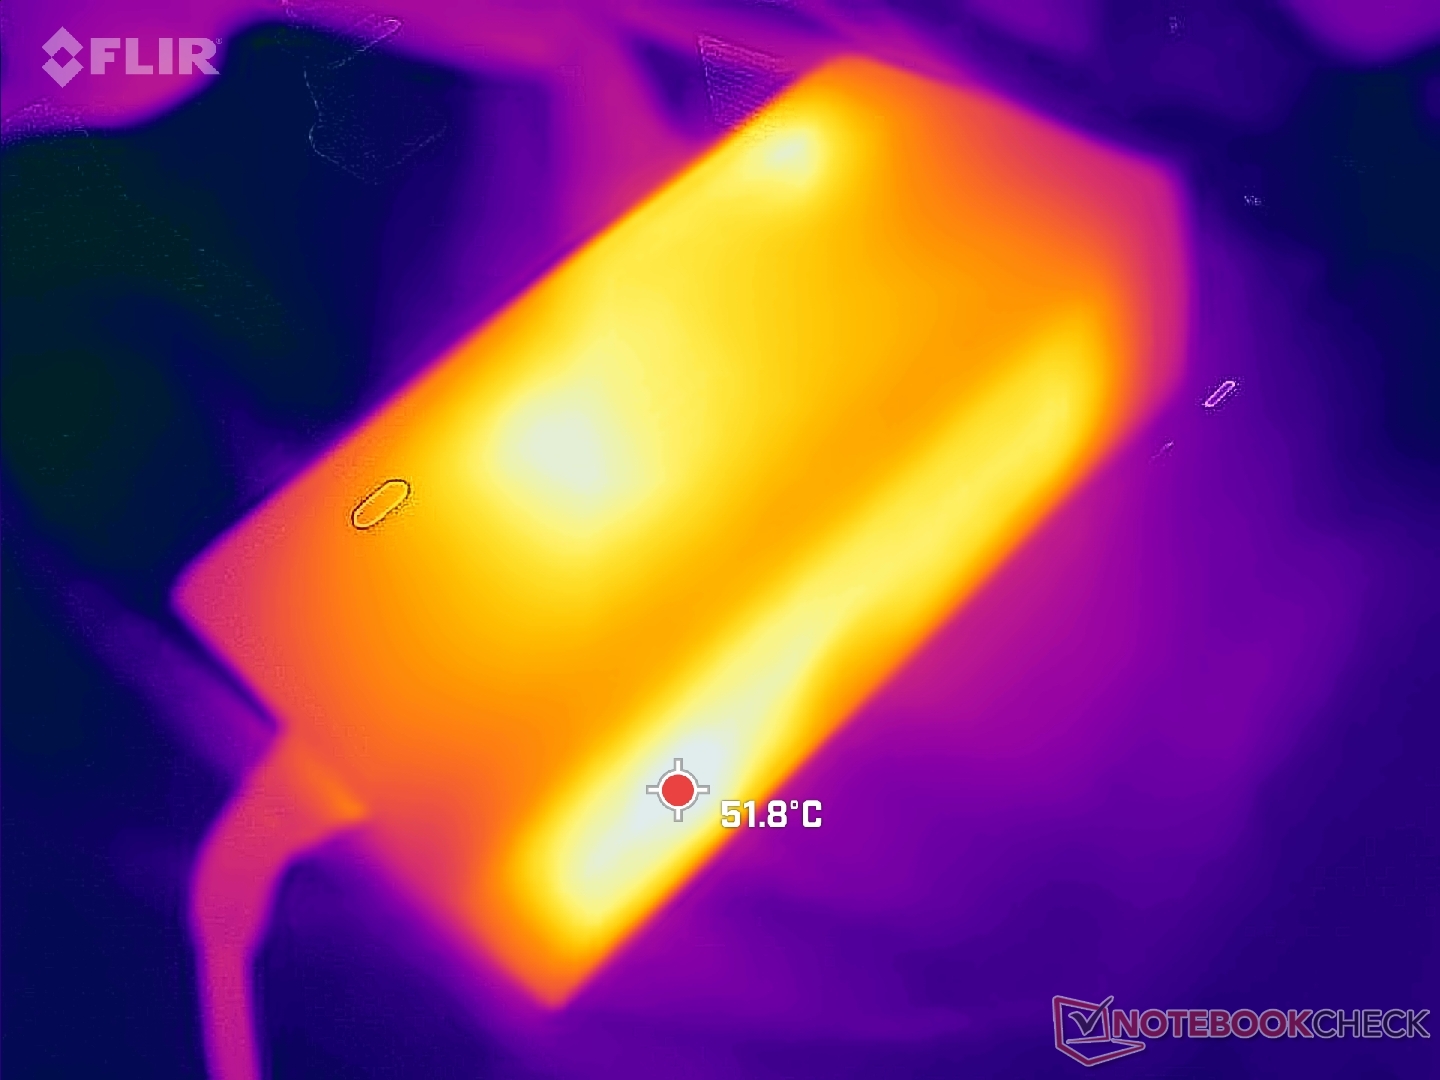
Somos capazes de registrar um consumo máximo de 50,2 W do pequeno-médio (~10 x 4,9 x 3,3 cm) adaptador de verruga de parede AC de 57 W quando a CPU está em 100% de utilização. Suspeitamos que isto pode ser ainda maior se vários dispositivos USB ou monitores externos USB-C estiverem conectados.

| desligado | |
| Ocioso | |
| Carga |
|
Key:
min: | |
| Beelink SER Pro Ryzen 5 5600H R5 5600H, Vega 7, Kingston NV1 SNVS/500GCN, , x, | Beelink SEi11 Pro i5-11320H, Iris Xe G7 96EUs, Kingston NV1 SNVS/500GCN, , x, | Beelink GTR5 R9 5900HX, Vega 8, Kingston NV1 SNVS/500GCN, , x, | Intel NUC11TNKi5 i5-1135G7, Iris Xe G7 80EUs, Transcend M.2 SSD 430S TS512GMTS430S, , x, | Beelink SEi8 i3-8109U, Iris Plus Graphics 655, Intel SSD 660p SSDPEKNW512G8, , x, | Beelink SER4 R7 4800U, Vega 8, Intel SSD 660p SSDPEKNW512G8, , x, | |
|---|---|---|---|---|---|---|
| Power Consumption | -30% | -28% | -41% | -2% | 32% | |
| Idle Minimum * (Watt) | 5.4 | 9.8 -81% | 6.2 -15% | 11.5 -113% | 7.5 -39% | 4.1 24% |
| Idle Average * (Watt) | 8.2 | 10.3 -26% | 8.9 -9% | 12.4 -51% | 7.6 7% | 4.1 50% |
| Idle Maximum * (Watt) | 8.3 | 10.5 -27% | 9 -8% | 12.9 -55% | 9.2 -11% | 4.6 45% |
| Load Average * (Watt) | 49.3 | 54.2 -10% | 66.8 -35% | 40.7 17% | 41.1 17% | 35.6 28% |
| Witcher 3 ultra * (Watt) | 46.1 | 53.1 -15% | 62.6 -36% | 43.9 5% | 35.6 23% | |
| Load Maximum * (Watt) | 50.2 | 59 -18% | 81.6 -63% | 73.5 -46% | 41.4 18% | 39.9 21% |
* ... menor é melhor
Power Consumption Witcher 3 / Stresstest
Power Consumption external Monitor
Pro
Contra
Veredicto - Outra Excelente Alternativa para a Intel NUC11
Por cerca de $450 USD, o Beelink SER5 Pro vem totalmente carregado com 16 GB de RAM, 500 GB de armazenamento, e uma cópia licenciada do Windows 11 Pro. Em contraste, um Intel NUC11PAHi7 equipado com a mesma capacidade de armazenamento e memória RAM atualmente no varejo por quase US$900. O SER5 é até mesmo capaz de oferecer um desempenho de processador mais rápido que a Intel e muitas das mesmas opções atualizáveis, incluindo SODIMM e armazenamento duplo. Se você está procurando economizar algumas centenas de dólares, então o Beelink deve estar no topo de sua lista de considerações.
O Beelink SER5 Pro é centenas de dólares mais barato que um NUC da Intel de desempenho semelhante. Como as empresas ainda podem preferir a confiabilidade do NUC, mas a maioria dos usuários domésticos vai querer considerar o Beelink mais acessível.
Há uma série de cantos cortados, mas nenhum é tão impactante para a experiência do usuário principal. Quando comparado ao Intel NUC, ao SER5 Pro falta o Thunderbolt, uma trava anti-roubo, suporte PCIe4 SSD, uma garantia de três anos do fabricante, e um esqueleto de chassi mais forte. O NUC ainda pode ser o melhor investimento se tais características forem importantes para você, mas a economia de preço é substancial.
Preço e Disponibilidade
O Beelink SER5 está agora disponível em na Amazônia por pouco menos de $400 USD.
Price comparison

