Asus ROG Zephyrus M16 revisão de laptop: Um pacote de jogos bem completo
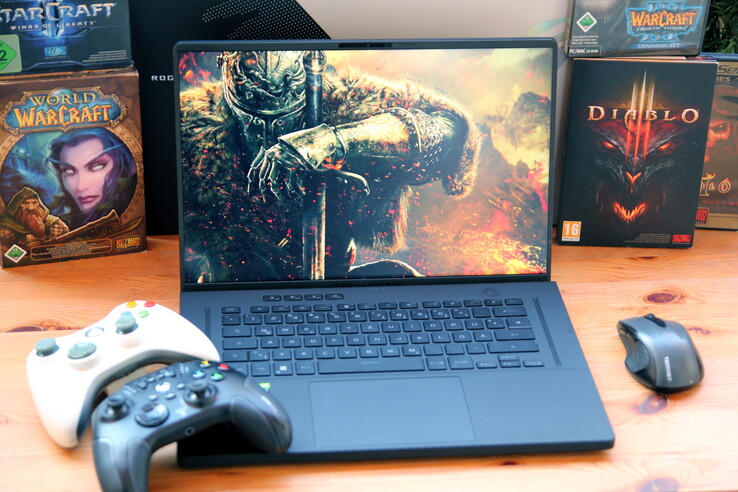
A M16 (2022) GU603zw herda de seu predecessor de mesmo nome, atualizando o pacote com uma poderosa CPU i9 Alder Lake e RTX 3070 Ti. Tudo isso vem em um formato bastante fino e compacto de 16 polegadas com um display de 16:10 (2.560 x 1.500 pixels) que mal falha nossa lista de melhores laptops móveis para jogos, já que pesa apenas 75 gramas (~2,6 oz) demais (>2 kg = 4,4 lb). Este teria sido o primeiro dispositivo de 16 polegadas da lista.
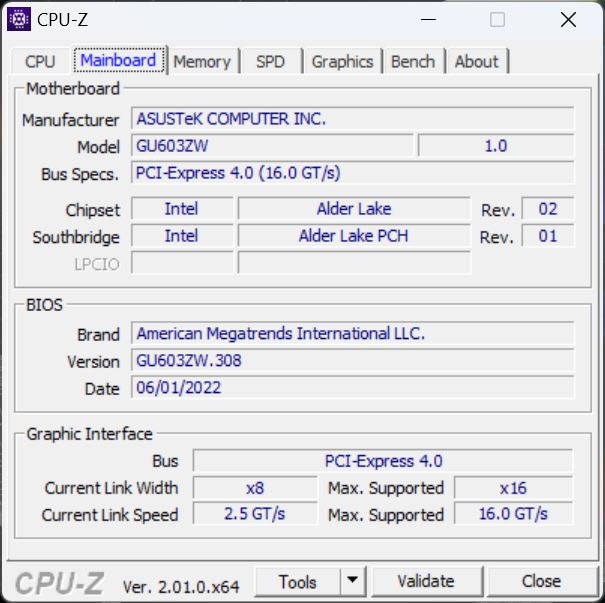
Como os laptops para jogos de 16 polegadas com display 16:10 ainda são a minoria, também incluímos dispositivos "convencionais" 16:9 com hardware similar em nossa comparação. Além dopredecessorsão particularmente osSchenker Vision 16 Proe oLenovo Legion 5 Promas também o Schenker XMG Foco 16e o Corsair Voyager a1600.
Possíveis concorrentes em comparação
Avaliação | Data | Modelo | Peso | Altura | Size | Resolução | Preço |
|---|---|---|---|---|---|---|---|
| 87.8 % v7 (old) | 02/2023 | Asus ROG Zephyrus M16 GU603Z i9-12900H, GeForce RTX 3070 Ti Laptop GPU | 2.1 kg | 19.9 mm | 16.00" | 2560x1600 | |
| 85.6 % v7 (old) | 07/2021 | Asus ROG Zephyrus M16 GU603H i9-11900H, GeForce RTX 3070 Laptop GPU | 2 kg | 20 mm | 16.00" | 2560x1600 | |
| 87.8 % v7 (old) | 11/2022 | Schenker Vision 16 Pro RTX 3070 Ti i7-12700H, GeForce RTX 3070 Ti Laptop GPU | 1.7 kg | 17.1 mm | 16.00" | 2560x1600 | |
| 87.7 % v7 (old) | 10/2022 | Lenovo Legion 5 Pro 16ARH7H RTX 3070 Ti R7 6800H, GeForce RTX 3070 Ti Laptop GPU | 2.6 kg | 26.6 mm | 16.00" | 2560x1600 | |
| 87 % v7 (old) | 01/2023 | Schenker XMG Focus 16 (i7-12700H, RTX 3060) i7-12700H, GeForce RTX 3060 Laptop GPU | 2.2 kg | 24.3 mm | 16.00" | 2560x1600 | |
| 86.6 % v7 (old) | 12/2022 | Corsair Voyager a1600 R9 6900HS, Radeon RX 6800M | 2.4 kg | 19.9 mm | 16.00" | 2560x1600 |
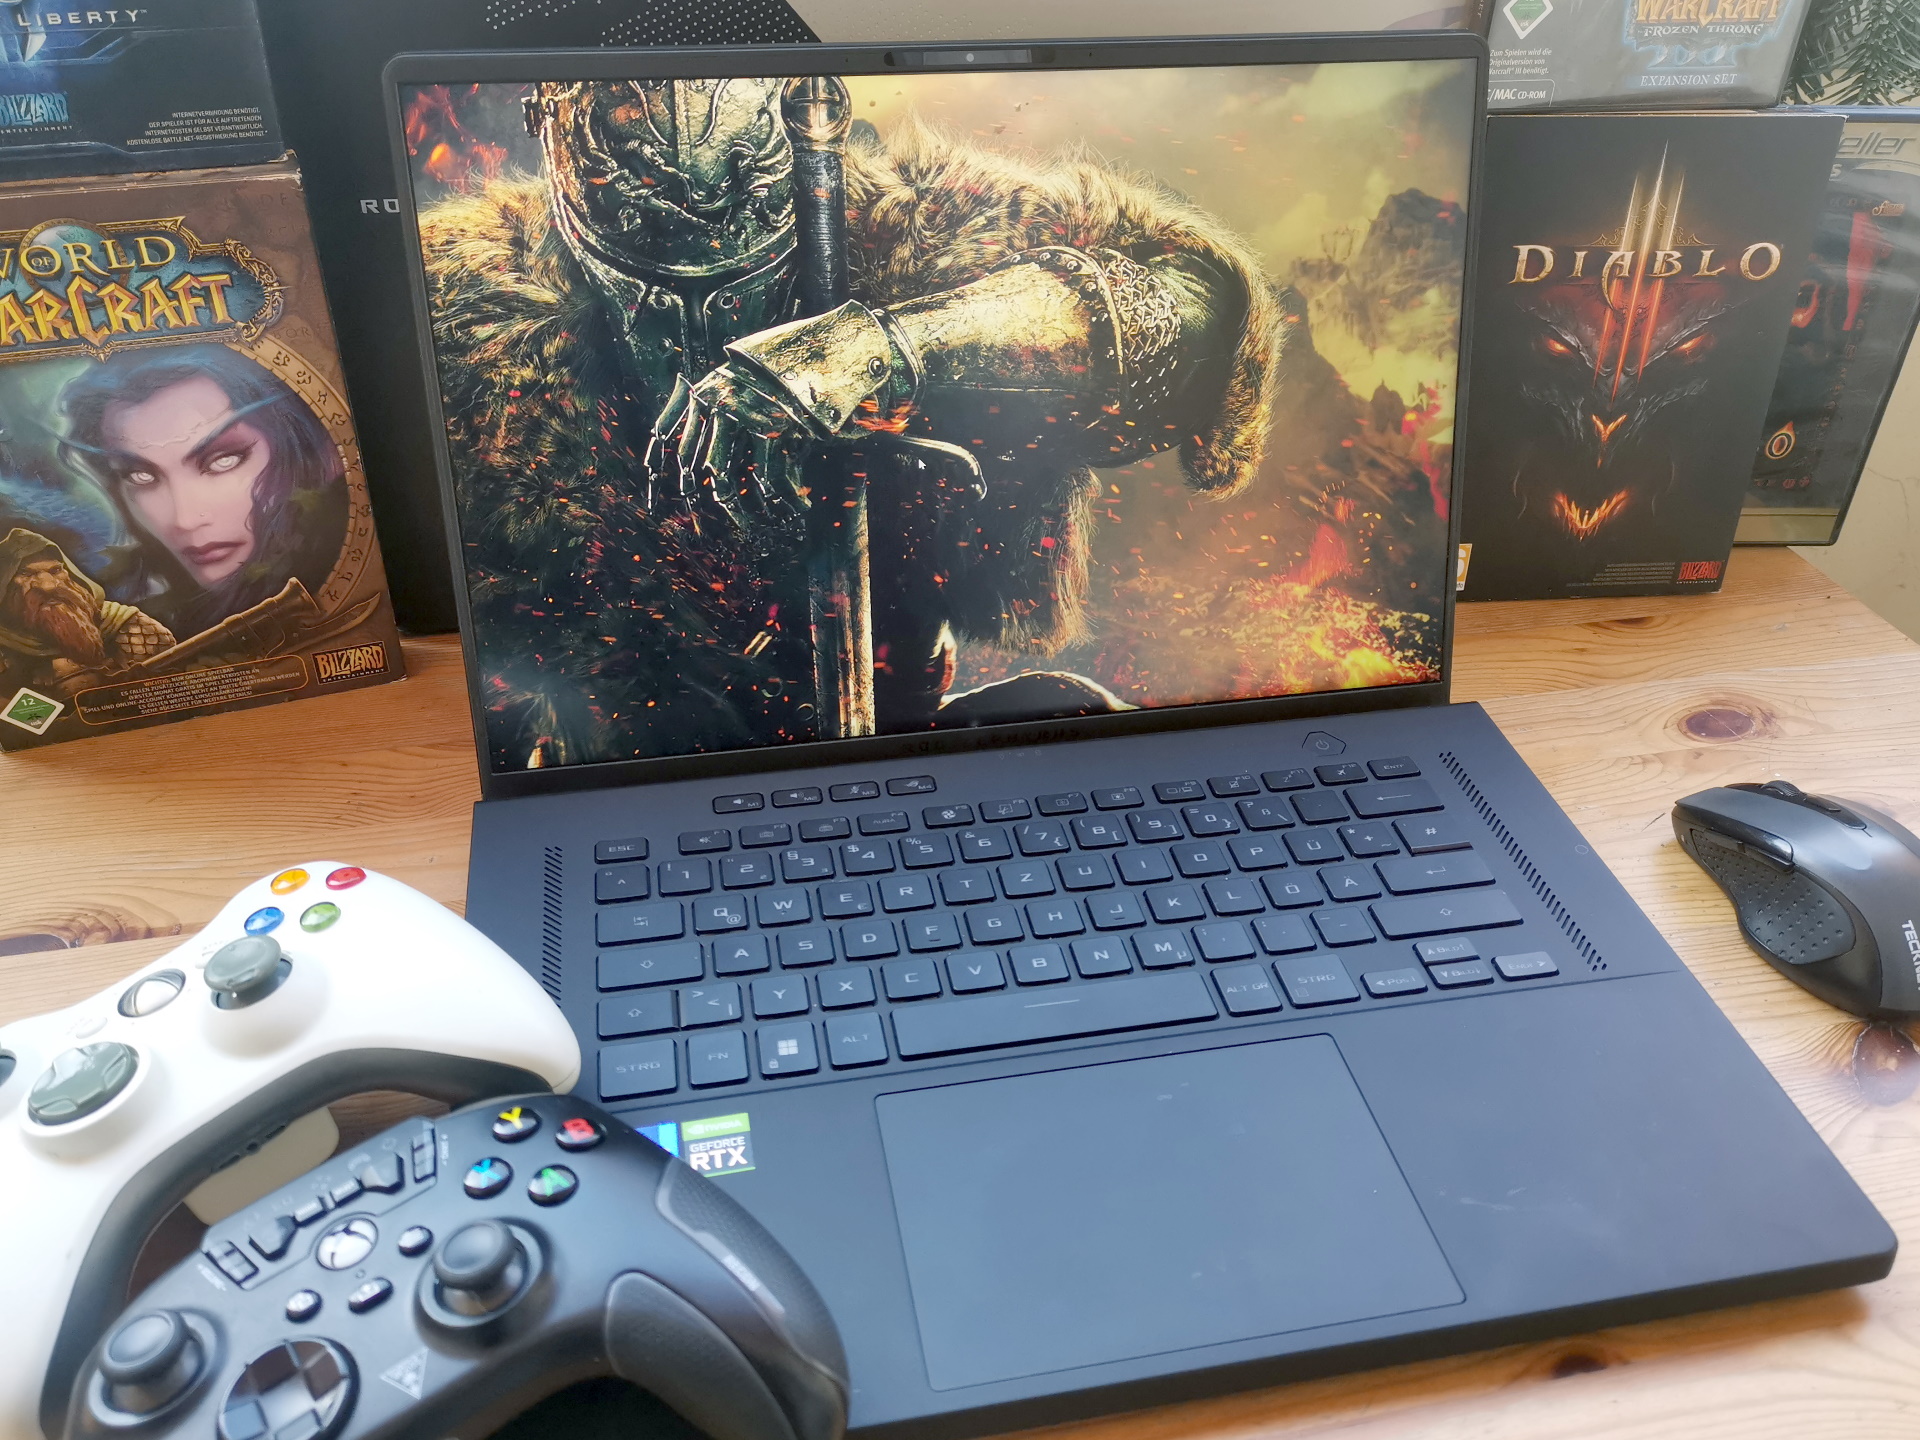
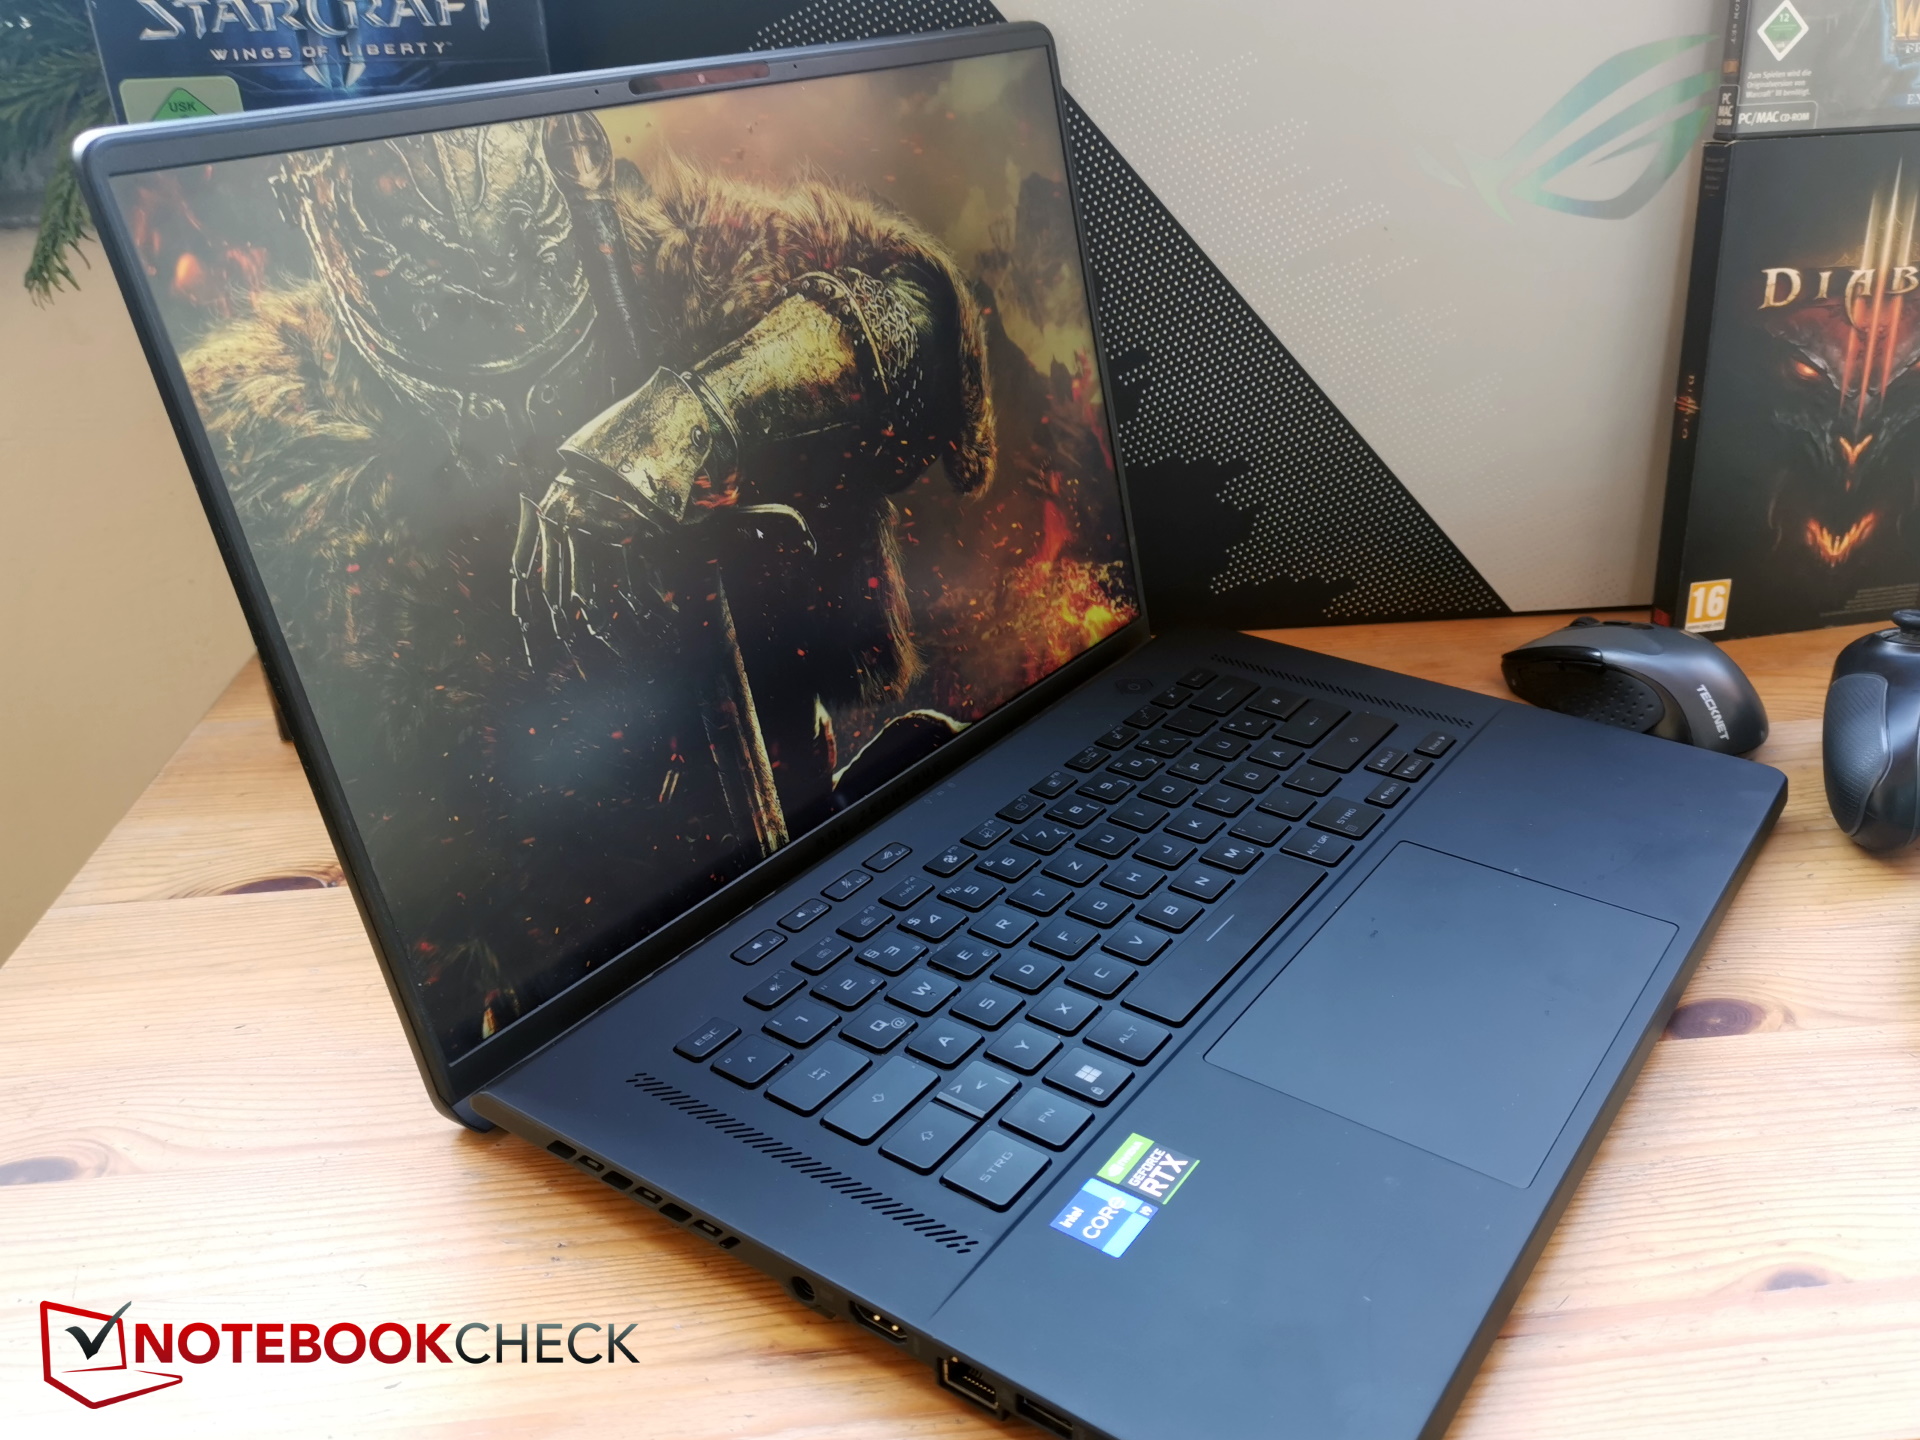
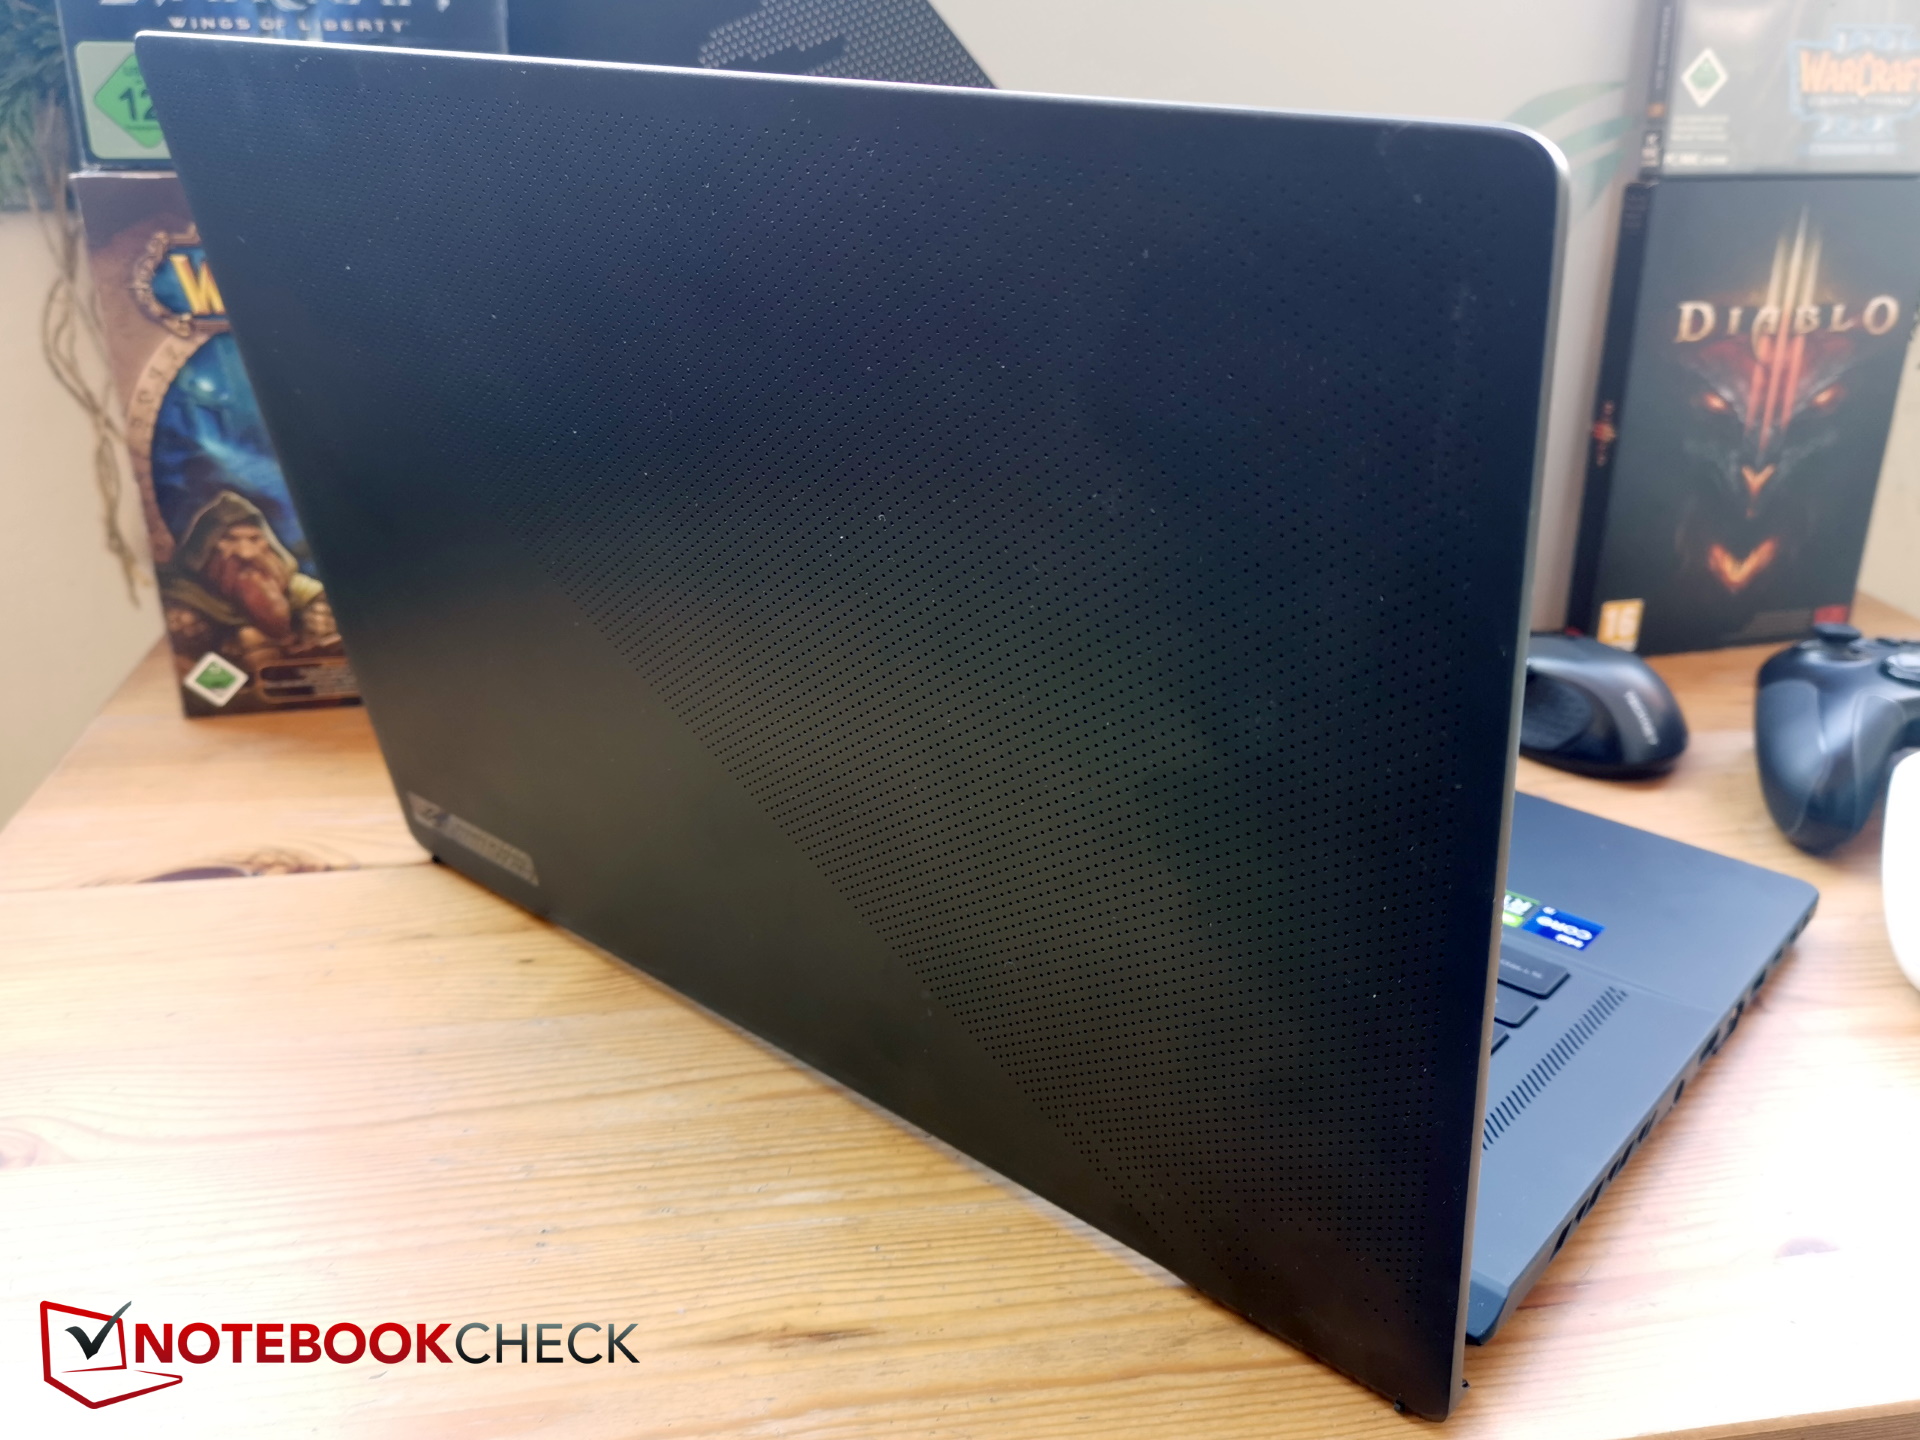
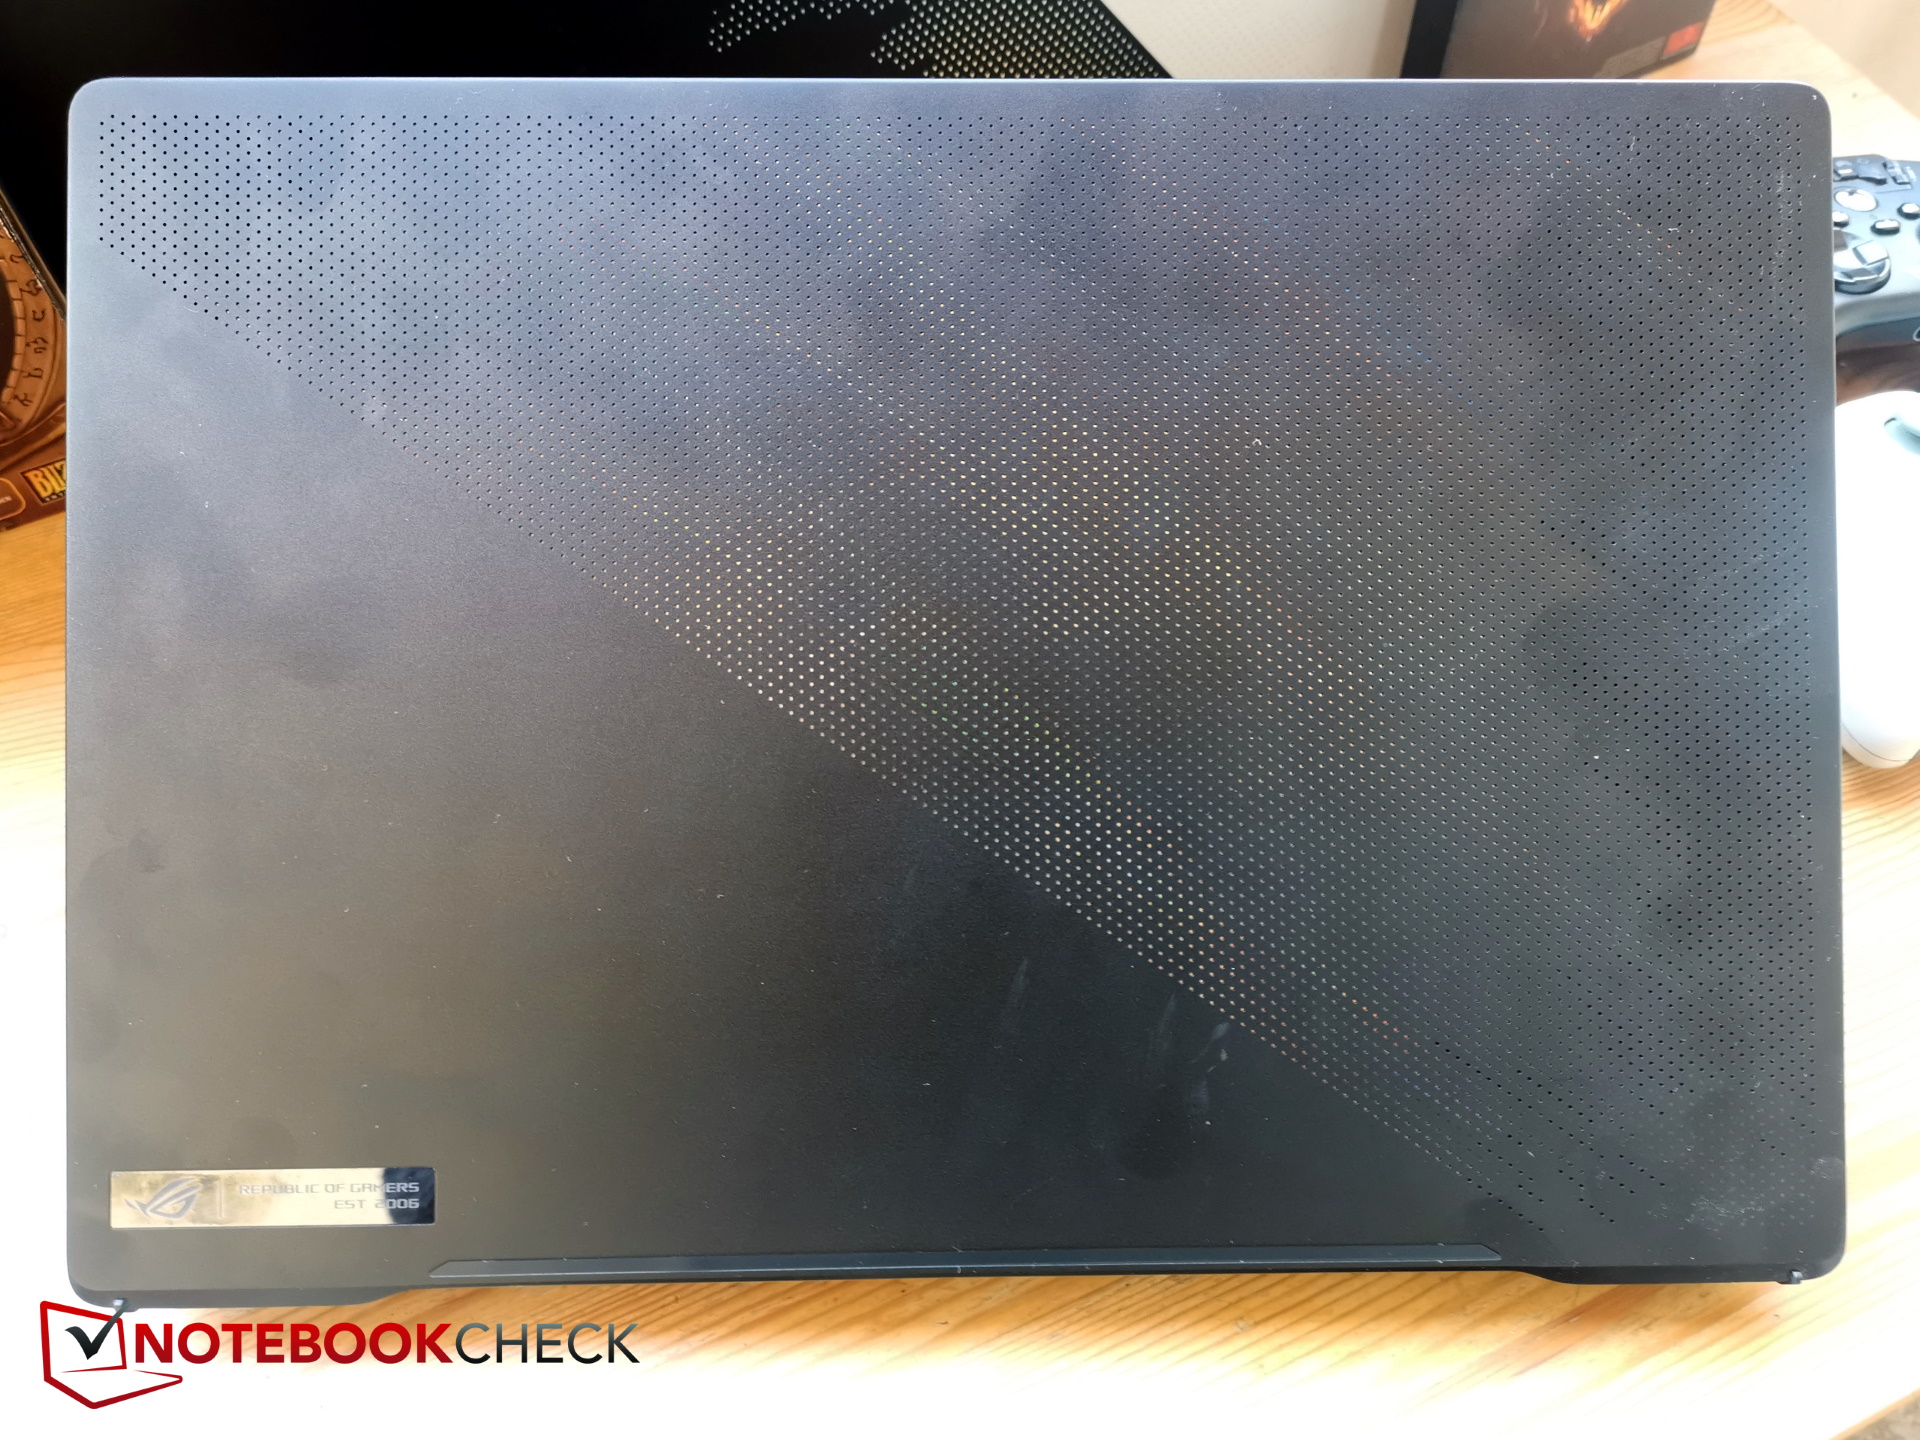
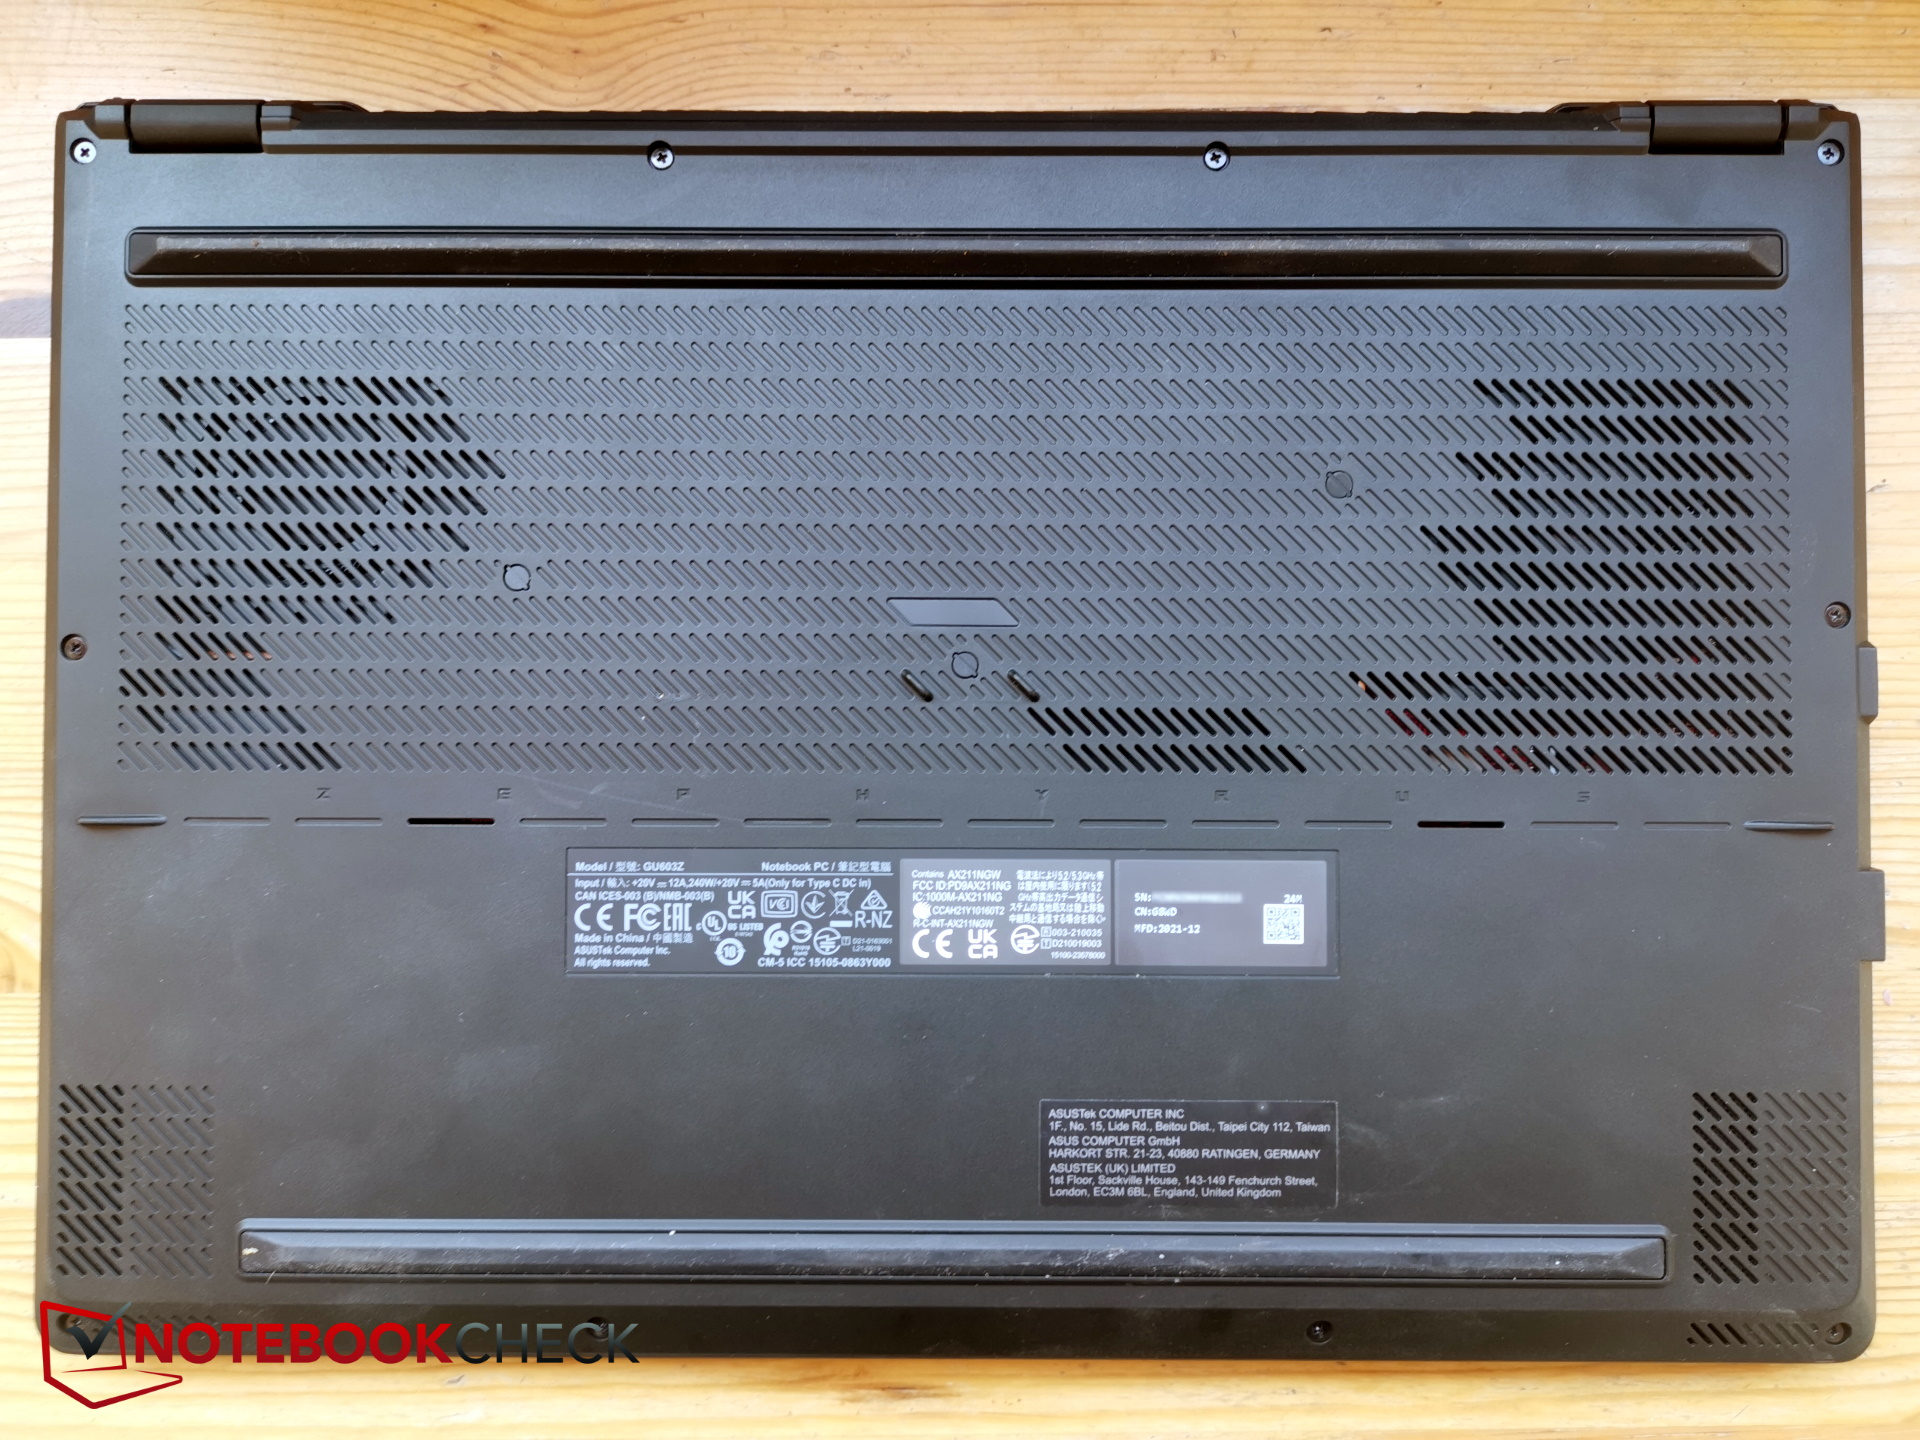
Estojo - Slim portátil para jogos de 16 polegadas
Como praticamente nada mudou no caso, encaminhamos você para nosso teste da M16 de 2021que fornece descrições detalhadas do caso, das opções de manutenção e dos dispositivos de entrada.
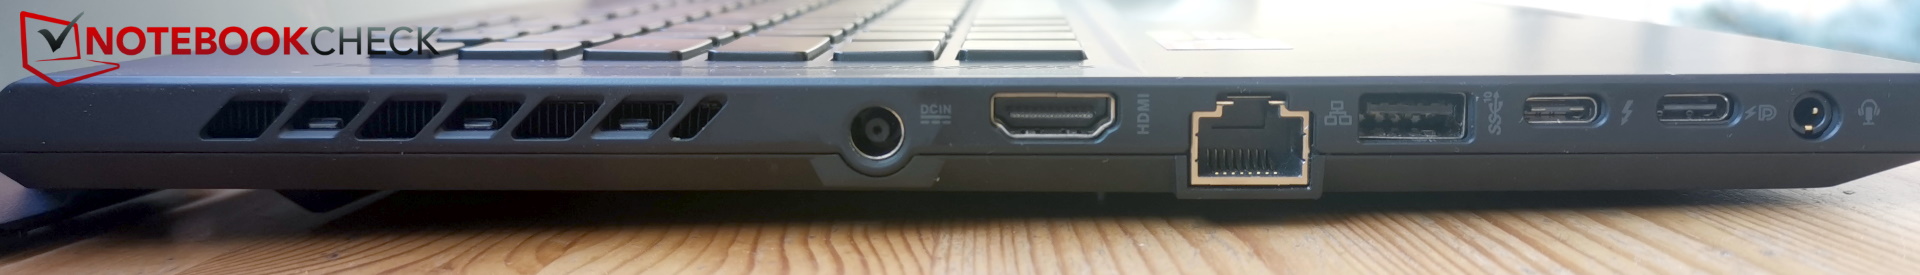
Equipamento de conexão - HDMI 2.1 e Thunderbolt 4

Leitor de cartões SD
O leitor de cartões SC é limitado aos cartões microSD, mas pelo menos nosso AV PRO microSD 128 GB V60 se encaixa perfeitamente sem ficar de fora. Em comparação com o predecessor, que já teve um bom desempenho, a velocidade é novamente ligeiramente aumentada.
| SD Card Reader | |
| average JPG Copy Test (av. of 3 runs) | |
| Asus ROG Zephyrus M16 GU603Z | |
| Média da turma Gaming (20.9 - 210, n=54, últimos 2 anos) | |
| Asus ROG Zephyrus M16 GU603H (AV PRO microSD 128 GB V60) | |
| Corsair Voyager a1600 (AV Pro SD microSD 128 GB V60) | |
| Schenker Vision 16 Pro RTX 3070 Ti (AV Pro V60) | |
| Schenker XMG Focus 16 (i7-12700H, RTX 3060) (AV Pro SD microSD 128 GB V60) | |
| maximum AS SSD Seq Read Test (1GB) | |
| Asus ROG Zephyrus M16 GU603Z | |
| Asus ROG Zephyrus M16 GU603H (AV PRO microSD 128 GB V60) | |
| Média da turma Gaming (25.5 - 261, n=51, últimos 2 anos) | |
| Corsair Voyager a1600 (AV Pro SD microSD 128 GB V60) | |
| Schenker XMG Focus 16 (i7-12700H, RTX 3060) (AV Pro SD microSD 128 GB V60) | |
| Schenker Vision 16 Pro RTX 3070 Ti (AV Pro V60) | |
Comunicação
A Asus usa o módulo Intel AX211, que também suporta a rede de 6-Ghz. Em comparação com o módulo MediaTek do predecessor, as taxas de transferência aumentam significativamente. O desempenho é muito constante.
Webcam


Visor - 16 polegadas com QHD+ e 165 Hz
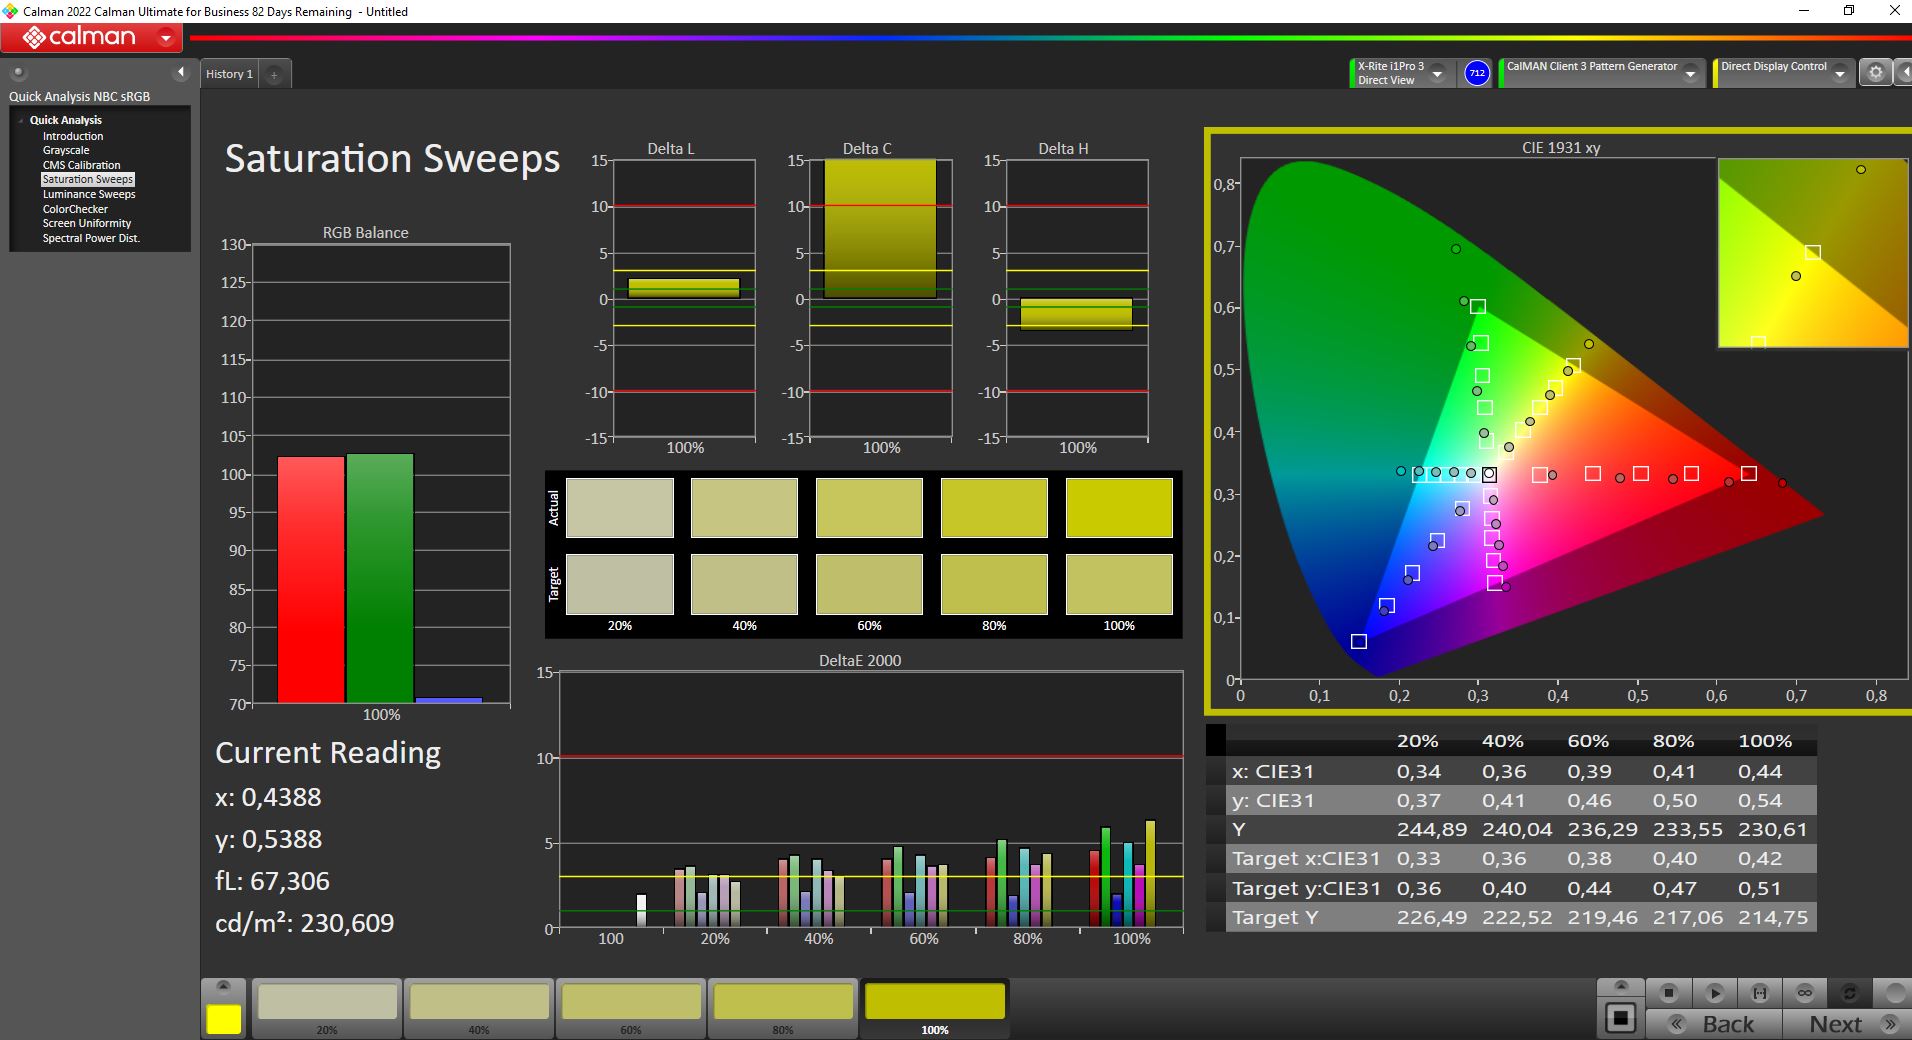
Embora compartilhe as mesmas especificações básicas (16 in, IPS, 16:10, 2.560 x 1.600, 165 Hz) com o predecessor, o Asus usa agora um painel diferente. Em vez de usar um painel da AU Optronics, desta vez ele vem da BOE. Enquanto o painel é ainda ligeiramente mais brilhante (481 lêndeas), a distribuição de brilho é mais desigual, e o brilho diminui consideravelmente em direção ao canto inferior esquerdo em particular. Devido a um valor de preto significativamente melhorado, o valor do contraste aumenta positivamente.
Os tempos de resposta são relativamente rápidos, embora o predecessor tenha respondido ainda mais rápido aqui. O PWM não é usado para controle de brilho, e algum leve sangramento na tela só é aparente em cenas escuras.

| |||||||||||||||||||||||||
iluminação: 82 %
iluminação com acumulador: 484 cd/m²
Contraste: 2367:1 (Preto: 0.21 cd/m²)
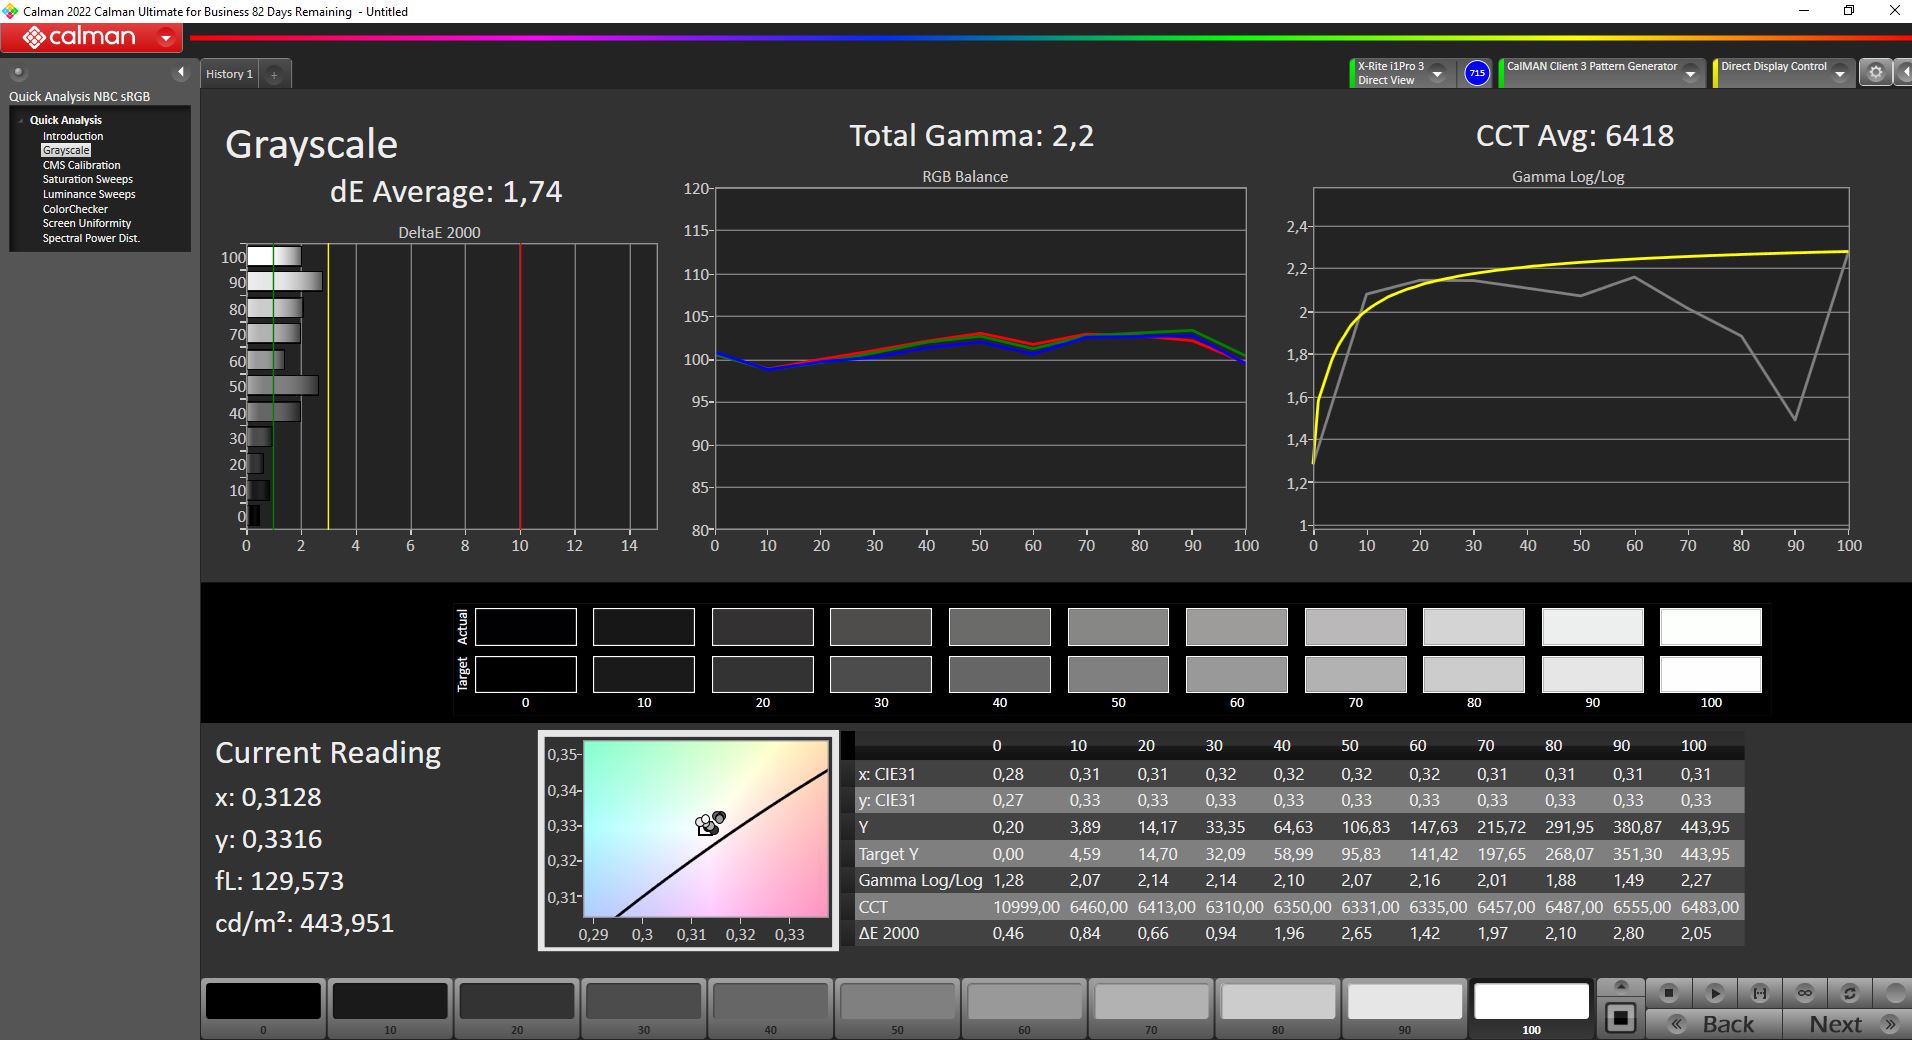
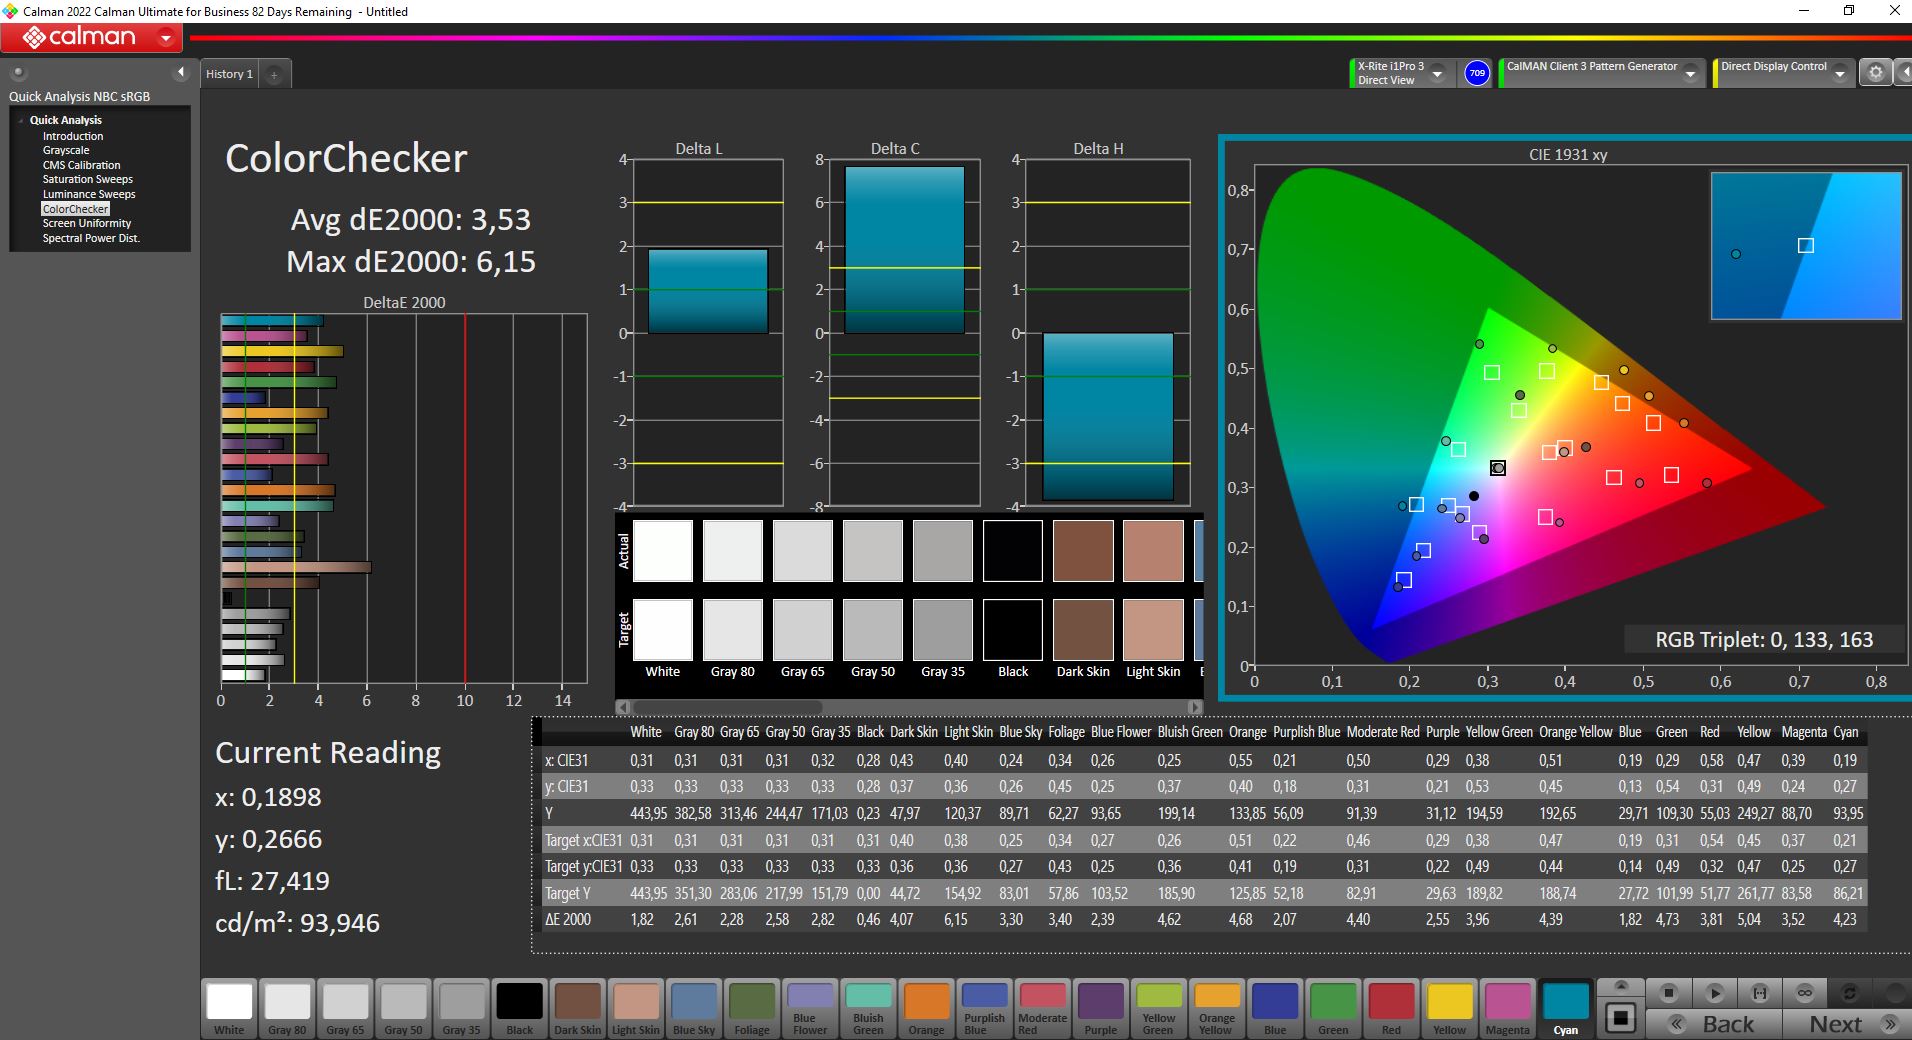
ΔE ColorChecker Calman: 3.53 | ∀{0.5-29.43 Ø4.71}
calibrated: 3.53
ΔE Greyscale Calman: 1.74 | ∀{0.09-98 Ø4.96}
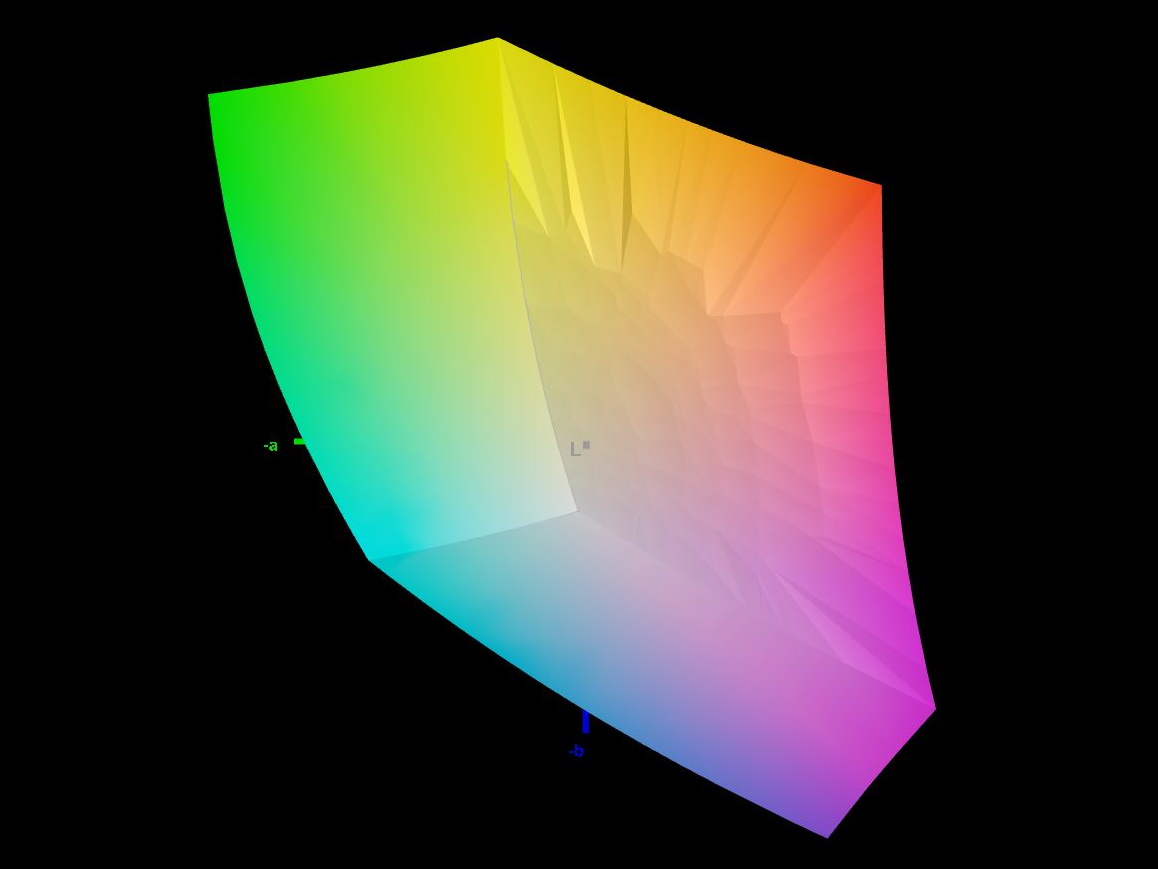
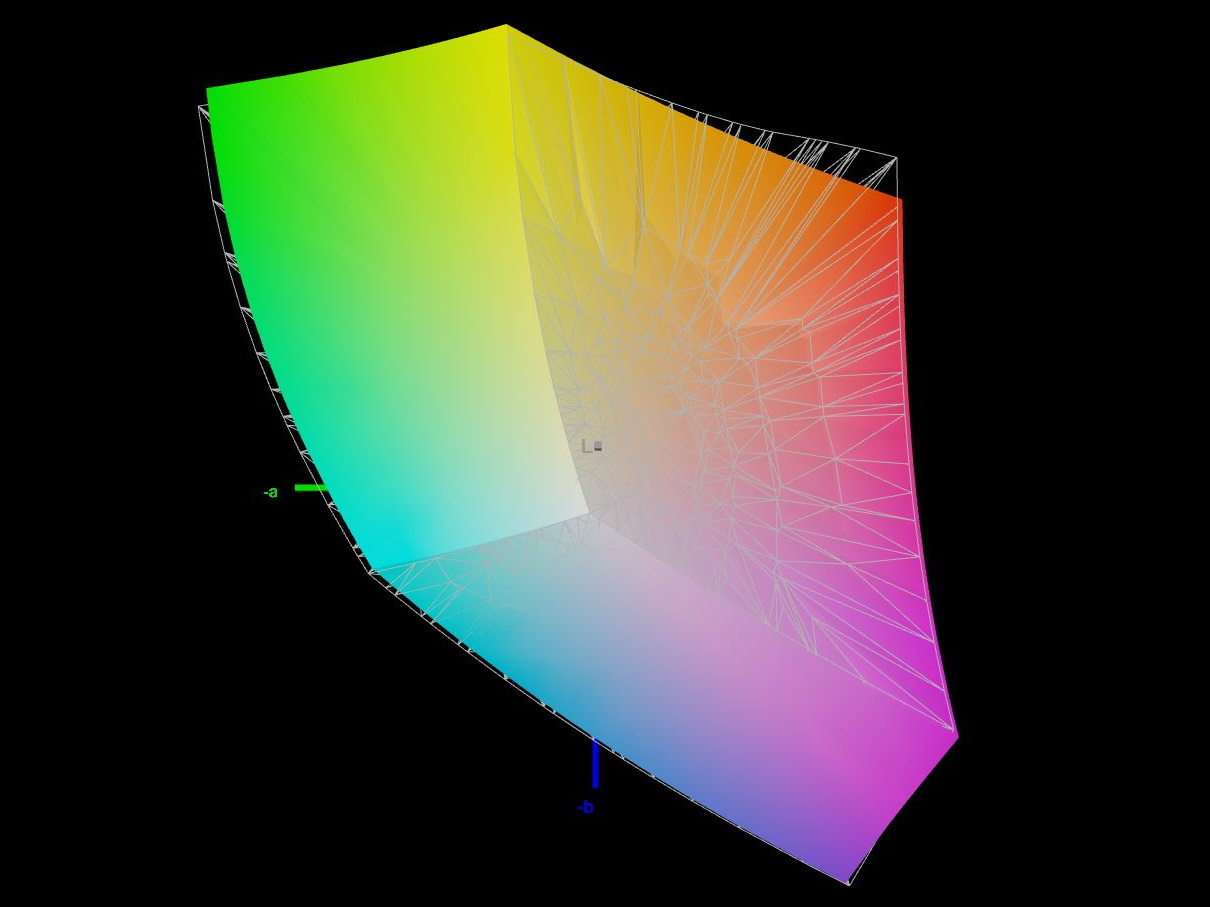
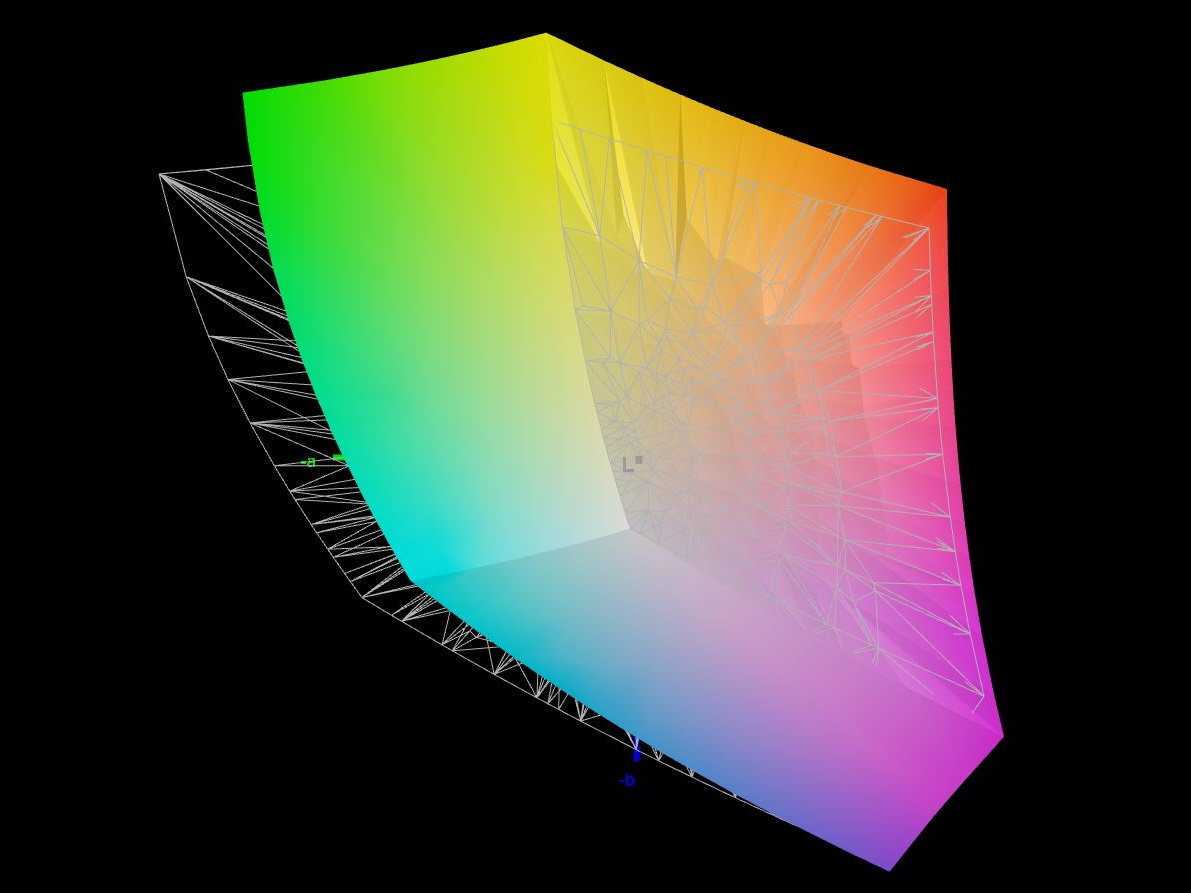
83.1% AdobeRGB 1998 (Argyll 3D)
98.5% sRGB (Argyll 3D)
92.8% Display P3 (Argyll 3D)
Gamma: 2.2
CCT: 6418 K
| Asus ROG Zephyrus M16 GU603Z BOE0A0B (BOE CQ NE160QDM-NY3), IPS, 2560x1600, 16" | Asus ROG Zephyrus M16 GU603H AU Optronics AUOC199, IPS, 2560x1600, 16" | Schenker Vision 16 Pro RTX 3070 Ti N160QDM-NZ1, IPS, 2560x1600, 16" | Lenovo Legion 5 Pro 16ARH7H RTX 3070 Ti BOE CQ NE160QDM-NY1, IPS, 2560x1600, 16" | Schenker XMG Focus 16 (i7-12700H, RTX 3060) BOE NE16oQDM-NY1, IPS, 2560x1600, 16" | Corsair Voyager a1600 BOE0A3B, IPS, 2560x1600, 16" | |
|---|---|---|---|---|---|---|
| Display | -15% | -15% | -14% | -14% | ||
| Display P3 Coverage (%) | 92.8 | 68.7 -26% | 67.3 -27% | 68.3 -26% | 68.7 -26% | |
| sRGB Coverage (%) | 98.5 | 96.7 -2% | 96.1 -2% | 96.6 -2% | 98.2 0% | |
| AdobeRGB 1998 Coverage (%) | 83.1 | 70 -16% | 69.5 -16% | 70.6 -15% | 70.1 -16% | |
| Response Times | 39% | -37% | -51% | -62% | -36% | |
| Response Time Grey 50% / Grey 80% * (ms) | 7.6 ? | 4.8 ? 37% | 14.3 ? -88% | 14.4 ? -89% | 16.4 ? -116% | 13 ? -71% |
| Response Time Black / White * (ms) | 10 ? | 6 ? 40% | 8.6 ? 14% | 11.2 ? -12% | 10.8 ? -8% | 10 ? -0% |
| PWM Frequency (Hz) | ||||||
| Screen | -28% | -34% | -11% | -40% | -21% | |
| Brightness middle (cd/m²) | 497 | 448 -10% | 364 -27% | 522.8 5% | 460 -7% | 355 -29% |
| Brightness (cd/m²) | 481 | 446 -7% | 347 -28% | 503 5% | 442 -8% | 340 -29% |
| Brightness Distribution (%) | 82 | 86 5% | 89 9% | 84 2% | 89 9% | 91 11% |
| Black Level * (cd/m²) | 0.21 | 0.48 -129% | 0.3 -43% | 0.41 -95% | 0.32 -52% | 0.53 -152% |
| Contrast (:1) | 2367 | 933 -61% | 1213 -49% | 1275 -46% | 1438 -39% | 670 -72% |
| Colorchecker dE 2000 * | 3.53 | 2.76 22% | 3.3 7% | 2.47 30% | 3.65 -3% | 2.43 31% |
| Colorchecker dE 2000 max. * | 6.15 | 7.09 -15% | 6.6 -7% | 6.56 -7% | 7.49 -22% | 4.31 30% |
| Colorchecker dE 2000 calibrated * | 3.53 | 2.86 19% | 2.5 29% | 0.61 83% | 3.65 -3% | 1.14 68% |
| Greyscale dE 2000 * | 1.74 | 3.1 -78% | 5.2 -199% | 3 -72% | 5.87 -237% | 2.62 -51% |
| Gamma | 2.2 100% | 2.153 102% | 2.14 103% | 2.27 97% | 2.42 91% | 2.28 96% |
| CCT | 6418 101% | 6826 95% | 6331 103% | 6719 97% | 6711 97% | 6909 94% |
| Color Space (Percent of AdobeRGB 1998) (%) | 87 | |||||
| Color Space (Percent of sRGB) (%) | 100 | |||||
| Média Total (Programa/Configurações) | 6% /
-16% | -29% /
-30% | -26% /
-17% | -39% /
-38% | -24% /
-22% |
* ... menor é melhor
Asus anuncia 100% de cobertura do espaço de cor DCI-P3, mas medimos "apenas" 92,8%. O espaço de cores AdobeRGB ainda é coberto a 83%. Pelo menos no campo de teste de nossos concorrentes selecionados, isto ainda resulta na posição de topo. Em geral, a tela também é adequada para a edição profissional de imagens e vídeos.
No estado de entrega, o painel já está bem calibrado. Com apenas 1,74, o valor DeltaE da escala cinza é particularmente baixo. No ColorChecker, nossa ferramenta de Calibração de Cores Calman para Mostrador de Retrato mede desvios ligeiramente maiores. Uma calibragem adicional não melhora ainda mais estes valores, mas, ao invés disso, desgasta a escala de cinza que já é muito boa.
Exibir tempos de resposta
| ↔ Tempo de resposta preto para branco | ||
|---|---|---|
| 10 ms ... ascensão ↗ e queda ↘ combinadas | ↗ 4.6 ms ascensão | 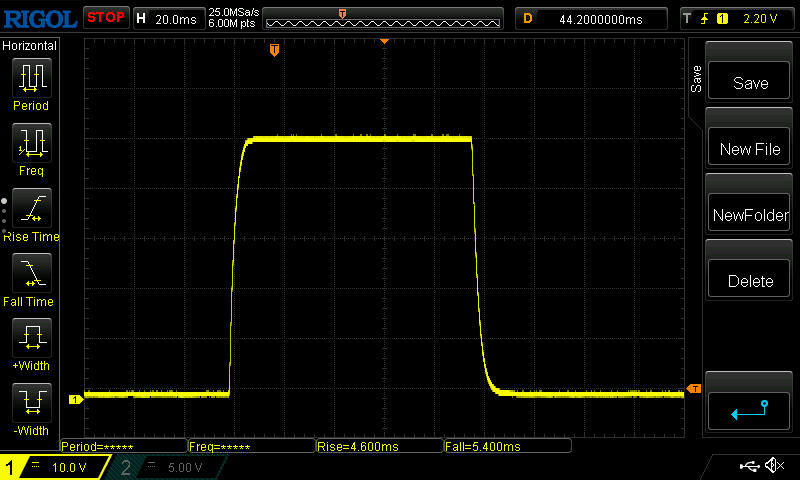 |
| ↘ 5.4 ms queda | ||
| A tela mostra boas taxas de resposta em nossos testes, mas pode ser muito lenta para jogadores competitivos. Em comparação, todos os dispositivos testados variam de 0.1 (mínimo) a 240 (máximo) ms. » 27 % de todos os dispositivos são melhores. Isso significa que o tempo de resposta medido é melhor que a média de todos os dispositivos testados (19.8 ms). | ||
| ↔ Tempo de resposta 50% cinza a 80% cinza | ||
| 7.6 ms ... ascensão ↗ e queda ↘ combinadas | ↗ 3.4 ms ascensão | 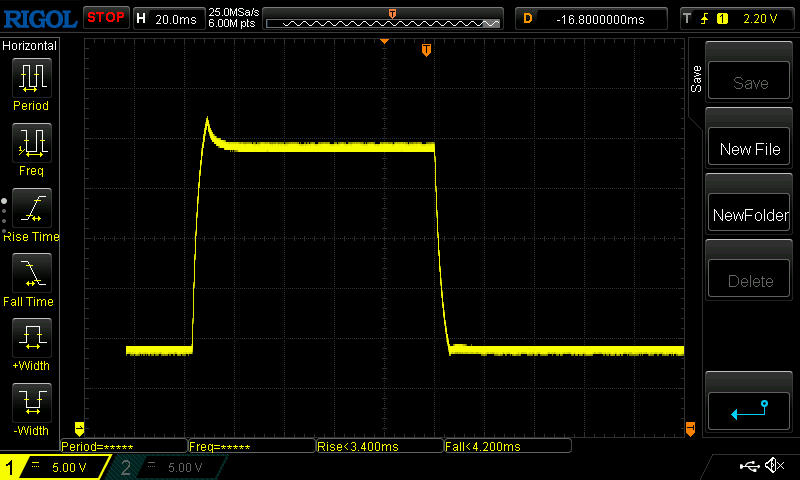 |
| ↘ 4.2 ms queda | ||
| A tela mostra taxas de resposta muito rápidas em nossos testes e deve ser muito adequada para jogos em ritmo acelerado. Em comparação, todos os dispositivos testados variam de 0.165 (mínimo) a 636 (máximo) ms. » 20 % de todos os dispositivos são melhores. Isso significa que o tempo de resposta medido é melhor que a média de todos os dispositivos testados (31 ms). | ||
Cintilação da tela / PWM (modulação por largura de pulso)
| Tela tremeluzindo / PWM não detectado |  | ||
[pwm_comparison] Em comparação: 52 % de todos os dispositivos testados não usam PWM para escurecer a tela. Se PWM foi detectado, uma média de 7757 (mínimo: 5 - máximo: 343500) Hz foi medida. | |||
Apesar do bom brilho da tela, você ainda deve evitar a luz direta do sol ao ar livre e certificar-se de olhar a tela diretamente da frente, pois caso contrário a visibilidade cai rapidamente.

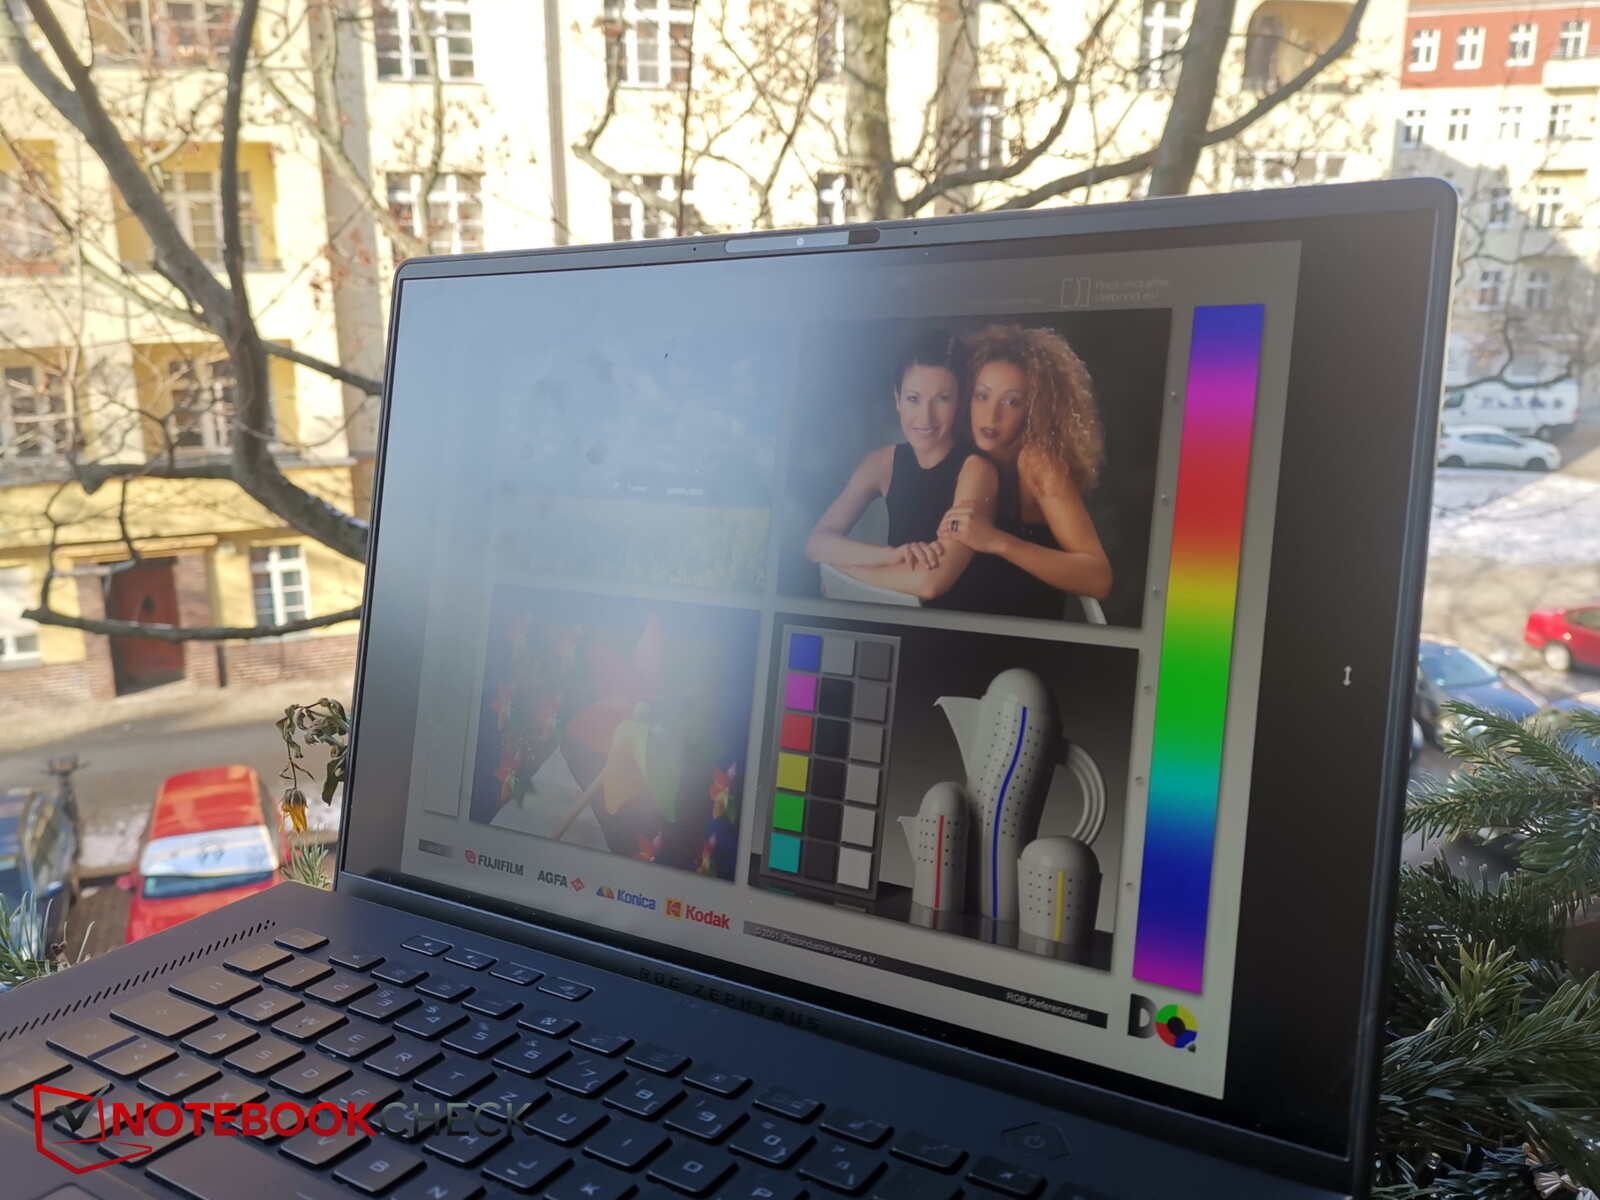
O conteúdo da tela pode ser lido facilmente, mesmo de ângulos extremos de visualização. Ao olhar para a tela pelos lados, o brilho é menor do que quando se olha de cima ou de baixo para os ângulos de visão.

Desempenho - 120-Watt RTX 3070-Ti ligeiramente abaixo da média
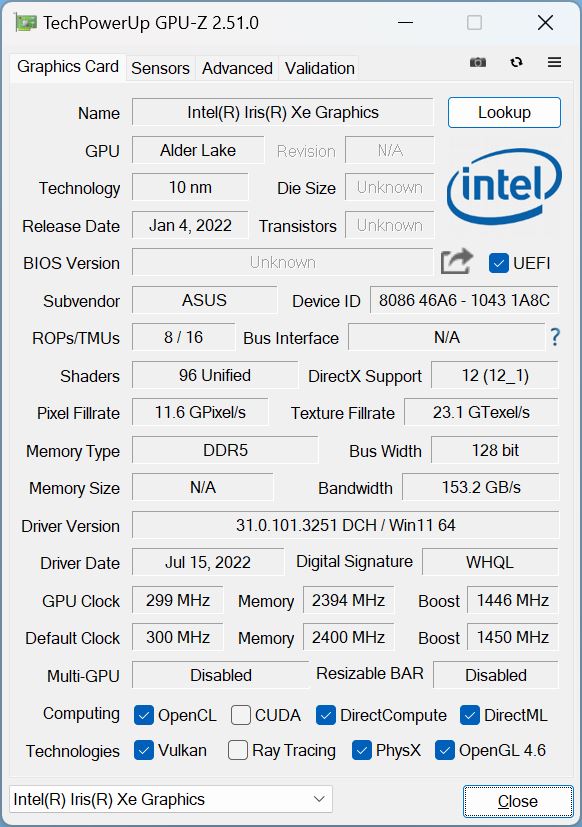
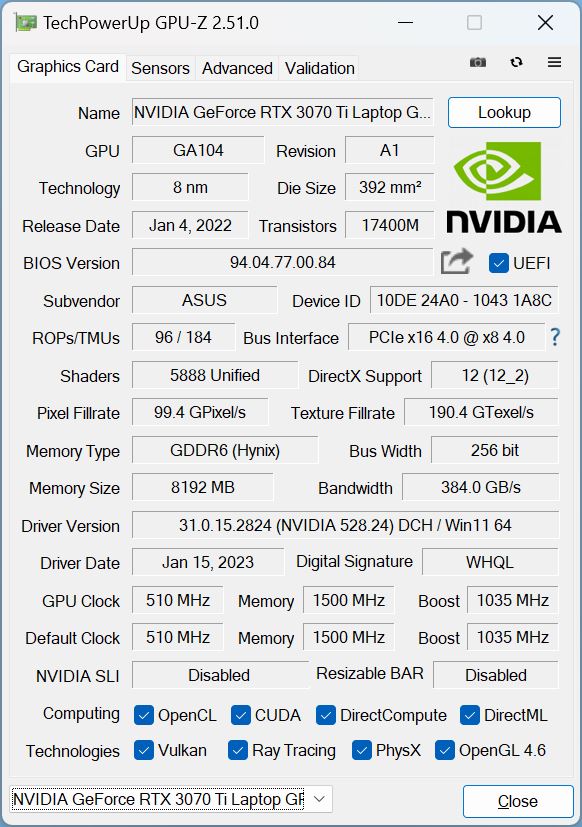
O ROG Zephyrus está disponível em várias configurações de equipamento. O M16 também deve estar disponível com uma CPU Intel da 13ª geração e RTX 40xx em breve, enquanto nossa unidade de teste ainda usa umNúcleo i9-12900HeRTX 3070 Ti.
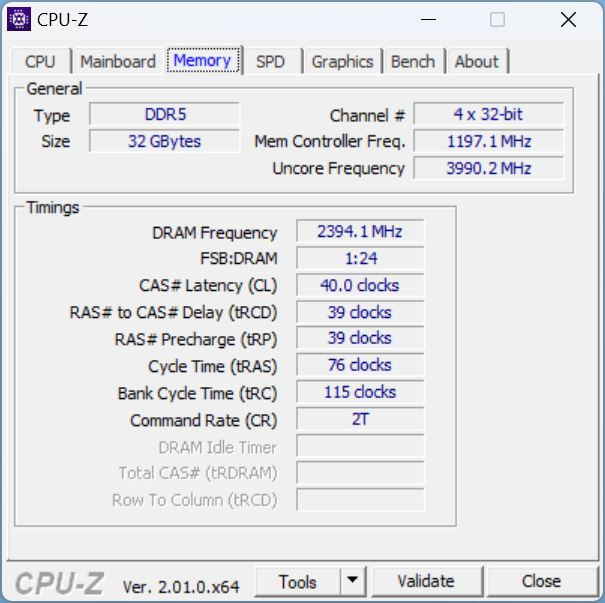
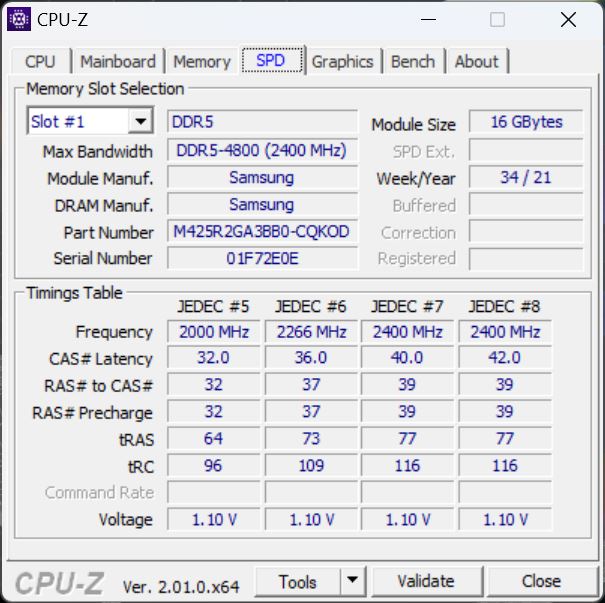
Alternativamente, quase tudo é possível a partir doRTX 3050 Tiaté o RTX 3080 Ti. Com o processador, você tem atualmente a escolha entre o i7-12700He nosso top model. O equipamento é completado por 32 GB de RAM, mas também há numerosas opções disponíveis aqui.
Condições de teste
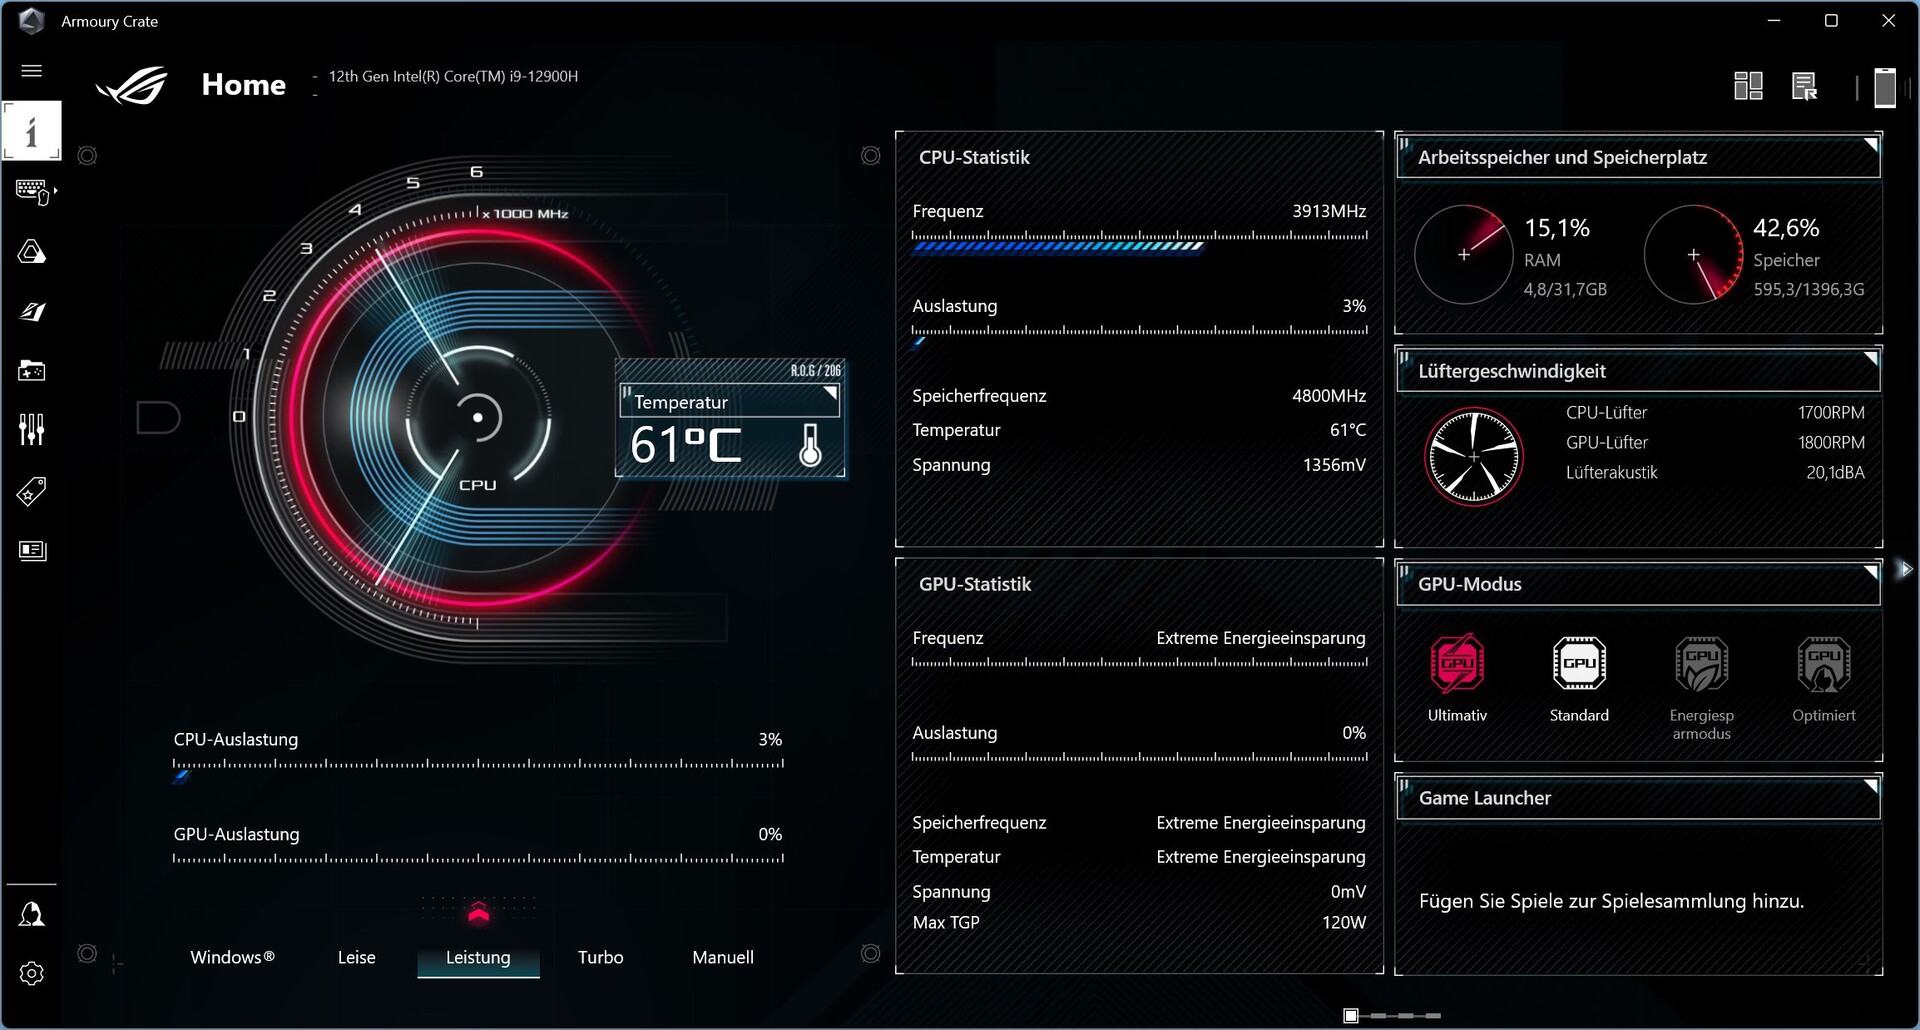
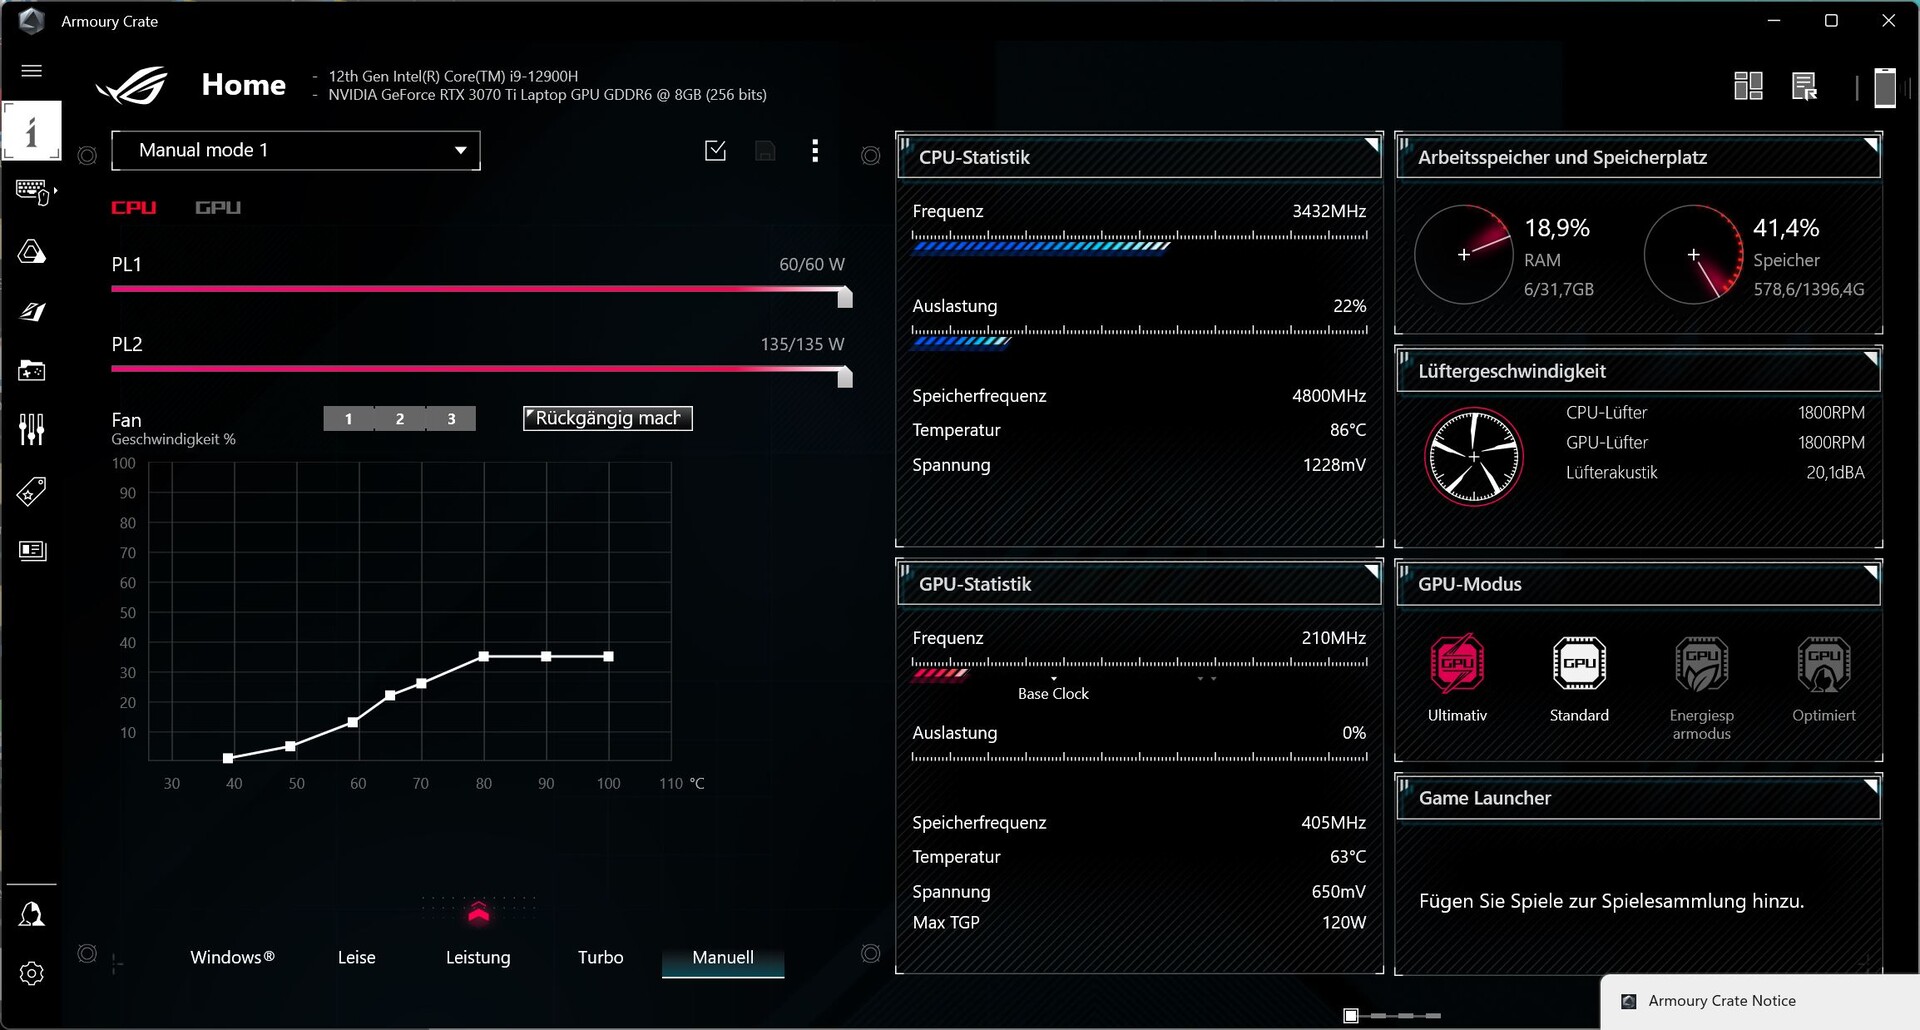
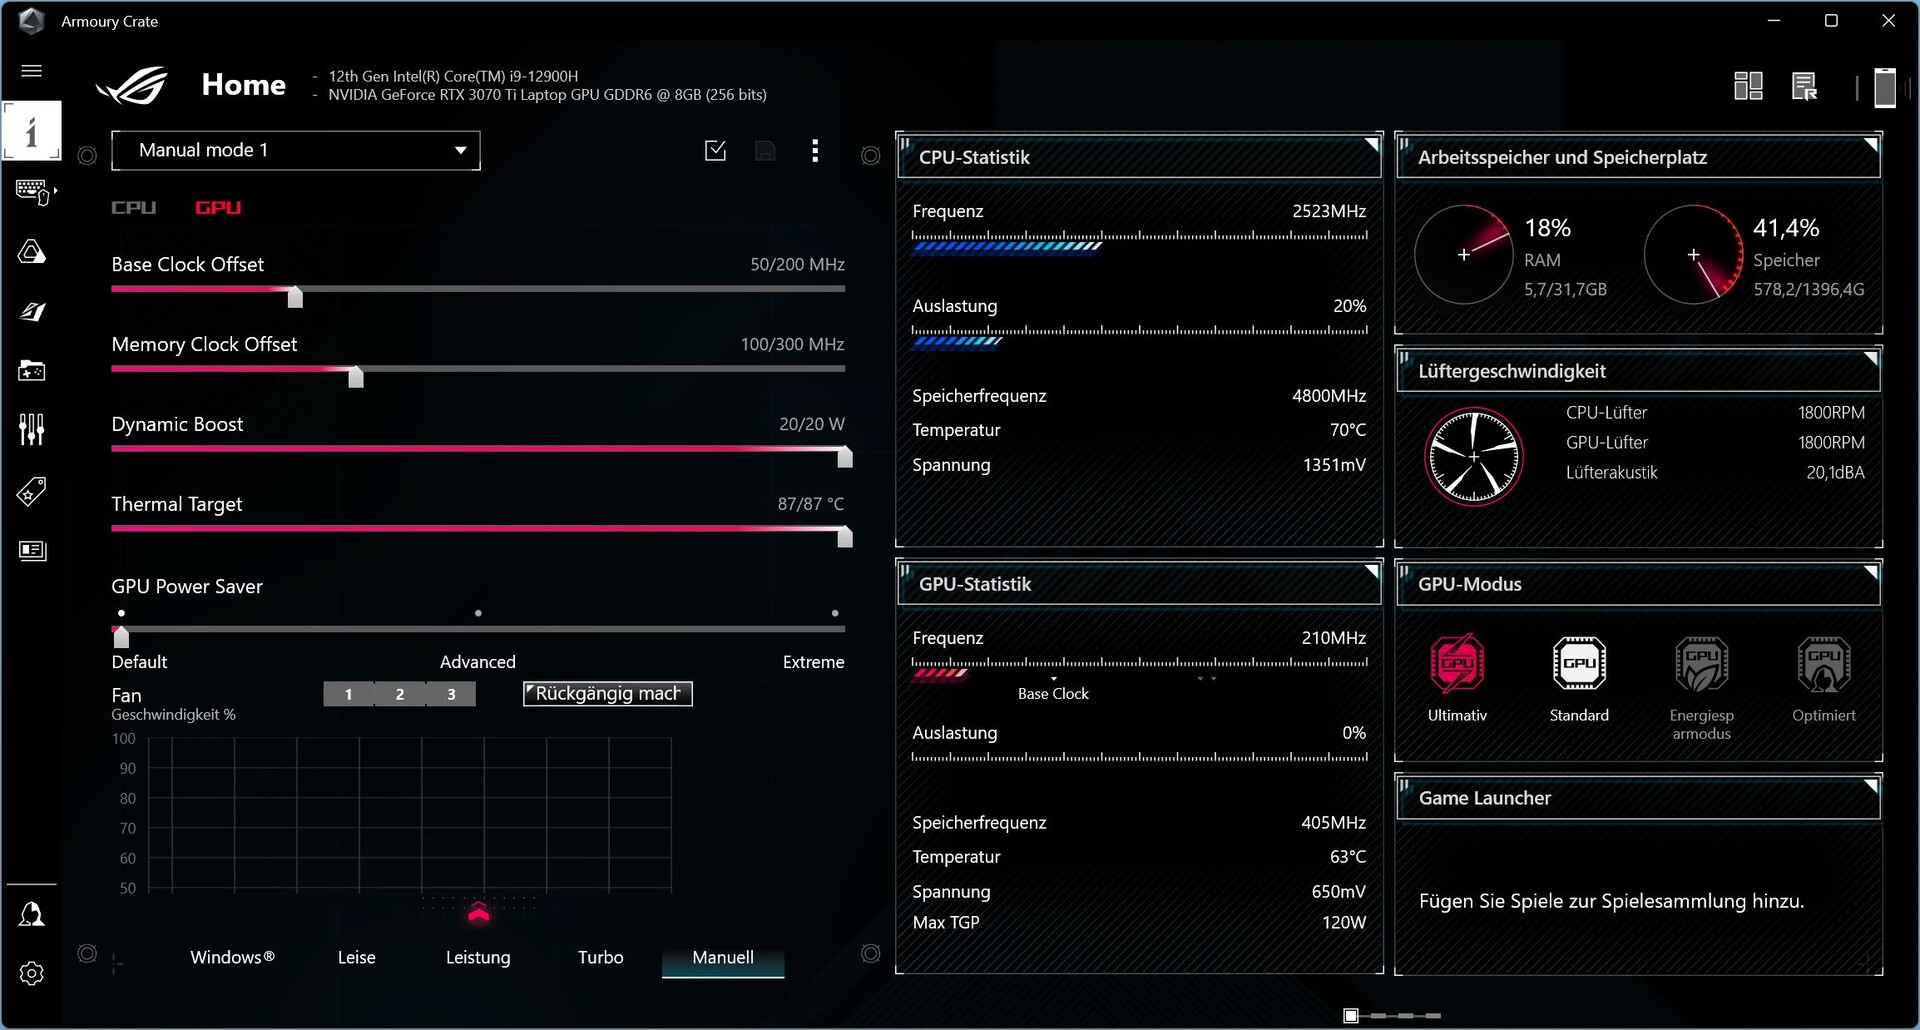
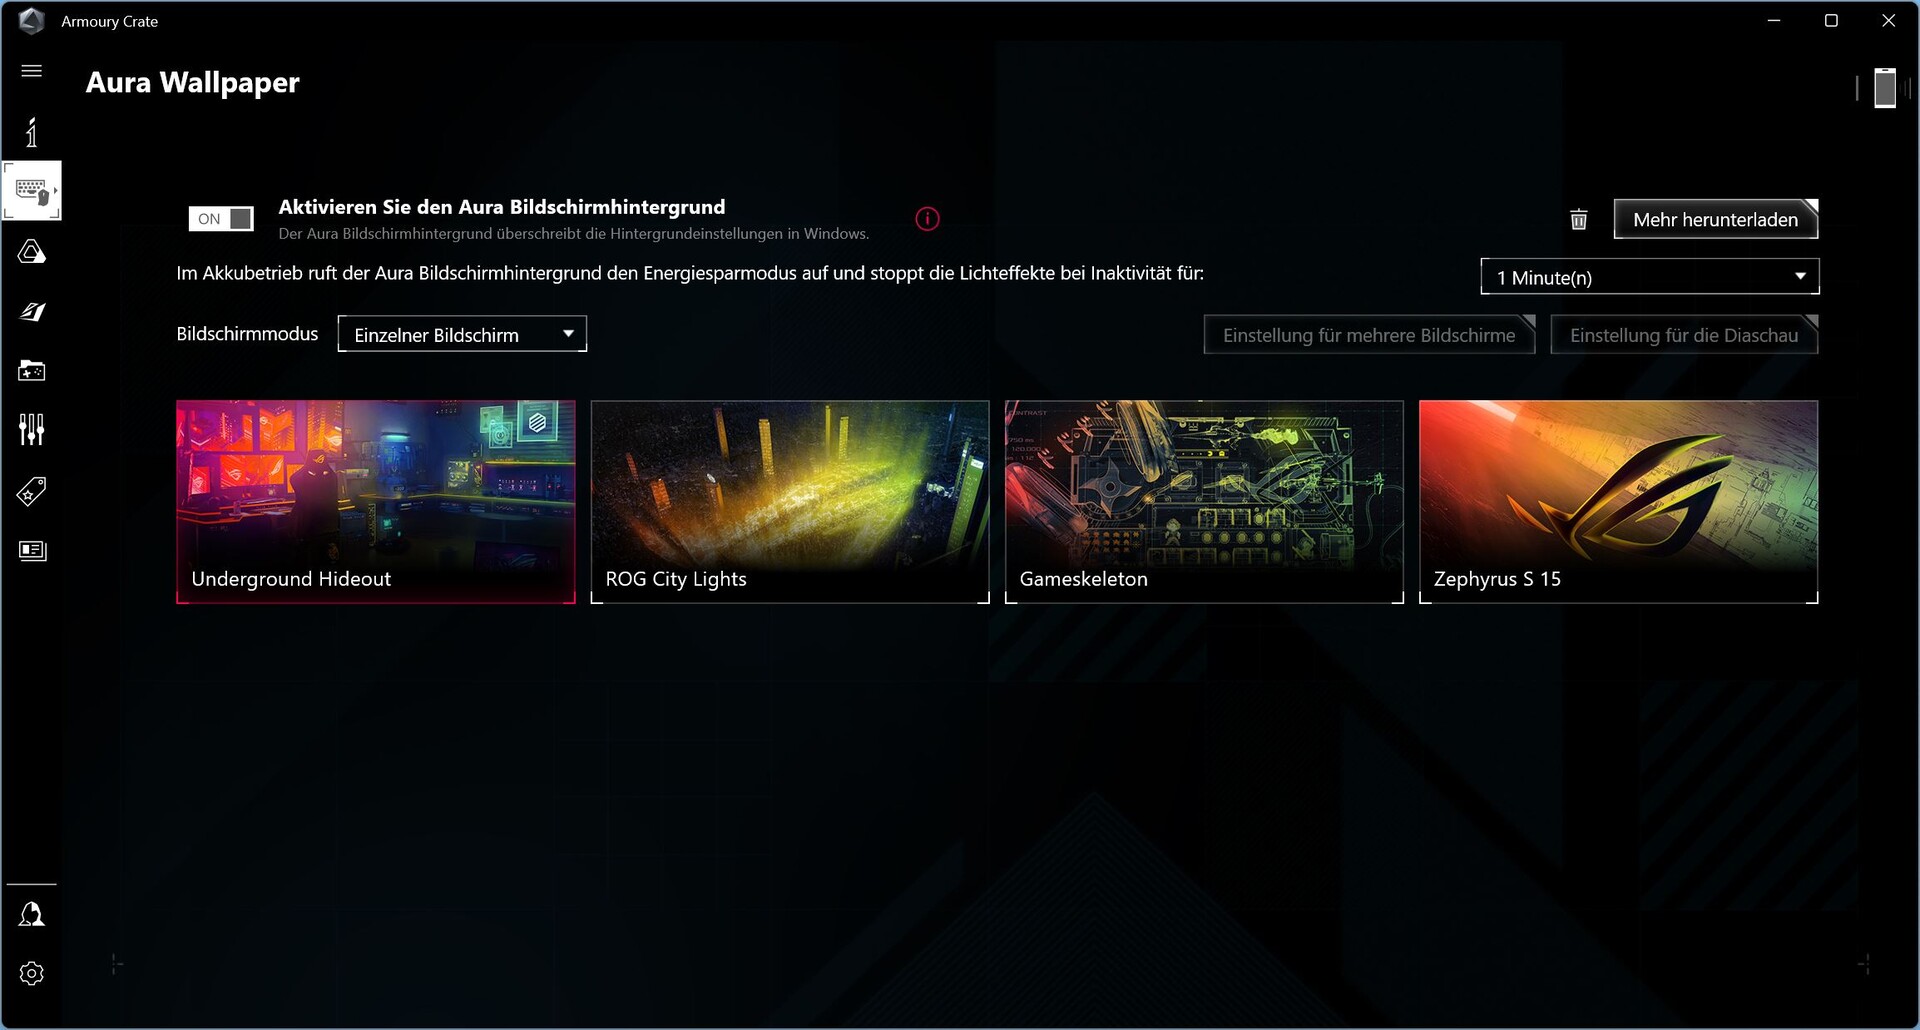
O software Asus Armoury Crate permite ajustar várias configurações no laptop, portanto o usuário deve se familiarizar com isto. Ele oferece as opções para procurar atualizações do dispositivo, selecionar papéis de parede coloridos e dinâmicos da Aura, ou controlar o desempenho.
O fabricante oferece três modos de desempenho (Quiet, Performance e Turbo) e também dá a opção de controlar o desempenho usando os modos de desempenho do Windows ou mesmo definir vários limites de potência você mesmo em um modo manual - opções que estão faltando com muitos outros fabricantes.
Como no modo Turbo, o laptop já é muito barulhento durante a operação ociosa, nós executamos todo o benchmark no modo "Performance". O modo "Silencioso" é usado apenas para os testes de bateria - não há modo de economia de energia separado.
Mesmo que o software em si seja bem organizado, vários erros de tradução ou frases incompletas (na versão em alemão) ainda impedem uma boa impressão geral.

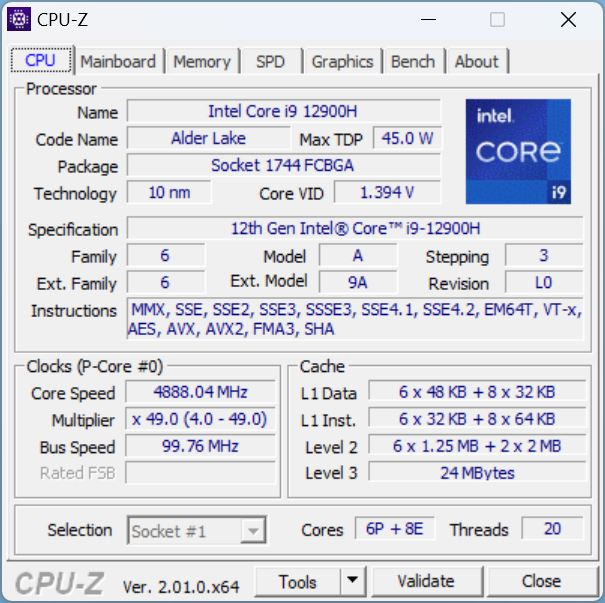
Processador
A Asus já anunciou a M16 com a Intel Gen13. Até que isso se torne disponível, ainda estamos usando um Intel Core i9-12900Hem nossa unidade de teste. A CPU high-end oferece 6 núcleos de desempenho e 8 núcleos de eficiência. Os núcleos de desempenho têm uma velocidade de relógio de até 5 GHz, e a velocidade básica do relógio dos núcleos de eficiência é de 1,8 GHz. Uma vez que somente os núcleos P suportam hyperthreading, obtemos um total de 12 roscas.
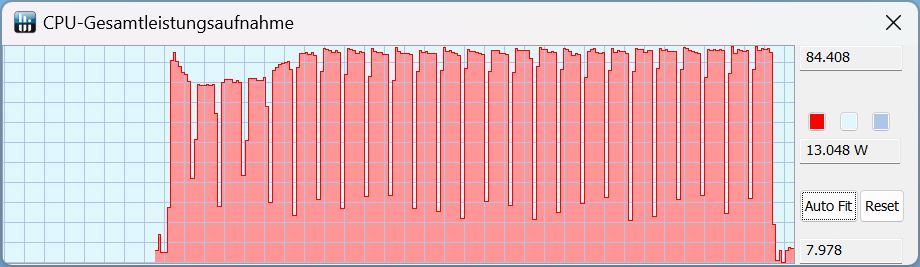
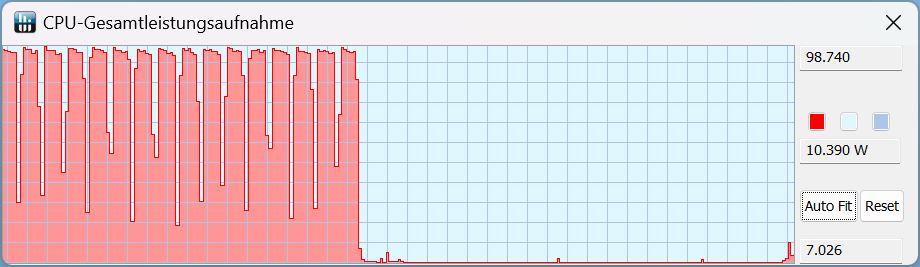
No loop Cinebench, o desempenho constante é muito estável, com o TDP máximo atingindo cerca de 84 watts no modo Performance. O desempenho doi7-12700H no muito poderosoXMG Foco 16se torna ainda um pouco melhor no início. Mas após a quarta corrida, seu desempenho cai abaixo do da nossa M16, que também bate oRyzen 7 6800 noLegion 5.
A propósito, ao invés de 84 watts, um potente 99 watts está disponível no modo Turbo! Durante a operação com bateria, isto é apenas cerca de 40 watts, com o desempenho caindo de forma correspondente.
Em todos os testes, o 2022 M16 é cerca de 20% mais rápido do que o predecessor com umi9-11900H.
Cinebench R15 Multi Constant Load Test
Cinebench R23: Multi Core | Single Core
Cinebench R20: CPU (Multi Core) | CPU (Single Core)
Cinebench R15: CPU Multi 64Bit | CPU Single 64Bit
Blender: v2.79 BMW27 CPU
7-Zip 18.03: 7z b 4 | 7z b 4 -mmt1
Geekbench 5.5: Multi-Core | Single-Core
HWBOT x265 Benchmark v2.2: 4k Preset
LibreOffice : 20 Documents To PDF
R Benchmark 2.5: Overall mean
| CPU Performance rating | |
| Média da turma Gaming | |
| Asus ROG Zephyrus M16 GU603Z | |
| Schenker XMG Focus 16 (i7-12700H, RTX 3060) | |
| Média Intel Core i9-12900H | |
| Schenker Vision 16 Pro RTX 3070 Ti | |
| Lenovo Legion 5 Pro 16ARH7H RTX 3070 Ti | |
| Corsair Voyager a1600 | |
| Asus ROG Zephyrus M16 GU603H -2! | |
| Cinebench R23 / Multi Core | |
| Média da turma Gaming (10488 - 42661, n=107, últimos 2 anos) | |
| Schenker XMG Focus 16 (i7-12700H, RTX 3060) | |
| Asus ROG Zephyrus M16 GU603Z | |
| Média Intel Core i9-12900H (7359 - 19648, n=28) | |
| Lenovo Legion 5 Pro 16ARH7H RTX 3070 Ti | |
| Corsair Voyager a1600 | |
| Schenker Vision 16 Pro RTX 3070 Ti | |
| Cinebench R23 / Single Core | |
| Média da turma Gaming (1166 - 2415, n=107, últimos 2 anos) | |
| Asus ROG Zephyrus M16 GU603Z | |
| Média Intel Core i9-12900H (1634 - 1930, n=28) | |
| Schenker Vision 16 Pro RTX 3070 Ti | |
| Schenker XMG Focus 16 (i7-12700H, RTX 3060) | |
| Corsair Voyager a1600 | |
| Lenovo Legion 5 Pro 16ARH7H RTX 3070 Ti | |
| Cinebench R20 / CPU (Multi Core) | |
| Média da turma Gaming (4029 - 16433, n=106, últimos 2 anos) | |
| Schenker XMG Focus 16 (i7-12700H, RTX 3060) | |
| Asus ROG Zephyrus M16 GU603Z | |
| Média Intel Core i9-12900H (2681 - 7471, n=28) | |
| Lenovo Legion 5 Pro 16ARH7H RTX 3070 Ti | |
| Asus ROG Zephyrus M16 GU603H | |
| Corsair Voyager a1600 | |
| Schenker Vision 16 Pro RTX 3070 Ti | |
| Cinebench R20 / CPU (Single Core) | |
| Média da turma Gaming (442 - 913, n=106, últimos 2 anos) | |
| Asus ROG Zephyrus M16 GU603Z | |
| Média Intel Core i9-12900H (624 - 738, n=28) | |
| Schenker Vision 16 Pro RTX 3070 Ti | |
| Schenker XMG Focus 16 (i7-12700H, RTX 3060) | |
| Asus ROG Zephyrus M16 GU603H | |
| Lenovo Legion 5 Pro 16ARH7H RTX 3070 Ti | |
| Corsair Voyager a1600 | |
| Cinebench R15 / CPU Multi 64Bit | |
| Média da turma Gaming (1578 - 6330, n=105, últimos 2 anos) | |
| Schenker Vision 16 Pro RTX 3070 Ti | |
| Schenker Vision 16 Pro RTX 3070 Ti | |
| Schenker XMG Focus 16 (i7-12700H, RTX 3060) | |
| Asus ROG Zephyrus M16 GU603Z | |
| Média Intel Core i9-12900H (1395 - 3077, n=28) | |
| Lenovo Legion 5 Pro 16ARH7H RTX 3070 Ti | |
| Asus ROG Zephyrus M16 GU603H | |
| Corsair Voyager a1600 | |
| Cinebench R15 / CPU Single 64Bit | |
| Média da turma Gaming (188.8 - 350, n=106, últimos 2 anos) | |
| Asus ROG Zephyrus M16 GU603Z | |
| Média Intel Core i9-12900H (235 - 277, n=29) | |
| Schenker Vision 16 Pro RTX 3070 Ti | |
| Schenker XMG Focus 16 (i7-12700H, RTX 3060) | |
| Lenovo Legion 5 Pro 16ARH7H RTX 3070 Ti | |
| Corsair Voyager a1600 | |
| Asus ROG Zephyrus M16 GU603H | |
| Blender / v2.79 BMW27 CPU | |
| Schenker Vision 16 Pro RTX 3070 Ti | |
| Asus ROG Zephyrus M16 GU603H | |
| Média Intel Core i9-12900H (160 - 451, n=28) | |
| Corsair Voyager a1600 | |
| Lenovo Legion 5 Pro 16ARH7H RTX 3070 Ti | |
| Schenker XMG Focus 16 (i7-12700H, RTX 3060) | |
| Asus ROG Zephyrus M16 GU603Z | |
| Média da turma Gaming (79 - 330, n=104, últimos 2 anos) | |
| 7-Zip 18.03 / 7z b 4 | |
| Média da turma Gaming (33491 - 148086, n=105, últimos 2 anos) | |
| Asus ROG Zephyrus M16 GU603Z | |
| Lenovo Legion 5 Pro 16ARH7H RTX 3070 Ti | |
| Schenker XMG Focus 16 (i7-12700H, RTX 3060) | |
| Corsair Voyager a1600 | |
| Média Intel Core i9-12900H (34684 - 76677, n=28) | |
| Asus ROG Zephyrus M16 GU603H | |
| Schenker Vision 16 Pro RTX 3070 Ti | |
| 7-Zip 18.03 / 7z b 4 -mmt1 | |
| Média da turma Gaming (4199 - 7436, n=105, últimos 2 anos) | |
| Asus ROG Zephyrus M16 GU603Z | |
| Schenker Vision 16 Pro RTX 3070 Ti | |
| Média Intel Core i9-12900H (5302 - 6289, n=28) | |
| Corsair Voyager a1600 | |
| Lenovo Legion 5 Pro 16ARH7H RTX 3070 Ti | |
| Schenker XMG Focus 16 (i7-12700H, RTX 3060) | |
| Asus ROG Zephyrus M16 GU603H | |
| Geekbench 5.5 / Multi-Core | |
| Média da turma Gaming (6460 - 28263, n=105, últimos 2 anos) | |
| Asus ROG Zephyrus M16 GU603Z | |
| Schenker XMG Focus 16 (i7-12700H, RTX 3060) | |
| Média Intel Core i9-12900H (8519 - 14376, n=31) | |
| Schenker Vision 16 Pro RTX 3070 Ti | |
| Lenovo Legion 5 Pro 16ARH7H RTX 3070 Ti | |
| Corsair Voyager a1600 | |
| Asus ROG Zephyrus M16 GU603H | |
| Geekbench 5.5 / Single-Core | |
| Média da turma Gaming (986 - 2474, n=105, últimos 2 anos) | |
| Asus ROG Zephyrus M16 GU603Z | |
| Schenker Vision 16 Pro RTX 3070 Ti | |
| Média Intel Core i9-12900H (1631 - 1897, n=31) | |
| Schenker XMG Focus 16 (i7-12700H, RTX 3060) | |
| Asus ROG Zephyrus M16 GU603H | |
| Lenovo Legion 5 Pro 16ARH7H RTX 3070 Ti | |
| Corsair Voyager a1600 | |
| HWBOT x265 Benchmark v2.2 / 4k Preset | |
| Média da turma Gaming (11.5 - 44.4, n=105, últimos 2 anos) | |
| Asus ROG Zephyrus M16 GU603Z | |
| Lenovo Legion 5 Pro 16ARH7H RTX 3070 Ti | |
| Schenker XMG Focus 16 (i7-12700H, RTX 3060) | |
| Média Intel Core i9-12900H (8.05 - 22.5, n=28) | |
| Corsair Voyager a1600 | |
| Asus ROG Zephyrus M16 GU603H | |
| Schenker Vision 16 Pro RTX 3070 Ti | |
| LibreOffice / 20 Documents To PDF | |
| Corsair Voyager a1600 | |
| Lenovo Legion 5 Pro 16ARH7H RTX 3070 Ti | |
| Média da turma Gaming (33.2 - 88.8, n=105, últimos 2 anos) | |
| Schenker XMG Focus 16 (i7-12700H, RTX 3060) | |
| Schenker Vision 16 Pro RTX 3070 Ti | |
| Média Intel Core i9-12900H (36.8 - 59.8, n=28) | |
| Asus ROG Zephyrus M16 GU603Z | |
| Asus ROG Zephyrus M16 GU603H | |
| R Benchmark 2.5 / Overall mean | |
| Asus ROG Zephyrus M16 GU603H | |
| Corsair Voyager a1600 | |
| Lenovo Legion 5 Pro 16ARH7H RTX 3070 Ti | |
| Schenker XMG Focus 16 (i7-12700H, RTX 3060) | |
| Schenker Vision 16 Pro RTX 3070 Ti | |
| Média Intel Core i9-12900H (0.4218 - 0.506, n=28) | |
| Asus ROG Zephyrus M16 GU603Z | |
| Média da turma Gaming (0.3439 - 0.759, n=106, últimos 2 anos) | |
* ... menor é melhor
AIDA64: FP32 Ray-Trace | FPU Julia | CPU SHA3 | CPU Queen | FPU SinJulia | FPU Mandel | CPU AES | CPU ZLib | FP64 Ray-Trace | CPU PhotoWorxx
| Performance rating | |
| Média da turma Gaming | |
| Lenovo Legion 5 Pro 16ARH7H RTX 3070 Ti | |
| Corsair Voyager a1600 | |
| Asus ROG Zephyrus M16 GU603Z | |
| Schenker XMG Focus 16 (i7-12700H, RTX 3060) | |
| Média Intel Core i9-12900H | |
| Schenker Vision 16 Pro RTX 3070 Ti | |
| Asus ROG Zephyrus M16 GU603H -9! | |
| AIDA64 / FP32 Ray-Trace | |
| Média da turma Gaming (10227 - 85542, n=105, últimos 2 anos) | |
| Lenovo Legion 5 Pro 16ARH7H RTX 3070 Ti | |
| Corsair Voyager a1600 | |
| Asus ROG Zephyrus M16 GU603Z | |
| Schenker XMG Focus 16 (i7-12700H, RTX 3060) | |
| Schenker Vision 16 Pro RTX 3070 Ti | |
| Média Intel Core i9-12900H (4074 - 18289, n=29) | |
| AIDA64 / FPU Julia | |
| Média da turma Gaming (51376 - 238426, n=105, últimos 2 anos) | |
| Lenovo Legion 5 Pro 16ARH7H RTX 3070 Ti | |
| Corsair Voyager a1600 | |
| Schenker XMG Focus 16 (i7-12700H, RTX 3060) | |
| Asus ROG Zephyrus M16 GU603Z | |
| Schenker Vision 16 Pro RTX 3070 Ti | |
| Média Intel Core i9-12900H (22307 - 93236, n=29) | |
| AIDA64 / CPU SHA3 | |
| Média da turma Gaming (2180 - 10115, n=105, últimos 2 anos) | |
| Schenker XMG Focus 16 (i7-12700H, RTX 3060) | |
| Lenovo Legion 5 Pro 16ARH7H RTX 3070 Ti | |
| Asus ROG Zephyrus M16 GU603Z | |
| Corsair Voyager a1600 | |
| Média Intel Core i9-12900H (1378 - 4215, n=29) | |
| Schenker Vision 16 Pro RTX 3070 Ti | |
| AIDA64 / CPU Queen | |
| Média da turma Gaming (49785 - 173351, n=90, últimos 2 anos) | |
| Lenovo Legion 5 Pro 16ARH7H RTX 3070 Ti | |
| Asus ROG Zephyrus M16 GU603Z | |
| Corsair Voyager a1600 | |
| Schenker XMG Focus 16 (i7-12700H, RTX 3060) | |
| Média Intel Core i9-12900H (78172 - 111241, n=28) | |
| Schenker Vision 16 Pro RTX 3070 Ti | |
| AIDA64 / FPU SinJulia | |
| Média da turma Gaming (4424 - 33636, n=105, últimos 2 anos) | |
| Corsair Voyager a1600 | |
| Lenovo Legion 5 Pro 16ARH7H RTX 3070 Ti | |
| Schenker XMG Focus 16 (i7-12700H, RTX 3060) | |
| Asus ROG Zephyrus M16 GU603Z | |
| Média Intel Core i9-12900H (5709 - 10410, n=29) | |
| Schenker Vision 16 Pro RTX 3070 Ti | |
| AIDA64 / FPU Mandel | |
| Média da turma Gaming (25115 - 128721, n=105, últimos 2 anos) | |
| Lenovo Legion 5 Pro 16ARH7H RTX 3070 Ti | |
| Corsair Voyager a1600 | |
| Schenker XMG Focus 16 (i7-12700H, RTX 3060) | |
| Asus ROG Zephyrus M16 GU603Z | |
| Schenker Vision 16 Pro RTX 3070 Ti | |
| Média Intel Core i9-12900H (11257 - 45581, n=29) | |
| AIDA64 / CPU AES | |
| Lenovo Legion 5 Pro 16ARH7H RTX 3070 Ti | |
| Corsair Voyager a1600 | |
| Asus ROG Zephyrus M16 GU603Z | |
| Média da turma Gaming (39258 - 247074, n=105, últimos 2 anos) | |
| Média Intel Core i9-12900H (31935 - 151546, n=29) | |
| Schenker XMG Focus 16 (i7-12700H, RTX 3060) | |
| Schenker Vision 16 Pro RTX 3070 Ti | |
| AIDA64 / CPU ZLib | |
| Média da turma Gaming (574 - 2531, n=105, últimos 2 anos) | |
| Schenker XMG Focus 16 (i7-12700H, RTX 3060) | |
| Asus ROG Zephyrus M16 GU603Z | |
| Média Intel Core i9-12900H (449 - 1193, n=29) | |
| Lenovo Legion 5 Pro 16ARH7H RTX 3070 Ti | |
| Corsair Voyager a1600 | |
| Schenker Vision 16 Pro RTX 3070 Ti | |
| Asus ROG Zephyrus M16 GU603H | |
| AIDA64 / FP64 Ray-Trace | |
| Média da turma Gaming (5509 - 45446, n=105, últimos 2 anos) | |
| Lenovo Legion 5 Pro 16ARH7H RTX 3070 Ti | |
| Corsair Voyager a1600 | |
| Asus ROG Zephyrus M16 GU603Z | |
| Schenker XMG Focus 16 (i7-12700H, RTX 3060) | |
| Schenker Vision 16 Pro RTX 3070 Ti | |
| Média Intel Core i9-12900H (2235 - 10511, n=29) | |
| AIDA64 / CPU PhotoWorxx | |
| Média da turma Gaming (12271 - 89891, n=105, últimos 2 anos) | |
| Schenker Vision 16 Pro RTX 3070 Ti | |
| Asus ROG Zephyrus M16 GU603Z | |
| Média Intel Core i9-12900H (20960 - 48269, n=30) | |
| Lenovo Legion 5 Pro 16ARH7H RTX 3070 Ti | |
| Schenker XMG Focus 16 (i7-12700H, RTX 3060) | |
| Corsair Voyager a1600 | |
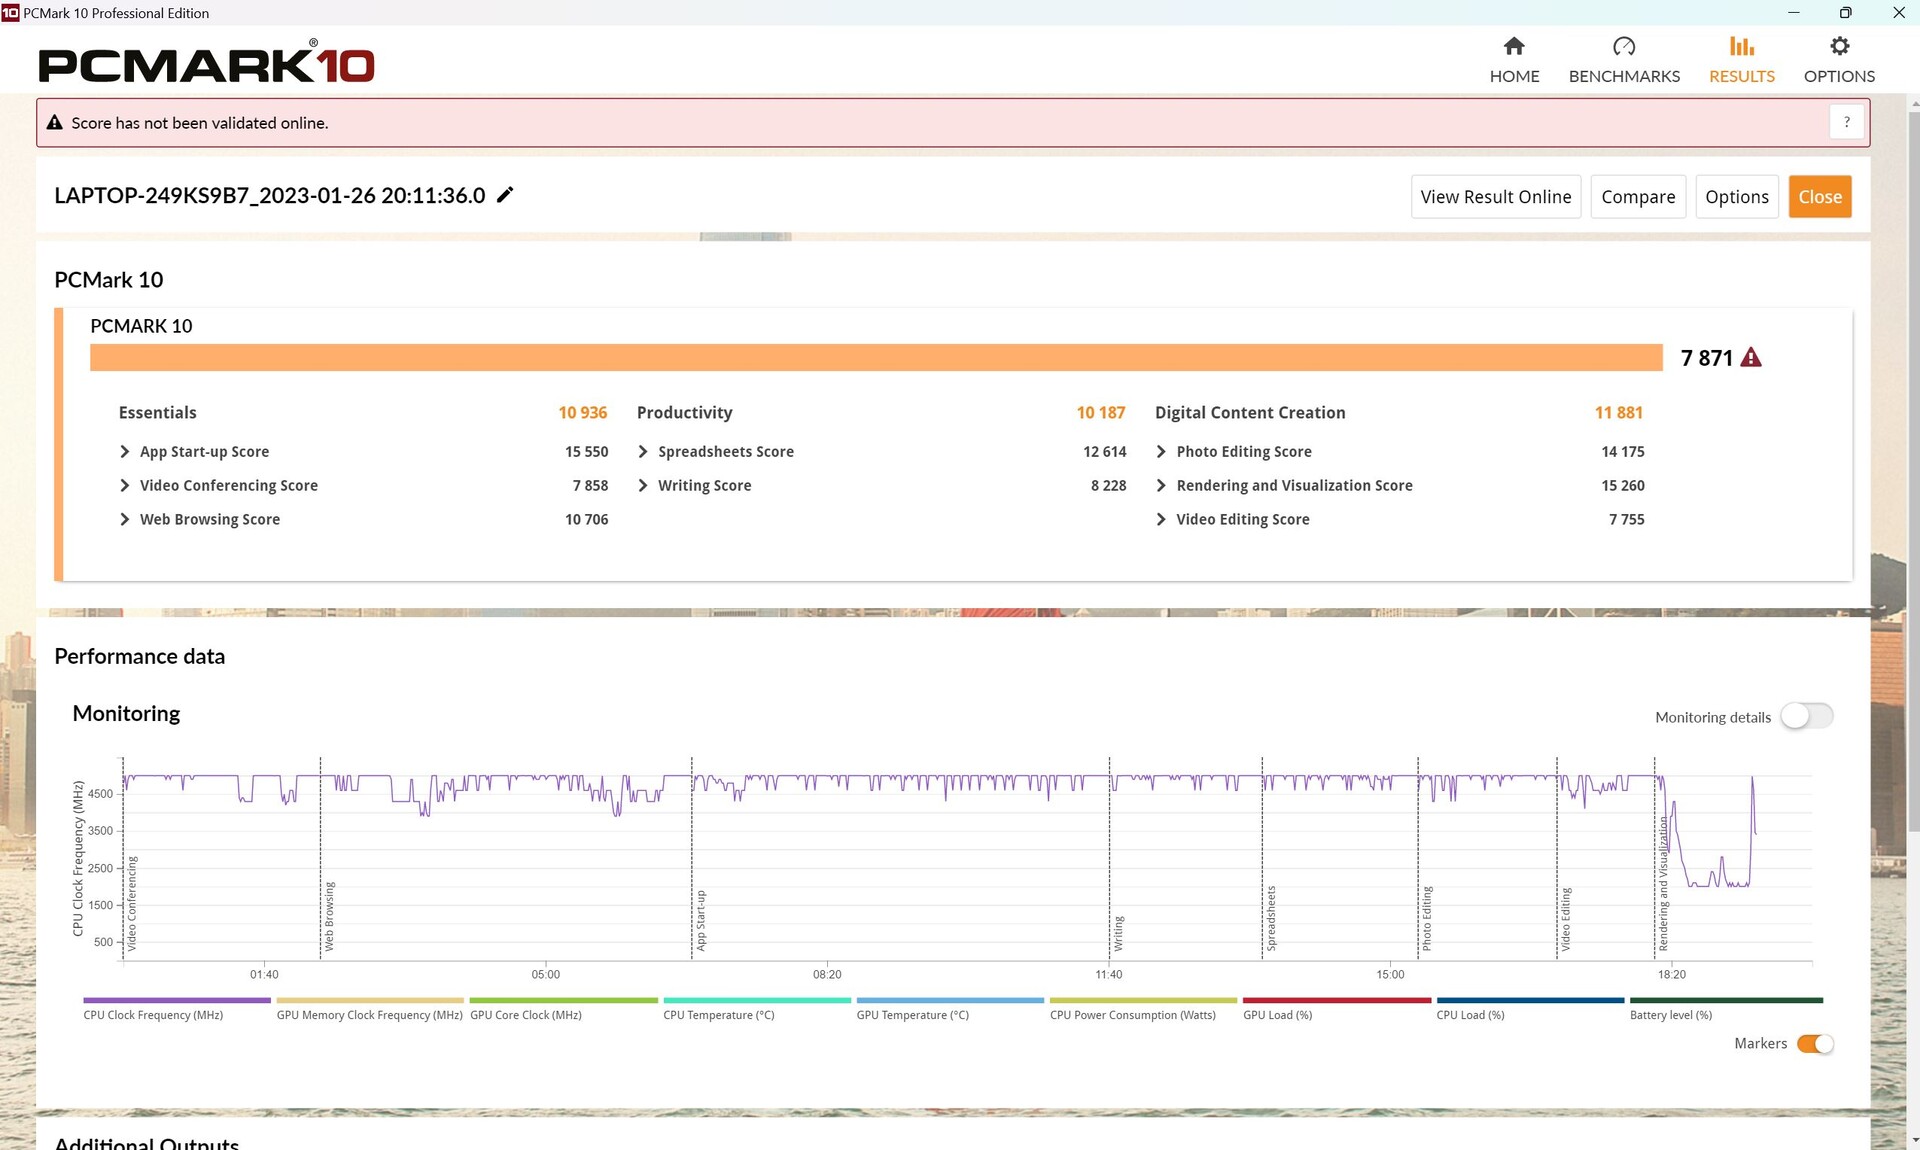
Desempenho do sistema
No PCMark, a combinação de i9 e RTX 3070 Tiassume a liderança em todos os benchmarks, mas este também é o nível de desempenho esperado. O mesmo vale para os benchmarks do CrossMark.
CrossMark: Overall | Productivity | Creativity | Responsiveness
| PCMark 10 / Score | |
| Média da turma Gaming (5828 - 12414, n=93, últimos 2 anos) | |
| Asus ROG Zephyrus M16 GU603Z | |
| Média Intel Core i9-12900H, NVIDIA GeForce RTX 3070 Ti Laptop GPU (7087 - 8072, n=6) | |
| Lenovo Legion 5 Pro 16ARH7H RTX 3070 Ti | |
| Corsair Voyager a1600 | |
| Schenker XMG Focus 16 (i7-12700H, RTX 3060) | |
| Asus ROG Zephyrus M16 GU603H | |
| PCMark 10 / Essentials | |
| Asus ROG Zephyrus M16 GU603Z | |
| Média Intel Core i9-12900H, NVIDIA GeForce RTX 3070 Ti Laptop GPU (10266 - 11663, n=6) | |
| Média da turma Gaming (8810 - 11935, n=97, últimos 2 anos) | |
| Asus ROG Zephyrus M16 GU603H | |
| Lenovo Legion 5 Pro 16ARH7H RTX 3070 Ti | |
| Schenker XMG Focus 16 (i7-12700H, RTX 3060) | |
| Corsair Voyager a1600 | |
| PCMark 10 / Productivity | |
| Média da turma Gaming (6845 - 25323, n=95, últimos 2 anos) | |
| Asus ROG Zephyrus M16 GU603Z | |
| Média Intel Core i9-12900H, NVIDIA GeForce RTX 3070 Ti Laptop GPU (9402 - 10742, n=6) | |
| Schenker XMG Focus 16 (i7-12700H, RTX 3060) | |
| Lenovo Legion 5 Pro 16ARH7H RTX 3070 Ti | |
| Asus ROG Zephyrus M16 GU603H | |
| Corsair Voyager a1600 | |
| PCMark 10 / Digital Content Creation | |
| Média da turma Gaming (7602 - 19954, n=95, últimos 2 anos) | |
| Asus ROG Zephyrus M16 GU603Z | |
| Lenovo Legion 5 Pro 16ARH7H RTX 3070 Ti | |
| Média Intel Core i9-12900H, NVIDIA GeForce RTX 3070 Ti Laptop GPU (10009 - 12541, n=6) | |
| Corsair Voyager a1600 | |
| Asus ROG Zephyrus M16 GU603H | |
| Schenker XMG Focus 16 (i7-12700H, RTX 3060) | |
| CrossMark / Overall | |
| Média da turma Gaming (1366 - 2409, n=94, últimos 2 anos) | |
| Asus ROG Zephyrus M16 GU603Z | |
| Média Intel Core i9-12900H, NVIDIA GeForce RTX 3070 Ti Laptop GPU (1664 - 2044, n=6) | |
| Schenker XMG Focus 16 (i7-12700H, RTX 3060) | |
| Schenker Vision 16 Pro RTX 3070 Ti | |
| Lenovo Legion 5 Pro 16ARH7H RTX 3070 Ti | |
| Corsair Voyager a1600 | |
| CrossMark / Productivity | |
| Média da turma Gaming (1386 - 2254, n=94, últimos 2 anos) | |
| Asus ROG Zephyrus M16 GU603Z | |
| Média Intel Core i9-12900H, NVIDIA GeForce RTX 3070 Ti Laptop GPU (1591 - 1968, n=6) | |
| Lenovo Legion 5 Pro 16ARH7H RTX 3070 Ti | |
| Schenker XMG Focus 16 (i7-12700H, RTX 3060) | |
| Schenker Vision 16 Pro RTX 3070 Ti | |
| Corsair Voyager a1600 | |
| CrossMark / Creativity | |
| Média da turma Gaming (1343 - 2786, n=94, últimos 2 anos) | |
| Asus ROG Zephyrus M16 GU603Z | |
| Média Intel Core i9-12900H, NVIDIA GeForce RTX 3070 Ti Laptop GPU (1797 - 2148, n=6) | |
| Schenker Vision 16 Pro RTX 3070 Ti | |
| Schenker XMG Focus 16 (i7-12700H, RTX 3060) | |
| Lenovo Legion 5 Pro 16ARH7H RTX 3070 Ti | |
| Corsair Voyager a1600 | |
| CrossMark / Responsiveness | |
| Asus ROG Zephyrus M16 GU603Z | |
| Média Intel Core i9-12900H, NVIDIA GeForce RTX 3070 Ti Laptop GPU (1514 - 2069, n=6) | |
| Média da turma Gaming (1226 - 2334, n=94, últimos 2 anos) | |
| Lenovo Legion 5 Pro 16ARH7H RTX 3070 Ti | |
| Schenker XMG Focus 16 (i7-12700H, RTX 3060) | |
| Schenker Vision 16 Pro RTX 3070 Ti | |
| Corsair Voyager a1600 | |
| PCMark 10 Score | 7871 pontos | |
Ajuda | ||
| AIDA64 / Memory Copy | |
| Média da turma Gaming (21750 - 129946, n=105, últimos 2 anos) | |
| Asus ROG Zephyrus M16 GU603Z | |
| Schenker Vision 16 Pro RTX 3070 Ti | |
| Média Intel Core i9-12900H (34438 - 74264, n=29) | |
| Lenovo Legion 5 Pro 16ARH7H RTX 3070 Ti | |
| Corsair Voyager a1600 | |
| Schenker XMG Focus 16 (i7-12700H, RTX 3060) | |
| AIDA64 / Memory Read | |
| Média da turma Gaming (22956 - 118858, n=105, últimos 2 anos) | |
| Asus ROG Zephyrus M16 GU603Z | |
| Schenker Vision 16 Pro RTX 3070 Ti | |
| Média Intel Core i9-12900H (36365 - 74642, n=29) | |
| Lenovo Legion 5 Pro 16ARH7H RTX 3070 Ti | |
| Corsair Voyager a1600 | |
| Schenker XMG Focus 16 (i7-12700H, RTX 3060) | |
| AIDA64 / Memory Write | |
| Média da turma Gaming (22297 - 135096, n=105, últimos 2 anos) | |
| Asus ROG Zephyrus M16 GU603Z | |
| Schenker Vision 16 Pro RTX 3070 Ti | |
| Média Intel Core i9-12900H (32276 - 67858, n=29) | |
| Lenovo Legion 5 Pro 16ARH7H RTX 3070 Ti | |
| Corsair Voyager a1600 | |
| Schenker XMG Focus 16 (i7-12700H, RTX 3060) | |
| AIDA64 / Memory Latency | |
| Média da turma Gaming (75.3 - 259, n=105, últimos 2 anos) | |
| Corsair Voyager a1600 | |
| Schenker Vision 16 Pro RTX 3070 Ti | |
| Schenker XMG Focus 16 (i7-12700H, RTX 3060) | |
| Asus ROG Zephyrus M16 GU603Z | |
| Lenovo Legion 5 Pro 16ARH7H RTX 3070 Ti | |
| Média Intel Core i9-12900H (74.7 - 118.1, n=28) | |
| Asus ROG Zephyrus M16 GU603H | |
* ... menor é melhor
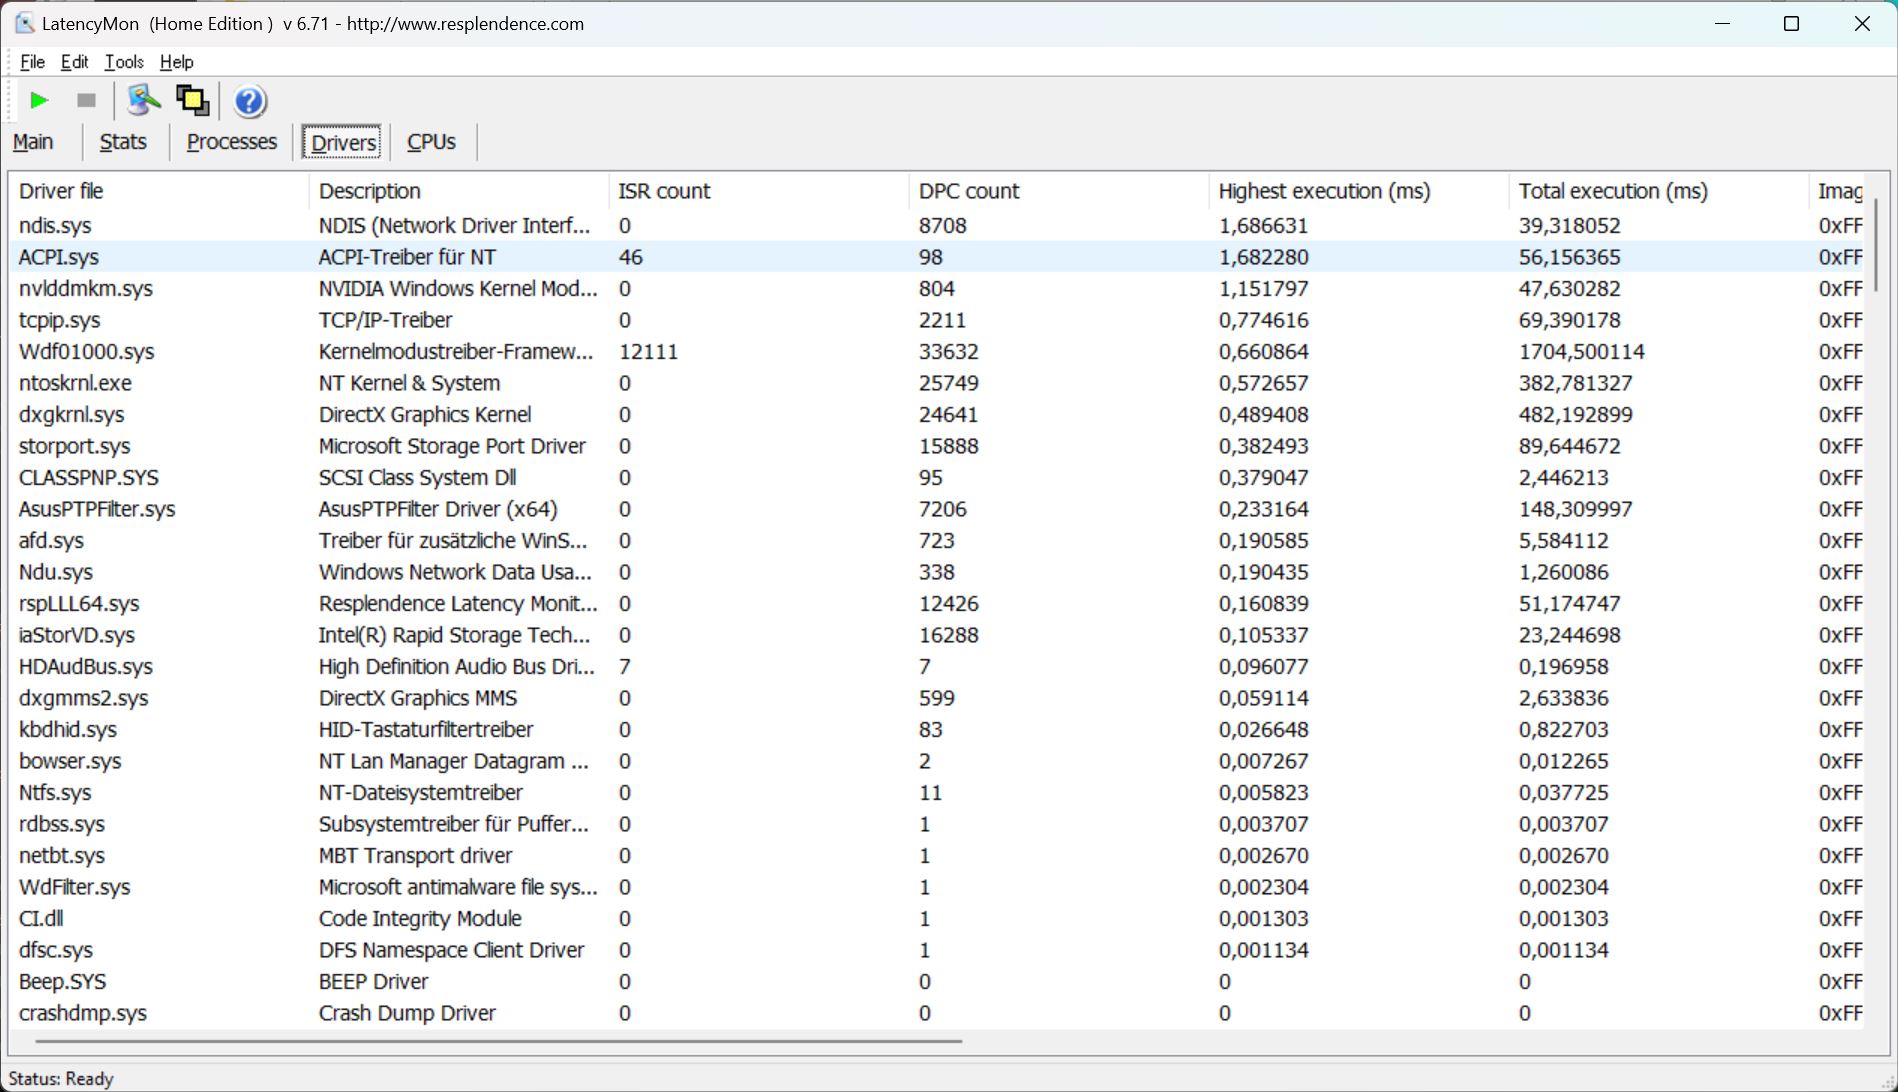
Latências DPC
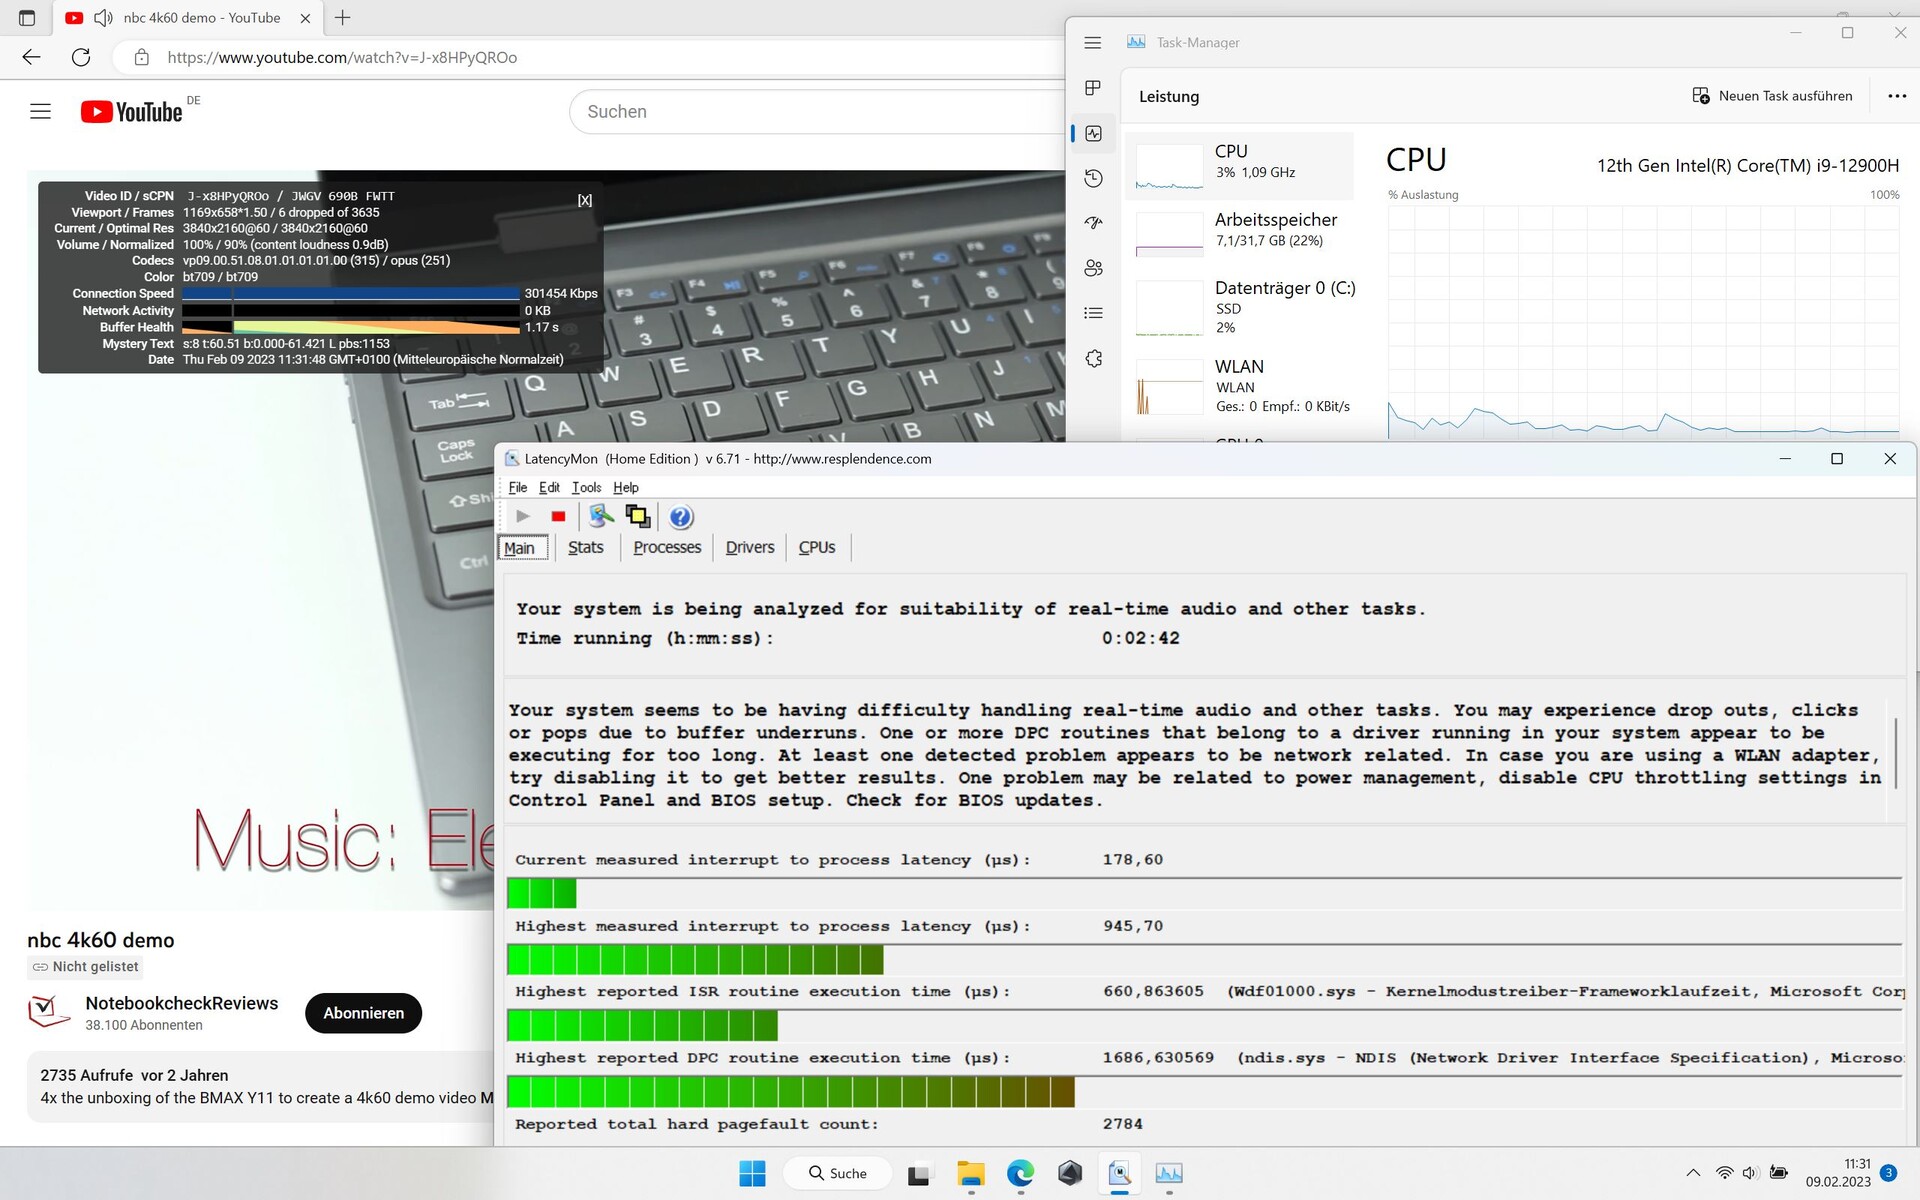
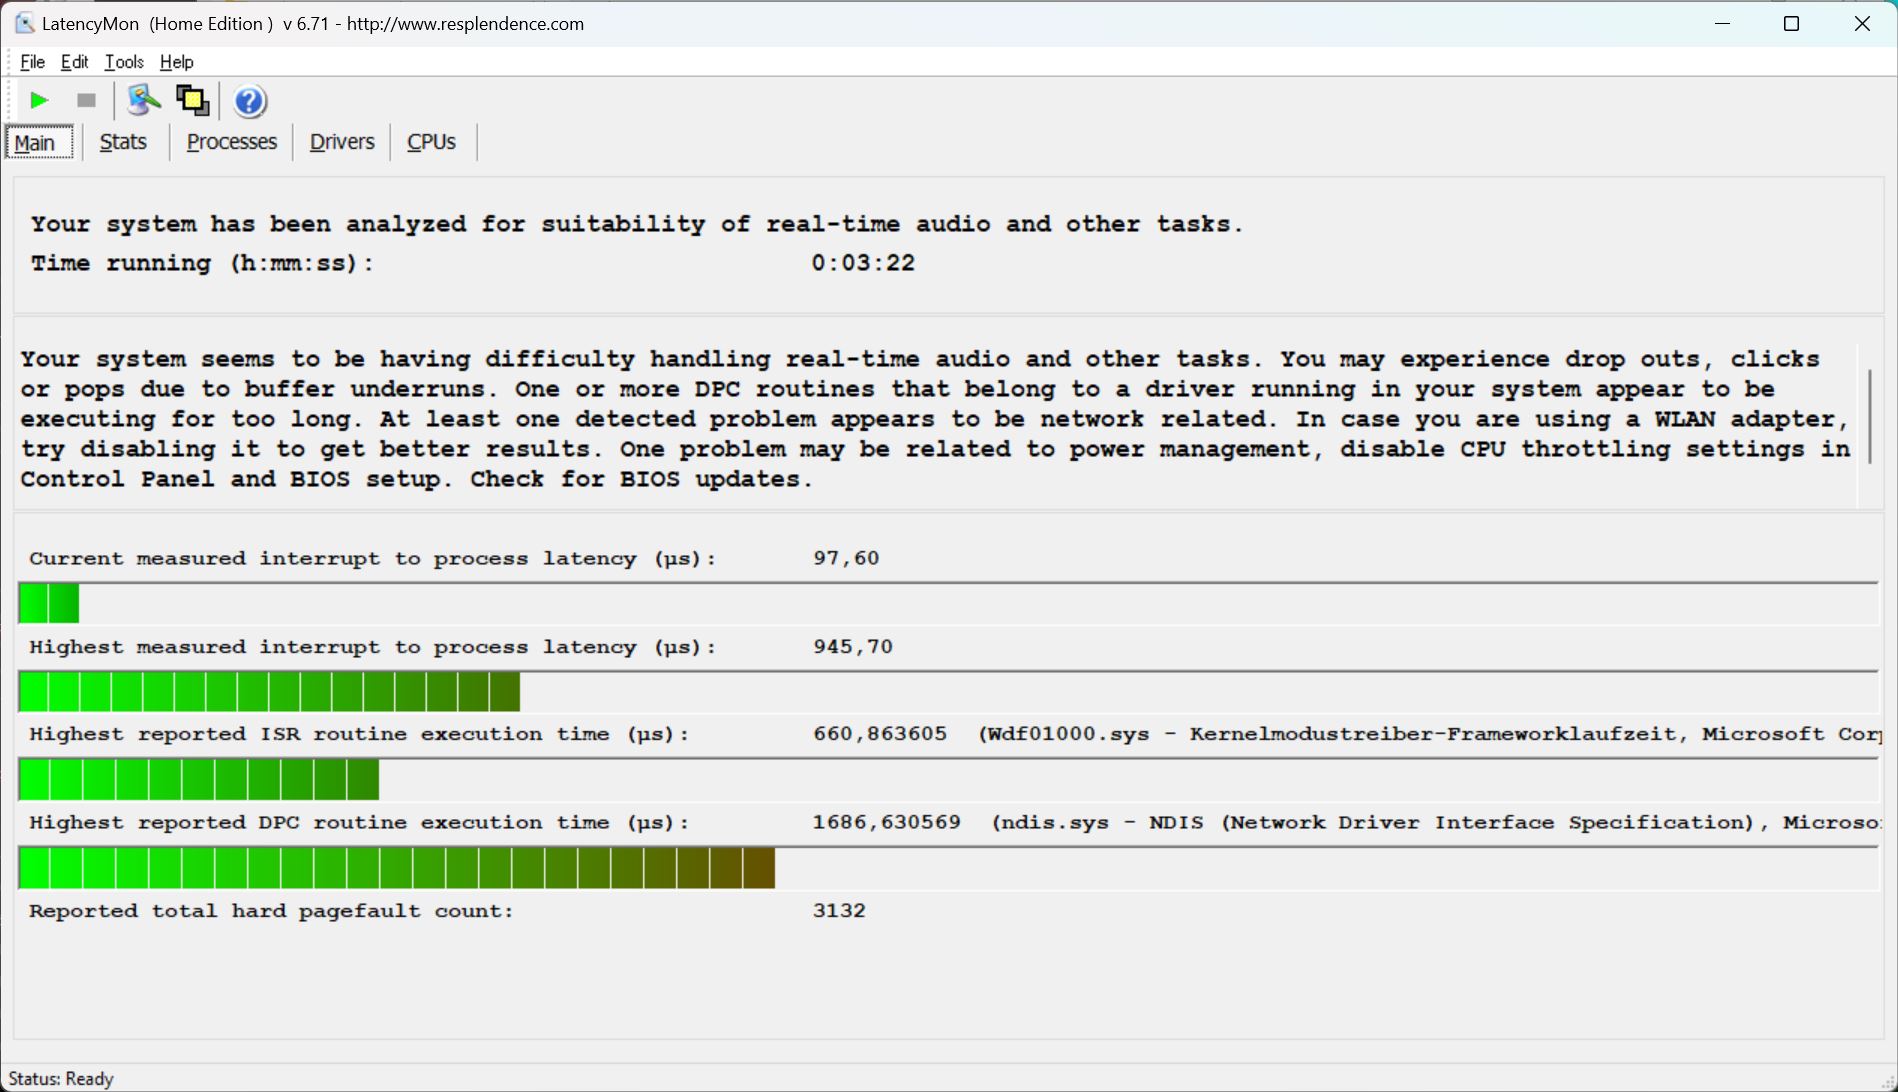
A LatencyMon infelizmente já encontra as primeiras latências ao iniciar o software, mesmo que não haja ações adicionais. Ao abrir o navegador com várias abas, as latências aumentam ainda mais.
Nosso vídeo de 4K/60 fps no YouTube também não é reproduzido sem nenhuma queda de quadros (6). Entretanto, os valores de latência não são particularmente altos em geral e inferiores aos do XMG Foco 16por exemplo. Por outro lado, elas se tornam evidentes mais cedo.
| DPC Latencies / LatencyMon - interrupt to process latency (max), Web, Youtube, Prime95 | |
| Schenker XMG Focus 16 (i7-12700H, RTX 3060) | |
| Asus ROG Zephyrus M16 GU603H | |
| Asus ROG Zephyrus M16 GU603Z | |
| Lenovo Legion 5 Pro 16ARH7H RTX 3070 Ti | |
| Corsair Voyager a1600 | |
| Schenker Vision 16 Pro RTX 3070 Ti | |
* ... menor é melhor
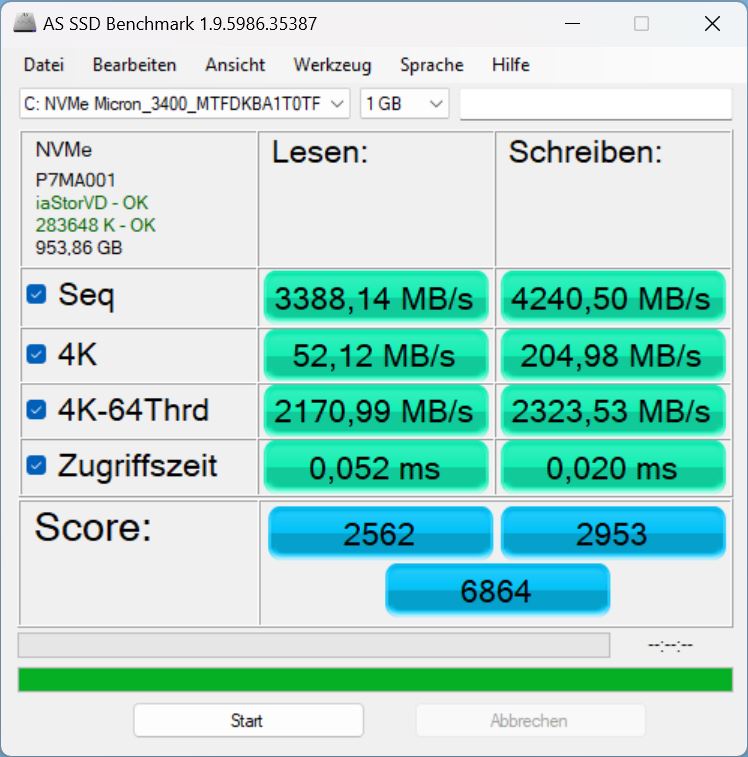
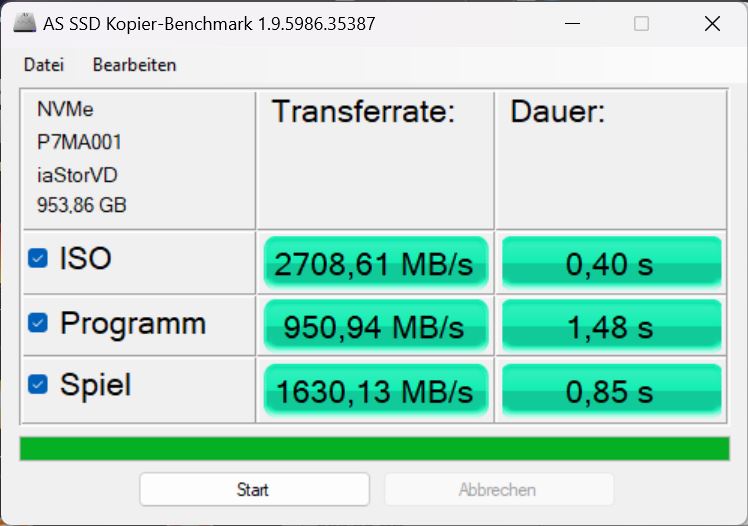
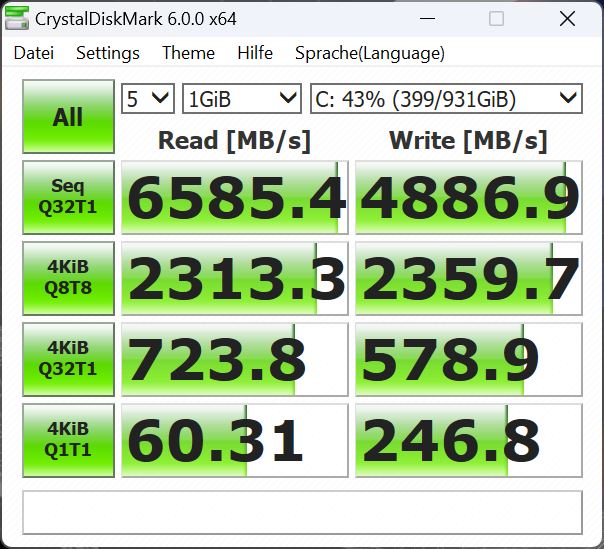
Solução de armazenamento
Nosso modelo de teste utiliza um SSD PCIe Gen4 da Micron com 1 TB de armazenamento. Em nosso lista dos melhores SSDsas referências confirmam valores decentes para a solução de armazenamento. Entretanto, os valores medidos do armazenamento da Samsung no predecessor ou no Legion 5são mais rápidos.
O SSD não é capaz de manter seu desempenho a longo prazo, mas a queda de desempenho é apenas pequena.

* ... menor é melhor
Disk Throttling: DiskSpd Read Loop, Queue Depth 8
Placa Gráfica
Nosso sistema de teste utiliza umRTX 3070 Tiapesar de ser realmente uma das GPUs mais poderosas para laptop, é "somente" permitida a utilização de 100 W mais 20 W de Dynamic Boost na M16. Não é muito surpreendente que quando permitido o uso de 150 W, a mesma GPU seja mais rápida no Legion 5 Proaté mesmo em até 27%!
Pelo menos, o predecessor com RTX 3070 (sem "Ti") é superada em 38%. O é superado.XMG Visão 16 Prosó permite um máximo de 95 W para a GPU, de modo que também permanece significativamente atrás da M16.
Em geral, a velocidade da placa gráfica de 120-W é cerca de 7 a 12% mais lenta que a média RTX 3070 Ti em nosso banco de dados.
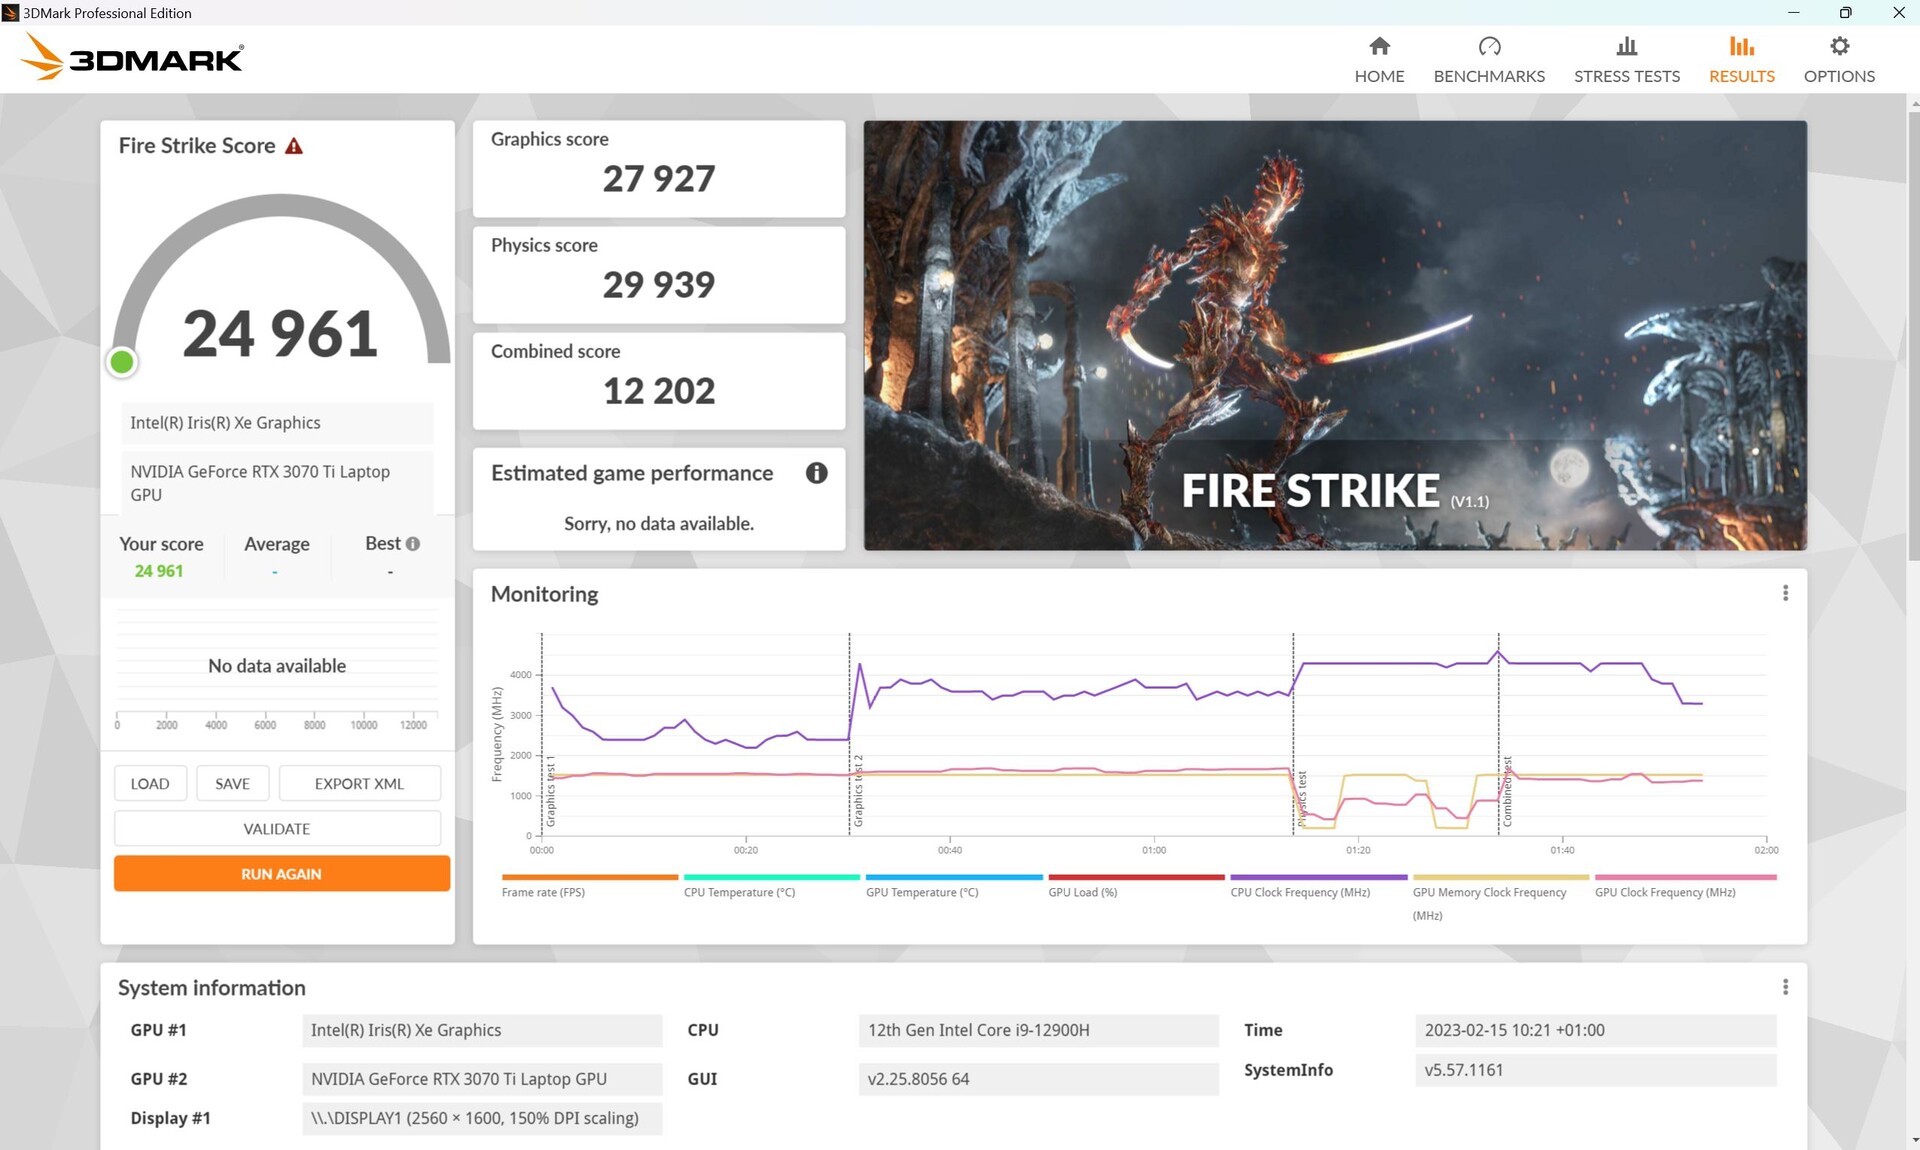
No modo Turbo, o desempenho e o consumo aumentam ligeiramente, e outro teste Fire-Strike resulta em uma pontuação gráfica que é cerca de 13% maior.
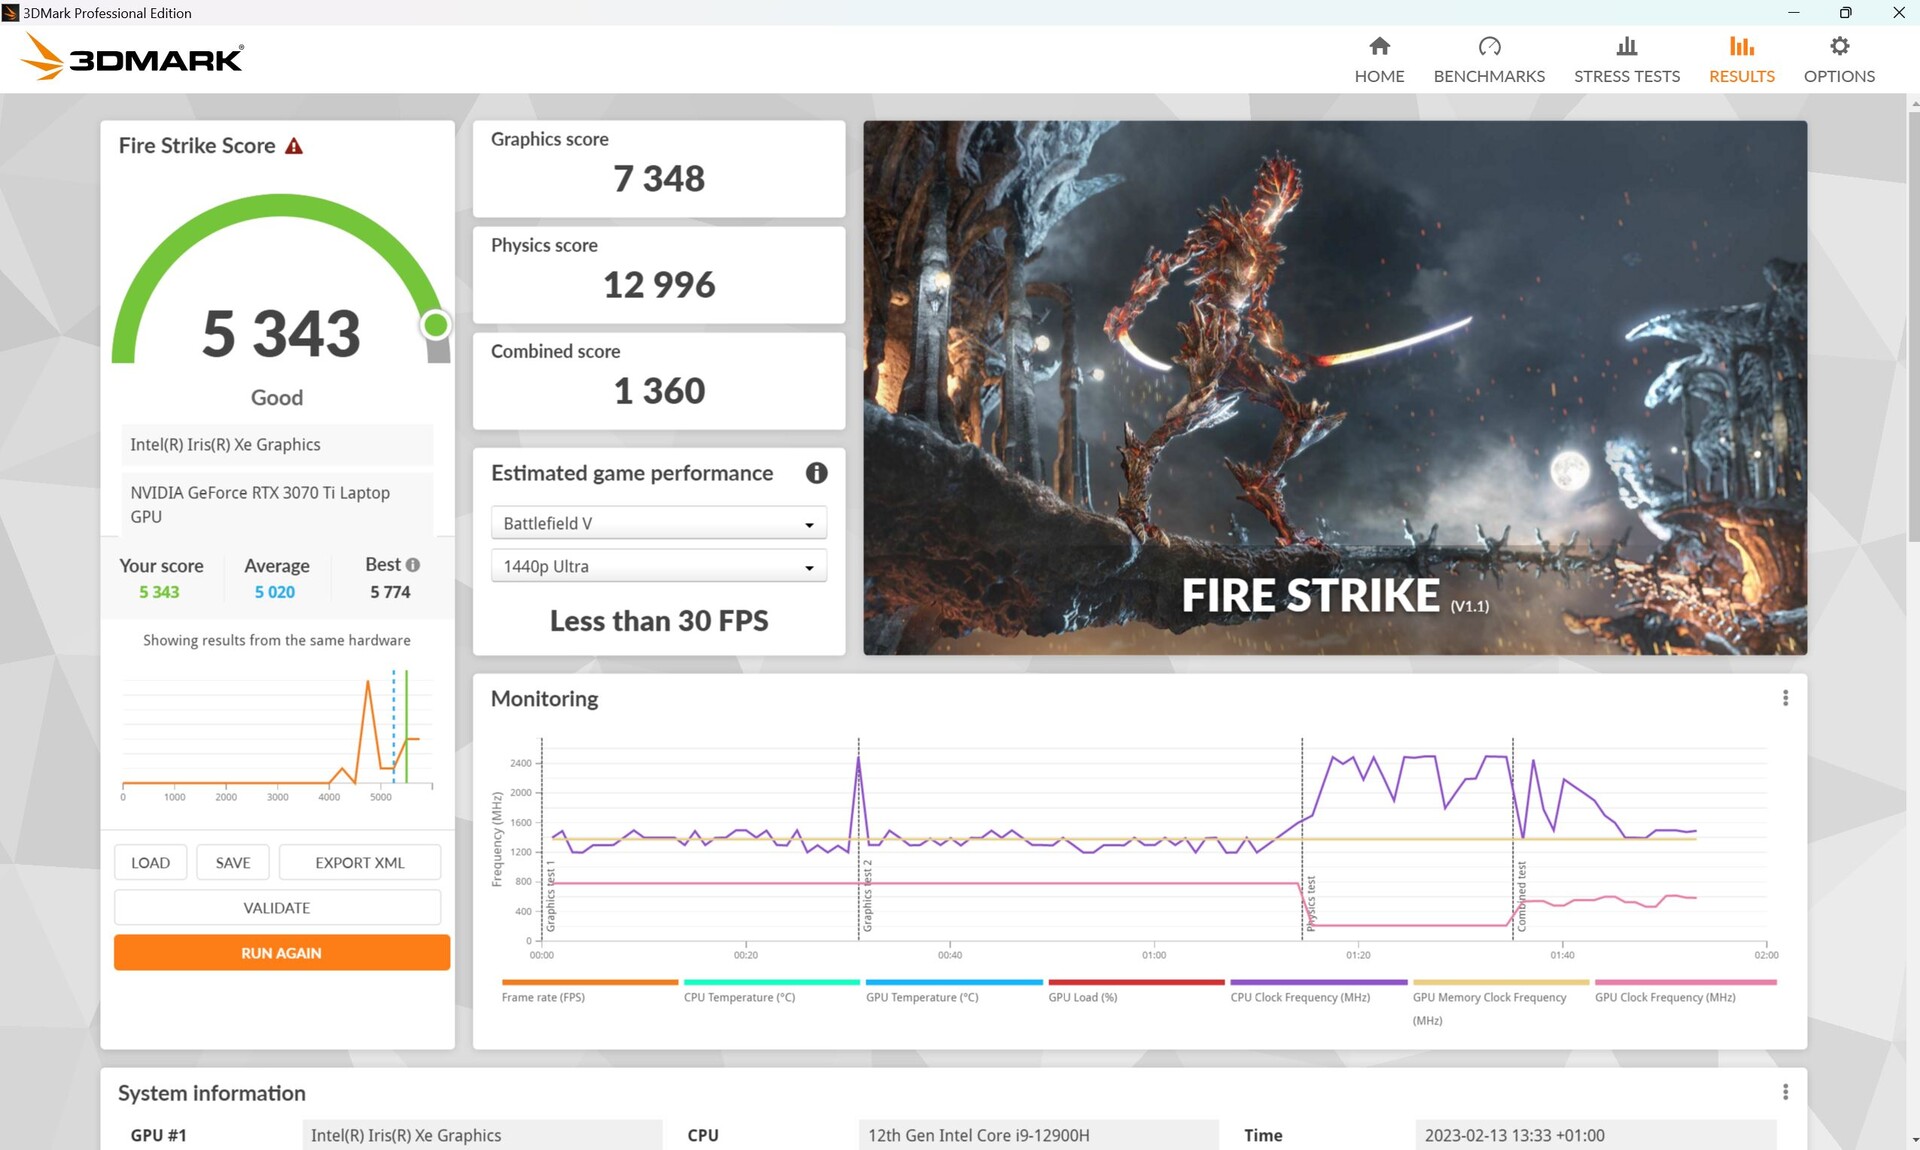
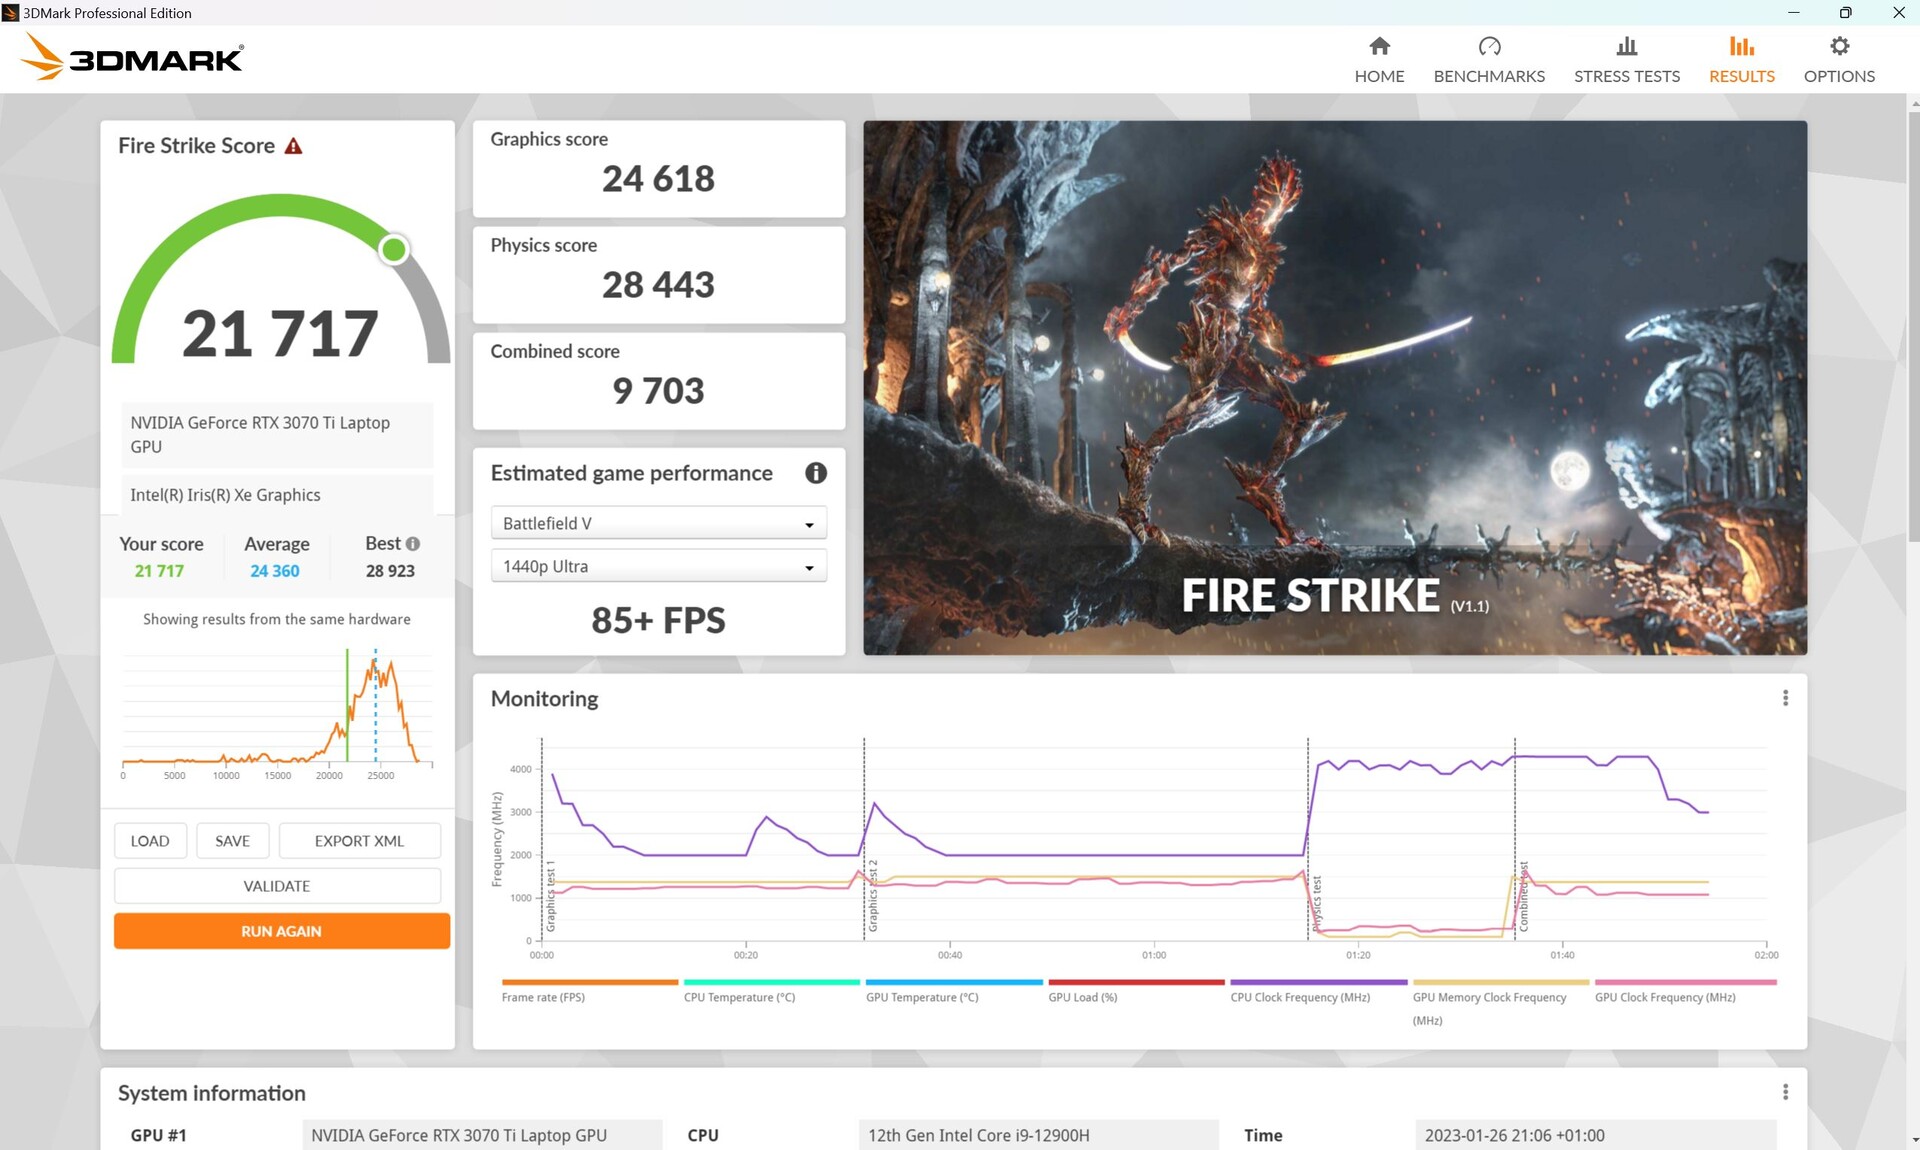
Durante a operação por bateria, o desempenho 3D cai significativamente. Comparado com os 24.618 pontos gráficos em Fire Strike durante a operação da rede elétrica, apenas 7.348 pontos 3D permanecem em funcionamento por bateria, o que corresponde a uma queda de 70%!
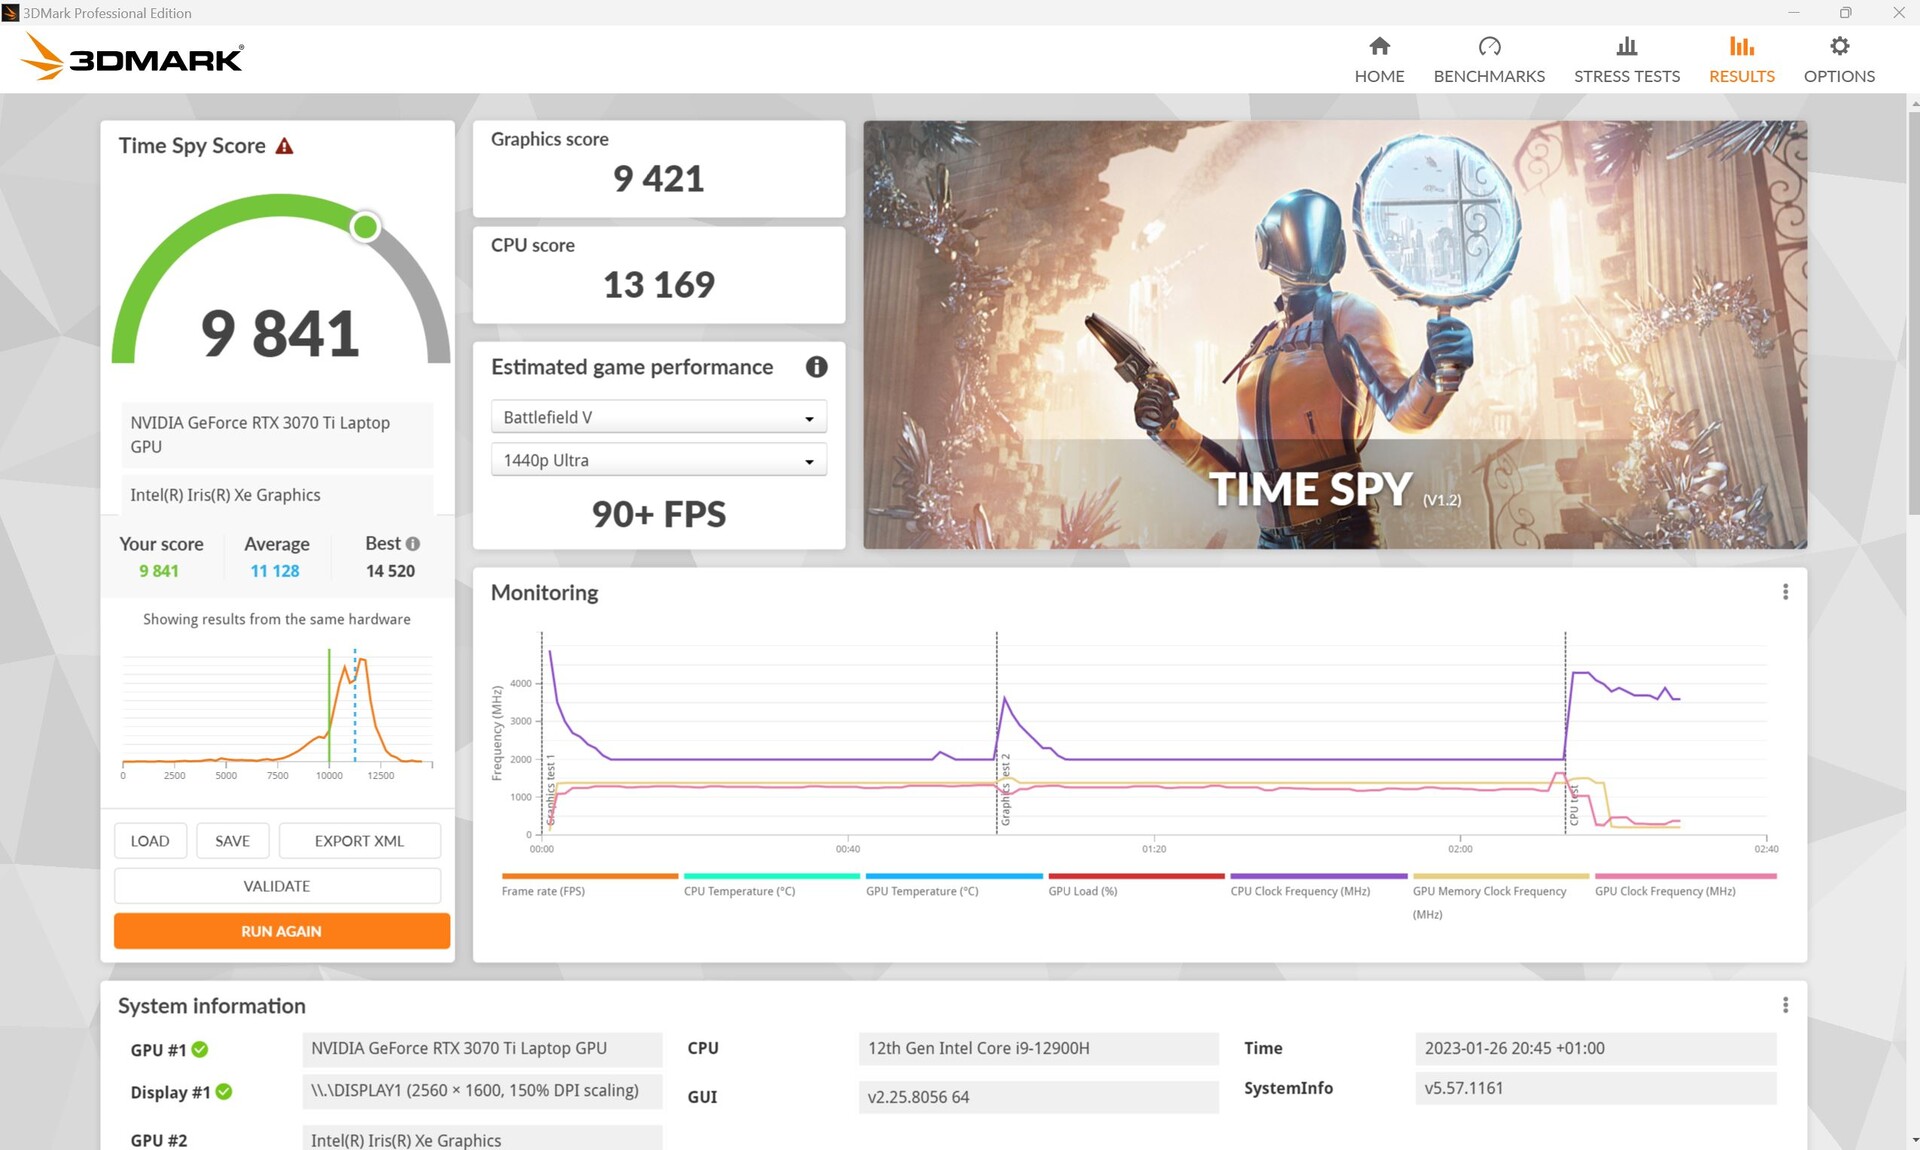
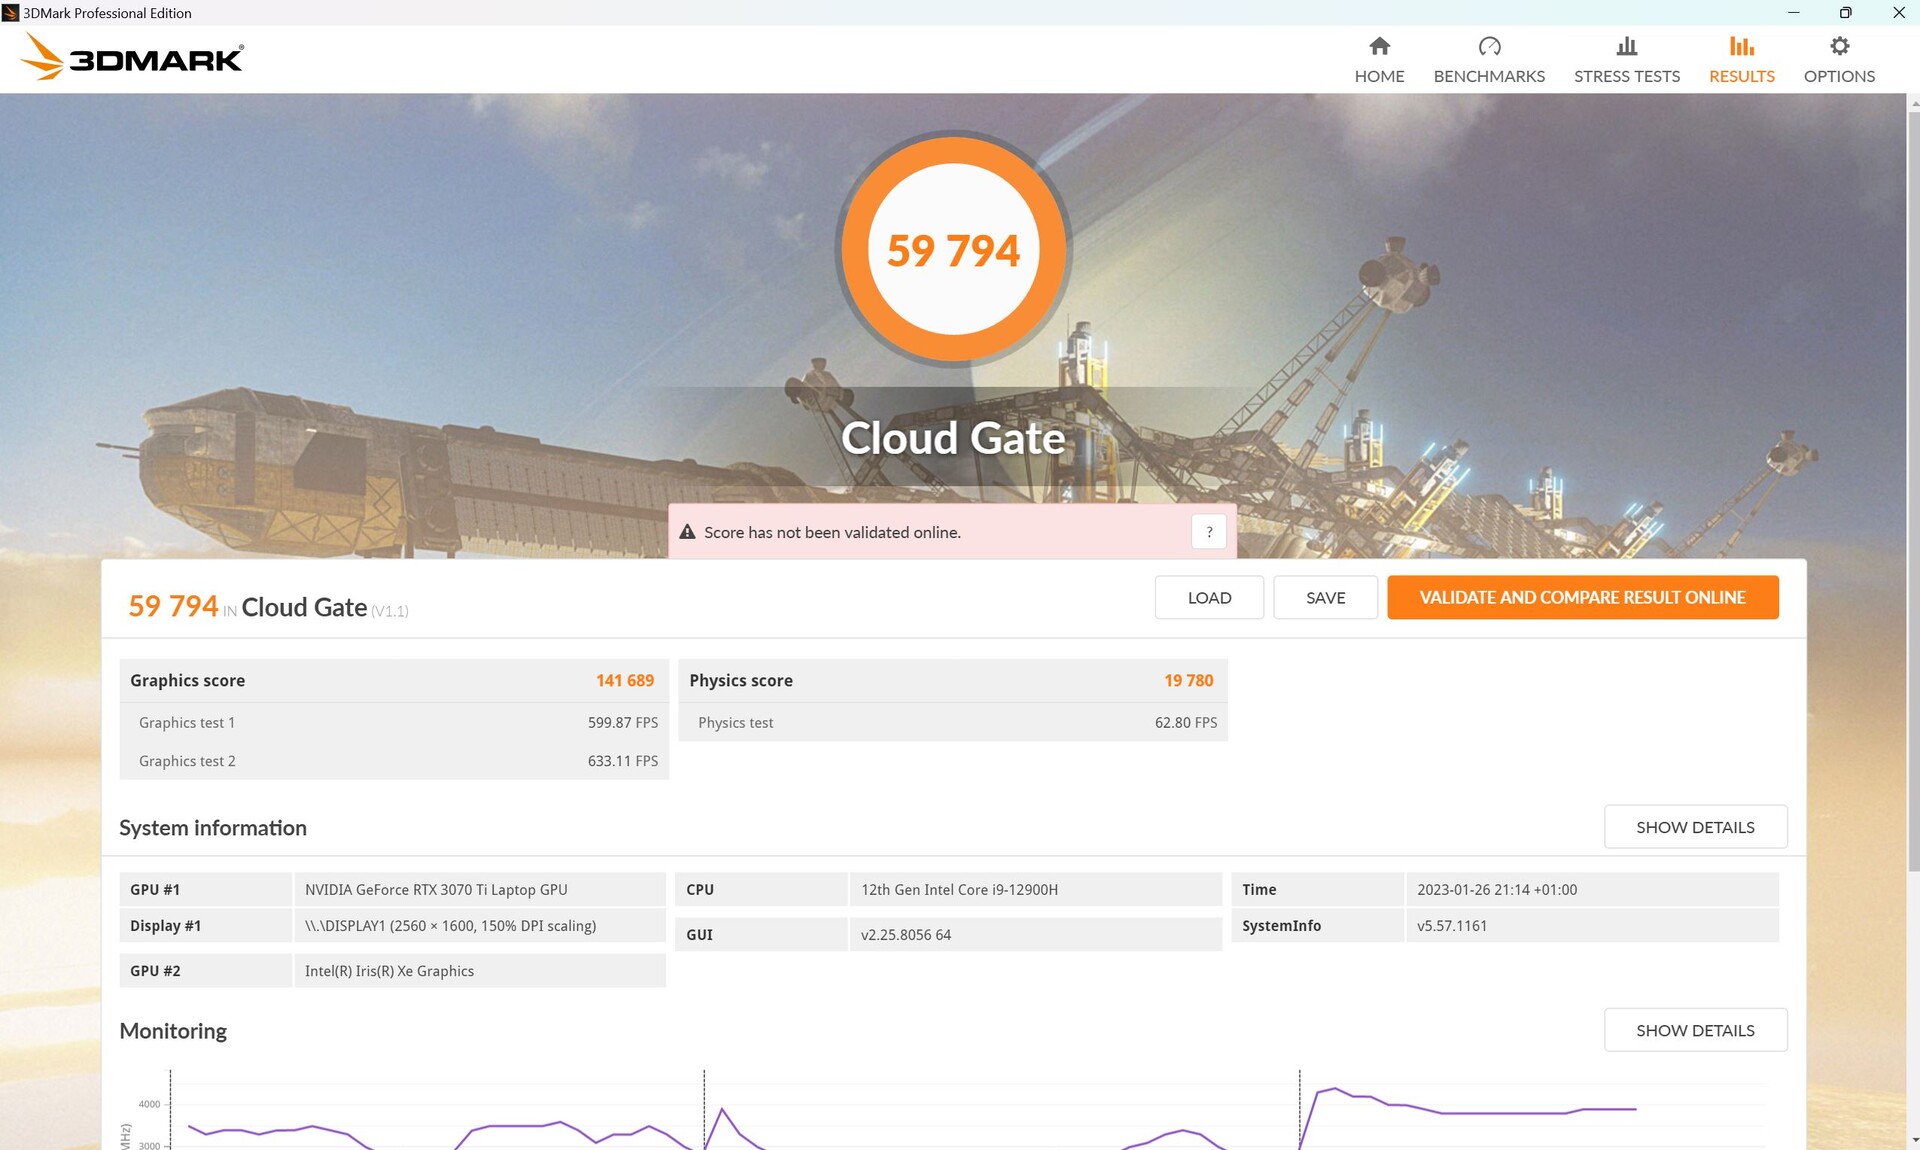
| 3DMark 11 Performance | 29169 pontos | |
| 3DMark Cloud Gate Standard Score | 59794 pontos | |
| 3DMark Fire Strike Score | 21717 pontos | |
| 3DMark Time Spy Score | 9841 pontos | |
Ajuda | ||
* ... menor é melhor
Desempenho nos jogos
Quando se joga, a diferença geral não é tão grande, também porque a poderosa CPU é capaz de alcançar os jogos pesados de CPU correspondentes. Em jogos pesados de GPU, como The Witcher 3 ou Strange Brigade, aLegion 5 Procom seu RTX 3070-Ti de 150-W está claramente à frente. Em DOTA 2 Reborn ou X-Plane 11.11, a M16 é capaz de colocar em cima.
| The Witcher 3 - 1920x1080 Ultra Graphics & Postprocessing (HBAO+) | |
| Média da turma Gaming (104.7 - 240, n=7, últimos 2 anos) | |
| Lenovo Legion 5 Pro 16ARH7H RTX 3070 Ti | |
| Corsair Voyager a1600 | |
| Asus ROG Zephyrus M16 GU603Z | |
| Asus ROG Zephyrus M16 GU603H | |
| Schenker Vision 16 Pro RTX 3070 Ti | |
| Schenker XMG Focus 16 (i7-12700H, RTX 3060) | |
O laptop não suporta Advanced Optimus, mas sim o Optimus normal, e também oferece uma chave MUX, permitindo alternar ativamente entre o modo integrado (ou Híbrido) e a GPU dedicada.
Nosso laço Witcher 3 resulta em taxas de quadros relativamente constantes. As diferenças de desempenho entre os concorrentes tornam-se facilmente visíveis aqui: EnquantoLegion 5 Pro é significativamente mais rápido, o Schenker Vision 16 Promal é superada.
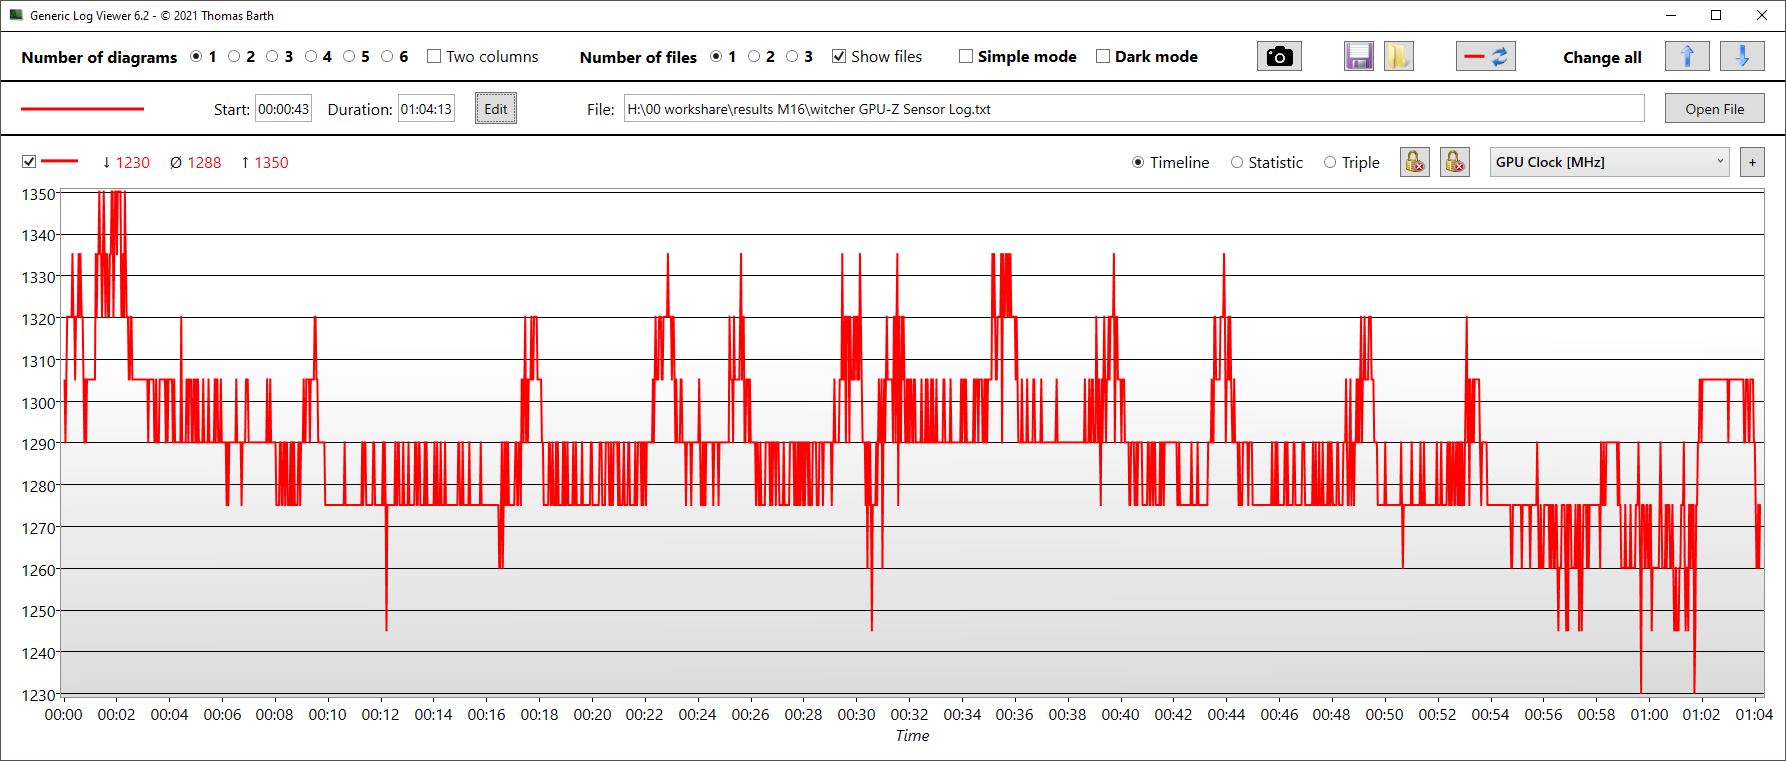
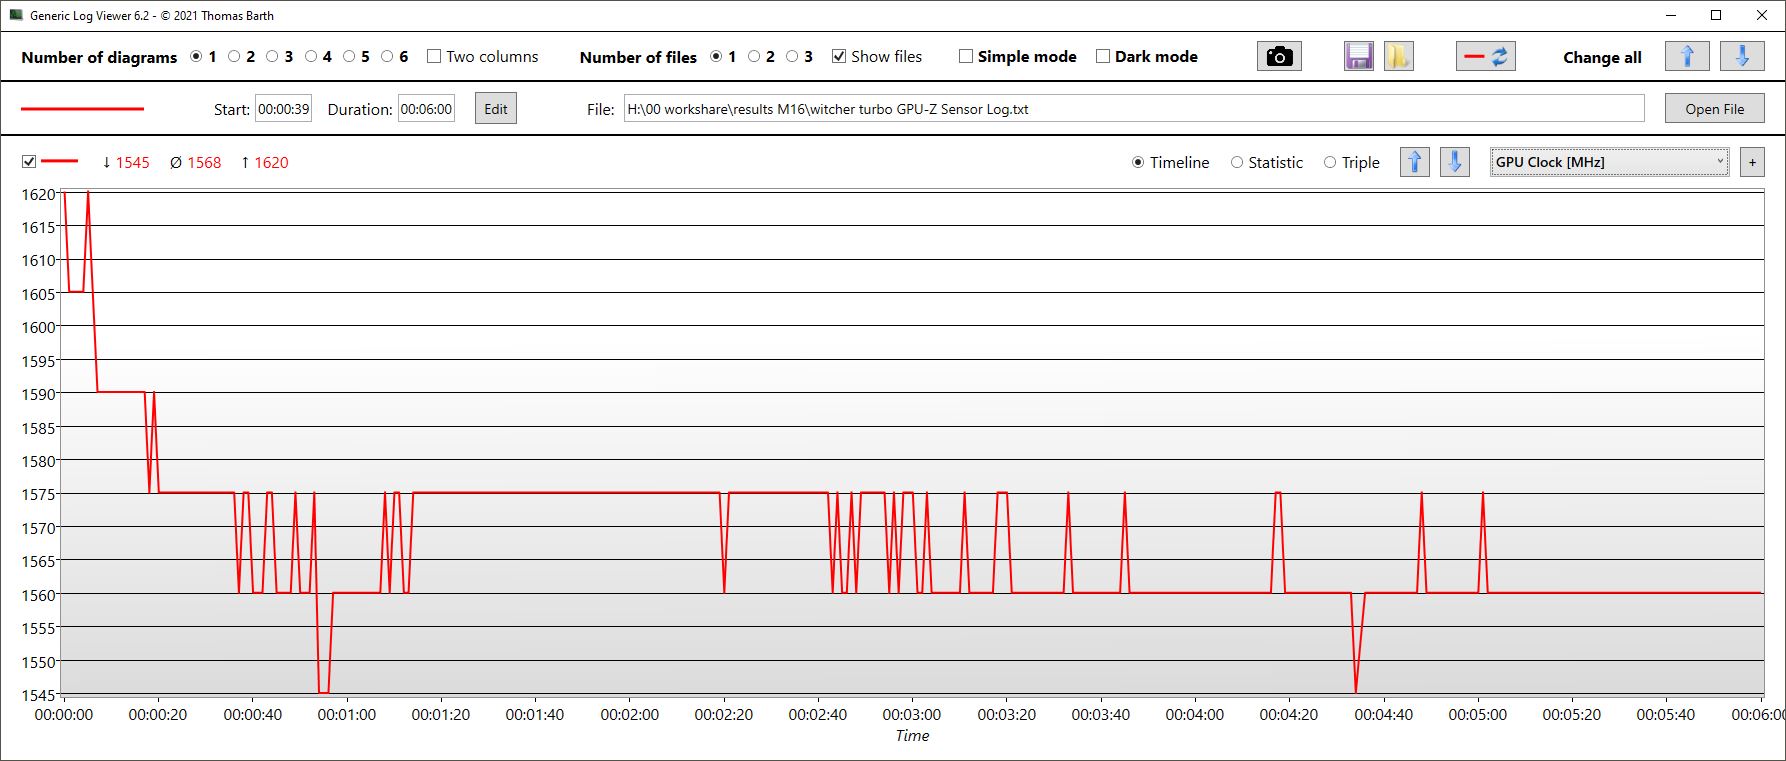
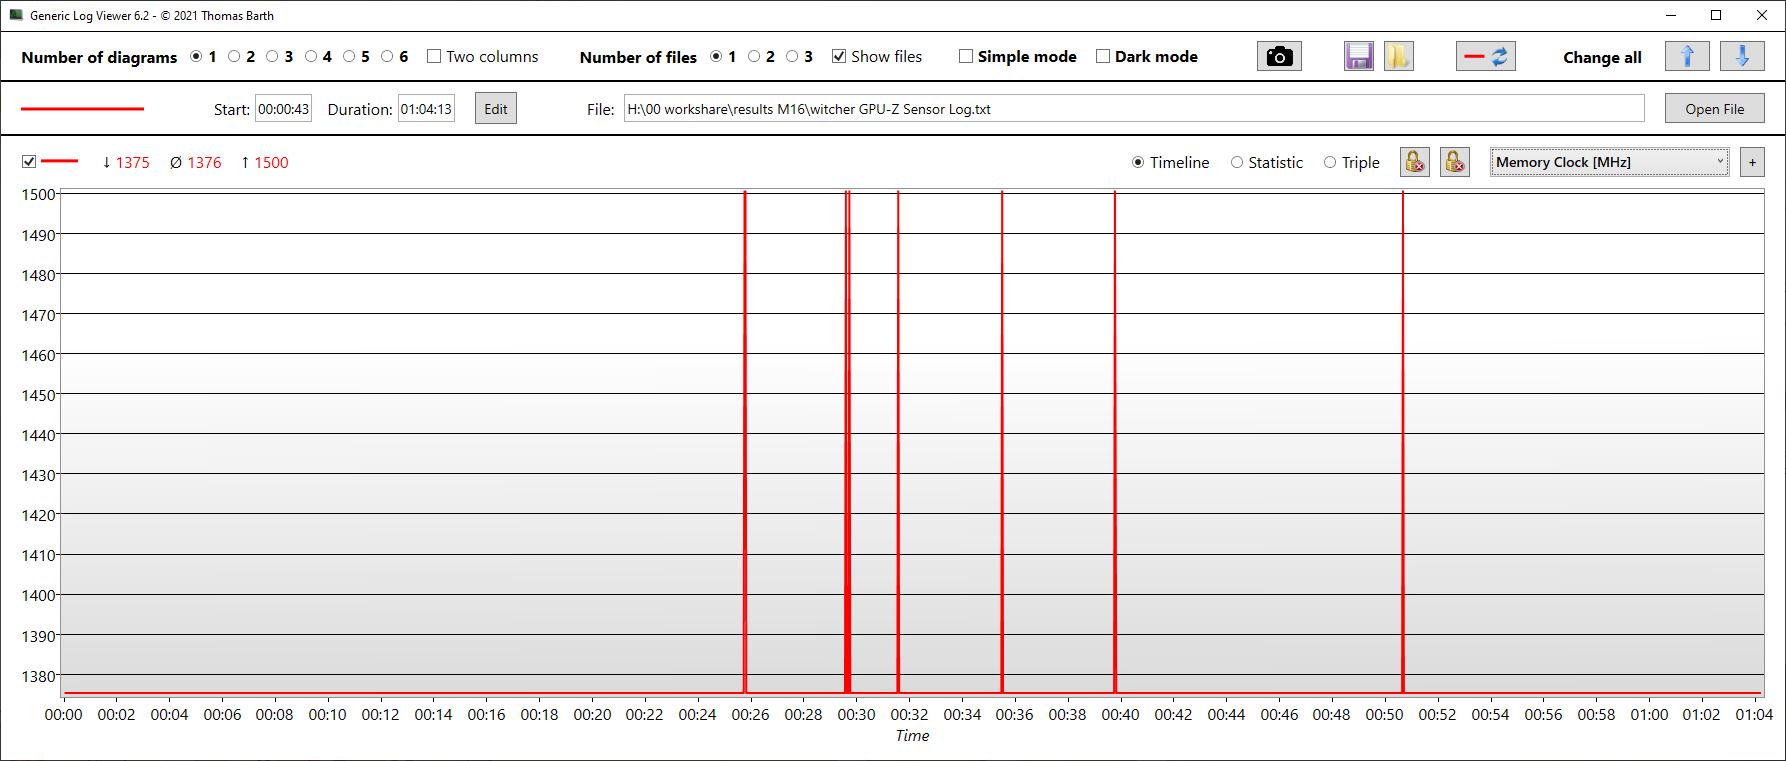
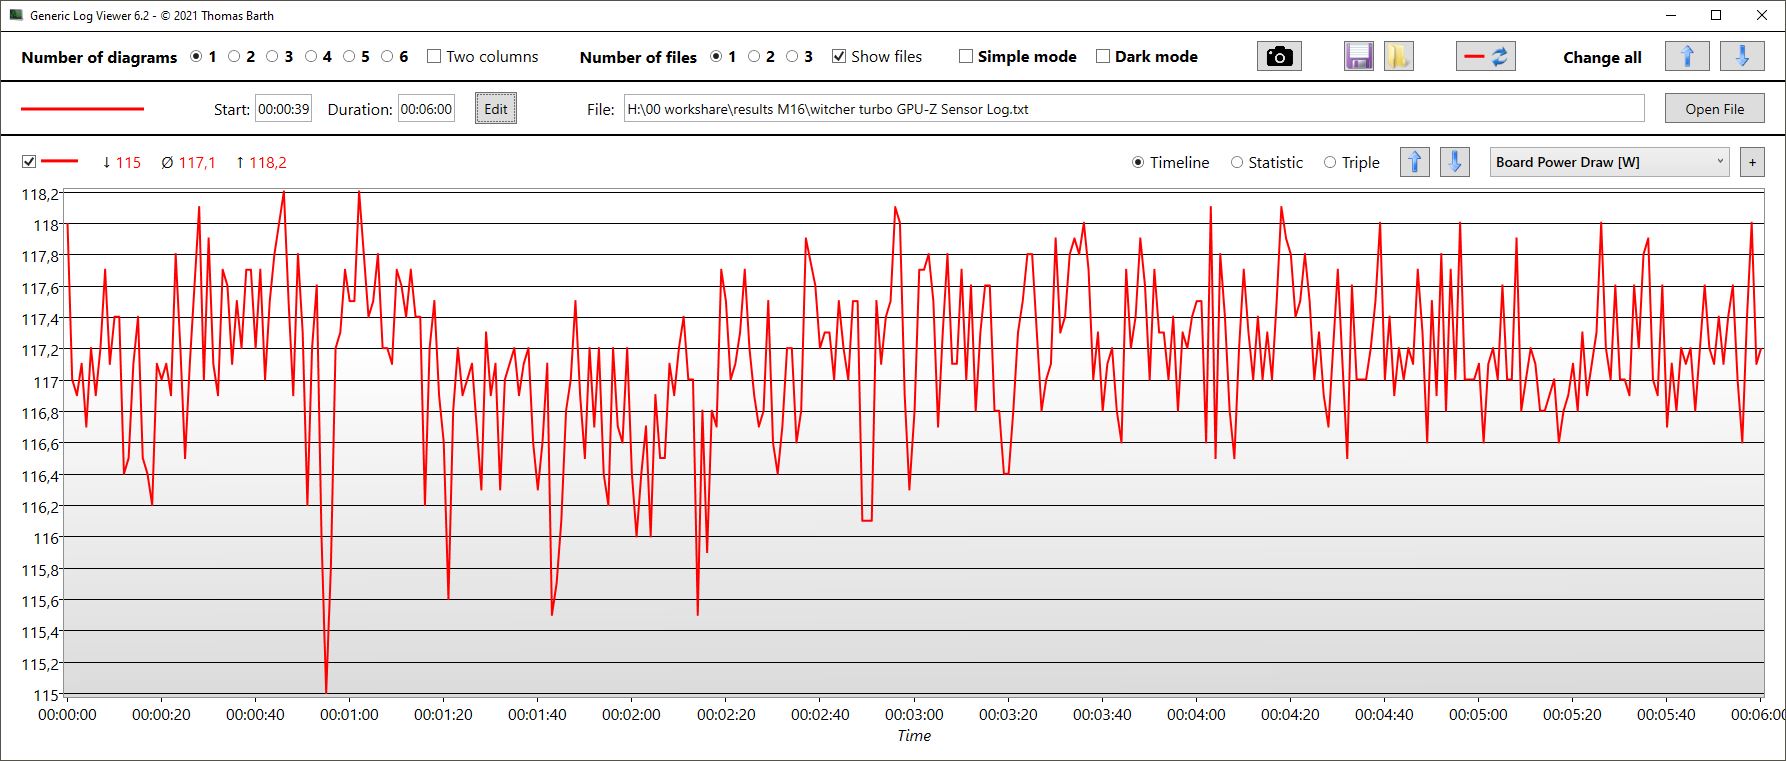
No modo Turbo (gráfico azul, medido durante 6 minutos), o desempenho aumenta consideravelmente, aproximando-se do do Legion 5 Pro em algumas peças. O ruído produzido pelo laptop é então igualmente alto, como você pode ver também na seção Emissões abaixo. A GPU e a velocidade de armazenamento aumentam, e o consumo de energia aumenta para quase 120 W.
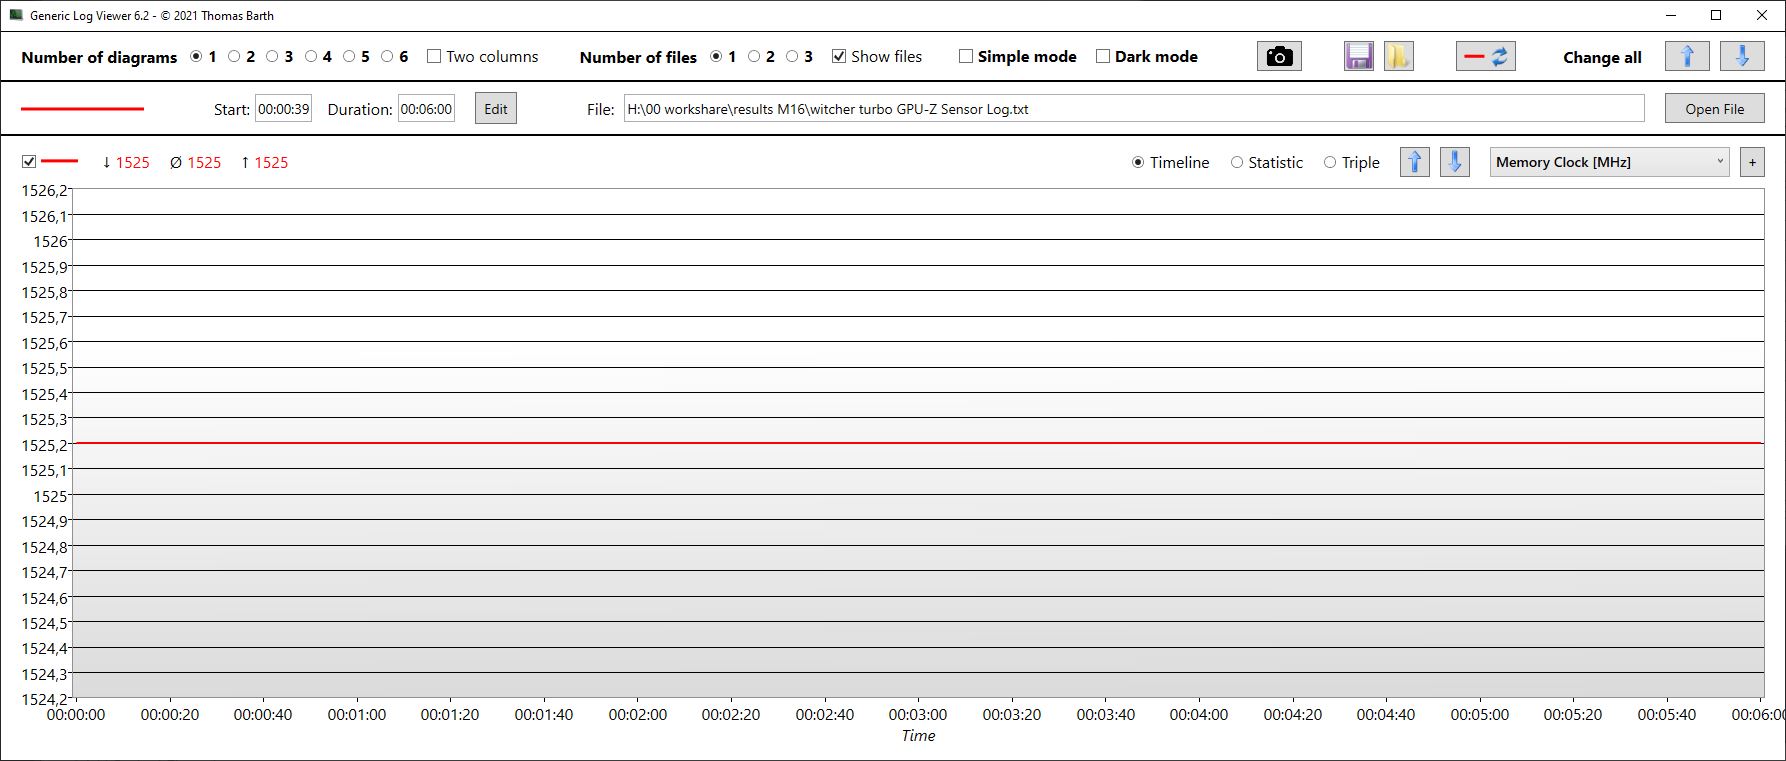
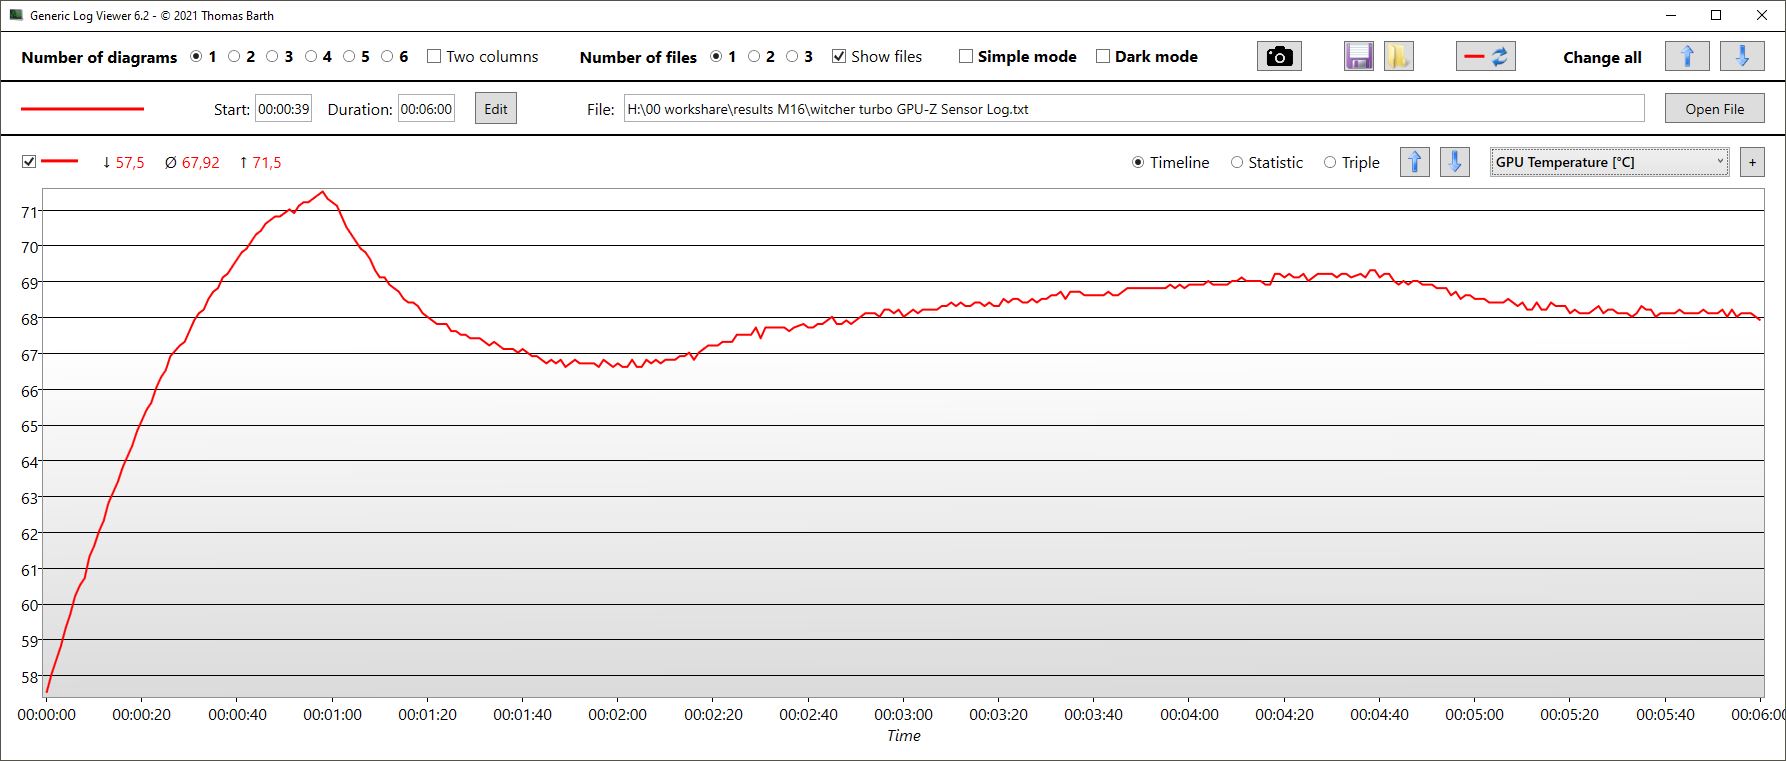
Com o tempo, a velocidade do relógio da GPU ainda diminui ligeiramente, terminando em média em 1.288 MHz. A placa aquece até cerca de 72 °C (162 °F), enquanto a placa consome apenas 93 W em média, o que ainda está longe de seu valor-alvo TGP.
The Witcher 3 FPS Chart
| baixo | média | alto | ultra | QHD | 4K | |
|---|---|---|---|---|---|---|
| GTA V (2015) | 184.6 | 171.4 | 108.1 | |||
| The Witcher 3 (2015) | 370.2 | 273.2 | 171 | 99.5 | ||
| Dota 2 Reborn (2015) | 195.2 | 174.7 | 170.2 | 160.5 | ||
| Final Fantasy XV Benchmark (2018) | 123.8 | 94.8 | 72.1 | 43 | ||
| X-Plane 11.11 (2018) | 166.8 | 145.7 | 115 | |||
| Far Cry 5 (2018) | 174 | 128 | 128 | 124 | 90 | |
| Strange Brigade (2018) | 376 | 227 | 187.9 | 163.8 | ||
| Dying Light 2 (2022) | 98.5 | 79 | 66 | 46.7 |
Emissões - Um Asus M16 moderado
Níveis de ruídos
Durante a operação ociosa, os ventiladores são freqüentemente desligados - mas não de forma consistente. De tempos em tempos, eles podem facilmente girar até 47 dB, por exemplo, logo após o reinício, quando o Windows está iniciando.
Durante a primeira cena do benchmark 3DMark 06, os ventiladores permanecem em sua maioria silenciosos a 34 dB, e o ruído do ventilador só aumenta para 47 dB logo antes do final. O Schenker Vision 16 Pro e o Legion 5 Pro são capazes de permanecer silenciosos ainda mais tempo.
Ao jogar, a operação da M16 permanece bastante silenciosa em comparação com seus concorrentes, alguns dos quais produzem um nível de ruído significativamente acima de 50 dB, enquanto o da M16 permanece abaixo desse nível. No entanto, isto só vale para o modo Performance. Se você usar o modo Turbo, os ventiladores giram até quase 55 dB, que está no mesmo nível que o Legion 5 Pro e significativamente mais alto do que o Vision 16 Pro.
Barulho
| Ocioso |
| 23 / 24 / 47 dB |
| Carga |
| 47.91 / 50.25 dB |
 | ||
30 dB silencioso 40 dB(A) audível 50 dB(A) ruidosamente alto |
||
min: | ||
| Asus ROG Zephyrus M16 GU603Z GeForce RTX 3070 Ti Laptop GPU, i9-12900H, Micron 3400 1TB MTFDKBA1T0TFH | Asus ROG Zephyrus M16 GU603H GeForce RTX 3070 Laptop GPU, i9-11900H, Samsung PM9A1 MZVL22T0HBLB | Schenker Vision 16 Pro RTX 3070 Ti GeForce RTX 3070 Ti Laptop GPU, i7-12700H, Samsung SSD 980 Pro 1TB MZ-V8P1T0BW | Lenovo Legion 5 Pro 16ARH7H RTX 3070 Ti GeForce RTX 3070 Ti Laptop GPU, R7 6800H, Samsung PM9A1 MZVL21T0HCLR | Schenker XMG Focus 16 (i7-12700H, RTX 3060) GeForce RTX 3060 Laptop GPU, i7-12700H, Samsung SSD 980 Pro 1TB MZ-V8P1T0BW | Corsair Voyager a1600 Radeon RX 6800M, R9 6900HS, Samsung PM9A1 MZVL22T0HBLB | |
|---|---|---|---|---|---|---|
| Noise | -8% | 8% | -1% | 0% | -9% | |
| desligado / ambiente * (dB) | 23 | 25 -9% | 22.9 -0% | 23.5 -2% | 23 -0% | 29.9 -30% |
| Idle Minimum * (dB) | 23 | 25 -9% | 24.3 -6% | 23.7 -3% | 23 -0% | 30.5 -33% |
| Idle Average * (dB) | 24 | 31 -29% | 24.3 -1% | 31.1 -30% | 23 4% | 30.6 -28% |
| Idle Maximum * (dB) | 47 | 42 11% | 24.3 48% | 32.2 31% | 32.07 32% | 30.7 35% |
| Load Average * (dB) | 47.91 | 48 -0% | 38.5 20% | 38.4 20% | 53.7 -12% | 44.5 7% |
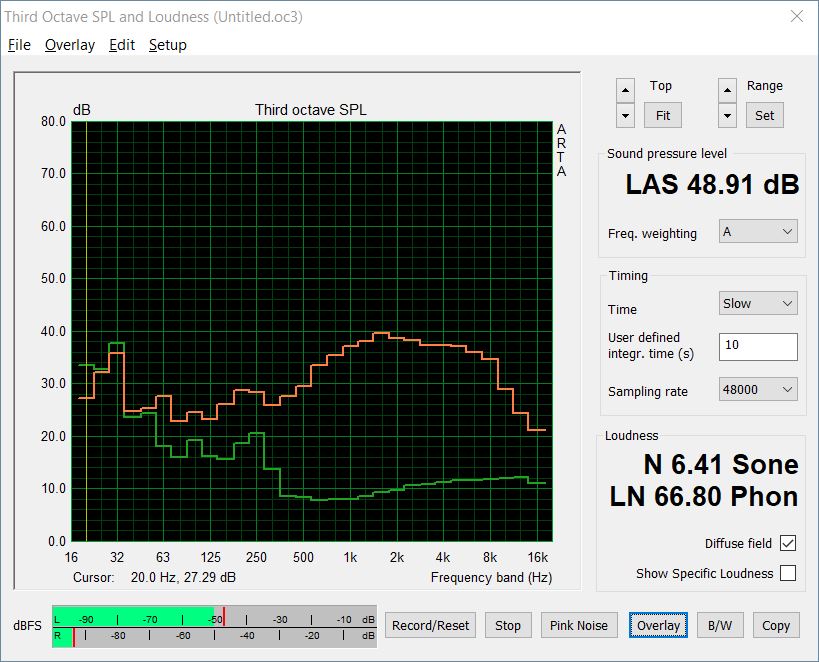
| Witcher 3 ultra * (dB) | 48.91 | 52 -6% | 51 -4% | 54.8 -12% | 54.58 -12% | |
| Load Maximum * (dB) | 50.25 | 56 -11% | 51 -1% | 54.8 -9% | 54.58 -9% | 51.1 -2% |
* ... menor é melhor
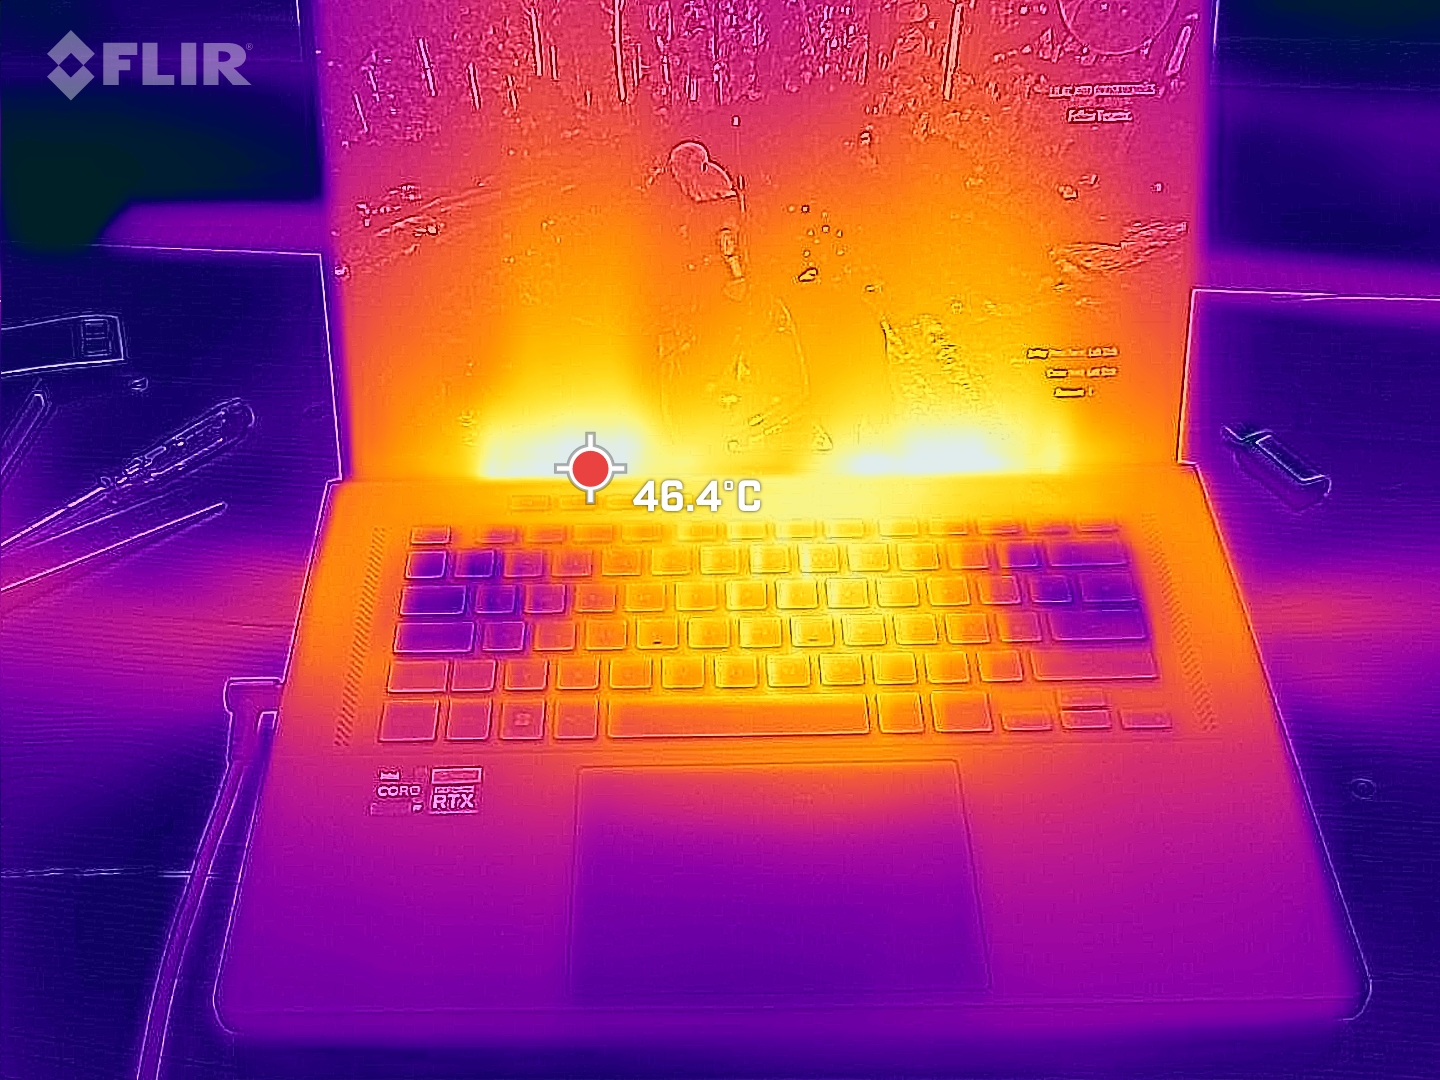
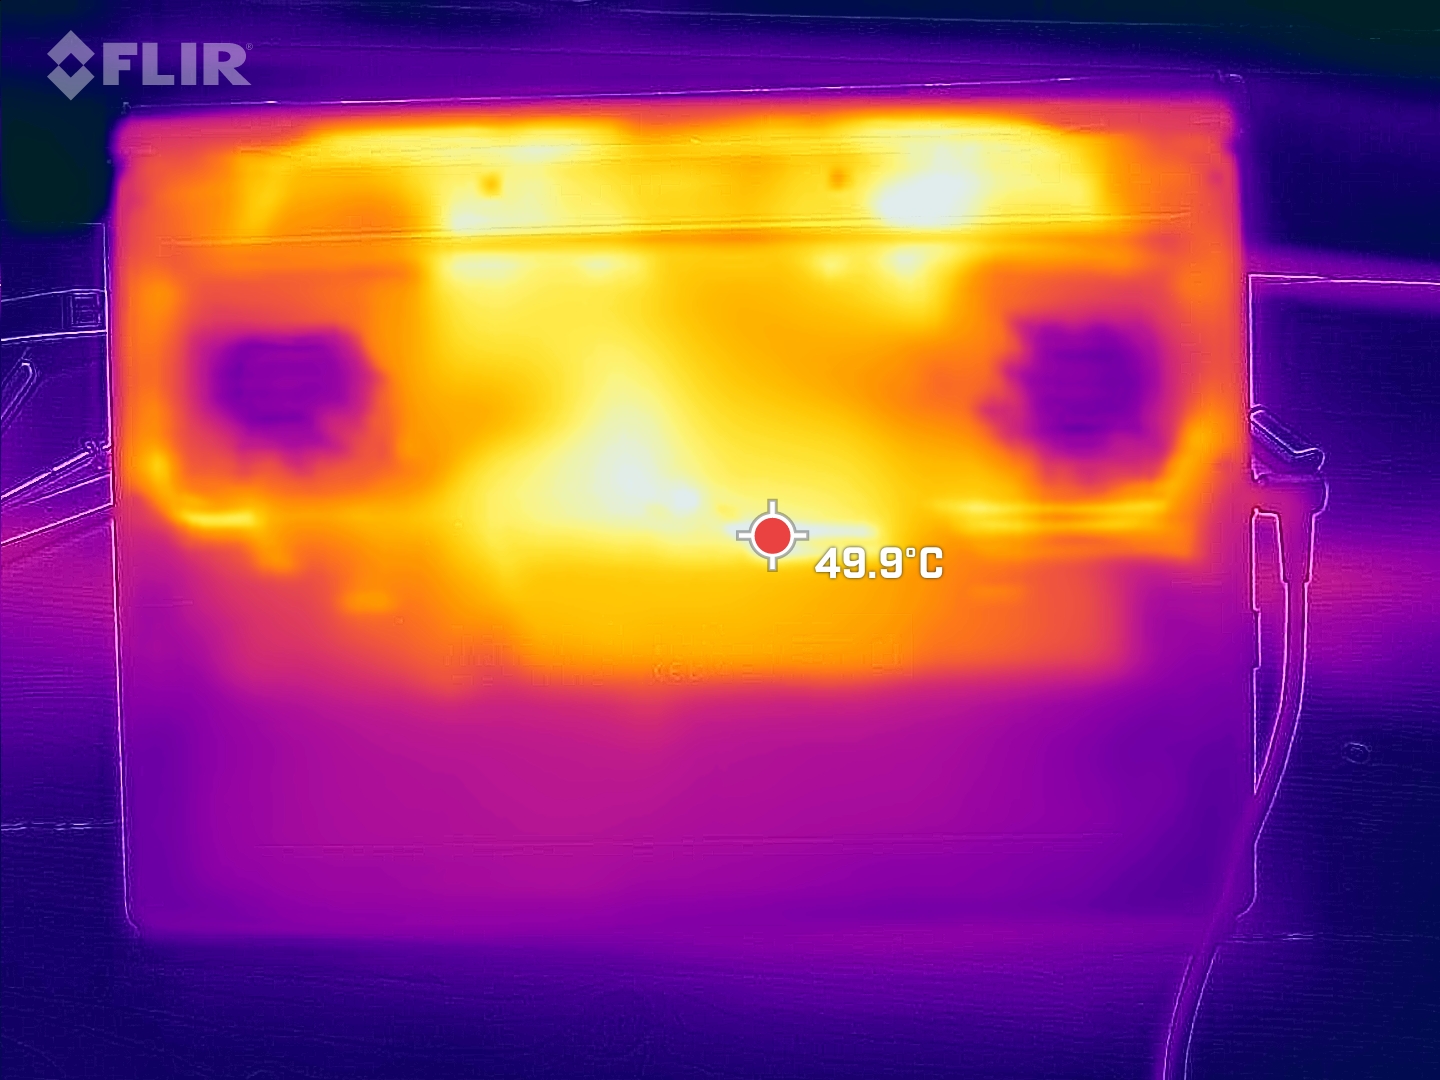
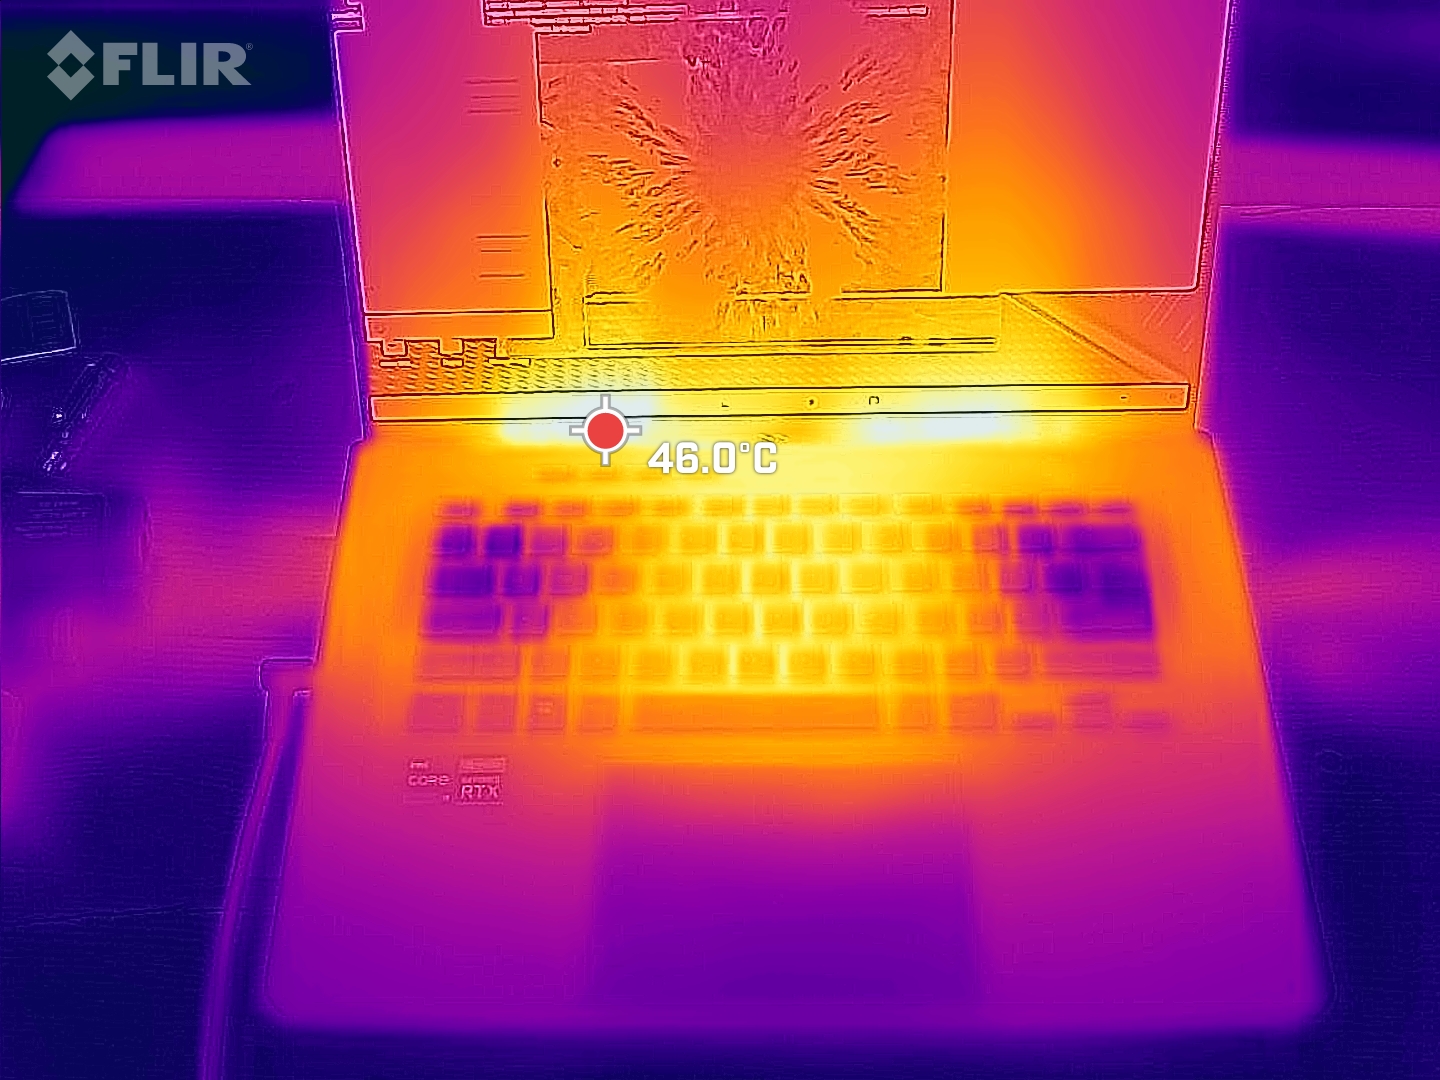
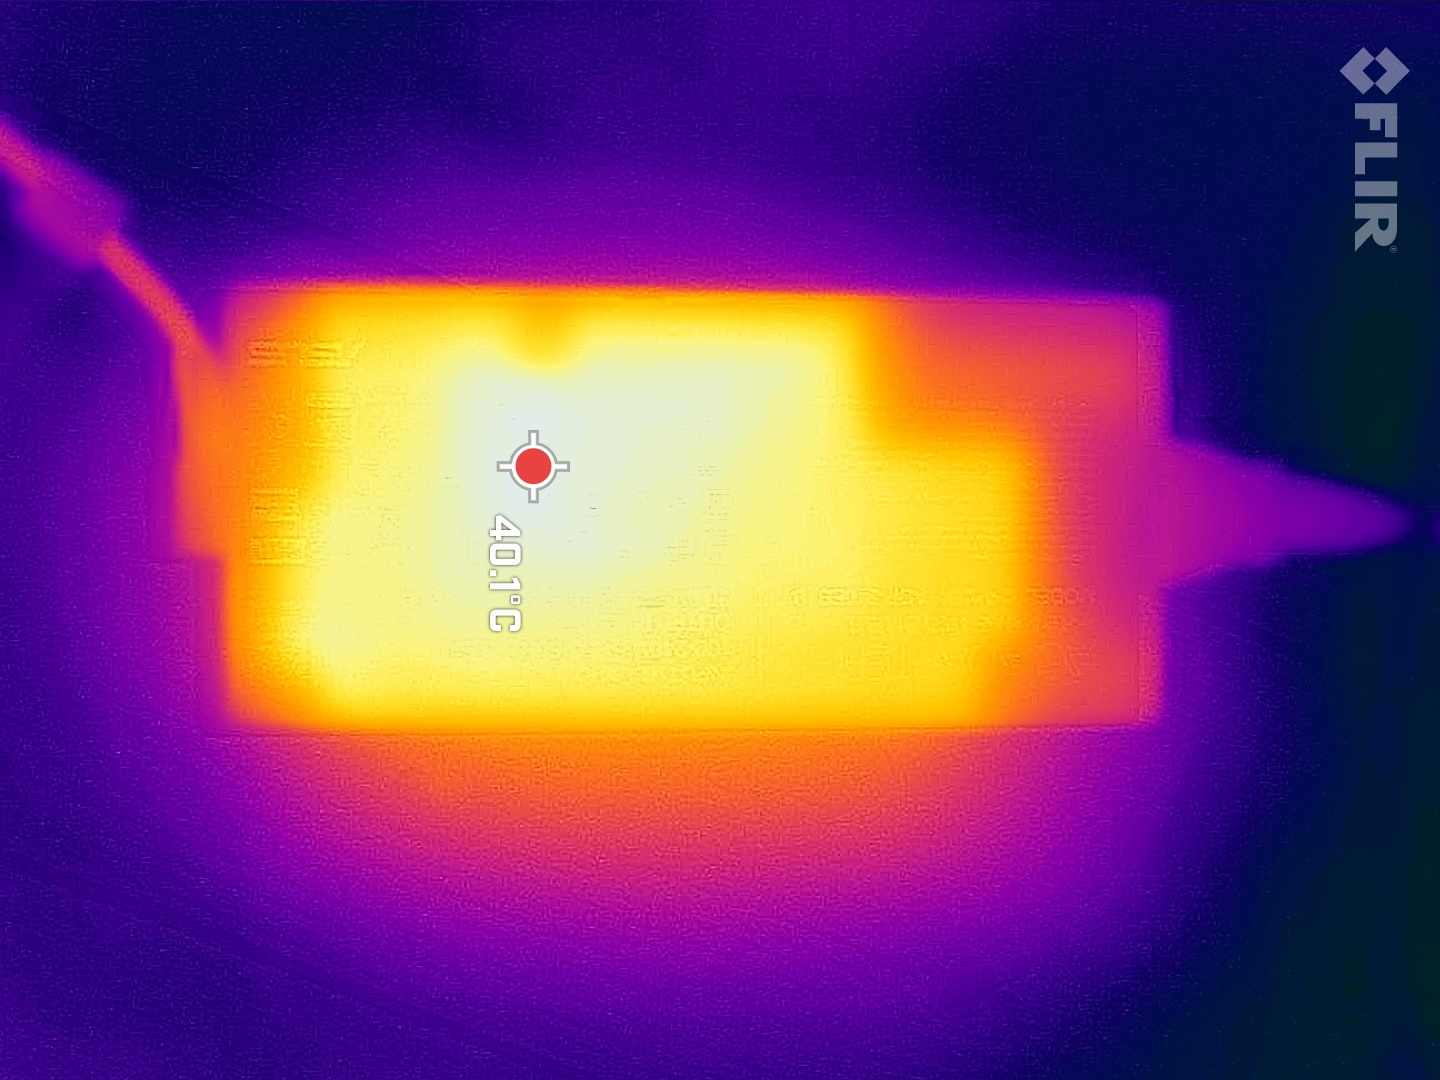
Temperaturas
Sob carga pesada, a parte superior e inferior da caixa aquece até um pouco acima de 50 °C (122 °F) . Isto permanece dentro dos limites habituais e é até ligeiramente melhor do que o predecessor. O Legion 5 Pro permanece ligeiramente mais frio no topo, e o Visão 16 Pro é ligeiramente mais frio na parte inferior.
(-) A temperatura máxima no lado superior é 52 °C / 126 F, em comparação com a média de 40.4 °C / 105 F , variando de 21.2 a 68.8 °C para a classe Gaming.
(-) A parte inferior aquece até um máximo de 51 °C / 124 F, em comparação com a média de 43.2 °C / 110 F
(+) Em uso inativo, a temperatura média para o lado superior é 26.4 °C / 80 F, em comparação com a média do dispositivo de 33.9 °C / ### class_avg_f### F.
(-) Jogando The Witcher 3, a temperatura média para o lado superior é 40.2 °C / 104 F, em comparação com a média do dispositivo de 33.9 °C / ## #class_avg_f### F.
(+) Os apoios para as mãos e o touchpad estão atingindo a temperatura máxima da pele (32 °C / 89.6 F) e, portanto, não estão quentes.
(-) A temperatura média da área do apoio para as mãos de dispositivos semelhantes foi 28.8 °C / 83.8 F (-3.2 °C / -5.8 F).
| Asus ROG Zephyrus M16 GU603Z Intel Core i9-12900H, NVIDIA GeForce RTX 3070 Ti Laptop GPU | Asus ROG Zephyrus M16 GU603H Intel Core i9-11900H, NVIDIA GeForce RTX 3070 Laptop GPU | Schenker Vision 16 Pro RTX 3070 Ti Intel Core i7-12700H, NVIDIA GeForce RTX 3070 Ti Laptop GPU | Lenovo Legion 5 Pro 16ARH7H RTX 3070 Ti AMD Ryzen 7 6800H, NVIDIA GeForce RTX 3070 Ti Laptop GPU | Schenker XMG Focus 16 (i7-12700H, RTX 3060) Intel Core i7-12700H, NVIDIA GeForce RTX 3060 Laptop GPU | Corsair Voyager a1600 AMD Ryzen 9 6900HS, AMD Radeon RX 6800M | |
|---|---|---|---|---|---|---|
| Heat | -15% | 9% | 3% | 4% | -7% | |
| Maximum Upper Side * (°C) | 52 | 52 -0% | 50.8 2% | 43.8 16% | 50 4% | 50.7 2% |
| Maximum Bottom * (°C) | 51 | 53 -4% | 46.3 9% | 53 -4% | 48 6% | 54.2 -6% |
| Idle Upper Side * (°C) | 29 | 38 -31% | 27.2 6% | 30 -3% | 28 3% | 35.8 -23% |
| Idle Bottom * (°C) | 33 | 41 -24% | 26.6 19% | 31.8 4% | 32 3% | 33 -0% |
* ... menor é melhor
Teste de estresse
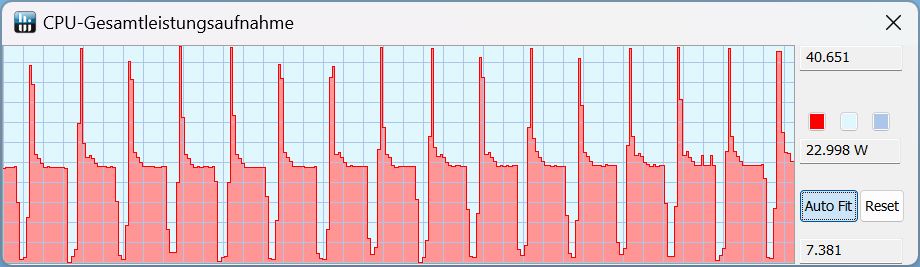
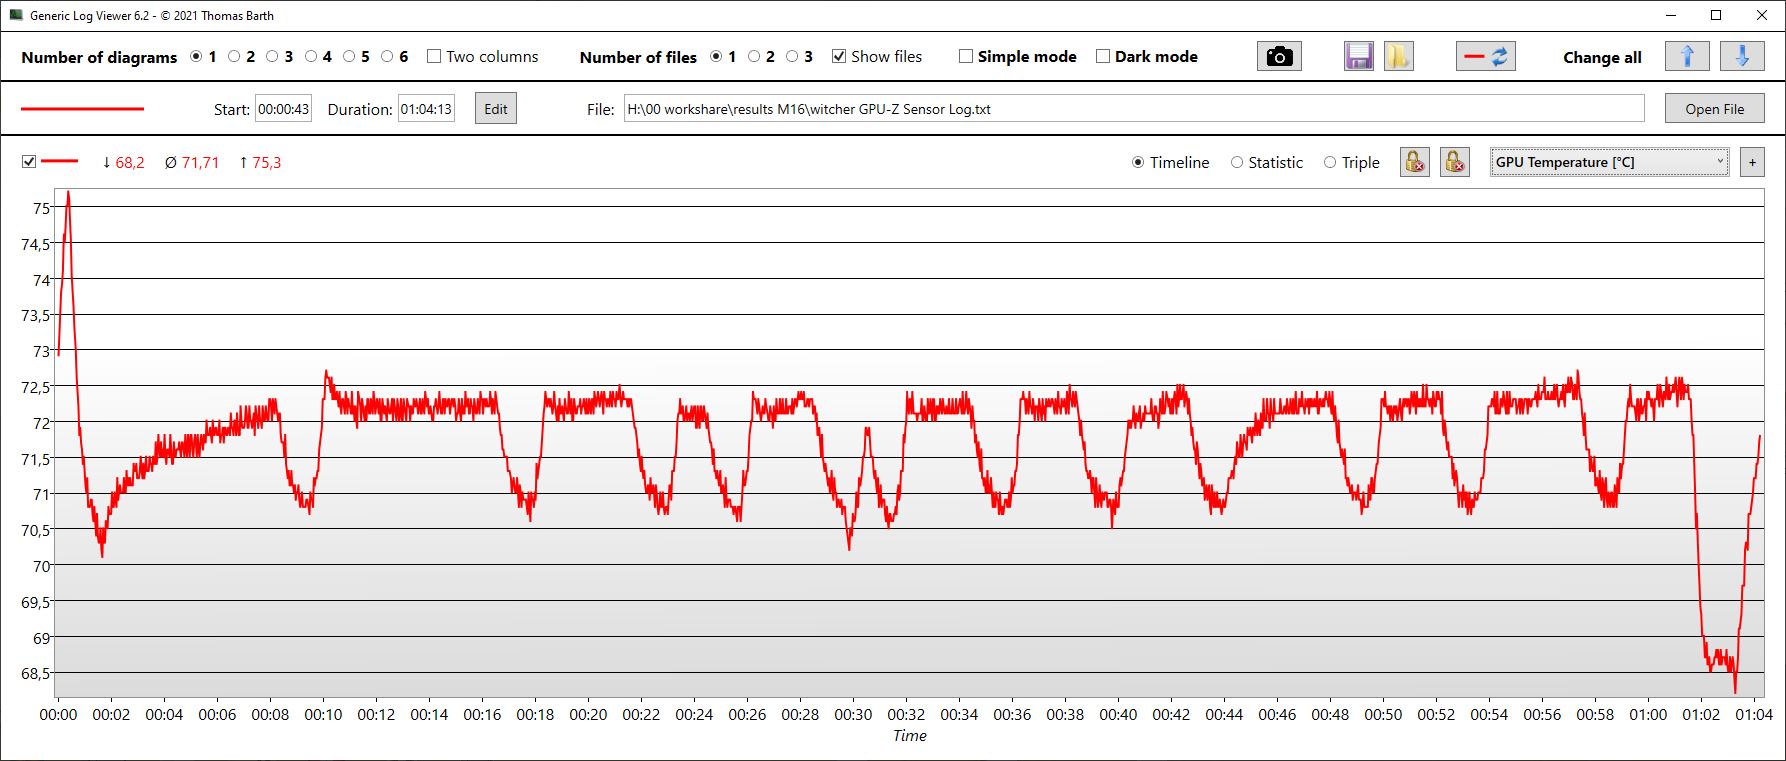
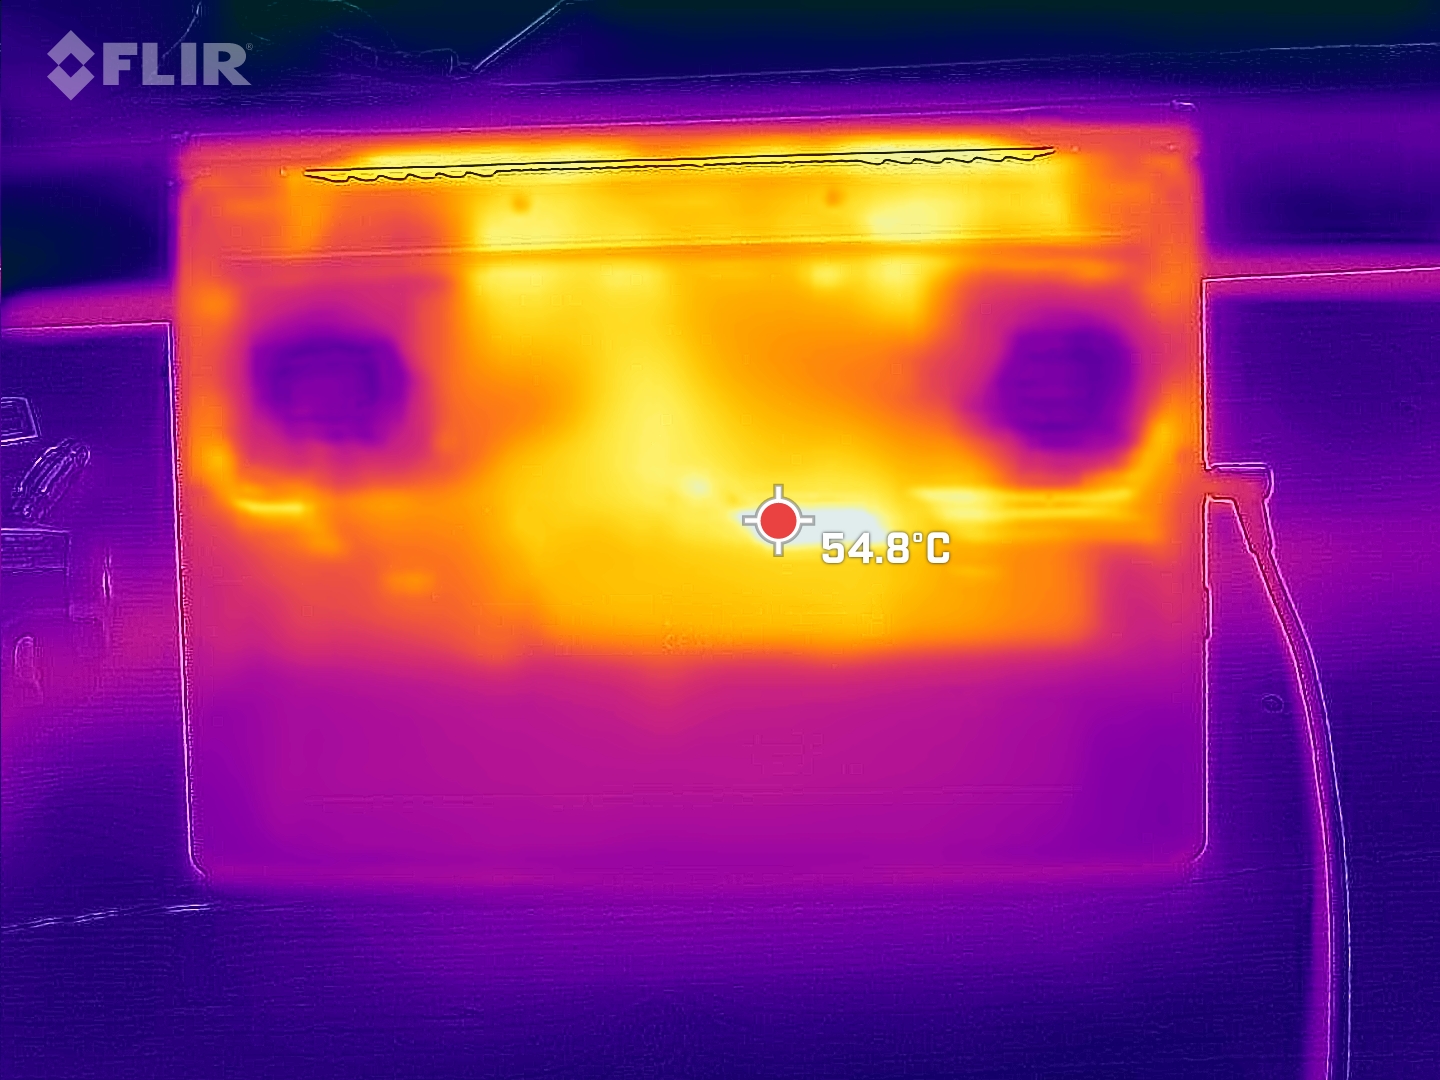
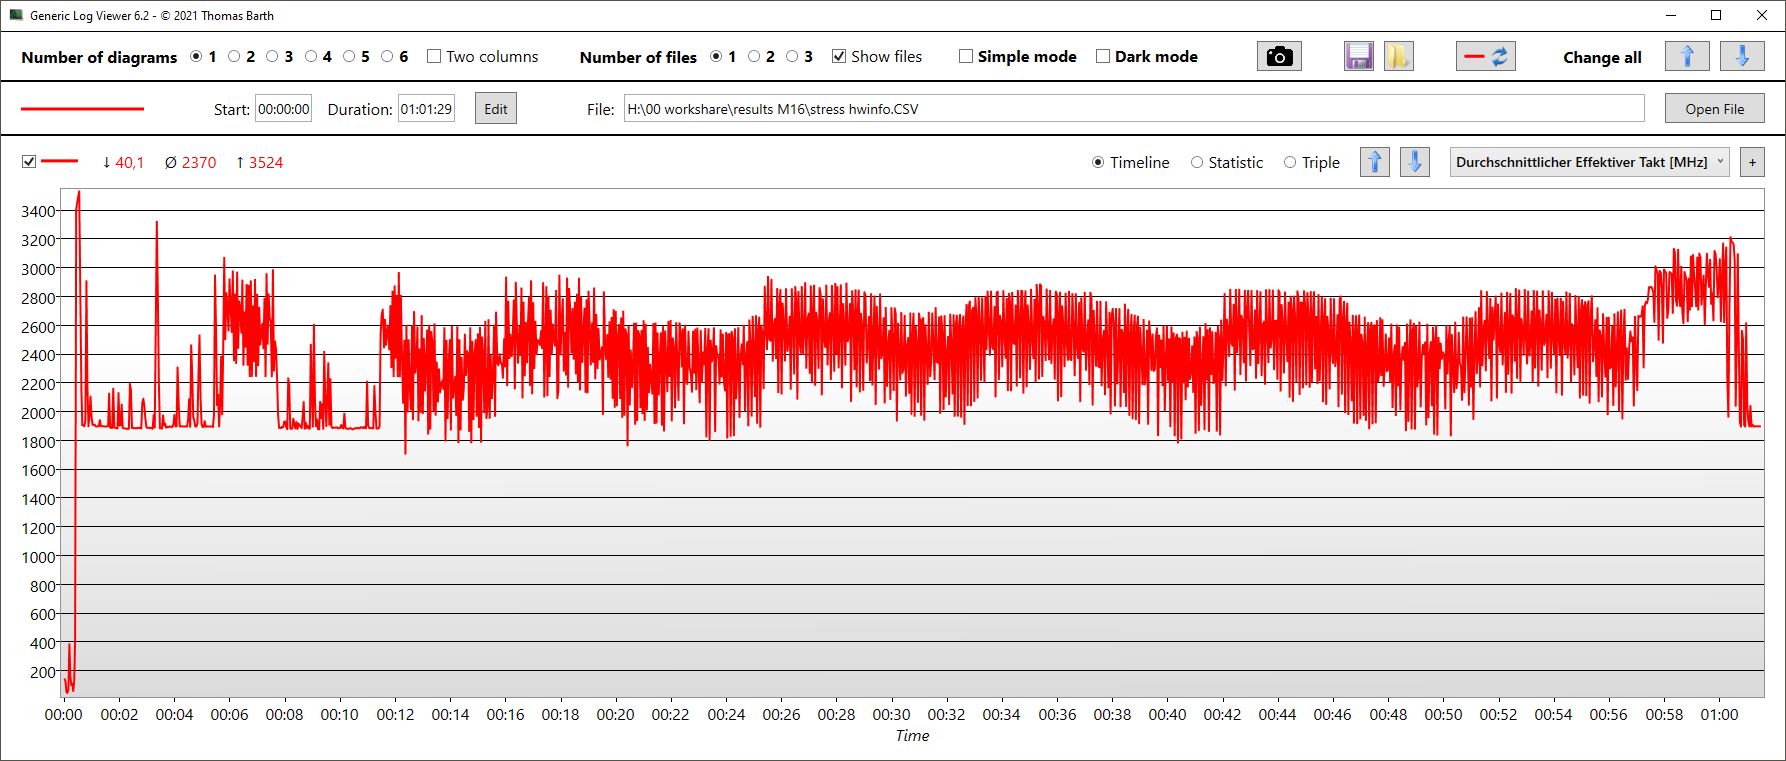
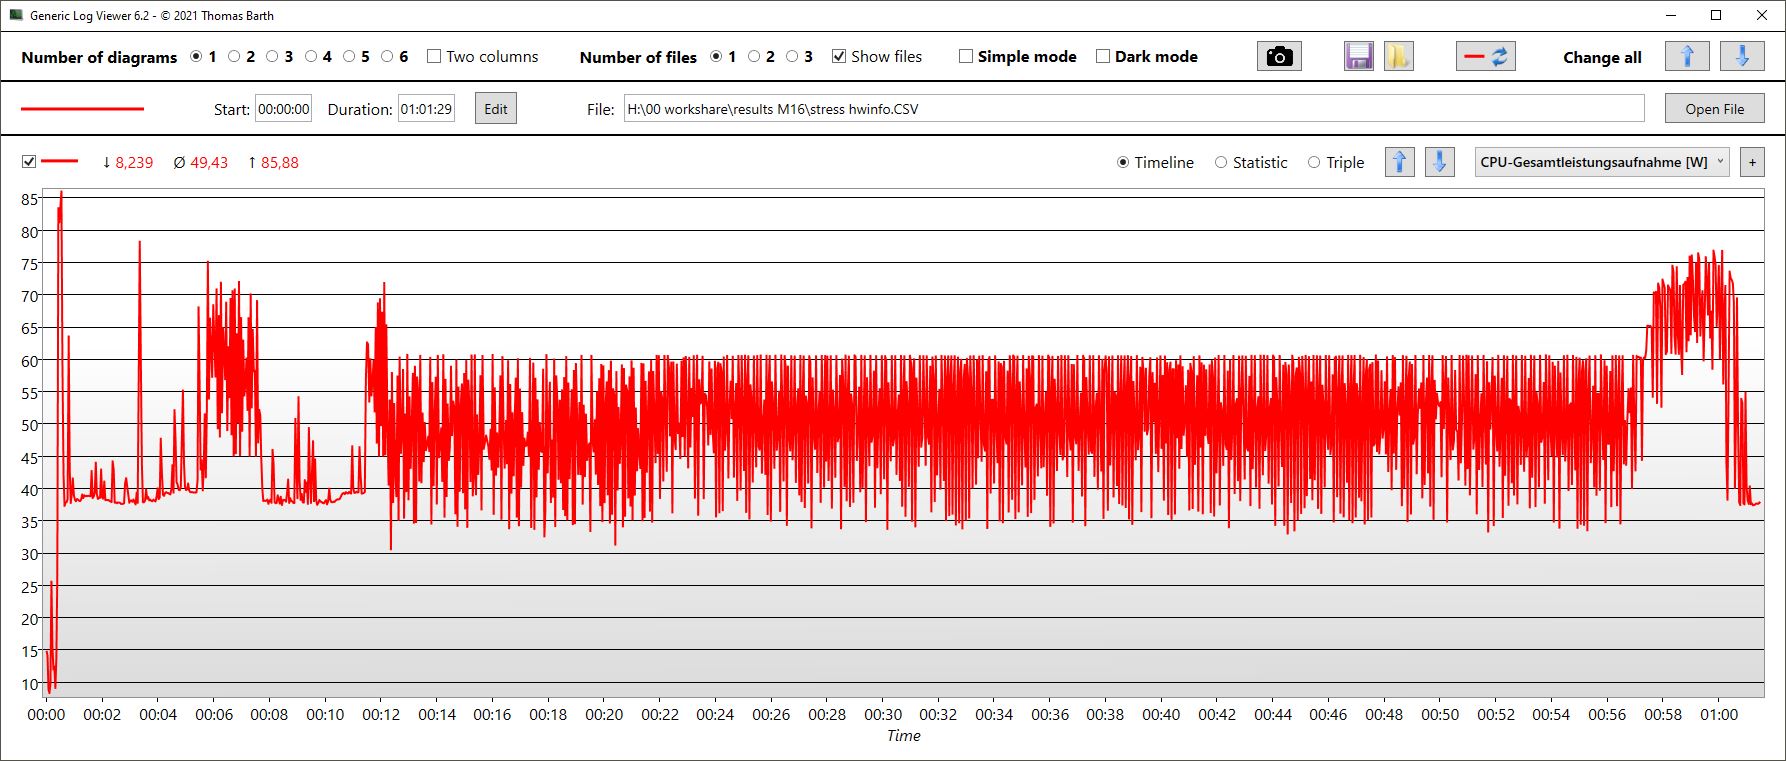
Os núcleos da CPU começam nosso teste de estresse brevemente em 3,5 GHz. Após alguns segundos, a velocidade do relógio começa a cair, nivelando em torno de 2,4 GHz. A temperatura varia com um máximo de 97 °C (207 °F) e 83 °C (181 °F) em média. O TDP da CPU é de 44 W, em média.
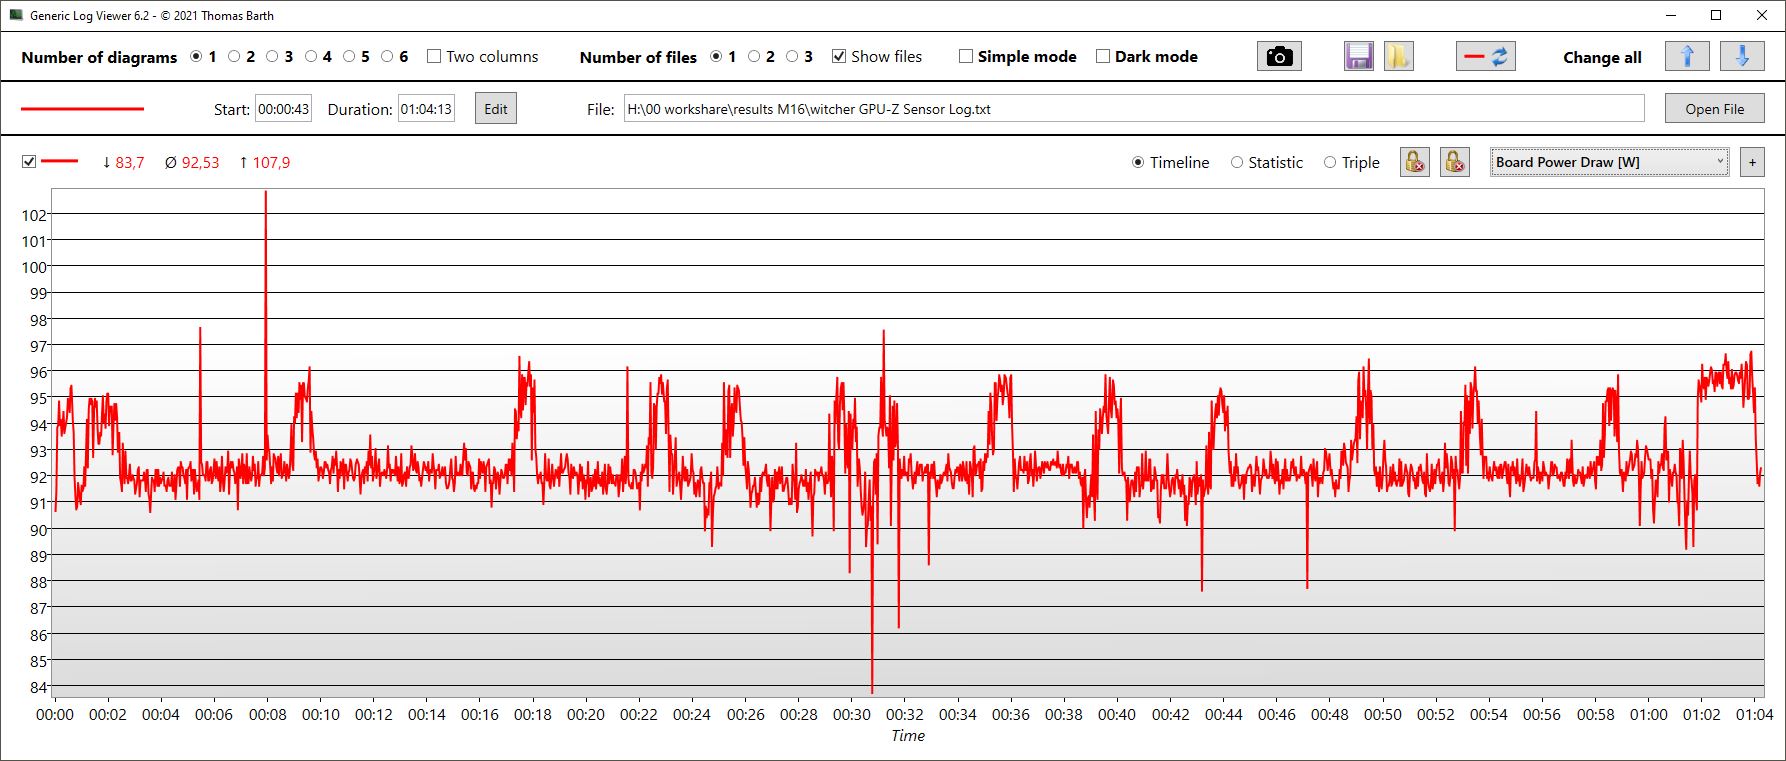
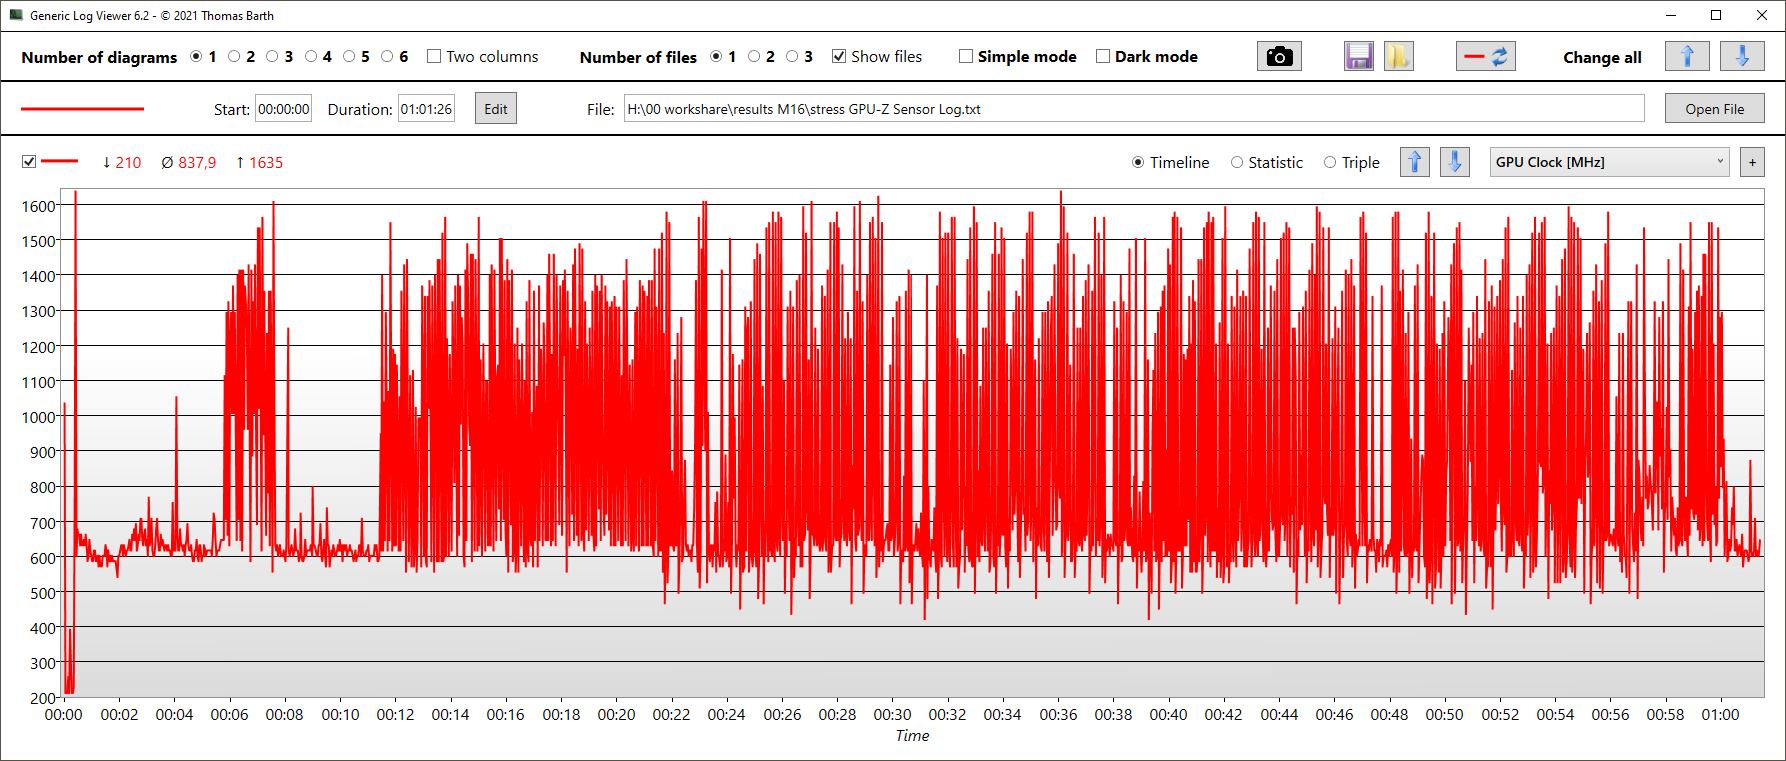
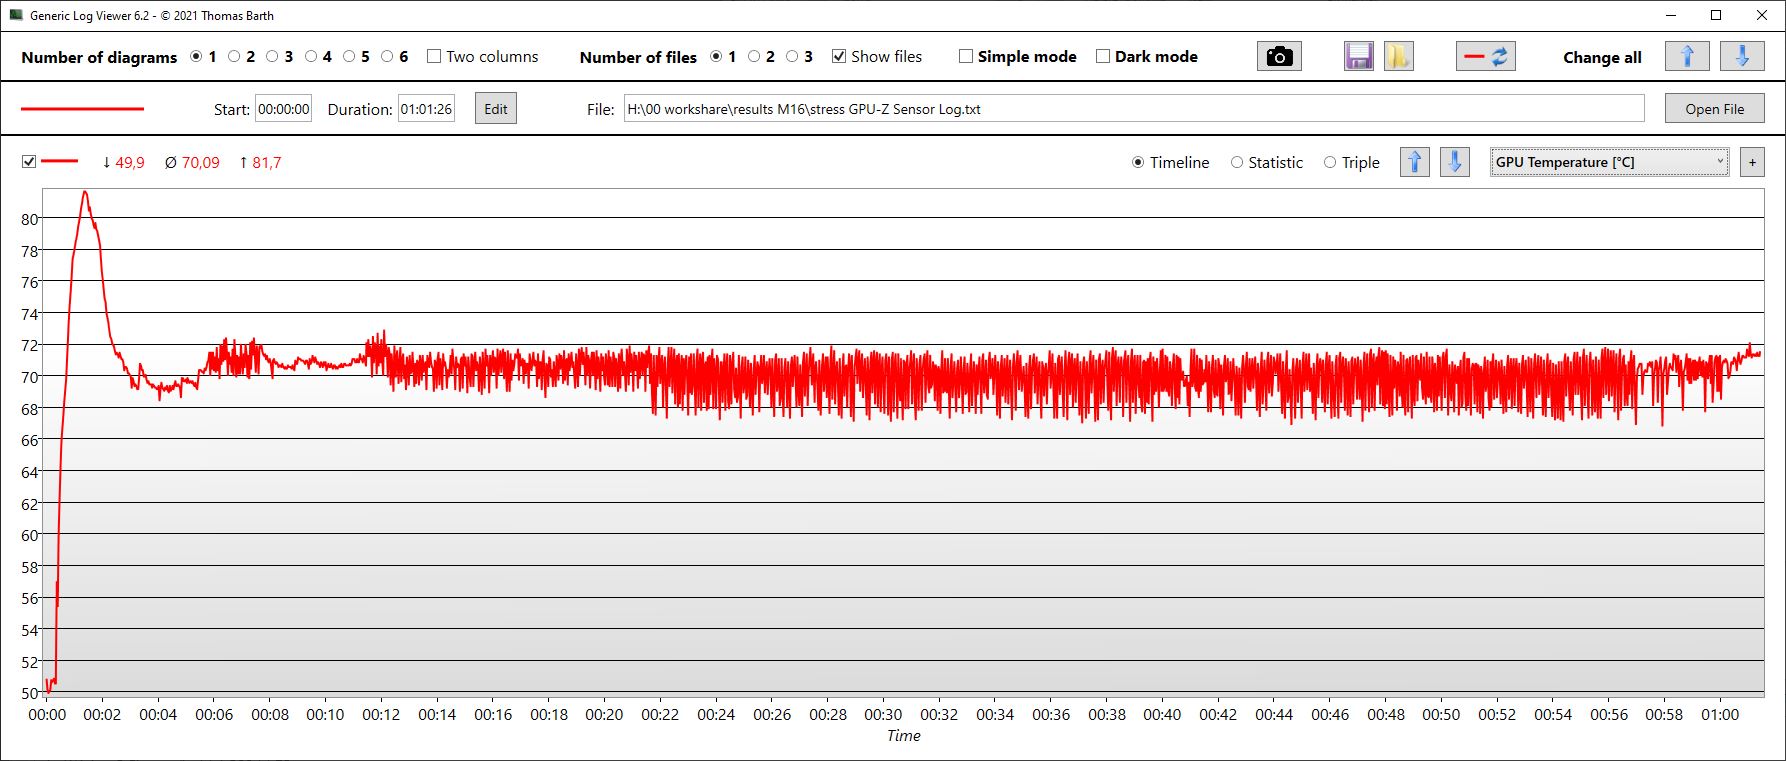
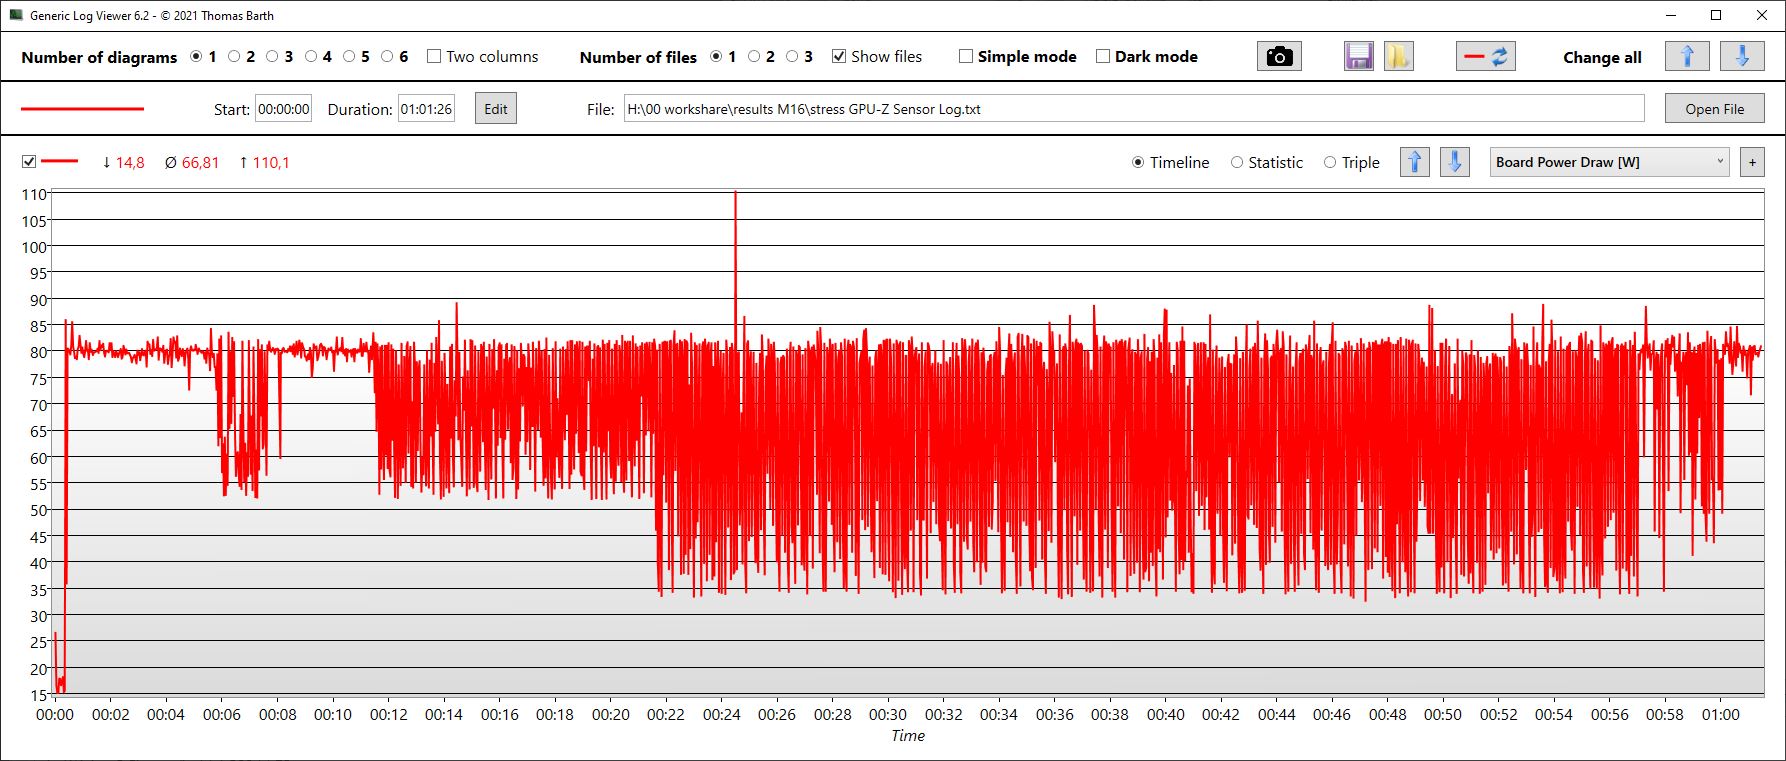
A velocidade gráfica varia significativamente entre 500 e 1.600 MHz, com uma média de 838 MHz. A velocidade de armazenamento varia em torno de 1,4 GHz, com o aquecimento da GPU até cerca de 70 °C (158 °F). Medimos um consumo de energia de cerca de 66 W.
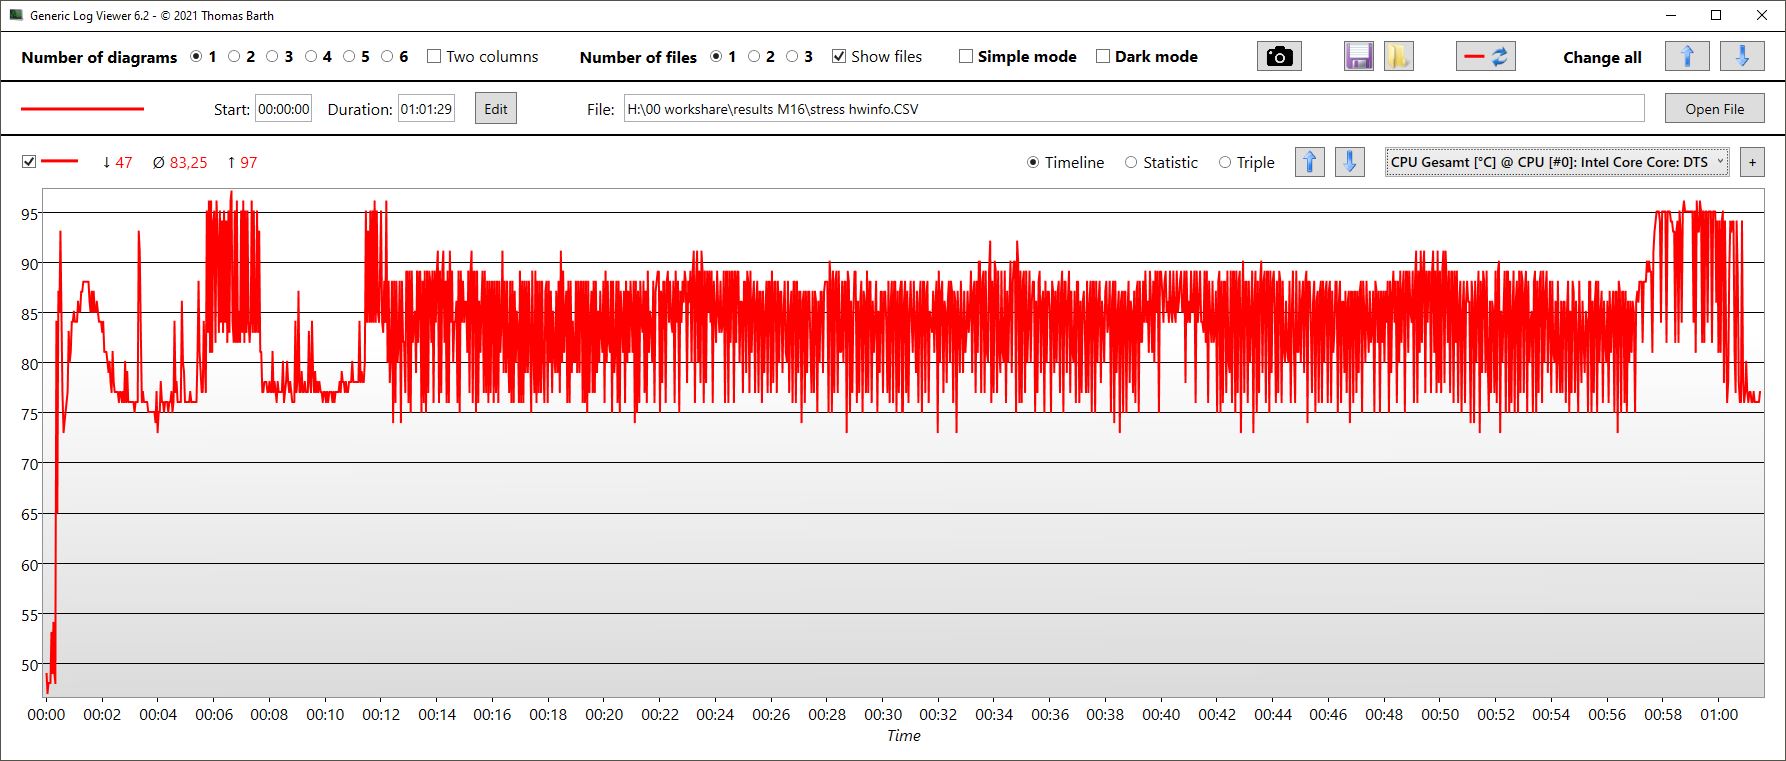
| Relógio CPU (GHz) | Relógio GPU (MHz) | Temperatura média da CPU (°C) | Temperatura média da GPU (°C) | |
| Prime95 + FurMark Stress | 2,4 | 838 | 83 | 70 |
| O Witcher 3 Stress | 1.1 | 1.288 | 68 | 72 |
Oradores
A Asus toma um caminho especial com os alto-falantes na M16: em vez dos alto-falantes estéreo usuais, o fabricante usa quatro alto-falantes com 2 W cada, dois para as altas freqüências e dois para os tons mais baixos. Isto se torna bastante perceptível, e os alto-falantes não só são relativamente altos, mas também oferecem médias e altas equilibradas, e até mesmo os graves não estão tão subrepresentados como em muitos concorrentes.
No entanto, eles ainda não podem substituir os alto-falantes externos decentes de meio caminho. Para a conexão de dispositivos de áudio analógicos, você pode usar uma porta de áudio combinada.
Asus ROG Zephyrus M16 GU603Z análise de áudio
(+) | os alto-falantes podem tocar relativamente alto (###valor### dB)
Graves 100 - 315Hz
(±) | graves reduzidos - em média 11.6% menor que a mediana
(±) | a linearidade dos graves é média (9.2% delta para a frequência anterior)
Médios 400 - 2.000 Hz
(+) | médios equilibrados - apenas 4.3% longe da mediana
(+) | médios são lineares (5.7% delta para frequência anterior)
Altos 2 - 16 kHz
(+) | agudos equilibrados - apenas 1.6% longe da mediana
(+) | os máximos são lineares (3.9% delta da frequência anterior)
Geral 100 - 16.000 Hz
(+) | o som geral é linear (10.1% diferença em relação à mediana)
Comparado com a mesma classe
» 5% de todos os dispositivos testados nesta classe foram melhores, 2% semelhantes, 93% piores
» O melhor teve um delta de 6%, a média foi 18%, o pior foi 132%
Comparado com todos os dispositivos testados
» 5% de todos os dispositivos testados foram melhores, 2% semelhantes, 94% piores
» O melhor teve um delta de 4%, a média foi 23%, o pior foi 134%
Lenovo Legion 5 Pro 16ARH7H RTX 3070 Ti análise de áudio
(±) | o volume do alto-falante é médio, mas bom (###valor### dB)
Graves 100 - 315Hz
(-) | quase nenhum baixo - em média 22.3% menor que a mediana
(-) | graves não são lineares (15.4% delta para frequência anterior)
Médios 400 - 2.000 Hz
(±) | médios mais altos - em média 7.1% maior que a mediana
(±) | a linearidade dos médios é média (9.5% delta para frequência anterior)
Altos 2 - 16 kHz
(+) | agudos equilibrados - apenas 1.9% longe da mediana
(+) | os máximos são lineares (3.6% delta da frequência anterior)
Geral 100 - 16.000 Hz
(-) | o som geral não é linear (30.3% diferença em relação à mediana)
Comparado com a mesma classe
» 96% de todos os dispositivos testados nesta classe foram melhores, 2% semelhantes, 3% piores
» O melhor teve um delta de 6%, a média foi 18%, o pior foi 132%
Comparado com todos os dispositivos testados
» 89% de todos os dispositivos testados foram melhores, 3% semelhantes, 9% piores
» O melhor teve um delta de 4%, a média foi 23%, o pior foi 134%
Gerenciamento de energia - Eficiente quando se joga mas ocioso é inconsistente
Consumo de energia
Infelizmente, o consumo ocioso varia fortemente e fica bastante elevado, mesmo que o gerente de tarefas não mostre nenhum processo que atrapalhe. Este também é o caso, mesmo após uma operação mais longa. Gostaríamos de receber aqui algumas atualizações de motoristas da Asus.
Enquanto se joga, o consumo da M16 é surpreendentemente baixo (144 W). O Vision 16 Pro consome cerca de 8% a mais, e o mais potente Legion 5 Pro até 45%! Considerando o desempenho adicional do Legion 5, isto não é muito surpreendente, mas a extensão da diferença é, já que mesmo o significativamente mais fraco predecessor consumiu mais energia quando jogava
.Se selecionarmos o modo Turbo para o M16, ele consome 175 W enquanto joga(O Witcher 3 )em vez de 144 W (gráfico azul). Isto é então um pouco mais do que o Vision 16 Pro, mas ainda menos do que os 209 W do Legion 5 Pro.
Medimos picos de carga temporários de até 220 W a partir da fonte de alimentação de 240 W, portanto, esta deve estar suficientemente equipada para todos os cenários de uso.
| desligado | |
| Ocioso | |
| Carga |
|
Key:
min: | |
| Asus ROG Zephyrus M16 GU603Z i9-12900H, GeForce RTX 3070 Ti Laptop GPU, Micron 3400 1TB MTFDKBA1T0TFH, IPS, 2560x1600, 16" | Asus ROG Zephyrus M16 GU603H i9-11900H, GeForce RTX 3070 Laptop GPU, Samsung PM9A1 MZVL22T0HBLB, IPS, 2560x1600, 16" | Schenker Vision 16 Pro RTX 3070 Ti i7-12700H, GeForce RTX 3070 Ti Laptop GPU, Samsung SSD 980 Pro 1TB MZ-V8P1T0BW, IPS, 2560x1600, 16" | Lenovo Legion 5 Pro 16ARH7H RTX 3070 Ti R7 6800H, GeForce RTX 3070 Ti Laptop GPU, Samsung PM9A1 MZVL21T0HCLR, IPS, 2560x1600, 16" | Schenker XMG Focus 16 (i7-12700H, RTX 3060) i7-12700H, GeForce RTX 3060 Laptop GPU, Samsung SSD 980 Pro 1TB MZ-V8P1T0BW, IPS, 2560x1600, 16" | Corsair Voyager a1600 R9 6900HS, Radeon RX 6800M, Samsung PM9A1 MZVL22T0HBLB, IPS, 2560x1600, 16" | Média NVIDIA GeForce RTX 3070 Ti Laptop GPU | Média da turma Gaming | |
|---|---|---|---|---|---|---|---|---|
| Power Consumption | -14% | 14% | -30% | -16% | -32% | -23% | -17% | |
| Idle Minimum * (Watt) | 10.8 | 11 -2% | 9 17% | 9.7 10% | 14.7 -36% | 16.9 -56% | 14.2 ? -31% | 13 ? -20% |
| Idle Average * (Watt) | 17 | 20 -18% | 13.3 22% | 14.8 13% | 18.6 -9% | 20.3 -19% | 19.9 ? -17% | 19 ? -12% |
| Idle Maximum * (Watt) | 17.8 | 30 -69% | 14.3 20% | 45.8 -157% | 21.2 -19% | 22.2 -25% | 26.2 ? -47% | 24.6 ? -38% |
| Load Average * (Watt) | 116 | 111 4% | 107 8% | 87.2 25% | 121 -4% | 133.4 -15% | 125.8 ? -8% | 110.7 ? 5% |
| Witcher 3 ultra * (Watt) | 144 | 156 -8% | 155.2 -8% | 209 -45% | 174 -21% | 206 -43% | ||
| Load Maximum * (Watt) | 220 | 197 10% | 172 22% | 275.3 -25% | 235 -7% | 248 ? -13% | 259 ? -18% |
* ... menor é melhor
Power Consumption The Witcher 3 / Stress Test
Power Consumption with External Monitor
Vida útil da bateria
O Asus não lista nenhum modo de economia de energia real nas opções de desempenho. Se você puxar o plugue, a M16 muda automaticamente para o modo Silencioso.
A capacidade da bateria é de 90 Wh, o que é decente em comparação. O Vision 16 Pro e o Legion 5 oferecem apenas uma capacidade de 80 Wh. Isto faz com que a M16 dure correspondentemente mais tempo.
Dependendo do brilho do visor, os tempos de funcionamento variam significativamente. Em nosso teste WiFi, a M16 dura entre 5 horas (com brilho total) e cerca de 7,5 horas (com 150 nits).
Você pode esperar mais ou menos o mesmo ao assistir filmes.
| Asus ROG Zephyrus M16 GU603Z i9-12900H, GeForce RTX 3070 Ti Laptop GPU, 90 Wh | Asus ROG Zephyrus M16 GU603H i9-11900H, GeForce RTX 3070 Laptop GPU, 90 Wh | Schenker Vision 16 Pro RTX 3070 Ti i7-12700H, GeForce RTX 3070 Ti Laptop GPU, 80 Wh | Lenovo Legion 5 Pro 16ARH7H RTX 3070 Ti R7 6800H, GeForce RTX 3070 Ti Laptop GPU, 80 Wh | Schenker XMG Focus 16 (i7-12700H, RTX 3060) i7-12700H, GeForce RTX 3060 Laptop GPU, 54 Wh | Corsair Voyager a1600 R9 6900HS, Radeon RX 6800M, 99 Wh | Média da turma Gaming | |
|---|---|---|---|---|---|---|---|
| Duração da bateria | 9% | -14% | -41% | -18% | 3% | 6% | |
| H.264 (h) | 7.3 | 6.1 -16% | 6 -18% | 8.32 ? 14% | |||
| WiFi v1.3 (h) | 7.4 | 7.7 4% | 6 -19% | 4.4 -41% | 4.8 -35% | 5.8 -22% | 7.11 ? -4% |
| Load (h) | 1.4 | 1.6 14% | 1.3 -7% | 1.4 0% | 2.1 50% | 1.502 ? 7% | |
| Reader / Idle (h) | 13.3 | 7 | 8.27 ? |
Pro
Contra
Veredicto - Um laptop de jogo bem redondo com um display de 16:10

O Asus ROG Zephyrus M16 é um laptop para jogos bem otimizado em geral, sem nenhuma área problemática significativa. Além do desempenho muito bom da CPU e da vida útil decente da bateria, a grande tela QHD+ de 16 polegadas no formato 16:10 também sabe como agradar com seus contrastes poderosos e uma cobertura de espaço de cores bastante alta.
Considerando o fato de que muitos concorrentes não possuem nenhum leitor de cartões SD, podemos perdoar que o Asus utilize apenas um leitor de cartões microSD, especialmente porque o dispositivo utilizado aqui é bastante rápido.RTX 3070 Titem apenas um TGP de 120 W, mas isto também significa que o laptop não fica muito quente e os níveis de ruído também permanecem dentro dos limites. Por outro lado, o Asus poderia otimizar o controle do ventilador, já que de tempos em tempos, os ventiladores podem, de repente, girar até 47 dB mesmo durante a operação ociosa.
A M16 se apresenta em sua maioria como um pacote de jogos bem completo. Apesar de não oferecer o máximo desempenho, o pacote é consistente com temperaturas e níveis de ruído moderados.
Aqueles que precisam de um desempenho superior podem dar uma olhada no Lenovo Legion 5 Proou você pode simplesmente ligar o modo Turbo igualmente alto na M16, levando a um aumento de desempenho notável e mensurável também aqui.
Preço e Disponibilidade
A Amazon lista várias configurações do Asus ROG Zephyrus M16 de 2022 a partir de $2249.
Asus ROG Zephyrus M16 GU603Z
- 02/14/2023 v7 (old)
Christian Hintze
Transparência
A seleção dos dispositivos a serem analisados é feita pela nossa equipe editorial. A amostra de teste foi fornecida ao autor como empréstimo pelo fabricante ou varejista para fins desta revisão. O credor não teve influência nesta revisão, nem o fabricante recebeu uma cópia desta revisão antes da publicação. Não houve obrigação de publicar esta revisão. Como empresa de mídia independente, a Notebookcheck não está sujeita à autoridade de fabricantes, varejistas ou editores.
É assim que o Notebookcheck está testando
Todos os anos, o Notebookcheck analisa de forma independente centenas de laptops e smartphones usando procedimentos padronizados para garantir que todos os resultados sejam comparáveis. Desenvolvemos continuamente nossos métodos de teste há cerca de 20 anos e definimos padrões da indústria no processo. Em nossos laboratórios de teste, equipamentos de medição de alta qualidade são utilizados por técnicos e editores experientes. Esses testes envolvem um processo de validação em vários estágios. Nosso complexo sistema de classificação é baseado em centenas de medições e benchmarks bem fundamentados, o que mantém a objetividade.Price comparison

