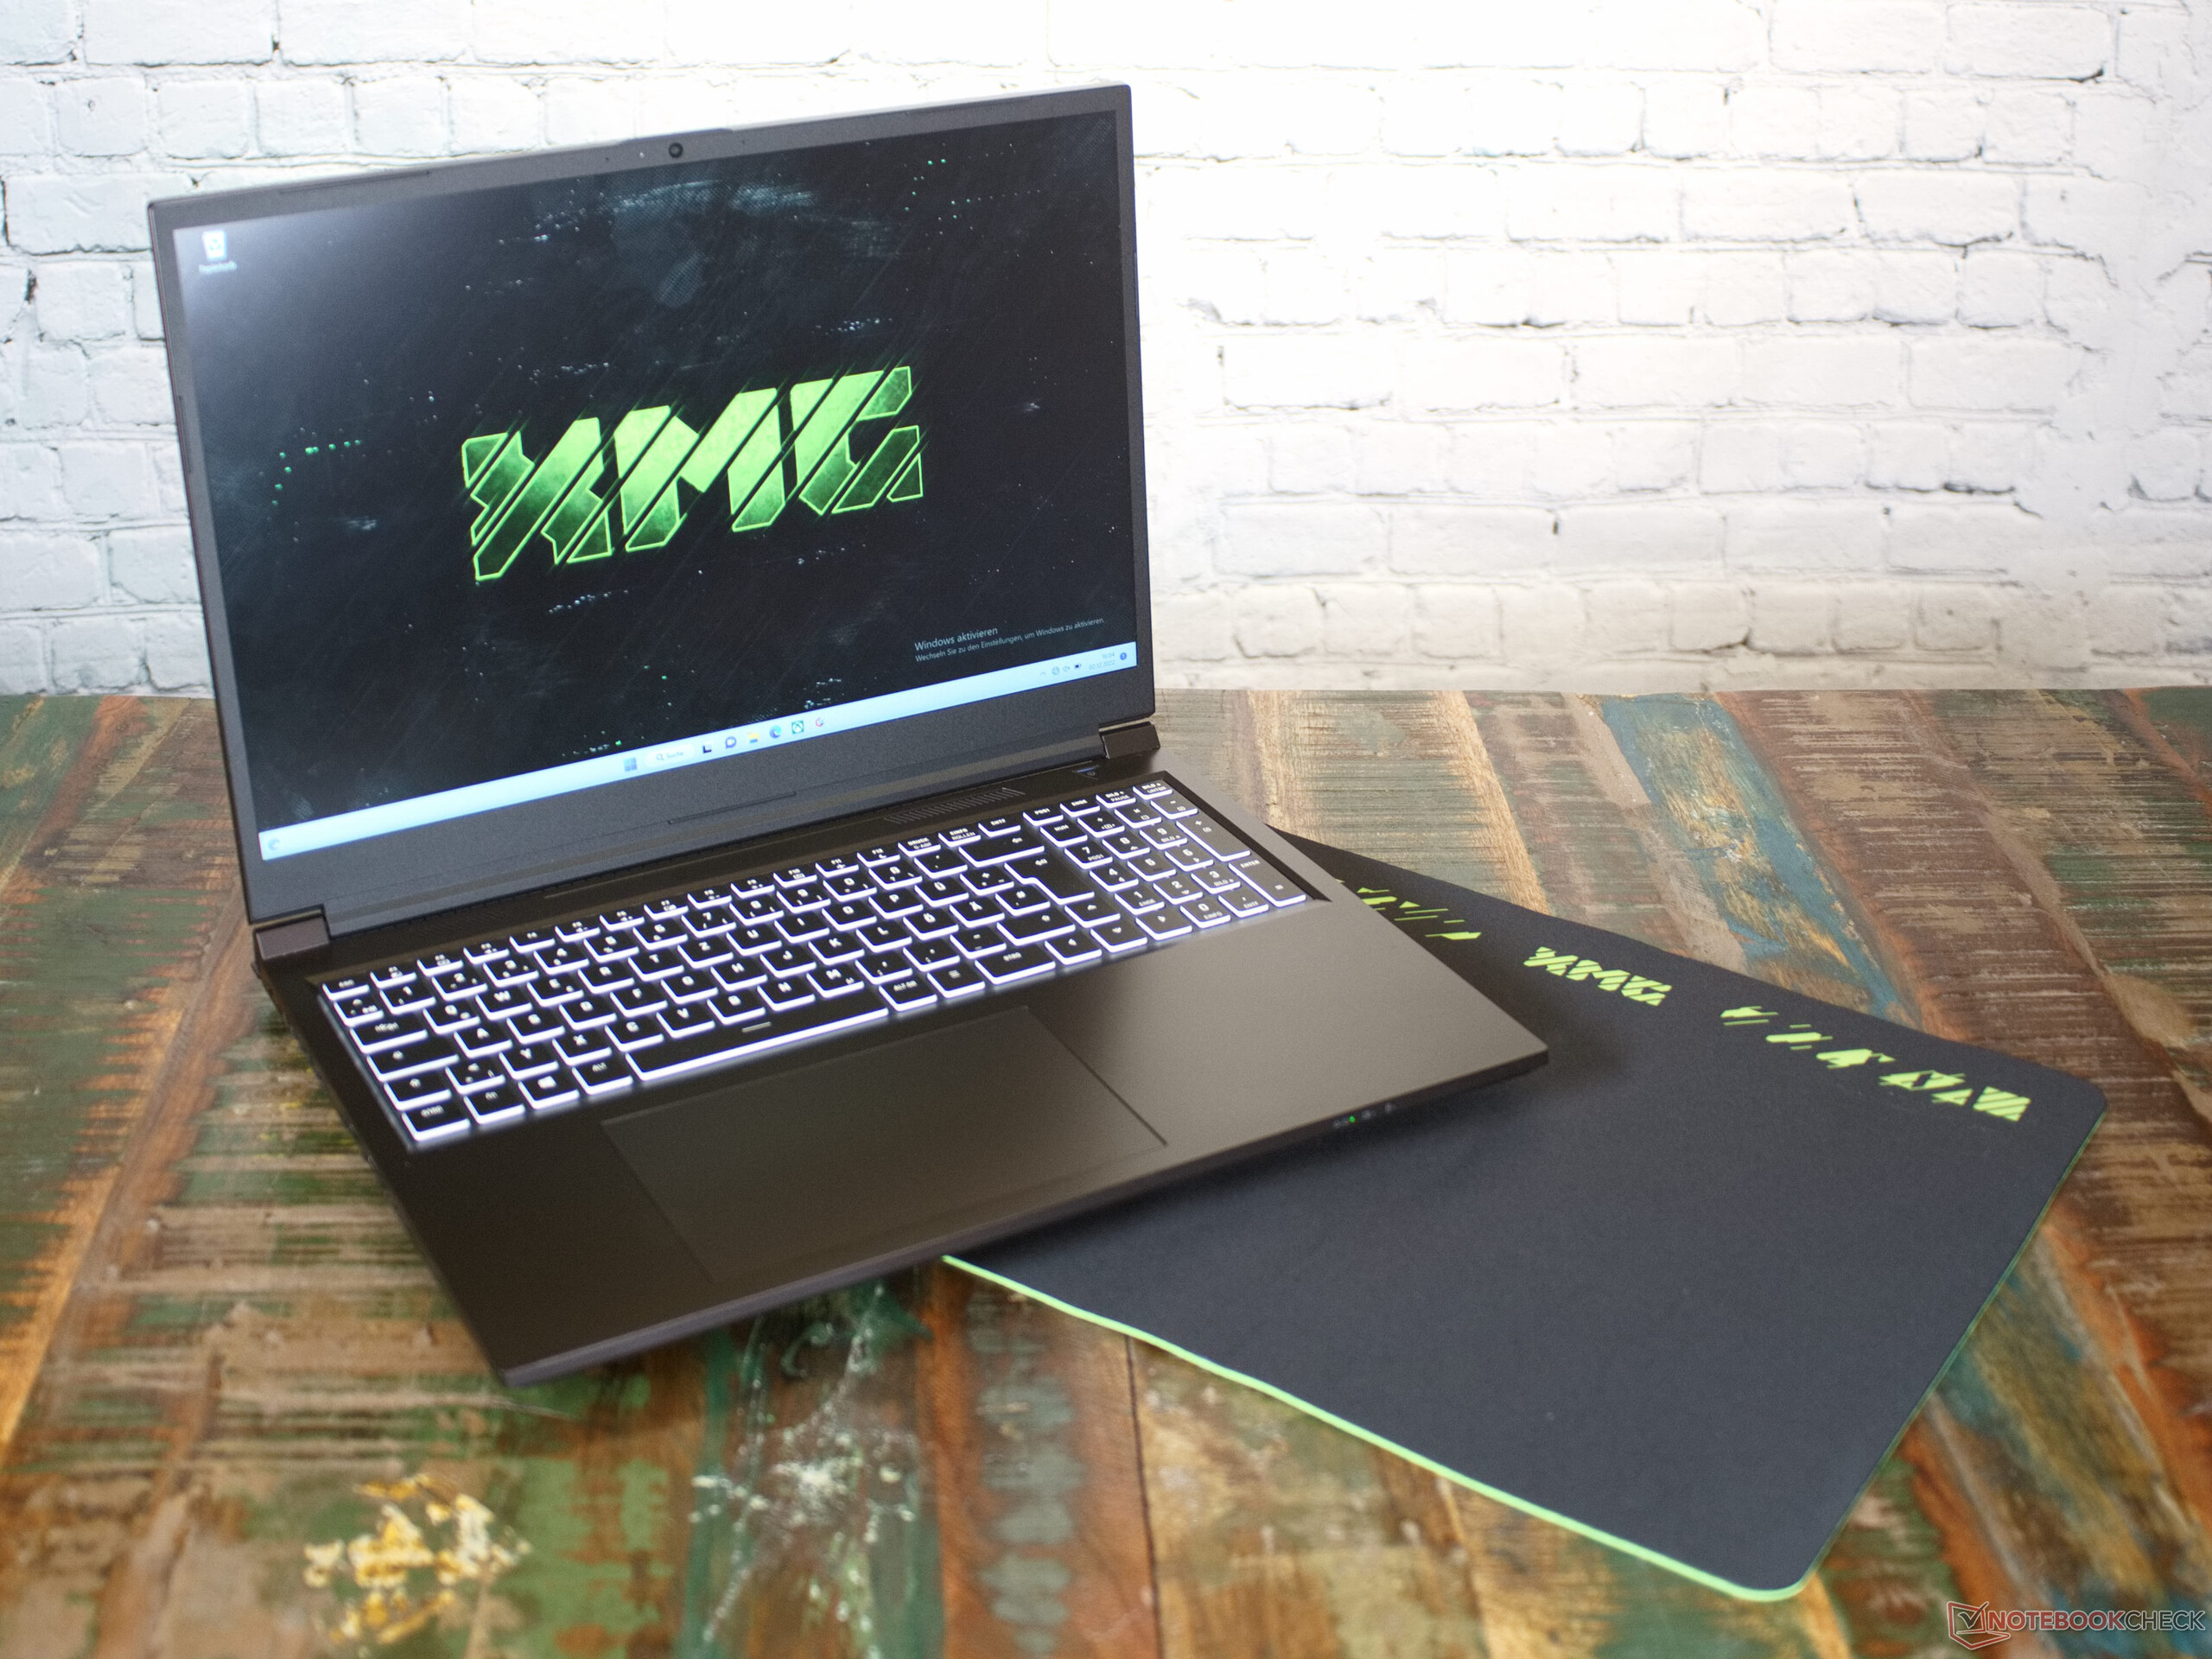
Schenker XMG Focus 16 revisão de laptop: Uma máquina de jogos montada na Alemanha
Os laptops de Leipzig estão disponíveis no fabricante alemão de computadores, Schenker. No XMG Focus 16, temos um laptop de gama média com uma tela de 16 polegadas. O laptop é confiável, sólido, e possui o design da marca Schenker. O dispositivo parece um pouco boxeado e não convencional sem ser excessivamente conspícuo. A Schenker equipou o XMG Focus 16 com hardware potente e uma tela com formato 16:10.
Nossos concorrentes foram selecionados principalmente a partir da categoria de preço de laptops de gama média, tais como o Dell G16 7620 ou oLenovo Legion 5 Pro. No entanto, um laptop multimídia fino com especificações similares, oAsus Zenbook Pro 16Xo computador portátil de jogos, é consideravelmente mais fino que os portáteis de jogos típicos, mas oferece níveis de desempenho igualmente elevados.
Possíveis concorrentes em comparação
Avaliação | Data | Modelo | Peso | Altura | Size | Resolução | Preço |
|---|---|---|---|---|---|---|---|
| 87 % v7 (old) | 01/2023 | Schenker XMG Focus 16 (i7-12700H, RTX 3060) i7-12700H, GeForce RTX 3060 Laptop GPU | 2.2 kg | 24.3 mm | 16.00" | 2560x1600 | |
| 88.4 % v7 (old) | 12/2022 | Asus ZenBook Pro 16X OLED UX7602ZM-ME115W i9-12900H, GeForce RTX 3060 Laptop GPU | 2.4 kg | 19.5 mm | 16.00" | 3840x2400 | |
| 86.1 % v7 (old) | 10/2022 | Dell G16 7620 i7-12700H, GeForce RTX 3060 Laptop GPU | 2.6 kg | 26.9 mm | 16.00" | 2560x1600 | |
| 89.5 % v7 (old) | 08/2022 | Asus ROG Flow X16 GV601RW-M5082W R9 6900HS, GeForce RTX 3070 Ti Laptop GPU | 2.1 kg | 19.4 mm | 16.10" | 2560x1600 | |
| 88.7 % v7 (old) | 12/2022 | Lenovo ThinkPad X1 Extreme G5-21DE003RGE i7-12700H, GeForce RTX 3060 Laptop GPU | 2.1 kg | 17.9 mm | 16.00" | 3840x2400 | |
| 87.9 % v7 (old) | 11/2022 | Lenovo Legion Slim 7-16IAH 82TF004YGE i7-12700H, GeForce RTX 3060 Laptop GPU | 2.2 kg | 16.9 mm | 16.00" | 2560x1600 | |
| 86.6 % v7 (old) | 07/2022 | Lenovo Legion 5 Pro 16IAH7H i7-12700H, GeForce RTX 3060 Laptop GPU | 2.6 kg | 27 mm | 16.00" | 2560x1600 |
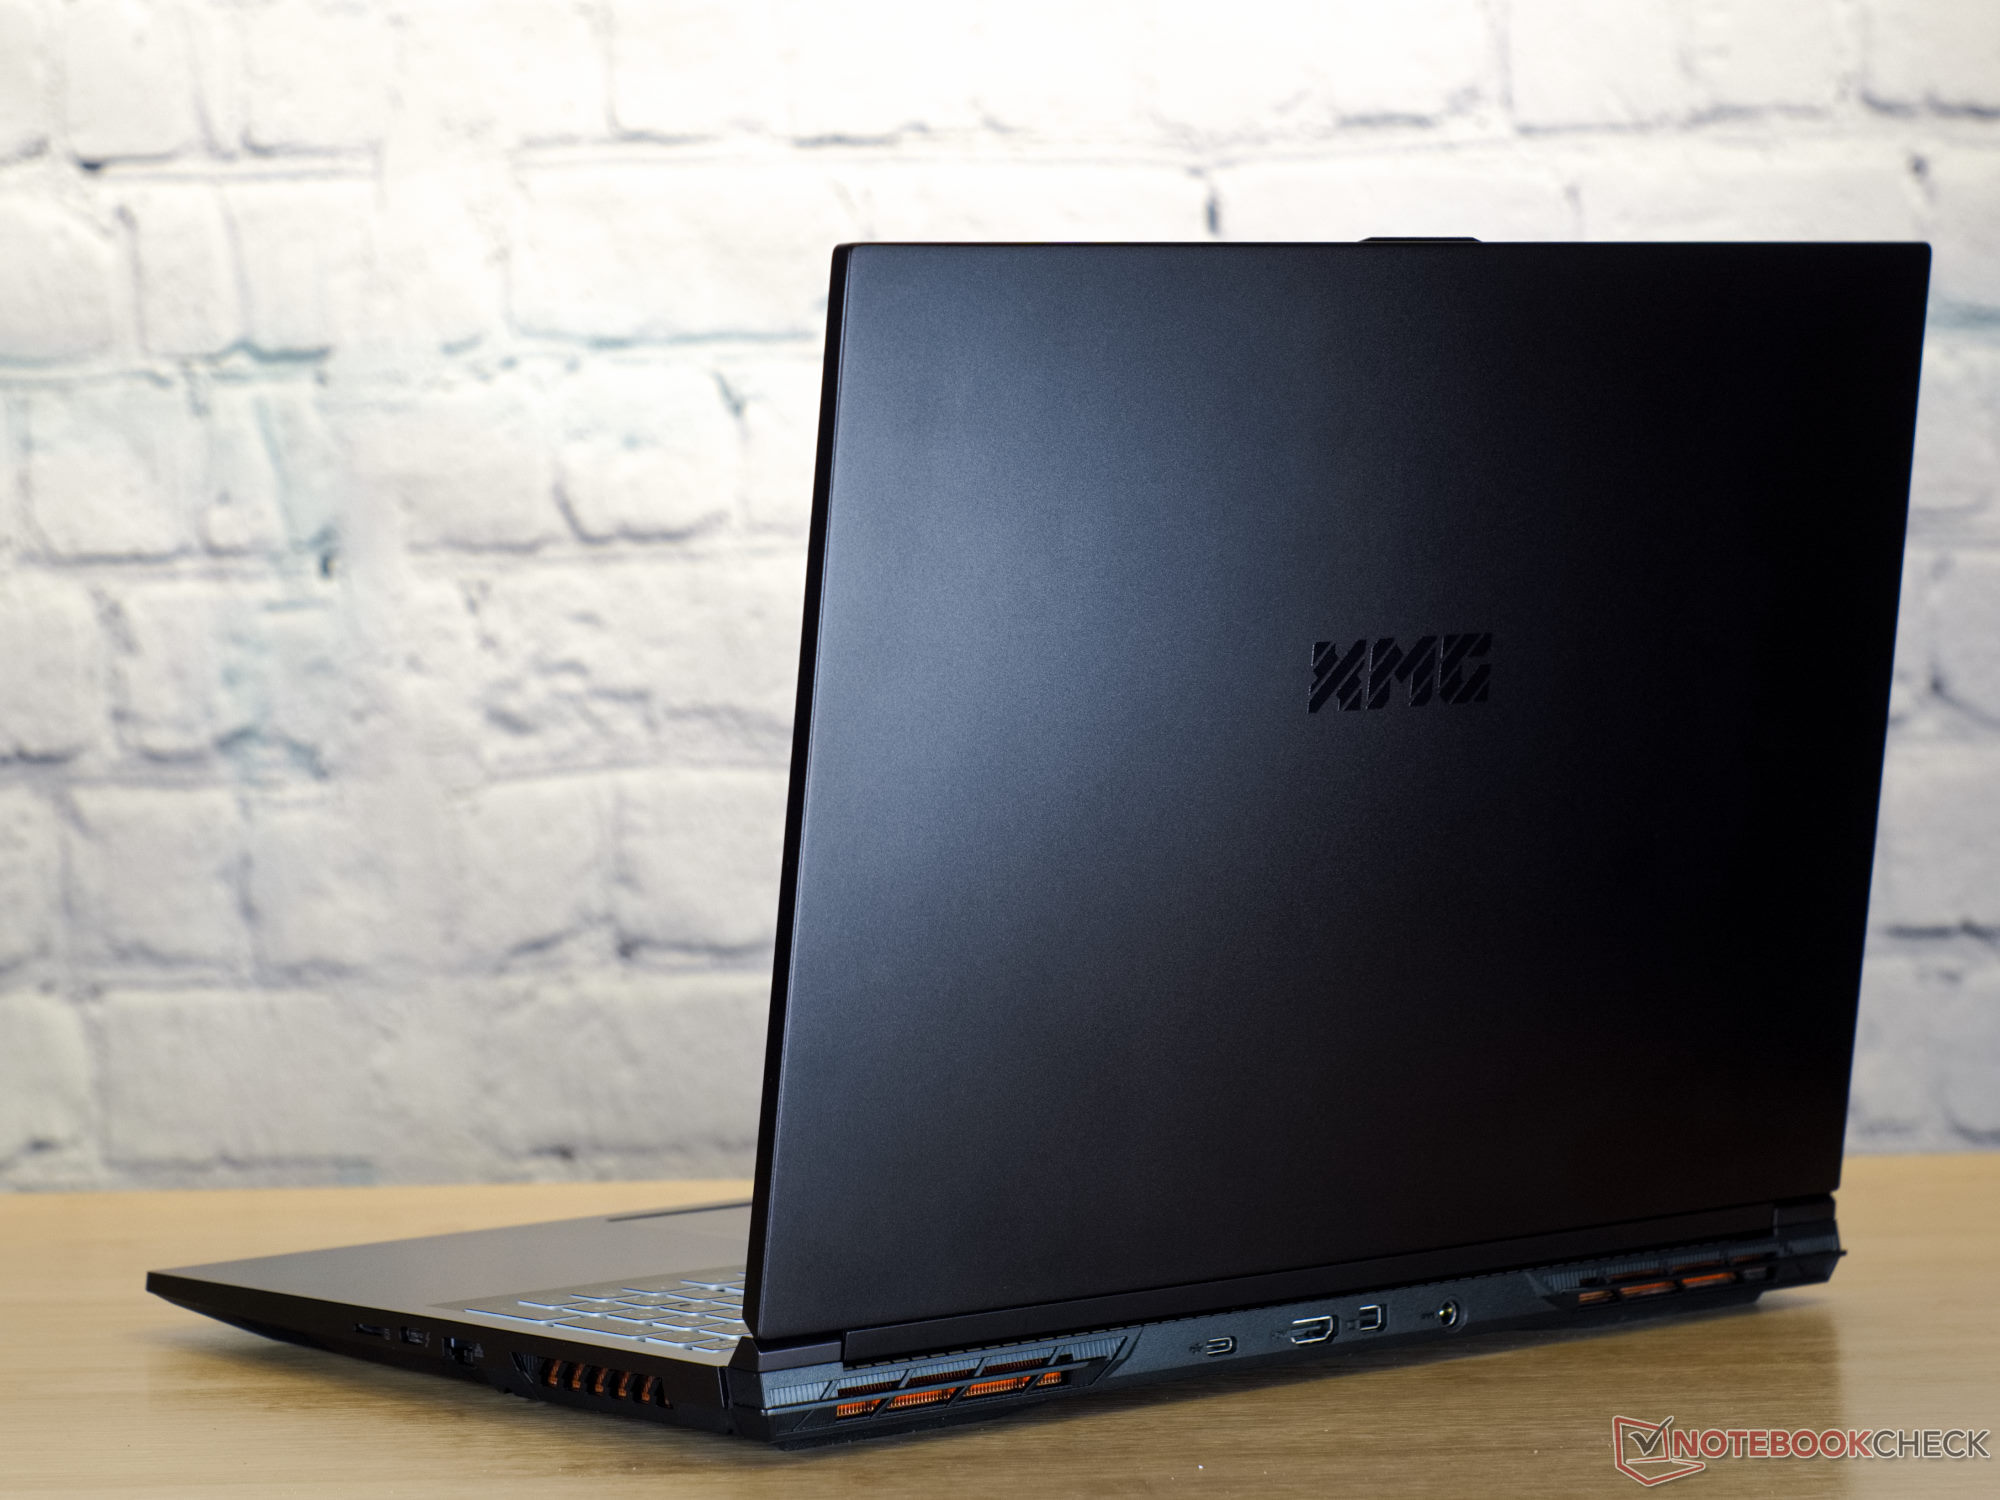
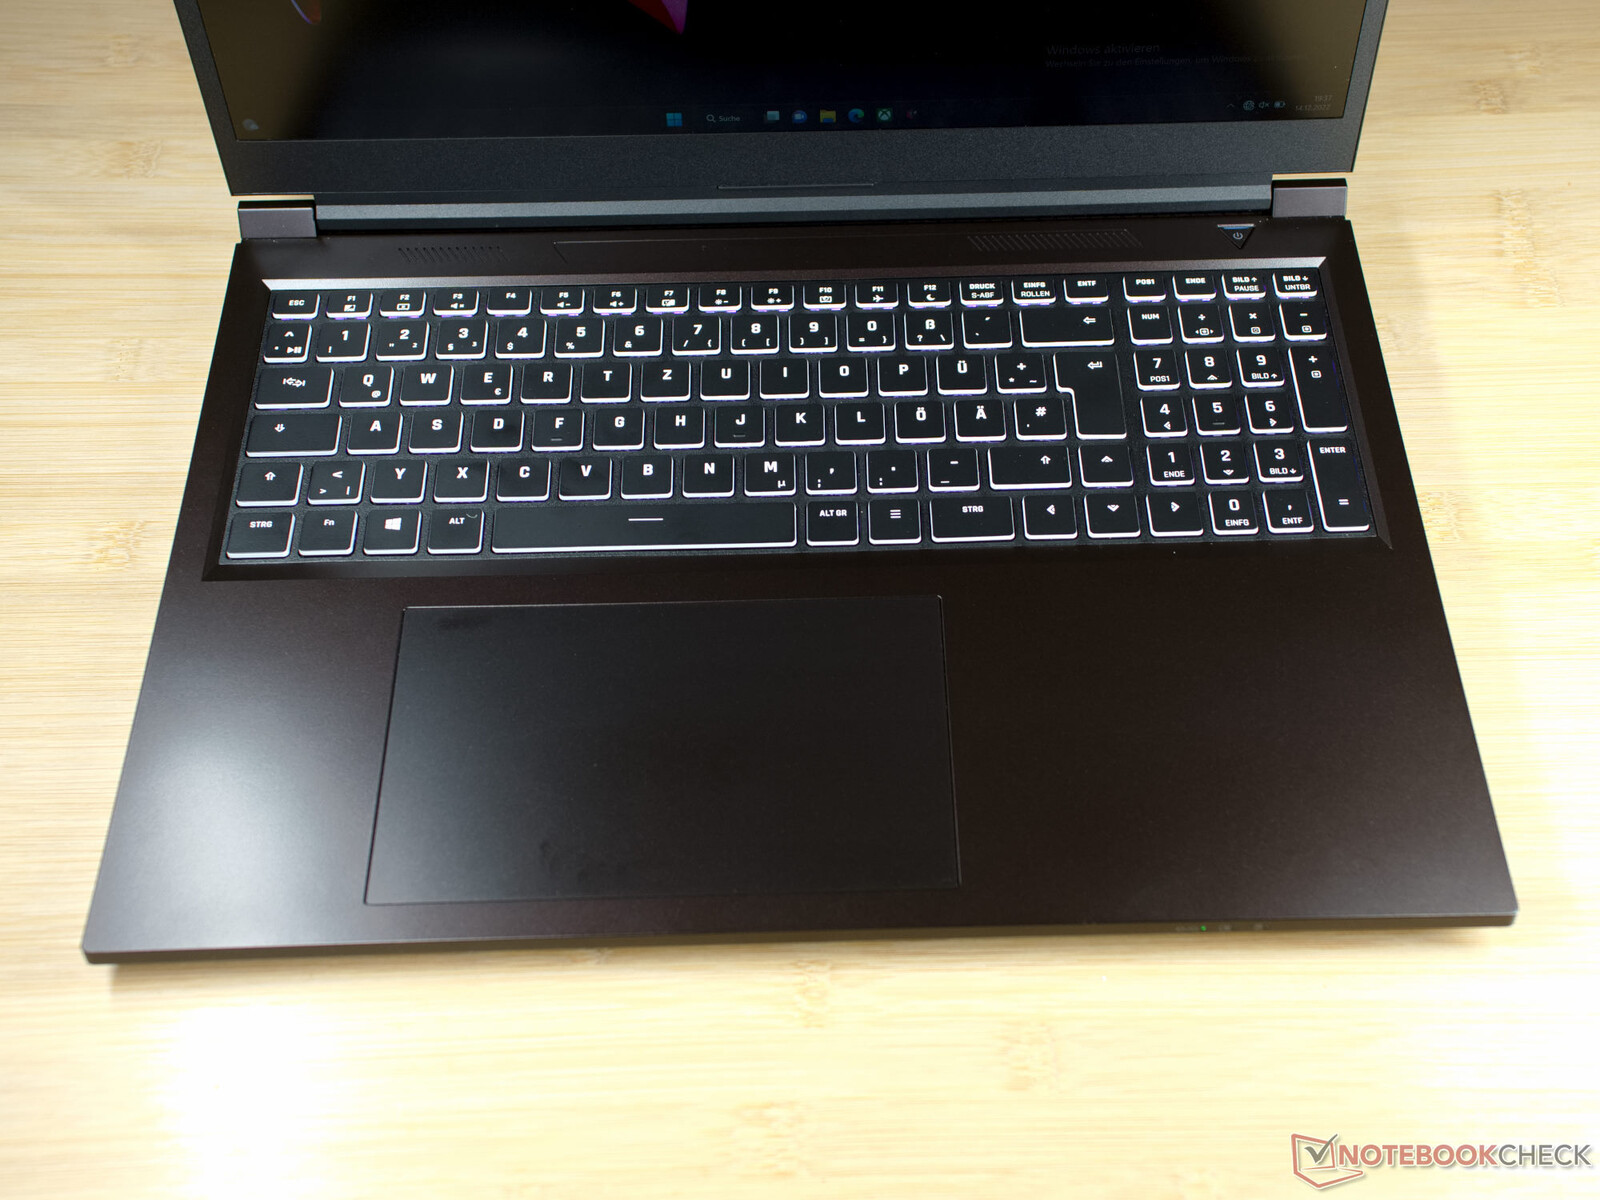
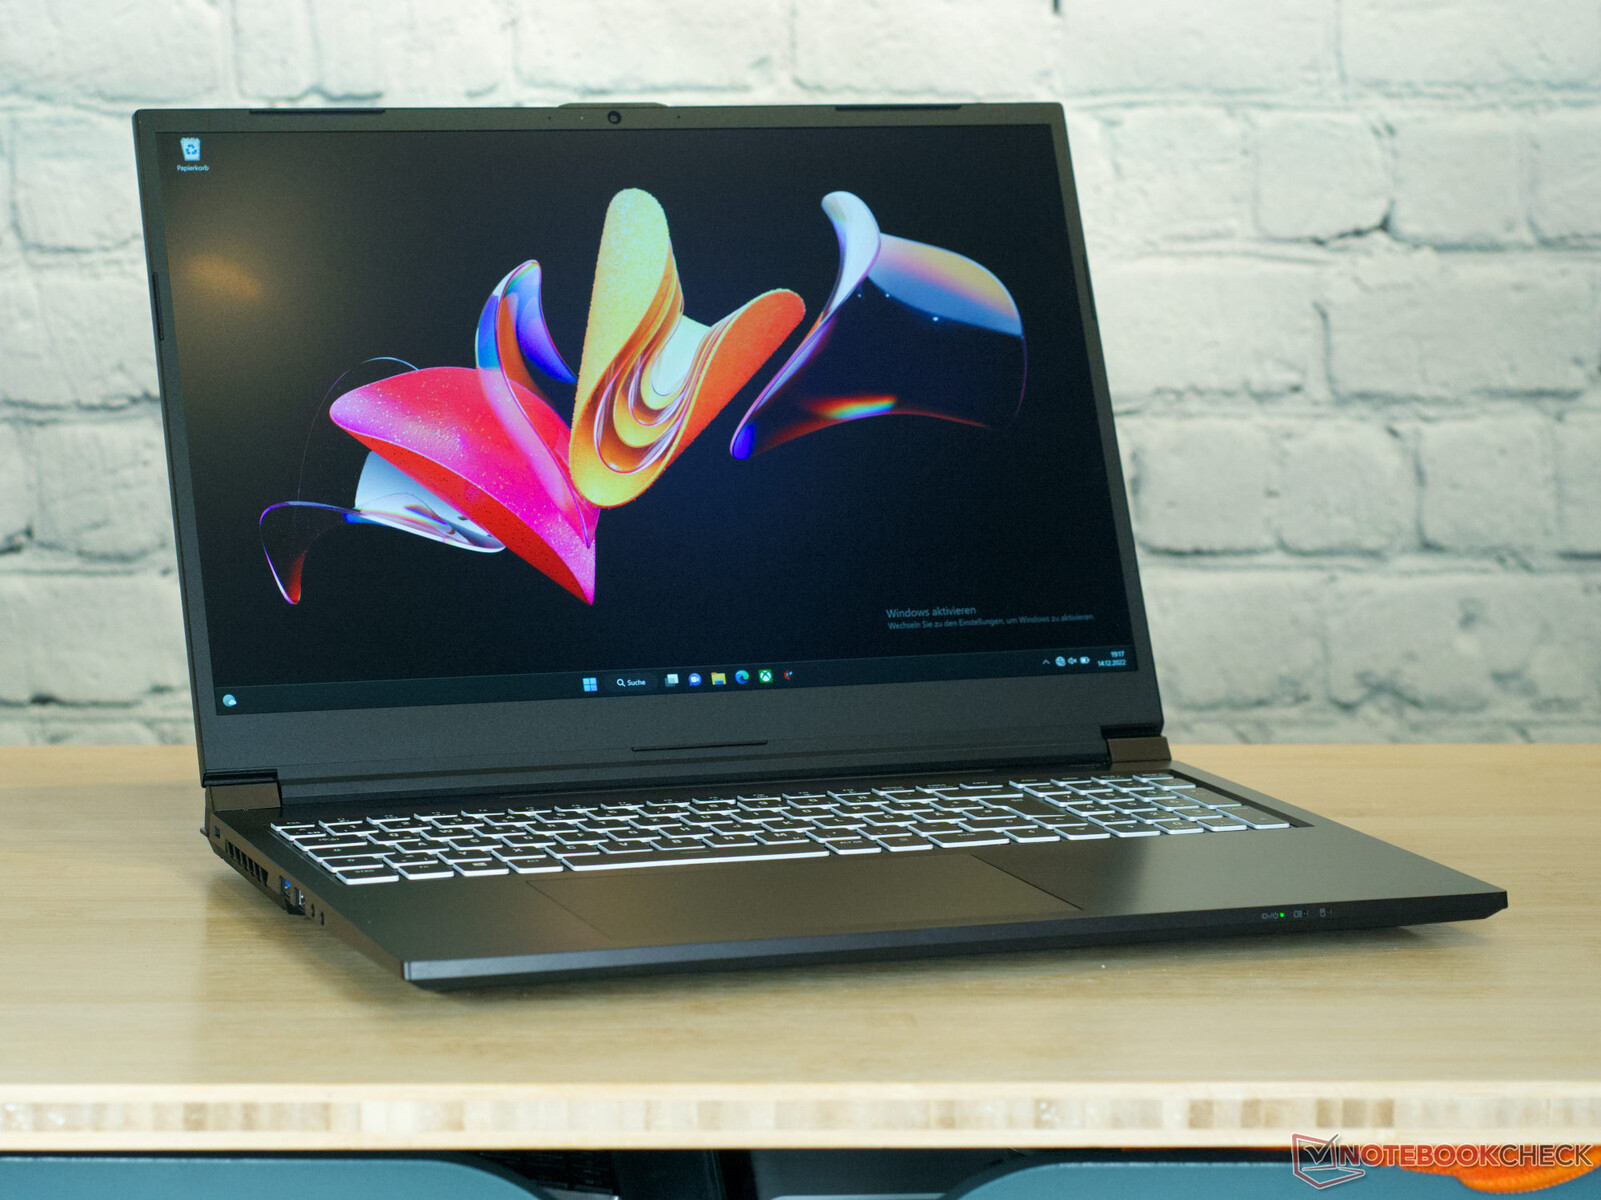
Estojo - preto, boxy e muito alumínio
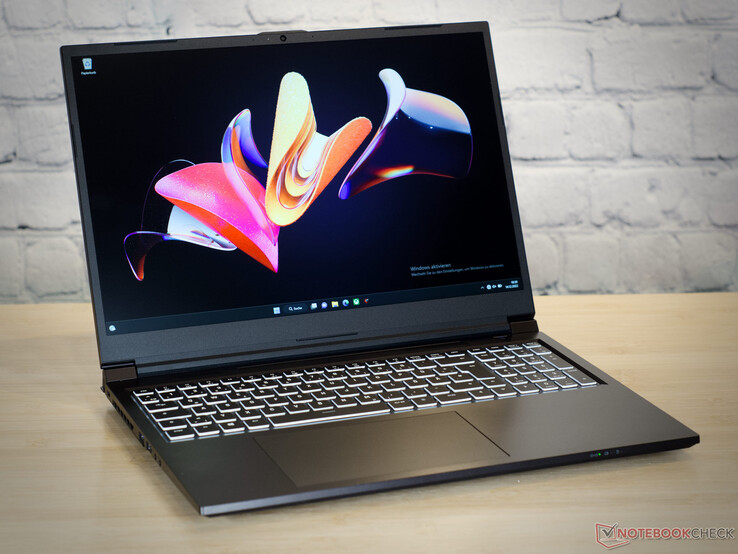
O XMG Schenker Focus 16 é preto e branco e é baseado em um barebone NP60PNP da Clevo. Tanto a tampa do display - que pode ser aberta a um ângulo de 130° - quanto a parte superior da base consistem em alumínio revestido de preto, ao contrário da tampa da base que é feita de plástico preto. Ao abrir o dispositivo, você encontrará o tipo de teclado que normalmente é encontrado em muitos laptops Schenker e Clevo. As teclas individuais possuem bordas brancas e superfícies de digitação pretas. Como em quase todos os laptops Schenker, o XMG Focus 16 é bastante compacto e básico no design, mas tem boa qualidade de construção. Temos um dispositivo confortável em nossas mãos que não mostra sinais de rangidos e ostenta uma dobradiça estável.
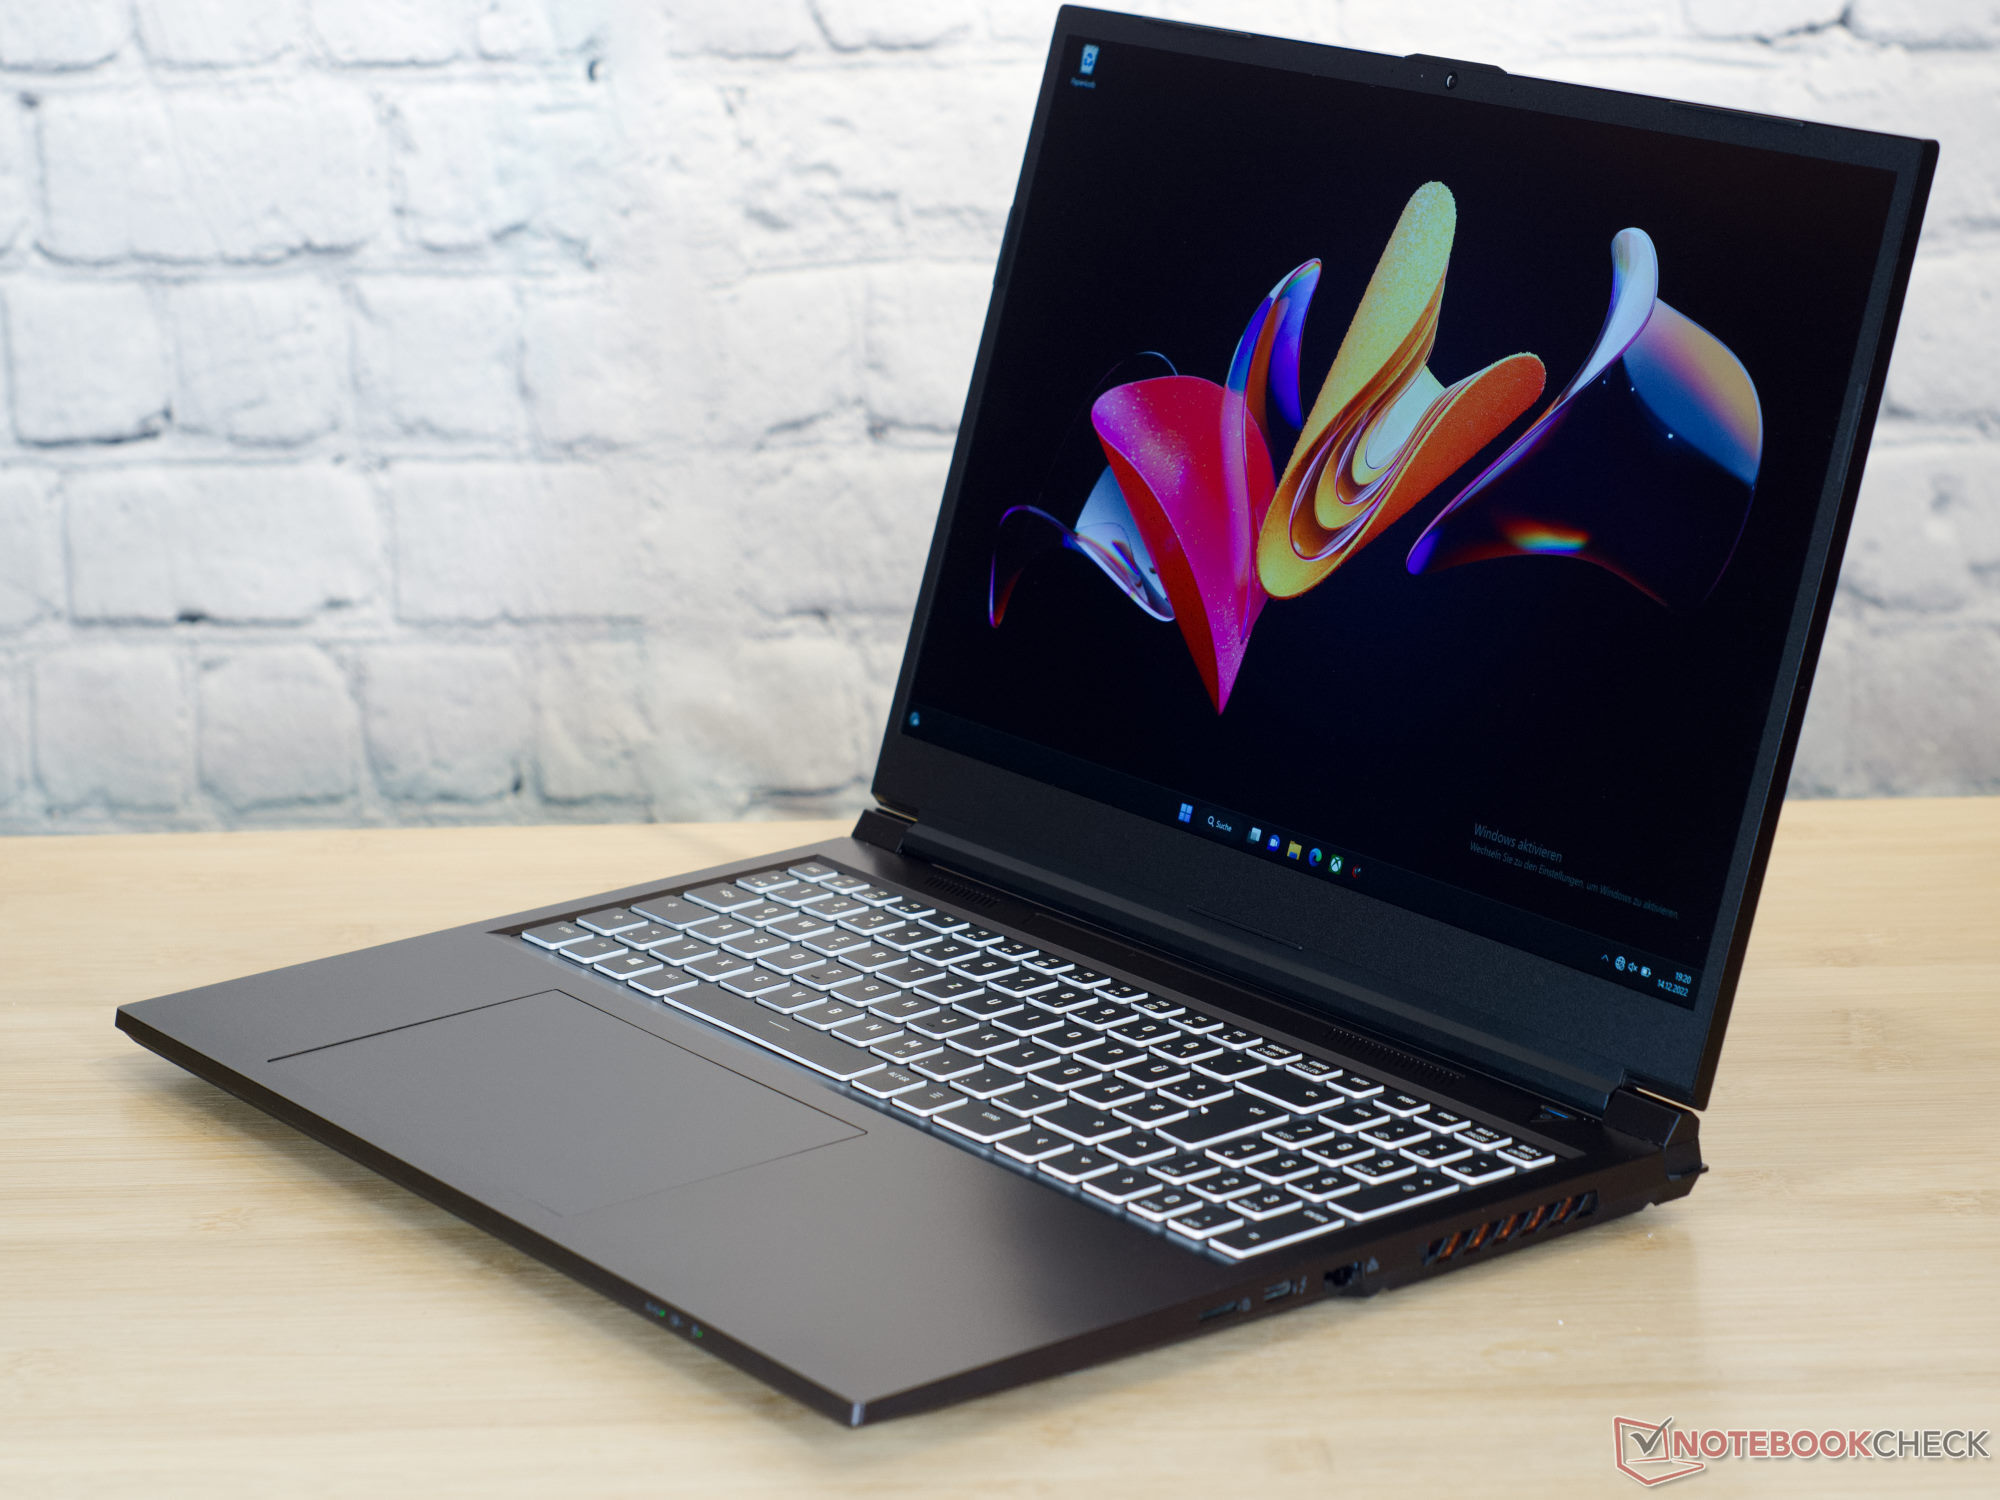
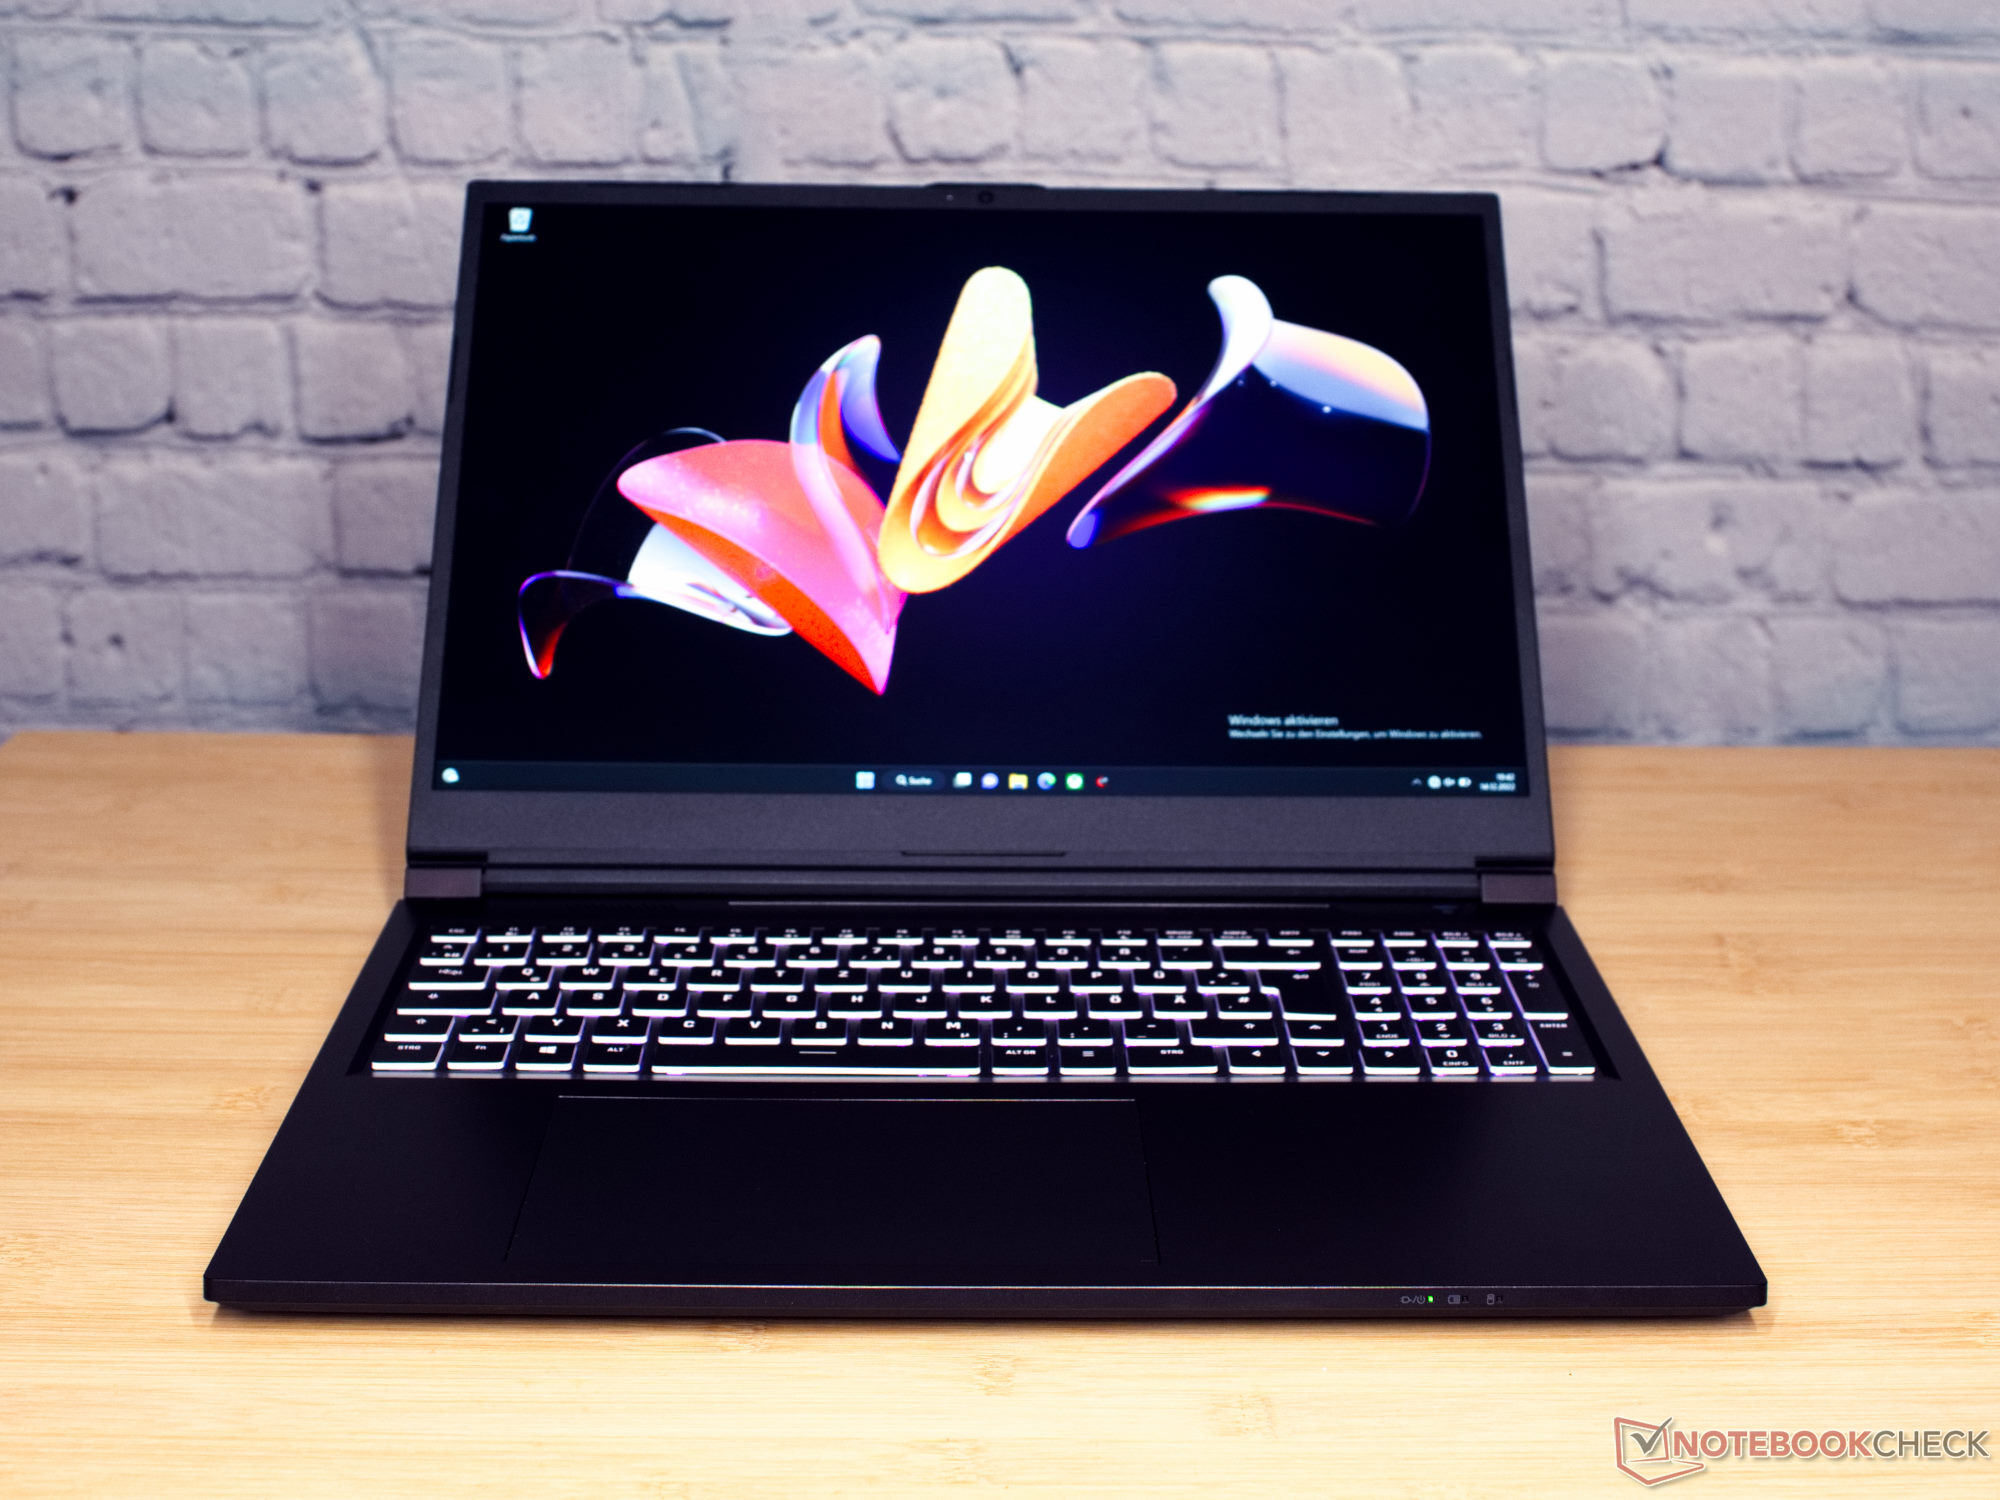
Ao inclinar a balança a 2,3 kg e medindo 2,4 cm de espessura, o laptop para jogos não se destaca de seus concorrentes diretos.
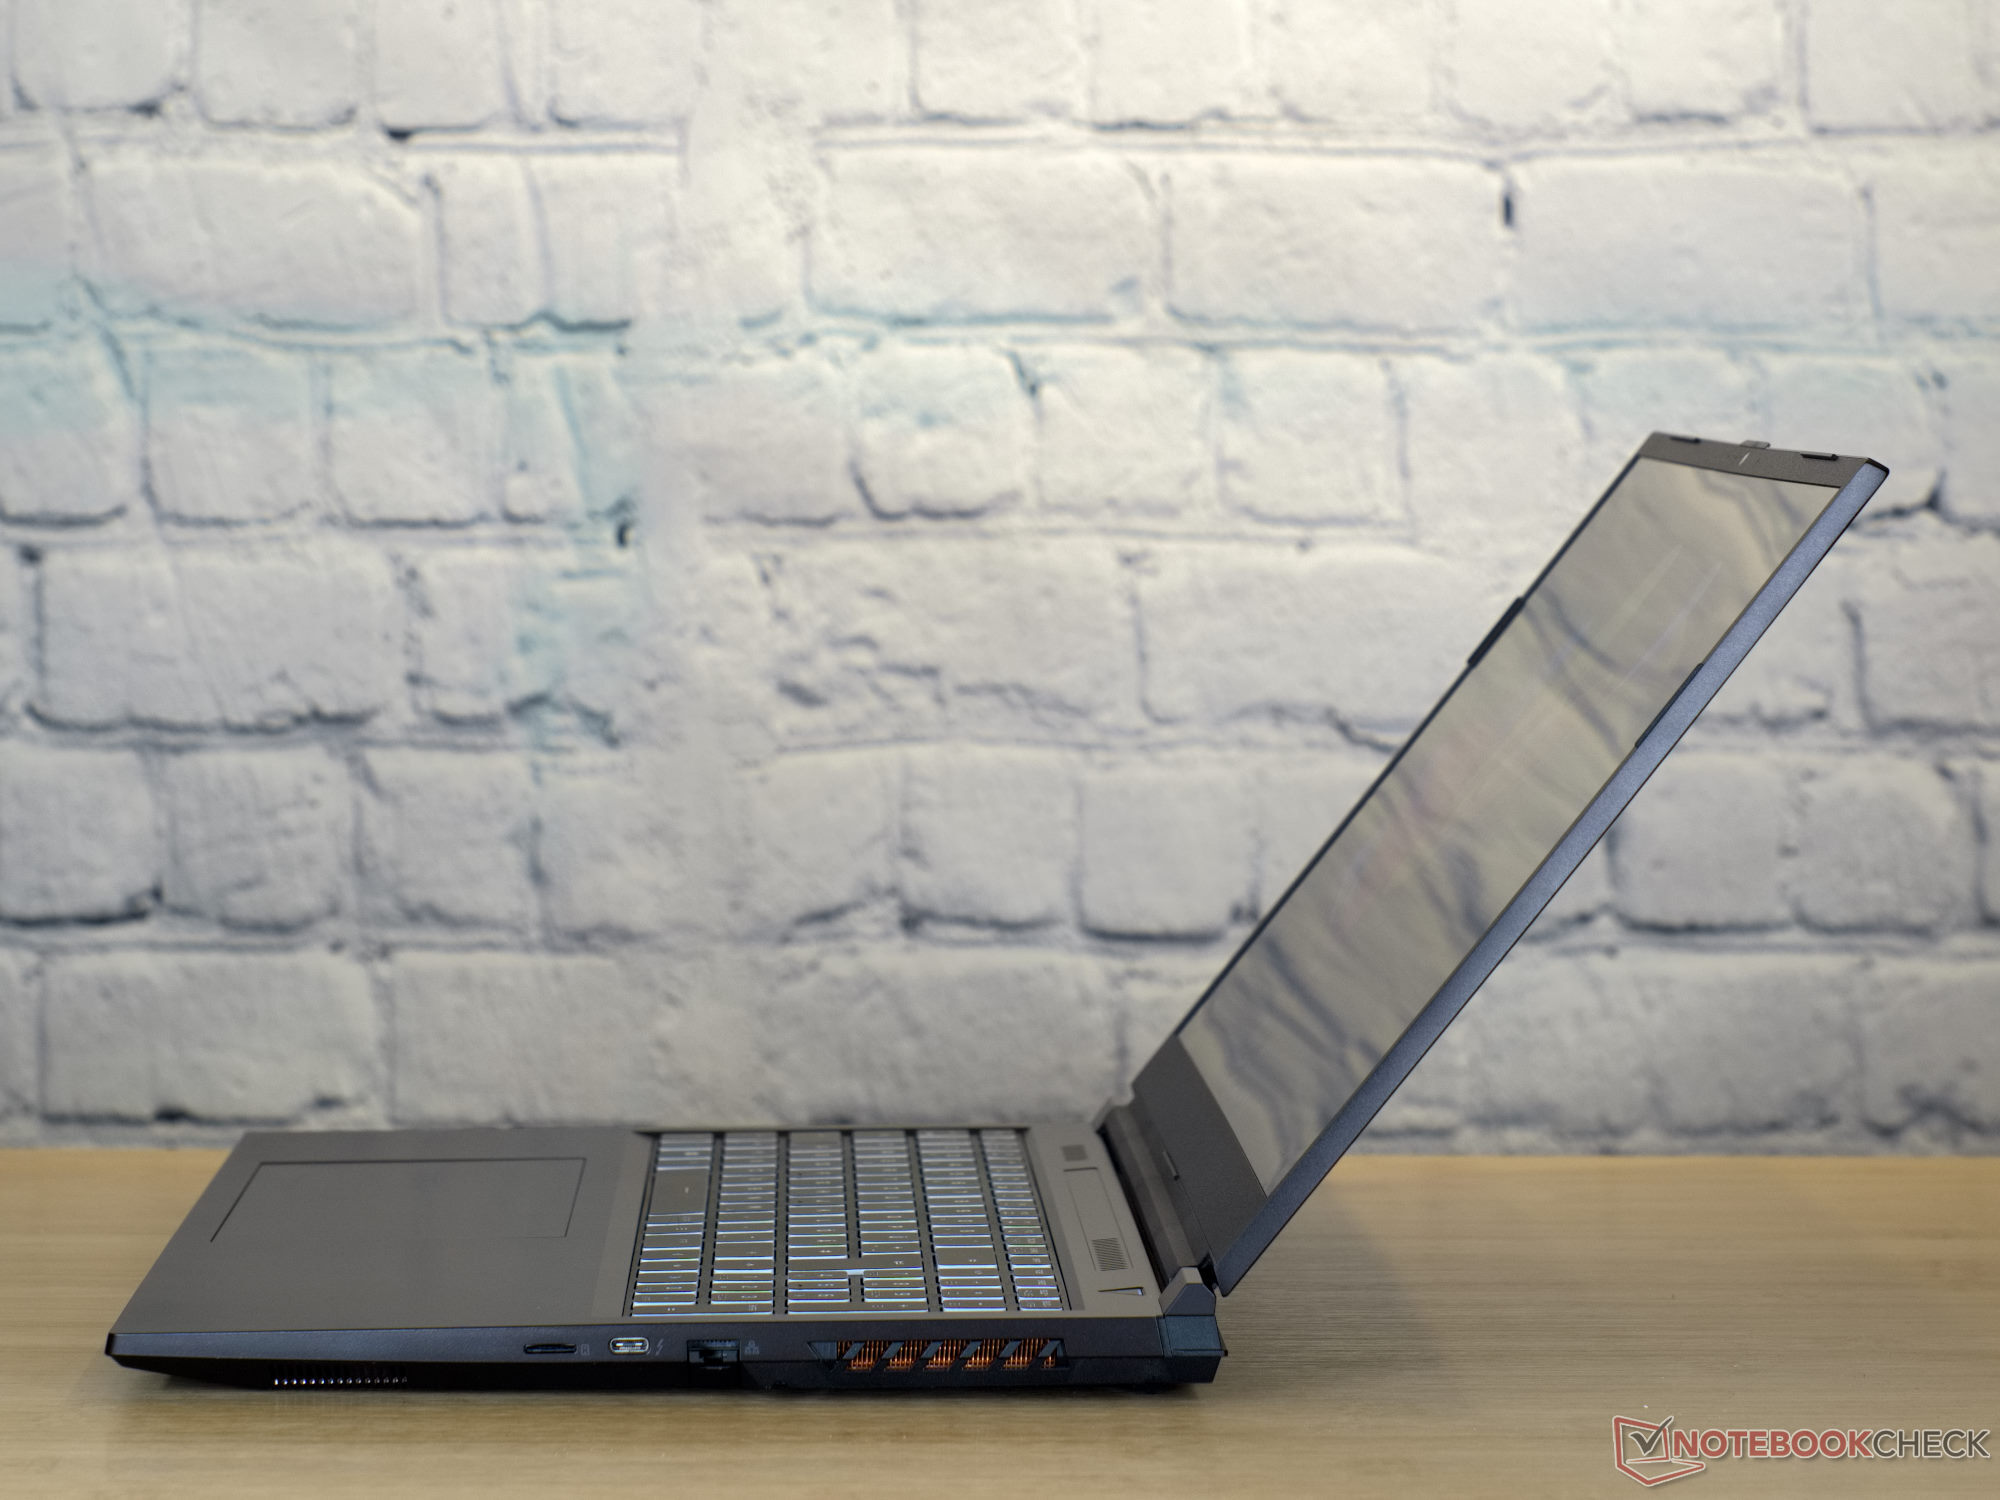
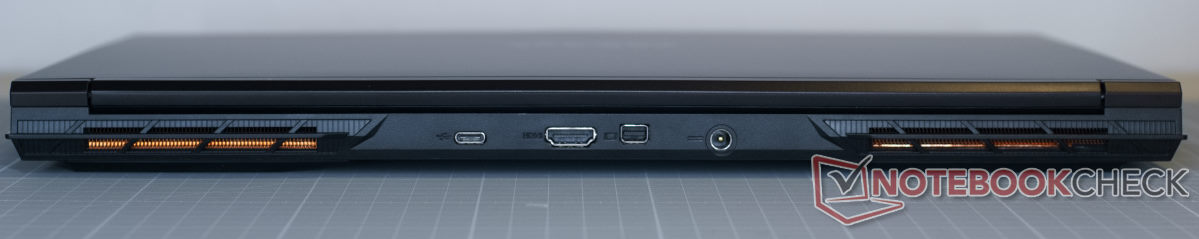
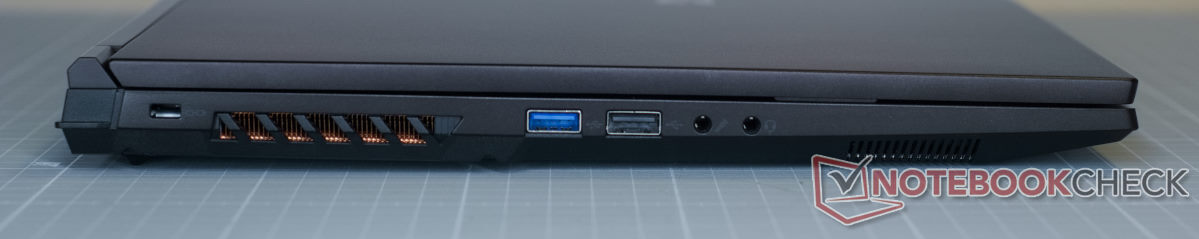
Características - muitas portas, alta velocidade de transferência e WiFi 6E
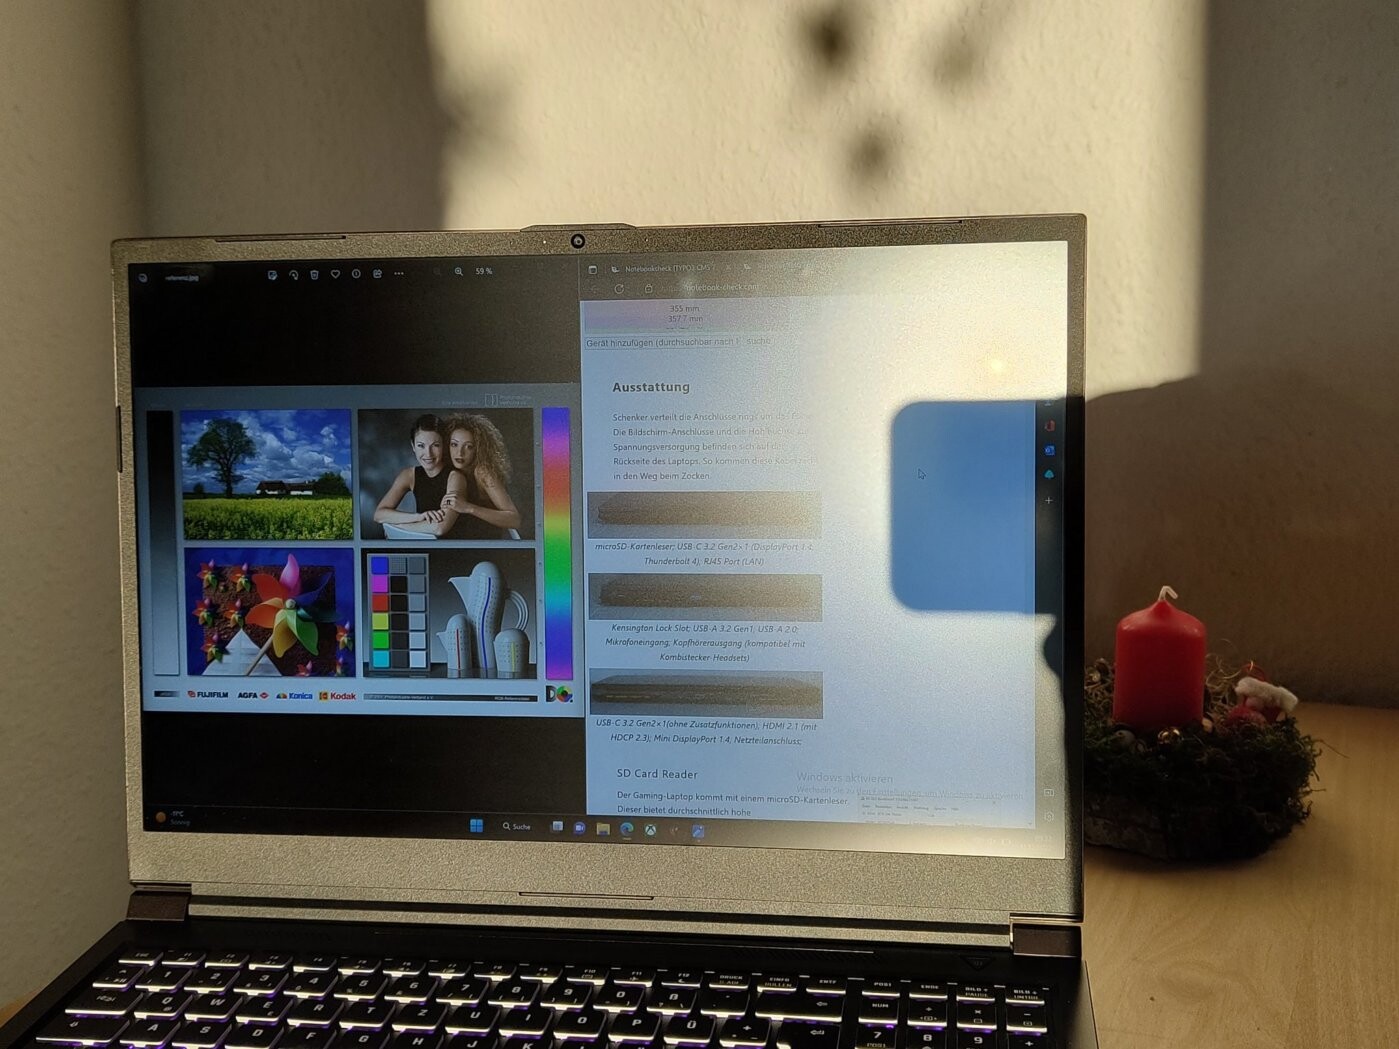
A Schenker colocou os portos em vários locais em torno do Focus. As portas do display, a tomada de alimentação, assim como uma porta USB-C podem ser encontradas na parte de trás do laptop. Isto garante que os cabos fiquem fora do caminho quando estiver jogando.
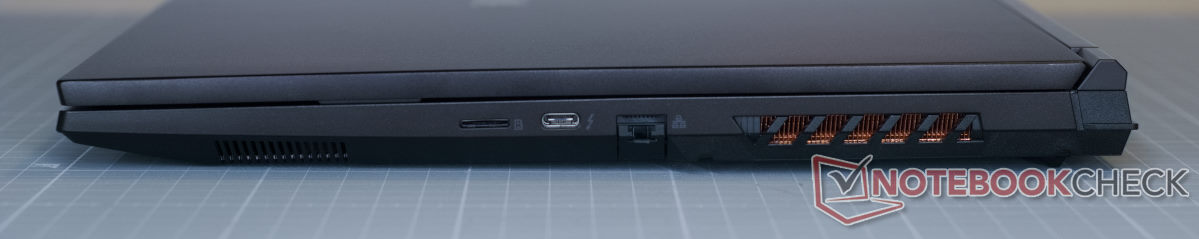
Leitor de cartões SD
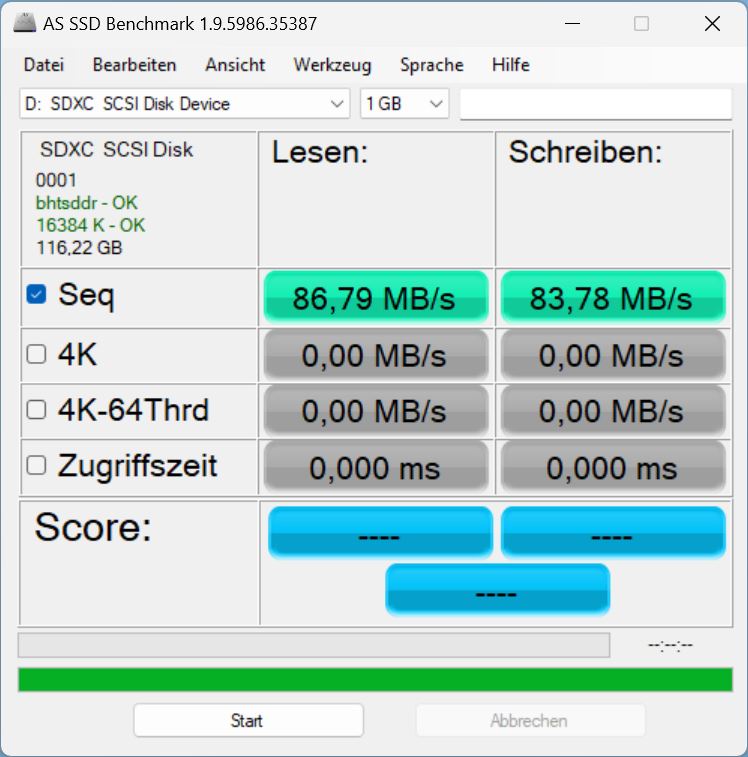
O laptop para jogos vem com um leitor de cartões microSD.
Em média, este oferece alta velocidade de transferência para conexões USB-3.0 para o hardware. A conexão ao nosso AV PRO microSD 128 GB V60poderia ser mais rápido - algo que é mostrado peloAsus Rog Flow.
| SD Card Reader | |
| average JPG Copy Test (av. of 3 runs) | |
| Asus ROG Flow X16 GV601RW-M5082W (AV Pro SD microSD 128 GB V60) | |
| Média da turma Gaming (20.9 - 210, n=54, últimos 2 anos) | |
| Schenker XMG Focus 16 (i7-12700H, RTX 3060) (AV Pro SD microSD 128 GB V60) | |
| Asus ZenBook Pro 16X OLED UX7602ZM-ME115W (AV Pro SD microSD 128 GB V60) | |
| Lenovo ThinkPad X1 Extreme G5-21DE003RGE (AV Pro V60) | |
| Lenovo Legion Slim 7-16IAH 82TF004YGE | |
| maximum AS SSD Seq Read Test (1GB) | |
| Asus ROG Flow X16 GV601RW-M5082W (AV Pro SD microSD 128 GB V60) | |
| Média da turma Gaming (25.5 - 261, n=51, últimos 2 anos) | |
| Lenovo Legion Slim 7-16IAH 82TF004YGE | |
| Schenker XMG Focus 16 (i7-12700H, RTX 3060) (AV Pro SD microSD 128 GB V60) | |
| Asus ZenBook Pro 16X OLED UX7602ZM-ME115W (AV Pro SD microSD 128 GB V60) | |
| Lenovo ThinkPad X1 Extreme G5-21DE003RGE (AV Pro V60) | |
Comunicação
A conexão WiFi está acima da média em termos de velocidade e estabilidade. O módulo LAN Intel X211 mostra aqui todo o seu potencial.
Webcam
Uma webcam típica de 720p pode ser encontrada dentro do laptop Schenker. No máximo, só fomos capazes de determinar desvios de cor relativamente pequenos. Caso contrário, a qualidade de imagem da webcam está em um nível típico.


 GeForce RTX 3060 Laptop GPU, i7-12700H, Samsung SSD 980 Pro 1TB MZ-V8P1T0BW")
 GeForce RTX 3060 Laptop GPU, i7-12700H, Samsung SSD 980 Pro 1TB MZ-V8P1T0BW")
Segurança
O Schenker XMG Focus 16 tem um Slot de Segurança Kensington. Caso contrário, todas as normas são cumpridas. O TPM 2.0 (via Intel PTT) está a bordo.
Extras
A Schenker inclui uma extensa documentação com todos os seus laptops. Na caixa, encontramos um CD com drivers, um pen drive com Windows pré-configurado, bem como um grande mousepad completo com o logotipo XMG.
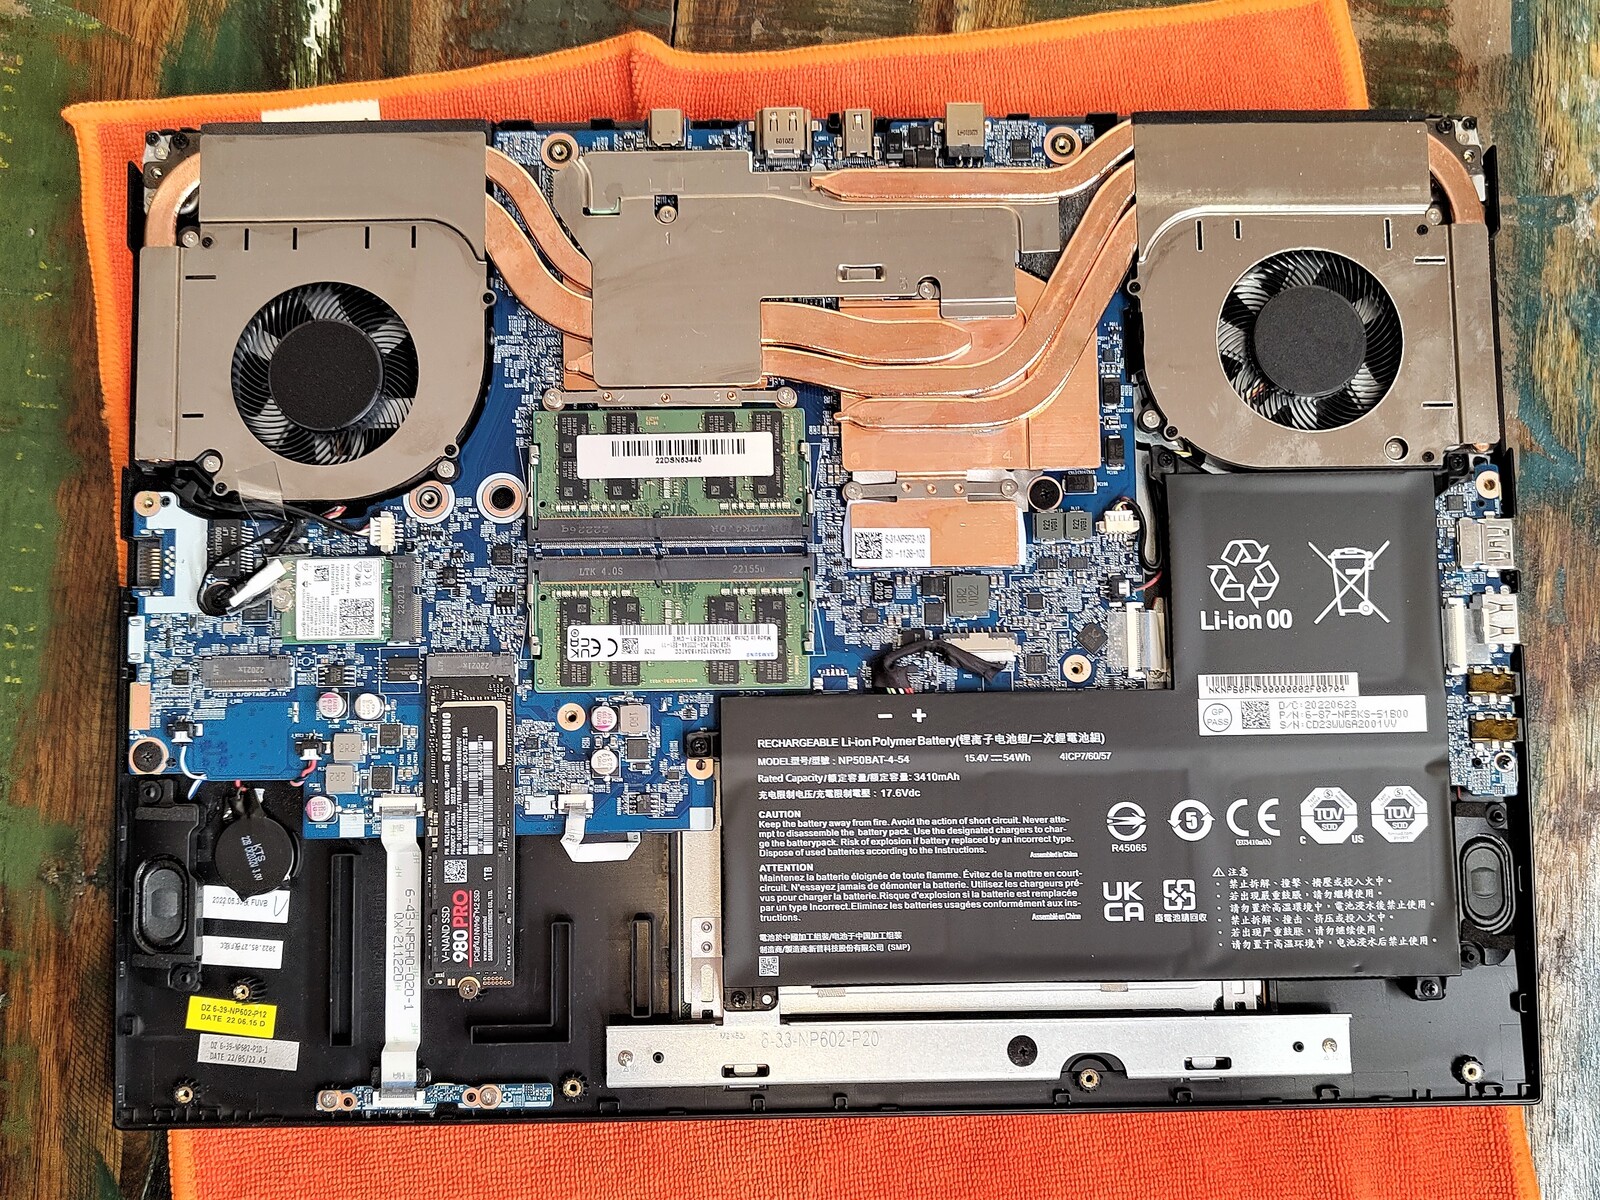
Serviço
Treze parafusos de cabeça cruzada mantêm a tampa de base firmemente no lugar. Quando estes são removidos, a placa de cobertura pode ser facilmente levantada. Dentro do laptop, encontramos dois slots de RAM (já ocupados) e dois slots M.2 (um ocupado). Todas as outras partes são aparafusadas, mas não coladas.
Garantia
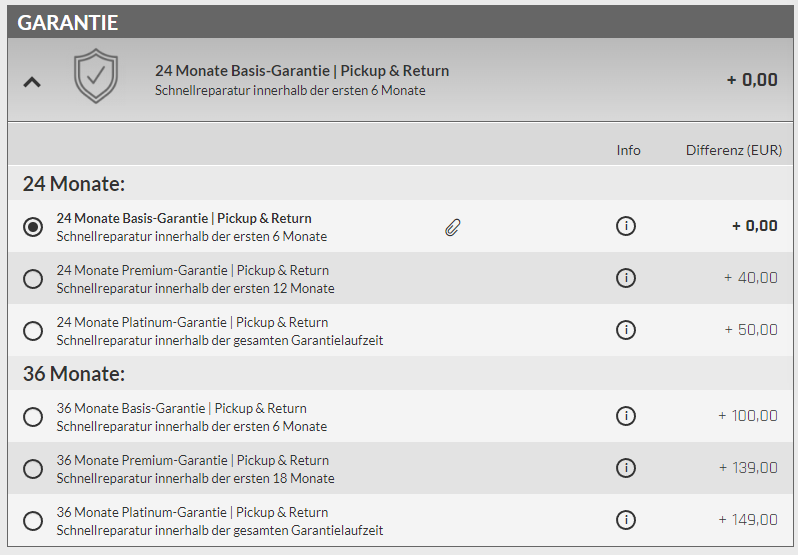
Os serviços de garantia que a Schenker fornece dependem das escolhas individuais feitas ao adquirir o dispositivo. A garantia básica é de 24 meses, incluindo tanto a retirada e devolução quanto os serviços de reparo rápido nos primeiros seis meses.
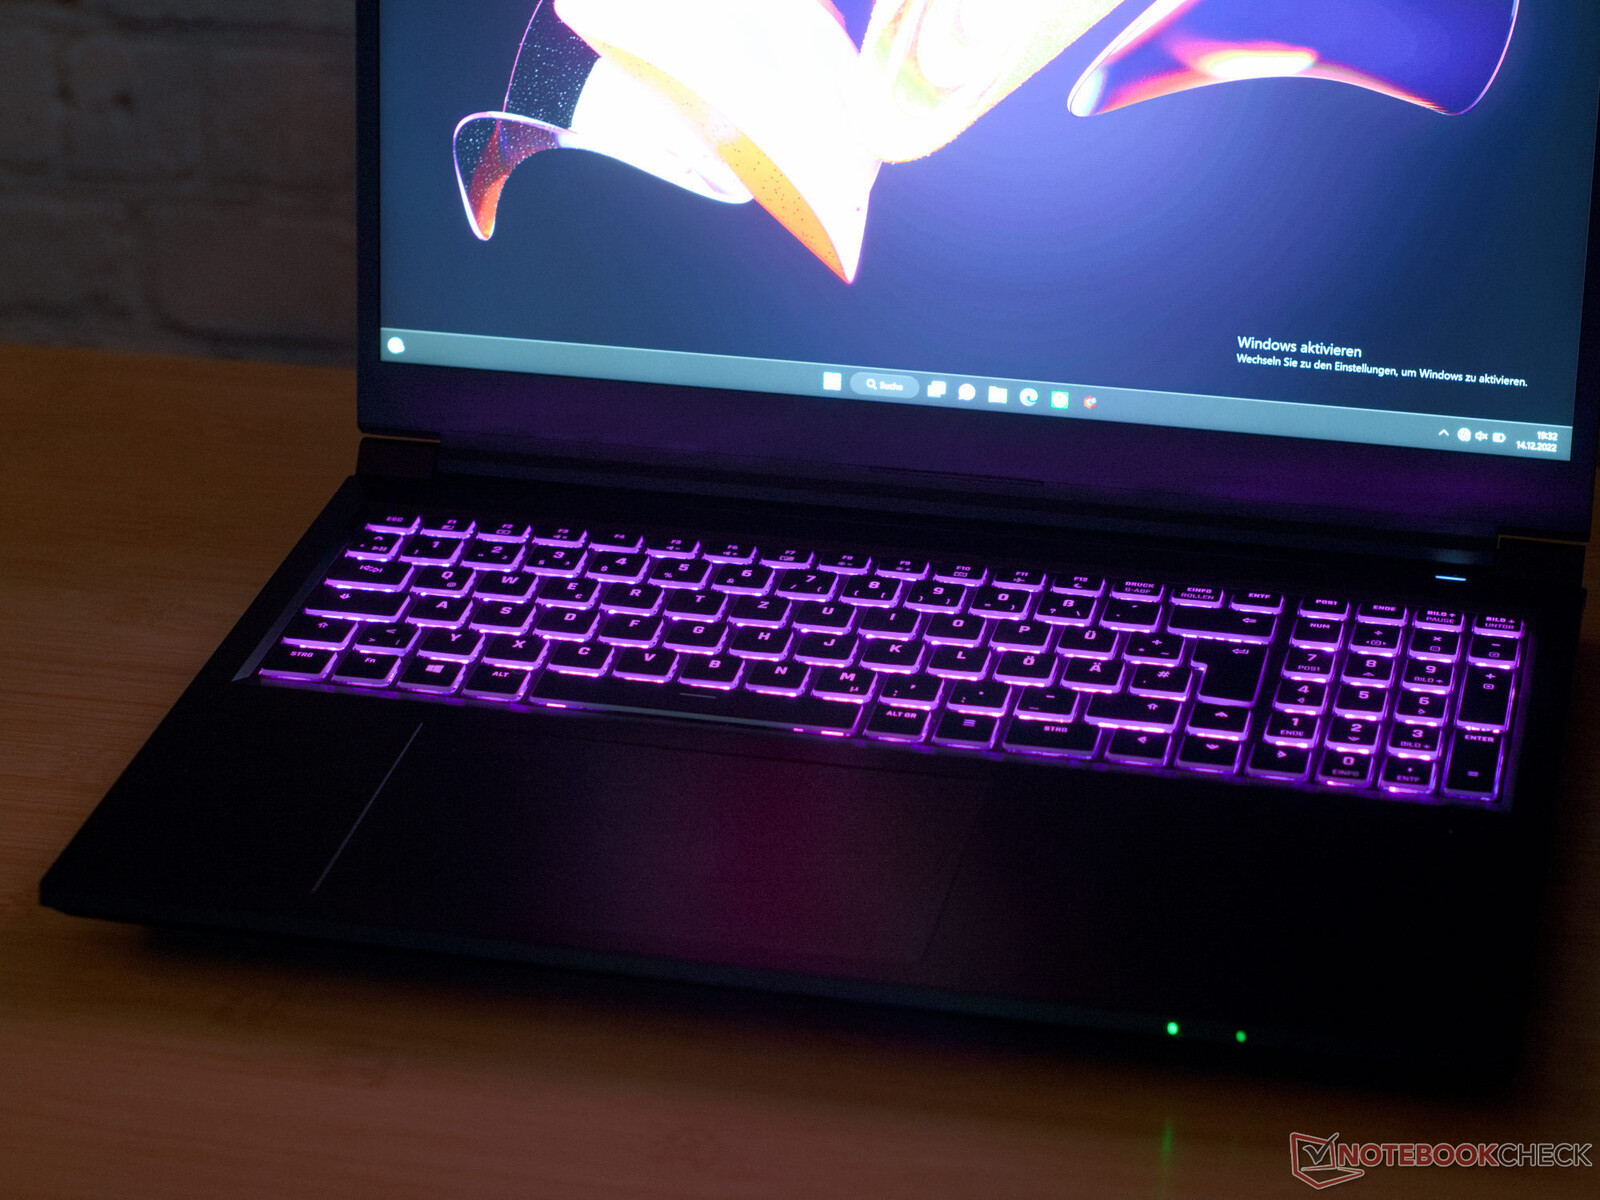
Dispositivos de entrada - viagem com chave longa
As letras impressas a laser do teclado são fáceis de ler com um curso de teclas de quase 2 mm, bem como teclas de setas em tamanho real, iluminação RGB e um teclado numérico. Mediante solicitação, a Schenker imprimirá a laser cada layout de teclado concebível.
Com 15 × 9 cm, o trackpad do laptop é muito grande. Embaraçoso para a Schenker: na entrega, o cabo de fita do trackpad não estava devidamente conectado, o que significava que inicialmente nos debatemos com um trackpad que não respondia. Uma vez corrigido este falso passe, o dispositivo de entrada funcionou ao mais alto nível.
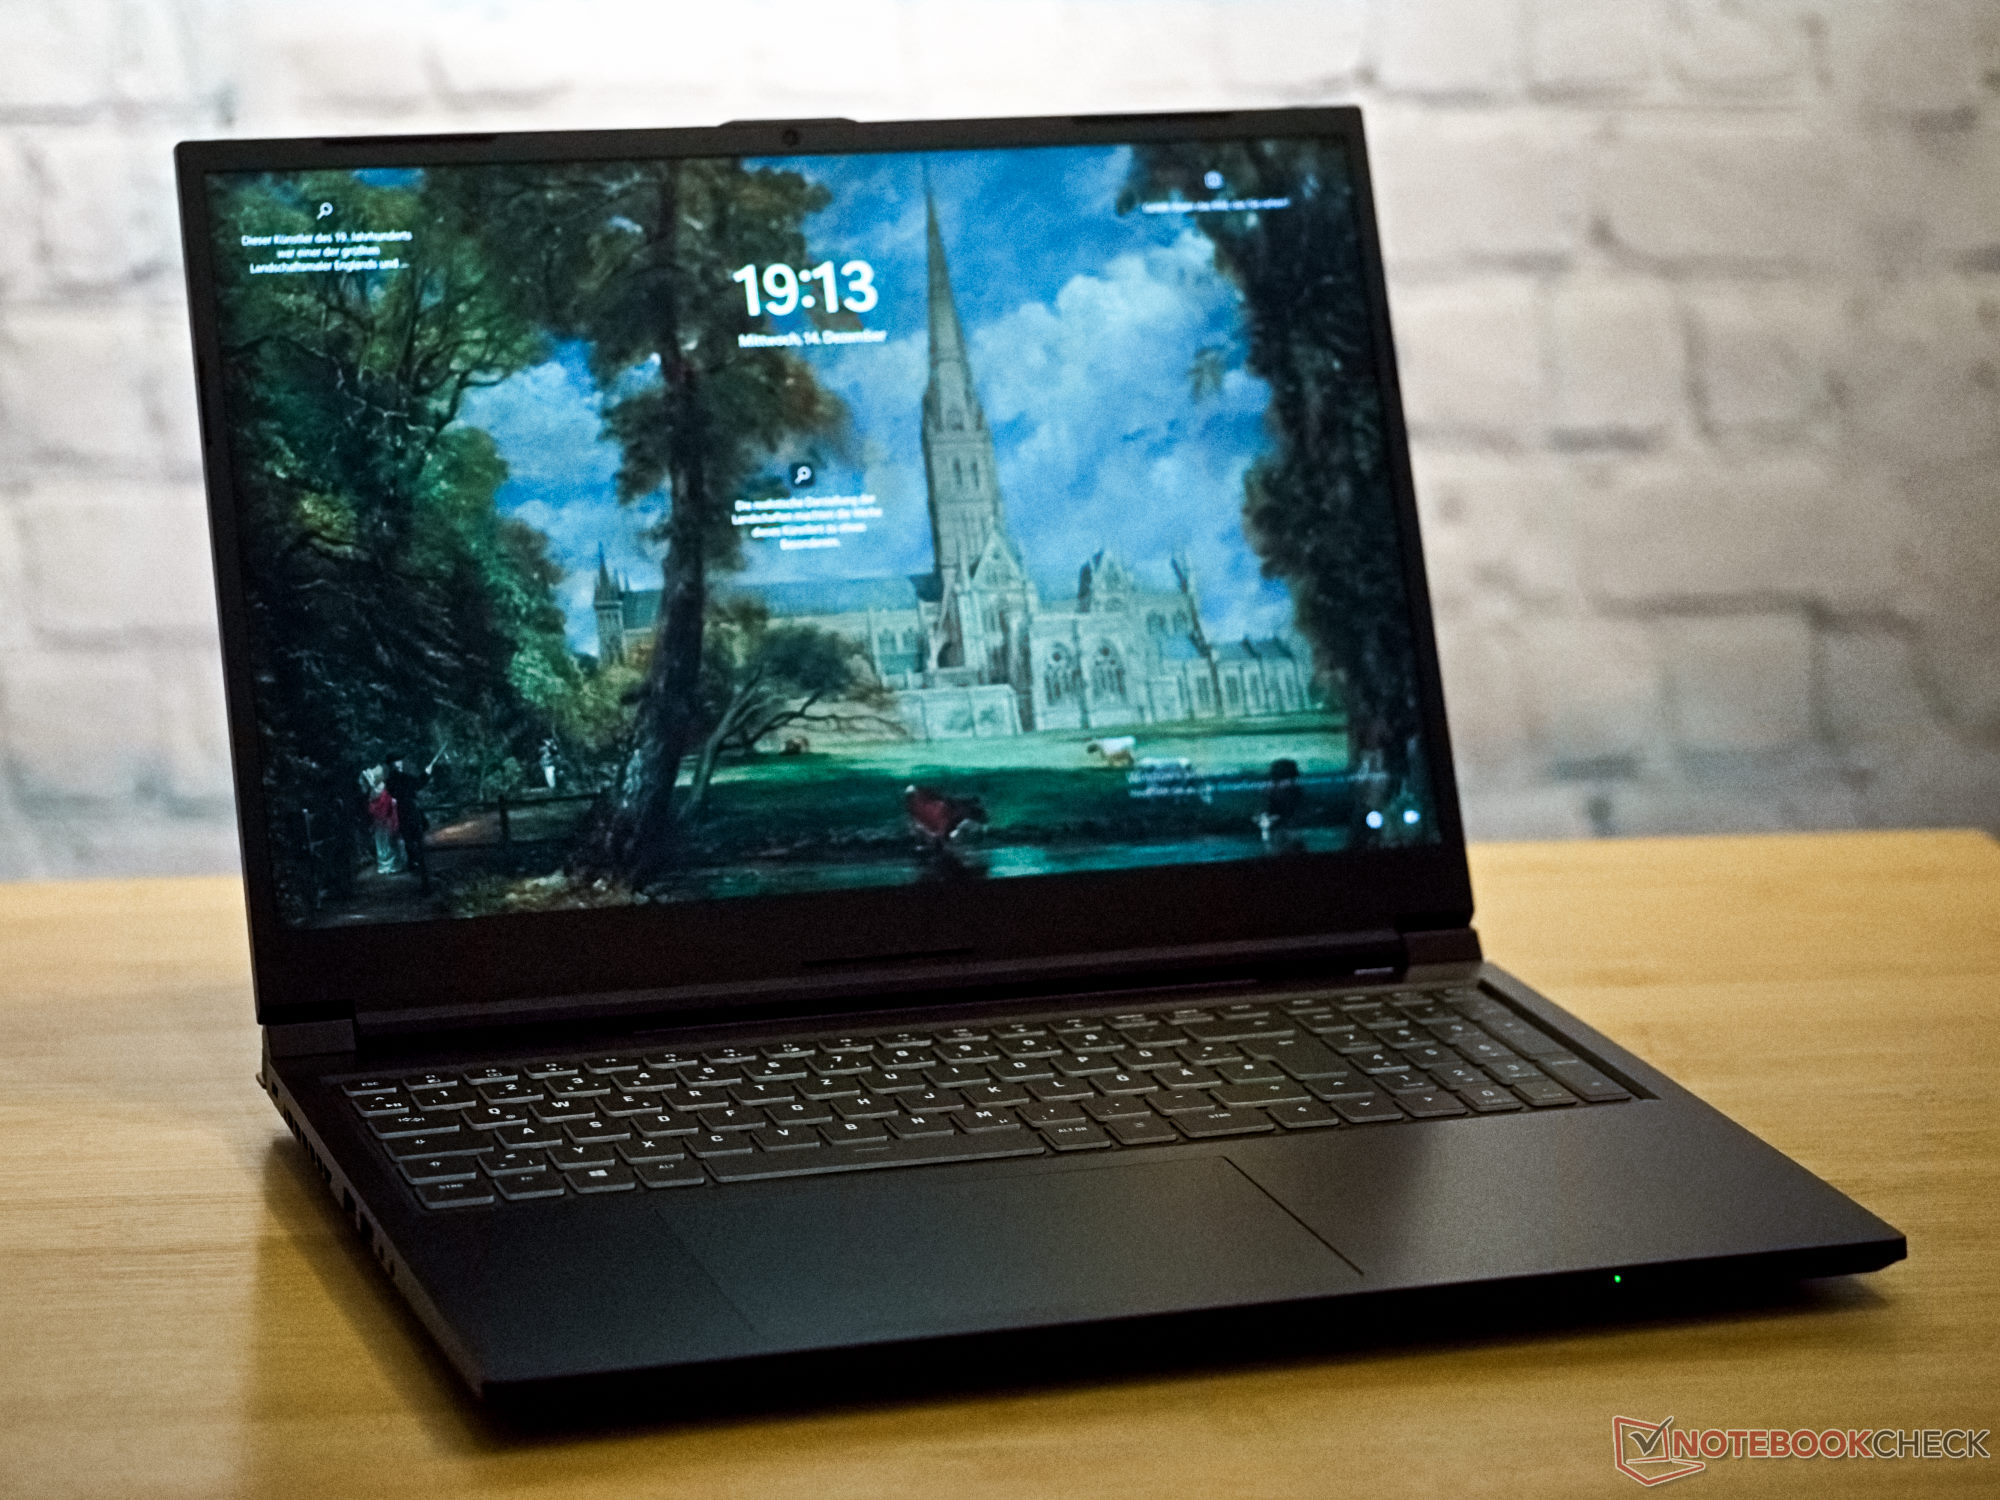
Visor - Visor 16:10 com QHD+
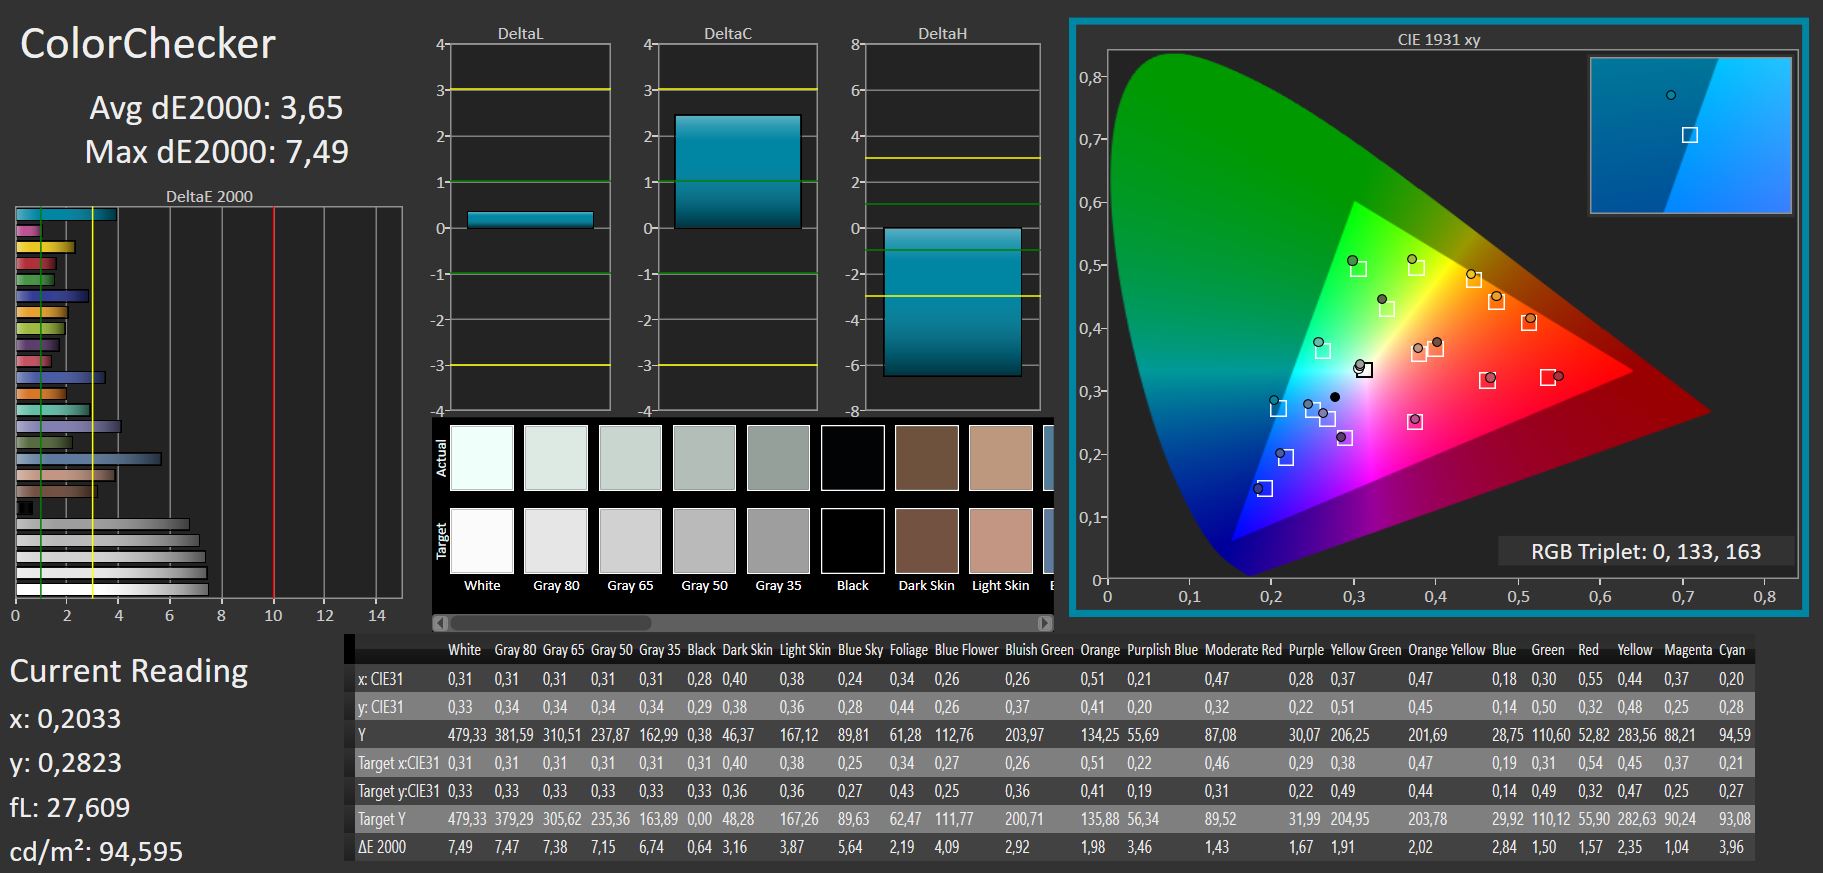
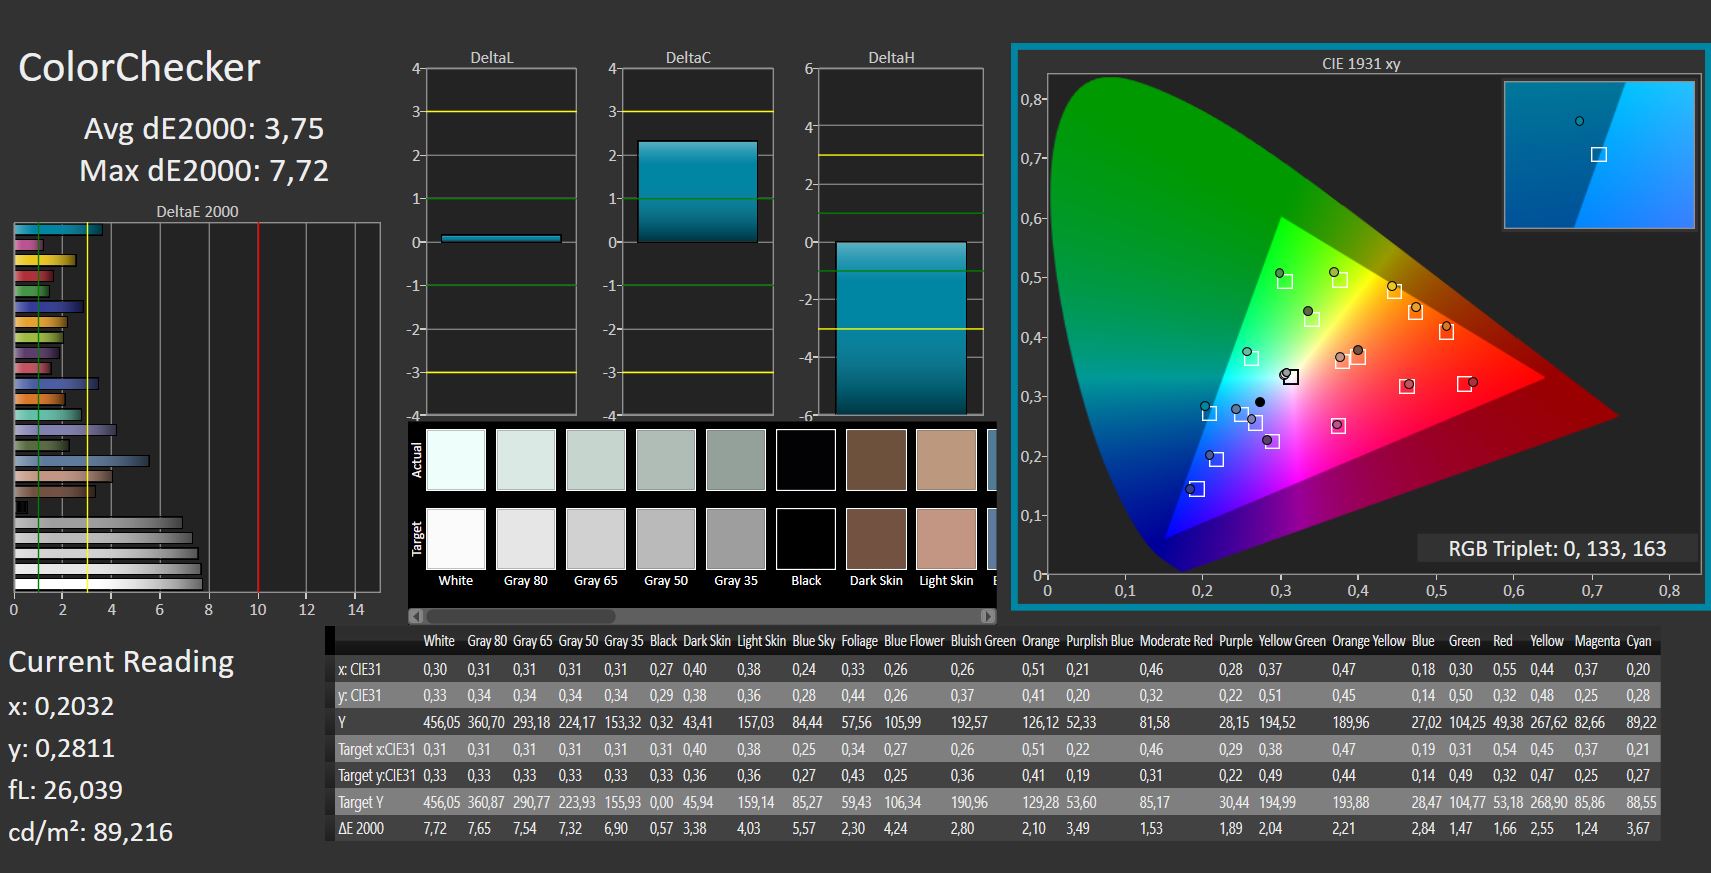
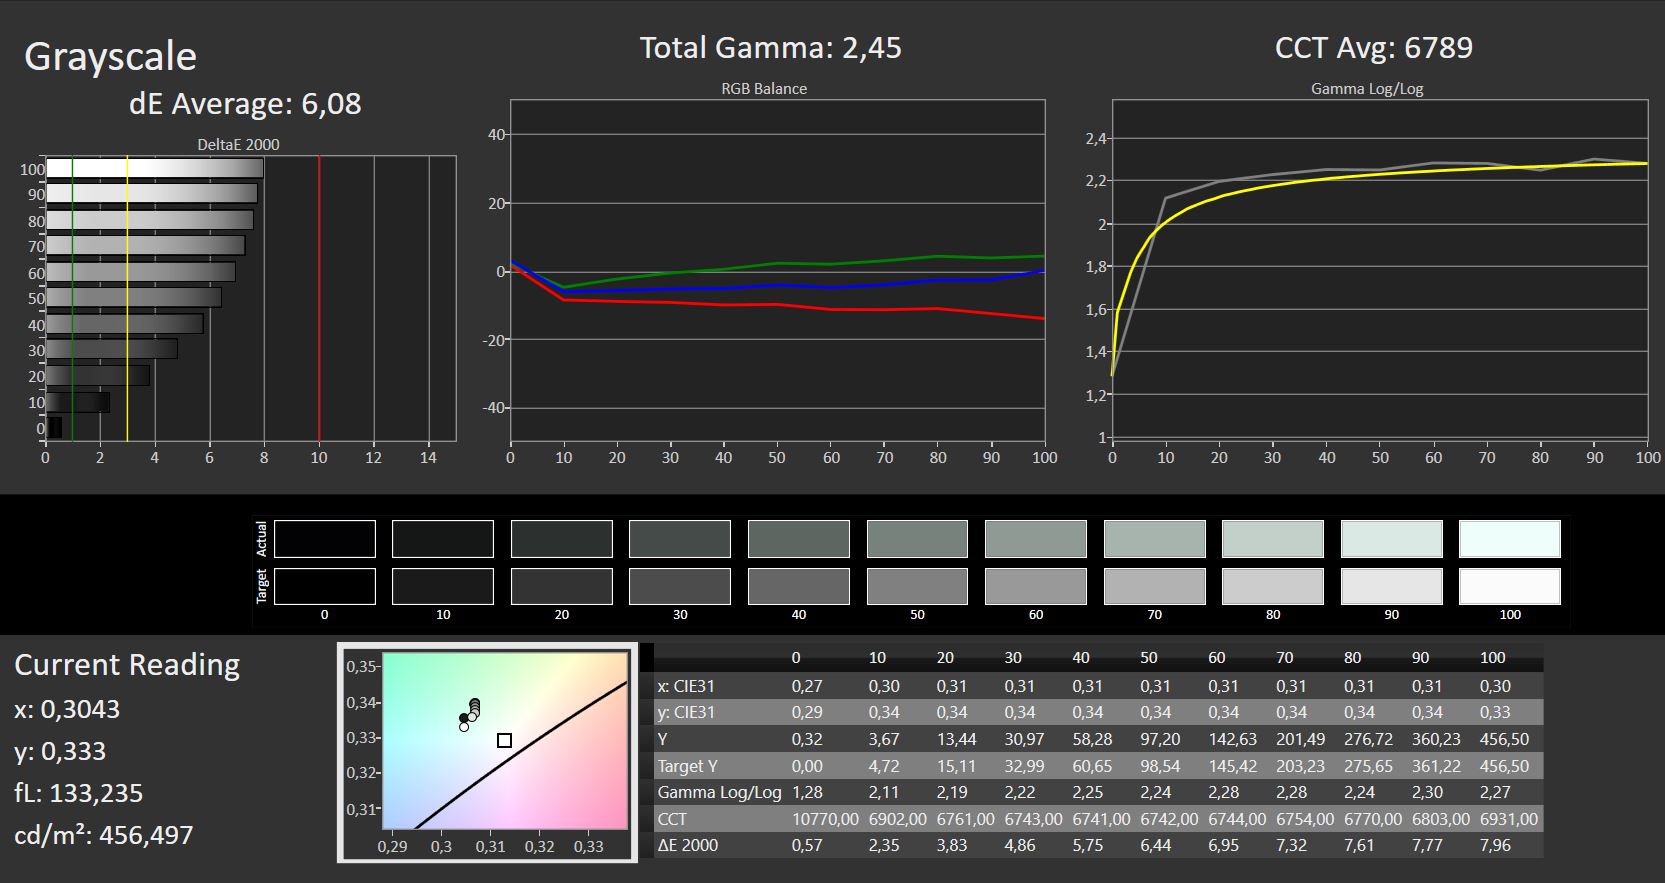
Com uma relação de aspecto de 16:10, a tela XMG Focus 16 não é exatamente típica. Embora ofereça uma alta resolução de 2560 × 1600 pixels e uma taxa de atualização de 165Hz, o tempo de resposta desta tela brilhante de 450 cd/m² não é tão baixo quanto seria de se esperar de um laptop para jogos. Os níveis de contraste, cobertura de cores, níveis de preto e iluminação podem ser descritos como bons. Não fomos capazes de detectar nenhum sangramento de luz.
| |||||||||||||||||||||||||
iluminação: 89 %
iluminação com acumulador: 455 cd/m²
Contraste: 1438:1 (Preto: 0.32 cd/m²)
ΔE ColorChecker Calman: 3.65 | ∀{0.5-29.43 Ø4.71}
calibrated: 3.65
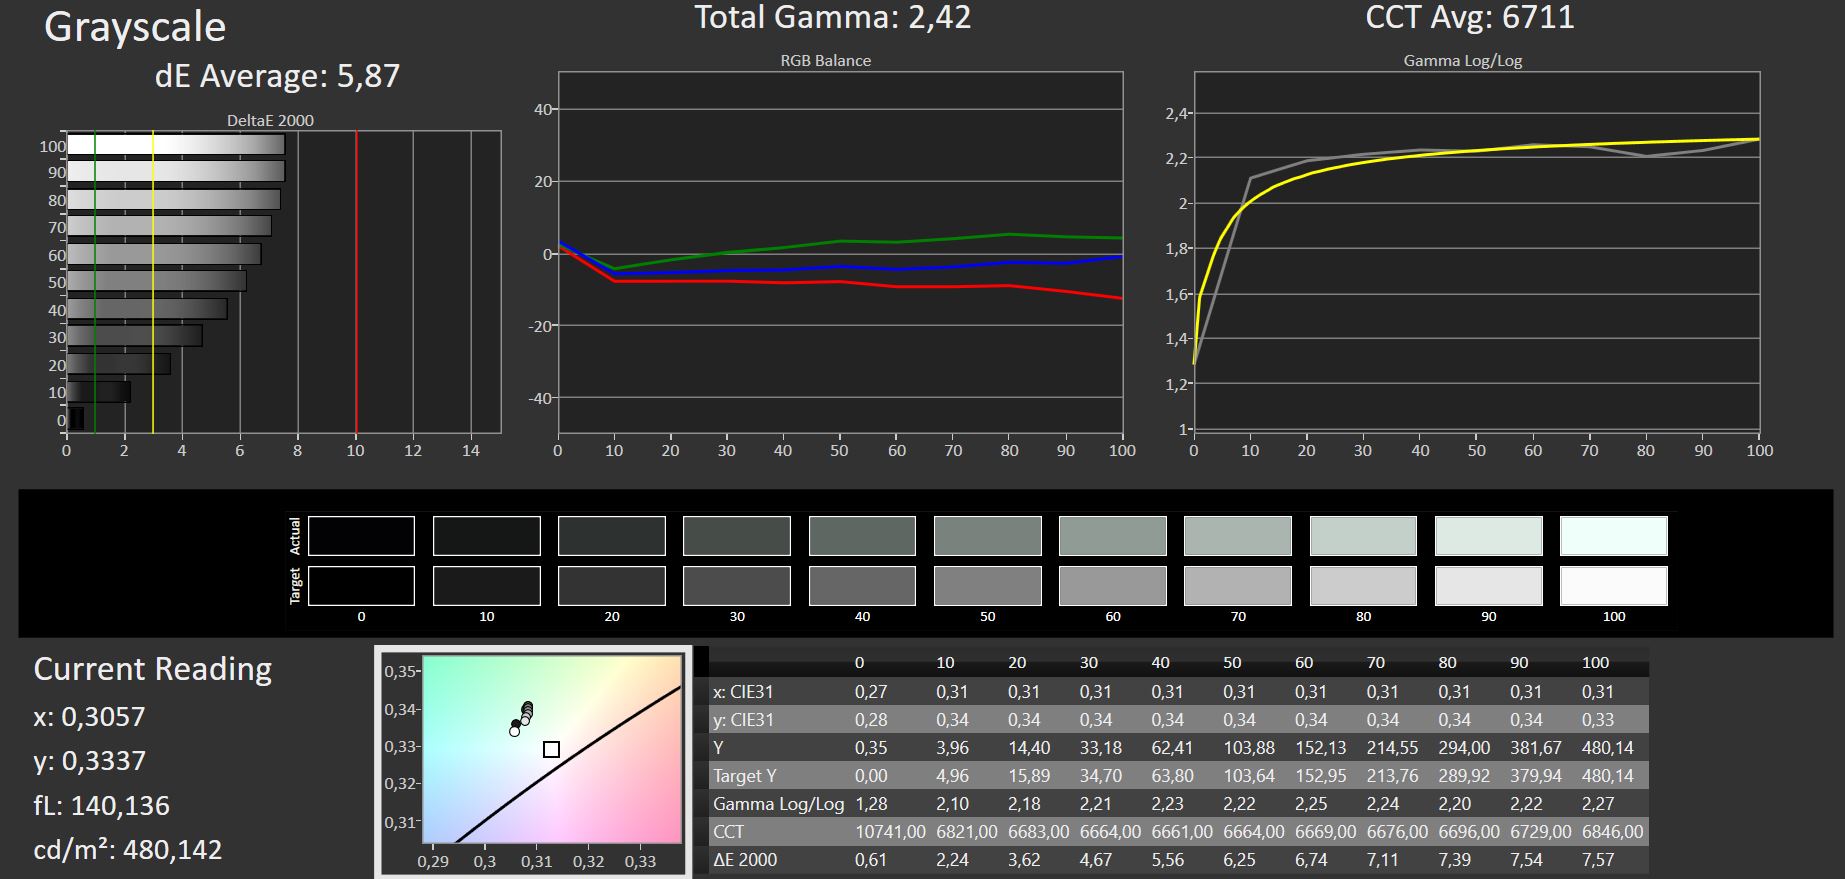
ΔE Greyscale Calman: 5.87 | ∀{0.09-98 Ø4.96}
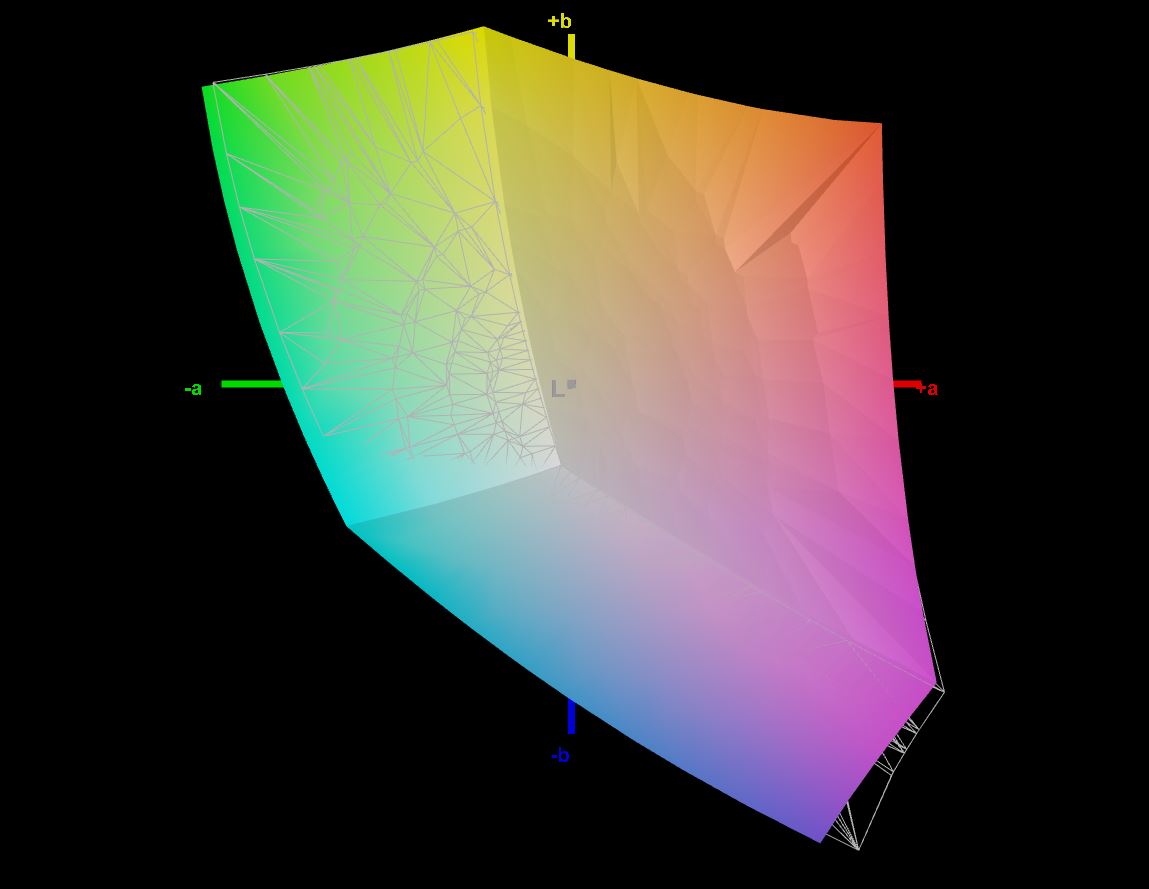
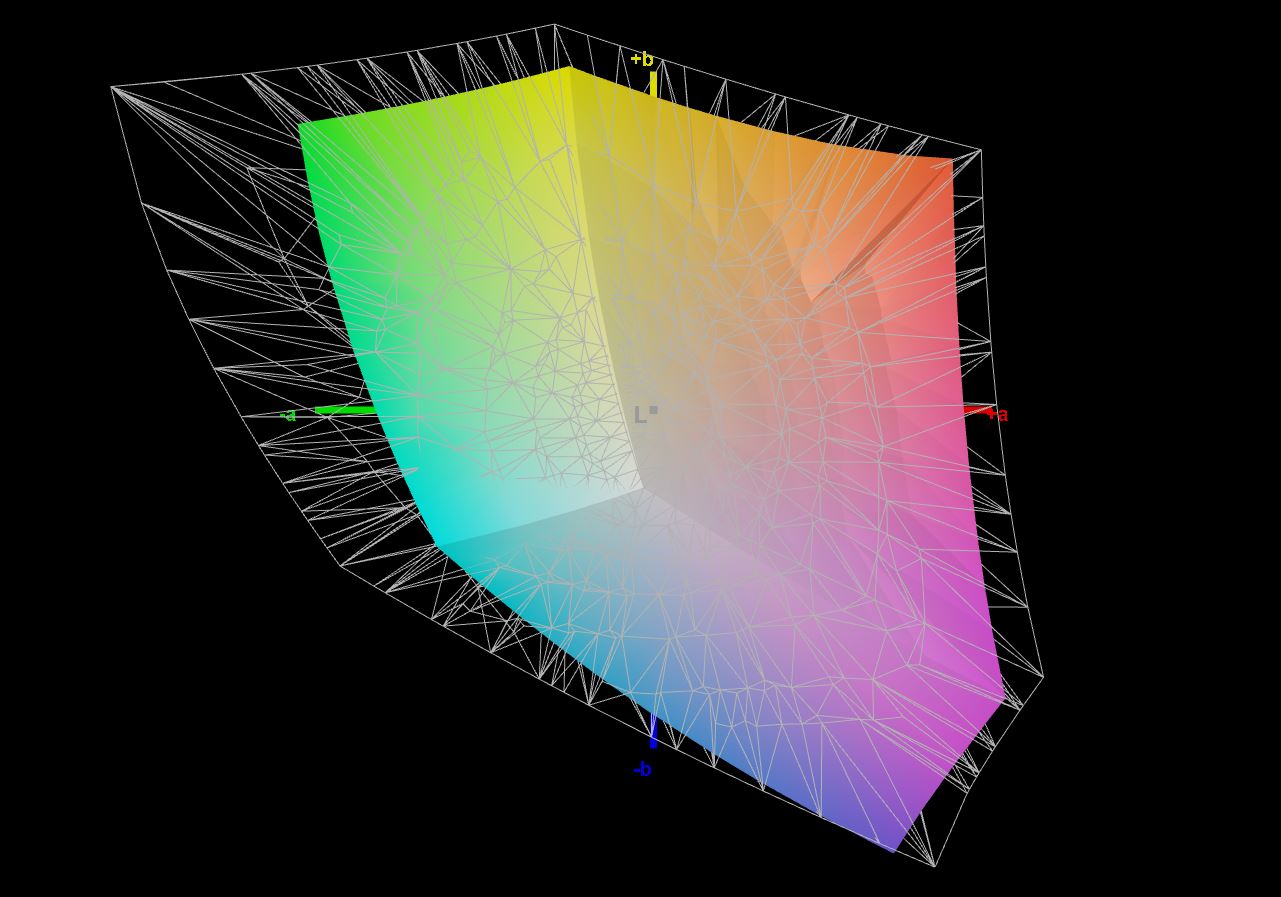
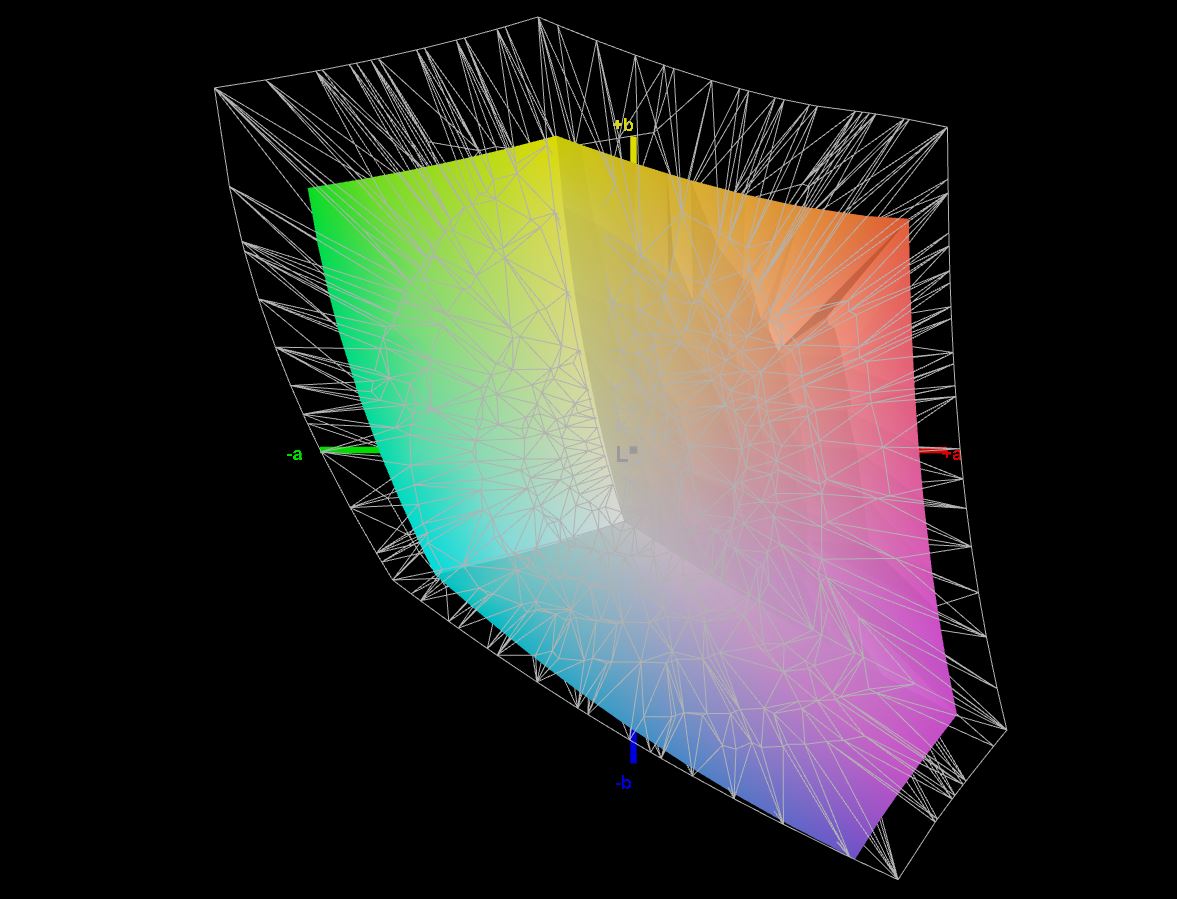
70.6% AdobeRGB 1998 (Argyll 3D)
96.6% sRGB (Argyll 3D)
68.3% Display P3 (Argyll 3D)
Gamma: 2.42
CCT: 6711 K
| Schenker XMG Focus 16 (i7-12700H, RTX 3060) BOE NE16oQDM-NY1, IPS, 2560x1600, 16" | Dell G16 7620 BOE NE16QDM, IPS, 2560x1600, 16" | Asus ZenBook Pro 16X OLED UX7602ZM-ME115W Samsung SDC415D, OLED, 3840x2400, 16" | Asus ROG Flow X16 GV601RW-M5082W AUO B160QAN02.S, Mini LED, 2560x1600, 16.1" | Lenovo ThinkPad X1 Extreme G5-21DE003RGE LP160UQ1-SPB1, IPS, 3840x2400, 16" | Lenovo Legion Slim 7-16IAH 82TF004YGE MNG007DA1-G , IPS LED, 2560x1600, 16" | Lenovo Legion 5 Pro 16IAH7H BOE CCQ_NE160QDM_NY1, IPS, 2560x1600, 16" | |
|---|---|---|---|---|---|---|---|
| Display | 0% | 25% | 26% | 22% | 3% | 1% | |
| Display P3 Coverage (%) | 68.3 | 68.3 0% | 99.84 46% | 99.82 46% | 84.6 24% | 70.5 3% | 68.53 0% |
| sRGB Coverage (%) | 96.6 | 98 1% | 99.99 4% | 99.99 4% | 99.2 3% | 99.1 3% | 98.38 2% |
| AdobeRGB 1998 Coverage (%) | 70.6 | 70.5 0% | 88.9 26% | 90.21 28% | 97.7 38% | 72.8 3% | 70.45 0% |
| Response Times | 26% | 85% | 16% | -129% | 31% | 30% | |
| Response Time Grey 50% / Grey 80% * (ms) | 16.4 ? | 8.6 ? 48% | 2 ? 88% | 11 ? 33% | 46 ? -180% | 12 ? 27% | 14 ? 15% |
| Response Time Black / White * (ms) | 10.8 ? | 10.4 ? 4% | 2 ? 81% | 11 ? -2% | 19.2 ? -78% | 7 ? 35% | 6 ? 44% |
| PWM Frequency (Hz) | 59 ? | 7400 ? | |||||
| Screen | 15% | 21% | 52% | 23% | 19% | 17% | |
| Brightness middle (cd/m²) | 460 | 369.4 -20% | 346 -25% | 498 8% | 476 3% | 523 14% | 515 12% |
| Brightness (cd/m²) | 442 | 348 -21% | 354 -20% | 502 14% | 470 6% | 494 12% | 475 7% |
| Brightness Distribution (%) | 89 | 83 -7% | 96 8% | 94 6% | 90 1% | 90 1% | 85 -4% |
| Black Level * (cd/m²) | 0.32 | 0.32 -0% | 0.11 66% | 0.35 -9% | 0.4 -25% | 0.45 -41% | |
| Contrast (:1) | 1438 | 1154 -20% | 4527 215% | 1360 -5% | 1308 -9% | 1144 -20% | |
| Colorchecker dE 2000 * | 3.65 | 1.78 51% | 2.28 38% | 1.87 49% | 1.9 48% | 2.6 29% | 2.38 35% |
| Colorchecker dE 2000 max. * | 7.49 | 4.41 41% | 4.94 34% | 6.15 18% | 4.7 37% | 5 33% | 4.37 42% |
| Colorchecker dE 2000 calibrated * | 3.65 | 1.22 67% | 2.16 41% | 1.94 47% | 1.3 64% | 1 73% | 1.1 70% |
| Greyscale dE 2000 * | 5.87 | 3.2 45% | 1.64 72% | 3.15 46% | 2.4 59% | 3.3 44% | 2.71 54% |
| Gamma | 2.42 91% | 2.2 100% | 2.37 93% | 330.95 1% | 2.24 98% | 2.17 101% | 2.49 88% |
| CCT | 6711 97% | 6750 96% | 6384 102% | 7294 89% | 6377 102% | 6013 108% | 6117 106% |
| Média Total (Programa/Configurações) | 14% /
14% | 44% /
33% | 31% /
41% | -28% /
1% | 18% /
17% | 16% /
15% |
* ... menor é melhor
A tela do laptop para jogos Schenker cobre 95% do sRGB com AdobeRGB e DisplayP3 sentados a cerca de 70%. A reprodução de cores é boa, se não exatamente perfeita. Um ΔΕ de menores de 3 seria desejável com o Focus 16 gerenciando uma média de 3,65 no ΔΕ. Assim, as devoções de cor ex-funções são aceitáveis. Nosso perfil ICC não resultou em nenhuma melhoria na reprodução de cores.

Exibir tempos de resposta
| ↔ Tempo de resposta preto para branco | ||
|---|---|---|
| 10.8 ms ... ascensão ↗ e queda ↘ combinadas | ↗ 5 ms ascensão | 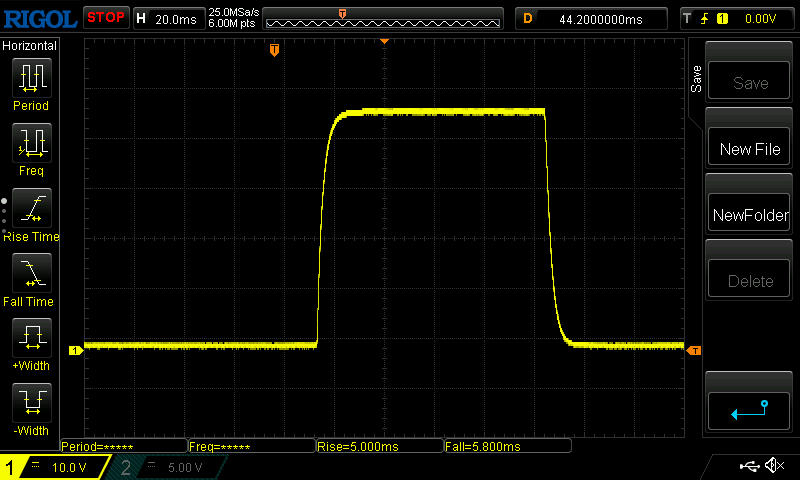 |
| ↘ 5.8 ms queda | ||
| A tela mostra boas taxas de resposta em nossos testes, mas pode ser muito lenta para jogadores competitivos. Em comparação, todos os dispositivos testados variam de 0.1 (mínimo) a 240 (máximo) ms. » 29 % de todos os dispositivos são melhores. Isso significa que o tempo de resposta medido é melhor que a média de todos os dispositivos testados (19.8 ms). | ||
| ↔ Tempo de resposta 50% cinza a 80% cinza | ||
| 16.4 ms ... ascensão ↗ e queda ↘ combinadas | ↗ 7.4 ms ascensão | 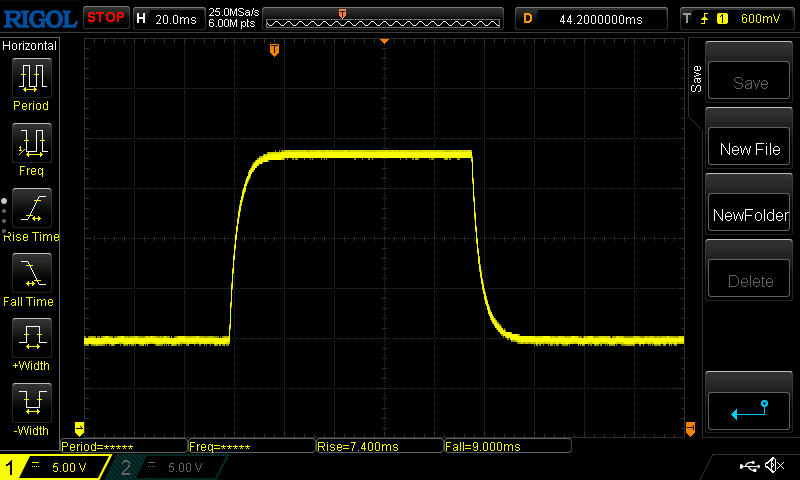 |
| ↘ 9 ms queda | ||
| A tela mostra boas taxas de resposta em nossos testes, mas pode ser muito lenta para jogadores competitivos. Em comparação, todos os dispositivos testados variam de 0.165 (mínimo) a 636 (máximo) ms. » 31 % de todos os dispositivos são melhores. Isso significa que o tempo de resposta medido é melhor que a média de todos os dispositivos testados (30.9 ms). | ||
Cintilação da tela / PWM (modulação por largura de pulso)
| Tela tremeluzindo / PWM não detectado | 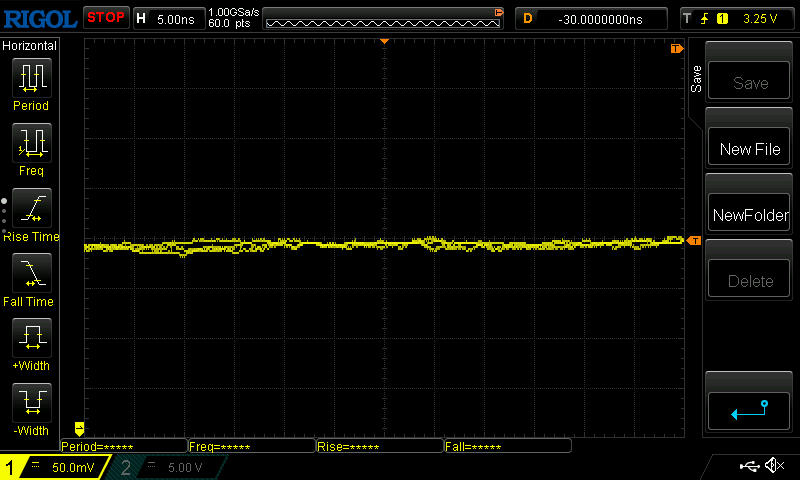 | ||
[pwm_comparison] Em comparação: 52 % de todos os dispositivos testados não usam PWM para escurecer a tela. Se PWM foi detectado, uma média de 7744 (mínimo: 5 - máximo: 343500) Hz foi medida. | |||
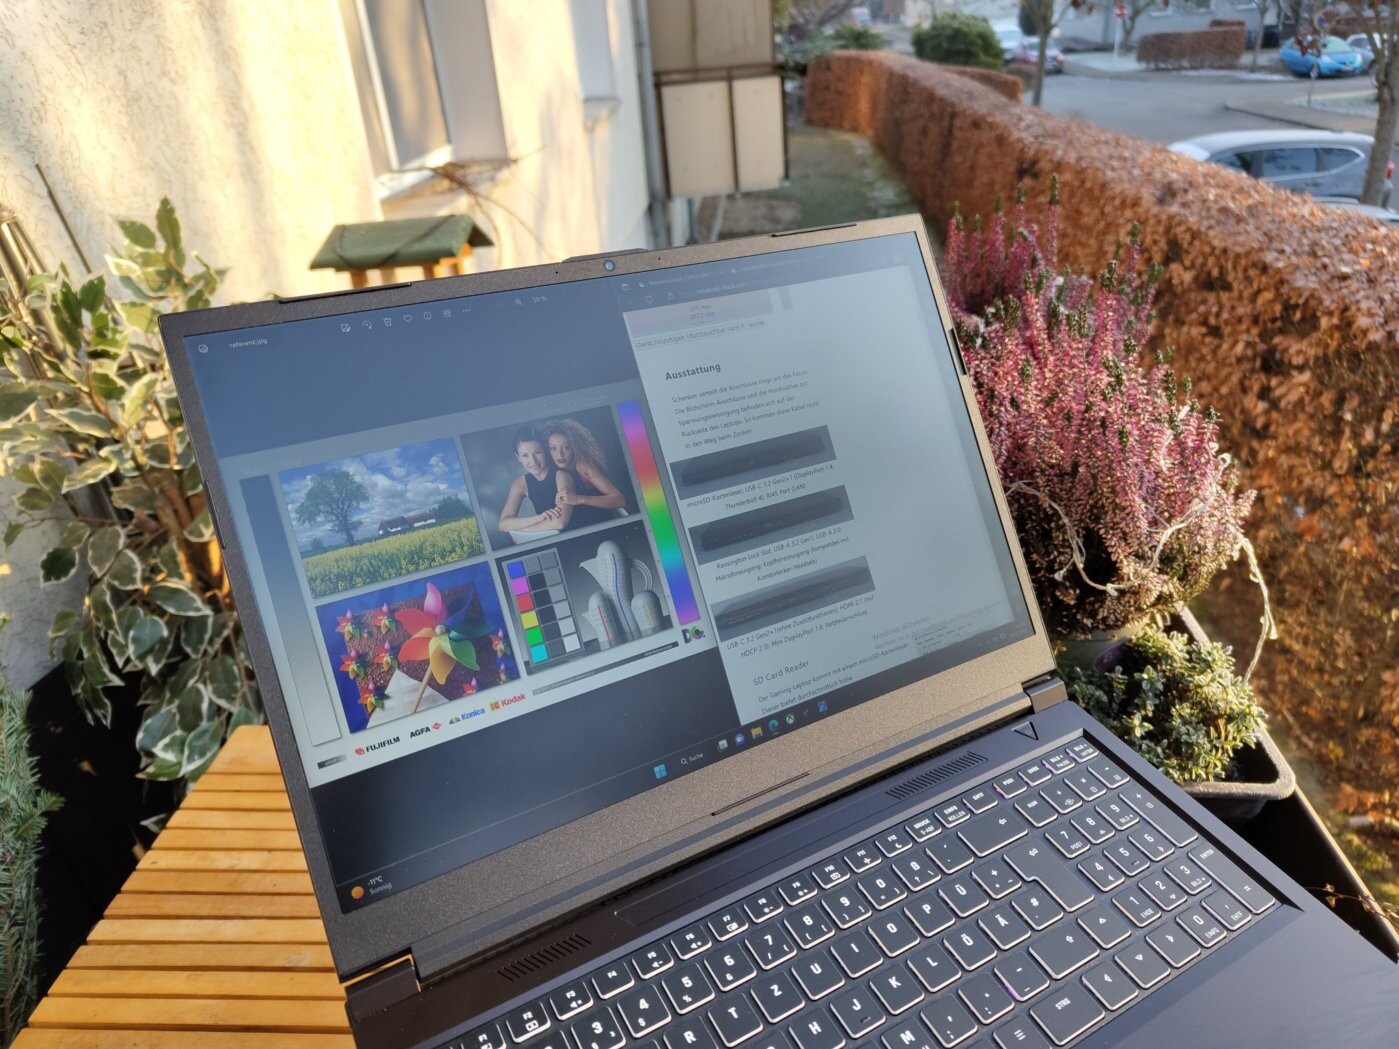
O painel IPS sem cintilação causou uma boa impressão no uso externo, bem como quando visto de vários ângulos. Somente quando o sol brilhava na tela fosca em um ângulo desfavorável é que encontramos dificuldades de legibilidade.

Desempenho - um pouco acima da média
Como em todos os laptops Schenker, o XMG Focus 16 também é altamente personalizável. Portanto, é possível selecionar a RAM, vários discos rígidos e outras opções no XMG Focus 16configurador. Atualmente não é possível escolher diferentes CPUs e GPUs. Todos os dispositivos XMG Focus 16 vêm com umIntel Core i7-12700He umNvidia GeForce RTX 3060. Além disso, nosso dispositivo de revisão foi equipado com 2×16GB DDR4 RAM e um 1TB Samsung NVMe SSD.
Tudo isso significa que temos um laptop que deve lidar com a maioria dos jogos modernos. No entanto, o RTX 3060 nem sempre consegue atingir mais de 60fps nas configurações gráficas mais altas e na resolução nativa do dispositivo.
Controle de desempenho e condições de teste
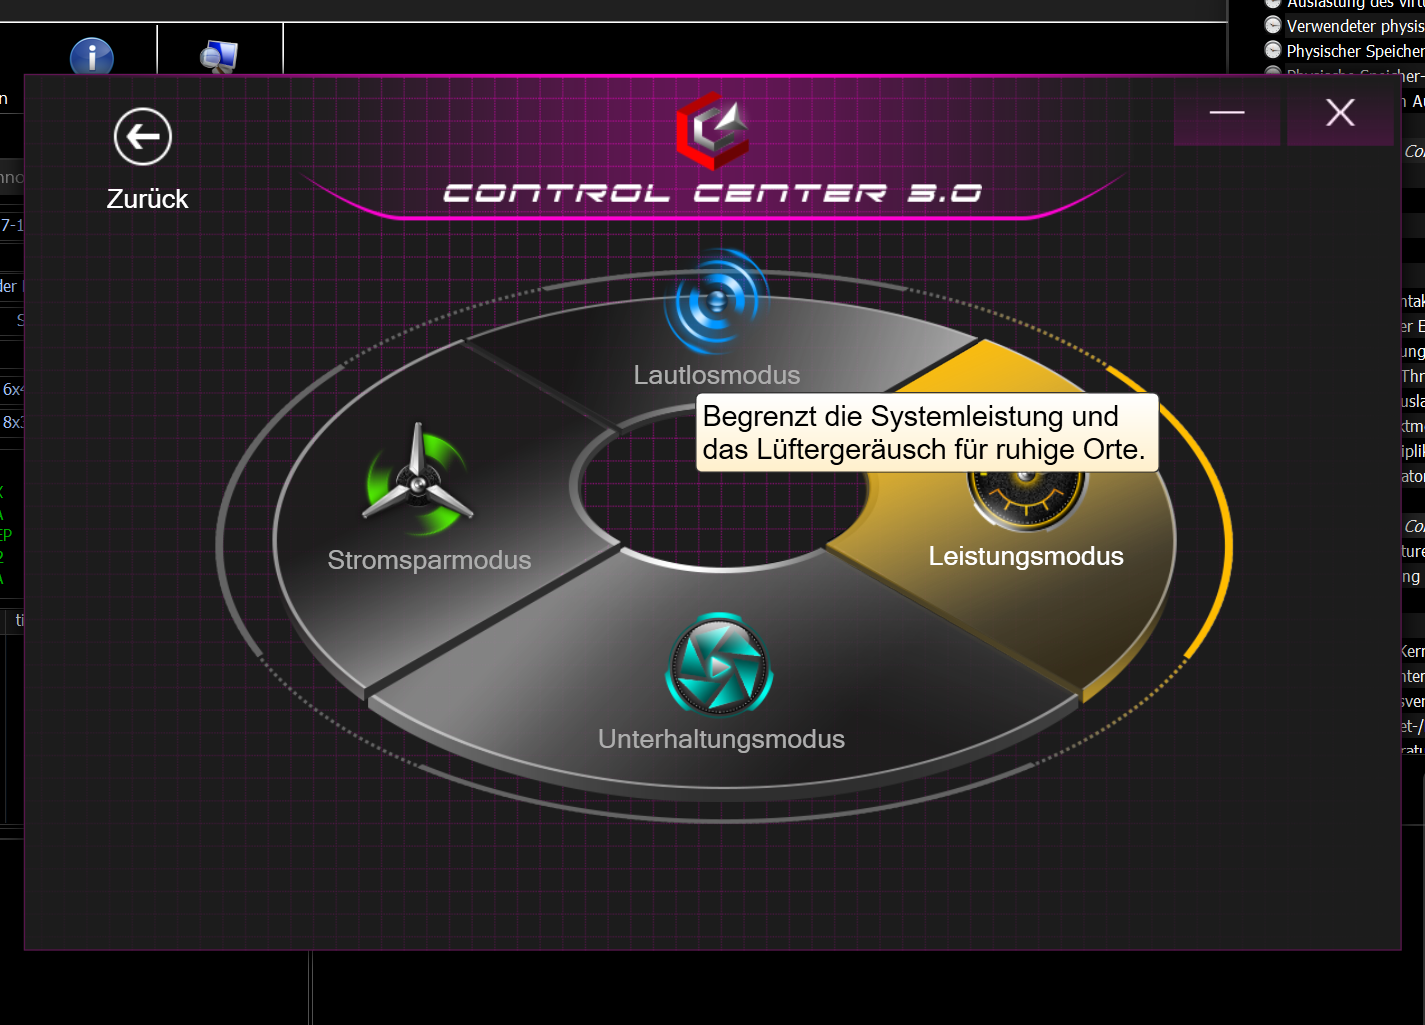
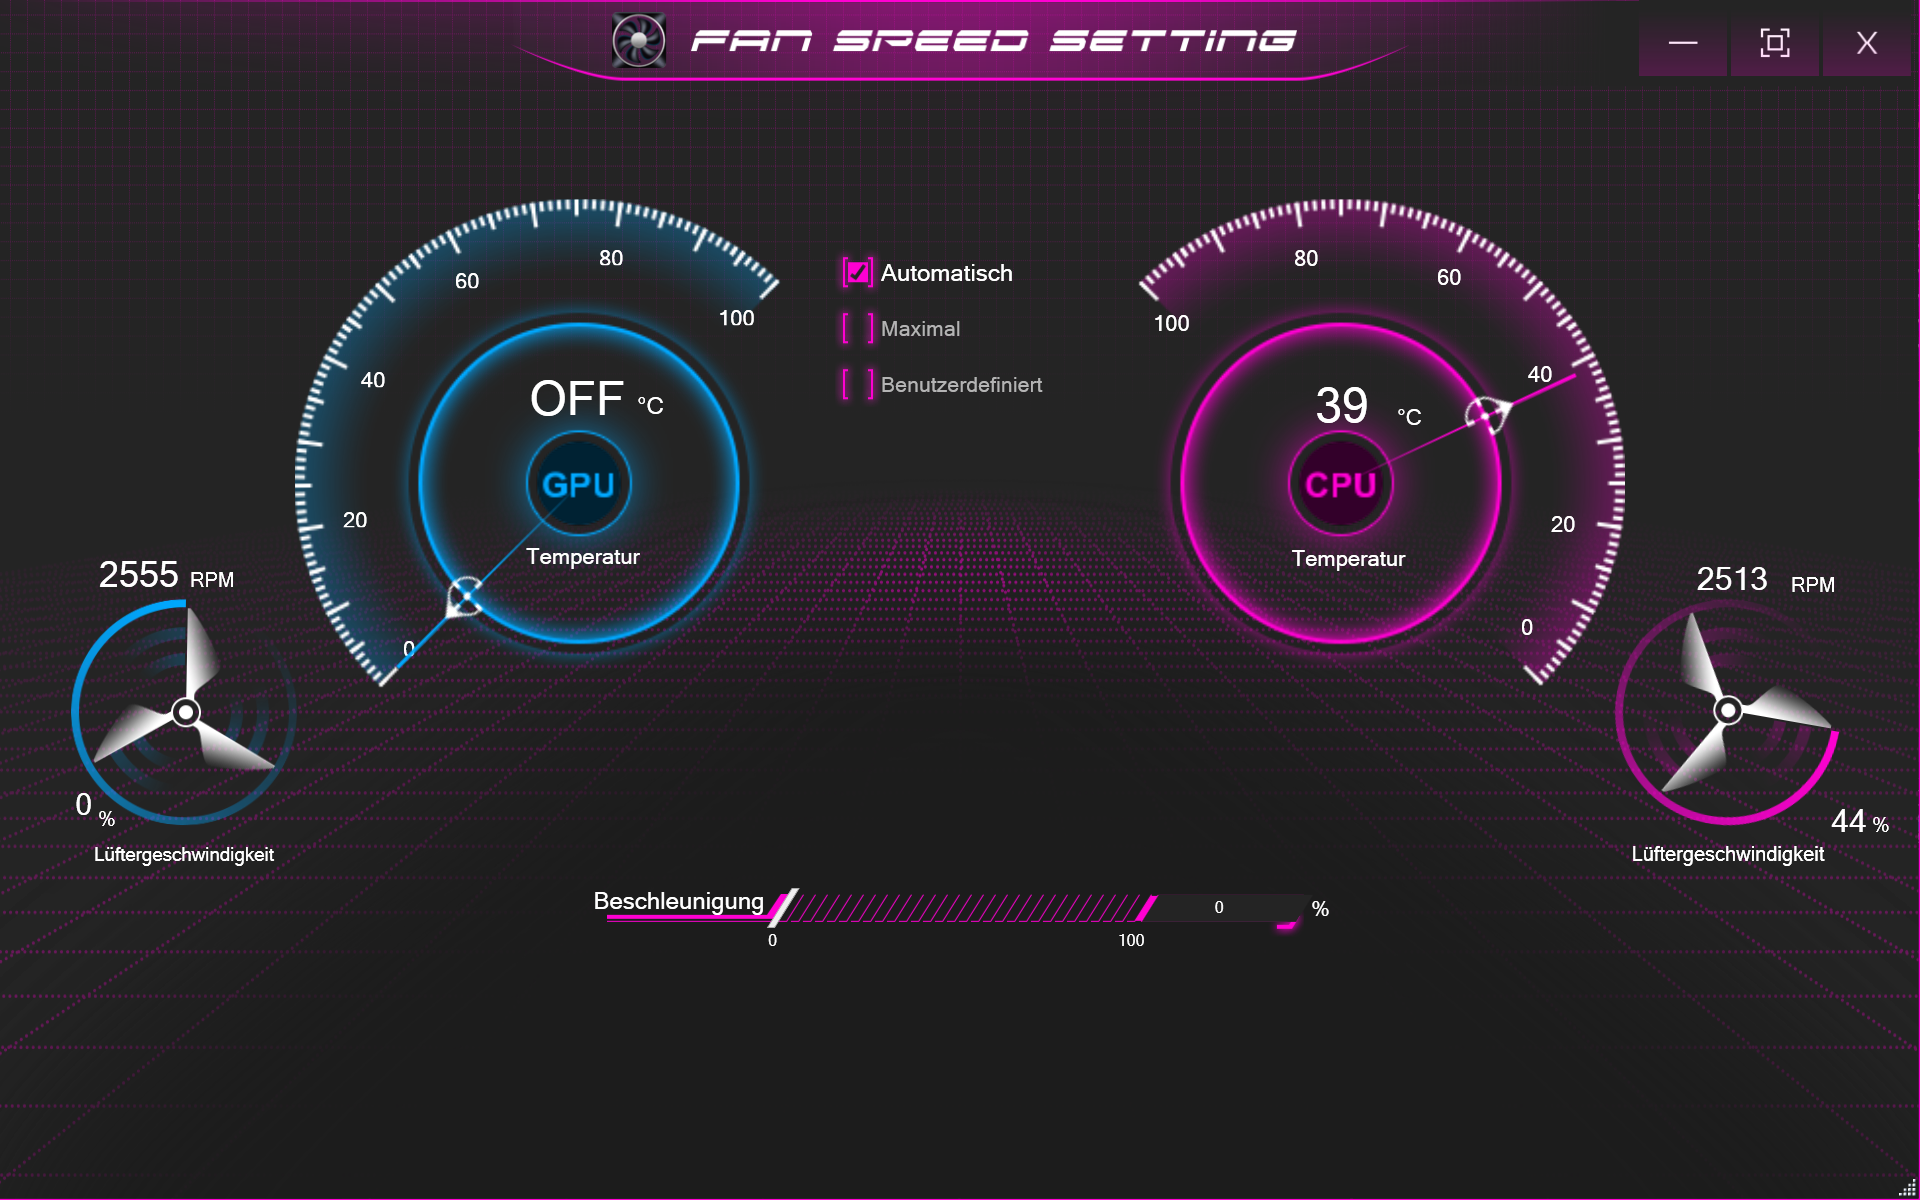
O nível de desempenho dos atuais laptops Schenker é definido através do Centro de Controle 3.0. Aqui você pode encontrar quatro opções de desempenho: do modo sussurro ao modo desempenho. As velocidades dos ventiladores, limites de desempenho e temperaturas alvo são especificados aqui. Para qualquer pessoa que goste de se familiarizar com estas configurações, o Centro de Controle também oferece várias opções para ajustar e monitorar a velocidade dos ventiladores.
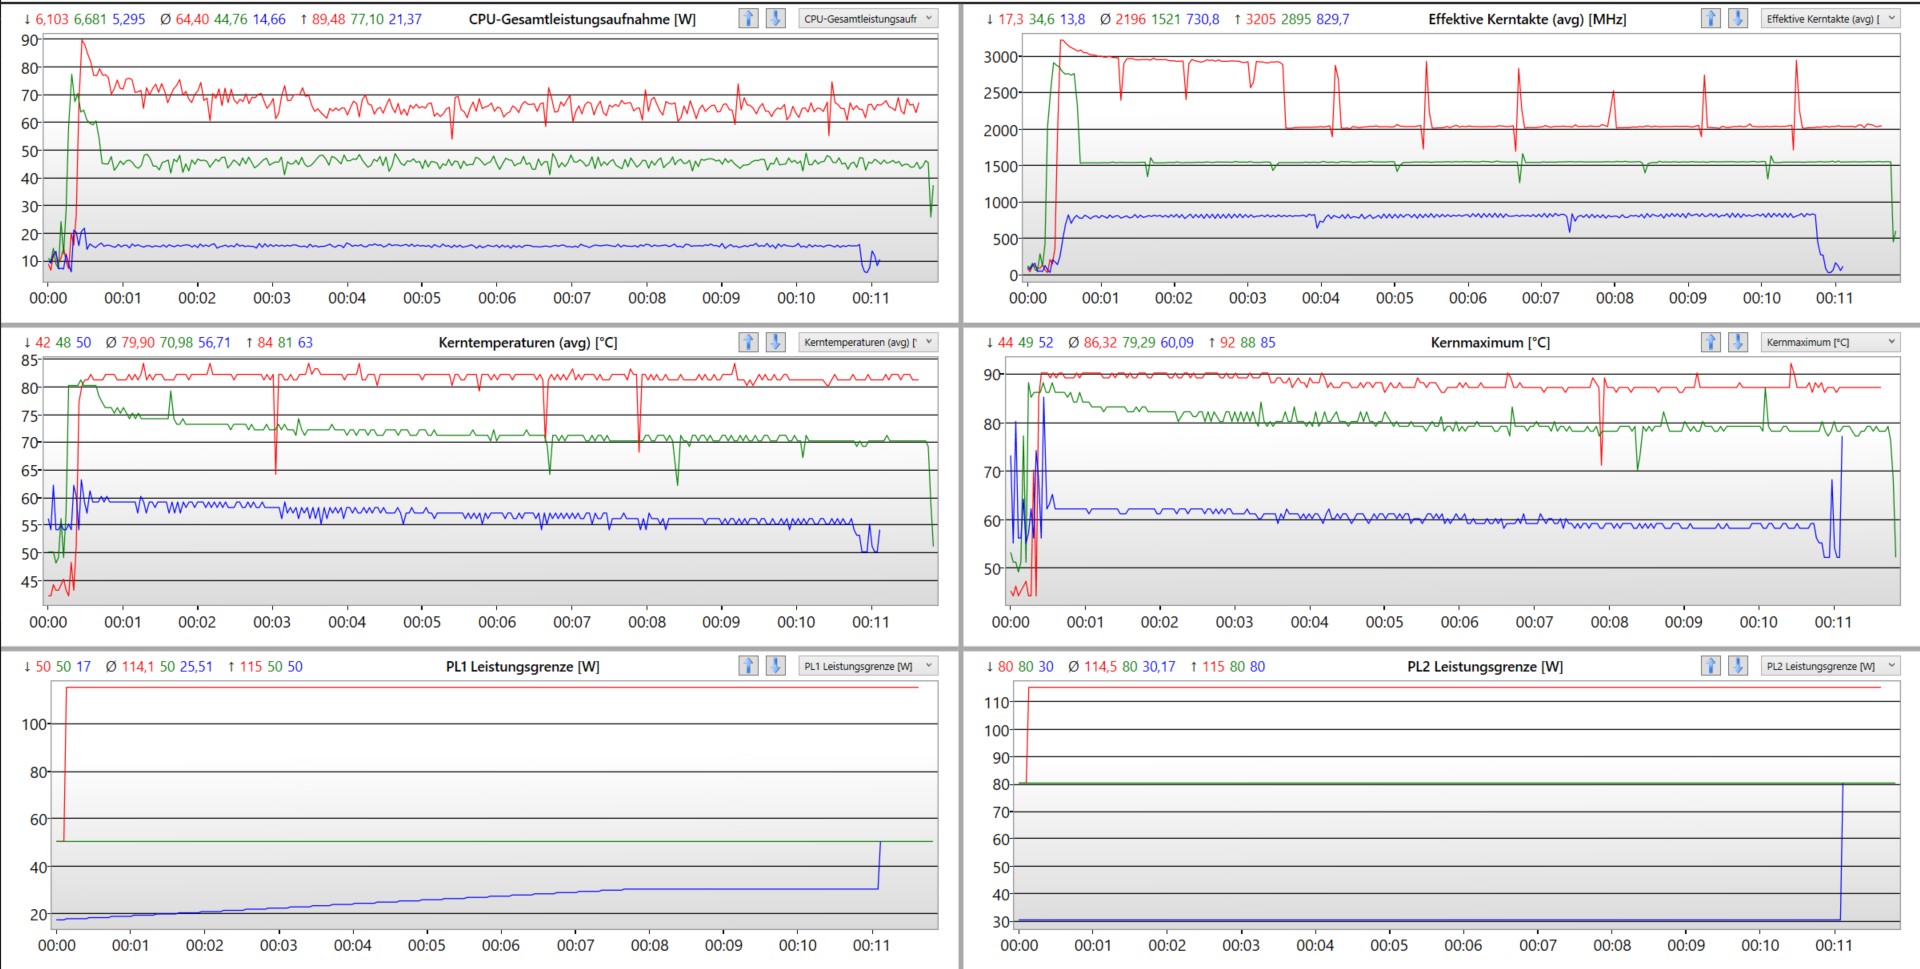
Isto afeta fortemente o desempenho do laptop. No modo de desempenho, 140 watts estão disponíveis para a CPU e GPU. Durante os testes, observamos um impulso dinâmico de cerca de 25 watts. Somente o processador pode trabalhar a uns bons 65 watts. Ao funcionar em modo sussurro ou modo de economia de energia, o Intel Core i7 e o Nvidia RTX 3060's consumo combinado de energia paira em torno de 45 watts. Devido às várias opções de ajuste do ventilador, no modo de economia de energia, a temperatura do hardware aumenta consideravelmente mais lentamente devido às várias opções de ajuste do ventilador. Da mesma forma, no modo de bateria, medimos um consumo combinado de energia de cerca de 25 watts.
Análise de log
Processador
OIntel Core i7-12700Hpertence aos processadores mais poderosos da geração Alder Lake da Intel. No Schenker XMG Focus 16, o processador tem um desempenho relativamente bom sem atingir seus melhores níveis. A longo prazo, o laptop foi incapaz de lidar com a queda de mais de 100 pontos de desempenho no loop do Cinbench com o tempo.
Além disso, as pontuações da CPU mostram que o i7 do laptop para jogos fica no meio do pacote quando comparado com seus concorrentes. No entanto, ele tem um desempenho superior à média de desempenho de umIntel Core i7-12700H. No entanto, o 12700H tem o melhor desempenho no Lenovo Legion 5 Pro. Em nenhum laptop em nosso banco de dados o i7 tem um desempenho melhor do que o encontrado no Legion. Determinamos um nível relativamente alto de 105 watts para PL2 no laptop Schenker, mas apenas 65 watts para PL1.
Cinebench R15 Multi sustained load
Cinebench R23: Multi Core | Single Core
Cinebench R20: CPU (Multi Core) | CPU (Single Core)
Cinebench R15: CPU Multi 64Bit | CPU Single 64Bit
Blender: v2.79 BMW27 CPU
7-Zip 18.03: 7z b 4 | 7z b 4 -mmt1
Geekbench 5.5: Multi-Core | Single-Core
HWBOT x265 Benchmark v2.2: 4k Preset
LibreOffice : 20 Documents To PDF
R Benchmark 2.5: Overall mean
| CPU Performance rating | |
| Média da turma Gaming | |
| Lenovo Legion 5 Pro 16IAH7H | |
| Asus ZenBook Pro 16X OLED UX7602ZM-ME115W | |
| Lenovo ThinkPad X1 Extreme G5-21DE003RGE | |
| Lenovo Legion Slim 7-16IAH 82TF004YGE | |
| Schenker XMG Focus 16 (i7-12700H, RTX 3060) | |
| Dell G16 7620 | |
| Média Intel Core i7-12700H | |
| Asus ROG Flow X16 GV601RW-M5082W | |
| Cinebench R23 / Multi Core | |
| Média da turma Gaming (10488 - 42661, n=104, últimos 2 anos) | |
| Lenovo Legion 5 Pro 16IAH7H | |
| Lenovo Legion Slim 7-16IAH 82TF004YGE | |
| Lenovo ThinkPad X1 Extreme G5-21DE003RGE | |
| Schenker XMG Focus 16 (i7-12700H, RTX 3060) | |
| Dell G16 7620 | |
| Asus ZenBook Pro 16X OLED UX7602ZM-ME115W | |
| Média Intel Core i7-12700H (4032 - 19330, n=64) | |
| Asus ROG Flow X16 GV601RW-M5082W | |
| Cinebench R23 / Single Core | |
| Média da turma Gaming (1601 - 2415, n=104, últimos 2 anos) | |
| Lenovo ThinkPad X1 Extreme G5-21DE003RGE | |
| Schenker XMG Focus 16 (i7-12700H, RTX 3060) | |
| Média Intel Core i7-12700H (778 - 1826, n=63) | |
| Lenovo Legion Slim 7-16IAH 82TF004YGE | |
| Lenovo Legion 5 Pro 16IAH7H | |
| Dell G16 7620 | |
| Asus ZenBook Pro 16X OLED UX7602ZM-ME115W | |
| Asus ROG Flow X16 GV601RW-M5082W | |
| Cinebench R20 / CPU (Multi Core) | |
| Média da turma Gaming (4029 - 16433, n=103, últimos 2 anos) | |
| Lenovo Legion 5 Pro 16IAH7H | |
| Lenovo ThinkPad X1 Extreme G5-21DE003RGE | |
| Lenovo Legion Slim 7-16IAH 82TF004YGE | |
| Dell G16 7620 | |
| Schenker XMG Focus 16 (i7-12700H, RTX 3060) | |
| Asus ZenBook Pro 16X OLED UX7602ZM-ME115W | |
| Média Intel Core i7-12700H (1576 - 7407, n=64) | |
| Asus ROG Flow X16 GV601RW-M5082W | |
| Cinebench R20 / CPU (Single Core) | |
| Média da turma Gaming (622 - 913, n=103, últimos 2 anos) | |
| Lenovo ThinkPad X1 Extreme G5-21DE003RGE | |
| Schenker XMG Focus 16 (i7-12700H, RTX 3060) | |
| Asus ZenBook Pro 16X OLED UX7602ZM-ME115W | |
| Média Intel Core i7-12700H (300 - 704, n=64) | |
| Lenovo Legion Slim 7-16IAH 82TF004YGE | |
| Lenovo Legion 5 Pro 16IAH7H | |
| Dell G16 7620 | |
| Asus ROG Flow X16 GV601RW-M5082W | |
| Cinebench R15 / CPU Multi 64Bit | |
| Média da turma Gaming (1578 - 6330, n=102, últimos 2 anos) | |
| Lenovo Legion 5 Pro 16IAH7H | |
| Lenovo Legion Slim 7-16IAH 82TF004YGE | |
| Lenovo ThinkPad X1 Extreme G5-21DE003RGE | |
| Schenker XMG Focus 16 (i7-12700H, RTX 3060) | |
| Dell G16 7620 | |
| Asus ZenBook Pro 16X OLED UX7602ZM-ME115W | |
| Média Intel Core i7-12700H (1379 - 2916, n=70) | |
| Asus ROG Flow X16 GV601RW-M5082W | |
| Cinebench R15 / CPU Single 64Bit | |
| Média da turma Gaming (188.8 - 350, n=103, últimos 2 anos) | |
| Asus ZenBook Pro 16X OLED UX7602ZM-ME115W | |
| Asus ZenBook Pro 16X OLED UX7602ZM-ME115W | |
| Lenovo ThinkPad X1 Extreme G5-21DE003RGE | |
| Schenker XMG Focus 16 (i7-12700H, RTX 3060) | |
| Lenovo Legion Slim 7-16IAH 82TF004YGE | |
| Média Intel Core i7-12700H (113 - 263, n=65) | |
| Lenovo Legion 5 Pro 16IAH7H | |
| Dell G16 7620 | |
| Asus ROG Flow X16 GV601RW-M5082W | |
| Blender / v2.79 BMW27 CPU | |
| Média Intel Core i7-12700H (168 - 732, n=63) | |
| Asus ROG Flow X16 GV601RW-M5082W | |
| Schenker XMG Focus 16 (i7-12700H, RTX 3060) | |
| Lenovo ThinkPad X1 Extreme G5-21DE003RGE | |
| Asus ZenBook Pro 16X OLED UX7602ZM-ME115W | |
| Dell G16 7620 | |
| Lenovo Legion Slim 7-16IAH 82TF004YGE | |
| Lenovo Legion 5 Pro 16IAH7H | |
| Média da turma Gaming (79 - 330, n=101, últimos 2 anos) | |
| 7-Zip 18.03 / 7z b 4 | |
| Média da turma Gaming (33491 - 148086, n=102, últimos 2 anos) | |
| Asus ZenBook Pro 16X OLED UX7602ZM-ME115W | |
| Lenovo Legion 5 Pro 16IAH7H | |
| Lenovo ThinkPad X1 Extreme G5-21DE003RGE | |
| Lenovo Legion Slim 7-16IAH 82TF004YGE | |
| Dell G16 7620 | |
| Schenker XMG Focus 16 (i7-12700H, RTX 3060) | |
| Asus ROG Flow X16 GV601RW-M5082W | |
| Média Intel Core i7-12700H (22844 - 73067, n=63) | |
| 7-Zip 18.03 / 7z b 4 -mmt1 | |
| Média da turma Gaming (4824 - 7436, n=102, últimos 2 anos) | |
| Lenovo ThinkPad X1 Extreme G5-21DE003RGE | |
| Asus ZenBook Pro 16X OLED UX7602ZM-ME115W | |
| Schenker XMG Focus 16 (i7-12700H, RTX 3060) | |
| Asus ROG Flow X16 GV601RW-M5082W | |
| Média Intel Core i7-12700H (2743 - 5972, n=63) | |
| Lenovo Legion 5 Pro 16IAH7H | |
| Lenovo Legion Slim 7-16IAH 82TF004YGE | |
| Dell G16 7620 | |
| Geekbench 5.5 / Multi-Core | |
| Média da turma Gaming (6460 - 28263, n=102, últimos 2 anos) | |
| Asus ZenBook Pro 16X OLED UX7602ZM-ME115W | |
| Lenovo Legion 5 Pro 16IAH7H | |
| Lenovo Legion Slim 7-16IAH 82TF004YGE | |
| Schenker XMG Focus 16 (i7-12700H, RTX 3060) | |
| Dell G16 7620 | |
| Lenovo ThinkPad X1 Extreme G5-21DE003RGE | |
| Média Intel Core i7-12700H (5144 - 13745, n=64) | |
| Asus ROG Flow X16 GV601RW-M5082W | |
| Geekbench 5.5 / Single-Core | |
| Média da turma Gaming (1403 - 2474, n=102, últimos 2 anos) | |
| Asus ZenBook Pro 16X OLED UX7602ZM-ME115W | |
| Lenovo ThinkPad X1 Extreme G5-21DE003RGE | |
| Schenker XMG Focus 16 (i7-12700H, RTX 3060) | |
| Média Intel Core i7-12700H (803 - 1851, n=64) | |
| Lenovo Legion Slim 7-16IAH 82TF004YGE | |
| Lenovo Legion 5 Pro 16IAH7H | |
| Dell G16 7620 | |
| Asus ROG Flow X16 GV601RW-M5082W | |
| HWBOT x265 Benchmark v2.2 / 4k Preset | |
| Média da turma Gaming (11.5 - 44.4, n=102, últimos 2 anos) | |
| Lenovo Legion 5 Pro 16IAH7H | |
| Asus ZenBook Pro 16X OLED UX7602ZM-ME115W | |
| Dell G16 7620 | |
| Lenovo Legion Slim 7-16IAH 82TF004YGE | |
| Schenker XMG Focus 16 (i7-12700H, RTX 3060) | |
| Lenovo ThinkPad X1 Extreme G5-21DE003RGE | |
| Média Intel Core i7-12700H (4.67 - 21.8, n=64) | |
| Asus ROG Flow X16 GV601RW-M5082W | |
| LibreOffice / 20 Documents To PDF | |
| Asus ROG Flow X16 GV601RW-M5082W | |
| Dell G16 7620 | |
| Média da turma Gaming (33.2 - 88.8, n=102, últimos 2 anos) | |
| Média Intel Core i7-12700H (34.2 - 95.3, n=63) | |
| Schenker XMG Focus 16 (i7-12700H, RTX 3060) | |
| Lenovo ThinkPad X1 Extreme G5-21DE003RGE | |
| Lenovo Legion 5 Pro 16IAH7H | |
| Lenovo Legion Slim 7-16IAH 82TF004YGE | |
| Asus ZenBook Pro 16X OLED UX7602ZM-ME115W | |
| R Benchmark 2.5 / Overall mean | |
| Dell G16 7620 | |
| Asus ROG Flow X16 GV601RW-M5082W | |
| Lenovo Legion 5 Pro 16IAH7H | |
| Média Intel Core i7-12700H (0.4441 - 1.052, n=63) | |
| Lenovo Legion Slim 7-16IAH 82TF004YGE | |
| Schenker XMG Focus 16 (i7-12700H, RTX 3060) | |
| Lenovo ThinkPad X1 Extreme G5-21DE003RGE | |
| Asus ZenBook Pro 16X OLED UX7602ZM-ME115W | |
| Média da turma Gaming (0.3439 - 0.59, n=102, últimos 2 anos) | |
* ... menor é melhor
AIDA64: FP32 Ray-Trace | FPU Julia | CPU SHA3 | CPU Queen | FPU SinJulia | FPU Mandel | CPU AES | CPU ZLib | FP64 Ray-Trace | CPU PhotoWorxx
| Performance rating | |
| Média da turma Gaming | |
| Asus ROG Flow X16 GV601RW-M5082W | |
| Lenovo Legion Slim 7-16IAH 82TF004YGE | |
| Asus ZenBook Pro 16X OLED UX7602ZM-ME115W | |
| Schenker XMG Focus 16 (i7-12700H, RTX 3060) | |
| Dell G16 7620 | |
| Lenovo ThinkPad X1 Extreme G5-21DE003RGE | |
| Lenovo Legion 5 Pro 16IAH7H | |
| Média Intel Core i7-12700H | |
Desempenho do sistema
Embora o laptop Schenker não possa ser acusado de fraqueza no uso normal, uma comparação com outros laptops potentes para jogos mostra que é possível fazer mais. Os resultados do benchmark PCMark10 e Crossmark estão ligeiramente abaixo da média. Como ambos os programas de benchmark não colocam o SSD sob tensão a longo prazo em nenhum dos sub-testes, a memória DDR4 um pouco mais lenta e o desempenho comparativamente baixo do processador são mais provavelmente os culpados.
CrossMark: Overall | Productivity | Creativity | Responsiveness
| PCMark 10 / Score | |
| Média da turma Gaming (5828 - 12414, n=93, últimos 2 anos) | |
| Lenovo Legion 5 Pro 16IAH7H | |
| Asus ZenBook Pro 16X OLED UX7602ZM-ME115W | |
| Lenovo Legion Slim 7-16IAH 82TF004YGE | |
| Lenovo ThinkPad X1 Extreme G5-21DE003RGE | |
| Média Intel Core i7-12700H, NVIDIA GeForce RTX 3060 Laptop GPU (5986 - 8156, n=12) | |
| Dell G16 7620 | |
| Schenker XMG Focus 16 (i7-12700H, RTX 3060) | |
| Asus ROG Flow X16 GV601RW-M5082W | |
| PCMark 10 / Essentials | |
| Lenovo Legion 5 Pro 16IAH7H | |
| Asus ZenBook Pro 16X OLED UX7602ZM-ME115W | |
| Lenovo Legion Slim 7-16IAH 82TF004YGE | |
| Média da turma Gaming (8810 - 11935, n=97, últimos 2 anos) | |
| Média Intel Core i7-12700H, NVIDIA GeForce RTX 3060 Laptop GPU (9289 - 12144, n=12) | |
| Lenovo ThinkPad X1 Extreme G5-21DE003RGE | |
| Dell G16 7620 | |
| Schenker XMG Focus 16 (i7-12700H, RTX 3060) | |
| Asus ROG Flow X16 GV601RW-M5082W | |
| PCMark 10 / Productivity | |
| Média da turma Gaming (6845 - 25323, n=95, últimos 2 anos) | |
| Asus ZenBook Pro 16X OLED UX7602ZM-ME115W | |
| Schenker XMG Focus 16 (i7-12700H, RTX 3060) | |
| Asus ROG Flow X16 GV601RW-M5082W | |
| Lenovo Legion Slim 7-16IAH 82TF004YGE | |
| Lenovo Legion 5 Pro 16IAH7H | |
| Lenovo ThinkPad X1 Extreme G5-21DE003RGE | |
| Média Intel Core i7-12700H, NVIDIA GeForce RTX 3060 Laptop GPU (6161 - 10362, n=12) | |
| Dell G16 7620 | |
| PCMark 10 / Digital Content Creation | |
| Média da turma Gaming (7602 - 19954, n=95, últimos 2 anos) | |
| Lenovo Legion 5 Pro 16IAH7H | |
| Dell G16 7620 | |
| Lenovo Legion Slim 7-16IAH 82TF004YGE | |
| Média Intel Core i7-12700H, NVIDIA GeForce RTX 3060 Laptop GPU (8950 - 12554, n=12) | |
| Lenovo ThinkPad X1 Extreme G5-21DE003RGE | |
| Asus ZenBook Pro 16X OLED UX7602ZM-ME115W | |
| Schenker XMG Focus 16 (i7-12700H, RTX 3060) | |
| Asus ROG Flow X16 GV601RW-M5082W | |
| CrossMark / Overall | |
| Média da turma Gaming (1366 - 2409, n=94, últimos 2 anos) | |
| Lenovo Legion Slim 7-16IAH 82TF004YGE | |
| Média Intel Core i7-12700H, NVIDIA GeForce RTX 3060 Laptop GPU (1649 - 2017, n=11) | |
| Asus ZenBook Pro 16X OLED UX7602ZM-ME115W | |
| Dell G16 7620 | |
| Lenovo Legion 5 Pro 16IAH7H | |
| Lenovo ThinkPad X1 Extreme G5-21DE003RGE | |
| Asus ROG Flow X16 GV601RW-M5082W | |
| Schenker XMG Focus 16 (i7-12700H, RTX 3060) | |
| CrossMark / Productivity | |
| Média da turma Gaming (1386 - 2254, n=94, últimos 2 anos) | |
| Lenovo Legion Slim 7-16IAH 82TF004YGE | |
| Média Intel Core i7-12700H, NVIDIA GeForce RTX 3060 Laptop GPU (1536 - 1958, n=11) | |
| Lenovo Legion 5 Pro 16IAH7H | |
| Dell G16 7620 | |
| Asus ZenBook Pro 16X OLED UX7602ZM-ME115W | |
| Lenovo ThinkPad X1 Extreme G5-21DE003RGE | |
| Asus ROG Flow X16 GV601RW-M5082W | |
| Schenker XMG Focus 16 (i7-12700H, RTX 3060) | |
| CrossMark / Creativity | |
| Média da turma Gaming (1343 - 2786, n=94, últimos 2 anos) | |
| Asus ZenBook Pro 16X OLED UX7602ZM-ME115W | |
| Lenovo Legion Slim 7-16IAH 82TF004YGE | |
| Média Intel Core i7-12700H, NVIDIA GeForce RTX 3060 Laptop GPU (1816 - 2084, n=11) | |
| Dell G16 7620 | |
| Lenovo ThinkPad X1 Extreme G5-21DE003RGE | |
| Lenovo Legion 5 Pro 16IAH7H | |
| Schenker XMG Focus 16 (i7-12700H, RTX 3060) | |
| Asus ROG Flow X16 GV601RW-M5082W | |
| CrossMark / Responsiveness | |
| Lenovo Legion Slim 7-16IAH 82TF004YGE | |
| Lenovo Legion 5 Pro 16IAH7H | |
| Média da turma Gaming (1226 - 2334, n=94, últimos 2 anos) | |
| Média Intel Core i7-12700H, NVIDIA GeForce RTX 3060 Laptop GPU (1210 - 2207, n=11) | |
| Dell G16 7620 | |
| Asus ZenBook Pro 16X OLED UX7602ZM-ME115W | |
| Lenovo ThinkPad X1 Extreme G5-21DE003RGE | |
| Asus ROG Flow X16 GV601RW-M5082W | |
| Schenker XMG Focus 16 (i7-12700H, RTX 3060) | |
| PCMark 10 Score | 7134 pontos | |
Ajuda | ||
* ... menor é melhor
Latências DPC
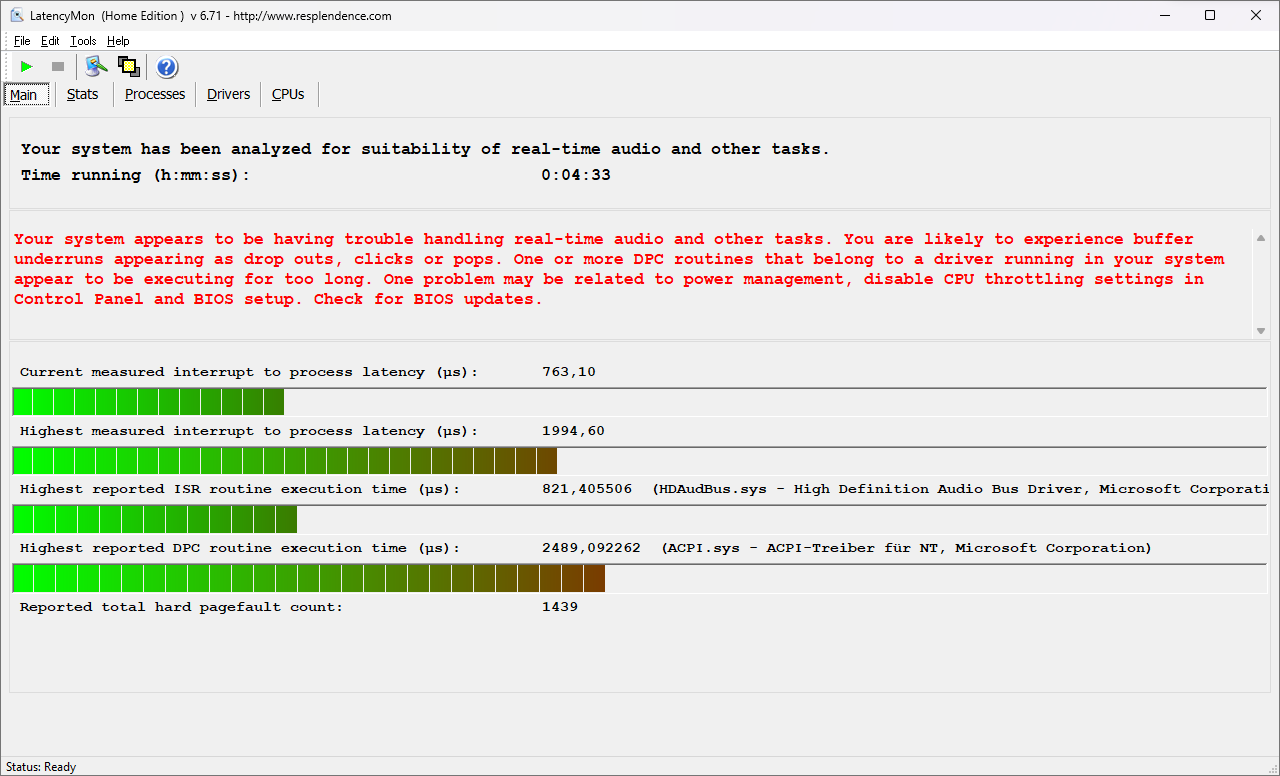
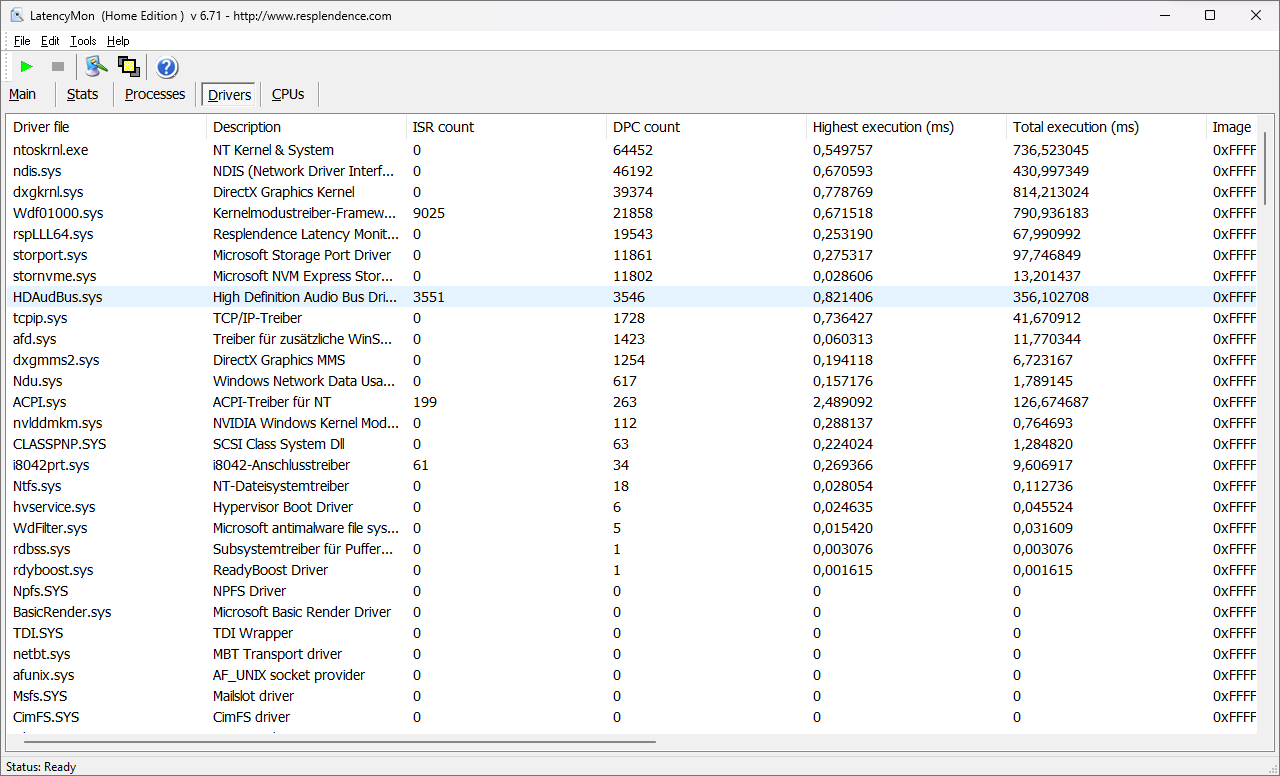
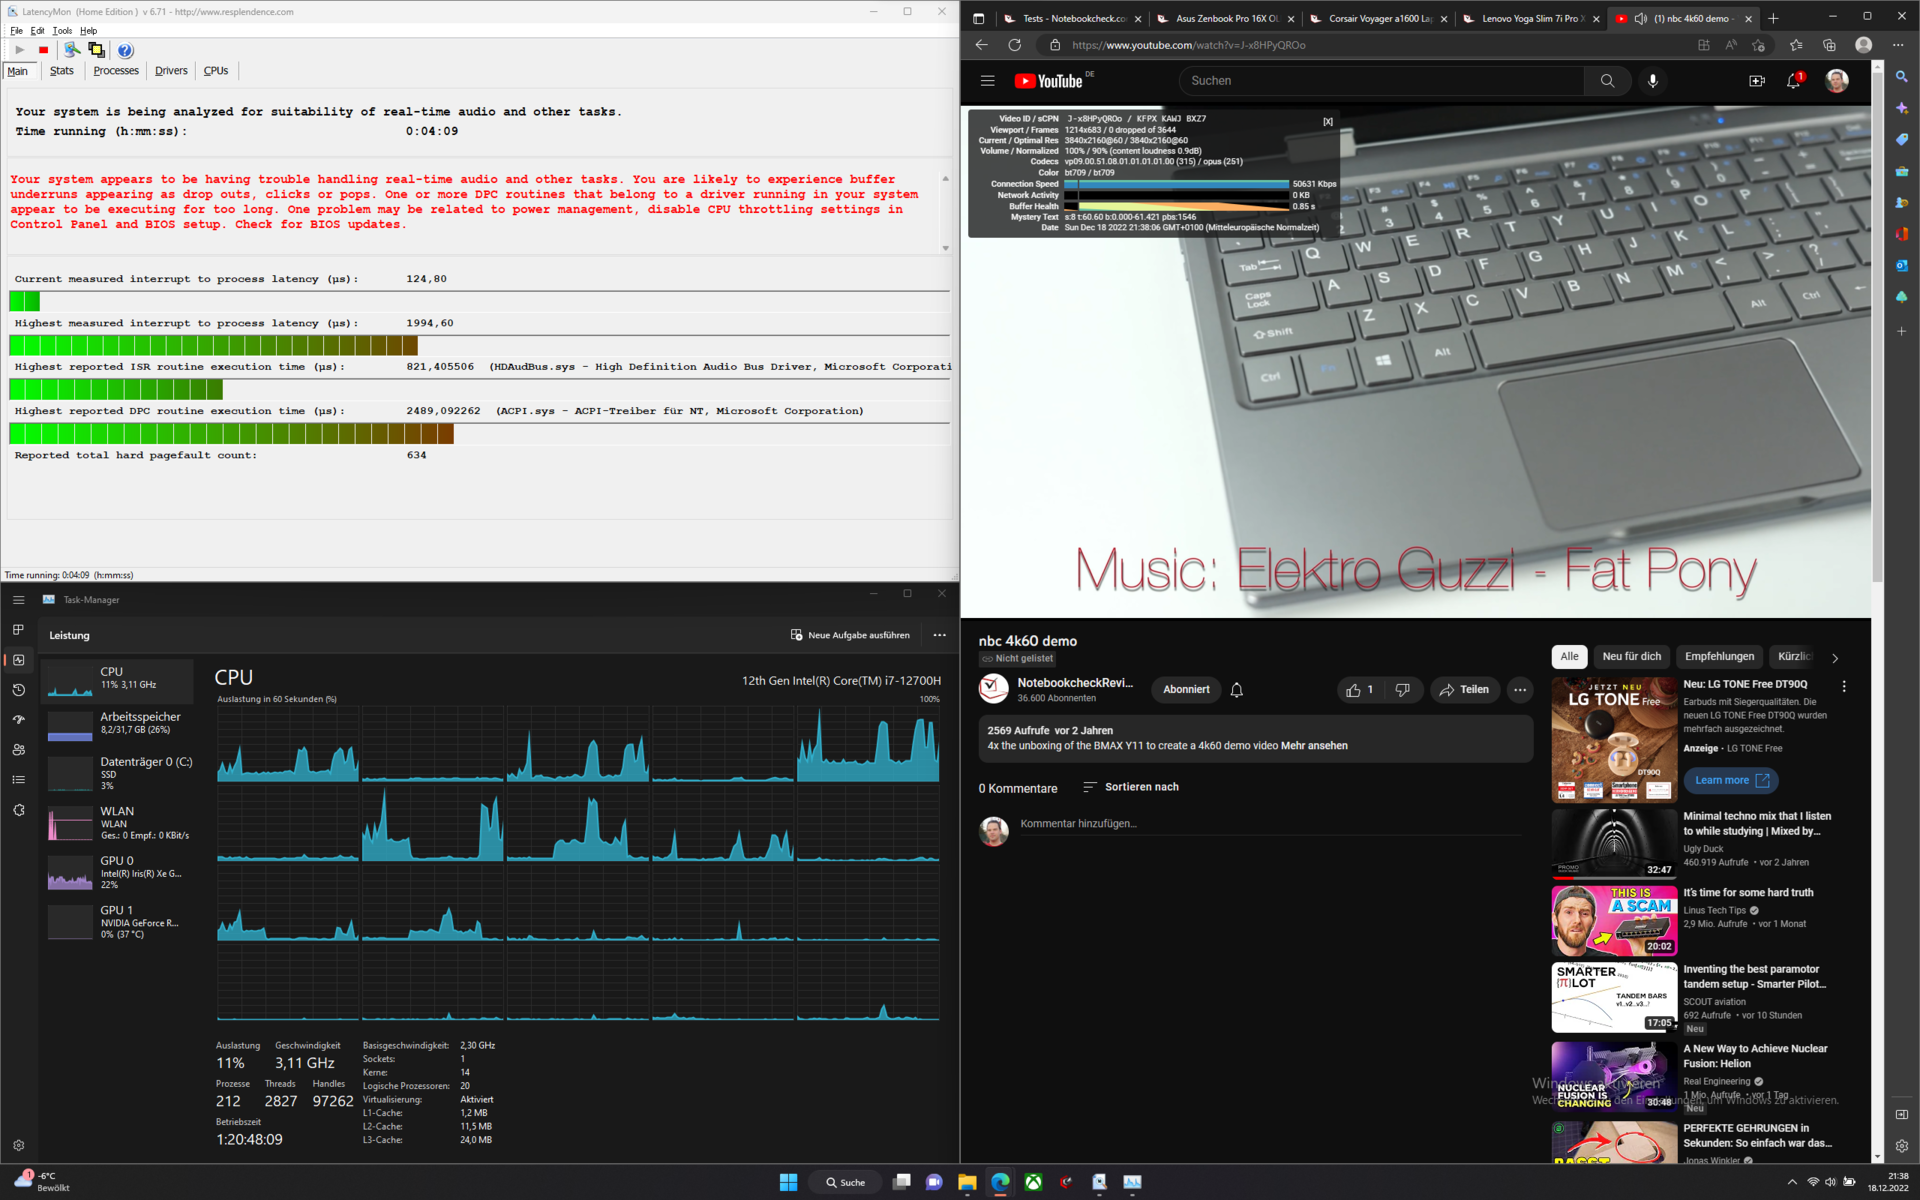
O XMG Focus 16 não está sozinho em termos de altas latências de DPC. Com a atual combinação de drivers, o laptop para jogos registrou altos níveis e, portanto, é inadequado para aplicações em tempo real. Nenhum frame foi pulado durante o teste de 4K 60Hz do YouTube.
| DPC Latencies / LatencyMon - interrupt to process latency (max), Web, Youtube, Prime95 | |
| Schenker XMG Focus 16 (i7-12700H, RTX 3060) | |
| Asus ROG Flow X16 GV601RW-M5082W | |
| Lenovo ThinkPad X1 Extreme G5-21DE003RGE | |
| Dell G16 7620 | |
| Lenovo Legion 5 Pro 16IAH7H | |
| Lenovo Legion Slim 7-16IAH 82TF004YGE | |
| Asus ZenBook Pro 16X OLED UX7602ZM-ME115W | |
* ... menor é melhor
Armazenamento em massa
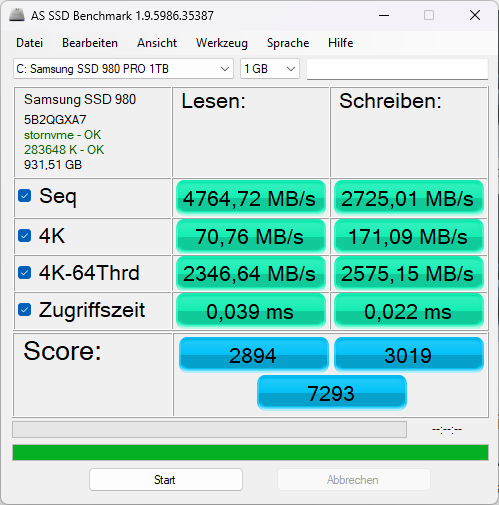
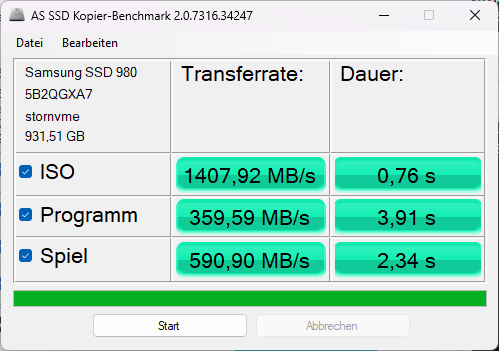
O laptop para jogos Schenker possui um SSD 980 Pro da Samsung de 1TB. Esta poderosa SSD está próxima ao topo de nossa tabela de referência de SSDs e HDDs. O armazenamento NVMe do laptop para jogos também é de alto desempenho. Entretanto, após algumas execuções no loop do DiskSpd, a SSD NVMe foi significativamente asfixiada. Este comportamento indica uma fraca dissipação de calor. Enquanto muitos outros fabricantes começaram a implementar almofadas térmicas em cima ou sob SSDs, a fim de dissipar o calor operacional, isto é algo que não pode ser dito do laptop da Schenker.

* ... menor é melhor
Continuous performance read: DiskSpd Read Loop, Queue Depth 8
Placa gráfica
UmNvidia GeForce RTX 3060faz seu trabalho no XMG Focus 16. Dependendo dos requisitos de qualidade, a placa gráfica é adequada para jogos Full HD ou QHD. O 3060 no laptop Schenker deve ser capaz de rodar a maioria dos títulos atuais a mais de 60fps na resolução total da tela. Apenas alguns poucos jogos requerem mais potência.
Após resultados de desempenho do sistema bastante pouco inspiradores, a placa gráfica do dispositivo Schenker nos surpreendeu com um excelente desempenho. Na maioria dos benchmarks, os 3060 da Schenker obtiveram altas pontuações. A pontuação muito alta no benchmark 3DMark Cloud Gate indica acesso rápido à memória gráfica.
| 3DMark 11 Performance | 26508 pontos | |
| 3DMark Ice Storm Standard Score | 147494 pontos | |
| 3DMark Cloud Gate Standard Score | 57261 pontos | |
| 3DMark Fire Strike Score | 19951 pontos | |
| 3DMark Time Spy Score | 8675 pontos | |
Ajuda | ||
* ... menor é melhor
Desempenho do jogo
O Nvidia GeForce RTX 3060 deve ser suficientemente potente para jogar a maioria dos jogos atuais a 60fps nas configurações mais altas usando a resolução QHD do visor. Entretanto, esta tela oferece uma taxa de atualização de 165 Hz. Os resultados do benchmark mostram que 165fps em Full HD pode ser alcançado em configurações de qualidade média.
Em comparação com outros laptops para jogos, o XMG Focus 16 obteve resultados moderadamente bons. Entretanto, oLenovo Legion 5 Proe oDell G16são um pouco mais poderosos.
Witcher 3 as taxas de quadros exibiam o comportamento típico do jogo de dia/noite. Durante o jogo, a taxa de quadros muda, dependendo do aumento ou diminuição da distância de sorteio.
Witcher 3 fps-diagram
| baixo | média | alto | ultra | QHD | 4K | |
|---|---|---|---|---|---|---|
| GTA V (2015) | 183.8 | 179.1 | 167.9 | 94.7 | 80.9 | |
| The Witcher 3 (2015) | 80 | |||||
| Dota 2 Reborn (2015) | 165.8 | 151.7 | 143.4 | 135.7 | 103.4 | |
| Final Fantasy XV Benchmark (2018) | 111.4 | 84.5 | 64.3 | 37.8 | ||
| X-Plane 11.11 (2018) | 137.6 | 123.9 | 99.5 | 89 | ||
| Strange Brigade (2018) | 340 | 210 | 171.2 | 150.1 | ||
| F1 22 (2022) | 168 | 166.1 | 141.8 | 53.5 | 34.8 |
Emissões - os ventiladores podem ser ajustados graças ao Centro de Controle
Emissões sonoras
Em comparação direta, 54 dB(A) sob carga não é exatamente silencioso. Se o laptop realmente precisa ser tão silencioso quanto um mouse, o Control Center 3.0 oferece um modo silencioso.
Barulho
| Ocioso |
| 23 / 23 / 32.07 dB |
| Carga |
| 53.7 / 54.58 dB |
 | ||
30 dB silencioso 40 dB(A) audível 50 dB(A) ruidosamente alto |
||
min: | ||
| Schenker XMG Focus 16 (i7-12700H, RTX 3060) GeForce RTX 3060 Laptop GPU, i7-12700H, Samsung SSD 980 Pro 1TB MZ-V8P1T0BW | Asus ZenBook Pro 16X OLED UX7602ZM-ME115W GeForce RTX 3060 Laptop GPU, i9-12900H, Samsung PM9A1 MZVL21T0HCLR | Dell G16 7620 GeForce RTX 3060 Laptop GPU, i7-12700H, WDC PC SN810 512GB | Asus ROG Flow X16 GV601RW-M5082W GeForce RTX 3070 Ti Laptop GPU, R9 6900HS, Micron 3400 1TB MTFDKBA1T0TFH | Lenovo ThinkPad X1 Extreme G5-21DE003RGE GeForce RTX 3060 Laptop GPU, i7-12700H, Micron 3400 1TB MTFDKBA1T0TFH | Lenovo Legion Slim 7-16IAH 82TF004YGE GeForce RTX 3060 Laptop GPU, i7-12700H, SK Hynix HFS001TEJ9X115N | Lenovo Legion 5 Pro 16IAH7H GeForce RTX 3060 Laptop GPU, i7-12700H, 2x Samsung PM9A1 MZVL21T0HCLR (RAID 0) | |
|---|---|---|---|---|---|---|---|
| Noise | -2% | 4% | -2% | 11% | 8% | -9% | |
| desligado / ambiente * (dB) | 23 | 26 -13% | 23.2 -1% | 25.5 -11% | 23.2 -1% | 23 -0% | 24.6 -7% |
| Idle Minimum * (dB) | 23 | 26 -13% | 28.3 -23% | 25.5 -11% | 23.2 -1% | 23 -0% | 28.7 -25% |
| Idle Average * (dB) | 23 | 26 -13% | 28.8 -25% | 25.5 -11% | 23.2 -1% | 23 -0% | 32 -39% |
| Idle Maximum * (dB) | 32.07 | 26 19% | 28.9 10% | 27.4 15% | 23.2 28% | 23 28% | 32 -0% |
| Load Average * (dB) | 53.7 | 48 11% | 32.4 40% | 49.9 7% | 45.5 15% | 43.7 19% | 45.2 16% |
| Witcher 3 ultra * (dB) | 54.58 | 48.3 12% | 45.5 17% | 51.7 5% | |||
| Load Maximum * (dB) | 54.58 | 54.6 -0% | 48.1 12% | 55 -1% | 45.5 17% | 52 5% | 54.4 -0% |
* ... menor é melhor
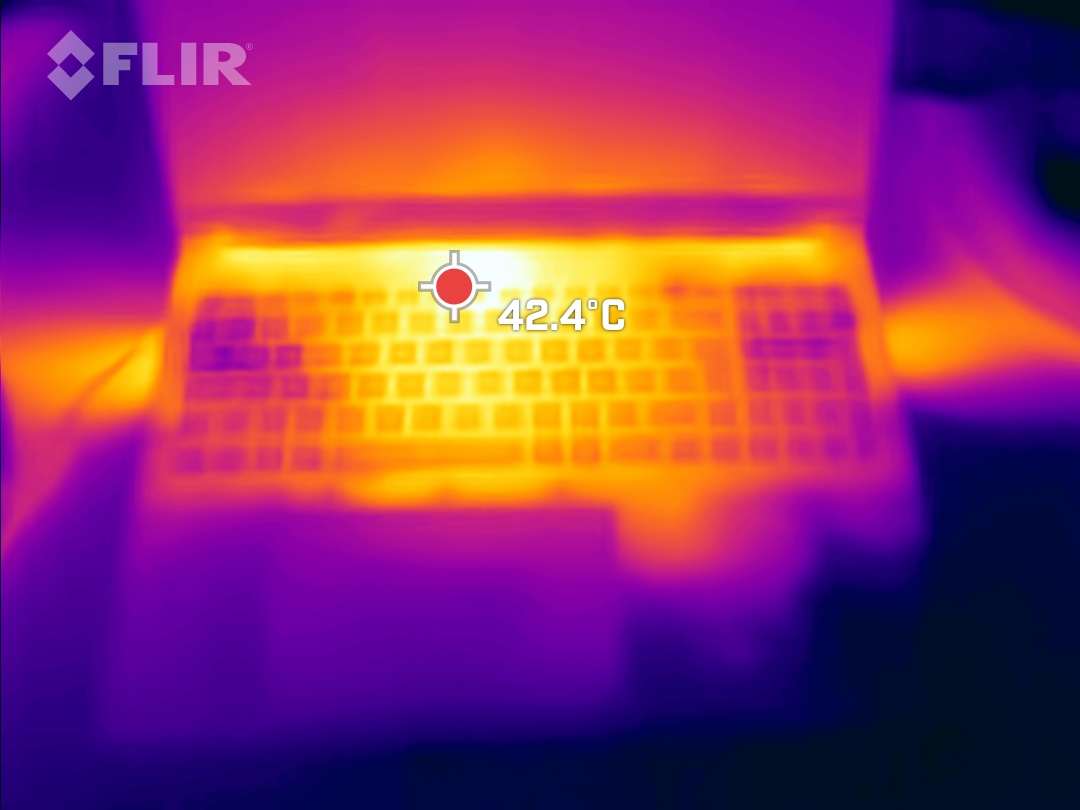
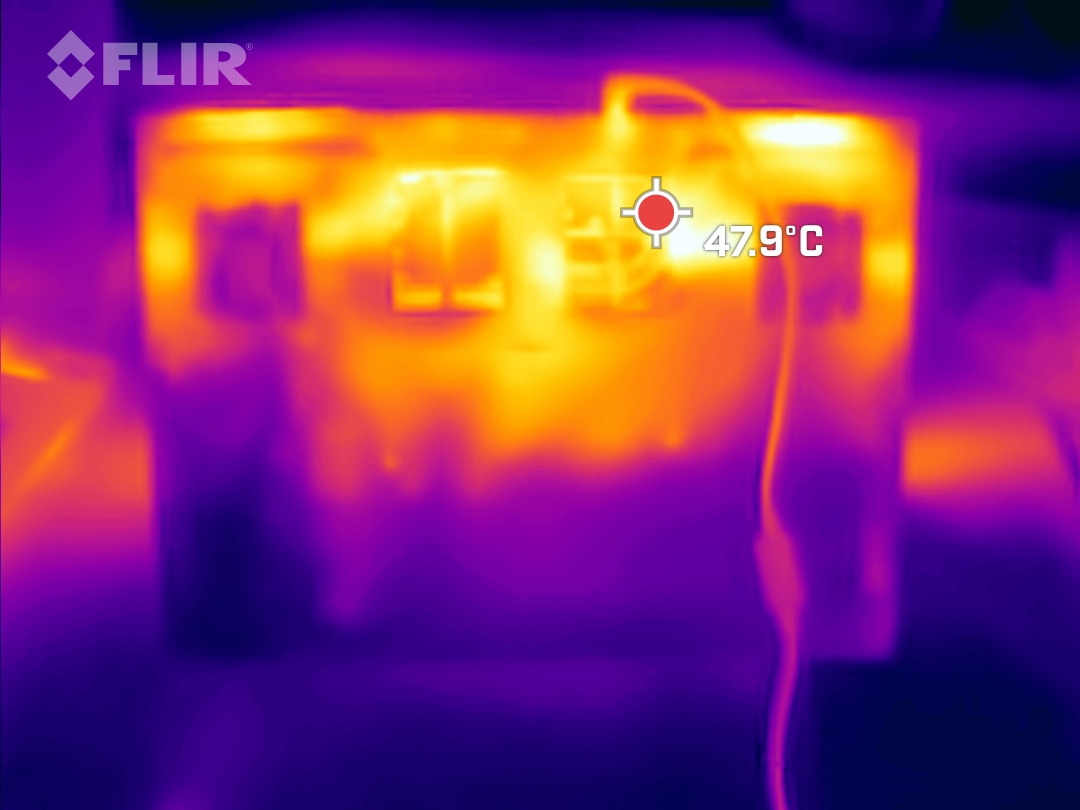
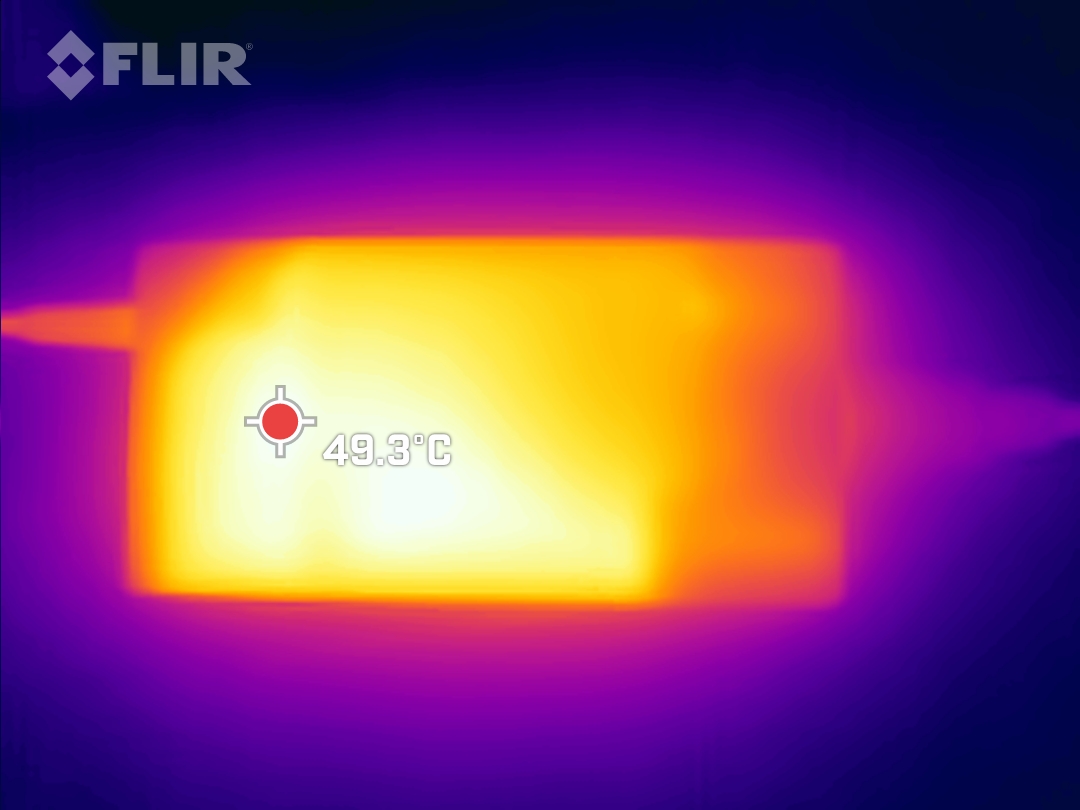
Temperatura
Em última análise, o alto nível de desempenho dos laptops para jogos anda sempre de mãos dadas com muito calor. O Focus 16 também fica relativamente quente, mas sem queimar seus dedos no teclado. Além do laptop em si, a fonte de alimentação também aquece durante a operação. Isto pode às vezes atingir temperaturas superiores a 50 °C.
(-) A temperatura máxima no lado superior é 50 °C / 122 F, em comparação com a média de 40.4 °C / 105 F , variando de 21.2 a 68.8 °C para a classe Gaming.
(-) A parte inferior aquece até um máximo de 48 °C / 118 F, em comparação com a média de 43.2 °C / 110 F
(+) Em uso inativo, a temperatura média para o lado superior é 25.3 °C / 78 F, em comparação com a média do dispositivo de 33.9 °C / ### class_avg_f### F.
(±) Jogando The Witcher 3, a temperatura média para o lado superior é 37.1 °C / 99 F, em comparação com a média do dispositivo de 33.9 °C / ## #class_avg_f### F.
(+) Os apoios para as mãos e o touchpad são mais frios que a temperatura da pele, com um máximo de 30 °C / 86 F e, portanto, são frios ao toque.
(±) A temperatura média da área do apoio para as mãos de dispositivos semelhantes foi 28.8 °C / 83.8 F (-1.2 °C / -2.2 F).
| Schenker XMG Focus 16 (i7-12700H, RTX 3060) Intel Core i7-12700H, NVIDIA GeForce RTX 3060 Laptop GPU | Asus ZenBook Pro 16X OLED UX7602ZM-ME115W Intel Core i9-12900H, NVIDIA GeForce RTX 3060 Laptop GPU | Dell G16 7620 Intel Core i7-12700H, NVIDIA GeForce RTX 3060 Laptop GPU | Asus ROG Flow X16 GV601RW-M5082W AMD Ryzen 9 6900HS, NVIDIA GeForce RTX 3070 Ti Laptop GPU | Lenovo ThinkPad X1 Extreme G5-21DE003RGE Intel Core i7-12700H, NVIDIA GeForce RTX 3060 Laptop GPU | Lenovo Legion Slim 7-16IAH 82TF004YGE Intel Core i7-12700H, NVIDIA GeForce RTX 3060 Laptop GPU | Lenovo Legion 5 Pro 16IAH7H Intel Core i7-12700H, NVIDIA GeForce RTX 3060 Laptop GPU | |
|---|---|---|---|---|---|---|---|
| Heat | 5% | 8% | -14% | -0% | -15% | -9% | |
| Maximum Upper Side * (°C) | 50 | 32 36% | 47.6 5% | 55.1 -10% | 52 -4% | 48.3 3% | 45.8 8% |
| Maximum Bottom * (°C) | 48 | 41.6 13% | 54 -13% | 50.3 -5% | 56.4 -18% | 55.3 -15% | 66.3 -38% |
| Idle Upper Side * (°C) | 28 | 32.6 -16% | 23 18% | 35.5 -27% | 26.4 6% | 35.7 -28% | 30.4 -9% |
| Idle Bottom * (°C) | 32 | 36 -13% | 24.6 23% | 36.1 -13% | 27.2 15% | 37.6 -18% | 30.4 5% |
* ... menor é melhor
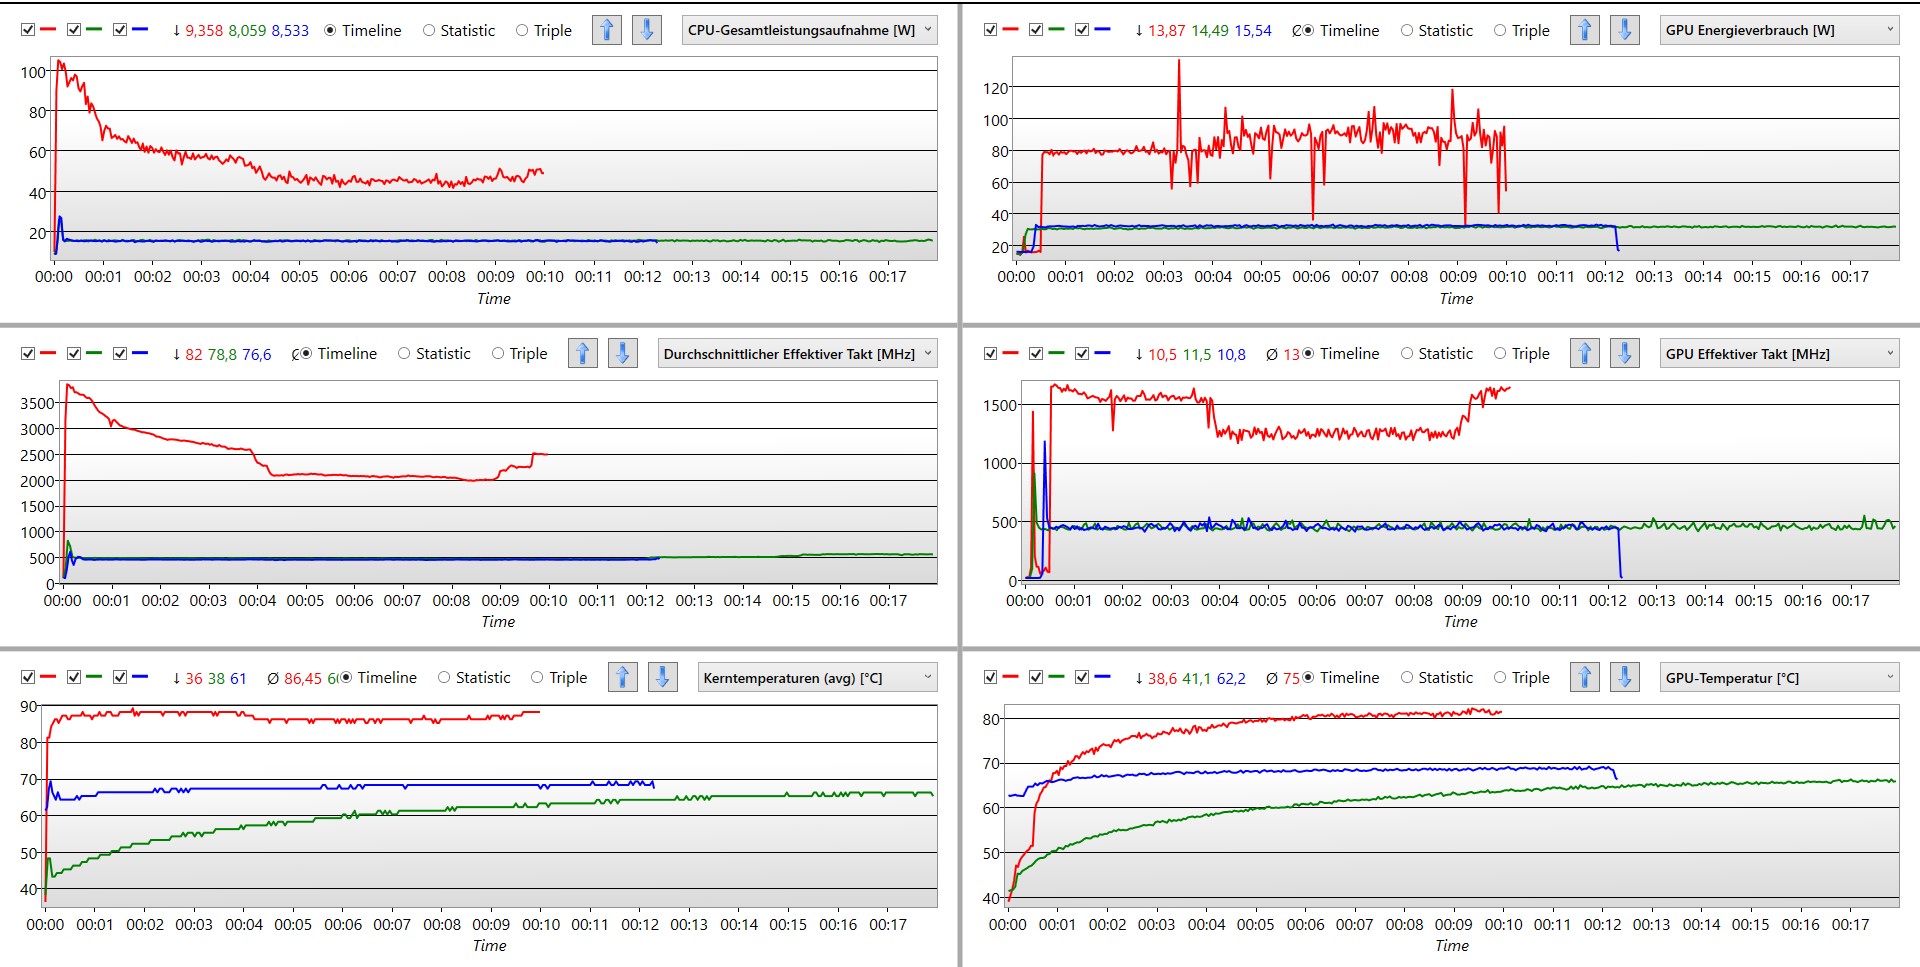
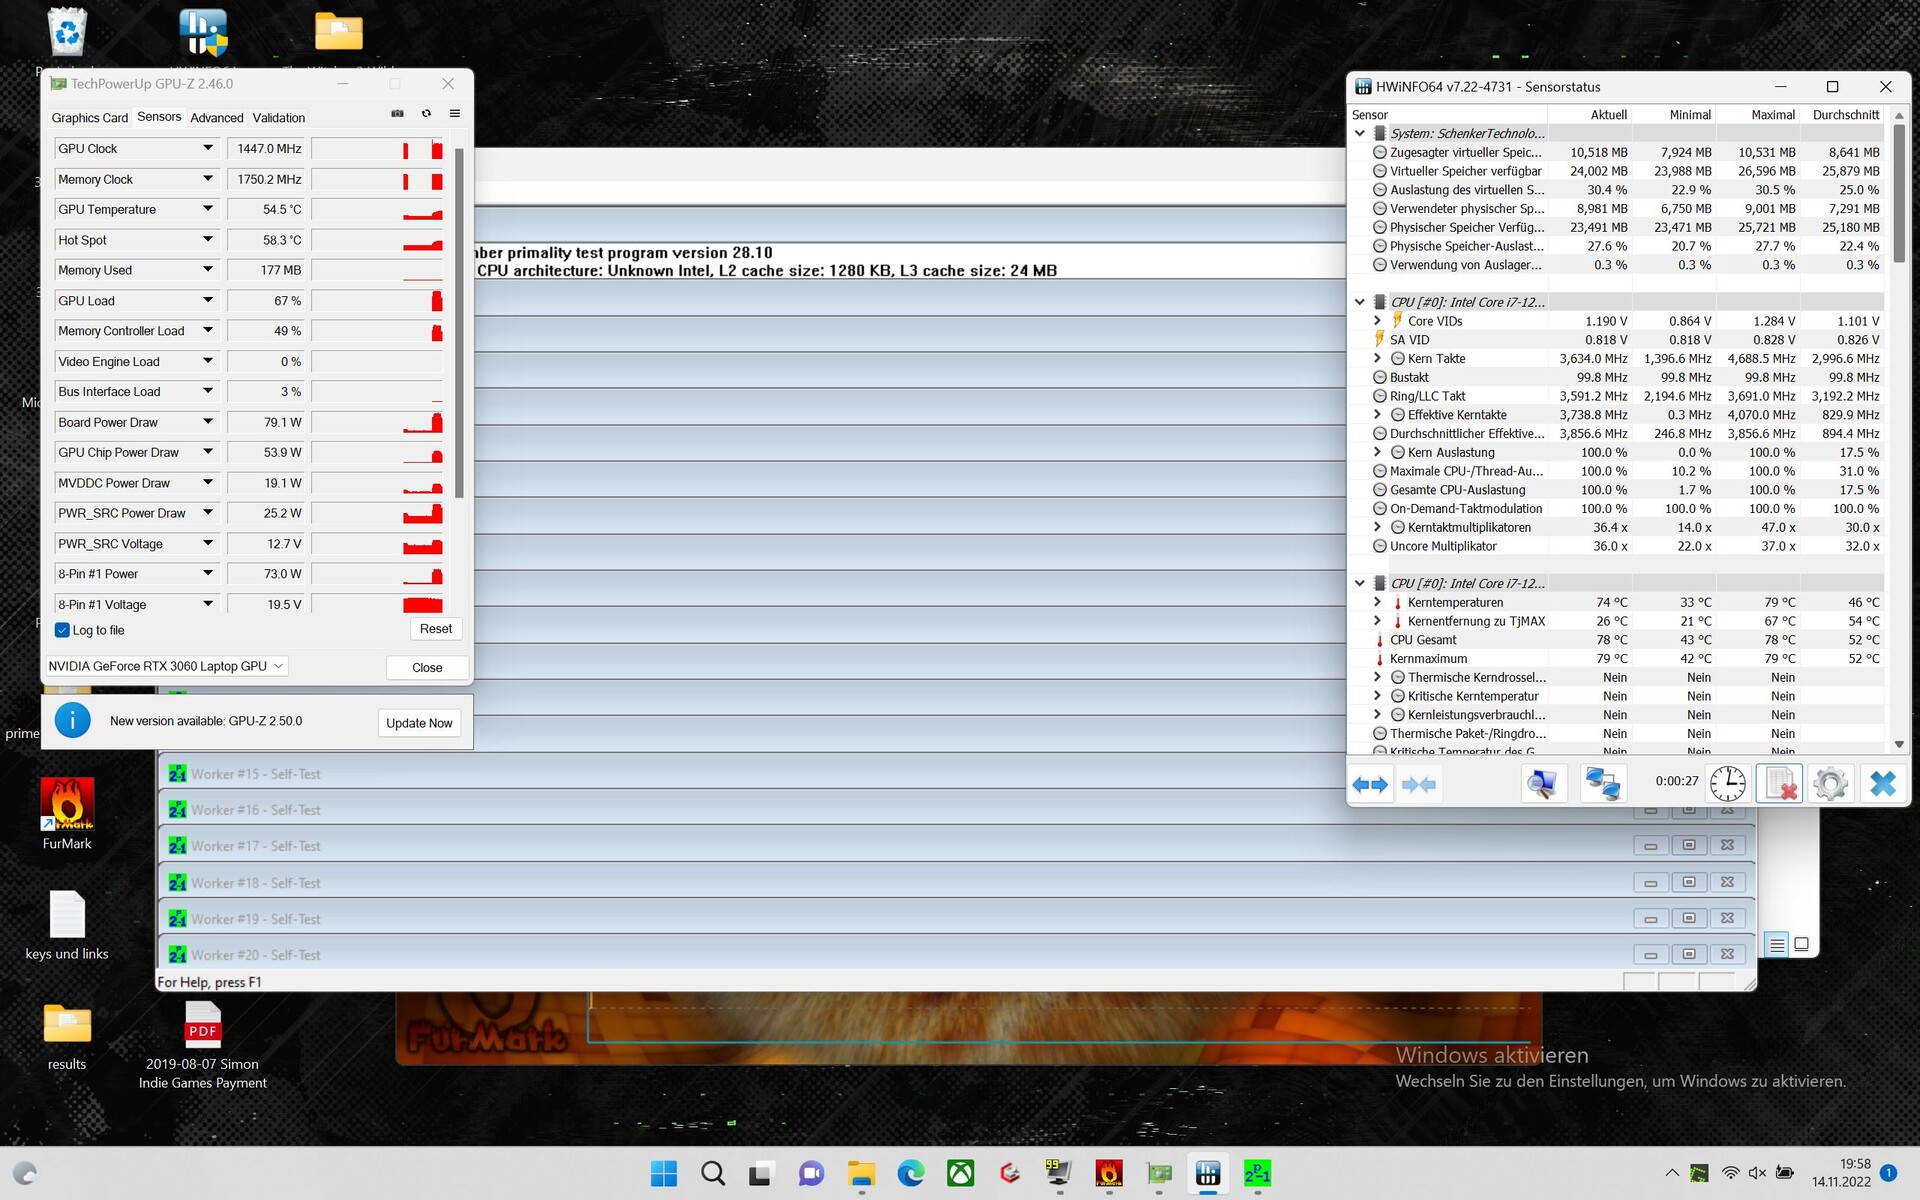
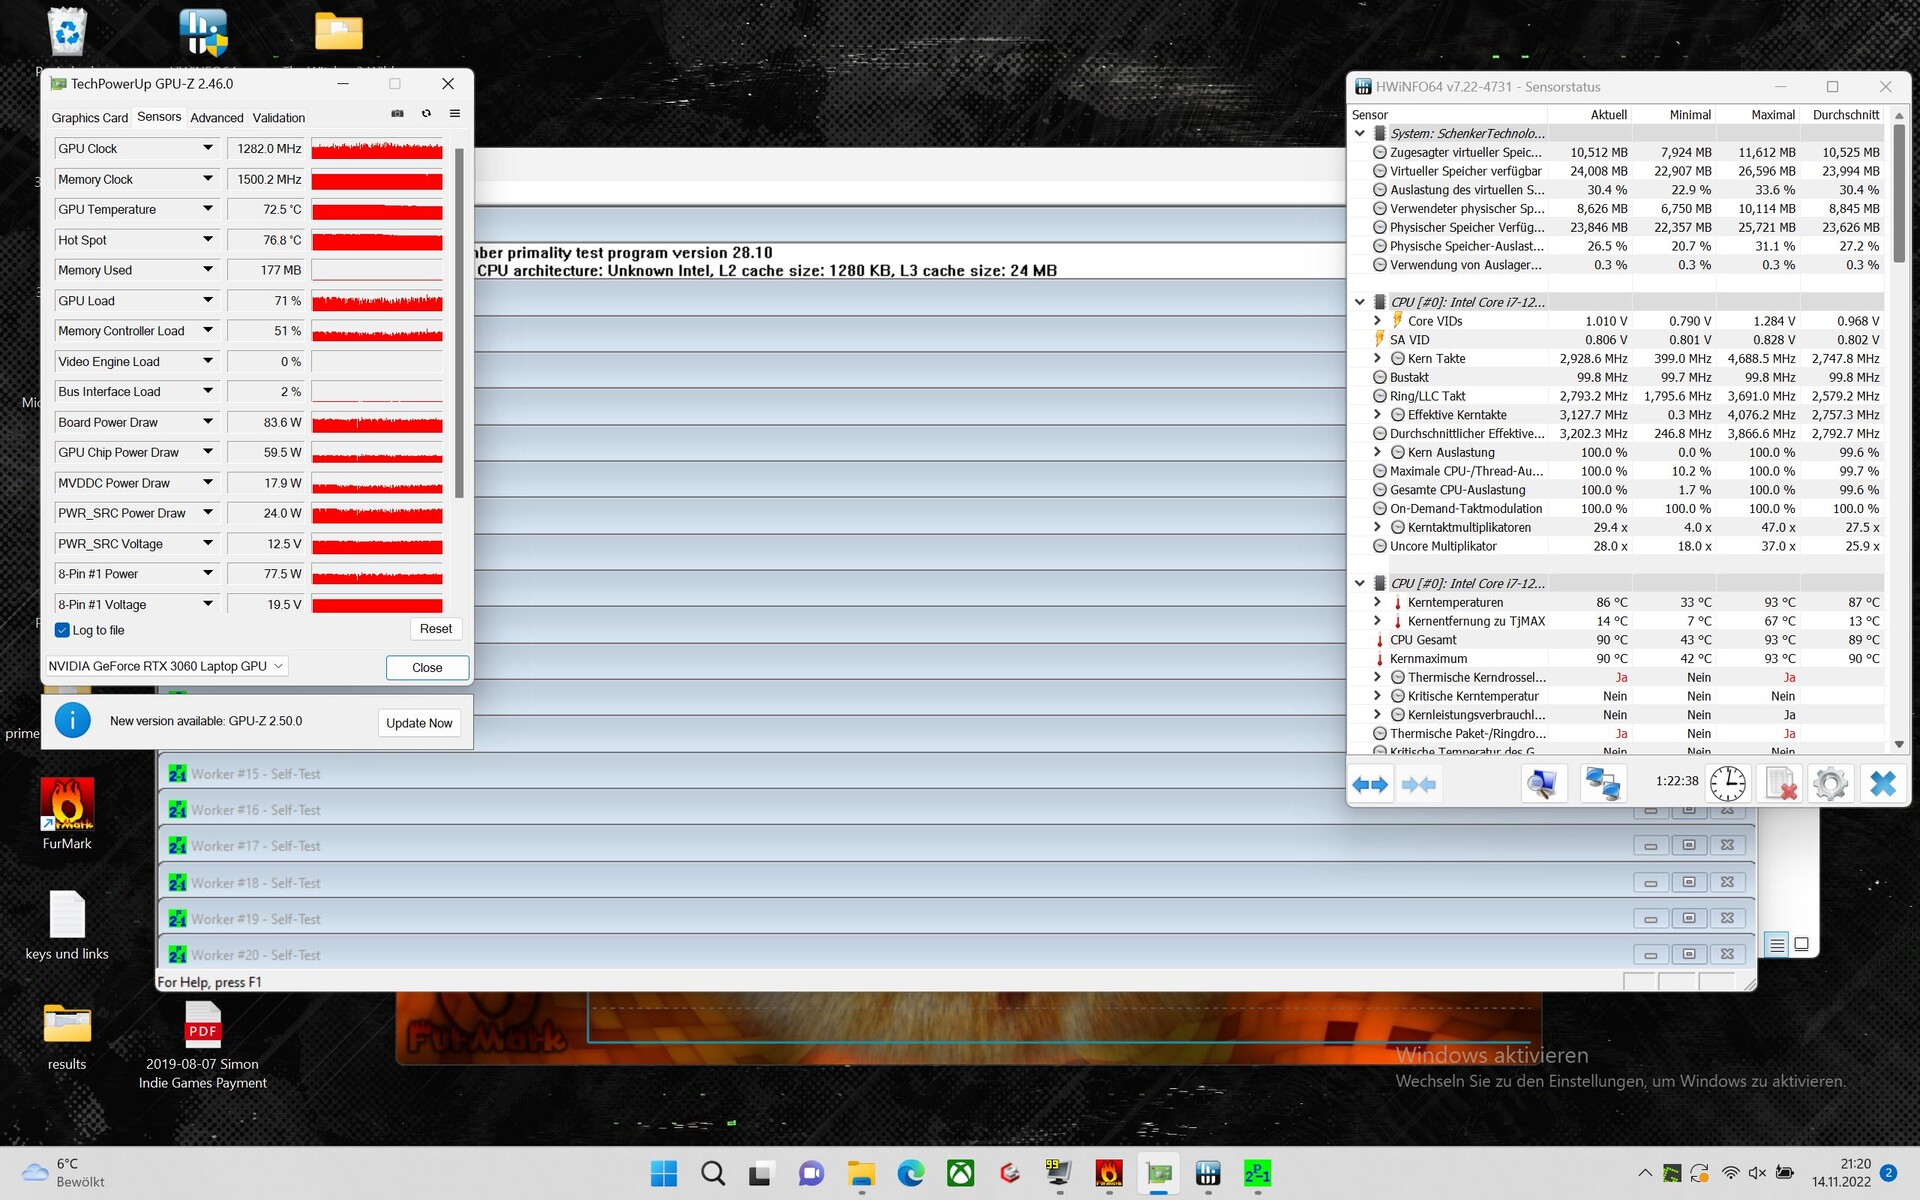
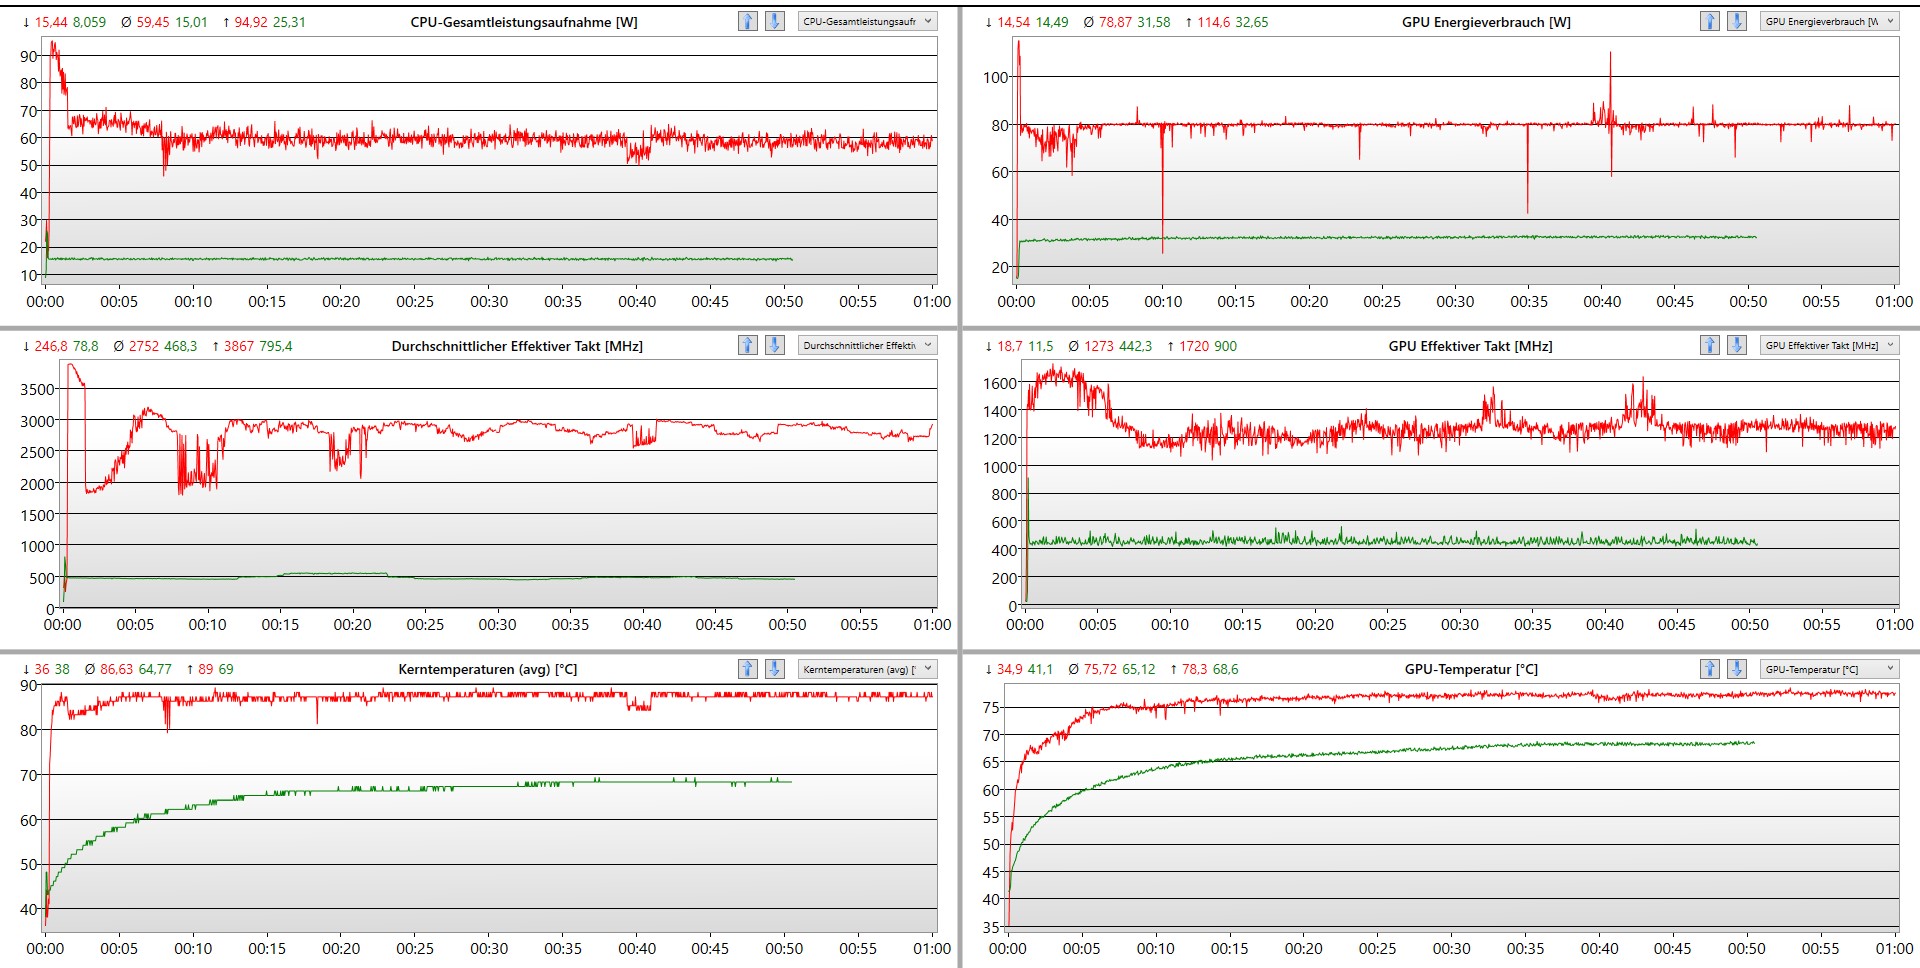
Teste de estresse
Durante o teste de estresse, as velocidades da CPU e GPU do Schenker XMG Focus 16 caem assim que as temperaturas atingem a marca de 80° e 90°C, respectivamente.
Oradores
O Schenker XMG Focus 16 tem duas pequenas caixas acústicas com pouco alcance dinâmico. Eles só fazem muito barulho na metade e dificilmente conseguem afogar os ventiladores do laptop. Os alto-falantes externos conectados através da tomada de áudio de 3,5 mm ou Bluetooth são quase obrigatórios. O laptop Schenker vem com o aplicativo Sound Blaster Cinema 6+. Isto garante uma excelente qualidade de som para fones de ouvido.
Schenker XMG Focus 16 (i7-12700H, RTX 3060) análise de áudio
(±) | o volume do alto-falante é médio, mas bom (###valor### dB)
Graves 100 - 315Hz
(-) | quase nenhum baixo - em média 24.4% menor que a mediana
(±) | a linearidade dos graves é média (8.1% delta para a frequência anterior)
Médios 400 - 2.000 Hz
(±) | médios mais altos - em média 10.6% maior que a mediana
(±) | a linearidade dos médios é média (13.1% delta para frequência anterior)
Altos 2 - 16 kHz
(+) | agudos equilibrados - apenas 4.7% longe da mediana
(±) | a linearidade dos máximos é média (10.4% delta para frequência anterior)
Geral 100 - 16.000 Hz
(-) | o som geral não é linear (30.1% diferença em relação à mediana)
Comparado com a mesma classe
» 96% de todos os dispositivos testados nesta classe foram melhores, 2% semelhantes, 3% piores
» O melhor teve um delta de 6%, a média foi 18%, o pior foi 132%
Comparado com todos os dispositivos testados
» 88% de todos os dispositivos testados foram melhores, 3% semelhantes, 9% piores
» O melhor teve um delta de 4%, a média foi 23%, o pior foi 134%
Asus ROG Flow X16 GV601RW-M5082W análise de áudio
(±) | o volume do alto-falante é médio, mas bom (###valor### dB)
Graves 100 - 315Hz
(±) | graves reduzidos - em média 12.7% menor que a mediana
(±) | a linearidade dos graves é média (13.8% delta para a frequência anterior)
Médios 400 - 2.000 Hz
(+) | médios equilibrados - apenas 1.3% longe da mediana
(+) | médios são lineares (4.7% delta para frequência anterior)
Altos 2 - 16 kHz
(±) | máximos mais altos - em média 6.4% maior que a mediana
(+) | os máximos são lineares (6.8% delta da frequência anterior)
Geral 100 - 16.000 Hz
(+) | o som geral é linear (12.9% diferença em relação à mediana)
Comparado com a mesma classe
» 17% de todos os dispositivos testados nesta classe foram melhores, 4% semelhantes, 79% piores
» O melhor teve um delta de 6%, a média foi 18%, o pior foi 132%
Comparado com todos os dispositivos testados
» 12% de todos os dispositivos testados foram melhores, 3% semelhantes, 85% piores
» O melhor teve um delta de 4%, a média foi 23%, o pior foi 134%
Gerenciamento de energia - consumo de energia típica de um laptop para jogos
Consumo de energia
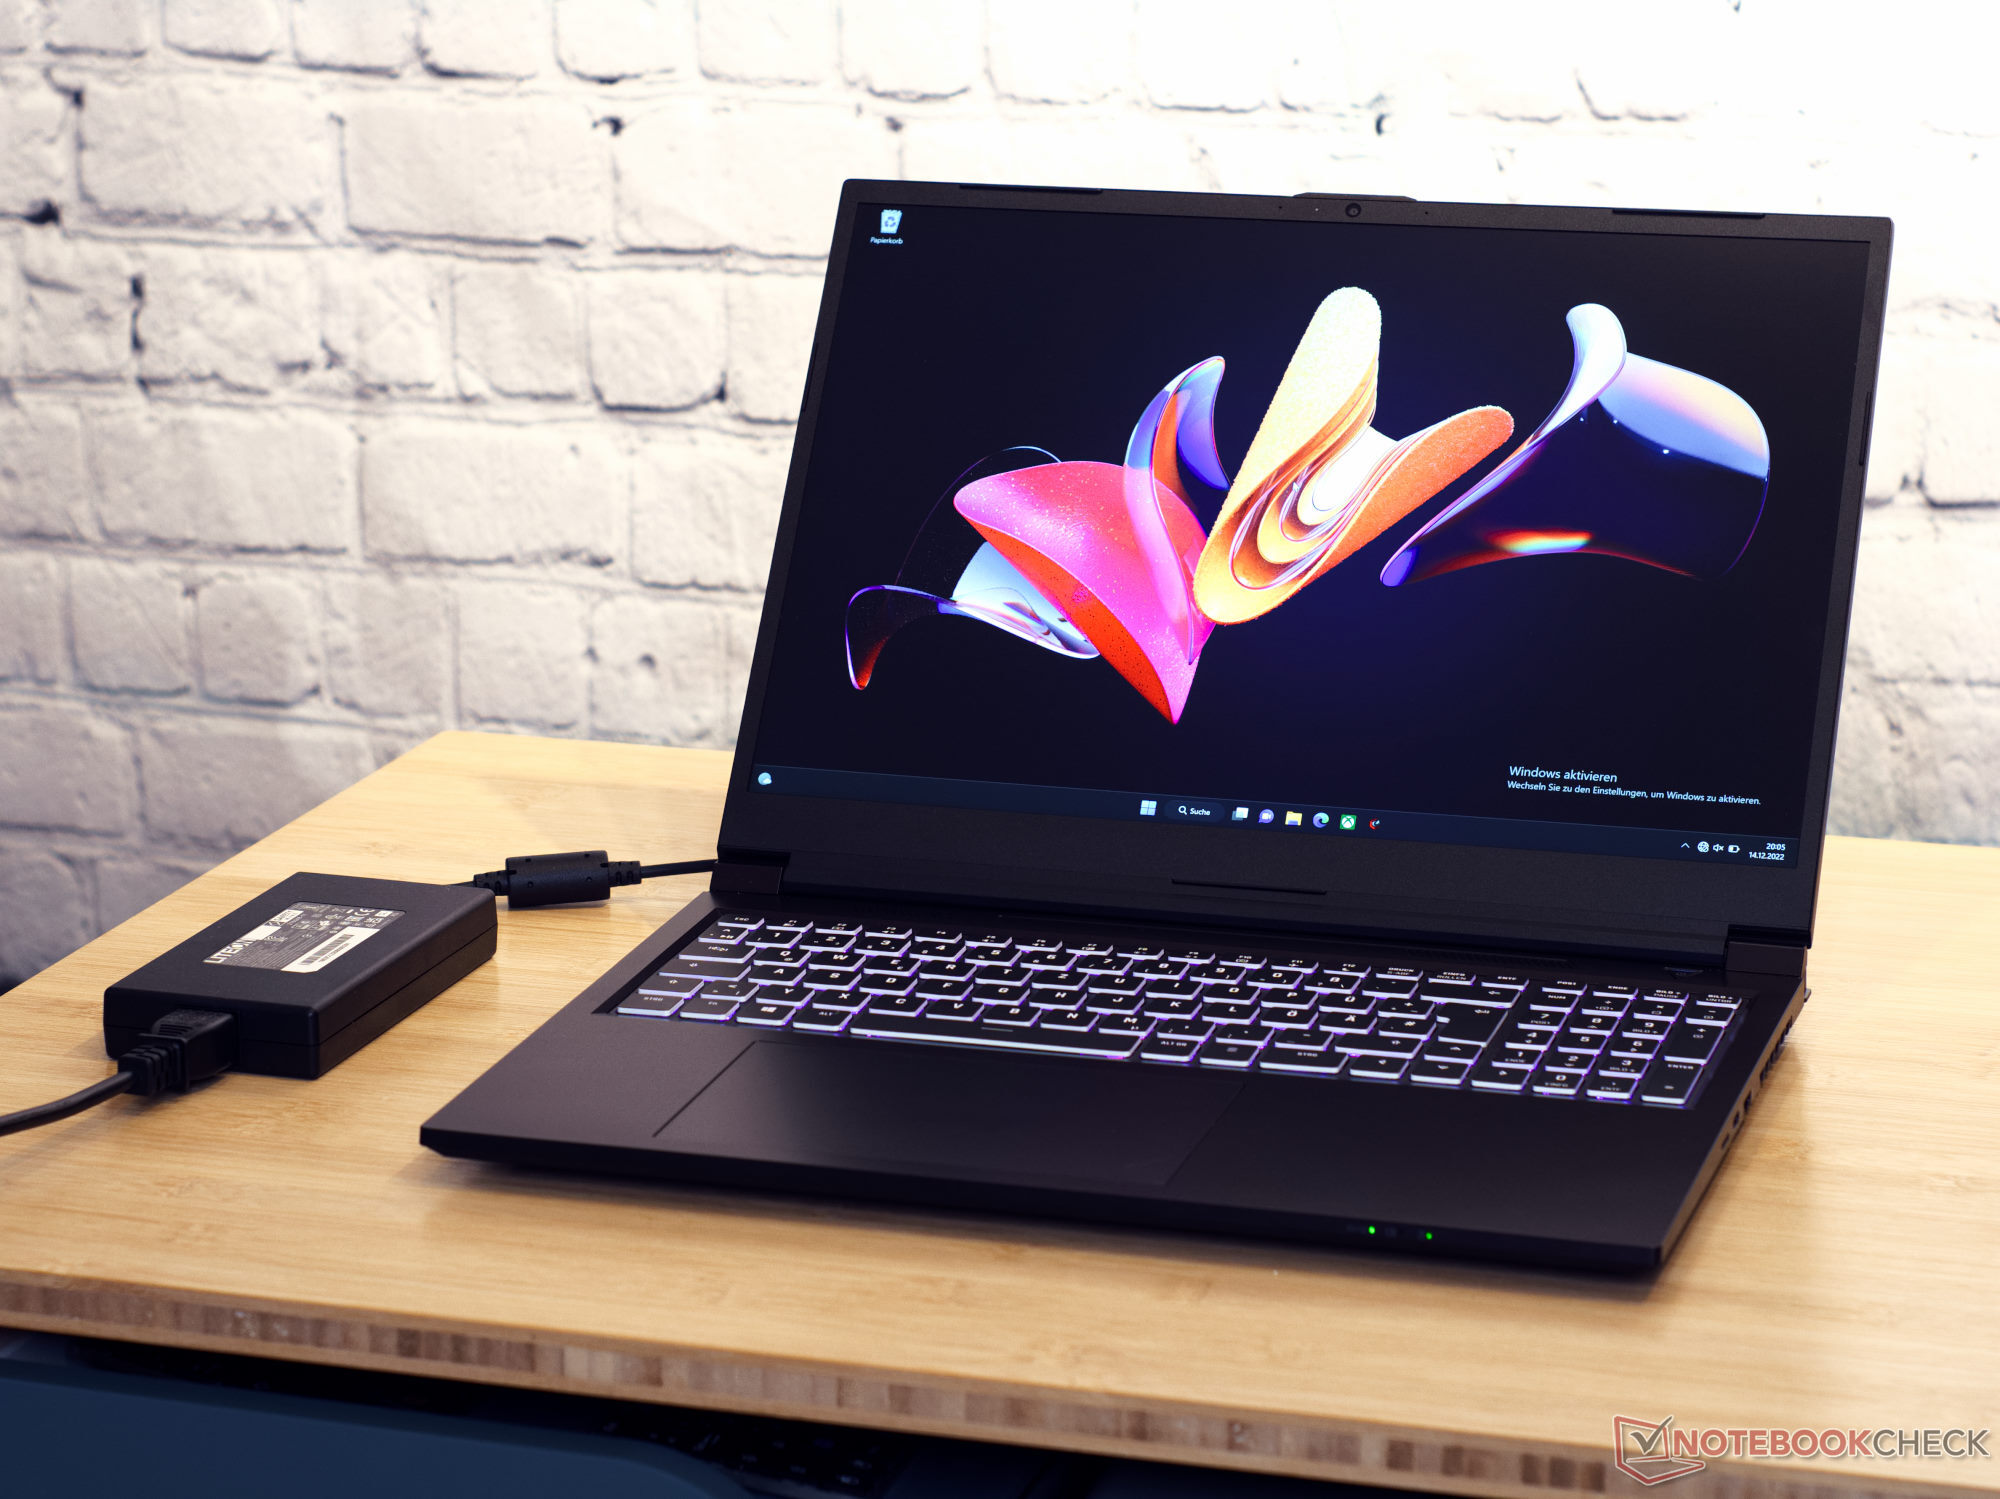
O laptop vem com uma unidade de alimentação de 180 watts da Lite-ON (PA-1181-76). Durante o teste de estresse, medimos o consumo de energia a longo prazo de 190 watts. No geral, a fonte de alimentação parece fraca considerando a configuração do laptop. Os dispositivos de comparação da Dell e Lenovo, com uma configuração semelhante à do laptop Schenker, vêm com pelo menos uma unidade de fonte de alimentação de 230 watts. E estes laptops tiram proveito disso.
Quando ocioso, o laptop usa mais 3 watts do que os dispositivos de comparação e, portanto, o coloca em pé de igualdade com os outros laptops de jogos no que diz respeito aos requisitos de energia. No total, o Schenker XMG Focus 16 não é realmente uma maravilha em termos de economia de energia, apesar da pequena unidade de fornecimento de energia.
| desligado | |
| Ocioso | |
| Carga |
|
Key:
min: | |
| Schenker XMG Focus 16 (i7-12700H, RTX 3060) i7-12700H, GeForce RTX 3060 Laptop GPU, Samsung SSD 980 Pro 1TB MZ-V8P1T0BW, IPS, 2560x1600, 16" | Asus ZenBook Pro 16X OLED UX7602ZM-ME115W i9-12900H, GeForce RTX 3060 Laptop GPU, Samsung PM9A1 MZVL21T0HCLR, OLED, 3840x2400, 16" | Dell G16 7620 i7-12700H, GeForce RTX 3060 Laptop GPU, WDC PC SN810 512GB, IPS, 2560x1600, 16" | Asus ROG Flow X16 GV601RW-M5082W R9 6900HS, GeForce RTX 3070 Ti Laptop GPU, Micron 3400 1TB MTFDKBA1T0TFH, Mini LED, 2560x1600, 16.1" | Lenovo ThinkPad X1 Extreme G5-21DE003RGE i7-12700H, GeForce RTX 3060 Laptop GPU, Micron 3400 1TB MTFDKBA1T0TFH, IPS, 3840x2400, 16" | Lenovo Legion Slim 7-16IAH 82TF004YGE i7-12700H, GeForce RTX 3060 Laptop GPU, SK Hynix HFS001TEJ9X115N, IPS LED, 2560x1600, 16" | Lenovo Legion 5 Pro 16IAH7H i7-12700H, GeForce RTX 3060 Laptop GPU, 2x Samsung PM9A1 MZVL21T0HCLR (RAID 0), IPS, 2560x1600, 16" | Média NVIDIA GeForce RTX 3060 Laptop GPU | Média da turma Gaming | |
|---|---|---|---|---|---|---|---|---|---|
| Power Consumption | 20% | -5% | -21% | 1% | 7% | -44% | 14% | -2% | |
| Idle Minimum * (Watt) | 14.7 | 11.1 24% | 14.4 2% | 12.2 17% | 11.8 20% | 13.3 10% | 22.8 -55% | 10.4 ? 29% | 13.1 ? 11% |
| Idle Average * (Watt) | 18.6 | 11.4 39% | 17.8 4% | 25.5 -37% | 22.4 -20% | 17.5 6% | 26.5 -42% | 14.5 ? 22% | 19 ? -2% |
| Idle Maximum * (Watt) | 21.2 | 14.4 32% | 31.5 -49% | 29.8 -41% | 23.1 -9% | 18.4 13% | 41 -93% | 21.4 ? -1% | 24.6 ? -16% |
| Load Average * (Watt) | 121 | 137.4 -14% | 101.2 16% | 183 -51% | 138 -14% | 122.8 -1% | 191 -58% | 109.3 ? 10% | 111.3 ? 8% |
| Witcher 3 ultra * (Watt) | 174 | 136 22% | 176.9 -2% | 183.6 -6% | 129.9 25% | 154.7 11% | 194.7 -12% | ||
| Load Maximum * (Watt) | 235 | 197 16% | 242.9 -3% | 253 -8% | 225.6 4% | 232.6 1% | 238 -1% | 206 ? 12% | 260 ? -11% |
* ... menor é melhor
Power consumption Witcher 3 / stress test
Power consumption with an external monitor
Duração da bateria
O Focus 16 contém uma pequena bateria de 54 Wh. Por esta razão, não deve ser surpresa que a vida útil da bateria seja inferior à metade dos dispositivos de comparação. No entanto, o modo de economia de energia do Centro de Controle é muito eficaz. O teste de navegação na Internet WiFi no brilho total da tela foi realizado usando a configuração do modo de entretenimento com o teste de 150-cd/m² realizado usando a configuração de economia de energia e taxa de atualização de 60Hz. Ajustado a este modo, a bateria dura consideravelmente mais tempo.
| Schenker XMG Focus 16 (i7-12700H, RTX 3060) i7-12700H, GeForce RTX 3060 Laptop GPU, 54 Wh | Asus ZenBook Pro 16X OLED UX7602ZM-ME115W i9-12900H, GeForce RTX 3060 Laptop GPU, 96 Wh | Dell G16 7620 i7-12700H, GeForce RTX 3060 Laptop GPU, 84 Wh | Asus ROG Flow X16 GV601RW-M5082W R9 6900HS, GeForce RTX 3070 Ti Laptop GPU, 90 Wh | Lenovo ThinkPad X1 Extreme G5-21DE003RGE i7-12700H, GeForce RTX 3060 Laptop GPU, 90 Wh | Lenovo Legion Slim 7-16IAH 82TF004YGE i7-12700H, GeForce RTX 3060 Laptop GPU, 99.99 Wh | Lenovo Legion 5 Pro 16IAH7H i7-12700H, GeForce RTX 3060 Laptop GPU, 80 Wh | Média da turma Gaming | |
|---|---|---|---|---|---|---|---|---|
| Duração da bateria | 86% | -23% | -9% | 31% | 1% | -41% | 28% | |
| WiFi v1.3 (h) | 4.8 | 8.9 85% | 5 4% | 5.7 19% | 6.7 40% | 5.2 8% | 3.6 -25% | 7.08 ? 48% |
| Load (h) | 1.4 | 2.6 86% | 0.7 -50% | 0.9 -36% | 1.7 21% | 1.3 -7% | 0.6 -57% | 1.496 ? 7% |
| Reader / Idle (h) | 12.7 | 7.1 | 7.84 ? | |||||
| Witcher 3 ultra (h) | 0.9 | 1.5 | 2.1 | |||||
| H.264 (h) | 7.3 | 9.5 | 4.1 | 8.27 ? |
Pro
Contra
Veredicto - um laptop de jogos médio com serviço acima da média
O XMG Focus 16 da Schenker fornece fps consistentemente altos nos jogos testados. No geral, o laptop para jogos Nvidia RTX 3060 oferece um desempenho acima da média. No entanto, a concorrência na forma do Dell G16 ou do Lenovo Legion 5 Pro oferece mais potência bruta a um preço quase idêntico. Apesar disso, o ganho de desempenho é bastante marginal.
No entanto, o laptop Schenker possui habilidades suaves mais fortes do que a concorrência da Dell e da Lenovo. O teclado do laptop Schenker impressiona com seu alto deslocamento de teclas e um bom feedback táctil. O XMG Focus 16 também desfruta de uma boa seleção de portas bem posicionadas. Além disso, o suporte ao cliente da Schenker também é impressionante. Como anteriormente, as consultas são respondidas de forma rápida e competente, freqüentemente em poucas horas. Isto ajudou a Schenker a alcançar o primeiro lugar pela terceira vez consecutiva em nosso pesquisa de suporte e atendimento ao cliente de laptop e smartphone. O design do XMG Focus 16 é uma questão de gosto. Para um laptop para jogos, o dispositivo é despretensioso, preto e pugilista.
O XMG Focus 16 extrai muita energia do hardware sem atingir os limites de seu potencial.
Em geral, o laptop Schenker é sólido como rocha, mas não consegue atingir um desempenho de alto nível. Em nenhuma área de nossos benchmarks e análises o laptop para jogos foi capaz de dominar a concorrência. O melhor desempenho da placa gráfica pode ser encontrado no Asus ROG Flow X16, com a Lenovo Legion 5 Pro alcançando o melhor desempenho da CPU. Além disso, o Asus Zenbook Pro 16X OLED tem a tela mais responsiva. Em cada uma destas áreas, o portátil Schenker oferece um desempenho adequado ou acima da média.
Preço e disponibilidade
Bestware.com é a loja online da Schenker onde o laptop para jogos pode ser configurado e encomendado. No momento da revisão, nossa especificação de teste XMG Focus 16pode ser obtido por cerca de 1.800 dólares americanos. Com apenas 8GB de RAM e sem um SSD NVMe, o preço base do laptop fica em torno de 1.600 dólares americanos.
Schenker XMG Focus 16 (i7-12700H, RTX 3060)
- 12/21/2022 v7 (old)
Marc Herter
Price comparison

