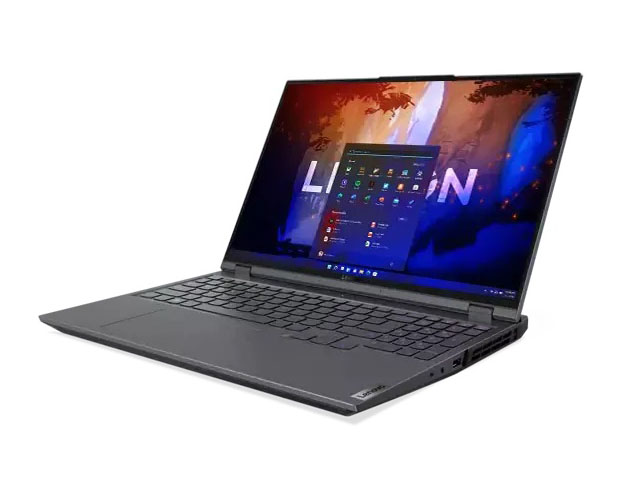
Lenovo Legion 5 Pro Gen 7 revisão laptop: Ryzen 7 6800H ou Ryzen 9 6900HX?
O Legion 5 Pro Gen 7 é um laptop de médio alcance superior para jogos sentado logo abaixo do mais caro ainda Legion 7 Série 16. Ele se une ao alinhamento cada vez mais comum de laptops de 16 polegadas como o HP Omen 16, Asus ROG Zephyrus M16, Dell G16ou o Gigabyte Aero 16 todos eles são alternativas ao modelo Lenovo em revisão.
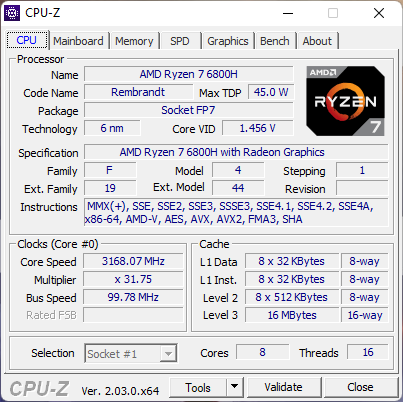
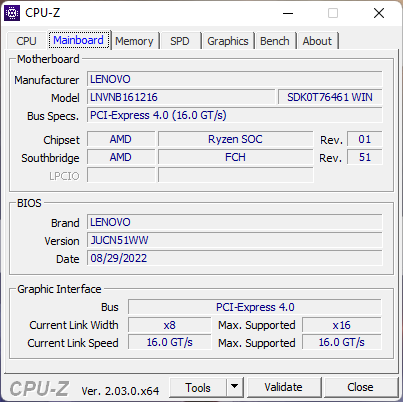
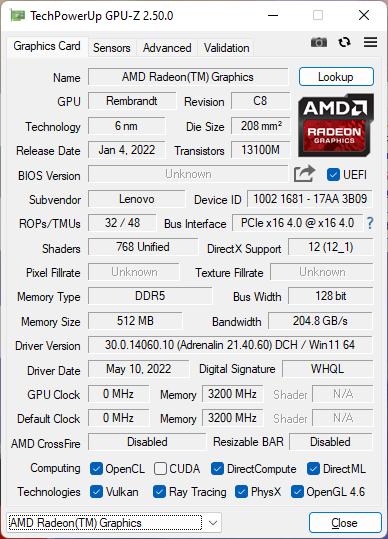
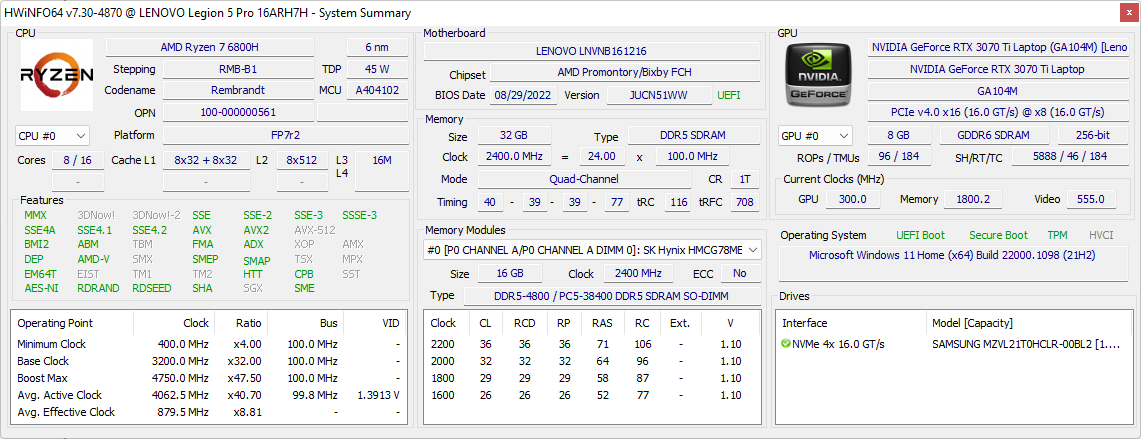
Nossa unidade de teste é fornecida com a CPU AMD Zen 3+ Ryzen 7 6800H com 150 W TGP GeForce RTX 3070 Ti gráfica por aproximadamente $1900 USD. Outras SKUs estão disponíveis com os Ryzen 9 6900HX, RTX 3070, RTX 3060, ou RTX 3050 Ti, mas todas as outras opções vêm com o mesmo display IPS 16:10 2560 x 1600 com suporte G-Sync.
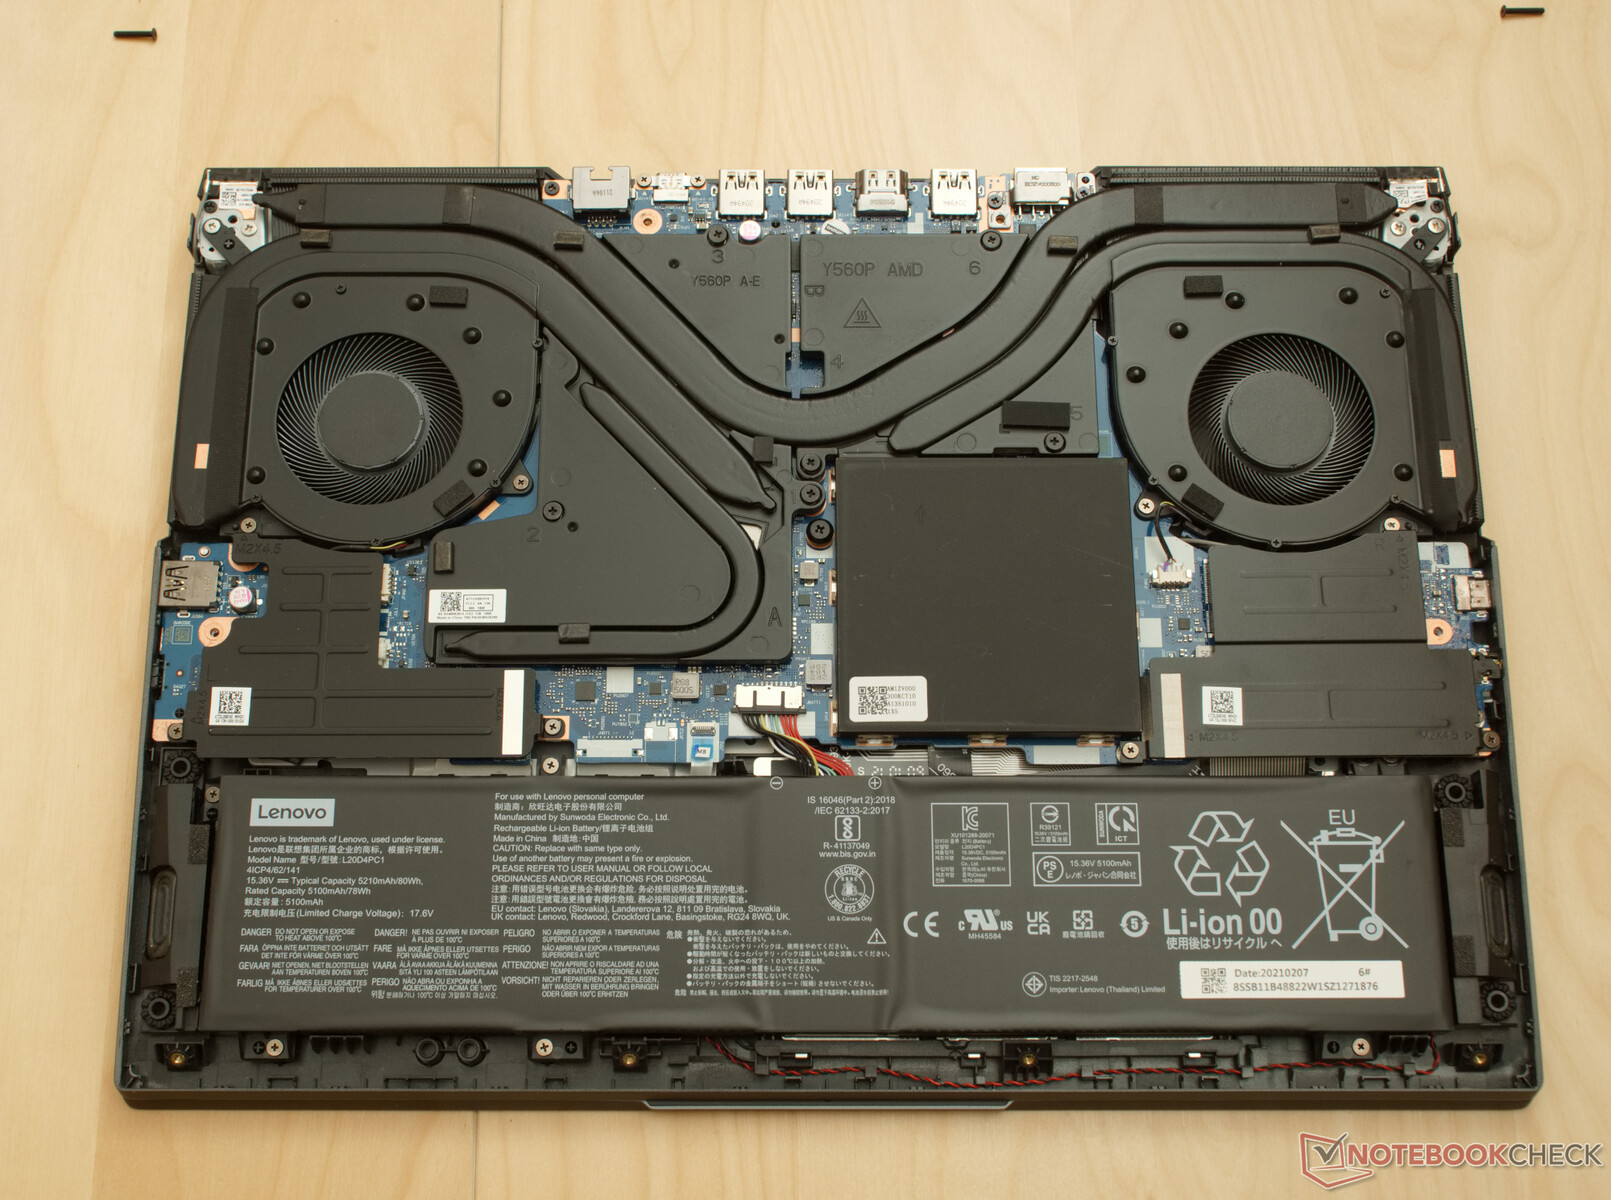
O 2022 Legion 5 Pro Gen 7 compartilha o mesmo design de chassi do modelo do ano passado e, portanto, recomendamos verificar nosso revisão existente do modelo 2021 para obter mais informações sobre as características físicas do dispositivo. A versão mais antiga utiliza processadores Zen 3 Ryzen 7 5800H e TGP 140 W GeForce RTX 3070 mais lentos em comparação
Mais análises da Lenovo:
Possíveis concorrentes em comparação
Avaliação | Data | Modelo | Peso | Altura | Size | Resolução | Preço |
|---|---|---|---|---|---|---|---|
| 87.7 % v7 (old) | 10/2022 | Lenovo Legion 5 Pro 16ARH7H RTX 3070 Ti R7 6800H, GeForce RTX 3070 Ti Laptop GPU | 2.6 kg | 26.6 mm | 16.00" | 2560x1600 | |
| 86.6 % v7 (old) | 07/2022 | Lenovo Legion 5 Pro 16IAH7H i7-12700H, GeForce RTX 3060 Laptop GPU | 2.6 kg | 27 mm | 16.00" | 2560x1600 | |
| 85.6 % v7 (old) | 07/2021 | Asus ROG Zephyrus M16 GU603H i9-11900H, GeForce RTX 3070 Laptop GPU | 2 kg | 20 mm | 16.00" | 2560x1600 | |
| 90.8 % v7 (old) | 09/2022 | Lenovo Legion 7 16ARHA7 R9 6900HX, Radeon RX 6850M XT | 2.6 kg | 19.4 mm | 16.00" | 2560x1600 | |
| 82.3 % v7 (old) | 05/2022 | HP Victus 16-e0145ng R5 5600H, GeForce RTX 3050 Ti Laptop GPU | 2.4 kg | 23.5 mm | 16.10" | 1920x1080 | |
| 86.1 % v7 (old) | 10/2022 | Dell G16 7620 i7-12700H, GeForce RTX 3060 Laptop GPU | 2.6 kg | 26.9 mm | 16.00" | 2560x1600 |
Estojo - Tampa externa e base inferior em alumínio
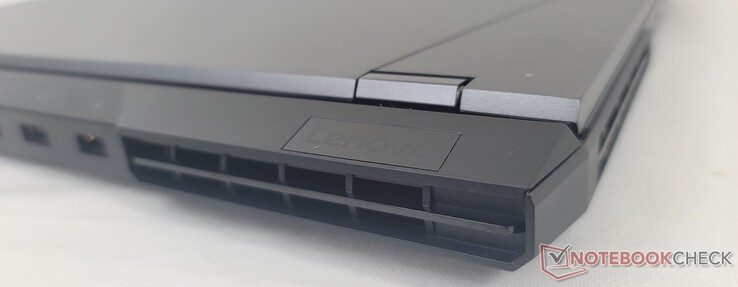
Há uma maneira fácil de distinguir o 2022 Legion 5 Pro 16 do 2021 Legion 5 Pro 16. O modelo 2022 tem mais uma porta USB-C ao longo da borda esquerda para três no total, enquanto o modelo 2021 tem apenas duas. Enquanto isso, o número de portas USB-A caiu de quatro para três. De outra forma, os dois modelos são visualmente idênticos.
Comunicação
| Networking | |
| iperf3 transmit AX12 | |
| Asus ROG Zephyrus M16 GU603H | |
| iperf3 receive AX12 | |
| Asus ROG Zephyrus M16 GU603H | |
| iperf3 receive AXE11000 6GHz | |
| Lenovo Legion 5 Pro 16ARH7H RTX 3070 Ti | |
| Lenovo Legion 7 16ARHA7 | |
| iperf3 receive AXE11000 | |
| Dell G16 7620 | |
| HP Victus 16-e0145ng | |
| iperf3 transmit AXE11000 6GHz | |
| Lenovo Legion 7 16ARHA7 | |
| Lenovo Legion 5 Pro 16ARH7H RTX 3070 Ti | |
| iperf3 transmit AXE11000 | |
| Dell G16 7620 | |
| HP Victus 16-e0145ng | |
Webcam
A Webcam continua a ser apenas 720p sem IR.


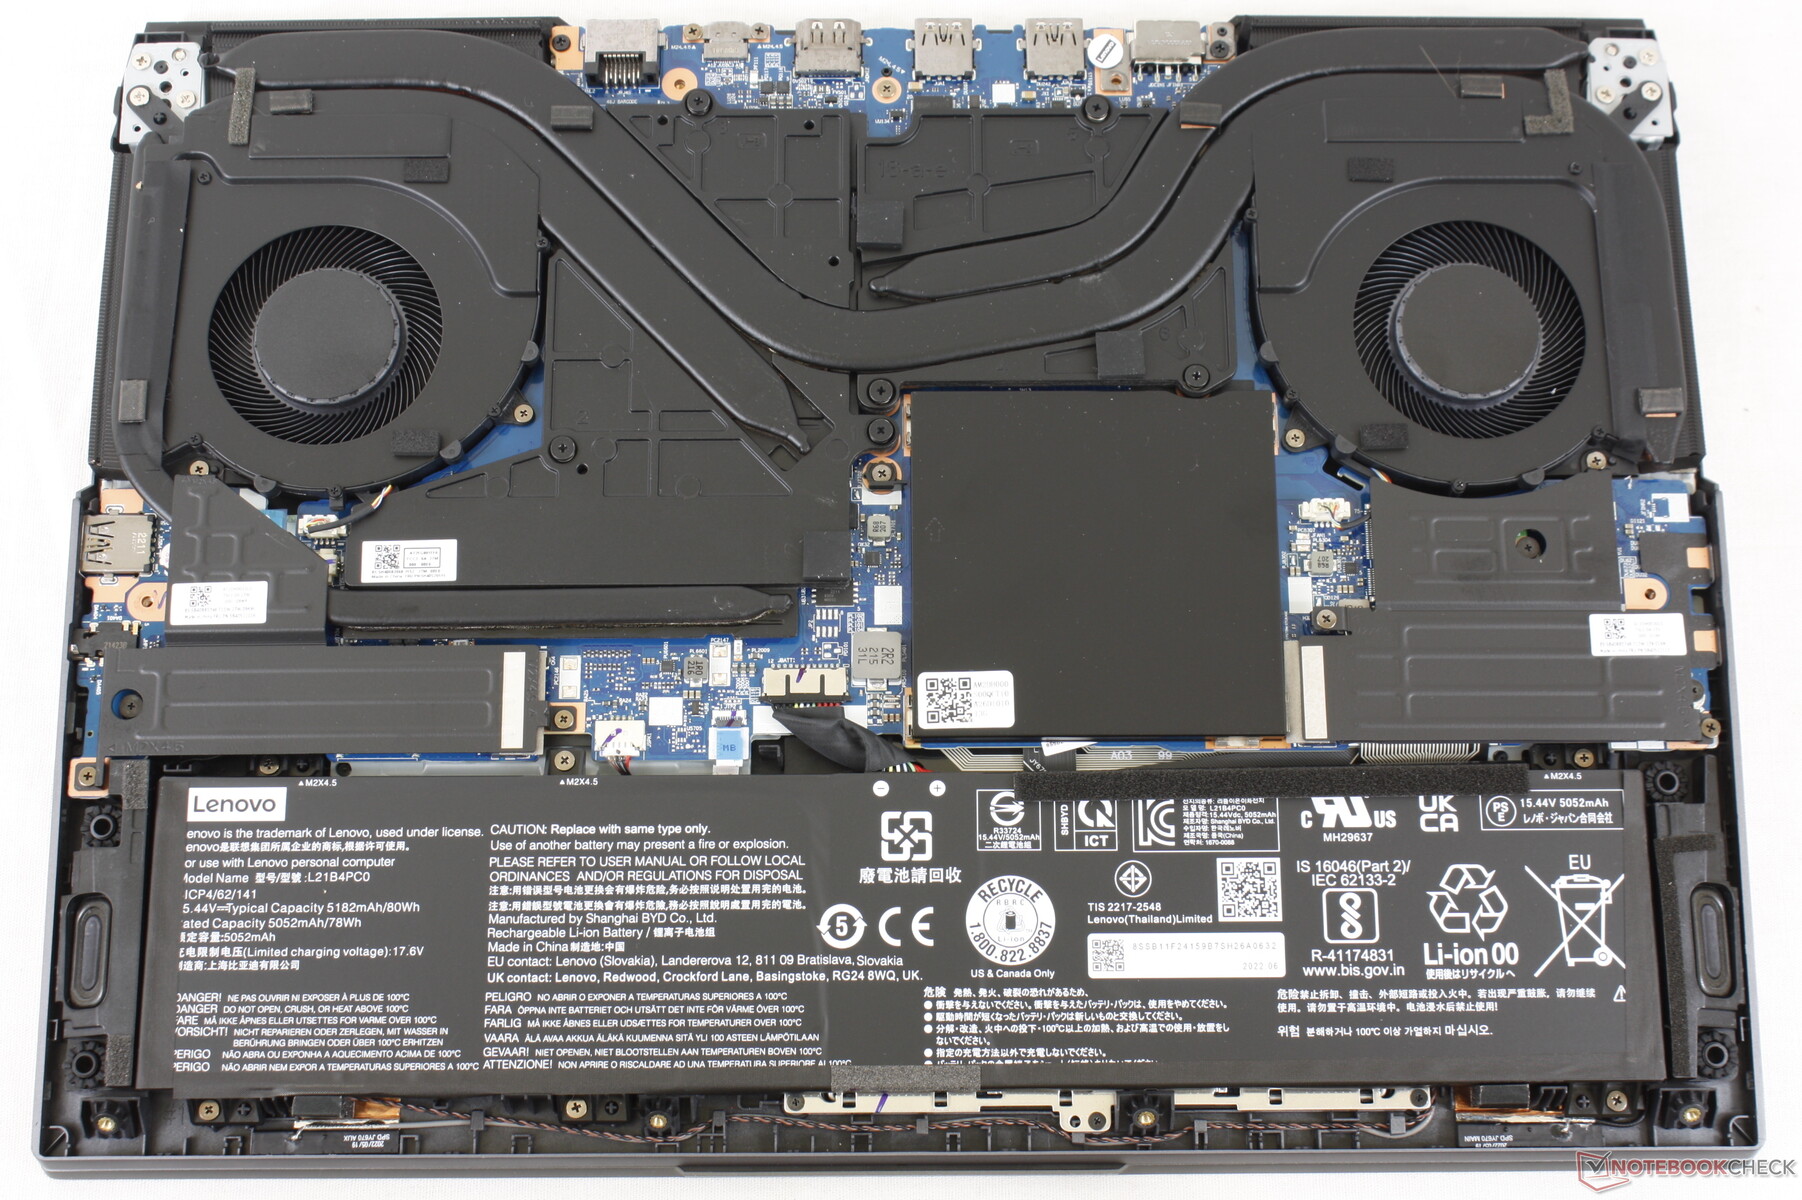
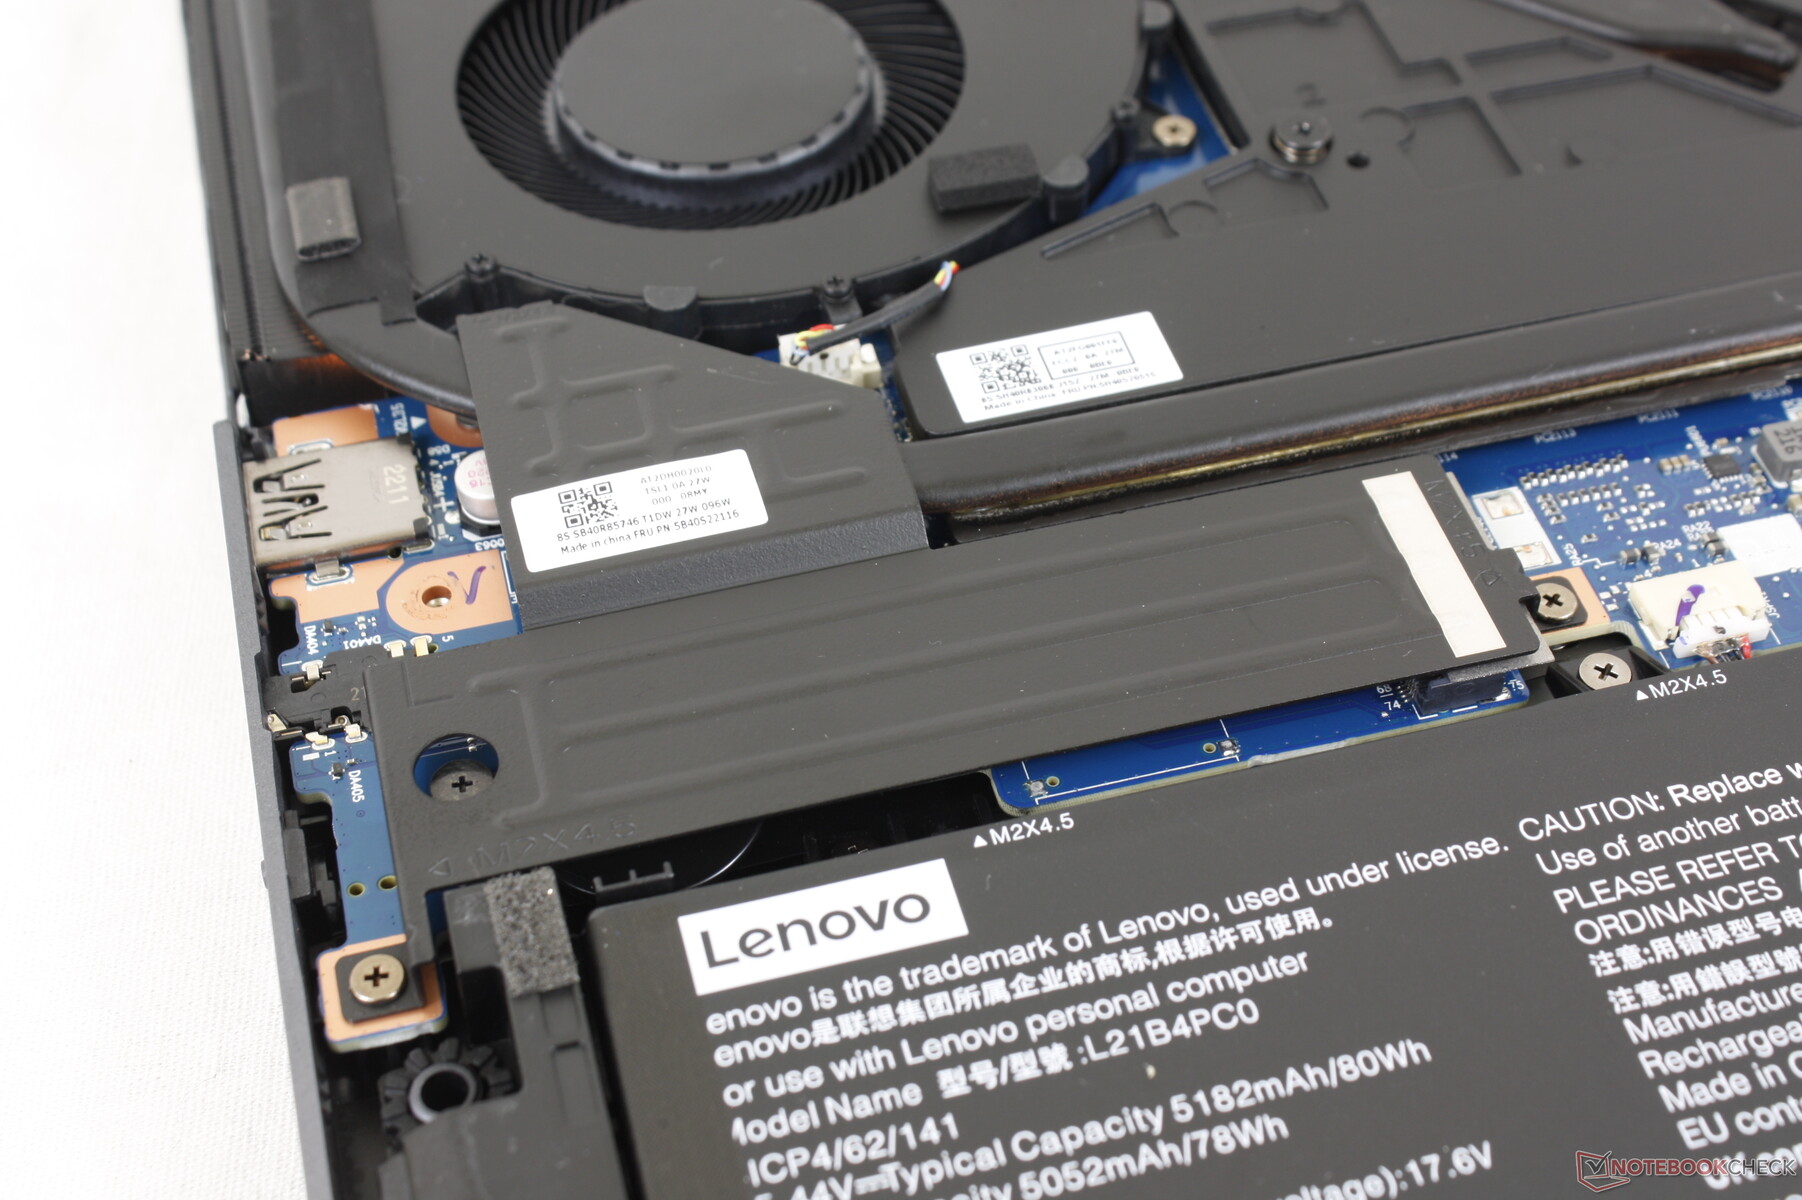
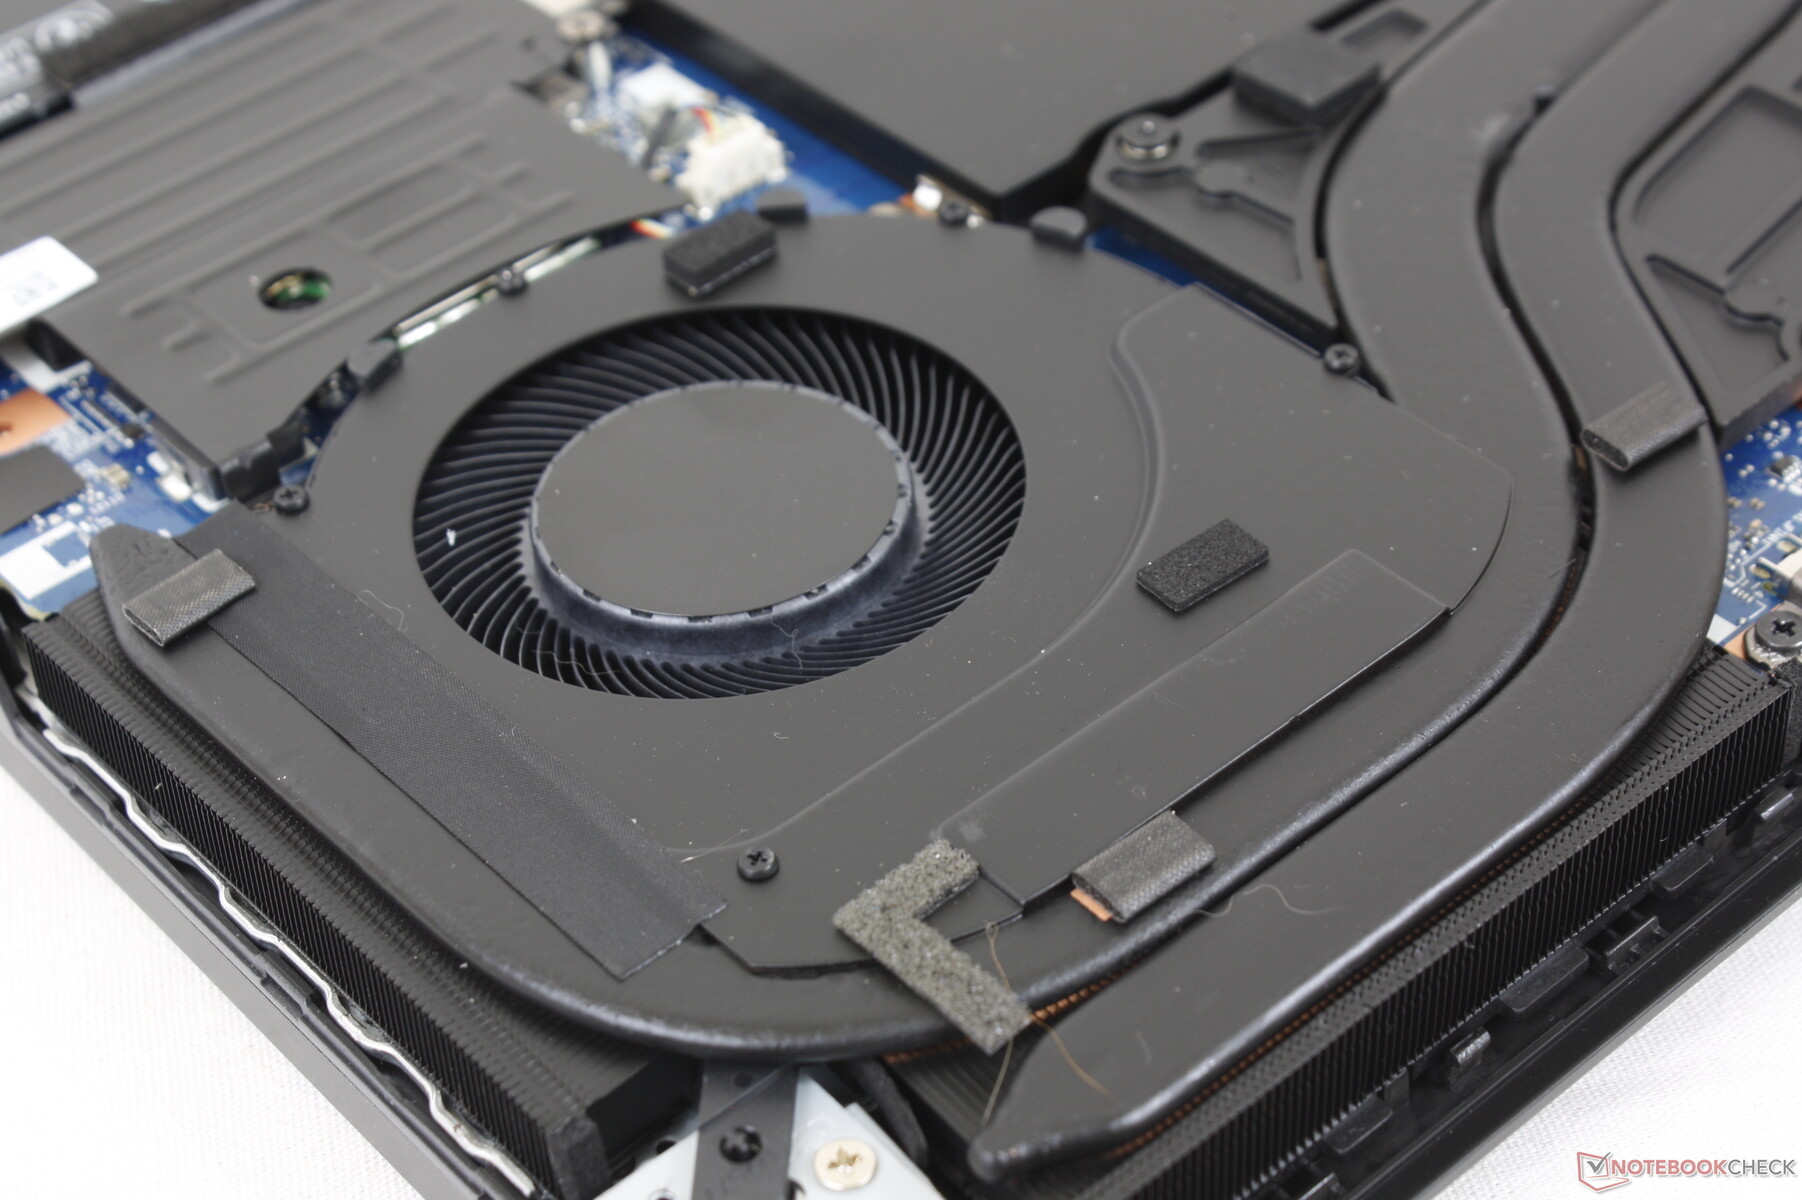
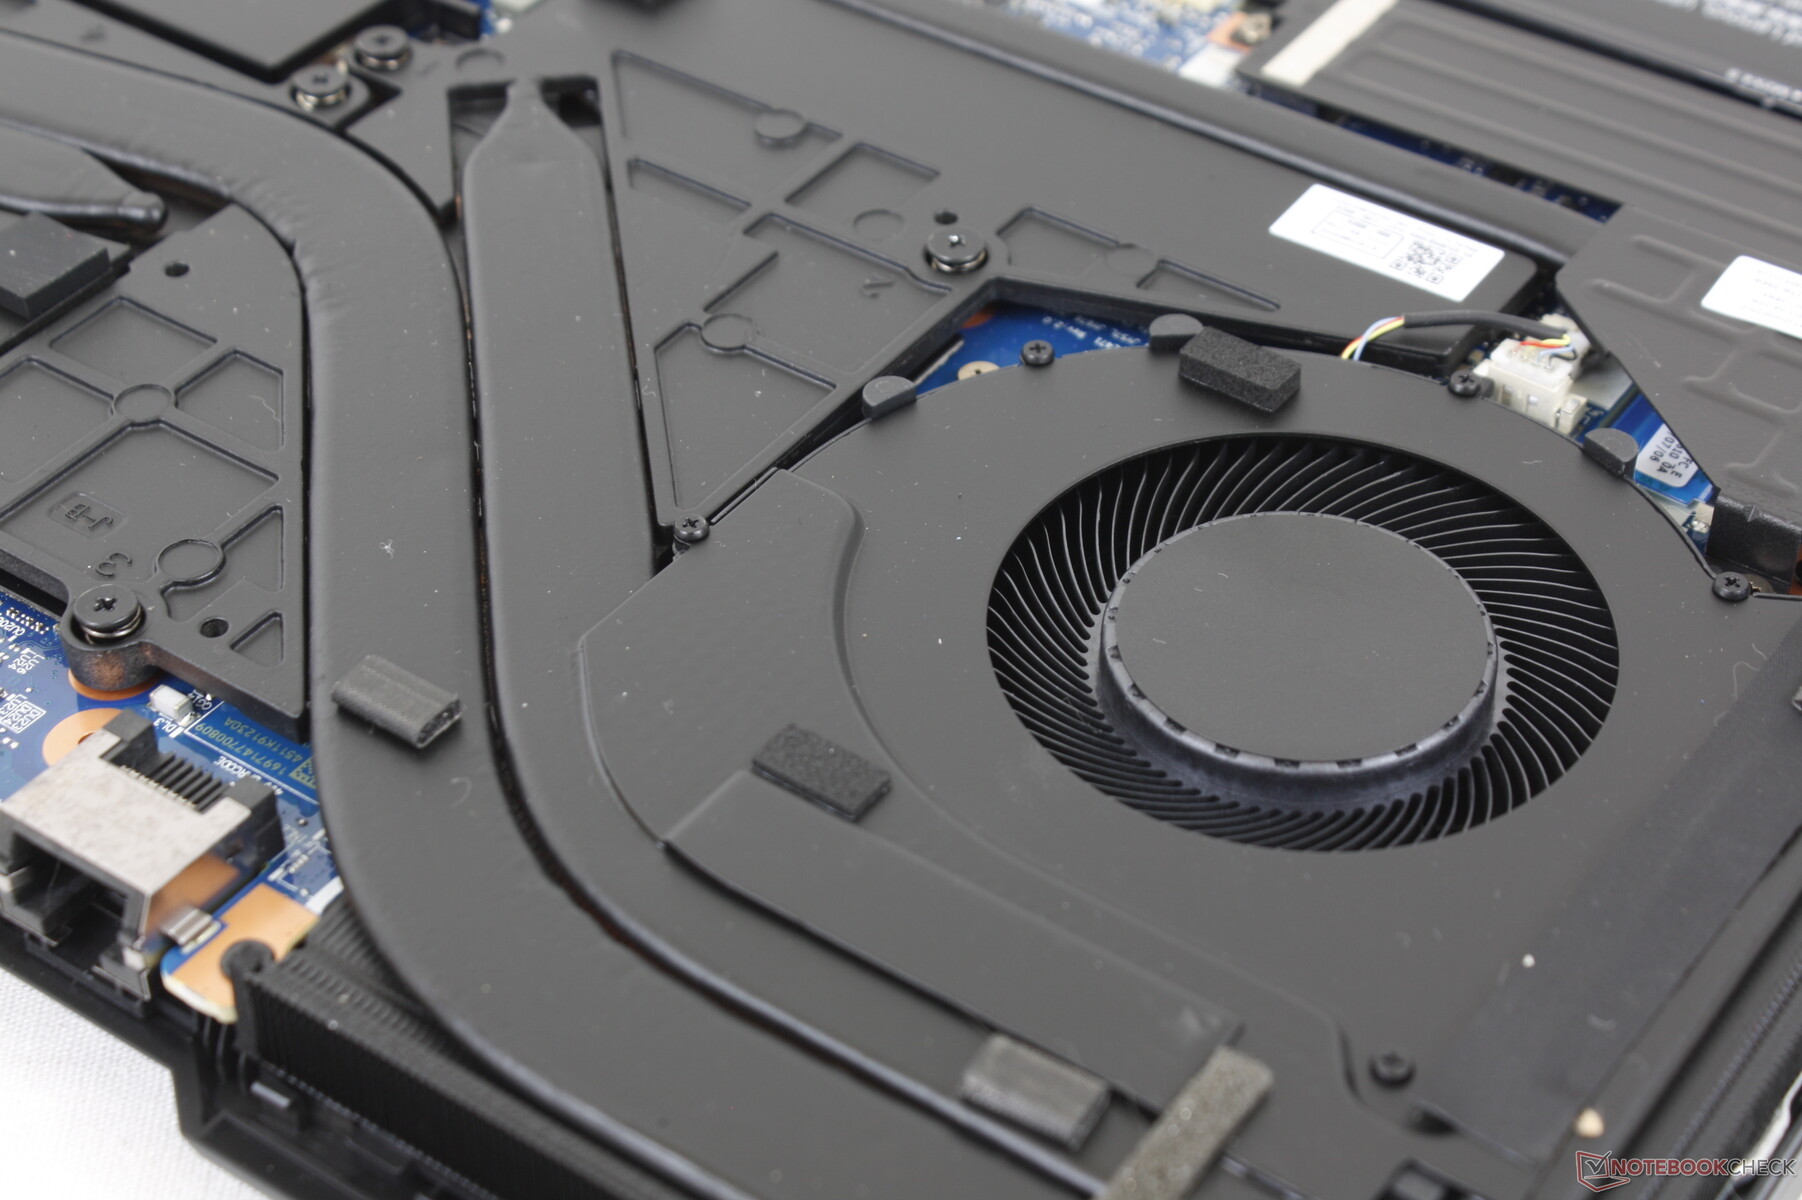
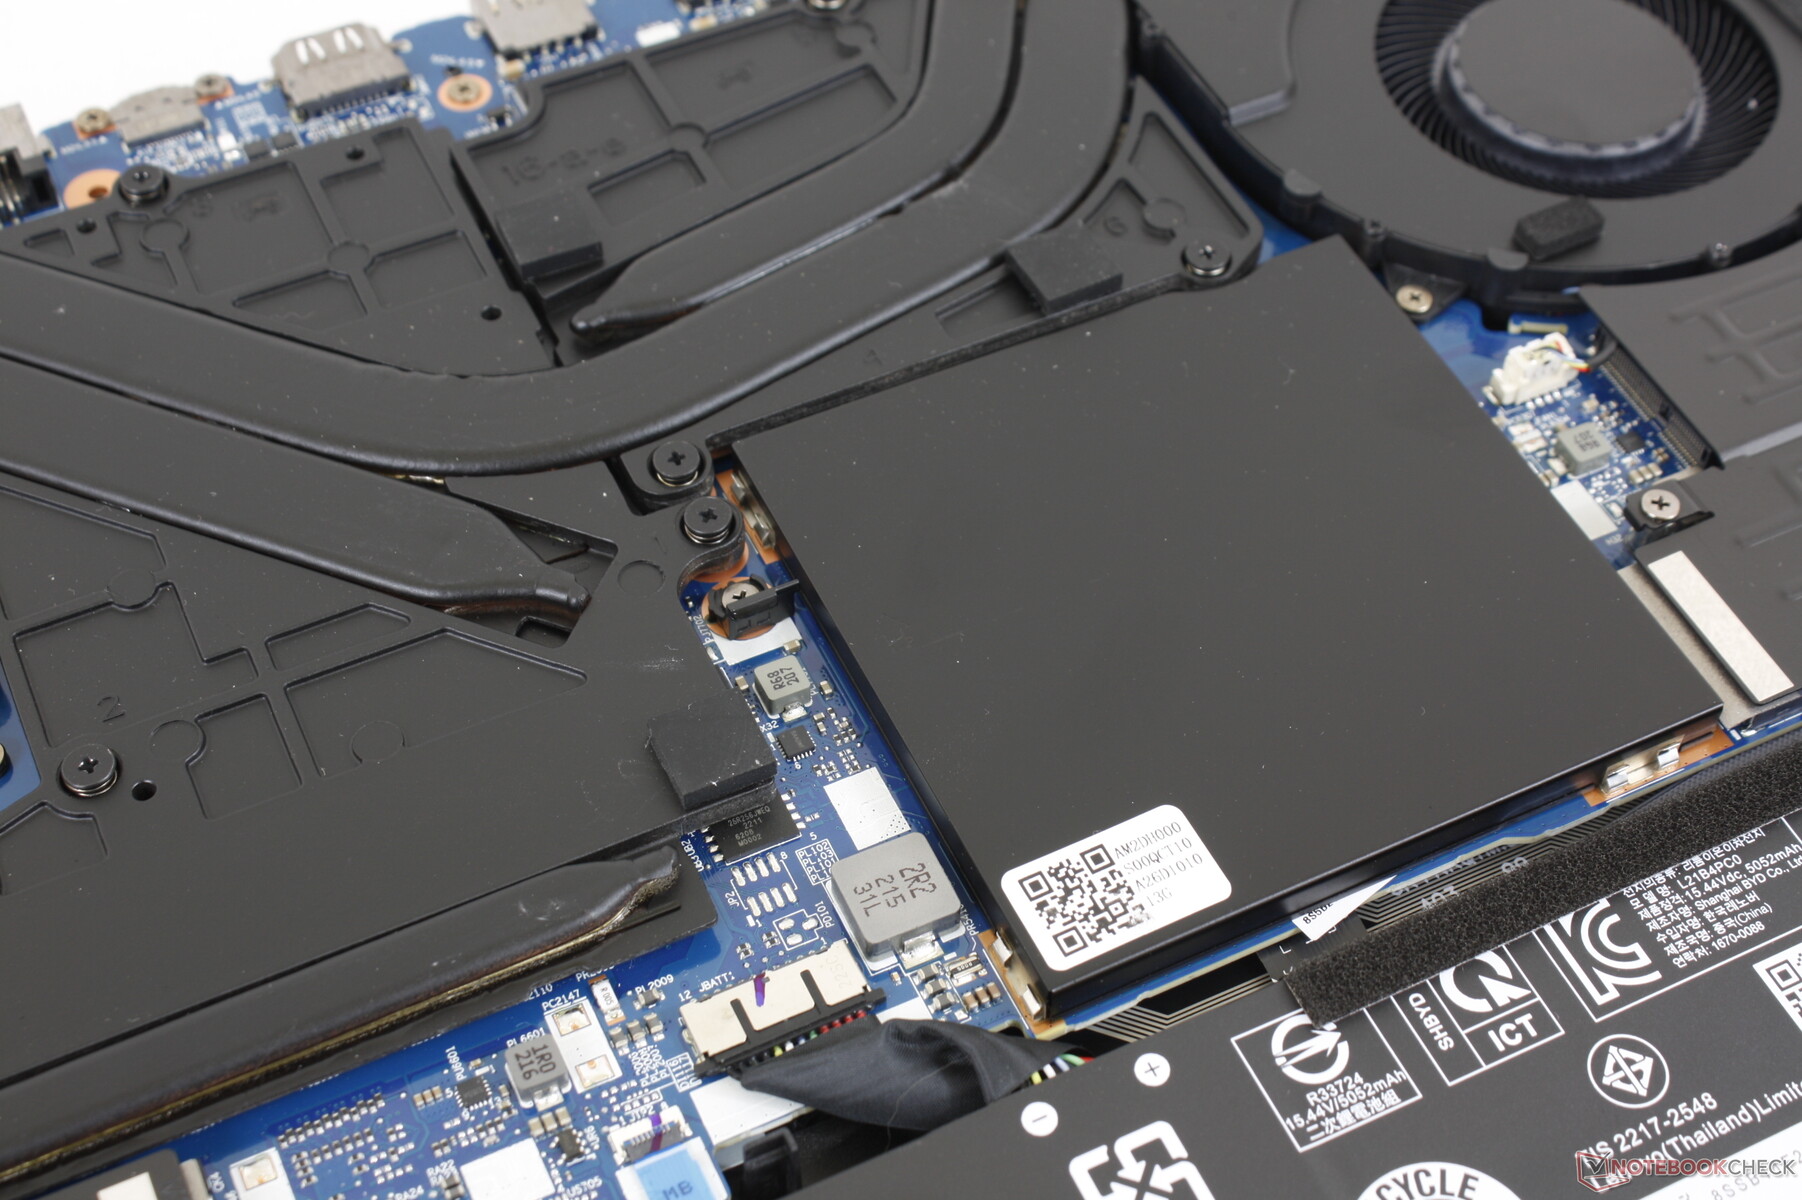
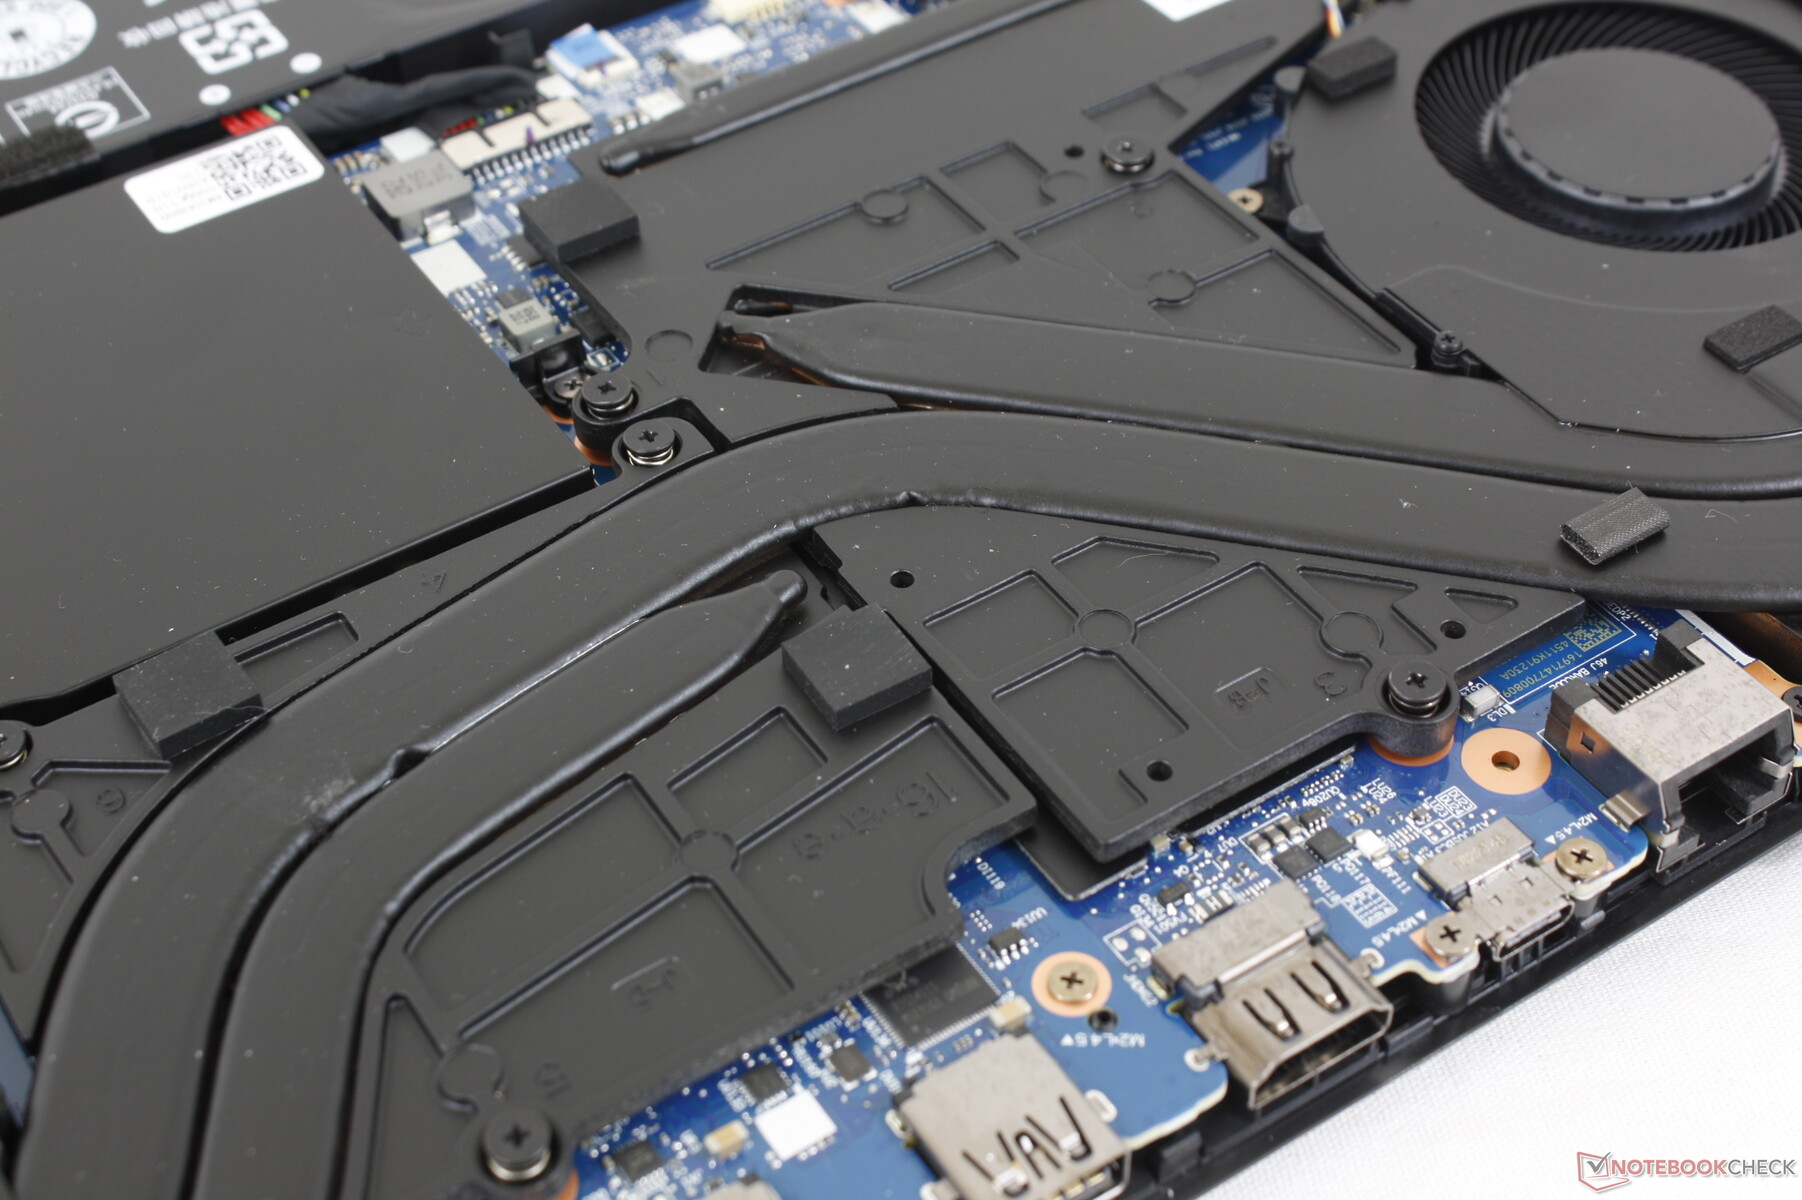
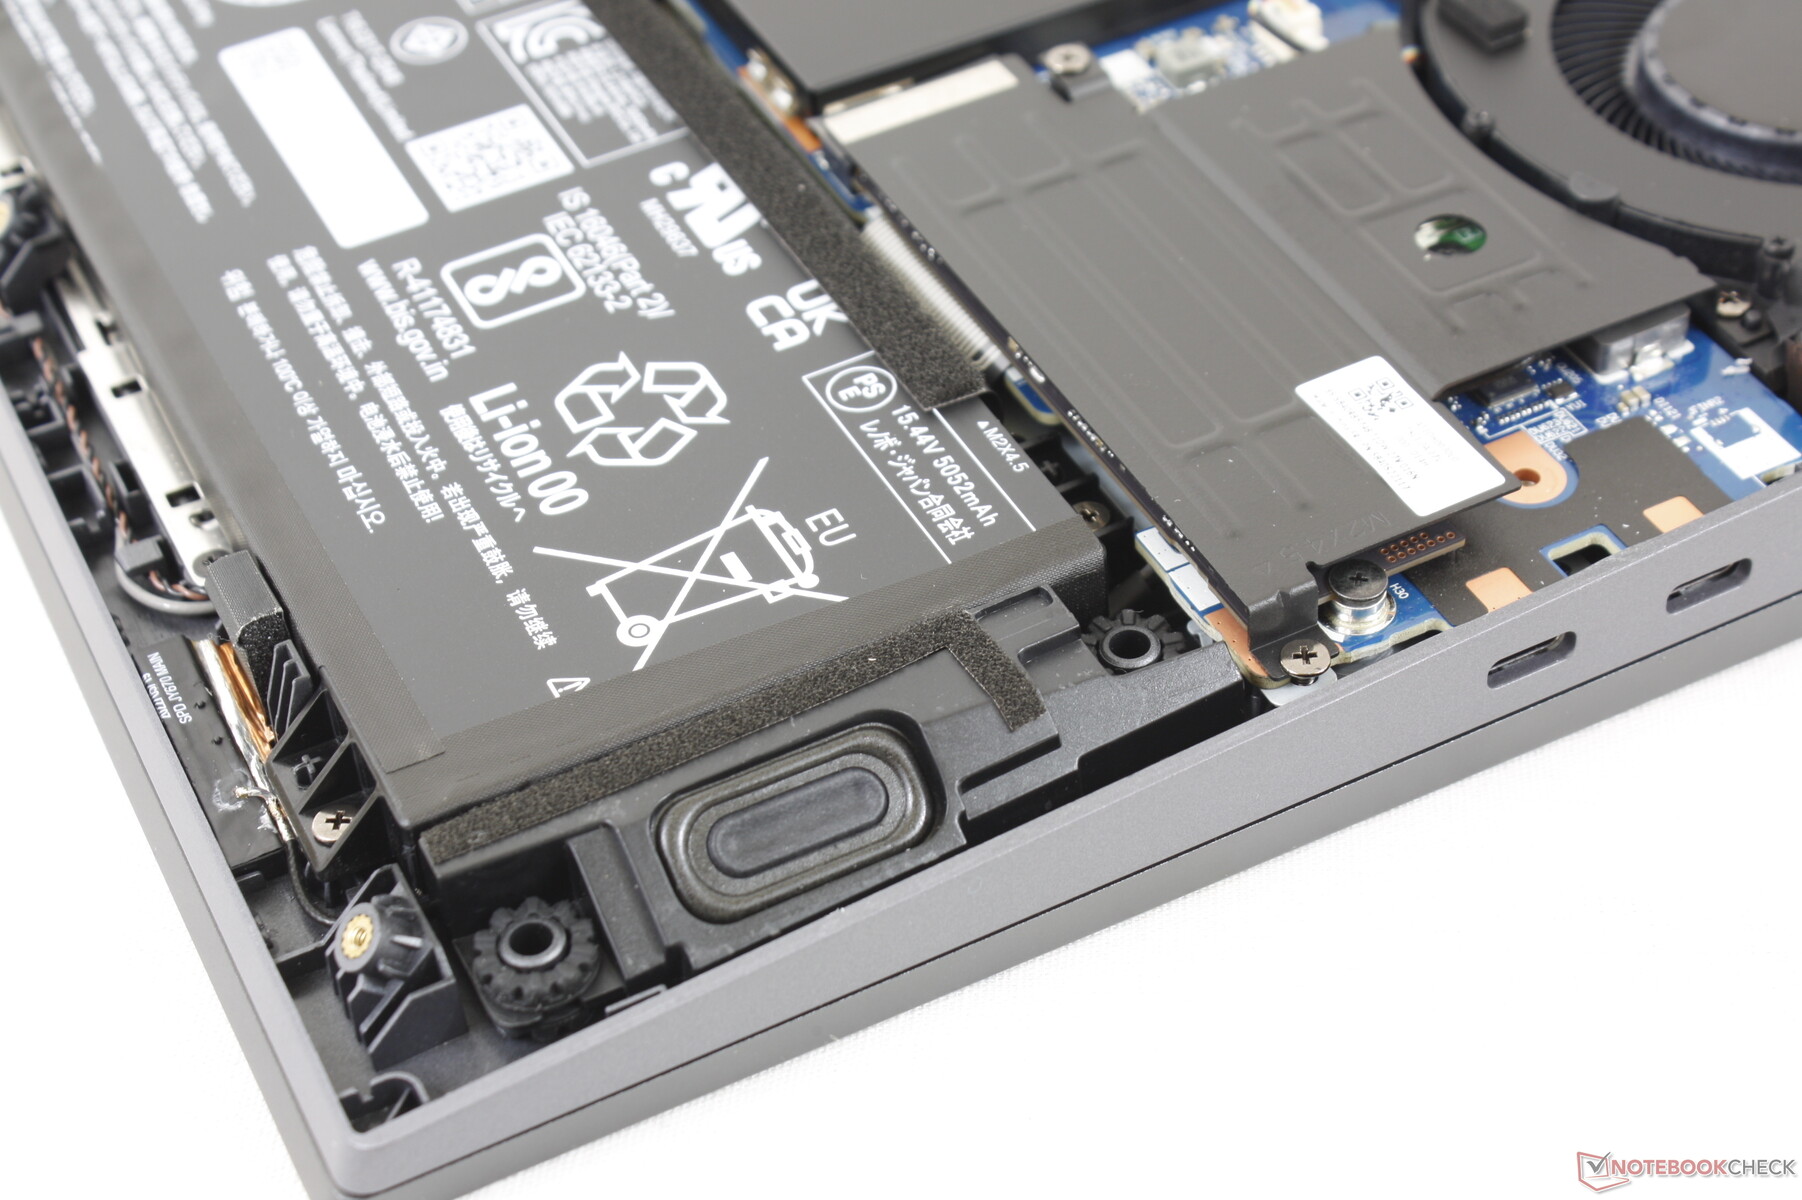
Manutenção
Acessórios e Garantia
Não há extras na caixa além do adaptador AC e da papelada. A garantia padrão limitada de um ano do fabricante se aplica se comprada nos EUA.
Display - Uma única opção
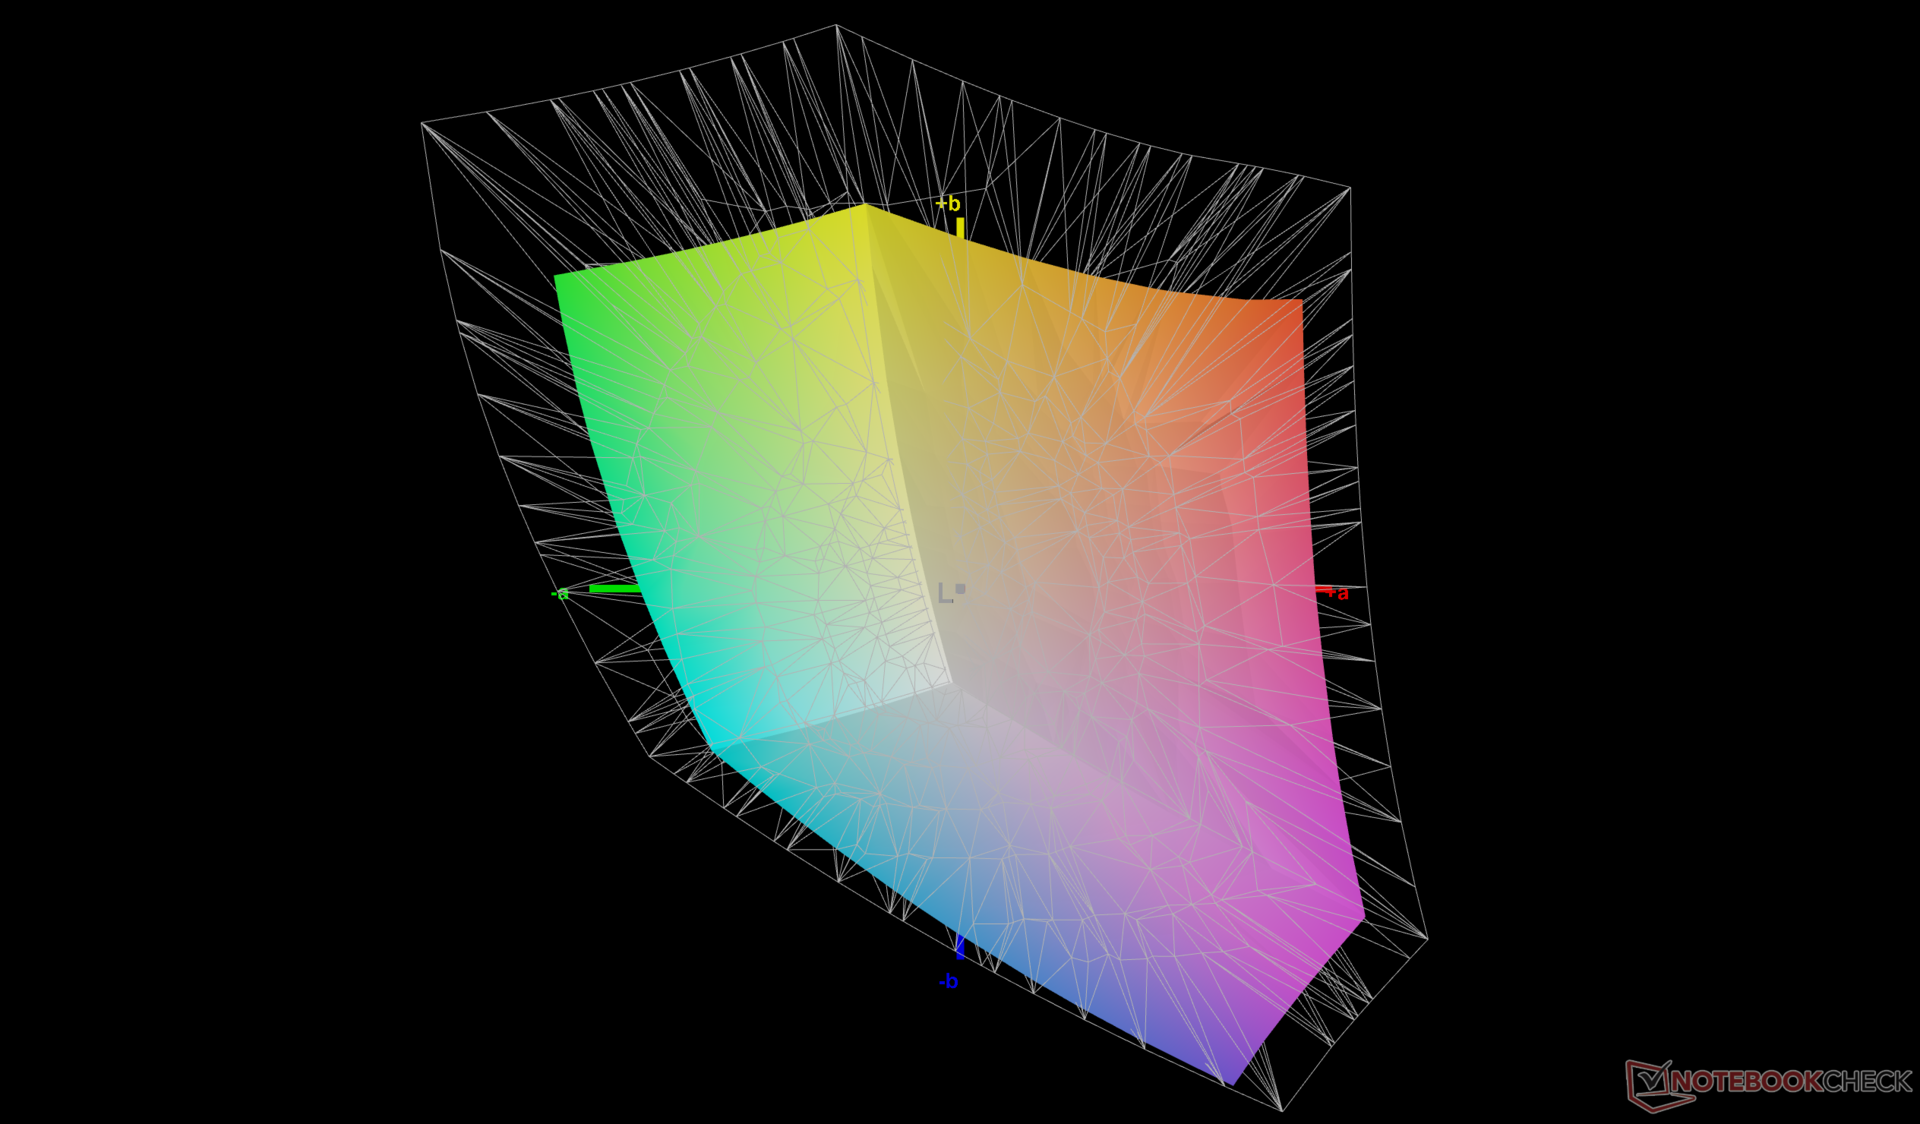
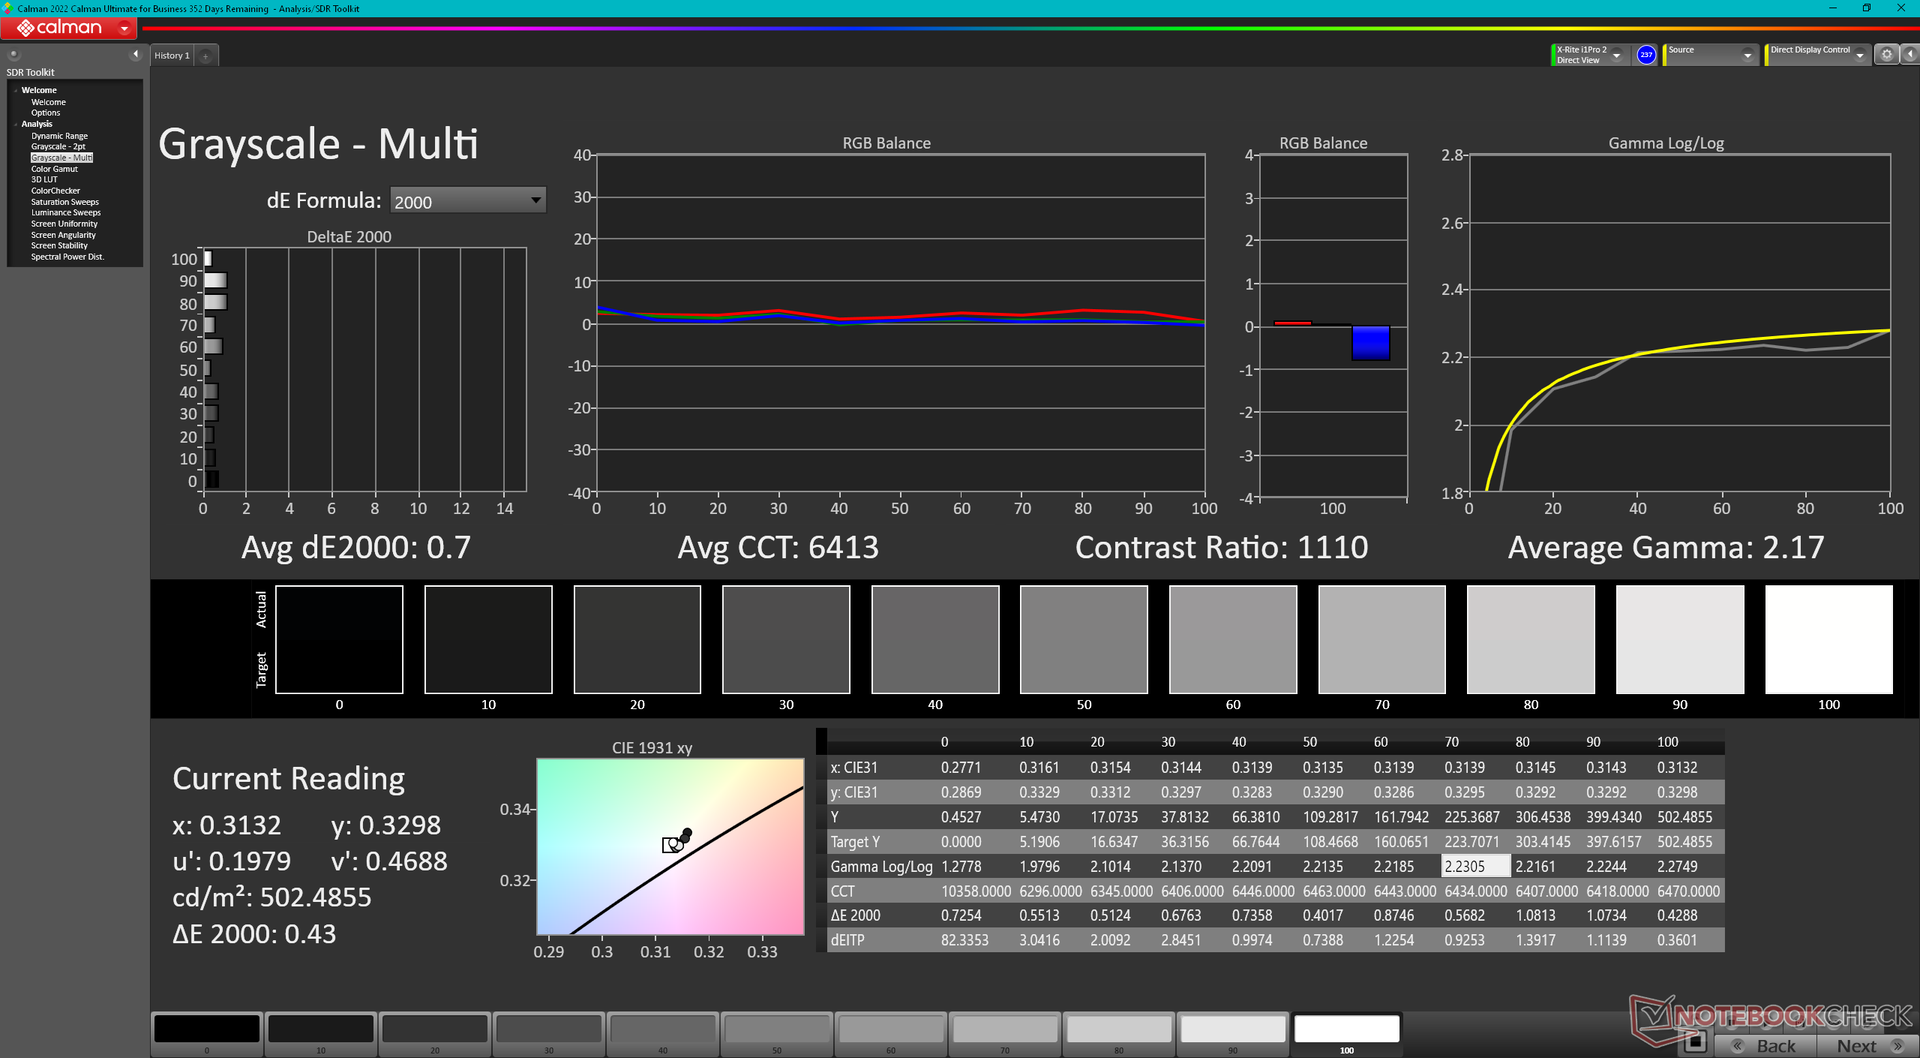
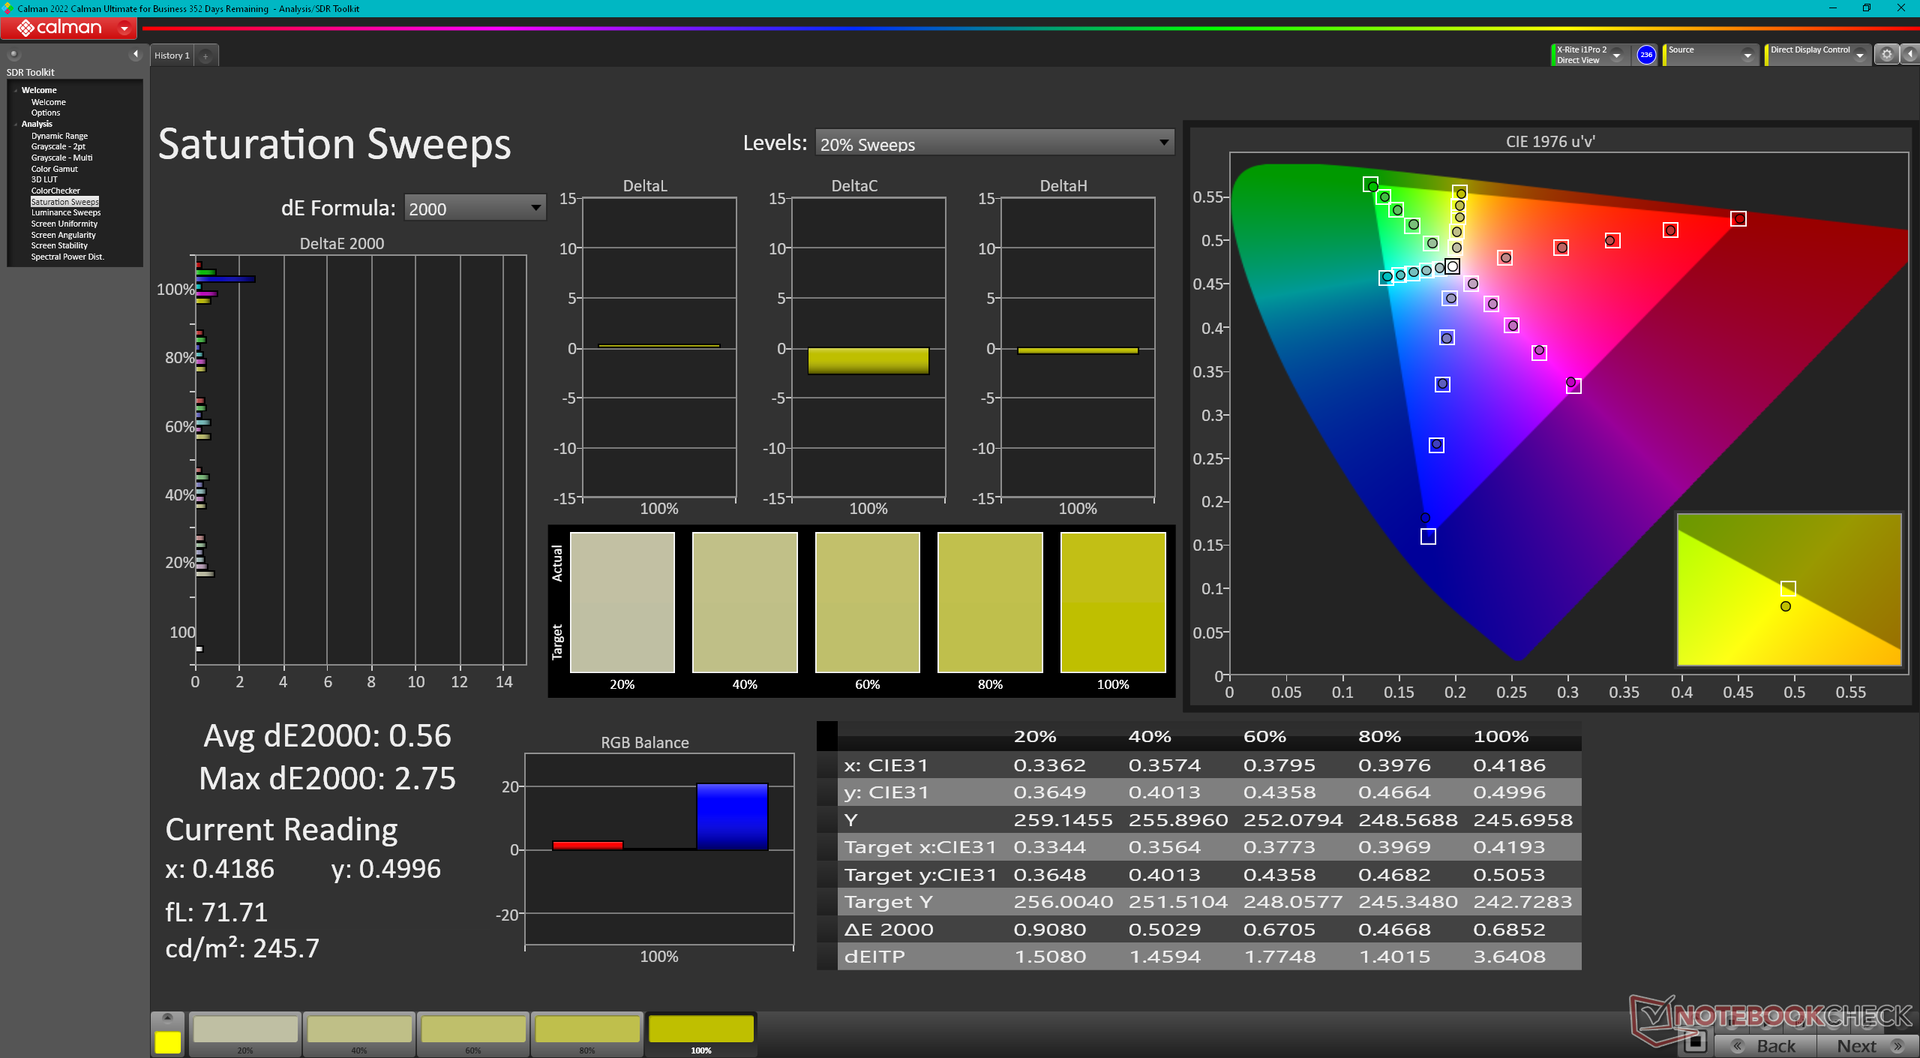
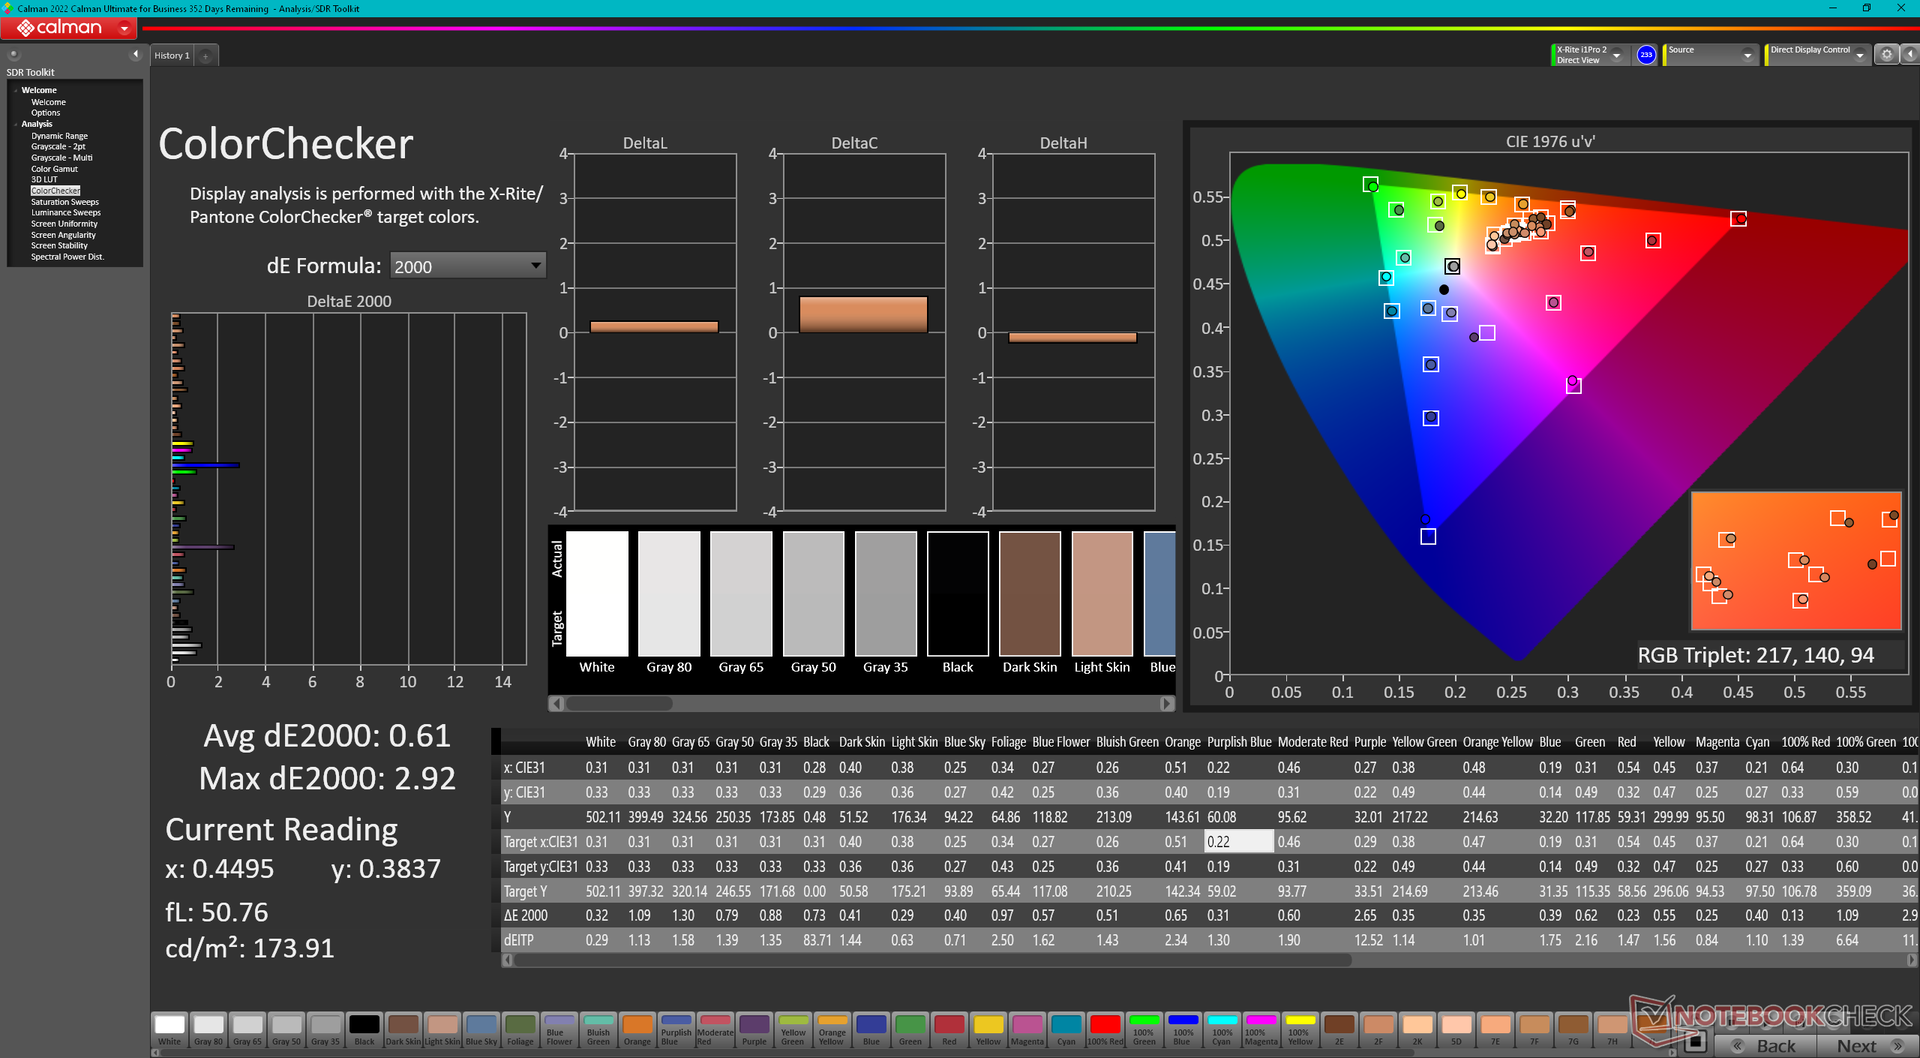
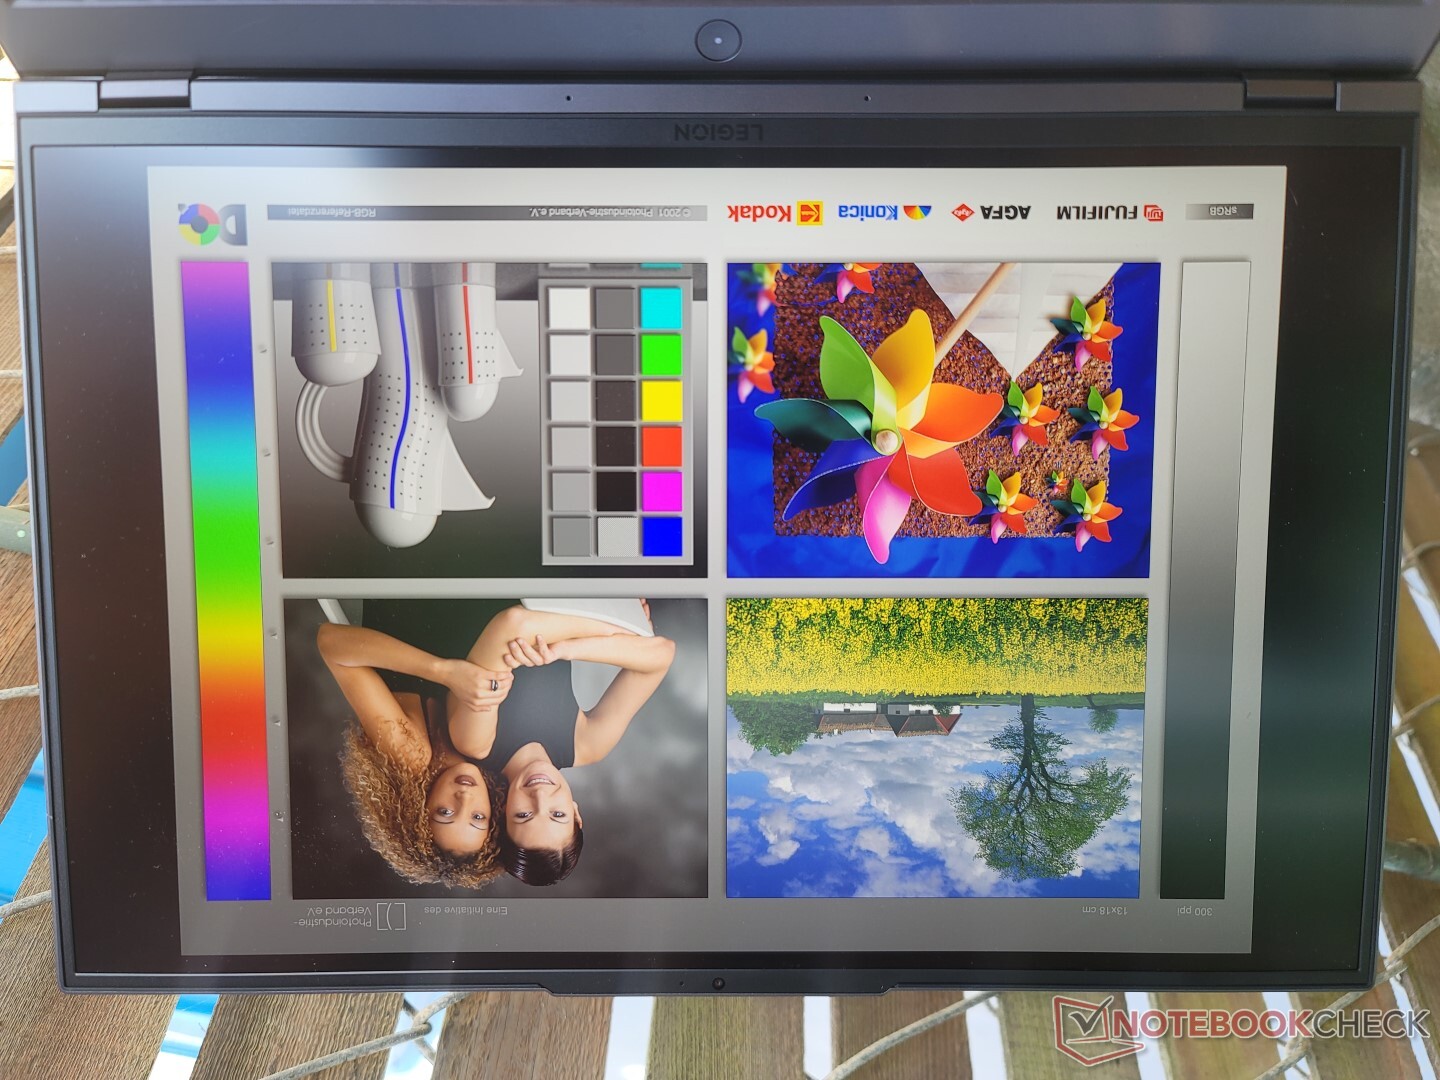
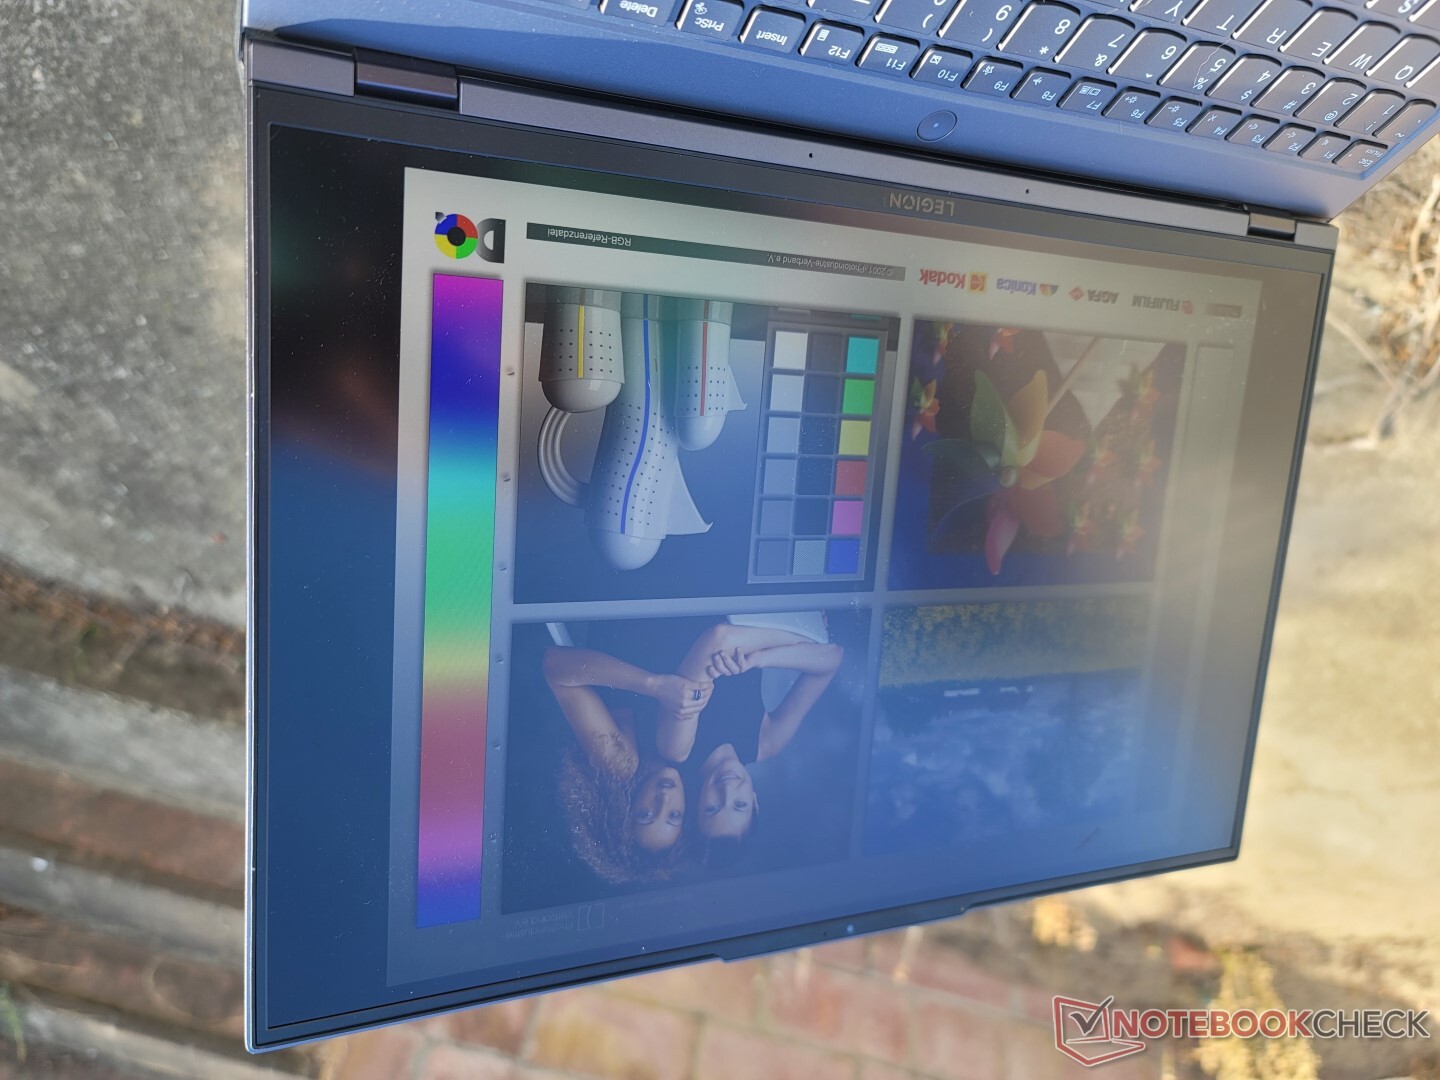
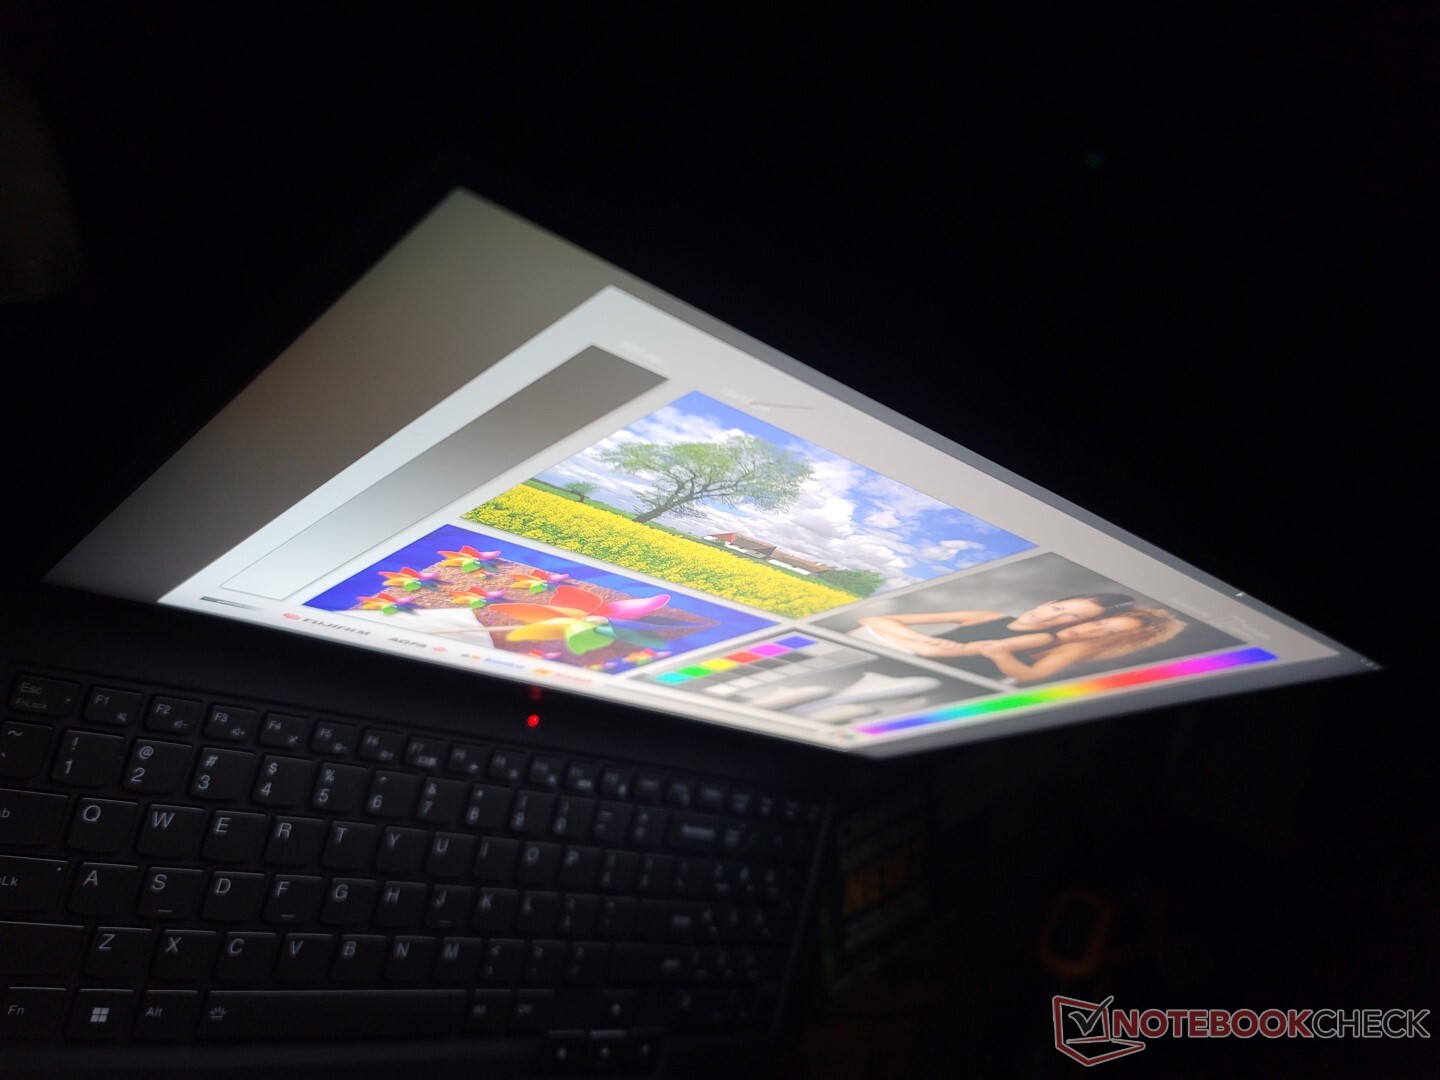
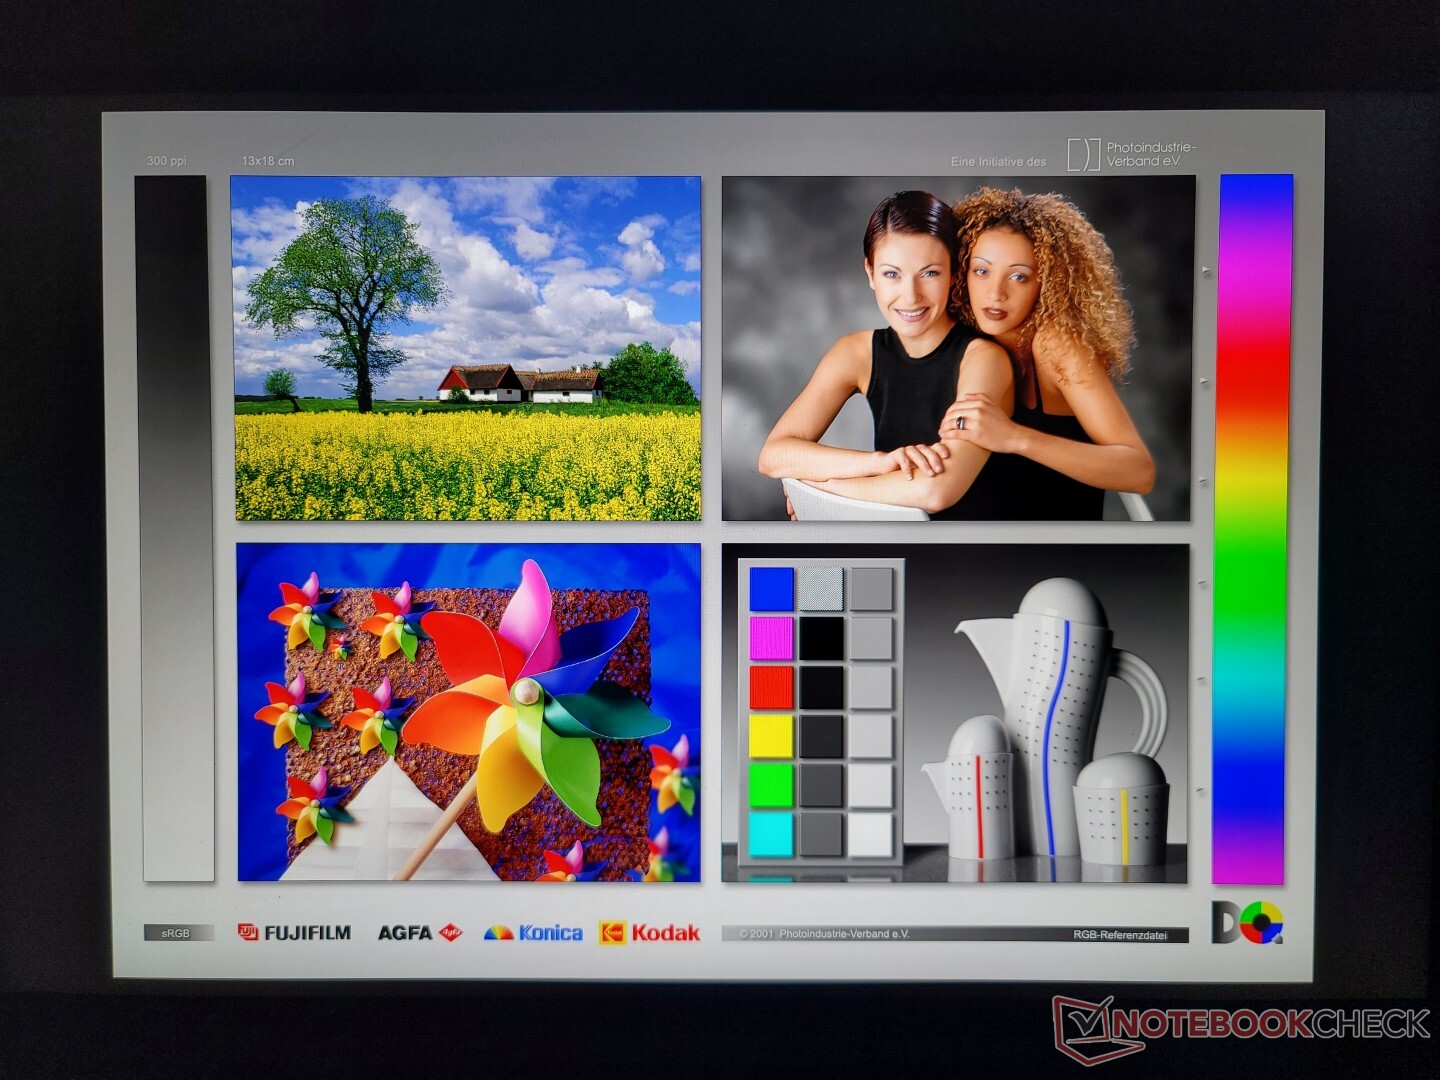
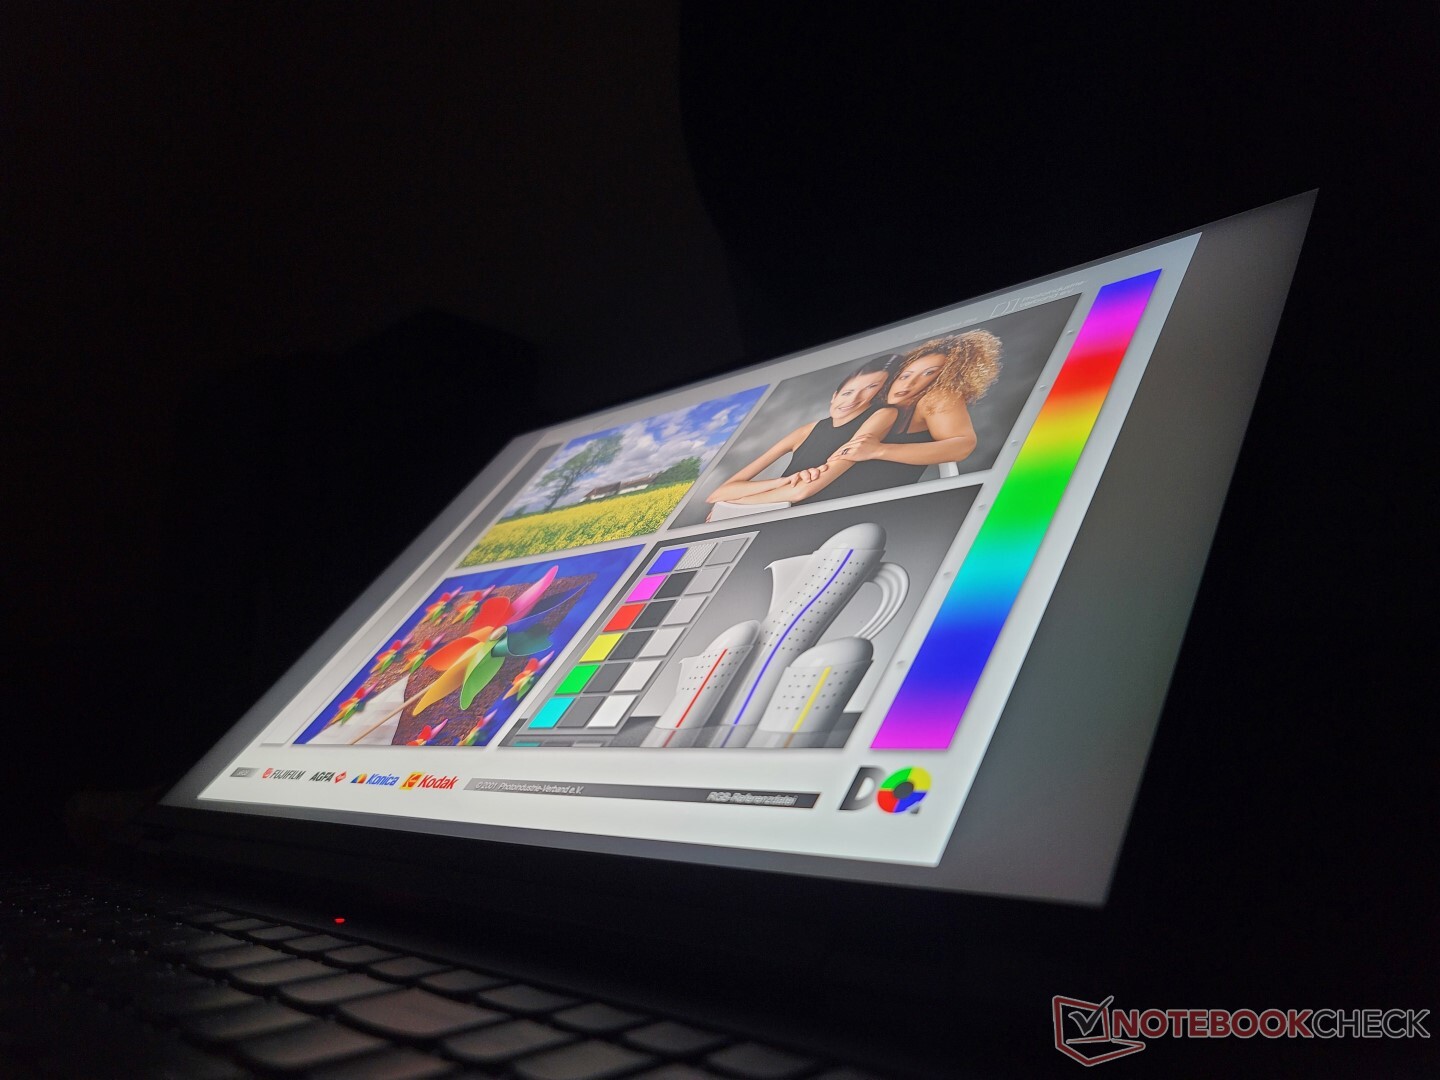
A Lenovo não mudou nada sobre o painel IPS BOE CQ NE160QDM-NY1 do modelo Legion 5 Pro 16 do ano passado. Nossas medidas abaixo mostram atributos similares em toda a linha, incluindo a cobertura total sRGB, tempos de resposta rápidos em preto e branco, ~1000:1 de contraste, e retroiluminação brilhante de 500-nit.
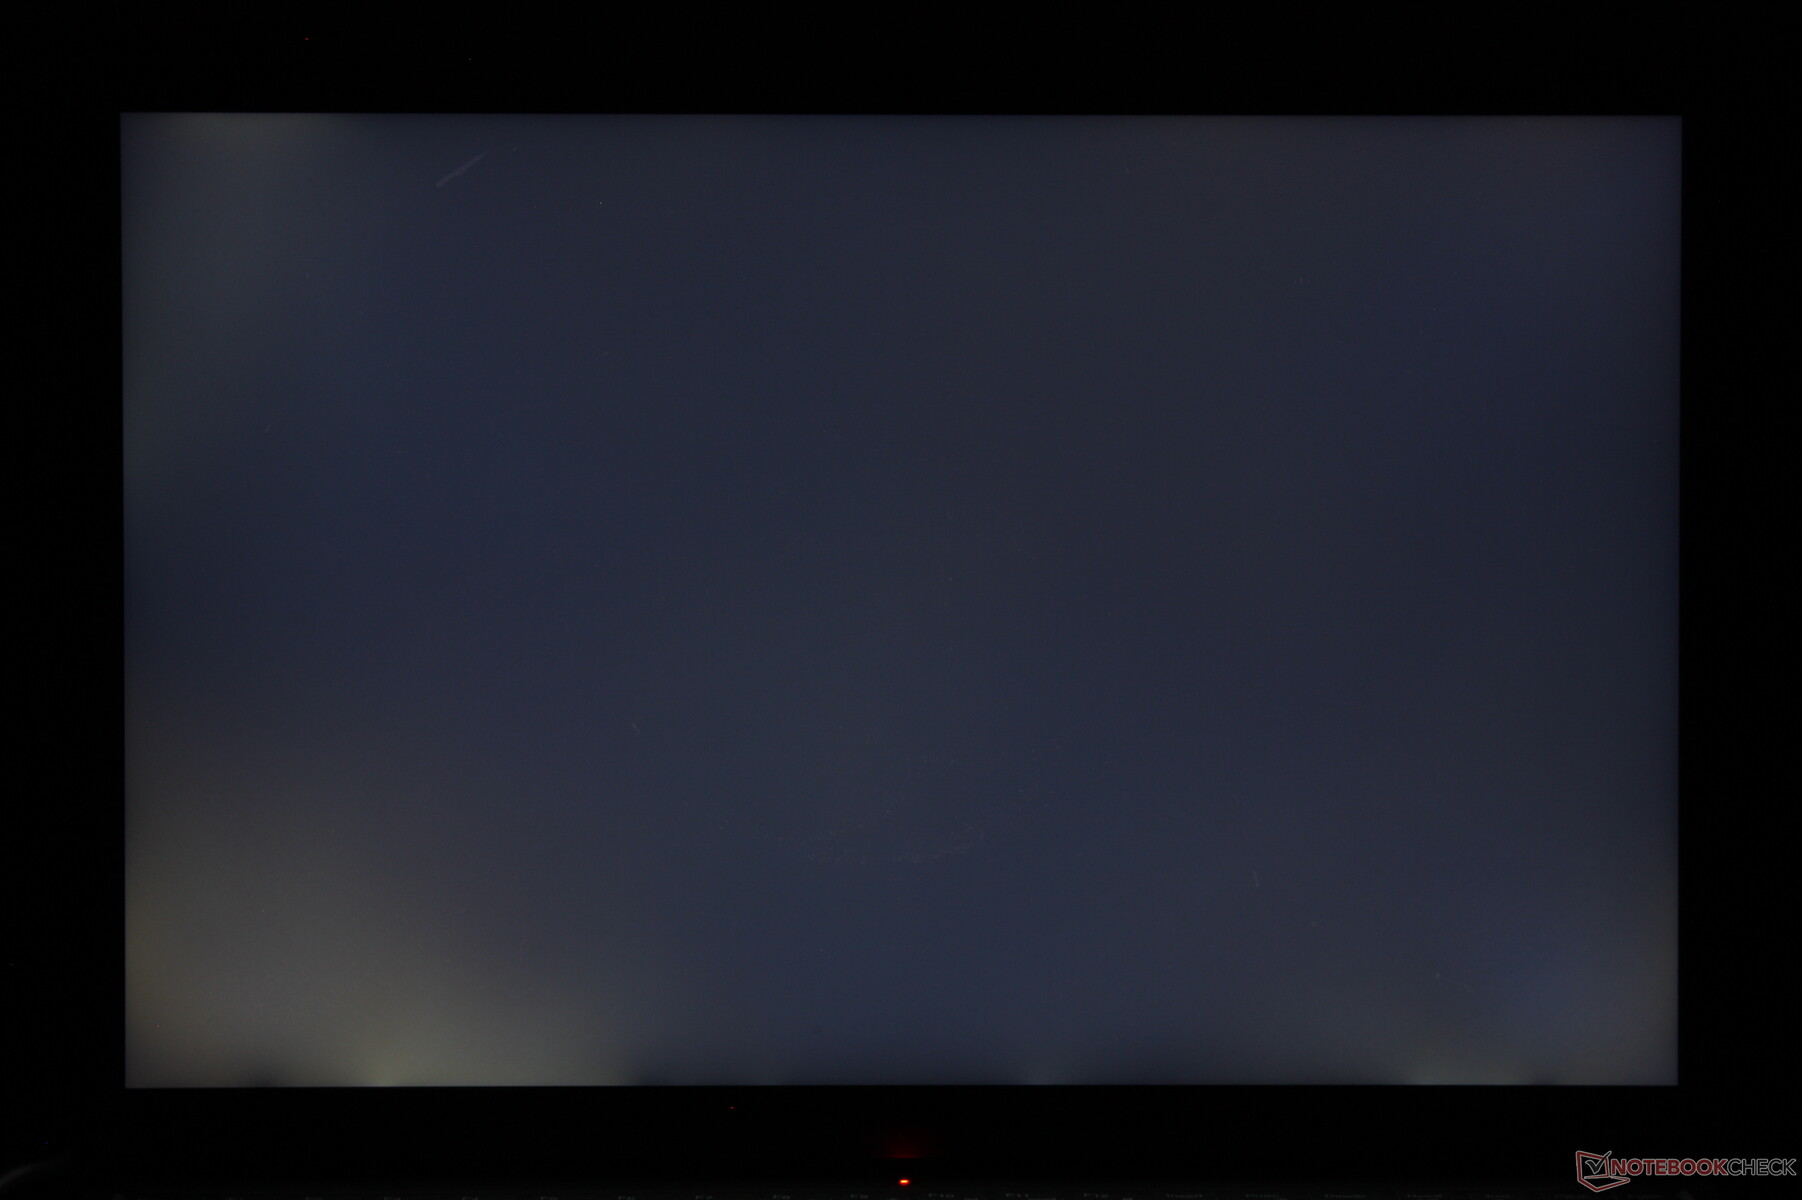
No entanto, nossa unidade específica sofre de um sangramento de luz traseira moderada, como mostra nossa foto abaixo. Espera-se algum sangramento leve desigual da maioria dos painéis IPS, mas esta intensidade é particularmente perturbadora para se ver em uma máquina de jogos de alto nível como a Legion 5 Pro 16.

| |||||||||||||||||||||||||
iluminação: 84 %
iluminação com acumulador: 522.8 cd/m²
Contraste: 1275:1 (Preto: 0.41 cd/m²)
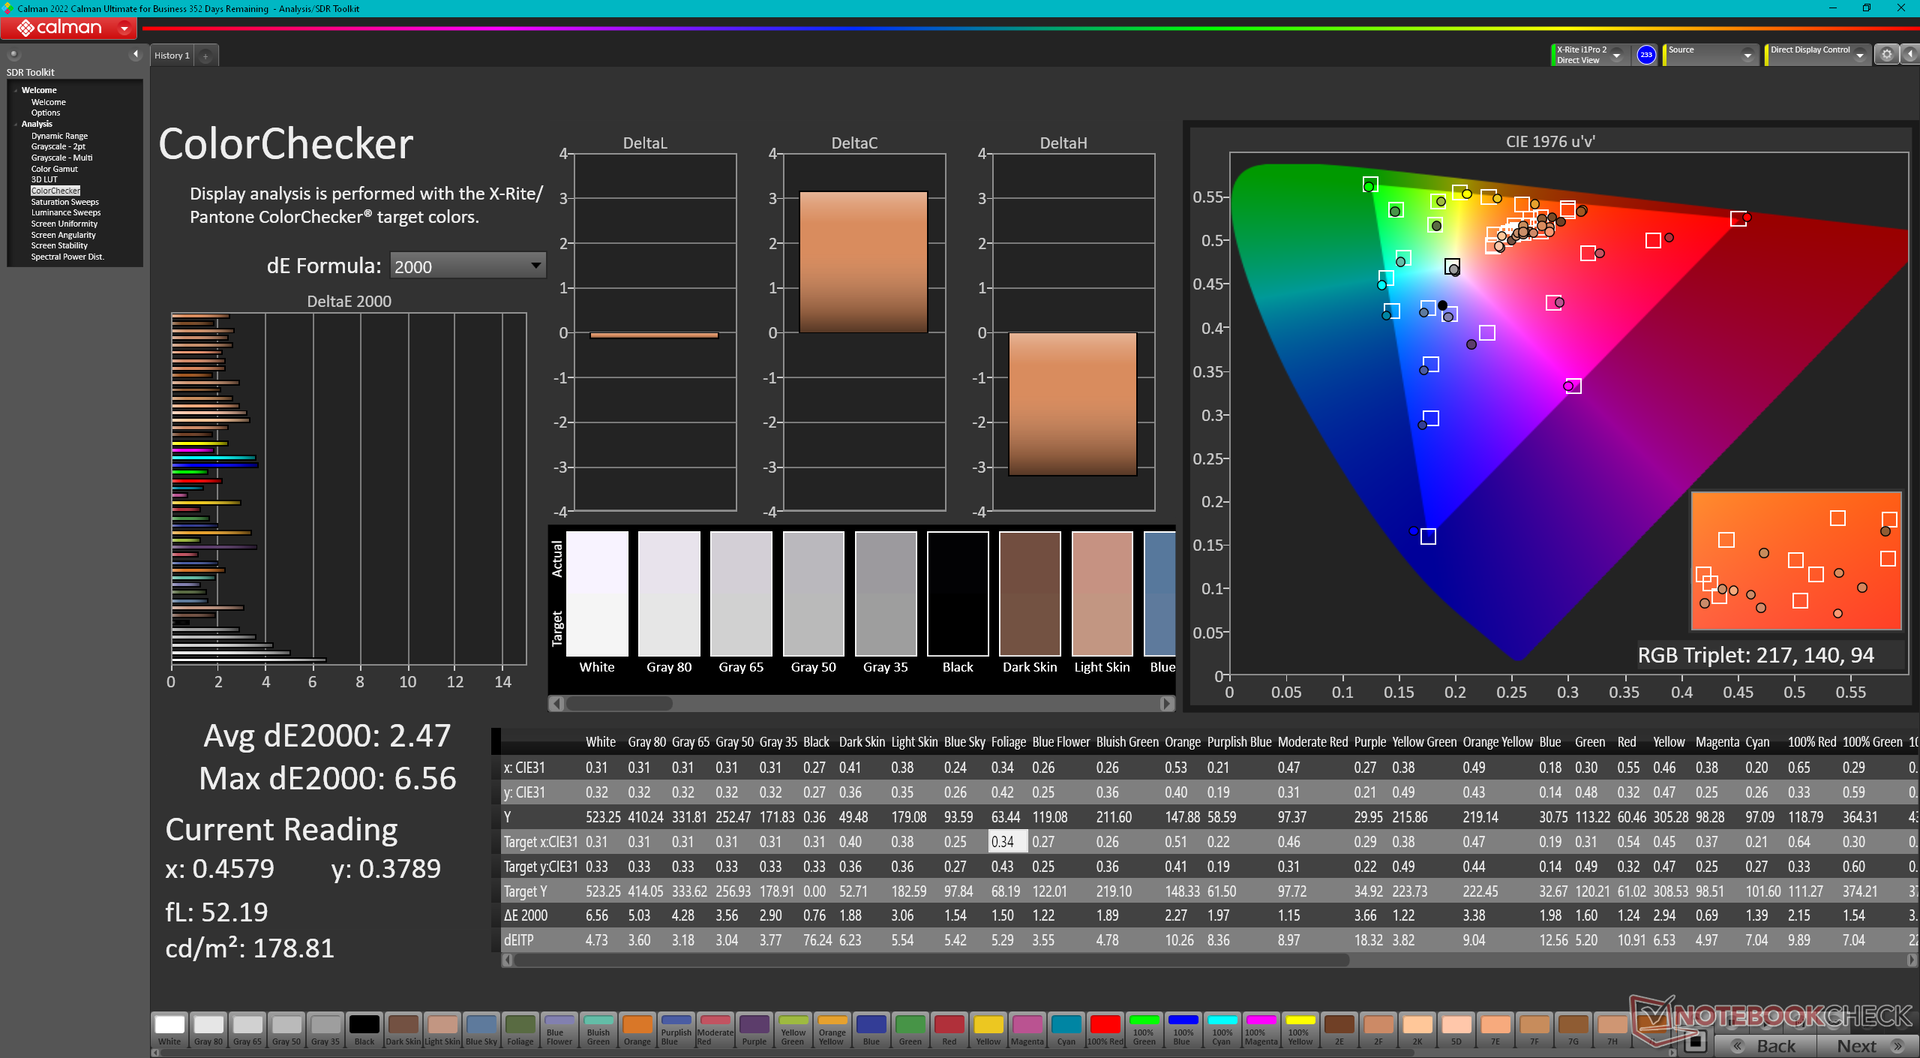
ΔE ColorChecker Calman: 2.47 | ∀{0.5-29.43 Ø4.73}
calibrated: 0.61
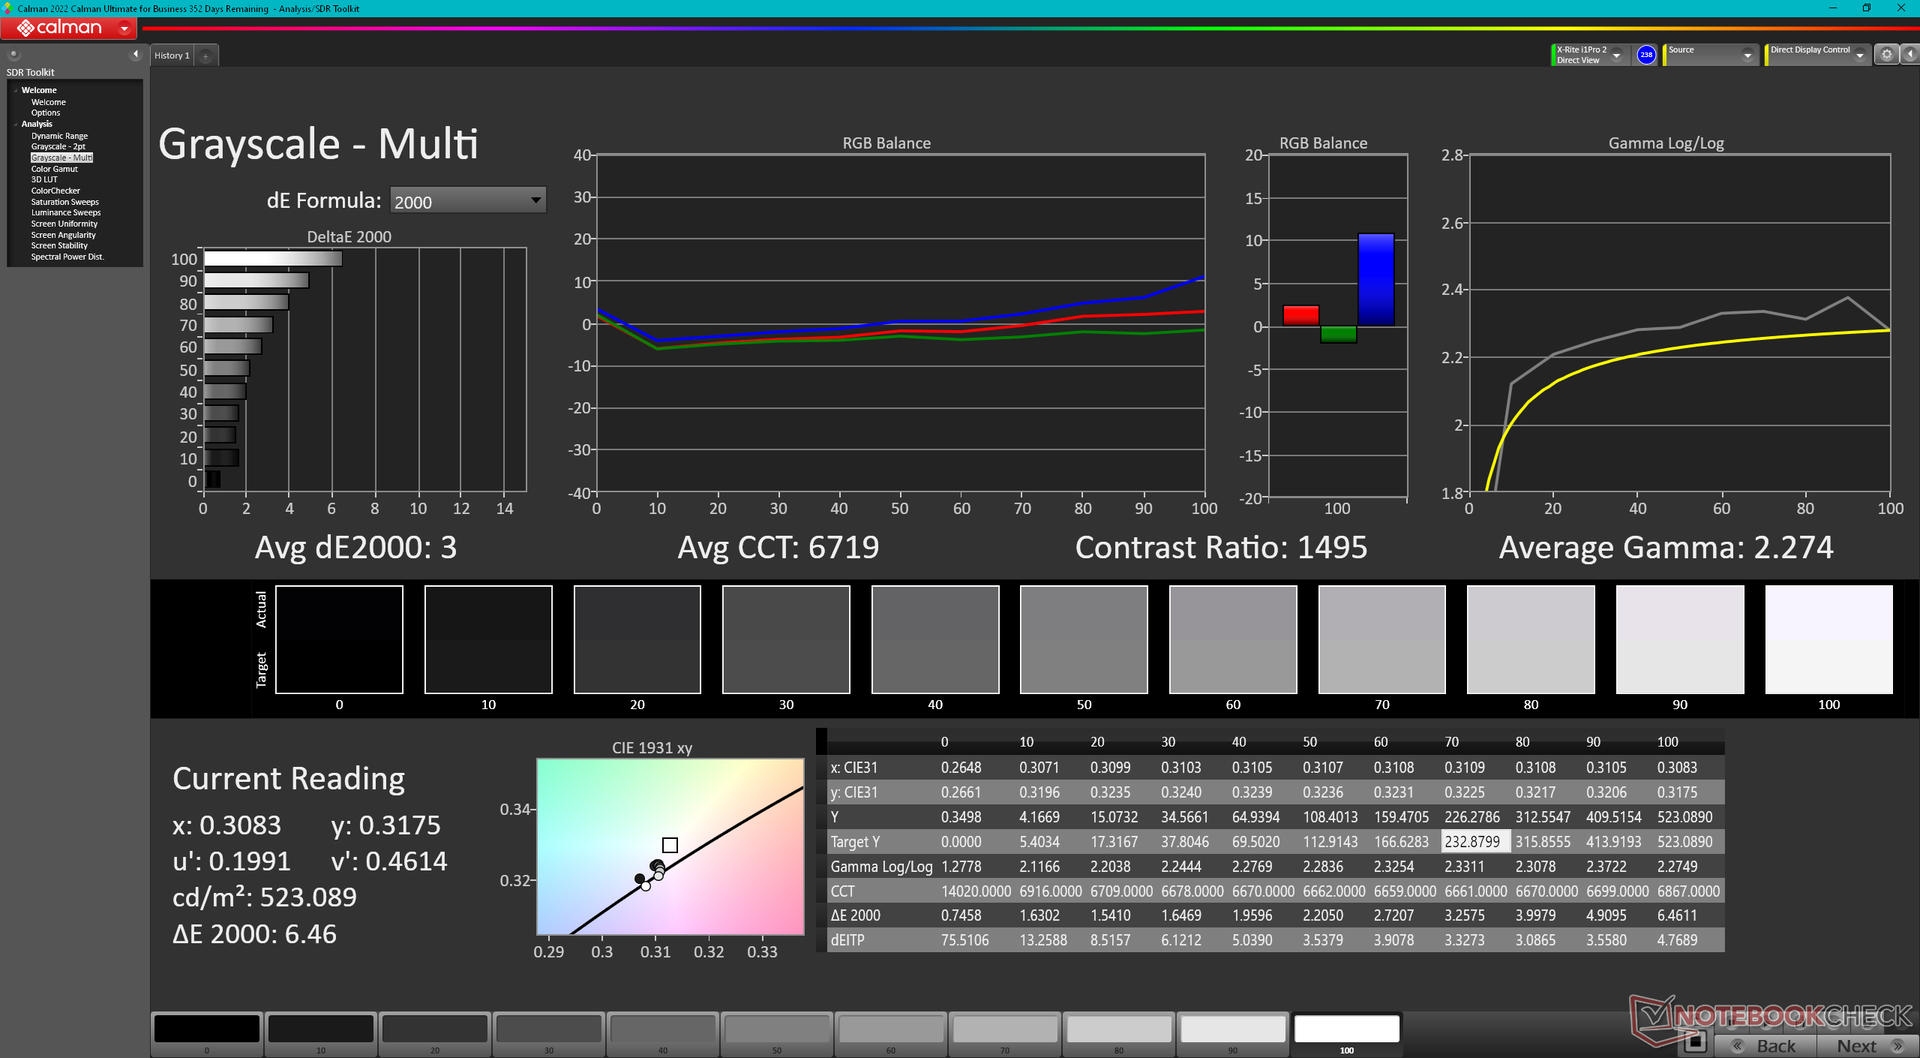
ΔE Greyscale Calman: 3 | ∀{0.09-98 Ø4.97}
69.5% AdobeRGB 1998 (Argyll 3D)
96.1% sRGB (Argyll 3D)
67.3% Display P3 (Argyll 3D)
Gamma: 2.27
CCT: 6719 K
| Lenovo Legion 5 Pro 16ARH7H RTX 3070 Ti BOE CQ NE160QDM-NY1, IPS, 2560x1600, 16" | Lenovo Legion 5 Pro 16IAH7H BOE CCQ_NE160QDM_NY1, IPS, 2560x1600, 16" | Asus ROG Zephyrus M16 GU603H AU Optronics AUOC199, IPS, 2560x1600, 16" | Lenovo Legion 7 16ARHA7 BOE CQ NE160QDM-NY1, IPS, 2560x1600, 16" | HP Victus 16-e0145ng CMN1609, IPS, 1920x1080, 16.1" | Dell G16 7620 BOE NE16QDM, IPS, 2560x1600, 16" | |
|---|---|---|---|---|---|---|
| Display | 2% | -4% | -37% | 1% | ||
| Display P3 Coverage (%) | 67.3 | 68.53 2% | 63.7 -5% | 41.6 -38% | 68.3 1% | |
| sRGB Coverage (%) | 96.1 | 98.38 2% | 95.3 -1% | 61.9 -36% | 98 2% | |
| AdobeRGB 1998 Coverage (%) | 69.5 | 70.45 1% | 65.7 -5% | 43 -38% | 70.5 1% | |
| Response Times | 25% | 57% | 25% | -90% | 24% | |
| Response Time Grey 50% / Grey 80% * (ms) | 14.4 ? | 14 ? 3% | 4.8 ? 67% | 9.2 ? 36% | 29.6 ? -106% | 8.6 ? 40% |
| Response Time Black / White * (ms) | 11.2 ? | 6 ? 46% | 6 ? 46% | 9.6 ? 14% | 19.4 ? -73% | 10.4 ? 7% |
| PWM Frequency (Hz) | ||||||
| Screen | -7% | -51% | -19% | -127% | -10% | |
| Brightness middle (cd/m²) | 522.8 | 515 -1% | 448 -14% | 478.8 -8% | 257 -51% | 369.4 -29% |
| Brightness (cd/m²) | 503 | 475 -6% | 446 -11% | 477 -5% | 239 -52% | 348 -31% |
| Brightness Distribution (%) | 84 | 85 1% | 86 2% | 90 7% | 88 5% | 83 -1% |
| Black Level * (cd/m²) | 0.41 | 0.45 -10% | 0.48 -17% | 0.43 -5% | 0.25 39% | 0.32 22% |
| Contrast (:1) | 1275 | 1144 -10% | 933 -27% | 1113 -13% | 1028 -19% | 1154 -9% |
| Colorchecker dE 2000 * | 2.47 | 2.38 4% | 2.76 -12% | 2.24 9% | 6.91 -180% | 1.78 28% |
| Colorchecker dE 2000 max. * | 6.56 | 4.37 33% | 7.09 -8% | 4.49 32% | 22.27 -239% | 4.41 33% |
| Colorchecker dE 2000 calibrated * | 0.61 | 1.1 -80% | 2.86 -369% | 1.89 -210% | 3.61 -492% | 1.22 -100% |
| Greyscale dE 2000 * | 3 | 2.71 10% | 3.1 -3% | 2.3 23% | 7.5 -150% | 3.2 -7% |
| Gamma | 2.27 97% | 2.49 88% | 2.153 102% | 2.25 98% | 2.125 104% | 2.2 100% |
| CCT | 6719 97% | 6117 106% | 6826 95% | 6955 93% | 6025 108% | 6750 96% |
| Color Space (Percent of AdobeRGB 1998) (%) | 87 | |||||
| Color Space (Percent of sRGB) (%) | 100 | |||||
| Média Total (Programa/Configurações) | 7% /
-0% | 3% /
-31% | 1% /
-9% | -85% /
-102% | 5% /
-3% |
* ... menor é melhor
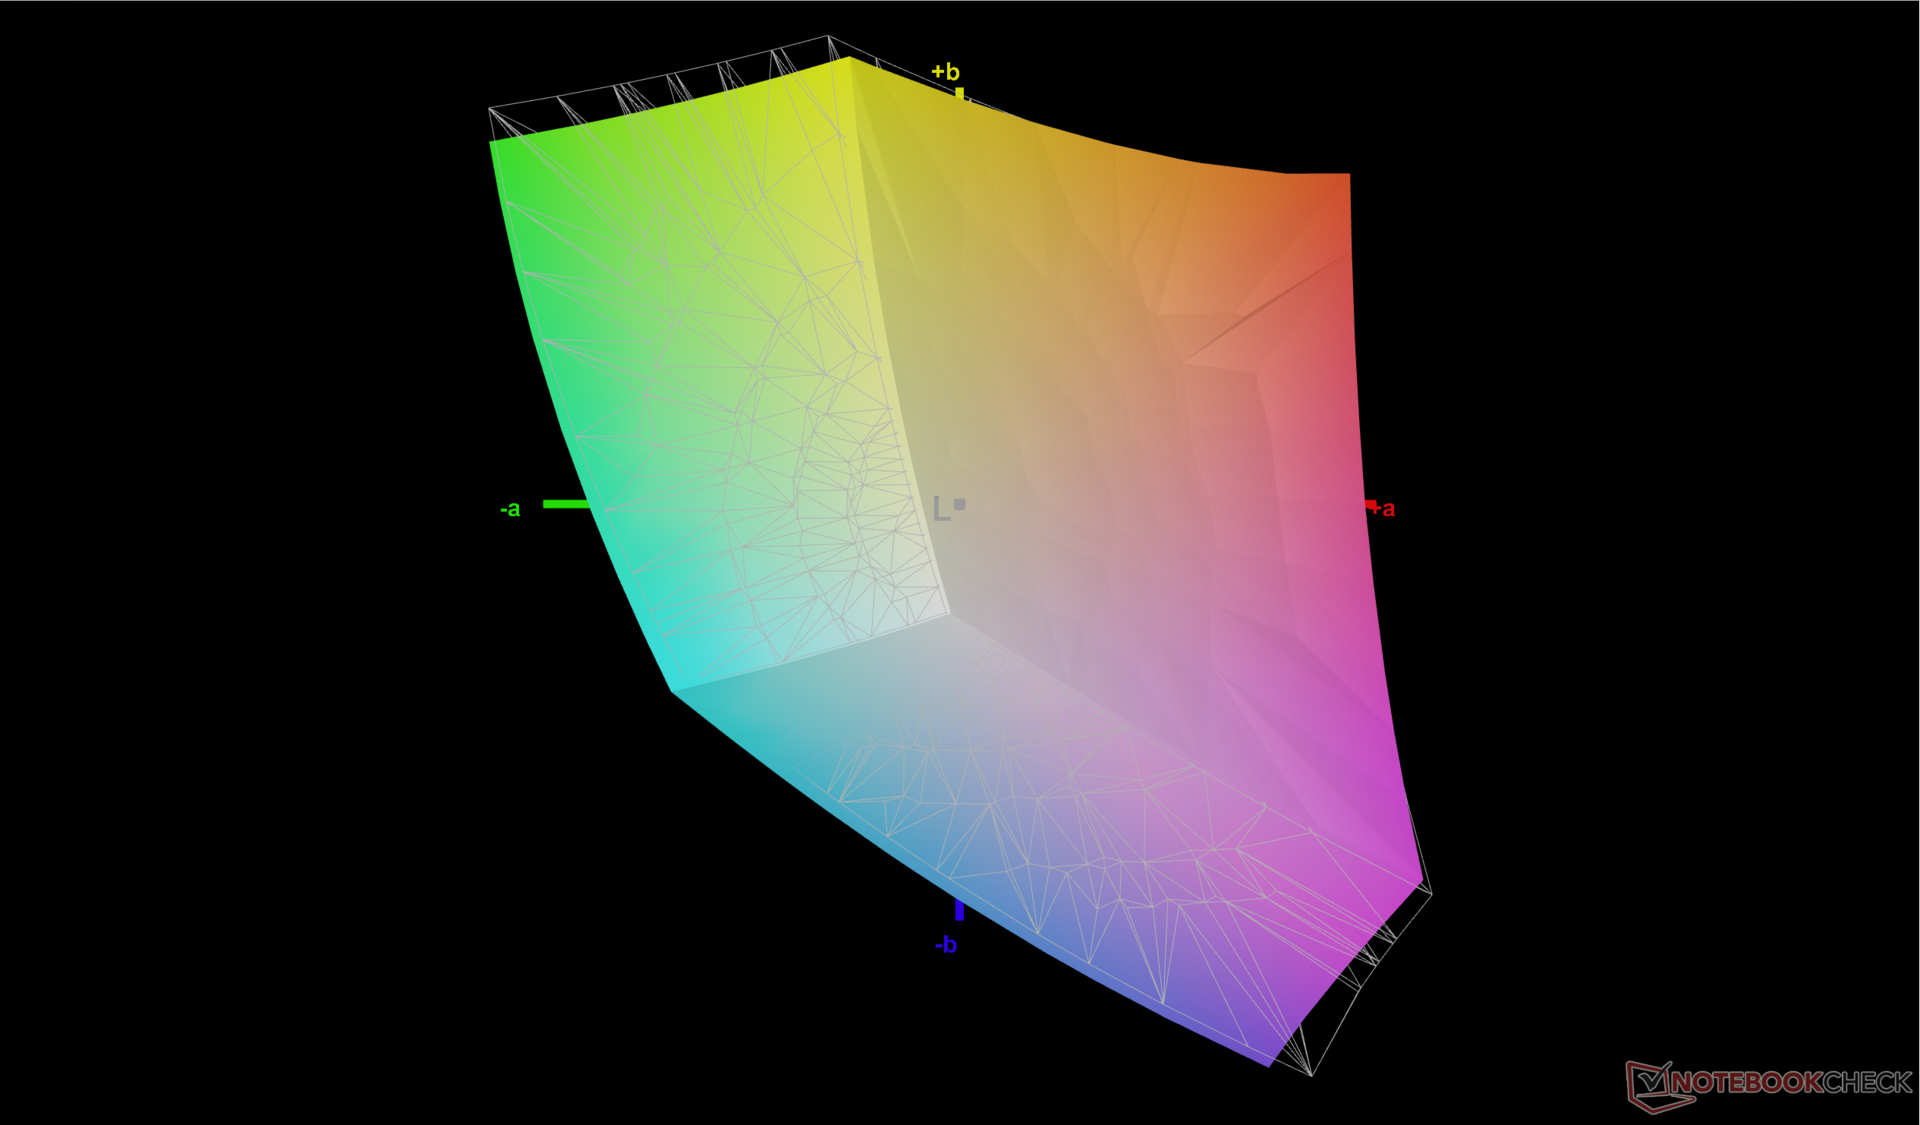
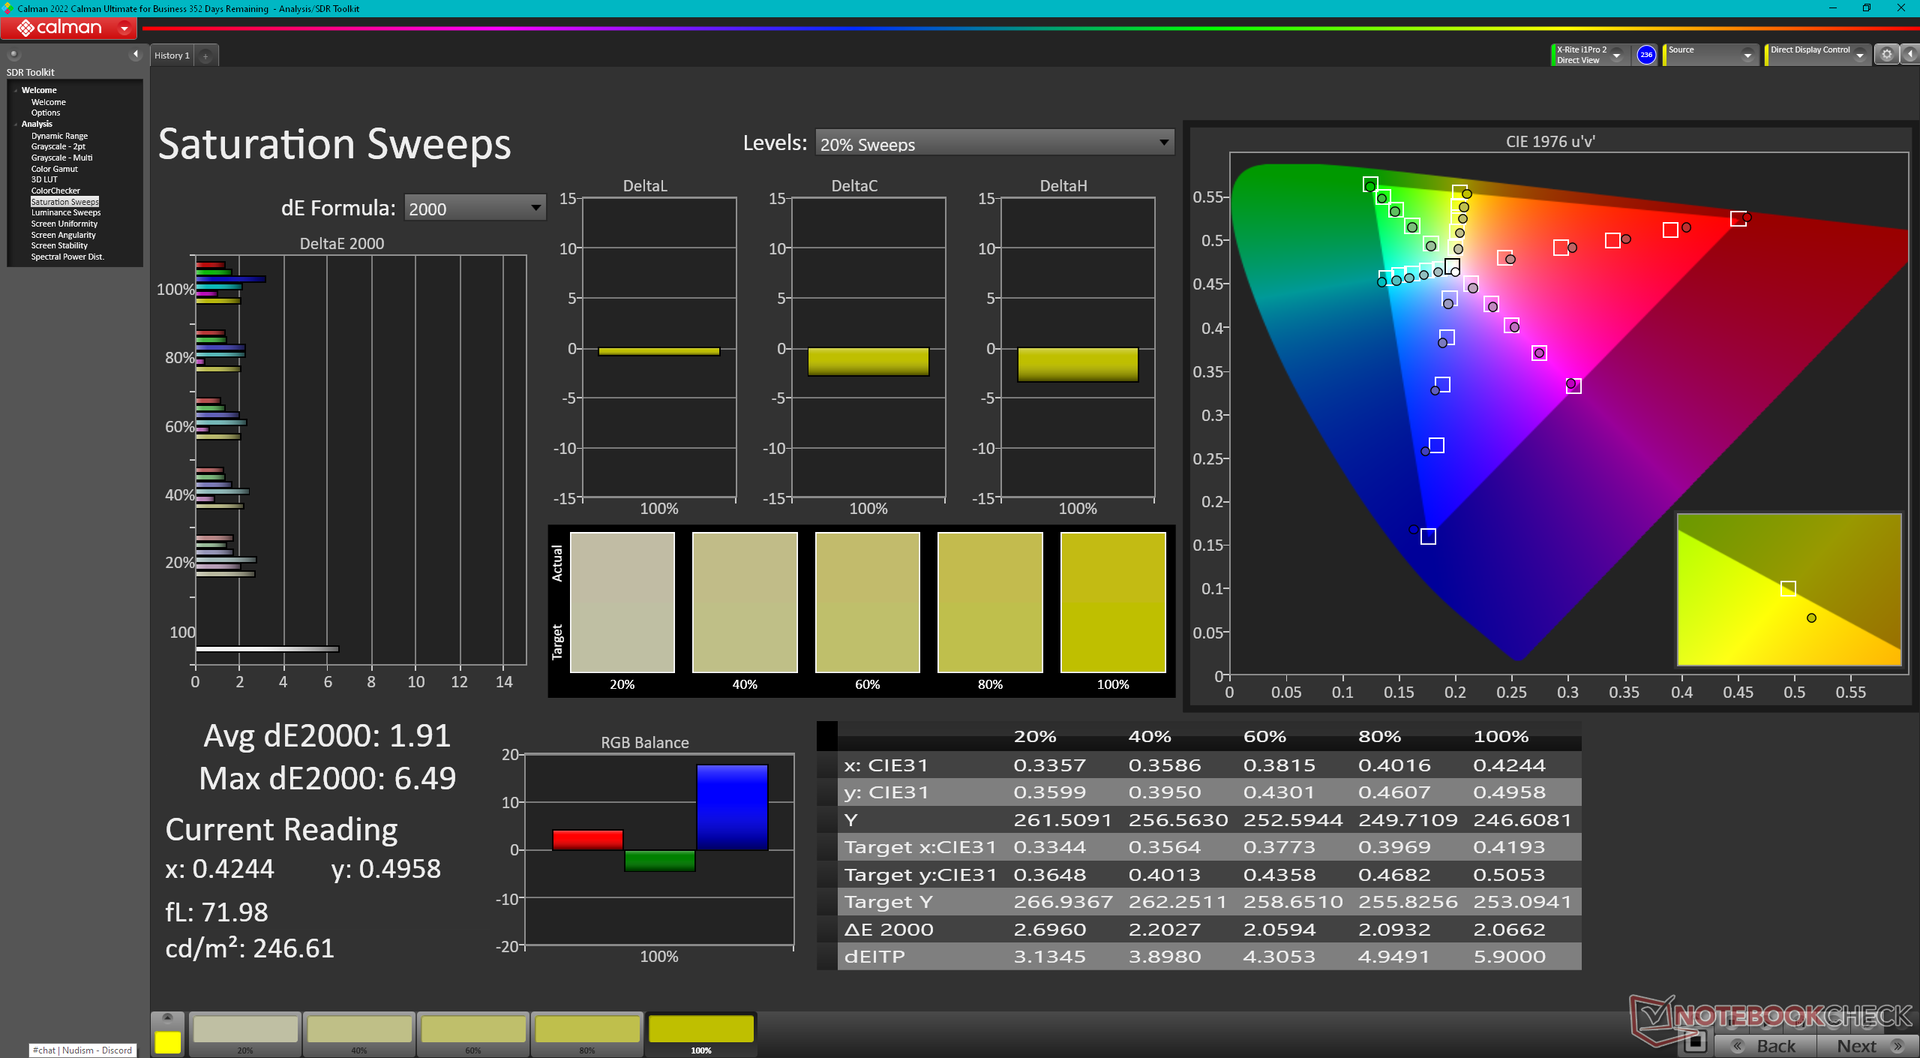
O display vem pré-calibrado com valores médios de escala de cinza e deltaE de cor de apenas 3 e 2,47, respectivamente, em nossa unidade específica. Calibrar nós mesmos o painel com um colorímetro X-Rite melhoraria ainda mais os valores de deltaE para apenas 0,7 e 0,6. Recomendamos aplicar nosso perfil de ICM calibrado acima para melhor explorar a cobertura completa do sRGB do display.
Exibir tempos de resposta
| ↔ Tempo de resposta preto para branco | ||
|---|---|---|
| 11.2 ms ... ascensão ↗ e queda ↘ combinadas | ↗ 6 ms ascensão | 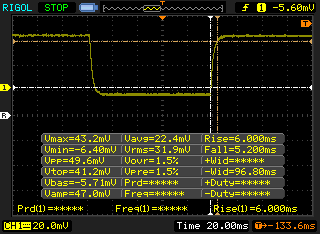 |
| ↘ 5.2 ms queda | ||
| A tela mostra boas taxas de resposta em nossos testes, mas pode ser muito lenta para jogadores competitivos. Em comparação, todos os dispositivos testados variam de 0.1 (mínimo) a 240 (máximo) ms. » 30 % de todos os dispositivos são melhores. Isso significa que o tempo de resposta medido é melhor que a média de todos os dispositivos testados (19.9 ms). | ||
| ↔ Tempo de resposta 50% cinza a 80% cinza | ||
| 14.4 ms ... ascensão ↗ e queda ↘ combinadas | ↗ 7.6 ms ascensão | 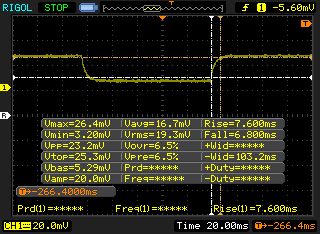 |
| ↘ 6.8 ms queda | ||
| A tela mostra boas taxas de resposta em nossos testes, mas pode ser muito lenta para jogadores competitivos. Em comparação, todos os dispositivos testados variam de 0.165 (mínimo) a 636 (máximo) ms. » 28 % de todos os dispositivos são melhores. Isso significa que o tempo de resposta medido é melhor que a média de todos os dispositivos testados (31.1 ms). | ||
Cintilação da tela / PWM (modulação por largura de pulso)
| Tela tremeluzindo / PWM não detectado | 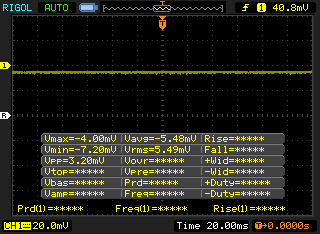 | ||
[pwm_comparison] Em comparação: 52 % de todos os dispositivos testados não usam PWM para escurecer a tela. Se PWM foi detectado, uma média de 7794 (mínimo: 5 - máximo: 343500) Hz foi medida. | |||

Desempenho - Apenas um pouco mais rápido
Condições de teste
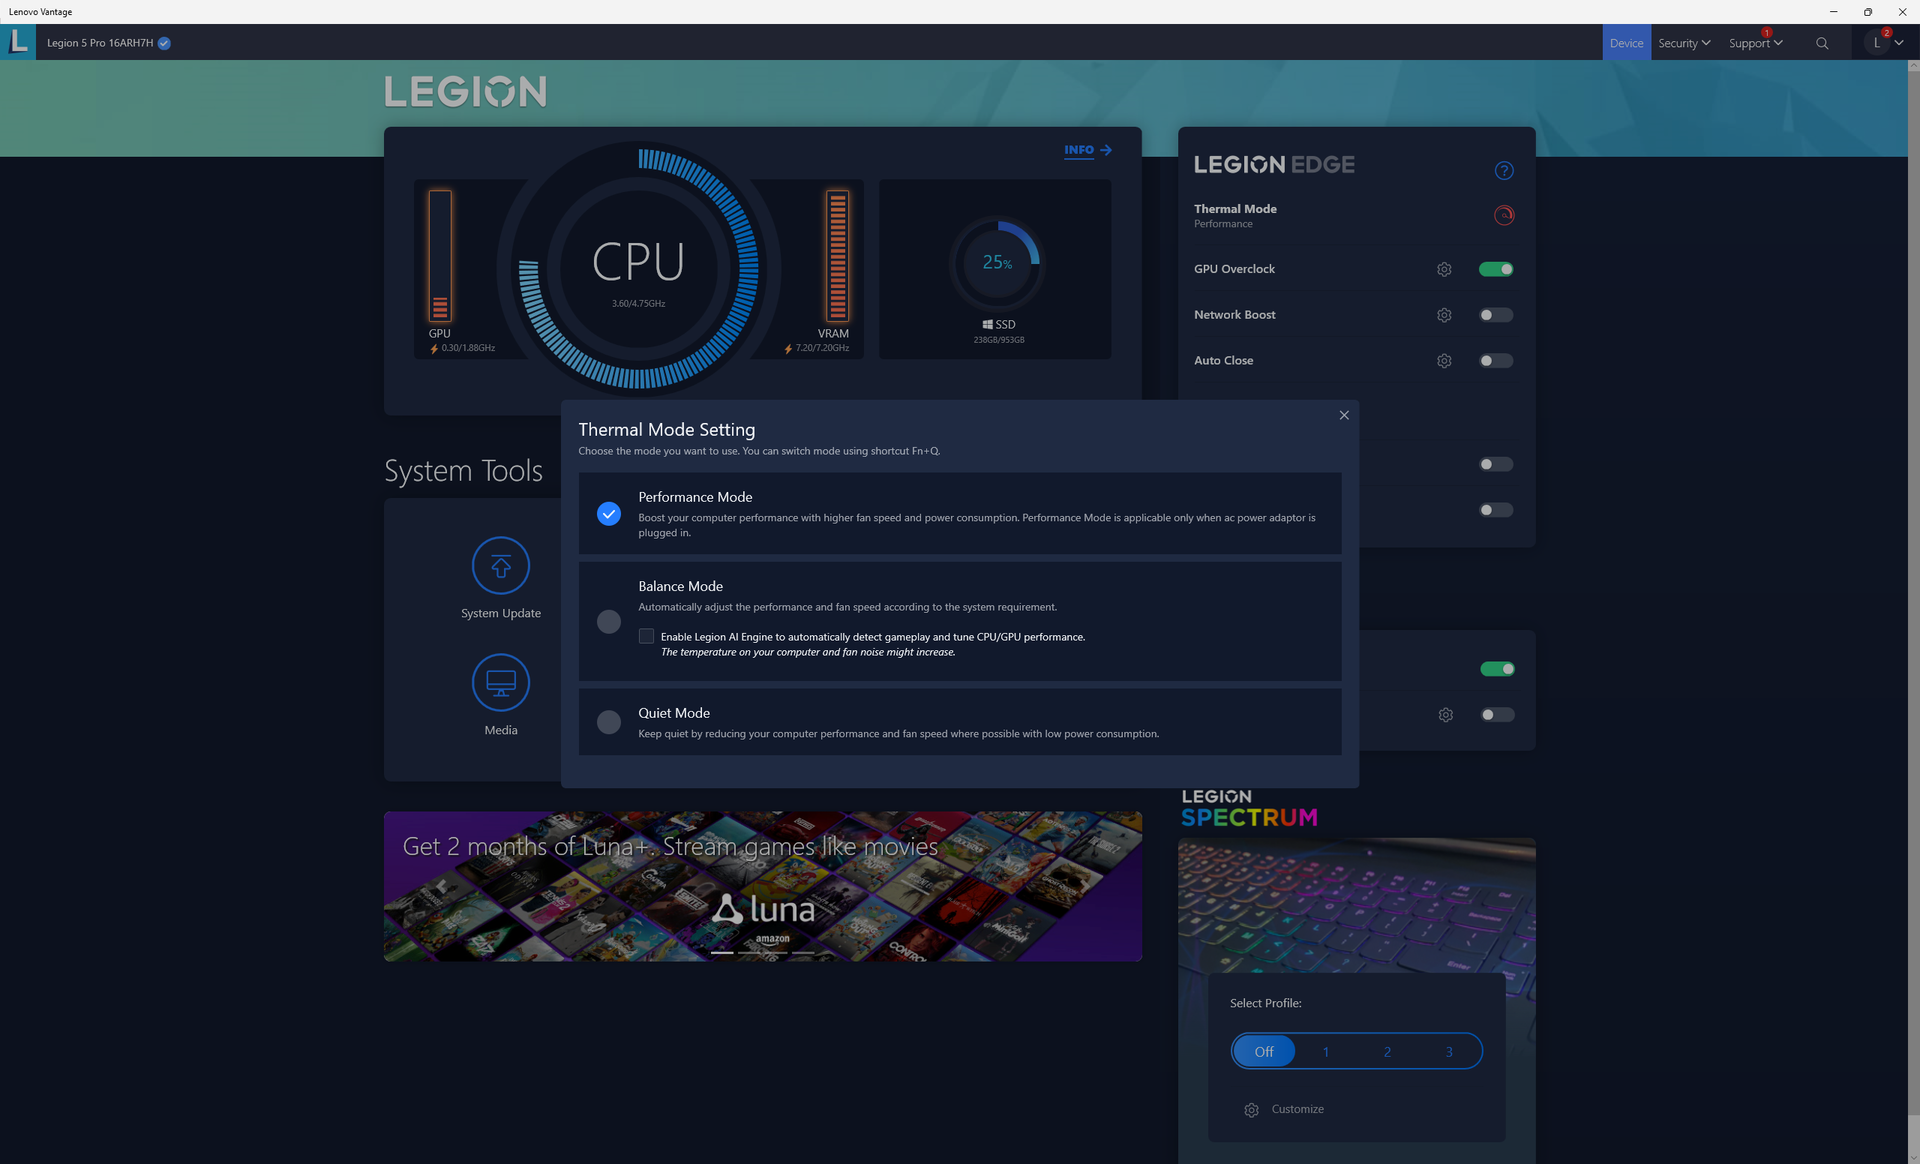
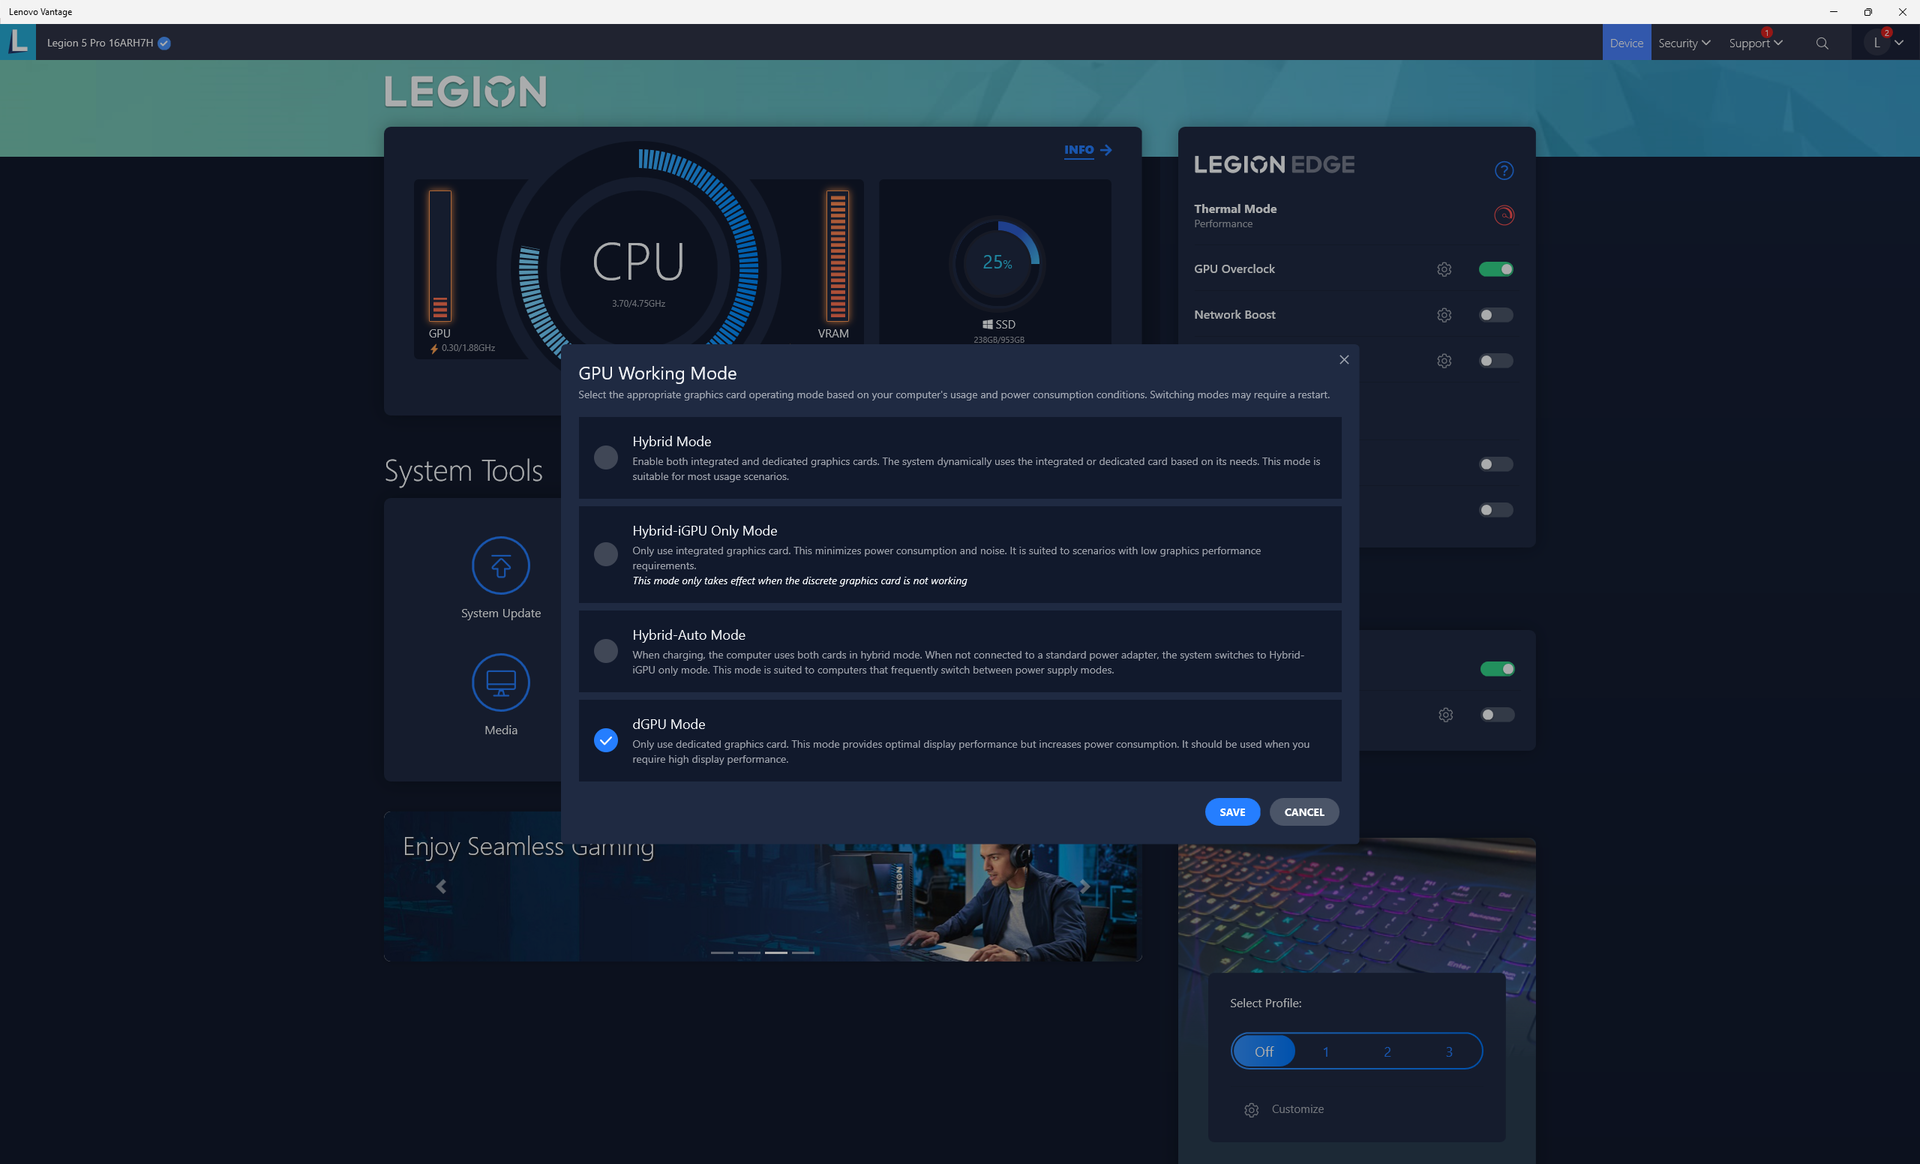
Configuramos nossa unidade para o modo Performance através do Windows e do software Lenovo Vantage antes de executar quaisquer benchmarks abaixo. Também nos certificamos de alternar o Overclock da GPU e o modo de trabalho da GPU para "apenas dGPU" para máxima performance. Os proprietários devem se familiarizar absolutamente com o software Vantage e suas várias configurações, como exemplificado pelas capturas de tela abaixo.

Processador
O desempenho de uma e várias roscas é cerca de 10% e 20% mais rápido do que na última geração Ryzen 7 5800Hrespectivamente, com base em nosso tempo com o HP Omen 16 e a Lenovo 2021 Legion 5 Pro 16. Embora não seja insignificante, o aumento de desempenho ano após ano não é tão grande quanto o salto da 11ª para a 12ª geração da Intel. O Núcleo i7-12700Hpor exemplo, ainda é cerca de 15% a 30% mais rápido do que o nosso Ryzen 7 6800H
Atualizando para o Ryzen 9 6900HX de nosso Ryzen 7 6800H espera-se que traga apenas ganhos marginais, na melhor das hipóteses, como mostram nossos gráficos de comparação abaixo. Assim, compradores conscientes do orçamento podem querer considerar um SKU Ryzen 7 6800H menos caro.
Cinebench R15 Multi Loop
Cinebench R23: Multi Core | Single Core
Cinebench R15: CPU Multi 64Bit | CPU Single 64Bit
Blender: v2.79 BMW27 CPU
7-Zip 18.03: 7z b 4 | 7z b 4 -mmt1
Geekbench 5.5: Multi-Core | Single-Core
HWBOT x265 Benchmark v2.2: 4k Preset
LibreOffice : 20 Documents To PDF
R Benchmark 2.5: Overall mean
| HWBOT x265 Benchmark v2.2 / 4k Preset | |
| Lenovo Legion 5 Pro 16IAH7H | |
| Alienware x15 R2 P111F | |
| Dell G16 7620 | |
| Lenovo Legion 5 Pro 16ARH7H RTX 3070 Ti | |
| Lenovo Legion 7 16ARHA7 | |
| Gigabyte A5 X1 | |
| Média AMD Ryzen 7 6800H (14.9 - 18.5, n=9) | |
| HP Omen 16-c0077ng | |
| Asus ROG Zephyrus M16 GU603H | |
| HP Victus 16-e0145ng | |
| Lenovo Legion C7 15IMH05 82EH0030GE | |
* ... menor é melhor
AIDA64: FP32 Ray-Trace | FPU Julia | CPU SHA3 | CPU Queen | FPU SinJulia | FPU Mandel | CPU AES | CPU ZLib | FP64 Ray-Trace | CPU PhotoWorxx
| Performance rating | |
| Lenovo Legion 7 16ARHA7 | |
| Lenovo Legion 5 Pro 16ARH7H RTX 3070 Ti | |
| Média AMD Ryzen 7 6800H | |
| Dell G16 7620 | |
| Lenovo Legion 5 Pro 16IAH7H | |
| HP Victus 16-e0145ng | |
| Asus ROG Zephyrus M16 GU603H -9! | |
| AIDA64 / FP32 Ray-Trace | |
| Lenovo Legion 7 16ARHA7 | |
| Lenovo Legion 5 Pro 16ARH7H RTX 3070 Ti | |
| Média AMD Ryzen 7 6800H (12876 - 17031, n=8) | |
| Dell G16 7620 | |
| Lenovo Legion 5 Pro 16IAH7H | |
| Lenovo Legion 5 Pro 16IAH7H | |
| HP Victus 16-e0145ng | |
| AIDA64 / FPU Julia | |
| Lenovo Legion 7 16ARHA7 | |
| Lenovo Legion 5 Pro 16ARH7H RTX 3070 Ti | |
| Média AMD Ryzen 7 6800H (82673 - 105987, n=8) | |
| Dell G16 7620 | |
| Lenovo Legion 5 Pro 16IAH7H | |
| Lenovo Legion 5 Pro 16IAH7H | |
| HP Victus 16-e0145ng | |
| AIDA64 / CPU SHA3 | |
| Dell G16 7620 | |
| Lenovo Legion 7 16ARHA7 | |
| Lenovo Legion 5 Pro 16ARH7H RTX 3070 Ti | |
| Lenovo Legion 5 Pro 16IAH7H | |
| Lenovo Legion 5 Pro 16IAH7H | |
| Média AMD Ryzen 7 6800H (2886 - 3634, n=8) | |
| HP Victus 16-e0145ng | |
| AIDA64 / CPU Queen | |
| Lenovo Legion 5 Pro 16ARH7H RTX 3070 Ti | |
| Lenovo Legion 7 16ARHA7 | |
| Dell G16 7620 | |
| Lenovo Legion 5 Pro 16IAH7H | |
| Média AMD Ryzen 7 6800H (75117 - 106322, n=8) | |
| HP Victus 16-e0145ng | |
| AIDA64 / FPU SinJulia | |
| Lenovo Legion 7 16ARHA7 | |
| Lenovo Legion 5 Pro 16ARH7H RTX 3070 Ti | |
| Média AMD Ryzen 7 6800H (11771 - 13120, n=8) | |
| Lenovo Legion 5 Pro 16IAH7H | |
| Lenovo Legion 5 Pro 16IAH7H | |
| Dell G16 7620 | |
| HP Victus 16-e0145ng | |
| AIDA64 / FPU Mandel | |
| Lenovo Legion 7 16ARHA7 | |
| Lenovo Legion 5 Pro 16ARH7H RTX 3070 Ti | |
| Média AMD Ryzen 7 6800H (45287 - 58327, n=8) | |
| HP Victus 16-e0145ng | |
| Lenovo Legion 5 Pro 16IAH7H | |
| Lenovo Legion 5 Pro 16IAH7H | |
| Dell G16 7620 | |
| AIDA64 / CPU AES | |
| Lenovo Legion 7 16ARHA7 | |
| Lenovo Legion 5 Pro 16ARH7H RTX 3070 Ti | |
| Lenovo Legion 5 Pro 16IAH7H | |
| Lenovo Legion 5 Pro 16IAH7H | |
| Média AMD Ryzen 7 6800H (67816 - 137383, n=8) | |
| Dell G16 7620 | |
| HP Victus 16-e0145ng | |
| AIDA64 / FP64 Ray-Trace | |
| Lenovo Legion 7 16ARHA7 | |
| Lenovo Legion 5 Pro 16ARH7H RTX 3070 Ti | |
| Média AMD Ryzen 7 6800H (6917 - 8980, n=8) | |
| Dell G16 7620 | |
| Lenovo Legion 5 Pro 16IAH7H | |
| Lenovo Legion 5 Pro 16IAH7H | |
| HP Victus 16-e0145ng | |
| AIDA64 / CPU PhotoWorxx | |
| Dell G16 7620 | |
| Lenovo Legion 5 Pro 16IAH7H | |
| Lenovo Legion 5 Pro 16IAH7H | |
| Lenovo Legion 7 16ARHA7 | |
| Lenovo Legion 5 Pro 16ARH7H RTX 3070 Ti | |
| Média AMD Ryzen 7 6800H (26496 - 30360, n=8) | |
| HP Victus 16-e0145ng | |
Desempenho do sistema
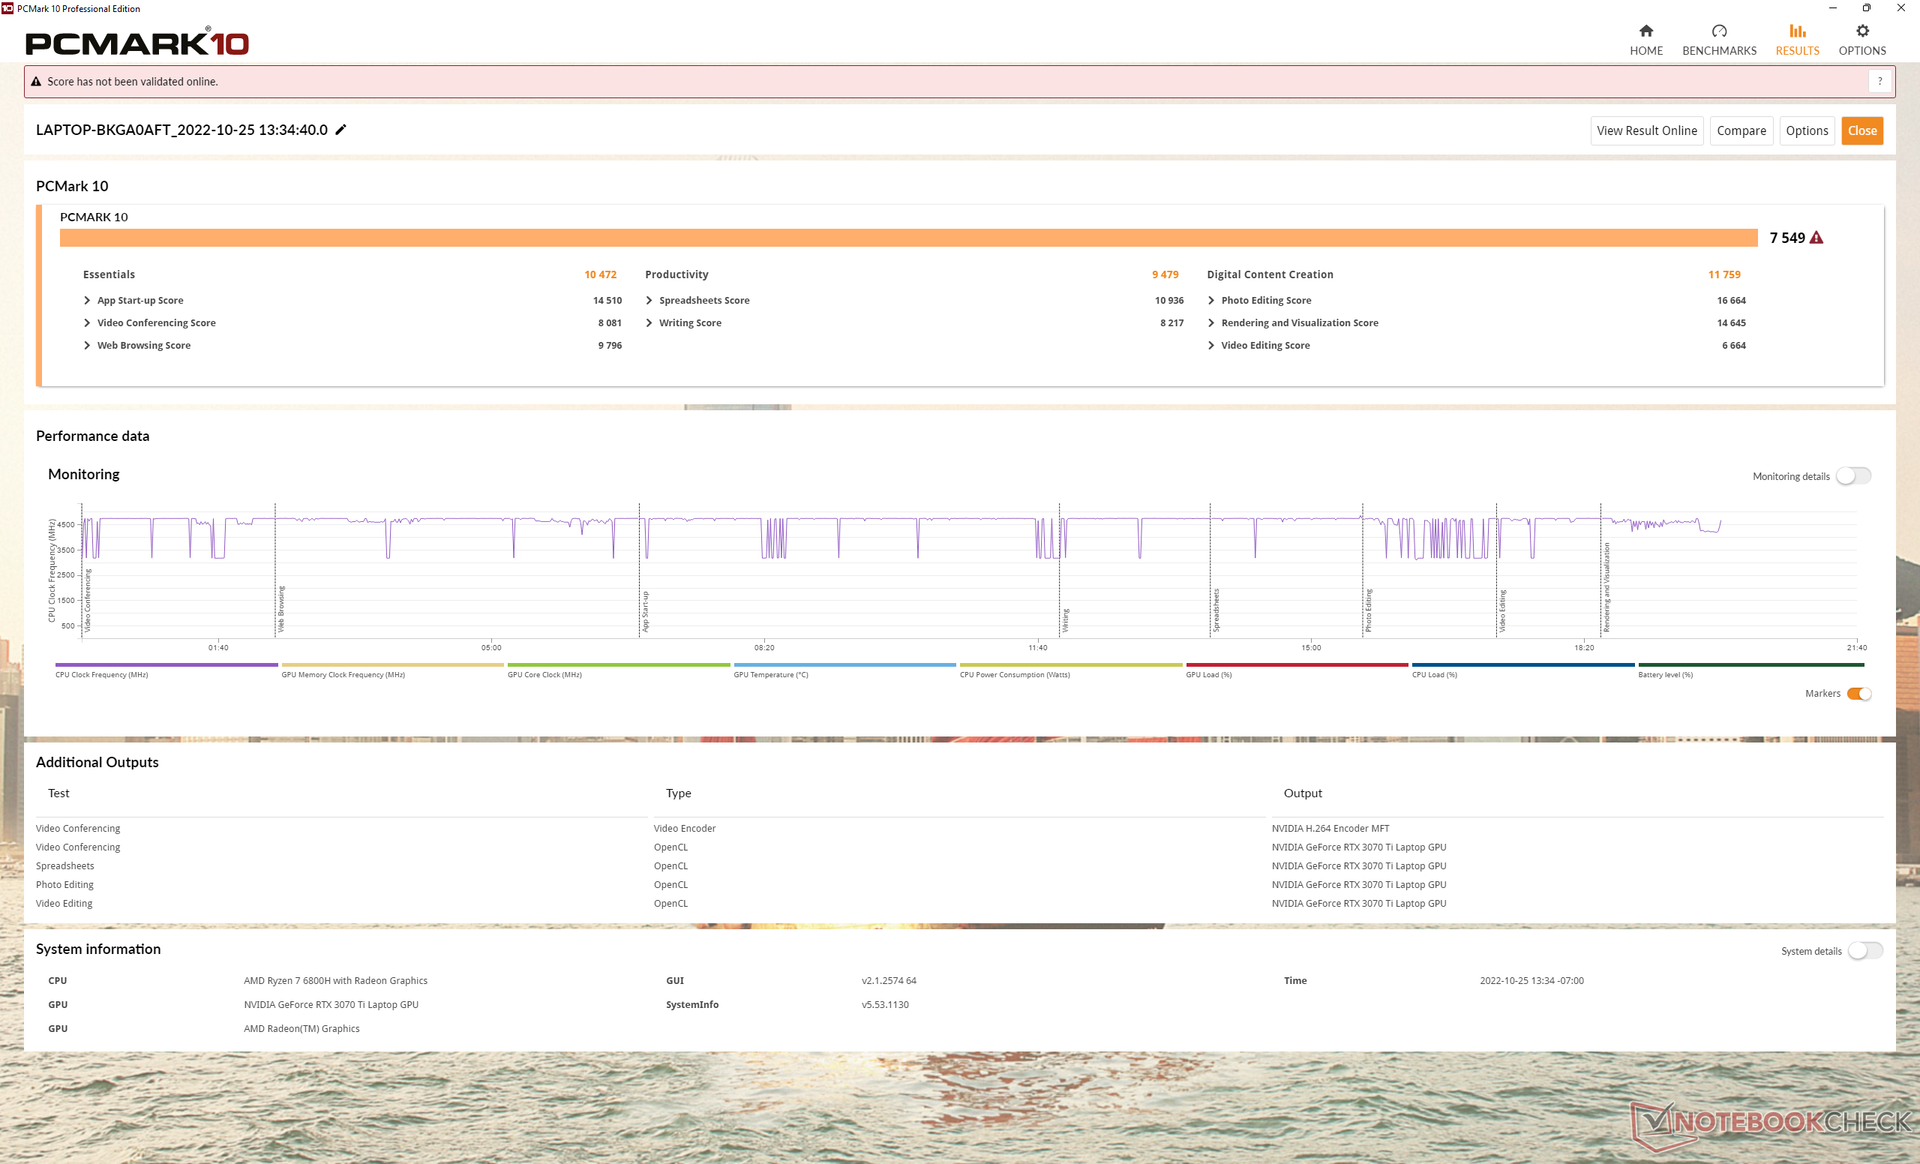
Os resultados da PCMark estão dentro dos pontos percentuais de um dígito de outros laptops de jogos de alta qualidade baseados em Intel como oDell G16 7620 mesmo que o Ryzen 7 6800H não consiga acompanhar as últimas CPUs Core do 12º gênero.
CrossMark: Overall | Productivity | Creativity | Responsiveness
| PCMark 10 / Score | |
| Lenovo Legion 5 Pro 16ARH7H RTX 3070 Ti | |
| Lenovo Legion 5 Pro 16IAH7H | |
| Lenovo Legion 7 16ARHA7 | |
| Dell G16 7620 | |
| Média AMD Ryzen 7 6800H, NVIDIA GeForce RTX 3070 Ti Laptop GPU (6783 - 7549, n=2) | |
| Asus ROG Zephyrus M16 GU603H | |
| HP Victus 16-e0145ng | |
| PCMark 10 / Essentials | |
| Lenovo Legion 5 Pro 16IAH7H | |
| Asus ROG Zephyrus M16 GU603H | |
| Lenovo Legion 7 16ARHA7 | |
| Lenovo Legion 5 Pro 16ARH7H RTX 3070 Ti | |
| Média AMD Ryzen 7 6800H, NVIDIA GeForce RTX 3070 Ti Laptop GPU (10343 - 10472, n=2) | |
| Dell G16 7620 | |
| HP Victus 16-e0145ng | |
| PCMark 10 / Productivity | |
| Lenovo Legion 5 Pro 16ARH7H RTX 3070 Ti | |
| Lenovo Legion 5 Pro 16IAH7H | |
| Média AMD Ryzen 7 6800H, NVIDIA GeForce RTX 3070 Ti Laptop GPU (8991 - 9479, n=2) | |
| Asus ROG Zephyrus M16 GU603H | |
| Lenovo Legion 7 16ARHA7 | |
| Dell G16 7620 | |
| HP Victus 16-e0145ng | |
| PCMark 10 / Digital Content Creation | |
| Lenovo Legion 5 Pro 16ARH7H RTX 3070 Ti | |
| Lenovo Legion 7 16ARHA7 | |
| Lenovo Legion 5 Pro 16IAH7H | |
| Dell G16 7620 | |
| Média AMD Ryzen 7 6800H, NVIDIA GeForce RTX 3070 Ti Laptop GPU (9108 - 11759, n=2) | |
| Asus ROG Zephyrus M16 GU603H | |
| HP Victus 16-e0145ng | |
| CrossMark / Overall | |
| Dell G16 7620 | |
| Lenovo Legion 5 Pro 16IAH7H | |
| Lenovo Legion 5 Pro 16ARH7H RTX 3070 Ti | |
| Lenovo Legion 7 16ARHA7 | |
| Média AMD Ryzen 7 6800H, NVIDIA GeForce RTX 3070 Ti Laptop GPU (1522 - 1643, n=2) | |
| CrossMark / Productivity | |
| Lenovo Legion 5 Pro 16IAH7H | |
| Dell G16 7620 | |
| Lenovo Legion 5 Pro 16ARH7H RTX 3070 Ti | |
| Média AMD Ryzen 7 6800H, NVIDIA GeForce RTX 3070 Ti Laptop GPU (1530 - 1600, n=2) | |
| Lenovo Legion 7 16ARHA7 | |
| CrossMark / Creativity | |
| Dell G16 7620 | |
| Lenovo Legion 5 Pro 16IAH7H | |
| Lenovo Legion 7 16ARHA7 | |
| Lenovo Legion 5 Pro 16ARH7H RTX 3070 Ti | |
| Média AMD Ryzen 7 6800H, NVIDIA GeForce RTX 3070 Ti Laptop GPU (1589 - 1746, n=2) | |
| CrossMark / Responsiveness | |
| Lenovo Legion 5 Pro 16IAH7H | |
| Dell G16 7620 | |
| Lenovo Legion 5 Pro 16ARH7H RTX 3070 Ti | |
| Média AMD Ryzen 7 6800H, NVIDIA GeForce RTX 3070 Ti Laptop GPU (1316 - 1481, n=2) | |
| Lenovo Legion 7 16ARHA7 | |
| PCMark 10 Score | 7549 pontos | |
Ajuda | ||
| AIDA64 / Memory Copy | |
| Lenovo Legion 5 Pro 16IAH7H | |
| Lenovo Legion 5 Pro 16IAH7H | |
| Dell G16 7620 | |
| Lenovo Legion 5 Pro 16ARH7H RTX 3070 Ti | |
| Lenovo Legion 7 16ARHA7 | |
| Média AMD Ryzen 7 6800H (48209 - 51186, n=8) | |
| HP Victus 16-e0145ng | |
| AIDA64 / Memory Read | |
| Dell G16 7620 | |
| Lenovo Legion 5 Pro 16IAH7H | |
| Lenovo Legion 5 Pro 16IAH7H | |
| Lenovo Legion 7 16ARHA7 | |
| Lenovo Legion 5 Pro 16ARH7H RTX 3070 Ti | |
| Média AMD Ryzen 7 6800H (43828 - 51778, n=8) | |
| HP Victus 16-e0145ng | |
| AIDA64 / Memory Write | |
| Lenovo Legion 5 Pro 16IAH7H | |
| Lenovo Legion 5 Pro 16IAH7H | |
| Dell G16 7620 | |
| Lenovo Legion 5 Pro 16ARH7H RTX 3070 Ti | |
| Lenovo Legion 7 16ARHA7 | |
| Média AMD Ryzen 7 6800H (51116 - 55307, n=8) | |
| HP Victus 16-e0145ng | |
| AIDA64 / Memory Latency | |
| Lenovo Legion 5 Pro 16IAH7H | |
| Lenovo Legion 5 Pro 16IAH7H | |
| Dell G16 7620 | |
| Média AMD Ryzen 7 6800H (83.1 - 104.1, n=8) | |
| Lenovo Legion 5 Pro 16ARH7H RTX 3070 Ti | |
| Lenovo Legion 7 16ARHA7 | |
| HP Victus 16-e0145ng | |
| Asus ROG Zephyrus M16 GU603H | |
* ... menor é melhor
Latência do DPC
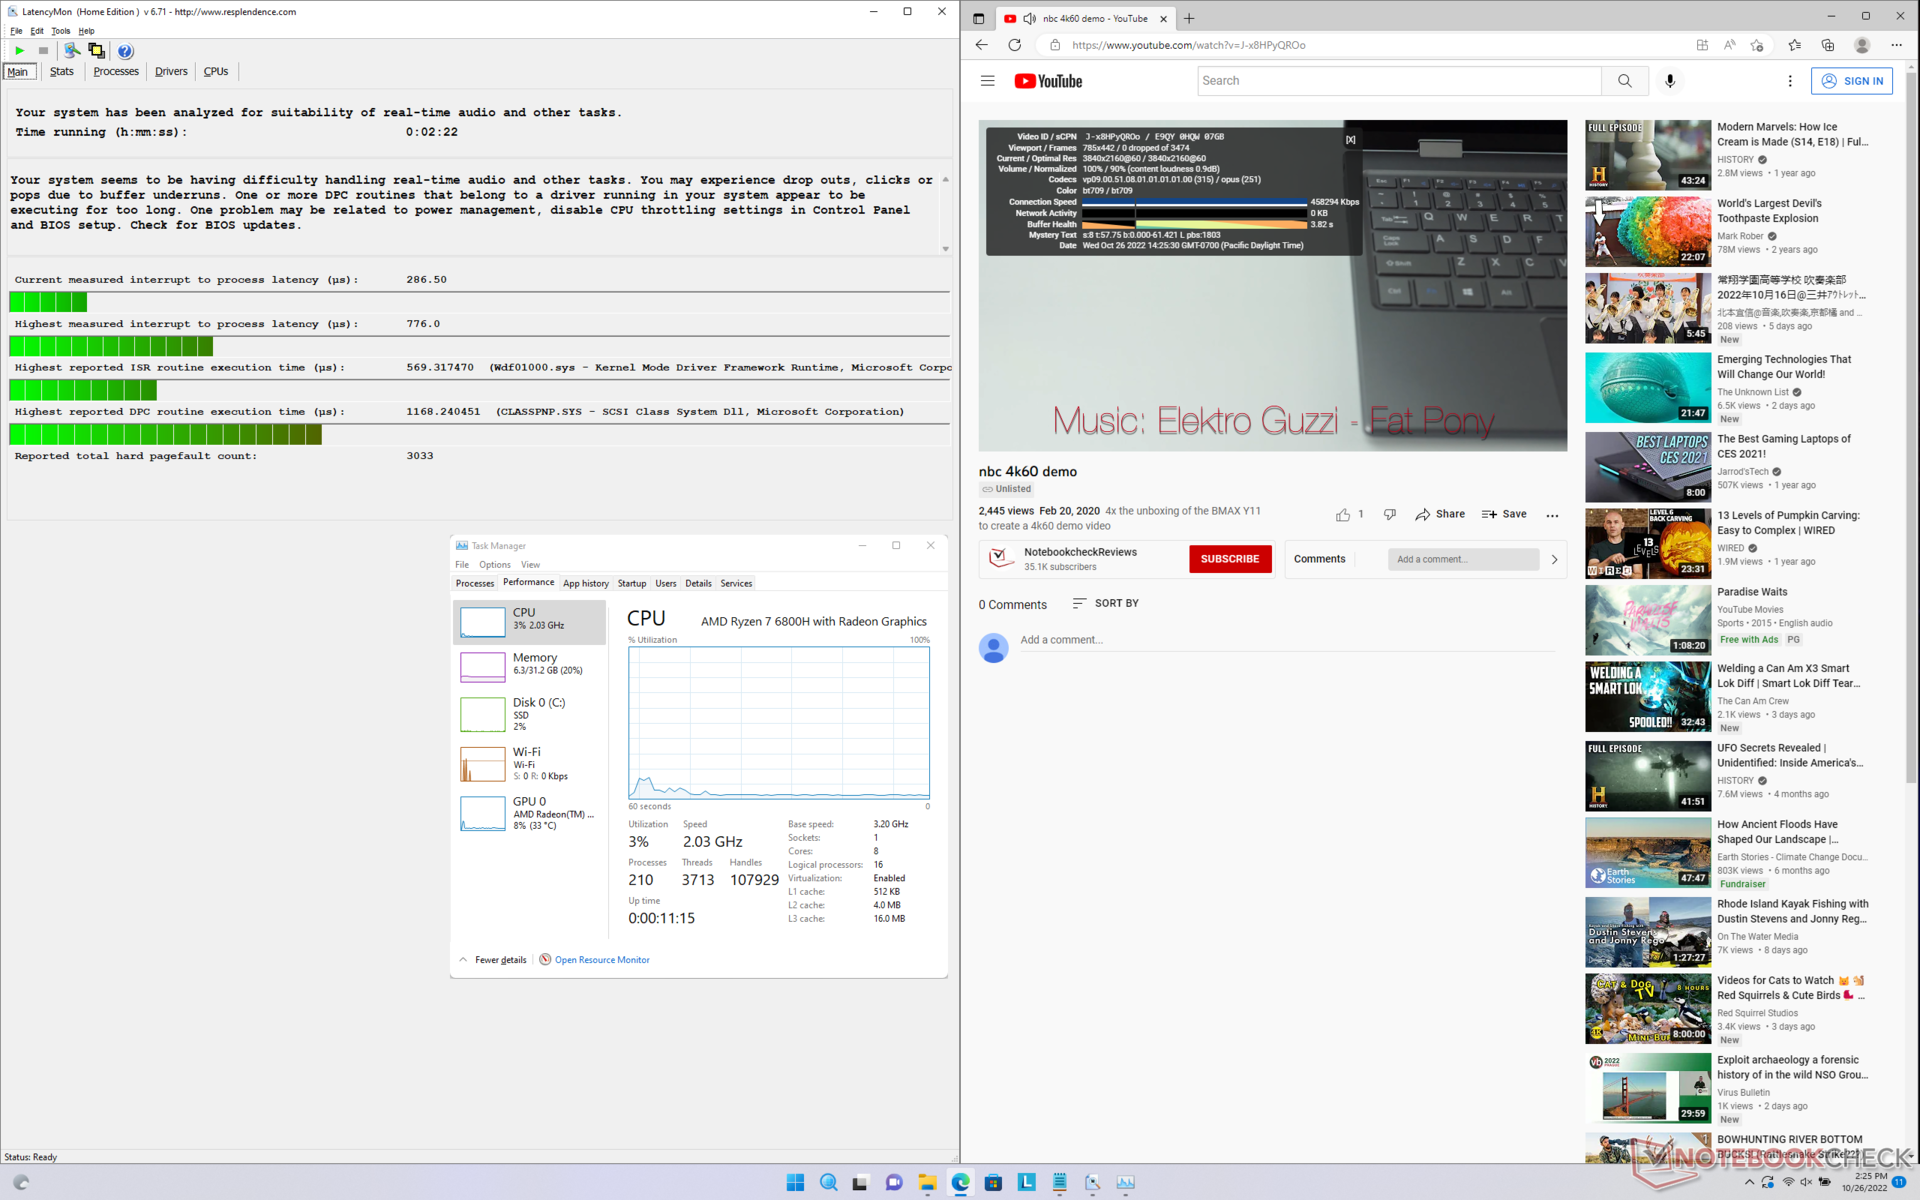
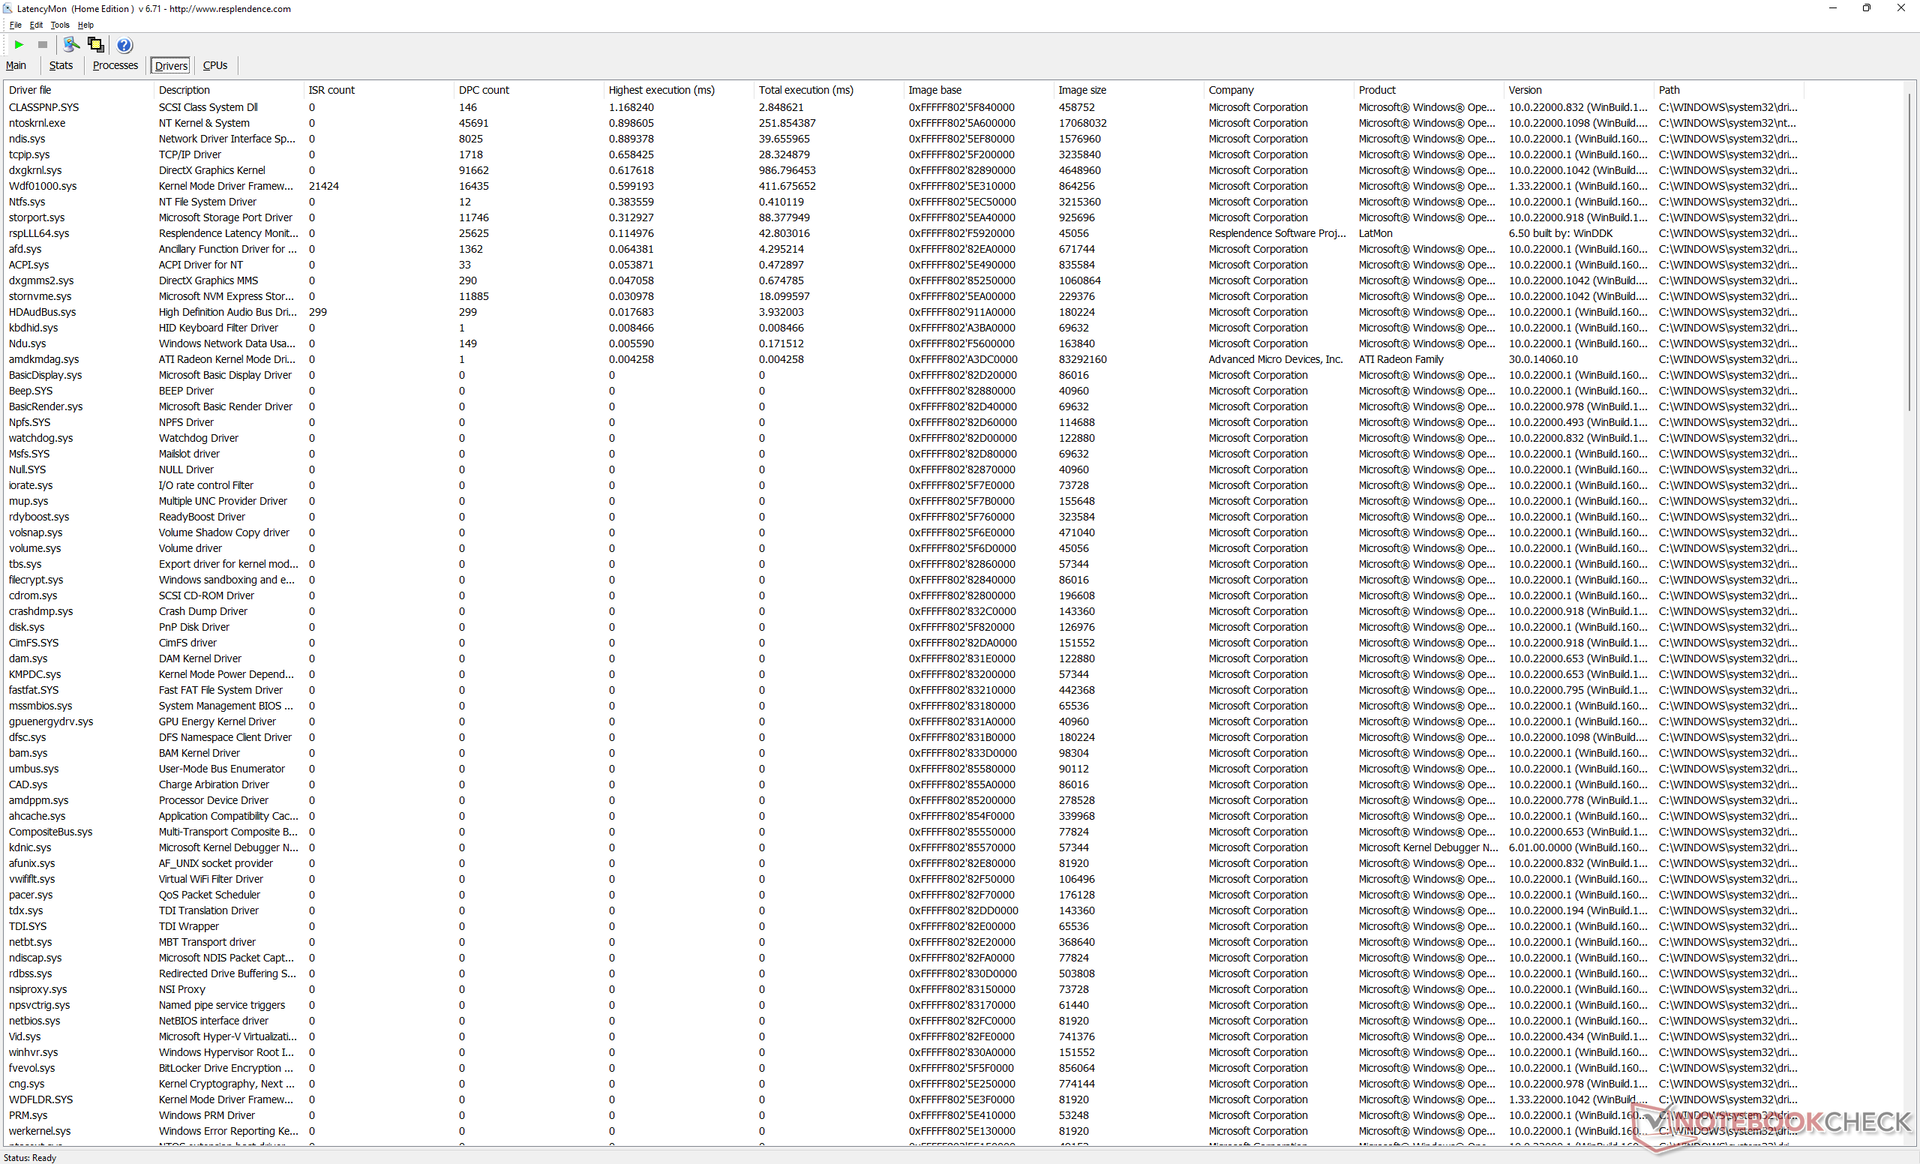
LatencyMon revela pequenos problemas de DPC ao abrir várias abas do navegador em nossa página inicial. a reprodução de vídeo de 4K a 60 FPS é perfeita e sem queda de quadros.
| DPC Latencies / LatencyMon - interrupt to process latency (max), Web, Youtube, Prime95 | |
| Lenovo Legion 7 16ARHA7 | |
| Asus ROG Zephyrus M16 GU603H | |
| Dell G16 7620 | |
| HP Victus 16-e0145ng | |
| Lenovo Legion 5 Pro 16ARH7H RTX 3070 Ti | |
| Lenovo Legion 5 Pro 16IAH7H | |
* ... menor é melhor
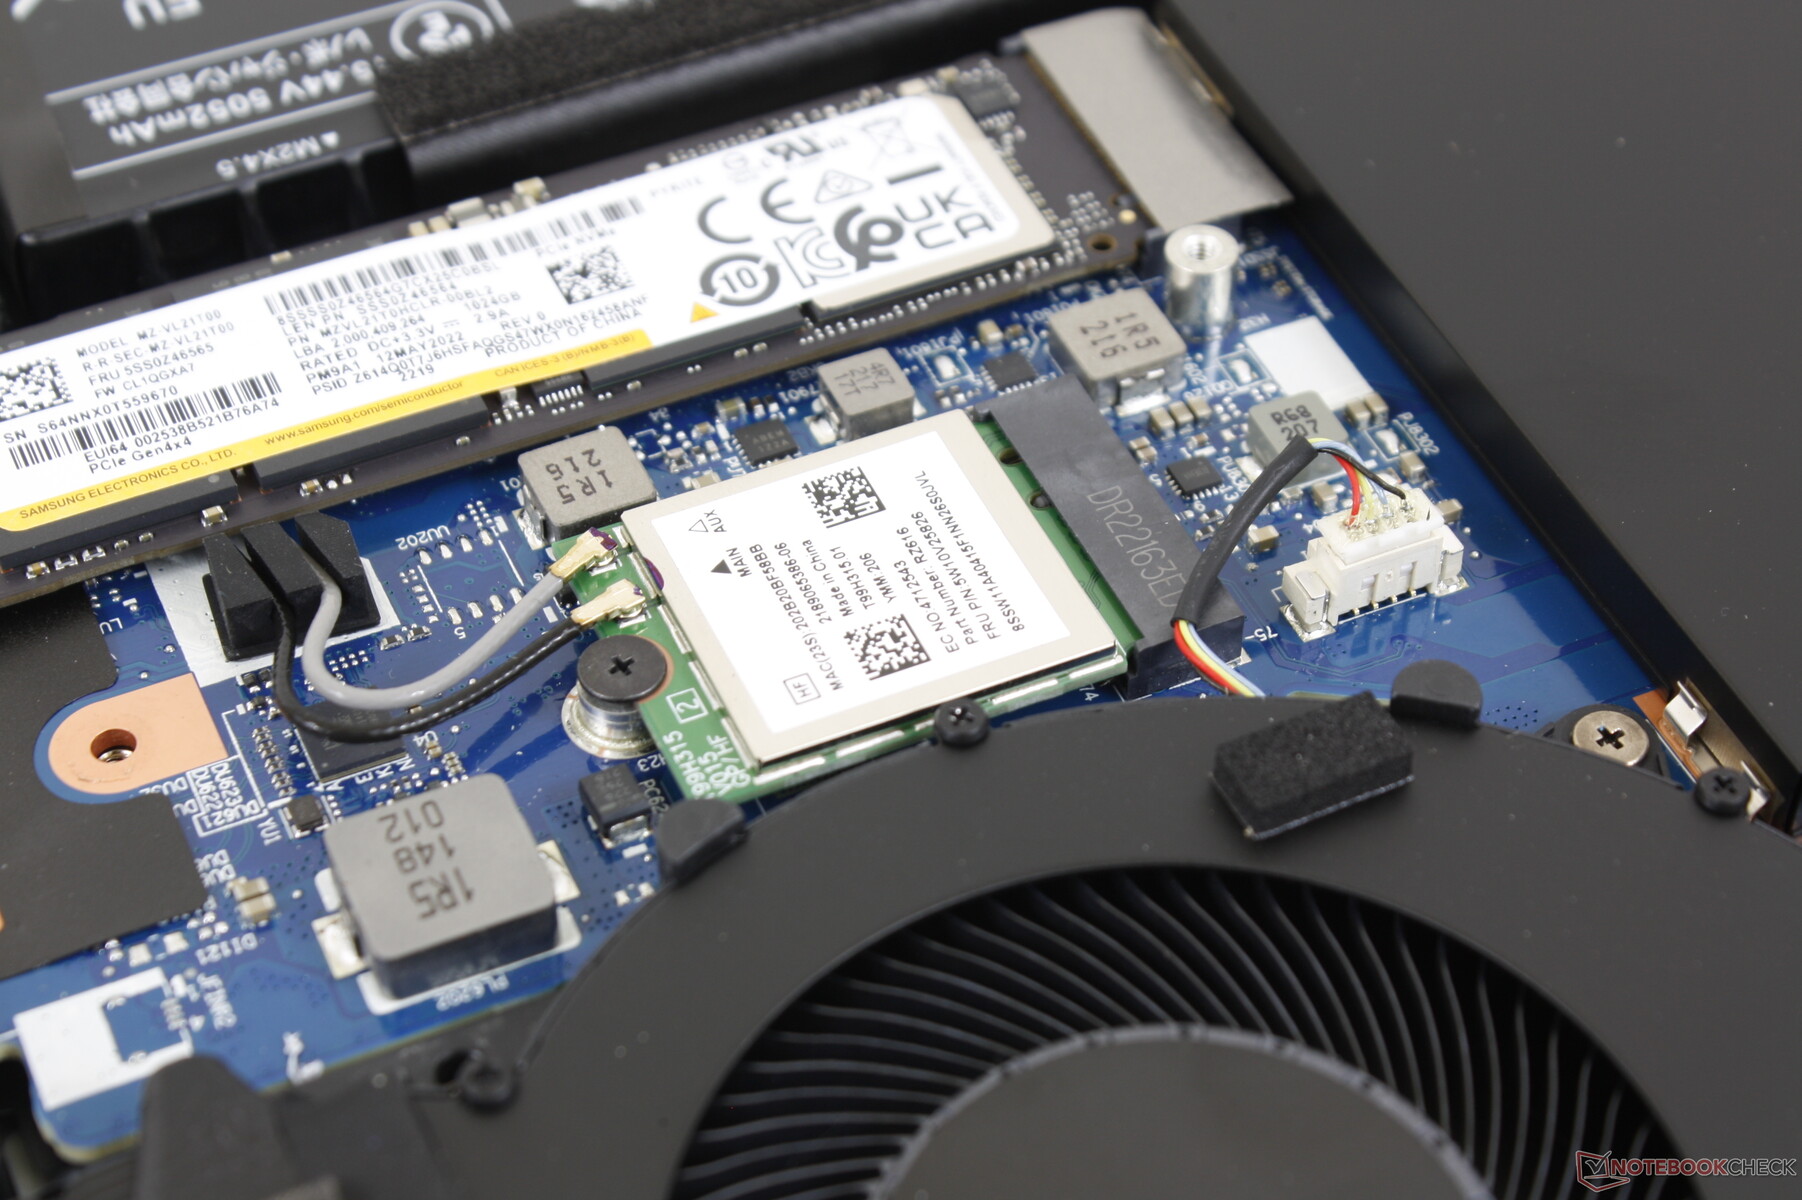
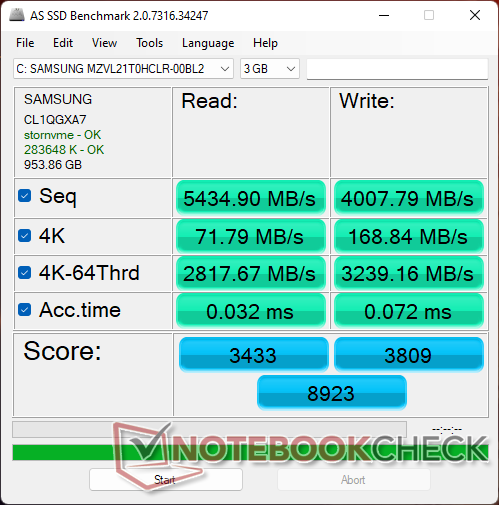
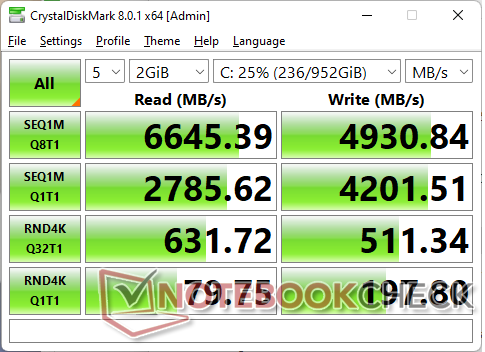
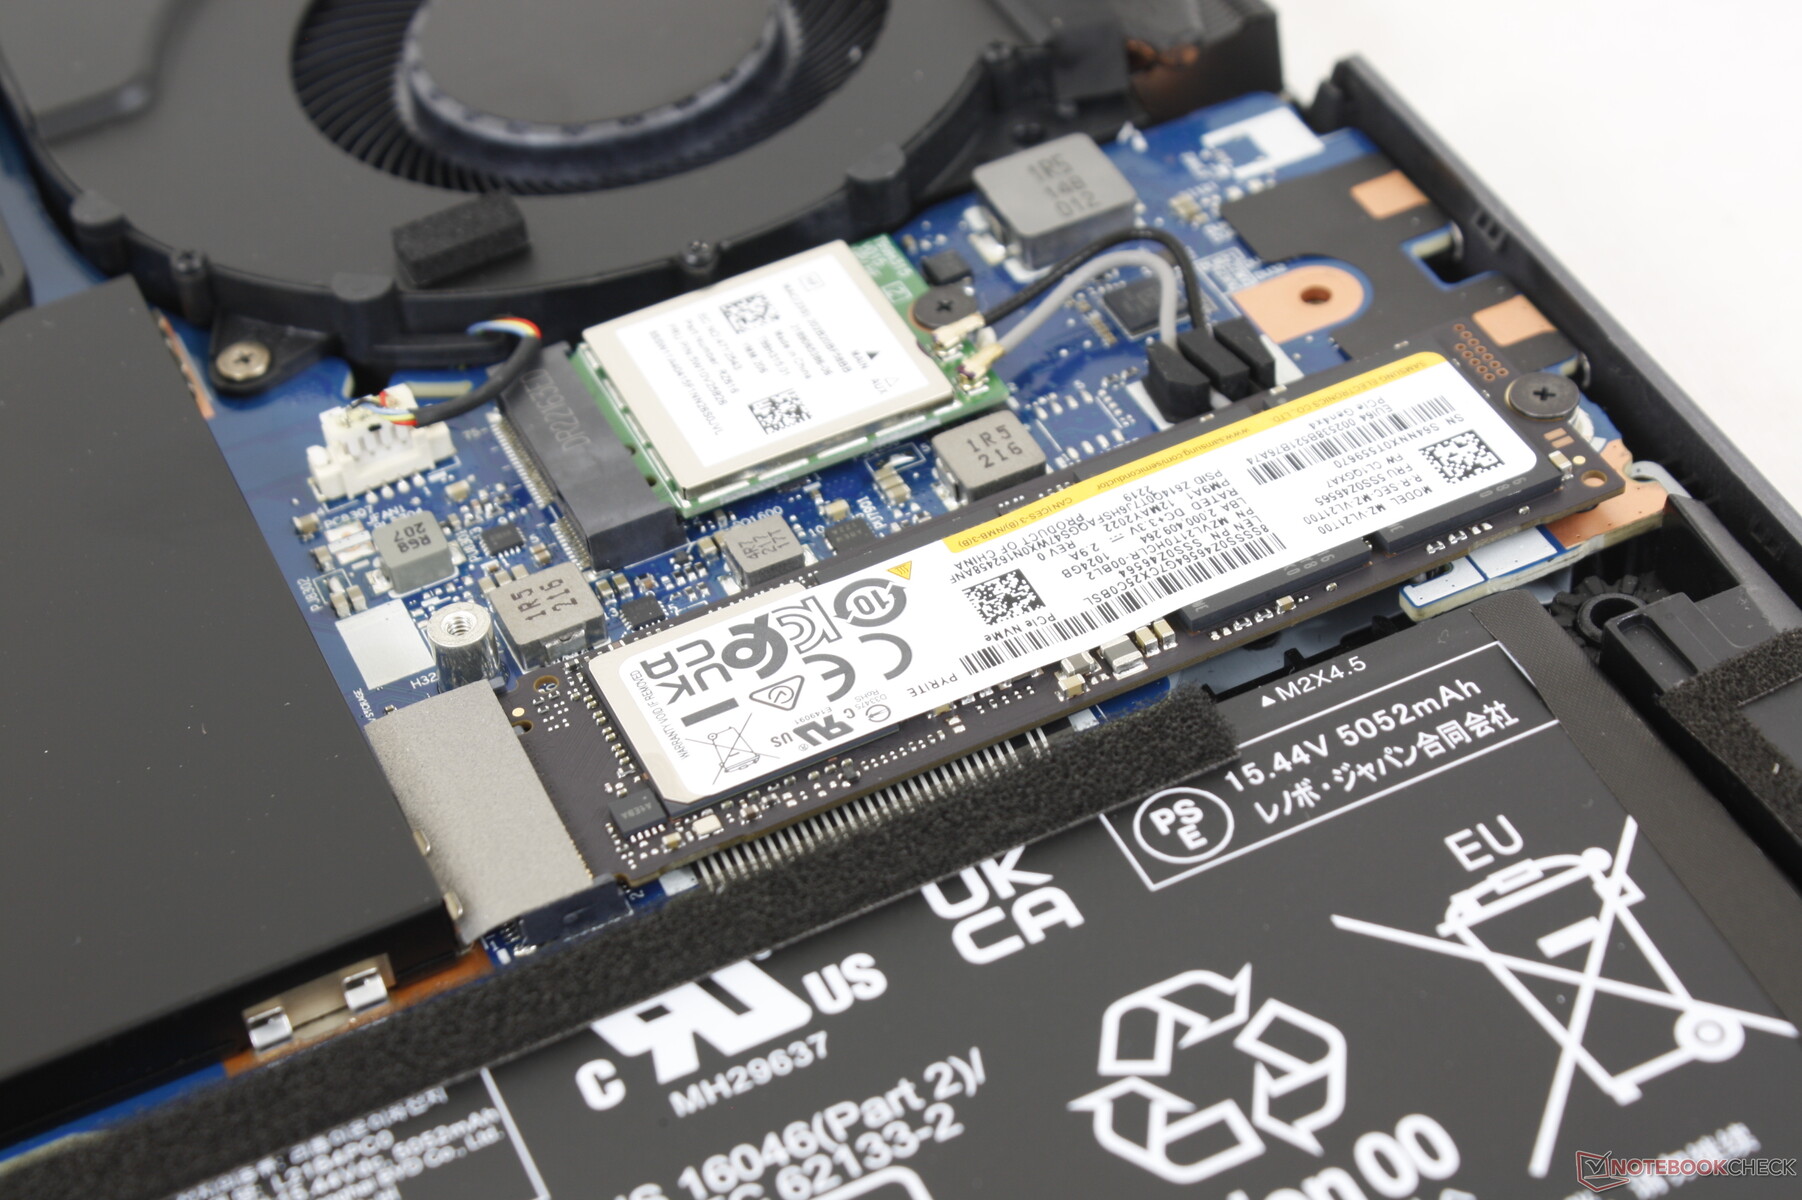
Dispositivos de armazenamento - Até duas SSDs PCIe4 NVMe

| Drive Performance rating - Percent | |
| Lenovo Legion 5 Pro 16IAH7H | |
| Lenovo Legion 5 Pro 16ARH7H RTX 3070 Ti | |
| Asus ROG Zephyrus M16 GU603H | |
| Dell G16 7620 | |
| Lenovo Legion 7 16ARHA7 | |
| HP Victus 16-e0145ng | |
* ... menor é melhor
Disk Throttling: DiskSpd Read Loop, Queue Depth 8
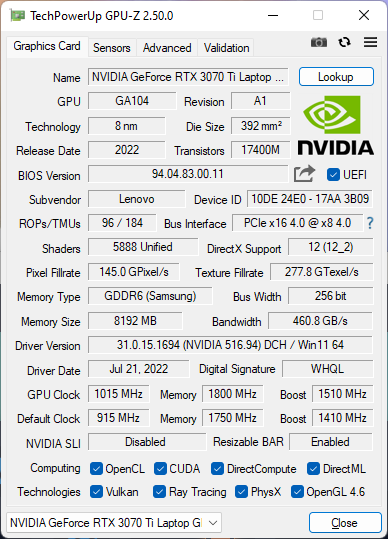
Desempenho da GPU - Gráficos de 150 W
O desempenho gráfico é excelente com resultados 3DMark que são quase 15% mais rápidos do que a média do laptop em nosso banco de dados com o mesmo GeForce RTX 3070 Ti GPU. Na verdade, ela até mesmo borda fora a RTX 3080 Ti no Alienware x15 R2.
O desempenho só cai em cerca de 5% se o modo Turbo for alternado. Assim, os usuários devem se lembrar de ativar o modo Turbo através do Lenovo Vantage se quiserem rodar o laptop em sua velocidade mais rápida.
Desgraduação para o nível inferior RTX 3070 ou RTX 3060 A SKU implicará um mergulho de desempenho de cerca de 10% e 30%, respectivamente, com base em nossa experiência com vários computadores portáteis RTX 3070 ou 3060.
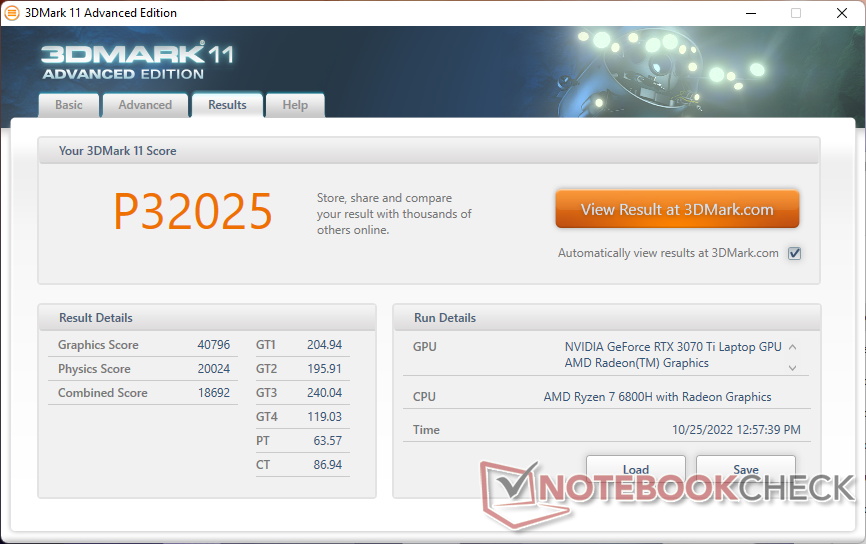
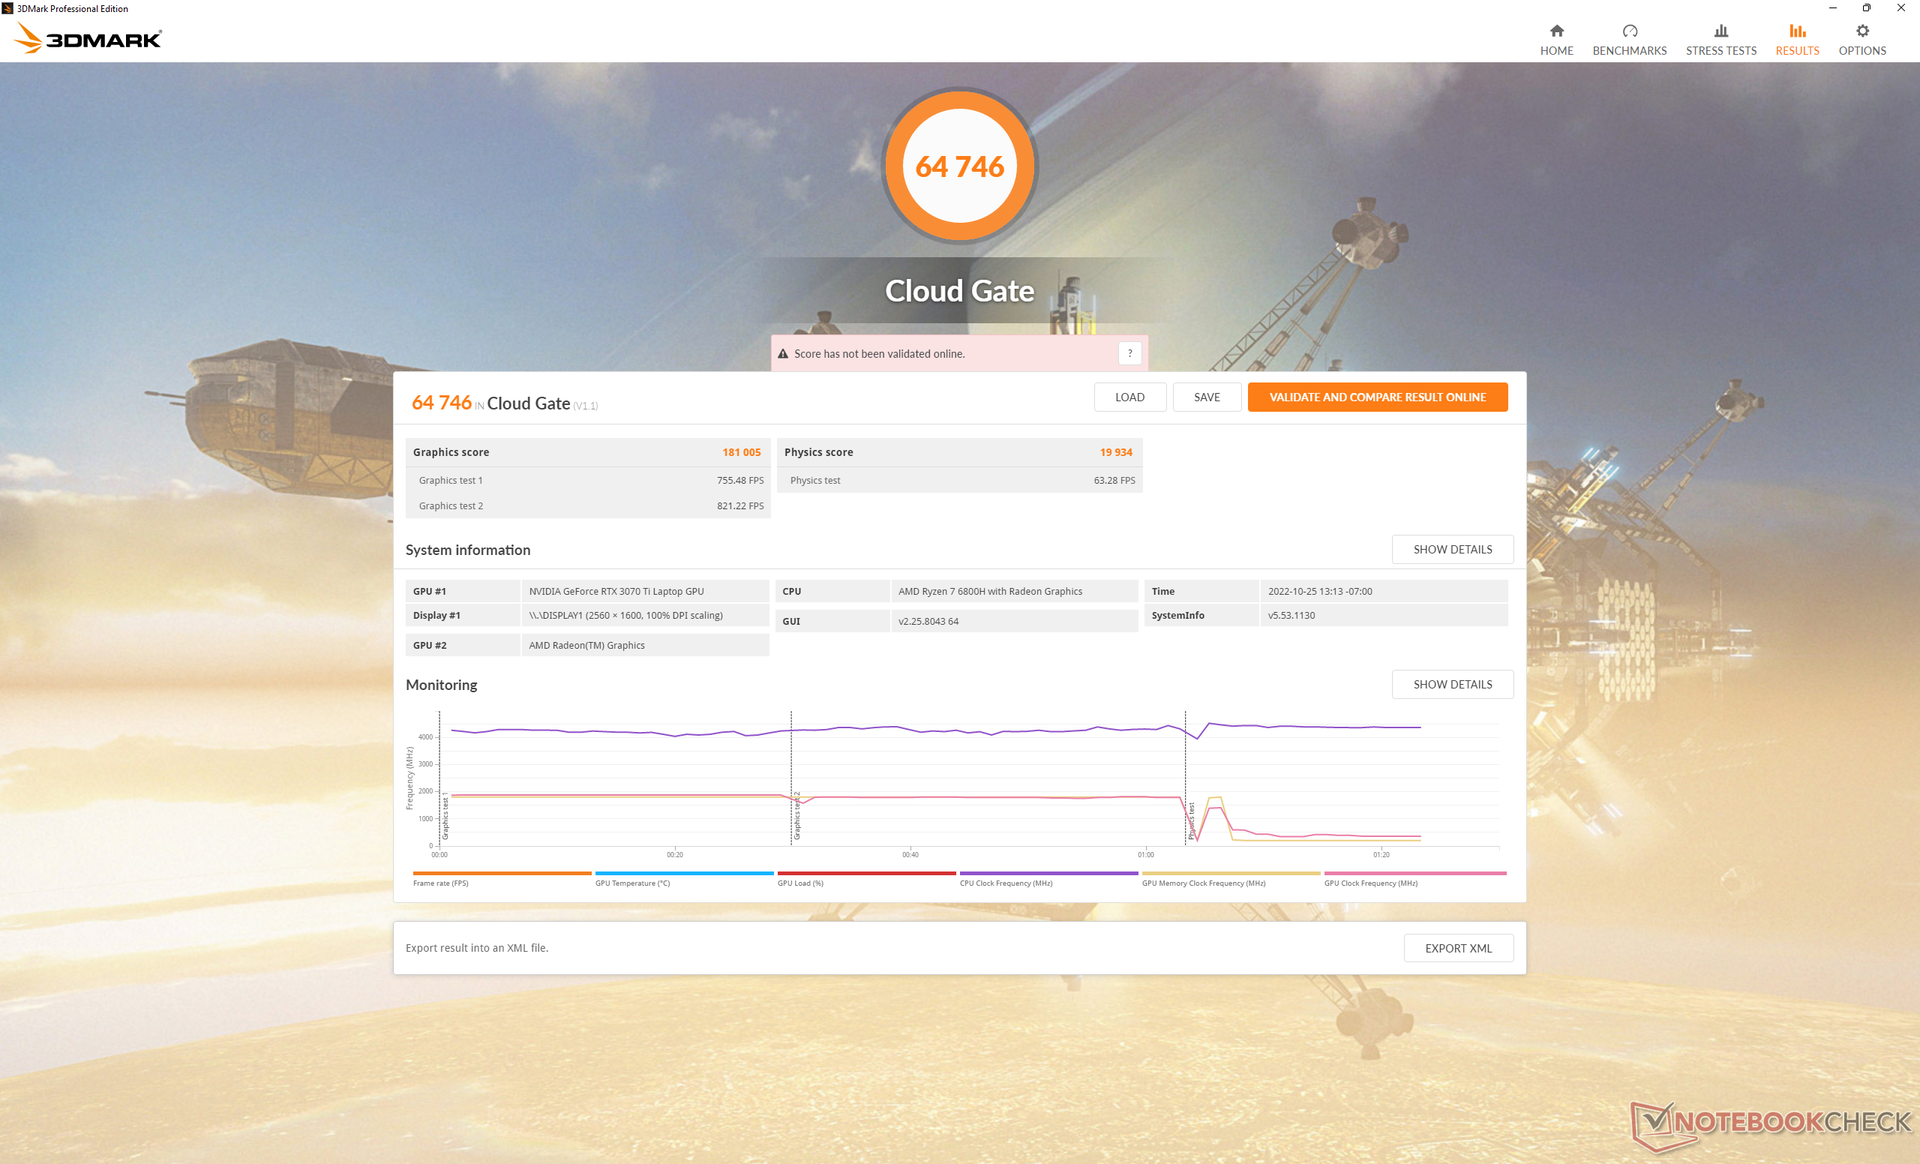
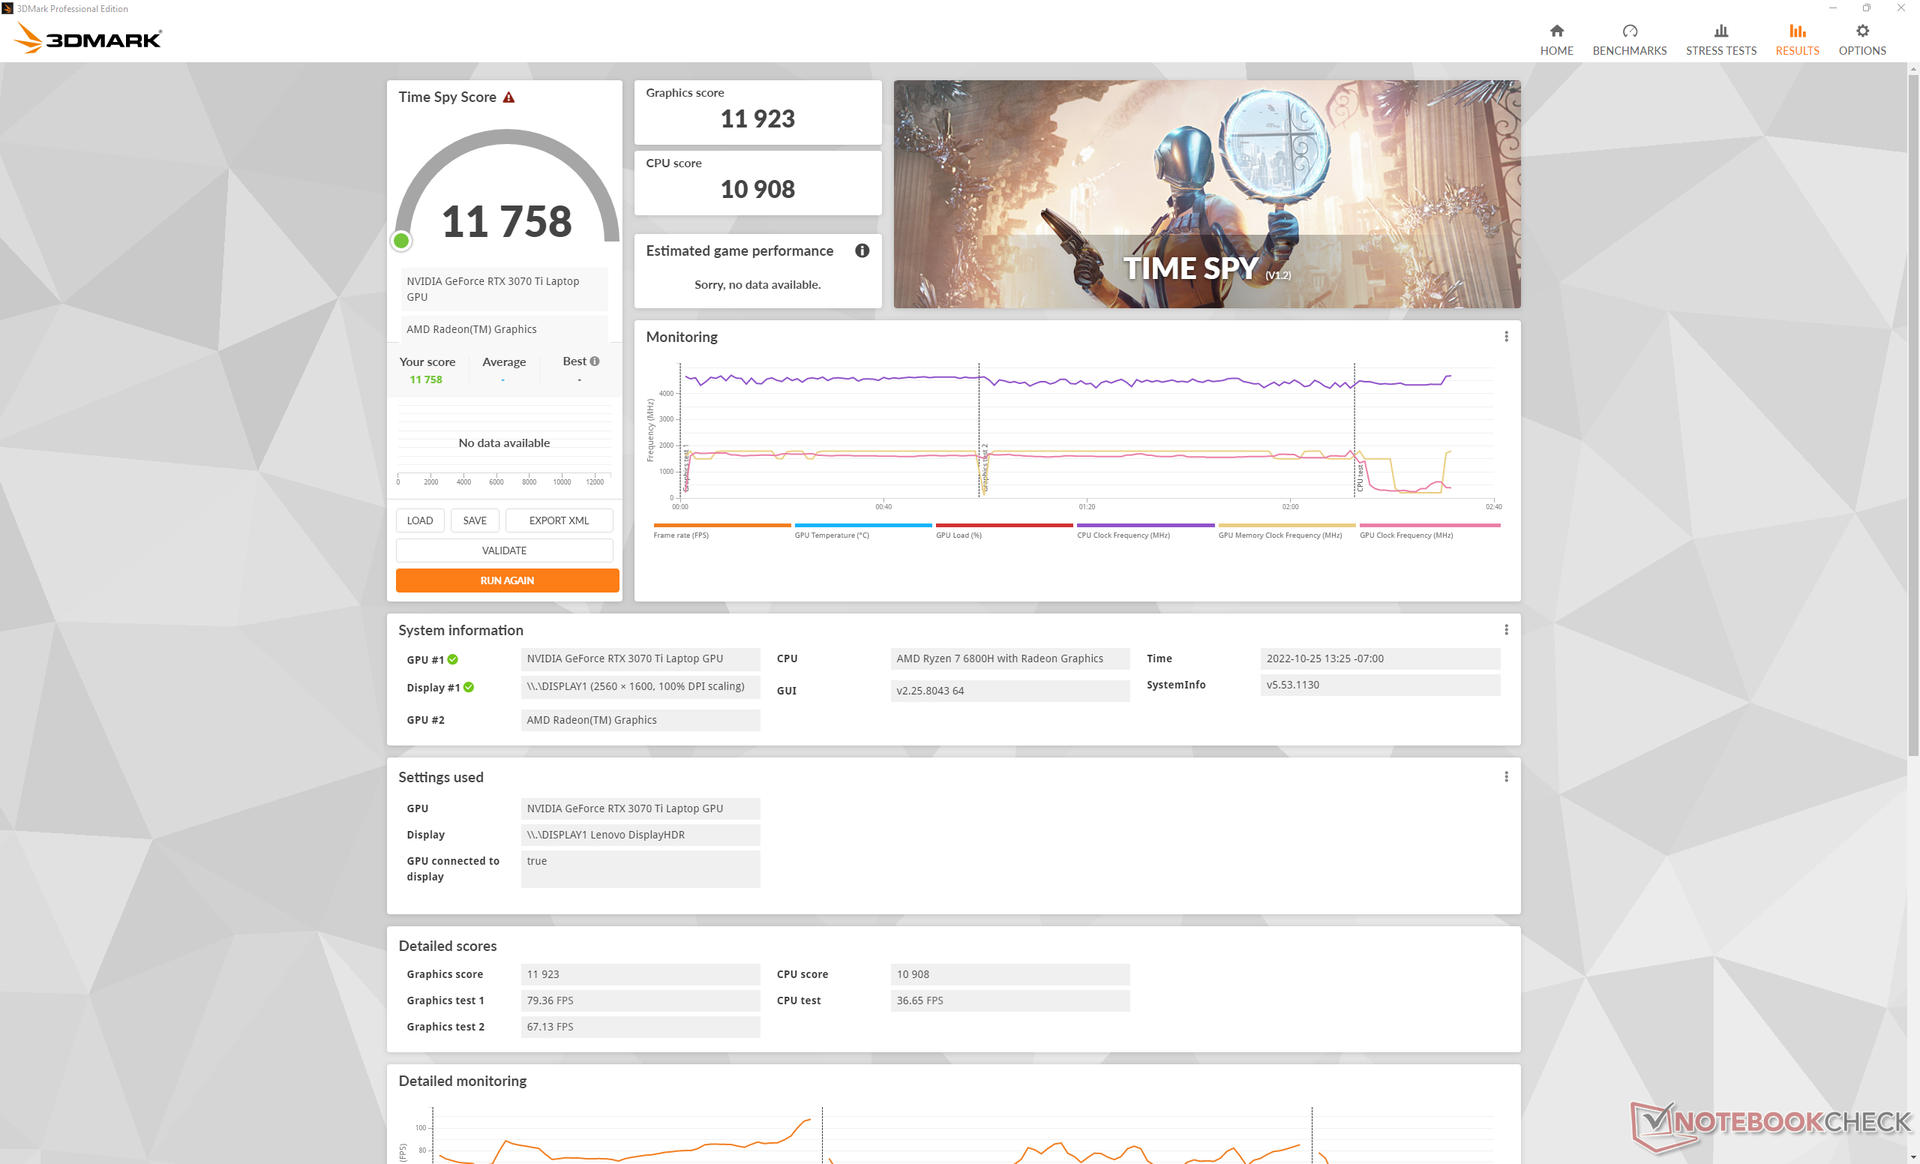
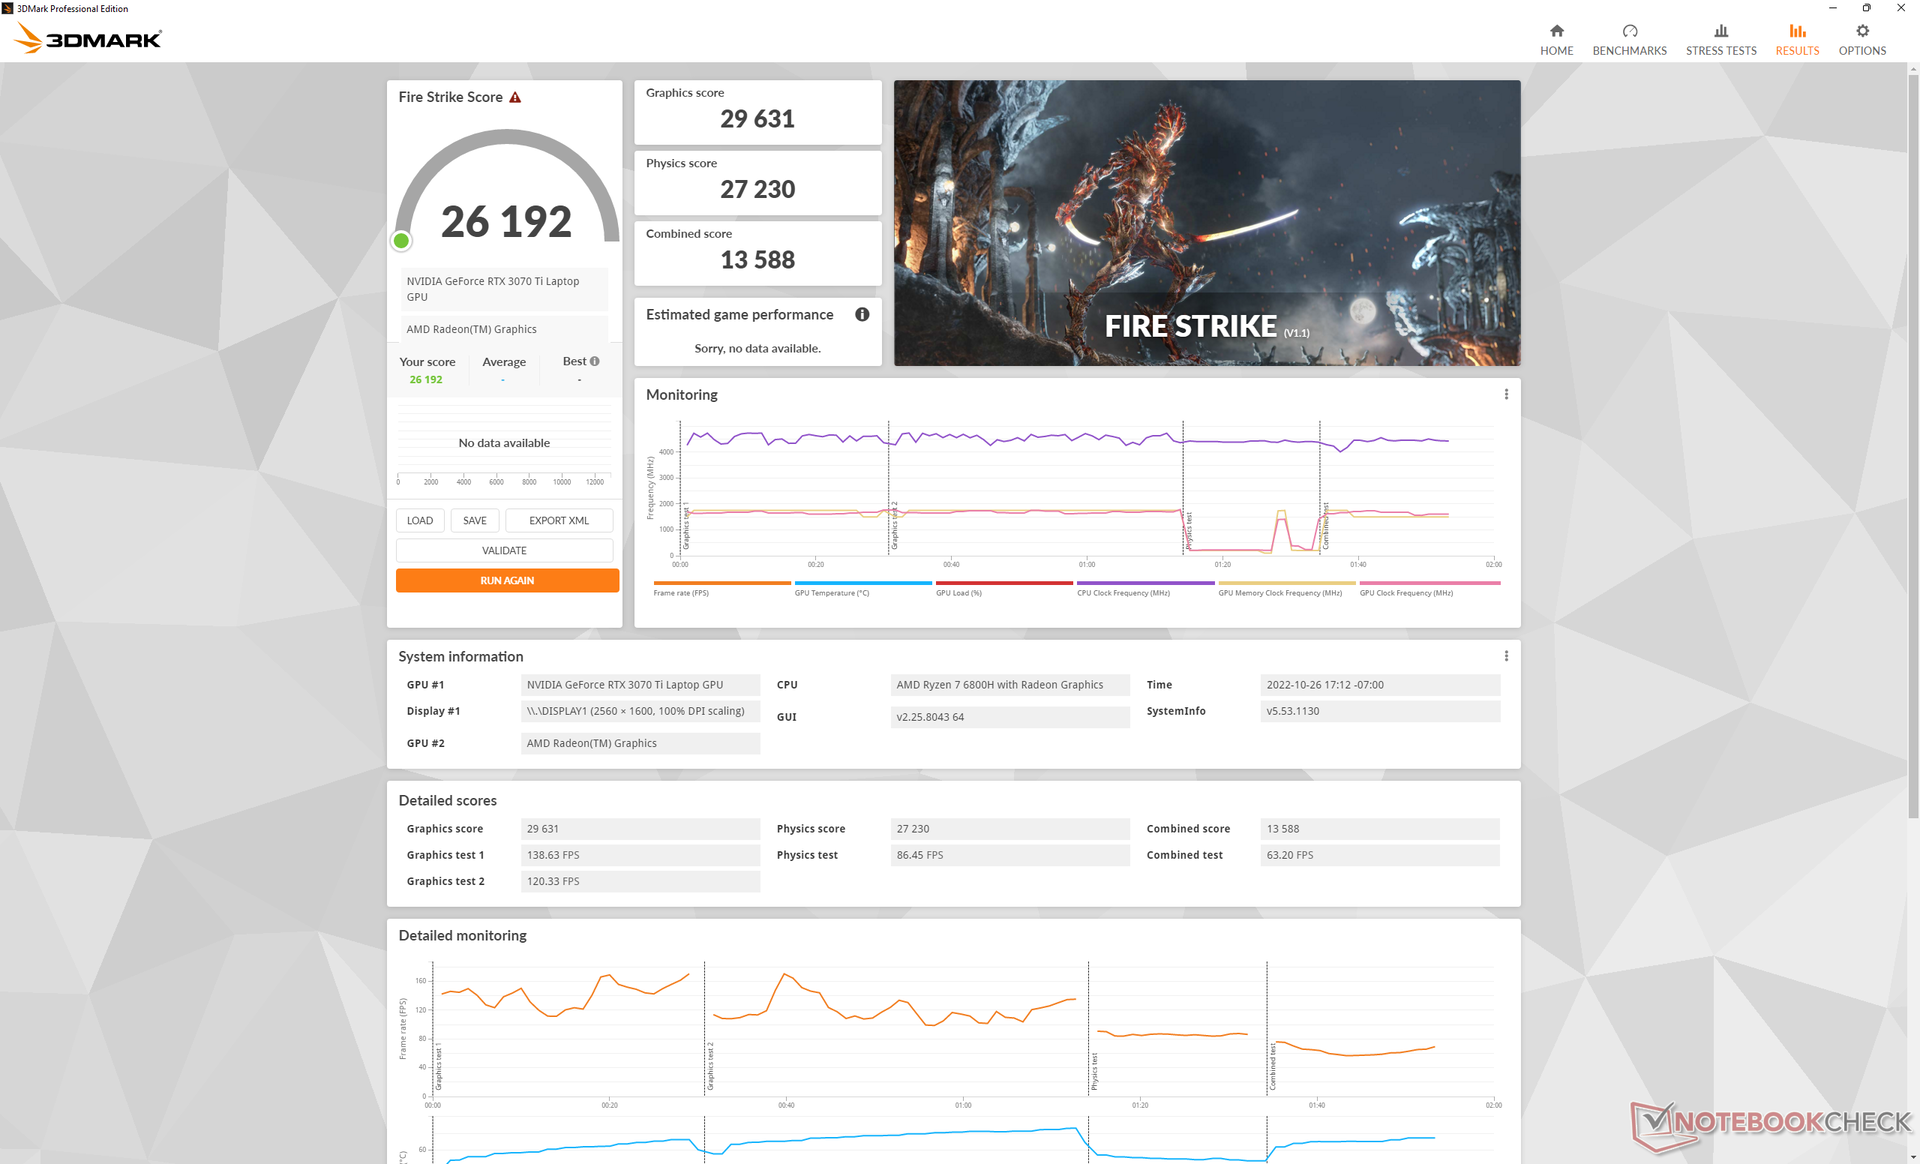
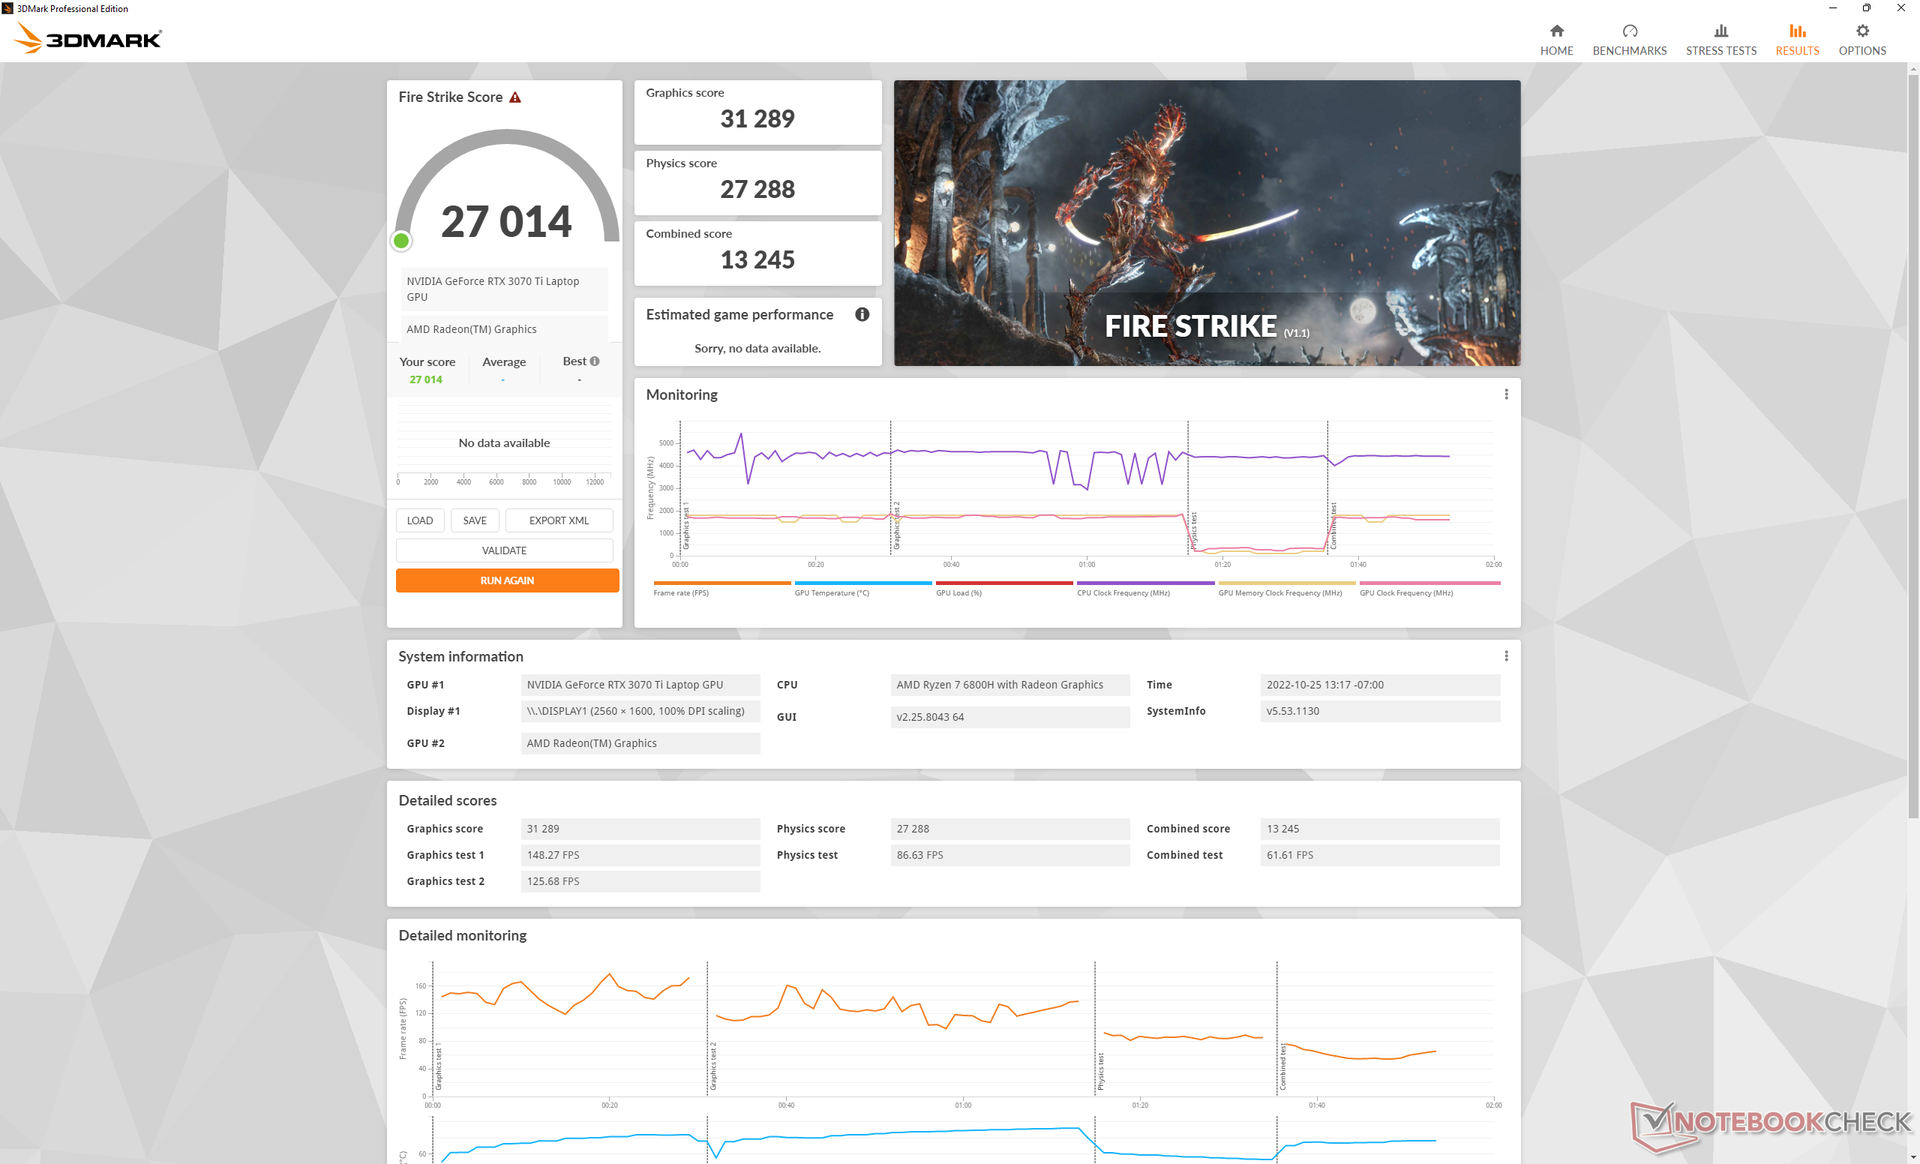
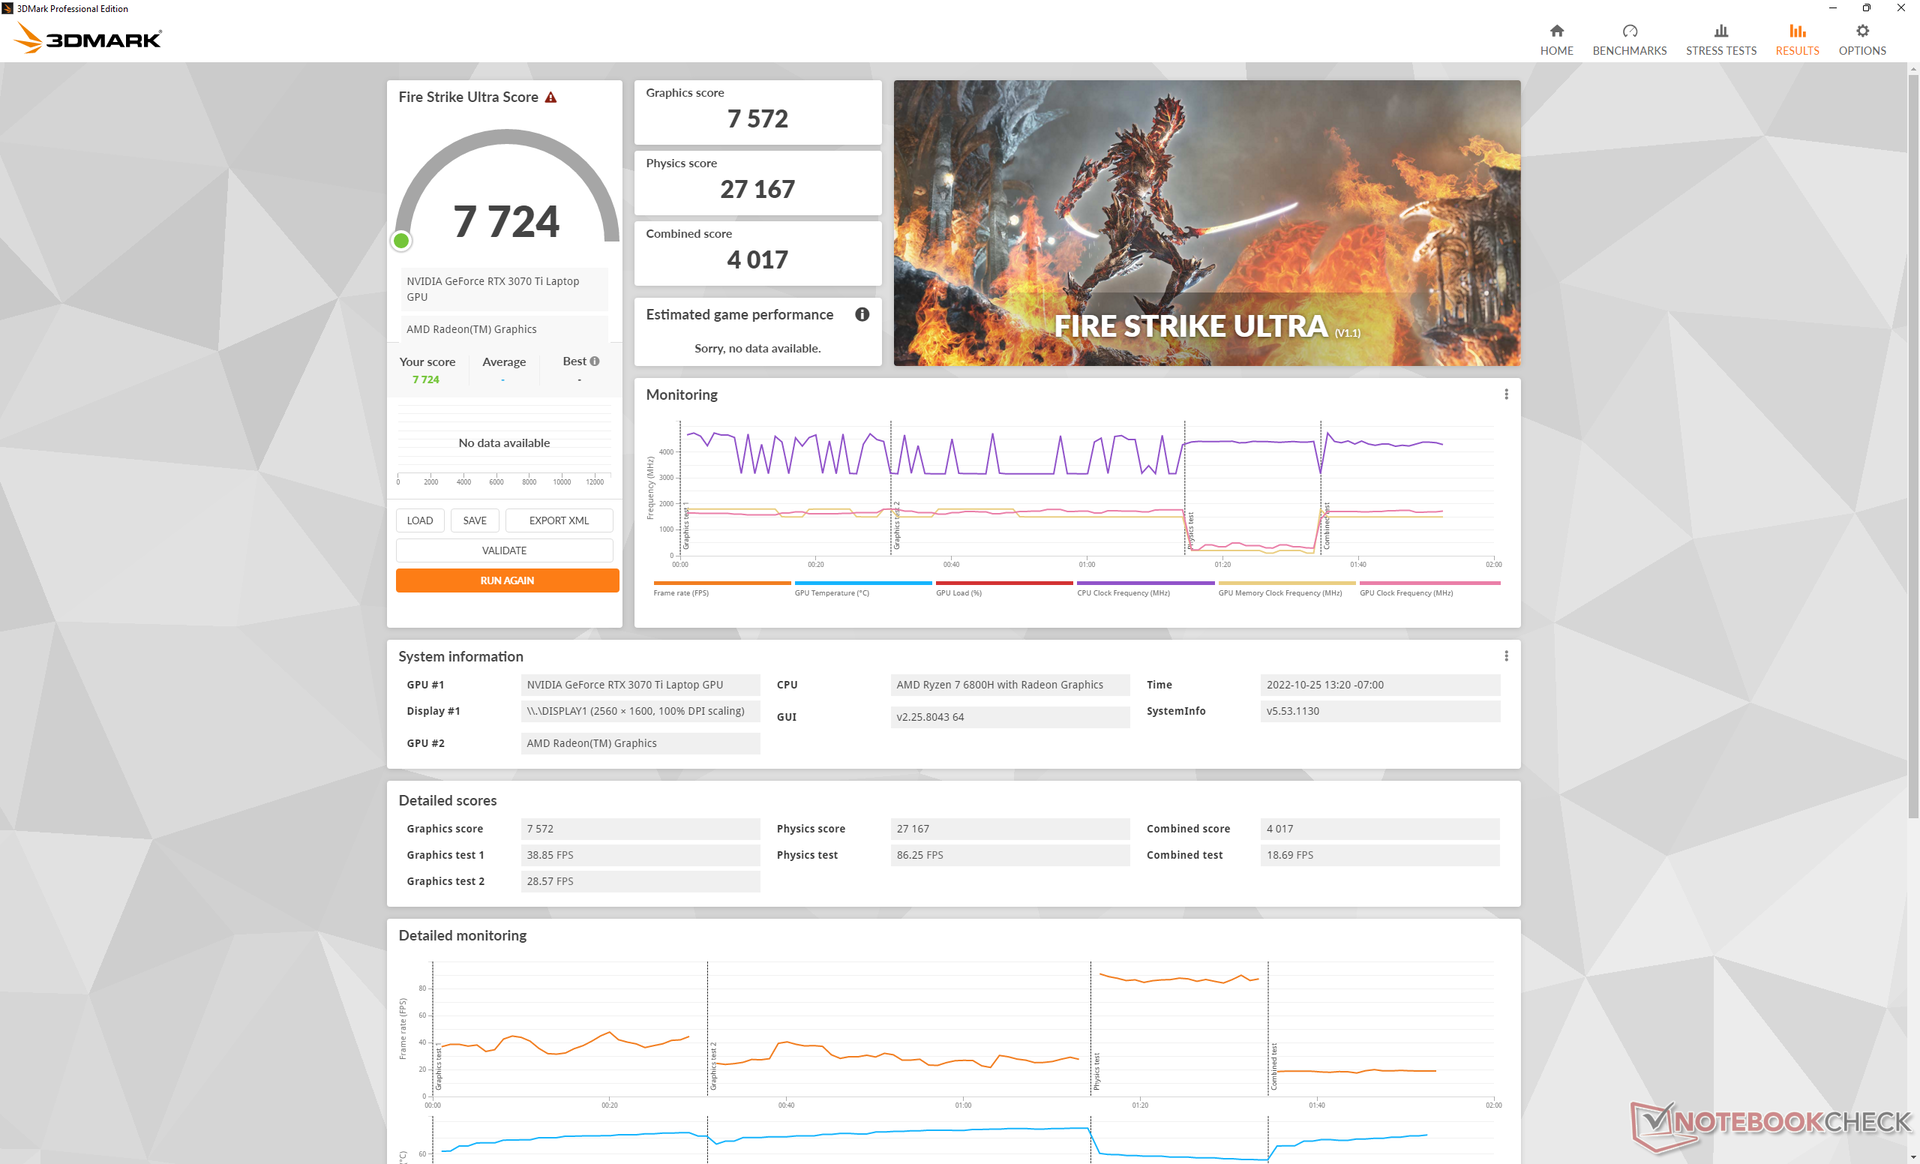
| 3DMark 11 Performance | 32025 pontos | |
| 3DMark Cloud Gate Standard Score | 64746 pontos | |
| 3DMark Fire Strike Score | 27014 pontos | |
| 3DMark Time Spy Score | 11758 pontos | |
Ajuda | ||
* ... menor é melhor
Witcher 3 FPS Chart
| baixo | média | alto | ultra | QHD | |
|---|---|---|---|---|---|
| GTA V (2015) | 181.5 | 176.5 | 167.6 | 104 | 98.8 |
| The Witcher 3 (2015) | 370.5 | 308.8 | 226 | 117 | |
| Dota 2 Reborn (2015) | 150.4 | 138 | 132.2 | 126.6 | |
| Final Fantasy XV Benchmark (2018) | 187.2 | 156 | 115.6 | 90.4 | |
| X-Plane 11.11 (2018) | 119.6 | 103.6 | 83.9 | ||
| Strange Brigade (2018) | 383 | 298 | 248 | 217 | 160.5 |
| Cyberpunk 2077 1.6 (2022) | 148.9 | 130.2 | 102.1 | 86 | 54.4 |
Emissões - Bastante barulhento
Ruído do sistema
O comportamento do ruído do ventilador está ligado à definição do perfil de potência. Quando no modo Power Saver com a GPU discreta desativada, por exemplo, o sistema permaneceria silencioso a 23,7 dB(A) contra um fundo silencioso de 23,5 dB(A). Infelizmente, a multitarefa leve ou a transmissão de vídeo são suficientes para aumentar o ruído para 32 dB(A) mais audível, muito parecido com o que observamos no modelo do ano passado
Os jogos induzem um ruído do ventilador de quase 55 dB(A), mesmo que o modo Turbo esteja desativado. Assim, você pode também ativar o modo Turbo quando estiver jogando, pois parece não fazer o sistema ficar mais alto ou mais silencioso. A faixa média de 50 dB(A) é mais alta do que a que gravamos no HP Victus 16 ou Dell G16 sob condições similares.
Barulho
| Ocioso |
| 23.7 / 31.1 / 32.2 dB |
| Carga |
| 38.4 / 54.8 dB |
 | ||
30 dB silencioso 40 dB(A) audível 50 dB(A) ruidosamente alto |
||
min: | ||
| Lenovo Legion 5 Pro 16ARH7H RTX 3070 Ti GeForce RTX 3070 Ti Laptop GPU, R7 6800H, Samsung PM9A1 MZVL21T0HCLR | Lenovo Legion 5 Pro 16IAH7H GeForce RTX 3060 Laptop GPU, i7-12700H, 2x Samsung PM9A1 MZVL21T0HCLR (RAID 0) | Asus ROG Zephyrus M16 GU603H GeForce RTX 3070 Laptop GPU, i9-11900H, Samsung PM9A1 MZVL22T0HBLB | Lenovo Legion 7 16ARHA7 Radeon RX 6850M XT, R9 6900HX, Samsung PM9A1 MZVL22T0HBLB | HP Victus 16-e0145ng GeForce RTX 3050 Ti Laptop GPU, R5 5600H, Samsung SSD PM981a MZVLB512HBJQ | Dell G16 7620 GeForce RTX 3060 Laptop GPU, i7-12700H, WDC PC SN810 512GB | |
|---|---|---|---|---|---|---|
| Noise | -8% | -9% | 13% | -2% | 6% | |
| desligado / ambiente * (dB) | 23.5 | 24.6 -5% | 25 -6% | 22.8 3% | 26 -11% | 23.2 1% |
| Idle Minimum * (dB) | 23.7 | 28.7 -21% | 25 -5% | 23 3% | 26 -10% | 28.3 -19% |
| Idle Average * (dB) | 31.1 | 32 -3% | 31 -0% | 23 26% | 28 10% | 28.8 7% |
| Idle Maximum * (dB) | 32.2 | 32 1% | 42 -30% | 23 29% | 34 -6% | 28.9 10% |
| Load Average * (dB) | 38.4 | 45.2 -18% | 48 -25% | 26.8 30% | 44 -15% | 32.4 16% |
| Witcher 3 ultra * (dB) | 54.8 | 52 5% | 54.3 1% | 48 12% | 48.3 12% | |
| Load Maximum * (dB) | 54.8 | 54.4 1% | 56 -2% | 54.2 1% | 53 3% | 48.1 12% |
* ... menor é melhor
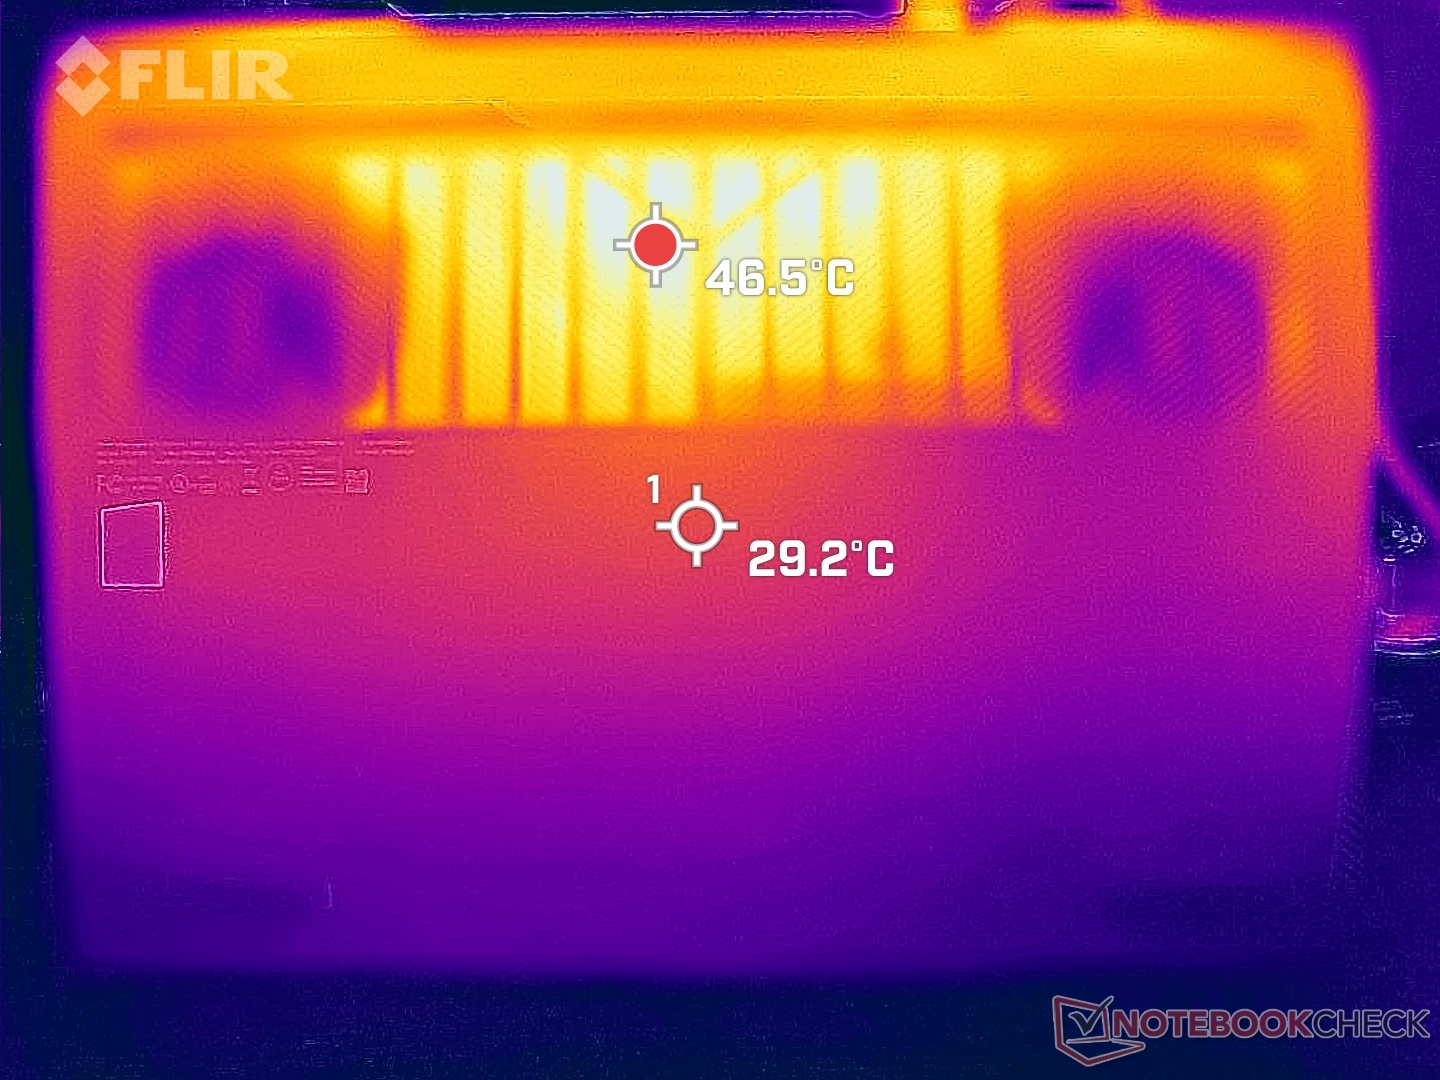
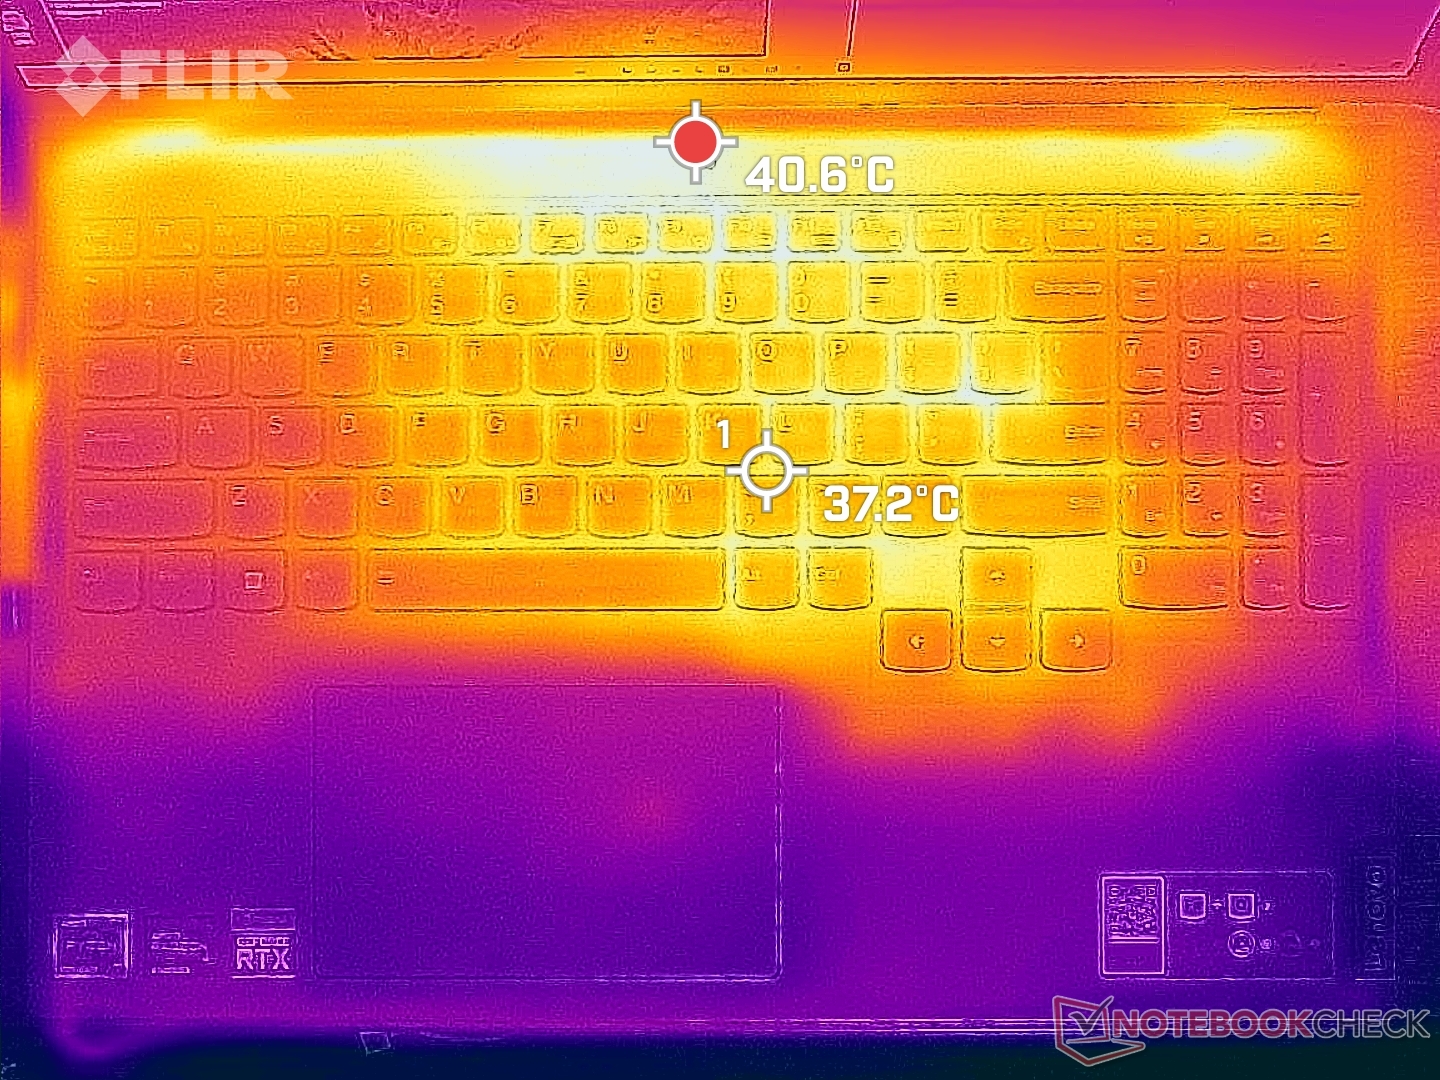
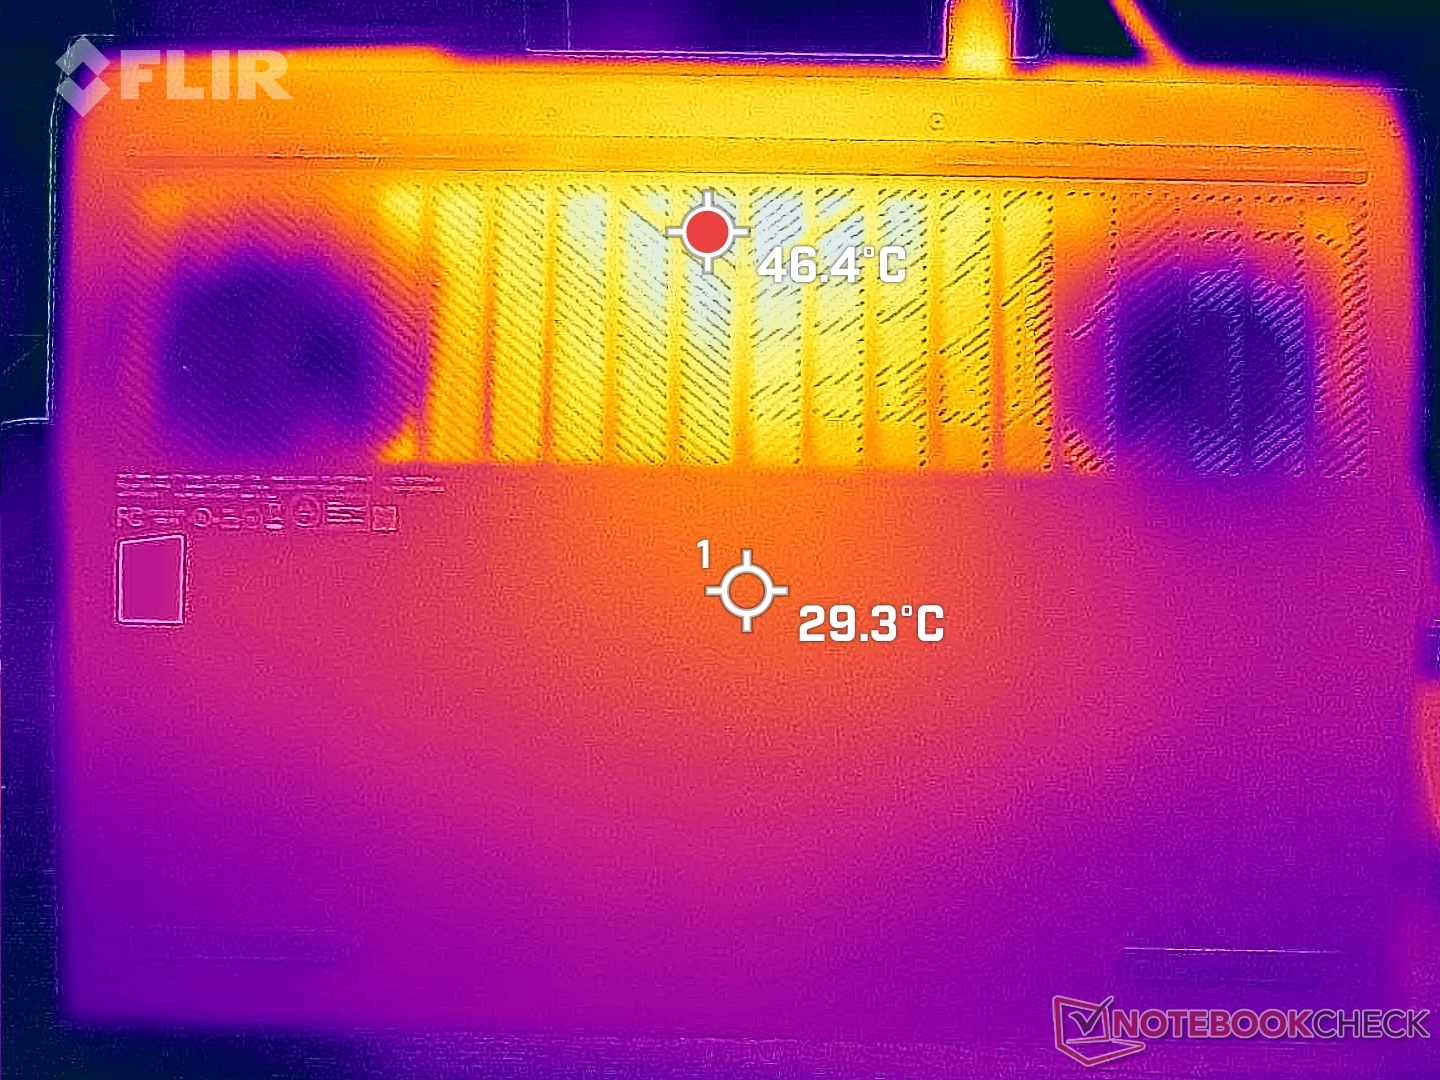
Temperatura
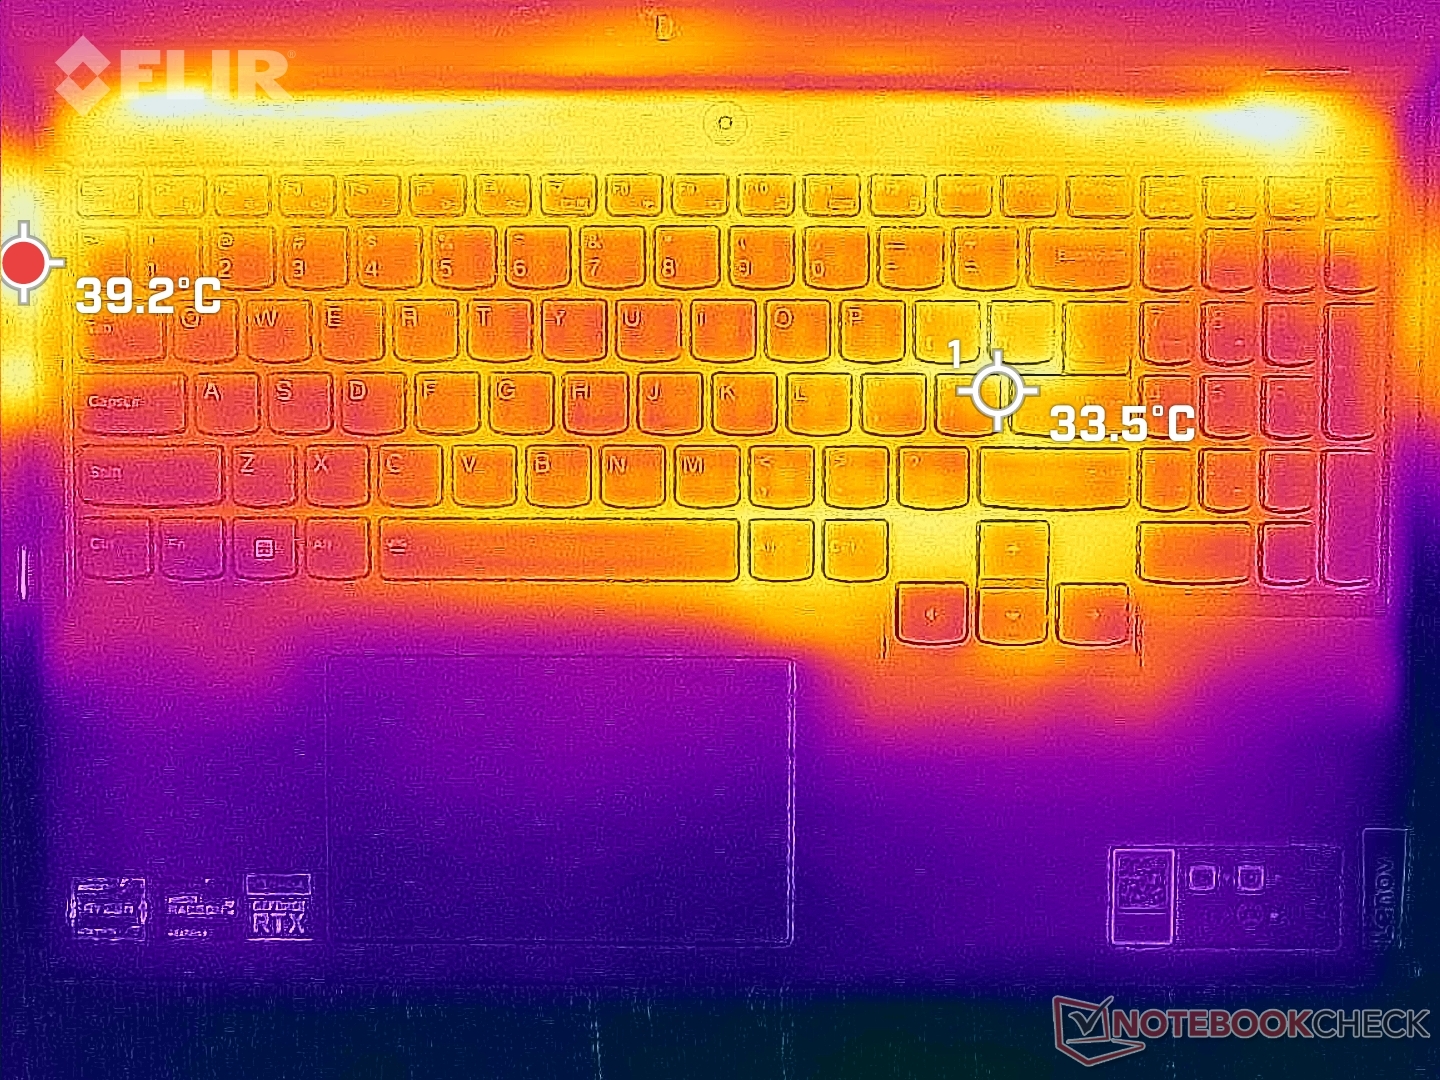
As temperaturas médias de superfície são muito mais frias do que no Asus ROG Zephyrus M16, embora seus pontos quentes sejam similares. Por exemplo, os pontos mais quentes da Lenovo e do Asus podem atingir até 53 C cada, mas os apoios das palmas e as áreas do teclado da Lenovo permanecem visivelmente mais frios e, portanto, mais confortáveis para jogar.
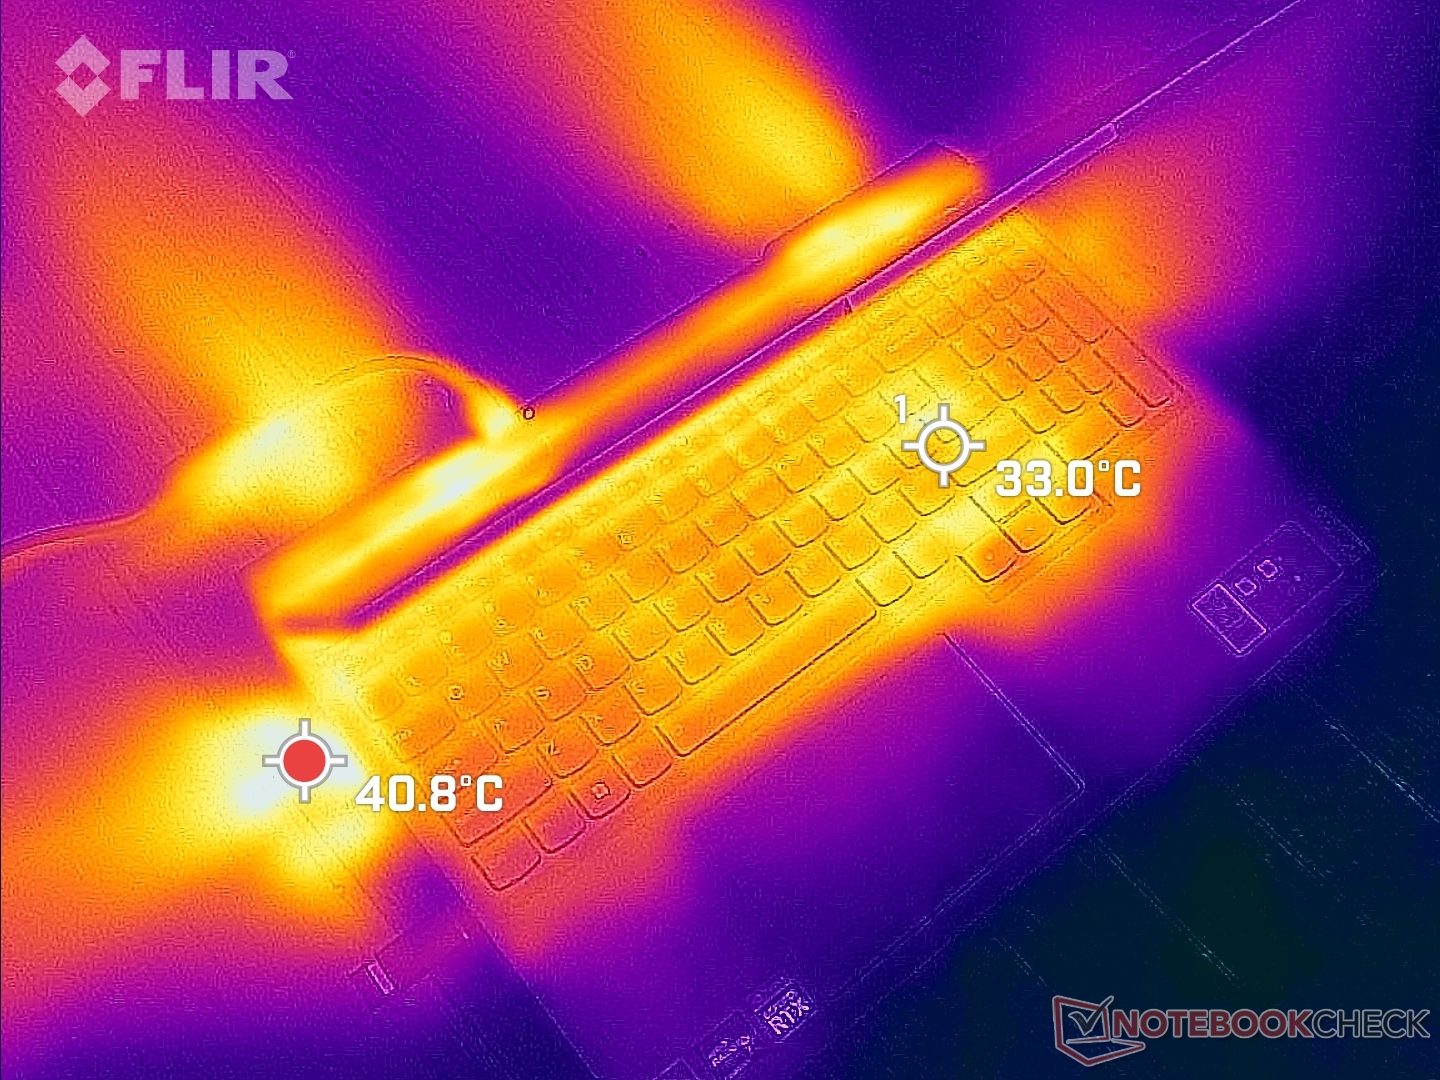
(±) A temperatura máxima no lado superior é 43.8 °C / 111 F, em comparação com a média de 40.4 °C / 105 F , variando de 21.2 a 68.8 °C para a classe Gaming.
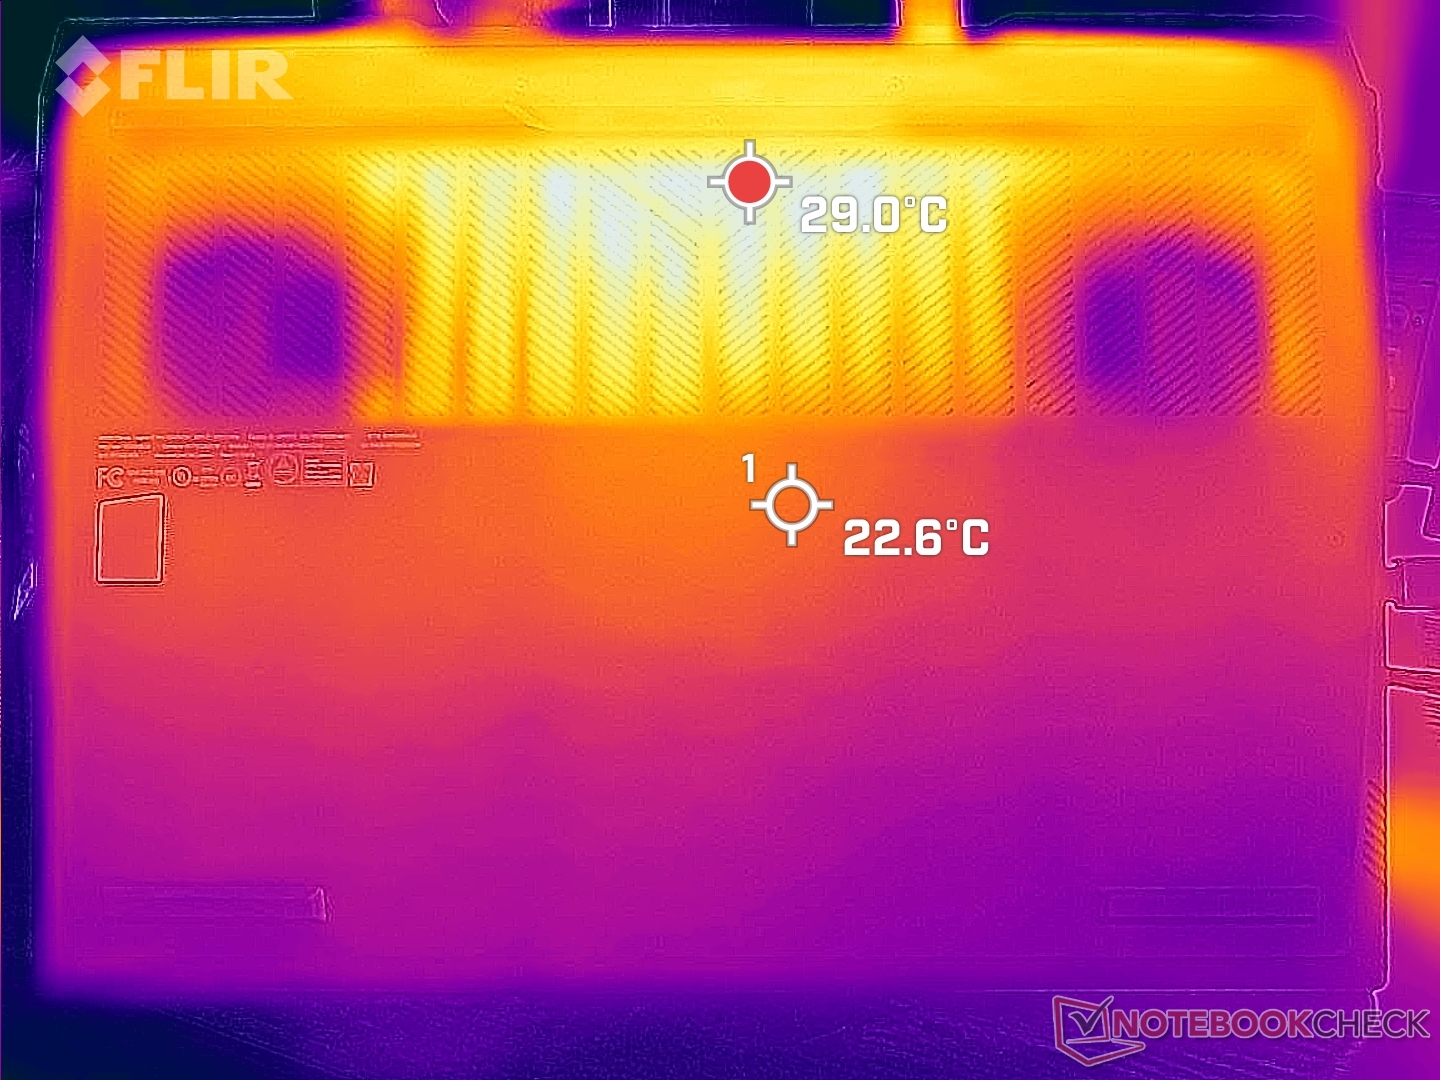
(-) A parte inferior aquece até um máximo de 53 °C / 127 F, em comparação com a média de 43.2 °C / 110 F
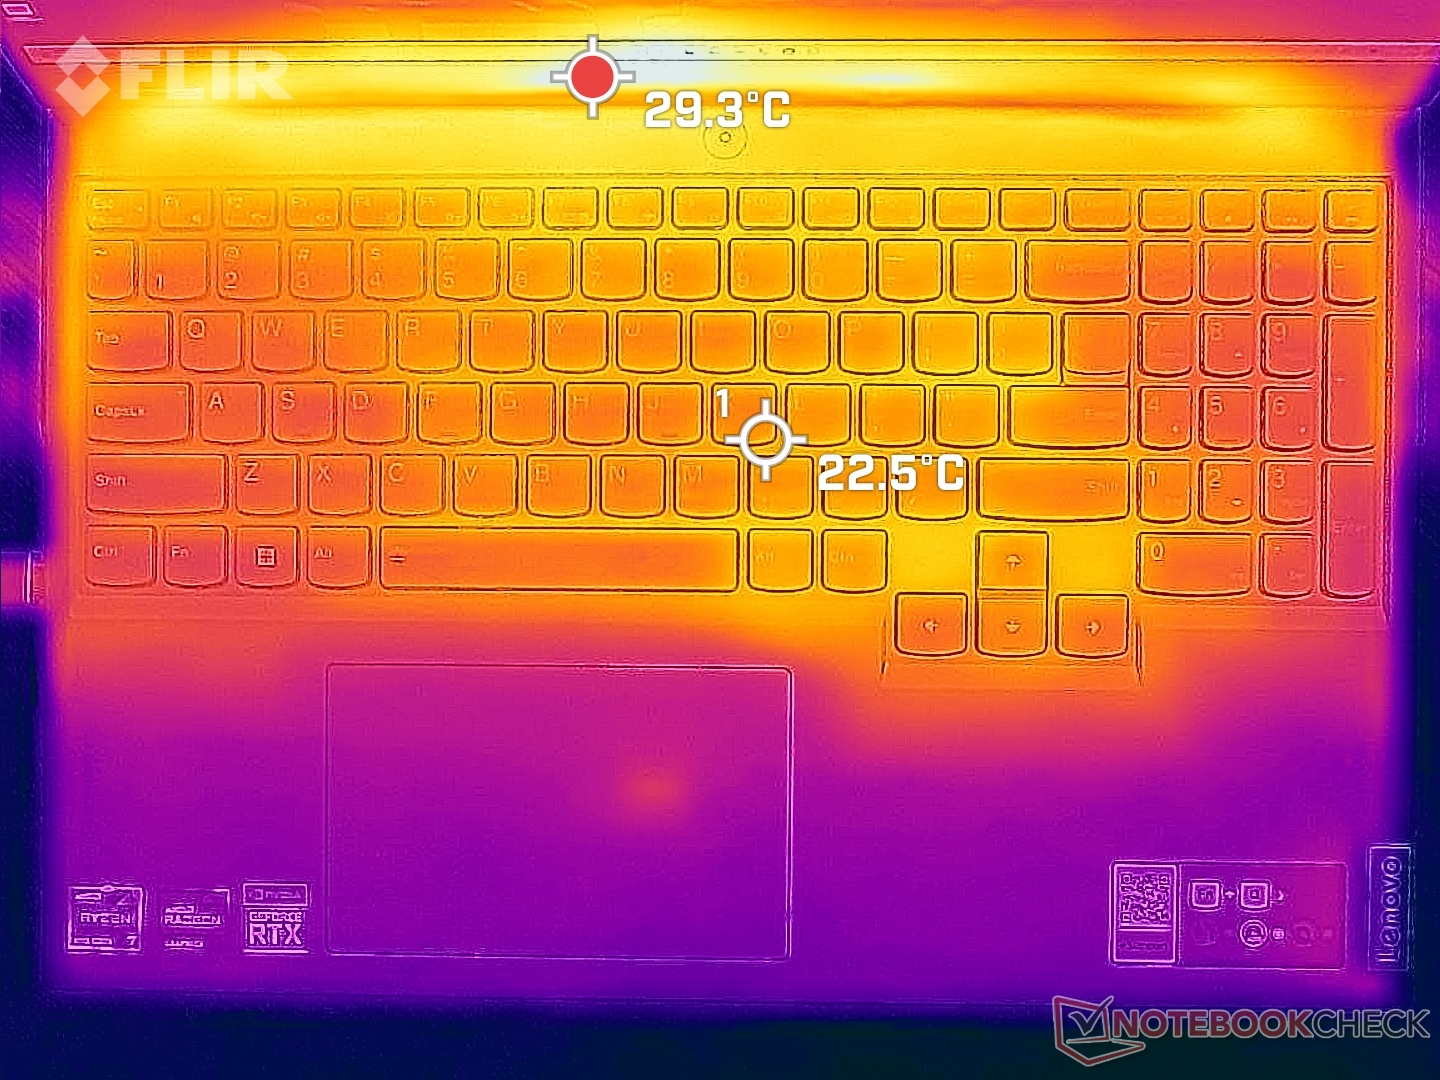
(+) Em uso inativo, a temperatura média para o lado superior é 27.4 °C / 81 F, em comparação com a média do dispositivo de 33.9 °C / ### class_avg_f### F.
(±) Jogando The Witcher 3, a temperatura média para o lado superior é 33.5 °C / 92 F, em comparação com a média do dispositivo de 33.9 °C / ## #class_avg_f### F.
(+) Os apoios para as mãos e o touchpad são mais frios que a temperatura da pele, com um máximo de 29.4 °C / 84.9 F e, portanto, são frios ao toque.
(±) A temperatura média da área do apoio para as mãos de dispositivos semelhantes foi 28.8 °C / 83.8 F (-0.6 °C / -1.1 F).
| Lenovo Legion 5 Pro 16ARH7H RTX 3070 Ti AMD Ryzen 7 6800H, NVIDIA GeForce RTX 3070 Ti Laptop GPU | Lenovo Legion 5 Pro 16IAH7H Intel Core i7-12700H, NVIDIA GeForce RTX 3060 Laptop GPU | Asus ROG Zephyrus M16 GU603H Intel Core i9-11900H, NVIDIA GeForce RTX 3070 Laptop GPU | Lenovo Legion 7 16ARHA7 AMD Ryzen 9 6900HX, AMD Radeon RX 6850M XT | HP Victus 16-e0145ng AMD Ryzen 5 5600H, NVIDIA GeForce RTX 3050 Ti Laptop GPU | Dell G16 7620 Intel Core i7-12700H, NVIDIA GeForce RTX 3060 Laptop GPU | |
|---|---|---|---|---|---|---|
| Heat | -7% | -19% | 5% | -12% | 9% | |
| Maximum Upper Side * (°C) | 43.8 | 45.8 -5% | 52 -19% | 37.2 15% | 54 -23% | 47.6 -9% |
| Maximum Bottom * (°C) | 53 | 66.3 -25% | 53 -0% | 43 19% | 47 11% | 54 -2% |
| Idle Upper Side * (°C) | 30 | 30.4 -1% | 38 -27% | 34 -13% | 41 -37% | 23 23% |
| Idle Bottom * (°C) | 31.8 | 30.4 4% | 41 -29% | 32.8 -3% | 31 3% | 24.6 23% |
* ... menor é melhor
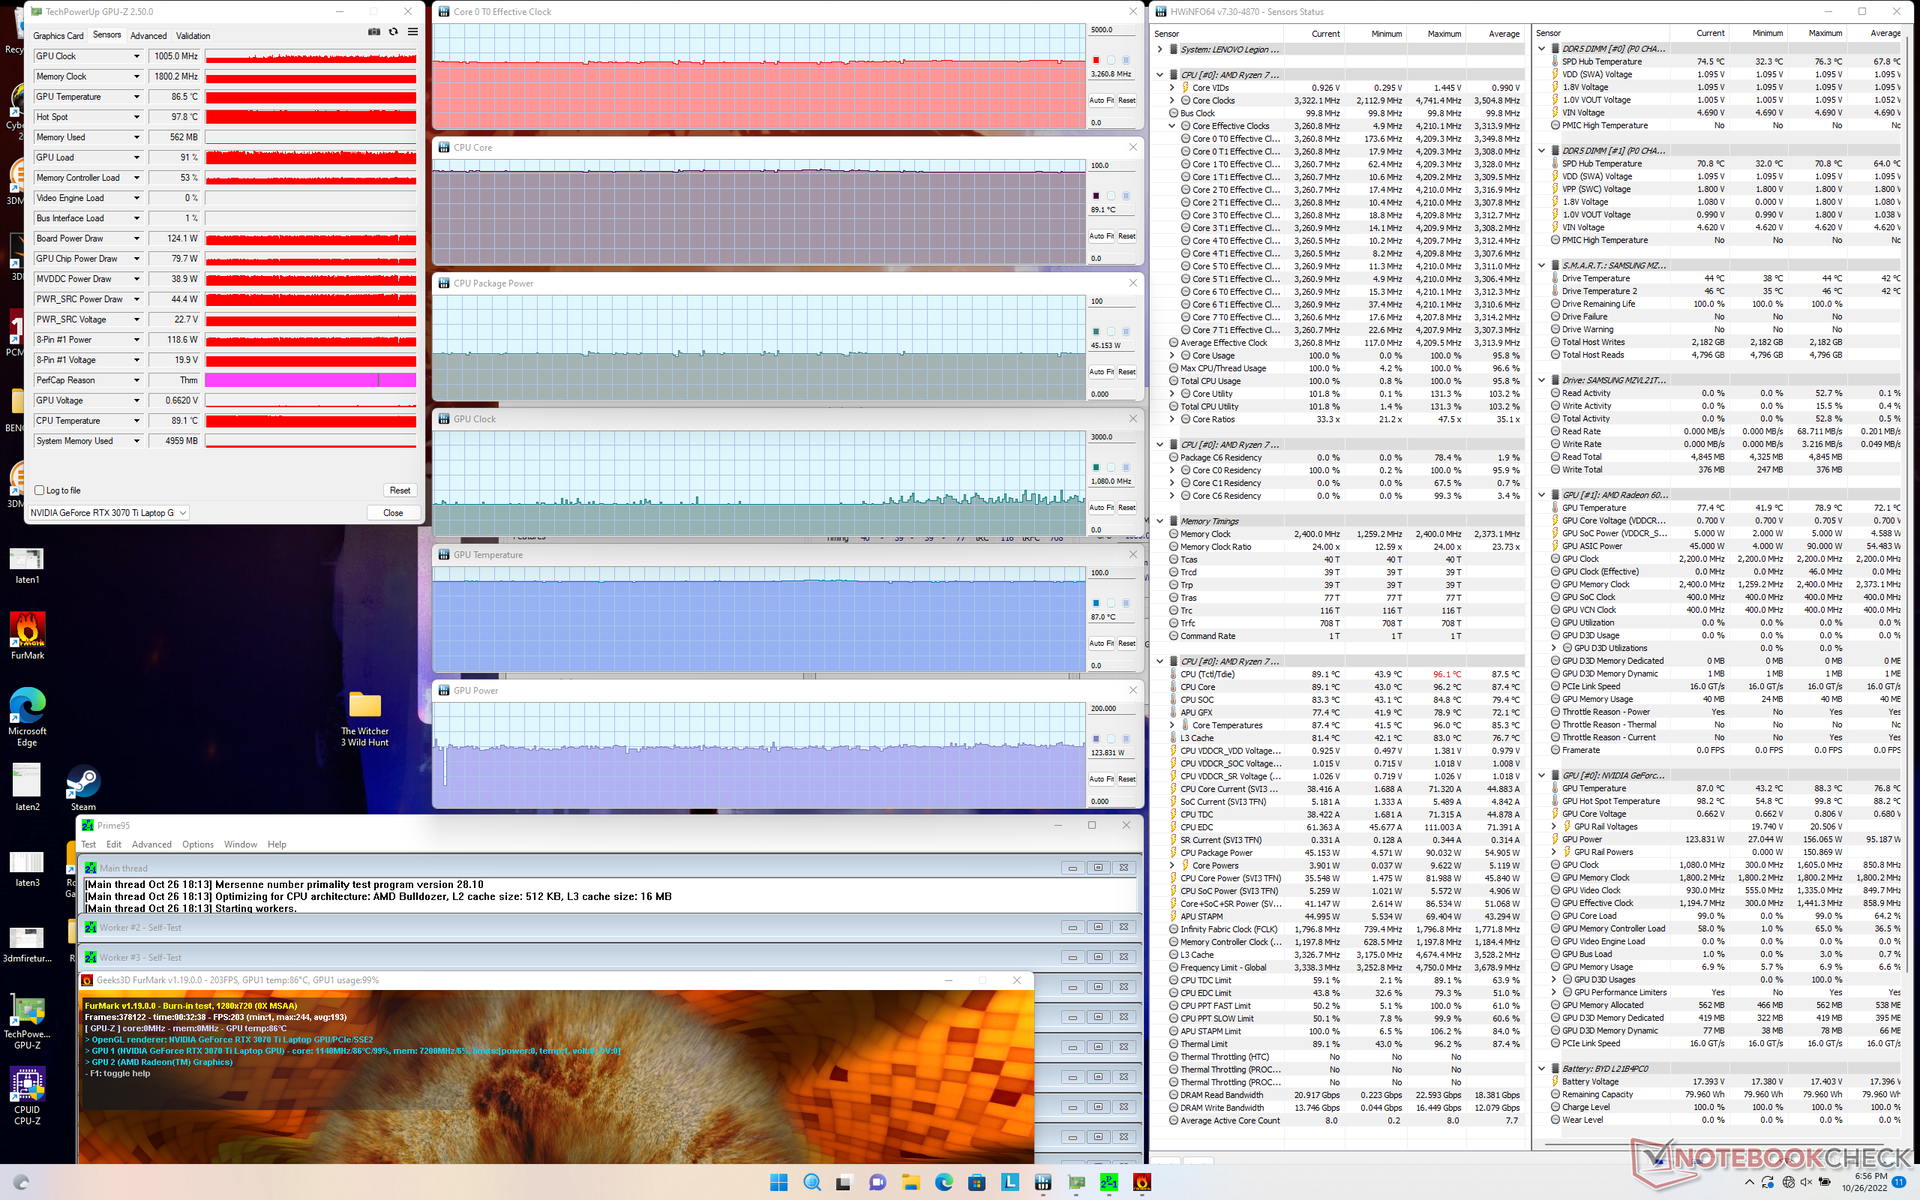
Teste de estresse
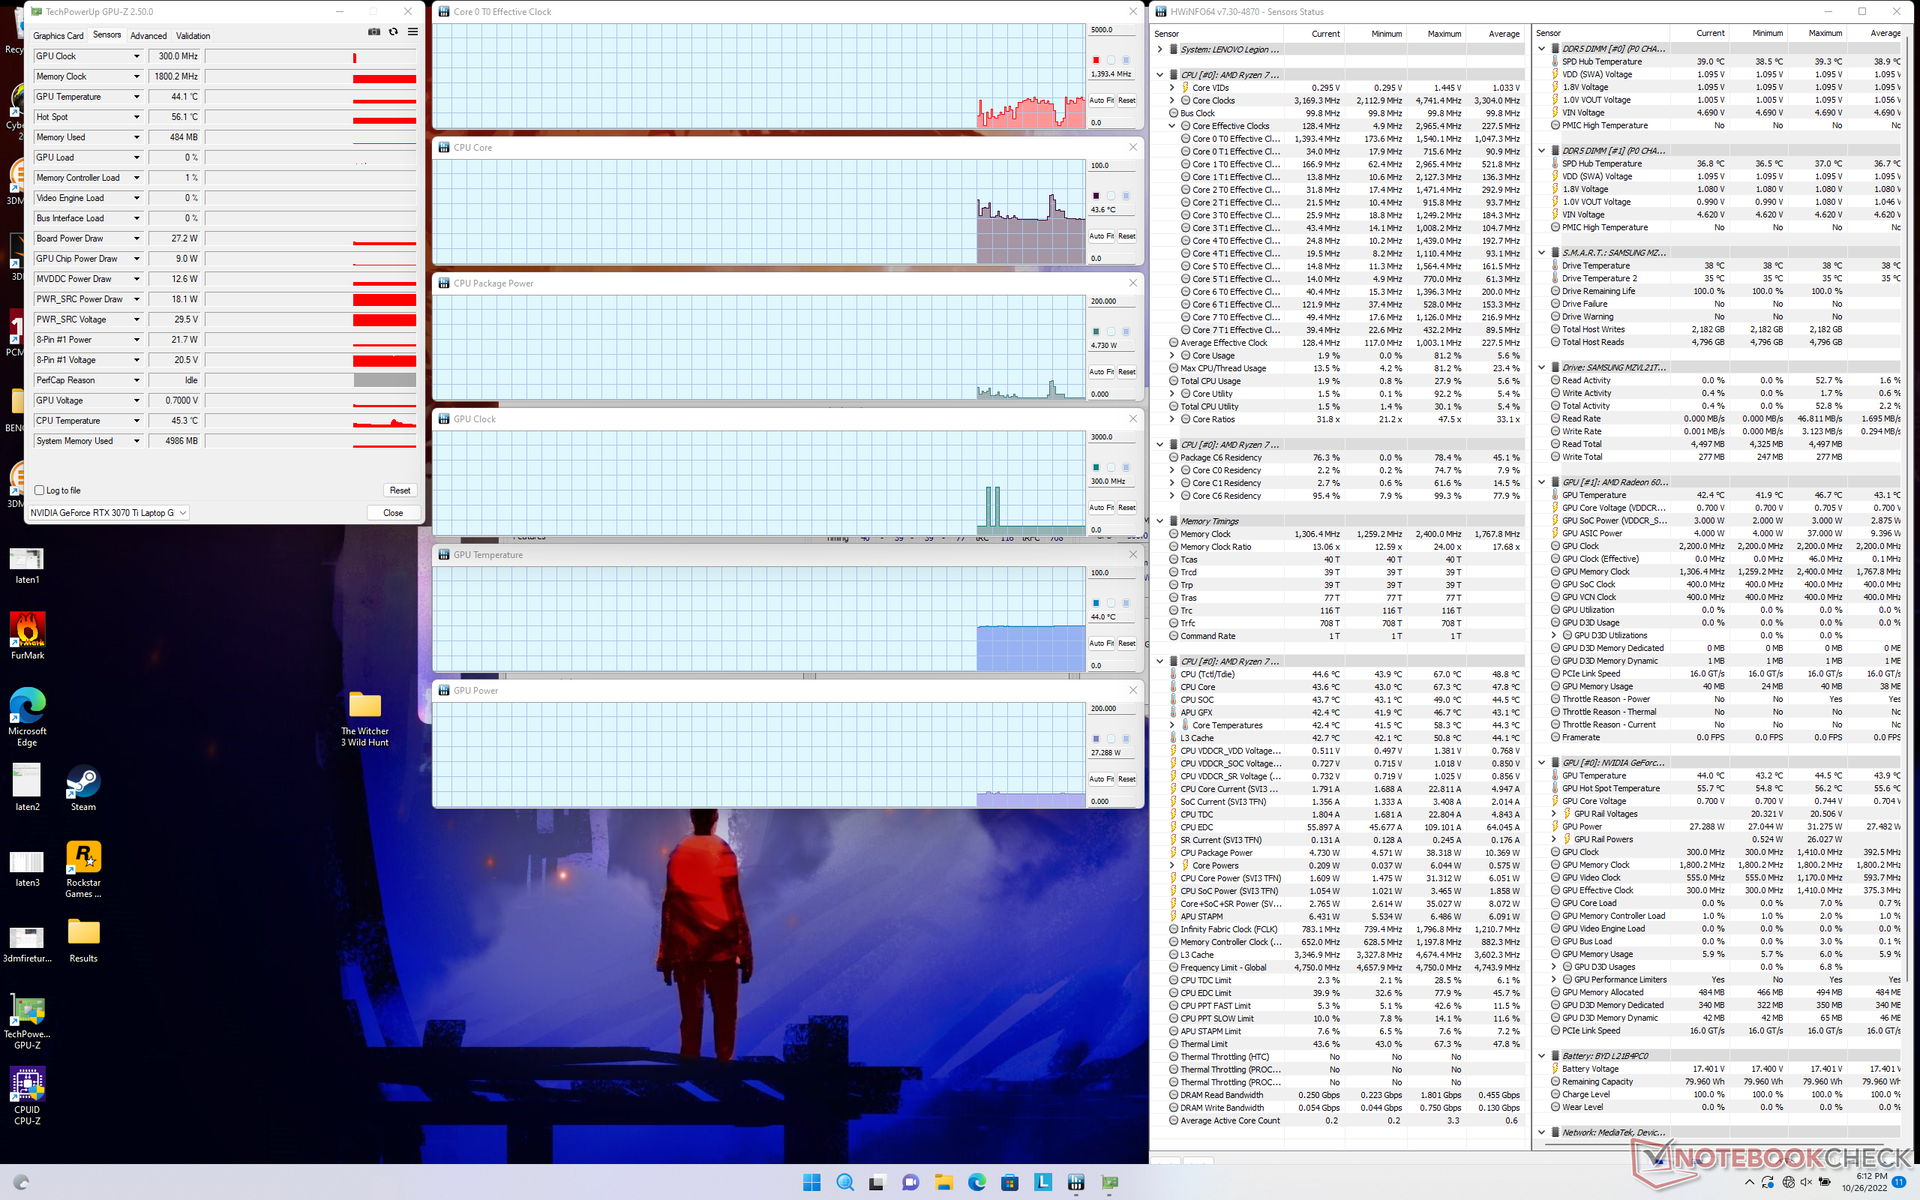
Quando sob estresse Prime95, a CPU aumentaria para 4,2 GHz e 90 W indefinidamente, sem necessidade de aceleramento. Infelizmente, as temperaturas centrais se tornarão muito quentes a pouco menos de 95 C, o que é mais quente do que na maioria dos outros laptops para jogos.
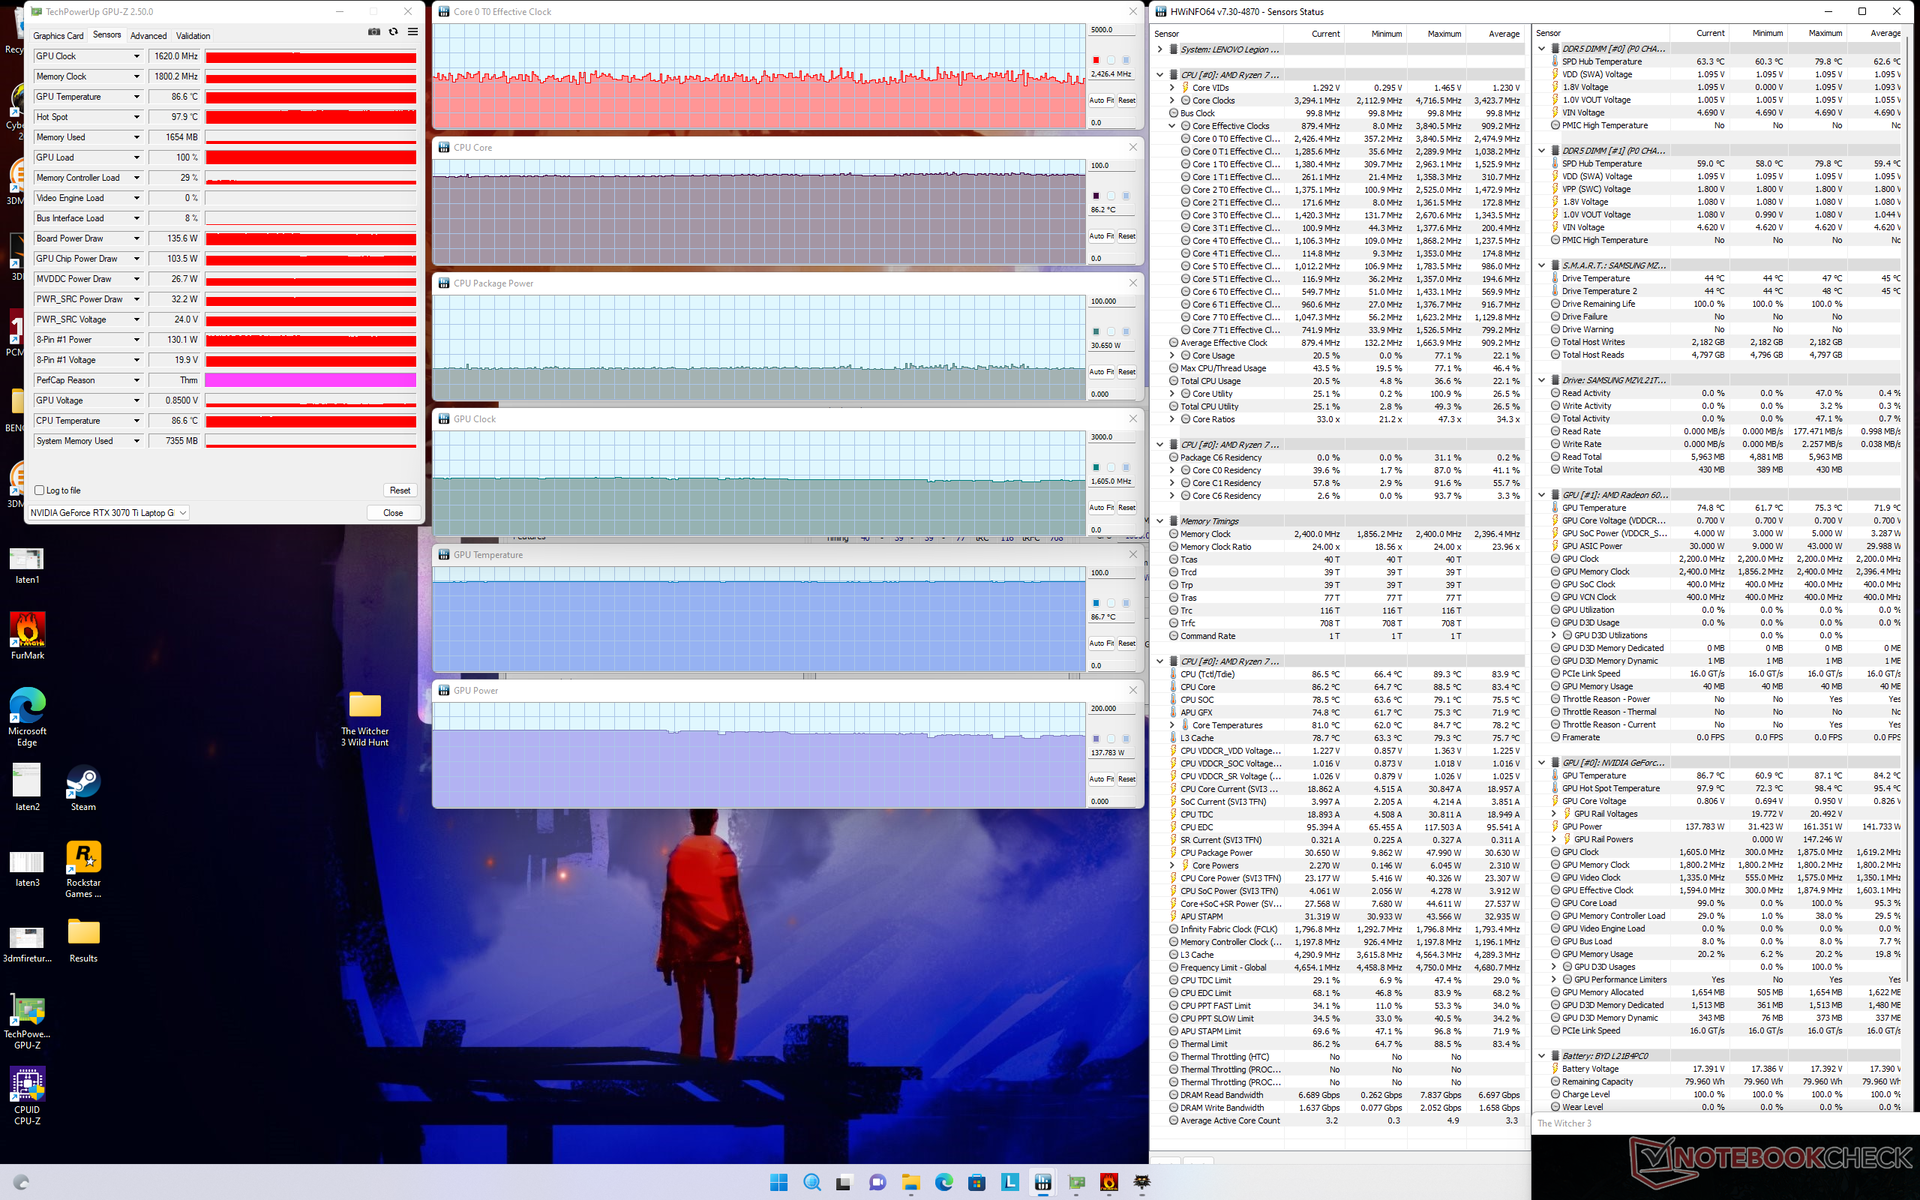
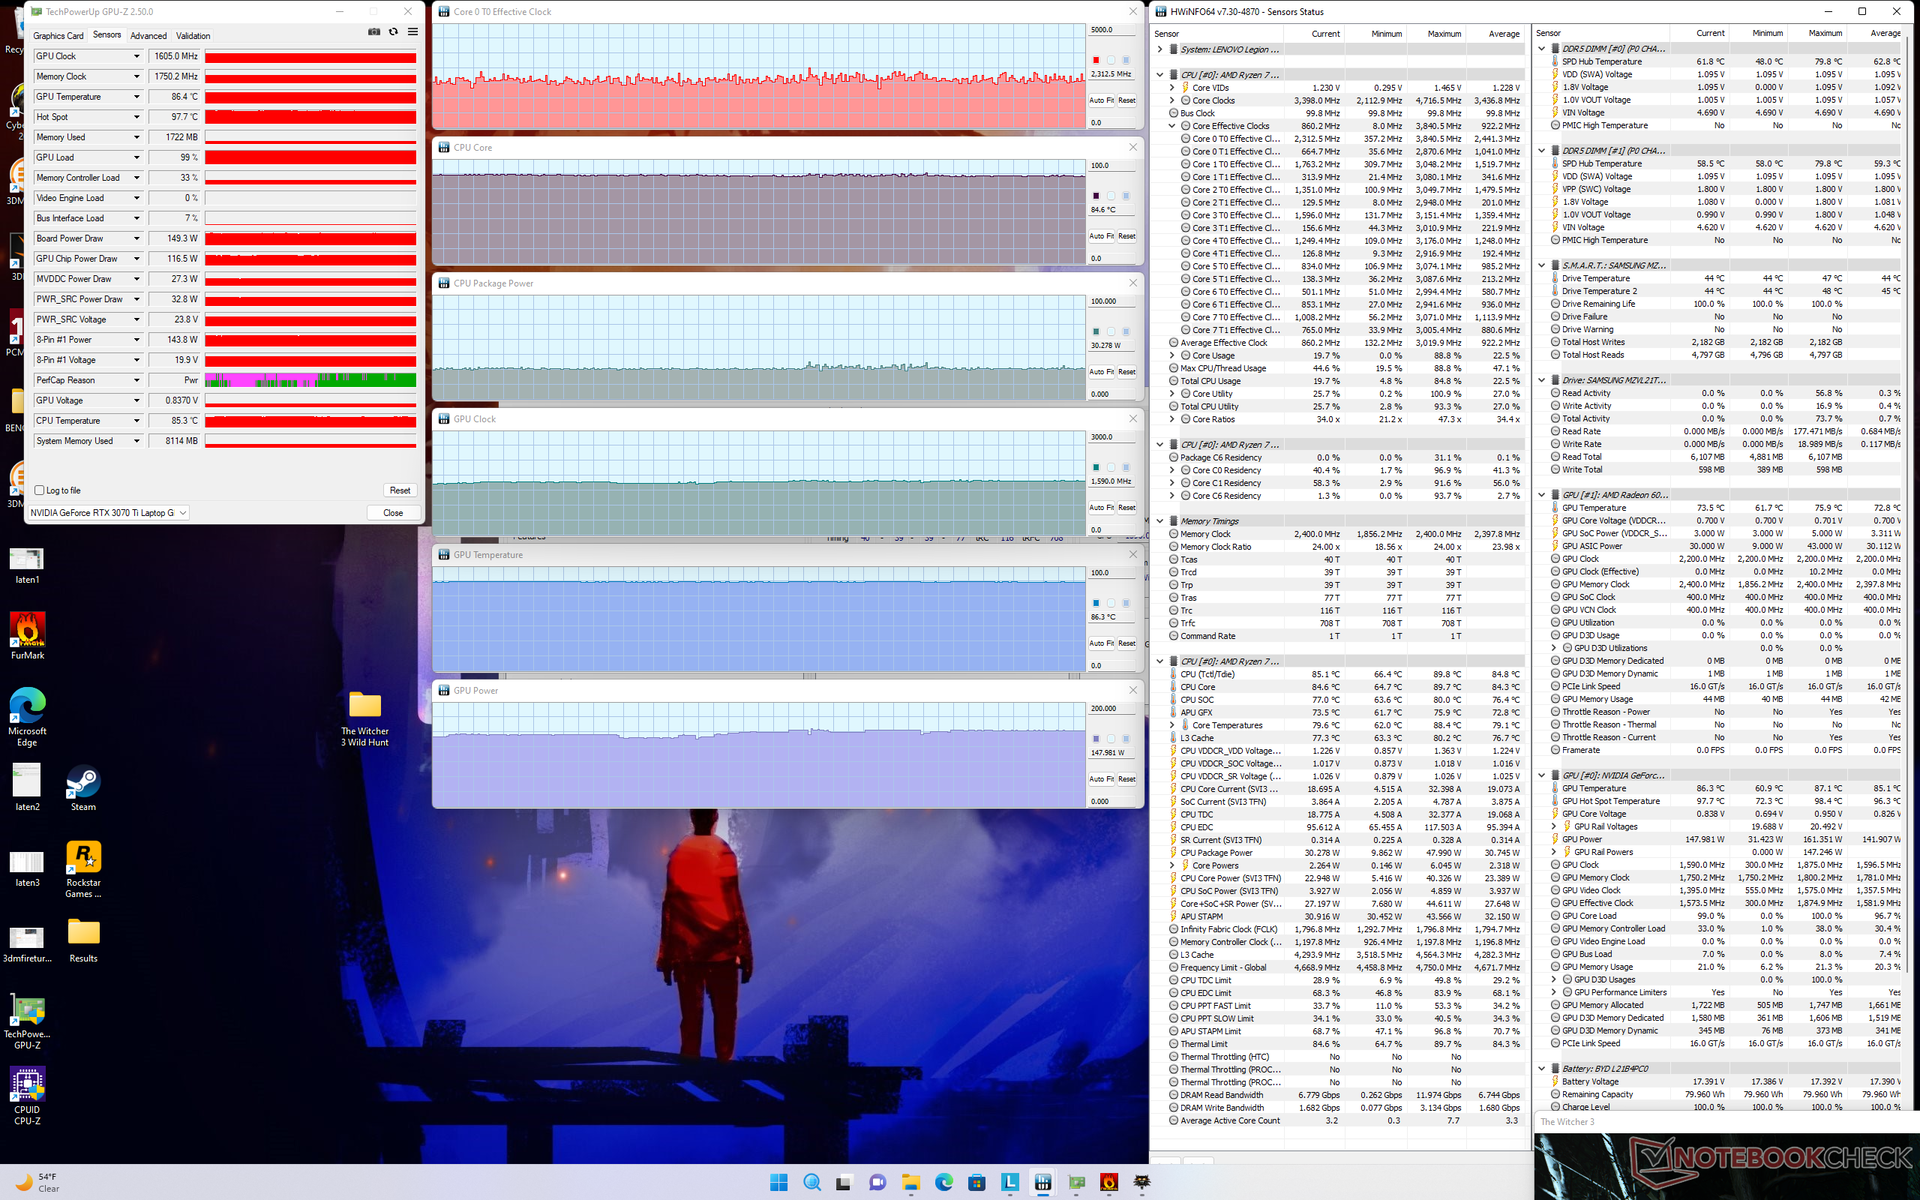
Quando em funcionamento Witcher 3 com o modo Turbo ativo, a GPU Nvidia se estabilizaria no núcleo de 1620 MHz, memória de 1800 MHz e consumo de 136 W. Curiosamente, repetir este teste com o modo Turbo desativado resultaria em relógios com núcleo e memória mais lentos de 1605 MHz e 1750 MHz, respectivamente, mas um consumo de energia de placa maior de 149 W. Você vai querer ativar o modo Turbo de qualquer forma, já que o desempenho gráfico ainda é ligeiramente mais rápido do que com o modo Turbo desativado.
Funcionando com bateria limita o desempenho. Um teste Fire Strike em baterias retornaria pontuações de Física e Gráficos de 20957 e 13153 pontos, respectivamente, em comparação com 27288 e 31289 pontos quando em rede elétrica.
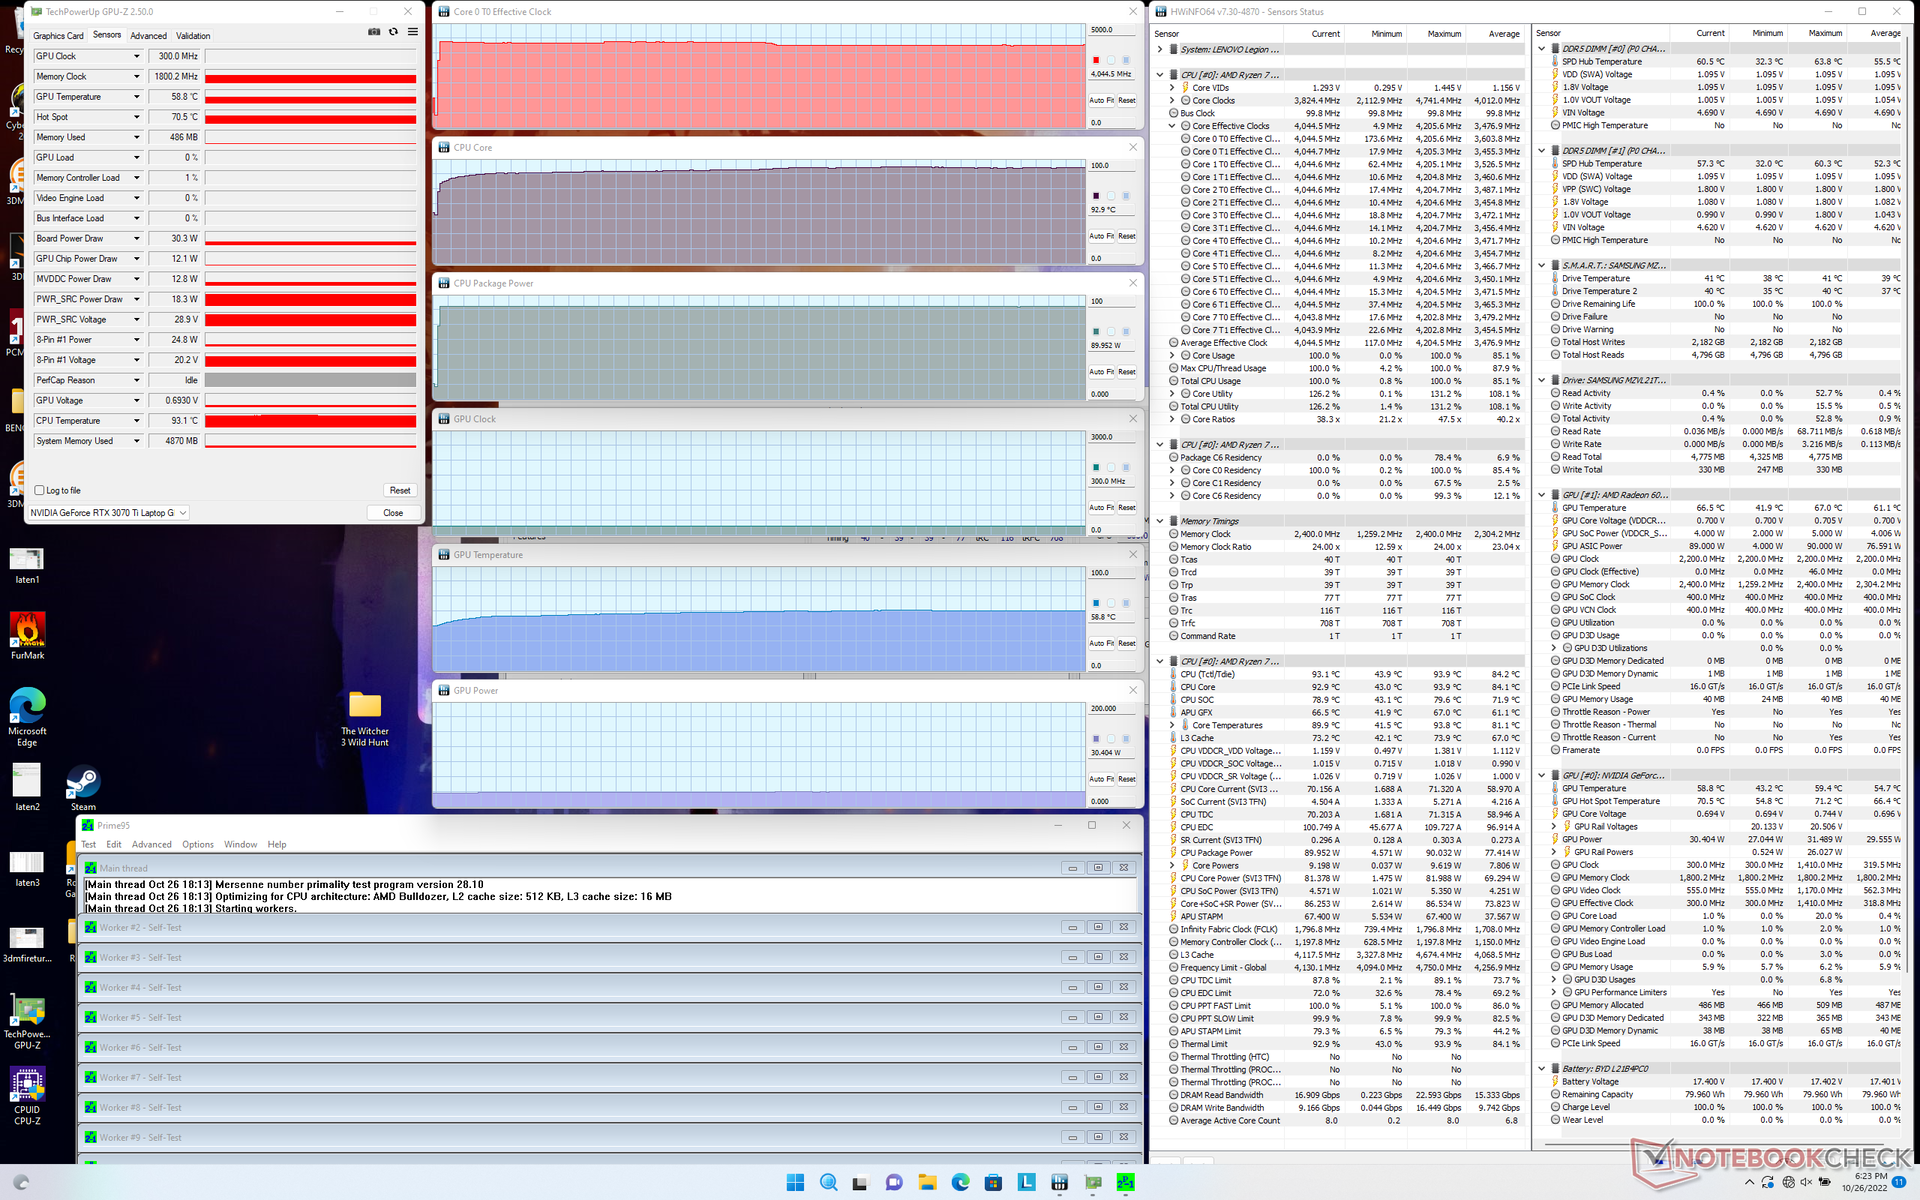
| Relógio CPU (GHz) | Relógio GPU (MHz) | Temperatura média da CPU (°C) | Temperatura média da GPU (°C) | |
| System Idle | -- | -- | 44 | 44 |
| Prime95 Stress | 4.1 | -- | 93 | 59 |
| Prime95 + FurMark Stress | 3.3 | 1005 | 89 | 87 |
| Witcher 3 Stress (Turbo on) | ~2.3 | 1620 | 86 | 87 |
| Witcher 3 Stress (Turbo off) | ~2.3 | 1605 | 85 | 86 |
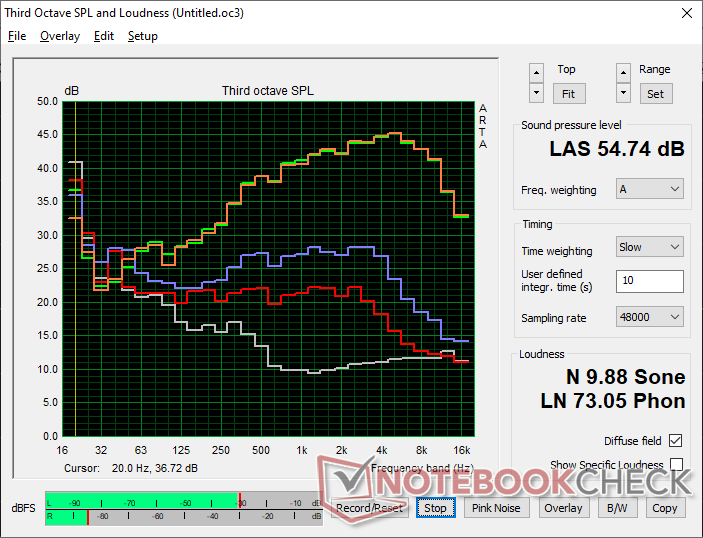
Oradores
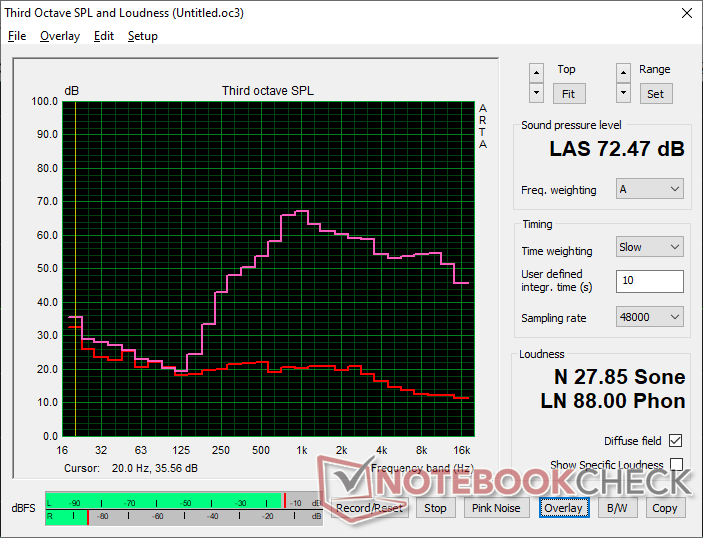
Lenovo Legion 5 Pro 16ARH7H RTX 3070 Ti análise de áudio
(±) | o volume do alto-falante é médio, mas bom (###valor### dB)
Graves 100 - 315Hz
(-) | quase nenhum baixo - em média 22.3% menor que a mediana
(-) | graves não são lineares (15.4% delta para frequência anterior)
Médios 400 - 2.000 Hz
(±) | médios mais altos - em média 7.1% maior que a mediana
(±) | a linearidade dos médios é média (9.5% delta para frequência anterior)
Altos 2 - 16 kHz
(+) | agudos equilibrados - apenas 1.9% longe da mediana
(+) | os máximos são lineares (3.6% delta da frequência anterior)
Geral 100 - 16.000 Hz
(-) | o som geral não é linear (30.3% diferença em relação à mediana)
Comparado com a mesma classe
» 96% de todos os dispositivos testados nesta classe foram melhores, 2% semelhantes, 3% piores
» O melhor teve um delta de 6%, a média foi 18%, o pior foi 132%
Comparado com todos os dispositivos testados
» 89% de todos os dispositivos testados foram melhores, 3% semelhantes, 9% piores
» O melhor teve um delta de 4%, a média foi 24%, o pior foi 134%
Asus ROG Zephyrus M16 GU603H análise de áudio
(±) | o volume do alto-falante é médio, mas bom (###valor### dB)
Graves 100 - 315Hz
(±) | graves reduzidos - em média 7.4% menor que a mediana
(±) | a linearidade dos graves é média (9.2% delta para a frequência anterior)
Médios 400 - 2.000 Hz
(±) | médios mais altos - em média 5.6% maior que a mediana
(+) | médios são lineares (4% delta para frequência anterior)
Altos 2 - 16 kHz
(+) | agudos equilibrados - apenas 2.6% longe da mediana
(+) | os máximos são lineares (6.7% delta da frequência anterior)
Geral 100 - 16.000 Hz
(+) | o som geral é linear (12.1% diferença em relação à mediana)
Comparado com a mesma classe
» 12% de todos os dispositivos testados nesta classe foram melhores, 4% semelhantes, 84% piores
» O melhor teve um delta de 6%, a média foi 18%, o pior foi 132%
Comparado com todos os dispositivos testados
» 9% de todos os dispositivos testados foram melhores, 2% semelhantes, 88% piores
» O melhor teve um delta de 4%, a média foi 24%, o pior foi 134%
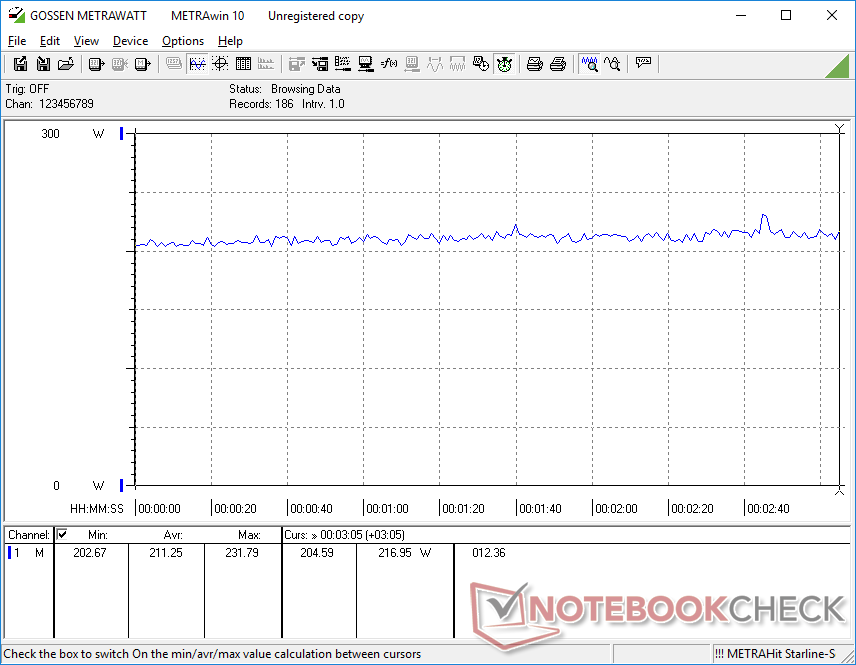
Gestão de Energia - Máquina Exigente
Consumo de energia
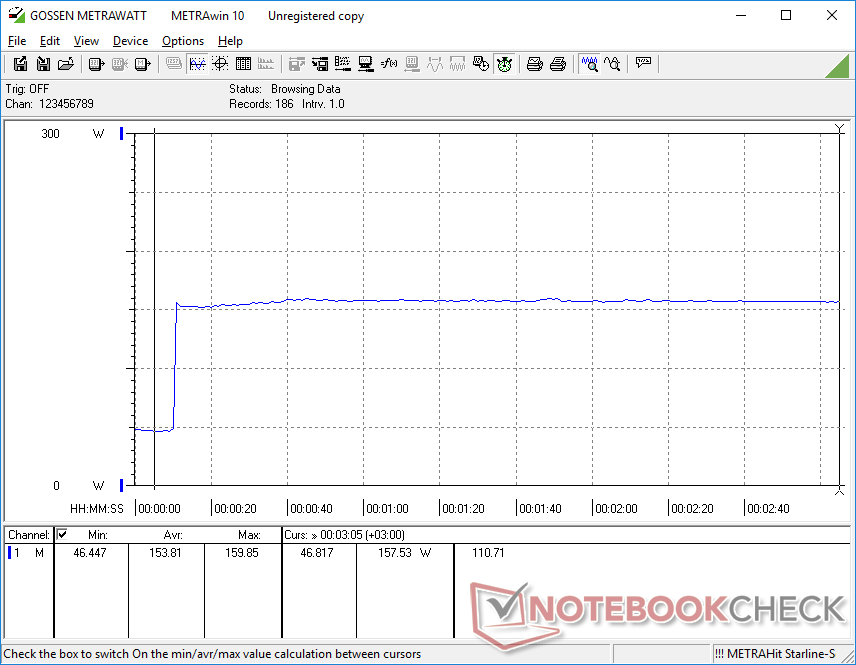
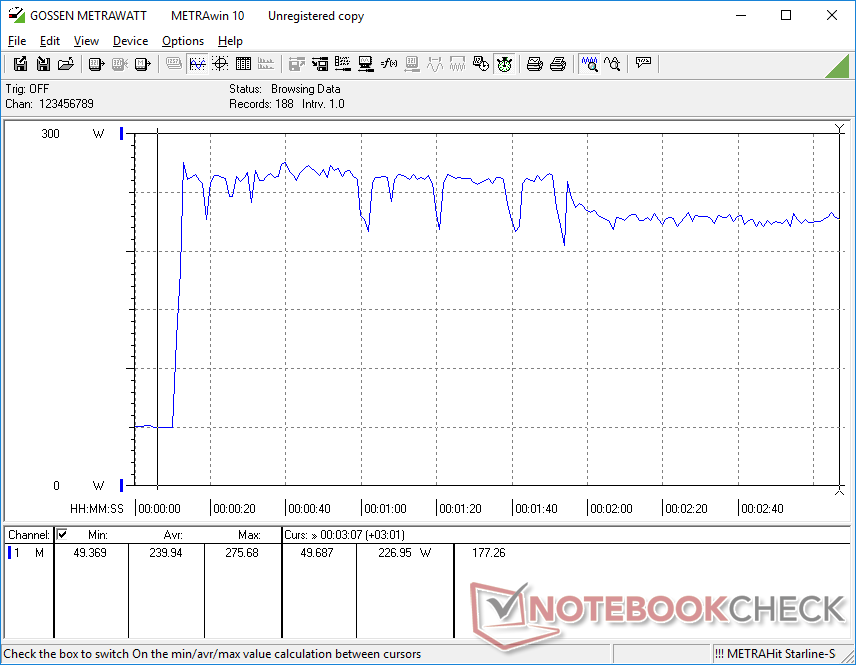
Embora o Ryzen 7 6800H seja cerca de 25% mais lento do que o Core i7-12700H, ele não é necessariamente 25% mais eficiente em termos de energia. De fato, o consumo de energia entre as versões AMD e Intel do Legion 5 Pro 16 é de cerca de 160 W em cada sistema quando em funcionamento Prime95. O consumo de energia também permanece bastante semelhante entre eles quando em funcionamento Witcher 3
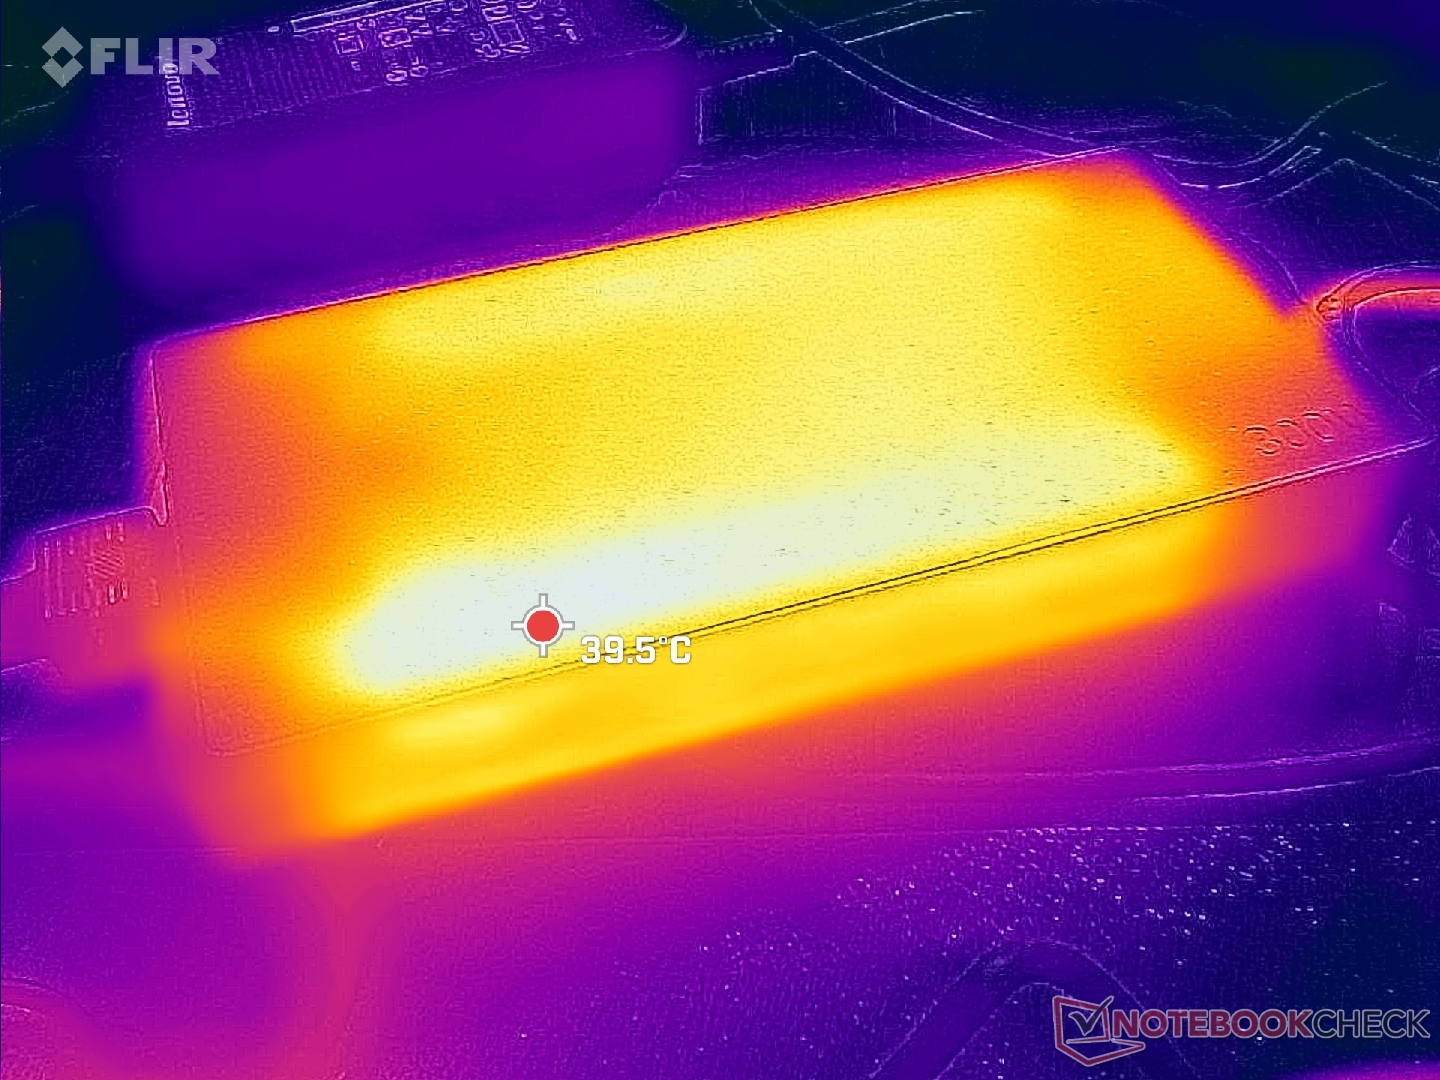
Somos capazes de registrar um consumo máximo temporário de 275 W do grande (~19,9 x 9,8 x 2,6 cm) adaptador CA de 300 W quando tanto a CPU quanto a GPU estão em 100% de utilização. O sistema pode carregar a uma taxa razoável e executar cargas exigentes simultaneamente.
| desligado | |
| Ocioso | |
| Carga |
|
Key:
min: | |
| Lenovo Legion 5 Pro 16ARH7H RTX 3070 Ti R7 6800H, GeForce RTX 3070 Ti Laptop GPU, Samsung PM9A1 MZVL21T0HCLR, IPS, 2560x1600, 16" | Lenovo Legion 5 Pro 16IAH7H i7-12700H, GeForce RTX 3060 Laptop GPU, 2x Samsung PM9A1 MZVL21T0HCLR (RAID 0), IPS, 2560x1600, 16" | Asus ROG Zephyrus M16 GU603H i9-11900H, GeForce RTX 3070 Laptop GPU, Samsung PM9A1 MZVL22T0HBLB, IPS, 2560x1600, 16" | Lenovo Legion 7 16ARHA7 R9 6900HX, Radeon RX 6850M XT, Samsung PM9A1 MZVL22T0HBLB, IPS, 2560x1600, 16" | HP Victus 16-e0145ng R5 5600H, GeForce RTX 3050 Ti Laptop GPU, Samsung SSD PM981a MZVLB512HBJQ, IPS, 1920x1080, 16.1" | Dell G16 7620 i7-12700H, GeForce RTX 3060 Laptop GPU, WDC PC SN810 512GB, IPS, 2560x1600, 16" | |
|---|---|---|---|---|---|---|
| Power Consumption | -50% | 2% | -5% | 33% | -4% | |
| Idle Minimum * (Watt) | 9.7 | 22.8 -135% | 11 -13% | 9.9 -2% | 7 28% | 14.4 -48% |
| Idle Average * (Watt) | 14.8 | 26.5 -79% | 20 -35% | 22 -49% | 9 39% | 17.8 -20% |
| Idle Maximum * (Watt) | 45.8 | 41 10% | 30 34% | 23.1 50% | 15 67% | 31.5 31% |
| Load Average * (Watt) | 87.2 | 191 -119% | 111 -27% | 94.4 -8% | 93 -7% | 101.2 -16% |
| Witcher 3 ultra * (Watt) | 209 | 194.7 7% | 156 25% | 249 -19% | 134.5 36% | 176.9 15% |
| Load Maximum * (Watt) | 275.3 | 238 14% | 197 28% | 276 -0% | 185 33% | 242.9 12% |
* ... menor é melhor
Power Consumption Witcher 3 / Stresstest
Power Consumption external Monitor
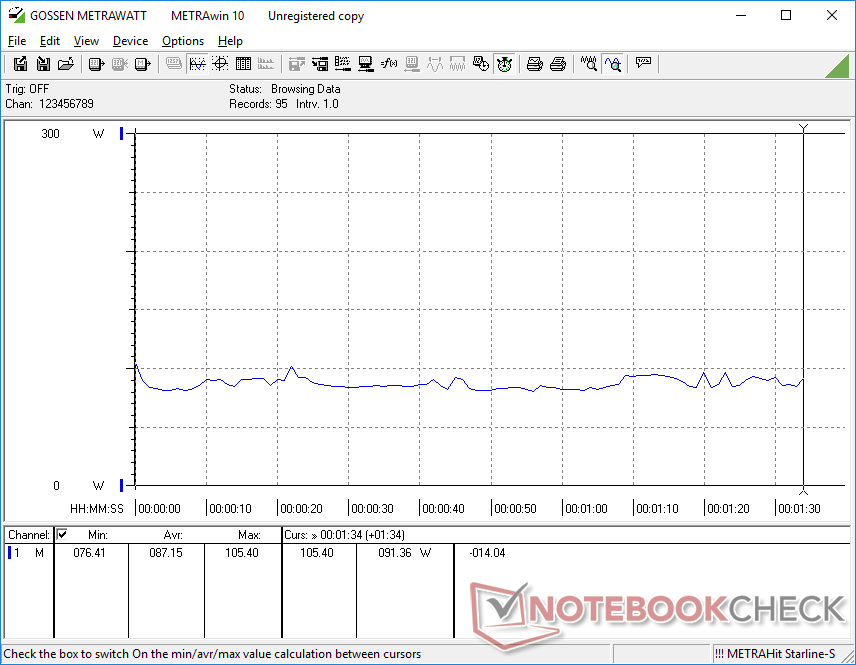
Vida útil da bateria - Não muito ruim
O tempo de execução da WLAN é quase uma hora maior do que na versão da Intel do Legion 5 Pro 16 quando configurado para o perfil de potência balanceada com o iGPU ativo. A melhor duração da bateria é provavelmente devido à CPU AMD mais eficiente ao executar menos cargas, como mostra nossa seção de Consumo de Energia acima. No entanto, ela ainda é relativamente curta em pouco menos de 4,5 horas em comparação com quase 8 horas no Asus ROG Zephyrus M16.
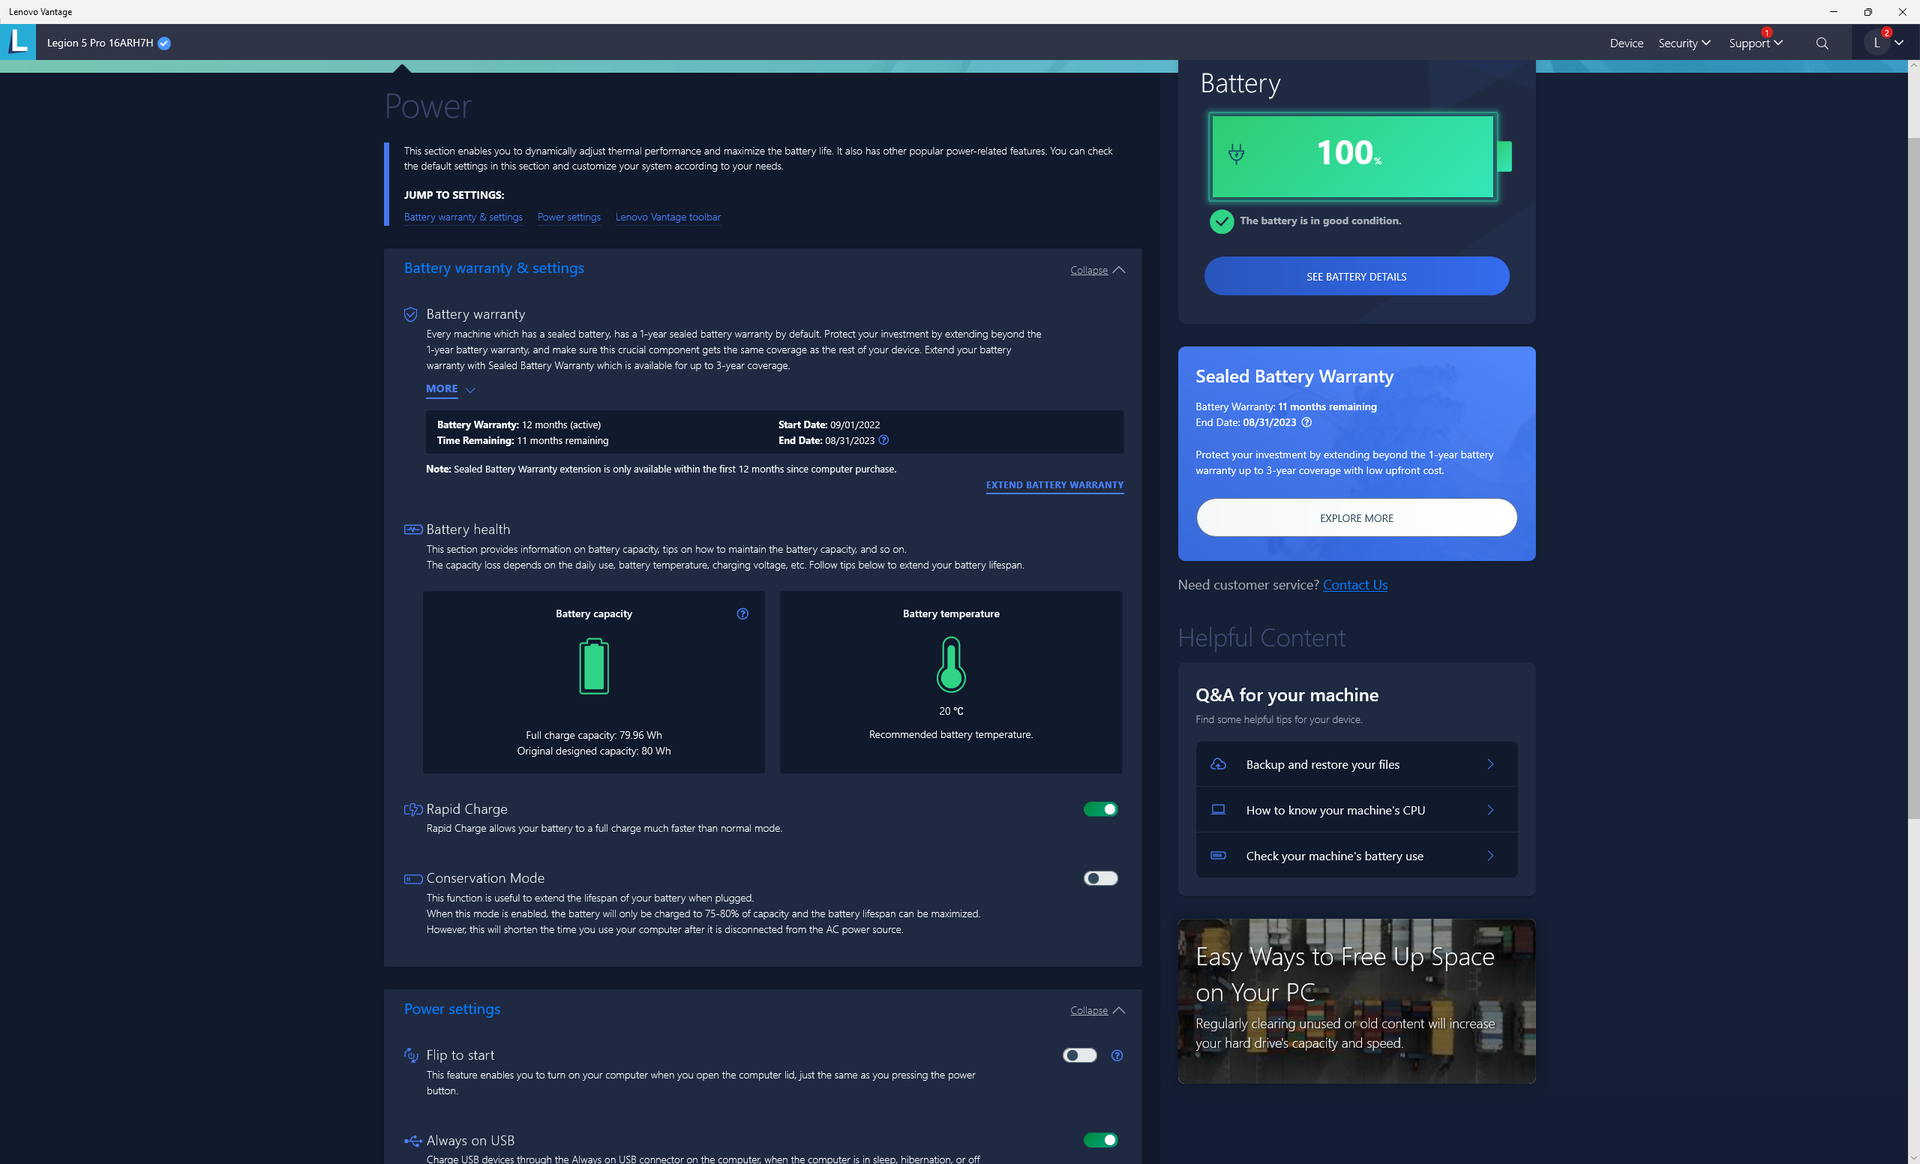
A carga de vazio a cheio leva pouco menos de uma hora quando o recurso de Carga Rápida é ativado. A maioria dos outros laptops leva entre 1,5 a 2 horas.
| Lenovo Legion 5 Pro 16ARH7H RTX 3070 Ti R7 6800H, GeForce RTX 3070 Ti Laptop GPU, 80 Wh | Lenovo Legion 5 Pro 16IAH7H i7-12700H, GeForce RTX 3060 Laptop GPU, 80 Wh | Asus ROG Zephyrus M16 GU603H i9-11900H, GeForce RTX 3070 Laptop GPU, 90 Wh | Lenovo Legion 7 16ARHA7 R9 6900HX, Radeon RX 6850M XT, 99 Wh | HP Victus 16-e0145ng R5 5600H, GeForce RTX 3050 Ti Laptop GPU, 70 Wh | Dell G16 7620 i7-12700H, GeForce RTX 3060 Laptop GPU, 84 Wh | |
|---|---|---|---|---|---|---|
| Duração da bateria | -18% | 75% | 66% | 61% | 14% | |
| WiFi v1.3 (h) | 4.4 | 3.6 -18% | 7.7 75% | 7.3 66% | 7.1 61% | 5 14% |
| H.264 (h) | 4.1 | |||||
| Witcher 3 ultra (h) | 2.1 | |||||
| Load (h) | 0.6 | 1.6 | 1.8 | 0.7 | ||
| Reader / Idle (h) | 13.3 | 4.9 | 7.1 |
Pro
Contra
Veredicto - Apenas um pouco mais rápido
Os Ryzen 7 6800H e 150 W GeForce RTX 3070 Ti são cerca de 10% mais rápidos do que os Ryzen 7 5800H e 140 W GeForce RTX 3070 em Legion 5 Pro do ano passado. A atualização de 2022 é, portanto, apenas uma pequena atualização sobre o modelo 2021, sem grandes mudanças externas ou internas.
Se você já possui a Lenovo 2021 Legion 5 Pro 16, então não está perdendo muito ao pular a versão 2022. A Lenovo provavelmente atualizará completamente a série nos próximos um a dois anos para mais grandes melhorias.
As alternativas mais próximas ao Legion 5 Pro 16, no momento, são Dell G16 e o Asus ROG Zephyrus M16 cada uma com taxa de atualização semelhante de 165 Hz e opções de CPU da série H. O modelo Asus é significativamente menor e mais leve, mas funciona ainda mais quente e é igualmente barulhento. Enquanto isso, o modelo Dell funciona mais silencioso, mas seu tamanho e temperatura central são ligeiramente mais quentes e pesados do que a já quente e pesada Lenovo.
Para futuras revisões, gostaríamos de ver temperaturas centrais mais frias e um software mais simples para controlar o desempenho. Na versão atual do Vantage, os usuários devem permitir quatro configurações separadas individualmente (MUX, Overclock GPU, Vantage Performance e Windows Performance) a fim de explorar totalmente a potência do laptop, que pode ficar irritante ao alternar entre diferentes modos de potência.
Preço e Disponibilidade
Lenovo Legion 5 Pro 16ARH7H RTX 3070 Ti
- 10/29/2022 v7 (old)
Allen Ngo
Price comparison

