Avaliação do Acer Swift Go 14 - O Meteor Lake Core Ultra 7 impressiona com seu núcleo de IA
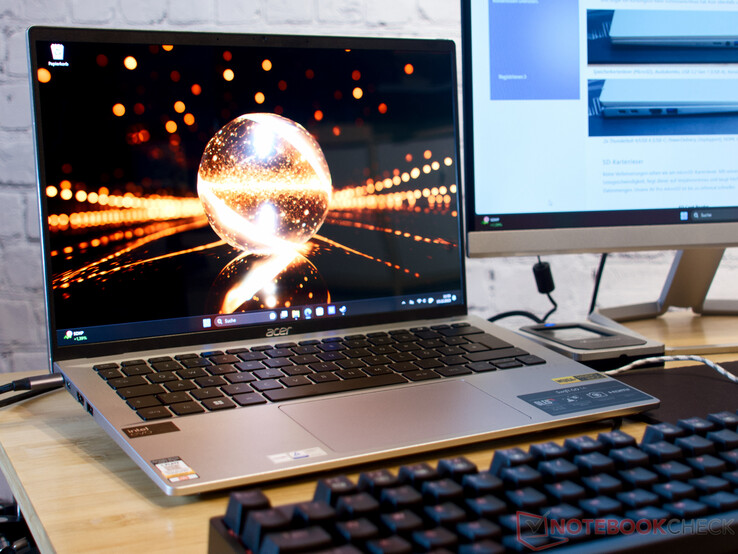
Ainda não se passaram dois meses desde que analisamos o Acer Swift Go 14. Ele nos impressionou pelo bom desempenho a um preço acessível. Nosso dispositivo de análise atual vem com a última geração de processadores da Intel. O Acer Swift Go 14 - que estará disponível na próxima primavera - possui um processador Intel Core Ultra 155H. Do ponto de vista do hardware, a Acer nos forneceu um laptop baseado em um dispositivo com especificações padrão. No entanto, até a primavera, ainda haverá pequenas melhorias no software que o acompanha, no gerenciamento de desempenho e no BIOS. Por esse motivo, não atribuiremos uma classificação até vermos quais melhorias futuras a última geração de processadores da Intel trará para esse modelo premium com tela OLED.
Em alguns benchmarks, registramos mais do que o dobro do desempenho em comparação com o antecessor, que tinha um Intel Core i5-1335U. Além disso, a nova Arc iGPU da Intel, sem dúvida, agradará a muitos gamers com os gráficos da Intel agora, pelo menos, no mesmo nível da Radeon RX 780M.
A própria Intel costuma comparar seus novos processadores com o Ryzen R7 7840U da AMD e, por esse motivo, daremos uma olhada no HP Pavillon Plus 14, que vem com variantes de processador Intel e AMD, como parte de nossa comparação. Um representante bastante incomum poderia ser o Ayaneo Air 1S, mas esse dispositivo também vem com o poderoso chip concorrente da AMD. E, finalmente, o LG Gram 2in1 e o Acer Swift Go 14 SFG14-71 e seu processador de 13ª geração concluem nosso ilustre grupo.
Possíveis concorrentes em comparação
Avaliação | Data | Modelo | Peso | Altura | Size | Resolução | Preço |
|---|---|---|---|---|---|---|---|
v (old) | 12/2023 | Acer Swift Go 14 SFG14-72 Ultra 7 155H, Arc 8-Core | 1.3 kg | 14.9 mm | 14.00" | 2880x1800 | |
| 85.6 % v7 (old) | 11/2023 | Acer Swift Go 14 SFG14-71 i5-1335U, Iris Xe G7 80EUs | 1.3 kg | 14.9 mm | 14.00" | 2880x1800 | |
| 85.8 % v7 (old) | 11/2023 | LG Gram 2in1 16 16T90R - G.AA78G i7-1360P, Iris Xe G7 96EUs | 1.5 kg | 17.2 mm | 16.00" | 2560x1600 | |
| 87.5 % v7 (old) | 12/2023 | HP Pavilion Plus 14-ew0153TU i7-1355U, Iris Xe G7 96EUs | 1.4 kg | 17.5 mm | 14.00" | 2880x1800 | |
| 90.4 % v7 (old) | 12/2023 | Lenovo ThinkPad T14 G4 21K4S02000 R7 PRO 7840U, Radeon 780M | 1.5 kg | 17.9 mm | 14.00" | 1920x1200 | |
| 88.2 % v7 (old) | 10/2023 | Ayaneo Air 1S Retro Power R7 7840U, Radeon 780M | 443.8 g | 21 mm | 5.50" | 1920x1080 | |
| 87.8 % v7 (old) | 11/2023 | HP Pavilion Plus 14-ey0095cl R7 7840U, Radeon 780M | 1.4 kg | 18.8 mm | 14.00" | 2880x1800 |
Caixa - Alumínio angular
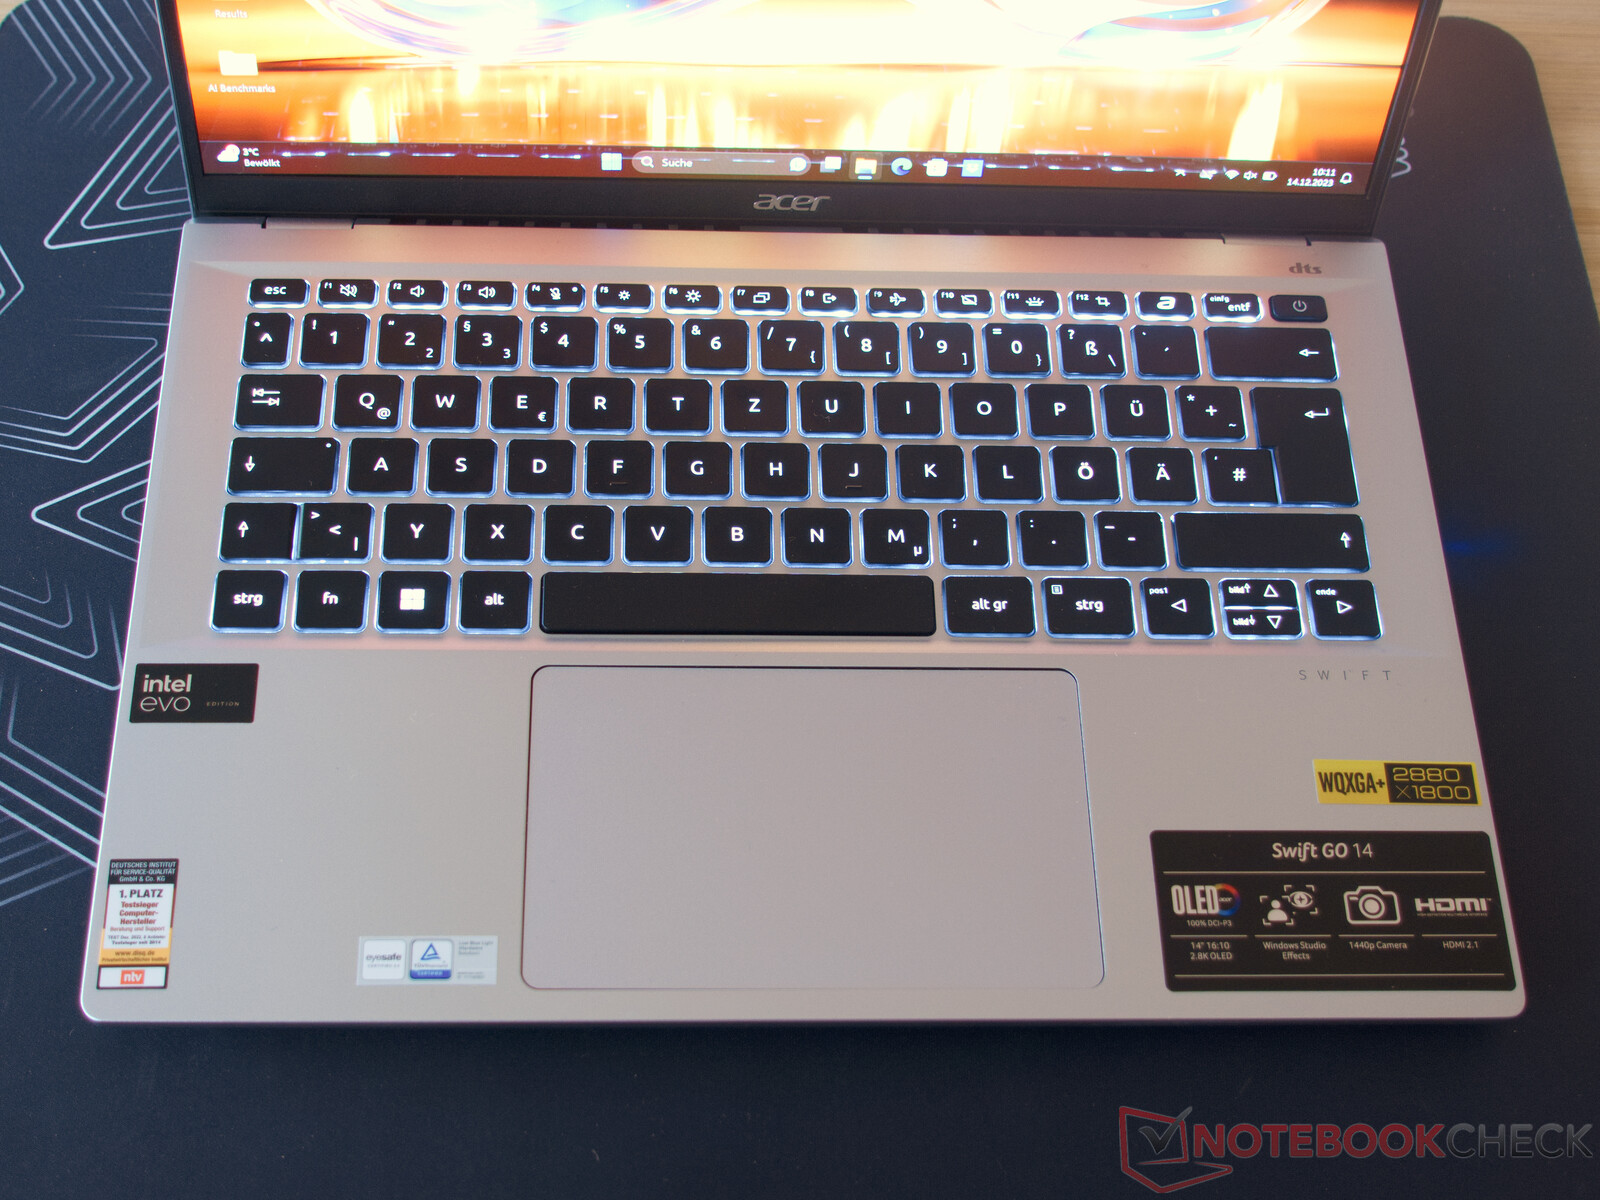
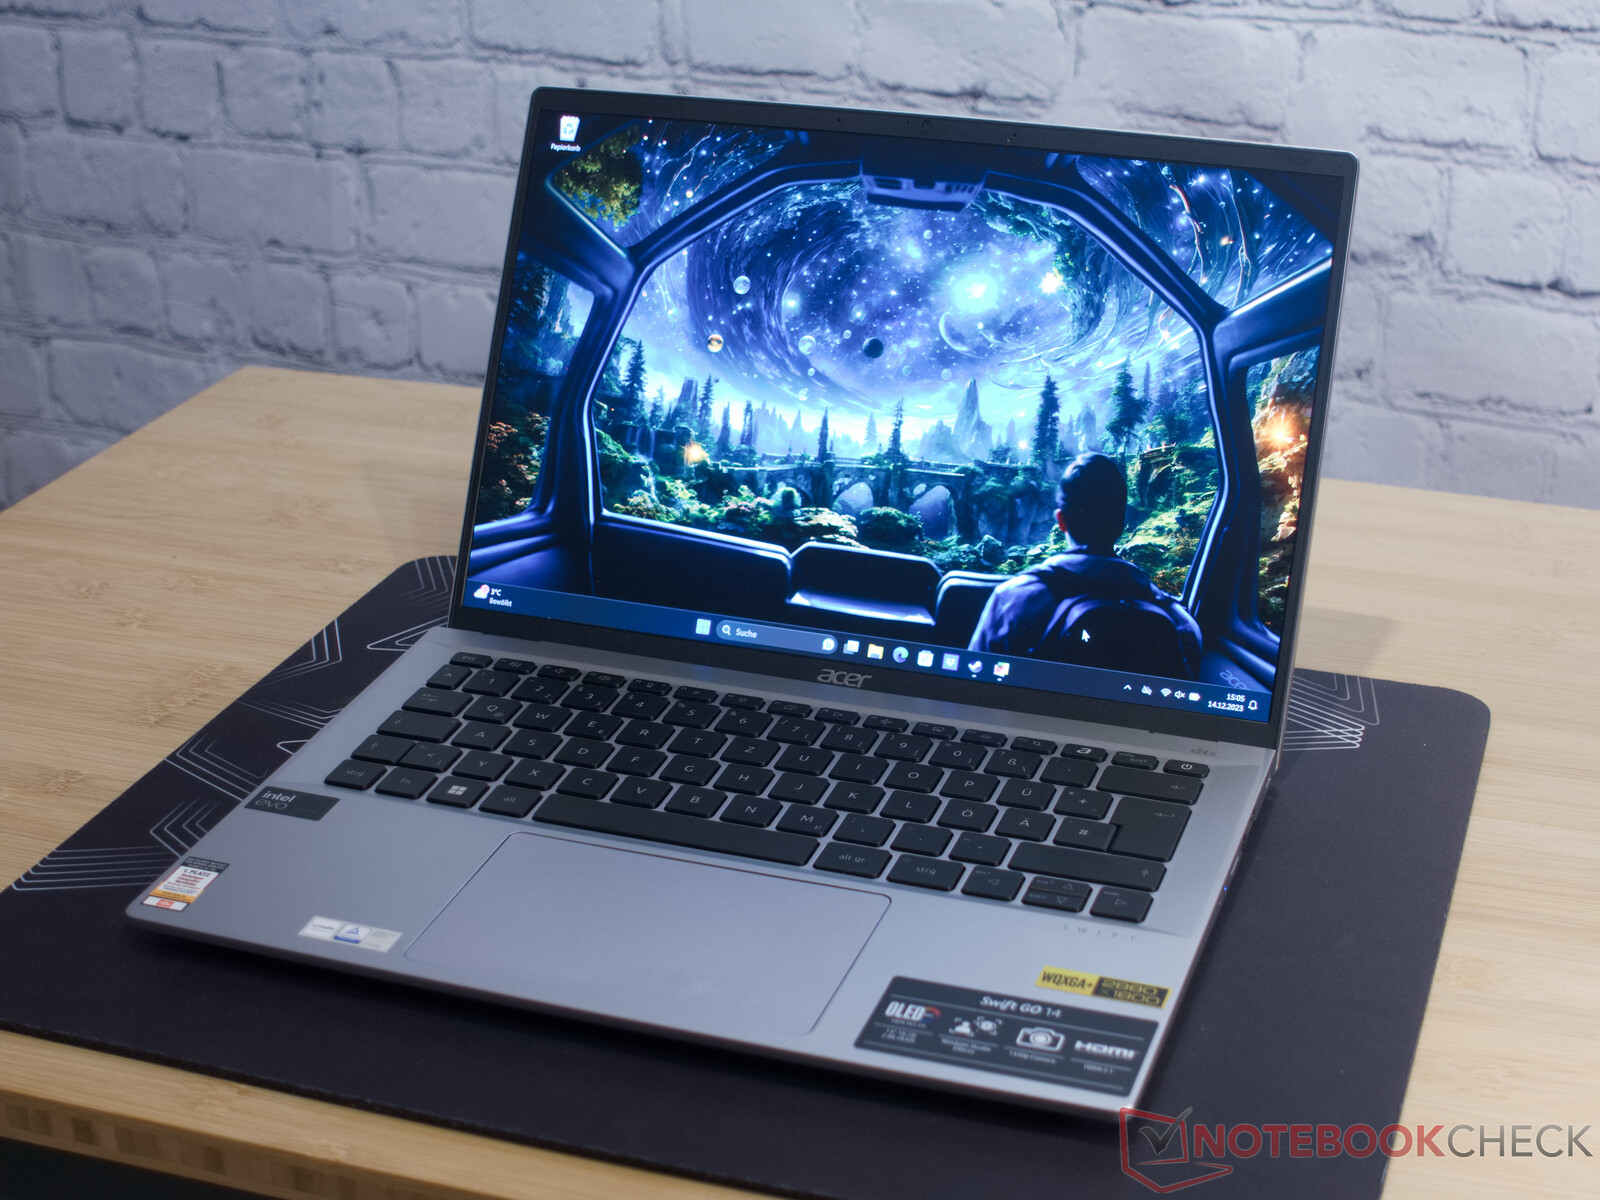
Embora as primeiras impressões sugiram que o dispositivo não sofreu nenhuma alteração, ainda assim notamos que a Acer realizou melhorias detalhadas na estrutura de alumínio. O design angular da estrutura não revela nenhuma falha de fabricação e isso significa que poderíamos quase copiar e colar toda a descrição do antecessor. No entanto, a Acer conseguiu instalar um touchpad significativamente maior, resultando em uma melhoria notável na usabilidade do laptop.

Recursos - Wi-Fi incrível e uma excelente webcam
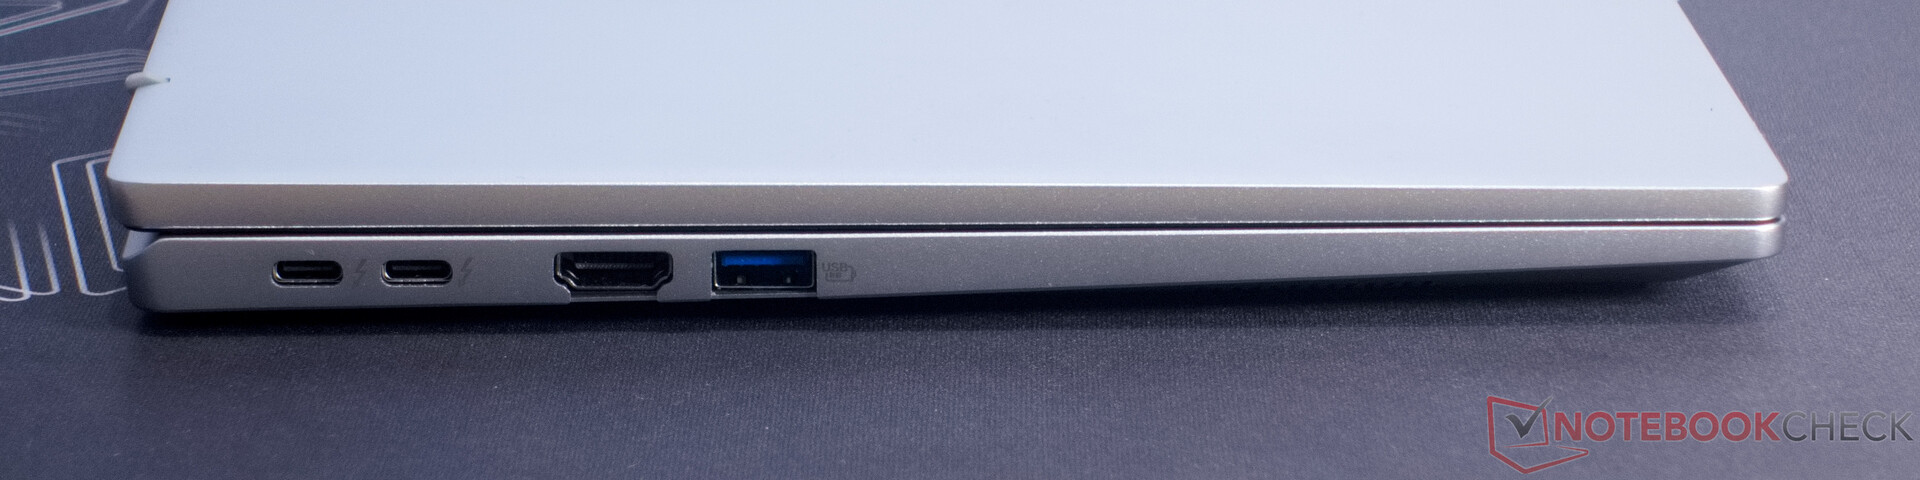
É possível conectar até três monitores ao pequeno laptop via HDMI 2.1 e ambas as portas Thunderbolt 4. O atual processador Intel Meteor Lake suporta a saída para até quatro monitores simultaneamente. Da mesma forma, a Acer conseguiu abrigar um leitor de cartão microSD e até mesmo um slot mini Kensington Lock.
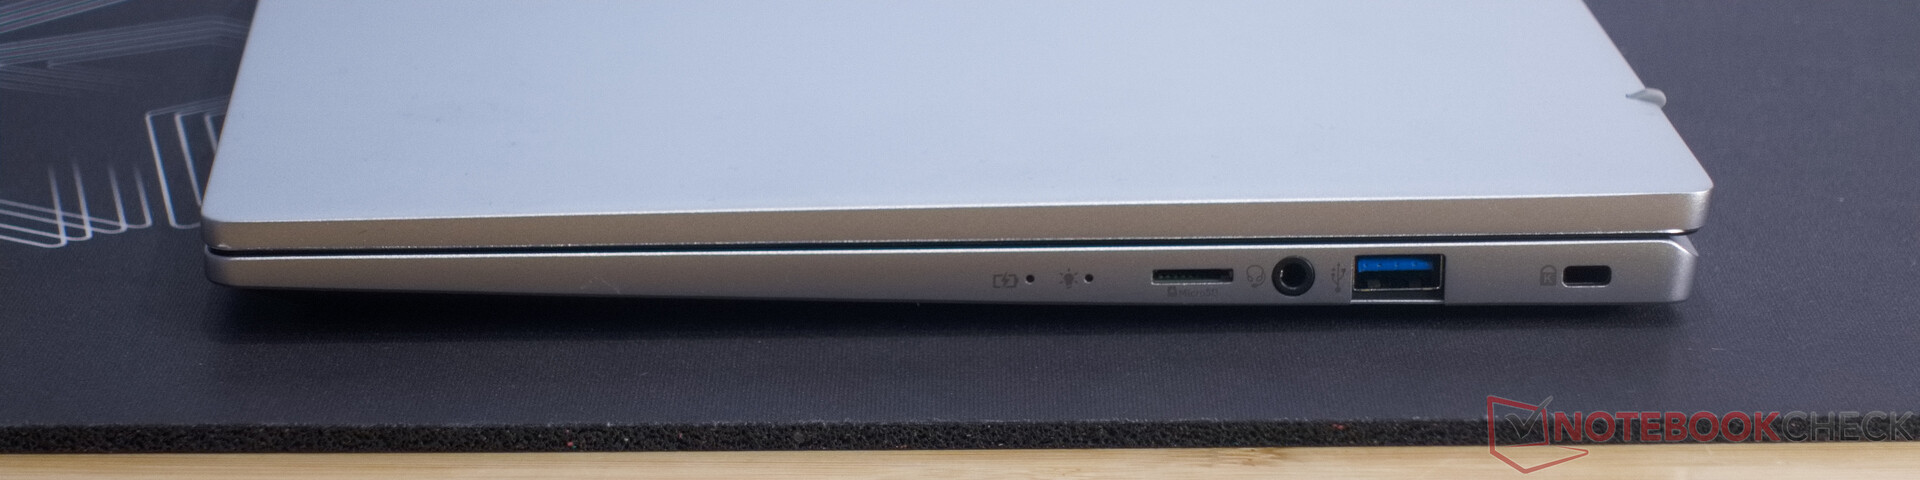
Leitor de cartão SD
Não há melhorias no leitor de cartão microSD. Com sua lenta velocidade de leitura de 28 MB/s, ele é comparável ao modelo do ano passado e é adequado apenas para pequenas quantidades de dados. Nosso microSD AV Pro é até dez vezes mais rápido.
| SD Card Reader | |
| average JPG Copy Test (av. of 3 runs) | |
| Média da turma Subnotebook (23.7 - 188, n=9, últimos 2 anos) | |
| Acer Swift Go 14 SFG14-72 | |
| maximum AS SSD Seq Read Test (1GB) | |
| Média da turma Subnotebook (24.9 - 195, n=8, últimos 2 anos) | |
| Acer Swift Go 14 SFG14-72 | |
Comunicação
Usando o iPerf3 e o Asus GT-AXE11000, em nosso teste de Wi-Fi, o Acer Swift Go demonstrou velocidades de transferência consideravelmente mais altas nas redes de 5 GHz e 6 GHz. Com até 1,9 GBit/s, os uploads e downloads para uma rede doméstica se movem em um ritmo acelerado.
Webcam
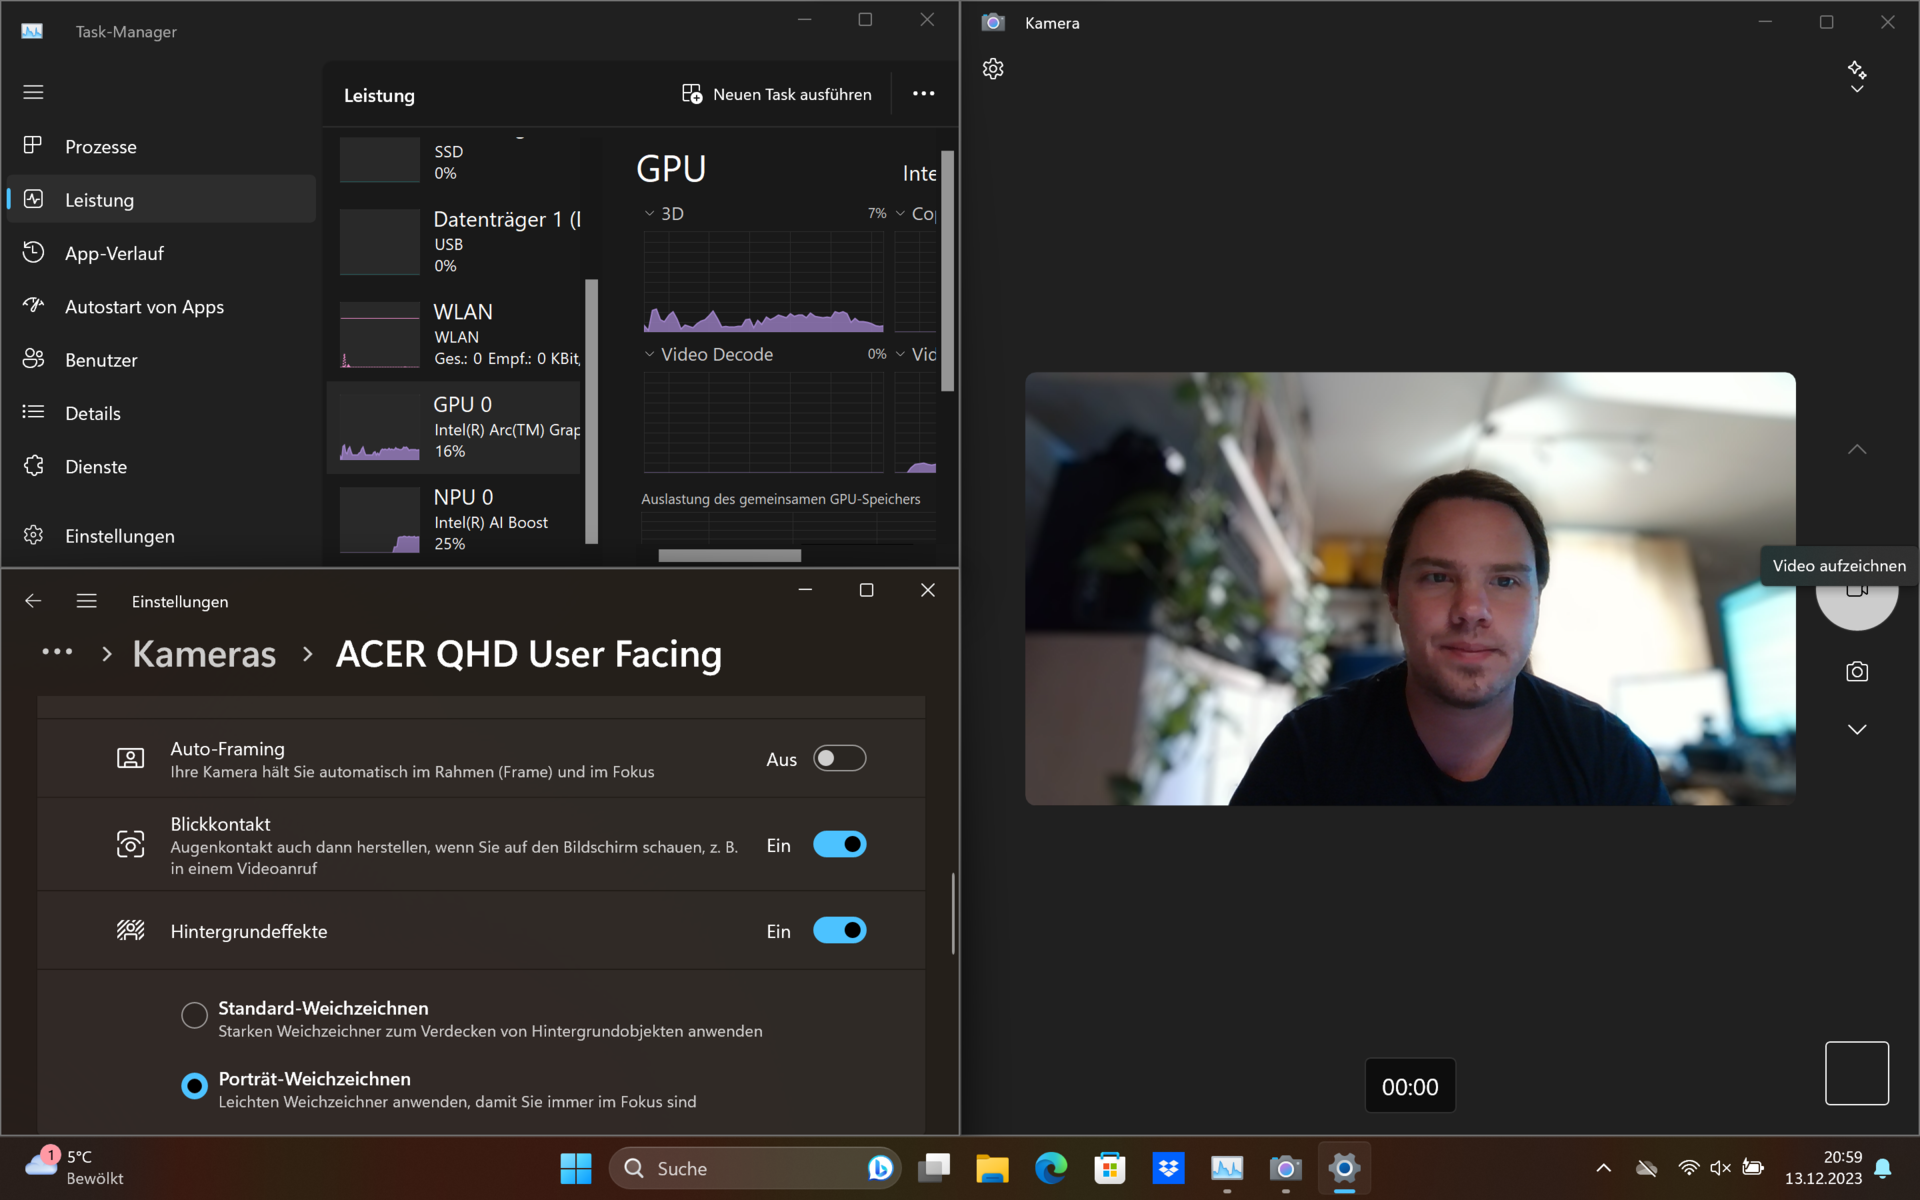
A webcam QHD do Acer Swift Go apresentou resultados muito impressionantes. A qualidade da imagem pode até ser melhorada um pouco mais graças à NPU da Intel e ao Windows Studio Effects. No entanto, isso sobrecarrega a iGPU e, como seria de esperar, os ventiladores do Acer Swift Go fazem sentir sua presença de forma rápida e barulhenta.


Segurança
Um sensor de impressão digital, um slot Kensington Lock e um TPM 2.0 estão integrados. Isso significa que todos os requisitos básicos de segurança relativos a roubo físico e proteção de acesso são atendidos.
Manutenção
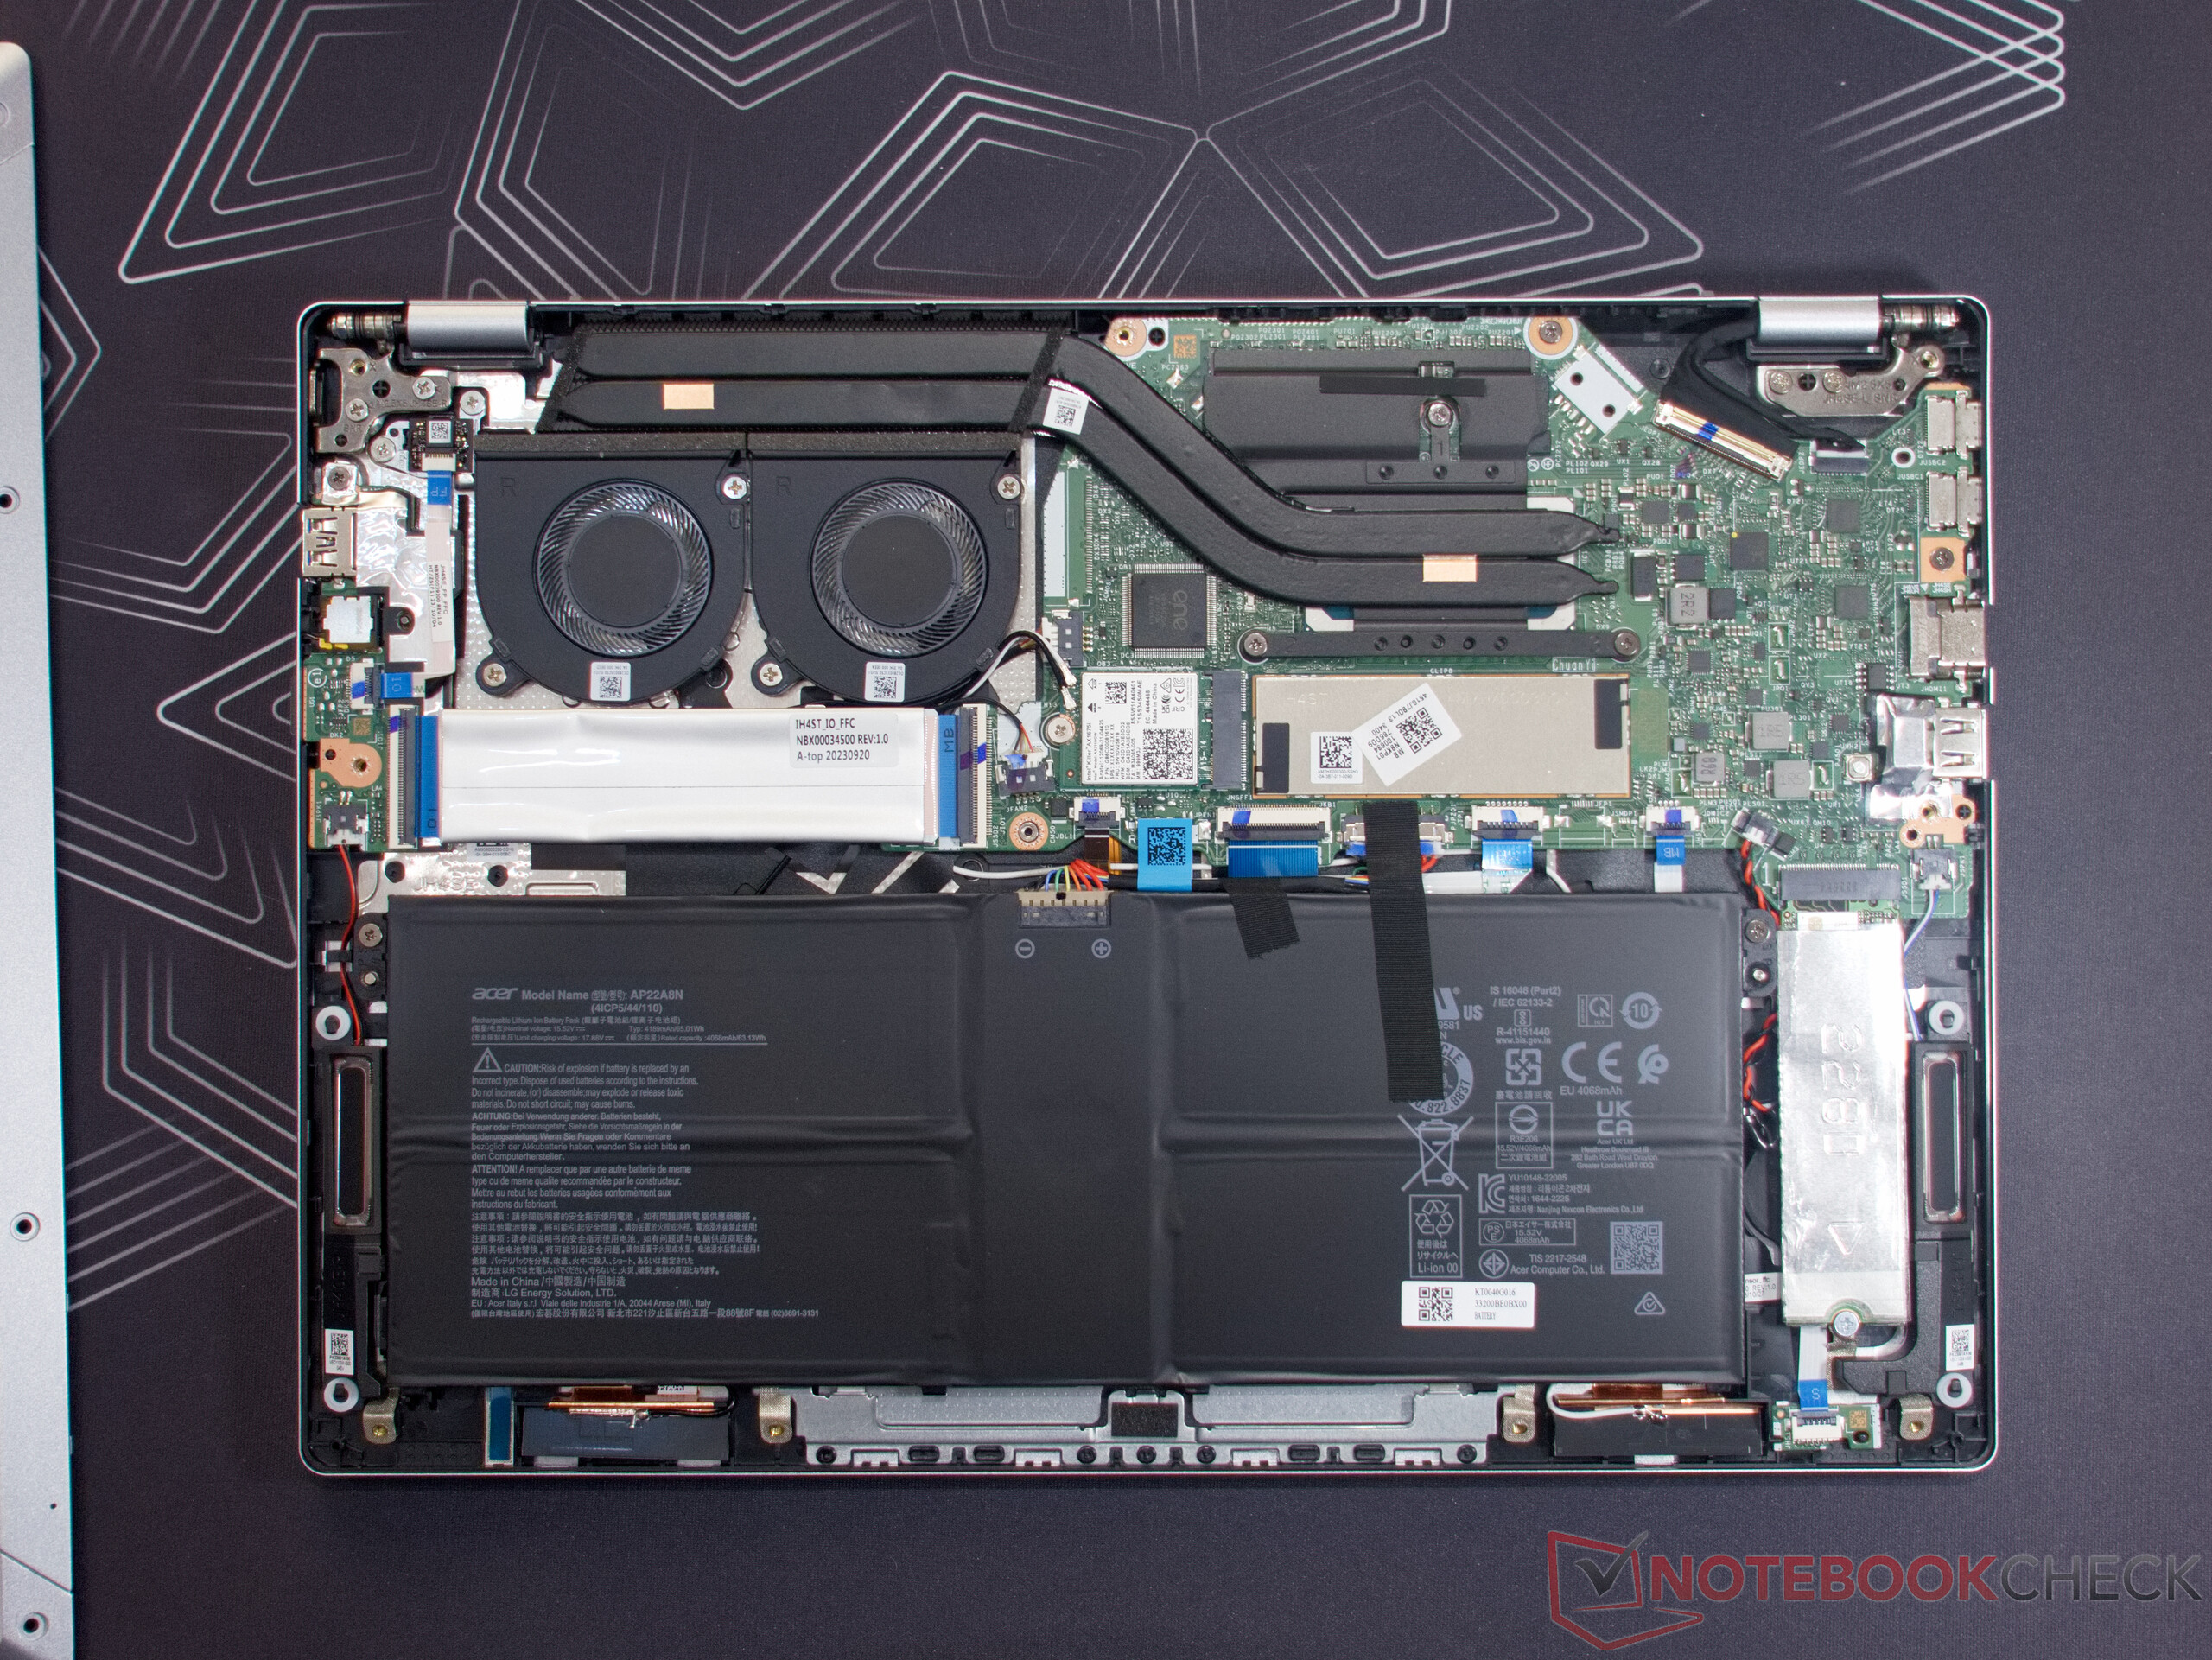
Foi necessária uma chave de fenda TX5 e uma ventosa para abrir o Acer Swift Go. Assim como no o antecessormuitas opções de manutenção podem ser encontradas no interior do laptop. Estão disponíveis dois slots M.2 (um ocupado), bem como um módulo Wi-Fi instalado. As ventoinhas podem ser facilmente removidas para fins de limpeza. Somente a memória RAM de 32 GB, de tamanho generoso, é soldada. A propósito, o slot M.2 livre pode ser encontrado sob o cabo de fita ao lado das ventoinhas.
Dispositivos de entrada - Um touchpad grande
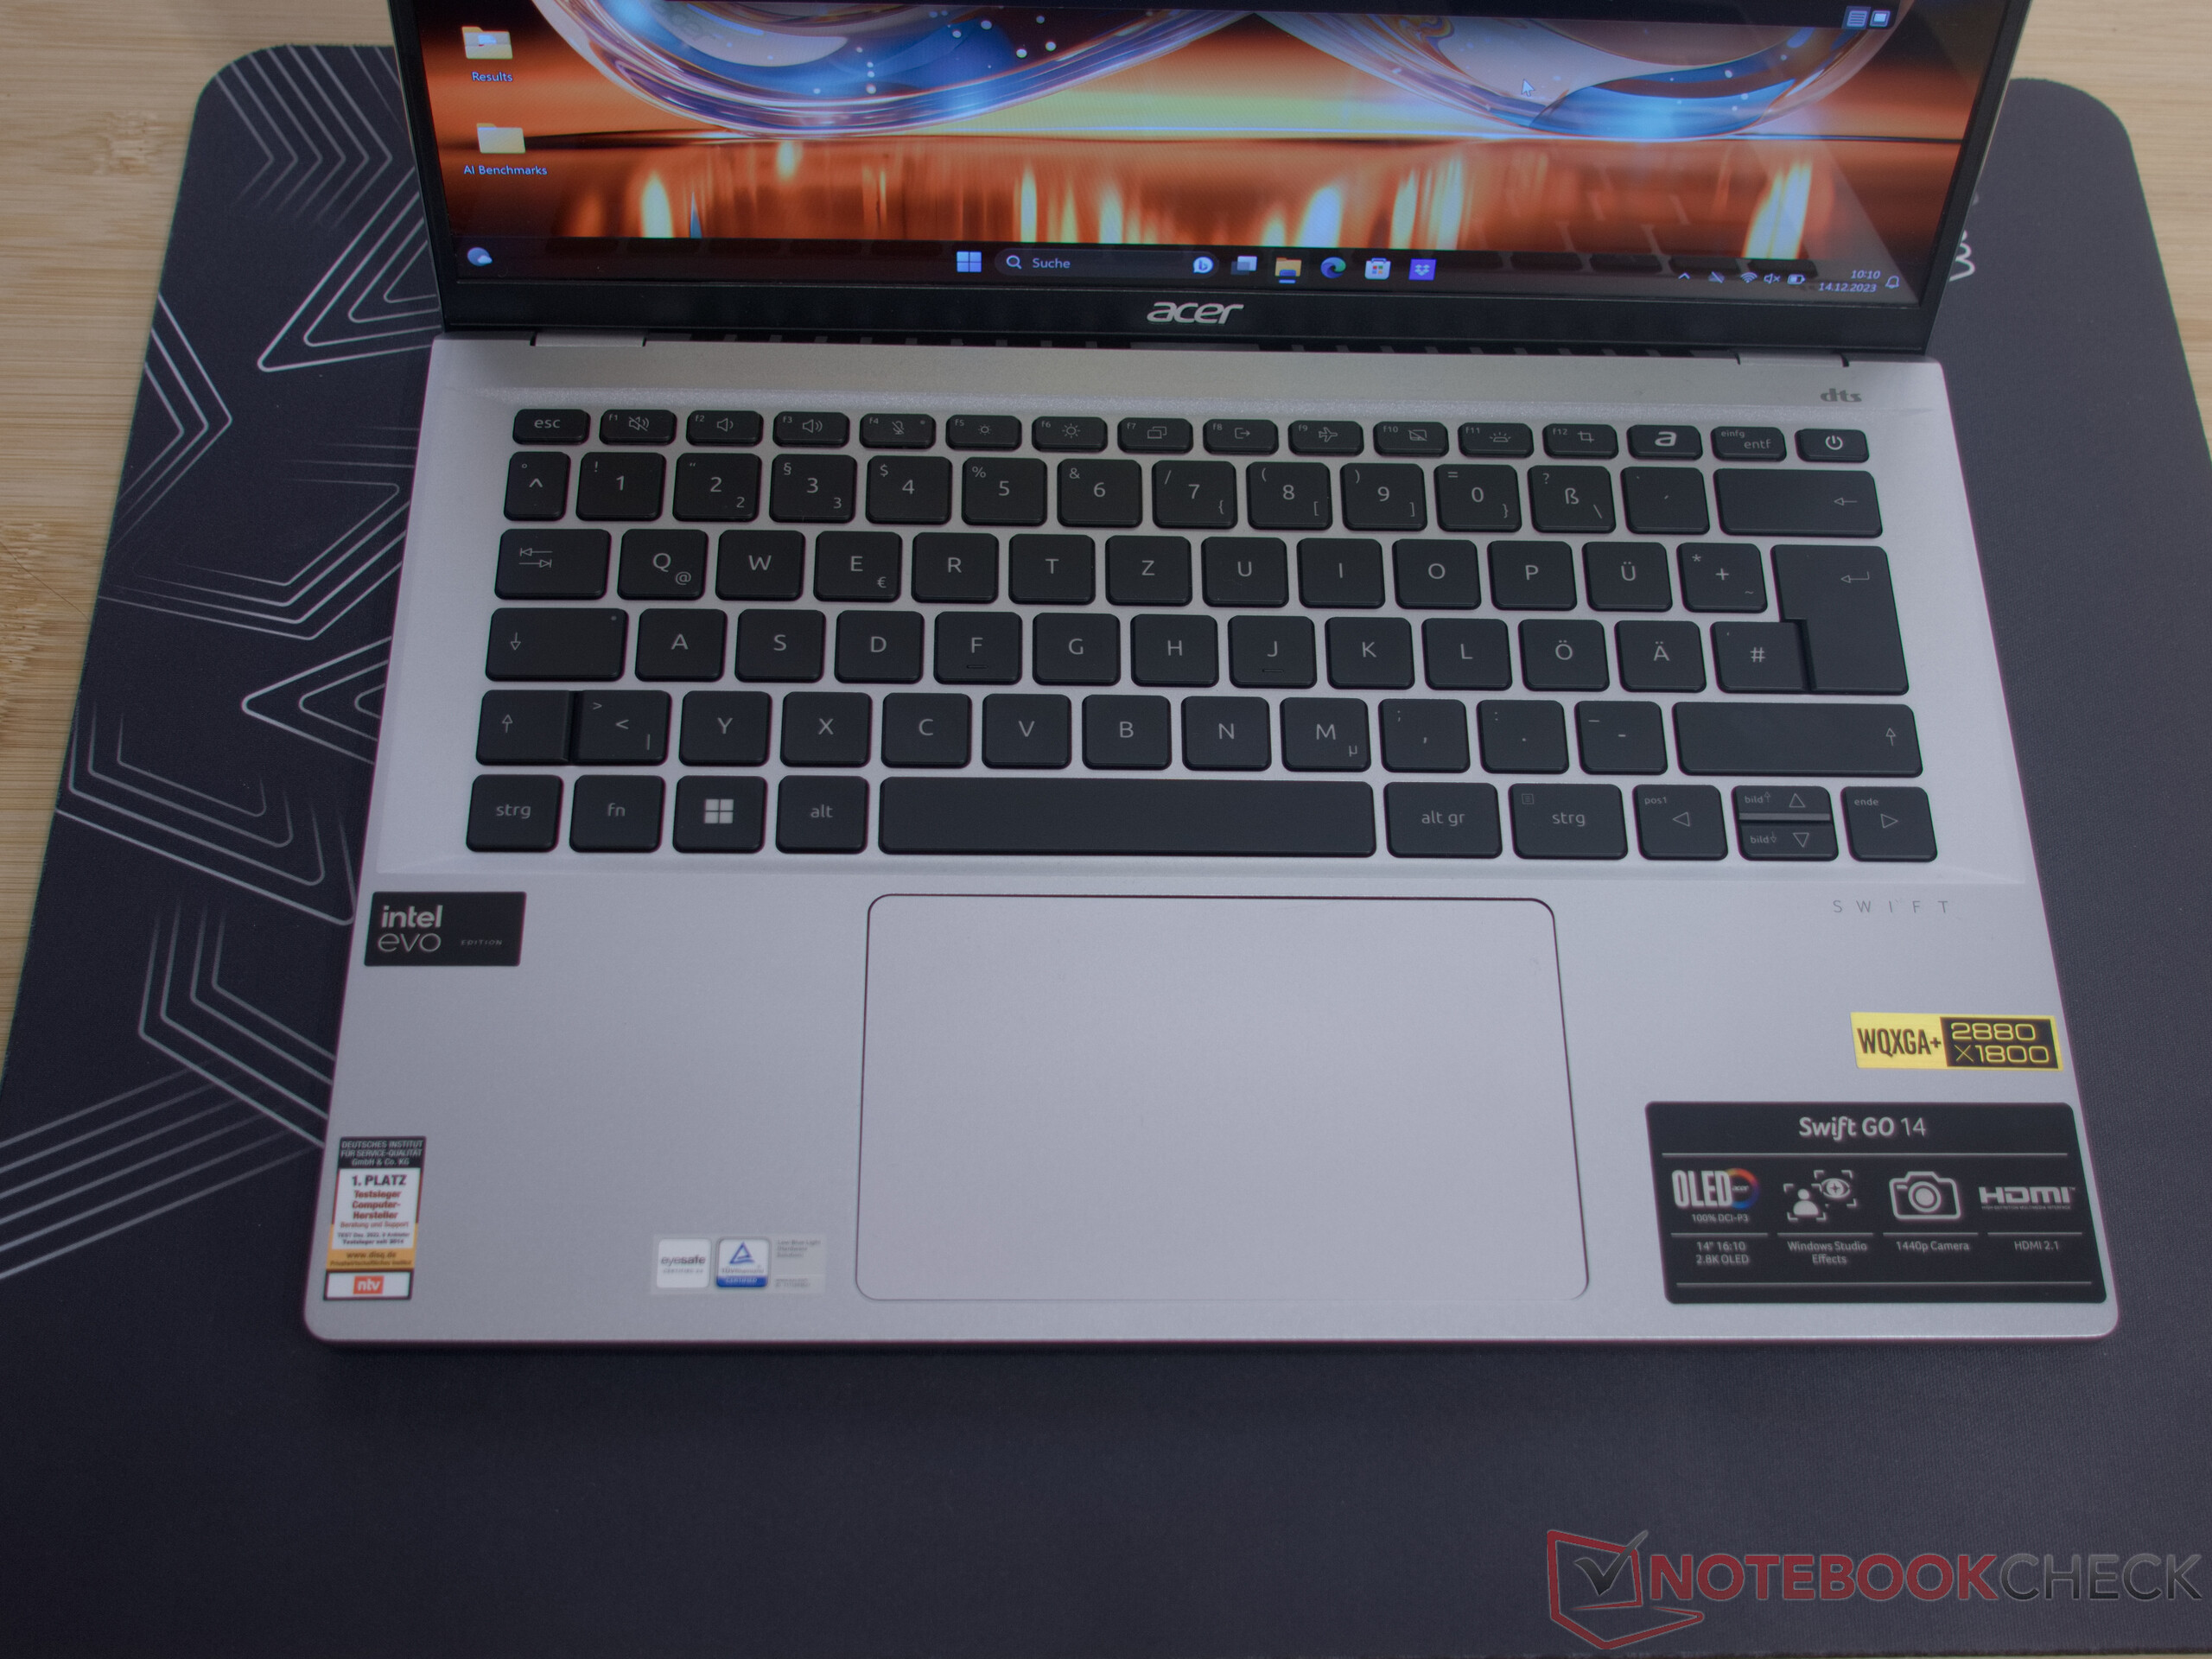
Teclado
Acima de tudo, o ponto de pressão da tecla retroiluminada poderia ser um pouco mais nítido. Fora isso, o teclado oferece uma experiência de digitação agradável. Em ambientes escuros, a luz de fundo das teclas pode ser ajustada em dois níveis. Da mesma forma que o antecessor, o revestimento superior também pode ser ligeiramente dobrado e isso pode irritar alguns usuários ao pressionar as teclas com firmeza.
Touchpad
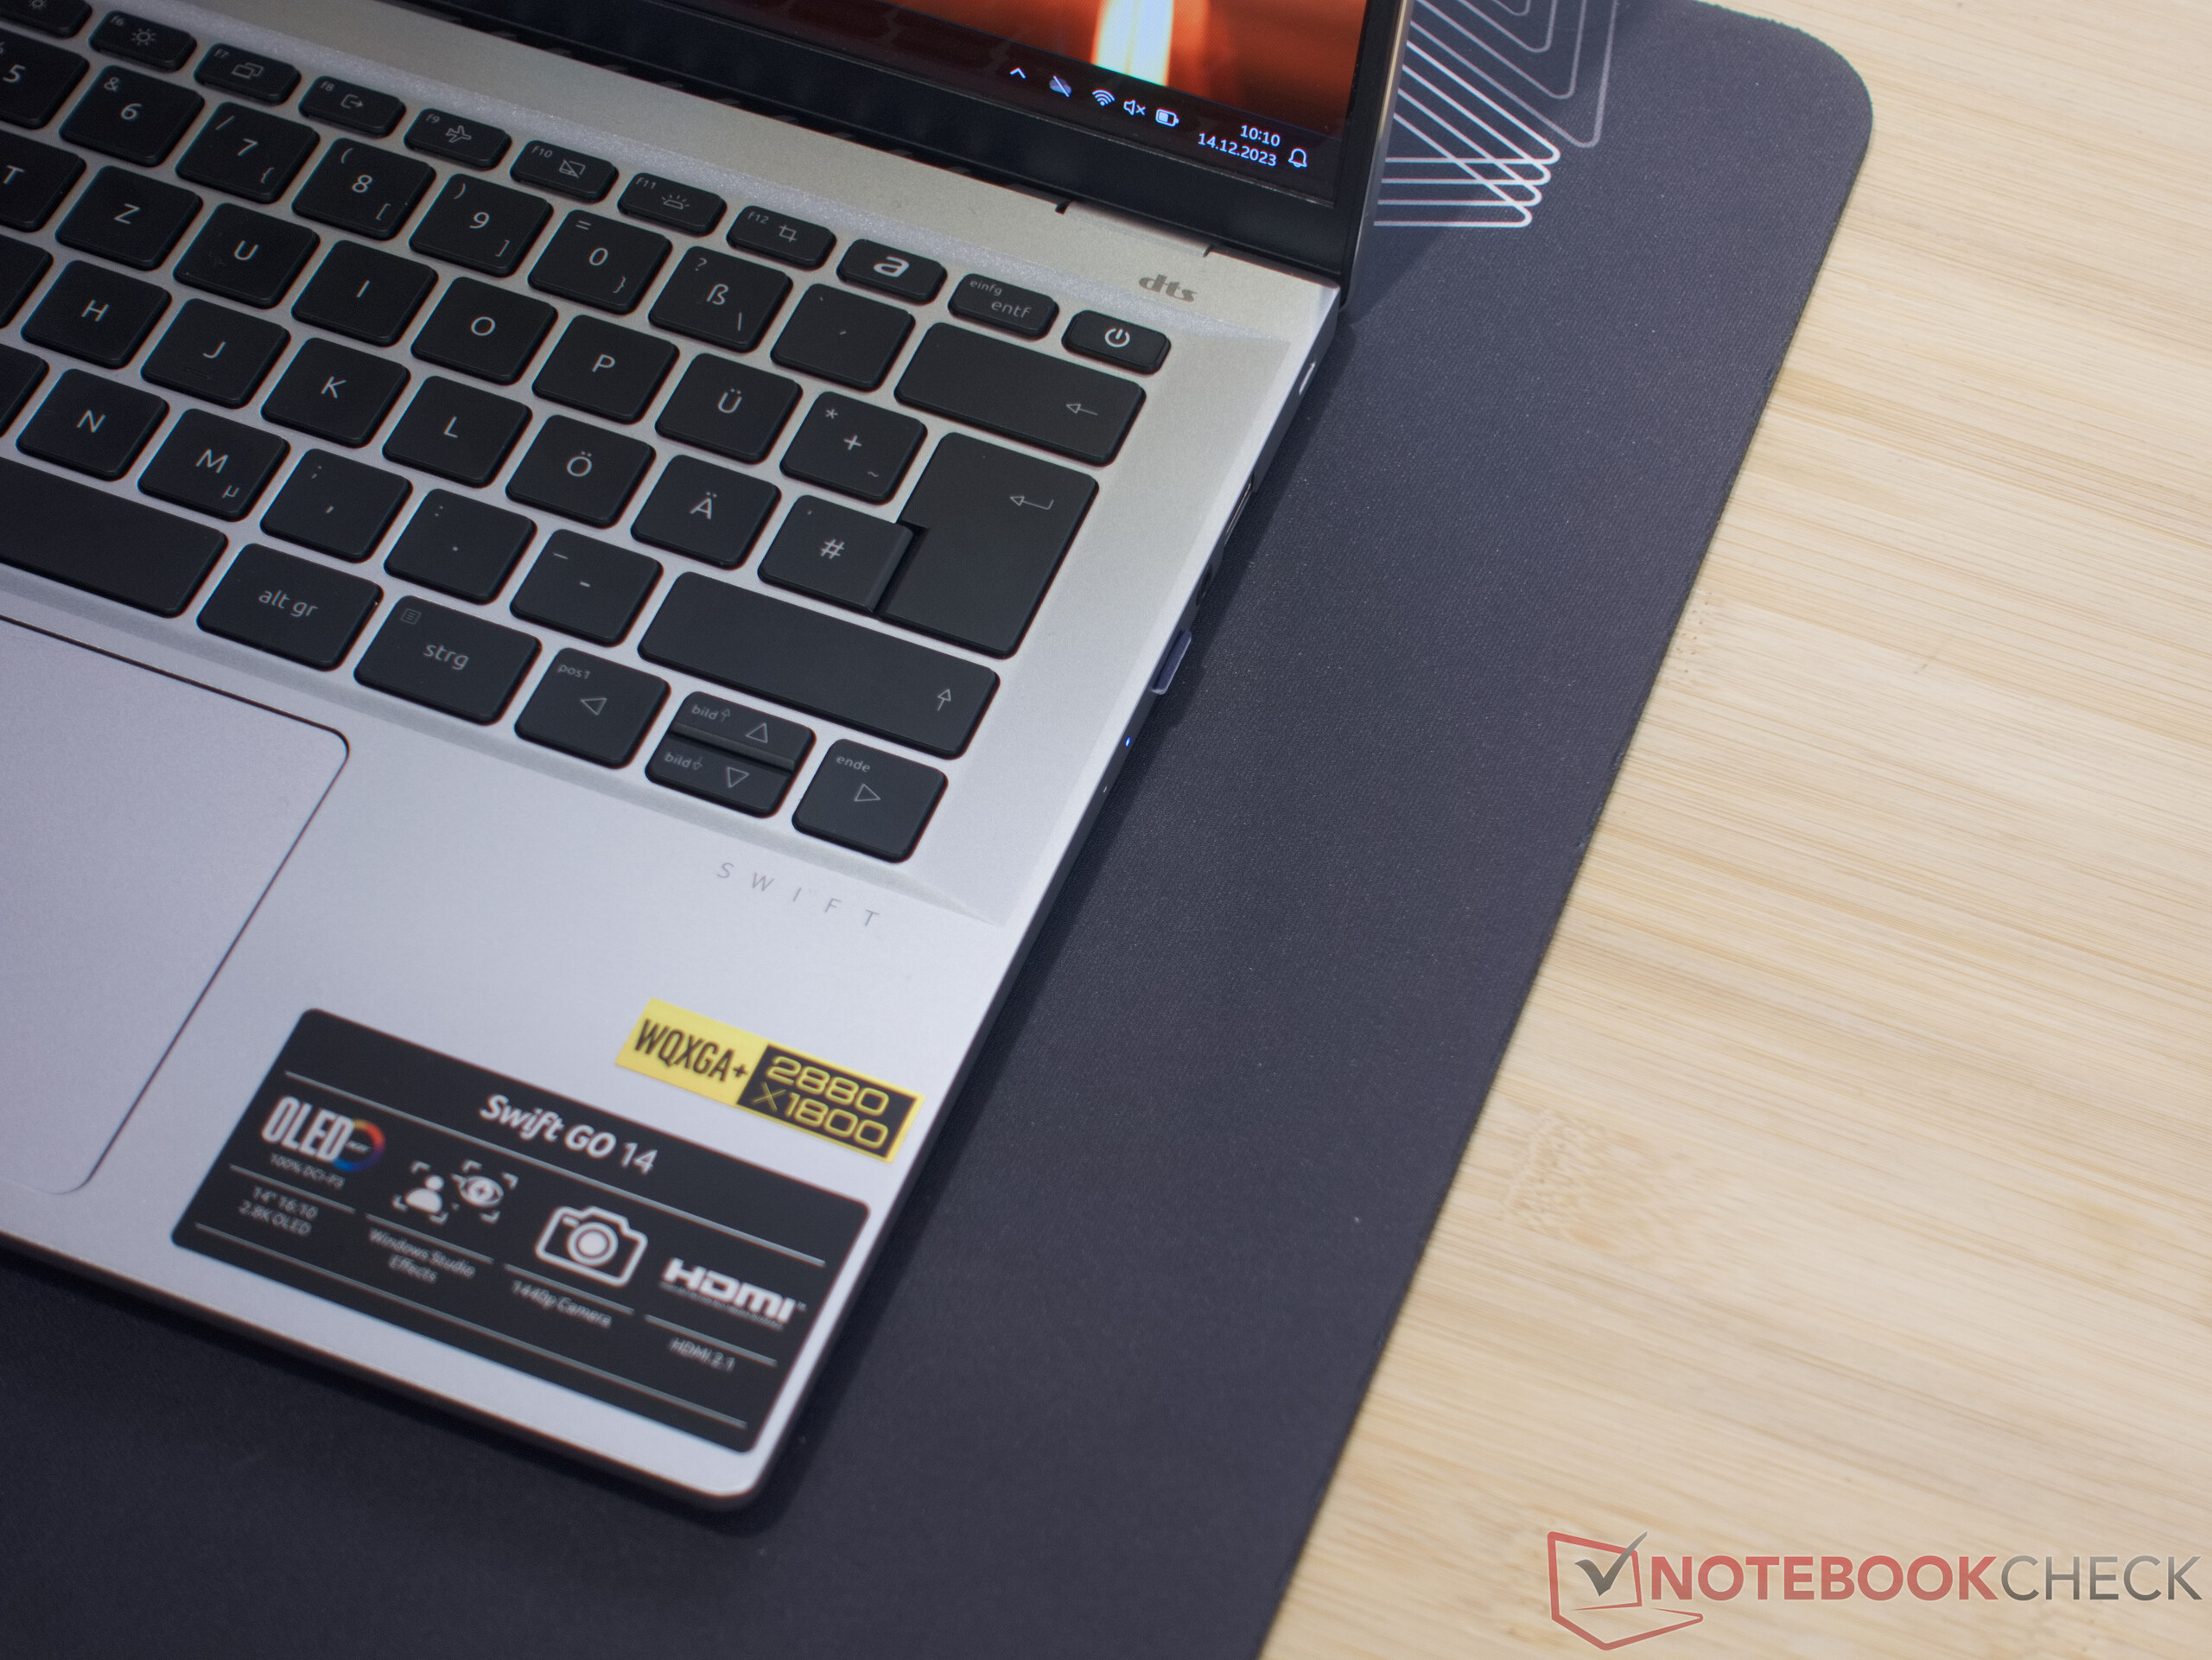
Na nova versão, a Acer aumentou significativamente o tamanho do touchpad do Swift Go 14, mas os raios nos cantos permanecem. Essa mudança não beneficia apenas a aparência. Na prática, muitas coisas, como arrastar e soltar e copiar, são mais fáceis de executar. Agora com 12 x 8 cm, o clickpad oferece muito mais espaço para entradas e controle por gestos.
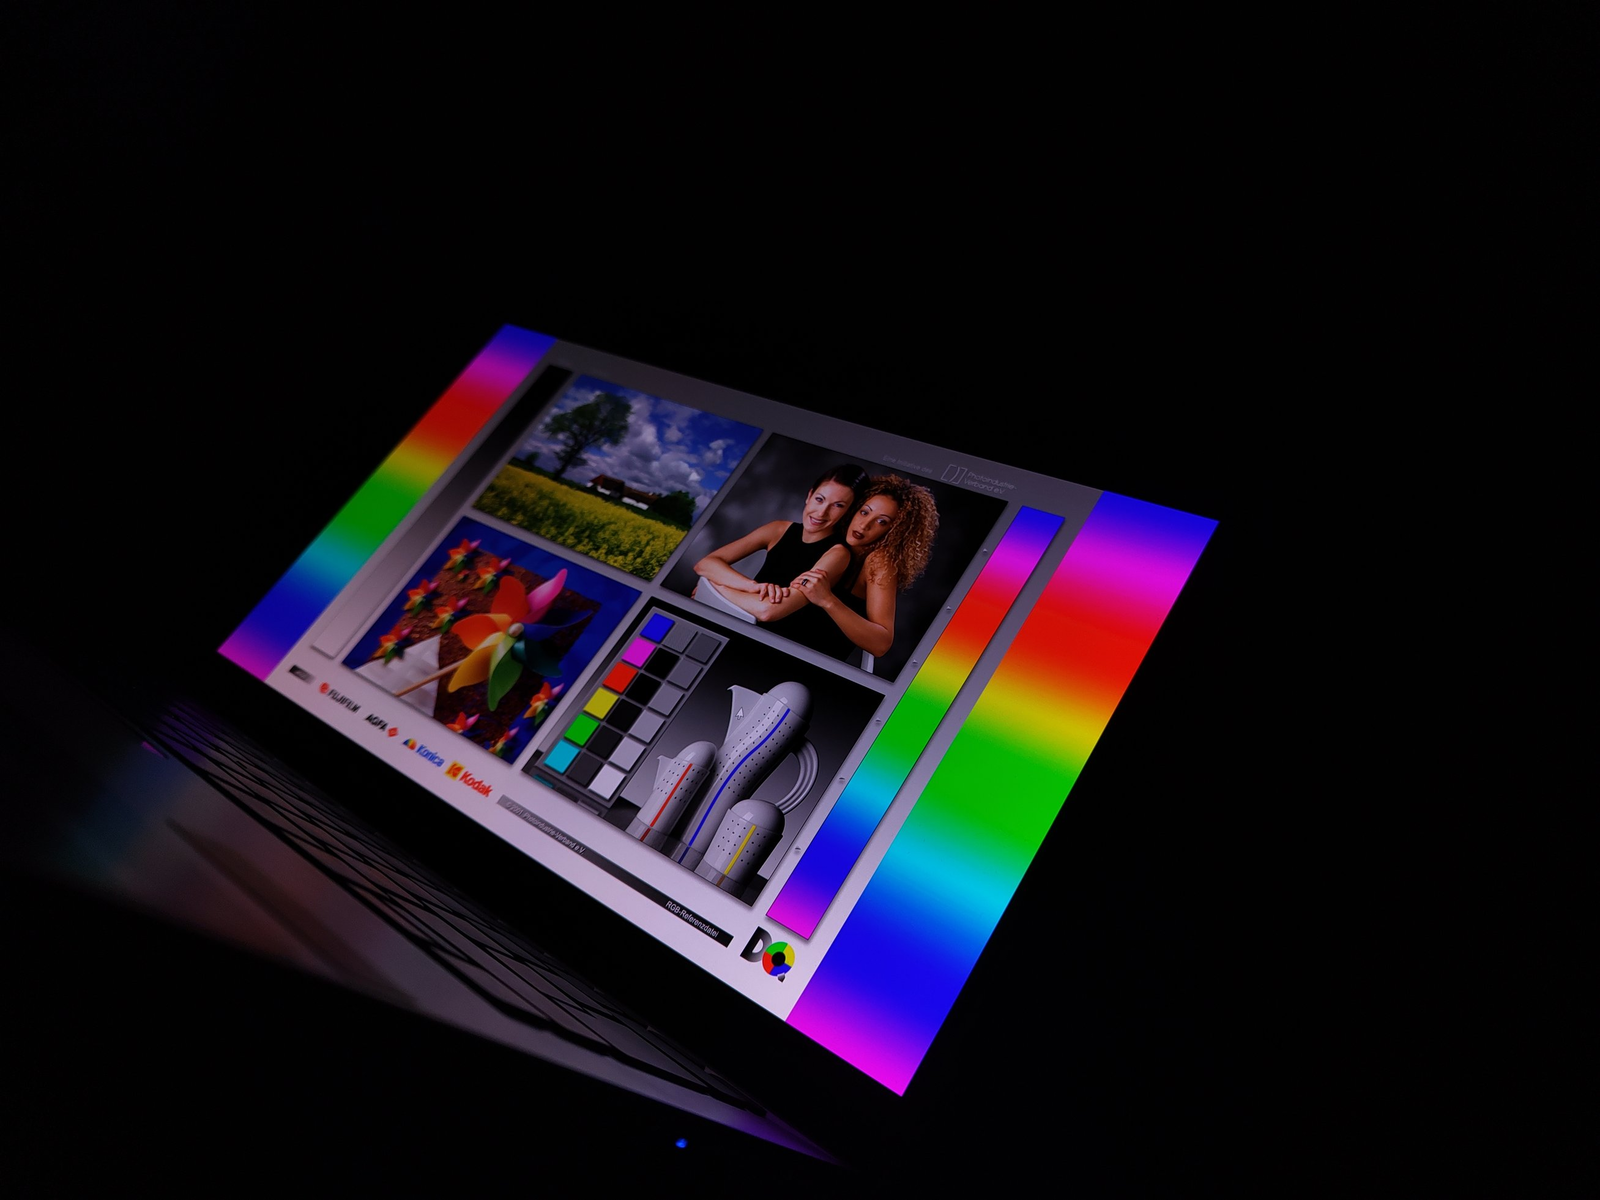
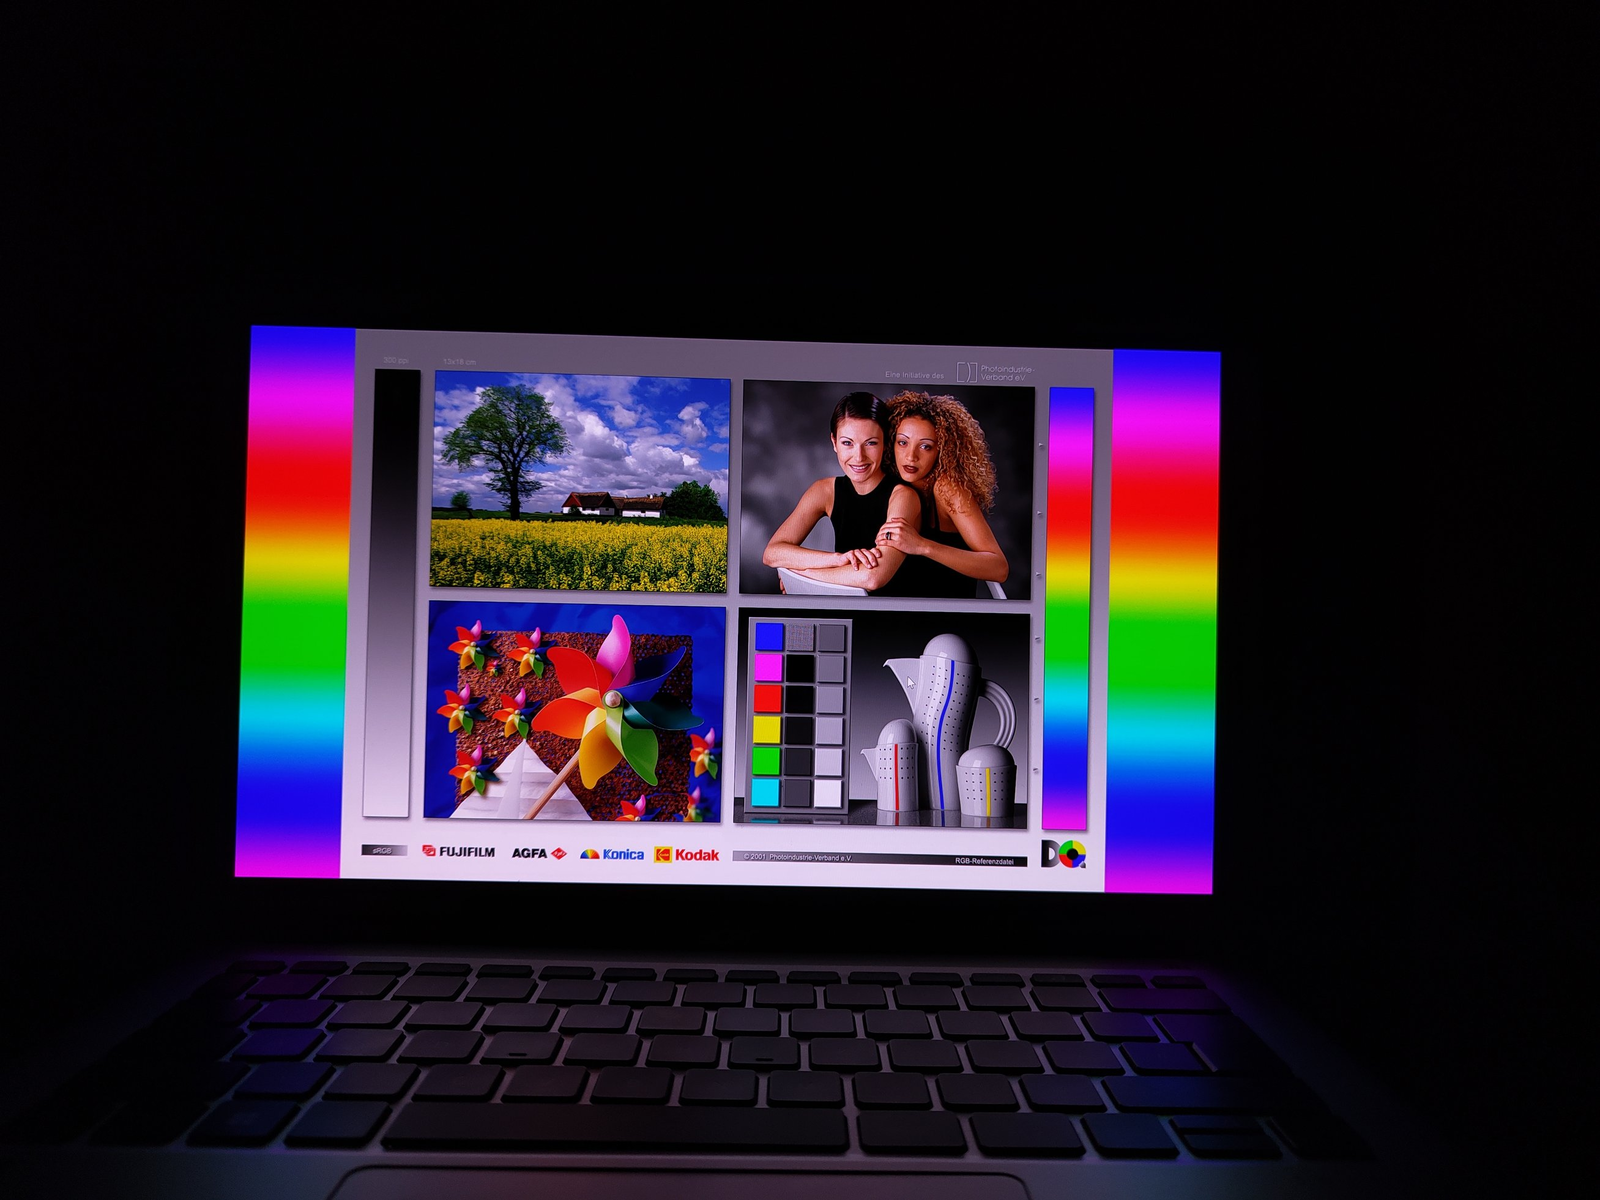
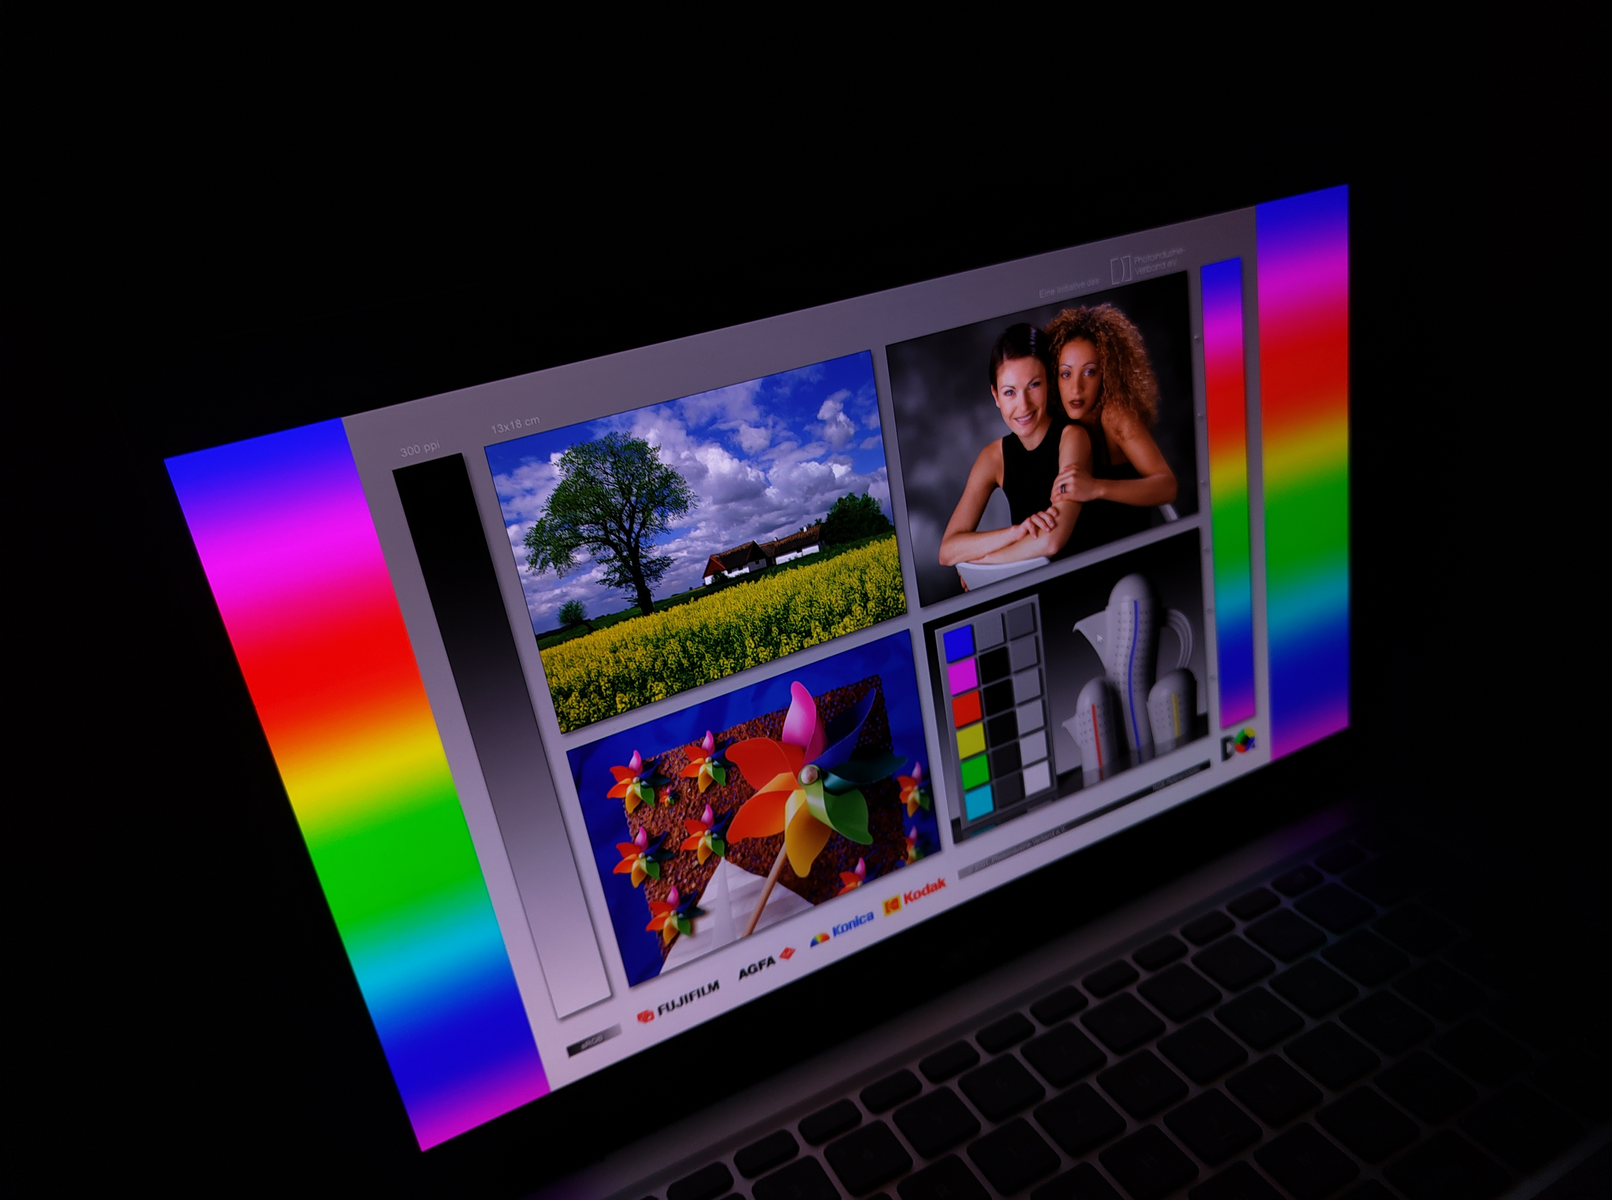
Tela - 2.8K, 90Hz OLED e HDR500
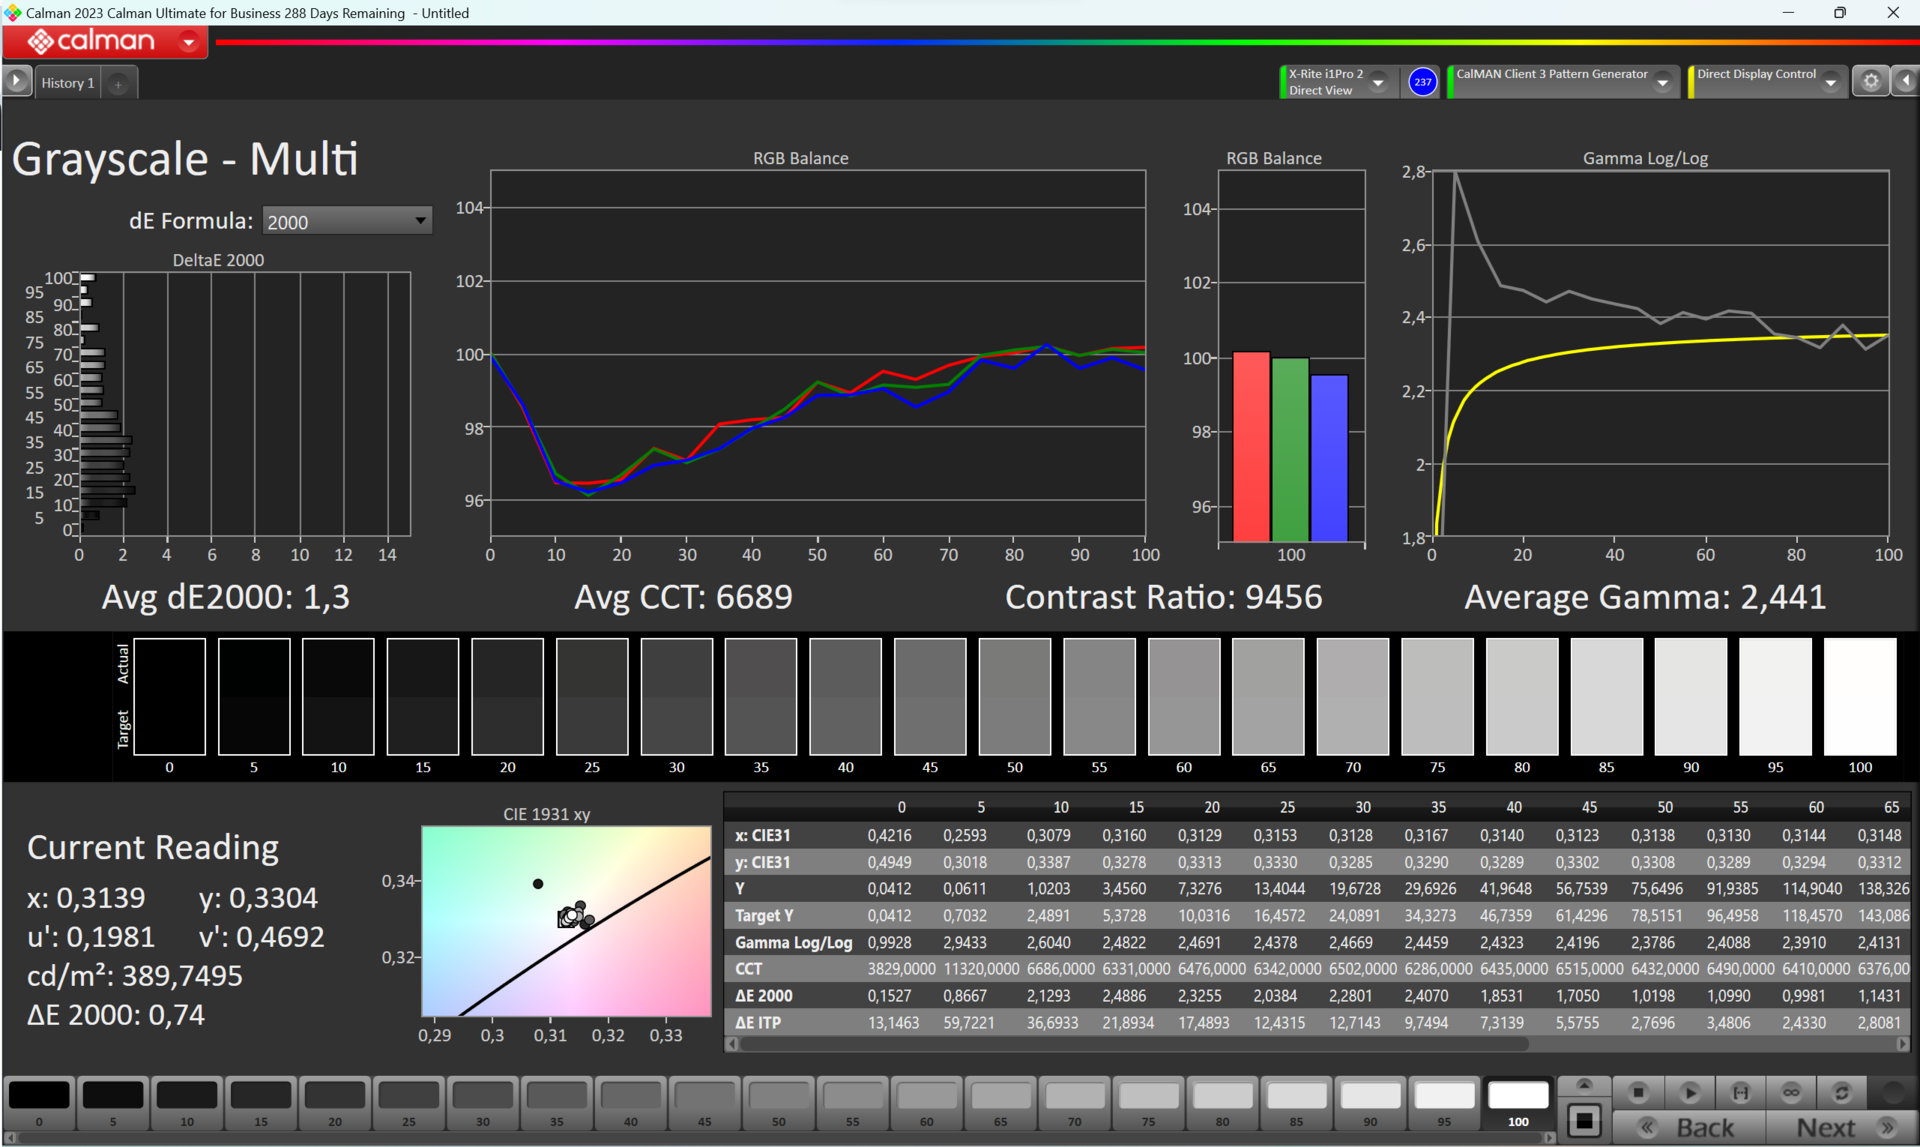
O modelo Acer Swift Go com processador Meteor Lake agora possui um painel OLED muito mais brilhante. Ele pode atingir 400 cd/m², e ainda mais, ao exibir conteúdo HDR. Pretos profundos e altos níveis de contraste são padrão para esse tipo de tecnologia de tela. O brilho é uniforme e, com uma resolução de 2,8K, em uma proporção de aspecto 16:10 de 14 polegadas (cerca de 36 cm), quase não é possível ver pixels individuais a olho nu. Isso tudo garante que possamos desfrutar de uma qualidade de imagem maravilhosa que pode brilhar tanto em ambientes externos quanto sob luzes de estúdio.
O novo aplicativo AcerSense do Swift Go oferece mais perfis de tela. No entanto, ainda não observamos nenhuma alteração nos valores medidos nos vários perfis. Como mencionado no início, a Acer ainda está trabalhando nos detalhes finais do laptop.
| |||||||||||||||||||||||||
iluminação: 98 %
iluminação com acumulador: 385 cd/m²
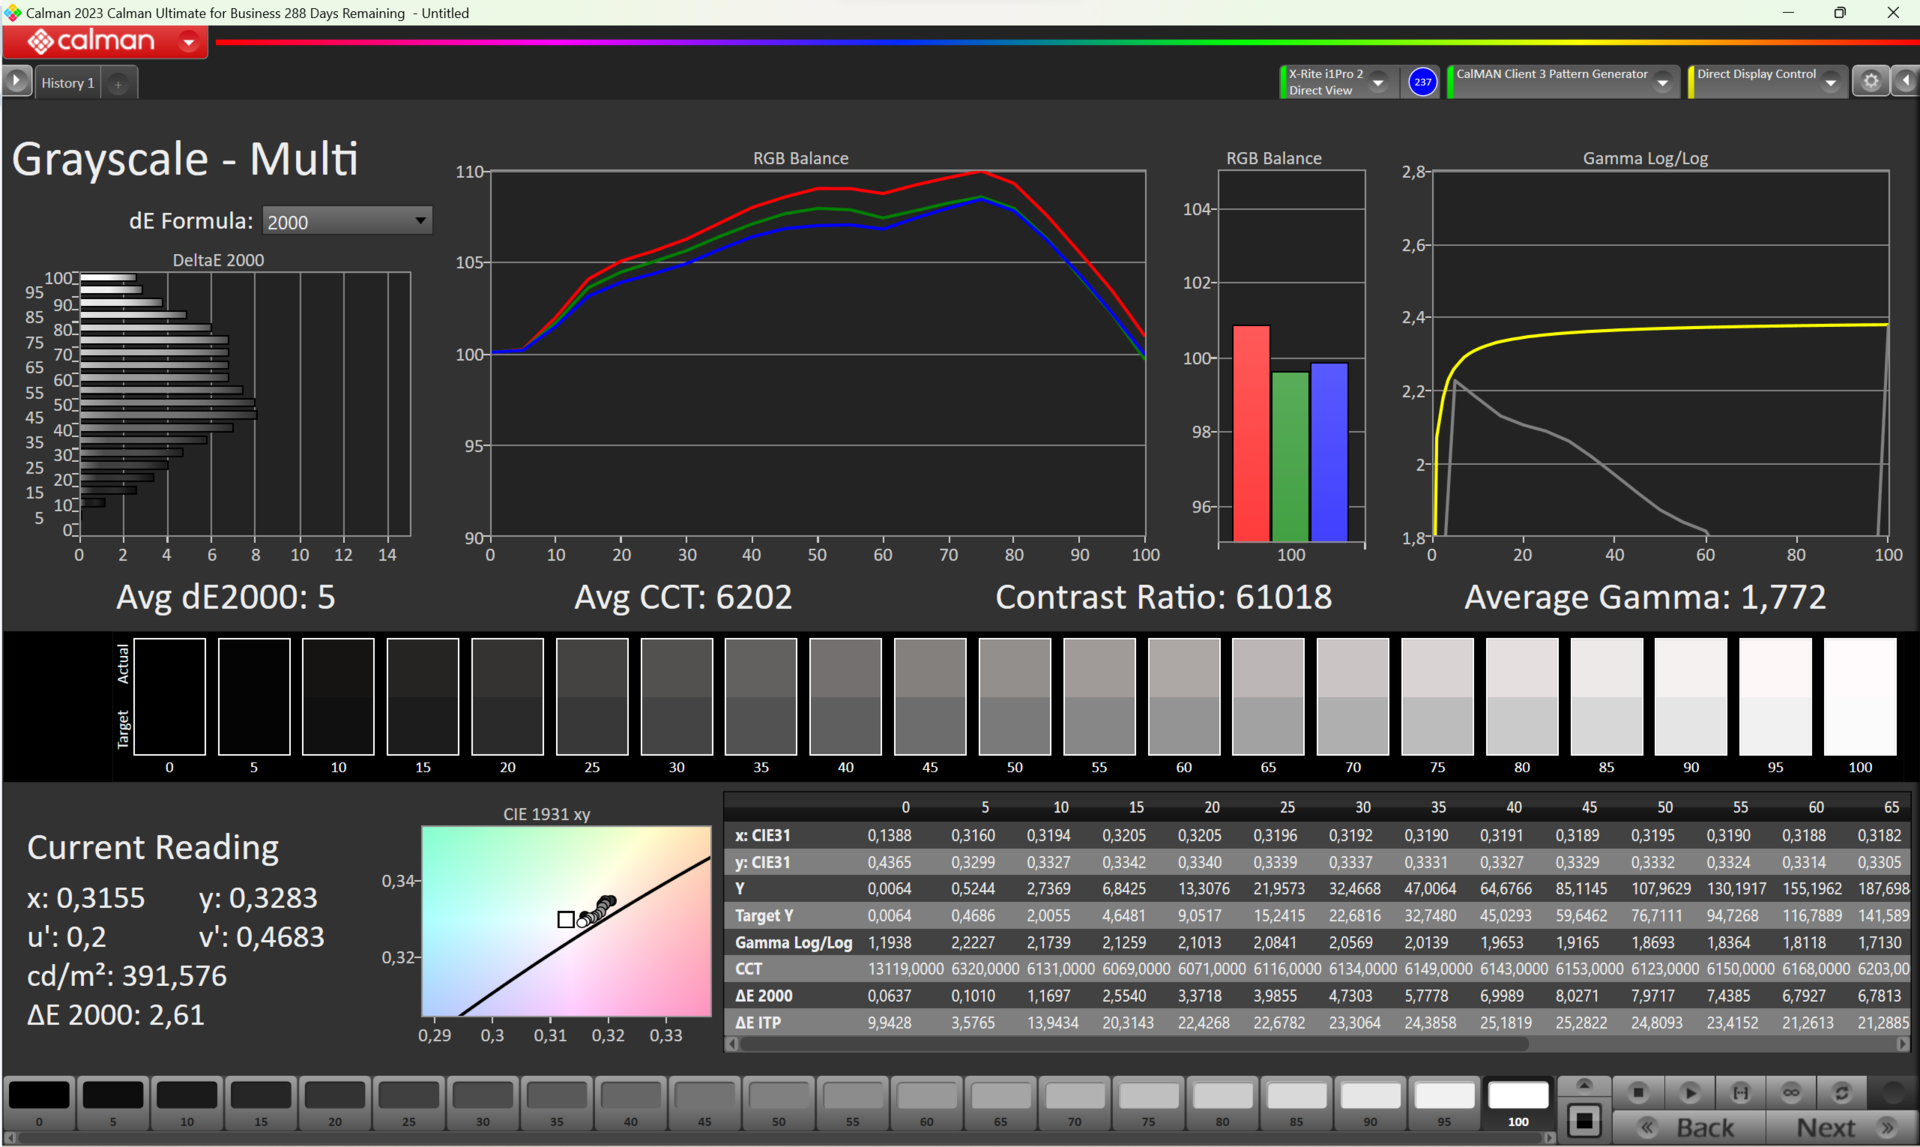
Contraste: 9440:1 (Preto: 0.0411 cd/m²)
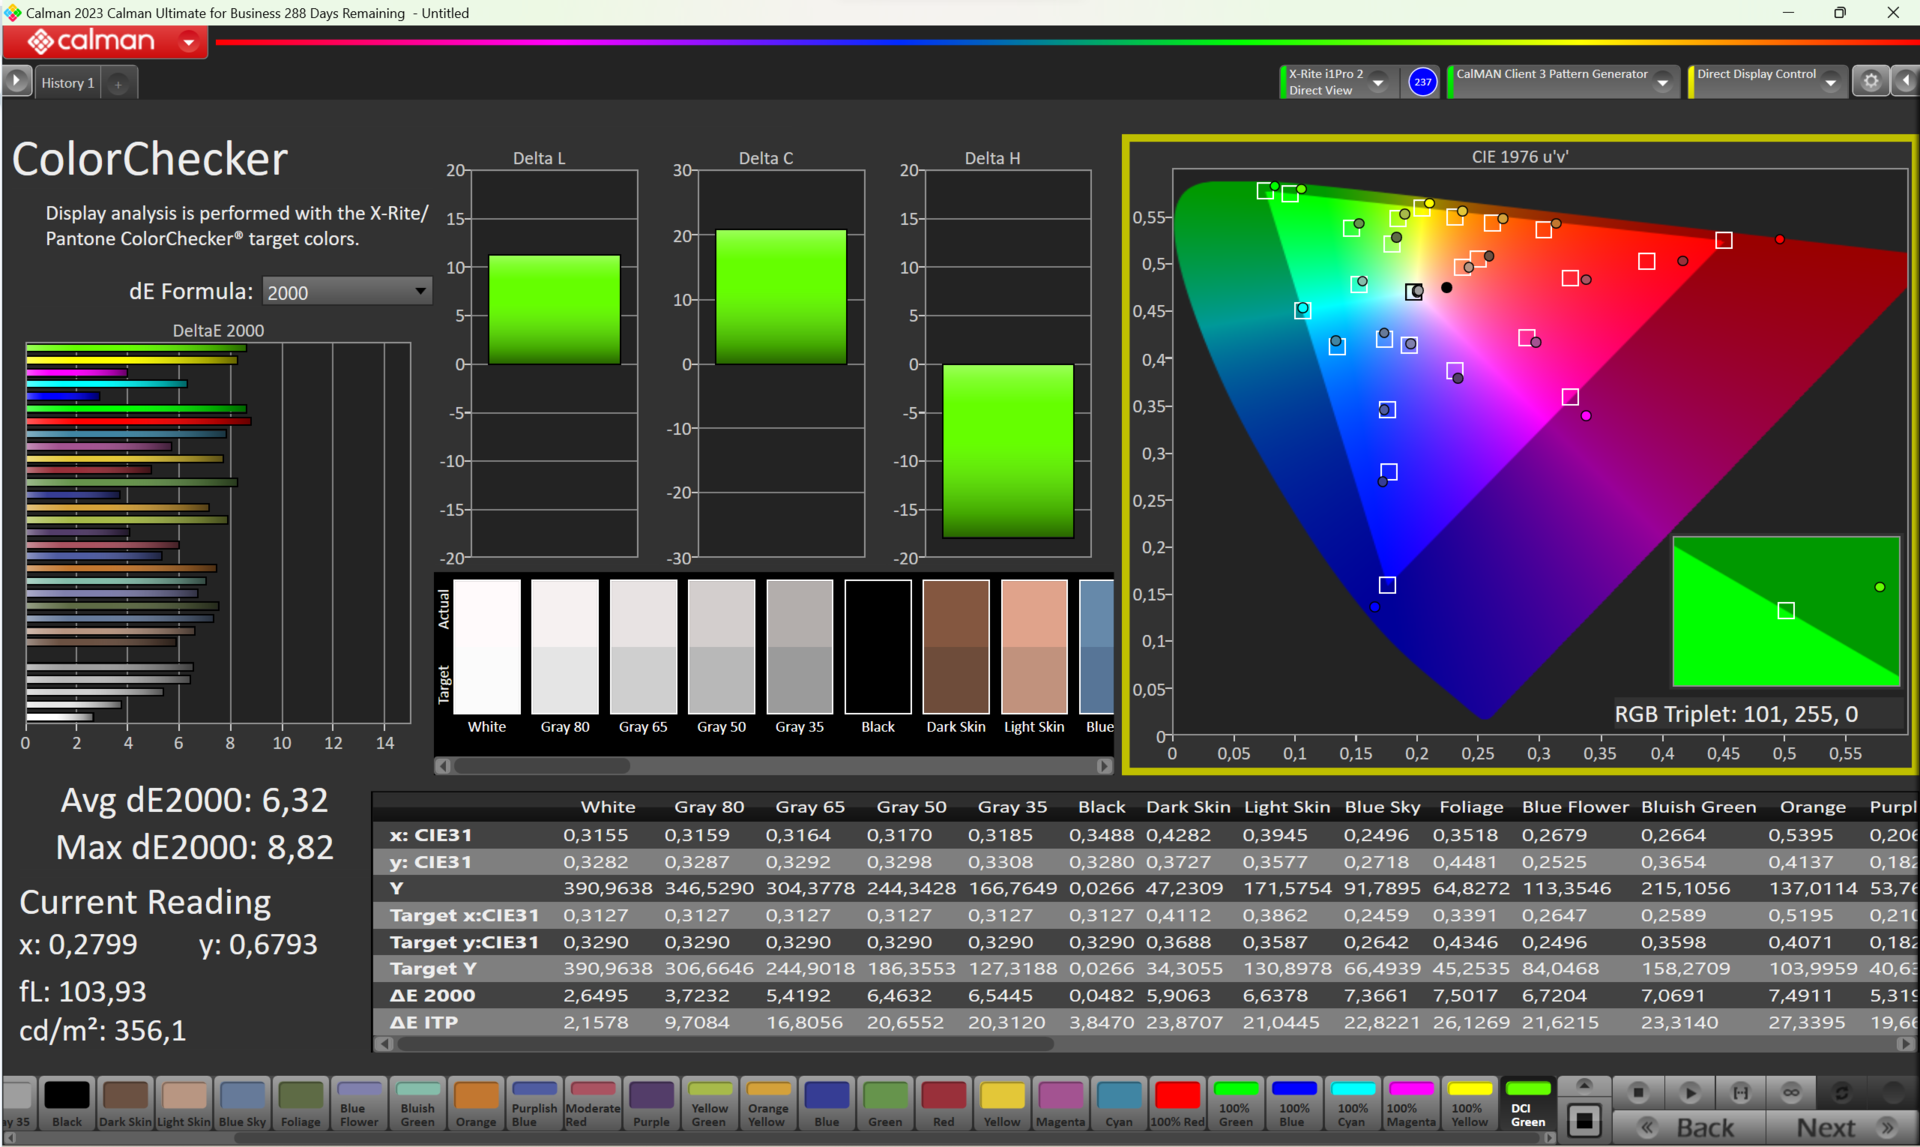
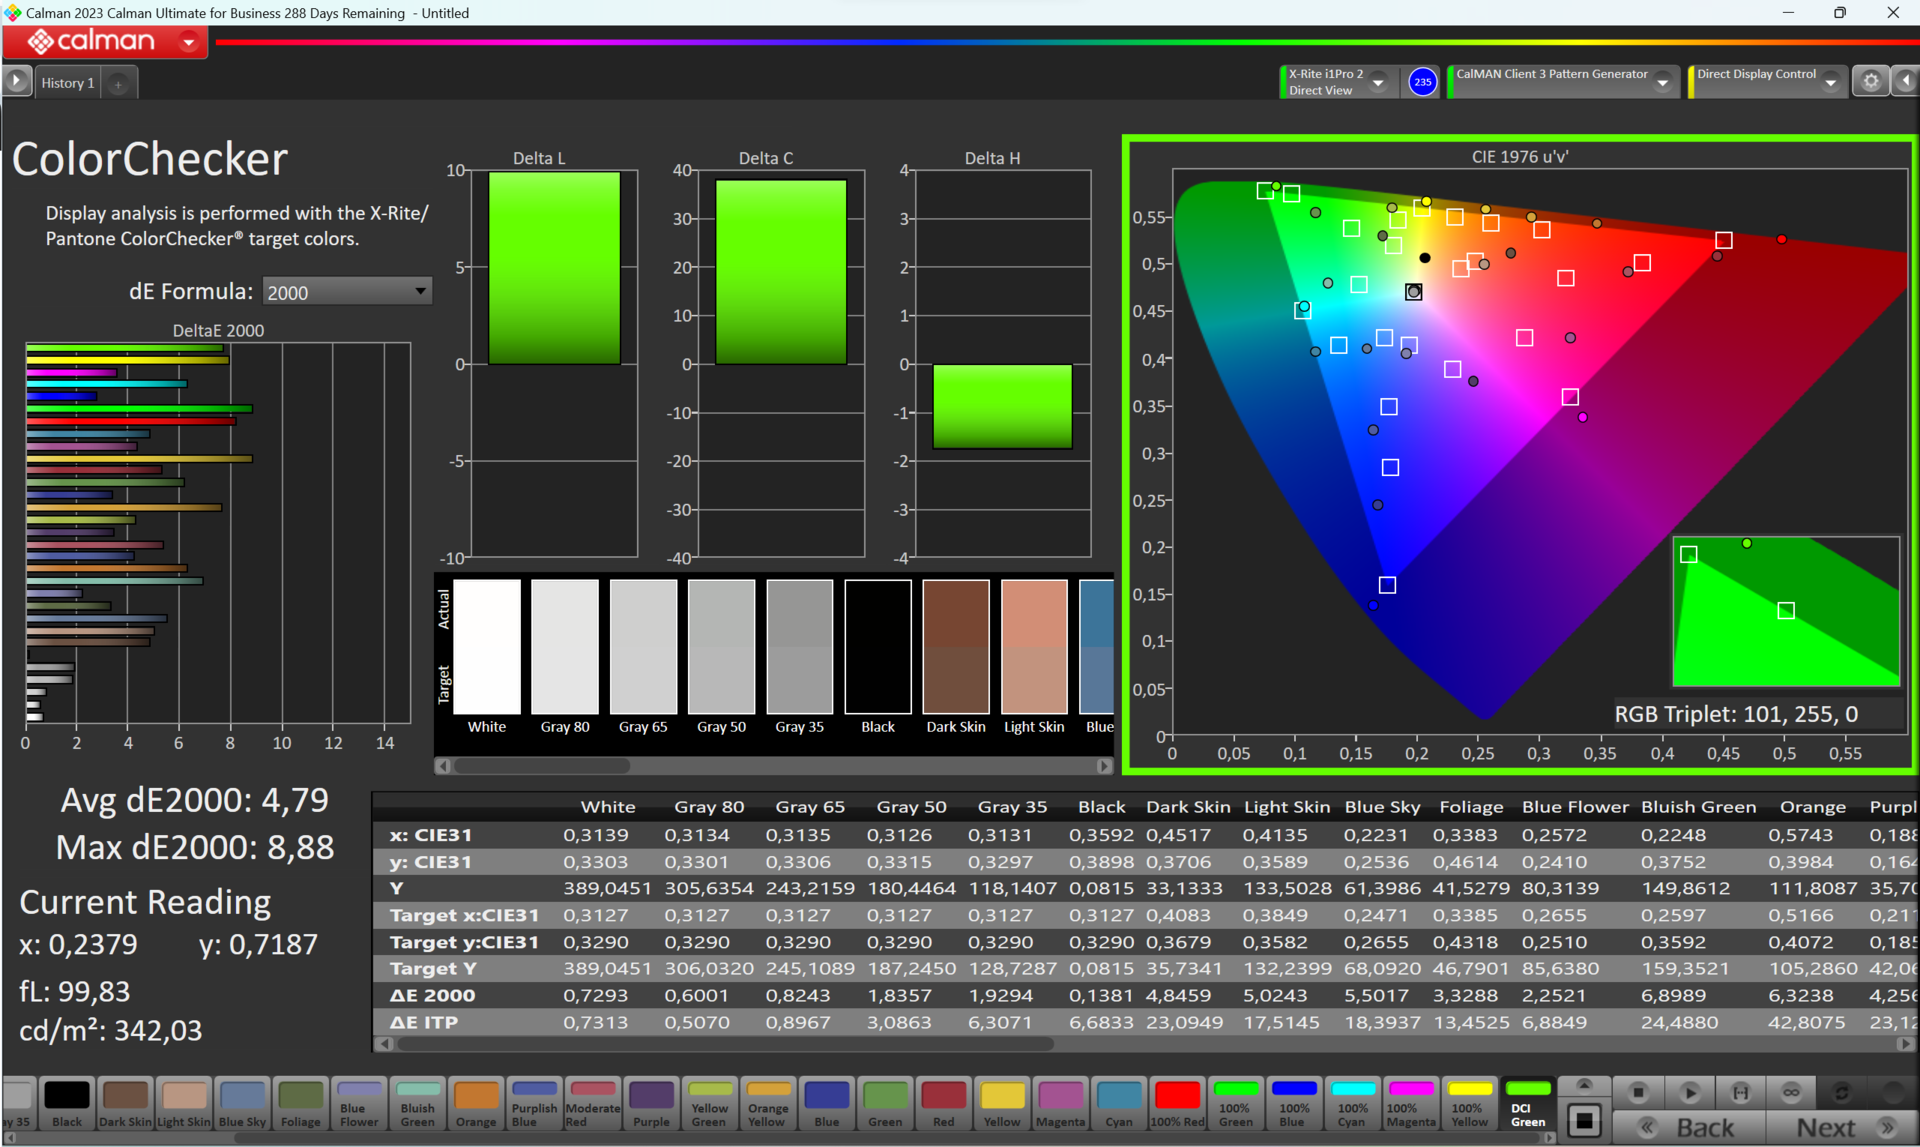
ΔE ColorChecker Calman: 6.32 | ∀{0.5-29.43 Ø4.71}
calibrated: 4.79
ΔE Greyscale Calman: 2.61 | ∀{0.09-98 Ø4.96}
98.56% AdobeRGB 1998 (Argyll 3D)
99.99% sRGB (Argyll 3D)
99.75% Display P3 (Argyll 3D)
Gamma: 1.772
CCT: 6202 K
| Acer Swift Go 14 SFG14-72 ATNA40YK11-0, OLED, 2880x1800, 14" | LG Gram 2in1 16 16T90R - G.AA78G LP160WQ1-SPB2, IPS, 2560x1600, 16" | HP Pavilion Plus 14-ew0153TU Samsung SDC4197, OLED, 2880x1800, 14" | Lenovo ThinkPad T14 G4 21K4S02000 MNE007JA1-1, IPS LED, 1920x1200, 14" | Ayaneo Air 1S Retro Power Ayaneo-OLED, OLED, 1920x1080, 5.5" | HP Pavilion Plus 14-ey0095cl Samsung SDC4197, OLED, 2880x1800, 14" | |
|---|---|---|---|---|---|---|
| Display | -6% | -3% | -22% | 0% | -1% | |
| Display P3 Coverage (%) | 99.75 | 96.5 -3% | 97.9 -2% | 67.1 -33% | 99.85 0% | 99.8 0% |
| sRGB Coverage (%) | 99.99 | 99.9 0% | 99.6 0% | 97.8 -2% | 100 0% | 100 0% |
| AdobeRGB 1998 Coverage (%) | 98.56 | 84.6 -14% | 92.1 -7% | 69.4 -30% | 99.71 1% | 95.8 -3% |
| Response Times | -856% | -182% | -871% | -20% | 78% | |
| Response Time Grey 50% / Grey 80% * (ms) | 2.2 ? | 38.4 ? -1645% | 10.8 ? -391% | 38.4 ? -1645% | 4.4 ? -100% | 0.82 ? 63% |
| Response Time Black / White * (ms) | 12.8 ? | 21.4 ? -67% | 9.29 ? 27% | 25.1 ? -96% | 5 ? 61% | 0.95 ? 93% |
| PWM Frequency (Hz) | 300 | 120 ? | 240 ? | 504.7 ? | ||
| Screen | -107% | 65% | -32% | -42% | 29% | |
| Brightness middle (cd/m²) | 388 | 329 -15% | 387 0% | 398 3% | 331 -15% | 384 -1% |
| Brightness (cd/m²) | 391 | 310 -21% | 387 -1% | 379 -3% | 339 -13% | 386 -1% |
| Brightness Distribution (%) | 98 | 88 -10% | 97 -1% | 90 -8% | 90 -8% | 98 0% |
| Black Level * (cd/m²) | 0.0411 | 0.39 -849% | 0.01 76% | 0.23 -460% | 0.07 -70% | |
| Contrast (:1) | 9440 | 844 -91% | 38700 310% | 1730 -82% | 4729 -50% | |
| Colorchecker dE 2000 * | 6.32 | 3.52 44% | 2.03 68% | 1.3 79% | 4.76 25% | 4.06 36% |
| Colorchecker dE 2000 max. * | 8.82 | 6.96 21% | 3.86 56% | 3.1 65% | 9.2 -4% | 6.73 24% |
| Colorchecker dE 2000 calibrated * | 4.79 | 1.15 76% | 1.6 67% | 1.2 75% | 5.04 -5% | 0.49 90% |
| Greyscale dE 2000 * | 2.61 | 5.75 -120% | 2.3 12% | 1.4 46% | 8.79 -237% | 1.1 58% |
| Gamma | 1.772 124% | 2.137 103% | 2.23 99% | 2.26 97% | 2.155 102% | 2.26 97% |
| CCT | 6202 105% | 7584 86% | 6523 100% | 6448 101% | 7571 86% | 6331 103% |
| Média Total (Programa/Configurações) | -323% /
-192% | -40% /
15% | -308% /
-149% | -21% /
-30% | 35% /
30% |
* ... menor é melhor


Todos os três espaços de cores são quase completamente cobertos pelo excelente OLED. Apenas o espaço de cores Adobe RGB fica 3% aquém da perfeição.
Até o momento, os vários perfis de exibição não mostraram melhorias nos desvios de cores medidos que, em seu estado atual, ainda são muito altos. Por exemplo, no espaço de cores Adobe RGB, nosso próprio perfil ICC oferece pequenas melhorias na reprodução de cores. Também podemos presumir que a Acer fará melhorias nessa área no software finalizado.
Exibir tempos de resposta
| ↔ Tempo de resposta preto para branco | ||
|---|---|---|
| 12.8 ms ... ascensão ↗ e queda ↘ combinadas | ↗ 11.8 ms ascensão |  |
| ↘ 1 ms queda | ||
| A tela mostra boas taxas de resposta em nossos testes, mas pode ser muito lenta para jogadores competitivos. Em comparação, todos os dispositivos testados variam de 0.1 (mínimo) a 240 (máximo) ms. » 33 % de todos os dispositivos são melhores. Isso significa que o tempo de resposta medido é melhor que a média de todos os dispositivos testados (19.8 ms). | ||
| ↔ Tempo de resposta 50% cinza a 80% cinza | ||
| 2.2 ms ... ascensão ↗ e queda ↘ combinadas | ↗ 1 ms ascensão |  |
| ↘ 1.2 ms queda | ||
| A tela mostra taxas de resposta muito rápidas em nossos testes e deve ser muito adequada para jogos em ritmo acelerado. Em comparação, todos os dispositivos testados variam de 0.165 (mínimo) a 636 (máximo) ms. » 11 % de todos os dispositivos são melhores. Isso significa que o tempo de resposta medido é melhor que a média de todos os dispositivos testados (31 ms). | ||
Cintilação da tela / PWM (modulação por largura de pulso)
| Tela tremeluzindo/PWM detectado | 300 Hz |  | |
A luz de fundo da tela pisca em 300 Hz (pior caso, por exemplo, utilizando PWM) . A frequência de 300 Hz é relativamente alta, portanto, a maioria dos usuários sensíveis ao PWM não deve notar nenhuma oscilação. No entanto, há relatos de que alguns usuários ainda são sensíveis ao PWM em 500 Hz e acima, portanto, esteja atento. [pwm_comparison] Em comparação: 52 % de todos os dispositivos testados não usam PWM para escurecer a tela. Se PWM foi detectado, uma média de 7754 (mínimo: 5 - máximo: 343500) Hz foi medida. | |||
Graças ao seu alto brilho, o Acer Swift Go tem um bom desempenho em situações externas, apesar de possuir uma tela brilhante. A análise do ângulo de visão também não revelou nenhuma anormalidade.
Desempenho - O Meteor Lake transforma o Swift Go em uma pequena máquina de jogos
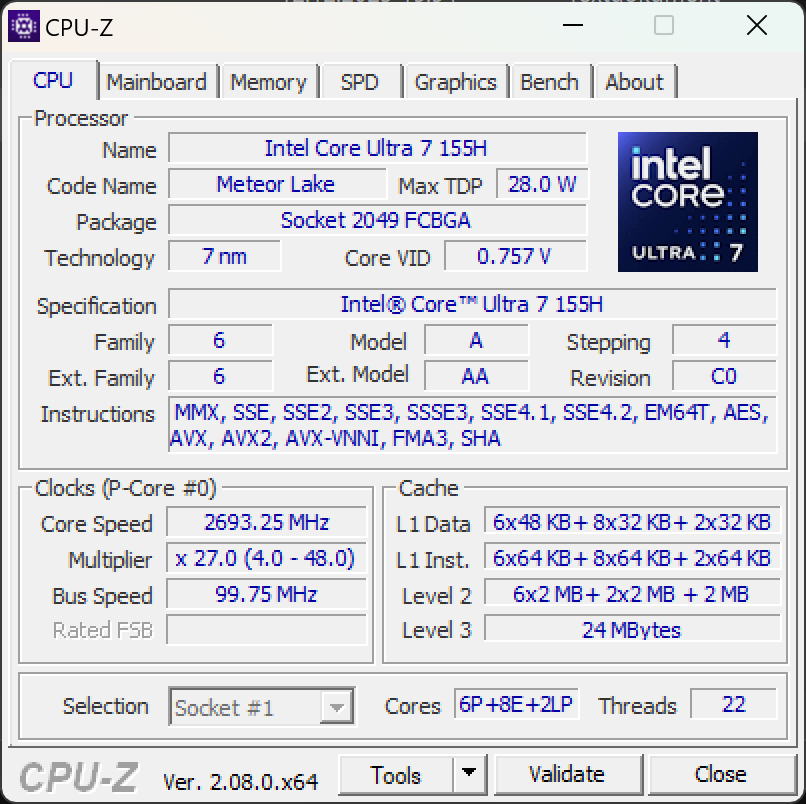
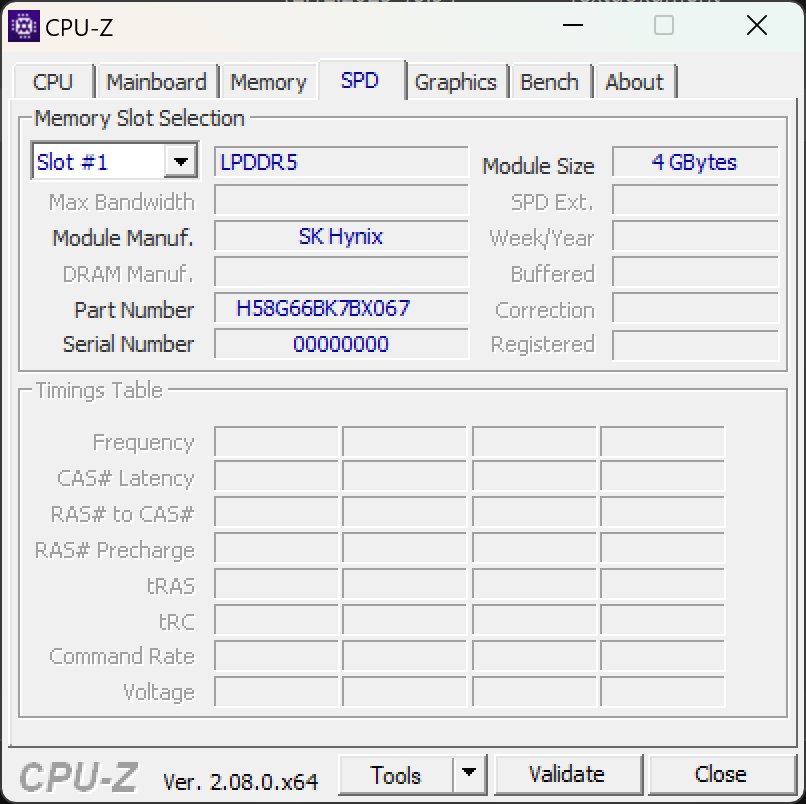
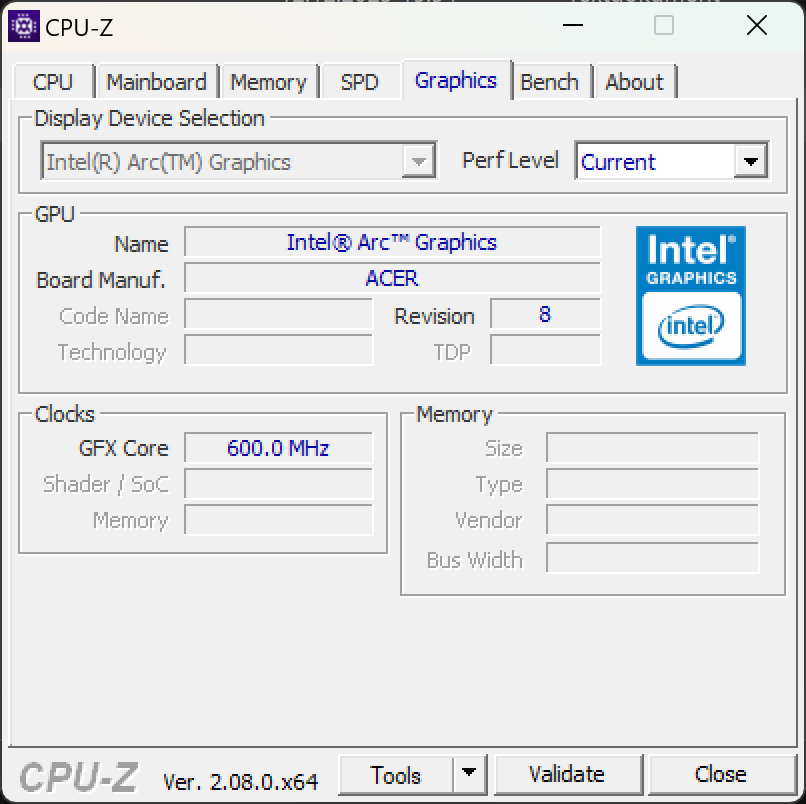
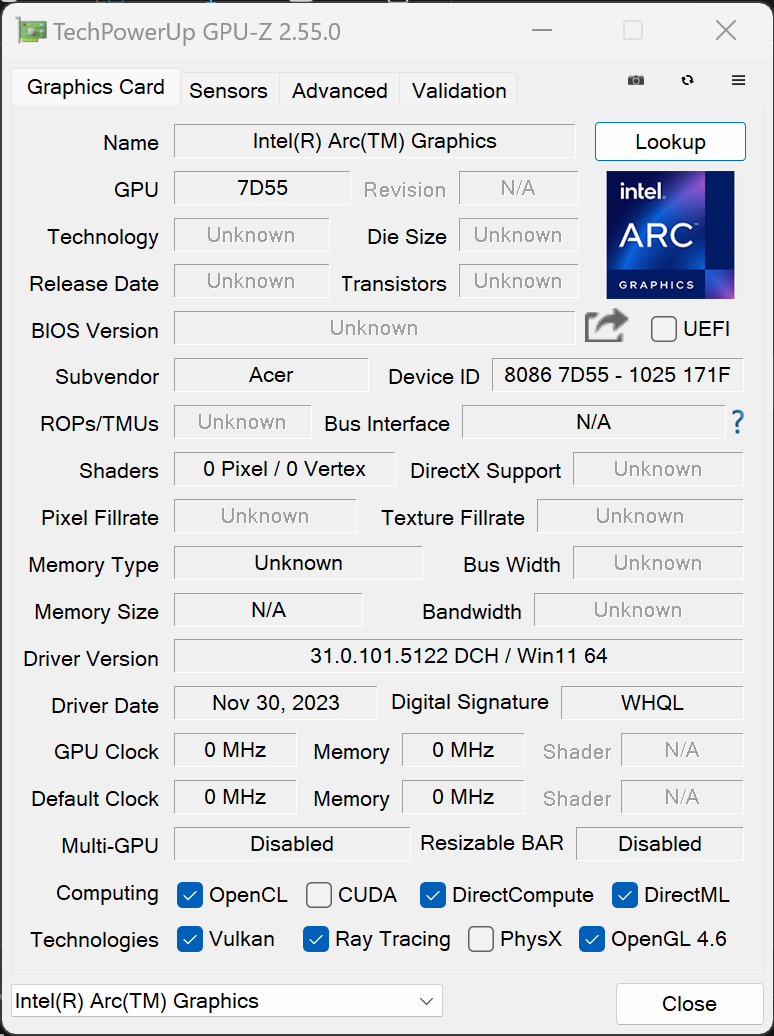
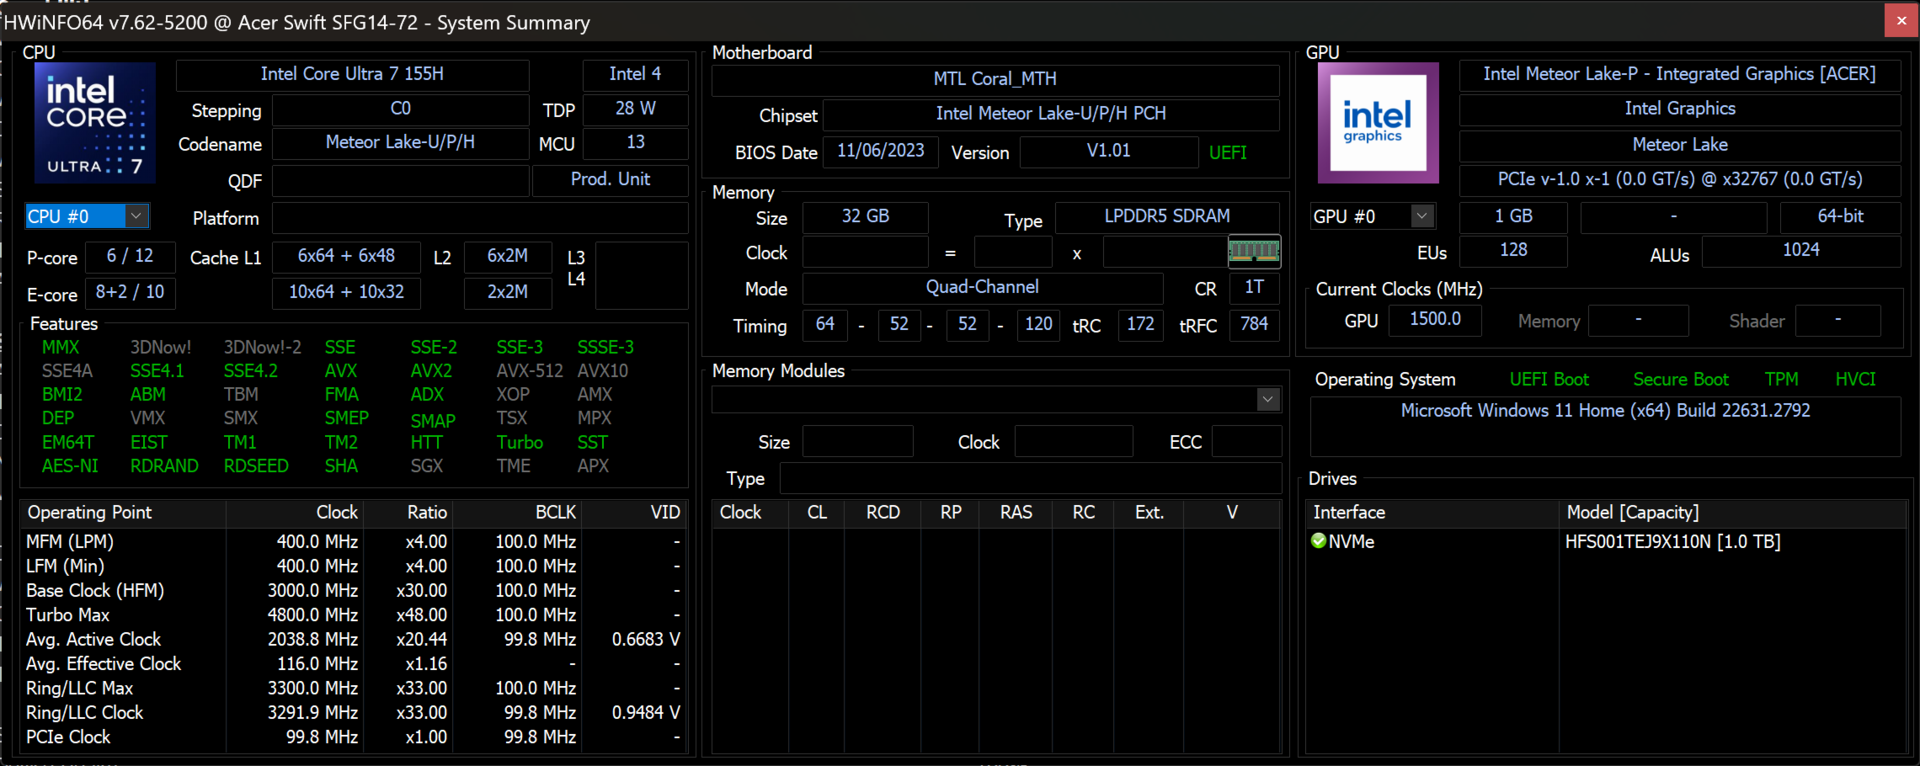
O novo Acer Swift Go 14 oferece um processador Intel Meteor Lake. Pela primeira vez, o Intel Core Ultra 7 155H também abriga uma Arc iGPU com oito núcleos e uma NPU. O dispositivo é complementado com 32 GB de RAM DDR5 e um SSD SK Hynix NVMe de 1 TB.

Condições de teste
Como mencionado no início, o Acer Swift Go 14 com o qual estamos lidando é um dispositivo que corresponde às especificações padrão de hardware. O software e o firmware da nossa máquina de análise ainda não estão totalmente aperfeiçoados. Por exemplo, em nosso Swift Go 14, os valores para o desempenho de aumento foram inicialmente configurados um pouco altos demais. No decorrer do teste, também tivemos problemas com o AlterView pré-instalado, que cria fundos 3D visualmente atraentes. Depois de uma animada conversa com a Acer, decidimos remover o software. Também conseguimos reduzir o PL2 para 55 watts e deixar o PL1 em 45 watts, tudo com a ajuda do Throttle Stop da TechPowerUp. Isso ajudou o laptop a funcionar consideravelmente melhor e mais estável. A Acer realizará um ajuste fino significativamente mais detalhado quando se tratar do gerenciamento final do desempenho. Isso deve fazer com que o laptop tenha um desempenho melhor do que o atual.
Processador
O novo processador da Intel traz consigo algumas mudanças há muito esperadas. Pela primeira vez, o chip com processo de fabricação de 7 nm agora oferece uma NPU e a nova Arc iGPU. O Core Ultra 7 155H abriga seis núcleos P, oito núcleos E e dois núcleos LP E adicionais que são considerados particularmente eficientes em termos de energia. Isso significa que há um total de 22 threads disponíveis.
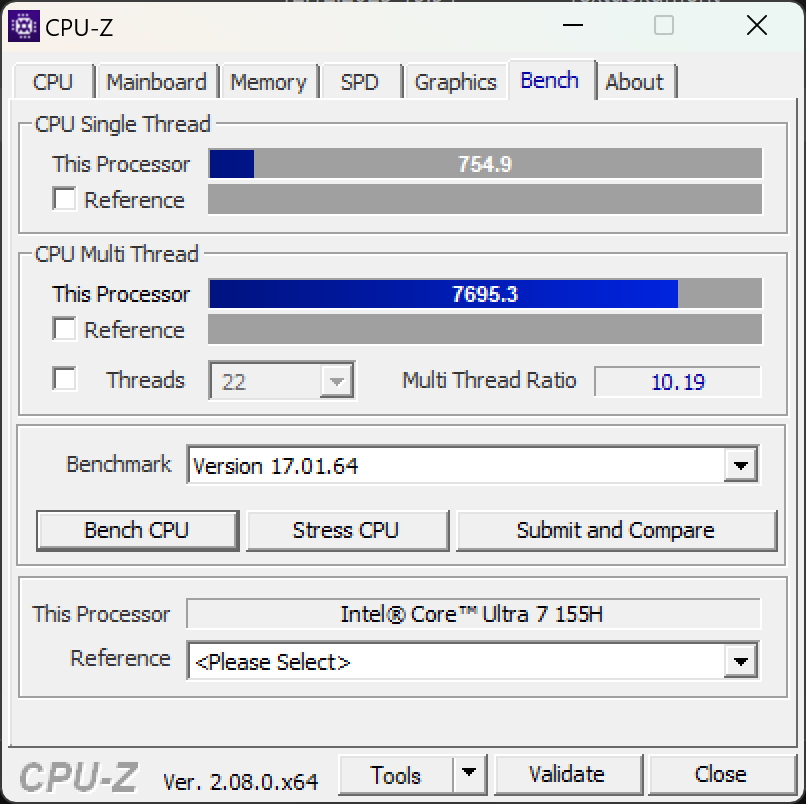
A mais recente geração de processadores da Intel não apresenta uma clara vantagem de desempenho em relação ao seu antecessor de 13ª geração mais semelhante. Aqui estamos lidando com dois dispositivos com o Intel Core i7-13700H. Da mesma forma, ele oferece seis núcleos P e oito núcleos E. Faltam apenas os dois núcleos E de baixo consumo de energia. O mais novo processador da Intel geralmente se sai bem em comparação com seu concorrente direto, o AMD Ryzen 7 7840U. Nos últimos tempos (e surpreendentemente), a equipe vermelha agora está na frente quando se trata de desempenho de núcleo único no Cinebench R23. Já publicamos uma análise detalhada da nova geração de processadores.
Cinebench R15 Multi Continuous Test
Cinebench R23: Multi Core | Single Core
Cinebench R20: CPU (Multi Core) | CPU (Single Core)
Cinebench R15: CPU Multi 64Bit | CPU Single 64Bit
Blender: v2.79 BMW27 CPU
7-Zip 18.03: 7z b 4 | 7z b 4 -mmt1
Geekbench 5.5: Multi-Core | Single-Core
HWBOT x265 Benchmark v2.2: 4k Preset
LibreOffice : 20 Documents To PDF
R Benchmark 2.5: Overall mean
| CPU Performance rating | |
| Média Intel Core Ultra 7 155H | |
| Acer Swift Go 14 SFG14-72 | |
| Lenovo ThinkPad T14 G4 21K4S02000 | |
| HP Pavilion Plus 14-ey0095cl | |
| Ayaneo Air 1S Retro Power | |
| Média da turma Subnotebook | |
| LG Gram 2in1 16 16T90R - G.AA78G | |
| HP Pavilion Plus 14-ew0153TU | |
| Acer Swift Go 14 SFG14-71 | |
| Cinebench R23 / Multi Core | |
| Acer Swift Go 14 SFG14-72 | |
| Média Intel Core Ultra 7 155H (9769 - 19007, n=52) | |
| Lenovo ThinkPad T14 G4 21K4S02000 | |
| Média da turma Subnotebook (1555 - 21812, n=59, últimos 2 anos) | |
| Ayaneo Air 1S Retro Power | |
| HP Pavilion Plus 14-ey0095cl | |
| LG Gram 2in1 16 16T90R - G.AA78G | |
| Acer Swift Go 14 SFG14-71 | |
| HP Pavilion Plus 14-ew0153TU | |
| Cinebench R23 / Single Core | |
| Acer Swift Go 14 SFG14-72 | |
| Média da turma Subnotebook (358 - 2213, n=60, últimos 2 anos) | |
| Lenovo ThinkPad T14 G4 21K4S02000 | |
| HP Pavilion Plus 14-ew0153TU | |
| Média Intel Core Ultra 7 155H (1496 - 1815, n=52) | |
| Ayaneo Air 1S Retro Power | |
| LG Gram 2in1 16 16T90R - G.AA78G | |
| HP Pavilion Plus 14-ey0095cl | |
| Acer Swift Go 14 SFG14-71 | |
| Cinebench R20 / CPU (Multi Core) | |
| Média Intel Core Ultra 7 155H (3798 - 7409, n=50) | |
| Acer Swift Go 14 SFG14-72 | |
| Lenovo ThinkPad T14 G4 21K4S02000 | |
| Média da turma Subnotebook (579 - 8541, n=56, últimos 2 anos) | |
| Ayaneo Air 1S Retro Power | |
| LG Gram 2in1 16 16T90R - G.AA78G | |
| HP Pavilion Plus 14-ey0095cl | |
| HP Pavilion Plus 14-ew0153TU | |
| Acer Swift Go 14 SFG14-71 | |
| Cinebench R20 / CPU (Single Core) | |
| Lenovo ThinkPad T14 G4 21K4S02000 | |
| Acer Swift Go 14 SFG14-72 | |
| Ayaneo Air 1S Retro Power | |
| Média Intel Core Ultra 7 155H (601 - 696, n=50) | |
| Média da turma Subnotebook (128 - 832, n=56, últimos 2 anos) | |
| HP Pavilion Plus 14-ew0153TU | |
| LG Gram 2in1 16 16T90R - G.AA78G | |
| HP Pavilion Plus 14-ey0095cl | |
| Acer Swift Go 14 SFG14-71 | |
| Cinebench R15 / CPU Multi 64Bit | |
| Acer Swift Go 14 SFG14-72 | |
| Média Intel Core Ultra 7 155H (1932 - 2880, n=56) | |
| LG Gram 2in1 16 16T90R - G.AA78G | |
| Lenovo ThinkPad T14 G4 21K4S02000 | |
| Média da turma Subnotebook (327 - 3345, n=56, últimos 2 anos) | |
| HP Pavilion Plus 14-ey0095cl | |
| Ayaneo Air 1S Retro Power | |
| Acer Swift Go 14 SFG14-71 | |
| HP Pavilion Plus 14-ew0153TU | |
| Cinebench R15 / CPU Single 64Bit | |
| Lenovo ThinkPad T14 G4 21K4S02000 | |
| HP Pavilion Plus 14-ey0095cl | |
| Média da turma Subnotebook (72.4 - 322, n=56, últimos 2 anos) | |
| Ayaneo Air 1S Retro Power | |
| Acer Swift Go 14 SFG14-72 | |
| Média Intel Core Ultra 7 155H (99.6 - 268, n=52) | |
| LG Gram 2in1 16 16T90R - G.AA78G | |
| HP Pavilion Plus 14-ew0153TU | |
| Acer Swift Go 14 SFG14-71 | |
| Blender / v2.79 BMW27 CPU | |
| HP Pavilion Plus 14-ew0153TU | |
| Acer Swift Go 14 SFG14-71 | |
| Média da turma Subnotebook (159 - 2271, n=57, últimos 2 anos) | |
| LG Gram 2in1 16 16T90R - G.AA78G | |
| HP Pavilion Plus 14-ey0095cl | |
| Ayaneo Air 1S Retro Power | |
| Lenovo ThinkPad T14 G4 21K4S02000 | |
| Média Intel Core Ultra 7 155H (175 - 381, n=47) | |
| Acer Swift Go 14 SFG14-72 | |
| 7-Zip 18.03 / 7z b 4 | |
| Acer Swift Go 14 SFG14-72 | |
| Média Intel Core Ultra 7 155H (41739 - 70254, n=50) | |
| Lenovo ThinkPad T14 G4 21K4S02000 | |
| Ayaneo Air 1S Retro Power | |
| HP Pavilion Plus 14-ey0095cl | |
| Média da turma Subnotebook (11668 - 77867, n=56, últimos 2 anos) | |
| LG Gram 2in1 16 16T90R - G.AA78G | |
| Acer Swift Go 14 SFG14-71 | |
| HP Pavilion Plus 14-ew0153TU | |
| 7-Zip 18.03 / 7z b 4 -mmt1 | |
| HP Pavilion Plus 14-ey0095cl | |
| Lenovo ThinkPad T14 G4 21K4S02000 | |
| Ayaneo Air 1S Retro Power | |
| Média da turma Subnotebook (2643 - 6699, n=58, últimos 2 anos) | |
| HP Pavilion Plus 14-ew0153TU | |
| Média Intel Core Ultra 7 155H (4594 - 5621, n=50) | |
| Acer Swift Go 14 SFG14-72 | |
| Acer Swift Go 14 SFG14-71 | |
| LG Gram 2in1 16 16T90R - G.AA78G | |
| Geekbench 5.5 / Multi-Core | |
| Média Intel Core Ultra 7 155H (10017 - 13556, n=52) | |
| Acer Swift Go 14 SFG14-72 | |
| Média da turma Subnotebook (2557 - 17218, n=48, últimos 2 anos) | |
| LG Gram 2in1 16 16T90R - G.AA78G | |
| Lenovo ThinkPad T14 G4 21K4S02000 | |
| HP Pavilion Plus 14-ey0095cl | |
| HP Pavilion Plus 14-ew0153TU | |
| Acer Swift Go 14 SFG14-71 | |
| Ayaneo Air 1S Retro Power | |
| Geekbench 5.5 / Single-Core | |
| Média da turma Subnotebook (726 - 2224, n=48, últimos 2 anos) | |
| Lenovo ThinkPad T14 G4 21K4S02000 | |
| HP Pavilion Plus 14-ey0095cl | |
| HP Pavilion Plus 14-ew0153TU | |
| Média Intel Core Ultra 7 155H (1462 - 1824, n=52) | |
| Acer Swift Go 14 SFG14-72 | |
| Ayaneo Air 1S Retro Power | |
| LG Gram 2in1 16 16T90R - G.AA78G | |
| Acer Swift Go 14 SFG14-71 | |
| HWBOT x265 Benchmark v2.2 / 4k Preset | |
| Média Intel Core Ultra 7 155H (9.93 - 21.2, n=50) | |
| Acer Swift Go 14 SFG14-72 | |
| Lenovo ThinkPad T14 G4 21K4S02000 | |
| HP Pavilion Plus 14-ey0095cl | |
| Ayaneo Air 1S Retro Power | |
| Média da turma Subnotebook (0.97 - 25.1, n=56, últimos 2 anos) | |
| LG Gram 2in1 16 16T90R - G.AA78G | |
| Acer Swift Go 14 SFG14-71 | |
| HP Pavilion Plus 14-ew0153TU | |
| LibreOffice / 20 Documents To PDF | |
| Acer Swift Go 14 SFG14-71 | |
| LG Gram 2in1 16 16T90R - G.AA78G | |
| Média da turma Subnotebook (39.9 - 220, n=55, últimos 2 anos) | |
| HP Pavilion Plus 14-ew0153TU | |
| Acer Swift Go 14 SFG14-72 | |
| HP Pavilion Plus 14-ey0095cl | |
| Média Intel Core Ultra 7 155H (37.5 - 79.2, n=49) | |
| Ayaneo Air 1S Retro Power | |
| Lenovo ThinkPad T14 G4 21K4S02000 | |
| R Benchmark 2.5 / Overall mean | |
| LG Gram 2in1 16 16T90R - G.AA78G | |
| Acer Swift Go 14 SFG14-71 | |
| Média da turma Subnotebook (0.4024 - 1.456, n=57, últimos 2 anos) | |
| Acer Swift Go 14 SFG14-72 | |
| Média Intel Core Ultra 7 155H (0.4457 - 0.53, n=49) | |
| HP Pavilion Plus 14-ew0153TU | |
| Lenovo ThinkPad T14 G4 21K4S02000 | |
| Ayaneo Air 1S Retro Power | |
| HP Pavilion Plus 14-ey0095cl | |
* ... menor é melhor
AIDA64: FP32 Ray-Trace | FPU Julia | CPU SHA3 | CPU Queen | FPU SinJulia | FPU Mandel | CPU AES | CPU ZLib | FP64 Ray-Trace | CPU PhotoWorxx
| Performance rating | |
| Lenovo ThinkPad T14 G4 21K4S02000 | |
| HP Pavilion Plus 14-ey0095cl | |
| Ayaneo Air 1S Retro Power | |
| Acer Swift Go 14 SFG14-72 | |
| Média Intel Core Ultra 7 155H | |
| Média da turma Subnotebook | |
| LG Gram 2in1 16 16T90R - G.AA78G | |
| Acer Swift Go 14 SFG14-71 | |
| HP Pavilion Plus 14-ew0153TU | |
| AIDA64 / FP32 Ray-Trace | |
| Lenovo ThinkPad T14 G4 21K4S02000 | |
| Ayaneo Air 1S Retro Power | |
| HP Pavilion Plus 14-ey0095cl | |
| Média da turma Subnotebook (1135 - 32888, n=57, últimos 2 anos) | |
| Acer Swift Go 14 SFG14-72 | |
| Média Intel Core Ultra 7 155H (6670 - 18470, n=50) | |
| LG Gram 2in1 16 16T90R - G.AA78G | |
| LG Gram 2in1 16 16T90R - G.AA78G | |
| Acer Swift Go 14 SFG14-71 | |
| HP Pavilion Plus 14-ew0153TU | |
| AIDA64 / FPU Julia | |
| Lenovo ThinkPad T14 G4 21K4S02000 | |
| HP Pavilion Plus 14-ey0095cl | |
| Ayaneo Air 1S Retro Power | |
| Acer Swift Go 14 SFG14-72 | |
| Média Intel Core Ultra 7 155H (40905 - 93181, n=50) | |
| Média da turma Subnotebook (5218 - 123315, n=57, últimos 2 anos) | |
| LG Gram 2in1 16 16T90R - G.AA78G | |
| Acer Swift Go 14 SFG14-71 | |
| HP Pavilion Plus 14-ew0153TU | |
| AIDA64 / CPU SHA3 | |
| Lenovo ThinkPad T14 G4 21K4S02000 | |
| Ayaneo Air 1S Retro Power | |
| HP Pavilion Plus 14-ey0095cl | |
| Acer Swift Go 14 SFG14-72 | |
| Média Intel Core Ultra 7 155H (1940 - 4436, n=50) | |
| Média da turma Subnotebook (444 - 5287, n=57, últimos 2 anos) | |
| LG Gram 2in1 16 16T90R - G.AA78G | |
| Acer Swift Go 14 SFG14-71 | |
| HP Pavilion Plus 14-ew0153TU | |
| AIDA64 / CPU Queen | |
| Lenovo ThinkPad T14 G4 21K4S02000 | |
| HP Pavilion Plus 14-ey0095cl | |
| Ayaneo Air 1S Retro Power | |
| Acer Swift Go 14 SFG14-72 | |
| Média Intel Core Ultra 7 155H (64698 - 94181, n=50) | |
| LG Gram 2in1 16 16T90R - G.AA78G | |
| HP Pavilion Plus 14-ew0153TU | |
| Média da turma Subnotebook (10579 - 95002, n=48, últimos 2 anos) | |
| Acer Swift Go 14 SFG14-71 | |
| AIDA64 / FPU SinJulia | |
| Lenovo ThinkPad T14 G4 21K4S02000 | |
| Ayaneo Air 1S Retro Power | |
| HP Pavilion Plus 14-ey0095cl | |
| Acer Swift Go 14 SFG14-72 | |
| Média Intel Core Ultra 7 155H (5639 - 10647, n=50) | |
| Média da turma Subnotebook (744 - 18418, n=57, últimos 2 anos) | |
| LG Gram 2in1 16 16T90R - G.AA78G | |
| HP Pavilion Plus 14-ew0153TU | |
| Acer Swift Go 14 SFG14-71 | |
| AIDA64 / FPU Mandel | |
| Lenovo ThinkPad T14 G4 21K4S02000 | |
| HP Pavilion Plus 14-ey0095cl | |
| Ayaneo Air 1S Retro Power | |
| Acer Swift Go 14 SFG14-72 | |
| Média Intel Core Ultra 7 155H (18236 - 47685, n=50) | |
| Média da turma Subnotebook (3341 - 65433, n=57, últimos 2 anos) | |
| LG Gram 2in1 16 16T90R - G.AA78G | |
| Acer Swift Go 14 SFG14-71 | |
| HP Pavilion Plus 14-ew0153TU | |
| AIDA64 / CPU AES | |
| Lenovo ThinkPad T14 G4 21K4S02000 | |
| LG Gram 2in1 16 16T90R - G.AA78G | |
| Média Intel Core Ultra 7 155H (45713 - 152179, n=50) | |
| Acer Swift Go 14 SFG14-72 | |
| Ayaneo Air 1S Retro Power | |
| HP Pavilion Plus 14-ey0095cl | |
| Média da turma Subnotebook (638 - 96917, n=57, últimos 2 anos) | |
| Acer Swift Go 14 SFG14-71 | |
| HP Pavilion Plus 14-ew0153TU | |
| AIDA64 / CPU ZLib | |
| Média Intel Core Ultra 7 155H (557 - 1250, n=50) | |
| Acer Swift Go 14 SFG14-72 | |
| Lenovo ThinkPad T14 G4 21K4S02000 | |
| HP Pavilion Plus 14-ey0095cl | |
| Ayaneo Air 1S Retro Power | |
| LG Gram 2in1 16 16T90R - G.AA78G | |
| Média da turma Subnotebook (164.9 - 1379, n=57, últimos 2 anos) | |
| Acer Swift Go 14 SFG14-71 | |
| HP Pavilion Plus 14-ew0153TU | |
| AIDA64 / FP64 Ray-Trace | |
| Lenovo ThinkPad T14 G4 21K4S02000 | |
| HP Pavilion Plus 14-ey0095cl | |
| Ayaneo Air 1S Retro Power | |
| Média da turma Subnotebook (610 - 17495, n=57, últimos 2 anos) | |
| Acer Swift Go 14 SFG14-72 | |
| Média Intel Core Ultra 7 155H (3569 - 9802, n=50) | |
| LG Gram 2in1 16 16T90R - G.AA78G | |
| Acer Swift Go 14 SFG14-71 | |
| HP Pavilion Plus 14-ew0153TU | |
| AIDA64 / CPU PhotoWorxx | |
| Média da turma Subnotebook (6569 - 85600, n=57, últimos 2 anos) | |
| Média Intel Core Ultra 7 155H (32719 - 54223, n=50) | |
| Acer Swift Go 14 SFG14-72 | |
| LG Gram 2in1 16 16T90R - G.AA78G | |
| Lenovo ThinkPad T14 G4 21K4S02000 | |
| HP Pavilion Plus 14-ew0153TU | |
| Acer Swift Go 14 SFG14-71 | |
| HP Pavilion Plus 14-ey0095cl | |
| Ayaneo Air 1S Retro Power | |
Desempenho do sistema
De acordo com a Intel, a nova Arc iGPU é a principal responsável por melhorias significativas no desempenho gráfico. Isso fica claro assim que damos uma olhada na seção de criação de conteúdo digital no PCMark 10. Nessa área, o Swift Go 14 e sua Arc iGPU são impressionantes. No geral, o desempenho do sistema do Acer Swift Go 14 é muito superior ao de seu antecessor e à maioria dos dispositivos de comparação. Isso significa que estamos lidando com um dispositivo potente que não tem motivos para recuar, mesmo quando confrontado com aplicativos 3D.
CrossMark: Overall | Productivity | Creativity | Responsiveness
WebXPRT 3: Overall
WebXPRT 4: Overall
Mozilla Kraken 1.1: Total
| PCMark 10 / Score | |
| Média da turma Subnotebook (4920 - 9939, n=45, últimos 2 anos) | |
| Lenovo ThinkPad T14 G4 21K4S02000 | |
| Média Intel Core Ultra 7 155H, Intel Arc 8-Core iGPU (4809 - 7529, n=34) | |
| Acer Swift Go 14 SFG14-72 | |
| HP Pavilion Plus 14-ey0095cl | |
| Ayaneo Air 1S Retro Power | |
| LG Gram 2in1 16 16T90R - G.AA78G | |
| HP Pavilion Plus 14-ew0153TU | |
| Acer Swift Go 14 SFG14-71 | |
| PCMark 10 / Essentials | |
| LG Gram 2in1 16 16T90R - G.AA78G | |
| Lenovo ThinkPad T14 G4 21K4S02000 | |
| Média Intel Core Ultra 7 155H, Intel Arc 8-Core iGPU (7605 - 11289, n=34) | |
| Média da turma Subnotebook (8552 - 11646, n=45, últimos 2 anos) | |
| Acer Swift Go 14 SFG14-72 | |
| HP Pavilion Plus 14-ew0153TU | |
| Acer Swift Go 14 SFG14-71 | |
| HP Pavilion Plus 14-ey0095cl | |
| Ayaneo Air 1S Retro Power | |
| PCMark 10 / Productivity | |
| Lenovo ThinkPad T14 G4 21K4S02000 | |
| Média da turma Subnotebook (5435 - 16606, n=45, últimos 2 anos) | |
| HP Pavilion Plus 14-ey0095cl | |
| Média Intel Core Ultra 7 155H, Intel Arc 8-Core iGPU (6042 - 10591, n=34) | |
| Acer Swift Go 14 SFG14-72 | |
| Ayaneo Air 1S Retro Power | |
| Acer Swift Go 14 SFG14-71 | |
| HP Pavilion Plus 14-ew0153TU | |
| LG Gram 2in1 16 16T90R - G.AA78G | |
| PCMark 10 / Digital Content Creation | |
| Média da turma Subnotebook (5722 - 13779, n=45, últimos 2 anos) | |
| Acer Swift Go 14 SFG14-72 | |
| Média Intel Core Ultra 7 155H, Intel Arc 8-Core iGPU (4985 - 10709, n=34) | |
| Lenovo ThinkPad T14 G4 21K4S02000 | |
| HP Pavilion Plus 14-ey0095cl | |
| Ayaneo Air 1S Retro Power | |
| LG Gram 2in1 16 16T90R - G.AA78G | |
| HP Pavilion Plus 14-ew0153TU | |
| Acer Swift Go 14 SFG14-71 | |
| CrossMark / Overall | |
| Lenovo ThinkPad T14 G4 21K4S02000 | |
| Média da turma Subnotebook (365 - 2356, n=59, últimos 2 anos) | |
| Média Intel Core Ultra 7 155H, Intel Arc 8-Core iGPU (1366 - 1903, n=34) | |
| Acer Swift Go 14 SFG14-72 | |
| HP Pavilion Plus 14-ew0153TU | |
| LG Gram 2in1 16 16T90R - G.AA78G | |
| HP Pavilion Plus 14-ey0095cl | |
| Acer Swift Go 14 SFG14-71 | |
| Ayaneo Air 1S Retro Power | |
| CrossMark / Productivity | |
| Lenovo ThinkPad T14 G4 21K4S02000 | |
| Média Intel Core Ultra 7 155H, Intel Arc 8-Core iGPU (1291 - 1798, n=33) | |
| Média da turma Subnotebook (364 - 2277, n=59, últimos 2 anos) | |
| HP Pavilion Plus 14-ew0153TU | |
| HP Pavilion Plus 14-ey0095cl | |
| Acer Swift Go 14 SFG14-72 | |
| LG Gram 2in1 16 16T90R - G.AA78G | |
| Acer Swift Go 14 SFG14-71 | |
| Ayaneo Air 1S Retro Power | |
| CrossMark / Creativity | |
| Média da turma Subnotebook (372 - 2743, n=59, últimos 2 anos) | |
| Lenovo ThinkPad T14 G4 21K4S02000 | |
| Média Intel Core Ultra 7 155H, Intel Arc 8-Core iGPU (1519 - 1929, n=33) | |
| Acer Swift Go 14 SFG14-72 | |
| HP Pavilion Plus 14-ey0095cl | |
| HP Pavilion Plus 14-ew0153TU | |
| LG Gram 2in1 16 16T90R - G.AA78G | |
| Acer Swift Go 14 SFG14-71 | |
| Ayaneo Air 1S Retro Power | |
| CrossMark / Responsiveness | |
| LG Gram 2in1 16 16T90R - G.AA78G | |
| Acer Swift Go 14 SFG14-71 | |
| Média Intel Core Ultra 7 155H, Intel Arc 8-Core iGPU (939 - 1802, n=33) | |
| Lenovo ThinkPad T14 G4 21K4S02000 | |
| Acer Swift Go 14 SFG14-72 | |
| Média da turma Subnotebook (312 - 1854, n=59, últimos 2 anos) | |
| HP Pavilion Plus 14-ew0153TU | |
| HP Pavilion Plus 14-ey0095cl | |
| Ayaneo Air 1S Retro Power | |
| WebXPRT 3 / Overall | |
| Média da turma Subnotebook (156 - 530, n=55, últimos 2 anos) | |
| Lenovo ThinkPad T14 G4 21K4S02000 | |
| HP Pavilion Plus 14-ey0095cl | |
| Acer Swift Go 14 SFG14-72 | |
| Média Intel Core Ultra 7 155H, Intel Arc 8-Core iGPU (252 - 299, n=34) | |
| HP Pavilion Plus 14-ew0153TU | |
| LG Gram 2in1 16 16T90R - G.AA78G | |
| Acer Swift Go 14 SFG14-71 | |
| Ayaneo Air 1S Retro Power | |
| WebXPRT 4 / Overall | |
| Média da turma Subnotebook (132 - 378, n=60, últimos 2 anos) | |
| HP Pavilion Plus 14-ew0153TU | |
| Média Intel Core Ultra 7 155H, Intel Arc 8-Core iGPU (166.4 - 309, n=29) | |
| HP Pavilion Plus 14-ey0095cl | |
| Ayaneo Air 1S Retro Power | |
| Mozilla Kraken 1.1 / Total | |
| LG Gram 2in1 16 16T90R - G.AA78G | |
| HP Pavilion Plus 14-ey0095cl | |
| Acer Swift Go 14 SFG14-71 | |
| Acer Swift Go 14 SFG14-71 | |
| Média Intel Core Ultra 7 155H, Intel Arc 8-Core iGPU (517 - 614, n=35) | |
| Acer Swift Go 14 SFG14-72 | |
| Lenovo ThinkPad T14 G4 21K4S02000 | |
| Ayaneo Air 1S Retro Power | |
| HP Pavilion Plus 14-ew0153TU | |
| Média da turma Subnotebook (234 - 1104, n=60, últimos 2 anos) | |
* ... menor é melhor
| PCMark 10 Score | 6625 pontos | |
Ajuda | ||
| AIDA64 / Memory Copy | |
| Média da turma Subnotebook (14554 - 131023, n=57, últimos 2 anos) | |
| Média Intel Core Ultra 7 155H (62397 - 96791, n=50) | |
| Acer Swift Go 14 SFG14-72 | |
| AIDA64 / Memory Read | |
| Média da turma Subnotebook (15948 - 127174, n=57, últimos 2 anos) | |
| Média Intel Core Ultra 7 155H (60544 - 90647, n=50) | |
| Acer Swift Go 14 SFG14-72 | |
| AIDA64 / Memory Write | |
| Média da turma Subnotebook (15709 - 135141, n=57, últimos 2 anos) | |
| Acer Swift Go 14 SFG14-72 | |
| Média Intel Core Ultra 7 155H (58692 - 93451, n=50) | |
| AIDA64 / Memory Latency | |
| Acer Swift Go 14 SFG14-72 | |
| Média Intel Core Ultra 7 155H (116.2 - 233, n=50) | |
| Média da turma Subnotebook (6.1 - 159.9, n=55, últimos 2 anos) | |
* ... menor é melhor
Armazenamento em massa
No Swift Go 14, um novo SSD NVMe da SK Hynix faz seu trabalho e consegue atingir velocidades de transferência médias a altas em todos os benchmarks. No loop DiskSpd, no qual o desempenho do armazenamento é analisado por um período mais longo, a velocidade de leitura cai ligeiramente.

* ... menor é melhor
Continuous Performance Read: DiskSpd Read Loop, Queue Depth 8
Placa de vídeo
De acordo com a Intel, o desempenho gráfico do novo processador para laptop é o dobro do desempenho da 13ª geração. De qualquer forma, nossos primeiros benchmarks confirmam um desempenho muito alto com o arc iGPU de oito núcleos de oito núcleos, conseguiu até mesmo superar a AMD Radeon 780M de forma convincente. As GPUs dedicadas para laptops da Intel ficam aquém em nossa análise. Mesmo deixando de lado o desempenho 3D, o desempenho da iGPU do Acer Swift Go é surpreendentemente alto.
| 3DMark 06 Standard Score | pontos | |
| 3DMark Vantage P Result | 43185 pontos | |
| 3DMark 11 Performance | 13075 pontos | |
| 3DMark Ice Storm Standard Score | 157591 pontos | |
| 3DMark Cloud Gate Standard Score | 29783 pontos | |
| 3DMark Fire Strike Score | 8314 pontos | |
| 3DMark Time Spy Score | 3471 pontos | |
Ajuda | ||
* ... menor é melhor
Desempenho em jogos
Com seus gráficos bastante aprimorados, o Intel Core Ultra 7 155H impressiona nos jogos, desde que o senhor não exagere nas configurações de qualidade ou na resolução. Os jogos em Full HD com qualidade média ou alta podem ser jogados a mais de 60 fps, na maioria dos jogos que testamos. Isso significa que o senhor pode dispensar o tipo de dGPU encontrado em muitos notebooks, como a GeForce RTX 2050 ou a Arc 530M.
| The Witcher 3 - 1920x1080 Ultra Graphics & Postprocessing (HBAO+) | |
| Ayaneo Air 1S Retro Power | |
| HP Pavilion Plus 14-ey0095cl | |
| Lenovo ThinkPad T14 G4 21K4S02000 | |
| Média da turma Subnotebook (13.9 - 34.6, n=12, últimos 2 anos) | |
| Acer Swift Go 14 SFG14-72 | |
| LG Gram 2in1 16 16T90R - G.AA78G | |
| HP Pavilion Plus 14-ew0153TU | |
| Acer Swift Go 14 SFG14-71 | |
A quase duplicação do desempenho gráfico fica evidente quando se observam as taxas de quadros no site Witcher 3 em configurações de ultraqualidade. O Swift Go 14 oferece quase o dobro de quadros por segundo que o Schenker Vision 14.
Witcher 3 FPS diagram
| baixo | média | alto | ultra | QHD | |
|---|---|---|---|---|---|
| GTA V (2015) | 124.1 | 120.8 | 34.8 | 13.1 | |
| The Witcher 3 (2015) | 23.3 | ||||
| Dota 2 Reborn (2015) | 99.4 | 90.4 | 76 | 73.4 | |
| Final Fantasy XV Benchmark (2018) | 42.8 | 32.1 | 18.2 | 14 | |
| X-Plane 11.11 (2018) | 54.5 | 42.5 | 36.1 | ||
| Far Cry 5 (2018) | 35 | 33 | |||
| Strange Brigade (2018) | 141.9 | 60.6 | 52 | 43.2 | |
| Horizon Zero Dawn (2020) | 33 | 28 () | 26 | ||
| Dying Light 2 (2022) | 31.1 | 29.9 | |||
| Hogwarts Legacy (2023) | 25.7 | 19.3 | 15.6 | ||
| F1 23 (2023) | 64.6 | 59 | 35.9 | 12.2 | |
| Ratchet & Clank Rift Apart (2023) | 28.4 | 29 | 25.9 | 21.1 | |
| Starfield (2023) | 11.5 | ||||
| Baldur's Gate 3 (2023) | 22.8 | 20.6 | 19.1 | ||
| Cyberpunk 2077 (2023) | 34.1 | 29.6 | 24 | 13.1 | |
| EA Sports WRC (2023) | 35.8 | 26.6 | 24.7 | 22.4 |
Desempenho da NPU
Uma unidade de processamento neural pode ser encontrada dentro do Intel Core Ultra 7 155H. Essa parte do processador tem a tarefa de processar aplicativos de IA com muita eficiência. Isso significa que modelos como o Stable Diffusion ou modelos de linguagem já podem ser executados no dispositivo. Usando o benchmark UL Procyon AI Interface, colocamos a GPU frente a frente com a NPU e verificamos simultaneamente o consumo de energia. Em ambos os cenários, rapidamente ficou claro que o desempenho da NPU estava apenas um pouco abaixo do desempenho da Arc iGPU quando se tratava de processar redes neurais, mas os requisitos de energia foram reduzidos quase pela metade. Isso definitivamente torna o acelerador de IA mais eficiente do que o chip gráfico para os mesmos aplicativos.
Portanto, é possível que muitos dos aplicativos de IA que atualmente são executados por meio da nuvem possam, em breve, ser executados localmente no próprio laptop, de maneira eficiente em termos de energia, sem a necessidade de uma conexão com a Internet.
Power consumption UL Procyon Ai Inference benchmark on an external monitor
| UL Procyon for Windows | |
| Acer Swift Go 14 SFG14-72 | |
| Overall Score Integer NPU | |
| Overall Score Integer GPU | |
A Intel gentilmente nos forneceu uma versão do Gimp que já inclui o Stable Diffusion com suporte a OpenVINO e NPU. Depois de uma longa configuração, o programa de conversão de texto em imagem funcionou de forma surpreendentemente rápida. Até o momento, era possível executar o Stable Diffusion em placas de vídeo Arc.


É certo que nem todas as imagens criadas pela rede neural são particularmente úteis. O Stable Diffusion tem uma capacidade limitada de lidar com rostos, pés e mãos vistos à distância. Mas as tarefas que o senhor define para o programa também devem ser definidas da forma mais clara possível. É necessário ter alguma experiência nessa área para garantir que o senhor obtenha o que pediu.
Emissões - Permanecem praticamente silenciosas
Emissões de ruído
Apesar do desempenho de alto nível, o novo Acer Swift Go não ficou mais barulhento. Com quase 45 dB(A) sob carga total, não se pode dizer que seja realmente silencioso, mas é tolerável. O Acer Swift Go lida com tarefas de pequeno e médio porte normalmente sem a presença audível da ventoinha.
Barulho
| Ocioso |
| 25 / 25 / 26.2 dB |
| Carga |
| 35.7 / 45.5 dB |
 | ||
30 dB silencioso 40 dB(A) audível 50 dB(A) ruidosamente alto |
||
min: | ||
| Acer Swift Go 14 SFG14-72 Arc 8-Core, Ultra 7 155H, SK hynix HFS001TEJ9X110NA | Acer Swift Go 14 SFG14-71 Iris Xe G7 80EUs, i5-1335U, WD PC SN740 SDDQNQD-512G-1014 | LG Gram 2in1 16 16T90R - G.AA78G Iris Xe G7 96EUs, i7-1360P, Samsung PM9A1 MZVL21T0HCLR | HP Pavilion Plus 14-ew0153TU Iris Xe G7 96EUs, i7-1355U, SK hynix PC801 HFS001TEJ9X101N | Lenovo ThinkPad T14 G4 21K4S02000 Radeon 780M, R7 PRO 7840U, Samsung PM9A1a MZVL21T0HDLU | Ayaneo Air 1S Retro Power Radeon 780M, R7 7840U, Ayaneo CyberThunder-2TB | HP Pavilion Plus 14-ey0095cl Radeon 780M, R7 7840U, WDC PC SN810 1TB | |
|---|---|---|---|---|---|---|---|
| Noise | 4% | 5% | 20% | 14% | 3% | 6% | |
| desligado / ambiente * (dB) | 25 | 24.9 -0% | 25.1 -0% | 19.35 23% | 23.1 8% | 23 8% | 23.4 6% |
| Idle Minimum * (dB) | 25 | 24.9 -0% | 25.1 -0% | 20.57 18% | 23.1 8% | 24.7 1% | 24.1 4% |
| Idle Average * (dB) | 25 | 24.9 -0% | 25.1 -0% | 20.57 18% | 23.1 8% | 25.2 -1% | 24.1 4% |
| Idle Maximum * (dB) | 26.2 | 24.9 5% | 26.1 -0% | 20.57 21% | 23.1 12% | 25.2 4% | 25.3 3% |
| Load Average * (dB) | 35.7 | 31.9 11% | 31.4 12% | 32.18 10% | 26.5 26% | 32.1 10% | 33.4 6% |
| Load Maximum * (dB) | 45.5 | 43.2 5% | 36.6 20% | 32.26 29% | 35.78 21% | 47.1 -4% | 39.4 13% |
| Witcher 3 ultra * (dB) | 43.2 | 41.1 | 29.44 | 35.7 | 39.4 |
* ... menor é melhor
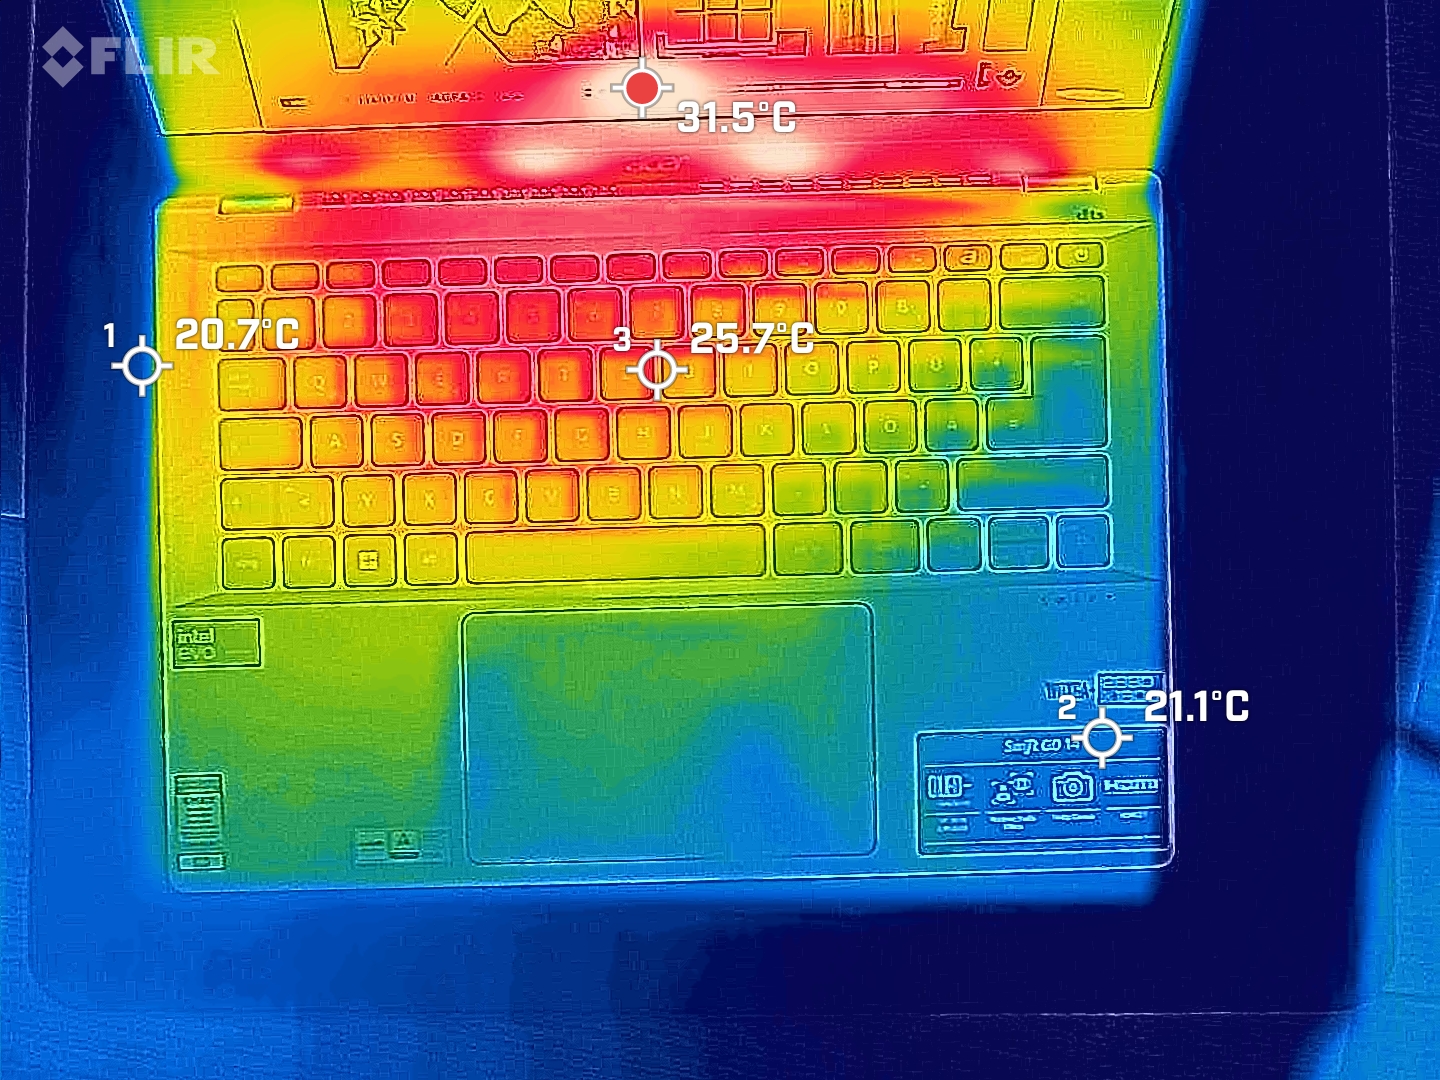
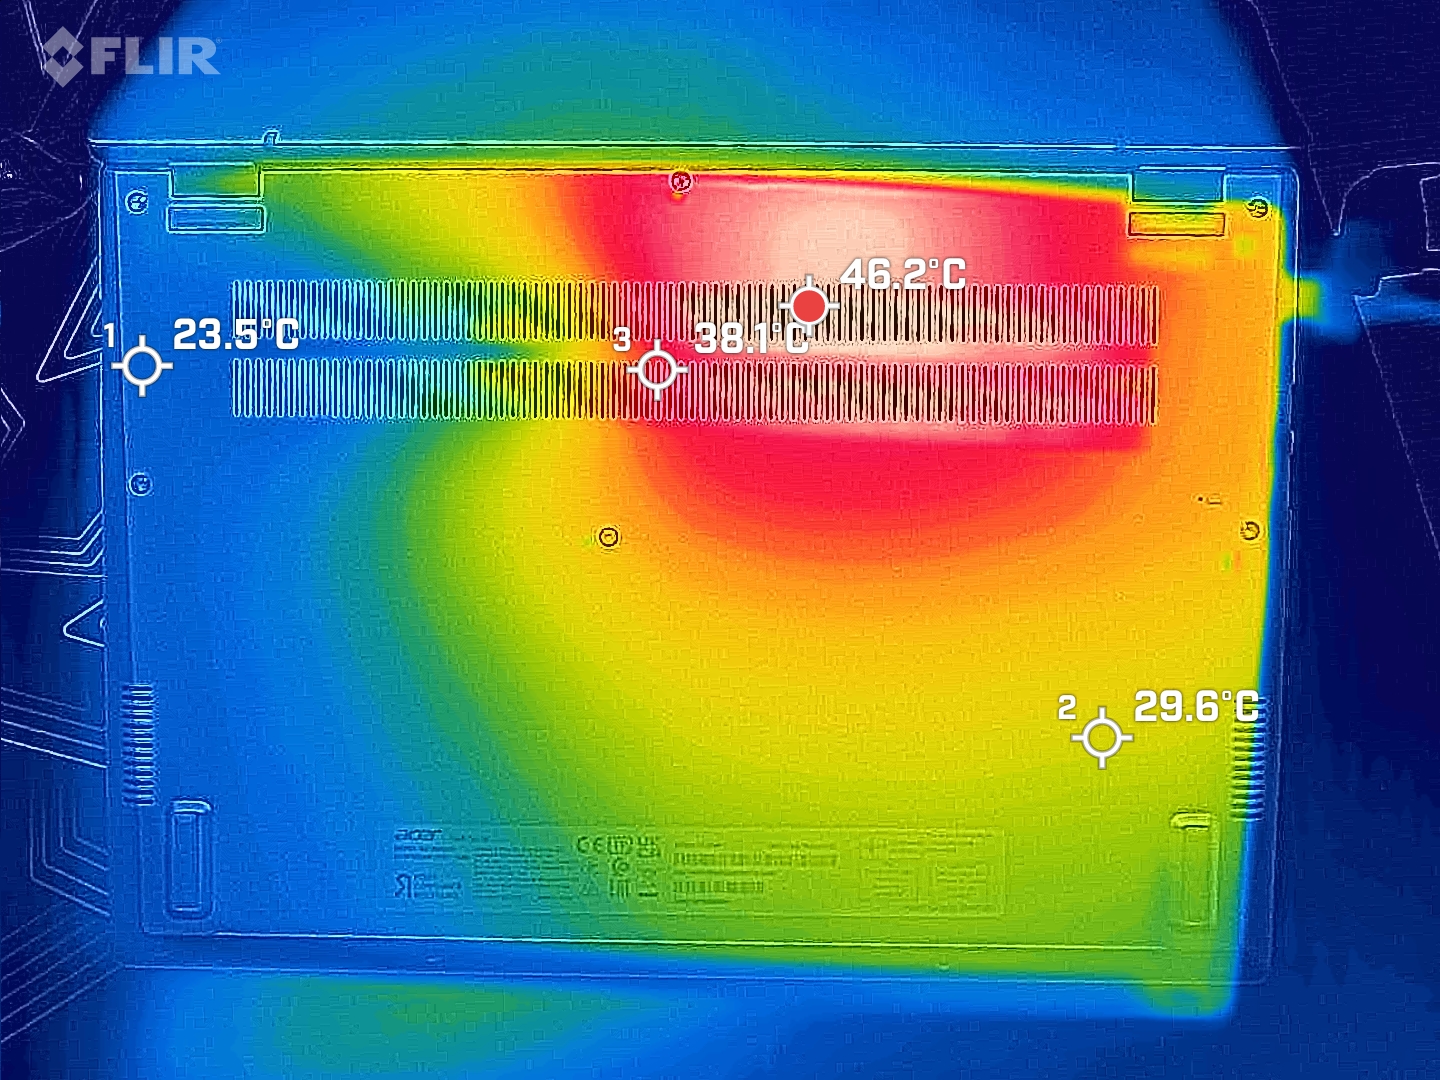
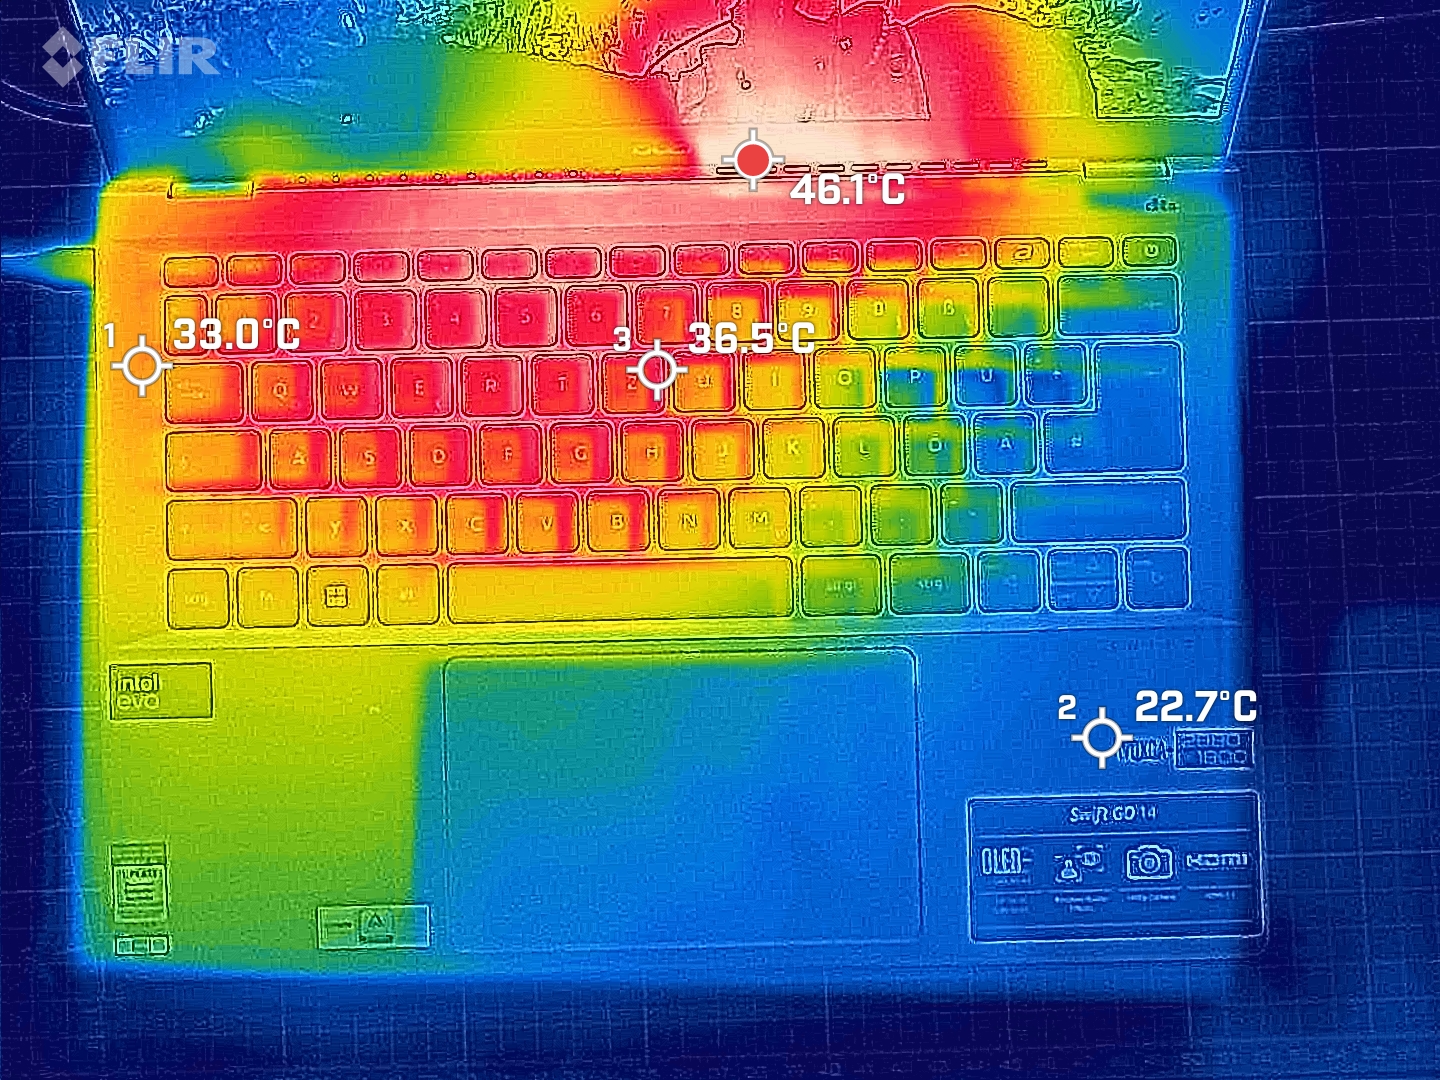
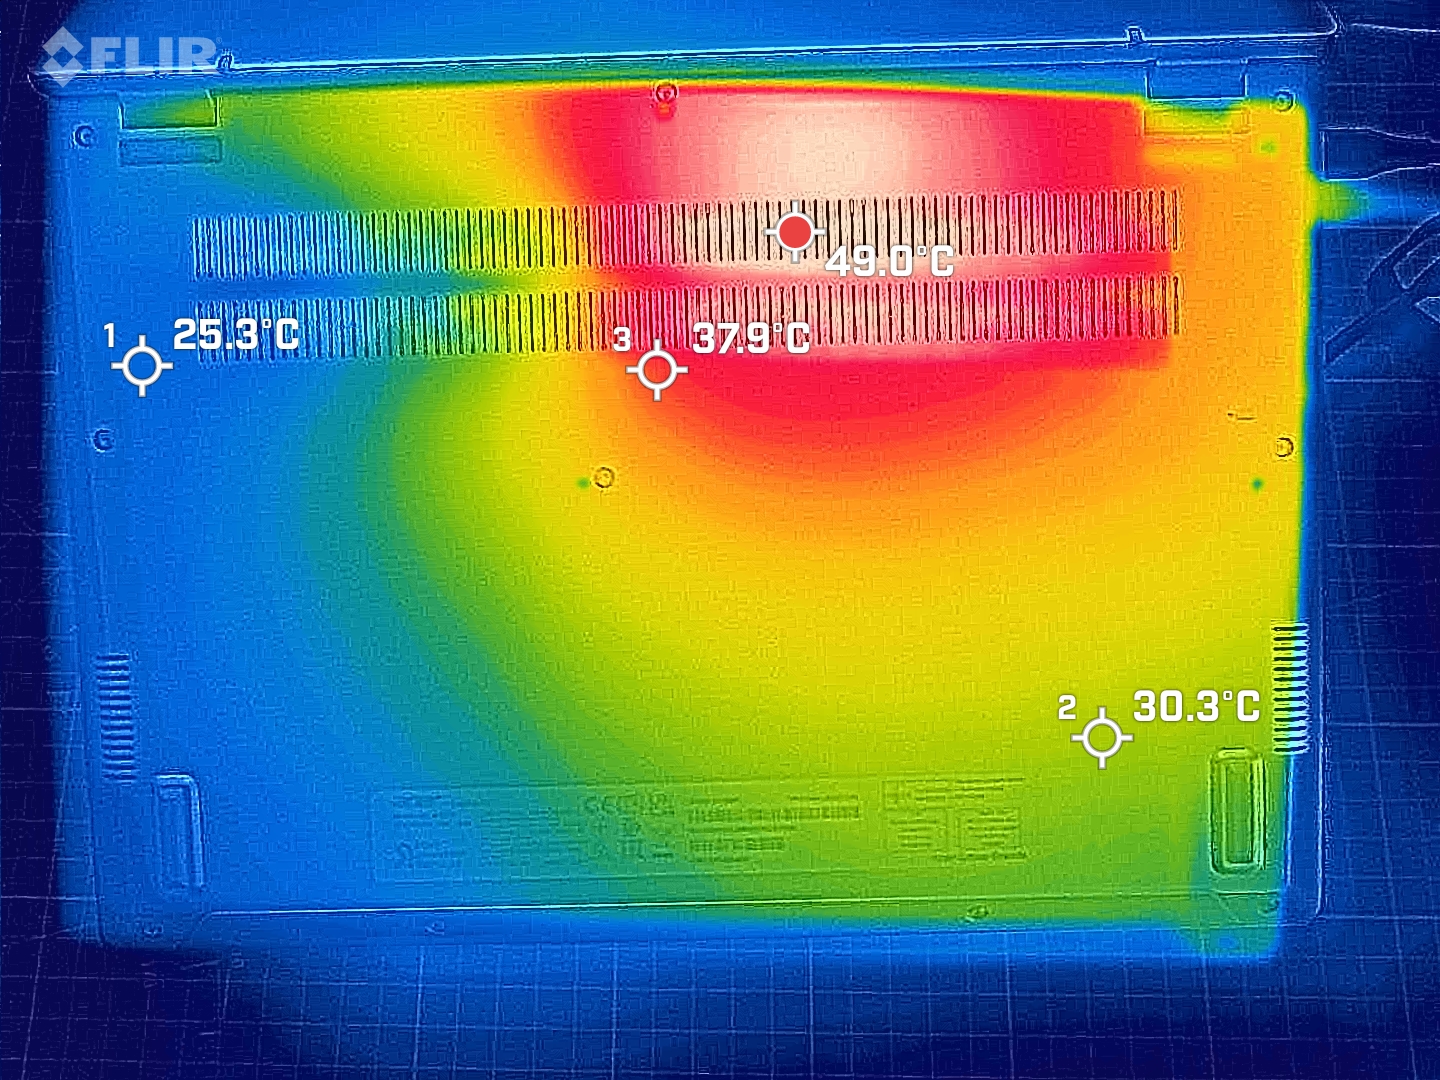
Temperatura
Infelizmente, o que não mudou foram as temperaturas muito altas da superfície do laptop, que medimos durante os testes. A barra atrás do teclado chegou a atingir 40 °C. No entanto, a área que mais aquece é a tela, para a qual o ar expelido pelo ventilador é direcionado. Apesar disso, em operação normal, ao navegar na Internet ou usar aplicativos de escritório, a superfície do laptop aquece apenas um pouco acima da temperatura ambiente.
(+) A temperatura máxima no lado superior é 36.5 °C / 98 F, em comparação com a média de 35.9 °C / 97 F , variando de 21.4 a 59 °C para a classe Subnotebook.
(-) A parte inferior aquece até um máximo de 49.5 °C / 121 F, em comparação com a média de 39.2 °C / 103 F
(+) Em uso inativo, a temperatura média para o lado superior é 22.6 °C / 73 F, em comparação com a média do dispositivo de 30.8 °C / ### class_avg_f### F.
(+) Os apoios para as mãos e o touchpad são mais frios que a temperatura da pele, com um máximo de 26.2 °C / 79.2 F e, portanto, são frios ao toque.
(±) A temperatura média da área do apoio para as mãos de dispositivos semelhantes foi 28.2 °C / 82.8 F (+2 °C / 3.6 F).
| Acer Swift Go 14 SFG14-72 Intel Core Ultra 7 155H, Intel Arc 8-Core iGPU | Acer Swift Go 14 SFG14-71 Intel Core i5-1335U, Intel Iris Xe Graphics G7 80EUs | LG Gram 2in1 16 16T90R - G.AA78G Intel Core i7-1360P, Intel Iris Xe Graphics G7 96EUs | HP Pavilion Plus 14-ew0153TU Intel Core i7-1355U, Intel Iris Xe Graphics G7 96EUs | Lenovo ThinkPad T14 G4 21K4S02000 AMD Ryzen 7 PRO 7840U, AMD Radeon 780M | Ayaneo Air 1S Retro Power AMD Ryzen 7 7840U, AMD Radeon 780M | HP Pavilion Plus 14-ey0095cl AMD Ryzen 7 7840U, AMD Radeon 780M | |
|---|---|---|---|---|---|---|---|
| Heat | -2% | -22% | 4% | 3% | -30% | 12% | |
| Maximum Upper Side * (°C) | 36.5 | 44.8 -23% | 55 -51% | 36.6 -0% | 43.5 -19% | 55 -51% | 39 -7% |
| Maximum Bottom * (°C) | 49.5 | 34.8 30% | 55.4 -12% | 37.2 25% | 47.4 4% | 53.2 -7% | 35.8 28% |
| Idle Upper Side * (°C) | 25.5 | 30.7 -20% | 34.9 -37% | 31.6 -24% | 24.9 2% | 37.1 -45% | 25.2 1% |
| Idle Bottom * (°C) | 35 | 32.5 7% | 30 14% | 30 14% | 26 26% | 40.1 -15% | 25.6 27% |
* ... menor é melhor
Teste de estresse
Como já foi mencionado, definimos o desempenho de aumento do processador em um nível ligeiramente abaixo do valor definido pela Acer. Nosso teste de estresse revelou que a configuração de desempenho contínuo do Core Ultra 7 (PL1) está um pouco alta demais. Depois de algum tempo, ele se estabiliza em torno de 43 watts em vez de 45, mas consegue manter seu nível de desempenho a longo prazo.
Alto-falantes
No geral, os alto-falantes do Acer Swift Go têm um bom som. Apenas os graves poderiam ter um pouco mais de força. Não conseguimos perceber uma diferença em relação ao antecessor.
Acer Swift Go 14 SFG14-72 análise de áudio
(+) | os alto-falantes podem tocar relativamente alto (###valor### dB)
Graves 100 - 315Hz
(-) | quase nenhum baixo - em média 29.6% menor que a mediana
(±) | a linearidade dos graves é média (13.8% delta para a frequência anterior)
Médios 400 - 2.000 Hz
(±) | médios mais altos - em média 6.4% maior que a mediana
(+) | médios são lineares (5.4% delta para frequência anterior)
Altos 2 - 16 kHz
(±) | máximos mais altos - em média 5.7% maior que a mediana
(±) | a linearidade dos máximos é média (7.4% delta para frequência anterior)
Geral 100 - 16.000 Hz
(±) | a linearidade do som geral é média (22.6% diferença em relação à mediana)
Comparado com a mesma classe
» 77% de todos os dispositivos testados nesta classe foram melhores, 4% semelhantes, 18% piores
» O melhor teve um delta de 5%, a média foi 18%, o pior foi 53%
Comparado com todos os dispositivos testados
» 67% de todos os dispositivos testados foram melhores, 6% semelhantes, 28% piores
» O melhor teve um delta de 4%, a média foi 23%, o pior foi 134%
Acer Swift Go 14 SFG14-71 análise de áudio
(+) | os alto-falantes podem tocar relativamente alto (###valor### dB)
Graves 100 - 315Hz
(-) | quase nenhum baixo - em média 29.2% menor que a mediana
(±) | a linearidade dos graves é média (11.1% delta para a frequência anterior)
Médios 400 - 2.000 Hz
(+) | médios equilibrados - apenas 3.9% longe da mediana
(+) | médios são lineares (6.5% delta para frequência anterior)
Altos 2 - 16 kHz
(+) | agudos equilibrados - apenas 2.1% longe da mediana
(+) | os máximos são lineares (5% delta da frequência anterior)
Geral 100 - 16.000 Hz
(±) | a linearidade do som geral é média (20.4% diferença em relação à mediana)
Comparado com a mesma classe
» 45% de todos os dispositivos testados nesta classe foram melhores, 10% semelhantes, 45% piores
» O melhor teve um delta de 7%, a média foi 21%, o pior foi 53%
Comparado com todos os dispositivos testados
» 54% de todos os dispositivos testados foram melhores, 8% semelhantes, 38% piores
» O melhor teve um delta de 4%, a média foi 23%, o pior foi 134%
Gerenciamento de energia - o Meteor Lake pode ser econômico
Consumo de energia
Diz-se que os novos processadores Meteor Lake da Intel são significativamente mais eficientes em termos de energia do que seus antecessores. Isso não foi totalmente óbvio para nós em nossos testes, mas, mais uma vez, isso destaca o status beta do software instalado. Fortes flutuações são aparentes em quase todas as medições de energia, o que indica picos de carga menores.
| desligado | |
| Ocioso | |
| Carga |
|
Key:
min: | |
| Acer Swift Go 14 SFG14-72 Ultra 7 155H, Arc 8-Core, SK hynix HFS001TEJ9X110NA, OLED, 2880x1800, 14" | LG Gram 2in1 16 16T90R - G.AA78G i7-1360P, Iris Xe G7 96EUs, Samsung PM9A1 MZVL21T0HCLR, IPS, 2560x1600, 16" | HP Pavilion Plus 14-ew0153TU i7-1355U, Iris Xe G7 96EUs, SK hynix PC801 HFS001TEJ9X101N, OLED, 2880x1800, 14" | Lenovo ThinkPad T14 G4 21K4S02000 R7 PRO 7840U, Radeon 780M, Samsung PM9A1a MZVL21T0HDLU, IPS LED, 1920x1200, 14" | Ayaneo Air 1S Retro Power R7 7840U, Radeon 780M, Ayaneo CyberThunder-2TB, OLED, 1920x1080, 5.5" | HP Pavilion Plus 14-ey0095cl R7 7840U, Radeon 780M, WDC PC SN810 1TB, OLED, 2880x1800, 14" | Média Intel Arc 8-Core iGPU | Média da turma Subnotebook | |
|---|---|---|---|---|---|---|---|---|
| Power Consumption | 9% | 14% | 38% | 22% | 15% | 3% | 29% | |
| Idle Minimum * (Watt) | 5.5 | 5.5 -0% | 6.7 -22% | 3.3 40% | 7.01 -27% | 6 -9% | 5.31 ? 3% | 3.73 ? 32% |
| Idle Average * (Watt) | 10.1 | 7.2 29% | 7.16 29% | 5.6 45% | 7.91 22% | 6.5 36% | 8.56 ? 15% | 6.51 ? 36% |
| Idle Maximum * (Watt) | 11.2 | 12.9 -15% | 11.17 -0% | 6.1 46% | 12.3 -10% | 13.9 -24% | 11.9 ? -6% | 7.88 ? 30% |
| Load Average * (Watt) | 45.9 | 55 -20% | 46.5 -1% | 40.1 13% | 19.66 57% | 41.9 9% | 53.6 ? -17% | 42.3 ? 8% |
| Witcher 3 ultra * (Watt) | 60.9 | 47 23% | 37.2 39% | 41.4 32% | 38.2 37% | 43.9 28% | ||
| Load Maximum * (Watt) | 104.1 | 63.6 39% | 64.36 38% | 51.8 50% | 50 52% | 50.8 51% | 84.2 ? 19% | 64.8 ? 38% |
* ... menor é melhor
Power consumption Witcher 3 / stress test
Power consumption with an external monitor
Duração da bateria
O Acer Swift Go 14, com seu processador Intel Meteor Lake e bateria de 65 Wh, ficou um pouco abaixo da marca de oito horas no teste de navegação na Internet por Wi-Fi. De acordo com nossas medições de energia, é o painel OLED que consome mais energia durante a navegação. A visita a sites e a execução de aplicativos no modo escuro devem melhorar consideravelmente os tempos de execução. Com o antecessor, era possível obter quase 45 minutos adicionais de tempo de execução.
| Acer Swift Go 14 SFG14-72 Ultra 7 155H, Arc 8-Core, 65 Wh | Acer Swift Go 14 SFG14-71 i5-1335U, Iris Xe G7 80EUs, 54.6 Wh | LG Gram 2in1 16 16T90R - G.AA78G i7-1360P, Iris Xe G7 96EUs, 80 Wh | HP Pavilion Plus 14-ew0153TU i7-1355U, Iris Xe G7 96EUs, 68 Wh | Lenovo ThinkPad T14 G4 21K4S02000 R7 PRO 7840U, Radeon 780M, 52.5 Wh | Ayaneo Air 1S Retro Power R7 7840U, Radeon 780M, 37.5 Wh | HP Pavilion Plus 14-ey0095cl R7 7840U, Radeon 780M, 68 Wh | Média da turma Subnotebook | |
|---|---|---|---|---|---|---|---|---|
| Duração da bateria | -5% | 58% | 20% | 48% | -17% | 37% | 71% | |
| WiFi v1.3 (h) | 8 | 7.6 -5% | 11.9 49% | 9.6 20% | 12.2 53% | 5.9 -26% | 8.5 6% | 14 ? 75% |
| Load (h) | 1.2 | 2 67% | 1.7 42% | 1.1 -8% | 2 67% | 1.998 ? 67% | ||
| H.264 (h) | 12 | 3.1 | 15.3 ? | |||||
| Gaming (h) | 1.2 | |||||||
| Reader / Idle (h) | 16.9 | 28.6 ? |
Pro
Contra
Veredicto - Não apenas no escritório
A Acer nos apresentou o Swift Go 14 um pouco antes de o dispositivo chegar ao mercado e isso significa que nem tudo funciona perfeitamente. Mas já tivemos a oportunidade de experimentar a mais recente geração de processadores da Intel e ficamos impressionados com o desempenho gráfico de alto nível do chip Meteor Lake. Ficaremos atentos às mudanças no dispositivo até a primavera do próximo ano e, então, daremos nosso veredicto final sobre o Swift Go 14 (2024). No entanto, já percebemos que a máquina compacta se beneficia do consideravelmente mais potente Core Ultra 7. O maior desempenho gráfico permite que o laptop e sua excelente tela OLED desfrutem de um espectro mais amplo de aplicativos. Isso, pelo menos, torna os jogos e a edição de vídeo uma possibilidade. O núcleo NPU no processador Processador Meteor Lake também foi capaz de demonstrar seu poder em nossos testes.
Pesando 1,3 kg, o Acer Swift Go 14 é um equipamento leve e potente que tem um impacto considerável dentro de seu elegante gabinete. O processador Meteor Lake da Intel garante uma gama significativamente maior de casos de uso de aplicativos.
Não há dúvida de que o Swift Go 14 é um dispositivo móvel. Graças ao Thunderbolt 4, HDMI 2.1 e algumas portas adicionais, não falta conectividade. Em breve, haverá outras alternativas com processadores Meteor Lake, com a Asus já oferecendo esse chipset em seu ZenBook 14. Quem estiver impaciente demais para esperar por laptops com processadores Intel deve dar uma olhada nas máquinas de 14 polegadas com o AMD Ryzen 7 7840U, como o HP Pavilion Plus 14.
Preço e disponibilidade
Espera-se que o Swift Go 14 esteja disponível a partir de fevereiro de 2024. Até o momento, foi anunciado um preço de compra antecipado de pouco menos de 1.000 euros para a Alemanha.
Transparência
A seleção dos dispositivos a serem analisados é feita pela nossa equipe editorial. A amostra de teste foi fornecida ao autor como empréstimo pelo fabricante ou varejista para fins desta revisão. O credor não teve influência nesta revisão, nem o fabricante recebeu uma cópia desta revisão antes da publicação. Não houve obrigação de publicar esta revisão. Como empresa de mídia independente, a Notebookcheck não está sujeita à autoridade de fabricantes, varejistas ou editores.
É assim que o Notebookcheck está testando
Todos os anos, o Notebookcheck analisa de forma independente centenas de laptops e smartphones usando procedimentos padronizados para garantir que todos os resultados sejam comparáveis. Desenvolvemos continuamente nossos métodos de teste há cerca de 20 anos e definimos padrões da indústria no processo. Em nossos laboratórios de teste, equipamentos de medição de alta qualidade são utilizados por técnicos e editores experientes. Esses testes envolvem um processo de validação em vários estágios. Nosso complexo sistema de classificação é baseado em centenas de medições e benchmarks bem fundamentados, o que mantém a objetividade.Price comparison

